gene flow vs. pollution pressure: genetic diversity of mytilus galloprovincialis in eastern adriatic
TRANSCRIPT

Gg
Aa
b
c
ARRA
KMEMFBB
1
aeMitbs(eleolegttd
0h
Aquatic Toxicology 136– 137 (2013) 22– 31
Contents lists available at SciVerse ScienceDirect
Aquatic Toxicology
jou rn al hom epage: www.elsev ier .com/ locate /aquatox
ene flow vs. pollution pressure: Genetic diversity of Mytilusalloprovincialis in eastern Adriatic
namaria Stambuka,∗, Maja Sruta, Zlatko Satovic b, Mirta Tkalecc, Göran I.V. Klobucara
Department of Zoology, Faculty of Science, University of Zagreb, Rooseveltov trg 6, 10000 Zagreb, CroatiaDepartment for Seed Science and Technology, Faculty of Agriculture, University of Zagreb, Svetosimunska cesta 25, 10000 Zagreb, CroatiaDepartment of Botany, Faculty of Science, University of Zagreb, Rooseveltov trg 6, 10000 Zagreb, Croatia
a r t i c l e i n f o
rticle history:eceived 31 January 2013eceived in revised form 20 March 2013ccepted 23 March 2013
eywords:editerranean mussel
a b s t r a c t
Environmental pollution may modify all the evolutionary processes involved in shaping the geneticpatterns of exposed populations. In order to evaluate the pollution impact on the genetic diversity ofMediterranean mussel Mytilus galloprovincialis ten populations inhabiting differently polluted sites alongthe eastern Adriatic coast, from pristine bays to heavily trafficked harbours, were studied. Pollution pres-sure was assessed through an integrated study of biological effects and responses across different levelsof biological organization. Eight microsatellite markers were analysed to assess genetic diversity of inves-
volutionary toxicologyicrosatellites
itnessiomonitoringiomarkers
tigated populations. Both the principal component analysis (PCA) of the biomarker data set as well asthe biomarker response index (BRI) confirmed substantial pollution pressure at the highly polluted sites,and very low pollution exposure at the three reference sites. Very shallow genetic differentiation wasfound in respect to maritime distances or pollution status, and this was attributed to a high gene flowamong the populations. However, populations inhabiting polluted sites exhibited higher levels of geneticdiversity and evolutionary mechanisms underlying this phenomenon are discussed.
© 2013 Elsevier B.V. All rights reserved.
. Introduction
Evolutionary toxicology is a rapidly growing scientific fieldiming to elucidate microevolutionary processes caused by thenvironmental pollution in natural populations (Bickham, 2011;edina et al., 2007). All of the four main evolutionary forces
nvolved in shaping genetic patterns of every population (muta-ion, selection, genetic drift and gene flow) can be severely modifiedy pollution pressure. On the level of population genetic diver-ity, several outcomes of pollution impact are hence hypothesizedBickham, 2011). The most frequently expected outcome is geneticrosion (Van Straalen and Timmermans, 2002), a genome-wideoss of genetic variability due to a reduction of effective size ofxposed population and an accompanying genetic drift. On thether hand, genotoxic pollution can result in an enhanced mutationoad, increasing the within-population genetic diversity (Rinnert al., 2011). Pollution pressure may also alter the survival of someenotypes due to selective advantages. While directional selec-
ion is expected to decrease within-population genetic diversityhrough the selection of resistant genotypes, enhancing the geneticifferentiation among-populations at the same time (Wirgin et al.,∗ Corresponding author. Tel.: +385 1 4877 700; fax: +385 1 4826 260.E-mail address: [email protected] (A. Stambuk).
166-445X/$ – see front matter © 2013 Elsevier B.V. All rights reserved.ttp://dx.doi.org/10.1016/j.aquatox.2013.03.017
2011), balancing selection acts toward the increase of within-population genetic diversity and low genetic divergence amongthe populations (Mäkinen et al., 2008). Pollution can also affect themigration patterns, acting as a barrier to new immigrants (Puritzand Toonen, 2011), or even creating an “ecological sink” by increas-ing the gene flow toward the impacted population (Matson et al.,2006).
Yet, due to the complexity and simultaneity of all of these evo-lutionary processes, it can be quite difficult to determine the causallink between the exposure to pollution and its consequences on thegenetic level in natural populations (Bickham, 2011; Medina et al.,2007). Thus, for a comprehensive study in the field of evolutionarytoxicology it is highly recommended to compare multiple popu-lations on unpolluted and polluted areas (Belfiore and Anderson,1998), and within this approach genetic variation should be com-prehended in the biogeographical context (Staton et al., 2001).
The Mediterranean mussel Mytilus galloprovincialis is (alongwith its sister species Mytilus edulis) among the most extensivelyinvestigated species in the field of ecotoxicology. Their sessile lifestyle, filter feeding behaviour, and high bioaccumulation capacitiestoward many marine pollutants makes them very suitable biore-
port species. Due to a long lived pelagic larva M. galloprovincialishas a high dispersal potential. But, although larvae can be in thepelagic state for over three weeks, larval dispersion of most individ-uals occurs within the 10 km, and some extent of self-recruitment
xicology 136– 137 (2013) 22– 31 23
iggetbDgtg
ewppstioMttg(esasoptmbaap
2
2
ws(tS(rs2bmtp(ec2teSwli
Fig. 1. Map of studied area with investigated sites at which Mytilus galloprovincialiswere sampled. Lim, Mljet and Ston–sites of low pollution intensity; Bakar, Trogir,
A. Stambuk et al. / Aquatic To
s anticipated within the population (Becker et al., 2007). M.alloprovincialis is considered as an invasive species of a wide geo-raphical distribution (Zardi et al., 2007), adapted to the variousnvironmental conditions, and is easily found and collected on pris-ine and polluted sites. It is aquacultured along the European coast,ut the breeding is based on the collection of the natural spatfall.ue to its high dispersal potential, a high degree of genetic homo-eneity of Mytilus sp. populations is frequently reported, althoughhere is some evidence of environmental conditions acting upon theenetic patterns (Gosset and Bierne, 2013 and references therein).
Our aim was to perform an integrated study across different lev-ls of biological organization, and to reveal whether and in whatay coastal pollution modifies the genetic diversity of M. gallo-
rovincialis populations in the eastern Adriatic. To cover a range ofollution conditions, we have chosen ten populations inhabitingites of different pollution intensity, from reference sites charac-erised by a low anthropogenic impact, sites of medium pollutionntensity, to the highly polluted harbours. Sites were chosen basedn the historical and literature data. During the last two decadesediterranean mussel was extensively studied in the respect to
he pollution status of particular sites and pollution hot-spots inhe eastern Adriatic under the frames of the biomonitoring pro-rammes “Adriatic Sea Project” (1998–2008) and “Project CroWat”2002–2005) (Bihari et al., 2003; Ivankovic et al., 2005; Klobucart al., 2008; Kljakovic-Gaspic et al., 2010). To infer pollution pres-ure acting upon each population, activities of several antioxidativend biotransformational enzymes were determined to address thetress response. Pollution effects were assessed by measurementf macromolecules damage, and condition index (CI) was used as aroxy for organism’s fitness. Eight microsatellite loci were appliedo reveal the differences in allelic frequencies, e.g., pollution-driven
icroevolution. Microsatellites were chosen as genetic markersecause they enable an insight in most of the processes affectingllelic frequencies in the stress-impacted populations (Dimsoskind Toth, 2001) and may reveal genetic scenarios in the recentopulation history.
. Materials and methods
.1. Sampling design
In spring (March–April) 2008 native Mediterranean musselsere collected in ten sites along the 500 km of Croatian Adriatic
hore: Lim (inner part of Lim channel, maritime reserve), Pulaharbour), Rijeka (harbour), Bakar (industrial area), Trogir (nau-ical harbour), Vranjic (former industrial area), Split (harbour),ton (aquaculture site in Maloston bay), Gruz (harbour) and MljetNational park, Polace basin) (Fig. 1). Low pollution impact on theeference sites Mljet, Ston and Lim has been confirmed in manytudies (e.g. Bihari et al., 2005; Cuculic et al., 2009; Klobucar et al.,008; Petrovic et al., 2004). Both Pula and Rijeka, in addition toeing heavily trafficked harbours, also receive nearly untreatedunicipal, industrial and shipyard wastewaters. Bakar is an indus-
rial area and the site of former coke-plant closed in 1995. Pollutionressure on these three sites has been intensively investigatedBihari et al., 2005; Micovic et al., 2009; Petrovic et al., 2004; Srutt al., 2011). Wider marine area of Split and Vranjic has long beenonsidered as the eastern Adriatic pollution hot spot (Ra –da et al.,012). However, during the last 15 years a number of environmen-al quality interventions have been conducted in the region (Ra –dat al., 2012), including the sediment dredging in the tourist harbour
plit. New infrastructure for most of the municipal and industrialastewaters is constructed, along with the dislocation of the out-ets away from the coast. In addition, most of the industrial plantsn the area were closed. Gruz is a renowned cruisers anchoring
Vranjic and Split–sites of medium pollution intensity; Pula, Rijeka and Gruz–sitesof high pollution intensity.
harbour, which also receives only mechanically pre-treated munic-ipal wastewaters from the town Dubrovnik (Caric, 2011). Pollutionimpact on the M. galloprovincialis populations inhabiting sites Tro-gir, Vranjic, Split and Gruz has also been previously reported (e.g.Bihari et al., 2003; Ivankovic et al., 2005; Klobucar et al., 2008;Kljakovic-Gaspic et al., 2010). Sites were grouped to low (Lim, Mljetand Ston), medium (Bakar, Trogir, Vranjic and Split) and high (Pula,Rijeka, Gruz) pollution intensity groups based on the chemical anal-yses, biomarker data and pollution trends combined from all of thesources mentioned above.
Within ten sampling days in March and April 30–32 individ-ual mussels were collected at each site from the 0.5 to 1 m depthusing metal clutch. At the site Ston aquacultured mussels were col-lected. Immediately upon the sampling mussels were put on iceand transferred to the nearest laboratory in the investigated region:Centre for marine research in Rovinj, Institute of Oceanography andFisheries in Split and Institute for marine and coastal research inDubrovnik. Tissue sampling was performed within three hours ofcollection. The same individuals (10 per each site), were sampledfor all biomarker analyses. Along with these 10 mussels, addi-tional 20–22 mussels per site were sampled for genetic analyses.Haemolymph was collected from individual mussels (N = 10) fromthe posterior adductor muscle sinus with a hypodermic syringe,and the samples were subsequently used for both the Comet assay(N = 8) and micronucleus test (N = 10). Animals were dissected andthe whole wet tissue was weighed to measure the condition index(CI, N = 8). Gills from the same 8 individuals per site were sampledand stored in liquid nitrogen for assessment of antioxidative andbiotransformation enzyme activities (catalase (CAT), glutathionereductase (GR) and glutathione S-transferase (GST)), and lipid per-oxidation by measuring malondialdehyde (MDA) content (N = 8)and of protein damage by measuring carbonyl content (N = 6). Man-
tle tissue of 29–32 individuals per site was preserved in 96% ethanolfor genetic analyses. In order to confirm the genotoxic influenceon impacted populations, additional sampling for the Comet assay(N = 8) was conducted in the autumn (September–October) of 2009.
2 xicolog
2
2
S
2
dip
2
h2E4
r2cp11(w7cpwmlo
foB((twAbaauap
bsapswato5Netwar
4 A. Stambuk et al. / Aquatic To
.2. Biological analyses
.2.1. Comet assayThe Comet assay was adapted from a protocol described by
ingh et al. (1988) with slight modifications (Klobucar et al., 2008).
.2.2. Micronucleus testMicronucleus test was performed according to the protocol
escribed by Klobucar et al. (2008). 10 slides per site were exam-ned and on the each slide 1000 cells were counted (i.e. 10,000 cellser site).
.2.3. Extract preparation and oxidative stress parametersFor protein extraction, gills were homogenized in steel
omogenising tube with steel balls (Retsch MM200) containing mL of 50 mM potassium phosphate buffer (pH 7.0) with 0.1 mMDTA. The homogenate was centrifuged at 10,000 × g for 12 min at◦C. Supernatant was collected and used for the following assays.
For carbonyl quantification, the dinitrophenylhydrazine (DNPH)eaction was used as described by Levine et al. (1994). Briefly,00 �L of supernatants diluted 1:1 (v/v) with extraction buffer wereombined with 300 �L of 10 mM DNPH in 2 M HCl. As a blind sam-le 200 �L of extract mixed with 2 M HCl (300 �L) was used. After
h incubation at room temperature (samples were mixed every5 min), the proteins were precipitated with 500 �L of cold 10%w/v) trichloroacetic acid and the pellets were washed three timesith 500 �L of ethanol:ethylacetate (1:1; v:v) and centrifuged at
00 g for 5 min at 4 ◦C to remove the excess reagent. The pre-ipitated proteins were finally dissolved in 6 M urea in 20 mMotassium phosphate buffer (pH 2.4) and the absorption at 370 nmas measured. Protein recovery was estimated for each sample byeasuring the absorption at 280 nm. Carbonyl contents were calcu-
ated using a molar absorption coefficient for aliphatic hydrazonesf 22 mM−1 cm−1 and expressed in nmol per mg of protein.
The level of lipid peroxidation was determined indirectly as theormation of malondialdehyde (MDA), a by-product of lipid per-xidation that reacts with thiobarbituric acid (TBA), according touege and Aust (1978) with slight modifications. Homogenates150 �L) were mixed with 450 �L of cold 10% trichloracetic acidTCA) to precipitate proteins. The precipitate was pelleted by cen-rifugation (10,000 × g for 15 min at 4 ◦C) and 550 �L of supernatantas reacted with an equal volume of 0.7% (w/v) TBA in 10% TCA.fter heating at 95 ◦C for 15 min, the mixture was cooled in an iceath. The absorbance of the supernatant was measured at 532 nmnd correction for unspecific turbidity was done by subtracting thebsorbance at 600 nm. As a blind sample 0.7% TBA in 10% TCA wassed. The content of lipid peroxides was calculated using a molarbsorption coefficient of 155 mM−1 cm−1 and expressed as nmoler mg of protein.
For enzyme assays supernatants were diluted with extractionuffer 1:3 (v/v). CAT activity (EC 1.11.1.6) was assayed by mea-uring the decrease in absorbance at 240 nm (ε = 36 mM−1 cm−1)ccording to Aebi (1984). The reaction mixture consisted of 50 mMotassium phosphate buffer (pH 7.0), 10 mM H2O2 and 50 �L ofample. CAT activity was expressed in units per mg of protein,here one unit is the hydrolysis of 1 �mol of H2O2 per minute,
t 25 ◦C and pH 7.0. GR activity (EC 1.8.1.7) was determined byhe oxidation of NADPH at 340 nm according to a modified methodf Ramos-Martinez et al. (1983). The reaction mixture contained0 mM potassium phosphate buffer (pH 7.0), 0.1 mM EDTA, 0.2 mMADPH, 0.5 mM GSSG, and 100 �L of sample. GR activity wasxpressed in units per mg of protein, where one unit is oxida-
ion of 1 nmol NADPH per minute at 25 ◦C and pH 7.0. GST activityas assayed by measuring the decrease in absorbance at 340 nmccording to Habig et al. (1974) with slight modifications. Theeaction mixture consisted of 50 mM potassium phosphate buffer
y 136– 137 (2013) 22– 31
(pH 6.5), 0.1 mM EDTA, 1 mM reduced glutathione (GSH), 50 �L ofextract and 500 �L of 1.5 mM 1-chloro-2,4- dinitrobenzene (CDNB)in ethanol (final concentration 0.5 mM). GST activity was expressedas nmol of conjugated glutathione per minute per mg of protein.
2.2.4. Condition indexCondition index (CI) was calculated based on the wet tis-
sue weight and mussel length according to the formula: CI = wetweight/mussel length × 100 (Gagné et al., 2008).
2.2.5. Biomarker data analysesAll results were expressed as means with the corresponding
standard deviation. The effective sample size in each group was thenumber of animals analysed. Increase or decrease of the biomarkervalues on polluted sites is considered statistically significant whenit reached significance in comparison to at least one of the refer-ence sites. Statistical analysis was performed using STATISTICA 7.1(StatSoft, Inc., USA). Comet assay and micronucleus test data werecompared by the non-parametric Mann–Whitney U-test. All otherparameters were statistically compared by the analysis of vari-ance (ANOVA) and the least significant difference (LSD) test wasperformed if ANOVA was significant at p < 0.05.
2.2.5.1. Biomarker response index (BRI). Biomarker response index(BRI) was calculated according to Hagger et al. (2008). Biomarkerdata were assigned with rank value according to the severity of thebiological response/effect of pollution (value 4 represent basal orreference values, value 1 significantly altered, and the values 2 and 3reflecting major or moderate alterations, respectively). Alterationswere evaluated based on the values on the reference sites, but alsoconsidering differences among all ten sites. The biomarkers werealso weighted according to their level of biological organisation;physiological endpoint (CI) was weighted as 3, cellular damages as2 and molecular endpoints (in term of enzymatic responses) as 1.Final BRI value was then calculated using the following formula:
BRI =n∑
i=1
biwi/
n∑
i=1
wi
where bi is the score of the biomarker, and wi is the weight of thebiomarker.
2.2.5.2. Principal component analysis (PCA). Principal componentanalysis (PCA) was used to discriminate between the sites accord-ing to pollution status based on the correlations within biomarkerdata set using STATISTICA 7.1 (StatSoft, Inc., USA). Biomarkers onthe molecular, cellular and individual level were used as activevariables.
2.2.6. Microsatellite markersDNA was extracted using GenEluteTM Mammalian Genomic
DNA miniprep kit (Sigma-Aldrich) following the manufacturer’sprotocol. Eight microsatellite loci were used to genotype 29–32individuals per studied population of M. galloprovincialis. Wehave used five EST-derived loci: MGE001, MGE003, MGE0005,MGE0007, MGE0008 (Yu and Li, 2007) and three anonymous loci:Mg�2, Mg�3 (Presa et al., 2002) and Mg181 (Varela et al., 2007).Microsatellite fragments were amplified under the following con-ditions: 95 ◦C (5 min), followed by 30 cycles at 94 ◦C (1 min), Ta
(1 min), and 72 ◦C (1 min) with a final extension step at 72 ◦C(10 min). PCRs were carried out in a total volume of 20 �l contain-ing 0.325 �M each of forward and reverse primers, 200 �M dNTPs,
1.5 mM MgCl2, 0.8 U Fermentas Taq DNA polymerase, 1 × KClbuffer, nuclease free water and app. 50 ng of DNA template. For-ward primers were fluorescent labelled. Ta was 52 ◦C for MGE0005,56 ◦C for MGE0007, MGE0008, MGE001, Mg�2, and Mg181; 60 ◦C
xicolog
fdat
2mb(nhtci1rIbbnv
e2c(Epewiipa
Ffpi
A. Stambuk et al. / Aquatic To
or MGE003 and Mg�3. Gene scans of amplification products wereone with automated sequencer ABI3730XL (Macrogen Inc. Korea),nd alleles were scored using GeneMapper 3.7 (Applied Biosys-ems).
.2.6.1. Within-population genetic diversity. Polymorphism Infor-ation Content (PIC) of each microsatellite marker was calculated
y PowerMarker V3.23 (Liu, 2002) software. GENEPOP 4.0Raymond and Rousset, 1995) was used to calculate the averageumber of alleles per locus (Nav), the observed (HO) and expectedeterozygosity (HE) and the inbreeding coefficient (FIS) as well aso test genotypic frequencies for each locus in each population foronformance to Hardy-Weinberg (HW) expectations. The probabil-ty test was based on Markov chain method (Guo and Thompson,992). The sequential Bonferroni adjustments were applied to cor-ect for the effect of multiple tests using SAS Release 9.2 (SASnstitute, 2004). The allelic richness, Nar, as the measure of the num-er of alleles per locus independent of sample size was calculatedy FSTAT v. 2.9.3.2 programme package (Goudet, 2002) while theumber of private alleles (Npr) per population was assessed by GDAer. 1.0 (Lewis and Zaykin, 2001).
Each locus was evaluated for the presence of null alleles, scoringrrors due to stuttering, and allelic dropout using MICRO-CHECKER.2.3 (Van Oosterhout et al., 2004). Estimation of null allele frequen-ies (fnull) based on the expectation-maximization (EM) algorithmDempster et al., 1977) were calculated using FreeNA (Chapuis andstoup, 2007). The adjusted allele frequencies were used to recom-ute expected heterozygosity values [HE(null)]. The estimations ofxpected heterozygosity with and without null allele correctionere compared in each population using the Kruskal–Wallis test
n SAS. FSTAT was used for testing the significance of differencesn average values of Nar, HO, HE, FIS and FST (A) among groups ofopulations inhabiting sites of different pollution intensity as wells (B) among regions (grouping according to the data from Table 2).
ig. 2. Biomarkers of pollution impact on Mytilus galloprovincialis at molecular, cellular anormation enzymes; (d)–(f) genotoxicity endpoints; (g) and (h) oxidative damage to proollution intensity (Lim, Mljet and Ston), grey bars represent sites of medium pollution i
ntensity (Pula, Rijeka and Gruz). Different symbols indicate statistically significant differ
y 136– 137 (2013) 22– 31 25
2.2.6.2. Among-population genetic differentiation and genetic rela-tionships. Genetic differentiation between all pairs of populationswas measured with pairwise FST estimates. Pairwise FST and theirrespective p-values for significant differences from zero were calcu-lated in FSTAT. As null alleles can influence the estimation of geneticdifferentiation (Chapuis and Estoup, 2007), pairwise FST(ENA) esti-mates were also computed following the excluding null allele (ENA)method in FreeNA.
Pairwise Cavalli-Sforza–Edwards’ chord distances (DCSE)(Cavalli-Sforza and Edwards, 1967) were calculated and unrootedphylogenetic tree was constructed using Fitch-Margoliash’salgorithm (Fitch and Margoliash, 1967) with 1000 bootstraps(Felsenstein, 1985) over microsatellite loci as implemented inSEQBOOT, GENDIST, FITCH, and CONSENSE programmes of thePHYLIP ver. 3.6b software package (Felsenstein, 1993). Mantel’stest (Mantel, 1967) was used to compute and test the linearcorrelation between the matrix of the maritime distances (inkm) between pairs of populations and the matrix of pairwiseCavalli-Sforza-Edwards’ chord distances. The significance levelwas assessed after 10,000 permutations as implemented inNTSYS-pc version 2.02 (Rohlf, 1997).
The analysis of molecular variance (AMOVA; Excoffier et al.,1992) was used to partition the total microsatellite diversity amongand within populations in ARLEQUIN ver. 3.0 (Excoffier et al.,2005). The variance components were tested statistically by non-parametric randomisation tests using 10,000 permutations.
3. Results
3.1. Biomarkers at the molecular, cellular and individual levels
Antioxidative and biotransformation enzyme activities showeddifferent responses to the pollution exposure, both dependingon the polluted sites and on the particular enzyme (Fig. 2a–c).
d individual level (mean ± st. dev.). (a)–(c) activities of antioxidative and biotrans-teins and lipids; (i) condition index. Light grey bars represent reference sites, lowntensity (Bakar, Trogir, Vranjic and Split) and dark grey bars sites of high pollutionence in comparison to the reference sites Lim (†), Mljet (�) or Ston (#) (p < 0.05).

26 A. Stambuk et al. / Aquatic Toxicology 136– 137 (2013) 22– 31
F data sf ); BakG
VsitGT
e2aano2pesatd
o(tas
TR
ig. 3. Principal component analysis (PCA) of Mytilus galloprovincialis biomarker
actorial plane. Lim, Mljet and Ston–sites of low pollution intensity (dashed ellipseruz–sites of high pollution intensity.
alues measured in reference mussel populations varied amongites, but were not statistically different. CAT activity exhibited annduction on several polluted sites (Fig. 2a), while GR was foundo be inhibited/depleted on several polluted sites (Fig. 2b). ForST pollution-modulated enhanced activity was found on the siterogir and decreased activity on some other sites (Fig. 2c).
Genotoxicity biomarkers were found to be significantlynhanced on most of the polluted sites. Analysis of the Comet assay008 revealed very strong genotoxic influence on the site Gruz,nd low integrity of DNA in mussels inhabiting the same site wasgain detected in the autumn 2009 (Fig. 2d and e). Comet assay didot indicate strong degradation of DNA in mussels collected fromther polluted sites, except for sites Trogir and Pula in the autumn009. MN incidence was, on the other hand, increased in all theolluted sites except in Trogir (Fig. 2f). Protein carbonylation waslevated in Rijeka and Gruz, although in Gruz it did not reach thetatistical significance, and MDA content was also not significantlyltered in comparison to the reference sites (Fig. 2g and h). CI was onhe average highest in the medium polluted sites, and significantlyecreased in the most impacted site Gruz (Fig. 2i).
Two dominant PCA components (PC1 and PC2) explained 66.61%f the variance of the biomarker data for different populations
Fig. 3a and b), with the highest factor loadings observed for geno-oxicity biomarkers, protein carbonylation and GST activity. Cometssay results correlated with MDA and CAT (indicators of oxidativetress), but not with the MN, confirming again a different modeable 1ank values, weight and scores for biomarkers per sites used to calculate biomarker resp
CAT GR GST tDNA 2008 tDNA
Weight 1 1 1 2 2
Lim 4 4 4 4 4
Mljet 4 3 4 4 4
Ston 4 4 4 4 3
Bakar 4 3 2 4 3
Trogir 3 2 2 4 2
Vranjic 3 3 4 4 3
Split 2 4 3 4 3
Pula 3 4 3 4 2
Rijeka 4 2 1 4 4
Gruz 2 2 4 1 1
et: (a) correlation circle defined by the biomarkers; (b) projection of sites in thear, Trogir, Vranjic and Split–sites of medium pollution intensity; Pula, Rijeka and
of action of these two genotoxicity endpoints. All reference siteswere grouped together, and except for the Trogir site, all othermedium polluted sites were positioned between the reference andthe highly polluted sites. Comet assay, MDA and CAT determined toa highest extent a prominent divergence of the site Gruz. MN cor-related with carbonylated proteins and both biomarkers had highfactor loadings for PC2, thus also contributing to the separation ofthe polluted from the reference sites.
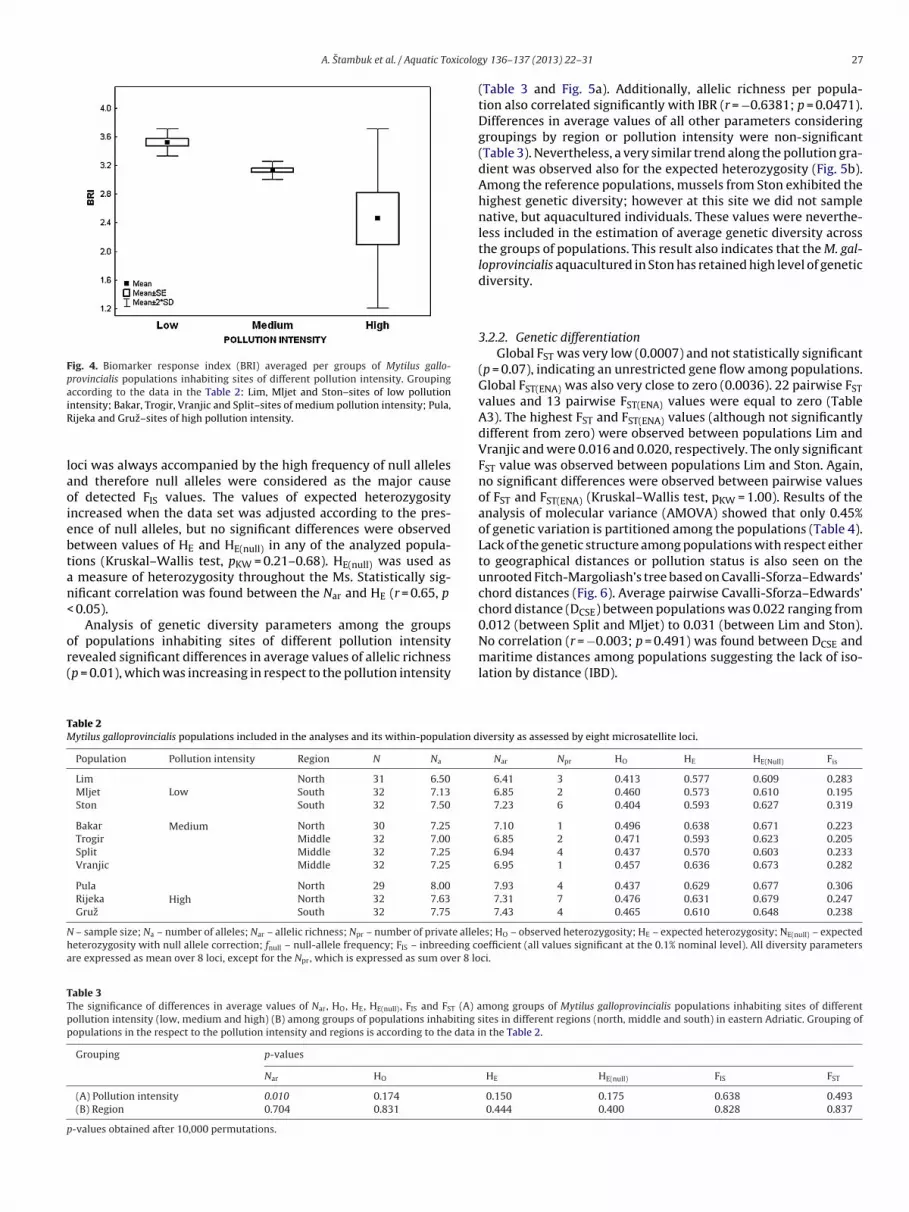
BRI data per site (rank values, weight values of biomarkers andfinal BRI score) are given in the Table 1. BRI also showed clear grada-tion in respect to the pollution status (Fig. 4), and ANOVA revealedstatistically significant differences of BRI among the groups of sitesof different pollution intensity (p < 0.05).
3.2. Genetic analyses
3.2.1. Within-population diversityWithin-population genetic diversity parameters and the group-
ing according to the pollution intensity or geographic region of allpopulations are shown in Table 2. All analysed loci were polymor-phic in all populations (Tables A1 and A2). No evidence of alleledropout was found in the data according to MICRO-CHECKER.
Null alleles were suggested in 32 out of 80 locus × populationcombinations (Table A2). Estimated null allele frequencies usingFreeNA ranged from 0.094 (Mge001 in Gruz) to 0.299 (Mg�2 inVranjic). Overall, significant heterozygosity deficiency at particularonse index (BRI).
2009 MN CAR MDA CI BRI
2 2 2 3
4 4 3 4 3.634 3 3 4 3.444 4 3 4 3.502 3 4 4 3.064 4 3 4 3.13n.d. 3 3 4 3.212 4 4 3 3.131 4 3 4 2.941 1 4 4 2.692 2 2 2 1.75
A. Stambuk et al. / Aquatic Toxicolog
Fig. 4. Biomarker response index (BRI) averaged per groups of Mytilus gallo-provincialis populations inhabiting sites of different pollution intensity. Groupingaccording to the data in the Table 2: Lim, Mljet and Ston–sites of low pollutioniR
laoiebtan<
or(
chord distances (Fig. 6). Average pairwise Cavalli-Sforza–Edwards’chord distance (DCSE) between populations was 0.022 ranging from
TM
Nha
TTpp
p
ntensity; Bakar, Trogir, Vranjic and Split–sites of medium pollution intensity; Pula,ijeka and Gruz–sites of high pollution intensity.
oci was always accompanied by the high frequency of null allelesnd therefore null alleles were considered as the major causef detected FIS values. The values of expected heterozygosityncreased when the data set was adjusted according to the pres-nce of null alleles, but no significant differences were observedetween values of HE and HE(null) in any of the analyzed popula-ions (Kruskal–Wallis test, pKW = 0.21–0.68). HE(null) was used as
measure of heterozygosity throughout the Ms. Statistically sig-ificant correlation was found between the Nar and HE (r = 0.65, p
0.05).
Analysis of genetic diversity parameters among the groupsf populations inhabiting sites of different pollution intensityevealed significant differences in average values of allelic richnessp = 0.01), which was increasing in respect to the pollution intensity
able 2ytilus galloprovincialis populations included in the analyses and its within-population d
Population Pollution intensity Region N Na
Lim North 31 6.50
Mljet Low South 32 7.13
Ston South 32 7.50
Bakar Medium North 30 7.25
Trogir Middle 32 7.00
Split Middle 32 7.25
Vranjic Middle 32 7.25
Pula North 29 8.00
Rijeka High North 32 7.63
Gruz South 32 7.75
– sample size; Na – number of alleles; Nar – allelic richness; Npr – number of private alleleterozygosity with null allele correction; fnull – null-allele frequency; FIS – inbreeding core expressed as mean over 8 loci, except for the Npr, which is expressed as sum over 8 lo
able 3he significance of differences in average values of Nar, HO, HE, HE(null) , FIS and FST (A) aollution intensity (low, medium and high) (B) among groups of populations inhabiting sopulations in the respect to the pollution intensity and regions is according to the data i
Grouping p-values
Nar HO
(A) Pollution intensity 0.010 0.174
(B) Region 0.704 0.831
-values obtained after 10,000 permutations.
y 136– 137 (2013) 22– 31 27
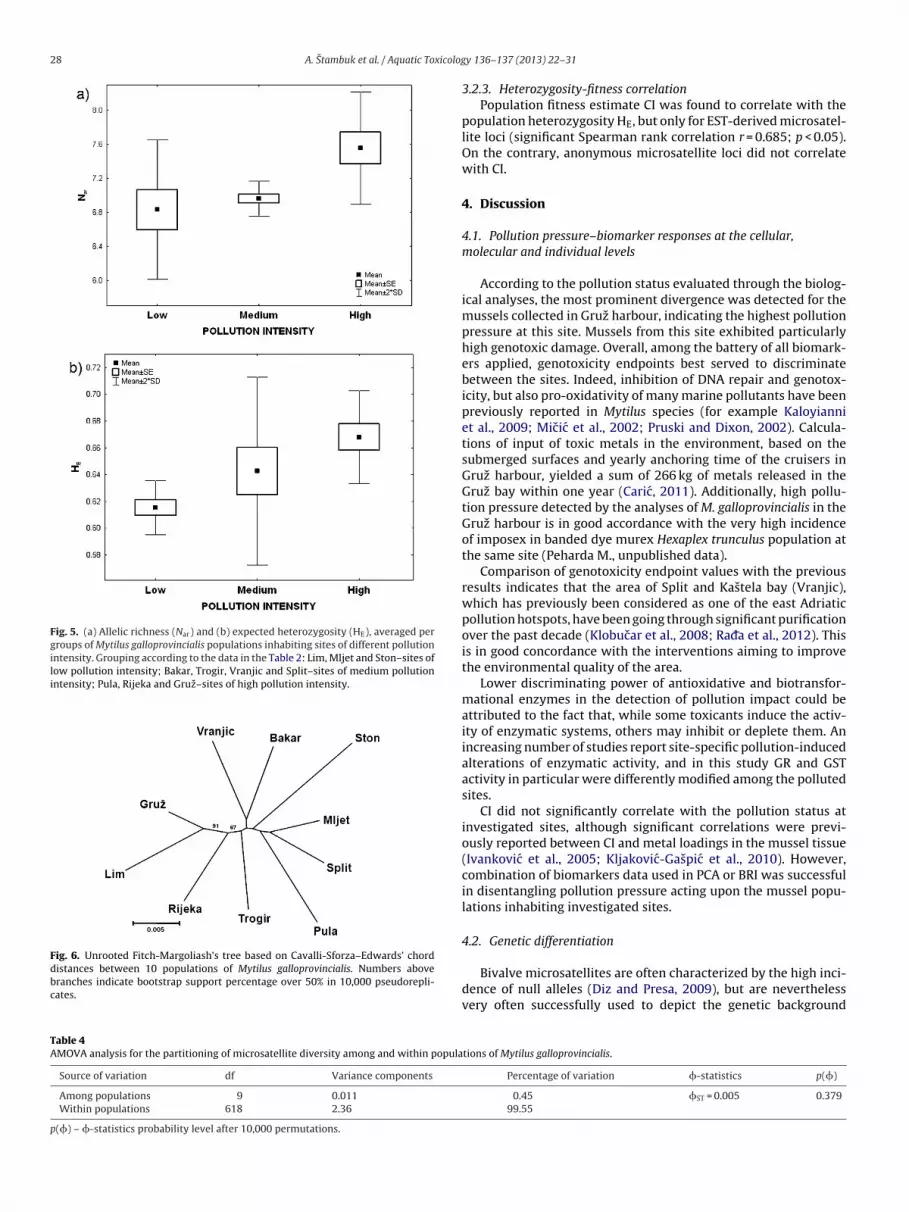
(Table 3 and Fig. 5a). Additionally, allelic richness per popula-tion also correlated significantly with IBR (r = −0.6381; p = 0.0471).Differences in average values of all other parameters consideringgroupings by region or pollution intensity were non-significant(Table 3). Nevertheless, a very similar trend along the pollution gra-dient was observed also for the expected heterozygosity (Fig. 5b).Among the reference populations, mussels from Ston exhibited thehighest genetic diversity; however at this site we did not samplenative, but aquacultured individuals. These values were neverthe-less included in the estimation of average genetic diversity acrossthe groups of populations. This result also indicates that the M. gal-loprovincialis aquacultured in Ston has retained high level of geneticdiversity.
3.2.2. Genetic differentiationGlobal FST was very low (0.0007) and not statistically significant
(p = 0.07), indicating an unrestricted gene flow among populations.Global FST(ENA) was also very close to zero (0.0036). 22 pairwise FSTvalues and 13 pairwise FST(ENA) values were equal to zero (TableA3). The highest FST and FST(ENA) values (although not significantlydifferent from zero) were observed between populations Lim andVranjic and were 0.016 and 0.020, respectively. The only significantFST value was observed between populations Lim and Ston. Again,no significant differences were observed between pairwise valuesof FST and FST(ENA) (Kruskal–Wallis test, pKW = 1.00). Results of theanalysis of molecular variance (AMOVA) showed that only 0.45%of genetic variation is partitioned among the populations (Table 4).Lack of the genetic structure among populations with respect eitherto geographical distances or pollution status is also seen on theunrooted Fitch-Margoliash’s tree based on Cavalli-Sforza–Edwards’
0.012 (between Split and Mljet) to 0.031 (between Lim and Ston).No correlation (r = −0.003; p = 0.491) was found between DCSE andmaritime distances among populations suggesting the lack of iso-lation by distance (IBD).
iversity as assessed by eight microsatellite loci.
Nar Npr HO HE HE(Null) Fis
6.41 3 0.413 0.577 0.609 0.2836.85 2 0.460 0.573 0.610 0.1957.23 6 0.404 0.593 0.627 0.319
7.10 1 0.496 0.638 0.671 0.2236.85 2 0.471 0.593 0.623 0.2056.94 4 0.437 0.570 0.603 0.2336.95 1 0.457 0.636 0.673 0.282
7.93 4 0.437 0.629 0.677 0.3067.31 7 0.476 0.631 0.679 0.2477.43 4 0.465 0.610 0.648 0.238
es; HO – observed heterozygosity; HE – expected heterozygosity; NE(null) – expectedefficient (all values significant at the 0.1% nominal level). All diversity parametersci.
mong groups of Mytilus galloprovincialis populations inhabiting sites of differentites in different regions (north, middle and south) in eastern Adriatic. Grouping ofn the Table 2.
HE HE(null) FIS FST
0.150 0.175 0.638 0.4930.444 0.400 0.828 0.837
28 A. Stambuk et al. / Aquatic Toxicolog
Fig. 5. (a) Allelic richness (Nar) and (b) expected heterozygosity (HE), averaged pergroups of Mytilus galloprovincialis populations inhabiting sites of different pollutionintensity. Grouping according to the data in the Table 2: Lim, Mljet and Ston–sites oflow pollution intensity; Bakar, Trogir, Vranjic and Split–sites of medium pollutionintensity; Pula, Rijeka and Gruz–sites of high pollution intensity.
Fig. 6. Unrooted Fitch-Margoliash’s tree based on Cavalli-Sforza–Edwards’ chorddistances between 10 populations of Mytilus galloprovincialis. Numbers abovebranches indicate bootstrap support percentage over 50% in 10,000 pseudorepli-cates.
Table 4AMOVA analysis for the partitioning of microsatellite diversity among and within popula
Source of variation df Variance components
Among populations 9 0.011
Within populations 618 2.36
p(�) – �-statistics probability level after 10,000 permutations.
y 136– 137 (2013) 22– 31
3.2.3. Heterozygosity-fitness correlationPopulation fitness estimate CI was found to correlate with the
population heterozygosity HE, but only for EST-derived microsatel-lite loci (significant Spearman rank correlation r = 0.685; p < 0.05).On the contrary, anonymous microsatellite loci did not correlatewith CI.
4. Discussion
4.1. Pollution pressure–biomarker responses at the cellular,molecular and individual levels
According to the pollution status evaluated through the biolog-ical analyses, the most prominent divergence was detected for themussels collected in Gruz harbour, indicating the highest pollutionpressure at this site. Mussels from this site exhibited particularlyhigh genotoxic damage. Overall, among the battery of all biomark-ers applied, genotoxicity endpoints best served to discriminatebetween the sites. Indeed, inhibition of DNA repair and genotox-icity, but also pro-oxidativity of many marine pollutants have beenpreviously reported in Mytilus species (for example Kaloyianniet al., 2009; Micic et al., 2002; Pruski and Dixon, 2002). Calcula-tions of input of toxic metals in the environment, based on thesubmerged surfaces and yearly anchoring time of the cruisers inGruz harbour, yielded a sum of 266 kg of metals released in theGruz bay within one year (Caric, 2011). Additionally, high pollu-tion pressure detected by the analyses of M. galloprovincialis in theGruz harbour is in good accordance with the very high incidenceof imposex in banded dye murex Hexaplex trunculus population atthe same site (Peharda M., unpublished data).
Comparison of genotoxicity endpoint values with the previousresults indicates that the area of Split and Kastela bay (Vranjic),which has previously been considered as one of the east Adriaticpollution hotspots, have been going through significant purificationover the past decade (Klobucar et al., 2008; Ra –da et al., 2012). Thisis in good concordance with the interventions aiming to improvethe environmental quality of the area.
Lower discriminating power of antioxidative and biotransfor-mational enzymes in the detection of pollution impact could beattributed to the fact that, while some toxicants induce the activ-ity of enzymatic systems, others may inhibit or deplete them. Anincreasing number of studies report site-specific pollution-inducedalterations of enzymatic activity, and in this study GR and GSTactivity in particular were differently modified among the pollutedsites.
CI did not significantly correlate with the pollution status atinvestigated sites, although significant correlations were previ-ously reported between CI and metal loadings in the mussel tissue(Ivankovic et al., 2005; Kljakovic-Gaspic et al., 2010). However,combination of biomarkers data used in PCA or BRI was successfulin disentangling pollution pressure acting upon the mussel popu-lations inhabiting investigated sites.
4.2. Genetic differentiation
Bivalve microsatellites are often characterized by the high inci-dence of null alleles (Diz and Presa, 2009), but are neverthelessvery often successfully used to depict the genetic background
tions of Mytilus galloprovincialis.
Percentage of variation �-statistics p(�)
0.45 �ST = 0.005 0.37999.55

xicolog
attiuss(egtcg2FIE2iFt2aMpbfedo(
4
pgicitiSsottaelabrmogi
gssaptml
and Institute for marine and coastal research in Dubrovnik. This
A. Stambuk et al. / Aquatic To
nd processes in populations of many bivalve species. Results ofhis survey point to a very shallow genetic differentiation relatedo geographic distances (overall genetic variation 0.45%, no IBD),ndicating very high genetic connectivity among studied subpop-lations of M. galloprovincialis on a relatively large geographicalcale (over 500 km of maritime distances). This pattern of broad-cale panmixia is consistent with the hypothesis of high gene flowcaused by the long lived larval pelagic state), which in the east-rn Adrianic basin seems to be strong enough to counteract neutralenetic differentiation caused by the genetic drift. Genetic varia-ion among M. galloprovincialis populations inhabiting the Iberianoast was found to be 0.91–2.68%, even over a much smaller geo-raphical distance (Diz and Presa, 2008, 2009; Lado-Insua et al.,011) and most of other studies of M. galloprovincialis report onST values somehow higher than in our study. However, lack ofBD was noticed by microsatellite or RAPD markers between someuropean populations of M. galloprovincialis as well (Diz and Presa,008; Giantsis et al., 2012; Zardi et al., 2007). On the other hand, IBD
s observed along the 300 km of the Almerıa-Orán Oceanographicront barrier (Diz and Presa, 2008), and among the populations inhe Southern New Zealand over moderate spatial scales (Westfall,011), indicating that hydrography and ecological factors associ-ted with it may still play an important role in the gene flow of. galloprovincialis. Microsatellite analysis revealed also a com-
lete lack of pollution-mediated genetic differentiation. This cane expected under the observed high gene flow, which is likely toorestall or mitigate pollution-affected genetic differentiation. Nev-rtheless, pollution-mediated post-settlement decrease in geneticiversity and selection-directed genetic differentiation in the facef high gene flow has been reported for the coral Stylophora pistillataZvuloni et al., 2008).
.3. Genetic diversity
Higher genetic diversity was detected in populations inhabitingolluted sites, and this increase followed the pollution intensityradient both for allelic richness and expected heterozygosity. Thiss not in accordance with the studies employing RAPD that indi-ated lower genetic diversity in M. galloprovincialis populationsnhabiting polluted sites (Giantsis et al., 2012; Ma et al., 2000). Onhe other hand, microsatellite markers showed temporal increasen the genetic diversity upon the Prestige oil-tanker spill in the NWpain (Lado-Insua et al., 2011). We propose here three hypothe-es on evolutionary processes underlying higher genetic diversityf M. galloprovincialis in polluted sites. The first hypothesis alludeso enhanced mutational load due to a genotoxic effect of pollu-ion. Significant correlation was found between genotoxic indicesnd allelic richness of studied populations. It is well known thatnvironmental pollution may enhance mutagenesis of microsatel-ites or expanded simple tandem repeat (ESTR) loci (Ben-Shlomond Shanas, 2011; Yauk et al., 2008). Yet, consideration shoulde given to the fact that increased genotoxic indices can simplyeflect the overall pollution status of the investigated site. Further-ore, the mutational load hypothesis is violating the assumption
f the strong gene flow (high number of larval immigrants and emi-rants), which would cause arising mutations to pass undetectedn the investigated populations.
The second hypothesis presumes an enhanced genetic intro-ression as a cause of the observed genetic diversity at pollutedites, considering the fact that a higher allelic richness can be aign of higher out-crossing (Bataillon et al., 1996). Although Puritznd Toonen (2011) found that coastal pollution negatively affected
elagic larval dispersal of the bat star Patiria miniata, this pat-ern might be quite species-specific. It is also known that pollutionay result in intense genetic inflow toward the impacted popu-ations, which serves as an ecological sink (Matson et al., 2006),
y 136– 137 (2013) 22– 31 29
and higher immigration may then increase the within-populationgenetic diversity. M. galloprovincialis embryos and larvae are farmore sensitive toward many environmental pollutants than adultmussels (Beiras and Bellas, 2008 and references therein). In marineenvironments periodic inputs of adverse pollution can cause adepletion of native larval and young post-settlement juvenilephases, enabling thus more new recruits to settle (genetic intro-gression).
The third hypothesis is based on associative overdominanceeffect and the advantage of more heterozygous mussels. Althoughdifferences in heterozygosity among the population groups didnot reach statistical significance, the increasing trend of heterozy-gosity in respect to pollution status is still apparent. This canalso be linked to the observed high allelic richness, consideringthe correlation between these two parameters observed in thisstudy, and reported in other mussel populations (Diz and Presa,2009). However, the link between heterozygosity and physiologicalcompetence of mussels in terms of enhanced growth, immunocom-petence or survival under stress was convincingly demonstratedin many studies (e.g. Florence et al., 2004; Myrand et al., 2002).Except for the allozymes, generally neutral microsatellites are alsosometimes reported in the heterosis context. Microsatellite het-erozygosity in Ostrea edulis was found to be associated with thegrowth and viability of the oyster larvae (Bierne et al., 1998) andauthors followed the hypothesis of neutral microsatellite loci asso-ciated with the fitness genes widespread through the genome.Furthermore, higher heterozygosity of functional genes is expectedto increase the adaptability of molluscan populations (Abele et al.,2009). Significant correlation between heterozygosity of the 5 EST-derived microsatellites and CI observed for M. galloprovincialis inthis study is nevertheless intriguing, because mussel CI is knownto depend also on the food availability, gametogenesis, and salin-ity (Hamer et al., 2008; Ivankovic et al., 2005; Mourgaud et al.,2002).
The results of this study indicate that the gene flow betweeneastern Adriatic subpopulations of M. galloprovincialis is highenough to counteract genetic differentiation related to geographicdistances or the differences in pollution pressure. High gene inflowis along with the higher fitness of more heterozygote individualsconsidered as a contributing source of higher genetic diversity inpolluted environments.
Contributors
AS and GK conceived the idea and designed the study; AS,MS and GK performed field work and sampling; AS and MS ana-lysed genotoxicity biomarkers; AS and MT analysed oxidative stressparameters; AS performed the genotyping analyses; ZS and AS ana-lysed microsatellite data; AS, ZS and MS wrote the Ms.
Acknowledgments
The authors wish to thank Dr. Dusica Ivankovic, Prof. dr. KrunoBrcic-Kostic and two anonymous referees for useful comments onthe early version of the Ms. Lana Malovic is acknowledged for thehelp with the Comet assay. Dr. Niksa Glavic, Moira Busic and MiselJelic helped with the mussel sampling, and Lea Hirsl helped withthe DNA isolations. Authors are very grateful for the laboratory hos-pitality provided by the following institutions: Centre for marineresearch in Rovinj, Institute of Oceanography and Fisheries in Split
work was conducted within the framework of the scientific ProjectNo. 119-0982934-3110, founded by the Republic of Croatia Scien-tific Research Council. The authors are grateful to Adam P. Maguirefor the English revision of the Ms.

3 xicolog
A
f2
R
A
AB
B
B
B
B
B
B
B
B
B
C
C
C
C
D
D
D
D
E
E
F
F
F
F
G
G
G
0 A. Stambuk et al. / Aquatic To
ppendix A. Supplementary data
Supplementary data associated with this article can beound, in the online version, at http://dx.doi.org/10.1016/j.aquatox.013.03.017.
eferences
bele, D., Brey, T., Philipp, E., 2009. Bivalve models of aging and the determinationof molluscan lifespans. Journal of Experimental Gerontology 44, 307–315.
ebi, H., 1984. Catalase in vitro. Methods in Enzymology 105, 121–126.ataillon, T.M., David, J.L., Schoen, D.J., 1996. Neutral genetic markers and conser-
vation genetics: simulated germplasm collections. Genetics 144, 409–417.ecker, B.J., Levin, L.A., Fodrie, F.J., McMillan, P.A., 2007. Complex larval connectivity
patterns among marine invertebrate populations. Proceedings of the NationalAcademy of Sciences of the United States of America 104, 3267–3272.
eiras, R., Bellas, J., 2008. Inhibition of embryo development of the Mytilus gal-loprovincialis marine mussel by organic pollutants; assessment of risk for itsextensive culture in the Galician Rias. Aquaculture 277, 208–212.
elfiore, N.M., Anderson, S.L., 1998. Genetic patterns as a tool for monitoring andassessment of environmental impacts. The example of genetic ecotoxicology.Environmental Monitoring and Assessment 51, 465–479.
en-Shlomo, R., Shanas, U., 2011. Genetic ecotoxicology of asbestos pollution in thehouse mouse Mus musculus domesticus. Environmental Science and PollutionResearch 18, 1264–1269.
ickham, J.W., 2011. The four cornerstones of evolutionary toxicology. Ecotoxicol-ogy 20, 497–502.
ierne, N., Launey, S., Naciri-Graven, Y., Bonhomme, F., 1998. Early effect of inbreed-ing as revealed by microsatellite analyses on Ostrea edulis larvae. Genetics 148,1893–1906.
ihari, N., Fafandel, M., Jaksic, Z., Plese, B., Batel, R., 2005. Spatial distribution ofDNA integrity in mussels, Mytilus galloprovincialis, from the Adriatic sea, Croatia.Bulletin of Environmental Contamination and Toxicology 75, 845–850.
ihari, N., Micic, M., Batel, R., Zahn, R.K., 2003. Flow cytometric detection of DNAcell cycle alterations in hemocytes of mussels (Mytilus galloprovincialis) off theAdriatic coast, Croatia. Aquatic Toxicology 64, 121–129.
uege, J.A., Aust, S.D., 1978. Microsomal lipid peroxidation. Methods in Enzymology52, 302–310.
aric, H., 2011. Cruising tourism environmental impacts: case study of Dubrovnik,Croatia. Journal of Coastal Research 61, 104–113.
avalli-Sforza, L.L., Edwards, A.W.F., 1967. Phylogenetic analysis: models and esti-mation procedures. Evolution 32, 550–570.
hapuis, M.P., Estoup, A., 2007. Microsatellite null alleles and estimation of popu-lation differentiation. Molecular Biology and Evolution 24, 621–631.
uculic, V., Cukrov, N., Kwokal, Z., Mlakar, M., 2009. Natural and anthropogenicsources of Hg, Cd, Pb, Cu and Zn in seawater and sediment of Mljet NationalPark, Croatia. Estuarine, Coastal and Shelf Science 81, 311–320.
empster, A.P., Laird, N.M., Rubin, D.B., 1977. Maximum likelihood from incompletedata via the EM algorithm. Journal of the Royal Statistical Society: Series B 39,1–38.
imsoski, P., Toth, G.P., 2001. Development of DNA-based microsatellite markertechnology for studies of genetic diversity in stressor impacted populations.Ecotoxicology 10, 229–232.
iz, A.P., Presa, P., 2008. Regional patterns of microsatellite variation inMytilus galloprovincialis from the Iberian Peninsula. Marine Biology 154,277–286.
iz, A.P., Presa, P., 2009. The genetic diversity pattern of Mytilus galloprovincialis inGalician Rias (NW Iberian estuaries). Aquaculture 287, 278–285.
xcoffier, L., Laval, G., Schneider, S., 2005. Arlequin ver. 3.0: an integrated soft-ware package for population genetics data analysis. Evolutionary BioinformaticsOnline 1, 47–50.
xcoffier, L., Smouse, P.E., Quattro, J.M., 1992. Analysis of molecular variance inferredfrom metric distances among DNA haplotypes: application to human mitocon-dreal DNA restriction sites. Genetics 131, 479–491.
elsenstein, J., 1985. Confidence limits on phylogenesis: an approach using thebootstrap. Evolution 39, 783–791.
elsenstein, J., 1993. PHYLIP (Phylogeny Inference Package) version 3.5c. Depart-ment of Genetics, University of Washington, Seattle.
itch, W.M., Margoliash, E., 1967. Construction of phylogenetic trees. Science 155,279–284.
lorence, M.M., Carissan-Lloyd, F.M.M., Pipe, R.K., Beaumont, A.R., 2004. Immuno-competence and heterozygosity in the mussel Mytilus edulis. Journal of theMarine Biological Association of the United Kingdom 84, 377–382.
agné, F., Burgeot, T., Hellou, J., St-Jean, S., Farcy, E., Blaise, C., 2008. Spatial variationsin biomarkers of Mytilus edulis mussels at four polluted regions spanning theNorthern Hemisphere. Environmental Research 107, 201–217.
iantsis, I.A., Kravva, N., Apostolidis, A.P., 2012. Genetic characterization and eval-uation of anthropogenic impacts on genetic patterns in cultured and wild
populations of mussels (Mytilus galloprovincialis) from Greece. Genetics andMolecular Research 11, 3814–3823.osset, C.C., Bierne, N., 2013. Differential introgression from a sister species explainshigh FST outlier loci within a mussel species. Journal of Evolutionary Biology 26,14–26.
y 136– 137 (2013) 22– 31
Goudet, J., 2002. FSTAT, a program for Windows (95 and above) to estimateand test gene diversities and fixation indices (version 2.9.3). Available at:www.unil.ch/izea/softwares/fstat.html
Guo, S.W., Thompson, E.A., 1992. Performing the exact test of Hardy-Weinbergproportions for multiple alleles. Biometrics 48, 361–372.
Habig, W.H., Pabst, M.J., Jakoby, W.B., 1974. Glutathione S-transferases – first enzy-matic step in mercapturic acid formation. Journal of Biological Chemistry 249,7130–7139.
Hagger, J.A., Jones, M.B., Lowe, D., Leonard, D.R.P., Owen, R., Galloway, T.S., 2008.Application of biomarkers for improving risk assessments of chemicals underthe water framework directive: a case study. Marine Pollution Bulletin 56,1111–1118.
Hamer, B., Jaksic, Z., Pavicic-Hamer, D., Peric, L., Medakovic, D., Ivankovic, D., Pavicic,J., Zilberberg, C., Schroder, H.C., Muller, W.E.G., Smodlaka, N., Batel, R., 2008.Effect of hypoosmotic stress by low salinity acclimation of Mediterranean
mussels Mytilus galloprovincialis on biological parameters used for pollutionassessment. Aquatic Toxicology 89, 137–151.
Ivankovic, D., Pavicic, J., Erk, M., Filipovic-Marijic, V., Raspor, B., 2005. Evaluation ofthe Mytilus galloprovincialis Lam. digestive gland metallothionein as a biomarkerin a long-term field study: seasonal and spatial variability. Marine PollutionBulletin 50, 1303–1313.
Kaloyianni, M., Dailianis, S., Chrisikopoulou, E., Zannou, A., Koutsogiannaki, S., Alam-dari, D.H., Koliakos, G., Dimitriadis, V.K., 2009. Oxidative effects of inorganic andorganic contaminants on haemolymph of mussels. Comparative Biochemistryand Physiology. A: Comparative Physiology 149, 631–639.
Kljakovic-Gaspic, Z., Herceg-Romanic, S., Kozul, D., Veza, J., 2010. Biomonitor-ing of organochlorine compounds and trace metals along the Eastern Adriaticcoast (Croatia) using Mytilus galloprovincialis. Marine Pollution Bulletin 60,1879–1889.
Klobucar, G.I.V., Stambuk, A., Hylland, K., Pavlica, M., 2008. Detection of DNAdamage in haemocytes of Mytilus galloprovincialis in the coastal ecosystemsof Kastela and Trogir bays, Croatia. Science of the Total Environment 405,330–337.
Lado-Insua, T., Pérez, M., Diz, A.P., Presa, P., 2011. Temporal estimates of geneticdiversity in some Mytilus galloprovincialis populations impacted by the Prestigeoil-spill. Continental Shelf Research 31, 466–475.
Levine, R.L., Williams, J.A., Stadtman, E.R., Shacter, E., 1994. Carbonyl assay fordetermination of oxidatively modified proteins. Methods in Enzymology 233,346–357.
Lewis, P.O., Zaykin, D., 2001. Genetic data analysis: computer program for the anal-ysis of allelic data. Version 1.0 (d16c). Free program distributed by the authorsover the internet from http://lewis.eeb.uconn.edu/lewishome/software.html
Liu, J., 2002. Powermarker – a powerful software for marker data analysis.North Carolina State University Bioinformatics Research Center, Raleigh, NC(www.powermarker.net).
Ma, X.L., Cowles, D.L., Carter, R.L., 2000. Effect of pollution on genetic diversity inthe bay mussel Mytilus galloprovincialis and the acorn barnacle Balanus glandula.Marine Environmental Research 50, 559–563.
Mäkinen, H.S., Cano, J.M., Merilä, J., 2008. Identifying footprints of direc-tional and balancing selection in marine and freshwater three-spinedstickleback (Gasterosteus aculeatus) populations. Molecular Ecology 17,3565–3582.
Mantel, B.F.J., 1967. The detection of disease clustering and a generalized regressionapproach. Cancer Research 27, 209–232.
Matson, C.W., Lambert, M.M., McDonald, T.J., Autenrieth, R.L., Donnelly, K.C.,Islamzadeh, A., Politov, D.I., Bickham, J.W., 2006. Evolutionary toxicology:population-level effects of chronic contaminant exposure on the marshfrogs (Rana ridibunda) of Azerbaijan. Environmental Health Perspectives 114,547–552.
Medina, M.H., Correa, J.A., Barata, C., 2007. Micro-evolution due to pollution: pos-sible consequences for ecosystem responses to toxic stress. Chemosphere 67,2105–2114.
Micic, M., Bihari, N., Jaksic, Z., Muller, W.E.G., Batel, R., 2002. DNA damage and apo-ptosis in the mussel Mytilus galloprovincialis. Marine Environmental Research53, 243–262.
Micovic, V., Bulog, A., Kucic, N., Jakovac, H., Radosevic-Stasic, B., 2009. Metal-lothioneins and heat shock proteins 70 in marine mussels as sensors ofenvironmental pollution in Northern Adriatic Sea. Environmental Toxicologyand Pharmacology 28, 439–447.
Mourgaud, Y., Martinez, E., Geffard, A., Andral, B., Stanisiere, J., Amiard, J., 2002.Metallothionein concentration in the mussel Mytilus galloprovincialis as a
biomarker of response to metal contamination: validation in the field. Biomark-ers 7, 479–490.
Myrand, B., Tremblay, R., Sevgny, J.M., 2002. Selection against blue mussel (Mytilusedulis L.) homozygotes under various stressful conditions. Journal of Heredity93, 238–248.
Petrovic, S., Semencic, L., Ozretic, B., Ozretic, M., 2004. Seasonal variations of phys-iological and cellular biomarkers and their use in the biomonitoring of northAdriatic coastal waters (Croatia). Marine Pollution Bulletin 49, 713–720.
Presa, P., Pérez, M., Diz, A.P., 2002. Polymorphic microsatellite markers for bluemussels (Mytilus spp.). Conservation Genetics 3, 441–443.
Pruski, A.M., Dixon, D.R., 2002. Effects of cadmium on nuclear integrity and DNArepair efficiency in the gill cells of Mytilus edulis L. Aquatic Toxicology 57,127–137.
Puritz, J.B., Toonen, R.J., 2011. Coastal pollution limits pelagic larval dispersal. NatureCommunications 2, 226.

xicolog
R
R
R
R
R
S
S
S
S
V
A. Stambuk et al. / Aquatic To
a –da, B., Santic, M., Kupresanin, M., 2012. Monitoring DNA damage in Mytilus gal-loprovincialis from the Kastela bay in Croatia. Russian Journal of Ecology 43,77–81.
amos-Martinez, J.I., Bartolomé, T.R., Pernas, R.V., 1983. Purification and propertiesof glutathione reductase from hepatopancreas of Mytilus edulis L. ComparativeBiochemistry and Physiology B 75, 689–692.
aymond, M., Rousset, F., 1995. GENEPOP (version 1.2): population genetics soft-ware for exact tests and ecumenicism. Journal of Heredity 86, 248–249.
inner, B.P., Matson, C.W., Islamzadeh, A., McDonald, T.J., Donnelly, K.C., Bickham,J.W., 2011. Evolutionary toxicology: contaminant-induced genetic mutations inmosquitofish from Sumgayit, Azerbaijan. Ecotoxicology 20, 365–376.
ohlf, F.J., 1997. NTSYS-PC 2.02i, Numerical Taxonomy and Multivariate AnalysisSystem. Exeter Software, Setauket.
AS Institute Inc., 2004. SAS/STAT 9. 1 User’s Guide. SAS Institute, Cary, NorthCarolina.
ingh, N.P., Tice, R.R., Schneider, E.L., 1988. A simple technique for quantitationof low levels of damage in individual cells. Experimental Cell Research 175,184–191.
ˇrut, M., Traven, L., Stambuk, A., Kralj, S., Zaja, R., Micovic, V., Klobucar, G.I.V., 2011.Genotoxicity of marine sediments in the fish hepatoma cell line PLHC-1 as
assessed by the comet assay. Toxicology in Vitro 25, 308–314.taton, J.L., Schizas, N.V., Chandler, G.T., Coull, B.C., Quattro, J.M., 2001. Ecotoxicology
and population genetics: the emergence of “phylogeographic and evolutionaryecotoxicology”. Ecotoxicology 10, 217–222.
an Oosterhout, C., Hutchinson, W.F., Wills, D.P.M., Shipley, P., 2004. MICRO-CHECKER: software for identifying and correcting genotyping errors inmicrosatellite data. Molecular Ecology Notes 4, 535–538.
y 136– 137 (2013) 22– 31 31
Van Straalen, N.M., Timmermans, M.J.T.N., 2002. Genetic variation in toxicant-stressed populations: an evaluation of the “genetic erosion” hypothesis. Humanand Ecological Risk Assessment 8, 983–1002.
Varela, M.A., Gonzalez-Tizon, A., Marinas, L., Martinez-Lage, A., 2007. Genetic diver-gence detected by ISSR markers and characterization of microsatellite regionsin Mytilus mussels. Biochemical Genetics 45, 565–578.
Westfall, K.M., 2011. Molecular ecology and systematics of blue mussels (genusMytilus) (Mytilidae; Bivalvia;Mollusca) in the Southern hemisphere. PhD Thesis.Victoria University of Wellington. 279 pp.
Wirgin, I., Roy, N.K., Loftus, M., Chambers, R.C., Franks, D.G., Hahn, M.E., 2011. Mech-anistic basis of resistance to PCBs in Atlantic tomcod from the Hudson River.Science 331, 1322–1325.
Yauk, C., Polyzos, A., Rowan-Carroll, A., Somers, C.M., Godschalk, R.W., Van Schooten,F.J., Berndt, M.L., Pogribny, I.P., Koturbash, I., Williams, A., Douglas, G.R.,Kovalchuk, O., 2008. Germ-line mutations, DNA damage, and global hyper-methylation in mice exposed to particulate air pollution in an urban/industriallocation. Proceedings of the National Academy of Sciences of the United Statesof America 105, 605–610.
Yu, H., Li, Q., 2007. Development of EST-SSRs in the Mediterranean blue mussel,Mytilus galloproviancialis. Molecular Ecology Notes 7, 1308–1310.
Zardi, G.I., McQuaid, C.D., Teske, P.R., Barker, N.P., 2007. Unexpected geneticstructure of mussel populations in south africa: indigenous Perna perna
and invasive Mytilus galloprovincialis. Marine Ecology Progress Series 337,135–144.Zvuloni, A., Mokady, O., Al-Zibdah, M., Bernardi, G., Gaines, S.D., Abelson, A., 2008.Local scale genetic structure in coral populations: a signature of selection.
Marine Pollution Bulletin 56, 430–438.