chapter - 3 death and survival on dialysis
TRANSCRIPT
Chapter - 3
DEATH AND SURVIVAL ON DIALYSIS
Wong Hin Seng
Ong Loke Meng
DEATH AND SURVIVAL ON DIALYSIS 21ST REPORT OF THE MALAYSIAN DIALYSIS AND TRANSPLANT REGISTRY 2013
SECTION 3.1: DEATH ON DIALYSIS
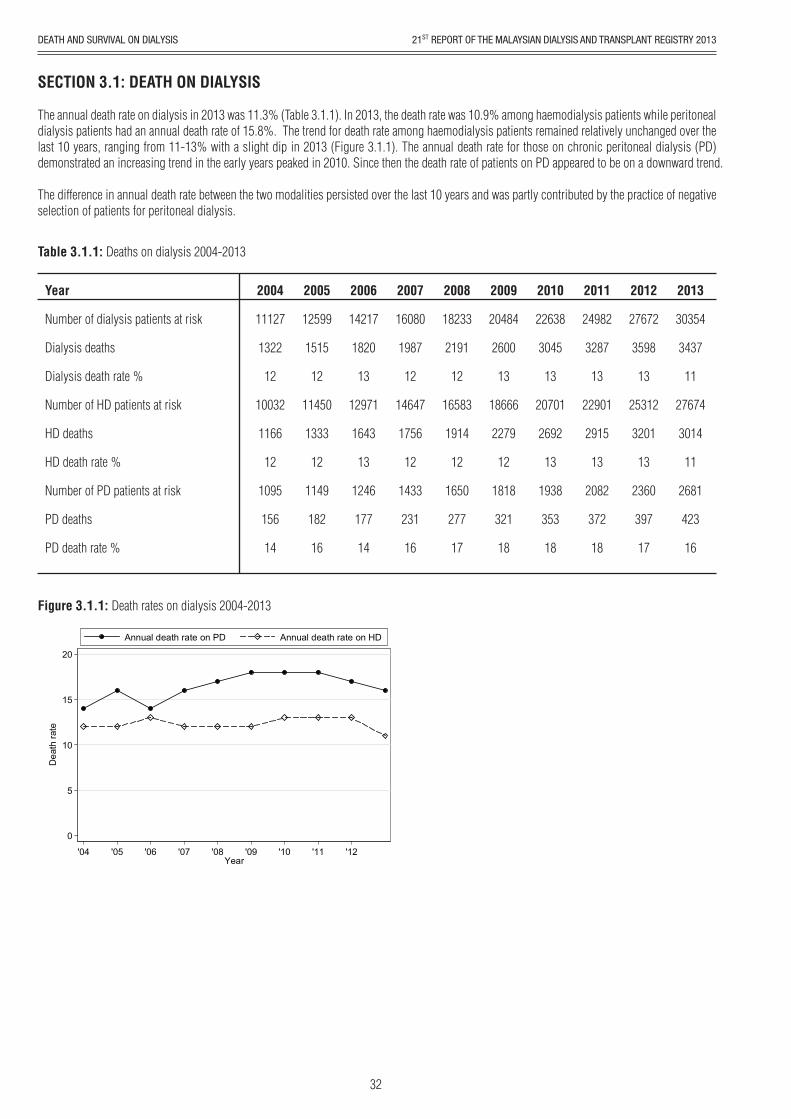
The annual death rate on dialysis in 2013 was 11.3% (Table 3.1.1). In 2013, the death rate was 10.9% among haemodialysis patients while peritoneal dialysis patients had an annual death rate of 15.8%. The trend for death rate among haemodialysis patients remained relatively unchanged over the last 10 years, ranging from 11-13% with a slight dip in 2013 (Figure 3.1.1). The annual death rate for those on chronic peritoneal dialysis (PD) demonstrated an increasing trend in the early years peaked in 2010. Since then the death rate of patients on PD appeared to be on a downward trend.
The difference in annual death rate between the two modalities persisted over the last 10 years and was partly contributed by the practice of negative selection of patients for peritoneal dialysis.
Table 3.1.1: Deaths on dialysis 2004-2013
Year
Number of dialysis patients at risk
Dialysis deaths
Dialysis death rate %
Number of HD patients at risk
HD deaths
HD death rate %
Number of PD patients at risk
PD deaths
PD death rate %
2004
11127
1322
12
10032
1166
12
1095
156
14
2005
12599
1515
12
11450
1333
12
1149
182
16
2006
14217
1820
13
12971
1643
13
1246
177
14
2007
16080
1987
12
14647
1756
12
1433
231
16
2008
18233
2191
12
16583
1914
12
1650
277
17
2009
20484
2600
13
18666
2279
12
1818
321
18
2010
22638
3045
13
20701
2692
13
1938
353
18
2011
24982
3287
13
22901
2915
13
2082
372
18
2012
27672
3598
13
25312
3201
13
2360
397
17
2013
30354
3437
11
27674
3014
11
2681
423
16
0
5
10
15
20
Dea
th ra
te
'04 '05 '06 '07 '08 '09 '10 '11 '12Year
Annual death rate on PD Annual death rate on HD
Figure 3.1.1: Death rates on dialysis 2004-2013
32
DEATH AND SURVIVAL ON DIALYSIS21ST REPORT OF THE MALAYSIAN DIALYSIS AND TRANSPLANT REGISTRY 2013
Cardiovascular disease remained the main cause of death in 2013; accounting for 35%. Death due to cardiovascular disease appeared to be increasing in the last 6 years and this was probably due to the increasing number of elderly and diabetic patients undergoing dialysis. Death at home accounted for another 19% and a majority of these deaths were probably due to cardiovascular events. Death from sepsis had increased over the last 6 years and has now became the second most common cause of death in 2013; accounting for 24% of all death.
Table 3.1.2: Causes of death on dialysis 2004-2013
YearCauses of Death
2004n %
2005n %
2006n %
2007n %
2008n %
344
302
189
19
24
20
29
9
306
80
1322
26
23
14
1
2
2
2
1
23
6
100
375
319
200
23
29
31
27
12
394
105
1515
25
21
13
2
2
2
2
1
26
7
100
513
353
254
23
27
41
35
23
379
172
1820
28
19
14
1
1
2
2
1
21
9
100
26
17
12
1
2
2
2
1
27
10
100
517
342
248
22
34
34
38
27
528
197
1987
31
19
16
1
2
3
2
1
17
8
100
678
423
356
30
45
56
44
24
363
172
2191
Cardiovascular
Died at home
Sepsis
PD peritonitis
GIT bleed
Cancer
Liver disease
Withdrawal
Others
Unknown
TOTAL
YearCauses of Death
2009n %
2010n %
2011n %
2012n %
2013n %
879
491
580
32
48
57
27
35
194
257
2600
34
19
22
1
2
2
1
1
7
10
100
1014
544
733
37
59
78
33
39
114
394
3045
33
18
24
1
2
3
1
1
4
13
100
1201
542
767
28
52
88
35
41
117
416
3287
37
16
23
1
2
3
1
1
4
13
100
35
16
26
1
2
2
1
1
4
13
100
1249
579
939
18
60
81
28
48
143
453
3598
35
19
24
1
2
2
1
1
5
9
100
1213
642
835
40
57
69
30
40
188
323
3437
Cardiovascular
Died at home
Sepsis
PD peritonitis
GIT bleed
Cancer
Liver disease
Withdrawal
Others
Unknown
TOTAL
33
DEATH AND SURVIVAL ON DIALYSIS 21ST REPORT OF THE MALAYSIAN DIALYSIS AND TRANSPLANT REGISTRY 2013
SECTION 3.2: PATIENT SURVIVAL ON DIALYSIS
3.2.1: Patient survival by type of dialysis modality
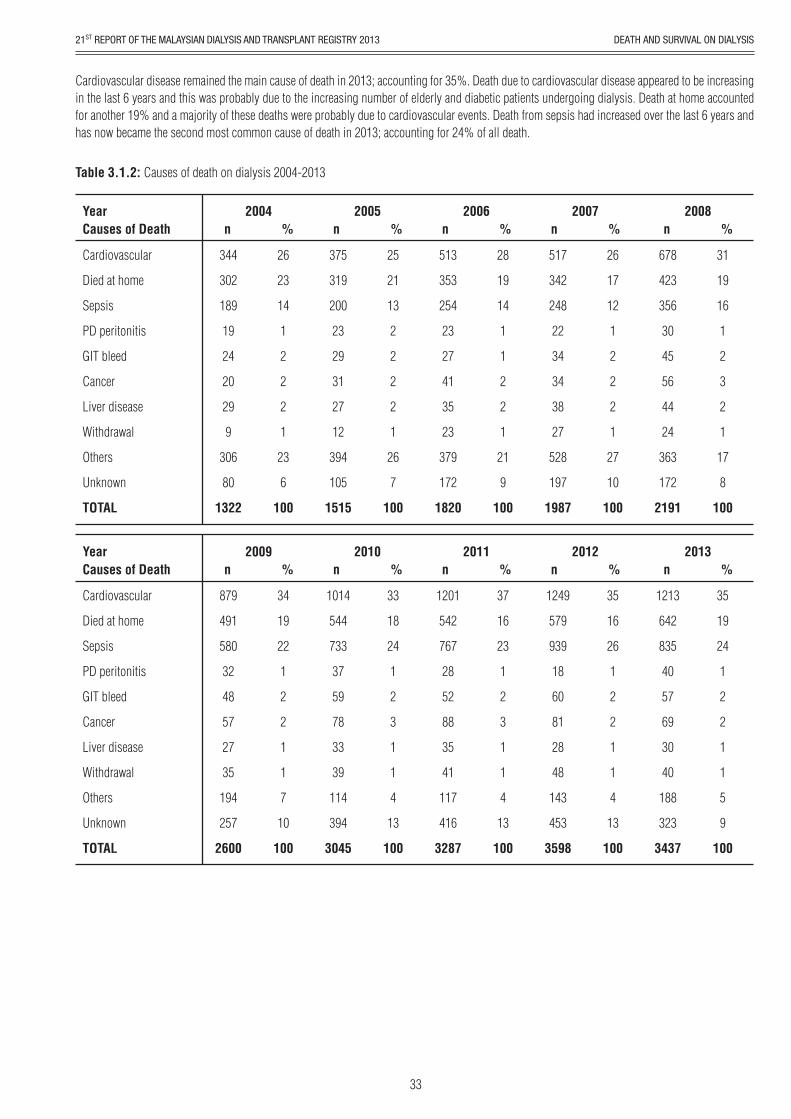
Patient survival by first dialysis modalities (censored for change of modality) was shown in Table & Figure 3.2.1(a). The overall unadjusted 5 years and 10 years patient survival on dialysis (censored for change in modality) were 54% and 30% respectively. The unadjusted patient survival was better for those on haemodialysis compared to those on PD and this survival difference began to widen after the first year. At 10 years the unadjusted patient survival on haemodialysis was 31% compared 20% in those on PD, 11% difference in 10-year survival.
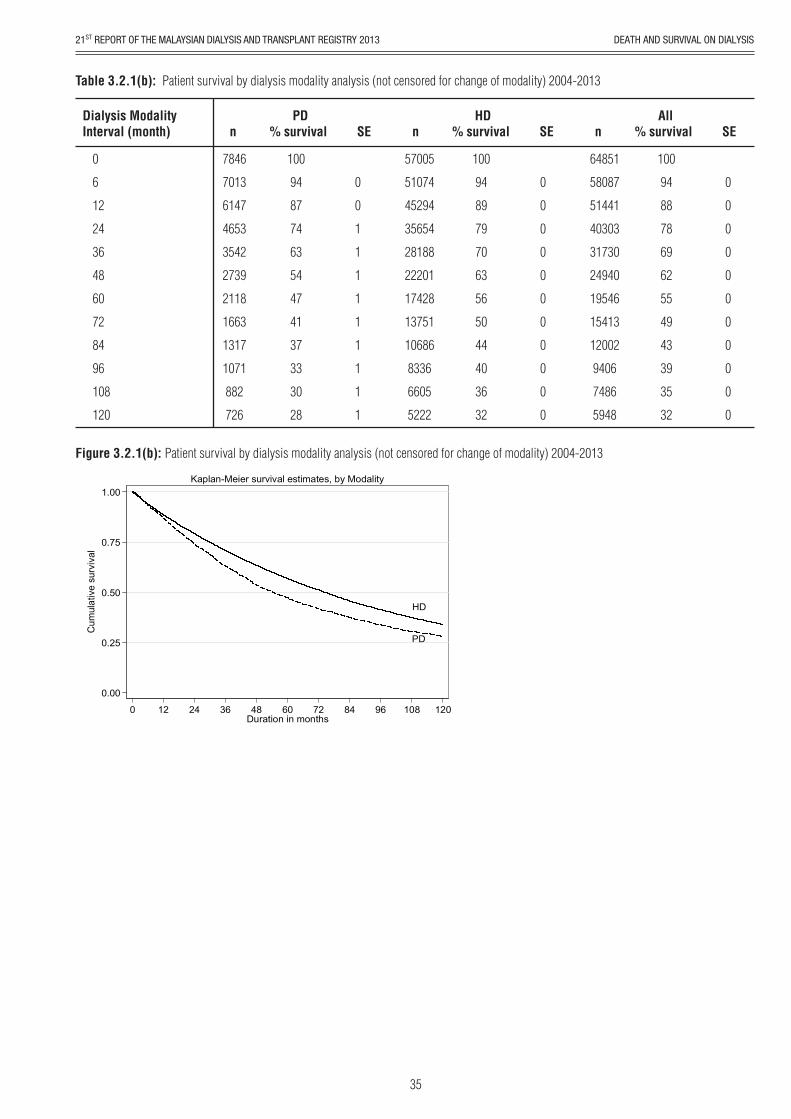
However, when patient survival by dialysis modalities was analysed as per ITT (disregarding change of dialysis modality) (Table & Figure 3.2.1b), the difference in survival according to dialysis modalities was less apparent. The overall unadjusted 10 years patient survival on haemodialysis and peritoneal dialysis were 32% and 28% respectively, 4% difference between the modalities.
Table 3.2.1(a): Patient survival by dialysis modality analysis (censored for change of modality) 2004-2013
Dialysis ModalityInterval (month)
PDn % survival SE
HDn % survival SE
Alln % survival SE
Figure 3.2.1(a): Patient survival by dialysis modality analysis (censored for change of modality) 2004-2013
7846
6773
5641
3804
2550
1725
1162
783
499
322
228
144
100
94
87
74
62
52
44
37
31
26
23
20
0
0
1
1
1
1
1
1
1
1
1
57005
50395
44189
34307
26590
20614
15869
12283
9315
7077
5438
4157
100
94
89
79
70
62
55
49
43
39
34
31
0
0
0
0
0
0
0
0
0
0
0
64851
57168
49830
38111
29140
22339
17031
13065
9813
7396
5665
4301
100
94
88
78
69
61
54
48
42
37
33
30
0
0
0
0
0
0
0
0
0
0
0
0
6
12
24
36
48
60
72
84
96
108
120
HD
PD
0.00
0.25
0.50
0.75
1.00
Cum
ulat
ive
surv
ival
0 12 24 36 48 60 72 84 96 108 120Duration in months
Kaplan-Meier survival estimates, by Modality
34
DEATH AND SURVIVAL ON DIALYSIS21ST REPORT OF THE MALAYSIAN DIALYSIS AND TRANSPLANT REGISTRY 2013
Table 3.2.1(b): Patient survival by dialysis modality analysis (not censored for change of modality) 2004-2013
Dialysis ModalityInterval (month)
PDn % survival SE
HDn % survival SE
Alln % survival SE
Figure 3.2.1(b): Patient survival by dialysis modality analysis (not censored for change of modality) 2004-2013
7846
7013
6147
4653
3542
2739
2118
1663
1317
1071
882
726
100
94
87
74
63
54
47
41
37
33
30
28
0
0
1
1
1
1
1
1
1
1
1
57005
51074
45294
35654
28188
22201
17428
13751
10686
8336
6605
5222
100
94
89
79
70
63
56
50
44
40
36
32
0
0
0
0
0
0
0
0
0
0
0
64851
58087
51441
40303
31730
24940
19546
15413
12002
9406
7486
5948
100
94
88
78
69
62
55
49
43
39
35
32
0
0
0
0
0
0
0
0
0
0
0
0
6
12
24
36
48
60
72
84
96
108
120
HD
PD
0.00
0.25
0.50
0.75
1.00
Cum
ulat
ive
surv
ival
0 12 24 36 48 60 72 84 96 108 120Duration in months
Kaplan-Meier survival estimates, by Modality
35
DEATH AND SURVIVAL ON DIALYSIS 21ST REPORT OF THE MALAYSIAN DIALYSIS AND TRANSPLANT REGISTRY 2013
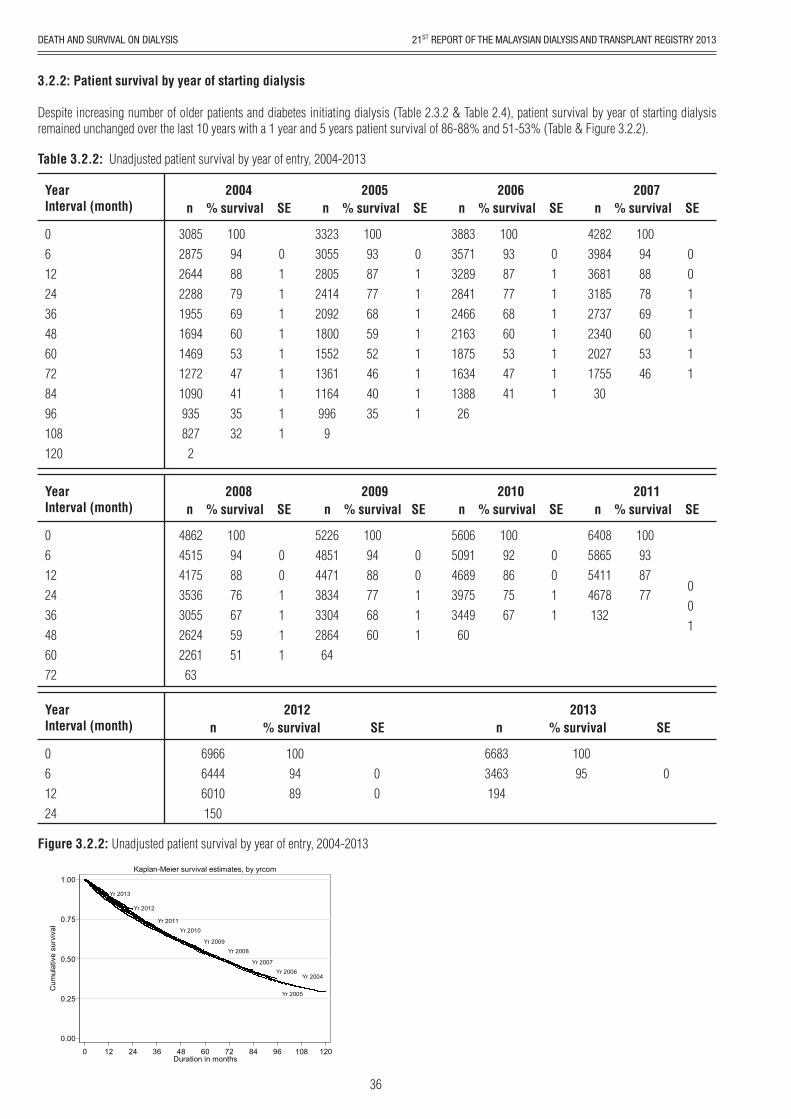
3.2.2: Patient survival by year of starting dialysis
Despite increasing number of older patients and diabetes initiating dialysis (Table 2.3.2 & Table 2.4), patient survival by year of starting dialysis remained unchanged over the last 10 years with a 1 year and 5 years patient survival of 86-88% and 51-53% (Table & Figure 3.2.2).
Table 3.2.2: Unadjusted patient survival by year of entry, 2004-2013
YearInterval (month)
2004n % survival SE
2005n % survival SE
2006n % survival SE
2007n % survival SE
308528752644228819551694146912721090935827
2
10094887969605347413532
0111111111
332330552805241420921800155213611164996
9
100938777685952464035
011111111
388335713289284124662163187516341388
26
1009387776860534741
01111111
42823984368131852737234020271755
30
10094887869605346
0011111
061224364860728496108120
Year Interval (month)
2008n % survival SE
2009n % survival SE
2010n % survival SE
2011n % survival SE
4862451541753536305526242261
63
100948876675951
001111
522648514471383433042864
64
1009488776860
00111
56065091468939753449
60
10092867567
0011
6408586554114678132
100938777
001
06122436486072
YearInterval (month)
2012n % survival SE
2013n % survival SE
696664446010150
1009489
00
66833463194
10095 0
061224
Figure 3.2.2: Unadjusted patient survival by year of entry, 2004-2013
Yr 2013
Yr 2012
Yr 2011Yr 2010
Yr 2009Yr 2008
Yr 2007Yr 2006
Yr 2005
Yr 2004
0.00
0.25
0.50
0.75
1.00
Cum
ulat
ive
surv
ival
0 12 24 36 48 60 72 84 96 108 120Duration in months
Kaplan-Meier survival estimates, by yrcom
36
DEATH AND SURVIVAL ON DIALYSIS21ST REPORT OF THE MALAYSIAN DIALYSIS AND TRANSPLANT REGISTRY 2013
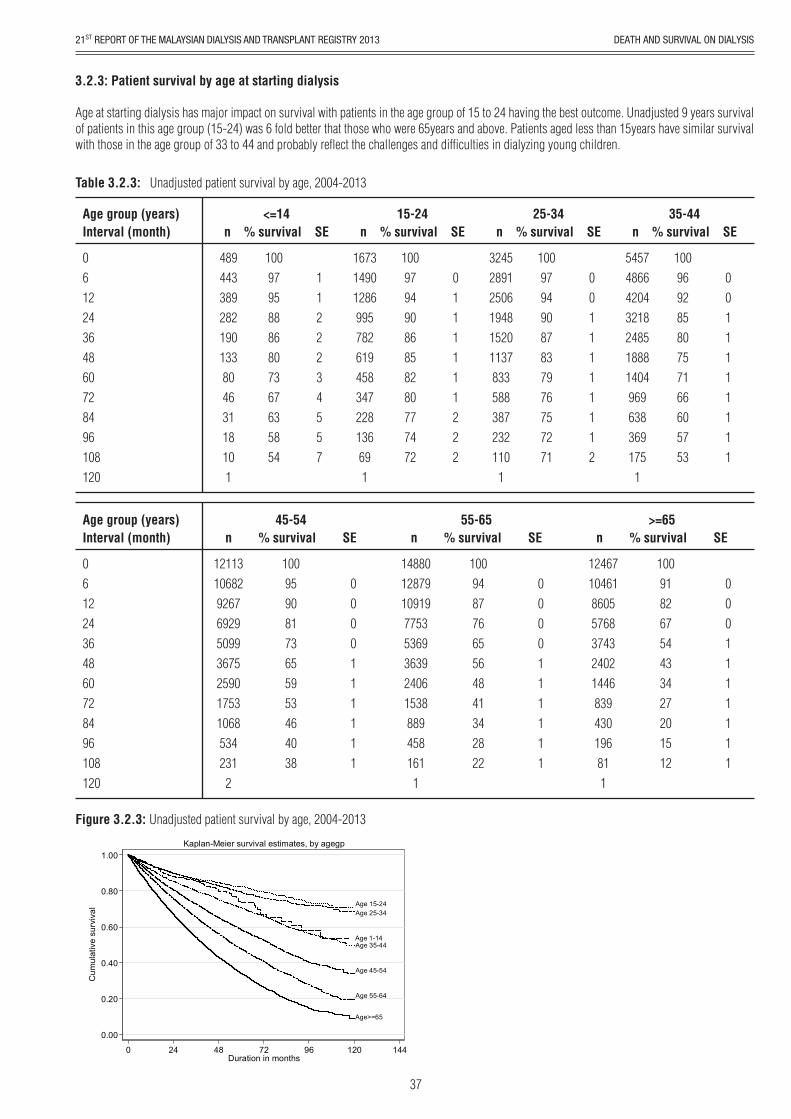
3.2.3: Patient survival by age at starting dialysis
Age at starting dialysis has major impact on survival with patients in the age group of 15 to 24 having the best outcome. Unadjusted 9 years survival of patients in this age group (15-24) was 6 fold better that those who were 65years and above. Patients aged less than 15years have similar survival with those in the age group of 33 to 44 and probably reflect the challenges and difficulties in dialyzing young children.
Figure 3.2.3: Unadjusted patient survival by age, 2004-2013
Table 3.2.3: Unadjusted patient survival by age, 2004-2013
Age group (years)Interval (month)
<=14n % survival SE
15-24n % survival SE
25-34n % survival SE
35-44n % survival SE
48944338928219013380463118101
10097958886807367635854
1122234557
167314901286995782619458347228136691
10097949086858280777472
0111111222
324528912506194815201137833588387232110
1
10097949087837976757271
0011111112
5457486642043218248518881404969638369175
1
10096928580757166605753
0011111111
061224364860728496108120
Age group (years)Interval (month)
45-54n % survival SE
55-65n % survival SE
>=65n % survival SE
12113106829267692950993675259017531068534231
2
10095908173655953464038
0000111111
14880128791091977535369363924061538889458161
1
10094877665564841342822
0000111111
124671046186055768374324021446839430196811
10091826754433427201512
0001111111
061224364860728496108120
Age>=65
Age 55-64
Age 45-54
Age 35-44
Age 25-34Age 15-24
Age 1-14
0.00
0.20
0.40
0.60
0.80
1.00
Cum
ulat
ive
surv
ival
0 24 48 72 96 120 144Duration in months
Kaplan-Meier survival estimates, by agegp
37
DEATH AND SURVIVAL ON DIALYSIS 21ST REPORT OF THE MALAYSIAN DIALYSIS AND TRANSPLANT REGISTRY 2013
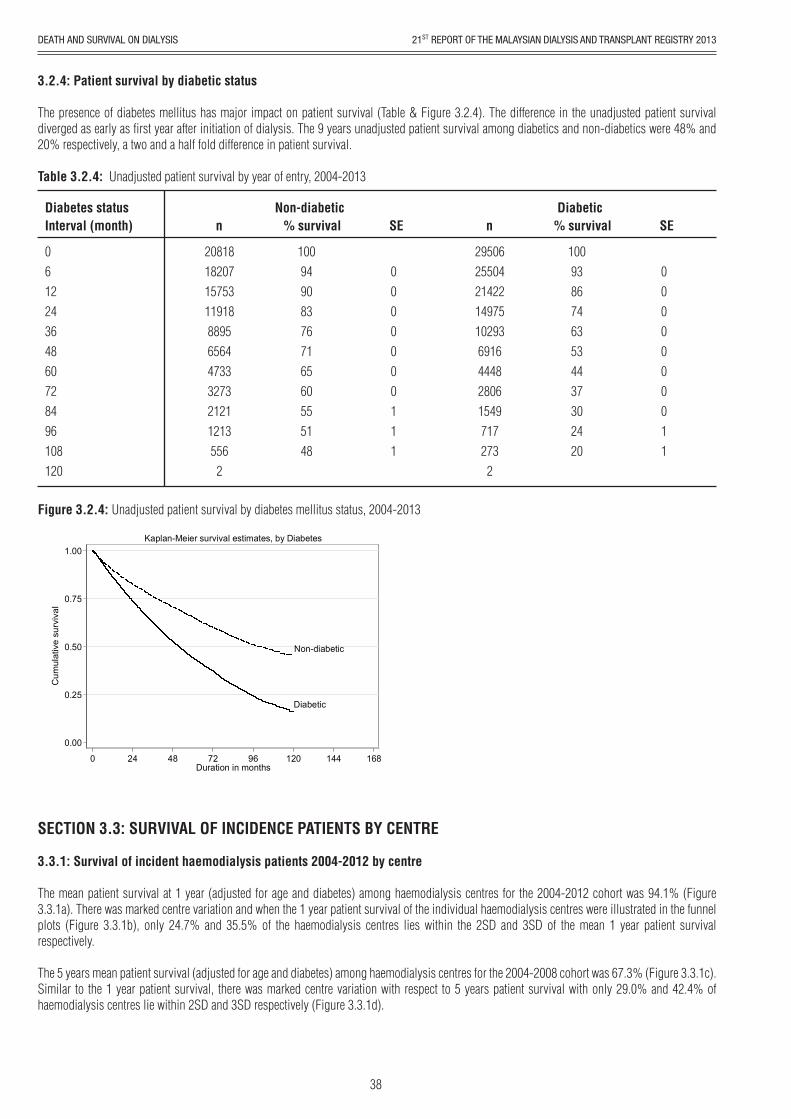
3.2.4: Patient survival by diabetic status
The presence of diabetes mellitus has major impact on patient survival (Table & Figure 3.2.4). The difference in the unadjusted patient survival diverged as early as first year after initiation of dialysis. The 9 years unadjusted patient survival among diabetics and non-diabetics were 48% and 20% respectively, a two and a half fold difference in patient survival.
SECTION 3.3: SURVIVAL OF INCIDENCE PATIENTS BY CENTRE
3.3.1: Survival of incident haemodialysis patients 2004-2012 by centre
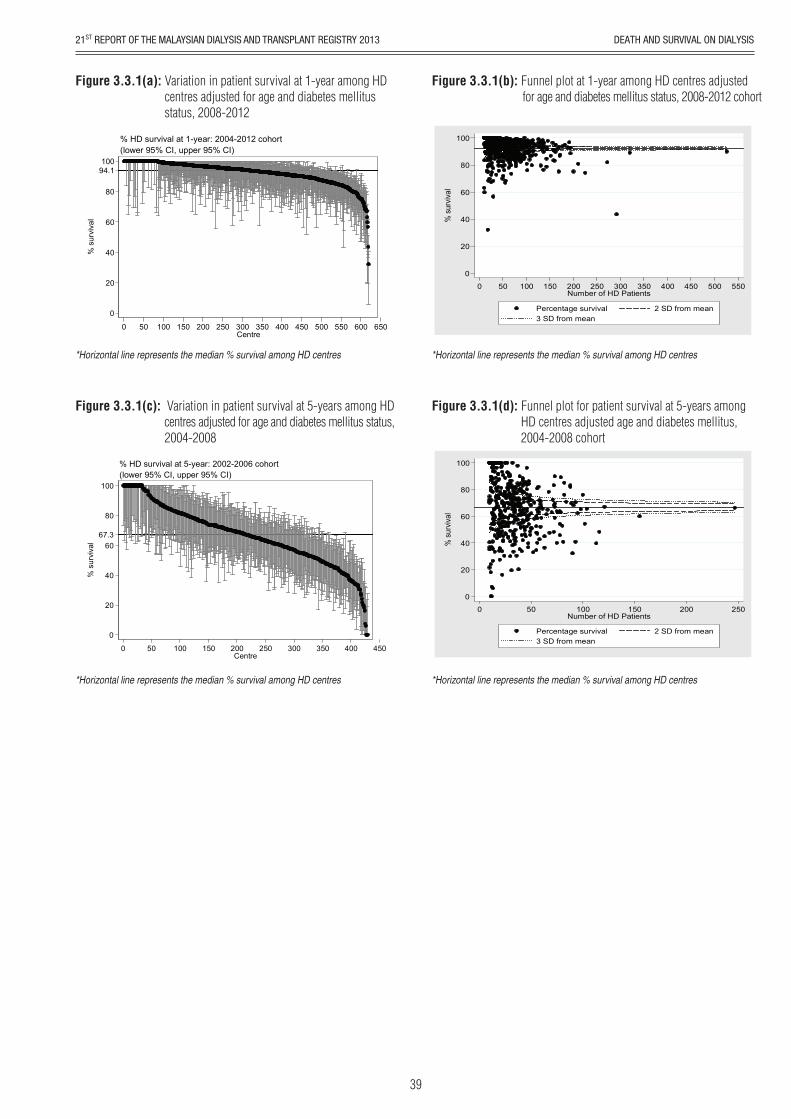
The mean patient survival at 1 year (adjusted for age and diabetes) among haemodialysis centres for the 2004-2012 cohort was 94.1% (Figure 3.3.1a). There was marked centre variation and when the 1 year patient survival of the individual haemodialysis centres were illustrated in the funnel plots (Figure 3.3.1b), only 24.7% and 35.5% of the haemodialysis centres lies within the 2SD and 3SD of the mean 1 year patient survival respectively.
The 5 years mean patient survival (adjusted for age and diabetes) among haemodialysis centres for the 2004-2008 cohort was 67.3% (Figure 3.3.1c). Similar to the 1 year patient survival, there was marked centre variation with respect to 5 years patient survival with only 29.0% and 42.4% of haemodialysis centres lie within 2SD and 3SD respectively (Figure 3.3.1d).
Table 3.2.4: Unadjusted patient survival by year of entry, 2004-2013
Diabetes statusInterval (month)
Non-diabeticn % survival SE
20818182071575311918889565644733327321211213556
2
10094908376716560555148
0000000111
Diabeticn % survival SE
29506255042142214975102936916444828061549717273
2
10093867463534437302420
0000000011
061224364860728496108120
Figure 3.2.4: Unadjusted patient survival by diabetes mellitus status, 2004-2013
Diabetic
Non-diabetic
0.00
0.25
0.50
0.75
1.00
Cum
ulat
ive
surv
ival
0 24 48 72 96 120 144 168Duration in months
Kaplan-Meier survival estimates, by Diabetes
38
DEATH AND SURVIVAL ON DIALYSIS21ST REPORT OF THE MALAYSIAN DIALYSIS AND TRANSPLANT REGISTRY 2013
Figure 3.3.1(a): Variation in patient survival at 1-year among HD centres adjusted for age and diabetes mellitus status, 2008-2012
Figure 3.3.1(b): Funnel plot at 1-year among HD centres adjusted for age and diabetes mellitus status, 2008-2012 cohort
0
20
40
60
80
10094.1
% s
urvi
val
0 50 100 150 200 250 300 350 400 450 500 550 600 650Centre
(lower 95% CI, upper 95% CI)% HD survival at 1-year: 2004-2012 cohort
0
20
40
60
80
100
% s
urviv
al
0 50 100 150 200 250 300 350 400 450 500 550Number of HD Patients
Percentage survival 2 SD from mean3 SD from mean
*Horizontal line represents the median % survival among HD centres *Horizontal line represents the median % survival among HD centres
Figure 3.3.1(c): Variation in patient survival at 5-years among HD centres adjusted for age and diabetes mellitus status, 2004-2008
Figure 3.3.1(d): Funnel plot for patient survival at 5-years among HD centres adjusted age and diabetes mellitus, 2004-2008 cohort
*Horizontal line represents the median % survival among HD centres *Horizontal line represents the median % survival among HD centres
0
20
40
60
80
100
67.3
% s
urvi
val
0 50 100 150 200 250 300 350 400 450Centre
(lower 95% CI, upper 95% CI)% HD survival at 5-year: 2002-2006 cohort
0
20
40
60
80
100
% s
urviv
al
0 50 100 150 200 250Number of HD Patients
Percentage survival 2 SD from mean3 SD from mean
39
DEATH AND SURVIVAL ON DIALYSIS 21ST REPORT OF THE MALAYSIAN DIALYSIS AND TRANSPLANT REGISTRY 2013
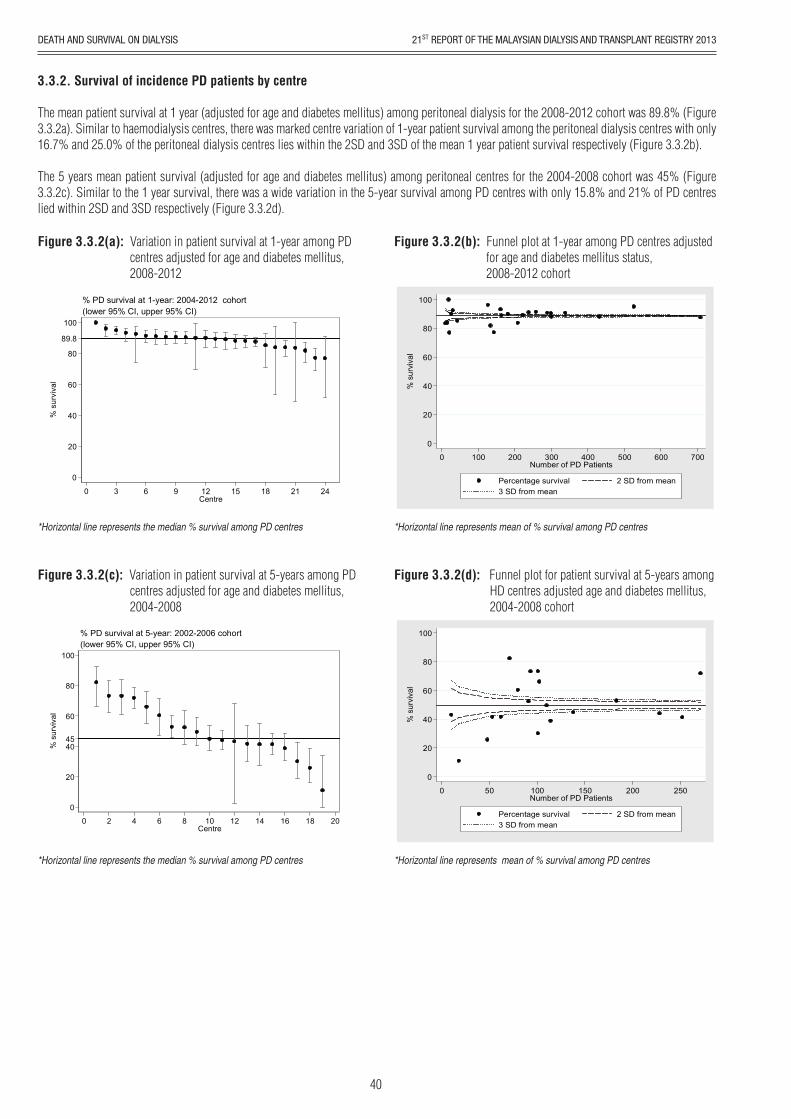
3.3.2. Survival of incidence PD patients by centre
The mean patient survival at 1 year (adjusted for age and diabetes mellitus) among peritoneal dialysis for the 2008-2012 cohort was 89.8% (Figure 3.3.2a). Similar to haemodialysis centres, there was marked centre variation of 1-year patient survival among the peritoneal dialysis centres with only 16.7% and 25.0% of the peritoneal dialysis centres lies within the 2SD and 3SD of the mean 1 year patient survival respectively (Figure 3.3.2b).
The 5 years mean patient survival (adjusted for age and diabetes mellitus) among peritoneal centres for the 2004-2008 cohort was 45% (Figure 3.3.2c). Similar to the 1 year survival, there was a wide variation in the 5-year survival among PD centres with only 15.8% and 21% of PD centres lied within 2SD and 3SD respectively (Figure 3.3.2d).
Figure 3.3.2(a): Variation in patient survival at 1-year among PD centres adjusted for age and diabetes mellitus, 2008-2012
Figure 3.3.2(b): Funnel plot at 1-year among PD centres adjusted for age and diabetes mellitus status, 2008-2012 cohort
*Horizontal line represents the median % survival among PD centres *Horizontal line represents mean of % survival among PD centres
0
20
40
60
80
100
% s
urvi
val
0 100 200 300 400 500 600 700Number of PD Patients
Percentage survival 2 SD from mean3 SD from mean
0
20
40
60
80
100
89.8
% s
urvi
val
0 3 6 9 12 15 18 21 24Centre
(lower 95% CI, upper 95% CI)% PD survival at 1-year: 2004-2012 cohort
Figure 3.3.2(c): Variation in patient survival at 5-years among PD centres adjusted for age and diabetes mellitus, 2004-2008
Figure 3.3.2(d): Funnel plot for patient survival at 5-years among HD centres adjusted age and diabetes mellitus, 2004-2008 cohort
*Horizontal line represents the median % survival among PD centres *Horizontal line represents mean of % survival among PD centres
0
20
40
60
80
100
45
% s
urvi
val
0 2 4 6 8 10 12 14 16 18 20Centre
(lower 95% CI, upper 95% CI)% PD survival at 5-year: 2002-2006 cohort
0
20
40
60
80
100
% s
urvi
val
0 50 100 150 200 250Number of PD Patients
Percentage survival 2 SD from mean3 SD from mean
40
DEATH AND SURVIVAL ON DIALYSIS21ST REPORT OF THE MALAYSIAN DIALYSIS AND TRANSPLANT REGISTRY 2013
SECTION 3.4: ADJUSTED MORTALITY OF DIALYSIS PATIENT
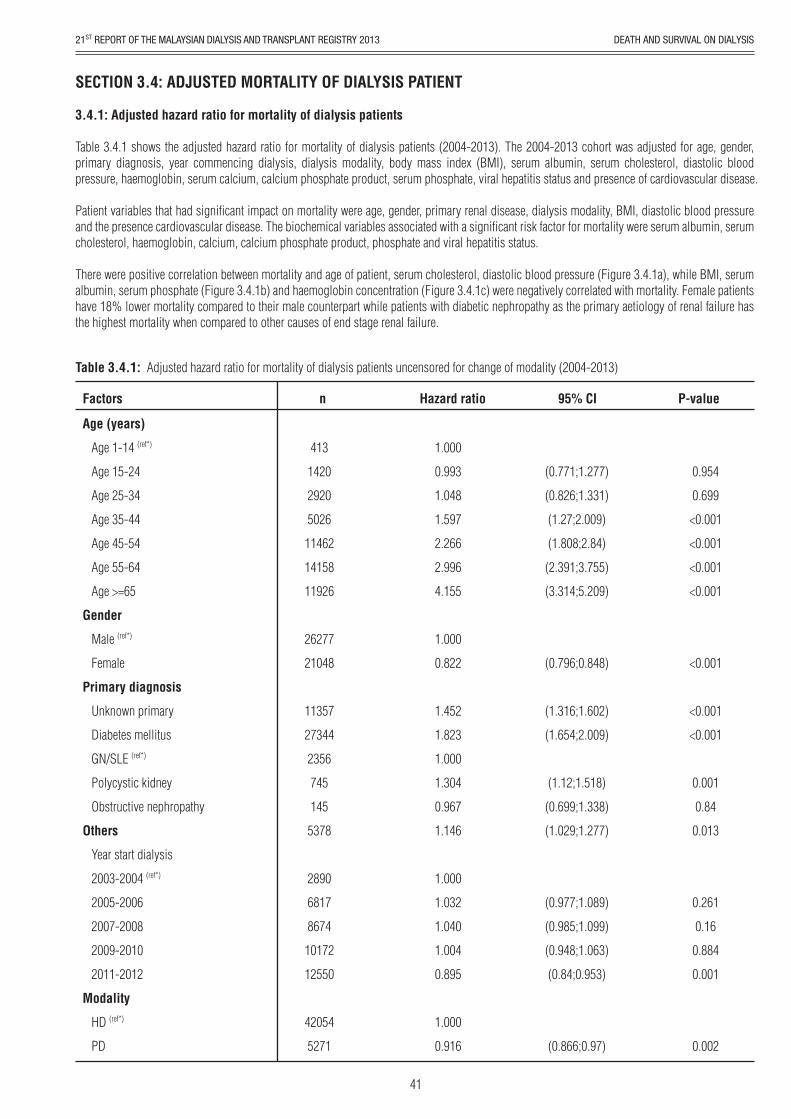
3.4.1: Adjusted hazard ratio for mortality of dialysis patients
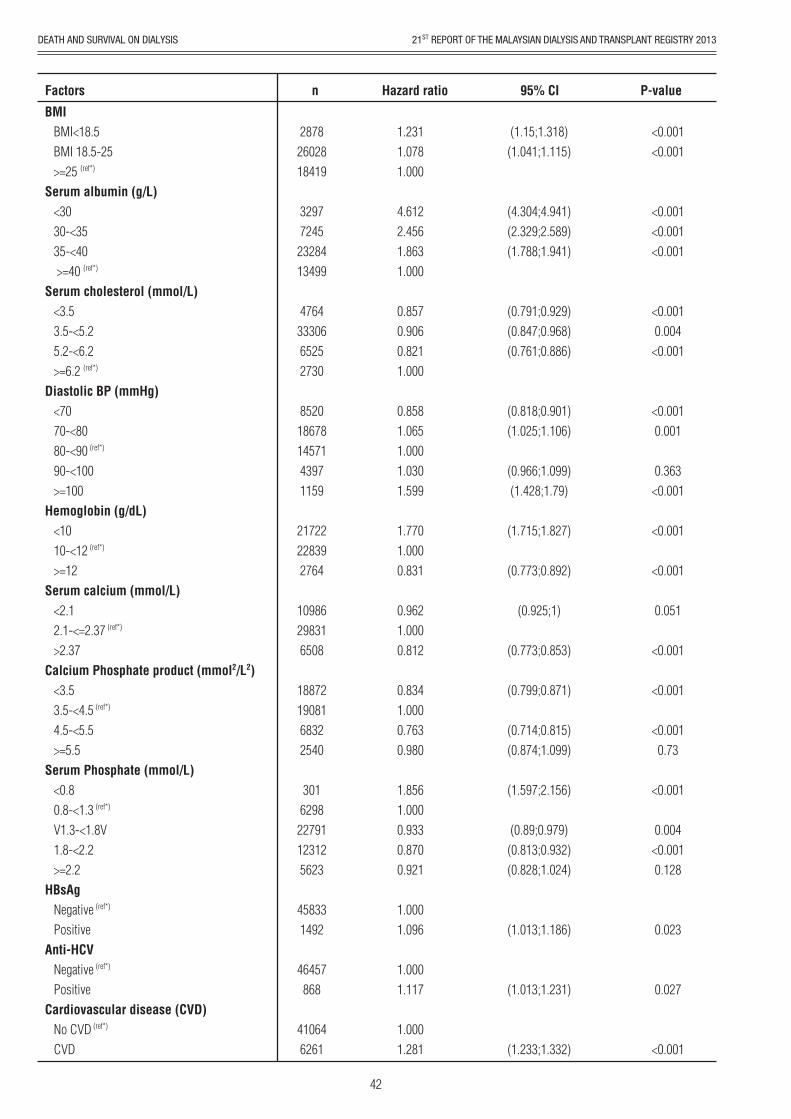
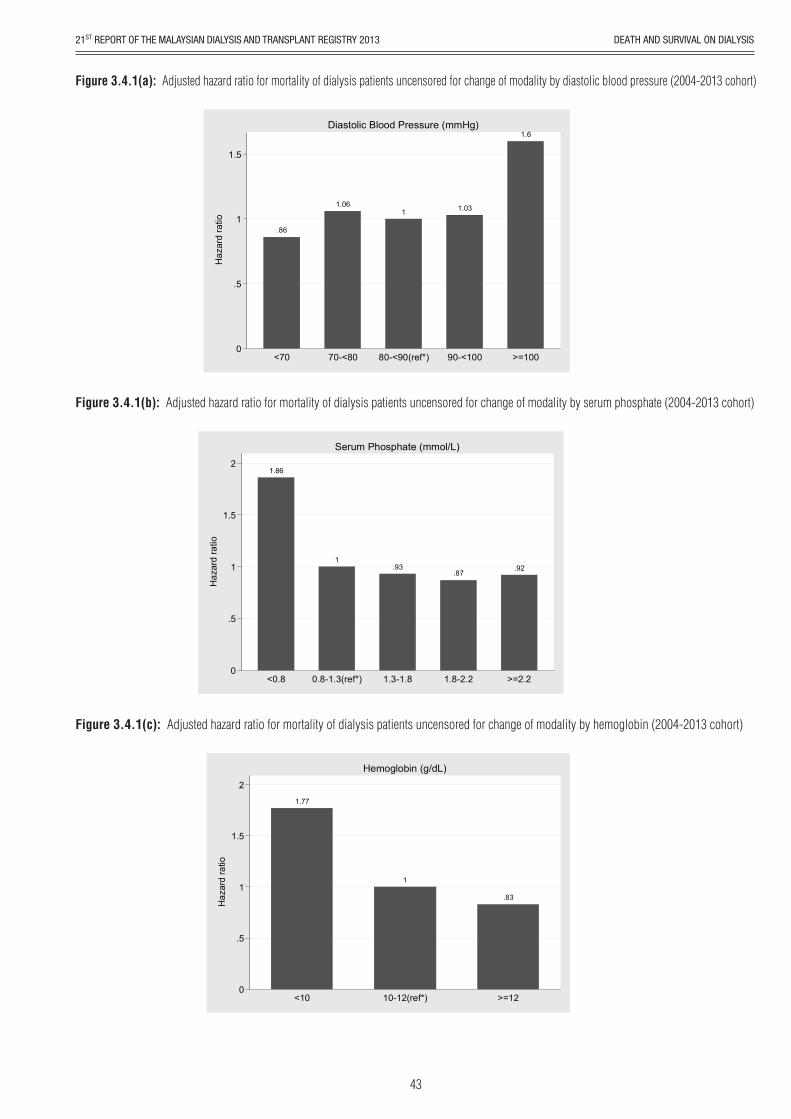
Table 3.4.1 shows the adjusted hazard ratio for mortality of dialysis patients (2004-2013). The 2004-2013 cohort was adjusted for age, gender, primary diagnosis, year commencing dialysis, dialysis modality, body mass index (BMI), serum albumin, serum cholesterol, diastolic blood pressure, haemoglobin, serum calcium, calcium phosphate product, serum phosphate, viral hepatitis status and presence of cardiovascular disease.
Patient variables that had significant impact on mortality were age, gender, primary renal disease, dialysis modality, BMI, diastolic blood pressure and the presence cardiovascular disease. The biochemical variables associated with a significant risk factor for mortality were serum albumin, serum cholesterol, haemoglobin, calcium, calcium phosphate product, phosphate and viral hepatitis status.
There were positive correlation between mortality and age of patient, serum cholesterol, diastolic blood pressure (Figure 3.4.1a), while BMI, serum albumin, serum phosphate (Figure 3.4.1b) and haemoglobin concentration (Figure 3.4.1c) were negatively correlated with mortality. Female patients have 18% lower mortality compared to their male counterpart while patients with diabetic nephropathy as the primary aetiology of renal failure has the highest mortality when compared to other causes of end stage renal failure.
Table 3.4.1: Adjusted hazard ratio for mortality of dialysis patients uncensored for change of modality (2004-2013)
Factors
413
1420
2920
5026
11462
14158
11926
26277
21048
11357
27344
2356
745
145
5378
2890
6817
8674
10172
12550
42054
5271
1.000
0.993
1.048
1.597
2.266
2.996
4.155
1.000
0.822
1.452
1.823
1.000
1.304
0.967
1.146
1.000
1.032
1.040
1.004
0.895
1.000
0.916
(0.771;1.277)
(0.826;1.331)
(1.27;2.009)
(1.808;2.84)
(2.391;3.755)
(3.314;5.209)
(0.796;0.848)
(1.316;1.602)
(1.654;2.009)
(1.12;1.518)
(0.699;1.338)
(1.029;1.277)
(0.977;1.089)
(0.985;1.099)
(0.948;1.063)
(0.84;0.953)
(0.866;0.97)
0.954
0.699
<0.001
<0.001
<0.001
<0.001
<0.001
<0.001
<0.001
0.001
0.84
0.013
0.261
0.16
0.884
0.001
0.002
Age (years)
Age 1-14 (ref*)
Age 15-24
Age 25-34
Age 35-44
Age 45-54
Age 55-64
Age >=65
Gender
Male (ref*)
Female
Primary diagnosis
Unknown primary
Diabetes mellitus
GN/SLE (ref*)
Polycystic kidney
Obstructive nephropathy
Others
Year start dialysis
2003-2004 (ref*)
2005-2006
2007-2008
2009-2010
2011-2012
Modality
HD (ref*)
PD
n Hazard ratio 95% CI P-value
41
DEATH AND SURVIVAL ON DIALYSIS 21ST REPORT OF THE MALAYSIAN DIALYSIS AND TRANSPLANT REGISTRY 2013
Factors
28782602818419
32977245
2328413499
47643330665252730
8520186781457143971159
21722228392764
10986298316508
188721908168322540
3016298
22791123125623
458331492
46457868
410646261
1.2311.0781.000
4.6122.4561.8631.000
0.8570.9060.8211.000
0.8581.0651.0001.0301.599
1.7701.0000.831
0.9621.0000.812
0.8341.0000.7630.980
1.8561.0000.9330.8700.921
1.0001.096
1.0001.117
1.0001.281
(1.15;1.318)(1.041;1.115)
(4.304;4.941)(2.329;2.589)(1.788;1.941)
(0.791;0.929)(0.847;0.968)(0.761;0.886)
(0.818;0.901)(1.025;1.106)
(0.966;1.099)(1.428;1.79)
(1.715;1.827)
(0.773;0.892)
(0.925;1)
(0.773;0.853)
(0.799;0.871)
(0.714;0.815)(0.874;1.099)
(1.597;2.156)
(0.89;0.979)(0.813;0.932)(0.828;1.024)
(1.013;1.186)
(1.013;1.231)
(1.233;1.332)
<0.001<0.001
<0.001<0.001<0.001
<0.0010.004
<0.001
<0.0010.001
0.363<0.001
<0.001
<0.001
0.051
<0.001
<0.001
<0.0010.73
<0.001
0.004<0.0010.128
0.023
0.027
<0.001
BMI BMI<18.5 BMI 18.5-25 >=25 (ref*)
Serum albumin (g/L) <30 30-<35 35-<40 >=40 (ref*)
Serum cholesterol (mmol/L) <3.5 3.5-<5.2 5.2-<6.2 >=6.2 (ref*)
Diastolic BP (mmHg) <70 70-<80 80-<90 (ref*)
90-<100 >=100Hemoglobin (g/dL) <10 10-<12 (ref*)
>=12Serum calcium (mmol/L) <2.1 2.1-<=2.37 (ref*)
>2.37Calcium Phosphate product (mmol2/L2) <3.5 3.5-<4.5 (ref*)
4.5-<5.5 >=5.5Serum Phosphate (mmol/L) <0.8 0.8-<1.3 (ref*)
V1.3-<1.8V 1.8-<2.2 >=2.2HBsAg Negative (ref*)
PositiveAnti-HCV Negative (ref*)
PositiveCardiovascular disease (CVD) No CVD (ref*)
CVD
n Hazard ratio 95% CI P-value
42
DEATH AND SURVIVAL ON DIALYSIS21ST REPORT OF THE MALAYSIAN DIALYSIS AND TRANSPLANT REGISTRY 2013
Figure 3.4.1(a): Adjusted hazard ratio for mortality of dialysis patients uncensored for change of modality by diastolic blood pressure (2004-2013 cohort)
.86
1.061 1.03
1.6
0
.5
1
1.5
Haz
ard
ratio
<70 70-<80 80-<90(ref*) 90-<100 >=100
Diastolic Blood Pressure (mmHg)
Figure 3.4.1(b): Adjusted hazard ratio for mortality of dialysis patients uncensored for change of modality by serum phosphate (2004-2013 cohort)
1.86
1.93
.87.92
0
.5
1
1.5
2
Haz
ard
ratio
<0.8 0.8-1.3(ref*) 1.3-1.8 1.8-2.2 >=2.2
Serum Phosphate (mmol/L)
Figure 3.4.1(c): Adjusted hazard ratio for mortality of dialysis patients uncensored for change of modality by hemoglobin (2004-2013 cohort)
1.77
1
.83
0
.5
1
1.5
2
Haz
ard
ratio
<10 10-12(ref*) >=12
Hemoglobin (g/dL)
43
DEATH AND SURVIVAL ON DIALYSIS 21ST REPORT OF THE MALAYSIAN DIALYSIS AND TRANSPLANT REGISTRY 2013
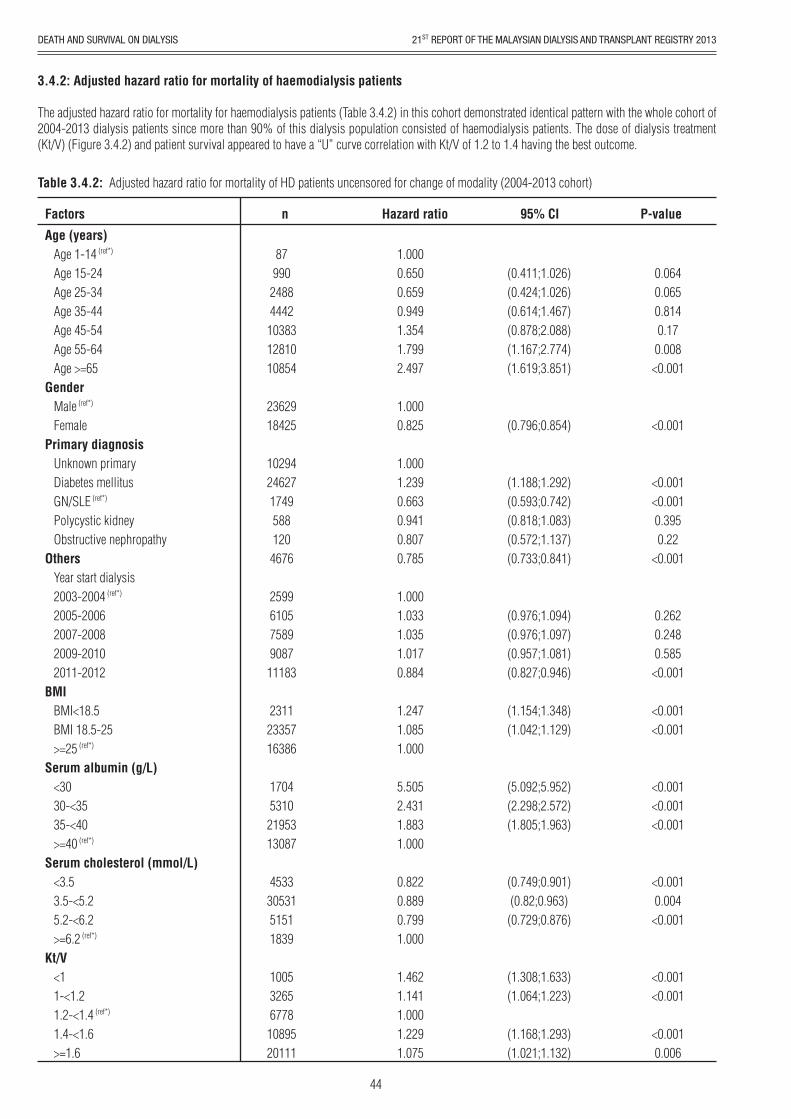
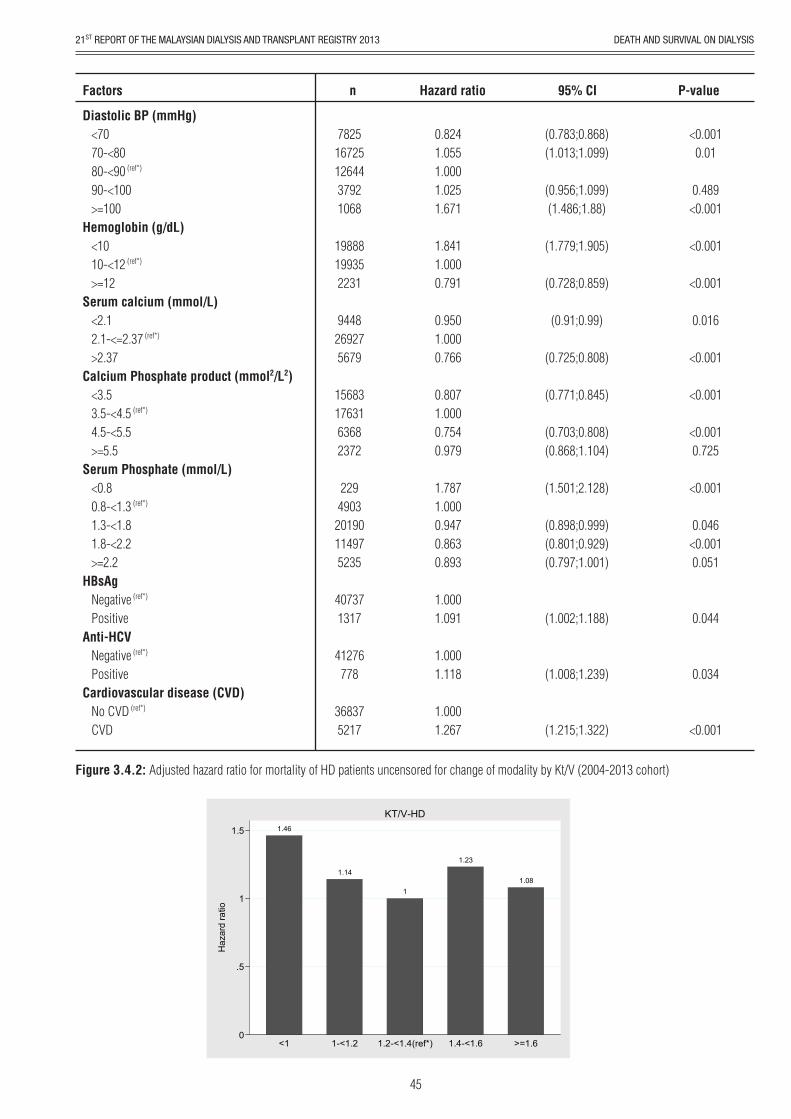
3.4.2: Adjusted hazard ratio for mortality of haemodialysis patients
The adjusted hazard ratio for mortality for haemodialysis patients (Table 3.4.2) in this cohort demonstrated identical pattern with the whole cohort of 2004-2013 dialysis patients since more than 90% of this dialysis population consisted of haemodialysis patients. The dose of dialysis treatment (Kt/V) (Figure 3.4.2) and patient survival appeared to have a “U” curve correlation with Kt/V of 1.2 to 1.4 having the best outcome.
Table 3.4.2: Adjusted hazard ratio for mortality of HD patients uncensored for change of modality (2004-2013 cohort)
Factors
87990
24884442
103831281010854
2362918425
10294246271749588120
4676
2599610575899087
11183
23112335716386
17045310
2195313087
45333053151511839
100532656778
1089520111
1.0000.6500.6590.9491.3541.7992.497
1.0000.825
1.0001.2390.6630.9410.8070.785
1.0001.0331.0351.0170.884
1.2471.0851.000
5.5052.4311.8831.000
0.8220.8890.7991.000
1.4621.1411.0001.2291.075
(0.411;1.026)(0.424;1.026)(0.614;1.467)(0.878;2.088)(1.167;2.774)(1.619;3.851)
(0.796;0.854)
(1.188;1.292)(0.593;0.742)(0.818;1.083)(0.572;1.137)(0.733;0.841)
(0.976;1.094)(0.976;1.097)(0.957;1.081)(0.827;0.946)
(1.154;1.348)(1.042;1.129)
(5.092;5.952)(2.298;2.572)(1.805;1.963)
(0.749;0.901)(0.82;0.963)
(0.729;0.876)
(1.308;1.633)(1.064;1.223)
(1.168;1.293)(1.021;1.132)
0.0640.0650.8140.17
0.008<0.001
<0.001
<0.001<0.0010.3950.22
<0.001
0.2620.2480.585
<0.001
<0.001<0.001
<0.001<0.001<0.001
<0.0010.004
<0.001
<0.001<0.001
<0.0010.006
Age (years) Age 1-14 (ref*)
Age 15-24 Age 25-34 Age 35-44 Age 45-54 Age 55-64 Age >=65Gender Male (ref*)
FemalePrimary diagnosis Unknown primary Diabetes mellitus GN/SLE (ref*)
Polycystic kidney Obstructive nephropathyOthers Year start dialysis 2003-2004 (ref*)
2005-2006 2007-2008 2009-2010 2011-2012BMI BMI<18.5 BMI 18.5-25 >=25 (ref*)
Serum albumin (g/L) <30 30-<35 35-<40 >=40 (ref*)
Serum cholesterol (mmol/L) <3.5 3.5-<5.2 5.2-<6.2 >=6.2 (ref*)
Kt/V <1 1-<1.2 1.2-<1.4 (ref*)
1.4-<1.6 >=1.6
n Hazard ratio 95% CI P-value
44
DEATH AND SURVIVAL ON DIALYSIS21ST REPORT OF THE MALAYSIAN DIALYSIS AND TRANSPLANT REGISTRY 2013
Figure 3.4.2: Adjusted hazard ratio for mortality of HD patients uncensored for change of modality by Kt/V (2004-2013 cohort)
Factors
7825167251264437921068
19888199352231
9448269275679
156831763163682372
2294903
20190114975235
407371317
41276778
368375217
0.8241.0551.0001.0251.671
1.8411.0000.791
0.9501.0000.766
0.8071.0000.7540.979
1.7871.0000.9470.8630.893
1.0001.091
1.0001.118
1.0001.267
(0.783;0.868)(1.013;1.099)
(0.956;1.099)(1.486;1.88)
(1.779;1.905)
(0.728;0.859)
(0.91;0.99)
(0.725;0.808)
(0.771;0.845)
(0.703;0.808)(0.868;1.104)
(1.501;2.128)
(0.898;0.999)(0.801;0.929)(0.797;1.001)
(1.002;1.188)
(1.008;1.239)
(1.215;1.322)
<0.0010.01
0.489<0.001
<0.001
<0.001
0.016
<0.001
<0.001
<0.0010.725
<0.001
0.046<0.0010.051
0.044
0.034
<0.001
Diastolic BP (mmHg) <70 70-<80 80-<90 (ref*)
90-<100 >=100Hemoglobin (g/dL) <10 10-<12 (ref*)
>=12Serum calcium (mmol/L) <2.1 2.1-<=2.37 (ref*)
>2.37Calcium Phosphate product (mmol2/L2) <3.5 3.5-<4.5 (ref*)
4.5-<5.5 >=5.5Serum Phosphate (mmol/L) <0.8 0.8-<1.3 (ref*)
1.3-<1.8 1.8-<2.2 >=2.2HBsAg Negative (ref*)
PositiveAnti-HCV Negative (ref*)
PositiveCardiovascular disease (CVD) No CVD (ref*)
CVD
n Hazard ratio 95% CI P-value
1.46
1.14
1
1.23
1.08
0
.5
1
1.5
Haz
ard
ratio
<1 1-<1.2 1.2-<1.4(ref*) 1.4-<1.6 >=1.6
KT/V-HD
45
DEATH AND SURVIVAL ON DIALYSIS 21ST REPORT OF THE MALAYSIAN DIALYSIS AND TRANSPLANT REGISTRY 2013
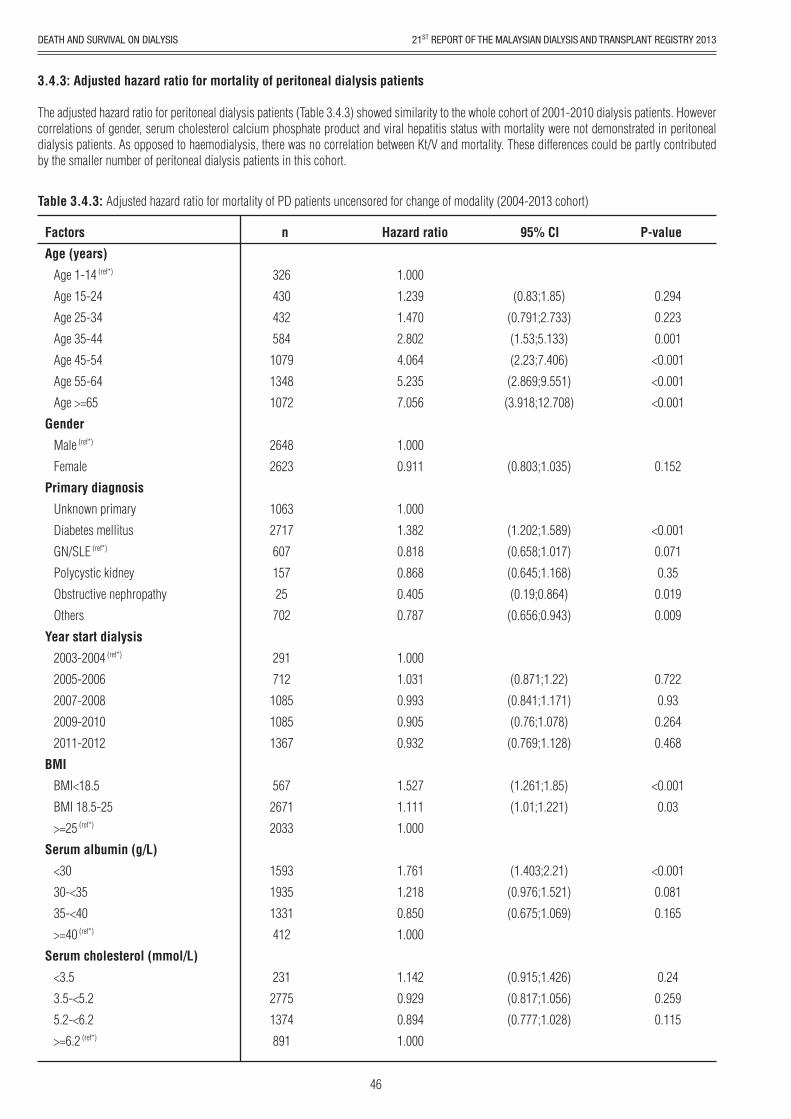
3.4.3: Adjusted hazard ratio for mortality of peritoneal dialysis patients
The adjusted hazard ratio for peritoneal dialysis patients (Table 3.4.3) showed similarity to the whole cohort of 2001-2010 dialysis patients. However correlations of gender, serum cholesterol calcium phosphate product and viral hepatitis status with mortality were not demonstrated in peritoneal dialysis patients. As opposed to haemodialysis, there was no correlation between Kt/V and mortality. These differences could be partly contributed by the smaller number of peritoneal dialysis patients in this cohort.
Table 3.4.3: Adjusted hazard ratio for mortality of PD patients uncensored for change of modality (2004-2013 cohort)
Factors
326
430
432
584
1079
1348
1072
2648
2623
1063
2717
607
157
25
702
291
712
1085
1085
1367
567
2671
2033
1593
1935
1331
412
231
2775
1374
891
1.000
1.239
1.470
2.802
4.064
5.235
7.056
1.000
0.911
1.000
1.382
0.818
0.868
0.405
0.787
1.000
1.031
0.993
0.905
0.932
1.527
1.111
1.000
1.761
1.218
0.850
1.000
1.142
0.929
0.894
1.000
(0.83;1.85)
(0.791;2.733)
(1.53;5.133)
(2.23;7.406)
(2.869;9.551)
(3.918;12.708)
(0.803;1.035)
(1.202;1.589)
(0.658;1.017)
(0.645;1.168)
(0.19;0.864)
(0.656;0.943)
(0.871;1.22)
(0.841;1.171)
(0.76;1.078)
(0.769;1.128)
(1.261;1.85)
(1.01;1.221)
(1.403;2.21)
(0.976;1.521)
(0.675;1.069)
(0.915;1.426)
(0.817;1.056)
(0.777;1.028)
0.294
0.223
0.001
<0.001
<0.001
<0.001
0.152
<0.001
0.071
0.35
0.019
0.009
0.722
0.93
0.264
0.468
<0.001
0.03
<0.001
0.081
0.165
0.24
0.259
0.115
Age (years)
Age 1-14 (ref*)
Age 15-24
Age 25-34
Age 35-44
Age 45-54
Age 55-64
Age >=65
Gender
Male (ref*)
Female
Primary diagnosis
Unknown primary
Diabetes mellitus
GN/SLE (ref*)
Polycystic kidney
Obstructive nephropathy
Others
Year start dialysis
2003-2004 (ref*)
2005-2006
2007-2008
2009-2010
2011-2012
BMI
BMI<18.5
BMI 18.5-25
>=25 (ref*)
Serum albumin (g/L)
<30
30-<35
35-<40
>=40 (ref*)
Serum cholesterol (mmol/L)
<3.5
3.5-<5.2
5.2-<6.2
>=6.2 (ref*)
n Hazard ratio 95% CI P-value
46
DEATH AND SURVIVAL ON DIALYSIS21ST REPORT OF THE MALAYSIAN DIALYSIS AND TRANSPLANT REGISTRY 2013
Factors
3145
1556
570
695
1953
1927
605
91
1834
2904
533
1538
2904
829
3189
1450
464
168
72
1395
2601
815
388
5096
175
5181
90
4227
1044
1.012
1.000
1.335
1.209
1.065
1.000
1.093
1.002
1.333
1.000
0.971
1.077
1.000
1.144
1.099
1.000
0.953
1.059
2.032
1.000
0.892
0.938
1.318
1.000
1.033
1.000
1.110
1.000
1.299
(0.859;1.191)
(0.823;2.166)
(1.05;1.393)
(0.956;1.187)
(0.92;1.3)
(0.646;1.556)
(1.207;1.473)
(0.837;1.127)
(0.969;1.196)
(1.007;1.3)
(0.957;1.262)
(0.759;1.196)
(0.726;1.545)
(1.504;2.746)
(0.799;0.995)
(0.759;1.159)
(0.947;1.833)
(0.835;1.279)
(0.813;1.514)
(1.173;1.439)
0.887
0.242
0.008
0.254
0.313
0.992
<0.001
0.701
0.169
0.039
0.181
0.679
0.766
<0.001
0.041
0.555
0.101
0.763
0.511
<0.001
Kt/V
<1.7
1.7-<2.0 (ref*)
>=2.0
Diastolic BP (mmHg)
<70
70-<80
80-<90 (ref*)
90-<100
>=100
Hemoglobin (g/dL)
<10
10-<12 (ref*)
>=12
Serum calcium (mmol/L)
<2.1
2.1-<=2.37 (ref*)
>2.37
Calcium Phosphate product (mmol2/L2)
<3.5
3.5-<4.5 (ref*)
4.5-<5.5
>=5.5
Serum Phosphate (mmol/L)
<0.8
0.8-<1.3 (ref*)
1.3-<1.8
1.8-<2.2
>=2.2
HBsAg
Negative (ref*)
Positive
Anti-HCV
Negative (ref*)
Positive
Cardiovascular disease (CVD)
No CVD (ref*)
CVD
n Hazard ratio 95% CI P-value
47
DEATH AND SURVIVAL ON DIALYSIS 21ST REPORT OF THE MALAYSIAN DIALYSIS AND TRANSPLANT REGISTRY 2013
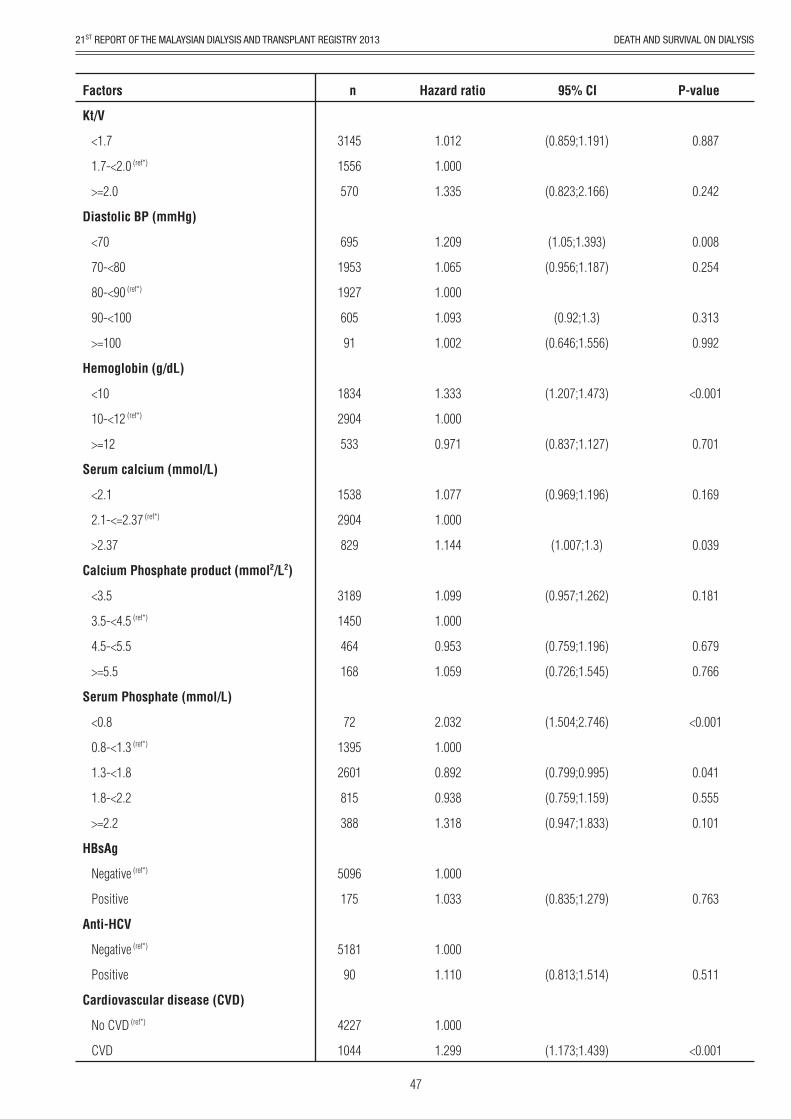
3.4.4: Risk adjusted mortality rate for haemodialysis patients by haemodialysis centres
There appeared to a marked centre variations in RAMR and the median risk adjusted mortality rate (RAMR) for haemodialysis patients by HD centres was 19.5 (Figure 3.4.4a). However, after taking into account the size of the haemodialysis centres, there was minimal variation of the RAMR rate among the various haemodialysis centres in this country where 71.2% of the HD centres lies within 3SD as demonstrated in the funnel plot (Figure 3.4.4b).
Figure 3.4.4(a): Variations in RAMR by HD centre, 2012 Figure 3.4.4(b): Funnel plot of RAMR by HD centre, 2012
0
10
20
30
40
50
60
70
80
90
100
RAM
R
0 50 100 150 200 250 300 350 400 450 500 550 600Centre
(lower 95% CI, Upper 95% CI)
0
10
20
30
40
50
60
70
80
90
100
RAM
R
20 50 80 110 140 170 200 230 260 290 320 350 380Number of patients in the centre
99% Control Limit
95% Control Limit
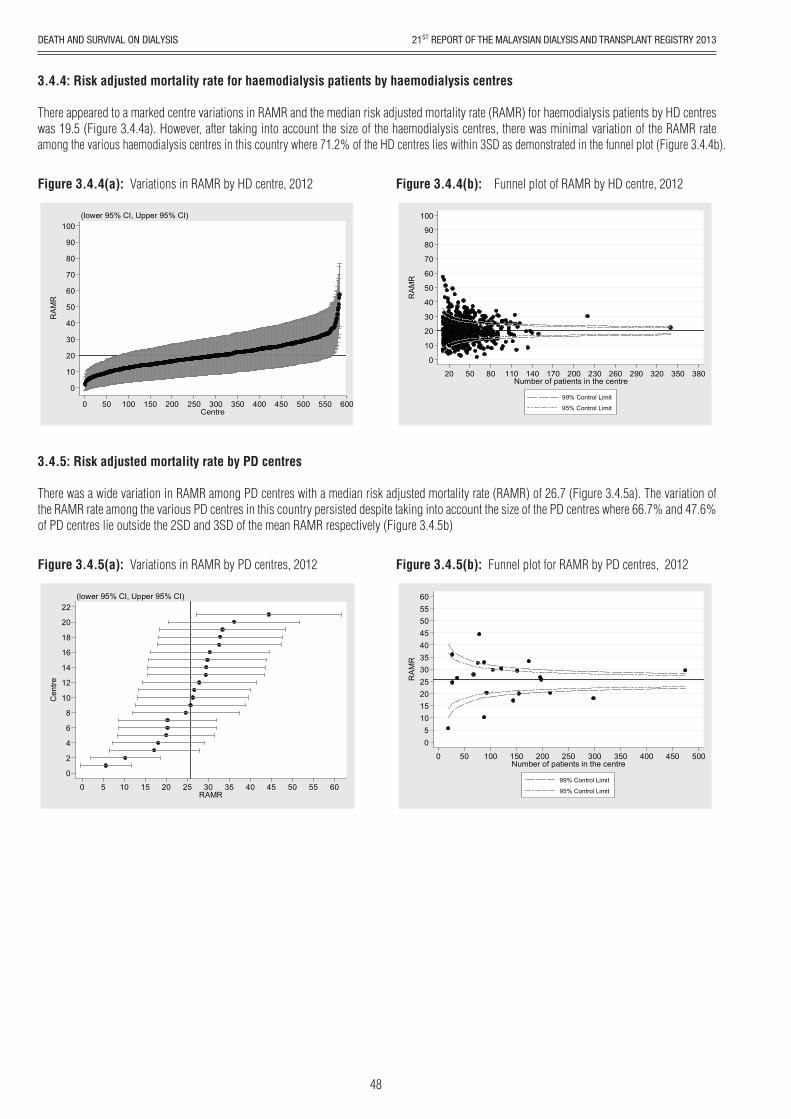
3.4.5: Risk adjusted mortality rate by PD centres
There was a wide variation in RAMR among PD centres with a median risk adjusted mortality rate (RAMR) of 26.7 (Figure 3.4.5a). The variation of the RAMR rate among the various PD centres in this country persisted despite taking into account the size of the PD centres where 66.7% and 47.6% of PD centres lie outside the 2SD and 3SD of the mean RAMR respectively (Figure 3.4.5b)
Figure 3.4.5(a): Variations in RAMR by PD centres, 2012 Figure 3.4.5(b): Funnel plot for RAMR by PD centres, 2012
0
2
4
6
8
10
12
14
16
18
20
22
Cen
tre
0 5 10 15 20 25 30 35 40 45 50 55 60RAMR
(lower 95% CI, Upper 95% CI)
05
1015202530354045505560
RAM
R
0 50 100 150 200 250 300 350 400 450 500Number of patients in the centre
99% Control Limit
95% Control Limit
48