changes in variability of soil moisture alter microbial community c and n resource use
TRANSCRIPT
This article appeared in a journal published by Elsevier. The attachedcopy is furnished to the author for internal non-commercial researchand education use, including for instruction at the authors institution
and sharing with colleagues.
Other uses, including reproduction and distribution, or selling orlicensing copies, or posting to personal, institutional or third party
websites are prohibited.
In most cases authors are permitted to post their version of thearticle (e.g. in Word or Tex form) to their personal website orinstitutional repository. Authors requiring further information
regarding Elsevier’s archiving and manuscript policies areencouraged to visit:
http://www.elsevier.com/copyright
Author's personal copy
Changes in variability of soil moisture alter microbial communityC and N resource use
Lisa K. Tiemann a,*, Sharon A. Billings b
aUniversity of Kansas, 2101 Constant Ave, Higuchi Hall, Lawrence, KS 66047, USAbUniversity of Kansas, Kansas Biological Survey, 2101 Constant Ave, Higuchi Hall, Lawrence, KS 66047, USA
a r t i c l e i n f o
Article history:Received 3 January 2011Received in revised form22 April 2011Accepted 26 April 2011Available online 13 May 2011
Keywords:GrasslandSoil carbonSoil nitrogenCarbon use efficiencySoil moisture variabilityPrecipitation regimeClimate change
a b s t r a c t
Grassland ecosystems contain w12% of global soil organic carbon (C) stocks and are located in regionswhere global climate change will likely alter the timing and size of precipitation events, increasingsoil moisture variability. In response to increased soil moisture variability and other forms of stress,microorganisms can induce ecosystem-scale alterations in C and N cycling processes through alterationsin their function. We explored the influence of physiological stress on microbial communities bymanipulating moisture variability in soils from four grassland sites in the Great Plains, representinga precipitation gradient of 485e1003 mm y�1. Keeping water totals constant, we manipulated thefrequency and size of water additions and dry down periods in these soils by applying water in twodifferent, two-week long wettingedrying cycles in a 72-day laboratory incubation. To assess the effectsof the treatments on microbial community function, we measured C mineralization, N dynamics,extracellular enzyme activities (EEA) and a proxy for substrate use efficiency. In soils from all four sitesundergoing a long interval (LI) treatment for which addedwaterwas applied once at the beginning of eachtwo-week cycle, 1.4e2.0 times more C was mineralized compared to soils undergoing a short interval (SI)treatment, for which four wetting events were evenly distributed over each two-week cycle. A proxy forcarbon use efficiency (CUE) suggests declines in this parameter with the greater soil moisture stressimposed in LI soils from all four different native soil moisture regimes. A decline in CUE in LI soils may havebeen related to an increased effort by microbes to obtain N-rich organic substrates for use as protectionagainst osmotic shock, consistent with EEA data. These results contrast with similar in situ studies ofresponse to increased soil moisture variability and may indicate divergent autotrophic vs. heterotrophicresponses to increased moisture variability. Increases in microbial N demand and decreases in microbialCUE with increased moisture variability observed in this study, regardless of the soils’ site of origin, implythat these systems may experience enhanced heterotrophic CO2 release and declines in plant-available Nwith climate change. This has particularly important implications for C budgets in these grasslands whencoupled with the declines in net primary productivity reported in other studies as a result of increases inprecipitation variability across the region.
� 2011 Elsevier Ltd. All rights reserved.
1. Introduction
Global climate models predict altered precipitation regimesacross North America in this century associated with increases inaverage surface temperatures, consistent with recent observations(Karl and Trenberth, 2003). Across the US Central Plains, thesealterations include an increase in the number and severity ofdroughts and larger rainfall events between drought periods, withlittle to no change in annual totals (Easterling et al., 2000; Knapp
et al., 2008). In this region, where annual potential evapotranspi-ration (PET) exceeds annual precipitation totals (Lauenroth andBurke, 1995), soil moisture is a limiting factor controlling both netprimary productivity (NPP) and microbial processing of large poolsof soil organic matter (SOM), and hence controlling soil carbon (C)and nitrogen (N) cycling (Harper et al., 2005; McCulley et al., 2005).
Investigators exploring how precipitationpulses drive ecosystemC and N cycling have typically focused on deserts and semi-aridgrasslands, where the pulse-driven nature of the system is mostevident (Austin et al., 2004). However, climate models predictthat both relatively xeric and mesic grasslands of North Americawill experience enhanced precipitation variability in the future(Easterling et al., 2000; Knapp et al., 2008). Understanding these
* Corresponding author. Tel.: þ1 785 864 1544; fax: þ1 785 864 1534.E-mail address: [email protected] (L.K. Tiemann).
Contents lists available at ScienceDirect
Soil Biology & Biochemistry
journal homepage: www.elsevier .com/locate/soi lb io
0038-0717/$ e see front matter � 2011 Elsevier Ltd. All rights reserved.doi:10.1016/j.soilbio.2011.04.020
Soil Biology & Biochemistry 43 (2011) 1837e1847
Author's personal copy
interactions is of particular importance in the grasslands of NorthAmerica, where soil organicmatter (SOM) concentrations are amongthe highest of all ecosystems (Scurlock and Hall, 1998), and wheresoils have the potential to serve as either a large C source or sinkwithclimate change (Scurlock and Hall, 1998; Knapp et al., 2008). Thesesystems, because of their capacity to store C and their predictedfuture exposure to enhanced precipitation variability have receivedsignificant research attention in recent years (Knapp et al., 2002,2008; Fay et al., 2003; Harper et al., 2005; Fay et al., 2008; Heisler-White et al., 2008). However, most of these studies focus on theinfluence of altered soil moisture variability on aboveground systemproductivity, leaving many questions about the fate of that produc-tivity, once incorporated into soil profiles, unaddressed. For example,increased variability of rainfall events can lead to decreased total soilrespiration (Harper et al., 2005), but the mechanism by which anydeclines in heterotrophic soil activity occurs remain unclear.
Multiple studies demonstrate the influence of soil moistureavailability and its variability as a key driver of grassland soilbiogeochemistry. Ratesof soil respirationdecreasewithmeanannualprecipitation (MAP) in grasslands of the Great Plains (McCulley et al.,2005), and the frequency and size of precipitation events can causeecosystem-scalealterations inCandNcyclingprocesses (Knappetal.,2002; Schimel et al., 2007). Precipitation events, particularly thosefollowingperiodsofdrought, cancreate largeflushesofnutrients andsoil organic carbon (SOC) by releasing, through diffusion, droughtaccumulated SOM, inorganic N and microbial necromass (Austinet al., 2004; Schimel et al., 2007; Iovieno and Baath, 2008; Butterlyet al., 2009). This flush of fresh substrate can be followed closelyby large pulses of microbial respiration (Fierer and Schimel, 2002;Iovieno and Baath, 2008; Butterly et al., 2009). In addition, soilmoisturefluctuations can also be responsible for significant variationin N uptake and release via microbial function (Fierer and Schimel,2002; Austin et al., 2004; Schimel et al., 2007). Soil microorganismscombat drought in several ways, all of which require an energeticinvestment and thus a drain on C resources (Borken and Matzner,2009; Schimel et al., 2007). One source of drought protection isthe manufacture of a layer of polysaccharide-rich mucilage thatprevents desiccation (Borken and Matzner, 2009). Microorganismsalso protect themselves against large, negative soil matric andosmotic potentials through the acquisition of protective osmolytes,generally N-rich substrates such as amino acids (Borken andMatzner, 2009; Schimel et al., 2007). Microorganisms can releasethese osmolytes quickly when the soil is re-wetted to protectthemselves against osmotic pressure and cell lysis. This uptake andrelease of N-rich resources can affect N cycling on an ecosystem scale(Schimel et al., 2007).
We explored the influence of soil moisture variability onbelowground grassland C and N dynamics by conducting incuba-tions of soils obtained from research sites across the precipitationgradient of North America’s Central Plains. These soils are relativelyC-rich and experience significant variability in moisture content
across the growing season that is linked to variation in respiratory Closses (McCulley et al., 2005). Precipitation patterns on the eastern,mesic end of this precipitation gradient have historically exhibitedrelatively small but frequent rain events, while on the western endof this gradient soil moisture variability ismuch greater, with longerdrought intervals and more extreme rainfall events (Lauenroth andBurke, 1995). As a first step towards understanding how climatechange-driven alterations in soilmoisture variabilitywill alter C andN dynamics in these systems, we exposed these soils to simulatedmoisture regimes during a laboratory incubation. Throughoutthe incubation, we measured CO2 released. We also assessed thenet N mineralized, microbial biomass, and extracellular enzymeactivities (EEA) associatedwith the degradation of C-, N-, and P-richorganic compounds, and calculated multiple proxies for microbialcarbon use efficiency (CUE). We hypothesized that as variability insoil moisture increases, microbial C and N resource transformationswill reflect a shift from biomass development to protection againstmoisture stress, and that this will be detectable via proxies forsubstrate use efficiency.We further hypothesized that soil microbialcommunities from the eastern, moister end of the precipitationgradient would experience relatively greater resource demands andlower substrate use efficiency with higher soil moisture variabilitythan microbial communities adapted to life on the western end ofthe gradient, where ambient variation in precipitation is high andsoil moisture levels are typically low.
Though data obtained from ex situ soil must be interpreted withcaution, laboratory incubations permit us to investigate hetero-trophic respiratory responses without the confounding inclusionof plants, and permit environmental control difficult to attainin intact systems. We intended this study to highlight the mostimportant potential mechanisms affecting soil C and N resourceuse, for further exploration in situ. We sought to elucidate themechanisms by which any changes in belowground microbialtransformations of SOM may occur in these systems with changesin moisture variability, and to highlight those measures of SOMtransformations likely to serve as bellwethers of changes in thefuture.
2. Materials and methods
2.1. Sites
We chose four sites along the eastewest precipitation gradientacross Kansas, USA, part of the North American Great Plains (Table 1).The easternmost site, part of the Kansas University Field Station lands(KUFS, W 95�1403500 N 38�1002100) is in an area where the averageannual precipitation is 1003 mm. The soils are gravelly silt loams(smectitic, thermic, Typic paleudolls) and vegetation is dominated bythe tallgrass prairie species Andropogon gerardii and Sorghastrumnutans. Our second site, located at the Konza Prairie Long TermEcological Research site (KNZ,W96�3301800 N39�50200), has an average
Table 1Characteristics of the four grassland study sites located across an eastewest precipitation gradient in Kansas, USA. Clay, silt, SOM, pH and bulk density are means � standarderror (n ¼ 3).
Site Kansas Field Stationand Ecological Reserves
Konza Prairie LTER K-State Western KansasAgricultural Research Center
Nature ConservancySmokey Valley Ranch
Abbreviation KUFS KNZ HYS SVRAverage annual precipitation 1003 mm 850 mm 579 mm 498 mmSoil type Typic paleudolls Typic natrusolls Cumulic haplustolls Aridic haplustolls% Clay 26.33 � 0.66 27.63 � 0.69 31.33 � 0.84 24.98 � 1.05% Silt 61.93 � 0.27 65.17 � 1.18 58.38 � 0.29 57.60 � 0.87% SOM 4.69 � 0.22 5.86 � 0.17 7.92 � 0.55 3.13 � 0.22pH 5.99 � 0.06 6.11 � 0.11 6.59 � 0.11 7.83 � 0.06Bulk density 1.30 � 0.01 1.08 � 0.06 1.07 � 0.05 1.32 � 0.03
L.K. Tiemann, S.A. Billings / Soil Biology & Biochemistry 43 (2011) 1837e18471838
Author's personal copy
annual precipitation of 835mm and soils that are a mix of silty loams(smectitic, mesic, Typic natrusolls) and silty clay loams (fine, mixed,superactive, mesic, Pachic argiustolls). Dominant vegetation includesA. gerardii, Andropogon scoparium, Panicum virgatum and S. nutans.The third site, part of the Kansas State University’s Western KansasAgricultural Research Center (HYS, W 99�1704600 N 38�5001300),receives an average of 578mmof precipitationyearly and the soils aresilt loams (fine-silty, mixed, superactive, mesic, Cumulic haplustolls).It is a mixed grass prairie that includes A. gerardii, A. scoparium,Bouteloua gracilis, Hesperostipa comata, Bouteloua curtipendula andPascopyrum smithii. The westernmost site, The Nature Conservancy’sSmokey Valley Ranch (SVR, W 100�5805500 N 38�5105000), is a shortgrass prairie dominated by B. gracilis and Buchloë dactyloides. Itreceives an average of 485mmof precipitation annually. The soils aresilt loams (fine-silty, mixed, superactive, mesic, Aridic haplustolls).All sites, which are part of actively grazed rangeland, were fenced toexclude cattle and have been burned annually, with the exception ofSVR, which is not burned.
2.2. Soil collection
Soils were collected from all four sites, from April 13 throughApril 15, 2008. We used 10 cm diameter by 10 cm beveled PVC toextract three soil cores from each site. The cores were placed in icedcoolers and returned to the lab at the University of Kansas wherethey were stored at 4 �C until the start of the incubation. Soilswere well-mixed and roots >2 mm in diameter were removed.A 15 g sub-sample fromeach corewas placed in a 60 �C oven for 48 hto determine gravimetric soil moisture. This dried soil was thenused to determine water holding capacity (WHC) by saturating 5 gdry soil placed inWhatman #4 filter paper fitted into funnels. Thesewere covered to prevent evaporative loss and allowed to drainovernight (Fierer and Schimel, 2002). Before the start of the incu-bation, soils were conditioned for one week in an incubator setat 20 �C at field moisture, which was w50% WHC for all soils.
2.3. Soil treatments
Soil from each of the three cores from each site was weighedinto pre-weighed 5 cm diameter by 5 cm in length PVC cores fittedon the bottom with coarse filter paper (85 g dry weight). The coreswere placed in 1 l Mason jars on top of a layer of glass beads to allowair circulation under the cores. The soils were separated into threetreatment groups, with one sample from each core at each site pergroup so that therewere a total of three replicates for each treatmentfor each site. The treatments consisted of a control, which was keptat 50%WHC throughout the incubation, and two different two-weeklong wettingedrying cycles that varied in both frequency and size ofthe water additions and dry down periods. Long interval (LI) soilswere given enoughwater to bring them to 75%WHC, followedby drydown periods that were two weeks in duration. Short interval (SI)soils received water equal to one quarter of the LI treatment twotimes perweek over each two-week cycle. Thus, for every two-weekcycle, both treatments received the same total amount of water,differing only in the timing and size of the individual additions.
We conducted the experiment for a total of six, two-week cycles.Water was applied using a needle and syringe for even coverage.During the dry downperiods, all soils were gently stirred regardlessof treatment, at the same time, in order to turn them over andpromote homogeneity of soil moisture throughout the PVC core.While we strove to keep aggregates intact during these soil turn-overs, we recognize that this may have influenced soil aggregation,C availability and the composition of the microbial communities,but we prioritized homogeneity of soil moisture within the soilcores. Because all soils were stirred regardless of water addition,
we assume that any effects due to stirring were equivalent amongtreatments. Control jars (maintained at 50% WHC) were coveredwith parafilm to allow gas exchange while preventing moistureloss during the incubation; all other treatment jars were left opento permit evaporation. All soils were weighed frequently to deter-mine soil moisture content, and were maintained at 24 �C. Sub-samples of all soils were harvested on day 58, the beginning ofthe last two-week cycle, for analyses described below. At the end ofthe final cycle (day 72), all soils received one final wetting to bringthem to w75% WHC. This moistening event included the additionof leachate derived from leaf litter, described in detail below, toprovide insight into the influence of variability of soil moistureregimes on microbial CUE.
2.4. Soil respiration
Soil respirationwasmeasured four timesperweek for all samples,on the day prior to and 2 h after any water additions, regardless ofwhether or not the soils received water that day. On each samplingdaywe sampledheadspacegas twice, once right aftercapping the jarsand a second time after a period of 2e4 h. Gas sampleswere obtainedthrough septa fitted into the jar lids via needle and syringe, andwereanalyzed for CO2 concentration on a Varian gas chromatograph usinga thermal conductivity detector (Varian, Walnut Creek, CA, USA).The difference between the two measures was used to calculate therate of C respired. Total C respired over the course of the incubationwas calculated by applying the average respiration rate between twosamplingdays to the timeperiodbetween those twosamplingevents.
2.5. Extracellular enzyme activity
We analyzed the activity of ten extracellular enzymes in soilssampled 4 h after water addition on day 58 and on day 73, 25 h afterleachate additions. We measured the activities of two cellulases andahemi-cellulase (b-1,4-glucosidase (BG), cellobiohydrolase (CBH),b-1-4-xylosidase (BXYL)) as well as an enzyme responsible for the break-downof starch, a-1-4-glucosidase (AG).We alsomeasured a chitinase,b-1-4-N-acetylglucosaminidase (NAG), a peptidase, leucine aminopeptidase (LAP), and the activity of phosphate-monoester phospho-hydrolase (PHOS), which releases phosphates from organic matter.The activities of these enzymeswere determined using correspondingsubstrates fluorescently labeled with methylumbelliferone (MUB) ormethyl coumarin (MC) added to soil slurries in 96-well microplates asper Saiya-Corket al. (2002). Soils fromKUFS,KNZandHYS,whichwereslightly acidic, were homogenized with 50mM sodium acetate bufferat pH of 6.5, close to the pHH2O of these soils. Soils from SVR, whichwere slightly alkaline, were homogenized in sodium bicarbonatebuffer at pH 7.8. Soils were incubated at 24 �C forw18 h. Fluorescencewas determined on a SpectraMaxGemini XS Fluorescence Platereader(Molecular Devices, Menlo Park, CA, USA) with 365 nm excitation and460 nm emission filters.
We also measured the activities of peroxidase, phenol oxidaseand urease using colorimetric assays set up in 96-well microplates(Saiya-Cork et al., 2002). Phenol oxidase and peroxidase activitieswere measured using the color change associated with the break-down of the substrate 3,4-dihydroxy-L-phenylalanine (L-DOPA).Urease activity was assessed by measuring the ammonium accu-mulated through the incubation using the color change producedby the addition of ammonium cyanurate and ammonium salicylate.Plates were analyzed on a SpectraMax 340PC 384 AbsorbancePlatereader (Molecular Devices, Menlo Park, CA, USA) at 460 nm forphenol oxidase and peroxidase and 610 nm for urease.
We group these enzymes into four categories, each representinga critical feature of SOMbreakdown. Labile C acquisition enzymeseBG, CBH, BXYL and AGe are responsible for the breakdown of C-rich
L.K. Tiemann, S.A. Billings / Soil Biology & Biochemistry 43 (2011) 1837e1847 1839
Author's personal copy
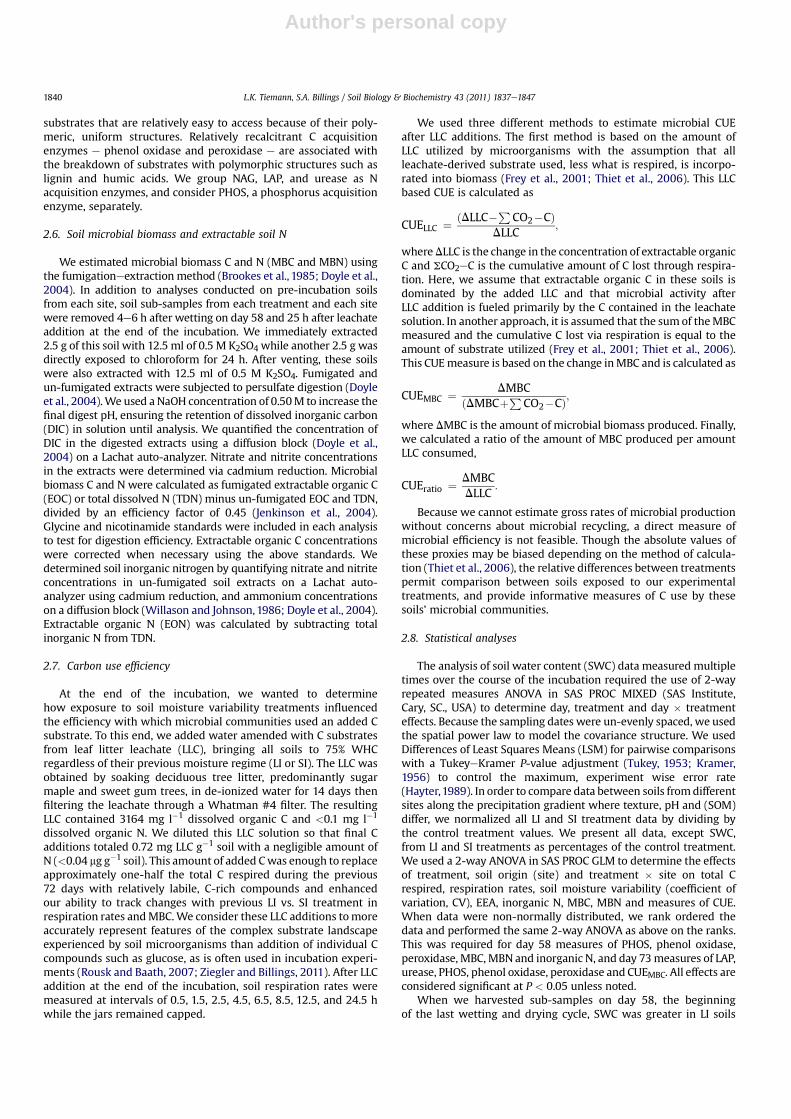
substrates that are relatively easy to access because of their poly-meric, uniform structures. Relatively recalcitrant C acquisitionenzymes e phenol oxidase and peroxidase e are associated withthe breakdown of substrates with polymorphic structures such aslignin and humic acids. We group NAG, LAP, and urease as Nacquisition enzymes, and consider PHOS, a phosphorus acquisitionenzyme, separately.
2.6. Soil microbial biomass and extractable soil N
We estimated microbial biomass C and N (MBC and MBN) usingthe fumigationeextraction method (Brookes et al., 1985; Doyle et al.,2004). In addition to analyses conducted on pre-incubation soilsfrom each site, soil sub-samples from each treatment and each sitewere removed 4e6 h after wetting on day 58 and 25 h after leachateaddition at the end of the incubation. We immediately extracted2.5 g of this soil with 12.5 ml of 0.5 M K2SO4 while another 2.5 g wasdirectly exposed to chloroform for 24 h. After venting, these soilswere also extracted with 12.5 ml of 0.5 M K2SO4. Fumigated andun-fumigated extracts were subjected to persulfate digestion (Doyleet al., 2004).We used a NaOH concentration of 0.50M to increase thefinal digest pH, ensuring the retention of dissolved inorganic carbon(DIC) in solution until analysis. We quantified the concentration ofDIC in the digested extracts using a diffusion block (Doyle et al.,2004) on a Lachat auto-analyzer. Nitrate and nitrite concentrationsin the extracts were determined via cadmium reduction. Microbialbiomass C and N were calculated as fumigated extractable organic C(EOC) or total dissolved N (TDN) minus un-fumigated EOC and TDN,divided by an efficiency factor of 0.45 (Jenkinson et al., 2004).Glycine and nicotinamide standards were included in each analysisto test for digestion efficiency. Extractable organic C concentrationswere corrected when necessary using the above standards. Wedetermined soil inorganic nitrogen by quantifying nitrate and nitriteconcentrations in un-fumigated soil extracts on a Lachat auto-analyzer using cadmium reduction, and ammonium concentrationson a diffusion block (Willason and Johnson,1986; Doyle et al., 2004).Extractable organic N (EON) was calculated by subtracting totalinorganic N from TDN.
2.7. Carbon use efficiency
At the end of the incubation, we wanted to determinehow exposure to soil moisture variability treatments influencedthe efficiency with which microbial communities used an added Csubstrate. To this end, we added water amended with C substratesfrom leaf litter leachate (LLC), bringing all soils to 75% WHCregardless of their previous moisture regime (LI or SI). The LLC wasobtained by soaking deciduous tree litter, predominantly sugarmaple and sweet gum trees, in de-ionized water for 14 days thenfiltering the leachate through a Whatman #4 filter. The resultingLLC contained 3164 mg l�1 dissolved organic C and <0.1 mg l�1
dissolved organic N. We diluted this LLC solution so that final Cadditions totaled 0.72 mg LLC g�1 soil with a negligible amount ofN (<0.04 mg g�1 soil). This amount of added Cwas enough to replaceapproximately one-half the total C respired during the previous72 days with relatively labile, C-rich compounds and enhancedour ability to track changes with previous LI vs. SI treatment inrespiration rates andMBC.We consider these LLC additions tomoreaccurately represent features of the complex substrate landscapeexperienced by soil microorganisms than addition of individual Ccompounds such as glucose, as is often used in incubation experi-ments (Rousk and Baath, 2007; Ziegler and Billings, 2011). After LLCaddition at the end of the incubation, soil respiration rates weremeasured at intervals of 0.5, 1.5, 2.5, 4.5, 6.5, 8.5, 12.5, and 24.5 hwhile the jars remained capped.
We used three different methods to estimate microbial CUEafter LLC additions. The first method is based on the amount ofLLC utilized by microorganisms with the assumption that allleachate-derived substrate used, less what is respired, is incorpo-rated into biomass (Frey et al., 2001; Thiet et al., 2006). This LLCbased CUE is calculated as
CUELLC ¼ ðDLLC�PCO2�CÞ
DLLC;
whereDLLC is the change in the concentration of extractable organicC and SCO2eC is the cumulative amount of C lost through respira-tion. Here, we assume that extractable organic C in these soils isdominated by the added LLC and that microbial activity afterLLC addition is fueled primarily by the C contained in the leachatesolution. In another approach, it is assumed that the sum of theMBCmeasured and the cumulative C lost via respiration is equal to theamount of substrate utilized (Frey et al., 2001; Thiet et al., 2006).This CUEmeasure is based on the change inMBC and is calculated as
CUEMBC ¼ DMBCðDMBCþP
CO2�CÞ;
where DMBC is the amount of microbial biomass produced. Finally,we calculated a ratio of the amount of MBC produced per amountLLC consumed,
CUEratio ¼ DMBCDLLC
:
Because we cannot estimate gross rates of microbial productionwithout concerns about microbial recycling, a direct measure ofmicrobial efficiency is not feasible. Though the absolute values ofthese proxies may be biased depending on the method of calcula-tion (Thiet et al., 2006), the relative differences between treatmentspermit comparison between soils exposed to our experimentaltreatments, and provide informative measures of C use by thesesoils’ microbial communities.
2.8. Statistical analyses
The analysis of soil water content (SWC) data measured multipletimes over the course of the incubation required the use of 2-wayrepeated measures ANOVA in SAS PROC MIXED (SAS Institute,Cary, SC., USA) to determine day, treatment and day � treatmenteffects. Because the sampling dates were un-evenly spaced, we usedthe spatial power law to model the covariance structure. We usedDifferences of Least Squares Means (LSM) for pairwise comparisonswith a TukeyeKramer P-value adjustment (Tukey, 1953; Kramer,1956) to control the maximum, experiment wise error rate(Hayter,1989). In order to compare data between soils fromdifferentsites along the precipitation gradient where texture, pH and (SOM)differ, we normalized all LI and SI treatment data by dividing bythe control treatment values. We present all data, except SWC,from LI and SI treatments as percentages of the control treatment.We used a 2-way ANOVA in SAS PROC GLM to determine the effectsof treatment, soil origin (site) and treatment � site on total Crespired, respiration rates, soil moisture variability (coefficient ofvariation, CV), EEA, inorganic N, MBC, MBN and measures of CUE.When data were non-normally distributed, we rank ordered thedata and performed the same 2-way ANOVA as above on the ranks.This was required for day 58 measures of PHOS, phenol oxidase,peroxidase, MBC, MBN and inorganic N, and day 73measures of LAP,urease, PHOS, phenol oxidase, peroxidase and CUEMBC. All effects areconsidered significant at P < 0.05 unless noted.
When we harvested sub-samples on day 58, the beginningof the last wetting and drying cycle, SWC was greater in LI soils
L.K. Tiemann, S.A. Billings / Soil Biology & Biochemistry 43 (2011) 1837e18471840
Author's personal copy
compared to SI. Though this permitted us to assess differences inmicrobial functionwith varying SWC, wewere primarily interestedin the influence of legacy effects of soil moisture variabilityon microbial functioning, not SWC per se. We address this issueby analyzing for and focusing much of our discussion on treatmenteffects on day 73, when SWC was equivalent among treatments,and thus any differences in measures of microbial communityfunction on this sampling date reflect legacy effects of months ofimposed differences in soil moisture variability.
3. Results
3.1. Soil moisture content and variability
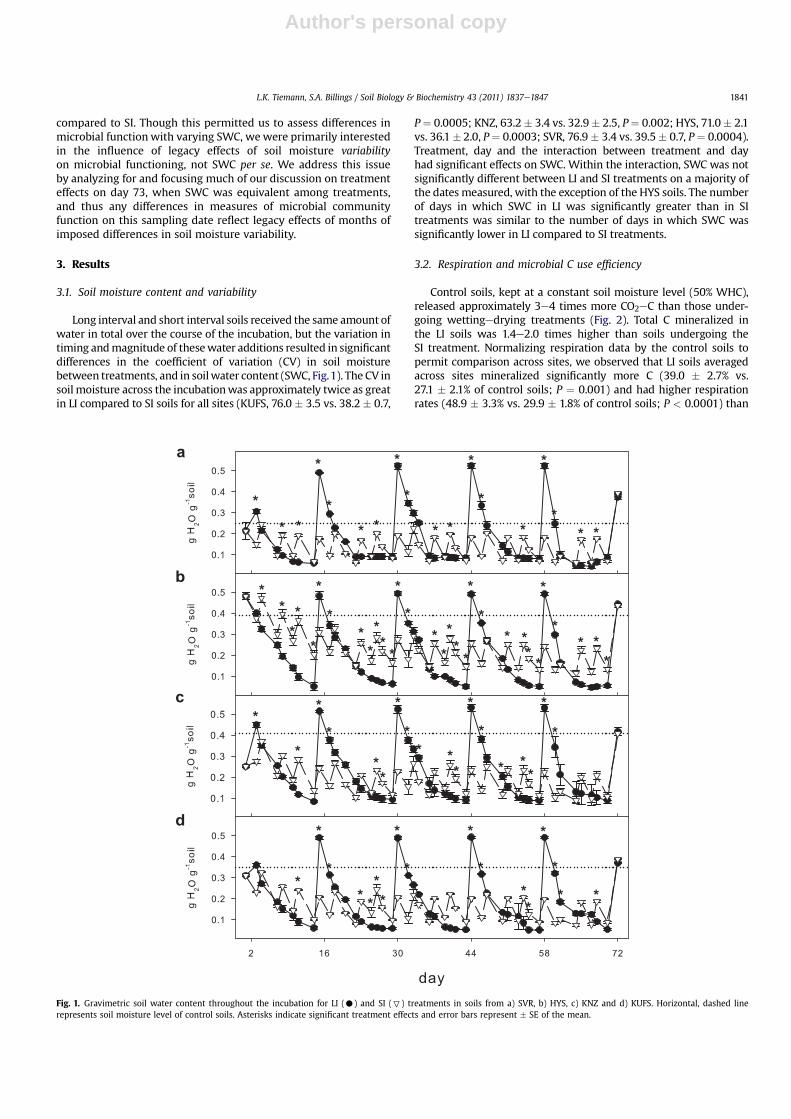
Long interval and short interval soils received the same amount ofwater in total over the course of the incubation, but the variation intiming andmagnitude of thesewater additions resulted in significantdifferences in the coefficient of variation (CV) in soil moisturebetween treatments, and in soilwater content (SWC, Fig.1). The CV insoil moisture across the incubationwas approximately twice as greatin LI compared to SI soils for all sites (KUFS, 76.0 � 3.5 vs. 38.2 � 0.7,
P¼ 0.0005; KNZ, 63.2� 3.4 vs. 32.9� 2.5, P¼ 0.002; HYS, 71.0� 2.1vs. 36.1 � 2.0, P¼ 0.0003; SVR, 76.9 � 3.4 vs. 39.5� 0.7, P¼ 0.0004).Treatment, day and the interaction between treatment and dayhad significant effects on SWC. Within the interaction, SWC was notsignificantly different between LI and SI treatments on a majority ofthe dates measured, with the exception of the HYS soils. The numberof days in which SWC in LI was significantly greater than in SItreatments was similar to the number of days in which SWC wassignificantly lower in LI compared to SI treatments.
3.2. Respiration and microbial C use efficiency
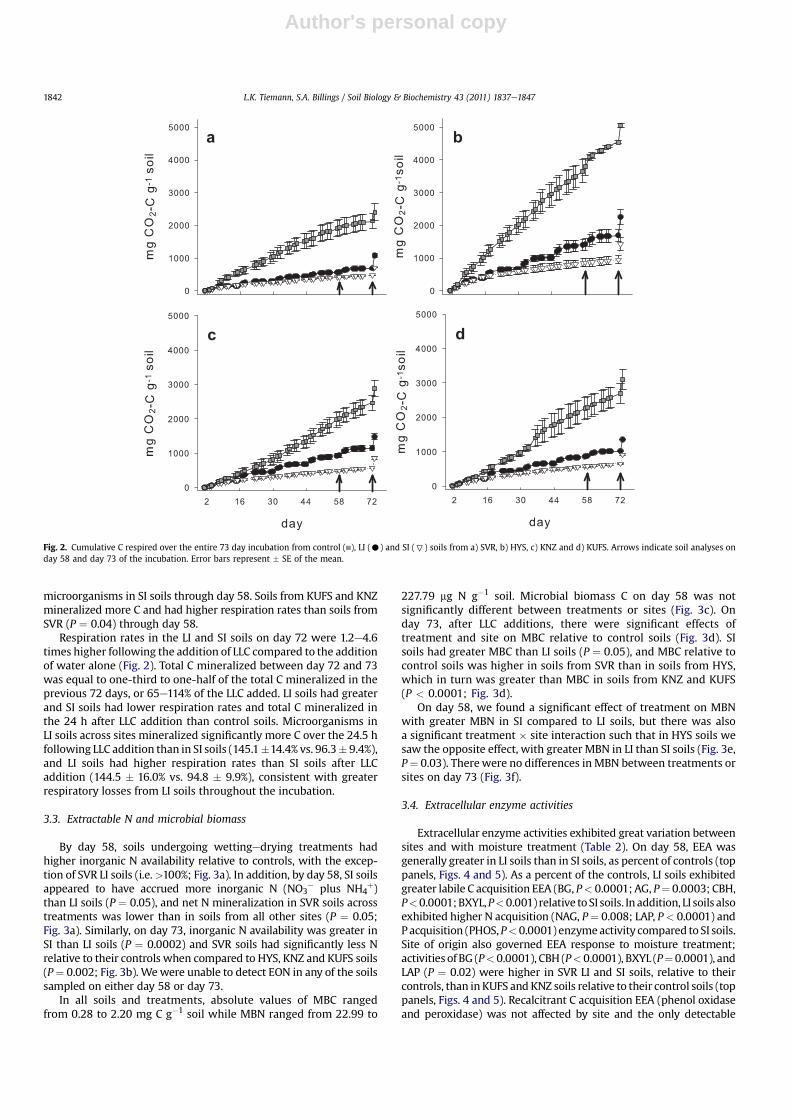
Control soils, kept at a constant soil moisture level (50% WHC),released approximately 3e4 times more CO2eC than those under-going wettingedrying treatments (Fig. 2). Total C mineralized inthe LI soils was 1.4e2.0 times higher than soils undergoing theSI treatment. Normalizing respiration data by the control soils topermit comparison across sites, we observed that LI soils averagedacross sites mineralized significantly more C (39.0 � 2.7% vs.27.1 � 2.1% of control soils; P ¼ 0.001) and had higher respirationrates (48.9 � 3.3% vs. 29.9 � 1.8% of control soils; P < 0.0001) than
Fig. 1. Gravimetric soil water content throughout the incubation for LI (C) and SI (7) treatments in soils from a) SVR, b) HYS, c) KNZ and d) KUFS. Horizontal, dashed linerepresents soil moisture level of control soils. Asterisks indicate significant treatment effects and error bars represent � SE of the mean.
L.K. Tiemann, S.A. Billings / Soil Biology & Biochemistry 43 (2011) 1837e1847 1841
Author's personal copy
microorganisms in SI soils through day 58. Soils from KUFS and KNZmineralized more C and had higher respiration rates than soils fromSVR (P ¼ 0.04) through day 58.
Respiration rates in the LI and SI soils on day 72 were 1.2e4.6times higher following the addition of LLC compared to the additionof water alone (Fig. 2). Total C mineralized between day 72 and 73was equal to one-third to one-half of the total C mineralized in theprevious 72 days, or 65e114% of the LLC added. LI soils had greaterand SI soils had lower respiration rates and total C mineralized inthe 24 h after LLC addition than control soils. Microorganisms inLI soils across sites mineralized significantly more C over the 24.5 hfollowing LLC addition than in SI soils (145.1�14.4% vs. 96.3� 9.4%),and LI soils had higher respiration rates than SI soils after LLCaddition (144.5 � 16.0% vs. 94.8 � 9.9%), consistent with greaterrespiratory losses from LI soils throughout the incubation.
3.3. Extractable N and microbial biomass
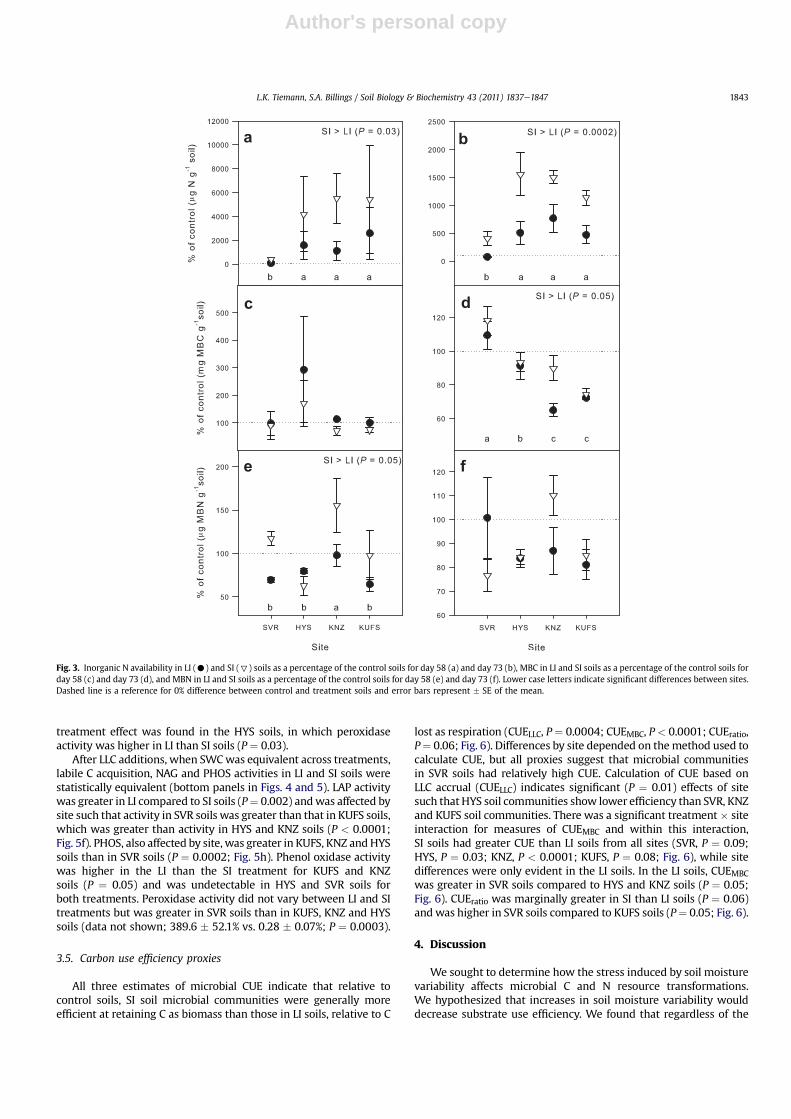
By day 58, soils undergoing wettingedrying treatments hadhigher inorganic N availability relative to controls, with the excep-tion of SVR LI soils (i.e.>100%; Fig. 3a). In addition, by day 58, SI soilsappeared to have accrued more inorganic N (NO3
� plus NH4þ)
than LI soils (P ¼ 0.05), and net N mineralization in SVR soils acrosstreatments was lower than in soils from all other sites (P ¼ 0.05;Fig. 3a). Similarly, on day 73, inorganic N availability was greater inSI than LI soils (P ¼ 0.0002) and SVR soils had significantly less Nrelative to their controls when compared to HYS, KNZ and KUFS soils(P¼ 0.002; Fig. 3b). Wewere unable to detect EON in any of the soilssampled on either day 58 or day 73.
In all soils and treatments, absolute values of MBC rangedfrom 0.28 to 2.20 mg C g�1 soil while MBN ranged from 22.99 to
227.79 mg N g�1 soil. Microbial biomass C on day 58 was notsignificantly different between treatments or sites (Fig. 3c). Onday 73, after LLC additions, there were significant effects oftreatment and site on MBC relative to control soils (Fig. 3d). SIsoils had greater MBC than LI soils (P ¼ 0.05), and MBC relative tocontrol soils was higher in soils from SVR than in soils from HYS,which in turn was greater than MBC in soils from KNZ and KUFS(P < 0.0001; Fig. 3d).
On day 58, we found a significant effect of treatment on MBNwith greater MBN in SI compared to LI soils, but there was alsoa significant treatment � site interaction such that in HYS soils wesaw the opposite effect, with greater MBN in LI than SI soils (Fig. 3e,P¼ 0.03). Therewere no differences inMBN between treatments orsites on day 73 (Fig. 3f).
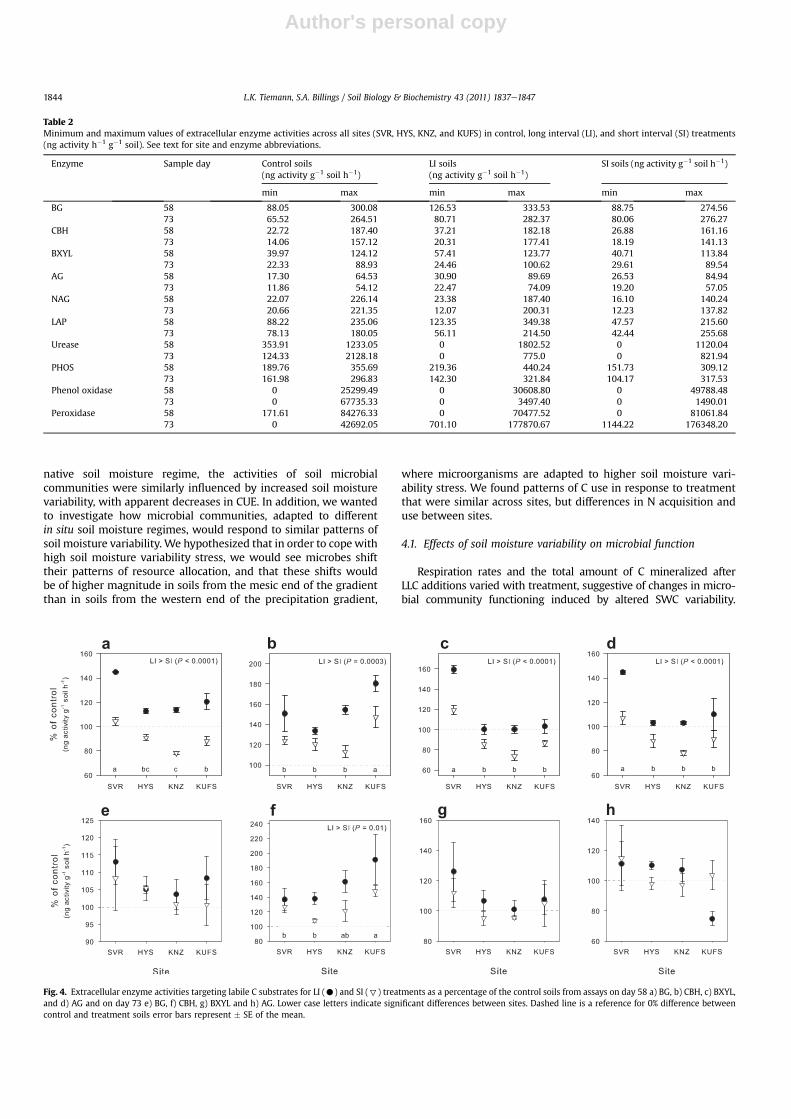
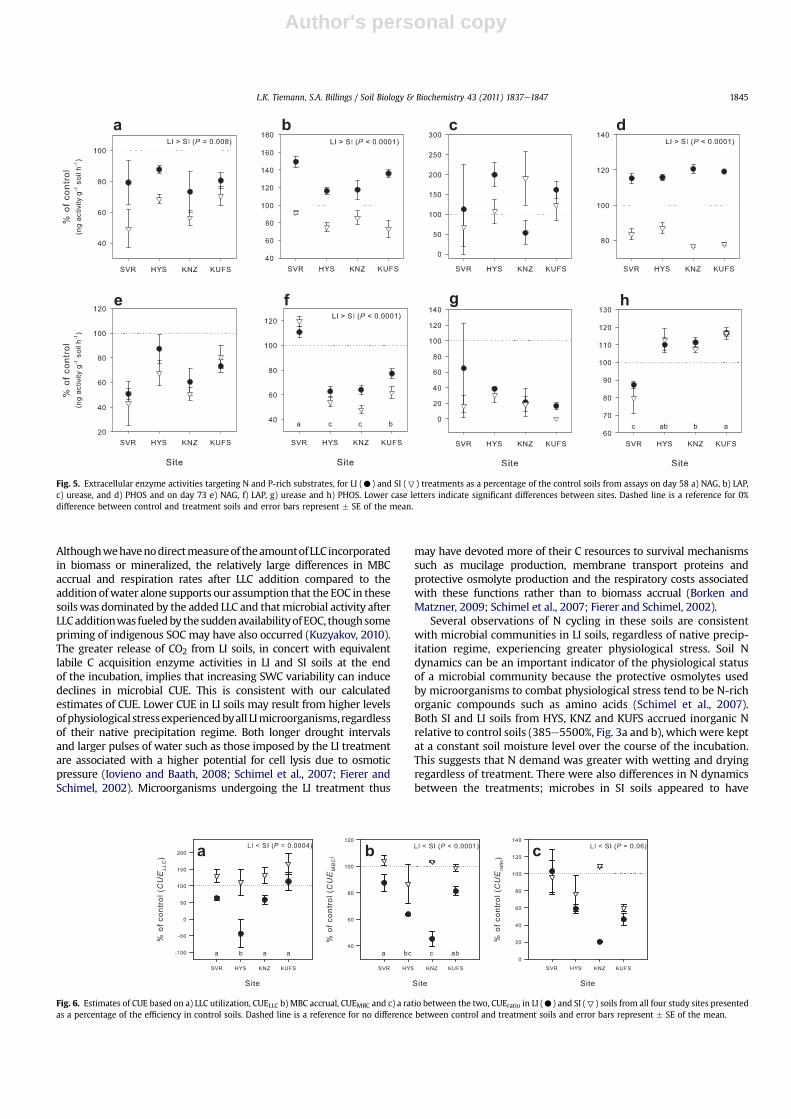
3.4. Extracellular enzyme activities
Extracellular enzyme activities exhibited great variation betweensites and with moisture treatment (Table 2). On day 58, EEA wasgenerally greater in LI soils than in SI soils, as percent of controls (toppanels, Figs. 4 and 5). As a percent of the controls, LI soils exhibitedgreater labile C acquisition EEA (BG, P< 0.0001; AG, P¼ 0.0003; CBH,P<0.0001;BXYL,P<0.001) relative toSI soils. In addition, LI soils alsoexhibited higher N acquisition (NAG, P¼ 0.008; LAP, P< 0.0001) andPacquisition (PHOS,P< 0.0001) enzymeactivity compared to SI soils.Site of origin also governed EEA response to moisture treatment;activities of BG (P< 0.0001), CBH (P< 0.0001), BXYL (P¼ 0.0001), andLAP (P ¼ 0.02) were higher in SVR LI and SI soils, relative to theircontrols, than inKUFS and KNZ soils relative to their control soils (toppanels, Figs. 4 and 5). Recalcitrant C acquisition EEA (phenol oxidaseand peroxidase) was not affected by site and the only detectable
Fig. 2. Cumulative C respired over the entire 73 day incubation from control ( ), LI (C) and SI (7) soils from a) SVR, b) HYS, c) KNZ and d) KUFS. Arrows indicate soil analyses onday 58 and day 73 of the incubation. Error bars represent � SE of the mean.
L.K. Tiemann, S.A. Billings / Soil Biology & Biochemistry 43 (2011) 1837e18471842
Author's personal copy
treatment effect was found in the HYS soils, in which peroxidaseactivity was higher in LI than SI soils (P ¼ 0.03).
After LLC additions, when SWCwas equivalent across treatments,labile C acquisition, NAG and PHOS activities in LI and SI soils werestatistically equivalent (bottom panels in Figs. 4 and 5). LAP activitywas greater in LI compared to SI soils (P¼ 0.002) andwas affected bysite such that activity in SVR soils was greater than that in KUFS soils,which was greater than activity in HYS and KNZ soils (P < 0.0001;Fig. 5f). PHOS, also affected by site, was greater in KUFS, KNZ andHYSsoils than in SVR soils (P ¼ 0.0002; Fig. 5h). Phenol oxidase activitywas higher in the LI than the SI treatment for KUFS and KNZsoils (P ¼ 0.05) and was undetectable in HYS and SVR soils forboth treatments. Peroxidase activity did not vary between LI and SItreatments but was greater in SVR soils than in KUFS, KNZ and HYSsoils (data not shown; 389.6 � 52.1% vs. 0.28 � 0.07%; P ¼ 0.0003).
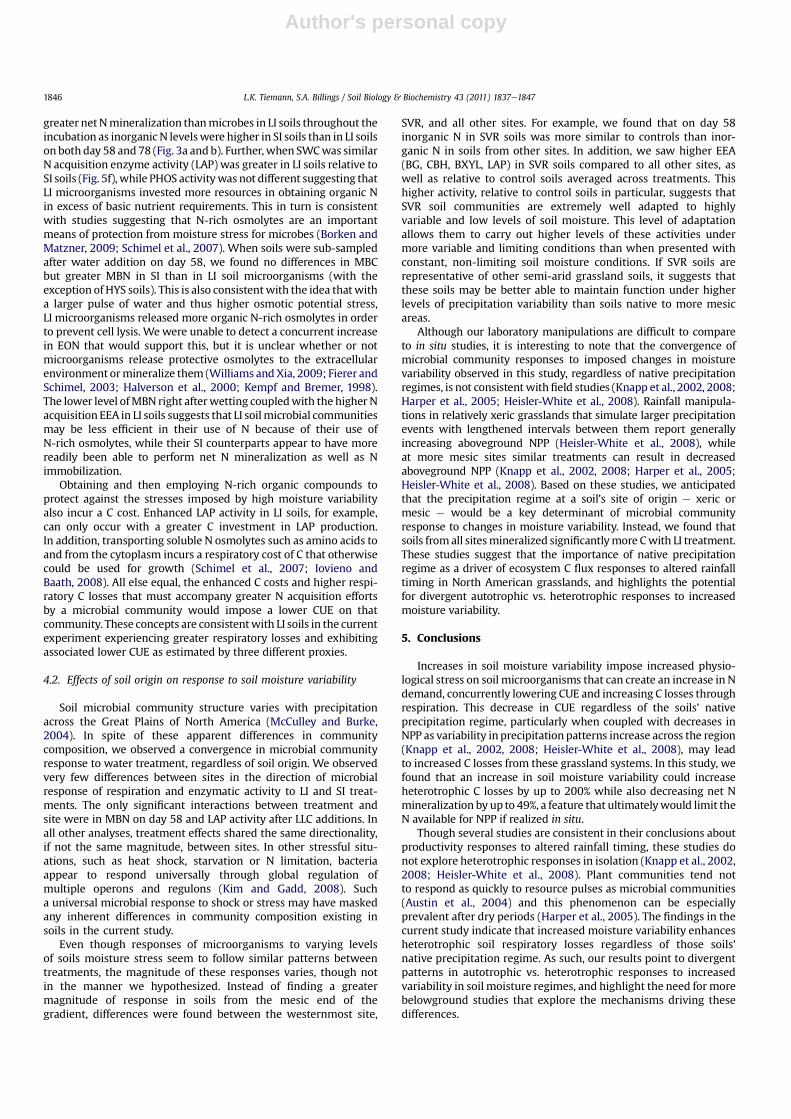
3.5. Carbon use efficiency proxies
All three estimates of microbial CUE indicate that relative tocontrol soils, SI soil microbial communities were generally moreefficient at retaining C as biomass than those in LI soils, relative to C
lost as respiration (CUELLC, P ¼ 0.0004; CUEMBC, P < 0.0001; CUEratio,P¼ 0.06; Fig. 6). Differences by site depended on themethod used tocalculate CUE, but all proxies suggest that microbial communitiesin SVR soils had relatively high CUE. Calculation of CUE based onLLC accrual (CUELLC) indicates significant (P ¼ 0.01) effects of sitesuch that HYS soil communities show lower efficiency than SVR, KNZand KUFS soil communities. There was a significant treatment � siteinteraction for measures of CUEMBC and within this interaction,SI soils had greater CUE than LI soils from all sites (SVR, P ¼ 0.09;HYS, P ¼ 0.03; KNZ, P < 0.0001; KUFS, P ¼ 0.08; Fig. 6), while sitedifferences were only evident in the LI soils. In the LI soils, CUEMBCwas greater in SVR soils compared to HYS and KNZ soils (P ¼ 0.05;Fig. 6). CUEratio was marginally greater in SI than LI soils (P ¼ 0.06)and was higher in SVR soils compared to KUFS soils (P¼ 0.05; Fig. 6).
4. Discussion
We sought to determine how the stress induced by soil moisturevariability affects microbial C and N resource transformations.We hypothesized that increases in soil moisture variability woulddecrease substrate use efficiency. We found that regardless of the
a
Fig. 3. Inorganic N availability in LI (C) and SI (7) soils as a percentage of the control soils for day 58 (a) and day 73 (b), MBC in LI and SI soils as a percentage of the control soils forday 58 (c) and day 73 (d), and MBN in LI and SI soils as a percentage of the control soils for day 58 (e) and day 73 (f). Lower case letters indicate significant differences between sites.Dashed line is a reference for 0% difference between control and treatment soils and error bars represent � SE of the mean.
L.K. Tiemann, S.A. Billings / Soil Biology & Biochemistry 43 (2011) 1837e1847 1843
Author's personal copy
native soil moisture regime, the activities of soil microbialcommunities were similarly influenced by increased soil moisturevariability, with apparent decreases in CUE. In addition, we wantedto investigate how microbial communities, adapted to differentin situ soil moisture regimes, would respond to similar patterns ofsoil moisture variability. We hypothesized that in order to copewithhigh soil moisture variability stress, we would see microbes shifttheir patterns of resource allocation, and that these shifts wouldbe of higher magnitude in soils from the mesic end of the gradientthan in soils from the western end of the precipitation gradient,
where microorganisms are adapted to higher soil moisture vari-ability stress. We found patterns of C use in response to treatmentthat were similar across sites, but differences in N acquisition anduse between sites.
4.1. Effects of soil moisture variability on microbial function
Respiration rates and the total amount of C mineralized afterLLC additions varied with treatment, suggestive of changes in micro-bial community functioning induced by altered SWC variability.
Table 2Minimum and maximum values of extracellular enzyme activities across all sites (SVR, HYS, KNZ, and KUFS) in control, long interval (LI), and short interval (SI) treatments(ng activity h�1 g�1 soil). See text for site and enzyme abbreviations.
Enzyme Sample day Control soils(ng activity g�1 soil h�1)
LI soils(ng activity g�1 soil h�1)
SI soils (ng activity g�1 soil h�1)
min max min max min max
BG 58 88.05 300.08 126.53 333.53 88.75 274.5673 65.52 264.51 80.71 282.37 80.06 276.27
CBH 58 22.72 187.40 37.21 182.18 26.88 161.1673 14.06 157.12 20.31 177.41 18.19 141.13
BXYL 58 39.97 124.12 57.41 123.77 40.71 113.8473 22.33 88.93 24.46 100.62 29.61 89.54
AG 58 17.30 64.53 30.90 89.69 26.53 84.9473 11.86 54.12 22.47 74.09 19.20 57.05
NAG 58 22.07 226.14 23.38 187.40 16.10 140.2473 20.66 221.35 12.07 200.31 12.23 137.82
LAP 58 88.22 235.06 123.35 349.38 47.57 215.6073 78.13 180.05 56.11 214.50 42.44 255.68
Urease 58 353.91 1233.05 0 1802.52 0 1120.0473 124.33 2128.18 0 775.0 0 821.94
PHOS 58 189.76 355.69 219.36 440.24 151.73 309.1273 161.98 296.83 142.30 321.84 104.17 317.53
Phenol oxidase 58 0 25299.49 0 30608.80 0 49788.4873 0 67735.33 0 3497.40 0 1490.01
Peroxidase 58 171.61 84276.33 0 70477.52 0 81061.8473 0 42692.05 701.10 177870.67 1144.22 176348.20
Fig. 4. Extracellular enzyme activities targeting labile C substrates for LI (C) and SI (7) treatments as a percentage of the control soils from assays on day 58 a) BG, b) CBH, c) BXYL,and d) AG and on day 73 e) BG, f) CBH, g) BXYL and h) AG. Lower case letters indicate significant differences between sites. Dashed line is a reference for 0% difference betweencontrol and treatment soils error bars represent � SE of the mean.
L.K. Tiemann, S.A. Billings / Soil Biology & Biochemistry 43 (2011) 1837e18471844
Author's personal copy
Althoughwehavenodirectmeasureof theamountofLLC incorporatedin biomass or mineralized, the relatively large differences in MBCaccrual and respiration rates after LLC addition compared to theaddition ofwater alone supports our assumption that the EOC in thesesoils was dominated by the added LLC and thatmicrobial activity afterLLCadditionwas fueledby thesuddenavailabilityofEOC, thoughsomepriming of indigenous SOC may have also occurred (Kuzyakov, 2010).The greater release of CO2 from LI soils, in concert with equivalentlabile C acquisition enzyme activities in LI and SI soils at the endof the incubation, implies that increasing SWC variability can inducedeclines in microbial CUE. This is consistent with our calculatedestimates of CUE. Lower CUE in LI soils may result from higher levelsofphysiological stressexperiencedbyall LImicroorganisms, regardlessof their native precipitation regime. Both longer drought intervalsand larger pulses of water such as those imposed by the LI treatmentare associated with a higher potential for cell lysis due to osmoticpressure (Iovieno and Baath, 2008; Schimel et al., 2007; Fierer andSchimel, 2002). Microorganisms undergoing the LI treatment thus
may have devoted more of their C resources to survival mechanismssuch as mucilage production, membrane transport proteins andprotective osmolyte production and the respiratory costs associatedwith these functions rather than to biomass accrual (Borken andMatzner, 2009; Schimel et al., 2007; Fierer and Schimel, 2002).
Several observations of N cycling in these soils are consistentwith microbial communities in LI soils, regardless of native precip-itation regime, experiencing greater physiological stress. Soil Ndynamics can be an important indicator of the physiological statusof a microbial community because the protective osmolytes usedby microorganisms to combat physiological stress tend to be N-richorganic compounds such as amino acids (Schimel et al., 2007).Both SI and LI soils from HYS, KNZ and KUFS accrued inorganic Nrelative to control soils (385e5500%, Fig. 3a and b), whichwere keptat a constant soil moisture level over the course of the incubation.This suggests that N demand was greater with wetting and dryingregardless of treatment. There were also differences in N dynamicsbetween the treatments; microbes in SI soils appeared to have
Fig. 5. Extracellular enzyme activities targeting N and P-rich substrates, for LI (C) and SI (7) treatments as a percentage of the control soils from assays on day 58 a) NAG, b) LAP,c) urease, and d) PHOS and on day 73 e) NAG, f) LAP, g) urease and h) PHOS. Lower case letters indicate significant differences between sites. Dashed line is a reference for 0%difference between control and treatment soils and error bars represent � SE of the mean.
Fig. 6. Estimates of CUE based on a) LLC utilization, CUELLC b) MBC accrual, CUEMBC and c) a ratio between the two, CUEratio in LI (C) and SI (7) soils from all four study sites presentedas a percentage of the efficiency in control soils. Dashed line is a reference for no difference between control and treatment soils and error bars represent � SE of the mean.
L.K. Tiemann, S.A. Billings / Soil Biology & Biochemistry 43 (2011) 1837e1847 1845
Author's personal copy
greater netNmineralization thanmicrobes in LI soils throughout theincubation as inorganicN levelswere higher in SI soils than in LI soilson both day 58 and 78 (Fig. 3a and b). Further, when SWCwas similarN acquisition enzyme activity (LAP) was greater in LI soils relative toSI soils (Fig. 5f), while PHOS activitywas not different suggesting thatLI microorganisms invested more resources in obtaining organic Nin excess of basic nutrient requirements. This in turn is consistentwith studies suggesting that N-rich osmolytes are an importantmeans of protection from moisture stress for microbes (Borken andMatzner, 2009; Schimel et al., 2007). When soils were sub-sampledafter water addition on day 58, we found no differences in MBCbut greater MBN in SI than in LI soil microorganisms (with theexception of HYS soils). This is also consistentwith the idea thatwitha larger pulse of water and thus higher osmotic potential stress,LI microorganisms released more organic N-rich osmolytes in orderto prevent cell lysis. We were unable to detect a concurrent increasein EON that would support this, but it is unclear whether or notmicroorganisms release protective osmolytes to the extracellularenvironment ormineralize them (Williams and Xia, 2009; Fierer andSchimel, 2003; Halverson et al., 2000; Kempf and Bremer, 1998).The lower level ofMBN right afterwetting coupledwith the higher Nacquisition EEA in LI soils suggests that LI soilmicrobial communitiesmay be less efficient in their use of N because of their use ofN-rich osmolytes, while their SI counterparts appear to have morereadily been able to perform net N mineralization as well as Nimmobilization.
Obtaining and then employing N-rich organic compounds toprotect against the stresses imposed by high moisture variabilityalso incur a C cost. Enhanced LAP activity in LI soils, for example,can only occur with a greater C investment in LAP production.In addition, transporting soluble N osmolytes such as amino acids toand from the cytoplasm incurs a respiratory cost of C that otherwisecould be used for growth (Schimel et al., 2007; Iovieno andBaath, 2008). All else equal, the enhanced C costs and higher respi-ratory C losses that must accompany greater N acquisition effortsby a microbial community would impose a lower CUE on thatcommunity. These concepts are consistentwith LI soils in the currentexperiment experiencing greater respiratory losses and exhibitingassociated lower CUE as estimated by three different proxies.
4.2. Effects of soil origin on response to soil moisture variability
Soil microbial community structure varies with precipitationacross the Great Plains of North America (McCulley and Burke,2004). In spite of these apparent differences in communitycomposition, we observed a convergence in microbial communityresponse to water treatment, regardless of soil origin. We observedvery few differences between sites in the direction of microbialresponse of respiration and enzymatic activity to LI and SI treat-ments. The only significant interactions between treatment andsite were in MBN on day 58 and LAP activity after LLC additions. Inall other analyses, treatment effects shared the same directionality,if not the same magnitude, between sites. In other stressful situ-ations, such as heat shock, starvation or N limitation, bacteriaappear to respond universally through global regulation ofmultiple operons and regulons (Kim and Gadd, 2008). Sucha universal microbial response to shock or stress may have maskedany inherent differences in community composition existing insoils in the current study.
Even though responses of microorganisms to varying levelsof soils moisture stress seem to follow similar patterns betweentreatments, the magnitude of these responses varies, though notin the manner we hypothesized. Instead of finding a greatermagnitude of response in soils from the mesic end of thegradient, differences were found between the westernmost site,
SVR, and all other sites. For example, we found that on day 58inorganic N in SVR soils was more similar to controls than inor-ganic N in soils from other sites. In addition, we saw higher EEA(BG, CBH, BXYL, LAP) in SVR soils compared to all other sites, aswell as relative to control soils averaged across treatments. Thishigher activity, relative to control soils in particular, suggests thatSVR soil communities are extremely well adapted to highlyvariable and low levels of soil moisture. This level of adaptationallows them to carry out higher levels of these activities undermore variable and limiting conditions than when presented withconstant, non-limiting soil moisture conditions. If SVR soils arerepresentative of other semi-arid grassland soils, it suggests thatthese soils may be better able to maintain function under higherlevels of precipitation variability than soils native to more mesicareas.
Although our laboratory manipulations are difficult to compareto in situ studies, it is interesting to note that the convergence ofmicrobial community responses to imposed changes in moisturevariability observed in this study, regardless of native precipitationregimes, is not consistentwithfield studies (Knapp et al., 2002, 2008;Harper et al., 2005; Heisler-White et al., 2008). Rainfall manipula-tions in relatively xeric grasslands that simulate larger precipitationevents with lengthened intervals between them report generallyincreasing aboveground NPP (Heisler-White et al., 2008), whileat more mesic sites similar treatments can result in decreasedaboveground NPP (Knapp et al., 2002, 2008; Harper et al., 2005;Heisler-White et al., 2008). Based on these studies, we anticipatedthat the precipitation regime at a soil’s site of origin e xeric ormesic e would be a key determinant of microbial communityresponse to changes in moisture variability. Instead, we found thatsoils fromall sitesmineralized significantlymore Cwith LI treatment.These studies suggest that the importance of native precipitationregime as a driver of ecosystem C flux responses to altered rainfalltiming in North American grasslands, and highlights the potentialfor divergent autotrophic vs. heterotrophic responses to increasedmoisture variability.
5. Conclusions
Increases in soil moisture variability impose increased physio-logical stress on soil microorganisms that can create an increase in Ndemand, concurrently lowering CUE and increasing C losses throughrespiration. This decrease in CUE regardless of the soils’ nativeprecipitation regime, particularly when coupled with decreases inNPP as variability in precipitation patterns increase across the region(Knapp et al., 2002, 2008; Heisler-White et al., 2008), may leadto increased C losses from these grassland systems. In this study, wefound that an increase in soil moisture variability could increaseheterotrophic C losses by up to 200% while also decreasing net Nmineralization by up to 49%, a feature that ultimatelywould limit theN available for NPP if realized in situ.
Though several studies are consistent in their conclusions aboutproductivity responses to altered rainfall timing, these studies donot explore heterotrophic responses in isolation (Knapp et al., 2002,2008; Heisler-White et al., 2008). Plant communities tend notto respond as quickly to resource pulses as microbial communities(Austin et al., 2004) and this phenomenon can be especiallyprevalent after dry periods (Harper et al., 2005). The findings in thecurrent study indicate that increased moisture variability enhancesheterotrophic soil respiratory losses regardless of those soils’native precipitation regime. As such, our results point to divergentpatterns in autotrophic vs. heterotrophic responses to increasedvariability in soil moisture regimes, and highlight the need for morebelowground studies that explore the mechanisms driving thesedifferences.
L.K. Tiemann, S.A. Billings / Soil Biology & Biochemistry 43 (2011) 1837e18471846
Author's personal copy
Acknowledgments
We thank D. Kettle, B. Johanning, and V. Salisbury of theUniversity of Kansas Field Station, R. Manes and R. Martin of theNature Conservancy, K. Harmoney of the Kansas State UniversityWestern Agricultural Research Center, and J. Briggs and J. Blair of theKonza Prairie LTER for logistic support and access to field sites. Wealso thank R. Rastok and A. Reed for help in the field and the lab, andthree anonymous reviewers whose comments helped improve thismanuscript. We acknowledge funding from NSF EPS-0553722,the Kansas Technology Enterprise Corporation, and University ofKansas General Research Fund allocation #2301257. This representsUniversity of Kansas Field Station publication number 907.
References
Austin, A.T., Yahdjian, L., Stark, J.M., Belnap, J., Porporato, A., Norton, U.,Ravetta, D.A., Schaeffer, S.M., 2004. Water pulses and biogeochemical cycles inarid and semiarid ecosystems. Oecologia 141, 221e235.
Borken, W., Matzner, E., 2009. Reappraisal of drying and wetting effects on C and Nmineralization and fluxes in soils. Global Change Biology 15, 808e824.
Brookes, P.C., Kragt, J.F., Powlson, D.S., Jenkinson, D.S., 1985. Chloroform fumigationand the release of soil-nitrogen e the effects of fumigation time and temper-ature. Soil Biology & Biochemistry 17, 831e835.
Butterly, C.R., Bunemann, E.K., McNeil, A.M., Baldock, J.A., Marschner, P., 2009.Carbon pulses but not phosphorus pulses are related to decreases in microbialbiomass during repeated drying and rewetting of soils. Soil Biology &Biochemistry 41, 1406e1416.
Doyle, A., Weintraub, M.N., Schimel, J.P., 2004. Persulfate digestion and simulta-neous colorimetric analysis of carbon and nitrogen in soil extracts. Soil ScienceSociety of America Journal 68, 669e676.
Easterling, D.R., Meehl, G.A., Parmesan, C., Changnon, S.A., Karl, T.R., Mearns, L.O.,2000. Climate extremes: observations, modeling, and impacts. Science 289,2068e2074.
Fay, P.A., Carlisle, J.D., Knapp, A.K., Blair, J.M., Collins, S.L., 2003. Productivityresponses to altered rainfall patterns in a C-4-dominated grassland. Oecologia137, 245e251.
Fay, P.A., Kaufman, D.M., Nippert, J.B., Carlisle, J.D., Harper, C.W., 2008. Changes ingrassland ecosystem function due to extreme rainfall events: implications forresponses to climate change. Global Change Biology 14, 1600e1608.
Fierer, N., Schimel, J.P., 2002. Effects of dryingerewetting frequency on soil carbonand nitrogen transformations. Soil Biology & Biochemistry 34, 777e787.
Fierer, N., Schimel, J.P., 2003. A proposed mechanism for the pulse in carbon dioxideproduction commonly observed following the rapid rewetting of a dry soil. SoilScience Society of America Journal 67, 798e805.
Frey, S.D., Gupta, V., Elliott, E.T., Paustian, K., 2001. Protozoan grazing affectsestimates of carbon utilization efficiency of the soil microbial community. SoilBiology & Biochemistry 33, 1759e1768.
Harper, C.W., Blair, J.M., Fay, P.A., Knapp, A.K., Carlisle, J.D., 2005. Increased rainfallvariability and reduced rainfall amount decreases soil CO2 flux in a grasslandecosystem. Global Change Biology 11, 322e334.
Halverson, L.J., Jones, T.M., Firestone, M.K., 2000. Release of intracellular solutes byfour soil bacteria exposed to dilution stress. Soil Science Society of AmericaJournal 64, 1630e1637.
Hayter, A.J., 1989. Pairwise comparisons of generally correlated means. Journal ofthe American Statistical Association 84, 208e213.
Heisler-White, J.L., Knapp, A.K., Kelly, E.F., 2008. Increasing precipitation eventsize increases aboveground net primary productivity in a semi-arid grassland.Oecologia 158, 129e140.
Iovieno, P., Baath, E., 2008. Effect of drying and rewetting on bacterial growth ratesin soil. FEMS Microbiology Ecology 65, 400e407.
Jenkinson, D.S., Brookes, P.C., Powlson, D.S., 2004. Measuring soil microbial biomass.Soil Biology & Biochemistry 36, 5e7.
Karl, T.R., Trenberth, K.E., 2003. Modern global climate change. Science 302,1719e1723.
Kempf, B., Bremer, E., 1998. Uptake and synthesis of compatible solutes as microbialstress responses to high-osmolality environments. Archives of Microbiology170, 319e330.
Kim, B.H., Gadd, G.M., 2008. Bacterial Physiology and Metabolism. CambridgeUniversity Press, Cambridge.
Knapp, A.K., Fay, P.A., Blair, J.M., Collins, S.L., Smith, M.D., Carlisle, J.D.,Harper, C.W., Danner, B.T., Lett, M.S., McCarron, J.K., 2002. Rainfall variability,carbon cycling, and plant species diversity in a mesic grassland. Science 298,2202e2205.
Knapp, A.K., Beier, C., Briske, D.D., Classen, A.T., Luo, Y., Reichstein, M., Smith, M.D.,Smith, S.D., Bell, J.E., Fay, P.A., Heisler, J.L., Leavitt, S.W., Sherry, R., Smith, B.,Weng, E., 2008. Consequences of more extreme precipitation regimes for terres-trial ecosystems. Bioscience 58, 811e821.
Kramer, C.Y., 1956. Extension of multiple range tests to group means with unequalnumbers of replications. Biometrics 12, 307e310.
Kuzyakov, Y., 2010. Priming effects: interactions between living and dead organicmatter. Soil Biology and Biochemistry 42, 1363e1371.
Lauenroth, W.K., Burke, I.C., 1995. Great Plains, climate variability. In: Encyclopediaof Environmental Biology. Academic Press, New York, NY, pp. 237e249.
McCulley, R.L., Burke, I.C., 2004. Microbial community composition across the GreatPlains: landscape versus regional variability. Soil Science Society of AmericaJournal 68, 106e115.
McCulley, R.L., Burke, I.C., Nelson, J.A., Lauenroth, W.K., Knapp, A.K., Kelly, E.F., 2005.Regional patterns in carbon cycling across the Great Plains of North America.Ecosystems 8, 106e121.
Rousk, J., Baath, E., 2007. Fungal and bacterial growth in soil with plant materials ofdifferent C/N ratios. FEMS Microbiology Ecology 62, 258e267.
Saiya-Cork, K.R., Sinsabaugh, R.L., Zak, D.R., 2002. The effects of long-term nitrogendeposition on extracellular enzyme activity in an Acer saccharum forest soil. SoilBiology & Biochemistry 34, 1309e1315.
Schimel, J., Balser, T.C., Wallenstein, M., 2007. Microbial stress-responsephysiology and its implications for ecosystem function. Ecology 88,1386e1394.
Scurlock, J.M.O., Hall, D.O., 1998. The global carbon sink: a grassland perspective.Global Change Biology 4, 229e233.
Thiet, R.K., Frey, S.D., Six, J., 2006. Do growth yield efficiencies differ betweensoil microbial communities differing in fungal: bacterial ratios? Reality checkand methodological issues. Soil Biology & Biochemistry 38, 837e844.
Tukey, J., 1953. Multiple comparisons. Journal of the American Statistical Associa-tion 48, 624e625.
Willason, S.W., Johnson, K.S., 1986. A rapid, highly sensitive technique for thedetermination of ammonia in seawater. Marine Biology 91, 285e290.
Williams, M.A., Xia, K., 2009. Characterization of the water soluble soil organic poolfollowing the rewetting of a dry soil in a drought-prone tallgrass prairie. SoilBiology and Biochemistry 41, 21e28.
Ziegler, S., Billings, S.A., 2011. Interactive effects of elevated CO2 and nitrogenfertilization on substrate carbon flow through forest soil microbial communi-ties. Journal of Geophysical Research e Biogeosciences 116, G01011, 14.
L.K. Tiemann, S.A. Billings / Soil Biology & Biochemistry 43 (2011) 1837e1847 1847