cern accelerator school cyclotrons, linacs
TRANSCRIPT

Yc % CERN 96-024 March 1996
XC96FG801
ORGANISATION EUROPEENNE POUR LA RECHERCHE NUCLEAIRE
C E R N EUROPEAN ORGANIZATION FOR NUCLEAR RESEARCH
CERN ACCELERATOR SCHOOL
CYCLOTRONS, LINACS AND THEIR APPLICATIONS
IBM International Education Centre, La Hulpe, Belgium28 April-5 May 1994
PROCEEDINGS
Editor: S. Turner
GENEVA0 - Mn 0 -? 1996
Copyright CERN, Genfeve, 1996
Propriety litteraire et scientifique reserveepour tous les pays du monde. Ce document nepeut etre reproduit ou traduit en tout ou enpartie sans l'autorisation ecrite du Directeurgeneral du CERN, titulaire du droit d'auteur.Dans les cas appropries, et s'il s'agit d'utiliserle document a des fins non commerciales, cetteautorisation sera volontiers accordee.Le CERN ne revendique pas la propriety desinventions brevetables et dessins ou modulessusceptibles de depot qui pourraient etredecrits dans le present document; ceux-ci peu-vent etre librement utilises par les instituts derecherche, les industriels et autres interesses.Cependant, le CERN se reserve le droit des'opposer a toute revendication qu'un usagerpourrait faire de la propriete scientifique ouindustrielle de toute invention et tout dessinou modele decrits dans le present document.
Literary and scientific copyrights reserved inall countries of the world. This report, orany part of it, may not be reprinted or trans-lated without written permission of the copy-right holder, the Director-General of CERN.However, permission will be freely granted forappropriate non-commercial use.If any patentable invention or registrabledesign is described in the report, CERN makesno claim to property rights in it but offers itfor the free use of research institutions, man-ufacturers and others. CERN, however, mayoppose any attempt by a user to claim anyproprietary or patent rights in such inventionsor designs as may be described in the presentdocument.
ISSN 0007-8328ISBN 92-9083-083-2
KS002037930R: FIDE008816145
CERN 96-024 March 1996
4 5 *
ORGANISATION EUROPEENNE POUR LA RECHERCHE NUCLEAIRE
C E R N EUROPEAN ORGANIZATION FOR NUCLEAR RESEARCH
CERN ACCELERATOR SCHOOL
CYCLOTRONS, LINACS AND THEIR APPLICATIONS
IBM International Education Centre, La Hulpe, Belgium28 April-5 May 1994
PROCEEDINGS
Editor: S. Turner
GENEVA1996

CERN-Service d'information scientifique-RD/958-2500-mars 1996
Abstract
fl—^p These proceedings present the lectures given at the eighth specialized course
organized by the CERN Accelerator School (CAS), the topic this time being 'Cyclotrons,Linacs and Their Applications'. Following an introductory lecture on linacs, thefundamental features of electron, ion and induction linacs are described together withtheir RF systems and particle sources. Cyclotrons are then introduced followed by detailsof their different types, their magnet and RF design, and their injection and extractionsystems, with a glance towards exotic and possible future machines. Chapters are thenpresented on the use of linacs and cyclotrons for medical, fission, fusion and materialapplications, as well as for isotope production. Finally, descriptions of the design of aradioisotope facility, the matching of accelerators to their task and the computational toolsused in their design are included. ,
CERN ACCELERATOR SCHOOLCRC, UNIVERSITE CATHOLIQUE DE LOUVAIN, BELGIUM
will organize a course on
CYCLOTRONS, LINACSAND THEIR APPLICATIONS
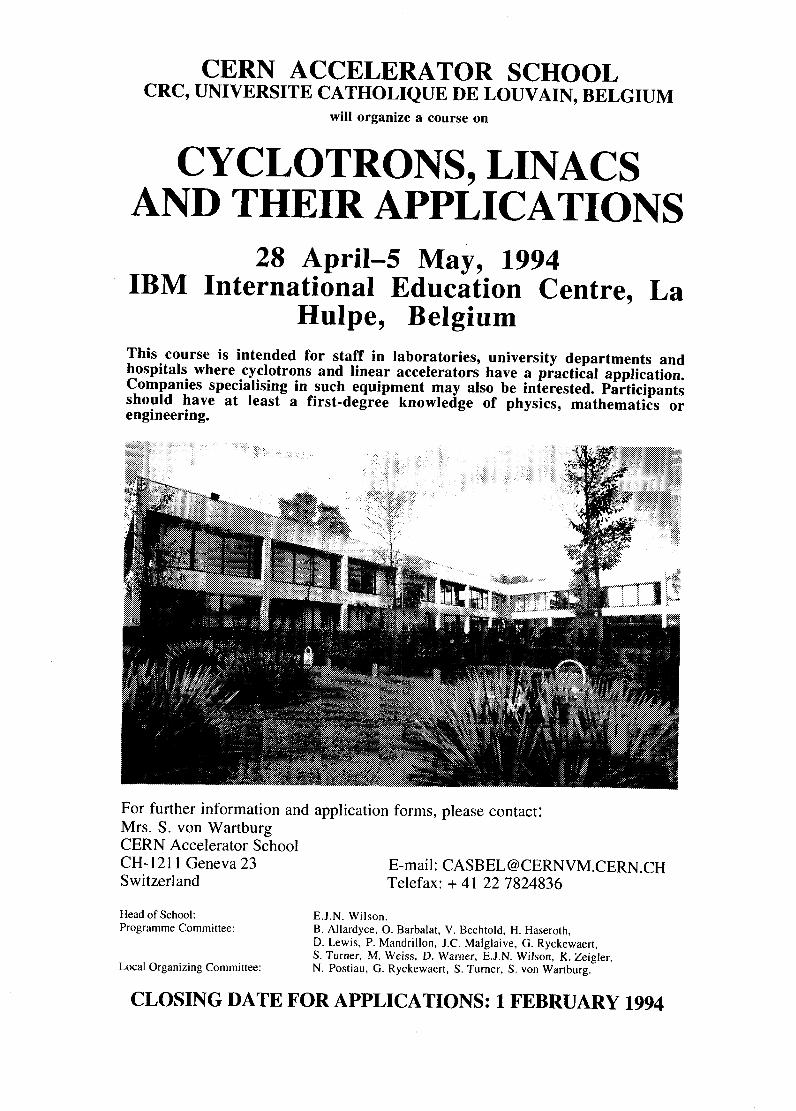
28 April-5 May, 1994IBM International Education Centre, La
Hulpe, BelgiumThis course is intended for staff in laboratories, university departments andhospitals where cyclotrons and linear accelerators have a practical application.Companies specialising in such equipment may also be interested. Participantsshould have at least a first-degree knowledge of physics, mathematics orengineering.
For further information and application forms, please contact:Mrs. S. von WartburgCERN Accelerator SchoolCH-1211 Geneva 23 E-mail: [email protected] Telefax: + 41 22 7824836
Head of School:Programme Committee:
Local Organizing Committee:
E.J.N. Wilson.B. Allardyce, O. Barbalat, V. Bechtold, H. Haseroth,D. Lewis, P. Mandrillon, J.C. Malglaive, G. Ryckewaert,S. Turner, M. Weiss, D. Warner, E.J.N. Wilson, K. Zeigler.N. Postiau, G. Ryckewaert, S. Turner, S. von Wartburg.
CLOSING DATE FOR APPLICATIONS: 1 FEBRUARY 1994

PROGRAMME FOR COURSE ON CYCLOTRONS, LINACS AND THEIR APPLICATIONSIBM International Education Centre, La Hulpe, Belgium, April 28 - May 5, 1994
Time08.0009.00
10.00
10.30
11.30
11.45
12.45
14.30
15.30
16.00
17.0018.0019.0020.00
Thursday28 April
Friday29 April
S a t u r d a y30 April
S u n d a y1 May
M o n d a y2 May
Tuesday3 May
Wednesday4 May
Thursday5 May
B R E A K F A S TIntroduction toRFlinear accelerators
P. Lapps toll e
Fundamentals ofelectron linacs
D. Warner
Fundamentals ofion linacs, I
M. WeissCOFFEE BREAK
Introduction tocyclotrons
T. Stammbach
Overview ofcyclotron types
T. S lam m bach
Cyclotronmagnet
calculations
Y. JongenMID MORNING BREAK
Medicalapplications ofelectron linacs
(includingdosimetry)
A. Wambersie
Cyclotrons fortherapy
P. Mandrillon
Non-medicalapplication of
linacs
K. BetheeLUNCH
Ion sources andelectron guns
C. HillTEA
Induction linacs
J. de MascureauCOCKTAIL
VISIT TOIBA AND CRCLOUVAIN-LA-
NEUVE
Isotopeproduction
V. BechtoldTEA
Computationaltools for
acceleratordesign
L. Rinolfi
E
X
c
u
R
S
I
O
N
Application oflinacs to fusion
I. Hofmann
Fundamentals ofion linacs, II
M. Weiss
Engineeringdesign and sub-
systems forlinacs
D. Tronc
Designing aradio isotope
facility
D. LewisC O F F E E BREAK
Injection intocyclotrons
P. Mandrillon
RF systems forcyclotrons
C. Bieth
Extraction fromcyclotrons
J. Botman
Exoticcyclotrons
U. TrinksMID MORNING BREAK
Applications ofion linacs
K. Bethge
Applications ofcyclotrons for
materialsresearch, I
K. Ziegler
Application ofhigh intensity
p-linacs tospallation
sourcesH. Lengeler
Review ofcommercially
availablemachines
O. BarbalatLUNCH
RF systems forlinacs
W. Pirkl
Applications ofcyclotrons for
materialsresearch, II
K. Ziegler
The use ofaccelerators in
the fissionenergy field
J. SchapiraT E A B R E A K
PET imaging
J.C. Clark
Medical imaging
S. Askienazy
Matchingaccelerators to
the task
M. Weiss
EVENING MEALBANQUET
TRANSPORT
TO
AIRPORT
VII
Foreword
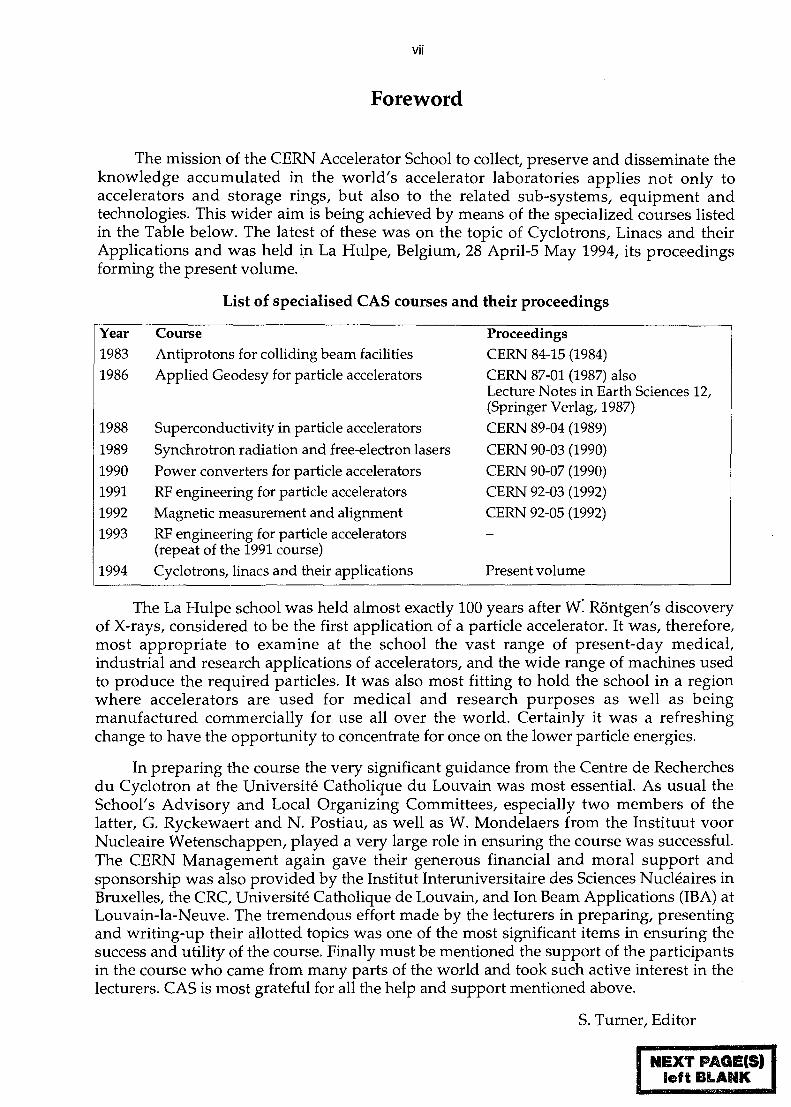
The mission of the CERN Accelerator School to collect, preserve and disseminate theknowledge accumulated in the world's accelerator laboratories applies not only toaccelerators and storage rings, but also to the related sub-systems, equipment andtechnologies. This wider aim is being achieved by means of the specialized courses listedin the Table below. The latest of these was on the topic of Cyclotrons, Linacs and theirApplications and was held in La Hulpe, Belgium, 28 April-5 May 1994, its proceedingsforming the present volume.
Year19831986
198819891990199119921993
1994
List of specialised CAS courses and
CourseAntiprotons for colliding beam facilitiesApplied Geodesy for particle accelerators
Superconductivity in particle acceleratorsSynchrotron radiation and free-electron lasersPower converters for particle acceleratorsRF engineering for particle acceleratorsMagnetic measurement and alignmentRF engineering for particle accelerators(repeat of the 1991 course)Cyclotrons, linacs and their applications
their proceedings
ProceedingsCERN 84-15 (1984)CERN 87-01 (1987) alsoLecture Notes in Earth Sciences 12,(Springer Verlag, 1987)CERN 89-04 (1989)CERN 90-03 (1990)CERN 90-07 (1990)CERN 92-03 (1992)CERN 92-05 (1992)—
Present volume
The La Hulpe school was held almost exactly 100 years after W. Rontgen's discoveryof X-rays, considered to be the first application of a particle accelerator. It was, therefore,most appropriate to examine at the school the vast range of present-day medical,industrial and research applications of accelerators, and the wide range of machines usedto produce the required particles. It was also most fitting to hold the school in a regionwhere accelerators are used for medical and research purposes as well as beingmanufactured commercially for use all over the world. Certainly it was a refreshingchange to have the opportunity to concentrate for once on the lower particle energies.
In preparing the course the very significant guidance from the Centre de Recherchesdu Cyclotron at the Universite Catholique du Louvain was most essential. As usual theSchool's Advisory and Local Organizing Committees, especially two members of thelatter, G. Ryckewaert and N. Postiau, as well as W. Mondelaers from the Instituut voorNucleaire Wetenschappen, played a very large role in ensuring the course was successful.The CERN Management again gave their generous financial and moral support andsponsorship was also provided by the Institut Interuniversitaire des Sciences Nucleaires inBruxelles, the CRC, Universite Catholique de Louvain, and Ion Beam Applications (IBA) atLouvain-la-Neuve. The tremendous effort made by the lecturers in preparing, presentingand writing-up their allotted topics was one of the most significant items in ensuring thesuccess and utility of the course. Finally must be mentioned the support of the participantsin the course who came from many parts of the world and took such active interest in thelecturers. CAS is most grateful for all the help and support mentioned above.
S. Turner, Editor
NEXTleft BLANK

IX
Contents
Page
Foreword
P.M. LapostolleIntroduction to RF linear accelerators (linacs) 1
Brief history of linacs 1Longitudinal motion. Phase stability. Acceleration by a travelling wave 2Transverse motion. Defocusing action of the accelerating field 6Linac accelerating structures 6Detailed particle dynamics computation 9Space charge effects. Intensity limits 11Appendix 15
D.J. Warner
Fundamentals of electron linacs 17Introduction 17Some background history 17The electron 18Accelerating field and the dispersion curve 18The accelerator design 20Review of beam dynamics 27The complete linac 31Beam loading considerations 34Some more advanced applications 36
M. WeissFundamentals of ion linacs 39
Introduction 39Empty cavities: wave types and modes 39Loaded cavities: space harmonics, travelling and standing wave structures 42Fundamental cavity parameters 43Some typical ion linacs 44Structure computations: drift tube linac 48Action of electromagnetic fields on particles 49Beam loading of cavities: space charge 51The RFQ linear accelerator 52Conclusion 57

W. Pirkl
RF systems for linacs 59
RF power requirements 59Beam loading 60Anatomy of a fully regulated RF chain 61Overall structure of the RF system 63Special topics 65Further examples of linac RF systems 74Conclusions 77
J. de Mascureau
Induction linacs 79
Introduction 79Principle of operation 79Beam transverse dynamics in induction linacs 86Diagnostics 89Applications 92
C.E. Hill
Ion and electron sources 95
Introduction 95Plasma and positive ions 96Positive ion sources 98Negative ions 104Electron sources 107
T. Stammbach
Introduction to cyclotrons 113
Introduction, simple description of a cyclotron 113Basic equations and formulas 116Focusing in cyclotrons and the stability of the orbits 122Cyclotron components and subsystems 124Short history of cyclotron development 127Beam quality and the phase space of the beam 133
Y. Jongen and S. Zaretnba
Cyclotron magnet calculations 139
Introduction 139Cyclotron magnet qualities and functions 139Magnet design 145
P. Mandrillon
Injection into cyclotrons 153
Introduction 153The central region 153Injection from external sources 160

XI
J.I.M. Botman and H.L. HagedoornExtraction from cyclotrons 169
Introduction 169On deflection at n = 1 in the synchrocyclotron 169Stripping extraction 171Beam orbits 173Precessional extraction, numerical simulation 178Multi- and single-turn extraction 180Deflection devices 182Conclusion 184
IT. Trinks
Exotic cyclotrons — future cyclotrons 187Introduction 187Early work on the separated orbit cyclotron 188Superconducting separated-orbit cyclotrons 191The TRITRON project 212Future developments 221
A. Watnbersie and R.A. GahbauerMedical applications of electron linear accelerators 229
Introduction — role of radiation therapy in cancer management 229Rationale for radiation therapy 231Short description of a medical linear accelerator 235Therapy with high-energy photon beams 236Electron-beam therapy 239The future: new developments and trends in radiation therapy 243
K.H.W. BethgeNon-medical application of linacs 249
Introduction 249Accelerators for applied work and their requirements 250Requirements for accelerator applications 251Applications of electron accelerators 254Applications of heavy-ion accelerators 255Final remarks 255
K.H.W. BethgeApplications of ion linacs 259
Introduction 259Accelerator-based methods in materials research 259Methods for material analysis 260Final remarks 265

XII
I. HoftnannApplication of RF-linacs to heavy-ion fusion 267
Introduction 267Basic principles 267Driver accelerators 273Reactor aspects 279Outlook to a European initiative 281
H. LengelerApplication of high intensity linacs to spallation sources 285
Introduction 285Neutron scattering and synchrotron radiation applications 285Neutron sources 286Pulsed spallation sources 287The proposal for a European spallation source (ESS) 289The ESS linac layout 292Beam losses 293A special problem in a H" beam: Lorentz-stripping 295Conclusions 295
J.P. SchapiraThe use of accelerators in the fission energy field 297
Introduction 297The hybrid system fission-spallation 301Two examples of hybrid systems using thorium 307
P. MandrillonCyclotrons in radiotherapy 313
Introduction 313Physical and biological rationale 315Medical requirements for a facility 316Characteristics of a cyclotron for proton therapy 318Patient treatment using a cyclotron 318Dedicated cyclotron designs 322Conclusions 326
V. BechtoldIsotope production with cyclotrons 329
Introduction 329Target bodies and windows 331Activity calculations 331Activity transfer 332Automation 332Main radioisotopes 332Routine production systems 336

XIII
DJM. Lewis
Designing a radioisotope facility 343Introduction 343Isotopes available from cyclotrons 343Bombardment and isotope production process 346Design criteria for targets 351Cyclotron specification 355Radiochemistry 357Radiopharmaceutical production 358Design of the facility 359Conclusion 360
L. Rinolfi
Computational tools for accelerator design 363Introduction 363Method and tools 363Design according to the machine 364An example: the CLIC test facility (CTF) 366Basic ideas using a pencil and paper 366Analytical calculations using a pocket calculator 367Computational facilities from a desktop computer 368Simulation codes from large computers 371Computer codes for particle accelerator design 377Conclusion 378
M. Weiss
Matching accelerators to the task 381Introduction 381Description of the task 381Preliminary design considerations 382Design method 383Discussion of the results 391Concluding remarks 392
O. Barbalat
Commercially available accelerators 395Introduction 395Radiation therapy 395Radiation processing electron accelerators 395Ion implantation 396Cyclotrons for isotope production and proton therapy 396Synchrotron radiation 396Research accelerators 396Conclusion and outlook 397Appendix 398
List of participants 399
INTRODUCTION TO RF LINEAR ACCELERATORS (LINACS)D
P.M. Lapostolle
AbstractThe history of linear accelerators is now more than 50 years old andafter a difficult start presented many remarkable successes. Theory andtechnology encounter difficult problems briefly presented here with thesolutions so far developed on orbit stability, focusing, RF structure andbeam dynamics computations. Questions still remain however abouthigh intensity limits which, when answered, might still open a morebrilliant future for these types of machine.
1 . BRIEF HISTORY OF LINACS
The first accelerators built for nuclear physics were of electrostatic type; such machineswere efficient but limited in voltage due to electrical breakdown.
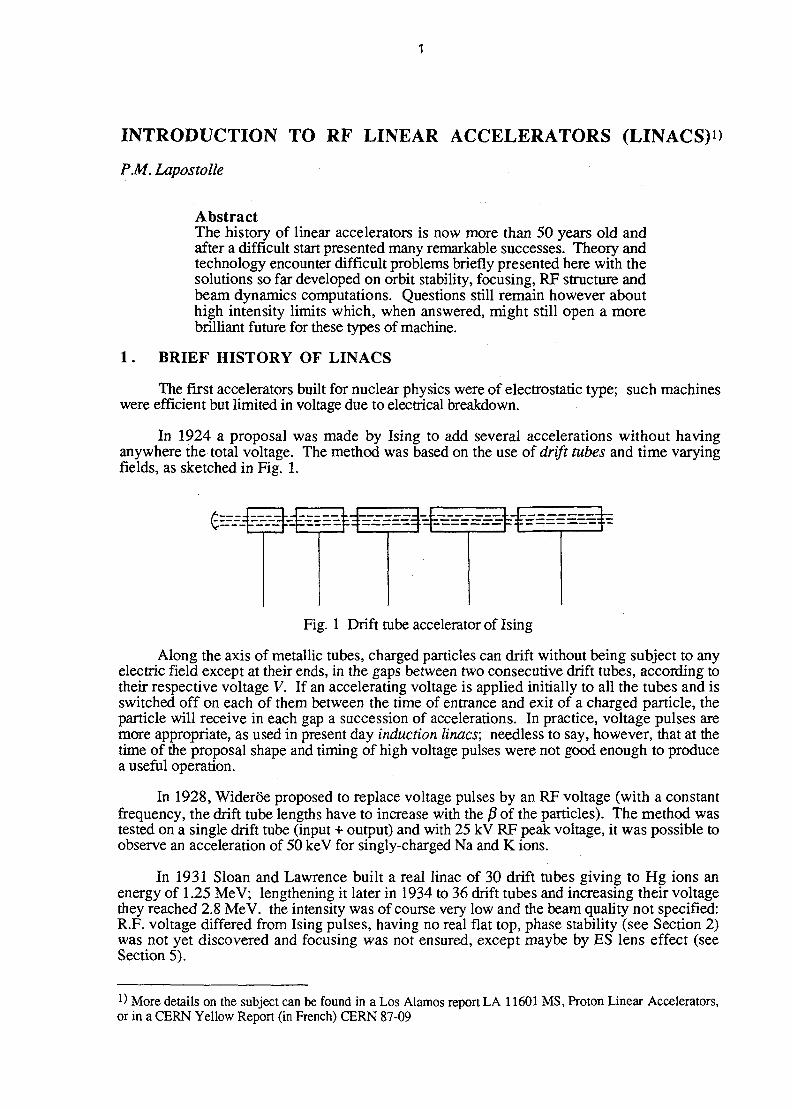
In 1924 a proposal was made by Ising to add several accelerations without havinganywhere the total voltage. The method was based on the use of drift tubes and time varyingfields, as sketched in Fig. 1.
£==
Fig. 1 Drift tube accelerator of Ising
Along the axis of metallic tubes, charged panicles can drift without being subject to anyelectric field except at their ends, in the gaps between two consecutive drift tubes, according totheir respective voltage V. If an accelerating voltage is applied initially to all the tubes and isswitched off on each of them between the time of entrance and exit of a charged particle, theparticle will receive in each gap a succession of accelerations. In practice, voltage pulses aremore appropriate, as used in present day induction linacs; needless to say, however, that at thetime of the proposal shape and timing of high voltage pulses were not good enough to producea useful operation.
In 1928, Wideroe proposed to replace voltage pulses by an RF voltage (with a constantfrequency, the drift tube lengths have to increase with the /? of the particles). The method wastested on a single drift tube (input + output) and with 25 kV RF peak voltage, it was possible toobserve an acceleration of 50 keV for singly-charged Na and K ions.
In 1931 Sloan and Lawrence built a real linac of 30 drift tubes giving to Hg ions anenergy of 1.25 MeV; lengthening it later in 1934 to 36 drift tubes and increasing their voltagethey reached 2.8 MeV. the intensity was of course very low and the beam quality not specified:R.F. voltage differed from Ising pulses, having no real flat top, phase stability (see Section 2)was not yet discovered and focusing was not ensured, except maybe by ES lens effect (seeSection 5).
!) More details on the subject can be found in a Los Alamos report LA 11601 MS, Proton Linear Accelerators,or in a CERN Yellow Report (in French) CERN 87-09

No further development occurred until the war, due to the lack of proper high power RFtechnology (limited then to 10 MHz) and to the discovery of the cyclotron. The length of theSloan and Lawrence machine approached 2 m with a /^ax of only a few thousandths; with thesame RF wavelength of 30 m acceleration of protons would have led to a prohibitive length. Incyclotrons, on the contrary, the spiralling of the trajectories together with some focusing effectallowed the succession of many accelerations over a limited extent, leading to the possibility ofproducing 10 MeV protons.
The development of radars offered, after the war, pulsed high voltage equipment in themetric and centimetric wave ranges; science and technology of electromagnetism and beamdynamics of already high level were men available.
The parallel development of circular accelerators (synchrocyclotrons and synchrotrons)was also helpful with the discovery of phase stability.
Ginzton, Hansen, Chodorow, Slater, Walkinshaw used 3 GHz to accelerate electrons.
Alvarez and Panofsky used 200 MHz for protons.
2 . LONGITUDINAL MOTION. PHASE STABILITY. ACCELERATION BYA TRAVELLING WAVE
For a given geometry of the drift tubes which corresponds to a certain rate ofacceleration, particles must receive at each gap an exact energy gain and the voltage must havean exact value. The RF voltage V applied is larger and there are two phases per RF period forwhich the voltage has the right value Vs (see Fig. 2). When the field is rising the phase isstable since a particle arriving too early will be less accelerated and slip slightly in phase untilthe next gap; vice versa for a late particle. The other phase is unstable. The stable phase iscalled the synchronous phase $s and one has
V —V
with 0 = 0 corresponding to the crest (proton case).
Fig. 2 Phase instability

In a first approach one can replace the discrete gap configuration by an equivalentcontinuous interaction (in Section 5 will appear a justification). One may say that the fielddistribution along the axis in the successive gaps presents an analogy with a standing wavepattern, sum of a forward and a backward wave. One would then consider the interaction ofthe forward synchronous wave with the particles.
Introducing relativity symbols and letting <ps, fis, ys refer to the synchronous particle,one has
W7 = 1 + 2
ITIQC
and putting
5y=y-ys
one can write, following the path of a particle, along the axis
d(Sy) qET, si -£2 = *—(cosp- coscp.)ds w
w ds w
dq>_ _ co_ (\_ _ _1_^ _ co 8y
ds ~ c[p ~fs) c ply]
whence
Forgetting about the change in ys one then obtains
»in <p-<pcos <ps) = Cl
where ET is the amplitude of the synchronous wave.
Such a motion derives from the Hamiltonian
„ co 5y2 qET , .H = ^5---3—s-fsm <p ~ ©cos
Neglecting the change in ysis only valid for heavy particles (protons and ions) for whichit is slow enough. It corresponds to an acceleration fighting against a constant breaking force(or to a forced pendulum model as often presented for circular machines).
One gets from it the usual stability bucket of Figs. 3 and 4; Fig. 5 shows the phase spaceplot relative to an operation with <ps = 0 (fixed point as used by Sloan and Lawrence).
Taking into account the change in ys opens up the bucket and gives the so-called golfclub, see Fig. 6 (notice that the coordinates used are not conjugate).
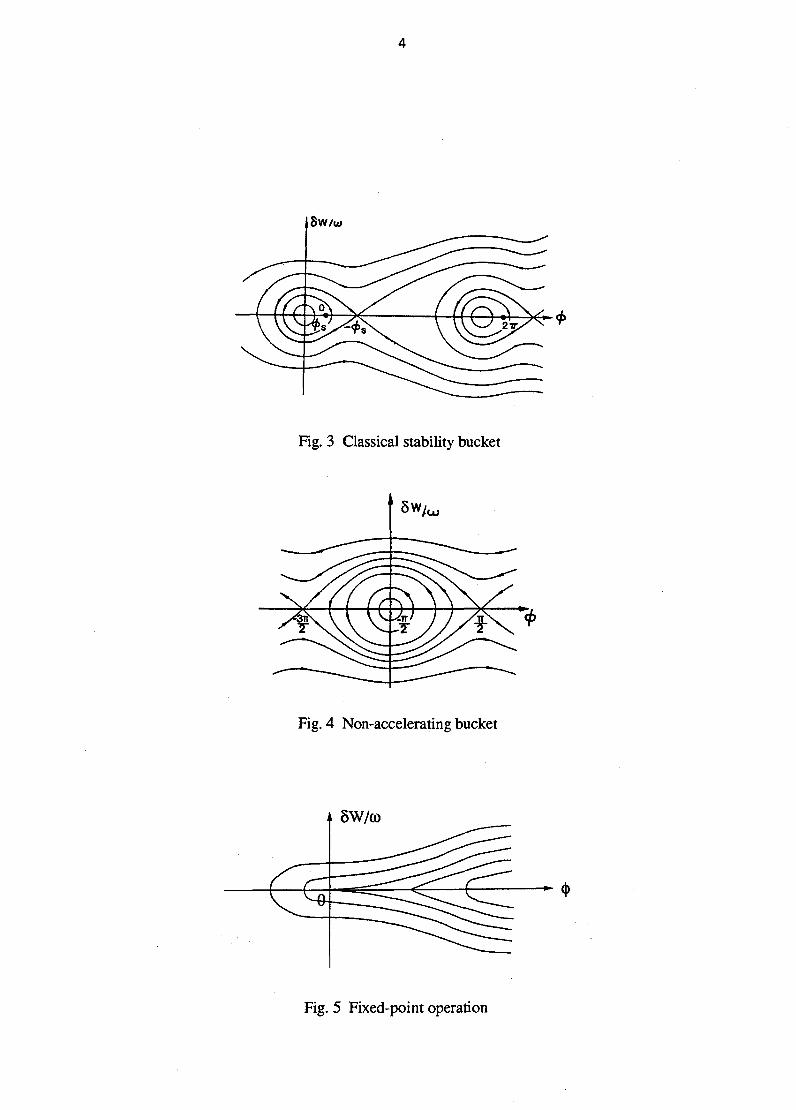
Fig. 3 Classical stability bucket
Fig. 4 Non-accelerating bucket
SW/oo
Fig. 5 Fixed-point operation

Fig. 6 Golf club
For electrons /increases very rapidly and /3 becomes close to 1 over a short distance.Most of the accelerating structure (apart from a buncher) is a constant velocity ft = 1 structure.
The previous derivation must be modified; keeping y instead of dy, it leads to:
where <p refers now to a 0 of the field expressed as ET sin <p (electron linac convention).Figure 7 shows a corresponding phase space plot. One may notice that the <PQ of a curvecorresponds to its position for y <*>.
Introducing, as is the custom
a-eETX eET
one can see that for a>2n the curve corresponding to <p0 = */2 which provides the maximumacceleration can start from W = 0. For a < n, however, there can be low energy electrons justslipping in phase and not accelerated (Fig. 7).
- T T -I /2
Fig. 7 Electron acceleration phase plot for a < n
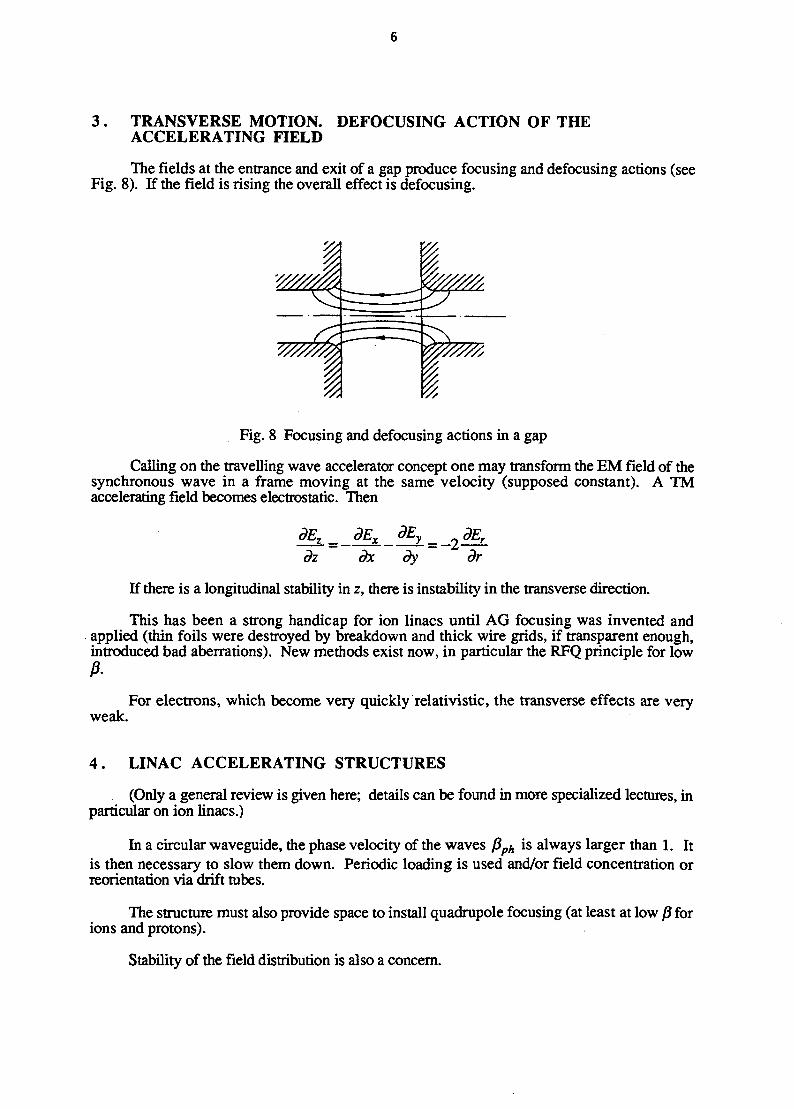
3 . TRANSVERSE MOTION. DEFOCUSING ACTION OF THEACCELERATING FIELD
The fields at the entrance and exit of a gap produce focusing and defocusing actions (seeFig. 8). If the field is rising the overall effect is defocusing.
Fig. 8 Focusing and defocusing actions in a gap
Calling on the travelling wave accelerator concept one may transform the EM field of thesynchronous wave in a frame moving at the same velocity (supposed constant). A TMaccelerating field becomes electrostatic. Then
dzdEx
dxdEy _ dEr
dy dr
If there is a longitudinal stability in z, there is instability in the transverse direction.
This has been a strong handicap for ion linacs until AG focusing was invented andapplied (thin foils were destroyed by breakdown and thick wire grids, if transparent enough,introduced bad aberrations). New methods exist now, in particular the RFQ principle for low
weak.For electrons, which become very quickly relativistic, the transverse effects are very
4 . LINAC ACCELERATING STRUCTURES
(Only a general review is given here; details can be found in more specialized lectures, inparticular on ion linacs.)
In a circular waveguide, the phase velocity of the waves fiph is always larger than 1. Itis then necessary to slow them down. Periodic loading is used and/or field concentration orreorientation via drift tubes.
The structure must also provide space to install quadrupole focusing (at least at low /J forions and protons).
Stability of the field distribution is also a concern.
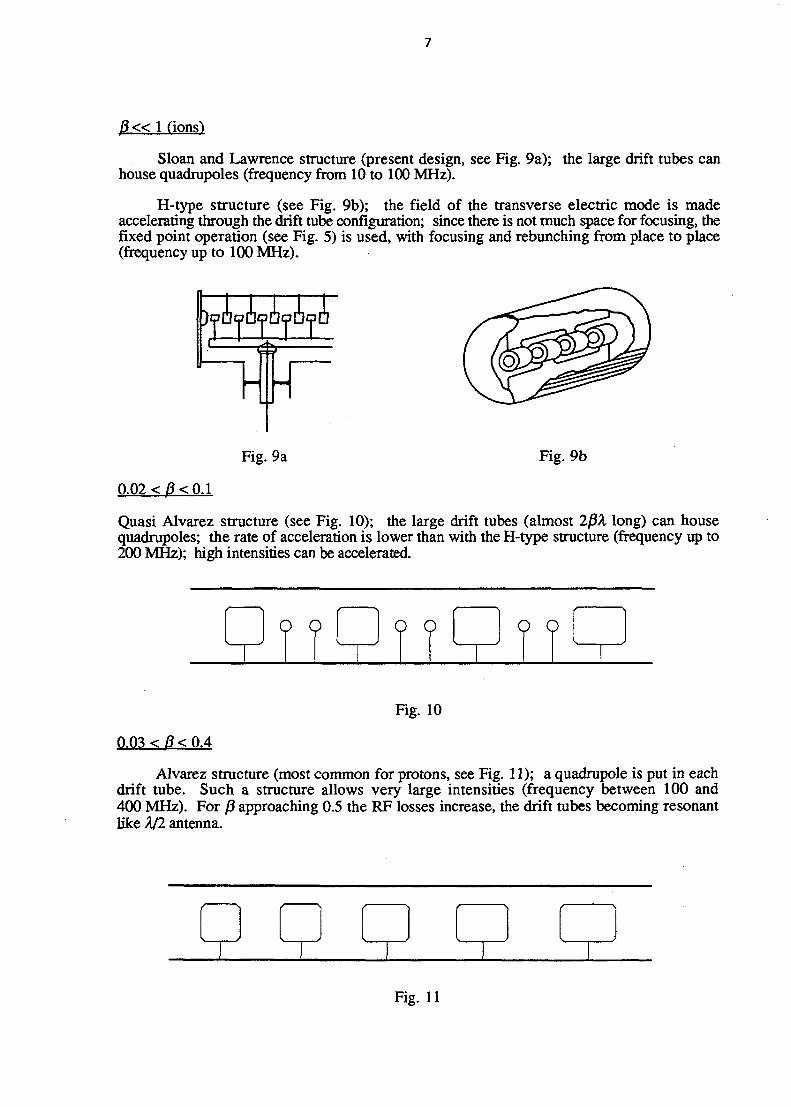
/ ? « 1 (ions')
Sloan and Lawrence structure (present design, see Fig. 9a); the large drift tubes canhouse quadrupoles (frequency from 10 to 100 MHz).
H-type structure (see Fig. 9b); the field of the transverse electric mode is madeaccelerating through the drift tube configuration; since there is not much space for focusing, thefixed point operation (see Fig. 5) is used, with focusing and rebunching from place to place(frequency up to 100 MHz).
aDaDpDaQaa
Fig. 9a Fig. 9b
0.02 < /?< 0.1
Quasi Alvarez structure (see Fig. 10); the large drift tubes (almost 2/U long) can housequadrupoles; the rate of acceleration is lower than with the H-type structure (frequency up to200 MHz); high intensities can be accelerated.
Q O
Fig. 10
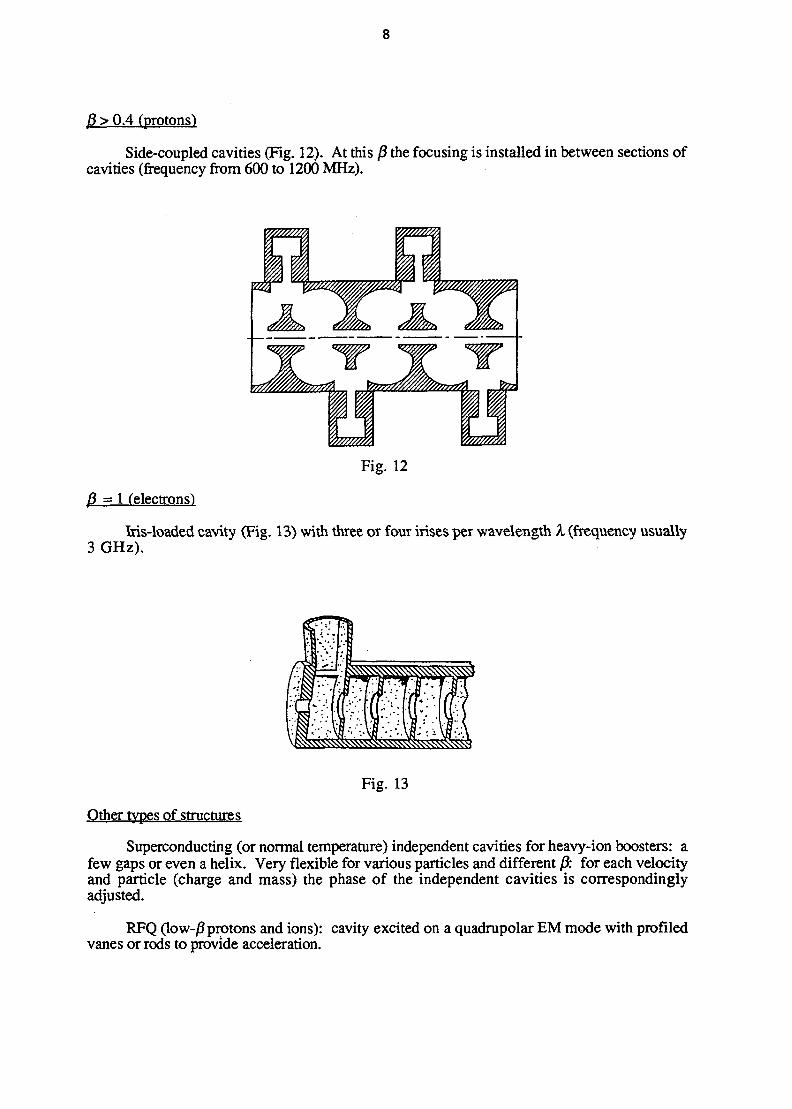
0.03 <B< 0.4
Alvarez structure (most common for protons, see Fig. 11); a quadrupole is put in eachdrift tube. Such a structure allows very large intensities (frequency between 100 and400 MHz). For p* approaching 0.5 the RF losses increase, the drift tubes becoming resonantlike A/2 antenna.
Fig. 11
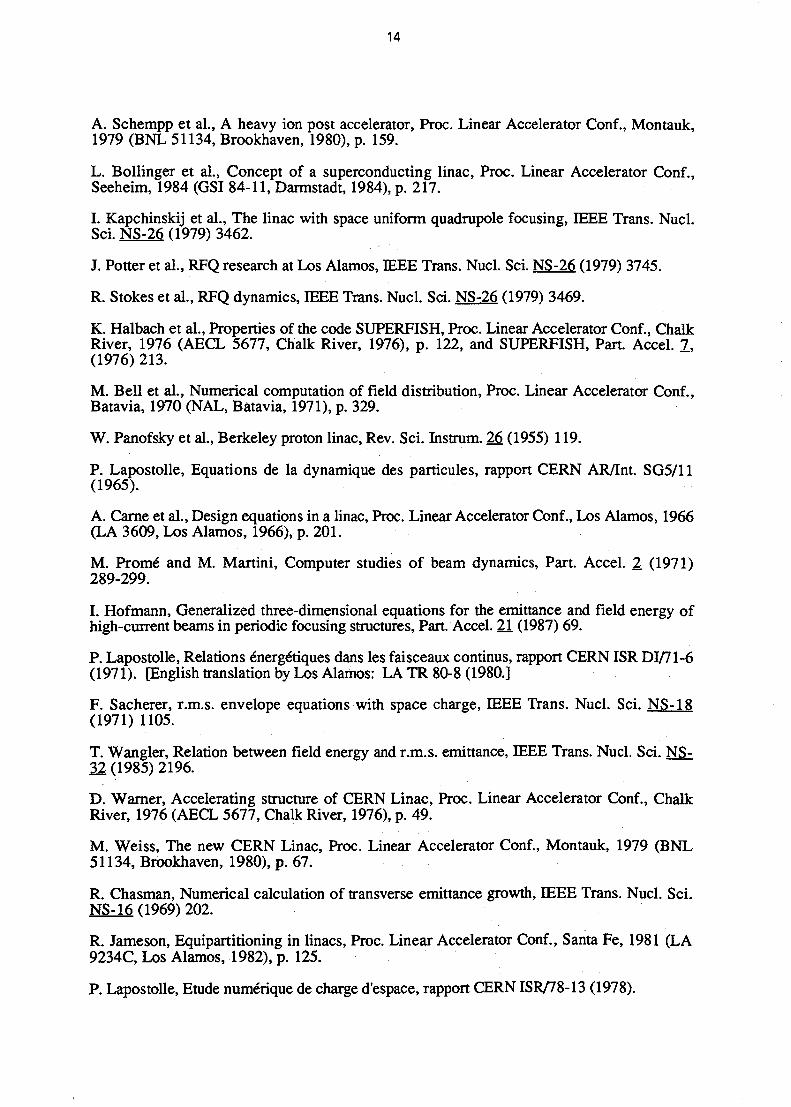
j3 > 0.4 (protons)
Side-coupled cavities (Fig. 12). At this B the focusing is installed in between sections ofcavities (frequency from 600 to 1200 MHz).
Fig. 12
B = 1 (electrons)
Ms-loaded cavity (Fig. 13) with three or four irises per wavelength X (frequency usually3 GHz).
Fig. 13
Other tvoes of structures
Superconducting (or normal temperature) independent cavities for heavy-ion boosters: afew gaps or even a helix. Very flexible for various particles and different B: for each velocityand particle (charge and mass) the phase of the independent cavities is correspondinglyadjusted.
RFQ (low- B protons and ions): cavity excited on a quadrupolar EM mode with profiledvanes or rods to provide acceleration.

5 . DETAILED PARTICLE DYNAMICS COMPUTATION
Acceleration through a gapTransit time factorSimulation codes
The initial approach (Panofsky equations) was developed from the experience gained onelectron beam tubes with grids (see Fig. 14). In the case of grids the field in a gap can beuniform of value Eo. With open holes on the contrary it penetrates inside and can have, on theaxis, a distribution as shown on the figure.
ig-
Eo r —
-g/2 0 g/2
Fig. 14 Accelerating gap
With the initial approach (with grids) if one assumes a particle crosses the gap with aconstant velocity v with the phase <p in the middle, the energy gain is:
+g/2 f s
AW = q j Eo cos [ — + (p Wz = qVT cos <p
with
voltage across the gap, and
where
T =sin fl / 2
6/2
= cog/v
6 is the transit time (in phase) through the gap and T is called the transit time factor (always< 1): it is the reduction in acceleration with respect to what the voltage V would give.
In the real case (without grids) it is possible to express the amplitude of the field Ez (z) onthe axis (as obtained from measurements or rather from a computer) with the help of a Fourierintegral:

10
,r = 0 ) = ~ JT{kz) cos kzz dz
with the inverse relation
VT(kz)= JEz(z,0)cos kzz dz—oo
from which
?2(z,0) sinfczz dz
In such an expression the field is represented as the sum of an infinite set of travellingwaves of amplitude proportional to T{kz) (in a standing wave configuration only two waves arepresent). Each wave T(kz) is an EM wave the complete distribution of which can be knownfrom Maxwell's equation (assuming circular symmetry) in such a way that the complete fielddistributions can be derived throughout the gap inside of a cylinder of radius a, the hole radius:
Ez(z,r,t) = — JT(kz)l0(krr) cos kzz cos (cot + <p)dkz
—oo
Er{z,r,i) = j^+j T(kz)^-Ix(krr) sin kzz cos (cot + <p)dkz
—oo ?
v +oe
In
with
vcBe(z,r,t) = — J ^(^z)—h{Kr)cos Kz sin
CK
=kl-co2 Ic1
With such expressions, making use of inverse Fourier relations, one can easily computethe energy gain. Along a parallel to die axis, at the distance r, one has:
AW = qVT{kz)lQ{krr) cos (p
where kz = CO/VQ and T(k2) is the amplitude factor relative to the synchronous wave; the factthat only the synchronous wave interacts justifies the approach used in Section 2. It alsoexplains a correction often introduced in the expression of the transit time, as follows:
9/2 I0{kra)
with, for 6, a slight correction to take into account the effect of the chamfer of the hole.
With the field equations above one can compute the phase change across the gap,accounting for the change in velocity, and the transverse motion. It is also possible to considera trajectory with a slope, such that

11
Such integrals lead to expressions involving T(k2) and its first and second derivatives withrespect to kz, according to the relation given above (see the report LA-11601-MS, page 80).
These expressions are used in common codes like PARMILA and MAPRO, validhowever only for protons and ions.
A more recent code, DYNAC, valid for all particles (including electrons), with a betteraccuracy, introduces instead of the radius r the reduced radius
with R = —dz
leading, in the paraxial approximation, to:
such that R and R' are conjugate (which was not the case for r and r').
This equation shows, in addition to the phase dependent term usually defocusing (seeSection 3), a focusing term of the electron lens type, mainly important for electrons but also forvery low velocity particles (explaining probably the weak focusing observed by Sloan andLawrence, see Section 1).
Such a term for a uniform field just leads by integration to the classical solution and therelation between r and /?; it can however in the case of localized fields (gaps) exhibit anappreciably enhanced effect, not at all in contradiction with the considerations developed in amoving frame at constant velocity.
The derivation of the equation in R, not given in the report LA-16601-MS, is developedin the Appendix.
6 . SPACE CHARGE EFFECTS. INTENSITY LIMITS
Particles of the same charge repel each other. Space charge field tends to increase thebeam size and hence entails a risk of loss.
According to Poisson's law a linear space charge field requires p = Cte.
The only solution for a uniform density, only possible for a continuous beam is the so-called Kajchinsky-Vladimirsky (K.V.) distribution, which is a surface distribution in the 4Dspace. Such a distribution is, of course, not very physical but fortunately it happens, fromenergy consideration, that the K.V. beam equations are satisfied approximately (over shortenough distances) by r.m.s. dimensions (size and emittances) for all distributions (for a K.V.distribution r.m.s. dimensions are half the real ones and r.m.s. emittances one quarter of thereal ones). Such a property is extremely useful, in simulation studies for instance, for findinggood matching conditions.
When the intensity increases, various phenomena occur, due to the non-linear characterof space charge forces.

12
Beam emittance can transfer from one coordinate to another and total emittance tends toincrease.
Around the beam core a "halo" develops; when trying to scrape it, it reappears. Even ifsuch a halo contains only one or a few per cent of the particles or even less this can be a veryserious problem for large intensity machines.
For small average intensity on the other hand, the emittance (beam quality) is the mainconcern. A practical recipe which leads to good operation is as follows:
AG focusing is usually specified by the phase advance per focusing period of theincoherent oscillations; calling OQ the value for zero intensity and a for full beamone must have Co < 90° and usually GQ in the range of 60 or 70° with O/OQ > 0.4.
In addition focusing and longitudinal stability should be adjusted, as far as possible,in such a way that transverse kinetic energy and longitudinal oscillation energyremain as close as possible to avoid emittance transfer.
Several simulation codes are available to study numerically the space charge effects. Thebeam is represented by a few thousand of macroparticles and several methods are used tocompute their space charge field:
A fast Fourier transform (FFT) routine to solve Poisson's law when one canassume a circular symmetry for the bunch (PIC, particle in cell code)
A numerical integration using analytical expressions valid for an ellipsoidal bunchshape (Ellipsoidal profile code)
A point-to-point computation which does not make any assumption on the geometrybut requires some care to avoid "collisional effects" (Particle-to-particle interactioncode); this last code is much slower when increasing the number of macroparticles.
Present theoretical approaches to study the details and analyze the phenomena stronglyrelated to highly non-linear space charge fields are making use of the modern theories ofstochasticity with resonance overlap effects and Arnold's diffusion. They are still underdevelopment.

13
BIBLIOGRAPHY
G. Ising, Ark. Mat. Astron. Fyz. 18 (1924) 1.
R. Widerde, Archiv fur Electrotechnik 21 (1928) 387.
D.H. Sloan and E.O. Lawrence, Phys. Rev. 38 (1931) 2021.
D.H. Sloan and W.M. Coates, Phys. Rev. 46 (1934) 539.
L. Alvarez, The design of a proton linear accelerator, Phys. Rev. 7Q (1946) 799.
J.P. Blewett, Phys. Rev. 88 (1952) 1197.
L. Alvarez et al., Berkelez proton linear accelerator, Rev. Sci. Instrum. 26 (1955) 111 and 210.
V.I. Veksler, A new method of acceleration, J. Phys. USSR 9 (1945) 153.
I. Kapchinskij and V. Vladimirskij, Proc. Int. Conf. on High Energy Accelerators, Geneva,1959 (CERN, Geneva, 1959), p. 274.
E.M. MacMillan, The synchrotron, Phys. Rev. 6j£ (1945) 143.
L. Smith, Linear accelerators, Handbuch der Physik, Band XLIV (Springer, Berlin, 1959), p.341-389.
H. Bruck, Accelerateurs circulaires de particules (Presses Univ. de France, Paris, 1966).[English translation by Los Alamos: Circular particle accelerators, LASL.LA TR 72-10 Rev.(1972).]
A. Lichtenberg, Phase space dynamics of particles (J. Wiely and Sons, New York, 1969).
E. McMillan, The relation between phase stability and first order focusing, Phys. Rev. SO(1950) 493.
L. Teng, AG focusing for linacs, Rev. Sci. Instrum. 25. (1954) 264.
L. Smith et al., Focusing in linacs, Rev. Sci. Instrum. 26. (1955) 220.
E. Nolte et al., The Munich heavy ion post accelerator, IEEE Trans. Nucl. Sci. NS-26 (1979)3724.
T. Fukushima et al., Measurement of interdigital H type linac, Proc. Linear Accelerator Conf.,Santa Fe, 1981 (LA 9234C, Los Alamos, 1982), p. 296.
E. Knapp et al., Standing-wave high-energy linacs, Rev. Sci. Instrum. 39 (1968) 979-991.
D. Bonne, The UNBLAC, Proc. Linear Accelerator Conf., Chalk River, 1976 (AECL 5677,Chalk River, 1976), p. 2.
L. Smith, Beam dynamics in induction linacs, Proc. Linear Accelerator Conf., Santa Fe, 1981(LA 9234C, Los Alamos, 1982), p. 111.
T. Fessenden, Induction linacs for HIF, Proc. Linear Accelerator Conf., Seeheim, 1984 (GSI84-11, Darmstadt, 1984), p. 485.
14
A. Schempp et al., A heavy ion post accelerator, Proc. Linear Accelerator Conf., Montauk,1979 (BNL 51134, Brookhaven, 1980), p. 159.
L. Bollinger et al., Concept of a superconducting linac, Proc. Linear Accelerator Conf.,Seeheim, 1984 (GSI 84-11, Darmstadt, 1984), p. 217.
I. Kapchinskij et al., The linac with space uniform quadrupole focusing, IEEE Trans. Nucl.Sci. NS-26 (1979) 3462.
J. Potter et al., RFQ research at Los Alamos, IEEE Trans. Nucl. Sci. NS-26 (1979) 3745.
R. Stokes et al., RFQ dynamics, IEEE Trans. Nucl. Sci. NS-26 (1979) 3469.
K. Halbach et al., Properties of the code SUPERFISH, Proc. Linear Accelerator Conf., ChalkRiver, 1976 (AECL 5677, Chalk River, 1976), p. 122, and SUPERFISH, Part. Accel. 7,(1976) 213.
M. Bell et al., Numerical computation of field distribution, Proc. Linear Accelerator Conf.,Batavia, 1970 (NAL, Batavia, 1971), p. 329.
W. Panofsky et al., Berkeley proton linac, Rev. Sci. Instrum. 26 (1955) 119.
P. Lapostolle, Equations de la dynamique des particules, rapport CERN AR/Int. SG5/11(1965).
A. Carne et al., Design equations in a linac, Proc. Linear Accelerator Conf., Los Alamos, 1966(LA 3609, Los Alamos, 1966), p. 201.
M. Prome and M. Martini, Computer studies of beam dynamics, Part. Accel. 2 (1971)289-299.
I. Hofmann, Generalized three-dimensional equations for the emittance and field energy ofhigh-current beams in periodic focusing structures, Part. Accel. 21 (1987) 69.
P. Lapostolle, Relations energetiques dans les faisceaux continus, rapport CERN ISR DI/71-6(1971). [English translation by Los Alamos: LA TR 80-8 (1980.]
F. Sacherer, r.m.s. envelope equations with space charge, IEEE Trans. Nucl. Sci. NS-18(1971) 1105.
T. Wangler, Relation between field energy and r.m.s. emittance, IEEE Trans. Nucl. Sci. NS-32 (1985) 2196.
D. Warner, Accelerating structure of CERN Linac, Proc. Linear Accelerator Conf., ChalkRiver, 1976 (AECL 5677, Chalk River, 1976), p. 49.
M. Weiss, The new CERN Linac, Proc. Linear Accelerator Conf., Montauk, 1979 (BNL51134, Brookhaven, 1980), p. 67.
R. Chasman, Numerical calculation of transverse emittance growth, IEEE Trans. Nucl. Sci.NSzl6 (1969) 202.
R. Jameson, Equipartitioning in linacs, Proc. Linear Accelerator Conf., Santa Fe, 1981 (LA9234C, Los Alamos, 1982), p. 125.
P. Lapostolle, Etude numerique de charge d'espace, rapport CERN ISR/78-13 (1978).

15
APPENDIX
EQUATION OF THE TRANSVERSE MOTION WITH THE REDUCEDRADIUS IN THE PARAXIAL APPROXIMATION
The equation
can be written
d(r' fiy) = -~^—(Er -pcBe)dt = k(r,z,t)dt (A.2)
Putting
R = K'S[pY = r^Y2-lf14 and R-dRldz (A.3)
one has
f = R [y1 - 1 ) 1 -—yfy 2-!)" — (A-4)
and
if-3/4 3R 2/ 2
Now, from Eq. (A.2), in the paraxial approximation
dEr - o!gg ] , A 6 .
with, according to Maxwell's equations
oEr 1 CTE. , doa 1 &£7 / A T \
— c = -z. and -^rs- = — T - r 2 - (A-7)<?r 2 (?z ar 2c OT
But one has from Eq. (A.2)
W r ) ^ (A.8)
and, for the longitudinal motion

16
Q-^qE, (A.9)dz
so that one also has
2 d2y _ af£z _ dEz q dEz
dz2 dz dz pc dt
Eventually one obtains
2moc3 p3Y* & I 2/WQC2

17
FUNDAMENTALS OF ELECTRON LINACS
D.J. WarnerCERN, Geneva, Switzerland
AbstractThe fundamentals of electron linacs are treated with particularapplication to industrial and medical linacs. Thus the energy range upto 20 MeV is emphasized and the technical solutions which areadapted to these applications outlined. For completeness the extrasophistication required for the advanced physics machines ismentioned in comparison with the more basic designs for commercialapplications.
1. INTRODUCTION
This treatment of electron linacs is part of a series of four lectures on thefundamentals of RF linear accelerators including an introduction [1], the fundamentals of ionlinacs [2], which gives accelerating structure theory in detail, and the present work. To avoidtoo much duplication, some of the theory in these papers will be used but not repeated. Thevery nature of the "fundamentals" would seem to exclude exciting new approaches to thesetopics and in fact, much of the material presented here was well established over forty yearsago, in particular for travelling wave linacs. Thus the references which have been most usefulconcern firstly the development and construction of SLAC [3], "The Stanford Two-MileAccelerator", and then the complete coverage in "Linear Accelerators"[4]. Some equationsand diagrams are given with more detail in the latter source and are often denoted here by"L&S p##". More recent information on electron linac design since 1970 can be found inspecialised conference proceedings [5]. The descriptive approach adopted here assumes somebackground in electromagnetism biased towards Radio-Frequency (RF) topics as treated forexample in [6].
2. SOME BACKGROUND HISTORY
Stanford University and MET in the US, and TRE Malvern in the UK made thesuccessful development of S-Band radar during World War 2. All of the above, appliedelectro-magnetic theory to wave-guides, antennas, resonant cavities, accurate measurementsand the essential microwave power generators, magnetrons and klystrons. Much of thiswork centred on S-Band at f=2856 MHz and it was logical for all these establishments todevelop electron linacs at about this frequency from 1946 onwards. The Stanford team has hadthe "highest profile" - partly due to the large number of small electron linacs produced in theearly years but mainly due to the prototype Mark III (1 GeV electron linac) which led to the20 GeV (1967) three kilometres Stanford Linear Accelerator, SLAC. This has been upgradedand transformed to the 50 GeV on 50 GeV e+ e' linear collider (1988), the SLC.
The tradition at all the institutes and firms which later produced commercial versionsof linacs, has remained firmly academic with theory, computations and model measurementsfundamental to the design process. The two books, by Neal [3] and by Livingston [7], give agood account of the early designs. In particular, the latter gives a paper on the first designstudies made at Stanford based on an ambitious 1 GeV linac with a maximum acceleratingrate of 30 MeV m"1 (SLC only averages 17 MeV m1!). The influence on present 3 GHztravelling wave, disc-loaded linacs is still felt even if the way the theory was presented, hasbeen superseded.
18
3. THE ELECTRON
Although for many purposes industrial and medical linacs only go to 10 MeV, theelectrons are nevertheless highly relativistic:
1 - p = (1 + = 0.5 f
The approximation is better than 1 % above 2 MeV. Applying this approximate formula fortwo typical cases:
1 - P = 0.02 for y= 5 i.e. for 2.1 MeV1 - p = 0.001 for y = 22 i.e. for 10.9 MeV
3.1 Consequences
i) The word "accelerator" must be interpreted relativistically. The force (F) on acharged particle arising from the accelerating field (eE) produces a change in momentum(dp/dt = d(mv)/dt). As the momentum of the electron increases its velocity, P,approaches c, and its relativistic mass, y, increases accordingly.
ii) Accelerating structures can be made to correspond to the constant velocity, v=c, aboveabout 1 MeV.
ii) After the packet of electrons (phase bunch) has been formed, its distribution is "frozen"above about 1 MeV i.e. special "bunch compressors" have to be used to change it.
iv) Space charge effects are generally negligible except for high currents at low energies.
4. ACCELERATING FIELD AND THE DISPERSION CURVE
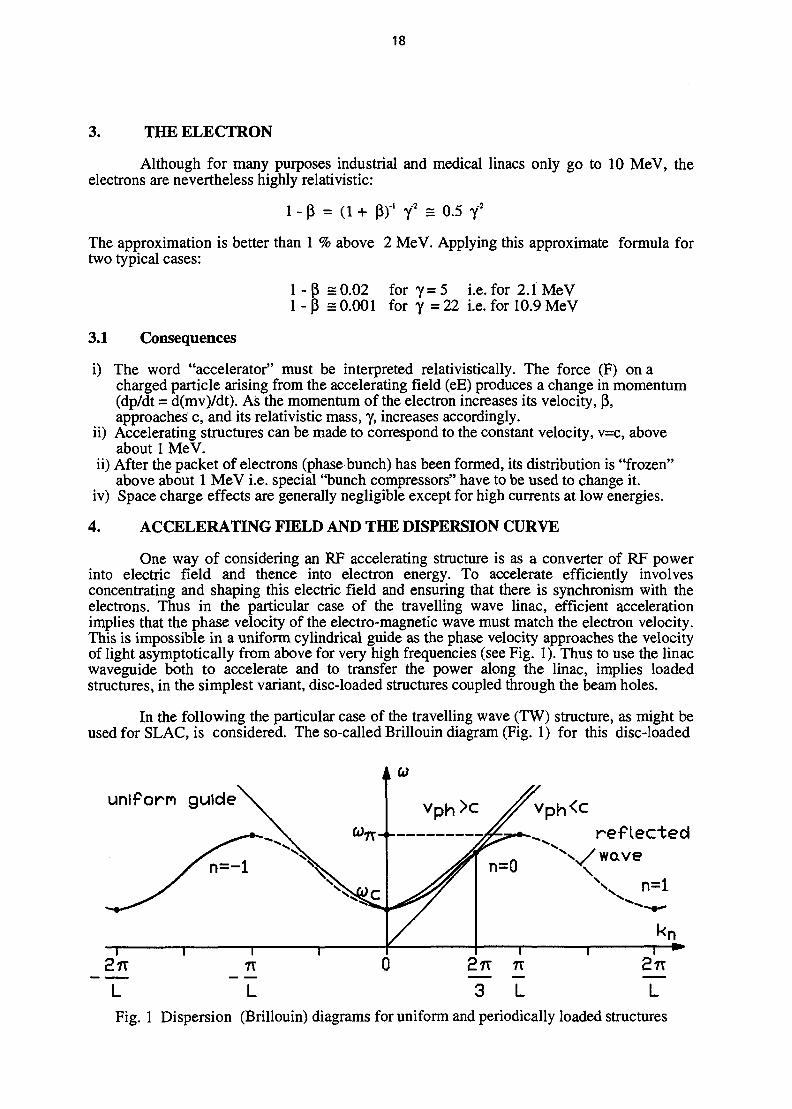
One way of considering an RF accelerating structure is as a converter of RF powerinto electric field and thence into electron energy. To accelerate efficiently involvesconcentrating and shaping this electric field and ensuring that there is synchronism with theelectrons. Thus in the particular case of the travelling wave linac, efficient accelerationimplies that the phase velocity of the electro-magnetic wave must match the electron velocity.This is impossible in a uniform cylindrical guide as the phase velocity approaches the velocityof light asymptotically from above for very high frequencies (see Fig. 1). Thus to use the linacwaveguide both to accelerate and to transfer the power along the linac, implies loadedstructures, in the simplest variant, disc-loaded structures coupled through the beam holes.
In the following the particular case of the travelling wave (TW) structure, as might beused for SLAC, is considered. The so-called Brillouin diagram (Fig. 1) for this disc-loaded
unlforn guide
reflected
7T 0 27V TV 2TT
~L~ ~ L T I T"Fig. 1 Dispersion (Brillouin) diagrams for uniform and periodically loaded structures
19
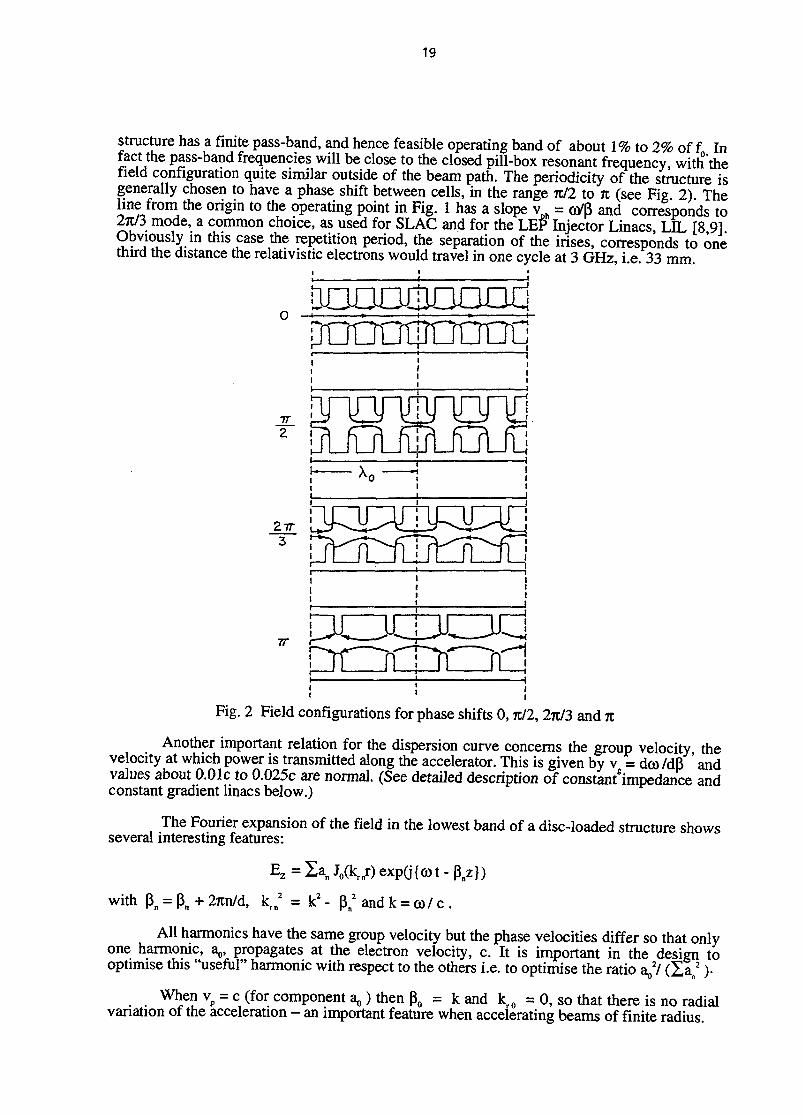
structure has a finite pass-band, and hence feasible operating band of about 1% to 2% off Infact the pass-band frequencies will be close to the closed pill-box resonant frequency with'thefield configuration quite similar outside of the beam path. The periodicity of the structure isgenerally chosen to have a phase shift between cells, in the range nil to n (see Fig 2) Theline from the origin to the operating point in Fig. 1 has a slope vBh = oyB and corresponds to211/3 mode, a common choice, as used for SLAC and for the LEP Injector Linacs, LEL [8 9]Obviously in this case the repetition period, the separation of the irises, corresponds to onethird the distance the relativistic electrons would travel in one cycle at 3 GHz, i.e. 33 mm
DOOOJUOODd
2TT
LOJU
Fig. 2 Field configurations for phase shifts 0,7t/2,2rc/3 and %
Another important relation for the dispersion curve concerns the group velocity thevelocity at which power is transmitted along the accelerator. This is given by v = doo MB ' andvalues about 0.01c to 0.025c are normal. (See detailed description of constant'impedance andconstant gradient linacs below.)
The Fourier expansion of the field in the lowest band of a disc-loaded structure showsseveral interesting features:
Ez = Xan J0(krnr) exp(j{cot - pnz})
with Bn = Bn + 2icn/d, krn2 = k2 - Bn
2 and k = co/ c .
All harmonics have the same group velocity but the phase velocities differ so that onlyone harmonic, a,,, propagates at the electron velocity, c. It is important in the design tooptimise this "useful" harmonic with respect to the others i.e. to optimise the ratio a^/ (£an
2 )•
When vp = c (for component a0) then Bo = k and kr0 = 0, so that there is no radialvariation of the acceleration - an important feature when accelerating beams of finite radius.

20
5. THE ACCELERATOR DESIGN
5.1 The Choice of Operating Frequency
The choice of operating frequency must satisfy several constraints. From the previouschapter it is clear that the disc-loaded guide must act simultaneously as an accelerator andtransmitter of power along the structure (see Fig. 3). Are the aperture sizes for powertransmission consistent with those necessary to transmit an electron beam? Typically for v / cfrom 0.01 to 0.03, the aperture diameter lies in the range aA, from 0.18 to 0.26 with v «= | 3 8 .Also the internal cavity diameter, b/A, varies only slightly i.e. from 0.78 to 0.79 for tlie aboverange of apertures. For the choice of frequency these apertures are not a serious limitation,typical diameters in the range 50mm down to 7 mm have been used, corresponding tofrequencies ranging from 1.2 GHz to 10 Ghz.
There are other more important considerations - shunt impedance, beam current,cavity filling time and dimensional tolerances, but the availability of suitable RF sources hasprobably had the most weight in the most usual choice of 3 GHz for the operating frequency(2.856 GHz in the USA, following Stanford).
INPUTCOUPLER
OUTPUTCOUPLER
MATCHING IRIS APERTURE
10 FT-
Fig. 3 Sketch of SLAC 3 m section
5.2 Shunt Impedance
A basic parameter in linac design concerns the acceleration that can be obtained for agiven power input. The shunt impedance per unit length of structure is defined in general(L&S, p. 637) as:
Z = (JlE2l dz)V (P /) where P is the total power dissipated.
A similar definition is used for electron linacs (L&S p.47):
Note that the first definition sometimes has the transit time factor included under theintegral sign [1,2] and the shunt impedance is then denoted by ZT2. For the electron linacdefinition the transit time factor is effectively included by considering only the acceleration by

21
the synchronous component, E, .. These (historical) definitions, give values twice theconventional lumped-circuit definition.
To first order the energy gain in an accelerating section:
= (Pr0/)0-5
with P the power dissipated in the accelerator i.e. the difference of the powers at input andoutput coupler of a TW linac. The more precise formulations applicable to the two variants ofTW accelerator are given below.
5.3 TW Structures
A complete treatment is not possible here but the basic definitions for the classicaltravelling-wave cases follow. As mentioned in Section 5.1 the loaded guide actssimultaneously as an accelerator and transmitter of power from input to output coupler (seeFig. 3) The power, which is progressively attenuated along the structure, is used to maintainthe stored energy per unit length, w, and hence the accelerating field, E^, in each cell.
5.3.1 Design Equations for Constant Impedance Structure (L&S, pp 47-53)
Filling time: tp = l/vg
Stored energy per unit length w = P/vg
Quality factor: Q = -co w/(dP/dz)
Note that r</Q is independent of P rJQ = E^2 /(CO w)
Operating mode for n discs per guide wave length: <(>0 = 2rc/n
Electric field decrement dE/dz = -aE
RF power decrement dP/dz = -2aP
After a distance, z, (i.e. integral from 0 to z): Ez = Eo exp (-Ja(z) dz)
P = P0exp(-j2a(z)dz)
The overall attenuation constant: T = Ja(z) dz
For a Constant Impedance (CI) structure, length / x = ai
The total stored energy after one filling time, tp W = ¥0%({ 1 - exp [-2T] }/2T)
5.3.2 Acceleration in a Constant Impedance Accelerator
If the electrons are accelerated at an angle 8 from the peak:
AV = Eo I ({1 - exp [-%] }/x) cos 6
AV = (2x)05 ({1 - exp [-T]}/T) (P r0 /)°"5 cos 8
Normally one aims to operate near 0 = 0 i.e. cos 8 = 1
The acceleration for a given power, P, and length, /, is optimised for x = 1.26 giving
AV = 0.903 (P r0 lfs

22
The optimum is not sharp, e.g. for x = 0.5 the factor 0.903 only reduces to 0.79 andwith / = 1 m, f = 3 GHz and Q = 13000, v /c increases from 0.19 % to 0.48 %, correspondingto an increase in aperture diameter from 12.9 mm to 16.5 mm. Many early TW acceleratorswere built to the constant impedance design.
5.3.3 Design Equations for Constant Gradient (CG) Structure (L&S, pp 60-63)
This variant ideally avoids the reduction of the electric field by varying the groupvelocity i.e. the aperture, along the accelerator. Some of the parameter definitions given forthe CI structure remain valid e.g. total stored energy as function of total attenuation, x; othermain differences are quoted below. As r0 only changes slowly with structure dimensions, thecondition for constant gradient is dP/dz = constant with Po, P, the power into and out of thestructure, length I. In particular:
dP/dz = - (Po - P)/l = - Po (1 - exp [-2x] )//
The group velocity decreases linearly with z along the structure.
vg = (C0//Q) (1 - {1 - exp [-2T] } z//)/(l - exp [-2t])
The filling time which is the time for power to pass from input to output coupler, istp = 2Q x /<», an expression which is valid for both CG and CI structures and which does notimply constant a along the structure.The energy gain is
AV = ({1 - exp [-2x]} P r0 /)0"5 cos 9
The slight improvement in energy gain with the non-identical cells is worthwhile forthe larger physics accelerators e.g. SLA.C, LAL and LIL, the latter two varying thedimensions in steps. With section lengths, 3.05 m (SLAC) and 4.5 m (LIL), the designsoptimise energy gain, field distribution and power utilisation; vjc reduces to about 0.7% atthe end of both types of section yet allows reasonable apertures there (19 mm and 18 mmrespectively). However, for the lm section with x = 0.5 treated in 5.3.2, there is only a 1 %increase in energy gain in the CG case.
5.4 Standing Wave Accelerators
Standing wave operation can be considered as the superposition of forward andbackward travelling waves in a resonant structure [2]. This requires no terminating load (asdoes the TW structure) so uses all the input power for the acceleration process. Although asimple disc-loaded structure could be made to operate in a standing wave mode, specialstructures are generally used to optimise the effective shunt impedance. In fact the attenuationin the structure must be much less (and v much greater) in the standing-wave case, to ensurethe proper combination of the forward and backward waves. It can be shown ([2] and L&S, pp6 5 - 7 5 ) that the phase shift between cells should be either n or n/2 to achieve an efficientacceleration from the sum of the two components. The rc-mode can however be rejected ashaving zero group velocity (edge of pass-band) and the corollary, the nearest modes much tooclose (in co). As will be seen below the apparant disadvantage of the 7t/2 mode, every othercell being unexcited, can be turned to advantage in the practical structures described.
One distinct difference for a standing-wave (SW) structure is that the electric fields(SW) build up in time, while for a TW accelerator they build up in space. Under pulsedoperation the field build-up is:
E/Es= 1 -exp(-©t/[2QJ)
Typically if Q, is about 15000, (and with a matched coupler QL = Q/2), the fieldbuilds up to 86% of maximum in about 1.7 |J.s.

23
The effective shunt impedance and Q are highest in 7C-mode but as vg = 0 there, specialmeasures would have to be taken to obtain power transfer along the structure without severelyperturbing the n phase change between cavities. The modification of the structure by additionof elements to provide a confluent passband at the operating point is discussed by Weiss [2].
It is the solution of this fundamental problem of SW structures which has led to thelarge variety of proposals, several of which have been successfully developed commercially.Many of the structures work in a bi-periodic %/2 mode in which every other cell acts as acoupling cell i.e. one which transfers power but provides no acceleration. There are severaldistinct types:
i) Where the coupling is all via the normal beam aperture to a special short cell (see Figs. 4and 14). The tri-periodic structure simulates a Jt-mode field in the accelerating cells [10].
Fig. 4 Tri-periodic structure with axial coupling - the LIL buncher
ii) Where the coupling is via off-axis slots to a cavity which is coaxial to the mainaccelerating cells ( see Fig. 5).
Fig. 5 Bi-periodic structure with on- and off-axis coupling

24
Fig. 6 An 800 MHz varying cell length model of the Los Alamos side-coupled accelerator
iii) Where the coupling cavities are separate cavities outside the main accelerating cavitychain, the Los Alamos side-coupled cavity is the best known of this type (Fig. 6). It isused on the Los Alamos Meson Physics Facility, (to accelerate protons between 100 MeVand 800 MeV) and by several manufacturers of medical linacs.
All of these variants achieve their basic aim of power transfer with vg/c, often > 0.1 aswell as high shunt impedance. One practical consideration for SW structures is that the inputcells are not perturbed by the input coupler, which can be placed near the middle of thestructure. These early cells can be partially optimised in field distribution to give betterbunching of the input beam. Type i) has some of the disadvantages of the normal disc-loadedstructure - the accelerating cells are plain "pill-boxes" with a large aperture to ensuresufficient coupling. The other structures can be optimised by using "nose-cones" and theapertures better matched to the beam size. Standing wave linacs are now preferred in manycommercial applications due to the flexibility mentioned above. They have one inherentdisadvantage compared to travelling wave linacs - the RF system has to tolerate a largereverse power during the pulse build-up, i.e. for several fis, so that a unidirectional devicesuch as an isolator, may be necessary in the RF feed line.
5.5 Technology of Accelerating Structures
5.5.1 Material and Surface Finish
The material on the inner surfaces is invariably copper or a copper alloy. This is toensure the lowest possible power losses (highest Q-factor) short of using silver. The e.m.currents are essentially confined to the surface by the "skin-effect" with the skin depth, 8 =1.2 [xm for pure copper at 3 GHz. The fabrication methods must therefore be consistent withthe required surface finish, nominally better than 0.1 (Xm.

25
5.5.2 Precision Required
In practice the precision requirements are very strict as the cumulative phase errorsover many travelling wave cells imply individual cell phase shifts to ± 0.1° or to + 30 kHz inan S-Band structure with a 30 MHz pass-band. The situation in the standing wave case seemsworse at first sight, as with a Q of 15000, ± 0.1° corresponds to ± 2 kHz. However thetolerances can be greater due to the stabilizing action of the coupling cells. It is inconceivableto machine all the cells with this corresponding precision e.g of ± 0.8 u\m on the cell diameter,so some tuning adjustment must be foreseen for the assembled accelerating section.
It is assumed that a choice of cell geometry has been made a priori and this willstrongly influence the manufacturing methods, often leading to a compromise between simpleshapes and more power-efficient ones. With the present wide-spread availability ofnumerically controlled lathes and milling machines, the more complicated geometries can beconsidered without too great a price penalty.
5.5.3 Vacuum Considerations
A further constraint concerns the vacuum pumping arrangements which can bethrough the beam apertures in short travelling wave sections. The vacuum requirements arenot stringent at normal operating voltage gradients so a clean unbaked system with metaljoints, suffices for operating pressures ~ 10' mbar. A separate vacuum envelope surroundingthe whole is often used on very long sections but this complication is avoided on short linacsfor medical or industrial applications (Fig. 7).
Fig. 7 The LIL 4.5 m travelling-wave section with cut-away of vacuum envelope
5.5.4 Some Fabrication Methods
These requirements has led to a wide variety of geometries and fabrication methods.For example, the standard SLAC iris-loaded structure [3] has been made by machining outer
26
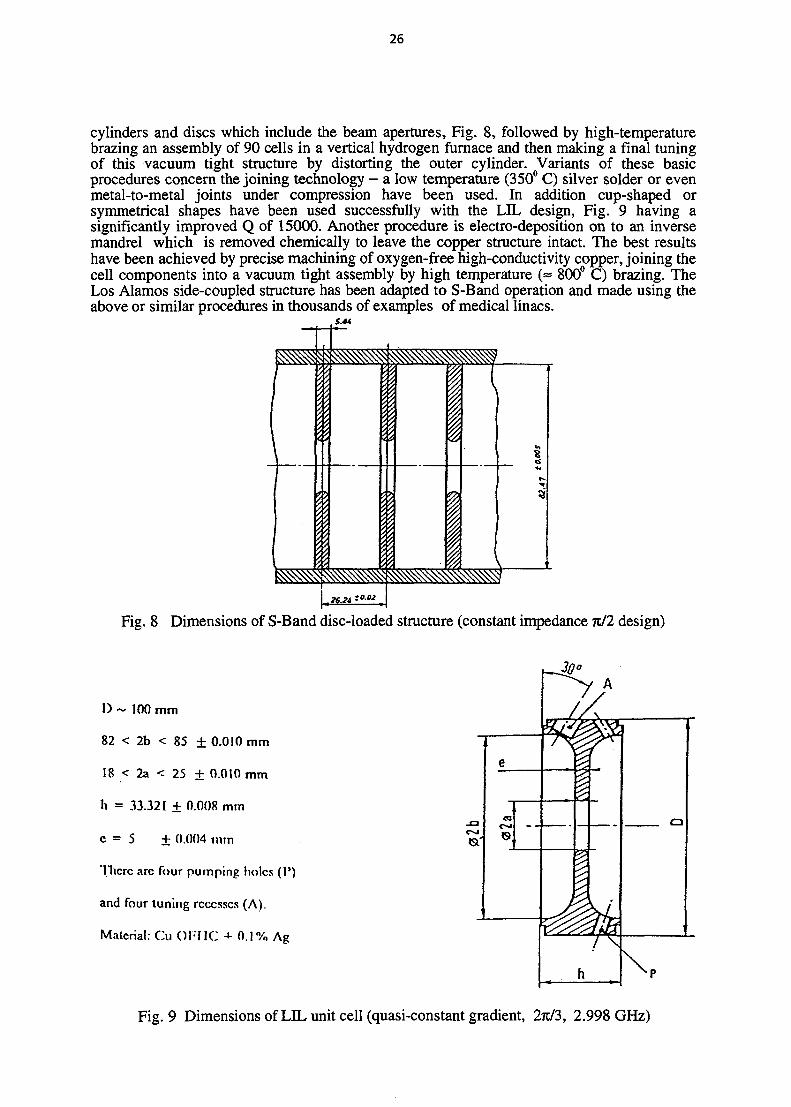
cylinders and discs which include the beam apertures, Fig. 8, followed by high-temperaturebrazing an assembly of 90 cells in a vertical hydrogen furnace and then making a final tuningof this vacuum tight structure by distorting the outer cylinder. Variants of these basicprocedures concern the joining technology - a low temperature (350° C) silver solder or evenmetal-to-metal joints under compression have been used. In addition cup-shaped orsymmetrical shapes have been used successfully with the LIL design, Fig. 9 having asignificantly improved Q of 15000. Another procedure is electro-deposition on to an inversemandrel which is removed chemically to leave the copper structure intact. The best resultshave been achieved by precise machining of oxygen-free high-conductivity copper, joining thecell components into a vacuum tight assembly by high temperature (« 800° C) brazing. TheLos Alamos side-coupled structure has been adapted to S-Band operation and made using theabove or similar procedures in thousands of examples of medical linacs.
Fig. 8 Dimensions of S-Band disc-loaded structure (constant impedance nil design)
D ~ 100 mm
82 < 2b < 85 ±0.010 mm
18 < 2a < 25 ± 0.010 mm
h = 33.321 + 0.008 mm
c = 5 + 0.004 mm
"Ilicrc arc four pumping holes (P)
and four tuning recesses (A).
Material: Cti OFMC -*• 0.1% Ag
e
/
J
0
/ A/
|
1
r
'i \
r h
Fig. 9 Dimensions of LIL unit cell (quasi-constant gradient, 2TC/3, 2.998 GHz)
27
5.5.5 Acceleration Rate and Structure Cooling
The maximum acceleration rate is limited by voltage breakdown and the RF powersources. In many applications the reliability is an important consideration so that 10 MeV m"1
suffices and leads to reasonably dimensioned linacs and power sources. In fact modernstanding wave designs can achieve > 25 MeV m1 with shunt impedances about 100 MeV m'1,and for special applications and short pulses (e.g. on the CLIC test facility) surface fields > 70MV m'1 are necessary.
Taking the accelerating rate of 10 MeV m1 as a reference value and applying this to astanding wave structurev with a nominal shunt impedance of 50 MQ. m1, it can be shown (seesection 5.2) that this gives a power dissipation of 2 MW m1. This is well matched to availableRF power sources, principally klystrons, in the 3 to 5 MW range.With a duty cycle of 0.1 %the thermal energy to be removed from the structure is 2 kW m'1 with the importantcondition that the structure steady-state temperature stability must be < 0.1° C,corresponding to < 5 kHz frequency stability in a copper structure. This problem can bealleviated in a single section linac if the klystron is tunable.
6. REVIEW OF BEAM DYNAMICS
The aim in this chapter is to give an appraisal of the beam dynamics as background tothe design problems of the complete linac. Again the emphasis is on those aspects whichparticularly concern low energy linacs destined for medical and commercial applications.Design features which lead to a compact single section accelerator which is easily operated aremost important. Thus problems associated with high currents, small emittances, very shortpulses (and microbunches) and many sections, will only be mentioned in passing.
6.1 Longitudinal Motion
As has been noted in section 3, electrons can be considered relativistic at 2 MeVespecially concerning efficient acceleration in a structure with vph = c. However, getting to thisenergy from energies below 100 keV involves some care - the vph = c travelling wavestructure cannot be used efficiently, mainly because the relative phase shift of the electrons istoo great with the usual accelerating rates. The standard analysis (L&S pp 116 to 121)considers the simplified accelerating field consisting of only the fundamental space harmonic,Eoz. The equations for y and 9 satisfy:
dy/dz = -(e E02/[mc2]) sin 6
de/dz = (2n/X) (py - p")
with phase, 0, measured from the field null in this case. Solving these equations andintroducing the reduced momentum, p = py, gives:
cos 6 - cos 9ra = (27cmcV[eE0ZM) ( [ p2 + I]"2 - [1 - pph2]l/2 - Pphp)
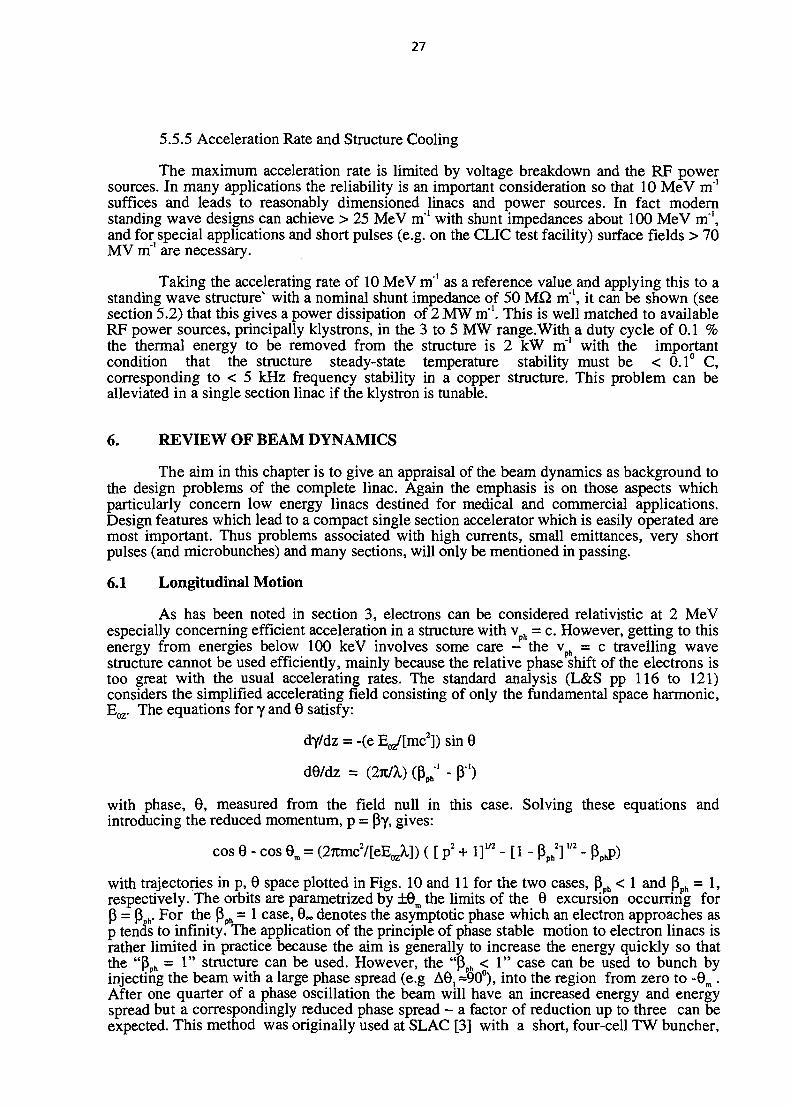
with trajectories in p, 9 space plotted in Figs. 10 and 11 for the two cases, pph < 1 and Pph = 1,respectively. The orbits are parametrized by ±0m the limits of the 9 excursion occurring forP = P h. For the Pph = 1 case, 9» denotes the asymptotic phase which an electron approaches asp tends to infinity. The application of the principle of phase stable motion to electron linacs israther limited in practice because the aim is generally to increase the energy quickly so thatthe "Pph = 1 " structure can be used. However, the "Pph < 1" case can be used to bunch byinjecting the beam with a large phase spread (e.g AO^O0), into the region from zero to -9m .After one quarter of a phase oscillation the beam will have an increased energy and energyspread but a correspondingly reduced phase spread - a factor of reduction up to three can beexpected. This method was originally used at SLAC [3] with a short, four-cell TW buncher,
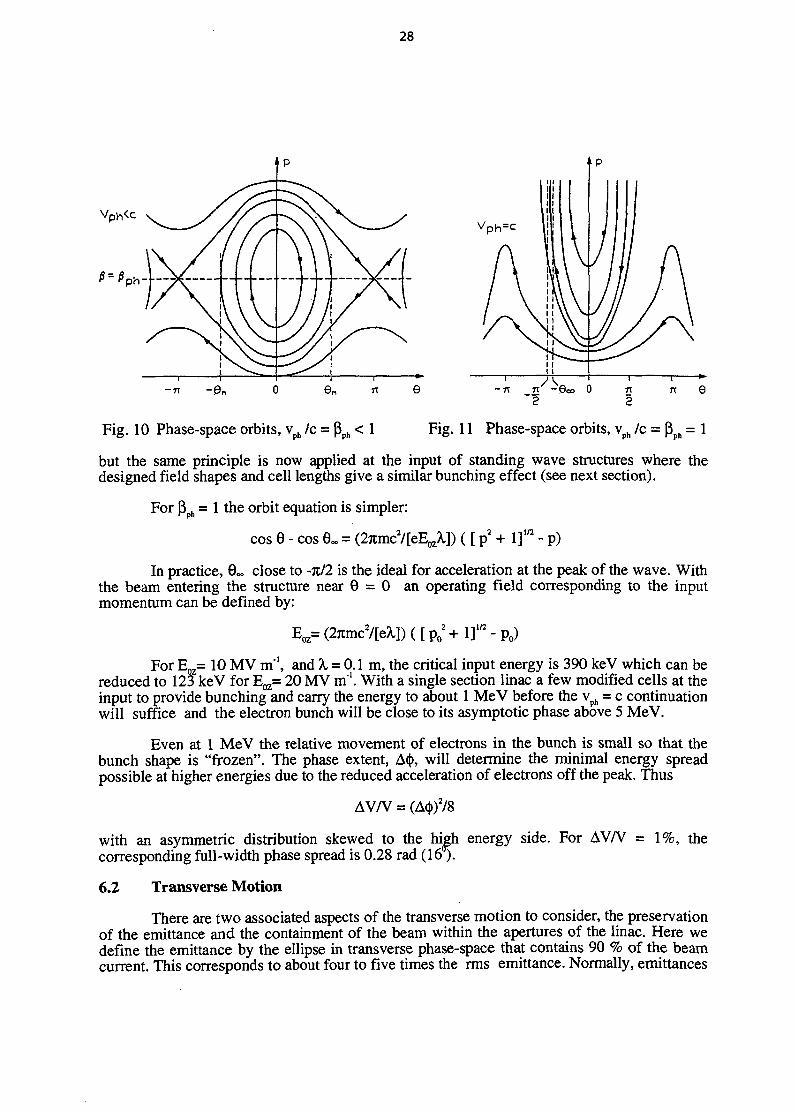
28
Vph<c
J p h -
- 7 T
Fig. 10 Phase-space orbits, vph /c = pph < 1 Fig. 11 Phase-space orbits, vph /c = pph = 1
but the same principle is now applied at the input of standing wave structures where thedesigned field shapes and cell lengths give a similar bunching effect (see next section).
For pph = 1 the orbit equation is simpler:
cos 6 - cos e~ = (27tmcV[eE0Z^]) ( [ p2 + I]1'2 - p)
In practice, 6~ close to -TC/2 is the ideal for acceleration at the peak of the wave. Withthe beam entering the structure near 6 = 0 an operating field corresponding to the inputmomentum can be defined by:
Eoz=(2*mc2/[eM)([po2+ir-po)
For Eoz= 10 MV m1, and X = 0.1 m, the critical input energy is 390 keV which can bereduced to 123 keV for Eoz= 20 MV m'1. With a single section linac a few modified cells at theinput to provide bunching and carry the energy to about 1 MeV before the vph = c continuationwill suffice and the electron bunch will be close to its asymptotic phase above 5 MeV.
Even at 1 MeV the relative movement of electrons in the bunch is small so that thebunch shape is "frozen". The phase extent, A(|), will determine the minimal energy spreadpossible at higher energies due to the reduced acceleration of electrons off the peak. Thus
AV/V = (A<)>)2/8
with an asymmetric distribution skewed to the high energy side. For AV/V = 1%, thecorresponding full-width phase spread is 0.28 rad (16).
6.2 Transverse Motion
There are two associated aspects of the transverse motion to consider, the preservationof the emittance and the containment of the beam within the apertures of the linac. Here wedefine the emittance by the ellipse in transverse phase-space that contains 90 % of the beamcurrent. This corresponds to about four to five times the rms emittance. Normally, emittances
29
are measured in radial (r) and angular (r') units and then normalised with p = Py, so that thenotion of emittance invariance can be invoked. One form for the normalised emittance is:
En = py (Area in r, r' phase space)/rc
with the area defined by the fraction of current contained or as a multiple of the rmsemittance. The units are m rad, often converted to mm mrad for practical convenience. Oneproblem at low energy and especially near the electron gun is that the emittance form is farfrom elliptical, sometimes like a line distorted by the optics into an "S" shape. The action ofabberations causes emittance growth which tends to produce a more nearly elliptical form athigher energies.
6.2.1 Typical Emittance Evolution
The first of two limiting cases occurs in electron linacs where the initial emittance isdetermined by an electron gun but subsequent elements in the focusing and accelerationsystems produce effects which substantially increase the emittance. Factors between 10 and100 are not unusual. The other limiting case concerns positron beams which have emittanceslimited by the acceptance of the acceleration section immediately following the productiontarget. This case will not be considered further here except to remark that positron beamemittances are generally more than ten times greater than the electron beam emittancegenerating them.
The ideal aberration-free electron gun with cathode radius 10 mm and transverse(thermal) electron energies about 0.2 eV would have an emittance, En ~ 4rc 10'6 m rad. [3]. Inpractice the grid (in the triode case) the focusing, pre-bunching, bunching and acceleratingelements introduce relatively large radial impulses depending on the electron bunch transversedimensions and phase spread. Typically En < 100 % 10'6 m rad. for V > 20 MeV and moderatecurrent (about 100 mA). A high current electron gun requires a larger cathode (emission about1 amp cm"2) which in turn leads to a larger emittance via all the effects mentioned above, withthe added complication of space charge effects at low energy. A typical case, the first bunchersection of the LEP Injector Linac (LDL) at 25 MeV, has En = 5OO7C 10'6 m rad for a 5 Aelectron beam in a 15 ns pulse and this value is approximately conserved up to theelectron/positron converter at 200 MeV. A reasonable aim for the moderate current lowenergy (< 20 MeV) accelerators is En < lOOrc 10'6 m rad.
6.2.2 Minimum Focusing Requirements at Low Energy
The evolution of the beam in an electron linac is often considered as if no focusing isrequired e.g. for En = lOOrc 10"6 m rad. at p =10 MeV/c the divergence of a beam with a waistof 5 mm diameter, is 2 mrad. and this divergence varies as l/p2. The increase in beam radius ina drift-space (without acceleration) is given by:
with ro and §o the maximum radius and angle at the beam waist, and r2 the beam radius at adistance z from the waist. The equivalent relation in the case of uniform acceleration (ordeceleration) is:
rz2 = r0
2 + ( pr ln[pZI/pz0] dz/dpz)2
with pr and pz the radial and longitudinal momenta respectively, with subscripts zO and zzdenoting the momenta at the waist and at position z. Note that pr = En/r0 and dz/dpz = 1/ y ' inthe relativistic case. The angle of the envelope is:
drz/dz = pr2 Infp /pzo] [dz/dpz] / [rz p2] => pr / pz for r z » r0

30
This formulation is usually used to demonstrate that the beam diameter increases by asurprisingly small amount above (for example) 10 MeV in an accelerator with y ' = 20 m"1
(10 MeV m"1). Here it is applied in forward and reverse directions to determine the requiredbeam envelope at the input of an accelerator to produce an acceptable beam at a higher energy.
Three cases will show the possibilities. Consider the transport of a beam through a linacwith En = 100 7i 10 m rad and with normalised input and output momenta (p = (3y) 0.4 and 40respectively and an acceleration rate, dp/dz = 20 m'1. The minimum envelope size andcorresponding envelope angle are derived for beams: a) With a waist at the input, b) With awaist at the output, and c) With equal radii at input and output. For cases a) and b) the waistand maximum beam radii are 4.8 mm and 6.8 mm respectively with corresponding envelopeangles 37 mrad and 0.37 mrad. The case c) radii are 4.8 mm with input and output envelopeangles 52 mrad and 0.52 mrad respectively. For these cases it would seem that with carefulmatching of the beam at the input (requiring perhaps a short auxiliary focusing solenoidbetween the 40 keV electron gun and the input), a 3 GHz (S-Band) structure could providesufficient aperture to transport the electron beam without loss.
6.2.3 Other Focusing and Beam Transport Possibilities
For completeness it should be mentioned that for better control of the beam sizeauxilliary focusing is often used in "physics" linacs where more elaborate prebunching schemesare installed after the electron gun or where there is a strong space charge effect to counteract.To keep the cylindrical symmetry at low energies, e.g. between the electron gun and theaccelerating section, solenoids are used, with a choice between short lenses with an ironcircuit concentrating the field across a gap or, where the geometry of the other elementsallows, a continuous field from an assembly of longer iron-free solenoids. A long solenoidoften consisting of many contiguous elements is mounted when necessary around the first(buncher) section. For positron linacs a very strong solenoid field, 0.3T to 0.4T, is necessaryfor the capture section directly after the electron/positron converter to ensure sufficientacceptance; typically An = 6000 7C10"6 m rad.
The use of quadrupole focusing magnets is generally limited in linacs to energies aboveabout 50 MeV where single lenses or multiplets can be placed between sections. However inthe energy range of medical and industrial accelerators, up to 20 MeV, quadrupole lenses willfind their use in the beam transport channel after the accelerators, due to the compact solutionspossible (including permanent magnets) and the greater flexibility in matching applications.
The very low beam momenta near the electron gun are easily affected by stray magneticfields and often compensation conductors are mounted to annul the effect of the earth'smagnetic field. In a complementary way, steering coils are often required to realign theelectron beam precisely on a "target".
6.3 Computational Tools
A review of the computational tools available for accelerator design is being presentedat this school [11]. For electron linacs the use of the powerful cavity design programs e.g.SUPERFISH and MAFIA, is surprisingly recent. One problem has been that the accuracy withwhich the resonant frequency could be obtained was not sufficient to define the manufacturingdimensions so precise prototypes are still required. However the use of the cavity programs isessential if a wide range of structures is to be studied and optimised, and if there is a follow-upwith a program which requires the electro-magnetic field distribution. For the dynamics therehave been programs since the sixties treating the electron gun and the integration of the basiclongitudinal dynamics equations. However the precision and usefulness of the programs wereoften limited by the speed of the central processers and the available fast memory. The last fewyears has seen both these limitations eliminated so that many programs can now be run ondesk-top systems. PARMELA is typical of the multiparticle programs necessary to study the
31
low energy parts of electron linacs in the presence of strong space-charge effects. It tracksparticles through the fields previously computed by a cavity program and includes space-charge impulses determined by a "particle-in-cell" subroutine. More advanced options, treatingimages and wakefields, are rarely necessary for the short linacs treated here.
7. THE COMPLETE LINAC
7.1 Typical Performance Requirements
Consider here the simplest linacs which comprise one accelerating section and whichare used essentially for medical, industrial and irradiation applications. Energies from 5 to20 MeV are normal with beam measured in terms of output power (e.g. 5 to 10 kW for anirradiation facility) and in terms of the gamma radiation dose they might deliver in a medicallinac (corresponding to a maximum mean beam energy « 1 kW). Normally the beam qualityrequirements are not strict and there is rarely difficulty in providing a satisfactory transverseemittance. In fact the ultimate emittance of an electron gun is always so small that it is theaberrations introduced by subsequent elements, e.g. prebunchers, space-charge and focusinglenses, which determine the final emittance (see section 6.2.1). A large energy spread will bemore significant in determining beam size if there are dispersive transport components.
The elements of the linac will be described from the gun to the output. It is notintended to treat any linac in detail - this will presumably be done under the applications.
7.2 Electron Guns and Beam Input Matching
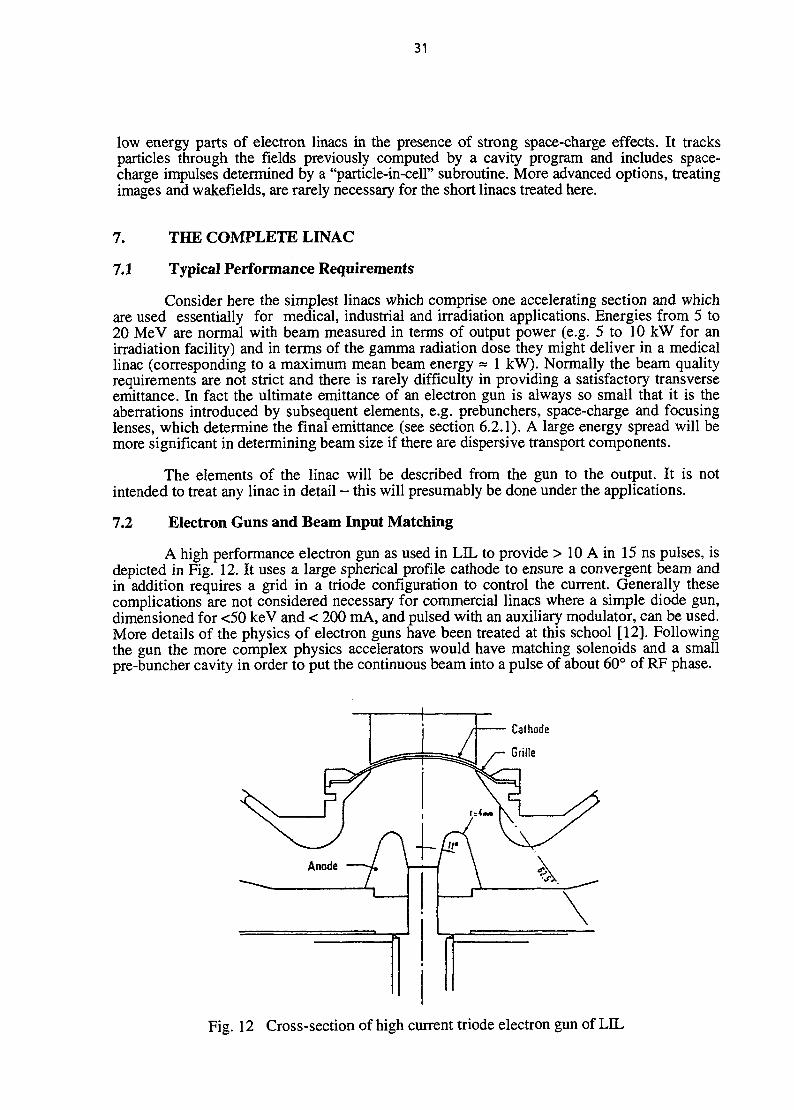
A high performance electron gun as used in LIL to provide > 10 A in 15 ns pulses, isdepicted in Fig. 12. It uses a large spherical profile cathode to ensure a convergent beam andin addition requires a grid in a triode configuration to control the current. Generally thesecomplications are not considered necessary for commercial linacs where a simple diode gun,dimensioned for <50 keV and < 200 mA, and pulsed with an auxiliary modulator, can be used.More details of the physics of electron guns have been treated at this school [12]. Followingthe gun the more complex physics accelerators would have matching solenoids and a smallpre-buncher cavity in order to put the continuous beam into a pulse of about 60° of RF phase.
Fig. 12 Cross-section of high current triode electron gun of LIL
32
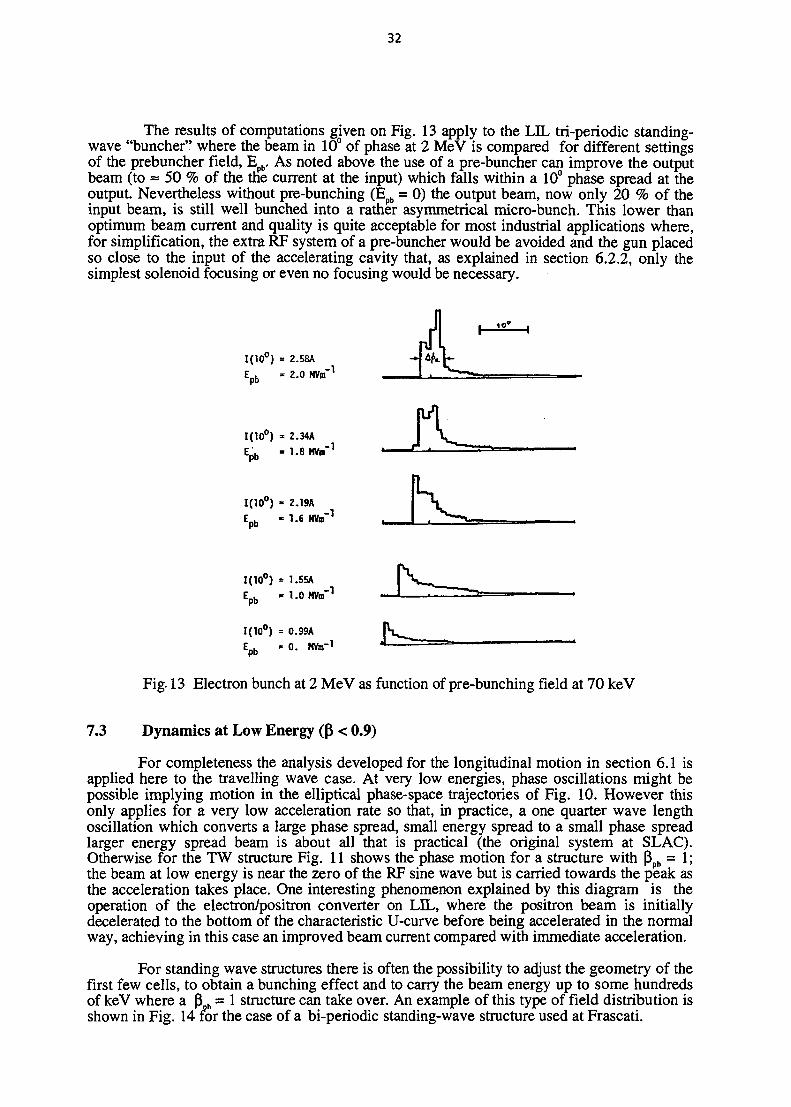
The results of computations given on Fig. 13 apply to the LIL tri-periodic standing-wave "buncher" where the beam in 10° of phase at 2 MeV is compared for different settingsof the prebuncher field, Epb. As noted above the use of a pre-buncher can improve the outputbeam (to « 50 % of the the current at the input) which falls within a 10° phase spread at theoutput. Nevertheless without pre-bunching (Epb = 0) the output beam, now only 20 % of theinput beam, is still well bunched into a rather asymmetrical micro-bunch. This lower thanoptimum beam current and quality is quite acceptable for most industrial applications where,for simplification, the extra RF system of a pre-buncher would be avoided and the gun placedso close to the input of the accelerating cavity that, as explained in section 6.2.2, only thesimplest solenoid focusing or even no focusing would be necessary.
1(10°) = 2.58A
E . = 2.0 HV
1(10°) = 2.34AEpb - 1 - 8 W
1(10°) - 2.19A
Ep b - 1-6 HV
1(10°) = l.SSA
1(10°) = O.99AE . «= 0 . MVm"1
Fig-13 Electron bunch at 2 MeV as function of pre-bunching field at 70 keV
7.3 Dynamics at Low Energy (p < 0.9)
For completeness the analysis developed for the longitudinal motion in section 6.1 isapplied here to the travelling wave case. At very low energies, phase oscillations might bepossible implying motion in the elliptical phase-space trajectories of Fig. 10. However thisonly applies for a very low acceleration rate so that, in practice, a one quarter wave lengthoscillation which converts a large phase spread, small energy spread to a small phase spreadlarger energy spread beam is about all that is practical (the original system at SLAC).Otherwise for the TW structure Fig. 11 shows the phase motion for a structure with Pph = 1;the beam at low energy is near the zero of the RF sine wave but is carried towards the peak asthe acceleration takes place. One interesting phenomenon explained by this diagram is theoperation of the electron/positron converter on LIL, where the positron beam is initiallydecelerated to the bottom of the characteristic U-curve before being accelerated in the normalway, achieving in this case an improved beam current compared with immediate acceleration.
For standing wave structures there is often the possibility to adjust the geometry of thefirst few cells, to obtain a bunching effect and to carry the beam energy up to some hundredsof keV where a p h = l structure can take over. An example of this type of field distribution isshown in Fig. 14 for the case of a bi-periodic standing-wave structure used at Frascati.
33
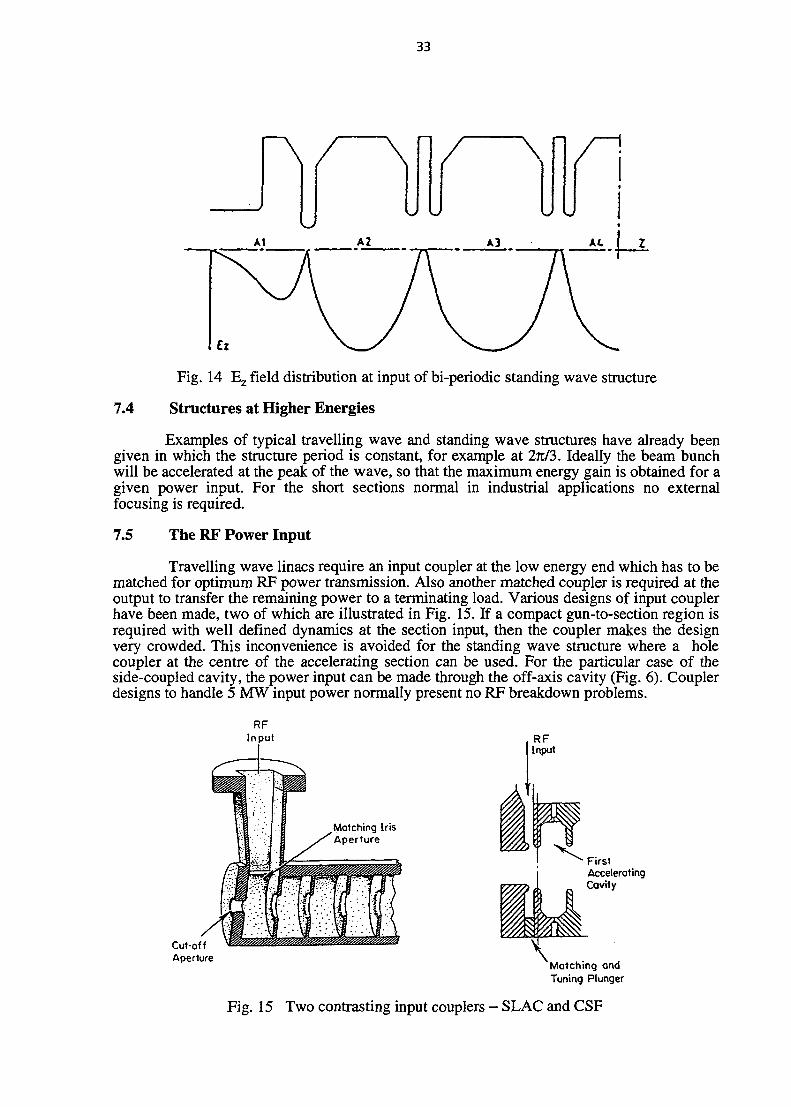
7.4
Fig. 14 Ez field distribution at input of bi-periodic standing wave structure
Structures at Higher Energies
Examples of typical travelling wave and standing wave structures have already beengiven in which the structure period is constant, for example at 2rc/3. Ideally the beam bunchwill be accelerated at the peak of the wave, so that the maximum energy gain is obtained for agiven power input. For the short sections normal in industrial applications no externalfocusing is required.
7.5 The RF Power Input
Travelling wave linacs require an input coupler at the low energy end which has to bematched for optimum RF power transmission. Also another matched coupler is required at theoutput to transfer the remaining power to a terminating load. Various designs of input couplerhave been made, two of which are illustrated in Fig. 15. If a compact gun-to-section region isrequired with well defined dynamics at the section input, then the coupler makes the designvery crowded. This inconvenience is avoided for the standing wave structure where a holecoupler at the centre of the accelerating section can be used. For the particular case of theside-coupled cavity, the power input can be made through the off-axis cavity (Fig. 6). Couplerdesigns to handle 5 MW input power normally present no RF breakdown problems.
Cut-offAperiure
FirstAcceleratingCavity
Matching andTuning Plunger
Fig. 15 Two contrasting input couplers - SLAC and CSF
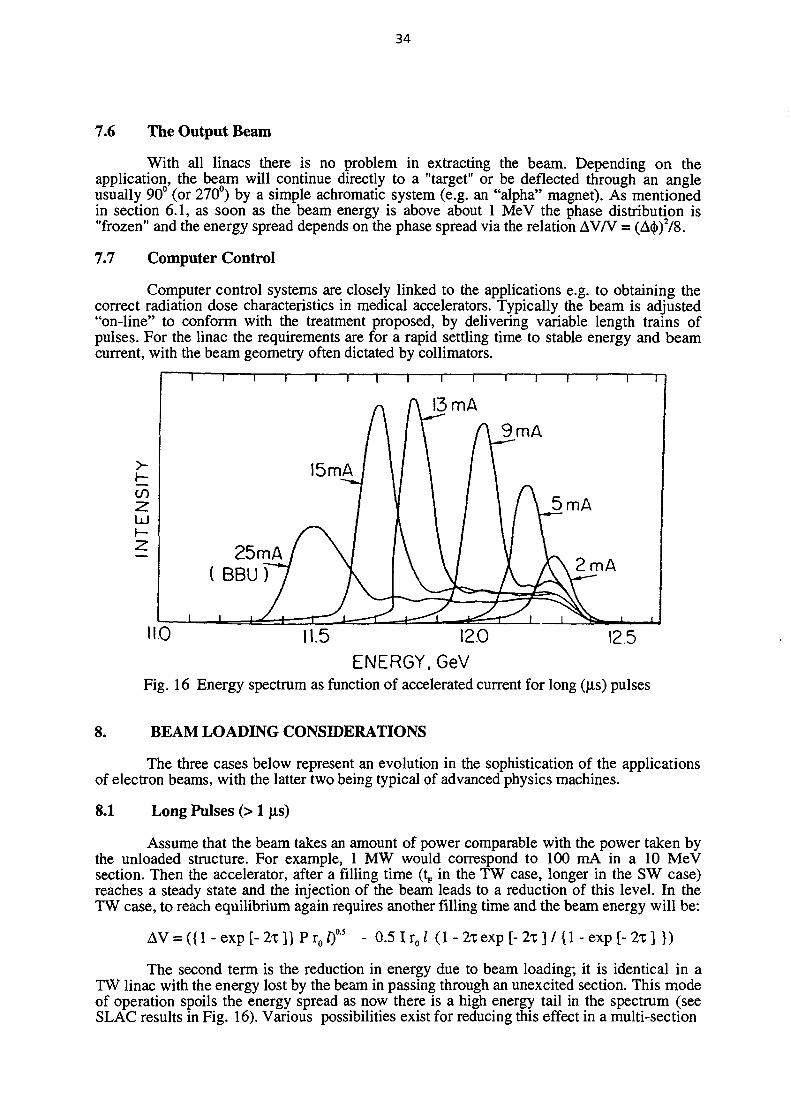
34
7.6 The Output Beam
With all linacs there is no problem in extracting the beam. Depending on theapplication, the beam will continue directly to a "target" or be deflected through an angleusually 90° (or 270°) by a simple achromatic system (e.g. an "alpha" magnet). As mentionedin section 6.1, as soon as the beam energy is above about 1 MeV the phase distribution is"frozen" and the energy spread depends on the phase spread via the relation AWV = (A<t>)2/8.
7.7 Computer Control
Computer control systems are closely linked to the applications e.g. to obtaining thecorrect radiation dose characteristics in medical accelerators. Typically the beam is adjusted"on-line" to conform with the treatment proposed, by delivering variable length trains ofpulses. For the linac the requirements are for a rapid settling time to stable energy and beamcurrent, with the beam geometry often dictated by collimators.
on2LU\-2
" 1 1 1
25mA/( BBUW
i i i
A15mA / \
i i i
A 13 mA
it r , 9 m A
A
1 1
5 mA
t \ 2 mA
i r
11.0 12.511.5 12.0
ENERGY, GeVFig. 16 Energy spectrum as function of accelerated current for long (|is) pulses
8. BEAM LOADING CONSIDERATIONS
The three cases below represent an evolution in the sophistication of the applicationsof electron beams, with the latter two being typical of advanced physics machines.
8.1 Long Pulses (> 1 JIS)
Assume that the beam takes an amount of power comparable with the power taken bythe unloaded structure. For example, 1 MW would correspond to 100 mA in a 10 MeVsection. Then the accelerator, after a filling time (tp in the TW case, longer in the SW case)reaches a steady state and the injection of the beam leads to a reduction of this level. In theTW case, to reach equilibrium again requires another filling time and the beam energy will be:
AV = ({1 -exp[-2x]} P r o 00.5 - 0 .5Ir 0 i - 2% exp [- 2x ] / {1 - exp [- 2T ]
The second term is the reduction in energy due to beam loading; it is identical in aTW linac with the energy lost by the beam in passing through an unexcited section. This modeof operation spoils the energy spread as now there is a high energy tail in the spectrum (seeSLAC results in Fig. 16). Various possibilities exist for reducing this effect in a multi-section

35
:OOM«V 2tOMcV 22OMeV
FWHH • 2M«V
80X ol currant In SM«V
230 M«V SOOM«V S10M.V
Fig. 17 Spectra—high charge, 15 ns pulse Fig. 18 Spectrum—lower charge, AV/V = (A(J))2/8
linac but for a single section the only possibility is to introduce the beam before the end of thefilling time in the TW case, or at the time during the rising edge of the pulse in the SW casewhere the RF level has reached the final loaded level. This possibility depends on thesophistication of the RF and/or gun modulators.
8.2 Beam Loading for ns Pulses
In this case the energy taken by the beam is an appreciable fraction of the storedenergy in the accelerating section of either TW or SW type. There is no possibility ofcorrecting this effect by modifying the RF drive, as the case of the LIL 4.5m TW sectionaccelerating 2.5 A shows. With a nominal energy gain of 50 MeV, the instantaneous beampower is 125 MW.
So an energy reduction in the pulse has to be tolerated, typically 10% from thebeginning to the end of the 12 ns, 2.5 A pulse in the 200 MeV high current part of LIL (seeFig. 17). Note that this will correspond to 36 micro-bunches at 3 GHz. The energy reductionoccurs only during the beam pulse and the recovery to the normal RF field level will take onefilling time.
8.3 Beam Loading for Single Pulses
This is the situation in some of the proposed linear colliders. Again the energy of thebunch comes from the stored energy of the accelerator. In practice the energy at the tail of thebunch will be less than at the beginning due to the effect of the longitudinal wake fieldsproduced by the head of the bunch.
8.4 Energy Spread
In the above cases, for sufficiently high currents, the energy spread due to RF levelreduction dominates. For lower charges < 0.5 nC e.g. LIL-W, the characteristic energy spreadAV/V = (A4>)2/8 occurs (Fig. 18). The resulting distribution is peaked at high energy with alow energy tail caused by electrons at the extreme phases.This formulation best applies athigher energies where the effect of the initial energy spread can be neglected.
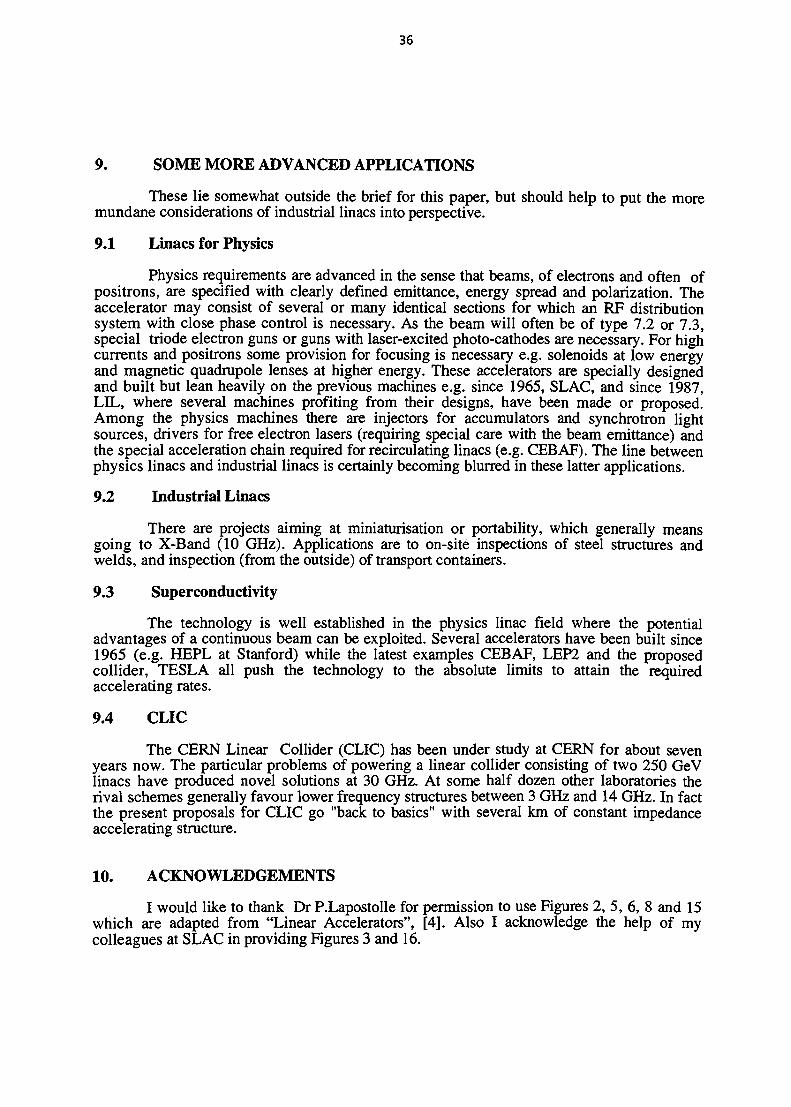
36
9. SOME MORE ADVANCED APPLICATIONS
These lie somewhat outside the brief for this paper, but should help to put the moremundane considerations of industrial linacs into perspective.
9.1 Linacs for Physics
Physics requirements are advanced in the sense that beams, of electrons and often ofpositrons, are specified with clearly defined emittance, energy spread and polarization. Theaccelerator may consist of several or many identical sections for which an RF distributionsystem with close phase control is necessary. As the beam will often be of type 7.2 or 7.3,special triode electron guns or guns with laser-excited photo-cathodes are necessary. For highcurrents and positrons some provision for focusing is necessary e.g. solenoids at low energyand magnetic quadrupole lenses at higher energy. These accelerators are specially designedand built but lean heavily on the previous machines e.g. since 1965, SLAC, and since 1987,LEL, where several machines profiting from their designs, have been made or proposed.Among the physics machines there are injectors for accumulators and synchrotron lightsources, drivers for free electron lasers (requiring special care with the beam emittance) andthe special acceleration chain required for recirculating linacs (e.g. CEBAF). The line betweenphysics linacs and industrial linacs is certainly becoming blurred in these latter applications.
9.2 Industrial Linacs
There are projects aiming at miniaturisation or portability, which generally meansgoing to X-Band (10 GHz). Applications are to on-site inspections of steel structures andwelds, and inspection (from the outside) of transport containers.
9.3 Superconductivity
The technology is well established in the physics linac field where the potentialadvantages of a continuous beam can be exploited. Several accelerators have been built since1965 (e.g. HEPL at Stanford) while the latest examples CEBAF, LEP2 and the proposedcollider, TESLA all push the technology to the absolute limits to attain the requiredaccelerating rates.
9.4 CLIC
The CERN Linear Collider (CLIC) has been under study at CERN for about sevenyears now. The particular problems of powering a linear collider consisting of two 250 GeVlinacs have produced novel solutions at 30 GHz. At some half dozen other laboratories therival schemes generally favour lower frequency structures between 3 GHz and 14 GHz. In factthe present proposals for CLIC go "back to basics" with several km of constant impedanceaccelerating structure.
10. ACKNOWLEDGEMENTS
I would like to thank Dr P.Lapostolle for permission to use Figures 2, 5, 6, 8 and 15which are adapted from "Linear Accelerators", [4]. Also I acknowledge the help of mycolleagues at SLAC in providing Figures 3 and 16.
37
REFERENCES
[I] P. Lapostolle, Introduction to RF Linear Accelerators, these proceedings.
[2] M. Weiss, Fundamentals of Ion Linacs, these proceedings.
[3] R. B. Neal, Editor, The Stanford Two-Mile Accelerator, Benjamin, (1968).
[4] P. Lapostolle and A. Septier (Eds), Linear Accelerators, North Holland Publishing,(1970), especially pages 39 to 146.
[5] After 1970: See the bi-annual series of linear accelerator conferences with the mostrecent at Tsukuba (1994).
[6] S. Ramo, J.R. Whinnery and T. Van Duzer, Fields and Waves in CommunicationsElectronics, John Wiley and Sons, (1984).
[7] M. Stanley Livingston, Development of High Energy Accelerators, Dover, (1966),pages 166 to 185.
[8] J.H.B. Madsen, LEP Injector Linacs, CERN PS 89-56 (LP).
[9] F. Dupont, Status of the LEP e* Injector Linacs, Proc. 1984 Linear AcceleratorConference, GSI-84-11, pages 288-292.
[10] B. Epsztein and Tran Due Tien, Tri-periodic Structures, Proc. 1968 Proton LinearAccelerator Conference, BNL50120 (1968), pages 457-470.
II1] L. Rinolfi, Computational Tools for Accelerator Design, these proceedings.
[12] C.E. Hill, Ion and Electron Sources, these proceedings.
NEXT PAQE(S)left BLSkMK
39
FUNDAMENTALS OF ION LINACS
M. WeissCERN, Geneva, Switzerland
AbstractThe operating principles of ion RF linear accelerators are described,based on the concept of 'slow waves' generated in 'loaded cavities'.Fundamental cavity parameters are presented, and equationsdescribing the action of electromagnetic fields on the particles aregiven. Space charge influences are touched upon only briefly. Varioustypes of linear accelerators are introduced according to their use atdifferent particle energies and frequencies.
1. INTRODUCTION
Linear accelerators (linacs) accelerate particles on a linear path. Usually linacs operatewith sinusoidally varying electromagnetic fields and are called RF linear accelerators. RFfields are created in a bounded volume, known as cavity, and the cavity operates either as awaveguide (the electromagnetic energy enters the cavity at one end, is dissipated partly alongthe cavity walls which are of finite conductivity, and exits at the other end to be dissipated ina matched load), or as a resonator (the electromagnetic energy is reflected back and forth onthe end walls). Accelerators working on these principles are called travelling- and standing-wave linacs, respectively. RF linacs operate in the frequency range of a few MHz up toseveral GHz. They are suitable for the acceleration of light particles, like electrons (at10 MeV electrons already have the relativistic velocity ft = 0.999), as well as of heavierparticles, ions (protons at 10 MeV have p = 0.145). Ions are slow particles and ion linacsusually operate in the MHz region whilst electron linacs operate in the GHz region. Thestructure of the cavity differs when used for slow or rapid particles. However, the basicprinciples of operation are always the same. This paper deals with ion linacs which have avast field of applications, such as physics research, nuclear waste transmutation, breeding ofnuclear fuel, materials study (neutron spallation sources) and medical applications (cancertreatment).
Sections 2 and 3 are essential for understanding the principles of operation of linearaccelerators with RF electromagnetic fields. The accelerating structures have been treated aslossless for better clarity; lossy structures would be treated in a similar way. Section 4outlines the basic cavity parameters, whilst Sections 5 and 6 deal with some more commonaccelerator types. Section 7 shows how the action of electromagnetic fields on particles iscomputed, and Section 8 touches the problem of space charge influences and the beamloading of cavities. Section 9 treats a particular accelerator called the radio-frequencyquadrupole (RFQ), which is in wide use all over the world. Section 10 gives some concludingremarks.
2. EMPTY CAVITIES: WAVE TYPES AND MODES
In free space, the electromagnetic wave has electric and magnetic field vectorsperpendicular to the direction of propagation. Such a wave type is called the transverseelectromagnetic wave (TEM). In bounded media, where the boundary is a perfect conductor,such a wave type is not possible because the boundary conditions cannot be satisfied. On theboundary, the tangential component of the electric field Et, as well as the normal componentof the magnetic field Bn, have to be zero. These conditions are satisfied if the wave has one ofthe field components in the direction of propagation (the longitudinal or z-axis of thecoordinate system). If it is the electric field component Ez, the wave type is called transversemagnetic (TM); if it is the magnetic field component Bz the wave type is called transverseelectric (TE), [1].
Wave propagation in cavities can be explained in terms of reflections from wall to wall;in this way one has a field component in the direction of propagation. Not all the angles of

40
wave incidence and reflection are allowed; only a discrete number of them satisfy theconditions. For each wave type, one can have certain wave modes, which are indicated bysubscripts. For example, in a rectangular cavity one can have cavity modes
TEmn or TMmn
m and n indicating the number of half waves in the x and y direction, respectively (see Fig. 1).If there is a third subscript (in resonators), it indicates the number of half waves in the zdirection.
Fig. 1 TEQI wave in a rectangular cavity
In linacs one distinguishes between two wave velocities: the phase velocity vph and thegroup velocity vg. The former is the velocity of the wave phenomenon, like that of rapid wavepropagation along the shore, resulting from an obliquely incident sea wave. Electromagneticwaves, moving with the velocity c and falling obliquely on the side walls of a cavity, wouldresult in a longitudinal (along the cavity) wave phenomenon moving with a phase velocitybigger than the velocity of light c. Of course, the wave energy does not move in thelongitudinal direction with the phase velocity, but with the much slower group velocity.However, for the acceleration of particles in accelerators it is the phase velocity which counts.To see this in more detail, we shall write the wave equation in cylindrical coordinates(accelerators usually have a circular cross section) for a rotationally symmetricelectromagnetic field like TM01, where the subscripts indicate the number of field variationsazimuthally, and the number of zeros of the axial field radially (0 < r < i?max), respectively:
O _ T — 0 .
The solution is usually given in the form of a product of functions of one variable:
Ez(z,r,t) = Z(z)R(r)T(t),
where the functions Z(z) and T(t) are of the form:
Z(z) °= exp (-jkz) ; T(t) <* exp (jcot).
The factor k in the exponent represents the phase advance of the wave per unit length. Thefactor co represents the phase change per unit time or the angular frequency. The exponentj(cot - kz) is typical for travelling waves. Counting z from the position of the crest of the waveat time t = 0, one stays on the crest if during motion the condition
remains satisfied. One has
ox - kz = 0 ,
Z _ CO _
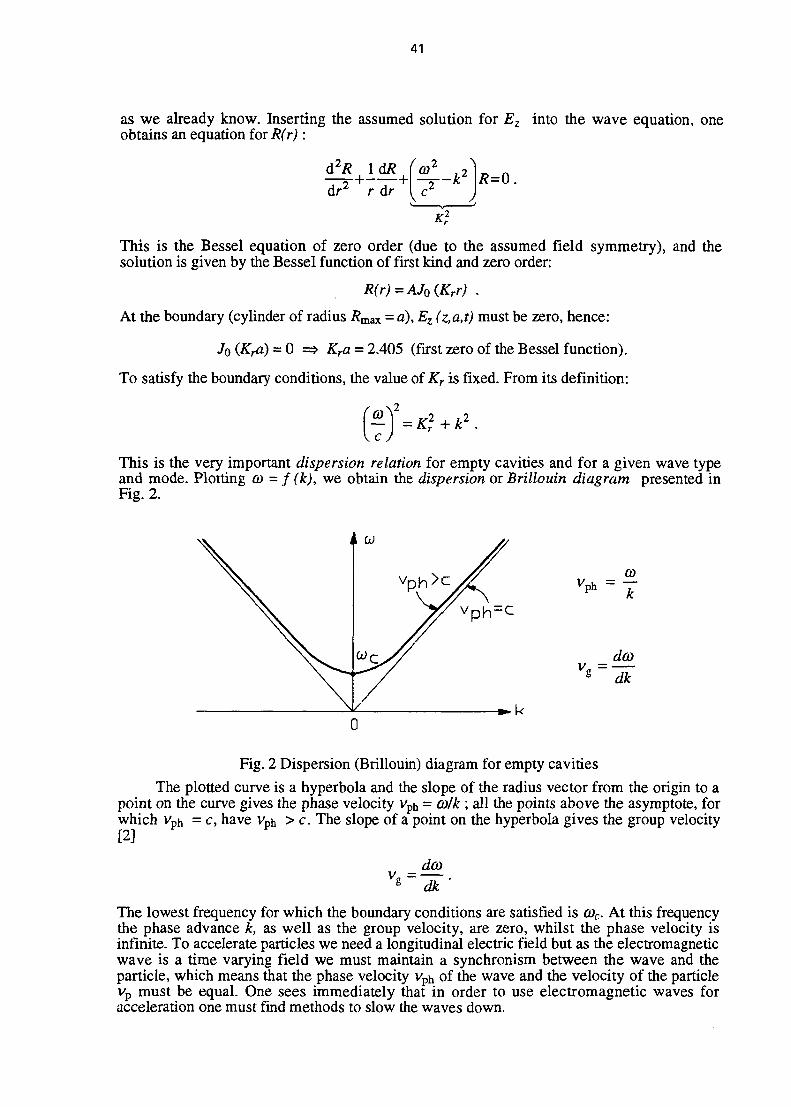
41
as we already know. Inserting the assumed solution for Ez into the wave equation, oneobtains an equation for R(r):
r dr
This is the Bessel equation of zero order (due to the assumed field symmetry), and thesolution is given by the Bessel function of first kind and zero order:
R(r)=AJ0(Krr) .
At the boundary (cylinder of radius /?max = a), Ez (z,a,t) must be zero, hence:
J0(Kra)-0 ==> Kra = 2.405 (first zero of the Bessel function).
To satisfy the boundary conditions, the value of Kr is fixed. From its definition:
c )
This is the very important dispersion relation for empty cavities and for a given wave typeand mode. Plotting a> = f (k), we obtain the dispersion or Brillouin diagram presented inFig. 2.
Q)
dco
Fig. 2 Dispersion (Brillouin) diagram for empty cavities
The plotted curve is a hyperbola and the slope of the radius vector from the origin to apoint on the curve gives the phase velocity vph = calk ; all the points above the asymptote, forwhich vPh = c, have vPh > c. The slope of a point on the hyperbola gives the group velocity[2]
dcov
The lowest frequency for which the boundary conditions are satisfied is 6)c- At this frequencythe phase advance it, as well as the group velocity, are zero, whilst the phase velocity isinfinite. To accelerate particles we need a longitudinal electric field but as the electromagneticwave is a time varying field we must maintain a synchronism between the wave and theparticle, which means that the phase velocity vPh of the wave and the velocity of the particlevp must be equal. One sees immediately that in order to use electromagnetic waves foracceleration one must find methods to slow the waves down.

42
3. LOADED CAVITIES: SPACE HARMONICS, TRAVELLING AND STANDINGWAVE STRUCTURES
One method to slow down the waves is to load' the cavity by introducing some periodicobstacles into it [3], as shown in Fig. 3. The study of the solution of the wave equation insuch a case is based on two essential points:
L = cell l e n g t h
iris (aperture)
Fig. 3 Disc-loaded cavity (schematic)
i) Floquet's theorem for periodic structures, which states that in a given mode of oscillationand at a given frequency, the wave function is multiplied by a constant such as e~JkL, whenmoving from one period to the next. A simple function that satisfies Floquet's theorem isg-jkz
ii) The complicated boundary conditions cannot be satisfied by a single mode, as was thecase with an empty cavity, but by a whole spectrum of space harmonics, which is in fact aFourier series applied to a periodic case. We now have:
Ez(r,z,t) = F(r,z)ej(ox-kz)
F(r,z + L) = F(r,z)
Introducing these expressions in the wave equation for rotationally symmetric waves weget:
• - n
drl r drKLa,rn un(r) = 0 ,
with
and
G) COv" k + 2mlL kn
For each n we have a travelling wave with its own velocity vph, which is slowed downcompared to the case of an empty cavity. In principle we can find an n such that vph = vp,which is what we wanted. For vph < c, one has K^ < 0 and so K^ = jkr. The solution of theBessel equation is now expressed by the Bessel functions of imaginary argument, which arecalled modified Bessel functions:
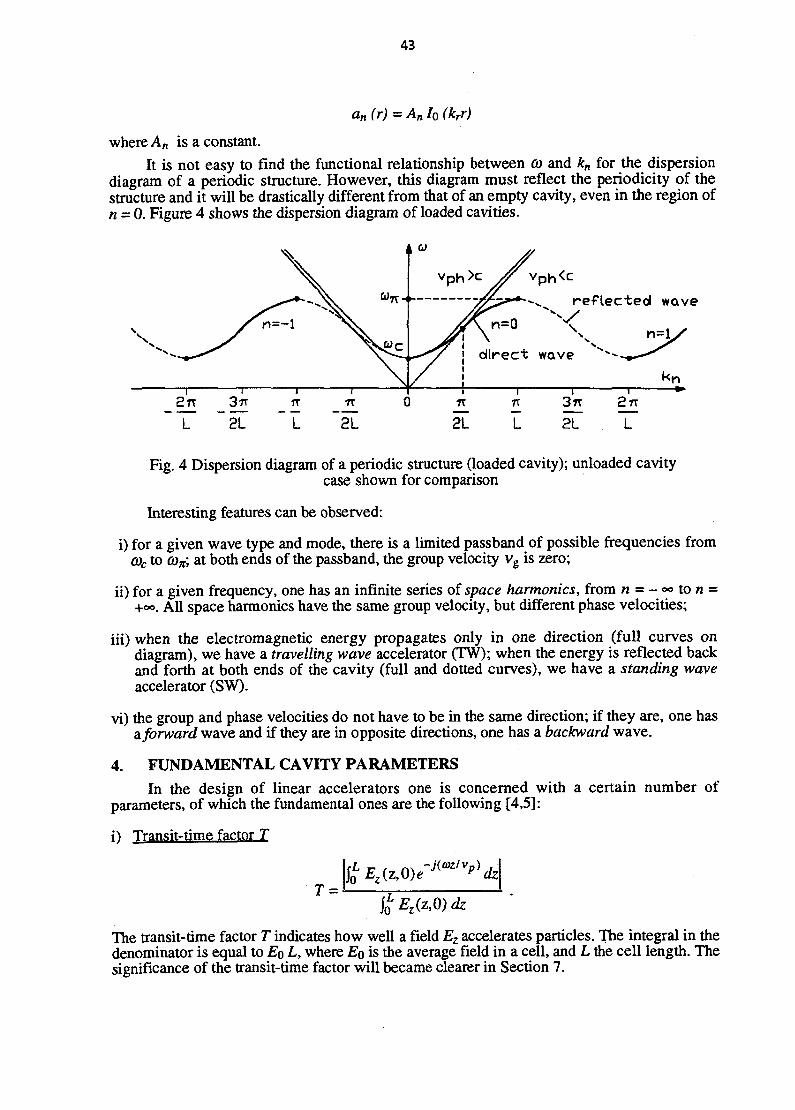
43
an (r) = An Io (krr)
where An is a constant.
It is not easy to find the functional relationship between co and kn for the dispersiondiagram of a periodic structure. However, this diagram must reflect the periodicity of thestructure and it will be drastically different from that of an empty cavity, even in the region ofn = 0. Figure 4 shows the dispersion diagram of loaded cavities.
ref lec ted wave
direct wave
2LnL 2L
2TT
L
Fig. 4 Dispersion diagram of a periodic structure (loaded cavity); unloaded cavitycase shown for comparison
Interesting features can be observed:
i) for a given wave type and mode, there is a limited passband of possible frequencies from0)c to CO*, at both ends of the passband, the group velocity vg is zero;
ii) for a given frequency, one has an infinite series of space harmonics, from n = - <» to n =+oo. All space harmonics have the same group velocity, but different phase velocities;
iii) when the electromagnetic energy propagates only in one direction (full curves ondiagram), we have a travelling wave accelerator (TW); when the energy is reflected backand forth at both ends of the cavity (full and dotted curves), we have a standing waveaccelerator (SW).
vi) the group and phase velocities do not have to be in the same direction; if they are, one hasa forward wave and if they are in opposite directions, one has a backward wave.
4. FUNDAMENTAL CAVITY PARAMETERS
In the design of linear accelerators one is concerned with a certain number ofparameters, of which the fundamental ones are the following [4,5]:
i) Transit-time factor T
dz\
%Ez(z,O)dz
The transit-time factor T indicates how well a field Ez accelerates particles. The integral in thedenominator is equal to EQ L, where EQ is the average field in a cell, and L the cell length. Thesignificance of the transit-time factor will became clearer in Section 7.
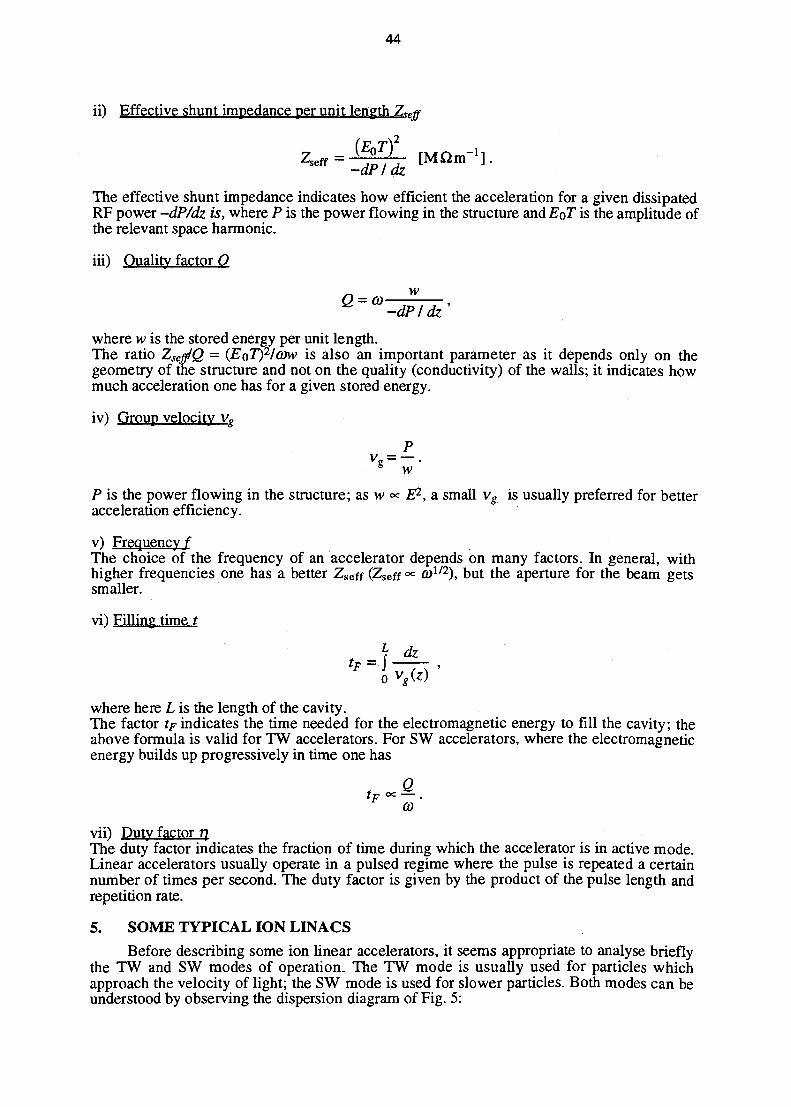
44
ii) Effective shunt impedance per unit length
Zseff = v~"~y [MQnT 1 ] .seff -dPIdz
The effective shunt impedance indicates how efficient the acceleration for a given dissipatedRF power -dP/dz is, where P is the power flowing in the structure andEoT is the amplitude ofthe relevant space harmonic.
iii) Quality factor O
" -dPIdz
where w is the stored energy per unit length.The ratio Zse-glQ = (EoT)2/anv is also an important parameter as it depends only on thegeometry of the structure and not on the quality (conductivity) of the walls; it indicates howmuch acceleration one has for a given stored energy.
iv) Group velocity vs
° wP is the power flowing in the structure; as w °= E2, a small vg is usually preferred for betteracceleration efficiency.
v) Frequency/The choice of the frequency of an accelerator depends on many factors. In general, withhigher frequencies one has a better Zseff (Zseff °= a>1/2), but the aperture for the beam getssmaller.
vD Filling time t
where here L is the length of the cavity.The factor tp indicates the time needed for the electromagnetic energy to fill the cavity; theabove formula is valid for TW accelerators. For SW accelerators, where the electromagneticenergy builds up progressively in time one has
(O
vii) Duty factor 77The duty factor indicates the fraction of time during which the accelerator is in active mode.Linear accelerators usually operate in a pulsed regime where the pulse is repeated a certainnumber of times per second. The duty factor is given by the product of the pulse length andrepetition rate.
5. SOME TYPICAL ION LINACS
Before describing some ion linear accelerators, it seems appropriate to analyse brieflythe TW and SW modes of operation. The TW mode is usually used for particles whichapproach the velocity of light; the SW mode is used for slower particles. Both modes can beunderstood by observing the dispersion diagram of Fig. 5:
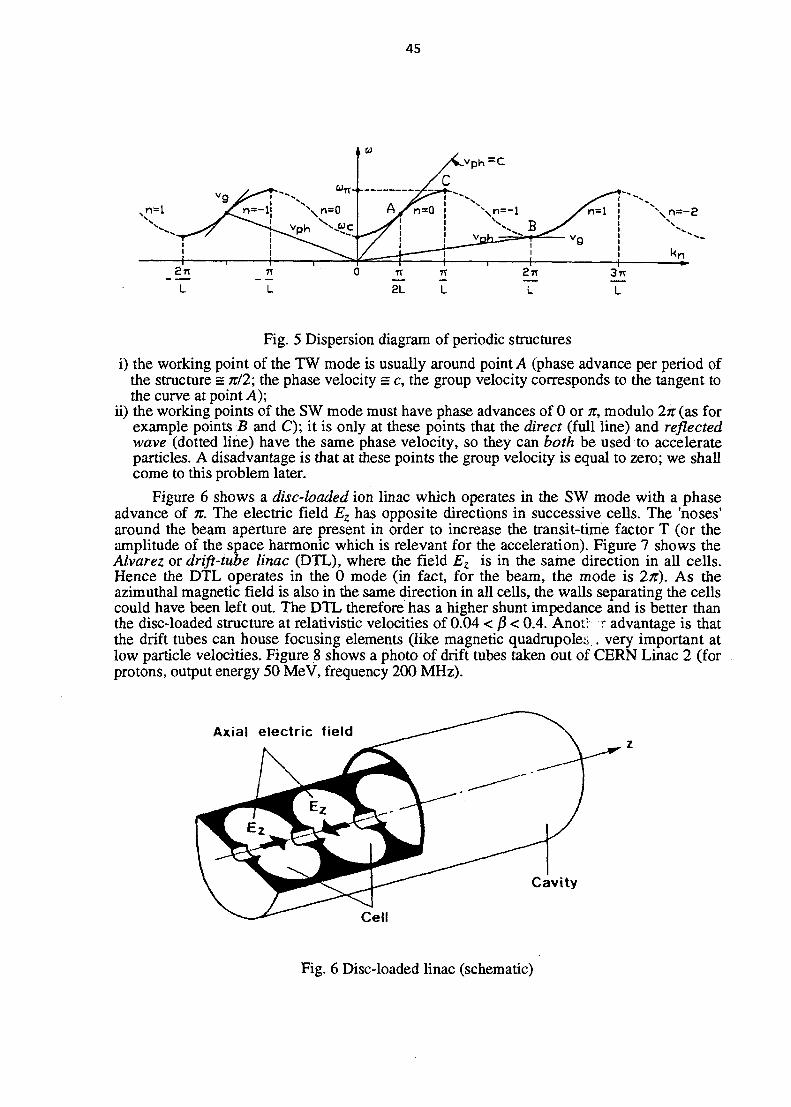
45
. «
Fig. 5 Dispersion diagram of periodic structures
i) the working point of the TW mode is usually around point A (phase advance per period ofthe structure = nil; the phase velocity = c, the group velocity corresponds to the tangent tothe curve at point A);
ii) the working points of the SW mode must have phase advances of 0 or n, modulo 2% (as forexample points B and C); it is only at these points that the direct (full line) and reflectedwave (dotted line) have the same phase velocity, so they can both be used to accelerateparticles. A disadvantage is that at these points the group velocity is equal to zero; we shallcome to this problem later.
Figure 6 shows a disc-boded ion linac which operates in the SW mode with a phaseadvance of n. The electric field Ez has opposite directions in successive cells. The 'noses'around the beam aperture are present in order to increase the transit-time factor T (or theamplitude of the space harmonic which is relevant for the acceleration). Figure 7 shows theAlvarez or drift-tube linac (DTL), where the field Ez is in the same direction in all cells.Hence the DTL operates in the 0 mode (in fact, for the beam, the mode is 2K). A S theazimuthal magnetic field is also in the same direction in all cells, the walls separating the cellscould have been left out. The DTL therefore has a higher shunt impedance and is better thanthe disc-loaded structure at relativistic velocities of 0.04 < )3 < 0.4. Anot! r advantage is thatthe drift tubes can house focusing elements (like magnetic quadrupoles , very important atlow particle velocities. Figure 8 shows a photo of drift tubes taken out of CERN Linac 2 (forprotons, output energy 50 MeV, frequency 200 MHz).
Axial electric field
Cavity
Cell
Fig. 6 Disc-loaded linac (schematic)
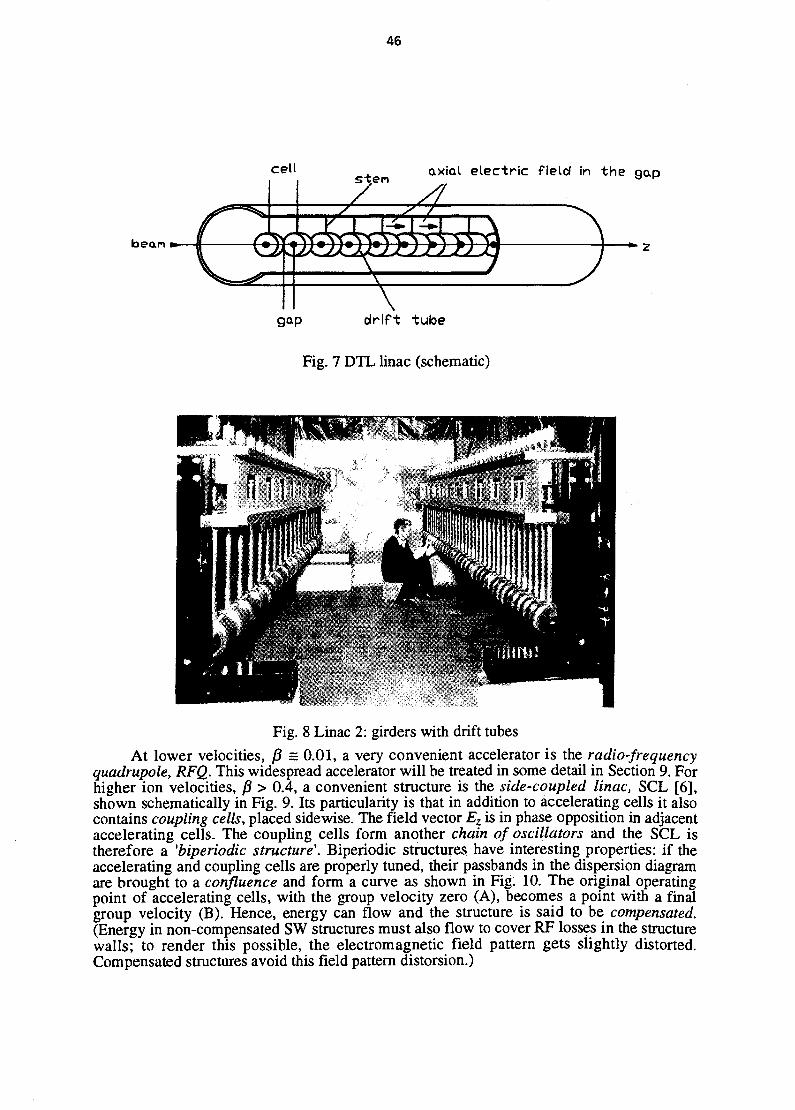
46
cell . axial electric field in the gap
7" //bean
gap
Fig. 7 DTL linac (schematic)
Fig. 8 Linac 2: girders with drift tubes
At lower velocities, ft = 0.01, a very convenient accelerator is the radio-frequencyquadrupole, RFQ. This widespread accelerator will be treated in some detail in Section 9. Forhigher ion velocities, (3 > 0.4, a convenient structure is the side-coupled linac, SCL [6],shown schematically in Fig. 9. Its particularity is that in addition to accelerating cells it alsocontains coupling cells, placed sidewise. The field vector Ez is in phase opposition in adjacentaccelerating cells. The coupling cells form another chain of oscillators and the SCL istherefore a 'biperiodic structure'. Biperiodic structures have interesting properties: if theaccelerating and coupling cells are properly tuned, their passbands in the dispersion diagramare brought to a confluence and form a curve as shown in Fig. 10. The original operatingpoint of accelerating cells, with the group velocity zero (A), becomes a point with a finalgroup velocity (B). Hence, energy can flow and the structure is said to be compensated.(Energy in non-compensated SW structures must also flow to cover RF losses in the structurewalls; to render this possible, the electromagnetic field pattern gets slightly distorted.Compensated structures avoid this field pattern distorsion.)

47
SEAM-CHANNEL
ACCELERATINGC«flTY
COUPLINGCWITY
Fig. 9 Side-coupled linac, SCL (schematic)
acceleratingcells
couplingcells
Fig. 10 Confluence of two passbands
The DTL can also be compensated, and a second chain of oscillators can be broughtinto the cavity in the form of post couplers (see Fig. 11). The inductance of the post couplerand its capacity towards the drift tube are tuned so as to bring the two passbands toconfluence. CERN Linac 2 is compensated in this way.
RF power input
Fig. 11 DTL cavity compensated with post couplers (schematic)

48
6. STRUCTURE COMPUTATIONS: DRIFT TUBE LINAC
Linear accelerators are periodic structures with complicated boundary conditions, and todesign them (geometry corresponding to a given frequency and field pattern) one usescomputer programs. To illustrate this procedure we take as an example the computation of theDTL, which operates with a TMoio field type and mode. The DTL is composed of one orseveral tanks (cavities), each tank containing a certain number of cells, coupled together, andall resonating at the same frequency. Each cell is composed of a gap and two half drift tubes,as seen in Fig. 7. The length of the cells increases according to the velocity of the particles,which have to cross a cell in one RF period. One computes only a certain number of cells, forvarious velocities, and then interpolates the results. Owing to symmetry it suffices to solvethe wave equation, with proper boundary conditions, in only a quarter of a cell, as shown inFig. 12. (In fact a cell is not symmetric because of the stem which holds the drift tube.However, one first neglects the stem and introduces it only later as a perturbation.) Toincrease the precision of calculations, the mesh size can be diminished in regions where thefield vectors have to be determined more accurately (see Fig. 13). In addition to fields, 2-Dprograms like SUPERFISH [7] or URMEL [8] compute also other cavity parameters, such asZseff, Q, power loss in the walls PL, average accelerating field EQ, stored energy w, transit-time factor T, etc. Some of these parameters are used in beam dynamics calculations.
^=0.068 /?=<UI7 /?=0.226
Fig. 12 Computation of DTL cells by SUPERFISH
Fig. 13 SUPERFISH calculations with a variable mesh size
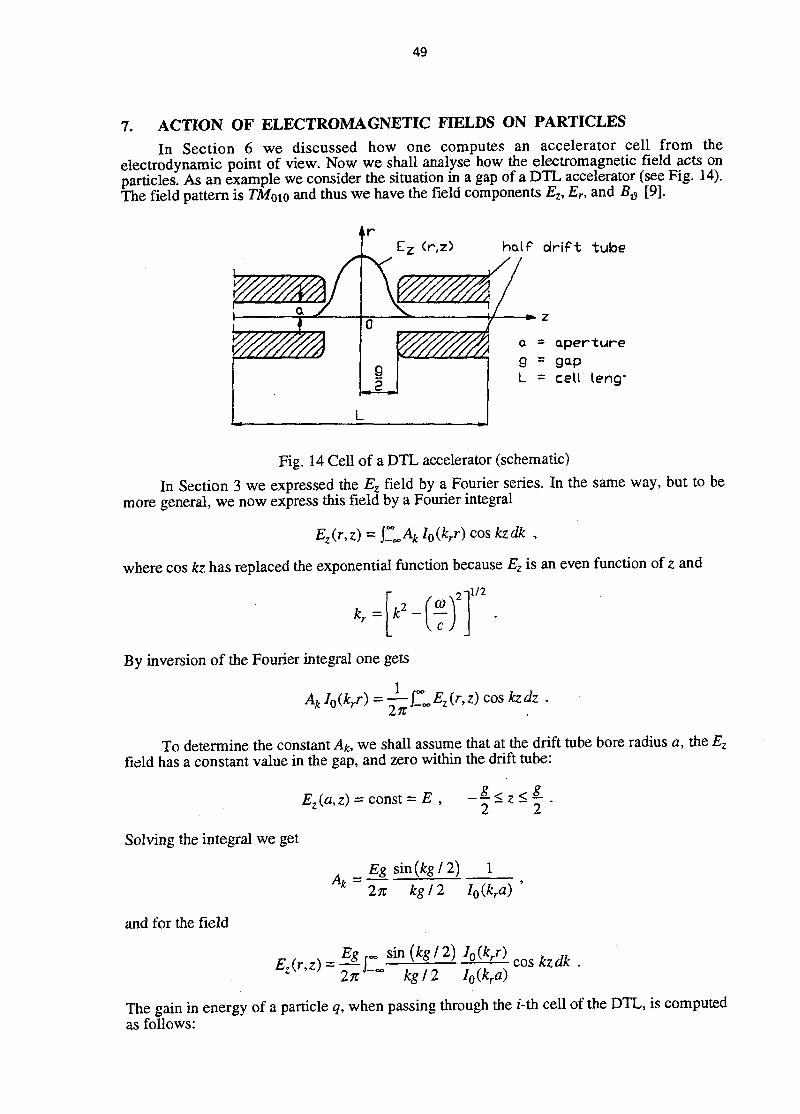
49
7. ACTION OF ELECTROMAGNETIC FIELDS ON PARTICLESIn Section 6 we discussed how one computes an accelerator cell from the
electrodynamic point of view. Now we shall analyse how the electromagnetic field acts onparticles. As an example we consider the situation in a gap of a DTL accelerator (see Fig. 14).The field pattern is TMoio and thus we have the field components Ez, Er, and B# [9].
\1
a >f
A/
V\ \
0
g.2.
L
E-z (r,z)
V
half
// ,
9L
drift tube
z
= aperture
= gap= cell \er\Q-
Fig. 14 Cell of a DTL accelerator (schematic)
In Section 3 we expressed the Ez field by a Fourier series. In the same way, but to bemore general, we now express this field by a Fourier integral
Ez{r,z) = £.4t W ) cos kzdk ,
where cos kz has replaced the exponential function because Ez is an even function of z and
*.-[f)1/2
By inversion of the Fourier integral one gets
V ) = T-Z»Ez(r>z)cos kzdz •
To determine the constant A*, we shall assume that at the drift tube bore radius a, the Ez
field has a constant value in the gap, and zero within the drift tube:
2 2
Solving the integral we get
_ £.g sin(fcg/2)2 ^ kg 12 IQ(kra)
c o s kzdk.
and for the field
The gain in energy of a particle q, when passing through the i-th cell of the DTL, is computedas follows:
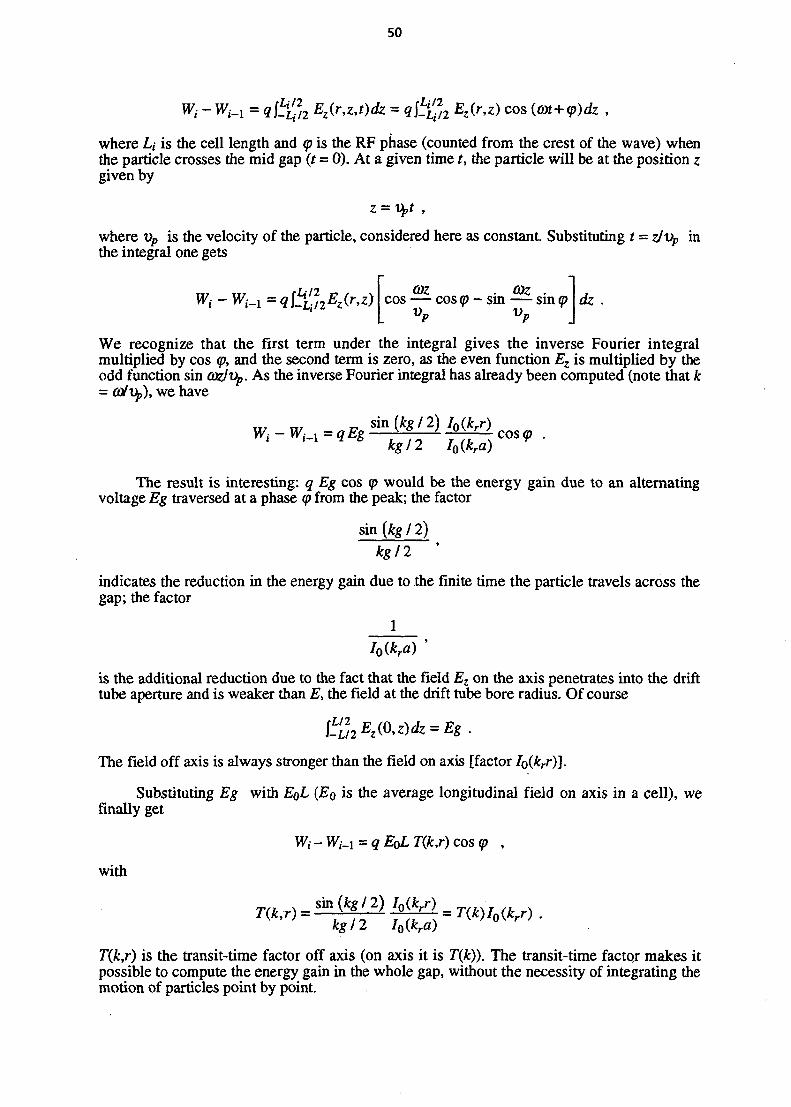
50
Ez(r,z,t)dz = q($2 Ez(r,z) cos {a>t+q>)dz ,
where L,- is the cell length and <p is the RF phase (counted from the crest of the wave) whenthe particle crosses the mid gap (t = 0). At a given time t, the particle will be at the position zgiven by
where vp is the velocity of the particle, considered here as constant. Substituting t = z/vp inthe integral one gets
0)Z . CDZ .cos — cos (p - sm — sin <p. VP VP
dz
We recognize that the first term under the integral gives the inverse Fourier integralmultiplied by cos (p, and the second term is zero, as the even function Ez is multiplied by theodd function sin oazlVp. As the inverse Fourier integral has already been computed (note that Jk= co/Vp), we have
kg 12
The result is interesting: q Eg cos (p would be the energy gain due to an alternatingvoltage Eg traversed at a phase q> from the peak; the factor
sin(*y/2)kg/2 '
indicates the reduction in the energy gain due to the finite time the particle travels across thegap; the factor
1
is the additional reduction due to the fact that the field Ez on the axis penetrates into the drifttube aperture and is weaker than E, the field at the drift tube bore radius. Of course
The field off axis is always stronger than the field on axis [factor Io(krr)].
Substituting Eg with EQL {E$ is the average longitudinal field on axis in a cell), wefinally get
Wi - Wi-x = q EQL T(k,r) cos (p ,
with
kg 12 I0(kra)
T(k,r) is the transit-time factor off axis (on axis it is T(k)). The transit-time factor makes itpossible to compute the energy gain in the whole gap, without the necessity of integrating themotion of particles point by point.

51
Knowing Ez, one can compute the other electromagnetic field components: Er with thedivergence theorem
giving
and B# via
rot B = - j - —- ,c 2 <?*
giving
<?z c2c2
One also has to make use of a property of Bessel functions:
jx Io(x)dx=xll(x) .
The formulae for all :he TMoio field components are written below:
Ez{r,z,t) = ^ C L T O J o C V ) cos kz cos(a>t+<p)dkLit
Er{r,z,t) = ~z-i^T(k)—Ix(krr) sin kz cos(ax+<p)dkkr
—Ii(krr) cos kz sin (at+(p)dk .
The components Er and B# produce a radial force on the moving particle. The changeof the radial momentum pr of the particle in a cell is
Er(r,z) cos| Z2. + (p j - VpB# (r,z) sin | ~ + <p 'Pr,i ~ Pr,i-l=<ll-lP y
The computation proceeds in an analogous way as with Wt - W^\.
8. BEAM LOADING OF CAVITIES: SPACE CHARGEIn Section 7 we have seen how the electromagnetic field in the cavity acts on particles.
Particles also act on the fields, and this interaction between beam and cavity is called beamloading of the cavity [10]. For reasons of phase stability [11,12], the beam bunch (particles inthe linac are grouped into bunches) and die RF field are not in phase: the bunch crosses thegap before the crest of the electric RF field. Therefore beam loading has a resistive as well asa capacitive component. The RF power supplied by the RF generator must, in addition tostructure losses, cover also the 'beam loading losses'. During the passage of the beam in thecavity, an RF amplitude and RF phase control is in action, and additional RF power iscorrectly supplied to keep the original pattern of the electromagnetic field in the cavity. Afeedback system acts on the tuners to keep the operating frequency stable.

52
The space charge of the beam which loads the cavity also produces a repulsive actionbetween particles. As the charge distribution in the beam is not uniform, the space chargeforces are non-linear. The question arises: how can one match a beam with non-uniformforces to a structure where the forces (as for example of focusing quadrupoles) arepredominantly linear? The answer is that it can be done provided one considers the root-mean-square {r.m.s) values of the particle distribution in phase space. Without going intomuch detail here, we just mention that Sacherer [13] has demonstrated that the evolution ofr.m.s values depends only on the linearized part of self forces, and that all beams having thesame intensity and the same r.m.s values behave in the same way. Therefore, once we knowthe r.m.s values of a real beam it can be replaced by an equivalent one having the same r.m.svalues, but a uniform density distribution. Such a beam can be matched.
The r.m.s beam sizes are computed via the second momenta of a normalizeddistribution function f{x,x',y,y',z,z^)
1 =\...]{x-xf f{x,x',y,y',z,zf)dxdydzdx'dy'dz' ,
where x is the first moment (average value), usually zero. The same is valid for other phasespace coordinates. The r.m.s beam emittance in the phase plane (x,xO is defined as
firms = P ? I - U F ) 2 1 1 / 2 •
9. THE RFQ LINEAR ACCELERATOR
The RFQ accelerator is a very particular ion linac because it accepts an unbunched(continuous) beam, bunches it, focuses it and accelerates it [14,15]. All these actions areperformed with RF fields: no external focusing is needed and the bunching efficiencyapproaches 100%. The RFQ is a Russian invention (Kapchinskij and Teplyakov), but itbecame popular worldwide only after the Los Alamos National Laboratory, LANL,established a design method and built a prototype in 1980 [16]. This ion accelerator is the bestone in the low energy range, from a few keV to a few MeV per atomic mass unit.
The operation of the RFQ can best be understood by considering a long electricquadrupole with an alternating voltage on it, as shown in Figs. 15 and 16. Particles movingalong the z-axis and staying inside the RFQ for several periods of the alternating voltage,would be exposed to an alternating gradient focusing (Fig. 15). If the tips of the quadrupoleelectrodes are not flat but 'modulated' in an appropriate way, a part of the electric field is'deviated' into the longitudinal direction and this field can be used to bunch and accelerateparticles (Fig. 16).
- — sin (u»t+f)
Fig. 15 Long electric quadrupole with alternating voltage
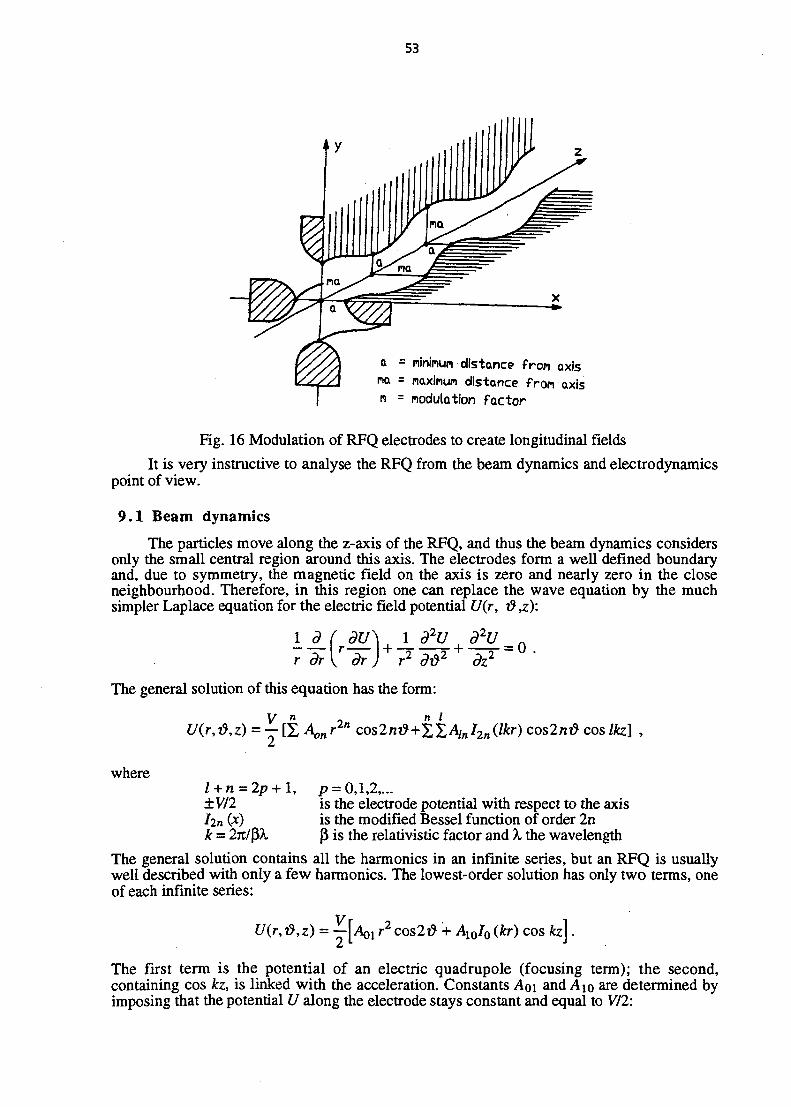
53
a = nininun distance fron axisda = naxinun distance fron axisn = modulation factor
Fig. 16 Modulation of RFQ electrodes to create longitudinal fields
It is very instructive to analyse the RFQ from the beam dynamics and electrodynamicspoint of view.
9.1 Beam dynamics
The particles move along the z-axis of the RFQ, and thus the beam dynamics considersonly the small central region around this axis. The electrodes form a well defined boundaryand, due to symmetry, the magnetic field on the axis is zero and nearly zero in the closeneighbourhood. Therefore, in this region one can replace the wave equation by the muchsimpler Laplace equation for the electric field potential U(r, & ,z):
LJLr dr dr)+ r2 d&2
dz= 0 .
The general solution of this equation has the form:
y n n i
U{r,&,z) = — [£ Knr cos2n&+YZAinhnWr) cos2n# cos Ikz] ,
wherel+n =±V/2
k =
1, p = 0,1,2,...is the electrode potential with respect to the axisis the modified Bessel function of order 2nP is the relativistic factor and X the wavelength
The general solution contains all the harmonics in an infinite series, but an RFQ is usuallywell described with only a few harmonics. The lowest-order solution has only two terms, oneof each infinite series:
U(r, &,z) - — Al0I0 (itr) cos kz]
The first term is the potential of an electric quadrupole (focusing term); the second,containing cos kz, is linked with the acceleration. Constants Aoi and AIQ are determined byimposing that the potential U along the electrode stays constant and equal to V/2:

54
m2l0(ka) + l0(mka)
1 ya a
The constants A10 and Aoi are expressed by geometric parameters, a, the minimum distance ofthe electrode from the axis, and m, the modulation factor. Increasing m one gets moreacceleration; decreasing a one gets more focusing. Multiplying the equation for Aoi by V onegets:
XV + Al0IQ(ka)V = V .
This equation tells us that part of the electrode voltage V is required for focusing (xV), andanother part for acceleration [A\Q IQ (ka)V\. As the electrode modulation can be produced in avery precise manner (e.g. by a numerically-controlled milling machine), we can obtain fieldswhich act on the beam as we want. The field components, derived from the two-termpotential function, are:
Er = -—• = - ¥-[2A0l r cos2^ + kA^I^kr) cos kz]or 2
0
rEz=- — = —kAl0IQ(kr) sin kz .
oz I
In addition, all these fields have to be multiplied by a time factor, such as sin (cot + (p), to takecare of their a.c. character. The computation of the energy gain per cell is done as with theDTL linac. The RFQ operates with a phase advance per cell of n, hence the cell length is/W2, i. e. the particles cross it in half of the RF period.
9.2 Electrodynamics
For the beam dynamics it was sufficient to consider a small region around the axis anddeal with the Laplace equation. For the electrodynamics one has to consider the whole cavityand solve the wave equation. The RFQ operates with the TE210 field configuration, which isschematically shown in Fig. 17, for an empty cavity as well as for a loaded cavity (electrodesof such a shape are called vanes). The modulation of the vanes is neglected as it has littleeffect on the design of the cavity. The electric field is transverse, and the magnetic field islongitudinal and of opposite sign in adjacent quadrants. An electric equivalent scheme for thefour-vane RFQ is shown in Fig. 18. To compute the cavity with a 2-D program likeSUPERFISH, it suffices to consider, due to symmetry, only one half of a quadrant (seeFig. 19). In the region where the fields have to be known with a greater precision, the mesh isfiner.
empty cavltyj node TE zva loaded cavity; node TE e i 0
Fig. 17 TE210 field pattern in empty and loaded cavities

55
Fig. 18 Equivalent scheme for a four-vane RFQ
Fig. 19 SUPERFISH calculations of a half quadrant of a four-vane RFQ
So far we have left out one question: what happens to the magnetic field at both ends ofthe RFQ? It cannot be perpendicular to the end covers of the cavity (perfect conductors), itmust be parallel to them. In fact the magnetic field of a quadrant satisfies this condition byturning around the vane as shown in Fig. 20. These end regions of the RFQ are computedwith 3-D programs like MAFIA [17].
Apart from the four-vane RFQ, one very often also uses a four-rod RFQ [18],developed by the University of Frankfurt and shown in Fig. 21. This RFQ resembles atransmission line and, indeed, the cavity which encloses it affects very little the resonantfrequency. This can be an advantage when operating at lower frequencies (< 100 MHz),where a four-vane RFQ would require too large a cavity. Figure 22 shows a design byMAFIA of a four-rod type RFQ with symmetric supports, built by the Laboratori Nazionali diLegnaro, LNL, Italy, for the CERN lead-ion project [19].

56
End cov«r
Fig. 20 End region of a four-vane RFQ and its equivalent circuit
Fig. 21 A four-rod type RFQ developed by the University of Frankfurt
Fig. 22 The lead-ion RFQ designed with MAFIA
57
10. CONCLUSION
The basic features of RF ion linear accelerators have been described in this paper. Inorder to accelerate particles, a synchronism between the electromagnetic wave and thevelocity of particles was required. The concept of the slowing down of waves linked withloaded cavities was essential for understanding how linacs function. The presentation ofspace harmonics in the dispersion diagram for periodic structures made clear the choice ofthe working point for either the TW or the SW structure. The fact that SW structures operateonly with phase advances per period of 0 or n became clear when considering that both thedirect and the reflected wave have to contribute to the acceleration of particles.
A few examples of ion linear accelerators operating in the SW mode have beenpresented. All of them, with the exception of the SCL, usually operate in the frequency rangeof one hundred to a few hundreds of MHz. Structure computations, as well as thecomputation of the action of the electromagnetic field on particles, have been presented withthe aim to show the methods applied. The notion of space charge and beam loading completethis introduction to RF ion linacs.
58
REFERENCES
[I] C. Ramo, J.R. Whinnery and T. van Duzer, in Fields and waves in communicationelectronics (John Wiley, New York, 1965) p. 374.
[2] J.C. Slater, in Microwave electronics (D. van Nostrand, New York, 1951) p. 395.
[3] Ibid., pp. 169-177.
[4] G.A. Loew and R.B. Neal, Accelerating structures, in Linear Accelerators, eds.P.M. Lapostolle and A.L. Septier (North Holland, Amsterdam, 1970), pp. 47-52.
[5] G. D6me, Review and survey of accelerating structures, in Linear Accelerators (seeRef. [4]).
[6] E.A. Knapp, High energy structures, in Linear Accelerators (see Ref. [4]), pp. 601-616.
[7] K. Halbach and R.F. Holsinger, Superfish - A computer program, Part. Accel. 7 (4)(1976) pp. 213-222.
[8] T. Weiland, On the computation of resonant modes in cylindrically symmetric cavities,Nucl. Instrum. Methods 216 (1983) pp. 229-248.
[9] P. Lapostolle, Introduction a la theorie des accelerateurs lin&rires, CERN 87-09 (1987).
[10] D. Boussard, Beam loading, Proc. CAS, Queen's College, Oxford, 1985; CERN 87-03(1987).
[II] P.M. Lapostolle, Introduction to RF linear accelerators (Linacs), these proceedings.
[12] M. Weiss, Introduction to RF linear accelerators, Proc. CAS, University of Jyvaskyla,Finland, 1992; CERN 94-01 (1994).
[13] F. Sacherer, RMS envelope equations with space charge, CERN/SI/Int. DL/70-12.
[14] I.M. Kapchinskiy, Strahldynamik in den Sektionen mit raumlich uniformerFokussierung, GSI-tr-14/76 (Translation from Russian).
[15] M. Weiss, Radio frequency quadrupole, Proc. CAS, Aarhus, Denmark,1986; CERN 87-10 (1987).
[16] R.H. Stokes et al., The radio frequency quadrupole, Proc. 11th Int. Conf. on HighEnergy Accelerators, Geneva, 1980 (Birkhauser, Basle, 1980).
[17] R. Klatt et al., Mafia - A three dimensional electromagnetic CAD system, Proc. LinearAccelerator Conf., 1986, SLAC report 303, pp. 276-278.
[18] A. Schempp et al., Zero-mode RFQ development in Frankfurt, Proc. Linear AcceleratorConf., Seeheim, Germany, 1984, ed. N. Angert (ISSN: 0171-4546, GSI-84-11, 1984)p. 338.
[19] A. Lombardi et al., Comparison study of RFQ structures for the lead ion Linac atCERN, Proc. EPAC, Berlin, 1992, eds. H. Henke, H. Honeyer and C. Petit-Jean-Genaz(Editions Frontieres, Gif-sur-Yvette, 1992) pp. 557-559.
59
RF SYSTEMS FOR LINACS
W. PirklCERN, Geneva, Switzerland
AbstractAn overview of RF systems for linacs is given, problems associatedwith beam loading are discussed and examples of RF systeminstallations presented.
1 . RF POWER REQUIREMENTS
In linear accelerators the beam has to gain its energy during a single pass through thestructure. This leads to high requirements on accelerating fields and on overall RF power. Atypical linac has therefore installed RF power in the range of tens to hundreds of Megawatts. Itis then justified to consider linacs as RF-oriented machines, in contrast to circular acceleratorswhich are rather magnet-oriented.
In the present context the RF system proper starts at the RF connection to the structure.The latter can be of the standing- or travelling-wave type, but whatever the mechanisms ofpower build-up and energy transfer to the beam may be there are two distinct requirements to becovered: delivering power to create and maintain a well defined field pattern in the structure(wall power Pwaii), and replacing the power transmitted to the particle beam (beam power^ ) . i.e.
All wall losses can be thought of as concentrated in a single resistor, the "shunt impedance" rdefined as
r = i / | e / (2*P w a l l )
where £/«. is the effective structure voltage seen by a beam of given velocity, i.e. taking intoaccount uie transit time factor T that expresses the voltage reduction due to the sinusoidal fieldvariation during beam-passage time. This is the "equivalent circuit" definition of the shuntimpedance hence the factor of 2 in the denominator which stems from the fact that the powergenerated by a sinusoidal RF voltage is a factor of two smaller than the power generated byDC.
On the other hand, the beam power is given by
where C/aCc is the average energy gain of the beam expressed in eV, <p the stable phase angleand h the spectral component of the beam current at the RF frequency. For short bunches thiscomponent is close to twice the DC current/o so that the beam power is approximately U^IQ.
Note that there is no third component representing additional losses caused bytransporting the beam power through the structure. This is due to the fact that it rides on top ofthe very large reactive energy flows related with the fields so that the additional transport lossescan be neglected for all practical purposes.
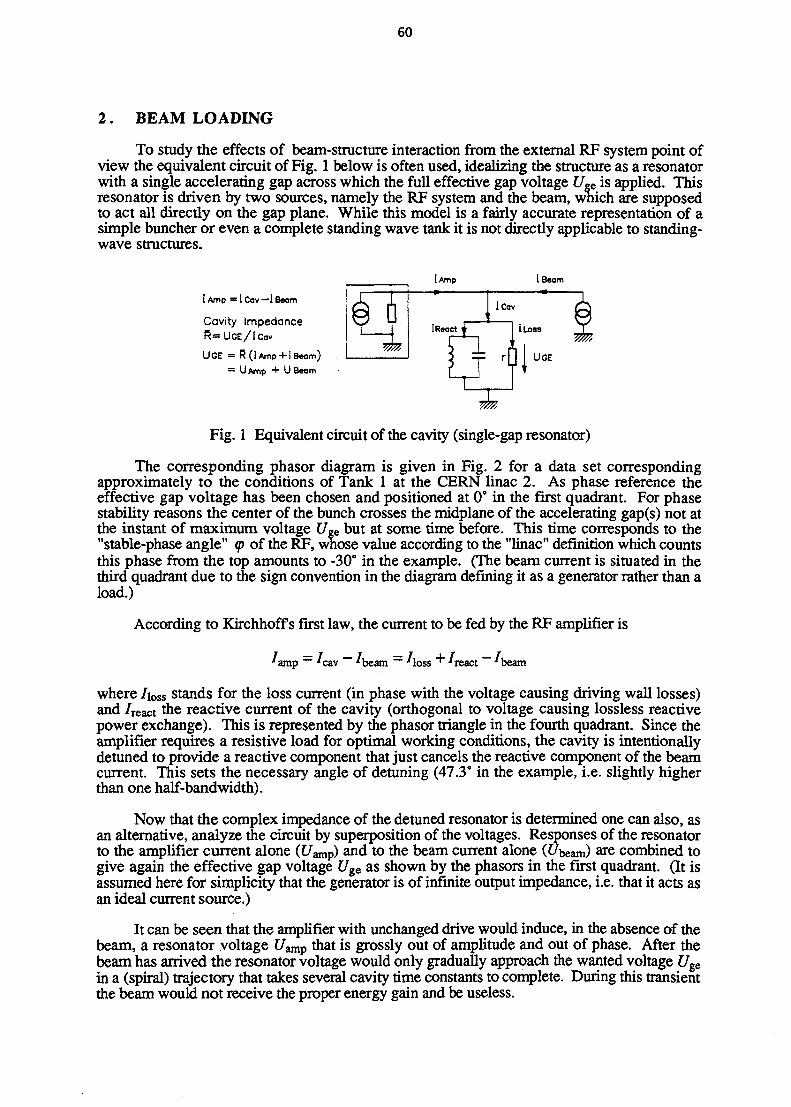
60
2 . BEAM LOADING
To study the effects of beam-structure interaction from the external RF system point ofview the equivalent circuit of Fig. 1 below is often used, idealizing the structure as a resonatorwith a single accelerating gap across which the full effective gap voltage £7™ is applied. Thisresonator is driven by two sources, namely the RF system and the beam, wnich are supposedto act all directly on the gap plane. While this model is a fairly accurate representation of asimple buncher or even a complete standing wave tank it is not directly applicable to standing-wave structures.
I Amp 1 Beam
i Amp = 1 Cov —I Beam
Cavity ImpedanceR=UGE/IC<JV
UGE =
= U Amp + U Beqm
Fig. 1 Equivalent circuit of the cavity (single-gap resonator)
The corresponding phasor diagram is given in Fig. 2 for a data set correspondingapproximately to the conditions of Tank 1 at the CERN linac 2. As phase reference theeffective gap voltage has been chosen and positioned at 0° in the first quadrant. For phasestability reasons the center of the bunch crosses the midplane of the accelerating gap(s) not atthe instant of maximum voltage £/«. but at some time before. This time corresponds to the"stable-phase angle" q> of the RF, whose value according to the "linac" definition which countsthis phase from the top amounts to -30° in the example. (The beam current is situated in thethird quadrant due to the sign convention in the diagram defining it as a generator rather than aload.)
According to Kirchhoff s first law, the current to be fed by the RF amplifier is
••amp = -"cav ~ •'beam = -Moss "*" 'react ~~ •'beam
where /i0Ss stands for the loss current (in phase with the voltage causing driving wall losses)and /react the reactive current of the cavity (orthogonal to voltage causing lossless reactivepower exchange). This is represented by the phasor triangle in the fourth quadrant. Since theamplifier requires a resistive load for optimal working conditions, the cavity is intentionallydetuned to provide a reactive component that just cancels the reactive component of the beamcurrent. This sets the necessary angle of detuning (47.3° in the example, i.e. slightly higherthan one half-bandwidth).
Now that the complex impedance of the detuned resonator is determined one can also, asan alternative, analyze the circuit by superposition of the voltages. Responses of the resonatorto the amplifier current alone (t/amp) and to the beam current alone (t/beam) are combined togive again the effective gap voltage Uge as shown by the phasors in the first quadrant. (It isassumed here for simplicity that the generator is of infinite output impedance, i.e. that it acts asan ideal current source.)
It can be seen that the amplifier with unchanged drive would induce, in the absence of thebeam, a resonator voltage t/amp that is grossly out of amplitude and out of phase. After thebeam has arrived the resonator voltage would only gradually approach the wanted voltage J7gein a (spiral) trajectory that takes several cavity time constants to complete. During this transientthe beam would not receive the proper energy gain and be useless.
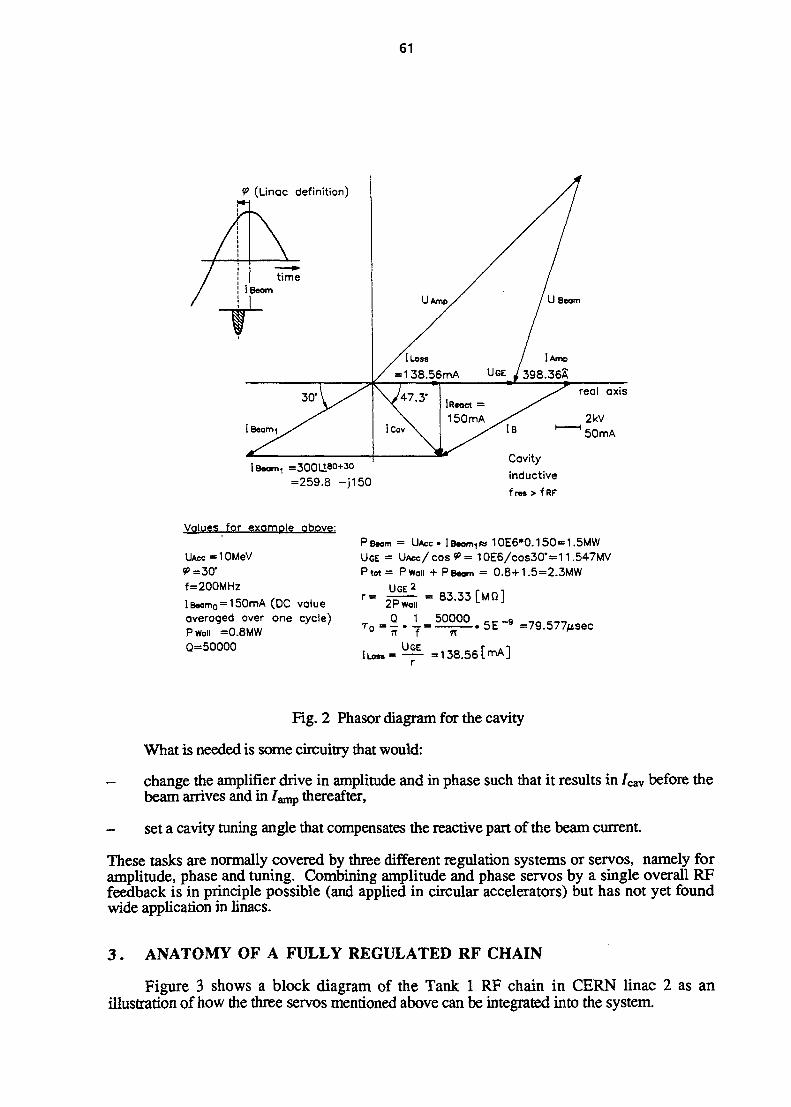
61
V (Linac definition)
I Beam, =3001180+30
=259.8 -J150
Vglues for exomple above:
UAcc=10MeV*>=30*f=200MHz1 Beam0 = 150mA (DC valueaveraged over one cycle)Pwaii =0.8MW0=50000
PBeom = UAcc iBeom fs 10E6*0.150=1.5MWUGE = UACC/COS^= 10E6/cos30'= 11.547MVPtot= Pwoii + Pewm = 0.8+1.5=2.3MW
UGE 2
2Pwoii= £ . 1 _ 50000
7T f 7T
ILO»= — =138.56[mA]
83.33 [MD]
5E~9 79.577Msec
Fig. 2 Phasor diagram for the cavity
What is needed is some circuitry that would:
- change the amplifier drive in amplitude and in phase such that it results in /cav before thebeam arrives and in /amP thereafter,
- set a cavity tuning angle that compensates the reactive part of the beam current
These tasks are normally covered by three different regulation systems or servos, namely foramplitude, phase and tuning. Combining amplitude and phase servos by a single overall RFfeedback is in principle possible (and applied in circular accelerators) but has not yet foundwide application in linacs.
3. ANATOMY OF A FULLY REGULATED RF CHAIN
Figure 3 shows a block diagram of the Tank 1 RF chain in CERN linac 2 as anillustration of how the three servos mentioned above can be integrated into the system.

62
(Centere rangeI of fast phase
modulator)
I i Motor commonds
Labels in rack
O Buffer output
¥ aOvervoltoge
Oelector
2SA bits
CentralTimingChain
2SC bits .Comoc5SA bits '
KI I
I I 12Local timing
Interlock
System
To feed B con_^. Tunning control
,' Trans, amplifier"*• tkV grid supplies
• Connected_ Moinly to
Power circuits
-I—*JM2] O Tu«
^MoJurTi]]
Fig. 3 Block diagram of a fully regulated RF chain
3 .1 Forward RF path (bold lines in Fig. 3)
A low-level RF signal of about 2 W arrives at the input plane with a well-defined phasefrom the phase reference line. The signal then travels through the detector box, 6-bit phaseshifter, phase and amplitude modulator, is gradually amplified in the transistor amplifier, poweramplifier, drive amplifier and final amplifier before arriving at the feeder loop of the resonator atsufficiently high power to cover tank requirements. Somewhere in the forward RF path therehave to be means to adjust output phase and amplitude at high speed in response to the electricalcorrecting signals out of the servos. This is straightforward for the phase which is in generalwell transmitted through almost any amplifier chain so that a low-level phase shifter can be usedat the input. However, the amplitude modulation is quite critical since most high poweramplifiers exhibit some kind of saturation and over saturation, where the RF output stalls oreven decreases for increased drive. In the present case these adverse effects are avoided by aspecial current stabilisation in the final amplifiers so that the amplitude modulator can beimplemented as a low-level device at the input of the chain. In other machines the amplitudelinearity problem is solved by controlling the RF output amplitude via the plate supply voltageusing a high-voltage floating modulator with one or more series tubes.
3.2 Amplitude and phase servo
A sample of the tank RF field is taken from the tank via a coupling loop, cleaned in abandpass filter and routed to the detector box ( lines in Fig. 3). It carries information ontank amplitude as well as tank phase. Both are demodulated in the detector box and appear atthe output in the form of video signals (AA (amplitude) and A (p (phase with respect to the inputplane)). In the feedback control module they are compared to the command value ATANK fortank amplitude generated in the control system, and to 0 as implied command value for the tank
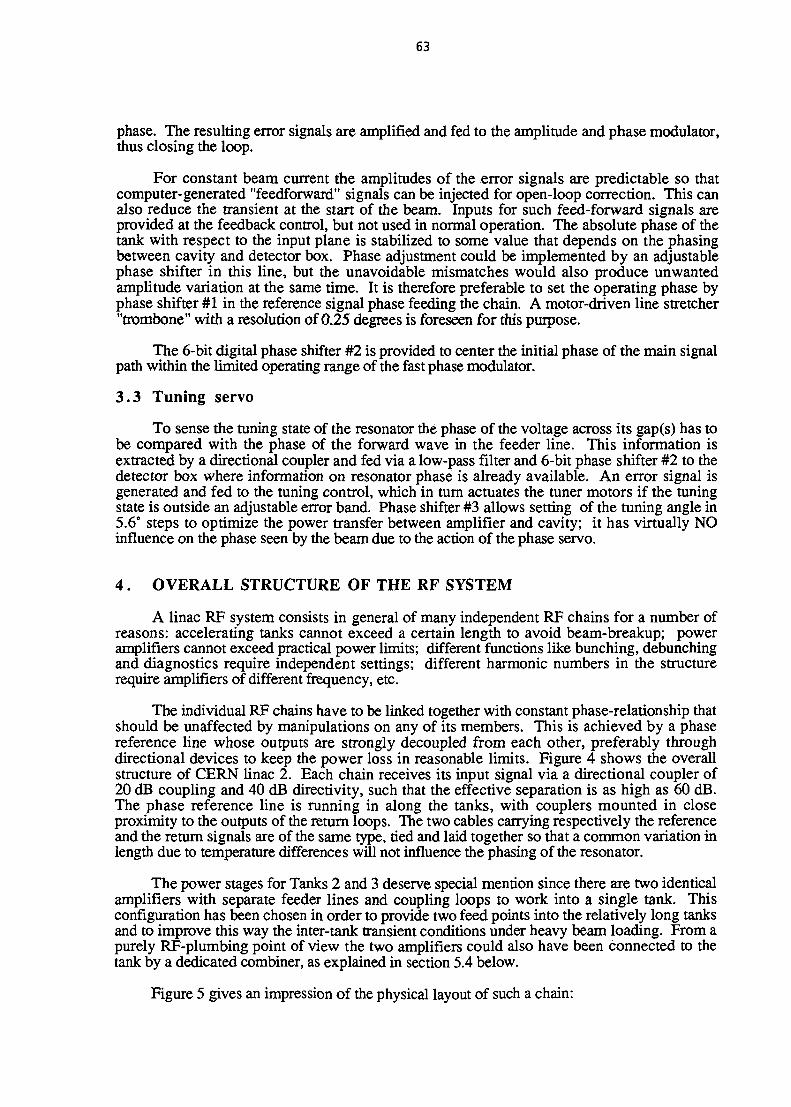
63
phase. The resulting error signals are amplified and fed to the amplitude and phase modulator,thus closing the loop.
For constant beam current the amplitudes of the error signals are predictable so thatcomputer-generated "feedforward" signals can be injected for open-loop correction. This canalso reduce the transient at the start of the beam. Inputs for such feed-forward signals areprovided at the feedback control, but not used in normal operation. The absolute phase of thetank with respect to the input plane is stabilized to some value that depends on the phasingbetween cavity and detector box. Phase adjustment could be implemented by an adjustablephase shifter in this line, but the unavoidable mismatches would also produce unwantedamplitude variation at the same time. It is therefore preferable to set the operating phase byphase shifter #1 in the reference signal phase feeding the chain. A motor-driven line stretcher"trombone" with a resolution of 0.25 degrees is foreseen for this purpose.
The 6-bit digital phase shifter #2 is provided to center the initial phase of the main signalpath within the limited operating range of the fast phase modulator.
3.3 Tuning servo
To sense the tuning state of the resonator the phase of the voltage across its gap(s) has tobe compared with the phase of the forward wave in the feeder line. This information isextracted by a directional coupler and fed via a low-pass filter and 6-bit phase shifter #2 to thedetector box where information on resonator phase is already available. An error signal isgenerated and fed to the tuning control, which in turn actuates the tuner motors if the tuningstate is outside an adjustable error band. Phase shifter #3 allows setting of the tuning angle in5.6° steps to optimize the power transfer between amplifier and cavity; it has virtually NOinfluence on the phase seen by the beam due to the action of the phase servo.
4 . OVERALL STRUCTURE OF THE RF SYSTEM
A linac RF system consists in general of many independent RF chains for a number ofreasons: accelerating tanks cannot exceed a certain length to avoid beam-breakup; poweramplifiers cannot exceed practical power limits; different functions like bunching, debunchingand diagnostics require independent settings; different harmonic numbers in the structurerequire amplifiers of different frequency, etc.
The individual RF chains have to be linked together with constant phase-relationship thatshould be unaffected by manipulations on any of its members. This is achieved by a phasereference line whose outputs are strongly decoupled from each other, preferably throughdirectional devices to keep the power loss in reasonable limits. Figure 4 shows the overallstructure of CERN linac 2. Each chain receives its input signal via a directional coupler of20 dB coupling and 40 dB directivity, such that the effective separation is as high as 60 dB.The phase reference line is running in along the tanks, with couplers mounted in closeproximity to the outputs of the return loops. The two cables carrying respectively the referenceand the return signals are of the same type, tied and laid together so that a common variation inlength due to temperature differences will not influence the phasing of the resonator.
The power stages for Tanks 2 and 3 deserve special mention since there are two identicalamplifiers with separate feeder lines and coupling loops to work into a single tank. Thisconfiguration has been chosen in order to provide two feed points into the relatively long tanksand to improve this way the inter-tank transient conditions under heavy beam loading. From apurely RF-plumbing point of view the two amplifiers could also have been connected to thetank by a dedicated combiner, as explained in section 5.4 below.
Figure 5 gives an impression of the physical layout of such a chain:
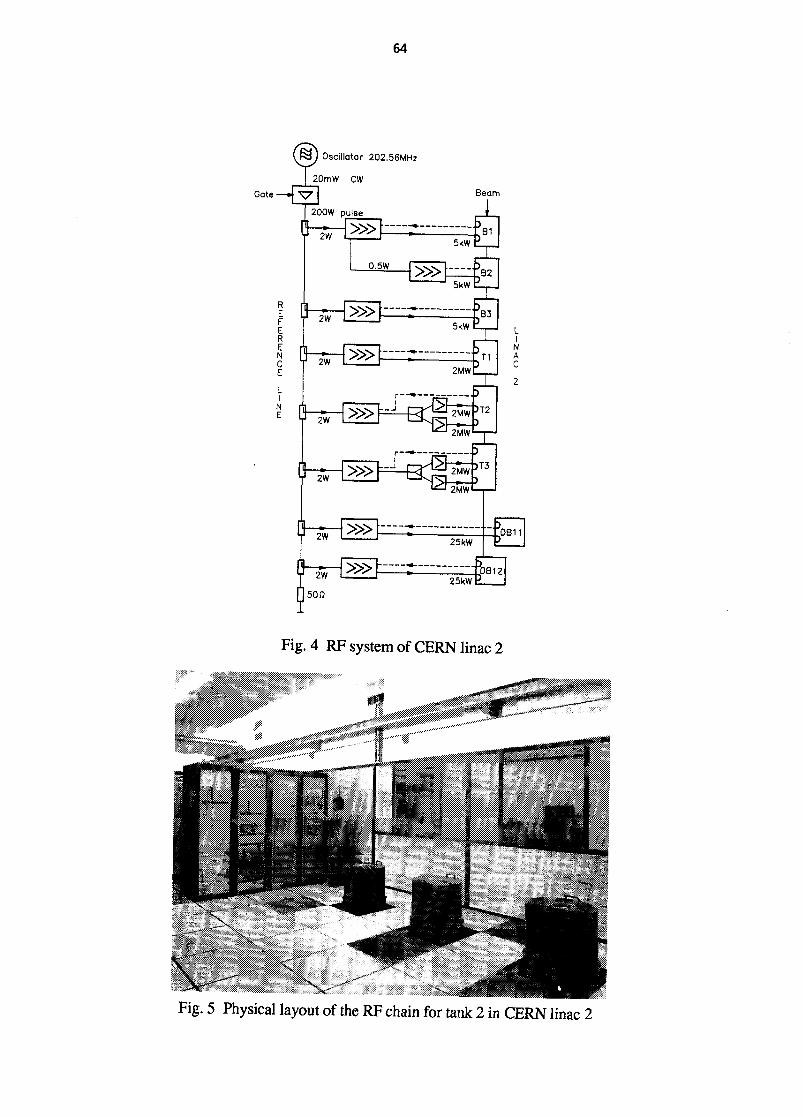
64
Oscillator 202.56MHz
20mW CW
Gate—• Beam
1»>-—r
5kWB1
0.5W
5kWB2
5kW
2MW
)
)"T15
Fig. 4 RF system of CERN linac 2
• * •
Fig. 5 Physical layout of the RF chain for tank 2 in CERN linac 2
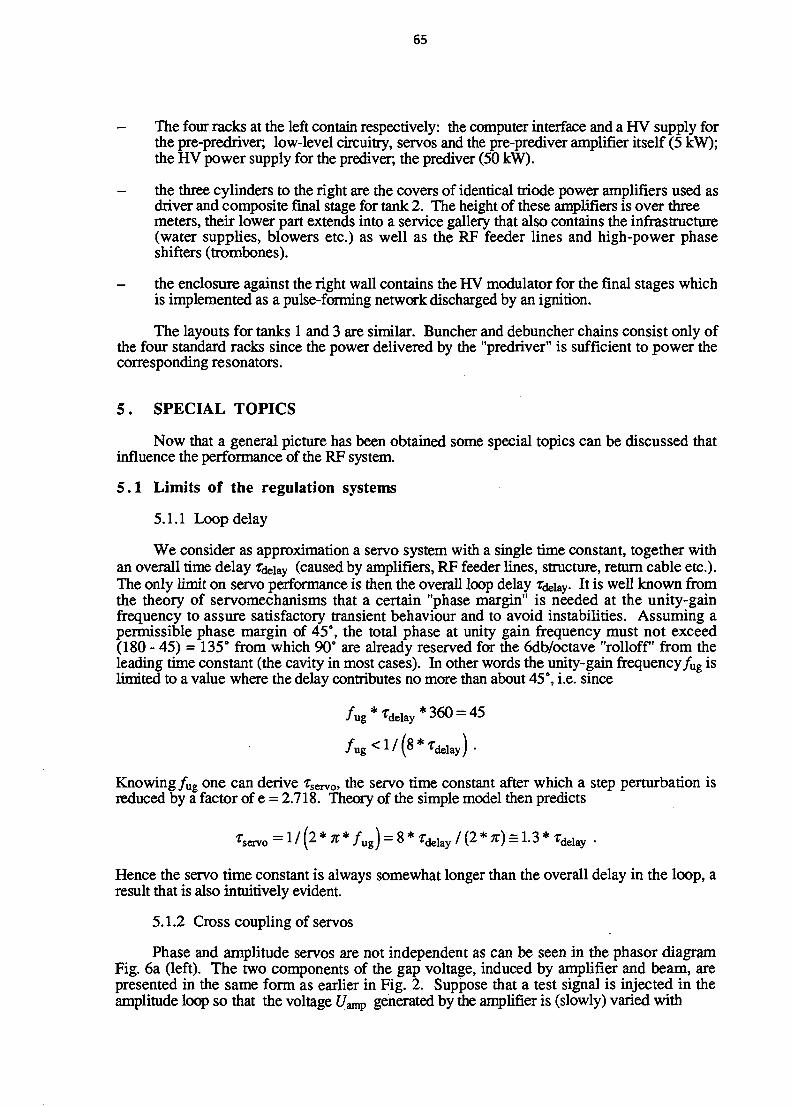
65
- The four racks at the left contain respectively: the computer interface and a HV supply forthe pre-predriver, low-level circuitry, servos and the pre-prediver amplifier itself (5 kW);the HV power supply for the prediver; the prediver (50 kW).
- the three cylinders to the right are the covers of identical triode power amplifiers used asdriver and composite final stage for tank 2. The height of these amplifiers is over threemeters, their lower part extends into a service gallery that also contains the infrastructure(water supplies, blowers etc.) as well as the RF feeder lines and high-power phaseshifters (trombones).
- the enclosure against the right wall contains the HV modulator for the final stages whichis implemented as a pulse-forming network discharged by an ignition.
The layouts for tanks 1 and 3 are similar. Buncher and debuncher chains consist only ofthe four standard racks since the power delivered by the "predriver" is sufficient to power thecorresponding resonators.
5 . SPECIAL TOPICS
Now that a general picture has been obtained some special topics can be discussed thatinfluence the performance of the RF system.
5.1 Limits of the regulation systems
5.1.1 Loop delay
We consider as approximation a servo system with a single time constant, together withan overall time delay Tdeiay (caused by amplifiers, RF feeder lines, structure, return cable etc.).The only limit on servo performance is then the overall loop delay Tdeiay It is well known fromthe theory of servomechanisms that a certain "phase margin" is needed at the unity-gainfrequency to assure satisfactory transient behaviour and to avoid instabilities. Assuming apermissible phase margin of 45°, the total phase at unity gain frequency must not exceed(180 - 45) = 135° from which 90° are already reserved for the 6db/octave "rolloff' from theleading time constant (the cavity in most cases). In other words the unity-gain frequency/ug islimited to a value where the delay contributes no more than about 45°, i.e. since
/ug*'delay* 360 = 45
/ u g < l / ( 8 * f d e l a y ) .
Knowing/ug one can derive TserVo> the servo time constant after which a step perturbation isreduced by a factor of e = 2.718. Theory of the simple model then predicts
'servo
Hence the servo time constant is always somewhat longer than the overall delay in the loop, aresult that is also intuitively evident.
5.1.2 Cross coupling of servos
Phase and amplitude servos are not independent as can be seen in the phasor diagramFig. 6a (left). The two components of the gap voltage, induced by amplifier and beam, arepresented in the same form as earlier in Fig. 2. Suppose that a test signal is injected in theamplitude loop so that the voltage t/amp generated by the amplifier is (slowly) varied with
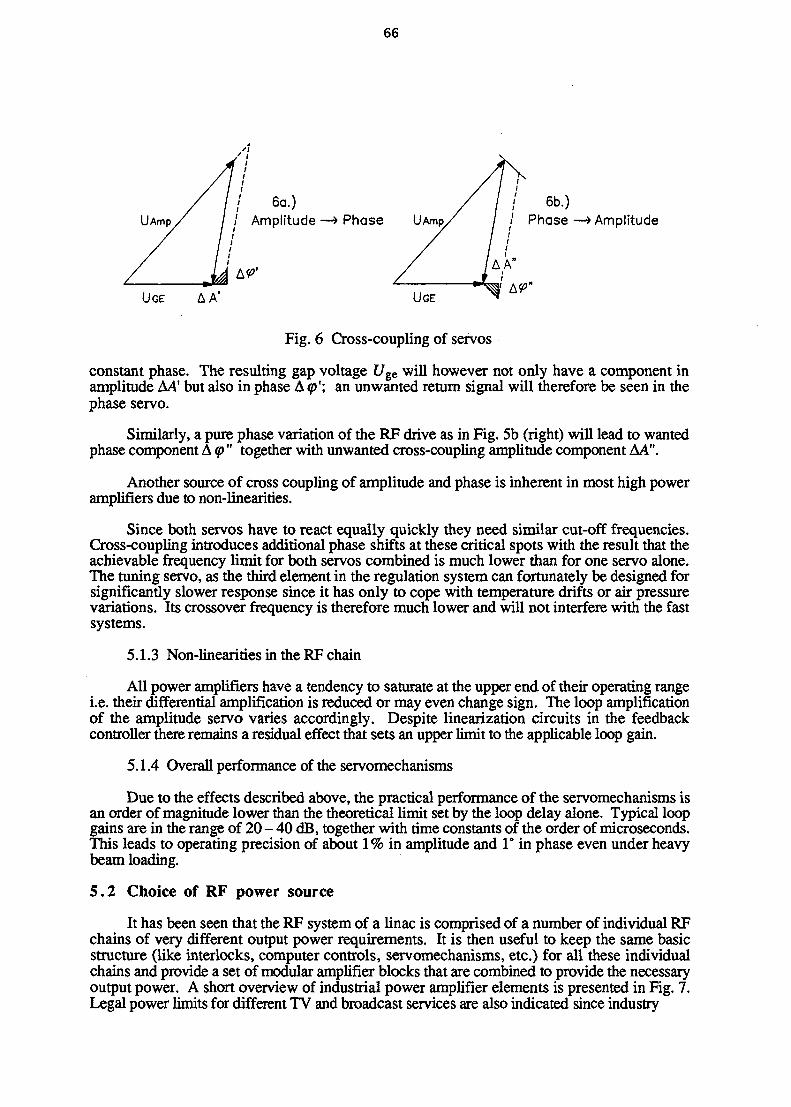
66
6a.)UAmp / / / Amplitude —> Phase Utmp/ / / Phase —> Amplitude
UGE A A' UGE
Fig. 6 Cross-coupling of servos
constant phase. The resulting gap voltage t/ge will however not only have a component inamplitude AA1 but also in phase A J'; an unwanted return signal will therefore be seen in thephase servo.
Similarly, a pure phase variation of the RF drive as in Fig. 5b (right) will lead to wantedphase component A <p" together with unwanted cross-coupling amplitude component AA".
Another source of cross coupling of amplitude and phase is inherent in most high poweramplifiers due to non-linearities.
Since both servos have to react equally quickly they need similar cut-off frequencies.Cross-coupling introduces additional phase shifts at these critical spots with the result that theachievable frequency limit for both servos combined is much lower than for one servo alone.The tuning servo, as the third element in the regulation system can fortunately be designed forsignificantly slower response since it has only to cope with temperature drifts or air pressurevariations. Its crossover frequency is therefore much lower and will not interfere with the fastsystems.
5.1.3 Non-linearities in the RF chain
All power amplifiers have a tendency to saturate at the upper end of their operating rangei.e. their differential amplification is reduced or may even change sign. The loop amplificationof the amplitude servo varies accordingly. Despite linearization circuits in the feedbackcontroller there remains a residual effect that sets an upper limit to the applicable loop gain.
5.1.4 Overall performance of the servomechanisms
Due to the effects described above, the practical performance of the servomechanisms isan order of magnitude lower than the theoretical limit set by the loop delay alone. Typical loopgains are in the range of 20 - 40 dB, together with time constants of the order of microseconds.This leads to operating precision of about 1% in amplitude and 1° in phase even under heavybeam loading.
5 .2 Choice of RF power source
It has been seen that the RF system of a linac is comprised of a number of individual RFchains of very different output power requirements. It is then useful to keep the same basicstructure (like interlocks, computer controls, servomechanisms, etc.) for all these individualchains and provide a set of modular amplifier blocks that are combined to provide the necessaryoutput power. A short overview of industrial power amplifier elements is presented in Fig. 7.Legal power limits for different TV and broadcast services are also indicated since industry
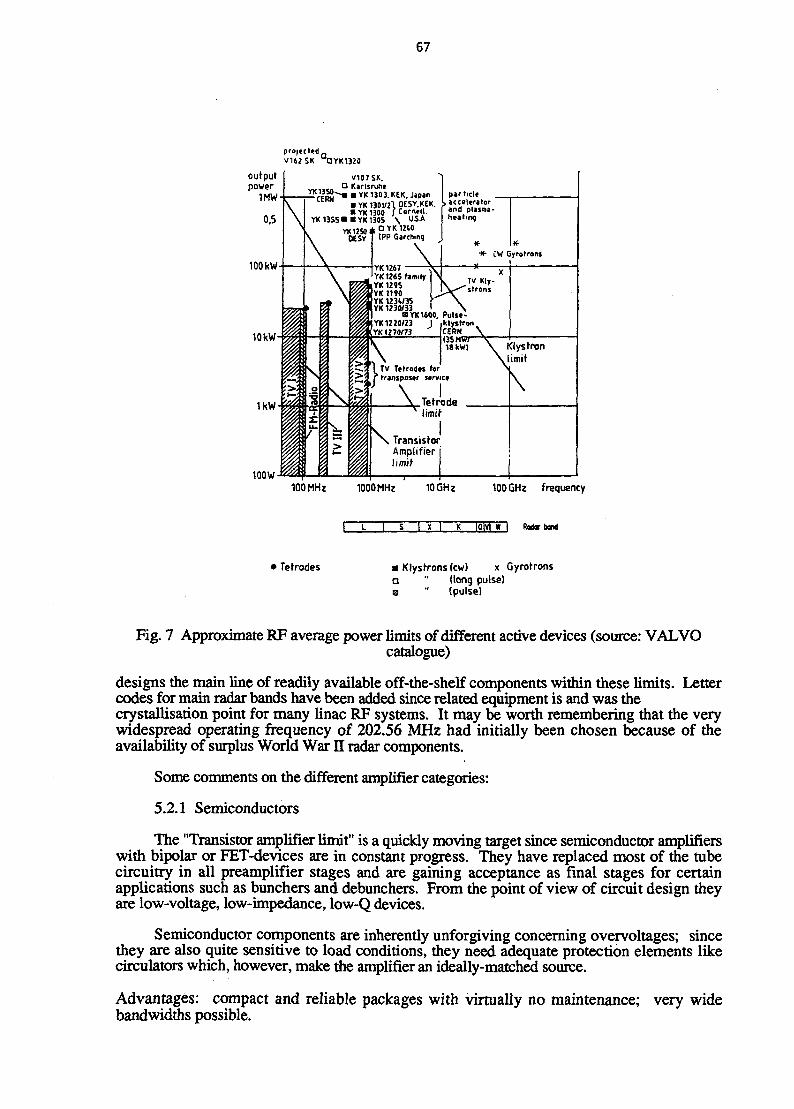
67
projectedV162SK OYK1320
outputpower
1MW
100 kW
10kW
1kW
100W
V107SK.• Karlsruhe• • • YK1303. KEK. Japan
2\ OESY.KEK.YK1300 /Cornell.
YK13SS* "YK130S \ USA
100 MHz 1000 MHz 10 GHz 100 GHz frequency
I L I S I X I K |Q|V| I I | Rotor bond
• Tetrodes • Klystrons (cw) x Gyrcrtrons
a " (long pulse)
a " (pulse)
Fig. 7 Approximate RF average power limits of different active devices (source: VALVOcatalogue)
designs the main line of readily available off-the-shelf components within these limits. Lettercodes for main radar bands have been added since related equipment is and was thecrystallisation point for many linac RF systems. It may be worth remembering that the verywidespread operating frequency of 202.56 MHz had initially been chosen because of theavailability of surplus World War II radar components.
Some comments on the different amplifier categories:
5.2.1 Semiconductors
The "Transistor amplifier limit" is a quickly moving target since semiconductor amplifierswith bipolar or FET-devices are in constant progress. They have replaced most of the tubecircuitry in all preamplifier stages and are gaining acceptance as final stages for certainapplications such as bunchers and debunchers. From the point of view of circuit design theyare low-voltage, low-impedance, low-Q devices.
Semiconductor components are inherently unforgiving concerning overvoltages; sincethey are also quite sensitive to load conditions, they need adequate protection elements likecirculators which, however, make the amplifier an ideally-matched source.
Advantages: compact and reliable packages with virtually no maintenance; very widebandwidths possible.
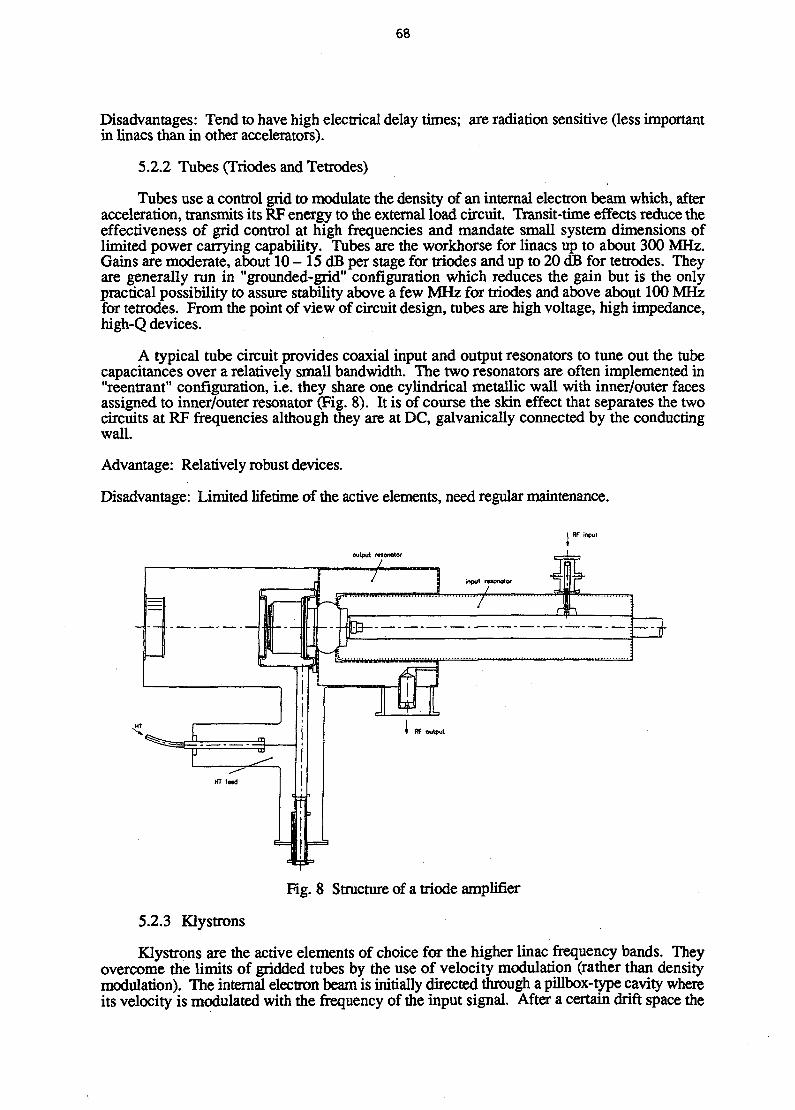
68
Disadvantages: Tend to have high electrical delay times; are radiation sensitive (less importantin linacs than in other accelerators).
5.2.2 Tubes (Triodes and Tetrodes)
Tubes use a control grid to modulate the density of an internal electron beam which, afteracceleration, transmits its RF energy to the external load circuit. Transit-time effects reduce theeffectiveness of grid control at high frequencies and mandate small system dimensions oflimited power carrying capability. Tubes are the workhorse for linacs up to about 300 MHz.Gains are moderate, about 10 - 15 dB per stage for triodes and up to 20 dB for tetrodes. Theyare generally run in "grounded-grid" configuration which reduces the gain but is the onlypractical possibility to assure stability above a few MHz for triodes and above about 100 MHzfor tetrodes. From the point of view of circuit design, tubes are high voltage, high impedance,high-Q devices.
A typical tube circuit provides coaxial input and output resonators to tune out the tubecapacitances over a relatively small bandwidth. The two resonators are often implemented in"reentrant" configuration, i.e. they share one cylindrical metallic wall with inner/outer facesassigned to inner/outer resonator (Fig. 8). It is of course the skin effect that separates the twocircuits at RF frequencies although they are at DC, galvanically connected by the conductingwall.
Advantage: Relatively robust devices.
Disadvantage: Limited lifetime of the active elements, need regular maintenance.
output r««wtor
input resonotoc/
RF output
Fig. 8 Structure of a triode amplifier
5.2.3 Klystrons
Klystrons are the active elements of choice for the higher linac frequency bands. Theyovercome the limits of gridded tubes by the use of velocity modulation (rather than densitymodulation). The internal electron beam is initially directed through a pillbox-type cavity whereits velocity is modulated with the frequency of the input signal. After a certain drift space the

69
faster electrons overtake the slower ones and create regions of higher density. Passive RFcavities provided at these regions further enhance the beam structure by the self-induced electricfield. The RF beam power is finally transferred to an internal RF cavity from where it isextracted to the external load.
Klystrons are very high voltage, high-Q devices. The long internal drift space of thebeam needs transverse focusing by solenoids or permanent magnets. As the length of this driftspace increases with the RF wavelength there is a practical lower limit for the operatingfrequency. Figure 9 shows the "Klystron Skyline", the pictorial representation of the unitsfrom one large European manufacturer. Also shown is the largest commercially availableklystron, almost 6 m in length for operation at 200 MHz. The large dimension has so farhindered its use in low-frequency linacs.
Advantages of klystrons: High gain of 40 - 50 dB (about 10 dB per internal cavity).High lifetime.
Disadvantages: Supply voltages of 100 - 200 kV necessitate special technology; X-ray hazardexists if not properly shielded; pulsed high-power klystrons tend to be noisy electrically andacoustically. In general only moderate DC-to-RF conversion efficiency ~ 50%.
5.2.4 Other RF power sources.
The upper power limit in klystrons is ultimately determined by the output resonator. Itsdimensions scale directly with the wavelength for a given cavity mode; at higher frequenciessome critical part (usually the coupling slot) becomes breakdown-limited due to the smalldimensions involved. Gyroklystrons, gyratrons and similar construction principles push thislimit upwards by the use of transverse rather than longitudinal extraction mechanisms whichallow larger cavity dimensions; their development is in full swing.
Two-beam accelerators first generate an auxiliary beam which runs in parallel with thephysics beam and serves as a distributed power source. A prominent example for extremelyhigh operating frequency is the CERN CLIC proposal which is presented in section 6.3.
5.3 Amplifier matching and resonator transients
According to a well known theorem in circuit theory, maximum power transfer betweensource and load occurs if their impedances are complex conjugate to each other. This isperfectly valid for low-level, linear circuitry but additional constraints of dynamic range have tobe considered at high power. Take for example an amplifier for P = 100 kW whose tube asactive element presents 15 kQ internal (source) impedance and supports a maximum RFvoltage U = 10 kV. 15 kQ is the optimum load at low level, but only up to the output voltagelimit of 10 kV corresponding to 5 kW. Beyond this point the load impedance has to be reducedto avoid saturation and sparking; full power can only be achieved at a load impedance oft/2/(2*P)= 500 Q. with drastically reduced amplification.
In virtually all active elements the optimal load resistance for maximum output powerdiffers by one or two orders of magnitude from the internal source resistance. Looking backfrom the feeder line into the amplifier, this internal source impedance appears at a voltage-standing-wave ratio (VSWR) of 10 to 100. It is assumed that the tube-to-feeder coupling isarranged such that the optimal load for maximum output power corresponds to the characteristicimpedance of the line.
The load impedance of cavities and tanks is not constant but exhibits a sharp resonance inthe frequency domain. It is customary to refer to cavity impedances at the "Detuned Short"(DS) plane of the feeder line. This has been implicitly been done in Fig. 1. The inputimpedance begins and ends at 0 Q for the fully detuned cavity, and describes the well known

Super Power Klystrons
Support and Stimulate High Energy Research
UHF TV Klystrons provide thereliable power for TV Broad-casting Networks worldwide'
Pulse KlystronsKey Components forLinacs and Radar
kogpJ.i
lOOOMHt
tOO kw
VK l » 0HOOHHi)!5kW
YK1M4 YK1MS » I )« /9W7VKI IW»I JO-MO HM, IM-UMKH, <7MMHHi U M I M I i 'Jftf' " M M ™
fc'""w p"w yiftffi,"'" " 5 " ^ W"5''WVKI2W)• 7 0 . . 6 ,
M/lSfcW
YKttJOLBand
tOMW«ul(t
YK lStO/1/ISBond
30 MWpol*.
YK«QO3GHI
3SMWPull*
YK1II03CH t
6MW
Fig. 9 The 'klystron skyline' of one European manufacturer

71
circle going through the center of the Smith-diagram for perfect match at the resonancefrequency (Fig. 10).
Source
R*i C
0
"DS" planeof cavity
&
Z
transformedsource impedance
1 L
"mi
u Cavity
Covitv response- steady state, f varied- transient f=f™« /
Locus of constantsource power
transformedsource Aiftipedonce
Moxi -Q
Ai
7Mini-0
AI
zIntermediate
Time domain:Transient ofRF envelope
Frequency domain:Amplitude response
Fig. 10 Influence of the line length between amplifier and cavity: maxi QJtmm Q
Fourier transform allows one to derive the behaviour in the time domain for transientconditions, i.e. for abrupt switching-on of the cavity by a gated sinusoid at the resonancefrequency. The apparent instantaneous cavity impedance is zero at the beginning, follows thereal axis, and finally stops at the steady-state resistance after several cavity time constants.
If the transformed source impedance is situated on this low-impedance part of the realaxis (Fig. 10 middle), then there is perfect match at least at one moment of the transient. Theoverall average power transfer during the filling phase is optimal and the fastest possiblerisetime results. In the frequency domain, the bandwidth is widest due to the strongestdamping of the resonator by the amplifier. The term "Mini-Q" has been coined for this regime.

72
Inversely, if the transformed source impedance is on the high-impedance part of the realaxis, there is never a perfect match; the average power transfer is worst; the risetime is slowest;the bandwidth smallest. This is designated as "Maxi-Q". These two extreme cases representthe only two points where the overall system is at "resonance", i.e. where the amplituderesponse in the frequency domain peaks at the operating frequency and where there is nobeating in time domain. These conditions should be set for best overall performance. The"Mini-Q" point is the preferred mode of operation, but is there is a tendency for amplifiersparking in case of cavity breakdowns. Therefore the more forgiving "Maxi-Q" mode hassometimes to be set during conditioning.
It should be pointed out that the above qualitative description is strictly valid only for low-level conditions. Saturation effects modify more or less the behaviour at nominal operatinglevels but the basic effects remain valid. As a practical consequence, a high-power phaseshifter (trombone) is in general necessary between amplifier and cavity for the optimisation oftransient behaviour (and not to adjust the overall phase at an ill-conditioned spot as issometimes suspected).
Some generators, especially semiconductors and klystrons, have stringent requirementsfor the load impedance that preclude the direct connection of a cavity in pulsed regime. Non-reciprocal ferrite devices such as circulators or insulators have to be provided in these cases toabsorb all load reflections. The transient behaviour becomes then independent of feeder linelength.
5.4 RF plumbing
The RF feeder line between the power amplifier and the structure transports in generalconsiderable RF power and has to be designed with some precaution. Except for very highduty cycle it is the peak-pulse power rather man the average power that sets the limits.
In coaxial systems the support of the inner conductor is often the weakest spot.Accumulation of dust and metallic particles, e.g. stemming from contact wear on phase shifters(trombones), may substantially reduce the flashover rating in particular on horizontally orienteddisks. The use of metallic A/4 stubs eliminates this problem altogether since there are noinsulating surfaces to be contaminated. It is of course prudent to choose the largest linediameter possible. This is more an economic than a technical problem, since coaxial linediameters of up to 300 mm having peak-power capabilities of tens of Megawatts can be usedaround 200 MHz without problems from higher-order modes. Contact erosion from RFcurrents has been a problem at some machines, this is again alleviated by large diametersresulting in lower current densities. Pressurisation by air or SF6 is sometimes used to increasethe peak power capability, at least permanent venting with dry air is advisable as a preventivemeasure. This complicates the mechanical design since continuity of the air channel has to beassured and excessive leaks avoided.
In waveguide systems the dimension of the feeder is in general predetermined by theoperating frequency. Pressurisation or evacuation are the means to achieve high peak-powercapability; sometimes both possibilities coexist. The number of vacuum/gas windows, theirposition with respect to voltage/current maxima under transient conditions, as well as particularrequirements of the elements to be interconnected have to be considered in the system layout.Waveguide flanges have to be carefully assembled to avoid RF leakage.
5.5 Power combining and splitting
5.5.1 Direct combining
It may occur that a single generator cannot provide the required output power; powercombining using several sources is then a solution. This method is the rule in semiconductoramplifiers where a great number of individual, identical output stages are working together in

73
one common output. Another example is a 200 MHz RF installation at CERN, delivering1 MW continuous power combined from 32 commercially available TV transmitters.Conversely, one large klystron may be able to feed several accelerating sections; powersplitting is then the answer. This is the case in most electron machines.
The preferred basic building block for both power combining and splitting is somedirectional device in the form of a "bridge transformer", "directional coupler", "magic tee","decoupled junction" etc. which exists in many coaxial or waveguide variants. If correctlyimbedded in the circuit they can either provide virtual independence between the individualsources or loads, or can implement matched source or load conditions even if assembled fromfully reflecting devices. One or several absorbers (also called terminations or loads) arenecessary to annihilate the unwanted reflections. Detailed descriptions can be found inmicrowave textbooks; practical examples are given below in the paragraph describing othermachines.
5.5.2 Pulse compression
The majority of Linacs are used at the relatively low duty cycle of a few per mil or percent, where the generators are operated up to the permissible peak power but may still haveconsiderable reserves in terms of average power (i.e. pulse length). One approach is then togenerate a longer pulse than ultimately needed and compress it in time, thus trading excesspulse length for additional peak power. An original scheme to achieve pulse compression inaccelerator environment was devised by Z.D. Farkas at SLAC under the name of SLED, ascheme now in widespread use in many Linacs under different names.
Its function is best explained by a DC analogy (see Fig. 11): Imagine a DC generatorcharging a capacitor. Reversing the polarity between generator and capacitor, in other wordschanging the generator phase by 180°, provokes a transient whose peak amplitude can attainmany times the current available from the generator alone.
DC onaloovSLED
Phase reversal ( + / — )
-115ms
RF implementation
PhaseModulator
o Storage cavities
3dB Coupler
7W Decelerationsection
Klystron
Waveforms of the conventional SLED
1
0
180deg
0
2
U
[Generator amplitude[
Generator phase I
. SLED amplitude
Fig. 11 RF pulse compression by the SLED principle
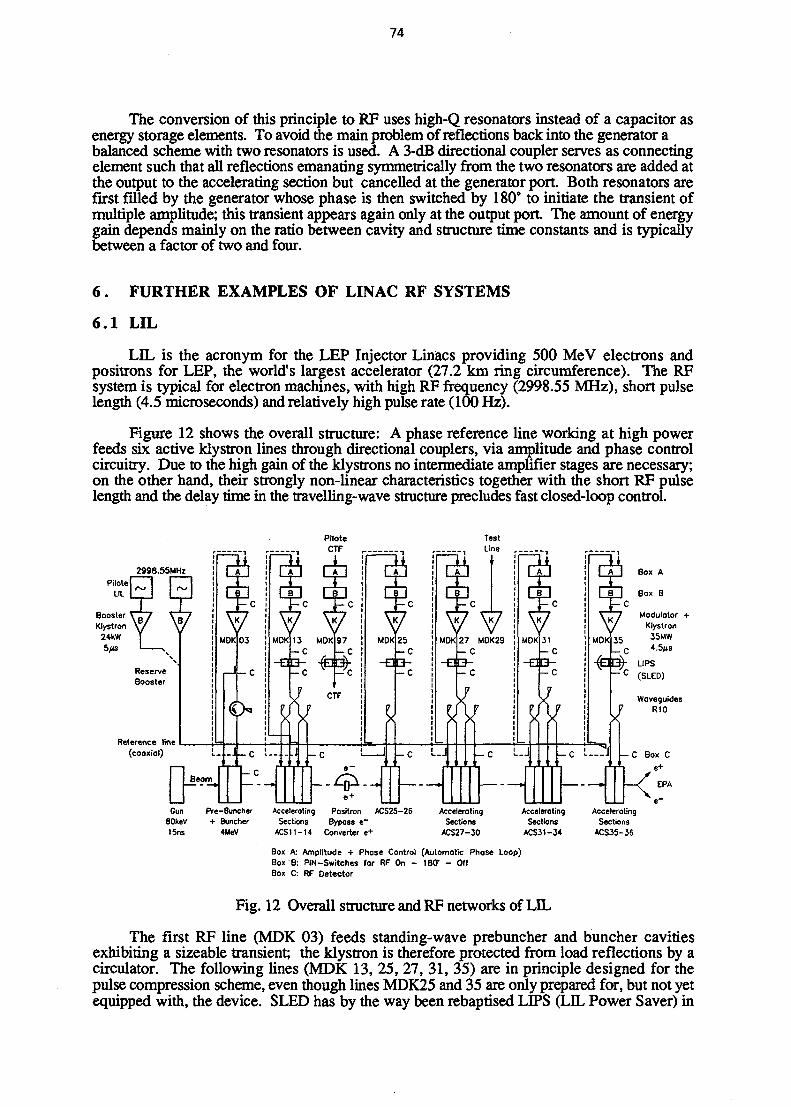
74
The conversion of this principle to RF uses high-Q resonators instead of a capacitor asenergy storage elements. To avoid die main problem of reflections back into the generator abalanced scheme widi two resonators is used. A 3-dB directional coupler serves as connectingelement such that all reflections emanating symmetrically from the two resonators are added atthe output to the accelerating section but cancelled at the generator port. Both resonators arefirst filled by the generator whose phase is then switched by 180° to initiate the transient ofmultiple amplitude; this transient appears again only at the output port The amount of energygain depends mainly on the ratio between cavity and structure time constants and is typicallybetween a factor of two and four.
6 . FURTHER EXAMPLES OF LINAC RF SYSTEMS
6.1 LIL
LIL is the acronym for the LEP Injector Linacs providing 500 MeV electrons andpositrons for LEP, the world's largest accelerator (27.2 km ring circumference). The RFsystem is typical for electron machines, with high RF frequency (2998.55 MHz), short pulselength (4.5 microseconds) and relatively high pulse rate (100 Hz).
Figure 12 shows the overall structure: A phase reference line working at high powerfeeds six active klystron lines through directional couplers, via amplitude and phase controlcircuitry. Due to the high gain of the klystrons no intermediate amplifier stages are necessary;on the other hand, their strongly non-linear characteristics together with the short RF pulselength and die delay time in die travelling-wave structure precludes fast closed-loop control.
PiloteUL
Gun80keV15ns
Pre-Buncher+ Buncher
4MeV
AcceleratingSections
ACS11-H
Positron ACS25-26Bypass e~
Converter e +
AcceleratingSections
ACS27-30
AcceleratingSections
ACS31-34
AcceleratingSections
ACS35-36
Box A: Amplitude + Phase Control (Automatic Phase Loop)Box B: PIN-Switches for RF On - 180" - OffBox C: RF Detector
Fig. 12 Overall structure and RF networks of LIL
The first RF line (MDK 03) feeds standing-wave prebuncher and buncher cavitiesexhibiting a sizeable transient; the klystron is therefore protected from load reflections by acirculator. The following lines (MDK 13, 25, 27, 31, 35) are in principle designed for thepulse compression scheme, even though lines MDK25 and 35 are only prepared for, but not yetequipped with, the device. SLED has by the way been rebaptised LIPS (LIL Power Saver) in
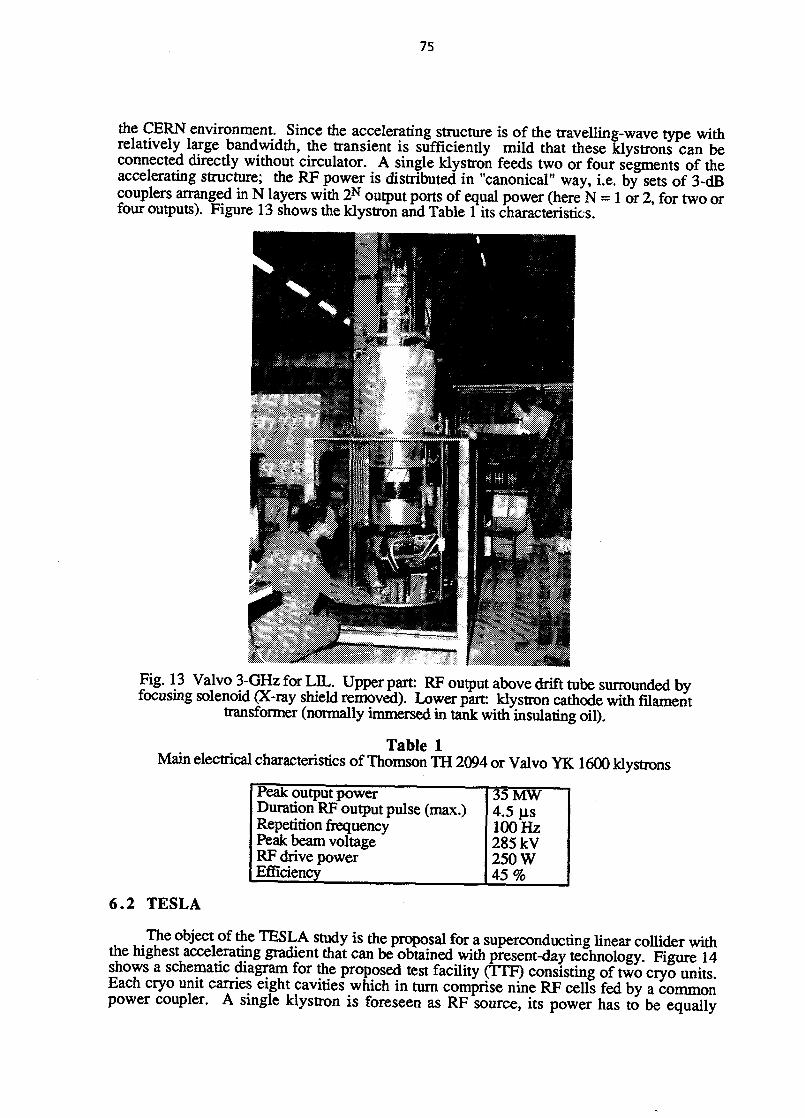
75
the CERN environment. Since the accelerating structure is of the travelling-wave type withrelatively large bandwidth, the transient is sufficiently mild that these klystrons can beconnected directly without circulator. A single klystron feeds two or four segments of theaccelerating structure; the RF power is distributed in "canonical" way, i.e. by sets of 3-dBcouplers arranged in N layers with 2N output ports of equal power (here N = 1 or 2, for two orfour outputs). Figure 13 shows the klystron and Table 1 its characteristics.
Fig. 13 Valvo 3-GHz for LIL. Upper part: RF output above drift tube surrounded byfocusing solenoid (X-ray shield removed). Lower part: klystron cathode with filament
transformer (normally immersed in tank with insulating oil).
Table 1Main electrical characteristics of Thomson TH 2094 or Valvo YK 1600 klystrons
Peak output powerDuration RF output pulse (max.)Repetition frequencyPeak beam voltageRF drive powerEfficiency
35 MW4.5 us100 Hz285 kV250 W45%
6.2 TESLA
The object of the TESLA study is the proposal for a superconducting linear collider withthe highest accelerating gradient that can be obtained with present-day technology Figure 14shows a schematic diagram for the proposed test facility (TTF) consisting of two cryo unitsEach cryo unit carries eight cavities which in turn comprise nine RF cells fed by a commonpower coupler. A single klystron is foreseen as RF source, its power has to be equally
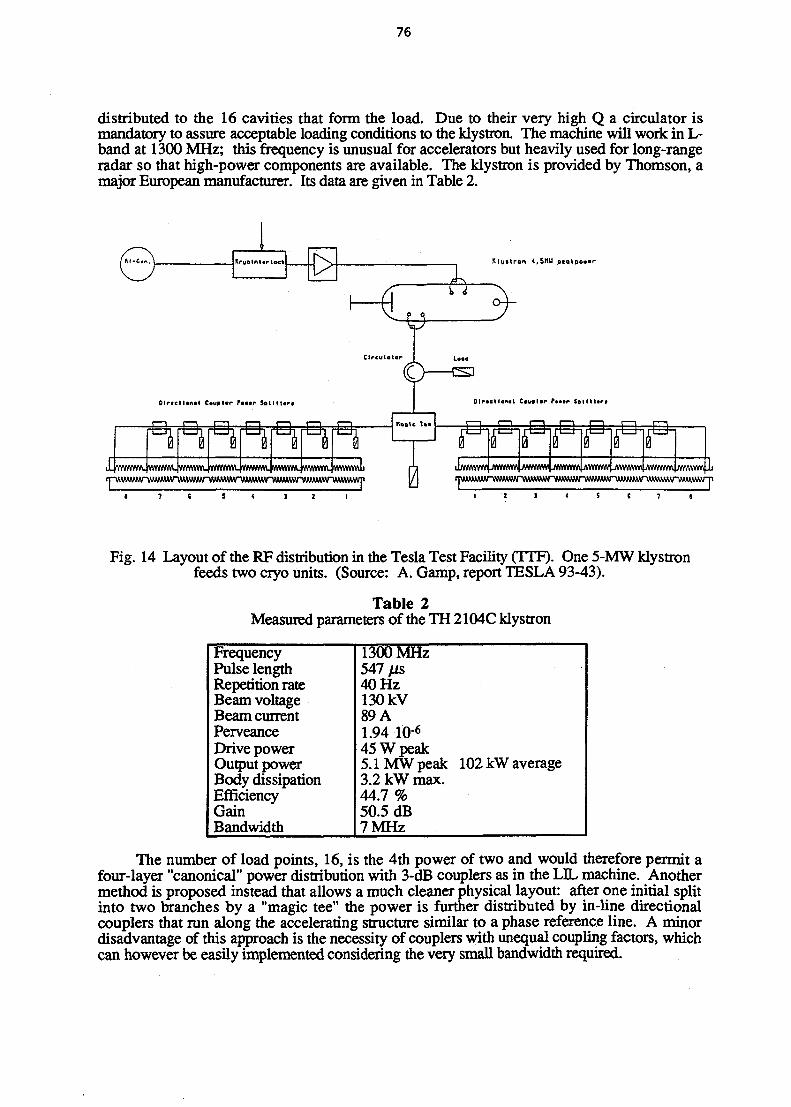
76
distributed to the 16 cavities that form the load. Due to their very high Q a circulator ismandatory to assure acceptable loading conditions to the klystron. The machine will work in L-band at 1300 MHz; this frequency is unusual for accelerators but heavily used for long-rangeradar so that high-power components are available. The klystron is provided by Thomson, amajor European manufacturer. Its data are given in Table 2.
Klustren 4.5MU pcakpovir
JL YVYVYVW. vwvmv. w i w w . YIYWWA. wwwm. mvwvw. VWWWL WIYWWJJ
1 2 3 4 S S 7 e
Fig. 14 Layout of the RF distribution in the Tesla Test Facility (TTF). One 5-MW klystronfeeds two cryo units. (Source: A. Gamp, report TESLA 93-43).
Table 2Measured parameters of the TH 2104C klystron
FrequencyPulse lengthRepetition rateBeam voltageBeam currentPerveanceDrive powerOutput powerBody dissipationEfficiencyGainBandwidth
1300 MHz547 /is40 Hz130 kV89 A1.94 iO"6
45 W peak5.1 MW peak 102 kW average3.2 kW max.44.7 %50.5 dB7 MHz
The number of load points, 16, is the 4th power of two and would therefore permit afour-layer "canonical" power distribution with 3-dB couplers as in the LEL machine. Anothermethod is proposed instead that allows a much cleaner physical layout: after one initial splitinto two branches by a "magic tee" the power is further distributed by in-line directionalcouplers that run along the accelerating structure similar to a phase reference line. A minordisadvantage of this approach is the necessity of couplers with unequal coupling factors, whichcan however be easily implemented considering the very small bandwidth required.
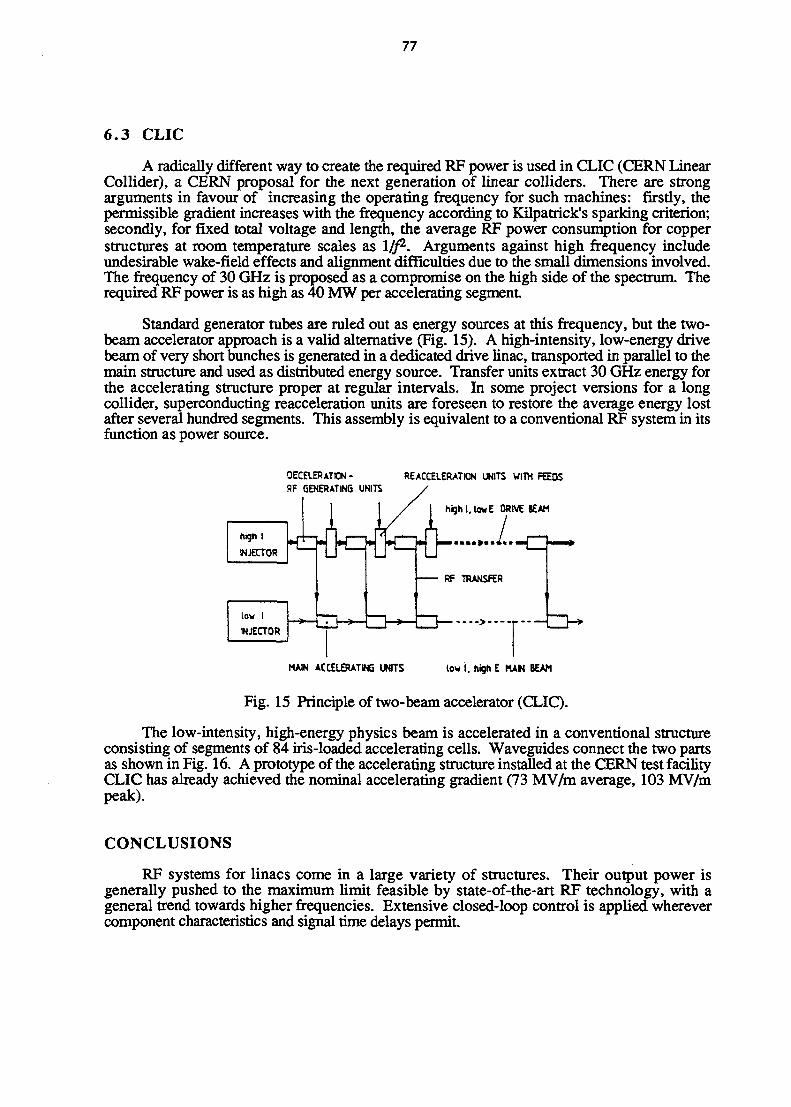
77
6 .3 CLIC
A radically different way to create the required RF power is used in CLIC (CERN LinearCollider), a CERN proposal for the next generation of linear colliders. There are strongarguments in favour of increasing the operating frequency for such machines: firstly, thepermissible gradient increases with the frequency according to Kilpatrick's sparking criterion;secondly, for fixed total voltage and length, the average RF power consumption for copperstructures at room temperature scales as Iff2. Arguments against high frequency includeundesirable wake-field effects and alignment difficulties due to the small dimensions involved.The frequency of 30 GHz is proposed as a compromise on the high side of the spectrum. Therequired RF power is as high as 40 MW per accelerating segment
Standard generator tubes are ruled out as energy sources at this frequency, but the two-beam accelerator approach is a valid alternative (Fig. 15). A high-intensity, low-energy drivebeam of very short bunches is generated in a dedicated drive linac, transported in parallel to themain structure and used as distributed energy source. Transfer units extract 30 GHz energy forthe accelerating structure proper at regular intervals. In some project versions for a longcollider, superconducting reacceleration units are foreseen to restore the average energy lostafter several hundred segments. This assembly is equivalent to a conventional RF system in itsfunction as power source.
DECELERATION - REACCELERATION UNITS WITH FEEDSRF GENERATING UNITS
/I high I, lowE DRIVE BEAM
MAIN ACCELERATING UMTS low I. high E MAN BEAM
Fig. 15 Principle of two-beam accelerator (CLIC).
The low-intensity, high-energy physics beam is accelerated in a conventional structureconsisting of segments of 84 iris-loaded accelerating cells. Waveguides connect the two partsas shown in Fig. 16. A prototype of the accelerating structure installed at the CERN test facilityCLIC has already achieved the nominal accelerating gradient (73 MV/m average, 103 MV/mpeak).
CONCLUSIONS
RF systems for linacs come in a large variety of structures. Their output power isgenerally pushed to the maximum limit feasible by state-of-the-art RF technology, with ageneral trend towards higher frequencies. Extensive closed-loop control is applied wherevercomponent characteristics and signal time delays permit.
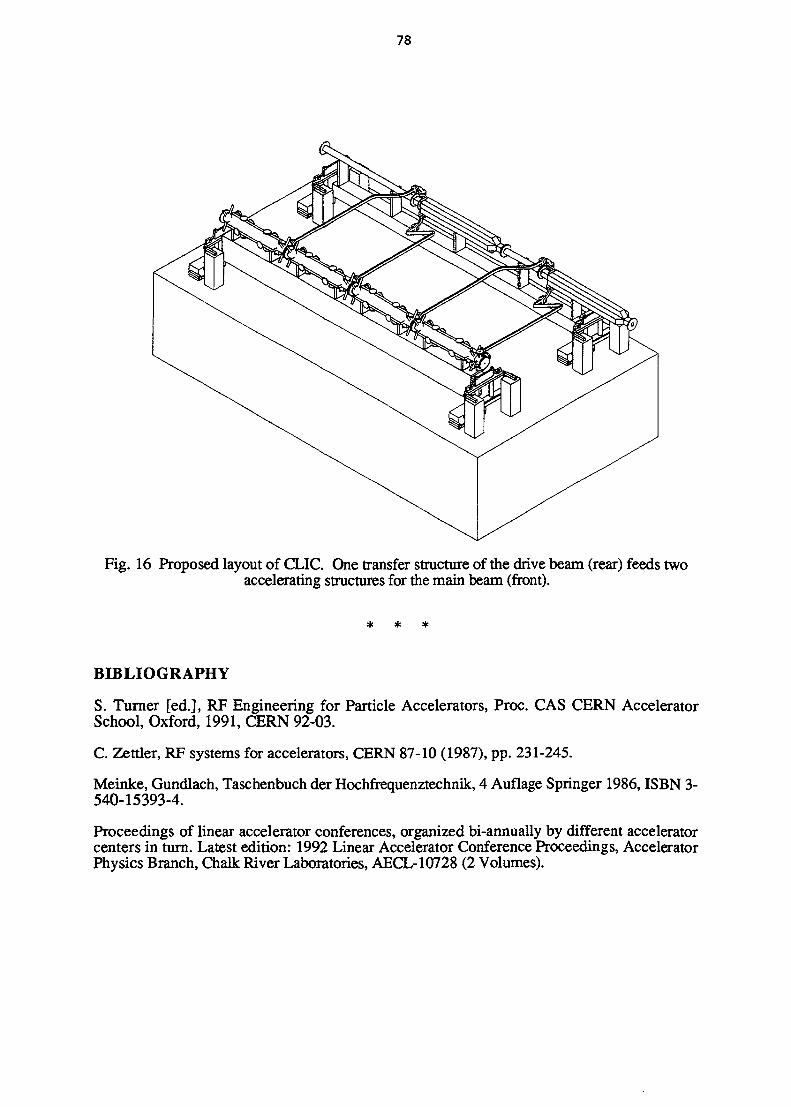
78
Fig. 16 Proposed layout of CLIC. One transfer structure of the drive beam (rear) feeds twoaccelerating structures for the main beam (front).
BIBLIOGRAPHY
S. Turner [ed.], RF Engineering for Particle Accelerators, Proc. CAS CERN AcceleratorSchool, Oxford, 1991, CERN 92-03.
C. Zettler, RF systems for accelerators, CERN 87-10 (1987), pp. 231-245.
Meinke, Gundlach, Taschenbuch der Hochfrequenztechnik, 4 Auflage Springer 1986, ISBN 3-540-15393-4.
Proceedings of linear accelerator conferences, organized bi-annually by different acceleratorcenters in turn. Latest edition: 1992 Linear Accelerator Conference Proceedings, AcceleratorPhysics Branch, Chalk River Laboratories, AECL-10728 (2 Volumes).
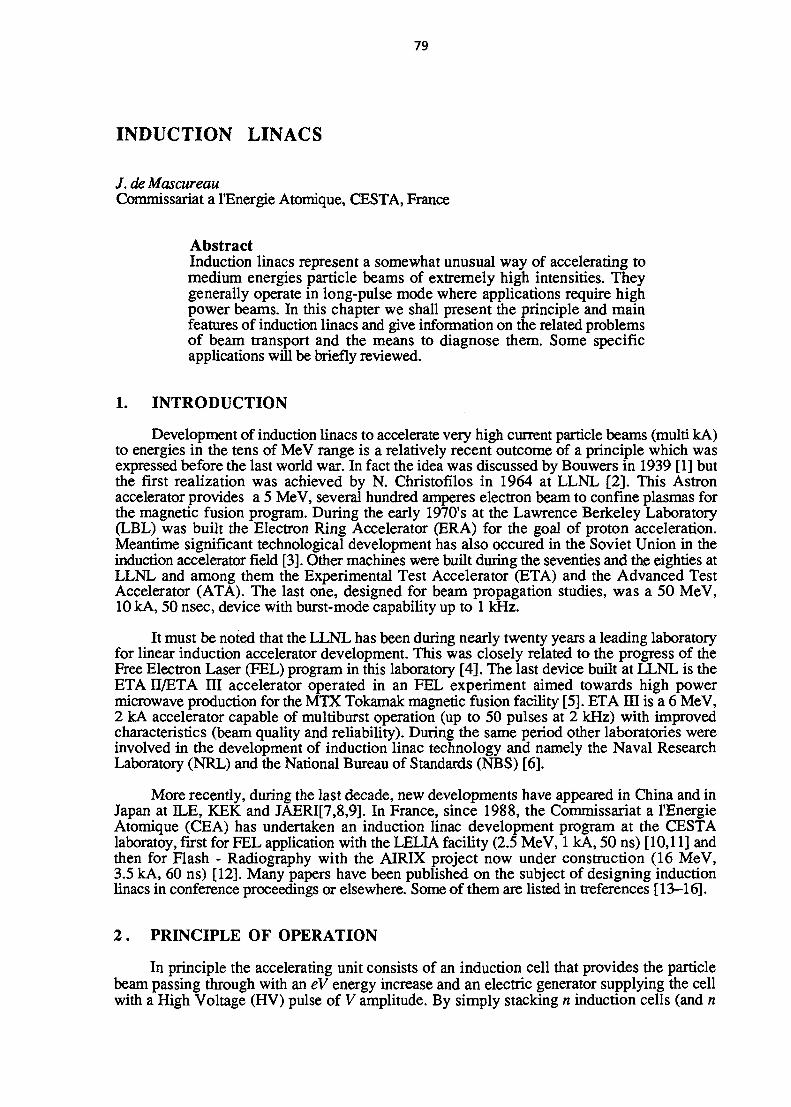
79
INDUCTION LINACS
/ . de MascureauCommissariat a rEnergie Atomique, CESTA, France
AbstractInduction linacs represent a somewhat unusual way of accelerating tomedium energies particle beams of extremely high intensities. Theygenerally operate in long-pulse mode where applications require highpower beams. In this chapter we shall present the principle and mainfeatures of induction linacs and give information on die related problemsof beam transport and the means to diagnose them. Some specificapplications will be briefly reviewed.
1. INTRODUCTION
Development of induction linacs to accelerate very high current particle beams (multi kA)to energies in the tens of MeV range is a relatively recent outcome of a principle which wasexpressed before the last world war. In fact the idea was discussed by Bouwers in 1939 [1] butthe first realization was achieved by N. Christofilos in 1964 at LLNL [2]. This Astronaccelerator provides a 5 MeV, several hundred amperes electron beam to confine plasmas forthe magnetic fusion program. During the early 1970's at the Lawrence Berkeley Laboratory(LBL) was built the Electron Ring Accelerator (ERA) for the goal of proton acceleration.Meantime significant technological development has also occured in the Soviet Union in theinduction accelerator field [3]. Other machines were built during the seventies and the eighties atLLNL and among them the Experimental Test Accelerator (ETA) and the Advanced TestAccelerator (ATA). The last one, designed for beam propagation studies, was a 50 MeV,10 kA, 50 nsec, device with burst-mode capability up to 1 kHz.
It must be noted that the LLNL has been during nearly twenty years a leading laboratoryfor linear induction accelerator development. This was closely related to the progress of theFree Electron Laser (FEL) program in this laboratory [4], The last device built at LLNL is theETA II/ETA III accelerator operated in an FEL experiment aimed towards high powermicrowave production for the MTX Tokamak magnetic fusion facility [5]. ETA HI is a 6 MeV,2 kA accelerator capable of multiburst operation (up to 50 pulses at 2 kHz) with improvedcharacteristics (beam quality and reliability). During the same period other laboratories wereinvolved in the development of induction linac technology and namely the Naval ResearchLaboratory (NRL) and the National Bureau of Standards (NBS) [6].
More recently, during the last decade, new developments have appeared in China and inJapan at ILE, KEK and JAERI[7,8,9]. In France, since 1988, the Commissariat a l'EnergieAtomique (CEA) has undertaken an induction linac development program at the CESTAlaboratoy, first for FEL application with the LELIA facility (2.5 MeV, 1 kA, 50 ns) [10,11] andthen for Flash - Radiography with the AIRIX project now under construction (16 MeV,3.5 kA, 60 ns) [12]. Many papers have been published on the subject of designing inductionlinacs in conference proceedings or elsewhere. Some of them are listed in treferences [13-16].
2 . PRINCIPLE OF OPERATION
In principle the accelerating unit consists of an induction cell that provides the particlebeam passing through with an eV energy increase and an electric generator supplying the cellwith a High Voltage (HV) pulse of V amplitude. By simply stacking n induction cells (and n
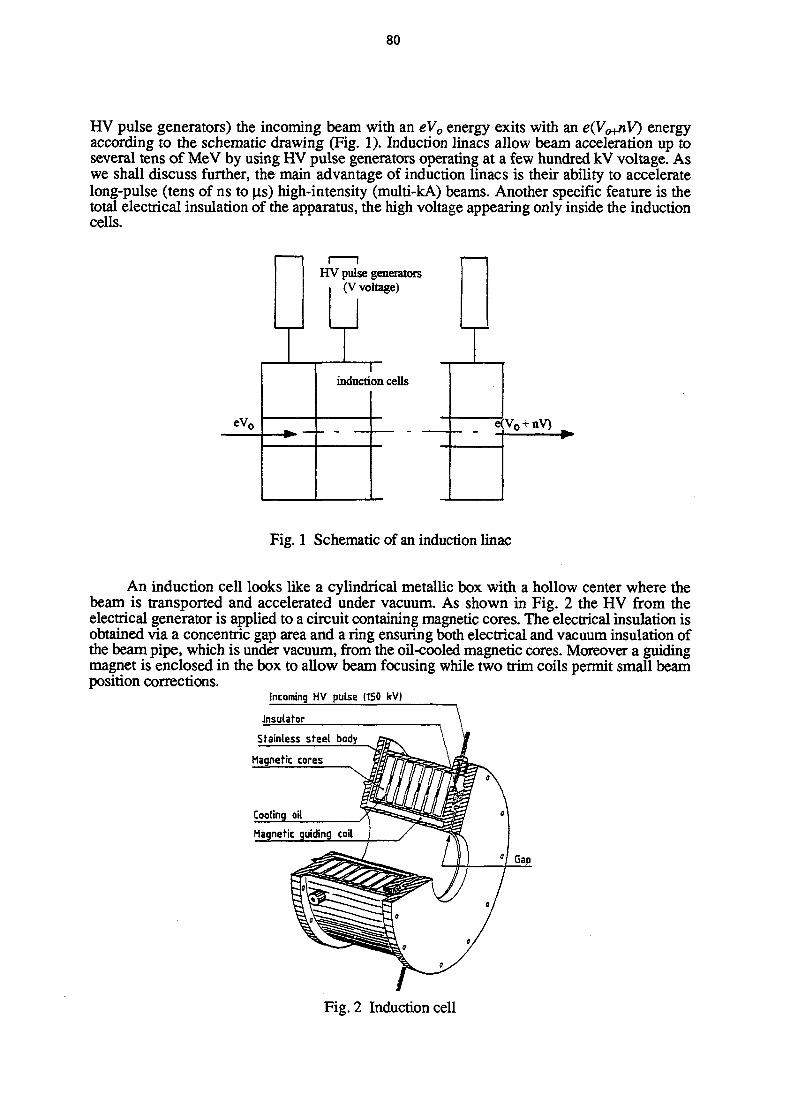
80
HV pulse generators) the incoming beam with an eV0 energy exits with an e(Vo+nV) energyaccording to the schematic drawing (Fig. 1). Induction linacs allow beam acceleration up toseveral tens of MeV by using HV pulse generators operating at a few hundred kV voltage. Aswe shall discuss further, the main advantage of induction linacs is their ability to acceleratelong-pulse (tens of ns to (xs) high-intensity (multi-kA) beams. Another specific feature is thetotal electrical insulation of the apparatus, the high voltage appearing only inside the inductioncells.
HV pulse generators(V voltage)
Iinduction cells
Fig. 1 Schematic of an induction linac
An induction cell looks like a cylindrical metallic box with a hollow center where thebeam is transported and accelerated under vacuum. As shown in Fig. 2 the HV from theelectrical generator is applied to a circuit containing magnetic cores. The electrical insulation isobtained via a concentric gap area and a ring ensuring both electrical and vacuum insulation ofthe beam pipe, which is under vacuum, from the oil-cooled magnetic cores. Moreover a guidingmagnet is enclosed in the box to allow beam focusing while two trim coils permit small beamposition corrections.
Incoming HV pulse (150 kV)
insulator
Stainless steel body
Magnetic cores
Fig. 2 Induction cell

81
2 . 1 The transformer analogy
In order to understand the induction cell principle, the analogy of the 1:1 transformer isusually presented as a first approach. In this comparison the primary winding is the metallicstructure of the cell, the beam itself playing the part of the secondary winding. When a squarepulse of Vo voltage and At duration is applied to the cell a magnetic field is created into thecores that induces on the beam an accelerating voltage of the same amplitude and duration.When n cells fed by identical electric pulses are coupled, the beam is given an nVo acceleratingvoltage as in a transformer with n primary windings and a single secondary. With this analogy,represented in Fig. 3, we can understand how, in an induction linac, a high accelerating voltagecan be reached by simply stacking along the beam axis many cells fed by a pulse of moderatevoltage.
However only the gross electric balance is concerned by this approach. To go further inthe design of the cell and the magnetic cores we have to study the current and voltagedistribution in the accelerator.
'JL TL "si
Fig. 3 The transformer analogy
2 .2 Current and voltage distribution
When the high voltage pulse {V0) At) from the coaxial transmission line enters the cell, itmeets on the one hand a capacitive element constituted by the accelerating gap, and on the otherhand an inductive element constituted by the magnetic material. The / supply current is thendivided into an /& charging current flowing into the gap and the inner wall of the cell, and an Immagnetization current flowing around the magnetic cores (see Fig. 4). If these cores have beenproperly magnetized before the pulse, they present a large inductance Zm limiting the evolutionof the Im current and preventing the line from being short-circuited on the electric ground.
The Ii, charging current equals the beam current and therefore is limited by its impedancewhich depends on the upstream diode characteristics. It has to be noticed that this current loopsin the HV generators by the means of coaxial cables. It never surrounds the magnetic coresunlike the transformer analogy has assumed.
Let us now consider the voltage distribution at different places of the apparatus and tobegin with, at the cable meeting point with the cell, assuming the HV generator and the cell are
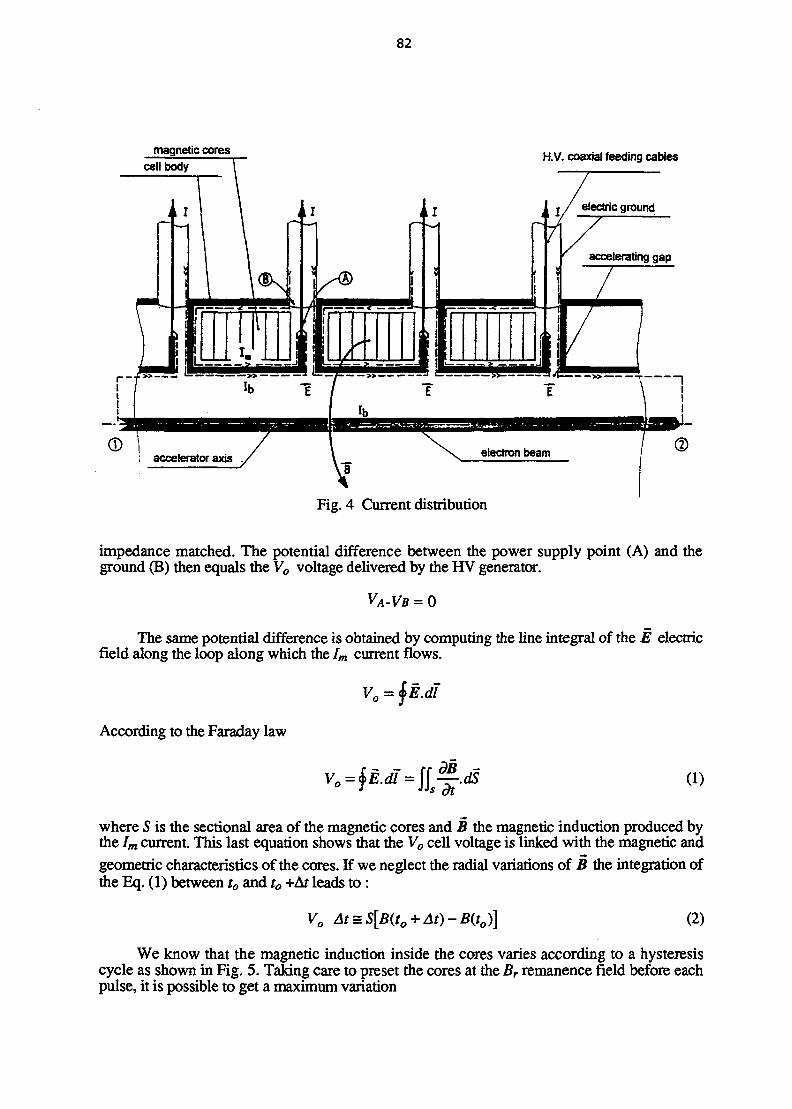
82
magnetic cores H.V. coaxial feeding cables
Fig. 4 Current distribution
impedance matched. The potential difference between the power supply point (A) and theground (B) then equals the Vo voltage delivered by the HV generator.
VA-VB = 0
The same potential difference is obtained by computing the line integral of the E electricfield along the loop along which the Im current flows.
Vo =
According to the Faraday law
(1)
where S is the sectional area of the magnetic cores and B the magnetic induction produced bythe Im current. This last equation shows that the Vo cell voltage is linked with the magnetic and
geometric characteristics of the cores. If we neglect the radial variations of B the integration ofthe Eq. (1) between t0 and to +Ar leads to :
(2)
We know that the magnetic induction inside the cores varies according to a hysteresiscycle as shown in Fig. 5. Taking care to preset the cores at the Br remanence field before eachpulse, it is possible to get a maximum variation

83
ABs=Br+Bs
where Brs is the value of B at saturation.
Fig. 5 Hysteresis cycleof a ferrite core
Fig. 6 Characteristic dimensionsof an induction cell
The equation (2) can be written as the following inequality:
Vo At<S.ABs (3)
This can be used for the dimensioning of the magnetic cores according to the high voltage pulsecharacteristics.
2 .3 Considerations for the design of magnetic materials
Ferrites are often used as magnetic material for their mechanical and magneticcharacteristics. Other materials have been used and among them Fe-Ni alloys and Metglass(from Allied Chemical). We currently have used PE 11B Ni-Zn ferrites from TDK. Themaximum ABS for this material is 6 kG. New PE 16 ferrite allows larger AByOf the order of7 kG. For Metglass 2605 SC the ABS value is much larger (~ 25 kG) but this material has tobe used in ribbons of small thickness (~ 20 \im) with Mylar insulation between consecutivelayers.
The role of the magnetic material is essential in the induction cell operation. Let us try tosee how it is possible to dimension these cores. If we consider the area they fill in the cell, itcould be regarded as a coaxial transmission line of length / ended by a short circuit Fig. 6. Theinternal conductor of the line is formed by the cylinder of radius n, the external conductor bythe cylinder of radius re and the short circuit by the SC plate. In this line, at point A, enters thevoltage wave (V0>Ar) associated with current Im such that:
(4)
Zm forming the characteristic impedance of the line.
84
As in a classical line, as the wave advances in the magnetic material, the Vo supplyvoltage is propagated lengthwise along the internal cylinder whereas the external cylinder andthe SC plate are kept at the ground potential. When the wave reaches the plate, the wholecylinder is virtually held at the Vo voltage. At this time the wave is reflected by the short circuitwith a polarity change for the voltage. As it comes back, the internal cylinder voltage goesprogressively to zero up to the A feeding point. Accordingly the Vo voltage can be held at theline terminals no longer than the time of a journey there and back for the wave along the cell atthe velocity 1 / -
In these conditions a pulse of AT duration will be used to best advantage by imposing amagnetic core length such as
At<2ljen (5)
where e and [i are respectively the dielectric constant and permeability of the magnetic material.
On the other hand the pulse duration must not be shorter than a single transit time of thewave, otherwise some magnetic cores would not see the pulse and would be useless. Thiscondition can be expressed by
At > l-Jeii (6)
It must be pointed out that Eqs. (5) and (6) hold only when the Im magnetization currentremains smaller thant the Is saturation current. If not, a saturation wave is created with avelocity larger than the electromagnetic wave velocity, and the magnetic cores get saturated in atime shorter than the pulse duration.
This condition Im < Is can as well be written as
Hm= <HS (7)
H =ImLog{re/ri)
If the magnetic cores can be considered as an ideal inductance L
L = — Log(re I rt) (9)
then
Vo = L^f- (10)dt
andEq. (10) leads to
Vo At<L.Is
Vo.At<V Hs Hre-rt)
Considering the hysteresis cycle of the magnetic core
85
ft-.Br+B»
we obtain again Eq. (3)
Vo At<S.ABs
The meaning of Eq. (3) is now clearer: when cells are dimensioned in such a way that thiscondition is fulfilled, then saturation of the magnetic cores is prevented during the high-voltagepulse by keeping the magnetization current lower than the saturation current.
To sum up, the transmission line analogy allows a better understanding of the phenomenaoccuring in the magnetic cores which play a double part:
- holding the gap at the charging potential by delaying the cell short circuit,- keeping the cell external structure at the ground potential during the whole high voltage
pulse.
The previous considerations are helpful in dimensioning the magnetic (ABS) andgeometrical (l,re - r{) characteristics of the cores. We shall give in another way informationabout \i and the internal radius r,-.
2.4 Cell coupling efficiency
During the flat top of the voltage pulse, the current from the HV pulse generator isdivided into two lines in the cell. The efficiency can be expressed as :
Assuming the cores to be properly simulated by an inductance ZOT and the beam by aresistance R, then we have
This efficiency is good provided that Zm is large compared to R. According to Eq. (9)one condition is to get fi as large as possible. Another condition is to improve the re I r% ratio,but this ratio also depends on other requirements. However the true effciency is lower due toanother resistance which is added in parallel with the cell in order to protect it against overvoltages. Indeed if operational problems occur, for example if the beam gets out of step withthe high voltage pulse, this additional resistance (we call it the "Ballast" resistor) prevents thegap from seeing an over voltage which could result in damaging breakdown. The actualefficiency can drop off to values under fifty percent.
2.5 High voltage generator
This aims at providing the induction cell with HV pulses having specific characteristics:
- high intensity, since I *>I
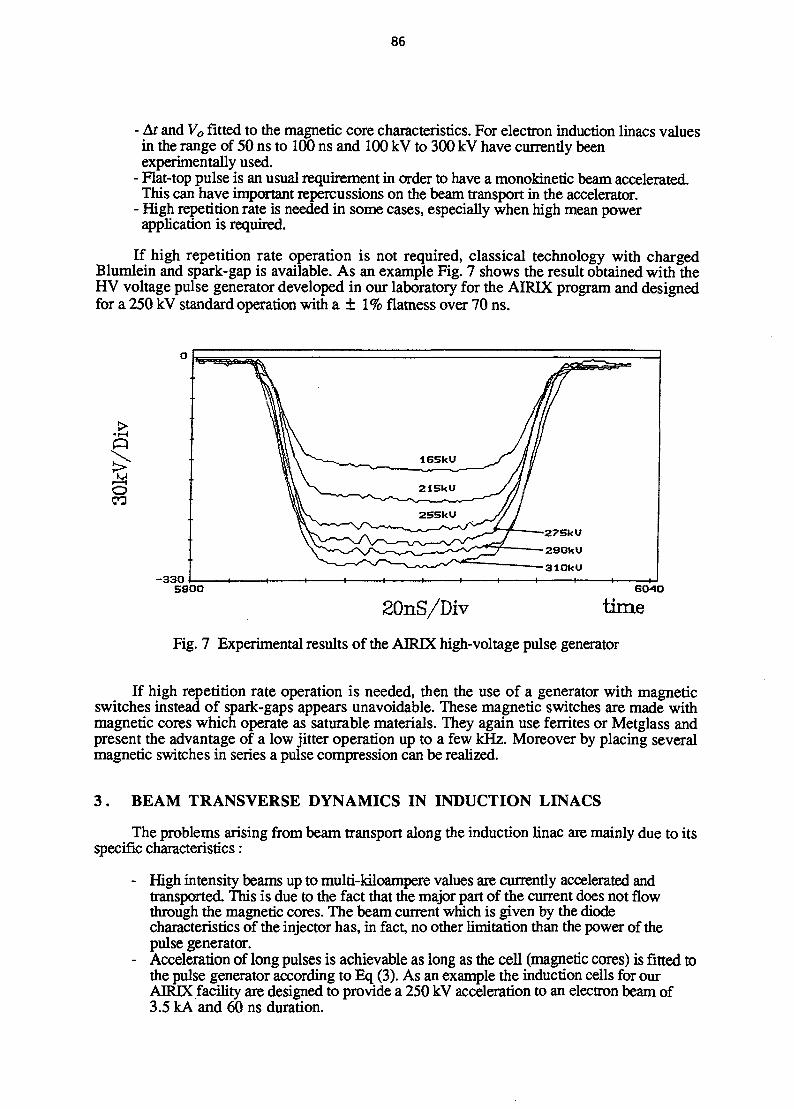
86
- At and Vo fitted to the magnetic core characteristics. For electron induction linacs valuesin the range of 50 ns to 100 ns and 100 kV to 300 kV have currently beenexperimentally used.
- Flat-top pulse is an usual requirement in order to have a monokinetic beam accelerated.This can have important repercussions on the beam transport in the accelerator.
- High repetition rate is needed in some cases, especially when high mean powerapplication is required.
If high repetition rate operation is not required, classical technology with chargedBlumlein and spark-gap is available. As an example Fig. 7 shows the result obtained with theHV voltage pulse generator developed in our laboratory for the AIRIX program and designedfor a 250 kV standard operation with a ± 1% flatness over 70 ns.
I
o
330
Y\V \__ Z15kU
^S\ 2S5kU /
1 1 1 1 1 1 1 1
/
~r—-—27SkU•—ZSOkU
• 31OkU1 1 1 hJ
580O
20nS/Div
Fig. 7 Experimental results of the AIRIX high-voltage pulse generator
60-40
time
If high repetition rate operation is needed, then the use of a generator with magneticswitches instead of spark-gaps appears unavoidable. These magnetic switches are made withmagnetic cores which operate as saturable materials. They again use ferrites or Metglass andpresent the advantage of a low jitter operation up to a few kHz. Moreover by placing severalmagnetic switches in series a pulse compression can be realized.
3 . BEAM TRANSVERSE DYNAMICS IN INDUCTION LINACS
The problems arising from beam transport along the induction linac are mainly due to itsspecific characteristics:
- High intensity beams up to multi-kiloampere values are currently accelerated andtransported. This is due to the fact that the major part of the current does not flowthrough the magnetic cores. The beam current which is given by the diodecharacteristics of the injector has, in fact, no other limitation than the power of thepulse generator.
- Acceleration of long pulses is achievable as long as the cell (magnetic cores) is fitted tothe pulse generator according to Eq (3). As an example the induction cells for ourAIREX facility are designed to provide a 250 kV acceleration to an electron beam of3.5 kA and 60 ns duration.

87
The phenomena which appear during the propagation can lead to a degradation of thebeam quality from:
- an emittance growth due to space charge effects,- an effective emittance growth due to transverse motions originating in chromatic
effects and Beam Break-Up (BBU) instabilities.
We briefly give some results concerning these phenomena and what can be done tominimize their effects.
3.1 Space charge effects
These find their origin in the non-uniform radial distribution of the charges in the beam.This results in a transformation of the potential energy into transverse kinetic energy. The effectis a redistribution of the electric charges in the beam which causes an emittance growth asshown in the next equation:
j^[U(z)U(o)] (12)
where en is the normalized emittance of the beamR is the beam radius (mean quadratic radius)/ is the beam current and Io is the limit current/? and y are the relativistic parameters.
The quantity in square brackets represents the variation of the electrostatic energy. As thebeam travels through the accelerator the beam profile has the tendency to get uniform whichimplies that U(z) goes to zero.
In order to minimize these effects which appear mainly in the case of high currents at lowenergy the obvious solutions consists in:
- injecting into the linac particles with as high an energy as possible (large y)- transporting a small radius beam.
But in the present case it is not possible to minimize / since it is a major feature of the inductionlinac. Another way is to consider the injection of an electron beam with a uniform radialdistribution, but this is a characteristic of the injector. In practice this effect is generallyimportant only at the entrance of the linac and compared to the following effects becomesnegligible as the energy increases.
3.2 Chromatic effects
These are often referred to as "corkscrew" motions especially in the North-Americanlitterature. Their origin is double:
- The particle energy has a AE variation during the pulse.- And the focusing system is not perfect (mechanical alignment, design of the focusing
magnets,...).
The result is a motion of the beam centroid. Due to the length of the particle pulse in aninduction linac, it induces a global emittance growth when this effect is integrated over thewhole pulse duration.

88
In order to minimize these effects care has to be taken of the beam quality with regard toits energy spread over the pulse duration. This is why we specify a AE <±1% for the electronbeam injected in to our AIRTX induction linac.
Another consequence is the need for an excellent quality focusing system along theaccelerator. As was indicated in Fig. 2 each induction cell has to be provided with a guidingmagnet. An example is shown in Fig. 8 representing the focusing magnet design of the AIRIXinduction cells. As can be seen in this figure soft-iron homogenizer rings mechanicallyconcentric to the beam pipe have been introduced. The effect is to reduce the transversecomponent of the magnetic field inside the solenoid. Measurements have shown animprovement in the ratio of the transverse-to-axial components which reduce to values under1(H all over the solenoid axis.
Moderate field (1.5 to 2 kG)
Hollow wire water cooled (6 x 6 or 5 x 5 mm)
Bifilar, four layers winding
Printed circuit trim coils (350 Gauss.cm)
Homogenizers
Ferrite
—Spacers
i -Guiding magnets
Homogenizers
rim coils
Fig. 8 Focusing magnet design of the AIRIX induction cell
In the same way, the mechanical design of the cells is an important concern in that themechanical axis has to be aligned with the magnetic axis since only the latter has an influence onthe beam. Moreover all the cells must be aligned together in order to minimize the dispersion oftheir axes not only for off-axis displacements but also for tilt effects. These considerations ofcell alignment are also concerned with beam break-up instabilities.
3.3 Beam Break-Up (BBU) Instability
This comes from the interaction of the beam with transverse electromagnetic fields in thegap cavities. The BBU mechanism can be briefly summarized as follows:
- an off-axis beam propagation in the induction cell induces the excitation of transverseelectromagnetic fields in the gap cavity.
- These electromagnectic fields then react on the beam to induce transverse motions at thefrequencies of the electromagnetic modes. Consequently the next cavities get excitedfrom step to step.
BBU instability is an exponentially growing phenomenon inducing transverse displacementswhich can be approximated by the following equation:
89
where Zj_ is the transverse impedance of the cell cavity and depends on:- the gap geometry- the materials used in the cavityG)± is the pulsation of the electromagnetic modeSE is the cell accelerating gradientkp is the wave number of the guiding magnet
In order to prevent the growth of BBU instabilites or to minimize their effects thefollowing recommendations must be taken into account:
- on-axis propagation of the beam in the accelerator,- accurate cell alignment (see § 3.2),- reduce the transverse impedance of the cell, especially for the dominating mode.
It depends on the gap geometry according to
where a is the width of the gap and D is the beam pipe diameter.
This impedance depends on the dielectric constant e of the insulator. A smaller £ leads tolower values of Zj_. For this purpose a plastic insulator, like Rexolite (e ~ 2.5) must bepreferred to an alumina insulator (e - 9).
- increase the cell gradient e,- increase the kp wave number, that is to say use a large B guiding field, but anoptimization has to be found with other effects which can lead to adjusting the B valuesalong the accelerator according to, for example:
The use of an electromagnetic code is necessary to calculate the transverse impedances. InFig. 9 are shown the impedances corresponding to different designs of the gap cavity for theAIRIX program with the PALAS code. The "VACUUM" case concerns a cell in which theferrites are under vacuum and there is no insulator, "REXOLITE" the technology designed forthe use of a specific plastic insulator, and "ALUMINA" the technology when a pure aluminainsulator is brazed on the body of the cell ensuring a perfect insulation between the ferrite areain oil and the beam area in vacuum. In this example we should notice that the technologicalcharacteristics (mechanical, electrical,...) have to be compared with the corresponding cellbehaviours concerning the BBU instability.
4 . DIAGNOSTICS
This is not the place to deal with the accelerator diagnostics in general. But, as we haveseen previously, induction linacs are characterized by very high intensity beams and longpulses. These specific features induce some problems of beam transport along the apparatus. Inorder to minimize the effects according to the recommendations given in the last section theaccelerator designers are required to accurately measure some important parameters of the beam
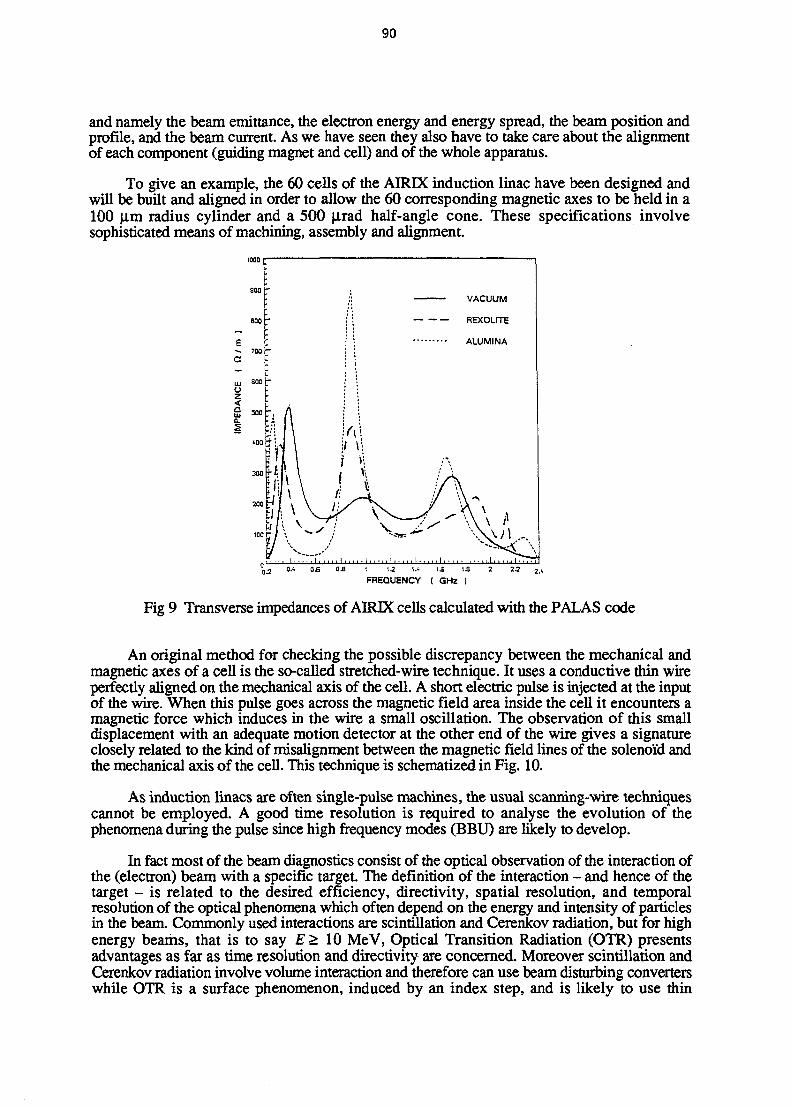
90
and namely the beam emittance, the electron energy and energy spread, the beam position andprofile, and the beam current. As we have seen they also have to take care about the alignmentof each component (guiding magnet and cell) and of the whole apparatus.
To give an example, the 60 cells of the AIRDC induction linac have been designed andwill be built and aligned in order to allow the 60 corresponding magnetic axes to be held in a100 |im radius cylinder and a 500 ^.rad half-angle cone. These specifications involvesophisticated means of machining, assembly and alignment.
1.2 I.' 13 IS
FREQUENCY ( GHz )
Fig 9 Transverse impedances of AIRIX cells calculated with the PALAS code
An original method for checking the possible discrepancy between the mechanical andmagnetic axes of a cell is the so-called stretched-wire technique. It uses a conductive thin wireperfectly aligned on the mechanical axis of the cell. A short electric pulse is injected at the inputof the wire. When this pulse goes across the magnetic field area inside the cell it encounters amagnetic force which induces in the wire a small oscillation. The observation of this smalldisplacement with an adequate motion detector at the other end of the wire gives a signatureclosely related to the kind of misalignment between the magnetic field lines of the solenoid andthe mechanical axis of the cell. This technique is schematized in Fig. 10.
As induction linacs are often single-pulse machines, the usual scanning-wire techniquescannot be employed. A good time resolution is required to analyse the evolution of thephenomena during the pulse since high frequency modes (BBU) are likely to develop.
In fact most of the beam diagnostics consist of the optical observation of the interaction ofthe (electron) beam with a specific target. The definition of the interaction - and hence of thetarget - is related to the desired efficiency, directivity, spatial resolution, and temporalresolution of the optical phenomena which often depend on the energy and intensity of particlesin the beam. Commonly used interactions are scintillation and Cerenkov radiation, but for highenergy beams, that is to say E > 10 MeV, Optical Transition Radiation (OTR) presentsadvantages as far as time resolution and directivity are concerned. Moreover scintillation andCerenkov radiation involve volume interaction and therefore can use beam disturbing converterswhile OTR is a surface phenomenon, induced by an index step, and is likely to use thin
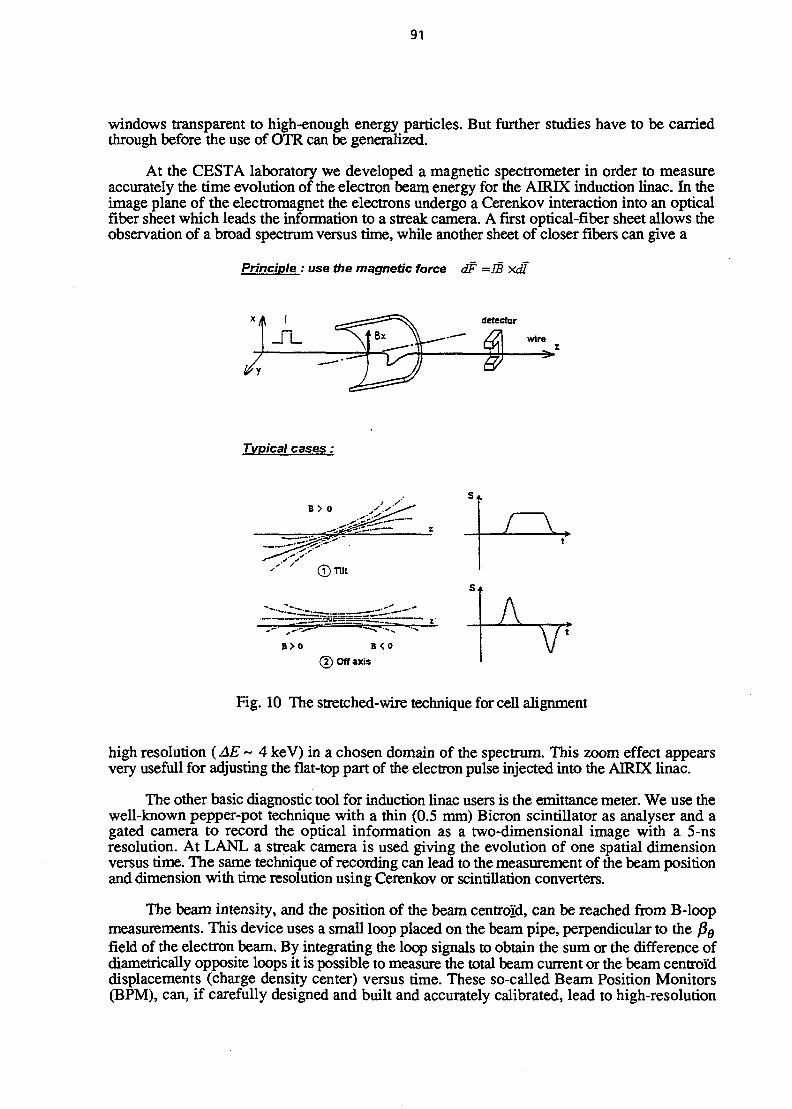
91
windows transparent to high-enough energy particles. But further studies have to be carriedthrough before the use of OTR can be generalized.
At the CESTA laboratory we developed a magnetic spectrometer in order to measureaccurately the time evolution of the electron beam energy for the ADRIX induction linac. In theimage plane of the electromagnet the electrons undergo a Cerenkov interaction into an opticalfiber sheet which leads the information to a streak camera. A first optical-fiber sheet allows theobservation of a broad spectrum versus time, while another sheet of closer fibers can give a
Principle : use the magnetic force dF =W y&
detector
wire
Typical cases:
S i
B>0 B<0(T> Off axis
A
Fig. 10 The stretched-wire technique for cell alignment
high resolution (AE ~ 4 keV) in a chosen domain of the spectrum. This zoom effect appearsvery usefull for adjusting the flat-top part of the electron pulse injected into the AIRIX linac.
The other basic diagnostic tool for induction linac users is the emittance meter. We use thewell-known pepper-pot technique with a thin (0.5 mm) Bicron scintillator as analyser and agated camera to record the optical information as a two-dimensional image with a 5-nsresolution. At LANL a streak camera is used giving the evolution of one spatial dimensionversus time. The same technique of recording can lead to the measurement of the beam positionand dimension with time resolution using Cerenkov or scintillation converters.
The beam intensity, and the position of the beam centroid, can be reached from B-loopmeasurements. This device uses a small loop placed on the beam pipe, perpendicular to the p9
field of the electron beam. By integrating the loop signals to obtain the sum or the difference ofdiametrically opposite loops it is possible to measure the total beam current or the beam centroiddisplacements (charge density center) versus time. These so-called Beam Position Monitors(BPM), can, if carefully designed and built and accurately calibrated, lead to high-resolution
92
time measurements of the beam-centroid motions closely related with the chromatic effects oreven with the high frequency modes of the BBU instabilities.
5 . APPLICATIONS
The specific applications of induction linacs result form their main characteristics:
- High intensity (multi-kA) and high brightness (small emittance)
(16)
- Long pluse (> 50 ns)- Small energy variations during the pulse- Repetition rate capability- High peak power and high average power.
Since the first machine, built in 1964, many applications of the induction linacs have beendeveloped. As we have seen in the first section they mainly concern the USA and the USSR butmore recently important programs began in eastern Asia (China, Japan, Corea) and in Europe(France). We will not review here all the facilites and all the subjects of interest but only give anoverview of the main applications and focus attention on two particular subjects (see § 5.1 and5.2).
At LLNL first studies were carried out for the goal of beam propagation in the atmosphere(ATA) but programs rapidly turned to FEL applications.
Research on magnetic confinement fusion was concerned at the beginning with theASTRON program and recently with the MTX experiment. At LBL an ion induction linac isbeing developed for inertial confinement fusion. At LLNL the FXR facility was built for highpower flash-radiography application [17] and at Los Alamos the DARHT induction acceleratoris designed to improve significantly the performances of FXR [18]. At CESTA, the CEA isnow designing and building the new AIRIX induction linac, similar to DARHT, for flashradiography.
But potential applications of the induction linac are not so limited: New studies are goingon for the injector of the future CLIC (CERN Linear Collider) where an induction linac couldbe used as a drive beam in a Two-Beam Accelerator (TBA) concept [19]. At the other extremityindustrial applications can be developed where high brightness beams are required whichcannot be reached with classical diode-type generators. They include all kinds of irradiation ofmaterials and particularly sterilization [20].
5 .1 Free Electron Laser (FEL) application
The induction linac is a good driver for FEL experiments where high power outputradiation is required. Since the FEL wavelength depends on the electron energy and the wigglerparameters (yw , /Jw) according to the equation
, 12
(17)
93
in most cases the resulting wavelength is in the microwave or Infrared (IR) domains. In theseconditions induction linac characteristics (small emittance and energy spread) can lead to a goodefficiency in the FEL interaction. Moreover the high beam intensity and brightness with highrepetition rate capability can lead to high peak power and high average power radiationemission.
An example of an induction linac FEL application was the MTX Tokamak experiment atLLNL. The microwave radiation at 140 GHz from the ETA II induction linac driven FEL wasused to heat the plasma of the MTX Tokamak. In this experiment the ETA II accelerator hasbeen improved (ETA III) in order to generate up to 50 pulses at a 2-kHz repetition rate. TheFEL used the IMP wiggler in the amplification mode of a gyrotron source at 140 GHz. Theaccelerator operation was stable enough to allow 25 microwave pulses to be injected in theTokamak with a 1-GW power.
5 .2 Flash radiography with induction linacs
Electron induction linacs can generate a powerful flash of hard X-Rays in order to makehigh quality radiographic images of dense, rapidly-moving objects. Here the goal is to producea large amount (dose) of X-Rays by focusing on a small spot (</> ~ 2 mm) into a conversiontarget a high intensity electron beam of convenient duration (At ~ 100 ns).
The quality of the radiographic source is given by a figure of merit (FM).
^ (18)
where D is the dose of X-Rays and <P the diameter of the X-Ray source.
As the dose is proportional to the beam intensity, multi-kiloampere induction linacs can beused where other accelerators cannot produce a good quality beam with a sharp focusingability. For Bremsstrahlung radiation from a target of Z atomic number the dose isapproximated by
DocZrV2%At (19)
where V is the electron energy on the target and which has to be high enough to produce thedesired dose of X-Rays on the object.
Small emittance is needed to achieve a good quality beam. We have seen that, in order tolimit the emittance growth along the accelerator care has to be taken to reduce the chromaticeffects and the BBU instabilities. The pulse duration is a compromise between dose andblurring due to the object velocity. Two new accelerator projects for this purpose are now inprogress: DARHT at Los Alamos USA, and AIRIX at CESTA near Bordeaux, France.

94
REFERENCES
[I] A. Bouwers, Electrische Hochstspannungen, Verlag Julius Springer, Berlin (1939).
[2] N.C. Christofilos et al, Rev. Sci. Instr. 35 (1964) 886.
[3] A.I. Anatskii et al., Atomn Energ. 21 (1966) 439.
[4] R.J. Briggs, LLNL, UCID 21 639 (1989).
[5] CJ. Lasnier et al., Proc. of the Particle Accelerator Conf., Washington 1993(IEEE 1993) vol II, p. 1554.
[6] J.E. Leiss et al, Particle Accelerator 10 (1980) 223.
[7] T. Akiba et al, Proc. Int. Conf. on High Power Particle Beams, Kobe (Japan) 1986.
[8] J. Kishiro et al., Proc. of the Particle Accelerator Conf., Washington 1993(IEEE 1993) Vol I, p 673.
[9] S. Kawasaki et al., Proc. of the Particle Accelerator Conf., Washington 1993(JEEE 1993) Vol I, p. 676.
[10] J. Bardy et al., Proc. of the 12th Int. FEL Conf., Paris 1990 (North Holland, 1991)p311.
II1] Ph. Eyharts et al., Proc. of the Particle Accelerator Conf., Washington 1993(IEEE 1993) Vol I, p 670.
[12] J. de Mascureau et al., Proc. of the Particle Accelerator Conf., Washington 1993(IEEE 1993) Vol I, p 697.
[13] S. Humphries, Principles of Charged Particle Acceleration, Wiley Interscience Publication, New Yor
[14] D. Keefe, Induction Linacs, LBL 21 528 (1986).
[15] C.A. Kapetanakos and P. Sprangle, Physics Today, February 1985, p 58.
[16] D. Keefe, Particle Accelerator 11 (1981) 187.
[17] B. Kulke et al., LLNL, Proc. 15th IEEE Power Modulator Symposium,Baltimore 1982.
[18] M. Burns et al., Proc. Int. Conf. on High Power Particle Beams, Washington 1992p283.
[19] R. Corsini, J. Gardelle, J. Grenier, Proc. of the Particle Accelerator Conf.,Washington 1993 (IEEE 1993) Vol I, p 626.
[20] Y.S. Cho et al., Proc. of the Particle Accelerator Conf., Washington 1993(IEEE 1993) Vol I, p 679.

95
ION AND ELECTRON SOURCES
C.E. HillCERN, Geneva, Switzerland
AbstractAlthough the acceleration of particle beams is understood byaccelerator physicists, the source of the primary particles is oftencloaked in mystery. This paper will attempt to shed some light on theprinciples and operation of basic lepton and hadron sources commonlyused in accelerators.
1 INTRODUCTION
During the design of a particle accelerator, the origin and identity of the particle is oftentreated as a mathematical fiction instead of an entity that must be produced at the beginning ofthe acceleration process. In many cases the source of the particles must be made to fit aroundthe design instead of being taken into consideration at an early stage. However, acceleratorsare not the only users of particle beams. Applications range from providing beams of hundredsof Amperes for fusion applications, nano-Amperes for microprobe trace analysis, broad beamsfor ion implantation, space thrusters, industrial polymerisation, food sterilisation, to medical,military and accelerator applications. The types of particles involved are equally as numerousand are limited only by the availability of a suitable source. Table 2 shows a selection of ionsource types which can be found.
Table 1A selection of types of ion source
Surface ionisation Plasma beamField ionisation DuoplasmatronSputter Hollow cathodeLaser PigatronsElectron beam ionisation MultifilamentArc discharge Cyclotron resonanceMultipole confinement Surface plasmaPennings MagnetronsCharge exchange RF plasma
As can be seen, the field is vast and can not be covered in a paper like this. Instead wewill cover some of those sources which are of interest to the accelerator field but it will reflectthe bias of the author's experience. To someone interested in hadron sources, electron sourcestend to be something of a mystery, but a simple introduction to electron devices will be given.This paper is intended to complement previous General Accelerator School presentations,especially those of N. Angert [1].
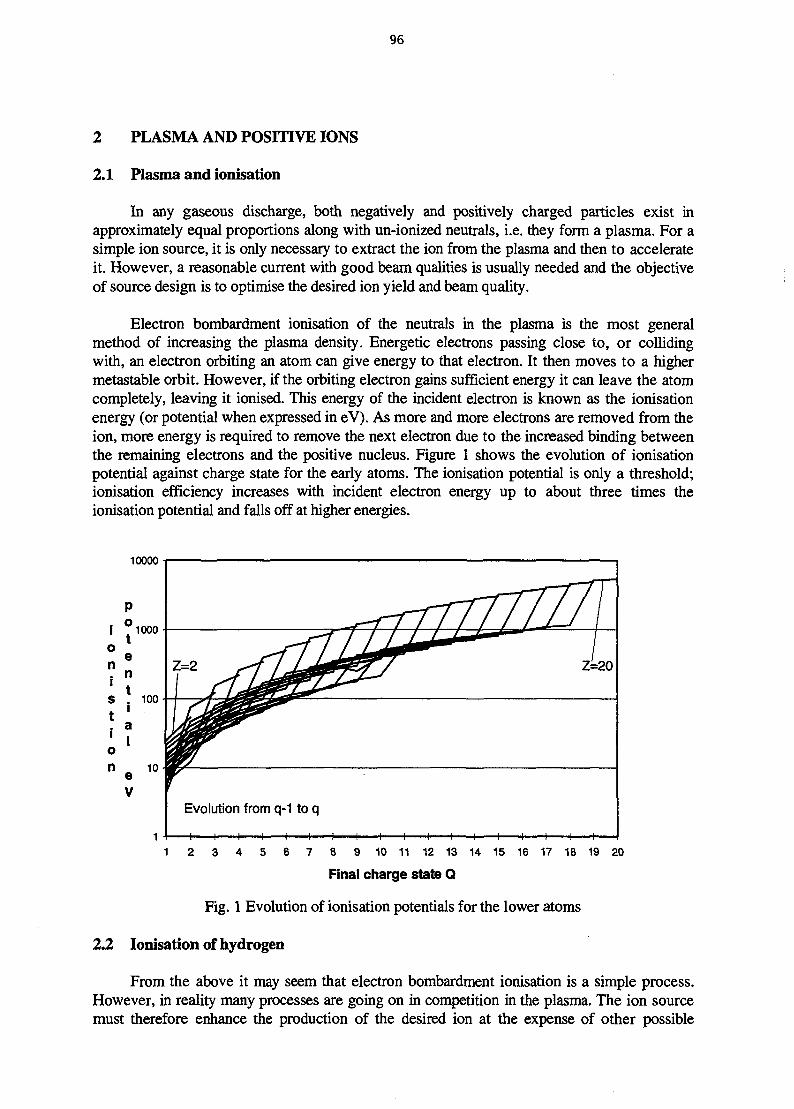
96
2 PLASMA AND POSITIVE IONS
2.1 Plasma and ionisation
In any gaseous discharge, both negatively and positively charged particles exist inapproximately equal proportions along with un-ionized neutrals, i.e. they form a plasma. For asimple ion source, it is only necessary to extract the ion from the plasma and then to accelerateit. However, a reasonable current with good beam qualities is usually needed and the objectiveof source design is to optimise the desired ion yield and beam quality.
Electron bombardment ionisation of the neutrals in the plasma is the most generalmethod of increasing the plasma density. Energetic electrons passing close to, or collidingwith, an electron orbiting an atom can give energy to that electron. It then moves to a highermetastable orbit. However, if the orbiting electron gains sufficient energy it can leave the atomcompletely, leaving it ionised. This energy of the incident electron is known as the ionisationenergy (or potential when expressed in eV). As more and more electrons are removed from theion, more energy is required to remove the next electron due to the increased binding betweenthe remaining electrons and the positive nucleus. Figure 1 shows the evolution of ionisationpotential against charge state for the early atoms. The ionisation potential is only a threshold;ionisation efficiency increases with incident electron energy up to about three times theionisation potential and falls off at higher energies.
10000
8 9 10 11 12 13 14
Final charge state Q
15 16 17 18 19 20
Fig. 1 Evolution of ionisation potentials for the lower atoms
2.2 Ionisation of hydrogen
From the above it may seem that electron bombardment ionisation is a simple process.However, in reality many processes are going on in competition in the plasma. The ion sourcemust therefore enhance the production of the desired ion at the expense of other possible
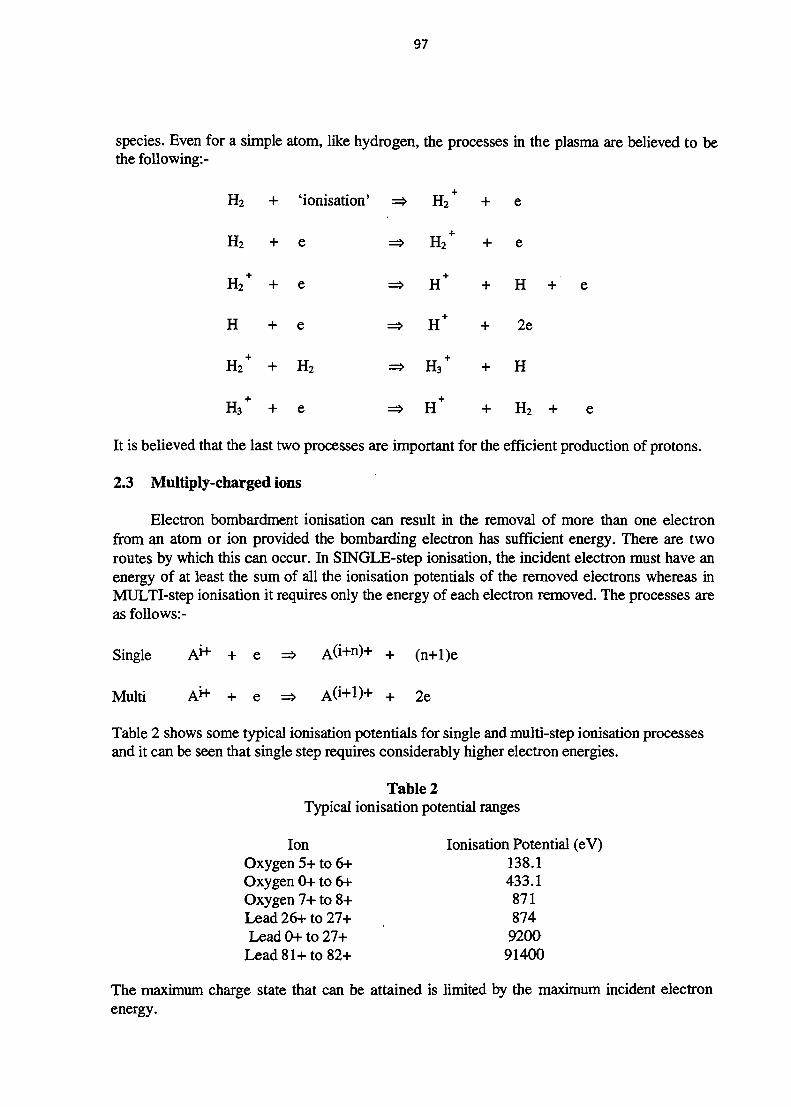
97
species. Even for a simple atom, like hydrogen, the processes in the plasma are believed to bethe following:-
H2 + 'ionisation' => H2 + e
H2 + e =* H2 + e
H 2+ + e => H + + H + e
H + e =» H + + 2e
H 2+ + H2 =» H 3
+ + H
H 3+ + e => H + + H2 + e
It is believed that the last two processes are important for the efficient production of protons.
2.3 Multiply-charged ions
Electron bombardment ionisation can result in the removal of more than one electronfrom an atom or ion provided the bombarding electron has sufficient energy. There are tworoutes by which this can occur. In SINGLE-step ionisation, the incident electron must have anenergy of at least the sum of all the ionisation potentials of the removed electrons whereas inMULTI-step ionisation it requires only the energy of each electron removed. The processes areas follows:-
Single
Multi A i + + e => A( i + 1)+ + 2e
Table 2 shows some typical ionisation potentials for single and multi-step ionisation processesand it can be seen that single step requires considerably higher electron energies.
Table 2Typical ionisation potential ranges
IonOxygen 5+ to 6+Oxygen 0+ to 6+Oxygen 7+ to 8+Lead 26+ to 27+Lead 0+ to 27+
Lead 81+ to 82+
Ionisation Potential (eV)138.1433.1871874
920091400
The maximum charge state that can be attained is limited by the maximum incident electronenergy.

98
Multi-step ionisation is thus the only really feasible route to high-charge-state ions butthis process takes time. This time depends on the plasma density and the ionisation crosssection and must be shorter than the ion lifetime in the plasma. The dependence of crosssection on electron energy means that the high energies required to produce high-charge statesare not an advantage for the production of low-charged seed ions. Ions are lost from theplasma by such processes as loss to the walls and electron capture from neutrals and plasmaelectrons. The design of high-charge-state sources is complicated by these phenomena.
3 POSITIVE ION SOURCES
3.1 The RF source
In the early days of CERN a radio frequency source of the Thonemann type shown inFig. 2 was used [2]. An RF electric field coupled into the plasma chamber maintains a lowpressure (10"2— 10'3 Torr) discharge. Positive ions are expelled from the discharge by anegatively biased repeller electrode. Plasma density is somewhat limited by self shielding of theplasma and losses to the walls. Shielding effects could be alleviated by increasing the RFfrequency. The application of a magnetic field to the plasma bottle increases ion production bylengthening the path of ionising electrons and reducing their drift to the walls. However,metalisation of the plasma bottle during operation can give rise to reliability problems.
Fig.2 CERN RF ion source
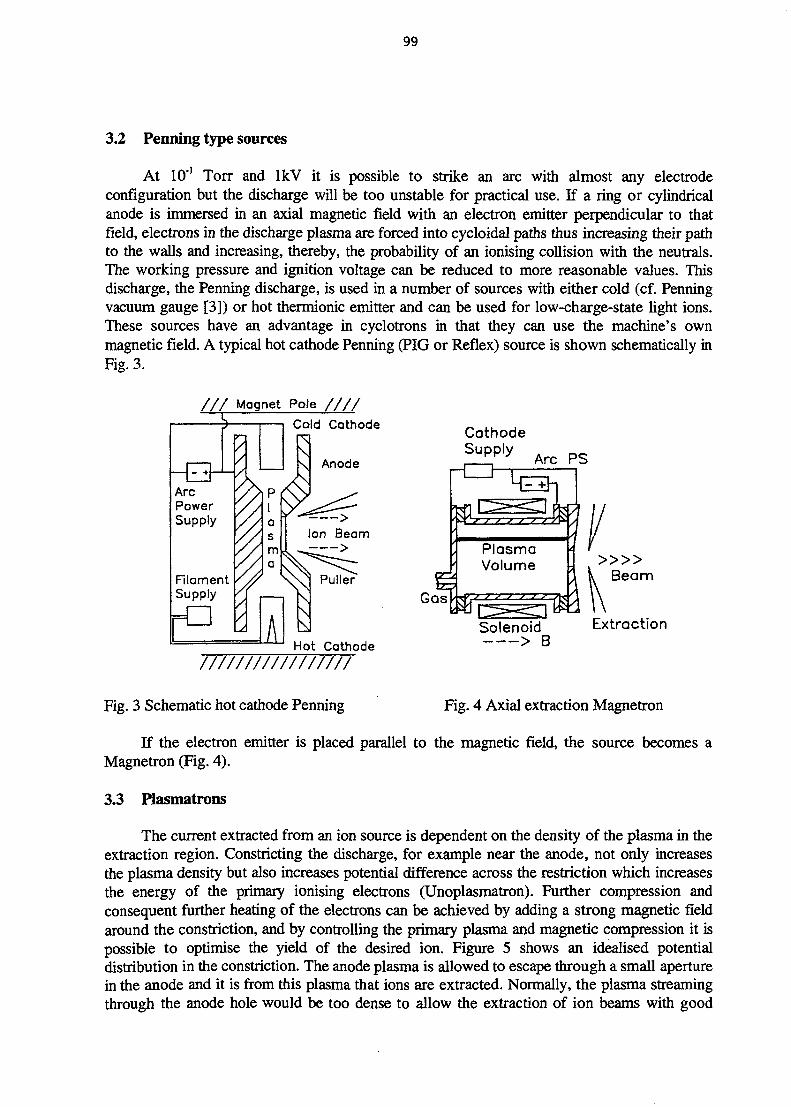
99
3.2 Penning type sources
At 10'1 Torr and lkV it is possible to strike an arc with almost any electrodeconfiguration but the discharge will be too unstable for practical use. If a ring or cylindricalanode is immersed in an axial magnetic field with an electron emitter perpendicular to thatfield, electrons in the discharge plasma are forced into cycloidal paths thus increasing their pathto the walls and increasing, thereby, the probability of an ionising collision with the neutrals.The working pressure and ignition voltage can be reduced to more reasonable values. Thisdischarge, the Penning discharge, is used in a number of sources with either cold (cf. Penningvacuum gauge [3]) or hot thermionic emitter and can be used for low-charge-state light ions.These sources have an advantage in cyclotrons in that they can use the machine's ownmagnetic field. A typical hot cathode Penning (PIG or Reflex) source is shown schematically inFig. 3.
/ / / Magnet Pole / / / /
-) 1 1 Cold Cathode
Anode
CathodeSupply
-cn- Arc PS
PlasmaVolume
Hot Cathode
Solenoid> B
K Beam
Extraction
Fig. 3 Schematic hot cathode Penning Fig. 4 Axial extraction Magnetron
If the electron emitter is placed parallel to the magnetic field, the source becomes aMagnetron (Fig. 4).
3.3 Plasmatrons
The current extracted from an ion source is dependent on the density of the plasma in theextraction region. Constricting the discharge, for example near the anode, not only increasesthe plasma density but also increases potential difference across the restriction which increasesthe energy of the primary ionising electrons (Unoplasmatron). Further compression andconsequent further heating of the electrons can be achieved by adding a strong magnetic fieldaround the constriction, and by controlling the primary plasma and magnetic compression it ispossible to optimise the yield of the desired ion. Figure 5 shows an idealised potentialdistribution in the constriction. The anode plasma is allowed to escape through a small aperturein the anode and it is from this plasma that ions are extracted. Normally, the plasma streamingthrough the anode hole would be too dense to allow the extraction of ion beams with good
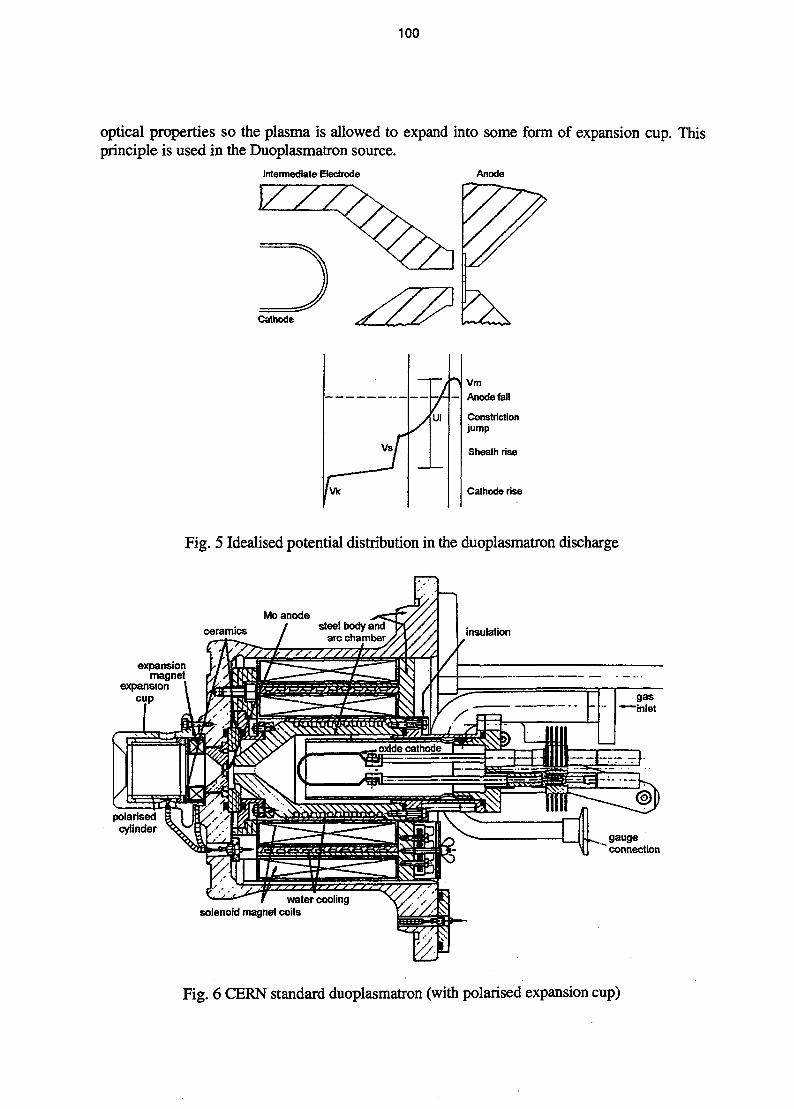
100
optical properties so the plasma is allowed to expand into some form of expansion cup. Thisprinciple is used in the Duoplasmatron source.
Intermediate Electrode
V //Anode
Cathode
Vs/
/Vk
/
I
Ui
*> VmAnode foil
Constrictionjump
Sheath rise
Cathode rise
Fig. 5 Idealised potential distribution in the duoplasmatron discharge
Mo anode
ceramics
expansionmagnet
expansioncup
water coolingsolenoid magnet coils
gauge" connection
Fig. 6 CERN standard duoplasmatron (with polarised expansion cup)
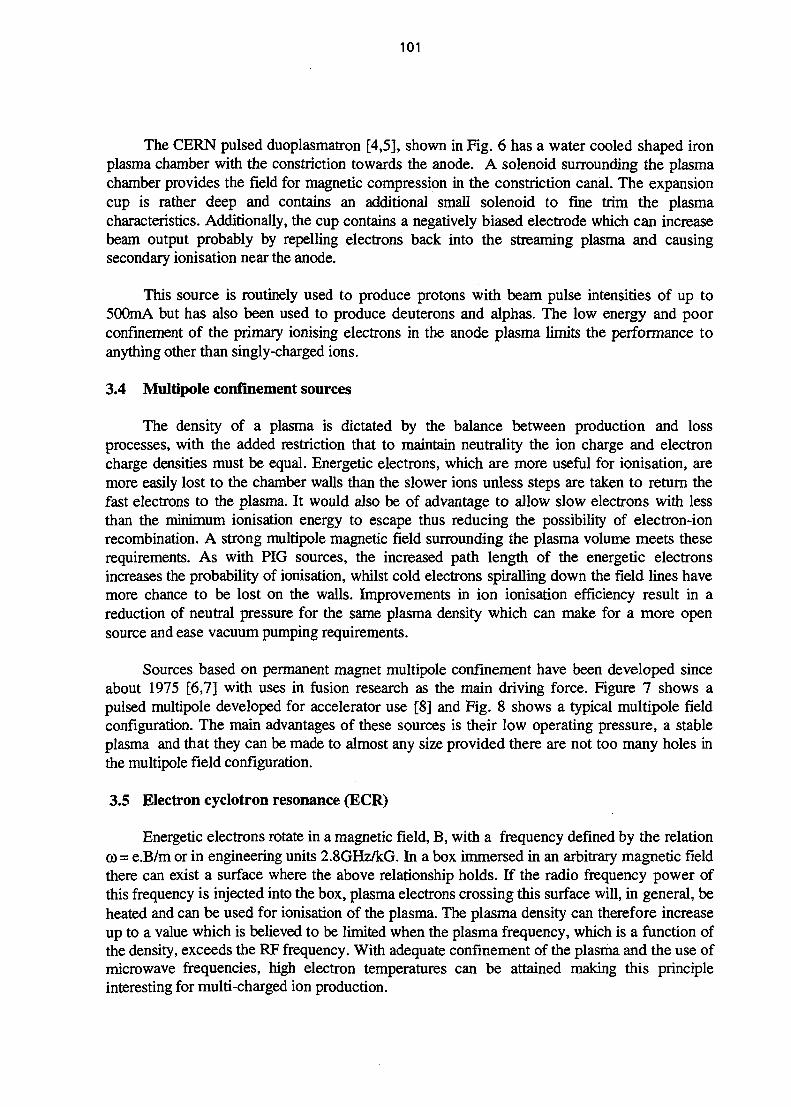
101
The CERN pulsed duoplasmatron [4,5], shown in Fig. 6 has a water cooled shaped ironplasma chamber with the constriction towards the anode. A solenoid surrounding the plasmachamber provides the field for magnetic compression in the constriction canal. The expansioncup is rather deep and contains an additional small solenoid to fine trim the plasmacharacteristics. Additionally, the cup contains a negatively biased electrode which can increasebeam output probably by repelling electrons back into the streaming plasma and causingsecondary ionisation near the anode.
This source is routinely used to produce protons with beam pulse intensities of up to500mA but has also been used to produce deuterons and alphas. The low energy and poorconfinement of the primary ionising electrons in the anode plasma limits the performance toanything other than singly-charged ions.
3.4 Multipole confinement sources
The density of a plasma is dictated by the balance between production and lossprocesses, with the added restriction that to maintain neutrality the ion charge and electroncharge densities must be equal. Energetic electrons, which are more useful for ionisation, aremore easily lost to the chamber walls than the slower ions unless steps are taken to return thefast electrons to the plasma. It would also be of advantage to allow slow electrons with lessthan the minimum ionisation energy to escape thus reducing the possibility of electron-ionrecombination. A strong multipole magnetic field surrounding the plasma volume meets theserequirements. As with PIG sources, the increased path length of the energetic electronsincreases the probability of ionisation, whilst cold electrons spiralling down the field lines havemore chance to be lost on the walls. Improvements in ion ionisation efficiency result in areduction of neutral pressure for the same plasma density which can make for a more opensource and ease vacuum pumping requirements.
Sources based on permanent magnet multipole confinement have been developed sinceabout 1975 [6,7] with uses in fusion research as the main driving force. Figure 7 shows apulsed multipole developed for accelerator use [8] and Fig. 8 shows a typical multipole fieldconfiguration. The main advantages of these sources is their low operating pressure, a stableplasma and that they can be made to almost any size provided there are not too many holes inthe multipole field configuration.
3.5 Electron cyclotron resonance (ECR)
Energetic electrons rotate in a magnetic field, B, with a frequency defined by the relation0) = e.B/m or in engineering units 2.8GHz/kG. In a box immersed in an arbitrary magnetic fieldthere can exist a surface where the above relationship holds. If the radio frequency power ofthis frequency is injected into the box, plasma electrons crossing this surface will, in general, beheated and can be used for ionisation of the plasma. The plasma density can therefore increaseup to a value which is believed to be limited when the plasma frequency, which is a function ofthe density, exceeds the RF frequency. With adequate confinement of the plasma and the use ofmicrowave frequencies, high electron temperatures can be attained making this principleinteresting for multi-charged ion production.
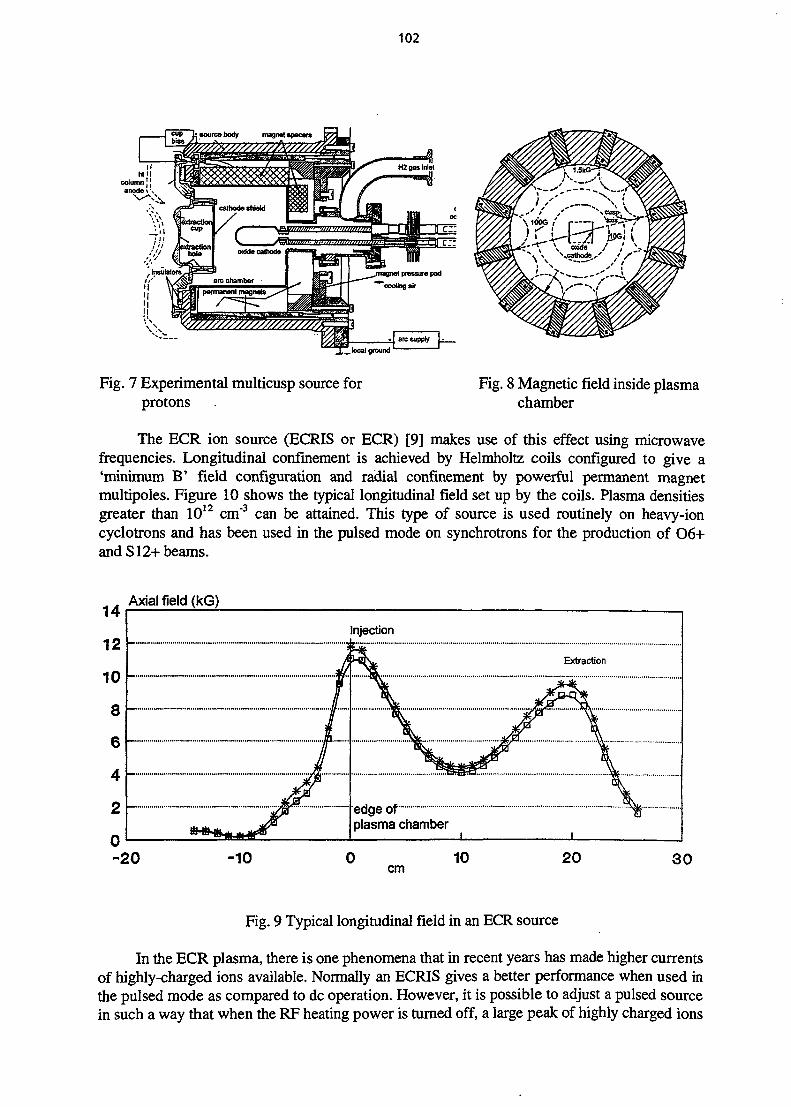
102
„_ local ground
Fig. 7 Experimental multicusp source forprotons
Fig. 8 Magnetic field inside plasmachamber
The ECR ion source (ECRIS or ECR) [9] makes use of this effect using microwavefrequencies. Longitudinal confinement is achieved by Helmholtz coils configured to give a'minimum B' field configuration and radial confinement by powerful permanent magnetmultipoles. Figure 10 shows the typical longitudinal field set up by the coils. Plasma densitiesgreater than 10 cm can be attained. This type of source is used routinely on heavy-ioncyclotrons and has been used in the pulsed mode on synchrotrons for the production of 06+and SI2+beams.
14
12
10
8
Axial field (kG)
Injection
l - l^\£ Extraction
\ ... *P%\ .JFX• y&r \^^ v
edge of " ^plasma chamber
i i
6h
4
2
0-20 -10
cm10 20 3 0
Fig. 9 Typical longitudinal field in an ECR source
In the ECR plasma, there is one phenomena that in recent years has made higher currentsof highly-charged ions available. Normally an ECRIS gives a better performance when used inthe pulsed mode as compared to dc operation. However, it is possible to adjust a pulsed sourcein such a way that when the RF heating power is turned off, a large peak of highly charged ions
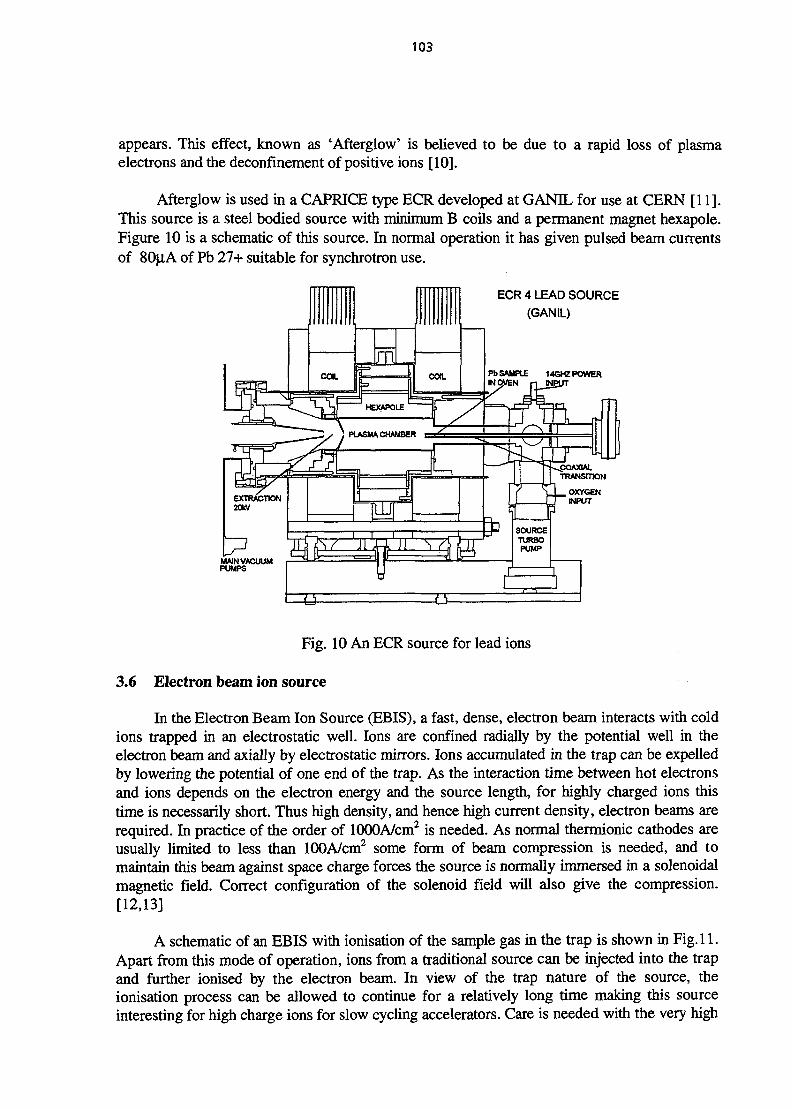
103
appears. This effect, known as 'Afterglow' is believed to be due to a rapid loss of plasmaelectrons and the deconfinement of positive ions [10].
Afterglow is used in a CAPRICE type ECR developed at GANIL for use at CERN [11].This source is a steel bodied source with minimum B coils and a permanent magnet hexapole.Figure 10 is a schematic of this source. In normal operation it has given pulsed beam currentsof 80{xA of Pb 27+ suitable for synchrotron use.
ECR 4 LEAD SOURCE
(GANIL)
Pb SAMPLE 14GH2 POWERWOVEN
MAIN VACUUMPUMPS
Fig. 10 An ECR source for lead ions
3.6 Electron beam ion source
In the Electron Beam Ion Source (EBIS), a fast, dense, electron beam interacts with coldions trapped in an electrostatic well. Ions are confined radially by the potential well in theelectron beam and axially by electrostatic mirrors. Ions accumulated in the trap can be expelledby lowering the potential of one end of the trap. As the interaction time between hot electronsand ions depends on the electron energy and the source length, for highly charged ions thistime is necessarily short. Thus high density, and hence high current density, electron beams arerequired. In practice of the order of lOOOA/cm2 is needed. As normal thermionic cathodes areusually limited to less than lOOA/cm2 some form of beam compression is needed, and tomaintain this beam against space charge forces the source is normally immersed in a solenoidalmagnetic field. Correct configuration of the solenoid field will also give the compression.[12,13]
A schematic of an EBIS with ionisation of the sample gas in the trap is shown in Fig.l 1.Apart from this mode of operation, ions from a traditional source can be injected into the trapand further ionised by the electron beam. In view of the trap nature of the source, theionisation process can be allowed to continue for a relatively long time making this sourceinteresting for high charge ions for slow cycling accelerators. Care is needed with the very high
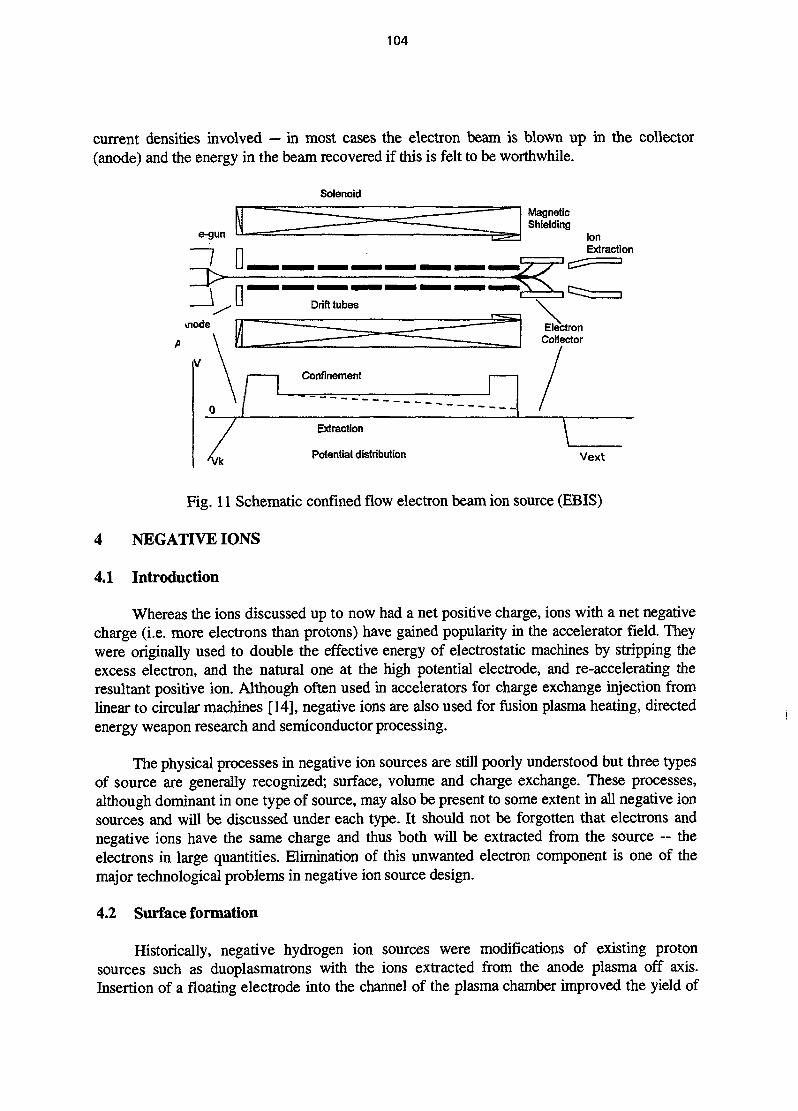
104
current densities involved — in most cases the electron beam is blown up in the collector(anode) and the energy in the beam recovered if this is felt to be worthwhile.
Solenoid
MagneticShielding
IonExtraction
Extraction
Potential distribution Vext
Fig. 11 Schematic confined flow electron beam ion source (EBIS)
4 NEGATIVE IONS
4.1 Introduction
Whereas the ions discussed up to now had a net positive charge, ions with a net negativecharge (i.e. more electrons than protons) have gained popularity in the accelerator field. Theywere originally used to double the effective energy of electrostatic machines by stripping theexcess electron, and the natural one at the high potential electrode, and re-accelerating theresultant positive ion. Although often used in accelerators for charge exchange injection fromlinear to circular machines [14], negative ions are also used for fusion plasma heating, directedenergy weapon research and semiconductor processing.
The physical processes in negative ion sources are still poorly understood but three typesof source are generally recognized; surface, volume and charge exchange. These processes,although dominant in one type of source, may also be present to some extent in all negative ionsources and will be discussed under each type. It should not be forgotten that electrons andnegative ions have the same charge and thus both will be extracted from the source ~ theelectrons in large quantities. Elimination of this unwanted electron component is one of themajor technological problems in negative ion source design.
4.2 Surface formation
Historically, negative hydrogen ion sources were modifications of existing protonsources such as duoplasmatrons with the ions extracted from the anode plasma off axis.Insertion of a floating electrode into the channel of the plasma chamber improved the yield of
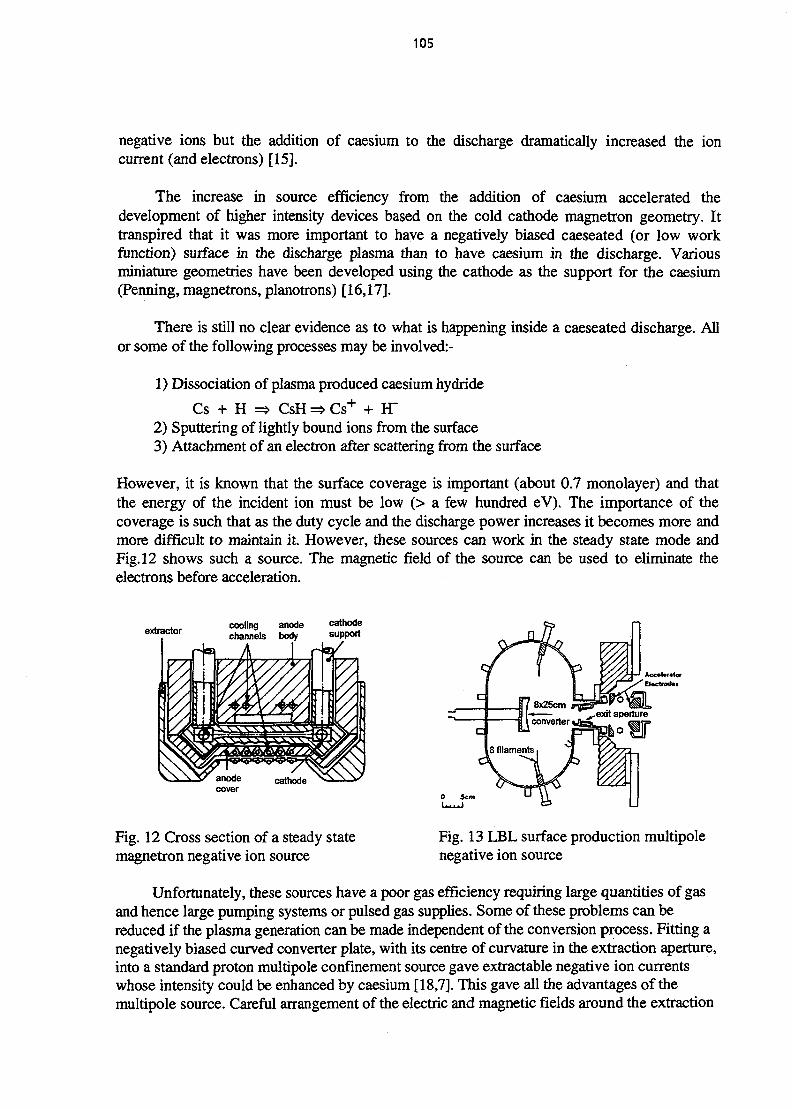
105
negative ions but the addition of caesium to the discharge dramatically increased the ioncurrent (and electrons) [15].
The increase in source efficiency from the addition of caesium accelerated thedevelopment of higher intensity devices based on the cold cathode magnetron geometry. Ittranspired that it was more important to have a negatively biased caeseated (or low workfunction) surface in the discharge plasma than to have caesium in the discharge. Variousminiature geometries have been developed using the cathode as the support for the caesium(Penning, magnetrons, planotrons) [16,17].
There is still no clear evidence as to what is happening inside a caeseated discharge. Allor some of the following processes may be involved:-
1) Dissociation of plasma produced caesium hydride
Cs + H => CsH => Cs+ + H"2) Sputtering of lightly bound ions from the surface3) Attachment of an electron after scattering from the surface
However, it is known that the surface coverage is important (about 0.7 monolayer) and thatthe energy of the incident ion must be low (> a few hundred eV). The importance of thecoverage is such that as the duty cycle and the discharge power increases it becomes more andmore difficult to maintain it. However, these sources can work in the steady state mode andFig. 12 shows such a source. The magnetic field of the source can be used to eliminate theelectrons before acceleration.
extractor cooling anodechannels body
Fig. 12 Cross section of a steady statemagnetron negative ion source
Fig. 13 LBL surface production multipolenegative ion source
Unfortunately, these sources have a poor gas efficiency requiring large quantities of gasand hence large pumping systems or pulsed gas supplies. Some of these problems can bereduced if the plasma generation can be made independent of the conversion process. Fitting anegatively biased curved converter plate, with its centre of curvature in the extraction aperture,into a standard proton multipole confinement source gave extractable negative ion currentswhose intensity could be enhanced by caesium [18,7]. This gave all the advantages of themultipole source. Careful arrangement of the electric and magnetic fields around the extraction

106
aperture reduces the electron current to acceptable levels. A source incorporating thesefeatures in shown in Fig. 13.
4.3 Volume production
Measurements of the negative ions in large-volume, low-pressure hydrogen dischargesindicated densities which were much larger than those predicted by theory [19]. Theoreticaland experimental studies showed that dissociative attachment of electrons to highly excitedmolecules was enhanced relative to attachment to ground state molecules. The addition of asmall dipole magnetic filter in the plasma volume of a standard multipole source, thusseparating it into two regions, enhanced the H" yield due to this process [20] whilst reducingthe electron component. It is believed that the ion formation is a two stage process:-
1) In the production volume between cathode and filter, hot electrons (100 - 200eV) ionise andvibrationally excite hydrogen molecules,
H2 + e > *H2+ + 2e > *H2 + e
2) Excited molecules and cold electrons (few eV) only diffuse past the filter. Dissociativeattachment between molecules and electrons takes place in this volume,
*H2 + e > *H2- > H" + *H
Hot electrons that pass the filter would quickly strip the negative ion as the extra electron isonly loosely bound (0.7eV).
Careful choice of the bias of the electrode which closes the front of the plasma volumeand of the source operating pressure can reduce the electron component to very low values.The good gas efficiency of the multipole and the absence of caesium make this sourceinteresting for both fusion and accelerator use. A prototype source for an acceleratorapplication [21] is shown in Fig. 14. Again, the addition of caesium to the discharge hasrecently been shown to enhance the yield [7].
4.4 Charge exchange
Double charge exchange of positive (or neutral) ion beams on alkali metal vapour targetswas once a favoured method of negative ion production,
X+ + Cs > X + Cs+ (neutralisation)
X + Cs > X- + Cs+ (ionisation)
Although this method is falling out of use for high currents because the reaction cross sectionfalls rapidly with incident particle energy above a few keV, this technique is used for exotic ionproduction such as polarised negative ions [22].
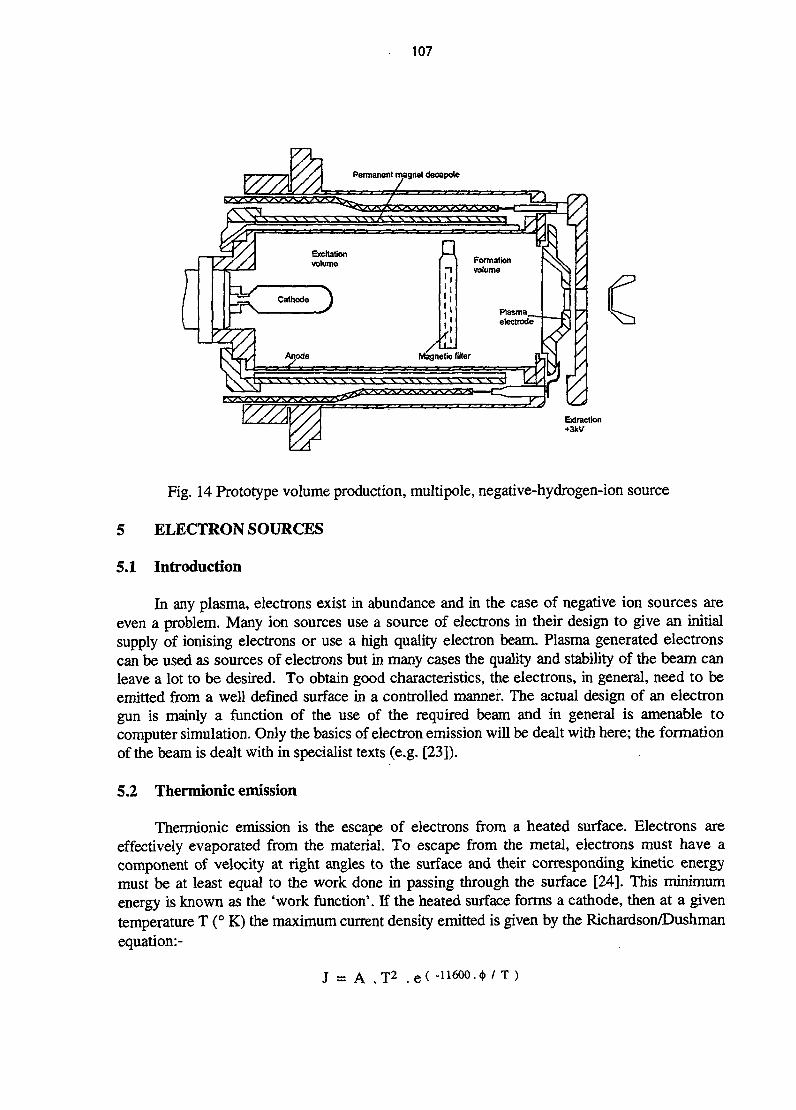
107
WZkPermanent magnet decapole
Fig. 14 Prototype volume production, multipole, negative-hydrogen-ion source
5 ELECTRON SOURCES
5.1 Introduction
In any plasma, electrons exist in abundance and in the case of negative ion sources areeven a problem. Many ion sources use a source of electrons in their design to give an initialsupply of ionising electrons or use a high quality electron beam. Plasma generated electronscan be used as sources of electrons but in many cases the quality and stability of the beam canleave a lot to be desired. To obtain good characteristics, the electrons, in general, need to beemitted from a well defined surface in a controlled manner. The actual design of an electrongun is mainly a function of the use of the required beam and in general is amenable tocomputer simulation. Only the basics of electron emission will be dealt with here; the formationof the beam is dealt with in specialist texts (e.g. [23]).
5.2 Thermionic emission
Thermionic emission is the escape of electrons from a heated surface. Electrons areeffectively evaporated from the material. To escape from the metal, electrons must have acomponent of velocity at right angles to the surface and their corresponding kinetic energymust be at least equal to the work done in passing through the surface [24]. This minimumenergy is known as the 'work function'. If the heated surface forms a cathode, then at a giventemperature T (° K) the maximum current density emitted is given by the Richardson/Dushmanequation:-
J = A . T 2 . e < - i i 6 0 0 . < t > / T )

108
where § is the work function (eV) and A is a constant with a theoretical value of120 A/cm2.K. In reality this value is not attained for real materials. Table 3 illustrates the basiccharacteristics of some thermionic emitter materials that are commonly used. It can be seenthat the most important parameter for thermionic emission is that the work function as shouldbe as low as possible to use a cathode at an acceptable temperature. The mixed oxide cathodeis commonly found in small radio type valves. Cs/W/O, although not good for thermal emitters,is usually found in photo-tubes whilst the heavy metal cathodes are used in high power electrontube devices.
Table 3Important characteristics of some thermionic emitter materials
MaterialTungsten
Thoriated WMixed oxides
CaesiumTantalumCs/O/W
A603
0.0116260
0.003
4.542.63
1.1.813.380.72
Temp (° K)250019001200
25001000
J (A/cm2)0.31.16
1.
2.380.35
In a diode structure, electrons leaving the cathode surface lower the electric field at thesurface. A stable condition exists when the field is zero as any further reduction would repelelectrons back to the cathode. This stable regime is known as 'space-charge-limited emission'and is governed by the Child Langmuir equation:-
J = P . V 3/2
where P, a constant which is a function of the geometry of the system, is known as theperveance. However, if the voltage becomes sufficiently high, the Richardson limit for currentis reached when the emission becomes temperature limited. Figure 15 shows the characteristicsof an ideal diode.
Diode Characteristic
Temperature
Current
Limited
Space ChargeLimited
Voltage
Fig. 15 Thermionic emission regimes
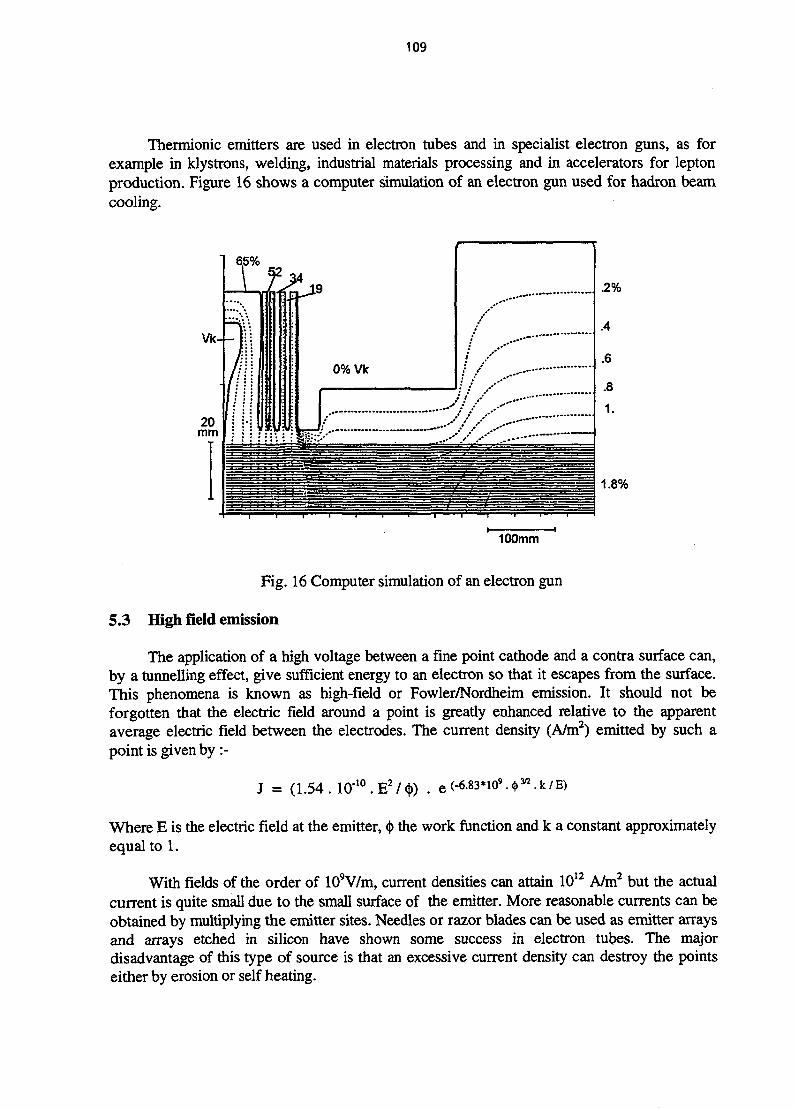
109
Thermionic emitters are used in electron tubes and in specialist electron guns, as forexample in klystrons, welding, industrial materials processing and in accelerators for leptonproduction. Figure 16 shows a computer simulation of an electron gun used for hadron beamcooling.
/ ...-• / / „.—
100mm
Fig. 16 Computer simulation of an electron gun
5.3 High field emission
The application of a high voltage between a fine point cathode and a contra surface can,by a tunnelling effect, give sufficient energy to an electron so that it escapes from the surface.This phenomena is known as high-field or Fowler/Nordheim emission. It should not beforgotten that the electric field around a point is greatly enhanced relative to the apparentaverage electric field between the electrodes. The current density (A/m2) emitted by such apoint is given by :-
10J = (1.54.10-10.E2/(J))
Where E is the electric field at the emitter,equal to 1.
the work function and k a constant approximately
With fields of the order of 109V/m, current densities can attain 1012 A/m2 but the actualcurrent is quite small due to the small surface of the emitter. More reasonable currents can beobtained by multiplying the emitter sites. Needles or razor blades can be used as emitter arraysand arrays etched in silicon have shown some success in electron tubes. The majordisadvantage of this type of source is that an excessive current density can destroy the pointseither by erosion or self heating.

110
5.4 Photo emission
Photons illuminating a metal surface may also liberate electrons. If the photon has anenergy at least equal to the work function, then electrons will be emitted, i.e.:-
X<h. c / e . (|>
where X is the wavelength of the incident light, c the velocity of light and h Plank's constant.For shorter wavelengths the electrons are emitted with an initial velocity given by
1/2 . m . v2 = h . v - e . <))
but in general these velocities are low. To obtain reasonable emission with normalwavelengths, a low work function material is needed, for this reason the Cs/O/W materialmentioned earlier is often used in photo tubes. Intense electron beams require intense lightsources, and lasers have been used to obtain very short high intensity electron beam pulsetrains intended for the generation of microwave power in future linear colliders.
REFERENCES
[1] N. Angert, Ion Sources, Proc. CERN Fifth General Accelerator Physics Course,Jvyaskla, September 1994, CERN 94-01, 619 (1994)
[2] U. Tallgren, CERN/MPS/Int. LIN 66-8, (1966)
[3] F.M. Penning, Physica, 4 ,71, (1937)
[4] B. Vosicki et. al., The Duoplasmatron Source for the CERN-PS Linac, Proc. LinearAccelerator Conference, Los Alamos, 1966 (LA-3609,1966)
[5] M. Hone, The Duoplasmatron Ion Source for the New CERN Linac Preinjector,CERN/PS/LR 79-37 (1979)
[6] K.N. Leung et. al., Characeteristics of a Multidipole Ion Source, Rev. Sci. Inst., 49, 321(1978)
[7] K.N. Leung, Multicusp Ion Sources, Proc. 5th. Int. Conf. Ion Sources, Beijing, 1983,Rev. Sci. Inst., 65,1165(1984)
[8] J. Grando et al., Tests with a Multidipole Ion Source on the CERN 500kV ExperimentalPre-accelerator, Proc. Linear Accelerator Conference, Monthauk, 1979 (BNL-51134,1979)
[9] R. Geller et al., Status of the Multiply Charged Heavy-ion Source MINIMAFIOS, Rev.Sci. Inst., 56,1505(1985)
[10] G. Melin et al., Some Particular Aspects of the Physics of the ECR Sources forMulticharged Ions, Proc. Int. Conf. on Ion Sources, Berkeley, 1989, Rev. Sci. Inst., 61,236(1990)

111
[11] M.P. Bourgarel et al., First Results of the 14.5GHz GANIL ECR Ion Source with theCW and the Pulsed Operation Mode, 2nd EPAC, Nice, 1, 645 (1990)
[12] J. Arianer, C. Goldstein, The Orsay Electron Beam Ion Source, Int. Conf. Heavy IonSources, Gatlinburg, 1976, IEEE Trans. Nucl. Sci NS-23,979 (1976)
[13] R. Schmeider, Physics of the EBIS and its Ions, NATO Workshop on Physics of HighlyIonised Atoms, Cargese, 1988, Plenum Press (1989)
[14] G. Rees, Injection, Proc. CERN Fifth General Accelerator Physics Course, Jvyaskla,September 1994, CERN 94-01,731 (1994)
[15] M. Kobayashi et al., Studies of the Hollow Discharge Duoplasmatron as a source of H"Ions, Rev. Sci. Inst, 47,1425 (1976)
[16] K. Prelec, Negative Hydrogen Ion Sources, BNL-33354 (1983)
[17] Yu. Belchenko et al., Ion Sources at the Novosibirsk Institute of Nuclear Physics, Proc.Int. Conf. on Ion Sources, Berkeley, 1989, Rev. Sci. Inst., 61, 378 (1990)
[18] K. Ehlers, K. Leung, Characteristics of a Self-extraction Negative Ion Source, 3rd. Int.Symp. Production and Neutralisation of Negative Ions and Beams, Brookhaven, 1983, AIPConf. Proc. 111(1984)
[19] M. Bacal et al., H" and D" Production in Plasmas, 3rd. Int. Symp. Production andNeutralisation of Negative Ions and Beams, Brookhaven, 1983, AIP Conf. Proc. I l l (1984)
[20] K. Leung et al., Extraction of Volume Produced H' Ions from a Multicusp Source, Rev.Sci. Inst., 54,56, (1983)
[21] C. Hill, Operation of a Short Pulse Negative Ion Source, Proc. Linear AcceleratorConference, Stanford, 1986, SLAC Report 303 (1986)
[22] R. Witkover et al., Conversion of the BNL 200MeV Linac to H~ and Polarised H'Acceleration, Proc. Linear Accelerator Conference, Seeheim, 1984, GS1-84-11 (1984)
[23] W. Herrmannsfeldt, EGUN - An Electron Optics and Gun Design Program, SLACReport 331(1988)
[24] A. van der Zeil, Solid State Physical Electronics, Macmillan (1958)
Further Reading
The Linac, Accelerator and Ion Source Conference ProceedingsT. Green, Intense Ion Beams, Rep. Prog. Phys., 37, 1257 (1974)A. Forrester, Large Ion Beams, Fundamentals of Generation and Propagation, Wiley (1988)I. Brown, The Physics and Technology of Ion Sources, Wiley (1989)
NEXTleft
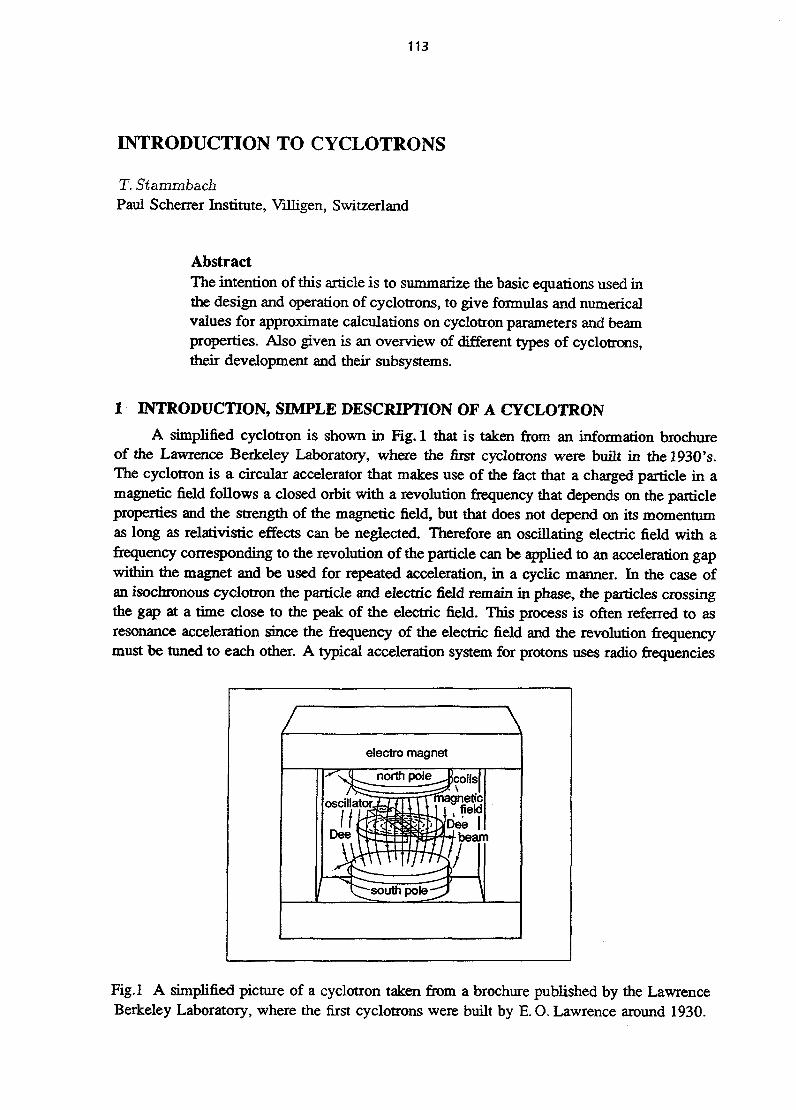
113
INTRODUCTION TO CYCLOTRONS
T. Stammba.chPaul Scherrer Institute, VUligen, Switzerland
AbstractThe intention of this article is to summarize the basic equations used inthe design and operation of cyclotrons, to give formulas and numericalvalues for approximate calculations on cyclotron parameters and beamproperties. Also given is an overview of different types of cyclotrons,their development and their subsystems.
1 INTRODUCTION, SIMPLE DESCRIPTION OF A CYCLOTRON
A simplified cyclotron is shown in Fig. 1 that is taken from an information brochureof the Lawrence Berkeley Laboratory, where the first cyclotrons were built in thel93O's.The cyclotron is a circular accelerator that makes use of the fact that a charged particle in amagnetic field follows a closed orbit with a revolution frequency that depends on the particleproperties and the strength of the magnetic field, but that does not depend on its momentumas long as relativistic effects can be neglected. Therefore an oscillating electric field with afrequency corresponding to the revolution of the particle can be applied to an acceleration gapwithin the magnet and be used for repeated acceleration, in a cyclic manner. In the case ofan isochronous cyclotron the particle and electric field remain in phase, the particles crossingthe gap at a time close to the peak of the electric field. This process is often referred to asresonance acceleration since the frequency of the electric field and the revolution frequencymust be tuned to each other. A typical acceleration system for protons uses radio frequencies
ri
electro magnet
^ L north pole_^jcoils|
oscillator. f ; T-rTrhagnetic: J1,f ieW
TTTT
»|e5? \
\
1
Fig.l A simplified picture of a cyclotron taken from a brochure published by the LawrenceBerkeley Laboratory, where the first cyclotrons were built by E. O. Lawrence around 1930.
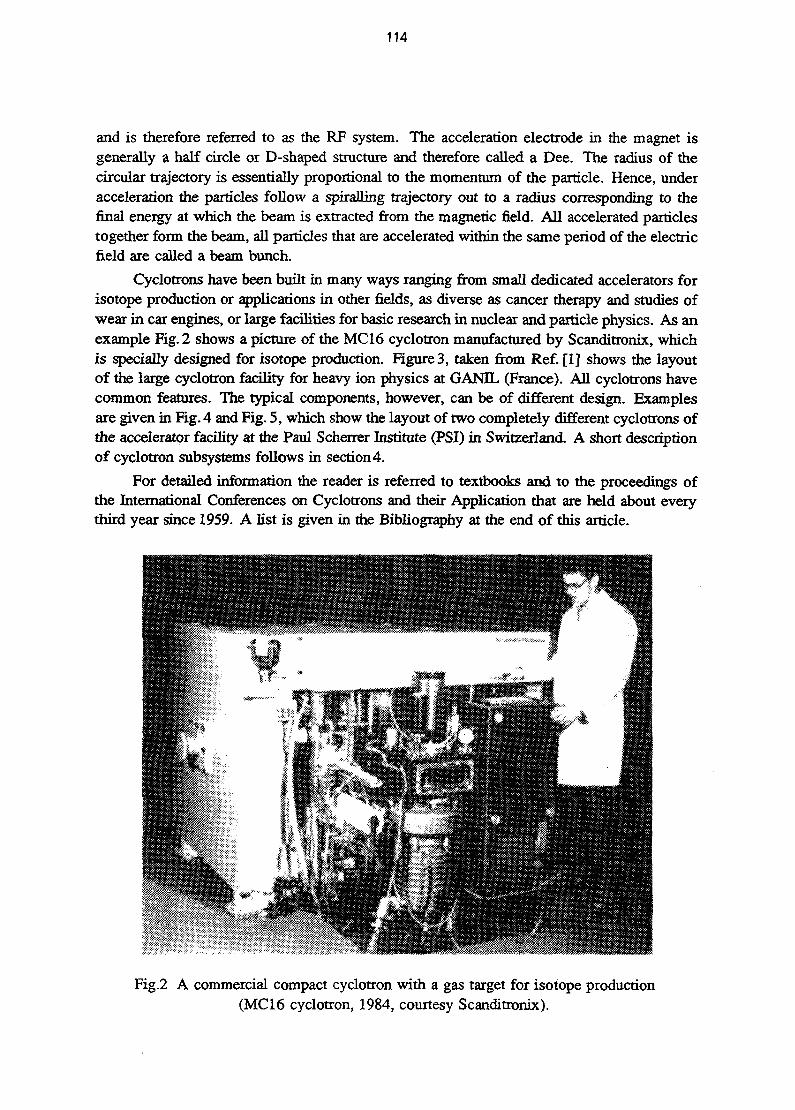
114
and is therefore referred to as the RF system. The acceleration electrode in the magnet isgenerally a half circle or D-shaped structure and therefore called a Dee. The radius of thecircular trajectory is essentially proportional to the momentum of the particle. Hence, underacceleration the particles follow a spiralling trajectory out to a radius corresponding to thefinal energy at which the beam is extracted from the magnetic field. All accelerated particlestogether form the beam, all particles that are accelerated within the same period of the electricfield are called a beam bunch.
Cyclotrons have been built in many ways ranging from small dedicated accelerators forisotope production or applications in other fields, as diverse as cancer therapy and studies ofwear in car engines, or large facilities for basic research in nuclear and particle physics. As anexample Fig. 2 shows a picture of the MCI6 cyclotron manufactured by Scanditronix, whichis specially designed for isotope production. Figure 3, taken from Ref. [1] shows the layoutof the large cyclotron facility for heavy ion physics at GANDL (France). All cyclotrons havecommon features. The typical components, however, can be of different design. Examplesare given in Fig. 4 and Fig. 5, which show the layout of two completely different cyclotrons ofthe accelerator facility at the Paul Scherrer Institute (PSI) in Switzerland. A short descriptionof cyclotron subsystems follows in section 4.
For detailed information the reader is referred to textbooks and to the proceedings ofthe International Conferences on Cyclotrons and their Application that are held about everythird year since 1959. A list is given in the Bibliography at the end of this article.
Fig.2 A commercial compact cyclotron with a gas target for isotope production(MC16 cyclotron, 1984, courtesy Scanditronix).
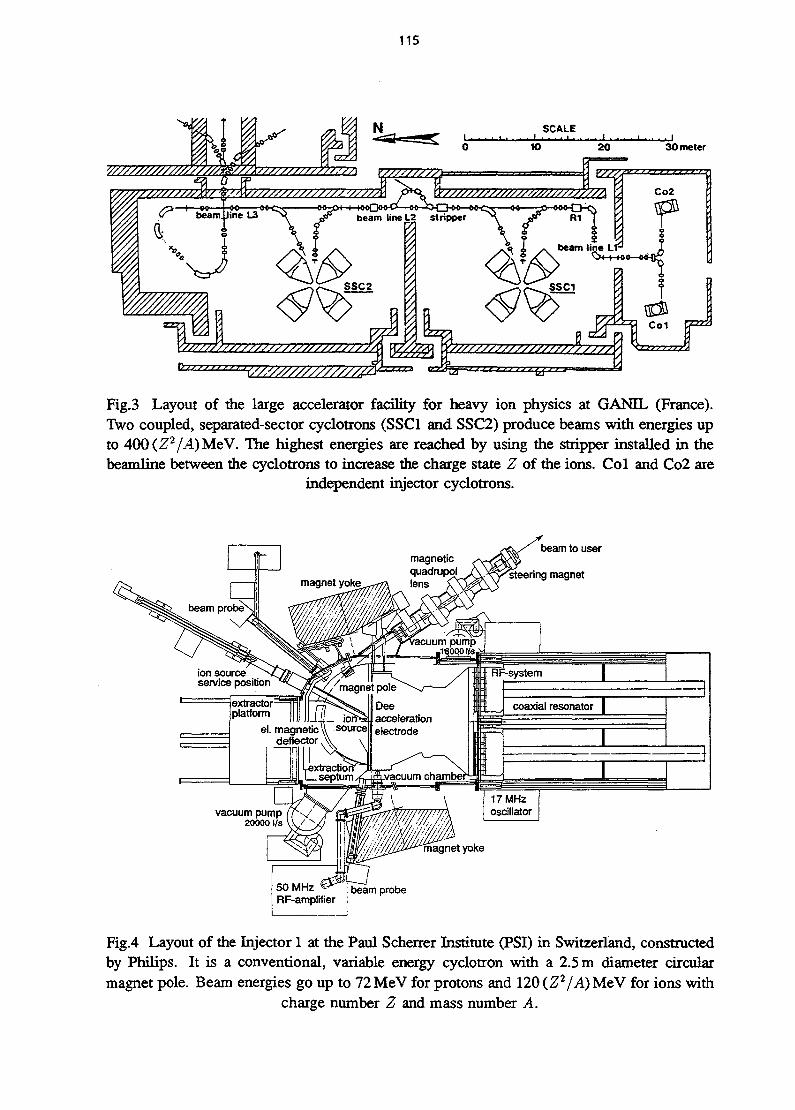
115
30 meter
Fig.3 Layout of the large accelerator facility for heavy ion physics at GANCL (France).Two coupled, separated-sector cyclotrons (SSCl and SSC2) produce beams with energies upto 400(.Z2/A)MeV. The highest energies are reached by using the stripper installed in thebeamline between the cyclotrons to increase the charge state Z of the ions. Col and Co2 are
independent injector cyclotrons.
beam to user
steering magnet
magnet pole
Deeaccelerationelectrode
extractor = = 1platform |
el. magnetic \\ sourcedeflector A \
Fig.4 Layout of the Injector 1 at the Paul Scherrer Institute (PSI) in Switzerland, constructedby Philips. It is a conventional, variable energy cyclotron with a 2.5 m diameter circularmagnet pole. Beam energies go up to 72MeV for protons and 120 (Z2/A)MeV for ions with
charge number Z and mass number A.
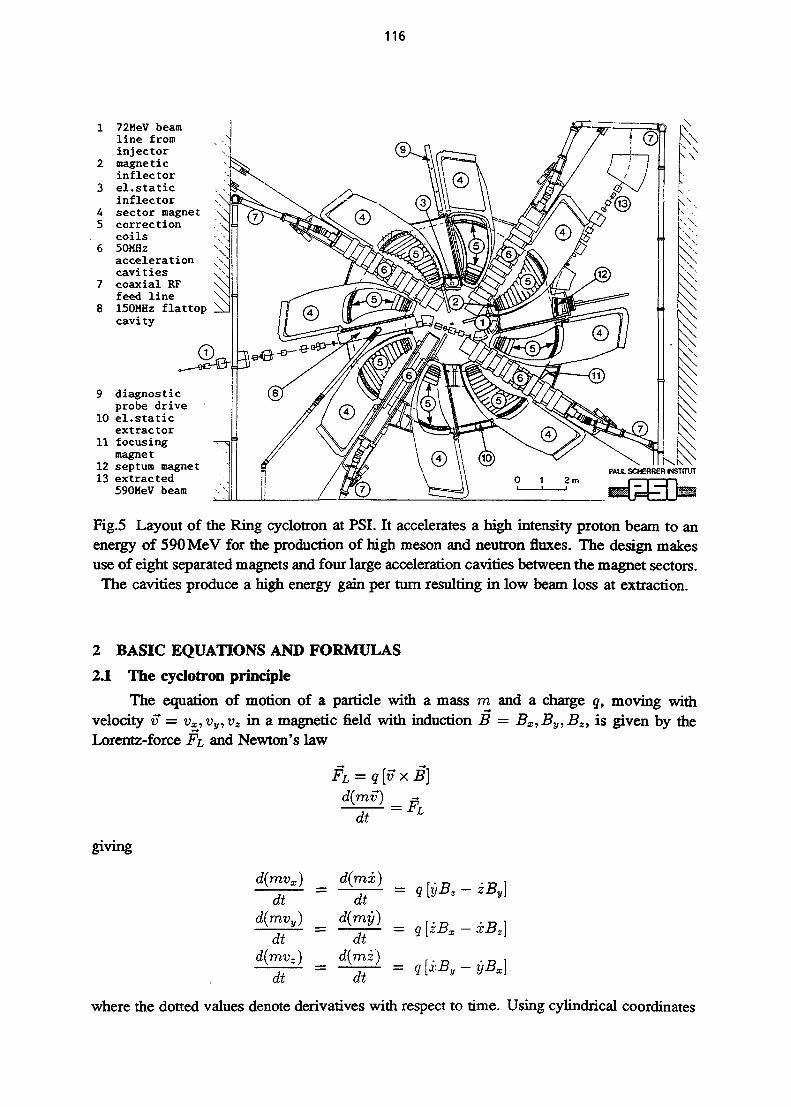
116
1 72MeV beamline frominjector
2 magneticinflector
3 el.staticinflector
4 sector magnet5 correction
coils6 50MHz
accelerationcavities
7 coaxial RFfeed line
8 150MHz flattopcavity
9 diagnosticprobe drive
10 el.staticextractor
11 focusingmagnet
12 septum magnet13 extracted
590MeV beam
Fig.5 Layout of the Ring cyclotron at PSI. It accelerates a high intensity proton beam to anenergy of 590 MeV for the production of high meson and neutron fluxes. The design makesuse of eight separated magnets and four large acceleration cavities between the magnet sectors.
The cavities produce a high energy gain per turn resulting in low beam loss at extraction.
2 BASIC EQUATIONS AND FORMULAS
2.1 The cyclotron principle
The equation of motion of a particle with a mass m and a charge q, moving withvelocity v = vx, vy, vz in a magnetic field with induction B = Bx, By, Bz, is given by theLorentz-force FL and Newton's law
FL = q[vxB]d{mv) -,
dt
giving
dt " q [yB* ~ v
dtd(mvz)
dtd(mz)
= q[xBy-yBx)dt dt
where the dotted values denote derivatives with respect to time. Using cylindrical coordinates
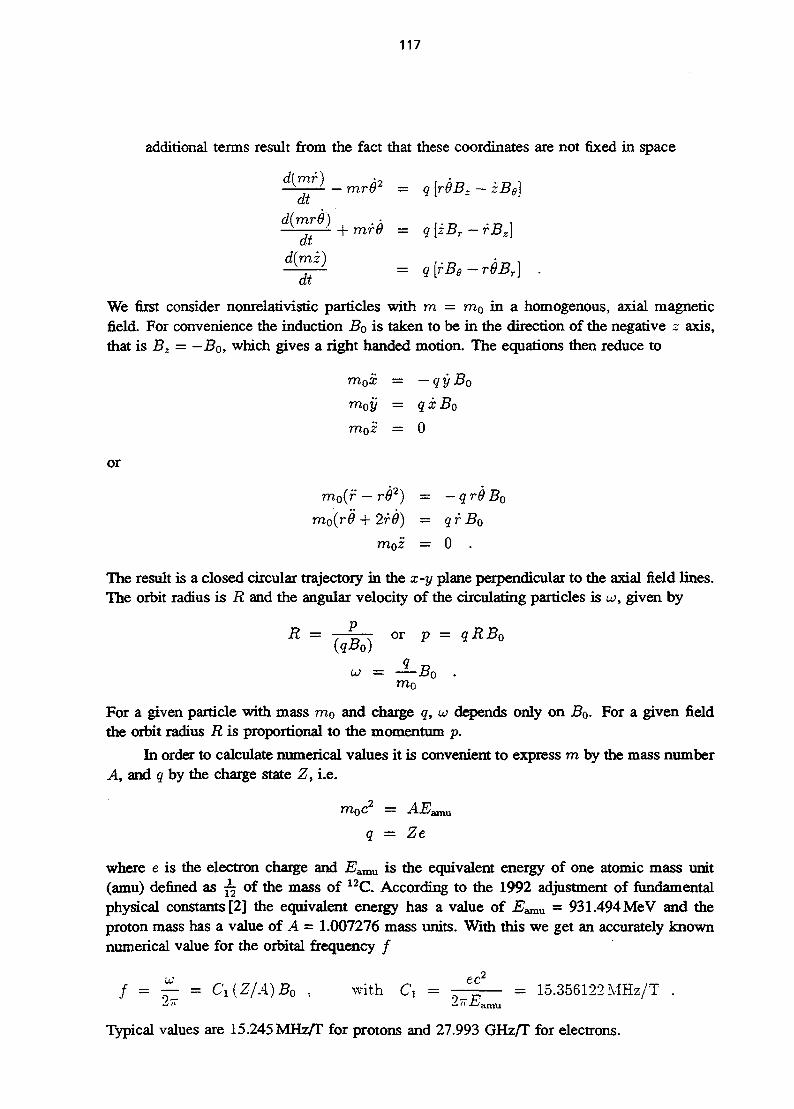
117
additional terms result from the fact that these coordinates are not fixed in space
d{mf)
dt- m.r92 = q [r9Bz - zB6]
d{ mrd) • .. _ . _ .-±——- + mrQ = q [zBr - rB.]
dt
^ = q[rBe-reBr] .
We first consider nonrelativistic particles with m = m0 in a homogenous, axial magneticfield. For convenience the induction Bo is taken to be in the direction of the negative * axis,that is Bz = — Bo, which gives a right handed motion. The equations then reduce to
mox = —qyB0
moy = qx Bo
moz — 0
or
mo(r - rd2) = -qr$B0
mo(r0 + 2rB) - qr Bo
— 0 .
The result is a closed circular trajectory in the x-y plane perpendicular to the axial field lines.The orbit radius is R and the angular velocity of the circulating particles is u>, given by
R = -T-^— or p = qRB0
For a given particle with mass m0 and charge q, u depends only on J?o- For a given fieldthe orbit radius R is proportional to the momentum p.
In order to calculate numerical values it is convenient to express m by the mass numberA, and q by the charge state Z, i.e.
q = Ze
where e is the electron charge and Egj^ is the equivalent energy of one atomic mass unit(amu) defined as ^ of the mass of 12C. According to the 1992 adjustment of fundamentalphysical constants [2] the equivalent energy has a value of Eamu = 931.494 MeV and theproton mass has a value of A - 1.007276 mass units. With this we get an accurately knownnumerical value for the orbital frequency /
ec2
f = •$- = C\(Z/A)B0 , with Ci = r - = — = 15.356122MHz/T
Typical values are 15.245 MHz/T for protons and 27.993 GHz/T for electrons.
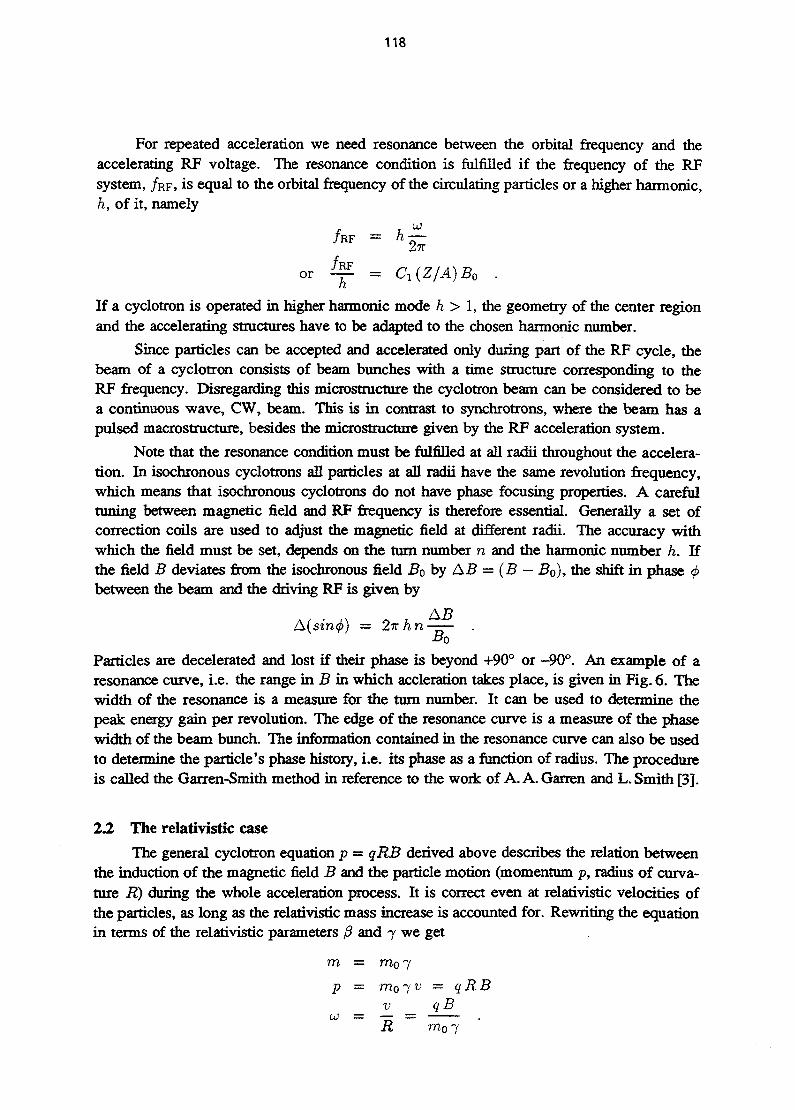
118
For repeated acceleration we need resonance between the orbital frequency and theaccelerating RF voltage. The resonance condition is fulfilled if the frequency of the RFsystem, /RF, is equal to the orbital frequency of the circulating particles or a higher harmonic,h, of it, namely
/ R F = hte
or
If a cyclotron is operated in higher harmonic mode ft > 1, the geometry of the center regionand the accelerating structures have to be adapted to the chosen harmonic number.
Since particles can be accepted and accelerated only during part of the RF cycle, thebeam of a cyclotron consists of beam bunches with a time structure corresponding to theRF frequency. Disregarding this microstructure the cyclotron beam can be considered to bea continuous wave, CW, beam. This is in contrast to synchrotrons, where the beam has apulsed macrostructure, besides the microstructure given by the RF acceleration system.
Note that the resonance condition must be fulfilled at all radii throughout the accelera-tion. In isochronous cyclotrons all particles at all radii have the same revolution frequency,which means that isochronous cyclotrons do not have phase focusing properties. A carefultuning between magnetic field and RF frequency is therefore essential. Generally a set ofcorrection coils are used to adjust the magnetic field at different radii. The accuracy withwhich the field must be set, depends on the turn number n and the harmonic number h. Ifthe field B deviates from the isochronous field Bo by AB = (B — J50), the shift in phase <f>between the beam and the driving RF is given by
A R&{sin<j>) — 2irhn—— .
Bo
Particles are decelerated and lost if their phase is beyond +90° or -90°. An example of aresonance curve, i.e. the range in B in which accleration takes place, is given in Fig. 6. Thewidth of the resonance is a measure for the turn number. It can be used to determine thepeak energy gain per revolution. The edge of the resonance curve is a measure of the phasewidth of the beam bunch. The information contained in the resonance curve can also be usedto determine the particle's phase history, i.e. its phase as a function of radius. The procedureis called the Garren-Smith method in reference to the work of A. A. Garren and L. Smith [3].
2.2 The relativistic case
The general cyclotron equation p = qRB derived above describes the relation betweenthe induction of the magnetic field B and the particle motion (momentum p, radius of curva-ture R) during the whole acceleration process. It is correct even at relativistic velocities ofthe particles, as long as the relativistic mass increase is accounted for. Rewriting the equationin terms of the relativistic parameters 0 and 7 we get
m = mo 7
P — mo 7 v = qRBv qB
R rnQ

119
beamcurrent
2.5-I <UA) ;
2.0-
1.5-
.
1.0-
0.5-
•
0.0-
PSI Injector 118.3.1994 ^~ A N^A / v t ^«K54| 1 A.
MeV p ^^c^C^^^^^^^^<>My-nrT
<
1 ^ 1R - 98cm
(
i
90cm80cm
\
70cm
60cm
, V V.9996 1.0000 1.0006
B/Bo
Fig.6 Resonance curve of the PSI Injector 1. Plotted is themeasured beam current as a function of B, showing therange of the magnetic field where particles are accelerated.
where 0 and 7 are denned in terms of the velocity of the particles v, the velocity of light cand the total energy J5tot (sum of rest energy moc
2 and kinetic energy), namely
va = v-c
7 =
ctot 1
moc* ' ; ( I - / ? 2 ) '
We see mat the angular velocity to can only be constant if the strength of the magnetic fieldfollows the relativistic mass increase during acceleration. The induction B must therefore bethe following function of radius
B(r) = Bo7(r)
Assuming a centered circular orbit with r = R and using y2 = 1 + /?(r)2/(l - /5(r)2) wecan write B(r) in terms of /3 and calculate B(r) from the relevant cyclotron parameters w,/ R F — huj/2-K and BQ
B{r) = Bo\
(1
whereCO— rc
/ RFC-2
C3(Z/A)B0
with Co = — = 0.02096 MH2c
with C, = - ^ - = 0.32184 T
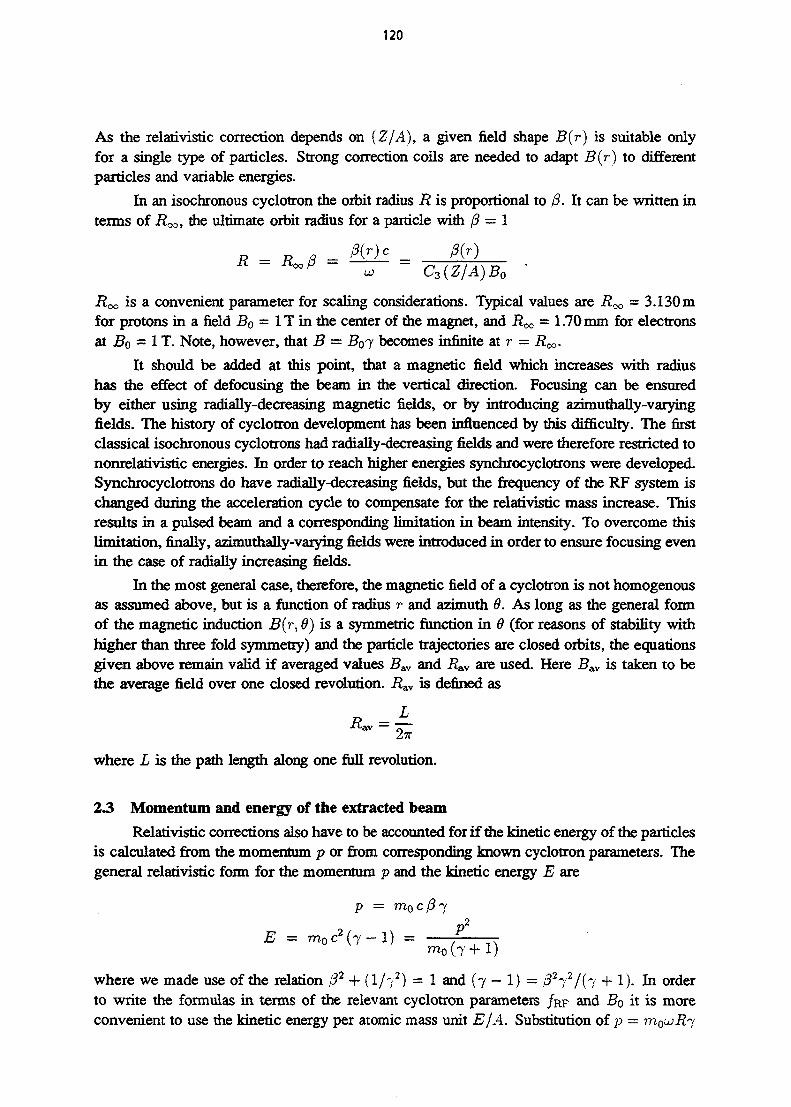
120
As the relativistic correction depends on {Z/A), a given field shape B(r) is suitable onlyfor a single type of particles. Strong correction coils are needed to adapt B(r) to differentparticles and variable energies.
In an isochronous cyclotron the orbit radius R is proportional to 0. It can be written interms of R^,, the ultimate orbit radius for a particle with 0 = 1
w C3{Z/A)B0
Roc is a convenient parameter for scaling considerations. Typical values are R,^ = 3.130mfor protons in a field Bo = I T in the center of the magnet, and Roo = 1.70mm for electronsat J?o = 1T. Note, however, that B = Boj becomes infinite at r = R^.
It should be added at this point, that a magnetic field which increases with radiushas the effect of defocusing the beam in the vertical direction. Focusing can be ensuredby either using radially-decreasing magnetic fields, or by introducing azimuthally-varyingfields. The history of cyclotron development has been influenced by this difficulty. The firstclassical isochronous cyclotrons had radially-decreasing fields and were therefore restricted tononrelativistic energies. In order to reach higher energies synchrocyclotrons were developed.Synchrocyclotrons do have radially-decreasing fields, but the frequency of the RF system ischanged during the acceleration cycle to compensate for the relativistic mass increase. Thisresults in a pulsed beam and a corresponding limitation in beam intensity. To overcome thislimitation, finally, azimuthally-varying fields were introduced in order to ensure focusing evenin the case of radially increasing fields.
In the most general case, therefore, the magnetic field of a cyclotron is not homogenousas assumed above, but is a function of radius r and azimuth 6. As long as the general formof the magnetic induction B(r, d) is a symmetric function in $ (for reasons of stability withhigher than three fold symmetry) and the particle trajectories are closed orbits, the equationsgiven above remain valid if averaged values Bav and i?av are used. Here B&v is taken to bethe average field over one closed revolution. R&v is defined as
where L is the path length along one full revolution.
23 Momentum and energy of the extracted beam
Relativistic corrections also have to be accounted for if the kinetic energy of the particlesis calculated from the momentum p or from corresponding known cyclotron parameters. Thegeneral relativistic form for the momentum p and the kinetic energy E are
p = m0c,/?7
2 , " 2
E = roo<r(7 - 1) =
where we made use of the relation 32 + (I/72) = 1 and (7 — 1) = /3272/(7 + !)• In orderto write the formulas in terms of the relevant cyclotron parameters /RF and Bo it is moreconvenient to use the kinetic energy per atomic mass unit E/A. Substitution of p =

121
and assuming resonance between u and the chosen harmonic h of the RF frequency /RF weget
-A = C4,"' ^R2(^f , with C 4 . = £-EwC 22 = 0.2046MeV/MHz2m2 .
A (7 + 1) & 2 amu 2
Substitution of p = qRBoj gives the relation of the energy per atomic mass unit as a function
of Bo
\ = C 5 - ^ - ( Z / A ) 2 i ? 2 B 2 , with C5 = ^E^Ci = 48.24 MeV/T2m2 .
When these formulas are used to calculate the energy of an extracted beam one has toconsider the fact that the energy depends on the extraction radius. It is important to emphasizethat we have to distinguish between the orbit radius R of the circulating particle and the radialcoordinate r in the cyclotron magnet. Only in the case of a circular orbit centered on themagnetic field, is R equal to the radial coordinate r in the magnet. Furthermore noncenteredmotion causes particles with a certain orbit radius R to reach the location where the beam ispulled out of the cyclotron orbit, before their momenta reach the value that corresponds tothe radial position of the extraction system. Hence the effective extraction radius, i?extr efr»i.e. the radius that determines the energy, depends on the centering of the orbits which isrelated to the beam quality. It is also influenced by the tuning of the extraction process. Inthe general case of a cyclotron with azimuthally varying fields R = R&v has to be used.
For a given magnetic field the energy per atomic mass unit E/A is proportional to
(Z/Af
§ = K{ZIAf
where the factor K is referred to as the if-value of the cyclotron magnet. In contrast to linacs(where the velocity is determined by the linac design) cyclotrons can reach considerably higherenergies if ions in higher charge states can be accelerated. This has been employed in heavyion facilities as can be seen in the example shown in Fig. 3. The beam, generally generated ina low charge state, is accelerated in a first cyclotron and then passed through a thin stripperfoil, where most of the remaining electrons are removed from the ions. This new beam, nowin a high charge state, is then accelerated to high energies in a second (or third) cyclotron.
For most cyclotrons the relativistic correction is not large: 7 is equal to 1.05 at 50MeVproton energy, and the factor 272 /(7 + 1) = 1.08 is close to unity.
At relativistic velocities the beam is often described in terms of pc
pc = moc2/3j •
To scale the action of magnetic focusing devices the magnetic stiffness Bp is used. It isdefined as follows
Bp = £ = Ce'/R^—^- •• w h e r e C<6 = C^ = 0.06512 T/MHzq (Z/Aj
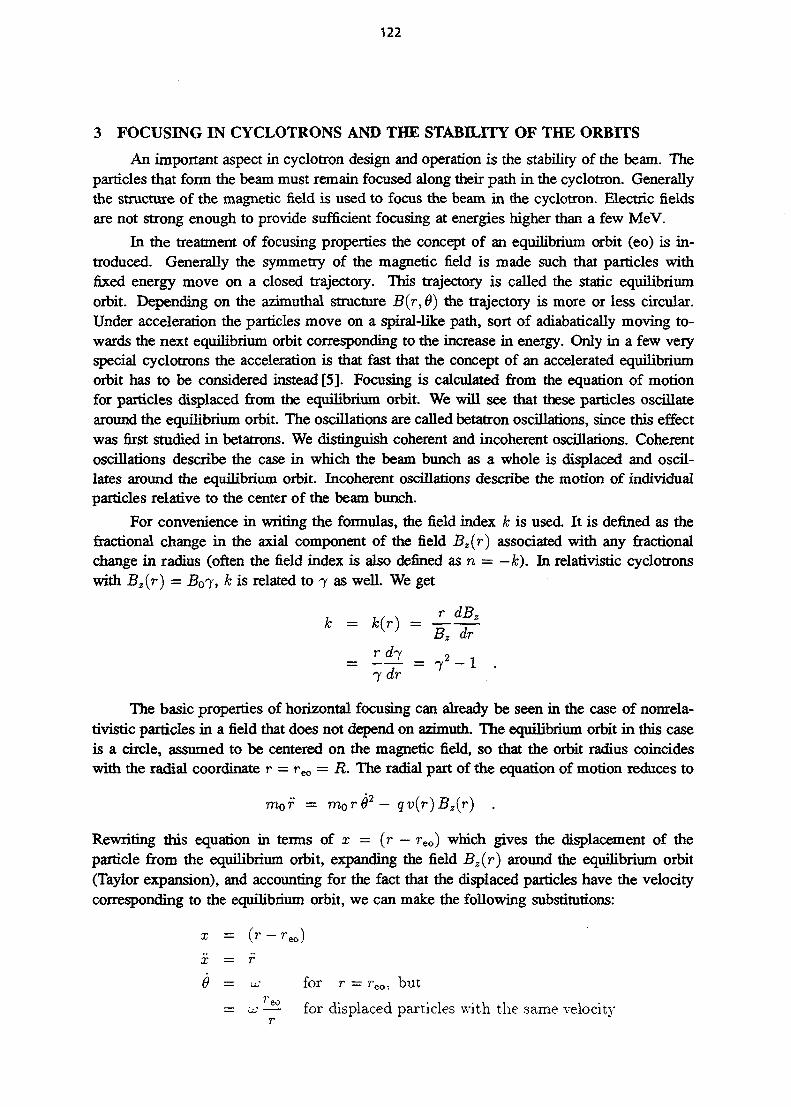
122
3 FOCUSING IN CYCLOTRONS AND THE STABILITY OF THE ORBITS
An important aspect in cyclotron design and operation is the stability of the beam. Theparticles that form the beam must remain focused along their path in the cyclotron. Generallythe structure of the magnetic field is used to focus the beam in the cyclotron. Electric fieldsare not strong enough to provide sufficient focusing at energies higher than a few MeV.
In the treatment of focusing properties the concept of an equilibrium orbit (eo) is in-troduced. Generally the symmetry of the magnetic field is made such that particles withfixed energy move on a closed trajectory. This trajectory is called the static equilibriumorbit. Depending on the azimuthal structure B(r, 0) the trajectory is more or less circular.Under acceleration the particles move on a spiral-like path, sort of adiabatically moving to-wards the next equilibrium orbit corresponding to the increase in energy. Only in a few veryspecial cyclotrons the acceleration is that fast that the concept of an accelerated equilibriumorbit has to be considered instead [5]. Focusing is calculated from the equation of motionfor particles displaced from the equilibrium orbit. We will see that these particles oscillatearound the equilibrium orbit. The oscillations are called betatron oscillations, since this effectwas first studied in betatrons. We distinguish coherent and incoherent oscillations. Coherentoscillations describe the case in which the beam bunch as a whole is displaced and oscil-lates around the equilibrium orbit. Incoherent oscillations describe the motion of individualparticles relative to the center of the beam bunch.
For convenience in writing the formulas, the field index k is used. It is defined as thefractional change in the axial component of the field Bz(r) associated with any fractionalchange in radius (often the field index is also defined as n = — k). In relativistic cyclotronswith Bz(r) = I?o7, k is related to 7 as well. We get
(r)k Kr) B2 dr
= - ^ = 7 2 ~ 1 •7 dr
The basic properties of horizontal focusing can already be seen in the case of nonrela-tivistic particles in a field that does not depend on azimuth. The equilibrium orbit in this caseis a circle, assumed to be centered on the magnetic field, so that the orbit radius coincideswith the radial coordinate r = r ^ = R. The radial part of the equation of motion reduces to
mo? — mor62— qv(r)Bz(r) .
Rewriting this equation in terms of x = (r — reo) which gives the displacement of theparticle from the equilibrium orbit, expanding the field Bz{r) around the equilibrium orbit(Taylor expansion), and accounting for the fact that the displaced particles have the velocitycorresponding to the equilibrium orbit, we can make the following substitutions:
x = (r - reo)
x — r
$ = u; for r = reo, but7'"
= u; — for displaced particles with the same velocityr

123
r2
r#2 _ ,2/leo\ ^
B,{r) = B,(reo) + (—r-1)^ + higher order termsar
reo
Neglecting higher-order terms this yields the differential equation for x
x — o;2(reo — x) — vu(l H )
which is the equation of a harmonic oscillator. A selected particular solution is
x = x0 cos(vru>t)
with
v? = 1 + k = j 2 ,
where vr is referred to as the radial betatron frequency and x0 is the betatron amplitude.
Radial focusing is strong. In almost all cyclotrons particles oscillate around the equi-librium orbit more than once per revolution. Contributions from aziinuthally varying fieldsare not very important in radial focusing.
Resonances can disturb the orbits [4,5]. Minor field perturbations for instance make thebeam unstable if vT = 1, that is where h = 0. This is the case in the center of the magnet, andin relativistic cyclotrons at the edge of the magnet pole where the increasing internal fieldturns into a decreasing one as the particles approach the fringing field.
Vertical or axial focusing is weak. Only with azimuthally varying fields appreciablevertical focusing can be achieved. Axially restoring forces result from the components BT
and B$. For this case the axial part of the equation of motion is
moz = q{rBe-r8Br) .
Again Br and Be, which are zero on the magnetic symmetry plane, are expanded aroundthe equilibrium orbit and expressed in terms of Bz using divB = 0. With Bz taken in thedirection of the negative z-axis the following substitutions can be used:
BJz) = ——^z = — z + higher order termsaz dr
Be{z) = —7— z = rr z + higher order termsaz rdv
m

124
Neglecting higher-order terms the differential equation for the axial motion relative to theequilibrium orbit becomes
2 , ? - 1
with a selected particular solution
z = ZQ cos{yzijoi)
and
vl = -k + "flutter term" .
vz is the vertical or axial betatron frequency and z0 the amplitude of the oscillation. The"flutter term" includes the contributions from the azimuthal variation of the field.
The formula for the axial or vertical betatron frequency vz shows the discrepancy be-tween the need of a decreasing field to achieve axial focusing and the demand for increasingfields to compensate for the increase in mass in relativistic cyclotrons. The first term becomesnegative in the latter case and an unstable trajectory would result, if it were not compensatedby the flutter term. The positive flutter term itself depends on dr/dt which is sizeable onlyif the shape of the orbits deviates much from circles. Therefore axial focusing is generallyweak and for highly relativistic energies azimuthal variation of the field alone is not suffi-cient. Spiral magnet sectors or spiral pole shims are used to enhance the contribution to axialfocusing. An approximative value of the flutter contribution Az/| for this case is
where the factor F contains the information on the azimuthal variation of the field and £ isthe spiral angle. F is called the flutter and can be calculated from the Fourier coefficents Ckof Bz(0). Approximately it is
A more general theoretical treatment of orbit dynamics can be found for instance inthe work of Hagedoom and Verster [6], Schulte and Hagedoom [7] and Gordon [8], or in thetextbooks listed in the Bibliography at the end of this article.
4 CYCLOTRON COMPONENTS AND SUBSYSTEMS
This section gives a short description of typical subsystems and components of cy-clotrons. Two examples were given in Figs. 4 and 5, which show the layout of two com-pletely different cyclotrons of the accelerator facility at PSI with their components. Detailson magnet design, RF systems, on beam injection and extraction in cyclotrons are the subjectof separate contributions to these proceedings.
The magnetic field is generally generated by electromagnets. In the case of Injector 1(Fig. 4) it is an H-type one-piece magnet with circular poles. The Ring cyclotron (Fig. 5), on

125
the other hand, uses eight separated sector magnets. Both cyclotrons have azimuthally varyingfields to introduce vertical or axial focusing up to relativistic energies. The size and weightof the magnet depends on the field level and the maximum energy. For room temperaturemagnets typical pole diameters are 1.5m for 30MeV protons and about 2.5 m for 100 MeV.In separated-sector cyclotrons the average field is lower, typical average orbit radii are 2 m at72 MeV and 4.5 m at 600 MeV. The typical weight of cyclotron magnets is shown in Fig. 7taken from Ref. [9]. With the construction of superconducting coils considerably higher fieldstrength could be achieved and the weight of the magnets was reduced accordingly.
10000:
5000
2000
1000:
500:
200
100:
50:
20
MagnetWeightWtTons]
W -
T / O
erfo
+ /'/
/-+- *
W oO'
t
x15 /
•At
+X A /+ ' KfMeVl
.1.5
+Compact Cyclotrons
oRing Cyclotrons
TTRIUMF
• Synchrocyclotrons
ASupercond. Cyclotrons
20 50 100 200 506"i000
Fig.7 Typical weight of cyclotron magnets plotted vs. iv"-values. Employingsuperconducting coils considerably higher field strength can be achieved and
the weight of the magnets can be reduced by a factor of about 15.
Early cyclotrons did not have an ion source. In the center of the magnet a filamentwas installed which ionized the residual gas, producing a rather diffuse beam of bad quality.This situation was improved by the introduction of an internal ion source. Confining thearc discharge in the so called hooded arc source gave better defined starting conditions andimproved beam quality. Modern cyclotrons do often use external ion sources and an axialinjection system to bring the beam into the center of the cyclotron magnet at low energy.These sources are generally optimized for special use, i.e. polarized ion sources, heavy ionsources, ECR (electron cyclotron resonance) sources for the production of highly chargedions, H~ sources of negative hydrogen atoms. Internal sources have a 4 to 10 mm diameterchimney parallel to the field lines in the center of the magnet. They either use a filamentto sustain the arc or cold cathodes and about 1 kV arc voltage to strike the arc (Penningdischarge). The electric field of the RF system accelerates the ions out of the plasma through

126
Table 1Comparison between an AVF-cyclotron and a separated-sector cyclotron
Cyclotron parametersTurn numberTurn separationMagnet
pole shimweight, gap
RF systemmax. accel. voltagefrequency
Ion sources (IS) internalexternal
InjectionBeam specifications
Injector modeproton E,I
Variable energyprotonsdeuteronsalphasheavy ions
Norm.emittance hor./vert.Phase widthEnergy spread (fwhm)
User (status 1992)Used as injectorNuclear physicsChem. & atomic phys.Radioisotope prod.Cancer therapyVarious irradiations
PSI Injector 1AVF-cyclotron
5000.3 - 3 mm at extraction
1 pole, 0 2.5 m4 spirals angle 55°
470t, gap 240/450mm< 1.6T, < 2.0T
180° Dee2 x 70kV
4.6-17 MHz, 50 MHzhot cathode hooded arc
ECR, polarized IS14 kV axial inj.system
72 MeV, max. 200 fxA
10-72 MeV, 10 (j,A10-65 MeV, 10/iA20-120 MeV, 5 fiA130 (Z 2 / ^ ) MeV
2.4 /1.2 7r mm mrad16° - 40°
0.3%
20%40%10%10%10%10%
PSI Injector 2sep. sector cycl.
10018 mm at extraction
4 sep.sectors, R=3.5mno spiral angle
4 x 1801, gap 35 mm0.36 T, 1.1 T2 resonators4 x 250 kV
50 MHz fixed-
cusp IS870 keV preinjector
72 MeV, max. 1.6 mA
----
1.2/1.2 7T mm mrad12°
0.2%
100%--
(parasitic 40 %)--
an exit slit in the chimney.
The RF-system and the geometry of the aceleration electrodes depends strongly on thegeneral design of the cyclotron, one 180° Dee in the case shown in Fig. 4, often two 90°Dees in smaller cyclotrons, or three 60° Dees in cyclotrons operated in a higher-harmonicmode h. Separated-sector cyclotrons employ large, high-Q RF resonators or cavities betweenthe magnets for acceleration. The obvious advantages are low RF loss and high energy gain.Typical values for the peak voltage are between 50 and lOOkV on Dees, up to 500kV inresonators and even 750 kV in the big cavities of the Ring cyclotron at PSI.
In the extraction systems generally electrostatic elements, electromagnetic elements andpasssive magnetic channels deflect the beam out of the circular orbits and focus the beam onits path through the fringing field. A critical part is the inner electrode of the first electrostaticdeflector, called the septum (latin for knife), as it separates off part from the circulating beam.
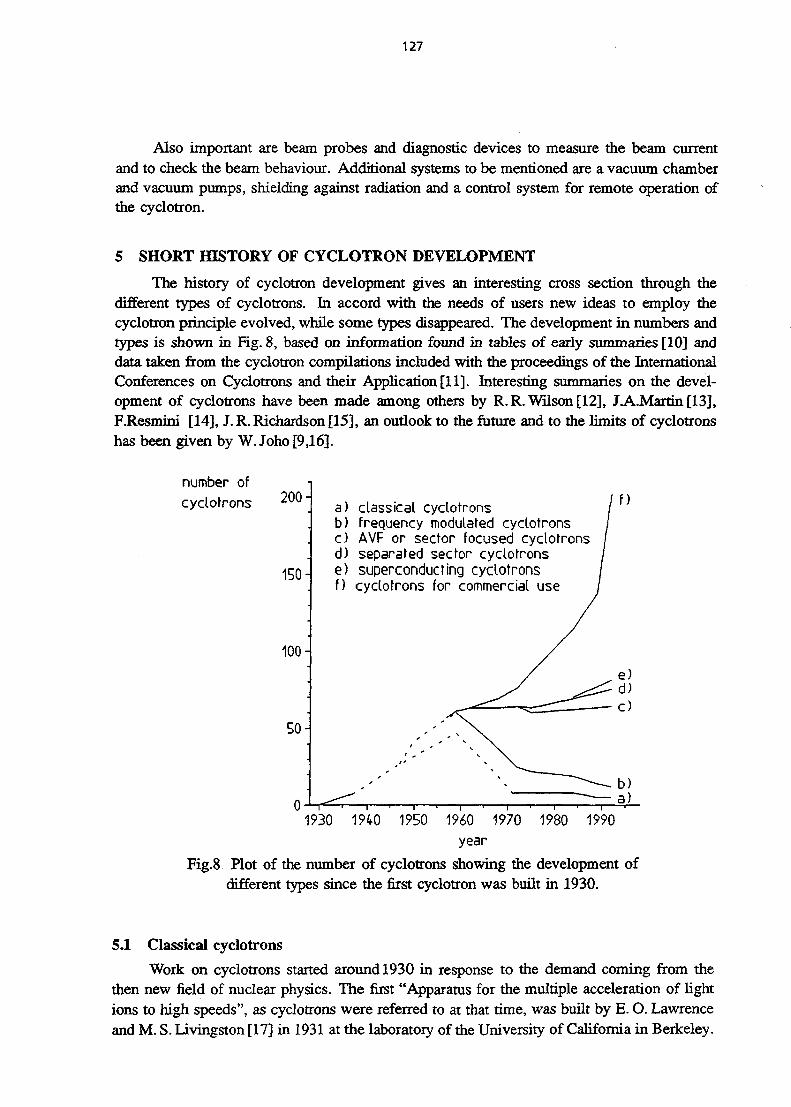
127
Also important are beam probes and diagnostic devices to measure the beam currentand to check the beam behaviour. Additional systems to be mentioned are a vacuum chamberand vacuum pumps, shielding against radiation and a control system for remote operation ofthe cyclotron.
5 SHORT HISTORY OF CYCLOTRON DEVELOPMENT
The history of cyclotron development gives an interesting cross section through thedifferent types of cyclotrons. In accord with the needs of users new ideas to employ thecyclotron principle evolved, while some types disappeared. The development in numbers andtypes is shown in Fig. 8, based on information found in tables of early summaries [10] anddata taken from the cyclotron compilations included with the proceedings of the InternationalConferences on Cyclotrons and their Application [11]. Interesting summaries on the devel-opment of cyclotrons have been made among others by R. R. Wilson [12], J.A.Martin [13],F.Resmini [14], J. R. Richardson [15], an outlook to the future and to the limits of cyclotronshas been given by W. Joho [9,16].
number of
cyclotrons 200-
150-
100-
50-
0
a) classical cyclotronsb) frequency modulated cyclotronsc) AVF or sector focused cyclotronsd) separated sector cyclotronse) superconducting cyclotronsf) cyclotrons for commercial use
f)
e)d)c)
b)a)
1930 1940 1950 1960 1970 1980 1990year
Fig.8 Plot of the number of cyclotrons showing the development ofdifferent types since the first cyclotron was built in 1930.
5.1 Classical cyclotrons
Work on cyclotrons started around 1930 in response to the demand coming from thethen new field of nuclear physics. The first "Apparatus for the multiple acceleration of lightions to high speeds", as cyclotrons were referred to at that time, was built by E. O. Lawrenceand M. S. Livingston [17] in 1931 at the laboratory of the University of California in Berkeley.
128
Today this laboratory is called the Lawrence Berkeley Laboratory in honour of the contributionof E.O.Lawrence to the cyclotron development. His "11-inch" cyclotron had a pole face28 cm in diameter and "produced a current of 0.001 /xA of 1,220,000 V protons" [18]. Alreadyin 1932 this cyclotron was used for experiments. A large number of cyclotrons where built inthe coming years. A review by B. Cohen in 1959 [10] lists 48 cyclotrons. All early cyclotronshad flat poles, and hence sufficient focusing due to the small decrease in the magnetic fieldstrength towards the edge of the pole. The contradiction between the demands from focusingon one hand, and radially increasing fields for the acceleration to relativistic energies on theother hand, must have been realized quite early. The conclusion, however, that the energyof these classical cyclotrons would be limited was only published in 1937, when H. E. Betheand M. E.Rose [19] predicted that 12MeV for protons and 34MeV for alpha particles wouldbe the maximum obtainable energy from a cyclotron.
5.2 Frequency modulated cyclotrons (FM-cydotrons) or synchrocyclotrons
Under the influence of the discovery of neutrons and muons and the prediction of theexistence of pions, all between 1932 and 1937, the quest for a solution to reach higher energieswas strongly stimulated. A proposal by L.H.Thomas published in 1938[20] to employ"variation of B with polar angle" was not taken up at that time, because it was consideredto be too difficult to produce a sinusodial magnetic field, as it was assumed in the proposal.Instead, frequency modulated cyclotrons were built after the war in 1945, following proposalspublished independently by V.Veksler [21] and E. M. McMillan [22]. These cyclotrons do havea radially decreasing magnetic field in order to enhance axial focusing, but in order to reachrelativistic energies the frequency has to be lowered while the particles are accelerated. Itturns out that these synchrocyclotrons, as these accelerators are called, possess the propertyof having phase stability. At any time during acceleration the phase of the particles oscillatesaround the phase that gives exactly the energy gain corresponding to the actual change infrequency of the driving RF-system. The frequency sweep is slow, about 50 to 4000 cycles/s.Hence the acceleration is slow as well and the Dee voltage need not be very high, typicallybetween lOkV and 40 kV. All these properties make synchrocyclotrons easy to build andeasy to operate. After J. R. Richardson "no other major accelerator is as forgiving as an FM-cyclotron" [15]. The disadvantage of frequency modulation is mat particles are acceleratedin cycles. Therefore synchrocyclotrons deliver pulsed beams with low duty factors and lowaverage beam intensities.
The "184-inch" synchrocyclotron in Berkeley was the first one to be built, again byE.O.Lawrence[23]. It reached energies up to 200MeV for proton beams and 400MeV foralpha-particle beams. The highest beam energy from a frequency modulated cyclotron wasachieved in Gatchina (St. Petersburg, Russia) reaching 1000 MeV. The interest in synchrocy-clotrons is declining, today seven synchrocylotrons are still in operation.
53 AVF (Azimuthally Varying Fields) or sector-focused cyclotrons
The motivation for further development of cyclotrons came from several sides. Alreadyin 1950 the demand for large flux of neutrons was the basis for classified work on an electronmodel with azimuthally varying fields by J. R. Richardson [15]. In high energy physics the firstartificial production of pions in 1949, of K- and H-mesons in 1953 stimulated further progress.
129
Alternate gradient and spiral-shaped fields were proposed for high energy accelerators. Finally,the intensity limitations found in synchrocyclotrons was a good reason to consider again theearly idea of L. H.Thomas [20] to enhance focusing using azimuthally varying fields (AVF).The breakthrough came with the end of the decade: in 1957 the first AVF cyclotron inDelft (The Netherlands) produced a beam. In 1959 at the first conference on sector-focusedcyclotrons the participants were enthusiastic about AVF. By 1962 six and by 1970 alreadyforty AVF cyclotrons were in operation. Improvement in flexibility, beam quality and beamintensity was rapid. Special needs and increasing demands from users could be satisfied,variable energy and a wider range of beams (heavy ion beams, polarized beams) could bedelivered. In 1969 W.Marshall refers to the AVF cyclotrons as very "versatile acceleratorsthat have many potential applications in fields entirely distinct from nuclear physics", like"radiochemistry, biology, medicine, metallurgy" [24]. This versatility is probably the reasonfor the continuing success of cyclotrons.
At high energies spiral pole shims are necessary to provide sufficient focusing. In the520 MeV cyclotron at TRIUMF (Canada) the spiral angle is as large as 70°, coming close toa practical limit. Beam intensities are generally either limited by the output of the source orby beam loss at extraction, since most AVF cyclotrons with a one-piece magnet do have anoverlapping turn structure at extraction.
A typical example of flexibility and versatility is the Injector 1 at PSI (see Fig. 4).Typical beam specifications, important cyclotron parameters and its present use is summarizedin Table 1 in comparison to corresponding parameters of Injector 2, a cyclotron speciallydesigned for high intensity operation.
5.4 Separated-sector cyclotrons
The next challenge came around 1970 from what was termed "the meson factory race".The goal was to provide pions and muons for research at flux levels 10-100 times largerthan available before, mainly for special experiments in nuclear and particle physics, but assoon as they were available the meson beams found also applications in other fields such assolid state physics and medicine. It was a competition between different laboratories and,what is more important, between different types of accelerators. Worldwide three mesonfactories were built, an 800 MeV linear accelerator at Los Alamos (USA), the H~-cyclotronat TRIUMF in Vancouver (Canada) with variable beam energies between 183 and 520 MeV,and the 590 MeV Ring cyclotron, a separated-sector cyclotron at PSI (Switzerland).
The step in cyclotron design from sector-shaped pole shims to separated- sector magnets,as proposed by H. A. Willax in 1963 [25], was just a logical expansion of the AVF principle.It had, however, significant impact on the mechanical and beam dynamical properties of thecyclotron. The free space between separated magnets allows the installation of powerful andefficient high-Q RF cavities or resonators instead of Dees squeezed in between the magnetpoles. This gives considerably higher acceleration voltage which results in good turn separa-tion. The beam can easily be extracted with little beam loss, which is a mandatory conditionfor high beam intensity cyclotrons.
The space between the magnets gives also the possibility to easily install a so-calledflat-top cavity. The idea behind a flat-top RF system is to make the acceleration independentof the phase of the individual particles in the beam bunch by flattening the peak of the cosine
130
of the regular RF acceleration voltage. This is achieved by the addition of a third harmonicto the cosine, with an amplitude of 11.5 % of the regular RF voltage, but with opposite sign(i.e. decelerating). First operation of a flat-top system was reported in 1981 by S.Adam etal., [26] giving results from the Ring cyclotron at PSI.
The price paid for these advantages is the need for a separate preaccelerator as injectorinto the innermost orbit. For topological reasons the sector magnets can not be extended allthe way to the center of the cyclotron.
Today eleven separated-sector cyclotrons are in operation, in all cases large cyclotronsfor either high current operation or for high energy heavy ion acceleration. In the latter casestripping of the ions between injector and main accelerator, or between successive stages, canbe used to increase the charge state of the preaccelerated ions, which allows them to reachhigher beam energies, as discussed in section 2.3. The layout of such a facility was shownin Fig. 3.
Typical parameters of a separated-sector cyclotron are given in Table 1 in comparisonto a conventional AVF cyclotron. An example of the striking difference in the turn separationat extraction is shown in Fig. 9.
5.5 Superconducting cyclotrons
With the development of superconductivity the question had to come up whether su-perconductivity would make a contribution to cyclotrons. At the beginning it still seemedunlikely that it would, because "there is no overriding problem that would be solved" byusing superconductivity, as H.G.Blosser[27], the pioneer in the field, said in 1972. Indeedthe effort needed to design such cyclotrons was considerable. But in two specific applicationsthe obvious advantage to have identical beam performance using magnets with 15 times lowerweight, as seen in Fig. 7, turned out to be important enough.
On the one hand University laboratories interested in heavy ion physics but without themeans to build up a large facility chose to construct superconducting cyclotrons. The firstwas built by H. G. Blosser [28] at the National Superconducting Cyclotron Laboratory in EastLansing (USA) producing beam in 1982. It is a if = 500 superconducting cyclotron. Theenergy range is comparable to that of the large cyclotrons at GANIL, but the orbit radius atextraction is 67 cm instead of 300 cm and the magnet weight is 1001 compared to 17001.
The other field in which the small size of the magnet was essential, is the medicalapplication in hospitals. The most typical case is the 50MeV deuteron cyclotron for neutrontherapy installed at the Harper Hospital in Detroit (USA). It is that small that it can beincorporated directly into the rotating irradiation gantry of a cancer treatment facility asshown in Fig. 10.
Today seven superconducting cyclotrons are in operation. A very special superconduct-ing cyclotron wilh separated orbit channels is the TRTTRON in Munich (Germany). It isdescribed in detail in another chapter of these proceedings.
5.6 Commercial cyclotrons
Commercial and industrial use of cyclotrons and the design of dedicated cyclotrons forspecific applications, mainly in medicine for cancer therapy or radioisotope production, came

131
a) Injector 1, 2uA optimized for low phase width
beamintensity ]
beamintensity measuring head:
finger
beam
body
95
radius (cm)
b) Injector 2, lOOuA
beamintensity J
3200 3240 3280 3320radius (mm)
3360
Fig.9 Typical turn structure close to the extraction radius. The striking differencein turn separation between a conventional cyclotron with a single magnet pole anda separated-sector cyclotron is shown in this plot of the turn structure measured on
beams from Injector 1 and Injector 2 at PSI.

132
a)
b)(cutaway to show cyclotron)
Fig. 10 The superconducting cyclotron at The Harper Hospital in Detroit (USA). It is smallenough to be integrated into the irradiation gantry for cancer therapy with neutrons, a) photo-graph of the late stage of construction showing the cyclotron mounted on the 4.3 m diameter
support ring, b) side view of the treatment facility (courtesy NSCL-MSU).

133
up soon after the AVF cyclotron had proven to be such a versatile accelerator. In the decadeafter 1960 several companies tried to get into the market with cyclotrons (e.g. AEG, Philips,Scanditronix, The Cyclotron Corporation, Thomson-CSF/CGR). Ten to fifteen years later,though, many of these companies reduced or stopped their effort in cyclotron developmentand marketing. It seems that first some progress on the side of application was necessary,as for example research in radiochemistry, development of positron emission tomographs(PET) or studies on the feasibility of cancer therapy with neutrons or with charged particles.Today, again fifteen years later, the number of small cyclotrons, dedicated to medical orcommercial use, grows rapidly. The list of cyclotron manufacturers contains many new names(e.g. C n PET Systems/Siemens, DV.Efremov Institute, EBCO, IB A, Oxford Instruments,Scanditronix, Sumitomo Heavy Industries, The Japan Steel Works) and complete systems,mainly for PET are offered. Many hospitals and many other users seem to be ready to installtheir own cyclotron.
An example of such a cyclotron specially designed for isotope production was shownin Fig. 2. All of these cyclotrons are optimized for their specific application. They are madeas simple as possible and easy to handle. This is also expressed in a clear way in the slogan"by pressing a maximum of two buttons existing personnel can produce any of four usefulO-15 isotopes", with which IB A is marketing one of their cyclotrons.
6 BEAM QUALITY AND THE PHASE SPACE OF THE BEAM
Individual particles are contained within a 6-dimensional phase space volume definedaround the center of the beam bunch to which they belong. The horizontal and verticaldistributions are described by the emittance areas Ax and Az, assumed to be upright ellipseswith axis xmax,x'm&x and zmax,z'max, where x'm&x and .zmax denote the divergence of theparticles with respect to the path defined by the center of the beam bunch (e.g. for a centeredbeam z' — dz/ds with ds = rudt). The longitudinal distribution is described by the phasewidth and the energy spread.
The emittance areas are
Az = 7Tz
The betatron oscillations of the particles filling the phase space can be represented by arotation in the corresponding subspace with angular velocities uru> and vzu>, respectively. Asan example some properties of the horizontal beam emittance are shown in Fig. 11. Betatronoscillations turn xmax into x'max = zmaxZ'V/-R- This is visualized in Fig. l ib. The width ofthe beam oscillates with the betatron frequency unless starting conditions XQ and x'o, or z0
and z'o, are adjusted such that the oscillations disappear. This is the case if
and |*Q| =
in what we call a beam matched to the eigenellipse of the cyclotron (Fig. l ie). A matchedbeam remains matched as long as vr or vz change slowly under acceleration. Then the ratioof .rmax to a;max and z'max to zmaK is for every radius R given by vr and vz.
Liouville's theorem can be applied which states that the phase space volume remainsconstant. Neglecting coupling between horizontal, vertical and longitudinal subspaces the
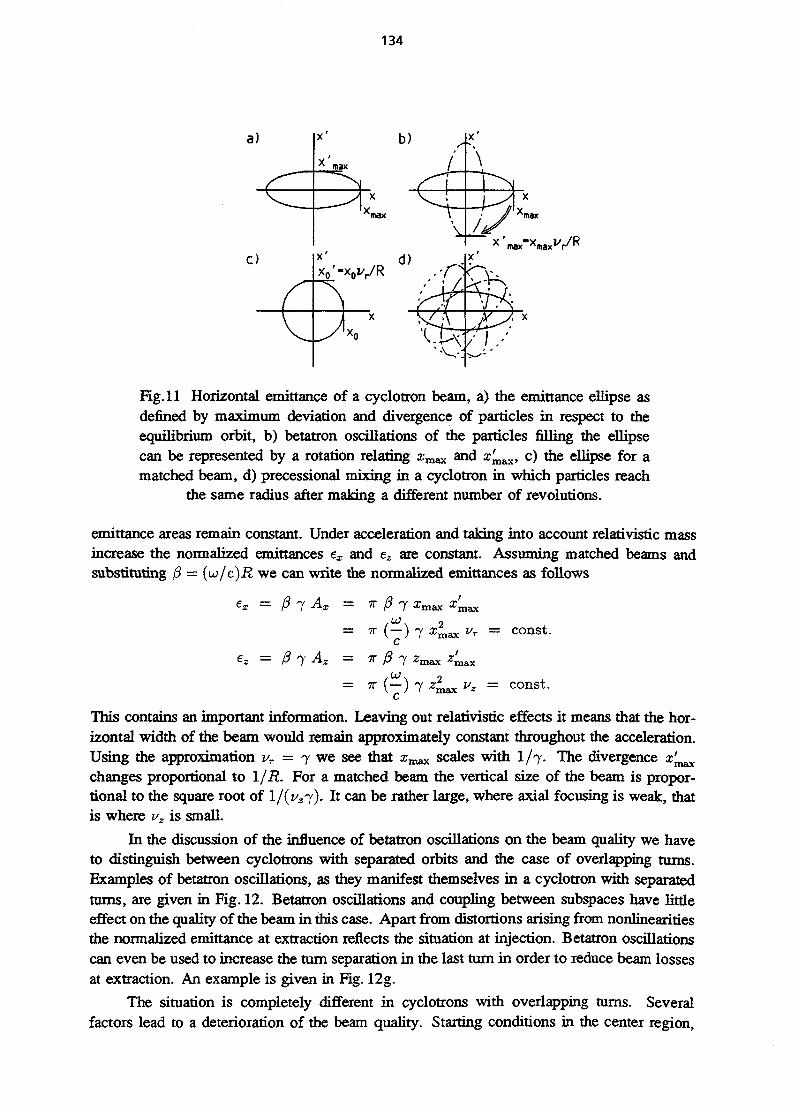
134
a)
Fig. 11 Horizontal emittance of a cyclotron beam, a) the emittance ellipse asdefined by maximum deviation and divergence of particles in respect to theequilibrium orbit, b) betatron oscillations of the particles filling the ellipsecan be represented by a rotation relating xmax and £max, c) the ellipse for amatched beam, d) precessional mixing in a cyclotron in which particles reach
the same radius after making a different number of revolutions.
emittance areas remain constant. Under acceleration and taking into account relativistic massincrease the normalized emittances ex and ez are constant. Assuming matched beams andsubstituting 8 = (u/c)R we can write the normalized emittances as follows
= 0 7 Ax = T /3 j x:max2
= j3 1 Az = -K 0 7
= const.
v, = const.
This contains an important information. Leaving out relativistic effects it means that the hor-izontal width of the beam would remain approximately constant throughout the acceleration.Using the approximation vr = 7 we see that Xmax scales with 1/7. The divergence x'max
changes proportional to 1/R. For a matched beam the vertical size of the beam is propor-tional to the square root of l/(i/3j). It can be rather large, where axial focusing is weak, thatis where vz is small.
In the discussion of the influence of betatron oscillations on the beam quality we haveto distinguish between cyclotrons with separated orbits and the case of overlapping turns.Examples of betatron oscillations, as they manifest themselves in a cyclotron with separatedturns, are given in Fig. 12. Betatron oscillations and coupling between subspaces have littleeffect on the quality of the beam in this case. Apart from distortions arising from nonlinearitiesthe normalized emittance at extraction reflects the situation at injection. Betatron oscillationscan even be used to increase the turn separation in the last turn in order to reduce beam lossesat extraction. An example is given in Fig. 12g.
The situation is completely different in cyclotrons with overlapping turns. Severalfactors lead to a deterioration of the beam quality. Starting conditions in the center region,
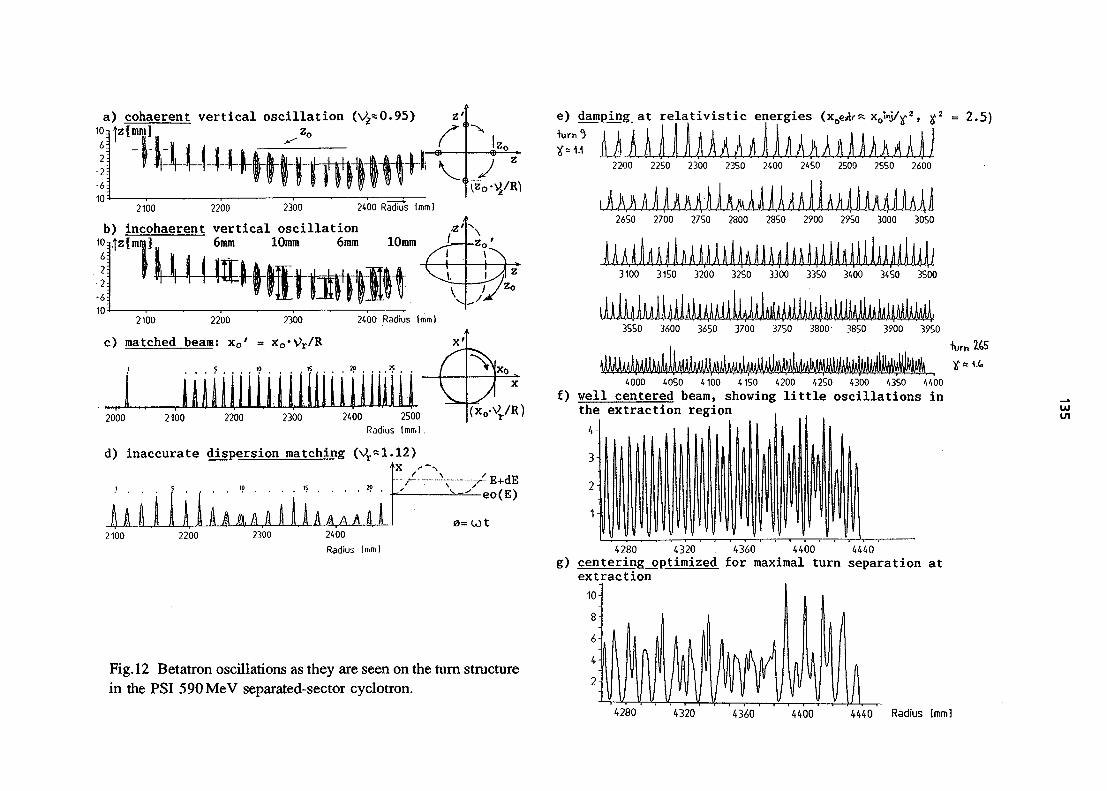
a) cohaerent ve r t i ca l osc i l l a t ioniOq|z[mm] zn6! ' '
2100 2200 2300 2400 Radius Imm)
b) incohaerent vertical oscillation -z'6mm 10mm 6mm 10mm L
2100 2200 2300
c) matched beam; x0' = xo'\>r/R
' 5 10 . 15 . . . . » X
2400 Radius (mm)
imii i i l i i l l l l l i2000 2100 2200 2300
d) inaccurate dispersion matching (\>r*
2400 2500Radius 1mm I.
lUt I I i h * A A A l l h i A A a l7
-' eo(E)
0=U)t2100 2200 2300 2400
Radius (mm)
Fig. 12 Betatron oscillations as they are seen on the turn structurein the PSI 590 MeV separated-sector cyclotron.
e) damping at relativistic energies (xo^r^ xo*»]/y2, y2 = 2.5)
"turn *)
2200 2250 2300 2350 2400 2450 2500 2550 2600
2650 2700 2750 2800 2850 2900 2950 3000 3050
3100 3150 3200 3250 3300 3350 3400 3450 3500
3550 3600 3650 3700 3750 3800- 3850 3900 3950
4000 40S0 4100 4150 4200 4250 4300 4350 4400f) well centered beam, showing l i t t l e oscillations in
the extraction region
MS
4280 4320 4360 4400 4440g) centering optimized for maximal turn separation at
extraction
4280 4320 4360 4400 4440 Radius [mm]

136
P 2 (mm)
a)
Fig.13 Enforced matching of a beam by collimation over several revolutions.The phase space is reduced to the ellipse that corresponds to a matched beam.Shown are results from the PSI Injector 1, a) measured initial emittance of the ionsource, b) calculated effect of the collimator (in order to compare the divergences
at different radii a reduced coordinate Pz = Rz' has been used).
especially if the cyclotron is operated with an internal ion source, do in general not agree withthe matching condition given above. In the case of overlapping turns particles can reach thesame radius after a different number of revolutions and hence with a different phase of theirbeatron oscillations. The superposition of the corresponding ellipses with different orientationin x and x', is called precessional mixing. It results in an enlarged, smeared out emittancearea if the beam is not matched (see Fig. l id). In addition, for particles with differentstarting phases the orbit centers do not coincide. Only one phase can be centered, while theothers oscillate around their equilibrium orbits. The consequence is that very often the beamemittance at extraction radius is too large for the extraction channels. The emittance of theextracted beam is then limited by the acceptance area of the extraction system. A remedyis strong collimation in the fibrst few turns to remove unwanted, mismatched portions of thebeam and reduction of the phase width of the accepted beam. An example is given in Fig. 13.
Typical values for the normalized horizontal emittance ex are 1.5 Trmmmrad (with col-limation) and up to 3 TT mm mrad (acceptance of the extraction system). Typical values forthe vertical emittance ez are 1 -K mm mrad (collimated beam) up to 3 TV mm mrad (full beam).The emittance areas in cyclotrons with separated turns are essentially determined by the ionsource.
Phase width and energy spread depend on the same factors discussed above and they,too, vary correspondingly. The phase acceptance can be as large as 60°, typical reportedvalues of the phase width of extracted beams are between 5° and 40° depending on theeffort undertaken to reduce the phase width by bunching the beam before injection or bycollimating the beam. The energy spread AE/E depends on the phase width and typicalvalues lie between 0.1 % and 1 % fwhm.

137
REFERENCES
ICC1 to ICC 13 are abbreviations for the Proceedings of the International Conferences onCyclotrons as summarized in the Bibliography below.[I] J. Ferine, ICC8 (1979) 1889[2] Particle Data Group, Phys. Rev. D45 (1992) 1, "Review of Particle Properties"[3] A.A.Garren, ICC2 (1962) 309 and A. A.Garren and L. Smith, ICC3 (1963) 18[4] M.M. Gordon, Nucl. List. & Meth. 18,19 (1962) p.243,268,281[5] W. Joho, ICC5, (1969) 159[6] H. L. Hagedoorn and N. F. Verster, Nucl. Inst. & Meth. 18,19 (1962) 201[7] W.M.Schulte and H. L.Hagedoorn, Nucl. Inst. & Meth. 171 (1980) p.409,439[8] M.M.Gordon, Part. Ace. 13 (1983) 67[9] W.Joho, CERN Ace. School Aarhus, CERN 87-10 (1987) 260
"Modern Trends in Cyclotrons"[10] B. Cohen, in Handbuch der Physik, Vol.44 (1959) 105[II] F.T.Howard and other authors, Cyclotron Compilation in the Proceedings of the
Int. Conf. on Cycl. and their Applications[12] R.R. Wilson, J.Appl.Phys. 11 (1940) 781 "Theory of the Cyclotron"[13] J.A.Martin, ICC5 (1969) 3 "Innovations in Isochronous Cyclotrons"[14] F.Resmini, ICC7 (1975) 19 "Summary Talk on Cyclotrons"[15] J.R. Richardson, ICC10 (1984) 617 "Short History of Cyclotrons"[16] W.Joho, ICC9 (1981) 337 "High Intensity Problems in Cyclotrons"[17] E.O.Lawrence and M.S.Livingston, Phys.Rev. 40 (1932) 19[18] E. O. Lawrence and D. Cooksey, Phys. Rev. 50 (1936) 1131[19] H.E.Bethe and M.E.Rose, Phys.Rev. 52 (1937) 1254[20] L.H.Thomas, Phys.Rev. 54 (1938) 580[21] V.Veksler, Journal of Physics, U.S.S.R., 9 (1945) 153[22] E.M. McMillan, Phys. Rev. 68 (1945) 143[23] W.M.Brobeck et aL, Phys. Rev. 71 (1947) 449[24] W. Marshall, ICC6 (1969) "Opening Remark"[25] H. A. Willax, ICC3 (1963) 386[26] S.Adam et al., IEEE Trans.NS-28(3) (1981) 2721[27] H.G.Blosser, ICC6 (1972) 16[28] H. G. Blosser, ICC8 (1979) 2040

138
BIBLIOGRAPHY
Textbooks
Principles of Charged Particle Acceleration, Stanley Humphries, jr., John Wiley & Sons 1986Particle Accelerators and their Uses, W.Scharf, Harwood Academic Publisher 1986The Physics of Charged Particle Beams, J.D. Lawson, Clarendon Press Oxford 1977Particle Accelerators: A Brief History, M. Stanley Livingston, Harvard University Press 1969Accelerateurs Circulaires de Particules, H. Brack, Bibl. des Scienc. et Techn. Nucleaires 1966Theory of Cyclic Accelerators, A. A. Kolomensky and A. N. Lebedev, North-Holland 1966Particle Accelerators, M. S. Livingston, J. P. Blewett, McGraw-Hill 1962Principles of Cyclic Particle Accelerators, J. J. Iivingood, D. Van Nostrand Comp. 1961
Articles on cyclotrons in Encyclopedias
G.H.Mackenzie, P.W.Schmor, H.R.Schneider, Cyclotrons, in Encyclopedia of AppliedPhysics, Vol.41992J. Cerny, the Cyclotron, in Nuclear Spectroscopy and Reactions A, 1974B. L. Cohen, Cyclotrons, in Handbuch der Physik, Vol.441959
Conference Proceedings
Proceedings of the International Conferences on Sector-focused Cyclotrons and on Cyclotronsand Their ApplicationICC1, Informal Conference on Sector-focused Cyclotrons 1959 in Sea Island,
NAS-NRC, Publ.656 (1959)ICC2, Int. Conf. 1962 in Los Angeles, Nucl. Inst. & Meth. 18,19 (1962)ICC3, Int. Conf. 1963 in Geneva, CERN 63-19 (1963)ICC4, Iht.Conf. 1966 in Gadinburg, IEEE Trans. NS-13(4) (1966)ICC5, 5thlnt. Cyclotron Conf. 1969 in Oxford, McDlroy, Butterworth (1971)ICC6, 6th Int. Cycl. Conf. 1972 in Vancouver, AIP Conf.Proc. No9 (1972)ICC7, 7thlnt. Cycl. Conf. 1975 in Zurich, Birkhauser (1975)ICC8, 8thlnt. Cycl. Conf. 1978 in Bloomington, IEEE Trans. NS-26(2) (1979)ICC9, 9th Int. Cycl. Conf. 1981 in Caen, les Editions de Physique (1982)ICC10, lOthlnt. Cycl. Conf. 1984 in East Lansing, IEEE New York (1984)ICC11,11th Int. Cycl. Cohf. 1986 in Tokyo, Ionics Publishing Tokyo (1987)ICC12, 12thlnt. Cycl. Conf. 1989 in Berlin, World Scientific Publ. (1991)ICC13, 13thlnt. Cycl. Conf. 1992 in Vancouver, World Scientific Publ. (1993)
Contributions to CERN Accelerator Schools
W. Joho, CAS Aarhus 1986, CERN 87-10 (1987) 1 "Modem Trends in Cyclotrons"H.L.Hagedoom et al., CAS Jiilich 1990, CERN 91-04 (1991) 323
"Introduction to Cyclotrons"H.L.Hagedoorn et al., CAS Leewenhorst 1991, CERN 92-01 (1992) 1 "Hamilton Theory.."P.Heikinnen, CAS Jyvaskyla 1992, CERN 94-01 (1994) p.805,819
"Cyclotrons" and "Injection and Extraction"

139
CYCLOTRON MAGNET CALCULATIONS
Y. Jongen and S. ZarembaIon Beam Applications s.a.Avenue Jean Lenoir 61348 Louvain-la-Neuve, Belgium
AbstractDifferent aspects of a cyclotron magnet design, and not only calcula-tions, are reviewed. The design is an iterative process starting froma simple model which requires a vision of the complete cyclotronand an integration of all subsystems. Finally detailed cyclotronmagnet calculations are described.
1 INTRODUCTION
Many accelerator physicists tend to merely reduce the cyclotron design to cyclotronmagnet calculations. This quite common error should be avoided. Therefore major issuesof cyclotron magnet design, not only calculations, will be discussed in this paper. Thetype of cyclotrons discussed here are fixed field, fixed frequency machines with azimuthallyvarying magnetic field (hills and valleys) provided by sectors (poles) and such as describedin textbooks, for example, in [1].
Cyclotron magnet design requires a vision of the complete cyclotron. Different sub-systems of cyclotron (RF (radiofrequency) system, vacuum, injection, extraction) interactwith each other and always interact with the magnet. Constraints imposed by a previ-ously completed design of the cyclotron magnet can create enormous difficulties laterwhen designing other elements.
Like any other design it is natural to start with a crude and simple model whichis iteratively refined as the design process converges. Finally very detailed and time-consuming calculations and an optimization of the cyclotron magnet are performed.
2 CYCLOTRON MAGNET QUALITIES AND FUNCTIONS
It seems that the time is over for cyclotrons to be designed and constructed mainlyfor nuclear physics experiments. The last few years confirm that the majority of currentlyconstructed cyclotrons and probably all future cyclotrons will be designed for specificapplications, and generally, for a single, unique task.
The most important consequences of this trend are that:
• versatility of cyclotrons is no longer an important issue;
• cost, simplicity, reliability and low radiation doses are very important for the cy-clotron users and for the cyclotron designers;
• weight, occupied space and consumed power are often less important to cyclotronusers than presumed by designers who see the minimization of these parametersas an interesting challenge.
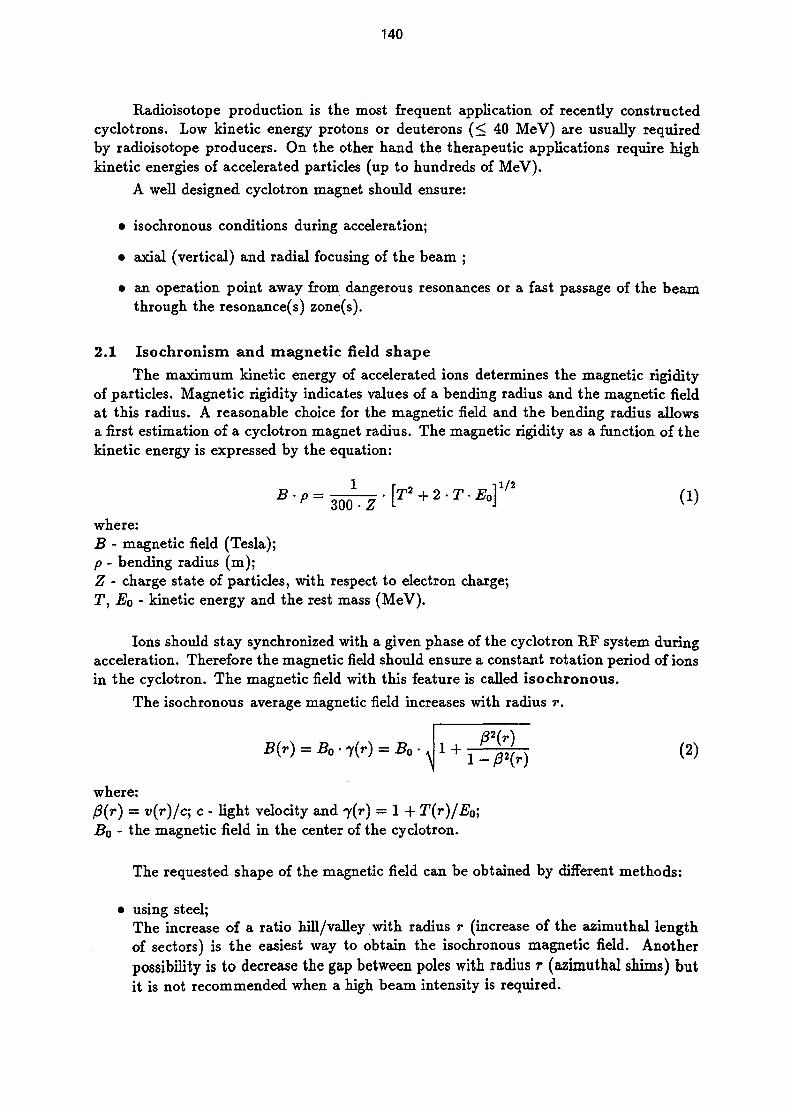
140
Radioisotope production is the most frequent application of recently constructedcyclotrons. Low kinetic energy protons or deuterons (< 40 MeV) are usually requiredby radioisotope producers. On the other hand the therapeutic applications require highkinetic energies of accelerated particles (up to hundreds of MeV).
A well designed cyclotron magnet should ensure:
• isochronous conditions during acceleration;
• axial (vertical) and radial focusing of the beam ;
• an operation point away from dangerous resonances or a fast passage of the beamthrough the resonance(s) zone(s).
2.1 Isochronism and magnetic field shapeThe maximum kinetic energy of accelerated ions determines the magnetic rigidity
of particles. Magnetic rigidity indicates values of a bending radius and the magnetic fieldat this radius. A reasonable choice for the magnetic field and the bending radius allowsa first estimation of a cyclotron magnet radius. The magnetic rigidity as a function of thekinetic energy is expressed by the equation:
where:B - magnetic field (Tesla);p - bending radius (m);Z - charge state of particles, with respect to electron charge;T, Eo - kinetic energy and the rest mass (MeV).
Ions should stay synchronized with a given phase of the cyclotron RF system duringacceleration. Therefore the magnetic field should ensure a constant rotation period of ionsin the cyclotron. The magnetic field with this feature is called isochronous.
The isochronous average magnetic field increases with radius r.
B(r) = Bo • 7(r) = Bo\
(r)
where:0(r) = v(r)/c; c - light velocity and 7(r) = 1 + T(r)/E0;Bo - the magnetic field in the center of the cyclotron.
The requested shape of the magnetic field can be obtained by different methods:
• using steel;The increase of a ratio hill/valley with radius r (increase of the azimuthal lengthof sectors) is the easiest way to obtain the isochronous magnetic field. Anotherpossibility is to decrease the gap between poles with radius r (azimuthal shims) butit is not recommended when a high beam intensity is required.
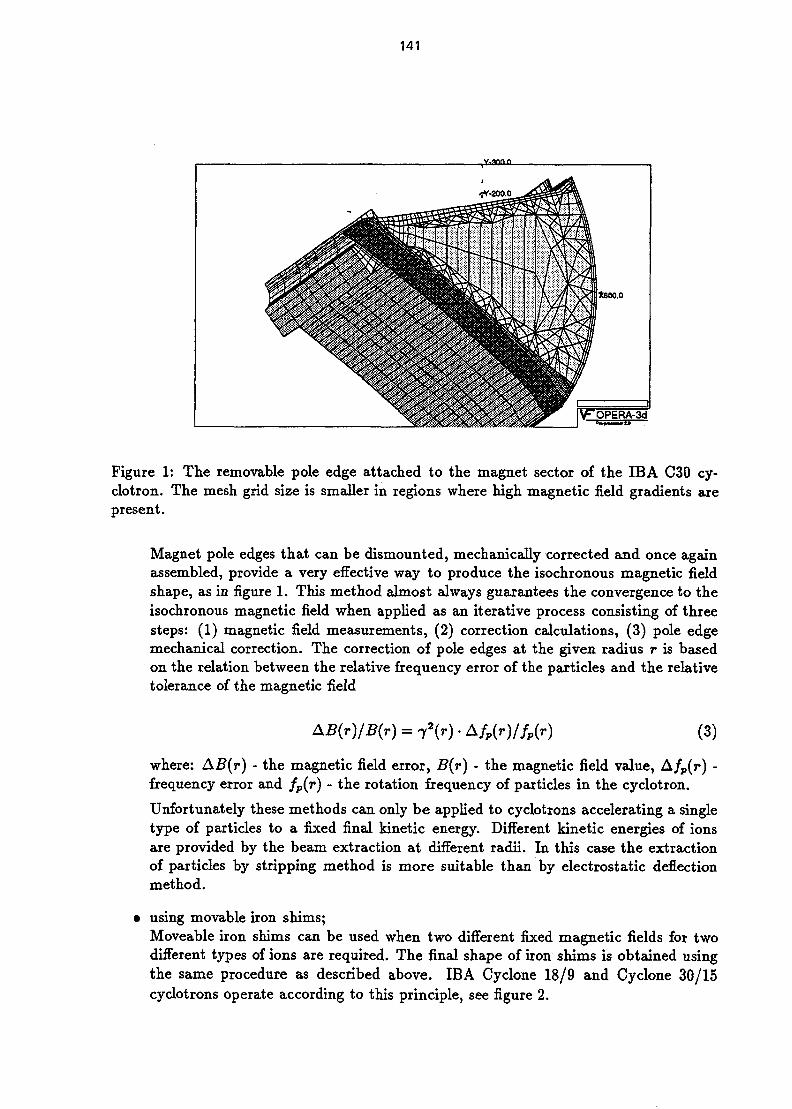
141
Figure 1: The removable pole edge attached to the magnet sector of the IBA C30 cy-clotron. The mesh grid size is smaller in regions where high magnetic field gradients arepresent.
Magnet pole edges that can be dismounted, mechanically corrected and once againassembled, provide a very effective way to produce the isochronous magnetic fieldshape, as in figure 1. This method almost always guarantees the convergence to theisochronous magnetic field when applied as an iterative process consisting of threesteps: (1) magnetic field measurements, (2) correction calculations, (3) pole edgemechanical correction. The correction of pole edges at the given radius r is basedon the relation between the relative frequency error of the particles and the relativetolerance of the magnetic field
AB(r)/B(r) = Afp(r)/fp(r) (3)
where: AB(r) - the magnetic field error, B(r) - the magnetic field value, A/P(r) -frequency error and fp(r) - the rotation frequency of particles in the cyclotron.
Unfortunately these methods can only be applied to cyclotrons accelerating a singletype of particles to a fixed final kinetic energy. Different kinetic energies of ionsare provided by the beam extraction at different radii. In this case the extractionof particles by stripping method is more suitable than by electrostatic deflectionmethod.
using movable iron shims;Moveable iron shims can be used when two different fixed magnetic fields for twodifferent types of ions are required. The final shape of iron shims is obtained usingthe same procedure as described above. IBA Cyclone 18/9 and Cyclone 30/15cyclotrons operate according to this principle, see figure 2.
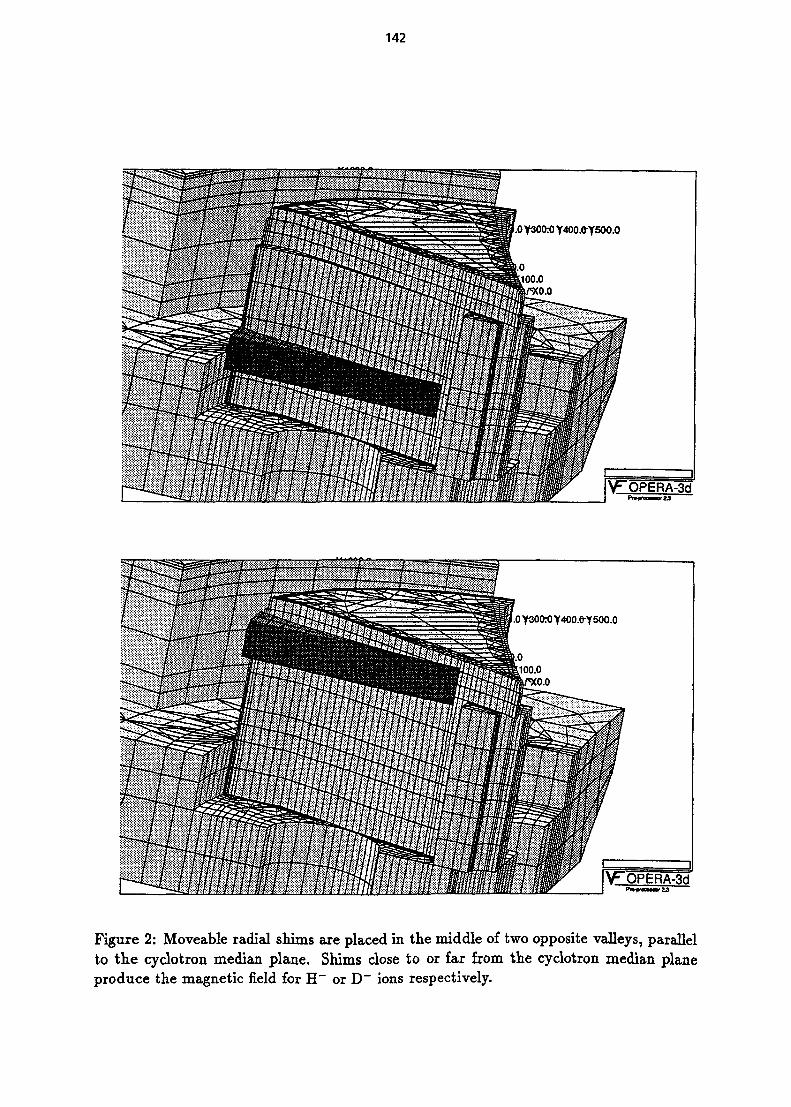
142
Figure 2: Moveable radial shims are placed in the middle of two opposite valleys, parallelto the cyclotron median plane. Shims close to or far from the cyclotron median planeproduce the magnetic field for H~ or D~ ions respectively.

143
• using trim-coils;The flexibility of the magnetic field modified by trim-coils permits the accelerationof different types of ions to different final kinetic energies with the beam extractionat the same final radius. The extraction of particles by the electrostatic deflectionis often preferred in this case.
Trim-coils require careful tuning using an adequate number of power supplies. Thecyclotron is more complicated so its reliability diminishes. It is also more expensiveand usually consumes more power.
2.2 Tolerances and imperfectionsAny discrepancy of a real cyclotron magnetic field and the isochronous magnetic
field results in a shift of accelerated particles with respect to the chosen phase of thecyclotron RF system. An acceptable phase shift of the particles determines the toleranceof the magnetic field isochronism. The equation below gives a relation between the phaseshift and the relative magnetic field imperfection:
in
d(sin <j>) = 2 • 7r • h • —— • n (4)•D»so
where:4> - phase shift of particles;h - harmonic mode of the cyclotron operation;n - number of turns;dB - amplitude of the magnetic field imperfection;Bito - nominal value of the isochronous magnetic field
The phase shift is given by the integral of equation 4. Therefore small, often op-posite signs and local imperfections of the magnetic field can be accepted. They cannot be accepted when they create local, positive gradients of the magnetic field resultingin imaginary values of the axial betatron frequency vz and consequently in axial blow-upof the beam, see section 2.3.
The acceptable maximum value of the phase shift depends on the type of particleextraction, the geometry of the accelerating electrodes (azimuthal length of the dees) andthe harmonic mode of operation.
Multiturn extraction allows larger phase shift. Values of the maximum acceptedphase shift are between 20 — 45° in currently constructed cyclotrons, assuming that par-ticles are still sufficiently accelerated in all accelerating gaps. The tolerance on the mag-netic field AB/B « 10~4 is frequently obtained by substitution of the accepted phaseshift to equation 4. Such requirements are possible to fulfill for the cyclotron magnet andits power supply.
For a single turn extraction without flat-topping, the accepted values of the phaseshift are much smaller, in the range of few degrees. The substitution of such phase shiftgives the tolerance of the magnetic field AB/B sa 10~7. Clearly it will be difficult to createthe magnetic field with such stability and to find the magnet power supply providing thesecharacteristics.
The cyclotron magnetic field B changes due to changes of the excitation current I
144
of the main coil(s). Generally in measurements AB/B are smaller than AI/I due to thesaturation of the magnet steel. A value of AB/B greater than AI/I more than likelyindicates problems with the cyclotron magnet and/or the measurements system.
2.3 Axial (vertical) and radial focusing of the beam avoiding dangerous res-onancesAxial (vertical) focusing of the beam can be provided by:
• negative field index i.e., the magnetic field decreasing with the radius;
• azimuthally varying magnetic field i.e., magnet sectors creating hills and valleysof the magnetic field;
• spiralization of magnet sectors.
The betatron frequencies can be approximated by the following equations [2] :
N2
* *+F
where:vz - axial (vertical) betatron frequency;vr - radial betatron frequency;k = r/(B) • d(B)/dr - radial field index;N - number of symmetry periods of the cyclotron;£ - sector spiral angle;F - magnetic field flutter at the radius r which can be defined using the calculatedaverages of the magnetic field (B) and of the magnetic field square (B2) at the radius r.The cyclotron magnetic field at the given radius r, having the iV-fold rotational symmetry,can be presented as Fourier series. The flutter of the magnetic field can also be definedusing coefficients of Fourier series Ai, Bi,i = 1,2,...:
_ (B) - {BY2 ^
The presented analytical formulas 5-7 are approximative. Correct values of thebetatron frequencies have to be calculated by programs tracking particle trajectories.
2.4 ResonancesResonance is encountered when
Kur + Luz = P (8)
where if, L and P are integers. P is the symmetry of the driving term and the sum|if | + \L\ is the order of the resonance. Resonances of order 1, 2 or 3 are driven by a dipo-lar, quadrupolar or sextupolar component of the guiding magnetic field respectively.

145
The amplitude of betatron oscillations grows at a resonance. Imperfection resonance(K • vT = P, L • vz = P) effects are dependent on the amplitude and the radial extensionof imperfection in the cyclotron. Coupling resonances (K, L ^ 0) are important whenlarge radial oscillations are generated. The axial acceptance of the cyclotron is generallymuch smaller than the radial and the beam is easily lost. The third order couplingWallrinshaw resonance vr — 2vz = 0 frequently encountered in cyclotrons is consideredas one of the most destructive.
The operation point {yT,vz) moves as the particle kinetic energy increases and cancross the resonance line(s). Resonances are dangerous when the crossing is slow (lowkinetic energy gain per turn) and/or when the driving term is large but the fast passagethrough the resonance zone does not greatly deteriorate a beam quality.
It is possible to show (e.g. [1]) that the field index is k = 7 2 — 1, when the magneticfield is isochronous. Therefore the radial betatron frequency vT (equation 6) can beexpressed as vT w 7 + • • •, where dots replace terms dependent on N, F and £.
Fundamental resonances given by the equation vT = JV/2 determine the minimumnumber of symmetry periods (sectors) of the cyclotron. The frequency of radial betatronoscillation starts from the value of 1 (7 = 1) at the cyclotron center. Cyclotrons withN = 2 sectors will be unstable from the center and therefore they do not exist.
Due to the same fundamental resonance the theoretical maximum kinetic energyof protons is limited to 469 (7 = 3/2) and 938 MeV (7 = 4/2) for cyclotrons with3 or 4 symmetry periods (sectors) respectively. Practically the maximum kinetic energyof particles will be smaller because terms dependent on N, F and £ increase the radialbetatron frequency vT.
Very high kinetic energies require more symmetry periods in the cyclotron. To avoidthe fundamental resonance vT = 3/2, it was necessary to mill a deep groove in each of threesectors of the AGOR cyclotron [3]. This ingenious solution multiplied by two the numberof sectors, without a significant decrease of the average magnetic field in the cyclotron.
3 M A G N E T DESIGN
3.1 Decision strategies
Decisions need to be taken concerning the choice of:
• gap between magnet poles (hills of the magnetic field);
• magnetic field level between magnet poles (hills of the magnetic field);
• magnet pole radius;
• gap in the valleys;
• number of symmetry periods (sectors).
3.2 Gap between magnet poles
Very often the choice of the gap between magnet poles is a compromise between thetwo situations presented below.
146
A small gap between magnet poles reduces the required number of ampere-turnsin the cyclotron main coil and allows the last orbit of accelerated particles to be broughtcloser to the pole edge. This reduces the radius of the pole and consequently diminishesthe overall weight of the magnet which is approximatively proportional to r%ole. A smallaxial gap limits the radial extension of the magnetic field hole in the cyclotron centercreated for the central region elements or the axial injection system. The defocusingradial gradient of the magnetic field in this region can deteriorate the beam by axialblow-up.
A large gap between magnet poles increases the available space for the beam os-cillating in axial (vertical) plane. Also such a gap facilitates the installation of differentelements of the cyclotron:
• diagnostic probes
• stripper(s)
• central region components: ion source(s) or inflector, dee bridge
• electrostatic deflector(s) in superconducting cyclotrons
It is never possible to keep the cyclotron field isochronous up to the limit of themagnet pole. The magnetic flux beyond the last orbit is useless but has to be guidedthrough the return yoke. An elliptic gap between the poles (closed beyond the last orbit),allows the last orbit to be brought within a few millimeters of the pole edge accordingto the magnetostatic theorem that the ellipsoid void in an infinite bloc of uniformlymagnetized steel will exhibit a constant magnetic field, dependent on the shape of theellipsoid.
In this case the magnetic field is isochronous to the magnetic shunt closing the gap.Unfortunately, a small tunnel has to be made for the extracted beam. The magnetic fieldin the tunnel is difficult to calculate and even more difficult to measure. Calculationsshow that gradients of this magnetic field are strong and nonlinear.
3.3 Number of sectors
The choice of the number of sectors is quite controversial. At first sight threesectors (symmetry periods) seem to be the best choice for low kinetic energy cyclotrons.Such structure was often used in old cyclotrons where the large gap between magnetpoles provided many possibilities for the installation of the necessary subsystems. Alsoit was used in recently constructed super-conducting cyclotrons where the gap was small.Super-conducting magnet valleys were filled with the RF system cavities and the smallaxially extraction system was installed between magnet poles. A disadvantage of thissolution is that three coupled resonators usually oscillate in phase so only harmonic modesH = 3,6, ... are possible.
Our personal opinion is that four sector (four-fold rotational symmetry) geometryof the cyclotron seems to be more practical. Two opposite valleys can be used by RFcavities operated in phase in harmonic mode H = 2,4,6, ... or at 180° in H = 1,3,5,...Two other valleys can be used for other devices: ion source, electrostatic deflector, internaltarget or movable iron shims.

147
3.4 Initial magnet calculationsInitial calculations start from the estimation of the cyclotron magnet pole dimensions
using equation 1. The chosen average magnetic field value (B) at the extraction radiusis the basis of the first estimation of the magnetic field in the hill Bhm, in the valley Bvaneyand the fraction of the hill a on one symmetry period according to the equation:
(B) = aBhui + (1 - a)BvaUey (9)
After adding the chosen number of sectors N one can verify the focusing propertiesof the cyclotron. The flutter F and slightly optimistic the betatron frequencies ur,uz
can be determined from the analytical equations 5-7. The reasonable minimum valueof the axial betatron frequency uz is about 0.10 — 0.15 when one wants to keep a smallgap between magnet poles. It is necessary to change one or more parameters or introducea spiralization of sectors when the value of vz is too small. Then new iteration of analyticalcalculations can follow.
Schematic drawings can facilitate the next step of magnet calculations. First it isnecessary to estimate a total magnetic flux in the cyclotron using the average magneticfield (B) and the pole radius. The pole dimensions are extended beyond the last orbit.The part of magnetic flux of this zone can be redirected by adding a chamfer on the outerpole edge. It should be remembered that in the median plane the effective field boundaryis about 0.6 gap width outside the pole edge. Then, the value of the magnetic field in theflux return (return yoke) has to be determined taking into consideration the magneticproperties of the used steel. The flux return shape can be designed when cross-sectionsof the flux return and the coil are known.
The coil cross-section is calculated from the number of ampere-turns in the cyclotron.The simple equation n • I « 8 • 105 • B • I where n • I is the number of ampere-turns (A), B isthe magnetic field (T) and I is the gap width (m) which determines the number of ampere-turns in the cyclotron gap. Then a certain number of ampere-turns for the steel shouldbe added. Added ampere-turns can be calculated assuming the constant value of themagnetic permeability in the magnet steel, or just estimated. Our experience confirmsthat it is difficult at this moment to find a correct value of the magnetic permeabilitydue to strong non-linearities of the magnetic field in magnet steel. An estimation can bemade by adding a generous percentage of ampere-turns to avoid later problems with thecoil power supply (e.g. 30% — 50% of ampere-turns). The total number of ampere-turnsgives the choice of coil cross-section and the current density. From the current densityone can estimate the coil cooling requirements. Coil shape design is possible with the lastinformation.
After finishing this step of magnet calculations, it is necessary to develop a completepreliminary shape of the cyclotron with all subsystems included. Holes and ports requiredby other cyclotron elements have to be taken into account to evaluate changes in thecyclotron magnet structure.
The calculations described above are simple, analytical and allow an initial layoutof the cyclotron magnet. More sophisticated tools are required for further optimizationof the cyclotron magnet.
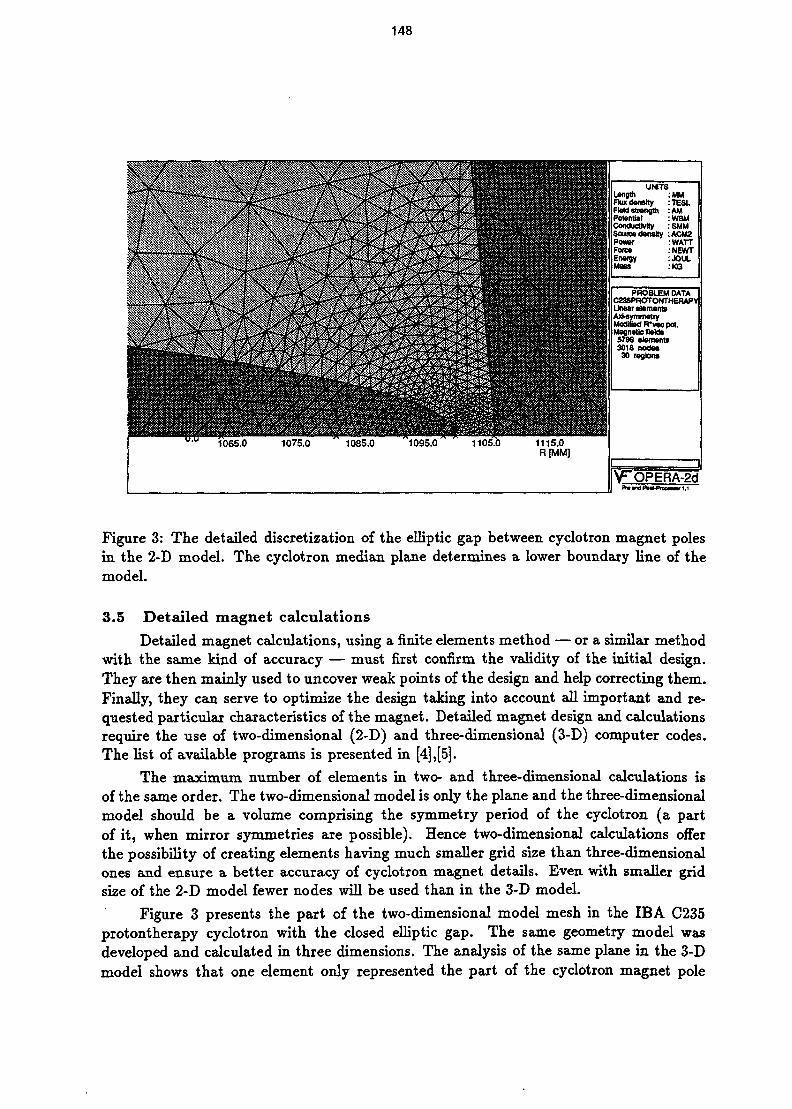
148
1065.0 1075.0 1085.0 1095.0
UMTSLength .MMFluxdwatty :TESLField strength :AMPotential :WBWConductivity :SMMSource density :ACM2Power :WATTFores :NEWTEnwgy :JOUL
:KG
PROBLEM DATAC23SPROTONTHEHAPYLinear elementsAid-symmetryModified Ffvac pot.Magnetic llekte5796 elements3016 nodes30 regions
V^OPERA-ad
Figure 3: The detailed discretization of the elliptic gap between cyclotron magnet polesin the 2-D model. The cyclotron median plane determines a lower boundary line of themodel.
3.5 Detailed magnet calculations
Detailed magnet calculations, using a finite elements method — or a similar methodwith the same kind of accuracy — must first confirm the validity of the initial design.They are then mainly used to uncover weak points of the design and help correcting them.Finally, they can serve to optimize the design taking into account all important and re-quested particular characteristics of the magnet. Detailed magnet design and calculationsrequire the use of two-dimensional (2-D) and three-dimensional (3-D) computer codes.The list of available programs is presented in [4], [5].
The maximum number of elements in two- and three-dimensional calculations isof the same order. The two-dimensional model is only the plane and the three-dimensionalmodel should be a volume comprising the symmetry period of the cyclotron (a partof it, when mirror symmetries are possible). Hence two-dimensional calculations offerthe possibility of creating elements having much smaller grid size than three-dimensionalones and ensure a better accuracy of cyclotron magnet details. Even with smaller gridsize of the 2-D model fewer nodes will be used than in the 3-D model.
Figure 3 presents the part of the two-dimensional model mesh in the IBA C235protontherapy cyclotron with the closed elliptic gap. The same geometry model wasdeveloped and calculated in three dimensions. The analysis of the same plane in the 3-Dmodel shows that one element only represented the part of the cyclotron magnet pole

149
between radii 1100 and 1105 mm and up to 6 mm from the cyclotron median plane.
The execution time of programs 2-D and 3-D is proportional to nz where n is thenumber of created node points. Only application of all possible symmetries of the cy-clotron magnet significantly contributes to a decrease of the total number of nodes in the3-D model. Sometimes the construction of 3-D models which do not respect strictlymodel symmetries can decrease the number of created nodes and the computing timebut the solution should be treated with limited confidence. Often excessively long com-puting times (tens of hours) and the impossibility to create more accurate model due toa lack of computer memory, encourage designers to develop more exactly two-dimensionalmodels.
Conductors created in two-dimensional calculations axe very simple and their mag-netic field is calculated very quickly. Programs 3-D offer, except for a library of thestandard shape conductors, practically unlimited possibilities for creating shapes of con-ductors as a sequence of bricks with variable cross-section. The magnetic field of coilshaving very exotic shapes (e.g. particular trim-coils) can be calculated this way but takea hopelessly long time (tens of hours).
2-D codes essentially solve x-y problems in which the third dimension is infinite or atleast long enough to be considered as infinite. Programs 2-D serve also to solve axisym-metric (cylindrical) three-dimensional problems. Cyclotrons with an azimuthally varyingfield are hardly axisymmetric, but the method of stacking factors can be used in regionswhere the magnet structure differs from axisymmetric (sectors and valleys, importantholes in the yoke). Figure 4 shows the application of this method. The stacking factorSF is defined as the fraction of the circle occupied by the real ferromagnetic material.Properties of the pseudo-material filling regions with the stacking factor are given by theB-H curve equation [6]:
(10)
where B and H axe related by the curve of B-H for the real ferromagnetic material.
Programs 2-D are useful to study details or local modifications which produce localeffects. At first the large model solution is calculated. Then a zoom of the area of interestfrom the large model is made (as e.g. in figure 3). Vector potential values corresponding tothe large model are assigned to boundary points of the zoomed model. The analysis of theeffects of perturbations has to take into account the conservation of the total magneticflux which results in a balance of a magnetic field increase at some places and a magneticfield decrease somewhere else in the model.
Three-dimensional calculations are more time and memory-consuming than two-dimensional. Three-dimensional models are the closest to reality. Therefore results of mea-surements axe expected to be close to results of calculations. It was observed in manycases that absolute results of calculations and measurements differ by 2 — 3%. This differ-ence can be explained by the absolute numerical precision of the software, by differencesof the B-H curves and still some geometrical differences between the model and the realcyclotron magnet. Grid size dimensions axe smaller in regions where high magnetic fieldgradients are expected (see e.g. figures 1, 2). Despite grid size variations small disconti-nuities of the magnetic fields are sometimes observed due to the limited number of nodesin the model mesh.

150
800.0
Z|MMJ
700.0
600.0
500.0
400.0
300.0
200.0
100.0
\
t
t
uHI
HUHl) IWU.V
t > t
Wmmk
I* • • • • •••MWWnBmaBagBWWM
3W.V / GC.U
*
HfalSCx.u i .00.0
R[MM)
UNITSl«iglh :MMFkndMtr :TESL
PounW :V«UCendudMr :SUMScwndnMy :AC»2P o m :WATTFOR* :N£WT
Man :KQ
PRC6LBI DATAMaWROTONTHQWYUn«ir>wnnt
M a i ' w RVacpol.
3OU noctol
V="OPERA-2d
Figure 4: Different stacking factors in distinct regions simulate the variation of thehill/valley ratio of the IBA 235 MeV protontherapy cyclotron featuring an elliptical gapbetween its poles.
The comparison of differences between calculations of two similar models and twocorresponding measurements (e.g. different coil current, shift of movable shims) very oftenshows a perfect agreement [7],[8].
Results of 2-D and 3-D magnetic field calculations are used to create maps of themagnetic field in the cyclotron median plane or in three-dimensions around this plane.Then the map of the magnetic field becomes a part of input data to programs calculatingtrajectories of particles and properties of the magnetic field [5], [9]. The most importantpart of the output of these programs present values of the frequency error, the integratedphase shift of particles and betatron frequencies. The magnet model has to be changedwhen one or more parameters are not acceptable. Our experience shows that during thecreation of the 3-D model one should foresee possibilities of unexpected changes of themodel geometry without the necessity to construct the model from scratch once again.
Fully acceptable values of the frequency error and the integrated phase shift of par-ticles ensures the isochronism of the magnetic field. Correct values of betatron frequenciesconfirm the focusing properties of the magnetic field and the absence of dangerous reso-nances during acceleration.
Magnetic calculations are followed by the analysis of mechanical deformations dueto the weight of magnet elements, magnetic forces between them and forces of the airpressure when the vacuum is produced in a cyclotron vacuum chamber. The requestfor minimal deformation and practical aspects of handling determine the partition of themagnet.

151
References
[1] J. J. Livingood - Principles of Cyclic Particle Accelerators; D. Van Nostrand Comp.,1961.
[2] H. L. Hagedoorn and N. F. Verster - Orbits in an AVF Cyclotron; Nuclear Instru-ments and Methods 18,19 (1962) 201-228; North-Holland Publishing Co.
[3] A. Laisne - The realisation of the magnetic circuit of the AGOR cyclotron; Pro-ceedings of the 2nd European Particle Accelerator Conference, EPAC 90, Nice, June12-16, 1990, p. 1172-1174.
[4] G. G. Molinari - Existing Commercial Tools and Criteria of Selection; in Short CourseComputer Aided Electromagnetic Analysis and Design: a Technical Introduction,Munich, November 1990.
[5] Computer Codes for Particle Accelerator Design and Analysis: A Compendium; LA-UR-90-1766, Los Alamos Accelerator Code Group, Second Edition, May 1990.
[6] W. Beeckman - PE2D Modelling of the Cyclone230 Cyclotron; part of Cyclotron De-sign with PE2D and TOSCA softwares at IB A; Proceedings of VECTOR FIELDS Eu-ropean User Meeting, Ion Beam Applications, Louvain-la-Neuve, Belgium, September1992.
[7] S. Zaremba- TOSCA Modelling of the Cyclone30 Cyclotron; part of Cyclotron Designwith PE2D and TOSCA softwares at IBA; Proceedings of VECTOR FIELDS Euro-pean User Meeting, Ion Beam Applications, Louvain-la-Neuve, Belgium, September1992.
[8] W. Beeckman and D. Vandeplassche - private communication.
[9] M. M. Gordon - Computation of Closed Orbits and Basic Focusing Properties forSector-Focused Cyclotrons and the Design of "CYCLOPS"; Particle Accelerators,vol. 16, p. 39-62, 1984.
NEXT PACE(S)left
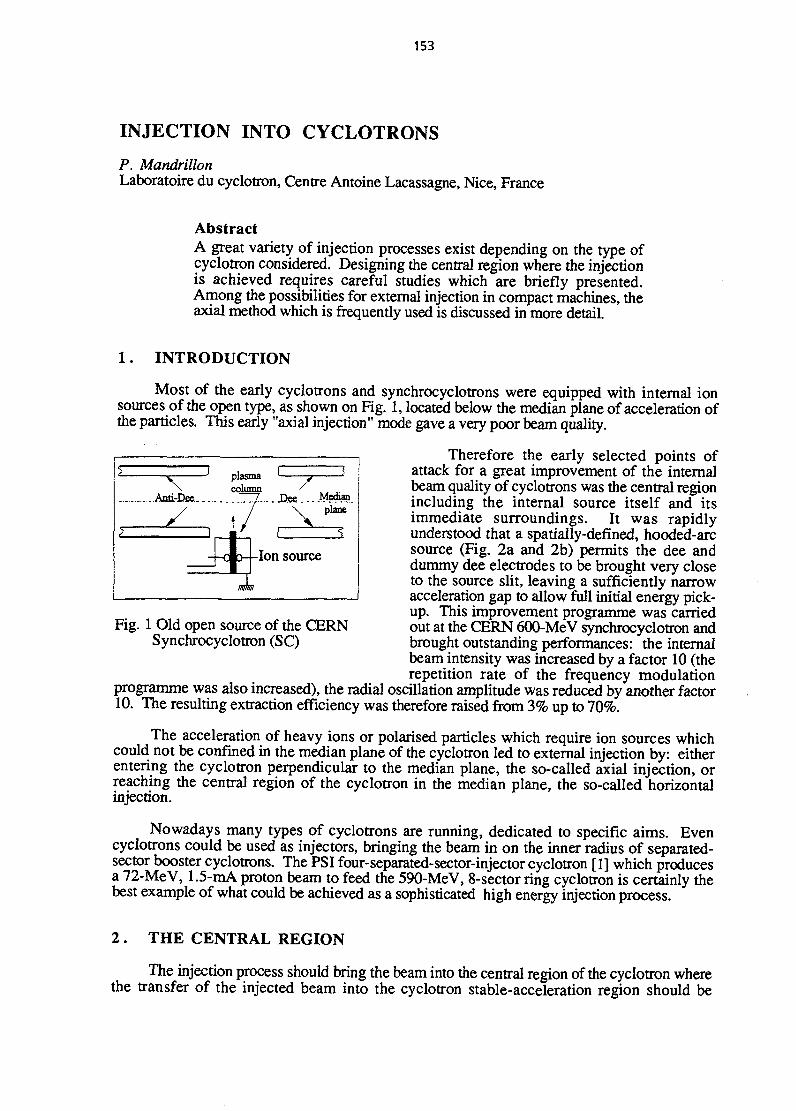
153
plasma
JD.es .Median
INJECTION INTO CYCLOTRONS
P. MandrillonLaboratoire du cyclotron, Centre Antoine Lacassagne, Nice, France
AbstractA great variety of injection processes exist depending on the type ofcyclotron considered. Designing the central region where the injectionis achieved requires careful studies which are briefly presented.Among the possibilities for external injection in compact machines, theaxial method which is frequently used is discussed in more detail.
1 . INTRODUCTION
Most of the early cyclotrons and synchrocyclotrons were equipped with internal ionsources of the open type, as shown on Fig. 1, located below the median plane of acceleration ofthe particles. This early "axial injection" mode gave a very poor beam quality.
Therefore the early selected points ofattack for a great improvement of the internalbeam quality of cyclotrons was the central regionincluding the internal source itself and itsimmediate surroundings. It was rapidlyunderstood that a spatially-defined, hooded-arcsource (Fig. 2a and 2b) permits the dee anddummy dee electrodes to be brought very closeto the source slit, leaving a sufficiently narrowacceleration gap to allow full initial energy pick-up. This improvement programme was carriedout at the CERN 600-MeV synchrocyclotron andbrought outstanding performances: the internalbeam intensity was increased by a factor 10 (therepetition rate of the frequency modulation
programme was also increased), the radial oscillation amplitude was reduced by another factor10. The resulting extraction efficiency was therefore raised from 3% up to 70%.
The acceleration of heavy ions or polarised particles which require ion sources whichcould not be confined in the median plane of the cyclotron led to external injection by: eitherentering the cyclotron perpendicular to the median plane, the so-called axial injection, orreaching the central region of the cyclotron in the median plane, the so-called horizontalinjection.
Nowadays many types of cyclotrons are running, dedicated to specific aims. Evencyclotrons could be used as injectors, bringing the beam in on the inner radius of separated-sector booster cyclotrons. The PSI four-separated-sector-injector cyclotron [1] which producesa 72-MeV, 1.5-mA proton beam to feed the 590-MeV, 8-sector ring cyclotron is certainly thebest example of what could be achieved as a sophisticated high energy injection process.
Ion source
Fig. 1 Old open source of the CERNSynchrocyclotron (SC)
2 . THE CENTRAL REGION
The injection process should bring the beam into the central region of the cyclotron wherethe transfer of the injected beam into the cyclotron stable-acceleration region should be
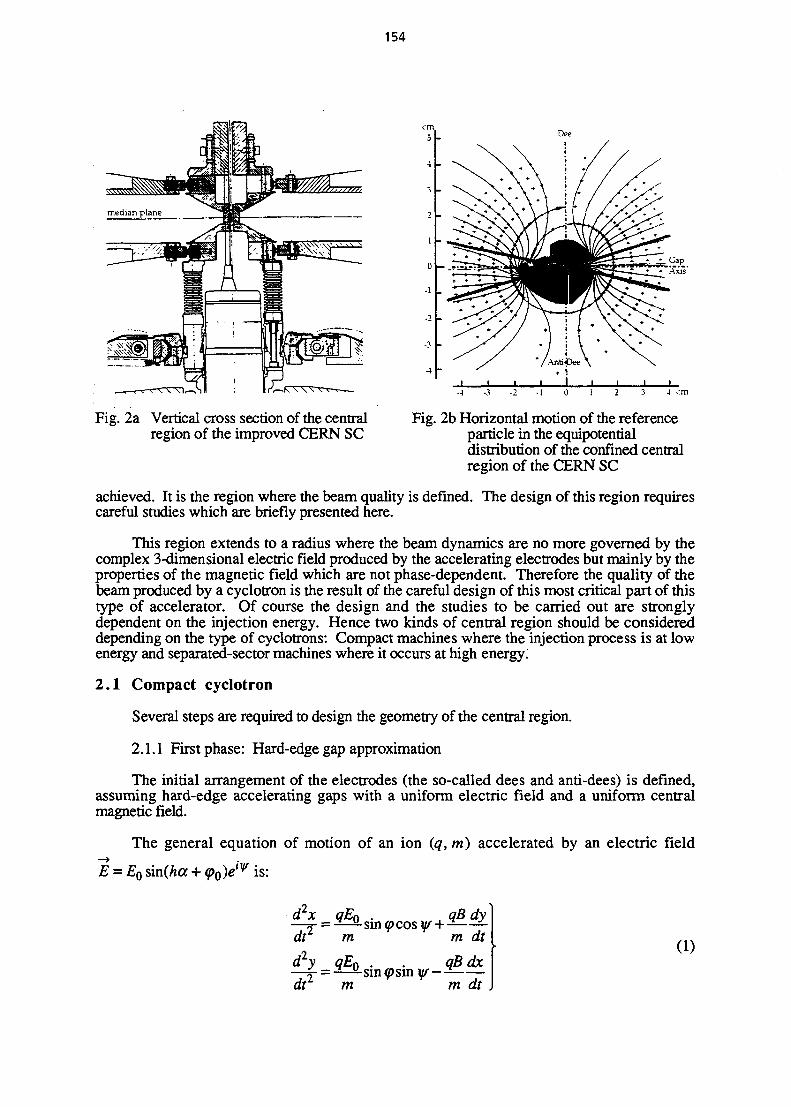
154
Dee
Fig. 2a Vertical cross section of the centralregion of the improved CERN SC
Fig. 2b Horizontal motion of the referenceparticle in the equipotentialdistribution of the confined centralregion of the CERN SC
achieved. It is the region where the beam quality is defined. The design of this region requirescareful studies which are briefly presented here.
This region extends to a radius where the beam dynamics are no more governed by thecomplex 3-dimensional electric field produced by the accelerating electrodes but mainly by theproperties of the magnetic field which are not phase-dependent. Therefore the quality of thebeam produced by a cyclotron is the result of the careful design of this most critical part of thistype of accelerator. Of course the design and the studies to be carried out are stronglydependent on the injection energy. Hence two kinds of central region should be considereddepending on the type of cyclotrons: Compact machines where the injection process is at lowenergy and separated-sector machines where it occurs at high energy:
2.1 Compact cyclotron
Several steps are required to design the geometry of the central region.
2.1.1 First phase: Hard-edge gap approximation
The initial arrangement of the electrodes (the so-called dees and anti-dees) is defined,assuming hard-edge accelerating gaps with a uniform electric field and a uniform centralmagnetic field.
The general equation of motion of an ion (q, m) accelerated by an electric field
E = EQ sin(ha + <po)elXff is:
dlx qEQ—Y~ -dt m
d2y qE0—Y~—-dt m
qBdy-——m dt
qB dx-m dt
(1)

155
where h = harmonic number =CORF
(0a = angular phase = ox
q> - electric phase = ha + <p0
y/ = argument of the electric field
P %!/ = — + —P = angular aperture of the dee
Fig. 3 Hard-edge gap
The solution of (1) is easily obtained using the complex Z = x + iy
— + iZ = Keiy/ cos(ha + <p0), K = csteda
The motion of the centre of curvature C could be easily interpreted:
(2)
Hence:
— = i(Zc - Z) =» iZc =~da da
Zc(f) - Zc(i) = -iKe^'Af[cos(ha +
(3)
(4)
Equation (4) shows that the displacement of C,Cfif, during the gap traversal is perpendicular
to E. Therefore, the centre-of-curvature motion could be constructed very easily using thisproperty by a simple algorithm.
Figure 4 presents the results of these simple hard-edge geometrical constructions in themedian plane of a three-dees geometry. The injection point I (Fig. 4, top) could be easilydetermined by minimizing the distance of the barycentre of the centres of curvature motion(Fig. 4, bottom) to the machine centre.
2.1.2 Second phase: Orbit calculations in the real gap
With these initial gap positions a geometry is constructed and the distribution of theequipotential is calculated using a 3-dimensional Laplace equation solver. A convenient method[2, 3] to calculate the orbit in the complex electric field distribution is to make use of theequipotential-lines distribution instead of calculating the components of the electric field. Theacceleration gap is decomposed into micro-gaps defined by two adjacent equipotential lines inthe median plane, the direction (but not the module) of the electric field is calculated and themotion of the orbit centre within the micro-gap is deduced by a simple geometrical constructionas shown in Fig. 5.

156
GAP 3
GAP 4 GAP 2
G A P 5 . > < •-. \ •••
..Ariti-Dee'3-3' .•• ..- /
: .-•* GAP 5
Fig. 4 Orbit and centre-of-curvature motion in the hard-edge gapapproximation of a three-dees geometry
Figure 6 presents a typical reference trajectory in the median plane of a superconductingcyclotron using three accelerating electrodes, three deltas, with the equipotential distribution inthe six gaps. The advantage of this method of discretization compared to the usual integrationof the equations of motion using the whole information of the electric field is its improvedspeed and its easy physical interpretation. This method gives a direct insight into the motion ofthe orbit centre during the gap traversal, making modifications easier to improve the centreingof the beam. In this second phase several readjustements of the geometry are needed tooptimise the shape of the electrodes.
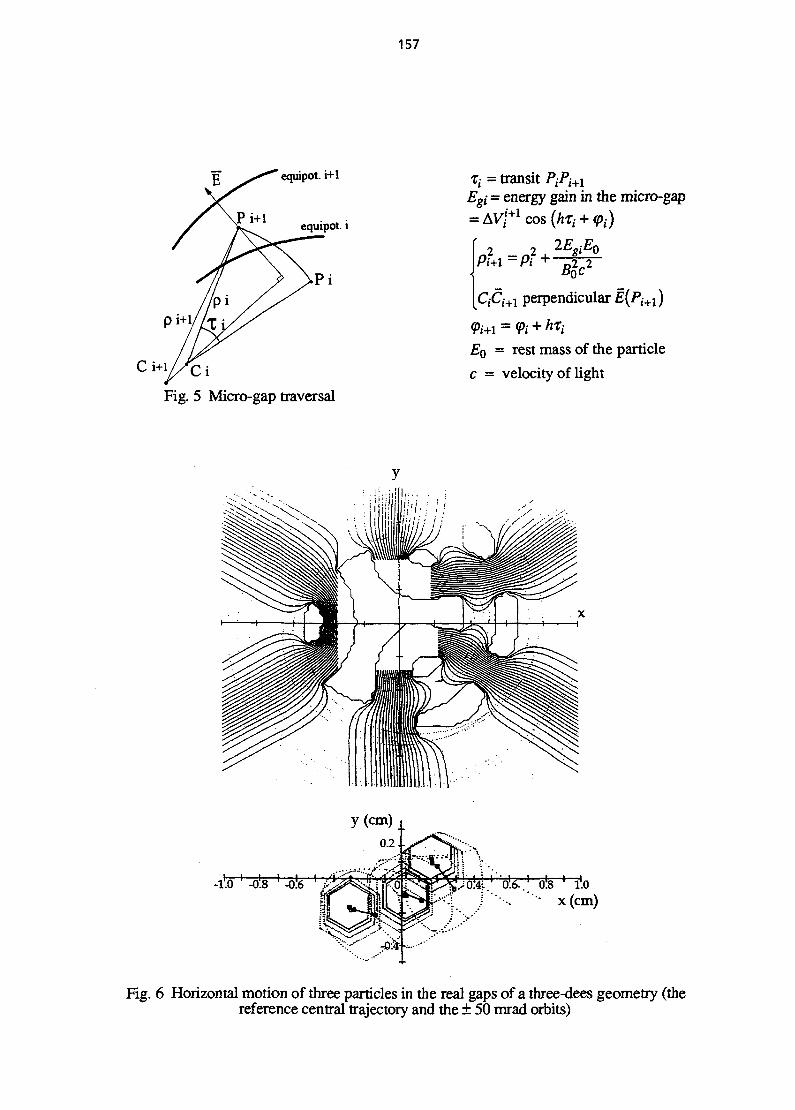
157
equipot. i
P i
Fig. 5 Micro-gap traversal
%x = transit PiPi+iEgi = energy gain in the micro-gap
/ 1
2 , 2EgiEo
CjCi+i perpendicular E(Pi+i)
EQ = rest mass of the particle
c = velocity of light
!j lilted
y(cm)
i Jo I » l I , f i ^ , li
I . • x(cm)
Fig. 6 Horizontal motion of three particles in the real gaps of a three-dees geometry (thereference central trajectory and the ± 50 mrad orbits)

158
2.1.3 Last phase: Vertical motion
The electric axial focusing or defocusing is strong in the injection region where thevelocity of the particle is small. These effects are strongly dependent on the phase of the ionswith respect to the RF voltage. They have been analysed in many basic papers using the thin-lens approximation in a 2D geometry.
The two types of effects which should be considered for the vertical motion during a deetraversal are presented in Fig. 7. The spatial effects due to the typical equipotential distributionare shown in the vertical cross section of the dee-dummy dee system (top). When the particleenters the gap (point E) the field is focusing. The time variation effect of the electric fieldduring the gap traversal is shown on the bottom figure. For a given dee aperture /? and anacceleration on the harmonic mode h, the superposition of these two effects could be interpretedas a succession of alternatively focusing and defocusing thick lenses.
Liner
Fig. 7 Vertical motion during the dee traversal
The precise analysis of these effects requires a detailed knowledge of the 3-D potentialdistribution. The discretisation method for the horizontal motion (micro-gaps) has beenextended by J.P. Schapira to 3-dimensions in the framework of the AGOR superconductingcyclotron central region studies.
The complete analysis of the vertical motion requires detailed knowledge of the magneticfield map. Local modifications of this field might be necessary to increase the magneticfocusing in the first turns of the injection region (the so-called field bump, centring coils etc.).Therefore, in the final phase of the central-region calculations, the adjustment of the magneticfield will imply slight modifications of the gaps.

159
2.2 Separated-sector cyclotron (SSC)
The isochronous cyclotrons considered here consist of magnet sectors separated by emptyvalleys. The radiofrequency accelerating structures, which could be either delta (providing twogaps) or single-gap cavities, are situated in the valleys, between the magnets. Therefore themagnet gaps could be quite small. This fact improves the vertical focusing properties. TheSSC require an injected beam at low energy and are proposed when a multi-stage acceleration isnecessary. A great variety of injectors are still existing for separated sector cyclotrons: externalsources at high voltage (e.g. the Cockroft-Walton at PSI), tandem Van de Graff (e.g. theinjector of the HMI SSC in Berlin), together with cyclotrons (the injector of the GANIL SSC inFrance or the injector of the 200-MeV SSC in South Africa), etc.
The injection in these machines should bring the beam through a magnetic field-freecentral region and then guide it into the first centred orbit. The injection process is often quitedifficult because the magnetic field should bend the injected beam more than the internal beam.The injection layout is made of different kinds of channels: either electrostatic channel ormagnetic channel to bend the beam on the first trajectory. In this type of cyclotron, the largespace available between the sectors provide the necessary space to house powerful acceleratingstructures and the radial separation between the injected orbit and the inner turn in the cyclotronis sufficiently large to install injection septa.
Therefore to optimise the layout of the injection systems it is necessary to study thefollowing aspects.
- beam optics and matching between the injector and the accelerator: the matching of theinjected beam properties to the so-called eigen-ellipses of the betatron transverse phasespace of the cyclotron orbit, is an essential condition for getting a good beam quality.Figure 8 presents the typical eigen ellipses for a four-sector magnet cyclotron at the centreof the hill and at the centre at the valley.
hill center line3
-3
mrad 3
4 v-3
mrad
I 3 r
valley center line
mm mm
Fig. 8 Eigen ellipses for a four-sector magnet cyclotron

160
- shaping the injection channel which is usually made of different bending and inflectionelements. In these calculations the stray field of the magnet sector should be taken intoaccount.
- mechanical implementation of the elements: the required space to house the bendingelements and the necessary diagnostic stations to measure the beam quality makes themechanical design of this region difficult and the central region of separated sectorcyclotrons is often crowded.
Figure 9 shows the typical example of the central region layout of the four separated-sector 200-MeV cyclotron in Faure [4] (NAC, South Africa). The beam is pre-accelerated byan 8-MeV compact cyclotron and is injected radially along a valley into the central region. Theinjection system consists of three injection elements: two bending magnets (BM1 and BM2)and a magnetic inflection channel (MIC) which is mounted in the pole-gap of a sector magnet
= -45°
e=o°
Fig. 9 Injection layout of the four-sector NAC-SSC
Since the eigen-ellipse transformation and the position of the injected equilibrium orbit aredefined by the magnetic properties of the sector magnet, it is important to inject the beam with aphase ellipse (for the two transversal phase spaces) corresponding to an eigen-ellipse, exactlyonto this orbit to obtain the best quality. This ensures periodic beam envelopes inside thecyclotron with a minimum of amplitude modulation and a good matching of the injected beam[5] to the acceptance of the cyclotron.
Numerical orbit calculations take into account that fringe fields and trajectories could betraced backwards from the centred orbits in the cyclotron, e.g. at the first valley centre line.For the geometry shown in Fig. 9 the phase ellipses at three angles (0 = -45°, 0° and 45°) arepresented in Fig. 10.
3 . INJECTION FROM EXTERNAL SOURCES
The need to inject beams of heavy ions, negative ions and also polarised ions has led tomany different injection concepts, either in the median plane of the cyclotron or axially. High-energy injection, heavy ions can be injected in the horizontal plane to reach the required radiusand men be stripped and placed onto the stable orbit from which they can be accelerated. Thismethod, proposed by C. Tobias [6] was developed at Orsay [7]. It is still successfully used[8,9] for injecting heavy ions from a tandem into a superconducting cyclotron.
In this section the axial method which is widely used will be discussed in more detail.Horizontal injection processes are also presented.
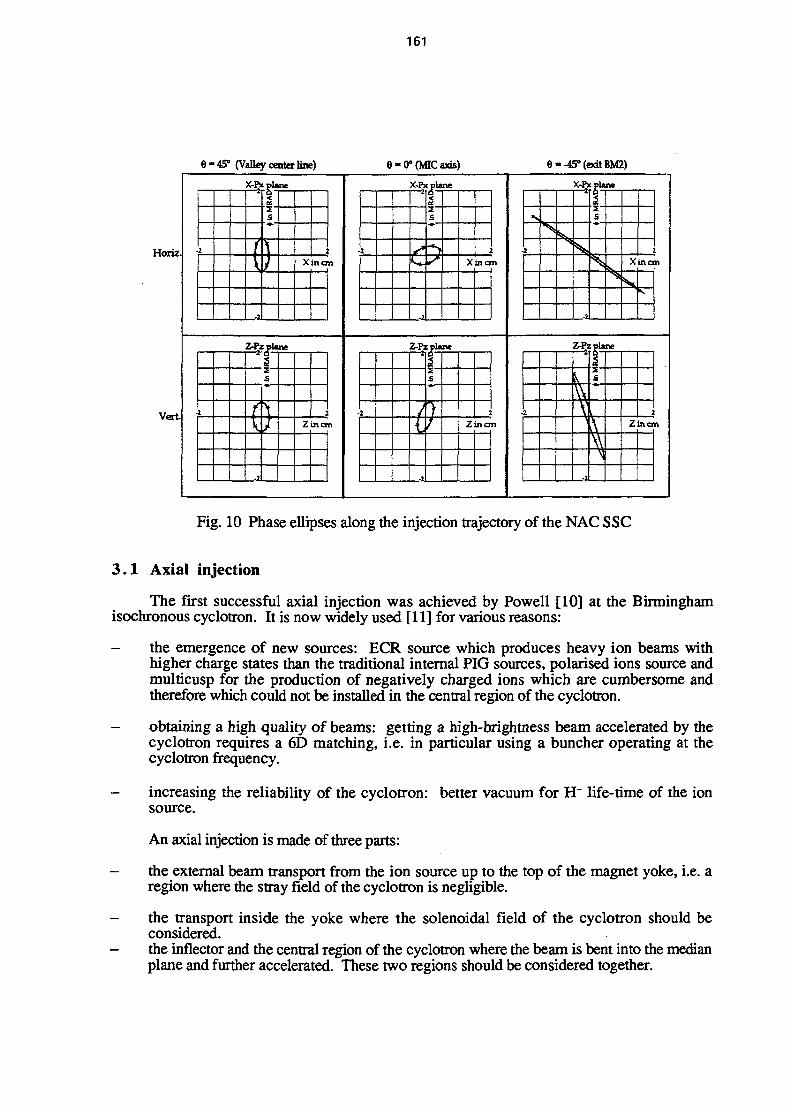
161
Horiz.
Vert
e- 45' (Valley center Hne)
X-Px plane
2 i\
-2
RA
D
S
\
) Xincm
Z-Pz plane
2
1i
s
f\ J Zincm
0-0° (MIC axis
X-Px plane
2 s. 2
RA
D
S
s
• * >
Xina
Z-Pz plane
2 /
(
3
}/
:Zincm
e --45°(odtBM2)
X-Px plane
s
2
Ss
RA
C
i
s
s Xincm
s
Z-Pz plane
2v\\
1s
A
\\N
Zincm
Fig. 10 Phase ellipses along the injection trajectory of the NAC SSC
3 . 1 Axial injection
The first successful axial injection was achieved by Powell [10] at the Birminghamisochronous cyclotron. It is now widely used [ 11] for various reasons:
- the emergence of new sources: ECR source which produces heavy ion beams withhigher charge states than the traditional internal PIG sources, polarised ions source andmulticusp for the production of negatively charged ions which are cumbersome andtherefore which could not be installed in the central region of the cyclotron.
- obtaining a high quality of beams: getting a high-brightness beam accelerated by thecyclotron requires a 6D matching, i.e. in particular using a buncher operating at thecyclotron frequency.
- increasing the reliability of the cyclotron: better vacuum for H" life-time of the ionsource.
An axial injection is made of three parts:
- the external beam transport from the ion source up to the top of the magnet yoke, i.e. aregion where the stray field of the cyclotron is negligible.
- the transport inside the yoke where the solenoidal field of the cyclotron should beconsidered.
- the inflector and the central region of the cyclotron where the beam is bent into the medianplane and further accelerated. These two regions should be considered together.
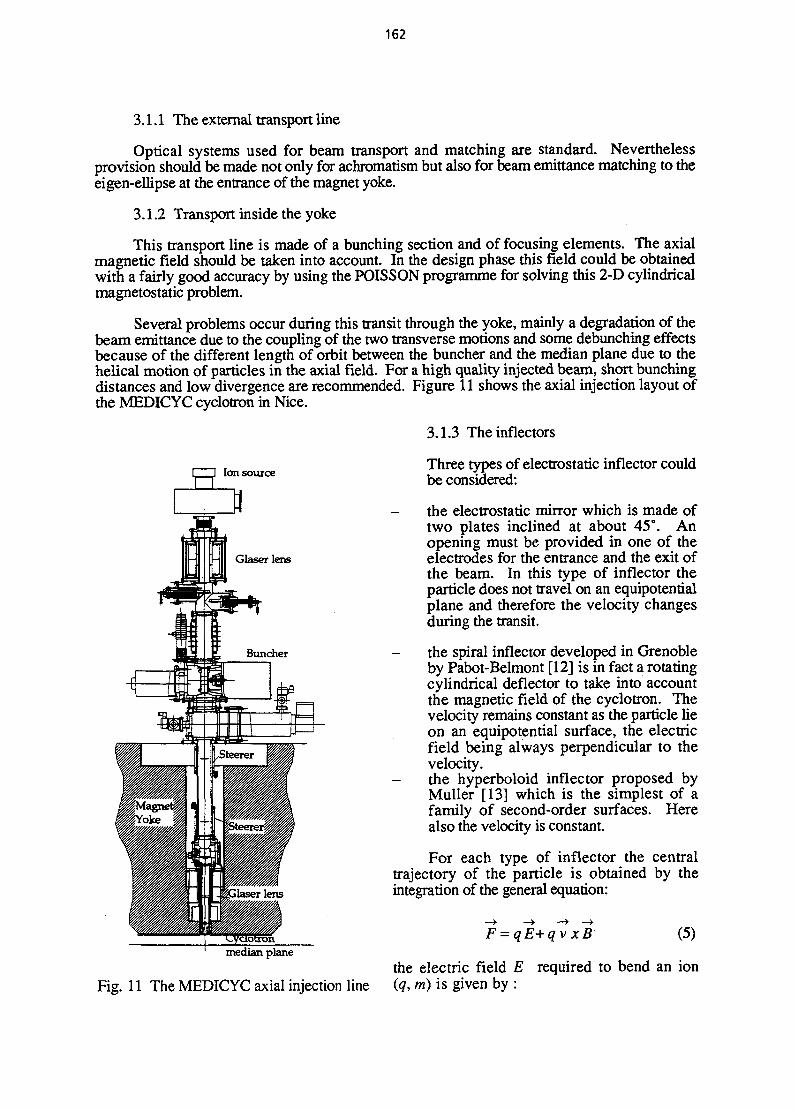
162
3.1.1 The external transport line
Optical systems used for beam transport and matching are standard. Neverthelessprovision should be made not only for achromatism but also for beam emittance matching to theeigen-ellipse at the entrance of the magnet yoke.
3.1.2 Transport inside the yoke
This transport line is made of a bunching section and of focusing elements. The axialmagnetic field should be taken into account. In the design phase this field could be obtainedwith a fairly good accuracy by using the POISSON programme for solving this 2-D cylindricalmagnetostatic problem.
Several problems occur during this transit through the yoke, mainly a degradation of thebeam emittance due to the coupling of the two transverse motions and some debunching effectsbecause of the different length of orbit between the buncher and the median plane due to thehelical motion of particles in the axial field. For a high quality injected beam, short bunchingdistances and low divergence are recommended. Figure 11 shows the axial injection layout ofthe MEDICYC cyclotron in Nice.
3.1.3 The inflectors
Three types of electrostatic inflector couldbe considered:
- the electrostatic mirror which is made oftwo plates inclined at about 45°. Anopening must be provided in one of theelectrodes for the entrance and the exit ofthe beam. In this type of inflector theparticle does not travel on an equipotentialplane and therefore the velocity changesduring the transit.
- the spiral inflector developed in Grenobleby Pabot-Belmont [12] is in fact a rotatingcylindrical deflector to take into accountthe magnetic field of the cyclotron. Thevelocity remains constant as the particle lieon an equipotential surface, the electricfield being always perpendicular to thevelocity.
- the hyperboloid inflector proposed byMuller [13] which is the simplest of afamily of second-order surfaces. Herealso the velocity is constant.
For each type of inflector the centraltrajectory of the particle is obtained by theintegration of the general equation:
F=qE+qvxB (5)median plane
the electric field E required to bend an ionFig. 11 The MEDICYC axial injection line (q, m) is given by :
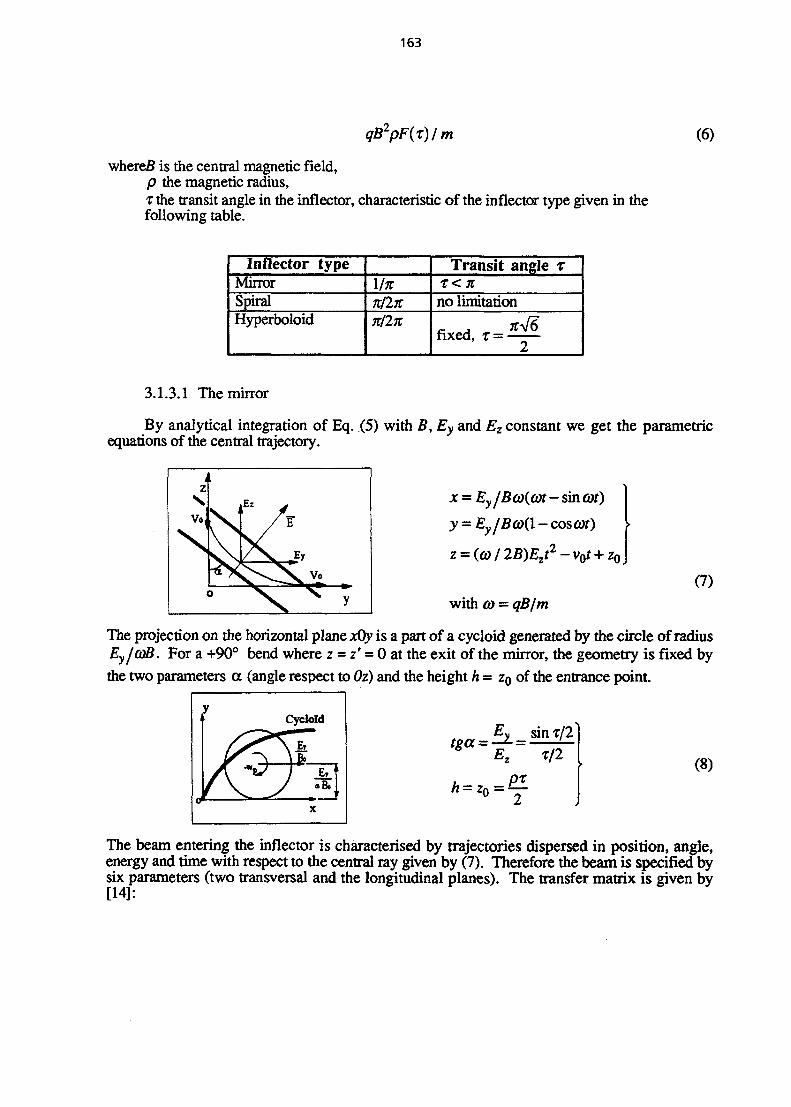
163
qtrpF{x)lm
where/? is the central magnetic field,p the magnetic radius,x the transit angle in the inflector, characteristic of the inflector type given in thefollowing table.
(6)
Inflector typeMirrorSpiralHyperboloid
HitTransit angle %
no limitation
_. , W6fixed, T =
2
3.1.3.1 The mirror
By analytical integration of Eq. (5) with B, Ey and Ez constant we get the parametricequations of the central trajectory.
x = Ey /Bco(cot - sin cot)
y = Ey/B(o{\ - cos at)
z
Vo,
\
Ez y
/
c V Ey
0 \ x y
= (co/2B)Ezt2-v0t+z0
with co = qB/m(7)
The projection on the horizontal plane xOy is a part of a cycloid generated by the circle of radiusEyfcoB. For a +90° bend where z = z' = 0 at the exit of the mirror, the geometry is fixed by
the two parameters a (angle respect to Oz) and the height h - z0 of the entrance point.
tga_ Ey _ sin r/2
T/2
- 7 -- Z 0 -
(8)
The beam entering the inflector is characterised by trajectories dispersed in position, angle,energy and time with respect to the central ray given by (7). Therefore the beam is specified bysix parameters (two transversal and the longitudinal planes). The transfer matrix is given by[14]:

164
T =
-sc
PT/2c
3
0
(--c)0
cos T/2,
0
0
0
_2£T
P -2sf
0? = s / c
c5
P00
-s/p0
2ps
c-st
0
T0
0
0
0
0
0
1
0
0
-t
px
2r /T- l
0
1
(9)
Where s = sin T /2 , C =
The electrostatic mirror is attractive for its simplicity (easiness of construction) and for the smallspace required to house it in the central region of the cyclotron. This last property could make ita good choice for a superconducting cyclotron where the available space is small.
3.1.3.2. The spiral inflector
This is characterised by the fact that in the vertical plane, the electric field is radial andperpendicular to the velocity. Under the influence of the vertical magnetic field this planerotates. Integration of (5) gives:
2ax- — + K-\
_ a f sJn(AT -1)6 sin(K +1)01
~2L K-\ K + l J= a(l- sin 6)
(10)
Where a = radius of curvature of the electric field:
tz
u
\ 9 / 1-
yRotating plane whichcontents E and T
0
Vnt8 = -^vertical angle
aa
P
Therefore this deflect<by two parameters.
The first-order optical properties of the spiral inflector could also be derived by using atransfer matrix [15] which is more complicated to obtain than in the case of the mirror. The
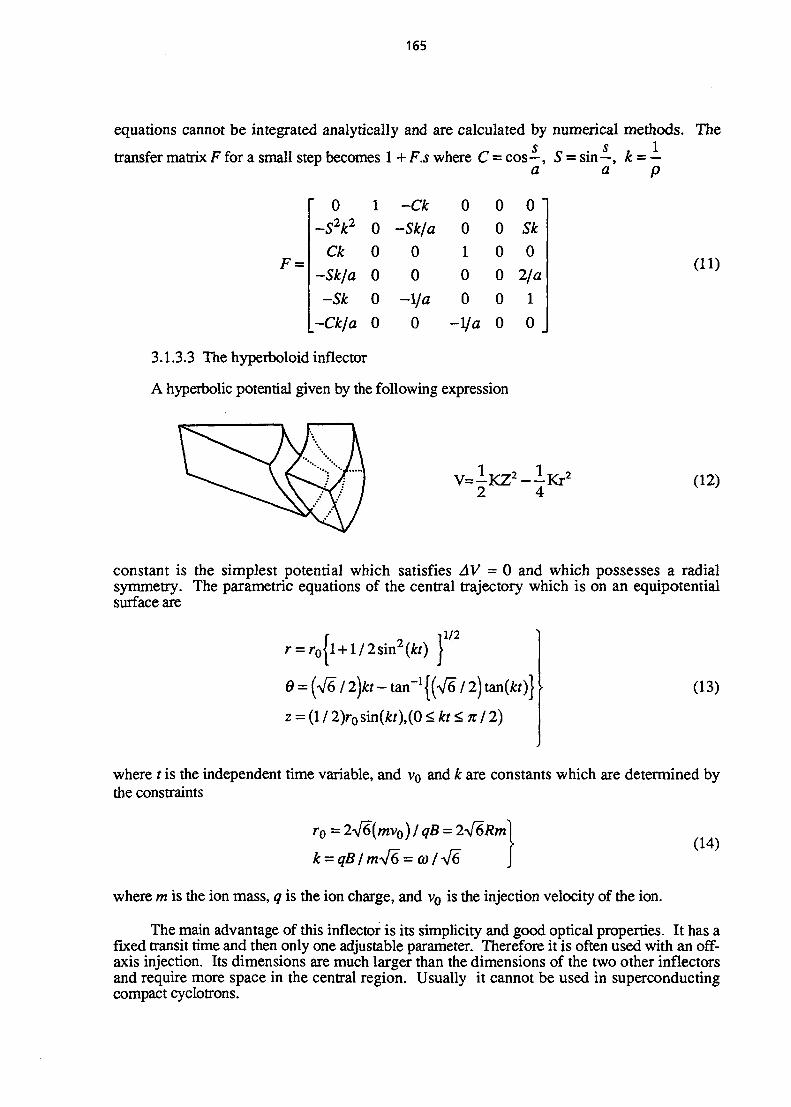
165
equations cannot be integrated analytically and are calculated by numerical methods. Thes s 1
transfer matrix F for a small step becomes 1 + F.s where C = cos—, S = sin—, k = —a a p
•p _
0~S2k2
Ck
-Sk/a
-Sk
-Ckja
10
0
0
0
0
-Ck-Sk/a
0
0
-I/a0
00
1
0
0- I / a
00
0
0
0
0
0Sk
0
2/a
1
0
3.1.3.3 The hyperboloid inflector
A hyperbolic potential given by the following expression
(11)
V=-KZ2-i.Kr2
2 4(12)
constant is the simplest potential which satisfies AV = 0 and which possesses a radialsymmetry. The parametric equations of the central trajectory which is on an equipotentialsurface are
11/21 1fl/2sin2(/fcr) |
d = (V6 / 2)itf - t a n " 1 ! ^ / 2) tan(Jkr)}
z = (1 / 2) <kt<n/2)
(13)
where f is the independent time variable, and VQ and it are constants which are determined bythe constraints
r0 = 2A/6 (mv0 )lqB =(14)
where m is the ion mass, q is the ion charge, and VQ is the injection velocity of the ion.
The main advantage of this inflector is its simplicity and good optical properties. It has afixed transit time and then only one adjustable parameter. Therefore it is often used with an off-axis injection. Its dimensions are much larger than the dimensions of the two other inflectorsand require more space in the central region. Usually it cannot be used in superconductingcompact cyclotrons.

166
3.2 Horizontal injection
Among the possibilities for injection in the median plane of compact cyclotrons are high-energy injection of heavy ions by change of charge in the central region, cycloidal motion alonga sector edge, while another simple possibility for injecting protons or deuterons is neutralbeam injection.
3.2.1 Injection of heavy ions by stripping
Fig. 12 Injection of heavy ions by stripping
The principle of this method is quite simpleand is illustrated in Fig. 12. The parametersof this injection method could be very easilycalculated using a hard-edge approximationwhich assumes a uniform field B in the diskof radius Re corresponding to the extractionradius. A beam of ions (mass A, charge Z,)is injected with an incident angle y. If weassume a non-relativistic beam, we obtainthe following equations:
Stripping radius
siny =2RersZs/Zi
with Zs the electric charge after stripping and Z, the electric charge before stripping.
3.2.2 Injection by precession along a sector edge
A horizontal injection scheme without channels has been proposed and successfullyrealised for the Delft four-sector cyclotron (this method was used for the first time at theLebedev Institute [16] in Moscow). A 200-keV proton beam drifts along a sector edge, asshown in Fig. 13, towards the cyclotron central region where the electric field of the dee startsto increase the orbit radius.
Dee \ g
— l»ap axis I H l B
-— ^ fSSwDummy-Dee >^TXB
Fig. 13 Precession injection in the Delft isochronous cyclotron

167
Beams of JJA have been accelerated up to the extraction radius with injected beamintensities between 1 and 2 mA. A strong first-harmonic magnetic bump, produced byextension of sectors 1 and 4 is used to centre the beam. However, this injection method is nolonger used.
3.2.3 The neutral-beam injector
In order to reach the extraction energy in a low number of turns in a superconductingcyclotron [17], high accelerating peak voltages should be used. This requires sufficiently largegaps in the central region so it could be better to eliminate any internal ion source or inflector foran axially-injected beam. Moreover the available space is small due to the high magnetic field.
These difficulties associated with injection may be circumvented by injecting a beam ofneutral hydrogen atoms of appropriate kinetic energy, (typically 100 keV) along the medianplane of the cyclotron in a direction perpendicular to the magnetic field as shown in Fig. 14.Near the centre of the magnet the beam passes through a charge converter comprising of a verythin foil of carbon or other solid material, which has the effect of stripping off the electronsfrom the hydrogen atoms, giving a beam of protons of suitable energy at the correct position,ready to be accelerated by the cyclotron. By adjusting the position of the stripping foil and thedirection of arrival of the neutral beam, the first orbits can be easily centred in the cyclotron.
The neutral beam to be injected into thecyclotron is prepared by accelerating a beamof hydrogen ions and passing it through acharge converter consisting of a cellcontaining gas at low pressure. It is anadvantage to start with a pre-accelerated beamof negative hydrogen ions rather thanprotons, because the cross-section forproducing neutral atoms is 10 times larger inthis case. For example for kinetic energy 100keV the cross-section for neutralisingnegative hydrogen ions in hydrogen gas is
2 10~16 cm2, so for a cell of length 50 cm atnormal temperature the required pressure is1.7 mT. Tests show that about 50% of theH~ beam can be converted to neutralhydrogen. The scattering in the gas cell willbe about 0.6 mrad, corresponding to 1.5 mmat the stripper foil (1 standard deviation). Theother important advantage of this neutralbeam injection system is the possibility ofbunching the injected beam before this gascell, and adding a fast beam switch-off bymeans of electrostatic deflecting plates.
Fig. 14 Central region of the superconductingcyclotron with the neutral injected beam
The most critical component is the stripper foil near the centre of the cyclotron whichconverts the neutral beam to free protons. It must be thin enough to limit the loss of energy.On the other hand it must be strong enough and resistant to thermal and radiation damage.Carbon foils, 25 nm thick, give satisfactory performance when measured on a test facility.Over a dozen 25 nm carbon stripper foils have been tested in the Cyclotron Laboratory in Nice,and have typically given over 20 uA x hours of useful proton beam before breaking. Thecyclotron could be equipped with a rapid foil changing mechanism.
168
The multiple scattering angle in the 25 nm carbon foil will be 24 mrad (1 standarddeviation). So with 1.5 mm beam width at the stripper the emittance of the injected protonbeam will be 36 Trmm. mrad (1 standard deviation).
ACKNOWLEDGEMENTS
The author is grateful to N. Fierier for reading the manuscript and is very much indebtedto C. Armando, P. Montalant and C. Bajard for their help in preparing the manuscript.
REFERENCES
[I] S. Adam et al., The commissioning of PSI Injector 2 for high intensity, high qualitybeams, Proceedings of the 13th Int. Conf. on Cyclotrons, Vancouver, July 1992, p. 36
[2] P. Mandrillon , Proceedings of the 9th Int. Conf. on cyclotrons, p. 307 and internalreport IPNO-GTA/85-01, IPN Orsay, France.
[3] P. Mandrillon and J.P. Schapira, 10th Int. Conf. on Cyclotrons and their applications,East-Lansing, April 1984, p. 332.
[4] National Accelerator Centre, South Africa, Annual Report, NAC/AR/80-01.
[5] A. Chabert et al., Chromatic correlations at injection and related ejection problems inseparated sector cyclotrons, IEEE Vol NS-26, N°3, June 1979.
[6] C. Tobias, Phys. Rev. 85, 764 (1952).
[7] A. Cabrespine, Eindhoven Colloquium on AVF Cyclotrons, April 1965.
[8] F. Alessandria et al., Status report on the heavy ion facility at LNS, Proceedings of the13th Int. Conf. on Cyclotrons, Vancouver July 1992, p. 90.
[9] C.B. Bigham et al., First operation of the Chalk River superconducting cyclotron NIM,A254, p. 237 (1987).
[10] A. J. Cox et al., Nucl. Instr. and Methods, 18, 19 (1992).
[II] G. Ryckewaert, Axial injection systems for cyclotrons, 9th Int. Conf. on cyclotrons andtheir applications, Caen, Sept. 1981, p. 241.
[12] J.L. Belmont, Axial injection and central region of the AVF cyclotron, Summer school onaccelerator technology, 1986 RCNP-Osaka.
[13] R.W. Miiller, Novel inflectors for cyclic accelerators, NIM 54,29 (1967).
[14] J.P. Schapira, Proprietes optiques du miroir electrostatique, Rapport interne Orsay,IPNO-GEPL/83-03.
[15] R. Baartman, Matching of ions sources to cyclotron inflectors, EPAC, Rome, June 6-10,1988, p. 947-948.
[16] V.A. Gladyshev et al., Sov. Atom. Ener. (trans.) 18, 3, 268 (1965).
[17] P. Mandrillon et al., A compact facility for high energy proton therapy based on asuperconducting cyclotron, EPAC 94, London, 27 June to 1 July 1994.
169
EXTRACTION FROM CYCLOTRONS
JIM. Botman and HL. HagedoornEindhoven University of Technology, Cyclotron Laboratory, Eindhoven, The Netherlands
AbstractSeveral methods of extraction of ions in cyclotrons, such as strippingextraction and resonance extraction, are considered. An extractionefficiency of nearly 100% can be achieved by providing a very highenergy gain per turn or alternatively, for H~ cyclotrons, by stripping.Only simple models are used to explain certain extraction features.Orbit centre coordinates are introduced. Examples of extraction devicesfor several cyclotrons are given.
1 . INTRODUCTION
There are various types of cyclotrons for different applications. Extraction mechanismsand extraction devices are naturally adapted to the specific use of these cyclotrons. One maydifferentiate between stripping extraction for H~ cyclotrons and the extraction of positive ionsemploying an electric septum and a magnetic channel. In general, positive-ion cyclotrons foranalytical purpose such as element analysis or material characterization, or for nuclear physics,do not require a large beam current but, instead, need a good beam quality and energyresolution. Here mostly resonance extraction methods are employed.
For the production of short-lived radionuclides high beam currents are neccessary, notonly because of favourable cost per unit of product, but also because of the short lifetime.Compact cyclotrons that accelerate positive ions for isotope production generally have a limit inextracted beam current of about 100 (iA. (Separated-sector cyclotrons can generate a muchhigher external current.) The internal beam of such a cyclotron yields a spot of a few mm2 on atarget. This means that with an energy of 30 MeV a beam power of 3 kW may hit theelectrodes. Given the geometry of the extraction electrodes this approaches the maximumallowable output, certainly if one wants to have a high reliability of machine operation. Theavailability of negative ion sources with high output has given the opportunity to acceleratebeams with high intensities e.g. 500 |iA, and extract them via stripping. Here, in general,requirements on beam quality are less important than for cyclotrons for analytical applications.
We consider several methods of extraction, using only simple theory, and we giveexamples of extraction devices. The general discussion is restricted to isochronous cyclotrons,unless synchrocyclotrons are mentioned explicitely. We will start, however, with an older ideaof extraction for early synchrocyclotrons.
It may be noted that because of the expanding orbits, extraction from cyclotrons in generalhas somewhat different aspects than for example fast and slow extraction techniques forsynchrotrons, although resonances are often exploited in both cases. Slow extraction forsynchrocyclotrons does have similar features to that for synchrotrons, however.
General theory and information on extraction from cyclotrons has been given byHeikkinen, Joho, Hagedoorn and others [1-3].
2 . ON DEFLECTION AT n = 1 IN THE SYNCHROCYCLOTRON
In this section we briefly consider a paper from 1951 by Hamilton and Lipkin [4], withthe title given above, in which a method was proposed for extraction from earlysynchrocyclotrons.
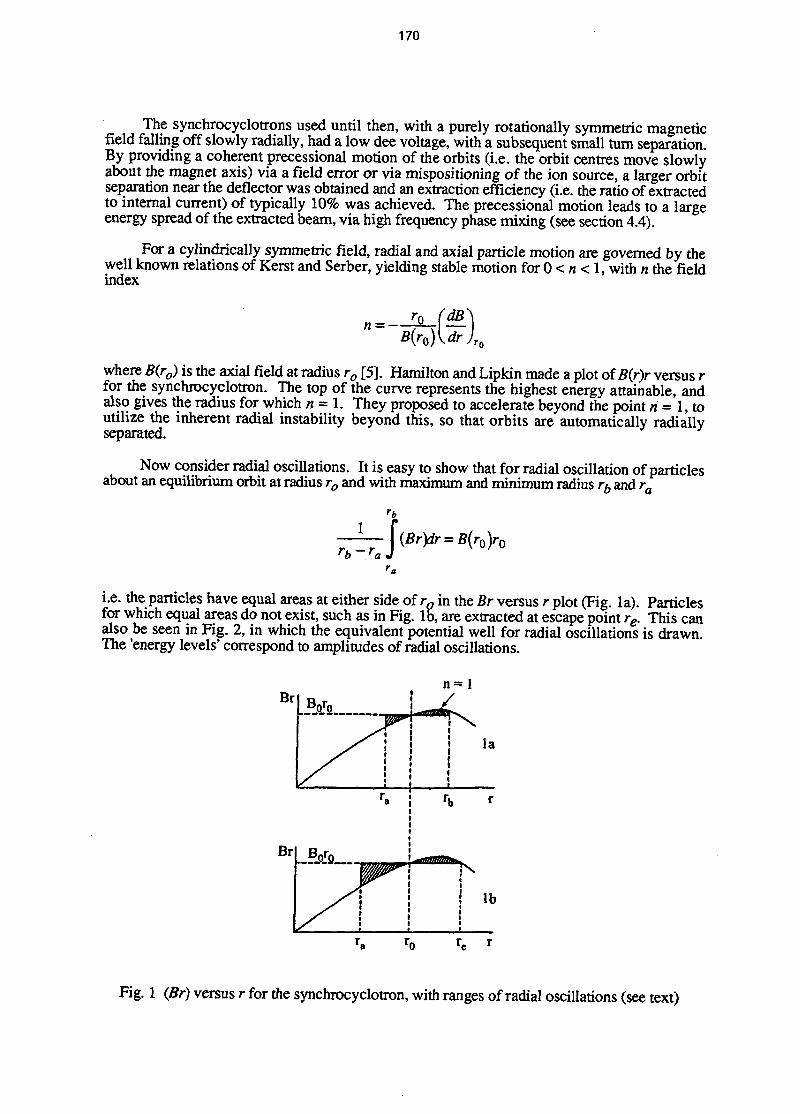
170
The synchrocyclotrons used until then, with a purely rotationally symmetric magneticfield falling off slowly radially, had a low dee voltage, with a subsequent small turn separation.By providing a coherent precessional motion of the orbits (i.e. the orbit centres move slowlyabout the magnet axis) via a field error or via mispositioning of the ion source, a larger orbitseparation near the deflector was obtained and an extraction efficiency (i.e. the ratio of extractedto internal current) of typically 10% was achieved. The precessional motion leads to a largeenergy spread of the extracted beam, via high frequency phase mixing (see section 4.4).
For a cylindrically symmetric field, radial and axial particle motion are governed by thewell known relations of Kerst and Serber, yielding stable motion for 0 < n < 1, with n the fieldindex
where B(ro) is the axial field at radius r0 [5]. Hamilton and Lipkin made a plot of B(r)r versus rfor the synchrocyclotron. The top of the curve represents the highest energy attainable, andalso gives the radius for which n = 1. They proposed to accelerate beyond the point n = 1, toutilize the inherent radial instability beyond this, so that orbits are automatically radiallyseparated.
Now consider radial oscillations. It is easy to show that for radial oscillation of particlesabout an equilibrium orbit at radius ro and with maximum and minimum radius rb and ra
i.e. the particles have equal areas at either side of r0 in the Br versus r plot (Fig. la). Particlesfor which equal areas do not exist, such as in Fig. lb, are extracted at escape point re. This canalso be seen in Fig. 2, in which the equivalent potential well for radial oscillations is drawn.The 'energy levels' correspond to amplitudes of radial oscillations.
Br
Br
|B0r2
ra
i
n
|
i r
= 1/
b
Atk
1111
la
r
lb
Fig. 1 (Br) versus r for the synchrocyclotron, with ranges of radial oscillations (see text)
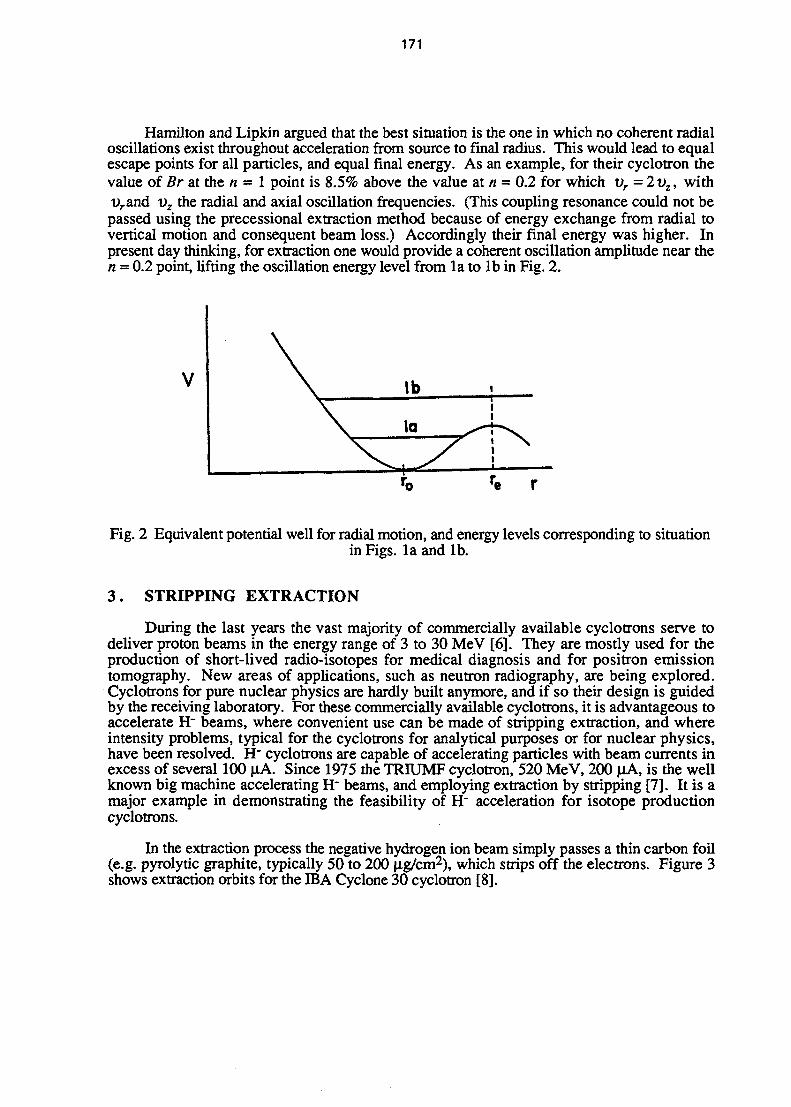
171
Hamilton and Lipkin argued that the best situation is the one in which no coherent radialoscillations exist throughout acceleration from source to final radius. This would lead to equalescape points for all particles, and equal final energy. As an example, for their cyclotron thevalue of Br at the n = 1 point is 8.5% above the value at n = 0.2 for which vr=2vz, witht)rand vz the radial and axial oscillation frequencies. (This coupling resonance could not bepassed using the precessional extraction method because of energy exchange from radial tovertical motion and consequent beam loss.) Accordingly their final energy was higher. Inpresent day thinking, for extraction one would provide a coherent oscillation amplitude near then = 0.2 point, lifting the oscillation energy level from la to lb in Fig. 2.
Fig. 2 Equivalent potential well for radial motion, and energy levels corresponding to situationin Figs, la and lb.
3 . STRIPPING EXTRACTION
During the last years the vast majority of commercially available cyclotrons serve todeliver proton beams in the energy range of 3 to 30 MeV [6]. They are mostly used for theproduction of short-lived radio-isotopes for medical diagnosis and for positron emissiontomography. New areas of applications, such as neutron radiography, are being explored.Cyclotrons for pure nuclear physics are hardly built anymore, and if so their design is guidedby the receiving laboratory. For these commercially available cyclotrons, it is advantageous toaccelerate H~ beams, where convenient use can be made of stripping extraction, and whereintensity problems, typical for the cyclotrons for analytical purposes or for nuclear physics,have been resolved. H~ cyclotrons are capable of accelerating particles with beam currents inexcess of several 100 JLLA. Since 1975 the TRIUMF cyclotron, 520 MeV, 200 jiA, is the wellknown big machine accelerating H" beams, and employing extraction by stripping [7]. It is amajor example in demonstrating the feasibility of H' acceleration for isotope productioncyclotrons.
In the extraction process the negative hydrogen ion beam simply passes a thin carbon foil(e.g. pyrolytic graphite, typically 50 to 200 ^ig/cm2), which strips off the electrons. Figure 3shows extraction orbits for the IB A Cyclone 30 cyclotron [8].
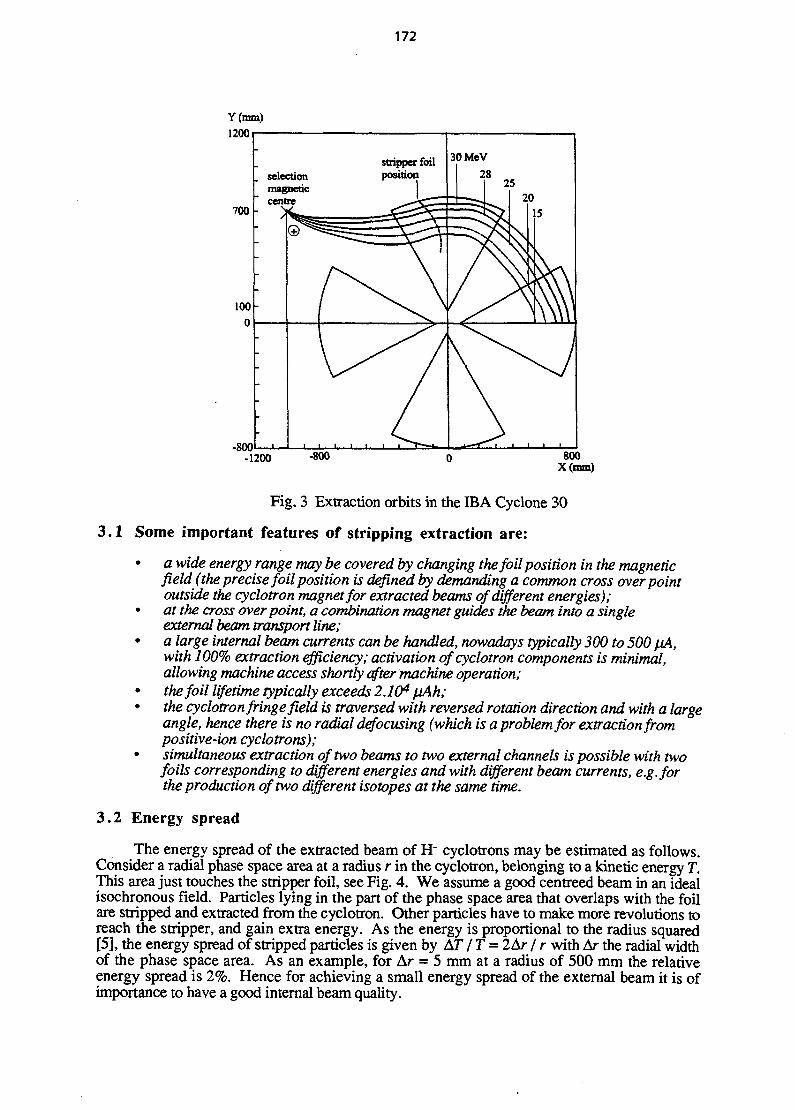
172
-800-1200 800
X(mm)
Fig. 3 Extraction orbits in the IBA Cyclone 30
3 .1 Some important features of stripping extraction are:
• a wide energy range may be covered by changing the foil position in the magneticfield (the precise foil position is defined by demanding a common cross over pointoutside the cyclotron magnet for extracted beams of different energies);
• at the cross over point, a combination magnet guides the beam into a singleexternal beam transport line;
• a large internal beam currents can be handled, nowadays typically 300 to 500 fjA,with 100% extraction efficiency; activation of cyclotron components is minimal,allowing machine access shortly after machine operation;
• the foil lifetime typically exceeds 2.104 fiAh;• the cyclotron fringe field is traversed with reversed rotation direction and with a large
angle, hence there is no radial defocusing (which is a problem for extraction frompositive-ion cyclotrons);
• simultaneous extraction of two beams to two external channels is possible with twofoils corresponding to different energies and with different beam currents, e.g. forthe production of two different isotopes at the same time.
3.2 Energy spread
The energy spread of the extracted beam of H~ cyclotrons may be estimated as follows.Consider a radial phase space area at a radius r in the cyclotron, belonging to a kinetic energy T.This area just touches the stripper foil, see Fig. 4. We assume a good centreed beam in an idealisochronous field. Particles lying in the part of the phase space area that overlaps with the foilare stripped and extracted from the cyclotron. Other particles have to make more revolutions toreach the stripper, and gain extra energy. As the energy is proportional to the radius squared[5], the energy spread of stripped particles is given by AT" / T = 2Ar / r with Ar the radial widthof the phase space area. As an example, for Ar = 5 mm at a radius of 500 mm the relativeenergy spread is 2%. Hence for achieving a small energy spread of the external beam it is ofimportance to have a good internal beam quality.

173
Fig. 4 Radial phase space area reaching the stripper foil
4 . BEAM ORBITS
4.1 Orbit separation
Now we consider the extraction from cyclotrons with the help of extraction devices suchas an electrostatic deflector, to direct the accelerated particles away from the cyclotron magneticfield. A large separation between successive turns is desired for reaching the highest extractionefficiency. In this section we give a simplified picture of orbit separation in a cyclotron, and weconsider some methods to increase the separation [3,9].
Taking cylindrical coordinates, the radial position of a panicle at an azimuth # in thecyclotron, is given by:
r(t?) = ro(t?) + jc(tf)sin(vrtf+#o) , (1)
where ro{ tf) is the radial position of the equilibrium orbit at that azimuth, x( # ) is the radialoscillation amplitude, and tf 0 is an arbitrary phase angle. For incoherent oscillations theamplitude x( t?) is given by
w i t n Pr0 (#) m e radial beta function for radius r0 and at azimuth •& and £xthe radial emittance.However, we now look at the radial position of the centre of the beam for a coherent oscillation,which has been induced by creating a field perturbation. Moreover we consider this at a fixedazimuth # iy i.e. the azimuth of the extractor entrance position. We restrict ourselves to thecase of v r near 1; as vr = / for isochronous cyclotrons, with y the relativistic factor, this is thecase for most cyclotrons. (The analysis can be adapted easily for the case of higher values of vre.g. near 1.5 or 2.)
Rewriting Eq. (1), the radial position at tf,- = 2KH as a function of turnnumber n, isgiven by:
(2)
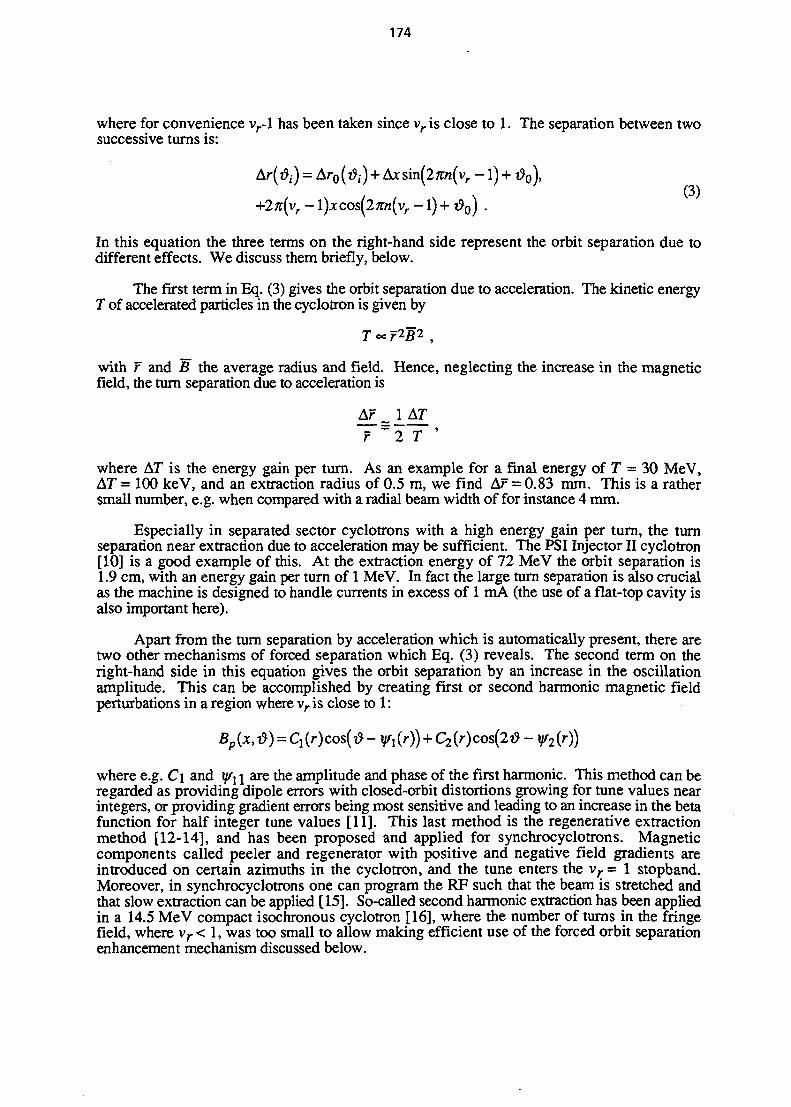
174
where for convenience vr-l has been taken since vr is close to 1. The separation between twosuccessive turns is:
;) + Axsin(2;m(vr - ) )
+2n(vr - l)jtcos(2/r«(vr -1) tf)
In this equation the three terms on the right-hand side represent the orbit separation due todifferent effects. We discuss them briefly, below.
The first term in Eq. (3) gives the orbit separation due to acceleration. The kinetic energyT of accelerated particles in the cyclotron is given by
with r and B the average radius and field. Hence, neglecting the increase in the magneticfield, the turn separation due to acceleration is
f ~ 2 T '
where AT is the energy gain per turn. As an example for a final energy of T = 30 MeV,A7= 100 keV, and an extraction radius of 0.5 m, we find AT = 0.83 mm. This is a rathersmall number, e.g. when compared with a radial beam width of for instance 4 mm.
Especially in separated sector cyclotrons with a high energy gain per turn, the turnseparation near extraction due to acceleration may be sufficient. The PSI Injector II cyclotron[10] is a good example of this. At the extraction energy of 72 MeV the orbit separation is1.9 cm, with an energy gain per turn of 1 MeV. In fact the large turn separation is also crucialas the machine is designed to handle currents in excess of 1 mA (the use of a flat-top cavity isalso important here).
Apart from the turn separation by acceleration which is automatically present, there aretwo other mechanisms of forced separation which Eq. (3) reveals. The second term on theright-hand side in this equation gives the orbit separation by an increase in the oscillationamplitude. This can be accomplished by creating first or second harmonic magnetic fieldperturbations in a region where vr is close to 1:
where e.g. C\ and V'I l are the amplitude and phase of the first harmonic. This method can beregarded as providing dipole errors with closed-orbit distortions growing for tune values nearintegers, or providing gradient errors being most sensitive and leading to an increase in the betafunction for half integer tune values [11]. This last method is the regenerative extractionmethod [12-14], and has been proposed and applied for synchrocyclotrons. Magneticcomponents called peeler and regenerator with positive and negative field gradients areintroduced on certain azimuths in the cyclotron, and the tune enters the v^ = 1 stopband.Moreover, in synchrocyclotrons one can program the RF such that the beam is stretched andthat slow extraction can be applied [15]. So-called second harmonic extraction has been appliedin a 14.5 MeV compact isochronous cyclotron [16], where the number of turns in the fringefield, where vr < 1, was too small to allow making efficient use of the forced orbit separationenhancement mechanism discussed below.
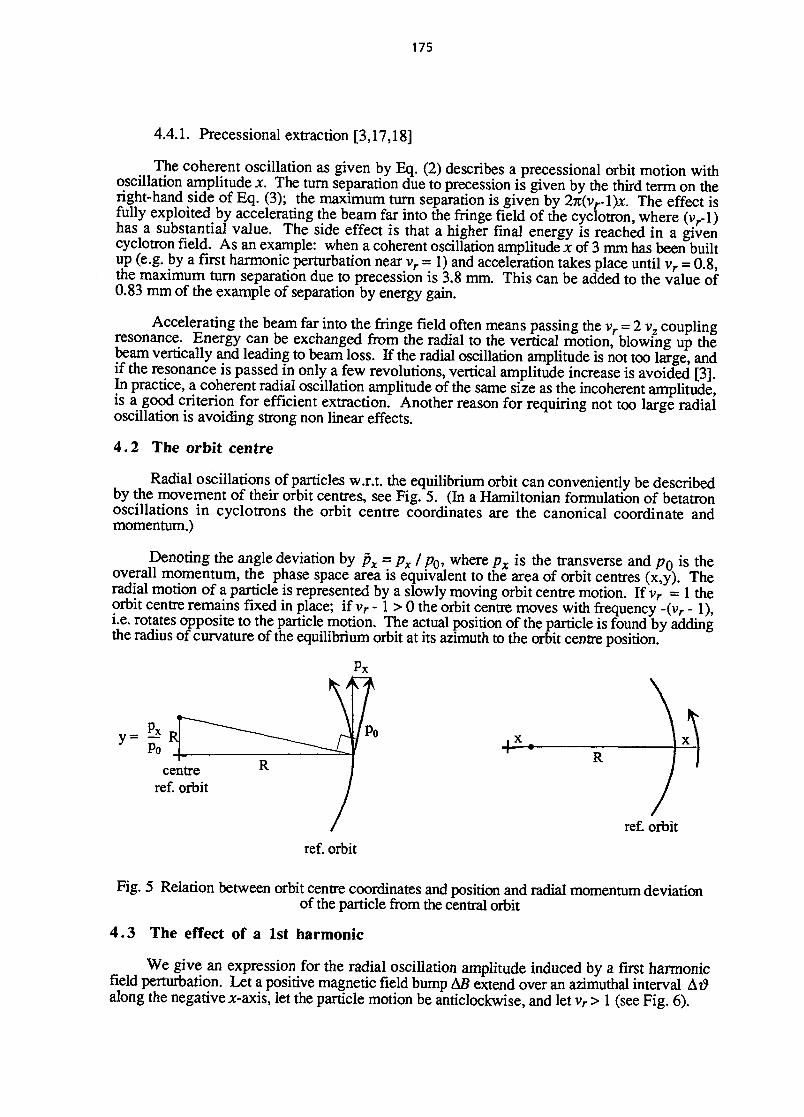
175
4.4.1. Precessional extraction [3,17,18]
The coherent oscillation as given by Eq. (2) describes a precessional orbit motion withoscillation amplitude x. The turn separation due to precession is given by the third term on theright-hand side of Eq. (3); the maximum turn separation is given by 2%(vr\)x. The effect isfully exploited by accelerating the beam far into the fringe field of the cyclotron, where (vr-l)has a substantial value. The side effect is that a higher final energy is reached in a givencyclotron field. As an example: when a coherent oscillation amplitude x of 3 mm has been builtup (e.g. by a first harmonic perturbation near vr = 1) and acceleration takes place until vr = 0.8,the maximum turn separation due to precession is 3.8 mm. This can be added to the value of0.83 mm of the example of separation by energy gain.
Accelerating the beam far into the fringe field often means passing the vr-2vz couplingresonance. Energy can be exchanged from the radial to the vertical motion, blowing up thebeam vertically and leading to beam loss. If the radial oscillation amplitude is not too large, andif the resonance is passed in only a few revolutions, vertical amplitude increase is avoided [3].In practice, a coherent radial oscillation amplitude of the same size as the incoherent amplitude,is a good criterion for efficient extraction. Another reason for requiring not too large radialoscillation is avoiding strong non linear effects.
4.2 The orbit centre
Radial oscillations of particles w.r.t. the equilibrium orbit can conveniently be describedby the movement of their orbit centres, see Fig. 5. (In a Hamiltonian formulation of betatronoscillations in cyclotrons the orbit centre coordinates are the canonical coordinate andmomentum.)
Denoting the angle deviation by px = px/ p0 , where px is the transverse and PQ is theoverall momentum, the phase space area is equivalent to the area of orbit centres (x,y). Theradial motion of a particle is represented by a slowly moving orbit centre motion. If vr = 1 theorbit centre remains fixed in place; if vr - 1 > 0 the orbit centre moves with frequency -(vr - 1),i.e. rotates opposite to the particle motion. The actual position of the particle is found by addingthe radius of curvature of the equilibrium orbit at its azimuth to the orbit centre position.
Rcentre
ref. orbit
ref. orbitref. orbit
Fig. 5 Relation between orbit centre coordinates and position and radial momentum deviationof the particle from the central orbit
4.3 The effect of a 1st harmonic
We give an expression for the radial oscillation amplitude induced by a first harmonicfield perturbation. Let a positive magnetic field bump AS extend over an azimuthal interval At?along the negative x-axis, let the particle motion be anticlockwise, and let vr > 1 (see Fig. 6).

176
bumpAy
Fig. 6. Orbit centre shift Ay due to a magnetic field bump along the negative x-axis
The 1st harmonic is
I f At?At— — I ABCL& = AB .
tt* It
0
The field bump gives a change in radial momentum:AfL = **At>
and an orbit centre shift:
A5
' B
In one turn a hypothetical particle with oscillation amplitude A, see Fig. 7, has its orbitcentre displaced by:
Ay2 = -2^(v r - l)A .
When Ayi = A^2 one finds a new equilibrium orbit, because the orbit is closed. The orbitcentre of this equilibrium orbit (middle of the closed curve) is given by Ax = A. The beamstarts oscillating around the new orbit centre. One finds:
Ax = -^—T*?.RH>
in which £j is the relative first harmonic £\ =A\IB.
Often
Ax = -z—
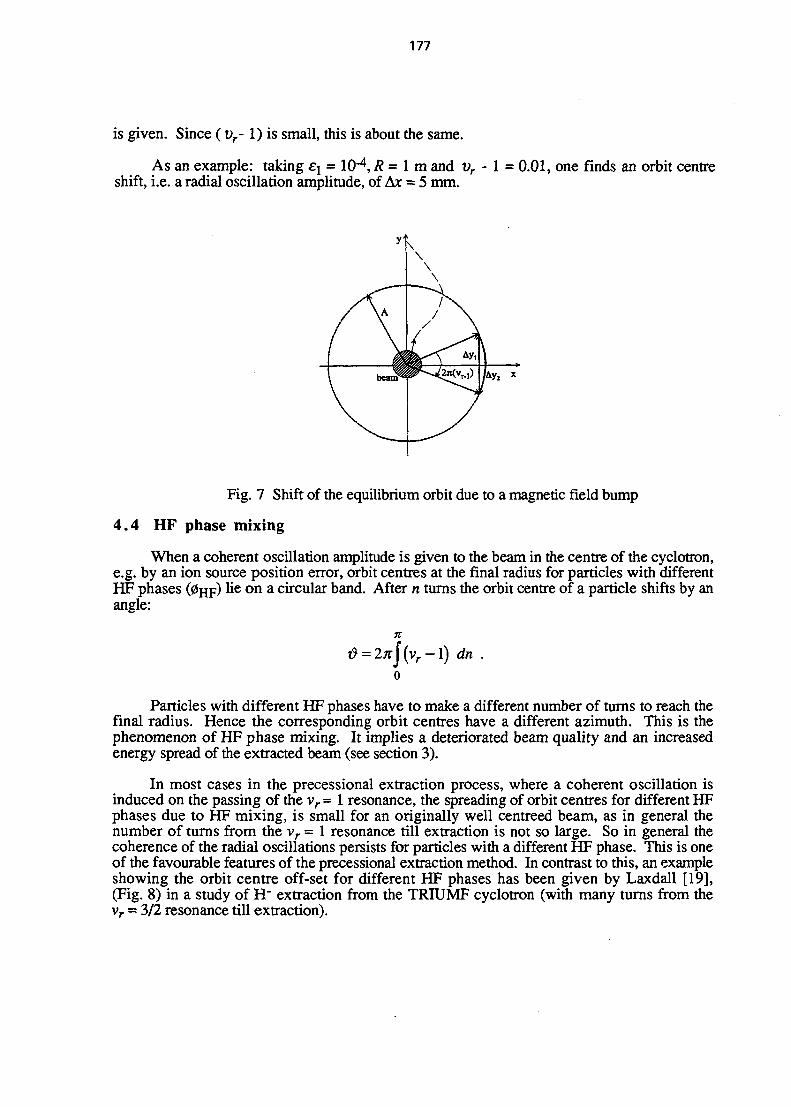
177
is given. Since (v r -1) is small, this is about the same.
As an example: taking £j = 10"4, R = 1 m and vr - 1 = 0.01, one finds an orbit centreshift, i.e. a radial oscillation amplitude, of Ax = 5 mm.
Fig. 7 Shift of the equilibrium orbit due to a magnetic field bump
4.4 HF phase mixing
When a coherent oscillation amplitude is given to the beam in the centre of the cyclotron,e.g. by an ion source position error, orbit centres at the final radius for particles with differentHF phases (0HF) u e o n a circular band. After n turns the orbit centre of" a particle shifts by anangle:
n- l ) dn
Particles with different HF phases have to make a different number of turns to reach thefinal radius. Hence the corresponding orbit centres have a different azimuth. This is thephenomenon of HF phase mixing. It implies a deteriorated beam quality and an increasedenergy spread of the extracted beam (see section 3).
In most cases in the precessional extraction process, where a coherent oscillation isinduced on the passing of the vr = 1 resonance, the spreading of orbit centres for different HFphases due to HF mixing, is small for an originally well centreed beam, as in general thenumber of turns from the vr = 1 resonance till extraction is not so large. So in general thecoherence of the radial oscillations persists for particles with a different HF phase. This is oneof the favourable features of the precessional extraction method. In contrast to this, an exampleshowing the orbit centre off-set for different HF phases has been given by Laxdall [19],(Fig. 8) in a study of H" extraction from the TRIUMF cyclotron (with many turns from thevr = 3/2 resonance till extraction).
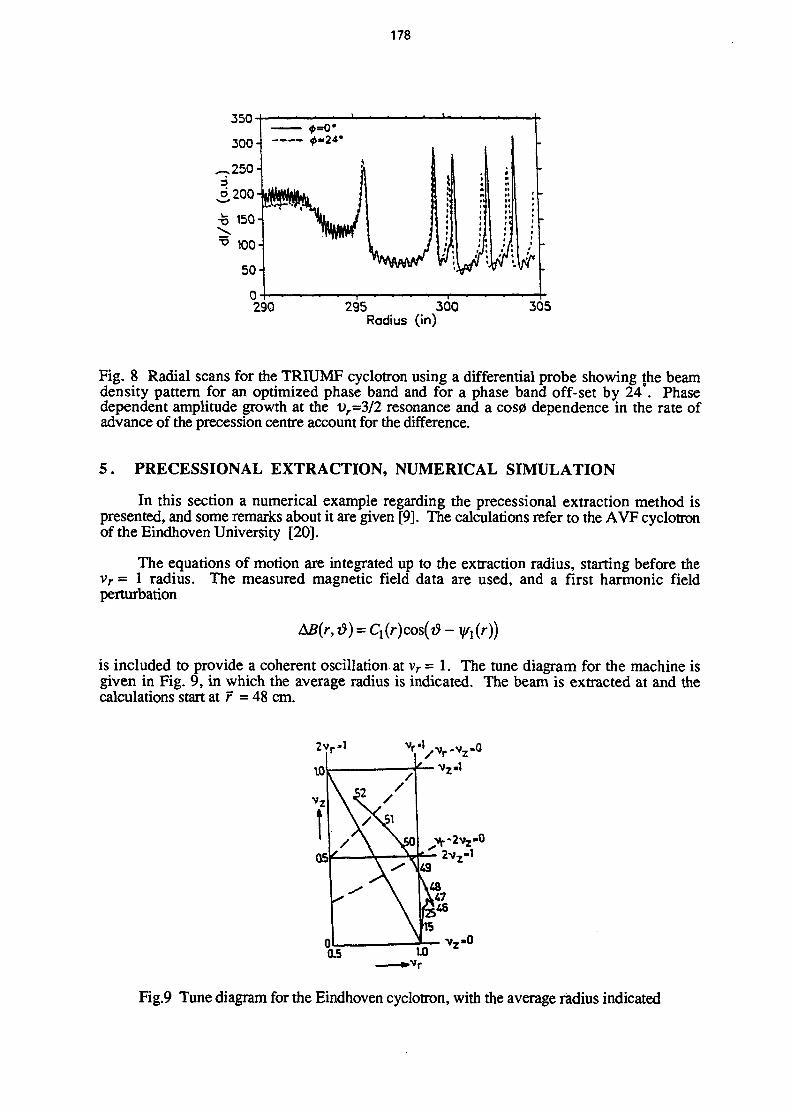
178
350
290 295 300Radius (in)
305
Fig. 8 Radial scans for the TRIUMF cyclotron using a differential probe showing the beamdensity pattern for an optimized phase band and for a phase band off-set by 24°. Phasedependent amplitude growth at the ur=3/2 resonance and a cos0 dependence in the rate ofadvance of the precession centre account for the difference.
5 . PRECESSIONAL EXTRACTION, NUMERICAL SIMULATION
In this section a numerical example regarding the precessional extraction method ispresented, and some remarks about it are given [9]. The calculations refer to the AVF cyclotronof the Eindhoven University [20].
The equations of motion are integrated up to the extraction radius, starting before thevr = 1 radius. The measured magnetic field data are used, and a first harmonic fieldperturbation
is included to provide a coherent oscillation at vr = 1. The tune diagram for the machine isgiven in Fig. 9, in which the average radius is indicated. The beam is extracted at and thecalculations start at r = 48 cm.
Fig.9 Tune diagram for the Eindhoven cyclotron, with the average radius indicated
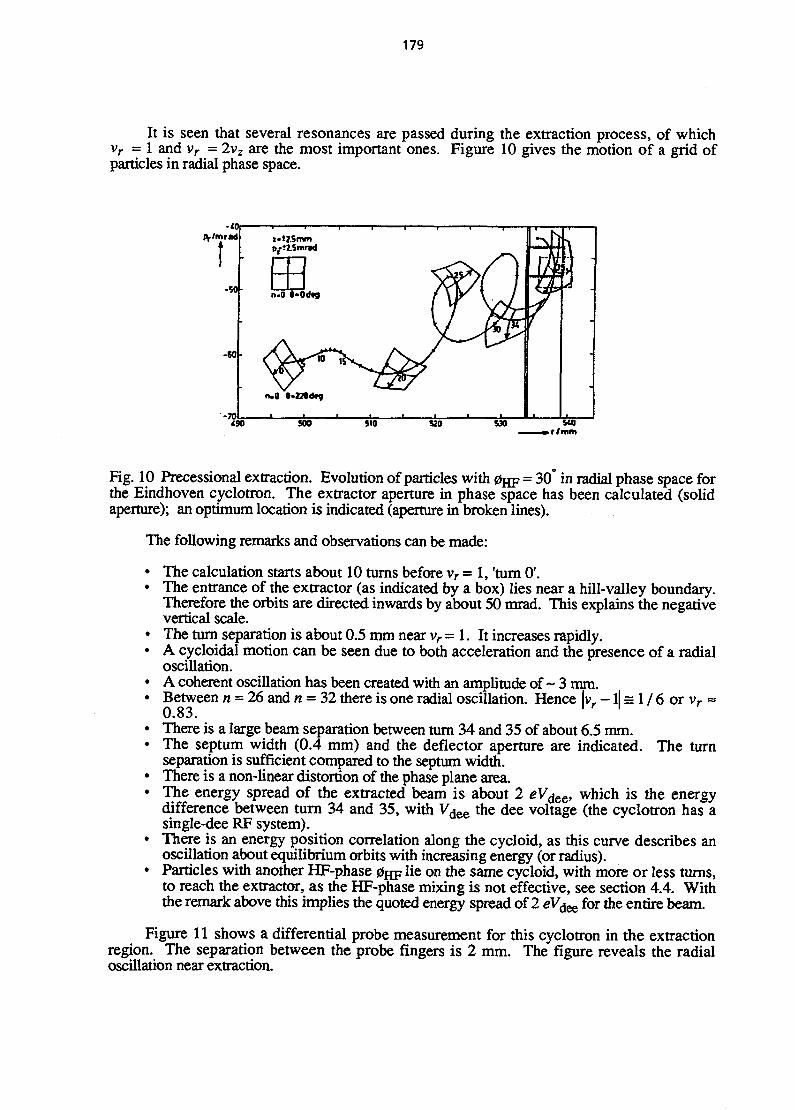
179
It is seen that several resonances are passed during the extraction process, of whichvr = 1 and vr = 2vz are the most important ones. Figure 10 gives the motion of a grid ofparticles in radial phase space.
Fig. 10 Precessional extraction. Evolution of particles with 0HF = 30° in radial phase space forthe Eindhoven cyclotron. The extractor aperture in phase space has been calculated (solidaperture); an optimum location is indicated (aperture in broken lines).
The following remarks and observations can be made:
• The calculation starts about 10 turns before vr = 1, 'turn 0'.• The entrance of the extractor (as indicated by a box) lies near a hill-valley boundary.
Therefore the orbits are directed inwards by about 50 mrad. This explains the negativevertical scale.
• The turn separation is about 0.5 mm near vr = 1. It increases rapidly.• A cycloidal motion can be seen due to both acceleration and the presence of a radial
oscillation.• A coherent oscillation has been created with an amplitude of ~ 3 mm.• Between n = 26 and n = 32 there is one radial oscillation. Hence |vr - ll = 1 / 6 or v, =
0.83. ' '• There is a large beam separation between turn 34 and 35 of about 6.5 mm.• The septum width (0.4 mm) and the deflector aperture are indicated. The turn
separation is sufficient compared to the septum width.• There is a non-linear distortion of the phase plane area.• The energy spread of the extracted beam is about 2 eVdee, which is the energy
difference between turn 34 and 35, with Vdee the dee voltage (the cyclotron has asingle-dee RF system).
• There is an energy position correlation along the cycloid, as this curve describes anoscillation about equilibrium orbits with increasing energy (or radius).
• Particles with another HF-phase 0Hp lie on the same cycloid, with more or less turns,to reach the extractor, as the HF-phase mixing is not effective, see section 4.4. Withthe remark above this implies the quoted energy spread of 2 eViee for the entire beam.
Figure 11 shows a differential probe measurement for this cyclotron in the extractionregion. The separation between the probe fingers is 2 mm. The figure reveals the radialoscillation near extraction.

180
total current (A+B)
current on target B(width 2mm)
BA
-J ,2mm
45 50• radius/cm
Fig. 11 Differential probe scan near extraction for the Eindhoven cyclotron
6. MULTI- AND SINGLE-TURN EXTRACTION
In general, particles with a different value of the HF-phase complete a different number ofrevolutions before reaching the extraction septum and having the final energy. In a purelyisochronous machine the HF phase of a particle remains constant, which explains this. Thisleads to multi-turn extraction. For the Eindhoven cyclotron, as an example, the number ofturns may vary by about 30, with a total number of about 300. Single-turn extraction on theother hand can be obtained when the HF phase width is restricted, e.g. with the help of slits inthe centre of the cyclotron. This leads to a reduced energy spread of the extracted beam. Multi-and single-turn extraction has been described by several authors [21,22].
The kinetic energy T and the radius r of particles on equilibrium orbits after N turns isgiven by:
where TQ and TQ belong to a central HF phase 0Q, and where 0 is the phase difference withrespect to 0Q. A plot of the energy for orbits near the extractor as a function of HF phase isgiven in Fig. 12. This figure also shows the energy levels belonging to the extractor opening,i.e. of the septum and the electrode. The top of the paraboles is shifted due to the effect of thefringe field. It is seen that several turns get extracted, with an energy pattern for the externalbeam as given in Fig. 13. Single-turn extraction is obtained for a phase width restricted to A0 =02 - 0i (see Fig. 13), or for l0l < arccos(WN + 1).
For example with N = 180,10l < 6°, single-turn extraction for a wider phase range andwith a small resulting energy spread can be obtained by applying a higher harmonic cavity inaddition to the fundamental RF frequency. This is the flat-topping principle [5]. Importantexamples of this are found in the PSI injector II and ring cyclotrons [10,23]. The additionaladvantage is of course the possibility to extract the beam with 100% efficiency. In Eindhoven aspecial minicyclotron (ILEC) has been constructed with an RF phase acceptance five timeslarger due to the flat-topping technique, and an energy spread less than 0.1% [24]. Thismachine serves especially for PBGE and PIXE microbeam applications.

181
Fig. 12 Kinetic energy versus HF phase near extraction
N + 2N+3N+4
h *o h
Fig. 13 Energy profile for the extracted beam
For the main Eindhoven cyclotron, which is a multiturn machine, single-turn experimentshave been made by restricting the RF phase width with radially selecting slits in the cyclotroncentre [25]. The accelerating voltage was set to have about 180 turns, hence the phase widthhad to be within 12°. Single-turn extraction was found by observing 100% variation in theexternal beam current as a function of the accelerating voltage, see Fig. 14. This implies that the
60
40
20
18.5 19.0 19.5
Fig. 14 Single-turn extraction demonstrated by 100% external beam variations as a function ofaccelerating voltage
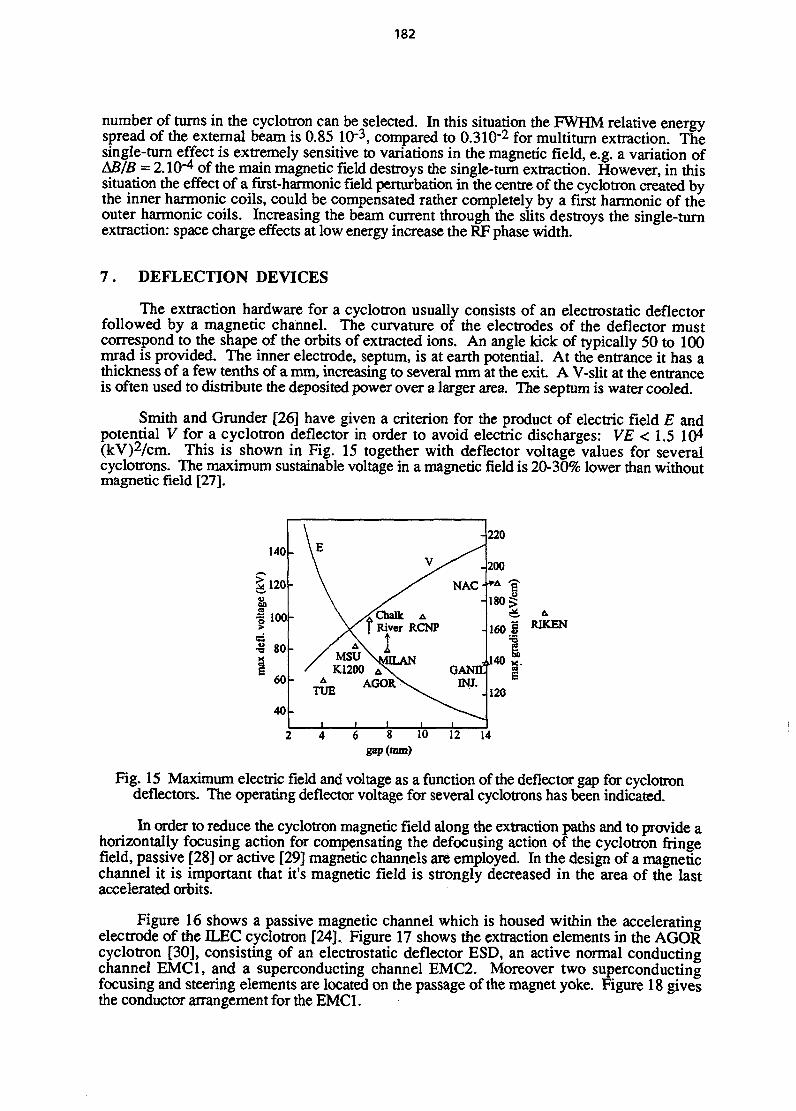
182
number of turns in the cyclotron can be selected. In this situation the FWHM relative energyspread of the external beam is 0.85 10"3, compared to 0.310'2 for multiturn extraction. Thesingle-turn effect is extremely sensitive to variations in the magnetic field, e.g. a variation ofAB/S = 2.10"4 of the main magnetic field destroys the single-turn extraction. However, in thissituation the effect of a first-harmonic field perturbation in the centre of the cyclotron created bythe inner harmonic coils, could be compensated rather completely by a first harmonic of theouter harmonic coils. Increasing the beam current through the slits destroys the single-turnextraction: space charge effects at low energy increase the RF phase width.
7 . DEFLECTION DEVICES
The extraction hardware for a cyclotron usually consists of an electrostatic deflectorfollowed by a magnetic channel. The curvature of the electrodes of the deflector mustcorrespond to the shape of the orbits of extracted ions. An angle kick of typically 50 to 100mrad is provided. The inner electrode, septum, is at earth potential. At the entrance it has athickness of a few tenths of a mm, increasing to several mm at the exit A V-slit at the entranceis often used to distribute the deposited power over a larger area. The septum is water cooled.
Smith and Grander [26] have given a criterion for the product of electric field E andpotential V for a cyclotron deflector in order to avoid electric discharges: VE < 1.5 104
(kV)2/cm. This is shown in Fig. 15 together with deflector voltage values for severalcyclotrons. The maximum sustainable voltage in a magnetic field is 20-30% lower than withoutmagnetic field [27].
140
120
1 100h>I 80
60
40
S RIKEN
2 4 6 8 10 12gap (mm)
Fig. 15 Maximum electric field and voltage as a function of the deflector gap for cyclotrondeflectors. The operating deflector voltage for several cyclotrons has been indicated.
In order to reduce the cyclotron magnetic field along the extraction paths and to provide ahorizontally focusing action for compensating the defocusing action of the cyclotron fringefield, passive [28] or active [29] magnetic channels are employed. In the design of a magneticchannel it is important that it's magnetic field is strongly decreased in the area of the lastaccelerated orbits.
Figure 16 shows a passive magnetic channel which is housed within the acceleratingelectrode of the ILEC cyclotron [24]. Figure 17 shows the extraction elements in the AGORcyclotron [30], consisting of an electrostatic deflector ESD, an active normal conductingchannel EMC1, and a superconducting channel EMC2. Moreover two superconductingfocusing and steering elements are located on the passage of the magnet yoke. Figure 18 givesthe conductor arrangement for the EMC 1.
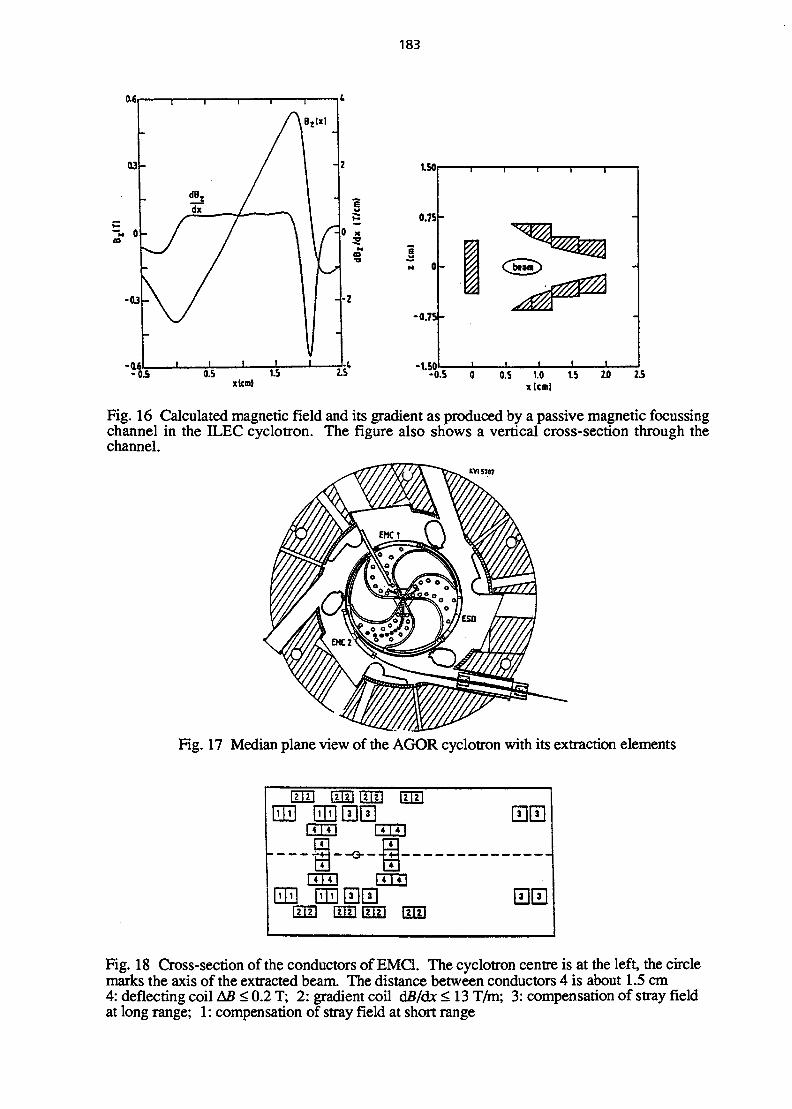
183
-0.5 Z.S 0.S 1.0 1.5 2.0 25-1.50
-0.S
Fig. 16 Calculated magnetic field and its gradient as produced by a passive magnetic focussingchannel in the ILEC cyclotron. The figure also shows a vertical cross-section through thechannel.
KV1SJ«7
Fig. 17 Median plane view of the AGOR cyclotron with its extraction elements
Fig. 18 Cross-section of the conductors of EMC1. The cyclotron centre is at the left, the circlemarks the axis of the extracted beam. The distance between conductors 4 is about 1.5 cm4: deflecting coil AB < 0.2 T; 2: gradient coil dB/dx < 13 T/m; 3: compensation of stray fieldat long range; 1: compensation of stray field at short range

184
8 . CONCLUSION
Several methods of extraction from (isochronous) cyclotrons have been discussed. Mostimportant are stripping extraction, resonance free and precessional extraction. Some hardwareaspects have been given.
ACKNOWLEDGEMENTS
We thank W. Kleeven (IBA), M. Kruip (Oxford Instruments), H. Schreuder (KVI) andBob Laxdall (TRIUMF) for useful information and comments.
REFERENCES
[ 1] P. Heikkingen, Injection and extraction for cyclotrons, CAS, CERN 94-01,Vol. II,(1994), 819.
[ 2] W. Joho, Extraction from medium and high energy cyclotrons, Proc. 5 Int. Conf. onCycL, Butterworths, London, (1971), 159.
[ 3] H.L. Hagedoorn and P. Kramer, Extraction studies in an AVF cyclotron, IEEE Trans.Nucl. Sci. NS-13, No. 4, (1966), 64.
[ 4] D.R. Hamilton and HJ. Lipkin, On deflection at n = 1 in the synchrocyclotron, Rev.Sci. Instr., Vol. 22, No. 10 (1951), 783.
[ 5] T. Stammbach, Introduction to cyclotrons, these proceedings.
[ 6] V. Bechtold, Commercially available compact cyclotrons for isotope production, Proc.13 Int. Conf. on Cycl., Vancouver 1992, World Scientific, (1993), 110.
[ 7] G. Dutto, The TRIUMF 520 MeV cyclotron, Ibid, 138.
[ 8] Y. Jongen et. al., Construction of the Louvain La Neuve 30 MeV 500 jiA H"cyclotron,Proc. 11 Int. Conf. on Cycl., Ionics, Tokyo, (1987), 275.
[ 9] F. Schutte et. al., Numerical calculations in the extraction process of the Eindhoven AVFcyclotron, Nucl. Instr. Meth. 127, (1975), 317.
[10] U. Schryber et. al., Status report on the new injector at SIN, 9 Int. Conf. on Cycl., LesEdition de Physique (France), (1981), 43.
[11] E. Wilson, Transverse beam dynamics, CAS, CERN 94-01, Vol. I., (1994), 131.
[12] J.L. Tuck and L.C. Teng, Regenerative deflector for synchrocyclotrons, Phys. Rev. 81,(1951), 305.
[13] K.J. Le Couteur, The regenerative deflector for synchrocyclotrons, Proc. Phys. Soc.London, B64, (1981), 1073.
[14] N.F. Verster, Regenerative extraction from the 150 MeV synchrocyclotron at theLaboratoire Curie, IICC, (1959), 224.
[15] D.W. Storm, A survey of synchrocyclotron projects, IEEE Trans. Nucl. Sci., Vol. NS-26, No. 2, (1979), 1970.
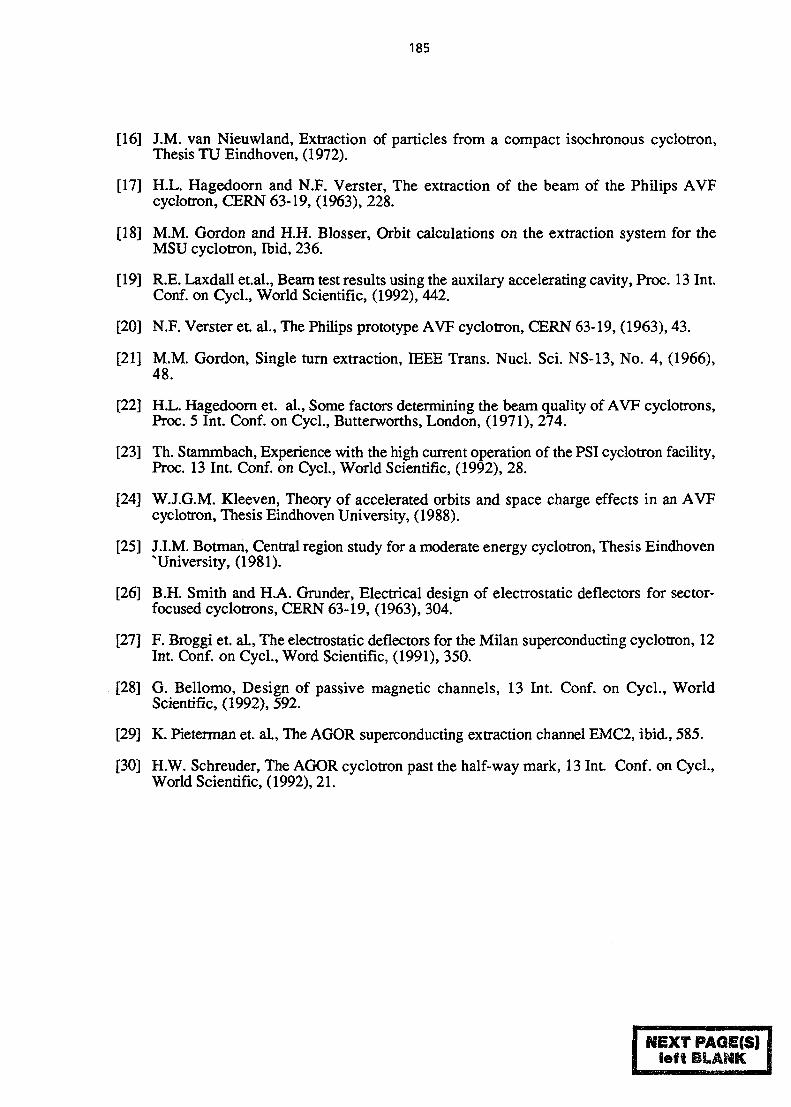
185
[16] J.M. van Nieuwland, Extraction of particles from a compact isochronous cyclotron,Thesis TU Eindhoven, (1972).
[17] H.L. Hagedoorn and N.F. Verster, The extraction of the beam of the Philips AVFcyclotron, CERN 63-19, (1963), 228.
[18] M.M. Gordon and H.H. Blosser, Orbit calculations on the extraction system for theMSU cyclotron, Ibid, 236.
[19] R.E. Laxdall et.al., Beam test results using the auxilary accelerating cavity, Proc. 13 Int.Conf. on Cycl., World Scientific, (1992), 442.
[20] N.F. Verster e t al., The Philips prototype AVF cyclotron, CERN 63-19, (1963), 43.
[21] M.M. Gordon, Single turn extraction, IEEE Trans. Nucl. Sci. NS-13, No. 4, (1966),48.
[22] H.L. Hagedoorn et. al., Some factors determining the beam quality of AVF cyclotrons,Proc. 5 Int. Conf. on Cycl., Butterworths, London, (1971), 274.
[23] Th. Stammbach, Experience with the high current operation of the PSI cyclotron facility,Proc. 13 Int. Conf. on Cycl., World Scientific, (1992), 28.
[24] W.J.G.M. Kleeven, Theory of accelerated orbits and space charge effects in an AVFcyclotron, Thesis Eindhoven University, (1988).
[25] J.I.M. Botman, Central region study for a moderate energy cyclotron, Thesis Eindhoven^University, (1981).
[26] B.H. Smith and H.A. Grunder, Electrical design of electrostatic deflectors for sector-focused cyclotrons, CERN 63-19, (1963), 304.
[27] F. Broggi et. al., The electrostatic deflectors for the Milan superconducting cyclotron, 12Int. Conf. on Cycl., Word Scientific, (1991), 350.
[28] G. Bellomo, Design of passive magnetic channels, 13 Int. Conf. on Cycl., WorldScientific, (1992), 592.
[29] K. Pieterman et. al., The AGOR superconducting extraction channel EMC2, ibid., 585.
[30] H.W. Schreuder, The AGOR cyclotron past the half-way mark, 13 Int. Conf. on CycL,World Scientific, (1992), 21.
NEXT PAGE(S)left BS.A§$K
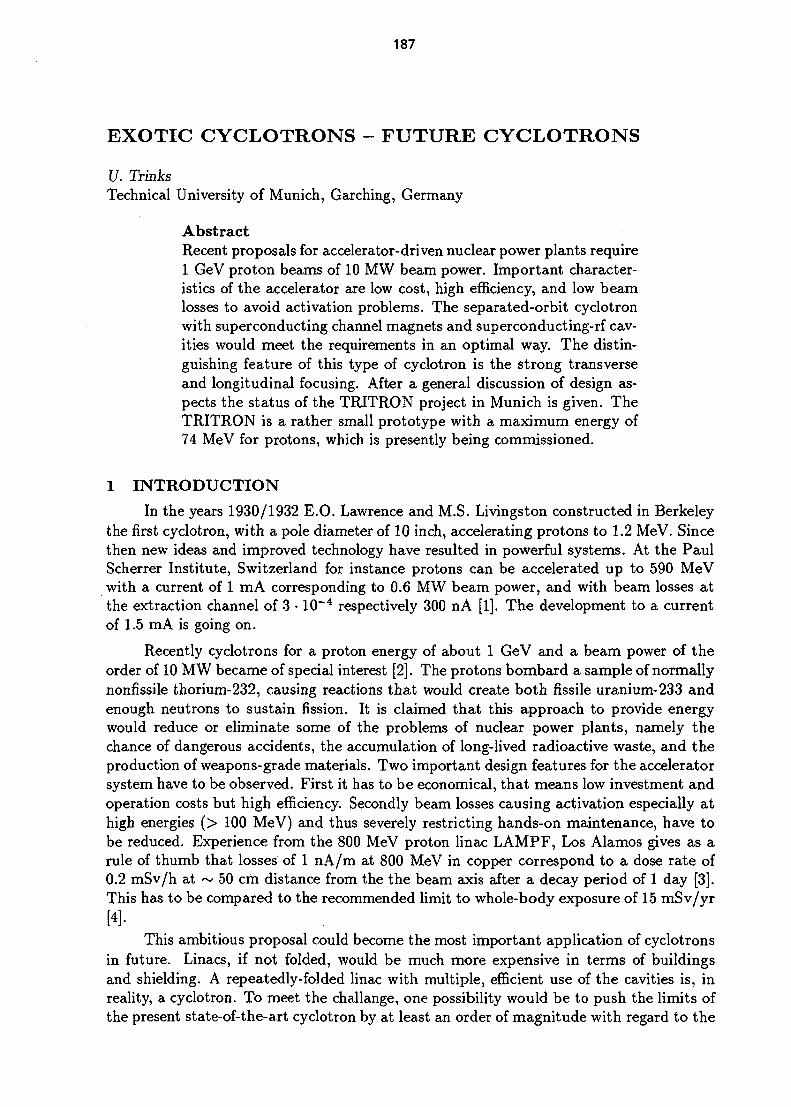
187
EXOTIC CYCLOTRONS - FUTURE CYCLOTRONS
17. TrinksTechnical University of Munich, Garching, Germany
AbstractRecent proposals for accelerator-driven nuclear power plants require1 GeV proton beams of 10 MW beam power. Important character-istics of the accelerator are low cost, high efficiency, and low beamlosses to avoid activation problems. The separated-orbit cyclotronwith superconducting channel magnets and superconducting-rf cav-ities would meet the requirements in an optimal way. The distin-guishing feature of this type of cyclotron is the strong transverseand longitudinal focusing. After a general discussion of design as-pects the status of the TRITRON project in Munich is given. TheTRITRON is a rather small prototype with a maximum energy of74 MeV for protons, which is presently being commissioned.
1 INTRODUCTION
In the years 1930/1932 E.O. Lawrence and M.S. Livingston constructed in Berkeleythe first cyclotron, with a pole diameter of 10 inch, accelerating protons to 1.2 MeV. Sincethen new ideas and improved technology have resulted in powerful systems. At the PaulScherrer Institute, Switzerland for instance protons can be accelerated up to 590 MeVwith a current of 1 mA corresponding to 0.6 MW beam power, and with beam losses atthe extraction channel of 3 • 10~4 respectively 300 nA [1]. The development to a currentof 1.5 mA is going on.
Recently cyclotrons for a proton energy of about 1 GeV and a beam power of theorder of 10 MW became of special interest [2]. The protons bombard a sample of normallynonfissile thorium-232, causing reactions that would create both fissile uranium-233 andenough neutrons to sustain fission. It is claimed that this approach to provide energywould reduce or eliminate some of the problems of nuclear power plants, namely thechance of dangerous accidents, the accumulation of long-lived radioactive waste, and theproduction of weapons-grade materials. Two important design features for the acceleratorsystem have to be observed. First it has to be economical, that means low investment andoperation costs but high efficiency. Secondly beam losses causing activation especially athigh energies (> 100 MeV) and thus severely restricting hands-on maintenance, have tobe reduced. Experience from the 800 MeV proton linac LAMPF, Los Alamos gives as arule of thumb that losses of 1 nA/m at 800 MeV in copper correspond to a dose rate of0.2 mSv/h at ~ 50 cm distance from the the beam axis after a decay period of 1 day [3].This has to be compared to the recommended limit to whole-body exposure of 15 mSv/yr[4]-
This ambitious proposal could become the most important application of cyclotronsin future. Linacs, if not folded, would be much more expensive in terms of buildingsand shielding. A repeatedly-folded linac with multiple, efficient use of the cavities is, inreality, a cyclotron. To meet the challange, one possibility would be to push the limits ofthe present state-of-the-art cyclotron by at least an order of magnitude with regard to the
188
beam power. Another possibility would be to look for a new design with further capabilityof development, taking new technology into account. In view of the prospects the secondway appears to be more favourable. As a starting point the present cyclotron design willbe examined critically, looking for possibilities of improvements. In principle a solutionfor all those shortcomings was proposed already more than 30 years ago, known as theseparated-orbit cyclotron (SOC). However to put this idea into practice superconductivitywas needed for bending and focusing as well as for acceleration of the particles. The firstcompletely superconducting separated-orbit cyclotron TRITRON is coming into operationat the moment.
2 EARLY WORK ON THE SEPARATED ORBIT CYCLOTRON2.1 Weak points of the present cyclotron design
All cyclotrons are dominated by the design of the magnetic system. The totalaxial height of the magnets is always large compared to the height of the magnetic fieldvolume really needed for bending and focusing the beam of particles. Since the magneticflux penetrating the orbit plane is returned outside the extraction radius, the magnetsbecome big, occupying valuable space at the cost of that for all other components. Therf-acceleration system and electrostatic injection/extraction elements are squeezed intonarrow gaps, limiting on the one hand the maximum rf voltage respectively the turnseparation and thus the intensity of extracted beam, on the other hand the maximumenergy due to voltage breakdown in the extraction channel.
The revolution frequency frev has to stay constant and is a subharmonic h of the rffrequency frj :
frev=v=L± = 1 J L I L - = const (1)2irr h 2 -K • m0 7
To get fTev independent of the velocity v of the particles (isochronism) the average bendingfield per turn B has to increase in proportion to the relative mass increase 7, imposinga particular radial dependence on this field. This condition restricts the focusing powerstrongly. It causes the number of radial betatron oscillations to be approximately equalto 7, so that stopbands have to be crossed, which finally sets the maximum energy fora machine with given symmetry, at least if the number of sectors is low. The focusingpower in axial direction has to be produced mainly by an azimuthal field variation, whichfor increasing particle energy reduces the efficiency of the bending field more and more.The major problem is that the fields at neighbouring orbits are completely linked.
The condition of isochronism excludes longitudinal focusing. If the particles, de-pending on their phases, gain different energies in the accelerating field, these differencesaccumulate and cause a radial beam broadening, which finally limits the intensity due toincreasing losses at the extraction channel. The lack of longitudinal focusing is a basicweakness of the ordinary isochronous cyclotron.
2.2 The principle of the separated orbit cyclotronTo overcome the problems F.M. Russell proposed already in 1963 the principle of
the SOC [5-7]. It combines the advantages of the isochronous cyclotron, the synchrotron,and the linear accelerator. In a SOC, the particles are guided by magnetic structuresalong a fixed spiral path with a turn separation much bigger than the radial beam width,
189
so that each of the field levels and radial gradients of radially neighbouring structurescan be chosen more or less independently, incorporating strong transverse focusing asin a synchrotron. The betatron oscillation numbers can be chosen far from the stabilitylimits, resonances can be avoided. Injection and extraction problems become insignificant.Hence the final energy can be achieved by a set of coupled rings.
The particles are. accelerated by rf cavities interspersed with the sectors of the mag-netic structures. The spiral path is designed in such a way, that the path length betweensucceeding cavities increases monotonely. The velocity of the particles has to increasecorrespondingly, at least on average, to keep them in phase with the accelerating voltage.For this the effective accelerating voltage per turn has to exceed a minimum voltage givenby:
^ 7 ( )
e r0
From: T = TOOC2(7 - 1) (kinetic energy)
Per turn: dT = e • AV, dr = Ar0
Here ro is the mean orbit radius (turn length over 27r) and Aro its increment per turn,the mean turn separation. As will be shown below in more detail the particles will followautomatically particular phase curves fixed by the initial energy and phase, so in fact therevolution frequency averaged along several turns stays constant. Locally the revolutionfrequency varies periodically due to longitudinal focusing. The relative variation of / r e v
is given by the variations of the velocity and of r:
t>0 is the velocity of a hypothetical isochronous particle running along the design orbit,that is with Ar = 0 and Av = 0. If the bending field levels of all magnetic structuresare set properly - starting with the first one and continuing step by step along the spiralpath with the aid of beam position probes - then the central particle of the bunch willmove along the orbit without radial deviations, that is Ar = 0. However the energy ofthe central particle may differ from the isochronous energy, so that Av ^ 0. The resultingfrequency deviation according to Eq. (3) will lead to stationary coherent energy andphase oscillations of the whole bunch with respect to the hypothetical particle movingisochronously, if the slope of the accelerating voltage as function of the phase is positive:if the bunch crosses the rf cavity at a phase too early (late), the energy gain is less(larger), and hence it will become slower (faster). Noncentral particles with Ar ^ 0 willexecute incoherent synchrotron oscillations with respect to the centre of the bunch. Dueto the difference concerning the Ar - term in Eq. (3) the incoherent oscillation numberis somewhat less than the coherent one.
Note the fundamental difference between the conventional isochronous cyclotron andthe separated-orbit cyclotron. In the first one, the 'isochronous field' is chosen such thatthe terms on the right hand side of Eq. (3) cancel out each other. Longitudinally theparticles are not fixed. In the separated-orbit cyclotron particles with proper injectionenergy and phase will follow the fixed spiral path. The magnetic field setting follows thetracking process. The particles are strongly focused even longitudinally.
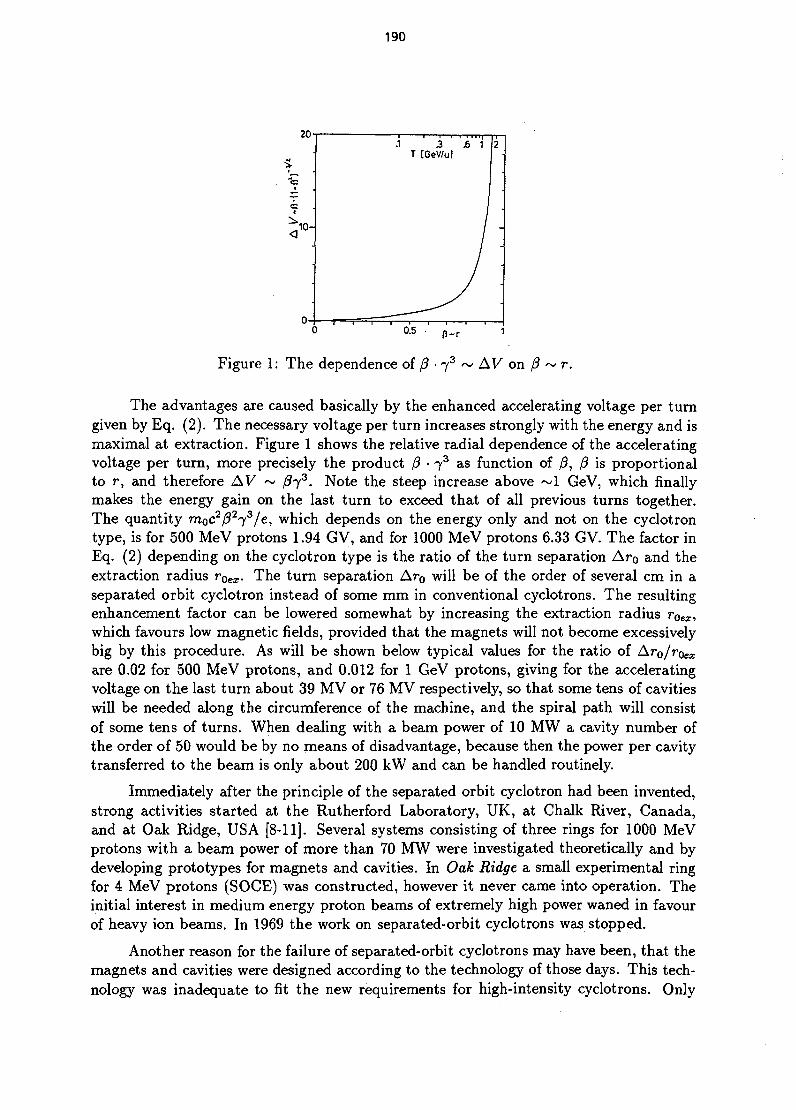
190
n~r
Figure 1: The dependence of j3 • j 3 ~ AV on ft ~ r.
The advantages are caused basically by the enhanced accelerating voltage per turngiven by Eq. (2). The necessary voltage per turn increases strongly with the energy and ismaximal at extraction. Figure 1 shows the relative radial dependence of the acceleratingvoltage per turn, more precisely the product 0 • j 3 as function of /?, /? is proportionalto r, and therefore AV ~ 0j3. Note the steep increase above ~1 GeV, which finallymakes the energy gain on the last turn to exceed that of all previous turns together.The quantity moc2/3273/e, which depends on the energy only and not on the cyclotrontype, is for 500 MeV protons 1.94 GV, and for 1000 MeV protons 6.33 GV. The factor inEq. (2) depending on the cyclotron type is the ratio of the turn separation Ar0 and theextraction radius rOex. The turn separation Ar0 will be of the order of several cm in aseparated orbit cyclotron instead of some mm in conventional cyclotrons. The resultingenhancement factor can be lowered somewhat by increasing the extraction radius rQex,which favours low magnetic fields, provided that the magnets will not become excessivelybig by this procedure. As will be shown below typical values for the ratio of Aro/roex
are 0.02 for 500 MeV protons, and 0.012 for 1 GeV protons, giving for the acceleratingvoltage on the last turn about 39 MV or 76 MV respectively, so that some tens of cavitieswill be needed along the circumference of the machine, and the spiral path will consistof some tens of turns. When dealing with a beam power of 10 MW a cavity number ofthe order of 50 would be by no means of disadvantage, because then the power per cavitytransferred to the beam is only about 200 kW and can be handled routinely.
Immediately after the principle of the separated orbit cyclotron had been invented,strong activities started at the Rutherford Laboratory, UK, at Chalk River, Canada,and at Oak Ridge, USA [8-11]. Several systems consisting of three rings for 1000 MeVprotons with a beam power of more than 70 MW were investigated theoretically and bydeveloping prototypes for magnets and cavities. In Oak Ridge a small experimental ringfor 4 MeV protons (SOCE) was constructed, however it never came into operation. Theinitial interest in medium energy proton beams of extremely high power waned in favourof heavy ion beams. In 1969 the work on separated-orbit cyclotrons was stopped.
Another reason for the failure of separated-orbit cyclotrons may have been, that themagnets and cavities were designed according to the technology of those days. This tech-nology was inadequate to fit the new requirements for high-intensity cyclotrons. Only
191
with superconductivity can full use be made of the advantages of the separated orbitcyclotron. However at that time superconductivity was not yet a well established tech-nology. High-field superconducting alloys able to carry extremely high-current densitieswere not discovered before the late 1950s and early 1960s. It took another 10 to 15 years,until the reduction in current carrying capacity of superconducting wires when woundinto a coil (degradation) was understood and removed, so that big superconducting mag-nets could be operated reliably and finally were incorporated into accelerators. The firstcyclotron with a superconducting magnet started to operate not before 1982 at Michigan,USA [12]. The development of rf superconductivity occured even later. Though the veryfirst superconducting accelerating structures as parts of an accelerator came into opera-tion successfully already in the late 1970s [13], it still needed almost ten years to finallyestablish this technology.
3 SUPERCONDUCTING SEPARATED-ORBIT CYCLOTRONS3.1 Principles of design
3.1.1 Superconducting-channel magnets
In 1983 the SOC was proposed again, this time starting with the design of thesuperconducting magnets [14, 15]. The very high current density of superconductingcables makes possible the use of channel magnets. The channel magnets consist of narrowsuperconducting cable beams on the left and right of the particle beam within a coldrectangular channel of steel (windowframe type). Figure 2 shows a radial cross section oftwo combined channels for neighbouring orbits of the spiral path. If the magnetizationstays below saturation (say B < 1.9 T) the ampere-turns of the coils per mm height ofthe window is less than 1512 A/mm.
(Where Bgaphgap > Bsteeilsteei/fi, with lsteei the length of flux lines in the steel and fi therelative permeability).
Due to the rather low magnetic induction the overall current density in the coils canbe chosen as high as 500 A/mm, which is still far from the critical limits of customarysuperconducting cables (with a copper-to-NbTi ratio of a ~ 1.4, and at a temperatureof 4.5 K, see Fig. 3). Hence the width of the cable beams on both sides of the windowneed not be more than bcah = 3 mm. This is small in comparision to the total width of achannel, which is determined by the turn separation Aro. The magnetic flux between thetwo cable beams in the window is returned immediately in the adjacent steel frame. Inorder to lead the flux without saturation, the width of the steel has to be the same as theinternal width bint of the window between the cables (plus bcab) multiplied by the ratio ofBmax/Bsat, where Bmax is the maximum induction needed in the channel. The internalwidth is given by:
Ar0 - 3 bcab . .hnt ^ 5 (5)
I +
The radial aperture for the beam is additionally reduced some percent by a copper pipe,which serves as support and shield for the coil (see below). With Aro = 10 cm and Bmax
= 1.75 T the radial aperture would be bapx ~ 4.3 cm. The axial aperture could easily be

192
Figure 2: Radial cross section of a magnet sector.
3-
2- Test
i g n
BIT] U
Figure 3: Critical currents of a cable (0.7 x 12.9 mm2) consisting of 14 strands ($ = 0.4mm, Cu/NbTi = 1.35, 56 filaments).
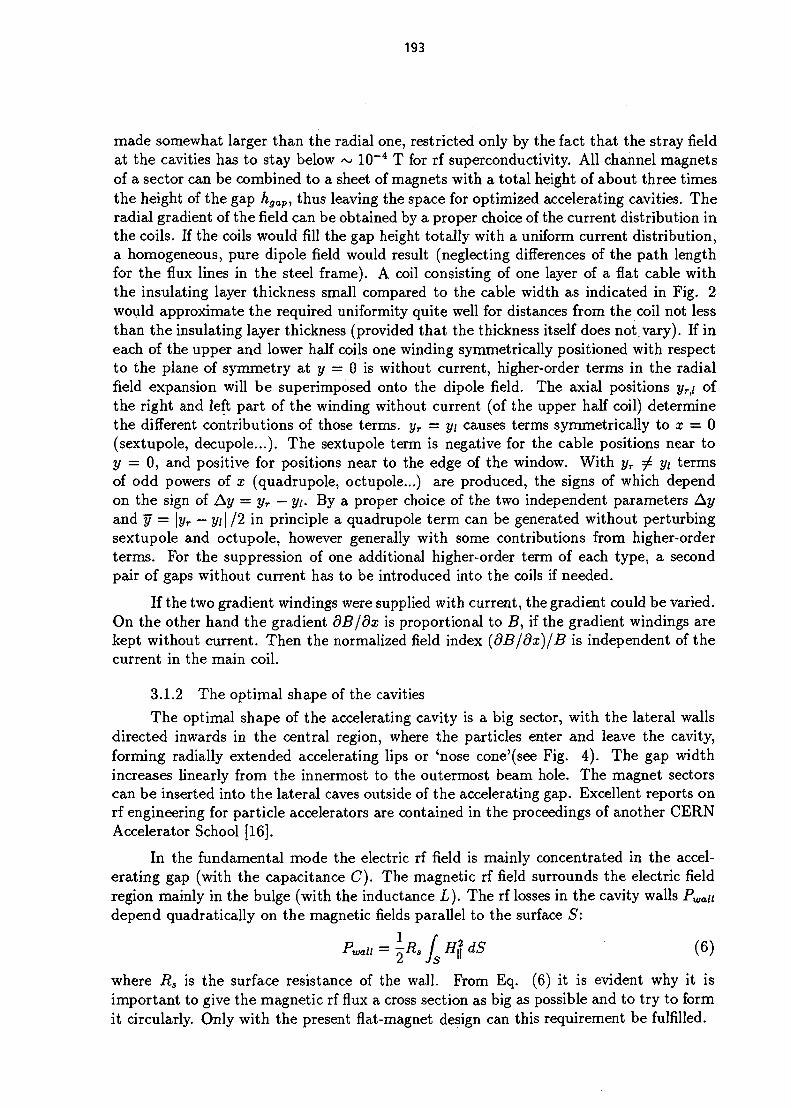
193
made somewhat larger than the radial one, restricted only by the fact that the stray fieldat the cavities has to stay below ~ 10~4 T for rf superconductivity. All channel magnetsof a sector can be combined to a sheet of magnets with a total height of about three timesthe height of the gap hgap, thus leaving the space for optimized accelerating cavities. Theradial gradient of the field can be obtained by a proper choice of the current distribution inthe coils. If the coils would fill the gap height totally with a uniform current distribution,a homogeneous, pure dipole field would result (neglecting differences of the path lengthfor the flux lines in the steel frame). A coil consisting of one layer of a flat cable withthe insulating layer thickness small compared to the cable width as indicated in Fig. 2would approximate the required uniformity quite well for distances from the coil not lessthan the insulating layer thickness (provided that the thickness itself does not. vary). If ineach of the upper and lower half coils one winding symmetrically positioned with respectto the plane of symmetry at y = 0 is without current, higher-order terms in the radialfield expansion will be superimposed onto the dipole field. The axial positions yTjt ofthe right and left part of the winding without current (of the upper half coil) determinethe different contributions of those terms. yT = yi causes terms symmetrically to x = 0(sextupole, decupole...). The sextupole term is negative for the cable positions near toy = 0, and positive for positions near to the edge of the window. With yr =£ y\ termsof odd powers of x (quadrupole, octupole...) are produced, the signs of which dependon the sign of Ay = yr — y\. By a proper choice of the two independent parameters Ayand y = \yr — Vi\ /2 in principle a quadrupole term can be generated without perturbingsextupole and octupole, however generally with some contributions from higher-orderterms. For the suppression of one additional higher-order term of each type, a secondpair of gaps without current has to be introduced into the coils if needed.
If the two gradient windings were supplied with current, the gradient could be varied.On the other hand the gradient dB/dx is proportional to B, if the gradient windings arekept without current. Then the normalized field index (dB/dx)/B is independent of thecurrent in the main coil.
3.1.2 The optimal shape of the cavities
The optimal shape of the accelerating cavity is a big sector, with the lateral wallsdirected inwards in the central region, where the particles enter and leave the cavity,forming radially extended accelerating lips or 'nose cone'(see Fig. 4). The gap widthincreases linearly from the innermost to the outermost beam hole. The magnet sectorscan be inserted into the lateral caves outside of the accelerating gap. Excellent reports onrf engineering for particle accelerators are contained in the proceedings of another CERNAccelerator School [16].
In the fundamental mode the electric rf field is mainly concentrated in the accel-erating gap (with the capacitance C). The magnetic rf field surrounds the electric fieldregion mainly in the bulge (with the inductance L). The rf losses in the cavity walls Pwaiidepend quadratically on the magnetic fields parallel to the surface S:
wall = \R*LHi d S
where Rs is the surface resistance of the wall. From Eq. (6) it is evident why it isimportant to give the magnetic rf flux a cross section as big as possible and to try to formit circularly. Only with the present flat-magnet design can this requirement be fulfilled.
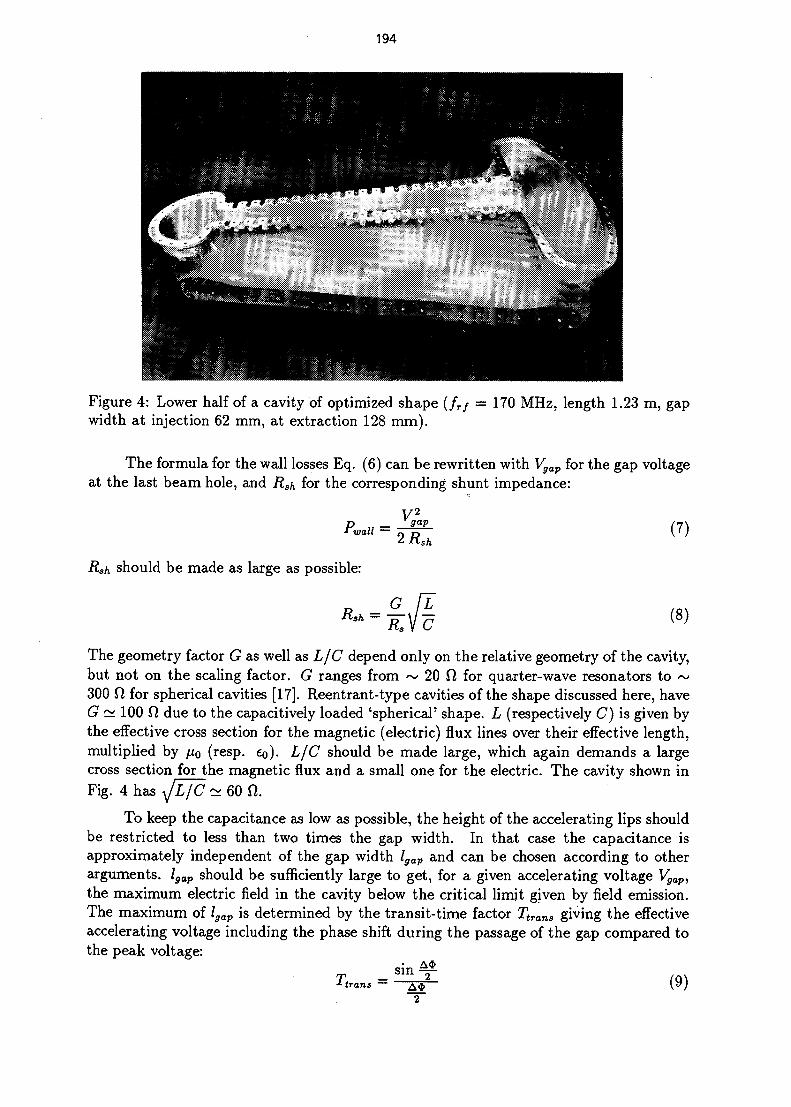
194
Figure 4: Lower half of a cavity of optimized shape (/ r / = 170 MHz, length 1.23 m, gapwidth at injection 62 mm, at extraction 128 mm).
The formula for the wall losses Eq. (6) can be rewritten with Vgap for the gap voltageat the last beam hole, and Rsh for the corresponding shunt impedance:
V2
p ygapwaU " 2 Rsh
(7)
Rsh should be made as large as possible:
Rsh_ G _ f l~ Rs\lC
(8)
The geometry factor G as well as L/C depend only on the relative geometry of the cavity,but not on the scaling factor. G ranges from ~ 20 fl for quarter-wave resonators to ~300 0 for spherical cavities [17]. Reentrant-type cavities of the shape discussed here, haveG ~ 100 Q due to the capacitively loaded 'spherical' shape. L (respectively C) is given bythe effective cross section for the magnetic (electric) flux lines over their effective length,multiplied by fi0 (resp. e0)- L/C should be made large, which again demands a largecross section for the magnetic flux and a small one for the electric. The cavity shown inFig. 4 has <JL~JC ~ 60 ft.
To keep the capacitance as low as possible, the height of the accelerating lips shouldbe restricted to less than two times the gap width. In that case the capacitance isapproximately independent of the gap width lgap and can be chosen according to otherarguments. lgap should be sufficiently large to get, for a given accelerating voltage Vgap,the maximum electric field in the cavity below the critical limit given by field emission.The maximum of lgap is determined by the transit-time factor Ttrans giving the effectiveaccelerating voltage including the phase shift during the passage of the gap compared tothe peak voltage:
(9)
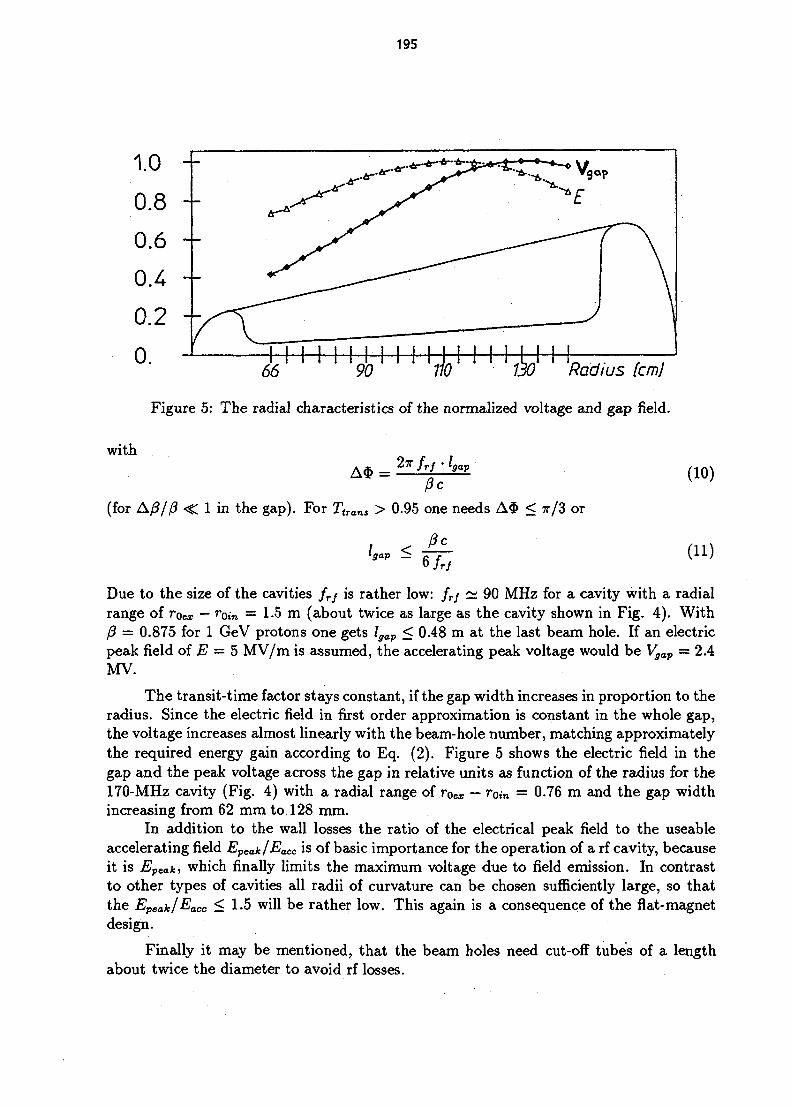
195
0. 66 90' ' ' '110' ' '• '130' ' Radius [cm]
Figure 5: The radial characteristics of the normalized voltage and gap field.
withA * _ ~T frf ' 'gap
fie(for Afi/fi < 1 in the gap). For T t rons > 0.95 one needs A$ < TT/3 or
Igap S6/r/
(10)
(11)
Due to the size of the cavities frj is rather low: fTj ~ 90 MHz for a cavity with a radialrange of roex — rOin = 1.5 m (about twice as large as the cavity shown in Fig. 4). WithP = 0.875 for 1 GeV protons one gets lgap < 0.48 m at the last beam hole. If an electricpeak field of E = 5 MV/m is assumed, the accelerating peak voltage would be Vgap = 2.4MV.
The transit-time factor stays constant, if the gap width increases in proportion to theradius. Since the electric field in first order approximation is constant in the whole gap,the voltage increases almost linearly with the beam-hole number, matching approximatelythe required energy gain according to Eq. (2). Figure 5 shows the electric field in thegap and the peak voltage across the gap in relative units as function of the radius for the170-MHz cavity (Fig. 4) with a radial range of rOeic — ro,n = 0.76 m and the gap widthincreasing from 62 mm to 128 mm.
In addition to the wall losses the ratio of the electrical peak field to the useableaccelerating field Epeak/Eacc is of basic importance for the operation of a rf cavity, becauseit is Epeaki which finally limits the maximum voltage due to field emission. In contrastto other types of cavities all radii of curvature can be chosen sufficiently large, so thatthe EpeaklEacc < 1.5 will be rather low. This again is a consequence of the flat-magnetdesign.
Finally it may be mentioned, that the beam holes need cut-off tubes of a lengthabout twice the diameter to avoid rf losses.
196
3.1.3 The need for rf superconductivity
During the first period of the SOC development in the early 1960s a system of threerings was discussed for 1 GeV protons, containing in total iVcov = 47 cavities, each about8 m long, with total wall losses of 28 MW [9]. Planning today a corresponding systemof cyclotrons for a beam power Pbeam = 10 MW one has to make the rf-to-beam-powerconversion efficiency T) close to one:
•*6eam •< f i o \
•*ibeam ~r •* 'cov • 'wo/ /
To achieve this, the wall losses have to be reduced fundamentally:
Ncav • Pwall <C Pbeam (13)
can be writtenPbeam h ' 0.6 Vgap • Ncav • Nturn (14)
with Ib the beam current, 0.6 Vgap the average voltage gain per beam hole, Ncav — 40 thenumber of cavities of the last, largest ring and Ntum = 1 + (roex — ro,n)/Aro = 1 + 1.5m/0.1 m = 16 the number of turns at a turn separation Ar0 = 0.1 m. Eqs. (7), (12) and(14) then result in:
\.2G^jjNcavNt1iTn 1.2-100-60-40-16
(15)
or Rs < 0.6 mfi (15a)
for a beam current of Ib = 10 mA. The surface resistance of copper at / r / = 90 MHz anda temperature of 300 K is 2.5 mft, far above the limit. However with rf superconductivitya surface resistance of less than Rs < 10~4 mf) at 90 MHz and 4.5 K can be obtained.Even if the effective cryogenic efficiency for removal of the wall losses at the temperatureof 4.2 K is assumed to be about 7?cryO — 2 • 10~3 the condition (13) will be kept.
The wall losses in superconducting cavities are caused by the normal-conductingelectrons, being accelerated by the rf fields in a thin surface layer. The surface resistance,which enters into the wall losses according to Eq. (6), increases with the frequencyapproximately as f2 and goes down with decreasing temperature. The experimental dataare described well by the empirical relation
Rs
Here A and a are factors depending on the material. The first term in Eq. (16) is theBCS resistance, following from the BCS theory. The second term is the residual resistance,which is temperature independent and not related to the superconducting surface. Normalconducting spots and dielectrics on the surface may contribute to Rres. Figure 6 showsthe frequency dependence of the BCS surface resistance of Pb, PbSn (4 Sn, 96 Pb atoms),and Nb at 4.2 K [17, 18]. The critical temperatures are rc(Pb) = 7.2 K, Tc(PbSn) =
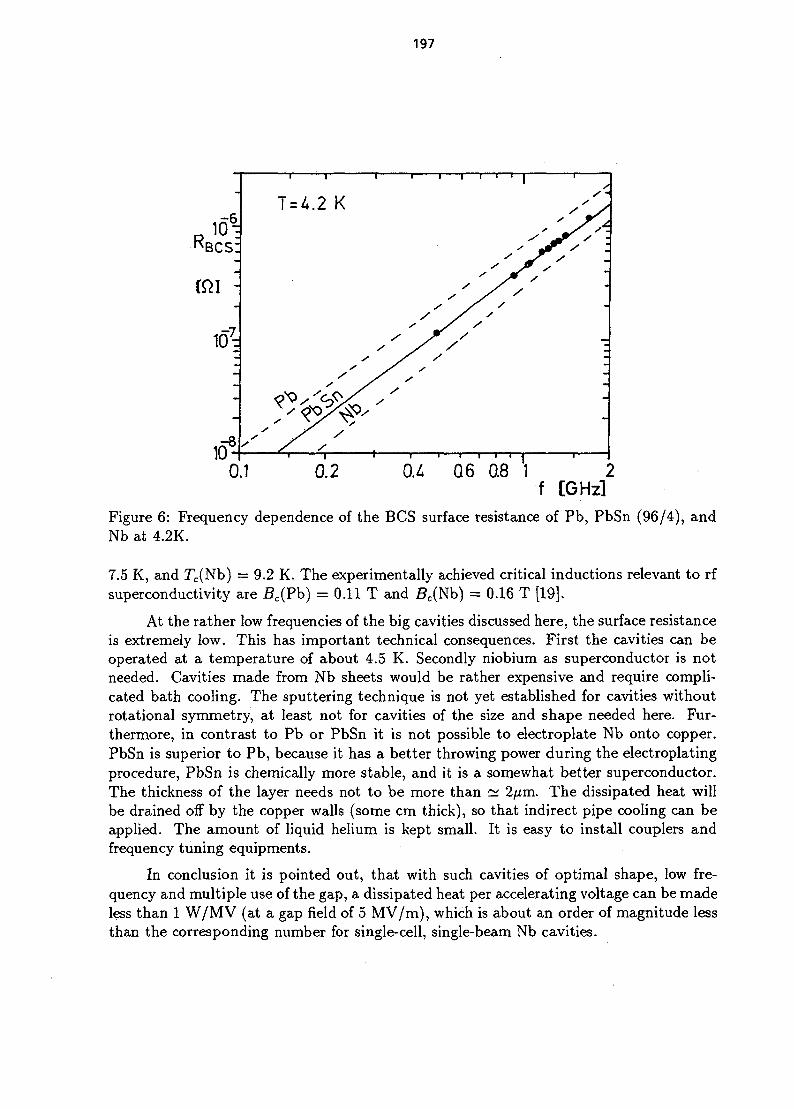
197
10 ~RBCS:
---
-8JL/
i
T =
'' /
/ 1 1/
Ss
1 ' ^
' r s :
s ~
1 . 1 1 1 1 1 1
0.1 0.2 0.4 Q6 0.8 1f [GHz]
Figure 6: Frequency dependence of the BCS surface resistance of Pb, PbSn (96/4), andNb at 4.2K.
7.5 K, and Tc(Nb) = 9.2 K. The experimentally achieved critical inductions relevant to rfsuperconductivity are 5c(Pb) = 0.11 T and £c(Nb) = 0.16 T [19].
At the rather low frequencies of the big cavities discussed here, the surface resistanceis extremely low. This has important technical consequences. First the cavities can beoperated at a temperature of about 4.5 K. Secondly niobium as superconductor is notneeded. Cavities made from Nb sheets would be rather expensive and require compli-cated bath cooling. The sputtering technique is not yet established for cavities withoutrotational symmetry, at least not for cavities of the size and shape needed here. Fur-thermore, in contrast to Pb or PbSn it is not possible to electroplate Nb onto copper.PbSn is superior to Pb, because it has a better throwing power during the electroplatingprocedure, PbSn is chemically more stable, and it is a somewhat better superconductor.The thickness of the layer needs not to be more than ~ 2//m. The dissipated heat willbe drained off by the copper walls (some cm thick), so that indirect pipe cooling can beapplied. The amount of liquid helium is kept small. It is easy to install couplers andfrequency tuning equipments.
In conclusion it is pointed out, that with such cavities of optimal shape, low fre-quency and multiple use of the gap, a dissipated heat per accelerating voltage can be madeless than 1 W/MV (at a gap field of 5 MV/m), which is about an order of magnitude lessthan the corresponding number for single-cell, single-beam Nb cavities.
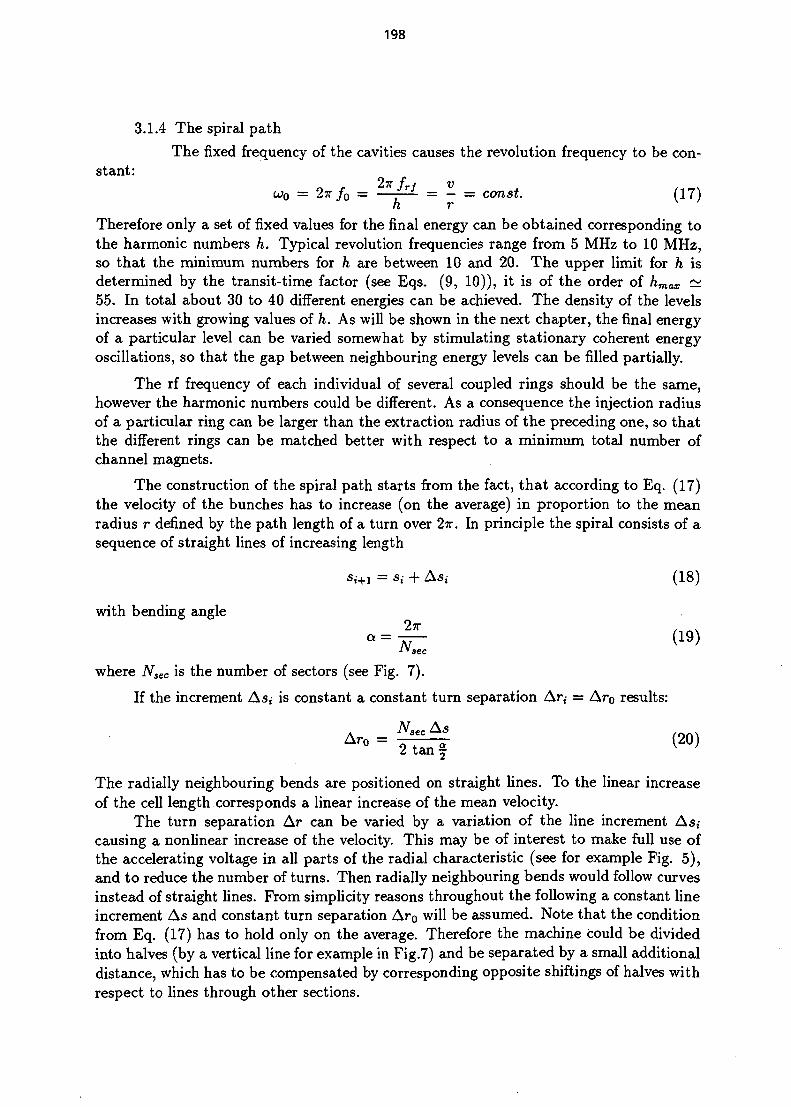
198
3.1.4 The spiral path
The fixed frequency of the cavities causes the revolution frequency to be con-stant:
co0 = 27T/0 = ^ r ^ - = - = const. (17)
Therefore only a set of fixed values for the final energy can be obtained corresponding tothe harmonic numbers h. Typical revolution frequencies range from 5 MHz to 10 MHz,so that the minimum numbers for h are between 10 and 20. The upper limit for h isdetermined by the transit-time factor (see Eqs. (9, 10)), it is of the order of hmax ~55. In total about 30 to 40 different energies can be achieved. The density of the levelsincreases with growing values of h. As will be shown in the next chapter, the final energyof a particular level can be varied somewhat by stimulating stationary coherent energyoscillations, so that the gap between neighbouring energy levels can be filled partially.
The rf frequency of each individual of several coupled rings should be the same,however the harmonic numbers could be different. As a consequence the injection radiusof a particular ring can be larger than the extraction radius of the preceding one, so thatthe different rings can be matched better with respect to a minimum total number ofchannel magnets.
The construction of the spiral path starts from the fact, that according to Eq. (17)the velocity of the bunches has to increase (on the average) in proportion to the meanradius r defined by the path length of a turn over 27r. In principle the spiral consists of asequence of straight lines of increasing length
s,-+i = Si + Asi (18)
with bending angle
jwhere JVsec is the number of sectors (see Fig. 7).
If the increment As,- is constant a constant turn separation Ar,- = Ar0 results:
The radially neighbouring bends are positioned on straight lines. To the linear increaseof the cell length corresponds a linear increase of the mean velocity.
The turn separation Ar can be varied by a variation of the line increment As,-causing a nonlinear increase of the velocity. This may be of interest to make full use ofthe accelerating voltage in all parts of the radial characteristic (see for example Fig. 5),and to reduce the number of turns. Then radially neighbouring bends would follow curvesinstead of straight lines. From simplicity reasons throughout the following a constant lineincrement As and constant turn separation Ar0 will be assumed. Note that the conditionfrom Eq. (17) has to hold only on the average. Therefore the machine could be dividedinto halves (by a vertical line for example in Fig.7) and be separated by a small additionaldistance, which has to be compensated by corresponding opposite shiftings of halves withrespect to lines through other sections.
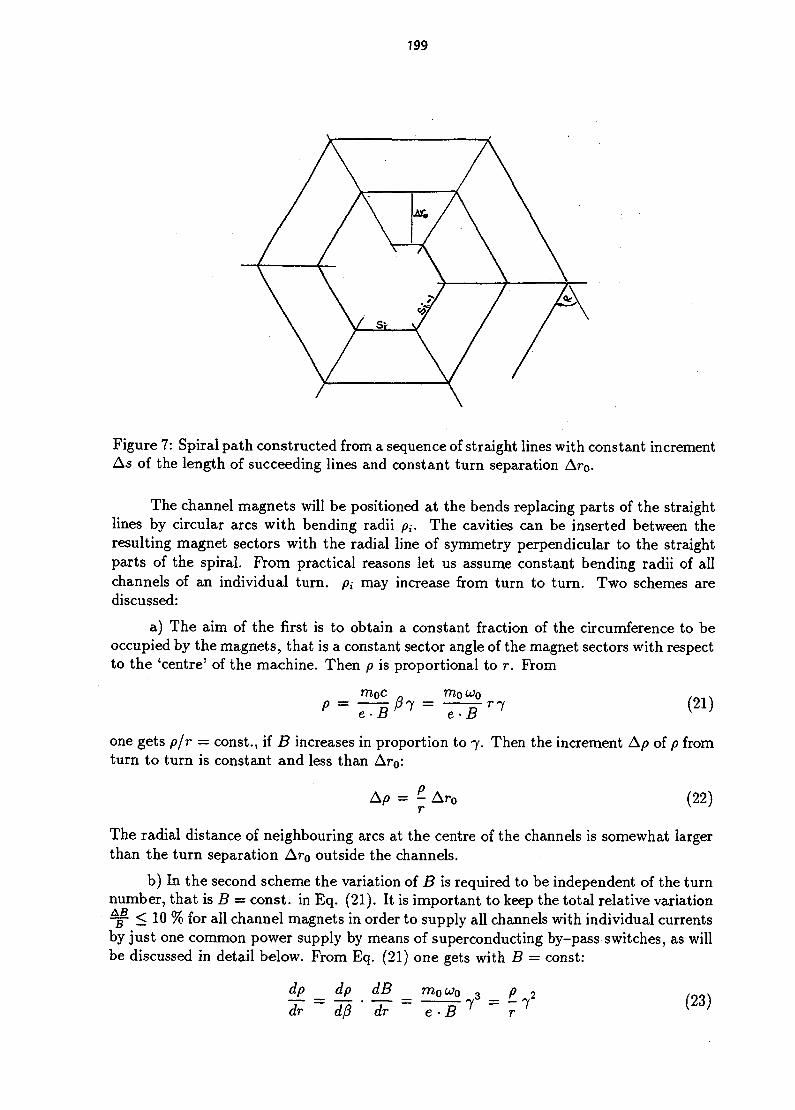
199
Figure 7: Spiral path constructed from a sequence of straight lines with constant incrementAs of the length of succeeding lines and constant turn separation
The channel magnets will be positioned at the bends replacing parts of the straightlines by circular arcs with bending radii pt. The cavities can be inserted between theresulting magnet sectors with the radial line of symmetry perpendicular to the straightparts of the spiral. From practical reasons let us assume constant bending radii of allchannels of an individual turn, pi may increase from turn to turn. Two schemes arediscussed:
a) The aim of the first is to obtain a constant fraction of the circumference to beoccupied by the magnets, that is a constant sector angle of the magnet sectors with respectto the 'centre' of the machine. Then p is proportional to r. From
p = e-B PI =moWo
e-B(21)
one gets pjr — const., if B increases in proportion to 7. Then the increment A/9 of p fromturn to turn is constant and less than Ar0:
A/9 = £ Ar0r(22)
The radial distance of neighbouring arcs at the centre of the channels is somewhat largerthan the turn separation Ar0 outside the channels.
b) In the second scheme the variation of B is required to be independent of the turnnumber, that is B — const, in Eq. (21). It is important to keep the total relative variation%- < 10 % for all channel magnets in order to supply all channels with individual currentsby just one common power supply by means of superconducting by-pass switches, as willbe discussed in detail below. From Eq. (21) one gets with B = const:
dp dp dB_~d7 e-B
_ P Ji" r 7 (23)

200
increases from turn to turn and may become even larger than Ar0 , so that thedistance of neighbouring arcs in the centre is somewhat less than Ar0, and the part of thecircumference occupied by the magnets is maximal on the last turn. For constant bendingradius pi per turn there still will be a small variation of the induction ^ = ^ = ^f 72
along each turn due to the momentum increase. In addition some variation of B willoccur from the stationary, coherent longitudinal motion of the bunch (see next section).
The cell length of turn number i (= l,2..Nturn) and sector number k (= l,2..Nsec)defined by the path length between the centres of the gaps of succeeding cavities can bewritten with so a constant length:
h - 2tan - (24)m=ln=l Z
3.2 Longitudinal beam dynamics
The longitudinal beam dynamics in a separated orbit cyclotron differs consid-erably from that of all previous accelerators [20]. Therefore it will be dealt with in moredetail in this section.
3.2.1 The dynamics of the central particle
First the longitudinal dynamics of the central particle are discussed. Thecentral particle is defined to follow the spiral path without any transverse deviations. Itslongitudinal dynamics are characterized by the kinetic energy T(m) and the rf phase 0(m),when the particle is at the centre of the cavity, with the turn number m as the independentvariable and m = 0 at the first cavity. The acceleration occurs in discontinuous steps.However many cavities will be crossed during one synchrotron oscillation. Thereforecontinuous differential equations can be written for T(m) and @(m) instead of differenceequations. Derivatives with respect to m are denoted by a prime.
The energy T(m) may be subdivided into a large, well known part Tis(m) and asmall residual term AT(m):
T(m) = Tia(m) 4- AT(m) (25)
Tis(m) is the energy of an isochronous particle, which by definition would need alwaysthe same time At per cell length. The velocity of the isochronous particle in units of chas to increase according to $ s(ra) = jfj£ with s,-,fc from Eq. (24). Then Tis(m) as wellas the derivatives T'is{m) and T"s{m) are known functions of m.
The first of two equations leading to a differential equation for AT concerns theenergy gain per turn:
T'{m) = AV(m) sin0(m) (26)
Here AV is the sum of the voltage amplitudes of all cavities per turn, multiplied bythe transit time factor, which is taken to be constant throughout the whole machine.The second equation describes the phase shift per turn due to deviations of the actualrevolution frequency from that of the isochronous particle / , s:

201
Both equations combined give the fundamental differential equation for AT(m):
AT" - ^rAT' +-J^).1Ly/AV>-(T>s + ATf.AT = 7?. • | £ - Jf (28)
The general solution of Eq. (28) is the sum of a particular (equilibrium) solution ATe(m)and an oscillatory solution ATs(m):
AT(m) = ATe(m) + ATs(m) (29)
The equilibrium solution.
In general Eq. (28) cannot be solved analytically. To get an approximate solutionfor ATe(m), it is first assumed that
2T'is • AT'e + ATe'2| < AV2 - T'is
2 (30)
This assumption will be justified, when the solution ATe(m) has been found. With thisEq. (28) becomes a nonhomogeneous linear differential equation with variable coefficients:
ATe" + b(m) • ATe' + q(m) • ATe = p(m) (31)
with
-AV'b(m) =
AV
- T'is2 (32)
AVPi") - l i
To give a realistic example Fig. 8 shows b(m), q(m), and p(m) for the TRITRON, whichwill be discussed in detail below and which shall accelerate particles on 20 turns with sixcavities of the type shown in Fig. 4 and Fig. 5 respectively . All three coefficients areknown, smooth functions of m and can be approximated by finite power series. ThereforeATe(m) can be written as a power series too:
ATe(m) = e0 + ca • m + e2 • m2 + • • - (33)
Inserted in Eq. (31) this gives a system of equations for the e,-. For the first two termsone gets
Co _ Po • (bi +qo) - Px-bp ^ Po9o • (bi + <?o) — ?i • &o qo
(34)
C l = ?i • Po ~ <7o • Pi ^ Elqi-b0 - q0 -(h + q0) q0
Generally ^0 is dominant. Therefore a good approximation for the equilibrium solution isgiven by
) * * § (35)
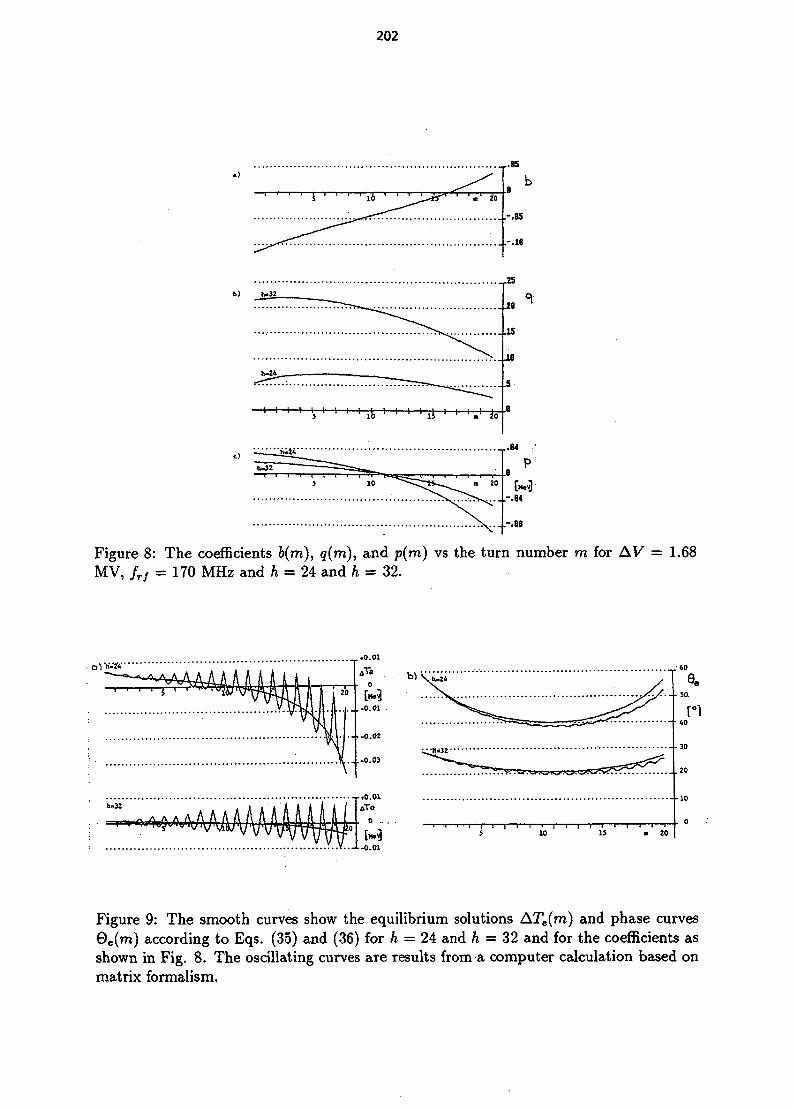
202
b) h-32
Figure 8: The coefficients 6(m), q(m), and p(m) vs the turn number m for AV = 1.68MV, frj = 170 MHz and ft = 24 and h = 32.
_.0.01•60
Figure 9: The smooth curves show the equilibrium solutions ATe(m) and phase curves0e(m) according to Eqs. (35) and (36) for h = 24 and k = 32 and for the coefficients asshown in Fig. 8. The oscillating curves are results from a computer calculation based onmatrix formalism.
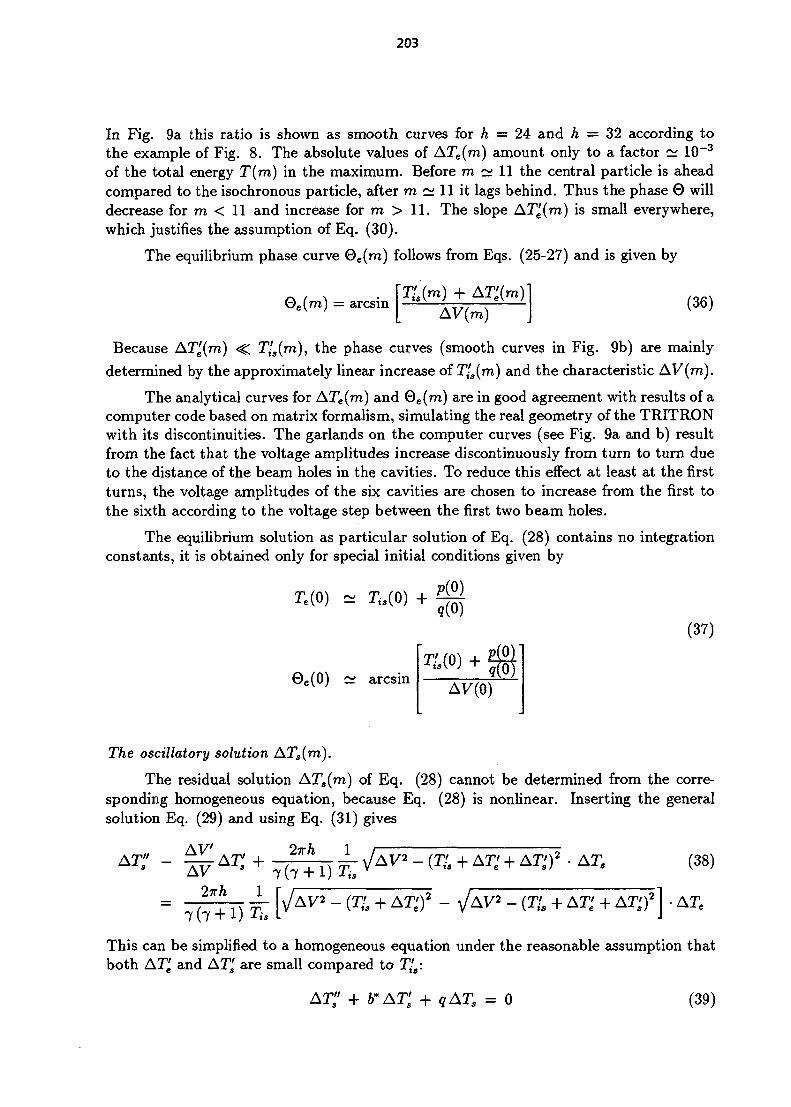
203
In Fig. 9a this ratio is shown as smooth curves for h = 24 and h = 32 according tothe example of Fig. 8. The absolute values of ATe(m) amount only to a factor ~ 10~3
of the total energy T{m) in the maximum. Before m ~ 11 the central particle is aheadcompared to the isochronous particle, after m ~ 11 it lags behind. Thus the phase 0 willdecrease for m < 11 and increase for m > 11. The slope AT;(ra) is small everywhere,which justifies the assumption of Eq. (30).
The equilibrium phase curve 0e(m) follows from Eqs. (25-27) and is given by
0e(m) = arcsinATe'(m)
AV(m)(36)
Because ATe'(m) <C T(s(m), the phase curves (smooth curves in Fig. 9b) are mainlydetermined by the approximately linear increase of T{s(m) and the characteristic AV(ra).
The analytical curves for ATe(m) and Qe(m) are in good agreement with results of acomputer code based on matrix formalism, simulating the real geometry of the TRITRONwith its discontinuities. The garlands on the computer curves (see Fig. 9a and b) resultfrom the fact that the voltage amplitudes increase discontinuously from turn to turn dueto the distance of the beam holes in the cavities. To reduce this effect at least at the firstturns, the voltage amplitudes of the six cavities are chosen to increase from the first tothe sixth according to the voltage step between the first two beam holes.
The equilibrium solution as particular solution of Eq. (28) contains no integrationconstants, it is obtained only for special initial conditions given by
Te(0) ~ Tis(0)
0e(O) ~ arcsin
m9(0)
T;M
(37)
The oscillatory solution ATs(m).
The residual solution ATs(ra) of Eq. (28) cannot be determined from the corre-sponding homogeneous equation, because Eq. (28) is nonlinear. Inserting the generalsolution Eq. (29) and using Eq. (31) gives
AV2%h
7(7 +
7 ( 7
~{TL
ATe' + ATS')2 • AT,
" { T L
(38)
This can be simplified to a homogeneous equation under the reasonable assumption thatboth ATe' and ATj are small compared to T{s:
AT; + b* AT; + qATs = o (39)

204
with
By factorization of
one obtains
with
_ (AVcos0eyAV cos 0e
ATs(m) =\
AV(m) cos0e(m)AV(0) cos0e(O) u
u" + q*u = 0
(b'V b"q = q ~ [2) ~ T
(40)
(41)
(42)
(43)
The quantity q* does not differ much from q, and it changes slowly with m. Thus anoscillatory solution
u = A(m) sin \P(m) (44)
can be inserted into Eq. (42), yielding two equations for A(m) and \I>(m):
(45)(46)
A" - AV'2 +q*A = 02A'W +AW = 0
The second one can be integrated once with AQ as integration constant to give
A = (47)
If ^ < 9*5 Eq. (45) can be integrated too with the result
* = nm + $o (48)
with tyo as second integration constant. Because of q* ~ const., one has
Q(m) ~ y/q* (49)
In Fig. 10 the function ^ for the above examples with h = 24 and ft = 32 are shown(curves). The oscillation numbers are of the order of 0.5, one oscillation needs only abouttwo turns. Indeed ^ <C q* is observed. Oscillation numbers calculated by the computercode simulating the discontinuous spiral orbit gave results (dots in Fig.lO), which arein good agreement with the curves. The small systematic deviations are caused by theimperfections of the continuous voltage amplitude function AV(m) mentioned above.
Finally the oscillating solution ATs(m) can be written as
ATs(m) = ATs0 • »?(m) • sin(fi(m) -m
with ATso, Vl/o constant and 7)(m) the amplitude function
(50)
ri{m) =AV(m) cosee(m)
AV(0) cosOe(0) (51)
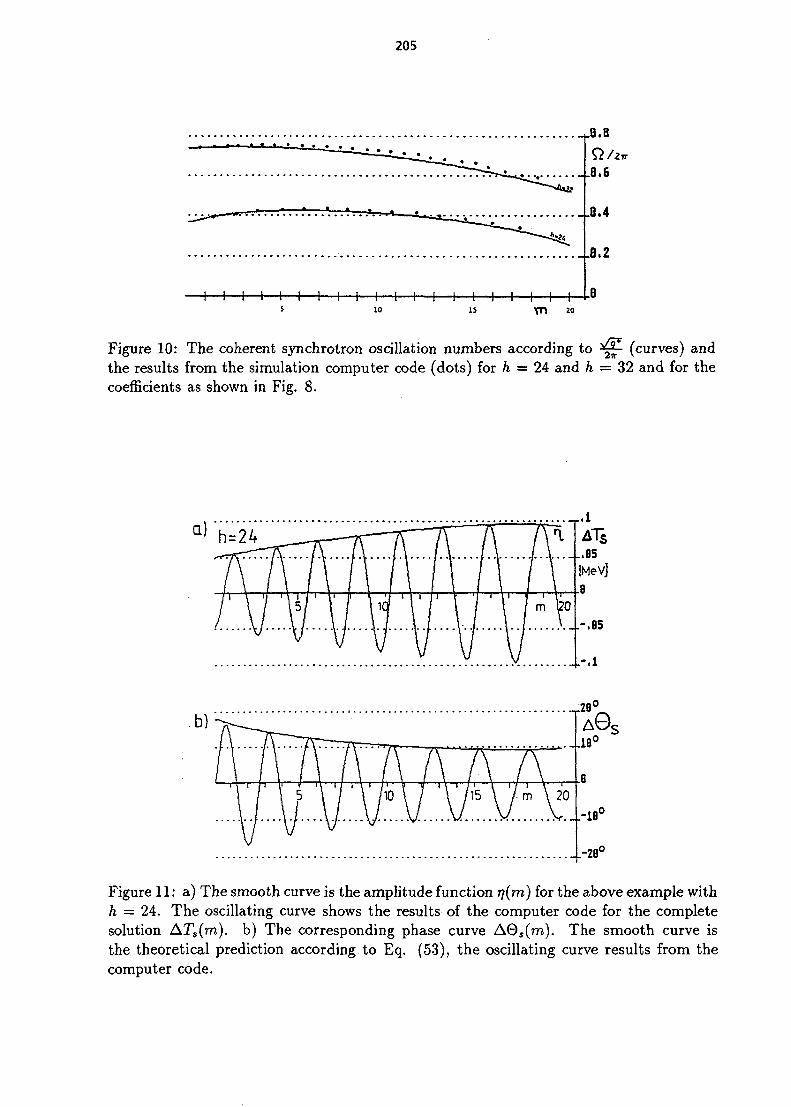
205
Figure 10: The coherent synchrotron oscillation numbers according tothe results from the simulation computer code (dots) for h — 24 and hcoefficients as shown in Fig. 8.
(curves) and32 and for the
Q) V-
Figure 11: a) The smooth curve is the amplitude function rj(m) for the above example withh = 24. The oscillating curve shows the results of the computer code for the completesolution ATs(m). b) The corresponding phase curve A0s(m). The smooth curve isthe theoretical prediction according to Eq. (53), the oscillating curve results from thecomputer code.
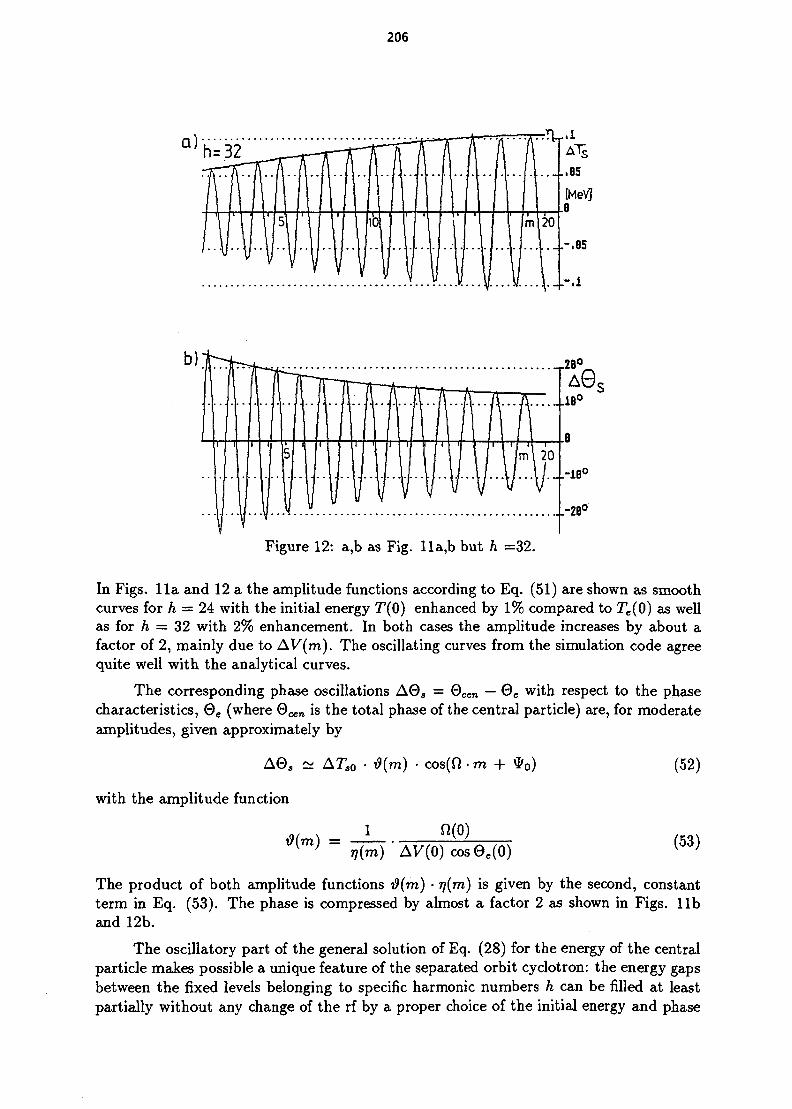
206
(MeVJ
28°
Figure 12: a,b as Fig. lla,b but h =32.
In Figs, l l a and 12 a the amplitude functions according to Eq. (51) are shown as smoothcurves for h = 24 with the initial energy 7\0) enhanced by 1% compared to Te(0) as wellas for h = 32 with 2% enhancement. In both cases the amplitude increases by about afactor of 2, mainly due to AV(m). The oscillating curves from the simulation code agreequite well with the analytical curves.
The corresponding phase oscillations AQS = 0cen — 0 e with respect to the phasecharacteristics, 0 e (where 0cen is the total phase of the central particle) are, for moderateamplitudes, given approximately by
~ ATs0 • •dim) • cos(ft • m +
with the amplitude function
cos 0e(O)
(52)
(53)
The product of both amplitude functions d(m) • r)(m) is given by the second, constantterm in Eq. (53). The phase is compressed by almost a factor 2 as shown in Figs, l iband 12b.
The oscillatory part of the general solution of Eq. (28) for the energy of the centralparticle makes possible a unique feature of the separated orbit cyclotron: the energy gapsbetween the fixed levels belonging to specific harmonic numbers h can be filled at leastpartially without any change of the rf by a proper choice of the initial energy and phase

207
(respectively rf-voltage amplitude), i.e. initial oscillations with definite amplitude andphase. The maximum value of ATS/T,S is limited by the noncentral particles. For a givenharmonic number h the central equilibrium phase 0 e has to fulfil
0 < 0 e < | - A0 6 (54)
where 2 A0j is the phase width of the bunch. The phase of noncentral particles has tostay below ~ to focus them. Thus in the maximum the amplitude of the phase oscillationsof the central particles may be
sO= | - 0 e - A0fc (55)
3.2.2 Longitudinal dynamics of noncentral particles
The energy Tnon and phase 0 n o n of noncentral particles generally differ fromthose of the central particle by ATnon and A0 n o n .
L non = Tis + ATe + ATS + ATnon (56)
Qnon = 0cen + A0 n o n (57)
For the energy gain per turn an equation corresponding to Eq. (26) can be set up:
Tnon = AV(m) smenon(m) (58)
The phase shift per turn of noncentral particles is determined by two terms:
2vh \ATe + ATS + ATnon 2 Arnon]non = ~ 7 ( 7 + l) I V ap ' 7 '~f-\ (59)
The first term in the brackets concerns the retardation and acceleration due to the velocityvariation with respect to the isochronous particle. The second term is due to the radialdeviation of noncentral particles from the spiral orbit because of deviations from theenergy of the central particle, neglecting coupling effects between the synchrotron andradial betatron oscillations. ap is the momentum compaction factor defined by the relation
dr Ap .„..
-7 = "'T <60>Generally ap varies slightly with the turn number m. It also relates the variation Ax ofthe radial beam width to the relative energy spread of noncentral particles,
ATnon (61)i
Using Eqs. (59) and (27) one gets
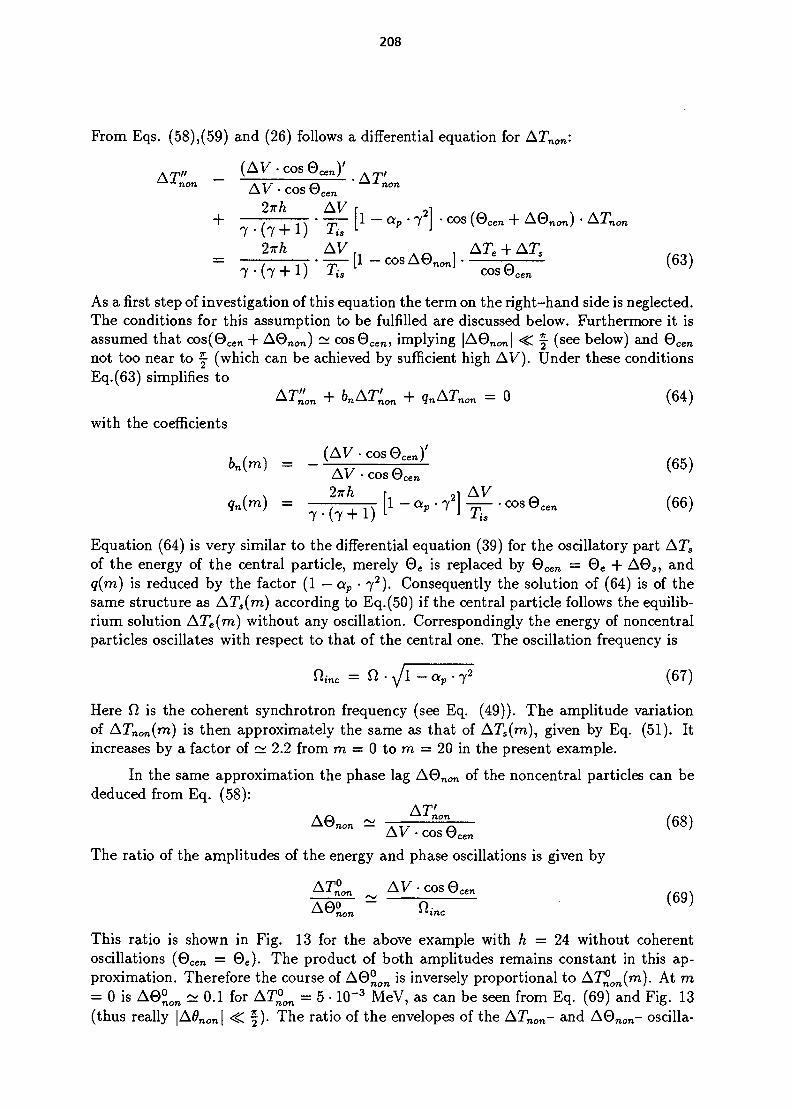
208
From Eqs. (58),(59) and (26) follows a differential equation for ATnon:
AT" - v cenJ -AT'AV-cos0 c e n
non
2wh AV r ,i+ , ^ • -jr [1 - ocp • 7 j • cos (0cen + A<dnon) • ATn
= , ^ ir^[l-cosA0non].— ' — (63)7- (7 + 1) T,s cos0cen
y
As a first step of investigation of this equation the term on the right-hand side is neglected.The conditions for this assumption to be fulfilled are discussed below. Furthermore it isassumed that cos(0cen -f A0n o n) ~ cos0cen , implying lAOndl -C § (see below) and 0 c e n
not too near to |- (which can be achieved by sufficient high AV). Under these conditionsEq.(63) simplifies to
AT^ n + 6nAT^on + qnATnon = 0 (64)
with the coefficients
CAT/.r^cA V(65)
AV a9 n ( m ) = 7 • (7 + 1
Equation (64) is very similar to the differential equation (39) for the oscillatory part AT"a
of the energy of the central particle, merely 0 e is replaced by 0 c e n = 0 e + AQS, andq(m) is reduced by the factor (1 — ap • j 2 ) . Consequently the solution of (64) is of thesame structure as ATs(m) according to Eq.(50) if the central particle follows the equilib-rium solution ATe(rn) without any oscillation. Correspondingly the energy of noncentralparticles oscillates with respect to that of the central one. The oscillation frequency is
72 (67)
Here fi is the coherent synchrotron frequency (see Eq. (49)). The amplitude variationof ATnon(m) is then approximately the same as that of AT$(m), given by Eq. (51). Itincreases by a factor of ~ 2.2 from m = 0 to m = 20 in the present example.
In the same approximation the phase lag A0 n o n of the noncentral particles can bededuced from Eq. (58):
A0 n o n ~ -rrr: li2^r (68)AV • cos 0c e n
The ratio of the amplitudes of the energy and phase oscillations is given by
^ (69)A0°non
This ratio is shown in Fig. 13 for the above example with h = 24 without coherentoscillations (0cen = 0e)- The product of both amplitudes remains constant in this ap-proximation. Therefore the course of A0° o n is inversely proportional to A7^on(m). At m= 0 is A0° o n ~ 0.1 for AT°on = 5 • 10~3 MeV, as can be seen from Eq. (69) and Fig. 13(thus really |A#non | <C f )• The ratio of the envelopes of the ATn o n- and A 0 n o n - oscilla-
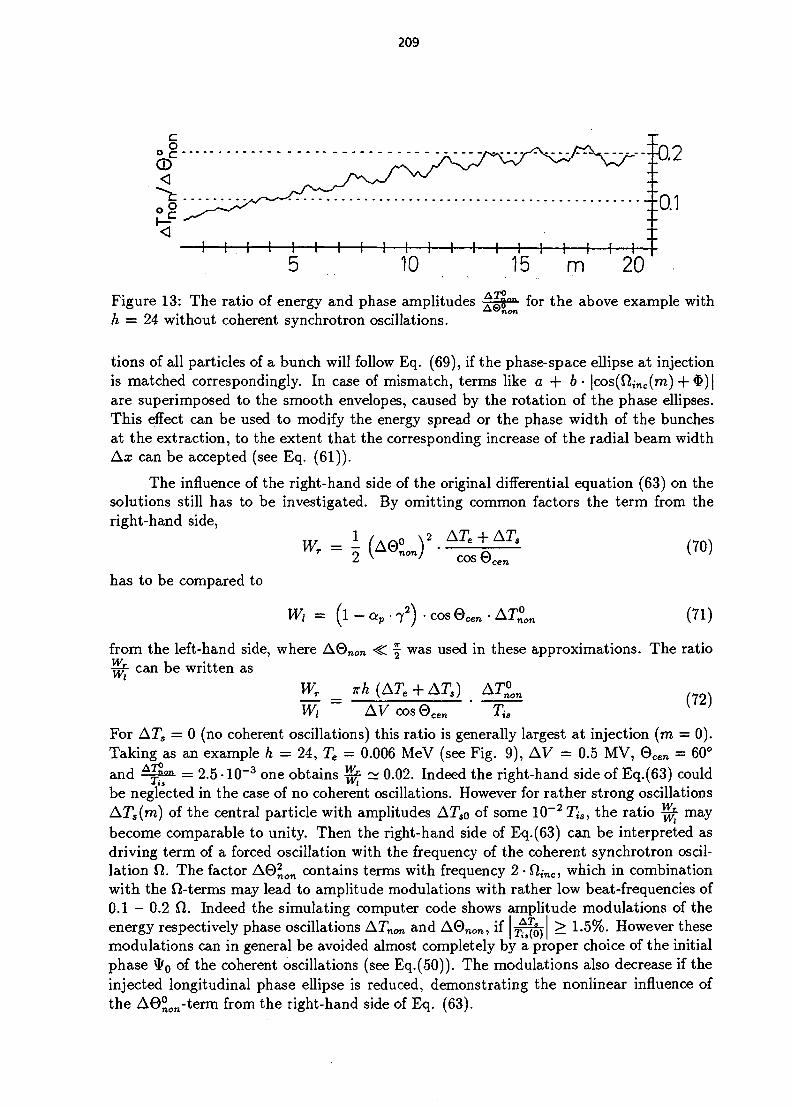
209
Figure 13: The ratio of energy and phase amplitudes AQg°" for the above example withh = 24 without coherent synchrotron oscillations.
tions of all particles of a bunch will follow Eq. (69), if the phase-space ellipse at injectionis matched correspondingly. In case of mismatch, terms like a + b • |cos(fi,nc(m) + $ ) |are superimposed to the smooth envelopes, caused by the rotation of the phase ellipses.This effect can be used to modify the energy spread or the phase width of the bunchesat the extraction, to the extent that the corresponding increase of the radial beam widthAx can be accepted (see Eq. (61)).
The influence of the right-hand side of the original differential equation (63) on thesolutions still has to be investigated. By omitting common factors the term from theright-hand side,
has to be compared to
wT = -
wt = ( i -
COS0,
0non
(70)
(71)
from the left-hand side, where ,•pj - can be written as
Wr
-C § was used in these approximations. The ratio
(72)Wi AVcos0 c e n Tis
For ATS = 0 (no coherent oscillations) this ratio is generally largest at injection (m = 0).Taking as an example h = 24, Te = 0.006 MeV (see Fig. 9), AV = 0.5 MV, 0 c e n = 60°and A
7?m = 2.5 • 10~3 one obtains ffi ~ 0.02. Indeed the right-hand side of Eq.(63) could
be neglected in the case of no coherent oscillations. However for rather strong oscillationsATs(m) of the central particle with amplitudes ATso of some 10~27;s, the ratio |pP maybecome comparable to unity. Then the right-hand side of Eq.(63) can be interpreted asdriving term of a forced oscillation with the frequency of the coherent synchrotron oscil-lation Cl. The factor A0£on contains terms with frequency 2 • f2,nc, which in combinationwith the Q-terms may lead to amplitude modulations with rather low beat-frequencies of0.1 - 0.2 fi. Indeed the simulating computer code shows amplitude modulations of theenergy respectively phase oscillations ATnon and A0 n o n , if ^TjL > 1.5%. However thesemodulations can in general be avoided almost completely by a proper choice of the initialphase $0 of the coherent oscillations (see Eq.(50)). The modulations also decrease if theinjected longitudinal phase ellipse is reduced, demonstrating the nonlinear influence ofthe A0°ore-term from the right-hand side of Eq. (63).
210
Another cause for the amplitude modulations could be an oscillating part of cos 0 c e n
in Eq. (66) and bn(m) (see Eq. 65)). Finally amplitude modulations may be initiated bythe change of the ratio of the axes of the longitudinal phase ellipse A&"m , which oscillates
non
according to Eq. (69), with the coherent oscillation frequency of Gcen this is about 1.5times the incoherent oscillation frequency fi,nc. By means of the simulating computercode it could be shown that by modification of the initial half axis ratio and tilt of thelongitudinal phase ellipse the modulations could be reduced.
3.3 Transverse beam dynamicsIn synchrotrons or storage rings with closed orbits the particles pass again and
again the same elements. Perturbations of the fields, the field gradients and nonlinearcontributions cause a resonant increase of the amplitudes of the betatron oscillations, ifthe betatron oscillation numbers Qx, Qy are within a stopband. The stopband width andthe growth rate of the amplitude are proportional to the field perturbation. Since thestopband width in reality is a shift of Q by a perturbation of the focusing power, it isindependent of the betatron oscillation amplitude for quadrupole errors (gradient errors,half-integer resonances), and it is proportional to that amplitude for sextupole errors(quadratic field perturbations, third-integer resonances). The equipotential lines for thetransverse motion are elliptical in the linear case. They will be deformed by quadraticfield perturbations to an approximately triangular shape with three saddle points of thepotential surface, where the particles could be lost. This description is strictly correctonly for azimuthally independent fields. In azimuthally varying fields resonances occurfor amplitudes above a critical limit given by
( 7 3 )
with AQ the shift of Q due to the perturbation, B" = d2B/dx2 on the length /, and /?here the /^-function [21]. Generally periodicities in the lattice and in the multipole patternmix to drive the resonances. In accelerators with closed orbits the Q-values are chosenwithin a window of the pattern of stopbands in the Q-diagram as big as possible.
In conventional cyclotrons the field has to obey the condition of isochronism, andthe Q-values cannot be fixed. Approximately Qx is given by J(1 — n) with the averagefield index n = — • = (•y2 — 1), thus Qx ~ 7. For final energies as high as 1 GeVstrong resonance stopbands have to be crossed. The particles pass many times the sameelements on their path of still some hundred of turns in total.
In a separated orbit cyclotron the situation is much less dangerous with respect toresonances [22]. The turn number is further reduced to some ten, and the course of theQ-values can be chosen in principle arbitrarily to stay between the stability limits givenby the focusing (too weak Q = 0 respectively too strong Q — iVsec/4). If the gradientwindings are operated without current, the field index n = — ^ • - is proportional top and thus will increase rapidly in any case (see section 3.3). If nevertheless resonanceproblems would arise the gradient could be varied by supplying the gradient windingswith currents.
In the separated orbit cyclotron a bunch passes each particular channel magnet onlyonce. From this point of view the separated orbit cyclotron represents a beam transfer
211
line. The bunches are guided along the spiral path through a sequence of cells. Each cellstarts with beam position probes for the radial x- and axial y-coordinates, followed by achannel magnet with combined bending and focusing, a straight path with the acceleratinggap, and is terminated by the position probes of the next cell. The beam has to be tracedfrom one position probe to the next, first with reduced intensity to allow complete beamloss without quenching the superconducting magnets or cavities. Starting with xi = 0at the first position probe the bending field of the intermediate channel magnet has tobe adjusted until x2 = 0 is reached for the beam position at the second probe. If therewould be an angular deviation xi ^ 0 at the first probe (which cannot be detected bythe probes), x'2 at the exit would be reduced automatically due to the arrangement of thecurved arc first and the straight part of the path behind. If necessary axial deviationsof the beam can be corrected by short superconducting steerer magnets positioned in atleast three different cells per turn. Thus all effects which would cause coherent betatronoscillations, such as misalignments of the magnets, can be excluded (integer resonances).
The two-dimensional emittances of the six-dimensional phase space of the particlesof a bunch will be elliptic. When transformed through two succeeding cells, one focusingand one defocusing, each particle of a beam ellipse will move in the different emittanceplanes, say (x,x'), on ellipses given by the properties of the transfer line (eigen ellipses)one turn per betatron oscillation. If the betatron frequencies of all particles are the same,the beam emittances stay elliptic, and the volume of the six-dimensional ellipsoid is con-served. However quadratic and higher-order field perturbations as well as phase dependentfocusing effects of the accelerating rf fields will cause individual AQ- shifts for differentparticles of the bunch. After some rotations corresponding to betatron oscillations thebunch will occupy enlarged phase ellipses of the shape of the eigen ellipses. To avoid thisdilution the beam ellipses have to be matched to the eigen ellipses at the entrance of thefirst pair of cells. The properties of the eigen ellipses vary somewhat from the injection tothe extraction, for example from the change of the field index due to the increase of thebending radius when entering the next turn. This small mismatching causes the phasespace volume of the bunch to grow somewhat. For a detailed analysis computer codessuch as MAD [23] and COSY [24] have to be used.
Some pecularities result from the extraordinary strong accelerating voltage and thenon-cylindrical symmetry of the rf cavities [22]. In the centre of the accelerating gap aty = 0 the magnetic rf field is perpendicular to the orbit plane, its amplitude is given byMaxwell:
B<Lv(r) = ^ - - 6 - § (74)UV/ or
with E°(r) the radial gradient of the amplitude of the electrical field in the gap. Ne-glecting local perturbations of the fields from the accelerating holes in the gap walls, amaximum value of dE^/dr < 1 MV/m2 may be assumed for an estimation. With frf =100 MHz one gets B^av < 1.6 mT, so that the bending power of the global magnetic rffield in any case will be less than 10 of the bending power of the channel magnets. Theresulting bending will be compensated automatically during the field setting procedureof the channel magnet as described above.
The longitudinal focusing power of the rf field can be represented by the focal length
212
/ s , given by
For frf = 100 MHz, AV = 1 MV, TtTans = 1, 0cen = 80°, and the proton energy 40 MeVthe focal length is / , = 66 m. It increases strongly with the proton energy. Thus thecavities can be regarded as thin lenses. The focusing in longitudinal direction is relatedto defocusing in the transverse directions by time dependent transverse field components.Neglecting the velocity variation in the gap one has for the focal lengths
j - + | + | * 0 (76)Jx Jy Js
In first order approximation both transverse focal lengths can be assumed to be equal
fx~fy~-2-fs (77)
With the same numbers as above one gets focal lengths of at least fx<y ~ - 100 m, sothat the defocusing power of the accelerating gaps would be less than 0.01 of the focusingpower of the neighbouring channel magnet. Since the focal lengths depend on the phase0, the vaiation of the defocusing in the accelerating gap for different particles of a bunchcould be of the same order of magnitude.
The radial betatron motion is coupled to the synchrotron oscillations. By thisthe radial betatron oscillation number Qx is somewhat enhanced, if compared to thecorresponding value with the rf voltage in the cavities switched off. This effect is theless, the better Qcoh <C Qx and Qinc <C Qx are fulfilled, where Qcoh and Qinc are theoscillation numbers of the coherent respectively incoherent synchrotron oscillations. Qinc
is reduced somewhat by the coupling.
4 THE TRITRON PROJECTBased on the design considerations discussed in the preceeding chapter a rather
small machine was developed at the Accelerator Laboratory of the Technical University ofMunich and the University of Munich (see Fig.14). The name of the project, TRITRONreminds one of the ancient engineer Daedalus, who is said to have made a thread gothrough the spiral of a Triton snail shell (though by the help of an ant). The TRITRONwill increase the energy of the ions from a 14-MV MP-tandem injector by a factor of five,or with k ~ 85 as design value. The main purpose of this machine is to develop thesuperconducting channel magnets and cavities and to gain experience in the design andoperation of this new type of accelerator. When the project was started it was unknown,if superconducting cavities of the type discussed above would operate at all. In order tokeep the accelerating voltage per turn low (design: 3.2 MV on the last turn), the turnseparation and the width of the channel magnets were chosen as small as possible: Ar0
= 40 mm = constant] Due to the resulting small aperture of the magnets (d = 10 mm)the machine will not be suited to accelerate beams with high currents.
4.1 The general layoutIn Table 1 some data of the TRITRON are summarized. The beam is guided
by 238 superconducting channel magnets along a spiral orbit with almost 20 turns. The

213
Table 1: General design data of TRITRON
Injectork - valueEnergy gain factorInjection radiusExtraction radiusTurn separationNumber of turns
Magnet data:
Cavity data:
Cryostat:
(outside of the channel magnets)
MP-tandem (14MV)85~4.90.66 m1.45 m40 mm19.8
Number of magnet sectors 12Number of channel magnets/sector 20 (19)Bending angle per channelSector angleBending radius />i, P20Increment of bending radius/turnGeometrical apertureMaximum magnetic induction
sector channels3rd injection channel
Normal.radial gradients | ^ • ^Betatron oscillation numbers
Qx
QySynchrotr. oscill. numbers (incoh:)
Number of cavitiesFixed rf frequencyHarmonic numbersTotal radial lengthRadial gap lengthGap width injection/extractionAperture of the beam holesMaximum gap voltageMaximum accelerating fieldPeak filed to maximum gap fieldUnloaded quality factorDissipated power per cavitySurface resistance
DiameterHeightCold massRefrigerator power at 4.6 K
30°20°430 mm, 942 mm26.94 mm10 mm
1.7 T2.4 T3.6 m"1, - 4.9 m~
1.2 ... 1.60.8 ... 1.7~0.2
6170 MHz~ 14 - ~ 551233 mm~ 0.85 m62 mm / 128 mm13 mm0.53 MV4.7 MV/m< 1.53.7 • 108
6 W2.5 • 10~Tn
3.6 m~ 3 m~ 7 tn155 W
Total grid power for TRITRON including connecting beam lines is 400 kW
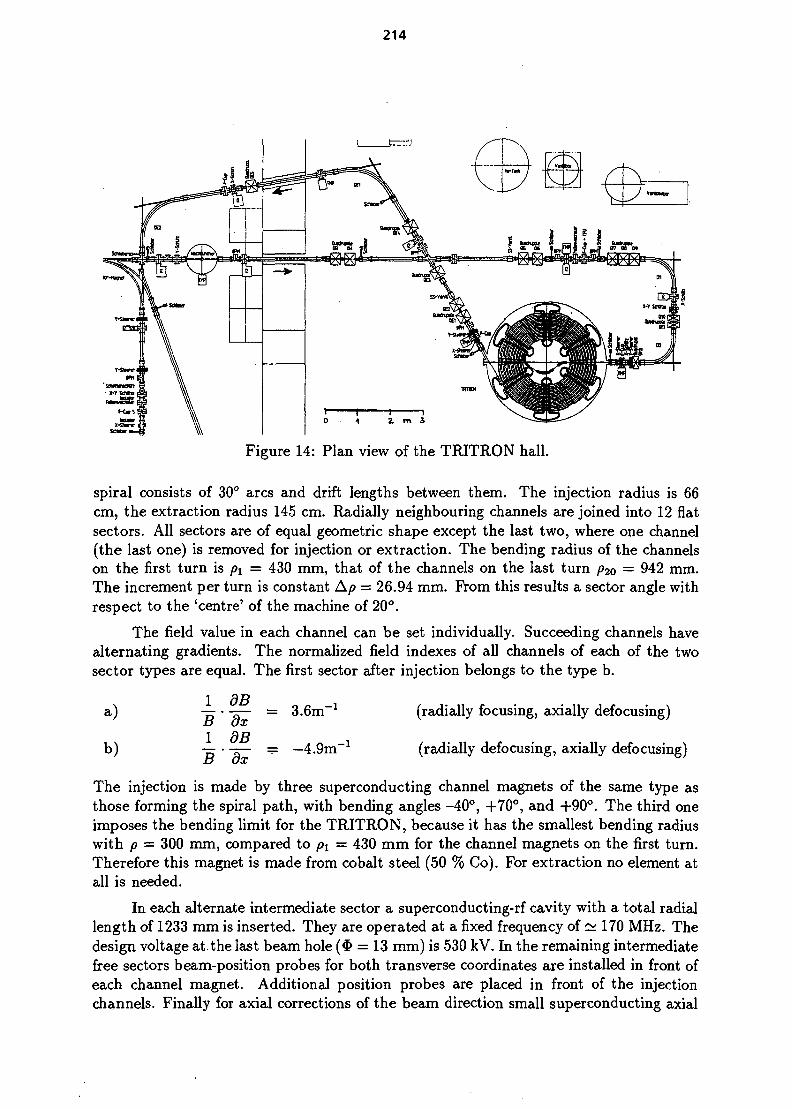
214
Figure 14: Plan view of the TRITRON hall.
spiral consists of 30° arcs and drift lengths between them. The injection radius is 66cm, the extraction radius 145 cm. Radially neighbouring channels are joined into 12 flatsectors. All sectors are of equal geometric shape except the last two, where one channel(the last one) is removed for injection or extraction. The bending radius of the channelson the first turn is p\ = 430 mm, that of the channels on the last turn p2o — 942 mm.The increment per turn is constant Ap = 26.94 mm. From this results a sector angle withrespect to the 'centre' of the machine of 20°.
The field value in each channel can be set individually. Succeeding channels havealternating gradients. The normalized field indexes of all channels of each of the twosector types are equal. The first sector after injection belongs to the type b.
a)
i f = -49m'1(radially focusing, axially defocusing)
(radially defocusing, axially defocusing)
The injection is made by three superconducting channel magnets of the same type asthose forming the spiral path, with bending angles -40°, +70°, and +90°. The third oneimposes the bending limit for the TRITRON, because it has the smallest bending radiuswith p = 300 mm, compared to p\ = 430 mm for the channel magnets on the first turn.Therefore this magnet is made from cobalt steel (50 % Co). For extraction no element atall is needed.
In each alternate intermediate sector a superconducting-rf cavity with a total radiallength of 1233 mm is inserted. They are operated at a fixed frequency of ~ 170 MHz. Thedesign voltage at the last beam hole (<& = 13 mm) is 530 kV. In the remaining intermediatefree sectors beam-position probes for both transverse coordinates are installed in front ofeach channel magnet. Additional position probes are placed in front of the injectionchannels. Finally for axial corrections of the beam direction small superconducting axial
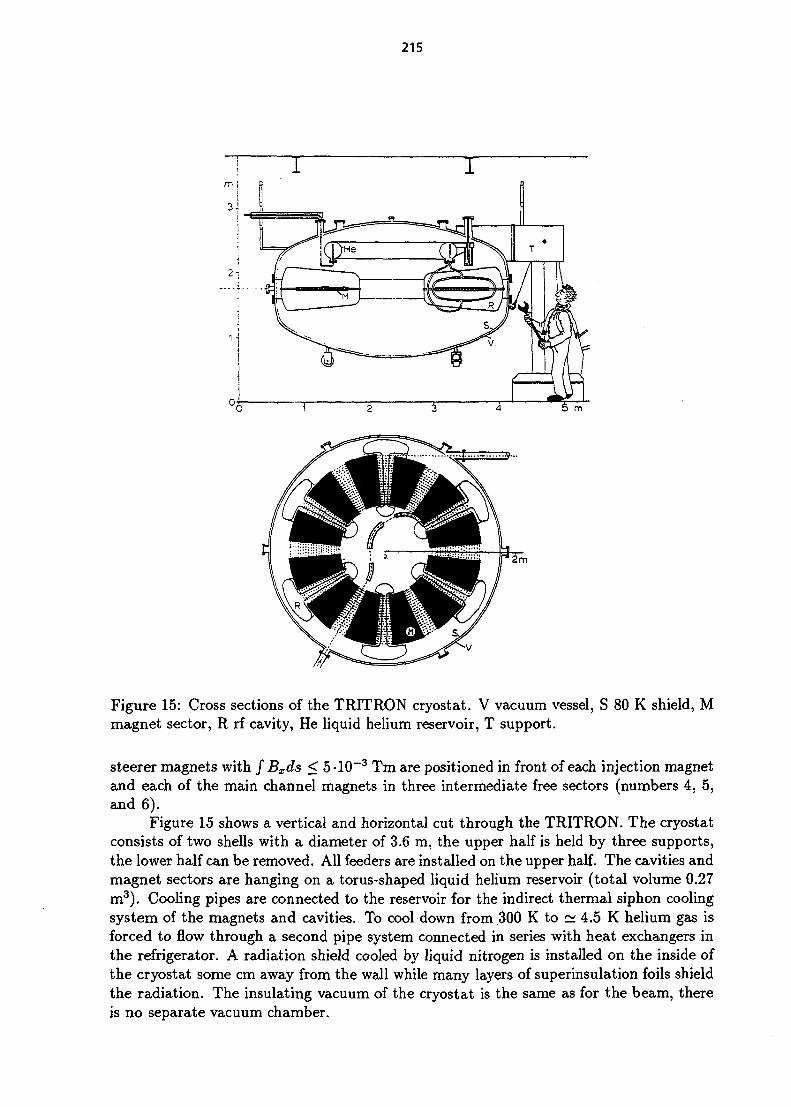
215
Figure 15: Cross sections of the TRITRON cryostat. V vacuum vessel, S 80 K shield, Mmagnet sector, R rf cavity, He liquid helium reservoir, T support.
steerer magnets with / Bxds < 5-10"3 Tm are positioned in front of each injection magnetand each of the main channel magnets in three intermediate free sectors (numbers 4, 5,and 6).
Figure 15 shows a vertical and horizontal cut through the TRITRON. The cryostatconsists of two shells with a diameter of 3.6 m, the upper half is held by three supports,the lower half can be removed. All feeders are installed on the upper half. The cavities andmagnet sectors are hanging on a torus-shaped liquid helium reservoir (total volume 0.27m3). Cooling pipes are connected to the reservoir for the indirect thermal siphon coolingsystem of the magnets and cavities. To cool down from .300 K to ~ 4.5 K helium gas isforced to flow through a second pipe system connected in series with heat exchangers inthe refrigerator. A radiation shield cooled by liquid nitrogen is installed on the inside ofthe cryostat some cm away from the wall while many layers of superinsulation foils shieldthe radiation. The insulating vacuum of the cryostat is the same as for the beam, thereis no separate vacuum chamber.
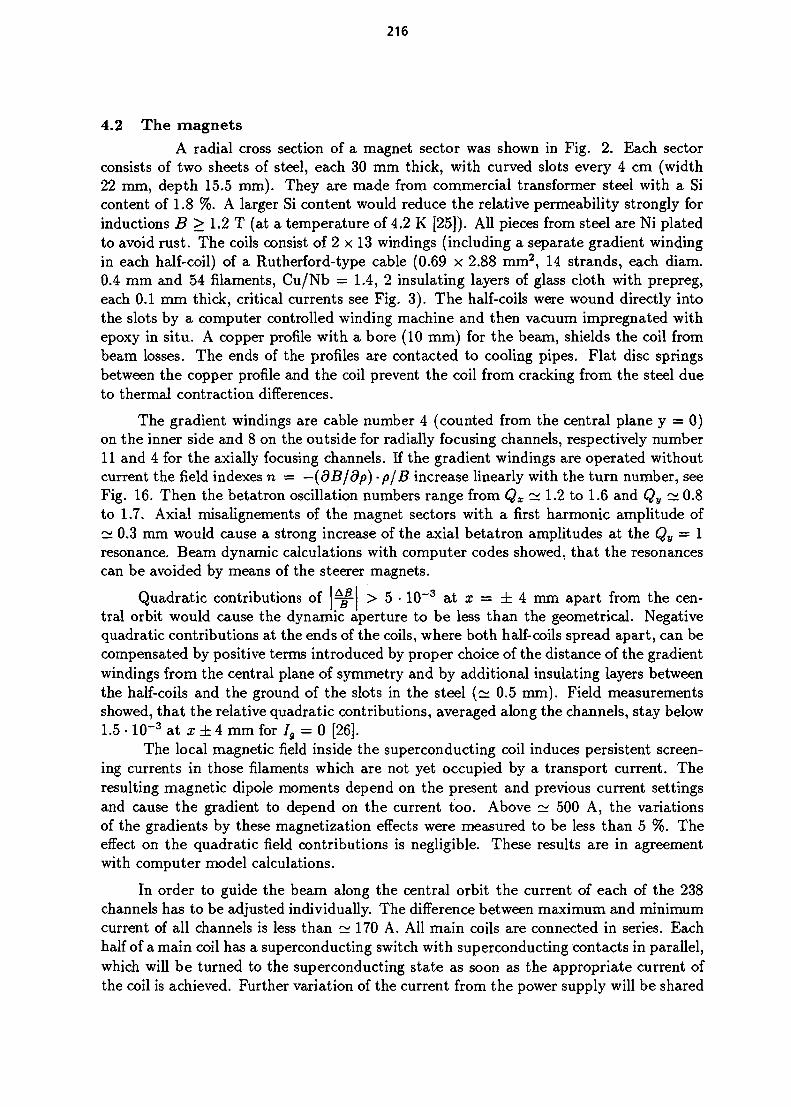
216
4.2 The magnets
A radial cross section of a magnet sector was shown in Fig. 2. Each sectorconsists of two sheets of steel, each 30 mm thick, with curved slots every 4 cm (width22 mm, depth 15.5 mm). They are made from commercial transformer steel with a Sicontent of 1.8 %. A larger Si content would reduce the relative permeability strongly forinductions B > 1.2 T (at a temperature of 4.2 K [25]). All pieces from steel are Ni platedto avoid rust. The coils consist of 2 x 13 windings (including a separate gradient windingin each half-coil) of a Rutherford-type cable (0.69 x 2.88 mm2, 14 strands, each diam.0.4 mm and 54 filaments, Cu/Nb = 1.4, 2 insulating layers of glass cloth with prepreg,each 0.1 mm thick, critical currents see Fig. 3). The half-coils were wound directly intothe slots by a computer controlled winding machine and then vacuum impregnated withepoxy in situ. A copper profile with a bore (10 mm) for the beam, shields the coil frombeam losses. The ends of the profiles are contacted to cooling pipes. Flat disc springsbetween the copper profile and the coil prevent the coil from cracking from the steel dueto thermal contraction differences.
The gradient windings are cable number 4 (counted from the central plane y = 0)on the inner side and 8 on the outside for radially focusing channels, respectively number11 and 4 for the axially focusing channels. If the gradient windings are operated withoutcurrent the field indexes n = —(dB/dp) • p/B increase linearly with the turn number, seeFig. 16. Then the betatron oscillation numbers range from Qx ~ 1.2 to 1.6 and Qy ~ 0.8to 1.7. Axial misalignements of the magnet sectors with a first harmonic amplitude of~ 0.3 mm would cause a strong increase of the axial betatron amplitudes at the Qy = 1resonance. Beam dynamic calculations with computer codes showed, that the resonancescan be avoided by means of the steerer magnets.
Quadratic contributions of ^g- > 5 • 10~3 at x = ± 4 mm apart from the cen-tral orbit would cause the dynamic aperture to be less than the geometrical. Negativequadratic contributions at the ends of the coils, where both half-coils spread apart, can becompensated by positive terms introduced by proper choice of the distance of the gradientwindings from the central plane of symmetry and by additional insulating layers betweenthe half-coils and the ground of the slots in the steel (~ 0.5 mm). Field measurementsshowed, that the relative quadratic contributions, averaged along the channels, stay below1.5 • 10~3 at x ± 4 mm for Ig = 0 [26].
The local magnetic field inside the superconducting coil induces persistent screen-ing currents in those filaments which are not yet occupied by a transport current. Theresulting magnetic dipole moments depend on the present and previous current settingsand cause the gradient to depend on the current too. Above ~ 500 A, the variationsof the gradients by these magnetization effects were measured to be less than 5 %. Theeffect on the quadratic field contributions is negligible. These results are in agreementwith computer model calculations.
In order to guide the beam along the central orbit the current of each of the 238channels has to be adjusted individually. The difference between maximum and minimumcurrent of all channels is less than ~ 170 A. All main coils are connected in series. Eachhalf of a main coil has a superconducting switch with superconducting contacts in parallel,which will be turned to the superconducting state as soon as the appropriate current ofthe coil is achieved. Further variation of the current from the power supply will be shared
217
= 3
+ 2 + 4 4$
n2 ( vert. foe.)
Figure 16: The field indexes nx and n2.
between the switch and the coil, according to the ratio of the inductances. The switchesare made of superconducting wires (hairpin shape) with the copper matrix etched offalong ~ 3 cm, which can be heated above the critical temperature with an Allen-Bradleyresistor. The filaments at the ends of the switch are mixed with those of all strands ofthe coil cable and pressed within a copper tube (pressure ~ 5 • 104 N/cm2) to form thesuperconducting joints.
From voltage measurements across a complete sector and across individual chan-nels the inductances of the channels were determined to range from 1 to 3 • 10~4 H inagreement with values calculated from the field energy. The mean inductance of the 40superconducting switches was 2.6 • 10~7 H. From this one expects a current variation inthe main coils of some 10~3 of the variation of the switch current. Indeed a relative changeof the field of < 6 • 10~4 in channel 19 was observed, when the main current in channel18 was lowered from 1000 A to 850 A, while the switches of all other channels (includingthat of channel 19) were superconducting. If the main current of several neighbouringchannels was changed simultaneously, the field variation in the channel with the switchsuperconducting was larger, indicating an increased 'cross talking'. This effect will not setin when the beam is thread through succeeding channels, because then the main currentof only one channel per sector will be changed.
The rate of current change in the superconducting switches could be as high as 20A/sec without quenches for currents in the switches below 220 A. At a rate of 0.5 A/secno switch quenched below 310 A. The total resistance of all normal conducting jointsbetween adjacent coils was less than 2.7 • 10~7J7 corresponding to a mean value less than7 • 10~9fi per joint. The total dissipated heat in the joints would be less than 1 W persector at the maximum current of 1800 A.
4.3 The cavitiesThe lower half of a cavity was shown in Fig. 4. The radial field and voltage
characteristics are shown in Fig. 5. The radial increase of the voltage due to that of thegap width corresponds approximately to the required energy gain of the ions. So far a
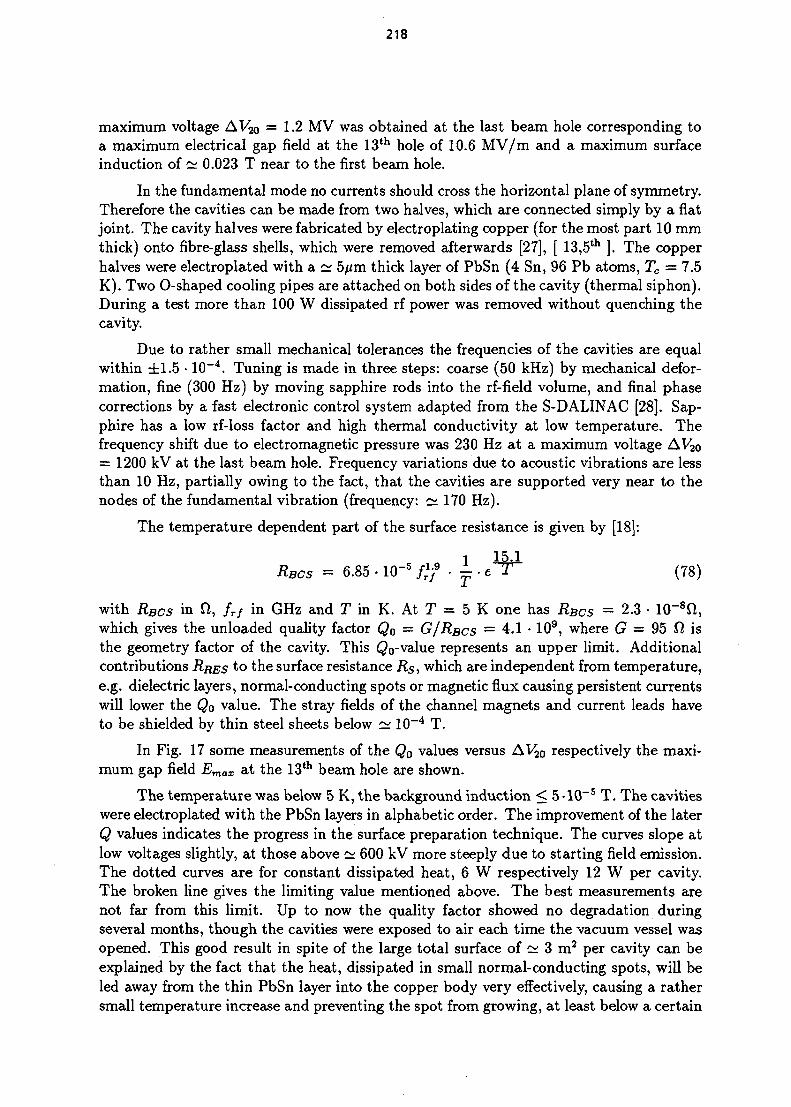
218
maximum voltage AV20 = 1.2 MV was obtained at the last beam hole corresponding toa maximum electrical gap field at the 13th hole of 10.6 MV/m and a maximum surfaceinduction of ~ 0.023 T near to the first beam hole.
In the fundamental mode no currents should cross the horizontal plane of symmetry.Therefore the cavities can be made from two halves, which are connected simply by a flatjoint. The cavity halves were fabricated by electroplating copper (for the most part 10 mmthick) onto fibre-glass shells, which were removed afterwards [27], [ 13,5th ]. The copperhalves were electroplated with a ~ 5^m thick layer of PbSn (4 Sn, 96 Pb atoms, Tc — 7.5K). Two O-shaped cooling pipes are attached on both sides of the cavity (thermal siphon).During a test more than 100 W dissipated rf power was removed without quenching thecavity.
Due to rather small mechanical tolerances the frequencies of the cavities are equalwithin ±1.5 • 10"4. Tuning is made in three steps: coarse (50 kHz) by mechanical defor-mation, fine (300 Hz) by moving sapphire rods into the rf-field volume, and final phasecorrections by a fast electronic control system adapted from the S-DALINAC [28]. Sap-phire has a low rf-loss factor and high thermal conductivity at low temperature. Thefrequency shift due to electromagnetic pressure was 230 Hz at a maximum voltage AV20= 1200 kV at the last beam hole. Frequency variations due to acoustic vibrations are lessthan 10 Hz, partially owing to the fact, that the cavities are supported very near to thenodes of the fundamental vibration (frequency: ~ 170 Hz).
The temperature dependent part of the surface resistance is given by [18]:
RBCS = 6.85 • 10"5 f}f • ± • e ^ (78)
with RBCS in ft, frf in GHz and T in K. At T = 5 K one has RBCS = 2.3 • 10"8ft,which gives the unloaded quality factor Qo — G/RBCS
= 4.1 • 109, where G = 95 ft isthe geometry factor of the cavity. This Qo-va\ue represents an upper limit. Additionalcontributions RRES to the surface resistance Rs, which are independent from temperature,e.g. dielectric layers, normal-conducting spots or magnetic flux causing persistent currentswill lower the Qo value. The stray fields of the channel magnets and current leads haveto be shielded by thin steel sheets below ~ 10~4 T.
In Fig. 17 some measurements of the QQ values versus AV20 respectively the maxi-mum gap field Emax at the 13th beam hole are shown.
The temperature was below 5 K, the background induction < 5-10"5 T. The cavitieswere electroplated with the PbSn layers in alphabetic order. The improvement of the laterQ values indicates the progress in the surface preparation technique. The curves slope atlow voltages slightly, at those above ~ 600 kV more steeply due to starting field emission.The dotted curves are for constant dissipated heat, 6 W respectively 12 W per cavity.The broken line gives the limiting value mentioned above. The best measurements arenot far from this limit. Up to now the quality factor showed no degradation duringseveral months, though the cavities were exposed to air each time the vacuum vessel wasopened. This good result in spite of the large total surface of ~ 3 m2 per cavity can beexplained by the fact that the heat, dissipated in small normal-conducting spots, will beled away from the thin PbSn layer into the copper body very effectively, causing a rathersmall temperature increase and preventing the spot from growing, at least below a certain
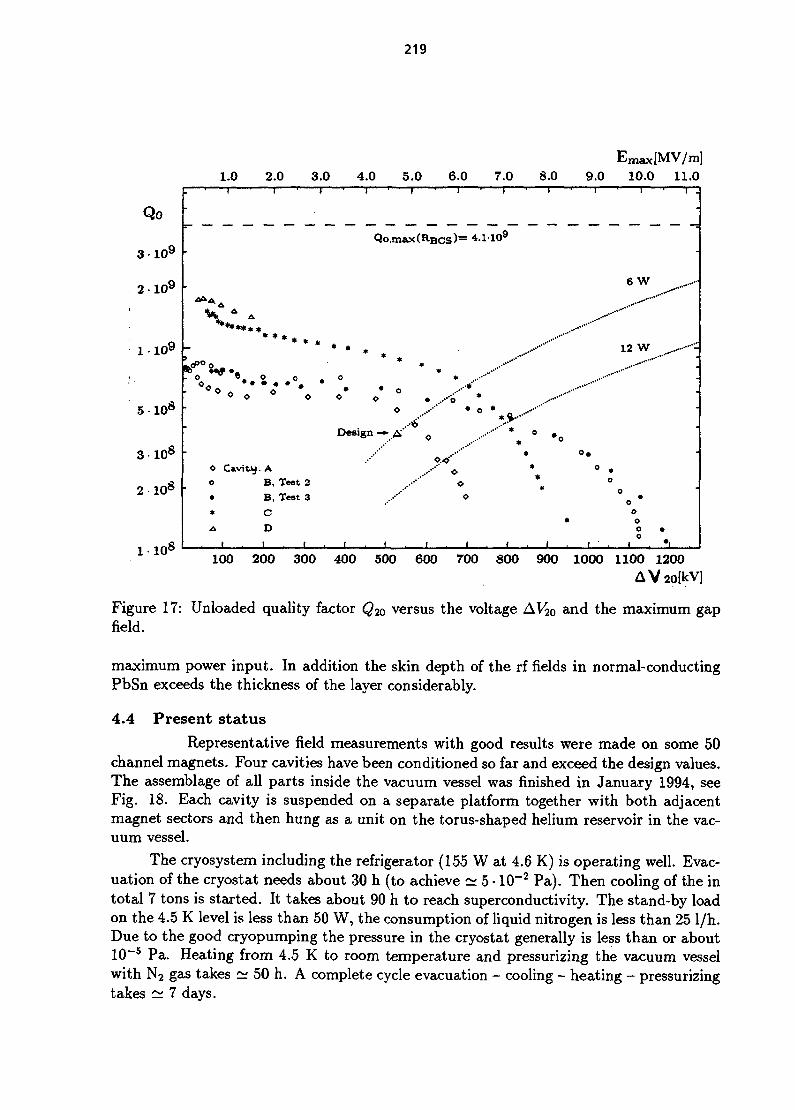
219
1.0 2.0 3.0 4.0 5.0 6.0 7.0 8.0 9.0 10.0 11.0
Qo
3 109
2 109
1 1 0 9 -
5 108
3 108
2 108
1 108
1
* * * * * * *
v ^
•
0 Cavitsjo•*
f
i
* *
oo
- A
B,B ,
C
D1
* *
0
Test
Test
i
* *
o
2
3
1
1
* * *
0
•
1 i • i
Qo,max(R-BCs):
* »*
• oO • ..•-0
o _..••••'
Design-* A"' A
1 ,
«.<#'•
..-••' o<
t . 1 .
= 4.1
.••''*
• o
•
>
0
1
1
** *•••••
. . - • • • ' • *
*
1
. - • - •
0 #
°*
*r
i * i • i .
6 W
12 W ,. =
....•—'
•
-
o .0 •
o
o0ooo •
I . I * i .
Figure 17:field.
100 200 300 400 500 600 700 800 900 1000 1100 1200
AVaofkV]
Unloaded quality factor <22o versus the voltage AV20 and the maximum gap
maximum power input. In addition the skin depth of the rf fields in normal-conductingPbSn exceeds the thickness of the layer considerably.
4.4 Present status
Representative field measurements with good results were made on some 50channel magnets. Four cavities have been conditioned so far and exceed the design values.The assemblage of all parts inside the vacuum vessel was finished in January 1994, seeFig. 18. Each cavity is suspended on a separate platform together with both adjacentmagnet sectors and then hung as a unit on the torus-shaped helium reservoir in the vac-uum vessel.
The cryosystem including the refrigerator (155 W at 4.6 K) is operating well. Evac-uation of the cryostat needs about 30 h (to achieve ~ 5 • 10"2 Pa). Then cooling of the intotal 7 tons is started. It takes about 90 h to reach superconductivity. The stand-by loadon the 4.5 K level is less than 50 W, the consumption of liquid nitrogen is less than 25 1/h.Due to the good cryopumping the pressure in the cryostat generally is less than or about10~5 Pa. Heating from 4.5 K to room temperature and pressurizing the vacuum vesselwith N2 gas takes ~ 50 h. A complete cycle evacuation - cooling - heating - pressurizingtakes ~ 7 days.

220
Figure 18: View into the TRITRON vacuum vessel from below with the lower half of thevessel removed (in January 1994).
221
The beam guiding system between the tandem and the TRITRON is ready exceptfor the bunching system [29]. The computer control system of the tandem and TRITRONis in an advanced state [30].
When the first three units together with the three injection channels were installed,ion beams were injected into the TRITRON for the first time (40 MeV 32S+14 and 20 MeV16O+8, not yet bunched). The main results of these tests can be summarized as follows:
- First beams passed successfully through the three injection channels, the followingfive channel magnets as well as three cavities on half of the innermost turn. Thebeam dimensions correspond to the expected values (diameter some mm). Someoptical properties of the magnets were checked with good results.
- No influence of stray fields on the cavities were observed. When operating the firstcavity at rather high levels, the expected horizontal spreading of the unbunched beamwas observed downstream.
- All channel magnets were operating at the same time with currents up to 1000A (about 60% of maximum). The technique of individual current setting in thechannels by just one power supply by means of the superconducting bypass switcheswas tested successfully. The fields in the three injection channels and the followingfive, innermost channels with the switch superconducting stayed stable, when thecurrent in the switches was changed by ± 100 A. No effect on the beam positionswas observed.
- In total 6 of some 120 beam position probes (wire scanners) were operating underreal conditions with good results.
- The first superconducting steerer magnets for axial beam corrections were taken intooperation.
The commissioning of the whole accelerator system is going on step by step.
5 FUTURE DEVELOPMENTSThe TRITRON project was started to develop the superconducting-rf cavities
and channel magnets and to gain experience in operating the new type of accelerator.The second part of that task is not yet finished. Nevertheless the present knowledge ofthe feasibility and limitations of the cavities and magnets can be used to discuss a systemof several rings for 1 GeV protons and 10 MW beam power more seriously. This paperwill be closed by presenting a set of very preliminary data of such a system.
Two combined separated orbit cyclotrons will be investigated. The total beam lossesshall not exceed 10 W or 10~6 in relative units to avoid quenching of the superconductingelements as well as high activation levels. Then the geometrical aperture bapx<y shouldbe at least 10 standard deviations crx<y of the beam width, assuming a gaussian particledensity. With the turn separation Ar0 = 10 cm, Bmax = 1.75 T and Bsat = 1.9 T we hadfrom Eq. (5) bapx = 43 mm (LAMPF: 19.1mm, PSI injection cyclotron: bapy = 35mm).
All cavities are assumed to be equal and about twice as large as the present TRITRONcavities. Larger cavities with a weight of > 3 ton would be difficult to handle and to fab-ricate with the present electroforming technique. The accelerating gap length shall range
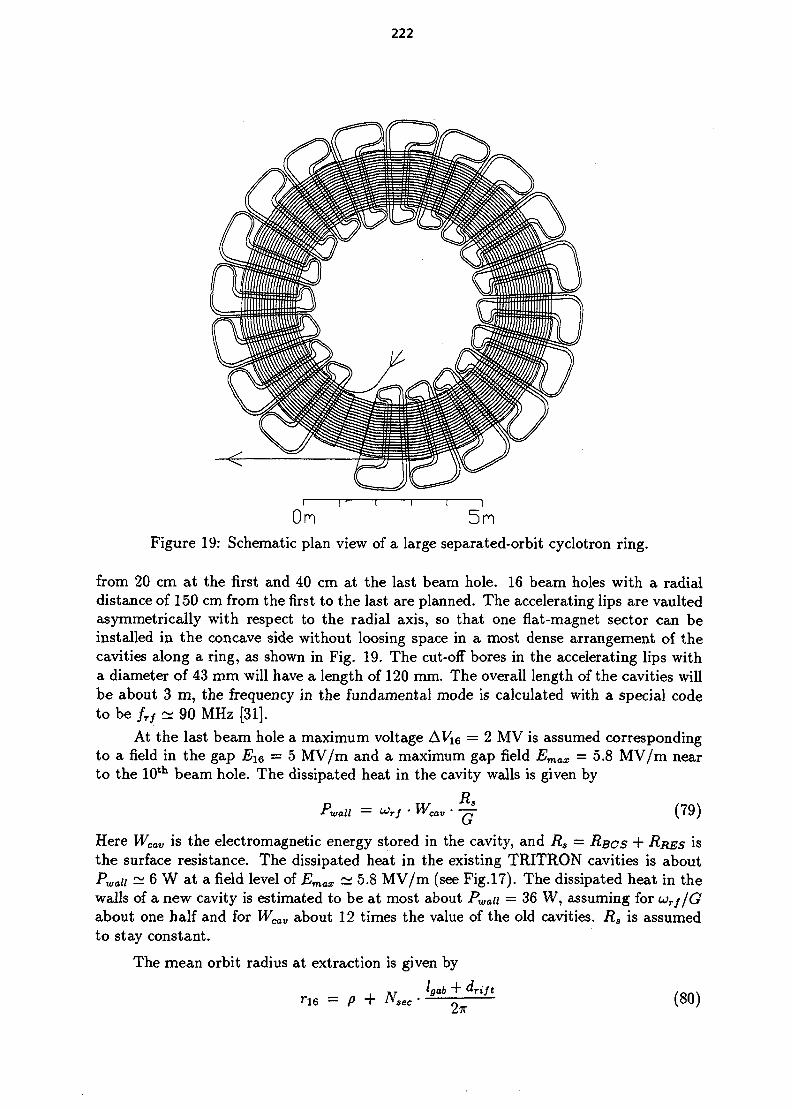
222
On 5nFigure 19: Schematic plan view of a large separated-orbit cyclotron ring.
from 20 cm at the first and 40 cm at the last beam hole. 16 beam holes with a radialdistance of 150 cm from the first to the last are planned. The accelerating lips are vaultedasymmetrically with respect to the radial axis, so that one flat-magnet sector can beinstalled in the concave side without loosing space in a most dense arrangement of thecavities along a ring, as shown in Fig. 19. The cut-off bores in the accelerating lips witha diameter of 43 mm will have a length of 120 mm. The overall length of the cavities willbe about 3 m, the frequency in the fundamental mode is calculated with a special codeto be frf ~ 90 MHz [31].
At the last beam hole a maximum voltage AVi6 = 2 MV is assumed correspondingto a field in the gap i£16 = 5 MV/m and a maximum gap field Emax = 5.8 MV/m nearto the 10th beam hole. The dissipated heat in the cavity walls is given by
Pwall = <+>rf • Wcav • — (79)
Here Wcav is the electromagnetic energy stored in the cavity, and Rs = RBCS + RRES isthe surface resistance. The dissipated heat in the existing TRITRON cavities is aboutPwaii ~ 6 W at a field level of Emax ~ 5.8 MV/m (see Fig.17). The dissipated heat in thewalls of a new cavity is estimated to be at most about Pwaii = 36 W, assuming for u>Tf/Gabout one half and for W^ about 12 times the value of the old cavities. Rs is assumedto stay constant.
The mean orbit radius at extraction is given by
r« = p + (80)
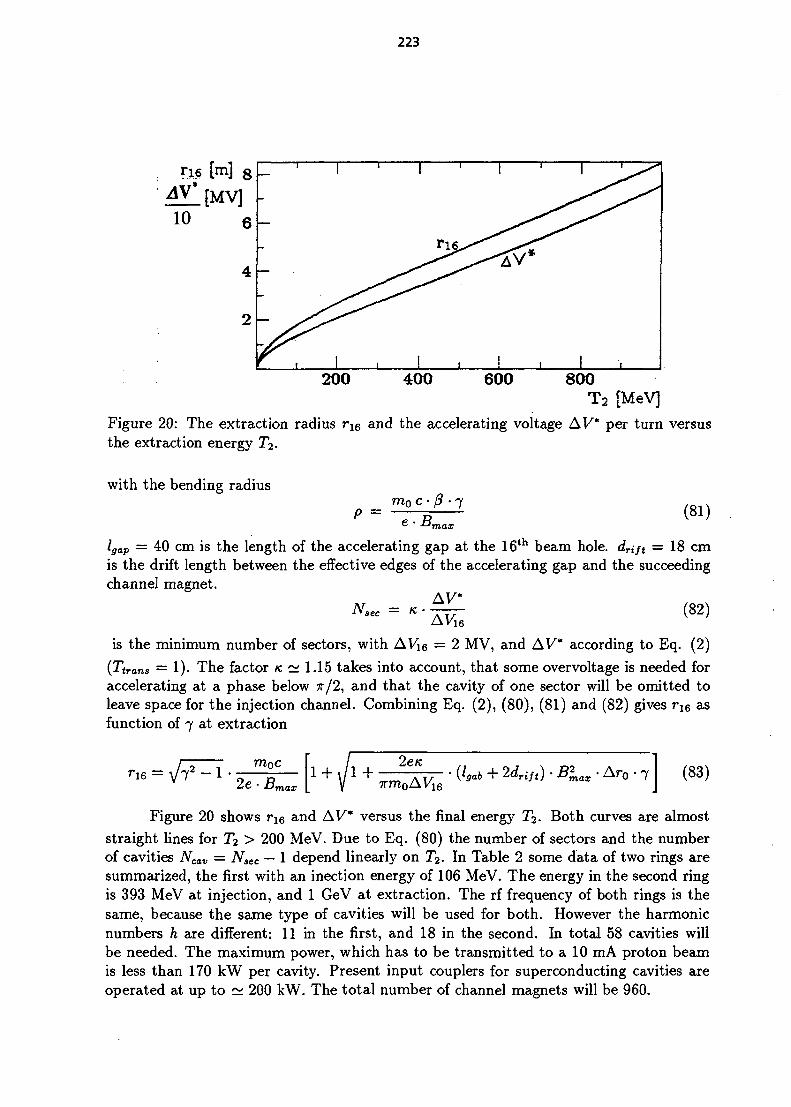
223
Tie [m] 8 C
200 400 600
Figure 20: The extraction radiusthe extraction energy Ti.
with the bending radius
800T2 [MeV]
and the accelerating voltage AV* per turn versus
P =m0 c • /? • 7
(81)
sap = 40 cm is the length of the accelerating gap at the 16th beam hole. drijt = 18 cmis the drift length between the effective edges of the accelerating gap and the succeedingchannel magnet.
Nsec =AV,16
(82)
is the minimum number of sectors, with AVi6 = 2 MV, and AV* according to Eq. (2)(Ttrans = 1)- The factor K ~ 1.15 takes into account, that some overvoltage is needed foraccelerating at a phase below TT/2, and that the cavity of one sector will be omitted toleave space for the injection channel. Combining Eq. (2), (80), (81) and (82) gives ri6 asfunction of 7 at extraction
moc2e-Bn
7rm0AV16( U + 2drift) • Blax • Ar0 • 7 (83)
Figure 20 shows r16 and AV* versus the final energy T^. Both curves are almoststraight lines for Ti > 200 MeV. Due to Eq. (80) the number of sectors and the numberof cavities iVC0V = Nsec — 1 depend linearly on Ti- In Table 2 some data of two rings aresummarized, the first with an inection energy of 106 MeV. The energy in the second ringis 393 MeV at injection, and 1 GeV at extraction. The rf frequency of both rings is thesame, because the same type of cavities will be used for both. However the harmonicnumbers h are different: 11 in the first, and 18 in the second. In total 58 cavities willbe needed. The maximum power, which has to be transmitted to a 10 mA proton beamis less than 170 kW per cavity. Present input couplers for superconducting cavities areoperated at up to ~ 200 kW. The total number of channel magnets will be 960.

224
Table 2: Some data of a two-ring system for 1 GeV protons
For both rings:
Turn separationGeometrical apertureDrift length cavity-channel magnet at extr.Maximum induction in the channel magnetsCavity: total radial length
radial distance 1 s t . . . 16th beam holegap with at injection
at extractionrf frequencyAccelerating voltage at extractionMaximum accelerating field in the gapDissipated heat per cavity
Ring
Injection energyExtraction energy
Injection radiusExtraction radius
Bending radius at extraction
Transit time factor at extractionat injection
Accelerating voltage per turn:at injectionat extraction
Number of sectorsNumber of cavitiesNumber of turnsNumber of channel magnets
Harmonic number
Transferred beam Dower/cavitv
Ar0bapx
driftBmax
Igapl
Igap2
frfAF16Emax
Pwall
I
106393
259419
3.23
0.9700.989
1033
181716
288
11
170
10 cm43 mm18 cm
1.75 T~ 3 m150 cm20 cm40 cm
~ 90 MHz2MV
5.8 MV/m< 36 W
II
393 MeV1000 MeV
685 cm845 cm
1.80 m
0.9550.970
20 MV75 MV
424116
672
18
150 kW

225
The limiting effects for the beam current are similar to those known from protonstorage rings. The beam creates fields, the space-charge fields and those from imagecurrents on the beam-tube walls, which act back on the beam itself. All related effectsdepend mainly on the longitudinal and transverse coupling impedances. Pure inductiveand capacitive impedances cause real, intensity dependent shifts of the betatron andsynchrotron oscillation numbers, and some change of the bunch dimensions. A resistiveimpedance causes imaginary frequency shifts Afi and eventually instabilities, with thetime constant of growth given by r = - ^ L , , In the separated orbit cyclotrons thebeam runs either in a copper tube inside the channel magnets or in a cavity gap. Theinfluence of the slits between the tubes and the cutoff bores of the cavities is assumed tobe negligible.
The resistive wall effect of the copper tubes is expected to be much less comparedto that of stainless steel vacuum chambers normally used in storage rings. The surfaceresistance of cold copper at 500 MHz for example is about 40 times less than that ofstainless steel at room temperature (anomalous skin effect). The reactive part of theimpedance in the separated orbit cyclotrons is mainly determined by the space chargeeffect. It decreases strongly with increasing particle energy. It can be overcome bychoosing the injection energy sufficiently high. In addition rather large shifts of thebetatron oscillation numbers are admissible due to the insensibility to resonance problems.Longitudinally the high accelerating voltage per turn causes unusual high synchrotronoscillation numbers, so that rather large shifts are admissible here also.
The superconducting cavities are traversed by 16 bunches in parallel, radially dis-tributed along a large range. So the exitation of higher-order modes by the beam hasto be expected. Some special features of the cavities may be helpful to overcome theseproblems. First the cavities are single cells, resulting in a simple line spectrum withoutbroad passbands. Thus there will be a certain chance to detune the cavity with respectto the frequency of a special higher-order mode, which may be excited by the beam.Secondly, the quality factor of all modes with surface currents crossing the horizontalplane of symmetry are reduced due to the poor flat rf joint. Finally, the cavity volumeis accessible from all sides to install higher-order mode couplers in an effective manner,avoiding trapped modes as in some multicell cavities. The interaction of several parallelhigh intensity bunches with a superconducting cavity of the TRITRON type can be inves-tigated experimentally by triggered electron pulses through the beam holes, theoreticallyby means of computer codes. So far various storage rings with superconducting multicellcavities operate stably with beams above 10 mA. In HERA at DESY a current of 60 mAis envisaged for the near future.
ACKNOWLEDGEMENTSThanks are given to all members of the TRITRON group, especially to L. Beck,
U. Buhl, A. Cazan, E. Jakubowska, J. Labedzki, J. Lugauer, H. Ruhland, L. Schweinham-mer and P. Schtz, who have made important contributions to this work. The TRITRONproject was funded by the German Federal Minister for Research and Technology (BMFT)under the contract number 06 TM 189.

226
References[1] W. Joho, PSI, private communication.
[2] F. Carminati, R. Klapisch, J.P. Revol, Ch. Roche, J.A. Rubbio and C. Rubbia, AnEnergy Amplifier for Cleaner and Inexhaustible Nuclear Energy Production Driveby a Particle Beam Accelerator, CERN / AT / 93-47 (ET).
[3] Proceedings: Technical Review for Next Generation Spallation Neutron Source, LosAlamos 1993, p.68.
[4] Particle Data Group, Review of Particle Properties, Phys.Rev. D 45 (1992), p. Ill30.
[5] F.M. Russell, A Fixed-Frequency, Fixed-Field, High-Energy Accelerator,Nud.Instrum. Methods 23, (1963) 229.
[6] F.M. Russell, A Strong-Focusing Cyclotron with Separated Orbits, Oak Ridge,ORNL-3431 (1993).
[7] F.M. Russell, Some Studies on Particle Dynamics in the Separated Orbit Cyclotron- A Review, Rutherford Laboratory, Chilton, Didcot, Berks., June 1964, NIRL / M/ 72.
[8] F.M. Russell (ed.), Proc. of the Symposium on Separated Orbit Cyclotrons andBeam-Cavity Interactions, Oxford, July 1966, RHEL / M 124.
[9] J.A. Martin, The Separated-Orbit Cyclotron, IEEE Trans. Nucl. Sci. NS-13 (1966)288.
[10] R.E. Worsham et al., A 4-MeV Experimental Separated-Orbit Cyclotron, IEEETrans. Nucl. Sci. NS-14 (1967) 760.
[11] Oak Ridge National Laboratory, Electronuclear Division Annual Progress Report1968, ORNL-4404
[12] H. Blosser, The K500 Superconducting Cyclotron, Proc. of the 10th Int. Conf. onCyclotrons and their Applications, 1984 East Lansing (USA), p. 713.
[13] Proc.of the Workshops on RF Superconductivity:1s t: Nov. 1980, Karlsruhe, Ed. M. Kuntze, KfK 3019.2nd: July 1984, Geneva, Ed. H. Lengeler, CERN.3 r d : Sep. 1987, Argonne, Ed. K.W. Shepard, ANL-PHY-88-1.4 t h: Aug. 1989,Tsukuba, Ed. Y. Kojima, KEK 89-21.5 t h: Aug. 1991, Hamburg, Ed. D. Proch, DESY M-92-01.6 th: Oct. 1993, Newport News, CEBAF, to be published.
[14] U. Trinks, W. Assmann and G. Hinderer, The TRITRON : A SuperconductingSeparated Orbit Cyclotron, Nucl.Instrum.Methods A244 (1986) 273.
[15] G. Hinderer and U. Trinks, Beam Dynamics in the TRITRON, Nucl. Instrum. Meth-ods A244 (1986) 283.

227
[16] S. Turner (ed.), CERN Accelerator School: RF Engineering for Particle Accelera-tors, 1991, Oxford, CERN 92-03 Vol.I+II.
[17] H. Piel, Superconducting Cavities, in S. Turner (ed.), CERN Accelerator School:Superconductivity in Particle Accelerators, 1989, Hamburg, CERN 89-04, p 149.
[18] L. Dietl, U. Trinks, The Surface Resistance of a Supercond. Lead-Tin Alloy, Nucl.Instrum.Methods A284 (1989) 293.
[19] W. Weingarten, Superconducting Cavities, Ref.[16], p.318.
[20] U. Trinks, Longitudinal Particle Dynamics in the TRITRON, Nucl. Instrum. Meth-ods A3fi6 (1991) 27.
[21] S. Turner (ed.), CERN Accelerator School: Fifth General Accelerator PhysicsCourse, 1992, Jyvskyl, CERN 94-01.
[22] G. Hinderer, C. Rie, U. Trinks, Transverse Beam Dynamics and Coupling Effects inthe TRITRON , Nucl.Instrum.Methods A317 (1992) 13.
[23] H. Grote and F. Ch. Iselin, The MAD Program, Version 8.1, CERN/SL/90-13(AP).
[24] M. Berz, COSY INFINITY, Version 5, Michigan State University, MSUCL-811.
[25] A. Mclnturff, J. Claus, Low Temperature Iron Measurements, Proceedings of the3 rd Intern. Conf. on Magnet Technology, Hamburg 1970, p.45.
[26] R. Kratz, G. Hinderer, J. Junger, J. Labedzki, U. Trinks, The SuperconductingTRITRON Magnets, 1991 IEEE Part. Accel. Conf., May 6-9, 1991, San Francisco,p. 2254.
[27] T. Grundey, J. Labedzki, P. Schtz, U. Trinks, The Supercond. Accelerating Cavitiesfor the TRITRON , Nucl.Instrum.Methods, A306 (1991) 21.
[28] V. Aab et al., Proc. European Part. Accel. Conf., 1988, Rome, p.335.
[29] G. Hinderer, M. Leu, The Beam Matching for the Tandem-TRITRON AcceleratorSystem, Nucl. Instrum. Methods, A287 (1990) 287.
[30] L. Rohrer, H. Schnitter, B. Walchshusl, The Tandem TRITRON Control System,Nucl. Instrum. Methods, A287 (1990) 170.
[31] S. Silaev, Isoparametric Finite Element Analysis of Time-Harmonic ElectromagneticFields in Three Dimensions, Nucl. Instrum. Methods, A328 (1993) 535.
NEXT PA@E(§)left BLMiK
229
MEDICAL APPLICATIONS OF ELECTRON LINEARACCELERATORS
A.Wambersie* andRA. Gahbauer**
* Service de Radiotherapie - Oncologie, Cliniques Universitaires St-Luc, UniversityCatholique de Louvain, Brussels, Belgium
** Division of Radiation Oncology, Ohio State University Hospitals, Columbus, Ohio, USA
AbstractThe role of radiation therapy in cancer management is first defined:today among the cancer patients who are cured (= 45 %) about one halfare cured by radiation therapy applied alone or in combination withsurgery or chemotherapy. The experience accumulated in decadesshows that, to be efficient, the radiation treatment must be deliveredwith a high physical selectivity. At present, electron linear acceleratorsare the primary equipment of a modern radiotherapy department, and alarge proportion of the patients are treated with a linear accelerator for atleast part of the treatment. Photon beams of about 6-20 MV have, ingeneral, a sufficient penetration in the tissues to treat most of thetumours with an adequate physical selectivity. A single beam is neverused alone, but a combination of several beams adequately orientedallow the radiation-oncologist to deliver the prescribed dose to the targetvolume without exceeding the tolerance of the surrounding normaltissues. Modem linear accelerators also allow us to apply electronbeam therapy. Electron beam therapy is suitable for the treatment ofsuperficial lesions (e.g., skin tumours) and is also the best availableirradiation treatment for Intra-Operative-Radiation-Therapy (IORT).Finally, conformation therapy, which is developed in many well-equipped and well-staffed centres, will probably further improve, in thenear future, the efficiency of linear accelerators at least for some tumourlocations.
1. INTRODUCTION — ROLE OF RADIATION THERAPY IN CANCERMANAGEMENT
Electron linear accelerators today constitute the core of the equipment of a modernradiation therapy department. Nowadays, the majority of the patients referred to a radiationtherapy department are treated with a linear accelerator for at least part of their treatment It islikely that this will remain true for the foreseeable future. Linear accelerators thus play, and willkeep playing, a significant role in cancer management in general and arc responsible for thetherapeutic success obtained in many tumour treatment. To illustrate the situation, Table 1 givesthe number of linear accelerators at present used in France for radiotherapy applications (theirtype and energy). The numbers of the other radiotherapy units are also given for comparison
Cancer has an increasing impact on the death rates in the Western world, as well as in thedeveloping countries. For example, in 1980, 730 000 deaths were attributed to cancer in thecountries of the European Union and there were 1 186 000 new cancer cases diagnosed in thatyear alone [2, 3]. These estimates exclude non-melanoma skin cancer, which, although a rarecause of death, nevertheless demands medical care. Even with the current prevention programs,the numbers will f inner increase within the next two decades. Similar figures have beenpublished for North America.

230
Table 1Number of radiotherapy units in France, on 1 January 1994
A. LINEAR ACCELERATORS
4-6 MV
10 MV
15 MV
20 MV
25-40 MV
20-25 MV25 MV
GECGR MevNEPTUNE 6ORION 5NEPTUNE 10SATURNE 1MSATURNE 15SATURNE 1SATURNE 41SATURNE 20SATURNE 11SATURNE 42SAGITTAIRE 32 MVSAGITTAIRE40MVSATURNE 25 MVSATURNE 111SATURNE 43
Total Linear Accelerators
18
27359
16994
10254
35157
Other companiesPhilips (SL 75/5)Clinac 600 C
Philips (SL 18)
Philips (SL 75/20)Siemens MevatronClinac 2100 C
Philips (SL 75/25)
84
4
3194
951
Total
31
30
34
48
17
444
208(+19)
B. OTHER TYPES OF RADIATION THERAPY UNITSRX 50-100 kVRX 150-305 kVCobal Units (including 1 gamma knife)BetatronsCyclotron neutron therapyCyclotron neutron + protontherapySynchrotron protontherapy
116 (-6)34 (-8)144 (-19)
1 (-2)111
1) The differences since 01.01.1993 are given (+) or (-)
Today, at the first consultation, approximately 65% of the patients have apparentlylocalized tumours. About 2/3 of these are cured either by surgery, radiotherapy, or acombination of both treatments. In this group of patients with probable but unproved subclinicalmetastatic disease, chemotherapy used as an adjutant treatment may prolong life and maybe curesome additional patients.
Among the other 35% of patients arriving at the first consultation with already inoperableor metastatic disease, only about 5% will be cured by combined treatment includingchemotherapy and immunotherapy as well as radiotherapy and/or surgery (Table 2). Althoughthere is promising progress in the field of medical oncology, this cure rate is largely limited tosolid paediatric tumours, leukaemias, lymphomas, and testicular tumours. These tumoursrepresent only about 5% of all cancers seen in a general population [4-6]. Although thesepercentages [5] are useful as an indication of the contribution of the different techniques tocancer cure, they will become progressively less relevant to the extent that combination of thesedifferent techniques is more and more successfully applied.
It is axiomatic that one must control the local disease if one aims ultimately at curing anycancer patient. In fact, it has been shown that 1/3 of the patients who die of cancer haduncontrolled local disease. If local failure could be reduced by 50%, one could expect a10-15% improvement in cure rate [7].
Surgical techniques have already reached a very high level. Further improvement will beseen in a reduction of mutilating procedures (limb-sparing operation, breast-conserving therapy,reduction of colostomies, and urinary diversions). On the other hand, wider excisions are still
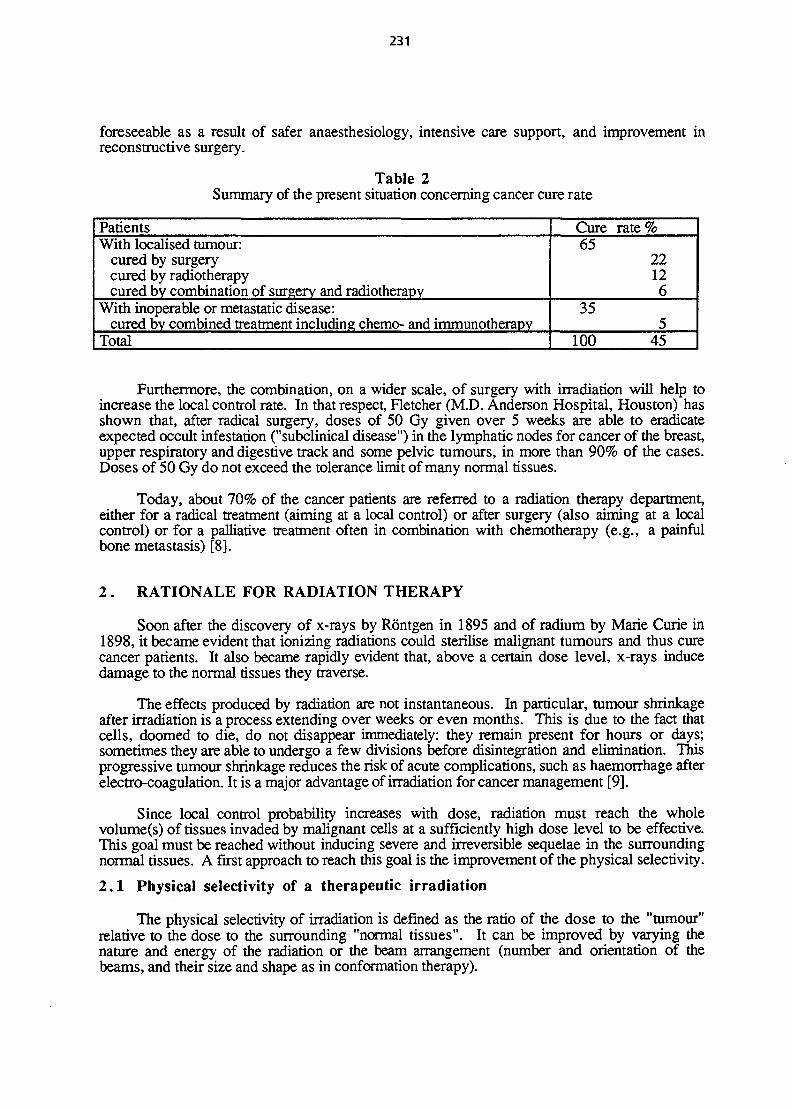
231
foreseeable as a result of safer anaesthesiology, intensive care support, and improvement inreconstructive surgery.
Table 2Summary of the present situation concerning cancer cure rate
PatientsWith localised tumour:
cured by surgerycured by radiotherapycured by combination of surgery and radiotherapy
With inoperable or metastatic disease:cured bv combined treatment including chemo- and immunotherapy
Total
Cure rate%65
22126
355
100 45
Furthermore, the combination, on a wider scale, of surgery with irradiation will help toincrease the local control rate. In that respect, Fletcher (M.D. Anderson Hospital, Houston) hasshown that, after radical surgery, doses of 50 Gy given over 5 weeks are able to eradicateexpected occult infestation ("subclinical disease") in the lymphatic nodes for cancer of the breast,upper respiratory and digestive track and some pelvic tumours, in more than 90% of the cases.Doses of 50 Gy do not exceed the tolerance limit of many normal tissues.
Today, about 70% of the cancer patients are referred to a radiation therapy department,either for a radical treatment (aiming at a local control) or after surgery (also aiming at a localcontrol) or for a palliative treatment often in combination with chemotherapy (e.g., a painfulbone metastasis) [8].
2 . RATIONALE FOR RADIATION THERAPY
Soon after the discovery of x-rays by Rontgen in 1895 and of radium by Marie Curie in1898, it became evident that ionizing radiations could sterilise malignant tumours and thus curecancer patients. It also became rapidly evident that, above a certain dose level, x-rays inducedamage to the normal tissues they traverse.
The effects produced by radiation are not instantaneous. In particular, tumour shrinkageafter irradiation is a process extending over weeks or even months. This is due to the fact thatcells, doomed to die, do not disappear immediately: they remain present for hours or days;sometimes they are able to undergo a few divisions before disintegration and elimination. Thisprogressive tumour shrinkage reduces the risk of acute complications, such as haemorrhage afterelectro-coagulation. It is a major advantage of irradiation for cancer management [9].
Since local control probability increases with dose, radiation must reach the wholevolume(s) of tissues invaded by malignant cells at a sufficiently high dose level to be effective.This goal must be reached without inducing severe and irreversible sequelae in the surroundingnormal tissues. A first approach to reach this goal is the improvement of the physical selectivity.
2.1 Physical selectivity of a therapeutic irradiation
The physical selectivity of irradiation is defined as the ratio of the dose to the "tumour"relative to the dose to the surrounding "normal tissues". It can be improved by varying thenature and energy of the radiation or the beam arrangement (number and orientation of thebeams, and their size and shape as in conformation therapy).
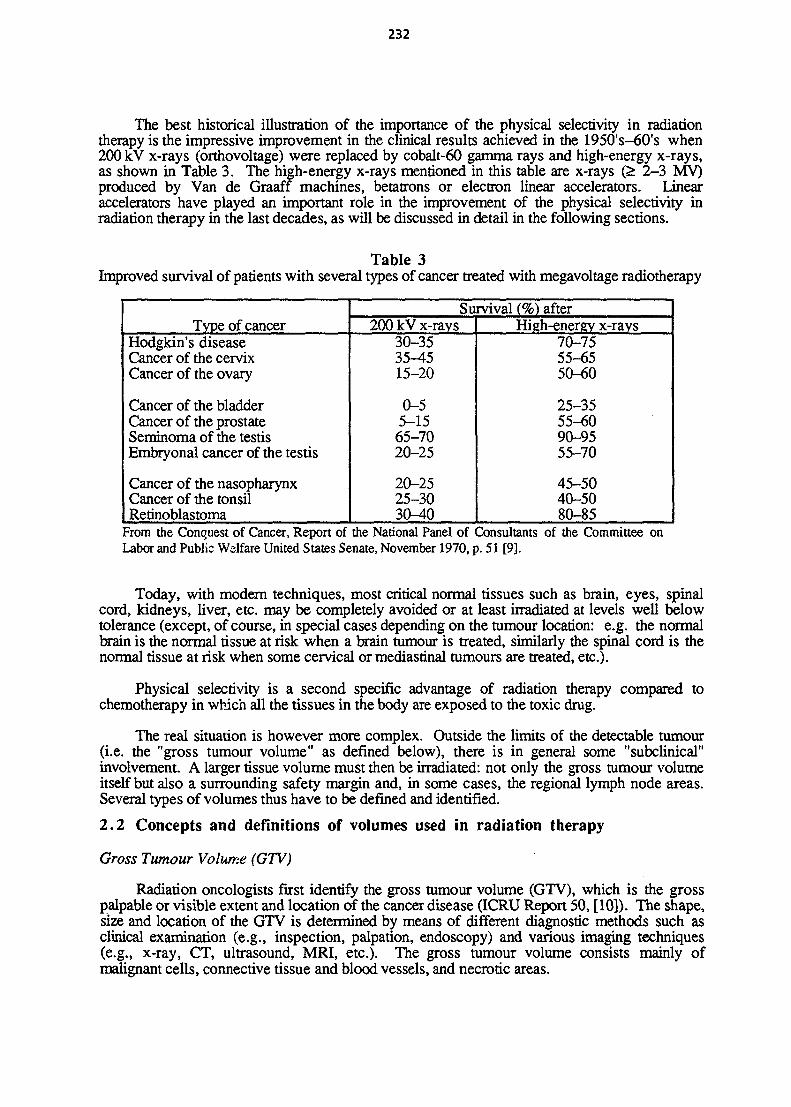
232
The best historical illustration of the importance of the physical selectivity in radiationtherapy is the impressive improvement in the clinical results achieved in the 1950's-60's when200 kV x-rays (orthovoltage) were replaced by cobalt-60 gamma rays and high-energy x-rays,as shown in Table 3. The high-energy x-rays mentioned in this table are x-rays (> 2-3 MV)produced by Van de Graaff machines, betatrons or electron linear accelerators. Linearaccelerators have played an important role in the improvement of the physical selectivity inradiation therapy in the last decades, as will be discussed in detail in the following sections.
Table 3Improved survival of patients with several types of cancer treated with megavoltage radiotherapy
Type of cancerHodgkin's diseaseCancer of the cervixCancer of the ovary
Cancer of the bladderCancer of the prostateSeminoma of the testisEmbryonal cancer of the testis
Cancer of the nasopharynxCancer of the tonsilRetinoblastoma
Survival (%) after200 kV x-rays
30-3535-4515-20
0-55-1565-7020-25
20-2525-3030-40
High-energy x-rays70-7555-6550-60
25-3555-6090-9555-70
45-5040-5080-85
From the Conquest of Cancer, Report of the National Panel of Consultants of the Committee onLabor and Public Welfare United States Senate, November 1970, p. 51 [9].
Today, with modern techniques, most critical normal tissues such as brain, eyes, spinalcord, kidneys, liver, etc. may be completely avoided or at least irradiated at levels well belowtolerance (except, of course, in special cases depending on the tumour location: e.g. the normalbrain is the normal tissue at risk when a brain tumour is treated, similarly the spinal cord is thenormal tissue at risk when some cervical or mediastinal tumours are treated, etc.).
Physical selectivity is a second specific advantage of radiation therapy compared tochemotherapy in which all the tissues in the body are exposed to the toxic drug.
The real situation is however more complex. Outside the limits of the detectable tumour(i.e. the "gross tumour volume" as defined below), there is in general some "subclinical"involvement. A larger tissue volume must then be irradiated: not only the gross tumour volumeitself but also a surrounding safety margin and, in some cases, the regional lymph node areas.Several types of volumes thus have to be defined and identified.
2.2 Concepts and definitions of volumes used in radiation therapy
Gross Tumour Volume (GTV)
Radiation oncologists first identify the gross tumour volume (GTV), which is the grosspalpable or visible extent and location of the cancer disease (ICRU Report 50, [10]). The shape,size and location of the GTV is determined by means of different diagnostic methods such asclinical examination (e.g., inspection, palpation, endoscopy) and various imaging techniques(e.g., x-ray, CT, ultrasound, MRI, etc.). The gross tumour volume consists mainly ofmalignant cells, connective tissue and blood vessels, and necrotic areas.

233
Clinical Target Volume (CTV)
Clinical experience has shown that around the GTV there is in general "subclinicalinvolvement", i.e., individual malignant cells, small cell clusters, or microextensions whichcannot be detected by the clinical or imaging procedures. Thus a safety margin surrounding theGTV must be irradiated to ensure local control of the disease. The size of the safety margindepends on the type of tumour, its location, and its tendency to invade the surrounding normaltissues (histology, grading, etc.). The GTV together with this safety margin consisting oftissues with presumed or proven subclinical involvement is defined as a Clinical Target Volume(CTV).
In addition to the safety margin around the tumour, other volumes with presumed orproven subclinical spread (such as regional lymph nodes) may also require irradiation. TheClinical Target Volume is thus the tissue volume that contains a demonstrable GTV and/orpresumed/proven subclinical microscopic malignant disease. This volume must be treated at anadequate dose level (and time-dose pattern) to achieve the aim of therapy, cure, or palliation.
Planning Target Volume (PTV)
To ensure that all tissues included in the CTV receive the prescribed dose, one has, inprinciple, to plan to irradiate a volume geometrically larger than die CTV. It is the PlanningTarget Volume or PTV.
The additional safety margin, included in the PTV, results from a number of factors:
movements of the tissues which contain the CTV (e.g., with respiration), as well asmovements of the patient.
variations in size and shape of the tissues that contain the CTV (e.g., differentfillings of the bladder, rectum, stomach).
all variations and uncertainties in beam geometry and patient-beam geometry. Thereare some uncertainties in the beam sizes, shapes and directions, as well as in therelative position of the beam with respect to the patient, the CTV and the normaltissues.
all uncertainties in dose distribution, especially in or close to the penumbra region,or where inhomogeneities have to be taken into account (e.g., beam penetration forelectron beams).
Delineation of the PTV is a matter of compromise and depends upon the judgement of theradiation-oncologist, who ultimately bears the responsibility for this decision. In particular, too-large safety margins will result in unnecessary side effects and complications.
2.3 Improvement of the differential effect. A problem for the radiobiologist
As defined above, the safety margins contained in the CTV and in the PTV consistprimarily of normal tissues and, only for a small proportion, of invading cancer cells. Becauseof the presence of these cells, the safety margin should be irradiated in principle to the highestpossible dose to prevent a local recurrence, but the tolerance of the normal tissues included in thesafety margin limits the dose which can be prescribed.
The difficulty cannot be solved by improving the physical selectivity of the irradiation; itrequires an improvement of the differential effect, and this brings us from the field of physics tothe field of radiooiology. Improvement of the differential effect implies, for a given (physical)

234
dose, increasing the effect of the cancer cell population and/or reducing the effects on the normaltissues [11, 12].
The possibility of improving the differential effect by adequately selecting the irradiationparameters is the third advantage of radiation therapy for cancer management.
Historically the first, and presently the most efficient, method for improving thedifferential effect was the fractionation of the dose, as initiated in 1919 by Regaud, Ferroux andCoutard at the Fondation Curie in Paris. Today, five fractions of 2 Gy each per week are usedas the conventional fractionation for most treatments.
As a further refinement, the fractionation could be adapted to the growth characteristics ofthe individual tumour (such as, the tumour doubling time, or better the potential doubling time,TPOT). In that respect, an EORTC study has shown that a shorter overall time brings a benefitfor some head and neck tumours with short TPOT. This implies the administration of severalsmall (< 1.5 Gy) fractions per day, since large fraction sizes are known to be harmful.
Combination of radiation with radiosensitizers is another method to improve thedifferential effect. Drugs such as misonidazole are used to sensitize selectively hypoxic cancercells. Other drugs, such as actinomycin D, bleomycin, adriamycin, 5-fluorouracil, and, morerecently, cis-platinum have been used as radiosensitizers in the treatment of oesophagus, lung,or intestinal tumours. Besides any synergistic effects, radiation and drugs have severalcomplementary actions which further justify their therapeutic association.
A third possibility for improving the differential effect is to replace x-rays (and other low-LET radiations) by high-LET radiations (ICRU Report 45 [10]). High-LET radiations bring abenefit for well-differentiated, slowly growing tumours and/or for tumours containing a largeproportion of hypoxic cancer cells [13-15].
2.4 Accuracy required in radiation therapy
Whatever the improvement in the radiobiological differential effect, the doses which areneeded to control a malignant tumour are often of the same order of magnitude as the tolerancedoses for the normal tissues. In addition, radiobiological and clinical evidence indicates that thedose-effect relations for tumour control are steep (Table 4) [16-18]. For some tumours, a dosevariation of a few percent can modify significantly the observed local control rate. The dose-effect relations are even steeper for normal tissue complications (Table 5) [17]. For these tworeasons, accurate dosimetry is needed, and, in 1976, the ICRU made the followingrecommendations: "the available evidence for certain types of tumours points to the need for anaccuracy of ± 5% in the delivery of an absorbed dose to a target volume if the eradication of theprimary tumour is sought" (ICRU Report 24 [10]). More recently (1987), Mijnheer et al. [17]recommended an accuracy in absorbed dose delivery of 3.5% (one standard deviation, for thedose at the specification point, for radical treatment).
Over the years, the ICRU has played an important role in the world-wide improvement ofdosimetry in radiation therapy. An important step in that direction was the definition ofquantities and of a system of units (ICRU Report 33 [10]). Besides quantities and units, theICRU has focused a great part of its efforts on the selection of procedures suitable for themeasurement and application of these quantities. This implies a critical review of the existingprocedures, value judgement, and finally the recommendation of selected procedures. Theseshould be well described and codified, and widely accepted in the different countries.
Several ICRU Reports have dealt with dosimetry protocols for photon therapy: Reports14, 17, 23, 24 and 42 [10]. For electron beam therapy, Report 35 remains a world-widereference. Other ICRU Reports have contributed to a better accuracy and uniformity ofdosimetry procedures in radiation therapy: Reports 44,46 and 48.
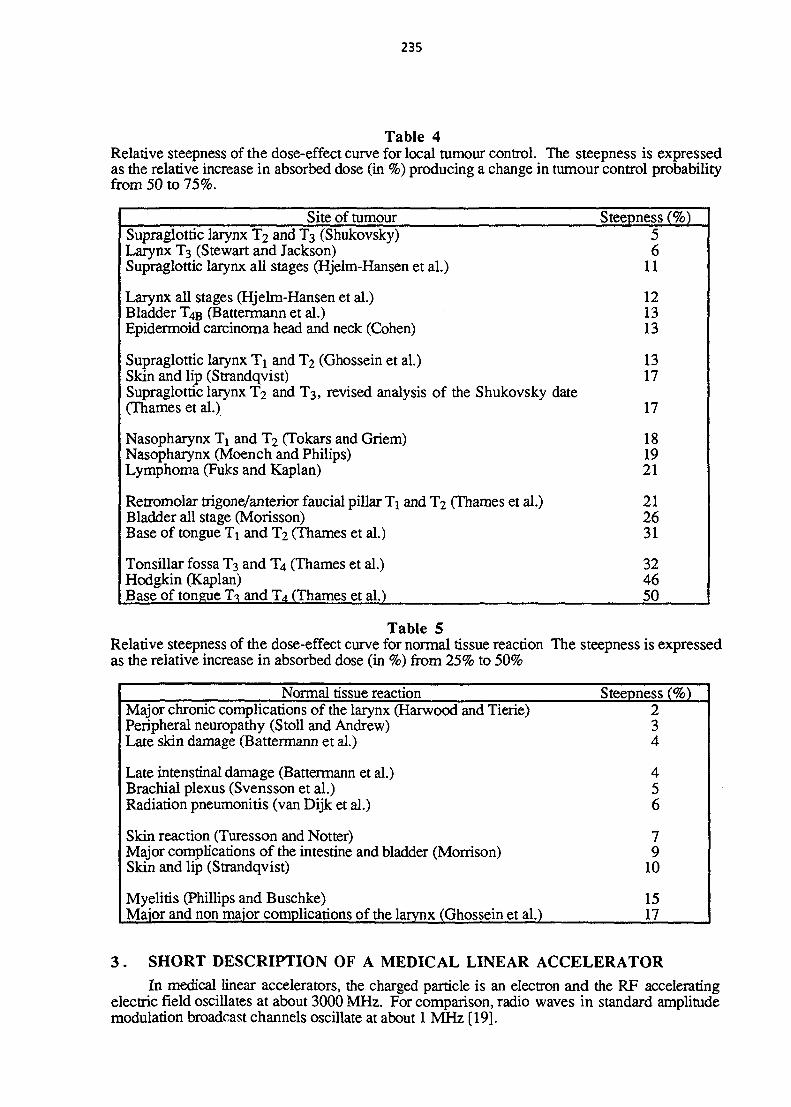
235
Table 4Relative steepness of the dose-effect curve for local tumour control. The steepness is expressedas the relative increase in absorbed dose (in %) producing a change in tumour control probabilityfrom 50 to 75%.
Site of tumourSupraglottic larynx T2 and T3 (Shukovsky)Larynx T3 (Stewart and Jackson)Supraglottic larynx all stages (Hjelm-Hansen et al.)
Larynx all stages (Hjelm-Hansen et al.)Bladder T4B (Battermann et al.)Epidermoid carcinoma head and neck (Cohen)
Supraglottic larynx Ti and T2 (Ghossein et al.)Skin and lip (Strandqvist)Supraglottic larynx T2 and T3, revised analysis of the Shukovsky date(Thames et al.)
Nasopharynx Ti and T2 (Tokars and Griem)Nasopharynx (Moench and Philips)Lymphoma (Fuks and Kaplan)
Retromolar trigone/anterior faucial pillar Ti and T2 (Thames et al.)Bladder all stage (Morisson)Base of tongue Ti and T2 (Thames et al.)
Tonsillar fossa T3 and T4 (Thames et al.)Hodgkin (Kaplan)Base of tongue T^ and T4 (Thames et al.)
Steepness (%)56
11
121313
1317
17
181921
212631
324650
Table 5Relative steepness of the dose-effect curve for normal tissue reaction The steepness is expressedas the relative increase in absorbed dose (in %) from 25% to 50%
Normal tissue reaction Steepness (%)Major chronic complications of the larynx (Harwood and Tierie) 2Peripheral neuropathy (Stoll and Andrew) 3Late skin damage (Battermann et al.) 4
Late intenstinal damage (Battermann et al.) 4Brachial plexus (Svensson et al.) 5Radiation pneumonitis (van Dijk et al.) 6
Skin reaction (Turesson and Notter) 7Major complications of the intestine and bladder (Morrison) 9Skin and lip (Strandqvist) 10
Myelitis (Phillips and Buschke) 15Major and non major complications of the larynx (Ghossein et al.) 17
3 . SHORT DESCRIPTION OF A MEDICAL LINEAR ACCELERATOR
In medical linear accelerators, the charged particle is an electron and the RF acceleratingelectric field oscillates at about 3000 MHz. For comparison, radio waves in standard amplitudemodulation broadcast channels oscillate at about 1 MHz [19].

236
The electrons are thermo-ionically emitted from a concave metal cathode at 1000 °C andaccelerated in the gun to about 1/4 the velocity of light by a pulsed dc electric field. They arethen formed (coalesced) into a pencil beam by a convergent electric field between the gunelectrodes. The RF electric field in the accelerating tube then forms the electron stream intobunches and accelerates them to more than 99% of the velocity of light, increasing their mass(e.g., by a factor of 13 at 6 MeV). The electrons then bombard the target (e.g., tungsten).When an electron enters a tungsten target, the positively-charged nuclei of the tungsten atomspull on the negatively-charged electron, shaking it violently as it passes by one such tungstenatom after another. These high-energy electrons give up a portion of the energy at eachsuccessive atom that they penetrate and emit hard, penetrating x-rays in the forward direction.Two sets of tungsten blocks allow the sizes of the radiation beam (square or rectangularsections) to be adjusted.
All modem medical electron linacs employ an isocentric gantry. The accelerator waveguide is mounted in the gantry, either (relatively) parallel to the gantry axis if a beam bendingmagnet is employed, or perpendicular to the gantry axis if a beam bending magnet is notrequired (low energy, e.g. 4 MV x-ray beam). A simplified block diagram of a medical linearaccelerator is presented in Fig. 1.
More and more modern linear accelerators are equipped with a multileaf collimator whichtypically consists of two sets of 20 leaves which can be moved independently allowing theapplication of irregularly-shaped beams better adapted to the complex shape of the target volume(Fig. 2) [20].
High efficiencyuavellingwavaaccelerating structure
Maximum f ietd sizein isocenlnc plansX-Bay beam: 40x40 cmElectron beam: 25x25 cm
Fig. 1 Simplified block diagram of a medical linear accelerator
4 . THERAPY WITH HIGH-ENERGY PHOTON BEAMS
The most important characteristics of a therapeutic photon beam are the penetration in theirradiated tissues ^eorh/dose curve), the skin sparing effect and the penumbra. For clinicalapplications, a singk beam is seldom applied; and, for each patient, the optimal combinationinvolving several (or many) photon beams has to be selected.

237
Fig. 2 Principle of a multileaf collimator. It consists of two sets of 20 leaves which can bemoved and adjusted independently. As a result, beams of any shape can be applied to closelymatch the shape of the target volume. Target volumes with complex shapes can be treated withminimum irradiation of the surrounding normal tissues [20].
4.1 Beam penetration — depth/dose curves
The penetration of the beam increases with energy (Fig. 3). The depth/dose curvesdescribe the variation of absorbed dose (relative to the maximum dose) as a function of depth, inthe irradiated medium, on the beam axis.
SupervoltoqeSkinsporing
Superficial100KVI mm AL HVL
Orthovoltooe250kV2mm Cu HVL
10 15DEPTH (cm)
Supervoltoqe
24MV X-roys100cm FSO6MV X-roystOOcm FSD6 0 C080cm FSD
J20
Fig. 3 Depth/dose curves for therapeutic photon beams of different energy. Low-energy x-raybeams (100 kV) are still in use and are suitable for treating skin lesions. Orthovoltage x-rays(200-500 kV) are totally inadequate to treat deep seated tumours; they are nearly completelyabandoned. Cobalt-60 is satisfactory for many clinical situations but x-ray energies between 8and 24 MV are needed to obtain adequate depth dose/curves. In addition to an improvement ofthe beam penetration with energy, there is a sparing effect which also increases with energy.Epidermis only is spared with cobalt-60 but the subcutaneous tissues are also protected with 8-24 MV photons.
X-rays of about 100 kV ("low-energy" x-rays) are still in use, but only for the treatment ofsuperficial (skin) lesions. Conventional x-rays ("orthovoltage", 200-250 kV) were the onlytreatment available up to 1955-1960, before cobalt-60, betatrons and linear accelerators wereavailable.
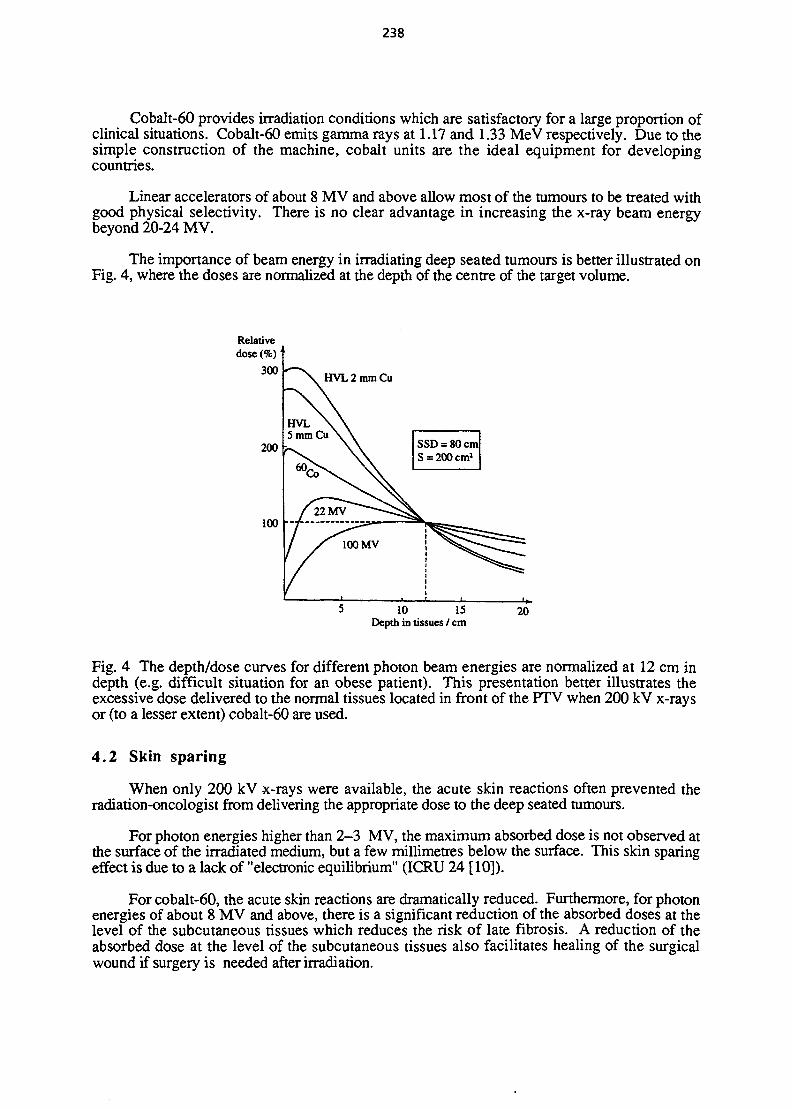
238
Cobalt-60 provides irradiation conditions which are satisfactory for a large proportion ofclinical situations. Cobalt-60 emits gamma rays at 1.17 and 1.33 MeV respectively. Due to thesimple construction of the machine, cobalt units are the ideal equipment for developingcountries.
Linear accelerators of about 8 MV and above allow most of the tumours to be treated withgood physical selectivity. There is no clear advantage in increasing the x-ray beam energybeyond 20-24 MV.
The importance of beam energy in irradiating deep seated tumours is better illustrated onFig. 4, where the doses are normalized at the depth of the centre of the target volume.
Relativedose (%)'
300
200
100
\ HVL 2 mm Cu
" \ \
HVL \ \5mmCu\\
^ \ \
/22MV
SSD = 80cmS=200cmI
^—^^?=^/ /100MV i ^ ^ ^
5 10 15Depth in tissues / cm
20
Fig. 4 The depth/dose curves for different photon beam energies are normalized at 12 cm indepth (e.g. difficult situation for an obese patient). This presentation better illustrates theexcessive dose delivered to the normal tissues located in front of the PTV when 200 kV x-raysor (to a lesser extent) cobalt-60 are used.
4.2 Skin sparing
When only 200 kV x-rays were available, the acute skin reactions often prevented theradiation-oncologist from delivering the appropriate dose to the deep seated tumours.
For photon energies higher than 2-3 MV, the maximum absorbed dose is not observed atthe surface of the irradiated medium, but a few millimetres below the surface. This skin sparingeffect is due to a lack of "electronic equilibrium" (ICRU 24 [10]).
For cobalt-60, the acute skin reactions are dramatically reduced. Furthermore, for photonenergies of about 8 MV and above, there is a significant reduction of the absorbed doses at thelevel of the subcutaneous tissues which reduces the risk of late fibrosis. A reduction of theabsorbed dose at the level of the subcutaneous tissues also facilitates healing of the surgicalwound if surgery is needed after irradiation.

239
4.3 Penumbra
Ideally, the absorbed dose within the geometrical limits of the photon beam should behomogeneous and the absorbed dose outside the beam as low as possible. Unfortunately, at theborder of the beam, there is a narrow region with a steep dose gradient: it is the "penumbraregion".
The penumbra width is defined, at a given depth, as the distance between two selectedisodose levels, i.e., between the 80% and 20% isodoses or between the 90% and 10% isodoses(100% being the maximum absorbed dose on the beam axis at that depth). In all cases, the twoisodose levels used for defining the penumbra should be specified (Fig. 5).
8MV XraysANT
10cm x10cm
RIGHT LEFT
POST
10cm
Fig. 5 Dose distribution obtained with a single 8 MV photon beam (beam size 10 cm x 10 cm).Transverse section through the patient body; the planning target volume (PTV) is indicated bythe hatched area. The dose is specified at the centre of the PTV (100%), it varies within thePTV from 114% to 86%. From ICRU 50 [10].
4.4 Beam combination
An acceptable dose distribution cannot be achieved with only a single photon beam. Thenormal tissues in front of the target volume receive too high a dose, and the normal tissuesbehind the target volume also receive a significant dose (see again Figs 3 and 4).
In the "cross-fire" technique, several beams that intersect at the level of the target volumeare used; as a result, the surrounding normal tissues at risk are irradiated only by one beam.The number and the orientation of the beams are selected by the radiation-oncologist; it is amatter of judgement and experience to select the optimal beam arrangement for each particularpatient. Some examples of treatment schemes are presented in Figs 6-9.
5. ELECTRON-BEAM THERAPY
Besides photon-beam therapy, modern linear accelerators allow electron-beam therapy tobe applied. For that purpose, in the accelerator head, the target is removed and the beam ofaccelerated electrons is directly oriented towards the patient and the PTV.

240
8MV Xr.ylBEAM,,! 37X
8MV Xrays 7cm x 16cm Rotation 300*
8EAM131
lOcmx
// 4
20cm
«20cm A BEAM , ,2 37*.
0 5 10cm
Fig. 6. Transverse section through thepelvis, with the display of the dosedistribution resulting from four beams: twosets of two parallel opposed beamsorthogonal to each other ("box technique").The PTV is indicated by the hatched area.The dose is specified (100 %) at the centreof the PTV and on the beam axes. The dosewithin the PTV ranges from 103 % to 95 %.This beam arrangement can be used for thetreatment of a locally-extended cervixcarcinoma. FromlCRU 50 [10].
Fig. 7. Transverse section through thethorax, with the display of the dosedistribution resulting from a moving beamtreatment with an 8-MV photon beam (largearc 300°). The PTV is indicated by thehatched area. The dose is specified at thecentre of the target volume (100 %) and on thecentral axis of the moving beam. The dosevariation within the PTV ranges from 102 %to 80 %. This irradiation technique can beused e.g. for the treatment of a mediastinaltumour (oesophagus as presented in thefigure) or a prostatic tumour. From ICRU 50[10].
6 S 10cm
• SEAMyrt Wcm 1 20cm
8MV Xrays BEAM
BEAM & 2
W*1
9cm x 10cm
Fig. 8 Three equally weighted 8-MV photon Fig. 9 Irradiation of a lateral lesion (e.g.beams are converging towards the centre of floor of the mouth). Two orthogonal 8-MVthe PTV. Wedge filters (45 °) are used for beams with 45° wedge filters are used,beams # 2 and 3 to achieve a homogeneous From ICRU 50 [10].dose distribution throughout the PTV. FromICRU 50 [10].
5.1 Characteristics of electron beams
The penetration of the electron beams in the tissues is much shallower than that of the x-ray beams and, in addition, can be adjusted by varying the energy of the incident electrons
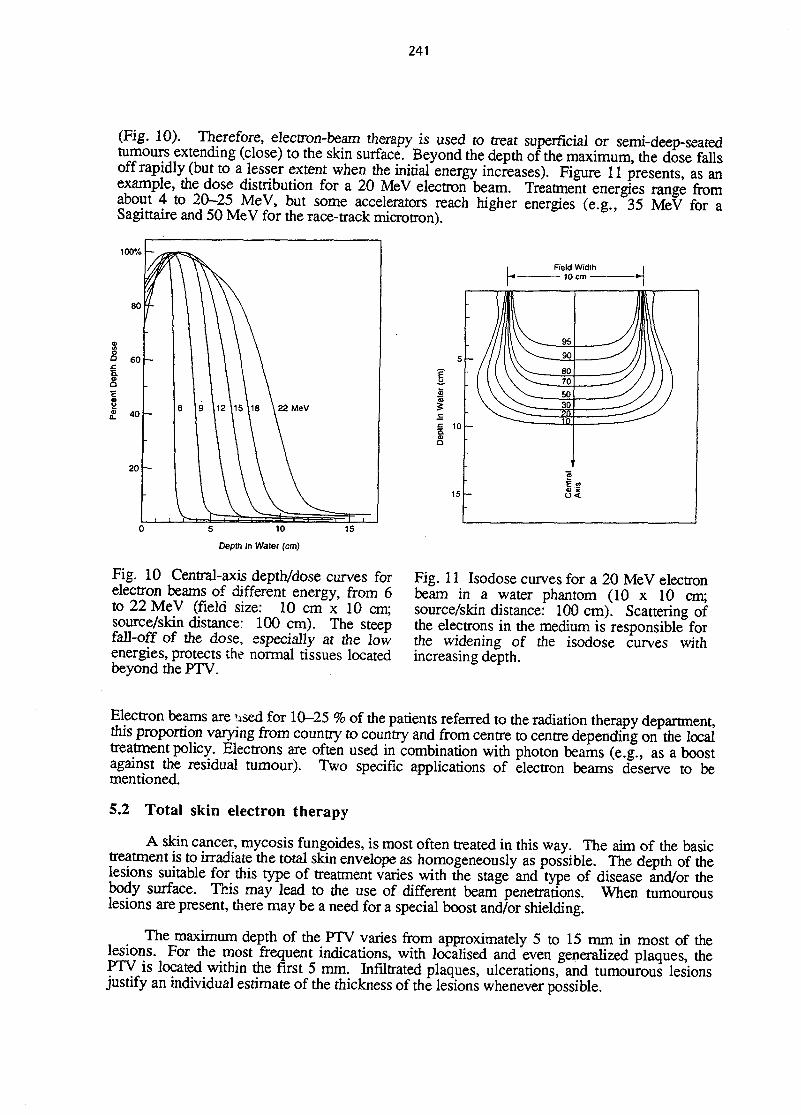
241
(Fig. 10). Therefore, electron-beam therapy is used to treat superficial or semi-deep-seatedtumours extending (close) to the skin surface. Beyond the depth of the maximum, the dose fallsoff rapidly (but to a lesser extent when the initial energy increases). Figure 11 presents, as anexample, the dose distribution for a 20 MeV electron beam. Treatment energies range fromabout 4 to 20-25 MeV, but some accelerators reach higher energies (e.g., 35 MeV for aSagittaire and 50 MeV for the race-track microtron).
h100%
80
60
40
20
-
\6 19 \ 1 2 \ i 5 \ i 8 \ 22 MeV
I \\vVV5 10
Depth In Water (cm)
15
£ 10 -
Fig. 10 Central-axis depth/dose curves forelectron beams of different energy, from 6to 22 MeV (field size: 10 cm x 10 cm;source/skin distance- 100 cm). The steepfall-off of the dose, especially at the lowenergies, protects the normal tissues locatedbeyond the PTV.
Fig. 11 Isodose curves for a 20 MeV electronbeam in a water phantom (10 x 10 cm;source/skin distance: 100 cm). Scattering ofthe electrons in the medium is responsible forthe widening of the isodose curves withincreasing depth.
Electron beams are used for 10-25 % of the patients referred to the radiation therapy department,this proportion varying from country to country and from centre to centre depending on the localtreatment policy. Electrons are often used in combination with photon beams (e.g., as a boostagainst the residual tumour). Two specific applications of electron beams deserve to bementioned.
5.2 Total skin electron therapy
A skin cancer, mycosis fungoides, is most often treated in this way. The aim of the basictreatment is to irradiate the total skin envelope as homogeneously as possible. The depth of thelesions suitable for this type of treatment varies with the stage and type of disease and/or thebody surface. This may lead to the use of different beam penetrations. When tumourouslesions are present, there may be a need for a special boost and/or shielding.
The maximum depth of the PTV varies from approximately 5 to 15 mm in most of thelesions. For the most frequent indications, with localised and even generalized plaques, thePTV is located within the first 5 mm. Infiltrated plaques, ulcerations, and tumourous lesionsjustify an individual estimate of the thickness of the lesions whenever possible.
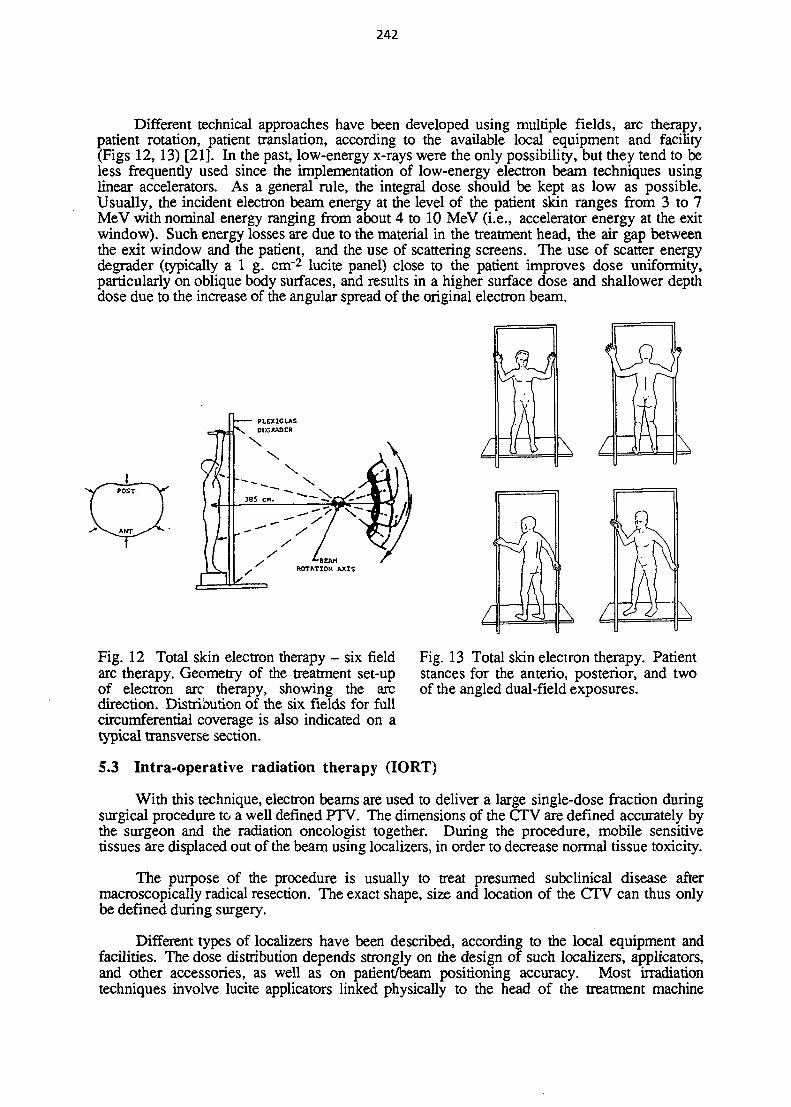
242
Different technical approaches have been developed using multiple fields, arc therapy,patient rotation, patient translation, according to the available local equipment and facility(Figs 12,13) [21]. In the past, low-energy x-rays were the only possibility, but they tend to beless frequently used since the implementation of low-energy electron beam techniques usinglinear accelerators. As a general rule, the integral dose should be kept as low as possible.Usually, the incident electron beam energy at the level of the patient skin ranges from 3 to 7MeV with nominal energy ranging from about 4 to 10 MeV (i.e., accelerator energy at the exitwindow). Such energy losses are due to the material in the treatment head, the air gap betweenthe exit window and the patient, and the use of scattering screens. The use of scatter energydegrader (typically a 1 g. cm"2 lucite panel) close to the patient improves dose uniformity,particularly on oblique body surfaces, and results in a higher surface dose and shallower depthdose due to the increase of the angular spread of the original electron beam.
Fig. 12 Total skin electron therapy - six fieldarc therapy. Geometry of the treatment set-upof electron arc therapy, showing the arcdirection. Distribution of the six fields for fullcircumferential coverage is also indicated on atypical transverse section.
Fig. 13 Total skin electron therapy. Patientstances for the anterio, posterior, and twoof the angled dual-field exposures.
5.3 Intra-operative radiation therapy (IORT)
With this technique, electron beams are used to deliver a large single-dose fraction duringsurgical procedure to a well defined PTV. The dimensions of the CTV are defined accurately bythe surgeon and the radiation oncologist together. During the procedure, mobile sensitivetissues are displaced out of the beam using localizers, in order to decrease normal tissue toxicity.
The purpose of the procedure is usually to treat presumed subclinical disease aftermacroscopically radical resection. The exact shape, size and location of the CTV can thus onlybe defined during surgery.
Different types of localizers have been described, according to the local equipment andfacilities. The dose distribution depends strongly on the design of such localizers, applicators,and other accessories, as well as on patient/beam positioning accuracy. Most irradiationtechniques involve lucite applicators linked physically to the head of the treatment machine

243
(docking system), but systems using laser beams and an optical set up (non-docking system) arealso in use (Figs 14, 15).
In general, the nominal incident electron beam energy ranges from 6 to 20 MeV (beamenergy at the exit window), giving energies between 3 and 15 MeV at the patient surface.Flattening filters are used to provide a homogeneity of ± 10 % within the geometrical beam; theyalso act as scattering foils leading to additional decrease in the beam energy at the patient level.Nominal energy thus becomes irrelevant, and beam quality can only be described usingdepth/dose distribution on the geometrical axis of the beam (assuming an homogeneous phantomparallel to the applicator end). In some cases, combination of adjacent beams has to be used totreat a PTV larger than the available localizers.
I.O.R.T. ELECTRON BEAM DEFINITION (L.I.S.)
l*f colNirator (iquara)
3rd ctHllmtlor(compM« Hup*)
Fig. 14 Shematic drawing of theLyon IORT system
Fig. 15 Electron beams for IORT. Thedose distribution varies with the localizer, inparticular with the angle between thelocalizer (or beam) axis and the distal planeof the localizer (perpendicular or oblique,left and right figure respectively). With anoblique beam, a higher electron energy isneeded to treat a given tissue thickness.
6 . THE FUTURE: NEW DEVELOPMENTS AND TRENDS IN RADIATIONTHERAPY
As mentioned above, the efficiency of radiation therapy may be improved either byincreasing the differential effect, the physical selectivity, or both.
Several attempts have been made to improve the "radiobiological differential effect":
- optimizing the fractionation scheme as a function of the characteristics of theindividual tumours;
- combining radiation with new radiosensitizing drugs, but also selecting their optimalcombination (e.g., time schedule for administration of both radiation and drugs).
However, it is probably through the development of new irradiation techniques that themost significant progress may be expected. An increase in total dose to the target volume,without exceeding the tolerance dose of the surrounding normal tissues, has always been the keyto a better clinical result [7,16,18].

244
A promising approach is the replacement of conventional x-rays by new types of radiation,at least for some tumour sites. Among them, fast neutrons and protons are the most commonlyused, and, to a lesser extent, heavy ions.
Fast neutrons, which are high-LET radiation, aim at improving the differential effect(ICRU Report 46 [10]). Radiobiology has shown that they are specifically efficient againsthypoxic (cancer) cells or against cells which accumulate in the resistant phases of the mitou'ccycle.
Recently, clinical observation has shown that neutrons bring a benefit for the treatment ofsome well-selected types of tumours [13, 14, 22]. The most convincing results were obtainedfor locally-extended inoperable salivary-gland tumours for which the conclusions of a NCIstudy are summarized as follows: "fast neutron radiation therapy alone is the treatment of choicefor salivary-gland tumours that cannot be completely resected and/or where the surgical risk offacial nerve damage is high" [15,23]. Also, for locally extended prostatic adenocarcinoma, tworandomized trials, initiated by the RTOG in the US, have shown the superiority of fast neutrons(used alone or as "mixed schedule") compared to conventional x-rays [23,24].
Proton-beam therapy improves the physical selectivity of the irradiation, but no benefit isto be expected from an improved differential effect [7]. However, the impressive clinical resultsobtained for selected tumour sites (in particular, uveal melanoma) by the pioneer centres haveencouraged several other centres to initiate proton therapy programs. The number of proton-therapy facilities is increasing: 4 in 1980, 6 in 1985, 10 in 1990, and 16 in 1994. Otherfacilities are planned.
Technological development has allowed the engineers to offer cyclotrons that are compact,reliable, and affordable. These compact cyclotrons, superconducting or based on conventionaltechnology, can be installed within the hospital. They will soon certainly facilitate thedevelopment of neutron- and proton-beam therapy.
Heavy ions combine the advantages of neutrons and protons: they enable the radiationoncologist to deliver a high-LET therapeutic irradiation with an excellent physical selectivitycomparable to that of proton beams. Heavy ions were applied at the Lawrence BerkeleyLaboratory, where 299 patients were treated with neon ions. Unfortunately, the facility wasclosed recently. However, an ambitious heavy-ion therapy program was started at the MRS inChina, Japan, in 1994. A third program will start at the GSI in Darmstadt, Germany, in 1996.
Unfortunately, for the present and the near future, the number of patients who couldbenefit from these new types of beams will be limited. Therefore, it is important to improve andto optimize the available techniques. In that respect, stereotactic radiosurgery, conformationradiotherapy, intra-operative radiotherapy, total skin irradiation, and modem developments inbrachytherapy have already brought encouraging results for some tumour types. Thesetechniques are being applied in an increasing number of large, well-equipped and well-staffedradiotherapy departments. Their safe application requires accurate dosimetry and careful qualitycontrol procedures. Some of these approaches (e.g., stereotactic radiosurgery and conformationradiotherapy) involve optimizing the use of linear accelerators and improving their technicalcharacteristics.
Stereotactic radiosurgery is used mainly for the treatment of lesions limited in size andlocated in the head (e.g., tumours of the base of the skull). By using a large number of narrowbeams intersecting at the level of the lesion or by using arc therapy, high doses can de deliveredto the lesion while keeping the dose to the surrounding normal structures relatively low. Thisprocedure requires accurate localization of the lesion, accurate dose computation, and accuratebeam/patient positioning (Fig. 16) [25].
Conformation therapy can be defined as an effort to optimize the treatment by adequatelyselecting the number and orientation of the beams, their size and shape. In other words, the

245
volume of tissues actually irradiated should match as closely as possible the PTV, even if it iscomplex in shape.
Since the early days of radiation therapy, some kind of conformation therapy was anobjective. Impressive examples were given already in the forties, for example by Baclesse andhis colleagues at the Fondation Curie in Paris, especially for some tumours of the head and neckarea. However, the poorly penetrating beam available at that time prevented the full success ofthese efforts.
100° Arci Vert
100° Arc 100° Arc
260° Arc
TU*NTMU I
a) b)
Fig. 16 Stereotactic radiosurgery. a) Overview of patient treatment. A special collimator and anaccurate head support system is added to the linear accelerator. Treatment uses both gantry andturntable rotation, b) Head schematic showing the three coordinate axes and the four arcs of atypical cranial treatment [25]
Today, four sets of new means are available to the radiation-oncologist:
a) complete patient data: typically in the form of a series of CT slices with detailedanatomical information (MRI or other imaging techniques). The location, extent andposition of the target volume relative to the organs at risk or anatomical reference pointscan be known accurately.
b) with high-energy, penetrating x-ray beams, it is possible to reach any point in the body,even in depth. Furthermore, the beams are well collimated; their size and shape can beadapted to the target volume. With complex beam arrangements, different beam shapescan be applied.
c) with the modern treatment planning systems (3-D), it is possible, even for a complextreatment, to visualise rapidly the resulting dose distribution and thus to optimize the beamarrangement based on reliable information.
d) lastly, with some sophisticated equipment, the treatment machine can be drivenautomatically by the computer of the treatment planning system.
An example of the possible development in the field of conformation therapy is given inFig. 17 where the target volume consists of the iliac and para-aortic lymph node areas. In
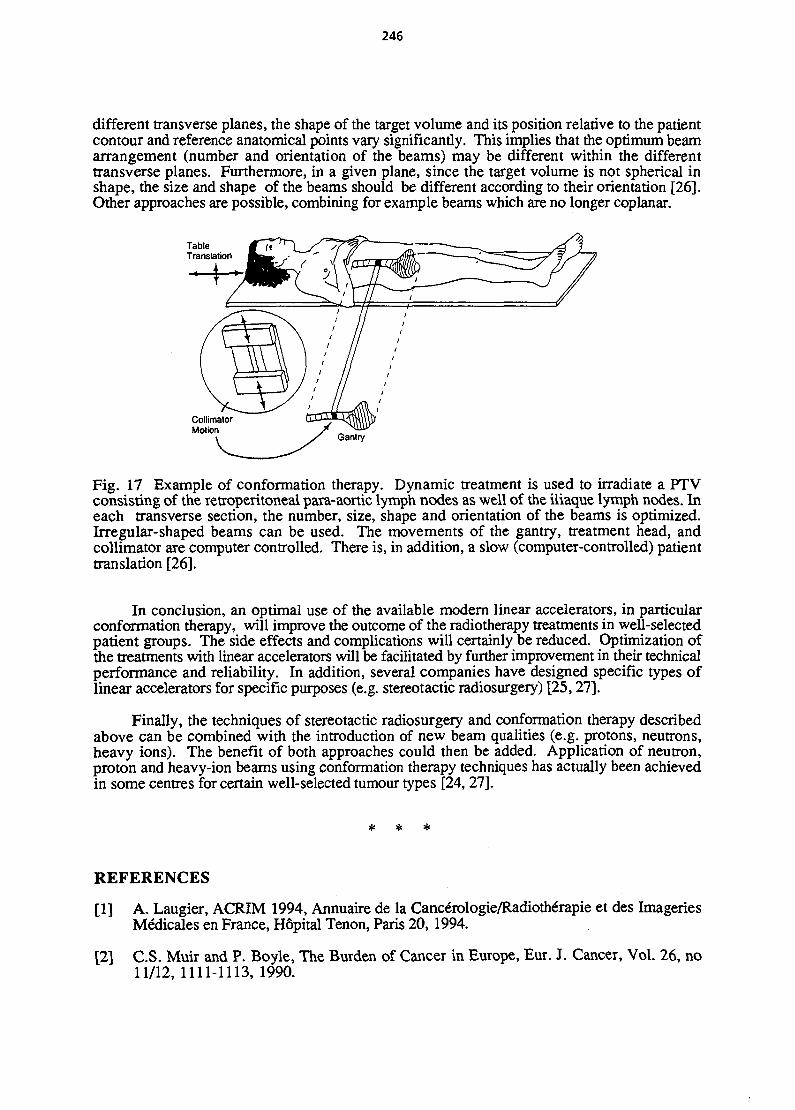
246
different transverse planes, the shape of the target volume and its position relative to the patientcontour and reference anatomical points vary significantly. This implies that the optimum beamarrangement (number and orientation of the beams) may be different within the differenttransverse planes. Furthermore, in a given plane, since the target volume is not spherical inshape, the size and shape of the beams should be different according to their orientation [26].Other approaches are possible, combining for example beams which are no longer coplanar.
Gantry
Fig. 17 Example of conformation therapy. Dynamic treatment is used to irradiate a PTVconsisting of the retroperitoneal para-aortic lymph nodes as well of the iliaque lymph nodes. Ineach transverse section, the number, size, shape and orientation of the beams is optimized.Irregular-shaped beams can be used. The movements of the gantry, treatment head, andcollimator are computer controlled. There is, in addition, a slow (computer-controlled) patienttranslation [26].
In conclusion, an optimal use of the available modern linear accelerators, in particularconformation therapy, will improve the outcome of the radiotherapy treatments in well-selectedpatient groups. The side effects and complications will certainly be reduced. Optimization ofthe treatments with linear accelerators will be facilitated by further improvement in their technicalperformance and reliability. In addition, several companies have designed specific types oflinear accelerators for specific purposes (e.g. stereotactic radiosurgery) [25,27].
Finally, the techniques of stereotactic radiosurgery and conformation therapy describedabove can be combined with the introduction of new beam qualities (e.g. protons, neutrons,heavy ions). The benefit of both approaches could then be added. Application of neutron,proton and heavy-ion beams using conformation therapy techniques has actually been achievedin some centres for certain well-selected tumour types [24,27].
REFERENCES
[1] A. Laugier, ACRIM 1994, Annuaire de la Cancerologie/Radiotherapie et des ImageriesMedicates en France, Hopital Tenon, Paris 20, 1994.
[2] C.S. Muir and P. Boyle, The Burden of Cancer in Europe, Eur. J. Cancer, Vol. 26, no11/12, 1111-1113, 1990.

247
[3] L. Davis, D. Hoel, J. Fox and A. Lopez, International trends in cancer mortality inFrance, West Germany, Italy, Japan, England and Wales, and the USA, The Lancet, 336,474-481, August 25, 1990.
[4] V.T. Devita, Progress in cancer management, Cancer, 51,2401-2409,1983.
[5] V.T. Devita and D. Korn, Progress against cancer, New Engl. J. Med., 315,964,1986.
[6] R. Doll, Are we winning the fight against cancer? An epidemiological assessment, EACR- Muhlboch Memorial Lecture, Eur. J. Cancer, Vol. 26, No. 4, 500-508, 1990.
[7] H.D. Suit, Potential for improving survival rates for the cancer patient by increasing theefficacy of treatment of the primary lesion, Cancer, 50,1227-1234,1982.
[8] Commission of the European Communities, Concerted action: cancer treatment with lightions in Europe - EULIMA, Final Report - Part 1: General Feasibility Study; A.Wambersie, P. Chauvel, G. Gademann, J.P. Gerard, R. Sealy, Socio-economic study,pp. 2-39, CEC, rue de la Loi 200, 1049, Brussels, 1992.
[9] A. Wambersie and G.F. Whitmore, Radiation therapy, ICRU News, InternationalCommission on Radiation Units and Measurements (ICRU), Inc., 1,15-20,1995.
[10] INternational Commission On Radiation Units And Measurements (ICRU):- Report 14: Radiation dosimetry: x-rays and gamma rays with maximum photon energies
between 0.6 and 50 MeV (1969).- Report 17: Radiation dosimetry: x-rays generated at potentials of 5 to 150 kV (1970).- Report 23: Measurement of absorbed dose in a phantom irradiated by a single beam of x
or gamma rays (1973).- Report 24: Determination of absorbed dose in a patient irradiated by beams of x or gamma
rays in radiotherapy procedures (1976).- Report 33: Radiation quantities and units (1980).- Report 35: Radiation dosimetry: electron beams with energies between 1 and 50 MeV
(1984).- Report 42: Use of computers in external beam radiotherapy procedures with high-energy
photons and electrons (1987).- Report 44: Tissue substitutes in radiation dosimetry and measurement (1989).- Report 45: Clinical neutron dosimetry - Part 1, Determination of absorbed dose in a
patient treated by external beams of fast neutrons (1989).- Report 46: Photon, electron, proton, and neutron interaction data for body tissues (1992).- Report 48: Phantoms and computational models in therapy, diagnosis and protection
(1993).- Report 50: Prescribing, recording and reporting photon beam therapy (1993).
ICRU, Inc., 7910 Woodmont Avenue, Suite 800, Bethesda, Maryland 20814-3095,USA.
[11] M. Tubiana, J. Dutreix and A. Wambersie, Radiobiologie, Hermann Ed., Paris, 1986.
[12] M. Tubiana, J. Dutreix and A. Wambersie, Introduction to radiobiology, Taylor &Francis, London, 1990.
[13] A. Wambersie, Neutron therapy: from radiobiological expectation to clinical reality,Radiation Protection Dosimetry, 44,379-395,1992.
[14] A. Wambersie, F. Richard and N. Breteau, Development of fast neutron therapyworldwide, Acta Oncologica, 33, 261-274, 1994.
248
[15] G.E. Laramore, J.M. Krall, T.W. Griffm, W. Duncan, M.P. Richter, K.R. Saroja, M.H.Maor and L.W. Davis, Neutron versus photon irradiation for unresectable salivary, glandtumors: final report of an RTOG-MRC randomized clinical trial, Int. J. RadiationOncology Biol. Phys., 27, 235-240, 1993.
[16] R.C. Ultrasun, Does improved depth dose characteristics and treatment planning correlatewith a gain in therapeutic results? Evidence from past clinical experience usingconventional radiation sources, Int. J. Radiation Oncology Biol.Phys., 22, 235-239,1992.
[17] BJ. Mijnheer, JJ. Battermann and A. Wambersie, What degree of accuracy is requiredand can be achieved in photon and neutron therapy? Radiotherapy and Oncology, 8,237-253, 1987.
[18] H.D. Thames, T.E. Schultheiss, J.H. Henry, S.L. Tucker, B.M. Dubray andW.A. Brock, Can modest escalations of dose be detected as increased tumor control? Int.
J. Radiation Oncology Biol.Phys., 22, 241-246, 1992.
[19] CJ. Karzmark, S. Nunan and E. Tanabe, Medical Electron Accelerators, McGraw-Hill,Inc., Health Professions Division, New York, 1993.
[20] A. Brahme: Optimal setting of multileaf collimators in stationery beam radiation therapy.Strahlentherapie und Oncologie, 164: 343-350,1988.
[21] AAPM, American Association of Physicists in Medicine, C.J. Karzmark (ed): Total skinelectron therapy; technique and dosimetry, Report* 23, American Institute of Physics,New York, 1987.
[22] WJ . Koh, J.M. Krall, L.J. Peters, M.H. Maor, G.E. Laramore, CM. Burnison,L.W. Davis, S. Zink and T.W. Griffin, Neutron vs. photon radiation therapy ininoperable regional, non-small cell lung cancer: results of a multicenter randomized trial,Int. J. Radiation Oncology Biol. Phys., 27, 499-505, 1993.
[23] National Cancer Institute (NCI), Fast neutron radiation therapy in the United States: atwenty-year NCI sponsored research program (NTCWG annual report, 1991), NationalCancer Institute, Bethesda, MD 20892, USA, 1991.
[24] M. Austin-Sempour, R. Caplan, K. Russell, G. Laramore, J. Jacky, P. Wootton,S. Hummel, K. Lindsley and T. Griffin, Impact of a multileaf collimator on treatmentmorbidity in localized carcinoma of the prostate, Int. J. Radiation Oncology, Biol.Phys.,30, 1065-1071, 1994.
[25] W. Lutz, K.R. Winston and N. Maleki: A system for stereotactic radiosurgery with alinear accelerator Int. J. Radiation Oncology BiolJPhys., 14, 373-381,1988.
[26] L.M. Chin, P.K. Kijewski, G.K Svensson, J.T. Chaffey, M.B. Levene andB. Bjarngard: A computer-controlled radiation therapy machine for pelvic and paraaorticnodal areas. Int. J. Radiation Oncology BioLPhys., 7, 61-70,1981.
[27] H.D. Kogelnik (Ed), Progress in Radio-Oncology V, International Proceedings Division,Monduzzi Editore, 40128 Bologna, Italy, 1995.

249
NON-MEDICAL APPLICATION OF LINACS
K.H.W. BethgeInstitut fur Kernphysik, J.W. Goethe Universitat, Frankfurt am Main, Germany
AbstractThe development of accelerator applications in different fields requires avery careful consideration of their features and limitations. Thusdifferent types of accelerators will be favoured in different fields.
1 . INTRODUCTION
The industrial technology developed during the last two hundred years in Europe andelsewhere in the world was devoted to the needs of the actual periods. These needs weretransport of people and goods, first within the continents which pursued the goal to establishfast and reliable railroad transportation, and thus the technique required was the development ofengines and tracks. The advent of the car boomed in times when the individualism reached itsclimax, it was thought to be the sign of freedom for all. Thus car industries boomedtremendously. Transport between continents was heavily supported by a large ship buildingindustry. The many unnecessary wars developed the arms industry in all its facettes. Allindustries were dominated by the engineering knowledge and skills developed over manydecades.
This was still the situation at the end of World War II , about 50 years ago. Mechanicaland electrical engineering has since reached a level of perfectionism down to the smallestdetails.
During the second half of the 20th century, however, particularly with the advent ofmicroelectronics which changed the general direction of thinking from macroscopic to thedevelopment of microscopic views, the same progress was not visible in most of the industries.To illustrate that I would like to mention a few examples. Modern techniques require methodsto test, for example, the adherence of thin layers on different sample materials. The generaltests were still performed as a tape test. Tapes on the surface of the layers were loaded withincreasing weight untill the layer peeled off, an almost archaic method. Except for thesemiconductor industry, ion implantation is only at a very preliminary state because thinking inatomic dimensions is not very well accepted by engineers. The same is true with analyticalmethods using probes of atomic or even nuclear dimension. The so-called hightechdevelopments already base their new products on submicroscopic dimensions. Not only ismicroelectronics a leading field but also all products which include thin-layer techniques aredirectly transforming basic physical results into technically applicable devices. It is well knownthat in many cases thin layers with special features fulfill the same demands as former bulkmaterials and that, even if more expensive in detail, the general tendency has proven to becheaper. Therefore it might be a permanent task for physicists to develop the methods so faronly applied in scientific laboratories to a standard that might be feasible and economicallyjustified for applying these techniques to a much larger extent.
Reasons for the very slow pace in introducing new techniques are certainly the fear thatinstruments and apparatus used in basic research do not fulfill the standards of reliability,permanent availability and easy handling important for industrial applications. The followingsections will list the present status and the needs for future improvements focusing onaccelerators.
Materials research requires, in contrast to service activities, almost universal availabilityof ions from almost all elements of the Periodic Table. Materials research is concerned to create
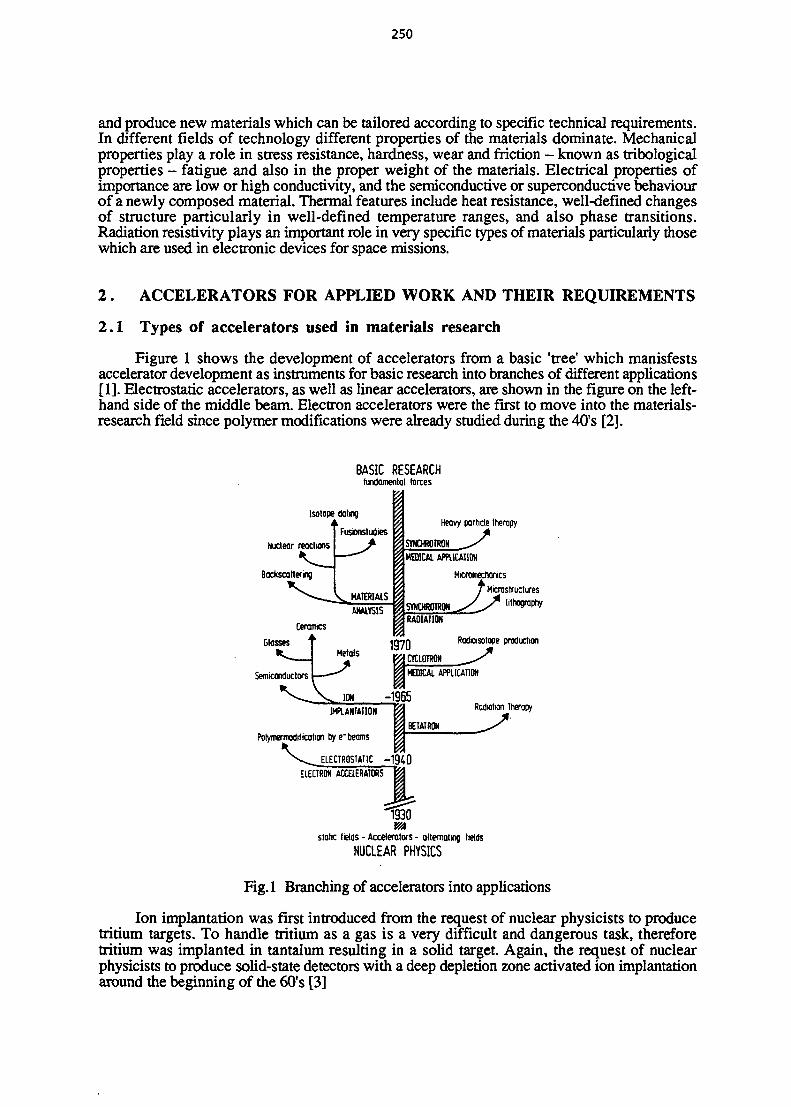
250
and produce new materials which can be tailored according to specific technical requirements.In different fields of technology different properties of the materials dominate. Mechanicalproperties play a role in stress resistance, hardness, wear and friction - known as tribologicalproperties - fatigue and also in the proper weight of the materials. Electrical properties ofimportance are low or high conductivity, and the semiconductive or superconductive behaviourof a newly composed material. Thermal features include heat resistance, well-defined changesof structure particularly in well-defined temperature ranges, and also phase transitions.Radiation resistivity plays an important role in very specific types of materials particularly thosewhich are used in electronic devices for space missions.
2 . ACCELERATORS FOR APPLIED WORK AND THEIR REQUIREMENTS
2.1 Types of accelerators used in materials research
Figure 1 shows the development of accelerators from a basic 'tree' which manisfestsaccelerator development as instruments for basic research into branches of different applications[1]. Electrostatic accelerators, as well as linear accelerators, are shown in the figure on the left-hand side of the middle beam. Electron accelerators were the first to move into the materials-research field since polymer modifications were already studied during the 40's [2].
BASIC RESEARCHfundamental forces
Isotope dating
Nuclear reactions
Back scattering
Fusionstudies
MATERIALSANALYSIS
Ceramics
ClassesMetals
_2Z SYNCHROTRON
MEDICAL APPLICATION
MicromecnonicsT Microstructures
SYNCHROTRON / ^ lithographyRADIATION
Semiconductors
1970B 3 CYCLOTRON| | MEDICAL APPLICATION
-1965
Rodioisotope production
IMPLANTATION
Potymermodificotion by e" beams
Radiation Therapy
BETATRON
v ^ ELECTROSTATIC - 1 9 4 QELECTRON ACCELERATORS
static fields - Accelerators - alternating fieldsNUCLEAR PHYSICS
Fig. 1 Branching of accelerators into applications
Ion implantation was first introduced from the request of nuclear physicists to producetritium targets. To handle tritium as a gas is a very difficult and dangerous task, thereforetritium was implanted in tantalum resulting in a solid target. Again, the request of nuclearphysicists to produce solid-state detectors with a deep depletion zone activated ion implantationaround the beginning of the 60's [3]

251
As indicated in Fig. 1 all types of accelerators are presently used in applied fields.Electrostatic accelerators of the Cockroft-Walton type are predominantly used in low-energymaterials modification mainly as ion implanters in the energy range up to about 500 keV. Theyare designed as machines for operation by workers who do not necessarily have an academiceducation. These machines are available commercially equipped with all the necessaryinstruments for ion implantation such as implantation chambers with a good high-vacuumsystem, vacuum locks, multiple axial goniometers and beam-scanning systems. All thesemachines provide easy access to all parts requiring frequent maintenance including particularlythe ion sources. In some industrial products several ion-source ports are available [4].
Electrostatic machines, mainly with a single acceleration stage, are presently used formaterials modification using electron beams. Many applications in polymer physics andchemistry use electron accelerators up to 500 keV.
The other group of electrostatic accelerators, generally called van de Graaff machines,find their largest field of application in materials analysis (see the chapter 'Applications of IonLinacs' in these proceedings). Several advantages explain their frequent use. In many analyticaltasks it is required to measure the distribution of the elements in thin layers. Since many van deGraaff accelerators produce voltages beynd 10 MV nuclear physics data can be used for theanalyses. Furthermore, since vast amounts of nuclear data are available for almost all isotopesof the elements of the Periodic Table the analytical laboratories are able to produce reliableanalysis data. In particular, one feature of the electrostatic accelerators, the variation of theenergy of the projectiles in very small steps - with special care one can achieve the 10 to 100eV range -place them in a favoured position in the application field.
3 . REQUIREMENTS FOR ACCELERATOR APPLICATIONS
The requirements for long-range applications are of a different nature. There are technicalrequirements for the accelerators themselves, and operational requirements for the specificapplication, which have to be considered in connection with the appropriate instrumentation.The general scheme can be subdivided into three main sections, the accelerators, the targets,and the measuring equipment usually known as the detector. These will each be described inthe following sections.
3 . 1 Accelerator requirements
Accelerators used in research laboratories, which are in general also the designer of suchmachines, are operated by a highly-skilled team of experts mainly with an academic education.This is not at all the basis for the industrial use of accelerators which have to be very reliableand permanently available. In this case the machines have to be operated on a push-button basisby non experts in the field and can only be used economically if they are available almost allaround the clock. This implies minimal maintenance with parts such as the ion sources whichhave to be replaced from time to time being readily accessible [4]. Power consumption(electricity as well as cooling) also has to be as low as possible since in industry the operationalcosts play the more important role in the long term
The next group of requirements concerns the performance of accelerators. In materialsresearch applications it is essential to have ion beams with the lowest possible energy spreadbecause this quantity directly determines the depth resolution either for materials modificationor materials analysis (see the 'Applications of Ion Linacs' chapter). Tables 1 and 2 list somepresently achievable figures for energy resolution and spread respectively.

252
Table 1Presently achievable energy resolution
Item
Ion source energy spreadGas stripper (tandem accelerators, negative-ion cyclotrons)(Voltage stability (electrostatic accelerators)RFQ
- (with debuncher)Linac (good phase stability)
— (with debuncher)
Energy resolution
AE~ 0.01-0.1 keVAE - 0.1-1 keVAU - 0.05-0.5 kV)AE/E - 1 %AE/E - 0 . 1 %AE/E - 1 - 2 %AE/E <0.1%
Table 2Energy spread of different ion sources
Ion source
Rf source inductively coupledRf source capacitively coupledDuoplasmatron (charge exchange)Duoplasmatron (direct extraction)PIG (cold cathodes)CryebisEBIT (electron beam ion trap)
ECRHIEFFISSurface-ionisation sourceLiquid-metal ion source
Energy spread(eV)
600300180
10-2015-252 * q
Xe44+ 10.6Th71+ 13
0-58
0.2-0.52-5
Reference
[5][5][5][6][7][8][9]
[10][11][12][13]
[14-16]
In some applications there are strict requirements concerning the geometrical size of thebeam spot So-called micro beams are necessary for the performance of lateral scans with goodspatial resolution. Beam spots in the range of a few .m^ are required.
One important quantity however is the beam brightness and new efforts must be madeto improve this.
3 .2 Target or probe requirements
For the overall performance the following quantities have to be considered, because theyinfluence the quality of the work:
Energy loss
Bohr straggling
Projected range
(eV/nm)a ~210 6 , />~0 .62
SE
p
&~0.3-10"6
(nm)

253
Depth resolution
Mass resolution
8Ec8E/8x
where c = / (k, 0 ) ,Q is the angle of incidence andk the kinematical factor.
8x/Rp~E-°-2
ml8m ocE/8E~E°2
almost constant.
Maximum depth analysis 5 =cdE/dx
where Ak is the difference of kinematical factors fordifferent impurity masses,EQ is the bombarding energy and
x the fit parameter (for a-particles in Si, t; ~ 0.9)
Doppler broadening (due to vibrations of target atoms, when heavy projectiles are used)
with £ 2 m ^ vibrational energy,
example lH on ! 5 N R ~ 0.1 keV (FWHM)15N on ! H R ~ 10 keV
Furthermore material requirements have to be met such as mechanical stability and/orelectrical conductivity.
3.3 Requirements of the detector systems
A third important quantity is the energy resolution of the detector system. For Si surface-barrier detectors an entrance window of about 0.01 |im increases the energy straggling. ThisBohr straggling is given by
8E oc Vx ~ 30 Vx (nm)
The energy resolution is further determined by the ionisation statistics
8Ee ~JFeE0
with F the Fano factor, e the energy for creating an ion pair (in Si: ~ 3.6 eV) and Eo thebombarding energy.
The nuclear stopping
8En (LSS) (~4keV)
is responsible for the life time of surface-barrier detectors. The resolution starts to deteriorate attotal counts of about 107.
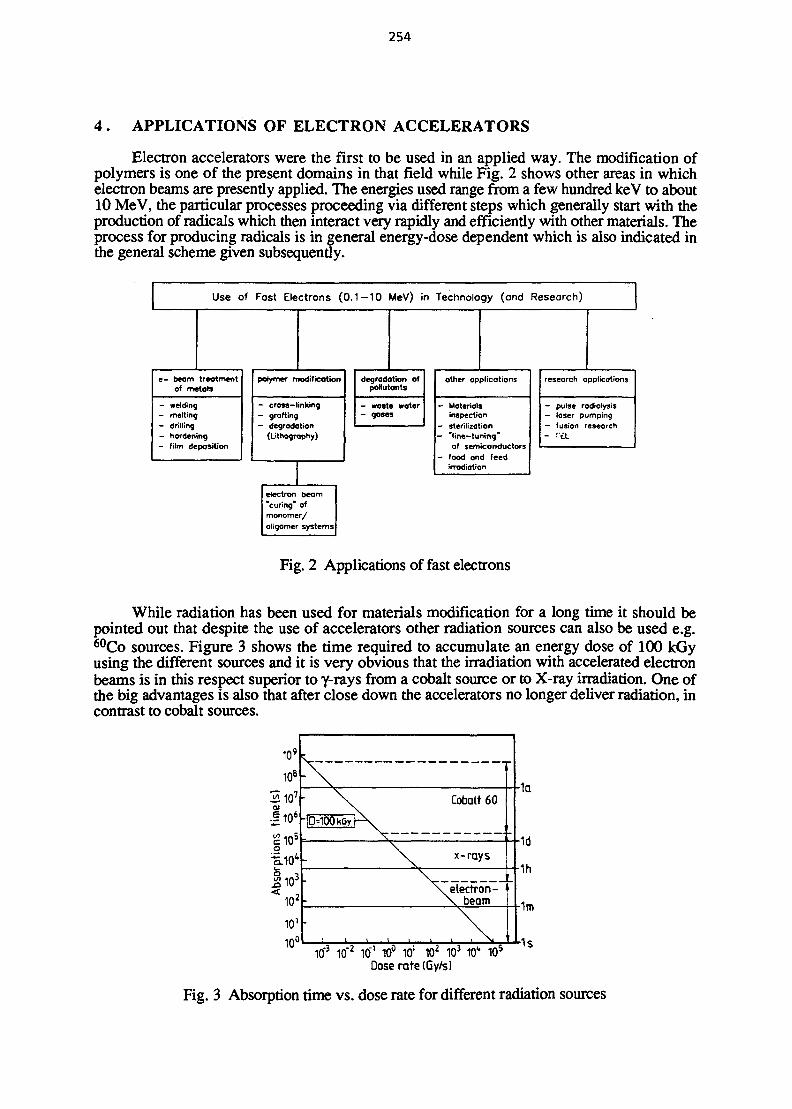
254
4 . APPLICATIONS OF ELECTRON ACCELERATORS
Electron accelerators were the first to be used in an applied way. The modification ofpolymers is one of the present domains in that field while Fig. 2 shows other areas in whichelectron beams are presently applied. The energies used range from a few hundred keV to about10 MeV, the particular processes proceeding via different steps which generally start with theproduction of radicals which then interact very rapidly and efficiently with other materials. Theprocess for producing radicals is in general energy-dose dependent which is also indicated inthe general scheme given subsequendy.
Use of Fost Electrons (0.1-10 MeV) in Technology (and Research)
e - beam treatmentof metals
- welding- melting— drilling— hardening- film deposition
polymer modification
- cross-linking- grafting- degradation
(Lithography)
electron beam'curing* ofmonomer/oligomer systems
degradation ofpollutants
- waste water- gases
other applications
- Materialsinspection
- sterilization- "fine-tuning"
of semiconductors- food and feed
irrodiotion
research applications
- pulse radiolysis- laser pumping— fusion research- !'£L
Fig. 2 Applications of fast electrons
While radiation has been used for materials modification for a long time it should bepointed out that despite the use of accelerators other radiation sources can also be used e.g.60Co sources. Figure 3 shows the time required to accumulate an energy dose of 100 kGyusing the different sources and it is very obvious that the irradiation with accelerated electronbeams is in this respect superior to y-rays from a cobalt source or to X-ray irradiation. One ofthe big advantages is also that after close down the accelerators no longer deliver radiation, incontrast to cobalt sources.
109k
108
a)
J106
| 1 O 5
Cobalt 60
x-rays
electron- 'beam
10"3 10~2 10"' 10° 101 102 103 101* 10s
Dose rate (Gy/s)
1a
•1d
1h
1m
•1s
Fig. 3 Absorption time vs. dose rate for different radiation sources
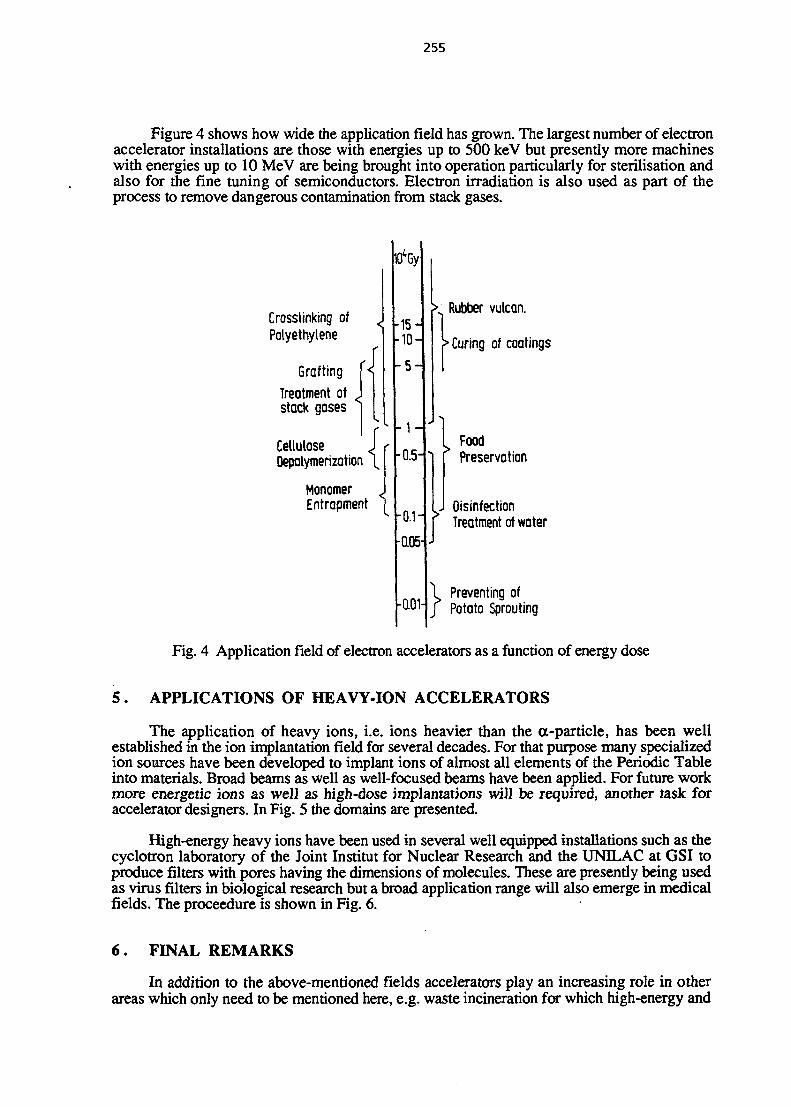
255
Figure 4 shows how wide the application field has grown. The largest number of electronaccelerator installations are those with energies up to 500 keV but presently more machineswith energies up to 10 MeV are being brought into operation particularly for sterilisation andalso for the fine tuning of semiconductors. Electron irradiation is also used as part of theprocess to remove dangerous contamination from stack gases.
1OiGy:
Crosslinking ofPolyethylene
GraftingTreatment ofstack gases
Cellulose JOepolymerization \
Monomer <
Entrapment [
15-10-
1 - 5 -
• 1 -
0.5-
0.1-
0.05-
-0.01
Rubber vulcan.
• Curing of coatings
FoodPreservation
DisinfectionTreatment of water
Preventing ofPotato Sprouting
Fig. 4 Application field of electron accelerators as a function of energy dose
5 . APPLICATIONS OF HEAVY-ION ACCELERATORS
The application of heavy ions, i.e. ions heavier than the oc-particle, has been wellestablished in the ion implantation field for several decades. For that purpose many specializedion sources have been developed to implant ions of almost all elements of the Periodic Tableinto materials. Broad beams as well as well-focused beams have been applied. For future workmore energetic ions as well as high-dose implantations will be required, another task foraccelerator designers. In Fig. 5 the domains are presented.
High-energy heavy ions have been used in several well equipped installations such as thecyclotron laboratory of the Joint Institut for Nuclear Research and the UNILAC at GSI toproduce filters with pores having the dimensions of molecules. These are presently being usedas virus filters in biological research but a broad application range will also emerge in medicalfields. The proceedure is shown in Fig. 6.
6 . FINAL REMARKS
In addition to the above-mentioned fields accelerators play an increasing role in otherareas which only need to be mentioned here, e.g. waste incineration for which high-energy and

256
high-intensity machines are required. Furthermore 'neutron accelerators' are being tested forbaggage and freight inspection purposes but still require further development. The whole fieldof applications may bring accelerators much more into the forefront and with much bettergeneral acceptance in the future.
1810
101
1 0 1 6
CM
-§1015
QJ10
o
1 O I :
Iff1
10'
I
BuriedConductors
MetalInterfaceMixing
Deep Amorphous jLayers
! Oxygen Precipitate Layers
Retrograde SourcesFor Power Switches
Buried Collectors
Buried Grids/Planes
Rom Program
isolation
•—Conventional &Retrograde Wells
—- LifetimeModifications
0 1 2 3 4 5 6Energy (MeV)
Fig. 5 Areas of high-dose and high-energy ion implantation
heavy-ionirradiation etching stopping rinsing drying
STOCHASTICALLY DISTRIBUTED 0.3 \IM PORES IN POLYCARBONATE.
Fig. 6 Processes in filter production by heavy-ion bombardment of polycarbonates [17]
257
REFERENCES
[I] K. Bethge, Industrial Applications of Accelerators in Advances of AcceleratorPhysics and Technologies, ed. H. Schopper, (World Scientific, Singapore, 1993)
[2] A. Charlesby, Proc. Roy. Soc. A 215 (1952) 187
[3] F.W. Martin, W.J. King and S. Harrison, IEEE Trans. NS U (1964) no.3, 280
[4] A.H.P. van Osterhout, Nucl. Instr. & Meth. Phys. Res. B50 (1990) 455
[5] L.E. Collins, D. Dandy and P.T. Stroud, Nucl. Instr. Meth. 42 (1966) 206
[6] L.E. Collins and R.H. Gobbet, Nucl. Instr. & Meth. 35 (1965) 277
[7] H. Baumann and K. Bethge, Nucl. Instr. & Meth. Phys. Res. 189 (1981) 107
[8] E. Beebe, L. Liljeby, A. Engstrom and M. Bjdrkhage, Phys. Scripta 47(1993) 470
[9] D.R. DeWitt et. al., Phys. Rev. A42 (1993) R1597
[10] H. Kurz et.al., Phys. Rev. A (1994) to be published
[II] R. Becker, private communication
[12] K. Volk, Thesis, University of Frankfurt, 1993
[13] R.G. Wilson and G.R. Brewer, Ion beams with Application to Ion Implantation, (Wiley,N.Y, 1973)
[14] W. Knauer, Optik 59. (1981) 335
[15] L.W. Swanson, G.A. Schwind and A.E. Bell, J. Appl. Phys. 5J. (1980) 3453
[16] G.L.R. Mair et. al., J. Phys. DJ6 (1983) DL209
[17] R. Spohr, Ion Tracks and Microtechnology, (Vieweg, Wiesbaden, 1990)
NEXT PAQE(S)left BL8MK
259
APPLICATIONS OF ION LINACS
K.H.W. BethgeInstitut fur Kernphysik, J.W. Goethe Universitat, Frankfurt am Main, Germany
AbstractPresently a domain of the application of linear accelerators concernsmaterials research. Many methods and processes have been developedin ion-beam treatment of materials based on atomic as well as nuclearphysics.
1 . INTRODUCTION
Materials modification as well as materials analysis is a fairly new field of applications asindicated in the chapter 'Non-medical Applications of Linacs'. The requirements on theaccelerators are, however, very specific according to the task which has to be met As indicatedin the introduction to the non-medical applications chapter, the name 'linear accelerator'includes by definition also electrostatic machines, not only the RF linacs. Thus the applicationsfor materials analysis are presently mainly using the electrostatic accelerators because of themuch better energy resolution which is directly proportional to the depth resolution inside asolid material.
2 . ACCELERATOR-BASED METHODS IN MATERIALS RESEARCH
Accelerators are basic instruments in materials modification as well as materials analysis.Materials modification covers the ion implantation which has developed to such an extent thatmaterials can almost be tailored by the proper selection of parameters. Some examples ofrelevant material properties are:
Mechanical properties: wear, frictionductility, elasticitybrittleness, machinabilityshape persistencestability against traction,compression, torsion
Electrical properties : conductivity (T dependent)persistence against lightsuperconductivitymagnetic susceptibility
Thermal properties : thermal conductivityheat persistenceshape persistencesurface resistivity
The energy deposition during ion bombardment of systems containing several componentsleads to mixing processes which also include ion-beam enhanced, radiation-induced diffusion.These processes are important, for example in the metallizing of ceramics.
Additional fields of application in materials science cover topics in catalysis, corrosionstudies, and porosity of materials for which the density of holes are important. Some fieldsoutside natural science and technology are criminology, archeology, art and history.
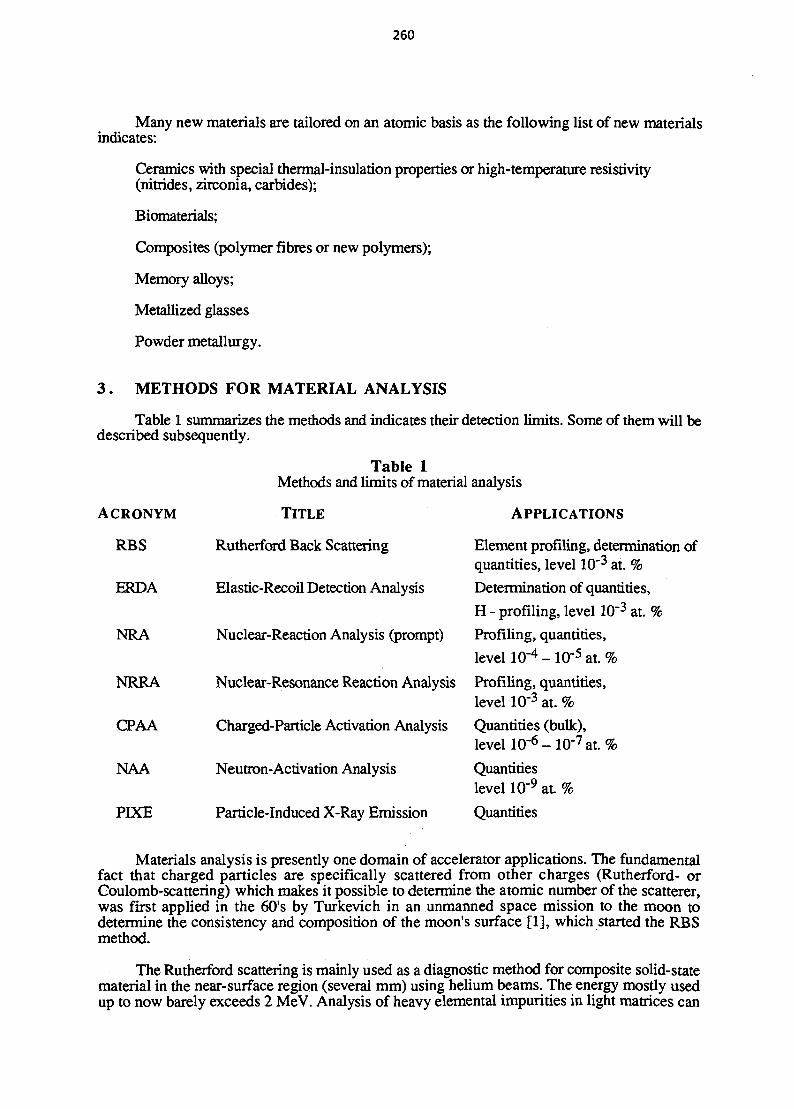
260
Many new materials are tailored on an atomic basis as the following list of new materialsindicates:
Ceramics with special thermal-insulation properties or high-temperature resistivity(nitrides, zirconia, carbides);
Biomaterials;
Composites (polymer fibres or new polymers);
Memory alloys;
Metallized glasses
Powder metallurgy.
3 . METHODS FOR MATERIAL ANALYSIS
Table 1 summarizes the methods and indicates their detection limits. Some of them will bedescribed subsequently.
ACRONYM
RBS
ERDA
NRA
NRRA
CPAA
NAA
PIXE
Table 1Methods and limits of material analysis
TITLE
Rutherford Back Scattering
APPLICATIONS
Elastic-Recoil Detection Analysis
Element profiling, determination ofquantities, level 10"3 at. %
Determination of quantities,
H - profiling, level 10'3 at. %
Nuclear-Reaction Analysis (prompt) Profiling, quantities,
level 10"4-10-5 at. %
Nuclear-Resonance Reaction Analysis Profiling, quantities,level 10'3 at. %
Charged-Particle Activation Analysis Quantities (bulk),level 10"6 - 10"7 at. %
Neutron-Activation Analysis
Particle-Induced X-Ray Emission
Quantitieslevel 10"9 at %
Quantities
Materials analysis is presently one domain of accelerator applications. The fundamentalfact that charged particles are specifically scattered from other charges (Rutherford- orCoulomb-scattering) which makes it possible to determine the atomic number of the scatterer,was first applied in the 60's by Turkevich in an unmanned space mission to the moon todetermine the consistency and composition of the moon's surface [1], which started the RBSmethod.
The Rutherford scattering is mainly used as a diagnostic method for composite solid-statematerial in the near-surface region (several mm) using helium beams. The energy mostly usedup to now barely exceeds 2 MeV. Analysis of heavy elemental impurities in light matrices can
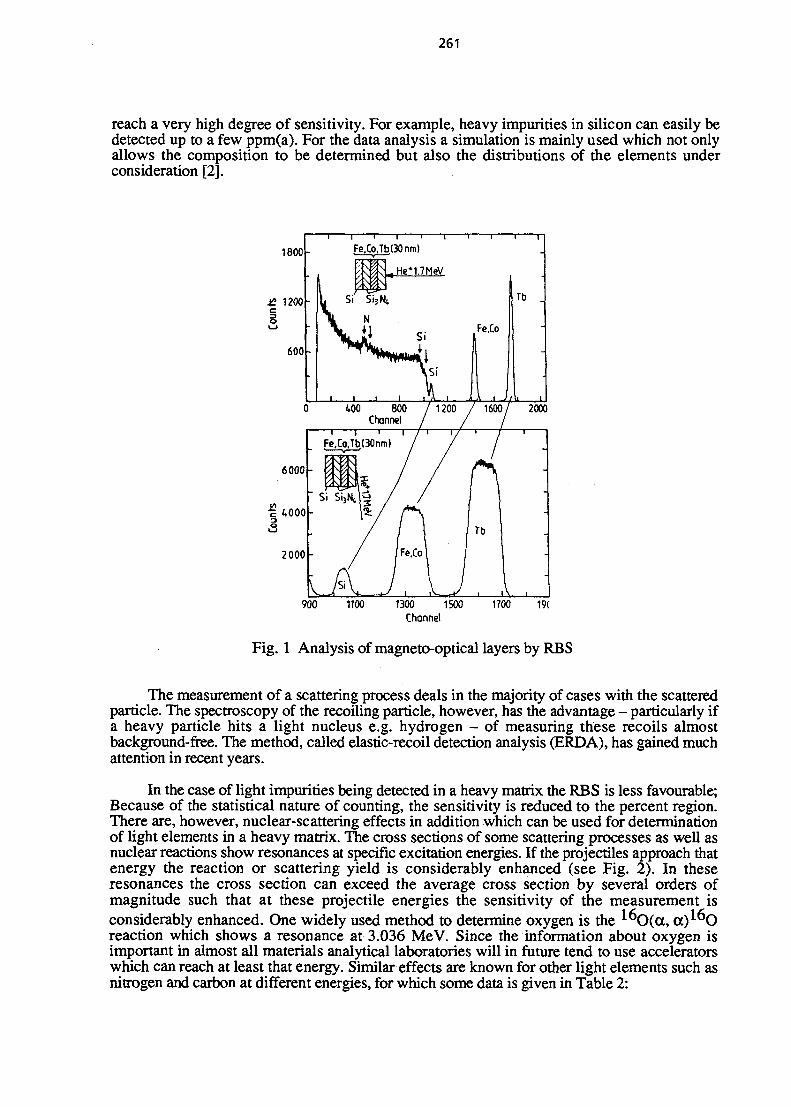
261
reach a very high degree of sensitivity. For example, heavy impurities in silicon can easily bedetected up to a few ppm(a). For the data analysis a simulation is mainly used which not onlyallows the composition to be determined but also the distributions of the elements underconsideration [2].
1800
£ 1200
600
Fe.Co.Tb.<30nm)
„ HeM.7MeV
400 800 / 1200 / 1600/ 2000Channel / /
900 1100 1300 1500 1700 19CChannel
Fig. 1 Analysis of magneto-optical layers by RBS
The measurement of a scattering process deals in the majority of cases with the scatteredparticle. The spectroscopy of the recoiling particle, however, has the advantage - particularly ifa heavy particle hits a light nucleus e.g. hydrogen - of measuring these recoils almostbackground-free. The method, called elastic-recoil detection analysis (ERDA), has gained muchattention in recent years.
In the case of light impurities being detected in a heavy matrix the RBS is less favourable;Because of the statistical nature of counting, the sensitivity is reduced to the percent region.There are, however, nuclear-scattering effects in addition which can be used for determinationof light elements in a heavy matrix. The cross sections of some scattering processes as well asnuclear reactions show resonances at specific excitation energies. If the projectiles approach thatenergy the reaction or scattering yield is considerably enhanced (see Fig. 2). In theseresonances the cross section can exceed the average cross section by several orders ofmagnitude such that at these projectile energies the sensitivity of the measurement isconsiderably enhanced. One widely used method to determine oxygen is the ^ O ( a , a ) ^ Oreaction which shows a resonance at 3.036 MeV. Since the information about oxygen isimportant in almost all materials analytical laboratories will in future tend to use acceleratorswhich can reach at least that energy. Similar effects are known for other light elements such asnitrogen and carbon at different energies, for which some data is given in Table 2:
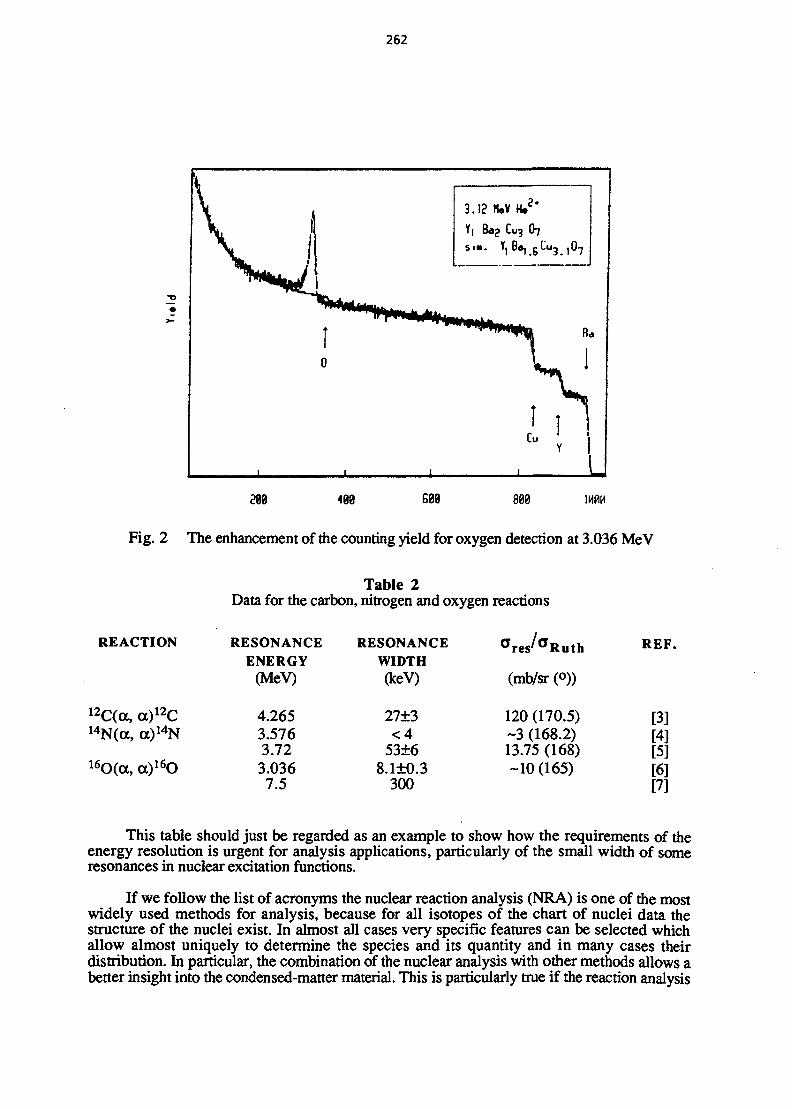
262
388 408 608
Fig. 2 The enhancement of the counting yield for oxygen detection at 3.036 MeV
Table 2Data for the carbon, nitrogen and oxygen reactions
REACTION
12C(a, cc)12C14N(a, a)14N
16O(a, a)16O
RESONANCEENERGY
(MeV)
4.2653.5763.723.0367.5
RESONANCEWIDTH(keV)
27±3<4
53±68.1±0.3
300
°res'°Ruth
(mb/sr (o))
120 (170.5)~3 (168.2)13.75 (168)-10 (165)
REF.
[3][4][5][6][7]
This table should just be regarded as an example to show how the requirements of theenergy resolution is urgent for analysis applications, particularly of the small width of someresonances in nuclear excitation functions.
If we follow the list of acronyms the nuclear reaction analysis (NRA) is one of the mostwidely used methods for analysis, because for all isotopes of the chart of nuclei data thestructure of the nuclei exist. In almost all cases very specific features can be selected whichallow almost uniquely to determine the species and its quantity and in many cases theirdistribution. In particular, the combination of the nuclear analysis with other methods allows abetter insight into the condensed-matter material. This is particularly true if the reaction analysis
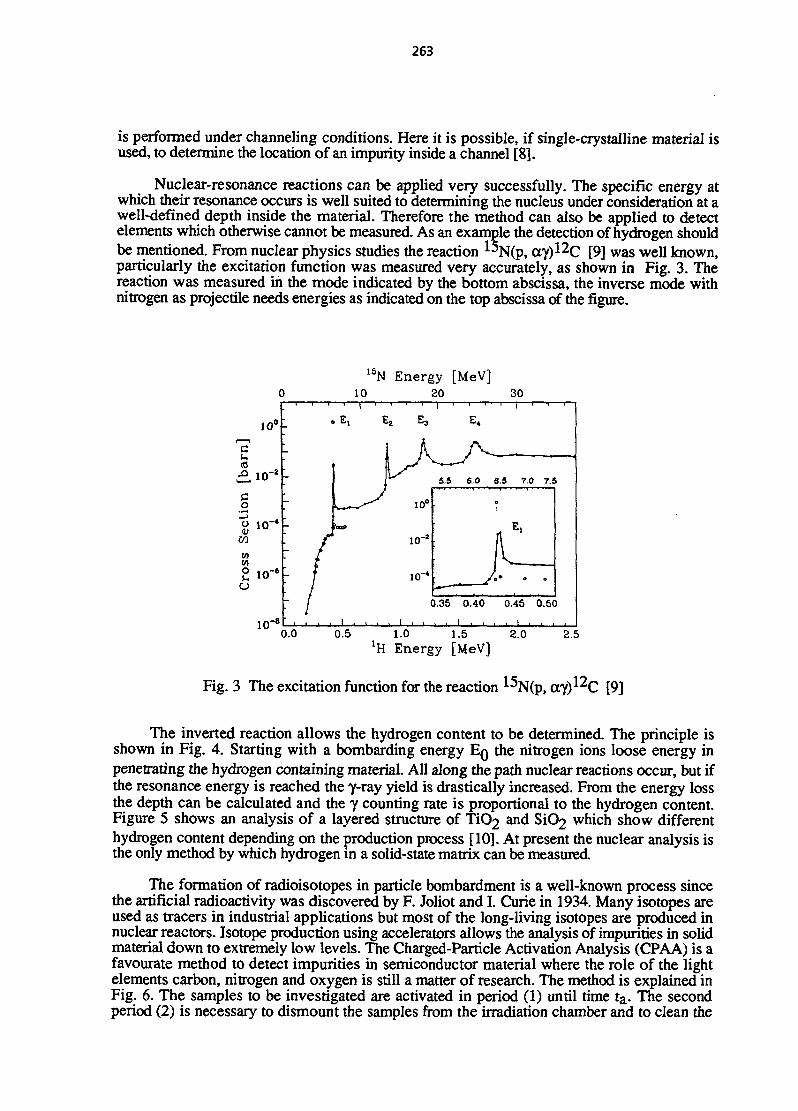
263
is performed under channeling conditions. Here it is possible, if single-crystalline material isused, to determine the location of an impurity inside a channel [8].
Nuclear-resonance reactions can be applied very successfully. The specific energy atwhich their resonance occurs is well suited to determining the nucleus under consideration at awell-defined depth inside the material. Therefore the method can also be applied to detectelements which otherwise cannot be measured. As an example the detection of hydrogen shouldbe mentioned. From nuclear physics studies the reaction ^NCp, cry)*2c [9] was well known,particularly the excitation function was measured very accurately, as shown in Fig. 3. Thereaction was measured in the mode indicated by the bottom abscissa, the inverse mode withnitrogen as projectile needs energies as indicated on the top abscissa of the figure.
15N Energy [MeV]10 20 30
0.0 0.5 1.0 1.5 2.0 2.5*H Energy [MeV]
Fig. 3 The excitation function for the reaction ^N(p, a y j ^ c [9]
The inverted reaction allows the hydrogen content to be determined. The principle isshown in Fig. 4. Starting with a bombarding energy EQ the nitrogen ions loose energy inpenetrating the hydrogen containing material. All along the path nuclear reactions occur, but ifthe resonance energy is reached the y-ray yield is drastically increased. From the energy lossthe depth can be calculated and the y counting rate is proportional to the hydrogen content.Figure 5 shows an analysis of a layered structure of Ti(>> and Si(>> which show differenthydrogen content depending on the production process [10]. At present the nuclear analysis isthe only method by which hydrogen in a solid-state matrix can be measured.
The formation of radioisotopes in particle bombardment is a well-known process sincethe artificial radioactivity was discovered by F. Joliot and I. Curie in 1934. Many isotopes areused as tracers in industrial applications but most of the long-living isotopes are produced innuclear reactors. Isotope production using accelerators allows the analysis of impurities in solidmaterial down to extremely low levels. The Charged-Particle Activation Analysis (CPAA) is afavourate method to detect impurities in semiconductor material where the role of the lightelements carbon, nitrogen and oxygen is still a matter of research. The method is explained inFig. 6. The samples to be investigated are activated in period (1) until time ta. The secondperiod (2) is necessary to dismount the samples from the irradiation chamber and to clean the

264
surface and in the third period (3) the usual measurement of a decay curve follows. From thedifferent half-lives the isotopes can be identified and the extrapolation to ta allows the quantitityto be determined. The detection limits for CPAA were already mentioned in the introductorytable of this paragraph.
Surface
Fig. 4 The measurement principle for hydrogen detection
8 9 10Energy [MeV]
n
Fig. 5 Hydrogen content in a multi-reflection layered structure. The open and closed symbolsindicate different production methods [10].
The detection limits of Neutron-Activation Analysis (NAA) exceed those of CPAA byseveral orders of magnitude. However, the light elements cannot be analysed by NAA. NAA isstill a domain of nuclear reactors.
The last of the listed methods, the Particle-Induced X-ray Emission (PIXE ), is also anaccelerator based method. It allows the elements to be determined by their characteristic X-rayemission. This method also allows quantities to be determined but not elemental distributions.
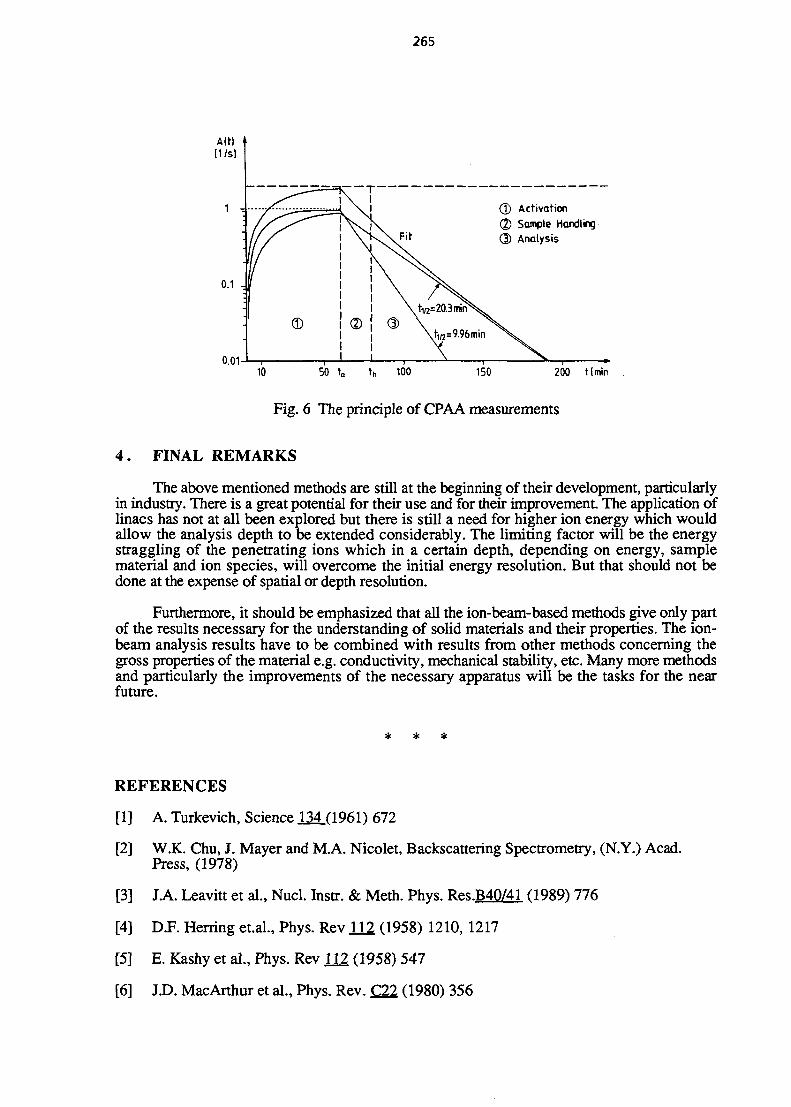
265
(T) ActivationQ) Sample Handlingd) Analysis
150 200 tlmin
Fig. 6 The principle of CPAA measurements
4 . FINAL REMARKS
The above mentioned methods are still at the beginning of their development, particularlyin industry. There is a great potential for their use and for their improvement. The application oflinacs has not at all been explored but there is still a need for higher ion energy which wouldallow the analysis depth to be extended considerably. The limiting factor will be the energystraggling of the penetrating ions which in a certain depth, depending on energy, samplematerial and ion species, will overcome the initial energy resolution. But that should not bedone at the expense of spatial or depth resolution.
Furthermore, it should be emphasized that all the ion-beam-based methods give only partof the results necessary for the understanding of solid materials and their properties. The ion-beam analysis results have to be combined with results from other methods concerning thegross properties of the material e.g. conductivity, mechanical stability, etc. Many more methodsand particularly the improvements of the necessary apparatus will be the tasks for the nearfuture.
REFERENCES
[1] A. Turkevich, Science 121(1961) 672
[2] W.K. Chu, J. Mayer and M.A. Nicolet, Backscattering Spectrometry, (N.Y.) Acad.Press, (1978)
[3] J.A. Leavitt et al., Nucl. Instr. & Meth. Phys. Res.B40/41 (1989) 776
[4] D.F. Herring et.al., Phys. Rev 112 (1958) 1210, 1217
[5] E. Kashy et al., Phys. Rev U2 (1958) 547
[6] J.D. MacArthur et al., Phys. Rev. £22 (1980) 356

266
[7 Huang-sheng Cheng et al., Nucl. Instr.& Meth. Phys. Res. B83 (1993) 449
[8] A. Mader, J.D. Meyer and K. Bethge, Nucl. Instr. & Meth. Phys. Res. B7I (1992) 65
[9] C. Rolfs and W. Rodney, Nucl. Phys. A235 (1974) 450
[10] M. Laube, W. Wagner and F. Rauch, Glastechn. Ber., Glass Sci. Techn. M (1994) 87
267
APPLICATION OF RF-LINACS TO HEAVY-ION FUSION
I. HofmannGSI Darmstadt, D-64220 Darmstadt 11
AbstractInertial confinement fusion driven by heavy ions is a potential ap-plication of RF linear accelerators to solve the energy problem. Thepresent status of accelerator, reactor and target studies is discussed,with main emphasis on accelerator physics and design issues. A re-cent proposal of an Ignition Facility to the European Commissionis outlined.
1 INTRODUCTIONHeavy ion accelerators for inertial confinement fusion have been considered since the
mid-seventies as a promising alternative to other paths towards fusion energy production.The main advantage of heavy ions as compared with lighter ions (p, Li) or laser beams is onthe one hand their classical behaviour in transport and beam-target coupling; on the otherhand the availability of a highly developed technology of accelerators for nuclear and highenergy physics. They have proven to be reliable, with high efficieny and repetition rate.The present interest is reflected by a consensus that heavy ions are the most promisingcanditate for commercial energy production by inertial fusion [1]. The unique strengthof lasers, on the other hand, is their capability to provide extremely high power pulses.Target experiments with lasers have now reached a status where they are comparable withmagnetic confinement fusion in terms of their proximity to ignition. For an overview onthe actual status of inertial fusion in general see Ref. [2].
Dedicated programs with research in this field are presently pursued on two alter-native paths: the RF linac - storage ring approach studied mainly in Europe [3] and theinduction linear accelerator pursued in the United States [4]. While the basic principlespresented here are applicable to both approaches, we confine the accelerator discussionon the RF linac - storage ring approach.
2 BASIC PRINCIPLES
2.1 Requirements for Fusion Energy ProductionThe fusion reaction with the most favourable cross section and temperature is
) (1)
where most of the energy is carried away by the neutron (14 MeV). This reaction hasa maximum cross section at 50 keV, but a sufficient reaction rate is already obtainedfor a plasma temperature of 5 keV. The D-D reaction looks attractive as it works with-out the radioactive tritium. It requires, however, about an order of magnitude higherplasma temperature. The cleanest reaction would be the B-p reaction, which producesonly charged particles (i.e. no neutrons), but at even higher plasma temperatures. Anaccelerator driven approach to this difficult task has recently been discussed in Ref.[5].
For thermonuclear burn a balance is needed between energy loss and fusion energy
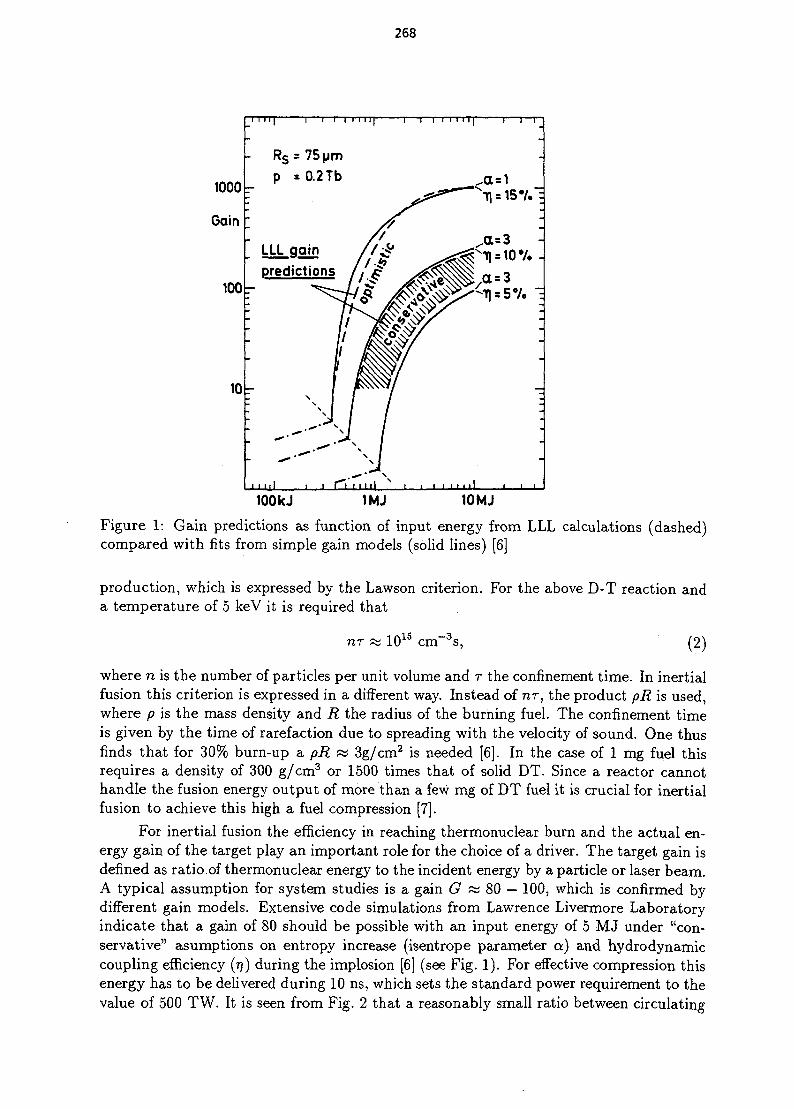
268
1000
Gain
ioob-
10 T
_ l 1 I I I 1 I I I
Rs = 75pm
p =0.2Tb
LLL gain
predictions
' 1• - i
1 ' " i i • » ' .
a = 1
-s^—"S| = 15»/.
-a , . .
ml
\l -tOOkJ 1MJ 10MJ
Figure 1: Gain predictions as function of input energy from LLL calculations (dashed)compared with fits from simple gain models (solid lines) [6]
production, which is expressed by the Lawson criterion. For the above D-T reaction anda temperature of 5 keV it is required that
nr 1015 cm"3s, (2)
where n is the number of particles per unit volume and r the confinement time. In inertialfusion this criterion is expressed in a different way. Instead of TIT, the product pR is used,where p is the mass density and R the radius of the burning fuel. The confinement timeis given by the time of rarefaction due to spreading with the velocity of sound. One thusfinds that for 30% burn-up a pR sa 3g/cm2 is needed [6]. In the case of 1 mg fuel thisrequires a density of 300 g/cm3 or 1500 times that of solid DT. Since a reactor cannothandle the fusion energy output of more than a few mg of DT fuel it is crucial for inertialfusion to achieve this high a fuel compression [7].
For inertial fusion the efficiency in reaching thermonuclear burn and the actual en-ergy gain of the target play an important role for the choice of a driver. The target gain isdefined as ratio of thermonuclear energy to the incident energy by a particle or laser beam.A typical assumption for system studies is a gain G s=s 80 — 100, which is confirmed bydifferent gain models. Extensive code simulations from Lawrence Livermore Laboratoryindicate that a gain of 80 should be possible with an input energy of 5 MJ under "con-servative" asumptions on entropy increase (isentrope parameter a) and hydrodynamiccoupling efficiency (rj) during the implosion [6] (see Fig. 1). For effective compression thisenergy has to be delivered during 10 ns, which sets the standard power requirement to thevalue of 500 TW. It is seen from Fig. 2 that a reasonably small ratio between circulating
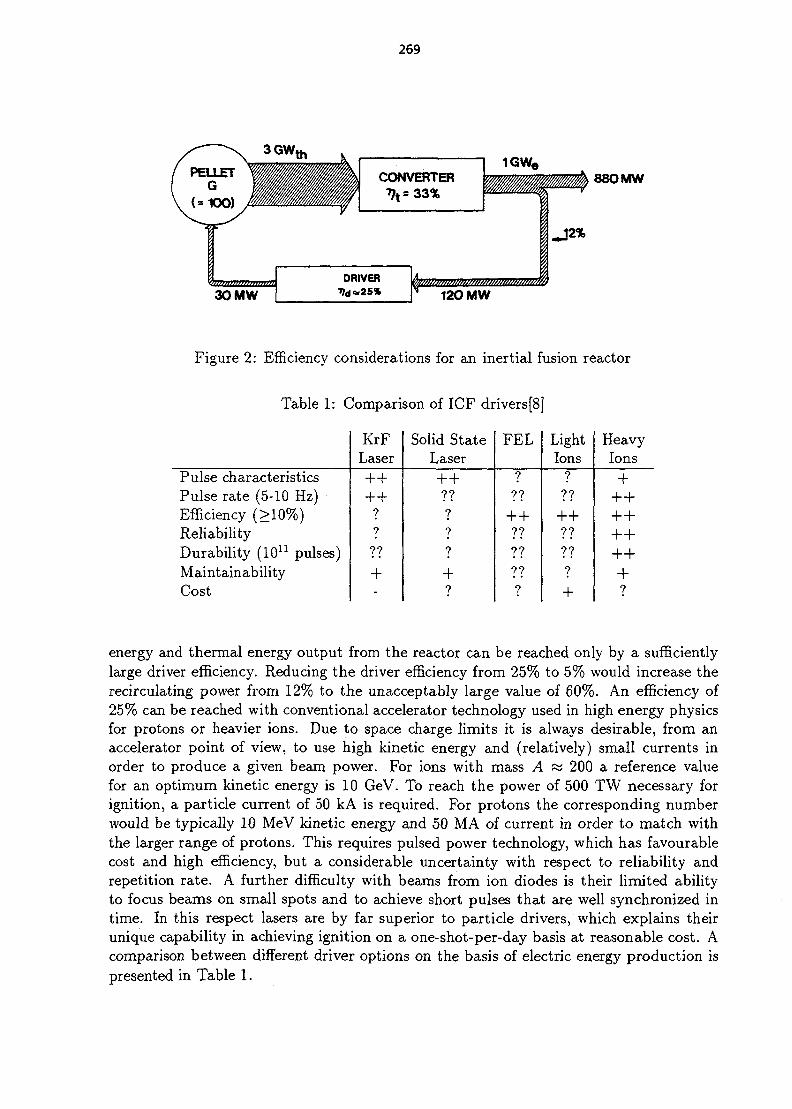
269
CONVERTER1GW,
30 MWDRIVER
88OMW
120 MW
Figure 2: Efficiency considerations for an inertial fusion reactor
Table 1: Comparison of ICF drivers[8]
Pulse characteristicsPulse rate (5-10 Hz)Efficiency (>1O%)ReliabilityDurability (1011 pulses)MaintainabilityCost
KrFLaser
++++????+-
Solid StateLaser
++?????+
FEL
???
++???????
LightIons
???++?????+
HeavyIons
-f++++-f-f-
+++IN
-
energy and thermal energy output from the reactor can be reached only by a sufficientlylarge driver efficiency. Reducing the driver efficiency from 25% to 5% would increase therecirculating power from 12% to the unacceptably large value of 60%. An efficiency of25% can be reached with conventional accelerator technology used in high energy physicsfor protons or heavier ions. Due to space charge limits it is always desirable, from anaccelerator point of view, to use high kinetic energy and (relatively) small currents inorder to produce a given beam power. For ions with mass A « 200 a reference valuefor an optimum kinetic energy is 10 GeV. To reach the power of 500 TW necessary forignition, a particle current of 50 kA is required. For protons the corresponding numberwould be typically 10 MeV kinetic energy and 50 MA of current in order to match withthe larger range of protons. This requires pulsed power technology, which has favourablecost and high efficiency, but a considerable uncertainty with respect to reliability andrepetition rate. A further difficulty with beams from ion diodes is their limited abilityto focus beams on small spots and to achieve short pulses that are well synchronized intime. In this respect lasers are by far superior to particle drivers, which explains theirunique capability in achieving ignition on a one-shot-per-day basis at reasonable cost. Acomparison between different driver options on the basis of electric energy production ispresented in Table 1.
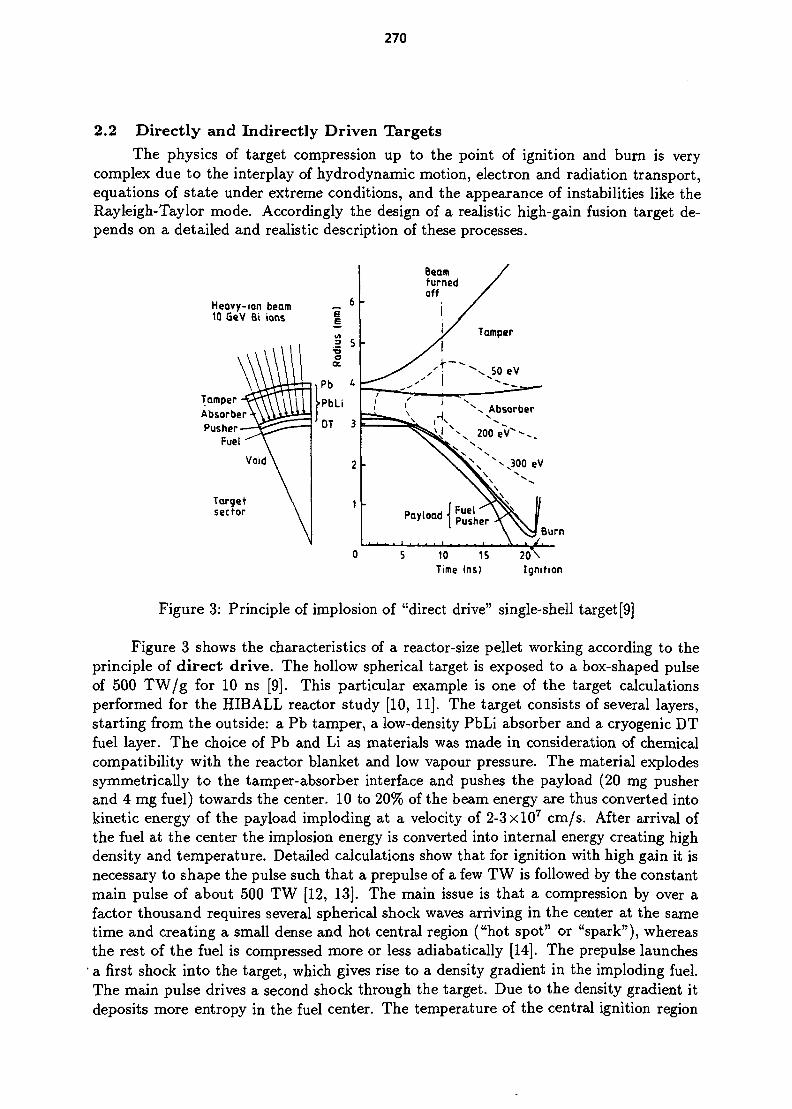
270
2.2 Directly and Indirectly Driven TargetsThe physics of target compression up to the point of ignition and burn is very
complex due to the interplay of hydrodynamic motion, electron and radiation transport,equations of state under extreme conditions, and the appearance of instabilities like theRayleigh-Taylor mode. Accordingly the design of a realistic high-gain fusion target de-pends on a detailed and realistic description of these processes.
Heovy-ion beam10 QeV 8i ions
TamperAbsorberPusher
Fuel
Targetsector
Burn
10 1STime (ns)
Figure 3: Principle of implosion of "direct drive" single-shell target [9]
Figure 3 shows the characteristics of a reactor-size pellet working according to theprinciple of direct drive. The hollow spherical target is exposed to a box-shaped pulseof 500 TW/g for 10 ns [9]. This particular example is one of the target calculationsperformed for the HIBALL reactor study [10, 11]. The target consists of several layers,starting from the outside: a Pb tamper, a low-density PbLi absorber and a cryogenic DTfuel layer. The choice of Pb and Li as materials was made in consideration of chemicalcompatibility with the reactor blanket and low vapour pressure. The material explodessymmetrically to the tamper-absorber interface and pushes the payload (20 mg pusherand 4 mg fuel) towards the center. 10 to 20% of the beam energy are thus converted intokinetic energy of the payload imploding at a velocity of 2-3 xlO7 cm/s. After arrival ofthe fuel at the center the implosion energy is converted into internal energy creating highdensity and temperature. Detailed calculations show that for ignition with high gain it isnecessary to shape the pulse such that a prepulse of a few TW is followed by the constantmain pulse of about 500 TW [12, 13]. The main issue is that a compression by over afactor thousand requires several spherical shock waves arriving in the center at the sametime and creating a small dense and hot central region ("hot spot" or "spark"), whereasthe rest of the fuel is compressed more or less adiabatically [14]. The prepulse launches
1 a first shock into the target, which gives rise to a density gradient in the imploding fuel.The main pulse drives a second shock through the target. Due to the density gradient itdeposits more entropy in the fuel center. The temperature of the central ignition region

271
rises to 5 keV and its density to 200g/cm3, whereas the surrounding fuel has a temperatureof 200-300 eV and density of 600 g/cm3. Ignition of the hot spot then drives a burn waveinto the colder fuel leading to the required high gain. The hot spot concept is crucialfor obtaining high gain with limited total energy, since it is only necessary that a fewpercent of the total fuel have to be driven to fusion conditions. The physics of the centralimplosion dynamics can be made more transparent by analytically studying self-similarsolutions [15].
Due to acceleration of high density material by a layer of lower density beamheated material the interface between both layers is subject to the exponentially growingRayleigh-Taylor instability. This is analogous to the instability of the interface of a heavyfluid resting upon a light fluid. Ignition can only be achieved, if the layer distortion re-mains small. A fundamental requirement of high-gain targets is thus the conservation ofspherical symmetry during the implosion. According to hydrodynamic code results thedeviations from symmetry should not exceed 1-2% [16, 17].
This is extremely difficult if not impossible to achieve in any practical scheme. Away out of this problem is indirect drive shown schematically in Fig. 4. This concept
casing
fusion capsule
hoMtaum radiation
Figure 4: Schematic target configuration for "indirect drive" with two converters
makes use of the conversion of incident beam energy into soft x-rays, which then drivethe implosion of the pellet. It is used in the Livermore laser fusion program with theNova laser and the future Nova upgrade laser heading towards pellet ignition and gain(National Ignition Facility) [18]. An important feature is the efficiency of conversion intox-rays. It is required to be as high as 70-90%, which can be achieved by heating theconverter to at least 300 eV temperature [19]. The specific energy for Au at 300 eV isabout 20 MJ/g, which limits the usable converter mass. The latter should not exceed 50mg in order to keep the energy invested into converter heating below 1 MJ (i.e. 20% ofthe totally available energy). Along with the driving power requirement of 500 TW, thissimple estimate leads to a specific power deposition of [19]:
P > 1016 W/g. (3)
Specific requirements of indirectly driven targets are discussed in Refs. [18, 20, 21].
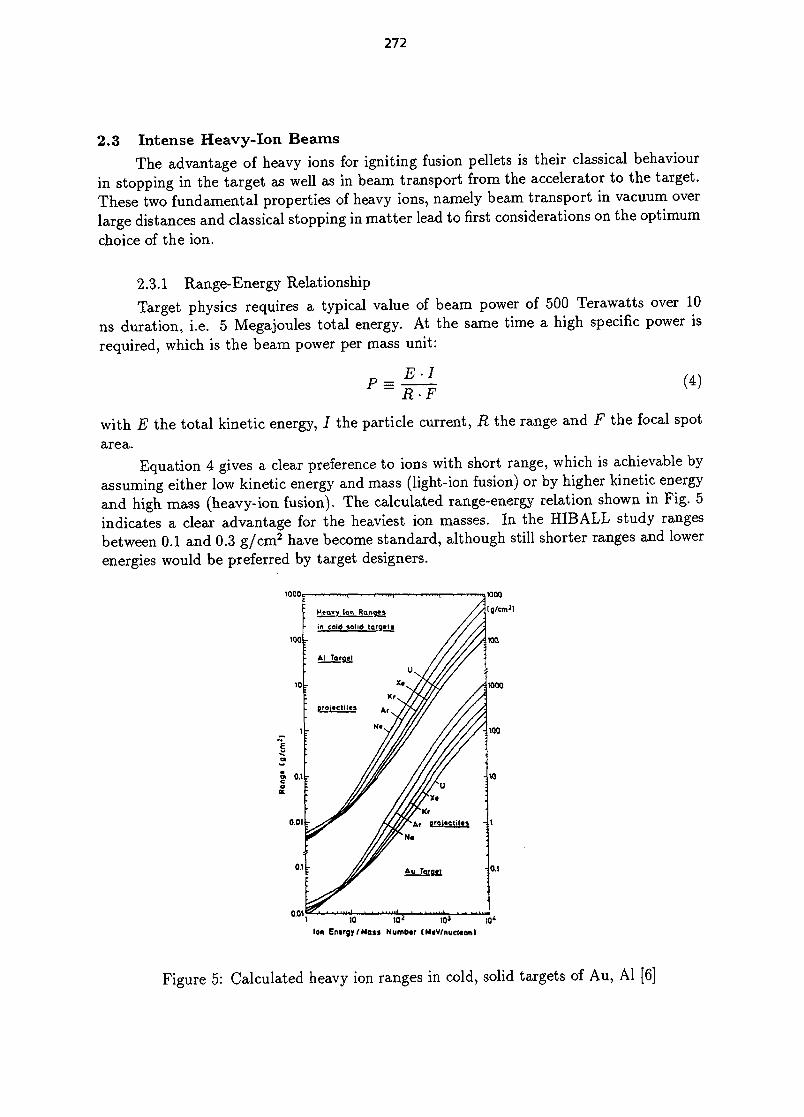
272
2.3 Intense Heavy-Ion BeamsThe advantage of heavy ions for igniting fusion pellets is their classical behaviour
in stopping in the target as well as in beam transport from the accelerator to the target.These two fundamental properties of heavy ions, namely beam transport in vacuum overlarge distances and classical stopping in matter lead to first considerations on the optimumchoice of the ion.
2.3.1 Range-Energy RelationshipTarget physics requires a typical value of beam power of 500 Terawatts over 10
ns duration, i.e. 5 Megajoules total energy. At the same time a high specific power isrequired, which is the beam power per mass unit:
P =E-IR-F
(4)
with E the total kinetic energy, I the particle current, R the range and F the focal spotarea.
Equation 4 gives a clear preference to ions with short range, which is achievable byassuming either low kinetic energy and mass (light-ion fusion) or by higher kinetic energyand high mass (heavy-ion fusion). The calculated range-energy relation shown in Fig. 5indicates a clear advantage for the heaviest ion masses. In the HIBALL study rangesbetween 0.1 and 0.3 g/cm2 have become standard, although still shorter ranges and lowerenergies would be preferred by target designers.
1000,
'1 10 tOJ I0J 10*Ion Entrgy/Mass NumBtr [H«V/nuci<en)
Figure 5: Calculated heavy ion ranges in cold, solid targets of Au, Al [6]
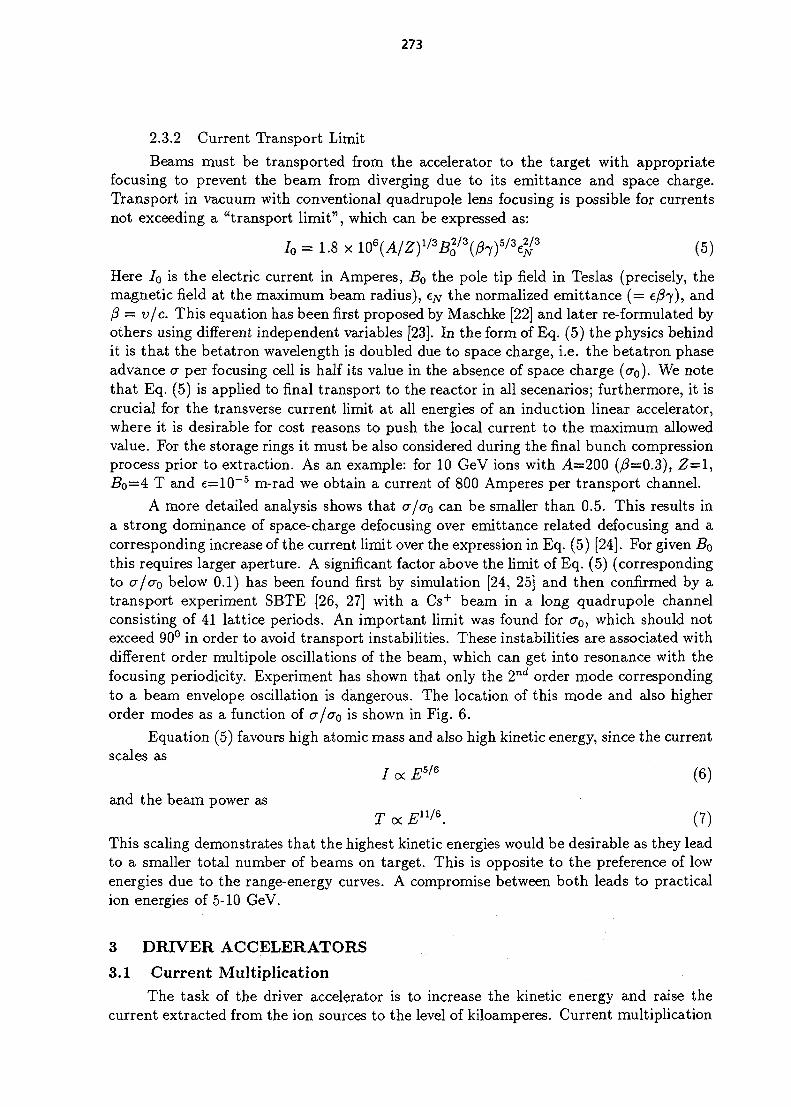
273
2.3.2 Current Transport LimitBeams must be transported from the accelerator to the target with appropriate
focusing to prevent the beam from diverging due to its emittance and space charge.Transport in vacuum with conventional quadrupole lens focusing is possible for currentsnot exceeding a "transport limit", which can be expressed as:
/o = 1.8 x 10⁶(A/Zy/3B20/3(^f3e2j{3 (5)
Here Io is the electric current in Amperes, Bo the pole tip field in Teslas (precisely, themagnetic field at the maximum beam radius), e^ the normalized emittance (= e/?7), and/? = v/c. This equation has been first proposed by Maschke [22] and later re-formulated byothers using different independent variables [23]. In the form of Eq. (5) the physics behindit is that the betatron wavelength is doubled due to space charge, i.e. the betatron phaseadvance a per focusing cell is half its value in the absence of space charge (<70). We notethat Eq. (5) is applied to final transport to the reactor in all secenarios; furthermore, it iscrucial for the transverse current limit at all energies of an induction linear accelerator,where it is desirable for cost reasons to push the local current to the maximum allowedvalue. For the storage rings it must be also considered during the final bunch compressionprocess prior to extraction. As an example: for 10 GeV ions with A=200 (/?=0.3), Z=l,JB0=4 T and e=10~5 m-rad we obtain a current of 800 Amperes per transport channel.
A more detailed analysis shows that cr/cro can be smaller than 0.5. This results ina strong dominance of space-charge defocusing over emittance related defocusing and acorresponding increase of the current limit over the expression in Eq. (5) [24]. For given Bothis requires larger aperture. A significant factor above the limit of Eq. (5) (correspondingto cr/cro below 0.1) has been found first by simulation [24, 25] and then confirmed by atransport experiment SBTE [26, 27] with a Cs+ beam in a long quadrupole channelconsisting of 41 lattice periods. An important limit was found for cr0, which should notexceed 90° in order to avoid transport instabilities. These instabilities are associated withdifferent order multipole oscillations of the beam, which can get into resonance with thefocusing periodicity. Experiment has shown that only the 2nd order mode correspondingto a beam envelope oscillation is dangerous. The location of this mode and also higherorder modes as a function of a/aQ is shown in Fig. 6.
Equation (5) favours high atomic mass and also high kinetic energy, since the currentscales as
/ oc E5'6 (6)
and the beam power asT oc Eu/6. (7)
This scaling demonstrates that the highest kinetic energies would be desirable as they leadto a smaller total number of beams on target. This is opposite to the preference of lowenergies due to the range-energy curves. A compromise between both leads to practicalion energies of 5-10 GeV.
3 DRIVER ACCELERATORS
3.1 Current MultiplicationThe task of the driver accelerator is to increase the kinetic energy and raise the
current extracted from the ion sources to the level of kiloamperes. Current multiplication
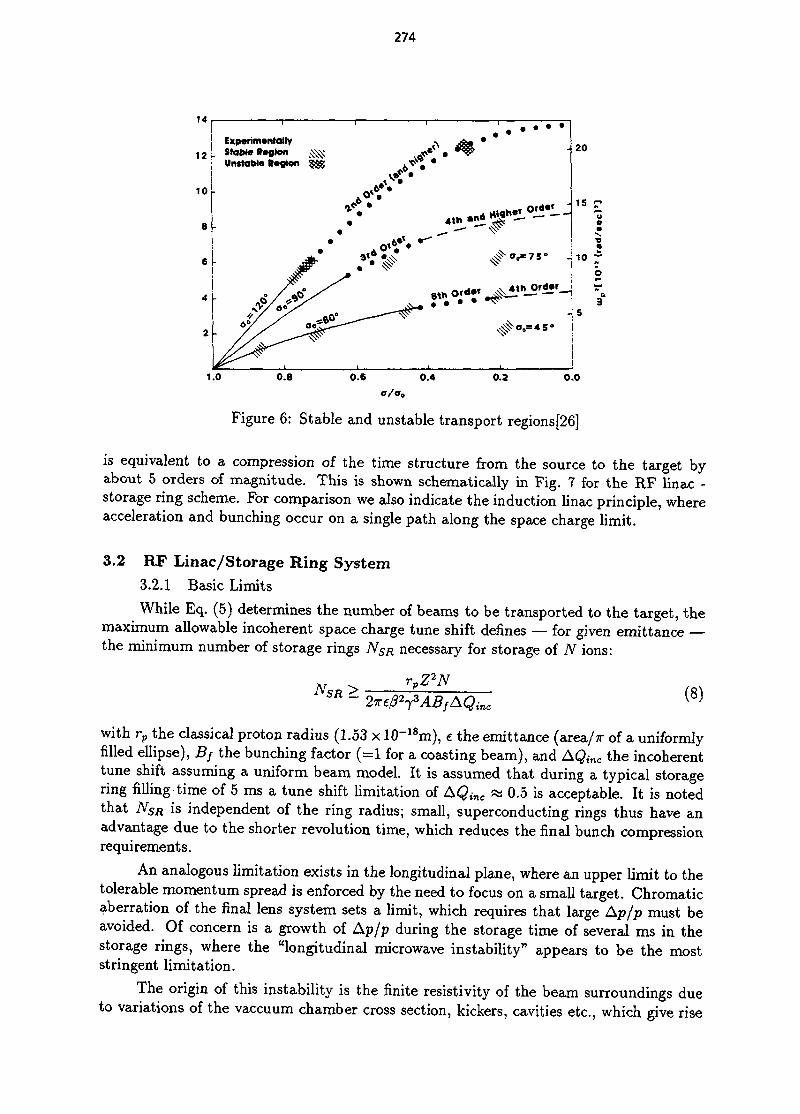
274
14I! Experimentally
1 2 L Stable Region
• •
; Unstable Region $ $
10
BL
Sf<"
**'
.-r-*J
20
1S r
•
0.0
a/a.
Figure 6: Stable and unstable transport regions[26]
is equivalent to a compression of the time structure from the source to the target byabout 5 orders of magnitude. This is shown schematically in Fig. 7 for the RF linac -storage ring scheme. For comparison we also indicate the induction linac principle, whereacceleration and bunching occur on a single path along the space charge limit.
3.2 RF Linac/Storage Ring System3.2.1 Basic Limits
While Eq. (5) determines the number of beams to be transported to the target, themaximum allowable incoherent space charge tune shift defines — for given emittance —the minimum number of storage rings NSR necessary for storage of N ions:
rpZ2N
(8)c
with rp the classical proton radius (1.53 x 10⁻¹⁸m), e the emittance (area/*- of a uniformlyfilled ellipse), Bf the bunching factor (=1 for a coasting beam), and AQinc the incoherenttune shift assuming a uniform beam model. It is assumed that during a typical storagering filling time of 5 ms a tune shift limitation of AQinc ss 0.5 is acceptable. It is notedthat NSR is independent of the ring radius; small, superconducting rings thus have anadvantage due to the shorter revolution time, which reduces the final bunch compressionrequirements.
An analogous limitation exists in the longitudinal plane, where an upper limit to thetolerable momentum spread is enforced by the need to focus on a small target. Chromaticaberration of the final lens system sets a limit, which requires that large Ap/p must beavoided. Of concern is a growth of Ap/p during the storage time of several ms in thestorage rings, where the "longitudinal microwave instability" appears to be the moststringent limitation.
The origin of this instability is the finite resistivity of the beam surroundings dueto variations of the vaccuum chamber cross section, kickers, cavities etc., which give rise
275
totalcurrent
10
1kA
100
10
1A
100 mA
final transport
buncher rings
storage rings
ion source• injector
ion acceleration in RF-linacsource >
transfer rings
100keV 1MeV 10 100 1GeV 10kinetic energy
Figure 7: Current multiplication schemes
to a resistive (real part) of the coupling impedance. Its feedback on the beam is shiftedin phase, such that it enhances an initial perturbation. This results in unstable growth,which can be suppressed by phase mixing or Landau damping due to a sufficiently large— yet here undesired — momentum spread.
For a parabolic momentum distribution the limiting current is given by the Keil-Schnell circle criterion:
2 2 ) aKS ~ ^ >7\7 /„[
tZ\Z{\ln\with Z\\ the coupling impedance for mode number n, rj = I/72 — I/72 (7t transitionenergy) and (Ap/p)fwhm the fwhm momentum spread.
The problem here is that for non-relativistic energies \Z\\/n\ is always large due tothe large space charge impedance (several kfi), which contributes to its imaginary part.It is not sufficient therefore to keep the resistive part of the impedance small. For heavyion fusion applications, on the other hand, it is necessary to exceed the limit of Eq. (9) byat least an order of magnitude. For the energies of relevance here there is unfortunatelyalmost no experimental evidence. Computer simulation on the other hand gives rise tosome optimism. Simulation results show that indeed for too small Ap/p there is an initialinstability. It saturates, however, at a level, where the momentum spread of most of theparticles remains at the initial value. A small fraction of the particles then forms a tailin the momentum distribution, which provides the required Landau damping [28] (seeFig. 8). Calculations have suggested that the current threshold of Eq. (9) could thus beexceeded by a factor as large as 50. Experimental confirmation of this self-stabilizingmechanism is very desirable. A step in this direction has been achieved with beamscooled by electrons, where it was found that due to a Gaussian momentum distributionthe Keil-Schnell threshold criterion can be exceeded by a factor 5-10 in equilibrium with
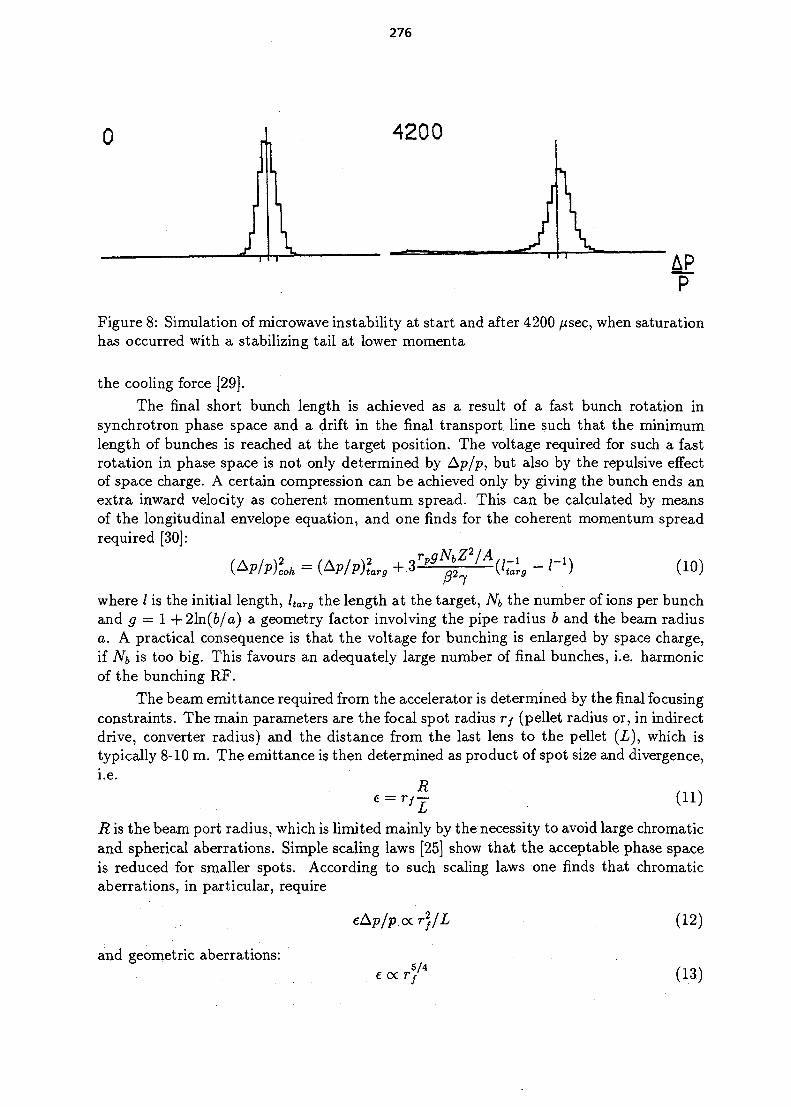
276
0 4200
r r r APP
Figure 8: Simulation of microwave instability at start and after 4200 ^sec, when saturationhas occurred with a stabilizing tail at lower momenta
the cooling force [29].The final short bunch length is achieved as a result of a fast bunch rotation in
synchrotron phase space and a drift in the final transport line such that the minimumlength of bunches is reached at the target position. The voltage required for such a fastrotation in phase space is not only determined by Ap/p, but also by the repulsive effectof space charge. A certain compression can be achieved only by giving the bunch ends anextra inward velocity as coherent momentum spread. This can be calculated by meansof the longitudinal envelope equation, and one finds for the coherent momentum spreadrequired [30]:
(AP/P)loh = (Ap/P)lrg + (10)
where / is the initial length, ltarg the length at the target, Nb the number of ions per bunchand g = 1 + 21n(6/a) a geometry factor involving the pipe radius b and the beam radiusa. A practical consequence is that the voltage for bunching is enlarged by space charge,if Nb is too big. This favours an adequately large number of final bunches, i.e. harmonicof the bunching RF.
The beam emittance required from the accelerator is determined by the final focusingconstraints. The main parameters are the focal spot radius Tj (pellet radius or, in indirectdrive, converter radius) and the distance from the last lens to the pellet (Z), which istypically 8-10 m. The emittance is then determined as product of spot size and divergence,i.e.
e = r y j (11)
R is the beam port radius, which is limited mainly by the necessity to avoid large chromaticand spherical aberrations. Simple scaling laws [25] show that the acceptable phase spaceis reduced for smaller spots. According to such scaling laws one finds that chromaticaberrations, in particular, require
and geometric aberrations:
eAp/p.oc rj/L
5/4
e oc r/
(12)
(13)

277
Table 2: Requirements for indirectly-driven targets
Ion (typical)Kinetic energyTotal energyFinal pulse durationFinal momentum spreadEmittance at targetSpot radiusIon rangeSpecific power
Bi+1
lOGeV5MJ (JV = 3.1*1015)10 ns (full width)Ap/p = 3 x 10"3
20TT mm mrad3 mm0.3 g/cm2
1016 W/g (maximum)
A reference set of parameters necessary for an indirectly driven target is given inTable 2 [31]. '
3.2.2 Driver Example
In the following we outline characteristic features of a driver satisfying the require-ments of Table 2 (see also Ref. [31]). A schematic layout is shown in Fig. 9. This schemeis preliminary in view of the complexity of the problem and the existing uncertainty onaccelerator limitations involving space charge.
Linac: It has the task of providing a pulse of typically 10 GeV ions sufficiently longto fill all storage rings and thus accumulate the desired total energy. For a current of 200mA this requires about 3 ms. No beam is required until the next target is ignited aftertypically a few hundred ms. At the low energy end ion sources feed a current of 25 mA intoeight parallel RFQ channels followed by Wideroe or some other appropriate structures.Repeated funneling of two adjacent channels into one channel with simultaneous frequencydoubling could lead to combination into a single Alvarez structure, which accelerates thebeam to the full energy. The total length of the RF linac is estimated to be 2-3 km.Recently an IH structure was studied as an attractive approach with promising costperformance due to an optimum accelerating gradient [32]. Due to the limited transversefocusing capability of this structure it seems preferable to work with a reduced linaccurrent (100 mA) and increase the stacking factor in the rings.
Transfer Rings: Current multiplication by a factor 4 is pursued by horizontal four-turn injection into each of the four transfer rings, which have the same radius as thestorage rings. A vertical emittance dilution factor of 2 is assumed for this stacking, wherewe assume a scheme working at an integer tune [33] (see Fig. 10). We note that themomentum spread of the injected beam allows debunching during one revolution.
Storage Rings: The content of all four transfer rings is ejected subsequently andstacked in the other phase-space plane with the same scheme as in Fig. 10. The stackedbeam is unbunched and assumed to exceed the Keil-Schnell threshold by a factor of about20. This can be tolerated if one assumes that the stabilizing tail mechanism works aspredicted. Beam loss due to intrabeam charge exchange can be calculated using crosssections for Bi+, which have been determined experimentally [34]. Calculations for the
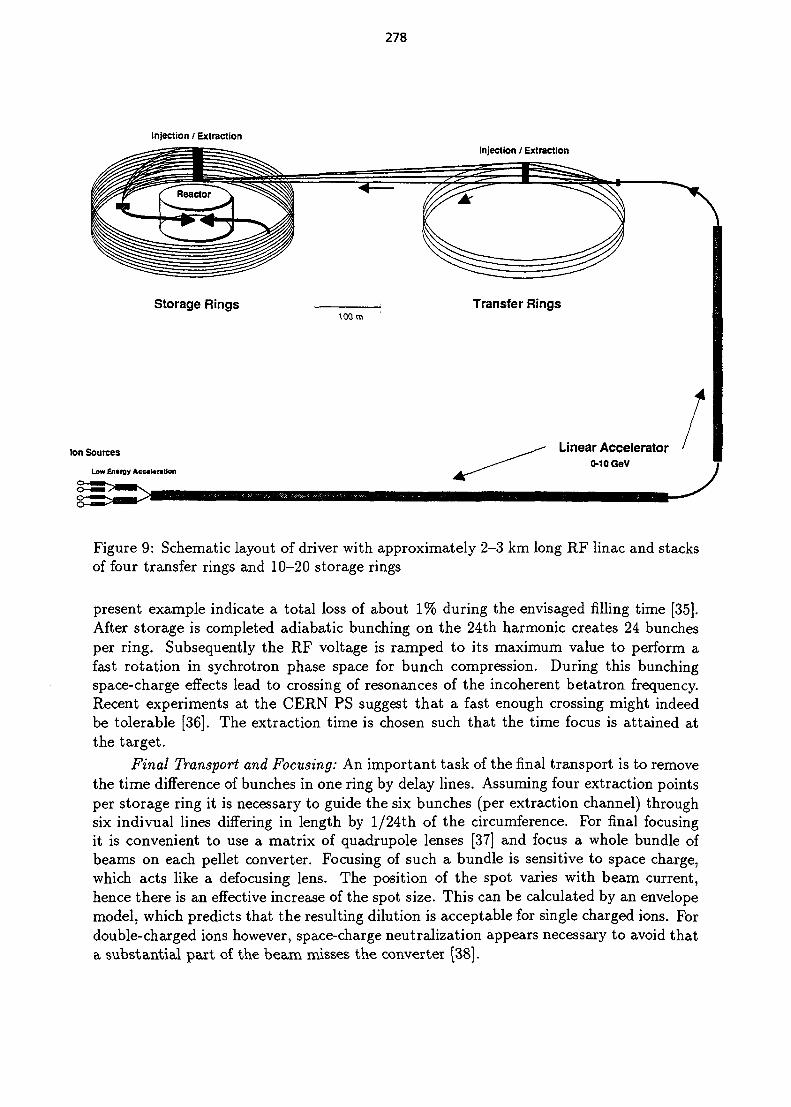
278
Injection / Extraction
Injection / Extraction
Storage Rings100 m
Transfer Rings
Ion Sources
Low Enaigy Acc*l«r«Uon
Linear Accelerator0-10 GeV
Figure 9: Schematic layout of driver with approximately 2-3 km long RF linac and stacksof four transfer rings and 10-20 storage rings
present example indicate a total loss of about 1% during the envisaged filling time [35].After storage is completed adiabatic bunching on the 24th harmonic creates 24 bunchesper ring. Subsequently the RF voltage is ramped to its maximum value to perform afast rotation in sychrotron phase space for bunch compression. During this bunchingspace-charge effects lead to crossing of resonances of the incoherent betatron frequency.Recent experiments at the CERN PS suggest that a fast enough crossing might indeedbe tolerable [36]. The extraction time is chosen such that the time focus is attained atthe target.
Final Transport and Focusing: An important task of the final transport is to removethe time difference of bunches in one ring by delay lines. Assuming four extraction pointsper storage ring it is necessary to guide the six bunches (per extraction channel) throughsix indivual lines differing in length by l/24th of the circumference. For final focusingit is convenient to use a matrix of quadrupole lenses [37] and focus a whole bundle ofbeams on each pellet converter. Focusing of such a bundle is sensitive to space charge,which acts like a defocusing lens. The position of the spot varies with beam current,hence there is an effective increase of the spot size. This can be calculated by an envelopemodel, which predicts that the resulting dilution is acceptable for single charged ions. Fordouble-charged ions however, space-charge neutralization appears necessary to avoid thata substantial part of the beam misses the converter [38].
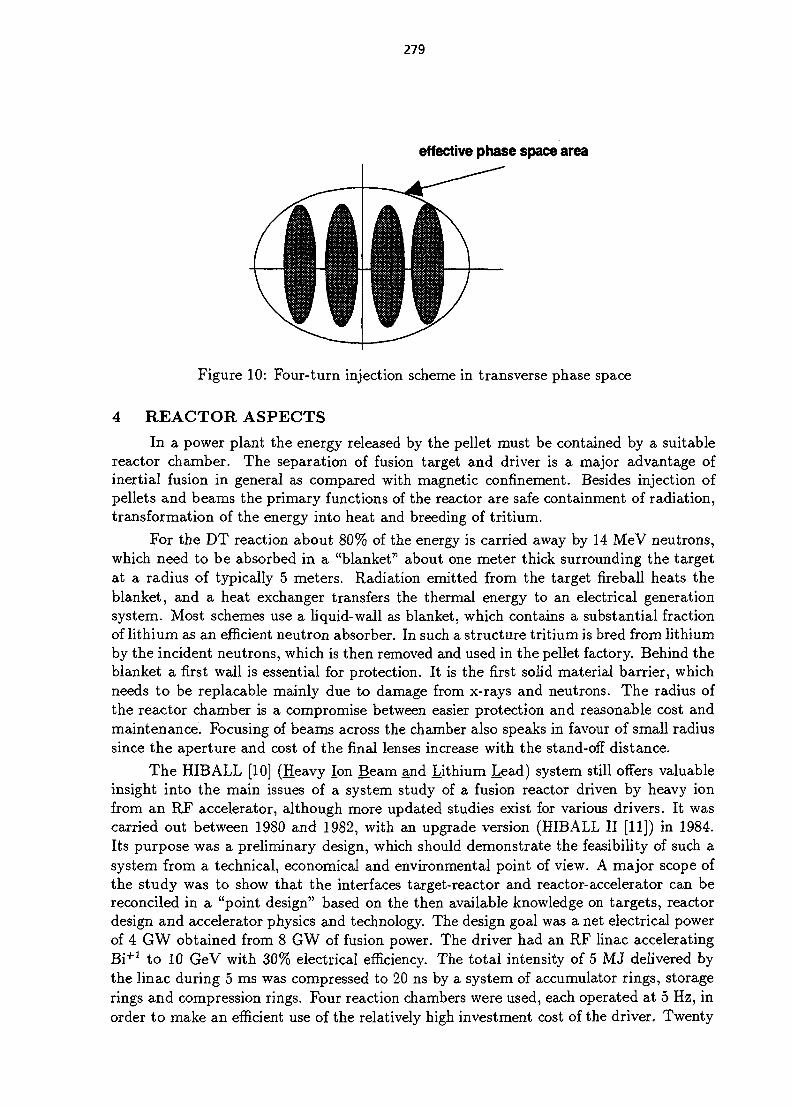
279
effective phase space area
Figure 10: Four-turn injection scheme in transverse phase space
4 REACTOR ASPECTS
In a power plant the energy released by the pellet must be contained by a suitablereactor chamber. The separation of fusion target and driver is a major advantage ofinertial fusion in general as compared with magnetic confinement. Besides injection ofpellets and beams the primary functions of the reactor are safe containment of radiation,transformation of the energy into heat and breeding of tritium.
For the DT reaction about 80% of the energy is carried away by 14 MeV neutrons,which need to be absorbed in a "blanket" about one meter thick surrounding the targetat a radius of typically 5 meters. Radiation emitted from the target fireball heats theblanket, and a heat exchanger transfers the thermal energy to an electrical generationsystem. Most schemes use a liquid-wall as blanket, which contains a substantial fractionof lithium as an efficient neutron absorber. In such a structure tritium is bred from lithiumby the incident neutrons, which is then removed and used in the pellet factory. Behind theblanket a first wall is essential for protection. It is the first solid material barrier, whichneeds to be replacable mainly due to damage from x-rays and neutrons. The radius ofthe reactor chamber is a compromise between easier protection and reasonable cost andmaintenance. Focusing of beams across the chamber also speaks in favour of small radiussince the aperture and cost of the final lenses increase with the stand-off distance.
The HIBALL [10] (Heavy Ion Beam and Lithium Lead) system still offers valuableinsight into the main issues of a system study of a fusion reactor driven by heavy ionfrom an RF accelerator, although more updated studies exist for various drivers. It wascarried out between 1980 and 1982, with an upgrade version (HIBALL II [11]) in 1984.Its purpose was a preliminary design, which should demonstrate the feasibility of such asystem from a technical, economical and environmental point of view. A major scope ofthe study was to show that the interfaces target-reactor and reactor-accelerator can bereconciled in a "point design" based on the then available knowledge on targets, reactordesign and accelerator physics and technology. The design goal was a net electrical powerof 4 GW obtained from 8 GW of fusion power. The driver had an RF linac acceleratingBi+1 to 10 GeV with 30% electrical efficiency. The total intensity of 5 MJ delivered bythe linac during 5 ms was compressed to 20 ns by a system of accumulator rings, storagerings and compression rings. Four reaction chambers were used, each operated at 5 Hz, inorder to make an efficient use of the relatively high investment cost of the driver. Twenty
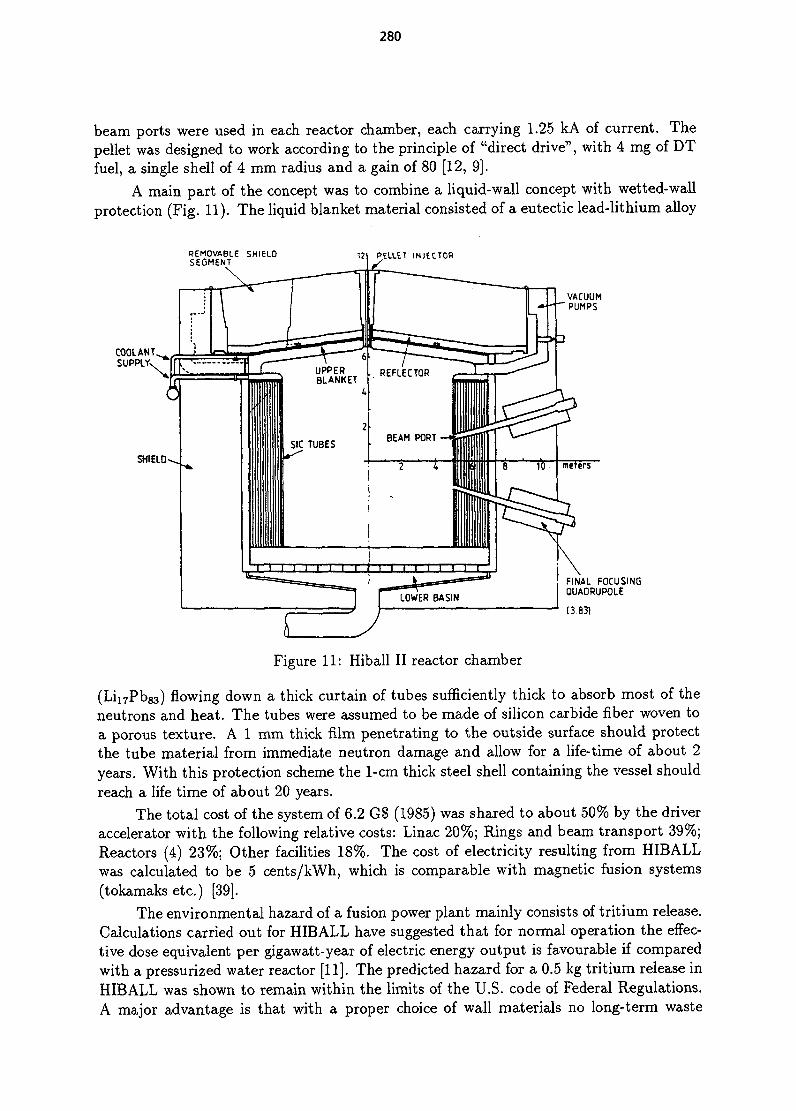
280
beam ports were used in each reactor chamber, each carrying 1.25 kA of current. Thepellet was designed to work according to the principle of "direct drive", with 4 mg of DTfuel, a single shell of 4 mm radius and a gain of 80 [12, 9].
A main part of the concept was to combine a liquid-wall concept with wetted-wallprotection (Fig. 11). The liquid blanket material consisted of a eutectic lead-lithium alloy
REMOVABLE SHIELDSEGMENT
PELLET INJECTOR
VACUUMPUMPS
COOLANTSUPPLY^ ~ | U . ' ""M
SHIELD
FINAL FOCUSINGQUA0RUP0LE
(3831
Figure 11: Hiball II reactor chamber
(LiirPbss) flowing down a thick curtain of tubes sufficiently thick to absorb most of theneutrons and heat. The tubes were assumed to be made of silicon carbide fiber woven toa porous texture. A 1 mm thick film penetrating to the outside surface should protectthe tube material from immediate neutron damage and allow for a life-time of about 2years. With this protection scheme the 1-cm thick steel shell containing the vessel shouldreach a life time of about 20 years.
The total cost of the system of 6.2 G$ (1985) was shared to about 50% by the driveraccelerator with the following relative costs: Linac 20%; Rings and beam transport 39%;Reactors (4) 23%; Other facilities 18%. The cost of electricity resulting from HIBALLwas calculated to be 5 cents/kWh, which is comparable with magnetic fusion systems(tokamaks etc.) [39].
The environmental hazard of a fusion power plant mainly consists of tritium release.Calculations carried out for HIBALL have suggested that for normal operation the effec-tive dose equivalent per gigawatt-year of electric energy output is favourable if comparedwith a pressurized water reactor [11]. The predicted hazard for a 0.5 kg tritium release inHIBALL was shown to remain within the limits of the U.S. code of Federal Regulations.A major advantage is that with a proper choice of wall materials no long-term waste
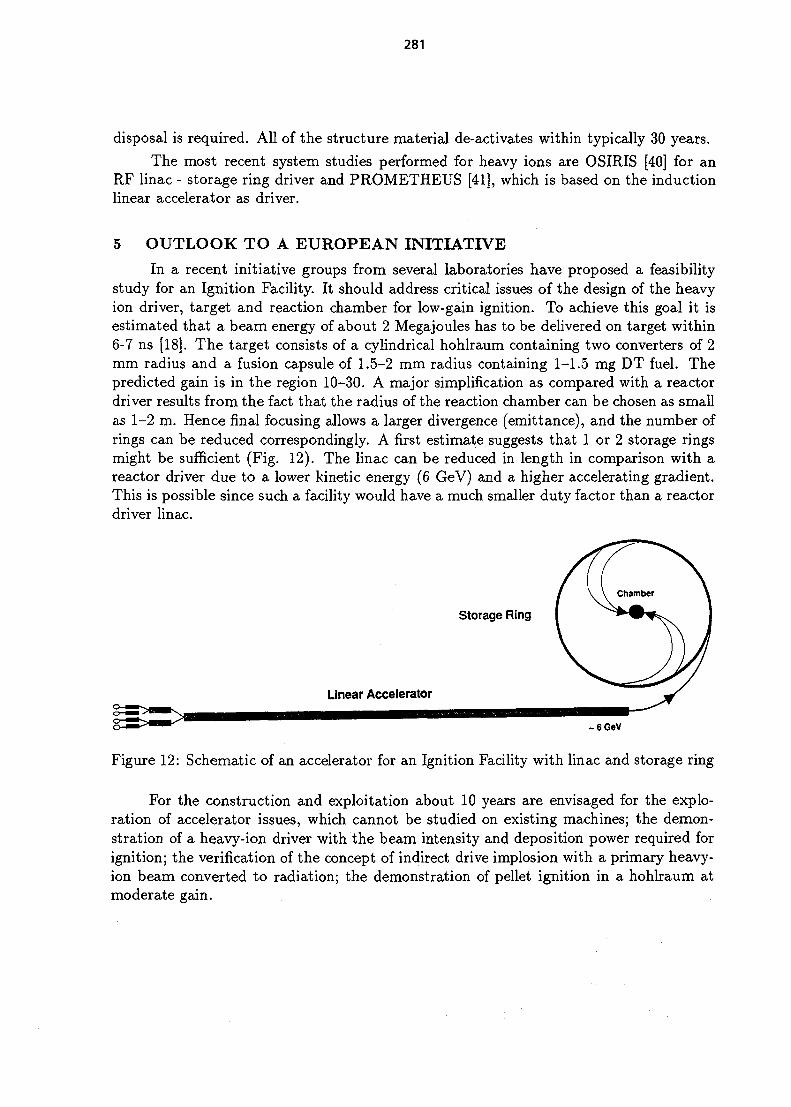
281
disposal is required. All of the structure material de-activates within typically 30 years.
The most recent system studies performed for heavy ions are OSIRIS [40] for anRF linac - storage ring driver and PROMETHEUS [41], which is based on the inductionlinear accelerator as driver.
5 OUTLOOK TO A EUROPEAN INITIATIVEIn a recent initiative groups from several laboratories have proposed a feasibility
study for an Ignition Facility. It should address critical issues of the design of the heavyion driver, target and reaction chamber for low-gain ignition. To achieve this goal it isestimated that a beam energy of about 2 Megajoules has to be delivered on target within6-7 ns [18]. The target consists of a cylindrical hohlraum containing two converters of 2mm radius and a fusion capsule of 1.5-2 mm radius containing 1-1.5 mg DT fuel. Thepredicted gain is in the region 10-30. A major simplification as compared with a reactordriver results from the fact that the radius of the reaction chamber can be chosen as smallas 1-2 m. Hence final focusing allows a larger divergence (emittance), and the number ofrings can be reduced correspondingly. A first estimate suggests that 1 or 2 storage ringsmight be sufficient (Fig. 12). The linac can be reduced in length in comparison with areactor driver due to a lower kinetic energy (6 GeV) and a higher accelerating gradient.This is possible since such a facility would have a much smaller duty factor than a reactordriver linac.
Linear Accelerator
- 6 Gev
Figure 12: Schematic of an accelerator for an Ignition Facility with linac and storage ring
For the construction and exploitation about 10 years are envisaged for the explo-ration of accelerator issues, which cannot be studied on existing machines; the demon-stration of a heavy-ion driver with the beam intensity and deposition power required forignition; the verification of the concept of indirect drive implosion with a primary heavy-ion beam converted to radiation; the demonstration of pellet ignition in a hohlraum atmoderate gain.

282
References
[I] Fusion Policy Advisory Committee (FPAC) Final Report, September 1990, US De-partment of Energy, Washington D.C.
[2] J. Meyer-ter-Vehn, Proc. 15th IAEA Conf. on Plasma Physics and Controlled NuclearFusion Research, Sevilla, Sept. 26-Oct. 1, 1994
[3] R. Bock, Proc. EPS Conference on Large Facilities in Physics, Lausanne, Sept. 12-14,1994
[4] R.O. Bangerter, Nuovo Cimento 106 A, 1445 (1993)
[5] A.G. Ruggiero, Nuovo Cimento 106 A, 1959 (1993)
[6] R.C. Arnold and J. Meyer-ter-Vehn, Rep. Prog. Phys. 50, 559-606 (1987)
[7] J. Nuckolls et al., Nature 239, 139 (1972)
[8] W.J. Hogan, Critera for Comparison of ICF Drivers, in 1986 Laser Program AnnualReport, Lawrence Livermore National Laboratory, chapt. 8, p.62 (1987)
[9] N. Metzler and J. Meyer-ter-Vehn, Laser and Particle Beams 2, 27 (1984)
[10] B.Badger et al., Kernforschungszentrum Karlsruhe Report KfK-3480 (1984)
[II] RIB ALL II- An Improved Conceptual Heavy Ion Beam Driven Fusion Reactor Study,Kernforschungszentrum Karlsruhe Report, KfK 3840 (1985)
[12] N.A. Tahir, K.A. Long, Nucl. Fusion 32, 887 (1983)
[13] K.A. Long and N.A. Tahir, Phys. Rev. A 35, 2631 (1987)
[14] R.E. Kidder, Nucl. Fusion 19, 223 (1979)
[15] J. Meyer-ter-Vehn and C. Schalk, Z. Naturf. 37a, 955 (1982)
[16] G. Buchwaldt et al., Laser and Particle Beams 1, 335 (1983)
[17] S. Atzeni, Part. Accel. 37-38, 495 (1992)
[18] J.D. Lindl, Nuovo Cimento 106 A, 1467 (1993)
[19] J. Meyer-ter-Vehn and M. Murakami, Part. Accel. 37-38, 519 (1992)
[20] S. Atzeni, Nuovo Cimento 106 A, 1489 (1993)
[21] K.H. Kang, K.J. Lutz, J.A. Maruhn and N.A. Tahir, Nuovo Cimento 106 A, 1465(1993)
[22] A.W. Maschke, unpublished note (1979)
[23] M. Reiser, Part. Accel. 8, 167 (1978)
[24] I. Hofmann, J. Laslett, L. Smith and I. Haber, Part. Accel. 13, 145 (1983)

283
[25] I. Hofmann, Adv. Electron. Electron Phys. Suppl. 13C, 49 (1983)
[26] W. Chupp et a l , Proc. Int. Symp. on Heavy Ion Accelerators and their Applicationto Inertial Fusion, Tokyo, Jan. 23-27, 1984, p. 460
[27] D. Keefe, American Institute of Physics Conference Proceedings 152, 63 (1986)
[28] I. Hofmann, Laser and Particle Beams 3, 1 (1985)
[29] I. Hofmann, Proceedings of the 1991 Particle Accelerator Conference, San Francisco,May 6-9, 1991, p. 2492
[30] L. Smith, Proc. ERDA Summer Study of Heavy Ions for Inertial Fusion, LBL 5543,77 (1976)
[31] I. Hofmann, Nuovo Cimento 106 A, 1457 (1993)
[32] U. Ratzinger, Nuovo Cimento 106 A, 1583 (1993)
[33] H. Takeda and S. Fenster, Proc. of the Heavy Ion Fusion Workshop, Berkeley, Oct.29-Nov.9, 1979, p. 362
[34] F. Melchert et al., Nucl. Instr. Meth. A278, 65 (1989)
[35] D. Budicin et al., Nuovo Cimento 106 A, 1621 (1993)
[36] R. Cappi, R. Garoby, D. Mohl, J.L. Vallet and E. Wildner, Proc. European Acceler-ator Conference, London, June 20-24, 1994, CERN-Report PS 94-21 (PA)
[37] C. Rubbia, On Heavy Ions Accelerators for Inertial Confinement Fusion, Proc. IAEATechnical Meeting on Drivers for Inertial Confinement Fusion, April 15-19, 1991,Osaka, p. 74
[38] I. Hofmann, R.W. Hasse and M. Reiser, J. Appl. Phys. 73 7061 (1993)
[39] W.R. Meier et al., American Institute of Physics Conference Proceedings 152, p. 515(1986)
[40] OSIRIS and SOMBRERO Inertial Fusion Power Plant Designs, WJSA-92-01 andDOE/ER/54100-1 (1992)
[41] PROMETHEUS-L and PROMETHEUS-H Inertial Fusion Energy Reactor DesignStudies, DOE/ER/54101, MDC 92E0008 (1992)
NEXT PAQE(8)left BLANK
285
APPLICATION OF HIGH INTENSITY LINACSTO SPALLATION SOURCES
H. LengelerCERN, Geneva, and European Spallation Source (ESS), KFA, Jiilich
AbstractHigh intensity linear H~ accelerators are at present studied forapplications in pulsed neutron spallation sources. The time structureimposed on the linac beam offers the possibility of time-of-flightmeasurements in neutron scattering and allows large peak intensities.For the production of extremely short neutron pulses (|i.sec) acombination of a linac with a high intensity accumulator or acceleratorring must be used. Low loss injection in the ring asks for accelerationof H" ions instead of protons. The planned European SpallationSource (ESS) is taken as an example for discussing the specificproblems and the design principles of a pulsed high intensity H" linac.
INTRODUCTION
High intensity proton and deuteron linacs have found during the last years a renewedinterest for pulsed neutron spallation sources [1], fusion material studies and nuclear wastetransmutation [2] or energy production. Peak intensities reached already 20 years ago in themost powerful low energy proton linacs ( -100 mA) would be almost adequate for theseapplications but average intensities are low by a large factor. The most powerful high energyproton linac in operation is LAMPF at Los Alamos with a peak intensity of 17 mA and anaverage intensity of about 1 mA at 800 MeV. A considerable increase of peak and averageintensity will be necessary for the new applications considered.
1 . NEUTRON SCATTERING AND SYNCHROTRON RADIATIONAPPLICATIONS
Neutron scattering and synchrotron radiation have led in the past to major breakthroughsin the study of the structure and dynamics of condensed matter. In Table 1 a few characteristicproperties of both types of radiation are given and their complementary for the study ofcondensed matter appears clearly. Neutron scattering has found applications in a wide range ofcondensed matter studies such as [3]
Crystal structures with large periodic cells(proteins, enzymes,...)Lattice dynamicsPhase transitionsDiffusion in solidsMetal-H2 systemsInterfacesHigh-Tc materialsMagnetic materialsPolymersDefect structures (stress and fatigue)FullerinesLiquids and quantum liquidsSoft matter

286
Table 1Comparison of neutron scattering and synchrotron radiation
n-scattering
Interaction principally with nuclei
Energy and momentum of neutrons can bematched simultaneously to length scalesappropriate for atomic structures (1 to 10 A)and to energies for excitations in condensedmatter (neV to eV) (static and dynamic behaviour)Large momentum transfer (and scattering angles)are possible and allow the exploration of largeperiodic cells with high resolution
Weak interaction, large penetration depthin matter, bulk properties can be studied;complex sample environment is possible,small radiation damage in biological substances
Large response differences to differentisotopes (in particular H and D)Good response of light atoms
Magnetic moment of neutrons couplesto magnetic moment of atoms;short wavelength variations of magneticmaterials can be studied
Intensities and source brightness muchsmaller than for synchrotron radiationBecause of weak interaction,n-scattering has always been anintensity limited field
Synchrotron radiation
Interaction mainly with electrons
Same wavelengths like neutronsbut much higher energies less suitedfor study of atomic excitations.E ~ keV: study of outer electron shells,chemical states (electron spectroscopy)E = 10 -100 keV: atomic arrangements(structure analysis e.g. in biological materials)
Small penetration depth, interaction mainlyconcentrated near surfaces
Isotopes hardly distinguishedVery weak response of light elements,in particular H
Polarisation possible
Large spectrum of photonsExtremely high source fluxes and brightness;small emittances allow veryhigh lateral resolutionUltrashort pulses (psec) with high repetitionrates (MHz)
2 . NEUTRON SOURCES
For many years nuclear reactors have been the main source of neutrons, producing acontinuous flow of particles. This line of sources has culminated in the construction ofdedicated high flux reactors. As an example one may mention the ELL reactor at Grenoble witha thermal power of 58 MW and a useful neutron flux of 1015n/cm2xs. However, as fission is ahighly exothermic effect releasing about 200 MeV of energy for every useful neutron (i. e. notneeded to sustain the chain reaction) very high power densities are produced in the reactor coreand limit ultimately the obtainable neutron flux. High flux reactors are near the end of theirdevelopment potential and one does not expect neutron fluxes an order of magnitude above theones reached at the ELL-reactor.
During the last years another type of neutron source has found growing interest: the socalled spallation source. Neutrons are produced by high energy protons (~ 1 GeV) hitting aheavy metal target and exciting nuclei to energies where neutrons are "evaporated" (spallation).Typical production rates for 1 GeV protons are of the order of 25 neutrons per incident proton(in Pb) and correspond to an energy consumption of about 40 MeV per neutron.
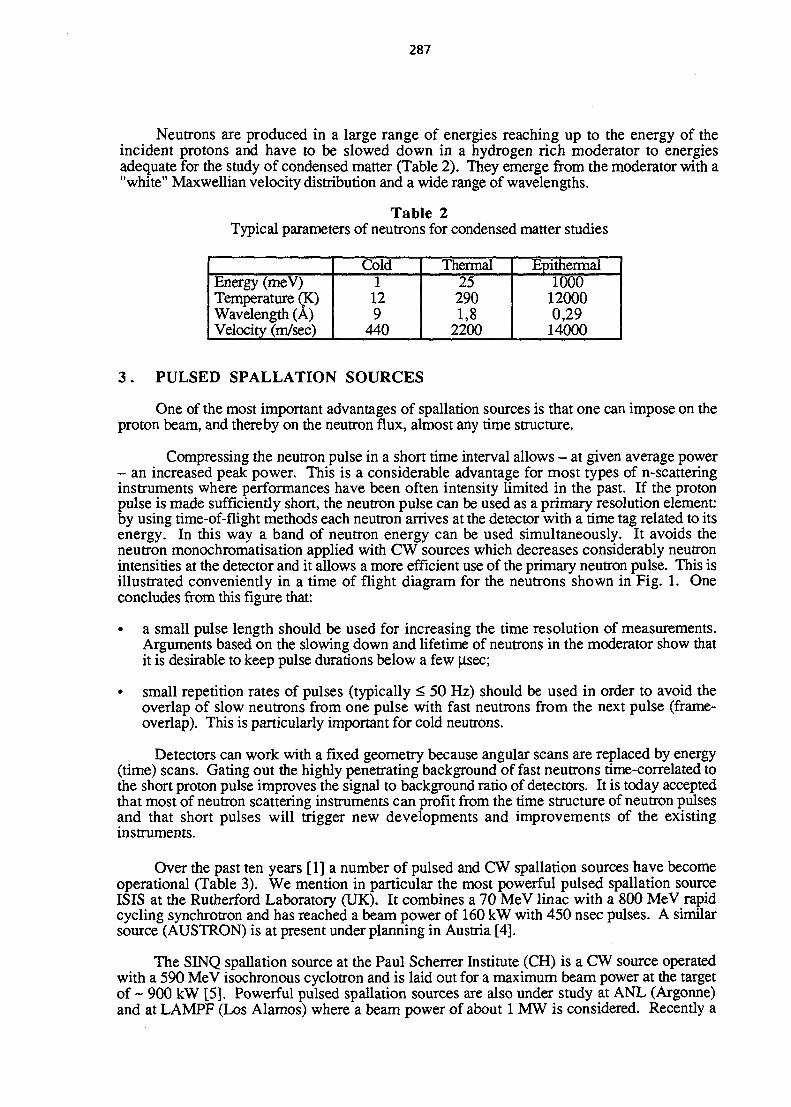
287
Neutrons are produced in a large range of energies reaching up to the energy of theincident protons and have to be slowed down in a hydrogen rich moderator to energiesadequate for the study of condensed matter (Table 2). They emerge from the moderator with a"white" Maxwellian velocity distribution and a wide range of wavelengths.
Table 2Typical parameters of neutrons for condensed matter studies
Energy (meV)Temperature (X)Wavelength (A)Velocity (m/sec)
Cold1
129
440
Thermal252901,8
2200
Epithermal1000
120000,29
14000
3 . PULSED SPALLATION SOURCES
One of the most important advantages of spallation sources is that one can impose on theproton beam, and thereby on the neutron flux, almost any time structure.
Compressing the neutron pulse in a short time interval allows - at given average power- an increased peak power. This is a considerable advantage for most types of n-scatteringinstruments where performances have been often intensity limited in the past. If the protonpulse is made sufficiently short, the neutron pulse can be used as a primary resolution element:by using time-of-flight methods each neutron arrives at the detector with a time tag related to itsenergy. In this way a band of neutron energy can be used simultaneously. It avoids theneutron monochromatisation applied with CW sources which decreases considerably neutronintensities at the detector and it allows a more efficient use of the primary neutron pulse. This isillustrated conveniently in a time of flight diagram for the neutrons shown in Fig. 1. Oneconcludes from this figure that:
• a small pulse length should be used for increasing the time resolution of measurements.Arguments based on the slowing down and lifetime of neutrons in the moderator show thatit is desirable to keep pulse durations below a few |isec;
• small repetition rates of pulses (typically < 50 Hz) should be used in order to avoid theoverlap of slow neutrons from one pulse with fast neutrons from the next pulse (frame-overlap). This is particularly important for cold neutrons.
Detectors can work with a fixed geometry because angular scans are replaced by energy(time) scans. Gating out the highly penetrating background of fast neutrons time-correlated tothe short proton pulse improves the signal to background ratio of detectors. It is today acceptedthat most of neutron scattering instruments can profit from the time structure of neutron pulsesand that short pulses will trigger new developments and improvements of the existinginstruments.
Over the past ten years [1] a number of pulsed and CW spallation sources have becomeoperational (Table 3). We mention in particular the most powerful pulsed spallation sourceISIS at the Rutherford Laboratory (UK). It combines a 70 MeV linac with a 800 MeV rapidcycling synchrotron and has reached a beam power of 160 kW with 450 nsec pulses. A similarsource (AUSTRON) is at present under planning in Austria [4].
The SINQ spallation source at the Paul Scherrer Institute (CH) is a CW source operatedwith a 590 MeV isochronous cyclotron and is laid out for a maximum beam power at the targetof ~ 900 kW [5]. Powerful pulsed spallation sources are also under study at ANL (Argonne)and at LAMPF (Los Alamos) where a beam power of about 1 MW is considered. Recently a
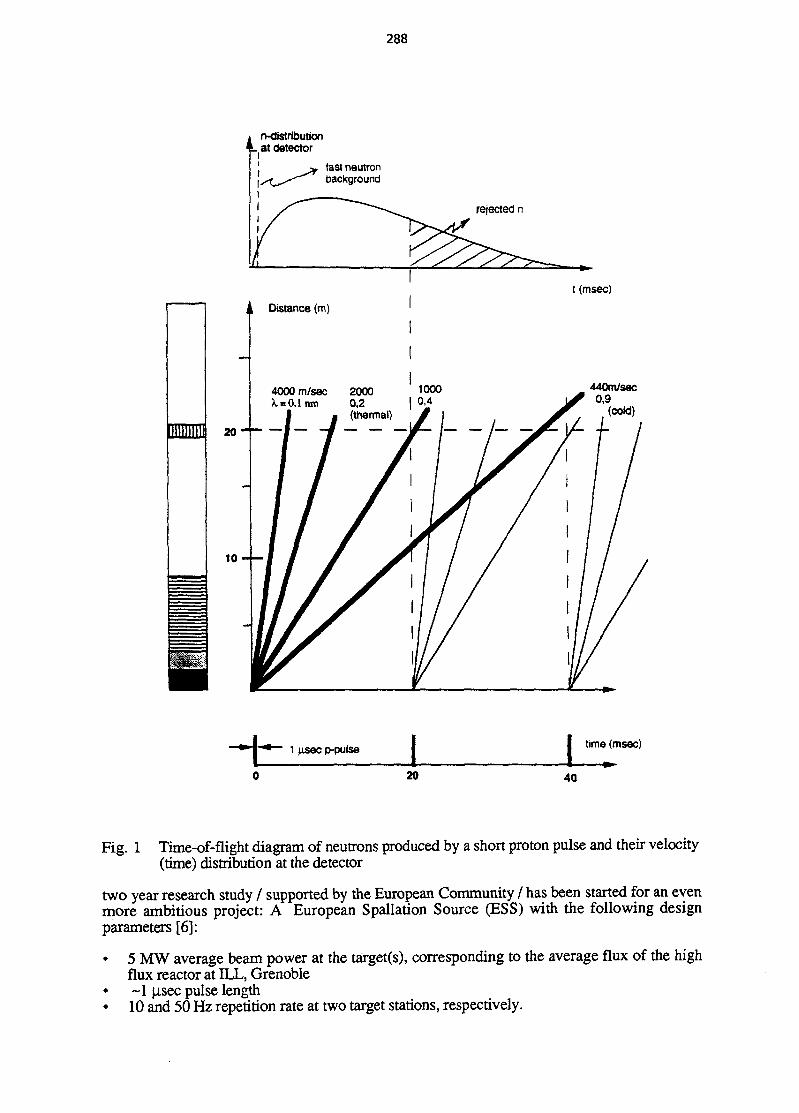
288
n-distribution' L at detector
fast neutronbackground
rejected n
Distance (m)
10
4000m/sec\ = 0A run
— 1 — —i
20000,2 |(thermal)
710000,4
t (msec)
440m/sec0,9
(coW)
• • I " * 1 |isecp-pulse
20
time (msec)
40
Fig. 1 Time-of-flight diagram of neutrons produced by a short proton pulse and their velocity(time) distribution at the detector
two year research study / supported by the European Community / has been started for an evenmore ambitious project: A European Spallation Source (ESS) with the following designparameters [6]:
• 5 MW average beam power at the target(s), corresponding to the average flux of the highflux reactor at ILL, Grenoble
• ~1 jisec pulse length• 10 and 50 Hz repetition rate at two target stations, respectively.

289
Table 3A few existing and planned pulsed and CW spallation sources
Facility
IPNS, Argonne
KENS.KEK
LANCSE,Los Alamos
ISIS,Rutherford Lab.
Austron II (planned)[4]
European Spallation
Source ESS
(planned)
SINQ
Accelerators
50 MeV Linac
500 MeV Svnchr.
40 MeV Linac
500 MeV Synchr.
800 MeV Linac
+ storage ring
70 MeV Linac
800 MeV Synchr.
130 MeV Linac
1.6 GeV Synchr.
1.334 GeV Linac
1.334 GeV
Accumulator
590 MeV
Cyclotron
Averagecurrentat target(UA)
20
10
60
200
125
3.750
1.500
Repetitionrate(Hz)
30
20
12
50
25
50
CW
Beam powerat target(kW)
10
5
80
160
200
5.000
900
Energy of onepulse at target(kJ)
0.33
0.25
7
3.2
8.2
100
-
Number ofprotons perpulse attarget
4x l0 1 2
3.1xlO12
5xlO13
2.5xlO13
3.2xlO13
5.2xlO14
(more than
one ring)
-
Presently this goal cannot be realised by a linear proton accelerator alone. One thereforeconsiders the use of a pulsed linac combined with a accumulator or an accelerator ring filled bymultiturn injection and emptied by fast one-turn ejection for reaching the desired peak powerand pulse lengths (Fig. 2). The beam power of 5 MW at the target can be produced by anadequate combination of proton energy and average current; an energy range of 0,8 to 3 GeV isat present under discussion.
4. THE PROPOSAL FOR A EUROPEAN SPALLATION SOURCE (ESS)
Recently a very first parameter set for ESS has been proposed; it combines a H'linac of1.33 GeV with two accumulator rings in parallel. A few parameters are given in Table 4 and aschematic view of the linac is given in Fig. 3.
The parameter range is amongst others restricted by the following constraints:
• A high average beam power and a low duty cycle for the neutron scattering experiments• Beam dynamics especially at low energy where the beam is heavily space charge dominated• The use of high intensity accumulator rings for compressing pulses to ~ 1 |U.sec
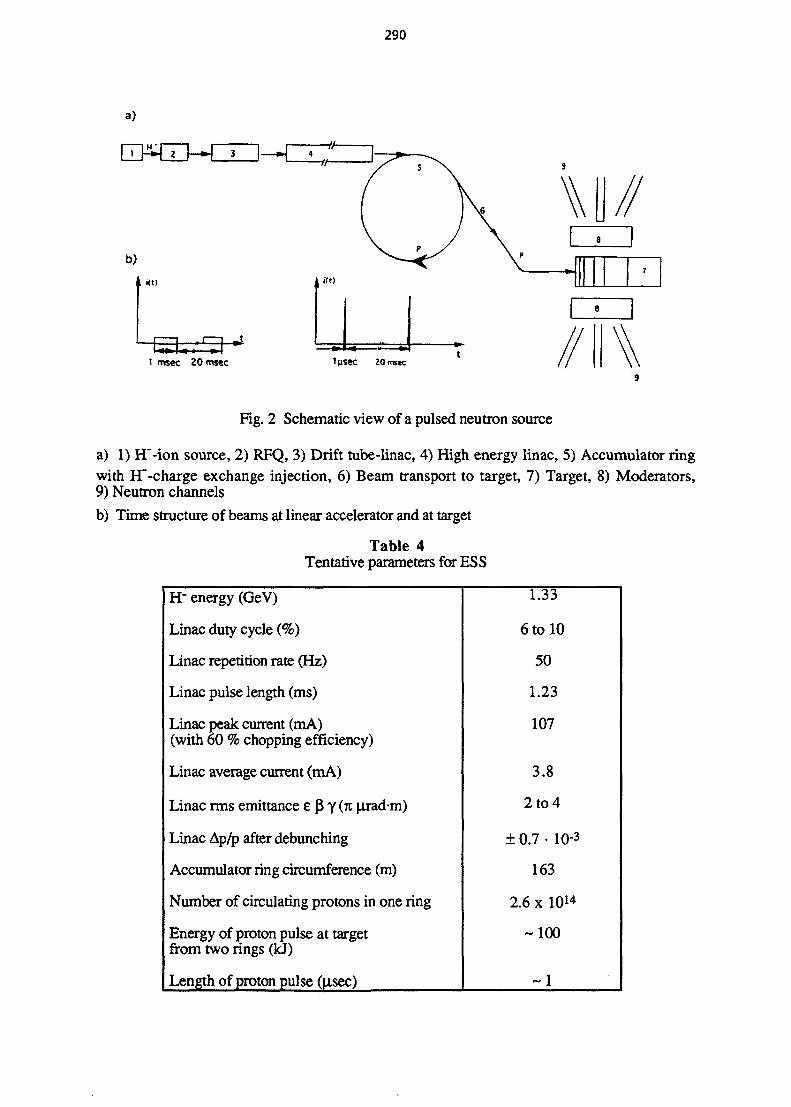
290
a)
1 msec 20 msec
Fig. 2 Schematic view of a pulsed neutron source
a) 1) H'-ion source, 2) RFQ, 3) Drift tube-linac, 4) High energy linac, 5) Accumulator ringwith H"-charge exchange injection, 6) Beam transport to target, 7) Target, 8) Moderators,9) Neutron channels
b) Time structure of beams at linear accelerator and at target
Table 4Tentative parameters for ESS
H" energy (GeV)
Linac duty cycle (%)
Linac repetition rate (Hz)
Linac pulse length (ms)
Linac peak current (mA)(with 60 % chopping efficiency)
Linac average current (mA)
Linac rms emittance e p y (K irad-m)
Linac Ap/p after debunching
Accumulator ring circumference (m)
Number of circulating protons in one ring
Energy of proton pulse at targetfrom two rings (kJ)
Length of proton pulse (fisec)
1.33
6 to 10
50
1.23
107
3.8
2to4
± 0.7 • 10-3
163
2.6 x 10¹⁴
-100
~ 1

291
a)
750k»VH+,H~
800m
100MeV 800MeV, 0.8MW
SCS
806MHz to «xp«rim«ntalareas and LAN3CE
b)
= 1mA; I - 17mA1ms; rep. rate « 120Hz
5-7MeV 150MeV 1.334G«V, 5MW
CCL
350MHz 700MHzA.
to accumulatorrings
<l> = 3.7mA; I = 100mAT p = 1.2ms; rep. rate = 50Hz
c)
1.2ms Tr -_20ms^-*g—
Fig. 3 Schematic layout: a) LAMPF linac (1972), b) Proposal for ESS-linac (1994), c) timestructure of chopped linac beam and of beam ejected from an accumulator ring at ESS
Present experience with high intensity proton and deuteron linacs makes it advisable notto exceed a peak current per rf pulse of about 100 mA. This value is also limited by theperformance of present H" sources and requires already the use of two H" sources in parallel.Similarly the low energy section up to about 7 MeV is doubled, necessitating the use of a beamfunnel.
The use of high intensity accumulator rings asks for very low injection losses down to alevel of kW only. This is the reason for using charge-exchange (H~ —> H+) injection by a thinstripping foil; it implies of course acceleration of H' in the linac [7]. The application of a lowloss H~-injection limits the number of injection turns per pulse to about 1000. This keeps theaverage number of passages of a given particle through the stripping foil sufficiently low (about1.5 to 2!). Another limit is given by fast growing instabilities in the high intensity rings with2.6 x 10*4 circulating protons (exceeding by a factor 10 the corresponding figure at ISIS). Asa consequence the linac pulses should not exceed a length of about 1 to 2 msec. Thecombination of this pulse length with a repetition rate of 50 Hz leads to a duty cycle around 5 to10 %. A direct use (without rings) of linac pulses at a third target station is considered. Forincreased flexibility it is planned to design the linac for a somewhat larger duty cycle.
One turn ejection by a fast kicker needs a time gap in the circulating proton current ofabout 200 nsec and requires therefore chopping of the linac H" beam. The chosen timestructure is 400 nsec/270 nsec with a chopping efficiency of 60 %.
In order to keep the ring aperture (and ring costs) as small as possible, emittance increasealong the linac should be kept as small as possible.
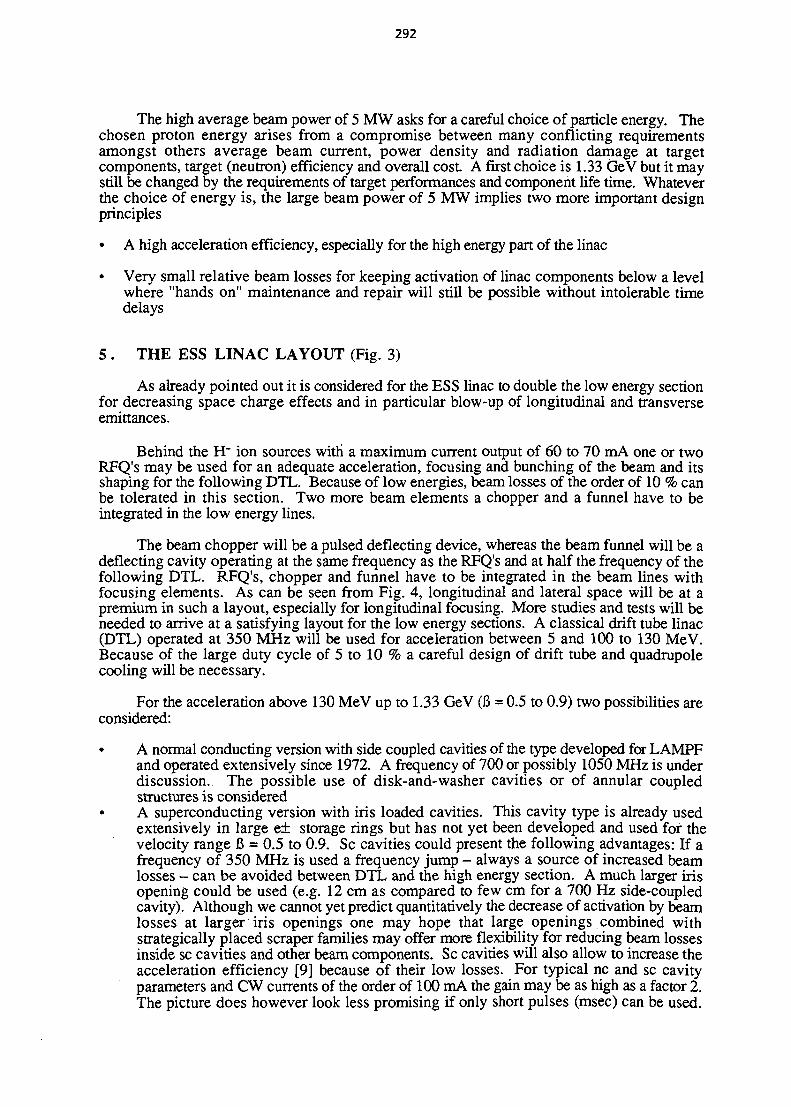
292
The high average beam power of 5 MW asks for a careful choice of particle energy. Thechosen proton energy arises from a compromise between many conflicting requirementsamongst others average beam current, power density and radiation damage at targetcomponents, target (neutron) efficiency and overall cost. A first choice is 1.33 GeV but it maystill be changed by the requirements of target performances and component life time. Whateverthe choice of energy is, the large beam power of 5 MW implies two more important designprinciples
• A high acceleration efficiency, especially for the high energy part of the linac
• Very small relative beam losses for keeping activation of linac components below a levelwhere "hands on" maintenance and repair will still be possible without intolerable timedelays
5 . THE ESS LINAC LAYOUT (Fig. 3)
As already pointed out it is considered for the ESS linac to double the low energy sectionfor decreasing space charge effects and in particular blow-up of longitudinal and transverseemittances.
Behind the H~ ion sources with a maximum current output of 60 to 70 mA one or twoRFQ's may be used for an adequate acceleration, focusing and bunching of the beam and itsshaping for the following DTL. Because of low energies, beam losses of the order of 10 % canbe tolerated in this section. Two more beam elements a chopper and a funnel have to beintegrated in the low energy lines.
The beam chopper will be a pulsed deflecting device, whereas the beam funnel will be adeflecting cavity operating at the same frequency as the RFQ's and at half the frequency of thefollowing DTL. RFQ's, chopper and funnel have to be integrated in the beam lines withfocusing elements. As can be seen from Fig. 4, longitudinal and lateral space will be at apremium in such a layout, especially for longitudinal focusing. More studies and tests will beneeded to arrive at a satisfying layout for the low energy sections. A classical drift tube linac(DTL) operated at 350 MHz will be used for acceleration between 5 and 100 to 130 MeV.Because of the large duty cycle of 5 to 10 % a careful design of drift tube and quadrupolecooling will be necessary.
For the acceleration above 130 MeV up to 1.33 GeV (6 = 0.5 to 0.9) two possibilities areconsidered:
• A normal conducting version with side coupled cavities of the type developed for LAMPFand operated extensively since 1972. A frequency of 700 or possibly 1050 MHz is underdiscussion. The possible use of disk-and-washer cavities or of annular coupledstructures is considered
• A superconducting version with iris loaded cavities. This cavity type is already usedextensively in large e± storage rings but has not yet been developed and used for thevelocity range 6 = 0.5 to 0.9. Sc cavities could present the following advantages: If afrequency of 350 MHz is used a frequency jump - always a source of increased beamlosses - can be avoided between DTL and the high energy section. A much larger irisopening could be used (e.g. 12 cm as compared to few cm for a 700 Hz side-coupledcavity). Although we cannot yet predict quantitatively the decrease of activation by beamlosses at larger iris openings one may hope that large openings combined withstrategically placed scraper families may offer more flexibility for reducing beam lossesinside sc cavities and other beam components. Sc cavities will also allow to increase theacceleration efficiency [9] because of their low losses. For typical nc and sc cavityparameters and CW currents of the order of 100 mA the gain may be as high as a factor 2.The picture does however look less promising if only short pulses (msec) can be used.
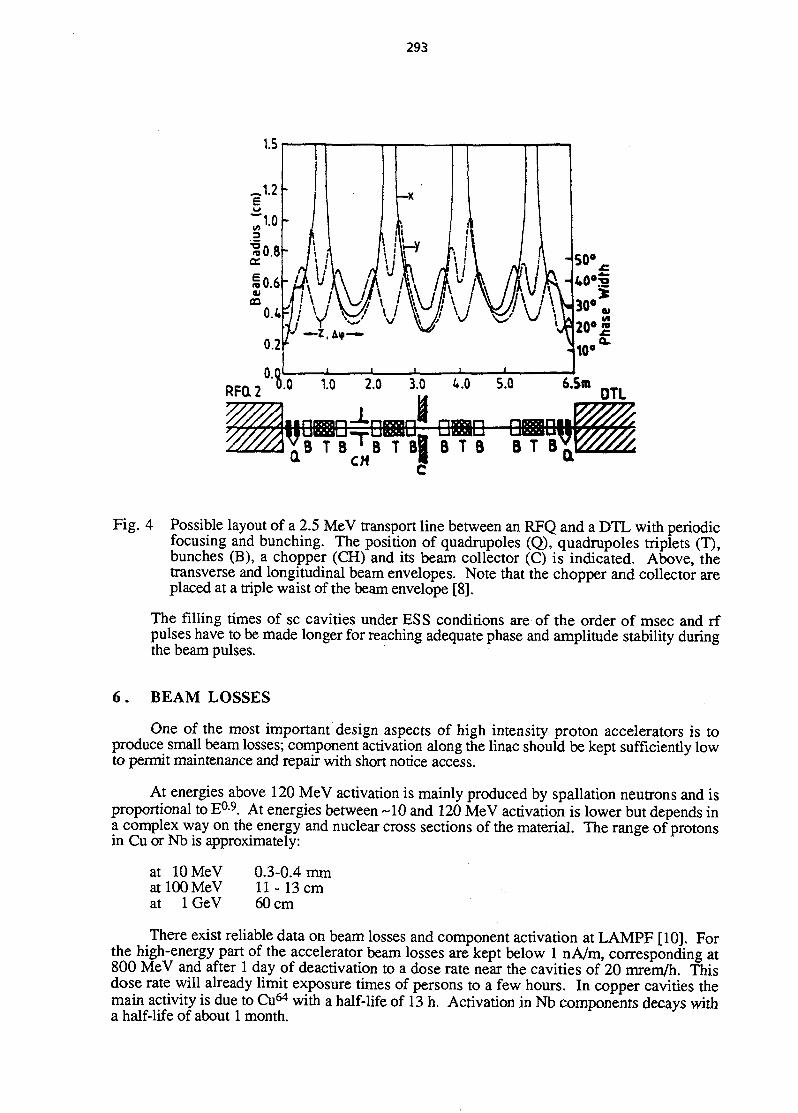
293
B T B ' B T B B B T B B T BCM i
Fig. 4 Possible layout of a 2.5 MeV transport line between an RFQ and a DTL with periodicfocusing and bunching. The position of quadrupoles (Q), quadrupoles triplets (T),bunches (B), a chopper (CH) and its beam collector (C) is indicated. Above, thetransverse and longitudinal beam envelopes. Note that the chopper and collector areplaced at a triple waist of the beam envelope [8].
The filling times of sc cavities under ESS conditions are of the order of msec and rfpulses have to be made longer for reaching adequate phase and amplitude stability duringthe beam pulses.
6 . BEAM LOSSES
One of the most important design aspects of high intensity proton accelerators is toproduce small beam losses; component activation along the linac should be kept sufficiently lowto permit maintenance and repair with short notice access.
At energies above 120 MeV activation is mainly produced by spallation neutrons and isproportional to E0-9. At energies between -10 and 120 MeV activation is lower but depends ina complex way on the energy and nuclear cross sections of the material. The range of protonsin Cu or Nb is approximately:
at 10 MeVat 100 MeVat 1 GeV
0.3-0.4 mm11-13 cm60 cm
There exist reliable data on beam losses and component activation at LAMPF [10]. Forthe high-energy part of the accelerator beam losses are kept below 1 n A/m, corresponding at800 MeV and after 1 day of deactivation to a dose rate near the cavities of 20 mrem/h. Thisdose rate will already limit exposure times of persons to a few hours. In copper cavities themain activity is due to Cu64 with a half-life of 13 h. Activation in Nb components decays witha half-life of about 1 month.
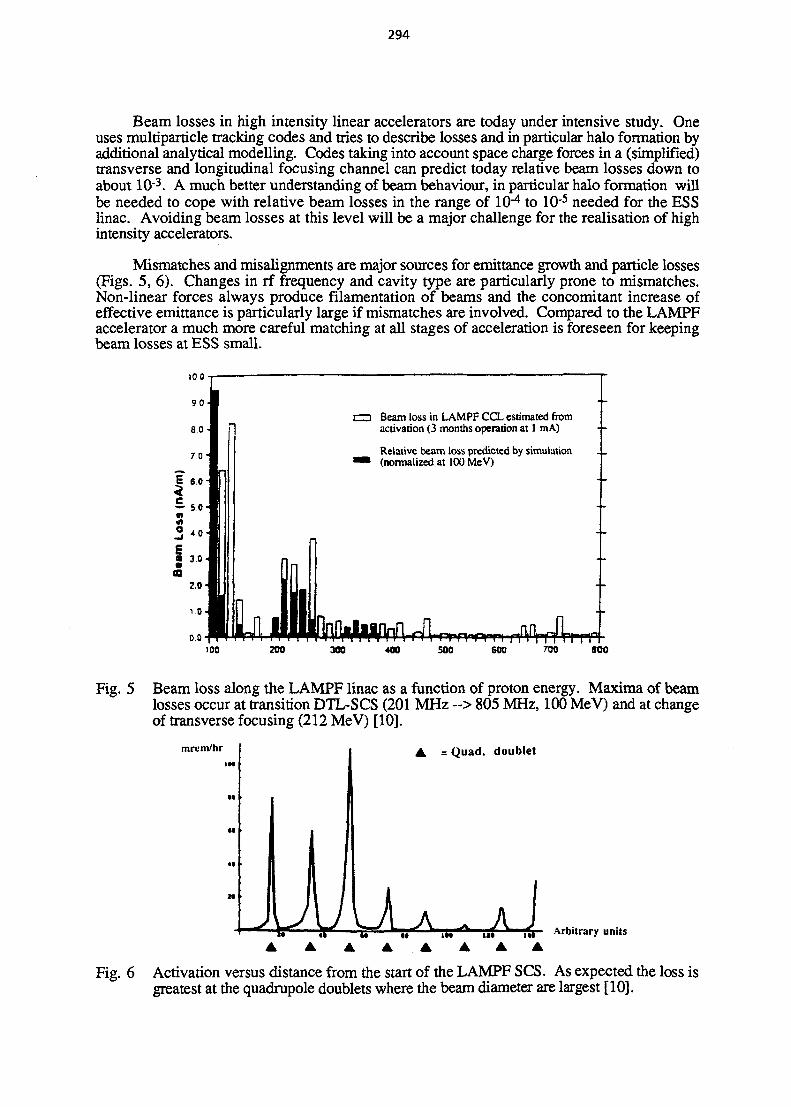
294
Beam losses in high intensity linear accelerators are today under intensive study. Oneuses multiparticle tracking codes and tries to describe losses and in particular halo formation byadditional analytical modelling. Codes taking into account space charge forces in a (simplified)transverse and longitudinal focusing channel can predict today relative beam losses down toabout 10"3. A much better understanding of beam behaviour, in particular halo formation willbe needed to cope with relative beam losses in the range of 10"4 to 10"5 needed for the ESSlinac. Avoiding beam losses at this level will be a major challenge for the realisation of highintensity accelerators.
Mismatches and misalignments are major sources for emittance growth and particle losses(Figs. 5, 6). Changes in rf frequency and cavity type are particularly prone to mismatches.Non-linear forces always produce filamentation of beams and the concomitant increase ofeffective emittance is particularly large if mismatches are involved. Compared to the LAMPFaccelerator a much more careful matching at all stages of acceleration is foreseen for keepingbeam losses at ESS small.
CZD Beam loss in LAMPF CCL estimated fromactivation (3 months operation at 1 mA)
Relative beam loss predicted by simulation 4-(normalized at 100 MeV)
100 zoo 300 400 500 600 700 800
Fig. 5 Beam loss along the LAMPF linac as a function of proton energy. Maxima of beamlosses occur at transition DTL-SCS (201 MHz --> 805 MHz, 100 MeV) and at changeof transverse focusing (212 MeV) [10].
mrem/hr = Quad, doublet
k AArbitrary units
Fig. 6 Activation versus distance from the start of the LAMPF SCS. As expected the loss isgreatest at the quadrupole doublets where the beam diameter are largest [10].

295
7. A SPECIAL PROBLEM IN A H" BEAM: Lorentz-stripping
In a spallation source the injection from a linac into the ring accelerator is done bystripping of H' ions because this process permits small injection losses. Consequently one hasto produce and accelerate H" ions in the linac. As the extra electron in the H' ion is very weaklybound it can be dissociated by the electric field created in its rest-system by an external magneticfield and in particular by bending magnets and by the quadrupole fields needed for focusingalong the linac. The probability of neutralisation [11] depends on the H~ kinetic energy and onthe strength of the quadrupole field which increases linearly with the distance from the axis.For a typical focusing quadrupole in the high 6 region one needs a gradient of about 20 T/m anda quadrupole length of 30 cm (independently of the use of nc or sc cavities). In Fig. 7 the lossrate per quadrupole doublet as a function of H" kinetic energy and of the distance from the axisis shown [12]. This loss rate should not exceed a value of about 1 nA/m at each doublet. Withan average current of 3.8 mA at 1.33 GeV this corresponds to a loss rate per doublet of 0.25 x10"6 and forces one to keep the beam radius at the doublets well below 2 cm. With focusingquadrupoles between all cryostats the large iris openings of sc cavities cannot be exploited forlarger beam dimensions because of Lorentz-stripping. To alleviate the problem the use ofdoublet focusing between cavities has been proposed.
QUADRUPOLE APERTURE RADM/i(cm)
f i E
11E
?1E
E 1E
o i E
giEm1E
SiE
jjME
^ I E
•01-
•02-
•03-
04-
•05-
•06-
•07-
•08-
•09-
•10 -
31E-12
/
/
/
/
/
5 /
/
' /
/
' >
• • — / • • —
11f
^*^s.
/
//
^f
>-—-" , - 1
200 400 600 800 1000KINETIC ENERGY (M«V)
1200 1400 1600
Fig. 7 Neutralisation rate of H" in a typical quadrupole doublet for an ESS-linac as a functionof H ' ion kinetic energy. Parameter: distance of particles from axis insidequadrupoles in cm [12].
8. CONCLUSIONS
Pulsed accelerator driven spallation sources for neutron scattering are a promisingalternative to CW reactor sources, because they allow high peak neutron intensities to bereached and a more efficient use of neutrons by time of flight methods. This is an importantadvantage for a field which has been traditionally intensity limited. There exist already anumber of pulsed spallation sources and plans for even higher intensity sources with beampowers of the order of MW, the most ambitious being the European Spallation Source (ESS)
296
with a beam power of 5 MW, a pulse length of ~ 1 usec and a repetition rate of 50 Hz. Withpresent day technologies this can only be obtained by a combination of an RF-linac and anaccumulator or accelerator ring. For the linac peak and average currents of 100 mA and a fewmA resp. at 1 GeV will be needed, well exceeding performances of existing proton linacs.
Because of space charge limits the low energy section of the linac will consist of twobeam lines combined by funnelling. The high energy end may use either normal conducting orsuperconducting accelerating cavities. Special problems arise because H" ions instead ofprotons have to be produced and accelerated so that a low-loss charge-exchange injection into aring can be applied. Fast one turn ejection from the ring also necessitates a chopped beam inthe linac. Besides avoiding emittance increase by space charges, low beam losses and a highacceleration efficiency will be dominating design criteria for the linac and the ring.
The high intensity linac can be considered for many aspects as a prototype for linacs to beused in nuclear waste transmutation and energy production. Although there much higheraverage beam currents are considered (100 mA) problems would be somewhat alleviatedbecause CW operation with protons will be possible.
ACKNOWLEDGEMENTS
I would like to thank my colleagues from the ESS group, in particular K. Bongardt andM. Pabst, for many fruitful discussions.
* * *
REFERENCES
[I] I.S.K. Gardner, EPAC, Rome 1988, p. 65
[2] J. Schapira, this Accelerator School
[3] J. Finney in Advances of Accelerator Physics and Technologies, Ed. H. Schopper,World Scientific 1993, p. 624
[4] H. Aiginger et al, EPAC Berlin (1992) and M. Regler, private communication
[5] G. Bauer, Proc. ICANS XI, Tsukuba, 1990, 41
[6] H. Lengeler, Proc. ICANS XII, Abingdon, May 1993, Rutherford Appleton Laboratory,Report 94-025, volume II, p-1
[7] G.H. Rees, CAS, 5th General Ace. Phys. Course, JyvaskylS, Finland, 1992, CERN94-01 p. 731
[8] K. Bongardt, KFA Jiilich, private communication
[9] H. Lengeler in [3], p. 321
[10] Proceedings: Technical Review for Next Generation Spallation Neutron Source, LosAlamos 1993, p. 68
[II] A.J. Jason, D.W. Hudgings and O.B. van Dyck, IEEE NS -28 (1981) 2704
[121 M. Pabst, KFA Julich, private communication
297
THE USE OF ACCELERATORS IN THE FISSION ENERGYFIELD
J.P. SchapiraIN2R3, Institut de Physique Nucleaire, Orsay, France
AbstractBecause high power accelerators are able to produce intense neutronfluxes, they have been proposed for breeding fissile materials or totransmute long-lived nuclei produced in nuclear reactors. Synergismbetween accelerators and reactors may enhance the three generalrequirements of a nuclear fuel cycle: energy, fuel and wastesustainability. After a historical review of early proposals, the threemain components of a hybrid system coupling an accelerator to a sub-critical reactor are discussed. Two recent examples based on thoriumwill be presented.
1 . INTRODUCTION
In 1939, very soon after the discovery of nuclear fission, it was recognized that a chainfission reaction could be sustained inside what will be designated as a nuclear reactor, toproduce energy at a constant rate. Such a possibility is due to the excess of neutrons (of theorder of 2.5-2.9 neutrons) released during each fission, and to the presence of a small fractionof delayed neutrons. However, at least in conventional reactors, there are usually not sufficientneutrons left for tasks other than energy production and reactor control. In addition to advancedtypes of reactor, the possibility of using high intensity accelerators was considered, as early as1952 [1], as a way of producing large numbers of neutrons, which could be used in the nuclearfuel cycle, either to breed artificial fissile materials such as 233U or 239Pu or to transmuteunwanted long-lived nuclei present in the high level active wastes.
1.1 Nuclear synergism
In a general way, energy Q can be produced from an exothermic nuclear reaction depictedas follows:
where N\ usually refers to the lightest particle and N2 to the "nuclear fuel".
To be usable for practical purposes, reaction (1) has to fulfill the following requirements:-a) the cross-section and the g-value must be the highest possible;-b) large quantities of particles Ni and fuel N2 must be available.
For those reasons, fission and fusion are the two basic nuclear processes which caneffectively be used for energy production, although up to now only fission has reachedindustrial maturity. Indeed, because of the absence of the Coulomb barrier, neutron-inducedreactions can exhibit very large nuclear cross-sections (such as for fission) and interact withlarge volumes of materials. Moreover, in the fission process, a large amount of energy Q isreleased, of the order of 200 MeV per fission. But, because only one type of fissile nucleus235U is present on earth, with a very low isotopic abundance (0.72% in natural uranium), theremight be a serious problem of fuel availability, depending on the development level of nuclear
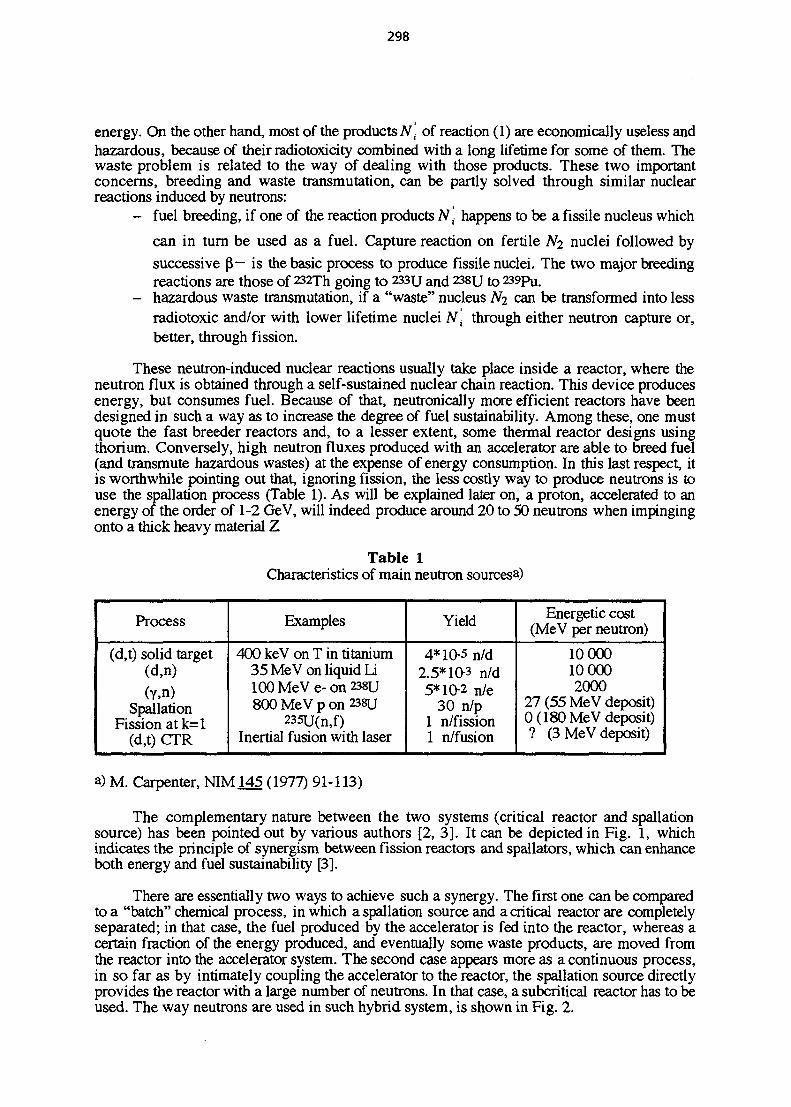
298
energy. On the other hand, most of the products Nt of reaction (1) are economically useless andhazardous, because of their radiotoxicity combined with a long lifetime for some of them. Thewaste problem is related to the way of dealing with those products. These two importantconcerns, breeding and waste transmutation, can be partly solved through similar nuclearreactions induced by neutrons:
- fuel breeding, if one of the reaction products N\ happens to be a fissile nucleus which
can in turn be used as a fuel. Capture reaction on fertile N2 nuclei followed bysuccessive |5— is the basic process to produce fissile nuclei. The two major breedingreactions are those of 232Th going to 233U and 238TJ to 239pu.
- hazardous waste transmutation, if a "waste" nucleus N2 can be transformed into lessradiotoxic and/or with lower lifetime nuclei Nt through either neutron capture or,better, through fission.
These neutron-induced nuclear reactions usually take place inside a reactor, where theneutron flux is obtained through a self-sustained nuclear chain reaction. This device producesenergy, but consumes fuel. Because of that, neutronically more efficient reactors have beendesigned in such a way as to increase the degree of fuel sustainability. Among these, one mustquote the fast breeder reactors and, to a lesser extent, some thermal reactor designs usingthorium. Conversely, high neutron fluxes produced with an accelerator are able to breed fuel(and transmute hazardous wastes) at the expense of energy consumption. In this last respect, itis worthwhile pointing out that, ignoring fission, the less costly way to produce neutrons is touse the spallation process (Table 1). As will be explained later on, a proton, accelerated to anenergy of the order of 1-2 GeV, will indeed produce around 20 to 50 neutrons when impingingonto a thick heavy material Z
Table 1Characteristics of main neutron sources8)
Process
(d,t) solid target(d,n)
(Y,n)Spallation
Fission at k=l(d,t) CTR
Examples
400 keV on T in titanium35 MeV on liquid Li100 MeV e- on 238U800 MeV p on 238U
235U(n,f)Inertia! fusion with laser
Yield
4*10-5 n/d2.5*10-3 n/d5*10-2 n/e
30 n/p1 n/fission1 n/fusion
Energetic cost(MeV per neutron)
10 00010 0002000
27 (55 MeV deposit)0(180 MeV deposit)? (3 MeV deposit)
a) M. Carpenter, NIM 145 (1977) 91-113)
The complementary nature between the two systems (critical reactor and spallationsource) has been pointed out by various authors [2, 3]. It can be depicted in Fig. 1, whichindicates the principle of synergism between fission reactors and spallators, which can enhanceboth energy and fuel sustainability [3].
There are essentially two ways to achieve such a synergy. The first one can be comparedto a "batch" chemical process, in which a spallation source and a critical reactor are completelyseparated; in that case, the fuel produced by the accelerator is fed into the reactor, whereas acertain fraction of the energy produced, and eventually some waste products, are moved fromthe reactor into the accelerator system. The second case appears more as a continuous process,in so far as by intimately coupling the accelerator to the reactor, the spallation source directlyprovides the reactor with a large number of neutrons. In that case, a subcritical reactor has to beused. The way neutrons are used in such hybrid system, is shown in Fig. 2.
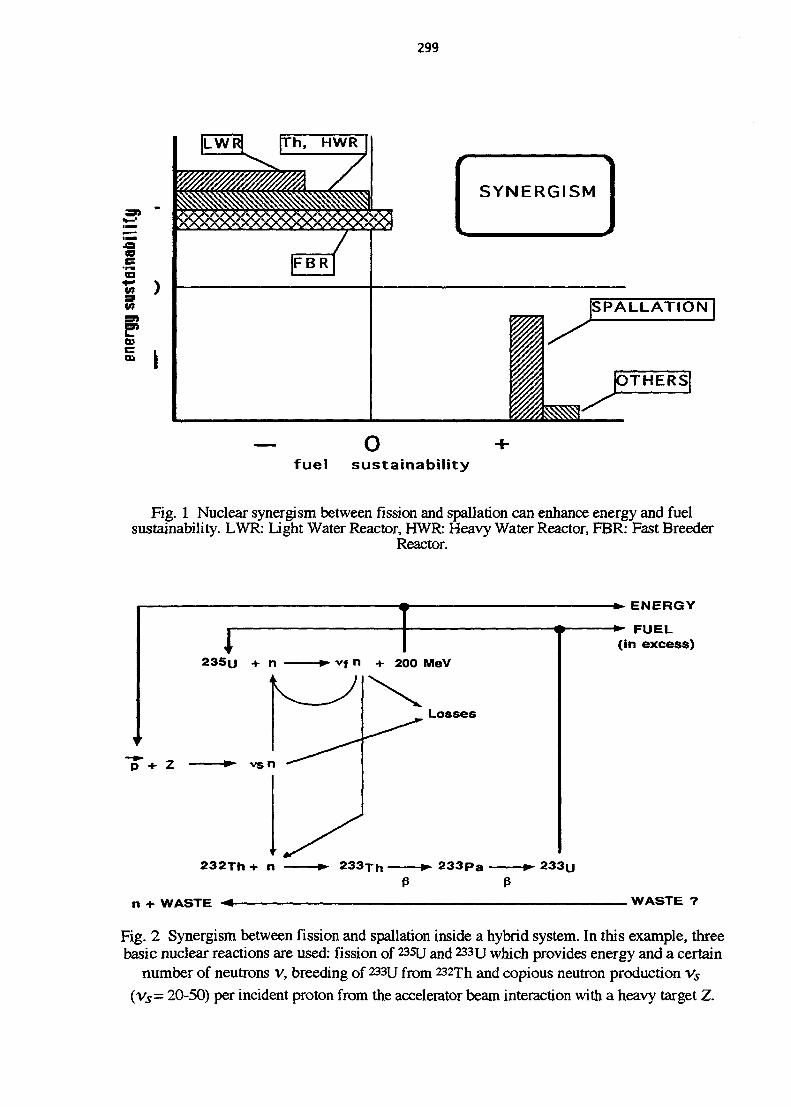
299
<n
8 >
SYNERGISM
ofuel sustainability
Fig. 1 Nuclear synergism between fission and spallation can enhance energy and fuelsustainability. LWR: Light Water Reactor, HWR: Heavy Water Reactor, FBR: Fast Breeder
Reactor.
*• ENERGY*- FUEL(in excess)
WASTE ?
Fig. 2 Synergism between fission and spallation inside a hybrid system. In this example, threebasic nuclear reactions are used: fission of 235U and 233TJ which provides energy and a certain
number of neutrons v, breeding of 233U from 232Th and copious neutron production vs
(Vy= 20-50) per incident proton from the accelerator beam interaction with a heavy target Z.
300
1.2 Historical review of nuclear synergism
Since the first proposal in 1952 by W.B. Lewis [1] of using an accelerator in the nuclearfuel cycle, the efforts carried out on this technology have largely varied, according to theimportance given to certain issues for which hybrid systems appeared as an attractive option. Infact, because they needed large technological developments, especially in the field of highintensity accelerating systems, research related to hybrid systems was reduced, if notabandoned, as soon as the originating issues were perceived to be no longer important. One candistinguish three basic periods, each corresponding to a different concern.
During the first period 1950-1970, research and development was carried out onbreeding accelerators, mainly in the United States and Canada At that time, there was in the USan increasing demand of plutonium in the context of the nuclear weapons program. Until largedeposits of uranium ore were discovered in this country by the end of the 50s, it was suggestedto use depleted uranium from enrichment plants to breed plutonium using neutrons produced bya high intensity accelerator. A 15 MeV, 100 mA linac prototype was built at Oak Ridge, in theframe of the project MTA (Material Testing Accelerator), and developed at Berkeley andLivermore from 1949 to 1954 when it was stopped [4]. Meanwhile, the ideas, originated byW.B. Lewis [1] in Canada, were developed in the context of the ING (Intense NeutronGenerator) program to build an intense neutron source [5], and later on, of the Canadianresearch program based on the CANDU reactor, fuelled with thorium [6-8]. In the latter case,the accelerator breeder would produce the extra quantities of 233U needed to provide the fuelsustainability of a thorium cycle based on CANDU reactors. At that time, Chalk River planneda very ambitious program, in order to build a 1 GeV, 300 mA linear accelerator [9, 10] in threesteps: ZEBRA (10 MeV, 300 mA), EMTF (200 MeV, 70 mA) and PILOT (1 GeV, 70 mA).
Nuclear proliferation appears as the main starting motivation for new proposals, duringthe second period, which goes approximately from 1975 to 1985. As a result of the ban on thecivilian use of plutonium, the Carter administration decided to abandon commercialreprocessing and to postpone the fast breeder program. But, at the same time, which wasbefore the American nuclear standstill, there was also a fear that uranium would become ascarce resource, due to expected nuclear program expansion. In order to reconcile theantiproliferation policy with those energy concerns, some proposals were made to use highintensity accelerators (1.5 GeV, 300 mA), to directly regenerate spent fuels [11-13] by toppingup their initial enrichment. In this context, a Brookhaven study proposed a proliferation-resistant fuel cycle, in which spent nuclear fuels were reused in the same type of reactor afterbeing directly irradiated by a linear accelerator fuel regenerator (LAFER). These ideas haveevolved towards integrated systems in which waste transmutation was included [14]. On thesame line, Forschungszentrum Mich GmbH proposed the SNQ project (1100 MeV, 5 mA) asa spallation neutron source [15]. The American projects were again not funded, due probably toa lack of political incentive in the context of a general nuclear standstill after the 1979 ThreeMile Island accident.
The third period starts in 1990, when a renewed interest for these technological optionsappeared in Japan, as part of the very ambitious OMEGA project [16,17] dealing with manyaspects of the back end of the fuel cycle, at Brookhaven [18] and Los Alamos [19-23] in theUnited States, and recently at CERN with C. Rubbia's proposal of an Energy Amplifier [24],All the proposals of real hybrid systems, coupling an accelerator to a sub-critical reactor, arethought of as a response to public and officials concerns on nuclear wastes and, in the UnitedStates, on the fate of military plutonium, as a result of the START 1 & 2 on nuclear weaponsdismantlement. In a broader sense, these proposals are considered as a way of renewing publicconfidence in nuclear energy programs. These efforts are coordinated by OCDE/NEA (NuclearEnergy Agency), which has since 1990 organized three important meetings of exchange andinformation [17, 25, 26], where present research programs on transmutation by acceleratorhave been presented. On the other hand, NEA is giving an impulse to a comparison of highenergy transport codes (see §2.2) [27].
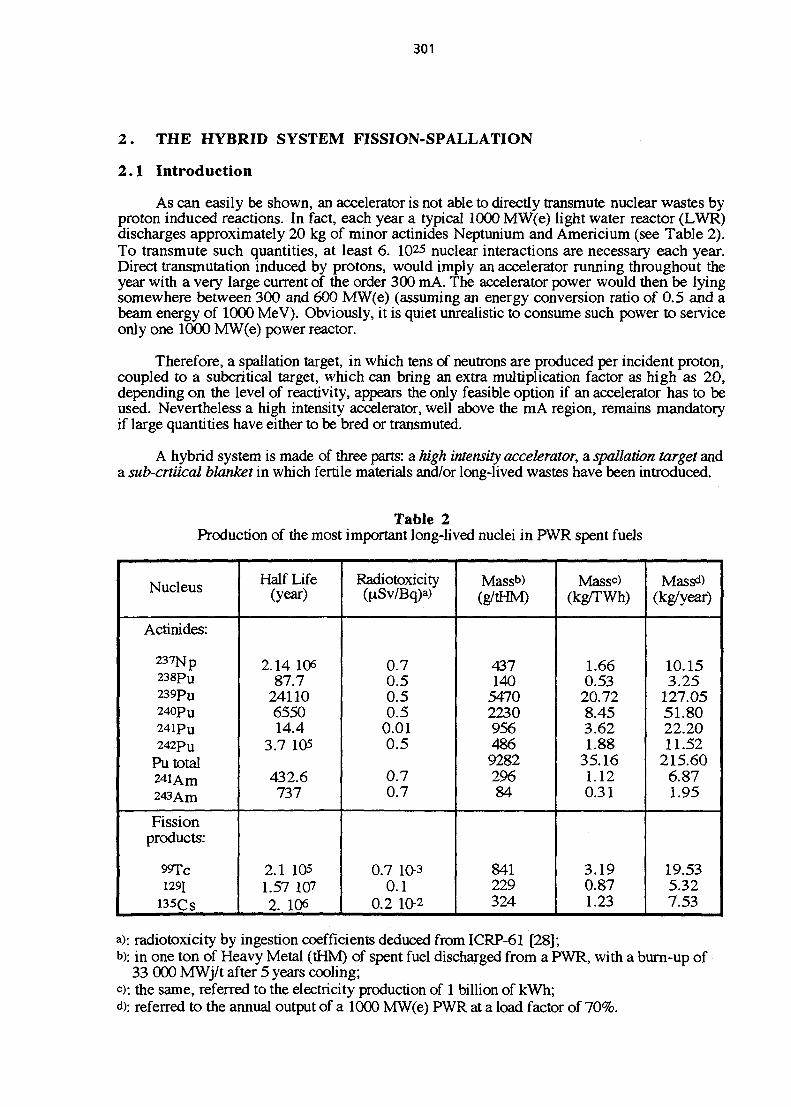
301
2 . THE HYBRID SYSTEM FISSION-SPALLATION
2.1 Introduction
As can easily be shown, an accelerator is not able to directly transmute nuclear wastes byproton induced reactions. In fact, each year a typical 1000 MW(e) light water reactor (LWR)discharges approximately 20 kg of minor actinides Neptunium and Americium (see Table 2).To transmute such quantities, at least 6. 1025 nuclear interactions are necessary each year.Direct transmutation induced by protons, would imply an accelerator running throughout theyear with a very large current of the order 300 mA. The accelerator power would then be lyingsomewhere between 300 and 600 MW(e) (assuming an energy conversion ratio of 0.5 and abeam energy of 1000 MeV). Obviously, it is quiet unrealistic to consume such power to serviceonly one 1000 MW(e) power reactor.
Therefore, a spallation target, in which tens of neutrons are produced per incident proton,coupled to a subcritical target, which can bring an extra multiplication factor as high as 20,depending on the level of reactivity, appears the only feasible option if an accelerator has to beused. Nevertheless a high intensity accelerator, well above the mA region, remains mandatoryif large quantities have either to be bred or transmuted.
A hybrid system is made of three parts: a high intensity accelerator, a spallation target anda sub-crtiical blanket in which fertile materials and/or long-lived wastes have been introduced.
Table 2Production of the most important long-lived nuclei in PWR spent fuels
Nucleus
Actinides:
237Np238pU
239pu
240pu
241PU
242pu
Pu total24iAm243Am
Fissionproducts:
95Tc1291
135CS
Half Life(year)
2.14 10687.7
24110655014.4
3.7 105
432.6737
2.1 1051.57 1072. 106
Radiotoxicity(}*Sv/Bq)a)
0.70.50.50.5
0.010.5
0.70.7
0.7 10-30.1
0.2 10-2
Massb)(g/tHM)
437140
54702230956486928229684
841229324
Massc)(kg/TWh)
1.660.53
20.728.453.621.88
35.161.120.31
3.190.871.23
Massd)(kg/year)
10.153.25
127.0551.8022.2011.52
215.606.871.95
19.535.327.53
a): radiotoxicity by ingestion coefficients deduced from ICRP-61 [28];b): in one ton of Heavy Metal (tHM) of spent fuel discharged from a PWR, with a burn-up of
33 000 MWj/t after 5 years cooling;c): the same, referred to the electricity production of 1 billion of kWh;d): referred to the annual output of a 1000 MW(e) PWR at a load factor of 70%.
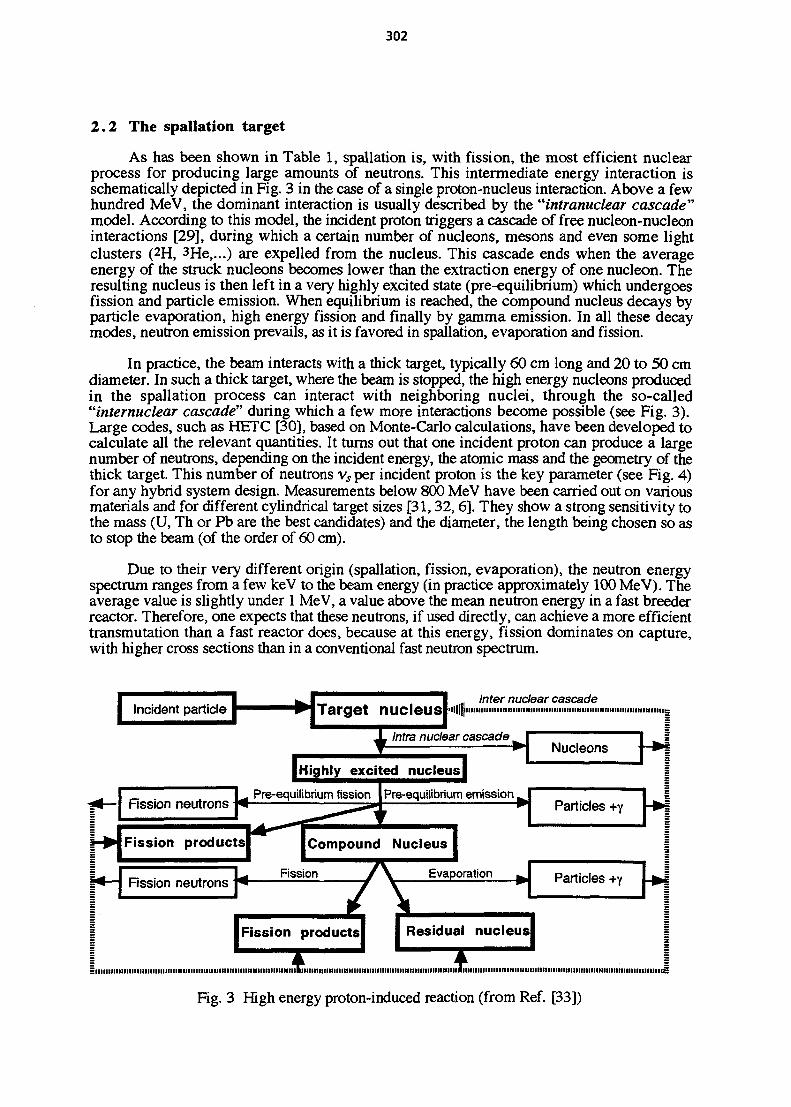
302
2.2 The spallation target
As has been shown in Table 1, spallation is, with fission, the most efficient nuclearprocess for producing large amounts of neutrons. This intermediate energy interaction isschematically depicted in Fig. 3 in the case of a single proton-nucleus interaction. Above a fewhundred MeV, the dominant interaction is usually described by the "intranuclear cascade"model. According to this model, the incident proton triggers a cascade of free nucleon-nucleoninteractions [29], during which a certain number of nucleons, mesons and even some lightclusters (2H, 3He,...) are expelled from the nucleus. This cascade ends when the averageenergy of the struck nucleons becomes lower than the extraction energy of one nucleon. Theresulting nucleus is then left in a very highly excited state (pre-equilibrium) which undergoesfission and particle emission. When equilibrium is reached, the compound nucleus decays byparticle evaporation, high energy fission and finally by gamma emission. In all these decaymodes, neutron emission prevails, as it is favored in spallation, evaporation and fission.
In practice, the beam interacts with a thick target, typically 60 cm long and 20 to 50 cmdiameter. In such a thick target, where the beam is stopped, the high energy nucleons producedin the spallation process can interact with neighboring nuclei, through the so-called"internuclear cascade" during which a few more interactions become possible (see Fig. 3).Large codes, such as HETC [30], based on Monte-Carlo calculations, have been developed tocalculate all the relevant quantities. It turns out that one incident proton can produce a largenumber of neutrons, depending on the incident energy, the atomic mass and the geometry of thethick target. This number of neutrons v$ per incident proton is the key parameter (see Fig. 4)for any hybrid system design. Measurements below 800 MeV have been carried out on variousmaterials and for different cylindrical target sizes [31,32, 6]. They show a strong sensitivity tothe mass (U, Th or Pb are the best candidates) and the diameter, the length being chosen so asto stop the beam (of the order of 60 cm).
Due to their very different origin (spallation, fission, evaporation), the neutron energyspectrum ranges from a few keV to the beam energy (in practice approximately 100 MeV). Theaverage value is slightly under 1 MeV, a value above the mean neutron energy in a fast breederreactor. Therefore, one expects that these neutrons, if used directly, can achieve a more efficienttransmutation than a fast reactor does, because at this energy, fission dominates on capture,with higher cross sections than in a conventional fast neutron spectrum.
Incident particle Target nucleus!
IInter nuclear cascade
Intra nuclear cascade.
Fission neutrons
I Highly excited nucleus!
Pre-equilibrium fission | Pre-equilibrium emission,
Fission products
Fission neutrons
Compound Nucleus
Nucleons
Particles +y
Particles
Fig. 3 High energy proton-induced reaction (from Ref. [33])
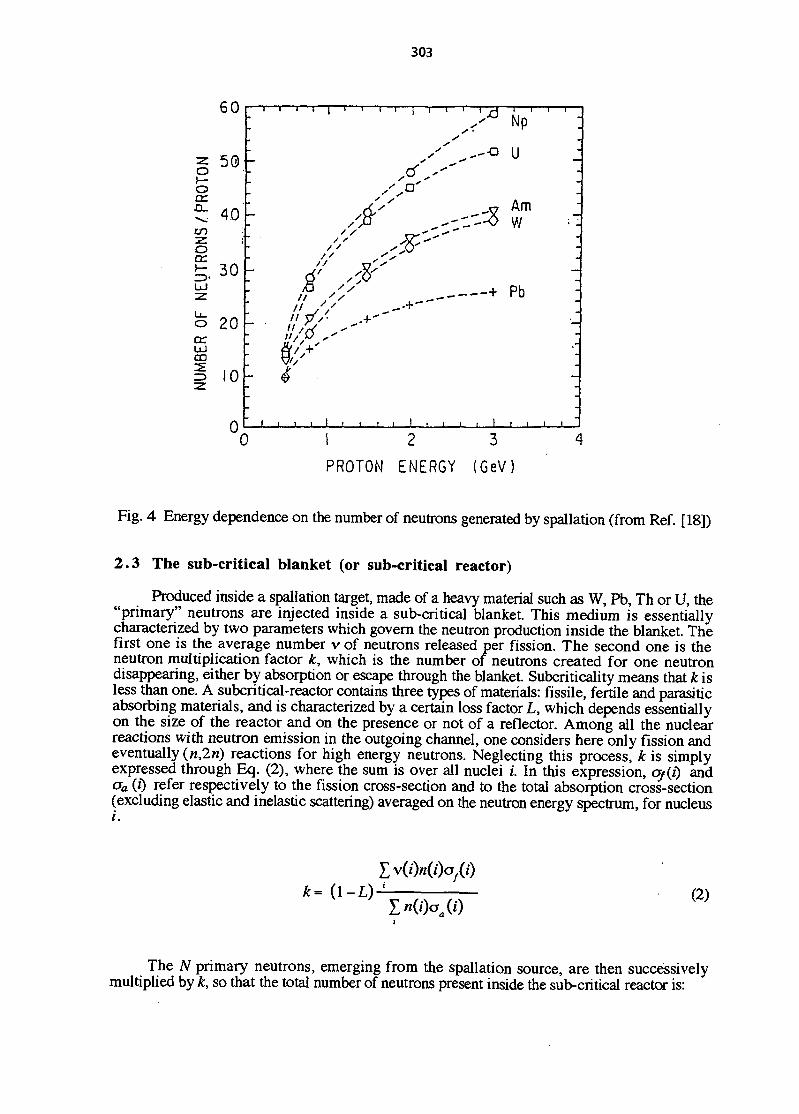
303
60
oen
in
o
40 -
30 -
o 2 0 -
UJCD
10 -
0
-
: B /'/II / '
ii X/ ^ " '
i i , t t t i i t
I ' ' ' ' JCJ
J-
1 , 1 1 , 1
Np ;
u :
AmW •"
Pb ;
—
-
•
0
PROTON ENERGY (GeV
Fig. 4 Energy dependence on the number of neutrons generated by spallation (from Ref. [18])
2.3 The sub-critical blanket (or sub-critical reactor)
Produced inside a spallation target, made of a heavy material such as W, Pb, Th or U, the"primary" neutrons are injected inside a sub-critical blanket. This medium is essentiallycharacterized by two parameters which govern the neutron production inside the blanket. Thefirst one is the average number v of neutrons released per fission. The second one is theneutron multiplication factor k, which is the number of neutrons created for one neutrondisappearing, either by absorption or escape through the blanket. Subcriticality means that k isless than one. A subcritical-reactor contains three types of materials: fissile, fertile and parasiticabsorbing materials, and is characterized by a certain loss factor!, which depends essentiallyon the size of the reactor and on the presence or not of a reflector. Among all the nuclearreactions with neutron emission in the outgoing channel, one considers here only fission andeventually (n,2n) reactions for high energy neutrons. Neglecting this process, k is simplyexpressed through Eq. (2), where the sum is over all nuclei /. In this expression, aj(J) andoa (i) refer respectively to the fission cross-section and to the total absorption cross-section(excluding elastic and inelastic scattering) averaged on the neutron energy spectrum, for nucleusi.
(2)
The A primary neutrons, emerging from the spallation source, are then successivelymultiplied by k, so that the total number of neutrons present inside the sub-critical reactor is:
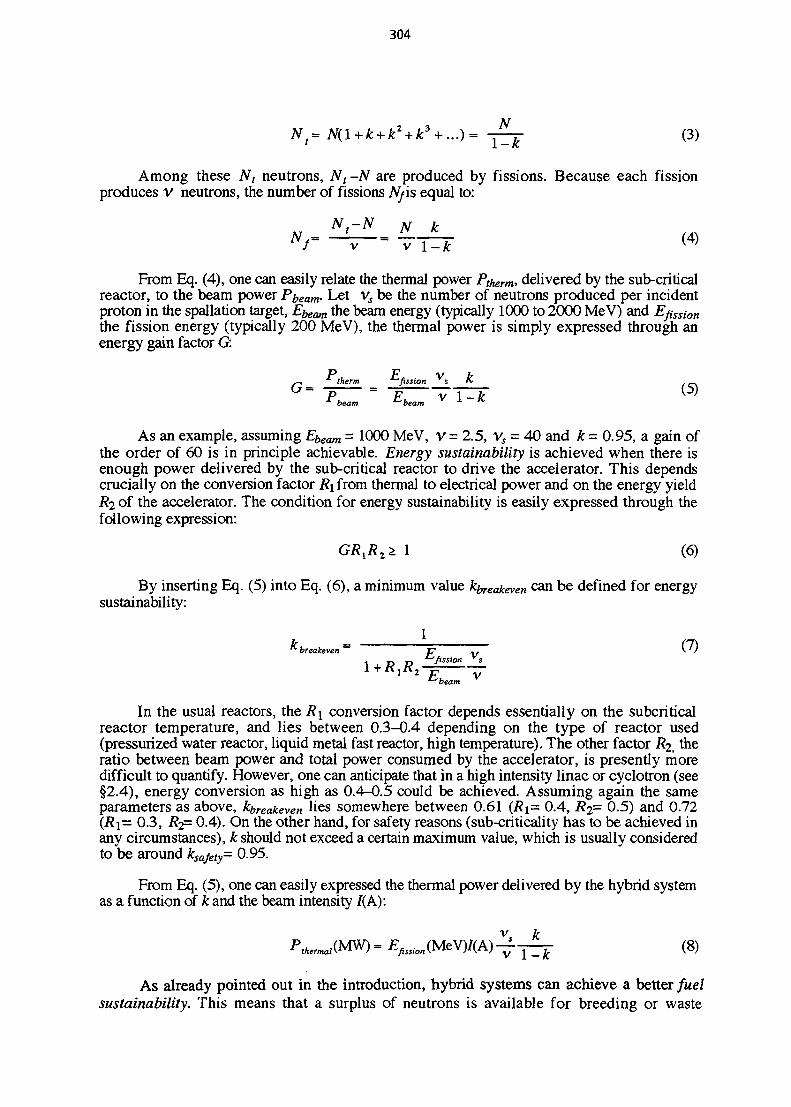
304
Nt= N(l+k + kz + Jfe3 + ...)= Y ^ J (3)
Among these Nt neutrons, N, -N are produced by fissions. Because each fissionproduces V neutrons, the number of fissions Nf is equal to:
(4)
From Eq. (4), one can easily relate the thermal power Ptherm* delivered by the sub-criticalreactor, to the beam power Pbeam- Let y$ be the number of neutrons produced per incidentproton in the spallation target, Ebeam the beam energy (typically 1000 to 2000 MeV) and EfiSSionthe fission energy (typically 200 MeV), the thermal power is simply expressed through anenergy gain factor G:
^ "therm '-'fission Vs K( 5 )p = EVTH (5)
* beam ^beam *• K
As an example, assuming Ebeam - 1000 MeV, v = 2.5, y, = 40 and k = 0.95, a gain ofthe order of 60 is in principle achievable. Energy sustainability is achieved when there isenough power delivered by the sub-critical reactor to drive the accelerator. This dependscrucially on the conversion factor Ri from thermal to electrical power and on the energy yieldi?2 of the accelerator. The condition for energy sustainability is easily expressed through thefollowing expression:
i* 1 (6)
By inserting Eq. (5) into Eq. (6), a minimum value reaA:even can be defined for energysustainability:
*• breakeven
7 V'beam
In the usual reactors, the R\ conversion factor depends essentially on the subcriticalreactor temperature, and lies between 0.3-0.4 depending on the type of reactor used(pressurized water reactor, liquid metal fast reactor, high temperature). The other factor #2, theratio between beam power and total power consumed by the accelerator, is presently moredifficult to quantify. However, one can anticipate that in a high intensity linac or cyclotron (see§2.4), energy conversion as high as 0.4-0.5 could be achieved. Assuming again the sameparameters as above, k},reakeven lies somewhere between 0.61 (i?i= 0.4, /?2= 0-5) and 0.72{R\- 0.3, /?2= 0-4). On the other hand, for safety reasons (sub-criticality has to be achieved inany circumstances), k should not exceed a certain maximum value, which is usually consideredto be around ksafety= 0.95.
From Eq. (5), one can easily expressed the thermal power delivered by the hybrid systemas a function of k and the beam intensity /(A):
(8)
As already pointed out in the introduction, hybrid systems can achieve a better fuelsustainability. This means that a surplus of neutrons is available for breeding or waste
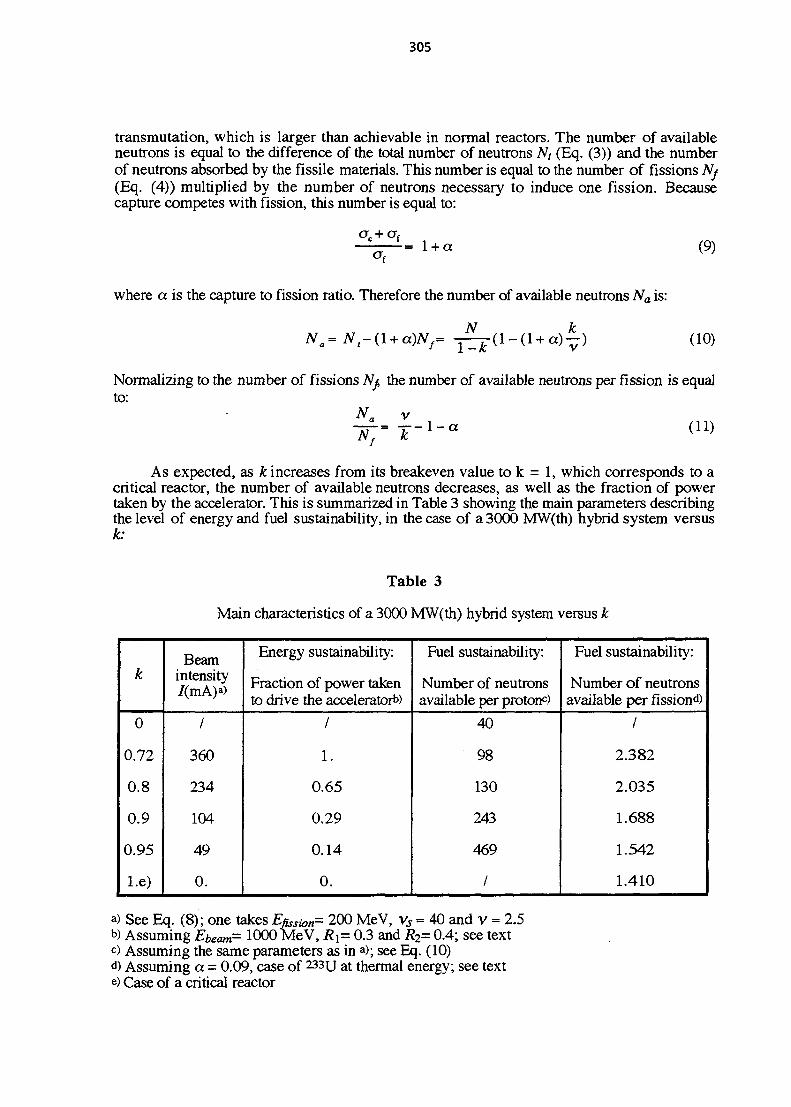
305
transmutation, which is larger than achievable in normal reactors. The number of availableneutrons is equal to the difference of the total number of neutrons iV/ (Eq. (3)) and the numberof neutrons absorbed by the fissile materials. This number is equal to the number of fissions Nf(Eq. (4)) multiplied by the number of neutrons necessary to induce one fission. Becausecapture competes with fission, this number is equal to:
ot(9)
where a is the capture to fission ratio. Therefore the number of available neutrons iVa is:
N. (10)
Normalizing to the number of fissions Nf, the number of available neutrons per fission is equalto:
N „ vT-l-a (11)Nf
As expected, as k increases from its breakeven value to k = 1, which corresponds to acritical reactor, the number of available neutrons decreases, as well as the fraction of powertaken by the accelerator. This is summarized in Table 3 showing the main parameters describingthe level of energy and fuel sustainability, in the case of a 3000 MW(th) hybrid system versusk:
Table 3
Main characteristics of a 3000 MW(th) hybrid system versus k
k
0
0.72
0.8
0.9
0.95
l.e)
Beamintensity7(mA)«>
/
360
234
104
49
0.
Energy sustainability:
Fraction of power takento drive the accelerator^)
/
1.
0.65
0.29
0.14
0.
Fuel sustainability:
Number of neutronsavailable per proton^)
40
98
130
243
469
/
Fuel sustainability:
Number of neutronsavailable per fission^)
/
2.382
2.035
1.688
1.542
1.410
a) See Eq. (8); one takes Epsion= 200 MeV, vs = 40 and v = 2.5b) Assuming Ebeam- 1000 MeV, Rx= 0.3 and R2= 0.4; see textc) Assuming the same parameters as in a); see Eq. (10)<*) Assuming a = 0.09, case of 233U at thermal energy; see texte) Case of a critical reactor
306
2.4 The high intensity accelerator
Because of the quantities of nuclei to be transmuted or to be produced by breeding, highintensity accelerators are required in hybrid systems. Focusing on transmutation, neutronsgenerated by an accelerator can be used to destroy either some long-lived fission productsthrough thermal neutron capture, or actinides mainly through fission.
In the first case, there is a net neutron consumption of the order of 1 to 1.5 neutrons pernucleus to be destroyed, depending on parasitic captures and losses from the blanket.Assuming the optimistic case of 1 neutron per fission product to be transmuted, Table 2 showsthat the destruction of the yearly production of "Tc by a 1000 MW(e) LWR, would need1.2 1026 neutrons, or 3 1024 protons (vs= 40) per year. This represents a beam current of 19mA assuming an accelerator load factor of 80%, associated to a k = 0,99Tc blanket
In the second case, fission is the ultimate process for actinide transmutation, eventuallypreceded by a few neutron captures. Therefore the actinide blanket has a certain level ofsubcriticality k, depending on the fuel composition. As shown in Table 3, beam intensities ofthe order of 50 to 100 mA (depending on k) are considered in order to drive a 3000 MW(th)subcritical reactor. This power level corresponds to the yearly consumption of 950 kg of fissilematerial, on the basis of a load factor of 80%. The fraction of these 950 kg representing wastes,will depend on the specific design of the subcritical reactor and of its fuel.
Clearly, accelerators in the range of 10 to 300 mA intensity and 800 to 2000 MeV energyhave to be considered for those tasks. Linear accelerators operating in CW are the mostappropriate type of accelerator, although cyclotrons may be considered for intensities less than10-15 mA. Two reference cases exist for the moment the LAMPF linear accelerator (800 MeV,1 mA average) at Los Alamos and the PSI cyclotron (600 MeV, 0.8 mA) at Villingen. There isa technological basis for an extrapolation to higher intensity in both cases [34,35]. In the caseof a proton linac, which can profit by the neutral beam program of SDI, the DOE EnergyAdvisory Review Board has recognized the feasibility of such an extrapolation [36]
The main technological issues are related to:- the beam losses inside the accelerating structures, which have to be maintained at a very
low level in order to avoid any activation which would prevent hand on maintenance;- the overall RF system efficiency, in order to achieve the highest energy sustainability of
the total hybrid system (see Eq. (6));- the availability and reliability of components, especially of the RF system.
On a linac, beam loss can be limited to a very small fraction of the total beam byachieving a very high ratio of the radial aperture of accelerating structure to beam size. This isespecially important in the high energy side of the linac. Fortunately, large apertures becomepossible (few cm) limiting to 2 10-7 per meter the beam fraction which is lost (case of LAMPF,see Ref. [34]). It seems that the needed objective of 10-8, quoted by the Los Alamos group isattainable [34]; in that case the dose rate will still be of the order of few tens of mrem per hourat contact. With a superconducting linac, beam losses should be even more reduced, as one canincrease the aperture size of the superconducting accelerating cavities. In a cyclotron, beamlosses appear mainly at the extraction. Extraction efficiency as high as 99% is now achieved onthe cyclotron at PSI [35].
Overall RF efficiency depends on the RF transmitter's efficiency and on the powerdissipated in the cavity walls. Because this quantity does not depend on the beam intensity, RFefficiency will increase with beam current. Reference [34] quotes RF transmitter efficiency nearto 70%. The power dissipated in the cavity walls is of the order of 30% of the beam power fora room temperature linac, and becomes negligible in superconducting cavities. An overallefficiency of the order of 50% and 70% are then quoted for both types of linac [34]. A similarsituation prevails for the RF system of a cyclotron.
307
3 . TWO EXAMPLES OF HYBRID SYTEMS USING THORIUM
As pointed out in section 1.2, new proposals for hybrid systems are emerging fromJapan (OMEGA project, Ref. [16,17]), Brookhaven [18], Los Alamos [19-23] and C. Rubbiaat CERN [24]. The last two are based on thorium, used in two different ways. Originally, theaim of the Los Alamos proposal called ATW (Accelerator Transmutation of Wastes) was thetransmutation of some long-lived minor actinides (pTNp and 241.243Am) and fission products("Tc, 135Cs), in relation to the cleaning up of the high level liquid wastes generated in the earlyweapons program [20]. Since then, the concept has evolved to an integrated system whichwould also produce energy. A more recent variant, called ABC (Accelerator Based Conversionof Plutonium), has been presented for weapons plutonium destruction [23]. On the other hand,Rubbia's proposal focuses on a system of power generation only, and is presented as anEnergy Amplifier [24].
Thorium, which is three times more abundant in the earth crust than uranium, has nofissile isotope. However, the most abundant isotope, 232Th, is fertile and leads to a fissileisotope 233U through neutron capture and two successive p-decays, as follows:
, , , 233 - 233 - 233 11 J\232Th + n => Th(P ) => Pa(p ) =» U (LZ)
In order to achieve a certain reactivity of the sub-critical reactor at the start, one has to mix232Th with some fissile materials (233U, 235U Or 239Pu), or breed 233U in situ from 232Th,using the neutrons produced by the accelerator (this is referred to as electro-breeding). Despitethis drawback of having no natural fissile isotope, the use of thorium has a certain number ofadvantages, including the following:
- high conversion ratio, near to unity, can be achieved in thermal reactors fuelled withthorium [37];
- it does not need any isotopic enrichment;- the natural decay products left at the mining site as wastes have short period;- during irradiation, high Z actinides, such as plutonium, are produced in very small
quantities;- the possibility to denature 233U with 238U and to detect easily any diversion of fissile
material due to the presence of 232U (see below), makes the fuel cycle a prioriproliferation resistant (provided the same safeguards concerning reactors will be appliedto high power accelerators).
On the other hand, there are severe radiological constraints in the fuel cycle, especiallyrelated to the presence of 232U whose descendant, 208T1, emits very hard gamma rays.
3.1 The Los Alamos proposals
The Los Alamos proposal is based on the Molten Salt Reactor Experiment carried on atOak-Ridge in the late sixties [38]. The Los Alamos proposal ATW intends to use very highneutron fluxes, of the order of 1016 n s-i cm2, in order to rapidly transmute actinides, as well assome fission products. At this level of neutron flux, a low core inventory becomes possible(this is not the case in standard reactors) with the important effect of limiting radioactivereleases in the case of an accident. But, a continuous flow system becomes necessary mainlyfor two reasons. Because of its rather long half-life of 27 days, 233Pa has to be removedpermanently from the intense neutron flux in order to decay to 233U without first capturing oneneutron. Secondly, the actinide composition has to be permanently adjusted (as a consequenceof the low inventory) and short lived or stable fission products removed. This implies a liquidfuel, such as molten salt mixed with a carrier salt LiF-BeF2. The scheme of the two variants ofATW are depicted in Fig. 5.
In the first variant [20,21], primary neutrons are produced with a 1.6 GeV proton beam,inside a 50-cm diameter liquid lead target. The blanket surrounding this target, comprises three

308
sectors. The inner one, where flux of the order of 5 1015 n s-1 cm2 is expected, is dedicated tothe destruction of selected long-lived fission products by neutrons moderated in heavy water.Indeed, fission product destruction requires high thermal neutron flux, due to their low capturecross-sections. In the middle region, thermal fission takes place in order either to produceenergy from 233U or to transmute minor actinides. Breeding 233U (via 233Pa) takes place in theouter region into which thorium nitrate is fed.
In the second variant [22], which uses a deuteron beam of 800 MeV, the neutron sourceis made of the molten salt itself surrounded by lead (calculations show that the neutron energycost is approximately the same as in the previous case, but that the number of spallationproducts is reduced). The same three-sector blanket remains, with the use of graphite asmoderator and the replacement of nitrate by molten salt in the outer region.
In both cases, there is a fairly complex chemical flowsheet (not represented on Fig. 5), tocontinuously remove 233pa, and the fission products, and feed 233U, the fission products andthe actinides. The subcriticality factor does not exceed 0.95. In that case, a proton linacdelivering a beam with an intensity of the order of 50 mA (depending on the target geometry) isnecessary to drive a 3000 MW(th) subcritical reactor (Table 3). In fact, Los Alamos isconsidering intensities up to 250 mA (especially for tritium production).
From a neutron economy point of view, an interesting feature of this thermal high fluxconcept is the possibility to destroy 237Np and, to a lesser extent 241 Am, more efficiently thanone would in a normal thermal reactor. Indeed, in a thermal flux below 2. 1015 n s-i cm2,23?Np is a nuclear poison, absorbing more neutrons than it generates (route A in Fig. 6). In athermal flux above 2. 10*5 n s-i cm2, 237{\jp is a nuclear fuel, generating more neutrons than itabsorbs (route B in Fig. 6). The key isotope in the 237]\jp burn sequence is 238Np, which in ahigh thermal flux can fission readily instead of decaying to the non fissile isotope 238Pu5 whichis a poison. 24iAm behaves similarly. The cross-sections (in barn) are averaged over the ATWneutron spectrum" (quoted from Ref. [22]).
The main goals of the ATW concept are described in Ref. [20]: power generation withinternal burning of the long-term wastes; transmutation of external wastes; incineration ofplutonium. Present status of technology related to ATW is also reviewed, especially thefollowing:
- the basic ATW accelerator will be a 1600 MeV, 250 mA proton linac, operating in CWmode and using two identical injection lines (RFQ, DTL) funneled into a coupled-cavitylinac made of 10275 cells. With respect to LAMPF, the average intensity will beincreased by a factor of 250. Such an increase is obtained in three steps: by increasingthe duty factor from 6% to 100 % (CW mode), by filling each RF "bucket" with abunch of particles (instead of only one every fourth) and by increasing the number ofprotons in each bunch (from 0.5 109 to 2.2 109 protons per bunch, representing a 4.4increase only). The technological basis for such an increase exists [36] but would needa development period of the order of 20 years [20]. The emphasis is put on the RFefficiency, on the economic performances (reliability, possibility of hand-onmaintenance, construction cost);
- the chemical processes associated with the use of molten salt;
- the need to isotopically separate certain fission products, such as 135Cs, which isnecessary if one wants to efficiently use neutrons and avoid captures leading tolong-lived nuclei. It has to be carefully studied.
- the behavior of materials to intense high energy neutron flux (radiation damage,activation).

309
These technological challenges remain the basis of ATW development and of subsequentvariants such as ABC, specifically designed to burn weapons plutonium [23].
SUB-CRITICALREACTOR
BEAM
SUB-CRITICALREACTOR
reflector
and
thoriumbreeding
molten salt
energy production233y
and
M.A. burning
molten salt
F.P.
transmutation
Graphite
reflector
or
Thoriumbreeding
nitrate
energy production233u
and/or
M.A. burningmolten salt
F.P.
transmutation
Dgp
•
externalneutronsource
Pb
Pb
externalneutronsource
molten salt
Fig. 5 The two variants of ATW
A
B
Fig. 6 The two-step fission of 237Np (from Ref. [22])
310
3.2 The C. Rubbia proposal at CERN
Instead of using a liquid thorium fuel, C. Rubbia proposed in 1993 a design of an hybridsystem based on a thermal sub-critical reactor, using a solid thorium fuel [24]. In that case, onecan take advantage of well proven PWR technologies and avoid any on-line chemistry. Such asytem has been called an Energy Amplifier (EA).
This approach has the important consequence that the neutron flux has to be maintained ata lower level than in ATW. This is so, essentially for two reasons. Because 233pa is nowcontinuously under neutron irradiation, one has to limit the flux in order to let 233pa decay to233U before being destroyed by neutron capture. Secondly, if one considers not using anycontrol rods, one has to be sure that in any circumstances the multiplication coefficient kremains less than 1. For example, in the case of abeam shutdown, the amount of 233pa mustnot exceed a certain fraction of that of 233U (of the order of 0.2 at equilibrium when k = 0.95[24]), because its 27-day decay to 233U leads to a reactivity increase (k must remain <1).Because the amount of 233Pa is proportional to the neutron flux, one has again to limit the flux.As a consequence, this low flux level, which is of the order of 1014 n g-i cm2, depending on theaverage cross-sections, limits the thermal power of the subcritical blanket. This is due to thefact that in such a system, the neutron flux generated from the spallation target, which lookslike a point source, decreases fairly rapidly with distance. Therefore a limited volume of thethorium blanket is affected by the neutron flux.
Because of these flux and inventory limitations, the right-hand side of the neutron balanceequation (13), which expresses the equality between the number of neutrons generated persecond and the number which disappear (stationary situation), imposes a limitation on the beamintensity and therefore on the thermal power (Eq. (5)).
(13)
(in this expression Ip is equal to the number of protons per sec, n(i) is the number of nuclei oftype i and O the flux).
In Ref. [24], a limited power of the order of 300-400 MW(th) and a beam of 10 mA arepresented as typical imposed values. For such an intensity, a cyclotron may be an attractivealternative to the linac option, specially in view of a future industrialization of the EnergyAmplifier [40].
A system using three cyclotrons injecting simultaneously in one booster has already beenproposed in 1986 [37]. Presently, there is a proposal [41] on the same line of a three-stage9-10 MW accelerating system which would drive the Energy Amplifier. Two versions areunder study, which comprises an injector (0 to 10 MeV or 0 to 30 MeV), an intermediateseparated sector cyclotron (10 to 120 MeV or 30 to 300 MeV) and the final booster (120 or 300MeV to 900 MeV). The final booster is a cyclotron with 10 separated magnetic sectors and 6RF cavities. The main interest of this project lies in the possibility of achieving a large radialgain at the extraction for single turn extraction, and a good RF efficiency. Values of 10-12 mmfor the turn separation and up to 40% for the RF efficiency are expected.
A test experiment is underway at CERN (Autumn 1994), using a secondary proton beamfrom the PS accelerator (Ep = 2.2 GeV). The aim of this experiment is to measure at very lowpower (109 protons every 12 sec) the basic parameters of a sub-critical natural UO2 assemblyand possibly the k coefficient.
311
REFERENCES
[I] W.B. Lewis, AECL-968 report (1952).
[2] A.A. Harms and W. Haefele, American Scientist, vol.69. n°3, May-June 1981.
[3] A.A. Harms and M. Heinler, Nuclear Energy Synergetics, Plenum Press, New York,1982.
[4] CM. Van Atta et al., UCRL-52144 report (1976).
[5] W.B. Lewis, AECL-3190 report (1958).
[6] J.S. Fraser et al., AECL-4658 report (1973).
[7] P.R. Tunnicliffe et al., High current proton linear accelerators and nuclear power, Proc.of the 1976 Proton Linear Accelerator Conference, Chalk River, Canada. 14 - 17 Sept1976.
[8] P.R. Tunnicliffe et al., High current proton linear accelerators and nuclear power, Procof an information meeting on accelerator-breeding, Upton, NY, USA. 18 - 19 Jan 1977.
[9] S.O. Schriber, AECL-7840 report (1982).
[10] S.O. Schriber, ZEBRA, the first stage of an accelerator breeder program, AECL-report(September 1983).
II1] P. Grand et al., Particle accelerator conference, Chicago, 16 -18 Mar 1977.
[12] M. Steinberg et al., Conference on emerging concepts in advanced nuclear energysystems, Graz, Austria, 29-31 Mar 1978.
[13] A.A. Harms et al., Annals of Nuclear Energy. (1978), v.5(5) p. 213-214.
[14] M. Steinberg et al., BNL-33020 report (1983).
[15] G.S. Bauer, KFA-29 report (1979).
[16] Nishida et al., Proc. of the 1989 seminar on nuclear data, Tokyo, Feb. 1990.
[17] Proceedings of the Information Exchange Meeting on Actinide and Fission ProductSeparation and Transmutation, OCDE/NEA, Mito City, Japan, November 6-8,1990.
[18] G. J. Van Tuyle et al., BNL-52279 report (1991).
[19] CD. Bowman et al., Proceedings of the 2nd international symposium on advancednuclear energy research, Tokyo, May 1990.
[20] C D. Bowman et al., Nuclear Instruments and Methods, A320 (1992) 336-367.
[21] R. A. Jameson et al., Nuclear Instruments and Methods, B68 (1992) 474.
[22] F. Venneri et al., LA-UR-93-752 report (1993).
[23] J.W. Toevs et al. LA-UR-94-1428 report (1994).

312
[24] F. Carminati et al., Energy Amplifier for cleaner and inexhaustible nuclear energyproduction driven bt a particle beam accelerator, CERN/ISC 93-37 report (1993).
[25] Proceedings of the Specialists' Meeting on Accelerator-Based Transmutation,OCDE/NEA, PSI Villigen, Switzerland, March 24-26,1992.
[26] Proceedings of the Information Exchange Meeting on Actinide and Fission ProductSeparation and Transmutation, OCDE/NEA, Argonne National Laboratory, Argonne,United States, November 11-13, 1992.
[27] M. Blann et al., International Code Comparison for Intermediate Energy Nuclear Data,OCDE/NEA report, Paris, 1994.
[28] ICRP Publication 61, Annual Limits on Intake of Radionuclides by workers based on the1990 Recommendations, Pergamon Press, Oxford, New York, Seoul, Tokyo, (1991).
[29] N. Metropolis et al., Physical Review, JJLO 185 1958.
[30] T.W. Armstrong and K.C. Chandler, ORNL-4744 report (1972).
[31] J.S. Fraser et al., Neutron production in thick targets bombarded by high-energyprotons, Phys. in Canada 21 (1965) 17.
[32] R.V. Vasil'kov et al., Mean number of secondary neutrons evaporated from nucleibombarded by high energy protons, Transl. Soviet Journal Nucl. Phys. 7 (1968) 64.
[33] A.J. Koning, Requirements for an Evaluated Nuclear Data File for Accelerator-BasedTransmutation, NEA/NSC/DOC(93), NEA/P&T report n°6.
[34] G.P. Lawrence et al., LA-UR-91-2797 report (1991).
[35] Th. Stammbach, Experience with the high current operation of the PSI cyclotron facility,Proc. of the 13th Int Conf. on Cyclotrons and their Applications, Vancouver, 1992.
[36] Accelerator Production of Tritium, report of the Energy Research Advisory Board to theUSDOE, DOE/S-0074 report, February 1990.
[37] A. M. Perry and A. M. Weinberg, Annual Review of Nuclear Science, 22 (1972) 317.
[38] Nucl. Appl. and Technol. 8 (1970) 102.
[39] P. Bonnaure et al., Actinide transmutation by spallation in the light of recent cyclotrondevelopment, ICENES-86, Madrid, July 1986.
[40] C. Geles et al., CERN/AT/ET/Internal note 94-002, (1994).
[41] P. Mandrillon, private communication, (1994).
313
CYCLOTRONS IN RADIOTHERAPY
P. MandrillonLaboratoire du cyclotron, Centre Antoine Lacassagne, Nice, France
AbstractRadiation therapy is one of the most frequently used methods fortreating cancer patients. Therefore improving the quality of thetreatment by using new irradiation technologies is one of theradiotherapist's constant concerns. The use of accelerators fordelivering protons, heavier charged particles and secondary beams suchas neutrons brings further improvement in dose distribution and ininteresting biological properties for radiations producing a high LinearEnergy Transfer (LET). Cyclotrons have been present in this fieldsince the early history of radiotherapy and they could play a major rolefor future dedicated hospital-based facilities which include not only anaccelerator but also specific beam-transport and beam-delivery systems.Modern cyclotron technology exists today to meet all of therequirements within a reasonable budget. Specific performances andseveral cyclotron designs are presented.
1 . INTRODUCTION
Heavy particles (protons, light ions, neutrons) offer a unique opportunity for improvingthe quality of radiation therapy. Their use has been pioneered over four decades at Berkeleywhere there was a very active collaboration between nuclear physicists, cyclotron designers,physicians and biologists and this fact is well illustrated by the early history of the cyclotronand its application in radiotherapy.
Ernest Lawrence, inventor of the cyclotron, started in the late thirties a collaborative workwith his brother John [1], a young physician, Paul Aebersold and Richard Stone [2] on the useof neutrons in the treatment of cancers. But there was at this time no basic biologicalinformation available to provide a rationale for the use of neutrons in preference to X-rays.Therefore an unexpectedly high incidence of late morbidity appeared. A renewed interestoccurred in the early sixties following a great deal of radiological work carried out byM. Catterall [3] and D. Bewley in the Hammersmith Hospital in London. This work explainedthe radioresistance of tumours and the role of the LET. Therefore the specifications requiredfor neutron therapy are now well known and modern cyclotrons are the standard tool for thisapplication.
In 1946, Robert Wilson [4] mentioned that the properties of beams of mono-energeticcharged particles such as protons and ions (deposition of a large fraction of their kinetic energyin a small volume at the end of their range (Bragg peak and distal dose fall off), small lateralscattering) could lead to a new radiotherapeutic tool. Again the high energy cyclotrons inBerkeley [5-6] were used for the first treatment with charged particles.
Table 1 presents a short review of cyclotron-based facilities running a medical programme(most of them part time). The figures on patient statistics are from the Newsletter "Particles"issued in January 1994, which is sponsored by the proton therapy co-operative group(PTCOG) and edited by Janet Sisterson from the Harvard Cyclotron Laboratory. The type andthe characteristics of the cyclotrons have been added in the two last columns.
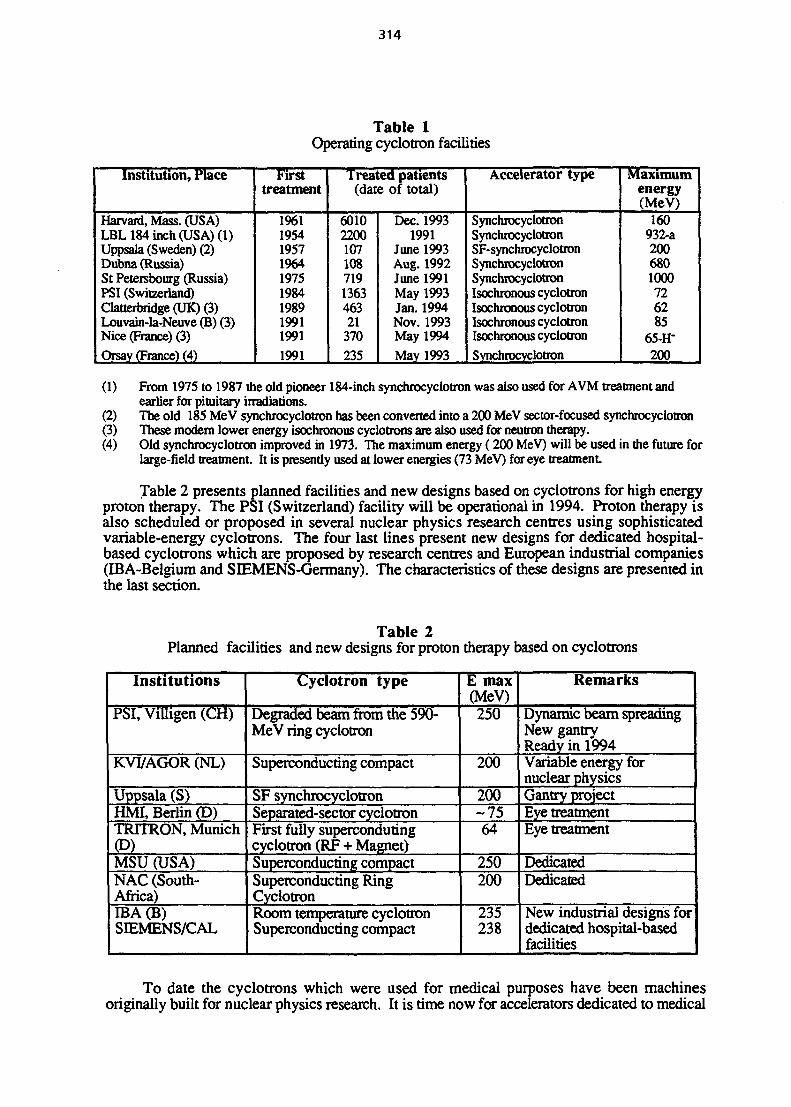
314
Table 1Operating cyclotron facilities
Institution, Place
Harvard, Mass. (USA)LBL184 inch (USA) (1)Uppsala (Sweden) (2)Dubna (Russia)St Petersbourg (Russia)PSI (Switzerland)Clatterbridge(UK)(3)Louvain-la-Neuve (B) (3)Nice (France) (3)
Orsay (France) (4)
Firsttreatment
196119541957196419751984198919911991
1991
Treated patients(date of total)
60102200107108719136346321370235
Dec. 19931991
June 1993Aug. 1992June 1991May 1993Jan. 1994Nov. 1993May 1994
Mav 1993
Accelerator type
SynchrocyclotronSynchrocyclotronSF-synchrocyclotronSynchrocyclotronSynchrocyclotronIsochronous cyclotronIsochronous cyclotronIsochronous cyclotronIsochronous cyclotron
Synchrocyclotron
Maximumenergy(MeV)
160932-a2006801000726285
65-H-200
(1) From 1975 to 1987 the old pioneer 184-inch synchrocyclotron was also used for AVM treatment andearlier for pituitary irradiations.
(2) The old 185 MeV synchrocyclotron has been converted into a 200 MeV sector-focused synchrocyclotron(3) These modern lower energy isochronous cyclotrons are also used for neutron therapy.(4) Old synchrocyclotron improved in 1973. The maximum energy (200 MeV) will be used in the future for
large-field treatment. It is presently used at lower energies (73 MeV) for eye treatment
Table 2 presents planned facilities and new designs based on cyclotrons for high energyproton therapy. The PSI (Switzerland) facility will be operational in 1994. Proton therapy isalso scheduled or proposed in several nuclear physics research centres using sophisticatedvariable-energy cyclotrons. The four last lines present new designs for dedicated hospital-based cyclotrons which are proposed by research centres and European industrial companies(IBA-Belgium and SIEMENS-Germany). The characteristics of these designs are presented indie last section.
Table 2Planned facilities and new designs for proton therapy based on cyclotrons
Institutions
PSI, ViUigen (CH)
KVI/AGOR (NL)
Uppsala (S)HMI, Berlin (D)TRITRON, Munich(D)MSU (USA)NAC (South-Africa)IBA (B)SIEMENS/CAL
Cyclotron type
Degraded beam from the 590-MeV ring cyclotron
Superconducting compact
SF synchrocyclotronSeparated-sector cyclotronFirst fully supercondutingcyclotron (RF + Magnet)Superconducting compactSuperconducting RingCyclotronRoom temperature cyclotronSuperconducting compact
E max(MeV)250
200
200-7564
250200
235238
Remarks
Dynamic beam spreadingNew gantryReady in 1994Variable energy fornuclear physicsGantry jwojectEye treatmentEye treatment
DedicatedDedicated
New industrial designs fordedicated hospital-basedfacilities
To date the cyclotrons which were used for medical purposes have been machinesoriginally built for nuclear physics research. It is time now for accelerators dedicated to medical
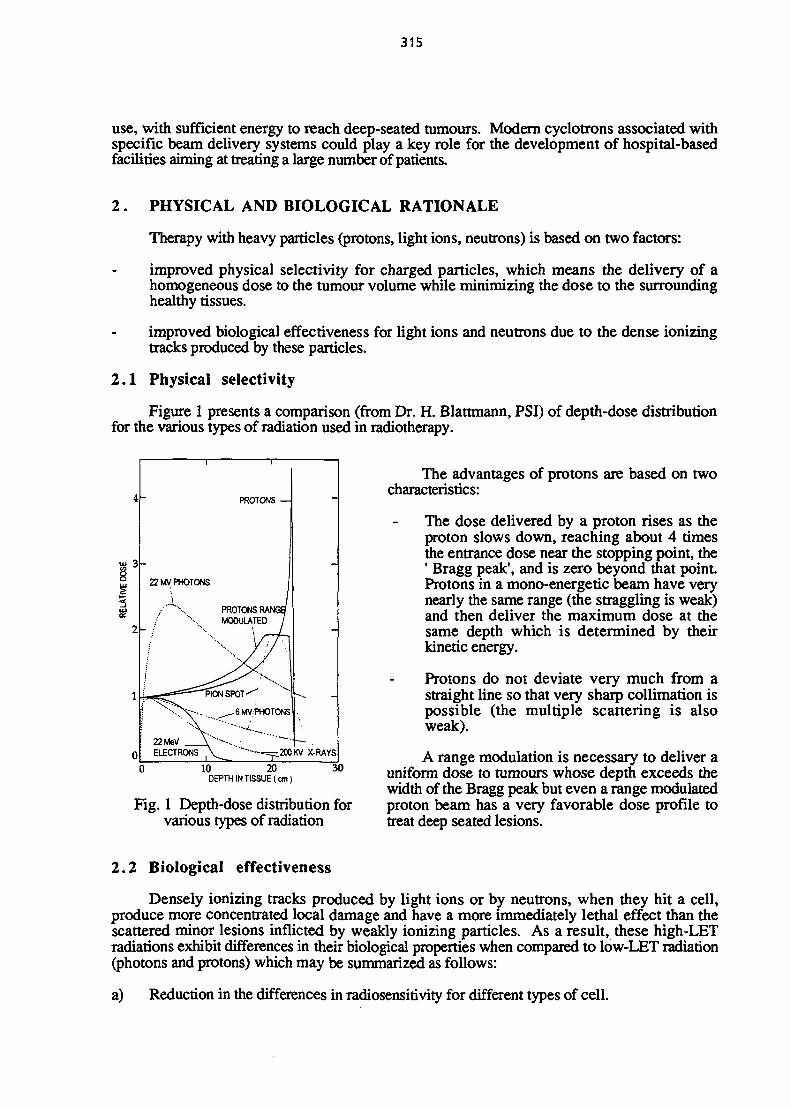
315
use, with sufficient energy to reach deep-seated tumours. Modern cyclotrons associated withspecific beam delivery systems could play a key role for the development of hospital-basedfacilities aiming at treating a large number of patients.
2 . PHYSICAL AND BIOLOGICAL RATIONALE
Therapy with heavy particles (protons, light ions, neutrons) is based on two factors:
improved physical selectivity for charged particles, which means the delivery of ahomogeneous dose to the tumour volume while minimizing the dose to the surroundinghealthy tissues.
improved biological effectiveness for light ions and neutrons due to the dense ionizingtracks produced by these particles.
2.1 Physical selectivity
Figure 1 presents a comparison (from Dr. H. Blattmann, PSI) of depth-dose distributionfor the various types of radiation used in radiotherapy.
4
<o 3
JJ
<
2
1
0
- PROTONS —
22 MV PHOTONS
\-•' '*******•.
/ \
/
22MeVELECTRONS
PROTONS RANGtiMODULATED 1
PIONSPOT-^
.. ^.6MV.PHOTONS
\ _ = ,200
-
-
KV X-RAYS
10 20DEPTH IN TISSUE (cm)
30
Fig. 1 Depth-dose distribution forvarious types of radiation
The advantages of protons are based on twocharacteristics:
The dose delivered by a proton rises as theproton slows down, reaching about 4 timesthe entrance dose near the stopping point, the1 Bragg peak', and is zero beyond that point.Protons in a mono-energetic beam have verynearly the same range (the straggling is weak)and then deliver the maximum dose at thesame depth which is determined by theirkinetic energy.
Protons do not deviate very much from astraight line so that very sharp collimation ispossible (the multiple scattering is alsoweak).
A range modulation is necessary to deliver auniform dose to tumours whose depth exceeds thewidth of the Bragg peak but even a range modulatedproton beam has a very favorable dose profile totreat deep seated lesions.
2.2 Biological effectiveness
Densely ionizing tracks produced by light ions or by neutrons, when they hit a cell,produce more concentrated local damage and have a more immediately lethal effect than thescattered minor lesions inflicted by weakly ionizing particles. As a result, these high-LETradiations exhibit differences in their biological properties when compared to low-LET radiation(photons and protons) which may be summarized as follows:
a) Reduction in the differences in radiosensitivity for different types of cell.
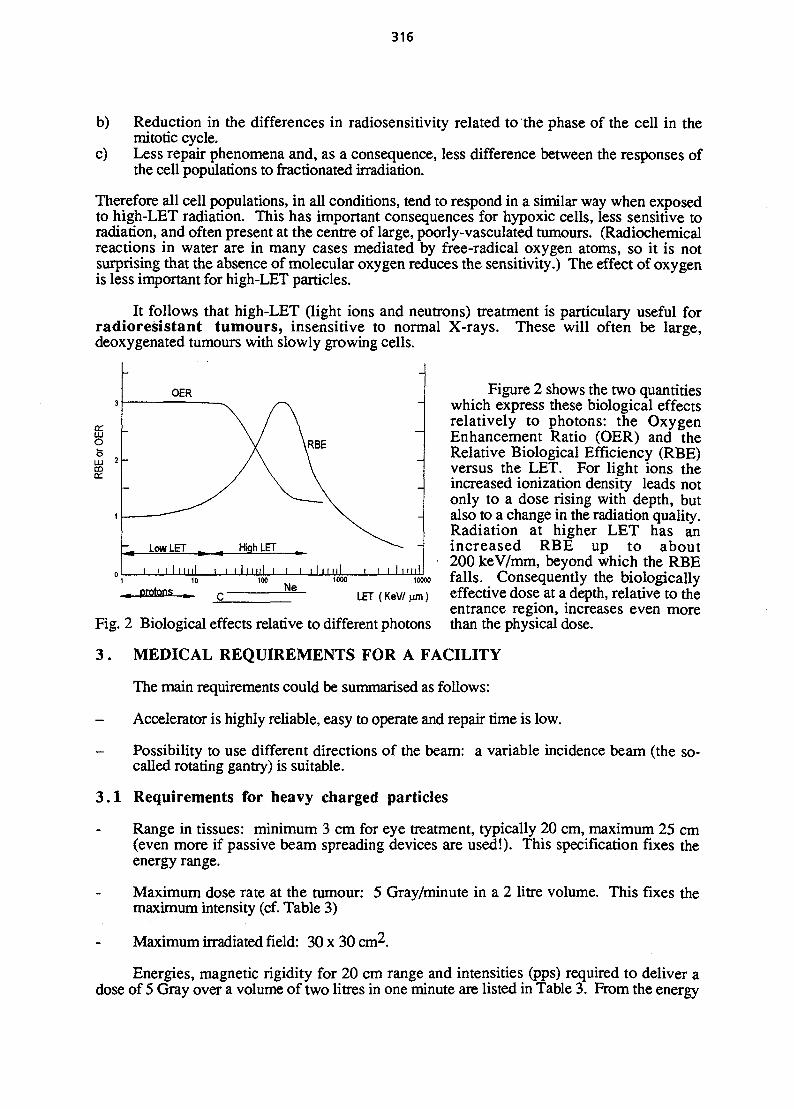
316
b) Reduction in the differences in radiosensitivity related to the phase of the cell in themitotic cycle.
c) Less repair phenomena and, as a consequence, less difference between the responses ofthe cell populations to fractionated irradiation.
Therefore all cell populations, in all conditions, tend to respond in a similar way when exposedto high-LET radiation. This has important consequences for hypoxic cells, less sensitive toradiation, and often present at the centre of large, poorly-vasculated tumours. (Radiochemicalreactions in water are in many cases mediated by free-radical oxygen atoms, so it is notsurprising that the absence of molecular oxygen reduces the sensitivity.) The effect of oxygenis less important for high-LET particles.
It follows that high-LET (light ions and neutrons) treatment is particulary useful forradioresistant tumours, insensitive to normal X-rays. These will often be large,deoxygenated tumours with slowly growing cells.
Figure 2 shows the two quantitieswhich express these biological effectsrelatively to photons: the OxygenEnhancement Ratio (OER) and theRelative Biological Efficiency (RBE)versus the LET. For light ions theincreased ionization density leads notonly to a dose rising with depth, butalso to a change in the radiation quality.Radiation at higher LET has anincreased RBE up to about200 keV/mm, beyond which the RBEfalls. Consequently the biologicallyeffective dose at a depth, relative to theentrance region, increases even morethan the physical dose.
LET (KeW urn)
Fig. 2 Biological effects relative to different photons
3 . MEDICAL REQUIREMENTS FOR A FACILITY
The main requirements could be summarised as follows:
Accelerator is highly reliable, easy to operate and repair time is low.
- Possibility to use different directions of the beam: a variable incidence beam (the so-called rotating gantry) is suitable.
3 . 1 Requirements for heavy charged particles
Range in tissues: minimum 3 cm for eye treatment, typically 20 cm, maximum 25 cm(even more if passive beam spreading devices are used!). This specification fixes theenergy range.
Maximum dose rate at the tumour: 5 Gray/minute in a 2 litre volume. This fixes themaximum intensity (cf. Table 3)
Maximum irradiated field: 30 x 30 cm^.
Energies, magnetic rigidity for 20 cm range and intensities (pps) required to deliver adose of 5 Gray over a volume of two litres in one minute are listed in Table 3. From the energy
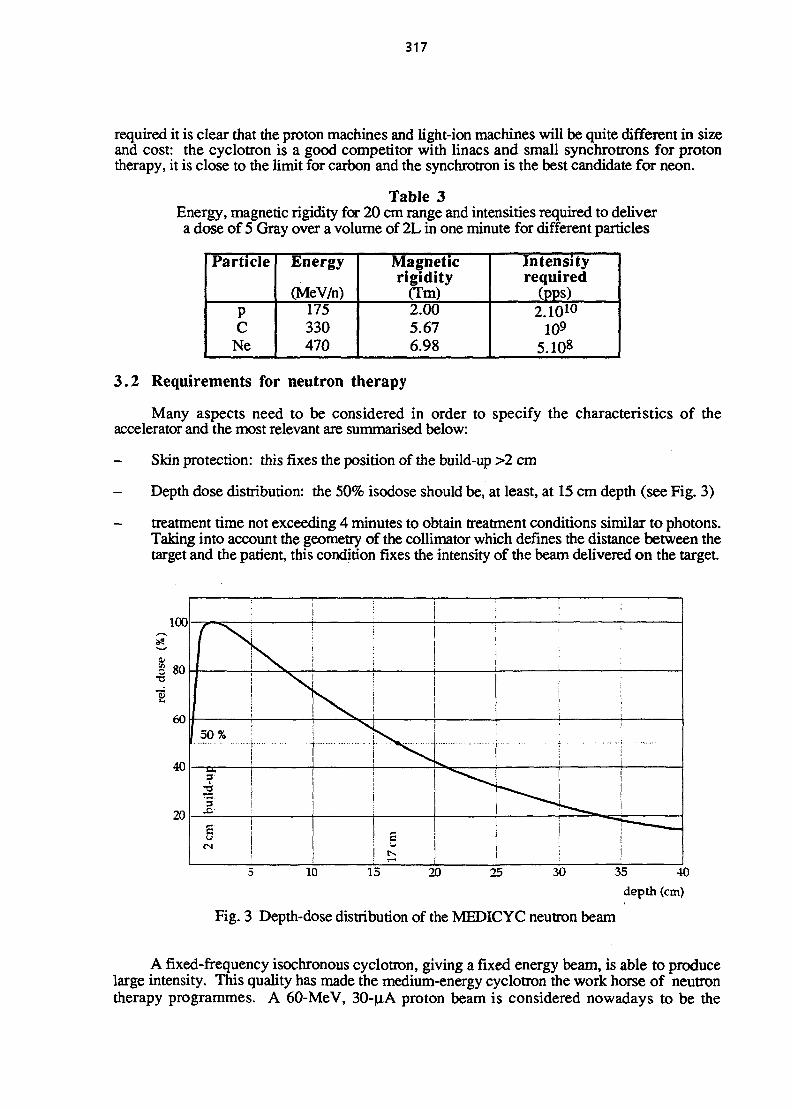
317
required it is clear that the proton machines and light-ion machines will be quite different in sizeand cost: the cyclotron is a good competitor with linacs and small synchrotrons for protontherapy, it is close to the limit for carbon and the synchrotron is the best candidate for neon.
Table 3Energy, magnetic rigidity for 20 cm range and intensities required to delivera dose of 5 Gray over a volume of 2L in one minute for different particles
Particle
PC
Ne
Energy
(MeV/n)175330470
Magneticrigidity
(Tm)2.005.676.98
Intensityrequired
(pps)2.1010
1095.108
3.2 Requirements for neutron therapy
Many aspects need to be considered in order to specify the characteristics of theaccelerator and the most relevant are summarised below:
- Skin protection: this fixes the position of the build-up >2 cm
- Depth dose distribution: the 50% isodose should be, at least, at 15 cm depth (see Fig. 3)
- treatment time not exceeding 4 minutes to obtain treatment conditions similar to photons.Taking into account the geometry of the collimator which defines the distance between thetarget and the patient, this condition fixes the intensity of the beam delivered on the target.
100
"2
80
60
40
20
: i :
rI 50%
build
-uf
\ 1
s !« 1
.
i
- —
j
10 15 20 25 30 35 40depth (cm)
Fig. 3 Depth-dose distribution of the MEDICYC neutron beam
A fixed-frequency isochronous cyclotron, giving a fixed energy beam, is able to producelarge intensity. This quality has made the medium-energy cyclotron the work horse of neutrontherapy programmes. A 60-MeV, 30-p.A proton beam is considered nowadays to be the

318
standard beam to meet these requirements (deuterons might also be used, e.g. thesuperconducting cyclotron installed in the Harper Hospital in Detroit).
4. CHARACTERISTICS OF A CYCLOTRON FOR PROTON THERAPY
The development of radiotherapy with proton beams in the 200-250 MeV range is achallenge to the accelerator community. Designing a cost effective accelerator, easily installedin a hospital and simple to operate is an overriding concern. A small footprint of the acceleratorand its associated switchyard and gantries is an important factor to reduce the total cost of thefacility. Therefore cyclotrons are good competitors with synchrotrons and linear acceleratorsfor reasons of energy, magnets, intensities and operation, and these aspects will be described inthe following sections.
4.1 Energy
The choice of a fixed energy makes the design simple. The magnet can then be optimisedand trimming coils are not necessary. The accelerator is at a fixed radio frequency and all thesettings of the beam lines are fixed.
4.2 Magnet
In order to reduce the dimensions of the cyclotron a high magnetic field should bechosen. This choice has two important consequences :
- It is impossible to accelerate negatively-charged ions due to electromagnetic stripping.(The MEDICYC high field compact cyclotron in Nice accelerates H~ ions up to 65 MeV,very close to the limit of stripping losses by the magnetic field.)
- Superconducting magnets are attractive because they are about half the weight of roomtemperature magnets.
4.3 Intensity
An isochronous cyclotron provides a continuous beam with ample intensity. This is akey factor for reliability. Also the beam intensity is easily controlled. The beam can be verystable and this is an important advantage for a dynamic beam-spreading system. To fullybenefit from these advantages an external injection system makes the cyclotron very flexible.On the MEDICYC cyclotron which uses an axial injection at 33 kV for the H" beam, a feedbackcontrol of the extracted beam intensity is installed using a few volts on the bunching cavity. Abeam stability better than 1% could be easily achieved (cf. Fig. 4).
4 .4 Operation
No sophisticated controls are needed. A simple programmable Logic Controller issufficient. The operation requires less complexity and this reduces the manpower costs.
5 . PATIENT TREATMENT USING A CYCLOTRON
The main characteristics of a cyclotron beam are its continuous time structure (apart, ofcourse, from the RF structure at several tens of MHz) and the good extracted beam emittancesand energy dispersion. These properties have important consequences for the beam deliverysystem and for the equipment, the so-called rotating gantry, which provides entry of the beaminto the patient from any arbitrary direction specified by therapy planning.
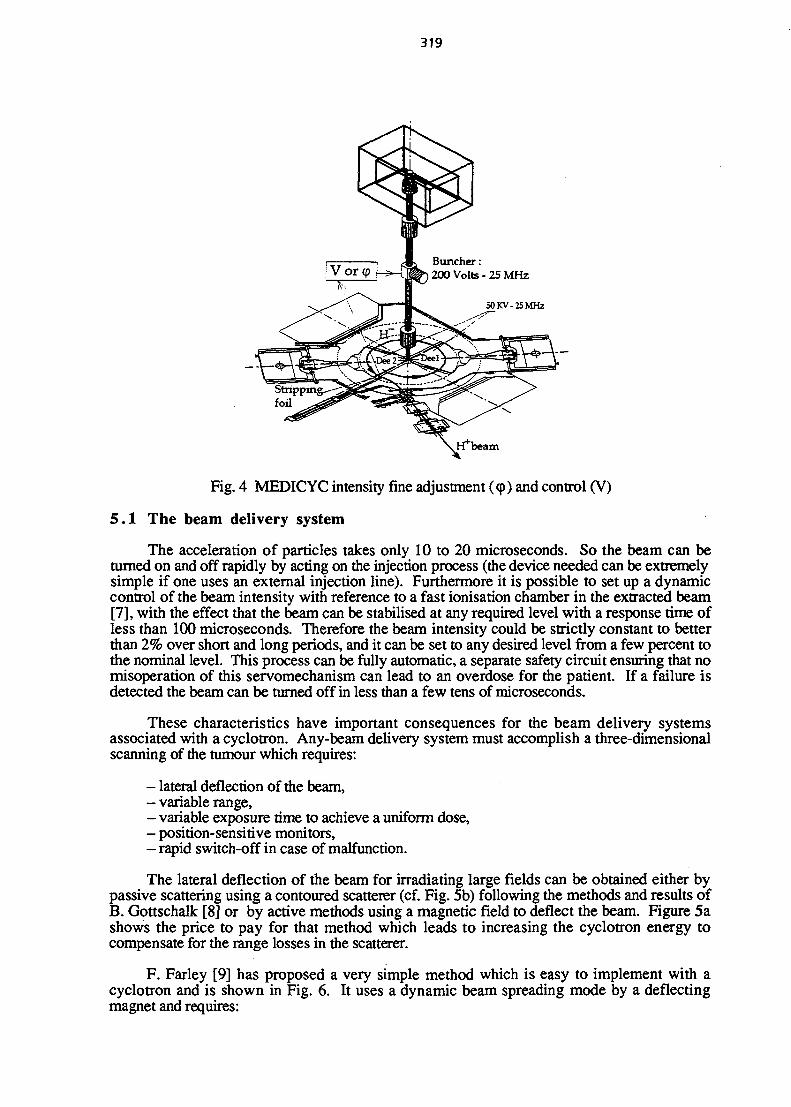
319
Buncher:200 Volts - 25 MHz
H^beam
Fig. 4 MEDICYC intensity fine adjustment (<p) and control (V)
5.1 The beam delivery system
The acceleration of particles takes only 10 to 20 microseconds. So the beam can beturned on and off rapidly by acting on the injection process (the device needed can be extremelysimple if one uses an external injection line). Furthermore it is possible to set up a dynamiccontrol of the beam intensity with reference to a fast ionisation chamber in the extracted beam[7], with the effect that the beam can be stabilised at any required level with a response time ofless than 100 microseconds. Therefore the beam intensity could be strictly constant to betterthan 2% over short and long periods, and it can be set to any desired level from a few percent tothe nominal level. This process can be fully automatic, a separate safety circuit ensuring that nomisoperation of this servomechanism can lead to an overdose for the patient. If a failure isdetected the beam can be turned off in less than a few tens of microseconds.
These characteristics have important consequences for the beam delivery systemsassociated with a cyclotron. Any-beam delivery system must accomplish a three-dimensionalscanning of the tumour which requires:
- lateral deflection of the beam,- variable range,- variable exposure time to achieve a uniform dose,- position-sensitive monitors,- rapid switch-off in case of malfunction.
The lateral deflection of the beam for irradiating large fields can be obtained either bypassive scattering using a contoured scatterer (cf. Fig. 5b) following the methods and results ofB. Gottschalk [8] or by active methods using a magnetic field to deflect the beam. Figure 5ashows the price to pay for that method which leads to increasing the cyclotron energy tocompensate for the range losses in the scatterer.
F. Farley [9] has proposed a very simple method which is easy to implement with acyclotron and is shown in Fig. 6. It uses a dynamic beam spreading mode by a deflectingmagnet and requires:

320
an A
25
20
'5
'0
230 MeV 2.0 meter throw
j
i
\ :
1 V;
i\
j /
PASSIVESCATTERING
REGION
!
/
SCANNINGREGION
(
\
'5 20 25 30 35! DEPTH i
Fig. 5a Performance of beam-spreading methods for illuminating a given field
CONTOURED SCATTERER
MODULATOR
FIXEDABSORBER
LEXAN
PATIENTAPERTURE
. PATIENTSNOUT J BOLUS
LEAD
Fig. 5b Beam spreading with a contoured scatterer

321
- An upstream modulator for range scanning at 50 Hz and which will spread the beam to aGaussian spot (fixed or variable, it does not matter!).
- A magnet which scans this spot linearly along a line perpendicular to the axis at a lowfrequency (1 Hz typical, so only a low power is needed in the magnet which has a smallgap because the deflection is in one plane only).
The patient is displaced steadily at 5 mm/sec. The combination of these two effects creates araster scan with uniform intensity. Of course the usual patient collimator and bolus move withthe patient.
Saming magnet
Fig. 6 Simple dynamic beam spreading by moving the patient
This simple method is not difficult to implement and could be easily extended to spotscanning and conformal therapy, due to the simplicity of intensity control of the cyclotronwhich has the advantage of using a rapid feedback for eliminating fluctuations and for varyingthe intensity under computer control of the intensity on the injection line. At PSI [10] a discretespot scanning technique has been developed. For each position the dose is applied byswitching on and off the beam with a kicker magnet which is located within the gantry.
5.2 Rotating gantries
In order to reduce the dose to the surrounding healthy tissue a standard techniqueconventionally used in radiotherapy is to treat the tumour several times with beams comingfrom different directions. This device is called a rotating gantry: the beam comes in along theaxis, is guided away from the centre and bent back towards the axis to cross it orthogonally. Ifthe beam line ends at the axis (i.e. the patient is located on the axis) the gantry is said to beisocentric. This component represents a significant fraction of the total cost of the facility. Theenergy of the beam extracted from the cyclotron is degraded at the exit of the gantry, so thesettings of all the magnets are fixed. In contrast with a synchrotron where the energy ischanged at the accelerator this whole beam line needs to be reset exactly. This factor couldreduce the costs of this equipment.
Several types of gantry have been studied in the past years, Fig. 7 shows schematicallytheir main properties and typical dimensions.
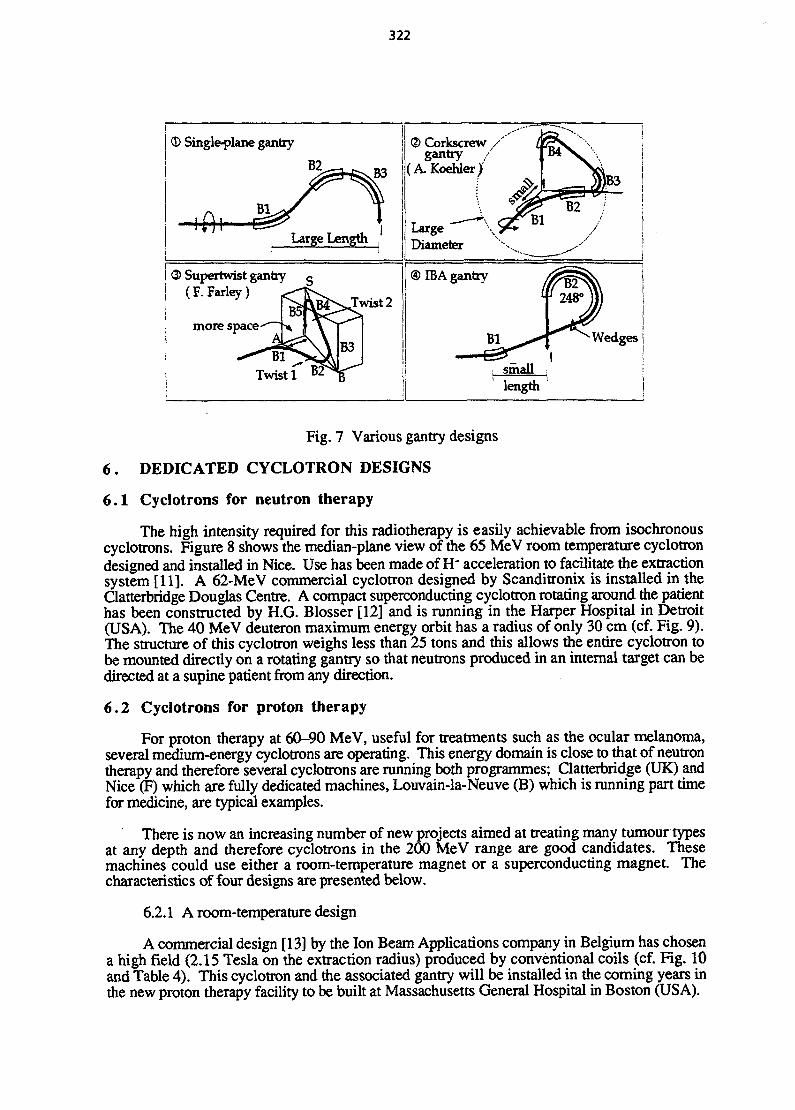
322
© Single-plane gantry
Bl
j ® Corkscrew / 'i! gantry /(A.Koehler)
LargeDiameter
<3> Supertwist gantry c(F.Farley)
more space
Twist 2
Wedges i
Twist 1 ; smalllength
Fig. 7 Various gantry designs
6 . DEDICATED CYCLOTRON DESIGNS
6.1 Cyclotrons for neutron therapy
The high intensity required for this radiotherapy is easily achievable from isochronouscyclotrons. Figure 8 shows the median-plane view of the 65 MeV room temperature cyclotrondesigned and installed in Nice. Use has been made of H" acceleration to facilitate the extractionsystem [11]. A 62-MeV commercial cyclotron designed by Scanditronix is installed in theClatterbridge Douglas Centre. A compact superconducting cyclotron rotating around die patienthas been constructed by H.G. Blosser [12] and is running in the Harper Hospital in Detroit(USA). The 40 MeV deuteron maximum energy orbit has a radius of only 30 cm (cf. Fig. 9).The structure of this cyclotron weighs less than 25 tons and this allows the entire cyclotron tobe mounted directly on a rotating gantry so that neutrons produced in an internal target can bedirected at a supine patient from any direction.
6.2 Cyclotrons for proton therapy
For proton therapy at 60-90 MeV, useful for treatments such as the ocular melanoma,several medium-energy cyclotrons are operating. This energy domain is close to that of neutrontherapy and therefore several cyclotrons are running both programmes; Clatterbridge (UK) andNice (F) which are fully dedicated machines, Louvain-la-Neuve (B) which is running part timefor medicine, are typical examples.
There is now an increasing number of new projects aimed at treating many tumour typesat any depth and therefore cyclotrons in the 200 MeV range are good candidates. Thesemachines could use either a room-temperature magnet or a superconducting magnet. Thecharacteristics of four designs are presented below.
6.2.1 A room-temperature design
A commercial design [13] by the Ion Beam Applications company in Belgium has chosena high field (2.15 Tesla on the extraction radius) produced by conventional coils (cf. Fig. 10and Table 4). This cyclotron and the associated gantry will be installed in the coming years inthe new proton therapy facility to be built at Massachusetts General Hospital in Boston (USA).
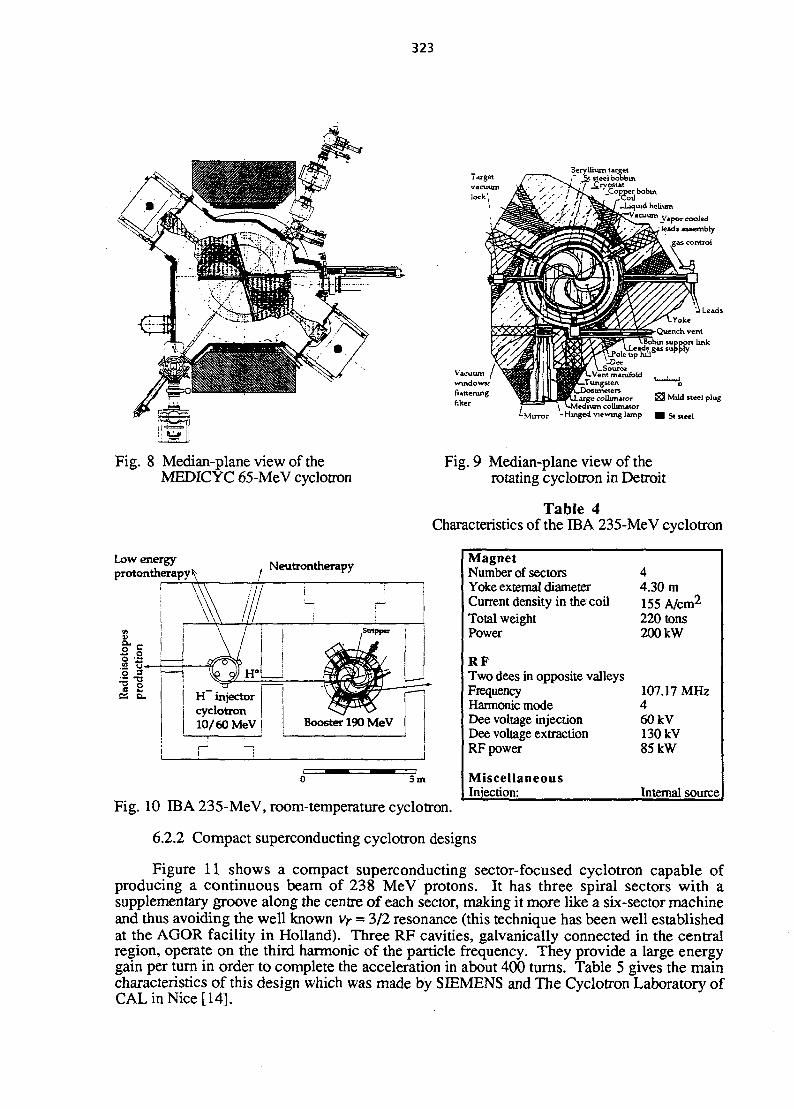
323
TargetBeryllium targetr St steel bobbin
.Coggbota-Liquid helium
_Vapor cooledf leads assembly
control
Leads
•Quench ventlink
.Sourcent manifold
.Tungsten"* iimeters
colhmitoriedium coUunator
Mirror -Hinged viewing lamp
S3 Mild steel plug
I St steel
Fig. 8 Median-plane view of theMEDICYC 65-MeV cyclotron
Fig. 9 Median-plane view of therotating cyclotron in Detroit
Table 4Characteristics of the IBA 235-MeV cyclotron
Low energyprotontherapy fc Neutrontherapy
l \
H injectorcyclotron10/60 MeV I
MagnetNumber of sectorsYoke external diameterCurrent density in the coilTotal weightPower
R FTwo dees in opposite valleysFrequencyHarmonic modeDee voltage injectionDee voltage extractionRF power
MiscellaneousInjection:
44.30 m155 A/cm2
220 tons200 kW
107.17 MHz460 kV130 kV85 kW
Internal sourceFig. 10 IBA 235-MeV, room-temperature cyclotron.
6.2.2 Compact superconducting cyclotron designs
Figure 11 shows a compact superconducting sector-focused cyclotron capable ofproducing a continuous beam of 238 MeV protons. It has three spiral sectors with asupplementary groove along the centre of each sector, making it more like a six-sector machineand thus avoiding the well known Vr = 3/2 resonance (this technique has been well establishedat the AGOR facility in Holland). Three RF cavities, galvanically connected in the centralregion, operate on the third harmonic of the particle frequency. They provide a large energygain per turn in order to complete the acceleration in about 400 turns. Table 5 gives the maincharacteristics of this design which was made by SIEMENS and The Cyclotron Laboratory ofCALinNice[14].

324
H*beam
1000
Fig. 11 The CAL/SIEMENS 238-MeV, superconducting cyclotron.
Table 5Main characteristics of the CAL/SIEMENS 238-MeV superconducting cyclotrons
MagnetNumber of sectorsYoke external diameterCurrent density in superconducting coilTotal weightPower including refrigerator
RF3 dees in galvanically connectedFrequencyHarmonic modeDee voltage injectionDee voltage extractionRF power
MiscellaneousInjection: Two options
3 i.e. "pseudo 6 sectors"3.10 m6800 A/cm2
80 tons35 kW
110MHz380 kV130 kV120 kW
axial or radial(neutral beam + central stripper)
H.G. Blosser from Michigan State University (USA) has designed a 250-MeV four-sector, compact, superconducting cyclotron for proton therapy [15]. Figure 12 shows ahorizontal section of this machine where magnet hills and dees repeat with 90* spacing.Protons are produced by an internal ion source.

325
G ^ ^ElectrostaticDeflector
Externalbeam central ray
Dee
Beam probe
Fig. 12 The MSU 250-MeV superconducting cyclotron
6.2.3 A superconducting-ring cyclotron design
Figure 13a shows the layout of a 200-MeV superconducting-ring cyclotron proposed bythe National Accelerator Centre in South Africa [16]. The magnet is made of four 15-tonsectors with superconducting S-coils located in separate cryostats at the radial boundary of eachsector. A small internal ion source is located in the central region. The design should, inprinciple, allow extraction at different energies by moving radially the extraction elementslocated in the low-field valleys. Figure 13b presents the median-plane distribution of themagnetic field with isofield contours at 0.3 T intervals from 0.6 to 4.2 T within a radius of1.2 m.
D
o 2m
a)
0 . 5 -
1.0-
-1.0 -0.5 0.5 1.0
b)
Fig. 13 The NAC 200-MeV cyclotron, a) Layout b) median-plane magnetic field.
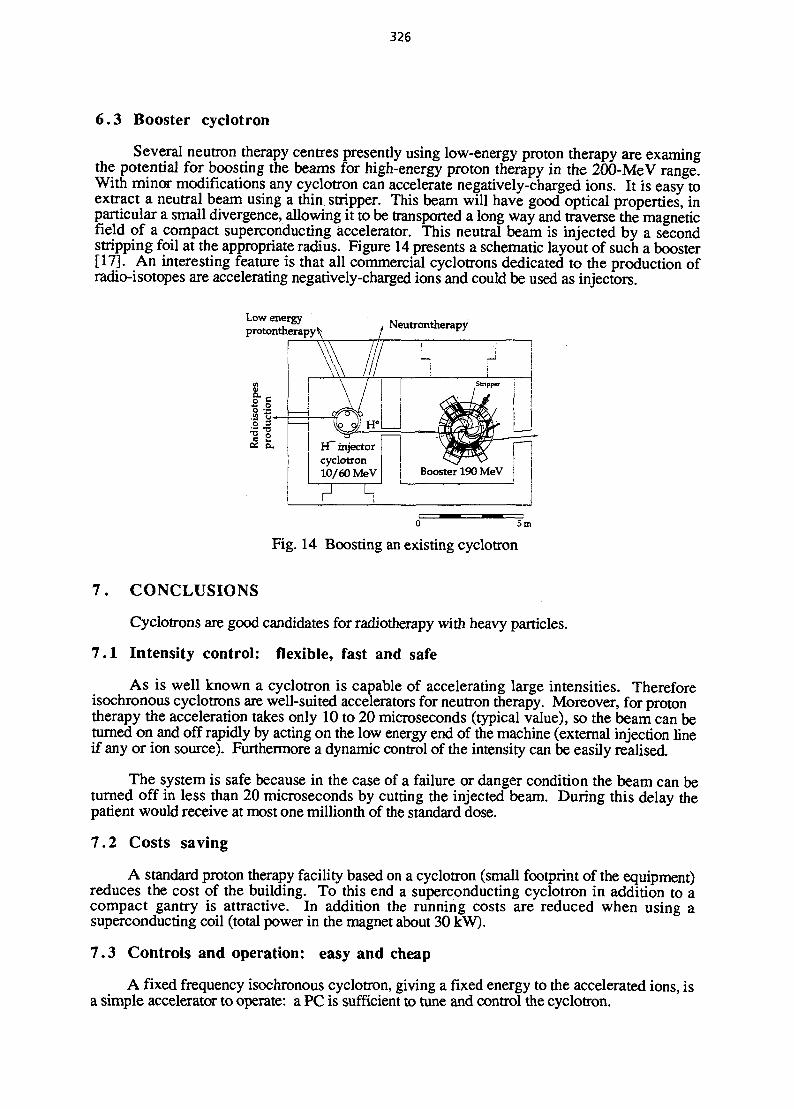
326
6.3 Booster cyclotron
Several neutron therapy centres presently using low-energy proton therapy are examingthe potential for boosting the beams for high-energy proton therapy in the 200-MeV range.With minor modifications any cyclotron can accelerate negatively-charged ions. It is easy toextract a neutral beam using a thin stripper. This beam will have good optical properties, inparticular a small divergence, allowing it to be transported a long way and traverse the magneticfield of a compact superconducting accelerator. This neutral beam is injected by a secondstripping foil at the appropriate radius. Figure 14 presents a schematic layout of such a booster[17]. An interesting feature is that all commercial cyclotrons dedicated to the production ofradio-isotopes are accelerating negatively-charged ions and could be used as injectors.
Low energyprotontherapy^ f Neutrontherapy
oiso
top
esu
ctio
nR
adpr
oc
\ \# S "- 1 M
H injectorcyclotron10/60 MeV
I 1
Stripper
Booster 190 MeV
0 5m
Fig. 14 Boosting an existing cyclotron
7. CONCLUSIONS
Cyclotrons are good candidates for radiotherapy with heavy particles.
7.1 Intensity control: flexible, fast and safe
As is well known a cyclotron is capable of accelerating large intensities. Thereforeisochronous cyclotrons are well-suited accelerators for neutron therapy. Moreover, for protontherapy the acceleration takes only 10 to 20 microseconds (typical value), so the beam can beturned on and off rapidly by acting on the low energy end of the machine (external injection lineif any or ion source). Furthermore a dynamic control of the intensity can be easily realised.
The system is safe because in the case of a failure or danger condition the beam can beturned off in less than 20 microseconds by cutting the injected beam. During this delay thepatient would receive at most one millionth of the standard dose.
7.2 Costs saving
A standard proton therapy facility based on a cyclotron (small footprint of the equipment)reduces the cost of the building. To this end a superconducting cyclotron in addition to acompact gantry is attractive. In addition the running costs are reduced when using asuperconducting coil (total power in the magnet about 30 kW).
7.3 Controls and operation: easy and cheap
A fixed frequency isochronous cyclotron, giving a fixed energy to the accelerated ions, isa simple accelerator to operate: a PC is sufficient to tune and control the cyclotron.

327
REFERENCES
[I] J. Lawrence and E. Lawrence, "The biological action of neutron rays" Proc. NationalAcad. Sciences 22: 124-133 (1936)
[2] R. Stone, J. Lawrence and P. Aebersold, "Preleminary report on use of fast neutrons intreatment of malignant disease" Radiology 35: 322-327 (1940)
[3] M. Catteral, "Fast neutrons in oncology", British Journal of Hospital Medicine, 12,853-860(1974)
[4] R. Wilson "Radiological use of fast protons "Radiology 47,487 (1946).[5] C. Tobias, H. Anger and J. Lawrence, "Radiobiological use of high energy deuterons
and alpha", American Journal of Roentgenology 67: 1 (1952).
[6] C. Tobias, J. Roberts and J. Lawrence, "Irradiation hypophysectomy and related studiesusing 340 MeV p and 190 MeV d" Proceedings of the Int. Conf. on Peaceful uses ofAtomic Energy held in Geneva in the United Nations.
[7] F. Farley, Oral presentation : "Supertwist gantry and dynamic beam spreading".XDCth PTCOG, October 31 to November 2,1993, Cambridge, Mass., USA.
[8] B. Gottschalk and M.S. Wagner, "Contoured scatterer for proton dose flattening",Harvard Cyclotron Laboratory, a preliminary report 3/29/89 (1989)
[9] F. Farley, private communication.
[10] E. Pedroni et ah, The 200 MeV proton therapy project at PSI: conceptual design andpractical realisation, to be published in Medical Physics, NS 94022
[II] P. Mandrillon et al., Commissionong and implementation of the MEDICYC Cyclotronprogramme, 12th Int. Conf. on Cyclotrons and their applications, Berlin, May 89.
[12] H. G. Blosser, 1988 Annual report of the National Superconducting CyclotronLaboratory, Michigan State University, p. 107.
[13] Y. Jongen et al., "Cyclotron based proton therapy system including a new design of largethrow gantries", to be published in the Proc. of the Como Conference on hadron therapy.
[14] P. Mandrillon et al., A compact facility for high energy proton therapy based on asuperconducting cyclotron, to be presented at EPAC 94 in London.
[15] H. G. Blosser et al., Proposal for a manufacturing prototype superconducting cyclotronfor advanced cancer therapy, NSCL-MSU, February 1993.
[16] H.N. Jungwirth and J.G. de Villiers, 13th Int. Conf. on Cyclotrons and theirApplications, Vancouver 1992,709-712.
[17] P. Mandrillon and F. Farley, Cyclotrons as booster for high energy proton therapy, to bepublished.
NEXT PAGE(S)left BLAUK

329
ISOTOPE PRODUCTION WITH CYCLOTRONS
V. BechtoldKernforschungszentrum Karlsruhe GmbH, Hauptabteilung Zyklotron, Karlsruhe, Germany
AbstractIn the last two decades cyclotron produced isotopes have gainedincreasing importance in nuclear medicine diagnosis. The lecture willcover aspects on target technology with regard to production efficency,quality, reliability and automation. The production methods for themost commonly used radionuclides will be described. An example fortwo routine production systems based on gas target technology for I-123 and Rb-81/Kr-81 are presented.
1. INTRODUCTION
Modern isotope production facilities consist of a compact H~ cyclotron (Fig. 1) in theenergy range between 10 MeV and 30 MeV with extracted currents up to 350 jiA [1] and ahighly sophisticated target technology and chemistry [2].
Fig. 1 Compact H" cyclotron built by Cyclotron Cooperation, USA
The radioisotopes produced for medical applications are used in nuclear medicine fordiagnosis. In contrary to X-ray studies where only static information can be obtained, nuclearmedicine provides dynamic information and hence allows time-dependent studies of thefunction of organs. The labelled biomolecules and the radioisotopes involved should have thefollowing ideal characteristics:
- no p" particleshort effective half-lifey-energy in the range between 100 and 300 keV.

330
The above characteristics result in a maximum efficiency in the diagnosis and a minimumradiation dose to the patient. For example, Fig. 2 shows a comparison between 1-131 and1-123. The physical properties show that the cyclotron produced 1-123 ("/-energy 159 keV; noP~; short half-life) is more favourable than the reactor produced 1-131 (y-energy 364, 637; {3~-emission, long half-life) for use in nuclear medical diagnosis.
Fig. 2 Comparison of the physical properties between 1-131 and 1-123
The production of radioisotopes used in nuclear medicine can be made with solid,gaseous and liquid targets. Figure 3 is an example for a solid target for 30 MeV protons and acurrent of 200 fiA. The target material which is electrochemically plated on a solid copperbacking is hit directly by the beam. The dissipated beam power of 6 kW can be removed byenforced cooling from the back-side of the target. To keep the power density low the beamstrikes the target under an angle of 5°-7°. Thus the temperature on-the target surface is keptbelow 150 °C.
proron beam
rarger material
m—*C- copper backing
warer cooling
Fig. 3 Layout of a solid target
Figure 4 shows a target layout for gaseous or liquid target material. In contrary to thesolid target the beam cannot hit the target material without entering the target vessel through athin metal window. The target vessel itself has to be water-cooled as well to cool down theliquid or the gas.

331
rarger vessel
prorons
rarger window
J
i
if
gas
-EX—
or liquid
inter/' ourler
water coolinq
Fig. 4 Layout of liquid or gas target
2 . TARGET BODIES AND WINDOWS
The choice of material for both the target body and window is dependent on the particularnuclide production process. Although a general rule does not exist, there are some aspects ofthe target bodies like activation, contamination, corrosion and cooling, which have to beconsidered [3, 4]. The parameters are influenced by the choice of bombarding particle, beamenergy, beam current, material and solvent. The criteria for target-window materials should bethe following:
- thickness of 1 - 200 jJm- pin-hole free- high mechanical strength- good thermal conductivity- high melting point- chemical resistance to oxidation
The target windows can be sealed either by 0-ring or welding. This depends on theparticular boundary conditions of cooling, temperature, pressure and radiation effects.
3 . ACTIVITY CALCULATIONS
When irradiating a target material with charged particles from a cyclotron, thedisintegration rate D of a produced radionuclide is:
where
/ = intensity of the irradiating particles (number of particles/cm2 s)N = number of target atomsN = W.K/AW 6.02 . 1023.W = weight of target materialK = natural abundance of target elementAw = atomic weighto = formation cross section in barn (10-24 cm2)

332
A = decay constant given by 0.693/ti/2 (s-1)t = duration of irradiation (sec)1 Ci = 3.7.1010 disintegrations/sec
From the equation it can be seen, that the amount of radioactivity produced, depends onthe intensity and energy (cross section <7is related to energy) of the bombarding particles, theamount of target material, the half-life of the produced radionuclide and the duration of
irradiation. The term (l — e~ ] reaches unity when tis approximately 4-5 half-lives of the
radionuclide. At that time the yield of the produced nuclide becomes maximum. Productionrates and decay become equal. Figure 5 shows this effect.
1 2 3 4 5 6irradiation rime in half tifes
Fig. 5 Production of radionuclides. The activity reaches saturation in 4-5 half-lives.
4 . ACTIVITY TRANSFER
After irradiation the produced isotope is still in the target matrix (solid) or inside the targetvessel (gas or liquid). In both cases the activity has to be transferred from the irradiation stationinto a hot cell for further processing. This transfer must be safe, reliable and sometimes fastand can be done either manually or automatically. For dose considerations and for safetyreasons an automatic transfer is recommended. The commonly used transport systems arerabbit or conveyer devices (for solid targets) and pipelines (for liquids and gases).
5 . AUTOMATION
For routine (daily) production a microprocessor controlled system is absolutelynecessary. Either a semiautomatic mode or a fully automatic mode guarantees a high reliabilityof the production process and a constant product quality. Moreover a remote handling of thetarget and the chemistry prevents personnel from obtaining a too-high radiation dose.
6 . MAIN RADIOISOTOPES
Table 1 summarizes the most important cyclotron-produced isotopes for medicalapplications. Common features for this radionuclide production are:
- production via (p,xn)-reaction- proton energy ranges between 10 MeV and 30 MeV- enriched isotopes for target material- recovery of target material- commercially available

333
Table 1Most common cyclotron produced radioisotopes for medical diagnostics
Radioisotope
GaIlium-67Bromine-77
Rubidium-81Indium-IllIodine-123
Thallium-201
Fluorine-18
Half-life(h)
78.357
4.667.213.2
73.1
1.8
Nuclear reaction
Zn-68(p,2n)Ga-67Kr-78(p,2n)Rb-77Rb-77-»Kr-77->Br-77Kr-82(p,2n)Rb-81Cd-112(p,2n)In-lllXe-124(p,2n)Cs-123Cs-123-»Xe-123->I-123Tl-203(p,3n)Pb-201Pb=201 ->T1-2O10-18(p,n)F-18
Bombarding energy(MeV)
2530
302230
20
18
Methods of preparations for these cyclotron-produced radionuclides are described below.
6.1 ThalJium-201
Half-life:Nuclear reaction:Proton-energy:Type of target:Target material:Activity transfer:Separation:
Production process
73.1 hTl-203(p,3n)Pb-20129 MeVsolid target, Tl-203 electroplated on target backingTl-203 > 90% enrichedrabbit or conveyer (irradiated target)chemical (Tl-203 from Pb-201; Pb-201 from Tl-201)
Immediately after the end of bombardment (EOB) the enriched Tl-203 is dissolved in acidand Pb-201 is isolated by the ion-exchanger method. The Tl-203 is retained on the column forthe further recovery process. Pb-201 is then absorbed on another ion-exchange column andenough time is allowed for Pb-201 to decay to Tl-201. Tl-201 is then eluted as thallouschloride in carrier-free form.
Tl-203, Pb-201 at EOB
target dissolvedseparation by ion-exchange column
Pb-201 in acid ion-exchange column
Pb-201 decay of Pb20l andgrowth of Tl-201Tl-201 eluted from column
1Tl-203 on column
recovery
Tl-201 as thallous chloridecarrier free
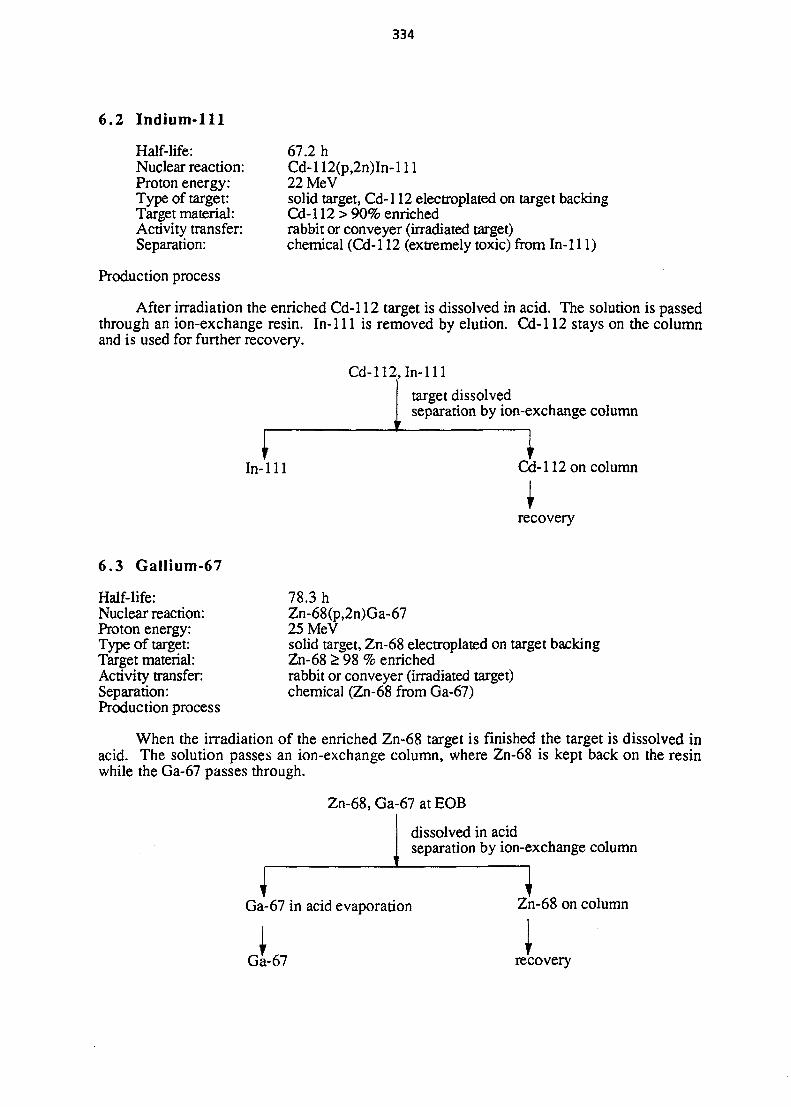
334
6.2 Indium-Ill
Half-life:Nuclear reaction:Proton energy:Type of target:Target material:Activity transfer:Separation:
Production process
67.2 hCd-112(p,2n)In-lll22MeVsolid target, Cd-112 electroplated on target backingCd-112 > 90% enrichedrabbit or conveyer (irradiated target)chemical (Cd-112 (extremely toxic) from In-Ill)
After irradiation the enriched Cd-112 target is dissolved in acid. The solution is passedthrough an ion-exchange resin. In-111 is removed by elution. Cd-112 stays on the columnand is used for further recovery.
Cd-112, In-Ill
target dissolvedseparation by ion-exchange column
In-111 Cd-112 on column
recovery
6.3 GaIlium-67
Half-life:Nuclear reaction:Proton energy:Type of target:Target material:Activity transfer:Separation:Production process
78.3 hZn-68(p,2n)Ga-6725MeVsolid target, Zn-68 electroplated on target backingZn-68 > 98 % enrichedrabbit or conveyer (irradiated target)chemical (Zn-68 from Ga-67)
When the irradiation of the enriched Zn-68 target is finished the target is dissolved inacid. The solution passes an ion-exchange column, where Zn-68 is kept back on the resinwhile the Ga-67 passes through.
Zn-68, Ga-67 at EOB
dissolved in acidseparation by ion-exchange column
Ga-67 in acid evaporation
Ga-67
Zn-68 on column
Irecovery
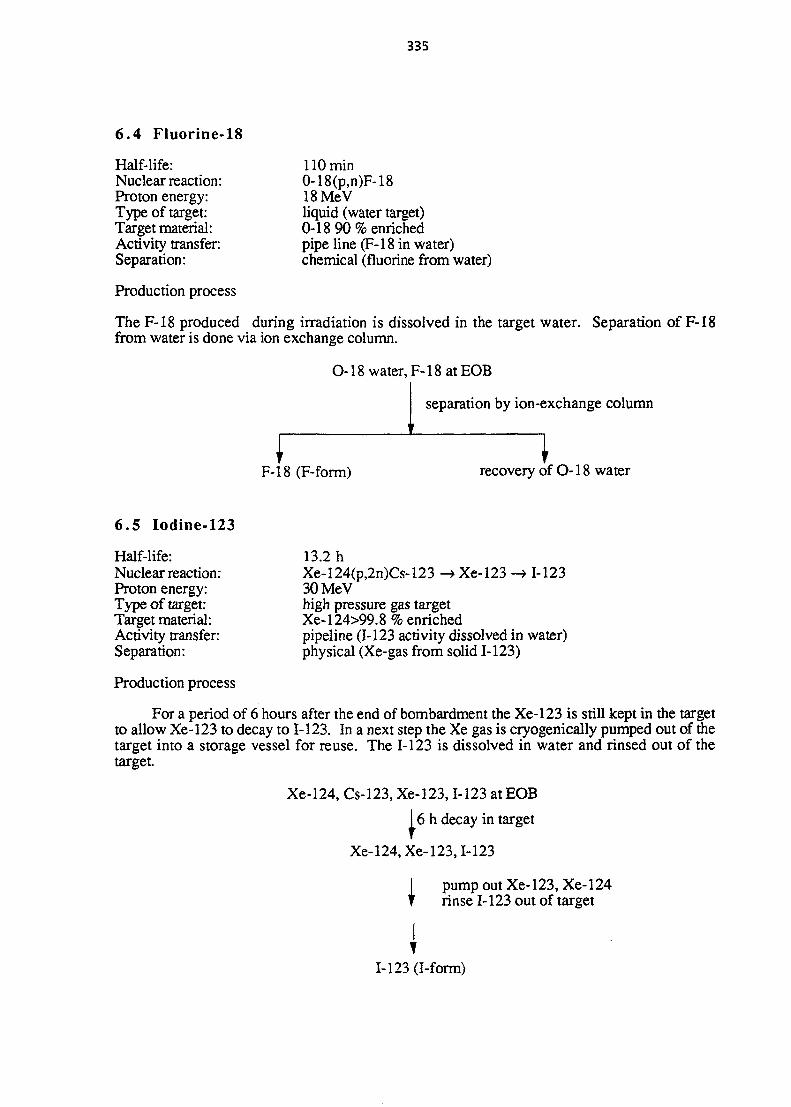
335
6.4 Fluorine-18
Half-life:Nuclear reaction:Proton energy:Type of target:Target material:Activity transfer:Separation:
Production process
110 minO-18(p,n)F-1818MeVliquid (water target)0-18 90% enrichedpipe line (F-18 in water)chemical (fluorine from water)
The F-18 produced during irradiation is dissolved in the target water. Separation of F-18from water is done via ion exchange column.
O-18 water, F-18 at EOB
separation by ion-exchange column
F-18 (F-form) recovery of O-18 water
6.5 Iodine-123
Half-life:Nuclear reaction:Proton energy:Type of target:Target material:Activity transfer:Separation:
Production process
13.2 hXe-124(p,2n)Cs-123 -» Xe-123 -> 1-12330MeVhigh pressure gas targetXe-124>99.8 % enrichedpipeline (1-123 activity dissolved in water)physical (Xe-gas from solid 1-123)
For a period of 6 hours after the end of bombardment the Xe-123 is still kept in the targetto allow Xe-123 to decay to 1-123. In a next step the Xe gas is cryogenically pumped out of thetarget into a storage vessel for reuse. The 1-123 is dissolved in water and rinsed out of thetarget.
Xe-124, Cs-123, Xe-123,1-123 at EOB
16 h decay in target
Xe-124, Xe-123,1-123
I pump out Xe-123, Xe-124T rinse 1-123 out of target
1-123 (I-form)

336
7. ROUTINE PRODUCTION SYSTEMS
7.1 Ultra-Pure Iodine-123 production via KIPROS
An example for a gas target arrangement for routine production is the Karlsruhe
S "8 4 a "faSh? fP ®.• ™» P * » P^Wes ultra pure S -T23 in
Iodine-123 has the following important advantages:
lower radiation dose for the patient (a factor 60-100 less than for iodine-131)lower radiation dose for the hospital personnel,markedly better scintigraph quality and hence a higher diagnostic powerlower environmental contamination (a factor 5900 lower than for iodine-131).
K *.n t h e . k " o w " iodine-123 production methods produce large amounts ofb y - P r o d u ™ i n t h e
uf o r m o f iodine-124 or iodine-125. Both these ifotopes posses
H tie , Z S C O m p a r S l e t o t h o s e of iodine-131. With the aim to produce iodine-123 with adeveloped P ° S S & * * p r o d u c t l o n m e t h o d v i a t h e Xe-124(p,2n)Cs-123 reaction was
Cs-123 5.9 min
Fig. 6 High pressure gas target system KIPROS for the production of ultra-pure 1-123 A
S h e S m ™SaQg n°S t i C T ' T i n frOnt ° f the target assures a Pr°Per alignmentof the beam. KIPROS is completely operated with a Simatic S-135 microprocessor
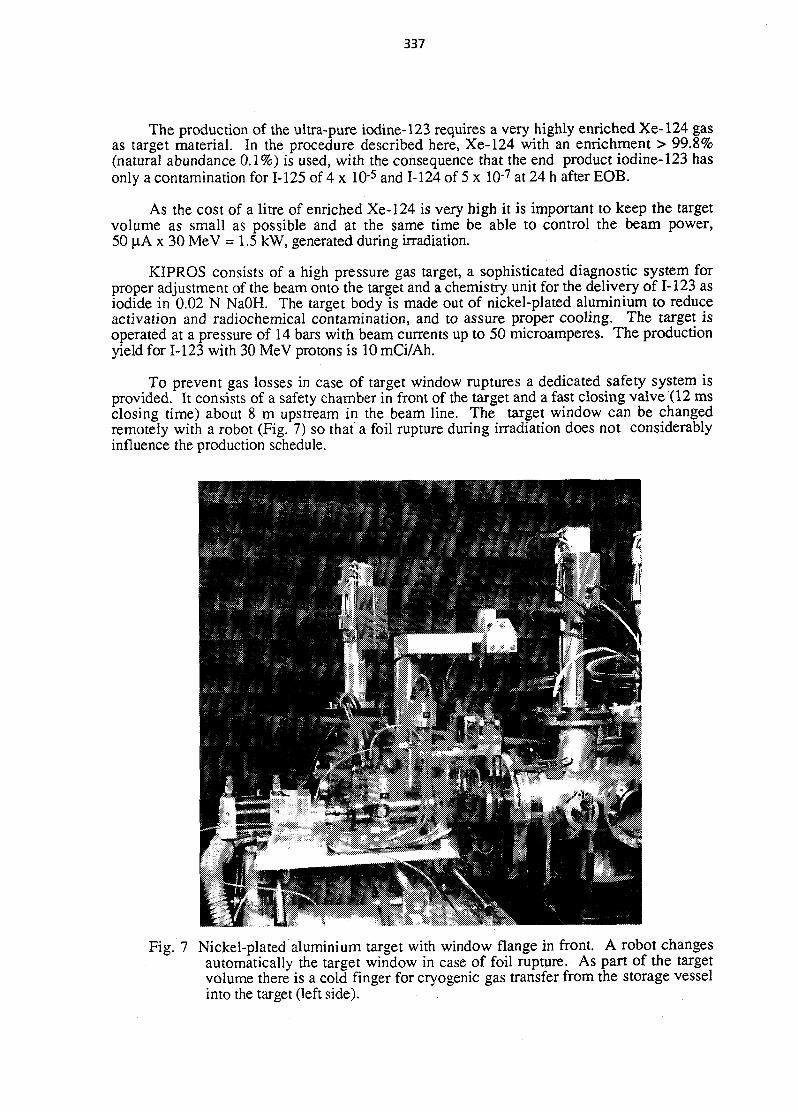
337
The production of the ultra-pure iodine-123 requires a very highly enriched Xe-124 gasas target material. In the procedure described here, Xe-124 with an enrichment > 99.8%(natural abundance 0.1%) is used, with the consequence that the end product iodine-123 hasonly a contamination for 1-125 of 4 x 1O5 and 1-124 of 5 x 10"7 at 24 h after EOB.
As the cost of a litre of enriched Xe-124 is very high it is important to keep the targetvolume as small as possible and at the same time be able to control the beam power,50 (J.A x 30 MeV = 1.5 kW, generated during irradiation.
KIPROS consists of a high pressure gas target, a sophisticated diagnostic system forproper adjustment of the beam onto the target and a chemistry unit for the delivery of 1-123 asiodide in 0.02 N NaOH. The target body is made out of nickel-plated aluminium to reduceactivation and radiochemical contamination, and to assure proper cooling. The target isoperated at a pressure of 14 bars with beam currents up to 50 microamperes. The productionyield for 1-123 with 30 MeV protons is 10 mCi/Ah.
To prevent gas losses in case of target window ruptures a dedicated safety system isprovided. It consists of a safety chamber in front of the target and a fast closing valve (12 msclosing time) about 8 m upstream in the beam line. The target window can be changedremotely with a robot (Fig. 7) so that a foil rupture during irradiation does not considerablyinfluence the production schedule.
<4: ' • ?5
mmr*Fig. 7 Nickel-plated aluminium target with window flange in front. A robot changes
automatically the target window in case of foil rupture. As part of the targetvolume there is a cold finger for cryogenic gas transfer from the storage vesselinto the target (left side).
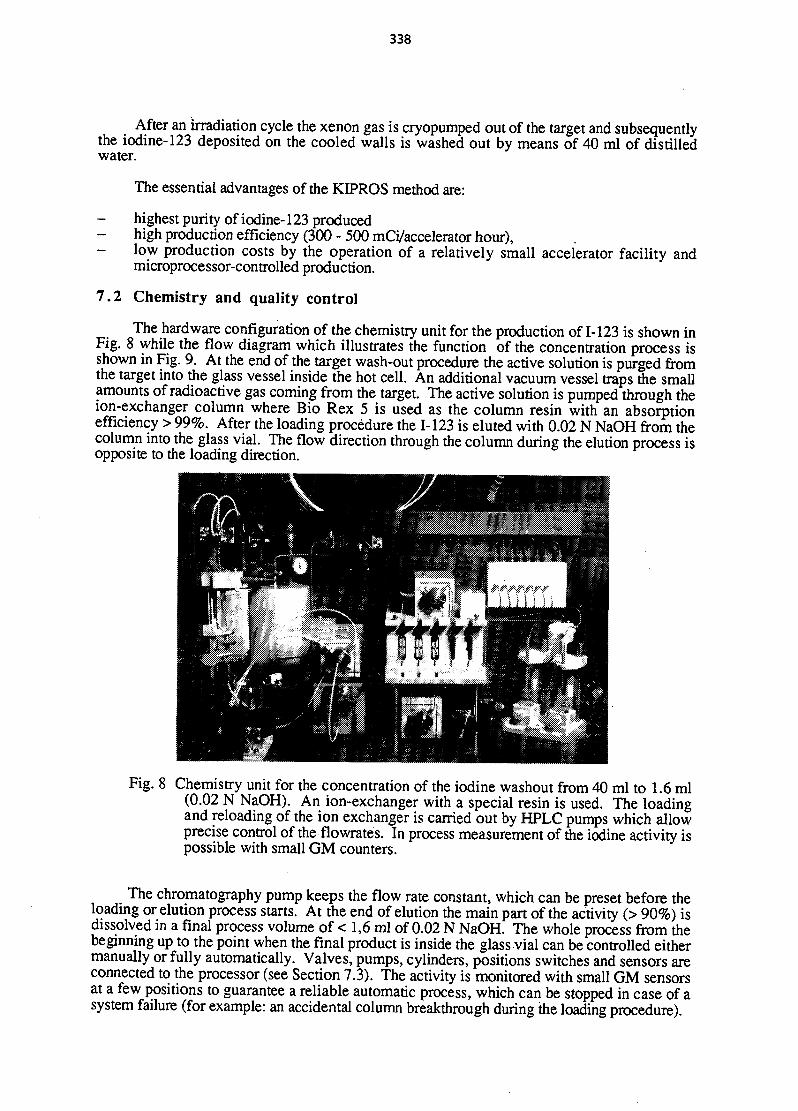
338
After an irradiation cycle the xenon gas is cryopumped out of the target and subsequentlythe iodine-123 deposited on the cooled walls is washed out by means of 40 ml of distilledwater.
The essential advantages of the KIPROS method are:
- highest purity of iodine-123 producedhigh production efficiency (300 - 500 mCi/accelerator hour),
- low production costs by the operation of a relatively small accelerator facility andmicroprocessor-controlled production.
7.2 Chemistry and quality control
The hardware configuration of the chemistry unit for the production of 1-123 is shown inFig. 8 while the flow diagram which illustrates the function of the concentration process isshown in Fig. 9. At the end of the target wash-out procedure the active solution is purged fromthe target into the glass vessel inside the hot cell. An additional vacuum vessel traps the smallamounts of radioactive gas coming from the target. The active solution is pumped through theion-exchanger column where Bio Rex 5 is used as the column resin with an absorptionefficiency > 99%. After the loading procedure the 1-123 is eluted with 0.02 N NaOH from thecolumn into the glass vial. The flow direction through the column during the elution process isopposite to the loading direction.
Fig. 8 Chemistry unit for the concentration of the iodine washout from 40 ml to 1.6 ml(0.02 N NaOH). An ion-exchanger with a special resin is used. The loadingand reloading of the ion exchanger is carried out by HPLC pumps which allowprecise control of the flowrates. In process measurement of the iodine activity ispossible with small GM counters.
The chromatography pump keeps the flow rate constant, which can be preset before theloading or elution process starts. At the end of elution the main part of the activity (> 90%) isdissolved in a final process volume of < 1,6 ml of 0.02 N NaOH. The whole process from thebeginning up to the point when the final product is inside the glass vial can be controlled eithermanually or fully automatically. Valves, pumps, cylinders, positions switches and sensors areconnected to the processor (see Section 7.3). The activity is monitored with small GM sensorsat a few positions to guarantee a reliable automatic process, which can be stopped in case of asystem failure (for example: an accidental column breakthrough during the loading procedure).

339
V11
Filter
V12 V13
Exhaust
1
V14 V15
•::Vi "&'••
VacuumVessel
Z5
I
Vial
V1
WasteCollector
IZ6
Sample •• ( y — • Waste
V6
Fig. 9 Flow diagram of the 1-123 concentration unit
The configuration of the multiport valves enables different samples to be obtained during theautomatic run. The samples are used for the quality control.
The quality control includes tests for the product identity, the radionuclide purity, theradiochemical purity and the pyrogen concentration. The radionuclide purity is measured with aGe detector while the radiochemical purity is determined by the thin-layer-chromatographymethod. The pyrogen concentration is checked with the Limulus-test.
7 .3 Control system
The control system consists of the programmable controller type Simatic S5-135 U, thecommunication station with monitor and keyboard and the printer station (Fig. 10). Thecontroller crate contains the following modules necessary for the operation of the productionprocess:
- Central processing unit (CPU) with a 16-bit microprocessor, internal memories, dataorganisation and an external memory for the user software
- Communication processor 525 for the process documentation which enables the datatransfer of all the various process parameters to a printer station
- Communication processor 526 for the communication between the controller and theterminal. Process commands can be entered via a keyboard, while status information (forexample: position of valve) and system messages are displayed on the monitorFig. 11
- Analog input modules for the measurement of analog process valuesDigital input modules for the connection of status indication signals
- Digital output modules for the connection of switching components.
The user software for the sequential and logical run of the process is written in a speciallanguage, called "STEP 5", which is optimized for the S5 Simatic controllers. The usersoftware for the communication processors (CP 525 and CP 526) is written by entering valuesin the different masks which are created by the COM 525 and COM 526 system programs.
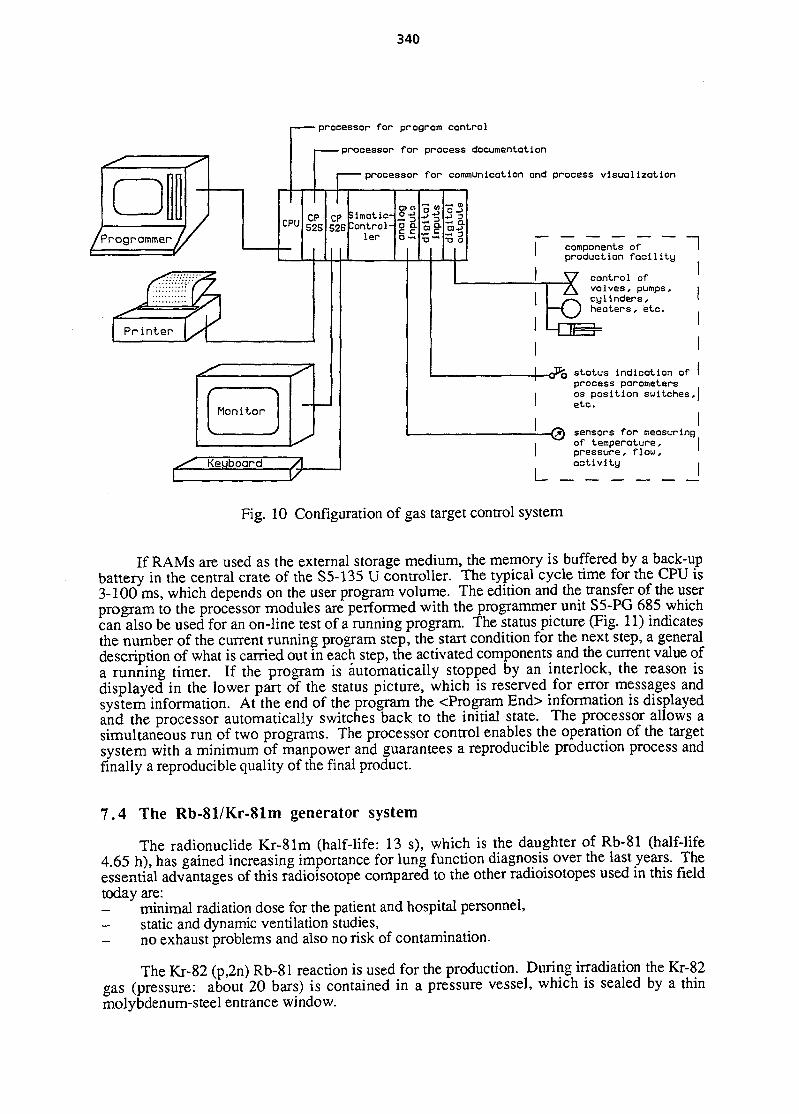
340
• processor for program control
-processor for process documentation
processor for communication and process visualization
components of Iproduction facility
control ofvalves, pumps,cylinders,heaters, etc.
status indication of Iprocess parametersas position switches,Ietc.
sensors for measuringof temperature, Ipressure, flow,activity
| I
Fig. 10 Configuration of gas target control system
If RAMs are used as the external storage medium, the memory is buffered by a back-upbattery in the central crate of the S5-135 U controller. The typical cycle time for the CPU is3-100 ms, which depends on the user program volume. The edition and the transfer of the userprogram to the processor modules are performed with the programmer unit S5-PG 685 whichcan also be used for an on-line test of a running program. The status picture (Fig. 11) indicatesthe number of the current running program step, the start condition for the next step, a generaldescription of what is carried out in each step, the activated components and the current value ofa running timer. If the program is automatically stopped by an interlock, the reason isdisplayed in the lower part of the status picture, which is reserved for error messages andsystem information. At the end of the program the <Program End> information is displayedand the processor automatically switches back to the initial state. The processor allows asimultaneous run of two programs. The processor control enables the operation of the targetsystem with a minimum of manpower and guarantees a reproducible production process andfinally a reproducible quality of the final product.
7.4 The Rb-81/Kr-81m generator system
The radionuclide Kr-81m (half-life: 13 s), which is the daughter of Rb-81 (half-life4.65 h), has gained increasing importance for lung function diagnosis over the last years. Theessential advantages of this radioisotope compared to the other radioisotopes used in this fieldtoday are:
minimal radiation dose for the patient and hospital personnel,- static and dynamic ventilation studies,- no exhaust problems and also no risk of contamination.
The Kr-82 (p,2n) Rb-81 reaction is used for the production. During irradiation the Kr-82gas (pressure: about 20 bars) is contained in a pressure vessel, which is sealed by a thinmolybdenum-steel entrance window.

341
Fig. 11 Colour monitor with keyboard for the communication with the control processor
The target arrangement is similar to the Xe-target. The Rb-81 produced duringirradiation, deposits on the cooled walls of the target vessel and is removed after the end ofbombardment by means of sterile water. The Rb-81 is then pumped 15 m via a stainless steelpipeline to a hot cell located outside the irradiation room. There the Rb-81 dissolved in water ispurged through a special ion exchanger which traps the Rb-81. This so-called generator is thenfitted into a transportable lead shield and a complete quality test is carried out. The KfKpossesses a pharmaceutical manufacturing permit for the Rb-81/Kr-81m generator according toparagraph 13 AMG. For the application of the generator in the hospitals it was imperative todevelop a simple application system. The "Kryptovent II" system, (Fig. 12) which has beendeveloped at KfK, is offered with the generators as a complete inhalation system.
The high pressure gas target system KIPROS is usable for highly-enriched target gases inparticular, where it is necessary to minimize gas inventory and gas losses. This system is usedfor the production of ultra-pure 1-123, Rb-81 and Br-77 at different production facilities inEurope, USA and Japan. The appropriate choice of nuclear reaction adapted to a compactcyclotron (maximum energy 30 MeV protons) combined with a sophisticated technique and amicroprocessor controlled process, guarantees a reliable and cost-effective production ofradioisotopes with high yields and constant product quality.
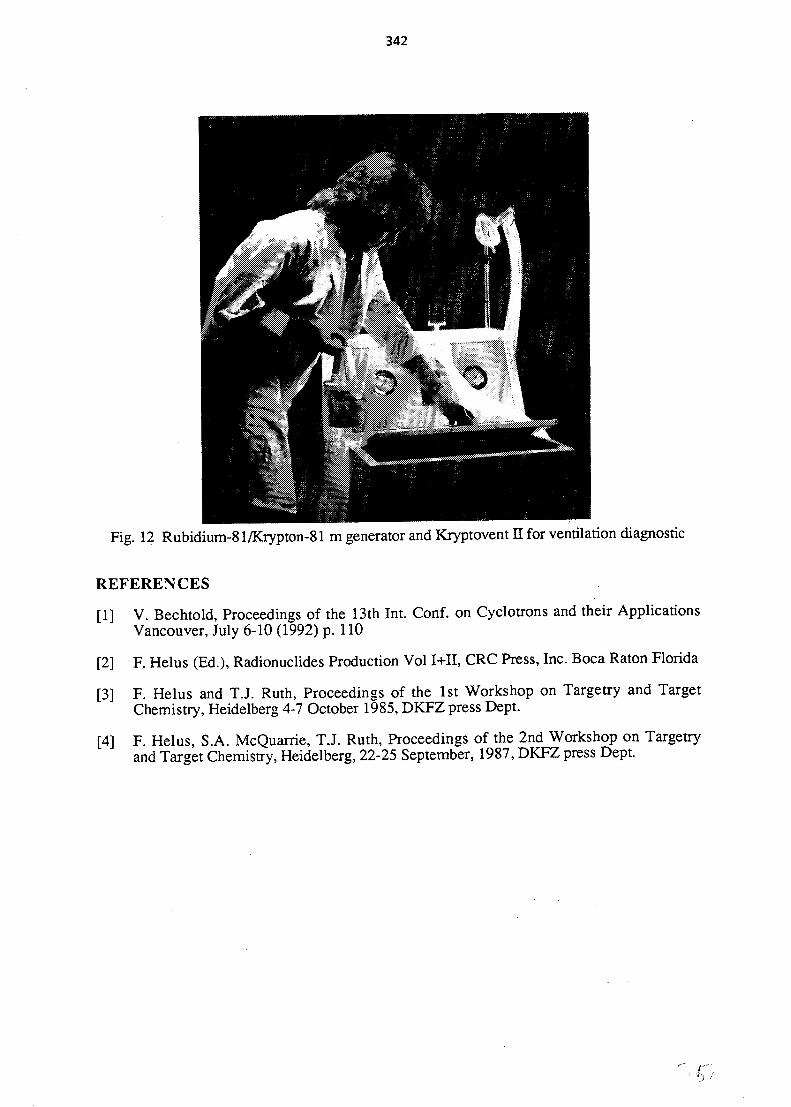
342
Fig. 12 Rubidium~81/Krypton-81 m generator and Kryptovent II for ventilation diagnostic
REFERENCES
[1] V. Bechtold, Proceedings of the 13th Int. Conf. on Cyclotrons and their ApplicationsVancouver, July 6-10 (1992) p. 110
[2] F. Helus (Ed.), Radionuclides Production Vol I+II, CRC Press, Inc. Boca Raton Florida
[3] F. Helus and T.J. Ruth, Proceedings of the 1st Workshop on Targetry and TargetChemistry, Heidelberg 4-7 October 1985, DKFZ press Dept.
[4] F. Helus, S.A. McQuarrie, TJ . Ruth, Proceedings of the 2nd Workshop on Targetryand Target Chemistry, Heidelberg, 22-25 September, 1987, DKFZ press Dept.
343
DESIGNING A RADIOISOTOPE FACILITY
Dewi M LewisAmersham International, Amersham, UK
AbstractThe physics concepts and methodology of designing a radioisotopeproduction facility based on a cyclotron is discussed with particularreference to manufacturing commercially useful isotopes known asradiopharmaceuticals. Commercially available cyclotron systems willbe discussed and a conceptual facility will be described; the isotopemost used in nuclear medicine, thallium 201, a heart imaging agent,will be used as a case study isotope. The requirements of GoodManufacturing Practice for the isotope products and the necessarycompliance with regulatory approvals will be outlined.
1 . INTRODUCTION
Cyclotron-produced radioisotopes were first developed for medical purposes at theUniversity of California, Berkeley, in 1936. For the next 30 years cyclotron constructionproliferated amongst universities and national research laboratories with increasing interest fromcommercial organisations for processing the isotopes as radiochemieals. However, in the early1960's genuine medical applications for several isotopes were identified, e.g. fluorine-18,rubidium-81 etc. and the first cyclotron project totally dedicated to commercial isotopesproduction was established in the UK by The Radiochemical Centre (now known as AmershamInternational). For the period 1965-78 several 'first generation1 cyclotrons were constructed,such as the early Cyclotron Corporation cyclotrons. These were essentially research cyclotronssimplified for industrial operations. However, from approximately 1975 onwards well-engineered, user-friendly or 'second generation1 compact machines became available, e.g.Scanditronix MC-40 series. A significant technical leap was taken in 1988 when EBA inBelgium developed a high intensity, low cost cyclotron with negative ion acceleration, highefficiency extraction and with fully automated controls. Concurrently with the development ofthese 30 to 40 MeV cyclotron models, several medically useful cyclotron isotopes were alsobeing licensed, e.g. gallium-67, iodine-123 etc.; by 1980 thallium-201 was available forcardiac imaging and has now become the most important commercial cyclotron isotope Inaddition to the growth in the medical applications of cyclotron isotopes, legislation forPharmaceuticals was being extended to include these cyclotron produced materials, i.e. theybecame radiopharmaceuticals.
Therefore, a present-day production facility will consist of a cyclotron, several beam linesand mechanical transport systems and a target arrangement which is custom built to be handledin the different chemical extraction processes for producing pure radiochemicals and then in thepharmaceutical production systems for producing sterile, injectable materials which complywith the pharmaceutical or drug licensing requirements of many countries. The underlyingphysics and chemistry of producing cyclotron radiopharmaceuticals will be discussed and adesign of a conceptual facility will be developed within the text.
2 . ISOTOPES AVAILABLE FROM CYCLOTRONS
Present-day radiopharmaceutical grade cyclotron isotopes are used for imaging anddiagnosis at nuclear medicine centres worldwide. A typical three-dimensional tomographicheart image section is shown in Fig. 1 using thallium-201. Some 2-3 million patient
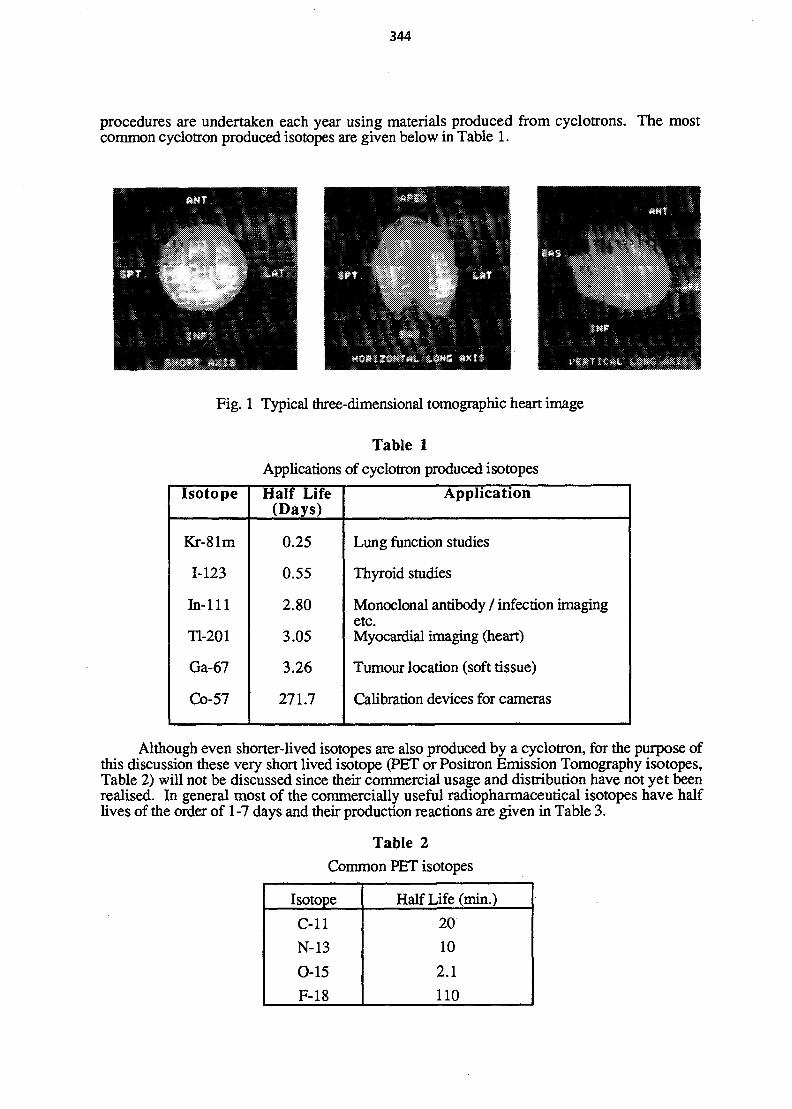
344
procedures are undertaken each year using materials produced from cyclotrons. The mostcommon cyclotron produced isotopes are given below in Table 1.
Fig. 1 Typical three-dimensional tomographic heart image
Table 1
Applications of cyclotron produced isotopes
Isotope
Kr-81m
1-123
In-Ill
Tl-201
Ga-67
Co-57
Half Life(Days)
0.25
0.55
2.80
3.05
3.26
271.7
Application
Lung function studies
Thyroid studies
Monoclonal antibody / infection imagingetc.Myocardial imaging (heart)
Tumour location (soft tissue)
Calibration devices for cameras
Although even shorter-lived isotopes are also produced by a cyclotron, for the purpose ofthis discussion these very short lived isotope (PET or Positron Emission Tomography isotopes,Table 2) will not be discussed since their commercial usage and distribution have not yet beenrealised. In general most of the commercially useful radiopharmaceutical isotopes have halflives of the order of 1-7 days and their production reactions are given in Table 3.
Table 2Common PET isotopes
Isotope
C-11
N-13
0-15
F-18
Half Life (min.)
20
10
2.1
110
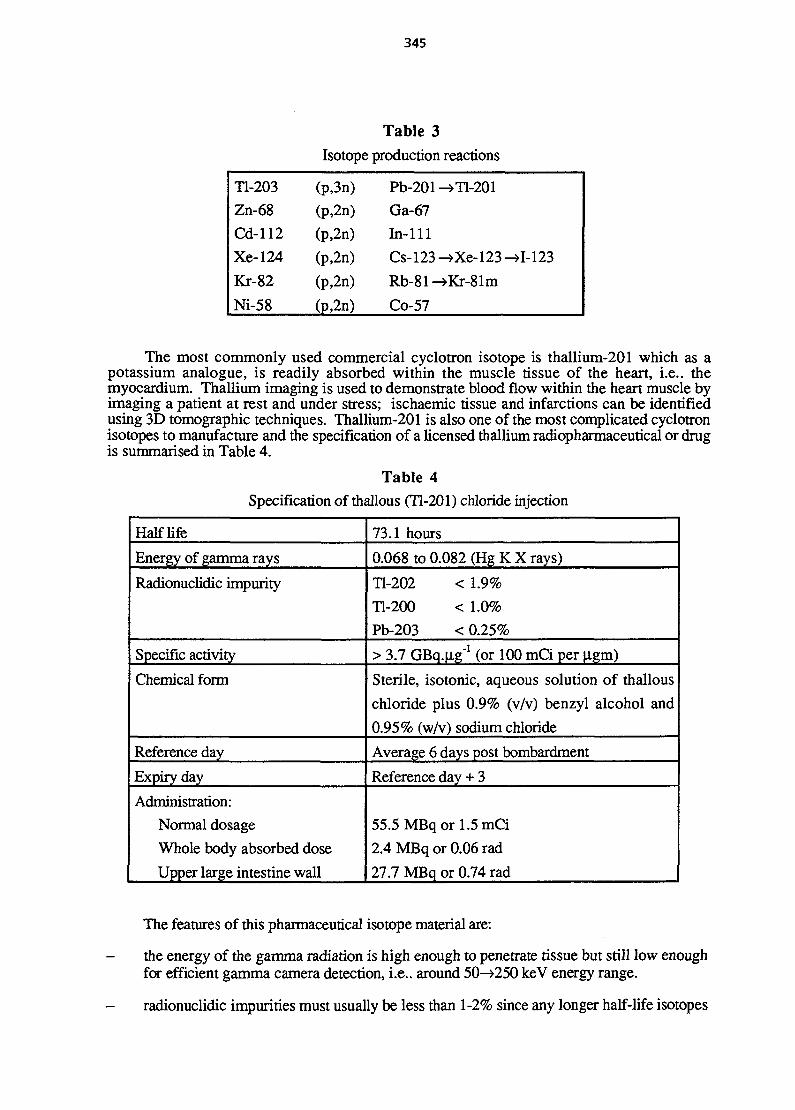
345
Table 3Isotope production reactions
Tl-203
Zn-68
Cd-112
Xe-124
Kr-82
Ni-58
(P,3n)
(p,2n)
(p,2n)
(p,2n)
(P,2n)
(P,2n)
Pb-201 ->T1-2O1
Ga-67
In-Il l
Cs-123->Xe-123-»I-123
Rb-81->Kr-81m
Co-57
The most commonly used commercial cyclotron isotope is thallium-201 which as apotassium analogue, is readily absorbed within the muscle tissue of the heart, i.e.. themyocardium. Thallium imaging is used to demonstrate blood flow within the heart muscle byimaging a patient at rest and under stress; ischaemic tissue and infarctions can be identifiedusing 3D tomographic techniques. Thallium-201 is also one of the most complicated cyclotronisotopes to manufacture and the specification of a licensed thallium radiopharmaceutical or drugis summarised in Table 4.
Table 4Specification of thallous (Tl-201) chloride injection
Half life
Energy of gamma rays
Radionuclidic impurity
Specific activity
Chemical form
Reference day
Expiry day
Administration:
Normal dosage
Whole body absorbed dose
Upper large intestine wall
73.1 hours
0.068 to 0.082 (Hg K X rays)
Tl-202 < 1.9%
Tl-200 < 1.0%
Pb-203 < 0.25%
> 3.7 GBq.iig'1 (or 100 mCi per |igm)
Sterile, isotonic, aqueous solution of thallous
chloride plus 0.9% (v/v) benzyl alcohol and
0.95% (w/v) sodium chloride
Average 6 days post bombardment
Reference day + 3
55.5 MBq or 1.5 mCi
2.4 MBq or 0.06 rad
27.7 MBq or 0.74 rad
The features of this pharmaceutical isotope material are:
- the energy of the gamma radiation is high enough to penetrate tissue but still low enoughfor efficient gamma camera detection, i.e.. around 50-»250 keV energy range.
- radionuclidic impurities must usually be less than 1-2% since any longer half-life isotopes

346
contribute to increasing patient radiation dose and to blurring of images.
- half lives are approximately 3 days, which is a convenient time period for themanufacture, delivery and administration of the material to the patient.
the specific activity of the isotope must be high enough to produce sufficient events orcounts in the required organ using a gamma camera imaging system.
- the radiopharmaceutical must be manufactured according to the protocols of "GoodManufacturing Practice".
- the specification and manufacturing protocols must comply with approved drug licenceconditions issued by the appropriate Government bodies.
3 . BOMBARDMENT AND ISOTOPE PRODUCTION PROCESS
For the purpose of this section the heart imaging agent thallium-201 will be used as a'case study'; the overall production of this isotope will include the following steps:
- Preparation of a target using as a starting material the enriched isotope thallium-203,
- Bombardment by a 25-30 MeV cyclotron proton beam,
- First chemical separation process to produce the intermediate or daughter isotopelead-201,
- Secondary chemical separation of the radioactive isotope thallium-201,
Pharmaceutical production of the sterile, radioactive, injectable thallous chloride.
Other important isotopes such as gallium-67, iodine-123 and indium-111 are produced byvery similar manufacturing processes. The preferred production reaction for producingthafiium-201 is shown below; in fact lead-201 is generated first.
decayThallium-203 (p,3n) Lead-201 -> Thallium-201
Naturally occurring thallium consists of two main isotopes - thallium-203 (naturalabundance 29.5%) and thallium-205 (natural abundance 70.5%); the initial raw material forcyclotron targets is the enriched stable isotope - thallium-203. Enriched isotopes are producedusually by large electromagnetic separators located within Government controlledestablishments, producing mainly uranium-235 for fuel and weapons applications. The original'calutron devices' at Oak Ridge are now 40 years old and are based on the concept of a 180°magnetic spectrometer and use large dipole magnets. Radioisotope production consumes a fewkilograms of these materials annually worldwide and the enrichment requirements for thedifferent isotopes are given below in Table 5.
The excitation cross sections for proton bombardment of thallium-203 are given in Fig. 2,indicating peak energies for the reactions (p,n), (p,2n) and (p,3n) etc. In addition, similarproduction cross sections exist for protons bombarding thallium-205 indicating that even a traceimpurity level of thallium-205 within the target material thallium-203 will lead to radioactiveimpurity species in the final product. The competing reactions are given below in Table 6.

347
Table 5Enrichment of isotopes
Isotope
Tl-203Zn-68
Cd-112
Xe-124
Othernaturallyoccurringisotopes
Tl-205Zn-64, Zn-66, Zn-67,Zn-68, Zn-70Cd-106, Cd-108, Cd-110,Cd-114, Cd-116Xe-126, Xe-128, Xe-130,Xe-132, Xe-134, Xe-136
% naturallyoccurring
29.5%18.6%
24.1%
0.095%
% radio-pharmaceutical
specification
98%98%
96%
>20%
Electro-magneticseparator
production(hours per kg)20,00065,000
55,000
Gaseousdiffusion
Approx. cost(M$/kg)
2.54.5
3.5
0.1per litre
1.1
1.0
S 0.9
•JT§ 0.8
1 1 ° ' 7
O 0.5
0.4
0.3
0.2
0.1
(p,4n) Pb200
f \/ \/ ^// /^ //45 40 35
/ * \ (p,3n)Pb201
/ \
/ \
/ \
\I \\ \
\(p,2n)Pb2oA __(p,n)Pb203
30 25 20 15 10 5 0
Beam energy (MeV)
Fig. 2 Excitation cross sections for Thallium 203
From the graphs in Fig. 2 it is possible to determine:- The maximum bombardment energy for the proton beam; in this case it is determined bythe impurity radionuclide lead-200 created via the reaction (p,4n), resulting in a daughterproduct Tl-200 which has a half life of 26 hours and a high energy gamma ray. This wouldincrease the patient dose considerably if the percentage impurity was allowed to be greater than1%. Consequently this fixes the maximum proton energy for thallium production at 28.5 MeV.
The minimum bombardment energy or exit energy of the proton beam is similarlyconstrained by the impurity radionuclide lead-202m created by the reaction (p,2n), the resultantdaughter product Tl-202 has a half life of 12 days and a y-emission of 1.0 MeV; the minimumenergy at the exit of the enriched Tl-203 material is similarly fixed at 22 MeV.
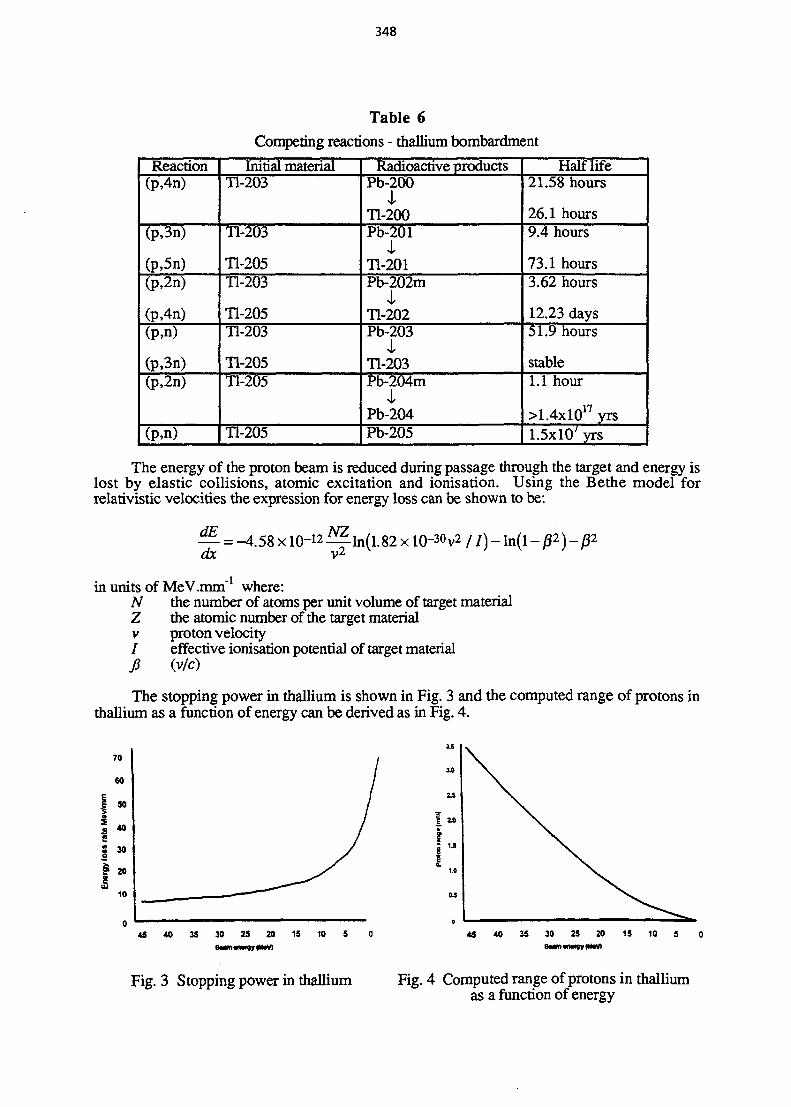
348
Table 6Competing reactions - thallium bombardment
Reaction(p,4n)
(P,3n)
(p,5n)(p,2n)
(P,4n)(p,n)
(P,3n)(P,2n)
(p,n)
Initial materialTl-203
Tl-203
Tl-205Tl-203
Tl-205Tl-203
Tl-205Tl-205
Tl-205
Radioactive productsPb-200
iTl-200Pb-201
iTl-201Pb-202m
iTl-202Pb-203
iTl-203Pb-204m
IPb-204Pb-205
Half life21.58 hours
26.1 hours9.4 hours
73.1 hours3.62 hours
12.23 days51.9 hours
stable1.1 hour
>1.4xlO17 yrs1.5x10' yrs
The energy of the proton beam is reduced during passage through the target and energy islost by elastic collisions, atomic excitation and ionisation. Using the Bethe model forrelativistic velocities the expression for energy loss can be shown to be:
— = -4.58xl0-i
in units of MeV.mm" where:N the number of atoms per unit volume of target materialZ the atomic number of the target materialv proton velocity/ effective ionisation potential of target materialJi (v/c)
The stopping power in thallium is shown in Fig. 3 and the computed range of protons inthallium as a function of energy can be derived as in Fig. 4.
70
60
50
Ie
20
10
45 40 35 30 25 20 15 10 5 0 45 40 35 30 25 20 15 10 5
Fig. 3 Stopping power in thallium Fig. 4 Computed range of protons in thalliumas a function of energy
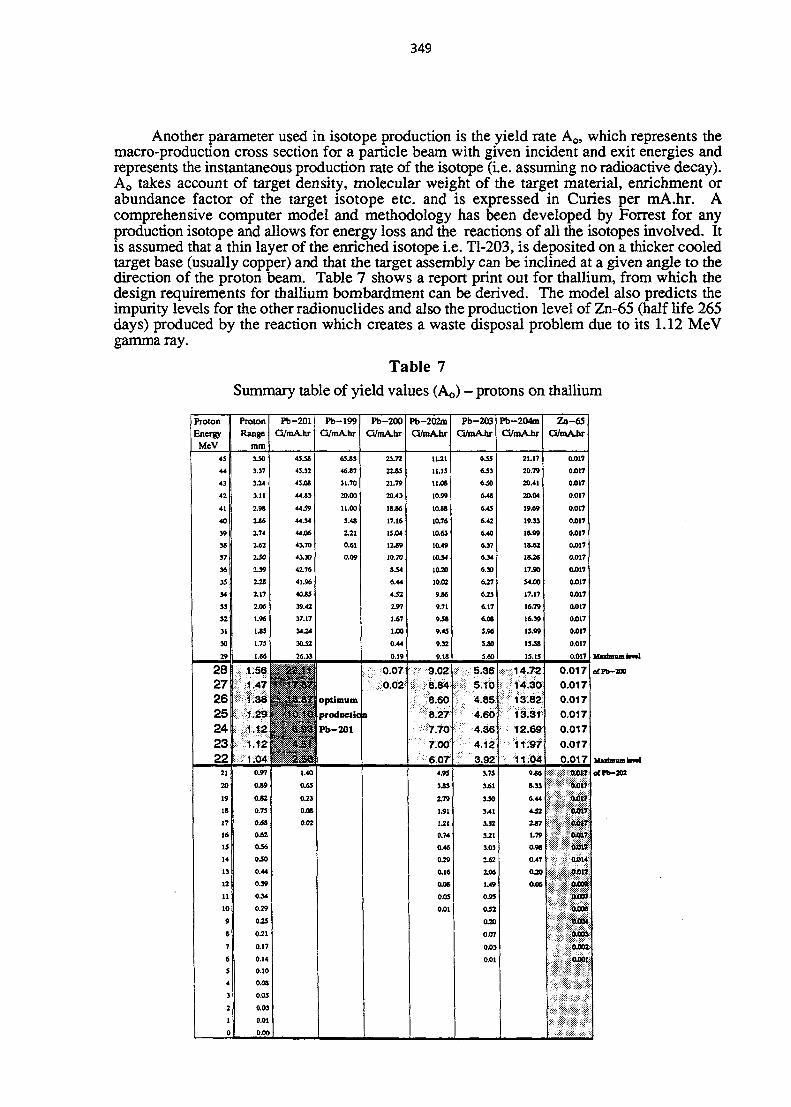
349
Another parameter used in isotope production is the yield rate Ao, which represents themacro-production cross section for a particle beam with given incident and exit energies andrepresents the instantaneous production rate of the isotope (i.e. assuming no radioactive decay).Ao takes account of target density, molecular weight of the target material, enrichment orabundance factor of the target isotope etc. and is expressed in Curies per mA.hr. Acomprehensive computer model and methodology has been developed by Forrest for anyproduction isotope and allows for energy loss and the reactions of all the isotopes involved. Itis assumed that a thin layer of the enriched isotope i.e. Tl-203, is deposited on a thicker cooledtarget base (usually copper) and that the target assembly can be inclined at a given angle to thedirection of the proton beam. Table 7 shows a report print out for thallium, from which thedesign requirements for thallium bombardment can be derived. The model also predicts theimpurity levels for the other radionuclides and also the production level of Zn-65 (half life 265days) produced by the reaction which creates a waste disposal problem due to its 1.12 MeVgamma ray.
Table 7
Summary table of yield values (Ao) - protons on thallium
ProtonEnergy
MeV45
44
43
42
41
40
39
38
37
36
35
34
33
32
31
30
29
28272625242322
21
20
19
IS
17
16
IS
14
13
12
11
10
9
8
7
65
2
1
0
ProtonRange
mm3J0
3.37
3.24
3.11
2.98
2-86
2.74
2.62
2J0
2.39
X2S
2.17
2.06
1.96
1.83
1.75
161
1.561.471.381.291.1?1.1P1.0*
o.r049
0.S2
0.750.68
0.62
0.56
0.50
0.44
0.39
0.34
0.29
0.25
0.21
0.17
0.14
0.100.08
0.05
0.03
0.01
0.00
Pb-201C3/mA.hr
45 JS
45.32
45.08
44.83
44.59
44.34
44.06
43.7043.30
42.76
41.96
4045
39.42
37.17
34.24
30.52
22.1117 St
Pb-1990/mA.hr
65.83
46.87
31.70
20.00
11.00
5.4S
2 3 1
0.61
0.09
' 3 87! optimum
h 10 10
6 93'1 4 5J
2 58. 4 0
0.65
0.23
0.OS
0.02
prodnctic
Pb-201
Pb-200GAnA.hr
23.72
21.79
20.43
18.86
17.16
15.04
1189
10.70
8.54
6.44
4.52
2.97
1.67
1XO
0.44
0.19
0.070.02
a
Pb-202mO/mA-hr
1141
11.15
11.08
10.99
10.88
10.76
10.63
10.4910.54
10.20
10.02
9.71
9 J »
9.45
9.32
9.1S
9.028.848.608.277.707.006.07
4.9S
3.83
2.79
1.91
1.21
0.74
0.46
0.29
0.16
0.08
0.05
0.01
Pb-203OAaAJir
645
643
6 JO
6.48
6.45
6.42
6.40
6.37
6LM
6.30
6.27
6J3
6.17
6.06
5.95
5.80
5.60
5.365.104.854.604.364.123.92
3.73
3.61
3 JO
3.41
3.32
3.21
3.03
2^2
2.06
1.49
0.93
0J2
030
0.07
0.03
0.01
Pb-2<M«nO/mAJir
21.17
20.79
20.41
20.04
19.69
19.33
15.99
18.62
1836
17.90
54.00
17.17
16.79
16.39
13.99
15J8
15.15
14.7214.3013.8213.3112.6911.9711.04
9.86
8.33
6.44
4.53
2 4 7
1.79
0.98
0.47
0 4 0
O06
Za-65O/mAJir
0.017
0X117
0.O17
0.017
0.017
0X117
0X117
0X>17
0.017
0X117
0X117
0.017
0X117
0X117
0X117
0.017
0.017
0.0170.0170.0170.0170.0170.0170.017
illissf§l|lf&oi|IllliSii
ifllllllmmIllliiSH
lllliilri;l:?ll;oxo:
::;:||||i:|s
••:'::.-w.:;:-'v::.::-':
Uuimomlml
of Pb-200
Uuimamky«!aCrb-202
350
Zn-65 is produced by the reaction:
Cu-65 (p,n) Zn-65
This model assumes that the remainder of the energy is deposited within the target base; thestopping power calculation can also be used to estimate the required thickness of this copperbase to ensure full proton absorption and no penetration into the cooling liquid which is usuallywater.
For a given set of irradiation conditions the activity produced is:
where
A, = AJt I-jXt
At is the activity in Curies at time t/ is the beam current in mAt is the bombardment time in hoursX is ln(2)/TT is the half life of the isotope produced
Tpical Ao values is given in Table 8.
Table 8Table of yield rates A<,
Isotope
Tl-201
Ga-67
In-111
Co-57
AoCCimA'V1)
21.64.3
6.3
0.032
^ (MeV)
28.525.5
29.0
22.0
Eom(MeV)
22.00.0
17.0
0.0
The design requirements for thallium-201 bombardment can then be determined and aregiven below in Table 9.
Table 9Design requirement for thallium bombardment
Maximum energy
Minimum energy
dE/dx
Effective thickness
Angle of inclination
Thickness of electroplating
28.0
22.0
11.9
0.566
6°
0.06
MeV
MeV
MeV.mm*1
mm
mm
Pb-200 production limitation
Pb-202 production limitation
Derived from 28.0 MeVincident beam energy and22.0 MeV exit energy
Calculated from above
Mechanical design
considerations
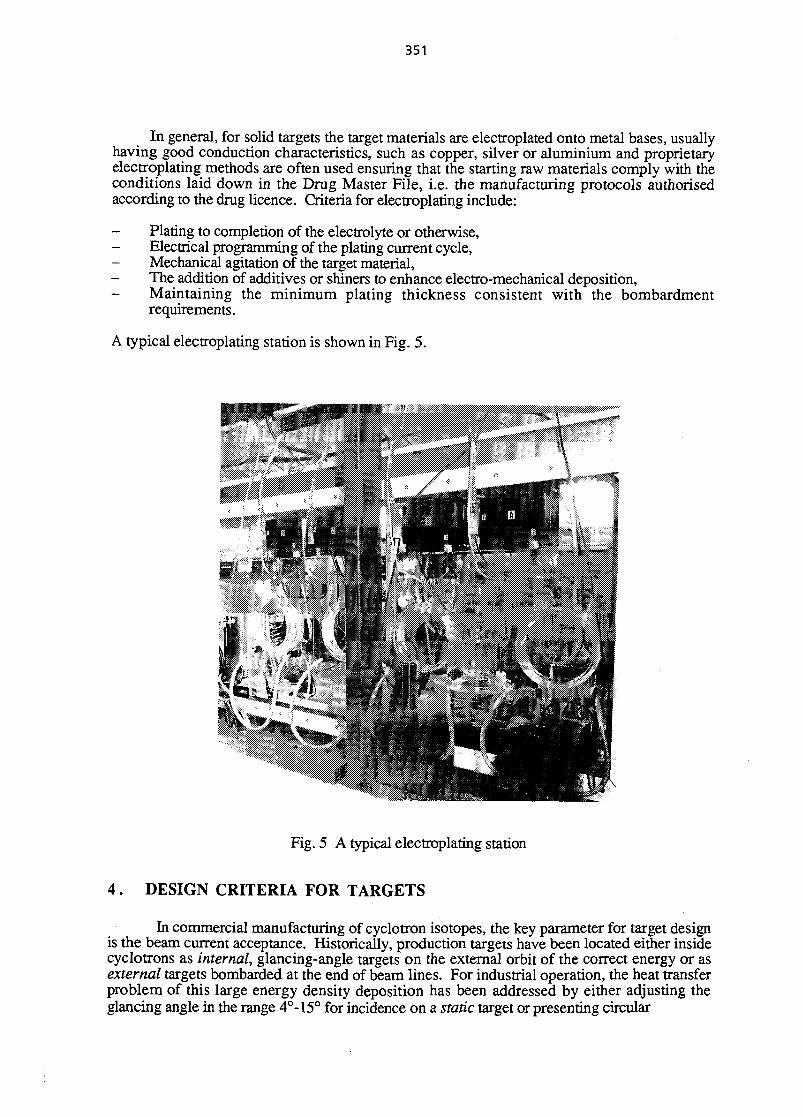
351
In general, for solid targets the target materials are electroplated onto metal bases, usuallyhaving good conduction characteristics, such as copper, silver or aluminium and proprietaryelectroplating methods are often used ensuring that the starting raw materials comply with theconditions laid down in the Drug Master File, i.e. the manufacturing protocols authorisedaccording to the drug licence. Criteria for electroplating include:
Plating to completion of the electrolyte or otherwise,Electrical programming of the plating current cycle,Mechanical agitation of the target material,
- The addition of additives or shiners to enhance electro-mechanical deposition,- Maintaining the minimum plating thickness consistent with the bombardment
requirements.
A typical electroplating station is shown in Fig. 5.
Fig. 5 A typical electroplating station
4. DESIGN CRITERIA FOR TARGETS
In commercial manufacturing of cyclotron isotopes, the key parameter for target designis the beam current acceptance. Historically, production targets have been located either insidecyclotrons as internal, glancing-angle targets on the external orbit of the correct energy or asexternal targets bombarded at the end of beam lines. For industrial operation, the heat transferproblem of this large energy density deposition has been addressed by either adjusting theglancing angle in the range 4°-15° for incidence on a static target or presenting circular

352
Table 10
Heating calculations for a stationary targetBEAM.
a.
b.
Q-
A.
PARAMETERS
1/2 beam heighi(m) = 0.0094
1/2 beam width(m) = 0.0009
Beam current (jiA) = 150
Energy (MeV) = 29
power of beam (W) = 4350
projected area of beam
on target (m ) = 0.0025
q(m). Mean heat flux
q.
TARGET
13.
(W/m H
X3.
COPPER
1.
X .
d.
(W/m ) = 1710817
Peak heat f lux(W/m2) = 3934879
PTATTNR PARAMETERS
Thermal conductivity ofplating material - 44
)- 44
Plating thickness (m)= 0.00010
BACKING PARAMETERS
Thermal conduct iv i tyof Cu (Wm/K) = 390
Thickness of Cu (m)= 0.002
Approximate correct ionfactor t o allow for heat"spread out" in copper
= 0.44
COPPER TO WATERHEAT
cp.
nb.
lb.
P i .
d.
w.
M.
m.
Re.
nw.
TRANSFER PARAMETERS
Copper/water heat transfer
coefficient (W/aiK.) = 60800
Specific heat of water
at 20° C(I/kgK) = 4 1 8 6
Viscosity of water at
20° C (Meg K) * 0.001
Thermal conductivity of water
at 20° C (W/m) = 0.602
Prandtl number = 6.95
Depth of water channel (m)
= 0.0037S
Width of water channel (m)= 0.025
Water flow rate (kg/s)
= 1.65
= M/(d*w) mass flux of cooling
water (kg-irt s) = 17600
Reynolds Number= 2md/nb = 132000
Viscosity of water at the temperatureof the Cu/water surface
= 0 000548 at 50°C
0.000283 at 100°C
0.000183 at 150°C
FINAL TARGET SURFACETEMPERATURE CALCULATION
The peak surface temperatureis calculated from the cooling watertemperature plus three additionaltemperature rises.
1. Water-copper (°C> = 44.8
2. Copper (°C> - 16.5
3. Plated targe t layer (°C)- &J.
Total temperature r ise ( C)«• 6 8 . 0
Chilled cooling water temperatur- 13.0 °C
Therefore, final peak targetsurface temperature
- 81.0 °C
geometry rotating targets at high speed to ensure optimum heat transfer. Current commerciallyavailable cyclotrons are capable of producing external beams with good emittance control forthe current range 150 - 400 [iA per beam on target. For the purposes of this 'case study' it willbe assumed that a beam current of up to 200 |iA external beam will be incident on a static targetat a glancing angle. Typical beam emittance is of the order of 5 to IOTC mm.mrad whichtranslates to available beam spot dimensions of the order of 3 - 20 mm in either dimension.Early experimental measurement and heat conduction calculations published by Pinto (Table 10)indicated that a temperature rise of 150°C would occur with an incident proton beam of30 MeV, 200 ^A on a target with no electroplated material but designed for optimum cooling.He concluded that for production targets, temperature rises could be limited to about 150°Ceven with electroplated target material; this temperature is lower than the melting point ofthallium metal and would guarantee integrity of the targetry and retention of the expensive rawmaterial on the target surface. This calculation was substantially improved by Forrest to allowfor the heat transfer across the interface between the electroplated layer and the base material forseveral different materials. The model also allowed for defining the optimum target inclinationangle for a given beam spot size and Table 11 indicates computed surface temperature increasesfor different glancing angles based on the following assumptions:
Optimum target mechanical design to stimulate turbulent flow with water cooling,

Table 11
Target Heating calculations for different metals and beam incident angles
Static Target Heating Calculations
Description:-
New machine stationary target:
All operational data as tabulated.
Target Plated Diameters:-Inner = 45 mmOuter = 85 mm
Target Plate Area = 4084 mm2
Data:-
Water TempWater » CopperBeam CurrentBeam EnergyBeam PowerBeam Y
* Beam 'y'* Target backing
* Beam 'x' Dimension* Beam 'y' Dimension
= 203= 30= 400= 30
CCHAMeV
= 12000 J / s= 20= 6= 2000
is acrossis across
mmmmHm
target/beam axistarget/beam axis
Metal
CuNiZnCdTl
Conductivity(W/mK)4019412210445.4
Specific Heat(J/kg.K)385442388231130
Density(g/cm3f
8.8908.6547.3668.63111.784
(JO
TargetMetal
CuNiZnCdTl
Reactionpath(mm)
0.951.861.601.07
15
179247281282337
14
171230260261308
1 3
162213239240281
Resultant surface temperatures for
12
154197220220255
«— Beam
1 1
145182201201231
Incident
1 0
137167183183208
the incident angles
Angle (degrees)
9
128153165166186
8
119139149149165
7
111126133134146
shown
6
102113119119128
5
93101105105111
4
8590929296
3
7679808083
2
6769696970
1
5959595959

354
- Uniform electroplated material,
- Target dimensions of approximately 6 mm high by 20 mm wide,
- Nominal beam energy 30 MeV,
- A maximum possible proton beam current of 400 (jA.
The computed surface temperatures for different incidence angles are given for typicalinitial raw materials used in radiopharmaceutical production with the requirement that thesurface temperature never exceeds the melting point of the material at the reduced vapourpressure within the target enclosure. In general, optimisation of computed models and practicalexperimentation result in the 'typical' target specification, shown in Table 12.
Table 12Target specification
Beam current
Beam size
Target inclination
Maximum power density deposition
Maximum temperature rise of Tl-203
400 \iA
20 mm
6°12 kW
128°C
.,30 MeV
x6mm
Due to the relatively high radioactivity activation levels of production targets, welldesigned, remote controlled mechanical transport systems are necessary to ensure that targetintegrity is maintained otherwise local contamination of radioactivity and loss of valuableenriched isotopes could occur. Two approaches are now used:
- Compact target transfer by pneumatically operated rabbit systems - the system designedby TRIUMF is shown in Fig. 6.
— Railway transfer systems which remove the target assembly from the cyclotron into ademounting station.
Fig 6 Target transfer showing rabbit (1) and target (2)

355
5 . CYCLOTRON SPECIFICATION
Requirements of cyclotrons for commercial isotope production are:
- Proton beams as indicated in Table 3; the large majority of useful isotopes can beproduced by proton reactions (p,xn).
- High beam currents, since the isotope production rate is proportional to beam current. -- Variable energy is required to accommodate all the reactions in Table 3.- Extracted beams are preferred to allow optimisation of target design and ease of handling- High reliability operation is essential for the production of these short-lived isotopes
which have to be delivered several times a week.- Low radiation activation levels are essential at the cyclotron and around the target system
to allow for regular maintenance, equipment upgrades etc.- Low operating costs are desirable for a viable, competitive commercial operation.
The present day 'third generation' compact cyclotrons have been designed specifically forthis type of commercial operation and satisfy the above requirements. Two excellent modelsare available as off-the-shelf packages, viz
IBA, Cyclone-30 designed by Yves Jongen, Louvain La Neuve, Belgium and
EBCO, TRS-30 designed by TRIUMF for EBCO Industries, Vancouver, Canada.
It is also worth mentioning Scanditronix's MC-32 NE which is a negative ion cyclotron butdoes have a lower output level. For the purposes of this paper, the Cyclone-30 is assumed.The performance specification of the Cyclone-30 is shown in Table 13 and a drawing of theCyclone-30 cyclotron is shown in Fig. 7.
Table 13IBA Cyclone-30 specification
Beam current
Energy range
Extraction beam
Beam emittance
Power consumption
Ion source
Base vacuum
350-500 \iA
15-30 MeV
2
5-10mmmrad
150 kW
External
3 x 10"7 torr
Clearly the above requirements for commercial isotope production are well met by thegeneral system specifications of the Cyclone-30, viz
Proton or deuteron beams can be produced efficiently.- High extracted beam currents of 350 to 500 n.A which are significantly higher than
previous 'second generation' cyclotrons, cf. 60 to 100 |J.A.- The extraction foil mechanism together with a 'combination' magnet provide an adequate
range of extraction energies.- High reliability operation is achieved by simple yet elegant magnet and RF design, well-
engineered extraction equipment, high reliability sub systems, comprehensive diagnosticfacilities and stable high beam extraction performance.
- Low radiation levels are maintained by efficient (negative ion) extraction, selection of low
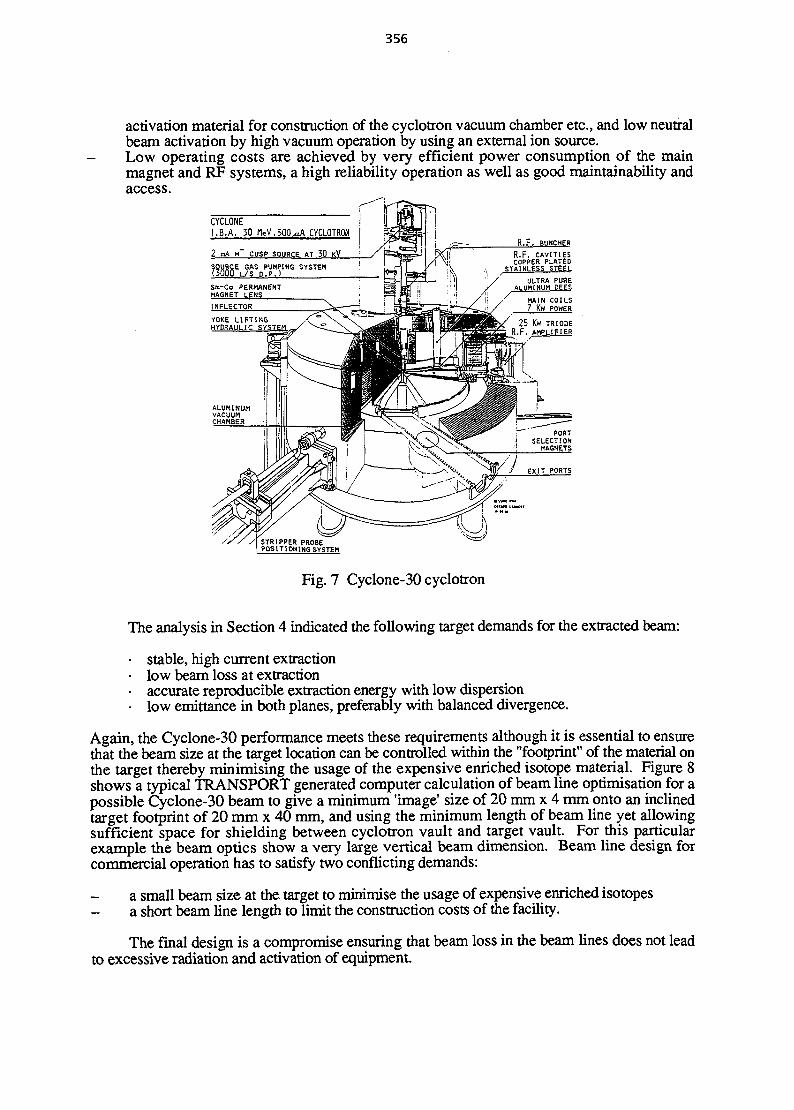
356
activation material for construction of the cyclotron vacuum chamber etc., and low neutralbeam activation by high vacuum operation by using an external ion source.Low operating costs are achieved by very efficient power consumption of the mainmagnet and RF systems, a high reliability operation as well as good maintainability andaccess.
CYCLONE.B.A. 30 MeV. 500 MA CYCLOTRON
2 mA H CUSP SOURCE AT 30 KV
Fig. 7 Cyclone-30 cyclotron
The analysis in Section 4 indicated the following target demands for the extracted beam:
• stable, high current extraction• low beam loss at extraction• accurate reproducible extraction energy with low dispersion• low emittance in both planes, preferably with balanced divergence.
Again, the Cyclone-30 performance meets these requirements although it is essential to ensurethat the beam size at the target location can be controlled within the "footprint" of the material onthe target thereby minimising the usage of the expensive enriched isotope material. Figure 8shows a typical TRANSPORT generated computer calculation of beam line optimisation for apossible Cyclone-30 beam to give a minimum 'image' size of 20 mm x 4 mm onto an inclinedtarget footprint of 20 mm x 40 mm, and using the minimum length of beam line yet allowingsufficient space for shielding between cyclotron vault and target vault. For this particularexample the beam optics show a very large vertical beam dimension. Beam line design forcommercial operation has to satisfy two conflicting demands:
a small beam size at the target to minimise the usage of expensive enriched isotopes- a short beam line length to limit the construction costs of the facility.
The final design is a compromise ensuring that beam loss in the beam lines does not leadto excessive radiation and activation of equipment.

357
50 -
40 -
30
20
10
1 0
-10
-20 -
-30 -
-40
-50 J
D-O-D
2 (Thousands) 4
Distance from Emittance Meter, mm
Fig. 8 Cyclone-30 beam optics calculated with the TRANSPORT program
6 . RADIOCHEMISTRY
In cyclotron systems, the amount of isotope generated in the targets is determined by thesum effect of the physical processes described earlier. Extraction of the radioisotope from thetargets is achieved by chemical or radiochemical methods. For example, in order to achieve thecorrect radiochemical formulation for thallium-201, the following processes are required:
First chemical separation: Acid extraction of the primary product lead-201 from the initialthallium-203 and the target base material, e.g. copper.
Second chemical separation: Ion exchange to remove the secondary product thallium-201from the primary product lead-201.
- Chemical recovery of the original thallium-203 from the aliquot of lead and thalliumisotopes as well as the copper impurities.
- Possible removal of the radioactive zinc-65 from the copper material in the target basesince this radionuclide constitutes a severe radioactive waste disposal issue.
The graph of Fig. 9 shows the change in radioactivity during the manufacture of Tl-201during bombardment, the first and second chemical separations, pharmaceutical production, thedecay of Tl-201 to the reference date of the product and to the expiry date of the material.
The majority of other isotopes using solid targets, e.g. Ga-67, In-111, etc. are producedby similar techniques although some processes may employ organic solvent extractionchemistry. The main exception is 1-123 which is usually produced by dedicated bombardmentand processing equipment such as the gas system using Xe-124 as developed at KF Karlsruhe.
These chemical processes are performed within a facility dedicated for the production ofradiochemicals and containing heavily shielded production plant or cells with shieldingequivalent to 10 or 20 cm lead. Each plant is usually equipped with:
• a set of manipulators,• leaded-glass window,• in-plant chemical equipment,• front-panel controls for electrics and pneumatics,• transfer ports for product flow, waste materials,• air flow into filtered air handling unit
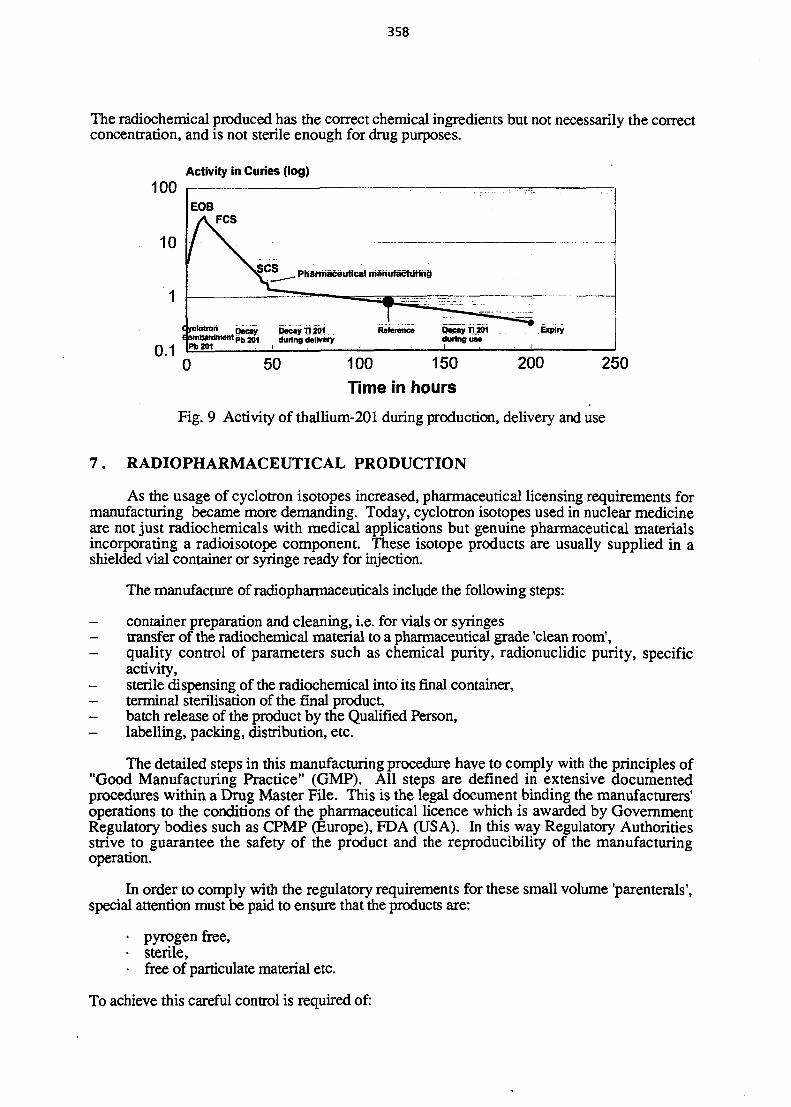
358
The radiochemical produced has the correct chemical ingredients but not necessarily the correctconcentration, and is not sterile enough for drug purposes.
Activity in Curies (log)
Pharmaceutical manufacturing
1
0.1<irck>lron i ) ^ Decay Ti2?1E amMrdment P b W 1 during delivery
Reference Decay T1_201during u »
Expiry
0 50 100 150 200 250Time in hours
Fig. 9 Activity of thallium-201 during production, delivery and use
7 . RADIOPHARMACEUTICAL PRODUCTION
As the usage of cyclotron isotopes increased, pharmaceutical licensing requirements formanufacturing became more demanding. Today, cyclotron isotopes used in nuclear medicineare not just radiochemicals with medical applications but genuine pharmaceutical materialsincorporating a radioisotope component. These isotope products are usually supplied in ashielded vial container or syringe ready for injection.
The manufacture of radiopharmaceuticals include the following steps:
- container preparation and cleaning, i.e. for vials or syringes- transfer of the radiochemical material to a pharmaceutical grade 'clean room',- quality control of parameters such as chemical purity, radionuclidic purity, specific
activity,sterile dispensing of the radiochemical into its final container,
- terminal sterilisation of the final product,batch release of the product by the Qualified Person,
- labelling, packing, distribution, etc.
The detailed steps in this manufacturing procedure have to comply with the principles of"Good Manufacturing Practice" (GMP). All steps are defined in extensive documentedprocedures within a Drug Master File. This is the legal document binding the manufacturers'operations to the conditions of the pharmaceutical licence which is awarded by GovernmentRegulatory bodies such as CPMP (Europe), FDA (USA). In this way Regulatory Authoritiesstrive to guarantee the safety of the product and the reproducibility of the manufacturingoperation.
In order to comply with the regulatory requirements for these small volume 'parenterals',special attention must be paid to ensure that the products are:
• pyrogen free,• sterile,• free of paniculate material etc.
To achieve this careful control is required of:

359
• the manufacturing environment,• the manufacturing processes,• the product containers.
In addition there is also a requirement that manufacturing operations are performed in a mannerthat minimises the risk of:
• cross contamination of one product by another,• incorrect labelling of product containers etc.
A system of Quality Assurance must be in place to ensure that all processes aredocumented, validated and performed repeatably in accordance with written instructions. Allbatches of materials used in processes must be tested to ensure conformance with specification;traceability of materials through to the finished product must be maintained and batches of finalproduct for sale must be tested/inspected to demonstrate conformance with specification. Allproduction facilities must be regularly monitored to ensure continuing performance tospecification, e.g.
water quality in purified suppliesair quality in clean roomsperformance of sterilisersintegrity of air filterscalibration of measuring instrumentsDuring the development phase of a new product, all processes must be systematically
validated to show that the process will produce the specified output for all inputs at the upperand lower limits of their specification ranges. This will include a demonstration that the productremains stable throughout its shelf life for specified storage conditions. All experimental andtest data must be retained and is liable to inspection by the Regulatory Authority. The finishedproduct must be stored and shipped in a manner that ensures that product deterioration does notoccur. Finally, the selection and training of staff is vital to the maintenance of GMP.
8 . DESIGN OF THE FACILITY
For the purpose of this discussion, the construction of a complete radiopharmaceuticalgrade facility is assumed on a green field site.
According to the principles described in Section 5, a cyclotron and associated beam linesare selected and purchased from a specialist vendor. Design features of the facility foraccommodating this accelerator hardware should include:
• construction of a solid base or plinth,• construction of a complete radiological shield or vault for the cyclotron, beam lines and
target system,• subterranean access to the cyclotron for maintenance,• adequate headroom for access to the ion source and for lifting the upper pole of the
magnet for maintenance.
The design of a conventional radiological shield or vault should allow for:
• attenuation of the neutron flux (produced at the isotope target) to a level of< 5 jj.Sv.hr"1 at the external surface of the shield
• selection of appropriate material (concrete) to ensure correct shielding efficiencywithout voids and without high Z materials which result in high activation levels,
• correct design to avoid neutron (and gamma) short paths in access ducts and channels• correct design of the movable access doors,

360
• fail safe interlock system for access to each vault• adequate shielding and protection around the beamline penetrations into target vaults.
Target station design should allow for:
• remote mechanical control of the target load/unload function,• diagnostic and monitoring of target performance parameters,• protection against loose material contamination from the target assembler,• installation of pneumatic controlled rabbit systems (or equivalent) with shielding to
transfer targets to their respective handling stations,• mechanical back-up for systems 'disaster' recovery of radioactive targets,• material specification for radiation hard materials, low-Z materials and wherever
possible, the absence of semiconductor control devices.
Support services for the accelerator/cyclotron system are:
• correctly fused, interference-free, electrical power supplies including uninterruptiblepower supplies for key equipment, i.e. computers, safety systems,
• high pressure, de-ionized water supply for cooling of the targets and the cyclotronsystem,
• air handling of cool, filtered air to avoid humidity and the accumulation of gaseousradionuclides such as argon 41 with appropriate ? cycles,
• compressed air for servicing much of the mechanical (pneumatic) controls,• mechanical engineering shop capable of machining radioactive components.
A validated waste disposal system with facility monitoring for unacceptable levels ofbackground radiation and contamination is necessary which includes:
• solid waste disposal and compaction of target and ancillary cyclotron components• removal of effluent generated in the radiochemical and pharmaceutical areas
An overall facility design is shown in Fig. 10 with
• segregated areas for cyclotron operations,• high level radioactive radiochemical processing area,• clean room environment for radiopharmaceutical finishing operations,• ground floor laboratories for quality control etc.,• appropriate personnel change rooms and environmental monitoring support services• upper storey accommodation for mechanical and electrical plant, non-radioactive
workshops, offices, etc.• warehouse, packing and product despatch areas for the final product.
9 . CONCLUSION
The design principles of a cyclotron facility for the commercial production ofradiopharmaceuticals has been described, explaining the underlying physical principles ofdesign, the requirements of radiochemical production and final pharmaceutical finishing. Thedesign of a "green field" facility with all the support functions at today's prices would costapproximately £8M sterling. However, in order to generate an adequate return on this financialinvestment, sales of cyclotron isotope products of the order of £4M to £5M per year arenecessary. This can only be achieved by:
- The large manufacturers who have existing approved drug licences and large salesorganisations capable of distributing the products too numerous hospitals and medicalcentres, or
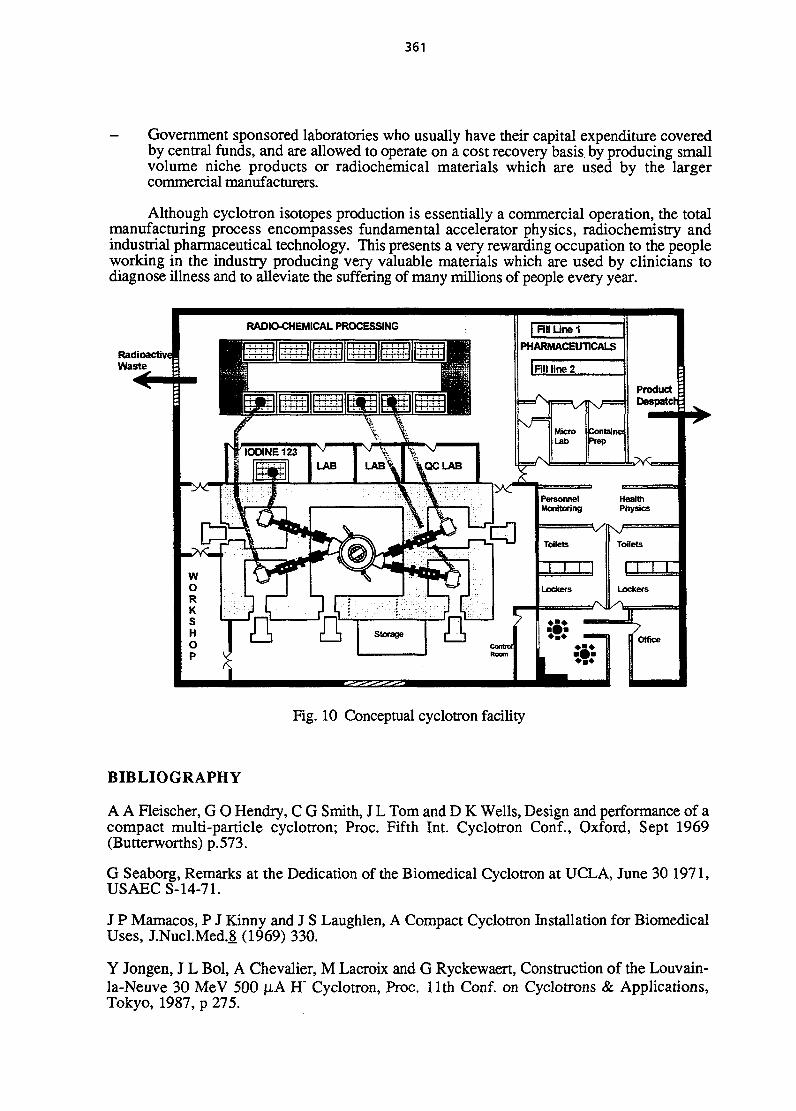
361
- Government sponsored laboratories who usually have their capital expenditure coveredby central funds, and are allowed to operate on a cost recovery basis by producing smallvolume niche products or radiochemical materials which are used by the largercommercial manufacturers.
Although cyclotron isotopes production is essentially a commercial operation, the totalmanufacturing process encompasses fundamental accelerator physics, radiochemistry andindustrial pharmaceutical technology. This presents a very rewarding occupation to the peopleworking in the industry producing very valuable materials which are used by clinicians todiagnose illness and to alleviate the suffering of many millions of people every year.
RadioaWaste
RADIO-CHEMICAL PROCESSING
Fig. 10 Conceptual cyclotron facility
BIBLIOGRAPHY
A A Fleischer, G O Hendry, C G Smith, J L Tom and D K Wells, Design and performance of acompact multi-particle cyclotron; Proc. Fifth Int. Cyclotron Conf., Oxford, Sept 1969(Butterworths) p.573.
G Seaborg, Remarks at the Dedication of the Biomedical Cyclotron at UCLA, June 30 1971,USAEC S-14-71.
J P Mamacos, P J Kinny and J S Laughlen, A Compact Cyclotron Installation for BiomedicalUses, J.Nucl.Med.8 (1969) 330.
Y Jongen, J L Bol, A Chevalier, M Lacroix and G Ryckewaert, Construction of the Louvain-la-Neuve 30 MeV 500 |iA H" Cyclotron, Proc. 11th Conf. on Cyclotrons & Applications,Tokyo, 1987, p 275.

362
M Lagunas Solar, Cyclotron production of no carrier added medical radionuclides, DEE Trans,on Nucl.Science, Vol. NS-30, No.2, p. 1805 (1983).
Qaim, Weinrich, Ollig, Int. J. Appl. Rad. Isotopes, 30, 85 (1979).
T J Ruth, The Production of Radionuclides for the Biosciences, Proc. 13th Int. Conf.Cyclotrons & Applications, Vancouver (World Scientific, 1992) p.206.
J Lamb, Commercial production of radioisotopes for nuclear medicine 1970-1980, IEEE Trans.Nucl. Science (April 1981), Vol NS-28 No.2, p.1916.
K Lebourtz, S Greene and T Fairchild, J. Nucl. Med., 16, 151 (1975).
J Tracy, Isotope separation program - present and future, Nucl. Inst. & Methods in PhysicsResearch, 282 (1989) p.261.
G Pinto, M Straatman, D Schyler, S Curris and G O Hendry, Target systems for radioisotopeproduction, IEEE Trans. Nucl. Science (April 1983), Vol NS-30 No.2, p.1797.
J J Burgerjon, Z Gelbart, G O Hendry, J C Lofvendahl, L Mcllwraith and G A Pinto, A highpower target system for radioisotope production, Proc. 11th Int. Conf. on Cyclotrons &Applications, Tokyo, 1986.
T R F Forrest, A method for calculation of cyclotron product yields, Amersham Internationalinternal report, November 1987, PTDS/R8.
T R F Forrest, Demonstration of a practical stationary target system, Amersham Internationalinternal report, November 1987, PTDS/R10.
IB A, Ion Beam Applications SA, Chemin du Cyclotron 2, B-1348 Louvain-la-Neuve,Belgium.
EBCO Industries Inc., 7851 Aldebridge Way, Richmond, BC, Canada V6X2A4.
Scanditronix AB, Jusbyborg, S-75229, Uppsala, Sweden.
European Communities Commission, "The Rules Governing Medicinal Products in theEuropean Community", Vol. IV (1989), ISBN 92-825-9572-2.

363
COMPUTATIONAL TOOLS FOR ACCELERATOR DESIGN
L. RinolfiCERN, Geneva, Switzerland
AbstractBased on the method generally followed for an accelerator design, thiscontribution describes some of the computational tools which can beused. A brief review is given for simulation codes related to the designof accelerator components and those related to the beam dynamicswith emphasis on electron linacs.
1. INTRODUCTION
The title of this contribution is rather ambiguous. Indeed it could imply that allcomputational tools available for accelerator design are described. Although the purpose is todescribe the codes running on various computers, and probably not the machines themselves, itwould be hard to cover all the codes currently available, even if we restrict ourselves to thefield of linacs and cyclotrons.
Therefore we will focus on the method which can be applied in the design of anyaccelerator and after that on the codes which have been found to be particularly useful in theanalysis and design of accelerators. If some readers do not find mention of their favorite codes,this is possibly due to limitations of knowledge or of room to describe them.
A deliberate choice is also made to avoid detailed description of the physics of the codes.In the references and bibliography given at the end, the reader will find more information aboutexisting and known codes and the related physics.
2. METHOD AND TOOLS
During the design phase of a whole accelerator project or a small test facility, or evenimprovements to an existing accelerator, many discussions and calculations are involved. Oncethe guide lines (physics) and the goals (beam performance) of the project are defined, theexercise starts. The different steps, with many interchanges between them, are:
i) submit the project to discussion by presenting the basic ideas
ii) check the orders of magnitude for the main parameters and see if the beamperformance is achievable
iii) elaborate a first model, generally based on analytical calculations
iv) realise the next model either from existing simulation codes or from a new one tobe written in order to model the real machine as well as possible
v) improve the model by including new factors and new effects if necessary.
These general rules have to be taken as advice and will avoid disappointment to theaccelerator designer tempted to jump directly to calculations with a 3-D code!

364
To illustrate the different phases, the following tool list is proposed:
i) pencil + paper
ii) pocket calculator
iii) desktop computer
iv) large computer.
Emphasis will be made on some existing simulation codes for linacs. Among the pro-posals for the future linear accelerators, there is the CLIC (CERN Linear Collider) which isforeseen beyond the year 2000. A small linear accelerator CTF (CLIC Test Facility) has beeninstalled at CERN and has been running for several years. It will be used, as an example, toillustrate this contribution.
3. DESIGN ACCORDING TO THE MACHINE
For a given type of particle (leptons, ions,...), two main topics should be considered:
1) the accelerator structure
2) the beam dynamics.
Three main families of accelerators and a particular case are presented.
3.1 Linear accelerators
A linear accelerator is a machine in which particles are accelerated on a linear path, acharged particle q crossing an electric field E being submitted to a force F = q E. Anelectrostatic field can be used to accelerate such particles. The dc accelerators (type Van deGraaff) are still used for low energy ion acceleration. Due to the limitations to high continuousvoltage, the acceleration in linear accelerators is produced by time-varying electric fields. Thetwo methods used are:
i) the RF (Radio Frequency) linac
ii) the induction linac.
The RF linacs are composed of resonant cavities (standing-wave structures) orwaveguides (travelling-wave structures) with sinusoidally varying electromagnetic fields in therange of some MHz up to 30 GHz [1,2,3]. Induction linacs [4] are composed of an array ofmodules where a pulsed current passing through a toroid produces a rapidly changingmagnetic flux and according to Faraday's law a voltage is induced across an accelerating gap.The beam dynamics concern the longitudinal and the transverse planes. They will normallydiffer according to the type of particles. Electrons are light particles and they are quicklyrelativistic. In a path length less than 1 m, they can approach the velocity of light and theytravel inside the linac at this essentially constant velocity. The consequence in the longitudinalphase plane is that the classical stability diagram of non-relativistic particles opens up and nophase oscillations can occur. As the beam charge increases some additional beam-dynamicseffects begin to degrade the beam performance (space charge, beam loading, wake fields,...).Solutions for reducing or cancelling these effects can significantly influence the parameterchoice for the accelerator design.

365
3.2 Circular accelerators
If linacs can be considered as RF-oriented machines, circular ring accelerators are rathermagnet-oriented machines. The accelerator structure consists basically of a pattern ofsuccessive dipoles, quadrupoles and drift spaces. For the acceleration process or for particularRF requirements, one or more RF cavities are installed. Again, the beam dynamics handle bothtransverse and longitudinal planes. For the latter the behaviour is similar to the linac for non-relativistic particles. For leptons, synchrotron radiation cannot be neglected and should betaken into account from the beginning even for the first model. In order to get a correct closedorbit, limitations on periodicity are preponderant in designing the lattice. Since a particlepasses the same place several times, there is a repetitive exposure to the errors andperturbations existing in the machine. This can lead to destructive resonances.
An uncommon use for a circular machine is to decelerate particles. An example is givenby the CERN Proton Synchrotron (PS) which receives antiprotons at 3.5 GeV/c and afterdeceleration down to 0.6 GeV/c ejects the particles towards LEAR (Low Energy AntiprotonRing). A storage ring represents also a special design and application.
Some particular beam-dynamics effects related to circular machines (closed-orbitdistortion, intra-beam scattering, instabilities due to resonances, transition energy,...) and thecomputational tools related to them, will not be described in this contribution.
3.3 Cyclotrons
As in the other accelerators the two main topics, the accelerator structure and the beamdynamics should be considered. However for such machines, the magnet system and the RFsystem are extremely interdependent. The cyclotron magnet design and the RF design require acomplete view of the cyclotron [5]. The two main issues are:
i) the isochronous aspect where the particles and the accelerating RF remain in phaseand where the magnetic field follows the relativistic mass increase during theacceleration process.
ii) the resonances: during the acceleration it is unavoidable to cross resonances, as insynchrotron machines. The time that the charged particles remain on the resonanceand the amplitude of the driving term determine the beam behaviour.
The analytical equations are given in Ref. [5, 6] and can be treated with a pocketcalculator or desktop computer. The available simulation codes will be mentioned in section 9.
3.4 Transfer lines
Although they are not accelerators, great care still needs to be taken in order to preservethe beam quality. Here the transfer structure is composed of drift spaces, dipoles andquadrupoles. For linacs the structures are open at each end and therefore they do not requirespecific techniques to inject and extract beams. Only at the injection should the beam bebunched. For circular machines, the beam characteristics at the end of the transfer line willdetermine the injection process, while the beam characteristics at the end of the accelerationwill determine the optics of the transfer line. Devices like septa and kickers should be includedin the design. The goal is to get 100% transmission in the transfer line and no degradation ofthe beam performance at the entrance of the next machine or in the detector. Manycomputational tools used for beam transport in transfer lines are those used for linear orcircular accelerators. Therefore, no specific development is required and the names of theprograms dealing with such issues are mentioned later on in the text

366
4. AN EXAMPLE: THE CLIC TEST FACILITY (CTF)
In 1985, a first proposal [7] for the CLIC project was made. For this new acceleratorproject, where an electron beam collides with a positron beam, the choice for the RF frequencyis 30 GHz. At this frequency, there is no device available which is able to deliver enoughpower to accelerate the beams. For the collision energy (500 GeV), an electric field of80 MV/m is required in order to keep the length of the linear accelerators reasonable (in therange of 4 km).
Therefore, the guide lines are: " invent a device (type klystron) which is able to deliverseveral tens of MW at 30 GHz and prove that is possible to accelerate an electron beam withsuch a device". The goals are:
i) production of an accelerating gradient of 80 MV/m
ii) prove that the RF structure is able to sustain such a high electric field.
We will see how the proposed steps for an accelerator design, with the correspondingcomputational tools, can be applied.
5. BASIC IDEAS USING A PENCIL AND PAPERWhen it was decided to produce a 30 GHz RF power source from an electron beam, a roughinvestigation showed that a short pulse (10 ps) and high charge (20 nC) were required. Afterhaving analyzed almost all classical machines, it became clear that both parameters were notachievable simultaneously. Therefore it was necessary to find a new source producing suchelectron pulses. The choice was made in the direction of photo-electrons: a photo-cathodeilluminated by a laser pulse would be able to produce such a beam. Figure 1 shows the firstlayout of the CTF.
4.S MeV/cTRS
LAS: LIL Accelerating Structure: it is a 4.5 m long travelling-wave structure (3 GHz)
TRS: TRansfer Structure: it is a CLIC decelerating structure (30 GHz)
CAS: CLIC Accelerating Structure (30 GHz)
Fig. 1 First layout of CTF
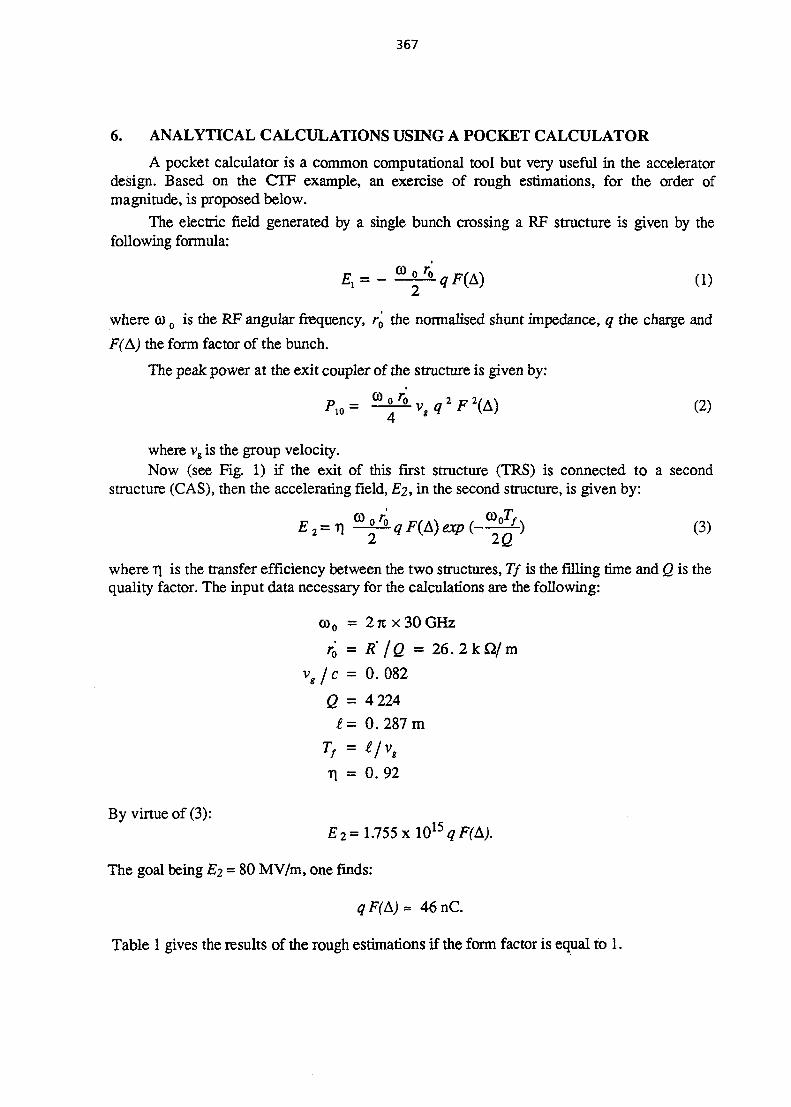
367
6. ANALYTICAL CALCULATIONS USING A POCKET CALCULATOR
A pocket calculator is a common computational tool but very useful in the acceleratordesign. Based on the CTF example, an exercise of rough estimations, for the order ofmagnitude, is proposed below.
The electric field generated by a single bunch crossing a RF structure is given by thefollowing formula:
where Q) 0 is the RF angular frequency, r'o the normalised shunt impedance, q the charge and
F(A) the form factor of the bunch.
The peak power at the exit coupler of the structure is given by:
^ (2)
where vg is the group velocity.Now (see Fig. 1) if the exit of this first structure (TRS) is connected to a second
structure (CAS), then the accelerating field, E2, in the second structure, is given by:
E^n^F^exp (-?£-) (3)
where r\ is the transfer efficiency between the two structures, Tf is the filling time and Q is thequality factor. The input data necessary for the calculations are the following:
co0 = 2% x30GHz
r0 = R' lQ = 2 6 . 2 k Q / m
vjc = 0. 082
Q = 4 224
* = 0. 287 mT — P I v
f — Is
r\ = 0. 92
By virtue of (3):
£ 2 = 1-755 x l O 1 5 ? ^ .
The goal being £2 = 80 MV/m, one finds:
qF(A)~ 46 nC
Table 1 gives the results of the rough estimations if the form factor is equal to 1.

368
Table 1
Electric fields and power for CTF
Parameters
Charge q
Power Pio
Peak decelerating field Ej on axis
Values
46
63
113
Unit
nC
MW
MV/m
From these rough estimations, one can imagine that a single bunch of 46 nC with a formfactor close to 1 (i.e. bunch length [FWHH] of 5 ps) will not be easy to produce and transport.Also a peak electric field of more than 100 MV/m on axis is not a current value for an RFstructure and will require a careful design. A pocket calculator is sufficient to estimate themain parameters at this step of the accelerator design.
7. COMPUTATIONAL FACILITIES FROM A DESKTOP COMPUTER
7.1 First model of accelerator design from analytical calculations
It is often possible to give analytical expressions to calculate the beam dynamics in agiven accelerator as a first model. For example the paraxial equation is used as a firstapproximation in many designs. References [1,2,3] provide basic equations for linacs andReferences [5,6] for cyclotrons.
Coming back to the CTF, it was found after experiments that the space-charge effectscombined with large dispersion of the first optics had an effect too significant to reach theexpected beam performance. Therefore it was decided to simplify the optics for the electronbeam (i.e. no bends between the gun and the subsequent acceleration) and shorten the pathlength of the beam at low energy. But as a consequence the optics for the laser became morecomplicated to correctly illuminate the photo-cathode. A new RF structure (Booster) wasadded to decrease the space charge-effects at low energy. Figure 2 shows the layout of thenew design.
4 CELL
BOOSTERill
TRS
SNF: Solenoid LAS: LIL Accelerating Structure >rQF. QD: Quadruples LJ ' 'TRS: Transfer Structure CAS: CLIC Accelerating Structure CAS
Fig. 2 Layout of the present CTF
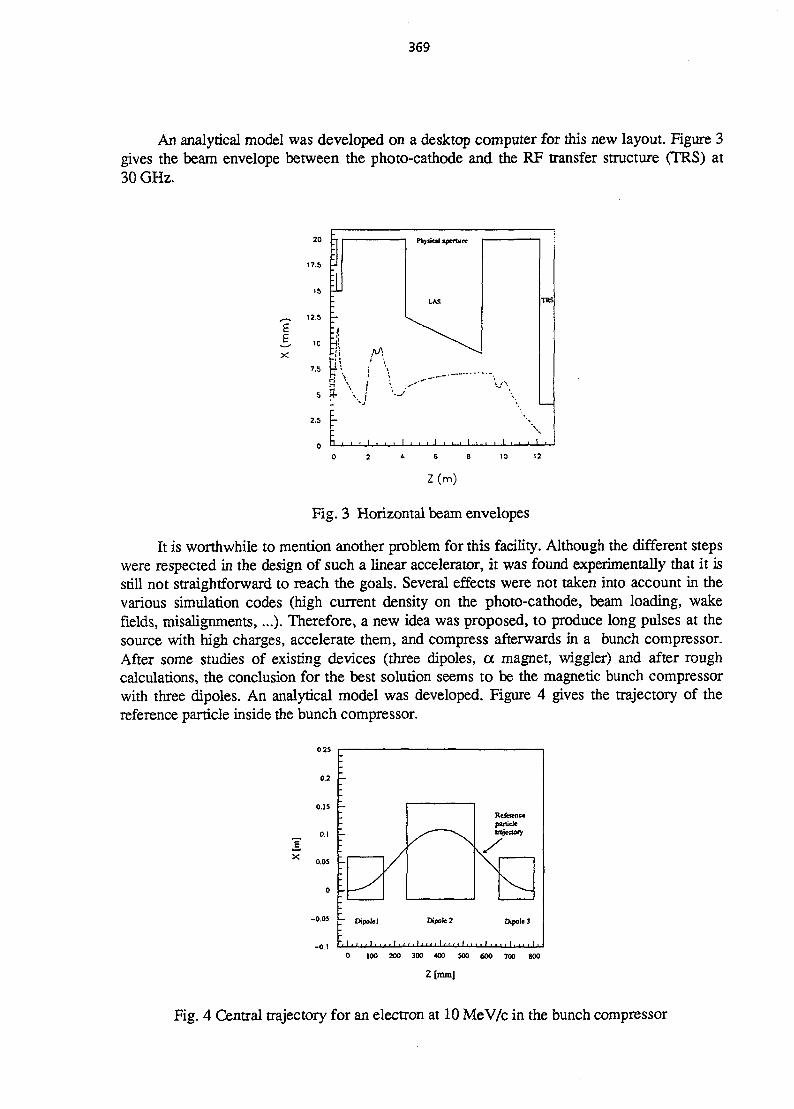
369
An analytical model was developed on a desktop computer for this new layout. Figure 3gives the beam envelope between the photo-cathode and the RF transfer structure (TRS) at30 GHz.
££
20
17.5
15
12.5
iL
t . ,
Pb>-tKM aperture
LAS TRS
, , i i i . , i i . . i . . i i .
Z(m)
Fig. 3 Horizontal beam envelopes
It is worthwhile to mention another problem for this facility. Although the different stepswere respected in the design of such a linear accelerator, it was found experimentally that it isstill not straightforward to reach the goals. Several effects were not taken into account in thevarious simulation codes (high current density on the photo-cathode, beam loading, wakefields, misalignments,...). Therefore, a new idea was proposed, to produce long pulses at thesource with high charges, accelerate them, and compress afterwards in a bunch compressor.After some studies of existing devices (three dipoles, a magnet, wiggler) and after roughcalculations, the conclusion for the best solution seems to be the magnetic bunch compressorwith three dipoles. An analytical model was developed. Figure 4 gives the trajectory of thereference particle inside the bunch compressor.
X
0.2
0.15
0.1
0.OS
T Oipole! Dipole2
. . . I . . . . I . i . . 1 . . . . I . . . . I .
DipoleJ
0 100 200 300 400 500 600 700 800
Z[mm]
Fig. 4 Central trajectory for an electron at 10 MeV/c in the bunch compressor
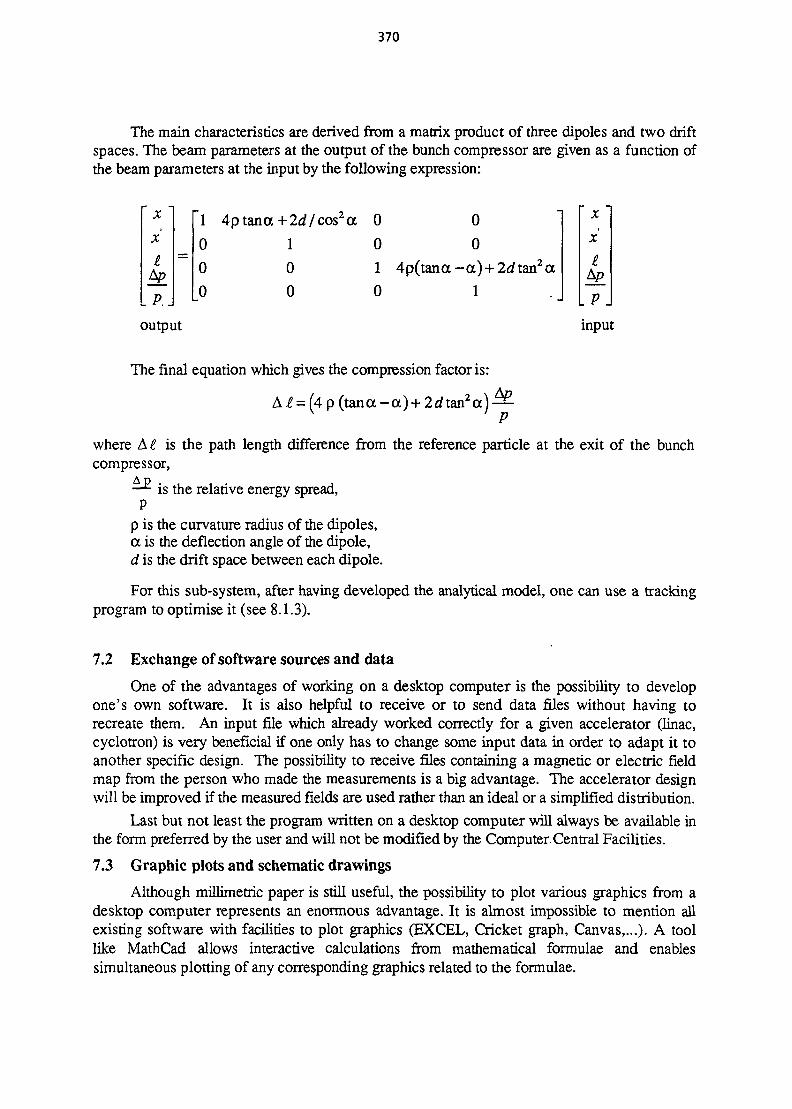
370
The main characteristics are derived from a matrix product of three dipoles and two driftspaces. The beam parameters at the output of the bunch compressor are given as a function ofthe beam parameters at the input by the following expression:
X
X
£Ap
. P..
output
1 4pt0
0
0
ana+21
0
0
0
0
0
0
4p(tana-cc) + 2fi?tan2a
xX
£
IP Jinput
The final equation which gives the compression factor is:
ApA £ = U p (tana - a ) + 2<2tan2a) —
V ' P
where A£ is the path length difference from the reference particle at the exit of the bunchcompressor,
—*- is the relative energy spread,P
p is the curvature radius of the dipoles,a is the deflection angle of the dipole,d is the drift space between each dipole.
For this sub-system, after having developed the analytical model, one can use a trackingprogram to optimise it (see 8.1.3).
7.2 Exchange of software sources and data
One of the advantages of working on a desktop computer is the possibility to developone's own software. It is also helpful to receive or to send data files without having torecreate them. An input file which already worked correctly for a given accelerator (linac,cyclotron) is very beneficial if one only has to change some input data in order to adapt it toanother specific design. The possibility to receive files containing a magnetic or electric fieldmap from the person who made the measurements is a big advantage. The accelerator designwill be improved if the measured fields are used rather than an ideal or a simplified distribution.
Last but not least the program written on a desktop computer will always be available inthe form preferred by the user and will not be modified by the Computer.Central Facilities.
7.3 Graphic plots and schematic drawings
Although millimetric paper is still useful, the possibility to plot various graphics from adesktop computer represents an enormous advantage. It is almost impossible to mention allexisting software with facilities to plot graphics (EXCEL, Cricket graph, Canvas,...). A toollike MathCad allows interactive calculations from mathematical formulae and enablessimultaneous plotting of any corresponding graphics related to the formulae.
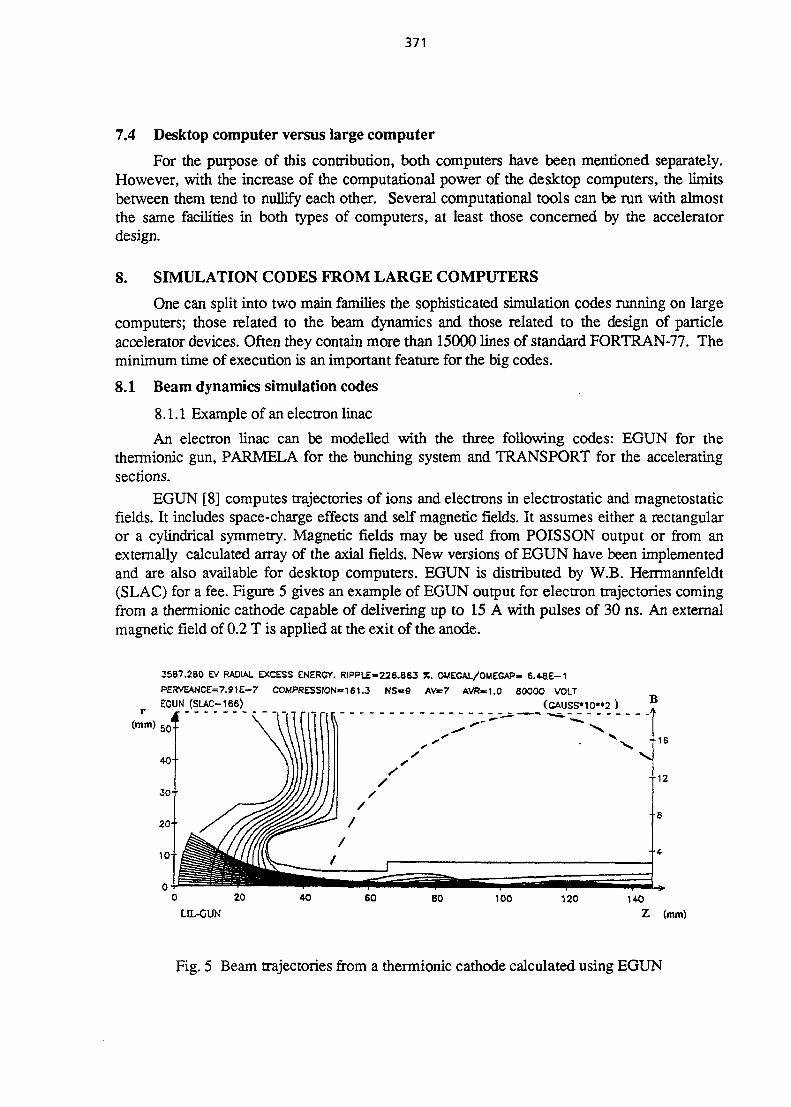
371
7.4 Desktop computer versus large computer
For the purpose of this contribution, both computers have been mentioned separately.However, with the increase of the computational power of the desktop computers, die limitsbetween them tend to nullify each other. Several computational tools can be run with almostthe same facilities in both types of computers, at least those concerned by the acceleratordesign.
8. SIMULATION CODES FROM LARGE COMPUTERS
One can split into two main families the sophisticated simulation codes running on largecomputers; those related to the beam dynamics and those related to the design of particleaccelerator devices. Often they contain more than 15000 lines of standard FORTRAN-77. Theminimum time of execution is an important feature for the big codes.
8.1 Beam dynamics simulation codes
8.1.1 Example of an electron linac
An electron linac can be modelled with the three following codes: EGUN for thethermionic gun, PARMELA for the bunching system and TRANSPORT for the acceleratingsections.
EGUN [8] computes trajectories of ions and electrons in electrostatic and magnetostaticfields. It includes space-charge effects and self magnetic fields. It assumes either a rectangularor a cylindrical symmetry. Magnetic fields may be used from POISSON output or from anexternally calculated array of the axial fields. New versions of EGUN have been implementedand are also available for desktop computers. EGUN is distributed by W.B. Herrmannfeldt(SLAC) for a fee. Figure 5 gives an example of EGUN output for electron trajectories comingfrom a thermionic cathode capable of delivering up to 15 A with pulses of 30 ns. An externalmagnetic field of 0.2 T is applied at the exit of the anode.
3587.280 EV RADIAL EXCESS ENERGY. R1PPLE-226.863 X. OMECAL/OMEGAP- 6.4.8E-1
PERVEANCE=7.91E-7 COMPRESSION 161.3 NS=9 AV=7 AVR«1.0 80000 VOLT
EGUN (SLAC-166) (GAUSS»10"2 )
0 20
LIL-CUN
B
• • 1 6
• • 1 2
Z (mm)
Fig. 5 Beam trajectories from a thermionic cathode calculated using EGUN

372
PARMELA (Phase And Radial Motion in Electron Linear Accelerator) is a multiparticletracking program with space-charge forces. It computes the particle distribution in six-dimensional phase space at the exit of each RF cell for any bunching system, the independentvariable being time. The code generates several types of initial electron distributions but thecontour of the chosen distribution should be as close as possible to the beam dimensionsderived from EGUN. The electric and magnetic fields in the RF structure can be provided byFourier coefficients for ideal sine waves or from a table calculated by a code such asSUPERFISH. External magnetic fields can be superimposed on any element (RF structure ormagnet) in the model. Although the main uses of PARMELA are for bunching systems, suchcodes can be used to simulate the beam dynamics in a whole linac composed of RF structuresbut also of magnets (dipoles, quadrupoles, solenoids, ....). From the output data it is possibleto plot the transverse and the longitudinal phase spaces at any place of the bunching system. Inaddition, the beam envelopes and the energy gain can be plotted all along the line. PARMELAis distributed by Lloyd Young (Los Alamos) free of charge. This code has proven to be a user-friendly tool and rather powerful in predicting the real behaviour of the beam. However it ispoorly documented and some laboratories have written specific user guides [9]. Figure 6 givesthe transverse phase space at the output of the bunching system. From such a distribution, itwill be possible to fit an ellipse from which parameters can be used as input data forTRANSPORT. These ellipses provide a good estimation of the transverse beam emittances.
- element no 1- Z = 0.8 cm- 1/2 fenetre en phase 130.
20. i . - fiornbre de partiate- total 535
f 5_ _£_ - fenetre 534
10...
5.
0. . .
" -5 . . .o
£-10.o
I -15.
-20.
-25.
. • / •
- H --10. -7.5 7.5 10.-5. -2.5 0. 2.5 5.
- coordonnee X - ( nnn )
Fig. 6 Transverse phase space at the bunching system output calculated with PARMELA
TRANSPORT [10] computes the transfer matrix of a beam line (first order up to thethird order). Elements of the line could be dipoles, quadrupoles, sextupoles, octupoles,solenoids and accelerating cavities. Starting from an ellipse in the transverse planes, one canperform the calculations all along the line for a given energy. As soon as particles are ultra-relativistic one can forget the space-charge effects. This is the case, in general, at the bunchingsystem exit. However if the charge is high in the accelerating structures, another phenomenonappears: beam loading. By simulation of the extreme energies, TRANSPORT can simulate thebeam loading effects in the electron linacs. From the output data one can plot the beamenvelopes, the energy gain, the beta functions, the dispersion function. Figure 7 shows an
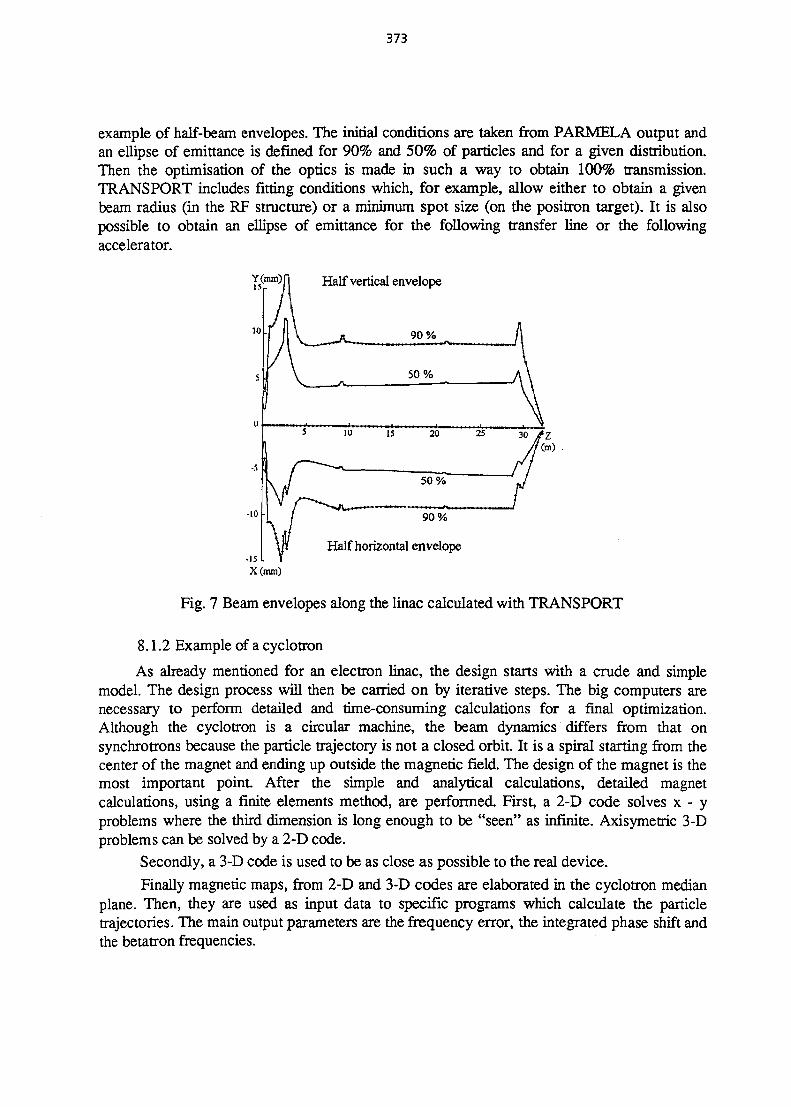
373
example of half-beam envelopes. The initial conditions are taken from PARMELA output andan ellipse of emittance is defined for 90% and 50% of particles and for a given distribution.Then the optimisation of the optics is made in such a way to obtain 100% transmission.TRANSPORT includes fitting conditions which, for example, allow either to obtain a givenbeam radius (in the RF structure) or a minimum spot size (on the positron target). It is alsopossible to obtain an ellipse of emittance for the following transfer line or the followingaccelerator.
Y(inm)j-j Half vertical envelope
10 . 90%
50%
15 20 25
50%
90%
Half horizontal envelope
Fig. 7 Beam envelopes along the linac calculated with TRANSPORT
8.1.2 Example of a cyclotron
As already mentioned for an electron linac, the design starts with a crude and simplemodel. The design process will then be carried on by iterative steps. The big computers arenecessary to perform detailed and time-consuming calculations for a final optimization.Although the cyclotron is a circular machine, the beam dynamics differs from that onsynchrotrons because the particle trajectory is not a closed orbit. It is a spiral starting from thecenter of the magnet and ending up outside the magnetic field. The design of the magnet is themost important point. After the simple and analytical calculations, detailed magnetcalculations, using a finite elements method, are performed. First, a 2-D code solves x - yproblems where the third dimension is long enough to be "seen" as infinite. Axisymetric 3-Dproblems can be solved by a 2-D code.
Secondly, a 3-D code is used to be as close as possible to the real device.
Finally magnetic maps, from 2-D and 3-D codes are elaborated in the cyclotron medianplane. Then, they are used as input data to specific programs which calculate the particletrajectories. The main output parameters are the frequency error, the integrated phase shift andthe betatron frequencies.
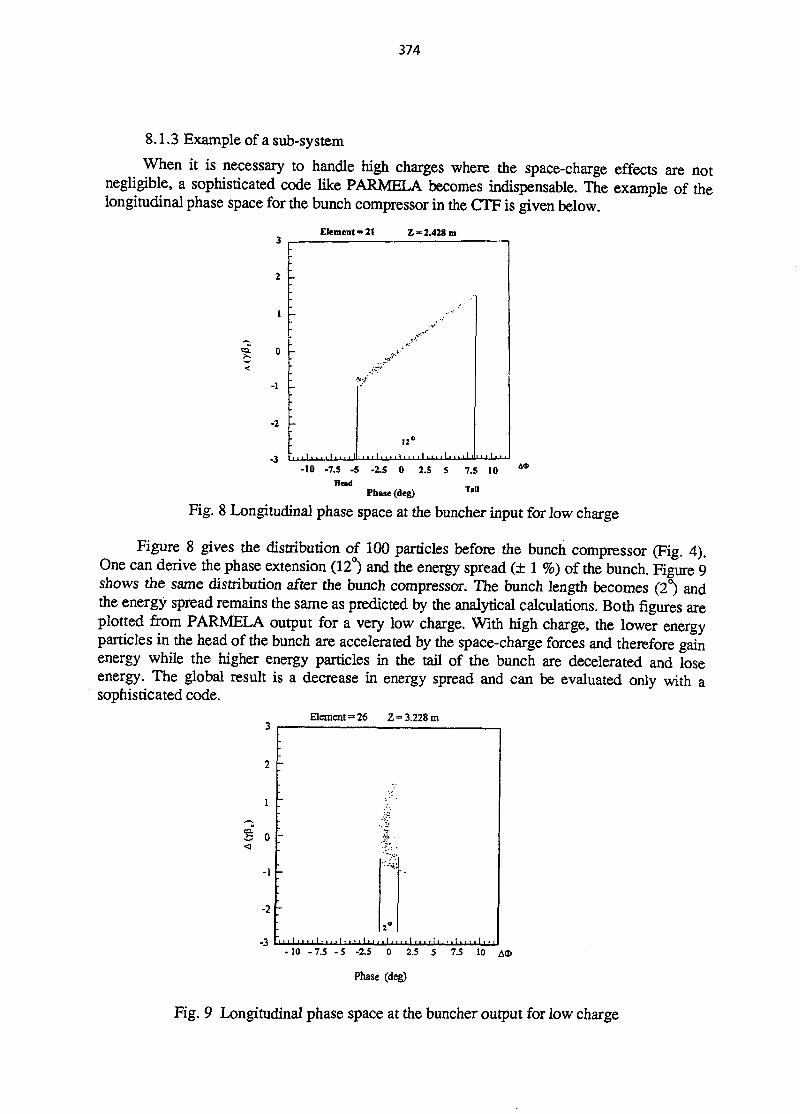
374
8.1.3 Example of a sub-system
When it is necessary to handle high charges where the space-charge effects are notnegligible, a sophisticated code like PARMELA becomes indispensable. The example of thelongitudinal phase space for the bunch compressor in the CTF is given below.
Element» 21 Z = 2.428 m
-10 -7.5 -S - iS 0 2.5 5 7.5 10Head
Phase (deg) Tail
Fig. 8 Longitudinal phase space at the buncher input for low charge
Figure 8 gives the distribution of 100 particles before the bunch compressor (Fig. 4).One can derive the phase extension (12°) and the energy spread (± 1 %) of the bunch. Figure 9shows the same distribution after the bunch compressor. The bunch length becomes (2°) andthe energy spread remains the same as predicted by the analytical calculations. Both figures areplotted from PARMELA output for a very low charge. With high charge, the lower energyparticles in the head of the bunch are accelerated by the space-charge forces and therefore gainenergy while the higher energy particles in the tail of the bunch are decelerated and loseenergy. The global result is a decrease in energy spread and can be evaluated only with asophisticated code.
3
2
1
i o
-2
-3
Element = 26
-
-
-
Z-
'% •
' • • - • ; •
2°
= 3.228 m
-10 -7.5 -5 -2.5 2.5 5 7.S 10 A0>
Phase (deg)
Fig. 9 Longitudinal phase space at the buncher output for low charge
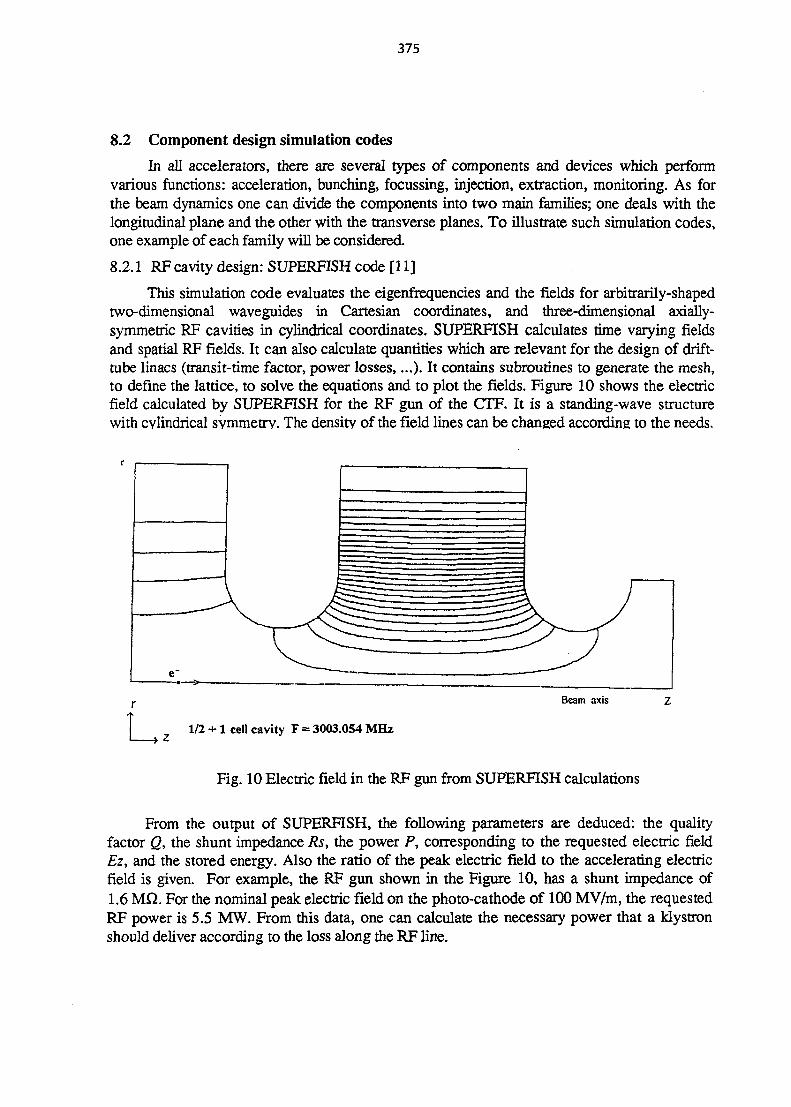
375
8.2 Component design simulation codes
In all accelerators, there are several types of components and devices which performvarious functions: acceleration, bunching, focussing, injection, extraction, monitoring. As forthe beam dynamics one can divide the components into two main families; one deals with thelongitudinal plane and the other with the transverse planes. To illustrate such simulation codes,one example of each family will be considered.
8.2.1 RF cavity design: SUPERFISH code [11]
This simulation code evaluates the eigenfrequencies and the fields for arbitrarily-shapedtwo-dimensional waveguides in Cartesian coordinates, and three-dimensional axially-symmetric RF cavities in cylindrical coordinates. SUPERFISH calculates time varying fieldsand spatial RF fields. It can also calculate quantities which are relevant for the design of drift-tube linacs (transit-time factor, power losses,...). It contains subroutines to generate the mesh,to define the lattice, to solve the equations and to plot the fields. Figure 10 shows the electricfield calculated by SUPERFISH for the RF gun of the CTF. It is a standing-wave structurewith cylindrical symmetry. The density of the field lines can be changed according to the needs.
Beam axis
1/2 + 1 cell cavity F = 3003.054 MHz
Fig. 10 Electric field in the RF gun from SUPERFISH calculations
From the output of SUPERFISH, the following parameters are deduced: the qualityfactor Q, the shunt impedance Rs, the power P, corresponding to the requested electric fieldEz, and the stored energy. Also the ratio of the peak electric field to the accelerating electricfield is given. For example, the RF gun shown in the Figure 10, has a shunt impedance of1.6 MQ. For the nominal peak electric field on the photo-cathode of 100 MV/m, the requestedRF power is 5.5 MW. From this data, one can calculate the necessary power that a klystronshould deliver according to the loss along the RF line.
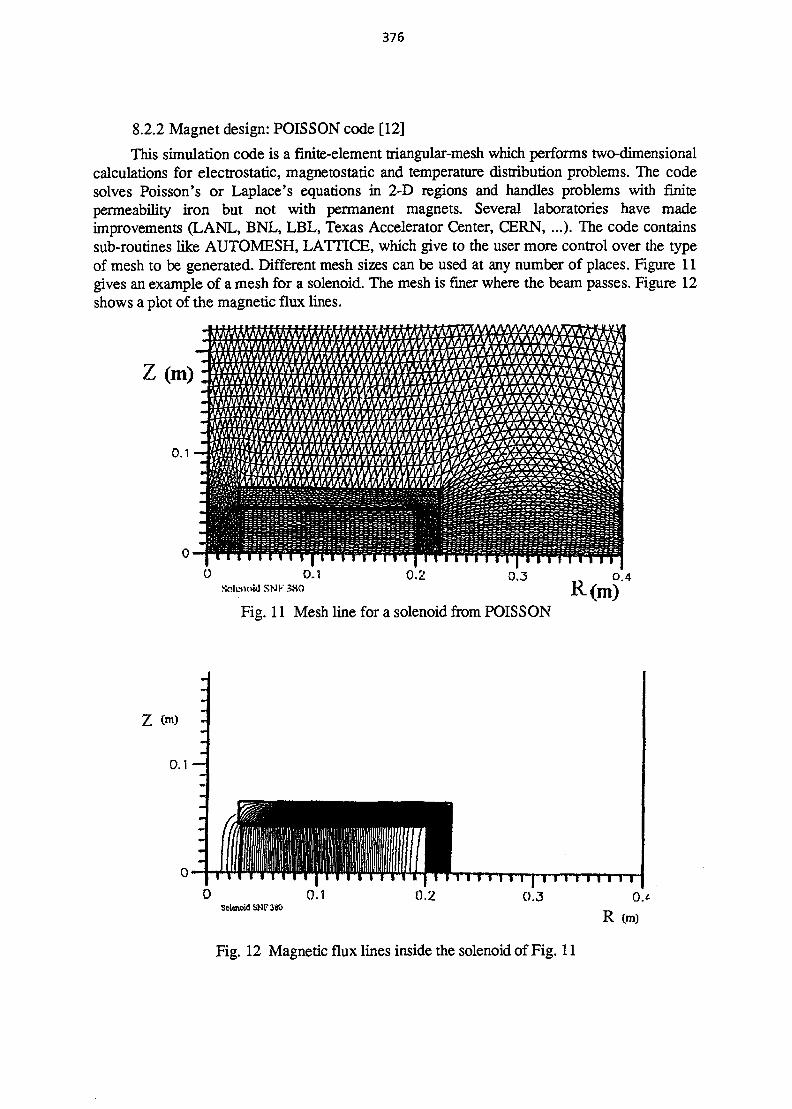
376
8.2.2 Magnet design: POISSON code [12]
This simulation code is a finite-element triangular-mesh which performs two-dimensionalcalculations for electrostatic, magnetostatic and temperature distribution problems. The codesolves Poisson's or Laplace's equations in 2-D regions and handles problems with finitepermeability iron but not with permanent magnets. Several laboratories have madeimprovements (LANL, BNL, LBL, Texas Accelerator Center, CERN,...). The code containssub-routines like AUTOMESH, LATTICE, which give to the user more control over the typeof mesh to be generated. Different mesh sizes can be used at any number of places. Figure 11gives an example of a mesh for a solenoid. The mesh is finer where the beam passes. Figure 12shows a plot of the magnetic flux lines.
Z(m):
0 0.1Solenoid SNK 3X0
0.3
Fig. 11 Mesh line for a solenoid from POISSONR(m)
O.4
0.1 —
0 0.1Solenoid SNF 380
I I I I I I I I I I I
0.3
R
Fig. 12 Magnetic flux lines inside the solenoid of Fig. 11

377
9. COMPUTER CODES FOR PARTICLE ACCELERATOR DESIGN
Many useful codes are widely distributed but several users make their own improvementsand the original author loses control. With each new generation of high energy accelerators,limitations in the existing codes are found and therefore it is necessary either to improve anexisting code or to write a new one. The consequence is often a duplication of the effort and aproliferation of different codes. When a simulation code provides an output which isinconsistent with the experimental results or when the data are suspicious, one should makecomparisons with another similar code. But then arises the problem of different types of inputand output and the different theoretical approaches. Table 2 lists some of the simulation codespresently available (alphabetic order).
Table 2Some current simulation codes
Use
Beam Dynamics:
- Linacs
- Cyclotrons
- Circular machines
- Transfer lines
Component design- RF cavities
- Magnets
- Ions and e" sources
- Klystrons
Codes
DYNAC, FLUX 2D, ITACA, MAPRO, PARMILA,PARMELA,...
NAJO, RELAX 3D,...
ABCI, MAD, PATRAC, PATRICIA, SAD,...
TRANSPORT, TURTLE,...
MAFIA, SUPERFISH,...
PE2D, POISSON, TOSCA,...
AXCEL, EGUN,...
RMKT,...
For the design of the next generation of high energy accelerators, there is a strong wishto establish an international collaboration and even an international center for acceleratorcodes. However it is not obvious how such collaborations can deal with the various types ofmachines and with the different types of particles. For the time being, each laboratory involvedin the design of accelerators uses the widely distributed codes like TRANSPORT,SUPERFISH, POISSON, and develops its own codes for the specific applications. Acompendium has been published by the Los Alamos Accelerator Code group [13] which givesa description of 203 codes used in 10 laboratories around the world. Though it is not anexhaustive list, it represents a useful document for those who are looking for existingsimulation codes which could cover the specific problem they have to deal with. Some newimprovements are not reported in [13]. For example, starting with the same approach asMAPRO and PARMILA (protons and ions), the code DYNAC [1] provides a better accuracyand can also be applied to electrons.

378
10. CONCLUSION
Whatever accelerator design one has to elaborate, it will always be necessary to use apencil and paper to express the basic ideas to be submitted to discussion and critics.
It is fundamental to develop analytical models in order to understand the simple physicsprinciples and for that a pocket calculator will always be useful and sufficient.
Finally when the physics is sufficiently understood, it is time to move to a desktopcomputer or a large computer to run sophisticated codes which, when they are correctly used,allow a rather good description of the new accelerator design and save time since it is notnecessary to build a prototype (magnet for example).
The door is still open to develop new simulation codes to take into account the very highcharges with their related effects, the superconductivity in linacs, cyclotrons and other circularmachines, and the high energies of the future accelerators.
ACKNOWLEDGEMENTS
My thanks go to F. Chautard, DJ. Warner and M. Weiss for their valuable comments onthis paper and to S. Turner for the careful reading of the text.
REFERENCES
[I] P. Lapostolle, Introduction to RF linear accelerators, these proceedings.
[2] D. Warner, Fundamentals of electron linacs, these proceedings.
[3] M. Weiss, Fundamentals of ion linacs, these proceedings.
[4] J. Mascureau, Induction linacs, these proceedings.
[5] Y. Jongen, Cyclotron magnet calculations, these proceedings.
[6] T. Stammbach, Introduction to cyclotrons, these proceedings.
[7] W. Schnell, Consideration of a two beam RF scheme for powering an RF linear collider,CLIC note 7, November 1985.
[8] W.B. Herrmannsfeldt, EGUN-An electron optics and gun design program, StanfordLinear Accelerator Center, report 331 (1988).
[9] B. Mouton, The PARMELA program, Version 4.3, LAL/Sera/93-455.
[10] K.L. Brown, F. Rothacker, D.C. Carey and C. Iselin, TRANSPORT: A computer pro-gram for designing charged particle beam transport systems, CERN report 80-04.
[II] K. Halbach and R.F. Holsinger, SUPERFISH-A computer program for evaluation of RFcavities with cylindrical symmetry, Particle Accelerators 7 (4), 213-222 (1976).
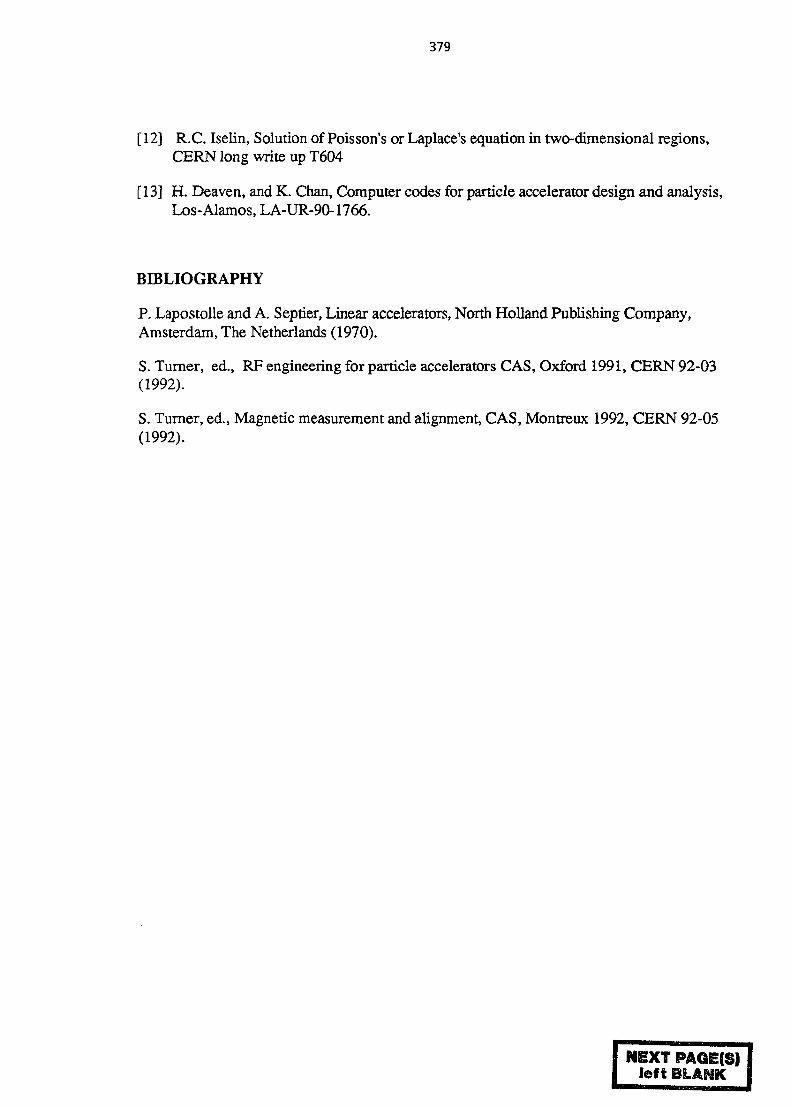
379
[12] R.C. Iselin, Solution of Poisson's or Laplace's equation in two-dimensional regions,CERN long write up T604
[13] H. Deaven, and K. Chan, Computer codes for particle accelerator design and analysis,Los-Alamos, LA-UR-90-1766.
BIBLIOGRAPHY
P. Lapostolle and A. Septier, Linear accelerators, North Holland Publishing Company,Amsterdam, The Netherlands (1970).
S. Turner, ed., RF engineering for particle accelerators CAS, Oxford 1991, CERN 92-03(1992).
S. Turner, ed., Magnetic measurement and alignment, CAS, Montreux 1992, CERN 92-05(1992).
NEXT §»AGE(S)left BLANK
381
MATCHING ACCELERATORS TO THE TASK
M. WeissCERN, Geneva, Switzerland
AbstractWhen a task or a project calls for the use of accelerators, thesehave to be chosen in such a way as to match best the requirements.The procedure applied in such cases is outlined in an example of amedical facility for cancer treatment.
1. INTRODUCTION
The choice of an accelerator for a given facility is not a simple affair, it requires a goodknowledge of several types of accelerator, which can be quite different in the way theyoperate. In a course like the present Applications of Cyclotrons and Linacs, it would havebeen natural to try to compare these two types, and figure out which one is better suited for aspecified task. But, even among cyclotrons, various types exist, and the same is true forlinacs. In practice, one would require different specialists to analyse, compute, and optimizedifferent types of accelerators and, in the end, one would have to choose the best solution,which is usually possible only after long discussions. To simplify things, this paper deals onlywith linear accelerators, but nevertheless establishes procedures by which different types oflinac are chosen to form an accelerator complex best suited to the task.
In Section 2 the task is specified, in this case a compact accelerator for medicalpurposes. Section 3 gives some preliminary design considerations, while Section 4 outlinesthe design method and gives some results. In Section 5 the solution is discussed, andSection 6 gives the concluding remarks.
2. DESCRIPTION OF THE TASK
The task we have chosen to demonstrate, the design procedure of an accelerator facility,is really under study. It is an Italian project, aimed at establishing a network of hospitalsequipped with accelerators for cancer treatment. The project is called TERA, the Italianacronym for hadrontherapy (terapia con adroni). Protons and light ions, like carbon oroxygen, seem well suited to the treatment of tumours: the distructive action of a beam of suchparticles can be directed on the cancerous cells, leaving the healthy tissue practicallyunharmed. This is due to the fact that the destructive action of the beam is mostlyconcentrated on the part of the body in which the particles are brought to a stop (Bragg peak).By varying the energy of the beam and scanning it sidewise, one can expose only the regionof the cancerous cells of a tumour to destruction, and spare the healthy tissue.
In the TERA project, one of the hospitals in the network is the Centre, being the onebest equipped with accelerators and with beam delivery systems to the various treatmentrooms. Other hospitals are to be equipped with compact accelerators, i.e. accelerators oflimited size and weight. Among the candidates for a compact accelerator are the cyclotrons(normal and superconducting) as well as linacs. In the latter case, in order to make theaccelerator small, one is tempted to go to high frequencies, and compose the compactaccelerator of various linac structures, each being the best choice in its energy range.
The specifications for a compact accelerator determine the particle type (proton), itsmaximum energy (200 MeV), the number of particles accelerated per second (2 x 10¹⁰) and,if the beam is pulsed, a minimum repetition rate (100 Hz). In addition, the requirements are toconstruct a reliable machine, easy to operate and to maintain, which means that one should

382
rely on 'proven technologies'. The accelerator should fit in a room of 100 square metresmaximum, all equipment included. Of course, the 'cost efficiency' of the proposedaccelerator could, in the end, be the determining factor for the choice.
This paper deals with the design of a compact accelerator composed of linacs operatingin the standing wave mode.
3. PRELIMINARY DESIGN CONSIDERATIONS
Before starting to design linacs as elements of the compact accelerator, one has todefine the compact accelerator itself in general terms. The following preliminaryconsiderations are of interest:
• Peak intensity in pulsed beams: the average current corresponding to the required2 x 10 particles per second is very small, approximately 3 nA (linacs can handle100 mA and more); therefore, to save RF power, one can operate the linacs in apulsed regime. For pulsed beams, a minimum repetition rate of 100 Hz is required bythe physicians; if the beam pulse is 3 /is long the peak current in the pulse is:
= 10100 Hz-3//s
which is again very small, even if one includes a safety factor in the peak current.
• Approximate compact linac length: at this stage, we do not distinguish between thevarious types of linacs used in the accelerator and apply the simple formula:
200 MeV
qE0T cos (ps
where q is the charge of the proton, E0T is the effective accelerating field which weassume to be 10 MV/m, <ps is the synchronous phase, = -20 , and L is theapproximate accelerator length, for which we get 22 m. Adding 20% to this length fordrift spaces between linac tanks, etc., we see that the accelerator will be about 27 mlong.
• RF and mains power: again we do not distinguish between the various parts of thecompact accelerator and apply the following formula for the peak RF power requiredto cover dissipation losses in the structure
where Zseff is the effective shunt impedance per unit length [1], assumed here to beabout 50 MQ/m; one obtains Pp = 45 MW. (The additional power which is deliveredto the beam being accelerated is neglected because of the very small beam current.)The average RF power is, of course, much lower, and is obtained by multiplying Pp
by the RF duty factor (product of the repetition rate, 100 Hz, and the RF pulse length,10 fJS [beam pulse length, 3 [JS, + RF field build up, 7 //s]):
Assuming that the efficiency of the RF power production is 40%, we would require amains power of
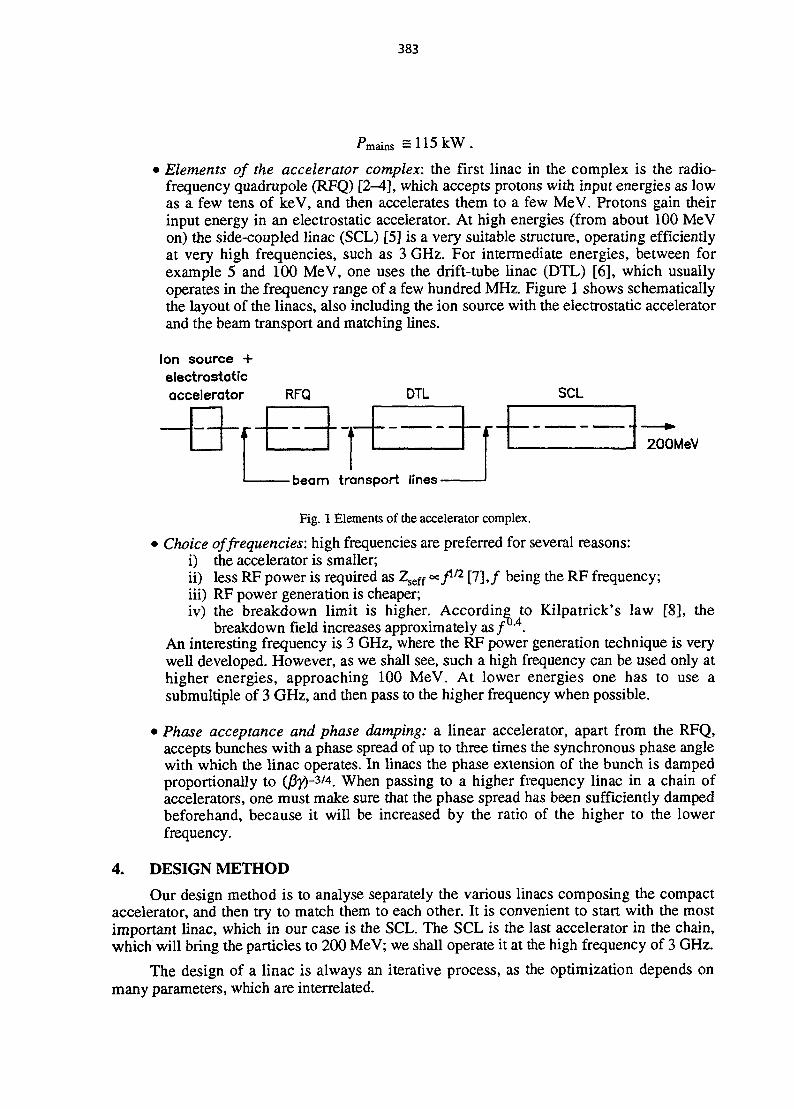
383
mains = 115kW.
• Elements of the accelerator complex: the first linac in the complex is the radio-frequency quadrupole (RFQ) [2-4], which accepts protons with input energies as lowas a few tens of keV, and then accelerates them to a few MeV. Protons gain theirinput energy in an electrostatic accelerator. At high energies (from about 100 MeVon) the side-coupled linac (SCL) [5] is a very suitable structure, operating efficientlyat very high frequencies, such as 3 GHz. For intermediate energies, between forexample 5 and 100 MeV, one uses the drift-tube linac (DTL) [6], which usuallyoperates in the frequency range of a few hundred MHz. Figure 1 shows schematicallythe layout of the linacs, also including the ion source with the electrostatic acceleratorand the beam transport and matching lines.
Ion source +electrostaticaccelerator RFQ DTL SCL
-beam transport lines-
200MeV
Fig. 1 Elements of the accelerator complex.
• Choice of frequencies: high frequencies are preferred for several reasons:i) the accelerator is smaller;ii) less RF power is required as Zseff <^f-a [7], / being the RF frequency;iii) RF power generation is cheaper;iv) the breakdown limit is higher. According to Kilpatrick's law [8], the
breakdown field increases approximately a s / .An interesting frequency is 3 GHz, where the RF power generation technique is verywell developed. However, as we shall see, such a high frequency can be used only athigher energies, approaching 100 MeV. At lower energies one has to use asubmultiple of 3 GHz, and then pass to the higher frequency when possible.
• Phase acceptance and phase damping: a linear accelerator, apart from the RFQ,accepts bunches with a phase spread of up to three times the synchronous phase anglewith which the linac operates. In linacs the phase extension of the bunch is dampedproportionally to (/ty)-3'4. When passing to a higher frequency linac in a chain ofaccelerators, one must make sure that the phase spread has been sufficiently dampedbeforehand, because it will be increased by the ratio of the higher to the lowerfrequency.
4. DESIGN METHOD
Our design method is to analyse separately the various linacs composing the compactaccelerator, and then try to match them to each other. It is convenient to start with the mostimportant linac, which in our case is the SCL. The SCL is the last accelerator in the chain,which will bring the particles to 200 MeV; we shall operate it at the high frequency of 3 GHz.
The design of a linac is always an iterative process, as the optimization depends onmany parameters, which are interrelated.
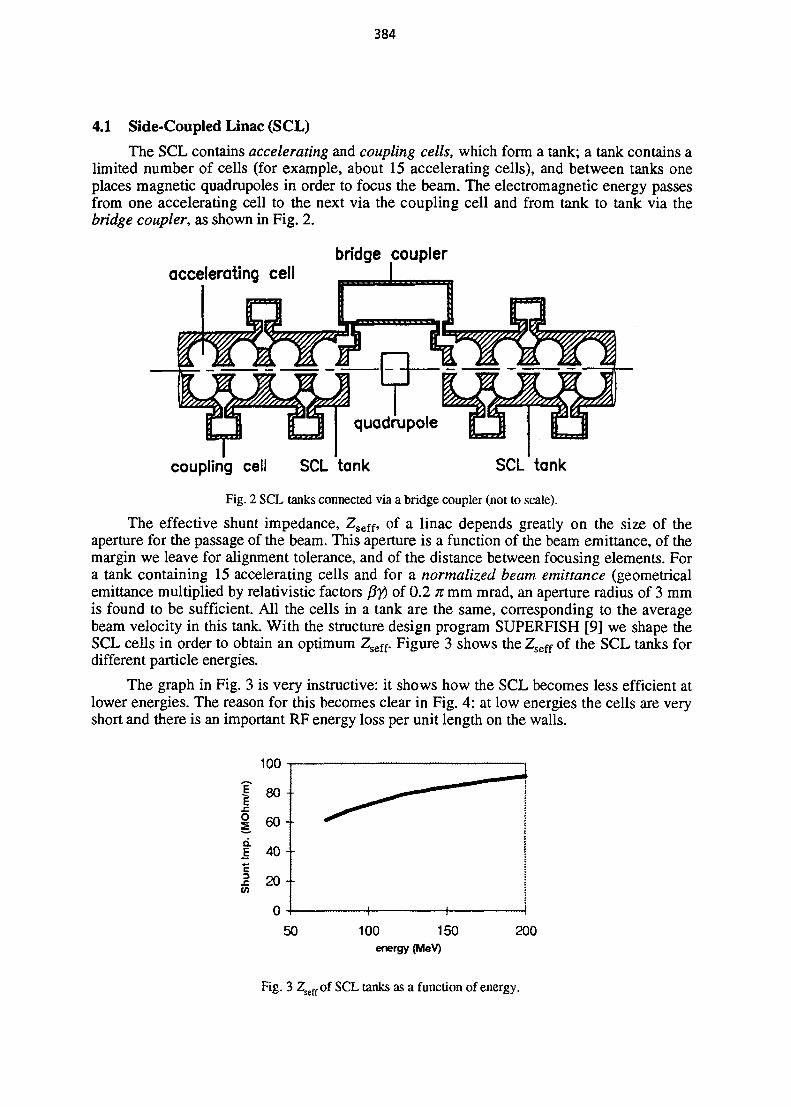
384
4.1 Side-Coupled Linac (SCL)
The SCL contains accelerating and coupling cells, which form a tank; a tank contains alimited number of cells (for example, about 15 accelerating cells), and between tanks oneplaces magnetic quadrupoles in order to focus the beam. The electromagnetic energy passesfrom one accelerating cell to the next via the coupling cell and from tank to tank via thebridge coupler, as shown in Fig. 2.
accelerating cellbridge coupler
coupling cell SCL tank SCL tank
Fig. 2 SCL tanks connected via a bridge coupler (not to scale).
The effective shunt impedance, Zseff, of a linac depends greatly on the size of theaperture for the passage of the beam. This aperture is a function of the beam emittance, of themargin we leave for alignment tolerance, and of the distance between focusing elements. Fora tank containing 15 accelerating cells and for a normalized beam emittance (geometricalemittance multiplied by relativistic factors fif) of 0.2 K mm mrad, an aperture radius of 3 mmis found to be sufficient. All the cells in a tank are the same, corresponding to the averagebeam velocity in this tank. With the structure design program SUPERFISH [9] we shape theSCL cells in order to obtain an optimum Zseff. Figure 3 shows the Zseff of the SCL tanks fordifferent particle energies.
The graph in Fig. 3 is very instructive: it shows how the SCL becomes less efficient atlower energies. The reason for this becomes clear in Fig. 4: at low energies the cells are veryshort and there is an important RF energy loss per unit length on the walls.
o
c
50 100 150energy (MeV)
200
Fig. 3 2' t( of SCL tanks as a function of energy.

385
SCL cell size variation with energy (oc/?r)
E-200MeV
E-150MeV
PR PR ffl ffl FR rH PRE-70MeV
Fig. 4 Shape of an SCL tank at different energies.
We decide, for the time being, that the SCL should start at about 70 MeV. We still haveto choose the average accelerating field in the tanks, EQ. A high EQ makes the acceleratorshort (interesting for a hospital), but the required RF power increases, being proportional toEQ . The Kilpatrick breakdown limit £jc is, at 3 GHz, 47 MV/m (see Fig. 5), and as this limitis very conservative, one usually allows for the maximum surface field Es < 2 Ek. In SCLstructures, due to their geometry, Es = 6 £0; from this a reasonable value for EQ is about15 MV/m.
KILPATRICK LIMIT
ou •
40 •
| 3 0 .
£=. 20 -111 10-
0-1000 2000
frequency [MHz]
3000
Fig. 5 Kilpatrick breakdown limit as function of frequency.
To design an SCL linac the following procedure is used:
i) A structure program like SUPERFISH determines the geometry of linac cellscorresponding to the frequency of 3 GHz and to different particle velocities; the
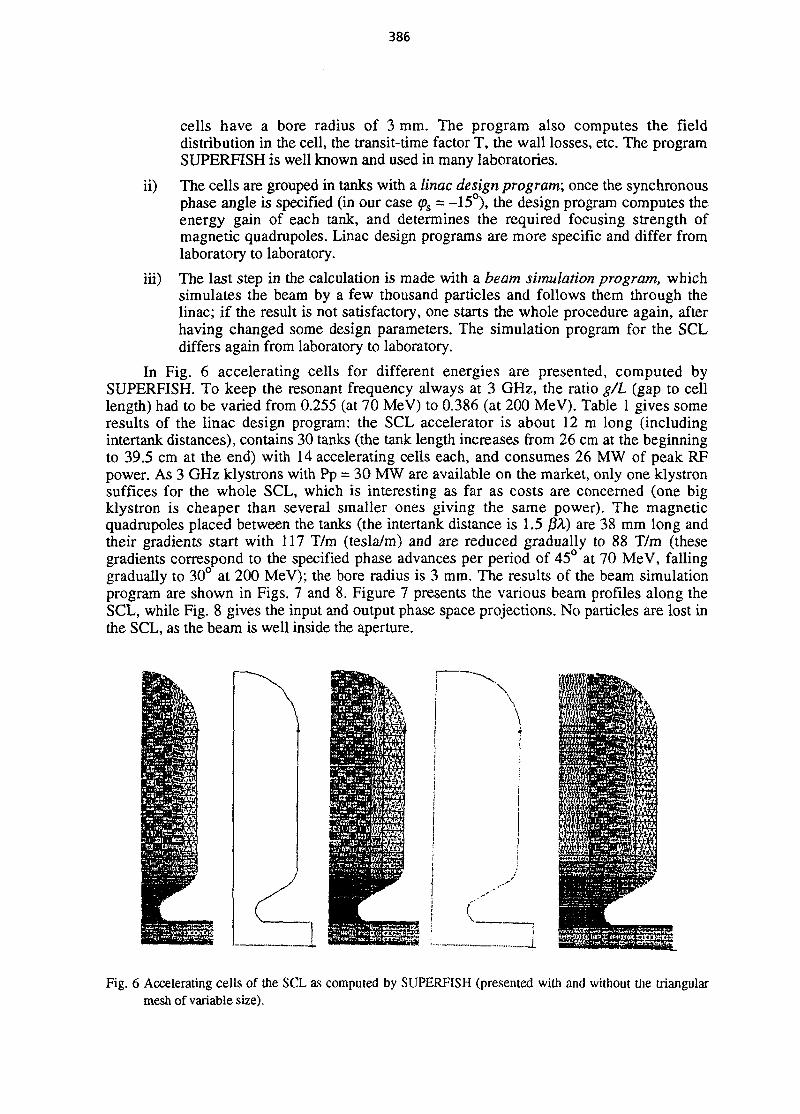
386
cells have a bore radius of 3 mm. The program also computes the fielddistribution in the cell, the transit-time factor T, the wall losses, etc. The programSUPERFISH is well known and used in many laboratories.
ii) The cells are grouped in tanks with a linac design program; once the synchronousphase angle is specified (in our case <ps = -15°), the design program computes theenergy gain of each tank, and determines the required focusing strength ofmagnetic quadrupoles. Linac design programs are more specific and differ fromlaboratory to laboratory.
iii) The last step in the calculation is made with a beam simulation program, whichsimulates the beam by a few thousand particles and follows them through thelinac; if the result is not satisfactory, one starts the whole procedure again, afterhaving changed some design parameters. The simulation program for the SCLdiffers again from laboratory to laboratory.
In Fig. 6 accelerating cells for different energies are presented, computed bySUPERFISH. To keep the resonant frequency always at 3 GHz, the ratio g/L (gap to celllength) had to be varied from 0.255 (at 70 MeV) to 0.386 (at 200 MeV). Table 1 gives someresults of the linac design program: the SCL accelerator is about 12 m long (includingintertank distances), contains 30 tanks (the tank length increases from 26 cm at the beginningto 39.5 cm at the end) with 14 accelerating cells each, and consumes 26 MW of peak RFpower. As 3 GHz klystrons with Pp = 30 MW are available on the market, only one klystronsuffices for the whole SCL, which is interesting as far as costs are concerned (one bigklystron is cheaper than several smaller ones giving the same power). The magneticquadrupoles placed between the tanks (the intertank distance is 1.5 /JA) are 38 mm long andtheir gradients start with 117 T/m (tesla/m) and are reduced gradually to 88 T/m (thesegradients correspond to the specified phase advances per period of 45° at 70 MeV, fallinggradually to 30° at 200 MeV); the bore radius is 3 mm. The results of the beam simulationprogram are shown in Figs. 7 and 8. Figure 7 presents the various beam profiles along theSCL, while Fig. 8 gives the input and output phase space projections. No particles are lost inthe SCL, as the beam is well inside the aperture.
Fig. 6 Accelerating cells of the SCL as computed by SUPERFISH (presented with and without the triangularmesh of variable size).
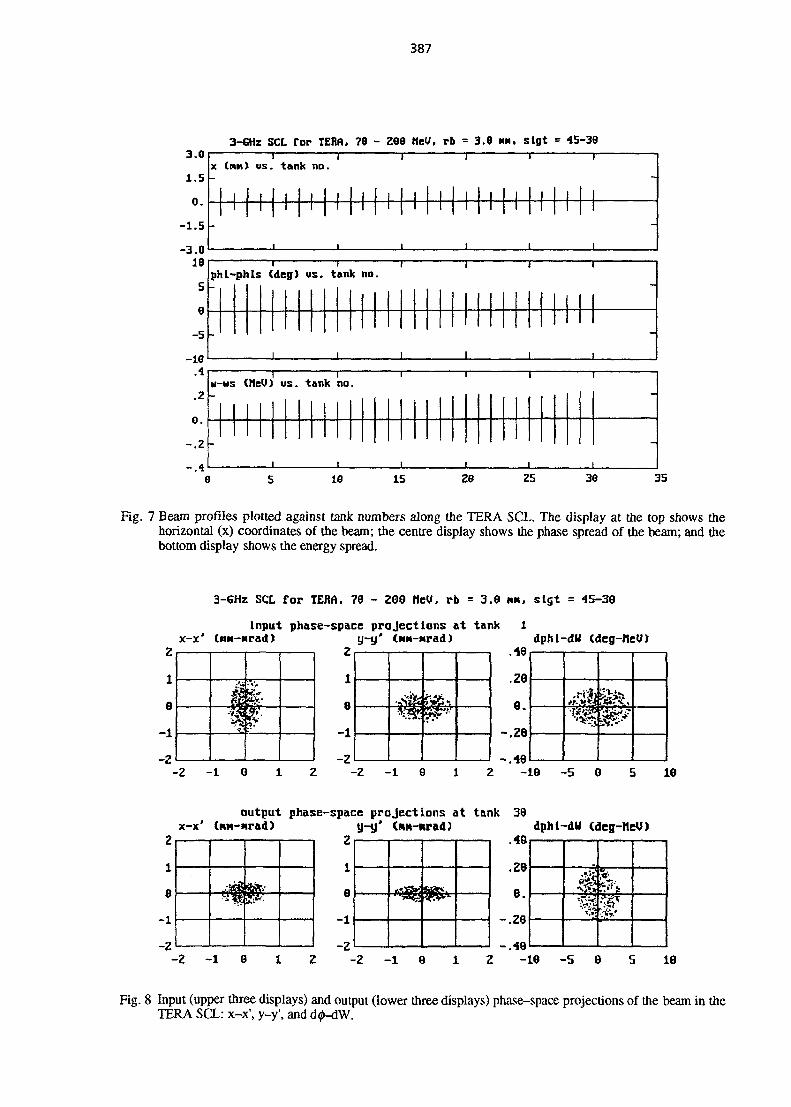
387
3-6Hz SCL for TEHfi. 79 - Z98 Mey. rb = 3.6 MM. s lgt = 45-393.0
l .S
0.
-1.5
-3.0
-5
-16.4
.2
- . 2
- . 4
X
n
tin Vs. tank no •1 1
p»
-
l i - p>its <de?> us . t ank no
-
w-
J1
-ws (HeU) Vs . t ank no•-
16 15 25 35
Fig. 7 Beam profiles plotted against tank numbers along the TERA SCL. The display at the top shows thehorizontal (x) coordinates of the beam; the centre display shows the phase spread of the beam; and thebottom display shows the energy spread.
Z
1
e
- l
-z
3-6Hz SCL for TERfl, 70 - ZGO NeU, rb = 3.9 MM. slgt = 45-30
Input phase-space projections at tank 1x-x' (MM-Mrad) y-y' (MM-Mrad) dpht-dU (deg-fieU)
y $
z1
8
-1
-Z
•jjfc
.48
.29
6.
-.28
-.48-Z -1 6 -2 -1 G -19 -5 Q 18
2
1
e
- l
-2
output phase-space projections at tank 38x-x' (MM-Mrad) y-y' (Mm-nrad) dphl-dW (deg-tieU)
2
-i
_2
.48
.28
e.
- .28
- 40-2 -1 0 -2 -l e -19 -5 8 18
Fig. 8 Input (upper three displays) and output (lower three displays) phase-space projections of the beam in theTERA SCL: x-x', y-y', and d^-dW.
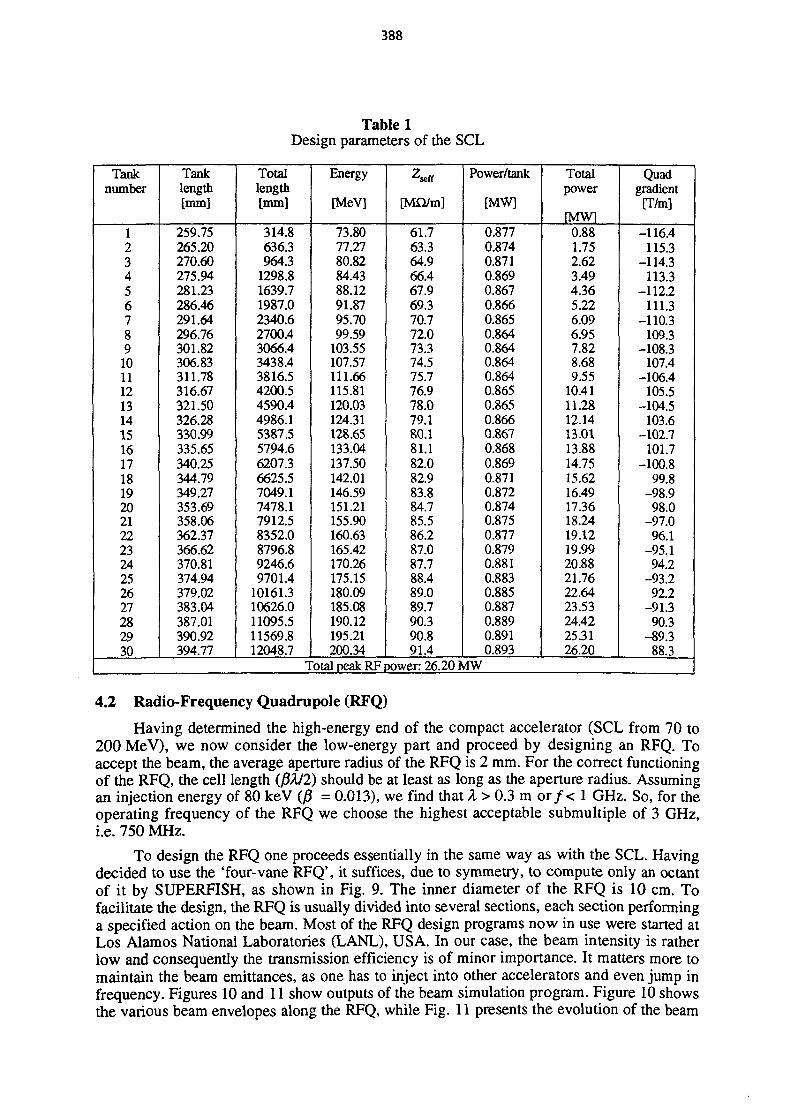
388
Table 1Design parameters of the SCL
Tanknumber
123456789
101112131415161718192021222324252627282930
Tanklength[mm]
259.75265.20270.60275.94281.23286.46291.64296.76301.82306.83311.78316.67321.50326.28330.99335.65340.25344.79349.27353.69358.06362.37366.62370.81374.94379.02383.04387.01390.92394.77
Totallength[mm]
314.8636.3964.3
1298.81639.71987.02340.62700.43066.43438.43816.54200.54590.44986.15387.55794.66207.36625.57049.17478.17912.58352.08796.89246.69701.4
10161.310626.011095.511569.812048.7
Energy
[MeV]
73.8077.2780.8284.4388.1291.8795.7099.59
103.55107.57111.66115.81120.03124.31128.65133.04137.50142.01146.59151.21155.90160.63165.42170.26175.15180.09185.08190.12195.21200.34
self
[Mfl/m]
61.763.364.966.467.969.370.772.073.374.575.776.978.079.180.181.182.082.983.884.785.586.287.087.788.489.089.790.390.891.4
Power/tank
[MW]
0.8770.8740.8710.8690.8670.8660.8650.8640.8640.8640.8640.8650.8650.8660.8670.8680.8690.8710.8720.8740.8750.8770.8790.8810.8830.8850.8870.8890.8910.893
Totalpower
[MW10.881.752.623.494.365.226.096.957.828.689.55
10.4111.2812.1413.0113.8814.7515.6216.4917.3618.2419.1219.9920.8821.7622.6423.5324.4225.3126.20
Quadgradient
[T/m]
-116.4115.3
-114.3113.3
-112.2111.3
-110.3109.3
-108.3107.4
-106.4105.5
-104.5103.6
-102.7101.7
-100.899.8
-98.998.0
-97.096.1
-95.194.2
-93.292.2
-91.390.3
-89.388.3
Total peak RF power: 26.20 MW
4.2 Radio-Frequency Quadrupole (RFQ)
Having determined the high-energy end of the compact accelerator (SCL from 70 to200 MeV), we now consider the low-energy part and proceed by designing an RFQ. Toaccept the beam, the average aperture radius of the RFQ is 2 mm. For the correct functioningof the RFQ, the cell length (/3/L/2) should be at least as long as the aperture radius. Assumingan injection energy of 80 keV (/? = 0.013), we find that A > 0.3 m o r / < 1 GHz. So, for theoperating frequency of the RFQ we choose the highest acceptable submultiple of 3 GHz,i.e. 750 MHz.
To design the RFQ one proceeds essentially in the same way as with the SCL. Havingdecided to use the 'four-vane RFQ', it suffices, due to symmetry, to compute only an octantof it by SUPERFISH, as shown in Fig. 9. The inner diameter of the RFQ is 10 cm. Tofacilitate the design, the RFQ is usually divided into several sections, each section performinga specified action on the beam. Most of the RFQ design programs now in use were started atLos Alamos National Laboratories (LANL), USA. In our case, the beam intensity is ratherlow and consequently the transmission efficiency is of minor importance. It matters more tomaintain the beam emittances, as one has to inject into other accelerators and even jump infrequency. Figures 10 and 11 show outputs of the beam simulation program. Figure 10 showsthe various beam envelopes along the RFQ, while Fig. 11 presents the evolution of the beam
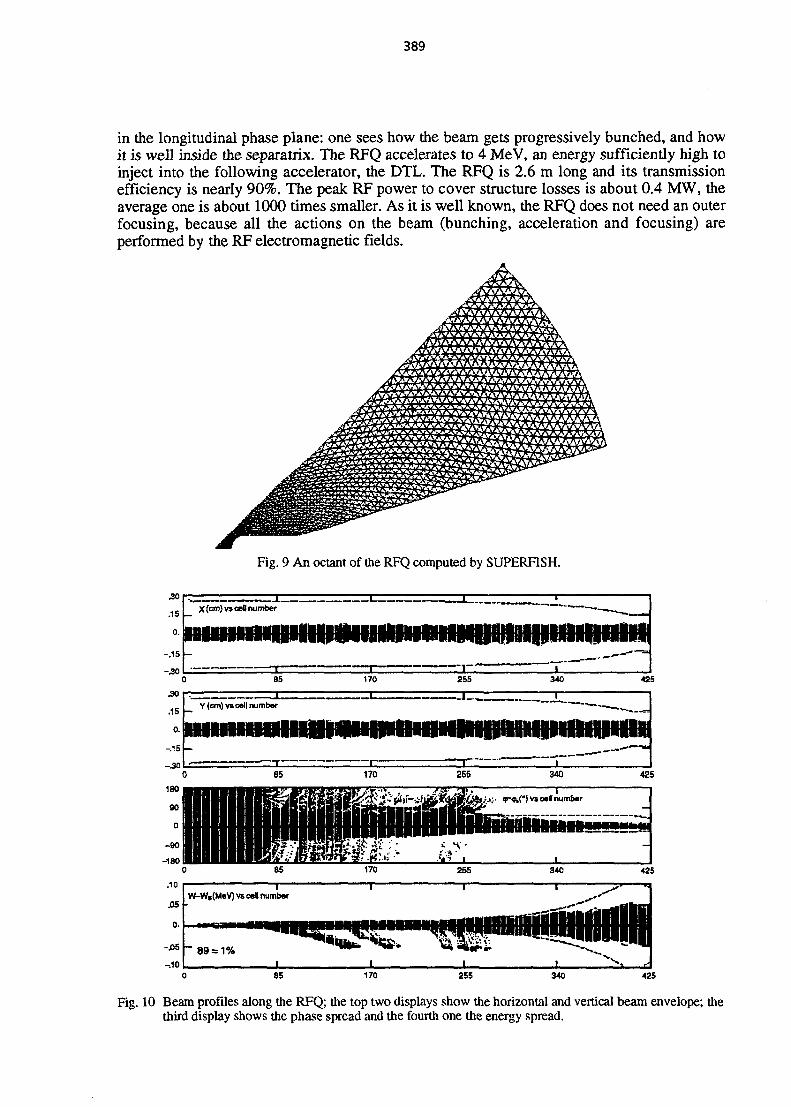
389
in the longitudinal phase plane: one sees how the beam gets progressively bunched, and howit is well inside the separatrix. The RFQ accelerates to 4 MeV, an energy sufficiently high toinject into the following accelerator, the DTL. The RFQ is 2.6 m long and its transmissionefficiency is nearly 90%. The peak RF power to cover structure losses is about 0.4 MW, theaverage one is about 1000 times smaller. As it is well known, the RFQ does not need an outerfocusing, because all the actions on the beam (bunching, acceleration and focusing) areperformed by the RF electromagnetic fields.
Fig. 9 An octant of the RFQ computed by SUPERFISH.
170 255 340 425
Fig. 10 Beam profiles along the RFQ; the top two displays show the horizontal and vertical beam envelope; thethird display shows the phase spread and the fourth one the energy spread.
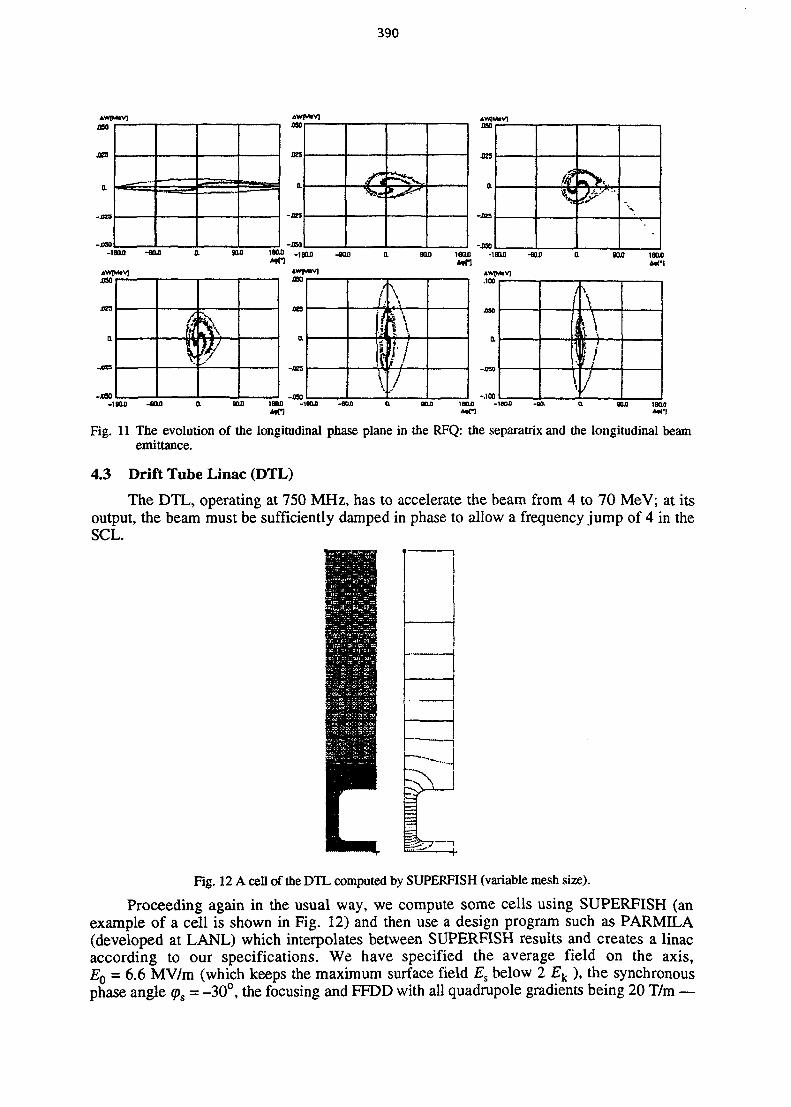
390
JE3
a
-JOT
• • —
-iaao -saa
JBO
900 16O0 _1
.023
g(XO l o a n >16(U] -B0.0
-WO —iBOgoo isao -18CU - a m
IN
tno IKLO ana IB<U>
Fig. 11 The evolution of the longitudinal phase plane in the RFQ: the separatrix and the longitudinal beamemittance.
4.3 Drift Tube Linac (DTL)
The DTL, operating at 750 MHz, has to accelerate the beam from 4 to 70 MeV; at itsoutput, the beam must be sufficiently damped in phase to allow a frequency jump of 4 in theSCL.
Fig. 12 A cell of the DTL computed by SUPERFISH (variable mesh size).
Proceeding again in the usual way, we compute some cells using SUPERFISH (anexample of a cell is shown in Fig. 12) and then use a design program such as PARMILA(developed at LANL) which interpolates between SUPERFISH results and creates a linacaccording to our specifications. We have specified the average field on the axis,Eo = 6.6 MV/m (which keeps the maximum surface field Es below 2 Ek ), the synchronousphase angle % = -30°, the focusing and FFDD with all quadrupole gradients being 20 T/m —
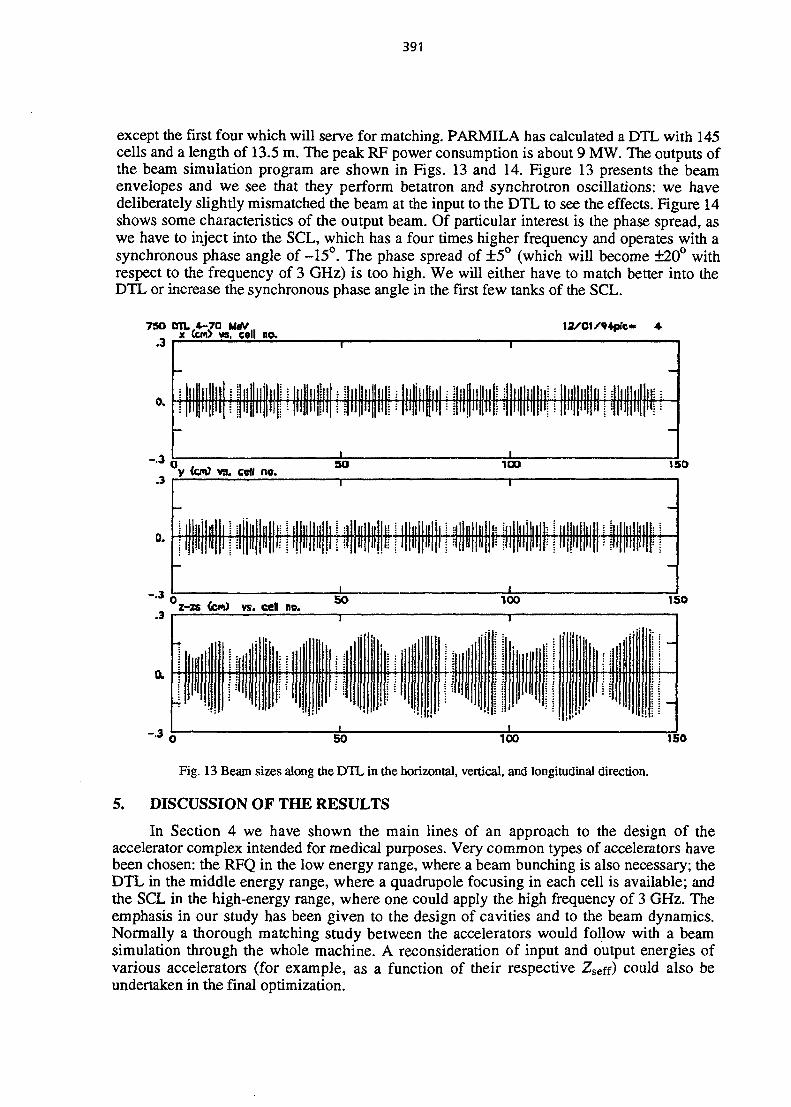
391
except the first four which will serve for matching. PARMILA has calculated a DTL with 145cells and a length of 13.5 m. The peak RF power consumption is about 9 MW. The outputs ofthe beam simulation program are shown in Figs. 13 and 14. Figure 13 presents the beamenvelopes and we see that they perform betatron and synchrotron oscillations: we havedeliberately slightly mismatched the beam at the input to the DTL to see the effects. Figure 14shows some characteristics of the output beam. Of particular interest is the phase spread, aswe have to inject into the SCL, which has a four times higher frequency and operates with asynchronous phase angle of -15°. The phase spread of ±5° (which will become ±20° withrespect to the frequency of 3 GHz) is too high. We will either have to match better into theDTL or increase the synchronous phase angle in the first few tanks of the SCL.
75O DTL ,4-70 MtVx (cm> vvs. cell no.
y (cm) va. ceil no.SO 100 150
0.
- .3
illII IIIIII i] iMil ' i i i ' j
Pi! Hill!l||l
11
i
11
i
jljlllljj:l||l||k
illllll!l||l!|
I1
ijiiii
=1 IfIIIP
1
If 11|fe ill
i
|ll||ll||:IIIII
Illlilll||!!
Mil illllllIf -0 50
z-zs OcfO vs. cefl no*100 ISO
i
-.3 50 100 150
Fig. 13 Beam sizes along the DTL in the horizontal, vertical, and longitudinal direction.
5. DISCUSSION OF THE RESULTS
In Section 4 we have shown the main lines of an approach to the design of theaccelerator complex intended for medical purposes. Very common types of accelerators havebeen chosen: the RFQ in the low energy range, where a beam bunching is also necessary; theDTL in the middle energy range, where a quadrupole focusing in each cell is available; andthe SCL in the high-energy range, where one could apply the high frequency of 3 GHz. Theemphasis in our study has been given to the design of cavities and to the beam dynamics.Normally a thorough matching study between the accelerators would follow with a beamsimulation through the whole machine. A reconsideration of input and output energies ofvarious accelerators (for example, as a function of their respective Zseff) could also beundertaken in the final optimization.

392
750 DTL 4-70 MeV
188.000
1 + 1 J O 0 Q
94.000
47,000
ncell - 1451/<»4pfc- 148
jJ1
\32O.0O -10.00 0.
phase spectrum
.40
.20
0.
-.20
-.15
tOOD 2SO0 "•3<2..3O~ -.15
IT
-20 -10 0«-«a vs. phl-phis« - 70.167 pa—30.0
20 _ ..ee Z6.ea sz.ee 7B.eeenergy spectrum
Fig. 14 Output beam characteristics of the DTL: the upper displays show the phase spectrum and the cross-section of the beam; the lower displays show the longitudinal beam emittance and the energy spectrum.
The accelerator complex, including the ion source and the matching lines, is about 30 mlong. To place the accelerator more conveniently in a room, one would envisage a 180° bendafter the DTL. In this case, the two parts of the compact accelerator, about three to fourmetres from each other, would leave enough space to place all the electronics and additionalequipment between them. The peak RF power consumption at 3 GHz is about 26 MW, and at750 MHz it is about 10 MW. The bigger power consumption at the higher frequency is due tothe much higher field Eo in the SCL, chosen in order to shorten the accelerator complex.
The RF power generation at 750 MHz is much less developed than at 3 GHz, and inaddition it is expensive. It would be advantageous for the medical accelerator to find means toswitch to the higher frequency at a lower energy and drastically reduce the powerconsumption at 750 MHz. This has in fact been done for the TERA project... but that isanother story.
6. CONCLUDING REMARKS
The design of an accelerator complex, apart from the electrodynamics and beamdynamics problems treated in this paper, of course involves other subjects which have to beproperly dealt with. The mechanics has to provide a rigid structure, easy to align, andthermally stable (water cooled, if necessary); the RF has to be properly fed into the cavity, sothat the latter is matched to the RF line, and the amplitudes and phases of the fields in thecavities have to be kept in tight tolerances. The vacuum system has to provide the required
393
operational pressure (in the range of lO-7 Torr) and the control system must be capable ofhandling remotely all of the major parameters. The diagnostics equipment plays an importantrole in the commissioning of the accelerator, as well as in its operation.
7. ACKNOWLEDGMENT
A. Lombardi's help with the computations was greatly appreciated.
REFERENCES
[1] M. Weiss, Fundamentals of ion linacs, these proceedings.
[2] R.H. Stokes et al., The radio frequency quadrupole, Proc. 11th Int. Conf. on HighEnergy Accelerators, Geneva, 1980 (Birkhauser, Basle, 1980).
[3] M. Weiss, Radio frequency quadrupole, Proc. CAS, Aarhus, Denmark, 1986; CERN87-10 (1987).
[4] A. Schempp et al., Zero-mode RFQ development in Frankfurt, Proc. Linear Accel.Conf., Seeheim, Germany, 1984, ed. N. Angert (ISSN: 0171-4546, GSI-84-11, 1984),p. 338.
[5] E.A. Knapp, High energy structures, in Linear Accelerators, eds. P.M. Lapostolle andA.L. Septier (North Holland, Amsterdam, 1970), pp. 601-616.
[6] P. Lapostolle, Introduction a la theorie des acce"16rateurs lindaires, CERN 87-09 (1987).
[7] G.A. Loew and R.B. Neal, Accelerating structures, in Linear Accelerators (seeRef. [5]), pp. 47-52.
[8] W.D. Kilpatrick, Criterion for vacuum sparking designed to include both RF and DC,in The Review of Scientific Instr., Vol. 28, number 10, October 1957, pp. 824-826.
[9] K. Halbach and R.F. Holsinger, SUPERFISH - a computer program, Part. Accel. 7 (4)(1976) pp. 213-222.
NEXT PAGE(S)left BLANK
395
COMMERCIALLY AVAILABLE ACCELERATORS
O.BarbalatCERN, Geneva, Switzerland
1 . INTRODUCTION
Particle accelerators originated from research for nuclear physics but they have nowfound many applications in research, industry and medicine. The extent of some of theseapplications is now wide enough to have a number of firms producing commercial machinesadapted to the needs of this growing market. This report briefly reviews the machines made orcommercialized by European companies.
As the parameters and performance figures may sometimes vary substantially it hasseemed preferable to advise the interested reader to consult directly the firms concerned. Theiraddresses are given in Appendix.
2 . RADIATION THERAPY
The bulk of radiation therapy for cancer treatment is today achieved through the use ofelectron accelerators. Because of their higher cost, the use of ions is still limited to a very smallnumber of facilities.
Linear electron accelerators for cancer therapy are machines mounted in a mobile gantrywhich also includes a beam transport system to deliver with precision the radiation to the arearequiring treatment. Depending on the type of treatment the system can work either in theelectron beam mode or in the photon mode (photons are produced by bremsstrahlung on atarget).
The machines can work at different energies, adjustable from 6 to 25 MeV depending onthe depth of the tumour.
Manufacturers such as General Electric Medical Systems* (FR), Philips (NL) andSiemens (DE) offer not only the accelerator but complete diagnostics and therapy systemscombining, in a single computer assisted facility, the diagnostics device (X-ray scanner orMagnetic Resonance Imager) and the accelerator for radiation therapy.
Scanditronix (SE) is also manufacturing medical electron accelerators but they are basedon the microtron principle. They offer machines capable of reaching 50 MeV.
3 . RADIATION PROCESSING ELECTRON ACCELERATORS
The applications of these machines range from the treatment of polymer cable insulationto increase the heat resistance to food processing to improve preservation, sterilization of agro-industrial effluents or inactivation of medical waste and many others.
The present market for radiation beam processing is however still rather limited and whilecapable of adapting their medical machines, major manufacturers like Philips and Siemens donot mention this application in their catalogues. However General Electric has created in France
* The company is the successor of CGR (Compagnie Generate de Radiologie), a long establishedFrench manufacturer of medical eauir>ment
396
a subsidiary with former CGR people, called MeV Industrie SA, for this particular market.Their standard machine has an energy of 10 MeV with a beam power of 20 kW.
The Budker Institute of Nuclear Physics in Russia has commercialized two lines ofmachines. One is based on a high voltage rectifier for energies up to 2 MeV and another usesradio frequency resonators for energies up to 3 MeV.
Scanditronix (SE) is also producing electron microtrons for these types of industrialprocessing.
Ion Beam Applications (IBA) in Belgium is developing an electron machine for highpower applications (100 kW), the Rhodotron, on the basis of a novel design from CEA Saclay.
4 . ION IMPLANTATION
The implantation of ions for semiconductor manufacturing is with radiation therapy thelargest application of particle accelerators. However there does not seem to be any Europeanmanufacturer.
Ion implanters for the modification of properties of the materials, in particular metals, areproposed by Danfysik (DK) and Whickham Ion Beam Systems (UK).
These machines are limited to the few hundreds of keV range and use high voltagerectifiers.
5 . CYCLOTRONS FOR ISOTOPE PRODUCTION AND PROTON THERAPY
While in the past a number of companies (Philips, CGR, Scanditronix) did manufacturecyclotrons, the only present producer is IBA (BE) which has developed several lines ofcompact and efficient ion accelerators ranging from 5 to 30 MeV, both for general purposemedical products and for short- lived positron emitting isotopes used for tomography (PETimaging). IBA is also offering higher energy cyclotrons (200/500 MeV) for proton therapy.Oxford Instruments (UK) has developed a compact 12 MeV cyclotron for PET applications.
6 . SYNCHROTRON RADIATION
Oxford Instruments has also designed and built a compact 700 MeV electron synchrotron(using superconducting magnets) to produce synchrotron radiation for micro-lithography.
7 . RESEARCH ACCELERATORS
Medium and high energy research accelerators have traditionally been designed and builtby the laboratory which intends to use them. However there are now a few commercial firmswhich can take this activity over at least for machines having parameters (energy/beam power)which do not require substantial developments.
One can mention in particular Euro-MeV (FR) and Scanditronix (SE) for electronaccelerators and IBA (BE) for cyclotrons.
Low energy accelerators and the associate systems (ion sources, beam lines andmonitors) used in particular for research in material science through various ion beam analysistechniques are manufactured by High Voltage Engineering Europa (NL). The machines, called

397
Tandetrons, use a high voltage multiplier-rectifier stack with negative ion sources combinedwith charge exchange. They can reach energies up to 15 MeV.
8 . CONCLUSION AND OUTLOOK
The present commercial market for accelerators is dominated by medical applications:electron linacs for therapy and ion cyclotrons for isotope production mainly for medicaldiagnostics.
If the prospects mentioned elsewhere in these proceedings to use accelerators in theenergy field for nuclear waste incineration and energy generation materialize, it could open awide new domain for ion linacs or cyclotrons and lead to the development of a new industrialsector.
Medical machines are characterized by energies in the tens of MeV range and beam powerlevels of a few kW. Present radiation processing applications require beam power of a few tensof kW. The new applications will require energies in the GeV range and megawatts of beampower. They will need high efficiencies, both in term of power conversion from electric mainsto beam and in terms of beam loss to keep induced radioactivity to a manageable level. It willbe a challenge both for the accelerator designers as well as the industrialists, but it is also ahighly promising perspective.
ACKNOWLEDGEMENTS
Accelerator manufacturers have kindly supplied information and data sheet concerningtheir products.
BIBLIOGRAPHY
O. Barbalat, Applications of Particle Accelerators, CERN/AC/93-04 (BLIT) rev. February,1994.
John Gordon et al., Atom smashers for profit and pleasure, Physics World, June 1994.
Frangois Savatier, Decontamination. Nouvelles applications pour relancer l'ionisation, LTJsineNouvelle, 5 mai 1994.
See also specific contributions to the School included in these Proceedings.
398
APPENDIX: LIST OF FIRMS MANUFACTURING ACCELERATORS
Danfysik A/SDK-4040JYLLINGETel. + 45.46.78.81.50Fax. + 45.46.73.15.51
EuroMeVM. J.Ch. Malglaive49 rue LamartineF-78000 VERSAILLESTel. + 33.1.30.21.82.06Fax. + 33.1.39.53.65.17
GE Medical Systems100 rue Camille DesmoulinsF-92137 ISSY-les-MOULINEAUX CedexTel. + 33.1.40.93.30.00Fax. + 33.1.40.93.33.33
High Voltage Engineering EuropeB.V.Mr. H. van Oosterhout (Sales Manager)P.O. Box 99NL-3800 AB AMERSFOORTTel. + 31.33.619741Fax. + 31.33.615291
Ion Beam Applications S.A.Chemin du Cyclotron, 2B-1348 LOUVAIN-la-NEUVETel.+ 32.10.47.58.11Fax. + 32.10.47.58.10
Budker Institute of Nuclear PhysicsProfessor A.N. SkrinskyDirectorSiberian DivisionAcademy of Science of the RussianFederation630090 NOVOSIBIRSKRussiaTel. + 7 095.65.60.31/65.09.10Fax. + 7.095.237.46.21
MeV Industrie S.A.Pare Technologique Gemini IIRoute de FOrmeF-91195 St. AUBINTel. +33.1.60.19.13.29Fax. +33.1.60.19.10.32
Oxford Instruments Ltd.Osney MeadGB-OXFORD OX2 0DXTel. + 44.865.24.14.56Fax. + 44.865.72.32.64
Philips Nederland B.V.Philips Medical SystemsMr. G.H.M. Coolen (Sales Support)P.O. Box 90050NL-5600 PB EINDHOVENTel. + 31.40.788.326Fax. + 31.40.785.827
Scanditronix ABHusbyborgS-75229 UPPSALATel. + 46.18.18.07.00Fax. + 46.18.53.72.76
Siemens AktiengesellschaftMedical Engineering GroupHenkestrasse 127D-8520ERLANGENTel. + 49.9131.84.0Fax. + 49.9131.84.37.54
Whickham Ion Beam Systems Ltd.DARCHEMWest Auckland RoadDarlingtonGB-Co DURHAM DL3OUPTel. + 44.325.38.23.33Fax. + 44.325.28.21.94

399
ABS, ML
ANGERT, N.
ARAI, E.
BEECKMAN, W.
BERGER, G.
BIBET, D.
BOL, J-L.
BOTTGER, R.
BREYNE, D.
BUETTIG, H.
BUKSH, P.
CAMPI, D.
CANELLA, S.
CARUSO, A.
CHAUTARD, F.
COHILIS, P.
COKRAGAN, A.
COLLIER, J.
CONARD, E.M.
COUILLAUD, C.
DARAS, T.
DEVOGHEL, S.
DEFOUR, J-P.
DELVAUX, J.-L.
FLANZ, J.
GOTO, A.
GREY MORGAN, T.
GUDEWICZ, P.
HARTMANN, B.
INABE, N.
KAMIGAITO, O.
KLEEVEN, W.
LIST OF PARTICIPANTS
IBA, Louvain-La-Neuve, Belgium
GSI, Darmstadt, Germany
Japan Society for the Promotion of Science, Bonn, Germany
IBA, Louvain-La-Neuve, Belgium
CRC, Univ. Catholique de Louvain, Louvain-La-Neuve, Belgium
GANIL, Caen, France
IBA, Louvain-La-Neuve, Belgium
Phys.-Technische Bundesanstalt, Braunschweig, Germany
CRC, Univ. Catholique de Louvain, Louvain-La-Neuve, Belgium
Research Centre Rossendorf Inc., Dresden, Germany
Douglas Cyclotron Unit, Clatterbridge Hospital, Bebington, UK
CERN, Geneva, Switzerland
INFN-LNL, Legnaro, Italy
INFN - LNS, Catania, Italy
CERN, Geneva, Switzerland
IBA, Louvain-La-Neuve, Belgium
IBA, Louvain-La-Neuve, Belgium
CERN, Geneva, Switzerland
Particle Accelerator Consultant, Dion Valmont, Belgium
CEA, Bruyeres-le-Chatel, France
CRC, Univ. Catholique de Louvain, Louvain-La-Neuve, Belgium
IBA, Louvain-La-Neuve, Belgium
IBA, Louvain-La-Neuve, Belgium
IBA, Louvain-La-Neuve, Belgium
Massachusetts General Hospital, Charlestown, MA, USA
RIKEN, Saitma, Japan
Amersham International PLC, Amersham, Bucks, UK
GANIL, Caen, France
Research Centre Rossendorf Inc., Dresden, Germany
RIKEN, Saitma, Japan
RIKEN, Saitma, Japan
IBA, Louvain-La-Neuve, Belgium
400
KROC, T.
LEBAILLY, A.
LINDQVIST, H.
LOISELET, M.
LUNDSTROM, B.
MACCIONI, P.
Me ADAMS, R.
MONDELAERS, W.
OLSEN, D.
PERRINE, J.P.
PETIT, E.
POIRIER, R.
POSTIAU, N.
PRINCIPE, R.
REGLER, M.
ROLFE, B.
RYCKEWAERT, J.
SCHUMANN, F.
SCRIVENS, R.
SHILTON, M.
SPARTA, A.
STRUCKMANS, K.
TATUM, A.
TAZAWA, S.
TSAI, W-F.
VANDENELZEN, R.
VANDEPLASSCHE, D.
WILDNER, E.
XIE, Z.Q.
YANG, T-N.
ZAREMBA, S.
Fermilab, Batavia, IL, USA
Nordion Europe SA, Fleurus, Belgium
AECL Research, Chalk River, Ontario, Canada
CRC, Univ. Catholique de Louvain, Louvain-La-Neuve, Belgium
The Svedberg Lab., Uppsala, Sweden
CERCA (FBFC), Romans-sur-Isere, France
AEA Technology, Culham, Abingdon, UK
University of Ghent, Ghent, Belgium
ORNL, Oak Ridge, TN, USA
ESRF, Grenoble, France
GANIL, Caen, France
TRIUMF, Vancouver, BC, Canada
CRC, Univ. Catholique de Louvain, Louvain-La-Neuve, Belgium
CERN, Geneva, Switzerland
Inst. of High Energy Physics, Vienna, Austria
Nordion International Inc., Kanata, Canada
CRC, Univ. Catholique de Louvain, Louvain-La-Neuve, Belgium
CEA, Bruyeres-le-Chatel, France
CERN, Geneva, Switzerland
Amersham International pic, Amersham, Bucks, UK
INFN-LNS, Catania, Italy
University of Ghent (RUG), Ghent, Belgium
ORNL, Oak Ridge, TN, USA
SHI Examination Co., Toyo shi, Japan
INER TR30/15 Cyclotron, Lung-Tan, Taiwan, R.O.C.
TRIUMF, Vancouver, BC, Canada
IBA, Louvain-La-Neuve, Belgium
CERN, Geneva, Switzerland
LBL, Berkeley, CA, USA
INER TR30/15 Cyclotron, Lung-Tan, Taiwan, R.O.C.
IBA, Louvain-La-Neuve, Belgium