cbct-based synthetic ct generation using generative
TRANSCRIPT
© Quantitative Imaging in Medicine and Surgery. All rights reserved. Quant Imaging Med Surg 2021;11(12):4820-4834 | https://dx.doi.org/10.21037/qims-20-1056
Original Article
CBCT-based synthetic CT generation using generative adversarial networks with disentangled representation
Jiwei Liu1#, Hui Yan2#, Hanlin Cheng1, Jianfei Liu3, Pengjian Sun1, Boyi Wang1, Ronghu Mao4, Chi Du5, Shengquan Luo1
1School of Automation and Electrical Engineering, University of Science and Technology Beijing, Beijing, China; 2Department of Radiation Oncology,
National Clinical Research Center for Cancer, Chinese Academy of Medical Sciences and Peking Union Medical College, Beijing, China; 3School
of Electrical Engineering and Automation, Anhui University, Hefei, China; 4Department of Radiation Oncology, The Affiliated Cancer Hospital of
Zhengzhou University, Henan Cancer Hospital, Zhengzhou, China; 5Cancer Center, The Second Peoples Hospital of Neijiang, Neijiang, China
Contributions: (I) Conception and design: J Liu, H Yan, J Liu, H Cheng; (II) Administrative support: J Liu, H Yan; (III) Provision of study materials
or patients: R Mao, H Yan; (IV) Collection and assembly of data: R Mao, H Cheng; (V) Data analysis and interpretation: H Cheng, H Yan; (VI)
Manuscript writing: All authors; (VII) Final approval of manuscript: All authors.
#These authors contributed equally to this work.
Correspondence to: Jiwei Liu. 30 Xueyuan Road, Beijing 100083, China. Email: [email protected]; Hui Yan. 17 Panjiayuannali, Beijing 100021,
China. Email: [email protected].
Background: Cone-beam computed tomography (CBCT) plays a key role in image-guided radiotherapy (IGRT), however its poor image quality limited its clinical application. In this study, we developed a deep-learning based approach to translate CBCT image to synthetic CT (sCT) image that preserves both CT image quality and CBCT anatomical structures.Methods: A novel synthetic CT generative adversarial network (sCTGAN) was proposed for CBCT-to-CT translation via disentangled representation. The approach of disentangled representation was employed to extract the anatomical information shared by CBCT and CT image domains. Both on-board CBCT and planning CT of 40 patients were used for network learning and those of another 12 patients were used for testing. Accuracy of our network was quantitatively evaluated using a series of statistical metrics, including the peak signal-to-noise ratio (PSNR), mean structural similarity index (SSIM), mean absolute error (MAE), and root-mean-square error (RMSE). Effectiveness of our network was compared against three state-of-the-art CycleGAN-based methods.Results: The PSNR, SSIM, MAE, and RMSE between sCT generated by sCTGAN and deformed planning CT (dpCT) were 34.12 dB, 0.86, 32.70 HU, and 60.53 HU, while the corresponding values between original CBCT and dpCT were 28.67 dB, 0.64, 70.56 HU, and 112.13 HU. The RMSE (60.53±14.38 HU) of sCT generated by sCTGAN was less than that of sCT generated by all the three comparing methods (72.40±16.03 HU by CycleGAN, 71.60±15.09 HU by CycleGAN-Unet512, 64.93±14.33 HU by CycleGAN-AG).Conclusions: The sCT generated by our sCTGAN network was closer to the ground truth (dpCT), in comparison to all the three comparing CycleGAN-based methods. It provides an effective way to generate high-quality sCT which has a wide application in IGRT and adaptive radiotherapy.
Keywords: Cone-beam CT; synthetic CT generation; generative adversarial network; disentangled representation;
image-guided radiation therapy
Submitted Oct 05, 2020. Accepted for publication Jun 02, 2021.
doi: 10.21037/qims-20-1056
View this article at: https://dx.doi.org/10.21037/qims-20-1056
4834
4821Quantitative Imaging in Medicine and Surgery, Vol 11, No 12 December 2021
© Quantitative Imaging in Medicine and Surgery. All rights reserved. Quant Imaging Med Surg 2021;11(12):4820-4834 | https://dx.doi.org/10.21037/qims-20-1056
Introduction
Cone beam computed tomography (CBCT) plays a vital role throughout a course of radiotherapy to assure accuracy of patient positioning and precision of beam delivery (1-3). However, issues of huge artifacts and inaccurate Hounsfield Unit (HU) values preclude CBCT images from various clinical applications, such as the high-precision adaptive treatment planning which involves contour deformation, plan optimization, and dose calculation etc. (4-7). For the sake of broadening the scope of clinical application for CBCT images, for instance in adaptive radiotherapy, high-quality CBCT-to-CT image synthesis is highly demanded.
With this regard, researchers have proposed a number of methods for enhancing CBCT image quality, including, but not limited to, Monte Carlo simulation (8,9), CT prior knowledge (10,11), histogram matching (4,12), and random forest (13). These model-based and conventional machine-learning-based methods achieved satisfying results in their applications, but they were still deficient in dealing with complex artifact models. Supervised deep-learning-based CBCT enhancement methods have shown their potentials in solving this problem, artificial neural networks, for instance, have strong fitting capabilities to effectively cope with artifact models. These methods usually required paired CBCT and CT to estimate the artifacts in CBCT images (14,15) or learn a CBCT-to-CT mapping model (16,17). Xie et al. used residual patches between the CBCT and aligned CT images to learn artifact models and remove scattering artifacts (14). Chen et al. used paired CBCT and CT to obtain output images close to aligned CT images (17). Although the image quality and dose calculation accuracy were improved in these works, they were limited to paired image data.
In recent years, image-translation-based synthetic CT (sCT) generation has been caught in the spotlight of attention in area of CBCT image quality enhancement. Image-translation-based methods usually employ the generative adversarial network (GAN) for achieving CBCT-to-CT translation. The resulting sCT images preserve CT image quality while keeping CBCT anatomy (18-26). These CBCT-to-CT translation-based methods can be generally divided into two categories: the paired (18-20) and unpaired (21-26). Paired CBCT-to-CT translation-based methods usually involve specific loss terms for improving network performance, such as smooth loss (18) and unidirectional relative total variation loss (19). Nevertheless, these methods require paired data for model training. On the contrary, unpaired CBCT-to-CT translation waives the
requirement of paired data, and hence, has gained increasing popularity in the community for network training (21-26). These methods employed a widely used unpaired image-to-image translation architecture, called cycle-consistent generation adversarial network (CycleGAN) (27). It enables translation from source image domain to target image domain without establishing a one-to-one mapping between training samples. Lei et al. adopted residual networks as the image generators in CycleGAN and improved CBCT image quality (22). Liang et al. used U-net (28) framework as image generators in CycleGAN to generate sCT from CBCT for head-and-neck (H&N) cancer patients (23). Liu et al. introduced attention gate to the image generators in CycleGAN to generate CBCT-based sCT (26).
Nonetheless, the anatomical information shared by CBCT and CT image domains is not fully utilized by existing CycleGAN-based methods (21-26). Disentangled representation, a technique to model factors of data variation, is capable of characterizing an image into domain-invariant and domain-specific parts, facilitating learning of diverse cross-domain mappings (29-31). Currently, several disentangled representation-based image translation studies demonstrated superior results compared to CycleGAN in unsupervised unpaired image-to-image translation (29-31). Few studies applied disentangled representation in the field of medical image processing, such as unsupervised CT metal artifact reduction (32). Up to the present, studies on unpaired CBCT-to-CT translation for sCT generation via disentangled representation are heavily scarce in the body of literature.
In this study, therefore, a novel synthetic CT generative adversarial network (sCTGAN) was proposed for the unpaired CBCT-to-CT translation via disentangled representation (31). This manuscript is organized as follows. In section II, the architecture of the proposed sCTGAN is introduced and the loss function that enabled training on the unpaired data is described in detail. Besides, the implementation and evaluation of sCTGAN method are explained. In section III, results of comparative analysis on the performance between our sCTGAN and three existing methods are summarized. In section IV, strengths and weaknesses of our sCTGAN method are discussed and possible future works are recommended.
Methods
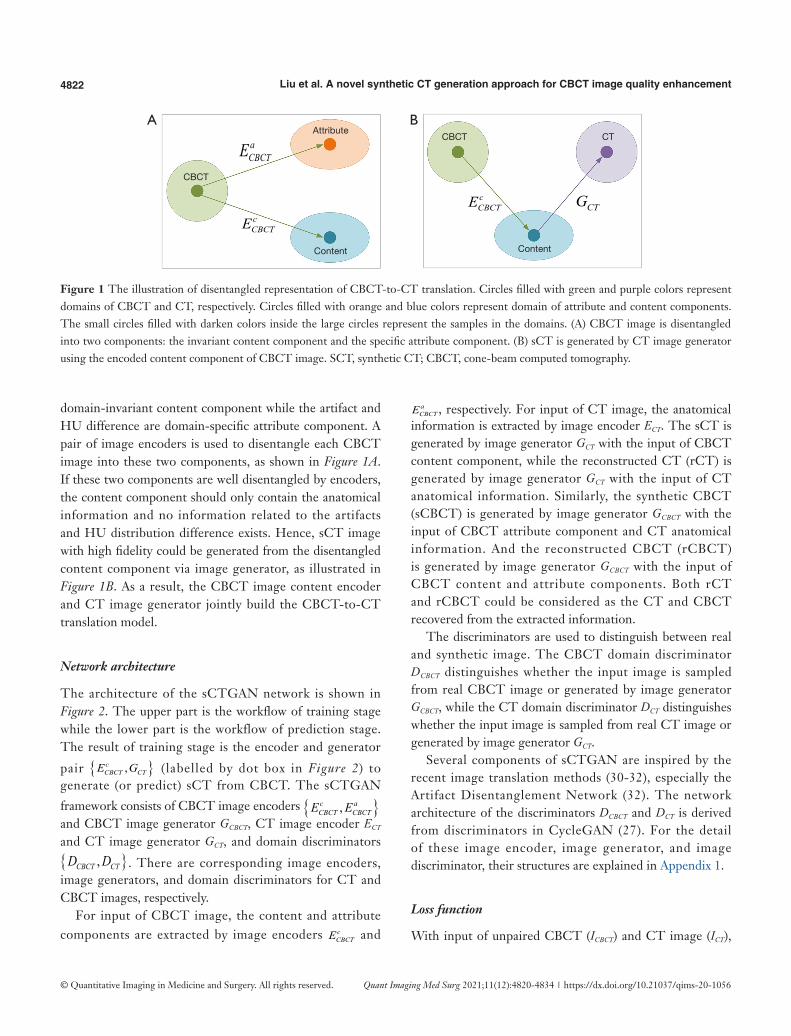
The CBCT-to-CT t rans l a t ion v i a d i sentang led representation is illustrated in Figure 1. It assumes that the anatomical information shared by CBCT and CT images is
4822 Liu et al. A novel synthetic CT generation approach for CBCT image quality enhancement
© Quantitative Imaging in Medicine and Surgery. All rights reserved. Quant Imaging Med Surg 2021;11(12):4820-4834 | https://dx.doi.org/10.21037/qims-20-1056
domain-invariant content component while the artifact and HU difference are domain-specific attribute component. A pair of image encoders is used to disentangle each CBCT image into these two components, as shown in Figure 1A. If these two components are well disentangled by encoders, the content component should only contain the anatomical information and no information related to the artifacts and HU distribution difference exists. Hence, sCT image with high fidelity could be generated from the disentangled content component via image generator, as illustrated in Figure 1B. As a result, the CBCT image content encoder and CT image generator jointly build the CBCT-to-CT translation model.
Network architecture
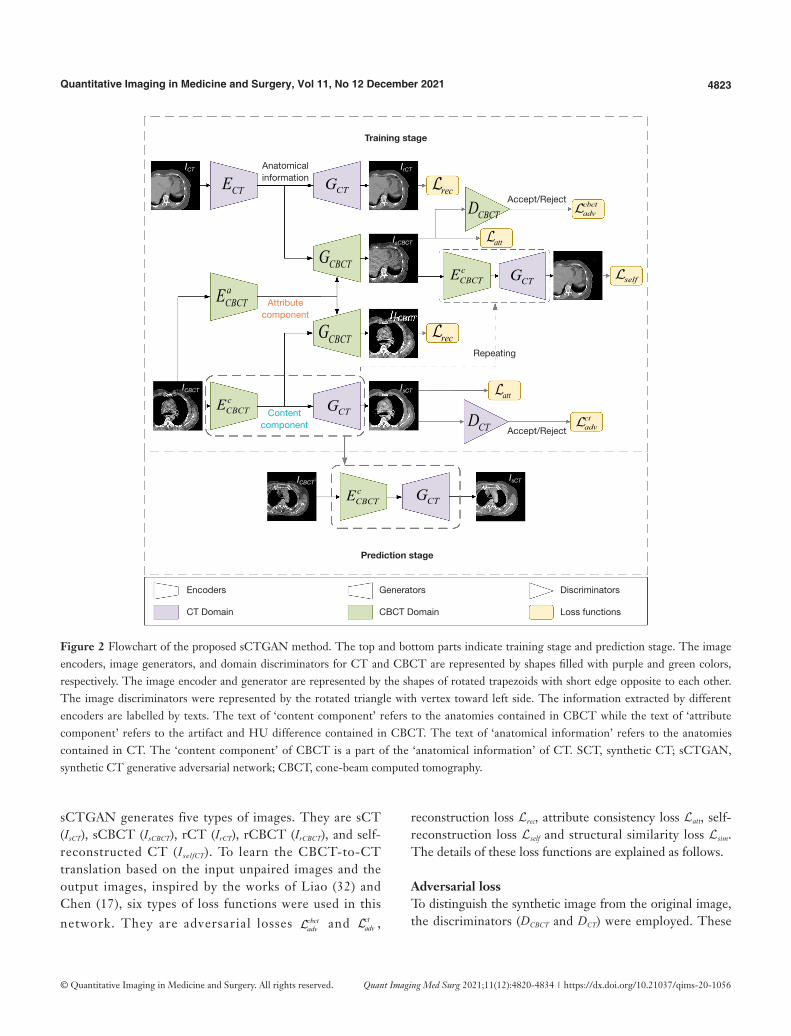
The architecture of the sCTGAN network is shown in Figure 2. The upper part is the workflow of training stage while the lower part is the workflow of prediction stage. The result of training stage is the encoder and generator
pair { },cCBCT CTE G (labelled by dot box in Figure 2) to
generate (or predict) sCT from CBCT. The sCTGAN
framework consists of CBCT image encoders { },c aCBCT CBCTE E
and CBCT image generator GCBCT, CT image encoder ECT and CT image generator GCT, and domain discriminators { },CBCT CTD D . There are corresponding image encoders, image generators, and domain discriminators for CT and CBCT images, respectively.
For input of CBCT image, the content and attribute components are extracted by image encoders c
CBCTE and
aCBCTE , respectively. For input of CT image, the anatomical
information is extracted by image encoder ECT. The sCT is generated by image generator GCT with the input of CBCT content component, while the reconstructed CT (rCT) is generated by image generator GCT with the input of CT anatomical information. Similarly, the synthetic CBCT (sCBCT) is generated by image generator GCBCT with the input of CBCT attribute component and CT anatomical information. And the reconstructed CBCT (rCBCT) is generated by image generator GCBCT with the input of CBCT content and attribute components. Both rCT and rCBCT could be considered as the CT and CBCT recovered from the extracted information.
The discriminators are used to distinguish between real and synthetic image. The CBCT domain discriminator DCBCT distinguishes whether the input image is sampled from real CBCT image or generated by image generator GCBCT, while the CT domain discriminator DCT distinguishes whether the input image is sampled from real CT image or generated by image generator GCT.
Several components of sCTGAN are inspired by the recent image translation methods (30-32), especially the Artifact Disentanglement Network (32). The network architecture of the discriminators DCBCT and DCT is derived from discriminators in CycleGAN (27). For the detail of these image encoder, image generator, and image discriminator, their structures are explained in Appendix 1.
Loss function
With input of unpaired CBCT (ICBCT) and CT image (ICT),
Figure 1 The illustration of disentangled representation of CBCT-to-CT translation. Circles filled with green and purple colors represent domains of CBCT and CT, respectively. Circles filled with orange and blue colors represent domain of attribute and content components. The small circles filled with darken colors inside the large circles represent the samples in the domains. (A) CBCT image is disentangled into two components: the invariant content component and the specific attribute component. (B) sCT is generated by CT image generator using the encoded content component of CBCT image. SCT, synthetic CT; CBCT, cone-beam computed tomography.
A B
CBCT
CBCT CTAttribute
Content Content
aCBCTE
cCBCTE
cCBCTE CTG
4823Quantitative Imaging in Medicine and Surgery, Vol 11, No 12 December 2021
© Quantitative Imaging in Medicine and Surgery. All rights reserved. Quant Imaging Med Surg 2021;11(12):4820-4834 | https://dx.doi.org/10.21037/qims-20-1056
sCTGAN generates five types of images. They are sCT (IsCT), sCBCT (IsCBCT), rCT (IrCT), rCBCT (IrCBCT), and self-reconstructed CT (IselfCT). To learn the CBCT-to-CT translation based on the input unpaired images and the output images, inspired by the works of Liao (32) and Chen (17), six types of loss functions were used in this network. They are adversarial losses cbct
adv and ctadv ,
reconstruction loss Lrec, attribute consistency loss Latt, self-reconstruction loss Lself and structural similarity loss Lsim. The details of these loss functions are explained as follows.
Adversarial lossTo distinguish the synthetic image from the original image, the discriminators (DCBCT and DCT) were employed. These
Figure 2 Flowchart of the proposed sCTGAN method. The top and bottom parts indicate training stage and prediction stage. The image encoders, image generators, and domain discriminators for CT and CBCT are represented by shapes filled with purple and green colors, respectively. The image encoder and generator are represented by the shapes of rotated trapezoids with short edge opposite to each other. The image discriminators were represented by the rotated triangle with vertex toward left side. The information extracted by different encoders are labelled by texts. The text of ‘content component’ refers to the anatomies contained in CBCT while the text of ‘attribute component’ refers to the artifact and HU difference contained in CBCT. The text of ‘anatomical information’ refers to the anatomies contained in CT. The ‘content component’ of CBCT is a part of the ‘anatomical information’ of CT. SCT, synthetic CT; sCTGAN, synthetic CT generative adversarial network; CBCT, cone-beam computed tomography.
Training stage
Prediction stage
Anatomicalinformation
Accept/Reject
Accept/Reject
Encoders
CT Domain
Generators
CBCT Domain
Discriminators
Loss functions
Attributecomponent
Contentcomponent
Repeating
CTG
CTG
CTG
cCBCTE
cCBCTE
cCBCTE
aCBCTE
CTG
CBCTG
CBCTG
CTE
CBCTD
CTD
rec
rec
att
att
cbctadv
ctadv
self
ICT IrCT
IsCBCT
IrCBCT
IsCT
IsCT
ICBCT
ICBCT
4824 Liu et al. A novel synthetic CT generation approach for CBCT image quality enhancement
© Quantitative Imaging in Medicine and Surgery. All rights reserved. Quant Imaging Med Surg 2021;11(12):4820-4834 | https://dx.doi.org/10.21037/qims-20-1056
two discriminators assign a label of 1 to the real CBCT or CT images, while a label of 0 to the synthetic CBCT or CT images. The adversarial loss of discriminator is defined as:
[1]
( ) ( ){ }( ) ( ){ }
log 1 log
log 1 log
ct cbctadv adv adv
CT CT CT sCT
CBCT CBCT CBCT sCBCT
D I D I
D I D I
+
= + −
+ + −
=
Reconstruction lossIn order to make image encoder and generator pairs { },CT CTE G a n d ( ){ }, ,c a
CBCT CBCT CBCTE E G a c t a s a u t o -encoders, reconstruction loss is defined as:
1 1rec rCBCT CBCT rCT CTI I I I+ −= − [2]
Where IrCBCT and IrCT are images reconstructed from input images ICBCT and ICT, respectively. l2-norm loss instead of -norm loss is used for sharper outputs (32).
Attribute consistency lossThe adversarial loss in Eq. (1) forces IsCT to approximate the real CT image, but it is difficult to ensure the prediction accuracy of IsCT based on single loss function. Therefore, an attribute consistency loss was introduced to improve the prediction accuracy of IsCT. The attribute consistency Loss is defined as:
( ) ( )1att CBCT sCT sCBCT CTI I I I− − −= [3]
The gap between |ICBCT-IsCT| and |IsCBCT-ICT| should be close due to the input of the same attribute component. If these two differences are close, the value of this loss function will be 0.
Self-reconstruction lossIselfCT is generated by re-applying disentangled representation to IsCBCT. The disentangled representation could be further regularized by comparing IselfCT with CT image ICT. Self-reconstruction loss is defined as:
1self selfCT CTI I−= [4]
Structural similarity lossThe similarity between the input images ICBCT and ICT was used to adjust the weight of loss terms. Structural similarity loss is defined as:
( )
( )1 CBCT CT
simCBCT CT
SSIM I IPSNR I I c− ,
,=
+ [5]
Where c is a variable that stabilizes the division with a weak denominator and set as 0.01, PSNR(ICBCT,ICT) and SSIM(ICBCT,ICT) denote PSNR and SSIM between ICBCT and ICT. The combination of PSNR and SSIM can measure the structural similarity between noisy CBCT and CT better.
The objective function of network learning can be expressed as a weighted sum of these losses:
( ) ( )1 sim adv rec att selfa
ct cbctsim adv adv rec tt self = + λ λ + λ + +λ +λ [6]
Where the hyper-parameter λ controls the importance of each term. The hyper-parameter values were set as follows: λadv=1.0, λrec=λatt=λself=5.0 , and λsim=10.0.
Network implementation
The proposed sCTGAN was implemented by PyTorch deep learning framework. The Adam optimizer was used with a learning rate of 1e-4 to minimize the objective function. The network model was trained, validated, and tested on an NVIDIA RTX 2080 GPU with 8 GB of memory. The batch size was set to 1 during network training, and 4 during network validation and testing.
All the pCT and CBCT slices were cropped or padded to dimensions 512×512 and then resampled to 384×384 in order to preserve more anatomical information in the training samples for effective network learning. The dimension of network input is 256×256 which is a patch of image. During the training stage, CBCT and pCT slices were randomly shuffled at each epoch so that the correspondence of images to patients was removed. For network training, CBCT and pCT slices were cropped to 256×256 pixels due to hardware limitation. These images were randomly flipped in the lateral direction for data augmentation. For network validation and testing, each input CBCT slice was cropped to four 256×256 pixel patches with an overlap between any two adjacent patches of 128×256. This overlap ensured that an output of continuous image can be obtained. Pixel values at the same position of the overlapped patches were averaged. These 2D sCT images were finally stacked and resampled to 3D sCT volumes in original image dimensions.
Evaluation
Patient dataPatient data were collected from Department of Radiation Oncology of the Affiliated Cancer Hospital of Zhengzhou
4825Quantitative Imaging in Medicine and Surgery, Vol 11, No 12 December 2021
© Quantitative Imaging in Medicine and Surgery. All rights reserved. Quant Imaging Med Surg 2021;11(12):4820-4834 | https://dx.doi.org/10.21037/qims-20-1056
University, Henan Cancer Hospital. They were randomly selected from the clinical database between 2018 and 2019. The timespan between the planning CT (pCT) and CBCT acquisition ranges from 0 to 12 days. There was no metal implant in these patients. All CBCT scans were acquired by on-board imager (Varian Medical System). A scan protocol was used with 110 kV, in-plane resolution of 0.51 to 0.91 mm, slice thickness of 1.98 to 2.00 mm, and image dimensions of 512×512×81. All pCT scans were acquired by a Philips Brilliance Big Bore CT scanner. The scan protocol was with 120 kV, in-plane resolution of 1.01 to 1.33 mm, slice thickness of 3.00 mm, and image dimensions of 512×512×145 to 512×512×180. The pCT and CBCT scans of 52 patients were divided into three sets (32 for training, 8 for validation, and 12 for testing).
Image preprocessingPrior to processing of the CBCT and pCT slices by the model, they were resampled to a 1.0 mm × 1.0 mm × 1.0 mm grid to achieve consistent spatial resolution. These slices were clipped to [−1,000, 2,000] HU followed by normalization to [−1, 1]. The lower bound of the sample dynamic range was set to −1,000 HU because the intercept value of Digital Imaging and Communications in Medicine (DICOM) data is −1,000. The upper bound of the sample dynamic range was set to 2,000 HU in order to reduce the dynamic range of images. Then the CBCT slices were rigidly registered to their corresponding pCT slices using AIRLab (33). This was because there were large shifts of anatomical structures from the image center in several CBCT images, which caused a reduced amount of or no anatomical information in randomly cropped image patches. The rigid registration was able to shift these anatomical structures back to the center of image for better performance of network learning.
Similarity metricsTo evaluate the HU accuracy of the sCT images, the deformable registration from pCT to corresponding CBCT was performed via AIRLab (33). The resulting deformed planning CT (dpCT) images was used as the ground truth for subsequent evaluation. The evaluation was conducted with similarity measures between sCT images generated by different methods and dpCT images. The similarity metrics included PSNR, SSIM, MAE, and RMSE. All these metrics were computed within the minimal external cube that covers the body. The definitions of these similarity measures are described in Appendix 2.
To demonstrate the effectiveness of our sCTGAN, it was compared with CycleGAN (27) as well as two CycleGAN-based methods, CycleGAN-Unet512 (23) and CycleGAN-AG (26). All above methods were trained and tested on the same dataset for fair comparison. The two-sample t test among the results of the four methods were performed. A level of P<0.05 was considered statistically significant.
Results
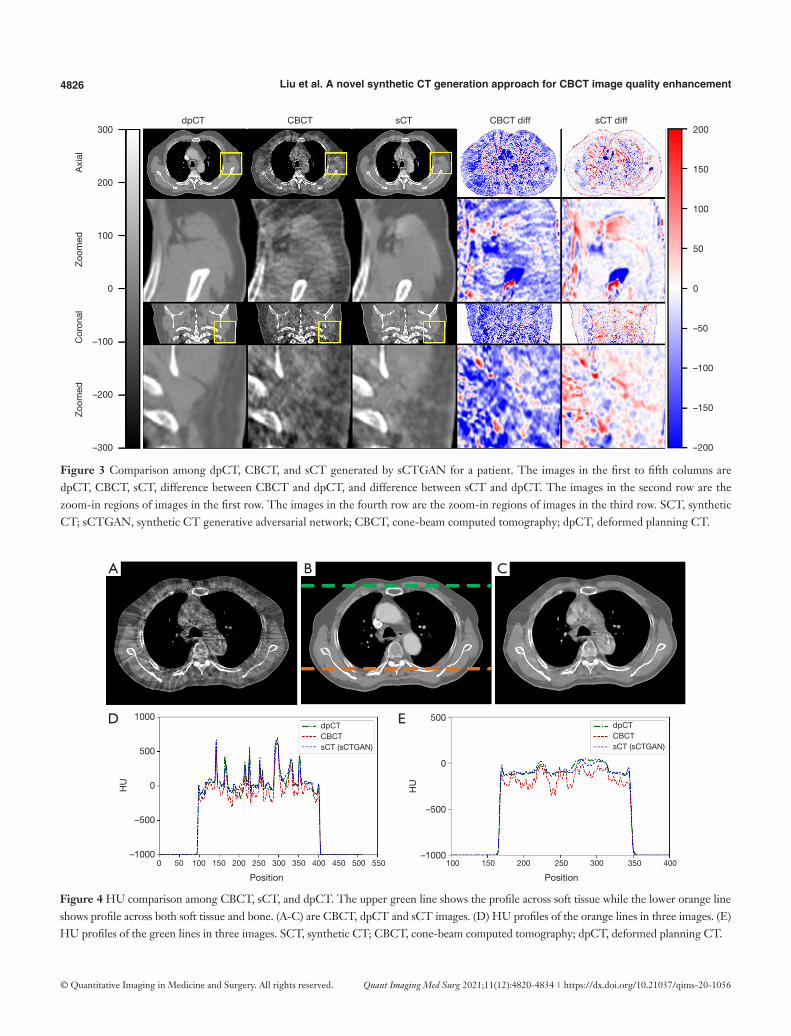
The training process took approximately 1 hours per epoch with a total of 40 epochs. The prediction time of one sCT slice took less than 1 second. The results of our proposed method for one patient is shown in Figure 3. It demonstrates that sCTGAN could effectively reduce artifacts as the resulting sCT images had smooth HU distribution and sharp organ boundaries. The images in second and fourth rows shows that sCTGAN can mostly restore detailed anatomical structures as presented in CBCT images. In addition, the profiles of CBCT, sCT, and dpCT images are comparatively shown in Figure 4. As indicated by the profile corresponding to the orange line passing through soft tissue and bone areas, the HU distribution of sCT was closer to that of dpCT. As indicated by the profile corresponding to the green line passing through soft tissue area, the distribution of HU values of sCT is smoother than that of CBCT. It is worth noting that the areas of heart in Figure 4A are brighter than the surrounding areas. This is caused by the incomplete CBCT correction.
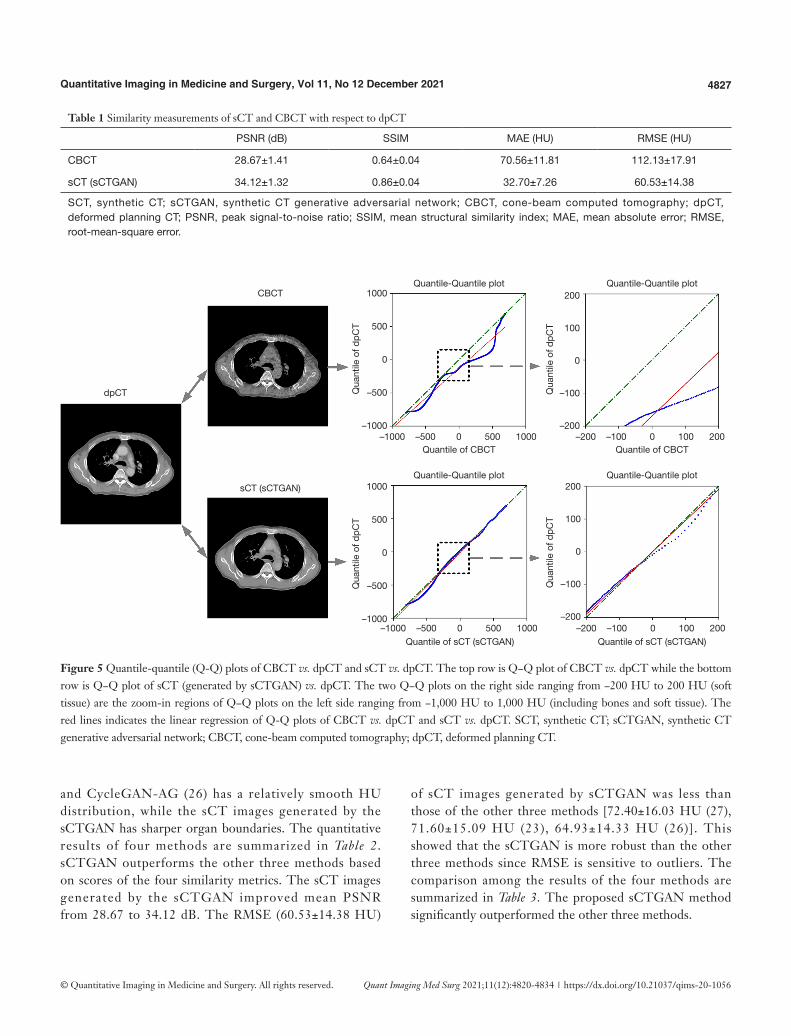
The result of prediction accuracy based on the four similarity metrics are summarized in Table 1. The PSNR, SSIM, MAE, and RMSE between sCT and dpCT are 34.12 dB, 0.86, 32.70 HU, and 60.53 HU, while the corresponding va lues between CBCT and dpCT are 28 .67 dB, 0.64, 70.56 HU, and 112.13 HU. To compare the HU values, the quantile-quantile (Q-Q) plot between CBCT and dpCT, and that between sCT and dpCT are shown in Figure 5. The closer the blue curve approached to the green line (diagonal line), the better agreement between the HU distributions is. It shows that the HU distribution of sCT is closer to that of dpCT than that of CBCT. This demonstrated that sCTGAN can effectively restore the HU distribution of input CBCT, especially in the soft-tissue region.
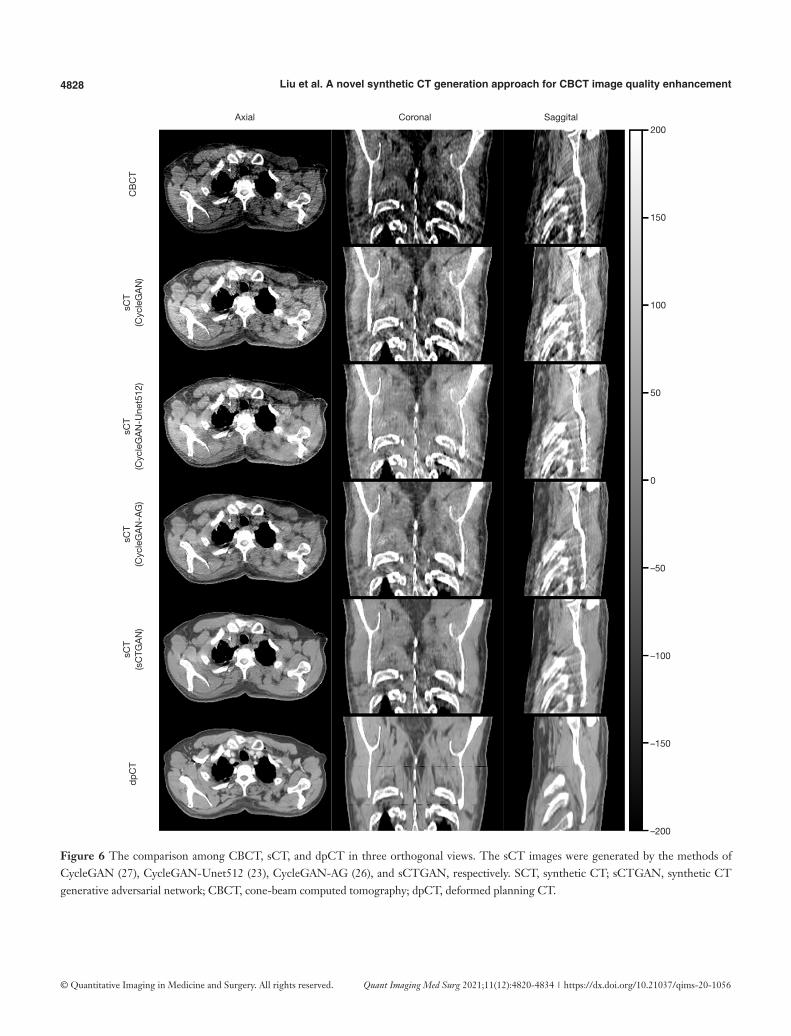
The CBCT and sCT generated by four CBCT-to-CT translation-based methods together with dpCT for one patient are shown in Figure 6. The sCT images generated by CycleGAN (27), CycleGAN-Unet512 (23)
4826 Liu et al. A novel synthetic CT generation approach for CBCT image quality enhancement
© Quantitative Imaging in Medicine and Surgery. All rights reserved. Quant Imaging Med Surg 2021;11(12):4820-4834 | https://dx.doi.org/10.21037/qims-20-1056
Figure 3 Comparison among dpCT, CBCT, and sCT generated by sCTGAN for a patient. The images in the first to fifth columns are dpCT, CBCT, sCT, difference between CBCT and dpCT, and difference between sCT and dpCT. The images in the second row are the zoom-in regions of images in the first row. The images in the fourth row are the zoom-in regions of images in the third row. SCT, synthetic CT; sCTGAN, synthetic CT generative adversarial network; CBCT, cone-beam computed tomography; dpCT, deformed planning CT.
Figure 4 HU comparison among CBCT, sCT, and dpCT. The upper green line shows the profile across soft tissue while the lower orange line shows profile across both soft tissue and bone. (A-C) are CBCT, dpCT and sCT images. (D) HU profiles of the orange lines in three images. (E) HU profiles of the green lines in three images. SCT, synthetic CT; CBCT, cone-beam computed tomography; dpCT, deformed planning CT.
300
200
100
0
–100
–200
–300
200
150
100
50
0
–50
–100
–150
–200
Zoo
med
C
oron
al
Zoo
med
A
xial
dpCT CBCT sCT CBCT diff sCT diff
A B C
D E1000
500
0
–500
–1000
500
0
–500
–1000
HU
Position Position
0 50 100 150 200 250 300 350 400 450 500 550 100 150 200 250 300 350 400
dpCTCBCTsCT (sCTGAN)
dpCTCBCTsCT (sCTGAN)
HU
4827Quantitative Imaging in Medicine and Surgery, Vol 11, No 12 December 2021
© Quantitative Imaging in Medicine and Surgery. All rights reserved. Quant Imaging Med Surg 2021;11(12):4820-4834 | https://dx.doi.org/10.21037/qims-20-1056
Table 1 Similarity measurements of sCT and CBCT with respect to dpCT
PSNR (dB) SSIM MAE (HU) RMSE (HU)
CBCT 28.67±1.41 0.64±0.04 70.56±11.81 112.13±17.91
sCT (sCTGAN) 34.12±1.32 0.86±0.04 32.70±7.26 60.53±14.38
SCT, synthetic CT; sCTGAN, synthetic CT generative adversarial network; CBCT, cone-beam computed tomography; dpCT, deformed planning CT; PSNR, peak signal-to-noise ratio; SSIM, mean structural similarity index; MAE, mean absolute error; RMSE, root-mean-square error.
Figure 5 Quantile-quantile (Q-Q) plots of CBCT vs. dpCT and sCT vs. dpCT. The top row is Q−Q plot of CBCT vs. dpCT while the bottom row is Q−Q plot of sCT (generated by sCTGAN) vs. dpCT. The two Q−Q plots on the right side ranging from −200 HU to 200 HU (soft tissue) are the zoom-in regions of Q−Q plots on the left side ranging from −1,000 HU to 1,000 HU (including bones and soft tissue). The red lines indicates the linear regression of Q-Q plots of CBCT vs. dpCT and sCT vs. dpCT. SCT, synthetic CT; sCTGAN, synthetic CT generative adversarial network; CBCT, cone-beam computed tomography; dpCT, deformed planning CT.
1000
500
0
–500
–1000
1000
500
0
–500
–1000
200
100
0
–100
–200
200
100
0
–100
–200
dpCT
CBCT
sCT (sCTGAN)
Quantile-Quantile plot
Qua
ntile
of d
pCT
Quantile of CBCT
Quantile of sCT (sCTGAN) Quantile of sCT (sCTGAN)
Quantile of CBCT
Qua
ntile
of d
pCT
Qua
ntile
of d
pCT
Qua
ntile
of d
pCT
–1000 –500 0 500 1000
–1000 –500 0 500 1000 –200 –100 0 100 200
–200 –100 0 100 200
Quantile-Quantile plot
Quantile-Quantile plot
Quantile-Quantile plot
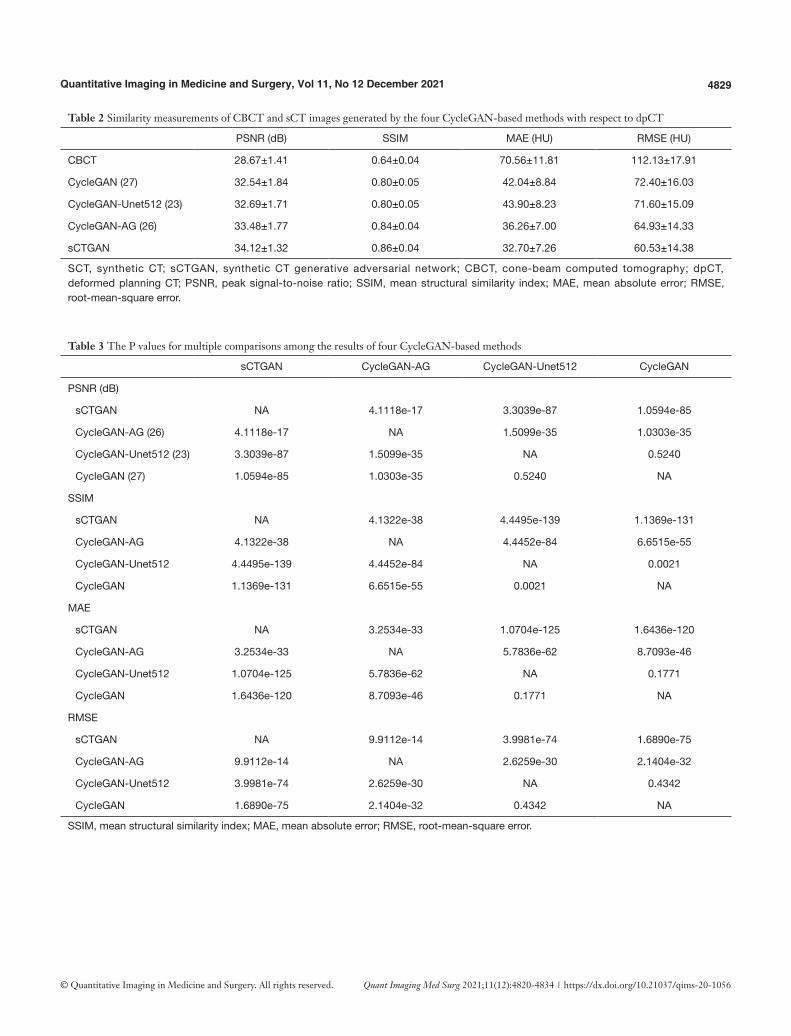
and CycleGAN-AG (26) has a relatively smooth HU distribution, while the sCT images generated by the sCTGAN has sharper organ boundaries. The quantitative results of four methods are summarized in Table 2. sCTGAN outperforms the other three methods based on scores of the four similarity metrics. The sCT images generated by the sCTGAN improved mean PSNR from 28.67 to 34.12 dB. The RMSE (60.53±14.38 HU)
of sCT images generated by sCTGAN was less than those of the other three methods [72.40±16.03 HU (27), 71.60±15.09 HU (23), 64.93±14.33 HU (26)]. This showed that the sCTGAN is more robust than the other three methods since RMSE is sensitive to outliers. The comparison among the results of the four methods are summarized in Table 3. The proposed sCTGAN method significantly outperformed the other three methods.
4828 Liu et al. A novel synthetic CT generation approach for CBCT image quality enhancement
© Quantitative Imaging in Medicine and Surgery. All rights reserved. Quant Imaging Med Surg 2021;11(12):4820-4834 | https://dx.doi.org/10.21037/qims-20-1056
Figure 6 The comparison among CBCT, sCT, and dpCT in three orthogonal views. The sCT images were generated by the methods of CycleGAN (27), CycleGAN-Unet512 (23), CycleGAN-AG (26), and sCTGAN, respectively. SCT, synthetic CT; sCTGAN, synthetic CT generative adversarial network; CBCT, cone-beam computed tomography; dpCT, deformed planning CT.
Axial
CB
CT
sCT
(Cyc
leG
AN
)sC
T(C
ycle
GA
N-U
net5
12)
sCT
(Cyc
leG
AN
-AG
)sC
T(s
CTG
AN
)dp
CT
Coronal200
150
100
50
0
–50
–100
–150
–200
Saggital
4829Quantitative Imaging in Medicine and Surgery, Vol 11, No 12 December 2021
© Quantitative Imaging in Medicine and Surgery. All rights reserved. Quant Imaging Med Surg 2021;11(12):4820-4834 | https://dx.doi.org/10.21037/qims-20-1056
Table 3 The P values for multiple comparisons among the results of four CycleGAN-based methods
sCTGAN CycleGAN-AG CycleGAN-Unet512 CycleGAN
PSNR (dB)
sCTGAN NA 4.1118e-17 3.3039e-87 1.0594e-85
CycleGAN-AG (26) 4.1118e-17 NA 1.5099e-35 1.0303e-35
CycleGAN-Unet512 (23) 3.3039e-87 1.5099e-35 NA 0.5240
CycleGAN (27) 1.0594e-85 1.0303e-35 0.5240 NA
SSIM
sCTGAN NA 4.1322e-38 4.4495e-139 1.1369e-131
CycleGAN-AG 4.1322e-38 NA 4.4452e-84 6.6515e-55
CycleGAN-Unet512 4.4495e-139 4.4452e-84 NA 0.0021
CycleGAN 1.1369e-131 6.6515e-55 0.0021 NA
MAE
sCTGAN NA 3.2534e-33 1.0704e-125 1.6436e-120
CycleGAN-AG 3.2534e-33 NA 5.7836e-62 8.7093e-46
CycleGAN-Unet512 1.0704e-125 5.7836e-62 NA 0.1771
CycleGAN 1.6436e-120 8.7093e-46 0.1771 NA
RMSE
sCTGAN NA 9.9112e-14 3.9981e-74 1.6890e-75
CycleGAN-AG 9.9112e-14 NA 2.6259e-30 2.1404e-32
CycleGAN-Unet512 3.9981e-74 2.6259e-30 NA 0.4342
CycleGAN 1.6890e-75 2.1404e-32 0.4342 NA
SSIM, mean structural similarity index; MAE, mean absolute error; RMSE, root-mean-square error.
Table 2 Similarity measurements of CBCT and sCT images generated by the four CycleGAN-based methods with respect to dpCT
PSNR (dB) SSIM MAE (HU) RMSE (HU)
CBCT 28.67±1.41 0.64±0.04 70.56±11.81 112.13±17.91
CycleGAN (27) 32.54±1.84 0.80±0.05 42.04±8.84 72.40±16.03
CycleGAN-Unet512 (23) 32.69±1.71 0.80±0.05 43.90±8.23 71.60±15.09
CycleGAN-AG (26) 33.48±1.77 0.84±0.04 36.26±7.00 64.93±14.33
sCTGAN 34.12±1.32 0.86±0.04 32.70±7.26 60.53±14.38
SCT, synthetic CT; sCTGAN, synthetic CT generative adversarial network; CBCT, cone-beam computed tomography; dpCT, deformed planning CT; PSNR, peak signal-to-noise ratio; SSIM, mean structural similarity index; MAE, mean absolute error; RMSE, root-mean-square error.
4830 Liu et al. A novel synthetic CT generation approach for CBCT image quality enhancement
© Quantitative Imaging in Medicine and Surgery. All rights reserved. Quant Imaging Med Surg 2021;11(12):4820-4834 | https://dx.doi.org/10.21037/qims-20-1056
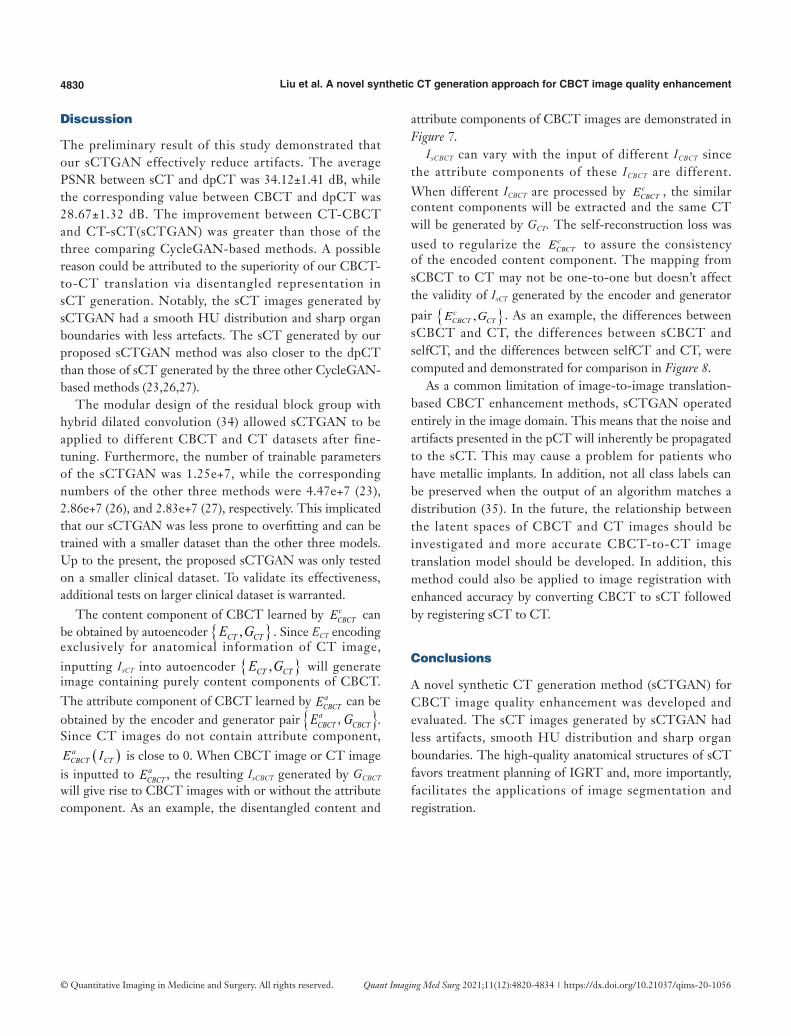
Discussion
The preliminary result of this study demonstrated that our sCTGAN effectively reduce artifacts. The average PSNR between sCT and dpCT was 34.12±1.41 dB, while the corresponding value between CBCT and dpCT was 28.67±1.32 dB. The improvement between CT-CBCT and CT-sCT(sCTGAN) was greater than those of the three comparing CycleGAN-based methods. A possible reason could be attributed to the superiority of our CBCT-to-CT translation via disentangled representation in sCT generation. Notably, the sCT images generated by sCTGAN had a smooth HU distribution and sharp organ boundaries with less artefacts. The sCT generated by our proposed sCTGAN method was also closer to the dpCT than those of sCT generated by the three other CycleGAN-based methods (23,26,27).
The modular design of the residual block group with hybrid dilated convolution (34) allowed sCTGAN to be applied to different CBCT and CT datasets after fine-tuning. Furthermore, the number of trainable parameters of the sCTGAN was 1.25e+7, while the corresponding numbers of the other three methods were 4.47e+7 (23), 2.86e+7 (26), and 2.83e+7 (27), respectively. This implicated that our sCTGAN was less prone to overfitting and can be trained with a smaller dataset than the other three models. Up to the present, the proposed sCTGAN was only tested on a smaller clinical dataset. To validate its effectiveness, additional tests on larger clinical dataset is warranted.
The content component of CBCT learned by cCBCTE can
be obtained by autoencoder { },CT CTE G . Since ECT encoding exclusively for anatomical information of CT image, inputting IsCT into autoencoder { },CT CTE G will generate image containing purely content components of CBCT. The attribute component of CBCT learned by a
CBCTE can be obtained by the encoder and generator pair { }a
CBCT CBCTE G, . Since CT images do not contain attribute component, ( )a
CBCT CTE I is close to 0. When CBCT image or CT image is inputted to a
CBCTE , the resulting IsCBCT generated by GCBCT will give rise to CBCT images with or without the attribute component. As an example, the disentangled content and
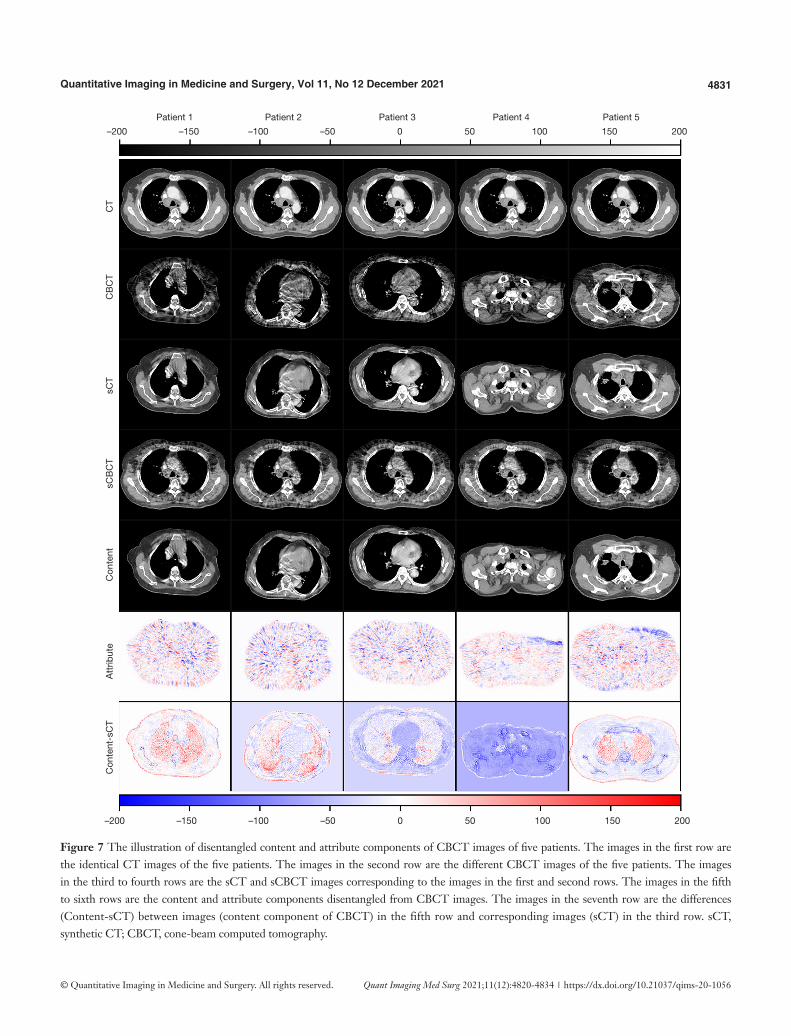
attribute components of CBCT images are demonstrated in Figure 7.
IsCBCT can vary with the input of different ICBCT since the attribute components of these ICBCT are different. When different ICBCT are processed by c
CBCTE , the similar content components will be extracted and the same CT will be generated by GCT. The self-reconstruction loss was used to regularize the c
CBCTE to assure the consistency of the encoded content component. The mapping from sCBCT to CT may not be one-to-one but doesn’t affect the validity of IsCT generated by the encoder and generator
pair { },cCBCT CTE G . As an example, the differences between
sCBCT and CT, the differences between sCBCT and selfCT, and the differences between selfCT and CT, were computed and demonstrated for comparison in Figure 8.
As a common limitation of image-to-image translation-based CBCT enhancement methods, sCTGAN operated entirely in the image domain. This means that the noise and artifacts presented in the pCT will inherently be propagated to the sCT. This may cause a problem for patients who have metallic implants. In addition, not all class labels can be preserved when the output of an algorithm matches a distribution (35). In the future, the relationship between the latent spaces of CBCT and CT images should be investigated and more accurate CBCT-to-CT image translation model should be developed. In addition, this method could also be applied to image registration with enhanced accuracy by converting CBCT to sCT followed by registering sCT to CT.
Conclusions
A novel synthetic CT generation method (sCTGAN) for CBCT image quality enhancement was developed and evaluated. The sCT images generated by sCTGAN had less artifacts, smooth HU distribution and sharp organ boundaries. The high-quality anatomical structures of sCT favors treatment planning of IGRT and, more importantly, facilitates the applications of image segmentation and registration.
4831Quantitative Imaging in Medicine and Surgery, Vol 11, No 12 December 2021
© Quantitative Imaging in Medicine and Surgery. All rights reserved. Quant Imaging Med Surg 2021;11(12):4820-4834 | https://dx.doi.org/10.21037/qims-20-1056
Figure 7 The illustration of disentangled content and attribute components of CBCT images of five patients. The images in the first row are the identical CT images of the five patients. The images in the second row are the different CBCT images of the five patients. The images in the third to fourth rows are the sCT and sCBCT images corresponding to the images in the first and second rows. The images in the fifth to sixth rows are the content and attribute components disentangled from CBCT images. The images in the seventh row are the differences (Content-sCT) between images (content component of CBCT) in the fifth row and corresponding images (sCT) in the third row. sCT, synthetic CT; CBCT, cone-beam computed tomography.
Patient 1 Patient 2 Patient 3 Patient 4 Patient 5
–200 –150 –100 –50 0 50 100 150 200
Con
tent
-sC
T
Att
ribut
e
Con
tent
s
CB
CT
sCT
C
BC
T
CT
–200 –150 –100 –50 0 50 100 150 200
4832 Liu et al. A novel synthetic CT generation approach for CBCT image quality enhancement
© Quantitative Imaging in Medicine and Surgery. All rights reserved. Quant Imaging Med Surg 2021;11(12):4820-4834 | https://dx.doi.org/10.21037/qims-20-1056
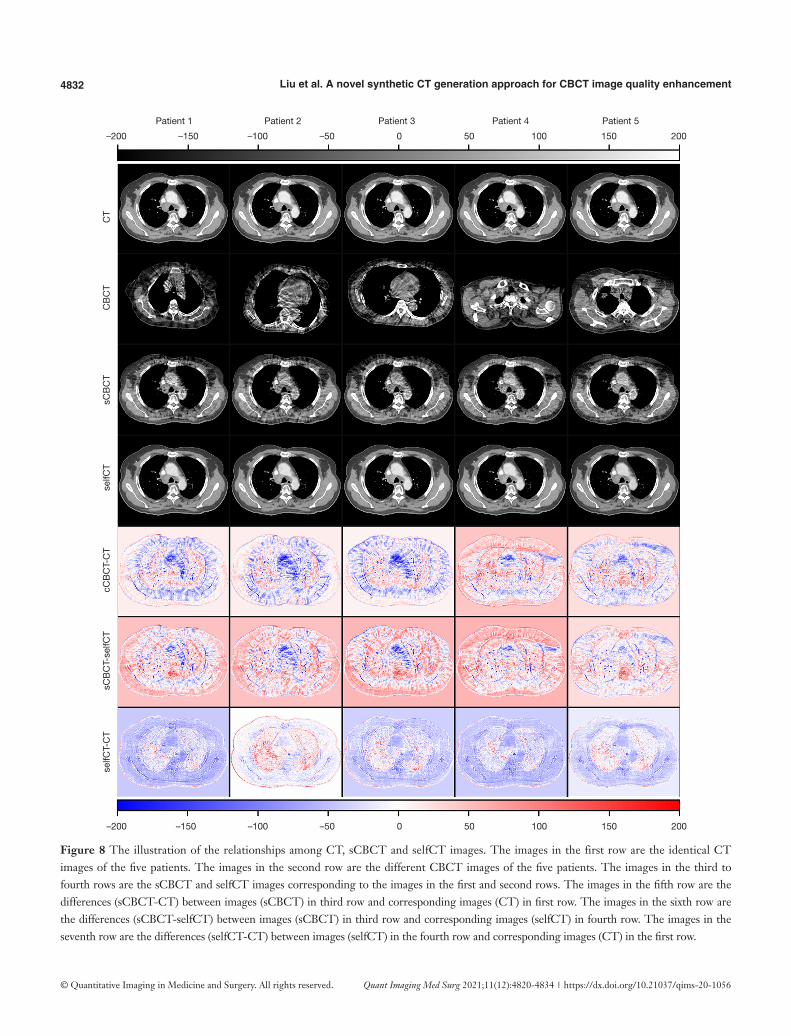
Figure 8 The illustration of the relationships among CT, sCBCT and selfCT images. The images in the first row are the identical CT images of the five patients. The images in the second row are the different CBCT images of the five patients. The images in the third to fourth rows are the sCBCT and selfCT images corresponding to the images in the first and second rows. The images in the fifth row are the differences (sCBCT-CT) between images (sCBCT) in third row and corresponding images (CT) in first row. The images in the sixth row are the differences (sCBCT-selfCT) between images (sCBCT) in third row and corresponding images (selfCT) in fourth row. The images in the seventh row are the differences (selfCT-CT) between images (selfCT) in the fourth row and corresponding images (CT) in the first row.
Patient 1 Patient 2 Patient 3 Patient 4 Patient 5
–200 –150 –100 –50 0 50 100 150 200
selfC
T-C
T
sCB
CT-
selfC
T
c
CB
CT-
CT
se
lfCT
s
CB
CT
CB
CT
C
T
–200 –150 –100 –50 0 50 100 150 200
4833Quantitative Imaging in Medicine and Surgery, Vol 11, No 12 December 2021
© Quantitative Imaging in Medicine and Surgery. All rights reserved. Quant Imaging Med Surg 2021;11(12):4820-4834 | https://dx.doi.org/10.21037/qims-20-1056
Acknowledgments
Funding: This work is supported by the Natural Science Foundation (NSF) of China (No. 11975312) and Beijing Municipal Natural Science Foundation (7202170). The authors gratefully appreciate the support from Varian Medical Systems for technical assistances.
Footnote
Provenance and Peer Review: With the arrangement by the Guest Editors and the editorial office, this article has been reviewed by external peers.
Conflicts of Interest: All authors have completed the ICMJE uniform disclosure form (available at https://dx.doi.org/10.21037/qims-20-1056). The special issue “Artificial Intelligence for Image-guided Radiation Therapy” was commissioned by the editorial office without any funding or sponsorship. The authors have no other conflicts of interest to declare.
Ethical Statement: The authors are accountable for all aspects of the work in ensuring that questions related to the accuracy or integrity of any part of the work are appropriately investigated and resolved. The study was conducted in accordance with the Declaration of Helsinki (as revised in 2013). This study was approved by institutional Ethics Committee of The Affiliated Cancer Hospital of Zhengzhou University, Henan Cancer Hospital. And the informed consent was waived in this retrospective study.
Open Access Statement: This is an Open Access article distributed in accordance with the Creative Commons Attribution-NonCommercial-NoDerivs 4.0 International License (CC BY-NC-ND 4.0), which permits the non-commercial replication and distribution of the article with the strict proviso that no changes or edits are made and the original work is properly cited (including links to both the formal publication through the relevant DOI and the license). See: https://creativecommons.org/licenses/by-nc-nd/4.0/.
References
1. Dawson LA, Jaffray DA. Advances in Image-Guided Radiation Therapy. J Clin Oncol 2007;25:938-46.
2. Hvid CA, Elstrøm UV, Jensen K, Grau C. Cone-beam computed tomography (CBCT) for adaptive image guided head and neck radiation therapy. Acta Oncol
2018;57:552-6.3. Ye JC, Qureshi MM, Clancy P, Dise LN, Willins J, Hirsch
AE. Daily patient setup error in prostate image guided radiation therapy with fiducial-based kilovoltage onboard imaging and conebeam computed tomography. Quant Imaging Med Surg 2015;5:665-72.
4. Park S, Plishker W, Quon H, Wong J, Shekhar R, Lee J. Deformable registration of CT and cone-beam CT with local intensity matching. Phys Med Biol 2017;62:927-47.
5. Vijayan R, De Silva T, Han R, Zhang X, Uneri A, Doerr S, Ketcha M, Perdomo-Pantoja A, Theodore N, Siewerdsen JH. Automatic pedicle screw planning using atlas-based registration of anatomy and reference trajectories. Phys Med Biol 2019;64:165020.
6. Zachiu C, de Senneville BD, Tijssen RHN, Kotte ANTJ, Houweling AC, Kerkmeijer LGW, Lagendijk JJW, Moonen CTW, Ries M. Non-rigid CT/CBCT to CBCT registration for online external beam radiotherapy guidance. Phys Med Biol 2017;63:015027.
7. Cole AJ, Veiga C, Johnson U, D’Souza D, Lalli NK, McClelland JR. Toward adaptive radiotherapy for lung patients: feasibility study on deforming planning CT to CBCT to assess the impact of anatomical changes on dosimetry. Phys Med Biol 2018;63:155014.
8. Zhang G, Jacobs R, Bosmans H. A model-based volume restoration approach for Monte Carlo scatter correction in image reconstruction of cone beam CT with limited field of view. SPIE Medical Imaging 2013:754-9.
9. Xu Y, Bai T, Yan H, Ouyang L, Pompos A, Wang J, Zhou L, Jiang SB, Jia X. A practical cone-beam CT scatter correction method with optimized Monte Carlo simulations for image-guided radiation therapy. Phys Med Biol 2015;60:3567-87.
10. Zöllner C, Rit S, Kurz C, Vilches-Freixas G, Kamp F, Dedes G, Belka C, Parodi K, Landry G. Decomposing a prior-CT-based cone-beam CT projection correction algorithm into scatter and beam hardening components. Phy Imag Radiat Oncol 2017;3:49-52.
11. Yang X, Liu T, Dong X, Tang X, Elder E, Curran W.J, Dhabaan A. A patch-based CBCT scatter artifact correction using prior CT. SPIE Medical Imaging 2017:566-72.
12. Kidar HS, Azizi H. Assessing the impact of choosing different deformable registration algorithms on cone-beam CT enhancement by histogram matching. Radiat Oncol 2018;13:217.
13. Lei Y, Tang X, Higgins K, Lin J, Jeong J, Liu T, Dhabaan A, Wang T, Dong X, Press R, Curran WJ, Yang X. Learning-based CBCT Correction Using Alternating Random Forest
4834 Liu et al. A novel synthetic CT generation approach for CBCT image quality enhancement
© Quantitative Imaging in Medicine and Surgery. All rights reserved. Quant Imaging Med Surg 2021;11(12):4820-4834 | https://dx.doi.org/10.21037/qims-20-1056
Based on Auto-context Model. Med Phys 2019;46:601-18.14. Xie S, Yang C, Zhang Z, Li H. Scatter Artifacts Removal
Using Learning-Based Method for CBCT in IGRT System. IEEE Access 2018;6:78031-7.
15. Jiang Y, Yang C, Yang P, Hu X, Luo C, Xue Y, Xu L, Hu X, Zhang L, Wang J, Sheng K, Niu T. Scatter correction of cone-beam CT using a deep residual convolution neural network (DRCNN). Phys Med Biol 2019;64:145003.
16. Li Y, Zhu J, Liu Z, Teng J, Xie Q, Zhang L, Liu X, Shi J, Chen L. A preliminary study of using a deep convolution neural network to generate synthesized CT images based on CBCT for adaptive radiotherapy of nasopharyngeal carcinoma. Phys Med Biol 2019;64:145010.
17. Chen L, Liang X, Shen C, Jiang S, Wang J. Synthetic CT generation from CBCT images via deep learning. Med Phys 2020;47:1115-25.
18. Zhao S, Li J, Huo Q. Removing ring artifacts in CBCT images via generative adversarial network. 2018 IEEE International Conference on Acoustics, Speech and Signal Processing (ICASSP) 2018:1055-9.
19. Wang Z, Li J, Enoh M. Removing ring artifacts in CBCT images via generative adversarial networks with unidirectional relative total variation loss. Neural Comput Appl 2019;31:5147-58.
20. Harms J, Lei Y, Wang T, Zhang R, Zhou J, Tang X, Curran WJ, Liu T, Yang X. Paired cycle-GAN-based image correction for quantitative cone-beam computed tomography. Med Phys 2019;46:3998-4009.
21. Kida S, Kaji S, Nawa K, Imae T, Nakamoto T, Ozaki S, Ohta T, Nozawa Y, Nakagawa K. Visual enhancement of Cone-beam CT by use of CycleGAN. Available online: https://arxiv.org/abs/1901.05773v3
22. Lei Y, Wang T, Harms J, Erfani G.S, Dong X, Zhou J, Patel P, Tang X, Liu T, Curran W.J, Higgins K, Yang X. Image quality improvement in cone-beam CT using deep learning. SPIE Medical Imaging 2019:556-61.
23. Liang X, Chen L, Nguyen D, Zhou Z, Gu X, Yang M, Wang J, Jiang S. Generating synthesized computed tomography (CT) from cone-beam computed tomography (CBCT) using CycleGAN for adaptive radiation therapy. Phys Med Biol 2019;64:125002.
24. Kurz C, Maspero M, Savenije MHF, Landry G, Kamp F, Pinto M, Li M, Parodi K, Belka C, van den Berg CAT. CBCT correction using a cycle-consistent generative adversarial network and unpaired training to enable photon and proton dose calculation. Phys Med Biol 2019;64:225004.
25. Park S, Ye JC. Unsupervised Cone-Beam Artifact Removal Using CycleGAN and Spectral Blending for Adaptive
Radiotherapy. 2020 IEEE 17th International Symposium on Biomedical Imaging (ISBI 2020) 2020:638-41.
26. Liu Y, Lei Y, Wang T, Fu Y, Tang X, Curran WJ, Liu T, Patel P, Yang X. CBCT-based synthetic CT generation using deep-attention cycleGAN for pancreatic adaptive radiotherapy. Med Phys 2020;47:2472-83.
27. Zhu JY, Park T, Isola P, Efros AA. Unpaired Image-to-Image Translation using Cycle-Consistent Adversarial Networks. 2017 The IEEE International Conference on Computer Vision (ICCV) 2017:2223-32.
28. Ronneberger O, Fischer P, Brox T. U-net: Convolutional networks for biomedical image segmentation. 2015 The international conference on medical image computing and computer-assisted intervention (MICCAI) 2015:234-41.
29. Lee HY, Tseng HY, Huang JB, Singh M, Yang MH. Diverse Image-to-Image Translation via Disentangled Representations. 2018 The European Conference on Computer Vision (ECCV) 2018:35-51.
30. Huang X, Liu M.Y, Belongie S, Kautz J. Multimodal Unsupervised Image-to-image Translation. 2018 The European Conference on Computer Vision (ECCV) 2018:172-89.
31. Lee HY, Tseng HY, Mao Q, Huang JB, Lu YD, Singh M, Yang MH. DRIT++: Diverse Image-to-Image Translation via Disentangled Representations. Int J Comput Vision 2020;128:2402-17.
32. Liao H, Lin W, Zhou SK, Luo J. Artifact Disentanglement Network for Unsupervised Metal Artifact Reduction. IEEE Trans Med Imaging 2020;39:634-43.
33. Sandkuhler R, Jud C, Andermatt S, Cattin P.C. AirLab: Autograd Image Registration Laboratory. Available online: https://arxiv.org/abs/1806.09907v2
34. Wang P, Chen P, Yuan Y, Liu D, Huang Z, Hou X, Cottrel G. Understanding Convolution for Semantic Segmentation. 2018 IEEE Winter Conference on Applications of Computer Vision (WACV) 2018:1451-60.
35. Cohen JP, Luck M, Honari S. Distribution matching losses can hallucinate features in medical image translation. 2016 The International Conference on Medical Image Computing and Computer-Assisted Intervention (MICCAI) 2016:529-536.
Cite this article as: Liu J, Yan H, Cheng H, Liu J, Sun P, Wang B, Mao R, Du C, Luo S. CBCT-based synthetic CT generation using generative adversarial networks with disentangled representation. Quant Imaging Med Surg 2021;11(12):4820-4834. doi: 10.21037/qims-20-1056
© Quantitative Imaging in Medicine and Surgery. All rights reserved. https://dx.doi.org/10.21037/qims-20-1056
Supplementary
Appendix 1
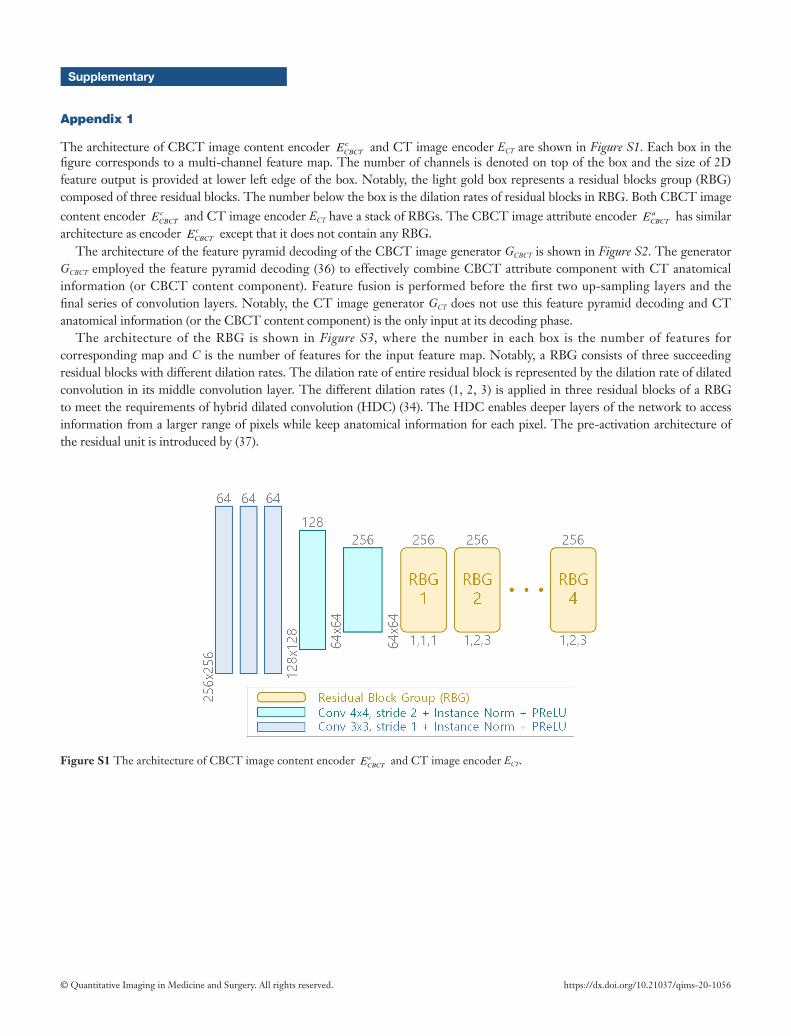
The architecture of CBCT image content encoder cCBCTE and CT image encoder ECT are shown in Figure S1. Each box in the
figure corresponds to a multi-channel feature map. The number of channels is denoted on top of the box and the size of 2D feature output is provided at lower left edge of the box. Notably, the light gold box represents a residual blocks group (RBG) composed of three residual blocks. The number below the box is the dilation rates of residual blocks in RBG. Both CBCT image content encoder c
CBCTE and CT image encoder ECT have a stack of RBGs. The CBCT image attribute encoder aCBCTE has similar
architecture as encoder cCBCTE except that it does not contain any RBG.
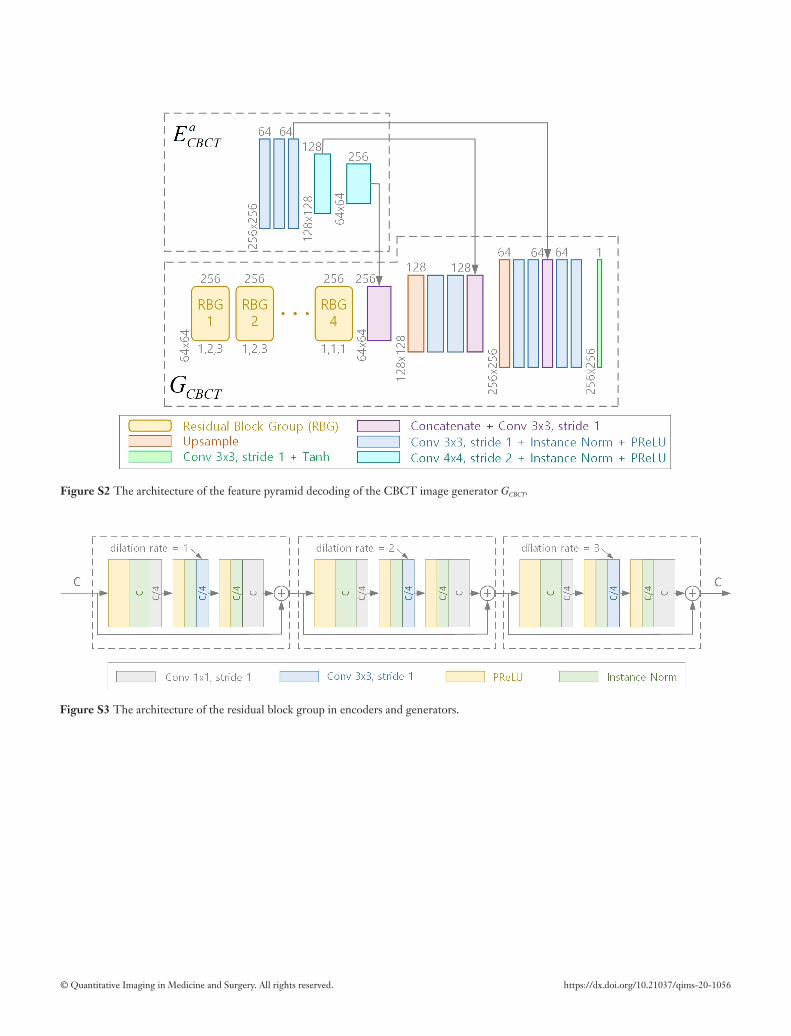
The architecture of the feature pyramid decoding of the CBCT image generator GCBCT is shown in Figure S2. The generator GCBCT employed the feature pyramid decoding (36) to effectively combine CBCT attribute component with CT anatomical information (or CBCT content component). Feature fusion is performed before the first two up-sampling layers and the final series of convolution layers. Notably, the CT image generator GCT does not use this feature pyramid decoding and CT anatomical information (or the CBCT content component) is the only input at its decoding phase.
The architecture of the RBG is shown in Figure S3, where the number in each box is the number of features for corresponding map and C is the number of features for the input feature map. Notably, a RBG consists of three succeeding residual blocks with different dilation rates. The dilation rate of entire residual block is represented by the dilation rate of dilated convolution in its middle convolution layer. The different dilation rates (1, 2, 3) is applied in three residual blocks of a RBG to meet the requirements of hybrid dilated convolution (HDC) (34). The HDC enables deeper layers of the network to access information from a larger range of pixels while keep anatomical information for each pixel. The pre-activation architecture of the residual unit is introduced by (37).
Figure S1 The architecture of CBCT image content encoder cCBCTE and CT image encoder ECT.
© Quantitative Imaging in Medicine and Surgery. All rights reserved. https://dx.doi.org/10.21037/qims-20-1056
Figure S2 The architecture of the feature pyramid decoding of the CBCT image generator GCBCT.
Figure S3 The architecture of the residual block group in encoders and generators.
© Quantitative Imaging in Medicine and Surgery. All rights reserved. https://dx.doi.org/10.21037/qims-20-1056
Appendix 2
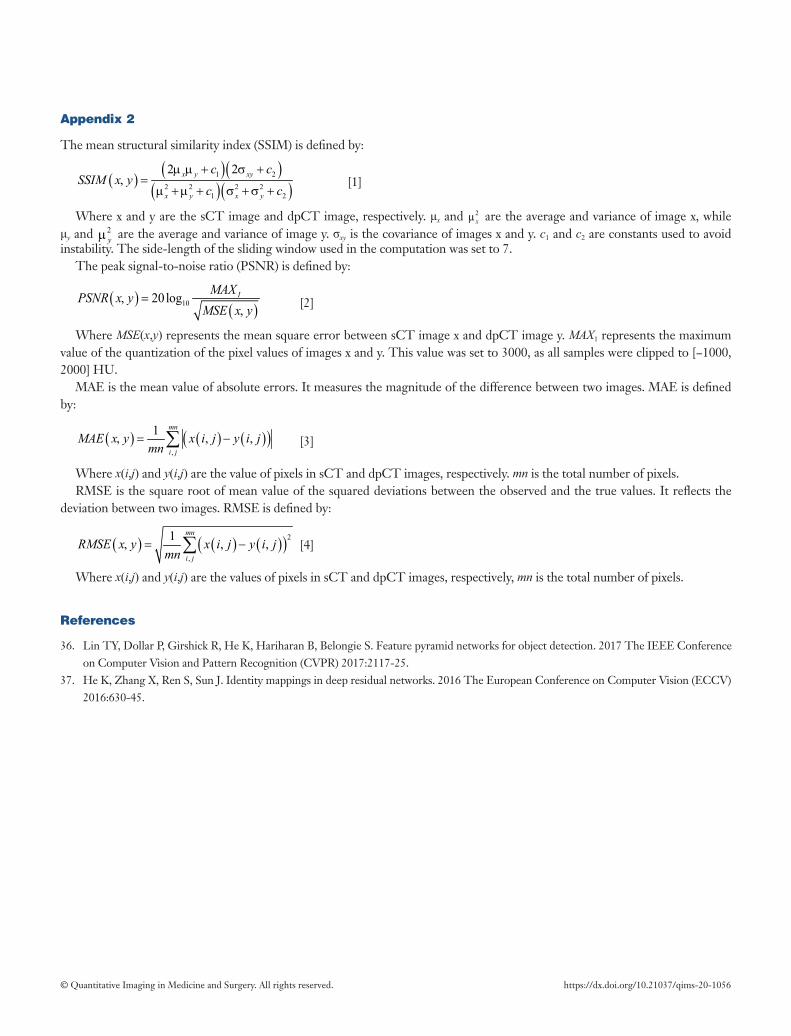
The mean structural similarity index (SSIM) is defined by:
( ) ( )( )( )( )
1 2
2 2 2 21 2
2 2x y xy
x y x y
c cSSIM x y
c c
µ µ + σ +,
µ + + σ +σ +=
µ [1]
Where x and y are the sCT image and dpCT image, respectively. μx and 2xµ are the average and variance of image x, while
μy and 2yµ are the average and variance of image y. σxy is the covariance of images x and y. c1 and c2 are constants used to avoid
instability. The side-length of the sliding window used in the computation was set to 7.The peak signal-to-noise ratio (PSNR) is defined by: ( )
( )1020 log IMAXPSNR x yMSE x y
,,
= [2]
Where MSE(x,y) represents the mean square error between sCT image x and dpCT image y. MAX1 represents the maximum value of the quantization of the pixel values of images x and y. This value was set to 3000, as all samples were clipped to [−1000, 2000] HU.
MAE is the mean value of absolute errors. It measures the magnitude of the difference between two images. MAE is defined by:
( ) ( ) ( )( )
,
1 , ,mn
i jMAE x y x i j y i j
mn=, −∑ [3]
Where x(i,j) and y(i,j) are the value of pixels in sCT and dpCT images, respectively. mn is the total number of pixels.RMSE is the square root of mean value of the squared deviations between the observed and the true values. It reflects the
deviation between two images. RMSE is defined by:
( ) ( ) ( )( )2
,
1 , ,mn
i jRMSE x y x i j y i j
mn=, −∑ [4]
Where x(i,j) and y(i,j) are the values of pixels in sCT and dpCT images, respectively, mn is the total number of pixels.
References
36. Lin TY, Dollar P, Girshick R, He K, Hariharan B, Belongie S. Feature pyramid networks for object detection. 2017 The IEEE Conference on Computer Vision and Pattern Recognition (CVPR) 2017:2117-25.
37. He K, Zhang X, Ren S, Sun J. Identity mappings in deep residual networks. 2016 The European Conference on Computer Vision (ECCV) 2016:630-45.