1d conditional generative adversarial network for spectrum
TRANSCRIPT
Rochester Institute of Technology Rochester Institute of Technology
RIT Scholar Works RIT Scholar Works
Articles Faculty & Staff Scholarship
6-11-2021
1D Conditional Generative Adversarial Network for Spectrum-to-1D Conditional Generative Adversarial Network for Spectrum-to-
spectrum Translation of Simulated Chemical Reflectance spectrum Translation of Simulated Chemical Reflectance
signatures signatures
Cara Murphy Systems & Technology Research
John Kerekes Rochester Institute of Technology
Follow this and additional works at: https://scholarworks.rit.edu/article
Part of the Other Physical Sciences and Mathematics Commons
Recommended Citation Recommended Citation Murphy, Cara and Kerekes, John, "1D Conditional Generative Adversarial Network for Spectrum-to-spectrum Translation of Simulated Chemical Reflectance signatures" (2021). Journal of Spectral Imaging, 10 (), 1-11. Accessed from https://scholarworks.rit.edu/article/2006
This Article is brought to you for free and open access by the Faculty & Staff Scholarship at RIT Scholar Works. It has been accepted for inclusion in Articles by an authorized administrator of RIT Scholar Works. For more information, please contact [email protected].
CorrespondenceCara Murphy ([email protected])
Received: 22 January 2021Revised: 26 April 2021Accepted: 26 April 2021Publication: 11 June 2021doi: 10.1255/jsi.2021.a2ISSN: 2040-4565
CitationC.P. Murphy and J. Kerekes, “1D conditional generative adversarial net-work for spectrum-to-spectrum translation of simulated chemical reflec-tance signatures”, J. Spectral Imaging 10, a2 (2021). https://doi.org/10.1255/jsi.2021.a2
© 2021 The Authors
This licence permits you to use, share, copy and redistribute the paper in any medium or any format provided that a full citation to the original paper in this journal is given.
1C.P. Murphy and J. Kerekes, J. Spectral Imaging 10, a2 (2021)JSIPeer Reviewed Article openaccess
1D conditional generative adversarial network for spectrum-to-spectrum translation of simulated chemical reflectance signatures
Cara P. Murphya,b,* and John Kerekesb
aSystems & Technology Research, 600 West Cummings Park, Woburn, MA 01801, USAbChester F. Carlson Center for Imaging Science, Rochester Institute of Technology, 54 Lomb Memorial Dr., Rochester, NY 14623, USA
ContactsCara Murphy: [email protected]
https://orcid.org/0000-0002-8595-8941John Kerekes: [email protected];
https://orcid.org/0000-0002-0754-8170
The classification of trace chemical residues through active spectroscopic sensing is challenging due to the lack of physics-based models that
can accurately predict spectra. To overcome this challenge, we leveraged the field of domain adaptation to translate data from the simulated
to the measured domain for training a classifier. We developed the first 1D conditional generative adversarial network (GAN) to perform
spectrum-to-spectrum translation of reflectance signatures. We applied the 1D conditional GAN to a library of simulated spectra and quantified
the improvement in classification accuracy on real data using the translated spectra for training the classifier. Using the GAN-translated library,
the average classification accuracy increased from 0.622 to 0.723 on real chemical reflectance data, including data from chemicals not included in
the GAN training set.
Keywords ctive ec r c c e ic l de ecti ec r l i i d i d ti c diti l A d r l ti
IntroductionIdentifying trace amounts (≤200 µg cm−2) of chemicals on surfaces is a desirable capability for a wide range of defence, intelligence and law enforcement applications.1 Chemicals of interest for these applications include explosives, chemical warfare agents, narcotics etc. Active long-wave-infrared (LWIR) spectroscopy, where “active” means an active illumination source is required, is arguably the only technique capable of achieving high- sensitivity standoff identification of trace chemicals on
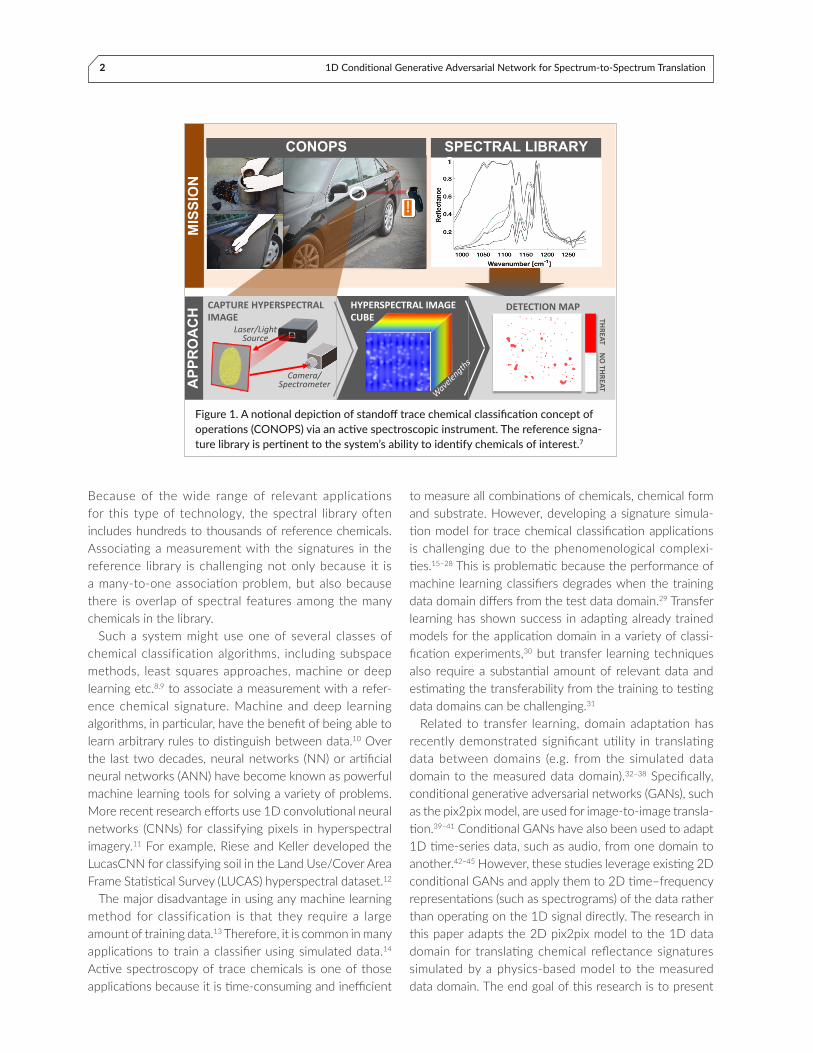
surfaces while achieving high areal coverage rates.2–4 A notional example of an active mid-infrared (MIR) hyper-spectral imaging (HSI) system is shown in Figure 1. The system operates by measuring the spectral reflectance, or the portion of which is reflected back towards the sensor, of the target surface in the LWIR portion of the optical spectrum using quantum cascade lasers (QCL) as the illumination source3,5,6 and comparing the measured signature to a spectral library of reference signatures.
2 1D Conditional Generative Adversarial Network for Spectrum-to-Spectrum Translation
Because of the wide range of relevant applications for this type of technology, the spectral library often includes hundreds to thousands of reference chemicals. Associating a measurement with the signatures in the reference library is challenging not only because it is a many-to-one association problem, but also because there is overlap of spectral features among the many chemicals in the library.
Such a system might use one of several classes of chemical classification algorithms, including subspace methods, least squares approaches, machine or deep learning etc.8,9 to associate a measurement with a refer-ence chemical signature. Machine and deep learning algorithms, in particular, have the benefit of being able to learn arbitrary rules to distinguish between data.10 Over the last two decades, neural networks (NN) or artificial neural networks (ANN) have become known as powerful machine learning tools for solving a variety of problems. More recent research efforts use 1D convolutional neural networks (CNNs) for classifying pixels in hyperspectral imagery.11 For example, Riese and Keller developed the LucasCNN for classifying soil in the Land Use/Cover Area Frame Statistical Survey (LUCAS) hyperspectral dataset.12
The major disadvantage in using any machine learning method for classification is that they require a large amount of training data.13 Therefore, it is common in many applications to train a classifier using simulated data.14 Active spectroscopy of trace chemicals is one of those applications because it is time-consuming and inefficient
to measure all combinations of chemicals, chemical form and substrate. However, developing a signature simula-tion model for trace chemical classification applications is challenging due to the phenomenological complexi-ties.15–28 This is problematic because the performance of machine learning classifiers degrades when the training data domain differs from the test data domain.29 Transfer learning has shown success in adapting already trained models for the application domain in a variety of classi-fication experiments,30 but transfer learning techniques also require a substantial amount of relevant data and estimating the transferability from the training to testing data domains can be challenging.31
Related to transfer learning, domain adaptation has recently demonstrated significant utility in translating data between domains (e.g. from the simulated data domain to the measured data domain).32–38 Specifically, conditional generative adversarial networks (GANs), such as the pix2pix model, are used for image-to-image transla-tion.39–41 Conditional GANs have also been used to adapt 1D time-series data, such as audio, from one domain to another.42–45 However, these studies leverage existing 2D conditional GANs and apply them to 2D time–frequency representations (such as spectrograms) of the data rather than operating on the 1D signal directly. The research in this paper adapts the 2D pix2pix model to the 1D data domain for translating chemical reflectance signatures simulated by a physics-based model to the measured data domain. The end goal of this research is to present
!
SPECTRAL LIBRARY
MIS
SIO
N
CONOPS
APP
RO
AC
H
Laser/Light Source
Camera/Spectrometer
Wavelen
gths
HYPERSPECTRAL IMAGE CUBE
DETECTION MAP
THREAT
CAPTURE HYPERSPECTRAL IMAGE
NO THREAT
Figure 1. A notional depiction of standoff trace chemical classification concept of operations (CONOPS) via an active spectroscopic instrument. The reference signa-ture library is pertinent to the system’s ability to identify chemicals of interest.7
C.P. Murphy and J. Kerekes, J. Spectral Imaging 10, a2 (2021) 3
a method for producing a library of more realistic spec-tral signatures capable of achieving high classification accuracy, as compared to libraries generated from state-of-the-art physics-based methods, in real active spectro-scopic data.
This paper is structured as follows. The first section in Materials and methods explains the 1D conditional GAN approach for chemical model enhancement proposed in this research. The next section discusses the recent LucasCNN classifier for hyperspectral data and how it was used in this research to demonstrate the improvement made by the GAN. The available measured data used for analysis are described in the following section and the physics-based model used to generate simulated data is described in the subsequent section. The final section of Materials and methods explains the data preparation, and model testing and training steps for performing analysis. The Results section shows a comparison of chemical classification accuracy with and without the 1D condi-tional GAN when classifying chemicals, including those not included in the GAN training set, as well as qualita-tive comparisons between GAN outputs, physics-based simulations and measured reflectance. We conclude with a thoughtful discussion of the utility and appropriateness of the proposed approach.
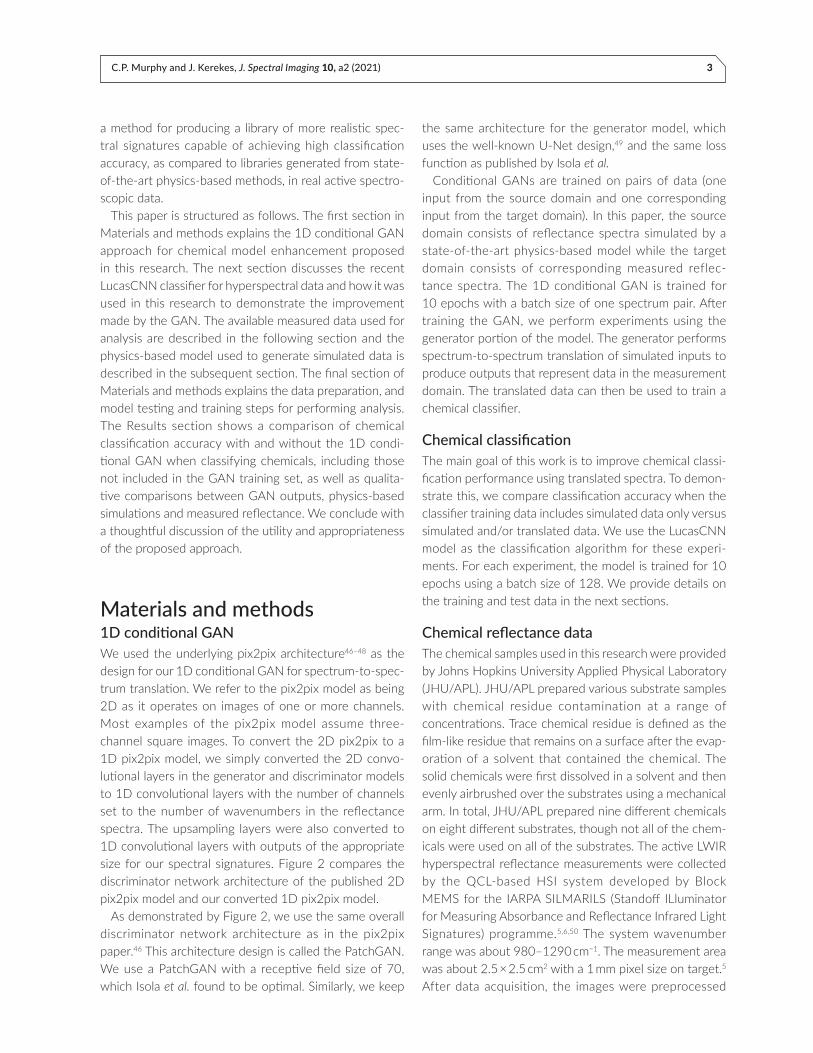
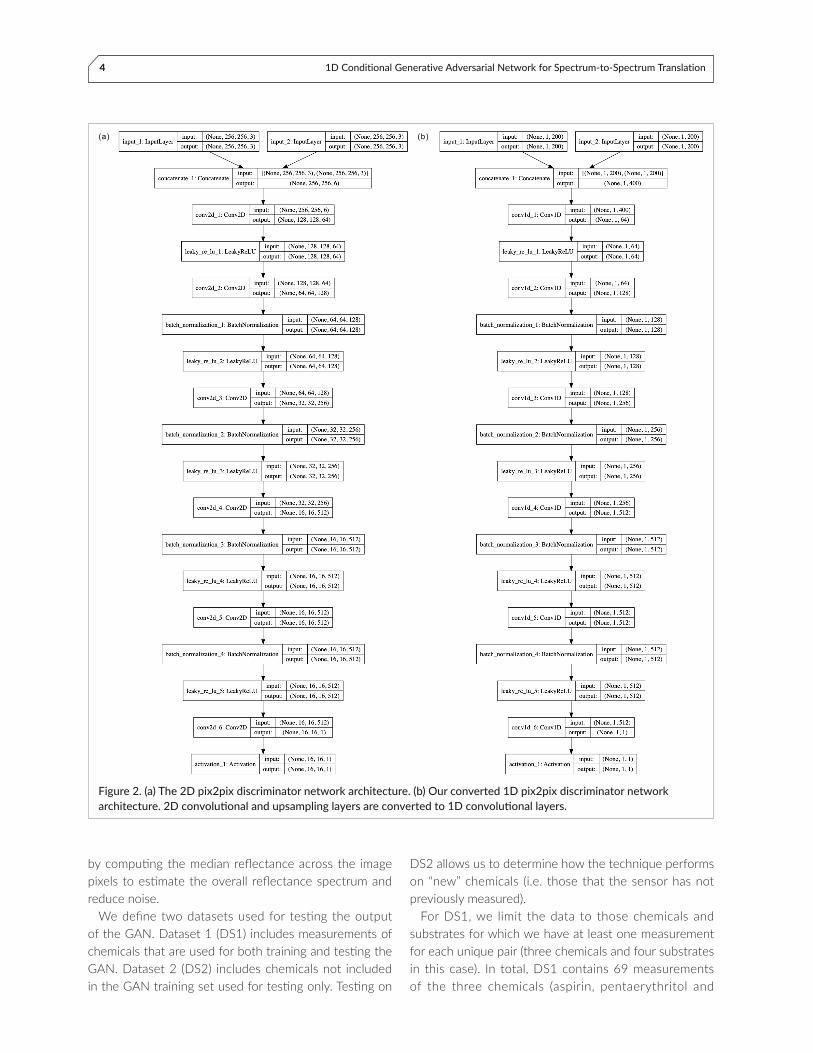
Materials and methods1D conditional GANWe used the underlying pix2pix architecture46–48 as the design for our 1D conditional GAN for spectrum-to-spec-trum translation. We refer to the pix2pix model as being 2D as it operates on images of one or more channels. Most examples of the pix2pix model assume three-channel square images. To convert the 2D pix2pix to a 1D pix2pix model, we simply converted the 2D convo-lutional layers in the generator and discriminator models to 1D convolutional layers with the number of channels set to the number of wavenumbers in the reflectance spectra. The upsampling layers were also converted to 1D convolutional layers with outputs of the appropriate size for our spectral signatures. Figure 2 compares the discriminator network architecture of the published 2D pix2pix model and our converted 1D pix2pix model.
As demonstrated by Figure 2, we use the same overall discriminator network architecture as in the pix2pix paper.46 This architecture design is called the PatchGAN. We use a PatchGAN with a receptive field size of 70, which Isola et al. found to be optimal. Similarly, we keep
the same architecture for the generator model, which uses the well-known U-Net design,49 and the same loss function as published by Isola et al.
Conditional GANs are trained on pairs of data (one input from the source domain and one corresponding input from the target domain). In this paper, the source domain consists of reflectance spectra simulated by a state-of-the-art physics-based model while the target domain consists of corresponding measured reflec-tance spectra. The 1D conditional GAN is trained for 10 epochs with a batch size of one spectrum pair. After training the GAN, we perform experiments using the generator portion of the model. The generator performs spectrum-to-spectrum translation of simulated inputs to produce outputs that represent data in the measurement domain. The translated data can then be used to train a chemical classifier.
Chemical classificationThe main goal of this work is to improve chemical classi-fication performance using translated spectra. To demon-strate this, we compare classification accuracy when the classifier training data includes simulated data only versus simulated and/or translated data. We use the LucasCNN model as the classification algorithm for these experi-ments. For each experiment, the model is trained for 10 epochs using a batch size of 128. We provide details on the training and test data in the next sections.
Chemical reflectance dataThe chemical samples used in this research were provided by Johns Hopkins University Applied Physical Laboratory (JHU/APL). JHU/APL prepared various substrate samples with chemical residue contamination at a range of concentrations. Trace chemical residue is defined as the film-like residue that remains on a surface after the evap-oration of a solvent that contained the chemical. The solid chemicals were first dissolved in a solvent and then evenly airbrushed over the substrates using a mechanical arm. In total, JHU/APL prepared nine different chemicals on eight different substrates, though not all of the chem-icals were used on all of the substrates. The active LWIR hyperspectral reflectance measurements were collected by the QCL-based HSI system developed by Block MEMS for the IARPA SILMARILS (Standoff ILluminator for Measuring Absorbance and Reflectance Infrared Light Signatures) programme.5,6,50 The system wavenumber range was about 980–1290 cm−1. The measurement area was about 2.5 × 2.5 cm2 with a 1 mm pixel size on target.5 After data acquisition, the images were preprocessed
4 1D Conditional Generative Adversarial Network for Spectrum-to-Spectrum Translation
by computing the median reflectance across the image pixels to estimate the overall reflectance spectrum and reduce noise.
We define two datasets used for testing the output of the GAN. Dataset 1 (DS1) includes measurements of chemicals that are used for both training and testing the GAN. Dataset 2 (DS2) includes chemicals not included in the GAN training set used for testing only. Testing on
DS2 allows us to determine how the technique performs on “new” chemicals (i.e. those that the sensor has not previously measured).
For DS1, we limit the data to those chemicals and substrates for which we have at least one measurement for each unique pair (three chemicals and four substrates in this case). In total, DS1 contains 69 measurements of the three chemicals (aspirin, pentaerythritol and
(a) (b)
Figure 2. (a) The 2D pix2pix discriminator network architecture. (b) Our converted 1D pix2pix discriminator network architecture. 2D convolutional and upsampling layers are converted to 1D convolutional layers.
C.P. Murphy and J. Kerekes, J. Spectral Imaging 10, a2 (2021) 5
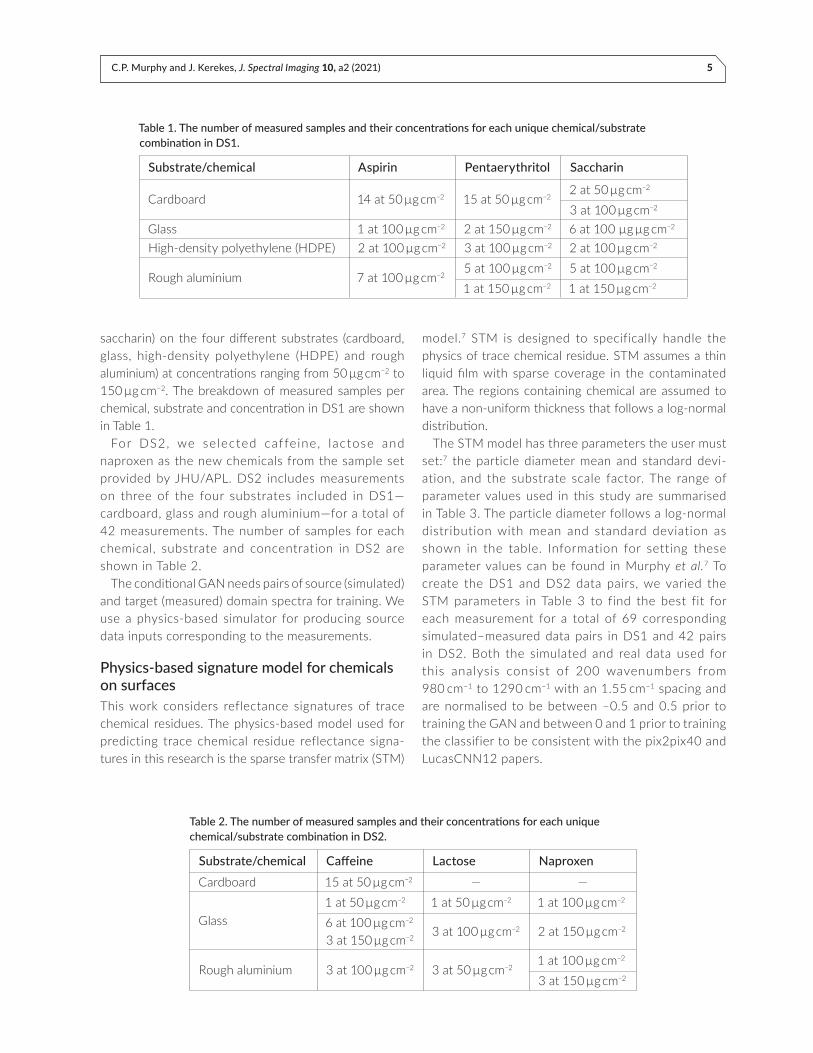
saccharin) on the four different substrates (cardboard, glass, high-density polyethylene (HDPE) and rough aluminium) at concentrations ranging from 50 µg cm−2 to 150 µg cm−2. The breakdown of measured samples per chemical, substrate and concentration in DS1 are shown in Table 1.
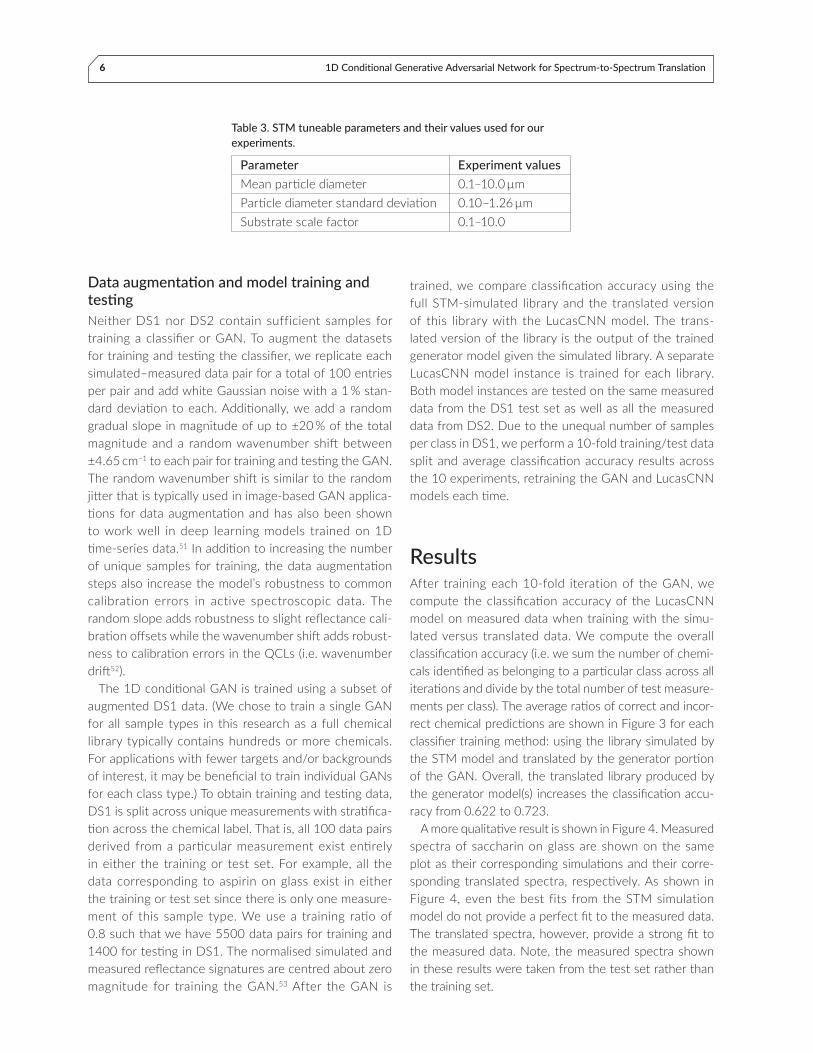
For DS2, we selected caffeine, lactose and naproxen as the new chemicals from the sample set provided by JHU/APL. DS2 includes measurements on three of the four substrates included in DS1—cardboard, glass and rough aluminium—for a total of 42 measurements. The number of samples for each chemical, substrate and concentration in DS2 are shown in Table 2.
The conditional GAN needs pairs of source (simulated) and target (measured) domain spectra for training. We use a physics-based simulator for producing source data inputs corresponding to the measurements.
Physics-based signature model for chemicals on surfacesThis work considers reflectance signatures of trace chemical residues. The physics-based model used for predicting trace chemical residue reflectance signa-tures in this research is the sparse transfer matrix (STM)
model.7 STM is designed to specifically handle the physics of trace chemical residue. STM assumes a thin liquid film with sparse coverage in the contaminated area. The regions containing chemical are assumed to have a non-uniform thickness that follows a log-normal distribution.
The STM model has three parameters the user must set:7 the particle diameter mean and standard devi-ation, and the substrate scale factor. The range of parameter values used in this study are summarised in Table 3. The particle diameter follows a log-normal distribution with mean and standard deviation as shown in the table. Information for setting these parameter values can be found in Murphy et al.7 To create the DS1 and DS2 data pairs, we varied the STM parameters in Table 3 to find the best fit for each measurement for a total of 69 corresponding simulated–measured data pairs in DS1 and 42 pairs in DS2. Both the simulated and real data used for this analysis consist of 200 wavenumbers from 980 cm−1 to 1290 cm−1 with an 1.55 cm−1 spacing and are normalised to be between –0.5 and 0.5 prior to training the GAN and between 0 and 1 prior to training the classifier to be consistent with the pix2pix40 and LucasCNN12 papers.
Substrate/chemical Aspirin Pentaerythritol Saccharin
Cardboard 14 at 50 µg cm−2 15 at 50 µg cm−22 at 50 µg cm−2
3 at 100 µg cm−2
Glass 1 at 100 µg cm−2 2 at 150 µg cm−2 6 at 100 µg µg cm−2
High-density polyethylene (HDPE) 2 at 100 µg cm−2 3 at 100 µg cm−2 2 at 100 µg cm−2
Rough aluminium 7 at 100 µg cm−25 at 100 µg cm−2 5 at 100 µg cm−2
1 at 150 µg cm−2 1 at 150 µg cm−2
Table 1. The number of measured samples and their concentrations for each unique chemical/substrate combination in DS1.
Substrate/chemical Caffeine Lactose NaproxenCardboard 15 at 50 µg cm−2 — —
Glass1 at 50 µg cm−2 1 at 50 µg cm−2 1 at 100 µg cm−2
6 at 100 µg cm−2
3 at 150 µg cm−2 3 at 100 µg cm−2 2 at 150 µg cm−2
Rough aluminium 3 at 100 µg cm−2 3 at 50 µg cm−21 at 100 µg cm−2
3 at 150 µg cm−2
Table 2. The number of measured samples and their concentrations for each unique chemical/substrate combination in DS2.
6 1D Conditional Generative Adversarial Network for Spectrum-to-Spectrum Translation
Data augmentation and model training and testingNeither DS1 nor DS2 contain sufficient samples for training a classifier or GAN. To augment the datasets for training and testing the classifier, we replicate each simulated–measured data pair for a total of 100 entries per pair and add white Gaussian noise with a 1 % stan-dard deviation to each. Additionally, we add a random gradual slope in magnitude of up to ±20 % of the total magnitude and a random wavenumber shift between ±4.65 cm−1 to each pair for training and testing the GAN. The random wavenumber shift is similar to the random jitter that is typically used in image-based GAN applica-tions for data augmentation and has also been shown to work well in deep learning models trained on 1D time-series data.51 In addition to increasing the number of unique samples for training, the data augmentation steps also increase the model’s robustness to common calibration errors in active spectroscopic data. The random slope adds robustness to slight reflectance cali-bration offsets while the wavenumber shift adds robust-ness to calibration errors in the QCLs (i.e. wavenumber drift52).
The 1D conditional GAN is trained using a subset of augmented DS1 data. (We chose to train a single GAN for all sample types in this research as a full chemical library typically contains hundreds or more chemicals. For applications with fewer targets and/or backgrounds of interest, it may be beneficial to train individual GANs for each class type.) To obtain training and testing data, DS1 is split across unique measurements with stratifica-tion across the chemical label. That is, all 100 data pairs derived from a particular measurement exist entirely in either the training or test set. For example, all the data corresponding to aspirin on glass exist in either the training or test set since there is only one measure-ment of this sample type. We use a training ratio of 0.8 such that we have 5500 data pairs for training and 1400 for testing in DS1. The normalised simulated and measured reflectance signatures are centred about zero magnitude for training the GAN.53 After the GAN is
trained, we compare classification accuracy using the full STM-simulated library and the translated version of this library with the LucasCNN model. The trans-lated version of the library is the output of the trained generator model given the simulated library. A separate LucasCNN model instance is trained for each library. Both model instances are tested on the same measured data from the DS1 test set as well as all the measured data from DS2. Due to the unequal number of samples per class in DS1, we perform a 10-fold training/test data split and average classification accuracy results across the 10 experiments, retraining the GAN and LucasCNN models each time.
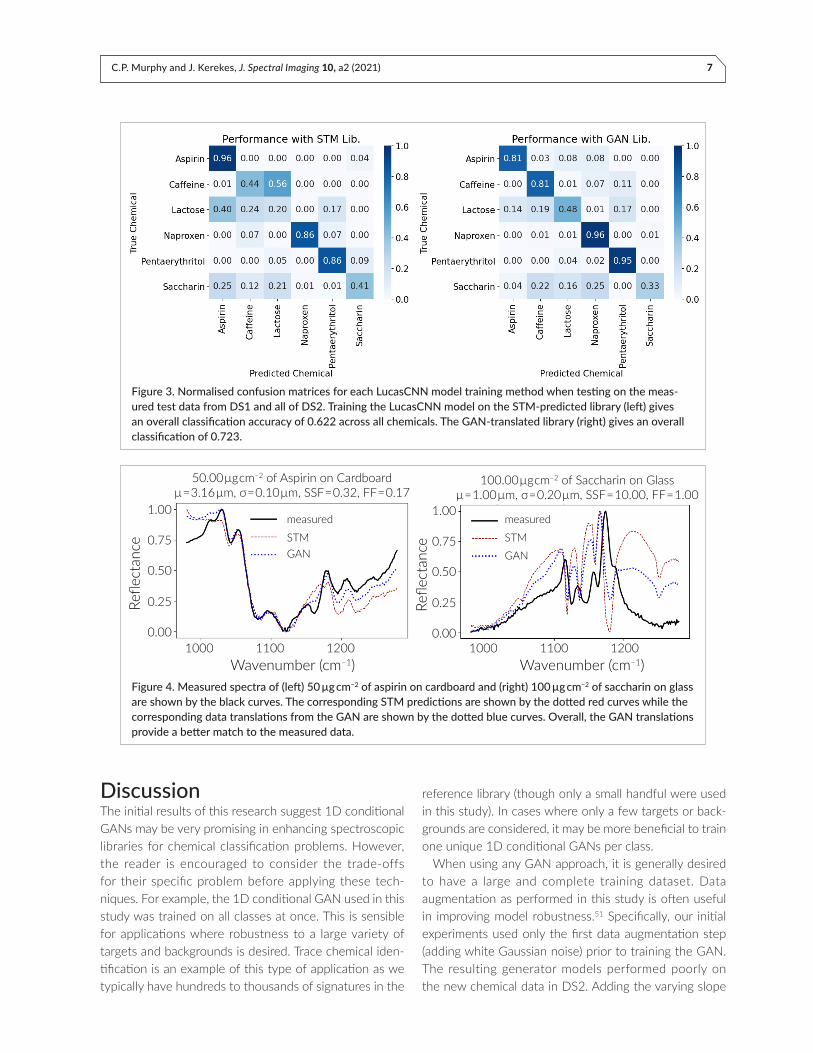
ResultsAfter training each 10-fold iteration of the GAN, we compute the classification accuracy of the LucasCNN model on measured data when training with the simu-lated versus translated data. We compute the overall classification accuracy (i.e. we sum the number of chemi-cals identified as belonging to a particular class across all iterations and divide by the total number of test measure-ments per class). The average ratios of correct and incor-rect chemical predictions are shown in Figure 3 for each classifier training method: using the library simulated by the STM model and translated by the generator portion of the GAN. Overall, the translated library produced by the generator model(s) increases the classification accu-racy from 0.622 to 0.723.
A more qualitative result is shown in Figure 4. Measured spectra of saccharin on glass are shown on the same plot as their corresponding simulations and their corre-sponding translated spectra, respectively. As shown in Figure 4, even the best fits from the STM simulation model do not provide a perfect fit to the measured data. The translated spectra, however, provide a strong fit to the measured data. Note, the measured spectra shown in these results were taken from the test set rather than the training set.
Parameter Experiment valuesMean particle diameter 0.1–10.0 µmParticle diameter standard deviation 0.10–1.26 µmSubstrate scale factor 0.1–10.0
Table 3. STM tuneable parameters and their values used for our experiments.
C.P. Murphy and J. Kerekes, J. Spectral Imaging 10, a2 (2021) 7
DiscussionThe initial results of this research suggest 1D conditional GANs may be very promising in enhancing spectroscopic libraries for chemical classification problems. However, the reader is encouraged to consider the trade-offs for their specific problem before applying these tech-niques. For example, the 1D conditional GAN used in this study was trained on all classes at once. This is sensible for applications where robustness to a large variety of targets and backgrounds is desired. Trace chemical iden-tification is an example of this type of application as we typically have hundreds to thousands of signatures in the
reference library (though only a small handful were used in this study). In cases where only a few targets or back-grounds are considered, it may be more beneficial to train one unique 1D conditional GANs per class.
When using any GAN approach, it is generally desired to have a large and complete training dataset. Data augmentation as performed in this study is often useful in improving model robustness.51 Specifically, our initial experiments used only the first data augmentation step (adding white Gaussian noise) prior to training the GAN. The resulting generator models performed poorly on the new chemical data in DS2. Adding the varying slope
Wavenumber (cm–1) Wavenumber (cm–1)1000 1100 1200 1000 1100 1200
1.00
0.00
0.25
0.50
0.75
1.00
0.00
0.25
0.50
0.75
Refle
ctan
ce
Refle
ctan
ce
100.00 µg cm–2 of Saccharin on Glassµ = 1.00 µm, = 0.20 µm, SSF = 10.00, FF = 1.00
50.00 µg cm–2 of Aspirin on Cardboardµ = 3.16 µm, = 0.10 µm, SSF = 0.32, FF = 0.17
measured measured
STMSTMGAN GAN
Figure 3. Normalised confusion matrices for each LucasCNN model training method when testing on the meas-ured test data from DS1 and all of DS2. Training the LucasCNN model on the STM-predicted library (left) gives an overall classification accuracy of 0.622 across all chemicals. The GAN-translated library (right) gives an overall classification of 0.723.
Figure 4. Measured spectra of (left) 50 µg cm−2 of aspirin on cardboard and (right) 100 µg cm−2 of saccharin on glass are shown by the black curves. The corresponding STM predictions are shown by the dotted red curves while the corresponding data translations from the GAN are shown by the dotted blue curves. Overall, the GAN translations provide a better match to the measured data.
8 1D Conditional Generative Adversarial Network for Spectrum-to-Spectrum Translation
and wavenumber shifts in the data greatly improved the model’s robustness and applicability to data that is very different from the training data. However, the data trans-lation only improved the fit to measured data for some chemicals and not all. More data and future research is required to increase the 1D conditional GAN’s robust-ness on new chemicals and/or substrates.
SummaryIn this work, we present a novel concept for enhancing trace chemical reflectance signature predictions. We begin with the physics-based STM signature model for simulating chemical residue reflectance. We suggest that though the model is best-suited for modelling chemical residue phenomenology, there are some limitations in its ability to fit to real data. To solve this problem, we developed the first 1D conditional GAN for spectrum-to-spectrum translation. The 1D condi-tional GAN translates the STM-simulated library from the simulation domain to the measurement domain. These translated spectra can be used to form a more realistic signature library for direct application to classify spectroscopic imagery or point spectra. We demon-strate the performance of the GAN on point spectra by comparing classification accuracy with and without data translation applied to the classifier training data. When classifying real chemical spectra, the classifi-cation accuracy improves from 0.622 to 0.723 after applying data translation to the classifier training library. The 1D conditional GAN shows promise for translating active spectroscopic reflectance signatures to the meas-ured data domain, though the reader is encouraged to consider the implications of this work before applying the model for their own research.
AcknowledgementsThe authors thank Dr Kristin DeWitt, IARPA programme manager of the SILMARILS programme for her support as well as the SILMARILS test and evaluation team—the Johns Hopkins University Applied Physics Laboratory, Pacific Northwest National Laboratory, Naval Research Laboratory and Air Force Research Laboratory—for providing contaminated samples used for analysis and corresponding metadata. Additionally, the authors thank their colleagues from Systems & Technology Research and Block MEMS for their provided insights.
References1. K. DeWitt, “Advances in active infrared spec-
troscopy for trace chemical detection”, Proc. SPIE 10986, 109860J (2019). https://doi.org/10.1117/12.2516198
2. M.C. Phillips and B.E. Bernacki, “Infrared spectros-copy of explosives residues: Measurement tech-niques and spectral analysis”, in Laser-Based Optical Detection of Explosives, Ed by P.M. Pellegrino, E.L. Holthoff and M.E. Farrell. CRC Press, pp. 213–256 (2015). https://doi.org/10.1201/9781315215280-16
3. P. Kotidis, E.R. Deutsch and A. Goyal, “Standoff detection of chemical and biological threats using miniature widely tunable QCLs”, Proc. SPIE 9467, 94672S (2015). https://doi.org/10.1117/12.2178169
4. A.K. Goyal and T.R. Myers, “Active mid-infrared reflectometry and hyperspectral imaging”, in Laser-Based Optical Detection of Explosives, Ed by P.M. Pellegrino, E.L. Holthoff and M.E. Farrell. CRC Press (2015). https://doi.org/10.1201/9781315215280-15
5. D.B. Kelley, A.K. Goyal, N. Zhu, D.A. Wood, T.R. Myers, P. Kotidis, C. Murphy, C. Georgan, G. Raz, R. Maulini and A. Müller, “High-speed mid-infra-red hyperspectral imaging using quantum cascade lasers”, Proc. SPIE 10183, 1018304 (2017). https://doi.org/10.1117/12.2261851
6. D.B. Kelley, D. Wood, A.K. Goyal and P. Kotidis, “High-speed and large-area scanning of surfaces for trace chemicals using wavelength-tunable quantum cascade lasers”, Proc. SPIE 10629, 1062909 (2018). https://doi.org/10.1117/12.2304387
7. C.P. Murphy, J.P. Kerekes, D.A. Wood and A.K. Goyal, “Practical model for improved classification of trace chemical residues on surfaces in active spec-troscopic measurements”, Opt. Eng. 59(9), 092012 (2020). https://doi.org/10.1117/1.OE.59.9.092012
8. G. Raz, C. Murphy, C. Georgan, R. Greenwood, R.K. Prasanth, T. Myers, A. Goyal, D. Kelley, D. Wood and Petros Kotidis, “Novel trace chemi-cal detection algorithms: a comparative study”, Proc. SPIE 10198, 101980D (2017). https://doi.org/10.1117/12.2258429
9. M. Eismann, Hyperspectral Remote Sensing. SPIE (2012). https://doi.org/10.1117/3.899758
10. M.G. Madden and T. Howley, “A machine learning application for classification of chemical spec-tra”, in Applications and Innovations in Intelligent Systems XVI, Ed by T. Allen, R. Ellis and M. Petridis. Springer, London, pp. 77–90 (2009). https://doi.org/10.1007/978-1-84882-215-3_6
C.P. Murphy and J. Kerekes, J. Spectral Imaging 10, a2 (2021) 9
11. W. Hu, Y. Huang, L. Wei, F. Zhang and H. Li, “Deep convolutional neural networks for hyperspectral image classification”, J. Sensors 2015, 258619 (2015). https://doi.org/10.1155/2015/258619
12. F.M. Riese and S. Keller, “Soil texture classifica-tion with 1D convolutional neural networks based on hyperspectral data”, ISPRS Ann. Photogramm. Remote Sens. Spatial Inf. Sci. IV-2/W5, 615–621 (2019). https://doi.org/10.5194/isprs-annals-IV-2-W5-615-2019
13. I. Goodfellow, Y. Bengio and A. Courville, Deep Learning. MIT Press (2016). http://www.deeplearn-ingbook.org
14. N. Ødegaard, A.O. Knapskog, C. Cochin and J. Louvigne, “Classification of ships using real and simulated data in a convolutional neural net-work”, in 2016 IEEE Radar Conference (RadarConf), pp. 1–6 (2016). https://doi.org/10.1109/RADAR.2016.7485270
15. K. DeWitt, “Machine learning for better trace chem-ical detection”, Proc. SPIE 10986, 109861A (2019). https://doi.org/10.1117/12.2516810
16. M. Phillips, J. Suter, B. Bernacki and T.J. Johnson, “Challenges of infrared reflective spectroscopy of solid-phase explosives and chemicals on sur-faces”, Proc. SPIE 8358, 83580T (2012). https://doi.org/10.1117/12.919477
17. J. Suter, B. Bernacki and M. Phillips, “Spectral and angular dependence of mid-infrared diffuse scat-tering from explosives residues for standoff detec-tion using external cavity quantum cascade lasers”, Appl. Phys. B 108, 965–974 (2012). https://doi.org/10.1007/s00340-012-5134-2
18. M.L. Wenrich and P.R. Christensen, “Optical con-stants of minerals derived from emission spectros-copy: Application to quartz”, J. Geophys. Res.: Solid Earth 101(B7), 15921–15931 (1996). https://doi.org/10.1029/96JB01153
19. P.D. Kleiber, V.H. Grassian, M.A. Young and P.K. Hudson, “T-matrix studies of aerosol particle shape effects on IR resonance spectral line profiles and comparison with an experiment”, J. Geophys. Res.: Atmospheres 114(D21) (2009). https://doi.org/10.1029/2009JD012710
20. V.P. Tishkovets, E.V. Petrova and M.I. Mishchenko, “Scattering of electromagnetic waves by ensembles of particles and discrete random media”, J. Quant. Spectrosc. Radiat. Transf. 112(13), 2095–2127 (2011). https://doi.org/10.1016/j.jqsrt.2011.04.010
21. B.H. Horgan, E.A. Cloutis, P. Mann and J.F. Bell, “Near-infrared spectra of ferrous mineral mixtures and methods for their identification in planetary sur-face spectra”, Icarus 234, 132–154 (2014). https://doi.org/10.1016/j.icarus.2014.02.031
22. L. Moroz, A. Basilevsky, T. Hiroi, S.S. Rout, D. Baither, C.H. van der Bogert, O.I. Yakovlev, A.V. Fisenko, L.F. Semjonova, V.S. Rusakov, D.A. Khramov, N.G. Zinovieva, G. Arnold and C.M. Pieters, “Spectral properties of simulated impact glasses produced from Martian soil analogue JSC Mars-1”, Icarus 202(1), 336–353 (2009). https://doi.org/10.1016/j.icarus.2009.02.007
23. L. Kirkland, K. Herr and P. Adams, “Infrared stealth surfaces: Why TES and THEMIS may miss some substantial, mineral deposits on Mars and impli-cations for remote sensing of planetary surfaces”, J. Geophys. Res. 108(E12) (2003). https://doi.org/10.1029/2003JE002105
24. B. Hapke, Theory of Reflectance and Emittance Spectroscopy, 2nd Edn. Cambridge University Press (2012).
25. R. Hudson, P. Gerakines and M. Moore, “Infrared spectra and optical constants of astronomical ices: II. ethane and ethylene”, Icarus 243, 148–157 (2014). https://doi.org/10.1016/j.icarus.2014.09.001
26. A. Politano, G. Chiarello, G. Benedek, E.V. Chulkov and P.M. Echenique, “Vibrational spectroscopy and theory of alkali metal adsorption and co-adsorp-tion on single-crystal surfaces”, Surf. Sci. Rep. 68(3), 305–389 (2013). https://doi.org/10.1016/j.sur-frep.2013.07.001
27. M. Van Thiel, E.D. Becker and G.C. Pimentel, “Infrared studies of hydrogen bonding of water by the matrix isolation technique”, J. Chem. Phys. 27(2), 486–490 (1957). https://doi.org/10.1063/1.1743753
28. K. Buijs and G.R. Choppin, “Near-infrared stud-ies of the structure of water. I. pure water”, J. Chem. Phys. 39(8), 2035–2041 (1963). https://doi.org/10.1063/1.1734579
29. H. Shimodaira, “Improving predictive inference under covariate shift by weighting the log-likelihood function”, J. Stat. Plan. Infer. 90(2), 227–244 (2000). https://doi.org/10.1016/S0378-3758(00)00115-4
30. K. Weiss, T. Khoshgoftaar and D. Wang, “A survey of transfer learning”, J. Big Dat. 3, 9 (2016). https://doi.org/10.1186/s40537-016-0043-6
31. C.V. Nguyen, T. Hassner, M. Seeger and C. Archambeau, “LEEP: A new measure to evalu-ate transferability of learned representations”, in
10 1D Conditional Generative Adversarial Network for Spectrum-to-Spectrum Translation
International Conference on Machine Learning (ICML 2020) (2020).
32. M. Wang and W. Deng, “Deep visual domain adaptation: A survey”, Neurocomputing 312, 135–153 (2018). https://doi.org/10.1016/j.neu-com.2018.05.083
33. L. Bruzzone and M. Marconcini, “Domain adaptation problems: A DASVM classification technique and a circular validation strategy”, IEEE Trans. Pattern Anal. Mach. Intell. 32, 770–787 (2010). https://doi.org/10.1109/TPAMI.2009.57
34. W. Chu, F. De la Torre and J.F. Cohn, “Selective transfer machine for personalized facial expres-sion analysis”, IEEE Trans. Pattern Anal. Mach. Intell. 39, 529–545 (2017). https://doi.org/10.1109/TPAMI.2016.2547397
35. M. Gheisari and M.S. Baghshah, “Unsupervised domain adaptation via representation learning and adaptive classifier learning”, Neurocomputing 165, 300–311 (2015). https://doi.org/10.1016/j.neu-com.2015.03.020
36. B. Gong, K. Grauman and F. Sha, “Connecting the dots with landmarks: Discriminatively learning domain-invariant features for unsupervised domain adaptation”, Proc. Mach. Learn. Res. 28, 222–230 (2013). http://proceedings.mlr.press/v28/gong13.html
37. S. Pachori, A. Deshpande and S. Raman, “Hashing in the zero shot framework with domain adaptation”, Neurocomputing 275, 2137–2149 (2018). https://doi.org/10.1016/j.neucom.2017.10.061
38. S.J. Pan, I.W. Tsang, J.T. Kwok and Q. Yang, “Domain adaptation via transfer component analysis”, IEEE Trans. Neural Net. 22, 199–210 (2011). https://doi.org/10.1109/TNN.2010.2091281
39. K. Bousmalis, N. Silberman, D. Dohan, D. Erhan and D. Krishnan, “Unsupervised pixel-level domain adap-tation with generative adversarial networks”, 2017 IEEE/CVF Conference on Computer Vision and Pattern Recognition 95–104 (2017). https://doi.org/10.1109/CVPR.2017.18
40. P. Isola, J. Zhu, T. Zhou and A.A. Efros, “Image-to-image translation with conditional adversarial net-works”, 2017 IEEE Conference on Computer Vision and Pattern Recognition, pp. 5967–5976 (2011). https://doi.org/10.1109/CVPR.2017.632
41. E. Tzeng, C. Devin, J. Hoffman, C. Finn, P. Abbeel, S. Levine, K. Saenko and T. Darrell, “Towards adapting deep visuomotor representations from simulated
to real environments”, ArXiv: 1511.07111 (2015). https://arxiv.org/abs/1511.07111v5
42. D. Michelsanti and Z.-H. Tan, “Conditional gener-ative adversarial networks for speech enhance-ment and noise-robust speaker verification”, Proc. Interspeech 2017 2008–2012 (2017). https://doi.org/10.21437/Interspeech.2017-1620
43. C. Wan, S. Chuang and H. Lee, “Towards audio to scene image synthesis using generative adversarial network”, arXiv: 1808.04108 (2018). https://arxiv.org/abs/1808.04108
44. C. Donahue, J.J. McAuley and M.S. Puckette, “Synthesizing audio with generative adversarial net-works”, arXiv: 1802.04208 (2018). https://arxiv.org/abs/1802.04208
45. K. Kumar, R. Kumar, T. de Boissiere, L. Gestin, W.Z. Teoh, J. Sotelo, A. de Brébisson, Y. Bengio and A.C. Courville, “MelGAN: Generative adversarial net-works for conditional waveform synthesis”, Adv. Neural Inform. Process. Syst. 32, (NeurIPS 2019) (2019). https://proceedings.neurips.cc/paper/2019/hash/6804c9bca0a615bdb9374d00a9fcba59-Ab-stract.html
46. P. Isola, pix2pix [Online; last commit 19 October 2019]. https://github.com/phillipi/pix2pix
47. J. Brownlee, How to Develop a Pix2Pix GAN for Image-to-Image Translation (2019). [Online; posted 2 August 2019]. https://machinelearningmastery.com/how-to-develop-a-pix2pix-gan-for-image-to-image-transla-tion/
48. J. Brownlee, How to Implement Pix2Pix GAN Models from Scratch with Keras (2019). [Online; posted 31 July 2019]. https://machinelearningmastery.com/how-to-implement-pix2pix-gan-models-from-scratch-with-keras/
49. O. Ronneberger, P. Fischer and T. Brox, “U-net: Convolutional networks for biomedical image segmentation”, in Medical Image Computing and Computer-Assisted Intervention – MICCAI 2015, Lecture Notes in Computer Science, Vol. 9351, pp. 234–241, Springer (2015). https://doi.org/10.1007/978-3-319-24574-4_28
50. D. Wood, D.B. Kelley, A.K. Goyal and P. Kotidis, “Mid-infrared reflection signatures for trace chemi-cals on surfaces”, Proc. SPIE 10629, 1062915 (2018). https://doi.org/10.1117/12.2304453
51. J. Yeomans, S. Thwaites, W.S.P. Robertson, D. Booth, B. Ng and D. Thewlis, “Simulating time-series data for improved deep neural

C.P. Murphy and J. Kerekes, J. Spectral Imaging 10, a2 (2021) 11
network performance”, IEEE Access 7, 131248–131255 (2019). https://doi.org/10.1109/ACCESS.2019.2940701
52. C. Dyroff, Tunable Diode Laser Absorption Spectroscopy for Trace Gas Measurements with High Sensitivity and Low Drift. Karlsruhe Series in Photonics & Communications, KIT Scientific Publishing (2009).
53. H. Thanh-Tung, T. Tran and S. Venkatesh, “Improving generalization and stability of generative adversarial networks”, arXiv: 1902.03984 (2019). https://arxiv.org/abs/1902.03984