case studies for developing globally responsible engineers
TRANSCRIPT
PHOTO: Fishing among mangroves. Alex Carrer
CASE STUDIES
Case studies for developing globally responsible engineers
DL B 10735-2015 ISBN 978-84-606-7546-4
Case studies for developing globally responsible engineers
COORDINATED BYAgustí Pérez-Foguet, Enric Velo, Pol Arranz, Ricard Ginéand Boris Lazzarini (Universitat Politècnica de Catalunya)Manuel Sierra (Universidad Politécnica de Madrid)Alejandra Boni and Jordi Peris (Universitat Politècnica de València)Guido Zolezzi and Gabriella Trombino (Università degli Studi di Trento)Rhoda Trimingham (Loughborough University)Valentín Villarroel (ONGAWA)Neil Nobles and Meadhbh Bolger (Practical Action)Francesco Mongera (Training Center for International Cooperation)Katie Cresswell-Maynard (Engineering Without Border UK)
EDITED BY Global Dimension in Engineering Education
Citation: Citation: GDEE (eds.) 2015, Case studies for developing globally responsible engineers, Global Dimension in Engineering Education, Barcelona. Available from: http://gdee.eu/index.php/resources.html
This publication is distributedunder an Attribution- Noncommercial-Share Alike License for Creative Commons
CASE STUDIES
Disclaimer: This document has been produced with the financial assistance of the European UnionThe contents of this document are the sole responsibility of the authors and can under no circumstances be regarded as reflecting the position of the European Union

In September 2015, a new framework for international action, based on Sustainable Development Goals (SDGs), has been unanimously adopted by the United Nations, to supersede the Millennium Development Goals set in 2000 . The SDGs seek to complete the unfinished business of the MDGs and respond to new challenges. They are action oriented, global in nature and universally applicable; and constitute a holistic, indivisible set of global priorities for sustainable development. These goals will integrate economic, social and environmental aspects and recognize their interlinkages in achieving sustainable development in all its dimensions.Technical and technological innovative solutions are expected to play a key role in addressing the vast majority of the SDGs. Engineering does and can play a major role in promoting human development and well-being. This, however, calls for global engineers that take a wider perspective and understand the potential for improving lives of the poor worldwide, through the appropriate design and use of technology. The global engineer is therefore equipped to combine qualitative social and ethical aspects with quantita-tive technical, economic and environmental factors.
Global Engineers: key professionals for Sustainable Human Development
SUSTAINABLE HUMAN DEVELOPMENT NEEDS PROFESSIONALS
HIGHER EDUCATION PLAYS A KEY ROLE IN PREPARING GLOBAL ENGINEERS
CASE STUDIES AS A TOOL IN ACQUIRING GLOBAL SKILLS
Higher education needs to prepare engineers with conceptual and practical instruments to recognize and deal with the challenges posed by an increasingly complex and inter-dependent world. However, there is a lack of knowledge and poor competences of teaching staff when introducing development-related issues in the curricula. This, in turn, negatively impacts on the attitudinal values and skills of students in relation to sustainable human development (SHD).Since 2013, the GDEE project (http://gdee.eu/), an initiative led by top EU universities and NGOs deliver-ing training services and infrastructure projects, has explored the challenges in widening and improving the training of engineers. As part of the aim to integrate SHD as a regular part of all technical university courses and to improve the background described above, the GDEE has facilitated the development of a set of case studies to be used as teaching materials.
The case studies are teaching materials written by academics from all around the world, in collaboration with practitioners from NGOs. They are based on real-life development projects, and therefore represent a useful cross-cutting tool to acquire “global skills”. In brief, each case study is made up of the following materials:
United Nations General Assembly. Report of the Open Working Group of the General Assembly on Sustainable Development Goals. Resolution A/68/970. 2014:24. Available at: http://undocs.org/A/68/970.
i) Description of the full case study, which includes an introduction (disciplines covered and learning outcomes), the context - from a Human Development perspective -, and two teaching activities;
ii) Class presentation, to assist academics with the presentation in the classroom of the context and the description of teaching activities;
iii) Class activity handout, designed for a two-hour class session. It includes the solution of the exercise and the evaluation criteria. The teaching methodology of this activity has been selected to fit the particularities of the teaching discipline;
iv) Homework activity handout, designed as a ten hour task, to be carried out preferably in small groups. It also includes the solution of the exercise and the evaluation criteria.In total, the GDEE has elaborated 28 case studies, which are briefly listed in the following table and included as separate chapters in this book.
1

SDG N. TITLE AUTHOR RESOURCES
SDG 2 SUSTAINABLE AGRICULTURE AND
RURAL DEVELOPMENT1
RURAL DEVELOPMENT AND PLANNING IN LDCs: THE “GAMBA DEVE – LICOMA AXIS”, DISTRICT OF CAIA, MOZAMBIQUE
I. Rama and C. Diamantini - Università di TrentoClass Activity
Homework Activity Power Point
Annexes
SDG 2 SUSTAINABLE AGRICULTURE AND
RURAL DEVELOPMENT2
REDUCING THE IMPACT OF SOIL EROSION AND RESERVOIR SILTATION ON AGRICULTURAL PRODUCTION AND WATER AVAILABILITY: THE CASE STUDY
OF THE LAABA CATCHMENT (BURKINA FASO)
V. Coviello, P. Vezza, I. Angeluccetti, S. Grimaldi - Primo Principio COOP (Coop2P)
Class Activity Homework Activity
Power Point
SDG 2 SUSTAINABLE AGRICULTURE AND
RURAL DEVELOPMENT3 TRADE AND MOBILITY ON THE ROOFTOP OF THE WORLD: GRAVITY
ROPEWAYS IN NEPAL
P. Parikh - University College London and A. Lamb - Engineers Without Borders UK
Class Activity Homework Activity
Power Point Annex
SDG 2 SUSTAINABLE AGRICULTURE AND
RURAL DEVELOPMENT4 SUSTAINABLE DEVELOPMENT OF AGRICULTURE AND FOOD SYSTEMS WITH
REGARD TO WATERC.G. Hernández Díaz-Ambrona, E. Arnés Prieto, O. Marín
González - Universidad Politécnica de Madrid
Class Activity Homework Activity
Power Point
SDG 2 SUSTAINABLE AGRICULTURE AND
RURAL DEVELOPMENT5 CONSERVATION AGRICULTURE: A COMPLEX AVENUE TO CONSERVE AND
IMPROVE SOILSH. Gómez-Macpherson and F.Villalobos -Instituto de
Agricultura Sostenible (IAS, CSIC) Class Activity
Homework Activity
SDG 6 CLEAN WATER AND SANITATION
6 THE NATIONAL RURAL WATER SUPPLY AND SANITATION PROGRAMME IN TANZANIA: A CASE STUDY
P. Milanesio and A.Garola - Universitat Politècnica de Catalunya
Class Activity Homework Activity
Power Point Annexes
SDG 6 CLEAN WATER AND SANITATION
7 USE OF STATISTICAL TOOLS IN A DEVELOPMENT CONTEXT. ANALYSIS OF VARIANCE (ANOVA)
M. Ortego and E. Lloret - Universitat Politècnica de Catalunya
Class Activity Homework Activity
Power Point Spreadsheet
SDG 6 CLEAN WATER AND SANITATION
8 WATER SUPPLY SYSTEM IN KOJANI ISLAND (ZANZIBAR, TANZANIA) M. Bezzi, G. Trombino, G. Zolezzi - University of TrentoClass Activity
Homework Activity Power Point
SDG 6 CLEAN WATER AND SANITATION
9 FAECAL SLUDGE MANAGEMENT IN LUSAKA, ZAMBIAA.Parker, P. Cruddas, C. Rose - Cranfield University
Class Activity Homework Activity
Power Point
SDG 6 CLEAN WATER AND SANITATION
10 WATER BALANCE ON THE CENTRAL RIFT VALLEYJ. Pascual-Ferrer and L. Candela - Universitat Politècnica
de Catalunya
Class Activity Homework Activity
Power Point Appendix
SDG 7 RENEWABLE ENERGY
11RURAL ELECTRIFICATION IN DEVELOPING COUNTRIES VIA AUTONOMOUS
MICRO-GRIDSC. Brivio and S. Mandelli - Politecnico di Milano
Class Activity Homework Activity
Power Point Spreadsheet
SDG 7 RENEWABLE ENERGY
12 PHOTOVOLTAICS ELECTRIFICATION IN OFF-GRID AREAS D. Masa Bote - Universidad Politécnica de MadridClass Activity
Homework Activity Power Point
SDG 7 RENEWABLE ENERGY
13DEVELOPMENT OF A MILP MODEL TO DESIGN WIND-PHOTOVOLTAIC
STAND-ALONE ELECTRIFICATION PROJECTS FOR ISOLATED COMMUNITIES IN DEVELOPING COUNTRIES
B. Domenech - Universitat Politècnica de CatalunyaClass Activity
Homework Activity Power Point
SDG 7 RENEWABLE ENERGY
14ESTIMATION OF INDOOR AIR POLLUTION AND HEALTH IMPACTS DUE TO
BIOMASS BURNING IN RURAL NORTHERN GHANA
D. K. B. Inkoom - Kwame Nkrumah University of Science and Technology and
A. Obrumah Crentsil - University of GhanaClass Activity
Homework Activity
SDG 7 RENEWABLE ENERGY
15 IMPROVED COOKSTOVES ASSESSMENT M. Clifford - University of NottinghamClass Activity
Homework Activity Power Point
SDG 7 RENEWABLE ENERGY
16SUPPORTING THE ADOPTION OF CLEAN COOKSTOVES AND FUELS: WHY
WON’T PEOPLE ADOPT THE PERFECT STOVE? P. Vilchis Tella - Stockholm Environment Institute Class Activity
Homework Activity
SDG 7 RENEWABLE ENERGY
17 DO-IT-YOURSELF APPROACH AS APPROPRIATE TECHNOLOGY FOR SOLARTHERMAL SYSTEM: THE EXAMPLE OF CDF MÉDINA, DAKAR (SENEGAL)
R. Mereu, T. Amati, I. Bengo - Politecnico di MilanoClass Activity
Homework Activity Power Point
SDG 7 RENEWABLE ENERGY
18 ESSENTIAL OIL EXTRACTION WITH CONCENTRATING SOLAR THERMAL ENERGY
F. Veynandt Ecole des Mines AlbiClass Activity
Homework Activity Power Point
SDG 7 RENEWABLE ENERGY
19 SURVIVAL IN THE DESERT SUN: COOL FOOD STORAGEP. Parikh - University College London andA. Lamb - Engineers Without Borders UK
Class Activity Homework Activity
Power Point
ENERGY ROADMAP IN GHANA AND BOTSWANASDG 7 RENEWABLE
ENERGY20 E. Essah - University of Reading Homework Activity
Class Activity
Power Point
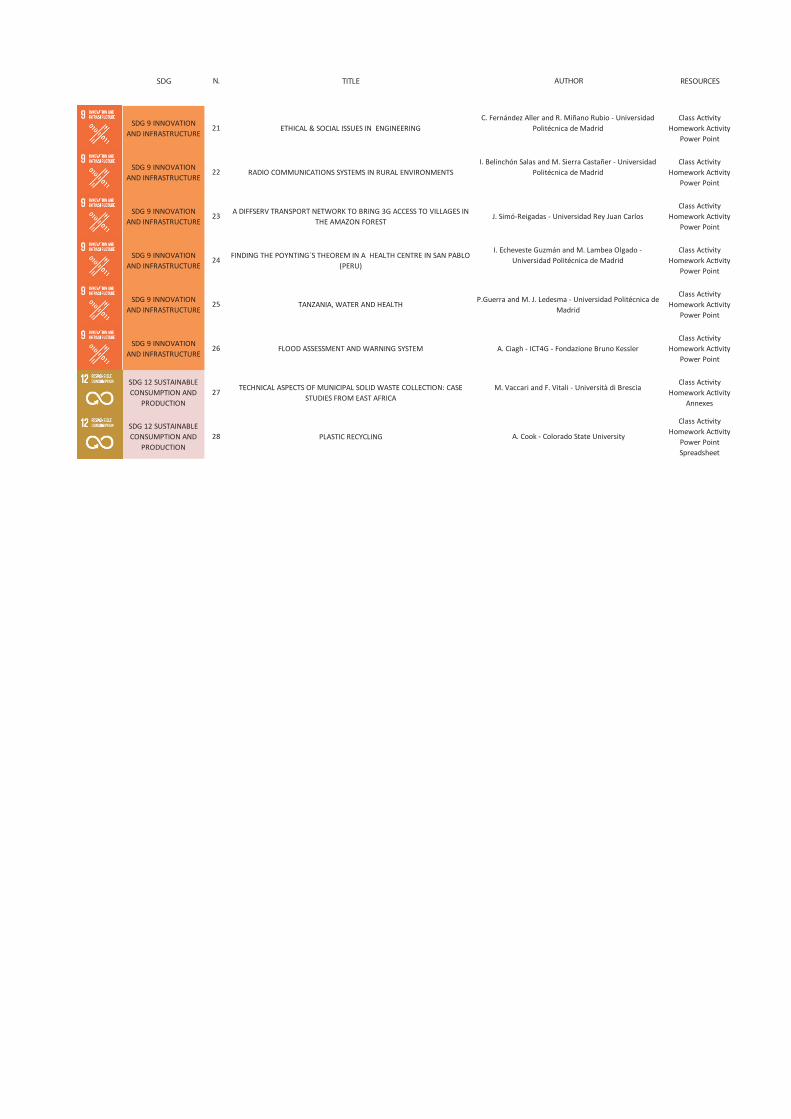
SDG 9 INNOVATION AND INFRASTRUCTURE
21 ETHICAL & SOCIAL ISSUES IN ENGINEERINGC. Fernández Aller and R. Miñano Rubio - Universidad
Politécnica de MadridClass Activity
Homework Activity Power Point
SDG 9 INNOVATION AND INFRASTRUCTURE
22 RADIO COMMUNICATIONS SYSTEMS IN RURAL ENVIRONMENTSI. Belinchón Salas and M. Sierra Castañer - Universidad
Politécnica de MadridClass Activity
Homework Activity Power Point
SDG 9 INNOVATION AND INFRASTRUCTURE
23 A DIFFSERV TRANSPORT NETWORK TO BRING 3G ACCESS TO VILLAGES IN THE AMAZON FOREST
J. Simó-Reigadas - Universidad Rey Juan CarlosClass Activity
Homework Activity Power Point
SDG 9 INNOVATION AND INFRASTRUCTURE
24 FINDING THE POYNTING´S THEOREM IN A HEALTH CENTRE IN SAN PABLO(PERU)
I. Echeveste Guzmán and M. Lambea Olgado - Universidad Politécnica de Madrid
Class Activity Homework Activity
Power Point
SDG 9 INNOVATION AND INFRASTRUCTURE
25 TANZANIA, WATER AND HEALTHP.Guerra and M. J. Ledesma - Universidad Politécnica de
Madrid
Class Activity Homework Activity
Power Point
SDG 9 INNOVATION AND INFRASTRUCTURE
26 FLOOD ASSESSMENT AND WARNING SYSTEM A. Ciagh - ICT4G - Fondazione Bruno KesslerClass Activity
Homework Activity Power Point
SDG 12 SUSTAINABLE CONSUMPTION AND
PRODUCTION27 TECHNICAL ASPECTS OF MUNICIPAL SOLID WASTE COLLECTION: CASE
STUDIES FROM EAST AFRICAM. Vaccari and F. Vitali - Università di Brescia
Class Activity Homework Activity
Annexes
SDG 12 SUSTAINABLE CONSUMPTION AND
PRODUCTION28 PLASTIC RECYCLING A. Cook - Colorado State University
Class Activity Homework Activity
Power Point Spreadsheet
RESOURCESAUTHORTITLEN.SDG
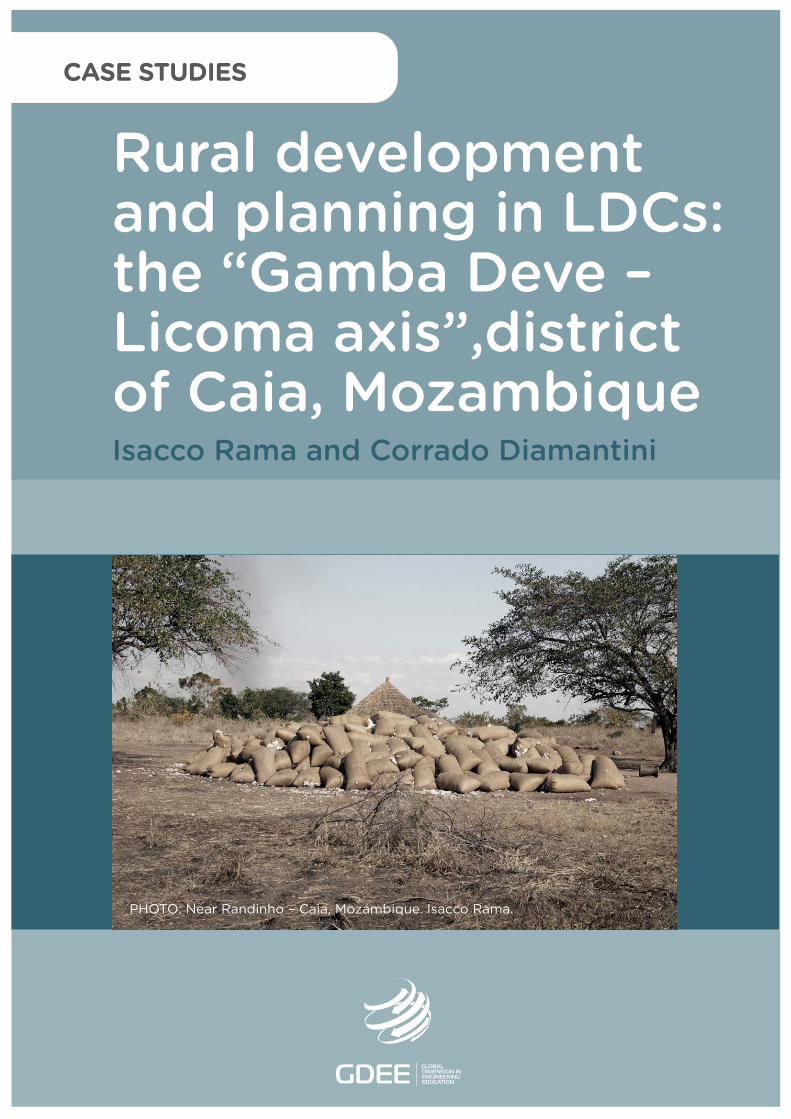
Isacco Rama and Corrado Diamantini
PHOTO: Near Randinho – Caia, Mozambique. Isacco Rama.
CASE STUDIES
Rural development and planning in LDCs: the “Gamba Deve –Licoma axis”,districtof Caia, Mozambique
DL B 10735-2015 ISBN 978-84-606-7546-4
Rural development and planning in LDCs: the “GambaDeve – Licoma axis”, district of Caia, Mozambique
COORDINATED BYAgustí Pérez-Foguet, Enric Velo, Pol Arranz, Ricard Ginéand Boris Lazzarini (Universitat Politècnica de Catalunya)Manuel Sierra (Universidad Politécnica de Madrid)Alejandra Boni and Jordi Peris (Universitat Politècnica de València)Guido Zolezzi and Gabriella Trombino (Università degli Studi di Trento)Rhoda Trimingham (Loughborough University)Valentín Villarroel (ONGAWA)Neil Nobles and Meadhbh Bolger (Practical Action)Francesco Mongera (Training Center for International Cooperation)Katie Cresswell-Maynard (Engineering Without Border UK)
EDITED BY Global Dimension in Engineering Education
Citation: Rama, I. and Diamantini, C. (2015) ' Rural development and planning in LDCs: the “Gamba Deve – Licoma axis”, district of Caia, Mozambique', in Case studies for developing globally responsible engineers, GDEE (eds.), Global Dimension in Engineering Education, Barcelona. Available from: http://gdee.eu/index.php/resources.html
This publication is distributedunder an Attribution- Noncommercial-Share Alike License for Creative Commons
CASE STUDIES
Disclaimer: This document has been produced with the financial assistance of the European UnionThe contents of this document are the sole responsibility of the authors and can under no circumstances be regarded as reflecting the position of the European Union
Rural Development and Planning in LDCs: The “Gamba Deve – Licoma axis”, District of Caia, Mozambique
RURAL DEVELOPMENT AND PLANNING IN LDCS: THE “GAMBA DEVE – LICOMA AXIS”, DISTRICT OF CAIA, MOZAMBIQUE Isacco Rama, DICAM – Università degli Studi di Trento Corrado Diamantini, DICAM – Università degli Studi di Trento
1
Rural Development and Planning in LDCs: The “Gamba Deve – Licoma axis”, District of Caia, Mozambique
INDEX 1. INTRODUCTION ........................................................................................................................... 3
1.1. DISCIPLINES COVERED ............................................................................................................. 3
1.2. LEARNING OUTCOMES .............................................................................................................. 4
1.3. ACTIVITIES .............................................................................................................................. 4
2. DESCRIPTION OF THE CONTEXT ............................................................................................. 4
2.1. THE PROBLEM OF ACCESSIBILITY OF REMOTE AREAS ................................................................. 4
2.2. THE CAIA DISTRICT ................................................................................................................. 5
2.3. THE STRATEGIC NATURE OF THE GAMBA DEVE – LICOMA AXIS ..................................................... 8
2.4. THE INFRASTRUCTURAL NETWORK .......................................................................................... 10
2.5. SERVICES TO THE POPULATION .............................................................................................. 12
3. CLASS ACTIVITY ....................................................................................................................... 18
3.1. CONTEXT AND DETERMINANTS................................................................................................ 18
3.2. EXAMINATION OF ROADWAY AND ROADWAY DEFECTS .............................................................. 21
3.3. TECHNICAL SOLUTIONS ADOPTED ........................................................................................... 25
3.4. MODEL SECTION .................................................................................................................... 26
3.5. EMBANKMENT SECTION .......................................................................................................... 26
3.6. LONGITUDINAL SLOPE SECTION .............................................................................................. 27
3.7. SECONDARY WATERWAYS CROSSING SECTION ........................................................................ 28
3.8. SYNERGIES ACHIEVED WITH THE ROADWAY ............................................................................. 29
4. HOMEWORK ACTIVITY ............................................................................................................. 29
4.1. ED1: PLANIMETRIC LAYOUT AND TECHNICAL SOLUTIONS ........................................................... 30
4.2. SERVICES TO THE POPULATION .............................................................................................. 30
4.3. EXPECTED BENEFITS IDENTIFICATION AND CLASSIFICATION ...................................................... 31
5. BIBLIOGRAPHY ......................................................................................................................... 32
2
Rural Development and Planning in LDCs: The “Gamba Deve – Licoma axis”, District of Caia, Mozambique
1. INTRODUCTION It is believed that the development of rural areas of low income countries is an important
factor in limiting migration to the cities, which do not appear capable of supporting this
weight in terms of labour demand and supply of services to the immigrant population. In this
kind of rural development, smaller towns play a key role and, thanks to the urban-rural
relations that smaller towns activate, they act as exchange nodes in supralocal relationships.
These rural-urban relationships are facilitated by transport infrastructures that result in ever
greater efficiency depending on their level of accessibility. One of the major problems of
access to the interior rural areas of developing countries consists, in fact, in the seasonality
of access to roads, often precluded during the rainy season.
Generally, benefits associated with efficient links between urban centres and rural areas are
the marketing of agricultural surplus and access to goods and services considered to be
urban. The creation of basic services distributed synergistically along rural axes is also
crucial in order to ensure higher standards of welfare to the rural population. Rural
infrastructural axes must be designed precisely to serve the local population and not solely
in support of commercial exchanges.
A final aspect of the problem is related to the costs of road infrastructures. Local
governments have often limited resources and the containment of costs during the design
phase is a fundamental factor.
1.1. DISCIPLINES COVERED
The proposed case study covers two disciplines, namely regional spacial planning and low-
volume road infrastructure design.
Concerning the first discipline, key aspects of the case study are:
• identification of the most suitable areas for road infrastructure, taking into
account both their growth potential and effectiveness for urban-rural relations;
• location of services to the population, taking into account the spatial
distribution and accessibility of human settlements.
• With regard to the second discipline covered, the fundamental aspect is the
road design aimed at maximizing the benefits with the minimum construction
and maintenance costs.
3
Rural Development and Planning in LDCs: The “Gamba Deve – Licoma axis”, District of Caia, Mozambique
1.2. LEARNING OUTCOMES
The learning objectives are:
• acknowledgement of the range of problems occuring in remote rural areas,
with reference to subsistence strategies, meaning production and
consumption by local population;
• acknowledgement of specific issues of the area, with reference both to the
marketing of agricultural surplus and to the access to public and private
services;
• ability to identify the appropriate contexts for investments in infrastructure and
services;
• ability to set up a road design adapted to the actual conditions within a
particular context, or at least the analysis of an infrastructure project in a low
income rural area.
1.3. ACTIVITIES
In class, students are introduced to the project. A discussion is then launched aimed at
clarifying doubts and, above all, determining any alternatives to the proposed technical
solution.
Activities carried out by students outside of class are expected to be in groups formed on the
basis of actual skills/interests possessed by each student.
2. DESCRIPTION OF THE CONTEXT The following section is focused on the context in which the case study takes place. The
problem of accessibility in remote areas will be detailed and the district of Caia will be
described. Successively, the specific issue of the strategic importance of the Gamba-Deve /
Licoma axis will be addressed, before providing a detailed description of the road services,
other infrastructures and service networks.
2.1. THE PROBLEM OF ACCESSIBILITY OF REMOTE AREAS
The roadway communication network was built in Mozambique during the colonial period.
There are settlements where the Portuguese roads did not arrive: the Portuguese favoured
trading and administrative posts and did not penetrate to the more remote areas that were
run by locals. The post-colonial government has invested as a priority in health and
education in the main urban centres and the current government invests in major works on
4
Rural Development and Planning in LDCs: The “Gamba Deve – Licoma axis”, District of Caia, Mozambique
the main axis. It is therefore evident that a capillary road network has not been developed to
date. Large areas still remain inadequately served by road networks for the transit of
vehicles, motorbikes and bicycles. The situation is aggravated during the rainy reason, when
the existing dirt roads become only partially passable due to the creation of mud and huge
water puddles. This fact generates huge restrictions for the transit of people and goods. In
countries where more than 70% of the population lives in rural areas, the lack of transport
infrastructure means a consequent lack of health and education services, low variety of
goods and general absence of modernity for the numerous remote areas.
2.2. THE CAIA DISTRICT Caia district is located in the central region of Mozambique, in a strategic position at the
crossroads of the EN1, the main roadway of the country, and the axis Caia-Sena-Tete. The
latter runs parallel to the railway line to Beira and Marromeu, the ER213 road and the
Zambezi river.
With an area of 3.542km2 and a population of 115,612 inhabitants, Caia is one of the most
densely populated rural districts of Mozambique (33ab / km2)1. The Caia district is bounded
on the northwest by the District of Chemba, to the east by the Zambezi River, on the west by
the District of Maringue and on the south by the districts of Cheringoma and Marromeu.
From the point of view of land cover, most of the district is savannah and wooded savannah
(66.3%). There are some forest areas (10.4%), areas of cultivated land (8.2%) and wetlands
and flooded areas (14.2%). Finally, infrastructure and settlements occupy a small part of the
territory of the district (0.8%).
1 INE, Censo Geral da População, 2007
5
Rural Development and Planning in LDCs: The “Gamba Deve – Licoma axis”, District of Caia, Mozambique
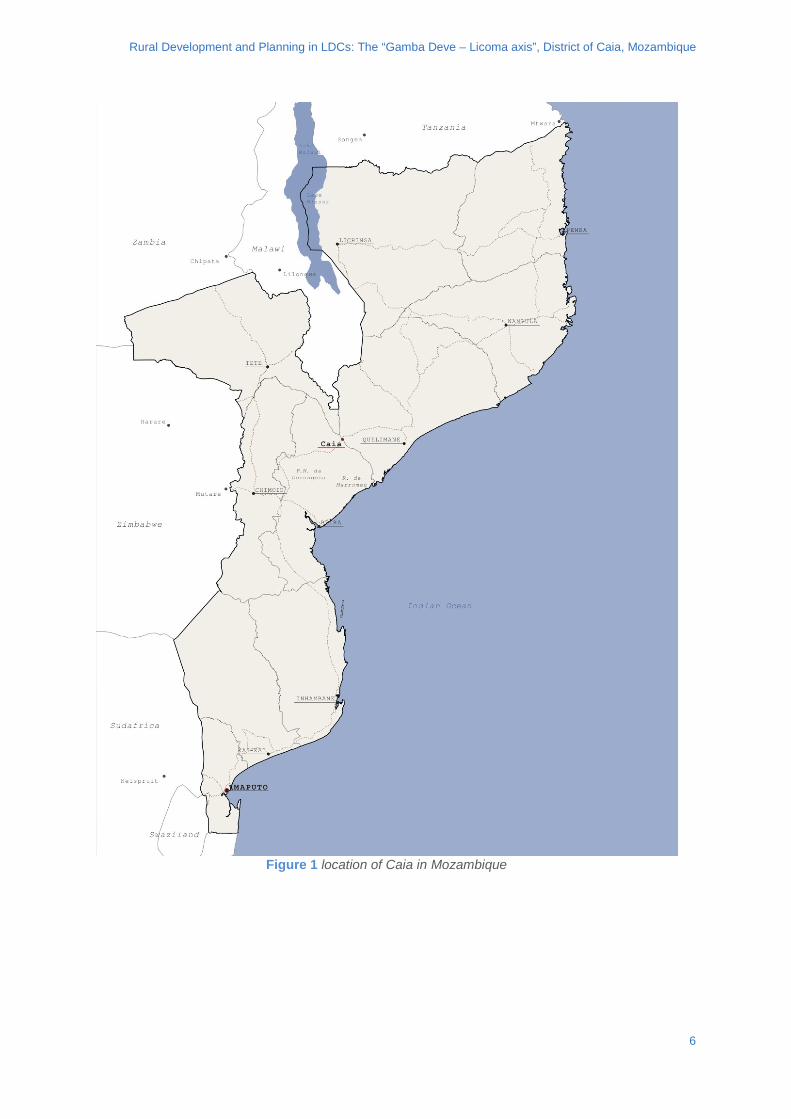
Figure 1 location of Caia in Mozambique
6
Rural Development and Planning in LDCs: The “Gamba Deve – Licoma axis”, District of Caia, Mozambique
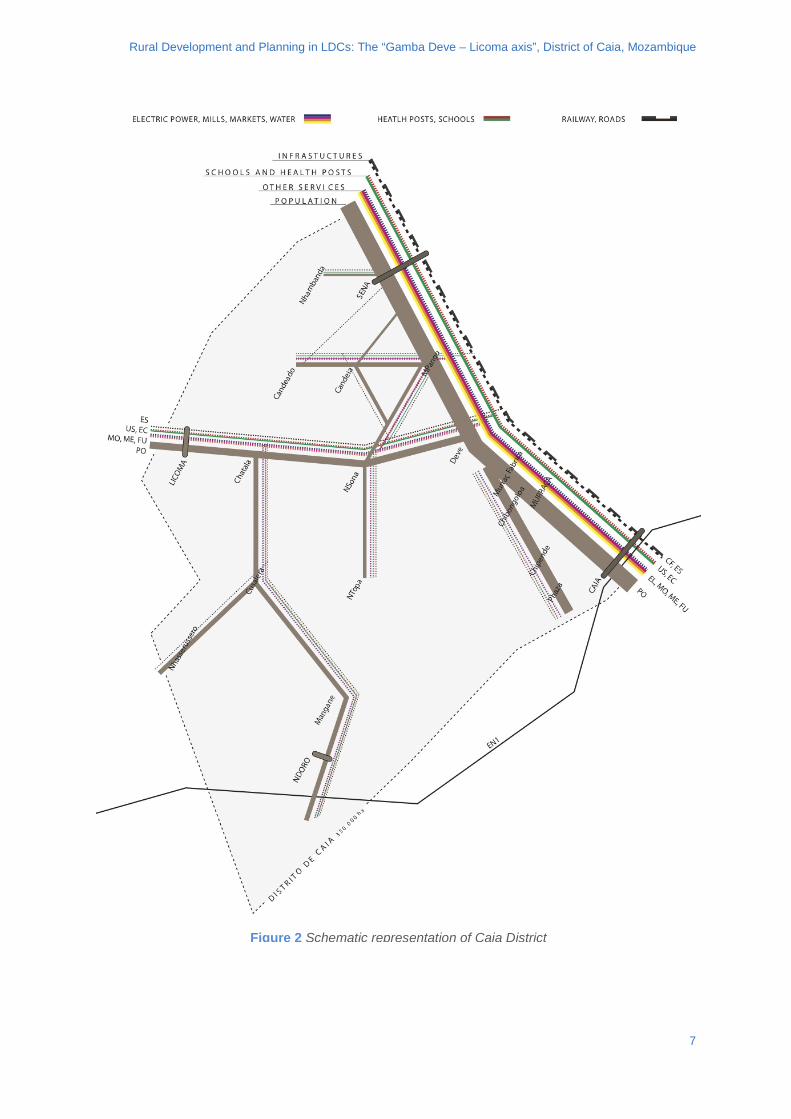
Figure 2 Schematic representation of Caia District
7
Rural Development and Planning in LDCs: The “Gamba Deve – Licoma axis”, District of Caia, Mozambique
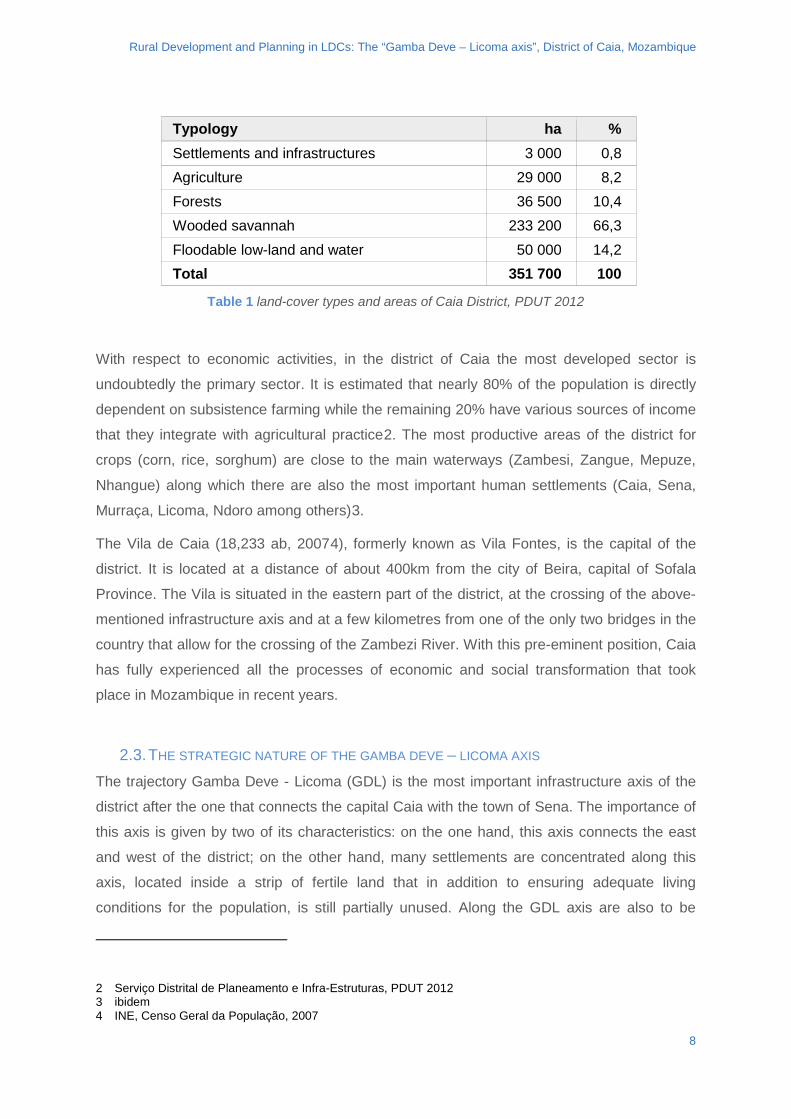
Typology ha % Settlements and infrastructures 3 000 0,8 Agriculture 29 000 8,2 Forests 36 500 10,4 Wooded savannah 233 200 66,3 Floodable low-land and water 50 000 14,2 Total 351 700 100
Table 1 land-cover types and areas of Caia District, PDUT 2012
With respect to economic activities, in the district of Caia the most developed sector is
undoubtedly the primary sector. It is estimated that nearly 80% of the population is directly
dependent on subsistence farming while the remaining 20% have various sources of income
that they integrate with agricultural practice2. The most productive areas of the district for
crops (corn, rice, sorghum) are close to the main waterways (Zambesi, Zangue, Mepuze,
Nhangue) along which there are also the most important human settlements (Caia, Sena,
Murraça, Licoma, Ndoro among others)3.
The Vila de Caia (18,233 ab, 20074), formerly known as Vila Fontes, is the capital of the
district. It is located at a distance of about 400km from the city of Beira, capital of Sofala
Province. The Vila is situated in the eastern part of the district, at the crossing of the above-
mentioned infrastructure axis and at a few kilometres from one of the only two bridges in the
country that allow for the crossing of the Zambezi River. With this pre-eminent position, Caia
has fully experienced all the processes of economic and social transformation that took
place in Mozambique in recent years.
2.3. THE STRATEGIC NATURE OF THE GAMBA DEVE – LICOMA AXIS
The trajectory Gamba Deve - Licoma (GDL) is the most important infrastructure axis of the
district after the one that connects the capital Caia with the town of Sena. The importance of
this axis is given by two of its characteristics: on the one hand, this axis connects the east
and west of the district; on the other hand, many settlements are concentrated along this
axis, located inside a strip of fertile land that in addition to ensuring adequate living
conditions for the population, is still partially unused. Along the GDL axis are also to be
2 Serviço Distrital de Planeamento e Infra-Estruturas, PDUT 2012 3 ibidem 4 INE, Censo Geral da População, 2007
8
Rural Development and Planning in LDCs: The “Gamba Deve – Licoma axis”, District of Caia, Mozambique
found some important service infrastructures for the population such as education and health
facilities, as well as private services that provide access to water and products on the local
markets.
The East-West connection is guaranteed by the road axis called Estrada Distrital N° 1
(ED1). This road, in addition to crossing through the GDL axis, connects at Licoma, the Caia
district with the district of Maringue, thus ensuring an inter-district link. The importance of the
GDL axis for the district is therefore evident, not only when considering the local scale, but
also on the regional scale.
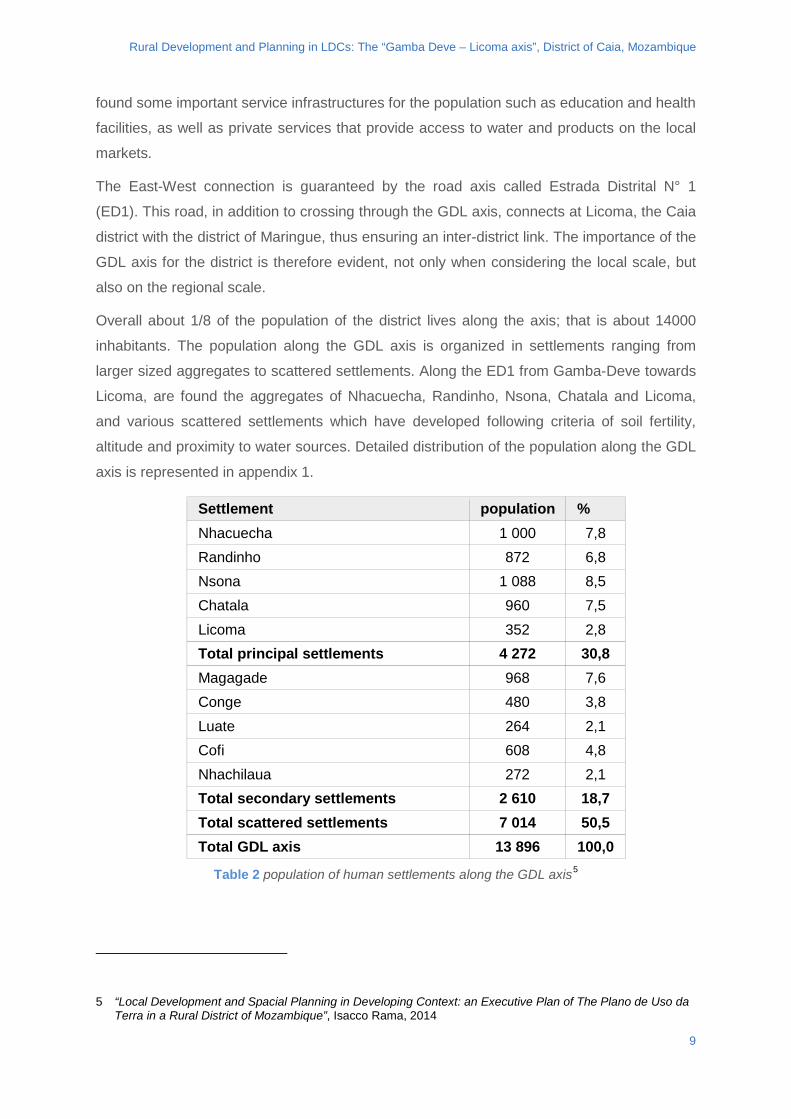
Overall about 1/8 of the population of the district lives along the axis; that is about 14000
inhabitants. The population along the GDL axis is organized in settlements ranging from
larger sized aggregates to scattered settlements. Along the ED1 from Gamba-Deve towards
Licoma, are found the aggregates of Nhacuecha, Randinho, Nsona, Chatala and Licoma,
and various scattered settlements which have developed following criteria of soil fertility,
altitude and proximity to water sources. Detailed distribution of the population along the GDL
axis is represented in appendix 1.
Settlement population % Nhacuecha 1 000 7,8 Randinho 872 6,8 Nsona 1 088 8,5 Chatala 960 7,5 Licoma 352 2,8 Total principal settlements 4 272 30,8 Magagade 968 7,6 Conge 480 3,8 Luate 264 2,1 Cofi 608 4,8 Nhachilaua 272 2,1 Total secondary settlements 2 610 18,7 Total scattered settlements 7 014 50,5 Total GDL axis 13 896 100,0
Table 2 population of human settlements along the GDL axis5
5 “Local Development and Spacial Planning in Developing Context: an Executive Plan of The Plano de Uso da Terra in a Rural District of Mozambique”, Isacco Rama, 2014
9
Rural Development and Planning in LDCs: The “Gamba Deve – Licoma axis”, District of Caia, Mozambique
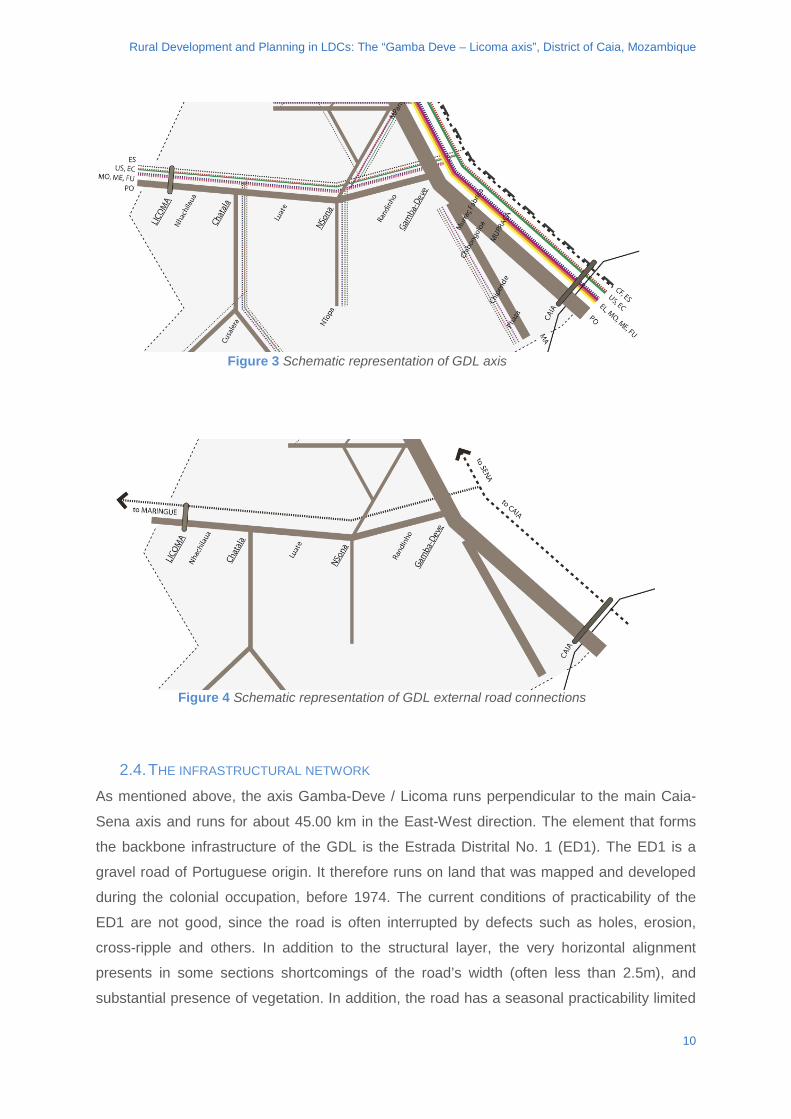
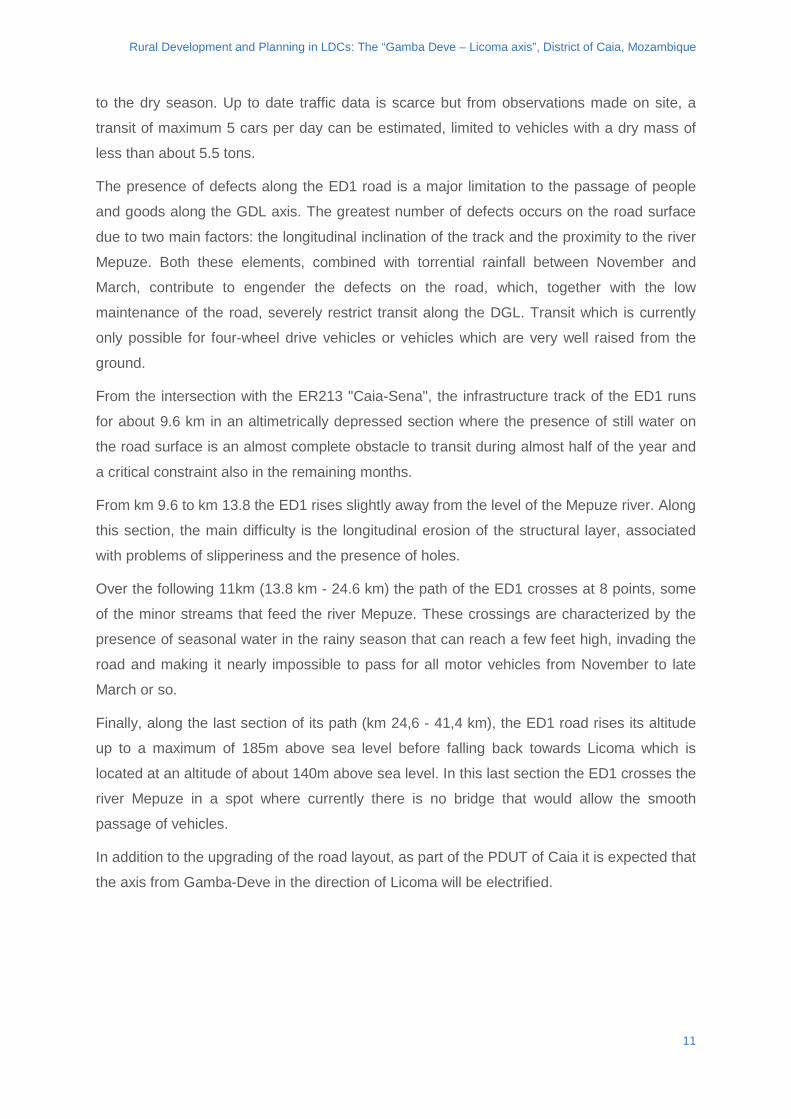
2.4. THE INFRASTRUCTURAL NETWORK As mentioned above, the axis Gamba-Deve / Licoma runs perpendicular to the main Caia-
Sena axis and runs for about 45.00 km in the East-West direction. The element that forms
the backbone infrastructure of the GDL is the Estrada Distrital No. 1 (ED1). The ED1 is a
gravel road of Portuguese origin. It therefore runs on land that was mapped and developed
during the colonial occupation, before 1974. The current conditions of practicability of the
ED1 are not good, since the road is often interrupted by defects such as holes, erosion,
cross-ripple and others. In addition to the structural layer, the very horizontal alignment
presents in some sections shortcomings of the road’s width (often less than 2.5m), and
substantial presence of vegetation. In addition, the road has a seasonal practicability limited
Figure 3 Schematic representation of GDL axis
Figure 4 Schematic representation of GDL external road connections
10
Rural Development and Planning in LDCs: The “Gamba Deve – Licoma axis”, District of Caia, Mozambique
to the dry season. Up to date traffic data is scarce but from observations made on site, a
transit of maximum 5 cars per day can be estimated, limited to vehicles with a dry mass of
less than about 5.5 tons.
The presence of defects along the ED1 road is a major limitation to the passage of people
and goods along the GDL axis. The greatest number of defects occurs on the road surface
due to two main factors: the longitudinal inclination of the track and the proximity to the river
Mepuze. Both these elements, combined with torrential rainfall between November and
March, contribute to engender the defects on the road, which, together with the low
maintenance of the road, severely restrict transit along the DGL. Transit which is currently
only possible for four-wheel drive vehicles or vehicles which are very well raised from the
ground.
From the intersection with the ER213 "Caia-Sena", the infrastructure track of the ED1 runs
for about 9.6 km in an altimetrically depressed section where the presence of still water on
the road surface is an almost complete obstacle to transit during almost half of the year and
a critical constraint also in the remaining months.
From km 9.6 to km 13.8 the ED1 rises slightly away from the level of the Mepuze river. Along
this section, the main difficulty is the longitudinal erosion of the structural layer, associated
with problems of slipperiness and the presence of holes.
Over the following 11km (13.8 km - 24.6 km) the path of the ED1 crosses at 8 points, some
of the minor streams that feed the river Mepuze. These crossings are characterized by the
presence of seasonal water in the rainy season that can reach a few feet high, invading the
road and making it nearly impossible to pass for all motor vehicles from November to late
March or so.
Finally, along the last section of its path (km 24,6 - 41,4 km), the ED1 road rises its altitude
up to a maximum of 185m above sea level before falling back towards Licoma which is
located at an altitude of about 140m above sea level. In this last section the ED1 crosses the
river Mepuze in a spot where currently there is no bridge that would allow the smooth
passage of vehicles.
In addition to the upgrading of the road layout, as part of the PDUT of Caia it is expected that
the axis from Gamba-Deve in the direction of Licoma will be electrified.
11
Rural Development and Planning in LDCs: The “Gamba Deve – Licoma axis”, District of Caia, Mozambique
2.5. SERVICES TO THE POPULATION
In rural areas of Mozambique, the network of public and private initiatives are cohabiting and
easily distinguishable. The public authority is represented by the administrative structure of
the state and provides two basic services to the population: education and healthcare. The
private sector is present with various initiatives, especially related to family-size or
cooperative structures, such as management of local markets, management of mills and the
network of water wells, supply of transport to the population, production and trade of
agricultural goods and, more rarely, working as employees.
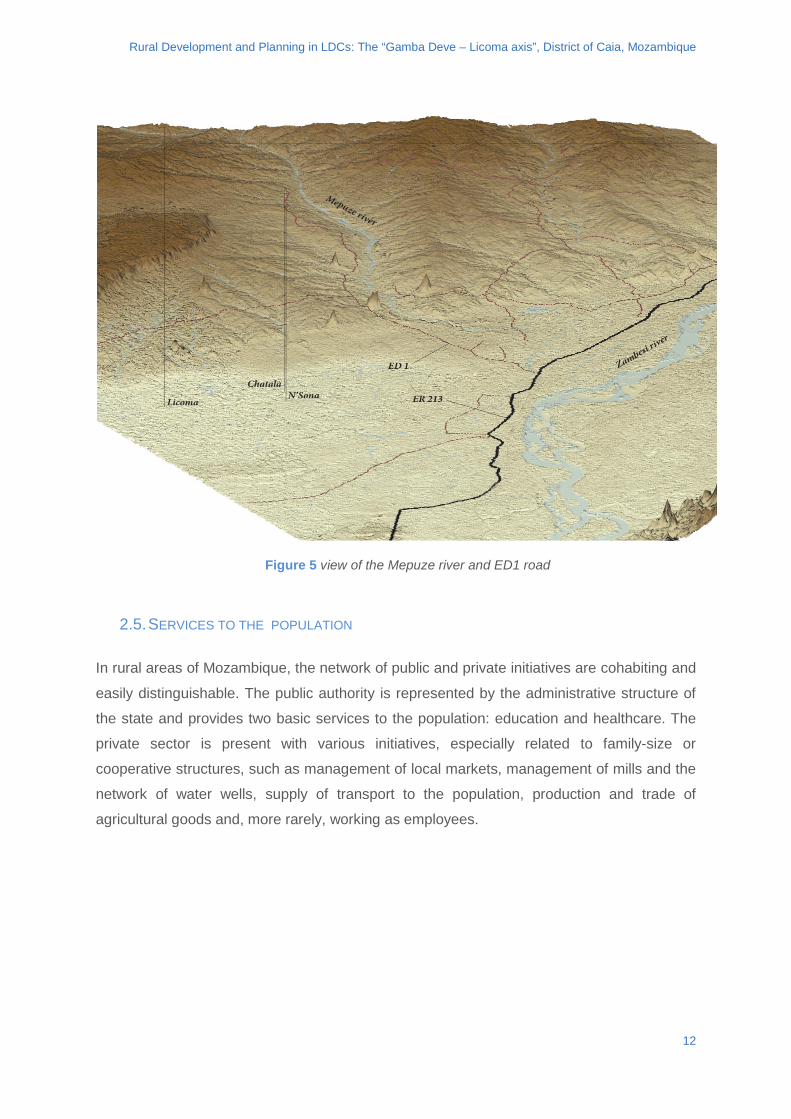
Figure 5 view of the Mepuze river and ED1 road
12
Rural Development and Planning in LDCs: The “Gamba Deve – Licoma axis”, District of Caia, Mozambique
Again with reference to rural areas in Mozambique, basic health facilities, namely Centro de
Saude and Posto de Saude, as well as basic educational facilities, Escola Primaria de 1°
grau (EP1) and Escola Primaria Completa (EPC), are constructed according to an
architectural standard. This provides for simple structures in reinforced concrete, featuring
two or three rooms. Often, schools and health facilities do not have electricity, or resort to
the use of solar panels. They often do not have running water and if not, they may resort to
simple ad-hoc hydraulic systems. Schools work on several shifts during the day. In the vast
majority of cases professionals of the two sectors (teachers, nurses, attendants) come from
outside GDL and are housed in public residential facilities.
In terms of the GDL axis, the presence of the public sector is translated into administrative
structures, such as the Posto da Localidade de Licoma (PAL) and the network of schools
and health facilities. At the PAL sits a public official (called Chefe da Localidade) and a small
secretariat (composed of two people). This administrative structure exerts some simple
mandates of an executive nature, including the promotion of health and education within its
jurisdiction. The schools and health facilities network along the GDL follows, with some key
exceptions, the presence of the population. Structures are in fact placed to coincide with the
main centres (aggregates). In particular, schools can be found near Gamba-Deve,
Nhacuecha, Randinho, Nsona, Chatala, Cofi and Licoma. Health posts can be found in
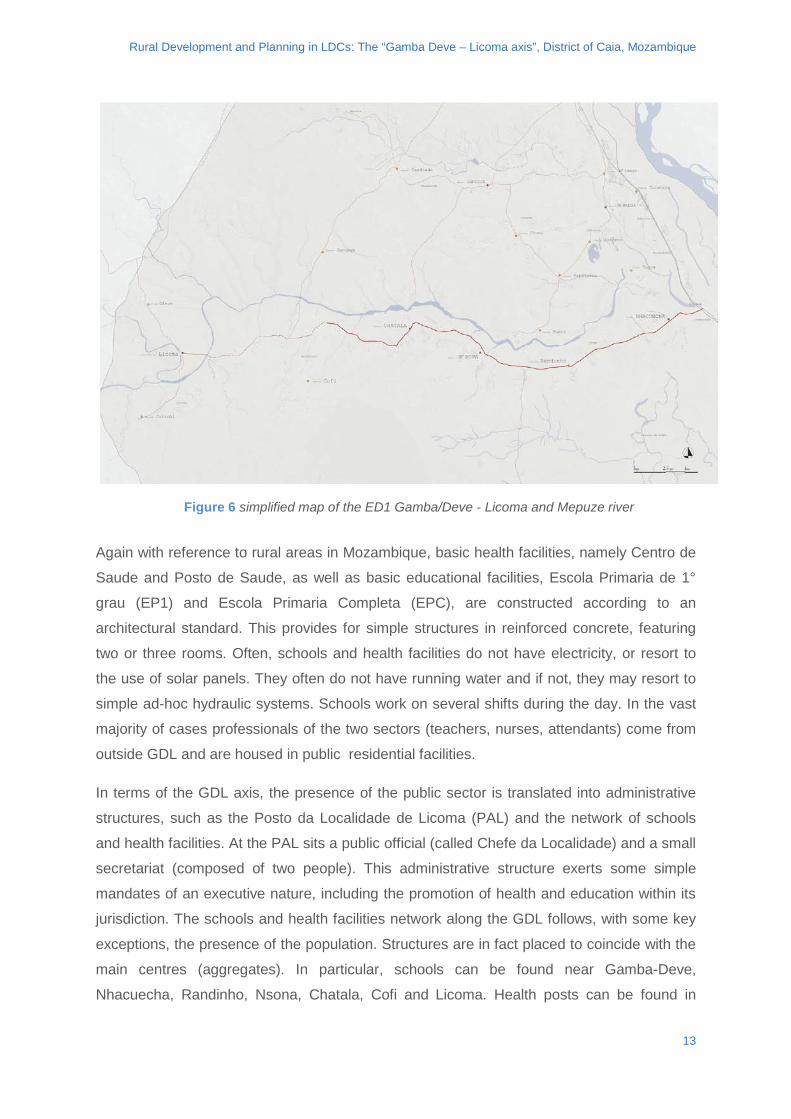
Figure 6 simplified map of the ED1 Gamba/Deve - Licoma and Mepuze river
13
Rural Development and Planning in LDCs: The “Gamba Deve – Licoma axis”, District of Caia, Mozambique
Gamba-Deva, Randinho, Chatala and Licoma. Aggregates listed above, all of medium size,
have a theoretically sufficient coverage of services.
The difficulty of access to services by the rural population is caused on the one hand by the
numerically significant presence of scattered settlements placed at a distance from the
aggregates, and on the other hand by the low quality of both education and health care
services. In fact, regarding schools, critical issues are related to: extremely high
pupils/teacher ratios, few school grades offered (grades 1 to 5), difficult access for distant
households, lack of teaching materials. As for the health care facilities, critical issues are
linked to: absence of qualified staff, lack of medicines and medical supplies, lack of health
care equipment, isolation of the health posts with respect to the hospital of Caia, resulting in
difficulty in the mobility of health staff and patients.
Health post population Centro de Saude de Gamba-Deve
3 198
Posto de Saude de Randinho 2 015 Centro de Saude de Chatala 3 166 Centro de Saude de Licoma 2 143 Total 10 522
Table 3 population per health post along the GDL axis
School grade pupils teachers ratio EP1 Nhacuecha 1°-5° 246 5 50 EP1 Randinho 1°-5° 240 3 80 EP1 Nsona 1°-5° 605 8 76 EP1 Chatala 1°-5° 553 6 93 EP1 Nhachilaua 1°-5° 455 4 114 EP1 Licoma 1°-5° 214 5 43 Total - 2 864 42 69
Table 4 pupils and teachers per school along the GDL axis
14
Rural Development and Planning in LDCs: The “Gamba Deve – Licoma axis”, District of Caia, Mozambique
In general, it can therefore be said that, although in recent years considerable efforts have been made by local and national governments to improve networks and structures, a shortage of materials/staff and poor quality of service remain at a critical level.
With regard to the services offered to the population and managed by the private sector, i.e. mills, water wells and local markets, the network is more dense and it is less easy to make generalizations. The water wells are generally constructed with funds managed partly by the technical district office (SDPI) and often obtained from donations. On average, wells do not exceed 35/40m depth and are composed of a battery of tubes connected with the water pump. Afridev-type manual water pumps are often used while more rarely small electric pumps are installed. As for the other services, the water well network follows largely the presence of the population, although there are a larger number of scattered settlements that are not covered by the service.
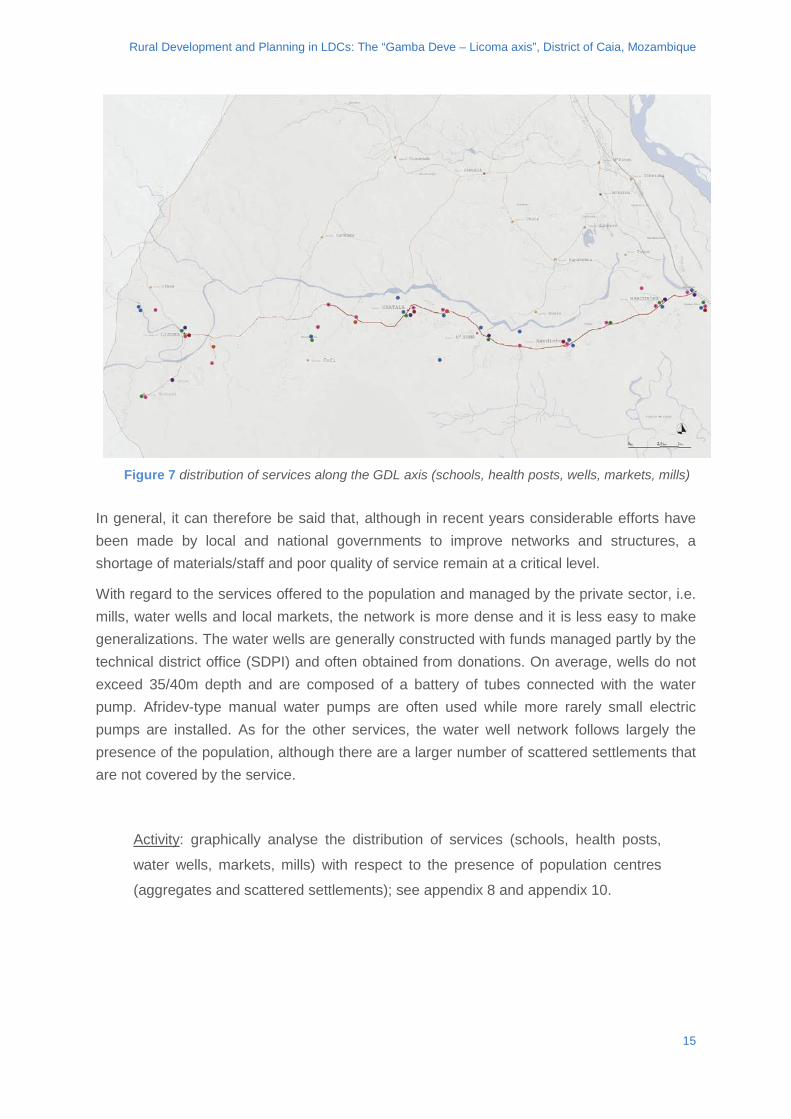
Activity: graphically analyse the distribution of services (schools, health posts,
water wells, markets, mills) with respect to the presence of population centres
(aggregates and scattered settlements); see appendix 8 and appendix 10.
Figure 7 distribution of services along the GDL axis (schools, health posts, wells, markets, mills)
15
Rural Development and Planning in LDCs: The “Gamba Deve – Licoma axis”, District of Caia, Mozambique
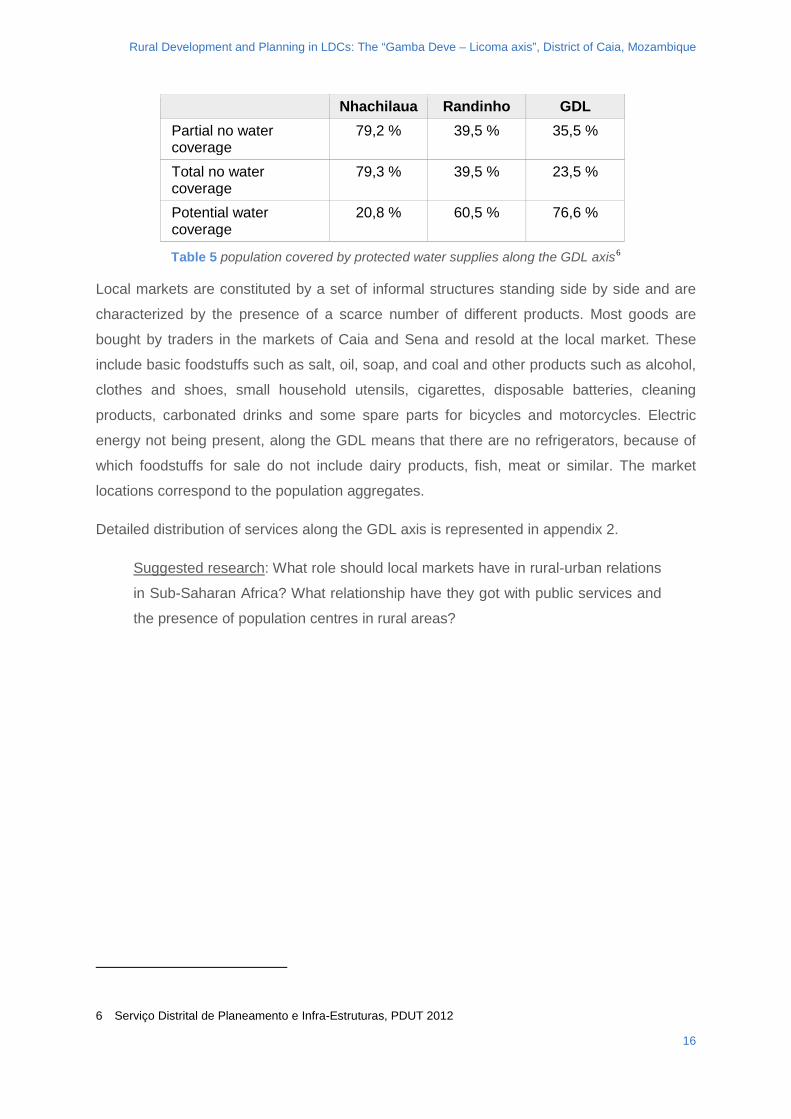
Nhachilaua Randinho GDL Partial no water coverage
79,2 % 39,5 % 35,5 %
Total no water coverage
79,3 % 39,5 % 23,5 %
Potential water coverage
20,8 % 60,5 % 76,6 %
Table 5 population covered by protected water supplies along the GDL axis6
Local markets are constituted by a set of informal structures standing side by side and are
characterized by the presence of a scarce number of different products. Most goods are
bought by traders in the markets of Caia and Sena and resold at the local market. These
include basic foodstuffs such as salt, oil, soap, and coal and other products such as alcohol,
clothes and shoes, small household utensils, cigarettes, disposable batteries, cleaning
products, carbonated drinks and some spare parts for bicycles and motorcycles. Electric
energy not being present, along the GDL means that there are no refrigerators, because of
which foodstuffs for sale do not include dairy products, fish, meat or similar. The market
locations correspond to the population aggregates.
Detailed distribution of services along the GDL axis is represented in appendix 2.
Suggested research: What role should local markets have in rural-urban relations
in Sub-Saharan Africa? What relationship have they got with public services and
the presence of population centres in rural areas?
6 Serviço Distrital de Planeamento e Infra-Estruturas, PDUT 2012
16
Rural Development and Planning in LDCs: The “Gamba Deve – Licoma axis”, District of Caia, Mozambique
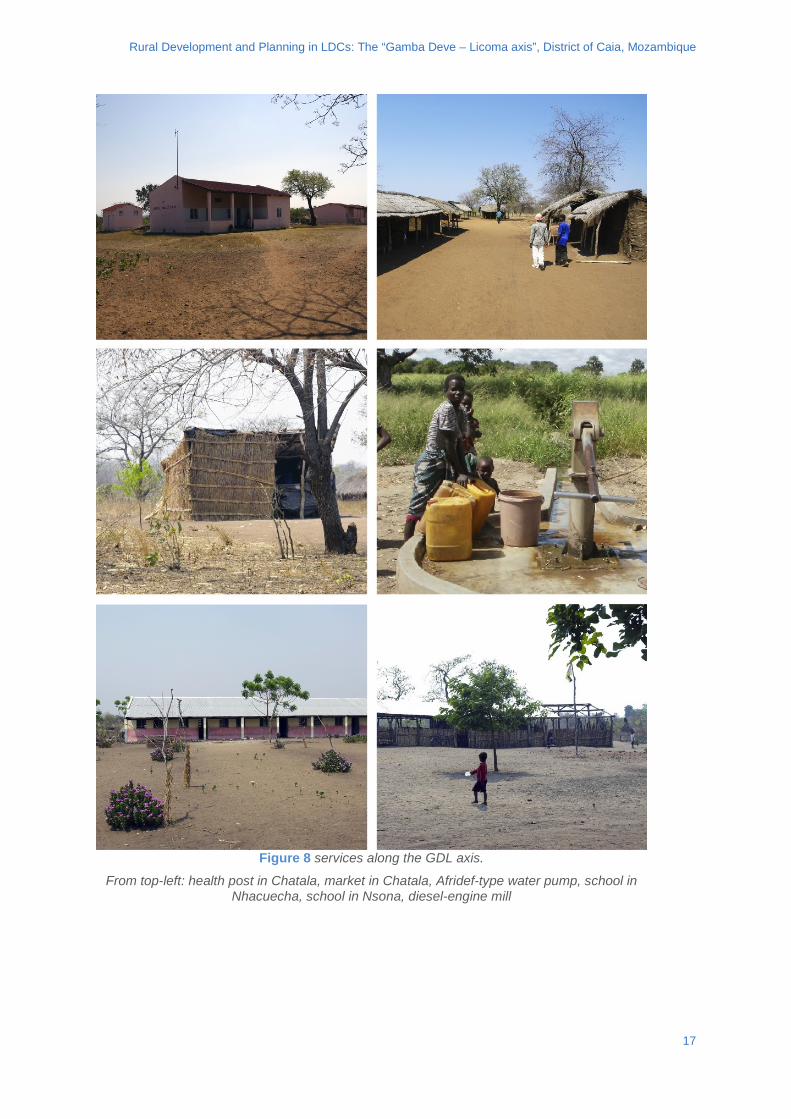
Figure 8 services along the GDL axis.
From top-left: health post in Chatala, market in Chatala, Afridef-type water pump, school in Nhacuecha, school in Nsona, diesel-engine mill
17
Rural Development and Planning in LDCs: The “Gamba Deve – Licoma axis”, District of Caia, Mozambique
3. CLASS ACTIVITY
It is suggested that the introduction to the project is made in 4 phases: (1) inspection of
context and determinants, (2) examination of the roadway and roadway defects, (3)
description of adopted technical solutions, (4) description of synergies adopted with the
roadway. In order to simplify the transmission of concepts during the lecture, in the following
section each of these stages will be illustrated.
Classroom activities can be developed according to the methods preferred by the professor,
although leaving ample space for interaction between students is considered of particular
importance. This is to be seen in the perspective of alternative proposals in terms of
technical-specific design for ED1 and the service network made by student groups during
the homework activity.
3.1. CONTEXT AND DETERMINANTS
It is very important to consider that the Case Study has been carried out in a rural area of
one of the countries with the lowest GDP per capita in the world. The GDL axis is
characterized by technological backwardness in agricultural practice, media isolation,
endemic poverty of the population. The rational allocation of resources is therefore of
fundamental importance, the detailed examination of the context and clarification of the
determining factors are the basis for a successful project.
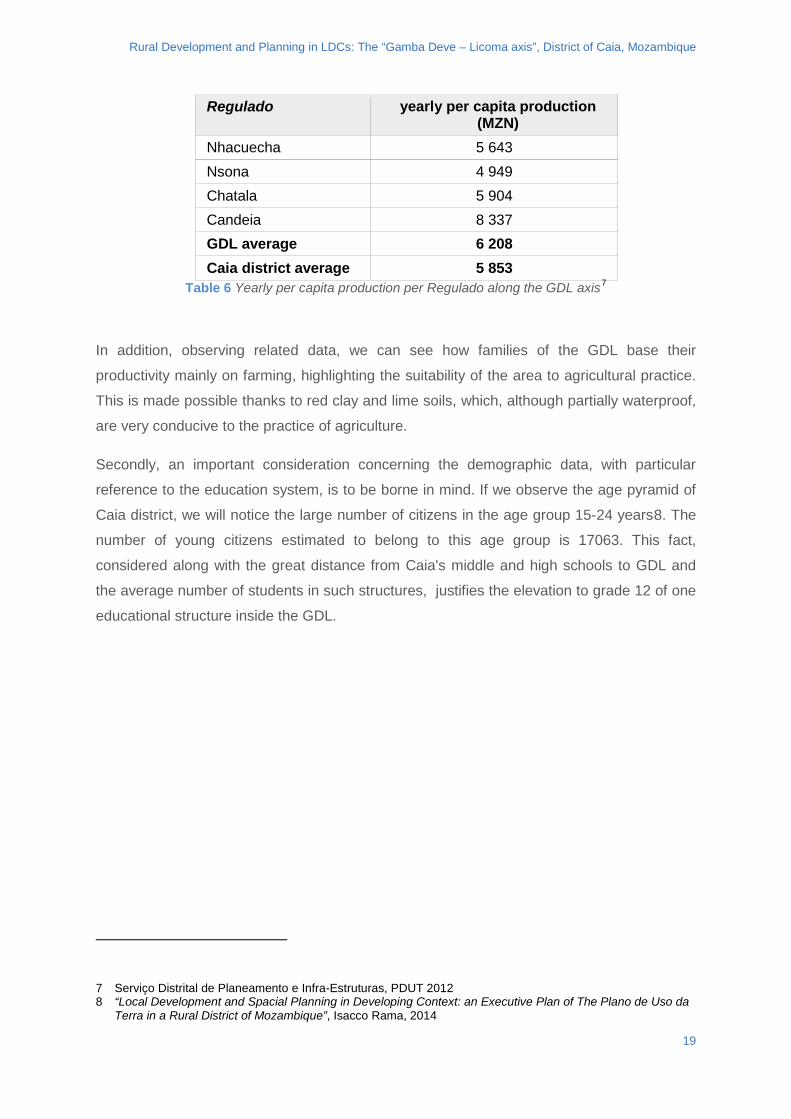
First of all it is important to consider that three out of four of the Regulados that stand on the
GDL axis have a per capita monetized annual production higher than the district average. In
relation to the Caia district, the overall productivity (the sum of the agricultural product and
that of animal hubandry) in Nhacuecha, Nsona, Chatala and Candeia is up to 6% higher
than the average.
18
Rural Development and Planning in LDCs: The “Gamba Deve – Licoma axis”, District of Caia, Mozambique
Regulado yearly per capita production (MZN)
Nhacuecha 5 643 Nsona 4 949 Chatala 5 904 Candeia 8 337 GDL average 6 208 Caia district average 5 853
Table 6 Yearly per capita production per Regulado along the GDL axis7
In addition, observing related data, we can see how families of the GDL base their
productivity mainly on farming, highlighting the suitability of the area to agricultural practice.
This is made possible thanks to red clay and lime soils, which, although partially waterproof,
are very conducive to the practice of agriculture.
Secondly, an important consideration concerning the demographic data, with particular
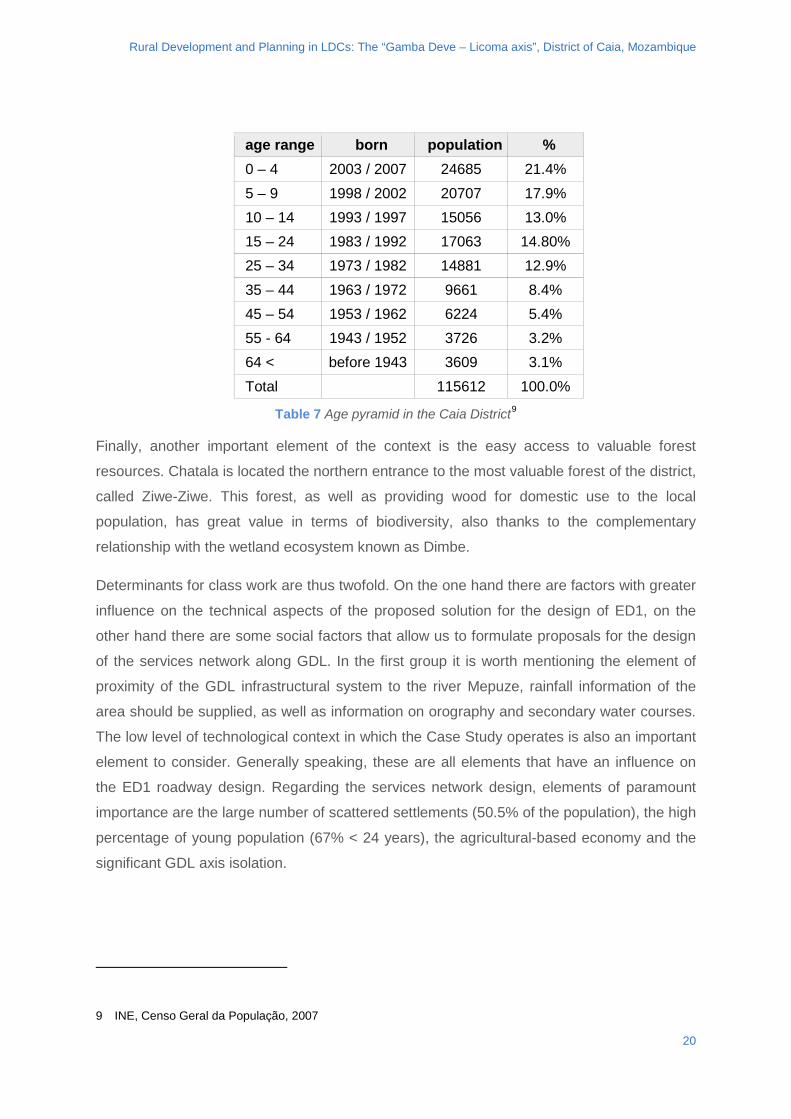
reference to the education system, is to be borne in mind. If we observe the age pyramid of
Caia district, we will notice the large number of citizens in the age group 15-24 years8. The
number of young citizens estimated to belong to this age group is 17063. This fact,
considered along with the great distance from Caia's middle and high schools to GDL and
the average number of students in such structures, justifies the elevation to grade 12 of one
educational structure inside the GDL.
7 Serviço Distrital de Planeamento e Infra-Estruturas, PDUT 2012 8 “Local Development and Spacial Planning in Developing Context: an Executive Plan of The Plano de Uso da
Terra in a Rural District of Mozambique”, Isacco Rama, 2014
19
Rural Development and Planning in LDCs: The “Gamba Deve – Licoma axis”, District of Caia, Mozambique
age range born population % 0 – 4 2003 / 2007 24685 21.4% 5 – 9 1998 / 2002 20707 17.9% 10 – 14 1993 / 1997 15056 13.0% 15 – 24 1983 / 1992 17063 14.80% 25 – 34 1973 / 1982 14881 12.9% 35 – 44 1963 / 1972 9661 8.4% 45 – 54 1953 / 1962 6224 5.4% 55 - 64 1943 / 1952 3726 3.2% 64 < before 1943 3609 3.1% Total 115612 100.0%
Table 7 Age pyramid in the Caia District9
Finally, another important element of the context is the easy access to valuable forest
resources. Chatala is located the northern entrance to the most valuable forest of the district,
called Ziwe-Ziwe. This forest, as well as providing wood for domestic use to the local
population, has great value in terms of biodiversity, also thanks to the complementary
relationship with the wetland ecosystem known as Dimbe.
Determinants for class work are thus twofold. On the one hand there are factors with greater
influence on the technical aspects of the proposed solution for the design of ED1, on the
other hand there are some social factors that allow us to formulate proposals for the design
of the services network along GDL. In the first group it is worth mentioning the element of
proximity of the GDL infrastructural system to the river Mepuze, rainfall information of the
area should be supplied, as well as information on orography and secondary water courses.
The low level of technological context in which the Case Study operates is also an important
element to consider. Generally speaking, these are all elements that have an influence on
the ED1 roadway design. Regarding the services network design, elements of paramount
importance are the large number of scattered settlements (50.5% of the population), the high
percentage of young population (67% < 24 years), the agricultural-based economy and the
significant GDL axis isolation.
9 INE, Censo Geral da População, 2007
20
Rural Development and Planning in LDCs: The “Gamba Deve – Licoma axis”, District of Caia, Mozambique
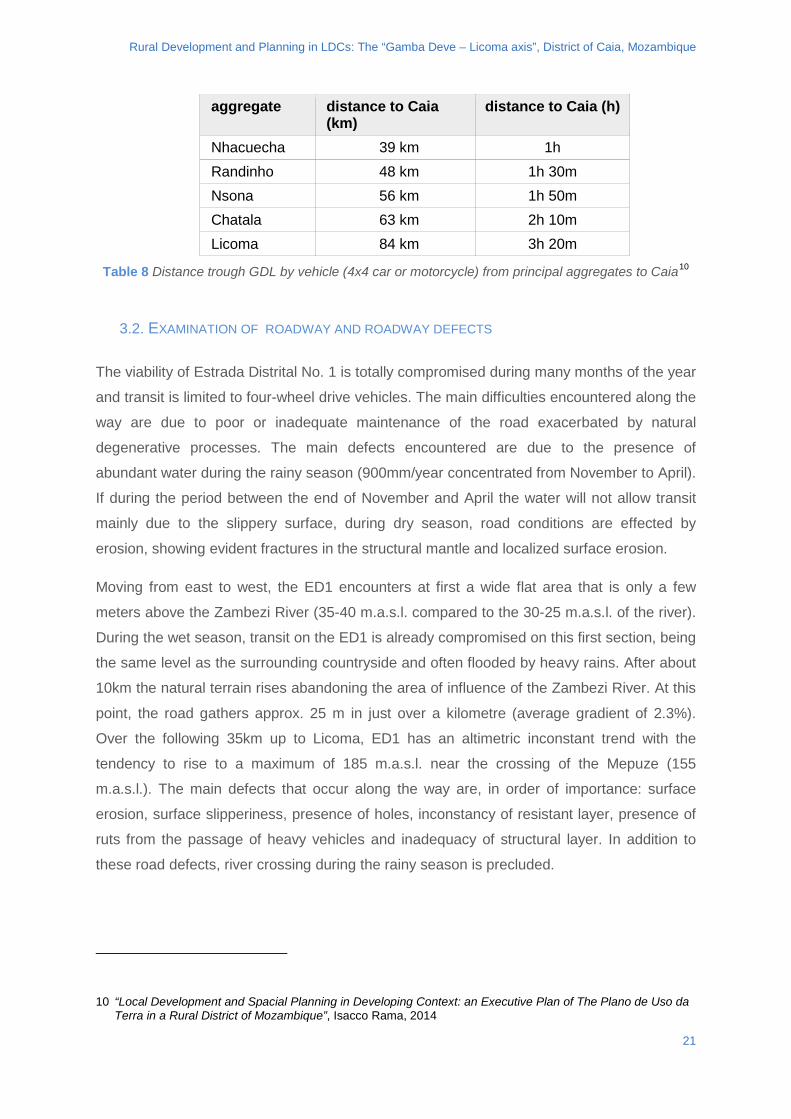
aggregate distance to Caia (km)
distance to Caia (h)
Nhacuecha 39 km 1h Randinho 48 km 1h 30m Nsona 56 km 1h 50m Chatala 63 km 2h 10m Licoma 84 km 3h 20m
Table 8 Distance trough GDL by vehicle (4x4 car or motorcycle) from principal aggregates to Caia10
3.2. EXAMINATION OF ROADWAY AND ROADWAY DEFECTS
The viability of Estrada Distrital No. 1 is totally compromised during many months of the year
and transit is limited to four-wheel drive vehicles. The main difficulties encountered along the
way are due to poor or inadequate maintenance of the road exacerbated by natural
degenerative processes. The main defects encountered are due to the presence of
abundant water during the rainy season (900mm/year concentrated from November to April).
If during the period between the end of November and April the water will not allow transit
mainly due to the slippery surface, during dry season, road conditions are effected by
erosion, showing evident fractures in the structural mantle and localized surface erosion.
Moving from east to west, the ED1 encounters at first a wide flat area that is only a few
meters above the Zambezi River (35-40 m.a.s.l. compared to the 30-25 m.a.s.l. of the river).
During the wet season, transit on the ED1 is already compromised on this first section, being
the same level as the surrounding countryside and often flooded by heavy rains. After about
10km the natural terrain rises abandoning the area of influence of the Zambezi River. At this
point, the road gathers approx. 25 m in just over a kilometre (average gradient of 2.3%).
Over the following 35km up to Licoma, ED1 has an altimetric inconstant trend with the
tendency to rise to a maximum of 185 m.a.s.l. near the crossing of the Mepuze (155
m.a.s.l.). The main defects that occur along the way are, in order of importance: surface
erosion, surface slipperiness, presence of holes, inconstancy of resistant layer, presence of
ruts from the passage of heavy vehicles and inadequacy of structural layer. In addition to
these road defects, river crossing during the rainy season is precluded.
10 “Local Development and Spacial Planning in Developing Context: an Executive Plan of The Plano de Uso da Terra in a Rural District of Mozambique”, Isacco Rama, 2014
21
Rural Development and Planning in LDCs: The “Gamba Deve – Licoma axis”, District of Caia, Mozambique
As seen, defects can be of different natures and suggest different design approaches. For
ED1, transit is affected basically by two main factors: presence of water on the road surface
and crossing of secondary water courses. Aside from these, crossings of Mulala and
Mepuze rivers are at the present moment nominally in the preliminary design and
construction phases.
Going back to road defects, the presence of water causes principally erosion and
slipperiness of the surface. This second defect is the more frequent as the wearing course is
composed of fine-grained soils (silts and clays). The interaction of these with water during
the rainy season gives rise to a highly plastic layer that can measure up to 20-25cm,
precluding the passage of all sorts of vehicles. This phenomenon has been observed both in
the low area adjacent to the Zambezi, and in lowland areas in the proximity of N'Sona and
Chatala where it is associated with the aggravating circumstance of a longitudinal gradient
/slope of the road higher than approx. 5/8%.
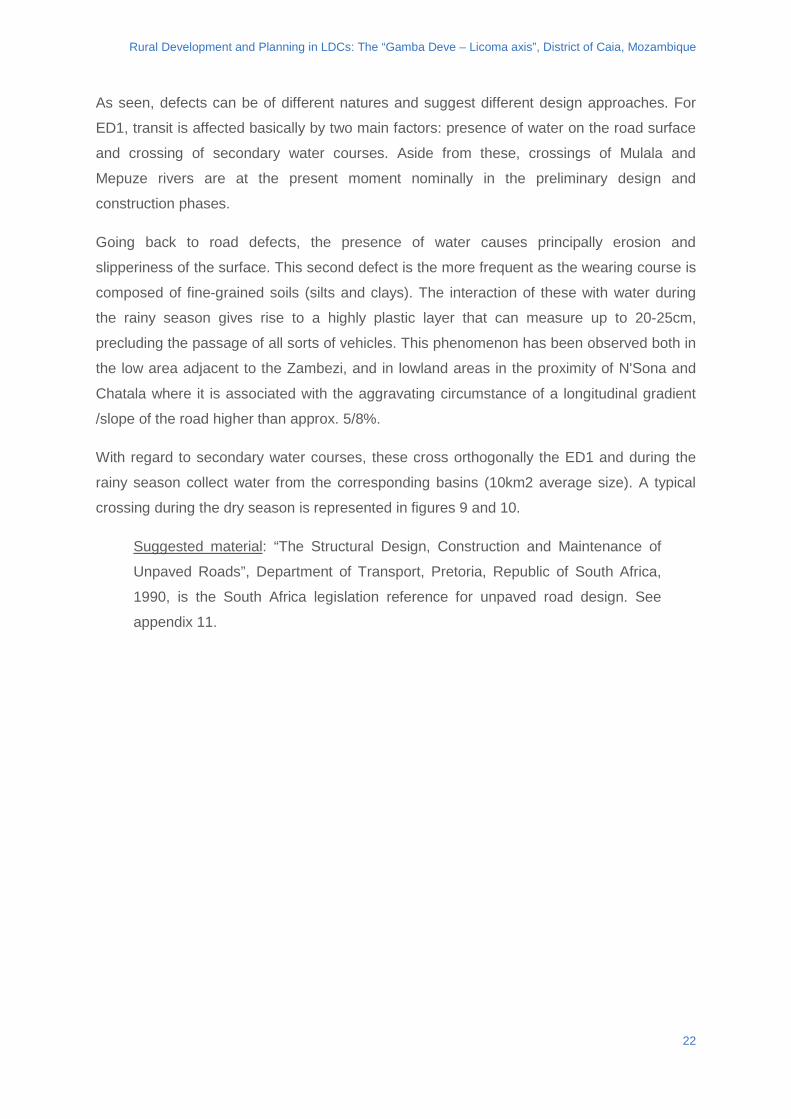
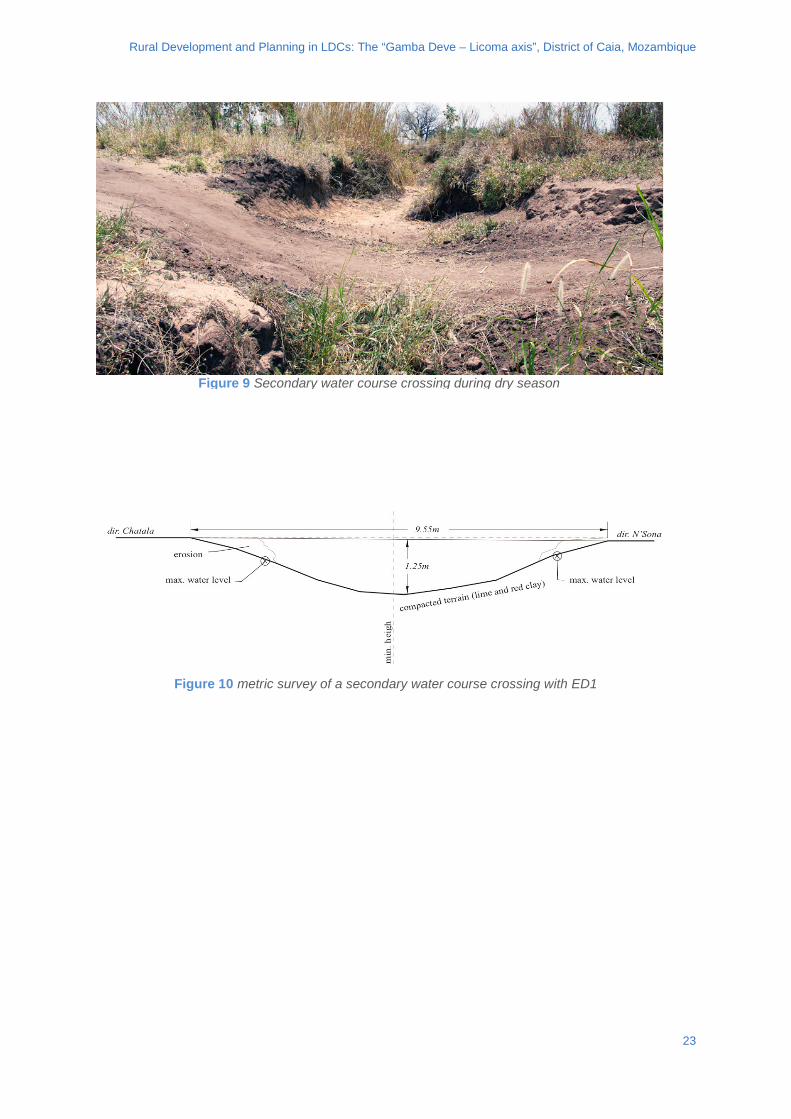
With regard to secondary water courses, these cross orthogonally the ED1 and during the
rainy season collect water from the corresponding basins (10km2 average size). A typical
crossing during the dry season is represented in figures 9 and 10.
Suggested material: “The Structural Design, Construction and Maintenance of
Unpaved Roads”, Department of Transport, Pretoria, Republic of South Africa,
1990, is the South Africa legislation reference for unpaved road design. See
appendix 11.
22
Rural Development and Planning in LDCs: The “Gamba Deve – Licoma axis”, District of Caia, Mozambique
Figure 10 metric survey of a secondary water course crossing with ED1
Figure 9 Secondary water course crossing during dry season
23
Rural Development and Planning in LDCs: The “Gamba Deve – Licoma axis”, District of Caia, Mozambique
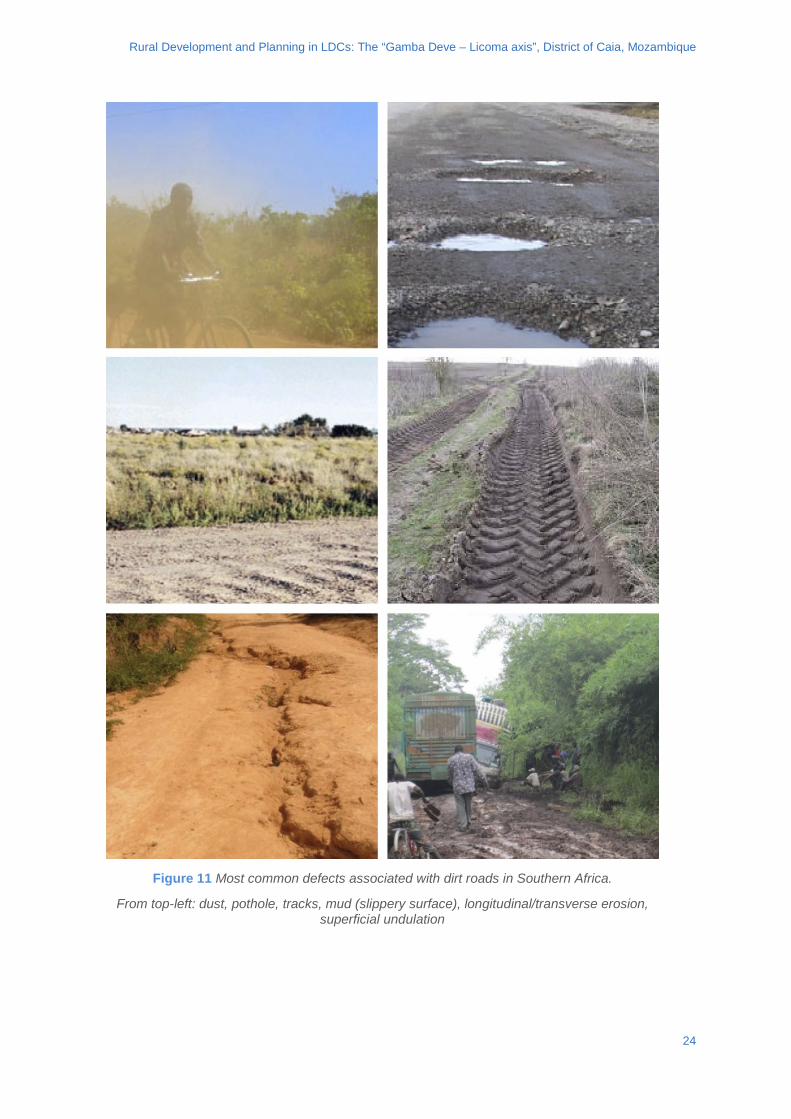
Figure 11 Most common defects associated with dirt roads in Southern Africa.
From top-left: dust, pothole, tracks, mud (slippery surface), longitudinal/transverse erosion, superficial undulation
24
Rural Development and Planning in LDCs: The “Gamba Deve – Licoma axis”, District of Caia, Mozambique
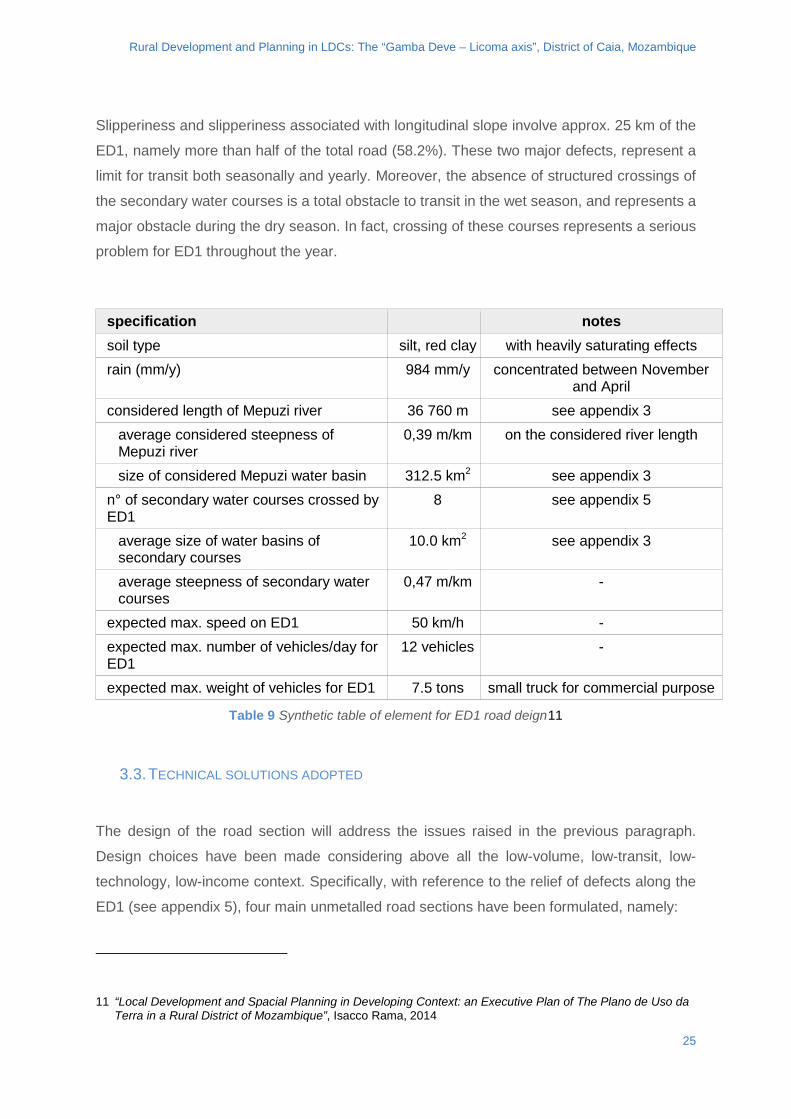
Slipperiness and slipperiness associated with longitudinal slope involve approx. 25 km of the
ED1, namely more than half of the total road (58.2%). These two major defects, represent a
limit for transit both seasonally and yearly. Moreover, the absence of structured crossings of
the secondary water courses is a total obstacle to transit in the wet season, and represents a
major obstacle during the dry season. In fact, crossing of these courses represents a serious
problem for ED1 throughout the year.
specification notes soil type silt, red clay with heavily saturating effects rain (mm/y) 984 mm/y concentrated between November
and April considered length of Mepuzi river 36 760 m see appendix 3
average considered steepness of Mepuzi river
0,39 m/km on the considered river length
size of considered Mepuzi water basin 312.5 km2 see appendix 3 n° of secondary water courses crossed by ED1
8 see appendix 5
average size of water basins of secondary courses
10.0 km2 see appendix 3
average steepness of secondary water courses
0,47 m/km -
expected max. speed on ED1 50 km/h - expected max. number of vehicles/day for ED1
12 vehicles -
expected max. weight of vehicles for ED1 7.5 tons small truck for commercial purpose
Table 9 Synthetic table of element for ED1 road deign11
3.3. TECHNICAL SOLUTIONS ADOPTED
The design of the road section will address the issues raised in the previous paragraph.
Design choices have been made considering above all the low-volume, low-transit, low-
technology, low-income context. Specifically, with reference to the relief of defects along the
ED1 (see appendix 5), four main unmetalled road sections have been formulated, namely:
11 “Local Development and Spacial Planning in Developing Context: an Executive Plan of The Plano de Uso da Terra in a Rural District of Mozambique”, Isacco Rama, 2014
25
Rural Development and Planning in LDCs: The “Gamba Deve – Licoma axis”, District of Caia, Mozambique
• model section
• embankment section (km 0.00 → km 9.60)
• longitudinal slope section (gradient >5/8%)
• secondary waterways crossing section (punctual)
These 4 design solutions will be briefly described below. Based on the cognitive framework
offered, students are encouraged during the homework activity to propose alternative
solutions that can subsequently be discussed in plenary.
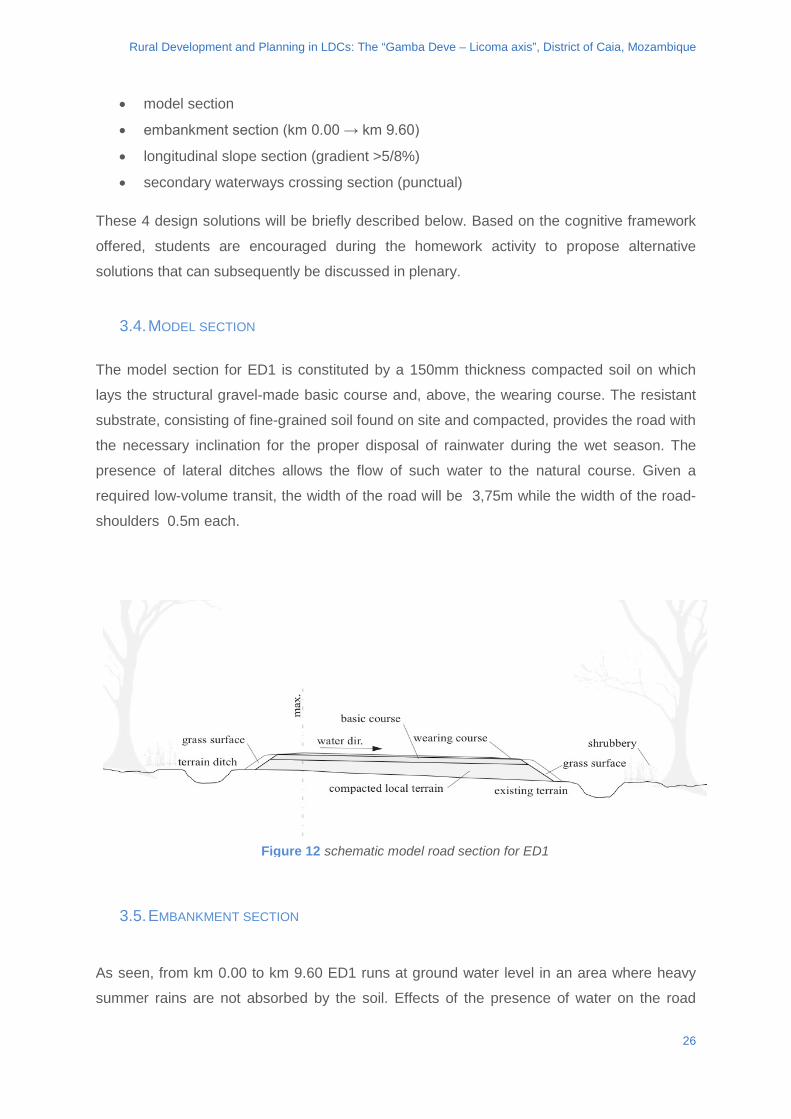
3.4. MODEL SECTION
The model section for ED1 is constituted by a 150mm thickness compacted soil on which
lays the structural gravel-made basic course and, above, the wearing course. The resistant
substrate, consisting of fine-grained soil found on site and compacted, provides the road with
the necessary inclination for the proper disposal of rainwater during the wet season. The
presence of lateral ditches allows the flow of such water to the natural course. Given a
required low-volume transit, the width of the road will be 3,75m while the width of the road-
shoulders 0.5m each.
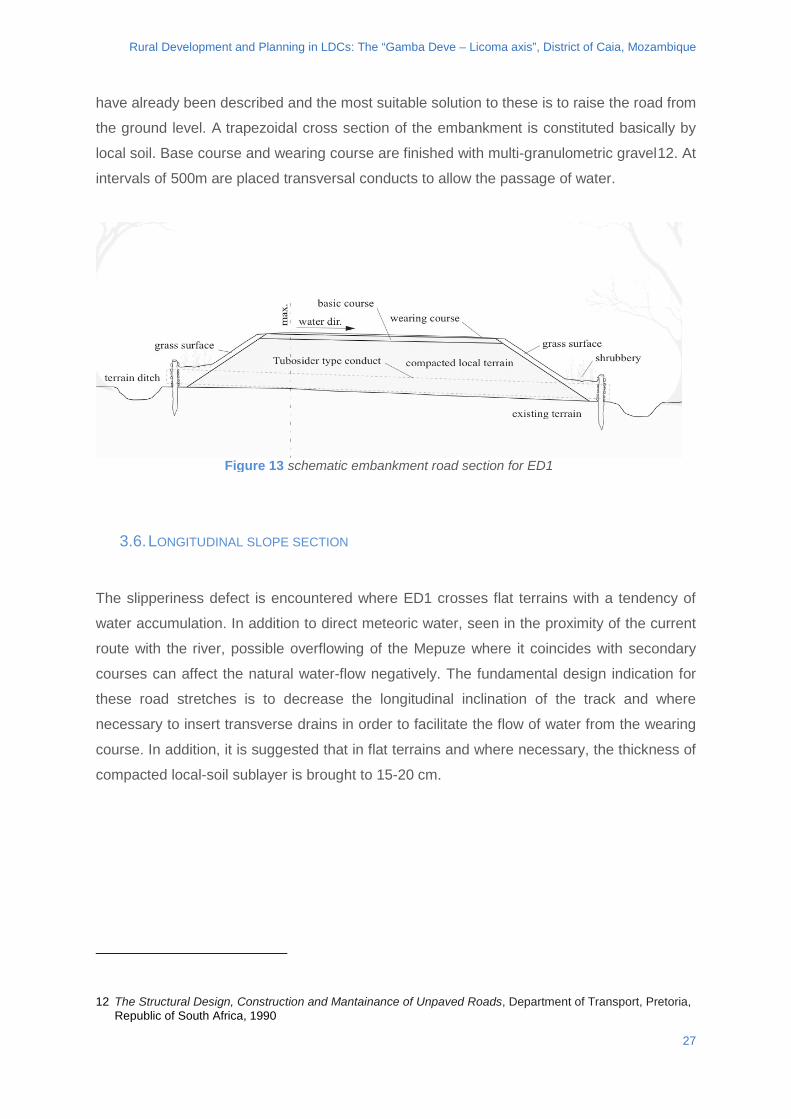
3.5. EMBANKMENT SECTION
As seen, from km 0.00 to km 9.60 ED1 runs at ground water level in an area where heavy
summer rains are not absorbed by the soil. Effects of the presence of water on the road
Figure 12 schematic model road section for ED1
26
Rural Development and Planning in LDCs: The “Gamba Deve – Licoma axis”, District of Caia, Mozambique
have already been described and the most suitable solution to these is to raise the road from
the ground level. A trapezoidal cross section of the embankment is constituted basically by
local soil. Base course and wearing course are finished with multi-granulometric gravel12. At
intervals of 500m are placed transversal conducts to allow the passage of water.
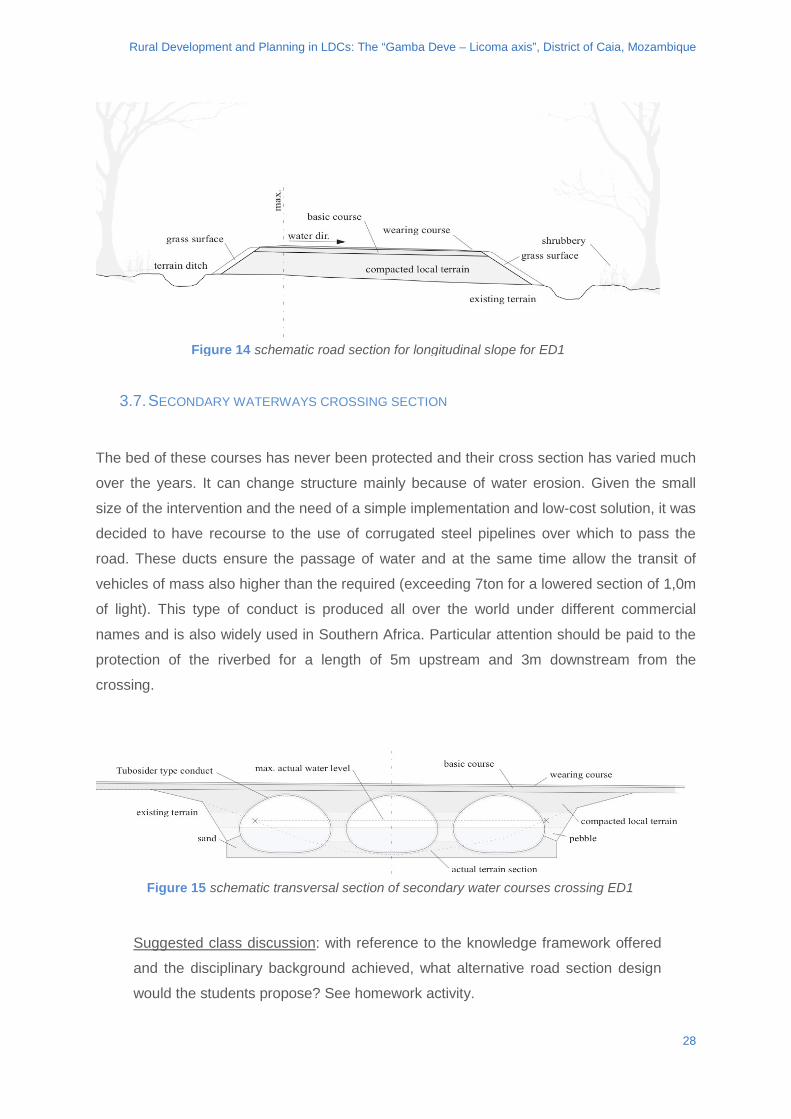
3.6. LONGITUDINAL SLOPE SECTION
The slipperiness defect is encountered where ED1 crosses flat terrains with a tendency of
water accumulation. In addition to direct meteoric water, seen in the proximity of the current
route with the river, possible overflowing of the Mepuze where it coincides with secondary
courses can affect the natural water-flow negatively. The fundamental design indication for
these road stretches is to decrease the longitudinal inclination of the track and where
necessary to insert transverse drains in order to facilitate the flow of water from the wearing
course. In addition, it is suggested that in flat terrains and where necessary, the thickness of
compacted local-soil sublayer is brought to 15-20 cm.
12 The Structural Design, Construction and Mantainance of Unpaved Roads, Department of Transport, Pretoria, Republic of South Africa, 1990
Figure 13 schematic embankment road section for ED1
27
Rural Development and Planning in LDCs: The “Gamba Deve – Licoma axis”, District of Caia, Mozambique
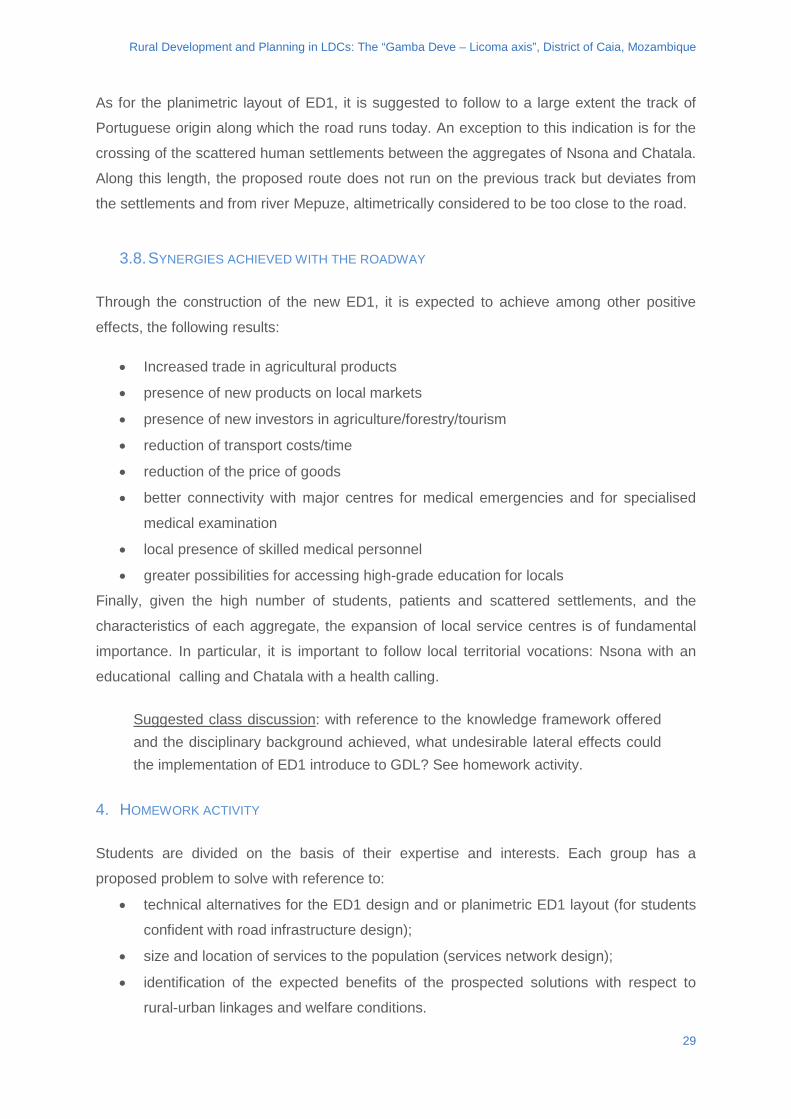
3.7. SECONDARY WATERWAYS CROSSING SECTION
The bed of these courses has never been protected and their cross section has varied much
over the years. It can change structure mainly because of water erosion. Given the small
size of the intervention and the need of a simple implementation and low-cost solution, it was
decided to have recourse to the use of corrugated steel pipelines over which to pass the
road. These ducts ensure the passage of water and at the same time allow the transit of
vehicles of mass also higher than the required (exceeding 7ton for a lowered section of 1,0m
of light). This type of conduct is produced all over the world under different commercial
names and is also widely used in Southern Africa. Particular attention should be paid to the
protection of the riverbed for a length of 5m upstream and 3m downstream from the
crossing.
Suggested class discussion: with reference to the knowledge framework offered
and the disciplinary background achieved, what alternative road section design
would the students propose? See homework activity.
Figure 15 schematic transversal section of secondary water courses crossing ED1
Figure 14 schematic road section for longitudinal slope for ED1
28
Rural Development and Planning in LDCs: The “Gamba Deve – Licoma axis”, District of Caia, Mozambique
As for the planimetric layout of ED1, it is suggested to follow to a large extent the track of
Portuguese origin along which the road runs today. An exception to this indication is for the
crossing of the scattered human settlements between the aggregates of Nsona and Chatala.
Along this length, the proposed route does not run on the previous track but deviates from
the settlements and from river Mepuze, altimetrically considered to be too close to the road.
3.8. SYNERGIES ACHIEVED WITH THE ROADWAY
Through the construction of the new ED1, it is expected to achieve among other positive
effects, the following results:
• Increased trade in agricultural products
• presence of new products on local markets
• presence of new investors in agriculture/forestry/tourism
• reduction of transport costs/time
• reduction of the price of goods
• better connectivity with major centres for medical emergencies and for specialised
medical examination
• local presence of skilled medical personnel
• greater possibilities for accessing high-grade education for locals
Finally, given the high number of students, patients and scattered settlements, and the
characteristics of each aggregate, the expansion of local service centres is of fundamental
importance. In particular, it is important to follow local territorial vocations: Nsona with an
educational calling and Chatala with a health calling.
Suggested class discussion: with reference to the knowledge framework offered and the disciplinary background achieved, what undesirable lateral effects could the implementation of ED1 introduce to GDL? See homework activity.
4. HOMEWORK ACTIVITY
Students are divided on the basis of their expertise and interests. Each group has a
proposed problem to solve with reference to:
• technical alternatives for the ED1 design and or planimetric ED1 layout (for students
confident with road infrastructure design);
• size and location of services to the population (services network design);
• identification of the expected benefits of the prospected solutions with respect to
rural-urban linkages and welfare conditions.
29
Rural Development and Planning in LDCs: The “Gamba Deve – Licoma axis”, District of Caia, Mozambique
In the following chapter requirements for each group of students we will specified. Note that
this exercise does not provide an assessment/mark to the student but encourages students
to support the choice of their proposal based on the cognitive framework offered.
4.1. ED1: PLANIMETRIC LAYOUT AND TECHNICAL SOLUTIONS
Specifically, students are required to verify the quality of the solution offered in the Case
Study and to formulate alternative solutions to the ED1 planimetric track layout. Essential
elements for the chosen formulation are: (1) distance to the river Mepuze, (2) relative
location of aggregates and scattered settlements. The suggested layout is shown in
Appendix 7 and Appendix 9.
The design sections for the ED1 have been described in the previous chapter. The technical
solution is based on the context description made at the beginning of this Case Study.
Students are invited to design alternatives to the proposed road sections, both in the use of
materials and machine technology. Essential elements to be considered are: (1) use of local
materials (soil, gravel, wood), (2) low-budget of the solution offered, (3) ease of
implementation.
4.2. SERVICES TO THE POPULATION The size of the network of services depends largely on the number of potential users that
each service may have. On this principle, and on the necessary quality of service offered, is
based the proposal to make Nsona an educational node and Chatala a healthcare node. For
both nodes an increase is expected in numeric capacity and an improvement in quality of
service. As shown, areas are found where the shortage of protected water sources is a
critical problem for the population, as well as the lack of basic products due to the absence
of local markets. The proposed reorganization of the services network for GDL is shown in
Appendix 3 and Appendix 8. It is based on the cognitive framework provided in chapter 1
and emphasizes the priority of each single intervention.
Given this description of the context, students are asked to propose any alternative
configuration of the network of public and private services that can meet the needs of the
population for now and in the near future. Essential elements for this are: (1) identification of
the most critical areas on the basis of the distribution of the population (Appendix 1) and the
current network of services (Appendix 2), (2) careful analysis of travel times to access the
services. In this sense, the joint reading of the functional restoration of ED1 and the
30
Rural Development and Planning in LDCs: The “Gamba Deve – Licoma axis”, District of Caia, Mozambique
proposed revision of the services network is necessary to obtain an holistic overview of the
GDL system.
4.3. EXPECTED BENEFITS IDENTIFICATION AND CLASSIFICATION
As previously mentioned in the Case Study the synergies expected thanks to the joint
process of functional restoration of ED1 and revision of the network of services to the
population have been highlighted. The joint design of infrastructure and services network
offers to the local population an enormous amount of benefits. As an example, thanks to the
new road, there is a reduction in time for transporting goods along the GDL as well as an
increase in the access to specialist health services for the population. In this last proposed
exercise, the student is required to identify, justifying each one, the expected benefits of the
joint design. It is also asked that they relate consequentially to each other such benefits and
study any adverse effects related to the incompleteness of the proposed solutions.
31
Rural Development and Planning in LDCs: The “Gamba Deve – Licoma axis”, District of Caia, Mozambique
5. BIBLIOGRAPHY
Boletim da Repubblica de Moçambique, 2007, Lei de Ordenamento do Territorio.
Boletim da Repubblica de Moçambique, 2008, Regulamento da Lei do Ordenamento do Territorio.
Department of Transport, Pretoria, Republic of South Africa, 1990, The Structural Design, Construction and Maintenance of Unpaved Roads.
FHWA Report TS-87-225, 1987 Washington DC, Surface Design and Rehabilitation Guidelines for Low-Volume Roads.
Governo do Distrito de Caia, Caia, 2012, PDUT - Plano Distrital de Uso da Terra do Distrito de Caia.
I. Rama, 2014, Local Development and Spacial Planning in Developing Context: an Executive Plan of The Plano de Uso da Terra in a Rural District of Mozambique.
Republica de Moçambique, Provincia de Sofala, Governo do Distrito de Caia, Caia, 2011, Plano Estrategico de Desenvolvimento do Distrito: PEDD 2010-2014.
Republica de Moçambique, Ministerio da Administraçao Estatal, 2005, Perfil do Distrito de Caia - Provincia de Sofala.
D. Satterthwaite, IIED, 2006, Small Urban Centres and Large Villages: The Habitat for Much of the World’s Low-Income Population.
C. Tacoli, IIED, 2006, The Earthscan Reader in Rural-Urban Linkages.
World Bank Publications, 2011. Africa’s Transport Infrastructure, K. M. Gwilliam.
32
Rural Development and Planning in LDCs: The “Gamba Deve – Licoma axis”, District of Caia, Mozambique
APPENDIXES
appendix 1: human settlements for GDL (cartography 1:50.000)
appendix 2: distribution of services for GDL (cartography 1:50.000)
appendix 3: proposed distribution of services for GDL (cartography 1:50.000)
appendix 4: water basin of the Mepuze River and secondary water courses (cartography 1:50.000)
appendix 5: photographic map of actual defects along ED1
appendix 6: in-site survey of present defects along ED1 (cartography 1:50.000)
appendix 7: proposed planimetry design for ED1 (cartography 1:50.000)
appendix 8: proposal for services and infrastructure for GDL (cartography 1:50.000)
appendix 9: schematic analysis of services and aggregates of GDL
appendix 10: functional scheme of services and aggregates of GDL
appendix 11: “The Structural Design, Construction and Maintenance of Unpaved Roads”, Department of Transport, Pretoria, Republic of South Africa, 1990.
Appendixes 1 to 10 are taken from I. Rama, 2014, Local Development and Spacial Planning in Developing Context: an Executive Plan of The Plano de Uso da Terra in a Rural District of Mozambique.
33

http://www.gdee.eu
This project is funded by
Velio Coviello, Paolo Vezza,Irene Angeluccetti, Stefania Grimaldi
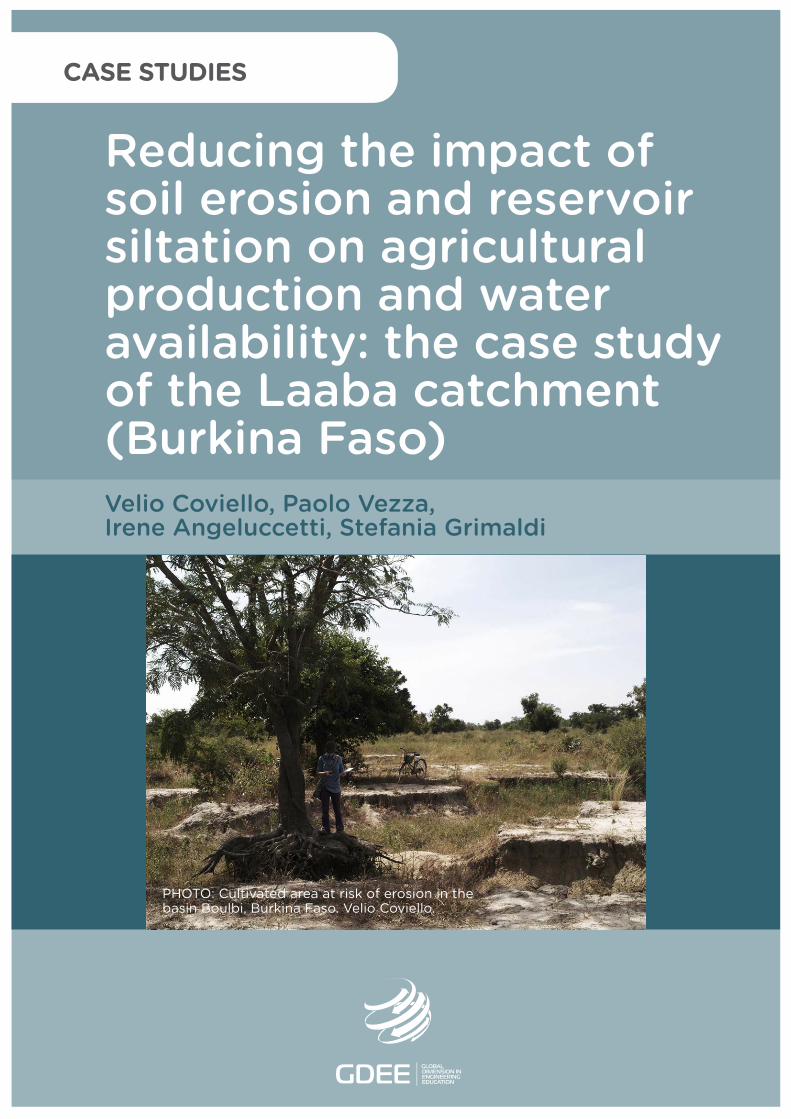
PHOTO: Cultivated area at risk of erosion in thebasin Boulbi, Burkina Faso. Velio Coviello.
CASE STUDIES
Reducing the impact of soil erosion and reservoirsiltation on agricultural production and wateravailability: the case studyof the Laaba catchment (Burkina Faso)
DL B 10735-2015 ISBN 978-84-606-7546-4
Reducing the impact of soil erosion and reservoir siltation on agricultural production and water availability: the case study of the Laaba catchment (Burkina Faso)
COORDINATED BYAgustí Pérez-Foguet, Enric Velo, Pol Arranz, Ricard Ginéand Boris Lazzarini (Universitat Politècnica de Catalunya)Manuel Sierra (Universidad Politécnica de Madrid)Alejandra Boni and Jordi Peris (Universitat Politècnica de València)Guido Zolezzi and Gabriella Trombino (Università degli Studi di Trento)Rhoda Trimingham (Loughborough University)Valentín Villarroel (ONGAWA)Neil Nobles and Meadhbh Bolger (Practical Action)Francesco Mongera (Training Center for International Cooperation)Katie Cresswell-Maynard (Engineering Without Border UK)
EDITED BY Global Dimension in Engineering Education
Citation: Coviello, V., Vezza, P., Angeluccetti, I., Grimaldi, S. (2015) ' Reducing the impact of soil erosion and reservoir siltation on agricultural production and water availability: the case study of the Laaba catchment (Burkina Faso)', in Case studies for developing globally responsible engineers, GDEE (eds.), Global Dimension in Engineering Education, Barcelona. Available from: http://gdee.eu/index.php/resources.html
This publication is distributedunder an Attribution- Noncommercial-Share Alike License for Creative Commons
CASE STUDIES
Disclaimer: This document has been produced with the financial assistance of the European UnionThe contents of this document are the sole responsibility of the authors and can under no circumstances be regarded as reflecting the position of the European Union
Reducing the impact of soil erosion and reservoir siltation on agricultural production and water availability: the case study of the Laaba catchment (Burkina Faso)
REDUCING THE IMPACT OF SOIL EROSION AND RESERVOIR SILTATION ON AGRICULTURAL PRODUCTION AND WATER AVAILABILITY: THE CASE STUDY OF THE LAABA CATCHMENT (BURKINA FASO) Velio Coviello, Primo Principio COOP (Coop2P), Portoconte Ricerche, Alghero, Italy Paolo Vezza, Primo Principio COOP (Coop2P), Portoconte Ricerche, Alghero, Italy Irene Angeluccetti, Primo Principio COOP (Coop2P), Portoconte Ricerche, Alghero, Italy Grimaldi Stefania, Primo Principio COOP (Coop2P), Portoconte Ricerche, Alghero, Italy
1
Reducing the impact of soil erosion and reservoir siltation on agricultural production and water availability: the case study of the Laaba catchment (Burkina Faso)
INDEX 1. INTRODUCTION ........................................................................................................................... 3
1.1. DISCIPLINES COVERED ............................................................................................................. 3
1.2. LEARNING OUTCOMES .............................................................................................................. 3
1.3. ACTIVITIES .............................................................................................................................. 4
2. DESCRIPTION OF THE CONTEXT ............................................................................................. 5 3. CLASS ACTIVITY ......................................................................................................................... 8
3.1. SHORT- AND LONG-TERM EFFECTS ........................................................................................... 8
3.2. SOLID TRANSPORT AND RESERVOIR SEDIMENTATION ............................................................... 11
3.3. MONETARY COSTS ANALYSIS ................................................................................................. 11
3.4. SOLUTION AND EVALUATION CRITERIA ..................................................................................... 12
4. HOMEWORK ACTIVITY ............................................................................................................. 13
4.1. SOLUTION ............................................................................................................................. 14
4.2. EVALUATION CRITERIA ........................................................................................................... 15
BIBLIOGRAPHY ................................................................................................................................. 16
2
Reducing the impact of soil erosion and reservoir siltation on agricultural production and water availability: the case study of the Laaba catchment (Burkina Faso)
1. INTRODUCTION
In the Sahelian region, recursive droughts and extremely high precipitation intensity values
are currently the main cause of soil erosion and land degradation. These processes are
exacerbated by the increasing human pressure and water demand. Soil erosion and solid
transport in river channels often leads to reservoir siltation and reduction of the amount of
water available for agriculture. To cope with these issues, Soil and Water Conservation
(SWC) measures, such as gabion check dams and stone contour lines, have been regularly
employed in the Sahelian area.
However, a proper cost-effectiveness analysis of the impact of SWC interventions on the
catchment sediment budget is needed to choose the proper action and limit soil erosion. In
the Sahelian context, where data for calibration and validation of models are scarce,
Grimaldi et al. (2013) defined an overall methodology to evaluate the economic sustainability
of a proposed SWC intervention.
In the present case study, students may use the proposed methodology to assess the
monetary sustainability of SWC measures in limiting the reservoir siltation of the Laaba dam
(Yatenga District, Northern Burkina Faso). In particular,
1) the catchment sediment budget is estimated by means of morphological characteristics, pedologic parameters and dam sedimentation rates;
2) a cost-effective analysis is then performed to assess the economic sustainability of possible land management plans that compare SWC interventions.
1.1. DISCIPLINES COVERED
Water and land management
Soil erosion and sediment transport
Dam management and siltation issues
1.2. LEARNING OUTCOMES
2 learning outcomes are expected. • How to estimate the amount of sediment yearly carried into the reservoir • Evaluate and compare different Soil and Water Conservation measures at the
catchment scale
3
Reducing the impact of soil erosion and reservoir siltation on agricultural production and water availability: the case study of the Laaba catchment (Burkina Faso)
1.3. ACTIVITIES
The two activities proposed are organised in a series of sequential steps. A wrapping-up
collective discussion concludes each activity. Every step involves the explanation of the
main concepts, a group work activity, a collective discussion activity, in order to achieve a
good level of understanding and stimulate a deeper interest in the topic. In particular, each
step is articulated as follows:
• a comprehensive explanation of the physical mechanisms involved and of the
assessment protocol suggested by the proposed method;
• a group activity during which the students try to apply the method using the data
provided;
• hands-on activity to compare and discuss the groups choices and results;
The first activity consists in the assessment of the amount of sediment yearly carried into the
reservoir in two, different scenarios: an untreated basin (H1) and a treated basin where soil
and water conservation measures are implemented (H2). This activity requires a basic
knowledge on sediment transport and deposition processes. All the equations and data
required are provided. This first activity is organised in 5 sequential steps, as follows:
1. assessment of the soil transport rate of the basin (Section 3.1; eq.4);
2. assessment of the impact of soil water conservation works on the catchment
sediment budget: short term impact (Section 3.1; eq. 2) in scenario H2;
3. assessment of the impact of soil water conservation works on the catchment
sediment budget: long term impact (Section 3.1; eq. 3, 4 and 5) in scenario H2;
4. assessment of the total impact of soil water conservation works on the
catchment sediment budget (Section 3, eq.1)
5. assessment of the reservoir sedimentation rate in scenarios H1 and H2 (Section
3.2)
The second activity requires the monetary cost analysis and the cost-effectiveness
assessment and comparison of the two, different land management scenarios H1 and H2.
This activity requires the understanding of the concept of pay-back period, siltation rate and
sediment trapping. All the equations and data required are provided. This activity is
organised in 3 sequential steps, as follows:
1. computation of the cost of reservoir desiltation in both scenarios H1 and H2
(Section 3.3);
2. computation of the cost of the implementation of the soil and water conservation
works in scenario H2 (Section 3.3);
4
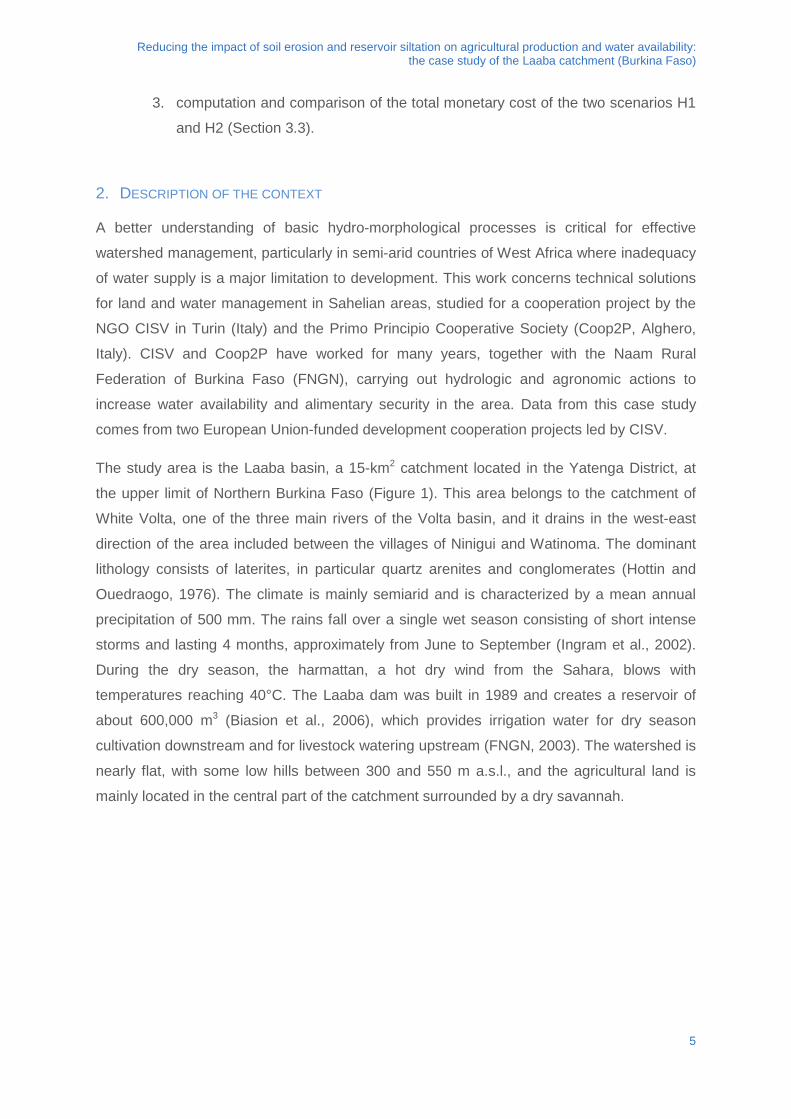
Reducing the impact of soil erosion and reservoir siltation on agricultural production and water availability: the case study of the Laaba catchment (Burkina Faso)
3. computation and comparison of the total monetary cost of the two scenarios H1
and H2 (Section 3.3).
2. DESCRIPTION OF THE CONTEXT
A better understanding of basic hydro-morphological processes is critical for effective
watershed management, particularly in semi-arid countries of West Africa where inadequacy
of water supply is a major limitation to development. This work concerns technical solutions
for land and water management in Sahelian areas, studied for a cooperation project by the
NGO CISV in Turin (Italy) and the Primo Principio Cooperative Society (Coop2P, Alghero,
Italy). CISV and Coop2P have worked for many years, together with the Naam Rural
Federation of Burkina Faso (FNGN), carrying out hydrologic and agronomic actions to
increase water availability and alimentary security in the area. Data from this case study
comes from two European Union-funded development cooperation projects led by CISV.
The study area is the Laaba basin, a 15-km2 catchment located in the Yatenga District, at
the upper limit of Northern Burkina Faso (Figure 1). This area belongs to the catchment of
White Volta, one of the three main rivers of the Volta basin, and it drains in the west-east
direction of the area included between the villages of Ninigui and Watinoma. The dominant
lithology consists of laterites, in particular quartz arenites and conglomerates (Hottin and
Ouedraogo, 1976). The climate is mainly semiarid and is characterized by a mean annual
precipitation of 500 mm. The rains fall over a single wet season consisting of short intense
storms and lasting 4 months, approximately from June to September (Ingram et al., 2002).
During the dry season, the harmattan, a hot dry wind from the Sahara, blows with
temperatures reaching 40°C. The Laaba dam was built in 1989 and creates a reservoir of
about 600,000 m3 (Biasion et al., 2006), which provides irrigation water for dry season
cultivation downstream and for livestock watering upstream (FNGN, 2003). The watershed is
nearly flat, with some low hills between 300 and 550 m a.s.l., and the agricultural land is
mainly located in the central part of the catchment surrounded by a dry savannah.
5
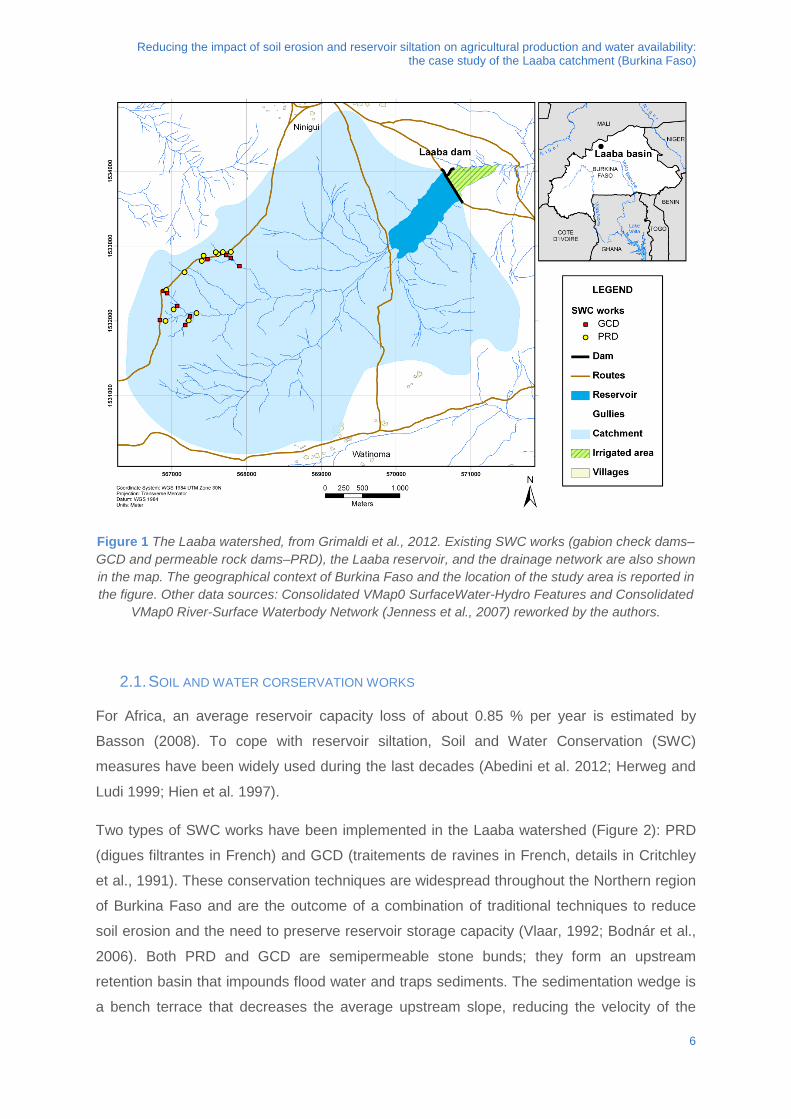
Reducing the impact of soil erosion and reservoir siltation on agricultural production and water availability: the case study of the Laaba catchment (Burkina Faso)
Figure 1 The Laaba watershed, from Grimaldi et al., 2012. Existing SWC works (gabion check dams–GCD and permeable rock dams–PRD), the Laaba reservoir, and the drainage network are also shown in the map. The geographical context of Burkina Faso and the location of the study area is reported in the figure. Other data sources: Consolidated VMap0 SurfaceWater-Hydro Features and Consolidated
VMap0 River-Surface Waterbody Network (Jenness et al., 2007) reworked by the authors.
2.1. SOIL AND WATER CORSERVATION WORKS
For Africa, an average reservoir capacity loss of about 0.85 % per year is estimated by
Basson (2008). To cope with reservoir siltation, Soil and Water Conservation (SWC)
measures have been widely used during the last decades (Abedini et al. 2012; Herweg and
Ludi 1999; Hien et al. 1997).
Two types of SWC works have been implemented in the Laaba watershed (Figure 2): PRD
(digues filtrantes in French) and GCD (traitements de ravines in French, details in Critchley
et al., 1991). These conservation techniques are widespread throughout the Northern region
of Burkina Faso and are the outcome of a combination of traditional techniques to reduce
soil erosion and the need to preserve reservoir storage capacity (Vlaar, 1992; Bodnár et al.,
2006). Both PRD and GCD are semipermeable stone bunds; they form an upstream
retention basin that impounds flood water and traps sediments. The sedimentation wedge is
a bench terrace that decreases the average upstream slope, reducing the velocity of the
6
Reducing the impact of soil erosion and reservoir siltation on agricultural production and water availability: the case study of the Laaba catchment (Burkina Faso)
flowing water (Gray and Leiser, 1982). These SWC practices can therefore control
stormwater runoff and flood-wave sediment transport capacity. Moreover, they can limit soil
loss and enhance soil fertility by improving water infiltration into the soil (Vlaar, 1992).
Figure 2 Examples of Soil and Water Conservation (SWC) works: (a) permeable rock dam (PRD); and (b) gabion check dam (GCD), from Grimaldi et al. 2012.
Permeable rock dam is defined as a prolonged embankment of stones, which diverts water
from the gullies and spreads it over the land (Desta et al., 2005; Vancampenhout et al.,
2006). Its medium height is 0.5-1 m and presents a triangular cross section in which the
steeper slope is placed upstream (Figure 2a). GCD is a weir from 1 to a few meters high
(Figure 2b), characterized by the presence of metallic gabions used to avoid the stone
displacement caused by the high flow rates in well-developed gullies (Vlaar, 1992).
For this study, data of 22 SWC works located in the Laaba watershed (Table I) were
collected between 2006 and 2011. Referring to each SWC work, data availability includes:
(i) type (PRD or GCD) and geometry of the structure: height, length, and width;
(ii) geographic positioning by means of a GPS;
(iii) year of construction, as reported in previous technical reports if available or as stated by the local population;
(iv) longitudinal gully profiles, by means of topographic surveys, that is, differential leveling performed with a total station;
(v) grain size distribution of retained sediments, sampled at a maximum depth of 1m.
7
Reducing the impact of soil erosion and reservoir siltation on agricultural production and water availability: the case study of the Laaba catchment (Burkina Faso)
3. CLASS ACTIVITY
The assessment of the cost-effectiveness of SWC measures in limiting reservoir siltation is
based on the comparison of the catchment sediment budgets before and after the
implementation of SWC measures. In particular, two opposite hypotheses have to be
compared:
H1) an untreated basin where reservoir desiltation is the only planned intervention;
H2) a treated basin where SWC measures are implemented, and reservoir desiltation is
planned.
Referring to an untreated basin (H1), a constant, average value of the soil sediment yield
(SYH1) was assumed. In a treated basin (H2), the SWC works produce a time-dependent
value of the soil sediment yield (SYH2), which can be expressed as:
SYH2(t) = SYH1 – (ΔV(t) + ΔQ(t)) (1)
Where ΔV and ΔQ are, respectively, the short-term and long-term effects of a SWC
intervention. ΔV consists in the volume yearly trapped by SWC works, characterized a
decreasing linear trend over time (Grimaldi et al. 2013). This short-term impact stops as
soon as SWC works are completely silted up; SWC work siltation reduces the effective
channel slope, which initiate the long term effect (ΔQ), that is, the reduction of soil sediment
yield at the catchment scale. The overall intervention impact is thus quantified by summing
up the volume trapped by the SWC works, ΔV(t), and the reduction rate of the sediment
transport capacity, ΔQ(t). The resulting sediment yield SYH2(t) is the algebraic sum of the
initial value SYH1 and the above mentioned sinking terms (eq. 1).
3.1. SHORT- AND LONG-TERM EFFECTS
The annual siltation rate ΔV is a key parameter in assessing the impact of SWC works. In
this case study, ΔV is defined as a function of (i) the worksite geometry, (ii) the river
morphology, and (iii) the grain size distribution. Following Grimaldi et al. (2013), which
proposed a multiplicative regression model to estimate (ΔV), the empirical formula to be
used is the following:
ΔV = α·Av·if0·d50 (2)
where α is the constant term, equal to 2500, related to the area of interest; Av is the vertical
area of the implemented SWC work (expressed in m2); if 0 is the average original slope of
8
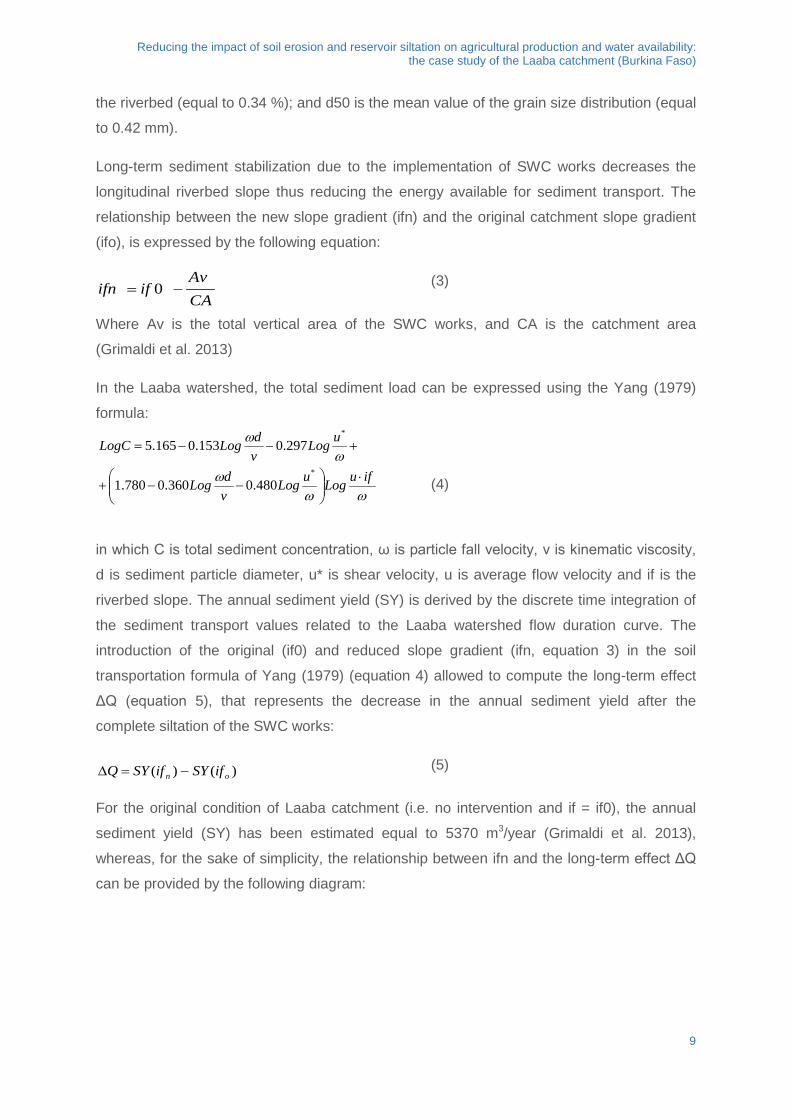
Reducing the impact of soil erosion and reservoir siltation on agricultural production and water availability: the case study of the Laaba catchment (Burkina Faso)
the riverbed (equal to 0.34 %); and d50 is the mean value of the grain size distribution (equal
to 0.42 mm).
Long-term sediment stabilization due to the implementation of SWC works decreases the
longitudinal riverbed slope thus reducing the energy available for sediment transport. The
relationship between the new slope gradient (ifn) and the original catchment slope gradient
(ifo), is expressed by the following equation:
(3)
Where Av is the total vertical area of the SWC works, and CA is the catchment area
(Grimaldi et al. 2013)
In the Laaba watershed, the total sediment load can be expressed using the Yang (1979)
formula:
(4)
in which C is total sediment concentration, ω is particle fall velocity, v is kinematic viscosity,
d is sediment particle diameter, u* is shear velocity, u is average flow velocity and if is the
riverbed slope. The annual sediment yield (SY) is derived by the discrete time integration of
the sediment transport values related to the Laaba watershed flow duration curve. The
introduction of the original (if0) and reduced slope gradient (ifn, equation 3) in the soil
transportation formula of Yang (1979) (equation 4) allowed to compute the long-term effect
ΔQ (equation 5), that represents the decrease in the annual sediment yield after the
complete siltation of the SWC works:
(5)
For the original condition of Laaba catchment (i.e. no intervention and if = if0), the annual
sediment yield (SY) has been estimated equal to 5370 m3/year (Grimaldi et al. 2013),
whereas, for the sake of simplicity, the relationship between ifn and the long-term effect ΔQ
can be provided by the following diagram:
)()( on ifSYifSYQ −=∆
CAAv
ififn −= 0
ωωω
ωω
ifuLoguLogvdLog
uLogvdLogLogC
⋅
−−+
+−−=
*
*
480.0360.0780.1
297.0153.0165.5
9
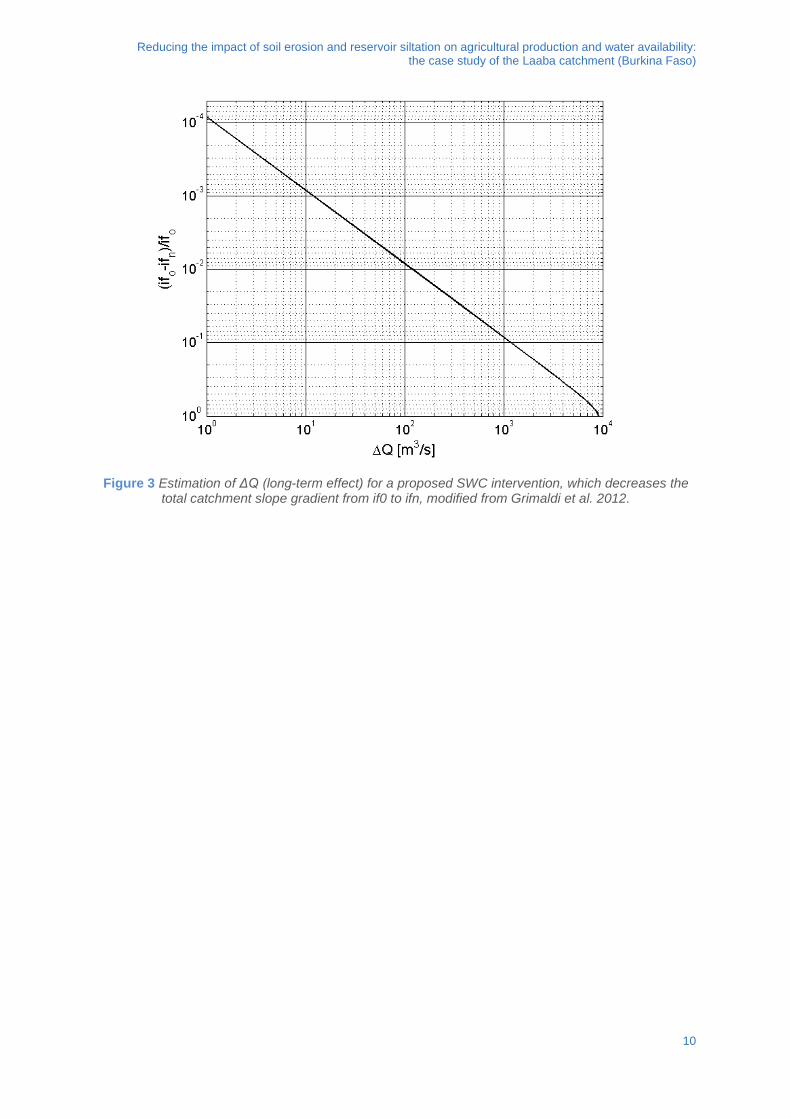
Reducing the impact of soil erosion and reservoir siltation on agricultural production and water availability: the case study of the Laaba catchment (Burkina Faso)
Figure 3 Estimation of ΔQ (long-term effect) for a proposed SWC intervention, which decreases the total catchment slope gradient from if0 to ifn, modified from Grimaldi et al. 2012.
10
Reducing the impact of soil erosion and reservoir siltation on agricultural production and water availability: the case study of the Laaba catchment (Burkina Faso)
3.2. SOLID TRANSPORT AND RESERVOIR SEDIMENTATION
Reservoir sedimentation is strongly affected by local characteristics, such as the sediment
type and the trap efficiency of the pond (Verstraeten and Poesen, 2002). Heinemann (1984)
listed different methods to assess reservoir efficiency in trapping sediments and several
studies concluded that evaluating reservoir sedimentation trough direct observation is a
valuable tool for studying spatial and time-averaged variations in sediment yield (Salas and
Shin, 1999; Nearing et al., 2000; Verstraeten and Poesen, 2002).
This statement has been verified for the Laaba reservoir by assessing the sediment
deposition in the Laaba reservoir by means of a bathymetric survey carried out in 2002
(FNGN, 2003). The average amount of sediment trapped each year was estimated as equal
to 2300 m3/year and, therefore, the reservoir trapped efficiency is assessed as equal to 2.33.
The latter value will be considered as a reservoir sedimentation rate at an annual scale.
3.3. MONETARY COSTS ANALYSIS
In the semiarid flat regions of Burkina Faso, water flushing is unfeasible, and sediments
must be mechanically dredged. To estimate the total cost of sediment removal, a digging
cost per unit volume of sediment (i.e., 1 m3) has to be assessed, as well as, the sum
required for the worksite setting-up. For the Laaba watershed, the assessment of reservoir
dredging costs included 1500 € for the installation of the worksite and a digging cost per unit
volume equal to 3 €/m3.
The total cost of SWC measures can be expressed as a function of the structure vertical
area (Av). This amount included the installation costs, the mechanical transport of materials,
the cost of the cages, the tools and the workforce. Referring to the Laaba watershed, The
average cost per square meter, estimated as equal to 15 €/m2, has been evaluated using
available knowledge and field experience and includes: (i) the worksite preparation (25
€/worksite), (ii) the mechanical transport of the stones from the quarries to the worksites (20
€ per transport trip of 7 m3 of stones), (iii) the cages made of galvanized iron, produced
locally (18 €/cage) (iv) the labor cost (about 0.5 person days of labor per m2 of Av), and (v)
the tools used for the construction and maintenance of the works (3000 €).
A direct monetary cost comparison (CC) is used to evaluate the effectiveness of SWC works
through the comparison between the two hypothetic scenarios H1 and H2. The economical
result of a proposed intervention should be evaluated after the end of the transitional period
required for the silting up of a SWC work. From the field observation, an average value of 5
years (conservative estimate) is assumed for the complete siltation of a SWC work (short
11
Reducing the impact of soil erosion and reservoir siltation on agricultural production and water availability: the case study of the Laaba catchment (Burkina Faso)
term effect). Then, a payback period (PBP) is estimated as equal to two times the duration of
the short-term effect (i.e., 10 years), to evaluate both short- and long-term effects. The cost
comparison between the two considered hypothesis can be then expressed by an equation
(5):
(6)
3.4. SOLUTION AND EVALUATION CRITERIA
A hypothetical SWC intervention plan, labelled as H2, has to be evaluated. This hypothetical
plan could consist of building new SWC structures for a total vertical area Av 1000m2. The
first step of the methodology consists in the evaluation of the short-term effect (ΔV) of the
SWC works. By introducing the Laaba catchment characteristics into equation (2) for the
considered SWC intervention plan, one can obtain:
ΔV; H2=3570m3
The introduction of the modified slope ifn (Equation 3) into the diagram reported in Figure 3
allowed the estimation of the long-term reduced sediment load of the catchment (ΔQ) for the
above mentioned interventions:
ΔQ; H2=150 m3
The monetary cost analysis is then performed to compare the considered scenarios (H1 and
H2) related with a 10-year PBP (Table I). Referring to scenario H1, the total cost is only
represented by the removal of sediments from the reservoir after 10 years. By contrast, in
scenario H2, the intervention total cost equals the sum of the initial investment cost for the
implementation of the SWC measures and the cost for sediment removal from the reservoir,
evaluated on the basis of a time-dependent reservoir siltation value. As shown in Table I, an
implemented vertical area of 1000 m2 (hypothesis H2) implies an economic investment equal
to 18.2 k€ but allows a monetary saving of 10.1 k€ in a 10-year PBP.
Table I Cost comparison for the Laaba watershed between hypothesis H1 (untreated basin) and H2
(basin-treated with total Av = 1000 m2) after the payback period (PBP = 10 years)
Cost Item Cost (k€)
Reservoir desiltation - Hyp. H1 83.4
Hyp. H2 SWC works 18.2
Reservoir desiltation 55.1
Total 73.3
Cost Comparison (CC) +10.1
12
Reducing the impact of soil erosion and reservoir siltation on agricultural production and water availability: the case study of the Laaba catchment (Burkina Faso)
4. HOMEWORK ACTIVITY
The hypothetical SWC intervention plan H2 analysed during the class activity allows a
monetary saving of 10.1 k€ in a 10-year PBP, when compared to the scenario of hypothesis
H1, in which reservoir desiltation is the only planned intervention.
Nevertheless, such a SWC intervention plan requires an initial investment of 18.2 k€. A
relatively large money allocation for SWC works might be widely opposed by the local
community, generally more prone to support the digging of new ponds or the purchasing of
water pumps to extract impounded water from reservoirs. Although an appropriate land and
water management plan is crucial to contrast soil loss and enhance soil fertility in a long term
horizon, it might be considered of secondary relevance due to the lack of tangible,
immediate results on production.
A small initial investment is more likely to be welcomed by local communities. Positive
outcomes from this first, pilot investment can trigger larger SWC interventions in the future;
these plans will lead to larger money saving and, more importantly, will have a wider
environmental impact.
The homework activity proposed consists in (1) defining a hypothetical SWC intervention
plan H3 for the Laaba catchment that, when compared to scenario H1, leads to an economic
balance in a pay-back period of 10 years; (2) discussing different options for the
implementation of the SWC intervention plan H3.
This activity will be carried out by groups composed of 3-4 students.
Based on the equations and the data provided during the class activity, each group will use
the methodology proposed to assess the total frontal area of SWC works to be implemented
in a land management plan at catchment scale in order to achieve monetary balance with
the initial scenario H1 in a payback period of 10 years.
After completing the assessment of the total frontal area of SWC works, each group is
encouraged to discuss the following land management problems:
(2a) the total frontal area computed can result either from a small number of “large” SWC
works or a large number of “small” SWC works. Which option would you advise? Why?
(2b) the total number of SWC works can be spread over the whole catchment area or be
concentrated in a small number of selected river branches. Which option would you advise?
Why?
13
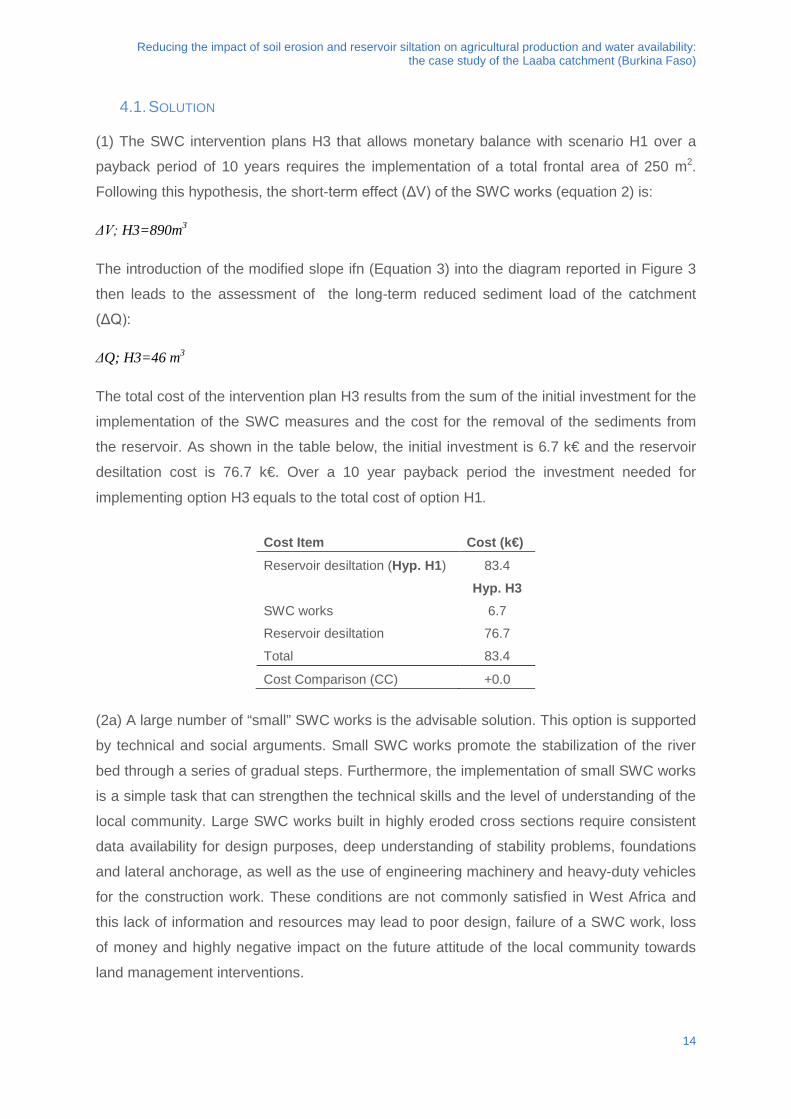
Reducing the impact of soil erosion and reservoir siltation on agricultural production and water availability: the case study of the Laaba catchment (Burkina Faso)
4.1. SOLUTION
(1) The SWC intervention plans H3 that allows monetary balance with scenario H1 over a
payback period of 10 years requires the implementation of a total frontal area of 250 m2.
Following this hypothesis, the short-term effect (ΔV) of the SWC works (equation 2) is:
ΔV; H3=890m3
The introduction of the modified slope ifn (Equation 3) into the diagram reported in Figure 3
then leads to the assessment of the long-term reduced sediment load of the catchment
(ΔQ):
ΔQ; H3=46 m3
The total cost of the intervention plan H3 results from the sum of the initial investment for the
implementation of the SWC measures and the cost for the removal of the sediments from
the reservoir. As shown in the table below, the initial investment is 6.7 k€ and the reservoir
desiltation cost is 76.7 k€. Over a 10 year payback period the investment needed for
implementing option H3 equals to the total cost of option H1.
Cost Item Cost (k€)
Reservoir desiltation (Hyp. H1) 83.4
Hyp. H3 SWC works 6.7
Reservoir desiltation 76.7
Total 83.4
Cost Comparison (CC) +0.0
(2a) A large number of “small” SWC works is the advisable solution. This option is supported
by technical and social arguments. Small SWC works promote the stabilization of the river
bed through a series of gradual steps. Furthermore, the implementation of small SWC works
is a simple task that can strengthen the technical skills and the level of understanding of the
local community. Large SWC works built in highly eroded cross sections require consistent
data availability for design purposes, deep understanding of stability problems, foundations
and lateral anchorage, as well as the use of engineering machinery and heavy-duty vehicles
for the construction work. These conditions are not commonly satisfied in West Africa and
this lack of information and resources may lead to poor design, failure of a SWC work, loss
of money and highly negative impact on the future attitude of the local community towards
land management interventions.
14
Reducing the impact of soil erosion and reservoir siltation on agricultural production and water availability: the case study of the Laaba catchment (Burkina Faso)
(2b) Depending on the morphology of the catchment, both options suggested might be
advisable. In a highly eroded catchment, the advisable solution consists in implementing
small SWC works close to the upstream head of each river branch in order to prevent, or at
least, limit the regressive upstream erosion of land. In a medium to low eroded catchment,
focusing the intervention on the most eroded river branches might be advisable. The
interventions on these river branches will provide the most effective example of an
appropriate land management plan to limit soil erosion and reservoir siltation at the
catchment scale.
4.2. EVALUATION CRITERIA
(1) The basic concepts of soil erosion, transport and deposition processes are understood,
the concept of land management plan is assimilated. The methodology here proposed is
understood and correctly applied in order to define an appropriate hypothesis for the SWC
intervention plan H3.
(2) Both technical and social issues of a SWC intervention plan are discussed.
15
Reducing the impact of soil erosion and reservoir siltation on agricultural production and water availability: the case study of the Laaba catchment (Burkina Faso)
BIBLIOGRAPHY Abedini M., Said A. M., Ahmad F., 2012. Effectiveness of check dam to control soil erosion in a tropical catchment (The Ulu Kinta Basin). Catena, 97, 63–70. Basson, C 2008. ‘Reservoir sedimentation - an overview of global sedimentation rates, sediment yield and sediment deposition prediction’, in CHR International Workshop on Erosion, Transport and Deposition of Sediment. Berne, Switzerland, UNESCO. Biasion A., Borgogno, Mondino E., Tonolo F., Rinaudo F. 2006. ‘High resolution satellite images for map production in developing countries’. In AARSE 2006 Conference Proceedings, Cairo. Bodnár F., De Graaff J., 2003. Factors influencing adoption of soil and water conservation measures in southern Mali. Land Degradation & Development, 14, 515–525. Bodnár F., Schrader T., Van Campen W., 2006. How project approach influences adoption of SWC by farmers, examples from southern Mali. Land Degradation & Development, 17, 479–494. UNITED NATIONS DEVELOPMENT PROGRAMME (2006) Human Development Report 2006: Beyond scarcity: Power, poverty and the global water crisis. New York. United Nations Development Programme. Critchley W., Siegert K., Chapman C., Finkel M., 1991. Water harvesting – a manual for the design and construction of water harvesting schemes for plant production. FAO, Food and Agriculture Organization of the United Nations: Rome, Italy. Desta G., Nyssen J., Poesen J., Deckers J., Haile M., Govers G., Moeyersons J., 2005. Effectiveness of stone bunds in controlling soil erosion on cropland in the Tigray Highlands, northern Ethiopia. Soil Use and Management, 21, 287–297. FNGN - Federation Nationale des Groupements Naam (Burkina Faso) (2003) Etude d’évaluation du projet d’appui a la protection et a la mise en valeur du barrage de Laaba. Ouahigouya. Gray, D.H., Leiser, A.T., 1982. Biotechnical slope protection and erosioncontrol. Van Nostrand Reinhold Company Inc: New York.
16
Reducing the impact of soil erosion and reservoir siltation on agricultural production and water availability: the case study of the Laaba catchment (Burkina Faso)
Grimaldi S., Angeluccetti I., Coviello V , Vezza, P. , 2013. Cost-effectiveness of soil and water conservation measures on the catchment sediment budget–the Laaba watershed case study, Burkina Faso. Land degradation & development,1. Herweg K., Ludi E., 1999. The performance of selected soil and water conservation measures-case studies from Ethiopia and Eritrea. Catena, 36, 99–114. Hien F.G., Rietkerk M., Stroosnijder L., 1997. Soil variability and effectiveness of soil and water conservation in the Sahel. Arid Soil Research and Rehabilitation, 11: 1–8. Hottin G., Ouedraogo O., 1976. Carte Géologique de la République de Haute-Volta. BRGM. Ingram K.T., Roncoli M.C., Kirshen P.H., 2002. Opportunities and constraints for farmers of west Africa to use seasonal precipitation forecasts with Burkina Faso as a case study. Agricultural Systems, 74: 331–349. Jenness J., Dooley J., Aguilar-Manjarrez J., Riva C., 2007. African water resource database. GIS-based tools for inland aquatic resource management. FAO: Rome. Mando, A., Zougmoré, R., Zombré, N.P., Hien V., 2001. Réhabilitation des sols dégradés dans les zones semi-arides de l’Afrique subsaharienne, in Floret C., Pontanier R. (Eds), La jachère en Afrique Tropicale; de la jachère naturelle à la jachère améliorée. Le point des connaissances. John Libbey Eurotext: Paris, pp. 311–339. Nearing M.A., Romkens M.J.M., Norton L.D., Stott D.E., Rhoton F.E., Laflen J.M., Flanagan D.C., Alonso C.V., Binger R.L., Dabney S.M., Doering O.C., Huang CH, McGregor K.C., Simon A., 2000. Measurements and models of soil loss rates. Science, 290: 1300–1301. Nyssen J., Harengeweyn N., Descheemaeker K., Gebremichael D., Vancampenhout K., Poesen J., Haile M., Moeyerson J., Buytaert W., Naudts J., Deckers J., Govers G., 2006. Comment on "Modelling the effect of soil and water conservation practices in Tugray, Ethiopia" [Agric. Ecosyst.Environ. 105 (2005) 29-40]. Agriculture, Ecosystem and Environment ,114, 407–411. Salas J.D., Shin H.S., 1999. Uncertainty analysis of reservoir sedimentation. Journal of Hydraulic Engineering, 125, 339–350. Vancampenhout K., Nyssen J., Gebremichael D., Deckers J., Poesen J., Haile M., Moeyersons J., 2006. Stone bunds for soil conservation in the northern Ethiopian highlands: impacts on soil fertility and crop yield. Soil Tillage Research, 90, 1–15.
17

Reducing the impact of soil erosion and reservoir siltation on agricultural production and water availability: the case study of the Laaba catchment (Burkina Faso)
Verstraeten G., Poesen J., 2002. Using sediment deposits in small ponds to quantify sediment yield fromsmall catchments: possibilities and limitations. Earth Surface Processes and Landforms, 27, 1425–1439. Yang C.T., 1979. Unit stream power equations for total load. Journal of Hydrology, 40, 123–138.
18

http://www.gdee.eu
This project is funded by
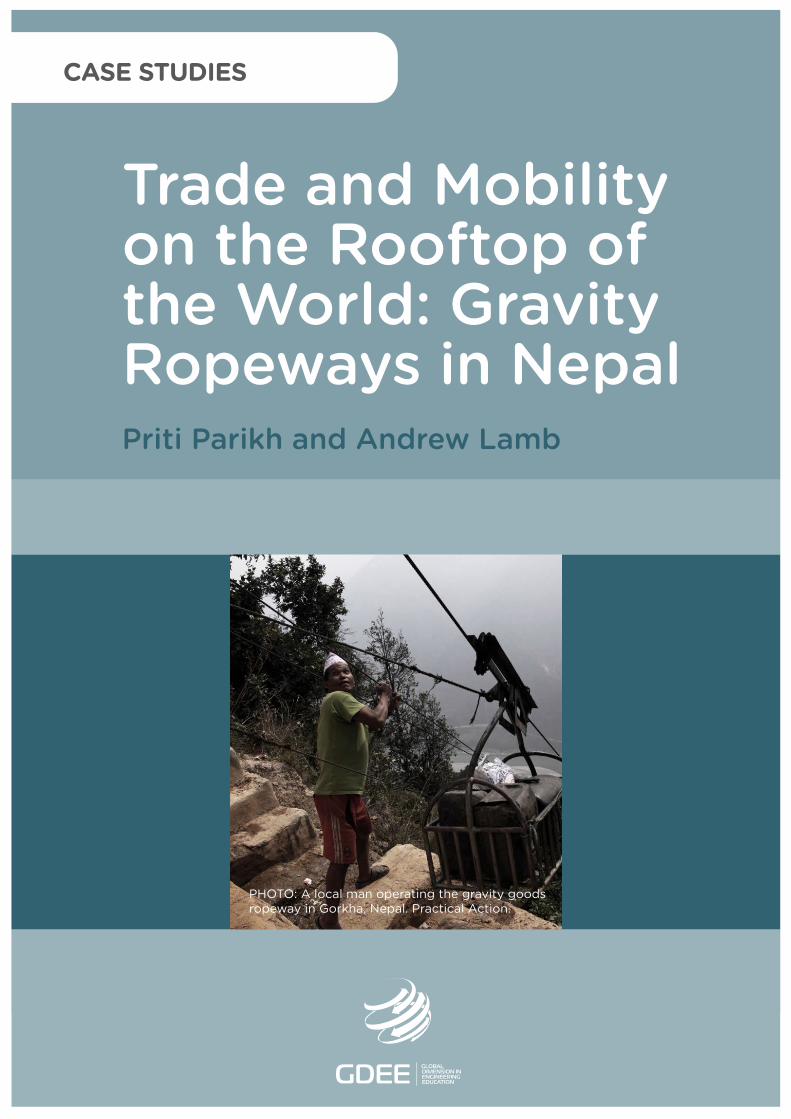
Trade and Mobilityon the Rooftop ofthe World: GravityRopeways in NepalPriti Parikh and Andrew Lamb
PHOTO: A local man operating the gravity goodsropeway in Gorkha, Nepal. Practical Action.
CASE STUDIES
Trade and Mobility on the Rooftop of the World: Gravity Ropeways in Nepal
DL B 10735-2015 ISBN 978-84-606-7546-4
COORDINATED BYAgustí Pérez-Foguet, Enric Velo, Pol Arranz, Ricard Ginéand Boris Lazzarini (Universitat Politècnica de Catalunya)Manuel Sierra (Universidad Politécnica de Madrid)Alejandra Boni and Jordi Peris (Universitat Politècnica de València)Guido Zolezzi and Gabriella Trombino (Università degli Studi di Trento)Rhoda Trimingham (Loughborough University)Valentín Villarroel (ONGAWA)Neil Nobles and Meadhbh Bolger (Practical Action)Francesco Mongera (Training Center for International Cooperation)Katie Cresswell-Maynard (Engineering Without Border UK)
EDITED BY Global Dimension in Engineering Education
Citation: Parikh, P. and Lamb, A. (2015) 'Trade and Mobility on the Rooftop of the World: Gravity Ropeways in Nepal', in Case studies for developing globallyresponsible engineers, GDEE (eds.), Global Dimension in Engineering Education, Barcelona. Available from: http://gdee.eu/index.php/resources.html
This publication is distributedunder an Attribution- Noncommercial-Share Alike License for Creative Commons
CASE STUDIES
Disclaimer: This document has been produced with the financial assistance of the European UnionThe contents of this document are the sole responsibility of the authors and can under no circumstances be regarded as reflecting the position of the European Union
Trade and Mobility on the Rooftop of the World: Gravity Ropeways in Nepal
TRADE AND MOBILITY ON THE ROOFTOP OF THE WORLD: GRAVITY ROPEWAYS IN NEPAL
Dr. Priti Parikh, University College London. Andrew Lamb, Engineers Without Borders UK.
1
Trade and Mobility on the Rooftop of the World: Gravity Ropeways in Nepal
INDEX 1. INTRODUCTION ........................................................................................................................... 3
1.1. DISCIPLINES COVERED ............................................................................................................. 3
1.2. LEARNING OUTCOMES .............................................................................................................. 3
1.3. ACTIVITIES .............................................................................................................................. 3
2. DESCRIPTION OF THE CONTEXT ............................................................................................. 4
2.1. LIVING IN THE HIMALAYAS ........................................................................................................ 4
2.2. INTRODUCTION TO GRAVITY ROPEWAYS ................................................................................... 5
2.3. PRACTICAL ACTION NEPAL ....................................................................................................... 6
2.4. CASE STUDY: JANAGAON ......................................................................................................... 6
2.5. CASE STUDY: BISHALTAR ......................................................................................................... 7
3. CLASS ACTIVITY ......................................................................................................................... 9
3.1. ABOUT GRAVITY ROPEWAYS .................................................................................................... 9
3.2. ROPEWAY CALCULATION TASK ................................................................................................. 9
4. HOMEWORK ACTIVITY ............................................................................................................. 13
4.1. TASK .................................................................................................................................... 13
4.2. EVALUATION CRITERIA ............................................................................................................ 14
4.3. EXAMPLE ANSWERS .............................................................................................................. 15
BIBLIOGRAPHY ................................................................................................................................. 17
2
Trade and Mobility on the Rooftop of the World: Gravity Ropeways in Nepal
1. INTRODUCTION The Global Dimension in Engineering Education (GDEE) is a European Union funded initiative involving the collaboration of development NGOs and universities, with an aim to integrate sustainable human development as a regular part of all technical university courses. Part of the initiative is the development of a set of case studies based on real field experiences of development projects. The case studies cover a broad range of topics directly related those studied in engineering, science and other technology, environment or development-related courses. This case study looks at a rare and challenging mode of transportation: the gravity ropeway. These are mechanically powered devices that, despite their simplicity, are difficult to implement safely but make a dramatic difference to the movement of goods and people. The case study is based solely on work by Practical Action Nepal (Practical Action Nepal, 2014). The case study allows students at any level to: analyse a mechanism; consider the challenges of actually building even a simple design; understand the enabling effects of technology; consider the design implications of transferring a technology between contexts; and appreciate the need for individual professionalism in such projects. Images for this case study can be found in the associated PowerPoint presentation.
1.1. DISCIPLINES COVERED Mechanical Engineering; Transport; Construction; Economics; Appropriate Technology. Other aspects include: Health & Safety; Development; Social Sciences; Professionalism.
1.2. LEARNING OUTCOMES 1. The contextual considerations of a technology, using the example of a gravity ropeway. 2. That simple technologies are not necessarily easy to engineer. 3. Applying numerical analysis to a real-world situation. 4. The roles of technology and professionalism in promoting human development.
1.3. ACTIVITIES Class Activity: Individual work and design with numerical analysis – ropeway design and loading.
3
Trade and Mobility on the Rooftop of the World: Gravity Ropeways in Nepal
Homework Activity: Individual work and personal research and essay – alternative contexts and implications for design and socio-economic factors. 2. DESCRIPTION OF THE CONTEXT The following sections outline the context and impacts of the gravity ropeways used in the Himalayan region of Nepal. The case study touches on a range of issues that are relevant to the activities, including: environmental issues (such as noise); income level; gender; progress on human development indicators; the effect of infrastructure provision in reducing the cost of business; the challenges of construction and maintenance in remote areas. The case study could be extended to also touch on issues such as: the project cycle; professional ethics; materials science; the effect of climate change on the Himalayan communities; a discussion of the right of access to infrastructure and the extent to which government can and should provide infrastructure to remote communities; the reasons why subsistence farmers and communities remain in difficult environments; the importance of communication and engaging with all stakeholders in an engineering project. Challenges exist with using ropeways to transport water, which could become a design/research project.
2.1. LIVING IN THE HIMALAYAS The Himalayas are known as the ‘rooftop of the world’. The mountain range contains many of the world’s highest peaks (around one hundred of which are over 7,200 metres) and about 15,000 glaciers – as well as very fertile hillsides and plentiful clean surface water (Wikipedia). The Himalayas are home to many different communities and ethnic groups. The majestic landscape is quiet, with the only sounds being from the wind, the bells of the Buddhist temples, dogs barking – and an occasional avalanche in the distance. The country of Nepal is dominated by the Himalayas. The rugged terrain and rapidly changing weather conditions make it very difficult to access the settlements that are scattered in the hills and mountains. In such a harsh mountainous region, transport is very difficult indeed; roads are long, steep and winding, expensive to build and maintain, and are frequently damaged by landslides. Even relatively short journeys (as the crow flies) can take days. Most journeys involve significant stretches on foot, climbing along paths and rope bridges whilst carrying goods and possessions. Getting crops to market can be exhausting and dangerous – it is generally mules, women and children who carry these heavy loads down treacherous, winding dirt tracks. Nepal is a rapidly developing country and is making impressive progress on most development indicators (Gapminder). However, life is difficult for families living in the remote
4
Trade and Mobility on the Rooftop of the World: Gravity Ropeways in Nepal
mountainous areas of Nepal. One in four people live on $1 a day (World Bank). They survive by growing food to eat and selling what is left over to provide the most basic necessities.
2.2. INTRODUCTION TO GRAVITY ROPEWAYS One of the most simple mechanisms is the rope and wheel. They are employed in almost every mode of modern transportation in some way. But as a mode of transport in themselves, their use is rare and restricted to unique – and often challenging – contexts. Using ropeways to transport goods and people across difficult terrain is an efficient and effective solution in place of long and arduous journeys by road or foot, and can greatly help improve the lives of local communities. In short, a gravity ropeway moves goods up and down a mountainside by hanging trolleys off wheels that roll along support ropes. As one trolley goes up, another trolley goes down. The weight of the descending trolley is what drives the system. The progress of the trolleys is managed by a control cable. The control cable runs through wheels at the stations at the top and bottom, and those wheels are controlled by a manually operated brake. Ropeways have also been developed to help people cross rivers (where passengers haul themselves along a horizontal ropeway). Aerial ropeways can also be used to carry people and goods, often driven by electric motors powered by micro-hydro (rather than gravity). Though it is a simple machine, a gravity ropeway must be implemented carefully and safety issues must be addressed. The loading and speed of the trolleys must be adequately controlled to avoid them crashing into the stations and potentially harming the operators. The support wires must be well anchored to ensure against collapse, which could potentially harm people or buildings underneath. The ropes and stations must be protected against corrosion, and the mechanism must be well oiled to prevent damage. The construction of the ropeways – which involves lifting and positioning long and heavy steel cables – is a significant challenge. Steps must be taken to ensure that people are not injured while operating the ropeway. If people (and not just goods) are being carried by a ropeway, then the engineer’s responsibility for the lives of those using it becomes very clear indeed. When implemented properly, a gravity ropeway can make a significant improvement in the lives of the communities it serves. An initial study showed that the transportation cost of the agro-based products decreases by at least 50% once served by a gravity ropeway system. Such encouraging statistics give the villagers the confidence to supply their products in larger quantities, and to enter competitive city markets. Access to a transportation system and to market linkages improves their socio-economic status in terms of income, health, education and community awareness. Promotion of this technology also helps the local economy by creating employment opportunities and by supporting local manufacturers and
5
Trade and Mobility on the Rooftop of the World: Gravity Ropeways in Nepal
service providers. The economic benefits of gravity ropeways allows for the funding of proper operation and maintenance by the communities that use them. With such support systems in place, gravity ropeways can be in operation for many years at a time.
2.3. PRACTICAL ACTION NEPAL Practical Action Nepal (Practical Action Nepal, 2014) is the local office of the international development charity Practical Action (Practical Action, 2014), which is headquartered in the UK. It was founded by the economist E. F. Schumacher who is known for writing ‘Small Is Beautiful’ and who coined the term ‘Intermediate Technologies’ (Schumacher, 1973), which became known as ‘Appropriate Technologies’. Practical Action Nepal began its transport programme in 1998. It focused on improving and promoting innovative systems that were appropriate to the geographic, environmental and economic context. These included technologies such as cable river crossings and bicycle ambulances and trailers. The role of Practical Action Nepal is to help communities install ropeways by providing technical assistance and to secure the initial capital costs. A typical process might be that Practical Action Nepal’s Access Project Manager and the community members hold numerous meetings regarding a feasibility study. A feasibility study is then conducted, funded by Practical Action Nepal. Depending on the outcome, a project budget is developed. The study is circulated among the relevant government ministries. If the Finance Ministry approves the budget (which may or may not use international aid donor funding), then an approval letter is sent to Ministry of Local Development who start the project with the co-operation of the agriculture offices, the local co-operatives and the farmers themselves. The farmers often put in hard work of transporting materials from the nearest road to the uphill station. A lot of manual work is required to transport the cables from the bottom station to the top station and men and women came in great numbers every day to help carry the wires, gravels and necessary tools required for the construction. The construction process is project managed by Practical Action Nepal, who also trains local operators once the gravity ropeway is completed.
2.4. CASE STUDY: JANAGAON Janagaon is one of six communities in Nepal who worked together with Practical Action to install a gravity ropeway. It has been in operation since June 2005. Dharma is 55 years old, with a wife and three children. He grows vegetables on a small plot of land in Janagaon village. He says, “It takes two hours to get down the mountain trail to the
6
Trade and Mobility on the Rooftop of the World: Gravity Ropeways in Nepal
main road, and during the monsoon, accidents are frequent. Now we have the gravity ropeway, the time saved means I can earn three times as much from selling my vegetables. With that extra money I can afford to farm animals, too. But I’m not just glad for me – the whole village is prospering thanks to the ropeway.” The main components of the ropeway are sourced locally and project staff train local manufacturers to build the parts. Practical Action shows the village group that is taking responsibility for the ropeway how to maintain it. A small charge to each user ensures enough money to keep the ropeway in good repair while also paying for two operators to manage the top and bottom stations safely. Before the installation of the ropeway in Janagaon, families often went without food or medicine during the winter months. The ropeway means people can get more produce to market from their mountain villages. And because it gets there quicker, it’s fresher and earns them more. They have more time to tend their crops, more money to buy fuel for cooking and heating, and can even pay for education and healthcare.
2.5. CASE STUDY: BISHALTAR Hira is married with four children and lives high in the hills above the new gravity ropeway station in Bishaltar, constructed in 2007. Hira grows tomatoes on his plot, which is three long hours walk from the roadside where traders come to buy produce. Before the gravity ropeway was constructed, Hira would have to pay a porter to carry his tomatoes down the mountain-side at a cost of 100 rupees per load. Now, a much heavier load can be transported using the ropeway for 15 rupees – seven times cheaper than hiring a porter. The three hour journey has been cut to just two minutes. The tomatoes arrive fresh and undamaged and fewer porters have to travel down perilous pathways. Hira’s tomatoes didn’t used to command a very high value. He was also limited in the amount he could grow, not by the size of his plot, but because it wasn’t cost effective to transport the goods down the mountainside. Hira was struggling to provide for his family. Now, Hira and his fellow farmers are producing higher quality and larger quantity of crops, having used some of their profits to buy fertiliser and increase their plot of land. They are earning 5 rupees more per kilogram of goods and are selling to traders from as far as 500kms away. During the farming season, this ropeway transports over 100 cages of produce from the top of the mountain to the bottom every day. Hira says: “Life is good now. Not just for me but for many other farmers. We couldn’t imagine how much of a difference this simple ropeway would make; I am saving time and money and can finally look forward to a more secure future for my family”.
7

Trade and Mobility on the Rooftop of the World: Gravity Ropeways in Nepal
The whole community is benefiting from the gravity ropeway, being involved in the project right from site selection. Now they have established a committee which represents the villagers using the ropeway, hired two staff members (one for the mountain top station and one for the roadside station) and mobilised over 50,000 rupees in savings (almost £400).
8
Trade and Mobility on the Rooftop of the World: Gravity Ropeways in Nepal
3. CLASS ACTIVITY
3.1. ABOUT GRAVITY ROPEWAYS The gravity ropeway operates by gravitational force without the use of external power. It consists of two trolleys which roll along support cables. The trolleys are also attached to a control cable in the middle which moves in a traditional flywheel system. When the loaded trolley at the up-station is pulled downward by the force of gravity, the other trolley at the bottom-station is pulled up by means of the control cable. The trolleys roll along support cables using a pulley system that guides the cable and provides a cushioning effect. The pulley system consists of a load-bearing pulley on top of the cable and a dummy pulley underneath. The trolley itself is simply a steel cage made from pipes, and should be as light as possible (say, about 30kg). Its centre of gravity should be well balanced when loaded. In principle the goods coming down from the up-station must be three times as heavy as the upwards load from the bottom-station. The speed of the trolleys depends on the angle of elevation made by the cables. A flywheel with bearing and bracket is used as a break to control the landing speed of the trolley at the bottom-station. Brake strips around the wheel are connected to a fixed support at one end and to the brake handle at the other end. Applying force to the handle applies the brakes to the wheel’s rim. The top and bottom station platforms are civil foundations housing the control pulley, the supporting cables and the braking system. They are used as the loading platforms and must be strong enough to withstand impacts. Communication between top and bottom stations is done by tapping the wire rope. The operator strikes the wire rope with a stick to send a wave through the wire.
3.2. ROPEWAY CALCULATION TASK The following problem is based on the pre-feasibility study of a gravity ropeway by Practical Action in Nongtraw, Nepal.
9
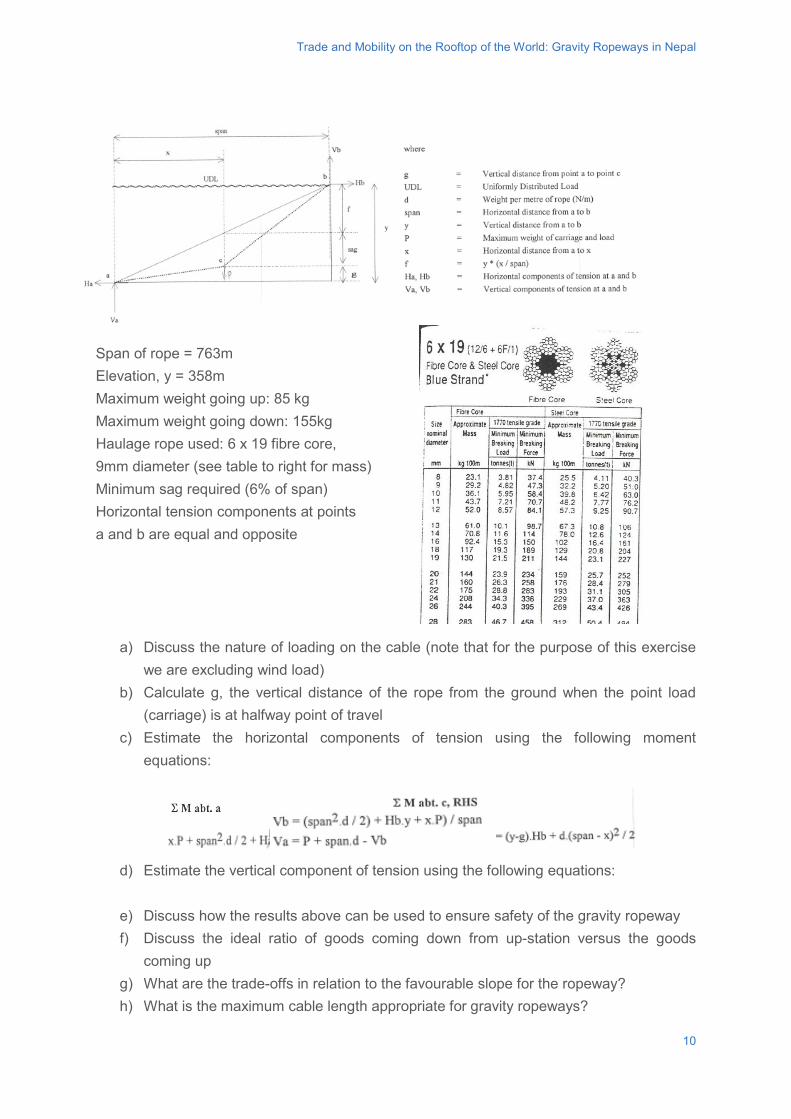
Trade and Mobility on the Rooftop of the World: Gravity Ropeways in Nepal
Span of rope = 763m Elevation, y = 358m Maximum weight going up: 85 kg Maximum weight going down: 155kg Haulage rope used: 6 x 19 fibre core, 9mm diameter (see table to right for mass) Minimum sag required (6% of span) Horizontal tension components at points a and b are equal and opposite
a) Discuss the nature of loading on the cable (note that for the purpose of this exercise we are excluding wind load)
b) Calculate g, the vertical distance of the rope from the ground when the point load (carriage) is at halfway point of travel
c) Estimate the horizontal components of tension using the following moment equations:
d) Estimate the vertical component of tension using the following equations:
e) Discuss how the results above can be used to ensure safety of the gravity ropeway f) Discuss the ideal ratio of goods coming down from up-station versus the goods
coming up g) What are the trade-offs in relation to the favourable slope for the ropeway? h) What is the maximum cable length appropriate for gravity ropeways?
10
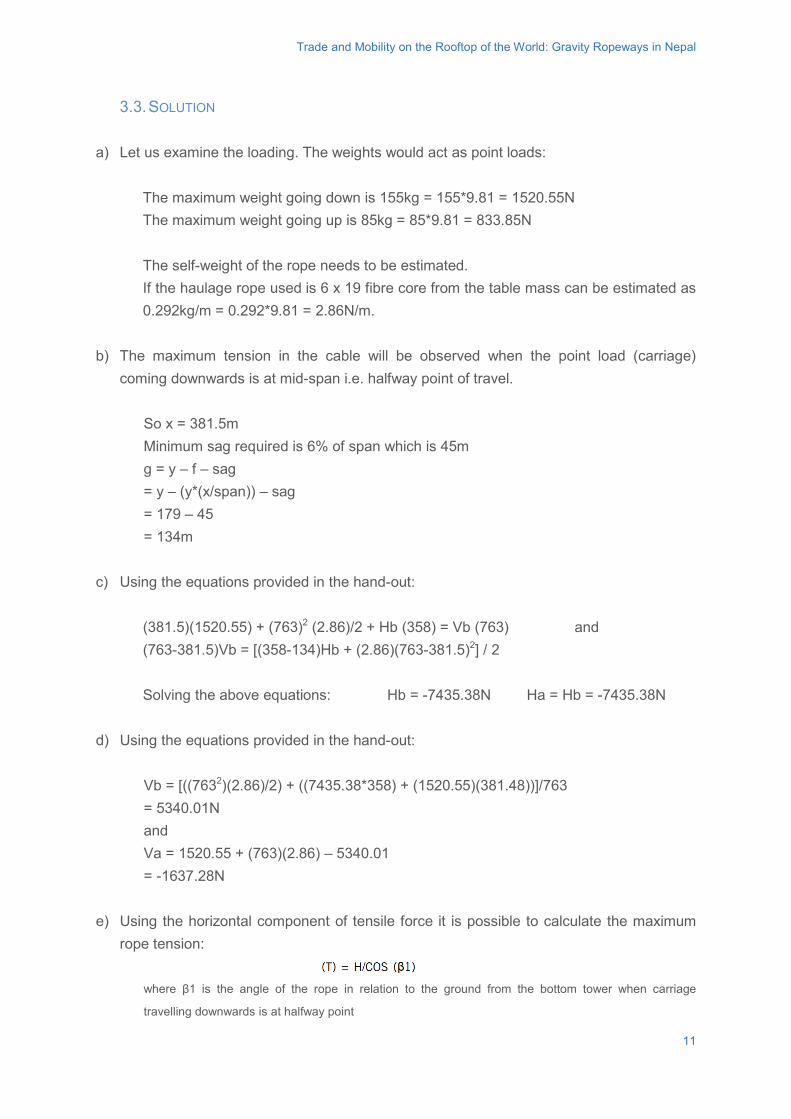
Trade and Mobility on the Rooftop of the World: Gravity Ropeways in Nepal
3.3. SOLUTION
a) Let us examine the loading. The weights would act as point loads:
The maximum weight going down is 155kg = 155*9.81 = 1520.55N The maximum weight going up is 85kg = 85*9.81 = 833.85N The self-weight of the rope needs to be estimated. If the haulage rope used is 6 x 19 fibre core from the table mass can be estimated as 0.292kg/m = 0.292*9.81 = 2.86N/m.
b) The maximum tension in the cable will be observed when the point load (carriage)
coming downwards is at mid-span i.e. halfway point of travel. So x = 381.5m Minimum sag required is 6% of span which is 45m g = y – f – sag = y – (y*(x/span)) – sag = 179 – 45 = 134m
c) Using the equations provided in the hand-out: (381.5)(1520.55) + (763)2 (2.86)/2 + Hb (358) = Vb (763) and (763-381.5)Vb = [(358-134)Hb + (2.86)(763-381.5)2] / 2 Solving the above equations: Hb = -7435.38N Ha = Hb = -7435.38N
d) Using the equations provided in the hand-out:
Vb = [((7632)(2.86)/2) + ((7435.38*358) + (1520.55)(381.48))]/763 = 5340.01N and Va = 1520.55 + (763)(2.86) – 5340.01 = -1637.28N
e) Using the horizontal component of tensile force it is possible to calculate the maximum
rope tension:
where β1 is the angle of the rope in relation to the ground from the bottom tower when carriage
travelling downwards is at halfway point
11
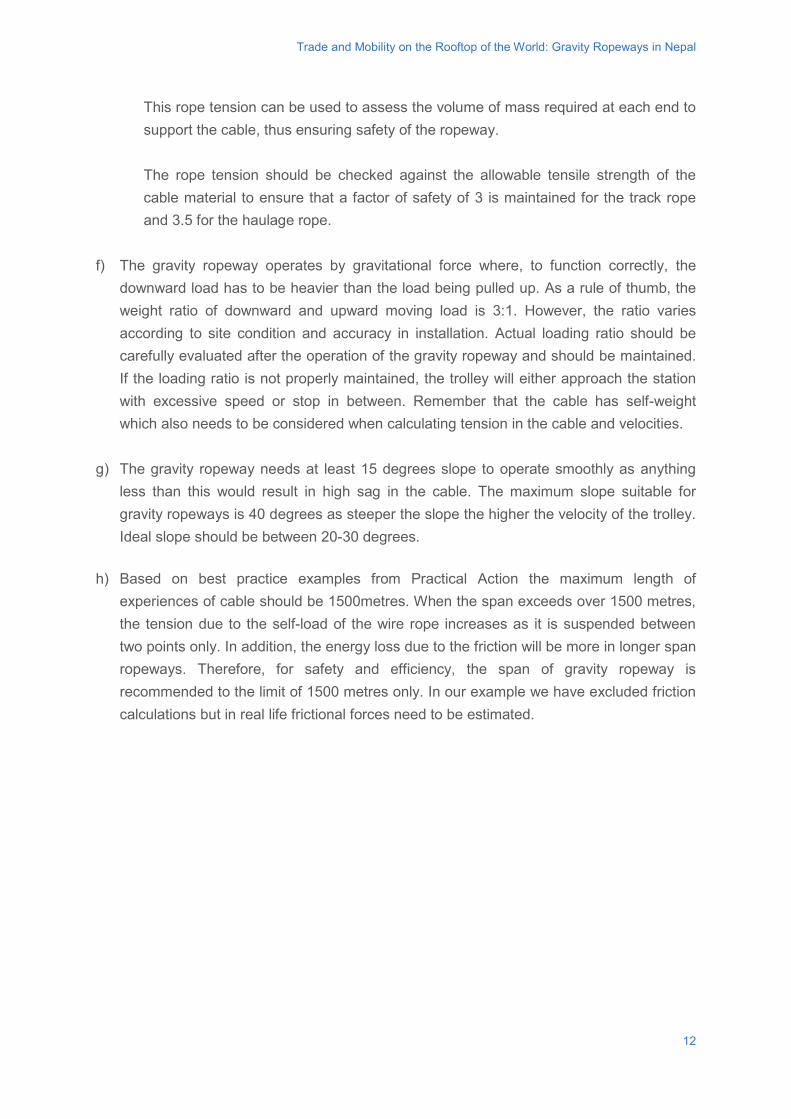
Trade and Mobility on the Rooftop of the World: Gravity Ropeways in Nepal
This rope tension can be used to assess the volume of mass required at each end to support the cable, thus ensuring safety of the ropeway. The rope tension should be checked against the allowable tensile strength of the cable material to ensure that a factor of safety of 3 is maintained for the track rope and 3.5 for the haulage rope.
f) The gravity ropeway operates by gravitational force where, to function correctly, the downward load has to be heavier than the load being pulled up. As a rule of thumb, the weight ratio of downward and upward moving load is 3:1. However, the ratio varies according to site condition and accuracy in installation. Actual loading ratio should be carefully evaluated after the operation of the gravity ropeway and should be maintained. If the loading ratio is not properly maintained, the trolley will either approach the station with excessive speed or stop in between. Remember that the cable has self-weight which also needs to be considered when calculating tension in the cable and velocities.
g) The gravity ropeway needs at least 15 degrees slope to operate smoothly as anything
less than this would result in high sag in the cable. The maximum slope suitable for gravity ropeways is 40 degrees as steeper the slope the higher the velocity of the trolley. Ideal slope should be between 20-30 degrees.
h) Based on best practice examples from Practical Action the maximum length of
experiences of cable should be 1500metres. When the span exceeds over 1500 metres, the tension due to the self-load of the wire rope increases as it is suspended between two points only. In addition, the energy loss due to the friction will be more in longer span ropeways. Therefore, for safety and efficiency, the span of gravity ropeway is recommended to the limit of 1500 metres only. In our example we have excluded friction calculations but in real life frictional forces need to be estimated.
12
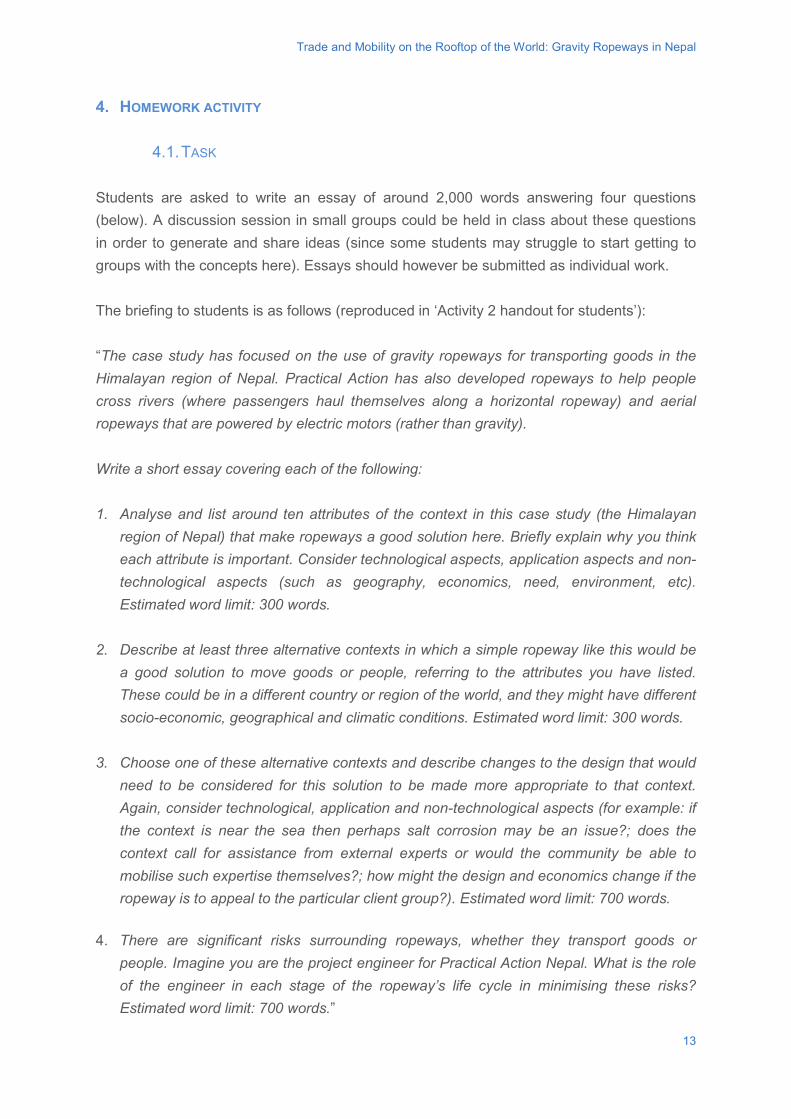
Trade and Mobility on the Rooftop of the World: Gravity Ropeways in Nepal
4. HOMEWORK ACTIVITY
4.1. TASK Students are asked to write an essay of around 2,000 words answering four questions (below). A discussion session in small groups could be held in class about these questions in order to generate and share ideas (since some students may struggle to start getting to groups with the concepts here). Essays should however be submitted as individual work. The briefing to students is as follows (reproduced in ‘Activity 2 handout for students’): “The case study has focused on the use of gravity ropeways for transporting goods in the Himalayan region of Nepal. Practical Action has also developed ropeways to help people cross rivers (where passengers haul themselves along a horizontal ropeway) and aerial ropeways that are powered by electric motors (rather than gravity). Write a short essay covering each of the following: 1. Analyse and list around ten attributes of the context in this case study (the Himalayan
region of Nepal) that make ropeways a good solution here. Briefly explain why you think each attribute is important. Consider technological aspects, application aspects and non-technological aspects (such as geography, economics, need, environment, etc). Estimated word limit: 300 words.
2. Describe at least three alternative contexts in which a simple ropeway like this would be a good solution to move goods or people, referring to the attributes you have listed. These could be in a different country or region of the world, and they might have different socio-economic, geographical and climatic conditions. Estimated word limit: 300 words.
3. Choose one of these alternative contexts and describe changes to the design that would
need to be considered for this solution to be made more appropriate to that context. Again, consider technological, application and non-technological aspects (for example: if the context is near the sea then perhaps salt corrosion may be an issue?; does the context call for assistance from external experts or would the community be able to mobilise such expertise themselves?; how might the design and economics change if the ropeway is to appeal to the particular client group?). Estimated word limit: 700 words.
4. There are significant risks surrounding ropeways, whether they transport goods or
people. Imagine you are the project engineer for Practical Action Nepal. What is the role of the engineer in each stage of the ropeway’s life cycle in minimising these risks? Estimated word limit: 700 words.”
13
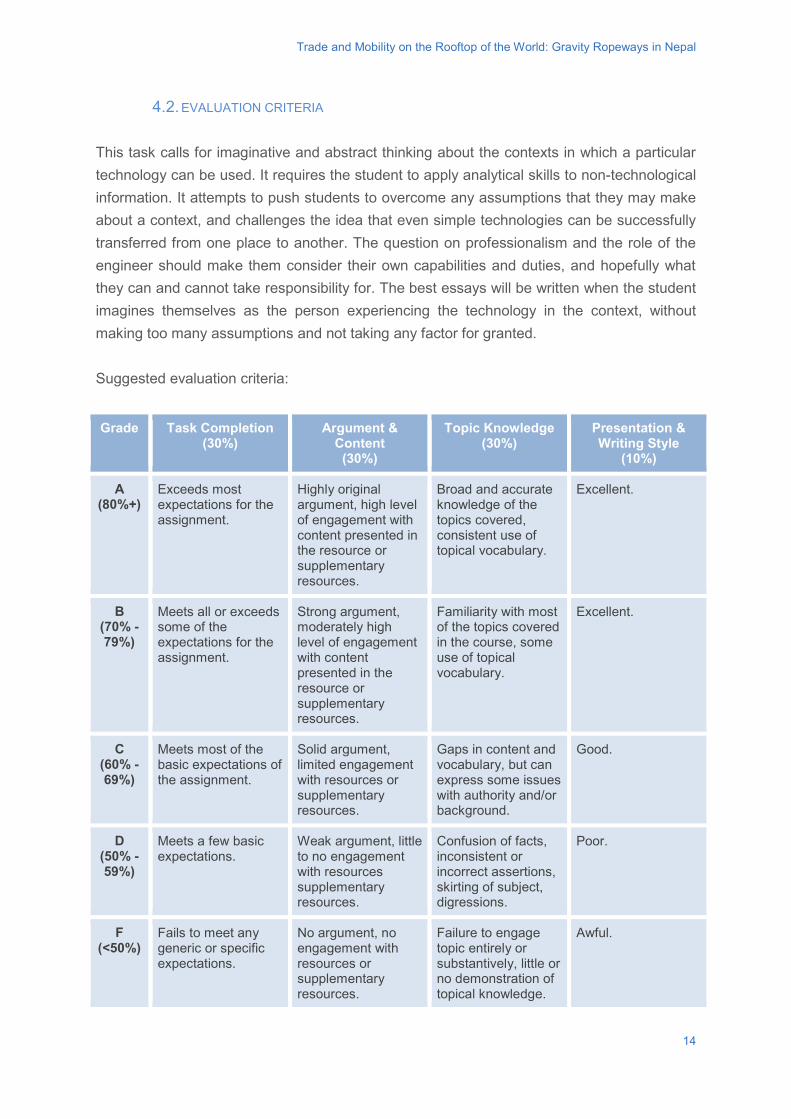
Trade and Mobility on the Rooftop of the World: Gravity Ropeways in Nepal
4.2. EVALUATION CRITERIA This task calls for imaginative and abstract thinking about the contexts in which a particular technology can be used. It requires the student to apply analytical skills to non-technological information. It attempts to push students to overcome any assumptions that they may make about a context, and challenges the idea that even simple technologies can be successfully transferred from one place to another. The question on professionalism and the role of the engineer should make them consider their own capabilities and duties, and hopefully what they can and cannot take responsibility for. The best essays will be written when the student imagines themselves as the person experiencing the technology in the context, without making too many assumptions and not taking any factor for granted. Suggested evaluation criteria:
Grade Task Completion (30%)
Argument & Content
(30%)
Topic Knowledge (30%)
Presentation & Writing Style
(10%)
A (80%+)
Exceeds most expectations for the assignment.
Highly original argument, high level of engagement with content presented in the resource or supplementary resources.
Broad and accurate knowledge of the topics covered, consistent use of topical vocabulary.
Excellent.
B (70% -79%)
Meets all or exceeds some of the expectations for the assignment.
Strong argument, moderately high level of engagement with content presented in the resource or supplementary resources.
Familiarity with most of the topics covered in the course, some use of topical vocabulary.
Excellent.
C (60% -69%)
Meets most of the basic expectations of the assignment.
Solid argument, limited engagement with resources or supplementary resources.
Gaps in content and vocabulary, but can express some issues with authority and/or background.
Good.
D (50% -59%)
Meets a few basic expectations.
Weak argument, little to no engagement with resources supplementary resources.
Confusion of facts, inconsistent or incorrect assertions, skirting of subject, digressions.
Poor.
F (<50%)
Fails to meet any generic or specific expectations.
No argument, no engagement with resources or supplementary resources.
Failure to engage topic entirely or substantively, little or no demonstration of topical knowledge.
Awful.
14
Trade and Mobility on the Rooftop of the World: Gravity Ropeways in Nepal
4.3. EXAMPLE ANSWERS 1. Attributes that students take from the case study will hopefully range from the obvious to
the subtle. Examples attributes might include: • Technological: Strong foundations. The rocky terrain allows for strong
foundations for the top and bottom stations of the ropeway. • Technological: Sourcing materials. The materials required to build the ropeway
are relatively easy to transport compared to, say, the materials needed to build a bridge.
• Application: Unmet need. There is a serious need in this context because there are roads cannot service the communities.
• Application: Small loads. The goods are from subsistence farmers and the quantities involved were small enough for human porters to carry, so the loads being placed on the ropeway are quite small and manageable.
• Non-technological: Low noise. The case study mentions the tranquillity of the environment so the ropeway is a good solution because it is low noise.
• Non-technological: Affordability. The community is already paying for porters to transport goods, so funds are therefore available to pay for the ropeway instead.
2. This question begins to look at the concept of technology transfer and the importance of
considering the context in which a technology will be used. Students should be able to explain why the contexts they have chosen would suit a ropeway. Hopefully the introduction to the task will have prompted some students to consider ropeways for moving people too. Example alternative contexts might include:
• Crossing a seasonal river bed (wadi) in a desert region • Getting goods to and from an off-shore lighthouse • Carrying small numbers of backpacker tourists to a lookout point on the edge of
an escarpment • Filming tracking shots inside caves for a television wildlife documentary • Carrying goods across a narrow canyon • Unloading a supply ship at a small sea port in a developing country
3. Students will have an understanding of the technical design from the earlier activity. This
question looks into how the technology needs to be adapted to make it appropriate to their new context, and so gives the student the opportunity to express some ideas on engineering design. The depth of consideration given to the context is key here. Taking the context of crossing a seasonal river bed (wadi) in a desert region, example design changes might include:
• Technological: Changes to the foundation structures of the stations at each end of the ropeway to take into account that they may have to be in sand.
15
Trade and Mobility on the Rooftop of the World: Gravity Ropeways in Nepal
• Technological: The possibility of altering the length of the ropeway since the width of seasonal rivers changes from one year to the next.
• Technological: Methods for cleaning sand out of the mechanisms. • Application: Since this ropeway will be horizontal it cannot use gravity, so a
method of hauling the trolley across will be required. • Application: If the ropeway is to carry people, a more extensive maintenance,
testing and safety regime will be required. • Non-technological: Will the ropeway be manned and operated for a fee or left for
users to operate themselves (and if so, how will its upkeep be paid for)? • Non-technological: Will introducing the ropeway completely displace the work of
boatmen who currently row goods across the river, and perhaps give rise to social tensions within the community?
4. This question begins to address professionalism and the role of the engineer. Since
these matters are not really discussed in the case study, the point of this question is to develop the awareness of the student of their own role in any project. Answers should correspond to stages of the project cycle and might include:
• Needs assessment: ensuring all stakeholders are consulted. • Planning: ensuring the route taken by the ropeway takes into account
engineering and community perspectives. • Design stage: getting the calculations right. • Construction: ensuring no corrupt practices. • Testing: not cutting corners to meet the project timetable. • Training: ensuring safety and equal access for all. • Operation: providing advice on whether the ropeway should be closed in a storm. • Maintenance: checklists to help ensure the correct procedures are followed. • Decommissioning: the ropeway is dismantled to leave the site safe.
16
Trade and Mobility on the Rooftop of the World: Gravity Ropeways in Nepal
BIBLIOGRAPHY Gapminder. (n.d.). Retrieved August 12, 2014, from Gapminder Global Statistics:
http://www.gapminder.org/world
Practical Action. (2006, July). Gravity Ropeways Technical Brief. Retrieved August 12, 2014, from Practical Action: http://practicalaction.org/media/preview/6986
Practical Action. (2009, February). Aerial Ropeways in Nepal. Retrieved August 12, 2014, from Practical Action: http://practicalaction.org/ropeways-aerial-ropeways-in-nepal-1
Practical Action. (2010, October). Gravity Goods Ropeways. Retrieved August 12, 2014, from Practical Action: http://practicalaction.org/ropeways-gravity-goods-ropeways-1
Practical Action. (2010, January). Technical Guidelines for Gravity Goods Ropeways. Retrieved August 12, 2014, from Practical Action: http://practicalaction.org/ropeways-technical-guidelines-for-gravity-goods-ropeway
Practical Action. (2014, August). Retrieved August 2014, from Practical Action main website: www.practicalaction.org
Practical Action. (2014, August). Gravity Ropeways. Retrieved August 12, 2014, from Practical Action: http://practicalaction.org/gravity-ropeways-8
Practical Action Nepal. (2012, January). Ropes of Hope. Retrieved August 12, 2014, from Practical Action: http://practicalaction.org/media/preview/21345
Practical Action Nepal. (2014, August). Retrieved August 2014, from Practical Action Nepal homepage: www.practicalaction.org/nepal
Practical Action South Asia. (2014, August). Gravity Ropeways. Retrieved August 12, 2014, from Practical Action: http://practicalaction.org/gravity_ropeways
Schumacher, E. F. (1973). Small is Beautiful: A study of economics as if people mattered. London: Blond & Briggs.
Wikipedia. (n.d.). Wikipedia entry on the Himalayas. Retrieved August 12, 2014, from http://en.wikipedia.org/wiki/Himalayas
World Bank. (n.d.). World Bank data portal - Nepal. Retrieved August 12, 2014, from http://data.worldbank.org/country/nepal
FURTHER/SUGGESTED MATERIAL
• Video: Ropes of Hope www.youtube.com/watch?v=Lc6JRVuYqZU • Video: Gravity Goods Ropeway www.youtube.com/watch?v=LaHS8eHzYqg • Video: Gravity Ropeways in Nepal www.youtube.com/watch?v=nvbGTBWMtkI
17

http://www.gdee.eu
This project is funded by
Carlos Gregorio Hernández Díaz-Ambrona, Esperanza Arnés Prieto and Omar Marín González
PHOTO:
CASE STUDIES
Sustainable Developmentof Agriculture and Foodsystems with regardto Water
DL B 10735-2015 ISBN 978-84-606-7546-4
Sustainable Development of Agriculture and Food systems with regard to Water
COORDINATED BYAgustí Pérez-Foguet, Enric Velo, Pol Arranz, Ricard Ginéand Boris Lazzarini (Universitat Politècnica de Catalunya)Manuel Sierra (Universidad Politécnica de Madrid)Alejandra Boni and Jordi Peris (Universitat Politècnica de València)Guido Zolezzi and Gabriella Trombino (Università degli Studi di Trento)Rhoda Trimingham (Loughborough University)Valentín Villarroel (ONGAWA)Neil Nobles and Meadhbh Bolger (Practical Action)Francesco Mongera (Training Center for International Cooperation)Katie Cresswell-Maynard (Engineering Without Border UK)
EDITED BY Global Dimension in Engineering Education
Citation: Hernández Díaz-Ambrona, C.G., Arnés Prieto, E. and Marín González, O. (2015) 'Sustainable Development of Agriculture and Food systems with regard to Water', in Case studies for developing globally responsible engineers, GDEE (eds.), Global Dimension in Engineering Education, Barcelona. Available from: http://gdee.eu/index.php/resources.html
This publication is distributedunder an Attribution- Noncommercial-Share Alike License for Creative Commons
CASE STUDIES
Disclaimer: This document has been produced with the financial assistance of the European UnionThe contents of this document are the sole responsibility of the authors and can under no circumstances be regarded as reflecting the position of the European Union
Sustainable Development of Agriculture and Food systems with regard to Water
SUSTAINABLE DEVELOPMENT OF AGRICULTURE AND FOOD SYSTEMS WITH REGARD TO WATER
Carlos Gregorio Hernández Díaz-Ambrona, Esperanza Arnés Prieto and Omar Marín González -Universidad Politécnica de Madrid.
“Everyone has the right to a standard of living adequate for the health and well-being of himself and of his family, including food, clothing, housing and medical care and necessary
social services, and the right to security in the event of unemployment, sickness, disability, widowhood, old age or other lack of livelihood in circumstances beyond his control.”
Article 25 - Universal Declaration of Human Rights
1
Sustainable Development of Agriculture and Food systems with regard to Water
INDEX 1. INTRODUCTION ........................................................................................................................... 3
1.1. DISCIPLINES COVERED ............................................................................................................. 4
1.2. LEARNING OUTCOMES .............................................................................................................. 5
1.3. ACTIVITIES .............................................................................................................................. 5
2. DESCRIPTION OF THE CONTEXT ............................................................................................. 5
2.1. DROUGHT AND WATER STRESS ............................................................................................... 7
2.2. DROUGHT MONITORING TOOLS ................................................................................................ 9
2.3. THE WATER BALANCE APPROACH .......................................................................................... 12
3. CLASS ACTIVITY ....................................................................................................................... 13
3.1. SOLUTION AND EVALUATION CRITERIA ..................................................................................... 14
4. HOMEWORK ACTIVITY ............................................................................................................. 20
4.1. SOLUTION AND EVALUATION CRITERIA ..................................................................................... 20
BIBLIOGRAPHY ................................................................................................................................. 24 FURTHER/SUGGESTED MATERIAL ................................................................................................ 27
2

Sustainable Development of Agriculture and Food systems with regard to Water
1. INTRODUCTION The biggest challenges related to agriculture are guaranteeing that the food supply keeps up with current population growth and improving the diet. It is projected that by 2050, the world’s population will rise to 9 billion. According to the Food and Agriculture Organization of the United Nations (FAO), food production will have to increase by 50% to 70% to ensure food needs are met. Also, the United Nations estimates that the need for water will increase by 30% to cover food demand. According to the Organization for Economic Co-operation and Development (OECD) environmental indicators for 2050 (OECD, 2012), there will have to be an increase in the water supply to avoid situations of food insecurity. However, the OECD projection estimates that 40% of the population will live in basins with a high level of water stress. The Cooperation Group on Agricultural Systems (AgSystems) is an interdepartmental consortium of university researchers from the Technical University of Madrid (Spain). AgSystems’ main area of research is the study of management and productivity of agricultural systems and their relation to the environment in terms of sustainability and resilience. The main target of the group is the design of new or adapted strategies for sustainable/resilience production systems under current and future conditions. To this end, AgSystems supports research projects that combine field experiments and the generation of crop systems simulation models linked to Decision Support Systems Simulation models. The main research lines are:
• Water and nitrogen management in agricultural systems • Modelling of crop and cropping systems • Impact of climate change
Current projects to support this contribution are:
• Rural Community Program of the Technical University of Madrid and related projects (2006- present).
• AGRISOST, Sustainable agricultural systems: Management of carbon, nitrogen and water for production and quality optimization (S2013/ABI-2717), BOCAM 20141(2014-2017).
1 Website: http://www.madrimasd.org/programas/web/agrisost
3
Sustainable Development of Agriculture and Food systems with regard to Water
• MACSUR, Modelling European Agriculture with Climate Change for Food Security. (2012-2015) FACCE JPI. European Commission. VII Framework Program.
1.1. DISCIPLINES COVERED Future sustainable and resilience agriculture will have to meet the following challenges (Diaz-Ambrona and Maletta, 2014): 1) Agriculture must guarantee food security with regard to quantity, quality, price, and accessibility. Agricultural products must be priced appropriately; prices must be high enough to ensure the standard of living of farmers, yet be affordable to everyone, especially to people in urban areas. 2) It is necessary to improve the systems of production in remote areas (which is important because 50% of the world’s poor are farmers), improving traditional farming techniques while preserving local, socially and culturally accepted varieties and crop systems. Marketable surpluses must be generated while increasing local trade of products that comprise the basic shopping basket. 3) Variability of production must be reduced by improving production techniques and increasing the diversity of crops through investment in agricultural research. Environmental risks (droughts, floods, freezing) must be prevented, and the effects of global environmental problems such as climate change in the medium and long term must be assessed. 4) It must preserve the environment, protect the nutritional integrity of the soil, reduce runoff to adjacent water bodies, protect biodiversity through diversification of crops and reduce heavy chemicals use. Water is one of the most prized land elements for life. Life arises from and moves around water. Plant growth depends on soil water availability. Plants are very efficient conductors of water; water penetrates from the soil through their roots and stems, then through their leaves out into the atmosphere, via transpiration. Crops need large amounts of water. Only 6.1% of the renewable fresh water supply is accessible runoff. Most water is found in the oceans (97.4%) and in ice, polar lands, and glaciers (2%). Freshwater distribution is irregular; some areas, such as the Amazon basin, have large quantities of water with minimal human usage, whereas others, such as Saharan Africa, have very little availability. Agricultural water requirements are calculated by estimating crop evapotranspiration needs. Transpiration water is linearly correlated with crop biomass. For example, the amount of water needed to produce a kilogram of grain under appropriate conditions varies from 1000 L for rice to 500 L for maize (Hernández and Marín, 2012). Water used is important for both rainfed and irrigated crops. Regulated water resources are focused as a service for irrigating land; it is for this reason that irrigation uses 70% of regulated water globally. Transpired water always returns to the atmosphere. A person needs to drink at least 2 L of freshwater per day, moreover a person needs 2000 L of water that is embedded or embodied in a balanced diet (which corresponds to the water used in food production). Improvements in yields of both
4
Sustainable Development of Agriculture and Food systems with regard to Water
rainfed and irrigated crops have increased water usage. According to Brauman et al. (2013), irrigated cropland and the demand for water will increase significantly by 2050.
1.2. LEARNING OUTCOMES Research question: How does weather variability impact farming? Could agricultural water management innovations help to reduce food insecurity and improve sustainable agriculture?
• Know agricultural water demand by crops, • Weather variability impact on farming, • Designing sustainable cropping systems to reduce poverty and increased food
security in rural areas, • Impact of new agricultural water management innovations in smallholder agriculture
Learning outcomes are expected:
• First learning outcome: Crops need large quantities of water • Second learning outcome: Water availability is the main cause of annual or
interannual variability in food production
1.3. ACTIVITIES
The two activities of the case studies are: 1) Class activity and 2) Homework. This case study is:
• Problem resolution • Individual work • Debate in the classroom
Tools and accesses needed:
• Computer • Spreadsheet application • Internet access
2. DESCRIPTION OF THE CONTEXT The FAO (FAO, 2007) estimates the minimum amount of water for poverty in 700 m3 of total available water per person per year. Taking into account the nutritional standard unit of 500 kg of cereal per person, the amount of water needed to grow rice and maize is 500 m3 and 250 m3 per person per year, respectively. For example, in Egypt, a country heavily reliant on
5
Sustainable Development of Agriculture and Food systems with regard to Water
irrigation, the forecast is that by 2025 the available water per capita will decrease to 500 m3 per year (NWRP, National Water Resources Plan, 2014). It is well-documented that irrigation contributes to the alleviation of hunger and poverty in Asia and Africa, although success is not reached in all cases (García-Bolaños et al., 2011; Borgia et al., 2013). These values show that agriculture is the activity for which most water is needed. Water is the main renewable resource required for cropping. Moreover, not only is a certain amount of water required, but water should be available in the quantity needed at key points in the crop cycle. Managing the availability of both, rainfall and irrigation water, is critical for successful agriculture.
Efficiency in the use of water depends on physiologic factors of crop species, environment, and crop management. Efficiency is greater in plants that have a photosynthetic mechanism called C4, including crops such as maize, sorghum, and sugarcane. These crops are adapted to tropical and subtropical climates and, therefore, do not grow in environments with average temperatures below 10 °C, as compared with C3 species such as wheat and barley which can grow in these environments. In addition, the photosynthetic mechanism called CAM (Crassulacean acid metabolism) common on plants among desert succulents (Cactaceae) or among tropical forest epiphytes (Bromeliaceae) shows the highest water efficiency, but with low net growth. Meanwhile, intensive growing in greenhouses allows control of climate-related variables that affect crop development and raises the efficiency of water use to the maximum due to high humidity inside the greenhouse. For example, in the case of tomatoes and beans, water use efficiency is almost 3.5 times greater in a greenhouse than for outdoor cultivation. In addition, irrigation allows higher productivity and decreases yield variability, therefore the risk of having years with famine or lack of a food supply is reduced.
Irrigation has contributed to yield stabilization and an increase in productivity, but water resources must be managed properly. In some regions of Asia and the Middle East, the ground water table is falling quickly because of a lack of water regulation and high demographic pressure (Hefny, 2012). For Hefny (2012), the key factors causing water/food-induced conflicts are water scarcity and population growth, mismanagement of water, problems in transboundary river basin management, limited information on water resource availability, water policy overlaps, water quality degradation and pollution, structural imbalance, problems with management authorities, limited awareness of water issues, a slow transfer of technology, a shortage of capacity building and institutional development, inadequate stakeholder participation, a shortage of available funds, and poor public awareness programmes. Finally, the growing meat demand is linked to an increase in grain production; it is estimated that 1 billion tonnes of grain is dedicated to feed animals annually, but crop and livestock are complementary, half of world’s food comes from mixed farms (Eisler et al., 2013). The authors discuss the steps to sustainable livestock management that focus on ruminants. Ruminants eat high fibre plants that are unsuitable for human, pasture
6
Sustainable Development of Agriculture and Food systems with regard to Water
management and improvement can help achieve sustainable livestock production (Eisler et al., 2013).
2.1. DROUGHT AND WATER STRESS
Drought is a natural hazard that occurs as a result of lower levels of precipitation or available water for economic activities than is considered normal for a particular location. Drought is one of the major weather related disasters (Horion et al., 2012). Drought must be considered a relative condition and must be considered as part of the dry season of a climatic region. Also, water stress is a perennial challenge in most arid and semi-arid regions of the world. Areas such as the semi-arid Sahel, the Horn of Africa and Southern Africa, have high dependence on groundwater2.
There are four approaches to measuring drought: meteorological, hydrological, agricultural, and socioeconomic (Wilhite and Glantz, 1985):
Meteorological drought is usually defined as the lack of precipitation over a long period compared with the normal distribution. It is based on the degree of dryness and the duration of the dry period.
Hydrological drought is related to the effects of periods of precipitation (including snowfall) shortfalls on surface or subsurface water supply. It reduces the amount of water in streamflow, groundwater, reservoir and lakes. Hydrological drought reduces the amount of water available for irrigation.
Agricultural drought links meteorological or hydrological drought to agricultural impacts. It is produced when evapotranspiration water demand is higher than available water from soil, precipitation and/or irrigation. Crop water demand depends on prevailing weather conditions, biological characteristics of the specific plant, its stage of growth (from emergence to maturity), and soil properties.
Socioeconomic drought is associated with the supply and demand of economic goods or services as consequence of meteorological, hydrological, or agricultural drought.
2 http://www.undp.org/content/dam/undp/library/corporate/HDR/Africa%20HDR/ UNDP-Africa%20HDR-2012-EN.pdf
7
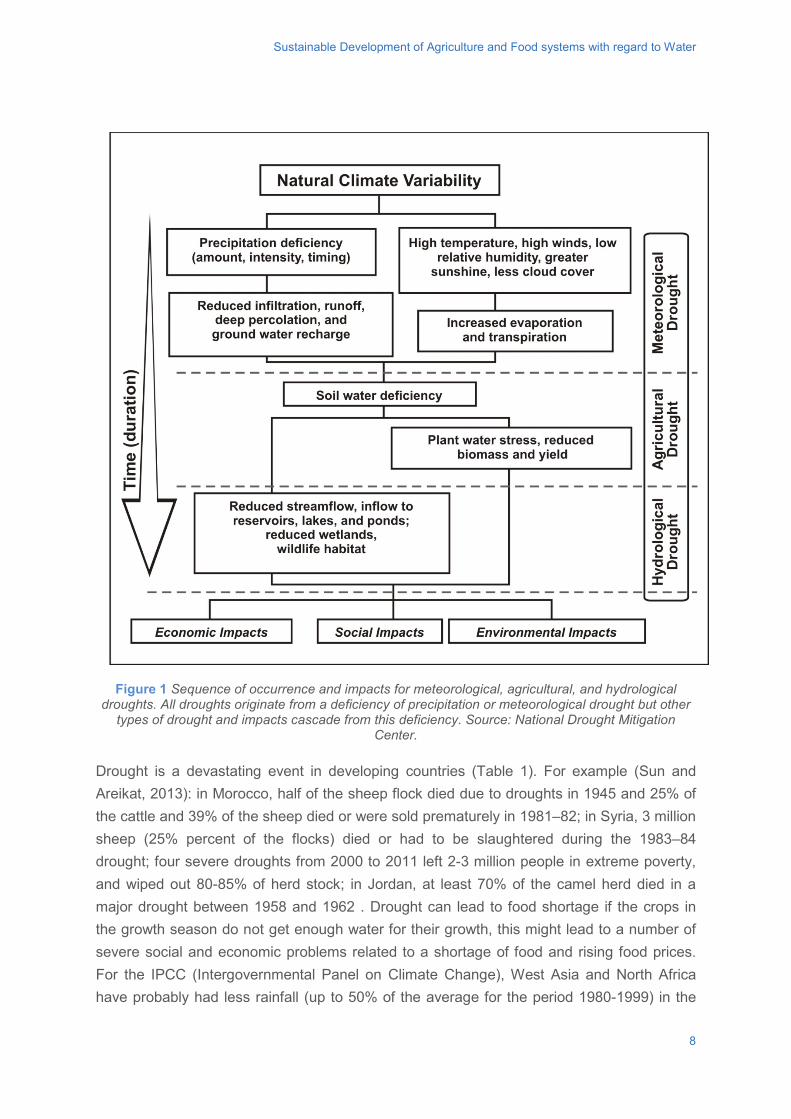
Sustainable Development of Agriculture and Food systems with regard to Water
Figure 1 Sequence of occurrence and impacts for meteorological, agricultural, and hydrological
droughts. All droughts originate from a deficiency of precipitation or meteorological drought but other types of drought and impacts cascade from this deficiency. Source: National Drought Mitigation
Center. Drought is a devastating event in developing countries (Table 1). For example (Sun and Areikat, 2013): in Morocco, half of the sheep flock died due to droughts in 1945 and 25% of the cattle and 39% of the sheep died or were sold prematurely in 1981–82; in Syria, 3 million sheep (25% percent of the flocks) died or had to be slaughtered during the 1983–84 drought; four severe droughts from 2000 to 2011 left 2-3 million people in extreme poverty, and wiped out 80-85% of herd stock; in Jordan, at least 70% of the camel herd died in a major drought between 1958 and 1962 . Drought can lead to food shortage if the crops in the growth season do not get enough water for their growth, this might lead to a number of severe social and economic problems related to a shortage of food and rising food prices. For the IPCC (Intergovernmental Panel on Climate Change), West Asia and North Africa have probably had less rainfall (up to 50% of the average for the period 1980-1999) in the
8
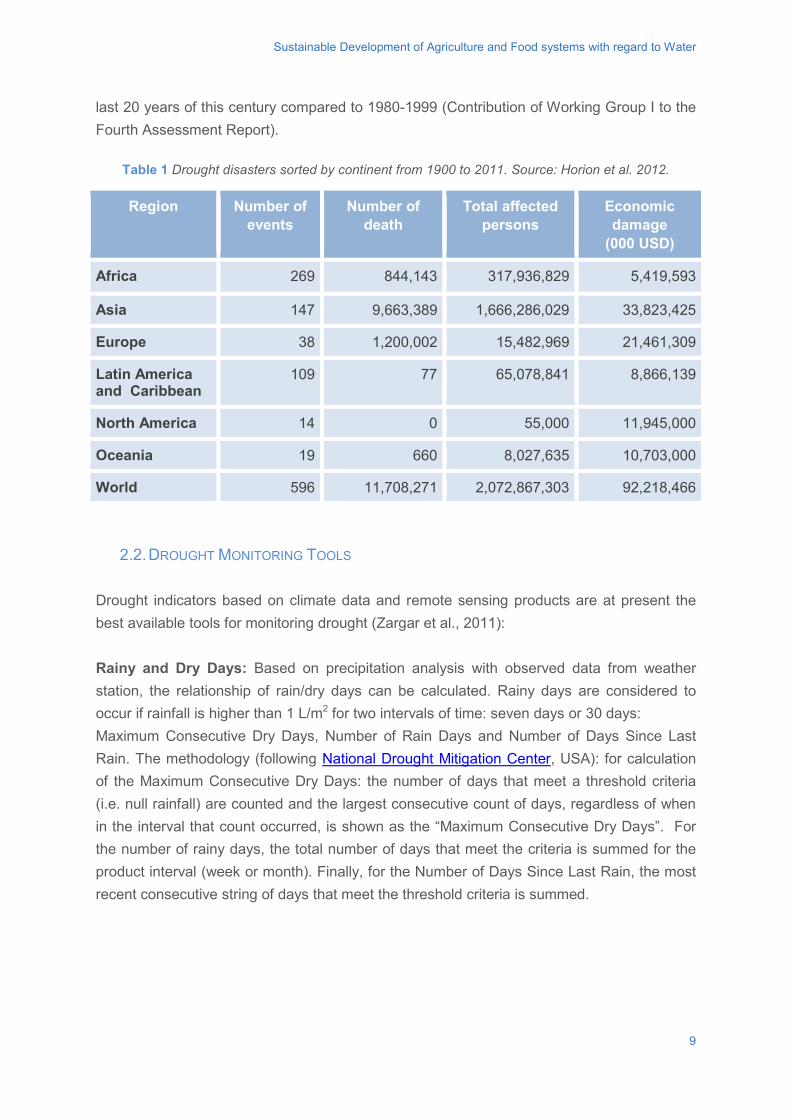
Sustainable Development of Agriculture and Food systems with regard to Water
last 20 years of this century compared to 1980-1999 (Contribution of Working Group I to the Fourth Assessment Report).
Table 1 Drought disasters sorted by continent from 1900 to 2011. Source: Horion et al. 2012.
Region Number of events
Number of death
Total affected persons
Economic damage
(000 USD)
Africa 269 844,143 317,936,829 5,419,593
Asia 147 9,663,389 1,666,286,029 33,823,425
Europe 38 1,200,002 15,482,969 21,461,309
Latin America and Caribbean
109 77 65,078,841 8,866,139
North America 14 0 55,000 11,945,000
Oceania 19 660 8,027,635 10,703,000
World 596 11,708,271 2,072,867,303 92,218,466
2.2. DROUGHT MONITORING TOOLS Drought indicators based on climate data and remote sensing products are at present the best available tools for monitoring drought (Zargar et al., 2011): Rainy and Dry Days: Based on precipitation analysis with observed data from weather station, the relationship of rain/dry days can be calculated. Rainy days are considered to occur if rainfall is higher than 1 L/m2 for two intervals of time: seven days or 30 days: Maximum Consecutive Dry Days, Number of Rain Days and Number of Days Since Last Rain. The methodology (following National Drought Mitigation Center, USA): for calculation of the Maximum Consecutive Dry Days: the number of days that meet a threshold criteria (i.e. null rainfall) are counted and the largest consecutive count of days, regardless of when in the interval that count occurred, is shown as the “Maximum Consecutive Dry Days”. For the number of rainy days, the total number of days that meet the criteria is summed for the product interval (week or month). Finally, for the Number of Days Since Last Rain, the most recent consecutive string of days that meet the threshold criteria is summed.
9
Sustainable Development of Agriculture and Food systems with regard to Water
Standardized Precipitation Index (SPI): is based only on precipitation3; it is effective in analysing wet periods/cycles and dry periods/cycles. If possible, one needs at least 20-30 years of monthly values, although 50-60 years are optimal and preferred. The index can be calculated with shorter data series, but this affects the confidence of results. The Standardized Precipitation Index is based on the probability of precipitation for any time-scale and is then transformed into an index. Drought Impact Reporter: The Drought Impact Reporter is an interactive web-based mapping tool designed to compile and display impact information from a variety of sources such as media, government agencies, and the public. Anyone is allowed to submit a drought impact, but there is a web moderator, and the moderator can request additional information as/when needed. It is operated in USA4 and is a social and collaborative indicator. Vegetation Drought Response Index (VegDRI): It is a bi-weekly index produced from remote sensing data using satellite-based observations. Vegetation Drought Response Index uses the Percent Average Seasonal Greenness (PASG) and Start of Season Anomaly (SOSA) variables. Both variables are calculated from the normalized difference vegetation index (NDVI) data acquired by NOAA’s Advanced Very High Resolution Radiometer (AVHRR). Climate-related variables incorporated into VegDRI include the Palmer Drought Severity Index (PDSI) and the Standardized Precipitation Index (SPI). Information about soils, land cover, land use, and the ecological setting are incorporated into VegDRI, because the climate-vegetation response can vary depending on these different environmental characteristics5. Crop water stress index: This is the most used index to quantify crop water stress in a field. It is based on canopy surface temperature. Temperature in plants is regulated through transpiration. The crop water stress index has two baselines: the non-water-stressed baseline, which represents a fully watered crop and maximum plant transpiration; and the maximum stressed baseline, which corresponds to a non-transpiring crop with fully closed stomata (Yuan et al., 2004). Regional networks on assessing and monitoring drought: Europe
• Drought Management Centre for South-Eastern Europe (DMCSEE) http://www.dmcsee.org/
3 http://www.wamis.org/agm/pubs/SPI/WMO_1090_EN.pdf 4 http://public.droughtreporter.unl.edu/submitreport/ 5 http://vegdri.unl.edu/
10
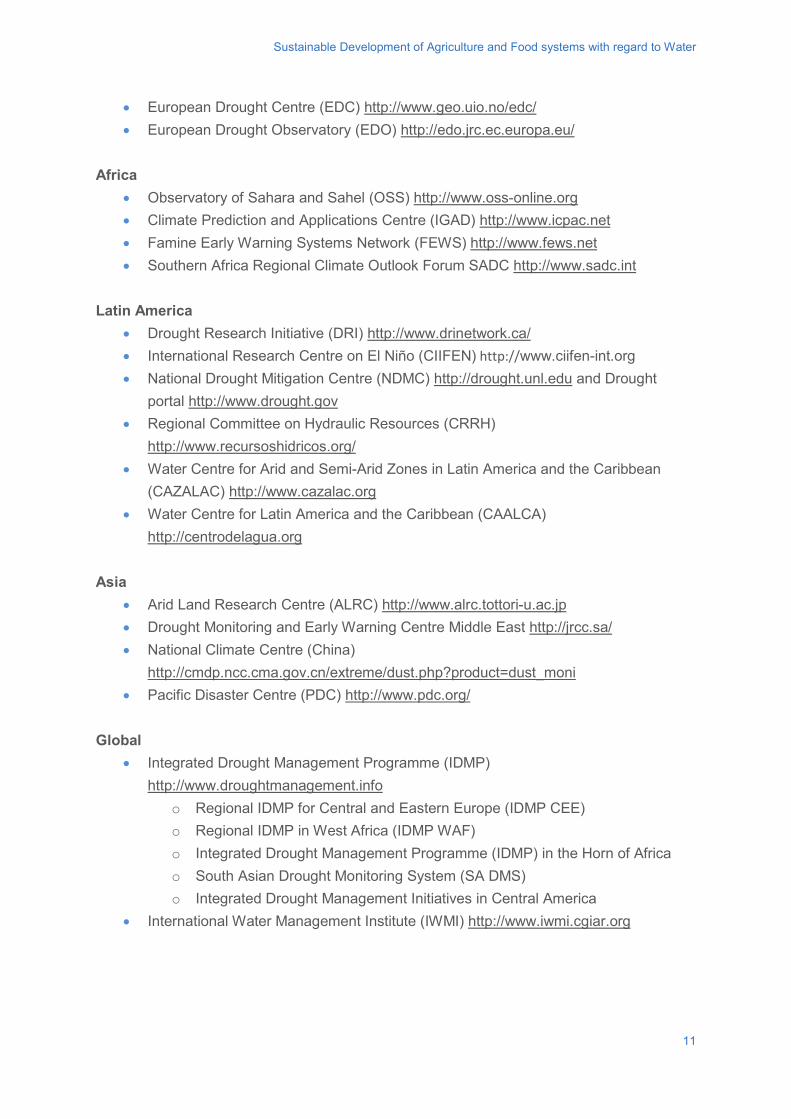
Sustainable Development of Agriculture and Food systems with regard to Water
• European Drought Centre (EDC) http://www.geo.uio.no/edc/ • European Drought Observatory (EDO) http://edo.jrc.ec.europa.eu/
Africa
• Observatory of Sahara and Sahel (OSS) http://www.oss-online.org • Climate Prediction and Applications Centre (IGAD) http://www.icpac.net • Famine Early Warning Systems Network (FEWS) http://www.fews.net • Southern Africa Regional Climate Outlook Forum SADC http://www.sadc.int
Latin America
• Drought Research Initiative (DRI) http://www.drinetwork.ca/ • International Research Centre on El Niño (CIIFEN) http://www.ciifen-int.org • National Drought Mitigation Centre (NDMC) http://drought.unl.edu and Drought
portal http://www.drought.gov • Regional Committee on Hydraulic Resources (CRRH)
http://www.recursoshidricos.org/ • Water Centre for Arid and Semi-Arid Zones in Latin America and the Caribbean
(CAZALAC) http://www.cazalac.org • Water Centre for Latin America and the Caribbean (CAALCA)
http://centrodelagua.org Asia
• Arid Land Research Centre (ALRC) http://www.alrc.tottori-u.ac.jp • Drought Monitoring and Early Warning Centre Middle East http://jrcc.sa/ • National Climate Centre (China)
http://cmdp.ncc.cma.gov.cn/extreme/dust.php?product=dust_moni • Pacific Disaster Centre (PDC) http://www.pdc.org/
Global
• Integrated Drought Management Programme (IDMP) http://www.droughtmanagement.info
o Regional IDMP for Central and Eastern Europe (IDMP CEE) o Regional IDMP in West Africa (IDMP WAF) o Integrated Drought Management Programme (IDMP) in the Horn of Africa o South Asian Drought Monitoring System (SA DMS) o Integrated Drought Management Initiatives in Central America
• International Water Management Institute (IWMI) http://www.iwmi.cgiar.org
11
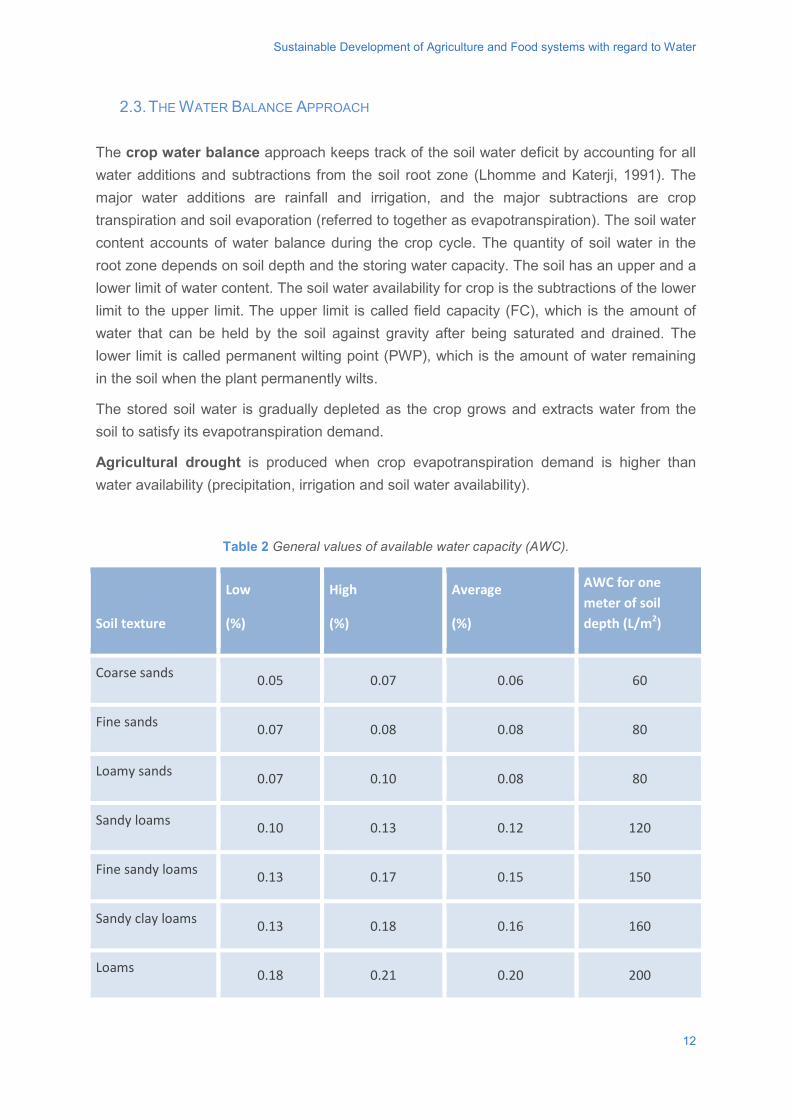
Sustainable Development of Agriculture and Food systems with regard to Water
2.3. THE WATER BALANCE APPROACH The crop water balance approach keeps track of the soil water deficit by accounting for all water additions and subtractions from the soil root zone (Lhomme and Katerji, 1991). The major water additions are rainfall and irrigation, and the major subtractions are crop transpiration and soil evaporation (referred to together as evapotranspiration). The soil water content accounts of water balance during the crop cycle. The quantity of soil water in the root zone depends on soil depth and the storing water capacity. The soil has an upper and a lower limit of water content. The soil water availability for crop is the subtractions of the lower limit to the upper limit. The upper limit is called field capacity (FC), which is the amount of water that can be held by the soil against gravity after being saturated and drained. The lower limit is called permanent wilting point (PWP), which is the amount of water remaining in the soil when the plant permanently wilts.
The stored soil water is gradually depleted as the crop grows and extracts water from the soil to satisfy its evapotranspiration demand.
Agricultural drought is produced when crop evapotranspiration demand is higher than water availability (precipitation, irrigation and soil water availability).
Table 2 General values of available water capacity (AWC).
Soil texture
Low
(%)
High
(%)
Average
(%)
AWC for one meter of soil depth (L/m2)
Coarse sands 0.05 0.07 0.06 60
Fine sands 0.07 0.08 0.08 80
Loamy sands 0.07 0.10 0.08 80
Sandy loams 0.10 0.13 0.12 120
Fine sandy loams 0.13 0.17 0.15 150
Sandy clay loams 0.13 0.18 0.16 160
Loams 0.18 0.21 0.20 200
12
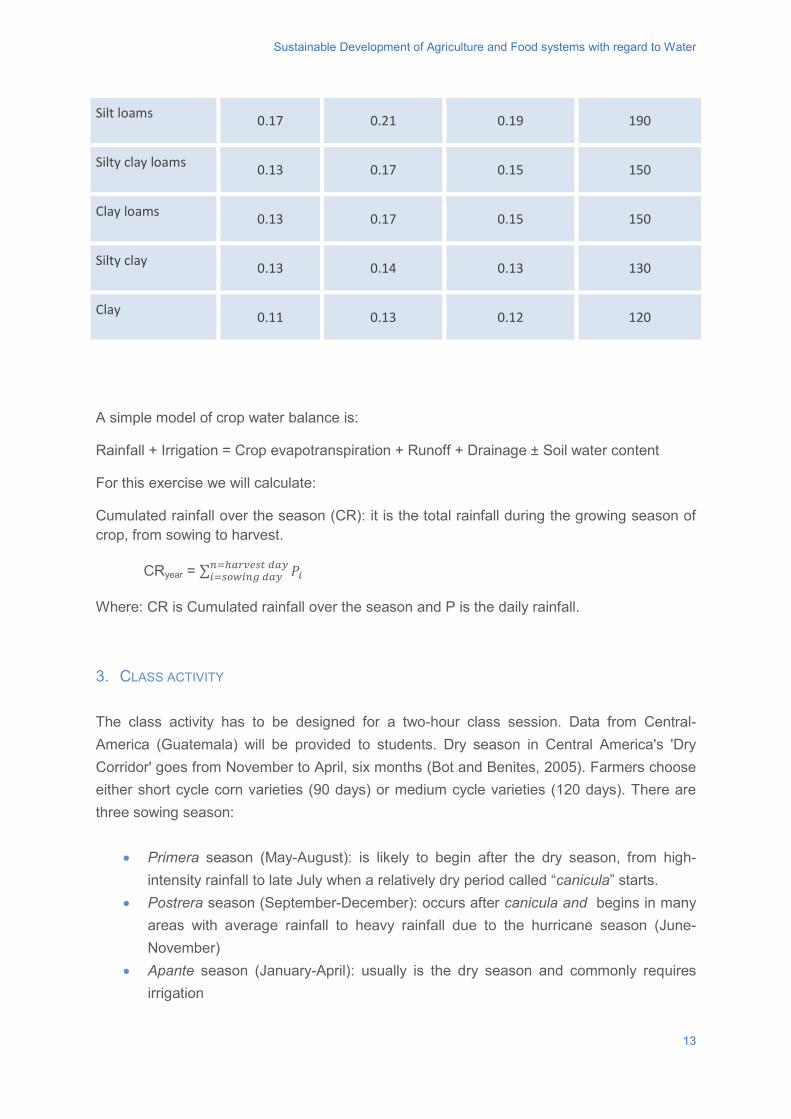
Sustainable Development of Agriculture and Food systems with regard to Water
Silt loams 0.17 0.21 0.19 190
Silty clay loams 0.13 0.17 0.15 150
Clay loams 0.13 0.17 0.15 150
Silty clay 0.13 0.14 0.13 130
Clay 0.11 0.13 0.12 120
A simple model of crop water balance is:
Rainfall + Irrigation = Crop evapotranspiration + Runoff + Drainage ± Soil water content
For this exercise we will calculate:
Cumulated rainfall over the season (CR): it is the total rainfall during the growing season of crop, from sowing to harvest.
CRyear = ∑ 𝑃𝑃𝑖𝑖𝑛𝑛=ℎ𝑎𝑎𝑎𝑎𝑎𝑎𝑎𝑎𝑎𝑎𝑎𝑎 𝑑𝑑𝑎𝑎𝑑𝑑𝑖𝑖=𝑎𝑎𝑠𝑠𝑠𝑠𝑖𝑖𝑛𝑛𝑠𝑠 𝑑𝑑𝑎𝑎𝑑𝑑
Where: CR is Cumulated rainfall over the season and P is the daily rainfall.
3. CLASS ACTIVITY The class activity has to be designed for a two-hour class session. Data from Central-America (Guatemala) will be provided to students. Dry season in Central America's 'Dry Corridor' goes from November to April, six months (Bot and Benites, 2005). Farmers choose either short cycle corn varieties (90 days) or medium cycle varieties (120 days). There are three sowing season:
• Primera season (May-August): is likely to begin after the dry season, from high-intensity rainfall to late July when a relatively dry period called “canicula” starts.
• Postrera season (September-December): occurs after canicula and begins in many areas with average rainfall to heavy rainfall due to the hurricane season (June-November)
• Apante season (January-April): usually is the dry season and commonly requires irrigation
13
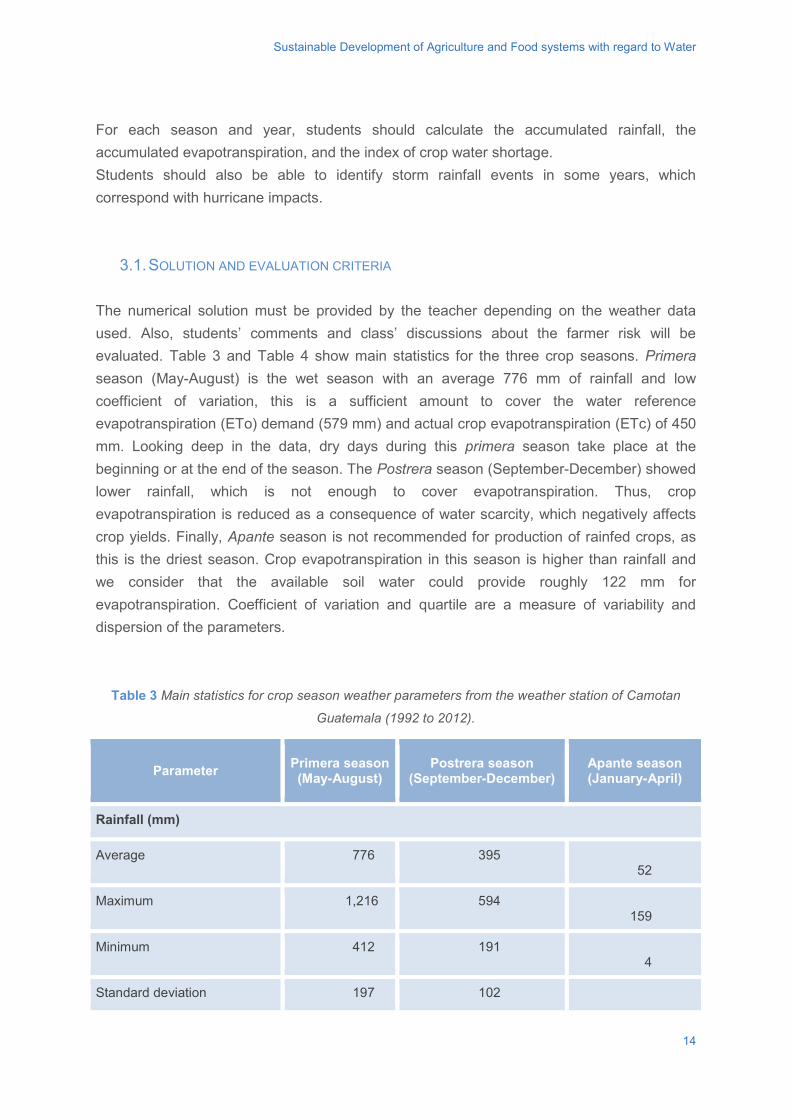
Sustainable Development of Agriculture and Food systems with regard to Water
For each season and year, students should calculate the accumulated rainfall, the accumulated evapotranspiration, and the index of crop water shortage. Students should also be able to identify storm rainfall events in some years, which correspond with hurricane impacts.
3.1. SOLUTION AND EVALUATION CRITERIA The numerical solution must be provided by the teacher depending on the weather data used. Also, students’ comments and class’ discussions about the farmer risk will be evaluated. Table 3 and Table 4 show main statistics for the three crop seasons. Primera season (May-August) is the wet season with an average 776 mm of rainfall and low coefficient of variation, this is a sufficient amount to cover the water reference evapotranspiration (ETo) demand (579 mm) and actual crop evapotranspiration (ETc) of 450 mm. Looking deep in the data, dry days during this primera season take place at the beginning or at the end of the season. The Postrera season (September-December) showed lower rainfall, which is not enough to cover evapotranspiration. Thus, crop evapotranspiration is reduced as a consequence of water scarcity, which negatively affects crop yields. Finally, Apante season is not recommended for production of rainfed crops, as this is the driest season. Crop evapotranspiration in this season is higher than rainfall and we consider that the available soil water could provide roughly 122 mm for evapotranspiration. Coefficient of variation and quartile are a measure of variability and dispersion of the parameters.
Table 3 Main statistics for crop season weather parameters from the weather station of Camotan
Guatemala (1992 to 2012).
Parameter Primera season (May-August)
Postrera season (September-December)
Apante season (January-April)
Rainfall (mm)
Average 776 395 52
Maximum 1,216 594 159
Minimum 412 191 4
Standard deviation 197 102
14
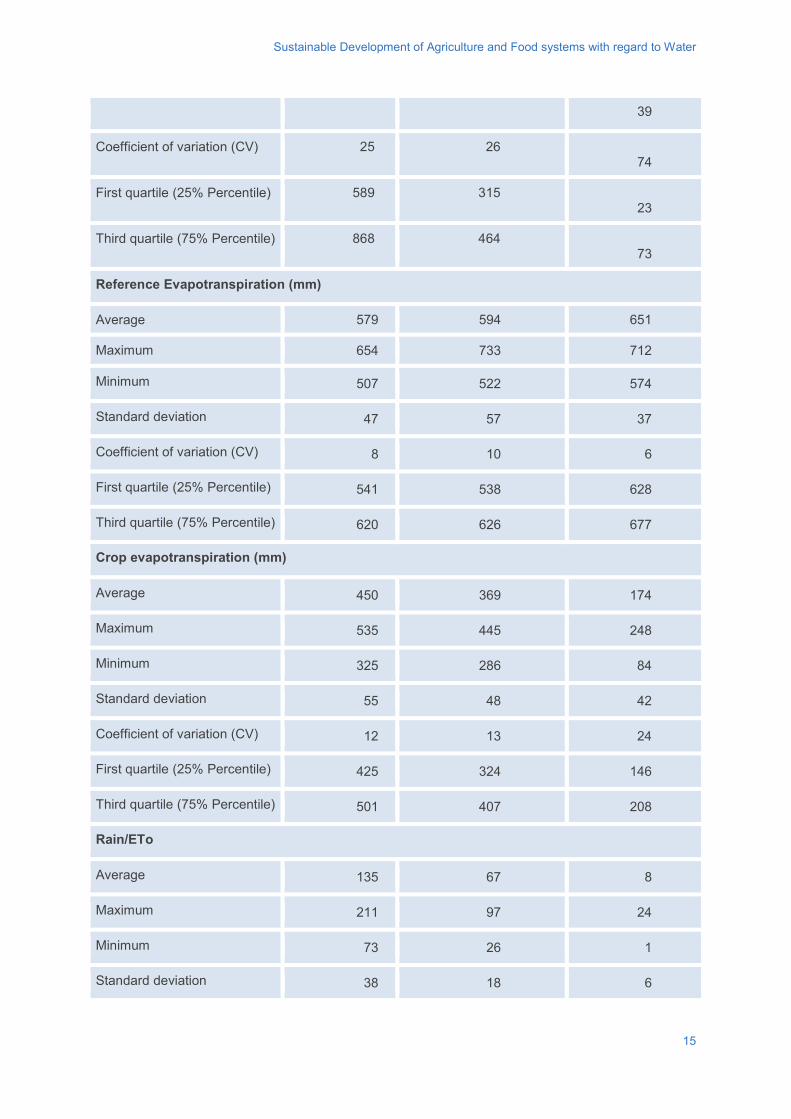
Sustainable Development of Agriculture and Food systems with regard to Water
39
Coefficient of variation (CV) 25 26 74
First quartile (25% Percentile) 589 315 23
Third quartile (75% Percentile) 868 464 73
Reference Evapotranspiration (mm)
Average 579 594 651
Maximum 654 733 712
Minimum 507 522 574
Standard deviation 47 57 37
Coefficient of variation (CV) 8 10 6
First quartile (25% Percentile) 541 538 628
Third quartile (75% Percentile) 620 626 677
Crop evapotranspiration (mm)
Average 450 369 174
Maximum 535 445 248
Minimum 325 286 84
Standard deviation 55 48 42
Coefficient of variation (CV) 12 13 24
First quartile (25% Percentile) 425 324 146
Third quartile (75% Percentile) 501 407 208
Rain/ETo
Average 135 67 8
Maximum 211 97 24
Minimum 73 26 1
Standard deviation 38 18 6
15
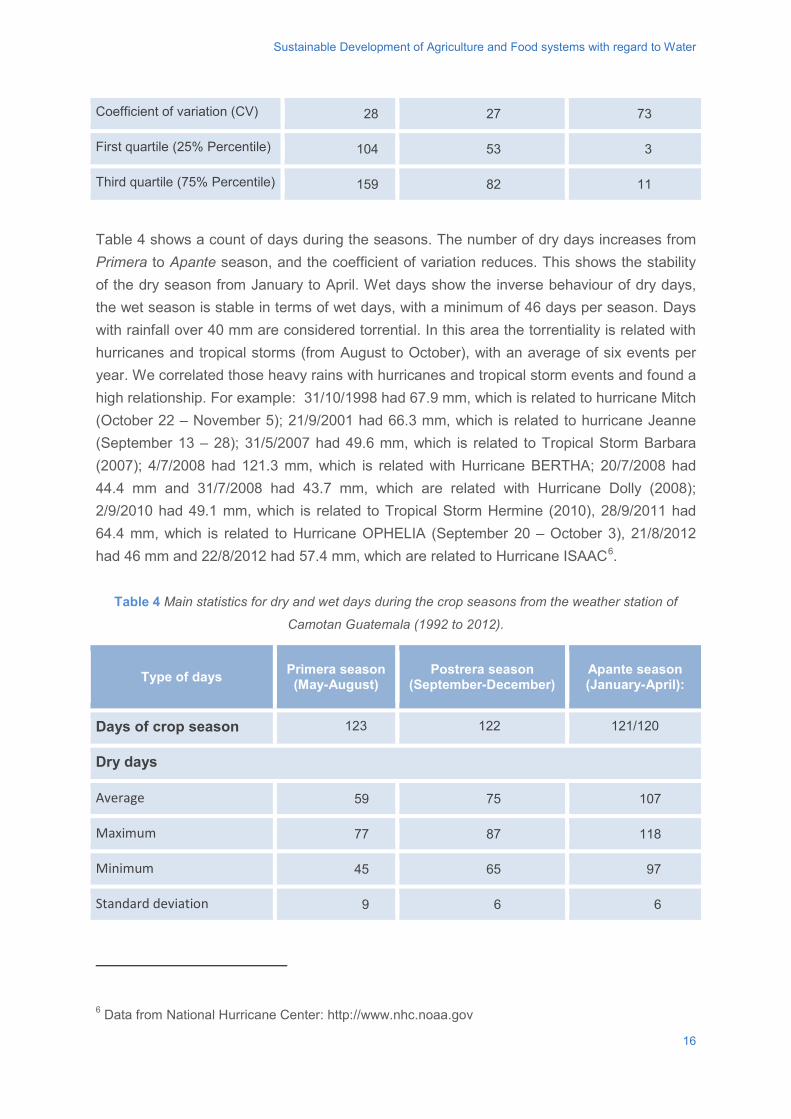
Sustainable Development of Agriculture and Food systems with regard to Water
Coefficient of variation (CV) 28 27 73
First quartile (25% Percentile) 104 53 3
Third quartile (75% Percentile) 159 82 11
Table 4 shows a count of days during the seasons. The number of dry days increases from Primera to Apante season, and the coefficient of variation reduces. This shows the stability of the dry season from January to April. Wet days show the inverse behaviour of dry days, the wet season is stable in terms of wet days, with a minimum of 46 days per season. Days with rainfall over 40 mm are considered torrential. In this area the torrentiality is related with hurricanes and tropical storms (from August to October), with an average of six events per year. We correlated those heavy rains with hurricanes and tropical storm events and found a high relationship. For example: 31/10/1998 had 67.9 mm, which is related to hurricane Mitch (October 22 – November 5); 21/9/2001 had 66.3 mm, which is related to hurricane Jeanne (September 13 – 28); 31/5/2007 had 49.6 mm, which is related to Tropical Storm Barbara (2007); 4/7/2008 had 121.3 mm, which is related with Hurricane BERTHA; 20/7/2008 had 44.4 mm and 31/7/2008 had 43.7 mm, which are related with Hurricane Dolly (2008); 2/9/2010 had 49.1 mm, which is related to Tropical Storm Hermine (2010), 28/9/2011 had 64.4 mm, which is related to Hurricane OPHELIA (September 20 – October 3), 21/8/2012 had 46 mm and 22/8/2012 had 57.4 mm, which are related to Hurricane ISAAC6.
Table 4 Main statistics for dry and wet days during the crop seasons from the weather station of
Camotan Guatemala (1992 to 2012).
Type of days Primera season (May-August)
Postrera season (September-December)
Apante season (January-April):
Days of crop season 123 122 121/120
Dry days
Average 59 75 107
Maximum 77 87 118
Minimum 45 65 97
Standard deviation 9 6 6
6 Data from National Hurricane Center: http://www.nhc.noaa.gov
16
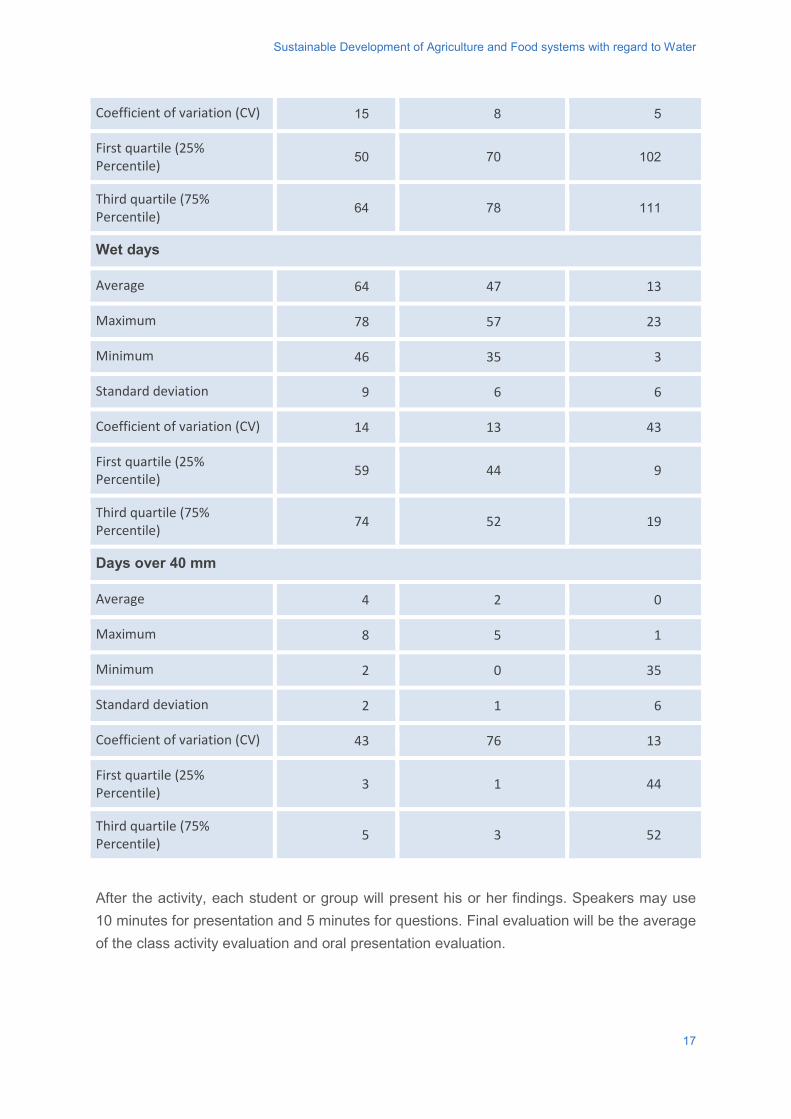
Sustainable Development of Agriculture and Food systems with regard to Water
Coefficient of variation (CV) 15 8 5
First quartile (25% Percentile) 50 70 102
Third quartile (75% Percentile) 64 78 111
Wet days
Average 64 47 13
Maximum 78 57 23
Minimum 46 35 3
Standard deviation 9 6 6
Coefficient of variation (CV) 14 13 43
First quartile (25% Percentile) 59 44 9
Third quartile (75% Percentile) 74 52 19
Days over 40 mm
Average 4 2 0
Maximum 8 5 1
Minimum 2 0 35
Standard deviation 2 1 6
Coefficient of variation (CV) 43 76 13
First quartile (25% Percentile) 3 1 44
Third quartile (75% Percentile) 5 3 52
After the activity, each student or group will present his or her findings. Speakers may use 10 minutes for presentation and 5 minutes for questions. Final evaluation will be the average of the class activity evaluation and oral presentation evaluation.
17
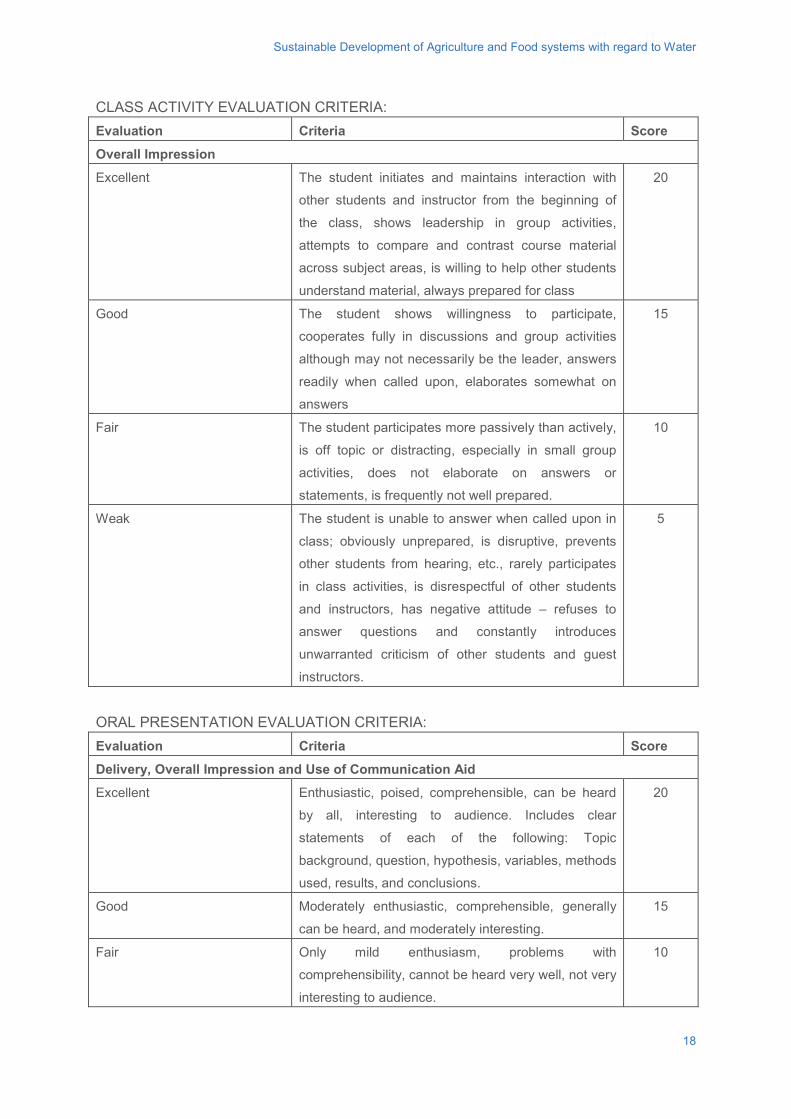
Sustainable Development of Agriculture and Food systems with regard to Water
CLASS ACTIVITY EVALUATION CRITERIA: Evaluation Criteria Score
Overall Impression
Excellent The student initiates and maintains interaction with
other students and instructor from the beginning of
the class, shows leadership in group activities,
attempts to compare and contrast course material
across subject areas, is willing to help other students
understand material, always prepared for class
20
Good The student shows willingness to participate,
cooperates fully in discussions and group activities
although may not necessarily be the leader, answers
readily when called upon, elaborates somewhat on
answers
15
Fair The student participates more passively than actively,
is off topic or distracting, especially in small group
activities, does not elaborate on answers or
statements, is frequently not well prepared.
10
Weak The student is unable to answer when called upon in
class; obviously unprepared, is disruptive, prevents
other students from hearing, etc., rarely participates
in class activities, is disrespectful of other students
and instructors, has negative attitude – refuses to
answer questions and constantly introduces
unwarranted criticism of other students and guest
instructors.
5
ORAL PRESENTATION EVALUATION CRITERIA: Evaluation Criteria Score
Delivery, Overall Impression and Use of Communication Aid
Excellent Enthusiastic, poised, comprehensible, can be heard
by all, interesting to audience. Includes clear
statements of each of the following: Topic
background, question, hypothesis, variables, methods
used, results, and conclusions.
20
Good Moderately enthusiastic, comprehensible, generally
can be heard, and moderately interesting.
15
Fair Only mild enthusiasm, problems with
comprehensibility, cannot be heard very well, not very
interesting to audience.
10
18
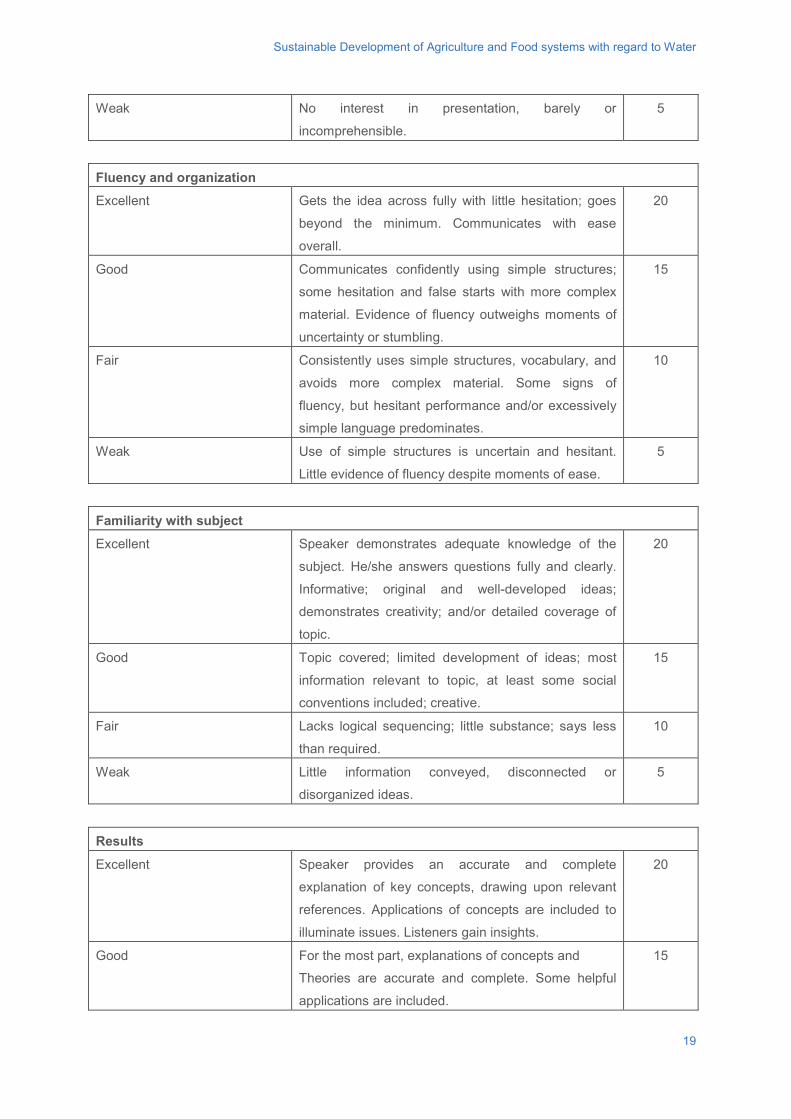
Sustainable Development of Agriculture and Food systems with regard to Water
Weak No interest in presentation, barely or
incomprehensible.
5
Fluency and organization
Excellent Gets the idea across fully with little hesitation; goes
beyond the minimum. Communicates with ease
overall.
20
Good Communicates confidently using simple structures;
some hesitation and false starts with more complex
material. Evidence of fluency outweighs moments of
uncertainty or stumbling.
15
Fair Consistently uses simple structures, vocabulary, and
avoids more complex material. Some signs of
fluency, but hesitant performance and/or excessively
simple language predominates.
10
Weak Use of simple structures is uncertain and hesitant.
Little evidence of fluency despite moments of ease.
5
Familiarity with subject
Excellent Speaker demonstrates adequate knowledge of the
subject. He/she answers questions fully and clearly.
Informative; original and well-developed ideas;
demonstrates creativity; and/or detailed coverage of
topic.
20
Good Topic covered; limited development of ideas; most
information relevant to topic, at least some social
conventions included; creative.
15
Fair Lacks logical sequencing; little substance; says less
than required.
10
Weak Little information conveyed, disconnected or
disorganized ideas.
5
Results
Excellent Speaker provides an accurate and complete
explanation of key concepts, drawing upon relevant
references. Applications of concepts are included to
illuminate issues. Listeners gain insights.
20
Good For the most part, explanations of concepts and
Theories are accurate and complete. Some helpful
applications are included.
15
19
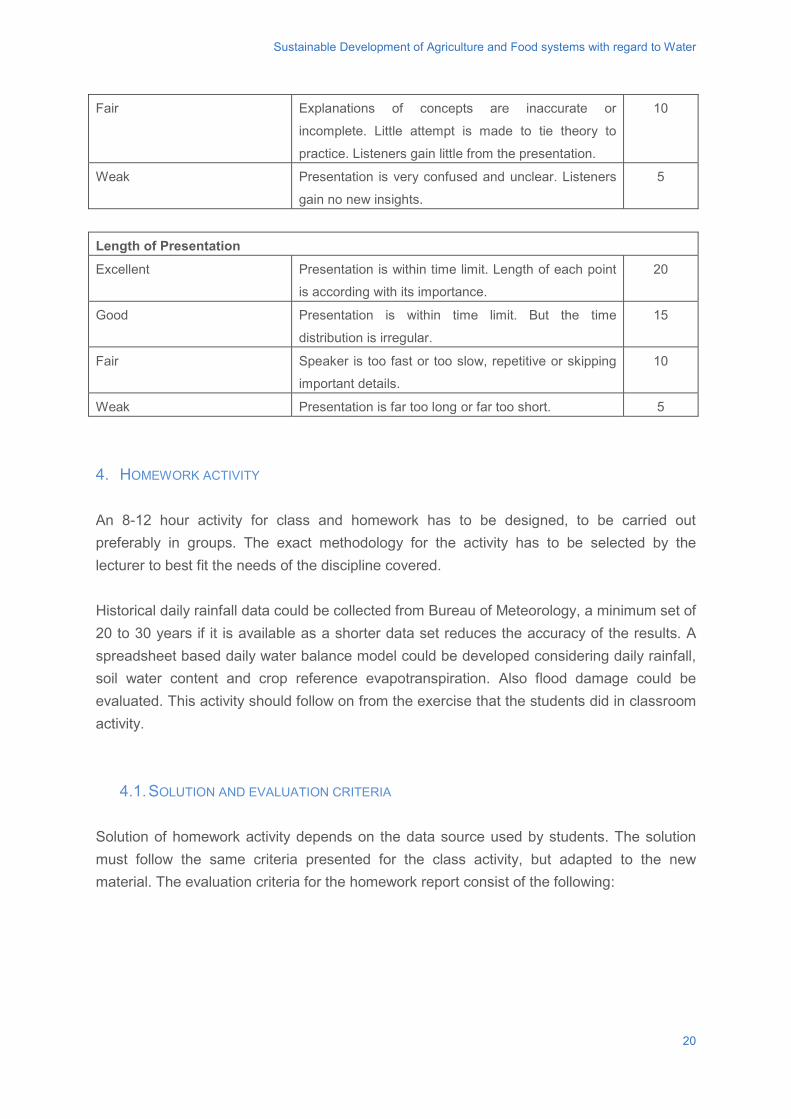
Sustainable Development of Agriculture and Food systems with regard to Water
Fair Explanations of concepts are inaccurate or
incomplete. Little attempt is made to tie theory to
practice. Listeners gain little from the presentation.
10
Weak Presentation is very confused and unclear. Listeners
gain no new insights.
5
Length of Presentation
Excellent Presentation is within time limit. Length of each point
is according with its importance.
20
Good Presentation is within time limit. But the time
distribution is irregular.
15
Fair Speaker is too fast or too slow, repetitive or skipping
important details.
10
Weak Presentation is far too long or far too short. 5
4. HOMEWORK ACTIVITY An 8-12 hour activity for class and homework has to be designed, to be carried out preferably in groups. The exact methodology for the activity has to be selected by the lecturer to best fit the needs of the discipline covered. Historical daily rainfall data could be collected from Bureau of Meteorology, a minimum set of 20 to 30 years if it is available as a shorter data set reduces the accuracy of the results. A spreadsheet based daily water balance model could be developed considering daily rainfall, soil water content and crop reference evapotranspiration. Also flood damage could be evaluated. This activity should follow on from the exercise that the students did in classroom activity.
4.1. SOLUTION AND EVALUATION CRITERIA Solution of homework activity depends on the data source used by students. The solution must follow the same criteria presented for the class activity, but adapted to the new material. The evaluation criteria for the homework report consist of the following:
20
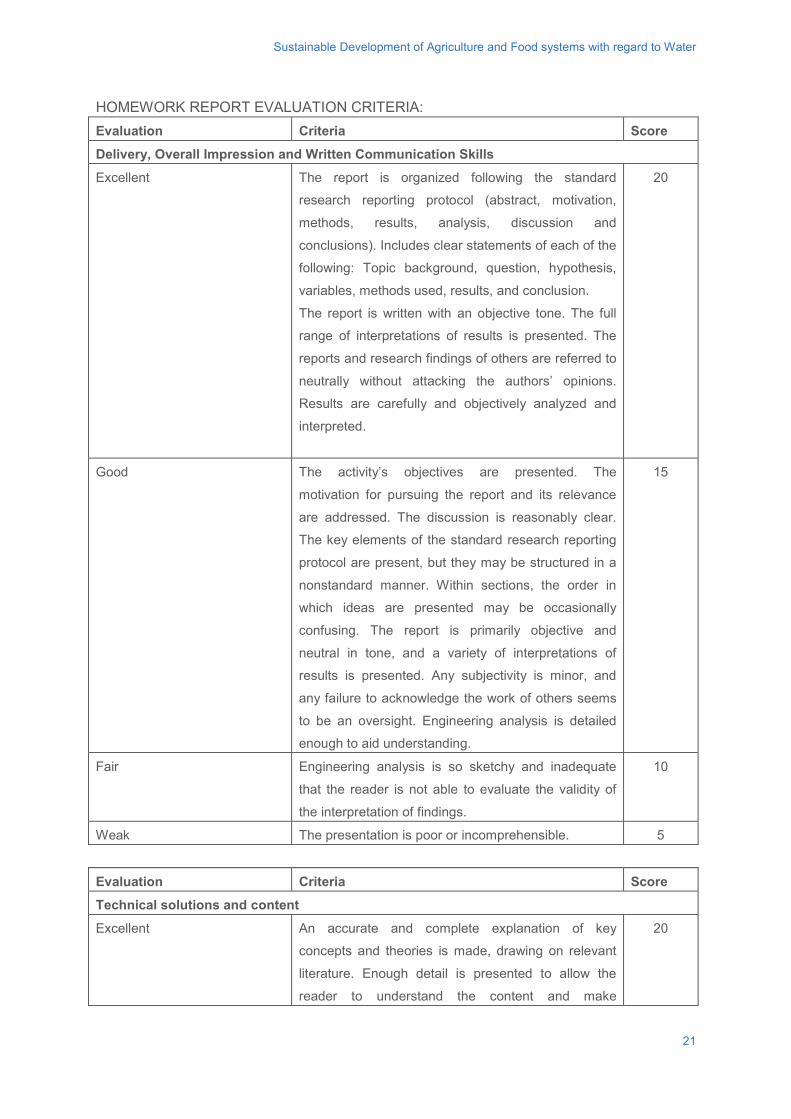
Sustainable Development of Agriculture and Food systems with regard to Water
HOMEWORK REPORT EVALUATION CRITERIA: Evaluation Criteria Score
Delivery, Overall Impression and Written Communication Skills
Excellent The report is organized following the standard
research reporting protocol (abstract, motivation,
methods, results, analysis, discussion and
conclusions). Includes clear statements of each of the
following: Topic background, question, hypothesis,
variables, methods used, results, and conclusion.
The report is written with an objective tone. The full
range of interpretations of results is presented. The
reports and research findings of others are referred to
neutrally without attacking the authors’ opinions.
Results are carefully and objectively analyzed and
interpreted.
20
Good The activity’s objectives are presented. The
motivation for pursuing the report and its relevance
are addressed. The discussion is reasonably clear.
The key elements of the standard research reporting
protocol are present, but they may be structured in a
nonstandard manner. Within sections, the order in
which ideas are presented may be occasionally
confusing. The report is primarily objective and
neutral in tone, and a variety of interpretations of
results is presented. Any subjectivity is minor, and
any failure to acknowledge the work of others seems
to be an oversight. Engineering analysis is detailed
enough to aid understanding.
15
Fair Engineering analysis is so sketchy and inadequate
that the reader is not able to evaluate the validity of
the interpretation of findings.
10
Weak The presentation is poor or incomprehensible. 5
Evaluation Criteria Score
Technical solutions and content
Excellent An accurate and complete explanation of key
concepts and theories is made, drawing on relevant
literature. Enough detail is presented to allow the
reader to understand the content and make
20
21
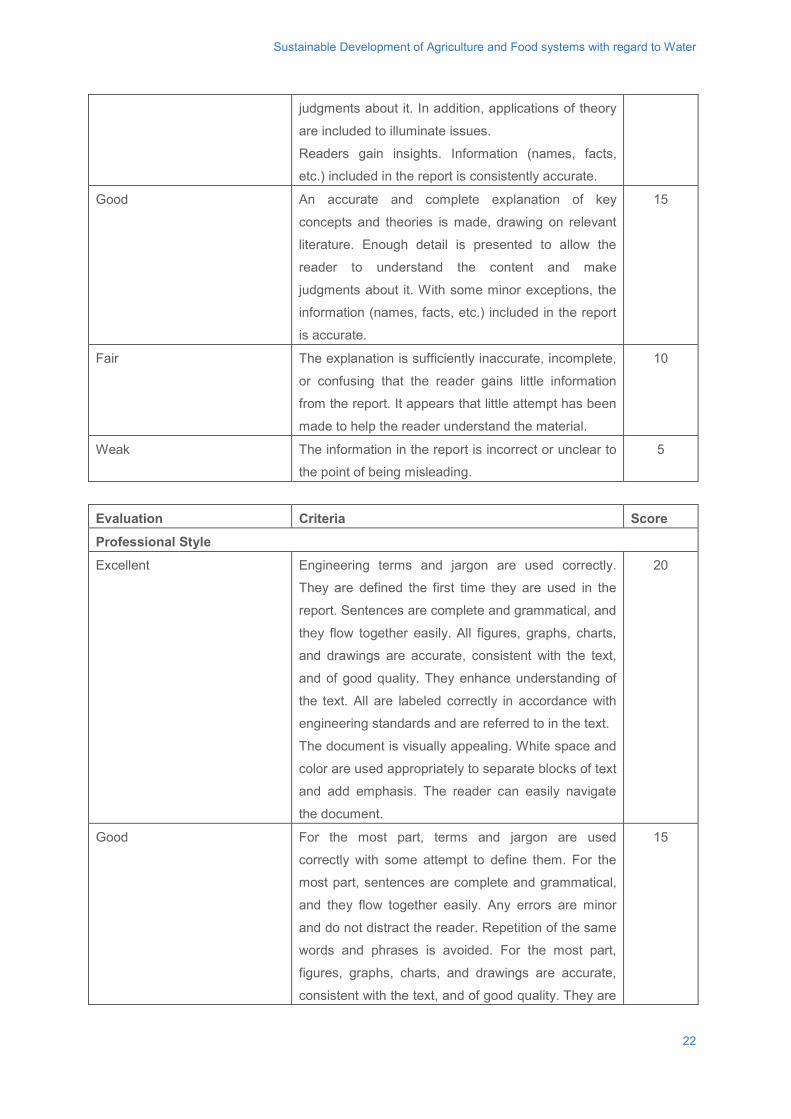
Sustainable Development of Agriculture and Food systems with regard to Water
judgments about it. In addition, applications of theory
are included to illuminate issues.
Readers gain insights. Information (names, facts,
etc.) included in the report is consistently accurate.
Good An accurate and complete explanation of key
concepts and theories is made, drawing on relevant
literature. Enough detail is presented to allow the
reader to understand the content and make
judgments about it. With some minor exceptions, the
information (names, facts, etc.) included in the report
is accurate.
15
Fair The explanation is sufficiently inaccurate, incomplete,
or confusing that the reader gains little information
from the report. It appears that little attempt has been
made to help the reader understand the material.
10
Weak The information in the report is incorrect or unclear to
the point of being misleading.
5
Evaluation Criteria Score
Professional Style
Excellent Engineering terms and jargon are used correctly.
They are defined the first time they are used in the
report. Sentences are complete and grammatical, and
they flow together easily. All figures, graphs, charts,
and drawings are accurate, consistent with the text,
and of good quality. They enhance understanding of
the text. All are labeled correctly in accordance with
engineering standards and are referred to in the text.
The document is visually appealing. White space and
color are used appropriately to separate blocks of text
and add emphasis. The reader can easily navigate
the document.
20
Good For the most part, terms and jargon are used
correctly with some attempt to define them. For the
most part, sentences are complete and grammatical,
and they flow together easily. Any errors are minor
and do not distract the reader. Repetition of the same
words and phrases is avoided. For the most part,
figures, graphs, charts, and drawings are accurate,
consistent with the text, and of good quality. They are
15
22
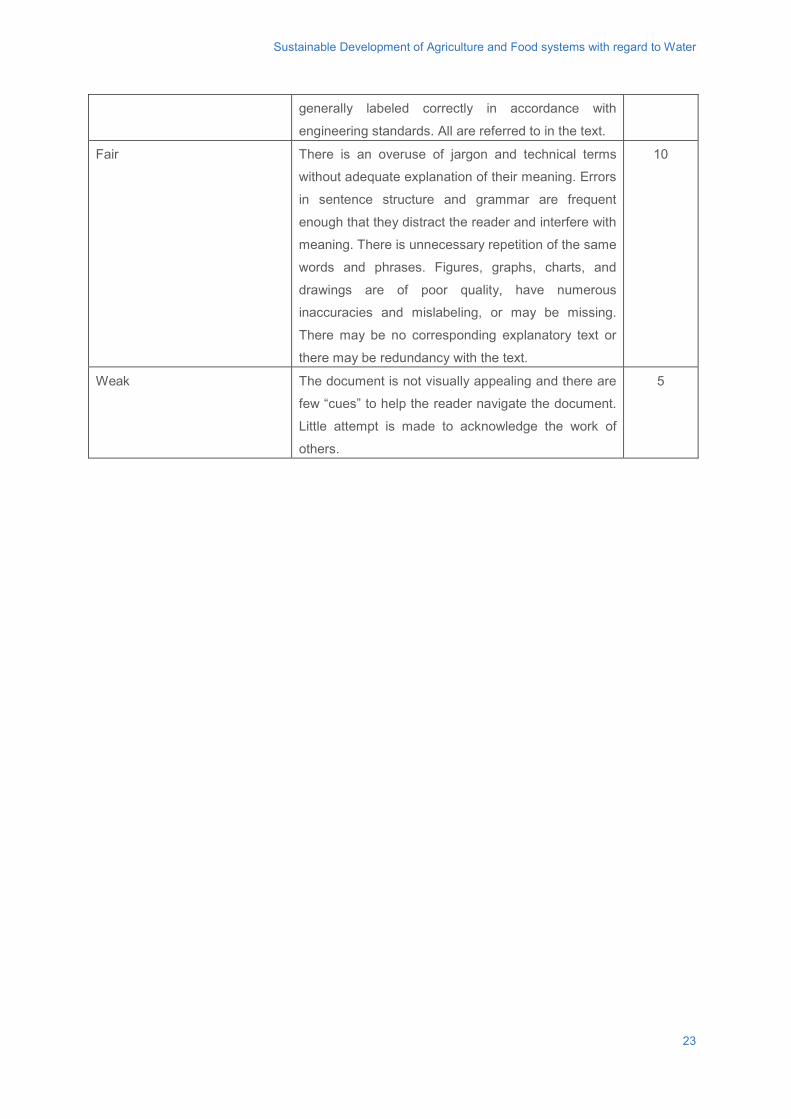
Sustainable Development of Agriculture and Food systems with regard to Water
generally labeled correctly in accordance with
engineering standards. All are referred to in the text.
Fair There is an overuse of jargon and technical terms
without adequate explanation of their meaning. Errors
in sentence structure and grammar are frequent
enough that they distract the reader and interfere with
meaning. There is unnecessary repetition of the same
words and phrases. Figures, graphs, charts, and
drawings are of poor quality, have numerous
inaccuracies and mislabeling, or may be missing.
There may be no corresponding explanatory text or
there may be redundancy with the text.
10
Weak The document is not visually appealing and there are
few “cues” to help the reader navigate the document.
Little attempt is made to acknowledge the work of
others.
5
23
Sustainable Development of Agriculture and Food systems with regard to Water
BIBLIOGRAPHY Arnés Prieto, E., Marín González, O., Merino Zazo, A., Hernández Díaz-Ambrona, C.G., 2013. Evaluación de la sostenibilidad de la agricultura de subsistencia en San José de Cusmapa, Nicaragua. Revista Española de Estudios Agrosociales y Pesqueros 236, 171-197.
Blas Morente, A., Barreiro Elorza, P., Griepentrog, H.W., Dias Da Costa, G.S., Díaz-Ambrona, C.H., 2013. Even-sowing pattern strategies for a low-input agricultural system in forage maize. Agricultural Engineering International: CIGR Journal 15 (4), 171-179.
BOCAM 2014. ORDEN 3017/2014, de 24 de septiembre, de la Consejera de Educación, Juventud y Deporte, por la que se resuelve la convocatoria de ayudas para la realización de Programas de Actividades de I + D entre grupos de investigación de la Comunidad de Madrid en Tecnologías 2013, cofinanciada con fondos estructurales. BOCAM 252 de 24 septiembre de 2014, pp. 34-50.
Borgia C., García-Bolaños M., Li T., Gómez-Macpherson H., Comas J., Connor D., Mateos L., 2013. Benchmarking for performance assessment of small and large irrigation schemes along the Senegal Valley in Mauritania. Agricultural Water Management, 121, 19–26.
Bot, A., Benites, J., 2005, ‘Drought-resistant Soils: Optimization of Soil Moisture for Sustainable Plant Production’ in Proceedings of the Electronic Conference Organized by the FAO Land and Water Development Division, FAO, Roma, 82 pp.
Brauman, K.A., Siebert, S., Foley, J.A. 2013. Improvements in crop water productivity increase water sustainability and food security—a global analysis. Environmental Research Letters 8 (2), 024030.
Díaz-Ambrona C.G.H., Maletta, E., 2014. Achieving Global Food Security through Sustainable Development of Agriculture and Food Systems with Regard to Nutrients, Soil, Land, and Waste Management. Current Sustainable/Renewable Energy Reports 1 (2), 57-65.
Diaz-Ambrona, C.H., Gigena, R., Mendoza, C.O., 2013. Climate Change Impacts on Maize and Dry Bean Yields of smallholder farmers in Honduras. Iberoamerican Journal of Development Studies 2, 5-22.
Eisler M.C., Lee M.R.F., Tarlton J.F., Martin G.B., Beddington J., Dungait J.A.J., Greathead H., Liu J., Mathew S., Miller H., Misselbrook T., Murray P., Vinod V.K., Saun R.V., Winter M., 2014. Agriculture: Steps to sustainable livestock. Nature 507(7490), 32–34.
24
Sustainable Development of Agriculture and Food systems with regard to Water
FOOD AND AGRICULTURE ORGANIZATION OF THE UNITED NATIONS (2007) Irrigation management transfer: worldwide efforts and results. FAO Water Report #32. International Water Management Institute, Sri Lanka and Food and Agricultural Organisation, Rome; 2007.
García-Bolaños M, Borgia C, Poblador N, Dia M, Seyid OMV, Mateos L. 2001. Performance assessment of small irrigation schemes along the Mauritanian banks of the Senegal River. Agricultural Water Management 98 (7), 1141–52.
Guofu Yuan, Y. Luo, Xiaomin Sun, Dengyin Tang, 2004. Evaluation of a crop water stress index for detecting water stress in winter wheat in the North China Plain, Agricultural Water Management 64 (1), 29-40.
Hefny, M.A., 2012. Changing behaviour as a policy tool for enhancing food security. Water Policy 14, 106-20.
Hernández Díaz-Ambrona, C.G., Marín, O., 2012. Los retos de la ingeniería de regadíos y la soberanía alimentaria, in: Neira Seijo, X. (Eds), Agroecología y gobernanza del agua. Sociedad Española de Agricultura Ecológica y SOGA, Lugo, pp 69-94.
Horion S., Carrão H., Singleton A., Barbosa P. and Vogt J. 2012. JRC experience on the development of Drought Information Systems. Europe, Africa and Latin America. EUR 25235 EN. Luxembourg (Luxembourg): Publications Office of the European Union, JRC68769, doi: 10.2788/15761.
Horion, S., Carrão, H., Singleton, A., Barbosa, P., Vogt, J. (2012). JRC experience on the development of Drought Information Systems. Europe, Africa and Latin America. EUR 25235 EN. Publications Office of the European Union, Luxembourg, JRC68769.
Lhomme, J.P., Katerji, N., 1991. A simple modelling of crop water balance for agrometeorological applications. Ecological Modelling 57, 11-25.
MAGRAMA, 2013. Anuarios de Estadística Agraria. Madrid: Secretaría General Técnica. Ministerio de Agricultura, Alimentación y Medio Ambiente; 2013. Available at http://www.magrama.gob.es. Accessed January 2, 2014.
Muñoz-García, M.A., Moreda, G.P., Raga-Arroyo, M.P., Marín, O., 2013. Water harvesting for young trees using Peltier modules powered by photovoltaic solar energy. Computers and Electronics in Agriculture 93, 60–67.
NWRP 2005. Water for the future. National Water Resources Plan. Ministry of Water Resources and Irrigation, Egypt. Available from: <http://ocid.nacse.org/>. [2 January 2014].
25
Sustainable Development of Agriculture and Food systems with regard to Water
ORGANISATION FOR ECONOMIC CO-OPERATION AND DEVELOPMENT (2012) Environmental Outlook to 2050: The Consequences of Inaction. Organisation for Economic Co-operation and Development. OECD Publishing, Paris.
Sun, W., Areikat, S., 2013. Establishing Drought Early Warning Systems in West Asia and North Africa. UN-DESA/DSD Intern Feb-April 2013. Available: from <https://sustainabledevelopment.un.org/content/documents/2411Technical%20Report-%20EWS-%20For%20Website.pdf>. [16 March 2015].
Wilhite, D.A., Glantz, M.H., 1985. Understanding the Drought Phenomenon: The Role of Definitions. Water International 10(3), 111-120.
Zargar, A., Sadiq, R., Naser, B., Khan, F.I., 2011. A review of drought indices. Environmental Review 19, 333-349.
26
Sustainable Development of Agriculture and Food systems with regard to Water
FURTHER/SUGGESTED MATERIAL
• Book: Dixon, J., Gulliver A., Gibbon D. 2001. Farming Systems and Poverty: Improving Farmers' Livelihoods in a Changing World. FAO and World Bank.
Summary: http://www.fao.org/3/a-ac349e.pdf English: ftp://ftp.fao.org/docrep/fao/003/y1860e/y1860e.pdf Spanish: ftp://ftp.fao.org/docrep/fao/003/y1860s/y1860s00.pdf
• Video: What Causes Drought? https://www.youtube.com/watch?v=IOIV7Aulty4 • Video: Floods and Droughts : Two Problems with One Solution
https://www.youtube.com/watch?v=vj3UwWETaNo • Video: Coping with drought (Kenya), https://www.youtube.com/watch?v=8TSHA6-
UqGI • Report: Agricultural drought assessment report (India),
http://jsac.jharkhand.gov.in/pdf/Drought/Drough_assessment_october2012-Part1_1.pdf
• Report: World Meteorological Organization: Drought within the context of the region VI (Europe), http://www.wmo.int/pages/prog/hwrp/documents/regions/DOC8.pdf
• Article: Hess, U., Richter, K., Stoppa, A. Weather Risk Management for Agriculture and Agri-Business in Developing Countries. FAO. http://www.fao.org/uploads/media/Weather%20Risk%20Management%20for%20Agriculture%20and%20Agri-Business%20in%20Developing%20Countries.pdf
• Article: Rojas, O., Vrieling, A., Rembold F. Assessing drought probability for agricultural areas in Africa with coarse resolution remote sensing imagery, http://www.fao.org/climatechange/38004-05a54c6f3e665ea2fabdec165b7948383.pdf
• PPT presentation: Irrigation & Water Requirements of Vegetable Crops, http://es.slideshare.net/munishsharma0255/irrigation-water-requirements-of-vegetable-crops
• PPT presentation: Coping with drought in crop improvement -- a global perspective, http://es.slideshare.net/GCProgramme/coping-withdrought-id4jmribaut2013
• PPT presentation: T12- Agriculture drought and land degradation loss in arab region, http://www.slideshare.net/NENAwaterscarcity/t12-wadid-erian-lw-18-12-2013-economics-ld-and-d-presentation
• PPT presentation: From Drought Management Strategies to Drought Management Policies, http://es.slideshare.net/gwpceewaterpartnership/joint-gwp-ceedmcsee-training-14-greece-from-drought-strategies-to-policieskaravitis
27

http://www.gdee.eu
This project is funded by
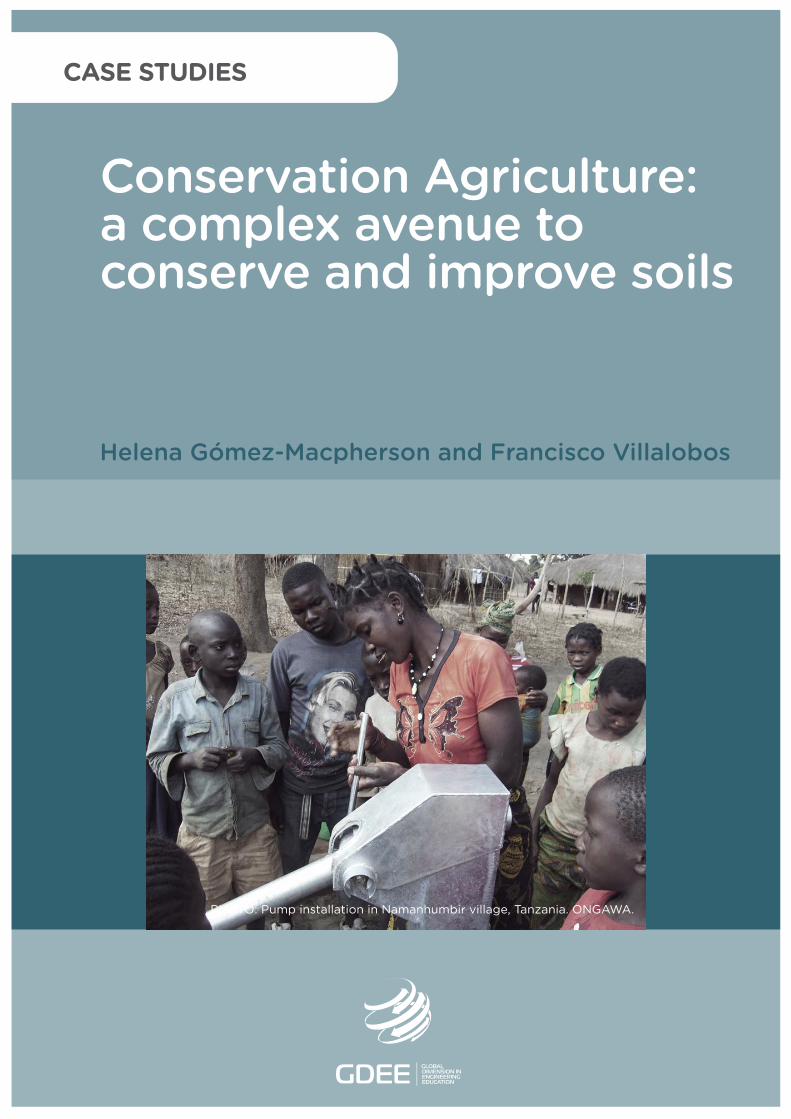
Helena Gómez-Macpherson and Francisco Villalobos
PHOTO: Pump installation in Namanhumbir village, Tanzania. ONGAWA.
CASE STUDIES
Conservation Agriculture: a complex avenue to conserve and improve soils
DL B 10735-2015 ISBN 978-84-606-7546-4
Conservation Agriculture: a complex avenueto conserve and improve soils
COORDINATED BYAgustí Pérez-Foguet, Enric Velo, Pol Arranz, Ricard Ginéand Boris Lazzarini (Universitat Politècnica de Catalunya)Manuel Sierra (Universidad Politécnica de Madrid)Alejandra Boni and Jordi Peris (Universitat Politècnica de València)Guido Zolezzi and Gabriella Trombino (Università degli Studi di Trento)Rhoda Trimingham (Loughborough University)Valentín Villarroel (ONGAWA)Neil Nobles and Meadhbh Bolger (Practical Action)Francesco Mongera (Training Center for International Cooperation)Katie Cresswell-Maynard (Engineering Without Border UK)
EDITED BY Global Dimension in Engineering Education
Citation: Gómez-Macpherson, H. and Villalobos, F. (2015) ' Conservation Agriculture: a complex avenue to conserve and improve soils', in Case studies for developing globally responsible engineers, GDEE (eds.), Global Dimension in Engineering Education, Barcelona. Available from: http://gdee.eu/index.php/resources.html
This publication is distributedunder an Attribution- Noncommercial-Share Alike License for Creative Commons
CASE STUDIES
Disclaimer: This document has been produced with the financial assistance of the European UnionThe contents of this document are the sole responsibility of the authors and can under no circumstances be regarded as reflecting the position of the European Union
Conservation Agriculture: a complex avenue to conserve and improve soils
CONSERVATION AGRICULTURE: A COMPLEX AVENUE TO CONSERVE AND IMPROVE SOILS
Helena Gómez-Macpherson and Francisco Villalobos Instituto de Agricultura Sostenible (IAS, CSIC), Córdoba, Spain.
1
Conservation Agriculture: a complex avenue to conserve and improve soils
INDEX
1. INTRODUCTION ........................................................................................................................... 3
1.1. DISCIPLINES COVERED ............................................................................................................. 3
1.2. LEARNING OUTCOMES .............................................................................................................. 3
1.3. ACTIVITIES .............................................................................................................................. 4
2. DESCRIPTION OF THE CONTEXT ............................................................................................. 4
2.1. ESTIMATION OF SOIL EROSION .................................................................................................. 6
2.2. CONSERVATION AGRICULTURE (CA) ........................................................................................ 8
2.3. COMPLEX INTERACTING PATHWAYS LIMITING CA SUCCESS ........................................................ 8
2.4. OTHER TERMS RELATED TO CA THAT MAY CREATE CONFUSION ................................................ 10
2.5. CA IMPACT ON CROP YIELD IN SUB-SAHARAN AFRICA (SSA) ................................................... 11
3. CLASS ACTIVITY ....................................................................................................................... 13
3.1. FIRST PART: EXPLORING FACTORS INFLUENCING SOIL EROSION (30’ TO CALCULATE VALUES; 30’ TO DISCUSS RESULTS) ................................................................................................................................ 13
3.1.1. SOLUTION AND EVALUATION CRITERIA .............................................................. 14
3.2. SECOND PART: DEBATE BETWEEN TWO GROUPS OF STUDENTS IN FAVOR OF CONSERVATION AGRICULTURE OR CONVENTIONAL AGRICULTURE. (1 HOUR) .................................................................... 15
3.2.1. SOLUTION AND EVALUATION CRITERIA .............................................................. 16
4. HOMEWORK ACTIVITY ............................................................................................................. 16
4.1. SOLUTION AND EVALUATION CRITERIA ..................................................................................... 16
BIBLIOGRAPHY ................................................................................................................................. 17
2
Conservation Agriculture: a complex avenue to conserve and improve soils
1. INTRODUCTION Soil erosion leads to soil degradation and water pollution; it is considered the main environmental threat associated with agriculture. Conservation Agriculture (CA) was developed to counteract this trend. Widespread implementation of CA in North and South America and Australia suggests significant farmer profitability, achieved through a combination of sustained or increased agronomic productivity and reduced input costs. Many believe similar agronomic benefits can accrue to farmers in Europe and Africa, despite differences in biophysical and socio-economic environments across these regions. However, the adoption of CA is minimal in both continents. This case study explores the requirements for developing successful CA systems in general and for smallholder farmers in Sub-Saharan Africa (SSA) in particular. The case study is largely based on the study “The impact of conservation agriculture on agricultural yields: A review of the evidence”, commissioned by the Independent Science and Partnership Counsel (http://ispc.cgiar.org/) and published in Agriculture, Ecosystems and Environment Journal (Brouder and Gómez-Macpherson, 2014). The case includes, firstly, an introduction to soil erosion, its estimation, and identification of factors driving it, and secondly, an introduction of CA, its key elements and the complex interaction of factors and paths within the system. Class activities proposed are to enable students to become familiar with the Universal Soil Loss Equation (USLE) and its use for evaluating land uses. The viewing of several videos on soil quality and various aspects of conservation by the students at home is also proposed.
1.1. DISCIPLINES COVERED Agronomy; crop ecology; soil and water conservation; soil erosion; on-farm management.
1.2. LEARNING OUTCOMES
• Understand interacting biophysical factors and process pathways towards soil quality and crop performance influenced by CA technologies.
• Ability to estimate soil erosion according to local conditions in order to evaluate land use options and their potential impact on soil erosion.
3
Conservation Agriculture: a complex avenue to conserve and improve soils
1.3. ACTIVITIES Home Activity 1 Two main groups will be formed: Conventional Agriculture and Conservation Agriculture. Each group will discuss pros/cons for both systems and find arguments to defend their assigned system and against the other system. Class Activity 1 The two big groups, Conventional Agriculture and Conservation Agriculture, will have a debate on the two systems. One person per group will present their assigned system in 5 minutes. After this, different students will present the arguments following a given order. Class Activity 2 In small groups, students will estimate soil losses for different environmental conditions and crop managements. Each group will present their results and a table will be filled in with the information. All groups will together discuss which factors affect soil erosion more and what can farmers do about it. 2. DESCRIPTION OF THE CONTEXT During last century, the development of powerful tractors replaced the less intensive traditional soil management methods. The new methods allowed rapid farm work and were extremely effective at controlling weeds, but also resulted in soil degradation Tillage disrupts and exposes protected soil aggregates and organic matter to aeration and microbial attacks, and therefore, increases the risk of water and wind soil erosion. Tillage also incorporates crop residues into the soil during its preparation to facilitate crop sowing, but at the same time leaves the soil surface unprotected against erosive elements. Erosion is the process of soil loss. Firstly, it requires energy for removing the particles, and then, some transport medium. The energy is obtained from the impact of raindrops and the transfer of momentum from water (surface runoff) or wind. Soil water erosion is accompanied by soil nutrient losses and accumulated sediment and pollutants in surface water. As a result, soil erosion reduces soil fertility and water storage capacity and thus, soil productivity capacity. On a larger scale, soil loss implies a reduction of vegetation, which in turn intensifies erosion and ultimately leads to desertification. Soil erosion is considered the main environmental threat associated with agriculture, even in irrigated cropping systems, due to the expansion of sprinkler and drip irrigation into inappropriate land (Fig. 1).
4
Conservation Agriculture: a complex avenue to conserve and improve soils
Soil degradation due to inappropriate management can have devastating effects. The “Dust Bowl” in mid=west USA early in the 20th century is the best known example. The impact on society and the environment was such that it led to the creation of the Soil Conservation Service in USA in a bid to avoid its repetition (Fig. 2). The Mediterranean region is particularly prone to water erosion because of heavy rainfall events that occur in autumn or winter when fields have little vegetative protection (Fig. 3). In this region, soil is prepared for cultivation in the summer and cereal crops are sown in autumn, while spring crops are sown as soon as temperatures start to rise in March. In general, crop residues are either incorporated into the soil or removed from the field and sold for additional income. The magnitude of the problem of soil erosion in the region was acknowledged in the Pan-European Soil Erosion Risk Assessment, which illustrated that risk figures of above 10 tn/ha/yr are relatively common in the southern European countries (Montanarella, 2005). Conservation Agriculture (CA) was developed to solve the problem of land degradation due to inappropriate agriculture practices by reducing soil disturbance to the minimum, maximizing soil cover with residues and increase crop diversification via a process of crop rotation (FAO, 2015a). Current global estimates of the extent of adoption of CA as a package are 124 million hectares (FAO, 2015b), nearly 85 % of which is concentrated in five countries: the United States, Brazil, Argentina, Australia, and Canada. The prevalence of CA in these areas alone suggests CA to be privately profitable for adopters. Furthermore, several environmental benefits have been theorized and some are now documented (Hobbs et al., 2008). Nonetheless, the potential environmental and economic benefits of CA adoption for crops in agro-ecologicalzones beyond the intensively studied systems of the Americas and Australia remain uncertain and contested (Stevenson et al. 2014). In fact, CA is hardly adopted in Europe and Africa. This case study explores the requirements for developing successful CA systems, in general, and for smallholder farmers in Sub-Saharan Africa (SSA) in particular. The case study is largely based on the study “The impact of conservation agriculture on agricultural yields: A review of the evidence”, commissioned by the Independent Science and Partnership Counsel (ispc.cgiar.org) and published in Agriculture, Ecosystems and Environment Journal (Brouder and Gómez-Macpherson, 2014). Before addressing CA, some concepts related to soil erosion and how to estimate it are provided.
5
Conservation Agriculture: a complex avenue to conserve and improve soils
2.1. ESTIMATION OF SOIL EROSION The main factors that determine soil erosion are topography (slope and length of slope), rainfall level, soil properties and soil management practices. Soil water erosion is proportional to runoff, which occurs when precipitation is higher than water infiltration into the soil, and to erodibility, a parameter that reflects how easily a particular soil is eroded. Soil erosion can be quantified using the Universal Soil Loss Equation, USLE (Wischmeier and Smith, 1978), or its revised version, RUSLE (Renard et al. 1997), both of which were developed in the U.S.A. (www.iwr.msu.edu/rusle/). USLE is primary used as a predictive tool to evaluate land use options and can be expressed as: A = R x K x LS x C x P where A (Mg / ha / yr) is the average annual soil loss by erosion; R is the rainfall-runoff erosivity factor; K is the soil erodibility factor; LS, the slope length and steepness factor; C, the cover-management factor; and P, the support practice factor. R depends on the energy and duration of rainfall, but can be roughly calculated based on the monthly rainfall distribution (Bergsma 1981): R = 4.17 Σ(Pi
2/P) -152 where Pi is the precipitation (mm) of month i and P the annual precipitation (mm). Local rainfall can be measured by installing a pluviometer or rain gauge in the field. There are automatic ones that can record hourly or daily rainfall. However, very simple models can be fabricated at home (Fig. 4). The erodibility K (Mg / ha / yr) depends mostly on structural stability of the soil, which is proportional to the texture and organic matter. K is equivalent to the soil loss that would occur in standard conditions, that is, if the land was kept as clean fallow, has a slope of 9% and a length of 22 m. Soils with a high silt content are most erodible as they tend to crust, produce high rates of runoff and particles are easily detached. High organic matter reduces erodibility because it improves structural stability by reducing the susceptibility of soil particles to detach with rain, runoff or wind. Figure 5 shows a map of estimated K in Europe. LS represents the combined effect of slope length (L) and slope steepness (S) on soil erosion. LS is the ratio of erosion in the conditions of interest, to that happening in the standard situation (length of 22 m; slope of 9%). LS can be roughly calculated as: LS = [0.065 + 0.0456 pt + 0.006541 pt
2] (lt/22.1)NT
6
Conservation Agriculture: a complex avenue to conserve and improve soils
where pt is the slope (%) of the land, lt is the length (m) and NT is a factor that depends on the slope steepness. The C factor reflects the effect of the crop (Cc) and the soil management method (Cm) on rainfall erosivity in relative terms from the deviation from standard clean-tilled continuous-fallow conditions. The C factor is obtained as the product of Cc and Cm. Finally, the P factor indicates the effect of measures for erosion control, i.e. practices that reduce the velocity of runoff and the tendency of runoff to flow directly down-slope. There have been extensive studies to calibrate these factors for different situations. However, if no information is available, Table 1 provides an approximation to factors for an initial estimate of average annual soil loss (A). USLE is a poor predictor of actual erosion, but the factor values reflect the relative effects of alternative practices on erosion. Farmers can reduce the risk of soil erosion by carefully choosing the crop and sowing time and the tillage system. Any tillage that reduces soil disturbance and keeps residues on the ground reduces the risk of soil erosion. In annual crops-based systems, zero tillage with mulch is most effective.
Table 1 USLE: values of factors.
K Factor Texture Average Organic matter <2% >2% Fine clay 0.17 0.19 0.15 Clay 0.22 0.24 0.21 Clay loam 0.30 0.33 0.28 Loam 0.30 0.34 0.26 Sandy loam 0.13 0.14 0.12 Sand 0.02 0.03 0.01 Silty clay 0.26 0.27 0.26 Silty clay loam 0.32 0.35 0.30 Silt loam 0.38 0.41 0.37 Sandy clay loam 0.20 0.20 0.20 Loamy sand 0.04 0.05 0.04 NT parameter to calculate LS Factor Slope (%)
<1
0.20 1-3
0.30
3-5
0.40 >5
0.50
Cc parameter Cereals
0.35
Sunflower
0.50 Horticultural crops
0.50
Fruit orchards + cover crop
0.10 Pastures
0.02
Cm parameter Autumn tillage
1.00
Spring tillage
0.90 Vertical tillage + some residues 0.60 Ridge planting
0.35
7
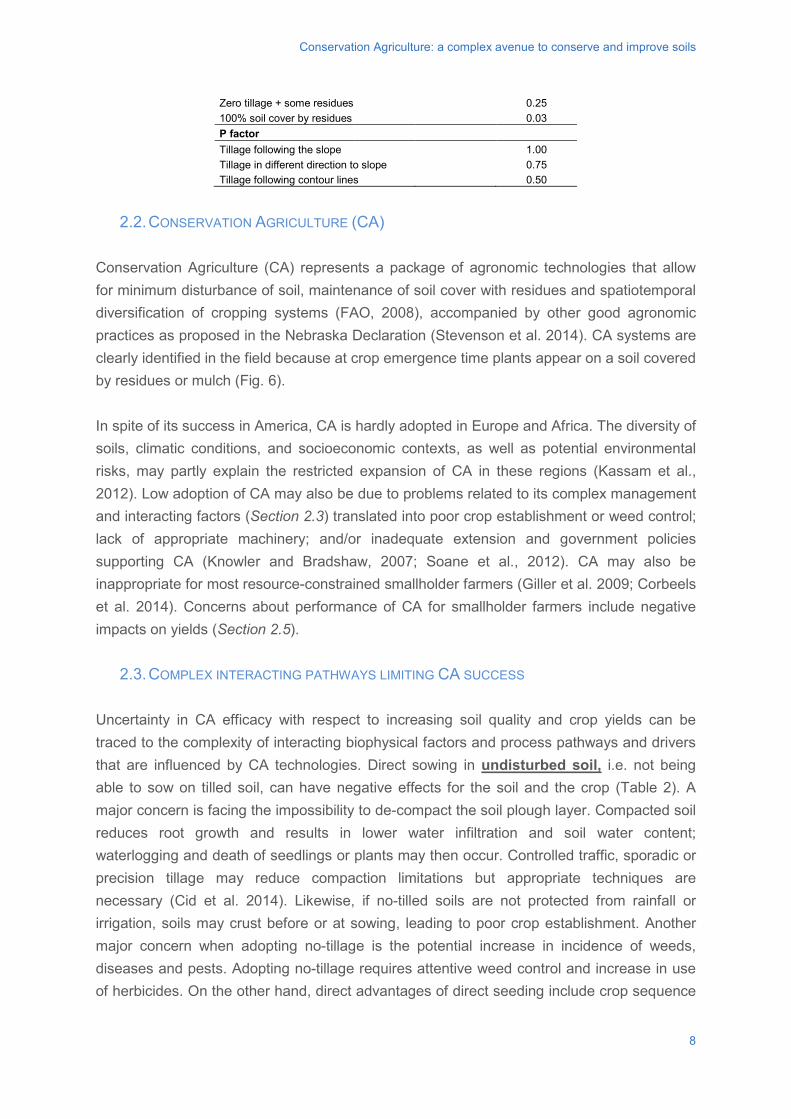
Conservation Agriculture: a complex avenue to conserve and improve soils
Zero tillage + some residues
0.25 100% soil cover by residues
0.03
P factor Tillage following the slope
1.00
Tillage in different direction to slope 0.75 Tillage following contour lines 0.50
2.2. CONSERVATION AGRICULTURE (CA)
Conservation Agriculture (CA) represents a package of agronomic technologies that allow for minimum disturbance of soil, maintenance of soil cover with residues and spatiotemporal diversification of cropping systems (FAO, 2008), accompanied by other good agronomic practices as proposed in the Nebraska Declaration (Stevenson et al. 2014). CA systems are clearly identified in the field because at crop emergence time plants appear on a soil covered by residues or mulch (Fig. 6). In spite of its success in America, CA is hardly adopted in Europe and Africa. The diversity of soils, climatic conditions, and socioeconomic contexts, as well as potential environmental risks, may partly explain the restricted expansion of CA in these regions (Kassam et al., 2012). Low adoption of CA may also be due to problems related to its complex management and interacting factors (Section 2.3) translated into poor crop establishment or weed control; lack of appropriate machinery; and/or inadequate extension and government policies supporting CA (Knowler and Bradshaw, 2007; Soane et al., 2012). CA may also be inappropriate for most resource-constrained smallholder farmers (Giller et al. 2009; Corbeels et al. 2014). Concerns about performance of CA for smallholder farmers include negative impacts on yields (Section 2.5).
2.3. COMPLEX INTERACTING PATHWAYS LIMITING CA SUCCESS Uncertainty in CA efficacy with respect to increasing soil quality and crop yields can be traced to the complexity of interacting biophysical factors and process pathways and drivers that are influenced by CA technologies. Direct sowing in undisturbed soil, i.e. not being able to sow on tilled soil, can have negative effects for the soil and the crop (Table 2). A major concern is facing the impossibility to de-compact the soil plough layer. Compacted soil reduces root growth and results in lower water infiltration and soil water content; waterlogging and death of seedlings or plants may then occur. Controlled traffic, sporadic or precision tillage may reduce compaction limitations but appropriate techniques are necessary (Cid et al. 2014). Likewise, if no-tilled soils are not protected from rainfall or irrigation, soils may crust before or at sowing, leading to poor crop establishment. Another major concern when adopting no-tillage is the potential increase in incidence of weeds, diseases and pests. Adopting no-tillage requires attentive weed control and increase in use of herbicides. On the other hand, direct advantages of direct seeding include crop sequence
8
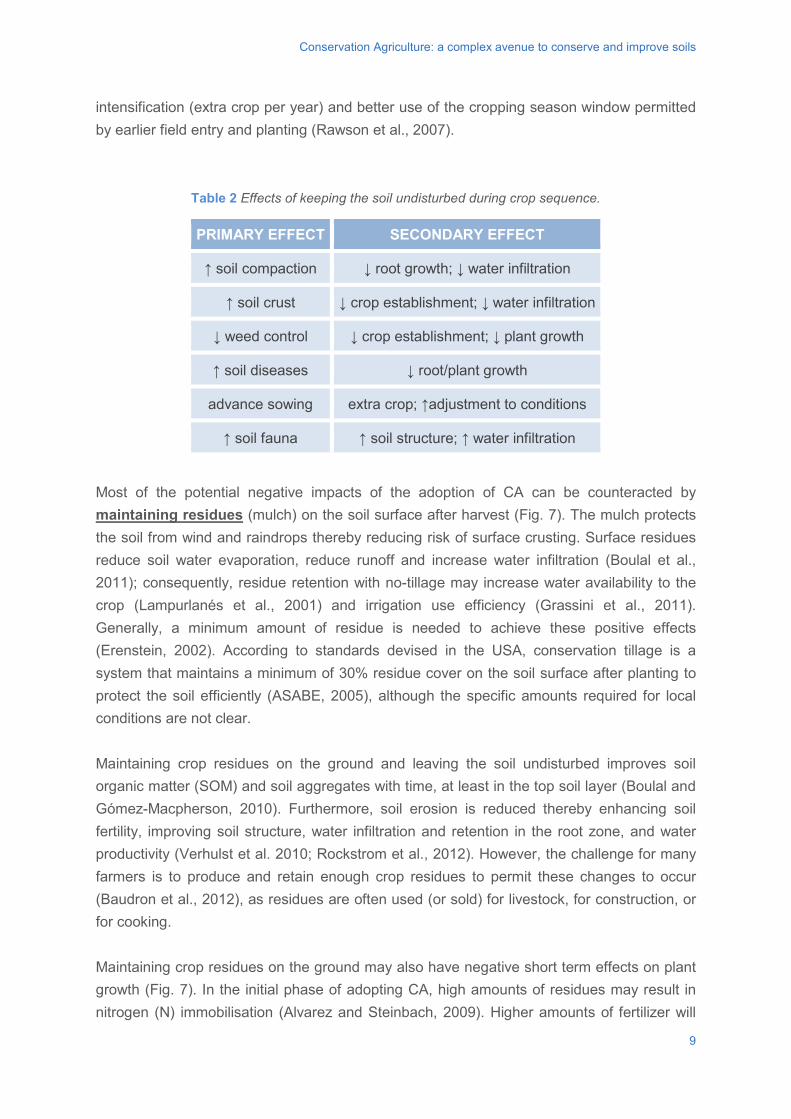
Conservation Agriculture: a complex avenue to conserve and improve soils
intensification (extra crop per year) and better use of the cropping season window permitted by earlier field entry and planting (Rawson et al., 2007).
Table 2 Effects of keeping the soil undisturbed during crop sequence.
PRIMARY EFFECT SECONDARY EFFECT
↑ soil compaction ↓ root growth; ↓ water infiltration
↑ soil crust ↓ crop establishment; ↓ water infiltration
↓ weed control ↓ crop establishment; ↓ plant growth
↑ soil diseases ↓ root/plant growth
advance sowing extra crop; ↑adjustment to conditions
↑ soil fauna ↑ soil structure; ↑ water infiltration
Most of the potential negative impacts of the adoption of CA can be counteracted by maintaining residues (mulch) on the soil surface after harvest (Fig. 7). The mulch protects the soil from wind and raindrops thereby reducing risk of surface crusting. Surface residues reduce soil water evaporation, reduce runoff and increase water infiltration (Boulal et al., 2011); consequently, residue retention with no-tillage may increase water availability to the crop (Lampurlanés et al., 2001) and irrigation use efficiency (Grassini et al., 2011). Generally, a minimum amount of residue is needed to achieve these positive effects (Erenstein, 2002). According to standards devised in the USA, conservation tillage is a system that maintains a minimum of 30% residue cover on the soil surface after planting to protect the soil efficiently (ASABE, 2005), although the specific amounts required for local conditions are not clear. Maintaining crop residues on the ground and leaving the soil undisturbed improves soil organic matter (SOM) and soil aggregates with time, at least in the top soil layer (Boulal and Gómez-Macpherson, 2010). Furthermore, soil erosion is reduced thereby enhancing soil fertility, improving soil structure, water infiltration and retention in the root zone, and water productivity (Verhulst et al. 2010; Rockstrom et al., 2012). However, the challenge for many farmers is to produce and retain enough crop residues to permit these changes to occur (Baudron et al., 2012), as residues are often used (or sold) for livestock, for construction, or for cooking. Maintaining crop residues on the ground may also have negative short term effects on plant growth (Fig. 7). In the initial phase of adopting CA, high amounts of residues may result in nitrogen (N) immobilisation (Alvarez and Steinbach, 2009). Higher amounts of fertilizer will
9
Conservation Agriculture: a complex avenue to conserve and improve soils
then be required to compensate the temporary immobilisation until soil fertility is increased and the system is balanced. Additionally, non-mobile soil nutrients, e.g. phosphorus (K), cannot be incorporated into the soil in detriment of growth, unless drills are prepared to incorporate basal fertilizers. Residues also reduce radiation interception by the soil and hence soil warming during early establishment of spring crops when temperatures are low. Leaving residues on the ground also requires specific drills to enable farmers to sow through them (Baker et al., 2007). The technology has evolved to find different solutions to different conditions, including equipment for two-wheeled tractors used in smallholder farms (Fig. 8). In CA, crop rotation has a major role in facilitating weed control and reducing the risk of pest and diseases incidence (Fig. 7). Having legumes in the rotation may also improve the nutrient cycle (Giller et al. 2009). Additionally, the rotation wouldhelp to maintain a manageable amount of residues in the system by combining high and low producing crops (Boulal et al., 2012). As with other models of sustainable agriculture, CA should be considered to be fully implemented in the long term, which would allow all of its associated benefits to be seen (Rusinamhodzi et al., 2011). Interacting pathways and tradeoffs as a function of prevailing weather and temperature regimes must be carefully considered. For example: the higher water infiltration with zero tillage (ZT) and residue retention may increase the risk of N leaching, while decreasing the risk of water logging; soil insulation by residues in temperate regions may negatively impact crop establishment, whereas in the tropics itmay keep soil temperatures lower and closer to the optimum for nutrient cycling. It is also crucial to understand time-lags for ZT adoption impacts. Above all, both expanding good agronomy and widening the scope of CA are necessary for developing successful options (Baudron et al., 2012; Rockström et al., 2009).
2.4. OTHER TERMS RELATED TO CA THAT MAY CREATE CONFUSION The following systems are often associated to CA but not necessarily result in expected benefits for the soil or crop: No-till (NT) / Zero till (ZT): NT and ZT simply involve the absence of tillage operations on the soil. Crops are planted directly into a seedbed not tilled after harvesting the previous crop. NT or ZT practitioners do not necessarily leave the residues on the ground. Direct seeding, direct drilling, plantio direto and siembra directa are terms used for ZT in other countries. Conservation tillage/ Minimum tillage/ Reduced tillage/ Mulch tillage: These are tillage operations that leave at least 30% of the soil surface covered by plant residues. Farmers do
10
Conservation Agriculture: a complex avenue to conserve and improve soils
not use deep ploughing. It was developed as a management system after the “Dust Bowl” of the 1930’s in the Mid-West areas of the USA. Strip tillage: narrow strips of 12-15 cm are cultivated and a row of crop is sown in these strips. This system is appropriate when a large amount of residues are produced.
2.5. CA IMPACT ON CROP YIELD IN SUB-SAHARAN AFRICA (SSA) Whether CA adoption increases crop yield and under what conditions it does so remains unclear, particularly in smallholder systems typically found in developing countries. Studies comparing direct seeded crops in undisturbed soil (ZT) with tilled treatments (CT) have been conducted for three main annual crops in SSA: 22, 10 and 8 studies on maize, cowpea and sorghum cropping, respectively (Brouder and Gómez-Macpherson, 2014). These studies present results that were often incomplete, specifically, critical descriptors for deepening on the drivers of soil quality or crop yield are absent (Fig. 7). Information on residue management, seasonal rainfall, weed control effectiveness or soil texture are also often missing. In spite of these limitations, some key trends on CA impact on crop yield can be identified in maize. Immediately following adoption (≤ 2 yr), ZT generally resulted in lower yields than CT but this effect changed over time in some cases (Fig. 9). Seventeen of the 22 maize studies present results for three or more years. Results are highly variable but there is an apparent, positive tendency for ZT yield improvement over time (~70 kg ha-1 yr-1 yield difference (ZT – CT)) although the relationship is not significant. Reasons for lower yield in ZT were not clear but the most common argument is poorer weed control. In three studies, higher soil compaction is associated with lower productivity. Only a few CA studies with sorghum and cowpea crops can be identified. This is probably a reflection of reduced agricultural development efforts in the difficult environments where these two crops are most common. Again, there is a general negative impact on yields when ZT is compared to CT (on average 0.34 and 0.02 t ha-1 less grain in sorghum and millet). However, not only are studies of these crops fewer in number but also their duration rarely exceeds 2 years. As for maize, longer duration studies may be necessary to show anticipated positive impacts on soil quality and water balance with sorghum and cowpea, particularly when soils are currently deemed marginal for crop production, under extreme rainfall and temperatures, and where competition for residues with livestock is significant. Furthermore, changing from local cultivation habits in sorghum management to a novel system requires time (Garcia-Ponce et al., 2013). The more complex the novel system is, the longer the period of time required by the farmer and researcher to master it.
11
Conservation Agriculture: a complex avenue to conserve and improve soils
The limited number of studies and the variation in treatments make it difficult to infer direct effects due to maintenance of residues and having mulch on the soil ground. In maize, only four studies compare ZT and CT with and without the presence of mulch. Results suggest ZT performs slightly better than CT when both treatments have mulch on the surface (0.18 t grain/ha higher on average) but slightly worse when residues are removed or incorporated (0.28 t grain/ha lower on average). Rusinamhodzi et al.’s (2011) review shows no clear benefits to yield of having mulch in zero- and minimum tillage systems and, further, indicates that mulch could have a negative effect over the long term due to increased occurrence of water-logging conditions. It is important to note, however, that these studies consider neither the opportunity costs of crop residues kept on the field versus an alternative use as fuel or fodder, nor the direct costs of mulch supplement. In maize, the largest collection of studies, preliminary analysis suggests average grain yields are 28 and 33% higher when rotated than when cultivated continually in ZT and CT, respectively (10 and 33 cases). In two maize studies where monoculture was compared to a rotation with a legume, the rotation benefit is higher in ZT than CT (25 and 9 % increment in grain yield, respectively). In summary, results from the review suggest that, in the short term, CT generally outperforms ZT for the staple crops examined. This may be the result of direct, short-term effects per se, e.g. increased soil compaction, or the need for farmers and researchers to learn about the various new technologies embedded in the CA system. For example, we mentioned above that more attention is needed for weed control in ZT to optimize management efficacy. The use of herbicide will facilitate ZT success but there is a need to develop a reliable herbicide regime for each system which may be combined with early hand weeding (Mishra and Singh, 2012). Good management is the first step for detecting tillage or mulch effects on crop productivity (Baudron et al., 2012). If access to inputs is limited and agro-environmental conditions are difficult, the technology options should be adapted accordingly (see “best-fit” options in Giller at al., 2011). Examples of intermediate systems can be found in Lahmar et al. (2012), Bayala et al. (2012) and Rockström et al. (2009). The initial negative impact of ZT on grain yield may reduce with time (Fig. 9) as several positive factors may only come into play in the long-term, particularly those linked with mulching (Fig. 7). Well-designed long-term studies are needed in order to respond to some of the points raised above (Govaerts et al., 2006.). Moreover, not only must good general agronomic practices be pursued for the duration of the experiment, but the specifics of management implementation and efficacy must be captured. These detailed studies should be accompanied by on-farm studies that can provide feedback for targeted research and by surveys for local characterization and identification of structural problems beyond the field scale (Giller at al., 2011). Studies at farm scale will also capture the economic benefits and/or costs of CA, an essential consideration for smallholder farmers.
12
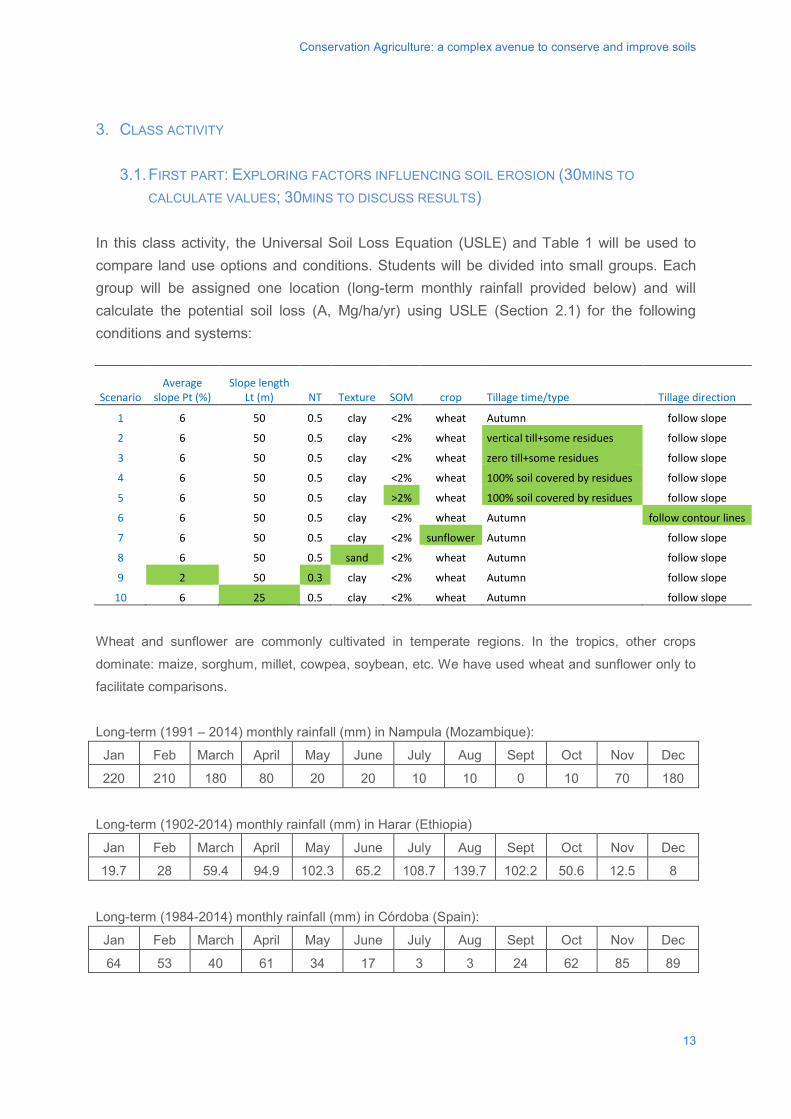
Conservation Agriculture: a complex avenue to conserve and improve soils
3. CLASS ACTIVITY
3.1. FIRST PART: EXPLORING FACTORS INFLUENCING SOIL EROSION (30MINS TO
CALCULATE VALUES; 30MINS TO DISCUSS RESULTS) In this class activity, the Universal Soil Loss Equation (USLE) and Table 1 will be used to compare land use options and conditions. Students will be divided into small groups. Each group will be assigned one location (long-term monthly rainfall provided below) and will calculate the potential soil loss (A, Mg/ha/yr) using USLE (Section 2.1) for the following conditions and systems:
Scenario Average
slope Pt (%) Slope length
Lt (m) NT Texture SOM crop Tillage time/type Tillage direction
1 6 50 0.5 clay <2% wheat Autumn follow slope
2 6 50 0.5 clay <2% wheat vertical till+some residues follow slope
3 6 50 0.5 clay <2% wheat zero till+some residues follow slope
4 6 50 0.5 clay <2% wheat 100% soil covered by residues follow slope
5 6 50 0.5 clay >2% wheat 100% soil covered by residues follow slope
6 6 50 0.5 clay <2% wheat Autumn follow contour lines
7 6 50 0.5 clay <2% sunflower Autumn follow slope
8 6 50 0.5 sand <2% wheat Autumn follow slope
9 2 50 0.3 clay <2% wheat Autumn follow slope
10 6 25 0.5 clay <2% wheat Autumn follow slope
Wheat and sunflower are commonly cultivated in temperate regions. In the tropics, other crops
dominate: maize, sorghum, millet, cowpea, soybean, etc. We have used wheat and sunflower only to
facilitate comparisons.
Long-term (1991 – 2014) monthly rainfall (mm) in Nampula (Mozambique):
Jan Feb March April May June July Aug Sept Oct Nov Dec
220 210 180 80 20 20 10 10 0 10 70 180
Long-term (1902-2014) monthly rainfall (mm) in Harar (Ethiopia)
Jan Feb March April May June July Aug Sept Oct Nov Dec
19.7 28 59.4 94.9 102.3 65.2 108.7 139.7 102.2 50.6 12.5 8
Long-term (1984-2014) monthly rainfall (mm) in Córdoba (Spain):
Jan Feb March April May June July Aug Sept Oct Nov Dec
64 53 40 61 34 17 3 3 24 62 85 89
13
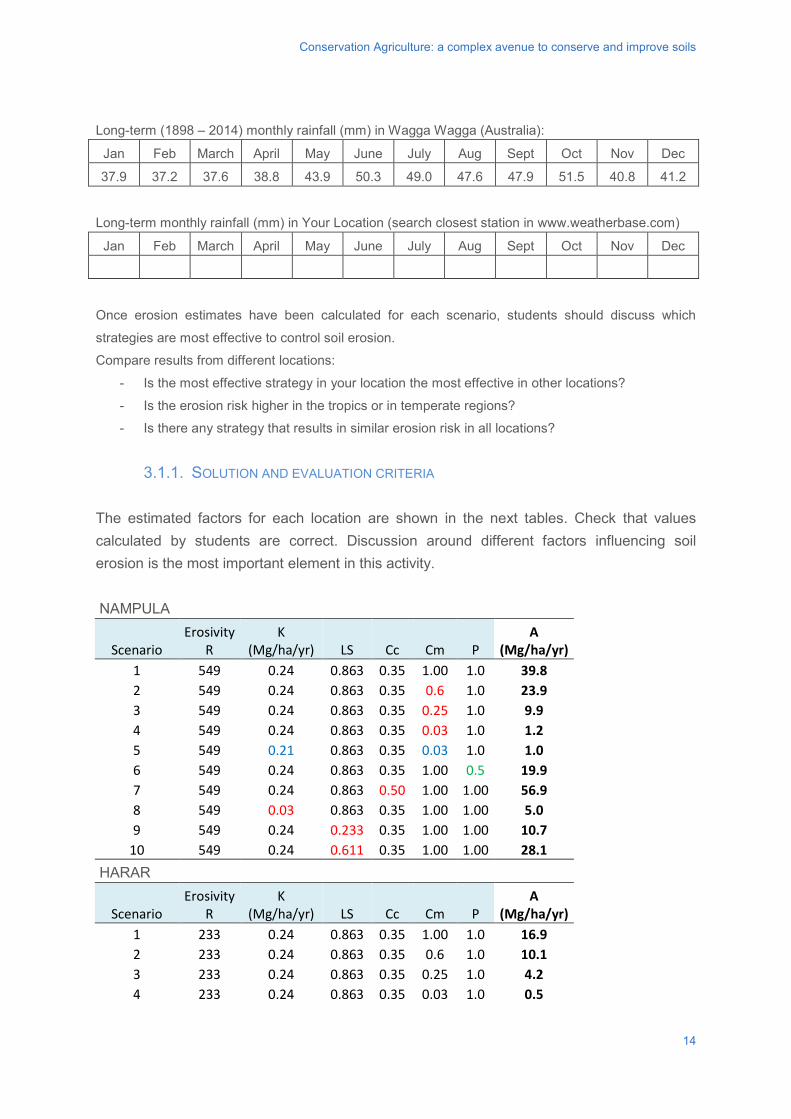
Conservation Agriculture: a complex avenue to conserve and improve soils
Long-term (1898 – 2014) monthly rainfall (mm) in Wagga Wagga (Australia):
Jan Feb March April May June July Aug Sept Oct Nov Dec
37.9 37.2 37.6 38.8 43.9 50.3 49.0 47.6 47.9 51.5 40.8 41.2
Long-term monthly rainfall (mm) in Your Location (search closest station in www.weatherbase.com)
Jan Feb March April May June July Aug Sept Oct Nov Dec
Once erosion estimates have been calculated for each scenario, students should discuss which
strategies are most effective to control soil erosion.
Compare results from different locations:
- Is the most effective strategy in your location the most effective in other locations?
- Is the erosion risk higher in the tropics or in temperate regions?
- Is there any strategy that results in similar erosion risk in all locations?
3.1.1. SOLUTION AND EVALUATION CRITERIA The estimated factors for each location are shown in the next tables. Check that values calculated by students are correct. Discussion around different factors influencing soil erosion is the most important element in this activity. NAMPULA
Scenario Erosivity
R K
(Mg/ha/yr) LS Cc Cm P A
(Mg/ha/yr) 1 549 0.24 0.863 0.35 1.00 1.0 39.8 2 549 0.24 0.863 0.35 0.6 1.0 23.9 3 549 0.24 0.863 0.35 0.25 1.0 9.9 4 549 0.24 0.863 0.35 0.03 1.0 1.2 5 549 0.21 0.863 0.35 0.03 1.0 1.0 6 549 0.24 0.863 0.35 1.00 0.5 19.9 7 549 0.24 0.863 0.50 1.00 1.00 56.9 8 549 0.03 0.863 0.35 1.00 1.00 5.0 9 549 0.24 0.233 0.35 1.00 1.00 10.7
10 549 0.24 0.611 0.35 1.00 1.00 28.1 HARAR
Scenario Erosivity
R K
(Mg/ha/yr) LS Cc Cm P A
(Mg/ha/yr) 1 233 0.24 0.863 0.35 1.00 1.0 16.9 2 233 0.24 0.863 0.35 0.6 1.0 10.1 3 233 0.24 0.863 0.35 0.25 1.0 4.2 4 233 0.24 0.863 0.35 0.03 1.0 0.5
14
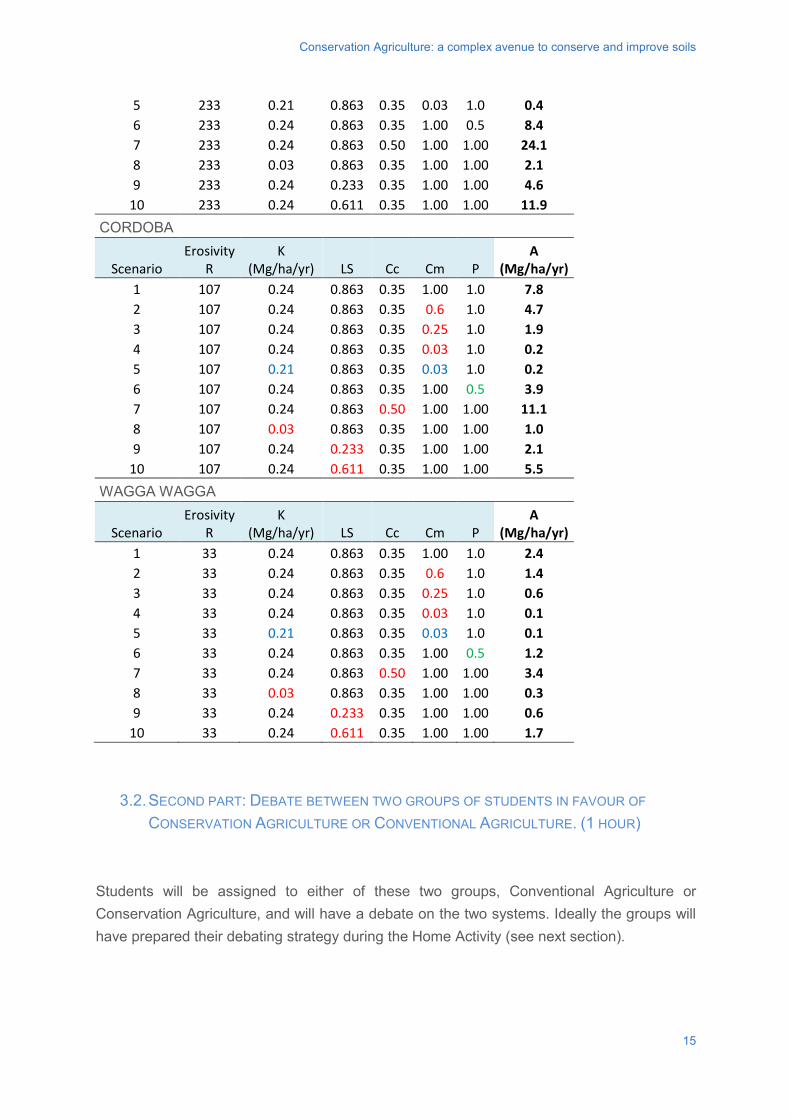
Conservation Agriculture: a complex avenue to conserve and improve soils
5 233 0.21 0.863 0.35 0.03 1.0 0.4 6 233 0.24 0.863 0.35 1.00 0.5 8.4 7 233 0.24 0.863 0.50 1.00 1.00 24.1 8 233 0.03 0.863 0.35 1.00 1.00 2.1 9 233 0.24 0.233 0.35 1.00 1.00 4.6
10 233 0.24 0.611 0.35 1.00 1.00 11.9 CORDOBA
Scenario Erosivity
R K
(Mg/ha/yr) LS Cc Cm P A
(Mg/ha/yr) 1 107 0.24 0.863 0.35 1.00 1.0 7.8 2 107 0.24 0.863 0.35 0.6 1.0 4.7 3 107 0.24 0.863 0.35 0.25 1.0 1.9 4 107 0.24 0.863 0.35 0.03 1.0 0.2 5 107 0.21 0.863 0.35 0.03 1.0 0.2 6 107 0.24 0.863 0.35 1.00 0.5 3.9 7 107 0.24 0.863 0.50 1.00 1.00 11.1 8 107 0.03 0.863 0.35 1.00 1.00 1.0 9 107 0.24 0.233 0.35 1.00 1.00 2.1
10 107 0.24 0.611 0.35 1.00 1.00 5.5 WAGGA WAGGA
Scenario Erosivity
R K
(Mg/ha/yr) LS Cc Cm P A
(Mg/ha/yr) 1 33 0.24 0.863 0.35 1.00 1.0 2.4 2 33 0.24 0.863 0.35 0.6 1.0 1.4 3 33 0.24 0.863 0.35 0.25 1.0 0.6 4 33 0.24 0.863 0.35 0.03 1.0 0.1 5 33 0.21 0.863 0.35 0.03 1.0 0.1 6 33 0.24 0.863 0.35 1.00 0.5 1.2 7 33 0.24 0.863 0.50 1.00 1.00 3.4 8 33 0.03 0.863 0.35 1.00 1.00 0.3 9 33 0.24 0.233 0.35 1.00 1.00 0.6
10 33 0.24 0.611 0.35 1.00 1.00 1.7
3.2. SECOND PART: DEBATE BETWEEN TWO GROUPS OF STUDENTS IN FAVOUR OF
CONSERVATION AGRICULTURE OR CONVENTIONAL AGRICULTURE. (1 HOUR) Students will be assigned to either of these two groups, Conventional Agriculture or Conservation Agriculture, and will have a debate on the two systems. Ideally the groups will have prepared their debating strategy during the Home Activity (see next section).
15
Conservation Agriculture: a complex avenue to conserve and improve soils
One person per group will present their assigned system in 5 minutes. After this, different students will present the arguments following a given order. Arguments should consider technical, socioeconomic and environmental issues and can be in favour of their assigned system, or against the other system. Arguments should be well-elaborated and based on literature, if/where possible. Short videos or slides may be used to support their arguments (see Further/Suggested Material Section).
3.2.1. SOLUTION AND EVALUATION CRITERIA There is no single solution. The evaluation will be by group and the following criteria should be considered:
- Clearness of presentation - Coherence in arguments - Technical, socioeconomic and environmental issues addressed - Tools used in the debate: quality of slides if prepared by the group, justification of
videos or others tools used 4. HOMEWORK ACTIVITY This activity is divided into two parts. Firstly, students will independently look for information on their assigned system (4 hours). Secondly, students will work in groups to prepare the debate (4 hours). Each group may be organized in subgroups to prepare different parts of the argument.
4.1. SOLUTION AND EVALUATION CRITERIA The evaluation will be done during the debate in the class activity.
16
Conservation Agriculture: a complex avenue to conserve and improve soils
BIBLIOGRAPHY Alvarez, R., Steinbach, H.S., 2009. A review of the effects of tillage systems on some soil physical properties, water content, nitrate availability and crops yield in the Argentine Pampas. Soil Tillage Res. 104, 1–15. ASABE Standards (2005) ASABE Standards EP291.3 FEB2005: Terminology and Definitions for Soil Tillage and Soil-Tool Relationships. ASABE, St. Joseph, MI, USA. Baker, C.J., Saxton, K.E., Ritchie, W.R., Chamen, W.C.T., Reicosky, D.C., Ribeiro, M.F.S., Justice, S.E., Hobbs, P.R., 2007. No-Tillage Seeding in Conservation Agriculture– 2nd Edition. CABI and FAO, Rome. 326 pp. Baudron, F., Tittonell, P., Corbeels, M., Letourmy, P., Giller, K.E., 2012. Comparative performance of conservation agriculture and current smallholder farming practices in semi-arid Zimbabwe. Field Crops Res. 132, 117–128. Bayala, J., Sileshi, G.W., Coe, R., Kalinganire, A., Tchoundjeu, Z., Sinclair, F., Garrity, D., 2012. Cereal yield response to conservation agriculture practices in drylands of West Africa: A quantitative synthesis. J. Arid Environ. 78, 13-25. Bergsma, A. 1981. Indices of rain erosivity. A review. ITC Jounral 4: 460 – 483. Boulal, H., Gómez-Macpherson, H., 2010. Dynamics of soil organic carbon in an innovative irrigated permanent bed system on sloping land in southern Spain. Agric. Ecosyst. Environ. 139, 284-292. Boulal, H., Mateos, L., Gómez-Macpherson, H., 2011. Soil management and traffic effects on infiltration of irrigation water applied using sprinklers. Irrig. Sci. 29, 403-412. Boulal, H., Gómez-Macpherson, H., Villalobos, F., 2012. Permanent bed planting in irrigated Mediterranean conditions: short-term effects on soil quality, crop yield and water use efficiency. Field Crops Res. 130, 120-127. Brouder, S. M., Gómez-Macpherson, H., 2014. The impact of conservation agriculture on smallholder agricultural yields: A scoping review of the evidence. Agric.Ecosyst.Environ. 187, 11-32. Cid, P., Carmona, I., Murillo, J.M., Gómez-Macpherson, H., 2014. No-tillage permanent bed planting and controlled traffic in a maize-cotton irrigated system under Mediterranean
17
Conservation Agriculture: a complex avenue to conserve and improve soils
conditions: Effects on soil compaction, crop performance and carbon sequestration. Eur. J. Agron. 61, 24-34. Corbeels, M., de Graaff, J., Ndah, T. H., Penot, E., Baudron, F., Naudin, K., . Andrieu, N., Chirat, G., Schuler, J., Nyagumbo, I., Rusinamhodzi, L., Traore, K., Mzoba, H.D & Adolwa, I.S., 2014. Understanding the impact and adoption of conservation agriculture in Africa: a multi-scale analysis. Agric. Ecosyst. Environ. 187, 155-170. Erenstein, O., 2011. Cropping systems and crop residue management in the Trans-Gangetic Plains: Issues and challenges for conservation agriculture from village surveys. Agric. Sys. 104, 54-62. FAO, 2015a. Conservation Agriculture. Available at http://www.fao.org/ag/ca/1a.html (Accessed 14/3/2015). FAO, 2015b. CA Adoption Worldwide, FAO AQUASTAT database. Available at: http://www.fao.org/nr/water/aquastat/dbase/indexesp.stm (accessed 01-15). García-Ponce, E., Gómez-Macpherson, H., Diallo, O., Djibril, M., Baba, C., Porcel, O., Mathieu, B., Comas, J., Mateos, L., Connor, D.J., 2013. Contribution of sorghum to productivity of small-holder irrigation schemes: On-farm research in the Senegal River Valley, Mauritania. Agric. Syst. 115, 72-82. Giller, K.E., Witter, E., Corbeels, M., Tittonell, P., 2009. Conservation agriculture and smallholder farming in Africa: The heretics’ view. Field Crops Res. 114, 23-34. Giller, K.E., Tittonell, P., Rufino, M.C., van Wijk, M.T., Zingore, S., Mapfumo, P., Adjei-Nsiah, S., Herrero, M., Chikowo, R., Corbeels, M., Rowe, E.C., Baijukya, F., Mwijage, A., Smith, J., Yeboah, E., van der Burg, W.J., Sanogo, O.M., Misiko, M., de Ridder, N., Karanja, S., Kaizzi, C., K’ungu, J., Mwale, M., Nwaga, D., Pacini, C., Vanlauwe, B., 2011. Communicating complexity: integrated assessment of trade-offs concerning soil fertility management within African farming systems to support innovation and development. Agricult. Syst. 104, 191–203. Govaerts, B., Sayre, K.D., Deckers, J., 2006. Towards minimum data sets for soil quality assessment. The case of zero-tillage wheat/maize rotations in the highlands of Mexico. Soil Tillage Res. 87, 163–174. Grassini, P., Yang, H., Irmak, S., Thorburn, J., Burr, C., Cassman, K.G., 2011. High-yield irrigated maize in the Western U.S. Corn Belt. II. Irrigation management and crop water productivity. Field Crops Res. 120, 133–141.
18
Conservation Agriculture: a complex avenue to conserve and improve soils
Hobbs P.R., Sayre K., Gupta R., 2008. The role of conservation agriculture in sustainable agriculture. Phil. Trans. R. Soc. B. 363, 543-555. Kassam, A., Friedrich, T., Derpsch, R., Lahmar, R., Mrabet, R., Basch, G., González-Sánchez, E.J. and Serraj, R., 2012. Conservation agriculture in the dry Mediterranean climate. F.Crop.Res., 132, 7-17. Knowler, D. and Bradshaw, B., 2007. Farmers’ adoption of conservation agriculture: A review and synthesis of recent research. Food Policy 32(1), 25–48. Lahmar, R., Bationo, B.A., Lamso, N.D., Guéro, Y., Tittonell, P., 2012. Tailoring conservation agriculture technologies to West Africa semi-arid zones: building on traditional local practices for soil restoration. Field Crop Res. 132, 158–167. Lampurlanés, J., Angás, P., Cantero-Martínez, C., 2001. Root growth, soil water content and yield of barley under different tillage systems on two soils in semiarid conditions. Field Crops Res. 69, 27–40. Mishra, J.S., Singh, V.P., 2012. Tillage and weed control effects on productivity of a dry seeded rice–wheat system on a Vertisol in Central India. Soil Tillage Res. 123, 11-20. Montanarella, L. 2005. Emerging issues in soil and water management for vineyard and olive-tree orchard. In: Integrated soil and water management for orchard development (Eds. Benites J., Pisante M., Stagbari F.). FAO, Rome, Italy. Rawson, H.M., Gómez-Macpherson, H., Hossain, A.B.S., Saifuzzaman, M., ur-Rashid, H., Sufian, M.A., Samad, M.A., Sarker, A.Z., Ahmed, F., Talukder, Z.I, Rahman, M., Siddique, M.M.A.B., Ammin M. 2007. On-farm wheat trials in Bangladesh: A study to reduce perceived constraints to yield in traditional wheat areas and southern lands that remain fallow during the dry season. Exp. Agric. 43, 21-40. Renard, K.G., Foster, G.R., Weesies, G.A., McCool, D.K. & Yoder, D.C., 1997. Predicting soil erosion by water: a guide to conservation planning with the revised universal soil loss equation (RUSLE). U.S. Dep. Agric., Agric. Handb. No. 703. Washington D.C. Rockström, J., Kaumbutho, P., Mwalley, J., Nzabi, A.W., Temesgen, M., Mawenya, L., Barron, J., Mutua, J., Damgaard-Larsen, S., 2009. Conservation farming strategies in East and Southern Africa: yields and rain water productivity from on-farm action research. Soil Tillage Res. 103, 23–32.
19
Conservation Agriculture: a complex avenue to conserve and improve soils
Rusinamhodzi, L., Corbeels, M., van Wijk, M.T., Rufino, M.C., Nyamangara, J., Giller, K.E., 2011. A meta-analysis of long-term effects of conservation agriculture on maize grain yield under rain-fed conditions. Agron. Sustain. Dev. 31, 657-673. Soane, B.B., Ball, B.C., Arvidsson, J., Basch, G., Moreno, F., Roger-Estrade, J., 2012. No-till in northern, western and south-western Europe: A review of problems and opportunities for crop production and the environment. Soil Tillage Res. 118, 66–87. Stevenson, J. R., Serraj, R., & Cassman, K. G., 2014. Evaluating conservation agriculture for small-scale farmers in Sub-Saharan Africa and South Asia. Agriculture, Ecosystems & Environment, 187, 1-10. Verhulst, N., Govaerts, B., Verachtert, E., Castellanos- Navarrete, A., Mezzalamaa, M., Wall, P., Chocobar, A., Deckers, J., Sayre, K.D., 2010. Conservation Agriculture, Improving Soil Quality for Sustainable Production Systems? In: Lal, R., Stewart, B.A. (Eds.), Advances in Soil Science: Food Security and Soil Quality. CRC Press, Boca Raton, FL, USA, pp. 137-208. Wischmeier, W. & Smith, D., 1978. Predicting rainfall erosion losses: a guide to conservation planning. U.S. Dep. Agric., Agric. Handb. No. 537. Washington D.C.
20
Conservation Agriculture: a complex avenue to conserve and improve soils
FURTHER/SUGGESTED MATERIAL • Web page on CA with different type of resources (articles, PPT presentations, videos…)
by The Conservation Agriculture Group at Cornell University (http://conservationagriculture.mannlib.cornell.edu/index.html).
• Movie: The Grapes of Wrath (1940), directed by John Ford. • Video: No-Till Agriculture Prevents Soil Erosion, by World Bank
(https://www.youtube.com/watch?v=LpltrgkLqWc&list=PL2AC32AFA191F85D9&index=6)
• Video: USDA-NRCS Ohio state agronomist Mark Scarpitti demonstrates differences between tilled and no-till soils in ability to absorb fertilizer and avoid runoff (http://www.notill.org/resources/basics-of-no-till/differences-in-tilled-and-no-till-soils).
• Video: 1) Introduction to Conservation Agriculture Cropping Systems by UCANR (https://www.youtube.com/watch?v=Df59FO9Uxx0&index=5&list=PL2AC32AFA191F85D9).
• Video: 2) The Value of Residues in Conservation Agriculture Systems by UCANR (https://www.youtube.com/watch?v=pNqXOeQJ4MU).
• Video: Controlled Traffic Farming by NACC ( ). https://www.youtube.com/watch?v=zUlr9PKkQRM
• Video: Spreading Conservation Agriculture in Malawi by CIMMYT (https://www.youtube.com/watch?v=nyuhU9JBwWA).
• Video: Sustainable Intensification of Maize-Legume Systems for Food Security in Eastern and Southern Africa by CIMMYT (https://www.youtube.com/watch?v=vlszRU2rVig).
21

http://www.gdee.eu
This project is funded by
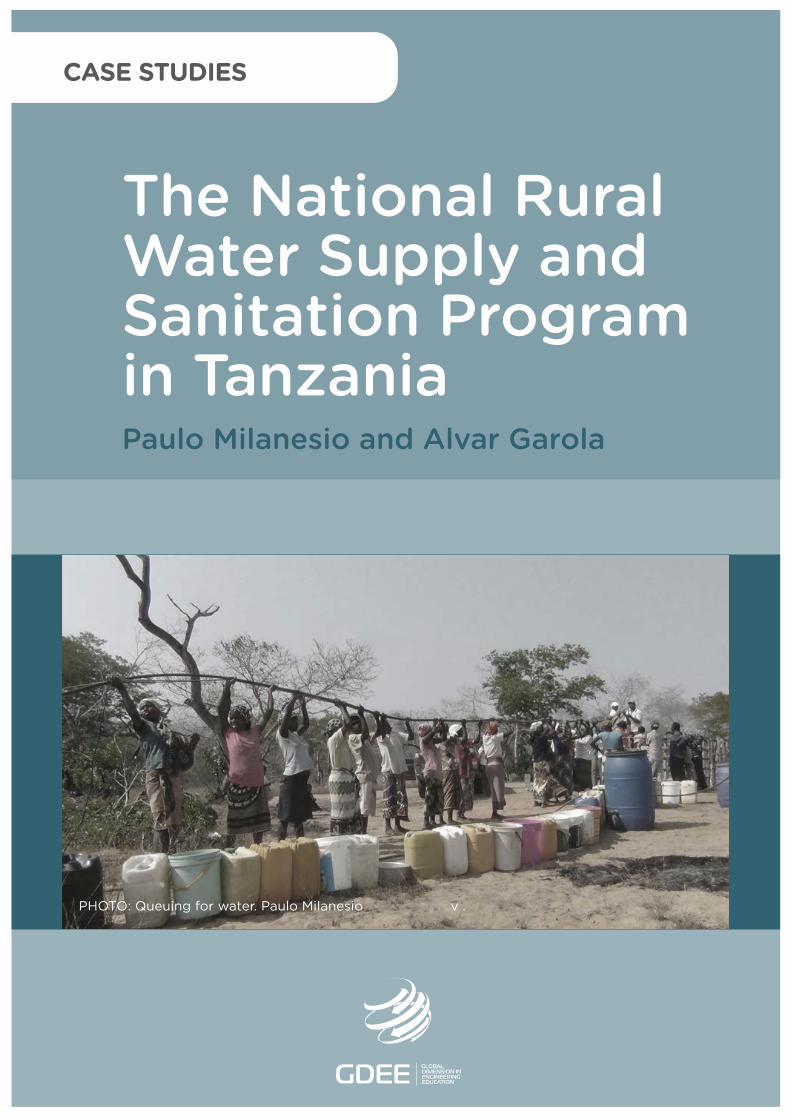
The National RuralWater Supply and Sanitation Programin TanzaniaPaulo Milanesio and Alvar Garola
PHOTO: Queuing for water. Paulo Milanesio v .
CASE STUDIES

A.1
The National Rural Water Supply and Sanitation Program in Tanzania
COORDINATED BYAgustí Pérez-Foguet, Enric Velo, Pol Arranz, Ricard Ginéand Boris Lazzarini (Universitat Politècnica de Catalunya)Manuel Sierra (Universidad Politécnica de Madrid)Alejandra Boni and Jordi Peris (Universitat Politècnica de València)Guido Zolezzi and Gabriella Trombino (Università degli Studi di Trento)Rhoda Trimingham (Loughborough University)Valentín Villarroel (ONGAWA)Neil Nobles and Meadhbh Bolger (Practical Action)Francesco Mongera (Training Center for International Cooperation)Katie Cresswell-Maynard (Engineering Without Border UK)
EDITED BY Global Dimension in Engineering Education
Citation: Milanesio, P. and Garola, A. (2015) ' The National Rural Water Supply and Sanitation Program in Tanzania', in Case studies for developing globallyresponsible engineers, GDEE (eds.), Global Dimension in Engineering Education, Barcelona. Available from: http://gdee.eu/index.php/resources.html
This publication is distributedunder an Attribution- Noncommercial-Share Alike License for Creative Commons
DL B 10735-2015 ISBN 978-84-606-7546-4
CASE STUDIES
Disclaimer: This document has been produced with the financial assistance of the European UnionThe contents of this document are the sole responsibility of the authors and can under no circumstances be regarded as reflecting the position of the European Union
The National Rural Water Supply and Sanitation Program in Tanzania
THE NATIONAL RURAL WATER SUPPLY AND SANITATION PROGRAMME IN TANZANIA: A CASE STUDY
Paulo Milanesio, Universitat Politècnica de Catalunya Alvar Garola, Universitat Politècnica de Catalunya
1
The National Rural Water Supply and Sanitation Program in Tanzania
INDEX
1. INTRODUCTION ................................................................................................................................................... 3
1.1. DISCIPLINES COVERED ......................................................................................................................... 4
1.2. LEARNING OUTCOMES........................................................................................................................... 4
1.3. ACTIVITIES ............................................................................................................................................... 4
2. DESCRIPTION OF THE CONTEXT ..................................................................................................................... 5
2.1. FRAMEWORK OF NATIONAL RESOURCES ALLOCATION IN DEVELOPING COUNTRIES .............. 5
2.2. TANZANIA –CONTEXT OF THE CASE STUDY ...................................................................................... 7
2.3. WATER, SANITATION AND HYGIENE: THE WORLD REALITY AND TANZANIA`S SITUATION ......... 8
2.4. THE NATIONAL RURAL WATER SUPPLY & SANITATION PROGRAM (NRWSSP) AT TANZANIA .. 11
3. CLASS ACTIVITY ............................................................................................................................................... 14
3.1. THE NRWSSP IMPLEMENTATION ........................................................................................................ 14
3.2. ECONOMIC COST – BENEFIT ANALYSIS IN THE WASH SECTOR ................................................... 16
3.3. SOLUTION AND EVALUATION CRITERIA ............................................................................................ 17
4. HOMEWORK ACTIVITY..................................................................................................................................... 22
4.1. THE NRWSSP ALLOCATION OF FUNDS ............................................................................................. 22
4.2. THE WATERAID WATER POINT MAPPING .......................................................................................... 27
4.3. SOLUTION AND EVALUATION CRITERIA THE PROGRAM ................................................................ 30
5. BIBLIOGRAPHY ................................................................................................................................................. 32
6. FURTHER/SUGGESTED MATERIAL ................................................................................................................ 34
7. POWERPOINT PRESENTATION .................................................................... Error! No s'ha definit el marcador.
2
The National Rural Water Supply and Sanitation Program in Tanzania
1. INTRODUCTION
The Tanzanian government, as many others in the Sub-Saharan region, has undertaken an ambitious
plan to improve and increase access to water and sanitation services. In 2006, the National Rural
Water Supply and Sanitation Program (NRWSSP) was launched as part of a bigger plan to improve
and increase access to water. To implement this ambitious program and meet the corresponding
objectives it was necessary to develop a comprehensive resources allocation strategy in order to set
out what factors should be considered, and how they should be weighted and applied. With limited
resources, adequate mechanisms are required to ensure that efforts and available resources are
allocated to those water and sanitation activities that will produce the greatest impact for beneficiaries.
Thus, evaluating the economic costs of interventions and the resulting benefits is critically important for
effective resource allocation. While many criteria help to determine where resources should be
targeted, such as social and environmental considerations, a sound economic cost-benefit analysis is
a vital and useful tool for decision-makers (Sanctuary 2012).
In this case study, students will first analyse how the NRWSSP allocated available resources and how
the decisions were made by the Ministry of Water in collaboration with the World Bank, the principal
donor of the program. Second, an alternative case study is presented for analysis, based on the
strategy followed by the well-known NGO WaterAid in Tanzania. A comparison between these two
different alternatives will allow the students to draw corresponding conclusions on effective resource
allocation for water and sanitation. The student will firstly receive a theoretical session about the
fundamentals presented in this document: an analysis of the context including the national resources
allocation in developing countries framework; a brief description of the context in The United Republic
of Tanzania; the global and Tanzanian situation concerning the Water, Sanitation and Hygiene
(WASH) sector; and a description of the NRWSSP. After that, the two activities will be presented: In
the first activity (class activity) students will work on understanding how the NRWSSP select
beneficiaries of the program and allocate corresponding resources. In the second activity (the
homework) fieldwork of the organization WaterAid will be described. This field work consists of a water
point mapping approach (WPM) that was designed as a procedure for measuring access to water. This
new way of measuring population water needs allowed WaterAid to have a different perspective on
improving water access. Thus, the case study will help the students to integrate all those information
and to compare these two outlooks and conclude through their differences.
3
The National Rural Water Supply and Sanitation Program in Tanzania
1.1. DISCIPLINES COVERED
The case study covers the allocation of national resources for the WASH field in a developing country,
The United Republic of Tanzania. It is intended that students will understand the methodology
implemented and criticize it through a cost-benefit analysis, that examines the results obtained and the
way the funds have been allocated. This analysis will be possible after the students have completed a
class activity and a complementary homework activity. Apart from the NRWSSP methodology and
results, the case study also shows an alternative methodology executed by WaterAid, which is
characterized fundamentally by fieldwork where data was obtained through a Water Point Mapping
(WPM) approach. The presented case study promotes teamwork and encourages an atmosphere of
constructive debate since the students will be organized in groups of 3 or 4 to carry out the activities.
1.2. LEARNING OUTCOMES
As a result of this case study, students are expected to be able to:
• Understand the problem of lack of access to drinking water and sanitation services and its
consequences on human development.
• Know how national governments develop a National WASH Program and decide how to
allocate national resources.
• Develop an economic cost-benefit analysis relevant to the WASH sector.
• Work with real data and process it in order to recognize how to allocate the funds of
Tanzania’s National Program.
• Understand how the WPM approach works and the differences that exist between using
this and the Government of Tanzania’s approach allocate funds.
1.3. ACTIVITIES
The following learning activities are proposed:
• Theoretical session: 2 hours class work on the economic analysis of water supply
projects. The case study will be presented as a means to understand the way that the
allocation of resources is conducted in developing countries, especially the WASH
sector. Prior to this session, the students will have to read basic materials on economic
cost-benefit analysis and queuing disciplines. It is also advisable for the students to read
the context of this case study in advance. 4
The National Rural Water Supply and Sanitation Program in Tanzania
• Problem resolution activity: the students will be organized into working groups and will
be presented a communications problem based on the same context explained in the
theory session. The problem will involve a cost-benefit analysis. Two activities are
proposed (a class activity and a homework activity). Several solutions will be
proposed during the class activity and each group will have to discuss the best way to
solve the problem and define the details. Afterwards, students should develop this work
through the homework activity, which is a decision-making exercise based on the class
discussion and additional contributions of each group. The outcome will be a report
produced by each group. It is important to consider that calculations in this case study
will be conducted using the maximum amount of data available, which means that the
lecturer can also reduce the exercise where necessary to meet class requirements.
2. DESCRIPTION OF THE CONTEXT
In this section a description of the context of the case study is provided. First, the framework of national
resources allocation in developing countries is briefly explained. Secondly, the context of the case study
of Tanzania is given, in relation to the WASH situation at global and national levels; the NRWSSP is then
presented. Finally, the specific context of the proposed WaterAid case study is clarified and the
methodology used for the funds allocation explained.
2.1 FRAMEWORK OF NATIONAL RESOURCES ALLOCATION IN DEVELOPING COUNTRIES
A resource allocation framework sets out what factors should be considered, and how they should be
weighted and applied. Considering the case study analyzed in this report, the framework for national
resources allocation will be applied to the rural water supply and sanitation sector.
As it is very important to conduct good resource allocation within any development sector, adequate
mechanisms are required to ensure that resources are allocated to those water and sanitation activities
that are likely to have the greatest impact on achieving sector objectives. Also, it is important to note
that there are many factors to consider when assessing how best to allocate resources between and
within water and sanitation sub-sectors, but there is never one ‘right’ answer. Thus, determination of
the best way to allocate resources within a country is a key decision, whether targeted at centrally
managed projects or (increasingly) as local decentralized funding. Considering that the division of rural
resources is a particularly difficult issue to resolve, this case study will contribute to understanding
these concepts. Finally, it should be highlighted that effective financial management requires good
5
The National Rural Water Supply and Sanitation Program in Tanzania
monitoring, evaluation and audit procedures (Fisher, 2005).
As mentioned above, there is not only one method that can be used to make decisions on resources
allocation. There are several different methods, like the sub-sector driven approach, or the sector
objectives driven approach. The overall focus for the first of these is to allocate resources based on the
importance of each sub-sector concerned Using the second method, resource allocation is based on
the objectives and targets of the sector as a whole, investing where the gaps are greatest. The case
study presented in this report uses the first methodology and a “Sector Investment Plan” (SIP)
approach is completed. Using this method, several institutions take part in what is called Sector Wide
Approach (SWAp), with key stakeholders meeting regularly to develop integrated sector policies, plans
and budgets. This method is increasingly used and donors’ support is allocated across different
institutions around the countryas funds are decentralised to local governments. Considering that
geographical allocation is politically sensitive, the simplest method of allocation uses population levels,
but this does not account for differing poverty levels, costs of providing services and access rates to
them. Calculating and comparing these factors for different regions requires elaborate formulae and
transparency is vital so that resource allocation decisions can be challenged (Fisher, 2005). However,
cost-benefit analysis is rarely, if ever, the sole procedure used for making public investment and policy
related decisions. Views differ on how desirable this current situation is, but political reality dictates that
many other interests are embedded in decisions made (Brower R, etal. – 2005).
6
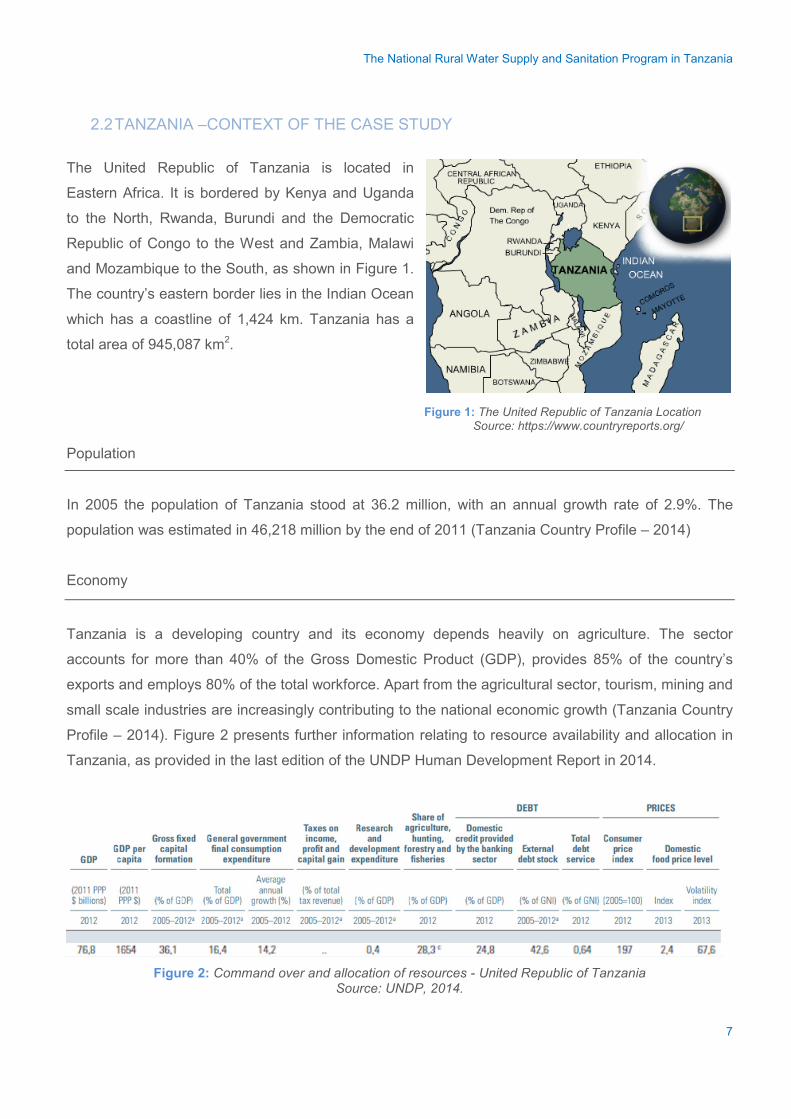
The National Rural Water Supply and Sanitation Program in Tanzania
2.2 TANZANIA –CONTEXT OF THE CASE STUDY
The United Republic of Tanzania is located in
Eastern Africa. It is bordered by Kenya and Uganda
to the North, Rwanda, Burundi and the Democratic
Republic of Congo to the West and Zambia, Malawi
and Mozambique to the South, as shown in Figure 1.
The country’s eastern border lies in the Indian Ocean
which has a coastline of 1,424 km. Tanzania has a
total area of 945,087 km2.
Population
In 2005 the population of Tanzania stood at 36.2 million, with an annual growth rate of 2.9%. The
population was estimated in 46,218 million by the end of 2011 (Tanzania Country Profile – 2014)
Economy
Tanzania is a developing country and its economy depends heavily on agriculture. The sector
accounts for more than 40% of the Gross Domestic Product (GDP), provides 85% of the country’s
exports and employs 80% of the total workforce. Apart from the agricultural sector, tourism, mining and
small scale industries are increasingly contributing to the national economic growth (Tanzania Country
Profile – 2014). Figure 2 presents further information relating to resource availability and allocation in
Tanzania, as provided in the last edition of the UNDP Human Development Report in 2014.
Figure 2: Command over and allocation of resources - United Republic of Tanzania Source: UNDP, 2014.
Figure 1: The United Republic of Tanzania Location Source: https://www.countryreports.org/
7
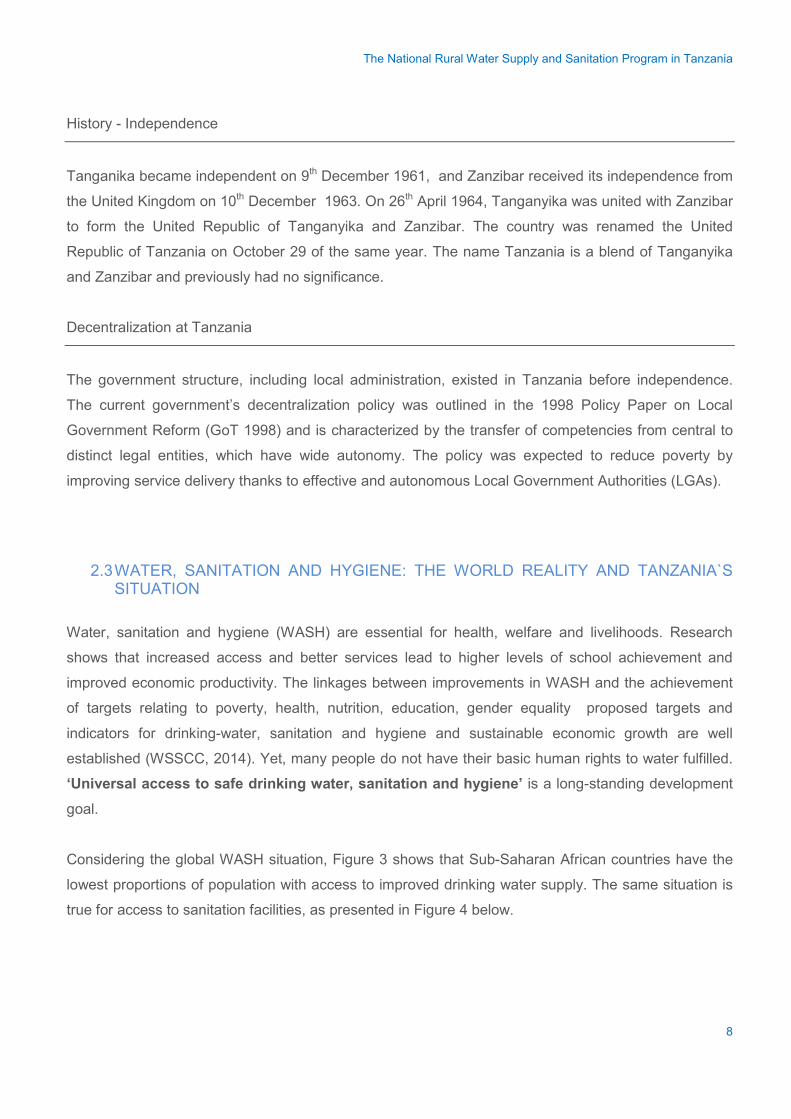
The National Rural Water Supply and Sanitation Program in Tanzania
History - Independence
Tanganika became independent on 9th December 1961, and Zanzibar received its independence from
the United Kingdom on 10th December 1963. On 26th April 1964, Tanganyika was united with Zanzibar
to form the United Republic of Tanganyika and Zanzibar. The country was renamed the United
Republic of Tanzania on October 29 of the same year. The name Tanzania is a blend of Tanganyika
and Zanzibar and previously had no significance. Decentralization at Tanzania
The government structure, including local administration, existed in Tanzania before independence.
The current government’s decentralization policy was outlined in the 1998 Policy Paper on Local
Government Reform (GoT 1998) and is characterized by the transfer of competencies from central to
distinct legal entities, which have wide autonomy. The policy was expected to reduce poverty by
improving service delivery thanks to effective and autonomous Local Government Authorities (LGAs).
2.3 WATER, SANITATION AND HYGIENE: THE WORLD REALITY AND TANZANIA`S SITUATION
Water, sanitation and hygiene (WASH) are essential for health, welfare and livelihoods. Research
shows that increased access and better services lead to higher levels of school achievement and
improved economic productivity. The linkages between improvements in WASH and the achievement
of targets relating to poverty, health, nutrition, education, gender equality proposed targets and
indicators for drinking-water, sanitation and hygiene and sustainable economic growth are well
established (WSSCC, 2014). Yet, many people do not have their basic human rights to water fulfilled.
‘Universal access to safe drinking water, sanitation and hygiene’ is a long-standing development
goal.
Considering the global WASH situation, Figure 3 shows that Sub-Saharan African countries have the
lowest proportions of population with access to improved drinking water supply. The same situation is
true for access to sanitation facilities, as presented in Figure 4 below.
8
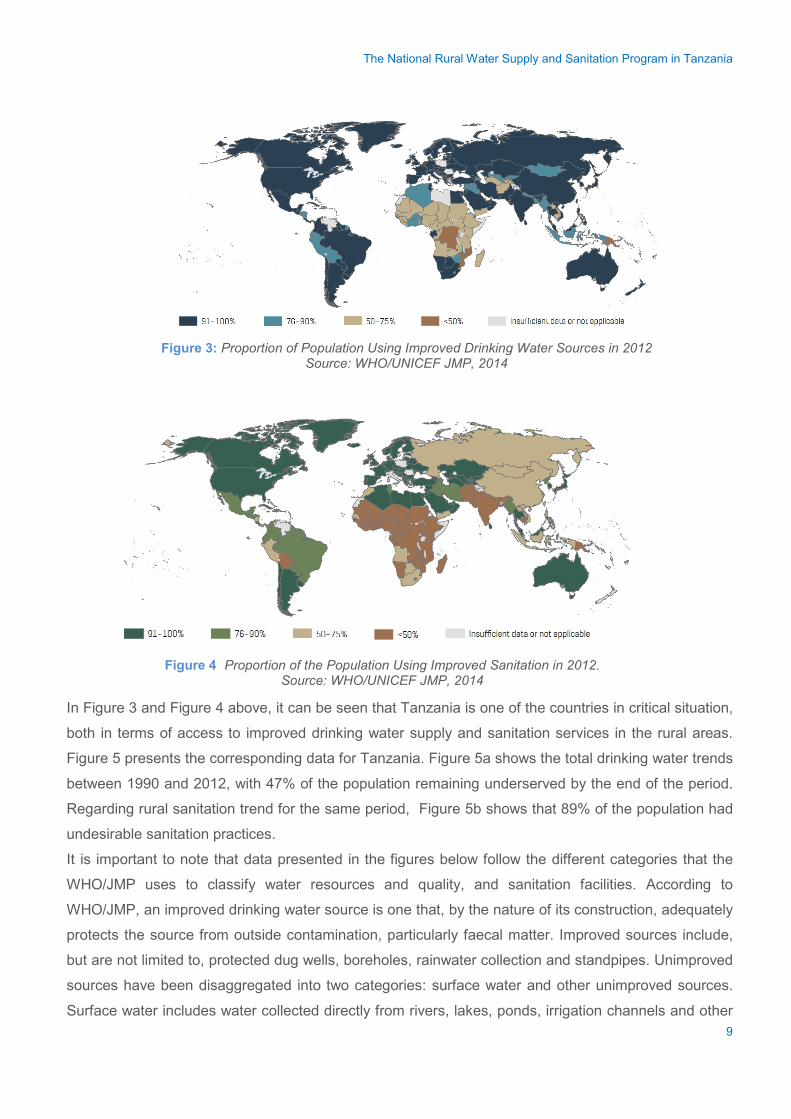
The National Rural Water Supply and Sanitation Program in Tanzania
In Figure 3 and Figure 4 above, it can be seen that Tanzania is one of the countries in critical situation,
both in terms of access to improved drinking water supply and sanitation services in the rural areas.
Figure 5 presents the corresponding data for Tanzania. Figure 5a shows the total drinking water trends
between 1990 and 2012, with 47% of the population remaining underserved by the end of the period.
Regarding rural sanitation trend for the same period, Figure 5b shows that 89% of the population had
undesirable sanitation practices.
It is important to note that data presented in the figures below follow the different categories that the
WHO/JMP uses to classify water resources and quality, and sanitation facilities. According to
WHO/JMP, an improved drinking water source is one that, by the nature of its construction, adequately
protects the source from outside contamination, particularly faecal matter. Improved sources include,
but are not limited to, protected dug wells, boreholes, rainwater collection and standpipes. Unimproved
sources have been disaggregated into two categories: surface water and other unimproved sources.
Surface water includes water collected directly from rivers, lakes, ponds, irrigation channels and other
Figure 3: Proportion of Population Using Improved Drinking Water Sources in 2012 Source: WHO/UNICEF JMP, 2014
Figure 4 Proportion of the Population Using Improved Sanitation in 2012. Source: WHO/UNICEF JMP, 2014
9
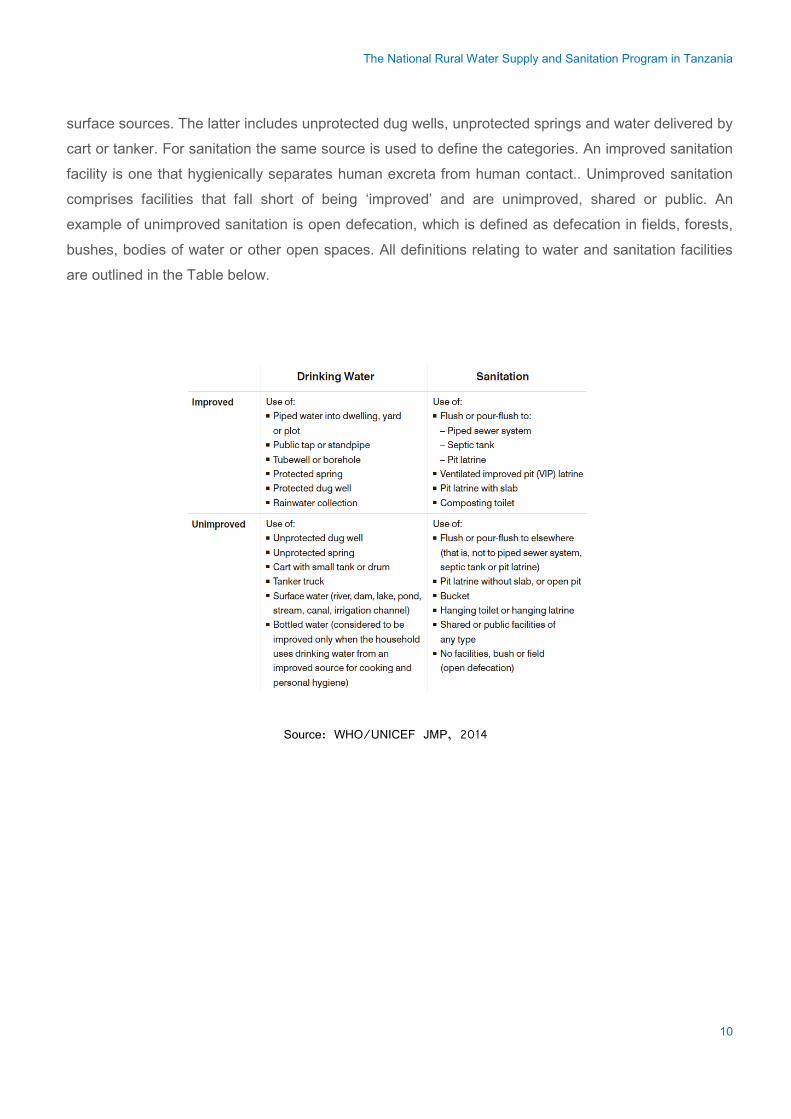
The National Rural Water Supply and Sanitation Program in Tanzania
surface sources. The latter includes unprotected dug wells, unprotected springs and water delivered by
cart or tanker. For sanitation the same source is used to define the categories. An improved sanitation
facility is one that hygienically separates human excreta from human contact.. Unimproved sanitation
comprises facilities that fall short of being ‘improved’ and are unimproved, shared or public. An
example of unimproved sanitation is open defecation, which is defined as defecation in fields, forests,
bushes, bodies of water or other open spaces. All definitions relating to water and sanitation facilities
are outlined in the Table below.
Source: WHO/UNICEF JMP, 2014
10
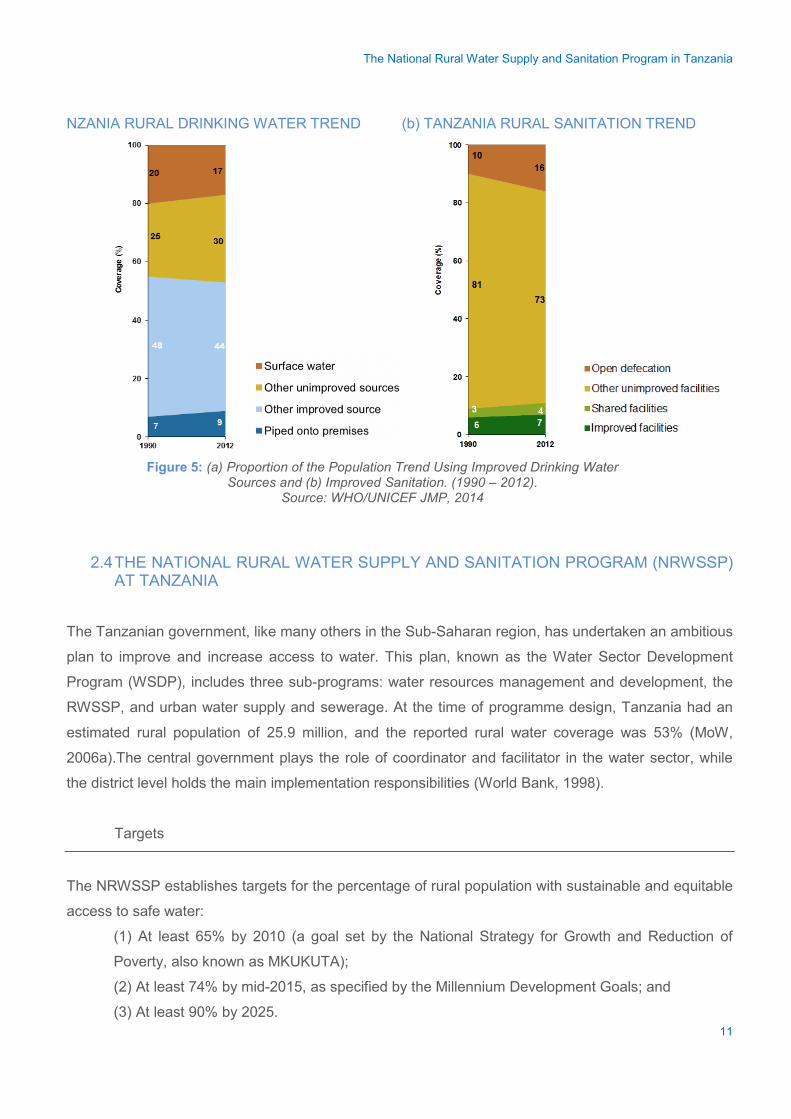
The National Rural Water Supply and Sanitation Program in Tanzania
NZANIA RURAL DRINKING WATER TREND (b) TANZANIA RURAL SANITATION TREND
2.4 THE NATIONAL RURAL WATER SUPPLY AND SANITATION PROGRAM (NRWSSP) AT TANZANIA
The Tanzanian government, like many others in the Sub-Saharan region, has undertaken an ambitious
plan to improve and increase access to water. This plan, known as the Water Sector Development
Program (WSDP), includes three sub-programs: water resources management and development, the
RWSSP, and urban water supply and sewerage. At the time of programme design, Tanzania had an
estimated rural population of 25.9 million, and the reported rural water coverage was 53% (MoW,
2006a).The central government plays the role of coordinator and facilitator in the water sector, while
the district level holds the main implementation responsibilities (World Bank, 1998).
Targets
The NRWSSP establishes targets for the percentage of rural population with sustainable and equitable
access to safe water:
(1) At least 65% by 2010 (a goal set by the National Strategy for Growth and Reduction of
Poverty, also known as MKUKUTA);
(2) At least 74% by mid-2015, as specified by the Millennium Development Goals; and
(3) At least 90% by 2025.
Figure 5: (a) Proportion of the Population Trend Using Improved Drinking Water Sources and (b) Improved Sanitation. (1990 – 2012).
Source: WHO/UNICEF JMP, 2014
11
The National Rural Water Supply and Sanitation Program in Tanzania
Population Growth estimation
The estimated population growth rate for the period at the national level is derived from the population
growth estimated for the region in the 2002 household census. Overall, the fulfilment of the above
targets will require extending water supply coverage to an additional 33.8 million people from 2005 to
2025.
Cost Estimation
The estimated costs for the rural component (i.e., excluding small towns) is US$1.61 billion, with
US$1.46 billion for capital investment, including rehabilitation, US$51 million for management and
operational support to districts, nearly US$17 million for institutional strengthening and development,
and US$74 million for contingencies (Ministry of Water 2006a, “Table 3-4”).
General Planning Process
The process at district level combines approaches from two different directions: top-down and bottom
up. Every year the LGA decides on their budget based on allocations to their districts, which is
submitted to the Ministry of Funds (MoF). The MoF has the last decision and approves the national
budget. At the ministry level the same system is used and the development grants are allocated only to
qualified districts. However the mechanism is different, since the Ministry allocates funds to qualified
districts according to formulae, and the LGA makes the final selection of beneficiaries discussing
during the full council meeting.
Key Aspects at Ministry Level
For this case study we will concentrate in the Ministry’s mechanisms of decision making. The allocation
of NRWSSP resources are affected by the following responsibilities: design of programme, allocation
of resources and formulation of guidelines to help LGAs.
In reference to the design of the programme, it is important to notice that calculation of costs for each
district was based on two general principles: i) current coverage rates – the program aims to increase
coverage levels in those district showing lowest coverage -, and ii) technological options presented in
each district.
Hence, the number of water points needed to attain the desired coverage for every district was
calculated and the costs were assigned based on the foreseen technology mix. This technology mix
12
The National Rural Water Supply and Sanitation Program in Tanzania
was the main driver for cost calculation, neither the total costs per district nor the budget per capita
have any relationship with the initial water coverage per district. (Jimenez, etal. 2011)
With respect to the allocation of resources, allocation of NRWSSP funds from ministry to district level
is driven by formulae. Three different water budgets are in place:
• The Development Budget (also named the Capital Development Grant: is used for
implementing water infrastructure and constructing demonstration latrines. This
represents 91.22% of the estimated budget of the programme. The proportion of
unserved population living in one district compared with the total unserved population in
the country is taken as the parameter for allocating funds. This represents a major shift
between the intended goal and the implementation of the plan, since the largest groups
of unserved people will be targeted there will not be territorial equity.
• The Recurrent Budget (also named the Rural Water Block Grant), it is the investment
assigned for the annual supervision, monitoring and support of water services in rural
communities. In this budget priority is given to unserved areas (90%).
• The Capacity Building Grant: for this grant, the same amount is allocated regardless of
the district.
13
The National Rural Water Supply and Sanitation Program in Tanzania
3. CLASS ACTIVITY
3.1 THE NRWSSP IMPLEMENTATION
The NRWSSP has a planning process that assigns the main responsibilities at different government
levels, which affects the allocation of resources related to the programme. At the Ministry of Water, the
main responsibility is the design of the RWSSP, which includes the allocation of funds to districts and
preparation of guidelines for implementation. This allocation of funds, which is the main topic
addressed in this case study, is analysed in the following paragraphs.
The forecasted allocation of resources is derived from three general principles (Ministry of Water
2006a):
• Districts with less coverage will receive more funds to bring their level of service closer to the
national level. In 2004, the reported coverage by district ranged from 6.4 to 91.8%. The
RWSSP aims for all districts to be in the range 80 to 95% by 2025.
• The proposed water supply technologies and related costs are derived from the existing mix of
technologies in each district, combined with a demand assessment study performed in 18
districts and expert opinions.
• Government investment forecasts for 2005–2025 assume that only 25% of all rural systems in
existence in 2004 will require major investments for rehabilitation during that period (MoW
2006a, “5.6.1.3. Rehabilitation of Existing Systems”). Additionally, capital investment for major
system rehabilitation is assumed to account for 66% of the cost of new water supply services
by technology. As a result of these two assumptions, only US$77 million of government funds
has been set aside for rehabilitation (MoW 2006a, Annex B “Appendix 5”).
NRWSSP Implementation Manual Resume
The National Rural Water Supply and Sanitation Programme (NRWSSP) is the national plan to reduce
poverty and improve the health and quality of life of the rural population. The Ministry of Water (MoW)
has implemented several Rural Water Supply and Sanitation Projects over the past 30 years, with
support from different donors, External Support Agencies (ESAs) and Non-Governmental
Organisations (NGOs),which are putting the water policy into practice. The core problem addressed
by these initiatives is the inadequate supply of clean and safe water and the low standard of sanitation
that prevails in rural settlements.
14
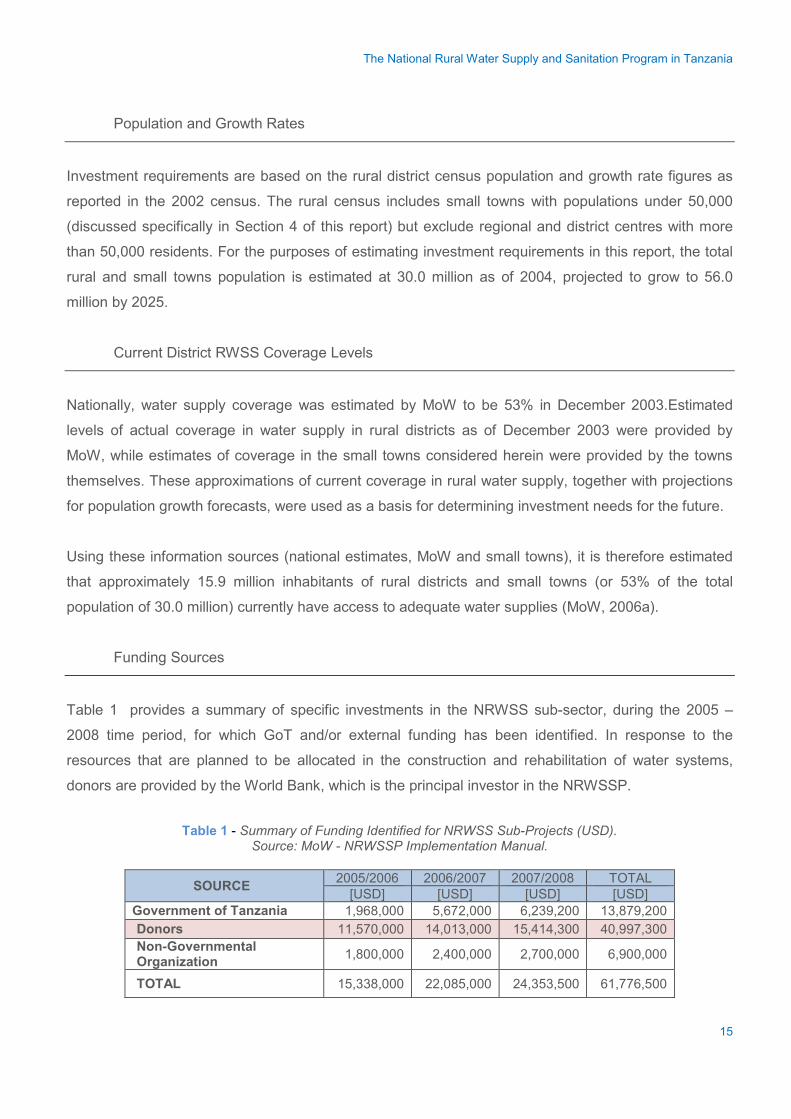
The National Rural Water Supply and Sanitation Program in Tanzania
Population and Growth Rates
Investment requirements are based on the rural district census population and growth rate figures as
reported in the 2002 census. The rural census includes small towns with populations under 50,000
(discussed specifically in Section 4 of this report) but exclude regional and district centres with more
than 50,000 residents. For the purposes of estimating investment requirements in this report, the total
rural and small towns population is estimated at 30.0 million as of 2004, projected to grow to 56.0
million by 2025.
Current District RWSS Coverage Levels
Nationally, water supply coverage was estimated by MoW to be 53% in December 2003.Estimated
levels of actual coverage in water supply in rural districts as of December 2003 were provided by
MoW, while estimates of coverage in the small towns considered herein were provided by the towns
themselves. These approximations of current coverage in rural water supply, together with projections
for population growth forecasts, were used as a basis for determining investment needs for the future.
Using these information sources (national estimates, MoW and small towns), it is therefore estimated
that approximately 15.9 million inhabitants of rural districts and small towns (or 53% of the total
population of 30.0 million) currently have access to adequate water supplies (MoW, 2006a).
Funding Sources
Table 1 provides a summary of specific investments in the NRWSS sub-sector, during the 2005 –
2008 time period, for which GoT and/or external funding has been identified. In response to the
resources that are planned to be allocated in the construction and rehabilitation of water systems,
donors are provided by the World Bank, which is the principal investor in the NRWSSP.
Table 1 - Summary of Funding Identified for NRWSS Sub-Projects (USD).
Source: MoW - NRWSSP Implementation Manual.
SOURCE 2005/2006 2006/2007 2007/2008 TOTAL [USD] [USD] [USD] [USD]
Government of Tanzania 1,968,000 5,672,000 6,239,200 13,879,200 Donors 11,570,000 14,013,000 15,414,300 40,997,300 Non-Governmental Organization 1,800,000 2,400,000 2,700,000 6,900,000
TOTAL 15,338,000 22,085,000 24,353,500 61,776,500
15
The National Rural Water Supply and Sanitation Program in Tanzania
3.2 ECONOMIC COST – BENEFIT ANALYSIS IN THE WASH SECTOR
Economic principles that can inform water policy debates rest on the concepts of benefit and cost. That
is why the cost–benefit framework, in general, can provide a comparison of total economic gains and
losses resulting from a proposed water policy. For public water policy proposals, maximum beneficial
use of water and its complementary resources requires that government formulate, implement and
evaluate their water resource programmes using these economic principles. Using methods that are
grounded in time-tested economic principles, the cost–benefit analysis can provide decision-makers
with a comparison of the impacts of two or more water policy options. Using this methodology, it is
possible to examine the growth of the social benefit derived from the water used and not just the
quantity of water used itself. Economic efficiency, measured as the difference between added benefits
and added costs, can inform water managers and the public of the economic impacts of water
programmes to address peace, development, health, the environment, climate and poverty (Ward F.
A., 2012). Improving water supply and sanitation and water resources management boosts countries’
economic growth and contributes greatly to poverty eradication (Sanctuary M., 2012). A cost–benefit
analysis is an analytical technique for measuring the economic efficiency of public actions by
translating positive and negative effects to a common measure (normally money), in the WASH sector
is possible to apply this and obtain important results that help decision-making on resource allocation.
DISCUSSION:
As outlined above, the NRWSSP is implemented through the construction of new water systems and
technologies, or the rehabilitation of existing ones. These technologies are an obvious part of the costs
list and generate specific benefits for associated sectors. Apart from those related to technologies,
there are others factors that can be listed as costs and benefices.
Costs of water improvement vary principally with the infrastructure and implementing costs, depending
on the technology adopted and the population covered. Furthermore, the benefits associated to the
implementation of technologies have influence at a range of diverse levels. In groups of three or four
students, list which other costs and benefits should be taken into account in order to make an
economic analysis that allows for the correct resource allocation to be decided upon and implemented.
After listing them, explain why they are important for the decision-making processes and the
beneficiaries’ selection. Discuss them with the other groups in the class with the aim of defining a final
list that will be necessary for the homework activity. The first line of a solution table to help students
create the list of factors required is given below.
16
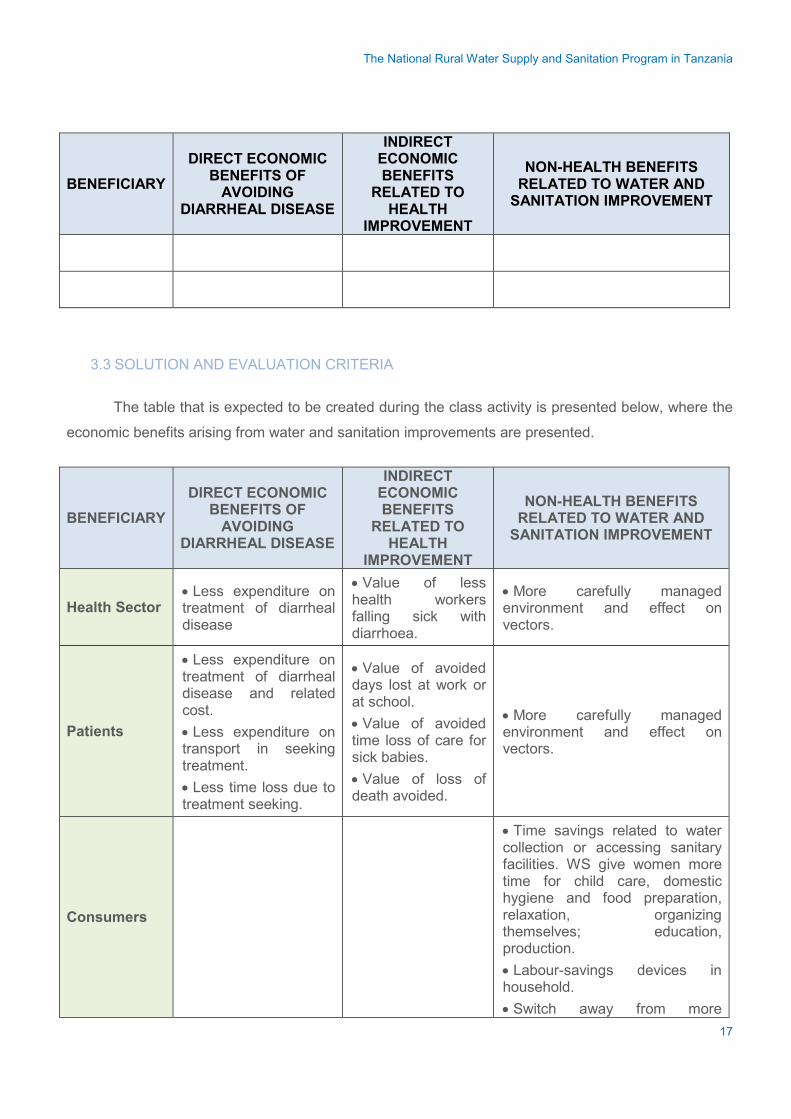
The National Rural Water Supply and Sanitation Program in Tanzania
BENEFICIARY DIRECT ECONOMIC
BENEFITS OF AVOIDING
DIARRHEAL DISEASE
INDIRECT ECONOMIC BENEFITS
RELATED TO HEALTH
IMPROVEMENT
NON-HEALTH BENEFITS RELATED TO WATER AND
SANITATION IMPROVEMENT
3.3 SOLUTION AND EVALUATION CRITERIA
The table that is expected to be created during the class activity is presented below, where the
economic benefits arising from water and sanitation improvements are presented.
BENEFICIARY DIRECT ECONOMIC
BENEFITS OF AVOIDING
DIARRHEAL DISEASE
INDIRECT ECONOMIC BENEFITS
RELATED TO HEALTH
IMPROVEMENT
NON-HEALTH BENEFITS RELATED TO WATER AND
SANITATION IMPROVEMENT
Health Sector • Less expenditure on treatment of diarrheal disease
• Value of less health workers falling sick with diarrhoea.
• More carefully managed environment and effect on vectors.
Patients
• Less expenditure on treatment of diarrheal disease and related cost. • Less expenditure on transport in seeking treatment. • Less time loss due to treatment seeking.
• Value of avoided days lost at work or at school. • Value of avoided time loss of care for sick babies. • Value of loss of death avoided.
• More carefully managed environment and effect on vectors.
Consumers
• Time savings related to water collection or accessing sanitary facilities. WS give women more time for child care, domestic hygiene and food preparation, relaxation, organizing themselves; education, production. • Labour-savings devices in household. • Switch away from more
17
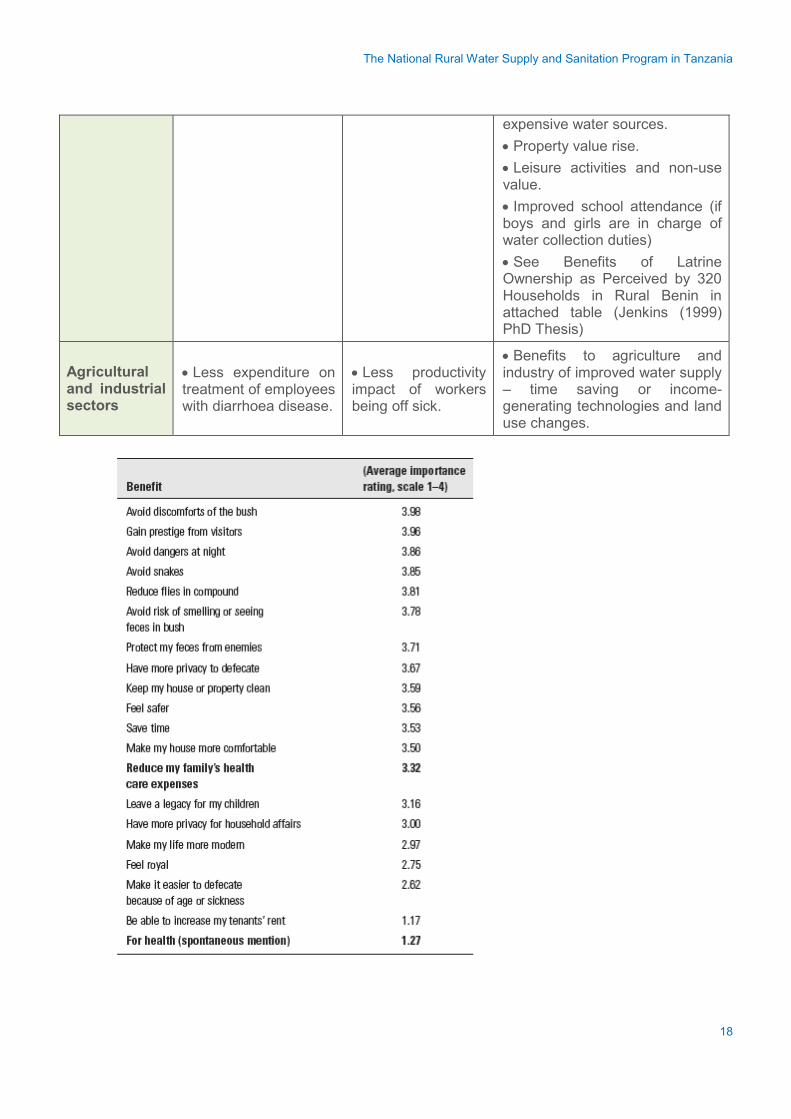
The National Rural Water Supply and Sanitation Program in Tanzania
expensive water sources. • Property value rise. • Leisure activities and non-use value. • Improved school attendance (if boys and girls are in charge of water collection duties) • See Benefits of Latrine Ownership as Perceived by 320 Households in Rural Benin in attached table (Jenkins (1999) PhD Thesis)
Agricultural and industrial sectors
• Less expenditure on treatment of employees with diarrhoea disease.
• Less productivity impact of workers being off sick.
• Benefits to agriculture and industry of improved water supply – time saving or income-generating technologies and land use changes.
18
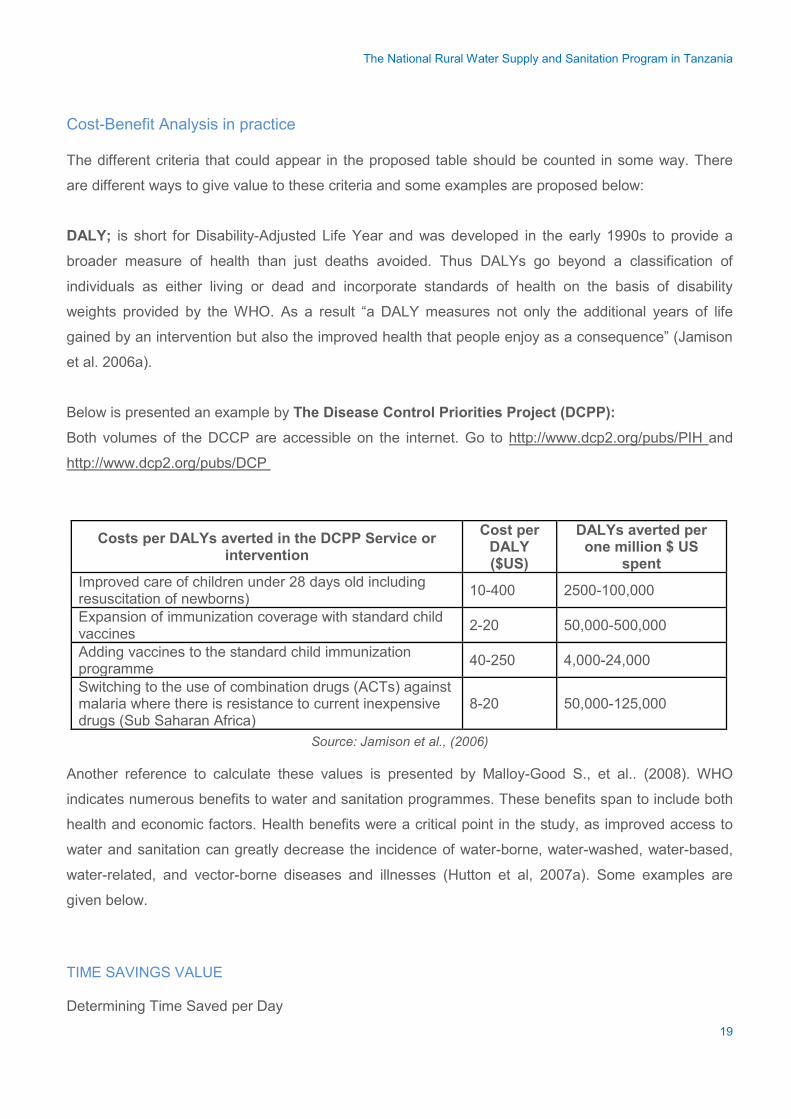
The National Rural Water Supply and Sanitation Program in Tanzania
Cost-Benefit Analysis in practice The different criteria that could appear in the proposed table should be counted in some way. There
are different ways to give value to these criteria and some examples are proposed below:
DALY; is short for Disability-Adjusted Life Year and was developed in the early 1990s to provide a
broader measure of health than just deaths avoided. Thus DALYs go beyond a classification of
individuals as either living or dead and incorporate standards of health on the basis of disability
weights provided by the WHO. As a result “a DALY measures not only the additional years of life
gained by an intervention but also the improved health that people enjoy as a consequence” (Jamison
et al. 2006a).
Below is presented an example by The Disease Control Priorities Project (DCPP): Both volumes of the DCCP are accessible on the internet. Go to http://www.dcp2.org/pubs/PIH and
http://www.dcp2.org/pubs/DCP
Costs per DALYs averted in the DCPP Service or intervention
Cost per DALY ($US)
DALYs averted per one million $ US
spent Improved care of children under 28 days old including resuscitation of newborns) 10-400 2500-100,000
Expansion of immunization coverage with standard child vaccines 2-20 50,000-500,000
Adding vaccines to the standard child immunization programme 40-250 4,000-24,000
Switching to the use of combination drugs (ACTs) against malaria where there is resistance to current inexpensive drugs (Sub Saharan Africa)
8-20 50,000-125,000
Source: Jamison et al., (2006)
Another reference to calculate these values is presented by Malloy-Good S., et al.. (2008). WHO
indicates numerous benefits to water and sanitation programmes. These benefits span to include both
health and economic factors. Health benefits were a critical point in the study, as improved access to
water and sanitation can greatly decrease the incidence of water-borne, water-washed, water-based,
water-related, and vector-borne diseases and illnesses (Hutton et al, 2007a). Some examples are
given below.
TIME SAVINGS VALUE Determining Time Saved per Day
19
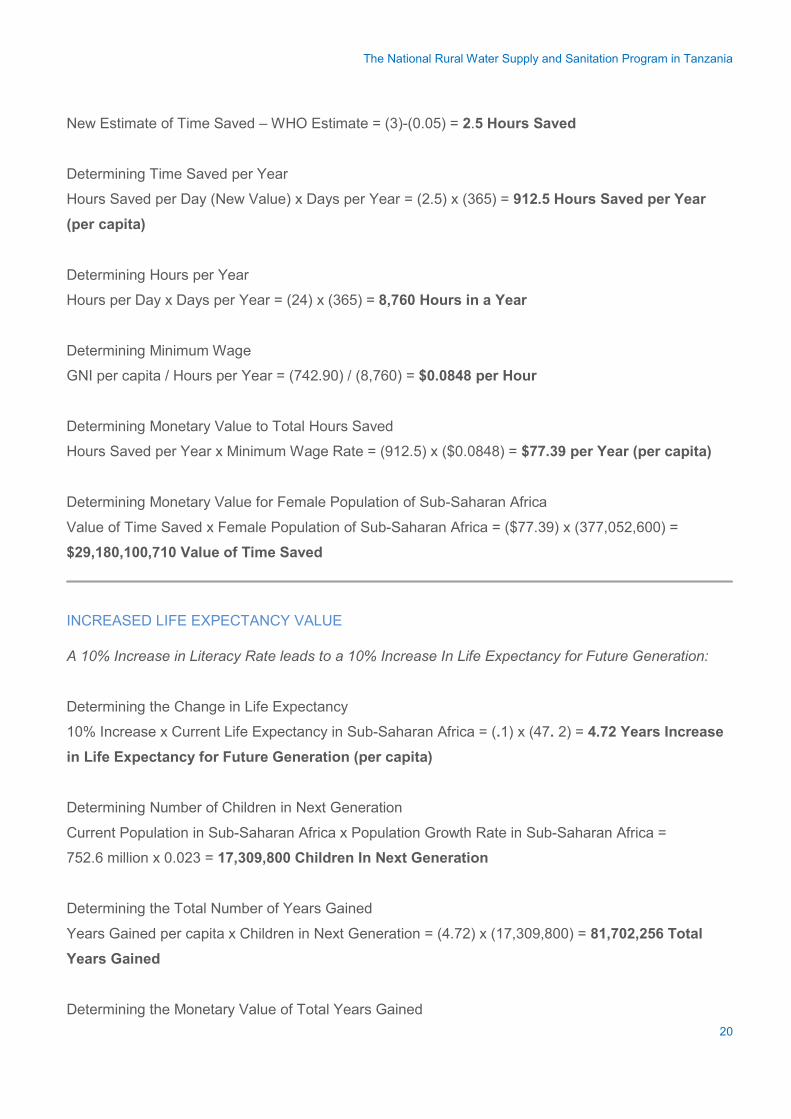
The National Rural Water Supply and Sanitation Program in Tanzania
New Estimate of Time Saved – WHO Estimate = (3)-(0.05) = 2.5 Hours Saved
Determining Time Saved per Year
Hours Saved per Day (New Value) x Days per Year = (2.5) x (365) = 912.5 Hours Saved per Year (per capita)
Determining Hours per Year
Hours per Day x Days per Year = (24) x (365) = 8,760 Hours in a Year
Determining Minimum Wage
GNI per capita / Hours per Year = (742.90) / (8,760) = $0.0848 per Hour
Determining Monetary Value to Total Hours Saved
Hours Saved per Year x Minimum Wage Rate = (912.5) x ($0.0848) = $77.39 per Year (per capita)
Determining Monetary Value for Female Population of Sub-Saharan Africa
Value of Time Saved x Female Population of Sub-Saharan Africa = ($77.39) x (377,052,600) =
$29,180,100,710 Value of Time Saved
INCREASED LIFE EXPECTANCY VALUE A 10% Increase in Literacy Rate leads to a 10% Increase In Life Expectancy for Future Generation:
Determining the Change in Life Expectancy
10% Increase x Current Life Expectancy in Sub-Saharan Africa = (.1) x (47. 2) = 4.72 Years Increase in Life Expectancy for Future Generation (per capita)
Determining Number of Children in Next Generation
Current Population in Sub-Saharan Africa x Population Growth Rate in Sub-Saharan Africa =
752.6 million x 0.023 = 17,309,800 Children In Next Generation
Determining the Total Number of Years Gained
Years Gained per capita x Children in Next Generation = (4.72) x (17,309,800) = 81,702,256 Total Years Gained
Determining the Monetary Value of Total Years Gained 20

The National Rural Water Supply and Sanitation Program in Tanzania
Total Years Gained x GNI per capita in Sub-Saharan Africa = (81,702,256) x ($742.90) =
$60,696,605,980 Value Gained From Increased Life Expectancy
21
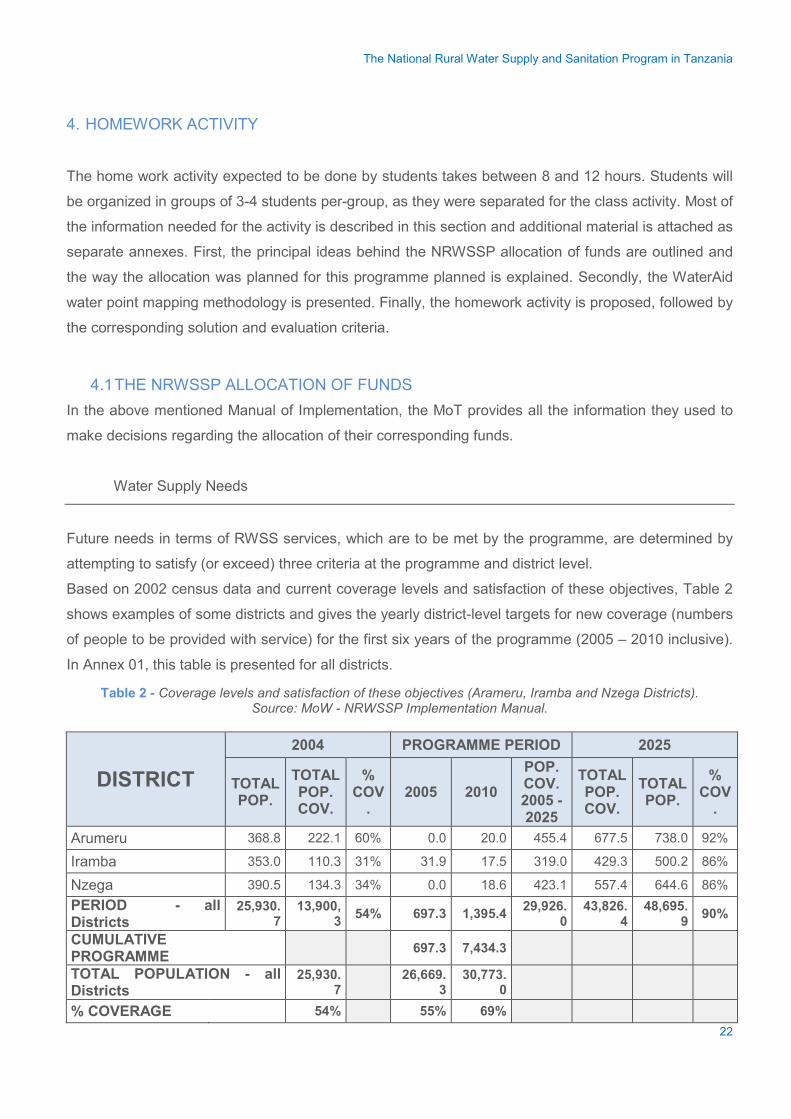
The National Rural Water Supply and Sanitation Program in Tanzania
4. HOMEWORK ACTIVITY
The home work activity expected to be done by students takes between 8 and 12 hours. Students will
be organized in groups of 3-4 students per-group, as they were separated for the class activity. Most of
the information needed for the activity is described in this section and additional material is attached as
separate annexes. First, the principal ideas behind the NRWSSP allocation of funds are outlined and
the way the allocation was planned for this programme planned is explained. Secondly, the WaterAid
water point mapping methodology is presented. Finally, the homework activity is proposed, followed by
the corresponding solution and evaluation criteria.
4.1 THE NRWSSP ALLOCATION OF FUNDS In the above mentioned Manual of Implementation, the MoT provides all the information they used to
make decisions regarding the allocation of their corresponding funds.
Water Supply Needs
Future needs in terms of RWSS services, which are to be met by the programme, are determined by
attempting to satisfy (or exceed) three criteria at the programme and district level.
Based on 2002 census data and current coverage levels and satisfaction of these objectives, Table 2
shows examples of some districts and gives the yearly district-level targets for new coverage (numbers
of people to be provided with service) for the first six years of the programme (2005 – 2010 inclusive).
In Annex 01, this table is presented for all districts.
Table 2 - Coverage levels and satisfaction of these objectives (Arameru, Iramba and Nzega Districts). Source: MoW - NRWSSP Implementation Manual.
DISTRICT 2004 PROGRAMME PERIOD 2025
TOTAL POP.
TOTAL POP. COV.
% COV
. 2005 2010
POP. COV. 2005 - 2025
TOTAL POP. COV.
TOTAL POP.
% COV
.
Arumeru 368.8 222.1 60% 0.0 20.0 455.4 677.5 738.0 92%
Iramba 353.0 110.3 31% 31.9 17.5 319.0 429.3 500.2 86%
Nzega 390.5 134.3 34% 0.0 18.6 423.1 557.4 644.6 86% PERIOD - all Districts
25,930.7
13,900,3 54% 697.3 1,395.4 29,926.
0 43,826.
4 48,695.
9 90%
CUMULATIVE PROGRAMME 697.3 7,434.3
TOTAL POPULATION - all Districts
25,930.7 26,669.
3 30,773.
0
% COVERAGE 54% 55% 69% 22
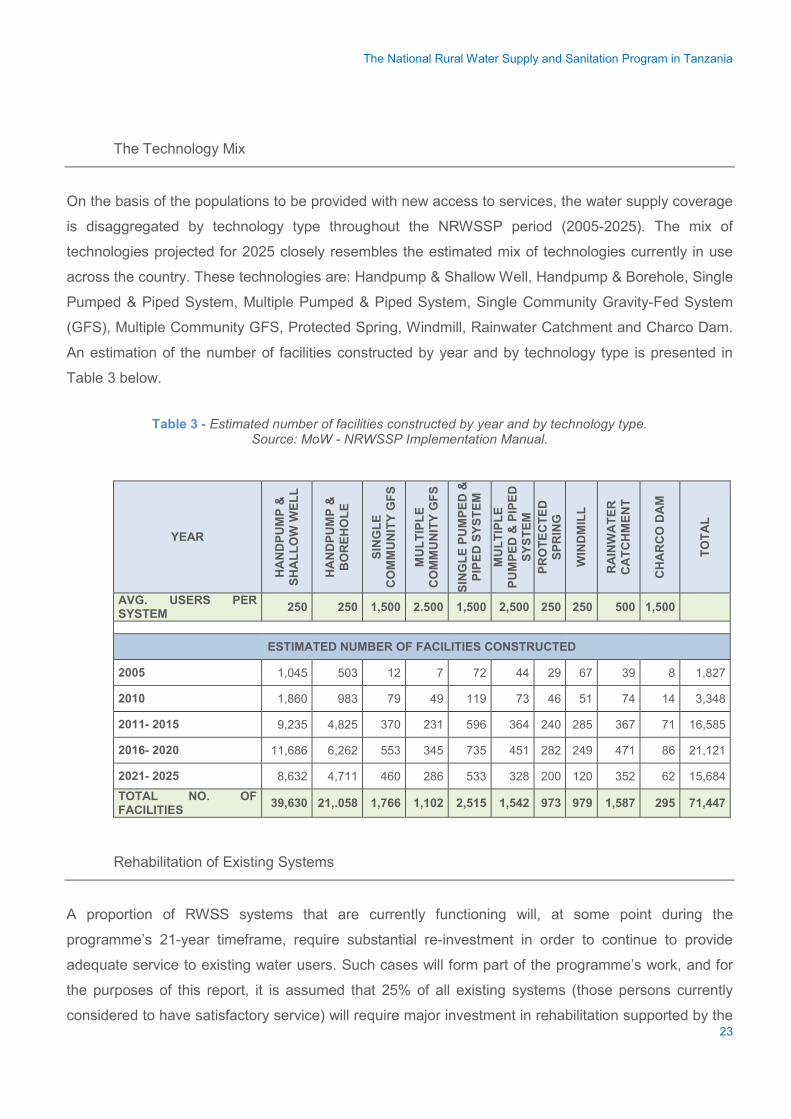
The National Rural Water Supply and Sanitation Program in Tanzania
The Technology Mix
On the basis of the populations to be provided with new access to services, the water supply coverage
is disaggregated by technology type throughout the NRWSSP period (2005-2025). The mix of
technologies projected for 2025 closely resembles the estimated mix of technologies currently in use
across the country. These technologies are: Handpump & Shallow Well, Handpump & Borehole, Single
Pumped & Piped System, Multiple Pumped & Piped System, Single Community Gravity-Fed System
(GFS), Multiple Community GFS, Protected Spring, Windmill, Rainwater Catchment and Charco Dam.
An estimation of the number of facilities constructed by year and by technology type is presented in
Table 3 below.
Table 3 - Estimated number of facilities constructed by year and by technology type.
Source: MoW - NRWSSP Implementation Manual.
YEAR
HA
ND
PUM
P &
SH
ALL
OW
WEL
L
HA
ND
PUM
P &
B
OR
EHO
LE
SIN
GLE
C
OM
MU
NIT
Y G
FS
MU
LTIP
LE
CO
MM
UN
ITY
GFS
SIN
GLE
PU
MPE
D &
PI
PED
SYS
TEM
MU
LTIP
LE
PUM
PED
& P
IPED
SY
STEM
PR
OTE
CTE
D
SPR
ING
WIN
DM
ILL
RA
INW
ATE
R
CA
TCH
MEN
T
CH
AR
CO
DA
M
TOTA
L
AVG. USERS PER SYSTEM 250 250 1,500 2.500 1,500 2,500 250 250 500 1,500
ESTIMATED NUMBER OF FACILITIES CONSTRUCTED
2005 1,045 503 12 7 72 44 29 67 39 8 1,827
2010 1,860 983 79 49 119 73 46 51 74 14 3,348
2011- 2015 9,235 4,825 370 231 596 364 240 285 367 71 16,585
2016- 2020 11,686 6,262 553 345 735 451 282 249 471 86 21,121
2021- 2025 8,632 4,711 460 286 533 328 200 120 352 62 15,684 TOTAL NO. OF FACILITIES 39,630 21,.058 1,766 1,102 2,515 1,542 973 979 1,587 295 71,447
Rehabilitation of Existing Systems
A proportion of RWSS systems that are currently functioning will, at some point during the
programme’s 21-year timeframe, require substantial re-investment in order to continue to provide
adequate service to existing water users. Such cases will form part of the programme’s work, and for
the purposes of this report, it is assumed that 25% of all existing systems (those persons currently
considered to have satisfactory service) will require major investment in rehabilitation supported by the 23
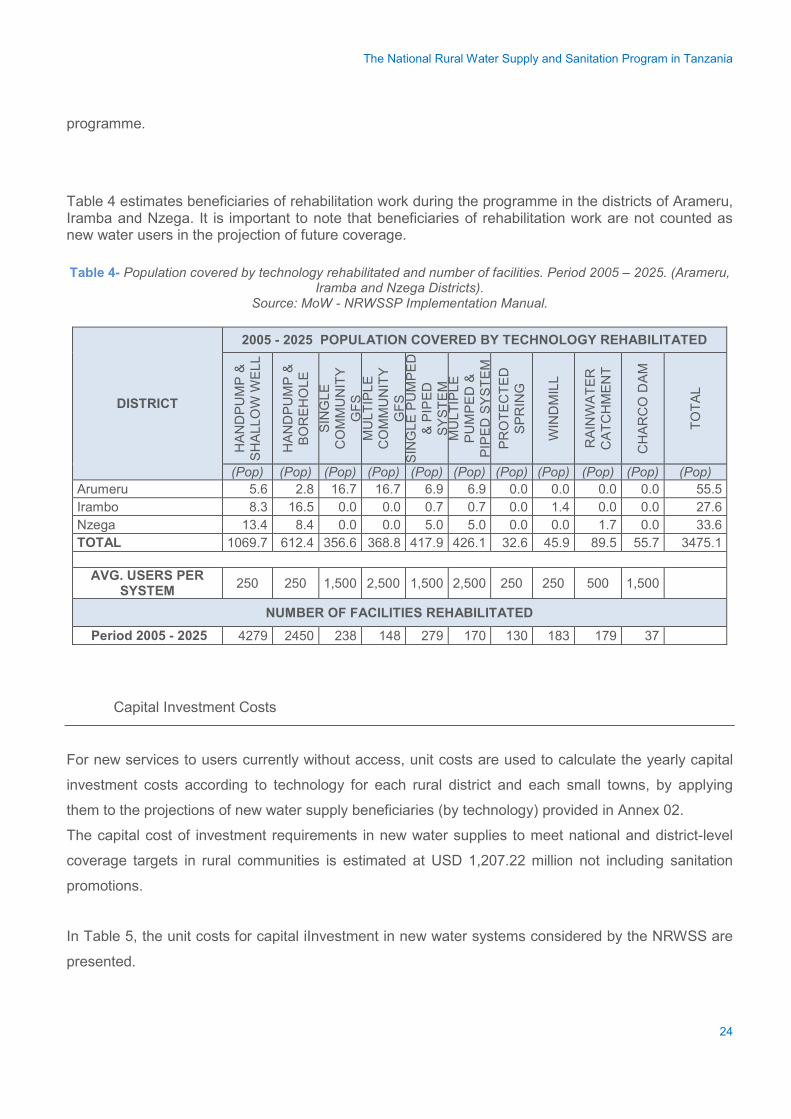
The National Rural Water Supply and Sanitation Program in Tanzania
programme.
Table 4 estimates beneficiaries of rehabilitation work during the programme in the districts of Arameru, Iramba and Nzega. It is important to note that beneficiaries of rehabilitation work are not counted as new water users in the projection of future coverage.
Table 4- Population covered by technology rehabilitated and number of facilities. Period 2005 – 2025. (Arameru,
Iramba and Nzega Districts). Source: MoW - NRWSSP Implementation Manual.
DISTRICT
2005 - 2025 POPULATION COVERED BY TECHNOLOGY REHABILITATED
HAN
DPU
MP
& SH
ALL
OW
WEL
L
HAN
DPU
MP
& BO
REH
OLE
SI
NG
LE
CO
MM
UN
ITY
GFS
M
ULT
IPLE
C
OM
MU
NIT
Y G
FS
SIN
GLE
PU
MPE
D
& PI
PED
SY
STE
M
MU
LTIP
LE
PUM
PED
&
PIP
ED S
YST
EM
PRO
TEC
TED
SP
RIN
G
WIN
DM
ILL
RAI
NW
ATER
C
ATC
HM
ENT
CH
ARC
O D
AM
TOTA
L
(Pop) (Pop) (Pop) (Pop) (Pop) (Pop) (Pop) (Pop) (Pop) (Pop) (Pop) Arumeru 5.6 2.8 16.7 16.7 6.9 6.9 0.0 0.0 0.0 0.0 55.5 Irambo 8.3 16.5 0.0 0.0 0.7 0.7 0.0 1.4 0.0 0.0 27.6 Nzega 13.4 8.4 0.0 0.0 5.0 5.0 0.0 0.0 1.7 0.0 33.6 TOTAL 1069.7 612.4 356.6 368.8 417.9 426.1 32.6 45.9 89.5 55.7 3475.1
AVG. USERS PER
SYSTEM 250 250 1,500 2,500 1,500 2,500 250 250 500 1,500
NUMBER OF FACILITIES REHABILITATED Period 2005 - 2025 4279 2450 238 148 279 170 130 183 179 37
Capital Investment Costs
For new services to users currently without access, unit costs are used to calculate the yearly capital
investment costs according to technology for each rural district and each small towns, by applying
them to the projections of new water supply beneficiaries (by technology) provided in Annex 02.
The capital cost of investment requirements in new water supplies to meet national and district-level
coverage targets in rural communities is estimated at USD 1,207.22 million not including sanitation
promotions.
In Table 5, the unit costs for capital iInvestment in new water systems considered by the NRWSS are
presented.
24
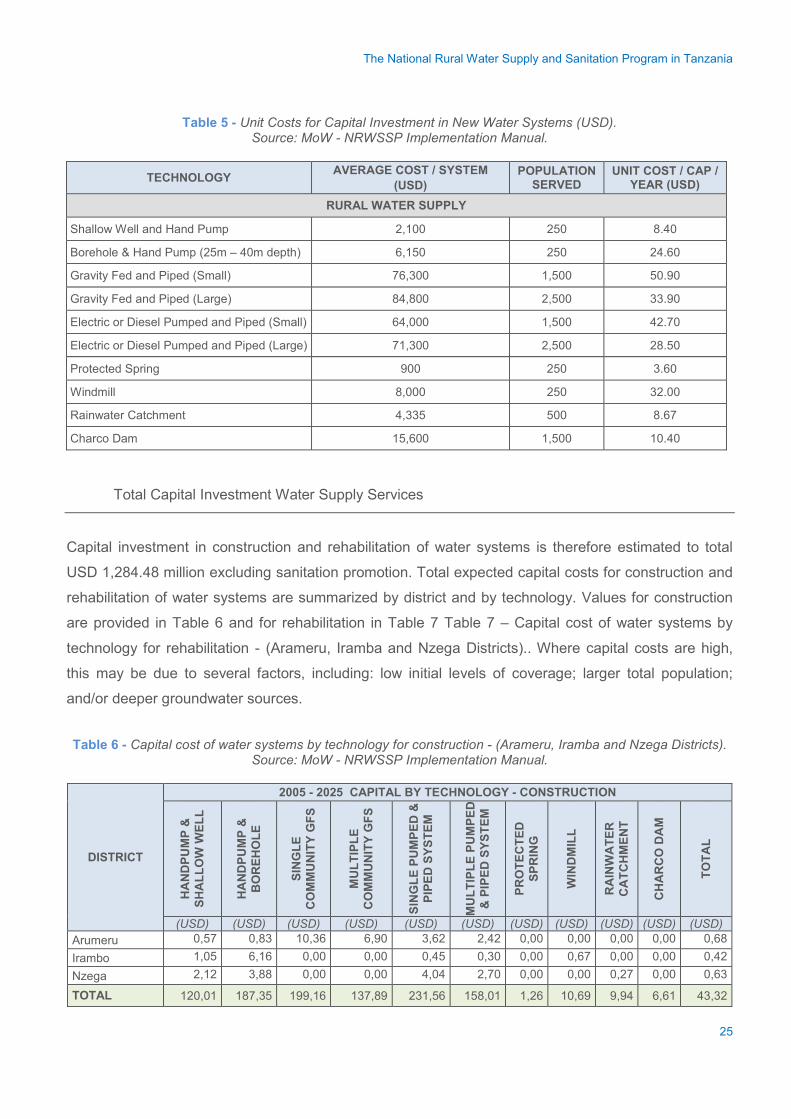
The National Rural Water Supply and Sanitation Program in Tanzania
Table 5 - Unit Costs for Capital Investment in New Water Systems (USD). Source: MoW - NRWSSP Implementation Manual.
TECHNOLOGY AVERAGE COST / SYSTEM (USD)
POPULATION SERVED
UNIT COST / CAP / YEAR (USD)
RURAL WATER SUPPLY
Shallow Well and Hand Pump 2,100 250 8.40
Borehole & Hand Pump (25m – 40m depth) 6,150 250 24.60
Gravity Fed and Piped (Small) 76,300 1,500 50.90
Gravity Fed and Piped (Large) 84,800 2,500 33.90
Electric or Diesel Pumped and Piped (Small) 64,000 1,500 42.70
Electric or Diesel Pumped and Piped (Large) 71,300 2,500 28.50
Protected Spring 900 250 3.60
Windmill 8,000 250 32.00
Rainwater Catchment 4,335 500 8.67
Charco Dam 15,600 1,500 10.40
Total Capital Investment Water Supply Services
Capital investment in construction and rehabilitation of water systems is therefore estimated to total
USD 1,284.48 million excluding sanitation promotion. Total expected capital costs for construction and
rehabilitation of water systems are summarized by district and by technology. Values for construction
are provided in Table 6 and for rehabilitation in Table 7 Table 7 – Capital cost of water systems by
technology for rehabilitation - (Arameru, Iramba and Nzega Districts).. Where capital costs are high,
this may be due to several factors, including: low initial levels of coverage; larger total population;
and/or deeper groundwater sources.
Table 6 - Capital cost of water systems by technology for construction - (Arameru, Iramba and Nzega Districts).
Source: MoW - NRWSSP Implementation Manual.
DISTRICT
2005 - 2025 CAPITAL BY TECHNOLOGY - CONSTRUCTION
HA
ND
PUM
P &
SH
ALL
OW
WEL
L
HA
ND
PUM
P &
B
OR
EHO
LE
SIN
GLE
C
OM
MU
NIT
Y G
FS
MU
LTIP
LE
CO
MM
UN
ITY
GFS
SIN
GLE
PU
MPE
D &
PI
PED
SYS
TEM
MU
LTIP
LE P
UM
PED
&
PIP
ED S
YSTE
M
PRO
TEC
TED
SP
RIN
G
WIN
DM
ILL
RA
INW
ATE
R
CA
TCH
MEN
T
CH
AR
CO
DA
M
TOTA
L
(USD) (USD) (USD) (USD) (USD) (USD) (USD) (USD) (USD) (USD) (USD) Arumeru 0,57 0,83 10,36 6,90 3,62 2,42 0,00 0,00 0,00 0,00 0,68 Irambo 1,05 6,16 0,00 0,00 0,45 0,30 0,00 0,67 0,00 0,00 0,42 Nzega 2,12 3,88 0,00 0,00 4,04 2,70 0,00 0,00 0,27 0,00 0,63
TOTAL 120,01 187,35 199,16 137,89 231,56 158,01 1,26 10,69 9,94 6,61 43,32
25
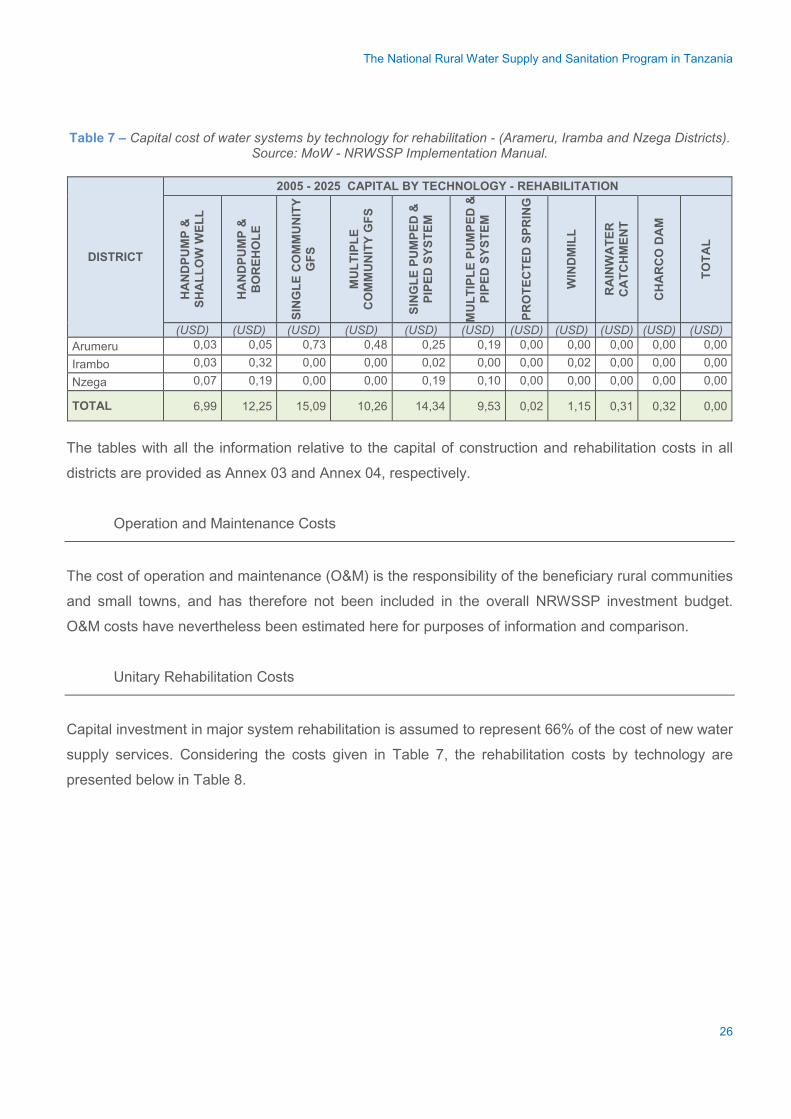
The National Rural Water Supply and Sanitation Program in Tanzania
Table 7 – Capital cost of water systems by technology for rehabilitation - (Arameru, Iramba and Nzega Districts).
Source: MoW - NRWSSP Implementation Manual.
DISTRICT
2005 - 2025 CAPITAL BY TECHNOLOGY - REHABILITATION H
AN
DPU
MP
&
SHA
LLO
W W
ELL
HA
ND
PUM
P &
B
OR
EHO
LE
SIN
GLE
CO
MM
UN
ITY
GFS
MU
LTIP
LE
CO
MM
UN
ITY
GFS
SIN
GLE
PU
MPE
D &
PI
PED
SYS
TEM
MU
LTIP
LE P
UM
PED
&
PIPE
D S
YSTE
M
PRO
TEC
TED
SPR
ING
WIN
DM
ILL
RA
INW
ATE
R
CA
TCH
MEN
T
CH
AR
CO
DA
M
TOTA
L
(USD) (USD) (USD) (USD) (USD) (USD) (USD) (USD) (USD) (USD) (USD) Arumeru 0,03 0,05 0,73 0,48 0,25 0,19 0,00 0,00 0,00 0,00 0,00 Irambo 0,03 0,32 0,00 0,00 0,02 0,00 0,00 0,02 0,00 0,00 0,00 Nzega 0,07 0,19 0,00 0,00 0,19 0,10 0,00 0,00 0,00 0,00 0,00
TOTAL 6,99 12,25 15,09 10,26 14,34 9,53 0,02 1,15 0,31 0,32 0,00
The tables with all the information relative to the capital of construction and rehabilitation costs in all
districts are provided as Annex 03 and Annex 04, respectively.
Operation and Maintenance Costs
The cost of operation and maintenance (O&M) is the responsibility of the beneficiary rural communities
and small towns, and has therefore not been included in the overall NRWSSP investment budget.
O&M costs have nevertheless been estimated here for purposes of information and comparison.
Unitary Rehabilitation Costs
Capital investment in major system rehabilitation is assumed to represent 66% of the cost of new water
supply services. Considering the costs given in Table 7, the rehabilitation costs by technology are
presented below in Table 8.
26
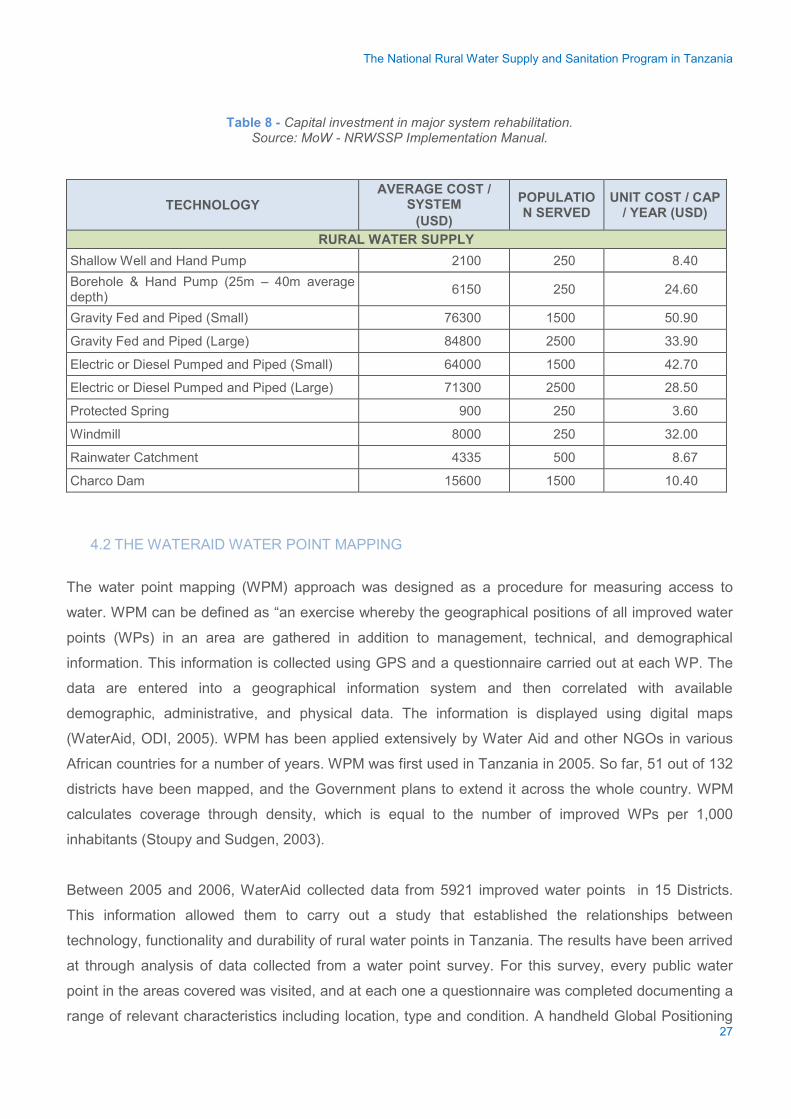
The National Rural Water Supply and Sanitation Program in Tanzania
Table 8 - Capital investment in major system rehabilitation. Source: MoW - NRWSSP Implementation Manual.
TECHNOLOGY AVERAGE COST /
SYSTEM (USD)
POPULATION SERVED
UNIT COST / CAP / YEAR (USD)
RURAL WATER SUPPLY Shallow Well and Hand Pump 2100 250 8.40 Borehole & Hand Pump (25m – 40m average depth) 6150 250 24.60
Gravity Fed and Piped (Small) 76300 1500 50.90
Gravity Fed and Piped (Large) 84800 2500 33.90
Electric or Diesel Pumped and Piped (Small) 64000 1500 42.70
Electric or Diesel Pumped and Piped (Large) 71300 2500 28.50
Protected Spring 900 250 3.60
Windmill 8000 250 32.00
Rainwater Catchment 4335 500 8.67
Charco Dam 15600 1500 10.40
4.2 THE WATERAID WATER POINT MAPPING
The water point mapping (WPM) approach was designed as a procedure for measuring access to
water. WPM can be defined as “an exercise whereby the geographical positions of all improved water
points (WPs) in an area are gathered in addition to management, technical, and demographical
information. This information is collected using GPS and a questionnaire carried out at each WP. The
data are entered into a geographical information system and then correlated with available
demographic, administrative, and physical data. The information is displayed using digital maps
(WaterAid, ODI, 2005). WPM has been applied extensively by Water Aid and other NGOs in various
African countries for a number of years. WPM was first used in Tanzania in 2005. So far, 51 out of 132
districts have been mapped, and the Government plans to extend it across the whole country. WPM
calculates coverage through density, which is equal to the number of improved WPs per 1,000
inhabitants (Stoupy and Sudgen, 2003).
Between 2005 and 2006, WaterAid collected data from 5921 improved water points in 15 Districts.
This information allowed them to carry out a study that established the relationships between
technology, functionality and durability of rural water points in Tanzania. The results have been arrived
at through analysis of data collected from a water point survey. For this survey, every public water
point in the areas covered was visited, and at each one a questionnaire was completed documenting a
range of relevant characteristics including location, type and condition. A handheld Global Positioning 27
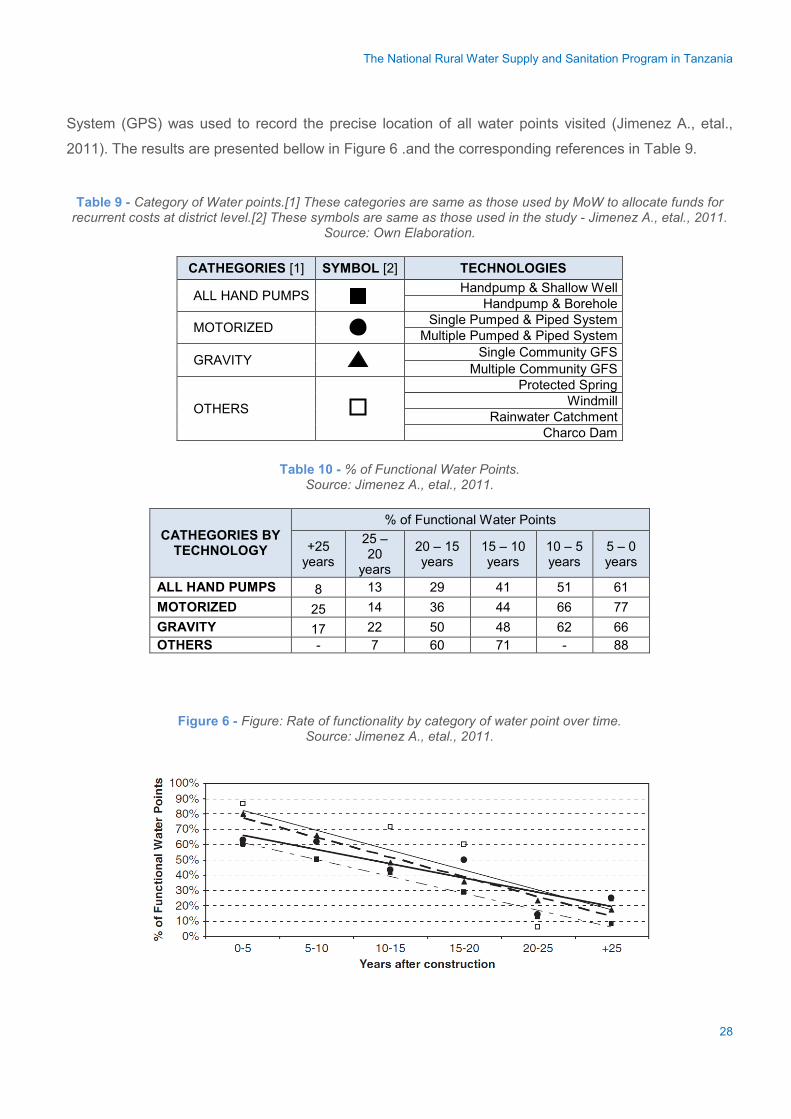
The National Rural Water Supply and Sanitation Program in Tanzania
System (GPS) was used to record the precise location of all water points visited (Jimenez A., etal.,
2011). The results are presented bellow in Figure 6 .and the corresponding references in Table 9.
Table 9 - Category of Water points.[1] These categories are same as those used by MoW to allocate funds for recurrent costs at district level.[2] These symbols are same as those used in the study - Jimenez A., etal., 2011.
Source: Own Elaboration.
CATHEGORIES [1] SYMBOL [2] TECHNOLOGIES
ALL HAND PUMPS Handpump & Shallow Well Handpump & Borehole
MOTORIZED Single Pumped & Piped System Multiple Pumped & Piped System
GRAVITY Single Community GFS Multiple Community GFS
OTHERS
Protected Spring Windmill
Rainwater Catchment Charco Dam
Table 10 - % of Functional Water Points.
Source: Jimenez A., etal., 2011.
CATHEGORIES BY TECHNOLOGY
% of Functional Water Points
+25 years
25 – 20
years
20 – 15 years
15 – 10 years
10 – 5 years
5 – 0 years
ALL HAND PUMPS 8 13 29 41 51 61 MOTORIZED 25 14 36 44 66 77 GRAVITY 17 22 50 48 62 66 OTHERS - 7 60 71 - 88
Figure 6 - Figure: Rate of functionality by category of water point over time. Source: Jimenez A., etal., 2011.
28
The National Rural Water Supply and Sanitation Program in Tanzania
Figure 6 .presents simple linear regressions by category that yield interesting results (Jimenez A., etal.,
2011). Hand pumps had the least favourable functionality–function over time dropped from 61% in the
first five years to 6% in the 25-year period. Similarly, motorised systems started at 77% and dropped to
13% in the same period. Gravity-fed systems worked better in the long run than any other category of
WP and dropped from 66% to 20%. In all three categories, just 35 to 47% of WPs were working 15
years after installation. WPs in the ‘‘other’’ category had better scores, but this category included very
few WPs (just 152 out of 6,814) and, as explained above, grouped WPs of very different types.
EXERCISE PROPOSED: As explained above, the NRWSSP considers the rehabilitation of systems that were constructed before
its implementation. The WaterAid research and the results shown in Table 10 and Figure 5 allow
improvement of the data and implementation criteria that NRWSSP uses. As homework it is expected
that the students work in the same groups as for the class activity. The exercises proposed are, to:
• Create a list of districts, listed by cost of construction + rehabilitation (NRWSSP data).
• Create a new list with the additional criterion of rehabilitation of the new constructions.
• Create a matrix by districts that includes this new criterion of rehabilitation and compare
the solutions with the one that includes only the NRWSSP data (above).
• Considering the resources tendency (Annex 05) and using the matrix created, find the
differences between the two solutions (NRWSSP only and with WaterAid data). How
many districts will it be possible to cover using the WaterAid WPM data? And without,
as NRWSSP proposes?
For this exercise the students should be provided with the data included in the Annexes. Using these
and obtaining the results asked, an interpretation of them should be made.
Apart from calculating the matrix (see above), each group should discuss the following points and give
their corresponding conclusions:
• Importance of rehabilitation during the programme.
• The best option between covering the entire population with construction of water
systems, and covering part of the population with construction of systems considering
rehabilitation of these during the programme implementation process.
• Calculated resources and viability of them.
Finally, consider all the previous conclusions to provide a list comprising all the necessary elements
that should be considered during the decision-making process for a national water supply programme
29
The National Rural Water Supply and Sanitation Program in Tanzania
resources allocation plan.
4.3 SOLUTION AND EVALUATION CRITERIA THE PROGRAM
The solution for the first part is provided in the document “Solution_Case Study_NRWSSP.xls”, where
it is possible to find different folders following the necessary procedure to arrive at the final
conclusions. These principal conclusions are in the last folder of the “.xls” document.
The rehabilitation during the execution of the programme is important due to the necessity of people to
conserve their water resources. It is not fully beneficial if the water system will just be working for a few
years.
The best option is to cover less of the population and ensure the rehabilitation of these new systems.
This is the best way to ensure the sustainability of these systems and the whole programme into the
long-term future. Also, this consideration will allow the population covered to develop their economic
activities, which would have a positive influence on the rest of the country.
The list, required in the last part of the exercise, comprising elements that should be considered during
the decision-making process for a National Water Supply Program resources allocation, should include
those that appear in the table that presents the solution of the Class Activity (see Section 3.3), plus any
additions. This will allow the students to have a general understanding of the whole case study. The
listed elements are:
• Expenditure on treatment of diarrheal disease
• Value of less health workers falling sick with diarrhoea.
• Environment management and effect on vectors.
• Expenditure on treatment of diarrheal disease and related cost.
• Expenditure on transport in seeking treatment.
• Time loss due to treatment seeking.
• Value of avoided days lost at work or at school.
• Value of avoided time loss of care for sick babies.
• Value of loss of death avoided.
• Environment management and effect on vectors.
• Time savings related to water collection or accessing sanitary facilities.
• Labour-savings devices in household.
• Switch away from more expensive water sources.
30
The National Rural Water Supply and Sanitation Program in Tanzania
• Property value rise.
• Leisure activities and non-use value.
• Expenditure on treatment of employees with diarrhoea disease.
• Productivity impact of workers being off sick.
• Impacts to agriculture and industry of improved water supply – time saving or income-
generating technologies and land use changes.
31
The National Rural Water Supply and Sanitation Program in Tanzania
5. BIBLIOGRAPHY
• Brouwer R.; Pearce David. “Cost–Benefit Analysis and Water Resources Management”. G
MPG Books Ltd, Bodmin, Cornwall - Great Britain 2005.
• Fisher Julie - WEDC - Water, Engineering and Development Centre, Loughborough University,
UK – 2005
• Giné Garriga, R., & Pérez Foguet, A. (2008). Sustainability assessment of national rural water
supply program in Tanzania. Natural Resources Forum, 32, 327–342.
• Government of United Republic of Tanzania, 2002. National Water Policy. Ministry of Water
and Livestock Development, Dar es Salaam.
• Hutton, G., Haller, L., & Bartram, J. (2007a). Economic and health effects of increasing
coverage of low cost household drinking-water supply and sanitation intervention to countries
off-track to meet MDG target 10. Geneva: World Health Organization.
• Jamison et al 2006a; Priorities in Health, World Bank, Washington.
• Jiménez, A., & Pérez Foguet, A. (2011). Implementing pro-poor policies in a decentralized
context: the case of the Rural Water Supply and Sanitation Program in Tanzania. Sustainability
Science, 6(1), 37–49. doi:10.1007/s11625-010-0121-1
• Jiménez, A., & Perez-Foguet, A. (2011). The relationship between technology and functionality
of rural water points: evidence from Tanzania. Water Science and Technology, 63(5), 948–955.
doi:10.2166/wst.2011.274
• Jiménez, A., & Perez-Foguet, A. (2011). Water Point Mapping for the Analysis of Rural Water
Supply Plans: Case Study from Tanzania. Journal of Water Resources Planning and
Management-Asce, 137(5), 439–447. doi:10.1061/(asce)wr.1943-5452.0000135
• Jamison et al 2006b; Disease Control Priorities in Developing Countries, World Bank,
Washington.
• JMP – WHO/UNICEF (Joint Monitoring Programme for Water Supply and Sanitation.
http://www.wssinfo.org/data-estimates/graphs/ . Last accessed at September 2014.
• Malloy-Good S., Smith K., 2008. Cost-Benefit Analysis of Improved Water and Sanitation for
Women and Girls in Sub-Saharan Africa. Columbia University School of Social Work
Economics for International Affairs.
• MINISTRY OF FOREIGN AFFAIRS AND INTERNATIONAL COOPERATION, The United
Republic of Tanzania - "Tanzania Country Profile".
http://www.foreign.go.tz/tanzania/category/country-profile. Last accessed August 2014.
• Ministry of Water. (2006a). “National rural water supply and sanitation program (NRWSSP).” 32
The National Rural Water Supply and Sanitation Program in Tanzania
United Republic of Tanzania, Dodoma, Tanzania.
• Ministry of Water. (2006b). “Water sector development program: Implementation manual.”
United Republic of Tanzania, Dodoma, Tanzania.
• Prime Minister’s Office Regional Administration and Local Government (PMO-RALG). (2002).
“Population and housing census 2002.” National Bureau of Statistics, Dar es Salaam,
Tanzania.
• Sanctuary M.; Tropp H. (SIWI); Haller L. (WHO). “Making Water a Part of Economic
Development: The Economic Benefits of Improved Water Management and Services” -
November, 2012. Available in: http://www.siwi.org/publication/making-water-a-part-of-
economic-development-the-economic-benefits-of-improved-water-management-and-services/
• Stoupy, O., Sudgen, S., 2003. Halving the Number of People without Access to SafeWater by
2015 —A Malawian Perspective. Part 2: New indicators for the millennium development goal.
WaterAid.
• UN Data, A world of information. “United Republic of Tanzania”. Available at:
https://data.un.org/CountryProfile.aspx?crName=United%20Republic%20of%20Tanzania . Last
Accessed at September 2014.
• UNDP - Human Development Report 2014. Sustaining Human Progress: Reducing
Vulnerabilities and Building Resilience, 2014. United Nations Development Programme - New
York, USA.
• Ward F. A., 2012. “Cost–benefit and water resources policy: a survey”. Water Policy Vol. 14 -
pp 250–280.
• Wateraid/ODI, 2005. Learning for advocacy and good practice. WaterAid water point mapping.
Prepared by Katharina Welle, Overseas Development Institute. Available at
http://www.wateraid.org/international/what_we_do/policy_and_research/ . Last accessed
August 2014.
• WHO, 2004. “Water, Sanitation and Hygiene links to health: Facts and Figures.”
• World Bank - "Community water supply and sanitation conference. Water and sanitation
program", 1998. http://www-wds.worldbank.org
• World Health Organization, UNICEF, 2000. Global Water Supply and Sanitation Assessment
2000 Report, Geneva: WHO.
• WSSCC (Water Supply and Sanitation Collaborative Council) – “Wash targets and indicators
post-2015: Recommendations from international consultations comprehensive
recommendations”- April 2014).
33
The National Rural Water Supply and Sanitation Program in Tanzania
6. FURTHER/SUGGESTED MATERIAL
ANNEX 01: Population Estimation<Annex01_Case Study_NRWSSP.xls>
ANNEX 02: New water supply beneficiaries<Annex02_Case Study_NRWSSP.xls>
ANNEX 03: Construction Capital Cost<Annex03_Case Study_NRWSSP.xls>
ANNEX 04: Rehabilitation Capital Costs<Annex04_Case Study_NRWSSP.xls>
ANNEX 05: Resources Tendency <Annex 05_Case Study_NRWSSP.xls>
34

http://www.gdee.eu
This project is funded by
Maribel Ortego and Enric Lloret
PHOTO: Monduli District, Tanzania. Agustí Pérez-Foguet .
CASE STUDIES
Use of Statistical Toolsin a development context. Analysis of Variance(ANOVA)
DL B 10735-2015 ISBN 978-84-606-7546-4
Use of Statistical Tools in a development context. Analysis of Variance (ANOVA)
COORDINATED BYAgustí Pérez-Foguet, Enric Velo, Pol Arranz, Ricard Ginéand Boris Lazzarini (Universitat Politècnica de Catalunya)Manuel Sierra (Universidad Politécnica de Madrid)Alejandra Boni and Jordi Peris (Universitat Politècnica de València)Guido Zolezzi and Gabriella Trombino (Università degli Studi di Trento)Rhoda Trimingham (Loughborough University)Valentín Villarroel (ONGAWA)Neil Nobles and Meadhbh Bolger (Practical Action)Francesco Mongera (Training Center for International Cooperation)Katie Cresswell-Maynard (Engineering Without Border UK)
EDITED BY Global Dimension in Engineering Education
Citation: Ortego, M. and Lloret, E. (2015) ' Use of Statistical Tools in a development context. Analysis of Variance (ANOVA)', in Case studies for developing globally responsible engineers, GDEE (eds.), Global Dimension in Engineering Education, Barcelona. Available from: http://gdee.eu/index.php/resources.html
This publication is distributedunder an Attribution- Noncommercial-Share Alike License for Creative Commons
CASE STUDIES
Disclaimer: This document has been produced with the financial assistance of the European UnionThe contents of this document are the sole responsibility of the authors and can under no circumstances be regarded as reflecting the position of the European Union
Use of statistical tools in a development context. Analysis of variance (ANOVA)
USE OF STATISTICAL TOOLS IN A DEVELOPMENT CONTEXT. ANALYSIS OF VARIANCE (ANOVA)
Dr. Maribel Ortego, Department of Applied Mathematics III, Universitat Politècnica de Catalunya
Enric Lloret, Civil engineer consultant, MSc in Technologies for Human Development candidate
1
Use of statistical tools in a development context. Analysis of variance (ANOVA)
INDEX
1 INTRODUCTION ............................................................................................................................. 3
1.1 DISCIPLINES COVERED ....................................................................................................... 3
1.2 LEARNING OUTCOMES ........................................................................................................ 4
1.3 ACTIVITIES ............................................................................................................................. 4
2 DESCRIPTION OF THE CONTEXT................................................................................................ 4
2.1 INTRODUCTION: WATER ACCES, JMP AND WMP ............................................................. 5
2.2 JUSTIFICATION. IMPORTANCE OF STATISTICS IN DATA ANALYSIS .............................. 7
3 CLASS ACTIVITY ........................................................................................................................... 9
3.1 METHODOLOGY .................................................................................................................... 9
3.2 PROPOSED STATEMENT ..................................................................................................... 9
3.3 SOLUTION ............................................................................................................................ 10
3.4 EVALUATION CRITERIA ...................................................................................................... 16
4 HOMEWORK ACTIVITY ............................................................................................................... 16
4.1 METHODOLOGY .................................................................................................................. 17
4.2 PROPOSED STATEMENT ................................................................................................... 16
4.3 SOLUTION .......................................................................................................................... 178
4.3.1 LOGARITHMIC TRANSFORMATION OF “WATER CONSUMPTION_SCORE” VARIABLE 17
4.3.2 FETCHING TIME vs WATER COLLECTED (plot) ................................................................ 17
4.3.3 ANOVA TEST ........................................................................................................................ 20
4.4 EVALUATION CRITERIA ...................................................................................................... 25
5 BIBLIOGRAPHY ........................................................................................................................... 25
6 FURTHER WORK ......................................................................................................................... 25
2
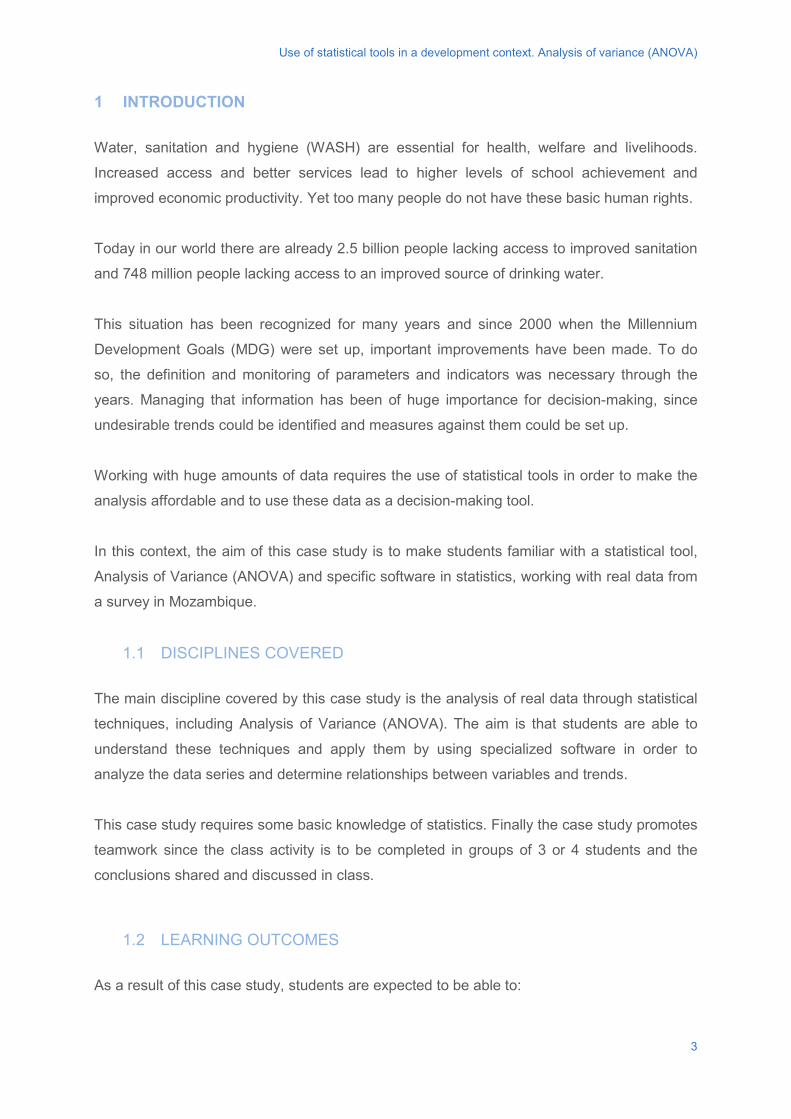
Use of statistical tools in a development context. Analysis of variance (ANOVA)
1 INTRODUCTION
Water, sanitation and hygiene (WASH) are essential for health, welfare and livelihoods.
Increased access and better services lead to higher levels of school achievement and
improved economic productivity. Yet too many people do not have these basic human rights.
Today in our world there are already 2.5 billion people lacking access to improved sanitation
and 748 million people lacking access to an improved source of drinking water.
This situation has been recognized for many years and since 2000 when the Millennium
Development Goals (MDG) were set up, important improvements have been made. To do
so, the definition and monitoring of parameters and indicators was necessary through the
years. Managing that information has been of huge importance for decision-making, since
undesirable trends could be identified and measures against them could be set up.
Working with huge amounts of data requires the use of statistical tools in order to make the
analysis affordable and to use these data as a decision-making tool.
In this context, the aim of this case study is to make students familiar with a statistical tool,
Analysis of Variance (ANOVA) and specific software in statistics, working with real data from
a survey in Mozambique.
1.1 DISCIPLINES COVERED
The main discipline covered by this case study is the analysis of real data through statistical
techniques, including Analysis of Variance (ANOVA). The aim is that students are able to
understand these techniques and apply them by using specialized software in order to
analyze the data series and determine relationships between variables and trends.
This case study requires some basic knowledge of statistics. Finally the case study promotes
teamwork since the class activity is to be completed in groups of 3 or 4 students and the
conclusions shared and discussed in class.
1.2 LEARNING OUTCOMES
As a result of this case study, students are expected to be able to:
3
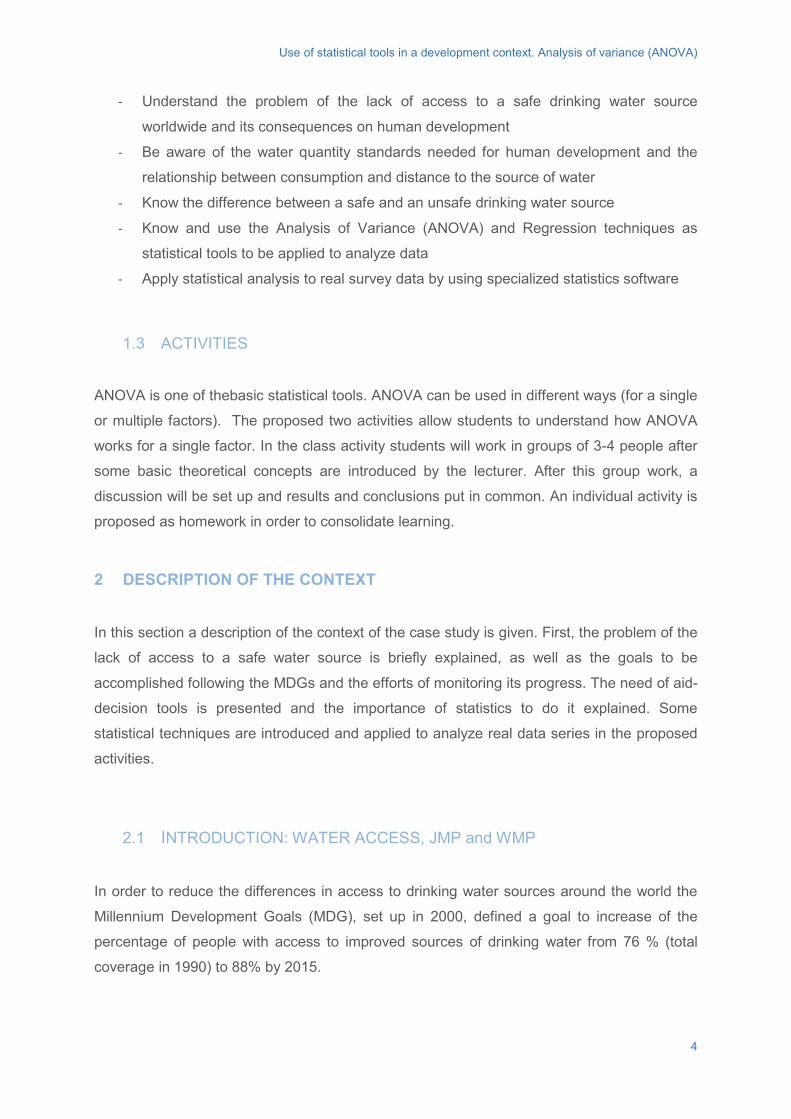
Use of statistical tools in a development context. Analysis of variance (ANOVA)
- Understand the problem of the lack of access to a safe drinking water source
worldwide and its consequences on human development
- Be aware of the water quantity standards needed for human development and the
relationship between consumption and distance to the source of water
- Know the difference between a safe and an unsafe drinking water source
- Know and use the Analysis of Variance (ANOVA) and Regression techniques as
statistical tools to be applied to analyze data
- Apply statistical analysis to real survey data by using specialized statistics software
1.3 ACTIVITIES
ANOVA is one of thebasic statistical tools. ANOVA can be used in different ways (for a single
or multiple factors). The proposed two activities allow students to understand how ANOVA
works for a single factor. In the class activity students will work in groups of 3-4 people after
some basic theoretical concepts are introduced by the lecturer. After this group work, a
discussion will be set up and results and conclusions put in common. An individual activity is
proposed as homework in order to consolidate learning.
2 DESCRIPTION OF THE CONTEXT
In this section a description of the context of the case study is given. First, the problem of the
lack of access to a safe water source is briefly explained, as well as the goals to be
accomplished following the MDGs and the efforts of monitoring its progress. The need of aid-
decision tools is presented and the importance of statistics to do it explained. Some
statistical techniques are introduced and applied to analyze real data series in the proposed
activities.
2.1 INTRODUCTION: WATER ACCESS, JMP and WMP
In order to reduce the differences in access to drinking water sources around the world the
Millennium Development Goals (MDG), set up in 2000, defined a goal to increase of the
percentage of people with access to improved sources of drinking water from 76 % (total
coverage in 1990) to 88% by 2015.
4
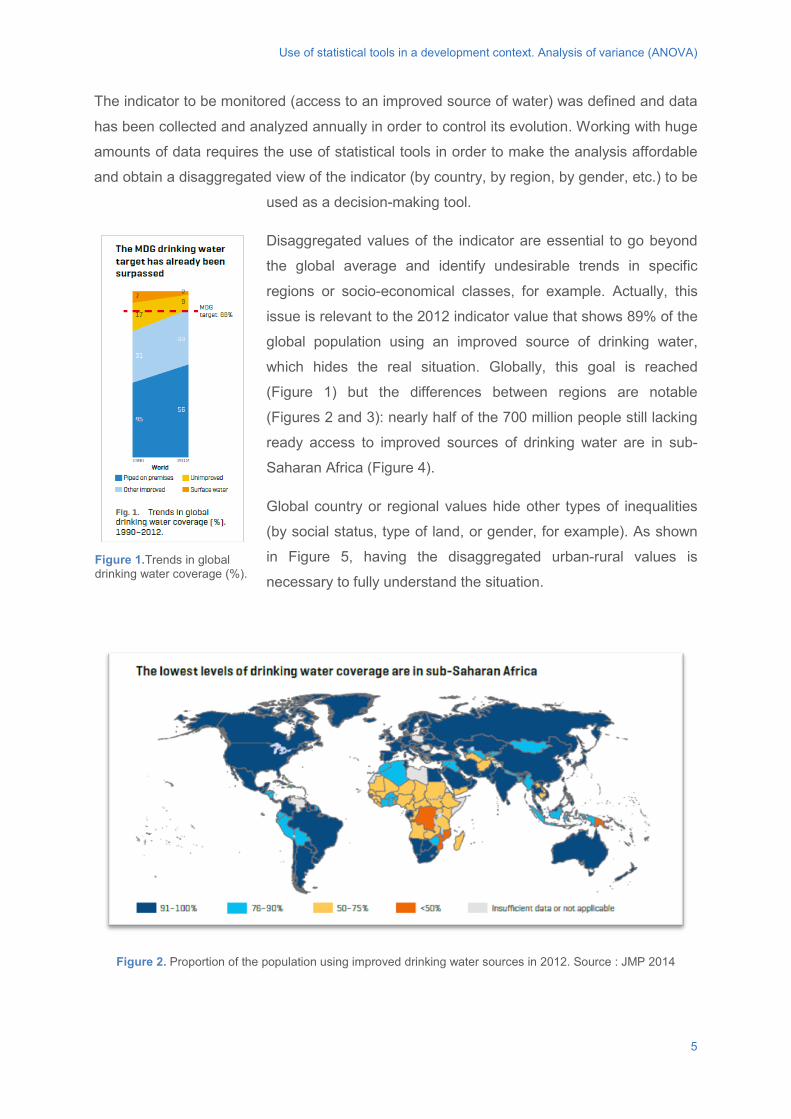
Use of statistical tools in a development context. Analysis of variance (ANOVA)
The indicator to be monitored (access to an improved source of water) was defined and data
has been collected and analyzed annually in order to control its evolution. Working with huge
amounts of data requires the use of statistical tools in order to make the analysis affordable
and obtain a disaggregated view of the indicator (by country, by region, by gender, etc.) to be
used as a decision-making tool.
Disaggregated values of the indicator are essential to go beyond
the global average and identify undesirable trends in specific
regions or socio-economical classes, for example. Actually, this
issue is relevant to the 2012 indicator value that shows 89% of the
global population using an improved source of drinking water,
which hides the real situation. Globally, this goal is reached
(Figure 1) but the differences between regions are notable
(Figures 2 and 3): nearly half of the 700 million people still lacking
ready access to improved sources of drinking water are in sub-
Saharan Africa (Figure 4).
Global country or regional values hide other types of inequalities
(by social status, type of land, or gender, for example). As shown
in Figure 5, having the disaggregated urban-rural values is
necessary to fully understand the situation.
Figure 2. Proportion of the population using improved drinking water sources in 2012. Source : JMP 2014
Figure 1.Trends in global drinking water coverage (%).
5
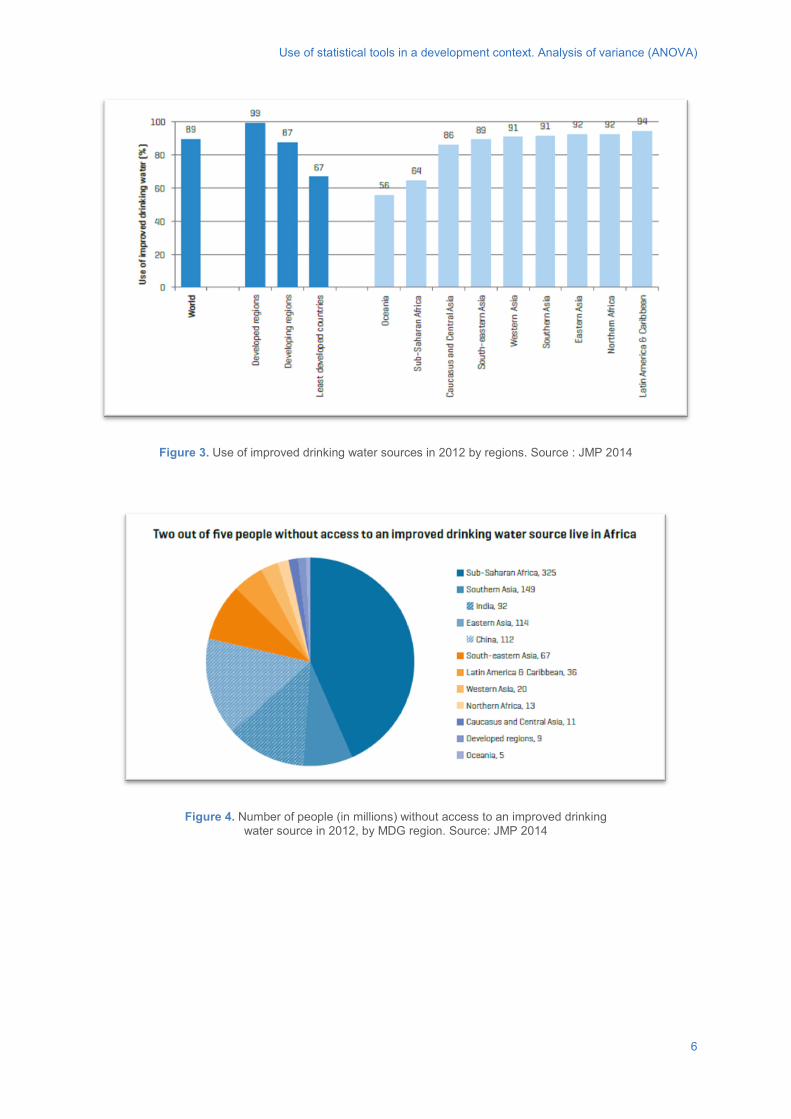
Use of statistical tools in a development context. Analysis of variance (ANOVA)
Figure 3. Use of improved drinking water sources in 2012 by regions. Source : JMP 2014
Figure 4. Number of people (in millions) without access to an improved drinking water source in 2012, by MDG region. Source: JMP 2014
6
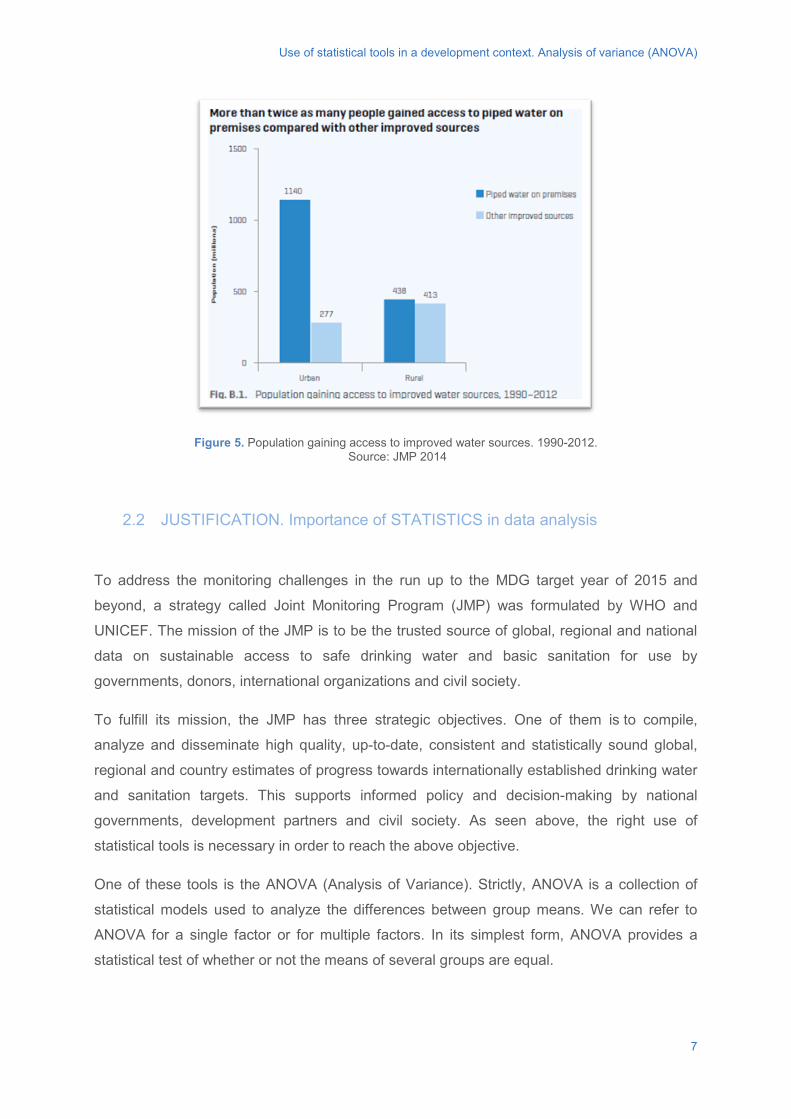
Use of statistical tools in a development context. Analysis of variance (ANOVA)
Figure 5. Population gaining access to improved water sources. 1990-2012. Source: JMP 2014
2.2 JUSTIFICATION. Importance of STATISTICS in data analysis
To address the monitoring challenges in the run up to the MDG target year of 2015 and
beyond, a strategy called Joint Monitoring Program (JMP) was formulated by WHO and
UNICEF. The mission of the JMP is to be the trusted source of global, regional and national
data on sustainable access to safe drinking water and basic sanitation for use by
governments, donors, international organizations and civil society.
To fulfill its mission, the JMP has three strategic objectives. One of them is to compile,
analyze and disseminate high quality, up-to-date, consistent and statistically sound global,
regional and country estimates of progress towards internationally established drinking water
and sanitation targets. This supports informed policy and decision-making by national
governments, development partners and civil society. As seen above, the right use of
statistical tools is necessary in order to reach the above objective.
One of these tools is the ANOVA (Analysis of Variance). Strictly, ANOVA is a collection of
statistical models used to analyze the differences between group means. We can refer to
ANOVA for a single factor or for multiple factors. In its simplest form, ANOVA provides a
statistical test of whether or not the means of several groups are equal.
7
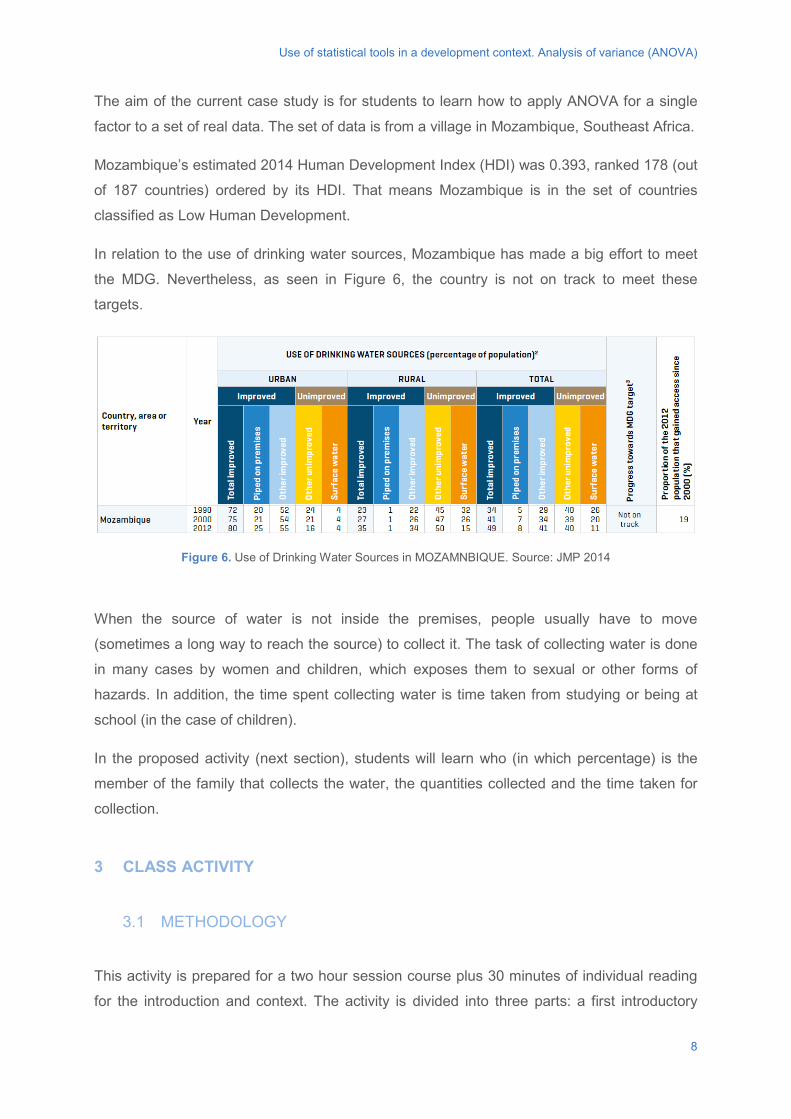
Use of statistical tools in a development context. Analysis of variance (ANOVA)
The aim of the current case study is for students to learn how to apply ANOVA for a single
factor to a set of real data. The set of data is from a village in Mozambique, Southeast Africa.
Mozambique’s estimated 2014 Human Development Index (HDI) was 0.393, ranked 178 (out
of 187 countries) ordered by its HDI. That means Mozambique is in the set of countries
classified as Low Human Development.
In relation to the use of drinking water sources, Mozambique has made a big effort to meet
the MDG. Nevertheless, as seen in Figure 6, the country is not on track to meet these
targets.
Figure 6. Use of Drinking Water Sources in MOZAMNBIQUE. Source: JMP 2014
When the source of water is not inside the premises, people usually have to move
(sometimes a long way to reach the source) to collect it. The task of collecting water is done
in many cases by women and children, which exposes them to sexual or other forms of
hazards. In addition, the time spent collecting water is time taken from studying or being at
school (in the case of children).
In the proposed activity (next section), students will learn who (in which percentage) is the
member of the family that collects the water, the quantities collected and the time taken for
collection.
3 CLASS ACTIVITY
3.1 METHODOLOGY
This activity is prepared for a two hour session course plus 30 minutes of individual reading
for the introduction and context. The activity is divided into three parts: a first introductory
8
Use of statistical tools in a development context. Analysis of variance (ANOVA)
refresh of statistical concepts (30 min) to be developed by the lecturer, a second part of
group work (1 hour) and a final part of gathering conclusions and discussion of results in
class.
The session is to be carried out in a well-equipped computer classroom. Specific statistical
software (called “R”) (R core team, 2014) will be introduced, understanding that the aim of
the activity is not to manage this software but to show students the potentialities of this kind
of resource.
In the following sections, we will introduce an “R” code (“R” commands –instructions-
combination) that solves the activity. Instructions may vary if other statistical software is
used.
3.2 PROPOSED STATEMENT
In a village of Mozambique, a survey was conducted to monitor the current WATSAN (Water
and Sanitation) situation. Data was taken from 1229 households distributed across 18
districts. The available data are:
- The current water source situation of each household: piped on premises, or not.
- The person fetching water (fetching person) in the household: adult female, adult male, girl (age < 15 years old), or boy (<15 years old).
- The total number of members in each household.
- The amount of water consumption, in litres/person a day.
- The time to fetch water.
In this activity we will focus on the time to fetch water. The aim is to apply an ANOVA for a
single factor (time of fetching water) and to determine if there is a marked difference between
this time depending on who is the family member fetching it.
The referred dataset is available for the activity in a .csv format file that should be given to
the students.
3.3 SOLUTION
In this section the steps to solve the activity are described. Each step is accompanied by a
short explanation and the right instruction to be used in “R”.
9
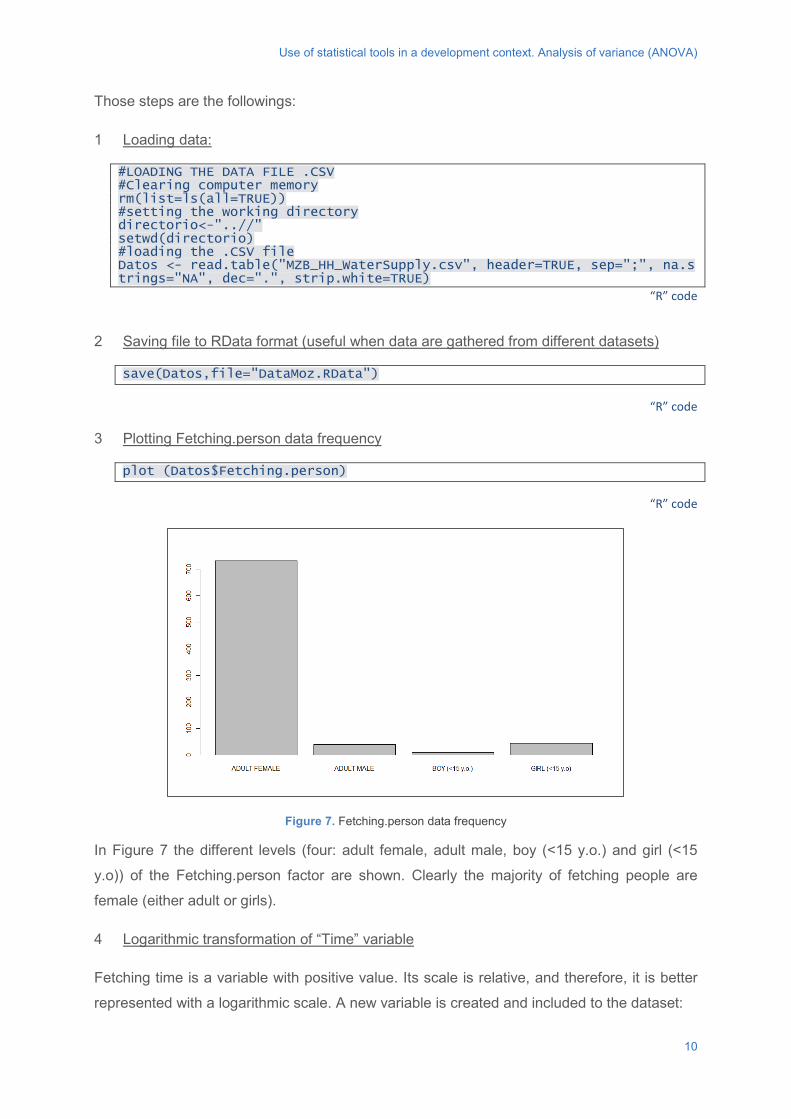
Use of statistical tools in a development context. Analysis of variance (ANOVA)
Those steps are the followings:
1 Loading data:
#LOADING THE DATA FILE .CSV #Clearing computer memory rm(list=ls(all=TRUE)) #setting the working directory directorio<-"..//" setwd(directorio) #loading the .CSV file Datos <- read.table("MZB_HH_WaterSupply.csv", header=TRUE, sep=";", na.strings="NA", dec=".", strip.white=TRUE)
“R” code
2 Saving file to RData format (useful when data are gathered from different datasets)
save(Datos,file="DataMoz.RData")
“R” code
3 Plotting Fetching.person data frequency
plot (Datos$Fetching.person)
“R” code
Figure 7. Fetching.person data frequency
In Figure 7 the different levels (four: adult female, adult male, boy (<15 y.o.) and girl (<15
y.o)) of the Fetching.person factor are shown. Clearly the majority of fetching people are
female (either adult or girls).
4 Logarithmic transformation of “Time” variable
Fetching time is a variable with positive value. Its scale is relative, and therefore, it is better
represented with a logarithmic scale. A new variable is created and included to the dataset:
10
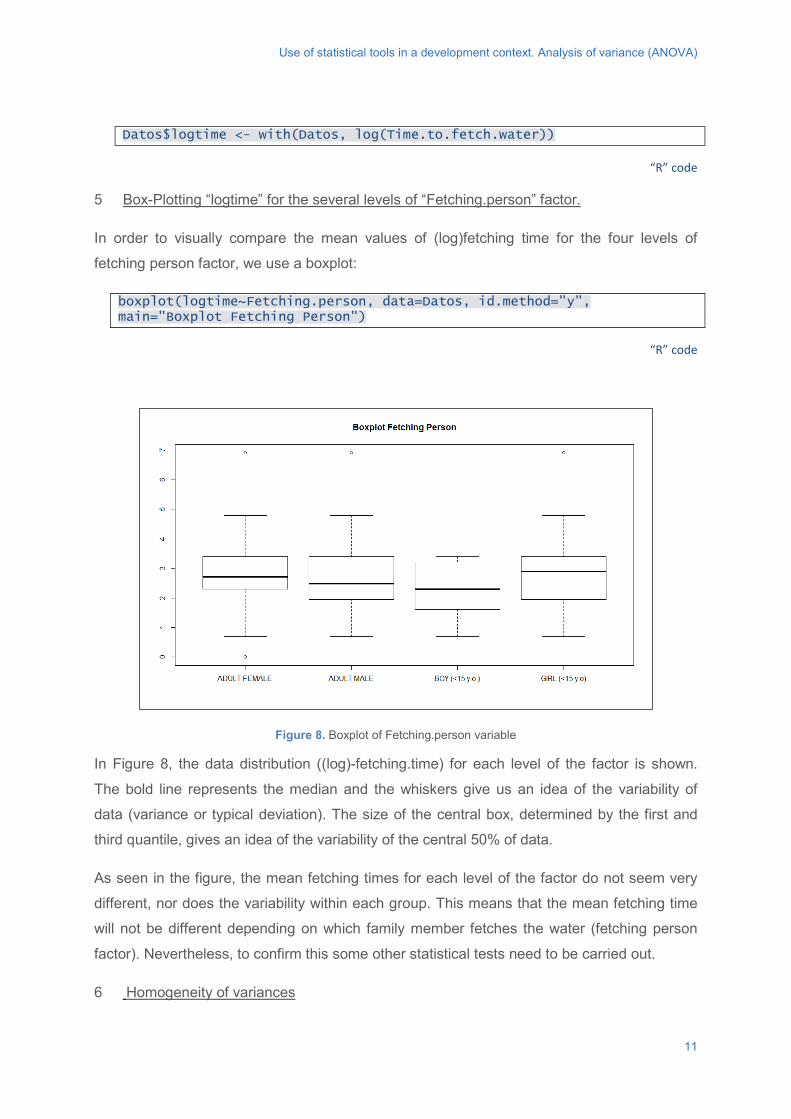
Use of statistical tools in a development context. Analysis of variance (ANOVA)
Datos$logtime <- with(Datos, log(Time.to.fetch.water))
“R” code
5 Box-Plotting “logtime” for the several levels of “Fetching.person” factor.
In order to visually compare the mean values of (log)fetching time for the four levels of
fetching person factor, we use a boxplot:
boxplot(logtime~Fetching.person, data=Datos, id.method="y", main="Boxplot Fetching Person")
“R” code
Figure 8. Boxplot of Fetching.person variable
In Figure 8, the data distribution ((log)-fetching.time) for each level of the factor is shown.
The bold line represents the median and the whiskers give us an idea of the variability of
data (variance or typical deviation). The size of the central box, determined by the first and
third quantile, gives an idea of the variability of the central 50% of data.
As seen in the figure, the mean fetching times for each level of the factor do not seem very
different, nor does the variability within each group. This means that the mean fetching time
will not be different depending on which family member fetches the water (fetching person
factor). Nevertheless, to confirm this some other statistical tests need to be carried out.
6 Homogeneity of variances
11
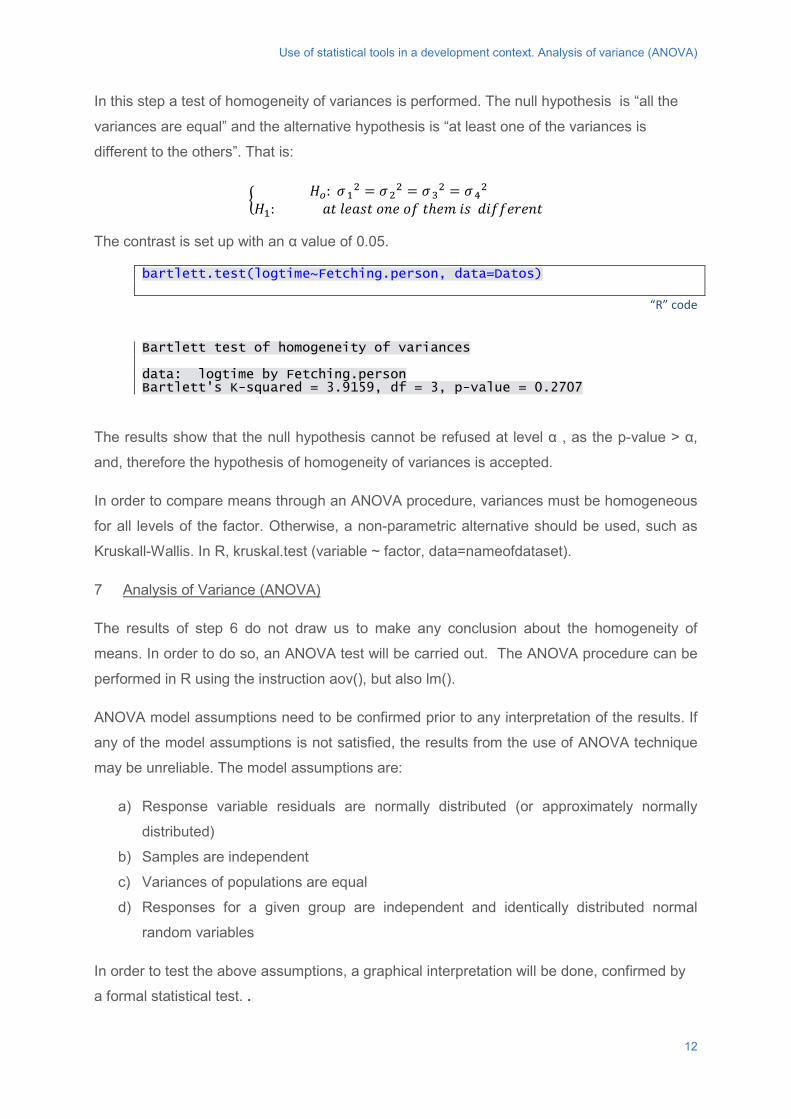
Use of statistical tools in a development context. Analysis of variance (ANOVA)
In this step a test of homogeneity of variances is performed. The null hypothesis is “all the
variances are equal” and the alternative hypothesis is “at least one of the variances is
different to the others”. That is:
� 𝐻𝐻𝑜𝑜: 𝜎𝜎 12 = 𝜎𝜎 2
2 = 𝜎𝜎 32 = 𝜎𝜎 4
2
𝐻𝐻1: 𝑎𝑎𝑎𝑎 𝑙𝑙𝑙𝑙𝑎𝑎𝑙𝑙𝑎𝑎 𝑜𝑜𝑜𝑜𝑙𝑙 𝑜𝑜𝑜𝑜 𝑎𝑎ℎ𝑙𝑙𝑒𝑒 𝑖𝑖𝑙𝑙 𝑑𝑑𝑖𝑖𝑜𝑜𝑜𝑜𝑙𝑙𝑑𝑑𝑙𝑙𝑜𝑜𝑎𝑎
The contrast is set up with an α value of 0.05.
bartlett.test(logtime~Fetching.person, data=Datos)
“R” code
Bartlett test of homogeneity of variances data: logtime by Fetching.person Bartlett's K-squared = 3.9159, df = 3, p-value = 0.2707
The results show that the null hypothesis cannot be refused at level α , as the p-value > α,
and, therefore the hypothesis of homogeneity of variances is accepted.
In order to compare means through an ANOVA procedure, variances must be homogeneous
for all levels of the factor. Otherwise, a non-parametric alternative should be used, such as
Kruskall-Wallis. In R, kruskal.test (variable ~ factor, data=nameofdataset).
7 Analysis of Variance (ANOVA)
The results of step 6 do not draw us to make any conclusion about the homogeneity of
means. In order to do so, an ANOVA test will be carried out. The ANOVA procedure can be
performed in R using the instruction aov(), but also lm().
ANOVA model assumptions need to be confirmed prior to any interpretation of the results. If
any of the model assumptions is not satisfied, the results from the use of ANOVA technique
may be unreliable. The model assumptions are:
a) Response variable residuals are normally distributed (or approximately normally
distributed)
b) Samples are independent
c) Variances of populations are equal
d) Responses for a given group are independent and identically distributed normal
random variables
In order to test the above assumptions, a graphical interpretation will be done, confirmed by
a formal statistical test. .
12
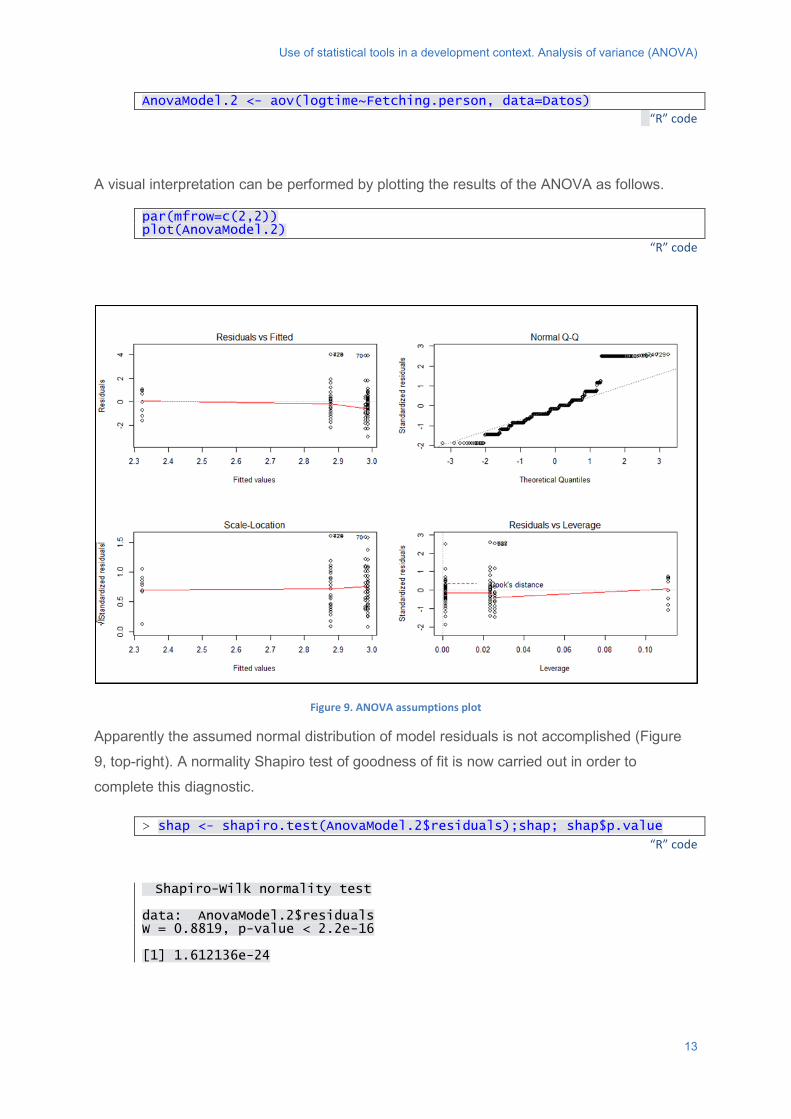
Use of statistical tools in a development context. Analysis of variance (ANOVA)
AnovaModel.2 <- aov(logtime~Fetching.person, data=Datos)
“R” code
A visual interpretation can be performed by plotting the results of the ANOVA as follows.
par(mfrow=c(2,2)) plot(AnovaModel.2)
“R” code
Figure 9. ANOVA assumptions plot
Apparently the assumed normal distribution of model residuals is not accomplished (Figure
9, top-right). A normality Shapiro test of goodness of fit is now carried out in order to
complete this diagnostic.
> shap <- shapiro.test(AnovaModel.2$residuals);shap; shap$p.value “R” code
Shapiro-Wilk normality test data: AnovaModel.2$residuals W = 0.8819, p-value < 2.2e-16 [1] 1.612136e-24
13
Use of statistical tools in a development context. Analysis of variance (ANOVA)
In this case p-value is less than α =0.05, and therefore the hypothesis of normality of the
model residuals is rejected.
Normality of residuals is one of the assumptions of linear models. If this assumption is not
accomplished, the decisions taken from tests should be made with care, as the distribution of
the test statistic is not normal. For instance, the distribution of the ANOVA test statistic is not
an F-distribution, and therefore the p-value should be interpreted with care.
For this dataset the error distribution is skewed by the presence of a few large outliers.
These few extreme observations can have a great influence on parameter estimates of the
model, as the estimation method is the minimization of the squared error. Outliers should be
studied with care. There are a few possibilities for their appearance: error codes taken as
values, transcription errors, non-adequacy of the linear model, or presence of two or more
mixed populations, among others.
summary(AnovaModel.2)
“R” code
Df Sum Sq Mean Sq F value Pr(>F) Fetching.person 3 4.3 1.439 0.575 0.632 Residuals 819 2050.2 2.503 406 observations deleted due to missingness
As normality of the model residuals has been rejected, the distribution of the test statistic is
not an F-Fisher-Snedekor, but a distribution with heavier tails. A simulation study may be
performed in order to obtain the exact value of the p-value for this unknown distribution.
However, it is possible to make a decision about the equality of means between the different
levels of the factor: the value of the p-value is substantially greater than α =0.05, and
therefore the hypothesis of equality cannot be rejected at this α =0.05 level. That is, the
mean values of fetching time are the same for all levels of the fetching person factor (women,
girls, boys or other people in the family).
8 Anova using lm()
The homogeneity of means can also be assessed through the lm() procedure in R, as ANOVA can be rewritten as a linear model.
AnovaModel.lm <- lm(logtime~Fetching.person, data=Datos) summary(AnovaModel.lm)
“R” code
14
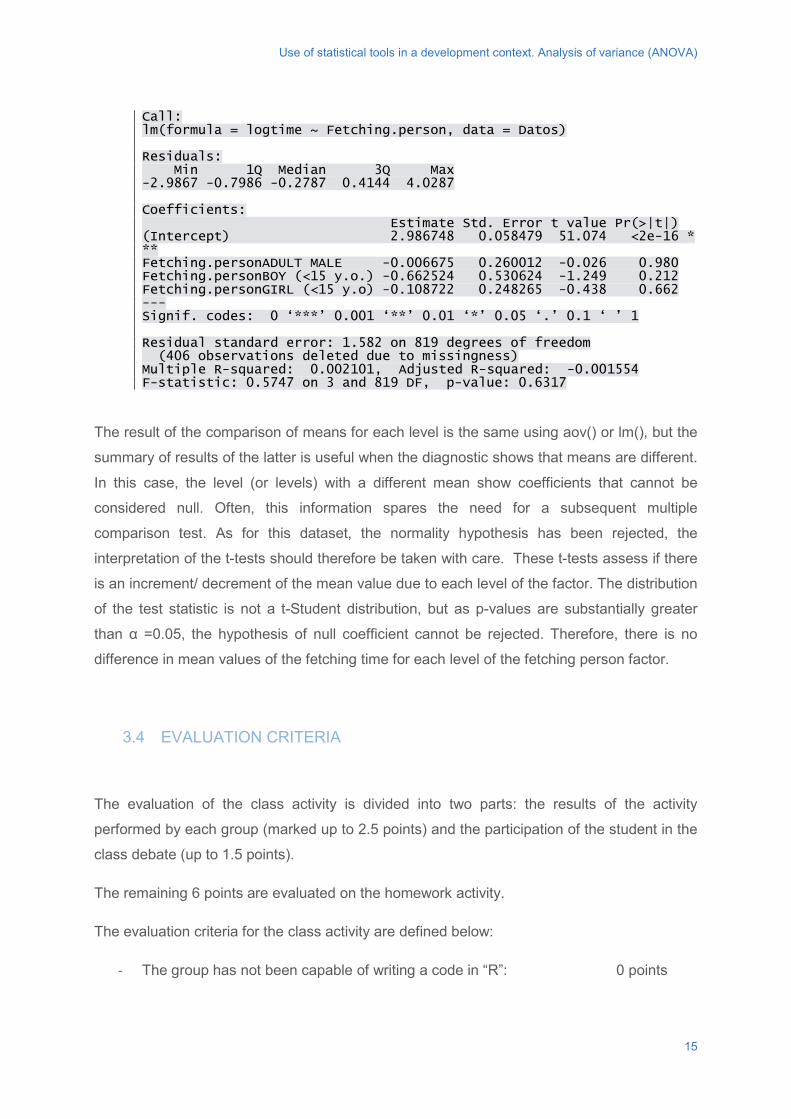
Use of statistical tools in a development context. Analysis of variance (ANOVA)
Call: lm(formula = logtime ~ Fetching.person, data = Datos) Residuals: Min 1Q Median 3Q Max -2.9867 -0.7986 -0.2787 0.4144 4.0287 Coefficients: Estimate Std. Error t value Pr(>|t|) (Intercept) 2.986748 0.058479 51.074 <2e-16 *** Fetching.personADULT MALE -0.006675 0.260012 -0.026 0.980 Fetching.personBOY (<15 y.o.) -0.662524 0.530624 -1.249 0.212 Fetching.personGIRL (<15 y.o) -0.108722 0.248265 -0.438 0.662 --- Signif. codes: 0 ‘***’ 0.001 ‘**’ 0.01 ‘*’ 0.05 ‘.’ 0.1 ‘ ’ 1 Residual standard error: 1.582 on 819 degrees of freedom (406 observations deleted due to missingness) Multiple R-squared: 0.002101, Adjusted R-squared: -0.001554 F-statistic: 0.5747 on 3 and 819 DF, p-value: 0.6317
The result of the comparison of means for each level is the same using aov() or lm(), but the
summary of results of the latter is useful when the diagnostic shows that means are different.
In this case, the level (or levels) with a different mean show coefficients that cannot be
considered null. Often, this information spares the need for a subsequent multiple
comparison test. As for this dataset, the normality hypothesis has been rejected, the
interpretation of the t-tests should therefore be taken with care. These t-tests assess if there
is an increment/ decrement of the mean value due to each level of the factor. The distribution
of the test statistic is not a t-Student distribution, but as p-values are substantially greater
than α =0.05, the hypothesis of null coefficient cannot be rejected. Therefore, there is no
difference in mean values of the fetching time for each level of the fetching person factor.
3.4 EVALUATION CRITERIA
The evaluation of the class activity is divided into two parts: the results of the activity
performed by each group (marked up to 2.5 points) and the participation of the student in the
class debate (up to 1.5 points).
The remaining 6 points are evaluated on the homework activity.
The evaluation criteria for the class activity are defined below:
- The group has not been capable of writing a code in “R”: 0 points
15
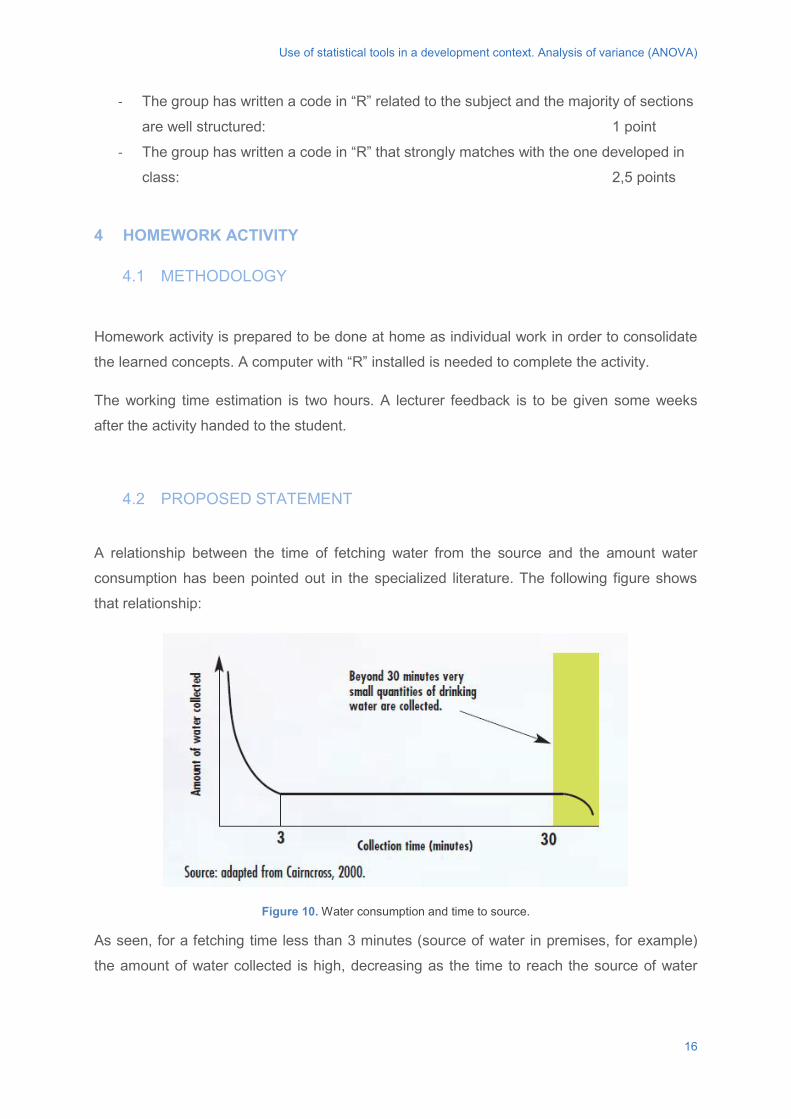
Use of statistical tools in a development context. Analysis of variance (ANOVA)
- The group has written a code in “R” related to the subject and the majority of sections
are well structured: 1 point
- The group has written a code in “R” that strongly matches with the one developed in
class: 2,5 points
4 HOMEWORK ACTIVITY
4.1 METHODOLOGY
Homework activity is prepared to be done at home as individual work in order to consolidate
the learned concepts. A computer with “R” installed is needed to complete the activity.
The working time estimation is two hours. A lecturer feedback is to be given some weeks
after the activity handed to the student.
4.2 PROPOSED STATEMENT
A relationship between the time of fetching water from the source and the amount water
consumption has been pointed out in the specialized literature. The following figure shows
that relationship:
Figure 10. Water consumption and time to source.
As seen, for a fetching time less than 3 minutes (source of water in premises, for example)
the amount of water collected is high, decreasing as the time to reach the source of water
16
Use of statistical tools in a development context. Analysis of variance (ANOVA)
increases. For a fetching time between 3 and 30 minutes the amount of water collected
stabilizes and above 30 minutes the amount of water collected decreases.
The activity consists of:
- Represent (plot) the relationship between the fetching time and the amount of water
collected for the real data from Mozambique.
- Perform an ANOVA test to know whether the mean amount of water collected is the
same regardless of the fetching time, or whether it depends on it (as shown in Figure
10).
4.3 SOLUTION
4.3.1 LOGARITHMIC TRANSFORMATION OF “WATER CONSUMPTION_SCORE”
VARIABLE
As in the case of the variable ‘Time needed to fetch water’, the variable ‘Water consumption’
has a positive value, and its scale can be considered as relative. Therefore, it is better
represented if transformed by means of a logarithmic transformation. A new variable is
created and included to the dataset:
Datos$logWaterCons <- with(Datos, log(Water.Consumption))
“R” code
4.3.2 FETCHING TIME vs WATER COLLECTED (plot)
The variables to be plotted are “ log Water Consumption” and “Fetching time 2”.
The “R” instructions to be used are: plot(), and par() to define the plotting-window
distribution.
par(mfrow=c(1,1)) plot(Datos$Fetching.time3, Datos$logWaterCons, xlab = "Fetching_Time", ylab = "Q collected")
“R” code
17
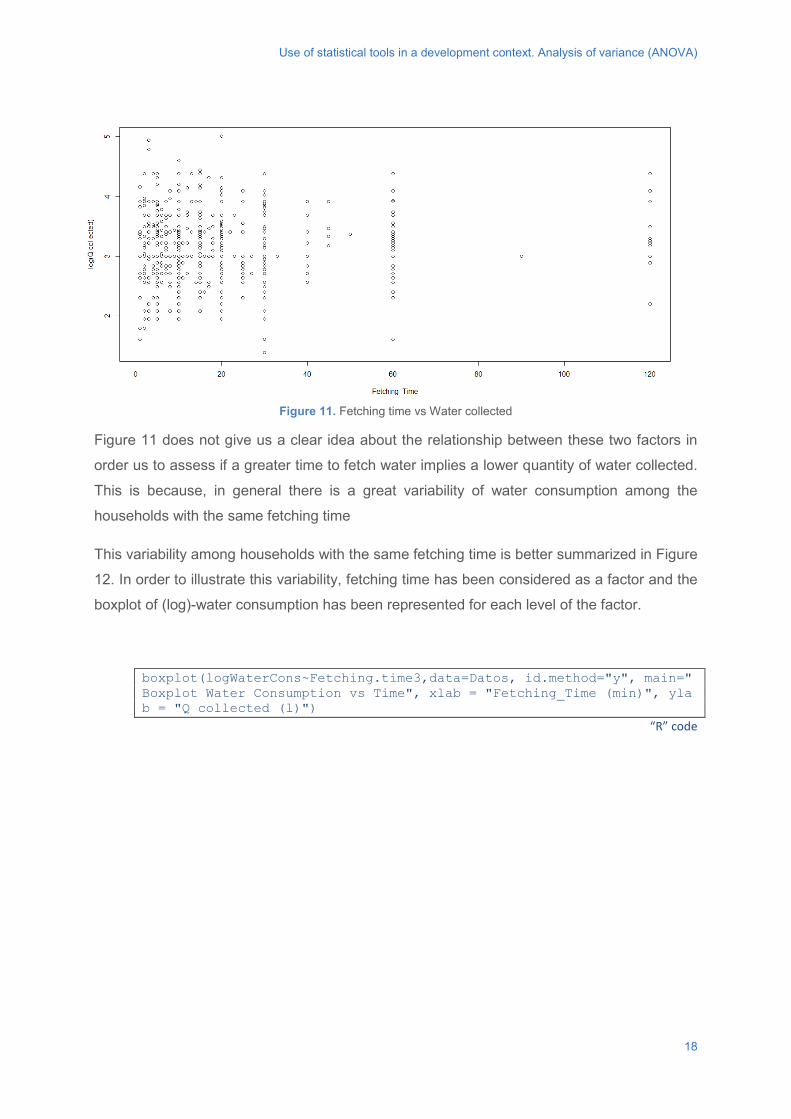
Use of statistical tools in a development context. Analysis of variance (ANOVA)
Figure 11. Fetching time vs Water collected
Figure 11 does not give us a clear idea about the relationship between these two factors in
order us to assess if a greater time to fetch water implies a lower quantity of water collected.
This is because, in general there is a great variability of water consumption among the
households with the same fetching time
This variability among households with the same fetching time is better summarized in Figure
12. In order to illustrate this variability, fetching time has been considered as a factor and the
boxplot of (log)-water consumption has been represented for each level of the factor.
boxplot(logWaterCons~Fetching.time3,data=Datos, id.method="y", main="Boxplot Water Consumption vs Time", xlab = "Fetching_Time (min)", ylab = "Q collected (l)")
“R” code
18
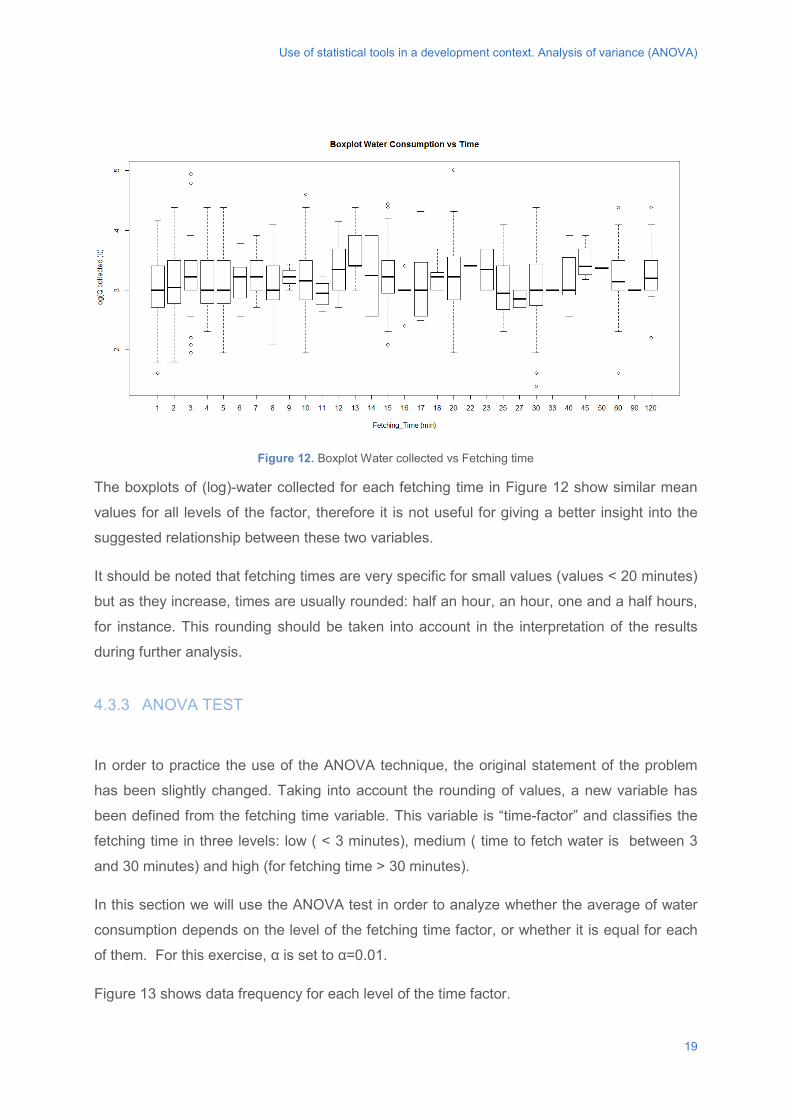
Use of statistical tools in a development context. Analysis of variance (ANOVA)
Figure 12. Boxplot Water collected vs Fetching time
The boxplots of (log)-water collected for each fetching time in Figure 12 show similar mean
values for all levels of the factor, therefore it is not useful for giving a better insight into the
suggested relationship between these two variables.
It should be noted that fetching times are very specific for small values (values < 20 minutes)
but as they increase, times are usually rounded: half an hour, an hour, one and a half hours,
for instance. This rounding should be taken into account in the interpretation of the results
during further analysis.
4.3.3 ANOVA TEST
In order to practice the use of the ANOVA technique, the original statement of the problem
has been slightly changed. Taking into account the rounding of values, a new variable has
been defined from the fetching time variable. This variable is “time-factor” and classifies the
fetching time in three levels: low ( < 3 minutes), medium ( time to fetch water is between 3
and 30 minutes) and high (for fetching time > 30 minutes).
In this section we will use the ANOVA test in order to analyze whether the average of water
consumption depends on the level of the fetching time factor, or whether it is equal for each
of them. For this exercise, α is set to α=0.01.
Figure 13 shows data frequency for each level of the time factor.
19
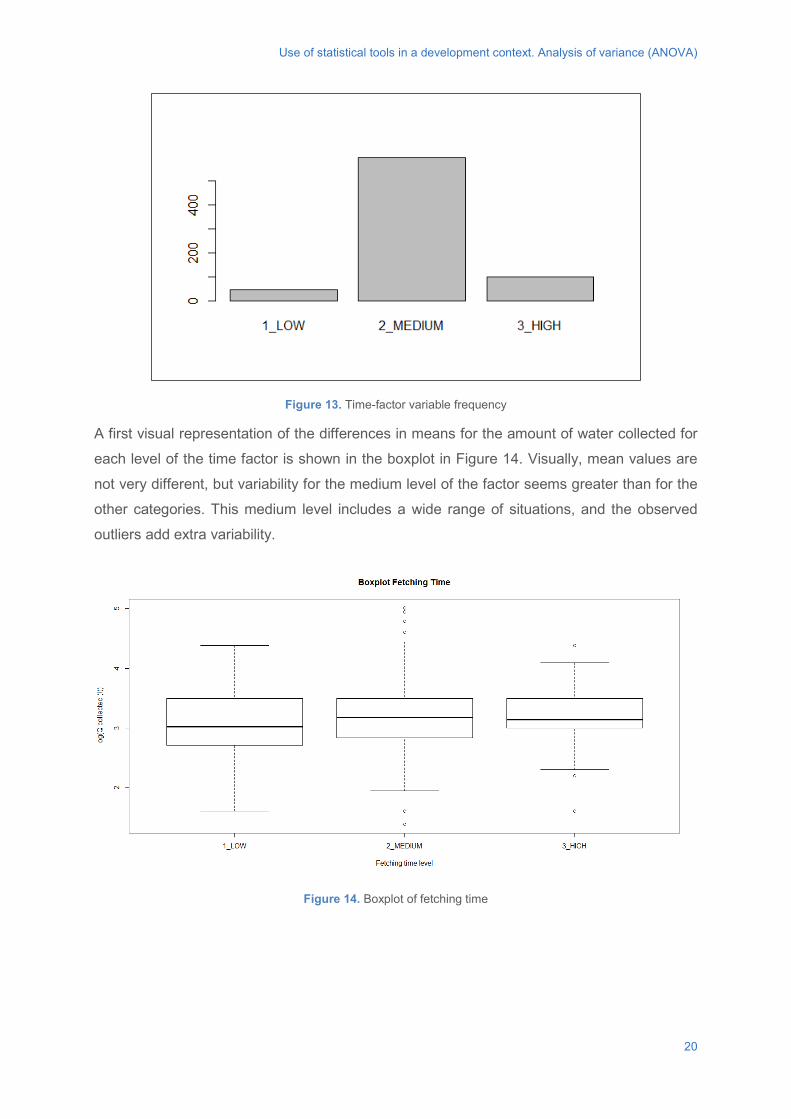
Use of statistical tools in a development context. Analysis of variance (ANOVA)
Figure 13. Time-factor variable frequency
A first visual representation of the differences in means for the amount of water collected for
each level of the time factor is shown in the boxplot in Figure 14. Visually, mean values are
not very different, but variability for the medium level of the factor seems greater than for the
other categories. This medium level includes a wide range of situations, and the observed
outliers add extra variability.
Figure 14. Boxplot of fetching time
20
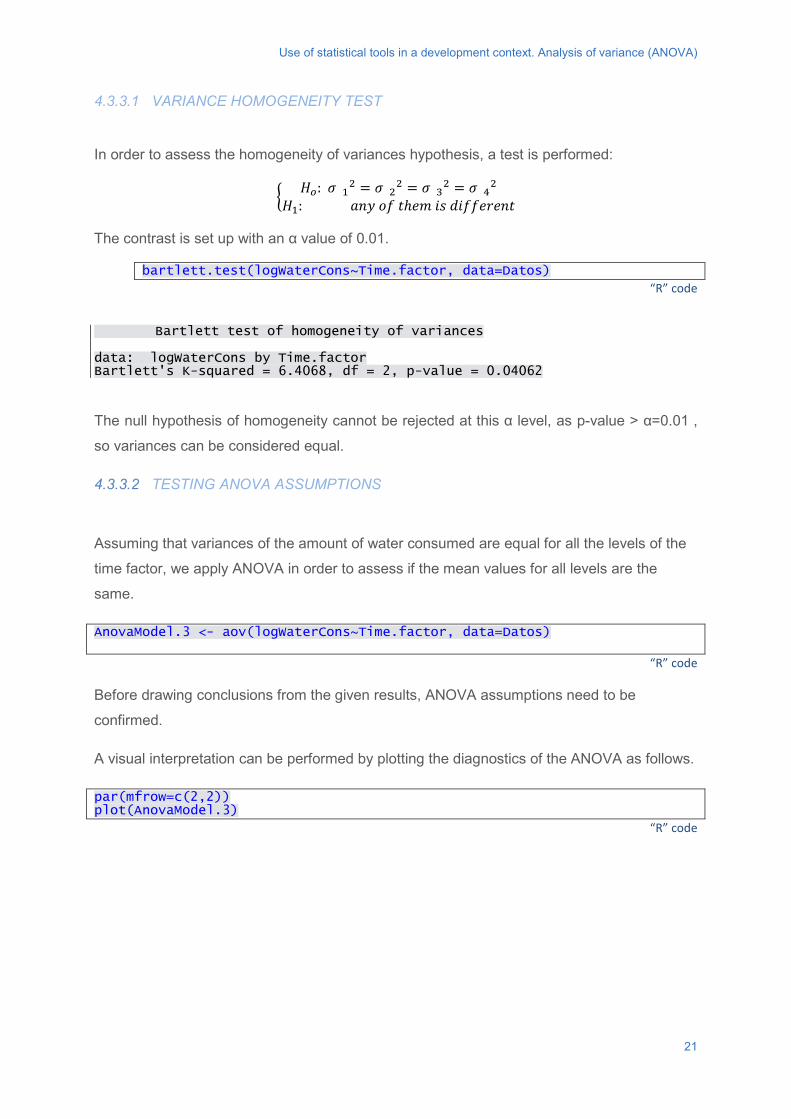
Use of statistical tools in a development context. Analysis of variance (ANOVA)
4.3.3.1 VARIANCE HOMOGENEITY TEST
In order to assess the homogeneity of variances hypothesis, a test is performed:
� 𝐻𝐻𝑜𝑜: 𝜎𝜎 12 = 𝜎𝜎 22 = 𝜎𝜎 32 = 𝜎𝜎 42𝐻𝐻1: 𝑎𝑎𝑜𝑜𝑎𝑎 𝑜𝑜𝑜𝑜 𝑎𝑎ℎ𝑙𝑙𝑒𝑒 𝑖𝑖𝑙𝑙 𝑑𝑑𝑖𝑖𝑜𝑜𝑜𝑜𝑙𝑙𝑑𝑑𝑙𝑙𝑜𝑜𝑎𝑎
The contrast is set up with an α value of 0.01.
bartlett.test(logWaterCons~Time.factor, data=Datos)
“R” code
Bartlett test of homogeneity of variances data: logWaterCons by Time.factor Bartlett's K-squared = 6.4068, df = 2, p-value = 0.04062
The null hypothesis of homogeneity cannot be rejected at this α level, as p-value > α=0.01 ,
so variances can be considered equal.
4.3.3.2 TESTING ANOVA ASSUMPTIONS
Assuming that variances of the amount of water consumed are equal for all the levels of the
time factor, we apply ANOVA in order to assess if the mean values for all levels are the
same.
AnovaModel.3 <- aov(logWaterCons~Time.factor, data=Datos)
“R” code
Before drawing conclusions from the given results, ANOVA assumptions need to be
confirmed.
A visual interpretation can be performed by plotting the diagnostics of the ANOVA as follows.
par(mfrow=c(2,2)) plot(AnovaModel.3)
“R” code
21
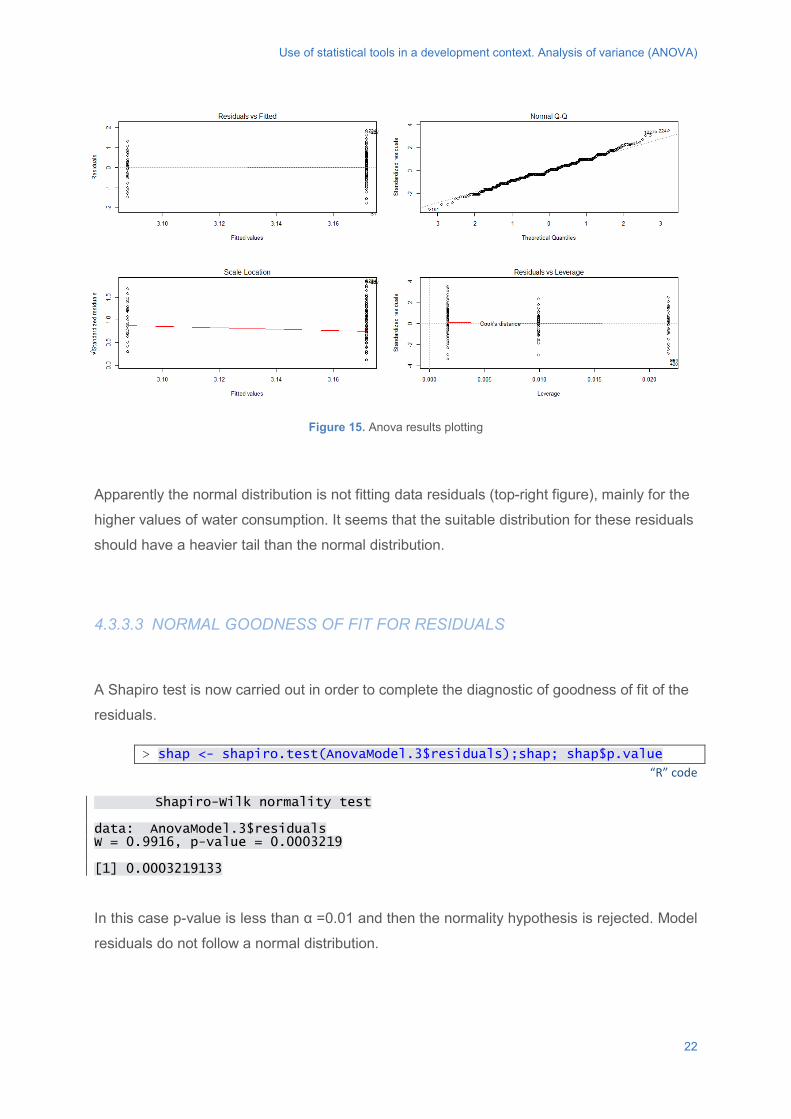
Use of statistical tools in a development context. Analysis of variance (ANOVA)
Figure 15. Anova results plotting
Apparently the normal distribution is not fitting data residuals (top-right figure), mainly for the
higher values of water consumption. It seems that the suitable distribution for these residuals
should have a heavier tail than the normal distribution.
4.3.3.3 NORMAL GOODNESS OF FIT FOR RESIDUALS
A Shapiro test is now carried out in order to complete the diagnostic of goodness of fit of the
residuals.
> shap <- shapiro.test(AnovaModel.3$residuals);shap; shap$p.value “R” code
Shapiro-Wilk normality test data: AnovaModel.3$residuals W = 0.9916, p-value = 0.0003219 [1] 0.0003219133
In this case p-value is less than α =0.01 and then the normality hypothesis is rejected. Model
residuals do not follow a normal distribution.
22
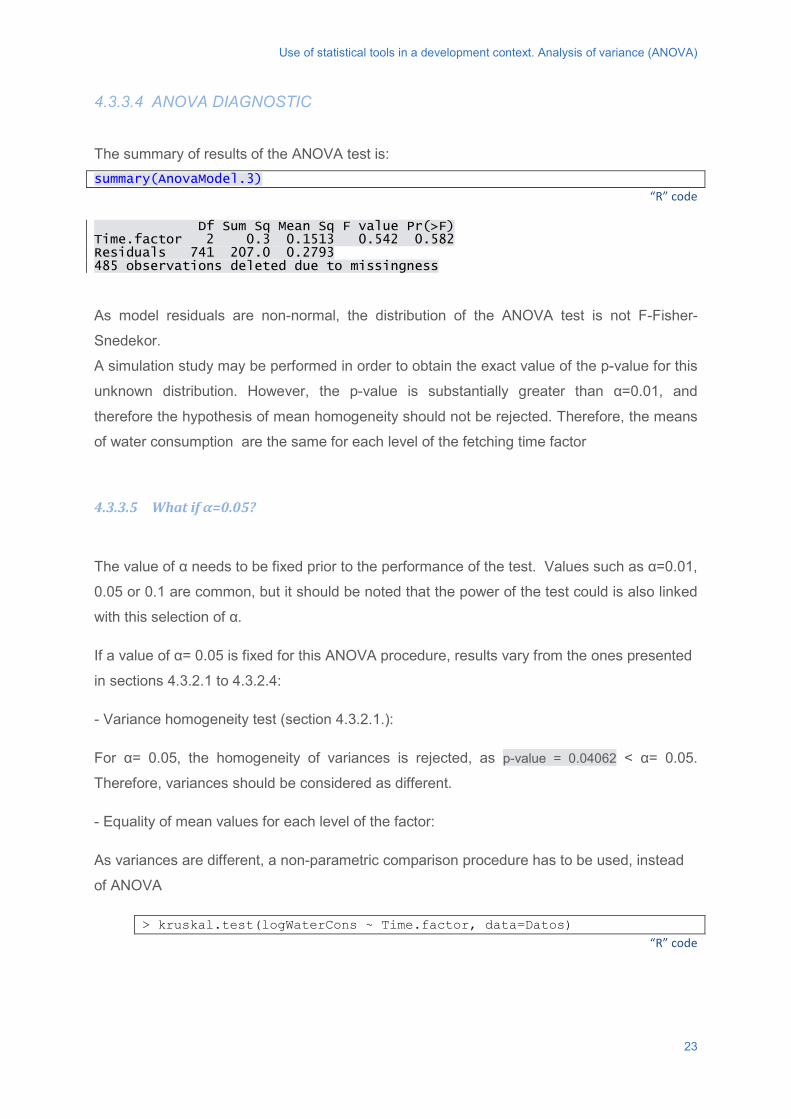
Use of statistical tools in a development context. Analysis of variance (ANOVA)
4.3.3.4 ANOVA DIAGNOSTIC
The summary of results of the ANOVA test is: summary(AnovaModel.3)
“R” code
Df Sum Sq Mean Sq F value Pr(>F) Time.factor 2 0.3 0.1513 0.542 0.582 Residuals 741 207.0 0.2793 485 observations deleted due to missingness
As model residuals are non-normal, the distribution of the ANOVA test is not F-Fisher-
Snedekor.
A simulation study may be performed in order to obtain the exact value of the p-value for this
unknown distribution. However, the p-value is substantially greater than α=0.01, and
therefore the hypothesis of mean homogeneity should not be rejected. Therefore, the means
of water consumption are the same for each level of the fetching time factor
4.3.3.5 What if α=0.05?
The value of α needs to be fixed prior to the performance of the test. Values such as α=0.01,
0.05 or 0.1 are common, but it should be noted that the power of the test could is also linked
with this selection of α.
If a value of α= 0.05 is fixed for this ANOVA procedure, results vary from the ones presented
in sections 4.3.2.1 to 4.3.2.4:
- Variance homogeneity test (section 4.3.2.1.):
For α= 0.05, the homogeneity of variances is rejected, as p-value = 0.04062 < α= 0.05.
Therefore, variances should be considered as different.
- Equality of mean values for each level of the factor:
As variances are different, a non-parametric comparison procedure has to be used, instead
of ANOVA
> kruskal.test(logWaterCons ~ Time.factor, data=Datos) “R” code
23
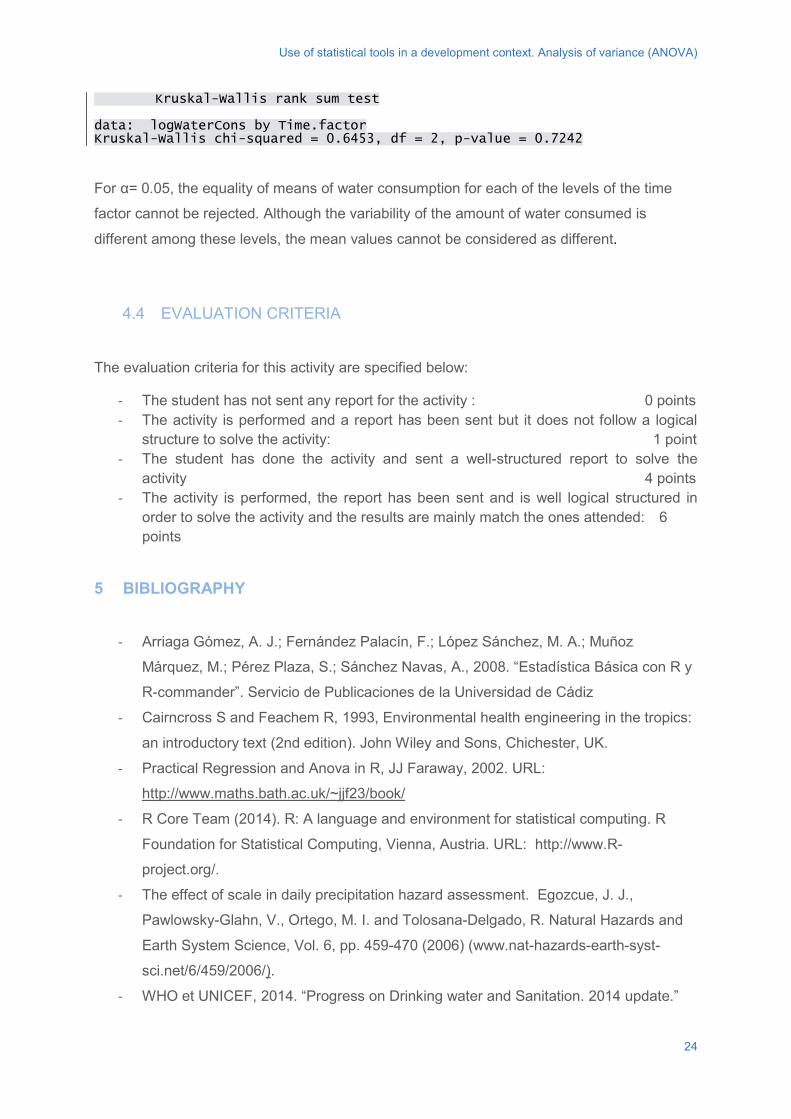
Use of statistical tools in a development context. Analysis of variance (ANOVA)
Kruskal-Wallis rank sum test data: logWaterCons by Time.factor Kruskal-Wallis chi-squared = 0.6453, df = 2, p-value = 0.7242
For α= 0.05, the equality of means of water consumption for each of the levels of the time
factor cannot be rejected. Although the variability of the amount of water consumed is
different among these levels, the mean values cannot be considered as different.
4.4 EVALUATION CRITERIA
The evaluation criteria for this activity are specified below:
- The student has not sent any report for the activity : 0 points - The activity is performed and a report has been sent but it does not follow a logical
structure to solve the activity: 1 point - The student has done the activity and sent a well-structured report to solve the
activity 4 points - The activity is performed, the report has been sent and is well logical structured in
order to solve the activity and the results are mainly match the ones attended: 6 points
5 BIBLIOGRAPHY
- Arriaga Gómez, A. J.; Fernández Palacín, F.; López Sánchez, M. A.; Muñoz
Márquez, M.; Pérez Plaza, S.; Sánchez Navas, A., 2008. “Estadística Básica con R y
R-commander”. Servicio de Publicaciones de la Universidad de Cádiz
- Cairncross S and Feachem R, 1993, Environmental health engineering in the tropics:
an introductory text (2nd edition). John Wiley and Sons, Chichester, UK.
- Practical Regression and Anova in R, JJ Faraway, 2002. URL:
http://www.maths.bath.ac.uk/~jjf23/book/
- R Core Team (2014). R: A language and environment for statistical computing. R
Foundation for Statistical Computing, Vienna, Austria. URL: http://www.R-
project.org/.
- The effect of scale in daily precipitation hazard assessment. Egozcue, J. J.,
Pawlowsky-Glahn, V., Ortego, M. I. and Tolosana-Delgado, R. Natural Hazards and
Earth System Science, Vol. 6, pp. 459-470 (2006) (www.nat-hazards-earth-syst-
sci.net/6/459/2006/).
- WHO et UNICEF, 2014. “Progress on Drinking water and Sanitation. 2014 update.”
24

Use of statistical tools in a development context. Analysis of variance (ANOVA)
6 FURTHER WORK
The suggested activity allows for the introduction of the simplest form of ANOVA, 1-factor, to
students. However, ANOVA with 2 or more factors or ANCOVA can also be introduced using
the same dataset. Even linear and logistic regression methods can be introduced using this
framework, to answer questions related to the problem.
25

http://www.gdee.eu
This project is funded by
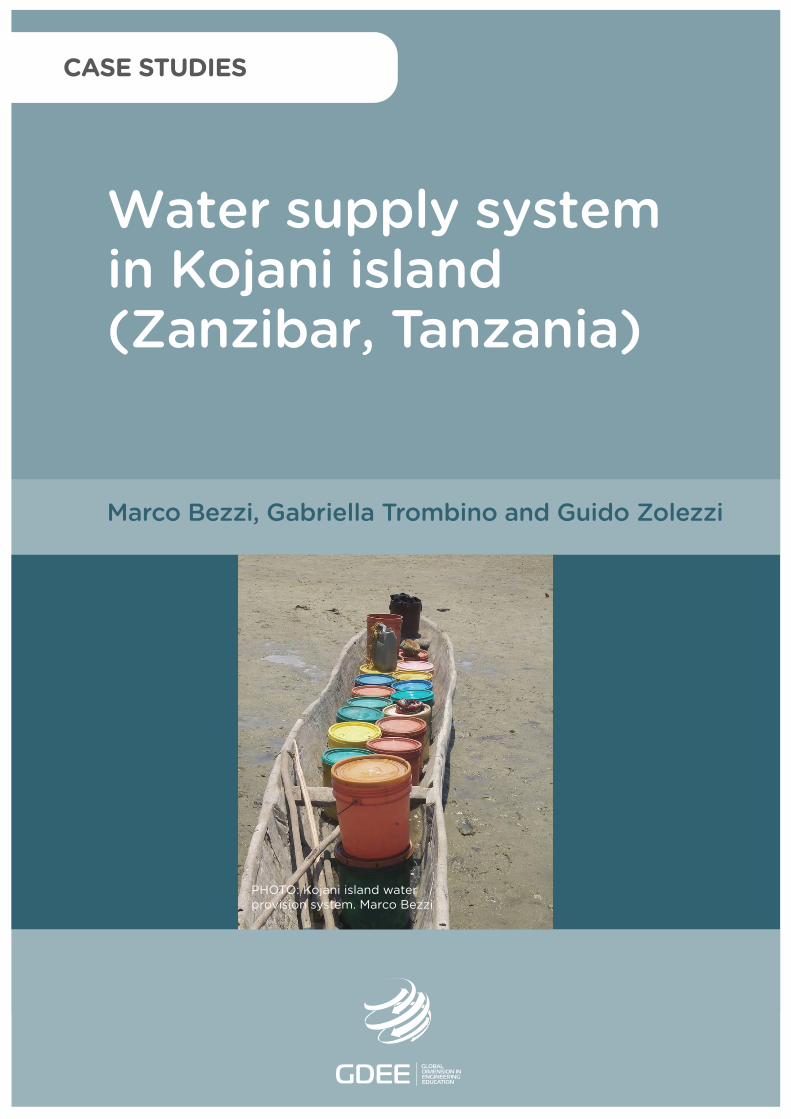
Water supply system in Kojani island (Zanzibar, Tanzania)
Marco Bezzi, Gabriella Trombino and Guido Zolezzi
PHOTO: Kojani island water provision system. Marco Bezzi
CASE STUDIES
Water supply system in Kojani island (Zanzibar, Tanzania)
DL B 10735-2015 ISBN 978-84-606-7546-4
COORDINATED BYAgustí Pérez-Foguet, Enric Velo, Pol Arranz, Ricard Ginéand Boris Lazzarini (Universitat Politècnica de Catalunya)Manuel Sierra (Universidad Politécnica de Madrid)Alejandra Boni and Jordi Peris (Universitat Politècnica de València)Guido Zolezzi and Gabriella Trombino (Università degli Studi di Trento)Rhoda Trimingham (Loughborough University)Valentín Villarroel (ONGAWA)Neil Nobles and Meadhbh Bolger (Practical Action)Francesco Mongera (Training Center for International Cooperation)Katie Cresswell-Maynard (Engineering Without Border UK)
EDITED BY Global Dimension in Engineering Education
Citation: Bezzi, M., Trombino, G., Zolezzi, G. (2015) 'Water supply system in Kojani island (Zanzibar, Tanzania)', in Case studies for developing globally responsible engineers, GDEE (eds.), Global Dimension in Engineering Education, Barcelona. Available from: http://gdee.eu/index.php/resources.html
This publication is distributedunder an Attribution- Noncommercial-Share Alike License for Creative Commons
CASE STUDIES
Disclaimer: This document has been produced with the financial assistance of the European UnionThe contents of this document are the sole responsibility of the authors and can under no circumstances be regarded as reflecting the position of the European Union
Water supply system in Kojani Island (Zanzibar, Tanzania)
WATER SUPPLY SYSTEM IN KOJANI ISLAND (ZANZIBAR, TANZANIA)
Marco Bezzi, Gabriella Trombino and Guido Zolezzi
UNESCO Chair in Engineering for Human and Sustainable Development; Department of
Civil Environmental and Mechanical Engineering - University of Trento, Italy
1
Water supply system in Kojani Island (Zanzibar, Tanzania)
INDEX
1. INTRODUCTION .............................................................................................................. 3
1.1. Disciplines covered ................................................................................................. 3
1.2. Learning outcomes ................................................................................................. 4
1.3. Activities ................................................................................................................. 4
2. DESCRIPTION OF THE CONTEXT .................................................................................. 4
2.1. Kojani island and its environmental context ................................................................ 4
2.2. Water supply in Kojani ................................................................................................ 6
2.3. Sanitary conditions in Kojani ...................................................................................... 9
2.4. Coping with WASH challenges in Kojani: past and present interventions ................. 10
3. CLASS ACTIVITY........................................................................................................... 12
3.1. Background: design of trasmission main in piped water supply ................................ 12
Design flow ..................................................................................................................... 12
Design pressure .............................................................................................................. 14
Design velocity ................................................................................................................ 14
Hydraulic design.............................................................................................................. 14
Water transmission by pumping ...................................................................................... 17
Pump selection ............................................................................................................... 19
3.2. Assignment .............................................................................................................. 19
3.3. Solution and evaluation criteria: ................................................................................ 20
Pipe diameter verification ................................................................................................ 20
Pump power-requirements .............................................................................................. 21
4. HOMEWORK ACTIVITY ................................................................................................. 21
4.1. Solution and evaluation criteria................................................................................. 22
Issue n. 1 ........................................................................................................................ 23
Issues n. 2 and 3 ............................................................................................................. 24
Evaluation criteria ............................................................................................................ 25
BIBLIOGRAPHY ................................................................................................................ 26
2
Water supply system in Kojani Island (Zanzibar, Tanzania)
1. INTRODUCTION
The Global Dimension in Engineering Education (GDEE) is a European Union funded initiative involving the collaboration of development NGOs and universities, with an aim to integrate sustainable human development as a regular part of all technical university courses. Part of the initiative is the development of a set of case studies based on real field experiences of development projects. The case studies cover a broad range of topics directly related those studied in engineering, science and other technology, environment or development-related courses.
This case study looks at the design and installation of the transmission main pipe in a drinking water supply system in a developing community located in a small island.
The transmission main is a key component of every piped water supply system: it usually conveys water from the main source to a storage tank that feeds the water distribution system. The correct design of a transmission main can make a dramatic difference in the functioning of a drinking water supply system and ultimately in people’s livelihoods. The case study is based on work coordinated by the Italian developmental organization Fondazione Ivo de Carneri ONLUS in the Kojani island, a small island located in the Zanzibar archipelago.
The case study allows students at any level to: learn the basic hydraulic design criteria for a transmission main and, in general, for a pipe connecting two tanks; analyse the hydraulic suitability of existing piping systems; consider the challenges of operationally placing the pipe within a real context of a developing community; appreciate the relative importance of technical, environmental, cultural and socioeconomic factors in the design and implementation of one component of a water supply system; and consider the implications of local stakeholder involvement a water project that interacts with the local territory.
1.1. DISCIPLINES COVERED
Hydraulics, fluid mechanics, hydraulic constructions, which are especially - though not exclusively - taught within BSc level courses of Civil, Environmental and Architectural Engineering. Other aspects include: health and safety; development; stakeholder participation; urban development.
3
Water supply system in Kojani Island (Zanzibar, Tanzania)
1.2. LEARNING OUTCOMES
The case study will present how to assess if the pipeline of a water scheme is technically appropriate in terms of flow-rate capacity and how to estimate the power of a pumping station of the aqueduct. As results of this case study, students are expected to be able to:
• understand some of the challenges related to the provision of water supply in aformerly not served area;
• learn how to calculate the diameter of a pipeline required in a pumpingtransmission system;
• understand the non-technical factors that play a relevant role in the design andimplementation of a new water supply project in a developing community.
1.3. ACTIVITIES
Class Activity: analysis and verification of hydraulic parameters of the new water-scheme of Kojani.
Homework Activity: group reading followed by short essay writing and final classroom discussion about non-technical factors and conflict management in the design and construction of water supply projects.
2. DESCRIPTION OF THE CONTEXT
2.1. KOJANI ISLAND AND ITS ENVIRONMENTAL CONTEXT
Kojani Island is about 7 square kilometers in area and is located in the District of Wete of the Pemba island (Tanzania: see figures 1 and 2). The population is about 15,000 inhabitants, concentrated in the main town called Kojani. Kojani Island suffers a series of criticalities in terms of water supply, sanitation and hygiene (WASH) typical of small islands in developing countries, and further difficulties arise from its peculiar environmental setting including its connections with the main island of Pemba. The town of Kojani essentially consists of two main parts: the historical village located on the seafront made of a sandy beach and the new Kojani urban expansion area that is located on the nearby hilly sites. The houses in the historical center are very close to one another and they are subject to frequent inundations from high-water due to tidal oscillations. This peculiar environmental setting creates highly critical conditions for the expanding urban settlement, because it makes hard to design and implement sustainable solid waste management and sanitation systems, particularly with sewage system. Almost half of the population still lives in the old town.
4
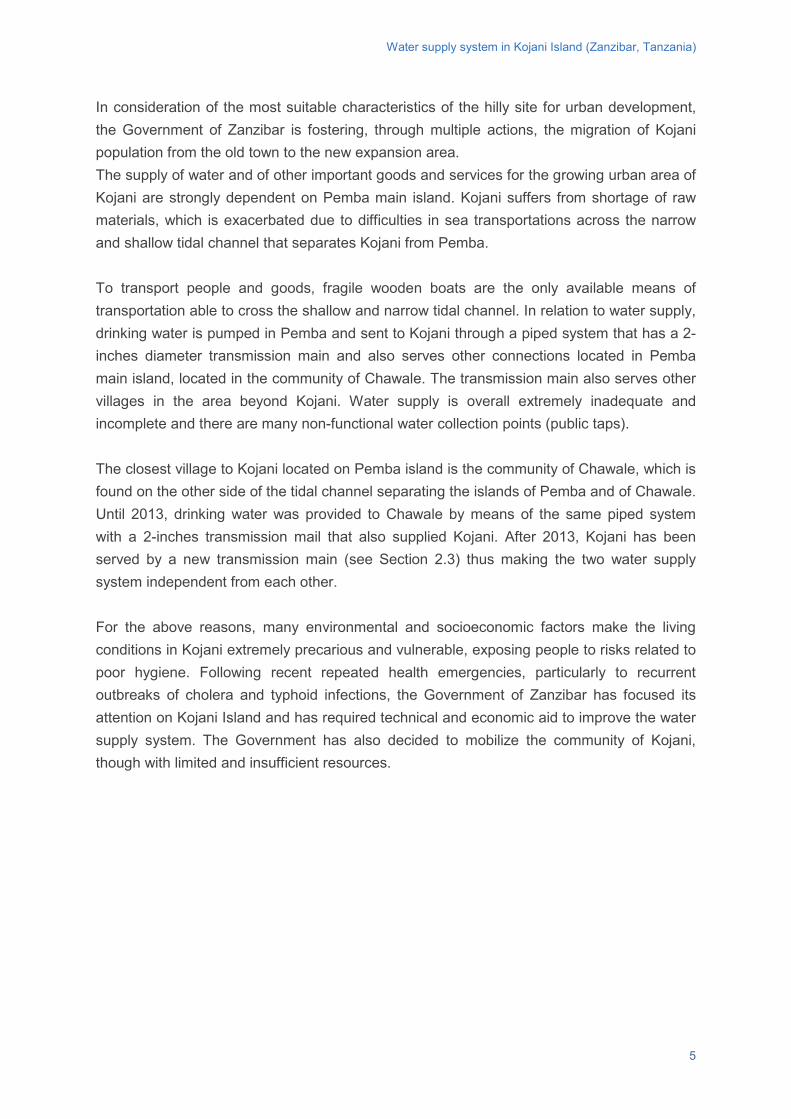
Water supply system in Kojani Island (Zanzibar, Tanzania)
In consideration of the most suitable characteristics of the hilly site for urban development, the Government of Zanzibar is fostering, through multiple actions, the migration of Kojani population from the old town to the new expansion area. The supply of water and of other important goods and services for the growing urban area of Kojani are strongly dependent on Pemba main island. Kojani suffers from shortage of raw materials, which is exacerbated due to difficulties in sea transportations across the narrow and shallow tidal channel that separates Kojani from Pemba.
To transport people and goods, fragile wooden boats are the only available means of transportation able to cross the shallow and narrow tidal channel. In relation to water supply, drinking water is pumped in Pemba and sent to Kojani through a piped system that has a 2-inches diameter transmission main and also serves other connections located in Pemba main island, located in the community of Chawale. The transmission main also serves other villages in the area beyond Kojani. Water supply is overall extremely inadequate and incomplete and there are many non-functional water collection points (public taps).
The closest village to Kojani located on Pemba island is the community of Chawale, which is found on the other side of the tidal channel separating the islands of Pemba and of Chawale. Until 2013, drinking water was provided to Chawale by means of the same piped system with a 2-inches transmission mail that also supplied Kojani. After 2013, Kojani has been served by a new transmission main (see Section 2.3) thus making the two water supply system independent from each other.
For the above reasons, many environmental and socioeconomic factors make the living conditions in Kojani extremely precarious and vulnerable, exposing people to risks related to poor hygiene. Following recent repeated health emergencies, particularly to recurrent outbreaks of cholera and typhoid infections, the Government of Zanzibar has focused its attention on Kojani Island and has required technical and economic aid to improve the water supply system. The Government has also decided to mobilize the community of Kojani, though with limited and insufficient resources.
5
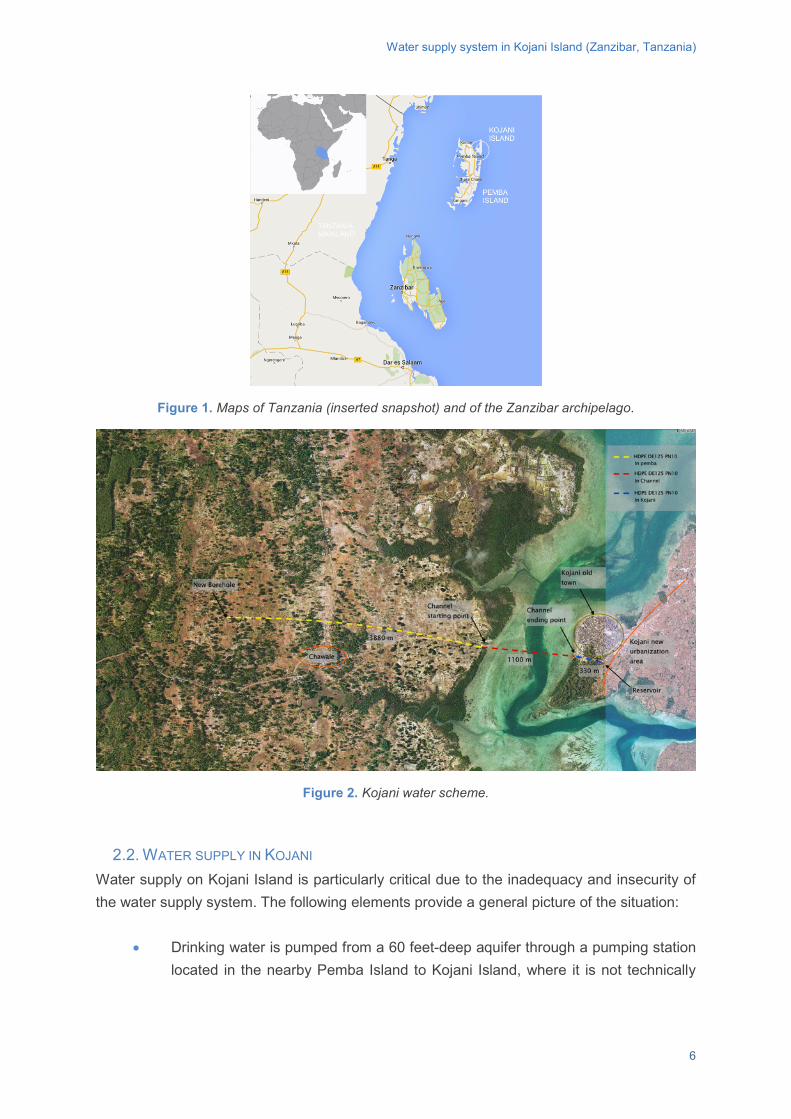
Water supply system in Kojani Island (Zanzibar, Tanzania)
Figure 1. Maps of Tanzania (inserted snapshot) and of the Zanzibar archipelago.
Figure 2. Kojani water scheme.
2.2. WATER SUPPLY IN KOJANI Water supply on Kojani Island is particularly critical due to the inadequacy and insecurity of the water supply system. The following elements provide a general picture of the situation:
• Drinking water is pumped from a 60 feet-deep aquifer through a pumping stationlocated in the nearby Pemba Island to Kojani Island, where it is not technically
6
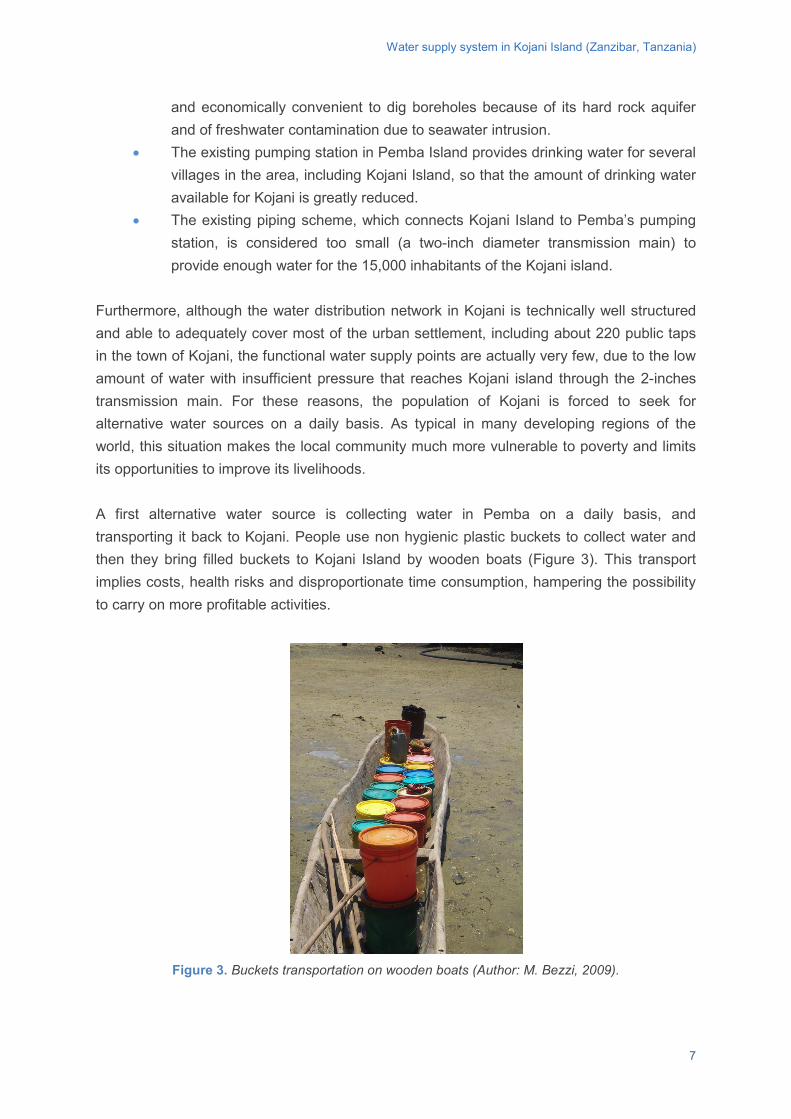
Water supply system in Kojani Island (Zanzibar, Tanzania)
and economically convenient to dig boreholes because of its hard rock aquifer and of freshwater contamination due to seawater intrusion.
• The existing pumping station in Pemba Island provides drinking water for several villages in the area, including Kojani Island, so that the amount of drinking water available for Kojani is greatly reduced.
• The existing piping scheme, which connects Kojani Island to Pemba’s pumping station, is considered too small (a two-inch diameter transmission main) to provide enough water for the 15,000 inhabitants of the Kojani island.
Furthermore, although the water distribution network in Kojani is technically well structured and able to adequately cover most of the urban settlement, including about 220 public taps in the town of Kojani, the functional water supply points are actually very few, due to the low amount of water with insufficient pressure that reaches Kojani island through the 2-inches transmission main. For these reasons, the population of Kojani is forced to seek for alternative water sources on a daily basis. As typical in many developing regions of the world, this situation makes the local community much more vulnerable to poverty and limits its opportunities to improve its livelihoods. A first alternative water source is collecting water in Pemba on a daily basis, and transporting it back to Kojani. People use non hygienic plastic buckets to collect water and then they bring filled buckets to Kojani Island by wooden boats (Figure 3). This transport implies costs, health risks and disproportionate time consumption, hampering the possibility to carry on more profitable activities.
Figure 3. Buckets transportation on wooden boats (Author: M. Bezzi, 2009).
7
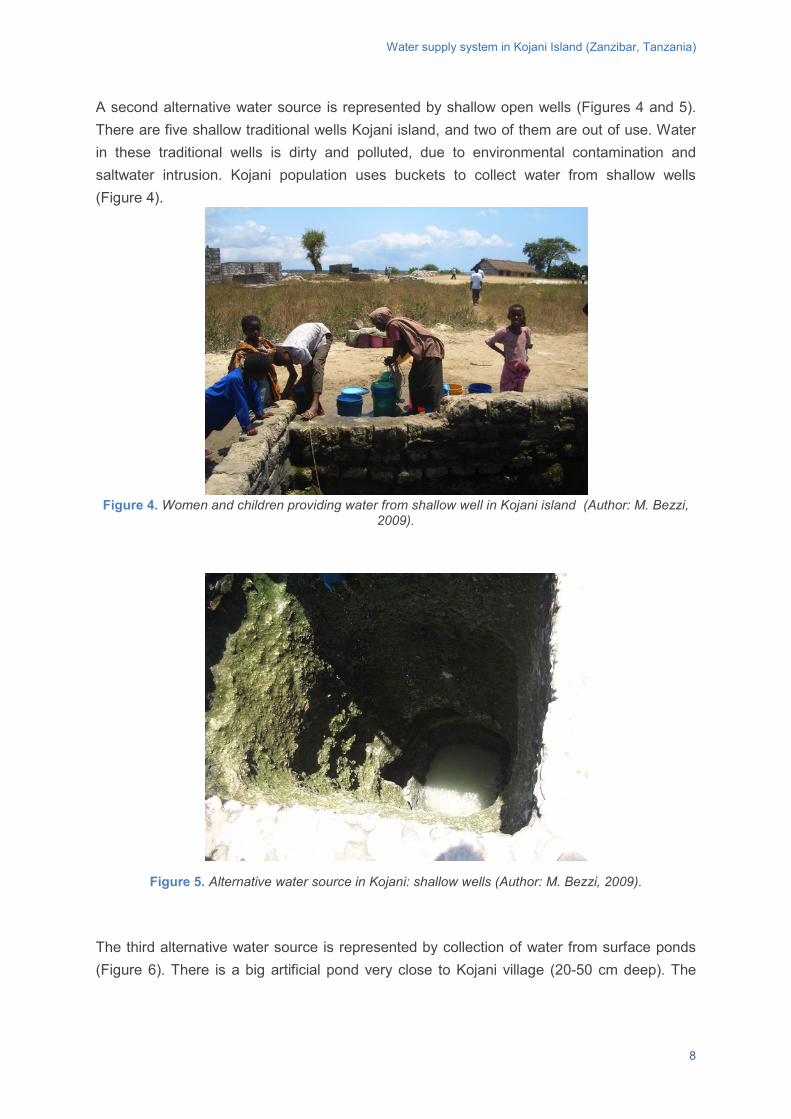
Water supply system in Kojani Island (Zanzibar, Tanzania)
A second alternative water source is represented by shallow open wells (Figures 4 and 5). There are five shallow traditional wells Kojani island, and two of them are out of use. Water in these traditional wells is dirty and polluted, due to environmental contamination and saltwater intrusion. Kojani population uses buckets to collect water from shallow wells (Figure 4).
Figure 4. Women and children providing water from shallow well in Kojani island (Author: M. Bezzi,
2009).
Figure 5. Alternative water source in Kojani: shallow wells (Author: M. Bezzi, 2009).
The third alternative water source is represented by collection of water from surface ponds (Figure 6). There is a big artificial pond very close to Kojani village (20-50 cm deep). The
8
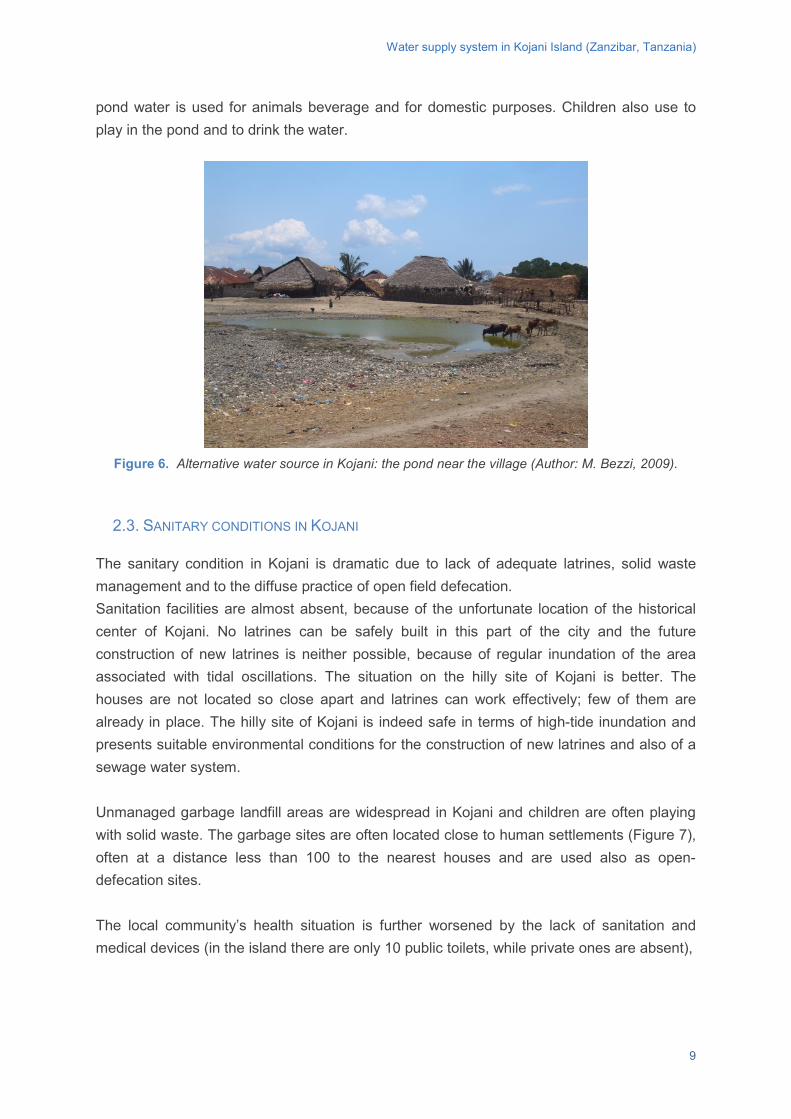
Water supply system in Kojani Island (Zanzibar, Tanzania)
pond water is used for animals beverage and for domestic purposes. Children also use to play in the pond and to drink the water.
Figure 6. Alternative water source in Kojani: the pond near the village (Author: M. Bezzi, 2009).
2.3. SANITARY CONDITIONS IN KOJANI
The sanitary condition in Kojani is dramatic due to lack of adequate latrines, solid waste management and to the diffuse practice of open field defecation. Sanitation facilities are almost absent, because of the unfortunate location of the historical center of Kojani. No latrines can be safely built in this part of the city and the future construction of new latrines is neither possible, because of regular inundation of the area associated with tidal oscillations. The situation on the hilly site of Kojani is better. The houses are not located so close apart and latrines can work effectively; few of them are already in place. The hilly site of Kojani is indeed safe in terms of high-tide inundation and presents suitable environmental conditions for the construction of new latrines and also of a sewage water system.
Unmanaged garbage landfill areas are widespread in Kojani and children are often playing with solid waste. The garbage sites are often located close to human settlements (Figure 7), often at a distance less than 100 to the nearest houses and are used also as open-defecation sites.
The local community’s health situation is further worsened by the lack of sanitation and medical devices (in the island there are only 10 public toilets, while private ones are absent),
9
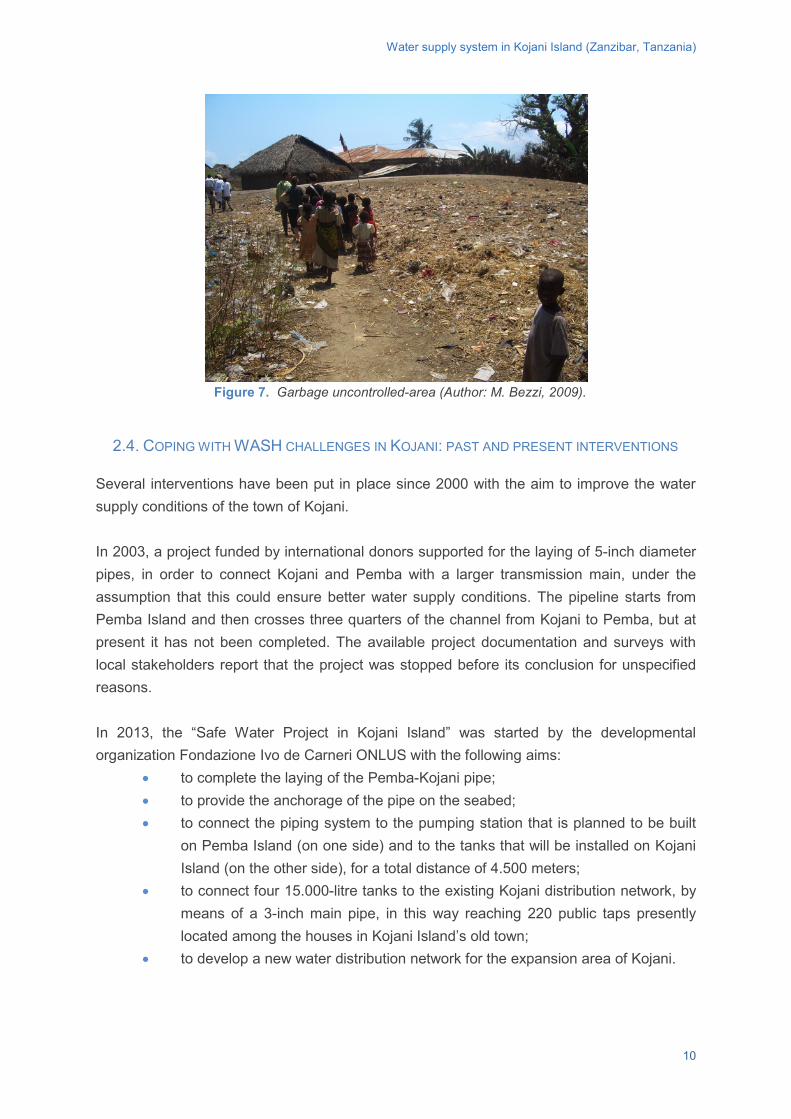
Water supply system in Kojani Island (Zanzibar, Tanzania)
Figure 7. Garbage uncontrolled-area (Author: M. Bezzi, 2009).
2.4. COPING WITH WASH CHALLENGES IN KOJANI: PAST AND PRESENT INTERVENTIONS
Several interventions have been put in place since 2000 with the aim to improve the water supply conditions of the town of Kojani. In 2003, a project funded by international donors supported for the laying of 5-inch diameter pipes, in order to connect Kojani and Pemba with a larger transmission main, under the assumption that this could ensure better water supply conditions. The pipeline starts from Pemba Island and then crosses three quarters of the channel from Kojani to Pemba, but at present it has not been completed. The available project documentation and surveys with local stakeholders report that the project was stopped before its conclusion for unspecified reasons. In 2013, the “Safe Water Project in Kojani Island” was started by the developmental organization Fondazione Ivo de Carneri ONLUS with the following aims:
• to complete the laying of the Pemba-Kojani pipe; • to provide the anchorage of the pipe on the seabed; • to connect the piping system to the pumping station that is planned to be built
on Pemba Island (on one side) and to the tanks that will be installed on Kojani Island (on the other side), for a total distance of 4.500 meters;
• to connect four 15.000-litre tanks to the existing Kojani distribution network, by means of a 3-inch main pipe, in this way reaching 220 public taps presently located among the houses in Kojani Island’s old town;
• to develop a new water distribution network for the expansion area of Kojani.
10
Water supply system in Kojani Island (Zanzibar, Tanzania)
To determine the maximum pullout flow from the well, several pumping tests have been performed showing the flow-rate of 8,3 l/s as the maximum sustainable for the aquifer. Moreover, in Pemba Island, the new pipeline was digged also through the administrative territory of the Chawale community located just in front of Kojani town. The community of Chawale is not a direct beneficiary of this new water supply system, and its water supply system is completely independent from the water supply system of Kojani. For this reason the construction of the new water scheme for Kojani is not negatively affecting the existing Chawale Water System neither in terms of water quantity nor of quality. The “Safe Water Project in Kojani Island” has involved a series of stakeholders, which are recalled in the following. The project has been coordinated by Ivo de Carneri Foundation - Zanzibar Branch (IdCF-ZB), the local branch of Fondazione Ivo de Carneri ONLUS, which is based in Italy. The project direct beneficiaries are the citizens of the Community of Kojani. The local community of Chawale was not beneficiary of the project and its independent water supply system was not going to be affected by the construction of the new Kojani transmission main, which however was going to partially cross its administrative territory. Local technical and implementing partners have been the Zanzibar Water Authority (ZAWA), responsible for the executive planning and the direction of the renovation and rehabilitation works, and the Public Health Laboratory - Ivo de carneri Foundation (PhL-IdCF), the reference centre for the development and implementation of protocols for systematic microbiological water analysis. Institutional support has been provided by the Italian Embassy in Tanzania. Technical support and advice has been provided by Ingegneria senza Frontiere - Trento (ISF-Trento), by staff of the UNESCO Chair in Engineering for Human and Sustainable Development of the University of Trento (Italy) and by the Azienda Sanitaria Locale - Torino (ASL-Torino), which provided laboratory activities supervision and external audit. For a variety of reasons, the community of Chawale, including its leaders, have not been informed about the ongoing “Safe Water Project in Kojani Island”. Conversely, the government of Zanzibar, formally also an external actor of the project, and in agreement with the Zanzibar Water Authority, has required to align the project goals with the governmental strategy on the urban development of Kojani town, in consideration of its dramatic sanitary situation. This strategy consists of several urbanistic measures to facilitate the inhabitants migration from the old town to the safer new expansion area located on the hills. These measures are among the attempts put in place by the Zanzibar government to overcome the reluctance of the Old Kojani inhabitants to leave their homes in the old part of Kojani in favour of the new settlements located on the hills. The design of the new water scheme for Kojani island has therefore foreseen the following three requirements, aimed at creating conditions that could support such migration process:
11
Water supply system in Kojani Island (Zanzibar, Tanzania)
• the new water tank located in the new urbanization area needs to provide water giving priority to the new urbanization area;
• in the new urbanization area a new HDPE distribution pipeline was foreseen to provide water to private taps;
• in the old Kojani town the old pipeline was not to be replaced, also because of the technical problems posed by digging in such a crowded area, and only public taps could be served with the new water scheme. No private taps could be served in the old Kojani town through the new water supply scheme.
During the construction of the pipeline a sabotage action was performed. The sabotage regards the introduction of material in the main pipeline obstructing the normal water flow e causing a significant pressure reduction. The causes of the sabotage are presently under investigation. 3. CLASS ACTIVITY
The activity is an exercise focusing on the hydraulic testing of the transmission main in the Kojani water supply scheme. The activity is introduced by a short summary of the methods to perform hydraulic design and testing of a transmission main.
3.1. BACKGROUND: DESIGN OF TRASMISSION MAIN IN PIPED WATER SUPPLY
Water transmission for community water supply purposes is often achieved by means of pressurized pipelines. Technical options have to be careful considered and compared with the involvement of community groups that will support and manage the system. Local knowledge has to be strongly taken into account to enhance cultural acceptability of the project.
DESIGN FLOW
The estimation of water demand in a distribution area has to consider the typical daily-fluctuation and thus a reservoir is the best solution for a proper water management of the water during the 24 hours. The reservoir localization has to be chosen by local people, based on technical advice and their own socio-cultural criteria. The reservoir is supplied from the transmission main. The transmission main has to be designed for the carrying capacity needed to supply water demand on the maximum consumption day at constant rate. The service reservoir will manage the hourly variations on the water demand during the day of maximum consumption. Depending on the pumping system (diesel or electric motor-drive
12
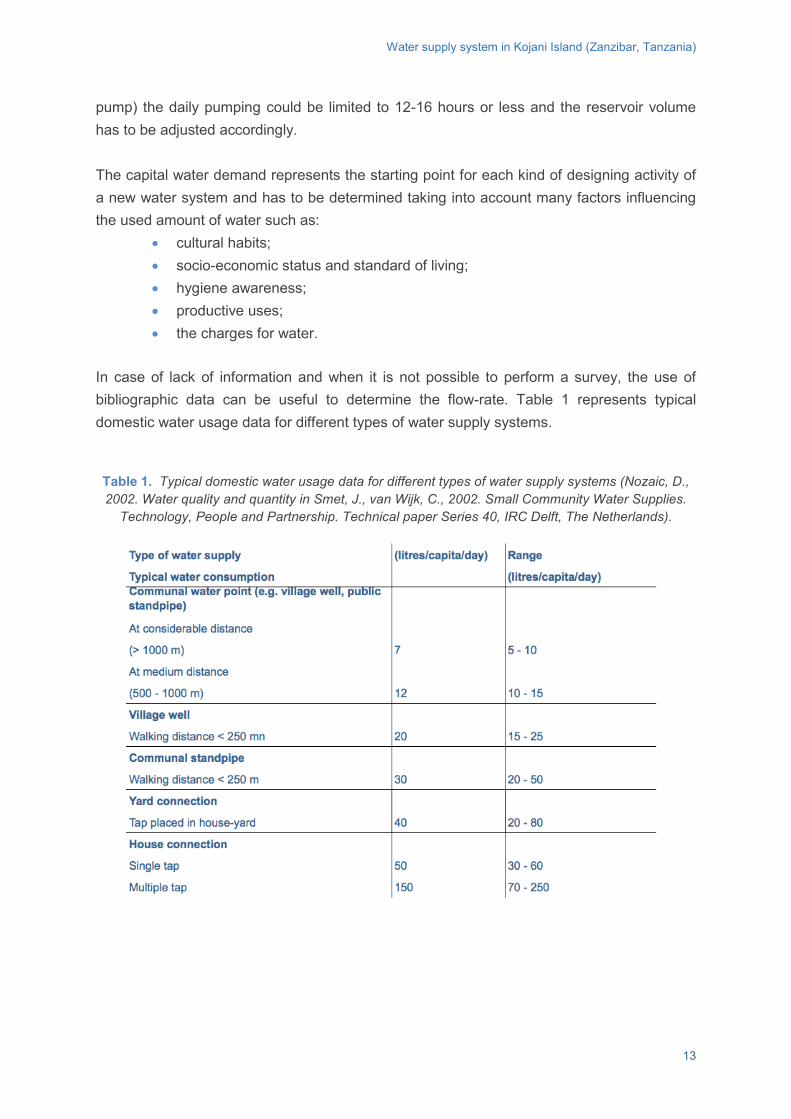
Water supply system in Kojani Island (Zanzibar, Tanzania)
pump) the daily pumping could be limited to 12-16 hours or less and the reservoir volume has to be adjusted accordingly. The capital water demand represents the starting point for each kind of designing activity of a new water system and has to be determined taking into account many factors influencing the used amount of water such as:
• cultural habits; • socio-economic status and standard of living; • hygiene awareness; • productive uses; • the charges for water.
In case of lack of information and when it is not possible to perform a survey, the use of bibliographic data can be useful to determine the flow-rate. Table 1 represents typical domestic water usage data for different types of water supply systems. Table 1. Typical domestic water usage data for different types of water supply systems (Nozaic, D., 2002. Water quality and quantity in Smet, J., van Wijk, C., 2002. Small Community Water Supplies.
Technology, People and Partnership. Technical paper Series 40, IRC Delft, The Netherlands).
13
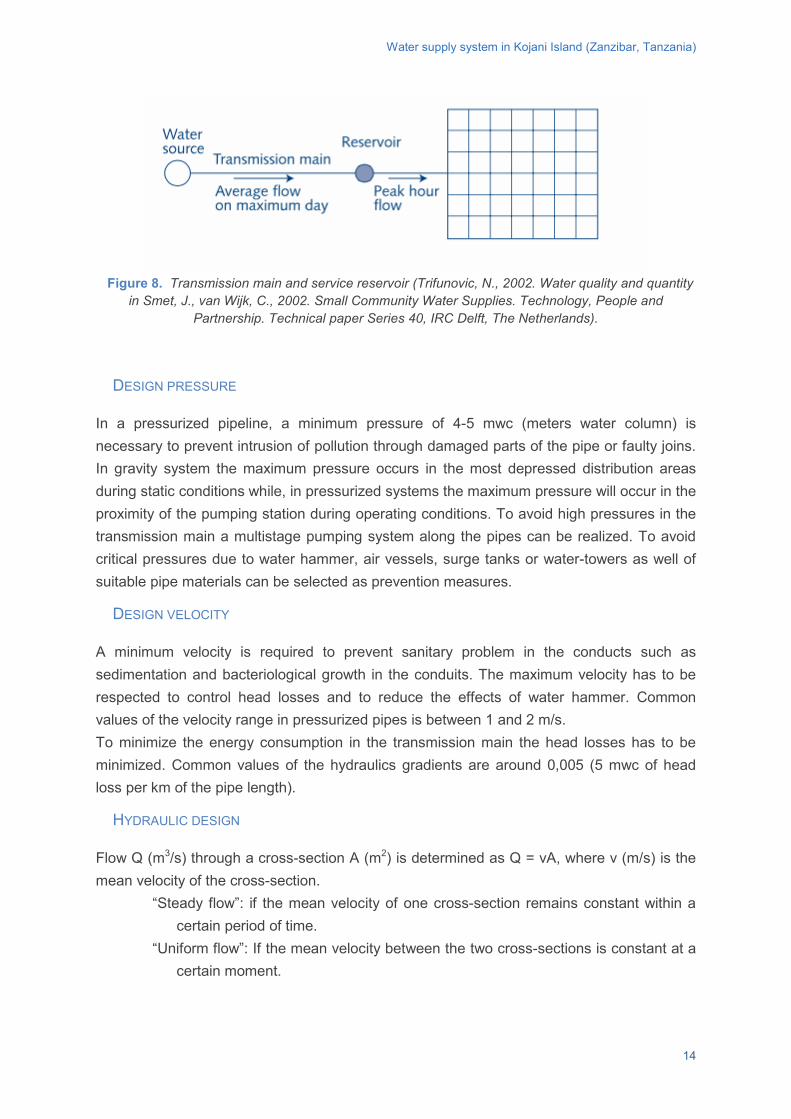
Water supply system in Kojani Island (Zanzibar, Tanzania)
Figure 8. Transmission main and service reservoir (Trifunovic, N., 2002. Water quality and quantity
in Smet, J., van Wijk, C., 2002. Small Community Water Supplies. Technology, People and Partnership. Technical paper Series 40, IRC Delft, The Netherlands).
DESIGN PRESSURE
In a pressurized pipeline, a minimum pressure of 4-5 mwc (meters water column) is necessary to prevent intrusion of pollution through damaged parts of the pipe or faulty joins. In gravity system the maximum pressure occurs in the most depressed distribution areas during static conditions while, in pressurized systems the maximum pressure will occur in the proximity of the pumping station during operating conditions. To avoid high pressures in the transmission main a multistage pumping system along the pipes can be realized. To avoid critical pressures due to water hammer, air vessels, surge tanks or water-towers as well of suitable pipe materials can be selected as prevention measures.
DESIGN VELOCITY
A minimum velocity is required to prevent sanitary problem in the conducts such as sedimentation and bacteriological growth in the conduits. The maximum velocity has to be respected to control head losses and to reduce the effects of water hammer. Common values of the velocity range in pressurized pipes is between 1 and 2 m/s. To minimize the energy consumption in the transmission main the head losses has to be minimized. Common values of the hydraulics gradients are around 0,005 (5 mwc of head loss per km of the pipe length).
HYDRAULIC DESIGN
Flow Q (m3/s) through a cross-section A (m2) is determined as Q = vA, where v (m/s) is the mean velocity of the cross-section.
“Steady flow”: if the mean velocity of one cross-section remains constant within a certain period of time.
“Uniform flow”: If the mean velocity between the two cross-sections is constant at a certain moment.
14
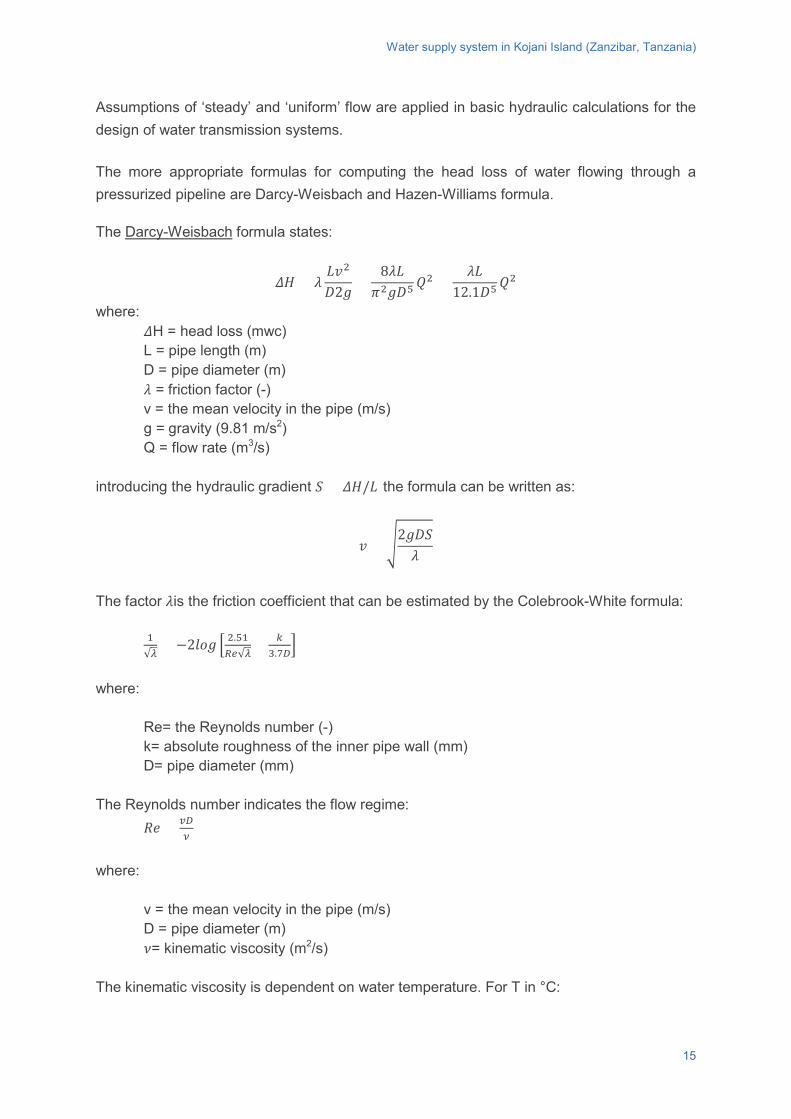
Water supply system in Kojani Island (Zanzibar, Tanzania)
Assumptions of ‘steady’ and ‘uniform’ flow are applied in basic hydraulic calculations for the design of water transmission systems. The more appropriate formulas for computing the head loss of water flowing through a pressurized pipeline are Darcy-Weisbach and Hazen-Williams formula. The Darcy-Weisbach formula states:
𝛥𝛥𝛥𝛥 = 𝜆𝜆𝐿𝐿𝑣𝑣2
𝐷𝐷2𝑔𝑔=
8𝜆𝜆𝐿𝐿𝜋𝜋2𝑔𝑔𝐷𝐷5 𝑄𝑄
2 =𝜆𝜆𝐿𝐿
12.1𝐷𝐷5𝑄𝑄2
where: 𝛥𝛥H = head loss (mwc) L = pipe length (m) D = pipe diameter (m) 𝜆𝜆 = friction factor (-) v = the mean velocity in the pipe (m/s) g = gravity (9.81 m/s2) Q = flow rate (m3/s)
introducing the hydraulic gradient 𝑆𝑆 = 𝛥𝛥𝛥𝛥/𝐿𝐿 the formula can be written as:
𝑣𝑣 = �2𝑔𝑔𝐷𝐷𝑆𝑆𝜆𝜆
The factor 𝜆𝜆is the friction coefficient that can be estimated by the Colebrook-White formula: 1
√𝜆𝜆= −2𝑙𝑙𝑙𝑙𝑔𝑔 � 2.51
𝑅𝑅𝑅𝑅√𝜆𝜆+ 𝑘𝑘
3.7𝐷𝐷�
where:
Re= the Reynolds number (-) k= absolute roughness of the inner pipe wall (mm) D= pipe diameter (mm)
The Reynolds number indicates the flow regime:
𝑅𝑅𝑅𝑅 = 𝑣𝑣𝐷𝐷𝜈𝜈
where:
v = the mean velocity in the pipe (m/s) D = pipe diameter (m) 𝜈𝜈= kinematic viscosity (m2/s)
The kinematic viscosity is dependent on water temperature. For T in °C:
15
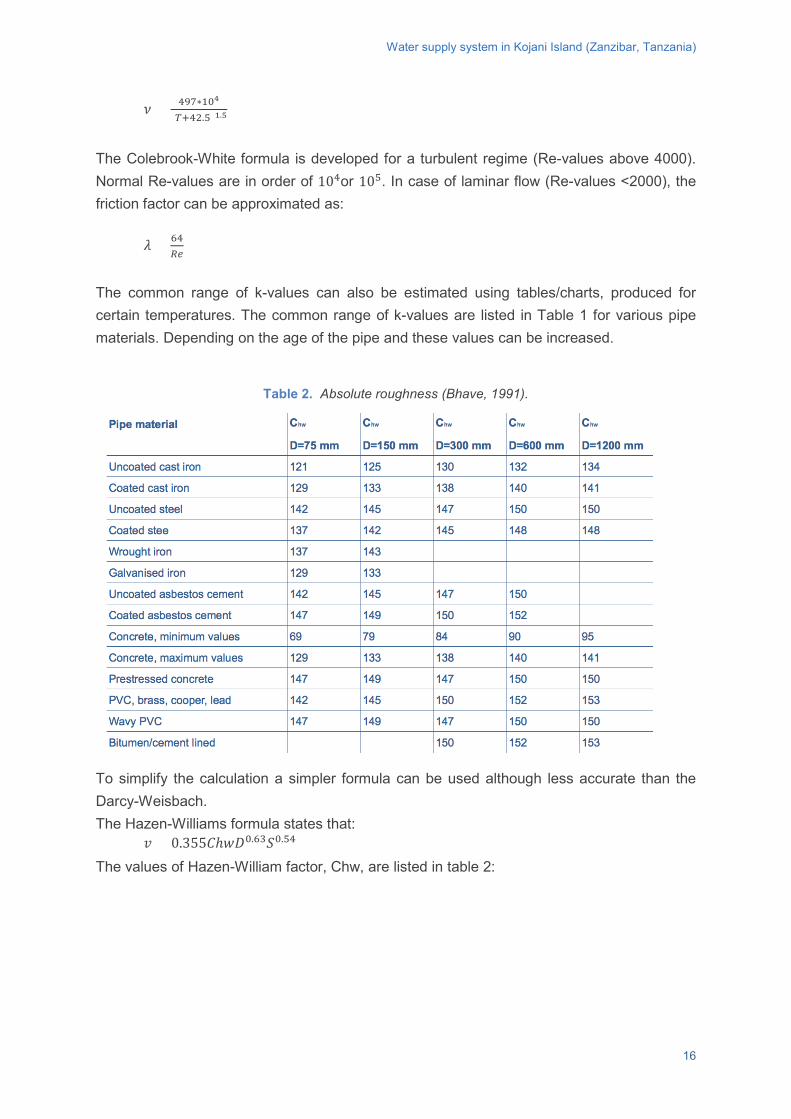
Water supply system in Kojani Island (Zanzibar, Tanzania)
𝜈𝜈 = 497∗104
(𝑇𝑇+42.5)1.5
The Colebrook-White formula is developed for a turbulent regime (Re-values above 4000). Normal Re-values are in order of 104or 105. In case of laminar flow (Re-values <2000), the friction factor can be approximated as: 𝜆𝜆 = 64
𝑅𝑅𝑅𝑅
The common range of k-values can also be estimated using tables/charts, produced for certain temperatures. The common range of k-values are listed in Table 1 for various pipe materials. Depending on the age of the pipe and these values can be increased.
Table 2. Absolute roughness (Bhave, 1991).
To simplify the calculation a simpler formula can be used although less accurate than the Darcy-Weisbach. The Hazen-Williams formula states that: 𝑣𝑣 = 0.355𝐶𝐶ℎ𝑤𝑤𝐷𝐷0.63𝑆𝑆0.54 The values of Hazen-William factor, Chw, are listed in table 2:
16
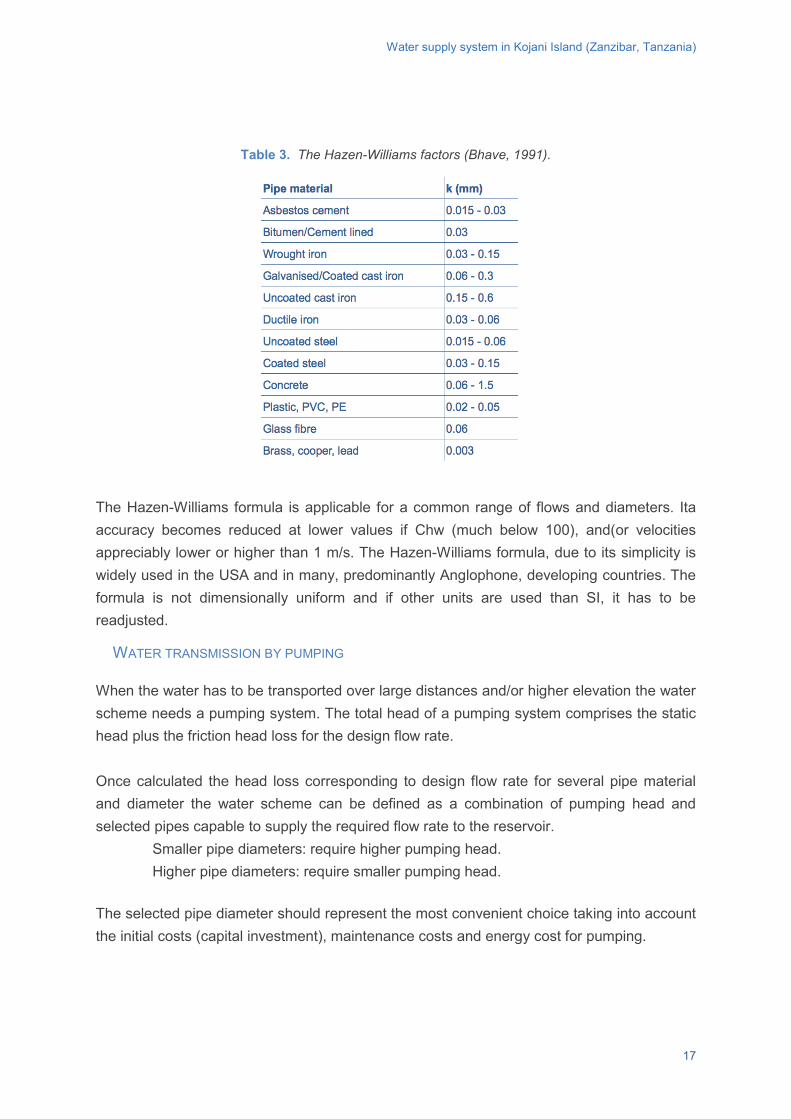
Water supply system in Kojani Island (Zanzibar, Tanzania)
Table 3. The Hazen-Williams factors (Bhave, 1991).
The Hazen-Williams formula is applicable for a common range of flows and diameters. Ita accuracy becomes reduced at lower values if Chw (much below 100), and(or velocities appreciably lower or higher than 1 m/s. The Hazen-Williams formula, due to its simplicity is widely used in the USA and in many, predominantly Anglophone, developing countries. The formula is not dimensionally uniform and if other units are used than SI, it has to be readjusted.
WATER TRANSMISSION BY PUMPING
When the water has to be transported over large distances and/or higher elevation the water scheme needs a pumping system. The total head of a pumping system comprises the static head plus the friction head loss for the design flow rate. Once calculated the head loss corresponding to design flow rate for several pipe material and diameter the water scheme can be defined as a combination of pumping head and selected pipes capable to supply the required flow rate to the reservoir.
Smaller pipe diameters: require higher pumping head. Higher pipe diameters: require smaller pumping head.
The selected pipe diameter should represent the most convenient choice taking into account the initial costs (capital investment), maintenance costs and energy cost for pumping.
17
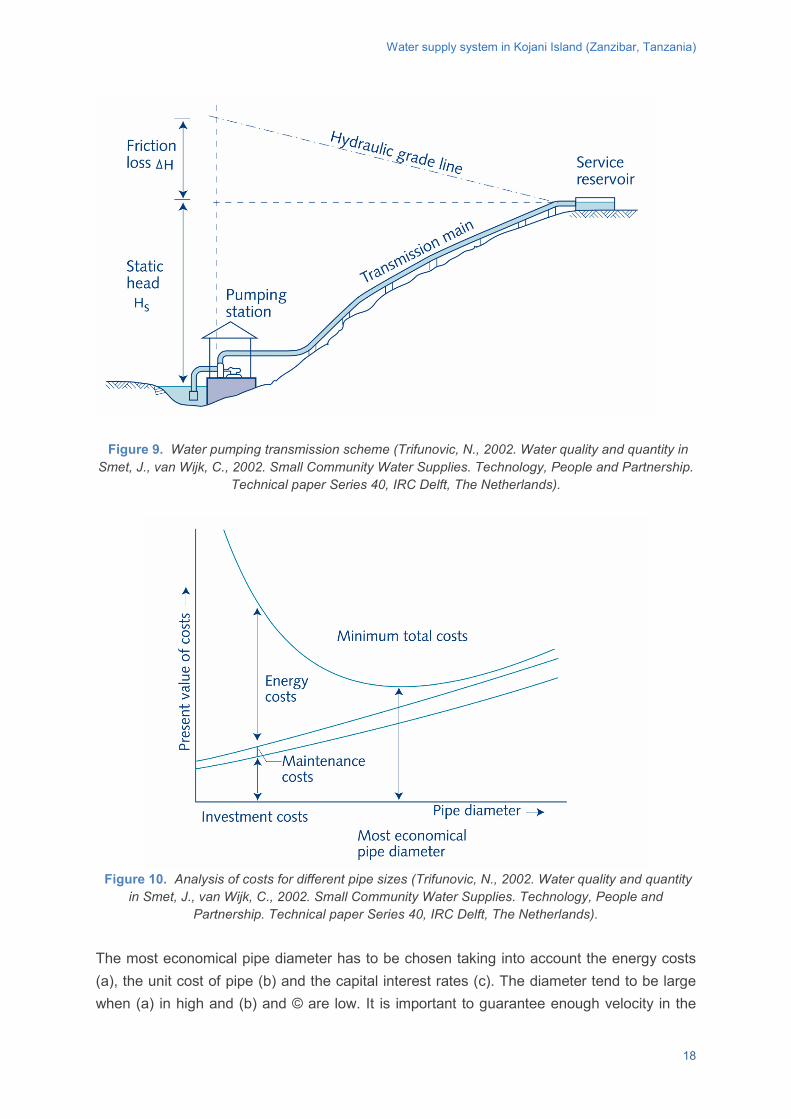
Water supply system in Kojani Island (Zanzibar, Tanzania)
Figure 9. Water pumping transmission scheme (Trifunovic, N., 2002. Water quality and quantity in Smet, J., van Wijk, C., 2002. Small Community Water Supplies. Technology, People and Partnership.
Technical paper Series 40, IRC Delft, The Netherlands).
Figure 10. Analysis of costs for different pipe sizes (Trifunovic, N., 2002. Water quality and quantity
in Smet, J., van Wijk, C., 2002. Small Community Water Supplies. Technology, People and Partnership. Technical paper Series 40, IRC Delft, The Netherlands).
The most economical pipe diameter has to be chosen taking into account the energy costs (a), the unit cost of pipe (b) and the capital interest rates (c). The diameter tend to be large when (a) in high and (b) and © are low. It is important to guarantee enough velocity in the
18
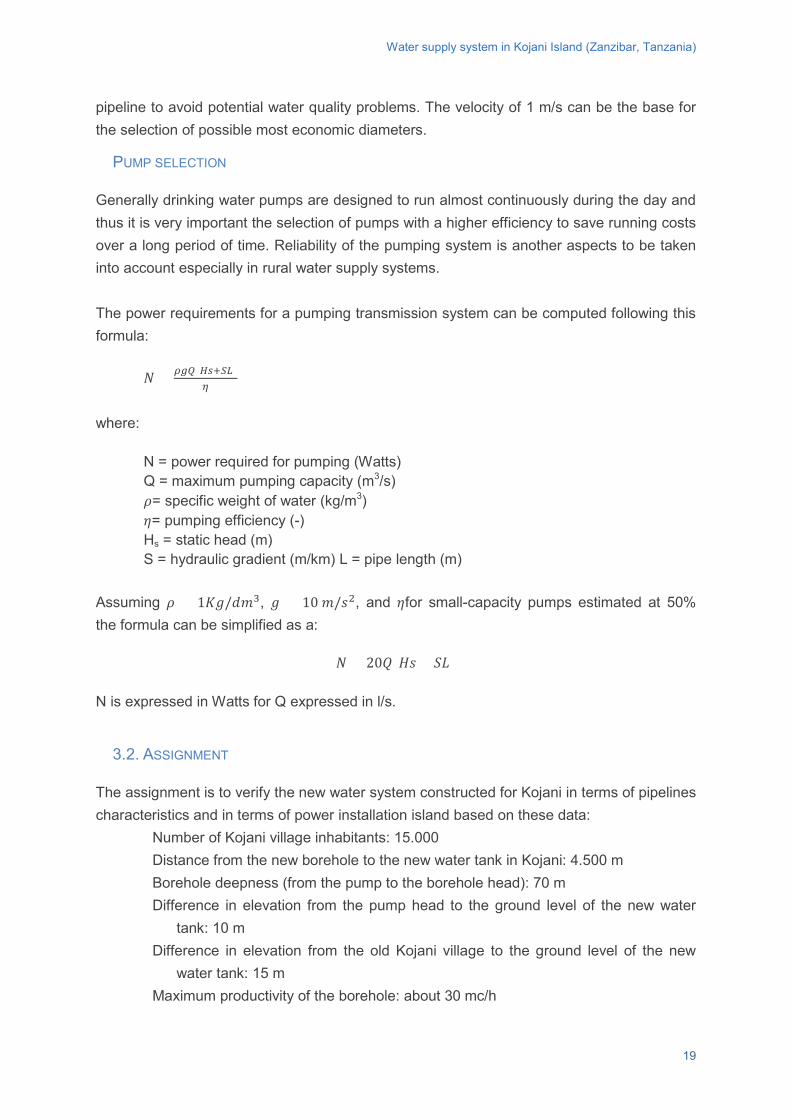
Water supply system in Kojani Island (Zanzibar, Tanzania)
pipeline to avoid potential water quality problems. The velocity of 1 m/s can be the base for the selection of possible most economic diameters.
PUMP SELECTION
Generally drinking water pumps are designed to run almost continuously during the day and thus it is very important the selection of pumps with a higher efficiency to save running costs over a long period of time. Reliability of the pumping system is another aspects to be taken into account especially in rural water supply systems. The power requirements for a pumping transmission system can be computed following this formula: 𝑁𝑁 = 𝜌𝜌𝜌𝜌𝜌𝜌(𝐻𝐻𝐻𝐻+𝑆𝑆𝑆𝑆)
𝜂𝜂
where:
N = power required for pumping (Watts) Q = maximum pumping capacity (m3/s) 𝜌𝜌= specific weight of water (kg/m3) 𝜂𝜂= pumping efficiency (-) Hs = static head (m) S = hydraulic gradient (m/km) L = pipe length (m)
Assuming 𝜌𝜌 = 1𝐾𝐾𝑔𝑔/𝑑𝑑𝑚𝑚3, 𝑔𝑔 = 10 𝑚𝑚/𝑠𝑠2, and 𝜂𝜂for small-capacity pumps estimated at 50% the formula can be simplified as a:
𝑁𝑁 = 20𝑄𝑄(𝛥𝛥𝑠𝑠 + 𝑆𝑆𝐿𝐿) N is expressed in Watts for Q expressed in l/s.
3.2. ASSIGNMENT
The assignment is to verify the new water system constructed for Kojani in terms of pipelines characteristics and in terms of power installation island based on these data:
Number of Kojani village inhabitants: 15.000 Distance from the new borehole to the new water tank in Kojani: 4.500 m Borehole deepness (from the pump to the borehole head): 70 m Difference in elevation from the pump head to the ground level of the new water
tank: 10 m Difference in elevation from the old Kojani village to the ground level of the new
water tank: 15 m Maximum productivity of the borehole: about 30 mc/h
19
Water supply system in Kojani Island (Zanzibar, Tanzania)
Aim of the assignment is to answer to these questions:
Is the HDPE pipe DE=125 mm, used for the connection from the new borehole to the new water tank, appropriate to transport water from the borehole to the new water tank?
What is the power of the pump that has to be installed for the Kojani Water System?
3.3. SOLUTION AND EVALUATION CRITERIA:
PIPE DIAMETER VERIFICATION
Taking into account the maximum productivity of the aquifer about 30 mc/h (8,3 l/s) the pipe-line used in the project is a HDPE pipe D=125 mm PN10.. The pipeline transport water from the borehole head to the new tank at 4500 m distance. The pressure difference between the borehole head and the tank water surface is 25,0 m. The absolute roughness of the pipe wall is k=0,25 mm and the water temperature can be considered equal to 20°C. Follow these steps to verify what will be the flow in the HDPE 125 mm pipe-line and to verify if it is enough to transport the aquifer maximum flow-rate. The difference between the pressure at the borehole head and the tank water-surface indicates the available head loss. Hence:
𝐴𝐴𝛥𝛥 = 25,0 𝑚𝑚𝑤𝑤𝑚𝑚 and 𝑆𝑆 = 25,0/4500 = 0,0055 For water temperature of 10°C, the kinematic viscosity is:
𝜐𝜐 = ((497 × 106)/(𝑇𝑇 + 42,5)1,5 = 1,31 × 10⁻⁶𝑚𝑚2/𝑠𝑠
The calculation has to be iterative due to the fact that the velocity (flow) is not known and it influences the Reynolds number. A common assumption is 𝑣𝑣 = 1,0 𝑚𝑚/𝑠𝑠 Further:
𝑅𝑅𝑅𝑅 = (1,0 × 0,125)/(1,31 × 10−6) = 9,54 × 10⁴
1/𝜆𝜆 = −2𝑙𝑙𝑙𝑙𝑔𝑔 � 5.1289(9,54×10⁴)0,89 + 0,25
3,7×125� = 6,273 𝜆𝜆 = 0,025
𝑣𝑣 = �2𝜌𝜌𝐷𝐷𝑆𝑆𝜆𝜆
= �2×9,81×0,125×0,00550,025
= 0,73 𝑚𝑚/𝑠𝑠
The calculated velocity is different from the assumed one of 1 m/s. Thus the procedure has to be repeated starting with this new value. For 𝑣𝑣 = 0,73 𝑚𝑚/𝑠𝑠we obtain:
𝑅𝑅𝑅𝑅 = (0,73 × 0,125)/(1,31 × 10−6) = 6,965 × 104
1/𝜆𝜆 = −2𝑙𝑙𝑙𝑙𝑔𝑔 � 5.1289(6,96×10⁴)0,89 + 0,25
3,7×125� = 6,202 𝜆𝜆 = 0,026
20
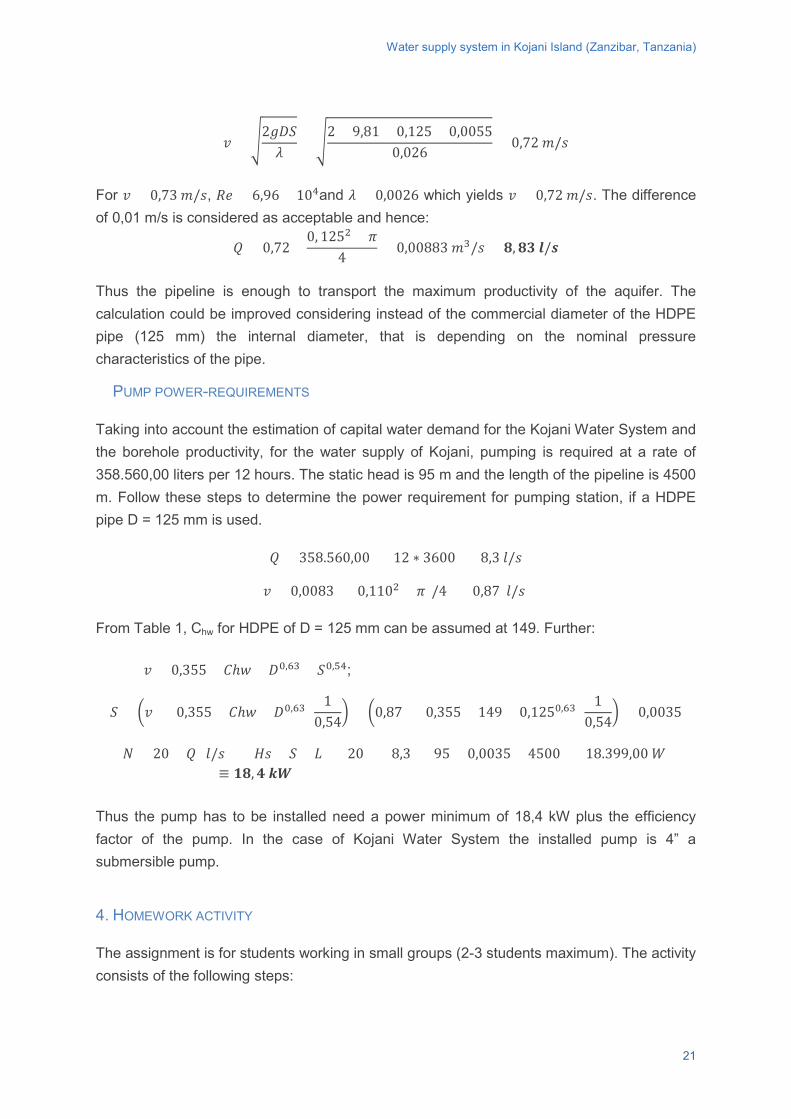
Water supply system in Kojani Island (Zanzibar, Tanzania)
𝑣𝑣 = �2𝑔𝑔𝐷𝐷𝑆𝑆𝜆𝜆
= �2 × 9,81 × 0,125 × 0,0055
0,026= 0,72 𝑚𝑚/𝑠𝑠
For 𝑣𝑣 = 0,73 𝑚𝑚/𝑠𝑠, 𝑅𝑅𝑅𝑅 = 6,96 × 10⁴and 𝜆𝜆 = 0,0026 which yields 𝑣𝑣 = 0,72 𝑚𝑚/𝑠𝑠. The difference of 0,01 m/s is considered as acceptable and hence:
𝑄𝑄 = 0,72 ×0, 1252 × 𝜋𝜋
4= 0,00883 𝑚𝑚3/𝑠𝑠 = 𝟖𝟖,𝟖𝟖𝟖𝟖 𝒍𝒍/𝒔𝒔
Thus the pipeline is enough to transport the maximum productivity of the aquifer. The calculation could be improved considering instead of the commercial diameter of the HDPE pipe (125 mm) the internal diameter, that is depending on the nominal pressure characteristics of the pipe.
PUMP POWER-REQUIREMENTS
Taking into account the estimation of capital water demand for the Kojani Water System and the borehole productivity, for the water supply of Kojani, pumping is required at a rate of 358.560,00 liters per 12 hours. The static head is 95 m and the length of the pipeline is 4500 m. Follow these steps to determine the power requirement for pumping station, if a HDPE pipe D = 125 mm is used.
𝑄𝑄 = 358.560,00 ÷ (12 ∗ 3600) = 8,3 𝑙𝑙/𝑠𝑠
𝑣𝑣 = 0,0083 ÷ (0,1102 × 𝜋𝜋)/4 = 0,87 𝑙𝑙/𝑠𝑠
From Table 1, Chw for HDPE of D = 125 mm can be assumed at 149. Further:
𝑣𝑣 = 0,355 × 𝐶𝐶ℎ𝑤𝑤 × 𝐷𝐷0,63 × 𝑆𝑆0,54;
𝑆𝑆 = �𝑣𝑣 ÷ (0,355 × 𝐶𝐶ℎ𝑤𝑤 × 𝐷𝐷0,63)1
0,54� = �0,87 ÷ (0,355 × 149 × 0,1250,63)
10,54
� = 0,0035
𝑁𝑁 = 20 × 𝑄𝑄 (𝑙𝑙/𝑠𝑠) × (𝛥𝛥𝑠𝑠 + 𝑆𝑆 × 𝐿𝐿) = 20 ÷× 8,3 × (95 + 0,0035 × 4500) = 18.399,00 𝑊𝑊 ≡ 𝟏𝟏𝟖𝟖,𝟒𝟒 𝒌𝒌𝒌𝒌
Thus the pump has to be installed need a power minimum of 18,4 kW plus the efficiency factor of the pump. In the case of Kojani Water System the installed pump is 4” a submersible pump.
4. HOMEWORK ACTIVITY
The assignment is for students working in small groups (2-3 students maximum). The activity consists of the following steps:
21
Water supply system in Kojani Island (Zanzibar, Tanzania)
a. Each group is required to read 2 preliminary documents (De Marchi and Ruffato, 2014; Trifunovic, 2002), cited in the Reference List and provided as additional material to this case study
b. After individual reading and discussion of the above two documents, each group is asked to prepare a short essay (max 10,000 characters, approx. 2 – 3 pages), focusing on the management of water supply projects in small communities of developing countries, starting from the case study of the water supply system in Kojani. The essay should reflect the debate that each group jointly develops to the following issues:
1) Which aspects have to be considered by a project team for the long – term
sustainability of a water supply project, especially in relation to the transmission main of a piped water supply scheme? Focus primarily on non-conventional engineering aspects, as social, economical, cultural, environmental and hygienical ones.
2) Develop one possible hypothesis that may explain the reasons behind the
sabotage of the newly installed transmission main after the project “Safe Water Supply in Kojani Island” was completed. Develop arguments to support the hypothesis in relation to the case study. As leaders of the project team, which alternative management options for the project would you recommend to consider to positively overcome the problem (once the sabotage had occurred)?
3) The sabotage can be viewed as an indicator of a latent conflict on water
resources within the area (De Marchi and Ruffato, 2014).
c. Once the essays have been prepared, the teacher organizes a classroom session during which the groups concisely present their work to the entire classroom (half of the time) and the teacher stimulates a debate about the three main issues on which the essay is focused.
4.1. SOLUTION AND EVALUATION CRITERIA
There are no unique / blueprint solutions to the proposed homework activities, though some general guidelines can be reported for the teacher to stimulate and facilitate the debate in the classroom on the three issues (1, 2, 3 under item b. above) on which the group essay are focused.
22
Water supply system in Kojani Island (Zanzibar, Tanzania)
ISSUE N. 1
A concept that can be used to develop and focus a discussion on this issue is related on how to define sustainability for a water supply system. The following ideas are summarized in Visscher (2006). Sustainability has initially been developed in relation to environmental issues, and the World Commission for Environment and Development in 1987 initially stated that “developments to meet the needs of the present generation should not compromise the resources, or the environmental conditions of future generations”. The Development Assistance Committee of the OECD (OECD/DAC), indicated in 1988 that it considers a development programme to be sustainable when it can provide an appropriate level of benefits over an extensive period of time after the financial, administrative or technical support of an external agency has ended. However, some care is required to translate this latter definition to the sustainability of a water supply system, because of its clear donor perspective and of the failure in encompassing the environmental element. An interesting definition has been proposed by CINARA – IRC is as follows (Visscher, 2006): “A water supply or sanitation system is sustainable when it:
• continuously provides an efficient and reliable service at a level which is desired; • can be financed or co-financed by the users with limited but feasible external
support and technical assistance; • and is used in an efficient way, without negatively affecting the environment.”
The concept of sustainability here integrates three main dimensions: the community (social and economic dimensions); the environment; and the technology. Such viewpoint is helpful in guiding a discussion related to issue n. 1 in this homework. Visscher further states: “the community comprises different people usually with common and conflicting interests and ideas and different socio-economic and cultural backgrounds. The water supply system may be one such common interest, but at the same time can be a major source of conflict. The identity of people in communities is shaped by their history and their socio-economic and environmental conditions. Some of them, often the economically better off, may be better informed, may know more of the world, but on the other hand, may have certain interests in keeping the status quo and therefore may not be willing to solve certain problems. Women may have interests different from those of men and may not have been heard in the past, or their position may make it difficult to achieve changes on their own. The environment is the boundary that shapes the community and dictates the risks it faces and the local resources it can draw from to meet its needs. In water supply, these risks often relate to issues such as: available water resources; their pattern over the year; their level of
23
Water supply system in Kojani Island (Zanzibar, Tanzania)
pollution; sanitation practices of the community; and land and water use. These aspects may be affected directly by users of the catchment area as well as by the broader issue of climate change. The environmental dimension also includes the possible effect a water supply system may have on the environment, for example, by producing wastewater and chemical sludge. The interface between environment and community represents the risk the community has to overcome in relation to, for example, its water supply. The risk-analysis helps to establish and prioritize actions to reduce the risks that will depend on the level of deterioration of the local environment. The action may focus on the reduction of the pollution level by water source protection or by introducing treatment. Technology is the combination of hardware and the knowledge to develop and sustain it. This dimension represents the possibilities and tools actors can use to reduce the environmental risks the community is facing. This risk reduction however, can only be sustainable if the community adopts the solution and gains ownership of it by making it its own. The interface between environment and technology represents the availability of knowledge and practical options to reduce the risk, either through technical matters or change in behaviour. It deals with the viability, effectiveness and efficiency of solutions and their effect on the environment. The interface between technology and community deals with the type of solutions the community is expecting, is willing and able to manage and sustain, and that are in line with the technical, socio-economic and environmental conditions and capacities of the community”.
ISSUES N. 2 AND 3
In the real case two hypotheses have been developed to explain the sabotage of the transmission main, the former being the most likely to approach the reality:
a. Lack of involvement of the community of Chawale in the Kojani water supply project: some community members of Chawale may therefore be responsible for the sabotage, because of the lack of proper involvement in the construction of the new water supply system.
b. The project strategy has not been well not understood by the local old Kojani inhabitants, who are reluctant to move to the new urban expansion area. They
A main conclusion concerning the rehabilitation of Kojani water system after the project completion has been as follows: “Religious representatives involvement is also necessary to avoid sabotage of the new water-system. During the debriefing meeting it was decided
24
Water supply system in Kojani Island (Zanzibar, Tanzania)
that Juma (ZAWA) will be responsible for the organization of a meeting with sheias and religious representatives. The meeting will involve Religious representatives, sheias, teachers. Aim of the meeting is to decide a shared strategy to convince the people of avoiding sabotage activities. The meeting will be organized in a school of Chwale before 15th April. Moreover in the specific recommendation is mentioned the following aspect: ‘Involvement of the 2 Sheias of Kojani and the 3 Sheias of Chwale is necessary for the good maintenance of the completed work and to avoid sabotage risk for the constructed aqueduct.” Socio-environmental conflicts arise from those who claim inclusion in decision-making (De Marchi and Ruffato, 2014). They are generated mostly because of resource scarcity, by a quantitative decrease, hence, less arable land, less fishery resources, less forest area; or because of the loss of it, for instance, by the aggravation of the air and water quality following pollution. The following questions, if not or partially answered in the students group presentations, can be used by the teacher to stimulate the discussion:
• Who are the relevant stakeholders of the case study and what has been done in terms of stakeholders involvement throughout the process?
• Which approaches you would have used to diagnose latent conflicts and to turn them into inclusive development opportunities if you had been the project team leader?
EVALUATION CRITERIA
• Capacity to analyze a case-study and identify the relevance of non-technical factors in engineering-based water supply projects
• Understanding of the basic drivers of environmental conflicts that may help in interpreting critical issues in water supply project, like the example presented in the case study
• Capacity to identify alternative management strategies to improve the long-term project sustainability
25
Water supply system in Kojani Island (Zanzibar, Tanzania)
BIBLIOGRAPHY
Bhave, P.R., 1991. Analysis of flow in water distribution systems. Lancaster, PA, USA, Technomic Publishing.
De Marchi, M. and Ruffato, M. (2014). Understanding environmental conflicts, in: Knowing the context and partners, GDEE (Eds.). Global Dimension in Engineering Education, Barcelona. Available from: http://gdee.eu/index.php/resources/courses-2 (March 5, 2016)
Fondazione Ivo de Carneri, Safe Water Project - Phase III. Available at: <http://www.fondazionedecarneri.it/progetto/progetto-acqua-sicura-fase-3/> (March 5, 2016).
Trifunovic, N., 2002. Water Transmission, in: Smet, J., van Wijk, C.A. (Eds.) Small Community Water Supplies. Technology, People and Partnership. Technical paper Series 40, Chapter 20, IRC Delft, The Netherlands. Available at <http://www.ircwash.org/sites/default/files/smet-2002-small_tp40.pdf > (March 5, 2016)
Smet, J., van Wijk, C., 2002. Small Community Water Supplies. Technology, People and Partnership. Technical paper Series 40, IRC Delft, The Netherlands. Available at <http://www.ircwash.org/sites/default/files/smet-2002-small_tp40.pdf > (March 5, 2016)
Visscher, j.T., 2006. Facilitating Community Water Supply Management: from transferring filtration technology to multi-stakeholder learning. Technical paper Series 46-E, IRC Delft, The Netherlands Available from < http://www.ircwash.org/resources/facilitating-community-water-supply-transferring-filtration-technology-multi-stakeholder> (March 5, 2016)
Wijk-Sijbesma, C.A. van, 2002. Planning and Management, in: Smet, J., van Wijk, C.A. (Eds.) Small Community Water Supplies. Technology, People and Partnership. Technical paper Series 40, Chapter 2, IRC Delft, The Netherlands. Available at <http://www.ircwash.org/sites/default/files/smet-2002-small_tp40.pdf > (March 5, 2016)
WORLD HEALTH ORGANIZATION (2003) Domestic Water Quantity, Service, Level and Health.
WORLD HEALTH ORGANIZATION (2011) Guidelines for Drinking-water quality -4th ed.
26

http://www.gdee.eu
This project is funded by
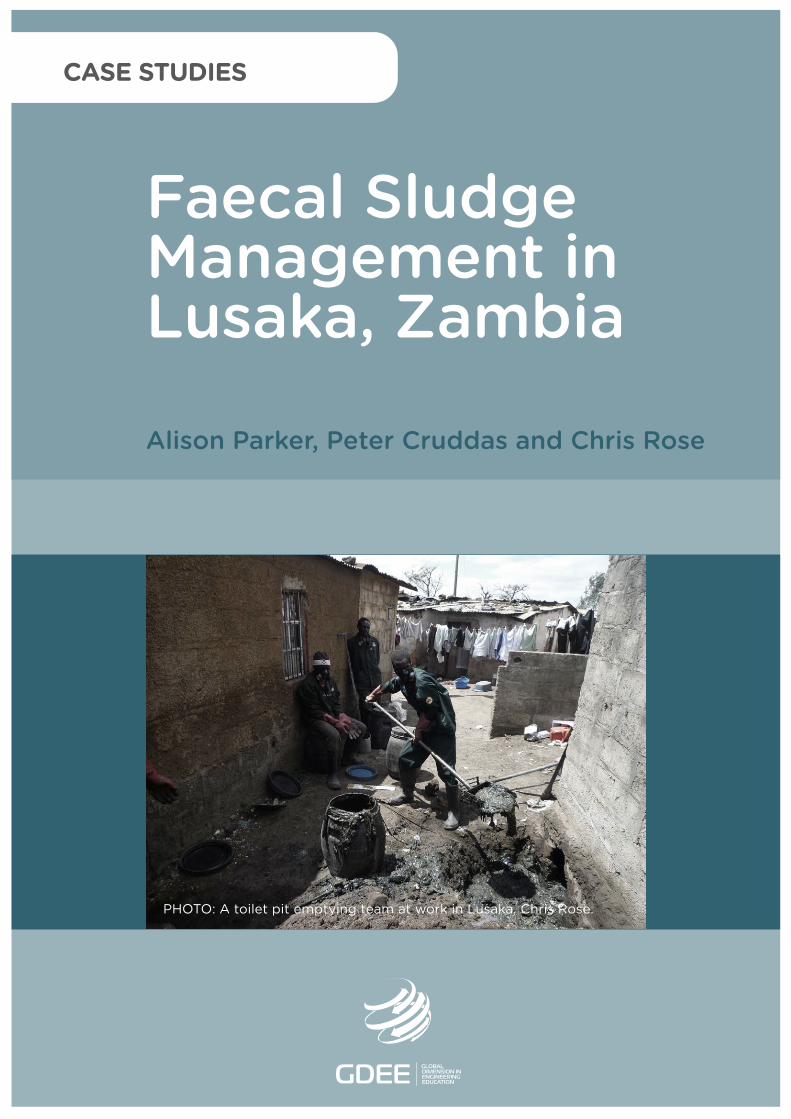
Faecal SludgeManagement inLusaka, Zambia
Alison Parker, Peter Cruddas and Chris Rose
PHOTO: A toilet pit emptying team at work in Lusaka. Chris Rose.
CASE STUDIES
Faecal Sludge Management in Lusaka, Zambia
DL B 10735-2015 ISBN 978-84-606-7546-4
COORDINATED BYAgustí Pérez-Foguet, Enric Velo, Pol Arranz, Ricard Ginéand Boris Lazzarini (Universitat Politècnica de Catalunya)Manuel Sierra (Universidad Politécnica de Madrid)Alejandra Boni and Jordi Peris (Universitat Politècnica de València)Guido Zolezzi and Gabriella Trombino (Università degli Studi di Trento)Rhoda Trimingham (Loughborough University)Valentín Villarroel (ONGAWA)Neil Nobles and Meadhbh Bolger (Practical Action)Francesco Mongera (Training Center for International Cooperation)Katie Cresswell-Maynard (Engineering Without Border UK)
EDITED BY Global Dimension in Engineering Education
Citation: Parker, A., Cruddas, P., Rose, C. (2015) 'Faecal Sludge Management in Lusaka, Zambia', in Case studies for developing globally responsible engineers, GDEE (eds.), Global Dimension in Engineering Education, Barcelona. Available from: http://gdee.eu/index.php/resources.html
This publication is distributedunder an Attribution- Noncommercial-Share Alike License for Creative Commons
CASE STUDIES
Disclaimer: This document has been produced with the financial assistance of the European UnionThe contents of this document are the sole responsibility of the authors and can under no circumstances be regarded as reflecting the position of the European Union
Faecal sludge management in Lusaka, Zambia
FAECAL SLUDGE MANAGEMENT IN LUSAKA, ZAMBIA
Alison Parker, Cranfield University Peter Cruddas, Cranfield University Chris Rose, Cranfield University
1
Faecal sludge management in Lusaka, Zambia
INDEX 1. INTRODUCTION ........................................................................................................................... 3
1.1. DISCIPLINES COVERED ............................................................................................................. 3
1.2. LEARNING OUTCOMES .............................................................................................................. 4
1.3. ACTIVITIES .............................................................................................................................. 4
2. DESCRIPTION OF THE CONTEXT ............................................................................................. 4
2.1. THE PIT EMPTYING TEAMS ........................................................................................................ 5
2.2. ECONOMICS AND MANAGEMENT ................................................................................................ 6
2.3. WASTE TREATMENT ................................................................................................................. 6
2.4. OUTCOME TO DATE .................................................................................................................. 8
3. CLASS ACTIVITY ......................................................................................................................... 8
3.1. METHODOLOGY ........................................................................................................................ 8
3.2. CLASS ACTIVITY DESCRIPTION................................................................................................... 8
3.3. SOLUTION AND EVALUATION CRITERIA ....................................................................................... 9
4. HOMEWORK ACTIVITY ............................................................................................................. 11
4.1. SOLUTION AND EVALUATION CRITERIA ..................................................................................... 12
BIBLIOGRAPHY ................................................................................................................................. 13
2
Faecal sludge management in Lusaka, Zambia
1. INTRODUCTION The Global Dimension in Engineering Education (GDEE) is a European Union funded
initiative involving a collaboration of development NGOs and Universities, with an aim to
integrate sustainable human development as a regular part of all technical university
courses. Part of the initiative is the development of a set of case studies based on real field
experiences of development projects. The case studies cover a broad range of topics
directly related those studied in engineering, science and other
technology/environment/development-related courses.
This case study examines issues surrounding the management of faecal sludge, using
Lusaka in Zambia as a case example. 2.5 billion people on our planet still lack access to
improved sanitation – they have nowhere safe to go to the toilet (WHO and UNICEF 2014).
Instead, they defecate in the open, use a “flying toilet” (a plastic bag which is thrown away),
or use a communal toilet. These options are unhygienic, undignified and present particular
risks for women. In rural areas people can build simple pit latrines and install a hygienic slab
on top which keeps it safe. When the pit fills up they just cover it up and dig a new one
elsewhere. But in urban areas with high population densities, this is not an option. In many
unplanned settlements and even in some planned ones there is no sewerage. Across the
world, forward thinking municipalities, NGOs and entrepreneurs are trialling systems to
provide safe sanitation in low income urban areas. This case study highlights the work which
the non-profit partnership organisation, Water and Sanitation for the Urban Poor (WSUP),
are doing in an area called Kanyama in Lusaka, Zambia. They are training pit latrine
emptiers in hygienic practices, treating the waste they collect and transforming it into useful
products. They are developing a sustainable business model which can be used elsewhere
in Lusaka and across the world.
1.1. DISCIPLINES COVERED
Sanitation is a multi-disciplinary topic and the majority of this case study could be used
across a range of disciplines including engineering, design, environmental science,
business, social science, public health and international development. The class activity
included covers the technical aspects of an anaerobic digester design so would be suitable
for students of environmental engineering, chemical engineering, process engineering, or
any other course that covers wastewater treatment. However, for non-engineering students,
the class activity could be omitted, making the case study suitable for a wide range of
disciplines. In fact, the global sanitation crisis will not be solved unless it is addressed by
experts from across the disciplinary spectrum.
3
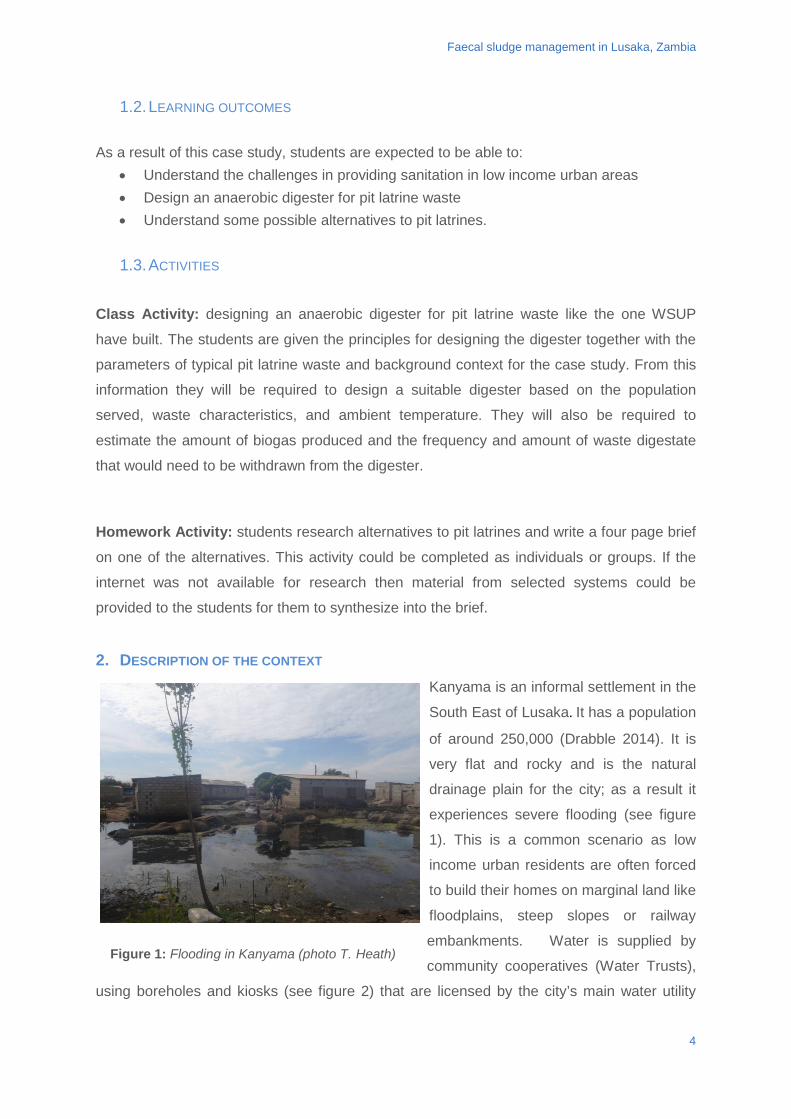
Faecal sludge management in Lusaka, Zambia
1.2. LEARNING OUTCOMES As a result of this case study, students are expected to be able to:
• Understand the challenges in providing sanitation in low income urban areas • Design an anaerobic digester for pit latrine waste • Understand some possible alternatives to pit latrines.
1.3. ACTIVITIES
Class Activity: designing an anaerobic digester for pit latrine waste like the one WSUP
have built. The students are given the principles for designing the digester together with the
parameters of typical pit latrine waste and background context for the case study. From this
information they will be required to design a suitable digester based on the population
served, waste characteristics, and ambient temperature. They will also be required to
estimate the amount of biogas produced and the frequency and amount of waste digestate
that would need to be withdrawn from the digester.
Homework Activity: students research alternatives to pit latrines and write a four page brief
on one of the alternatives. This activity could be completed as individuals or groups. If the
internet was not available for research then material from selected systems could be
provided to the students for them to synthesize into the brief.
2. DESCRIPTION OF THE CONTEXT
Kanyama is an informal settlement in the
South East of Lusaka. It has a population
of around 250,000 (Drabble 2014). It is
very flat and rocky and is the natural
drainage plain for the city; as a result it
experiences severe flooding (see figure
1). This is a common scenario as low
income urban residents are often forced
to build their homes on marginal land like
floodplains, steep slopes or railway
embankments. Water is supplied by
community cooperatives (Water Trusts),
using boreholes and kiosks (see figure 2) that are licensed by the city’s main water utility
Figure 1: Flooding in Kanyama (photo T. Heath)
4
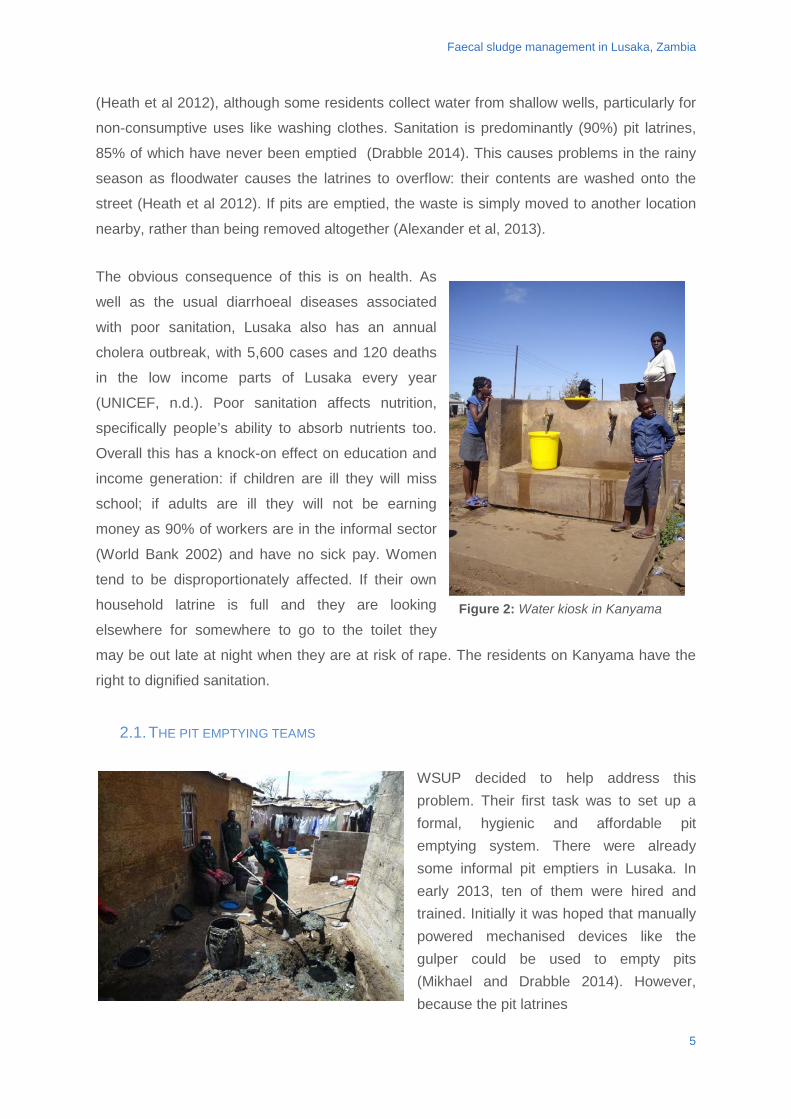
Faecal sludge management in Lusaka, Zambia
(Heath et al 2012), although some residents collect water from shallow wells, particularly for
non-consumptive uses like washing clothes. Sanitation is predominantly (90%) pit latrines,
85% of which have never been emptied (Drabble 2014). This causes problems in the rainy
season as floodwater causes the latrines to overflow: their contents are washed onto the
street (Heath et al 2012). If pits are emptied, the waste is simply moved to another location
nearby, rather than being removed altogether (Alexander et al, 2013).
The obvious consequence of this is on health. As
well as the usual diarrhoeal diseases associated
with poor sanitation, Lusaka also has an annual
cholera outbreak, with 5,600 cases and 120 deaths
in the low income parts of Lusaka every year
(UNICEF, n.d.). Poor sanitation affects nutrition,
specifically people’s ability to absorb nutrients too.
Overall this has a knock-on effect on education and
income generation: if children are ill they will miss
school; if adults are ill they will not be earning
money as 90% of workers are in the informal sector
(World Bank 2002) and have no sick pay. Women
tend to be disproportionately affected. If their own
household latrine is full and they are looking
elsewhere for somewhere to go to the toilet they
may be out late at night when they are at risk of rape. The residents on Kanyama have the
right to dignified sanitation.
2.1. THE PIT EMPTYING TEAMS
WSUP decided to help address this problem. Their first task was to set up a formal, hygienic and affordable pit emptying system. There were already some informal pit emptiers in Lusaka. In early 2013, ten of them were hired and trained. Initially it was hoped that manually powered mechanised devices like the gulper could be used to empty pits (Mikhael and Drabble 2014). However, because the pit latrines
Figure 2: Water kiosk in Kanyama
5
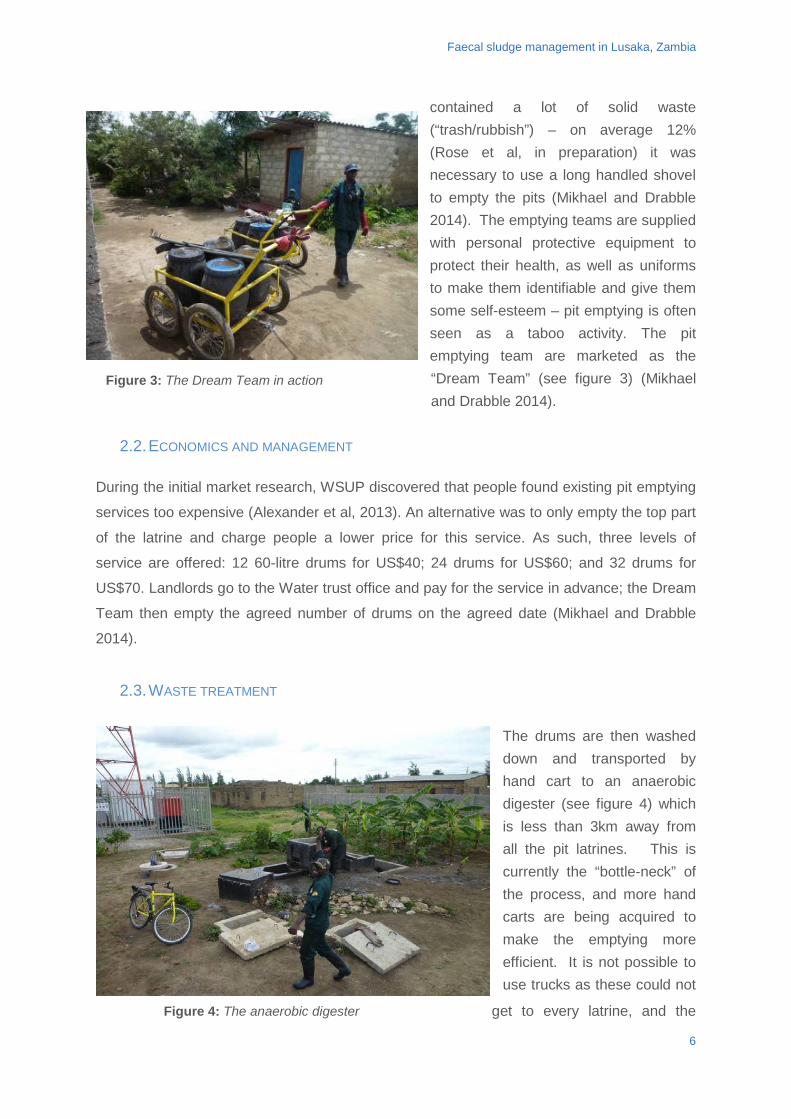
Faecal sludge management in Lusaka, Zambia
contained a lot of solid waste (“trash/rubbish”) – on average 12% (Rose et al, in preparation) it was necessary to use a long handled shovel to empty the pits (Mikhael and Drabble 2014). The emptying teams are supplied with personal protective equipment to protect their health, as well as uniforms to make them identifiable and give them some self-esteem – pit emptying is often seen as a taboo activity. The pit emptying team are marketed as the “Dream Team” (see figure 3) (Mikhael and Drabble 2014).
2.2. ECONOMICS AND MANAGEMENT
During the initial market research, WSUP discovered that people found existing pit emptying
services too expensive (Alexander et al, 2013). An alternative was to only empty the top part
of the latrine and charge people a lower price for this service. As such, three levels of
service are offered: 12 60-litre drums for US$40; 24 drums for US$60; and 32 drums for
US$70. Landlords go to the Water trust office and pay for the service in advance; the Dream
Team then empty the agreed number of drums on the agreed date (Mikhael and Drabble
2014).
2.3. WASTE TREATMENT
The drums are then washed down and transported by hand cart to an anaerobic digester (see figure 4) which is less than 3km away from all the pit latrines. This is currently the “bottle-neck” of the process, and more hand carts are being acquired to make the emptying more efficient. It is not possible to use trucks as these could not
get to every latrine, and the
Figure 3: The Dream Team in action
Figure 4: The anaerobic digester
6
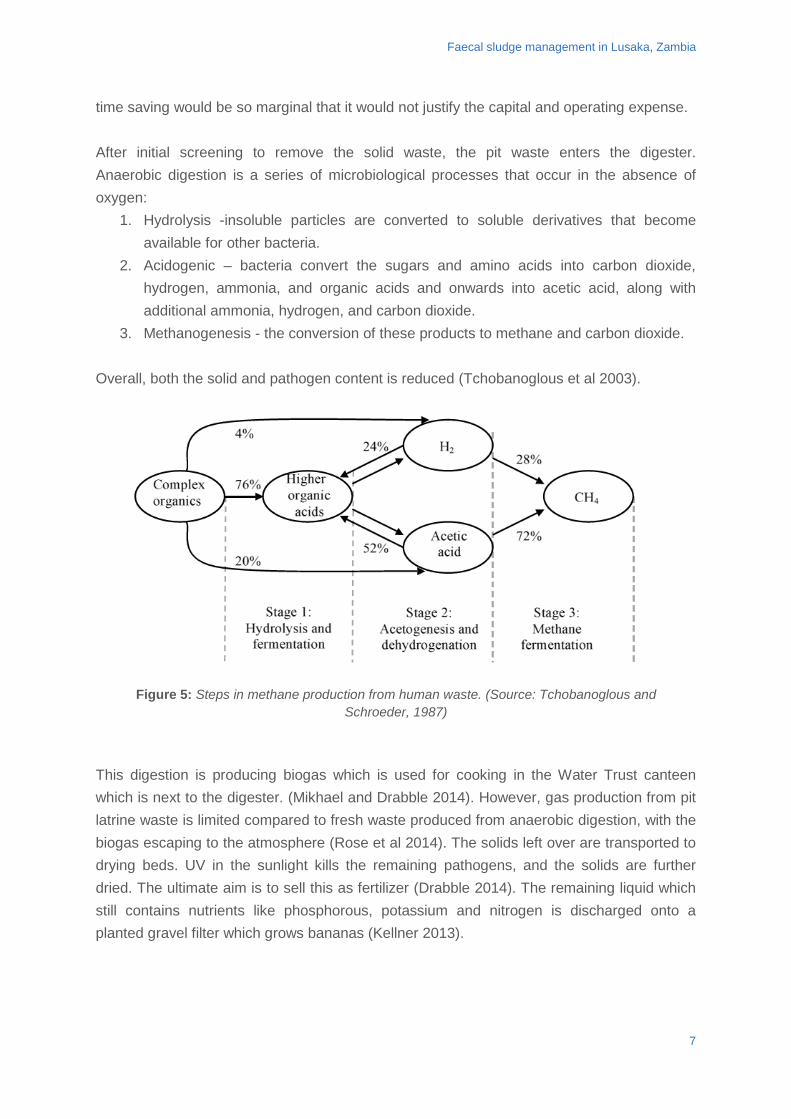
Faecal sludge management in Lusaka, Zambia
time saving would be so marginal that it would not justify the capital and operating expense. After initial screening to remove the solid waste, the pit waste enters the digester. Anaerobic digestion is a series of microbiological processes that occur in the absence of oxygen:
1. Hydrolysis -insoluble particles are converted to soluble derivatives that become available for other bacteria.
2. Acidogenic – bacteria convert the sugars and amino acids into carbon dioxide, hydrogen, ammonia, and organic acids and onwards into acetic acid, along with additional ammonia, hydrogen, and carbon dioxide.
3. Methanogenesis - the conversion of these products to methane and carbon dioxide. Overall, both the solid and pathogen content is reduced (Tchobanoglous et al 2003).
This digestion is producing biogas which is used for cooking in the Water Trust canteen which is next to the digester. (Mikhael and Drabble 2014). However, gas production from pit latrine waste is limited compared to fresh waste produced from anaerobic digestion, with the biogas escaping to the atmosphere (Rose et al 2014). The solids left over are transported to drying beds. UV in the sunlight kills the remaining pathogens, and the solids are further dried. The ultimate aim is to sell this as fertilizer (Drabble 2014). The remaining liquid which still contains nutrients like phosphorous, potassium and nitrogen is discharged onto a planted gravel filter which grows bananas (Kellner 2013).
Figure 5: Steps in methane production from human waste. (Source: Tchobanoglous and Schroeder, 1987)
7
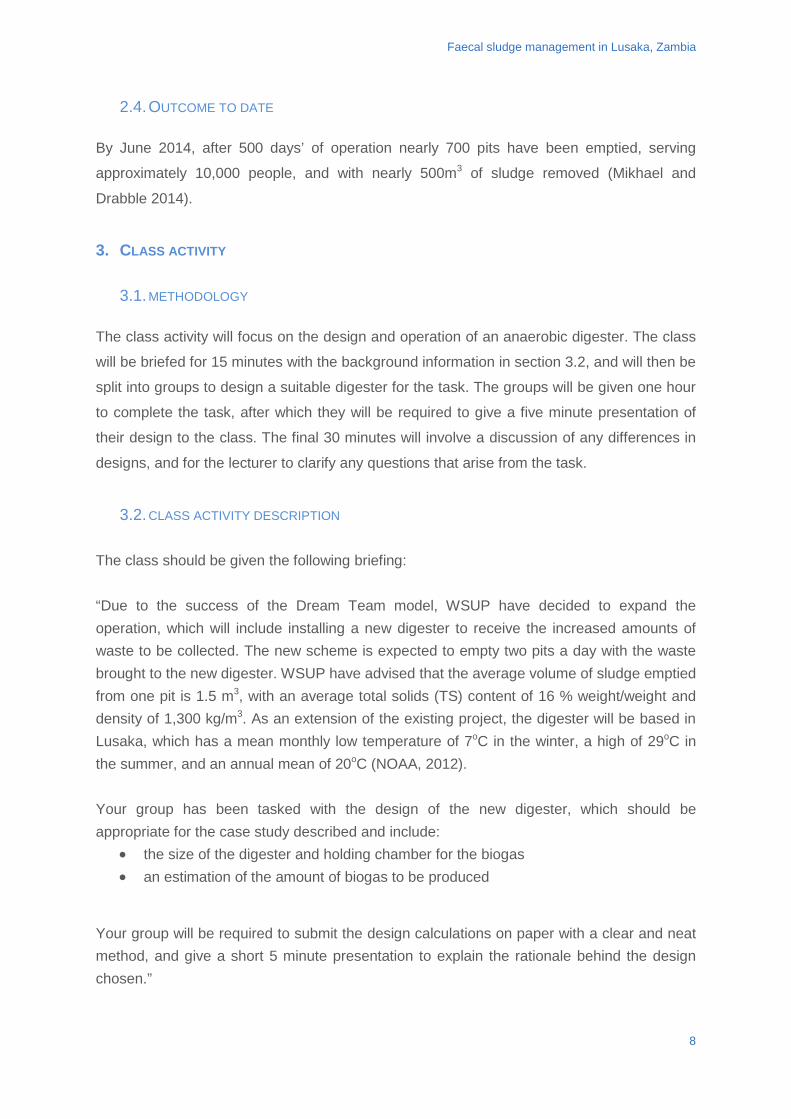
Faecal sludge management in Lusaka, Zambia
2.4. OUTCOME TO DATE By June 2014, after 500 days’ of operation nearly 700 pits have been emptied, serving
approximately 10,000 people, and with nearly 500m3 of sludge removed (Mikhael and
Drabble 2014).
3. CLASS ACTIVITY
3.1. METHODOLOGY The class activity will focus on the design and operation of an anaerobic digester. The class
will be briefed for 15 minutes with the background information in section 3.2, and will then be
split into groups to design a suitable digester for the task. The groups will be given one hour
to complete the task, after which they will be required to give a five minute presentation of
their design to the class. The final 30 minutes will involve a discussion of any differences in
designs, and for the lecturer to clarify any questions that arise from the task.
3.2. CLASS ACTIVITY DESCRIPTION
The class should be given the following briefing: “Due to the success of the Dream Team model, WSUP have decided to expand the operation, which will include installing a new digester to receive the increased amounts of waste to be collected. The new scheme is expected to empty two pits a day with the waste brought to the new digester. WSUP have advised that the average volume of sludge emptied from one pit is 1.5 m3, with an average total solids (TS) content of 16 % weight/weight and density of 1,300 kg/m3. As an extension of the existing project, the digester will be based in Lusaka, which has a mean monthly low temperature of 7oC in the winter, a high of 29oC in the summer, and an annual mean of 20oC (NOAA, 2012). Your group has been tasked with the design of the new digester, which should be appropriate for the case study described and include:
• the size of the digester and holding chamber for the biogas • an estimation of the amount of biogas to be produced
Your group will be required to submit the design calculations on paper with a clear and neat method, and give a short 5 minute presentation to explain the rationale behind the design chosen.”
8
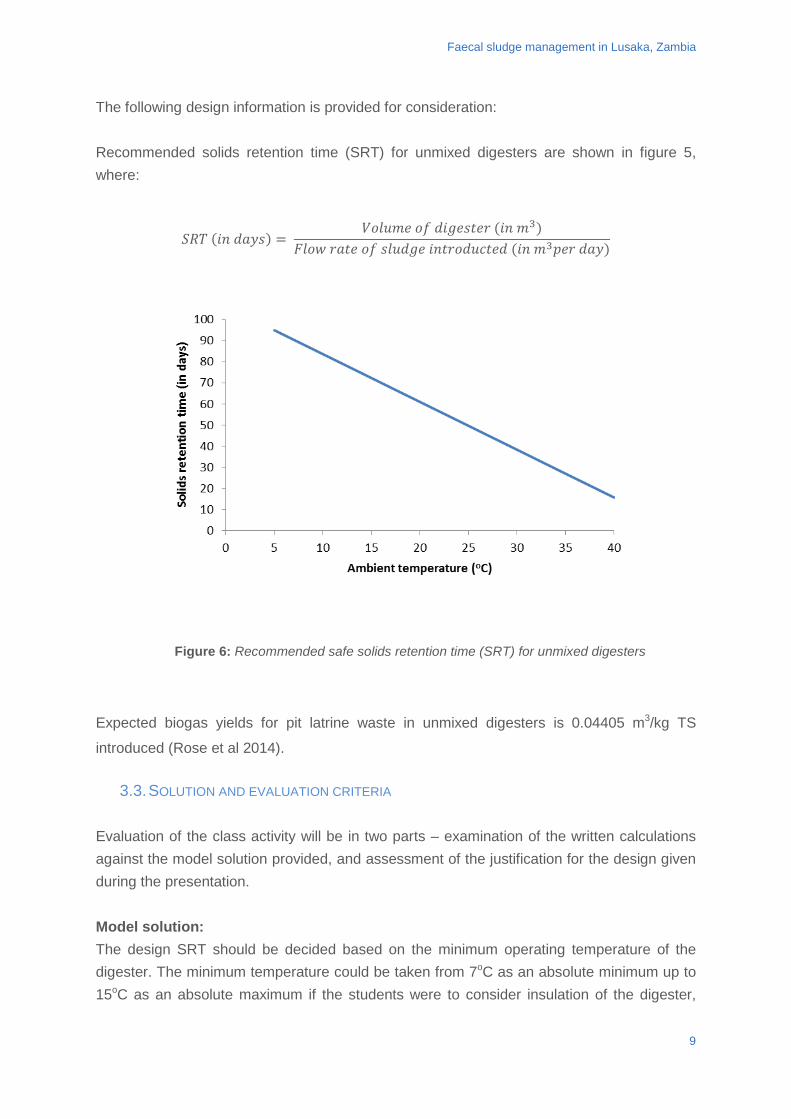
Faecal sludge management in Lusaka, Zambia
The following design information is provided for consideration: Recommended solids retention time (SRT) for unmixed digesters are shown in figure 5, where:
𝑆𝑆𝑆𝑆𝑆𝑆 (𝑖𝑖𝑖𝑖 𝑑𝑑𝑑𝑑𝑑𝑑𝑑𝑑) = 𝑉𝑉𝑉𝑉𝑉𝑉𝑉𝑉𝑉𝑉𝑉𝑉 𝑉𝑉𝑜𝑜 𝑑𝑑𝑖𝑖𝑑𝑑𝑉𝑉𝑑𝑑𝑑𝑑𝑉𝑉𝑑𝑑 (𝑖𝑖𝑖𝑖 𝑉𝑉3)
𝐹𝐹𝑉𝑉𝑉𝑉𝐹𝐹 𝑑𝑑𝑑𝑑𝑑𝑑𝑉𝑉 𝑉𝑉𝑜𝑜 𝑑𝑑𝑉𝑉𝑉𝑉𝑑𝑑𝑑𝑑𝑉𝑉 𝑖𝑖𝑖𝑖𝑑𝑑𝑑𝑑𝑉𝑉𝑑𝑑𝑉𝑉𝑖𝑖𝑑𝑑𝑉𝑉𝑑𝑑 (𝑖𝑖𝑖𝑖 𝑉𝑉3𝑝𝑝𝑉𝑉𝑑𝑑 𝑑𝑑𝑑𝑑𝑑𝑑)
Expected biogas yields for pit latrine waste in unmixed digesters is 0.04405 m3/kg TS
introduced (Rose et al 2014).
3.3. SOLUTION AND EVALUATION CRITERIA Evaluation of the class activity will be in two parts – examination of the written calculations against the model solution provided, and assessment of the justification for the design given during the presentation. Model solution: The design SRT should be decided based on the minimum operating temperature of the digester. The minimum temperature could be taken from 7oC as an absolute minimum up to 15oC as an absolute maximum if the students were to consider insulation of the digester,
Figure 6: Recommended safe solids retention time (SRT) for unmixed digesters
9
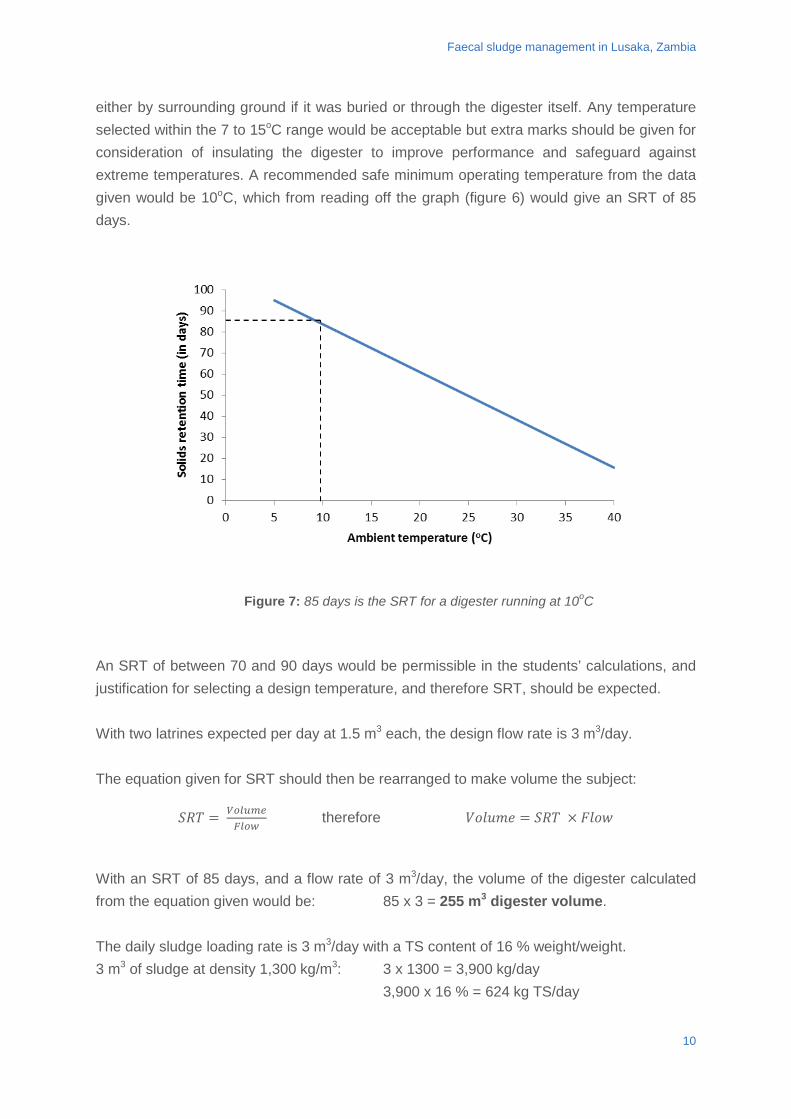
Faecal sludge management in Lusaka, Zambia
either by surrounding ground if it was buried or through the digester itself. Any temperature selected within the 7 to 15oC range would be acceptable but extra marks should be given for consideration of insulating the digester to improve performance and safeguard against extreme temperatures. A recommended safe minimum operating temperature from the data given would be 10oC, which from reading off the graph (figure 6) would give an SRT of 85 days.
An SRT of between 70 and 90 days would be permissible in the students’ calculations, and justification for selecting a design temperature, and therefore SRT, should be expected. With two latrines expected per day at 1.5 m3 each, the design flow rate is 3 m3/day. The equation given for SRT should then be rearranged to make volume the subject:
𝑆𝑆𝑆𝑆𝑆𝑆 = 𝑉𝑉𝑉𝑉𝑉𝑉𝑉𝑉𝑉𝑉𝑉𝑉𝐹𝐹𝑉𝑉𝑉𝑉𝐹𝐹
therefore 𝑉𝑉𝑉𝑉𝑉𝑉𝑉𝑉𝑉𝑉𝑉𝑉 = 𝑆𝑆𝑆𝑆𝑆𝑆 × 𝐹𝐹𝑉𝑉𝑉𝑉𝐹𝐹
With an SRT of 85 days, and a flow rate of 3 m3/day, the volume of the digester calculated from the equation given would be: 85 x 3 = 255 m3 digester volume. The daily sludge loading rate is 3 m3/day with a TS content of 16 % weight/weight. 3 m3 of sludge at density 1,300 kg/m3: 3 x 1300 = 3,900 kg/day 3,900 x 16 % = 624 kg TS/day
Figure 7: 85 days is the SRT for a digester running at 10oC
10

Faecal sludge management in Lusaka, Zambia
With an expected biogas yield of 0.04405 m3/kg TS introduced: 624 x 0.04405 =27.4872 m3/day of biogas produced. The mean yield will fluctuate seasonally with change in temperature and extra marks should be given to groups who make this observation. 4. HOMEWORK ACTIVITY The homework activity should be introduced by asking the students to think about the disadvantages of the current system in Lusaka, and contribute their answers in a group discussion. Points could include:
• Pit latrines can pollute shallow groundwater, which is still used as a water source. • There is some spillage into people’s yards during the pit emptying process (see slide
5). • Even with PPE pit emptiers still face health risks and stigma. • Not all the biogas is captured – a large proportion escapes to the atmosphere form
the pit latrines. • The fertiliser sales have not yet been proven. • The planted gravel filters may be being overloaded (see slide 11). • $40 is a lot for a one-off payment
Give the students the following brief: “Kanyama Water Trust would like to try an alternative sanitation system. They are interested in a system that:
• Protects the environment and people’s health • Maximises the value of the energy and nutrients in the waste • Is affordable to their customers without requiring any subsidy • Has been piloted in a similar location already
Research and compile a four-page brief on an alternative system, explaining how it is well suited to work effectively in Kanyama. If you cannot find a system that meets all of the Waters Trust’s requirements justify why you think your chosen option is the best compromise.”
11
Faecal sludge management in Lusaka, Zambia
4.1. SOLUTION AND EVALUATION CRITERIA The selected systems should meet the criteria above, but the reality is that this is a relatively new area of development and most promising systems are still under trial. The following are some questions against which to evaluate the selected solution: Does the proposed system:
• provide treatment of all the waste (both the liquid and solid components) to an appropriate standard?
• provide hygienic separation of users from their faeces? • protect workers’ health? • capture energy and/or nutrients in a way that is
o acceptable to the end users of the products? o cost-effective? o scientifically proven?
• have a proven business model that includes o an affordable cost to households? o low operation and maintenance costs (including energy)? o a realistic assessment of the value of the energy and/or nutrient products?
• have a low footprint suitable for a dense urban area? • operate without a sewer network? • operate without additional water?
Students should show evidence that they have critically assessed their data sources. Documents from the developers of these systems may provide a biased evaluation. The following is a list of alternative faecal sludge management systems which the students could pick. It would also be possible to nominate these in advance to each group/individual if research time was limited.
• Clean Team http://www.cleanteamtoilets.com/ • Loowatt http://www.loowatt.com/ • SOIL http://www.oursoil.org/ • X-runner http://www.xrunner-venture.com/home/4583965215 • Sulabh http://www.sulabhinternational.org/content/two-pit-system • Condominial sewerage e.g.
http://www.wsp.org/sites/wsp.org/files/publications/BrasilFinal2.pdf • DEWATS http://www.borda-net.org/dewats-service-packages.html • Biofil http://www.biofilcom.org/ • Sanergy http://saner.gy/ • LaDePa e.g. http://www.susana.org/docs_ccbk/susana_download/2-1624-
harrison.pdf
12
Faecal sludge management in Lusaka, Zambia
BIBLIOGRAPHY Alexander, D., Valerio, C., Signorini, M. 2013. Welcome to Pump Away. San Francisco. Ideo.org. Drabble, S. 2014 Innovation Blog: Piloting two treatment methods for faecal sludge in Lusaka., Available from: http://www.wsup.com/2014/01/30/innovation-blog-piloting-two-treatment-methods-for-faecal-sludge-in-lusaka/ [5 August 2014] Heath, T.T., Parker, A.H., Weatherhead E.K., 2012. A Rapid Climate Adaptation Assessment for water and sanitation providers in low-income cities. Environment and Urbanization 24(2), 619-627 Kellner, C. 2013. Banana for Kanyama. Wasaza Newsletter 2, 7-8 Mikhael, G., Drabble, S. 2014. FSM services in Lusaka: moving up the excreta management ladder, Practice Note 17. London. WSUP NOAA, National Oceanic and Atmospheric Administration 2012. Lusaka International Airport Climate Norms 1961 – 1990. Available at: ftp://ftp.atdd.noaa.gov/pub/GCOS/WMO-Normals/RA-I/ZA/67665.TXT Rose, C.M. Parker, A.H. Cartmell, E. 2014, ‘The biochemical methane potential of faecal sludge from on-site sanitation instalments in low income countries’, Paper presented at the 12th Specialized Conference on Small Water and Wastewater Systems & 4th Specialized Conference on Resources Oriented Sanitation, Muscat, Sultanate of Oman Rose, C.M., Parker, A.H., Cartmell E, Kabika, J. in preparation, The characterisation of faecal sludge from on-site sanitation systems to inform anaerobic treatment technology in low-income countries. Tchobanoglous, G., Burton, F.L., Stensel, H.D. 2003. Wastewater engineering treatment and reuse, 4ed, McGraw Hill. New York, U.S.A. Tchobanoglous, G. and Schroeder, E. 1987. Water quality: characteristics, modelling, modification, pp. 648-652. Addison Wesley Longman, Boston, U.S.A. UNICEF, n.d. Disaster Risk Reduction, Emergency Preparedness & Response. Available from http://www.unicef.org/zambia/cross_cutting.html [5 August 2014]
13
Faecal sludge management in Lusaka, Zambia
WHO and UNICEF 2014, Progress on sanitation and drinking-water, 2014 update. Geneva. WHO and UNICEF World Bank. 2002. Upgrading of low income settlements, country assessment report. Available at http://web.mit.edu/urbanupgrading/upgrading/case-examples/overview-africa/country-assessments/reports/Zambia-report.html [5 August 2014] FURTHER/SUGGESTED MATERIAL
• Using Biogas technology to solve pit latrine waste disposal problems, Practical Action Technical Brief http://www.engineeringforchange.org/static/content/Sanitation/S00039/Biogas%20pit%20latrine%20waste%20solution%20technical%20brief.pdf
• Disposal of latrine waste: Is biogas the answer? A review of literature. Daniel Buston and Brian Reed, Engineers Without Borders UK http://www.hedon.info/docs/EWB_ENERGY_Daniel_Buxton_and_Brian_Reed_Disposal_of_latrine_waste_Is_Biogas_the_answer.pdf
• Anaerobic Digestion: Principles and Practices for Biogas Systems. Charles Gunnerson and David Stuckey, World Bank Technical Paper No. 49 http://www-wds.worldbank.org/servlet/WDSContentServer/IW3P/IB/1999/11/19/000178830_98101904164835/Rendered/PDF/multi_page.pdf
14

http://www.gdee.eu
This project is funded by
Water Balance on theCentral Rift Valley
Jordi Pascual-Ferrer and Lucila Candela
PHOTO: Grazing the herd. Jordi Codony Gisbert.
CASE STUDIES
Water Balance on the Central Rift Valley
DL B 10735-2015 ISBN 978-84-606-7546-4
COORDINATED BYAgustí Pérez-Foguet, Enric Velo, Pol Arranz, Ricard Ginéand Boris Lazzarini (Universitat Politècnica de Catalunya)Manuel Sierra (Universidad Politécnica de Madrid)Alejandra Boni and Jordi Peris (Universitat Politècnica de València)Guido Zolezzi and Gabriella Trombino (Università degli Studi di Trento)Rhoda Trimingham (Loughborough University)Valentín Villarroel (ONGAWA)Neil Nobles and Meadhbh Bolger (Practical Action)Francesco Mongera (Training Center for International Cooperation)Katie Cresswell-Maynard (Engineering Without Border UK)
EDITED BY Global Dimension in Engineering Education
Citation: Pascual-Ferrer, J. and Candela, L. (2015) ' Water Balance on the Central Rift Valley', in Case studies for developing globally responsible engineers, GDEE (eds.), Global Dimension in Engineering Education, Barcelona. Available from: http://gdee.eu/index.php/resources.html
This publication is distributedunder an Attribution- Noncommercial-Share Alike License for Creative Commons
CASE STUDIES
Disclaimer: This document has been produced with the financial assistance of the European UnionThe contents of this document are the sole responsibility of the authors and can under no circumstances be regarded as reflecting the position of the European Union
Water balance on the central rift valley
WATER BALANCE ON THE CENTRAL RIFT VALLEY
J. Pascual-Ferrer, Institute of Sustainability, UPC-Barcelona Tech.
L. Candela, Department of Geotechnical Engineering and Geoscience, UPC-Barcelona Tech.
1
Water balance on the central rift valley
INDEX WATER BALANCE ON THE CENTRAL RIFT VALLEY ..................................................................... 1
1. INTRODUCTION ........................................................................................................................... 3
1.1. DISCIPLINE COVERED .......................................................................................................... 3
1.2. LEARNING OUTCOMES .............................................................................................................. 3
1.3. BRIEF PRESENTATION OF THE TWO ACTIVITIES ........................................................................... 3
2. DESCRIPTION OF THE CONTEXT ............................................................................................. 4
2.1. WATER BALANCE: .................................................................................................................... 4
2.2. WATER RESOURCES MANAGEMENT .......................................................................................... 6
2.3. ETHIOPIA AND THE CENTRAL RIFT VALLEY (CRV) ..................................................................... 8
2.4. CRV: WATER QUALITY AND QUANTITY ................................................................................... 11
2.5. CRV: SOCIO-ECONOMIC ASPECTS .......................................................................................... 12
2.6. CRV: WATER MANAGEMENT ................................................................................................... 14
3. CLASS ASSIGNMENT PROCEDURE: ...................................................................................... 16
3.1. STATEMENT ........................................................................................................................... 16
4. HOMEWORK .............................................................................................................................. 20
4.1. METHODOLOGY ..................................................................................................................... 20
4.2. PROPOSED STATEMENT ......................................................................................................... 20
4.3. SOLUTION ............................................................................................................................. 22
5. BIBLIOGRAPHY .................................................... ERROR! NO S'HA DEFINIT EL MARCADOR.
2
Water balance on the central rift valley
1. INTRODUCTION
1.1. DISCIPLINE COVERED The objective of this case study is to introduce the concept of the water balance on a basin as a mean to evaluate water resources and to be able to design development strategies according to the water resources available. Main goal focusses on the understanding of key concepts such as water balance, water deficit, water surplus or evapotranspiration and their role in water resources. Moreover, through this exercise it is expected a full comprehension of the impacts that different development agendas may carry on water resources availability on a basin and, hence, on the downstream/upstream users and the environment.
1.2. LEARNING OUTCOMES As a result of this exercise, students are expected to be able to:
• Understand the evapotranspiration process and learn how it can be estimated • Conduct a basin water balance and understand the main information provided for
the assessment of water resources and water uses in a basin • Analyse the different proposed strategies while managing water resources and
further implications
1.3. BRIEF PRESENTATION OF THE TWO ACTIVITIES The class activity is focused on calculating the water balance in the basin, by estimating potential evapotranspiration through the Thornthwaite method in the first stage. The homework activity focuses on the water balance calculation in three selected sub-basins. The exercise includes current water use and demand estimation. Later, students will discuss different development strategies set on place and possible environmental impacts of these.
3
Water balance on the central rift valley
2. DESCRIPTION OF THE CONTEXT Water is crucial for humankind, not only as a means to sustain our life, but as a determining factor in many production activities (agriculture, industry, transport, etc.). Moreover, due to the high level of stress human development is putting on the environment and the services it provides, the concept of environmental water use has arisen. There is therefore a need to understand howwater interacts with the environment and with human activities in order to properly determine how to protect humankind from potentially devastating effects of mis-management, to optimize benefits that it can bring to development, etc. All these analysis shall be conducted at basin level, as explained below.
2.1. WATER BALANCE: Following the Dublin Statement on Water and Sustainable Development (1992), “the most appropriate geographical entity for the planning and management of water resources is the river basin, including surface and groundwater”. Therefore, the work developed in the case study is based at the river basin scale. The river basin can be defined as the portion of land drained by a river and its tributaries, which may drain into the sea or into an endorheic lake. It is important to highlight that groundwater basins may not fully correspond to the surface catchment area or surface basin. In order to devise a water budget within a basin, knowledge of the water balance is required. The water balance is a concept based on mass balance, and is calculated by counting all water inputs and outputs in the basin, as well as the variation in the water storage. According to the water cycle, this can be translated into the following expression:
Precipitation = Evapotranspiration + Water Surplus ± Water Storage variation Precipitation (P) is the process which transforms water moisture either into rain (its liquid phase) or into ice or snow (its solid phase). Evapotranspiration is the joint combination of evaporation and transpiration. The first term is the physical process in which water passes from liquid to gas, and may occur on (i) the soil and vegetation surfaces immediately after rainfall, (ii) from water surfaces (such as rivers, lakes and reservoirs), and (iii) from infiltrated water in the soil top layer (either recently infiltrated or moving back to the surface after a period in the sub-surface region). On the other hand, transpiration consists of the vaporization of liquid water contained in plant tissues and the movement of that vapour to the atmosphere (Edwards et al., 1983). Both evaporation and transpiration are quite difficult to measure separately, as they occur simultaneously and from a hydrological point of view only the amount of water returned to
4
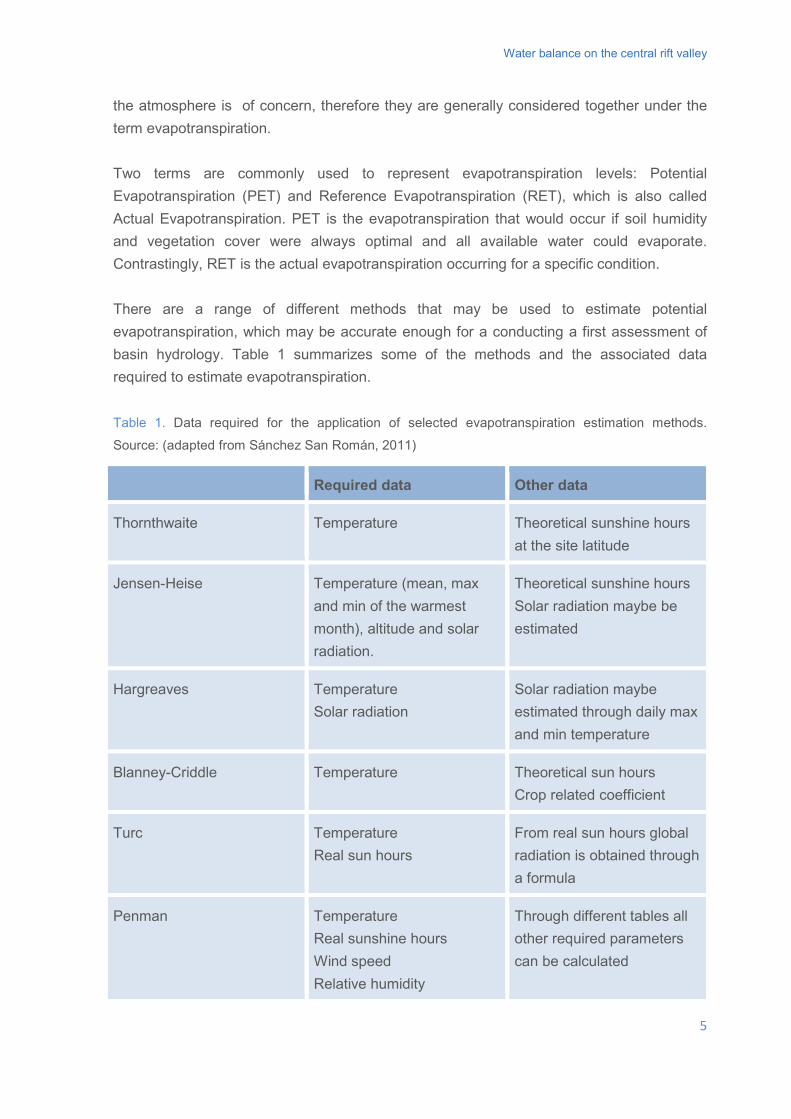
Water balance on the central rift valley
the atmosphere is of concern, therefore they are generally considered together under the term evapotranspiration. Two terms are commonly used to represent evapotranspiration levels: Potential Evapotranspiration (PET) and Reference Evapotranspiration (RET), which is also called Actual Evapotranspiration. PET is the evapotranspiration that would occur if soil humidity and vegetation cover were always optimal and all available water could evaporate. Contrastingly, RET is the actual evapotranspiration occurring for a specific condition. There are a range of different methods that may be used to estimate potential evapotranspiration, which may be accurate enough for a conducting a first assessment of basin hydrology. Table 1 summarizes some of the methods and the associated data required to estimate evapotranspiration. Table 1. Data required for the application of selected evapotranspiration estimation methods.
Source: (adapted from Sánchez San Román, 2011)
Required data Other data
Thornthwaite Temperature Theoretical sunshine hours at the site latitude
Jensen-Heise Temperature (mean, max and min of the warmest month), altitude and solar radiation.
Theoretical sunshine hours Solar radiation maybe be estimated
Hargreaves Temperature Solar radiation
Solar radiation maybe estimated through daily max and min temperature
Blanney-Criddle Temperature Theoretical sun hours Crop related coefficient
Turc Temperature Real sun hours
From real sun hours global radiation is obtained through a formula
Penman Temperature Real sunshine hours Wind speed Relative humidity
Through different tables all other required parameters can be calculated
5
Water balance on the central rift valley
Commonly these different methodologies are used to calculate evapotranspiration on a monthly basis using mean data collected over a perdiod of a number of years. However, for soil-plant-water balance, daily calculations are recommended. Once precipitation data is known, calculation of the potential evapotranspiration and information regarding the field capacity (FC) of the soil in a basin allows the water balance calculation to be conducted. Usually the water balance in a surface basin is calculated on a monthly basis, and this allowsan estimation of the reference evapotranspiration, water deficit, water storage and water surplus to be obtained. The water deficit is the difference between potential evapotranspiration and reference evapotranspiration (PET - RET), while the water storage is water stored on the soil once potential and reference evapotranspiration are equal (RET = PET) and the field capacity is not achieved (P - PET < FC). Lastly, once the available water capacity is exceeded (P > PET + FC), it is named water surplus, which is water that cannot be retained by the soil and constitutes surface runoff or groundwater flow. This water balance constitutes an initial assessment of available water resources, either for rain fed agriculture or for any other uses. A number of codes are available for the study of hydrologic processes, with varying levels of complexity depending on the processes of the water cycle simulated. Some of the available codes are:
• HSPF (Hydrologic Simulation Program – FORTRAN), developed by the Environmental Protection Agency form the USA.
• SWAT (Soil and Water Assessment Tool), developed by the US Department of Agriculture.
• MIKE Basin, developed by the DHI. • HEC-HMS (Hydrologic Modeling System), developed by the US Army Corps of
Engineers.
2.2. WATER RESOURCES MANAGEMENT For centuries, water within watersheds was not considered a scarce resource. However, continuous population growth combined with more recent climate and environmental changes threatens both quantity and quality of water resources, and thus the peaceful coexistence of human populations within a watershed and its ecosystems. As a result, water resources management has increased in its importance to solve increasing water conflicts.
6
Water balance on the central rift valley
Water governance is defined by the political, social, economic and administrative systems that are in place, and which directly or indirectly affect the use, development and management of water resources and water service delivery at different levels of society (UNDP, 2010). Appropriate water governance may solve most existing water-related problems. In order to achieve good water governance globally, at the 2002 World Summit on Sustainable Development, which took place in Johannesburg, it was stated that all countries should develop Integrated Water Resources Management (IWRM) plans (United Nations, 1992). IWRM can be defined as a process that promotes the co-ordinated development and management of water, land and related resources, in order to maximize the resultant economic and social welfare in an equitable manner without compromising the sustainability of vital ecosystems (Global Water Partnership, 2000). In some regions, water has conventionally been managed within administrative rather than natural boundaries, in a fragmented rather than holistic manner, and in a technocratic rather than participatory way (Gourbesville, 2008). The IWRM approach uses the basin as the basic water management unit. Moreover, the basis of IWRM is that water uses are interdependent, which means that all uses should be considered together: land and water, surface and ground water hydrology, upstream and downstream activities and interests, etc. IWRM is a type of management approach that aims to establish a dialogue between all involved stakeholders. As such, IWRM should help create a transparent and accountable water regime in which competing claims can be moderated by well-informed participatory processes (Black and Hall, 2004). All over the world, water used for irrigation accounts for approximately 70% of all water withdrawals (World Business Council for Sustainable Development, 2009). Yet globally, just the 19% of crops are irrigated. Some cross-country studies have determined that in areas where irrigation is used, poverty levels are a 20-30% lower than in areas where there is no irrigation. Domestic water use comprises water used for drinking, sanitation, cooking, washing and gardening. These uses represent just 8% of overall water usage. But globally there are still 884 million people without access to an improved water source, 37% of whom live in Sub-Saharan Africa (WHO/UNICEF, 2010). Even some people who have access to water via an improved water point may have to spend a large amount of time fetching water (e.g. in Uganda 41% of the population who use an improved water point have their water point at more than 30 minutes walking distance).
7
Water balance on the central rift valley
Lastly, water is essential for ecosystems’ survival, each of which requires a certain amount and quality of water to keep functioning. According to De Groot (1992), the functioning of natural processes is the basis for the existence ofhumankind on the earth, as natural ecosystems supply essential resources and raw materials. Environmental functions are ‘the capacity of natural processes and components to provide goods and services that satisfy human needs, directly or indirectly’ (de Groot, 1992). These functions can be subdivided in four different groups (de Groot et al., 2002): (i) Regulation functions (capacity of natural and semi-natural ecosystems to regulate ecosystem processes, to maintain essential ecological processes and life support systems); (ii) Production functions (provision of ecosystem goods for human consumption); (iii) Habitat functions (natural ecosystems provide refuge and reproduction habitat to wild plants and animals) and (iv) Information functions (natural ecosystems may provide reflection, spiritual enrichment, cognitive development, recreation and aesthetic experience). Water resources management may allow for the improvement of economic and social welfare, by establishing a dialogue between all involved stakeholders. Such a dialogue will not only prevent the deterioration of life of the poorest both today and tomorrow, but also help the the poorest to improve their livelihoods . If more equitable access to water is to be guaranteed, several social, economic, ecological and capacity obstacles will need to be faced (UNDP, 2004).;transparent and participatory water governance can help overcome these obstacles.
2.3. ETHIOPIA AND THE CENTRAL RIFT VALLEY (CRV) Ethiopia is the second most populated country in Africa with over 73.9 million people (Population Census Comission. F.D.R. Ethiopia, 2008). Its 1,100,000 km2 ranks Ethiopia as the 10th largest African country. Addis Ababa is not only Ethiopia’s capital but also hosts the African Union Commission. The country is ranked in 171st position out of 182 in the Human Development Index ranking (PNUD, 2009). Agriculture is the backbone of the Ethiopian economy, providing 43.8% of the GDP (compared with 13.2% from industry and 43% from services) and is also the sector which employs most of the labor force, with 85% working in agriculture . The main export crop is coffee, although others such as qat, teff or cut flowers are also important for Ethiopian’s economy. Ethiopia is one of the poorest countries in the world, and although it has a high rate of economic growth rate (8%), 38.7% of its population still lives below poverty line (Central Inelligence Agency, 2009). Although irrigation is growing all over the country, still droughts have a strong impact on the economic growth. The spatial and temporal variability of water resources limits development and constrains management and equitable distribution.
8
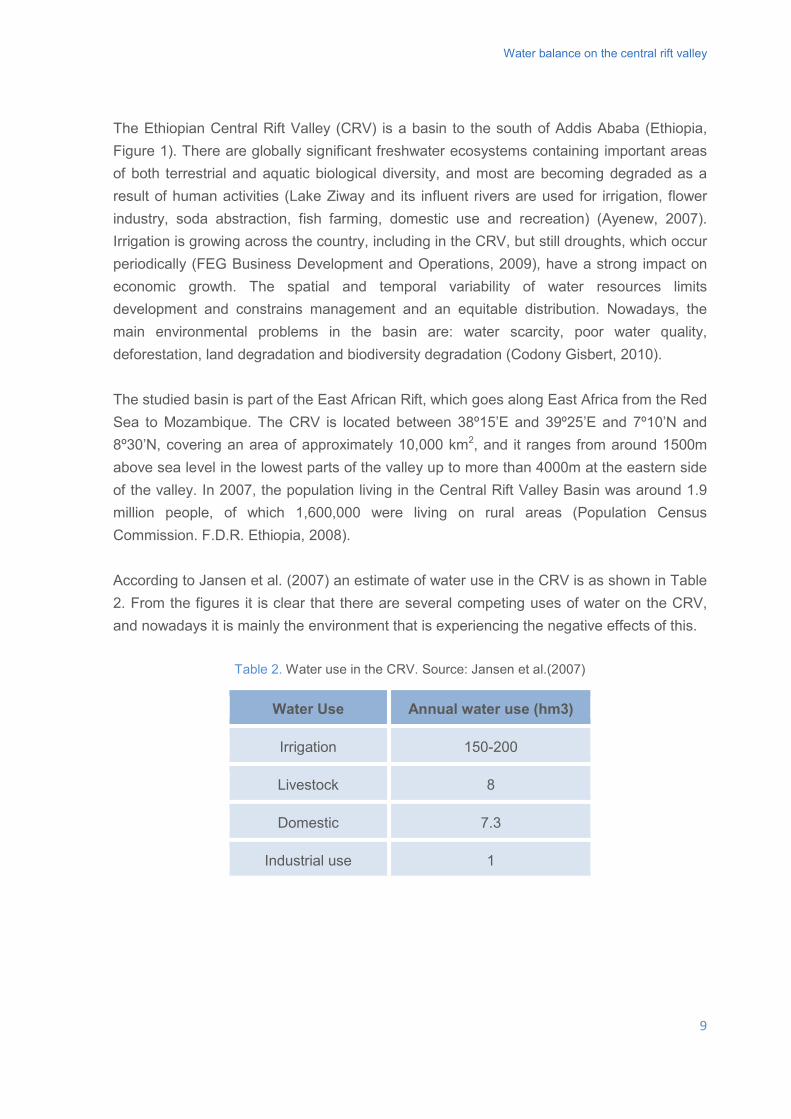
Water balance on the central rift valley
The Ethiopian Central Rift Valley (CRV) is a basin to the south of Addis Ababa (Ethiopia, Figure 1). There are globally significant freshwater ecosystems containing important areas of both terrestrial and aquatic biological diversity, and most are becoming degraded as a result of human activities (Lake Ziway and its influent rivers are used for irrigation, flower industry, soda abstraction, fish farming, domestic use and recreation) (Ayenew, 2007). Irrigation is growing across the country, including in the CRV, but still droughts, which occur periodically (FEG Business Development and Operations, 2009), have a strong impact on economic growth. The spatial and temporal variability of water resources limits development and constrains management and an equitable distribution. Nowadays, the main environmental problems in the basin are: water scarcity, poor water quality, deforestation, land degradation and biodiversity degradation (Codony Gisbert, 2010). The studied basin is part of the East African Rift, which goes along East Africa from the Red Sea to Mozambique. The CRV is located between 38º15’E and 39º25’E and 7º10’N and 8º30’N, covering an area of approximately 10,000 km2, and it ranges from around 1500m above sea level in the lowest parts of the valley up to more than 4000m at the eastern side of the valley. In 2007, the population living in the Central Rift Valley Basin was around 1.9 million people, of which 1,600,000 were living on rural areas (Population Census Commission. F.D.R. Ethiopia, 2008). According to Jansen et al. (2007) an estimate of water use in the CRV is as shown in Table 2. From the figures it is clear that there are several competing uses of water on the CRV, and nowadays it is mainly the environment that is experiencing the negative effects of this.
Table 2. Water use in the CRV. Source: Jansen et al.(2007)
Water Use Annual water use (hm3)
Irrigation 150-200
Livestock 8
Domestic 7.3
Industrial use 1
9
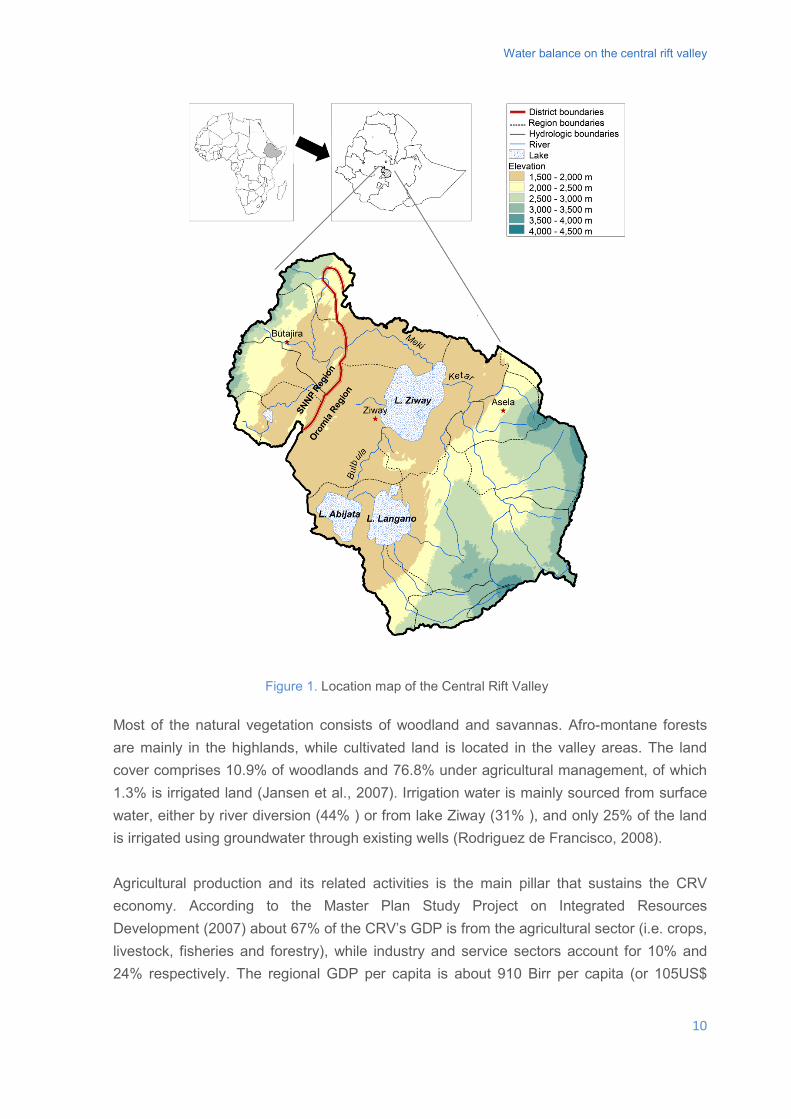
Water balance on the central rift valley
Most of the natural vegetation consists of woodland and savannas. Afro-montane forests are mainly in the highlands, while cultivated land is located in the valley areas. The land cover comprises 10.9% of woodlands and 76.8% under agricultural management, of which 1.3% is irrigated land (Jansen et al., 2007). Irrigation water is mainly sourced from surface water, either by river diversion (44% ) or from lake Ziway (31% ), and only 25% of the land is irrigated using groundwater through existing wells (Rodriguez de Francisco, 2008). Agricultural production and its related activities is the main pillar that sustains the CRV economy. According to the Master Plan Study Project on Integrated Resources Development (2007) about 67% of the CRV’s GDP is from the agricultural sector (i.e. crops, livestock, fisheries and forestry), while industry and service sectors account for 10% and 24% respectively. The regional GDP per capita is about 910 Birr per capita (or 105US$
Figure 1. Location map of the Central Rift Valley
10
Water balance on the central rift valley
using 2005 exchange rate), which is a low GDP per capita even compared to Ethiopian standards. The amin water management problems can be exposed as: (i) an overexploitation of water resources, hindering ecosystems survival and rising competition of uses between subsistence farming, industrial farming and tourism promotion; (ii) poor water quality, endangering both irrigation and drinking water provision; and (iii) high dependency of population on water resources to sustain their livelihoods.
2.4. CRV: WATER QUALITY AND QUANTITY The average level of Lake Ziway has decreased by around 0.5 m since 2002 (Jansen et al., 2007), and hence the level of the Bulbula river outflow has also decreased. Due to this, Lake Abyata (the outermost lake of the basin located in the Abyata-Shala National Park) has been suffering from a drastic decrease of water input, endangering the rich biodiversity of the area (Oromia Environmental Protection Office, 2005). Lake Abyata’s recent decrease has added to the rapid changes in lake extension and volume suffered during the last forty years (Ayenew, 2007). In Ethiopia, between 150,000 and 200,000 ha/yr of forest cover are being lost either because it is changed into new agricultural land, or because it is used for charcoal production or construction (Ayenew, 2007). The CRV itself has suffered deforestation and land use maps based on satellite interpretation (from LANDSAT MSS and ASTER images) (Jansen et al., 2007) show that during the period 1986-2006 forest cover in the region decreased by almost 50%. Irrigation has also shown a great increase in the region. Large-scale irrigation started in the 1970s in the Lake Ziway catchment, and it experienced great development during the 1980s (Legesse and Ayenew, 2006). It was also in the 1980s that water demanding industry (a soda ash factory) started operating at Lake Abyata’s shore and the greatest decrease of the lake level started (Alemayehu et al., 2006). Since then, irrigation has kept growing. As an example, during the period 2007-2013 Adami Tulu Jido Kombolocha and Dugda woredas (Ethiopian districts), both situated on the western shore of Lake Ziway, have had an increase in irrigated land of around 70%. Public perception and acceptance of decreasing water resources is clear. However, the public seems to be reluctant to accept that upstream water abstraction is currently detrimental to downstream users and ecosystems. Although there has been no substantial reduction of precipitation during the last 50 years (Ayenew, 2004), people still perceive rainfall reduction as the real cause of lack of water in the region (Codony Gisbert, 2010).
11
Water balance on the central rift valley
Both man-made and non-anthropogenic factors are affecting water quality in the area. Most of the CRV is covered by volcanic rocks, mainly ignimbrites, basalts and rhyolites, which cause great levels of fluoride in the groundwater (Chernet et al., 2001). Flouride levels reach up to 200 mg/l in the floor of the rift, although its concentration decreases in the highlands, where it can be less than 1 mg/l (except in some points where confined thermal springs can be found) (Ayenew, 2008). In some areas the population is drinking this contaminated water, which results in dental and skeletal fluorosis (Ayenew, 2008, Raventós Vilalta, 2010). Moreover, the alkaline and sodic characteristics of this water is damaging the agricultural potential of the soil where it is used for irrigation (Chernet et al., 2001). In terms of anthropogenic factors, deforestation and loss of vegetation cover is causing sediment and nutrients to be washed away. This material then reaches the terminal lakes and causes eutrophication, which is killing fish and other microorganisms, as seen in Lake Abyata (Ayenew, 2007). Although clear results on water quality are not available, the use of agrochemicals and pesticides in the area in order to improve land productivity may be endangering water quality.
2.5. CRV: SOCIO-ECONOMIC ASPECTS Environmental degradation intensifies inequality through the adverse impacts it has on already disadvantaged people, but conversely, inequalities in human development may amplify environmental degradation (HDR, 2011). A household survey conducted by Master Plan consultants (Halcrow and GIRD, 2007) has shown that the main sources of income of the population are both crop production and livestock rearing, as can be seen in Figure 2. As a result of land productivity, which appears to be quite low in some areas of the basin, and the small size of the plots cultivated by farmers, farming is primarily subsistence based, and certain areas of the CRV are considered as food deficit zones (FEG Business Development and Operations, 2009).
12
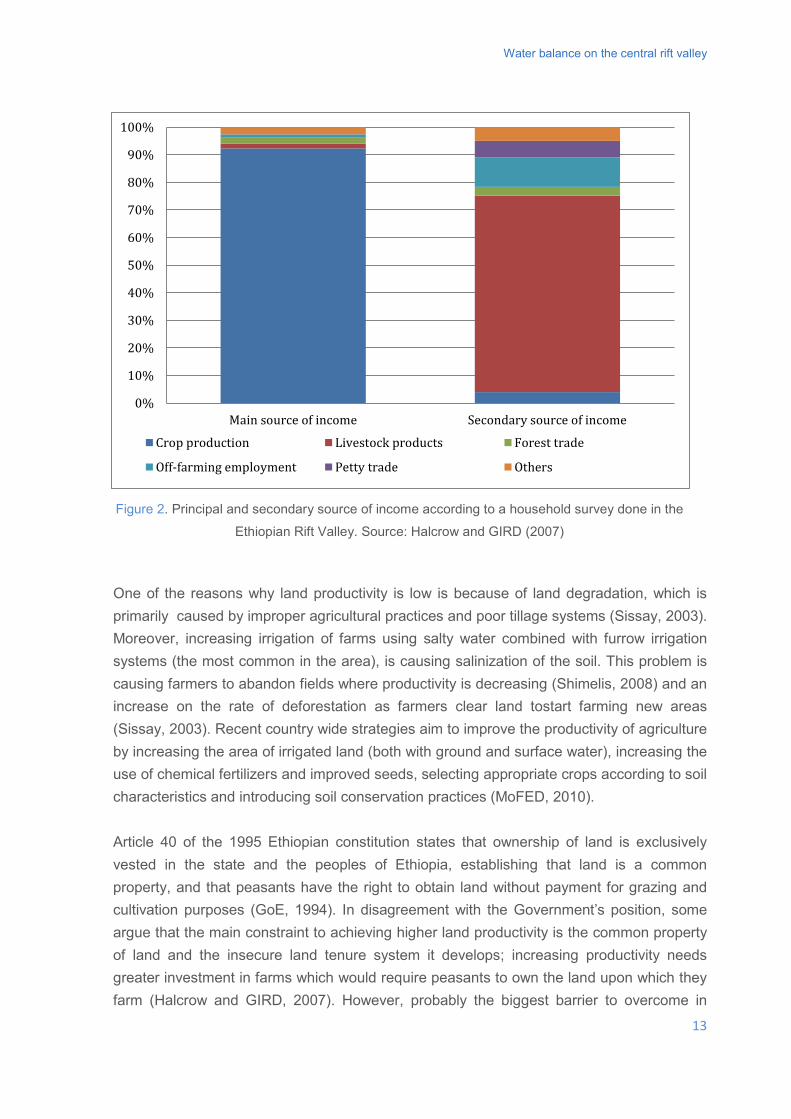
Water balance on the central rift valley
One of the reasons why land productivity is low is because of land degradation, which is primarily caused by improper agricultural practices and poor tillage systems (Sissay, 2003). Moreover, increasing irrigation of farms using salty water combined with furrow irrigation systems (the most common in the area), is causing salinization of the soil. This problem is causing farmers to abandon fields where productivity is decreasing (Shimelis, 2008) and an increase on the rate of deforestation as farmers clear land tostart farming new areas (Sissay, 2003). Recent country wide strategies aim to improve the productivity of agriculture by increasing the area of irrigated land (both with ground and surface water), increasing the use of chemical fertilizers and improved seeds, selecting appropriate crops according to soil characteristics and introducing soil conservation practices (MoFED, 2010). Article 40 of the 1995 Ethiopian constitution states that ownership of land is exclusively vested in the state and the peoples of Ethiopia, establishing that land is a common property, and that peasants have the right to obtain land without payment for grazing and cultivation purposes (GoE, 1994). In disagreement with the Government’s position, some argue that the main constraint to achieving higher land productivity is the common property of land and the insecure land tenure system it develops; increasing productivity needs greater investment in farms which would require peasants to own the land upon which they farm (Halcrow and GIRD, 2007). However, probably the biggest barrier to overcome in
Figure 2. Principal and secondary source of income according to a household survey done in the
Ethiopian Rift Valley. Source: Halcrow and GIRD (2007)
13
0%
10%
20%
30%
40%
50%
60%
70%
80%
90%
100%
Main source of income Secondary source of income
Crop production Livestock products Forest trade
Off-farming employment Petty trade Others
Water balance on the central rift valley
increasing agricultural production in the CRV is the small size of landholdings, as they currently average 0.85 ha per farm (Raventós Vilalta, 2010). Oromia regional government has established a minimum plot size per household of 0,5 Ha for annual crops and 0,25 Ha for perennial crops, as well as a maximum of 0,5 Ha of irrigated land (ONRS, 2007).The SNNPR regional government has established a minimum 0,5 Ha per plot without differentiating the type of crop, and also a plot of 0,5 Ha for irrigation systems (SNNPRS, 2007). As plots of this size are insufficient to support a family, farmers remain in a cycle of poverty, as they cannot afford the required investments to improve their productivity. Fragmented land tenure together with a lack of capacities not only hinders productivity but also leads to an overexploitation of land, an intensive use of agrochemicals and, where irrigation is available, a high competition for and abuse of water. Moreover, as the population is growing, the threat of deforestation on the forests that still exist in the area is increasing. Lately, regional legislation has allowed farmers to rent plots (in almost half of the region of Oromia(ONRS, 2007)), although the lack of other livelihood means does not seem to facilitate concentration processes. Agricultueis not the only practice overexploiting land, livestock farming is also doing so and there are clear evidences of overgrazing (Jansen et al., 2007). Livestock is part of the farming system in the highland areas, where animals are grown for meat and milk production. They are also used as draft animalsand therefore make an important contribution to the income of households. In the drier southern lowlands of the Rift Valley, livestock production is based on semi-nomadic pastoral systems and is seen as the main source of wealth. Additional income is obtained from charcoal production, which further compounds deforestation and the disappearance of acacia forests is causing a reduction in the habitat and food source of migratory birds (Shimelis, 2008). New legislation on forest management has toughened penalties on unlicensed forest exploitation (GoE, 2007b), but a lack of capacity to enforce the legislation may hinder its immediate impact.
2.6. CRV: WATER MANAGEMENT In line with the country’s overall decentralization scheme, the water sector has also gone through the process of decentralization. The Federal Government, through the Ministry of Water and Energy (MoWE, previously called Ministry of Water Resources) is in charge of policy and strategy development at central level (Wube et al., 2009), and provision of technical support to regional water bureaus and offices (Ministry of Water & Energy, 2010). Under the umbrella of the MoWE there are the River Basin Organizations (RBO), which have the overall objective of promoting and monitoring the integrated water resources management process, namely: (i) providing policy guidance and planning oversight; (ii)
14
Water balance on the central rift valley
preparing river basin master plans; (iii) deciding on major water works and water allocation; (iv) proposing water rates and (v) managing water use disputes between Regional States in the basin (GoE, 2007a). The first RBO was developed for the Abbay Basin (or Blue Nile Basin), and current legislation has been written based on experience in that basin (Raventós Vilalta, 2010). Since the first RBO, few other RBOs have been established, although on of those that has is the Rift Valley Lakes Basin RBO. This RBO is composed by different sub-basins within it, among which is the CRV basin. Despite the presence of the RBO, problems have arisen in water resources management in the basin. The ability to manage water effectively is diminished by: lack of capacityand ignorance on laws, regulations and procedures by regional and local governments (Raventós Vilalta, 2010); lack of coordination among different involved stakeholders (Codony Gisbert, 2010); and a lack of a proper monitoring network and an updated national database on water resources and use. Moreover, despite policy guidelines that establish stakeholder participation and decentralization, the Federal Government still exerts the greatest influence in the region (Raventós Vilalta, 2010). Water policy in Ethiopia tries to combine aspects of both social equity and economic efficiency. Consistentwith Government laws and international conventions, every Ethiopian citizen has the fundamental right to have access to sufficient water of acceptable quality, to satisfy basic human needs (MoWR, 1999). On the other hand, public and private agencies and persons applying for water use permits and certification of their technical and professional competence have the full right to use any water resources, provided they fulfill requirements set by the supervising body (either the Federal or the Regional Government) (GoE, 2000). Environmental policy states that rural water supply systems require an environmental impact assessment, although there are several exceptions: surface and ground water fed irrigation projects covering less than 50 ha; all small scale agricultural activities; and the rearing of cattle (<50 heads), pigs (<100 heads), or poultry (<500 heads) (EPA, 2003). As a result of these policies, more facilities are able to use water for productive activities than for domestic purposes. As the Ethiopian water policy establishes that all water resources are common property of the people of Ethiopia and the state, irrigation water is common property rather than private, therefore no one is being held responsible for the mismanagement of water irrigation can cause (Raventós Vilalta, 2010).
15
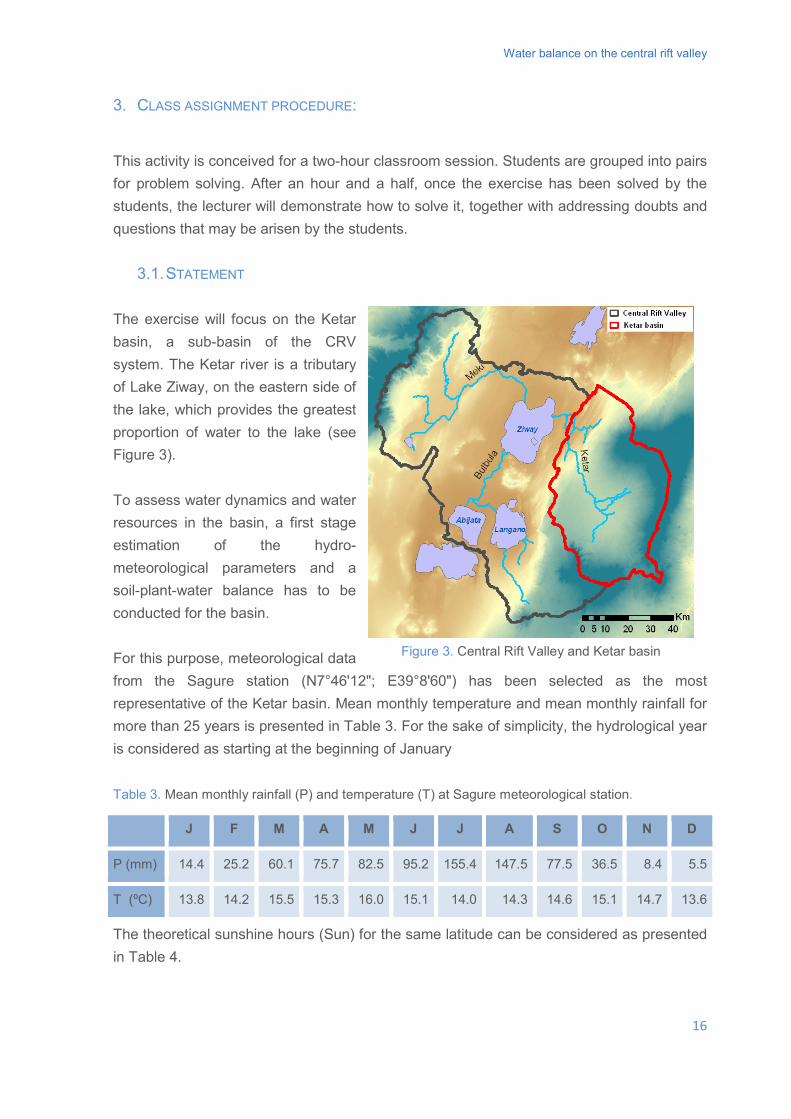
Water balance on the central rift valley
3. CLASS ASSIGNMENT PROCEDURE:
This activity is conceived for a two-hour classroom session. Students are grouped into pairs for problem solving. After an hour and a half, once the exercise has been solved by the students, the lecturer will demonstrate how to solve it, together with addressing doubts and questions that may be arisen by the students.
3.1. STATEMENT The exercise will focus on the Ketar basin, a sub-basin of the CRV system. The Ketar river is a tributary of Lake Ziway, on the eastern side of the lake, which provides the greatest proportion of water to the lake (see Figure 3). To assess water dynamics and water resources in the basin, a first stage estimation of the hydro-meteorological parameters and a soil-plant-water balance has to be conducted for the basin. For this purpose, meteorological data from the Sagure station (N7°46'12"; E39°8'60") has been selected as the most representative of the Ketar basin. Mean monthly temperature and mean monthly rainfall for more than 25 years is presented in Table 3. For the sake of simplicity, the hydrological year is considered as starting at the beginning of January Table 3. Mean monthly rainfall (P) and temperature (T) at Sagure meteorological station.
J F M A M J J A S O N D
P (mm) 14.4 25.2 60.1 75.7 82.5 95.2 155.4 147.5 77.5 36.5 8.4 5.5
T (ºC) 13.8 14.2 15.5 15.3 16.0 15.1 14.0 14.3 14.6 15.1 14.7 13.6
The theoretical sunshine hours (Sun) for the same latitude can be considered as presented in Table 4.
Figure 3. Central Rift Valley and Ketar basin
16
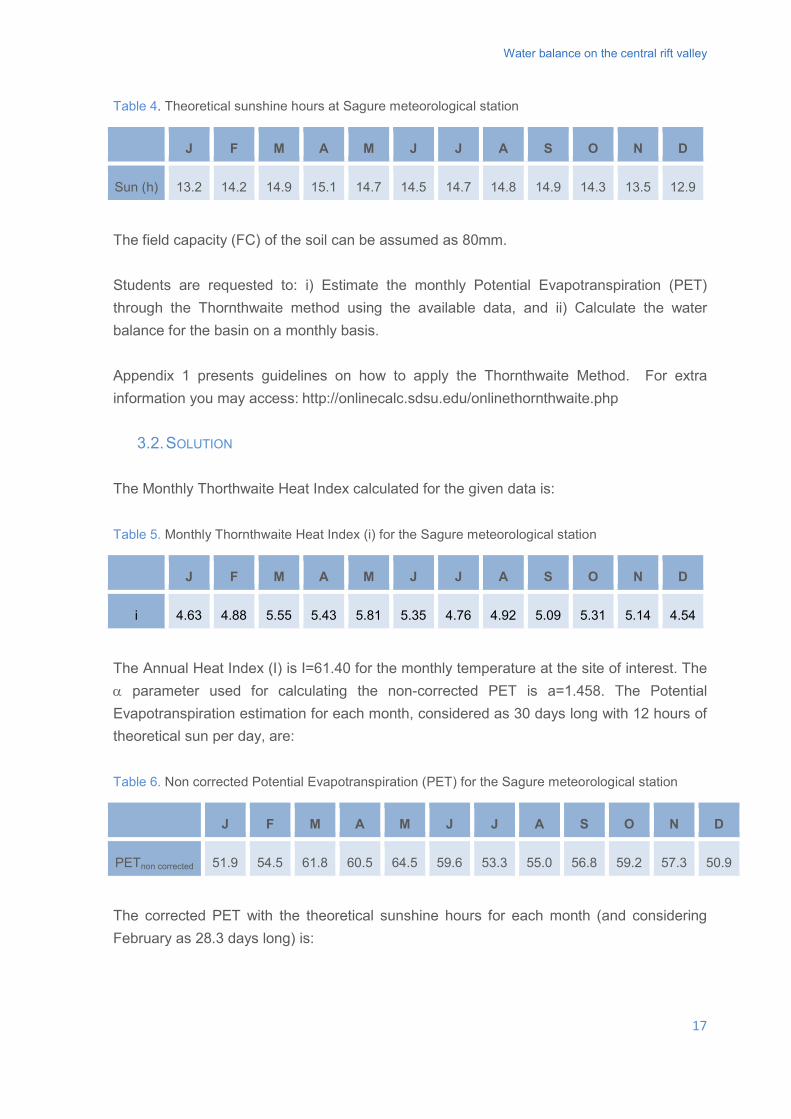
Water balance on the central rift valley
Table 4. Theoretical sunshine hours at Sagure meteorological station
J F M A M J J A S O N D
Sun (h) 13.2 14.2 14.9 15.1 14.7 14.5 14.7 14.8 14.9 14.3 13.5 12.9
The field capacity (FC) of the soil can be assumed as 80mm. Students are requested to: i) Estimate the monthly Potential Evapotranspiration (PET) through the Thornthwaite method using the available data, and ii) Calculate the water balance for the basin on a monthly basis. Appendix 1 presents guidelines on how to apply the Thornthwaite Method. For extra information you may access: http://onlinecalc.sdsu.edu/onlinethornthwaite.php
3.2. SOLUTION The Monthly Thorthwaite Heat Index calculated for the given data is: Table 5. Monthly Thornthwaite Heat Index (i) for the Sagure meteorological station
J F M A M J J A S O N D
i 4.63 4.88 5.55 5.43 5.81 5.35 4.76 4.92 5.09 5.31 5.14 4.54
The Annual Heat Index (I) is I=61.40 for the monthly temperature at the site of interest. The α parameter used for calculating the non-corrected PET is a=1.458. The Potential Evapotranspiration estimation for each month, considered as 30 days long with 12 hours of theoretical sun per day, are: Table 6. Non corrected Potential Evapotranspiration (PET) for the Sagure meteorological station
J F M A M J J A S O N D
PETnon corrected 51.9 54.5 61.8 60.5 64.5 59.6 53.3 55.0 56.8 59.2 57.3 50.9
The corrected PET with the theoretical sunshine hours for each month (and considering February as 28.3 days long) is:
17
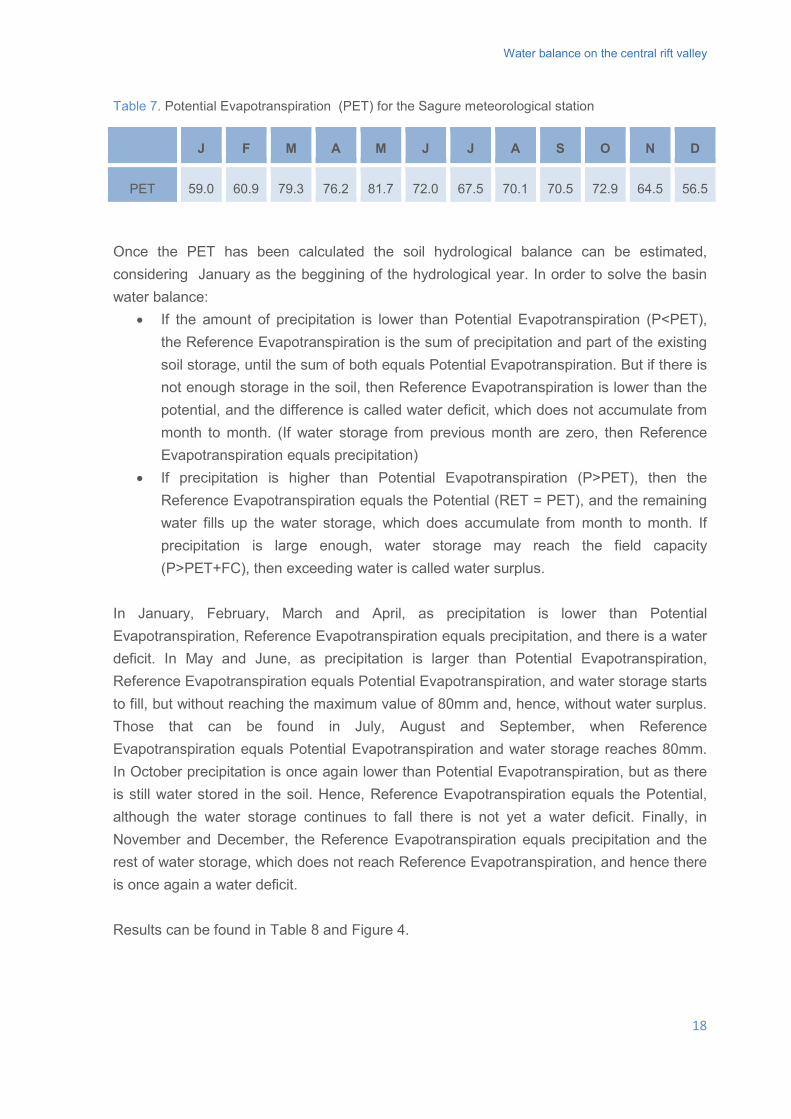
Water balance on the central rift valley
Table 7. Potential Evapotranspiration (PET) for the Sagure meteorological station
J F M A M J J A S O N D
PET 59.0 60.9 79.3 76.2 81.7 72.0 67.5 70.1 70.5 72.9 64.5 56.5
Once the PET has been calculated the soil hydrological balance can be estimated, considering January as the beggining of the hydrological year. In order to solve the basin water balance:
• If the amount of precipitation is lower than Potential Evapotranspiration (P<PET), the Reference Evapotranspiration is the sum of precipitation and part of the existing soil storage, until the sum of both equals Potential Evapotranspiration. But if there is not enough storage in the soil, then Reference Evapotranspiration is lower than the potential, and the difference is called water deficit, which does not accumulate from month to month. (If water storage from previous month are zero, then Reference Evapotranspiration equals precipitation)
• If precipitation is higher than Potential Evapotranspiration (P>PET), then the Reference Evapotranspiration equals the Potential (RET = PET), and the remaining water fills up the water storage, which does accumulate from month to month. If precipitation is large enough, water storage may reach the field capacity (P>PET+FC), then exceeding water is called water surplus.
In January, February, March and April, as precipitation is lower than Potential Evapotranspiration, Reference Evapotranspiration equals precipitation, and there is a water deficit. In May and June, as precipitation is larger than Potential Evapotranspiration, Reference Evapotranspiration equals Potential Evapotranspiration, and water storage starts to fill, but without reaching the maximum value of 80mm and, hence, without water surplus. Those that can be found in July, August and September, when Reference Evapotranspiration equals Potential Evapotranspiration and water storage reaches 80mm. In October precipitation is once again lower than Potential Evapotranspiration, but as there is still water stored in the soil. Hence, Reference Evapotranspiration equals the Potential, although the water storage continues to fall there is not yet a water deficit. Finally, in November and December, the Reference Evapotranspiration equals precipitation and the rest of water storage, which does not reach Reference Evapotranspiration, and hence there is once again a water deficit. Results can be found in Table 8 and Figure 4.
18
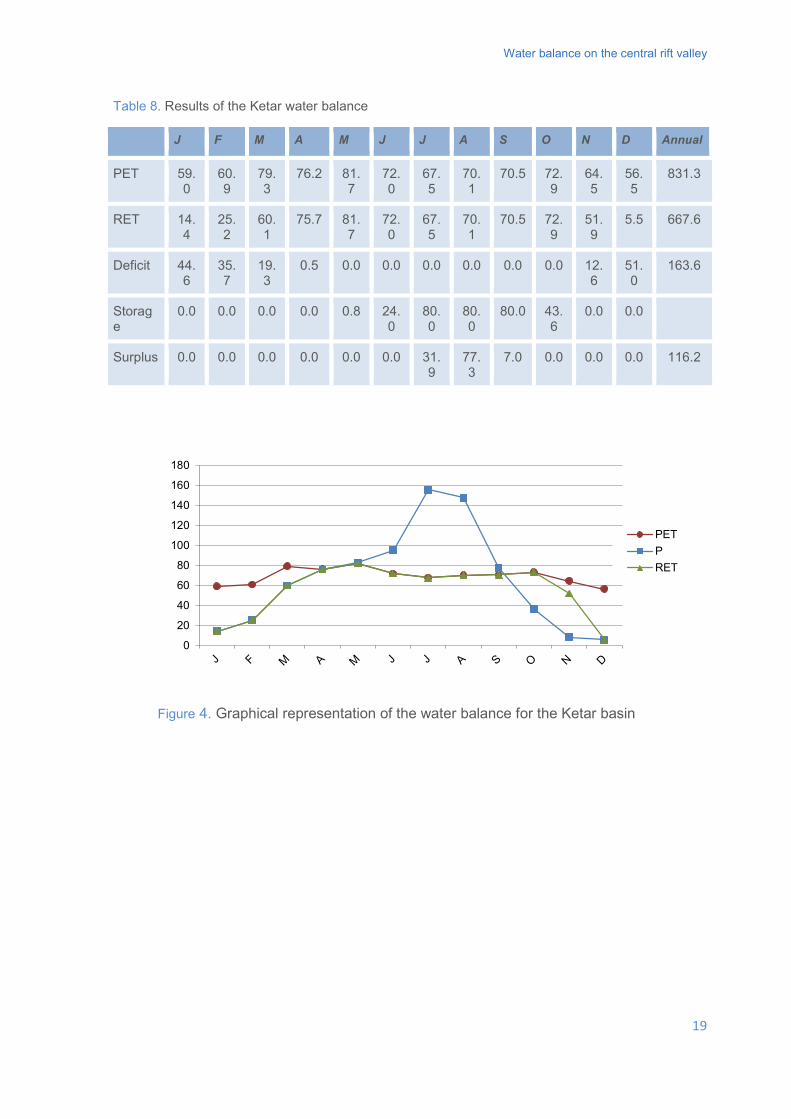
Water balance on the central rift valley
Table 8. Results of the Ketar water balance
J F M A M J J A S O N D Annual
PET 59.0
60.9
79.3
76.2 81.7
72.0
67.5
70.1
70.5 72.9
64.5
56.5
831.3
RET 14.4
25.2
60.1
75.7 81.7
72.0
67.5
70.1
70.5 72.9
51.9
5.5 667.6
Deficit 44.6
35.7
19.3
0.5 0.0 0.0 0.0 0.0 0.0 0.0 12.6
51.0
163.6
Storage
0.0 0.0 0.0 0.0 0.8 24.0
80.0
80.0
80.0 43.6
0.0 0.0
Surplus 0.0 0.0 0.0 0.0 0.0 0.0 31.9
77.3
7.0 0.0 0.0 0.0 116.2
Figure 4. Graphical representation of the water balance for the Ketar basin
19
0
20
40
60
80
100
120
140
160
180
PETPRET
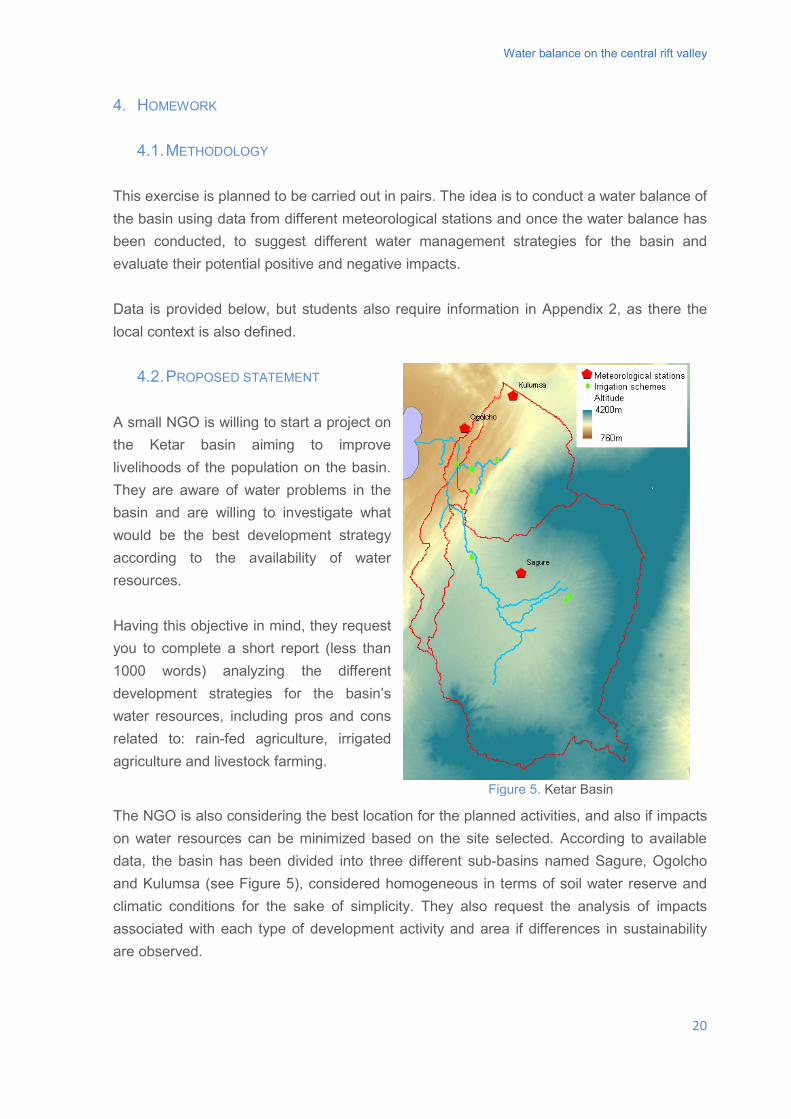
Water balance on the central rift valley
4. HOMEWORK
4.1. METHODOLOGY This exercise is planned to be carried out in pairs. The idea is to conduct a water balance of the basin using data from different meteorological stations and once the water balance has been conducted, to suggest different water management strategies for the basin and evaluate their potential positive and negative impacts. Data is provided below, but students also require information in Appendix 2, as there the local context is also defined.
4.2. PROPOSED STATEMENT A small NGO is willing to start a project on the Ketar basin aiming to improve livelihoods of the population on the basin. They are aware of water problems in the basin and are willing to investigate what would be the best development strategy according to the availability of water resources. Having this objective in mind, they request you to complete a short report (less than 1000 words) analyzing the different development strategies for the basin’s water resources, including pros and cons related to: rain-fed agriculture, irrigated agriculture and livestock farming.
The NGO is also considering the best location for the planned activities, and also if impacts on water resources can be minimized based on the site selected. According to available data, the basin has been divided into three different sub-basins named Sagure, Ogolcho and Kulumsa (see Figure 5), considered homogeneous in terms of soil water reserve and climatic conditions for the sake of simplicity. They also request the analysis of impacts associated with each type of development activity and area if differences in sustainability are observed.
Figure 5. Ketar Basin
20
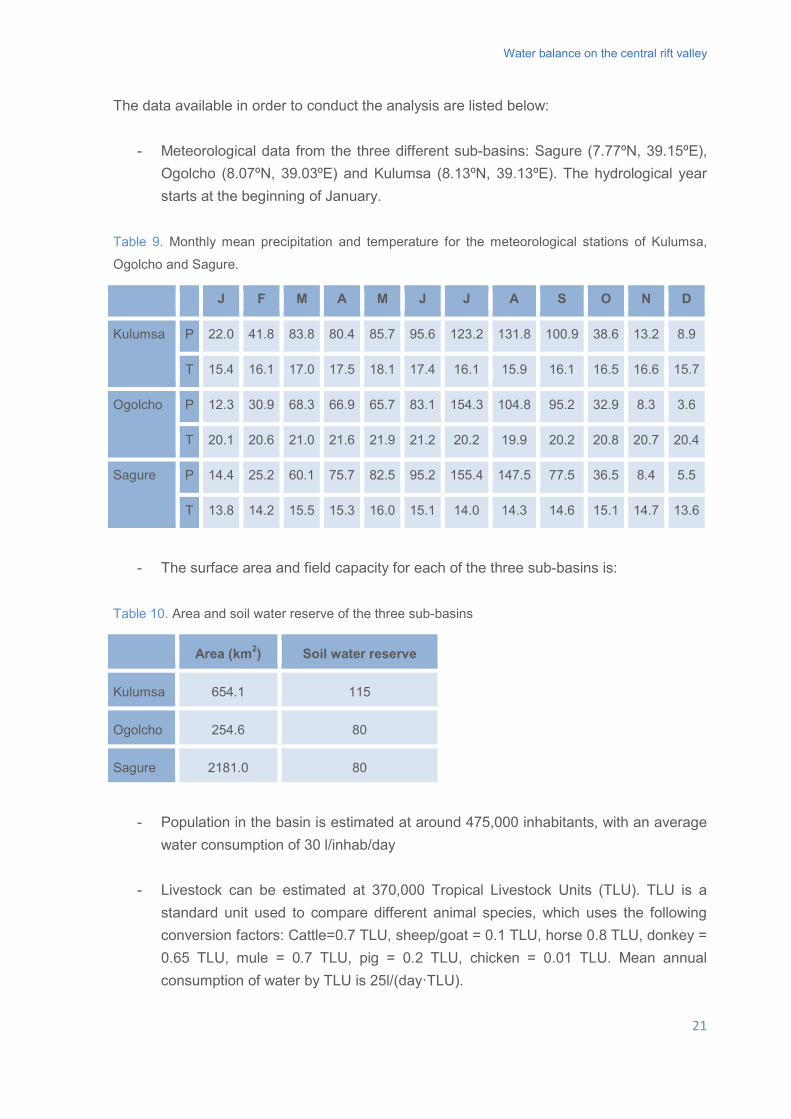
Water balance on the central rift valley
The data available in order to conduct the analysis are listed below:
- Meteorological data from the three different sub-basins: Sagure (7.77ºN, 39.15ºE), Ogolcho (8.07ºN, 39.03ºE) and Kulumsa (8.13ºN, 39.13ºE). The hydrological year starts at the beginning of January.
Table 9. Monthly mean precipitation and temperature for the meteorological stations of Kulumsa,
Ogolcho and Sagure.
J F M A M J J A S O N D
Kulumsa P 22.0 41.8 83.8 80.4 85.7 95.6 123.2 131.8 100.9 38.6 13.2 8.9
T 15.4 16.1 17.0 17.5 18.1 17.4 16.1 15.9 16.1 16.5 16.6 15.7
Ogolcho P 12.3 30.9 68.3 66.9 65.7 83.1 154.3 104.8 95.2 32.9 8.3 3.6
T 20.1 20.6 21.0 21.6 21.9 21.2 20.2 19.9 20.2 20.8 20.7 20.4
Sagure P 14.4 25.2 60.1 75.7 82.5 95.2 155.4 147.5 77.5 36.5 8.4 5.5
T 13.8 14.2 15.5 15.3 16.0 15.1 14.0 14.3 14.6 15.1 14.7 13.6
- The surface area and field capacity for each of the three sub-basins is:
Table 10. Area and soil water reserve of the three sub-basins
Area (km2) Soil water reserve
Kulumsa 654.1 115
Ogolcho 254.6 80
Sagure 2181.0 80
- Population in the basin is estimated at around 475,000 inhabitants, with an average
water consumption of 30 l/inhab/day
- Livestock can be estimated at 370,000 Tropical Livestock Units (TLU). TLU is a standard unit used to compare different animal species, which uses the following conversion factors: Cattle=0.7 TLU, sheep/goat = 0.1 TLU, horse 0.8 TLU, donkey = 0.65 TLU, mule = 0.7 TLU, pig = 0.2 TLU, chicken = 0.01 TLU. Mean annual consumption of water by TLU is 25l/(day·TLU).
21
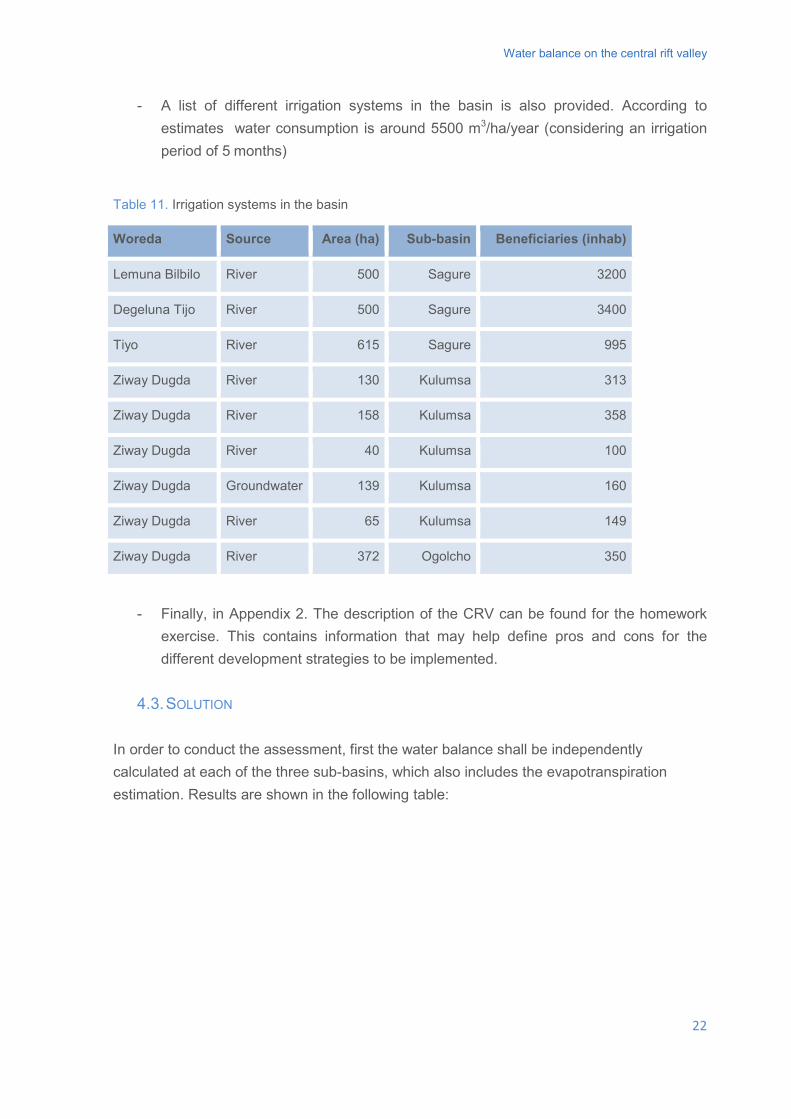
Water balance on the central rift valley
- A list of different irrigation systems in the basin is also provided. According to estimates water consumption is around 5500 m3/ha/year (considering an irrigation period of 5 months)
Table 11. Irrigation systems in the basin
Woreda Source Area (ha) Sub-basin Beneficiaries (inhab)
Lemuna Bilbilo River 500 Sagure 3200
Degeluna Tijo River 500 Sagure 3400
Tiyo River 615 Sagure 995
Ziway Dugda River 130 Kulumsa 313
Ziway Dugda River 158 Kulumsa 358
Ziway Dugda River 40 Kulumsa 100
Ziway Dugda Groundwater 139 Kulumsa 160
Ziway Dugda River 65 Kulumsa 149
Ziway Dugda River 372 Ogolcho 350
- Finally, in Appendix 2. The description of the CRV can be found for the homework
exercise. This contains information that may help define pros and cons for the different development strategies to be implemented.
4.3. SOLUTION
In order to conduct the assessment, first the water balance shall be independently calculated at each of the three sub-basins, which also includes the evapotranspiration estimation. Results are shown in the following table:
22
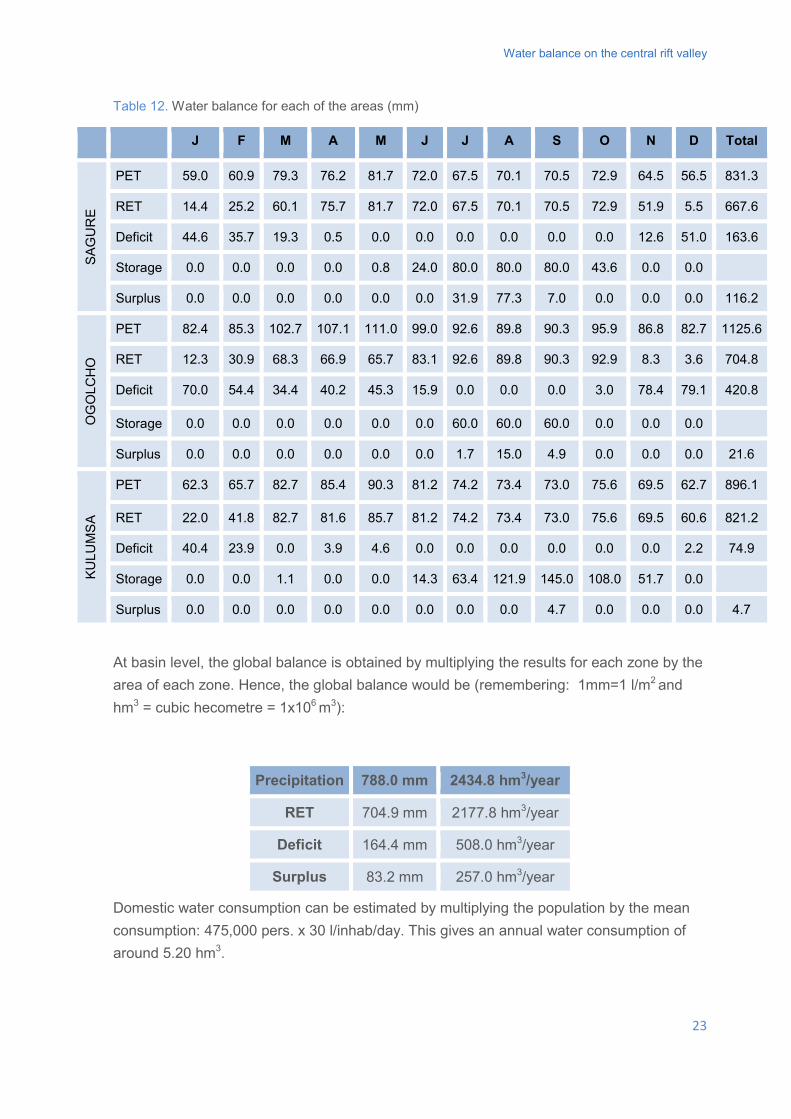
Water balance on the central rift valley
Table 12. Water balance for each of the areas (mm)
J F M A M J J A S O N D Total
SAG
UR
E
PET 59.0 60.9 79.3 76.2 81.7 72.0 67.5 70.1 70.5 72.9 64.5 56.5 831.3
RET 14.4 25.2 60.1 75.7 81.7 72.0 67.5 70.1 70.5 72.9 51.9 5.5 667.6
Deficit 44.6 35.7 19.3 0.5 0.0 0.0 0.0 0.0 0.0 0.0 12.6 51.0 163.6
Storage 0.0 0.0 0.0 0.0 0.8 24.0 80.0 80.0 80.0 43.6 0.0 0.0
Surplus 0.0 0.0 0.0 0.0 0.0 0.0 31.9 77.3 7.0 0.0 0.0 0.0 116.2
OG
OLC
HO
PET 82.4 85.3 102.7 107.1 111.0 99.0 92.6 89.8 90.3 95.9 86.8 82.7 1125.6
RET 12.3 30.9 68.3 66.9 65.7 83.1 92.6 89.8 90.3 92.9 8.3 3.6 704.8
Deficit 70.0 54.4 34.4 40.2 45.3 15.9 0.0 0.0 0.0 3.0 78.4 79.1 420.8
Storage 0.0 0.0 0.0 0.0 0.0 0.0 60.0 60.0 60.0 0.0 0.0 0.0
Surplus 0.0 0.0 0.0 0.0 0.0 0.0 1.7 15.0 4.9 0.0 0.0 0.0 21.6
KULU
MS
A
PET 62.3 65.7 82.7 85.4 90.3 81.2 74.2 73.4 73.0 75.6 69.5 62.7 896.1
RET 22.0 41.8 82.7 81.6 85.7 81.2 74.2 73.4 73.0 75.6 69.5 60.6 821.2
Deficit 40.4 23.9 0.0 3.9 4.6 0.0 0.0 0.0 0.0 0.0 0.0 2.2 74.9
Storage 0.0 0.0 1.1 0.0 0.0 14.3 63.4 121.9 145.0 108.0 51.7 0.0
Surplus 0.0 0.0 0.0 0.0 0.0 0.0 0.0 0.0 4.7 0.0 0.0 0.0 4.7
At basin level, the global balance is obtained by multiplying the results for each zone by the area of each zone. Hence, the global balance would be (remembering: 1mm=1 l/m2 and hm3 = cubic hecometre = 1x10⁶ m3):
Precipitation 788.0 mm 2434.8 hm3/year
RET 704.9 mm 2177.8 hm3/year
Deficit 164.4 mm 508.0 hm3/year
Surplus 83.2 mm 257.0 hm3/year
Domestic water consumption can be estimated by multiplying the population by the mean consumption: 475,000 pers. x 30 l/inhab/day. This gives an annual water consumption of around 5.20 hm3.
23
Water balance on the central rift valley
On the other hand, irrigation consumption can be estimated at 13.85 hm3, after considering 2519 ha of irrigated land in the basin, and a mean irrigation dose of 5500m3 per year per hectare. Livestock consumption can be estimated at 3.38 hm3 per year. For the report evaluation, it is important that: i) results are based on the calculated water balance for each of the areas and the whole basin and ii) water resource use/demand prior to the new proposed management is known in order to fully understand the impact that different uses may have on the basin. The test should observe pros and cons of each strategy, considering aspects such as those listed below:
- Reduction of water available may hinder downstream users: impacts on Lake Ziway - Irrigated agriculture has larger economic benefits than rain-fed agriculture - Kulumsa sub-basin appears to be best for rain-fed irrigation due to lower water
deficit - The use of irrigation may cause soil erosion - Use of agrochemicals may hinder water quality and favor eutrophication - Use of groundwater for irrigation may damage soil for water use due to its alkaline
and sodic characteristics - The increase of cattle number may also impact water quality
24
Water balance on the central rift valley
5. BIBLIOGRAPHY
• ALEMAYEHU, T., AYENEW, T. & KEBEDE, S. (2006) Hydrogeochemical and lake level changes in the Ethiopian Rift. Journal of Hydrology, 316, 290-300.
• AYENEW, T. (2004) Environmental implications of changes in the levels of lakes in the Ethiopian Rift since 1970. Regional Environmental Change, 4, 192-204.
• AYENEW, T. (2007) Water management problems in the Ethiopian rift: Challenges for development. Journal of African Earth Sciences, 48, 222-236.
• AYENEW, T. (2008) The distribution and hydrogeological controls of fluoride in the groundwater of central Ethiopian rift and adjacent highlands. Environmental Geology, 54, 1313-1324.
• BLACK, M. & HALL, A. (2004) Pro-poor water governance. IN ASIAN DEVELOPMENT BANK (Ed.) Water and Poverty: the themes.
• CENTRAL INELLIGENCE AGENCY (2009) The World Factbook 2009. Central Intelligence Agency.
• CHERNET, T., TRAVI, Y. & VALLES, V. (2001) Mechanism of degradation of the quality pf natural water in the Lakes Region of the Ethiopian Rift Valley. Water Resources, 35, 2819-2832.
• CODONY GISBERT, J. (2010) Environmental Governance in the Ethiopian Central Rift Valley. Civil Engineering. Barcelona, Master Thesis in Civil Engineering. Universitat Politècnica de Catalunya.
• DE GROOT, R. S. (1992) Functions of Nature: Evaluation of nature in environmental planning, management and decision making, Groningen, Wolters-Noordhoff.
• DE GROOT, R. S., WILSON, M. A. & BOUMANS, R. M. J. (2002) A typology for the classification, description and valuation of ecosystem functions, goods and services. Ecological Economics, 41, 393-408.
• EDWARDS, K. A., CLASSEN, G. A. & SCHROTEN, E. H. J. (1983) The water resource in tropical Africa and its exploitation. ILCA Research Report. International Livestock Centre for Africa.
• EPA (2003) Guideline ambient environmental standards for Ethiopia. . IN ENVIRONMENTAL PROTECTION AUTHORITY AND THE UNITED NATIONS INDUSTRIAL DEVELOPMENT ORGANIZATION (Ed.). Addis Ababa., Ecologically Sustainable Industrial Development (ESID) Project,.
• FEG BUSINESS DEVELOPMENT AND OPERATIONS (2009) Adami Tulu Woreda: East Shewa Administrative Zone. Oromiya Livelihood Zone Reports. Addis Ababa.
25
Water balance on the central rift valley
• GLOBAL WATER PARTNERSHIP (2000) Integrated Water Resources Management. TAC Background Papers No. 4, Stockholm, Sweden, GWP.
• GOE (1994) Government of the Federal Democratic Republic of Ethiopia, Ethiopian Federal Democratic Republic Constitution. IN FEDERAL NEGARIT GAZETA OF THE FEDERAL DEMOCRATIC REPUBLIC OF ETHIOPIA (Ed.) 1st Year No 1. Addis Ababa.
• GOE (2000) Government of the Federal Democratic Republic of Ethiopia. Ethiopian Water Resources Management Proclamation No. 197/2000. IN FEDERAL NEGARIT GAZETA OF THE FEDERAL DEMOCRATIC REPUBLIC OF ETHIOPIA (Ed.) 6th Year No. 25. Addis Abeba.
• GOE (2007a) Government of the Federal Democratic Republic of Ethiopia. Proclamation No. 534/2007. River Basin Councils and Authorities Proclamation. IN MINISTRY OF WATER & ENERGY (Ed.). Federal Negarit Gazeta.
• GOE (2007b) Government of the Federal Democratic Republic of Ethiopia. Proclamation No. 542/2007. Forest Development, Conservation and Utilization Proclamation. IN MINISTRY OF AGRICULTURE AND RURAL DEVELOPMENT (Ed.). Federal Negarit Gazeta.
• GOURBESVILLE, P. (2008) Integrated river basin management, ICT and DSS: Challenges and needs. Physics and Chemistry of the Earth, Parts A/B/C, 33, 312-321.
• HALCROW AND GIRD (2007) Rift Valley Lakes Basin Integrated Resources Development Master Plan Study Project. Draft Phase 1 Report. Addis Ababa, Ministry of Water Resources. The Federal Democratic Republic of Ethiopia.
• HALCROW GROUP LIMITED AND GENERATION INTEGRATED RURAL DEVELOPMENT CONSULTANTS (2007) Rift Valley Lakes Basin Integrated Resources Development Master Plan Study Project. Draft Phase 1 Report. Addis Ababa, Ministry of Water Resources. The Federal Democratic Republic of Ethiopia.
• JANSEN, H., HENGSDIJK, H., LEGESSE, D., AYENEW, T., HELLEGERS, P. & SPLIETHOFF, P. (2007) Land and water resources assessment in the Ethiopian Central Rift Valley. Alterra report 1587. Wageningen, Alterra.
• LEGESSE, D. & AYENEW, T. (2006) Effect of improper water and land resource utilization on the central Main Ethiopian Rift lakes. Quaternary International, 148, 8-18.
• MINISTRY OF WATER & ENERGY (2010) Ministry of Water & Energy. Introdcution. Addis Ababa, Abebe Tasew.
26
Water balance on the central rift valley
• MOFED (2010) Growth and Transformation Plan: 2010/11-2014/15. Volume 1: Main Text. IN MINISTRY OF FINANCE AND ECONOMIC DEVELOPMENT. FEDERAL DEMOCRATIC REPUBLIC OF ETHIOPIA (Ed.). Addis Ababa.
• MOWR (1999) Ethiopian Water Resources Management Policy. IN MINISTERY OF WATER RESOURCES. FEDERAL DEMOCRATIC REPUBLIC OF ETHIOPIA (Ed.). Addis Ababa.
• ONRS (2007) Oromia National Regional State. Proclamation No. 130/ 2007. Proclamation to amend the proclamation No . 56/2002, 70/2003, 103/2005 of Oromia Rural Land Use and Administration. IN OROMIA NATIONAL REGIONAL STATE (Ed.).
• OROMIA ENVIRONMENTAL PROTECTION OFFICE (2005) A review of the current status and an outline of a future management plan for Lakes Abiyata and Ziway. Addis Ababa, Ethiopia.
• PNUD (2009) Human Development Report 2006.Overcoming barriers: Human mobility and development. Human Development Report. New York, UNDP.
• POPULATION CENSUS COMISSION. F.D.R. ETHIOPIA (2008) Summary and Statistical Report of the 2007: Population and Housing Census Results. IN UNITED NATIONS POPULATION FUND (Ed.). Addis Ababa.
• POPULATION CENSUS COMMISSION. F.D.R. ETHIOPIA (2008) Summary and Statistical Report of the 2007: Population and Housing Census Results. IN UNITED NATIONS POPULATION FUND (Ed.). Addis Ababa.
• RAVENTÓS VILALTA, E. (2010) Water Resources Management in the Central Rift Valley of Ethiopia. Civil Engineering. Barcelona, Master Thesis in Civil Engineering. Universitat Politècnica de Catalunya.
• RODRIGUEZ DE FRANCISCO, J. C. (2008) Preconditions for a Payment for Environmental Services establishment at Central Rift Valley, Ethiopia. Department of Social Sciences. Wageningen, the Netherlands, Wageningen University.
• SÁNCHEZ SAN ROMÁN, F. J. (2011) Materiales de clase (http://ocw.usal.es/ciencias-experimentales/hidrologia/maeriales-de-clase). OCW-USAL.
• SHIMELIS, S. (2008) Environmental problems of Central Rift Valley of Ethiopia Addis Ababa. Not published, Intermón Oxfam.
• SISSAY, L. (2003) Biodiversity potentials and threats to the southern Rift Valley lakes of Ethiopia. IN UNION, T. W. C. (Ed.) Wetlands of Ethiopia.
• SNNPRS (2007) Southern Nations, Nationalities and Peoples Regional State. Southern Nations, Nationalities and Peoples land administration and use
27
Water balance on the central rift valley
proclamation no. 110/2007. IN DEBUB NEGARIT GAZETA OF THE SOUTHERN NATIONS NATIONALITIES AND PEOPLES REGIONAL STATE (Ed.) 13th Year No. 10. Awassa.
• UNDP (2004) Water Governance for Poverty Reduction: Key Issues and the UNDP Response to Millennium Development Goals, New York, UNDP.
• UNDP (2010) United Nations Development Programme. www.watergovernance.org. Stockholm, SIWI.
• UNITED NATIONS (1992) The Dublin Statement on Water and Sustainable Development. International Conference on Water and the Environment. Dublin, Ireland.
• WHO/UNICEF (2010) Progress on drinking water and sanitation: 2010 update. Geneva, WHO and New York, UNICEF, Joint Monitoring Programme for Water Supply and Sanitation.
• WORLD BUSINESS COUNCIL FOR SUSTAINABLE DEVELOPMENT (2009) Water: Facts and Trends. Version 2.
• WUBE, M., ALEMU, E., ENDESHAW, A. & GIRMAW, N. (2009) Matching funds allocation in the Ethiopian Water Supply and Sanitation Project (EWSSP). A case study in Benishangul-Gumuz regional state. Addis Ababa, Ethiopia. , RiPPLE.
28

http://www.gdee.eu
This project is funded by
Rural electrification in Developing Countries via autonomous Micro-Grids
Claudio Brivio and Stefano Mandelli
PHOTO: Channel, weir and intake of hydropower system at Ngarenanyuki Secondary school Tanzania (April 2014). Stefano Mandelli .
CASE STUDIES

DL B 10735-2015 ISBN 978-84-606-7546-4
COORDINATED BYAgustí Pérez-Foguet, Enric Velo, Pol Arranz, Ricard Ginéand Boris Lazzarini (Universitat Politècnica de Catalunya)Manuel Sierra (Universidad Politécnica de Madrid)Alejandra Boni and Jordi Peris (Universitat Politècnica de València)Guido Zolezzi and Gabriella Trombino (Università degli Studi di Trento)Rhoda Trimingham (Loughborough University)Valentín Villarroel (ONGAWA)Neil Nobles and Meadhbh Bolger (Practical Action)Francesco Mongera (Training Center for International Cooperation)Katie Cresswell-Maynard (Engineering Without Border UK)
EDITED BY Global Dimension in Engineering Education
Citation: Brivio, C. and Mandelli, S. (2015) 'Rural electrification in Developing Countries via autonomous Micro-Grids', in Case studies for developing globallyresponsible engineers, GDEE (eds.), Global Dimension in Engineering Education, Barcelona. Available from: http://gdee.eu/index.php/resources.html
This publication is distributedunder an Attribution- Noncommercial-Share Alike License for Creative Commons
Rural electrification in Developing Countriesvia autonomous Micro-Grids
CASE STUDIES
Disclaimer: This document has been produced with the financial assistance of the European UnionThe contents of this document are the sole responsibility of the authors and can under no circumstances be regarded as reflecting the position of the European Union

Rural electrification in Developing Countries via autonomous Micro-Grids
Eng. Claudio Brivio, Politecnico di Milano, Department of Energy Eng. Stefano Mandelli, Politecnico di Milano, Department of Energy UNESCO Chair in Energy for Sustainable Development - http://www.unescochair-e4sd.polimi.it
RURAL ELECTRIFICATION IN DEVELOPING COUNTRIES VIA AUTONOMOUS MICRO-GRIDS
Rural electrification in Developing Countries via autonomous Micro-Grids INDEX 1. INTRODUCTION ............................................................................................................................. 3
1.1. Disciplines covered ................................................................................................................... 3
1.2. Learning outcomes ................................................................................................................... 3
1.3. Activities .................................................................................................................................... 4
2. DESCRIPTION OF THE CONTEXT ............................................................................................... 4
2.1. Access to electricity in rural context ......................................................................................... 4
2.2. Electrification via Micro-Grids ................................................................................................... 6
2.3. An appropriate instrument for energy planning: HOMER® ...................................................... 8
2.3.1. Load Modelling............................................................................................................... 9
2.3.2. Resource Modelling ....................................................................................................... 9
2.3.3. Components Modelling ................................................................................................ 10
2.3.4. Economic Modelling ..................................................................................................... 11
2.4. The case study: Ngarenanyuki ............................................................................................... 12
2.4.1. Hydro-Turbine .............................................................................................................. 13
2.4.2. Back-up unit ................................................................................................................. 13
2.4.3. Diesel generator........................................................................................................... 14
2.4.4. Loads ........................................................................................................................... 14
3. CLASS ACTIVITY ......................................................................................................................... 16
3.1. Face-to-face lesson ................................................................................................................ 16
3.1.1. Data entry .................................................................................................................... 17
3.1.3. Discussion .................................................................................................................... 19
3.2. Team work session ................................................................................................................. 20
3.2.1. Solution and evaluation criteria.................................................................................... 21
4. HOMEWORK ACTIVITY ............................................................................................................... 22
4.1. Solution and evaluation criteria .............................................................................................. 22
BIBLIOGRAPHY ................................................................................................................................... 29
Rural electrification in Developing Countries via autonomous Micro-Grids 1. INTRODUCTION Nowadays, rural areas dwellers in Developing Countries (DCs) are the ones who are affected the most by poor access to electricity. In these rural areas, Micro-Grids (MGs) mainly based on renewable energy sources, are often the suitable solution to promote access to electricity by exploiting locally available resources while respecting social and environmental constraints. However, the energy planning phase and consequently deciding the size of such systems is not a straightforward process for local actors who might not have sufficient capabilities to detect the right solutions for the context they are operating in. Energy planning software provides a support by addressing this lack and guiding the user through the above mentioned phases and suggesting the right answer in terms of MG configuration in accord with the local demands and available resources. In this lesson, after a brief introduction on the problem of access to energy and on how the MGs can face this issue, one of the most common energy planning software tools is presented and applied to a real case study. The case study refers to the rural context of Ngarenanyuki (Arusha, Tanzania) which is the area of intervention of the project “Energy 4 growing” implemented by a research group of the Department of Energy of the Politecnico di Milano and funded by the Polisocial program (www.polisocial.polimi.it/us/home, www.unescochair-e4sd.polimi.it).
1.1. DISCIPLINES COVERED The main disciplines covered by this case study are the methods and models used for rural energy planning and rural electrification. The aim is to describe a general approach which leads through the different steps of analysis of a technological solution for rural electrification: from detecting the useful information of the context to translating that information into energy planning software to assess the feasibility of an MG. After giving an introduction to the fundamentals of the access to energy issue and to the MG technology, the aim of the lecture is reached by covering two main steps:
1. the understanding of the energy planning tool. Specifically the description of how the chosen software describes: loads, resources, components and economics;
2. the modelling of a real case study to better understand the issues of rural electrification and the application of the software tool. Thanks to the availability of real data from the rural context of Ngarenanyuki in Tanzania the student is guided through the structuring of the analysis with the software. Then, the simulation is performed followed by a critical analysis of the results.
1.2. LEARNING OUTCOMES
As a result of this case study, students are expected to be able to:
Rural electrification in Developing Countries via autonomous Micro-Grids
• Understand the problem of the lack of access to electricity and its consequences; • Know the main technological solutions for rural electrification and in particular the
role of MGs; • Learn how to operate a piece of energy planning software and be able to employ it
for basic analyses; • Be able to translate data collected from the field into an energy planning software,
analyse a possible MG solution and explain the results in a clear and structured way.
1.3. ACTIVITIES The modelling of an MG is a complex task and hence the activities have been prepared in order to ease students’ understanding of the problem.
1. In the first activity (face-to-face lesson) students are introduced to the energy planning software tool. By means of the Ngarenanyuki case study, students will understand how to manage data from the field, how to use the software and how to analyse the results.
2. In the second activity (team-work session) the students, divided in a few groups, independently reprocess the steps of the face-to-face lesson and they are requested to make appropriate changes in the input data in order to better adapt the MG to the Ngraenanyuki context. Finally, the students are evaluated on their ability to solve such problems, comparing their performance with the solution.
3. In the third activity (homework session) students are requested to consider the problem from all points of views, not only technical, in order to understand the real problematics of rural electrification. Finally, as for the second activity, students are evaluated on their ability to come to an appropriate conclusion.
2. DESCRIPTION OF THE CONTEXT
In this section a general context description of the case study is realized. First, the problem of the lack of access to electricity is briefly explained. Then, Micro-Grids, as one of the most promising off-grid technologies for rural electrification, and HOMER®, as one of the most popular energy planning software, are presented. Finally, the specific context of Ngarenanyuki in Tanzania is clarified.
2.1. ACCESS TO ELECTRICITY IN RURAL CONTEXT In recent years, the issue of access to energy has climbed positions in the priorities of the global agenda. The connection between access to energy and human development is
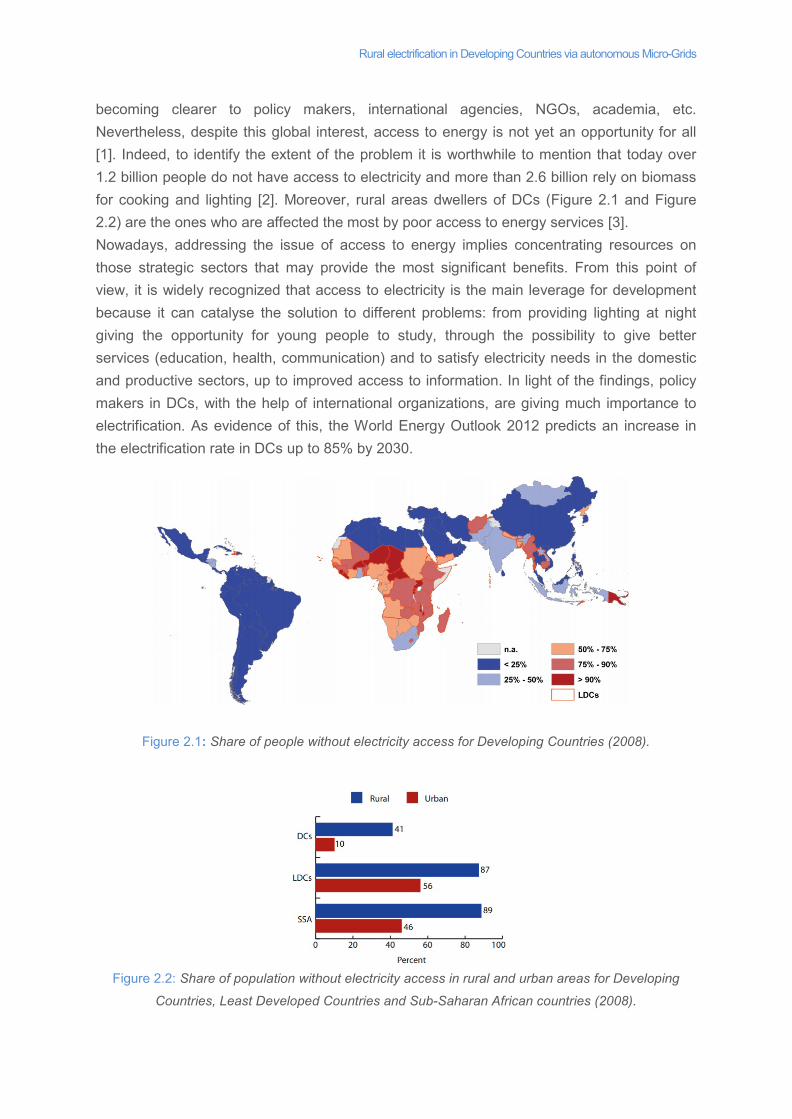
Rural electrification in Developing Countries via autonomous Micro-Grids becoming clearer to policy makers, international agencies, NGOs, academia, etc. Nevertheless, despite this global interest, access to energy is not yet an opportunity for all [1]. Indeed, to identify the extent of the problem it is worthwhile to mention that today over 1.2 billion people do not have access to electricity and more than 2.6 billion rely on biomass for cooking and lighting [2]. Moreover, rural areas dwellers of DCs (Figure 2.1 and Figure 2.2) are the ones who are affected the most by poor access to energy services [3]. Nowadays, addressing the issue of access to energy implies concentrating resources on those strategic sectors that may provide the most significant benefits. From this point of view, it is widely recognized that access to electricity is the main leverage for development because it can catalyse the solution to different problems: from providing lighting at night giving the opportunity for young people to study, through the possibility to give better services (education, health, communication) and to satisfy electricity needs in the domestic and productive sectors, up to improved access to information. In light of the findings, policy makers in DCs, with the help of international organizations, are giving much importance to electrification. As evidence of this, the World Energy Outlook 2012 predicts an increase in the electrification rate in DCs up to 85% by 2030.
Figure 2.1: Share of people without electricity access for Developing Countries (2008).
Figure 2.2: Share of population without electricity access in rural and urban areas for Developing
Countries, Least Developed Countries and Sub-Saharan African countries (2008).
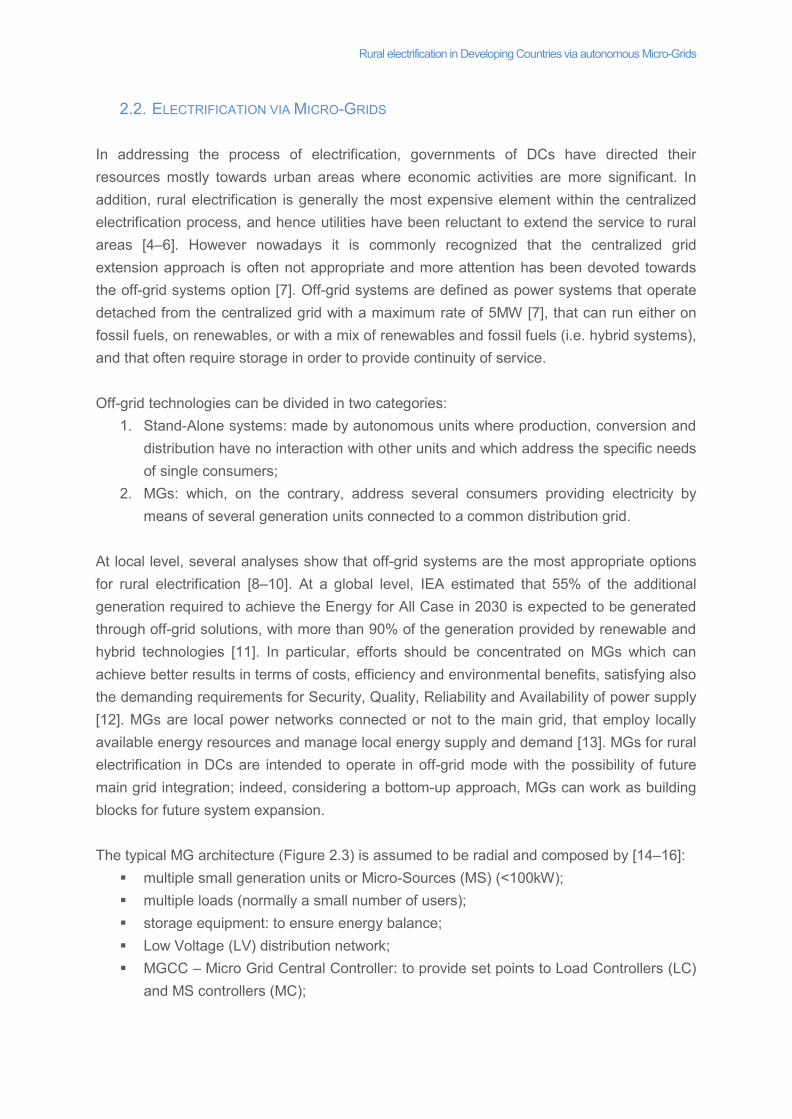
Rural electrification in Developing Countries via autonomous Micro-Grids
2.2. ELECTRIFICATION VIA MICRO-GRIDS In addressing the process of electrification, governments of DCs have directed their resources mostly towards urban areas where economic activities are more significant. In addition, rural electrification is generally the most expensive element within the centralized electrification process, and hence utilities have been reluctant to extend the service to rural areas [4–6]. However nowadays it is commonly recognized that the centralized grid extension approach is often not appropriate and more attention has been devoted towards the off-grid systems option [7]. Off-grid systems are defined as power systems that operate detached from the centralized grid with a maximum rate of 5MW [7], that can run either on fossil fuels, on renewables, or with a mix of renewables and fossil fuels (i.e. hybrid systems), and that often require storage in order to provide continuity of service. Off-grid technologies can be divided in two categories:
1. Stand-Alone systems: made by autonomous units where production, conversion and distribution have no interaction with other units and which address the specific needs of single consumers;
2. MGs: which, on the contrary, address several consumers providing electricity by means of several generation units connected to a common distribution grid.
At local level, several analyses show that off-grid systems are the most appropriate options for rural electrification [8–10]. At a global level, IEA estimated that 55% of the additional generation required to achieve the Energy for All Case in 2030 is expected to be generated through off-grid solutions, with more than 90% of the generation provided by renewable and hybrid technologies [11]. In particular, efforts should be concentrated on MGs which can achieve better results in terms of costs, efficiency and environmental benefits, satisfying also the demanding requirements for Security, Quality, Reliability and Availability of power supply [12]. MGs are local power networks connected or not to the main grid, that employ locally available energy resources and manage local energy supply and demand [13]. MGs for rural electrification in DCs are intended to operate in off-grid mode with the possibility of future main grid integration; indeed, considering a bottom-up approach, MGs can work as building blocks for future system expansion. The typical MG architecture (Figure 2.3) is assumed to be radial and composed by [14–16]: multiple small generation units or Micro-Sources (MS) (<100kW); multiple loads (normally a small number of users); storage equipment: to ensure energy balance; Low Voltage (LV) distribution network; MGCC – Micro Grid Central Controller: to provide set points to Load Controllers (LC)
and MS controllers (MC);
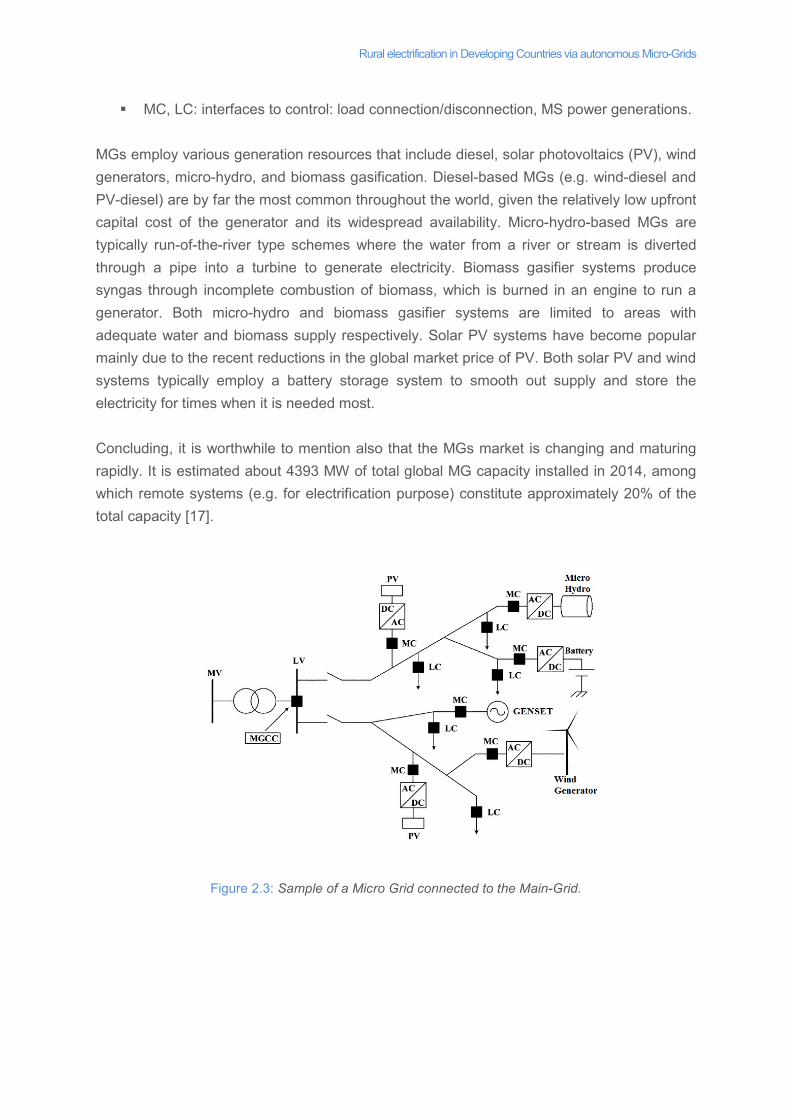
Rural electrification in Developing Countries via autonomous Micro-Grids MC, LC: interfaces to control: load connection/disconnection, MS power generations.
MGs employ various generation resources that include diesel, solar photovoltaics (PV), wind generators, micro-hydro, and biomass gasification. Diesel-based MGs (e.g. wind-diesel and PV-diesel) are by far the most common throughout the world, given the relatively low upfront capital cost of the generator and its widespread availability. Micro-hydro-based MGs are typically run-of-the-river type schemes where the water from a river or stream is diverted through a pipe into a turbine to generate electricity. Biomass gasifier systems produce syngas through incomplete combustion of biomass, which is burned in an engine to run a generator. Both micro-hydro and biomass gasifier systems are limited to areas with adequate water and biomass supply respectively. Solar PV systems have become popular mainly due to the recent reductions in the global market price of PV. Both solar PV and wind systems typically employ a battery storage system to smooth out supply and store the electricity for times when it is needed most. Concluding, it is worthwhile to mention also that the MGs market is changing and maturing rapidly. It is estimated about 4393 MW of total global MG capacity installed in 2014, among which remote systems (e.g. for electrification purpose) constitute approximately 20% of the total capacity [17].
Figure 2.3: Sample of a Micro Grid connected to the Main-Grid.
Rural electrification in Developing Countries via autonomous Micro-Grids
2.3. AN APPROPRIATE INSTRUMENT FOR ENERGY PLANNING: HOMER®
The Hybrid Optimization Model for Electric Renewables is a computer model developed by the U.S. National Renewable Energy Laboratory (NREL) to assist in the design of micro-power systems and to facilitate the comparison of power generation technologies across a wide range of applications. HOMER® is a commercial software, but a fully-functioning trial version can be downloaded at http://www.homerenergy.com together with a free licence for two weeks. HOMER® models a power system’s physical behaviour and its life-cycle cost, which is the total cost of installing and operating the system over its life span.
HOMER® can model grid-connected and off-grid micro-power systems serving electric loads, and comprising any combination of photovoltaic (PV) modules, wind turbines, small hydro, biomass power, reciprocating engine generators, micro-turbines, fuel cells, batteries, and hydrogen storage. HOMER® performs three principal tasks: simulation, optimization, and sensitivity analysis.
• The simulation process serves two purposes. First, it determines whether the system is feasible. HOMER® considers the system to be feasible if it can adequately serve the loads and satisfies any other constraints imposed by the user. Second, it estimates the life-cycle cost of the system, which is the total cost of installing and operating the system over its lifetime. HOMER® steps through the year one hour at a time, simulating the designed plant and calculating the available renewable power, comparing it to the electric load, and deciding what to do with surplus renewable power in times of excess, or how best to generate additional power from other sources to address the deficit. HOMER® simulates how the system operates over one year and assumes that the key simulation results for that year (such as fuel consumption, battery throughput, and surplus power production) are representative of every other year in the project lifetime, it does not consider changes over time, such as load growth or the deterioration of component performance with aging.
• The optimization process determines the best possible system configuration. In HOMER®, the best possible, or optimal, system configuration is the one that satisfies the user specified constraints at the lowest total net present cost (this single value includes all costs and revenues that occur within the project lifetime, with future cash flows discounted to the present.). In the optimization process, HOMER® simulates many different system configurations, discards the infeasible ones (those that do not satisfy the user-specified constraints), ranks the feasible ones according to total net present cost, and presents the feasible one with the lowest total net present cost as the optimal system configuration.
• The sensitivity analysis reveals how sensitive the outputs are to changes in the inputs. In a sensitivity analysis, the HOMER® user enters a range of values for a single input variable. One of the primary uses of sensitivity analysis is in dealing with uncertainty. If a
Rural electrification in Developing Countries via autonomous Micro-Grids
system designer is unsure of the value of a particular variable, he or she can enter several values covering the likely range and see how the results vary across that range.
2.3.1. LOAD MODELLING
HOMER® models different types of loads. In the case of electrical systems, there are two loads that the software uses: primary load and deferrable load.
• Primary load is electrical demand that the power system must meet at a specific time. Electrical demand associated with lights, radio, TV, household appliances, computers, and industrial processes is typically modelled as primary load. When a consumer switches on a light, the power system must supply electricity to that light immediately; the load cannot be deferred until later. If electrical demand exceeds supply, there is a shortfall that HOMER® records as unmet load.
• Deferrable load is electrical demand that can be met anytime within a defined time interval. Water pumps, icemakers, and battery-charging stations are examples of deferrable loads because the storage inherent to each of those loads allows some flexibility as to when the system can serve them.
2.3.2. RESOURCE MODELLING
The term resource applies to anything coming from outside the system that is used by the system to generate electric power. In this section we describe how HOMER® models three of the most relevant renewable sources. Solar Resource To model a system containing a PV array, the HOMER® user must provide solar resource data for the location of interest. Solar resource data indicate the amount of global solar radiation that strikes Earth’s surface in a typical year. The data can be in one of three forms: hourly average global solar radiation on the horizontal surface (kW/m2), monthly average global solar radiation on the horizontal surface (kWh/m2day), or monthly average clearness index. If the user chooses to provide monthly solar resource data, HOMER® generates synthetic hourly global solar radiation data (in the form of an 8760-hour data set) using an appropriate algorithm. Wind Resource To model a system comprising one or more wind turbines, the HOMER® user must provide wind resource data indicating the wind speeds the turbines would experience in a typical year. The user can provide measured hourly wind speed data if available. Otherwise, HOMER® can generate synthetic hourly data from 12 monthly average wind speeds and four additional statistical parameters (HOMER® provides default values for each of these parameters).
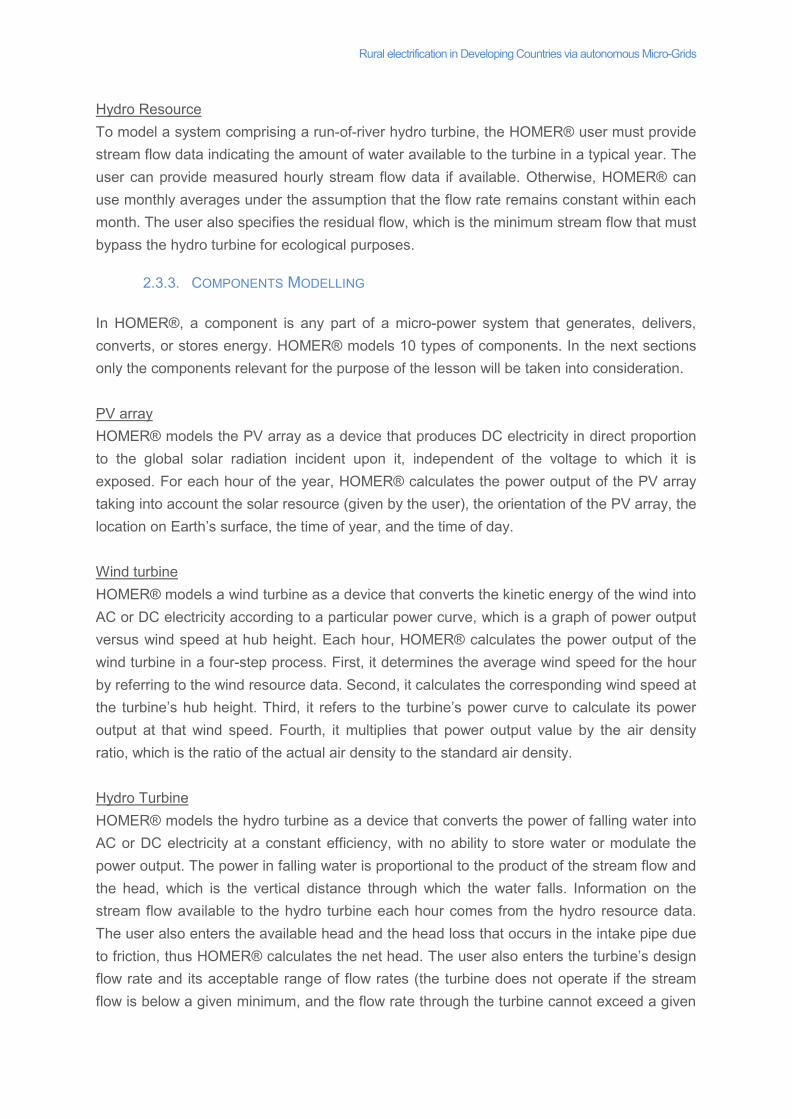
Rural electrification in Developing Countries via autonomous Micro-Grids Hydro Resource To model a system comprising a run-of-river hydro turbine, the HOMER® user must provide stream flow data indicating the amount of water available to the turbine in a typical year. The user can provide measured hourly stream flow data if available. Otherwise, HOMER® can use monthly averages under the assumption that the flow rate remains constant within each month. The user also specifies the residual flow, which is the minimum stream flow that must bypass the hydro turbine for ecological purposes.
2.3.3. COMPONENTS MODELLING
In HOMER®, a component is any part of a micro-power system that generates, delivers, converts, or stores energy. HOMER® models 10 types of components. In the next sections only the components relevant for the purpose of the lesson will be taken into consideration. PV array HOMER® models the PV array as a device that produces DC electricity in direct proportion to the global solar radiation incident upon it, independent of the voltage to which it is exposed. For each hour of the year, HOMER® calculates the power output of the PV array taking into account the solar resource (given by the user), the orientation of the PV array, the location on Earth’s surface, the time of year, and the time of day. Wind turbine HOMER® models a wind turbine as a device that converts the kinetic energy of the wind into AC or DC electricity according to a particular power curve, which is a graph of power output versus wind speed at hub height. Each hour, HOMER® calculates the power output of the wind turbine in a four-step process. First, it determines the average wind speed for the hour by referring to the wind resource data. Second, it calculates the corresponding wind speed at the turbine’s hub height. Third, it refers to the turbine’s power curve to calculate its power output at that wind speed. Fourth, it multiplies that power output value by the air density ratio, which is the ratio of the actual air density to the standard air density. Hydro Turbine HOMER® models the hydro turbine as a device that converts the power of falling water into AC or DC electricity at a constant efficiency, with no ability to store water or modulate the power output. The power in falling water is proportional to the product of the stream flow and the head, which is the vertical distance through which the water falls. Information on the stream flow available to the hydro turbine each hour comes from the hydro resource data. The user also enters the available head and the head loss that occurs in the intake pipe due to friction, thus HOMER® calculates the net head. The user also enters the turbine’s design flow rate and its acceptable range of flow rates (the turbine does not operate if the stream flow is below a given minimum, and the flow rate through the turbine cannot exceed a given
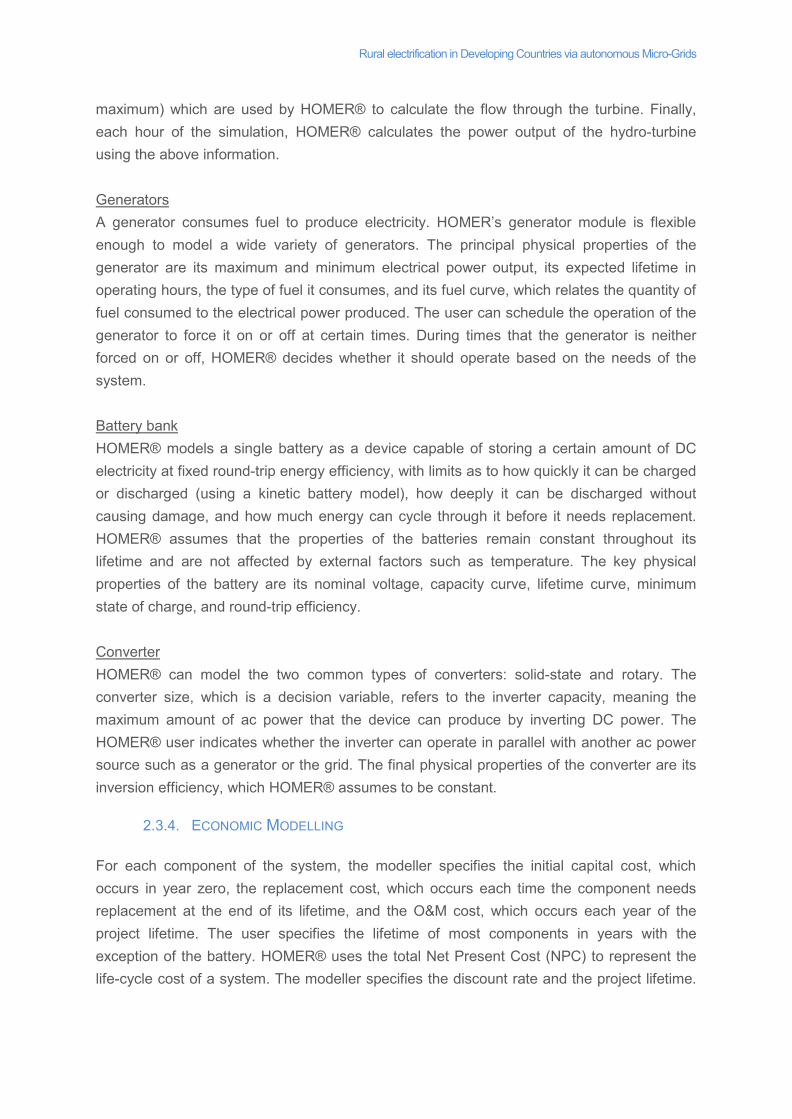
Rural electrification in Developing Countries via autonomous Micro-Grids maximum) which are used by HOMER® to calculate the flow through the turbine. Finally, each hour of the simulation, HOMER® calculates the power output of the hydro-turbine using the above information. Generators A generator consumes fuel to produce electricity. HOMER’s generator module is flexible enough to model a wide variety of generators. The principal physical properties of the generator are its maximum and minimum electrical power output, its expected lifetime in operating hours, the type of fuel it consumes, and its fuel curve, which relates the quantity of fuel consumed to the electrical power produced. The user can schedule the operation of the generator to force it on or off at certain times. During times that the generator is neither forced on or off, HOMER® decides whether it should operate based on the needs of the system. Battery bank HOMER® models a single battery as a device capable of storing a certain amount of DC electricity at fixed round-trip energy efficiency, with limits as to how quickly it can be charged or discharged (using a kinetic battery model), how deeply it can be discharged without causing damage, and how much energy can cycle through it before it needs replacement. HOMER® assumes that the properties of the batteries remain constant throughout its lifetime and are not affected by external factors such as temperature. The key physical properties of the battery are its nominal voltage, capacity curve, lifetime curve, minimum state of charge, and round-trip efficiency. Converter HOMER® can model the two common types of converters: solid-state and rotary. The converter size, which is a decision variable, refers to the inverter capacity, meaning the maximum amount of ac power that the device can produce by inverting DC power. The HOMER® user indicates whether the inverter can operate in parallel with another ac power source such as a generator or the grid. The final physical properties of the converter are its inversion efficiency, which HOMER® assumes to be constant.
2.3.4. ECONOMIC MODELLING
For each component of the system, the modeller specifies the initial capital cost, which occurs in year zero, the replacement cost, which occurs each time the component needs replacement at the end of its lifetime, and the O&M cost, which occurs each year of the project lifetime. The user specifies the lifetime of most components in years with the exception of the battery. HOMER® uses the total Net Present Cost (NPC) to represent the life-cycle cost of a system. The modeller specifies the discount rate and the project lifetime.
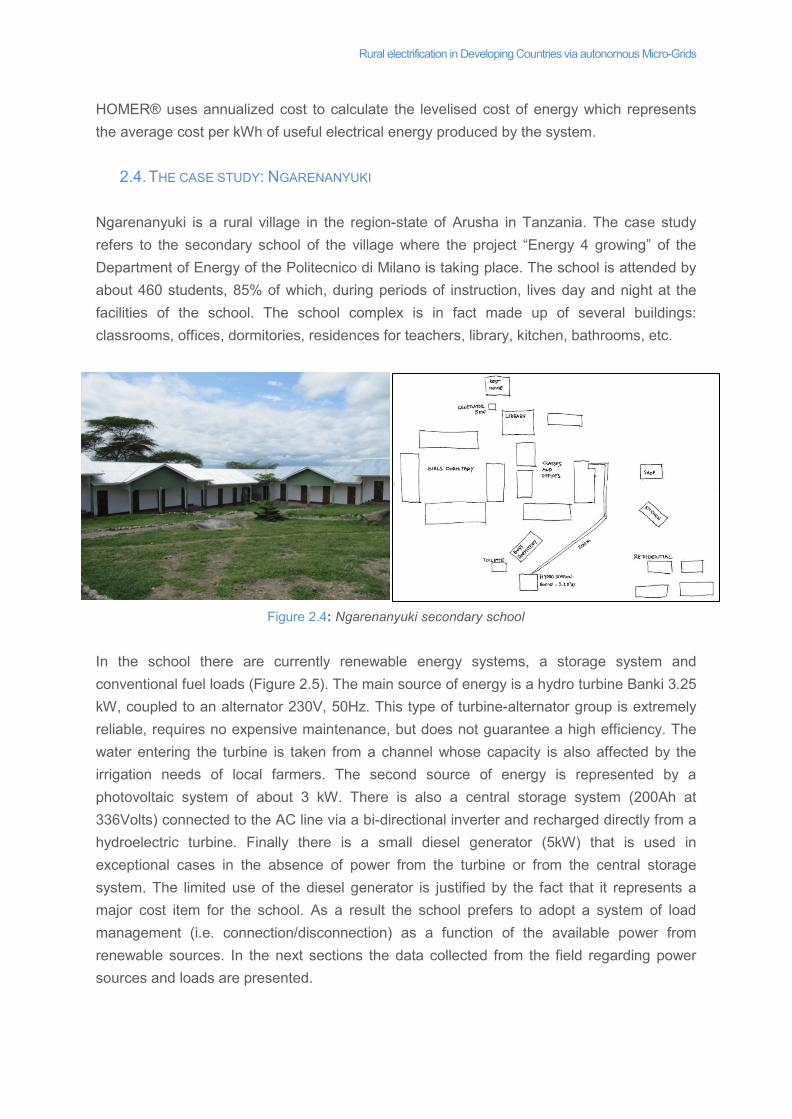
Rural electrification in Developing Countries via autonomous Micro-Grids HOMER® uses annualized cost to calculate the levelised cost of energy which represents the average cost per kWh of useful electrical energy produced by the system.
2.4. THE CASE STUDY: NGARENANYUKI Ngarenanyuki is a rural village in the region-state of Arusha in Tanzania. The case study refers to the secondary school of the village where the project “Energy 4 growing” of the Department of Energy of the Politecnico di Milano is taking place. The school is attended by about 460 students, 85% of which, during periods of instruction, lives day and night at the facilities of the school. The school complex is in fact made up of several buildings: classrooms, offices, dormitories, residences for teachers, library, kitchen, bathrooms, etc.
Figure 2.4: Ngarenanyuki secondary school
In the school there are currently renewable energy systems, a storage system and conventional fuel loads (Figure 2.5). The main source of energy is a hydro turbine Banki 3.25 kW, coupled to an alternator 230V, 50Hz. This type of turbine-alternator group is extremely reliable, requires no expensive maintenance, but does not guarantee a high efficiency. The water entering the turbine is taken from a channel whose capacity is also affected by the irrigation needs of local farmers. The second source of energy is represented by a photovoltaic system of about 3 kW. There is also a central storage system (200Ah at 336Volts) connected to the AC line via a bi-directional inverter and recharged directly from a hydroelectric turbine. Finally there is a small diesel generator (5kW) that is used in exceptional cases in the absence of power from the turbine or from the central storage system. The limited use of the diesel generator is justified by the fact that it represents a major cost item for the school. As a result the school prefers to adopt a system of load management (i.e. connection/disconnection) as a function of the available power from renewable sources. In the next sections the data collected from the field regarding power sources and loads are presented.
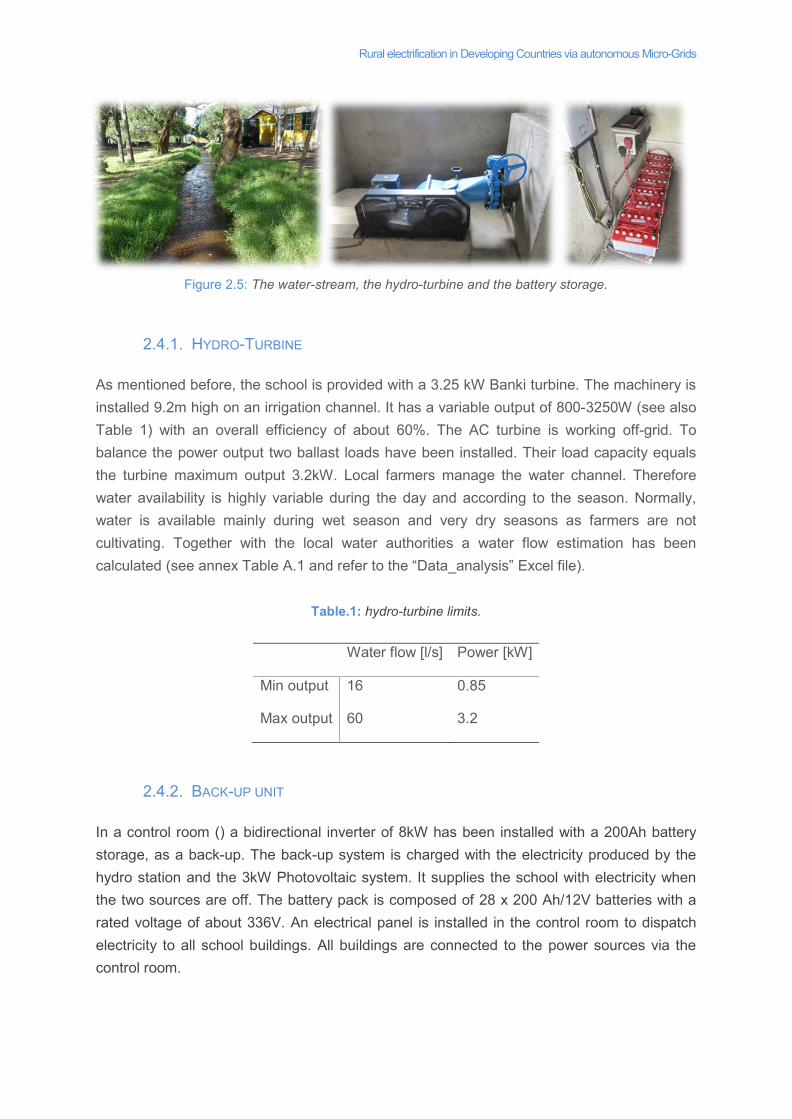
Rural electrification in Developing Countries via autonomous Micro-Grids
Figure 2.5: The water-stream, the hydro-turbine and the battery storage.
2.4.1. HYDRO-TURBINE
As mentioned before, the school is provided with a 3.25 kW Banki turbine. The machinery is installed 9.2m high on an irrigation channel. It has a variable output of 800-3250W (see also Table 1) with an overall efficiency of about 60%. The AC turbine is working off-grid. To balance the power output two ballast loads have been installed. Their load capacity equals the turbine maximum output 3.2kW. Local farmers manage the water channel. Therefore water availability is highly variable during the day and according to the season. Normally, water is available mainly during wet season and very dry seasons as farmers are not cultivating. Together with the local water authorities a water flow estimation has been calculated (see annex Table A.1 and refer to the “Data_analysis” Excel file).
Table.1: hydro-turbine limits.
Water flow [l/s] Power [kW]
Min output 16 0.85
Max output 60 3.2
2.4.2. BACK-UP UNIT
In a control room () a bidirectional inverter of 8kW has been installed with a 200Ah battery storage, as a back-up. The back-up system is charged with the electricity produced by the hydro station and the 3kW Photovoltaic system. It supplies the school with electricity when the two sources are off. The battery pack is composed of 28 x 200 Ah/12V batteries with a rated voltage of about 336V. An electrical panel is installed in the control room to dispatch electricity to all school buildings. All buildings are connected to the power sources via the control room.

Rural electrification in Developing Countries via autonomous Micro-Grids
Figure 6. the bidirectional inverter (left) and the electrical panel (right)
2.4.3. DIESEL GENERATOR
One diesel generator unit of 5kW is also installed in the school. However, the diesel generator is too expensive to be run both on a variable and fixed cost. Thus, it is switched on only when the school needs to use the photocopy machine and other specific activities (i.e. inauguration, school celebration) if the hydro/PV is not enough. The generator needs to be switched on and off manually. Nevertheless for analysis, the generator is considered not to be in use.
2.4.4. LOADS
Loads are now determined by the limited generating and storage capacity. Electricity services and backup units are managed to meet different priorities day by day according to the electricity availability. Main electricity uses are:
• Lighting service: in all classrooms from 6PM to 11PM. Monday- Sunday. Light in girls and boys dormitories are switched off at 11.30PM.
• Computer: at present all computers, are used by the Headmaster and the teachers, both for school need and private use. A computer room will be opened in the library. The estimation is based on some 40 units.
• Security Lights: all security lights are neon. Lights are on 12 hours per day • Fridges: there are 2 fridges at the school. One small for private use and one in the
school shop to freeze the meat when a cow is slaughtered. The freezer (Figure 7) helps the school to reduce the cost of meat. Instead of buying meat from the butcher the school is now keeping the cow.
• Water Pump: recently the school has dug a borehole (Figure 7) to reach a better quality water source. The water will be used for sanitary reasons, showers and
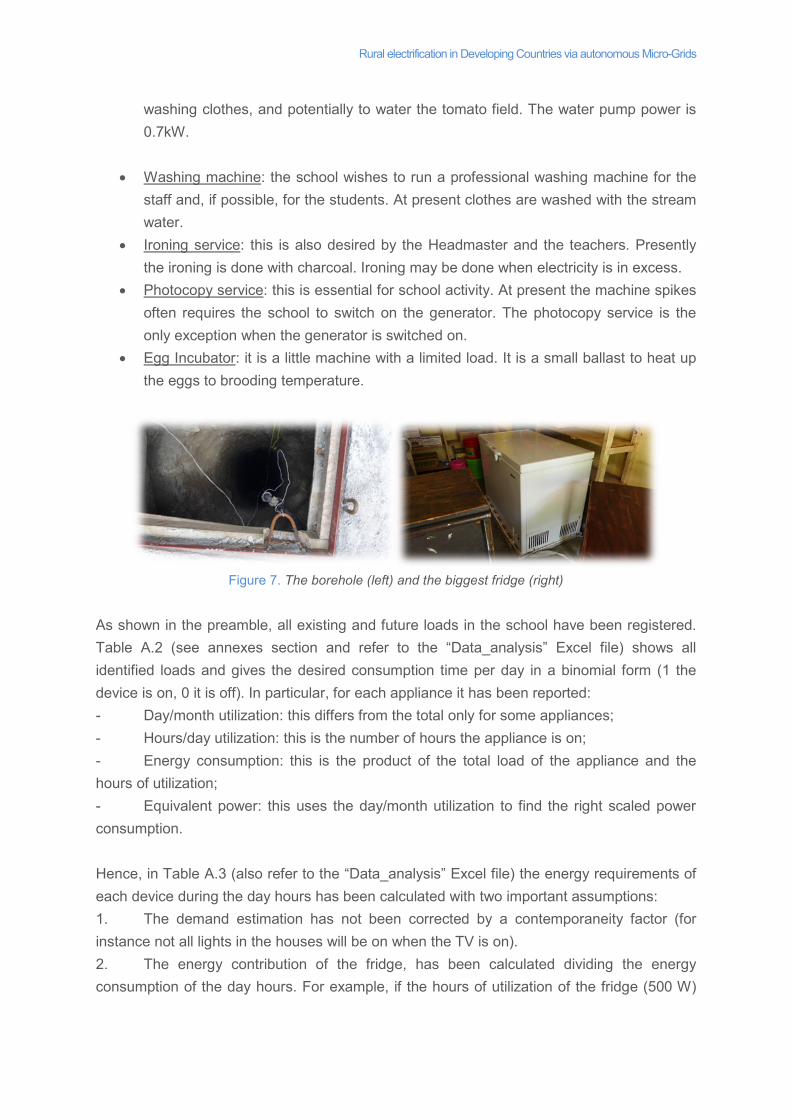
Rural electrification in Developing Countries via autonomous Micro-Grids
washing clothes, and potentially to water the tomato field. The water pump power is 0.7kW.
• Washing machine: the school wishes to run a professional washing machine for the
staff and, if possible, for the students. At present clothes are washed with the stream water.
• Ironing service: this is also desired by the Headmaster and the teachers. Presently the ironing is done with charcoal. Ironing may be done when electricity is in excess.
• Photocopy service: this is essential for school activity. At present the machine spikes often requires the school to switch on the generator. The photocopy service is the only exception when the generator is switched on.
• Egg Incubator: it is a little machine with a limited load. It is a small ballast to heat up the eggs to brooding temperature.
Figure 7. The borehole (left) and the biggest fridge (right) As shown in the preamble, all existing and future loads in the school have been registered. Table A.2 (see annexes section and refer to the “Data_analysis” Excel file) shows all identified loads and gives the desired consumption time per day in a binomial form (1 the device is on, 0 it is off). In particular, for each appliance it has been reported: - Day/month utilization: this differs from the total only for some appliances; - Hours/day utilization: this is the number of hours the appliance is on; - Energy consumption: this is the product of the total load of the appliance and the hours of utilization; - Equivalent power: this uses the day/month utilization to find the right scaled power consumption. Hence, in Table A.3 (also refer to the “Data_analysis” Excel file) the energy requirements of each device during the day hours has been calculated with two important assumptions: 1. The demand estimation has not been corrected by a contemporaneity factor (for instance not all lights in the houses will be on when the TV is on). 2. The energy contribution of the fridge, has been calculated dividing the energy consumption of the day hours. For example, if the hours of utilization of the fridge (500 W)
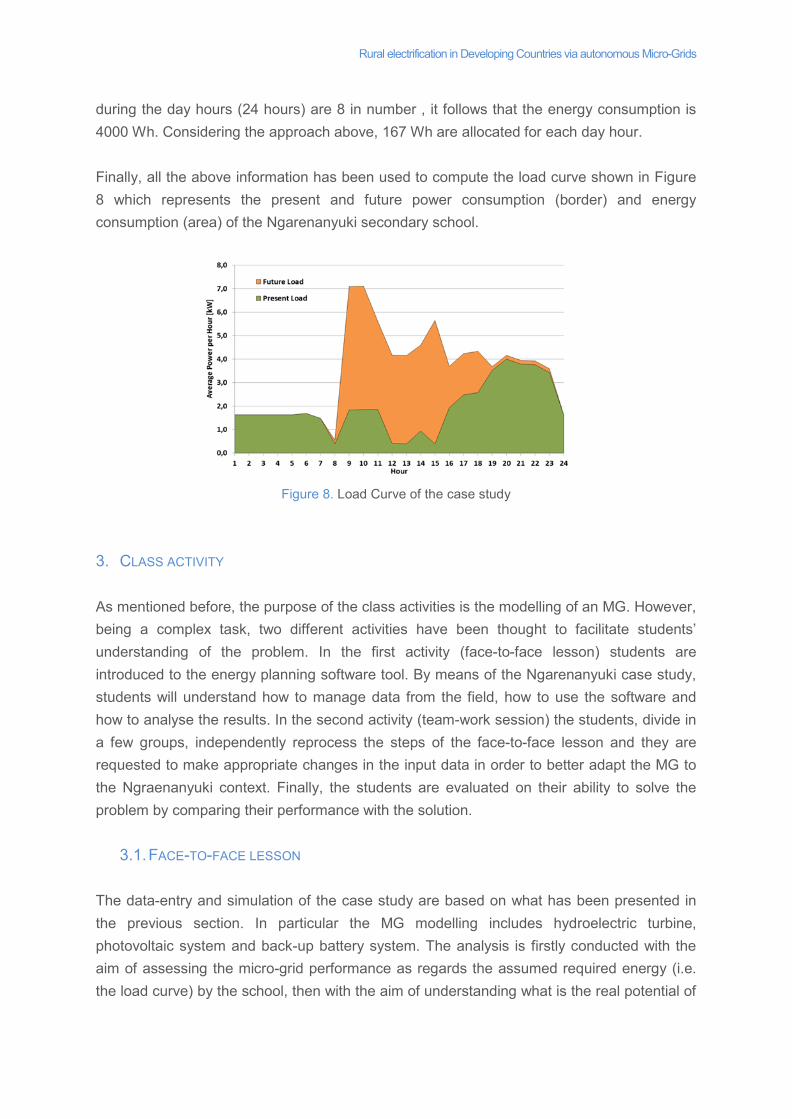
Rural electrification in Developing Countries via autonomous Micro-Grids during the day hours (24 hours) are 8 in number , it follows that the energy consumption is 4000 Wh. Considering the approach above, 167 Wh are allocated for each day hour. Finally, all the above information has been used to compute the load curve shown in Figure 8 which represents the present and future power consumption (border) and energy consumption (area) of the Ngarenanyuki secondary school.
Figure 8. Load Curve of the case study 3. CLASS ACTIVITY As mentioned before, the purpose of the class activities is the modelling of an MG. However, being a complex task, two different activities have been thought to facilitate students’ understanding of the problem. In the first activity (face-to-face lesson) students are introduced to the energy planning software tool. By means of the Ngarenanyuki case study, students will understand how to manage data from the field, how to use the software and how to analyse the results. In the second activity (team-work session) the students, divide in a few groups, independently reprocess the steps of the face-to-face lesson and they are requested to make appropriate changes in the input data in order to better adapt the MG to the Ngraenanyuki context. Finally, the students are evaluated on their ability to solve the problem by comparing their performance with the solution.
3.1. FACE-TO-FACE LESSON The data-entry and simulation of the case study are based on what has been presented in the previous section. In particular the MG modelling includes hydroelectric turbine, photovoltaic system and back-up battery system. The analysis is firstly conducted with the aim of assessing the micro-grid performance as regards the assumed required energy (i.e. the load curve) by the school, then with the aim of understanding what is the real potential of
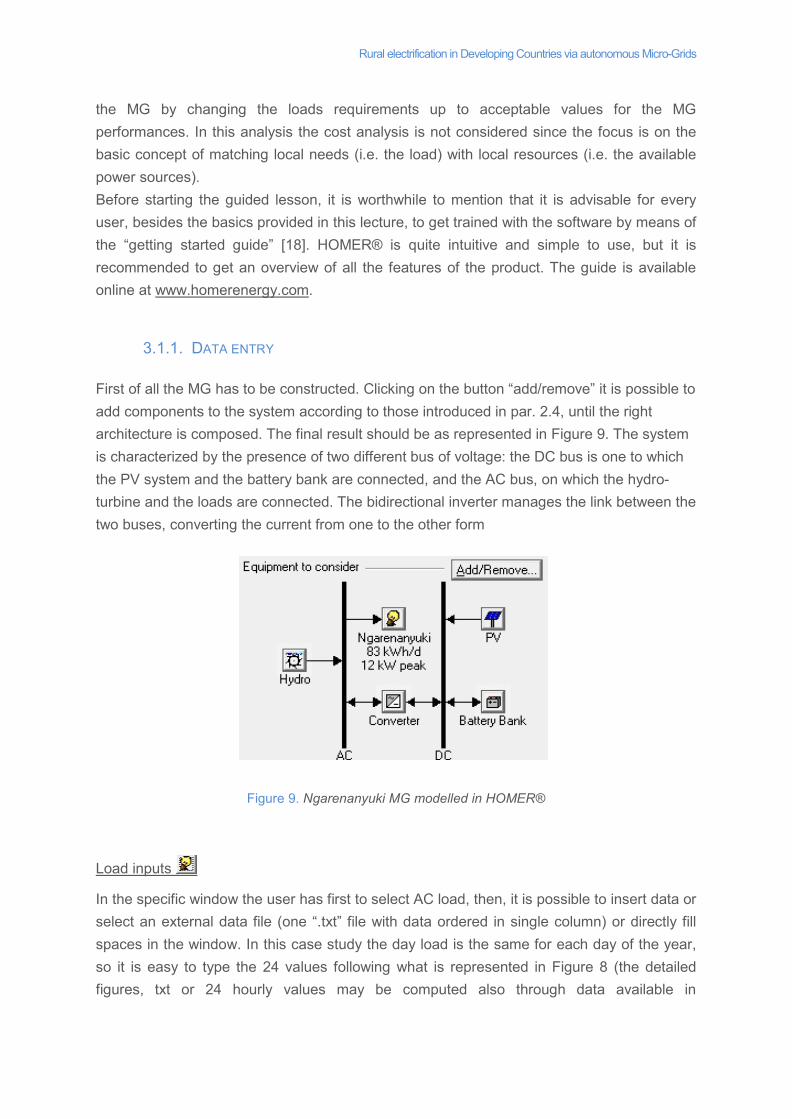
Rural electrification in Developing Countries via autonomous Micro-Grids the MG by changing the loads requirements up to acceptable values for the MG performances. In this analysis the cost analysis is not considered since the focus is on the basic concept of matching local needs (i.e. the load) with local resources (i.e. the available power sources). Before starting the guided lesson, it is worthwhile to mention that it is advisable for every user, besides the basics provided in this lecture, to get trained with the software by means of the “getting started guide” [18]. HOMER® is quite intuitive and simple to use, but it is recommended to get an overview of all the features of the product. The guide is available online at www.homerenergy.com.
3.1.1. DATA ENTRY
First of all the MG has to be constructed. Clicking on the button “add/remove” it is possible to add components to the system according to those introduced in par. 2.4, until the right architecture is composed. The final result should be as represented in Figure 9. The system is characterized by the presence of two different bus of voltage: the DC bus is one to which the PV system and the battery bank are connected, and the AC bus, on which the hydro-turbine and the loads are connected. The bidirectional inverter manages the link between the two buses, converting the current from one to the other form
Figure 9. Ngarenanyuki MG modelled in HOMER®
Load inputs
In the specific window the user has first to select AC load, then, it is possible to insert data or select an external data file (one “.txt” file with data ordered in single column) or directly fill spaces in the window. In this case study the day load is the same for each day of the year, so it is easy to type the 24 values following what is represented in Figure 8 (the detailed figures, txt or 24 hourly values may be computed also through data available in
Rural electrification in Developing Countries via autonomous Micro-Grids “Data_analysis” Excel file). Finally, in the low part of the window, the user may specify the random variability of the load (10% is an appropriate value).
Hydro resource inputs
In the resource section the user can enter the hydro resource input. Rearranging data presented in Table A.1 and in the “Data_analysis” Excel file, the user may create a “.txt” file with the values of the flow rate for each hour of the year. Having such a file it is easy to upload it in HOMER® by means of the option “import time series data file”. In the low part of the window the user can also scale the annual average flow rate to perform a sensitivity analysis during the simulation phase.
Hydro inputs
With reference to Table 1, the user may complete the required data in the specific window called “Hydro Inputs”. In particular, looking at the power limit of the Banki turbine, it is simple to calculate the minimum flow ratio as about 20% of the total. Available head, design flow rate and efficiency have been reported in the previous sections.
Solar resource inputs
In this window the user must insert the solar resource which will be used by the Photovoltaic (PV) system. There are two possibilities: (i) insert the coordinates of the MG location and leave the software to search for the right values through the web, (ii) type the required daily radiation data in the proper table. In this case study the second alternative has been followed, since daily radiation data could be obtained by a reliable source like the NASA datacentre [19]. Regarding the clearness index, HOMER® will find the values by itself as soon as the typing is completed.
PV inputs
Next step is the filling of the “PV inputs” window. In particular: the size to consider is 3 kW (note that infinite sizes may be tested if in a design phase), the derating factor may be set to a value around 80%, the slope degree (the inclination of the panel(s) from the ground), to be left on zero (flat panel(s)) if the location is between the two tropics, the azimuth which loses importance if there is no slope.
Converter inputs
The “Converter inputs” window is similar to the previous one. According to the already presented data, the size to consider is 8kW and the efficiency may be set to 90% in both directions.
Battery inputs
Finally, the “battery inputs” window needs to be filled. First, a battery type which is consistent with the one already present on the field (200Ah, 12Volts) is chosen. Second, the user must specify the number of strings and the number of batteries for each string to be performed by
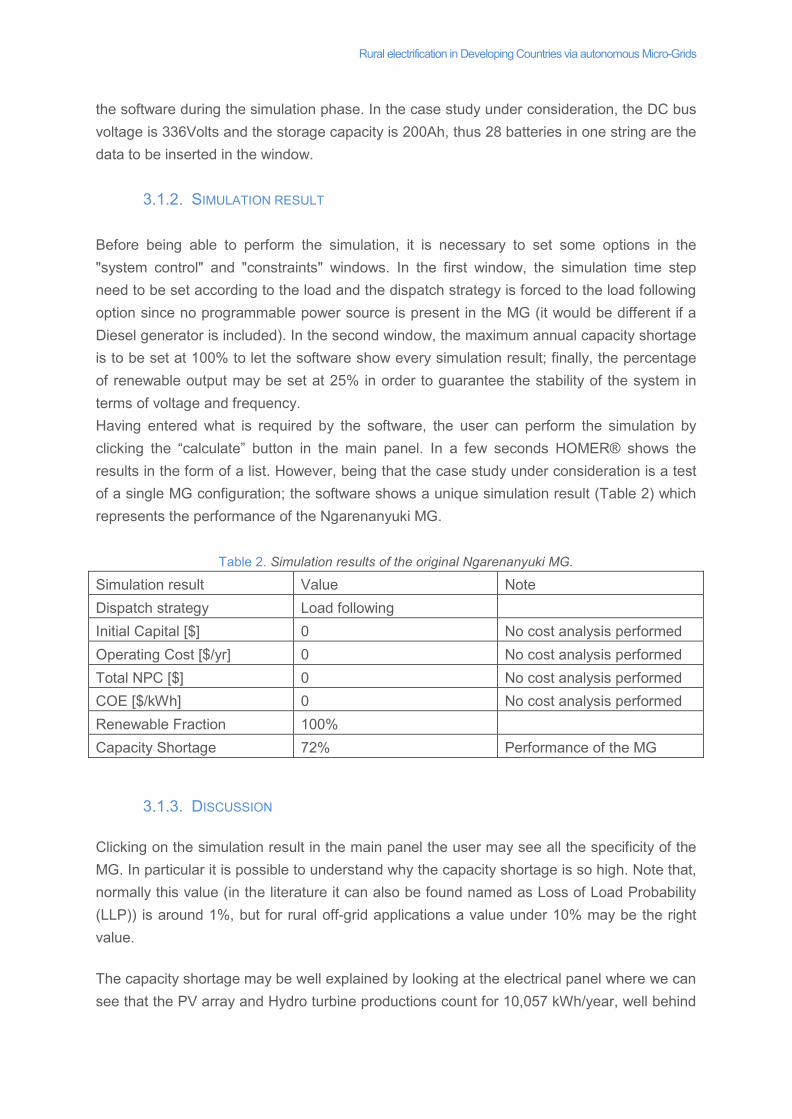
Rural electrification in Developing Countries via autonomous Micro-Grids the software during the simulation phase. In the case study under consideration, the DC bus voltage is 336Volts and the storage capacity is 200Ah, thus 28 batteries in one string are the data to be inserted in the window.
3.1.2. SIMULATION RESULT Before being able to perform the simulation, it is necessary to set some options in the "system control" and "constraints" windows. In the first window, the simulation time step need to be set according to the load and the dispatch strategy is forced to the load following option since no programmable power source is present in the MG (it would be different if a Diesel generator is included). In the second window, the maximum annual capacity shortage is to be set at 100% to let the software show every simulation result; finally, the percentage of renewable output may be set at 25% in order to guarantee the stability of the system in terms of voltage and frequency. Having entered what is required by the software, the user can perform the simulation by clicking the “calculate” button in the main panel. In a few seconds HOMER® shows the results in the form of a list. However, being that the case study under consideration is a test of a single MG configuration; the software shows a unique simulation result (Table 2) which represents the performance of the Ngarenanyuki MG.
Table 2. Simulation results of the original Ngarenanyuki MG.
Simulation result Value Note Dispatch strategy Load following Initial Capital [$] 0 No cost analysis performed Operating Cost [$/yr] 0 No cost analysis performed Total NPC [$] 0 No cost analysis performed COE [$/kWh] 0 No cost analysis performed Renewable Fraction 100% Capacity Shortage 72% Performance of the MG
3.1.3. DISCUSSION
Clicking on the simulation result in the main panel the user may see all the specificity of the MG. In particular it is possible to understand why the capacity shortage is so high. Note that, normally this value (in the literature it can also be found named as Loss of Load Probability (LLP)) is around 1%, but for rural off-grid applications a value under 10% may be the right value.
The capacity shortage may be well explained by looking at the electrical panel where we can see that the PV array and Hydro turbine productions count for 10,057 kWh/year, well behind
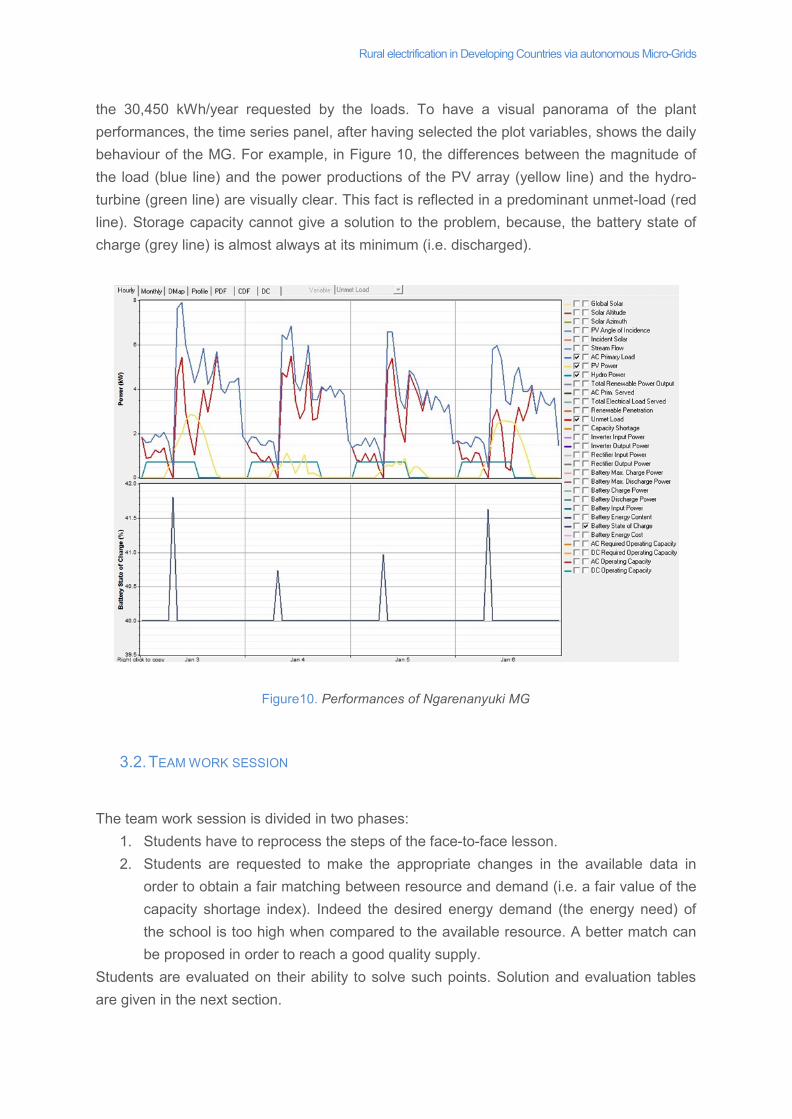
Rural electrification in Developing Countries via autonomous Micro-Grids the 30,450 kWh/year requested by the loads. To have a visual panorama of the plant performances, the time series panel, after having selected the plot variables, shows the daily behaviour of the MG. For example, in Figure 10, the differences between the magnitude of the load (blue line) and the power productions of the PV array (yellow line) and the hydro-turbine (green line) are visually clear. This fact is reflected in a predominant unmet-load (red line). Storage capacity cannot give a solution to the problem, because, the battery state of charge (grey line) is almost always at its minimum (i.e. discharged).
Figure10. Performances of Ngarenanyuki MG
3.2. TEAM WORK SESSION
The team work session is divided in two phases: 1. Students have to reprocess the steps of the face-to-face lesson. 2. Students are requested to make the appropriate changes in the available data in
order to obtain a fair matching between resource and demand (i.e. a fair value of the capacity shortage index). Indeed the desired energy demand (the energy need) of the school is too high when compared to the available resource. A better match can be proposed in order to reach a good quality supply.
Students are evaluated on their ability to solve such points. Solution and evaluation tables are given in the next section.
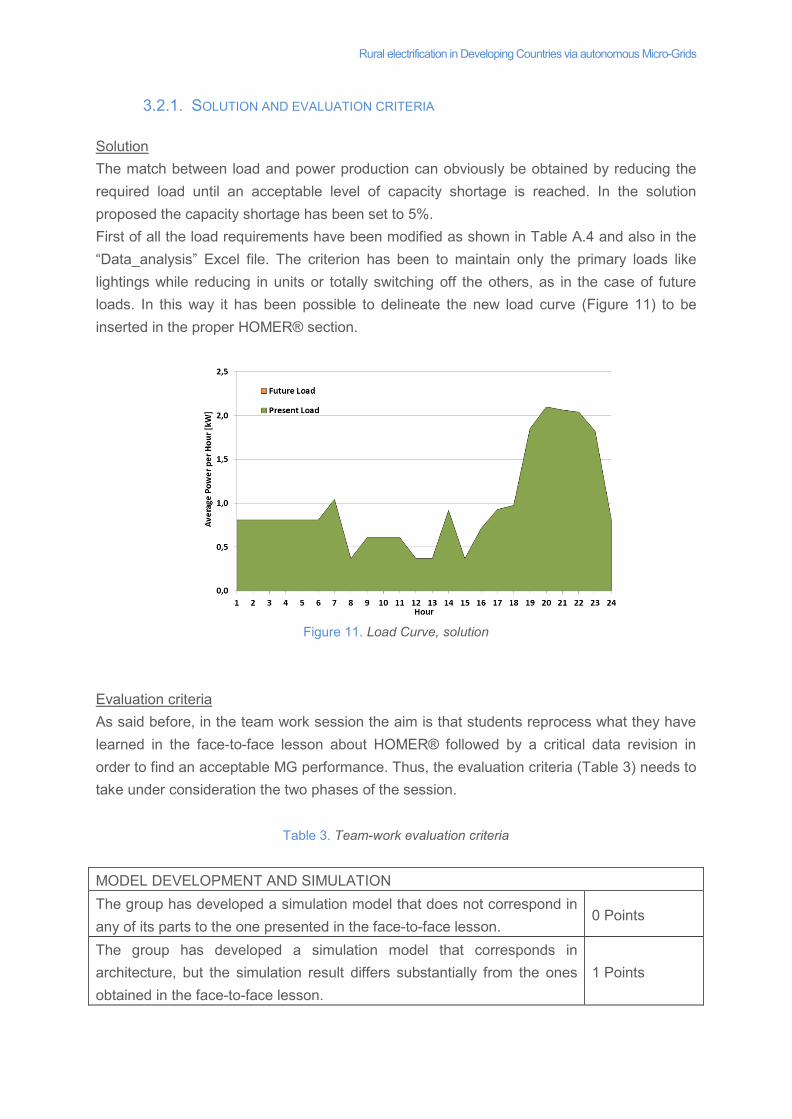
Rural electrification in Developing Countries via autonomous Micro-Grids
3.2.1. SOLUTION AND EVALUATION CRITERIA
Solution The match between load and power production can obviously be obtained by reducing the required load until an acceptable level of capacity shortage is reached. In the solution proposed the capacity shortage has been set to 5%. First of all the load requirements have been modified as shown in Table A.4 and also in the “Data_analysis” Excel file. The criterion has been to maintain only the primary loads like lightings while reducing in units or totally switching off the others, as in the case of future loads. In this way it has been possible to delineate the new load curve (Figure 11) to be inserted in the proper HOMER® section.
Figure 11. Load Curve, solution
Evaluation criteria As said before, in the team work session the aim is that students reprocess what they have learned in the face-to-face lesson about HOMER® followed by a critical data revision in order to find an acceptable MG performance. Thus, the evaluation criteria (Table 3) needs to take under consideration the two phases of the session.
Table 3. Team-work evaluation criteria
MODEL DEVELOPMENT AND SIMULATION The group has developed a simulation model that does not correspond in any of its parts to the one presented in the face-to-face lesson.
0 Points
The group has developed a simulation model that corresponds in architecture, but the simulation result differs substantially from the ones obtained in the face-to-face lesson.
1 Points
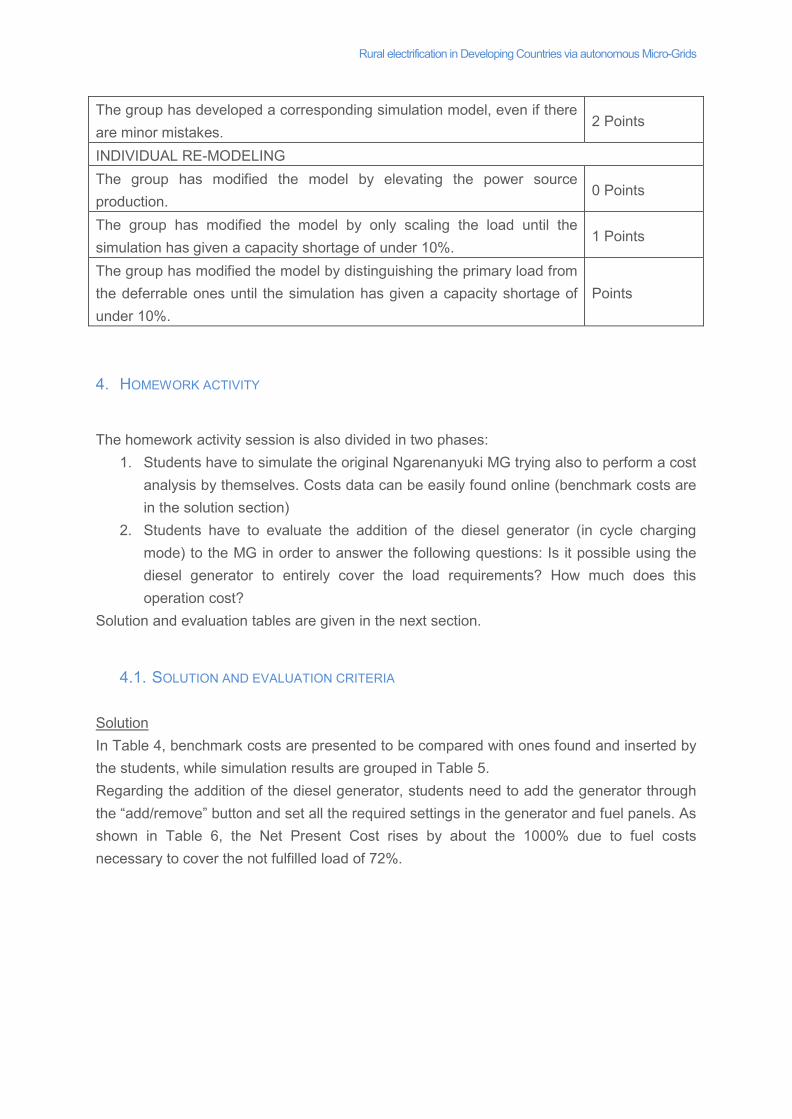
Rural electrification in Developing Countries via autonomous Micro-Grids The group has developed a corresponding simulation model, even if there are minor mistakes.
2 Points
INDIVIDUAL RE-MODELING The group has modified the model by elevating the power source production.
0 Points
The group has modified the model by only scaling the load until the simulation has given a capacity shortage of under 10%.
1 Points
The group has modified the model by distinguishing the primary load from the deferrable ones until the simulation has given a capacity shortage of under 10%.
Points
4. HOMEWORK ACTIVITY
The homework activity session is also divided in two phases: 1. Students have to simulate the original Ngarenanyuki MG trying also to perform a cost
analysis by themselves. Costs data can be easily found online (benchmark costs are in the solution section)
2. Students have to evaluate the addition of the diesel generator (in cycle charging mode) to the MG in order to answer the following questions: Is it possible using the diesel generator to entirely cover the load requirements? How much does this operation cost?
Solution and evaluation tables are given in the next section.
4.1. SOLUTION AND EVALUATION CRITERIA Solution In Table 4, benchmark costs are presented to be compared with ones found and inserted by the students, while simulation results are grouped in Table 5. Regarding the addition of the diesel generator, students need to add the generator through the “add/remove” button and set all the required settings in the generator and fuel panels. As shown in Table 6, the Net Present Cost rises by about the 1000% due to fuel costs necessary to cover the not fulfilled load of 72%.
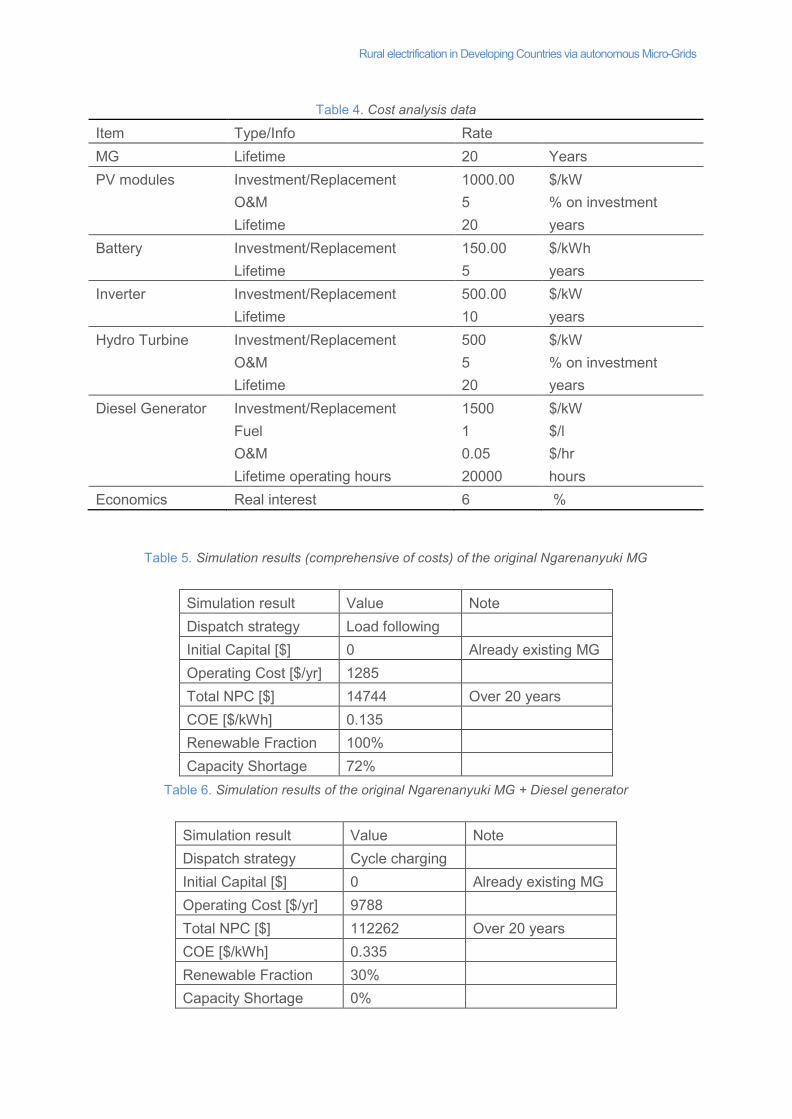
Rural electrification in Developing Countries via autonomous Micro-Grids
Table 4. Cost analysis data
Item Type/Info Rate MG Lifetime 20 Years PV modules Investment/Replacement 1000.00 $/kW O&M 5 % on investment Lifetime 20 years Battery Investment/Replacement 150.00 $/kWh Lifetime 5 years Inverter Investment/Replacement 500.00 $/kW Lifetime 10 years Hydro Turbine Investment/Replacement 500 $/kW O&M 5 % on investment Lifetime 20 years Diesel Generator Investment/Replacement 1500 $/kW Fuel 1 $/l O&M 0.05 $/hr Lifetime operating hours 20000 hours Economics Real interest 6 %
Table 5. Simulation results (comprehensive of costs) of the original Ngarenanyuki MG
Simulation result Value Note Dispatch strategy Load following Initial Capital [$] 0 Already existing MG Operating Cost [$/yr] 1285 Total NPC [$] 14744 Over 20 years COE [$/kWh] 0.135 Renewable Fraction 100% Capacity Shortage 72%
Table 6. Simulation results of the original Ngarenanyuki MG + Diesel generator
Simulation result Value Note Dispatch strategy Cycle charging Initial Capital [$] 0 Already existing MG Operating Cost [$/yr] 9788 Total NPC [$] 112262 Over 20 years COE [$/kWh] 0.335 Renewable Fraction 30% Capacity Shortage 0%
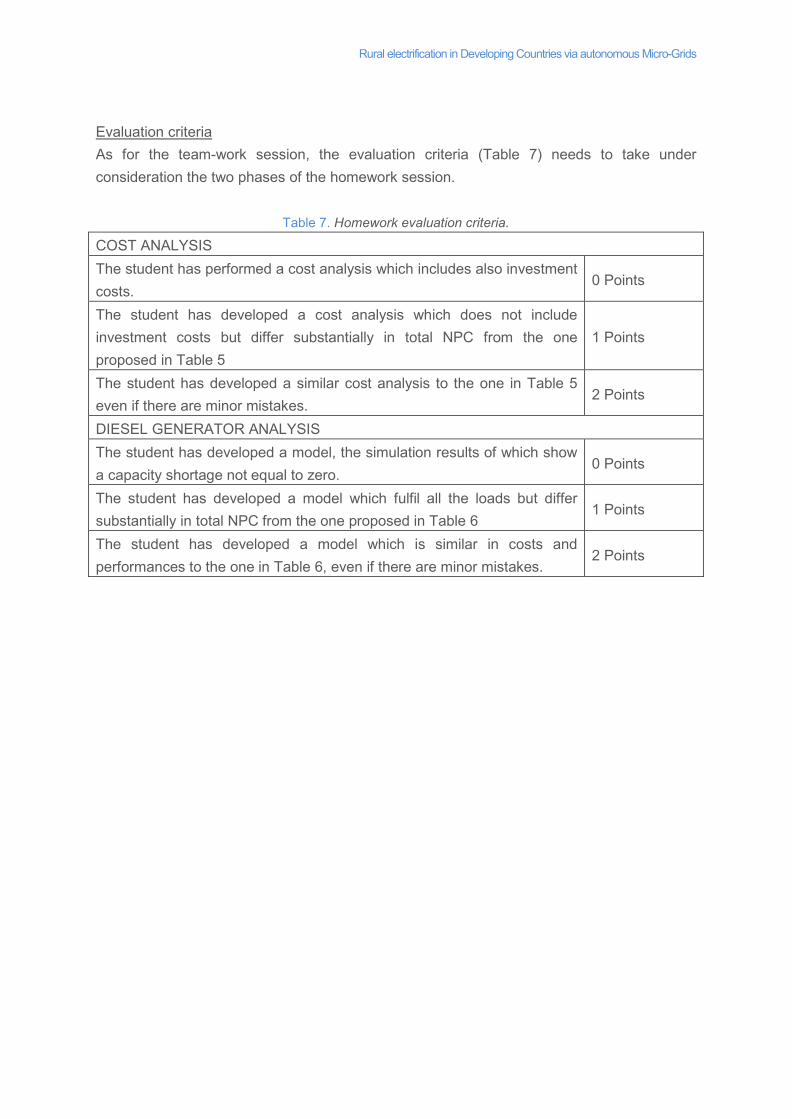
Rural electrification in Developing Countries via autonomous Micro-Grids Evaluation criteria As for the team-work session, the evaluation criteria (Table 7) needs to take under consideration the two phases of the homework session.
Table 7. Homework evaluation criteria.
COST ANALYSIS The student has performed a cost analysis which includes also investment costs.
0 Points
The student has developed a cost analysis which does not include investment costs but differ substantially in total NPC from the one proposed in Table 5
1 Points
The student has developed a similar cost analysis to the one in Table 5 even if there are minor mistakes.
2 Points
DIESEL GENERATOR ANALYSIS The student has developed a model, the simulation results of which show a capacity shortage not equal to zero.
0 Points
The student has developed a model which fulfil all the loads but differ substantially in total NPC from the one proposed in Table 6
1 Points
The student has developed a model which is similar in costs and performances to the one in Table 6, even if there are minor mistakes.
2 Points
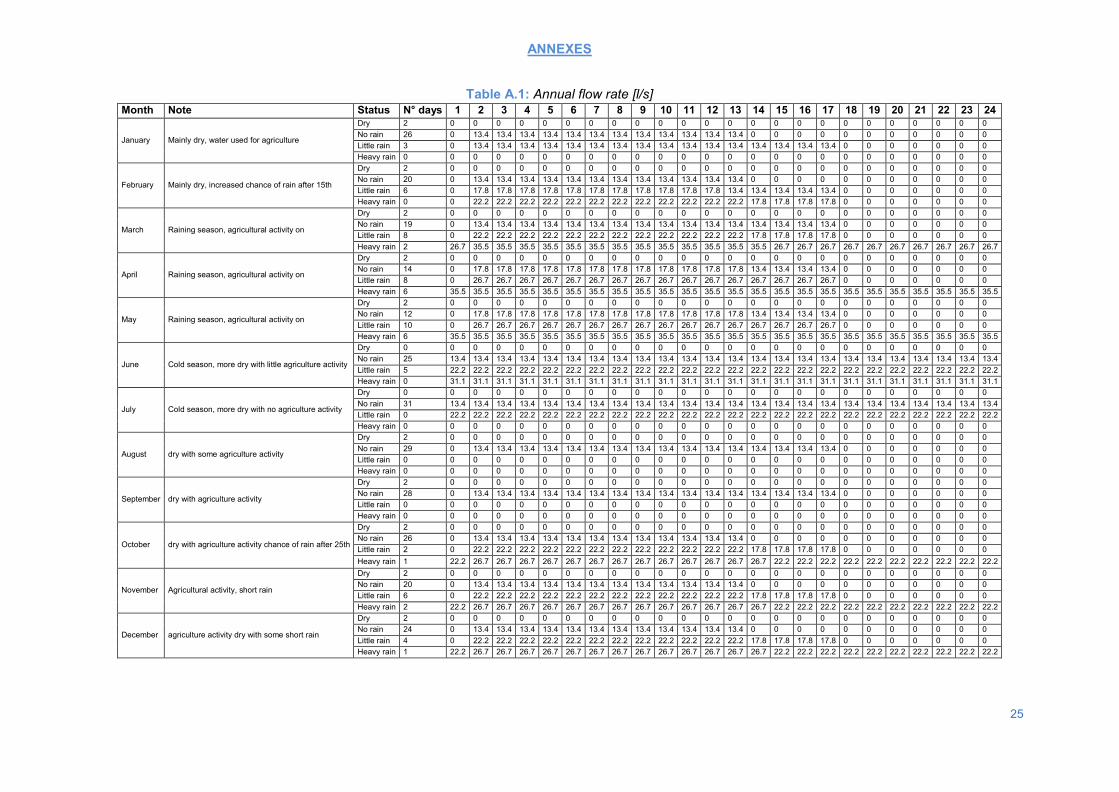
ANNEXES
Table A.1: Annual flow rate [l/s] Month Note Status N° days 1 2 3 4 5 6 7 8 9 10 11 12 13 14 15 16 17 18 19 20 21 22 23 24
January Mainly dry, water used for agriculture
Dry 2 0 0 0 0 0 0 0 0 0 0 0 0 0 0 0 0 0 0 0 0 0 0 0 0 No rain 26 0 13.4 13.4 13.4 13.4 13.4 13.4 13.4 13.4 13.4 13.4 13.4 13.4 0 0 0 0 0 0 0 0 0 0 0 Little rain 3 0 13.4 13.4 13.4 13.4 13.4 13.4 13.4 13.4 13.4 13.4 13.4 13.4 13.4 13.4 13.4 13.4 0 0 0 0 0 0 0 Heavy rain 0 0 0 0 0 0 0 0 0 0 0 0 0 0 0 0 0 0 0 0 0 0 0 0 0
February Mainly dry, increased chance of rain after 15th
Dry 2 0 0 0 0 0 0 0 0 0 0 0 0 0 0 0 0 0 0 0 0 0 0 0 0 No rain 20 0 13.4 13.4 13.4 13.4 13.4 13.4 13.4 13.4 13.4 13.4 13.4 13.4 0 0 0 0 0 0 0 0 0 0 0 Little rain 6 0 17.8 17.8 17.8 17.8 17.8 17.8 17.8 17.8 17.8 17.8 17.8 13.4 13.4 13.4 13.4 13.4 0 0 0 0 0 0 0 Heavy rain 0 0 22.2 22.2 22.2 22.2 22.2 22.2 22.2 22.2 22.2 22.2 22.2 22.2 17.8 17.8 17.8 17.8 0 0 0 0 0 0 0
March Raining season, agricultural activity on
Dry 2 0 0 0 0 0 0 0 0 0 0 0 0 0 0 0 0 0 0 0 0 0 0 0 0 No rain 19 0 13.4 13.4 13.4 13.4 13.4 13.4 13.4 13.4 13.4 13.4 13.4 13.4 13.4 13.4 13.4 13.4 0 0 0 0 0 0 0 Little rain 8 0 22.2 22.2 22.2 22.2 22.2 22.2 22.2 22.2 22.2 22.2 22.2 22.2 17.8 17.8 17.8 17.8 0 0 0 0 0 0 0 Heavy rain 2 26.7 35.5 35.5 35.5 35.5 35.5 35.5 35.5 35.5 35.5 35.5 35.5 35.5 35.5 26.7 26.7 26.7 26.7 26.7 26.7 26.7 26.7 26.7 26.7
April Raining season, agricultural activity on
Dry 2 0 0 0 0 0 0 0 0 0 0 0 0 0 0 0 0 0 0 0 0 0 0 0 0 No rain 14 0 17.8 17.8 17.8 17.8 17.8 17.8 17.8 17.8 17.8 17.8 17.8 17.8 13.4 13.4 13.4 13.4 0 0 0 0 0 0 0 Little rain 8 0 26.7 26.7 26.7 26.7 26.7 26.7 26.7 26.7 26.7 26.7 26.7 26.7 26.7 26.7 26.7 26.7 0 0 0 0 0 0 0 Heavy rain 6 35.5 35.5 35.5 35.5 35.5 35.5 35.5 35.5 35.5 35.5 35.5 35.5 35.5 35.5 35.5 35.5 35.5 35.5 35.5 35.5 35.5 35.5 35.5 35.5
May Raining season, agricultural activity on
Dry 2 0 0 0 0 0 0 0 0 0 0 0 0 0 0 0 0 0 0 0 0 0 0 0 0 No rain 12 0 17.8 17.8 17.8 17.8 17.8 17.8 17.8 17.8 17.8 17.8 17.8 17.8 13.4 13.4 13.4 13.4 0 0 0 0 0 0 0 Little rain 10 0 26.7 26.7 26.7 26.7 26.7 26.7 26.7 26.7 26.7 26.7 26.7 26.7 26.7 26.7 26.7 26.7 0 0 0 0 0 0 0 Heavy rain 6 35.5 35.5 35.5 35.5 35.5 35.5 35.5 35.5 35.5 35.5 35.5 35.5 35.5 35.5 35.5 35.5 35.5 35.5 35.5 35.5 35.5 35.5 35.5 35.5
June Cold season, more dry with little agriculture activity
Dry 0 0 0 0 0 0 0 0 0 0 0 0 0 0 0 0 0 0 0 0 0 0 0 0 0 No rain 25 13.4 13.4 13.4 13.4 13.4 13.4 13.4 13.4 13.4 13.4 13.4 13.4 13.4 13.4 13.4 13.4 13.4 13.4 13.4 13.4 13.4 13.4 13.4 13.4 Little rain 5 22.2 22.2 22.2 22.2 22.2 22.2 22.2 22.2 22.2 22.2 22.2 22.2 22.2 22.2 22.2 22.2 22.2 22.2 22.2 22.2 22.2 22.2 22.2 22.2 Heavy rain 0 31.1 31.1 31.1 31.1 31.1 31.1 31.1 31.1 31.1 31.1 31.1 31.1 31.1 31.1 31.1 31.1 31.1 31.1 31.1 31.1 31.1 31.1 31.1 31.1
July Cold season, more dry with no agriculture activity
Dry 0 0 0 0 0 0 0 0 0 0 0 0 0 0 0 0 0 0 0 0 0 0 0 0 0 No rain 31 13.4 13.4 13.4 13.4 13.4 13.4 13.4 13.4 13.4 13.4 13.4 13.4 13.4 13.4 13.4 13.4 13.4 13.4 13.4 13.4 13.4 13.4 13.4 13.4 Little rain 0 22.2 22.2 22.2 22.2 22.2 22.2 22.2 22.2 22.2 22.2 22.2 22.2 22.2 22.2 22.2 22.2 22.2 22.2 22.2 22.2 22.2 22.2 22.2 22.2 Heavy rain 0 0 0 0 0 0 0 0 0 0 0 0 0 0 0 0 0 0 0 0 0 0 0 0 0
August dry with some agriculture activity
Dry 2 0 0 0 0 0 0 0 0 0 0 0 0 0 0 0 0 0 0 0 0 0 0 0 0 No rain 29 0 13.4 13.4 13.4 13.4 13.4 13.4 13.4 13.4 13.4 13.4 13.4 13.4 13.4 13.4 13.4 13.4 0 0 0 0 0 0 0 Little rain 0 0 0 0 0 0 0 0 0 0 0 0 0 0 0 0 0 0 0 0 0 0 0 0 0 Heavy rain 0 0 0 0 0 0 0 0 0 0 0 0 0 0 0 0 0 0 0 0 0 0 0 0 0
September dry with agriculture activity
Dry 2 0 0 0 0 0 0 0 0 0 0 0 0 0 0 0 0 0 0 0 0 0 0 0 0 No rain 28 0 13.4 13.4 13.4 13.4 13.4 13.4 13.4 13.4 13.4 13.4 13.4 13.4 13.4 13.4 13.4 13.4 0 0 0 0 0 0 0 Little rain 0 0 0 0 0 0 0 0 0 0 0 0 0 0 0 0 0 0 0 0 0 0 0 0 0 Heavy rain 0 0 0 0 0 0 0 0 0 0 0 0 0 0 0 0 0 0 0 0 0 0 0 0 0
October dry with agriculture activity chance of rain after 25th
Dry 2 0 0 0 0 0 0 0 0 0 0 0 0 0 0 0 0 0 0 0 0 0 0 0 0 No rain 26 0 13.4 13.4 13.4 13.4 13.4 13.4 13.4 13.4 13.4 13.4 13.4 13.4 0 0 0 0 0 0 0 0 0 0 0 Little rain 2 0 22.2 22.2 22.2 22.2 22.2 22.2 22.2 22.2 22.2 22.2 22.2 22.2 17.8 17.8 17.8 17.8 0 0 0 0 0 0 0 Heavy rain 1 22.2 26.7 26.7 26.7 26.7 26.7 26.7 26.7 26.7 26.7 26.7 26.7 26.7 26.7 22.2 22.2 22.2 22.2 22.2 22.2 22.2 22.2 22.2 22.2
November Agricultural activity, short rain
Dry 2 0 0 0 0 0 0 0 0 0 0 0 0 0 0 0 0 0 0 0 0 0 0 0 0 No rain 20 0 13.4 13.4 13.4 13.4 13.4 13.4 13.4 13.4 13.4 13.4 13.4 13.4 0 0 0 0 0 0 0 0 0 0 0 Little rain 6 0 22.2 22.2 22.2 22.2 22.2 22.2 22.2 22.2 22.2 22.2 22.2 22.2 17.8 17.8 17.8 17.8 0 0 0 0 0 0 0 Heavy rain 2 22.2 26.7 26.7 26.7 26.7 26.7 26.7 26.7 26.7 26.7 26.7 26.7 26.7 26.7 22.2 22.2 22.2 22.2 22.2 22.2 22.2 22.2 22.2 22.2
December agriculture activity dry with some short rain
Dry 2 0 0 0 0 0 0 0 0 0 0 0 0 0 0 0 0 0 0 0 0 0 0 0 0 No rain 24 0 13.4 13.4 13.4 13.4 13.4 13.4 13.4 13.4 13.4 13.4 13.4 13.4 0 0 0 0 0 0 0 0 0 0 0 Little rain 4 0 22.2 22.2 22.2 22.2 22.2 22.2 22.2 22.2 22.2 22.2 22.2 22.2 17.8 17.8 17.8 17.8 0 0 0 0 0 0 0 Heavy rain 1 22.2 26.7 26.7 26.7 26.7 26.7 26.7 26.7 26.7 26.7 26.7 26.7 26.7 26.7 22.2 22.2 22.2 22.2 22.2 22.2 22.2 22.2 22.2 22.2
25
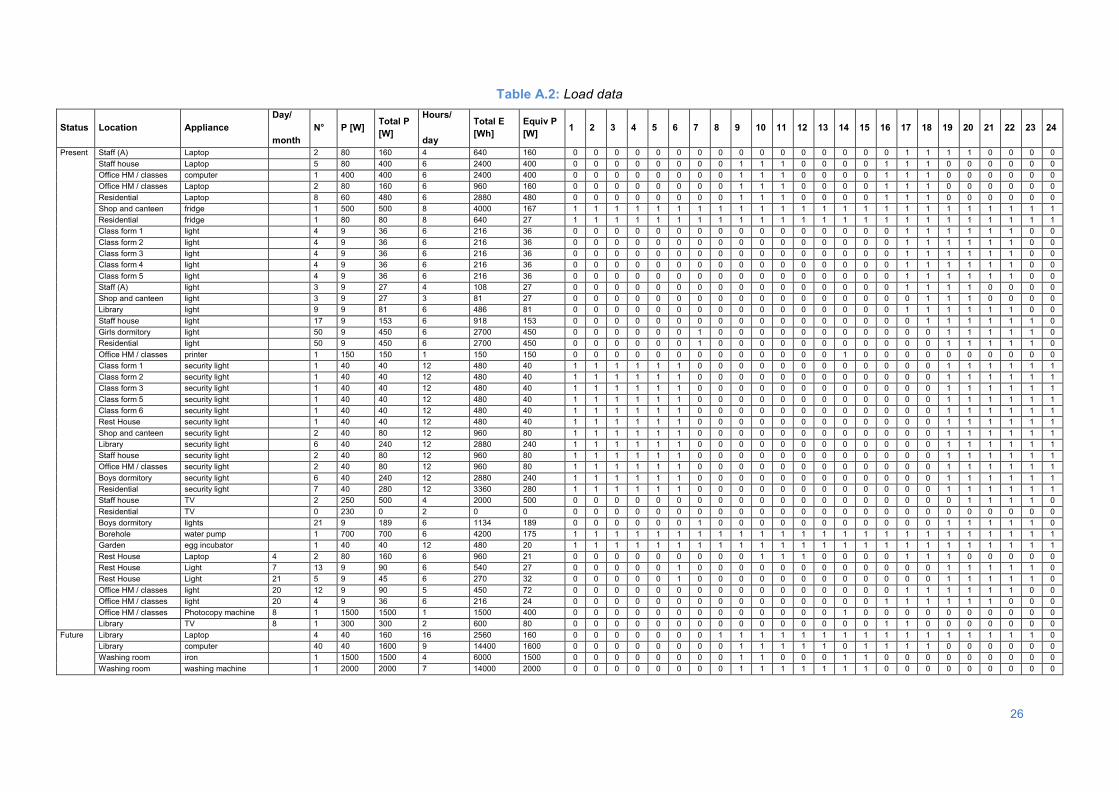
Table A.2: Load data
Status Location Appliance Day/
month N° P [W] Total P
[W]
Hours/
day
Total E [Wh]
Equiv P [W] 1 2 3 4 5 6 7 8 9 10 11 12 13 14 15 16 17 18 19 20 21 22 23 24
Present Staff (A) Laptop 2 80 160 4 640 160 0 0 0 0 0 0 0 0 0 0 0 0 0 0 0 0 1 1 1 1 0 0 0 0 Staff house Laptop 5 80 400 6 2400 400 0 0 0 0 0 0 0 0 1 1 1 0 0 0 0 1 1 1 0 0 0 0 0 0 Office HM / classes computer 1 400 400 6 2400 400 0 0 0 0 0 0 0 0 1 1 1 0 0 0 0 1 1 1 0 0 0 0 0 0 Office HM / classes Laptop 2 80 160 6 960 160 0 0 0 0 0 0 0 0 1 1 1 0 0 0 0 1 1 1 0 0 0 0 0 0 Residential Laptop 8 60 480 6 2880 480 0 0 0 0 0 0 0 0 1 1 1 0 0 0 0 1 1 1 0 0 0 0 0 0 Shop and canteen fridge 1 500 500 8 4000 167 1 1 1 1 1 1 1 1 1 1 1 1 1 1 1 1 1 1 1 1 1 1 1 1 Residential fridge 1 80 80 8 640 27 1 1 1 1 1 1 1 1 1 1 1 1 1 1 1 1 1 1 1 1 1 1 1 1 Class form 1 light 4 9 36 6 216 36 0 0 0 0 0 0 0 0 0 0 0 0 0 0 0 0 1 1 1 1 1 1 0 0 Class form 2 light 4 9 36 6 216 36 0 0 0 0 0 0 0 0 0 0 0 0 0 0 0 0 1 1 1 1 1 1 0 0 Class form 3 light 4 9 36 6 216 36 0 0 0 0 0 0 0 0 0 0 0 0 0 0 0 0 1 1 1 1 1 1 0 0 Class form 4 light 4 9 36 6 216 36 0 0 0 0 0 0 0 0 0 0 0 0 0 0 0 0 1 1 1 1 1 1 0 0 Class form 5 light 4 9 36 6 216 36 0 0 0 0 0 0 0 0 0 0 0 0 0 0 0 0 1 1 1 1 1 1 0 0 Staff (A) light 3 9 27 4 108 27 0 0 0 0 0 0 0 0 0 0 0 0 0 0 0 0 1 1 1 1 0 0 0 0 Shop and canteen light 3 9 27 3 81 27 0 0 0 0 0 0 0 0 0 0 0 0 0 0 0 0 0 1 1 1 0 0 0 0 Library light 9 9 81 6 486 81 0 0 0 0 0 0 0 0 0 0 0 0 0 0 0 0 1 1 1 1 1 1 0 0 Staff house light 17 9 153 6 918 153 0 0 0 0 0 0 0 0 0 0 0 0 0 0 0 0 0 1 1 1 1 1 1 0 Girls dormitory light 50 9 450 6 2700 450 0 0 0 0 0 0 1 0 0 0 0 0 0 0 0 0 0 0 1 1 1 1 1 0 Residential light 50 9 450 6 2700 450 0 0 0 0 0 0 1 0 0 0 0 0 0 0 0 0 0 0 1 1 1 1 1 0 Office HM / classes printer 1 150 150 1 150 150 0 0 0 0 0 0 0 0 0 0 0 0 0 1 0 0 0 0 0 0 0 0 0 0 Class form 1 security light 1 40 40 12 480 40 1 1 1 1 1 1 0 0 0 0 0 0 0 0 0 0 0 0 1 1 1 1 1 1 Class form 2 security light 1 40 40 12 480 40 1 1 1 1 1 1 0 0 0 0 0 0 0 0 0 0 0 0 1 1 1 1 1 1 Class form 3 security light 1 40 40 12 480 40 1 1 1 1 1 1 0 0 0 0 0 0 0 0 0 0 0 0 1 1 1 1 1 1 Class form 5 security light 1 40 40 12 480 40 1 1 1 1 1 1 0 0 0 0 0 0 0 0 0 0 0 0 1 1 1 1 1 1 Class form 6 security light 1 40 40 12 480 40 1 1 1 1 1 1 0 0 0 0 0 0 0 0 0 0 0 0 1 1 1 1 1 1 Rest House security light 1 40 40 12 480 40 1 1 1 1 1 1 0 0 0 0 0 0 0 0 0 0 0 0 1 1 1 1 1 1 Shop and canteen security light 2 40 80 12 960 80 1 1 1 1 1 1 0 0 0 0 0 0 0 0 0 0 0 0 1 1 1 1 1 1 Library security light 6 40 240 12 2880 240 1 1 1 1 1 1 0 0 0 0 0 0 0 0 0 0 0 0 1 1 1 1 1 1 Staff house security light 2 40 80 12 960 80 1 1 1 1 1 1 0 0 0 0 0 0 0 0 0 0 0 0 1 1 1 1 1 1 Office HM / classes security light 2 40 80 12 960 80 1 1 1 1 1 1 0 0 0 0 0 0 0 0 0 0 0 0 1 1 1 1 1 1 Boys dormitory security light 6 40 240 12 2880 240 1 1 1 1 1 1 0 0 0 0 0 0 0 0 0 0 0 0 1 1 1 1 1 1 Residential security light 7 40 280 12 3360 280 1 1 1 1 1 1 0 0 0 0 0 0 0 0 0 0 0 0 1 1 1 1 1 1 Staff house TV 2 250 500 4 2000 500 0 0 0 0 0 0 0 0 0 0 0 0 0 0 0 0 0 0 0 1 1 1 1 0 Residential TV 0 230 0 2 0 0 0 0 0 0 0 0 0 0 0 0 0 0 0 0 0 0 0 0 0 0 0 0 0 0 Boys dormitory lights 21 9 189 6 1134 189 0 0 0 0 0 0 1 0 0 0 0 0 0 0 0 0 0 0 1 1 1 1 1 0 Borehole water pump 1 700 700 6 4200 175 1 1 1 1 1 1 1 1 1 1 1 1 1 1 1 1 1 1 1 1 1 1 1 1 Garden egg incubator 1 40 40 12 480 20 1 1 1 1 1 1 1 1 1 1 1 1 1 1 1 1 1 1 1 1 1 1 1 1 Rest House Laptop 4 2 80 160 6 960 21 0 0 0 0 0 0 0 0 0 1 1 1 0 0 0 0 1 1 1 0 0 0 0 0 Rest House Light 7 13 9 90 6 540 27 0 0 0 0 0 1 0 0 0 0 0 0 0 0 0 0 0 0 1 1 1 1 1 0 Rest House Light 21 5 9 45 6 270 32 0 0 0 0 0 1 0 0 0 0 0 0 0 0 0 0 0 0 1 1 1 1 1 0 Office HM / classes light 20 12 9 90 5 450 72 0 0 0 0 0 0 0 0 0 0 0 0 0 0 0 0 1 1 1 1 1 1 0 0 Office HM / classes light 20 4 9 36 6 216 24 0 0 0 0 0 0 0 0 0 0 0 0 0 0 0 1 1 1 1 1 1 0 0 0 Office HM / classes Photocopy machine 8 1 1500 1500 1 1500 400 0 0 0 0 0 0 0 0 0 0 0 0 0 1 0 0 0 0 0 0 0 0 0 0 Library TV 8 1 300 300 2 600 80 0 0 0 0 0 0 0 0 0 0 0 0 0 0 0 1 1 0 0 0 0 0 0 0
Future Library Laptop 4 40 160 16 2560 160 0 0 0 0 0 0 0 1 1 1 1 1 1 1 1 1 1 1 1 1 1 1 1 0 Library computer 40 40 1600 9 14400 1600 0 0 0 0 0 0 0 0 1 1 1 1 1 0 1 1 1 1 0 0 0 0 0 0 Washing room iron 1 1500 1500 4 6000 1500 0 0 0 0 0 0 0 0 1 1 0 0 0 1 1 0 0 0 0 0 0 0 0 0 Washing room washing machine 1 2000 2000 7 14000 2000 0 0 0 0 0 0 0 0 1 1 1 1 1 1 1 0 0 0 0 0 0 0 0 0
26
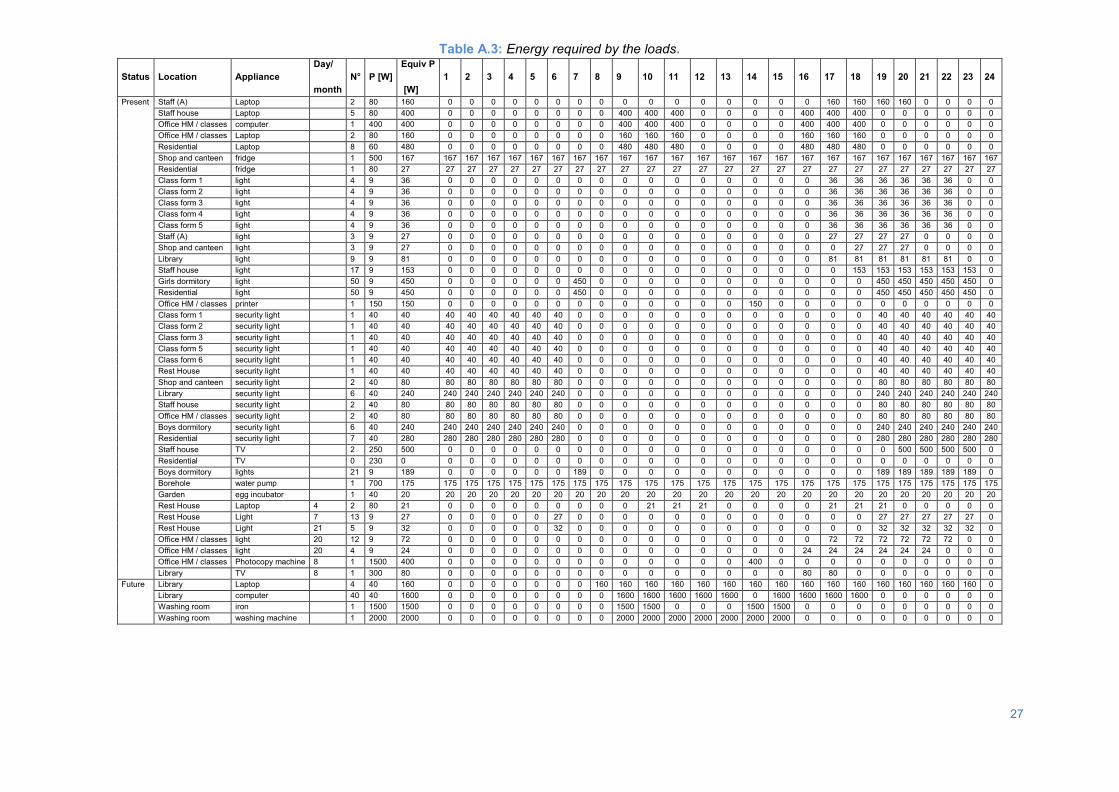
Table A.3: Energy required by the loads.
Status Location Appliance Day/
month N° P [W]
Equiv P
[W] 1 2 3 4 5 6 7 8 9 10 11 12 13 14 15 16 17 18 19 20 21 22 23 24
Present Staff (A) Laptop 2 80 160 0 0 0 0 0 0 0 0 0 0 0 0 0 0 0 0 160 160 160 160 0 0 0 0 Staff house Laptop 5 80 400 0 0 0 0 0 0 0 0 400 400 400 0 0 0 0 400 400 400 0 0 0 0 0 0 Office HM / classes computer 1 400 400 0 0 0 0 0 0 0 0 400 400 400 0 0 0 0 400 400 400 0 0 0 0 0 0 Office HM / classes Laptop 2 80 160 0 0 0 0 0 0 0 0 160 160 160 0 0 0 0 160 160 160 0 0 0 0 0 0 Residential Laptop 8 60 480 0 0 0 0 0 0 0 0 480 480 480 0 0 0 0 480 480 480 0 0 0 0 0 0 Shop and canteen fridge 1 500 167 167 167 167 167 167 167 167 167 167 167 167 167 167 167 167 167 167 167 167 167 167 167 167 167 Residential fridge 1 80 27 27 27 27 27 27 27 27 27 27 27 27 27 27 27 27 27 27 27 27 27 27 27 27 27 Class form 1 light 4 9 36 0 0 0 0 0 0 0 0 0 0 0 0 0 0 0 0 36 36 36 36 36 36 0 0 Class form 2 light 4 9 36 0 0 0 0 0 0 0 0 0 0 0 0 0 0 0 0 36 36 36 36 36 36 0 0 Class form 3 light 4 9 36 0 0 0 0 0 0 0 0 0 0 0 0 0 0 0 0 36 36 36 36 36 36 0 0 Class form 4 light 4 9 36 0 0 0 0 0 0 0 0 0 0 0 0 0 0 0 0 36 36 36 36 36 36 0 0 Class form 5 light 4 9 36 0 0 0 0 0 0 0 0 0 0 0 0 0 0 0 0 36 36 36 36 36 36 0 0 Staff (A) light 3 9 27 0 0 0 0 0 0 0 0 0 0 0 0 0 0 0 0 27 27 27 27 0 0 0 0 Shop and canteen light 3 9 27 0 0 0 0 0 0 0 0 0 0 0 0 0 0 0 0 0 27 27 27 0 0 0 0 Library light 9 9 81 0 0 0 0 0 0 0 0 0 0 0 0 0 0 0 0 81 81 81 81 81 81 0 0 Staff house light 17 9 153 0 0 0 0 0 0 0 0 0 0 0 0 0 0 0 0 0 153 153 153 153 153 153 0 Girls dormitory light 50 9 450 0 0 0 0 0 0 450 0 0 0 0 0 0 0 0 0 0 0 450 450 450 450 450 0 Residential light 50 9 450 0 0 0 0 0 0 450 0 0 0 0 0 0 0 0 0 0 0 450 450 450 450 450 0 Office HM / classes printer 1 150 150 0 0 0 0 0 0 0 0 0 0 0 0 0 150 0 0 0 0 0 0 0 0 0 0 Class form 1 security light 1 40 40 40 40 40 40 40 40 0 0 0 0 0 0 0 0 0 0 0 0 40 40 40 40 40 40 Class form 2 security light 1 40 40 40 40 40 40 40 40 0 0 0 0 0 0 0 0 0 0 0 0 40 40 40 40 40 40 Class form 3 security light 1 40 40 40 40 40 40 40 40 0 0 0 0 0 0 0 0 0 0 0 0 40 40 40 40 40 40 Class form 5 security light 1 40 40 40 40 40 40 40 40 0 0 0 0 0 0 0 0 0 0 0 0 40 40 40 40 40 40 Class form 6 security light 1 40 40 40 40 40 40 40 40 0 0 0 0 0 0 0 0 0 0 0 0 40 40 40 40 40 40 Rest House security light 1 40 40 40 40 40 40 40 40 0 0 0 0 0 0 0 0 0 0 0 0 40 40 40 40 40 40 Shop and canteen security light 2 40 80 80 80 80 80 80 80 0 0 0 0 0 0 0 0 0 0 0 0 80 80 80 80 80 80 Library security light 6 40 240 240 240 240 240 240 240 0 0 0 0 0 0 0 0 0 0 0 0 240 240 240 240 240 240 Staff house security light 2 40 80 80 80 80 80 80 80 0 0 0 0 0 0 0 0 0 0 0 0 80 80 80 80 80 80 Office HM / classes security light 2 40 80 80 80 80 80 80 80 0 0 0 0 0 0 0 0 0 0 0 0 80 80 80 80 80 80 Boys dormitory security light 6 40 240 240 240 240 240 240 240 0 0 0 0 0 0 0 0 0 0 0 0 240 240 240 240 240 240 Residential security light 7 40 280 280 280 280 280 280 280 0 0 0 0 0 0 0 0 0 0 0 0 280 280 280 280 280 280 Staff house TV 2 250 500 0 0 0 0 0 0 0 0 0 0 0 0 0 0 0 0 0 0 0 500 500 500 500 0 Residential TV 0 230 0 0 0 0 0 0 0 0 0 0 0 0 0 0 0 0 0 0 0 0 0 0 0 0 0 Boys dormitory lights 21 9 189 0 0 0 0 0 0 189 0 0 0 0 0 0 0 0 0 0 0 189 189 189 189 189 0 Borehole water pump 1 700 175 175 175 175 175 175 175 175 175 175 175 175 175 175 175 175 175 175 175 175 175 175 175 175 175 Garden egg incubator 1 40 20 20 20 20 20 20 20 20 20 20 20 20 20 20 20 20 20 20 20 20 20 20 20 20 20 Rest House Laptop 4 2 80 21 0 0 0 0 0 0 0 0 0 21 21 21 0 0 0 0 21 21 21 0 0 0 0 0 Rest House Light 7 13 9 27 0 0 0 0 0 27 0 0 0 0 0 0 0 0 0 0 0 0 27 27 27 27 27 0 Rest House Light 21 5 9 32 0 0 0 0 0 32 0 0 0 0 0 0 0 0 0 0 0 0 32 32 32 32 32 0 Office HM / classes light 20 12 9 72 0 0 0 0 0 0 0 0 0 0 0 0 0 0 0 0 72 72 72 72 72 72 0 0 Office HM / classes light 20 4 9 24 0 0 0 0 0 0 0 0 0 0 0 0 0 0 0 24 24 24 24 24 24 0 0 0 Office HM / classes Photocopy machine 8 1 1500 400 0 0 0 0 0 0 0 0 0 0 0 0 0 400 0 0 0 0 0 0 0 0 0 0 Library TV 8 1 300 80 0 0 0 0 0 0 0 0 0 0 0 0 0 0 0 80 80 0 0 0 0 0 0 0
Future Library Laptop 4 40 160 0 0 0 0 0 0 0 160 160 160 160 160 160 160 160 160 160 160 160 160 160 160 160 0 Library computer 40 40 1600 0 0 0 0 0 0 0 0 1600 1600 1600 1600 1600 0 1600 1600 1600 1600 0 0 0 0 0 0 Washing room iron 1 1500 1500 0 0 0 0 0 0 0 0 1500 1500 0 0 0 1500 1500 0 0 0 0 0 0 0 0 0 Washing room washing machine 1 2000 2000 0 0 0 0 0 0 0 0 2000 2000 2000 2000 2000 2000 2000 0 0 0 0 0 0 0 0 0
27
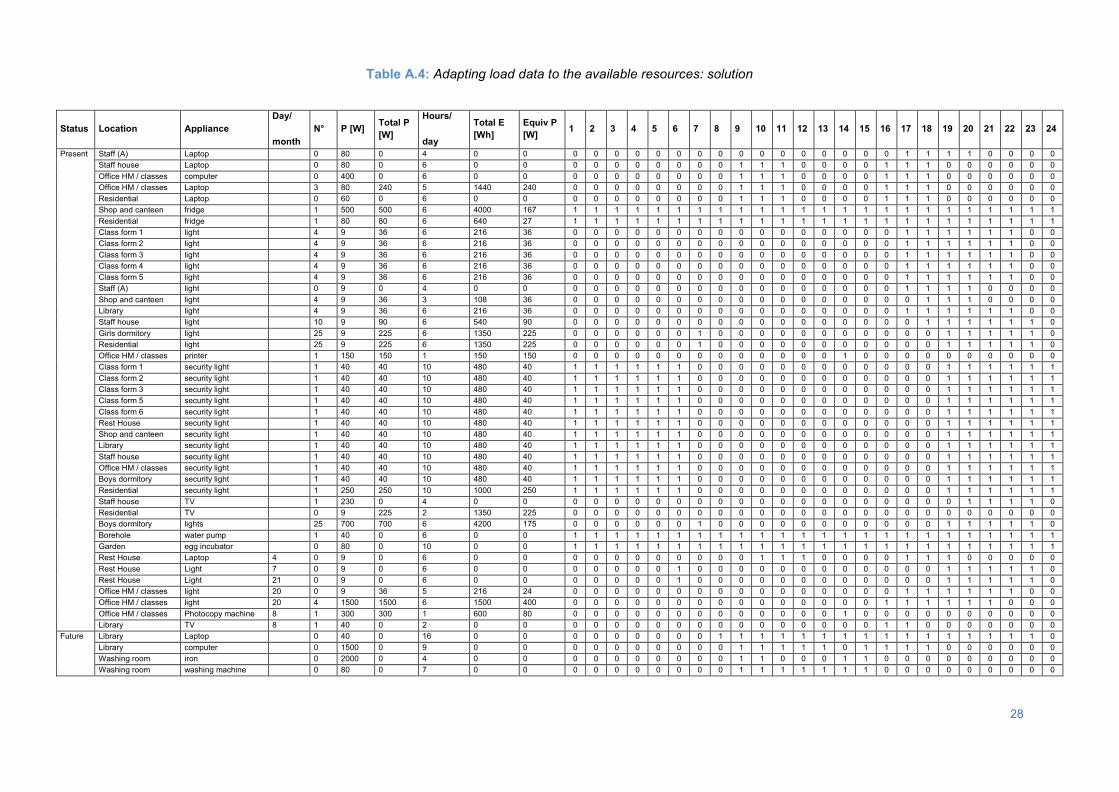
Table A.4: Adapting load data to the available resources: solution
Status Location Appliance Day/
month N° P [W] Total P
[W]
Hours/
day
Total E [Wh]
Equiv P [W] 1 2 3 4 5 6 7 8 9 10 11 12 13 14 15 16 17 18 19 20 21 22 23 24
Present Staff (A) Laptop 0 80 0 4 0 0 0 0 0 0 0 0 0 0 0 0 0 0 0 0 0 0 1 1 1 1 0 0 0 0 Staff house Laptop 0 80 0 6 0 0 0 0 0 0 0 0 0 0 1 1 1 0 0 0 0 1 1 1 0 0 0 0 0 0 Office HM / classes computer 0 400 0 6 0 0 0 0 0 0 0 0 0 0 1 1 1 0 0 0 0 1 1 1 0 0 0 0 0 0 Office HM / classes Laptop 3 80 240 5 1440 240 0 0 0 0 0 0 0 0 1 1 1 0 0 0 0 1 1 1 0 0 0 0 0 0 Residential Laptop 0 60 0 6 0 0 0 0 0 0 0 0 0 0 1 1 1 0 0 0 0 1 1 1 0 0 0 0 0 0 Shop and canteen fridge 1 500 500 6 4000 167 1 1 1 1 1 1 1 1 1 1 1 1 1 1 1 1 1 1 1 1 1 1 1 1 Residential fridge 1 80 80 6 640 27 1 1 1 1 1 1 1 1 1 1 1 1 1 1 1 1 1 1 1 1 1 1 1 1 Class form 1 light 4 9 36 6 216 36 0 0 0 0 0 0 0 0 0 0 0 0 0 0 0 0 1 1 1 1 1 1 0 0 Class form 2 light 4 9 36 6 216 36 0 0 0 0 0 0 0 0 0 0 0 0 0 0 0 0 1 1 1 1 1 1 0 0 Class form 3 light 4 9 36 6 216 36 0 0 0 0 0 0 0 0 0 0 0 0 0 0 0 0 1 1 1 1 1 1 0 0 Class form 4 light 4 9 36 6 216 36 0 0 0 0 0 0 0 0 0 0 0 0 0 0 0 0 1 1 1 1 1 1 0 0 Class form 5 light 4 9 36 6 216 36 0 0 0 0 0 0 0 0 0 0 0 0 0 0 0 0 1 1 1 1 1 1 0 0 Staff (A) light 0 9 0 4 0 0 0 0 0 0 0 0 0 0 0 0 0 0 0 0 0 0 1 1 1 1 0 0 0 0 Shop and canteen light 4 9 36 3 108 36 0 0 0 0 0 0 0 0 0 0 0 0 0 0 0 0 0 1 1 1 0 0 0 0 Library light 4 9 36 6 216 36 0 0 0 0 0 0 0 0 0 0 0 0 0 0 0 0 1 1 1 1 1 1 0 0 Staff house light 10 9 90 6 540 90 0 0 0 0 0 0 0 0 0 0 0 0 0 0 0 0 0 1 1 1 1 1 1 0 Girls dormitory light 25 9 225 6 1350 225 0 0 0 0 0 0 1 0 0 0 0 0 0 0 0 0 0 0 1 1 1 1 1 0 Residential light 25 9 225 6 1350 225 0 0 0 0 0 0 1 0 0 0 0 0 0 0 0 0 0 0 1 1 1 1 1 0 Office HM / classes printer 1 150 150 1 150 150 0 0 0 0 0 0 0 0 0 0 0 0 0 1 0 0 0 0 0 0 0 0 0 0 Class form 1 security light 1 40 40 10 480 40 1 1 1 1 1 1 0 0 0 0 0 0 0 0 0 0 0 0 1 1 1 1 1 1 Class form 2 security light 1 40 40 10 480 40 1 1 1 1 1 1 0 0 0 0 0 0 0 0 0 0 0 0 1 1 1 1 1 1 Class form 3 security light 1 40 40 10 480 40 1 1 1 1 1 1 0 0 0 0 0 0 0 0 0 0 0 0 1 1 1 1 1 1 Class form 5 security light 1 40 40 10 480 40 1 1 1 1 1 1 0 0 0 0 0 0 0 0 0 0 0 0 1 1 1 1 1 1 Class form 6 security light 1 40 40 10 480 40 1 1 1 1 1 1 0 0 0 0 0 0 0 0 0 0 0 0 1 1 1 1 1 1 Rest House security light 1 40 40 10 480 40 1 1 1 1 1 1 0 0 0 0 0 0 0 0 0 0 0 0 1 1 1 1 1 1 Shop and canteen security light 1 40 40 10 480 40 1 1 1 1 1 1 0 0 0 0 0 0 0 0 0 0 0 0 1 1 1 1 1 1 Library security light 1 40 40 10 480 40 1 1 1 1 1 1 0 0 0 0 0 0 0 0 0 0 0 0 1 1 1 1 1 1 Staff house security light 1 40 40 10 480 40 1 1 1 1 1 1 0 0 0 0 0 0 0 0 0 0 0 0 1 1 1 1 1 1 Office HM / classes security light 1 40 40 10 480 40 1 1 1 1 1 1 0 0 0 0 0 0 0 0 0 0 0 0 1 1 1 1 1 1 Boys dormitory security light 1 40 40 10 480 40 1 1 1 1 1 1 0 0 0 0 0 0 0 0 0 0 0 0 1 1 1 1 1 1 Residential security light 1 250 250 10 1000 250 1 1 1 1 1 1 0 0 0 0 0 0 0 0 0 0 0 0 1 1 1 1 1 1 Staff house TV 1 230 0 4 0 0 0 0 0 0 0 0 0 0 0 0 0 0 0 0 0 0 0 0 0 1 1 1 1 0 Residential TV 0 9 225 2 1350 225 0 0 0 0 0 0 0 0 0 0 0 0 0 0 0 0 0 0 0 0 0 0 0 0 Boys dormitory lights 25 700 700 6 4200 175 0 0 0 0 0 0 1 0 0 0 0 0 0 0 0 0 0 0 1 1 1 1 1 0 Borehole water pump 1 40 0 6 0 0 1 1 1 1 1 1 1 1 1 1 1 1 1 1 1 1 1 1 1 1 1 1 1 1 Garden egg incubator 0 80 0 10 0 0 1 1 1 1 1 1 1 1 1 1 1 1 1 1 1 1 1 1 1 1 1 1 1 1 Rest House Laptop 4 0 9 0 6 0 0 0 0 0 0 0 0 0 0 0 1 1 1 0 0 0 0 1 1 1 0 0 0 0 0 Rest House Light 7 0 9 0 6 0 0 0 0 0 0 0 1 0 0 0 0 0 0 0 0 0 0 0 0 1 1 1 1 1 0 Rest House Light 21 0 9 0 6 0 0 0 0 0 0 0 1 0 0 0 0 0 0 0 0 0 0 0 0 1 1 1 1 1 0 Office HM / classes light 20 0 9 36 5 216 24 0 0 0 0 0 0 0 0 0 0 0 0 0 0 0 0 1 1 1 1 1 1 0 0 Office HM / classes light 20 4 1500 1500 6 1500 400 0 0 0 0 0 0 0 0 0 0 0 0 0 0 0 1 1 1 1 1 1 0 0 0 Office HM / classes Photocopy machine 8 1 300 300 1 600 80 0 0 0 0 0 0 0 0 0 0 0 0 0 1 0 0 0 0 0 0 0 0 0 0 Library TV 8 1 40 0 2 0 0 0 0 0 0 0 0 0 0 0 0 0 0 0 0 0 1 1 0 0 0 0 0 0 0
Future Library Laptop 0 40 0 16 0 0 0 0 0 0 0 0 0 1 1 1 1 1 1 1 1 1 1 1 1 1 1 1 1 0 Library computer 0 1500 0 9 0 0 0 0 0 0 0 0 0 0 1 1 1 1 1 0 1 1 1 1 0 0 0 0 0 0 Washing room iron 0 2000 0 4 0 0 0 0 0 0 0 0 0 0 1 1 0 0 0 1 1 0 0 0 0 0 0 0 0 0 Washing room washing machine 0 80 0 7 0 0 0 0 0 0 0 0 0 0 1 1 1 1 1 1 1 0 0 0 0 0 0 0 0 0
28
Rural electrification in Developing Countries via autonomous Micro-Grids
BIBLIOGRAPHY
[1] IEA. World Energy Outlook. OECD Publishing; 2013.
[2] IEA. Key Worls Energy Statistics. Paris: 2012.
[3] UNDP. The Energy Access situation in Developing Countries - A Review focusing on the Least Developed Countries and Sub-Saharan Africa. 2012.
[4] August D, Mostert W. EUEI-PDF Review of Experiences with Rural Electrification Agencies Lessons for Africa 2008.
[5] Turkson J, Wohlgemuth N. Power sector reform and distributed generation in sub-Saharan Africa 2010;29.
[6] Zomers A. The challenge of rural electrification. Energy Sustain Dev 2003;7:69–76.
[7] Emanuela Colombo, Stefano Masera DB. Renewable Energy for Unleashing Sustainable Development. Springer International Publishing; 2013.
[8] Kaundinya DP, Balachandra P, Ravindranath NH. Grid-connected versus stand-alone energy systems for decentralized power—A review of literature. Renew Sustain Energy Rev 2009;13:2041–50.
[9] Nguyen KQ. Alternatives to grid extension for rural electrification: Decentralized renewable energy technologies in Vietnam. Energy Policy 2007;35:2579–89.
[10] Nouni M, Mullick S, Kandpal T. Providing electricity access to remote areas in India: An approach towards identifying potential areas for decentralized electricity supply. Renew Sustain Energy Rev 2008;12:1187–220.
[11] IEA. World Energy Outlook. OECD Publishing; 2011.
[12] Liu X, Su B. Microgrids - An Integration of Renewable Energy Technologies 2008.
[13] Schnitzer, Lounsbury, Carvallo, Deshmukh, Apt, Kammen. Microgrids for Rural Electrification : A critical review of best practices based on seven case studies. United Nations Foundation; 2014.
[14] Tomé J, Inesc S. Management of MicroGrids. JIEE Conf., 2003.
[15] Jiayi H, Chuanwen J, Rong X. A review on distributed energy resources and MicroGrid. Renew Sustain Energy Rev 2008;12:2472–83.
[16] Lopes JAP, Member S, Moreira CL, Madureira AG. Defining Control Strategies for MicroGrids Islanded Operation 2006;21:916–24.
[17] Navigant Research. Microgrid Deployment Tracker 2Q14 2014. www.navigantresearch.com/research/microgrid-deployment-tracker-2q14 (accessed September 13, 2014).
29

Rural electrification in Developing Countries via autonomous Micro-Grids
[18] Laboratory NRE. Getting Started Guide for HOMER 2011.
[19] Project P of WER. Surface meteorology and Solar Energy n.d. https://eosweb.larc.nasa.gov/sse/.
30

http://www.gdee.eu
This project is funded by
Daniel Masa Bote
PHOTO: Practical Action.
CASE STUDIES
Photovoltaics electrification in o�-grid areas

DL B 10735-2015 ISBN 978-84-606-7546-4
Photovoltaics electrification in o�-grid areas
COORDINATED BYAgustí Pérez-Foguet, Enric Velo, Pol Arranz, Ricard Ginéand Boris Lazzarini (Universitat Politècnica de Catalunya)Manuel Sierra (Universidad Politécnica de Madrid)Alejandra Boni and Jordi Peris (Universitat Politècnica de València)Guido Zolezzi and Gabriella Trombino (Università degli Studi di Trento)Rhoda Trimingham (Loughborough University)Valentín Villarroel (ONGAWA)Neil Nobles and Meadhbh Bolger (Practical Action)Francesco Mongera (Training Center for International Cooperation)Katie Cresswell-Maynard (Engineering Without Border UK)
EDITED BY Global Dimension in Engineering Education
Citation: Masa Bote, D. (2015) ' Photovoltaics electrification in o�-grid areas', in Case studies for developing globally responsible engineers, GDEE (eds.), Global Dimension in Engineering Education, Barcelona. Available from: http://gdee.eu/index.php/resources.html
This publication is distributedunder an Attribution- Noncommercial-Share Alike License for Creative Commons
CASE STUDIES
Disclaimer: This document has been produced with the financial assistance of the European UnionThe contents of this document are the sole responsibility of the authors and can under no circumstances be regarded as reflecting the position of the European Union
Photovoltaics Electrification in Off-Grid Areas
PHOTOVOLTAICS ELECTRIFICATION IN OFF-GRID AREAS
Daniel Masa Bote, Instituto de Energía Solar – Universidad Politécnica de Madrid.
1
Photovoltaics Electrification in Off-Grid Areas
INDEX
1. INTRODUCTION ........................................................................................................................... 3
1.1. DISCIPLINES COVERED ............................................................................................................. 4
1.2. LEARNING OUTCOMES .............................................................................................................. 4
1.3. ACTIVITIES .............................................................................................................................. 5
2. CLASS ACTIVITY ......................................................................................................................... 5
2.1. STAND-ALONE PV SYSTEMS ..................................................................................................... 5
2.1.1. INTRODUCTION TO PV SYSTEMS ................................................................................. 5
2.1.2. PV GENERATOR ............................................................................................................ 8
2.1.3. POWER CONDITIONING ............................................................................................... 10
2.1.4. ENERGY STORAGE: BATTERIES ................................................................................. 11
2.2. DESIGN OF STAND-ALONE PV SYSTEMS .................................................................................. 13
2.2.1. OPTIMAL ORIENTATION AND TILT ANGLES ................................................................. 13
2.2.2. ENERGY GENERATED BY A PV SYSTEM .................................................................... 14
2.2.3. SIZING OF THE STAND-ALONE PV SYSTEM ............................................................... 15
3. HOMEWORK ACTIVITY ............................................................................................................. 17
3.1. PROPOSED ACTIVITY .............................................................................................................. 18
3.2. SOLUTION AND EVALUATION CRITERIA ..................................................................................... 20
BIBLIOGRAPHY ................................................................................................................................. 24
2
Photovoltaics Electrification in Off-Grid Areas
1. INTRODUCTION
Energy is one of the most important available resources and, in any of its forms –mechanical, thermal, electricity– it is crucial for most human activities. However, access to energy is not universal. In 2014, according to the International Energy Agency1, 1,300 million people, which is 18% of global population, lacked access to electricity and 2,700 million people, 40% of global population, relied on the combustion of biomass for cooking.
In recent years, the use of renewable power worldwide has been increasing steadily. The share of electricity generated by non-hydroelectric renewable energy sources has increased from 1.7% in 2000 to 5.0% in 2012. Investment in renewable energy has been motivated by the increasing awareness of global warming caused by greenhouse emissions, the inevitable exhaustion of traditional energy sources (fossil fuels) in the future and the need for countries to assure energy self-sufficiency. The growth in electricity generation from renewable sources is almost exclusive to developed countries. This does not imply, however, that renewable energy sources are exclusive to developed countries or only suited to their needs. In fact, some of the main features of renewable energies are often overlooked and only those related to the factors that have motivated the aforementioned increase in use are considered. These neglected features are those that make renewable energies an appropriate energy source for rural areas of developing regions.
on Renewable energy generation via photovoltaics (PV), in particular, offers major advantages for rural electrification in developing regions: modularity, autonomy, low maintenance costs and absence of pollution. Modularity means that the efficiency of a PV system is not penalized by small system sizes. For example, a small solar home system of 50 watts performs similarly to a microgrid of several kilowatts. PV systems rely on sunlight to generate electricity, a renewable resource widely available and often abundant in the underdeveloped regions of the world. It must be noted that other renewable resources for the generation of electricity, like wind or flowing water, are less widely applicable as they depend more on site-specific factors than PV systems. Maintenance costs of PVs are usually low due to the high reliability of components, the absence of moving parts that may wear out and the fact that neither fuel nor supplies are needed on a regular basis. For example, PV crystalline modules, the more widely extended type of modules, are guaranteed by manufacturers to lose only as much as 10% of their nominal power after 20 years of operation and remain fully operational even after this time period. As a clean technology, PVs also have minimal impact on the environment and is a safer and healthier option compared to many traditional energy sources, such as burning kerosene for indoor
1 http://www.worldenergyoutlook.org/resources/energydevelopment/energyaccessdatabase/#d.en.8609
3
Photovoltaics Electrification in Off-Grid Areas
lighting. Nonetheless, it must also be noted that the major drawback of PVs, in comparison to other technologies, may be their higher initial investment cost.
The above advantages of PV electricity make this technology one of the most suitable electricity sources for rural areas of developing regions, unrivalled by traditional electricity sources and providing electricity to remote areas not reached by the traditional electric grid. Therefore, PV systems are a useful tool that contributes to human development and the well-being of inhabitants in such areas. Though it is difficult to account for the number of PV systems in use in developing countries, it is estimated that are currently more than three million of solar home systems.
This case study is aimed to provide knowledge on PV systems used in rural electrification in developing regions.
1.1. DISCIPLINES COVERED
This case study is suitable for courses on electrical engineering and energy systems, particularly those focused on renewable energies. Students will learn how to design a PV system and to estimate its output. Students will also have to extract relevant information from datasheets, manufacturers’ catalogues and irradiation databases.
This case study is intended to be included in courses that cover energy in general or renewable energy generation as main topics, and complement course syllabuses by providing a broader perspective in these areas. This case study is self-contained and students are not required to possess extensive previous knowledge of energy generation or electrical systems. In this regard, the case study includes explanation of all theoretical aspects involved. These explanations can be omitted if the students are familiar with the topics studied. However, some basic understanding of physical and electrical principles (like difference between energy and power, or between AC and DC) is required. Therefore, this case study can also be included in any engineering or technical course dealing with human development.
1.2. LEARNING OUTCOMES
Students are expected to achieve the following learning outcomes:
• Know the basic typologies of PV systems available for rural electrification andcriteria for choosing the most appropriate depending on the intendedapplication.
4
Photovoltaics Electrification in Off-Grid Areas
• Be able to develop a basic model to estimate the output of PV systems andrequired size according to a given expected electricity demand.
1.3. ACTIVITIES
This case study is divided in two activities than can be modified and adapted at the discretion of the lecturer:
• Activity 1: introduction to theoretical aspects that students will need for thiscase study. This phase can be omitted if the case study is included in a coursedealing with renewable energies and the topic has been previously addressed inclass. This is a class activity, with an estimated duration of two hours.
• Activity 2: based upon the knowledge acquired in the previous activity, thestudents will have to design a solar home system for a rural developingarea. The students will have to calculate the energy demand associated to thegiven loads and the size of a PV system able to provide enough electricity tomeet this demand. The size of the system will be dependent on the irradiation ofthe solar home system location. This is a homework activity and its estimatedduration is four hours.
2. CLASS ACTIVITY
2.1. STAND-ALONE PV SYSTEMS
This activity provides the necessary theoretical background that will be necessary to complete the other activities. This activity can be skipped or shortened if the students already possess knowledge of PV systems. The contents of this activity include a brief introduction to PV systems, methods for sizing a stand-alone system, estimating the irradiation received by a PV generator, and estimating the energy generated by a PV system.
2.1.1. INTRODUCTION TO PV SYSTEMS
PV systems can be divided in two main categories:
• Grid-connected systems. These systems are connected to electricitydistribution grids. Their design is usually optimized to maximize energyproduction. Grid-connected PV systems are subdivided into utility-scale solar
5
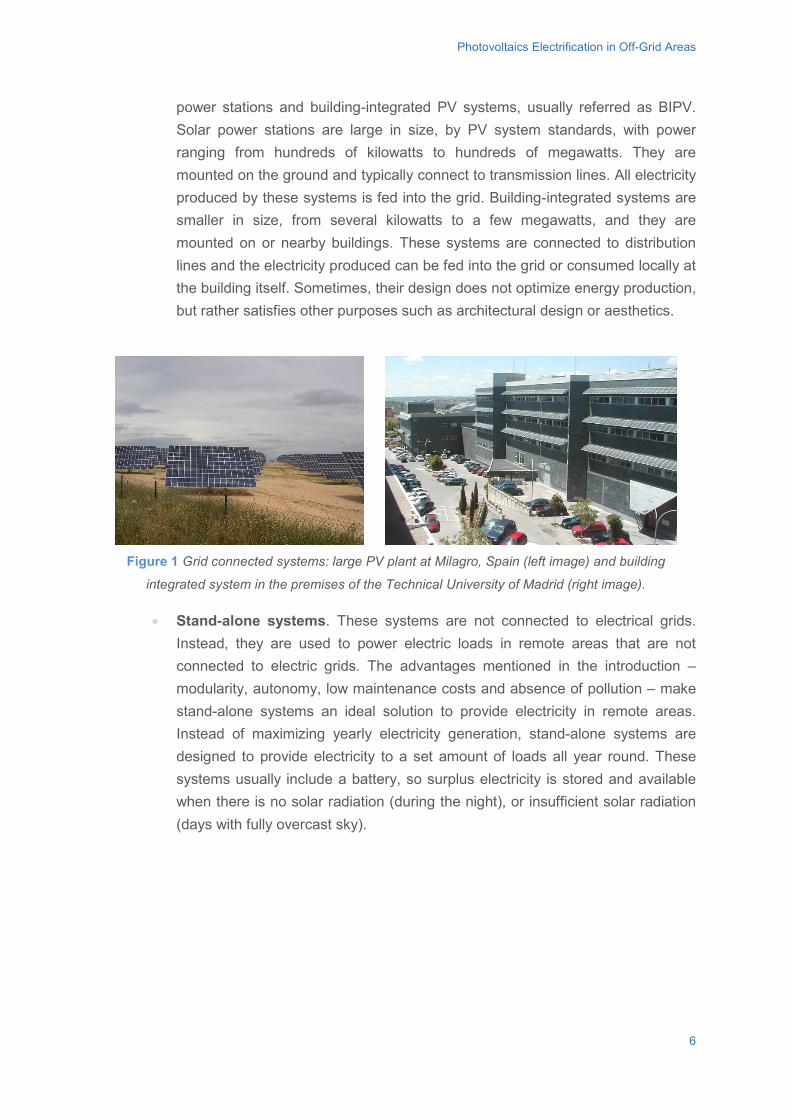
Photovoltaics Electrification in Off-Grid Areas
power stations and building-integrated PV systems, usually referred as BIPV. Solar power stations are large in size, by PV system standards, with power ranging from hundreds of kilowatts to hundreds of megawatts. They are mounted on the ground and typically connect to transmission lines. All electricity produced by these systems is fed into the grid. Building-integrated systems are smaller in size, from several kilowatts to a few megawatts, and they are mounted on or nearby buildings. These systems are connected to distribution lines and the electricity produced can be fed into the grid or consumed locally at the building itself. Sometimes, their design does not optimize energy production, but rather satisfies other purposes such as architectural design or aesthetics.
Figure 1 Grid connected systems: large PV plant at Milagro, Spain (left image) and building
integrated system in the premises of the Technical University of Madrid (right image).
• Stand-alone systems. These systems are not connected to electrical grids.Instead, they are used to power electric loads in remote areas that are notconnected to electric grids. The advantages mentioned in the introduction –modularity, autonomy, low maintenance costs and absence of pollution – makestand-alone systems an ideal solution to provide electricity in remote areas.Instead of maximizing yearly electricity generation, stand-alone systems aredesigned to provide electricity to a set amount of loads all year round. Thesesystems usually include a battery, so surplus electricity is stored and availablewhen there is no solar radiation (during the night), or insufficient solar radiation(days with fully overcast sky).
6
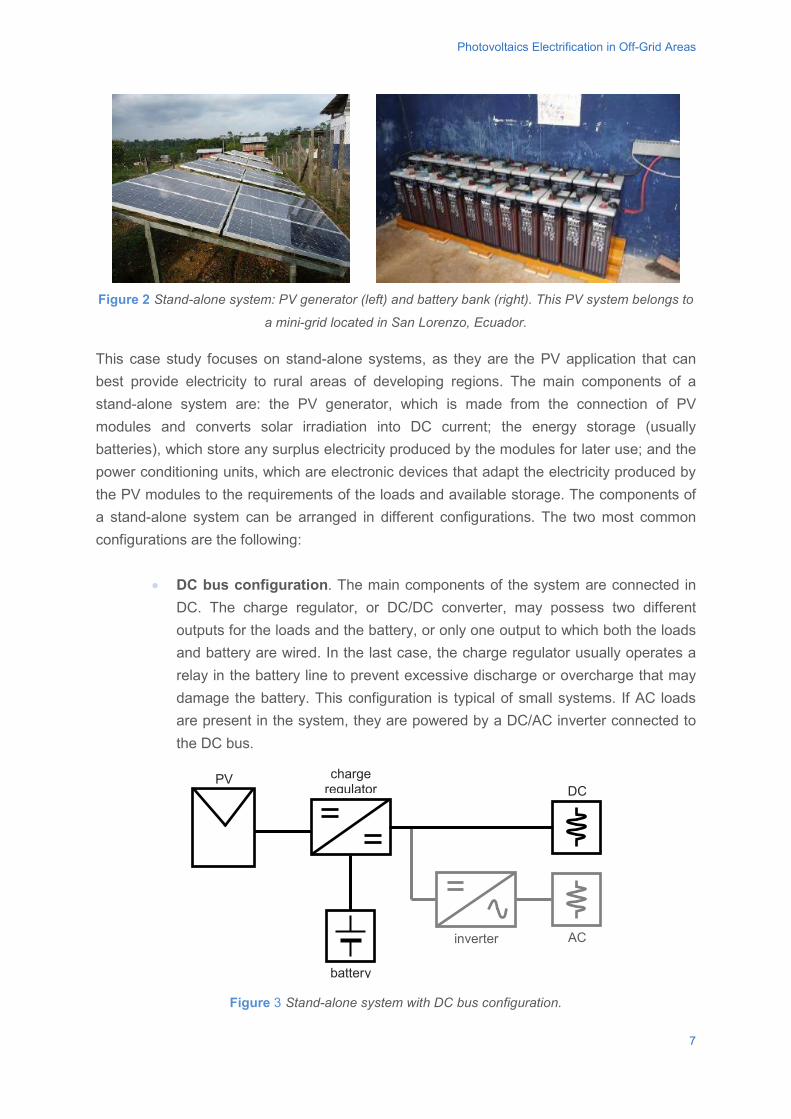
Photovoltaics Electrification in Off-Grid Areas
Figure 2 Stand-alone system: PV generator (left) and battery bank (right). This PV system belongs to
a mini-grid located in San Lorenzo, Ecuador.
This case study focuses on stand-alone systems, as they are the PV application that can best provide electricity to rural areas of developing regions. The main components of a stand-alone system are: the PV generator, which is made from the connection of PV modules and converts solar irradiation into DC current; the energy storage (usually batteries), which store any surplus electricity produced by the modules for later use; and the power conditioning units, which are electronic devices that adapt the electricity produced by the PV modules to the requirements of the loads and available storage. The components of a stand-alone system can be arranged in different configurations. The two most common configurations are the following:
• DC bus configuration. The main components of the system are connected inDC. The charge regulator, or DC/DC converter, may possess two differentoutputs for the loads and the battery, or only one output to which both the loadsand battery are wired. In the last case, the charge regulator usually operates arelay in the battery line to prevent excessive discharge or overcharge that maydamage the battery. This configuration is typical of small systems. If AC loadsare present in the system, they are powered by a DC/AC inverter connected tothe DC bus.
Figure 3 Stand-alone system with DC bus configuration.
PV charge regulator DC
AC inverter
battery
7
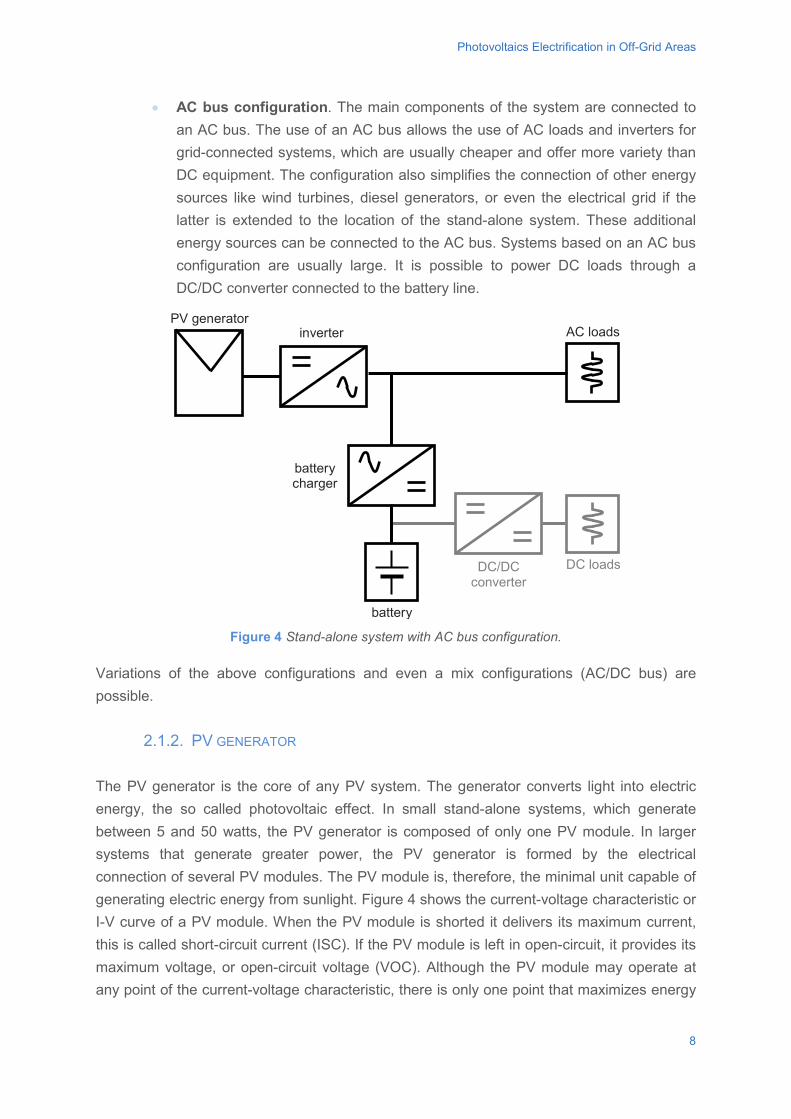
Photovoltaics Electrification in Off-Grid Areas
• AC bus configuration. The main components of the system are connected toan AC bus. The use of an AC bus allows the use of AC loads and inverters forgrid-connected systems, which are usually cheaper and offer more variety thanDC equipment. The configuration also simplifies the connection of other energysources like wind turbines, diesel generators, or even the electrical grid if thelatter is extended to the location of the stand-alone system. These additionalenergy sources can be connected to the AC bus. Systems based on an AC busconfiguration are usually large. It is possible to power DC loads through aDC/DC converter connected to the battery line.
Figure 4 Stand-alone system with AC bus configuration.
Variations of the above configurations and even a mix configurations (AC/DC bus) are possible.
2.1.2. PV GENERATOR
The PV generator is the core of any PV system. The generator converts light into electric energy, the so called photovoltaic effect. In small stand-alone systems, which generate between 5 and 50 watts, the PV generator is composed of only one PV module. In larger systems that generate greater power, the PV generator is formed by the electrical connection of several PV modules. The PV module is, therefore, the minimal unit capable of generating electric energy from sunlight. Figure 4 shows the current-voltage characteristic or I-V curve of a PV module. When the PV module is shorted it delivers its maximum current, this is called short-circuit current (ISC). If the PV module is left in open-circuit, it provides its maximum voltage, or open-circuit voltage (VOC). Although the PV module may operate at any point of the current-voltage characteristic, there is only one point that maximizes energy
PV generator
battery charger
AC loads inverter
battery
DC loads DC/DC converter
8
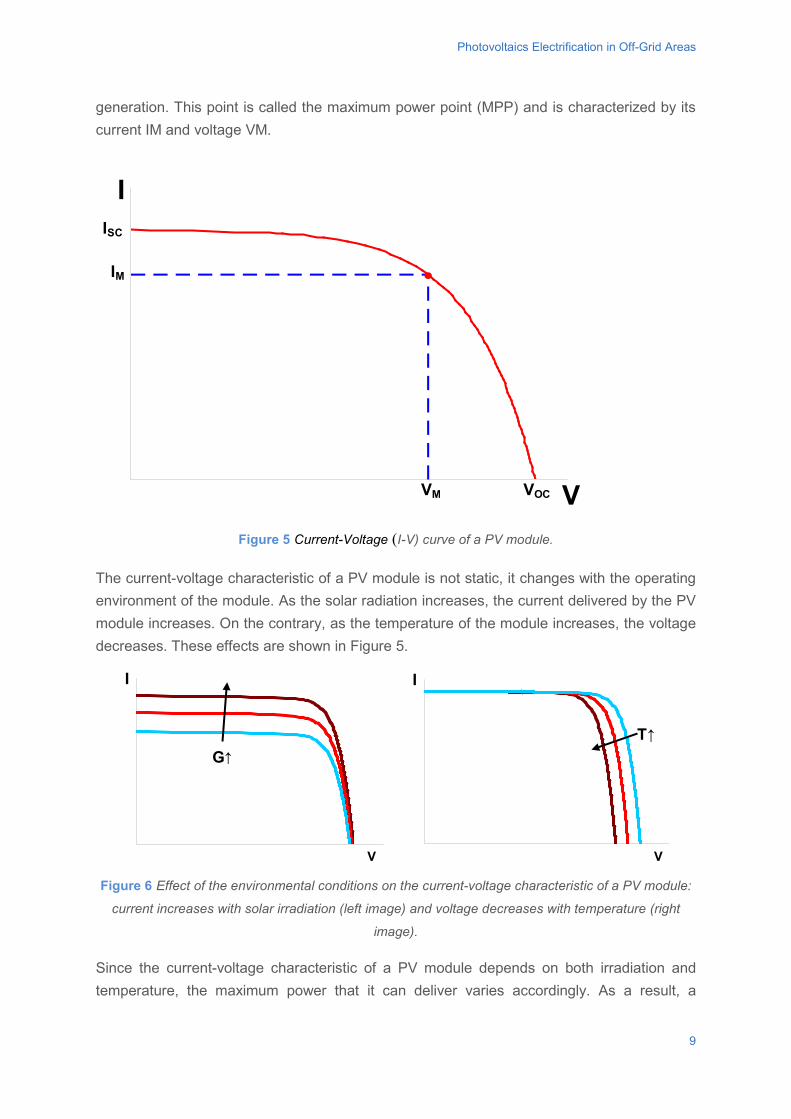
Photovoltaics Electrification in Off-Grid Areas
generation. This point is called the maximum power point (MPP) and is characterized by its current IM and voltage VM.
Figure 5 Current-Voltage (I-V) curve of a PV module.
The current-voltage characteristic of a PV module is not static, it changes with the operating environment of the module. As the solar radiation increases, the current delivered by the PV module increases. On the contrary, as the temperature of the module increases, the voltage decreases. These effects are shown in Figure 5.
Figure 6 Effect of the environmental conditions on the current-voltage characteristic of a PV module:
current increases with solar irradiation (left image) and voltage decreases with temperature (right
image).
Since the current-voltage characteristic of a PV module depends on both irradiation and temperature, the maximum power that it can deliver varies accordingly. As a result, a
I
V
ISC
IM
VM VOC
I
V
T↑
I
V
G↑
9
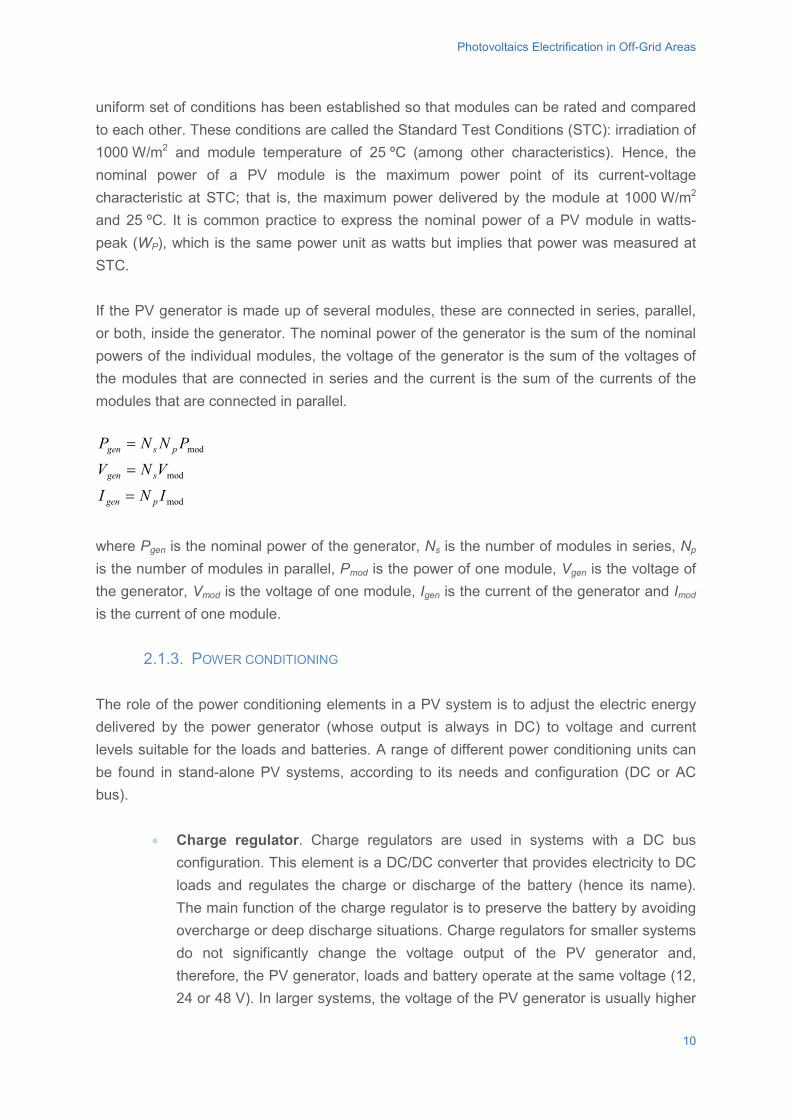
Photovoltaics Electrification in Off-Grid Areas
uniform set of conditions has been established so that modules can be rated and compared to each other. These conditions are called the Standard Test Conditions (STC): irradiation of 1000 W/m2 and module temperature of 25 ºC (among other characteristics). Hence, the nominal power of a PV module is the maximum power point of its current-voltage characteristic at STC; that is, the maximum power delivered by the module at 1000 W/m2 and 25 ºC. It is common practice to express the nominal power of a PV module in watts-peak (WP), which is the same power unit as watts but implies that power was measured at STC. If the PV generator is made up of several modules, these are connected in series, parallel, or both, inside the generator. The nominal power of the generator is the sum of the nominal powers of the individual modules, the voltage of the generator is the sum of the voltages of the modules that are connected in series and the current is the sum of the currents of the modules that are connected in parallel.
mod
mod
mod
INIVNV
PNNP
pgen
sgen
psgen
=
=
=
where Pgen is the nominal power of the generator, Ns is the number of modules in series, Np is the number of modules in parallel, Pmod is the power of one module, Vgen is the voltage of the generator, Vmod is the voltage of one module, Igen is the current of the generator and Imod is the current of one module.
2.1.3. POWER CONDITIONING The role of the power conditioning elements in a PV system is to adjust the electric energy delivered by the power generator (whose output is always in DC) to voltage and current levels suitable for the loads and batteries. A range of different power conditioning units can be found in stand-alone PV systems, according to its needs and configuration (DC or AC bus).
• Charge regulator. Charge regulators are used in systems with a DC bus configuration. This element is a DC/DC converter that provides electricity to DC loads and regulates the charge or discharge of the battery (hence its name). The main function of the charge regulator is to preserve the battery by avoiding overcharge or deep discharge situations. Charge regulators for smaller systems do not significantly change the voltage output of the PV generator and, therefore, the PV generator, loads and battery operate at the same voltage (12, 24 or 48 V). In larger systems, the voltage of the PV generator is usually higher
10
Photovoltaics Electrification in Off-Grid Areas
than the voltage of DC bus and the charge regulator reduces this voltage to a level suitable for the loads and battery.
• Solar inverter. Solar inverters are found in systems with either DC or AC busconfiguration. An inverter converts DC current into AC current, an operationcalled inversion. In a system with a DC bus configuration, the inverter isconnected to the output of the charge regulator. If an AC bus is used, theinverter is connected directly to the output of the PV generator. In a DC busconfiguration, the DC levels accepted by the inverter at its input are larger thanin an AC configuration.
• Bidirectional inverter. A bidirectional inverter or battery inverter is used instand-alone systems with AC bus configuration. This element charges anddischarges the battery from, or to, the AC bus when needed. Therefore, thiselement operates bi-directionally, converting from AC to DC and vice versa. Thebattery inverter also preservers the life of the battery by avoiding overchargingor deep discharging.
The power conditioning elements for a stand-alone PV system must be chosen according to the following criteria:
• Configuration of the system. A DC bus only requires a charge regulator andan inverter if AC loads are to be powered. Contrastingly, an AC bus alwaysrequires both solar inverters and a battery inverter.
• Maximum power of the system. The maximum operating power of the powerconditioning element must be appropriate to the nominal power of the PVgenerator, as well as the maximum power that is expected to be demanded bythe loads. It is not convenient to oversize these components because they workmore efficiently when the power delivered by them is closer to its maximum.
• Voltage and current levels. For both voltage and current, the input range thatis accepted by charge regulators or solar inverters must match the expectedoutput range of the PV generator. The fact that the voltage and current of a PVgenerator depend on operating conditions must be taken into account. Thevoltage output of a charge regulator must match the nominal voltage of thebattery and the DC loads. The output of a solar inverter, as well as the ACconnection of the battery inverter, must match the voltage and phase of the ACbus.
2.1.4. ENERGY STORAGE: BATTERIES
A PV system only generates electricity during daytime and this electricity depends on the irradiation level. In order to have access to electricity at night (for instance, for lighting
11
Photovoltaics Electrification in Off-Grid Areas
purposes) or when irradiation levels are low, stand-alone PV systems include energy storage to store for later use any surplus electricity that is generated by the system. The energy storage may be replaced, or its size reduced by the used of secondary generators like wind or diesel generators. Hybrid systems with two or more generators are outside the scope of this case study. The most common form of storage found in stand-alone systems is electrochemical accumulation or batteries. Of the different types of batteries that are available, lead-acid batteries are used in almost 100% of stand-alone systems. In solar pump applications, where the load of the system is a water pump, energy is usually stored as potential energy by means of filling an elevated water tank. There are several different types of lead-acid batteries: • Automotive batteries. These batteries (also called Starting, Lightning and Ignition
(SLI) batteries) are designed for use in vehicles. Their main advantages are low cost, wide availabilty, possibility of local production and easy ability to recycle. Their main drawback is their shortened lifetime, as they are not optimized for use in stand-alone systems.
• Deep cycle batteries. These batteries are designed to sustain deeper discharges than SLI batteries, and are therefore more suitable for stand-alone systems. The main advantage of deep cycle batteries is their longer lifetime. Their primary drawbacks are high cost and low availability in developing countries. Deep cycle batteries are divided into Flooded Acid Batteries (FLA) and Valve Regulated Lead Acid batteries (VRLA), or sealed batteries. FLA batteries are more reliable than VRLA batteries, but they may require maintenance once or twice a year. VRLA batteries require less maintenance but this is at the cost of reduced reliability.
The main parameter of a battery, besides its nominal voltage, is its capacity. The capacity of a battery is the amount of energy that can be stored in it and retrieved at a later time. The energy stored in a battery is usually expressed as a percentage of its capacity , or the State Of Charge (SOC), and ranges from 100% to 0%. However, a state of charge of zero is never achieved in practice because low levels of charge damage the battery and reduce its lifetime. In general, the SOC may never be below 50% for SLI batteries and 20% for deep cycle batteries. However, higher values are recommended in both cases to extend lifetime (60% and 45% respectively). With this in mind, when sizing the battery of stand-alone system, the minimum SOC must be considered. For example, if a storage capacity of 150 Wh is estimated and a SLI battery is chosen, the nominal capacity of the battery must be 300 Wh to assure that a SOC lower than 50% is not reached.
12
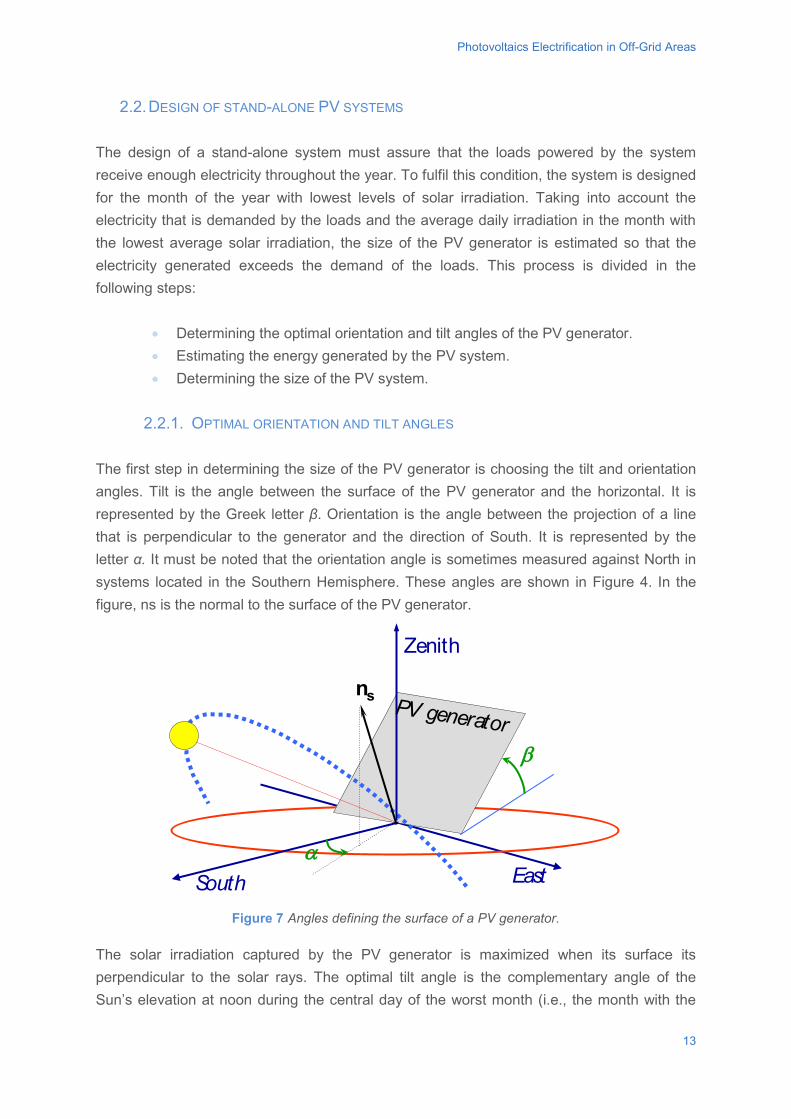
Photovoltaics Electrification in Off-Grid Areas
2.2. DESIGN OF STAND-ALONE PV SYSTEMS The design of a stand-alone system must assure that the loads powered by the system receive enough electricity throughout the year. To fulfil this condition, the system is designed for the month of the year with lowest levels of solar irradiation. Taking into account the electricity that is demanded by the loads and the average daily irradiation in the month with the lowest average solar irradiation, the size of the PV generator is estimated so that the electricity generated exceeds the demand of the loads. This process is divided in the following steps:
• Determining the optimal orientation and tilt angles of the PV generator. • Estimating the energy generated by the PV system. • Determining the size of the PV system.
2.2.1. OPTIMAL ORIENTATION AND TILT ANGLES
The first step in determining the size of the PV generator is choosing the tilt and orientation angles. Tilt is the angle between the surface of the PV generator and the horizontal. It is represented by the Greek letter β. Orientation is the angle between the projection of a line that is perpendicular to the generator and the direction of South. It is represented by the letter α. It must be noted that the orientation angle is sometimes measured against North in systems located in the Southern Hemisphere. These angles are shown in Figure 4. In the figure, ns is the normal to the surface of the PV generator.
Figure 7 Angles defining the surface of a PV generator.
The solar irradiation captured by the PV generator is maximized when its surface its perpendicular to the solar rays. The optimal tilt angle is the complementary angle of the Sun’s elevation at noon during the central day of the worst month (i.e., the month with the
β
α
PV generator
EastSouth
Zenith
ns
13
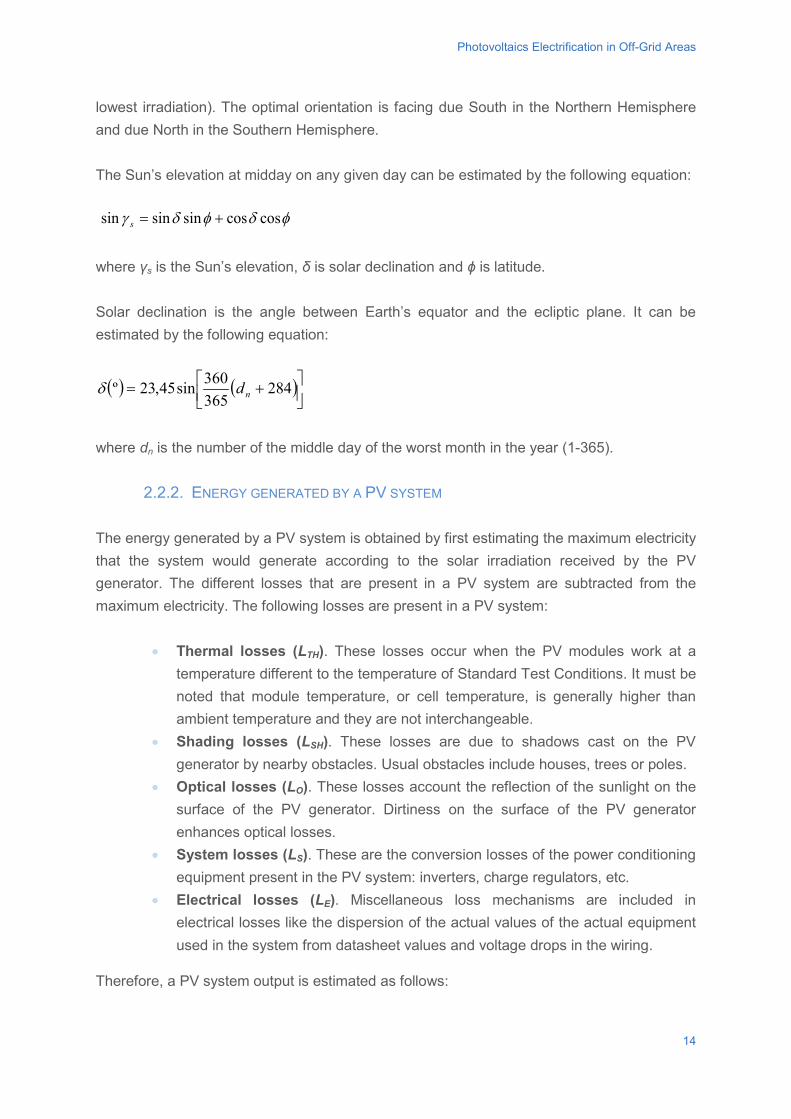
Photovoltaics Electrification in Off-Grid Areas
lowest irradiation). The optimal orientation is facing due South in the Northern Hemisphere and due North in the Southern Hemisphere.
The Sun’s elevation at midday on any given day can be estimated by the following equation:
φδφδγ coscossinsinsin +=s
where γs is the Sun’s elevation, δ is solar declination and ϕ is latitude.
Solar declination is the angle between Earth’s equator and the ecliptic plane. It can be estimated by the following equation:
( ) ( )
+= 284365360sin45,23º ndδ
where dn is the number of the middle day of the worst month in the year (1-365).
2.2.2. ENERGY GENERATED BY A PV SYSTEM
The energy generated by a PV system is obtained by first estimating the maximum electricity that the system would generate according to the solar irradiation received by the PV generator. The different losses that are present in a PV system are subtracted from the maximum electricity. The following losses are present in a PV system:
• Thermal losses (LTH). These losses occur when the PV modules work at atemperature different to the temperature of Standard Test Conditions. It must benoted that module temperature, or cell temperature, is generally higher thanambient temperature and they are not interchangeable.
• Shading losses (LSH). These losses are due to shadows cast on the PVgenerator by nearby obstacles. Usual obstacles include houses, trees or poles.
• Optical losses (LO). These losses account the reflection of the sunlight on thesurface of the PV generator. Dirtiness on the surface of the PV generatorenhances optical losses.
• System losses (LS). These are the conversion losses of the power conditioningequipment present in the PV system: inverters, charge regulators, etc.
• Electrical losses (LE). Miscellaneous loss mechanisms are included inelectrical losses like the dispersion of the actual values of the actual equipmentused in the system from datasheet values and voltage drops in the wiring.
Therefore, a PV system output is estimated as follows:
14
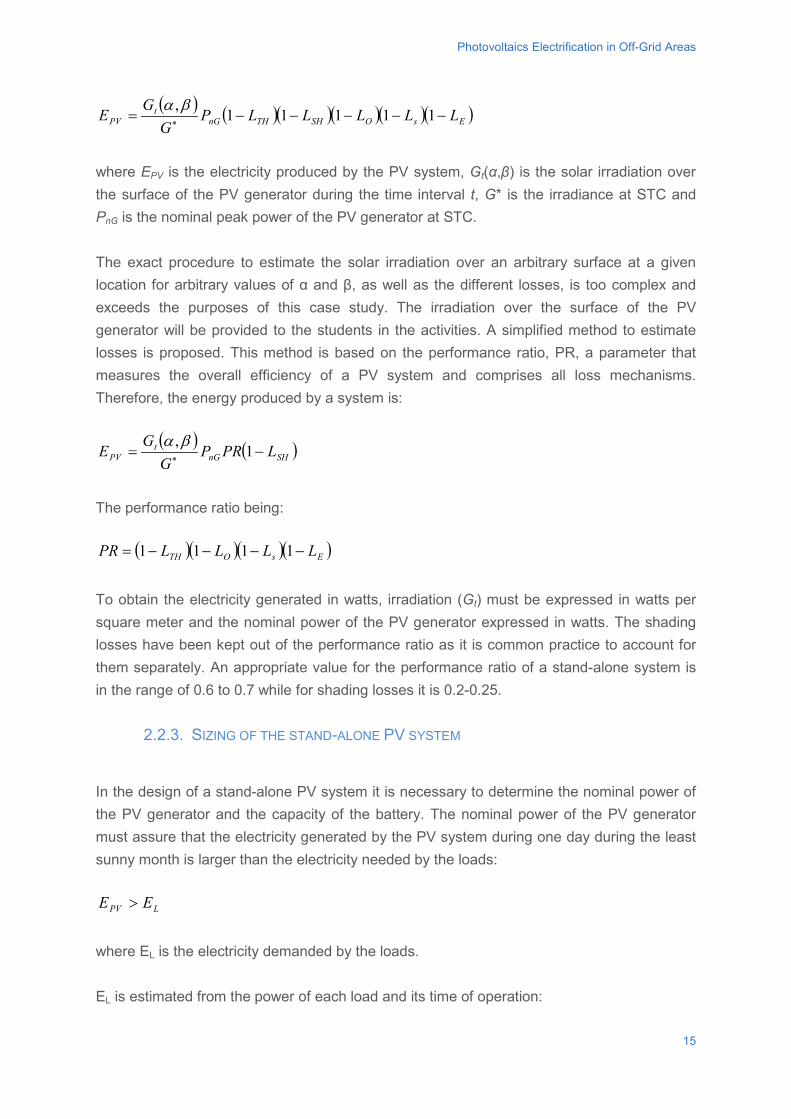
Photovoltaics Electrification in Off-Grid Areas
( ) ( )( )( )( )( )EsOSHTHnGt
PV LLLLLPG
GE −−−−−= ∗ 11111
,βα
where EPV is the electricity produced by the PV system, Gt(α,β) is the solar irradiation over the surface of the PV generator during the time interval t, G* is the irradiance at STC and PnG is the nominal peak power of the PV generator at STC. The exact procedure to estimate the solar irradiation over an arbitrary surface at a given location for arbitrary values of α and β, as well as the different losses, is too complex and exceeds the purposes of this case study. The irradiation over the surface of the PV generator will be provided to the students in the activities. A simplified method to estimate losses is proposed. This method is based on the performance ratio, PR, a parameter that measures the overall efficiency of a PV system and comprises all loss mechanisms. Therefore, the energy produced by a system is:
( ) ( )SHnGt
PV LPRPG
GE −= ∗ 1
,βα
The performance ratio being:
( )( )( )( )EsOTH LLLLPR −−−−= 1111 To obtain the electricity generated in watts, irradiation (Gt) must be expressed in watts per square meter and the nominal power of the PV generator expressed in watts. The shading losses have been kept out of the performance ratio as it is common practice to account for them separately. An appropriate value for the performance ratio of a stand-alone system is in the range of 0.6 to 0.7 while for shading losses it is 0.2-0.25.
2.2.3. SIZING OF THE STAND-ALONE PV SYSTEM
In the design of a stand-alone PV system it is necessary to determine the nominal power of the PV generator and the capacity of the battery. The nominal power of the PV generator must assure that the electricity generated by the PV system during one day during the least sunny month is larger than the electricity needed by the loads:
LPV EE >
where EL is the electricity demanded by the loads. EL is estimated from the power of each load and its time of operation:
15
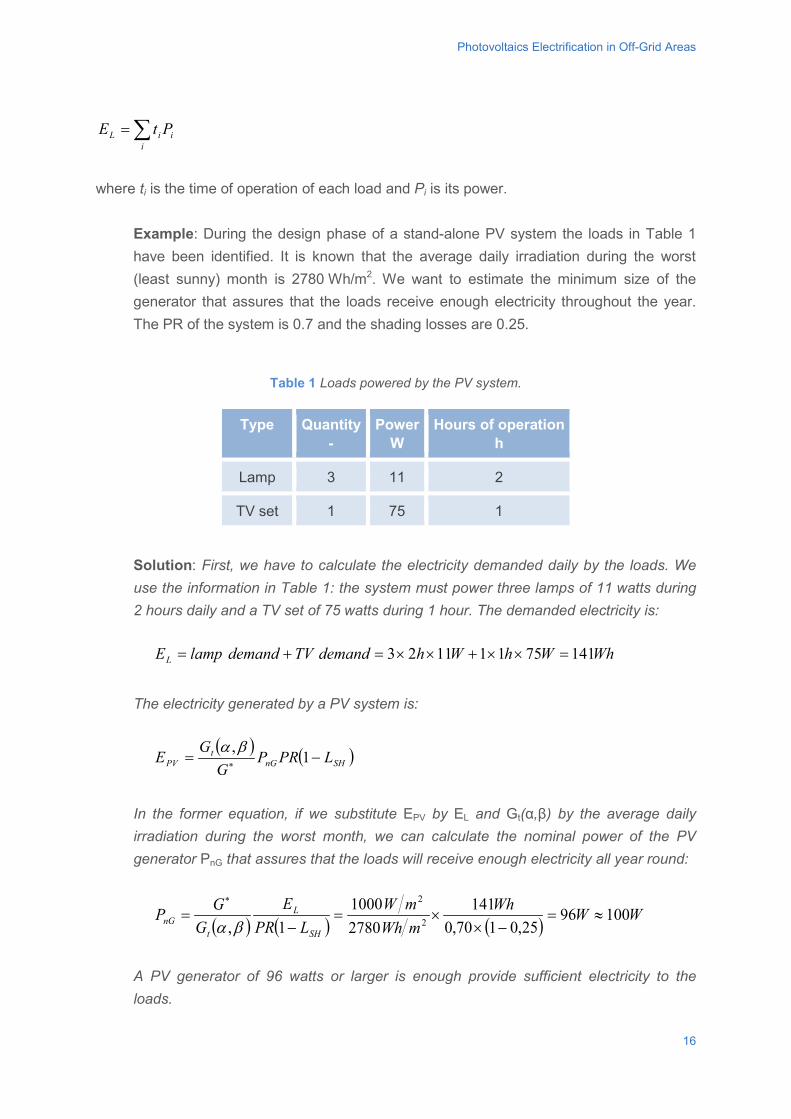
Photovoltaics Electrification in Off-Grid Areas
∑=i
iiL PtE
where ti is the time of operation of each load and Pi is its power.
Example: During the design phase of a stand-alone PV system the loads in Table 1 have been identified. It is known that the average daily irradiation during the worst (least sunny) month is 2780 Wh/m2. We want to estimate the minimum size of the generator that assures that the loads receive enough electricity throughout the year. The PR of the system is 0.7 and the shading losses are 0.25.
Table 1 Loads powered by the PV system.
Type Quantity -
Power W
Hours of operation h
Lamp 3 11 2
TV set 1 75 1
Solution: First, we have to calculate the electricity demanded daily by the loads. We use the information in Table 1: the system must power three lamps of 11 watts during 2 hours daily and a TV set of 75 watts during 1 hour. The demanded electricity is:
WhWhWhdemandTVdemandlampEL 14175111123 =××+××=+=
The electricity generated by a PV system is:
( ) ( )SHnGt
PV LPRPG
GE −= ∗ 1
,βα
In the former equation, if we substitute EPV by EL and Gt(α,β) by the average daily irradiation during the worst month, we can calculate the nominal power of the PV generator PnG that assures that the loads will receive enough electricity all year round:
( ) ( ) ( ) WWWhmWhmW
LPRE
GGP
SH
L
tnG 10096
25,0170,0141
27801000
1, 2
2
≈=−×
×=−
=∗
βα
A PV generator of 96 watts or larger is enough provide sufficient electricity to the loads.
16
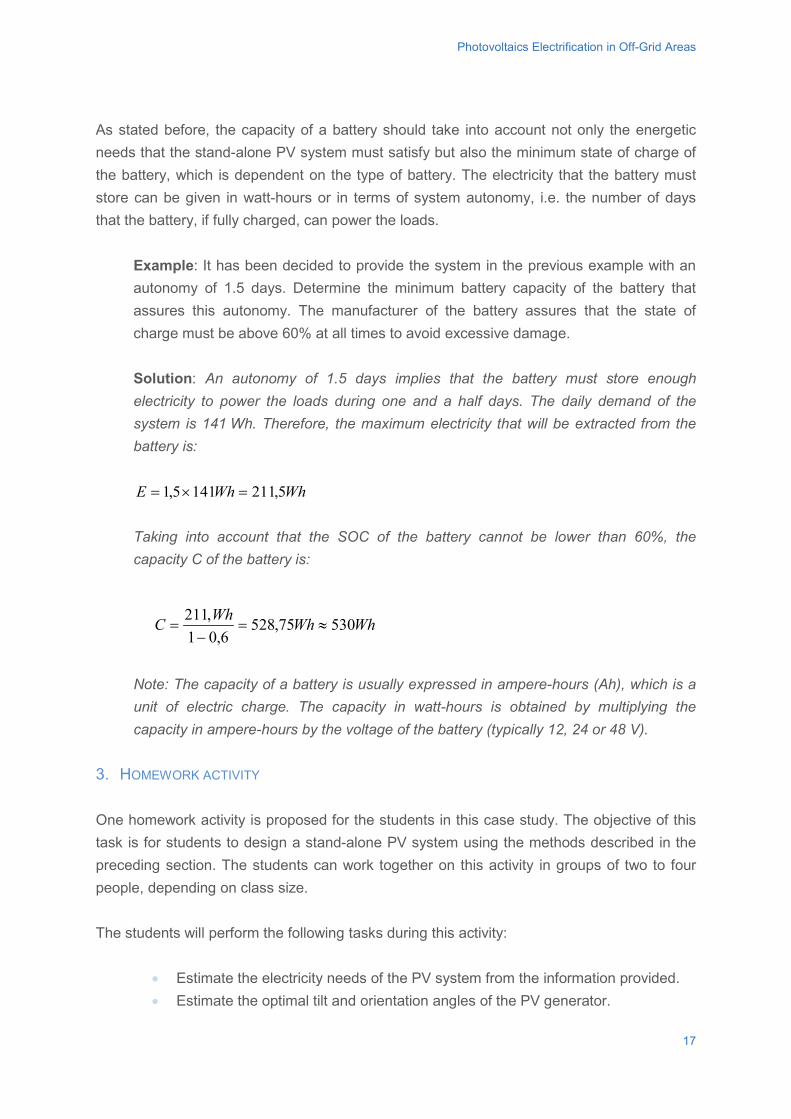
Photovoltaics Electrification in Off-Grid Areas
As stated before, the capacity of a battery should take into account not only the energetic needs that the stand-alone PV system must satisfy but also the minimum state of charge of the battery, which is dependent on the type of battery. The electricity that the battery must store can be given in watt-hours or in terms of system autonomy, i.e. the number of days that the battery, if fully charged, can power the loads.
Example: It has been decided to provide the system in the previous example with an autonomy of 1.5 days. Determine the minimum battery capacity of the battery that assures this autonomy. The manufacturer of the battery assures that the state of charge must be above 60% at all times to avoid excessive damage. Solution: An autonomy of 1.5 days implies that the battery must store enough electricity to power the loads during one and a half days. The daily demand of the system is 141 Wh. Therefore, the maximum electricity that will be extracted from the battery is:
WhWhE 5,2111415,1 =×= Taking into account that the SOC of the battery cannot be lower than 60%, the capacity C of the battery is:
WhWhWhC 53075,5286,01
,211≈=
−=
Note: The capacity of a battery is usually expressed in ampere-hours (Ah), which is a unit of electric charge. The capacity in watt-hours is obtained by multiplying the capacity in ampere-hours by the voltage of the battery (typically 12, 24 or 48 V).
3. HOMEWORK ACTIVITY One homework activity is proposed for the students in this case study. The objective of this task is for students to design a stand-alone PV system using the methods described in the preceding section. The students can work together on this activity in groups of two to four people, depending on class size. The students will perform the following tasks during this activity:
• Estimate the electricity needs of the PV system from the information provided. • Estimate the optimal tilt and orientation angles of the PV generator.
17
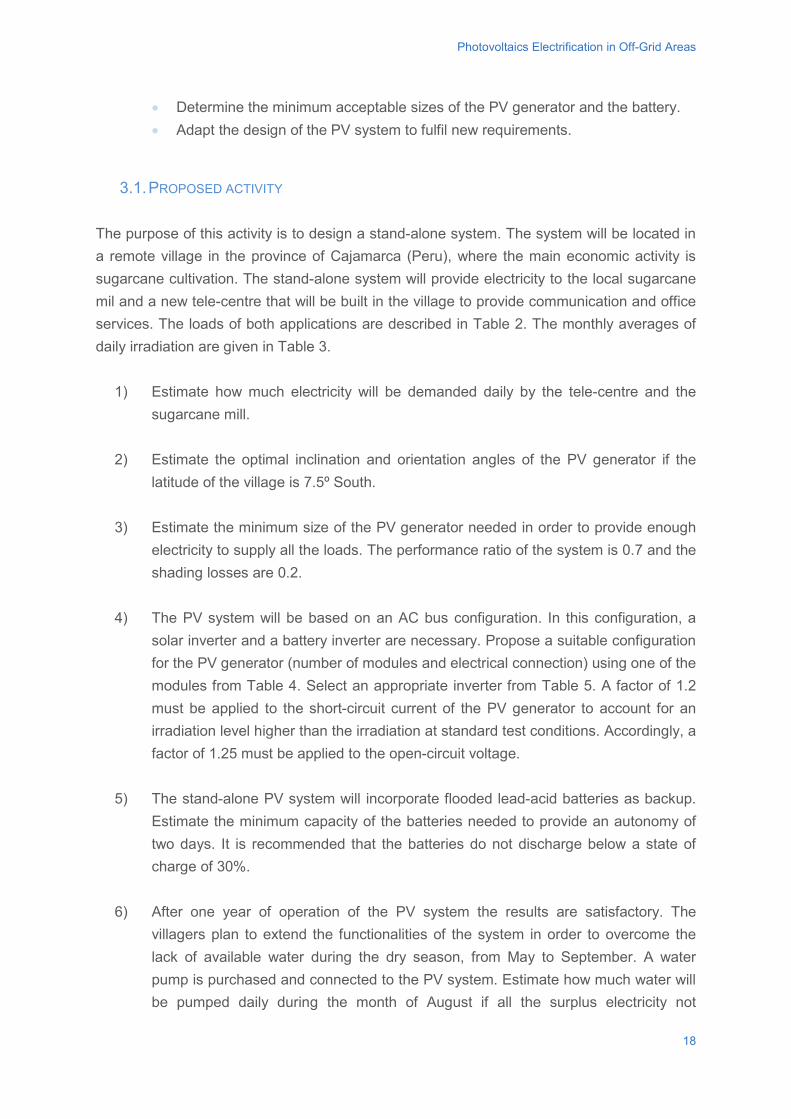
Photovoltaics Electrification in Off-Grid Areas
• Determine the minimum acceptable sizes of the PV generator and the battery.• Adapt the design of the PV system to fulfil new requirements.
3.1. PROPOSED ACTIVITY
The purpose of this activity is to design a stand-alone system. The system will be located in a remote village in the province of Cajamarca (Peru), where the main economic activity is sugarcane cultivation. The stand-alone system will provide electricity to the local sugarcane mil and a new tele-centre that will be built in the village to provide communication and office services. The loads of both applications are described in Table 2. The monthly averages of daily irradiation are given in Table 3.
1) Estimate how much electricity will be demanded daily by the tele-centre and thesugarcane mill.
2) Estimate the optimal inclination and orientation angles of the PV generator if thelatitude of the village is 7.5º South.
3) Estimate the minimum size of the PV generator needed in order to provide enoughelectricity to supply all the loads. The performance ratio of the system is 0.7 and theshading losses are 0.2.
4) The PV system will be based on an AC bus configuration. In this configuration, asolar inverter and a battery inverter are necessary. Propose a suitable configurationfor the PV generator (number of modules and electrical connection) using one of themodules from Table 4. Select an appropriate inverter from Table 5. A factor of 1.2must be applied to the short-circuit current of the PV generator to account for anirradiation level higher than the irradiation at standard test conditions. Accordingly, afactor of 1.25 must be applied to the open-circuit voltage.
5) The stand-alone PV system will incorporate flooded lead-acid batteries as backup.Estimate the minimum capacity of the batteries needed to provide an autonomy oftwo days. It is recommended that the batteries do not discharge below a state ofcharge of 30%.
6) After one year of operation of the PV system the results are satisfactory. Thevillagers plan to extend the functionalities of the system in order to overcome thelack of available water during the dry season, from May to September. A waterpump is purchased and connected to the PV system. Estimate how much water willbe pumped daily during the month of August if all the surplus electricity not
18
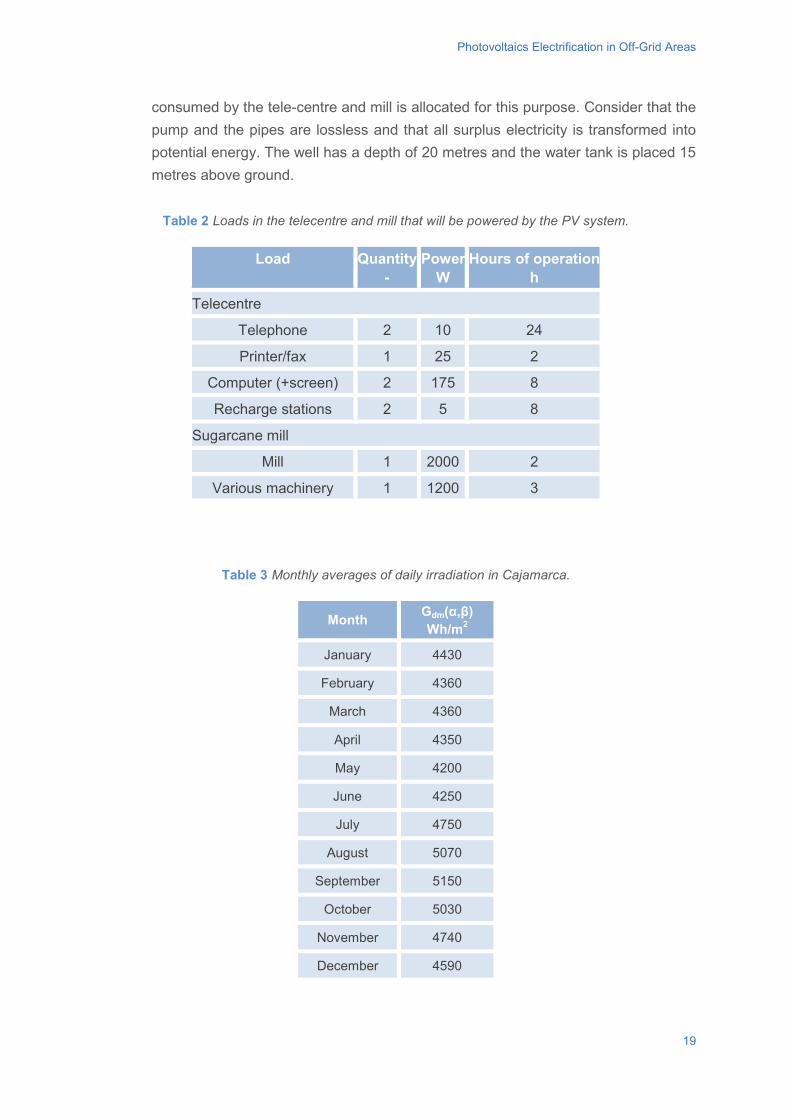
Photovoltaics Electrification in Off-Grid Areas
consumed by the tele-centre and mill is allocated for this purpose. Consider that the pump and the pipes are lossless and that all surplus electricity is transformed into potential energy. The well has a depth of 20 metres and the water tank is placed 15 metres above ground.
Table 2 Loads in the telecentre and mill that will be powered by the PV system.
Load Quantity -
Power W
Hours of operation h
Telecentre
Telephone 2 10 24
Printer/fax 1 25 2
Computer (+screen) 2 175 8
Recharge stations 2 5 8
Sugarcane mill
Mill 1 2000 2
Various machinery 1 1200 3
Table 3 Monthly averages of daily irradiation in Cajamarca.
Month Gdm(α,β) Wh/m2
January 4430
February 4360
March 4360
April 4350
May 4200
June 4250
July 4750
August 5070
September 5150
October 5030
November 4740
December 4590
19
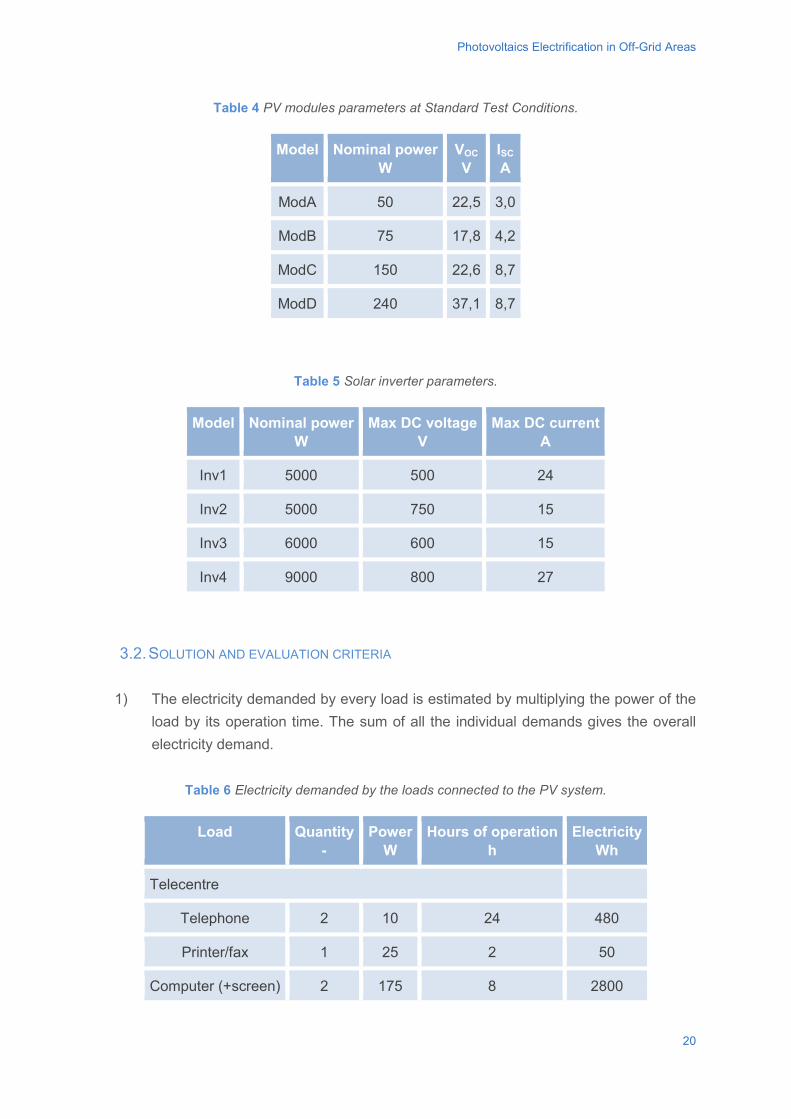
Photovoltaics Electrification in Off-Grid Areas
Table 4 PV modules parameters at Standard Test Conditions.
Model Nominal power W
VOC
V ISC
A
ModA 50 22,5 3,0
ModB 75 17,8 4,2
ModC 150 22,6 8,7
ModD 240 37,1 8,7
Table 5 Solar inverter parameters.
Model Nominal power W
Max DC voltage V
Max DC current A
Inv1 5000 500 24
Inv2 5000 750 15
Inv3 6000 600 15
Inv4 9000 800 27
3.2. SOLUTION AND EVALUATION CRITERIA
1) The electricity demanded by every load is estimated by multiplying the power of theload by its operation time. The sum of all the individual demands gives the overallelectricity demand.
Table 6 Electricity demanded by the loads connected to the PV system.
Load Quantity -
Power W
Hours of operation h
Electricity Wh
Telecentre
Telephone 2 10 24 480
Printer/fax 1 25 2 50
Computer (+screen) 2 175 8 2800
20
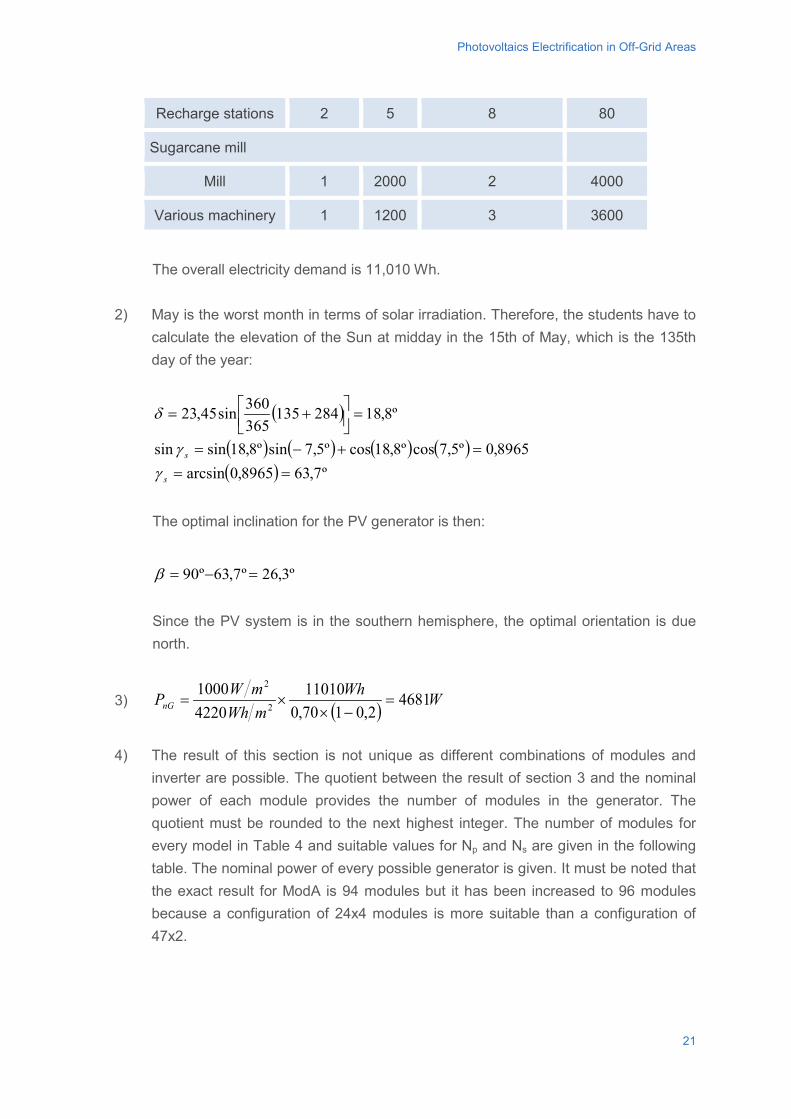
Photovoltaics Electrification in Off-Grid Areas
Recharge stations 2 5 8 80
Sugarcane mill
Mill 1 2000 2 4000
Various machinery 1 1200 3 3600
The overall electricity demand is 11,010 Wh.
2) May is the worst month in terms of solar irradiation. Therefore, the students have to
calculate the elevation of the Sun at midday in the 15th of May, which is the 135th day of the year:
( )
( ) ( ) ( ) ( )( ) º7,638965,0arcsin
8965,0º5,7cosº8,18cosº5,7sinº8,18sinsin
º8,18284135365360sin45,23
===+−=
=
+=
s
s
γγ
δ
The optimal inclination for the PV generator is then:
º3,26º7,63º90 =−=β Since the PV system is in the southern hemisphere, the optimal orientation is due north.
3) ( ) WWhmWhmWPnG 4681
2,0170,011010
42201000
2
2
=−×
×=
4) The result of this section is not unique as different combinations of modules and
inverter are possible. The quotient between the result of section 3 and the nominal power of each module provides the number of modules in the generator. The quotient must be rounded to the next highest integer. The number of modules for every model in Table 4 and suitable values for Np and Ns are given in the following table. The nominal power of every possible generator is given. It must be noted that the exact result for ModA is 94 modules but it has been increased to 96 modules because a configuration of 24x4 modules is more suitable than a configuration of 47x2.
21
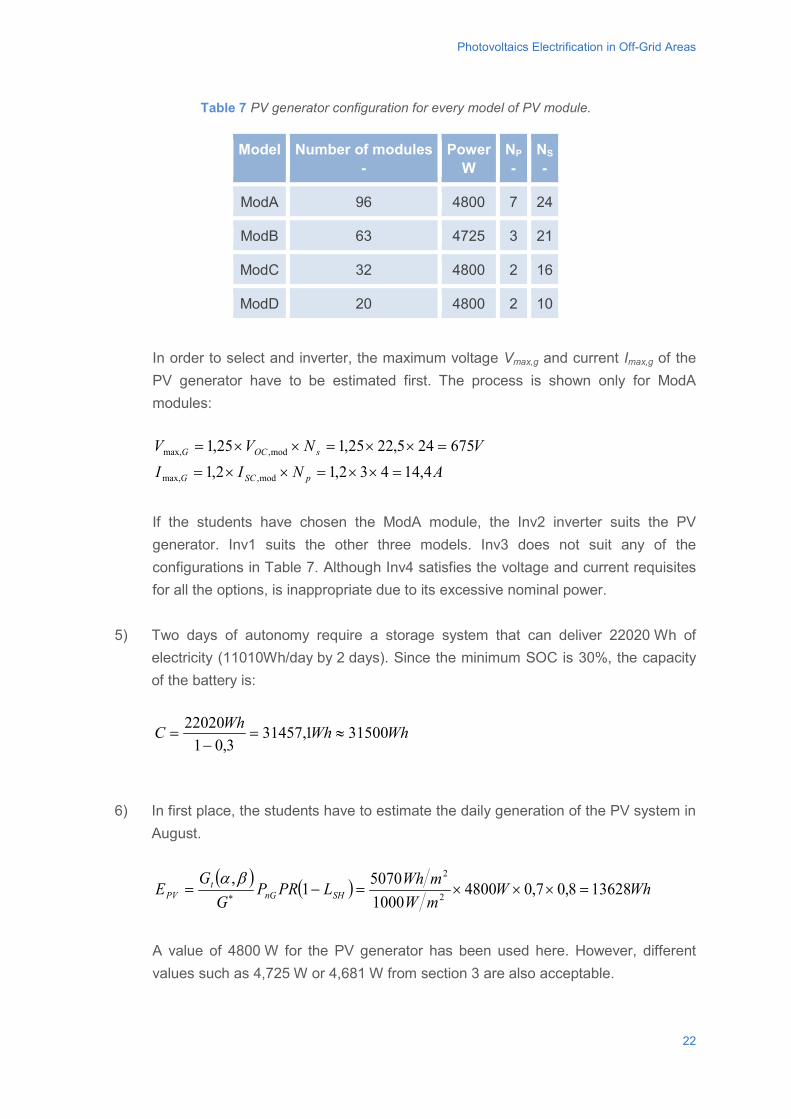
Photovoltaics Electrification in Off-Grid Areas
Table 7 PV generator configuration for every model of PV module.
Model Number of modules -
Power W
NP
- NS -
ModA 96 4800 7 24
ModB 63 4725 3 21
ModC 32 4800 2 16
ModD 20 4800 2 10
In order to select and inverter, the maximum voltage Vmax,g and current Imax,g of the PV generator have to be estimated first. The process is shown only for ModA modules:
ANIIVNVV
pSCG
sOCG
4,14432,12,1675245,2225,125,1
mod,max,
mod,max,
=××=××=
=××=××=
If the students have chosen the ModA module, the Inv2 inverter suits the PV generator. Inv1 suits the other three models. Inv3 does not suit any of the configurations in Table 7. Although Inv4 satisfies the voltage and current requisites for all the options, is inappropriate due to its excessive nominal power.
5) Two days of autonomy require a storage system that can deliver 22020 Wh of electricity (11010Wh/day by 2 days). Since the minimum SOC is 30%, the capacity of the battery is:
WhWhWhC 315001,314573,01
22020≈=
−=
6) In first place, the students have to estimate the daily generation of the PV system in August.
( ) ( ) WhWmWmWhLPRP
GG
E SHnGt
PV 136288,07,04800100050701
,2
2
=×××=−= ∗
βα
A value of 4800 W for the PV generator has been used here. However, different values such as 4,725 W or 4,681 W from section 3 are also acceptable.
22
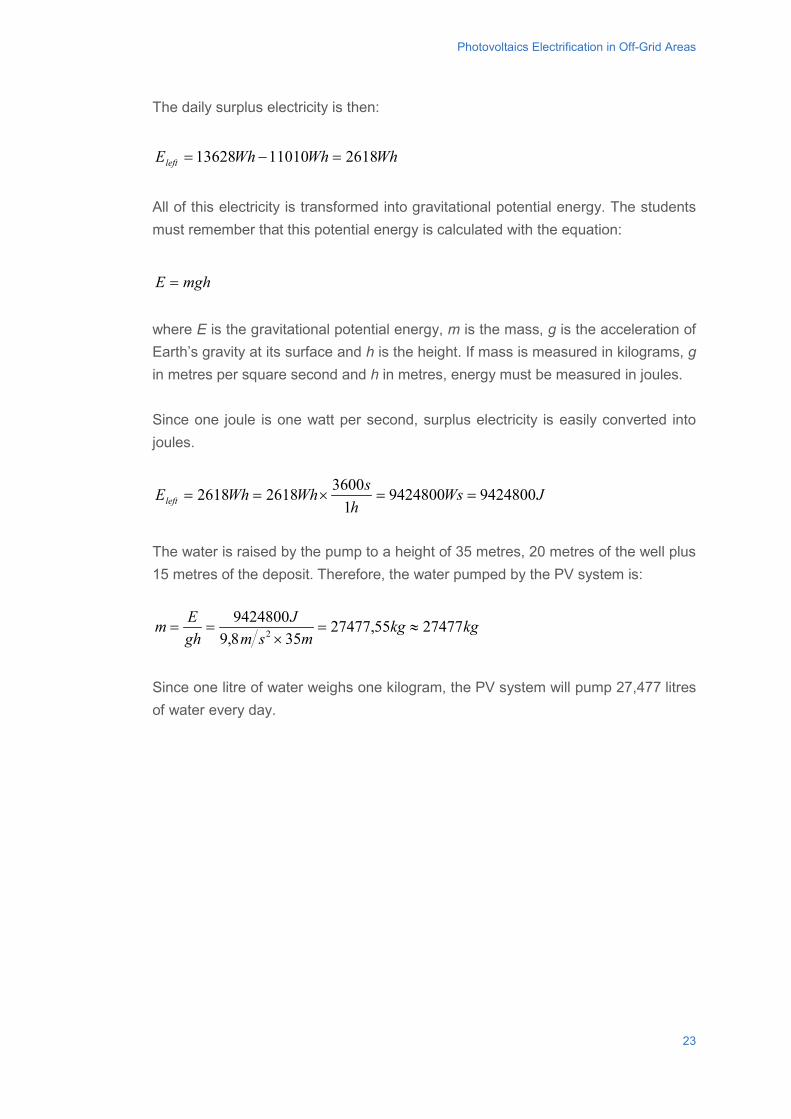
Photovoltaics Electrification in Off-Grid Areas
The daily surplus electricity is then:
WhWhWhEleft 26181101013628 =−= All of this electricity is transformed into gravitational potential energy. The students must remember that this potential energy is calculated with the equation:
mghE = where E is the gravitational potential energy, m is the mass, g is the acceleration of Earth’s gravity at its surface and h is the height. If mass is measured in kilograms, g in metres per square second and h in metres, energy must be measured in joules. Since one joule is one watt per second, surplus electricity is easily converted into joules.
JWsh
sWhWhEleft 942480094248001
360026182618 ==×==
The water is raised by the pump to a height of 35 metres, 20 metres of the well plus 15 metres of the deposit. Therefore, the water pumped by the PV system is:
kgkgmsm
JghEm 2747755,27477
358,99424800
2 ≈=×
==
Since one litre of water weighs one kilogram, the PV system will pump 27,477 litres of water every day.
23
Photovoltaics Electrification in Off-Grid Areas
BIBLIOGRAPHY Bindner, H., et al., 2005. Lifetime and Modelling of Lead Acid Batteries. Risø National Laboratory, Roskilde. FOOD AND AGRICULATURE ORGANIZATION OF THE UNITED NATIONS (2000) Environment and Natural Resources Working Paper No. 2: Solar Photovoltaics for Sustainable Agriculture and Rural Development. Rome. Food and Agriculture Organization of the United Nations. INTERNATIONAL ENERGY AGENCY PHOTOVOLTAIC POWER SYSTEMS PROGRAMME (2003) PV for rural electrification in Developing Countries – Programme Desing, Planning and Implementation. Report IEA-PVPS T9-05. International Energy Agency Photovoltaic Power Systems Programme. Joint Research Centre Institute for Energy and Transport, Photovoltaic Geographical Information System (PVGIS). Available from: <http://re.jrc.ec.europa.eu/pvgis/>. [11 May 2015]. Lorenzo, E., 1994. Solar Electricity: Engineering of Photovoltaic Systems. Progensa, Seville. Luque, A., Hegedus, S., 2003. Handbook of Photovoltaic Science and Engineering. Wiley, West Sussex. NASA Atmospheric Science Data Center, Surface meteorology and Solar Energy. Available from: <https://eosweb.larc.nasa.gov/cgi-bin/sse/grid.cgi>. [11 May 2015] UNITED NATIONS DEVELOPMENT PROGRAMME (2000) Energizing the Millennium Development Goals. A Guide to Energy Role’s in Reducing Poverty. United Nations Development Programme.
24

http://www.gdee.eu
This project is funded by
Bruno Domenech
PHOTO: Practical Action.
CASE STUDIES
Development of aMILP model to designwind-photovoltaic stand-alone electrification projects for isolatedcommunities indeveloping countries

DL B 10735-2015 ISBN 978-84-606-7546-4
Development of a MILP model to design wind-photovoltaicstand-alone electrification projects for isolated communities in developing countries
COORDINATED BYAgustí Pérez-Foguet, Enric Velo, Pol Arranz, Ricard Ginéand Boris Lazzarini (Universitat Politècnica de Catalunya)Manuel Sierra (Universidad Politécnica de Madrid)Alejandra Boni and Jordi Peris (Universitat Politècnica de València)Guido Zolezzi and Gabriella Trombino (Università degli Studi di Trento)Rhoda Trimingham (Loughborough University)Valentín Villarroel (ONGAWA)Neil Nobles and Meadhbh Bolger (Practical Action)Francesco Mongera (Training Center for International Cooperation)Katie Cresswell-Maynard (Engineering Without Border UK)
EDITED BY Global Dimension in Engineering Education
Citation: Domenech, B. (2015) ' Development of a MILP model to design wind-photovoltaic stand-alone electrification projects for isolated communities in developing countries', in Case studies for developing globally responsible engineers, GDEE (eds.), Global Dimension in Engineering Education, Barcelona. Available from: http://gdee.eu/index.php/resources.html
This publication is distributedunder an Attribution- Noncommercial-Share Alike License for Creative Commons
CASE STUDIES
Disclaimer: This document has been produced with the financial assistance of the European UnionThe contents of this document are the sole responsibility of the authors and can under no circumstances be regarded as reflecting the position of the European Union
Development of a MILP model to design wind-photovoltaic stand-alone electrification projects for isolated communities in developing countries
Dr. Bruno Domenech, Department of Management (DOE), Universitat Politècnica de Catalunya
DEVELOPMENT OF A MILP MODEL TO DESIGN WIND-PHOTOVOLTAIC STAND-ALONE ELECTRIFICATION PROJECTS FOR ISOLATED COMMUNITIES IN DEVELOPING COUNTRIES
1
Development of a MILP model to design wind-photovoltaic stand-alone electrification projects for isolated communities in developing countries
INDEX 1. INTRODUCTION ............................................................................................................................. 3
1.1. Disciplines covered ................................................................................................................. 3
1.2. Learning outcomes .................................................................................................................. 3
1.3. Activities .................................................................................................................................. 4
2. DESCRIPTION OF THE CONTEXT ............................................................................................... 4
2.1. Introduction: Access to electricity ............................................................................................ 4
2.2. Justification: Stand-alone electrification .................................................................................. 5
2.3. Context: Design aid model ...................................................................................................... 8
3. CLASS ACTIVITY ......................................................................................................................... 10
3.1. Methodology .......................................................................................................................... 10
3.2. Proposed statement .............................................................................................................. 11
3.3. Solution ................................................................................................................................. 13
3.4. Evaluation criteria .................................................................................................................. 16
4 HOMEWORK ACTIVITY ................................................................................................................... 17
4.1 Methodology .......................................................................................................................... 17
4.2 Proposed statement .............................................................................................................. 17
4.3. Modelling solution ................................................................................................................. 22
4.4. Solution ................................................................................................................................. 25
4.5. Evaluation criteria .................................................................................................................. 26
5. FURTHER MATERIALS ............................................................................................................... 27
6. BIBLIOGRAPHY ........................................................................................................................... 27 7. ACKNOWLEDGEMENT ............................................................................................................... 30
2
Development of a MILP model to design wind-photovoltaic stand-alone electrification projects for isolated communities in developing countries
1. INTRODUCTION
Electrification systems based on the use of renewable energies are a suitable option for providing electricity to isolated communities autonomously, particularly in rural areas from developing countries. To electrify these populations, designs that combine wind and photovoltaic (PV) technologies as well as individual systems and microgrids have recently proven advantageous. In this context, the aim of this case study is that students develop a Mixed Integer Linear Programming (MILP) model to design such projects. The model is based on the one presented by Ferrer-Martí et al. [2013] and allows minimizing the project cost, while considering the detail of the community, the energy resources and the available equipment. As a result, the size and location of all the equipment to install are defined.
1.1. DISCIPLINES COVERED
The main discipline covered by this case study is the modeling of a complex problem through quantitative methods. The aim is that students be able to conceptually conceive the problem and formulate the corresponding MILP model. Moreover, students have to solve it using specialized software for a community that has been prepared based on real data, and so they have to obtain the optimal electrification system and explain the solution (value of the variables) in a clear way. Although the case study can be solved with no more knowledge than quantitative methods, some basic technical concepts on electricity and renewable energies can help in the formulation of some constraints. Finally, the case study promotes teamwork since the two proposed activities are realized in groups of 3 or 4 students.
1.2. LEARNING OUTCOMES
As a result of this case study, students are expected to be able to:
• Understand the problem of the lack of access to electricity worldwide and its consequences on human development.
• Know the main components of rural electrification systems and the technical relationships between them.
• Formulate a MILP model to solve a complex problem, clearly defining the data necessary, the variables defining the solution, the objective function and the constraints.
• Solve the developed MILP model using specialized software, and explain the solution in a clear and structured way.
3
Development of a MILP model to design wind-photovoltaic stand-alone electrification projects for isolated communities in developing countries
1.3. ACTIVITIES
The design of electrification projects is a complex and hard task. In particular, the MILP model developed by Ferrer-Martí et al. [2013] includes many technical concepts that have been simplified in order to ease students’ understanding of the problem. However, the problem is still complex and so the activities have been prepared accordingly. In the first activity (in class) students are introduced on the problem during two hours. Specifically they have to work on a basic problem (very simplified), trying to develop an initial MILP model, in groups of 3 or 4 students. At the end of the activity a discussion between all the students is led by the lecturer in order to clarify the concepts and solve any doubts that may arise. In the second activity (at home) students start from the initial model developed previously, and have to include some new considerations. Thus, they obtain a comprehensive model that allows solving stand-alone electrification projects, using PV and wind energies and combining individual systems and microgrids. The example of a community (which has been prepared based on real data) is finally proposed, and students have to use specialized software to solve the model, obtain the optimal electrification system for the community and explain the solution in a clear way. This activity is also realized in groups of 3 or 4 students, and its duration is expected to be 10 hours, although this time can be slightly increased or reduced depending on students’ knowledge on the software for models’ resolution. The evaluation is divided between the two activities as detailed along this document.
2. DESCRIPTION OF THE CONTEXT
In this section a description of the context of the case study is realized. First, the problem of the lack of access to electricity is briefly explained. Then the need of aid tools to design stand-alone electrification projects is justified. Finally, the specific context of the proposed case study is clarified.
2.1. INTRODUCTION: ACCESS TO ELECTRICITY
Nowadays, an estimated 1.3 billion people do not have access to electricity [IEA, 2013], especially in rural areas from developing countries [Kanagawa & Nakata, 2008]. The contribution of energy, and particularly electricity, to meet the Millennium Development Goals of the United Nations Development Program has been widely demonstrated [DFID, 2002]. Among other benefits, access to electricity helps: reducing eyesight and lungs illnesses (caused by smoke from kerosene lamps and candles), extending the daily productive hours, allowing children to study in the evenings, getting a better education through the use of new technologies at schools, increasing access to means of communication and improving health centers through the use of some medical devices or
4
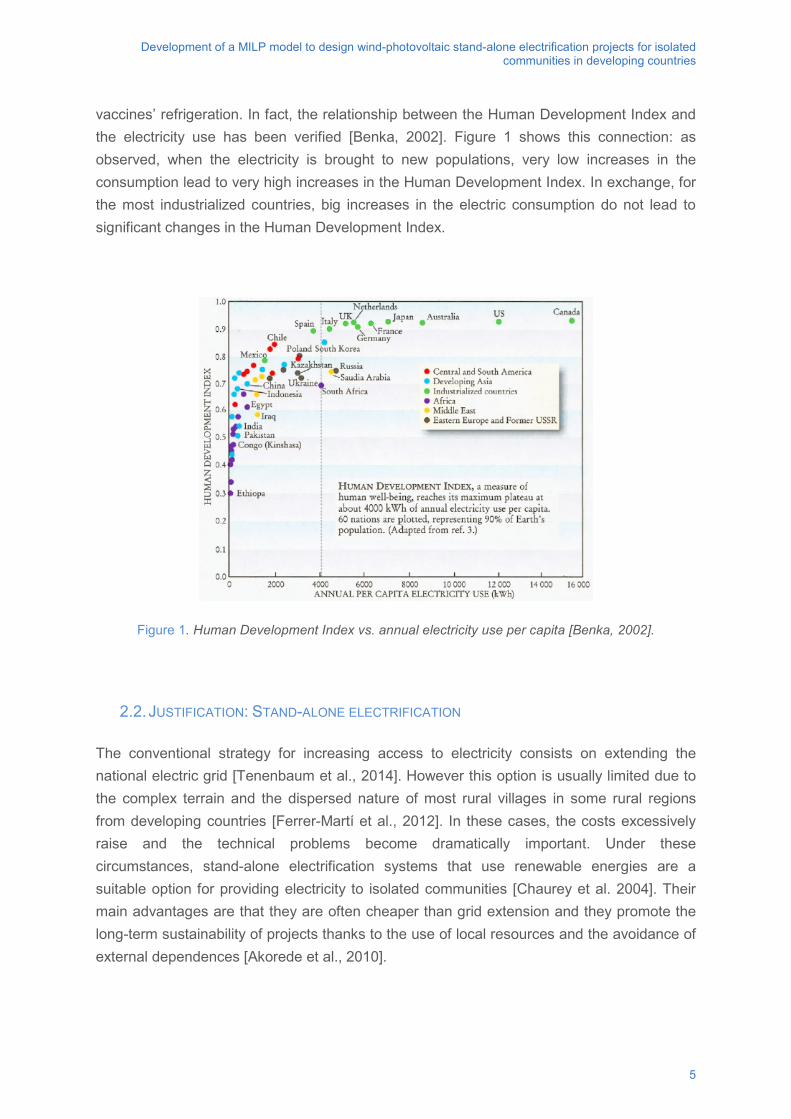
Development of a MILP model to design wind-photovoltaic stand-alone electrification projects for isolated communities in developing countries
vaccines’ refrigeration. In fact, the relationship between the Human Development Index and the electricity use has been verified [Benka, 2002]. Figure 1 shows this connection: as observed, when the electricity is brought to new populations, very low increases in the consumption lead to very high increases in the Human Development Index. In exchange, for the most industrialized countries, big increases in the electric consumption do not lead to significant changes in the Human Development Index.
Figure 1. Human Development Index vs. annual electricity use per capita [Benka, 2002].
2.2. JUSTIFICATION: STAND-ALONE ELECTRIFICATION
The conventional strategy for increasing access to electricity consists on extending the national electric grid [Tenenbaum et al., 2014]. However this option is usually limited due to the complex terrain and the dispersed nature of most rural villages in some rural regions from developing countries [Ferrer-Martí et al., 2012]. In these cases, the costs excessively raise and the technical problems become dramatically important. Under these circumstances, stand-alone electrification systems that use renewable energies are a suitable option for providing electricity to isolated communities [Chaurey et al. 2004]. Their main advantages are that they are often cheaper than grid extension and they promote the long-term sustainability of projects thanks to the use of local resources and the avoidance of external dependences [Akorede et al., 2010].
5
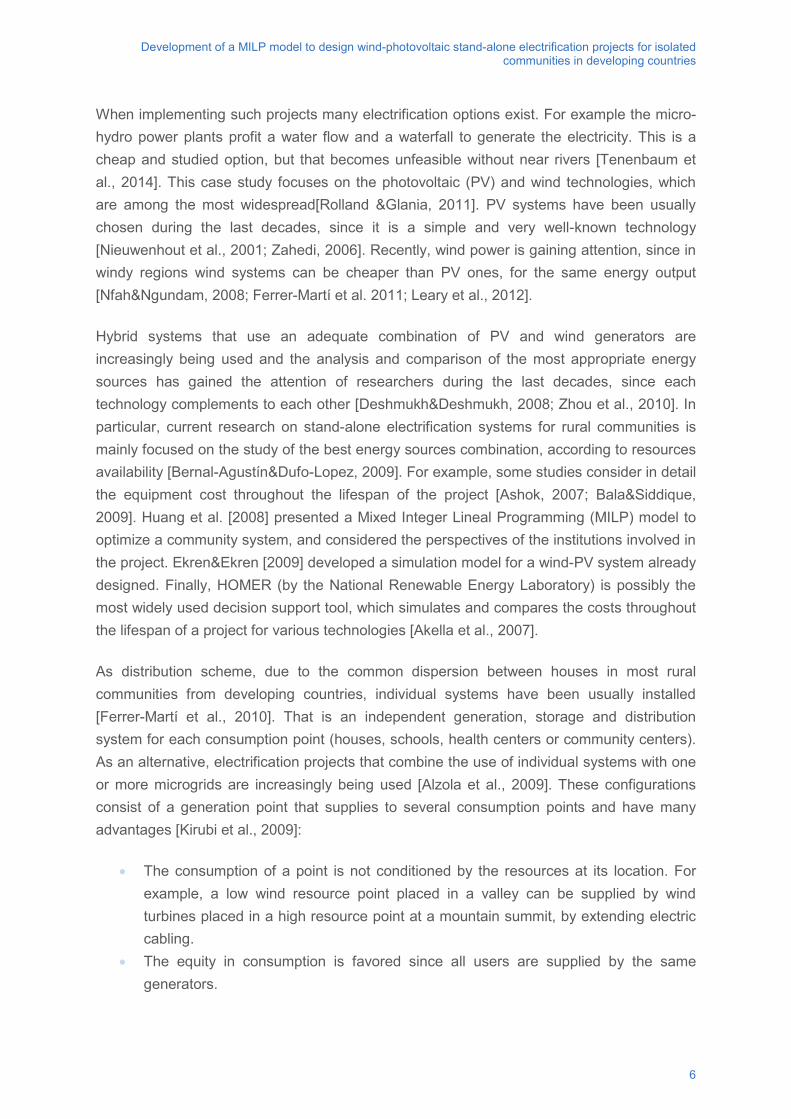
Development of a MILP model to design wind-photovoltaic stand-alone electrification projects for isolated communities in developing countries
When implementing such projects many electrification options exist. For example the micro-hydro power plants profit a water flow and a waterfall to generate the electricity. This is a cheap and studied option, but that becomes unfeasible without near rivers [Tenenbaum et al., 2014]. This case study focuses on the photovoltaic (PV) and wind technologies, which are among the most widespread[Rolland &Glania, 2011]. PV systems have been usually chosen during the last decades, since it is a simple and very well-known technology [Nieuwenhout et al., 2001; Zahedi, 2006]. Recently, wind power is gaining attention, since in windy regions wind systems can be cheaper than PV ones, for the same energy output [Nfah&Ngundam, 2008; Ferrer-Martí et al. 2011; Leary et al., 2012].
Hybrid systems that use an adequate combination of PV and wind generators are increasingly being used and the analysis and comparison of the most appropriate energy sources has gained the attention of researchers during the last decades, since each technology complements to each other [Deshmukh&Deshmukh, 2008; Zhou et al., 2010]. In particular, current research on stand-alone electrification systems for rural communities is mainly focused on the study of the best energy sources combination, according to resources availability [Bernal-Agustín&Dufo-Lopez, 2009]. For example, some studies consider in detail the equipment cost throughout the lifespan of the project [Ashok, 2007; Bala&Siddique, 2009]. Huang et al. [2008] presented a Mixed Integer Lineal Programming (MILP) model to optimize a community system, and considered the perspectives of the institutions involved in the project. Ekren&Ekren [2009] developed a simulation model for a wind-PV system already designed. Finally, HOMER (by the National Renewable Energy Laboratory) is possibly the most widely used decision support tool, which simulates and compares the costs throughout the lifespan of a project for various technologies [Akella et al., 2007].
As distribution scheme, due to the common dispersion between houses in most rural communities from developing countries, individual systems have been usually installed [Ferrer-Martí et al., 2010]. That is an independent generation, storage and distribution system for each consumption point (houses, schools, health centers or community centers). As an alternative, electrification projects that combine the use of individual systems with one or more microgrids are increasingly being used [Alzola et al., 2009]. These configurations consist of a generation point that supplies to several consumption points and have many advantages [Kirubi et al., 2009]:
• The consumption of a point is not conditioned by the resources at its location. For example, a low wind resource point placed in a valley can be supplied by wind turbines placed in a high resource point at a mountain summit, by extending electric cabling.
• The equity in consumption is favored since all users are supplied by the same generators.
6
Development of a MILP model to design wind-photovoltaic stand-alone electrification projects for isolated communities in developing countries
• Costs can be saved due to economies of scale. When assembling points in a microgrid, more powerful equipment can be used, which have a least ratio between cost and energy produced.
• A greater flexibility in the consumption is allowed; i.e. the consumption can be punctually increased either due to special days (as community celebrations), the development of productive activities or even the adhesion of a new user.
Figure 2 shows the duality between the usually implemented solution and the proposed solution. On the left figure, individual wind systems are used for each consumption point. Logically for higher demand points (big green squares), higher wind turbines are used (big blue circles). In exchange, the right figure combines individual systems with microgrids, and uses the most appropriate technology at each point. The central microgrid profits a high wind resource area to supply several consumption points, while the right microgrid has not high wind potential points, but joins a set of points due to their proximity. Additionally two individual systems are implemented.
Figure 2. Comparison of a wind individual system with a hybrid PV-wind system that combines microgrids and individual systems.
The use of microgrids has demonstrated to be beneficial to electrify isolated communities autonomously [Mendes et al., 2011; Ferrer-Martí et al., 2012; Yadoo & Cruickshank, 2012]. However, microgrids imply a higher difficulty in the design, being necessary to plan their structure and connections; and to study a good compromise between their extension (and the subsequent improvement in the service quality) and the possible cost increases when connecting consumption points [Ferrer-Martí et al., 2012]. In this line, research is being increasing during the last years [Jiayi et al., 2008; Chaurey&Kandpal, 2010; Kumar Basua et al., 2011; SelimUstun et al., 2011]. For example, VIPOR (by the National Renewable Energy Laboratory) is a very used decision support tool that considers both individual generation points and a microgrid with limited possible generation points. This tool uses a simulated
7
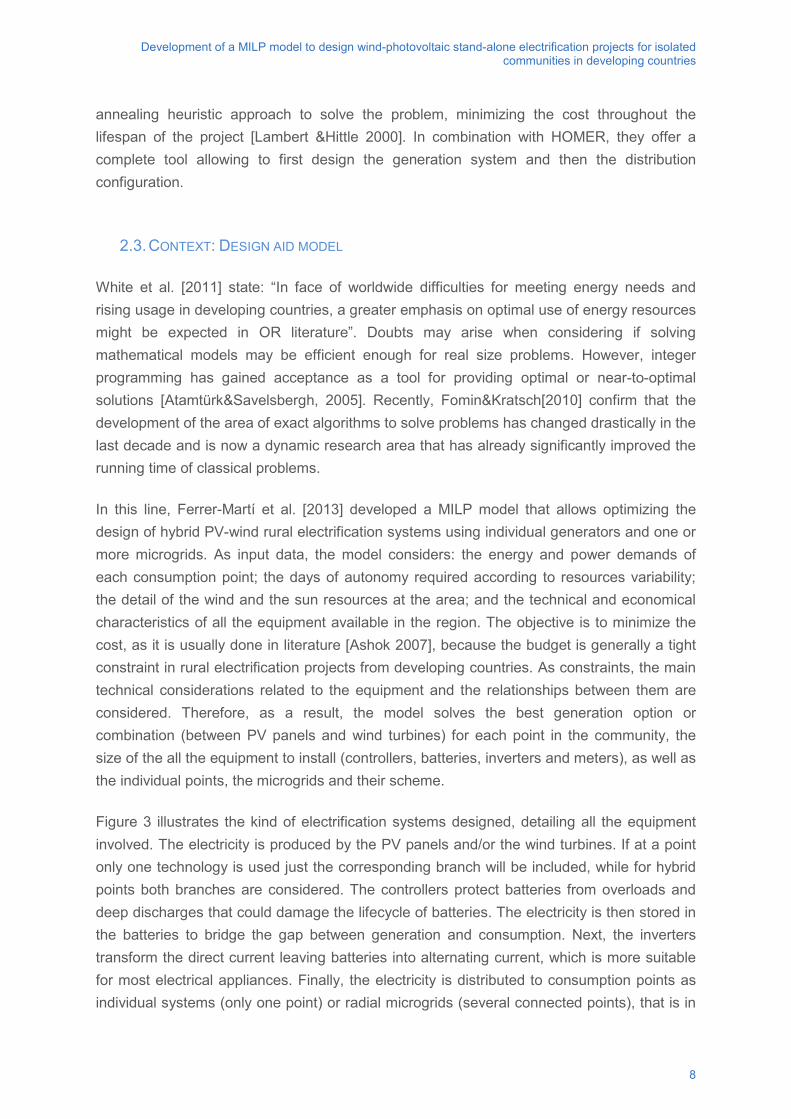
Development of a MILP model to design wind-photovoltaic stand-alone electrification projects for isolated communities in developing countries
annealing heuristic approach to solve the problem, minimizing the cost throughout the lifespan of the project [Lambert &Hittle 2000]. In combination with HOMER, they offer a complete tool allowing to first design the generation system and then the distribution configuration.
2.3. CONTEXT: DESIGN AID MODEL
White et al. [2011] state: “In face of worldwide difficulties for meeting energy needs and rising usage in developing countries, a greater emphasis on optimal use of energy resources might be expected in OR literature”. Doubts may arise when considering if solving mathematical models may be efficient enough for real size problems. However, integer programming has gained acceptance as a tool for providing optimal or near-to-optimal solutions [Atamtürk&Savelsbergh, 2005]. Recently, Fomin&Kratsch[2010] confirm that the development of the area of exact algorithms to solve problems has changed drastically in the last decade and is now a dynamic research area that has already significantly improved the running time of classical problems.
In this line, Ferrer-Martí et al. [2013] developed a MILP model that allows optimizing the design of hybrid PV-wind rural electrification systems using individual generators and one or more microgrids. As input data, the model considers: the energy and power demands of each consumption point; the days of autonomy required according to resources variability; the detail of the wind and the sun resources at the area; and the technical and economical characteristics of all the equipment available in the region. The objective is to minimize the cost, as it is usually done in literature [Ashok 2007], because the budget is generally a tight constraint in rural electrification projects from developing countries. As constraints, the main technical considerations related to the equipment and the relationships between them are considered. Therefore, as a result, the model solves the best generation option or combination (between PV panels and wind turbines) for each point in the community, the size of the all the equipment to install (controllers, batteries, inverters and meters), as well as the individual points, the microgrids and their scheme.
Figure 3 illustrates the kind of electrification systems designed, detailing all the equipment involved. The electricity is produced by the PV panels and/or the wind turbines. If at a point only one technology is used just the corresponding branch will be included, while for hybrid points both branches are considered. The controllers protect batteries from overloads and deep discharges that could damage the lifecycle of batteries. The electricity is then stored in the batteries to bridge the gap between generation and consumption. Next, the inverters transform the direct current leaving batteries into alternating current, which is more suitable for most electrical appliances. Finally, the electricity is distributed to consumption points as individual systems (only one point) or radial microgrids (several connected points), that is in
8
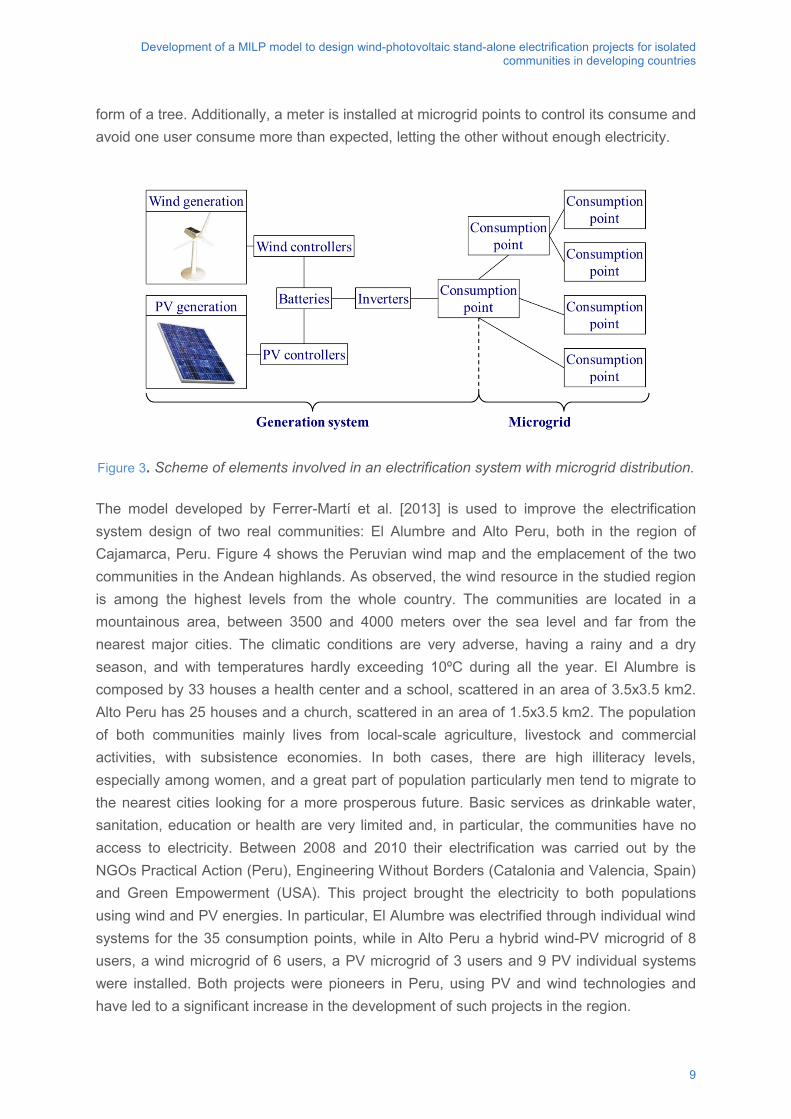
Development of a MILP model to design wind-photovoltaic stand-alone electrification projects for isolated communities in developing countries
form of a tree. Additionally, a meter is installed at microgrid points to control its consume and avoid one user consume more than expected, letting the other without enough electricity.
Figure 3. Scheme of elements involved in an electrification system with microgrid distribution.
The model developed by Ferrer-Martí et al. [2013] is used to improve the electrification system design of two real communities: El Alumbre and Alto Peru, both in the region of Cajamarca, Peru. Figure 4 shows the Peruvian wind map and the emplacement of the two communities in the Andean highlands. As observed, the wind resource in the studied region is among the highest levels from the whole country. The communities are located in a mountainous area, between 3500 and 4000 meters over the sea level and far from the nearest major cities. The climatic conditions are very adverse, having a rainy and a dry season, and with temperatures hardly exceeding 10ºC during all the year. El Alumbre is composed by 33 houses a health center and a school, scattered in an area of 3.5x3.5 km2. Alto Peru has 25 houses and a church, scattered in an area of 1.5x3.5 km2. The population of both communities mainly lives from local-scale agriculture, livestock and commercial activities, with subsistence economies. In both cases, there are high illiteracy levels, especially among women, and a great part of population particularly men tend to migrate to the nearest cities looking for a more prosperous future. Basic services as drinkable water, sanitation, education or health are very limited and, in particular, the communities have no access to electricity. Between 2008 and 2010 their electrification was carried out by the NGOs Practical Action (Peru), Engineering Without Borders (Catalonia and Valencia, Spain) and Green Empowerment (USA). This project brought the electricity to both populations using wind and PV energies. In particular, El Alumbre was electrified through individual wind systems for the 35 consumption points, while in Alto Peru a hybrid wind-PV microgrid of 8 users, a wind microgrid of 6 users, a PV microgrid of 3 users and 9 PV individual systems were installed. Both projects were pioneers in Peru, using PV and wind technologies and have led to a significant increase in the development of such projects in the region.
9
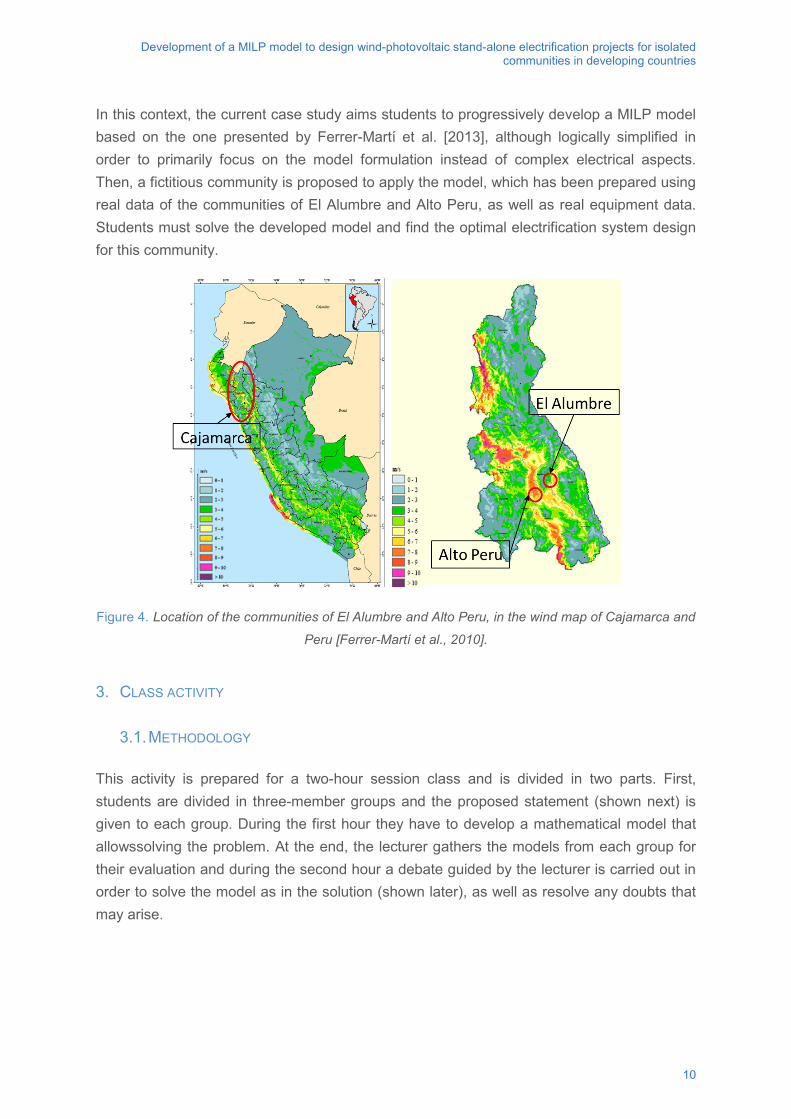
Development of a MILP model to design wind-photovoltaic stand-alone electrification projects for isolated communities in developing countries
In this context, the current case study aims students to progressively develop a MILP model based on the one presented by Ferrer-Martí et al. [2013], although logically simplified in order to primarily focus on the model formulation instead of complex electrical aspects. Then, a fictitious community is proposed to apply the model, which has been prepared using real data of the communities of El Alumbre and Alto Peru, as well as real equipment data. Students must solve the developed model and find the optimal electrification system design for this community.
Figure 4. Location of the communities of El Alumbre and Alto Peru, in the wind map of Cajamarca and
Peru [Ferrer-Martí et al., 2010].
3. CLASS ACTIVITY
3.1. METHODOLOGY
This activity is prepared for a two-hour session class and is divided in two parts. First, students are divided in three-member groups and the proposed statement (shown next) is given to each group. During the first hour they have to develop a mathematical model that allowssolving the problem. At the end, the lecturer gathers the models from each group for their evaluation and during the second hour a debate guided by the lecturer is carried out in order to solve the model as in the solution (shown later), as well as resolve any doubts that may arise.
10
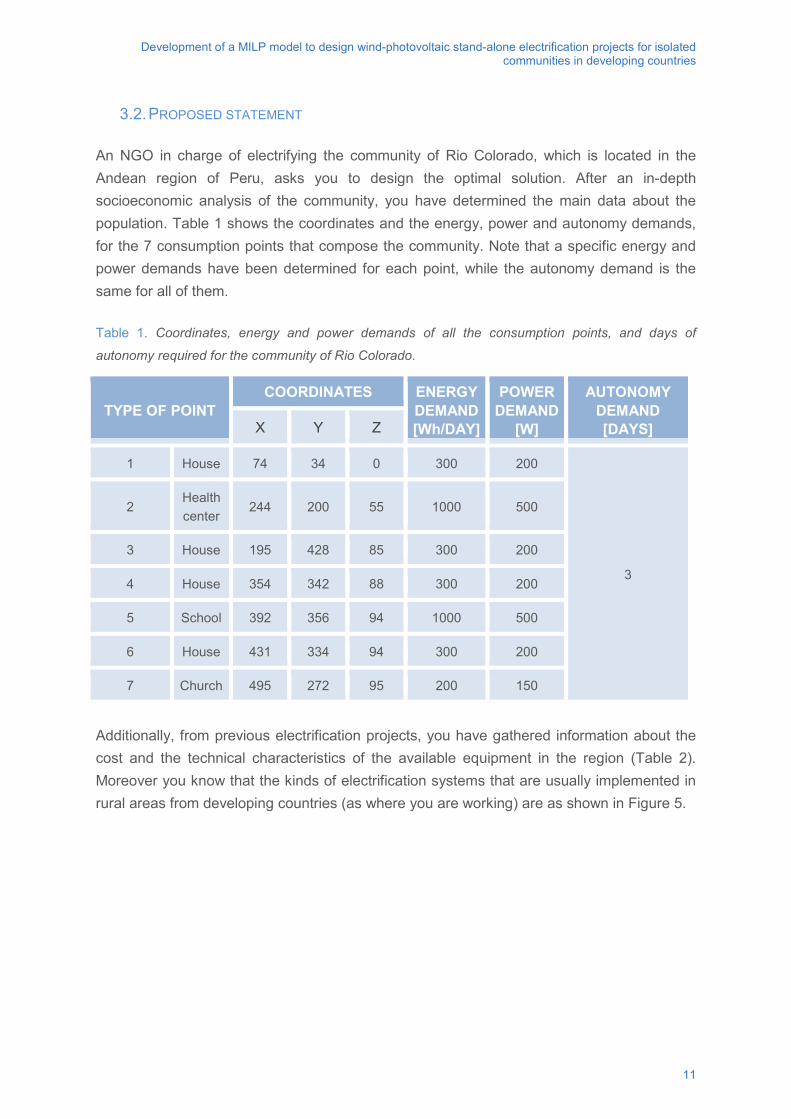
Development of a MILP model to design wind-photovoltaic stand-alone electrification projects for isolated communities in developing countries
3.2. PROPOSED STATEMENT
An NGO in charge of electrifying the community of Rio Colorado, which is located in the Andean region of Peru, asks you to design the optimal solution. After an in-depth socioeconomic analysis of the community, you have determined the main data about the population. Table 1 shows the coordinates and the energy, power and autonomy demands, for the 7 consumption points that compose the community. Note that a specific energy and power demands have been determined for each point, while the autonomy demand is the same for all of them.
Table 1. Coordinates, energy and power demands of all the consumption points, and days of
autonomy required for the community of Rio Colorado.
TYPE OF POINT COORDINATES ENERGY
DEMAND [Wh/DAY]
POWER DEMAND
[W]
AUTONOMY DEMAND [DAYS] X Y Z
1 House 74 34 0 300 200
3
2 Health center
244 200 55 1000 500
3 House 195 428 85 300 200
4 House 354 342 88 300 200
5 School 392 356 94 1000 500
6 House 431 334 94 300 200
7 Church 495 272 95 200 150
Additionally, from previous electrification projects, you have gathered information about the cost and the technical characteristics of the available equipment in the region (Table 2). Moreover you know that the kinds of electrification systems that are usually implemented in rural areas from developing countries (as where you are working) are as shown in Figure 5.
11
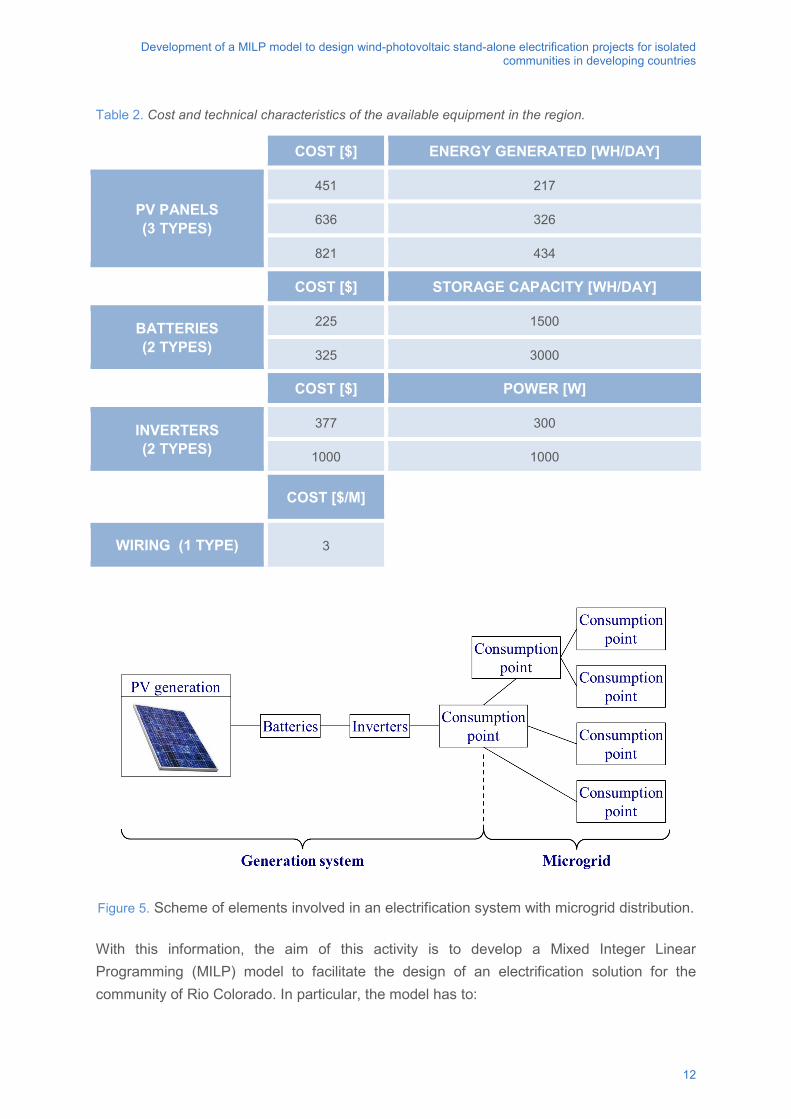
Development of a MILP model to design wind-photovoltaic stand-alone electrification projects for isolated communities in developing countries
Table 2. Cost and technical characteristics of the available equipment in the region.
COST [$] ENERGY GENERATED [WH/DAY]
PV PANELS (3 TYPES)
451 217
636 326
821 434
COST [$] STORAGE CAPACITY [WH/DAY]
BATTERIES (2 TYPES)
225 1500
325 3000
COST [$] POWER [W]
INVERTERS (2 TYPES)
377 300
1000 1000
COST [$/M]
WIRING (1 TYPE) 3
Figure 5. Scheme of elements involved in an electrification system with microgrid distribution.
With this information, the aim of this activity is to develop a Mixed Integer Linear Programming (MILP) model to facilitate the design of an electrification solution for the community of Rio Colorado. In particular, the model has to:
12
Development of a MILP model to design wind-photovoltaic stand-alone electrification projects for isolated communities in developing countries
• Minimize the initial investment cost. • Decide the type of equipment to install (PV panels, batteries and inverters) and
where. • Decide the configuration of the electrical distribution (microgrids and individual
systems). • Consider the technical limitations that are detailed next:
PV panels, batteries and inverters must be installed at consumption points. The PV panels installed at a point must produce enough electricity to cover the
energy demand of the supplied points (which will only be the point where generators are placed in the case of individual systems and will be this point plus the connected consumption points in the case of microgrids).
The batteries installed at a point must have enough storage capacity to cover the energy demand of the supplied points.
The inverters installed at a point must have enough power to cover the power demand of the supplied points.
Individual systems do not have any input nor output wire. In exchange, microgrids have a radial scheme (in form of a tree). The microgrid points where generators are placed cannot have input wires but can have one or more output wires. The connected points must have one and only one input wire but can have one or more output wires.
The wires connecting the equipment (from the PV generation until the first consumption point, indicated as Generation system in Figure 5) are not considered, since their length is not significant in front of the distance between points.
Remark: The target is to develop a MILP model as generic as possible, that can be used to solve the proposed problem, but that could allow designing another community with different data.
3.3. SOLUTION
Note: Data are parameters from reality needed to set the model out;
Variables are the aspects from the solution to be known;
The objective function is the target of the problem; and
The constraints are the limitations to the problem.
1. Data
Consumption points:
P Number of consumption points.
Lpd Distance [m] between two points p and d (p=1,…,P; d=1,…,P).
13
Development of a MILP model to design wind-photovoltaic stand-alone electrification projects for isolated communities in developing countries
EDp Electric energy demand [Wh/day] at p (p=1,…,P).
PDp Power demand [W] at p (p=1,…,P).
AD Required autonomy of the batteries [days].
PV Generation:
S Types of PV panels (s=1,…,S).
ESs Energy generated [Wh/day] by a PV panel of type s (s=1,…,S).
CSs Cost [$] of a PV panel of type s (s=1,…,S).
Batteries:
B Types of batteries (b=1,…,B).
EBb Capacity [Wh] of a battery of type b (b=1,…,B).
CBb Cost [$] of a battery of type b (b=1,…,B).
Inverters:
I Types of inverters (i=1,…,I).
PIi Maximum power [W] of an inverter of type I (i=1,…,I).
CIi Cost [$] of an inverter of type I (i=1,…,I).
Microgrid:
CC Cost [$/m] of the microgrids’ wire, including the infrastructure.
Additional data:
M Parameter with a very high value (infinite) used for modelling purposes.
2. Variables
• Integer non-negative variables to define the location and sizing of equipment:
xsps Number of PV panels of type s placed at point p (p=1,…,P; s=1,…,S).
xbpb Number of batteries of type b placed at point p (p=1,…,P; b=1,…,B).
xipi Number of inverters of type i placed at point p (p=1,…,P; i=1,…,I).
• Float non-negative variables to define energy and power flows:
fepd Flow of energy [Wh/day] between the points p and d (p=1,…,P; d=1,…,P | p≠d).
fppd Flow of power [W] between the points p and d (p=1,…,P; d=1,…,P | p≠d).
14
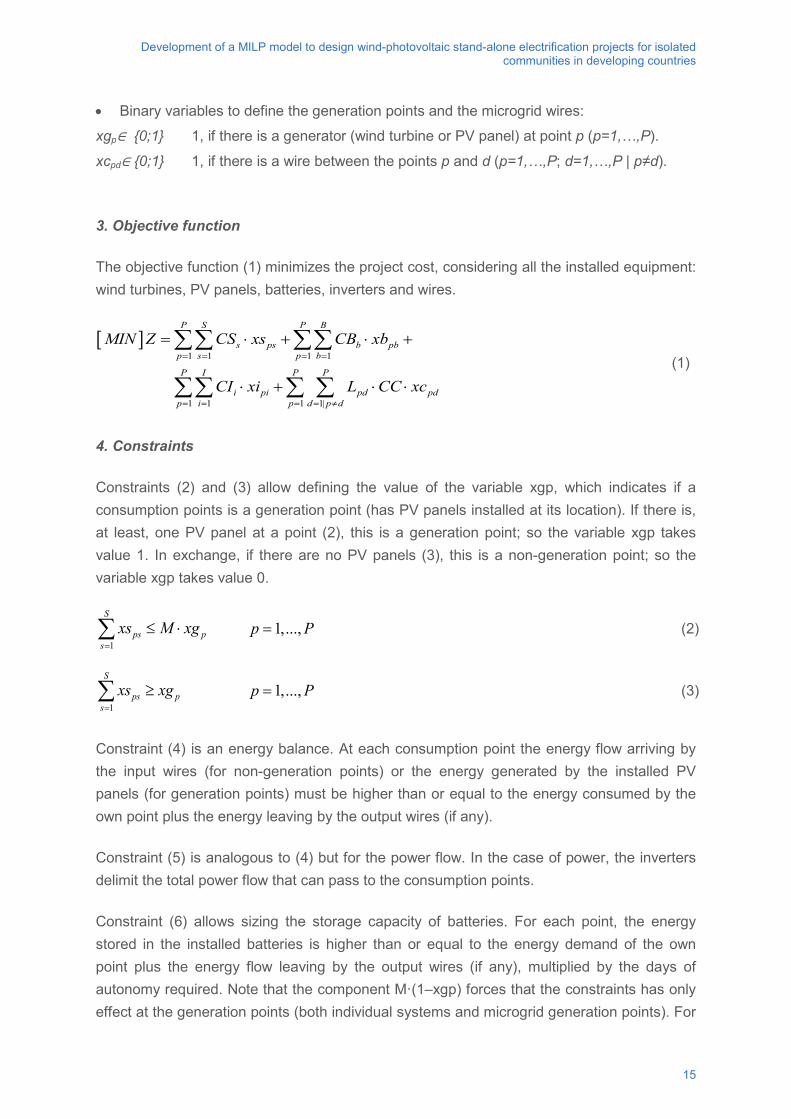
Development of a MILP model to design wind-photovoltaic stand-alone electrification projects for isolated communities in developing countries
• Binary variables to define the generation points and the microgrid wires:
xgp∈ {0;1} 1, if there is a generator (wind turbine or PV panel) at point p (p=1,…,P).
xcpd∈ {0;1} 1, if there is a wire between the points p and d (p=1,…,P; d=1,…,P | p≠d).
3. Objective function
The objective function (1) minimizes the project cost, considering all the installed equipment: wind turbines, PV panels, batteries, inverters and wires.
[ ]1 1 1 1
1 1 1 1|
P S P B
s ps b pbp s p b
P I P P
i pi pd pdp i p d p d
MIN Z CS xs CB xb
CI xi L CC xc
= = = =
= = = = ≠
= ⋅ + ⋅ +
⋅ + ⋅ ⋅
∑∑ ∑∑
∑∑ ∑ ∑ (1)
4. Constraints
Constraints (2) and (3) allow defining the value of the variable xgp, which indicates if a consumption points is a generation point (has PV panels installed at its location). If there is, at least, one PV panel at a point (2), this is a generation point; so the variable xgp takes value 1. In exchange, if there are no PV panels (3), this is a non-generation point; so the variable xgp takes value 0.
1
S
ps ps
xs M xg=
≤ ⋅∑ 1,...,p P= (2)
1
S
ps ps
xs xg=
≥∑ 1,...,p P= (3)
Constraint (4) is an energy balance. At each consumption point the energy flow arriving by the input wires (for non-generation points) or the energy generated by the installed PV panels (for generation points) must be higher than or equal to the energy consumed by the own point plus the energy leaving by the output wires (if any).
Constraint (5) is analogous to (4) but for the power flow. In the case of power, the inverters delimit the total power flow that can pass to the consumption points.
Constraint (6) allows sizing the storage capacity of batteries. For each point, the energy stored in the installed batteries is higher than or equal to the energy demand of the own point plus the energy flow leaving by the output wires (if any), multiplied by the days of autonomy required. Note that the component M·(1–xgp) forces that the constraints has only effect at the generation points (both individual systems and microgrid generation points). For
15
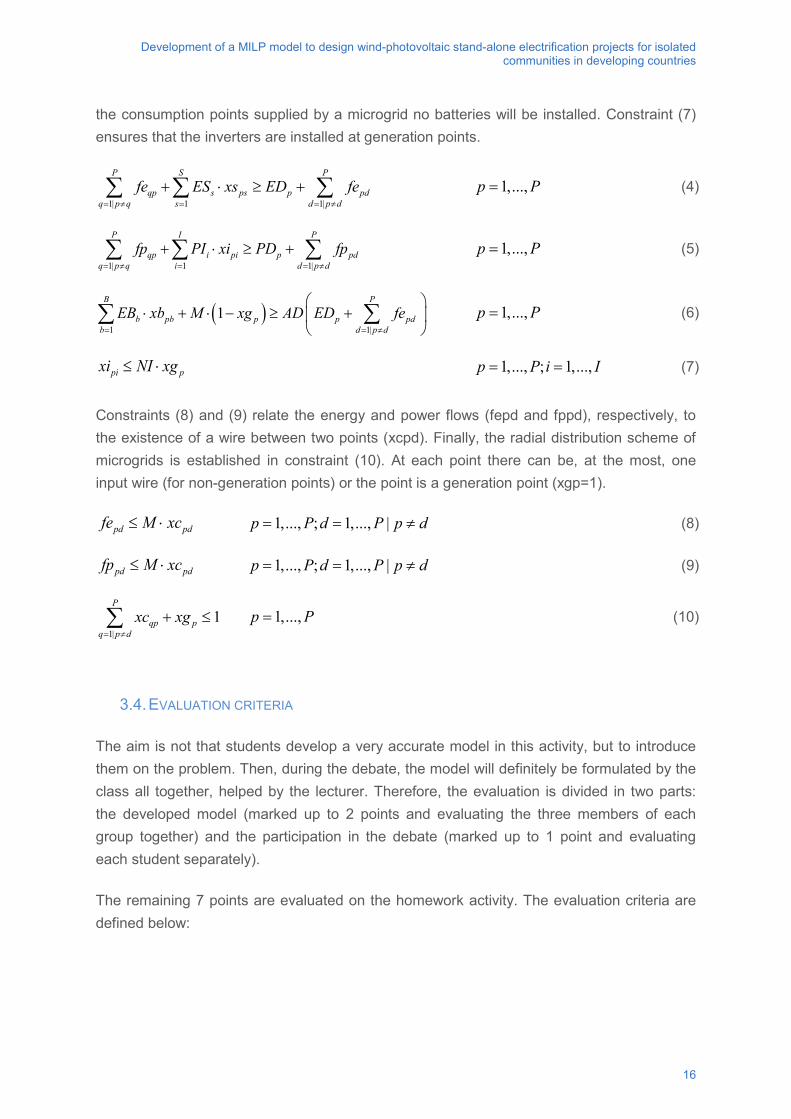
Development of a MILP model to design wind-photovoltaic stand-alone electrification projects for isolated communities in developing countries
the consumption points supplied by a microgrid no batteries will be installed. Constraint (7) ensures that the inverters are installed at generation points.
1| 1 1|
P S P
qp s ps p pdq p q s d p d
fe ES xs ED fe= ≠ = = ≠
+ ⋅ ≥ +∑ ∑ ∑ 1,...,p P= (4)
1| 1 1|
P I P
qp i pi p pdq p q i d p d
fp PI xi PD fp= ≠ = = ≠
+ ⋅ ≥ +∑ ∑ ∑ 1,...,p P= (5)
( )1 1|
1B P
b pb p p pdb d p d
EB xb M xg AD ED fe= = ≠
⋅ + ⋅ − ≥ +
∑ ∑ 1,...,p P= (6)
pi pxi NI xg≤ ⋅ 1,..., ; 1,...,p P i I= = (7)
Constraints (8) and (9) relate the energy and power flows (fepd and fppd), respectively, to the existence of a wire between two points (xcpd). Finally, the radial distribution scheme of microgrids is established in constraint (10). At each point there can be, at the most, one input wire (for non-generation points) or the point is a generation point (xgp=1).
pd pdfe M xc≤ ⋅ 1,..., ; 1,..., |p P d P p d= = ≠ (8)
pd pdfp M xc≤ ⋅ 1,..., ; 1,..., |p P d P p d= = ≠ (9)
1|1
P
qp pq p d
xc xg= ≠
+ ≤∑ 1,...,p P= (10)
3.4. EVALUATION CRITERIA
The aim is not that students develop a very accurate model in this activity, but to introduce them on the problem. Then, during the debate, the model will definitely be formulated by the class all together, helped by the lecturer. Therefore, the evaluation is divided in two parts: the developed model (marked up to 2 points and evaluating the three members of each group together) and the participation in the debate (marked up to 1 point and evaluating each student separately).
The remaining 7 points are evaluated on the homework activity. The evaluation criteria are defined below:
16
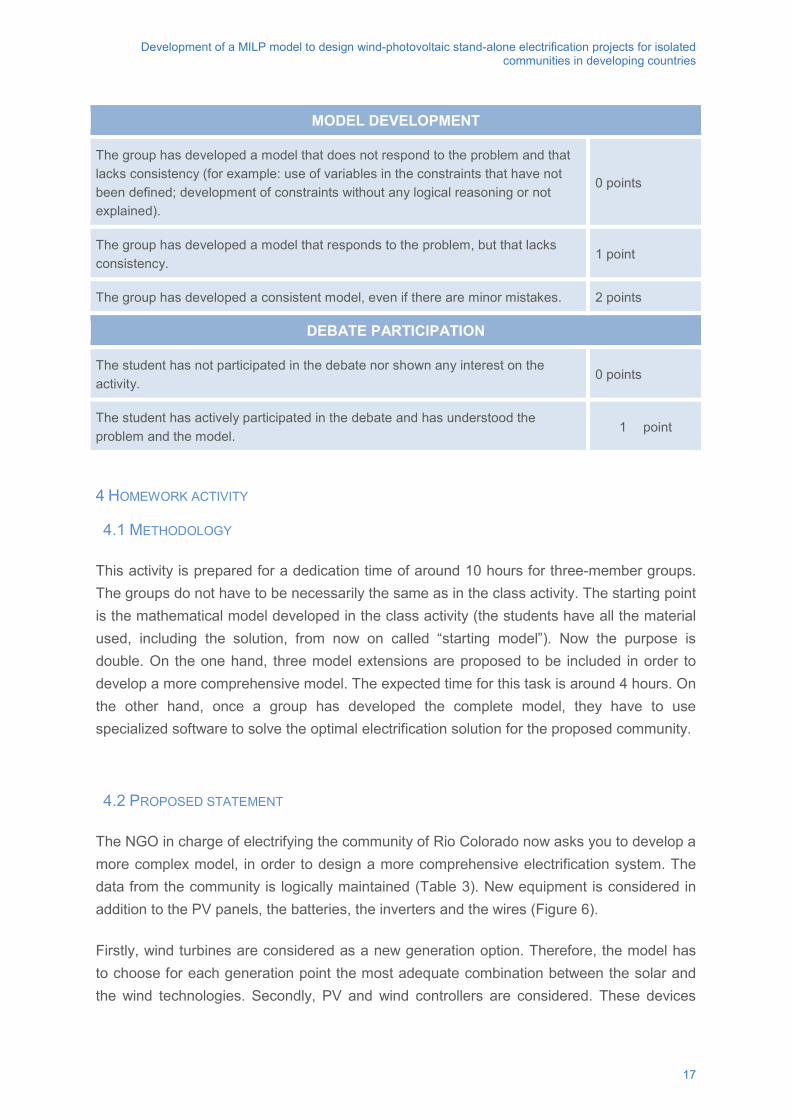
Development of a MILP model to design wind-photovoltaic stand-alone electrification projects for isolated communities in developing countries
MODEL DEVELOPMENT
The group has developed a model that does not respond to the problem and that lacks consistency (for example: use of variables in the constraints that have not been defined; development of constraints without any logical reasoning or not explained).
0 points
The group has developed a model that responds to the problem, but that lacks consistency.
1 point
The group has developed a consistent model, even if there are minor mistakes. 2 points
DEBATE PARTICIPATION
The student has not participated in the debate nor shown any interest on the activity.
0 points
The student has actively participated in the debate and has understood the problem and the model.
1 point
4 HOMEWORK ACTIVITY
4.1 METHODOLOGY
This activity is prepared for a dedication time of around 10 hours for three-member groups. The groups do not have to be necessarily the same as in the class activity. The starting point is the mathematical model developed in the class activity (the students have all the material used, including the solution, from now on called “starting model”). Now the purpose is double. On the one hand, three model extensions are proposed to be included in order to develop a more comprehensive model. The expected time for this task is around 4 hours. On the other hand, once a group has developed the complete model, they have to use specialized software to solve the optimal electrification solution for the proposed community.
4.2 PROPOSED STATEMENT
The NGO in charge of electrifying the community of Rio Colorado now asks you to develop a more complex model, in order to design a more comprehensive electrification system. The data from the community is logically maintained (Table 3). New equipment is considered in addition to the PV panels, the batteries, the inverters and the wires (Figure 6).
Firstly, wind turbines are considered as a new generation option. Therefore, the model has to choose for each generation point the most adequate combination between the solar and the wind technologies. Secondly, PV and wind controllers are considered. These devices
17
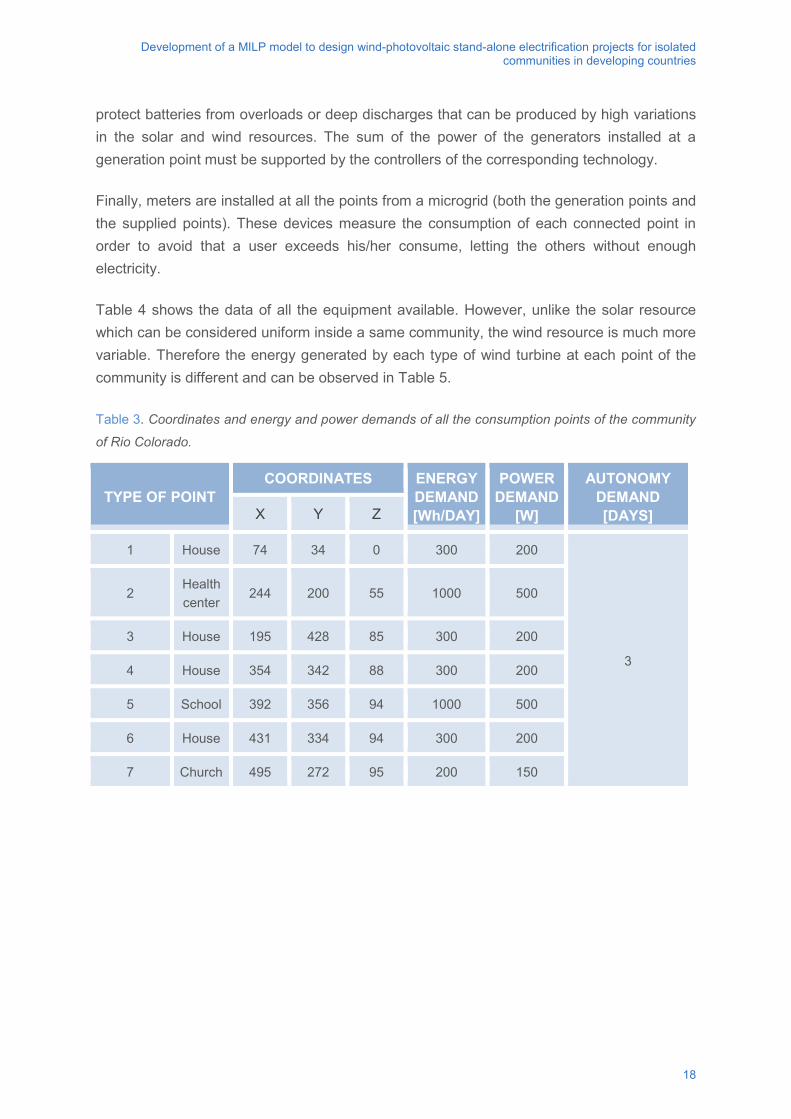
Development of a MILP model to design wind-photovoltaic stand-alone electrification projects for isolated communities in developing countries
protect batteries from overloads or deep discharges that can be produced by high variations in the solar and wind resources. The sum of the power of the generators installed at a generation point must be supported by the controllers of the corresponding technology.
Finally, meters are installed at all the points from a microgrid (both the generation points and the supplied points). These devices measure the consumption of each connected point in order to avoid that a user exceeds his/her consume, letting the others without enough electricity.
Table 4 shows the data of all the equipment available. However, unlike the solar resource which can be considered uniform inside a same community, the wind resource is much more variable. Therefore the energy generated by each type of wind turbine at each point of the community is different and can be observed in Table 5.
Table 3. Coordinates and energy and power demands of all the consumption points of the community
of Rio Colorado.
TYPE OF POINT COORDINATES ENERGY
DEMAND [Wh/DAY]
POWER DEMAND
[W]
AUTONOMY DEMAND [DAYS] X Y Z
1 House 74 34 0 300 200
3
2 Health center
244 200 55 1000 500
3 House 195 428 85 300 200
4 House 354 342 88 300 200
5 School 392 356 94 1000 500
6 House 431 334 94 300 200
7 Church 495 272 95 200 150
18
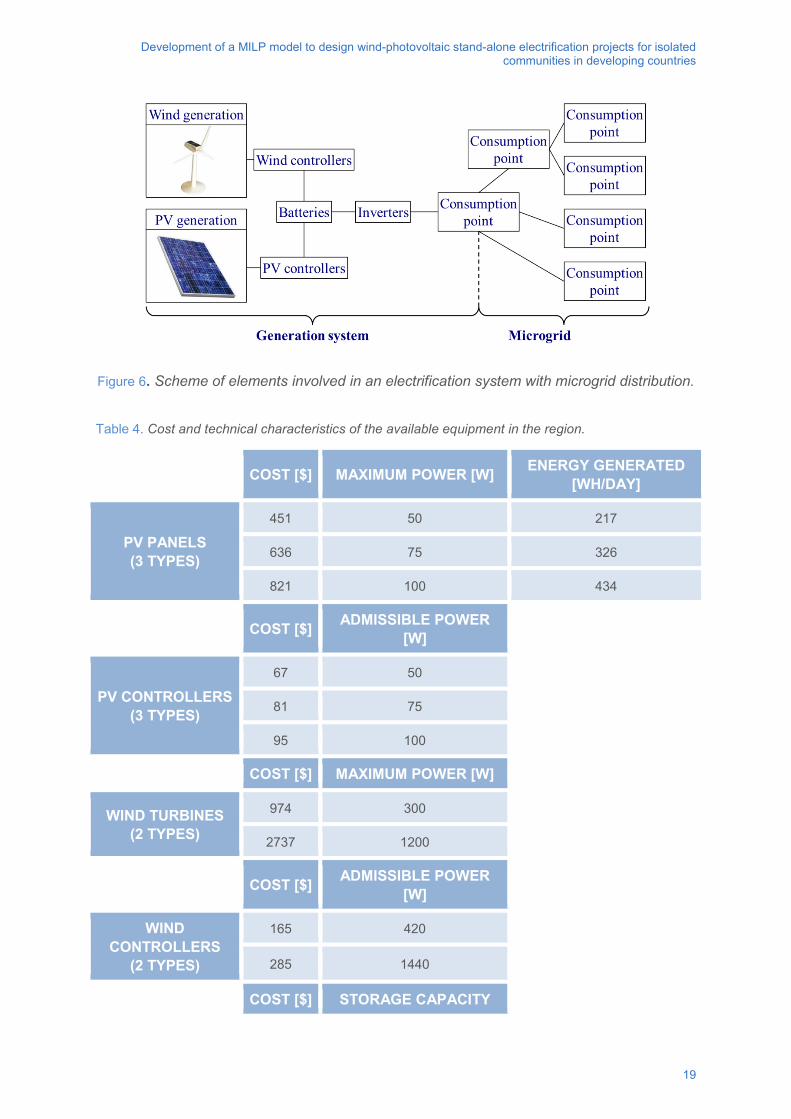
Development of a MILP model to design wind-photovoltaic stand-alone electrification projects for isolated communities in developing countries
Figure 6. Scheme of elements involved in an electrification system with microgrid distribution.
Table 4. Cost and technical characteristics of the available equipment in the region.
COST [$] MAXIMUM POWER [W] ENERGY GENERATED [WH/DAY]
PV PANELS (3 TYPES)
451 50 217
636 75 326
821 100 434
COST [$] ADMISSIBLE POWER [W]
PV CONTROLLERS (3 TYPES)
67 50
81 75
95 100
COST [$] MAXIMUM POWER [W]
WIND TURBINES (2 TYPES)
974 300
2737 1200
COST [$] ADMISSIBLE POWER [W]
WIND CONTROLLERS
(2 TYPES)
165 420
285 1440
COST [$] STORAGE CAPACITY
19
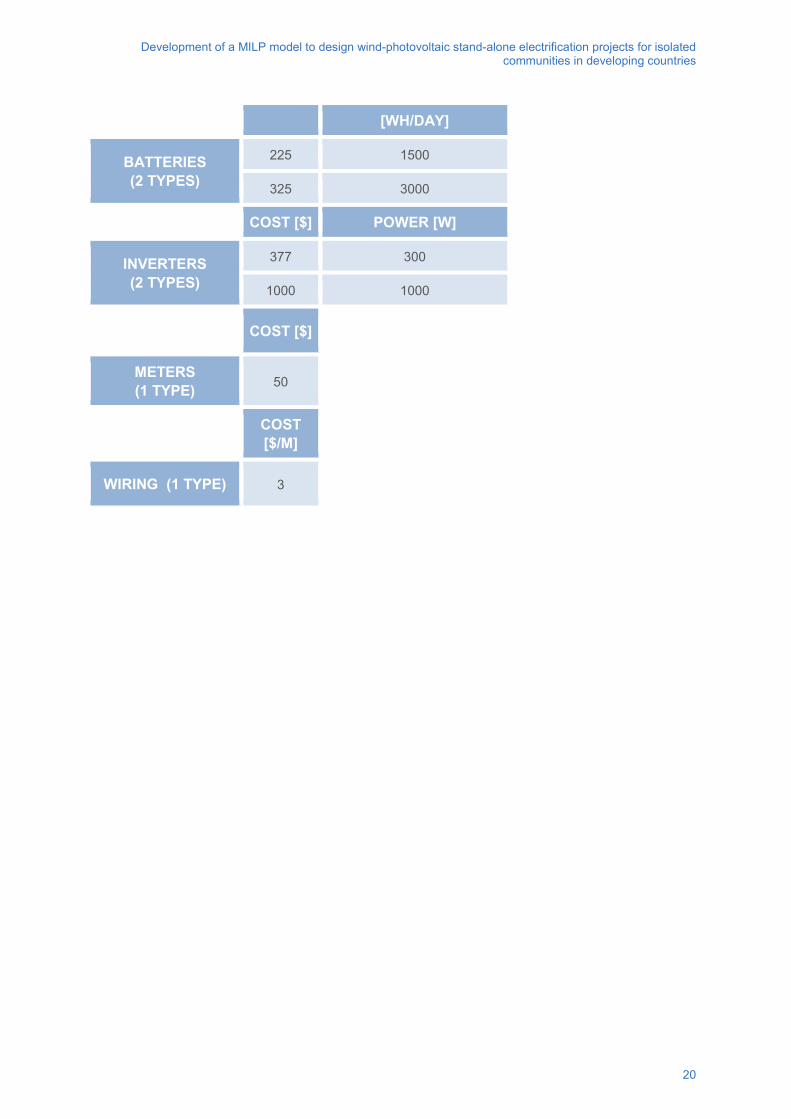
Development of a MILP model to design wind-photovoltaic stand-alone electrification projects for isolated communities in developing countries
[WH/DAY]
BATTERIES (2 TYPES)
225 1500
325 3000
COST [$] POWER [W]
INVERTERS (2 TYPES)
377 300
1000 1000
COST [$]
METERS (1 TYPE) 50
COST [$/M]
WIRING (1 TYPE) 3
20
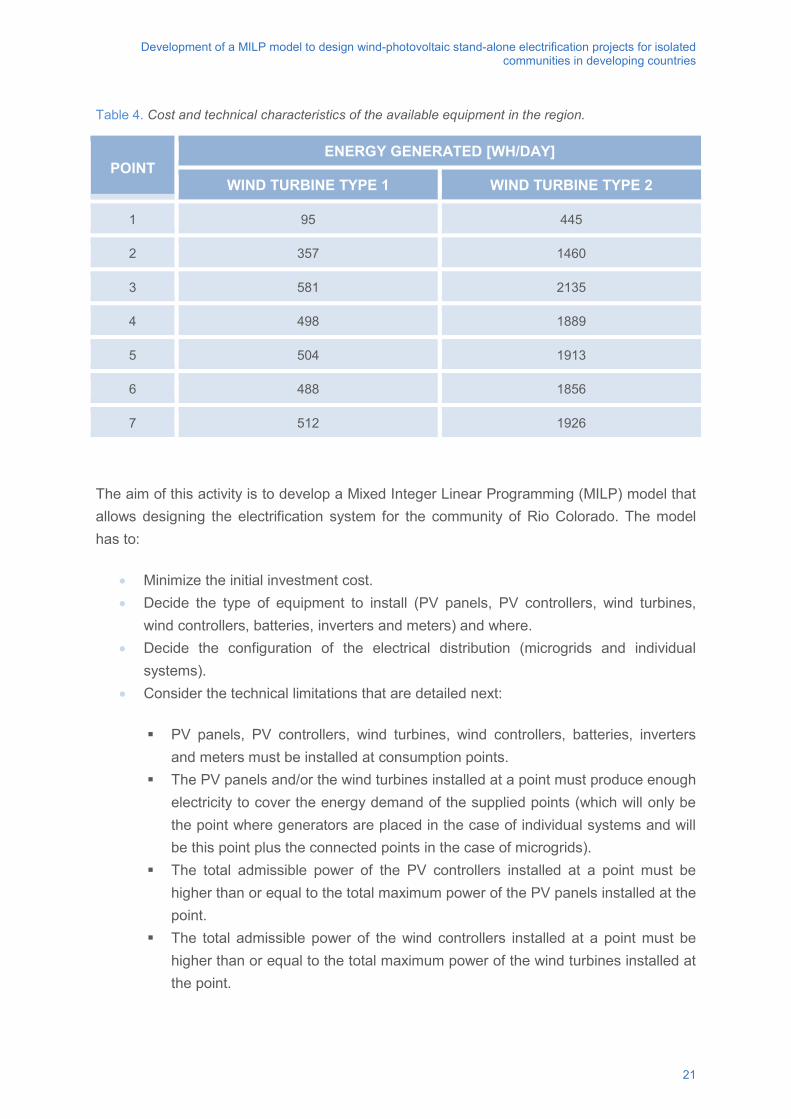
Development of a MILP model to design wind-photovoltaic stand-alone electrification projects for isolated communities in developing countries
Table 4. Cost and technical characteristics of the available equipment in the region.
POINT ENERGY GENERATED [WH/DAY]
WIND TURBINE TYPE 1 WIND TURBINE TYPE 2
1 95 445
2 357 1460
3 581 2135
4 498 1889
5 504 1913
6 488 1856
7 512 1926
The aim of this activity is to develop a Mixed Integer Linear Programming (MILP) model that allows designing the electrification system for the community of Rio Colorado. The model has to:
• Minimize the initial investment cost. • Decide the type of equipment to install (PV panels, PV controllers, wind turbines,
wind controllers, batteries, inverters and meters) and where. • Decide the configuration of the electrical distribution (microgrids and individual
systems). • Consider the technical limitations that are detailed next:
PV panels, PV controllers, wind turbines, wind controllers, batteries, inverters and meters must be installed at consumption points.
The PV panels and/or the wind turbines installed at a point must produce enough electricity to cover the energy demand of the supplied points (which will only be the point where generators are placed in the case of individual systems and will be this point plus the connected points in the case of microgrids).
The total admissible power of the PV controllers installed at a point must be higher than or equal to the total maximum power of the PV panels installed at the point.
The total admissible power of the wind controllers installed at a point must be higher than or equal to the total maximum power of the wind turbines installed at the point.
21
Development of a MILP model to design wind-photovoltaic stand-alone electrification projects for isolated communities in developing countries
The batteries installed at a point must have enough storage capacity to cover the energy demand of the supplied points.
The inverters installed at a point must have enough power to cover the power demand of the supplied points.
Meters must be installed only at the points belonging to a microgrid. Individual systems do not have any input nor output wire. In exchange,
microgrids have a radial scheme (in form of a tree). The microgrid points where generators are placed cannot have input wires but can have one or more output wires. The connected points must have one and only one input wire but can have one or more output wires.
The wires connecting the equipment (from the PV/wind generation until the first consumption point, indicated as Generation system in Figure 6) are not considered, since their length is not significant in front of the distance between points.
Remark: The target is to develop a MILP model as generic as possible, that can be used to solve the proposed problem, but that could allow designing another community with different data.
4.3. MODELLING SOLUTION
Next, the modelling of each extension is realized referring to the starting model presented in the solution of the class activity. Next the changes in the data, the variables, the objective function and the constraints are presented. Note that the added constraints follow the numbering used in the starting model (see solution from the class activity) while is a constraint or the objective function are modified, the equation number is indicated with an apostrophe (X’).
1. Data
The parameters related to the consumption points (P, Lpd, EDp, PDp, AD), the PV generation (S, ESs, CSs), the batteries (B, EBb, CBb), the inverters (I, PIi, CIi), the microgrid (CC) and the additional data (M) remain unchanged. Moreover, the next data are added:
PV Generation:
PSs Maximum power [W] of a PV panel of type s (s=1,…,S).
22
Development of a MILP model to design wind-photovoltaic stand-alone electrification projects for isolated communities in developing countries
Wind Generation:
A Types of wind turbines (a=1,…,A).
EApa Energy generated [Wh/day] by a wind turbine of type a placed at point p (p=1,…,P; a=1,…,A).
PAa Maximum power [W] of a wind turbine of type a (a=1,…,A).
CAa Cost [$] of a wind turbine of type a (a=1,…,A).
Wind controllers:
R Types of wind controllers (r=1,…,R).
PRr Maximum power [W] admissible by a wind controller of type r (r=1,…,R).
CRr Cost [$] of a wind controller of type r (r=1,…,R).
PV controllers:
Z Types of PV controllers (z=1,…,Z).
PZz Maximum power [W] admissible by a PV controller of type r (z=1,…,Z).
CZz Cost [$] of a PV controller of type r (z=1,…,Z).
Meter:
CM Cost [$] of an electric meter.
2. Variables
The integer non-negative variables used to define the location and sizing of the PV panels (xsps), the batteries (xbpb) and the inverters (xipi); the float non-negative variables to define energy(fepd) and power (fppd) flows; and the binary variables to define the generation points (xgp) and the microgrid wires (xcpd) remain unchanged. Moreover, the next variables are added.
• Integer non-negative variables to define the location and sizing of the new equipment: xapa Number of wind turbines of type a placed at point p (p=1,…,P; a=1,…,A).
xrpr Number of wind controllers of type r placed at point p (p=1,…,P; r=1,…,R).
xzpz Number of PV controllers of type z placed at point p (p=1,…,P; z=1,…,Z).
23
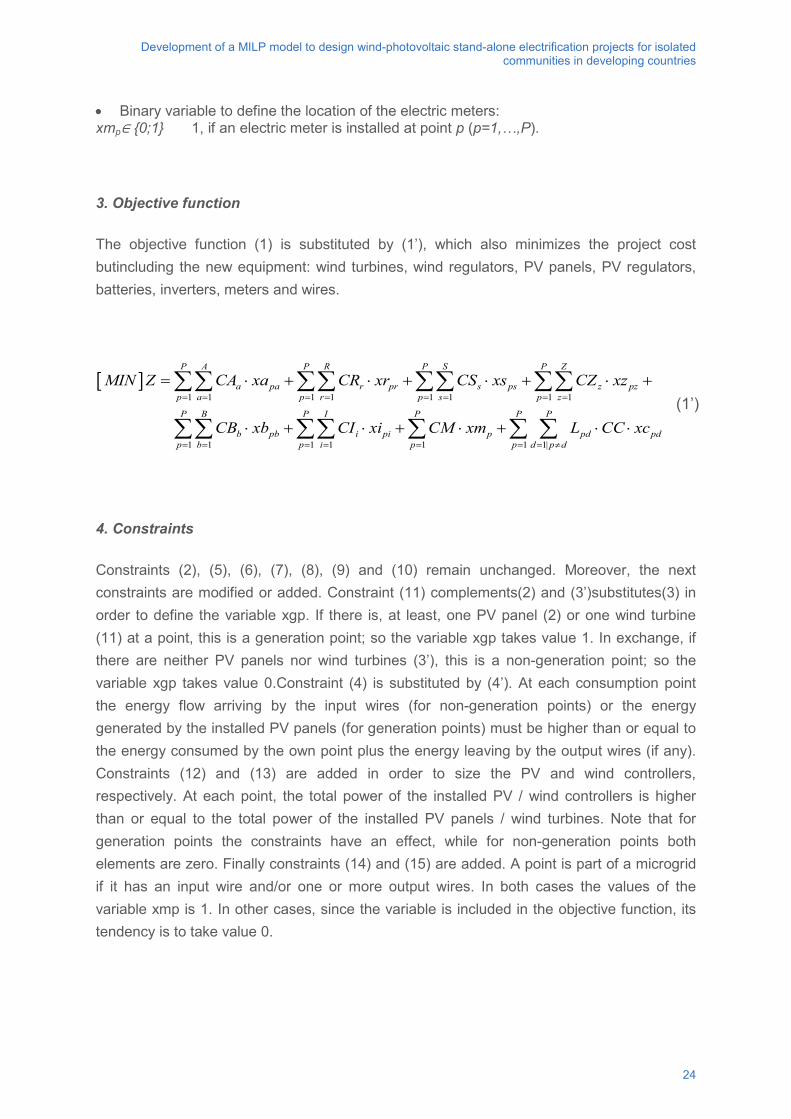
Development of a MILP model to design wind-photovoltaic stand-alone electrification projects for isolated communities in developing countries
• Binary variable to define the location of the electric meters: xmp∈ {0;1} 1, if an electric meter is installed at point p (p=1,…,P).
3. Objective function
The objective function (1) is substituted by (1’), which also minimizes the project cost butincluding the new equipment: wind turbines, wind regulators, PV panels, PV regulators, batteries, inverters, meters and wires.
[ ]1 1 1 1 1 1 1 1
1 1 1 1 1 1 1|
P A P R P S P Z
a pa r pr s ps z pzp a p r p s p z
P B P I P P P
b pb i pi p pd pdp b p i p p d p d
MIN Z CA xa CR xr CS xs CZ xz
CB xb CI xi CM xm L CC xc
= = = = = = = =
= = = = = = = ≠
= ⋅ + ⋅ + ⋅ + ⋅ +
⋅ + ⋅ + ⋅ + ⋅ ⋅
∑∑ ∑∑ ∑∑ ∑∑
∑∑ ∑∑ ∑ ∑ ∑ (1’)
4. Constraints
Constraints (2), (5), (6), (7), (8), (9) and (10) remain unchanged. Moreover, the next constraints are modified or added. Constraint (11) complements(2) and (3’)substitutes(3) in order to define the variable xgp. If there is, at least, one PV panel (2) or one wind turbine (11) at a point, this is a generation point; so the variable xgp takes value 1. In exchange, if there are neither PV panels nor wind turbines (3’), this is a non-generation point; so the variable xgp takes value 0.Constraint (4) is substituted by (4’). At each consumption point the energy flow arriving by the input wires (for non-generation points) or the energy generated by the installed PV panels (for generation points) must be higher than or equal to the energy consumed by the own point plus the energy leaving by the output wires (if any). Constraints (12) and (13) are added in order to size the PV and wind controllers, respectively. At each point, the total power of the installed PV / wind controllers is higher than or equal to the total power of the installed PV panels / wind turbines. Note that for generation points the constraints have an effect, while for non-generation points both elements are zero. Finally constraints (14) and (15) are added. A point is part of a microgrid if it has an input wire and/or one or more output wires. In both cases the values of the variable xmp is 1. In other cases, since the variable is included in the objective function, its tendency is to take value 0.
24
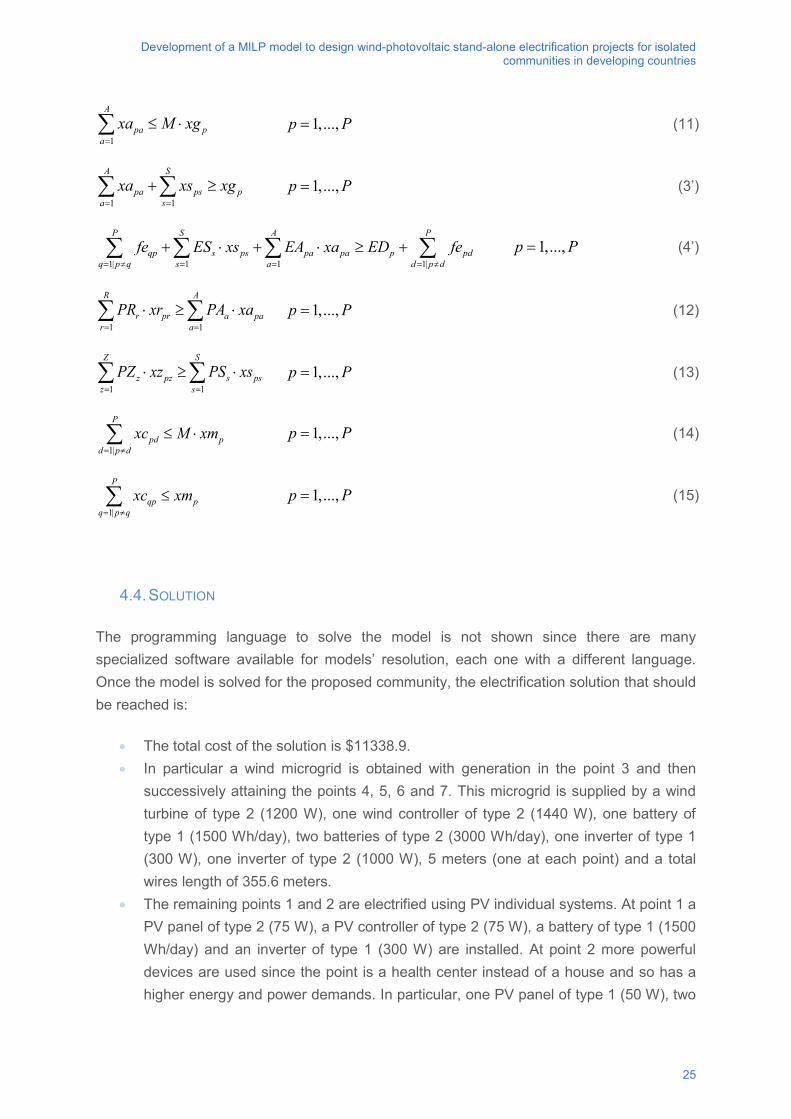
Development of a MILP model to design wind-photovoltaic stand-alone electrification projects for isolated communities in developing countries
1
A
pa pa
xa M xg=
≤ ⋅∑ 1,...,p P= (11)
1 1
A S
pa ps pa s
xa xs xg= =
+ ≥∑ ∑ 1,...,p P= (3’)
1| 1 1 1|
P S A P
qp s ps pa pa p pdq p q s a d p d
fe ES xs EA xa ED fe= ≠ = = = ≠
+ ⋅ + ⋅ ≥ +∑ ∑ ∑ ∑ 1,...,p P= (4’)
1 1
R A
r pr a par a
PR xr PA xa= =
⋅ ≥ ⋅∑ ∑ 1,...,p P= (12)
1 1
Z S
z pz s psz s
PZ xz PS xs= =
⋅ ≥ ⋅∑ ∑ 1,...,p P= (13)
1|
P
pd pd p d
xc M xm= ≠
≤ ⋅∑ 1,...,p P= (14)
1|
P
qp pq p q
xc xm= ≠
≤∑ 1,...,p P= (15)
4.4. SOLUTION
The programming language to solve the model is not shown since there are many specialized software available for models’ resolution, each one with a different language. Once the model is solved for the proposed community, the electrification solution that should be reached is:
• The total cost of the solution is $11338.9. • In particular a wind microgrid is obtained with generation in the point 3 and then
successively attaining the points 4, 5, 6 and 7. This microgrid is supplied by a wind turbine of type 2 (1200 W), one wind controller of type 2 (1440 W), one battery of type 1 (1500 Wh/day), two batteries of type 2 (3000 Wh/day), one inverter of type 1 (300 W), one inverter of type 2 (1000 W), 5 meters (one at each point) and a total wires length of 355.6 meters.
• The remaining points 1 and 2 are electrified using PV individual systems. At point 1 a PV panel of type 2 (75 W), a PV controller of type 2 (75 W), a battery of type 1 (1500 Wh/day) and an inverter of type 1 (300 W) are installed. At point 2 more powerful devices are used since the point is a health center instead of a house and so has a higher energy and power demands. In particular, one PV panel of type 1 (50 W), two
25
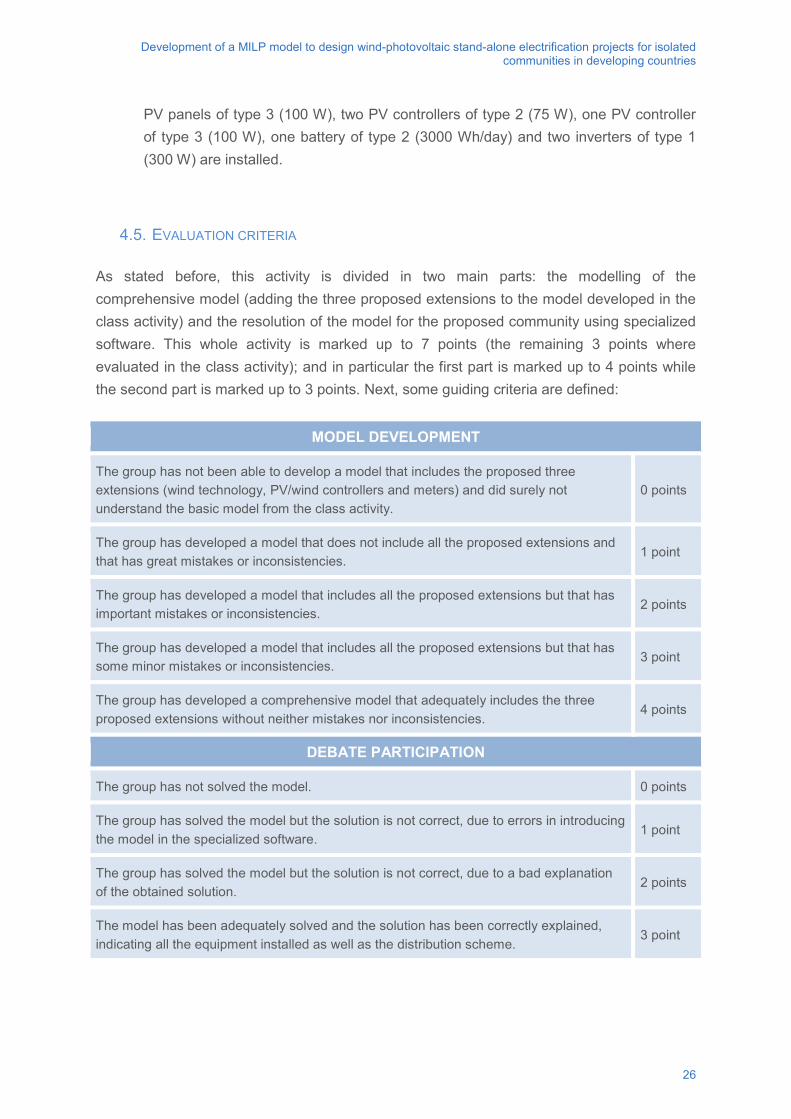
Development of a MILP model to design wind-photovoltaic stand-alone electrification projects for isolated communities in developing countries
PV panels of type 3 (100 W), two PV controllers of type 2 (75 W), one PV controller of type 3 (100 W), one battery of type 2 (3000 Wh/day) and two inverters of type 1 (300 W) are installed.
4.5. EVALUATION CRITERIA
As stated before, this activity is divided in two main parts: the modelling of the comprehensive model (adding the three proposed extensions to the model developed in the class activity) and the resolution of the model for the proposed community using specialized software. This whole activity is marked up to 7 points (the remaining 3 points where evaluated in the class activity); and in particular the first part is marked up to 4 points while the second part is marked up to 3 points. Next, some guiding criteria are defined:
MODEL DEVELOPMENT
The group has not been able to develop a model that includes the proposed three extensions (wind technology, PV/wind controllers and meters) and did surely not understand the basic model from the class activity.
0 points
The group has developed a model that does not include all the proposed extensions and that has great mistakes or inconsistencies.
1 point
The group has developed a model that includes all the proposed extensions but that has important mistakes or inconsistencies.
2 points
The group has developed a model that includes all the proposed extensions but that has some minor mistakes or inconsistencies.
3 point
The group has developed a comprehensive model that adequately includes the three proposed extensions without neither mistakes nor inconsistencies.
4 points
DEBATE PARTICIPATION
The group has not solved the model. 0 points
The group has solved the model but the solution is not correct, due to errors in introducing the model in the specialized software.
1 point
The group has solved the model but the solution is not correct, due to a bad explanation of the obtained solution.
2 points
The model has been adequately solved and the solution has been correctly explained, indicating all the equipment installed as well as the distribution scheme.
3 point
26
Development of a MILP model to design wind-photovoltaic stand-alone electrification projects for isolated communities in developing countries
5. FURTHER MATERIALS
Next, some videos show the electrification systems installed in the communities of Alto Peru and El Alumbre, as well as the life conditions of population and hoy electricity has allowed changing their lives:
• https://www.youtube.com/watch?v=H8Jzfsis2-w • http://vimeo.com/3582395 • http://vimeo.com/3190676 • http://vimeo.com/3570227 • https://www.youtube.com/watch?v=lEHg8o0sRtw
Additionally some presentations, articles, book chapters and a book are recommended to have a wide overview about the kind of projects focused by the developed mathematical model:
• https://grecdh.upc.edu/publicacions/congressos/energia-1/cng10-kenia-alumbre.pdf • http://greenempowerment.org/rnXHY_CommunitySmall-
ScaleWindGenerationinPeru.pdf • Ferrer-Martí, L., Domenech, B.,Canedo, W., Reza, C., Tellez, M., Dominguez,
M.,Perone, L., Salinas, J., 2010. Experiences of community wind electrification projects in Bolivia: Evaluation and improvements for future projects. In: Nayeripour, M., Kheshti, M., Sustainable growth and applications in renewable energy sources. Ed. Intech, pp. 85-106.
• Escobar, R., Vilar, D., Velo, E., Ferrer-Martí, L. Domenech, B., 2012. Promoting and improving renewable energy projects through local capacity development. In: Sencan, A., Modeling and optimization of renewable energy systems. Ed. Intech, pp. 147-170.
• Ferrer-Martí, L., Cubells, A., Velo, E., Carrillo, M., 2013. Proyectos de electrificación rural con energías renovables. Experiencias, lecciones aprendidas y retos de futuro. Ed. Icaria.
6. BIBLIOGRAPHY
Akella, A.K., Sharma, M.P., Saini, R.P., 2007. Optimum utilization of renewable energy sources in a remote area. Renewable&SustainableEnergyReviews,11, 894-908.
Akorede, M.F., Hizam, H., Pouresmaeil, E., 2010.Distributed energy resources and benefits to the environment. Renewable & Sustainable Energy Reviews,14, 724-734.
27
Development of a MILP model to design wind-photovoltaic stand-alone electrification projects for isolated communities in developing countries
Alzola, J.A., Vechiu, I., Camblong, H., Santos, M., Sall, Sowd, G., 2009. Microgrids project, Part 2: Design of an electrification kit with high content of renewable energy sources in Senegal. RenewableEnergy,34, 2151-2159.
Ashok, S., 2007.Optimized model for community-based hybrid energy system. Renewable Energy, 32, 1155-1164.
Atamtürk, A., Savelsbergh, M.W.P., 2005.Integer-programming software systems. Annals of Operations Research,140, 67-124.
Bala, B.K., Siddique, S.A., 2009. Optimal design of a PV-diesel hybrid system for electrification of an isolated island – Sandwip in Bangladesh using genetic algorithm. EnergyforSustainableDevelopment,13, 137-142.
Benka, S.G., 2002. The energy challenge. Physics Today, 55, 38-39.
Bernal-Agustín, J.L., Dufo-Lopez, R.,2009. Simulation and optimization of stand-alone hybrid renewable energy systems. Renewable & Sustainable Energy Reviews, 13, 2111-2118.
Chaurey, A., Ranganathana, M., Mohanty, P., 2004. Electricity access for geographically disadvantaged rural communities – technology and policy insights. EnergyPolicy,32, 1693-1705.
Chaurey, A., Kandpal, T.C., 2010. A techno-economic comparison of rural electrification basedon solar home systems and PV microgrids. Energy Policy, 38, 3118-3129.
DEPARTMENT FOR INTERNATIONAL DEVELOPMENT (2002) Energy for the poor: Underpinning the Millennium Development Goals. London. Department for International Development.
Deshmukh, M.K., Deshmukh, S.S., 2008. Modeling of hybrid renewable energy systems. Renewable &Sustainable Energy Reviews, 12, 235-249.
Ekren, B.Y., Ekren, O., 2009. Simulation based size optimization of a PV/wind hybrid energy conversion system with battery storage under various load and auxiliary energy conditions. Applied Energy,86, 1387-1394.
Ferrer-Martí, L., Garwood, A., Chiroque, J., Escobar, R., Coello, J., Castro, M., 2010. A community small-scale wind generation project in Peru. Wind Engineering. Special Issue on Small Wind Energy for Developing Countries, 277-288.
Ferrer-Martí, L., Pastor, R., Capó, G.M., Velo, E., 2011.Optimizingmicro-wind rural electrification projects. A case study in Peru. Journal of Global Optimization,50, 127-143.
Ferrer-Martí, L., Garwood, A., Chiroque, J., Ramírez, B., Marcelo, O., Garfí, M., Velo, E., 2012. Evaluating and comparing three community small-scale wind electrification projects. Renewable & Sustainable Energy Reviews,16, 5379-5390.
28
Development of a MILP model to design wind-photovoltaic stand-alone electrification projects for isolated communities in developing countries
Ferrer-Martí, L., Domenech, B., García-Villoria, A., Pastor, R., 2013. A MILP model to design hybrid-photovoltaic isolated rural electrification projects in developing countries. European Journal of OperationalResearch,226, 293-300.
Fomin, F.V., Kratsch, D., 2010.Exactexponentialalgorithms,Springer, Heidelberg Dordrech London New York.
Huang, G.H., Cai, Y.P., Yang, Z.F., Lin, Q.G., Tan, Q., 2008. Community-scale renewable energy systems planning under uncertainty – An interval chance-constrained programming approach. Renewable & Sustainable Energy Reviews, 13, 721-735.
IEA, International Energy Association. World energy outlook (2013).
Jiayi, H., Chuanwen, J., Rong, X., 2008. A review on distributed energy resources and microgrid. Renewable&SustainableEnergyReviews,12, 2472-2483.
Kanagawa, M., Nakata, T., 2008.Assessment of access to electricity and the socio-economic impacts in rural areas of developing countries. Energy Policy, 36, 2016-2029.
Kirubi, C., Jacobson, A., Kammen, D.M., Mills, A., 2009.Community-basedelectricmicro-grids can contribute to rural development: Evidence from Kenya. World Development, 37, 1208-1221.
Kumar Basua, A., Chowdhury, S.P., Chowdhury, S., Paul, S., 2011. Microgrids: Energy management by strategic deployment of DERs – A comprehensive survey. Renewable & Sustainable Energy Reviews,15, 4348-4356.
Lambert, T.W., Hittle, D.C., 2000. Optimization of autonomous village electrification systems by simulated annealing. Solar Energy, 68, 121-132.
Leary, J., While, A., Howell, R., 2012. Locally manufactured wind power technology for sustainable rural electrification. Energy Policy,43, 173-183.
Mendes, G., Ioakimidis, C., Ferrao, P., 2011.On the planning and analysis of integrated community energy systems: A review and survey of available tools. Renewable & Sustainable Energy Reviews,15, 4836-4854.
Nfah, E.M., Ngundam, J.M., 2008.Modelling of wind diesel battery hybrid power systems remote villages in Cameroon. Energy Conversion and Management, 49, 1295-1301.
Nieuwenhout, F.D.J., Van Dijk, A., Lasschuit, P.E., Van Roekel, G., Van Dijk, V.A.P., Hirsch, D., Arriaza, H., Hankins, M., Sharma, B.D., Wade, H., 2001. Experience with solar home systems in developing countries: A review. Progress in Photovoltaics: Research and Applications, 455-474.
Rolland, S., Glania, G., 2011. Hybrid mini-grids for rural electrification: Lessons learned. Brussels. Alliance for Rural Electrification.
29
Development of a MILP model to design wind-photovoltaic stand-alone electrification projects for isolated communities in developing countries
SelimUstun, T., Ozansoy, C., Zayegh, A., 2011.Recentdevelopments in microgrids and example cases around the world – A review. Renewable & Sustainable Energy Reviews, 15, 4030-4041.
Tenenbaum, B., Greacen, C., Siyambalapitiya, T., Knuckles, J., 2014. From the bottom up – How small power producers and micro-grids can deliver electrification and renewable energy in Africa. Washington. The World Bank.
White, L., Smith, H., Currie, C., 2011. OR in developing countries: A review. European Journal of Operational Research, 208, 1-11.
Yadoo, A., Cruickshank, H., 2012.The role for low carbon electrification technologies in poverty reduction and climate change strategies: A focus on renewable energy mini-grids with case studies in Nepal, Peru and Kenya. EnergyPolicy,42, 591-602.
Zahedi, A., 2006. Solar photovoltaic (PV) energy; latest developments in the building integrated and hybrid PV systems. RenewableEnergy,31, 711-718.
Zhou, W., Lou, C., Li, Z., Lu, L., Yang, H., 2010.Current status of research on optimum sizing of stand-alone hybrid solar–wind power generation systems. AppliedEnergy,87, 380-389.
7. ACKNOWLEDGEMENT
This paper was supported by the Spanish MICINN project ENE2010-15509 and by the Centre of Cooperation for Development of the Universitat Politècnica de Catalunya (UPC). The author is very grateful for all the assistance and support provided by the NGOs Practical Action (Peru), Engineering Without Borders (Catalonia, Spain) and Green Empowerment (USA).
30

http://www.gdee.eu
This project is funded by
Daniel K. B. Inkoom, and Aba Obrumah Crentsil
PHOTO: Practical Action.
CASE STUDIES
Estimation of indoor air pollution and healthimpacts due to biomass burning in rural northern Ghana

DL B 10735-2015 ISBN 978-84-606-7546-4
Estimation of indoor air pollution and health impacts due to biomass burning in rural northern Ghana
COORDINATED BYAgustí Pérez-Foguet, Enric Velo, Pol Arranz, Ricard Ginéand Boris Lazzarini (Universitat Politècnica de Catalunya)Manuel Sierra (Universidad Politécnica de Madrid)Alejandra Boni and Jordi Peris (Universitat Politècnica de València)Guido Zolezzi and Gabriella Trombino (Università degli Studi di Trento)Rhoda Trimingham (Loughborough University)Valentín Villarroel (ONGAWA)Neil Nobles and Meadhbh Bolger (Practical Action)Francesco Mongera (Training Center for International Cooperation)Katie Cresswell-Maynard (Engineering Without Border UK)
EDITED BY Global Dimension in Engineering Education
Citation: Inkoom, D.K.B. and Crentsil, A.O. (2015) ' Estimation of indoor air pollution and health impacts due to biomass burning in rural northern Ghana', in Case studies for developing globally responsible engineers, GDEE (eds.), Global Dimension in Engineering Education, Barcelona. Available from: http://gdee.eu/index.php/resources.html
This publication is distributedunder an Attribution- Noncommercial-Share Alike License for Creative Commons
CASE STUDIES
Disclaimer: This document has been produced with the financial assistance of the European UnionThe contents of this document are the sole responsibility of the authors and can under no circumstances be regarded as reflecting the position of the European Union
Estimation of indoor air pollution and health impacts due to biomass burning in rural northern Ghana
ESTIMATION OF INDOOR AIR POLLUTION AND HEALTH IMPACTS DUE TO BIOMASS BURNING IN RURAL NORTHERN GHANA
Dr. Daniel K. B. Inkoom, Department of Planning, KNUST, Kumasi, Ghana ([email protected])
Dr. Aba Obrumah Crentsil, Institute of Statistical, Social and Economic Research, University of Ghana, Legon ([email protected])
1
Estimation of indoor air pollution and health impacts due to biomass burning in rural northern Ghana
INDEX
1. INTRODUCTION ........................................................................................................................... 3
1.1 DISCIPLINES COVERED. .................................................................................................... 5
1.2 LEARNING OUTCOMES. ..................................................................................................... 5
1.3 ACTIVITIES ........................................................................................................................... 6
2. DESCRIPTION OF CONTEXT ..................................................................................................... 6
2.1 INDOOR AIR POLLUTION .................................................................................................... 7
2.2 THE HEALTH IMPACT OF EXPOSURE TO INDOOR AIR POLLUTION .............................. 8
2.3 EVIDENCE OF HEALTH EFFECTS OF POLLUTANTS (EPIDEMIOLOGICAL STUDIES) 10
2.4 ENERGY AND GENDER .................................................................................................... 11
3. CLASS ACTIVITY ....................................................................................................................... 12
Methodology ........................................................................................................................................ 12
4. HOMEWORK ACTIVITY ............................................................................................................. 17
ANNEX 2: HOUSEHOLD ENERGY SURVEY IN THE BONGO DISTRICT OF GHANA ............ 24
ANNEX 3 FURTHER MATERIALS .................................................................................................. 28
BIBLIOGRAFY ................................................................................................................................... 29
2
Estimation of indoor air pollution and health impacts due to biomass burning in rural northern Ghana
1. INTRODUCTION
Approximately 2.8 billion people, more than ever before in human history, use solid fuels for cooking. This is including wood, coal, charcoal, and agricultural residues. (Bonjour et al. 2013). When these fuels are used in traditional unimproved, open stoves, they emit substantial amounts of harmful pollutants, such as particulate matter (PM), carbon monoxide, and nitrogen and sulfur oxides. The concentration of particles with a diameter less than 10 μm, known as PM10, is the most widely used indicator of indoor air pollution in developing countries. But PM2.5 (fine particles with a diameter of 2.5 μm or less) has the greatest impact on respiratory health because these particles penetrate the bronchial and alveolar regions of the human body and the body is unable to remove them completely (Bruce et al., 2011). Women and young children are most exposed, and there is a well-documented relationship between indoor air pollution (IAP) and several diseases, most strongly with acute lower respiratory infections (ALRI) and chronic obstructive pulmonary disease (COPD), but also with lung cancer and tuberculosis (Desai et al., 2004 ).
According to the World Health Organisation (WHO 2014) in the year 2012, household air pollution from cooking with solid fuels was responsible for 4.3 million deaths worldwide. Figure 1 below shows the number of people who died from diseases attributed to household air pollution (HAP).
3
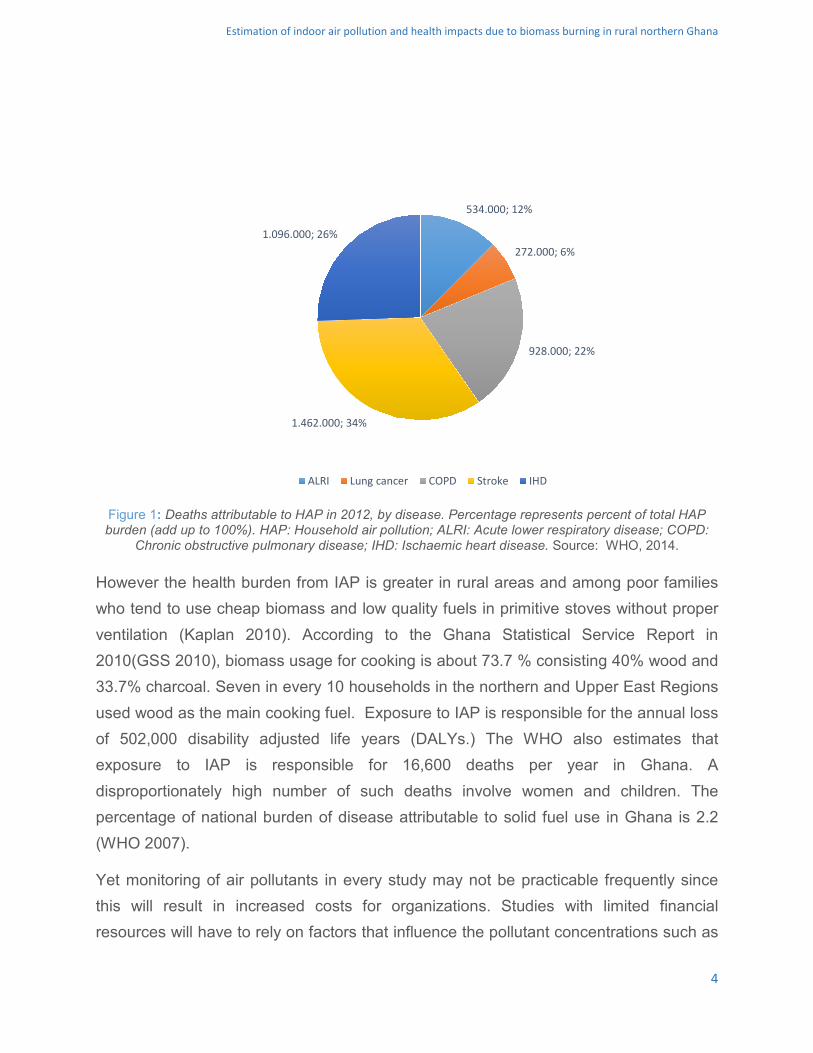
Estimation of indoor air pollution and health impacts due to biomass burning in rural northern Ghana
Figure 1: Deaths attributable to HAP in 2012, by disease. Percentage represents percent of total HAP burden (add up to 100%). HAP: Household air pollution; ALRI: Acute lower respiratory disease; COPD:
Chronic obstructive pulmonary disease; IHD: Ischaemic heart disease. Source: WHO, 2014.
However the health burden from IAP is greater in rural areas and among poor families who tend to use cheap biomass and low quality fuels in primitive stoves without proper ventilation (Kaplan 2010). According to the Ghana Statistical Service Report in 2010(GSS 2010), biomass usage for cooking is about 73.7 % consisting 40% wood and 33.7% charcoal. Seven in every 10 households in the northern and Upper East Regions used wood as the main cooking fuel. Exposure to IAP is responsible for the annual loss of 502,000 disability adjusted life years (DALYs.) The WHO also estimates that exposure to IAP is responsible for 16,600 deaths per year in Ghana. A disproportionately high number of such deaths involve women and children. The percentage of national burden of disease attributable to solid fuel use in Ghana is 2.2 (WHO 2007).
Yet monitoring of air pollutants in every study may not be practicable frequently since this will result in increased costs for organizations. Studies with limited financial resources will have to rely on factors that influence the pollutant concentrations such as
534.000; 12%
272.000; 6%
928.000; 22%
1.462.000; 34%
1.096.000; 26%
ALRI Lung cancer COPD Stroke IHD
4

Estimation of indoor air pollution and health impacts due to biomass burning in rural northern Ghana
fuel type, stove type, ventilation situation, house type, etc. most of which are essentially categorical in nature. As a result, it could be beneficial if we can identify some statistically significant factors and build statistical models for associating these factors with pollutant concentrations
In this context, the aim of this case study is that students to analyse and predict indoor air pollutants using categorical regression and estimate the burden of disease attributed to indoor air pollution from household use of solid fuels in rural Northern Ghana.
1.1 DISCIPLINES COVERED.
Main disciplines explored include: the estimation of indoor air pollutant; the burden of disease attributed to solid fuel use in a rural setting.
A background understanding of exposure measurement of indoor air pollution is required as well as and understanding of basic regression analysis.
The aim is for students to measure pollutants due to indoor air pollution and understand the health risk associated with biomass burning , especially among women and children (until they can work) and girls (as the learn cooking skills) who bear the responsibility for household cooking in rural areas.
1.2 LEARNING OUTCOMES.
As a result of this case study, students are expected to be able to:
• Understand the problem of the lack of access to modern cooking fuels worldwideand its consequences on human development, especially among women andchildren.
• Know the main components of rural household cooking systems and thetechnical relationships between them.
5
Estimation of indoor air pollution and health impacts due to biomass burning in rural northern Ghana
• Quantitatively measure Concentration of the different pollutants while burning thebiomass fuels to meet the domestic energy need.
• Estimate the exposure time of the residents in polluted air.
• Predict health impact of the residents due to inhale the polluted air
1.3 ACTIVITIES
Accurately estimating pollutant levels and estimating disease attributed to indoor air pollution from household use of solid fuels requires that students thoroughly understand literature. Data sets are available for such analysis. In the first activity (in class) students are introduced to the field data to help them draw descriptive tables. This should be done in groups of preferably 5. Again students should be introduced to single box and exposure dose equations to be used to estimate the disease attributed to indoor air pollution from household use of solid fuels, concentrate levels and exposure levels. At the end of the activity a discussion between all the students should be led by the lecturer in order to clarify the concepts and solve any doubts that may arise. This activity should last approximately two hours.
In second activity (at home) students are to predict ill-health due to exposure from the use of biomass fuels. In groups (comprising a maximum of 5), students should estimate the disease attributed to indoor air pollution from household use of solid fuels in rural Northern Ghana using the WHO exposure methodology. This activity duration is expected to be 10 hours, although this time can be slightly increased or reduced. The evaluation is divided between the two activities as detailed along this document
2. DESCRIPTION OF CONTEXT
In this section a description of the context of the case study is realized
6
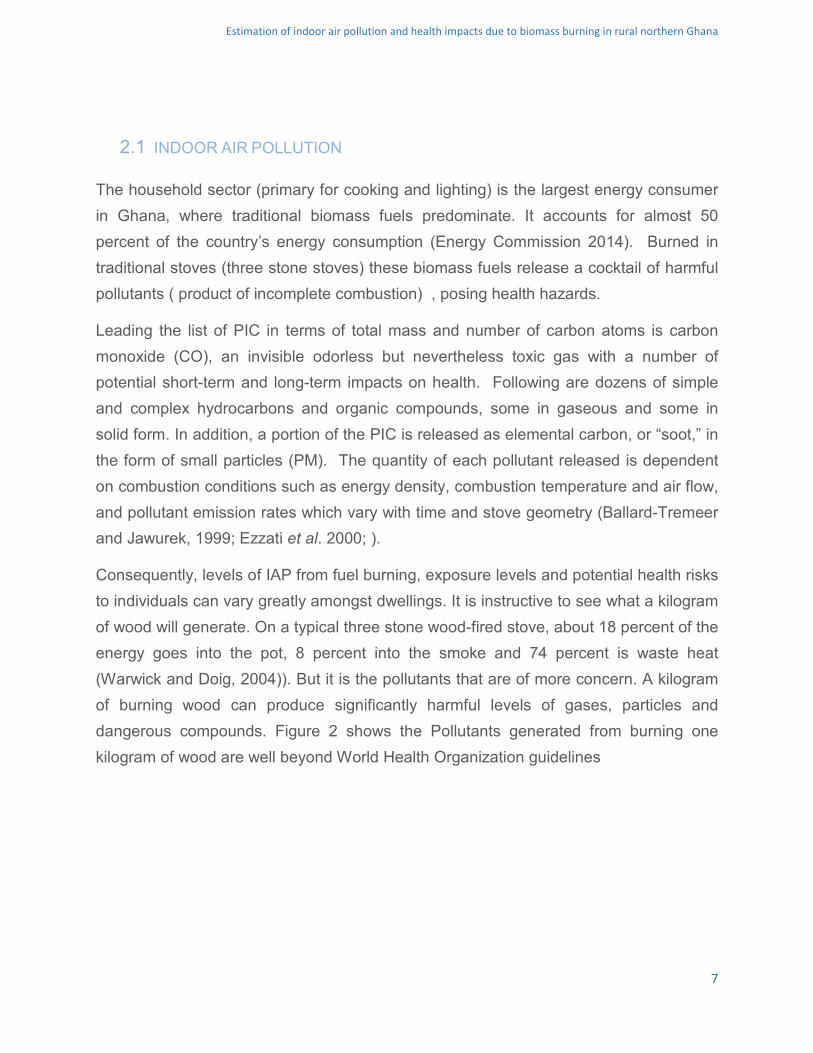
Estimation of indoor air pollution and health impacts due to biomass burning in rural northern Ghana
2.1 INDOOR AIR POLLUTION
The household sector (primary for cooking and lighting) is the largest energy consumer in Ghana, where traditional biomass fuels predominate. It accounts for almost 50 percent of the country’s energy consumption (Energy Commission 2014). Burned in traditional stoves (three stone stoves) these biomass fuels release a cocktail of harmful pollutants ( product of incomplete combustion) , posing health hazards.
Leading the list of PIC in terms of total mass and number of carbon atoms is carbon monoxide (CO), an invisible odorless but nevertheless toxic gas with a number of potential short-term and long-term impacts on health. Following are dozens of simple and complex hydrocarbons and organic compounds, some in gaseous and some in solid form. In addition, a portion of the PIC is released as elemental carbon, or “soot,” in the form of small particles (PM). The quantity of each pollutant released is dependent on combustion conditions such as energy density, combustion temperature and air flow, and pollutant emission rates which vary with time and stove geometry (Ballard-Tremeer and Jawurek, 1999; Ezzati et al. 2000; ).
Consequently, levels of IAP from fuel burning, exposure levels and potential health risks to individuals can vary greatly amongst dwellings. It is instructive to see what a kilogram of wood will generate. On a typical three stone wood-fired stove, about 18 percent of the energy goes into the pot, 8 percent into the smoke and 74 percent is waste heat (Warwick and Doig, 2004)). But it is the pollutants that are of more concern. A kilogram of burning wood can produce significantly harmful levels of gases, particles and dangerous compounds. Figure 2 shows the Pollutants generated from burning one kilogram of wood are well beyond World Health Organization guidelines
7
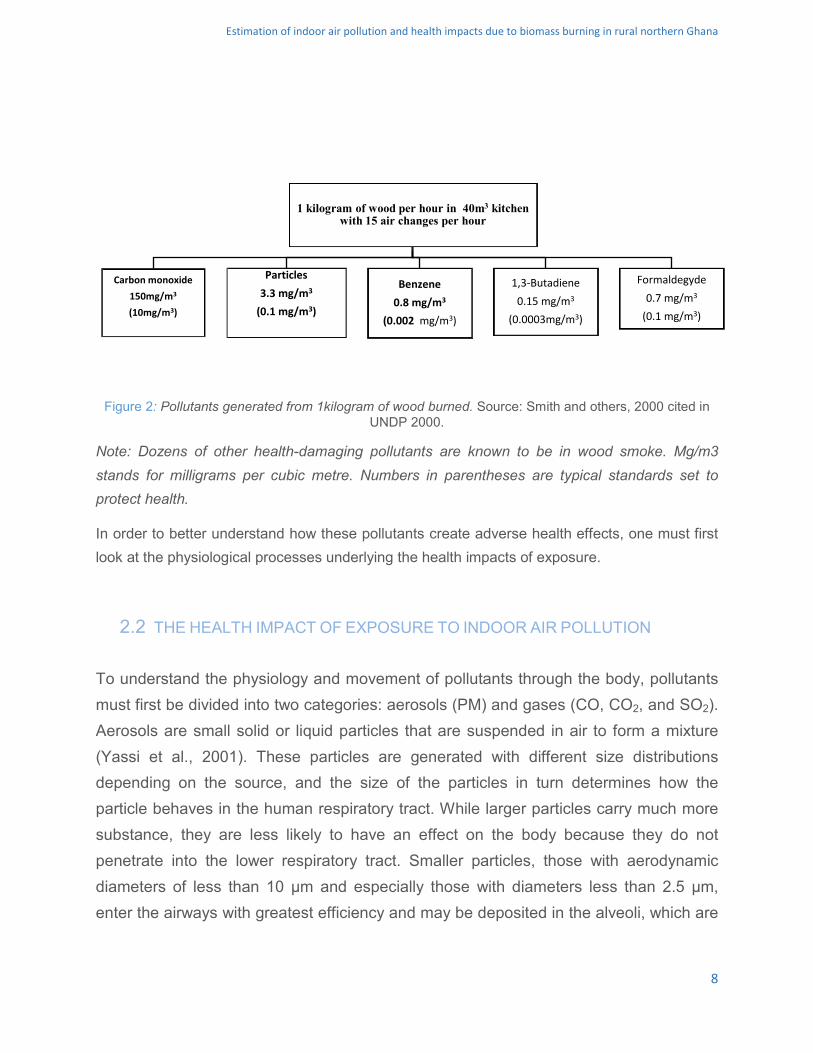
Estimation of indoor air pollution and health impacts due to biomass burning in rural northern Ghana
Figure 2: Pollutants generated from 1kilogram of wood burned. Source: Smith and others, 2000 cited in UNDP 2000.
Note: Dozens of other health-damaging pollutants are known to be in wood smoke. Mg/m3 stands for milligrams per cubic metre. Numbers in parentheses are typical standards set to protect health.
In order to better understand how these pollutants create adverse health effects, one must first look at the physiological processes underlying the health impacts of exposure.
2.2 THE HEALTH IMPACT OF EXPOSURE TO INDOOR AIR POLLUTION
To understand the physiology and movement of pollutants through the body, pollutants must first be divided into two categories: aerosols (PM) and gases (CO, CO2, and SO2). Aerosols are small solid or liquid particles that are suspended in air to form a mixture (Yassi et al., 2001). These particles are generated with different size distributions depending on the source, and the size of the particles in turn determines how the particle behaves in the human respiratory tract. While larger particles carry much more substance, they are less likely to have an effect on the body because they do not penetrate into the lower respiratory tract. Smaller particles, those with aerodynamic diameters of less than 10 μm and especially those with diameters less than 2.5 μm, enter the airways with greatest efficiency and may be deposited in the alveoli, which are
1 kilogram of wood per hour in 40m3 kitchen with 15 air changes per hour
Carbon monoxide 150mg/m3
(10mg/m3)
Particles 3.3 mg/m3
(0.1 mg/m3)
Benzene 0.8 mg/m3
(0.002 mg/m3)
1,3-Butadiene 0.15 mg/m3
(0.0003mg/m3)
Formaldegyde 0.7 mg/m3
(0.1 mg/m3)
8
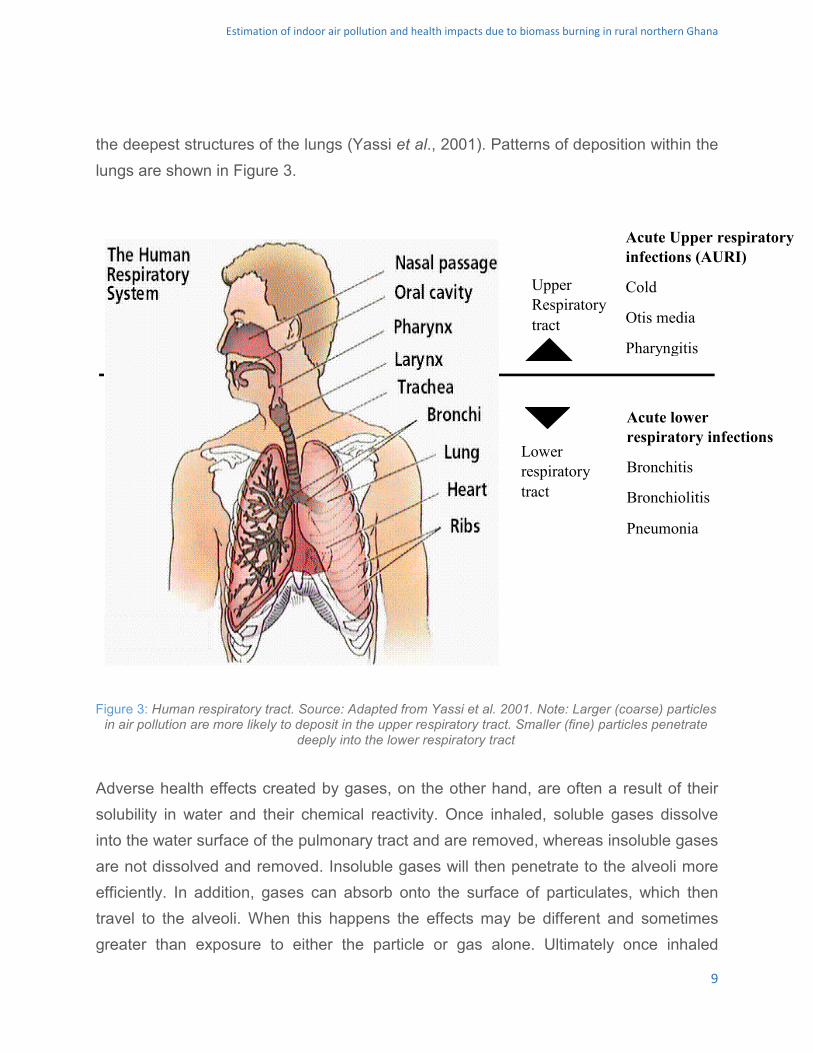
Estimation of indoor air pollution and health impacts due to biomass burning in rural northern Ghana
the deepest structures of the lungs (Yassi et al., 2001). Patterns of deposition within the lungs are shown in Figure 3.
Adverse health effects created by gases, on the other hand, are often a result of their solubility in water and their chemical reactivity. Once inhaled, soluble gases dissolve into the water surface of the pulmonary tract and are removed, whereas insoluble gases are not dissolved and removed. Insoluble gases will then penetrate to the alveoli more efficiently. In addition, gases can absorb onto the surface of particulates, which then travel to the alveoli. When this happens the effects may be different and sometimes greater than exposure to either the particle or gas alone. Ultimately once inhaled
Upper Respiratory tract
Lower respiratory tract
Acute lower respiratory infections
Bronchitis
Bronchiolitis
Pneumonia
Acute Upper respiratory infections (AURI)
Cold
Otis media
Pharyngitis
Figure 3: Human respiratory tract. Source: Adapted from Yassi et al. 2001. Note: Larger (coarse) particles in air pollution are more likely to deposit in the upper respiratory tract. Smaller (fine) particles penetrate
deeply into the lower respiratory tract
9
Estimation of indoor air pollution and health impacts due to biomass burning in rural northern Ghana
particles or insoluble gases reach the alveoli, they may release their constituents readily into the blood stream. The degree to which they enter the blood and are delivered to the body’s tissues depends on the concentration inhaled, the duration of exposure, their solubility in blood and in tissue, the reactivity of the compound, and the respiratory rate of the individual (Yassi et al. 2001).
Whether adverse health effects are displayed in an individual exposed to these pollutants depends largely on the dose (= pollutant concentration x exposure duration) received as well as their biological susceptibility to adverse health effects from exposure. Population groups that tend to be more susceptible to the effects of air pollution include: infants, children, the elderly, people with cardiovascular and respiratory diseases and people with impaired immune systems (EPA 2001 as cited in Matooane et al., 2004). Epidemiologists conducting IAP and health research in developing countries have attempted to incorporate these issues into their studies with varying degrees of success. These efforts are discussed below
2.3 EVIDENCE OF HEALTH EFFECTS OF POLLUTANTS (EPIDEMIOLOGICALSTUDIES)
Epidemiological studies undertaken in developing countries have aimed to establish a causal link between exposure to IAP and health effects in real life settings. According to reviews of these studies, there is good evidence that exposure increases the risk of acute lower respiratory infections in children, chronic obstructive pulmonary disease in adults, and lung cancer where coal is used exclusively (Bruce et al. 2002). A comprehensive survey conducted by the World Health Organization (WHO) in 2014 found that each year these diseases cause a considerable number of deaths (figure 1 above) worldwide.
Research has indicated that a disproportionate risk of exposure to IAP exists in women, infants and young children, as they spend the majority of time indoors, cooking (Sharma et al., 1998). Clear health risks are associated with obtaining and storing fuel for the domestic cooking stove. Collection of biomass fuels is associated with a variety of
10
Estimation of indoor air pollution and health impacts due to biomass burning in rural northern Ghana
mechanical injuries from felling, carrying and splitting wood, encounters with animals such as snakes and scorpions, violence, and exposure to vectors of a number of infectious diseases.
2.4 ENERGY AND GENDER
There is a differentiated impact of access to energy services for women and men but gender and energy concerns hardly enter macro-level policies. In most of the developing world, food processing, and water and firewood collection are traditionally female gender roles and take much of women’s and girls’ time and energy. Labour intensity of fire wood collection depends on many factors. Availability of wood, for example, influences traveling distance and time women spend collecting it. Household size and the amount of load a woman is able to carry at a time are all important determining factors. Some rural women are reported to carry up to 20 kilograms of firewood traveling an average distance of five kilometers (Warwick and Doig, 2004). Sometimes this is done with a baby strapped on the woman’s back.
Exposure models for Product of Incomplete Production in indoor environments
Frequent monitoring of air pollutants in every study may not be practicable since this raises the costs associated with the study. Studies with limited financial resources will have to rely on factors that influence the pollutant concentrations such as fuel type, stove type, ventilation situation, house type, etc. As a result, it is beneficial to identify some statistically significant factors and build statistical models for associating these factors with pollutant concentrations. In this case study, an attempt has been made in this direction by constructing a couple of statistical models based upon the single zone model (students should refer to reference for further reading on the model).
The single zone model
11
Estimation of indoor air pollution and health impacts due to biomass burning in rural northern Ghana
The simplest construct is the single-zone model, with the key ideas as follows. The air in a zone, typically a room bound by walls and a ceiling in the context of indoor air quality, is perfectly mixed such that any pollutant emitted into room air is uniformly mixed throughout the space. (The dimensions of the room are typically determined with a tape measure). The room receives fresh air at a given rate through natural infiltration and/or mechanical means, and this supply is matched by an outflow of room air by exfiltration and/or mechanical means at the same rate. Non-ventilation pollutant loss mechanisms (for example, particle deposition onto room surfaces) can be included. Different pollutant emission rate functions can be considered, but the simplest is a constant rate (for example, emissions during active cooking). The duration of emissions rate can be set to reflect the time the source emits into the zone. The effect of an exhaust chimney or canopy hood, which removes emitted pollutants before they mix into the general kitchen air, can also be accounted for by applying fractional terms to the emissions rate. Based on these parameters, the concentrations in a room can be estimated over time
The single zone model approach was applied to the household energy sector in developing countries as early as the 1980s. In this study, Smith et al. (1983) used a single zone model to predict kitchen concentrations of particulate matter and benzo(a)pyrene of resulting from cooking with solid fuels in A similar single zone modelling approach was employed by Prasad et al. (1985) to predict indoor CO concentrations resulting from cook stove emission.
3. CLASS ACTIVITY
Methodology
This activity is prepared for a two-hour session class and is divided in two parts. First, students are introduced to a proposed statement (shown next). During the first hour they have to use the data provided and models to predict emissions and pollutant concentrations. At the end, the lecturer gathers the solutions from each group for their evaluation and during the second hour a debate guided by the lecturer is carried out in
12
Estimation of indoor air pollution and health impacts due to biomass burning in rural northern Ghana
order to solve the model as in the solution (shown later), as well as resolve any doubts that may arise.
Proposed statement
An NGO interested in scaling up improved cooking stoves in rural Northern Ghana and monitoring 24-hr household (kitchen and living area) concentrations of PM2.5 and CO in 100 rural households in the Bongo district of the upper east Region of Ghana on a cross-sectional basis. An in-depth socioeconomic analysis of the communities was performed using data collected from questionnaires. In order to ensure cost-effective coverage of the key determinants of HAP concentrations, a stratified sampling technique was followed in this study to select households for indoor air monitoring in rural Ghana. A number of questions were also asked about fuel use, stove type, cooking locations and structural characteristics of kitchens. It was observed that most households used either crop residue, firewood or charcoal as their main cooking fuel. None purchased their fuels.
However due to limited financial resources the NGO was not able to physically measure pollutant levels. Based on the data (See attached data) provided the NGO has asked you to model pollutant concentrations from biomass fuel use for cooking in the surveyed households. This study focused on PM 2.5 and estimated exposure concentrations for the PM 2.5 emitted through the consumption of fuel inside residences in individual households, in order to assess the health risks from the combustion of these fuels.
From this data set, groups are required to develop of models to estimate household concentrations of pollutant burning by:
1. Providing Summary Data on Household Air Pollution Factors
To do this, you are required to go through the data and use simple descriptive statistics construct tables and write ups showing the types of fuel used by household, stoves used by households, amount of fuel used (Kg) by households.
3 Estimate Concentration of the different pollutants while burning the biomass fuels to meet the domestic energy need
13
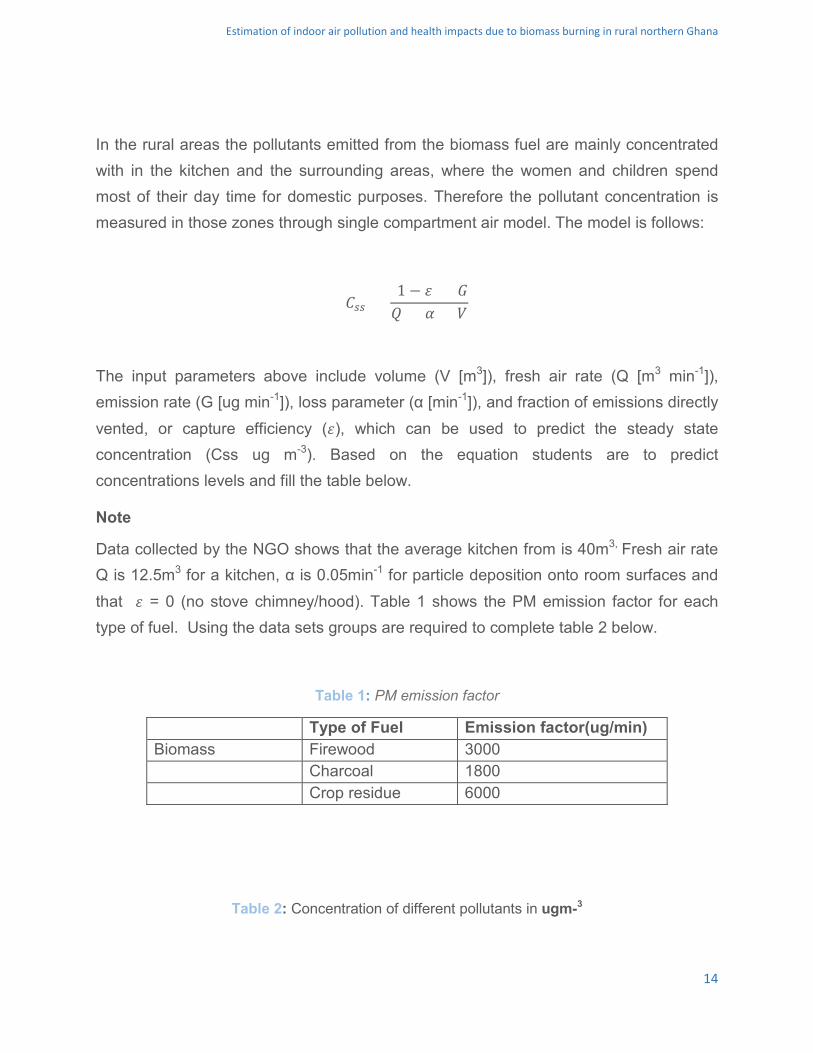
Estimation of indoor air pollution and health impacts due to biomass burning in rural northern Ghana
In the rural areas the pollutants emitted from the biomass fuel are mainly concentrated with in the kitchen and the surrounding areas, where the women and children spend most of their day time for domestic purposes. Therefore the pollutant concentration is measured in those zones through single compartment air model. The model is follows:
𝐶𝐶𝑠𝑠𝑠𝑠 = (1 − 𝜀𝜀) × 𝐺𝐺𝑄𝑄 + 𝛼𝛼 × 𝑉𝑉
The input parameters above include volume (V [m3]), fresh air rate (Q [m3 min-1]), emission rate (G [ug min-1]), loss parameter (α [min-1]), and fraction of emissions directly vented, or capture efficiency (𝜀𝜀), which can be used to predict the steady state concentration (Css ug m-3). Based on the equation students are to predict concentrations levels and fill the table below.
Note
Data collected by the NGO shows that the average kitchen from is 40m3, Fresh air rate Q is 12.5m3 for a kitchen, α is 0.05min-1 for particle deposition onto room surfaces and that 𝜀𝜀 = 0 (no stove chimney/hood). Table 1 shows the PM emission factor for each type of fuel. Using the data sets groups are required to complete table 2 below.
Table 1: PM emission factor
Type of Fuel Emission factor(ug/min) Biomass Firewood 3000 Charcoal 1800 Crop residue 6000
Table 2: Concentration of different pollutants in ugm-3
14
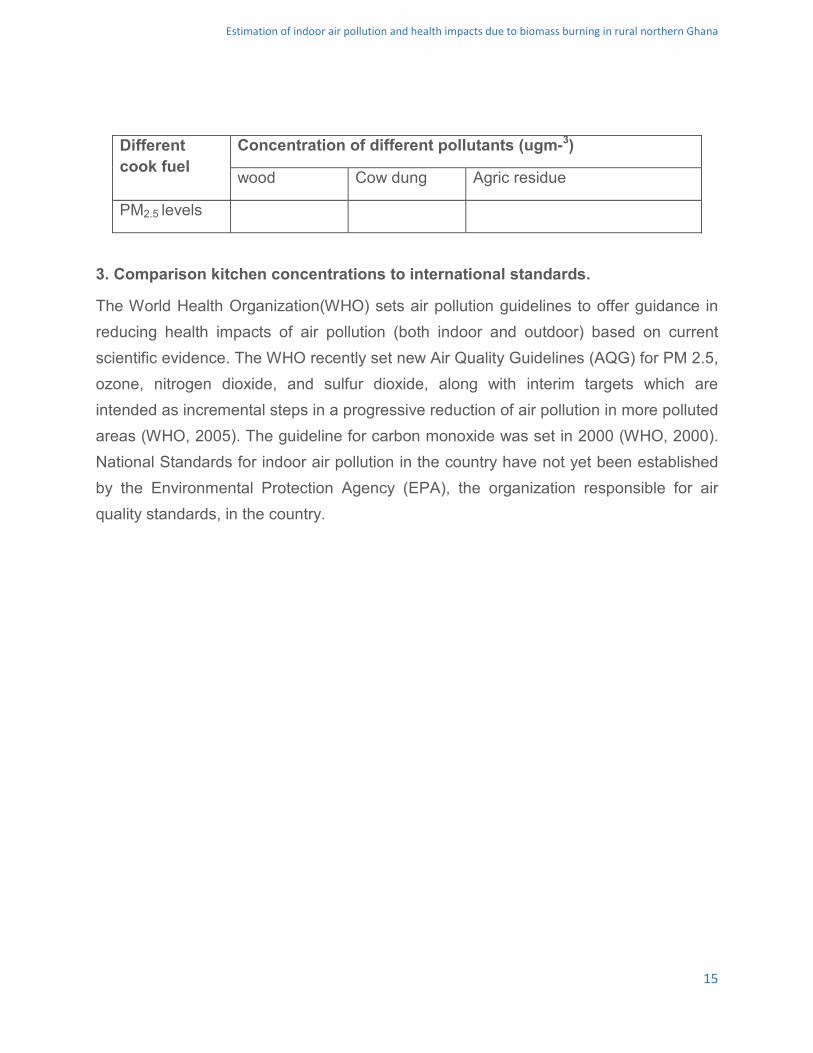
Estimation of indoor air pollution and health impacts due to biomass burning in rural northern Ghana
Different cook fuel
Concentration of different pollutants (ugm-3)
wood Cow dung Agric residue
PM2.5 levels
3. Comparison kitchen concentrations to international standards.
The World Health Organization(WHO) sets air pollution guidelines to offer guidance in reducing health impacts of air pollution (both indoor and outdoor) based on current scientific evidence. The WHO recently set new Air Quality Guidelines (AQG) for PM 2.5, ozone, nitrogen dioxide, and sulfur dioxide, along with interim targets which are intended as incremental steps in a progressive reduction of air pollution in more polluted areas (WHO, 2005). The guideline for carbon monoxide was set in 2000 (WHO, 2000). National Standards for indoor air pollution in the country have not yet been established by the Environmental Protection Agency (EPA), the organization responsible for air quality standards, in the country.
15
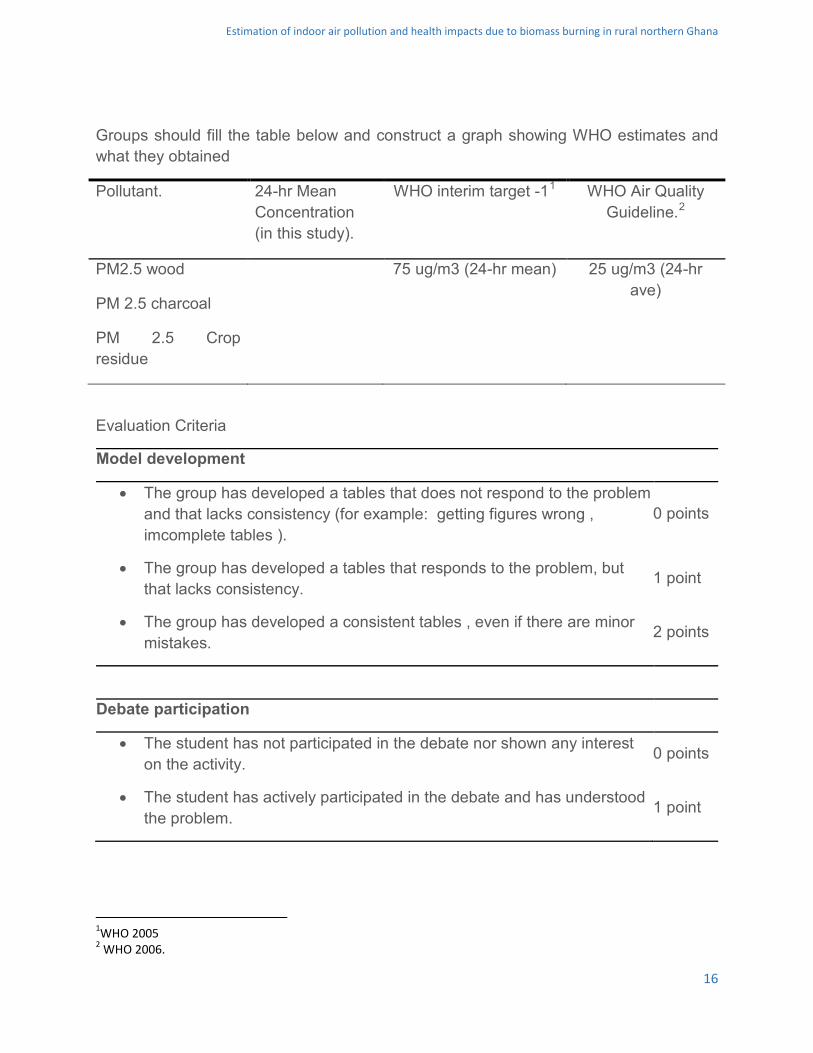
Estimation of indoor air pollution and health impacts due to biomass burning in rural northern Ghana
Groups should fill the table below and construct a graph showing WHO estimates and what they obtained
Pollutant. 24-hr Mean Concentration (in this study).
WHO interim target -11 WHO Air Quality Guideline.2
PM2.5 wood
PM 2.5 charcoal
PM 2.5 Crop residue
75 ug/m3 (24-hr mean) 25 ug/m3 (24-hr ave)
Evaluation Criteria
Model development
• The group has developed a tables that does not respond to the problem and that lacks consistency (for example: getting figures wrong , imcomplete tables ).
0 points
• The group has developed a tables that responds to the problem, but that lacks consistency.
1 point
• The group has developed a consistent tables , even if there are minor mistakes.
2 points
Debate participation
• The student has not participated in the debate nor shown any interest on the activity.
0 points
• The student has actively participated in the debate and has understood the problem.
1 point
1WHO 2005 2 WHO 2006.
16
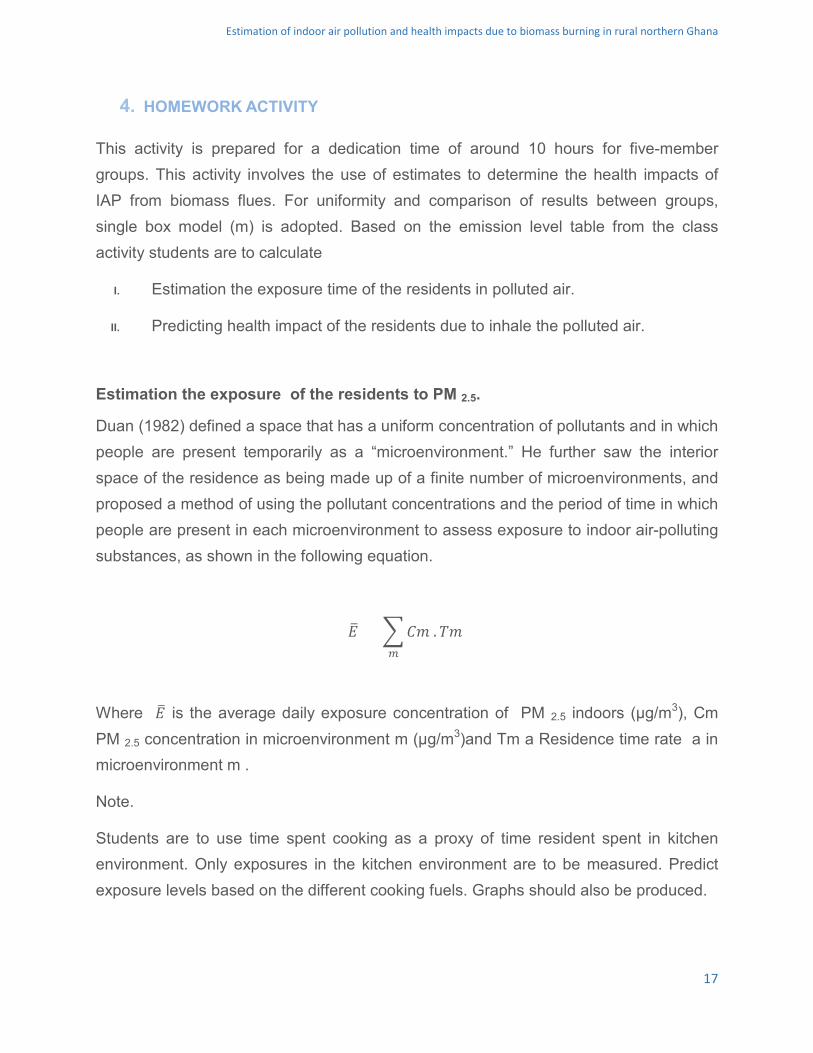
Estimation of indoor air pollution and health impacts due to biomass burning in rural northern Ghana
4. HOMEWORK ACTIVITY
This activity is prepared for a dedication time of around 10 hours for five-member groups. This activity involves the use of estimates to determine the health impacts of IAP from biomass flues. For uniformity and comparison of results between groups, single box model (m) is adopted. Based on the emission level table from the class activity students are to calculate
I. Estimation the exposure time of the residents in polluted air.
II. Predicting health impact of the residents due to inhale the polluted air.
Estimation the exposure of the residents to PM 2.5.
Duan (1982) defined a space that has a uniform concentration of pollutants and in which people are present temporarily as a “microenvironment.” He further saw the interior space of the residence as being made up of a finite number of microenvironments, and proposed a method of using the pollutant concentrations and the period of time in which people are present in each microenvironment to assess exposure to indoor air-polluting substances, as shown in the following equation.
𝐸𝐸� = �𝐶𝐶𝐶𝐶 .𝑇𝑇𝐶𝐶𝑚𝑚
Where 𝐸𝐸� is the average daily exposure concentration of PM 2.5 indoors (μg/m3), Cm PM 2.5 concentration in microenvironment m (μg/m3)and Tm a Residence time rate a in microenvironment m .
Note.
Students are to use time spent cooking as a proxy of time resident spent in kitchen environment. Only exposures in the kitchen environment are to be measured. Predict exposure levels based on the different cooking fuels. Graphs should also be produced.
17
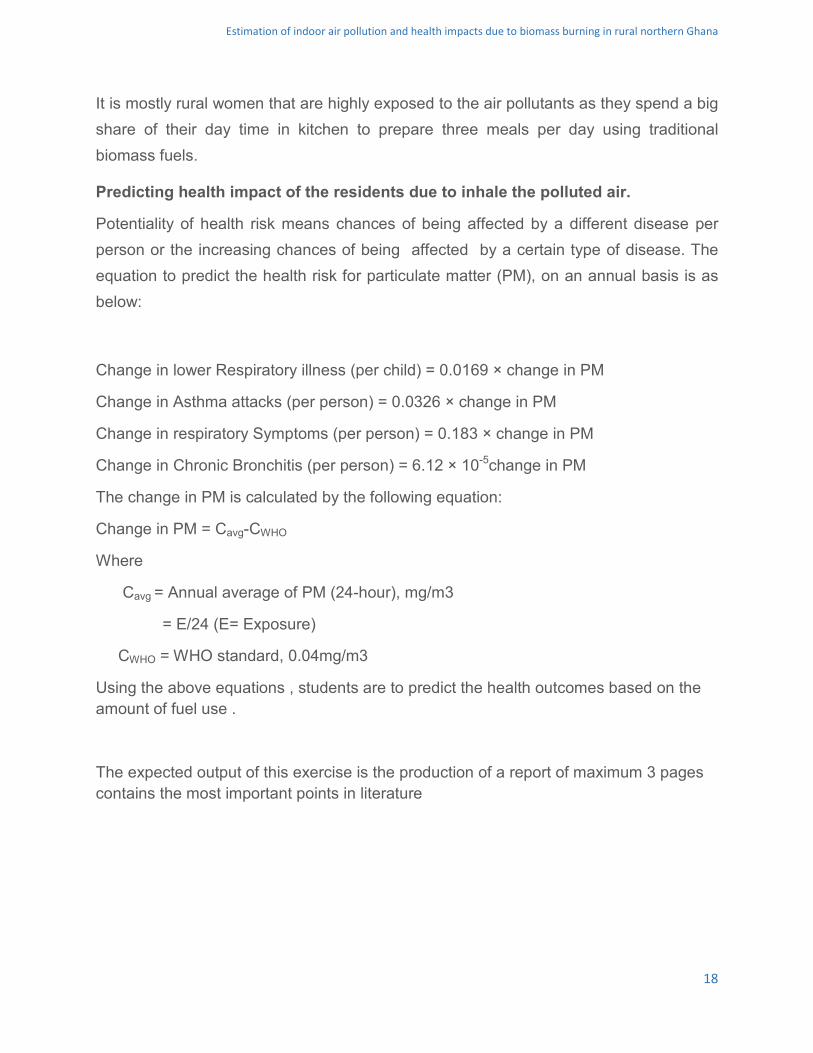
Estimation of indoor air pollution and health impacts due to biomass burning in rural northern Ghana
It is mostly rural women that are highly exposed to the air pollutants as they spend a big share of their day time in kitchen to prepare three meals per day using traditional biomass fuels.
Predicting health impact of the residents due to inhale the polluted air.
Potentiality of health risk means chances of being affected by a different disease per person or the increasing chances of being affected by a certain type of disease. The equation to predict the health risk for particulate matter (PM), on an annual basis is as below:
Change in lower Respiratory illness (per child) = 0.0169 × change in PM
Change in Asthma attacks (per person) = 0.0326 × change in PM
Change in respiratory Symptoms (per person) = 0.183 × change in PM
Change in Chronic Bronchitis (per person) = 6.12 × 10⁻⁵change in PM
The change in PM is calculated by the following equation:
Change in PM = Cavg-CWHO
Where
Cavg = Annual average of PM (24-hour), mg/m3
= E/24 (E= Exposure)
CWHO = WHO standard, 0.04mg/m3
Using the above equations , students are to predict the health outcomes based on the amount of fuel use .
The expected output of this exercise is the production of a report of maximum 3 pages contains the most important points in literature
18
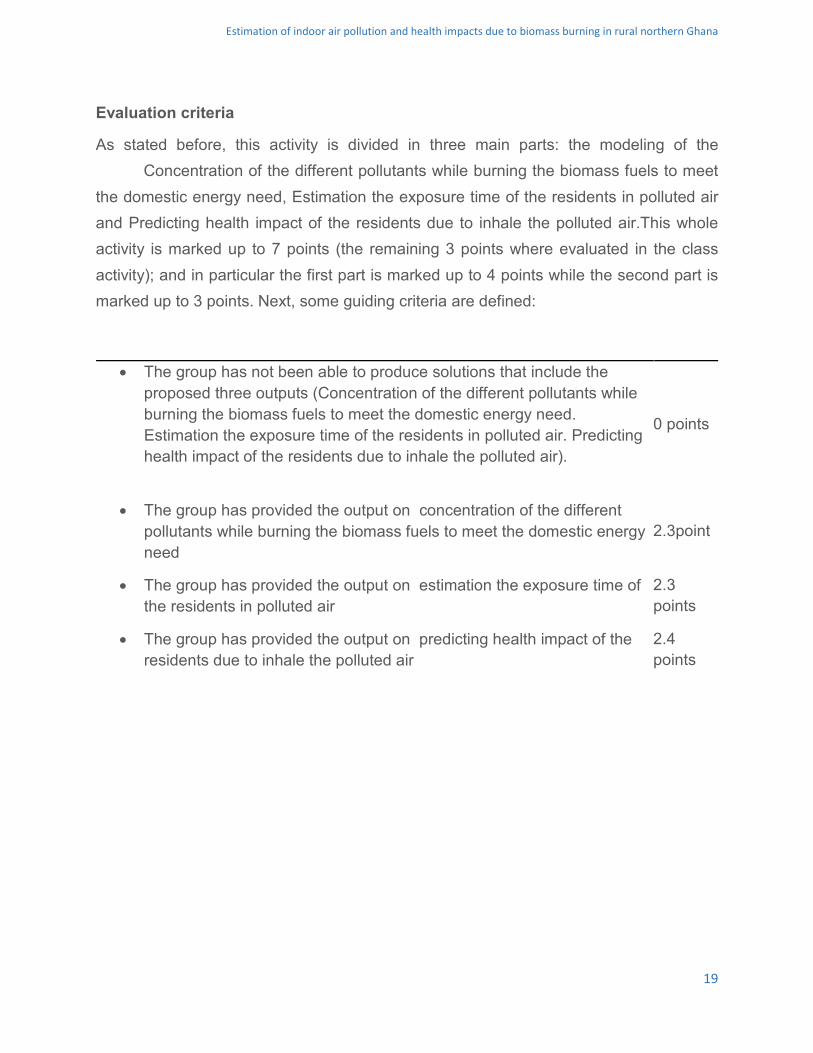
Estimation of indoor air pollution and health impacts due to biomass burning in rural northern Ghana
Evaluation criteria
As stated before, this activity is divided in three main parts: the modeling of the Concentration of the different pollutants while burning the biomass fuels to meet the domestic energy need, Estimation the exposure time of the residents in polluted air and Predicting health impact of the residents due to inhale the polluted air.This whole activity is marked up to 7 points (the remaining 3 points where evaluated in the class activity); and in particular the first part is marked up to 4 points while the second part is marked up to 3 points. Next, some guiding criteria are defined:
• The group has not been able to produce solutions that include the proposed three outputs (Concentration of the different pollutants while burning the biomass fuels to meet the domestic energy need. Estimation the exposure time of the residents in polluted air. Predicting health impact of the residents due to inhale the polluted air).
0 points
• The group has provided the output on concentration of the different pollutants while burning the biomass fuels to meet the domestic energy need
2.3point
• The group has provided the output on estimation the exposure time of the residents in polluted air
2.3 points
• The group has provided the output on predicting health impact of the residents due to inhale the polluted air
2.4 points
19
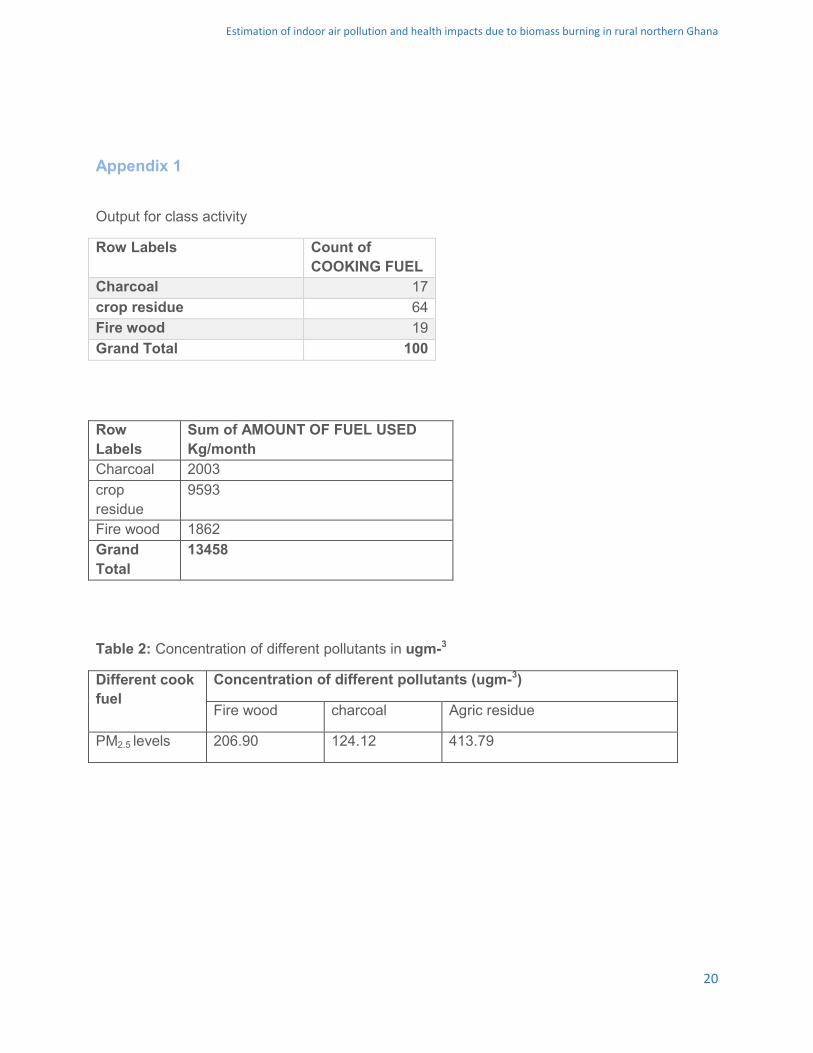
Estimation of indoor air pollution and health impacts due to biomass burning in rural northern Ghana
Appendix 1
Output for class activity
Row Labels Count of COOKING FUEL
Charcoal 17 crop residue 64 Fire wood 19 Grand Total 100
Row Labels
Sum of AMOUNT OF FUEL USED Kg/month
Charcoal 2003 crop residue
9593
Fire wood 1862 Grand Total
13458
Table 2: Concentration of different pollutants in ugm-3
Different cook fuel
Concentration of different pollutants (ugm-3)
Fire wood charcoal Agric residue
PM2.5 levels 206.90 124.12 413.79
20
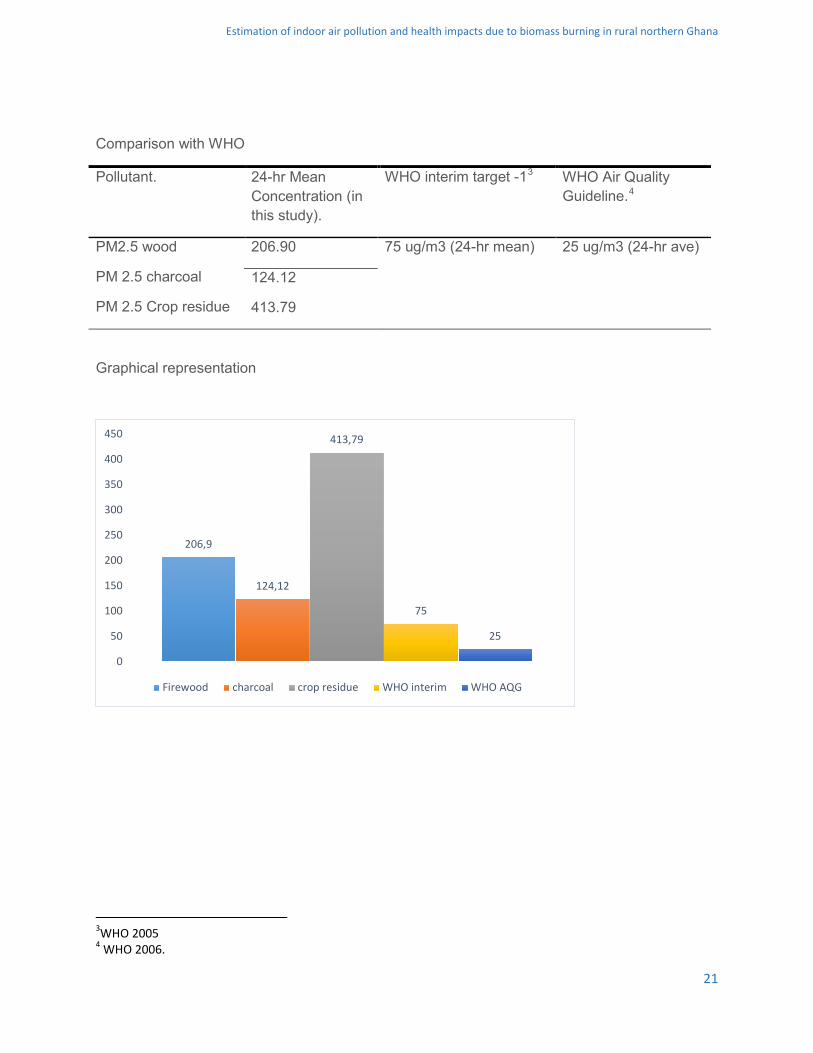
Estimation of indoor air pollution and health impacts due to biomass burning in rural northern Ghana
Comparison with WHO
Pollutant. 24-hr Mean Concentration (in this study).
WHO interim target -13 WHO Air Quality Guideline.4
PM2.5 wood
PM 2.5 charcoal
PM 2.5 Crop residue
206.90 75 ug/m3 (24-hr mean) 25 ug/m3 (24-hr ave)
124.12
413.79
Graphical representation
3WHO 2005 4 WHO 2006.
206,9
124,12
413,79
75
25
0
50
100
150
200
250
300
350
400
450
Firewood charcoal crop residue WHO interim WHO AQG
21
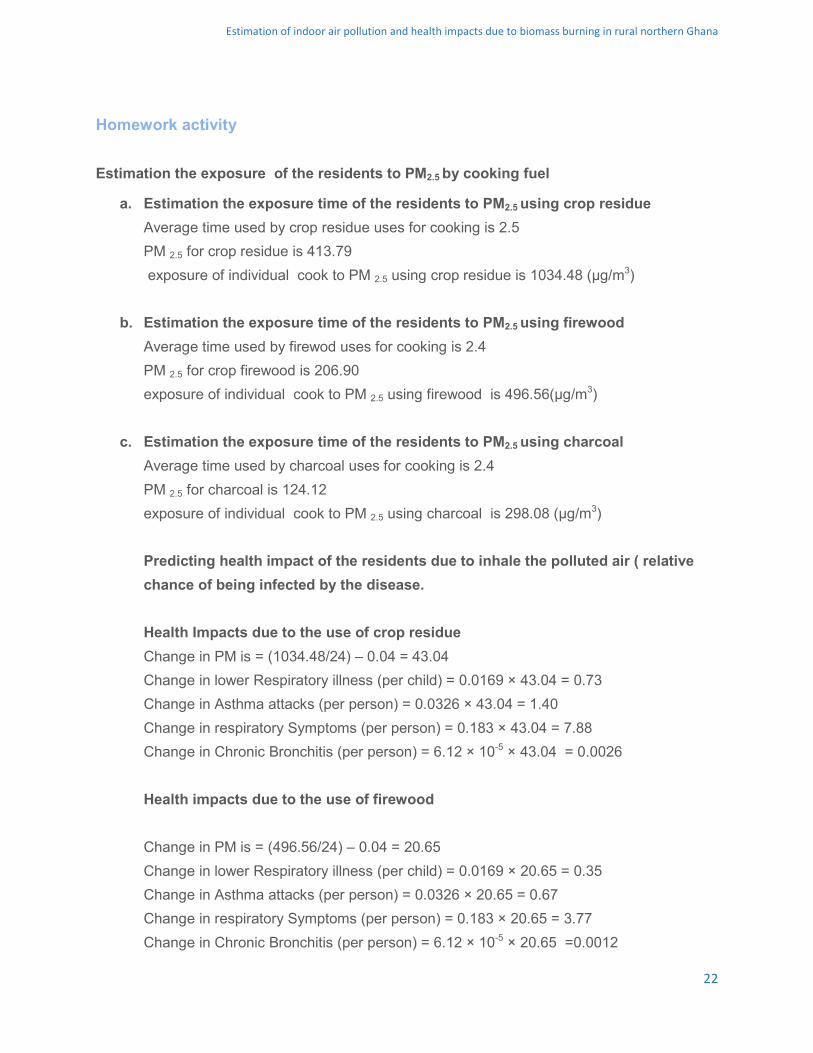
Estimation of indoor air pollution and health impacts due to biomass burning in rural northern Ghana
Homework activity
Estimation the exposure of the residents to PM2.5 by cooking fuel
a. Estimation the exposure time of the residents to PM2.5 using crop residue Average time used by crop residue uses for cooking is 2.5 PM 2.5 for crop residue is 413.79 exposure of individual cook to PM 2.5 using crop residue is 1034.48 (μg/m3)
b. Estimation the exposure time of the residents to PM2.5 using firewood Average time used by firewod uses for cooking is 2.4 PM 2.5 for crop firewood is 206.90 exposure of individual cook to PM 2.5 using firewood is 496.56(μg/m3)
c. Estimation the exposure time of the residents to PM2.5 using charcoal Average time used by charcoal uses for cooking is 2.4 PM 2.5 for charcoal is 124.12 exposure of individual cook to PM 2.5 using charcoal is 298.08 (μg/m3) Predicting health impact of the residents due to inhale the polluted air ( relative chance of being infected by the disease. Health Impacts due to the use of crop residue Change in PM is = (1034.48/24) – 0.04 = 43.04 Change in lower Respiratory illness (per child) = 0.0169 × 43.04 = 0.73 Change in Asthma attacks (per person) = 0.0326 × 43.04 = 1.40 Change in respiratory Symptoms (per person) = 0.183 × 43.04 = 7.88 Change in Chronic Bronchitis (per person) = 6.12 × 10-5 × 43.04 = 0.0026 Health impacts due to the use of firewood Change in PM is = (496.56/24) – 0.04 = 20.65 Change in lower Respiratory illness (per child) = 0.0169 × 20.65 = 0.35 Change in Asthma attacks (per person) = 0.0326 × 20.65 = 0.67 Change in respiratory Symptoms (per person) = 0.183 × 20.65 = 3.77 Change in Chronic Bronchitis (per person) = 6.12 × 10-5 × 20.65 =0.0012
22
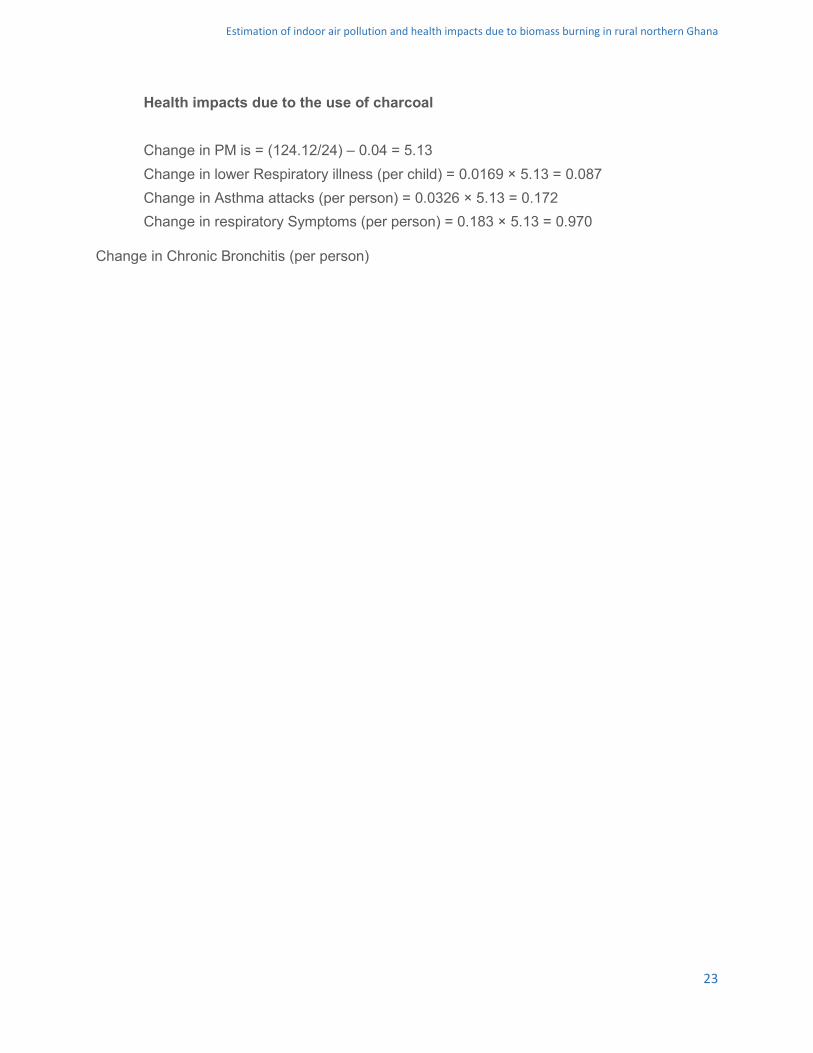
Estimation of indoor air pollution and health impacts due to biomass burning in rural northern Ghana
Health impacts due to the use of charcoal Change in PM is = (124.12/24) – 0.04 = 5.13 Change in lower Respiratory illness (per child) = 0.0169 × 5.13 = 0.087 Change in Asthma attacks (per person) = 0.0326 × 5.13 = 0.172 Change in respiratory Symptoms (per person) = 0.183 × 5.13 = 0.970
Change in Chronic Bronchitis (per person)
23
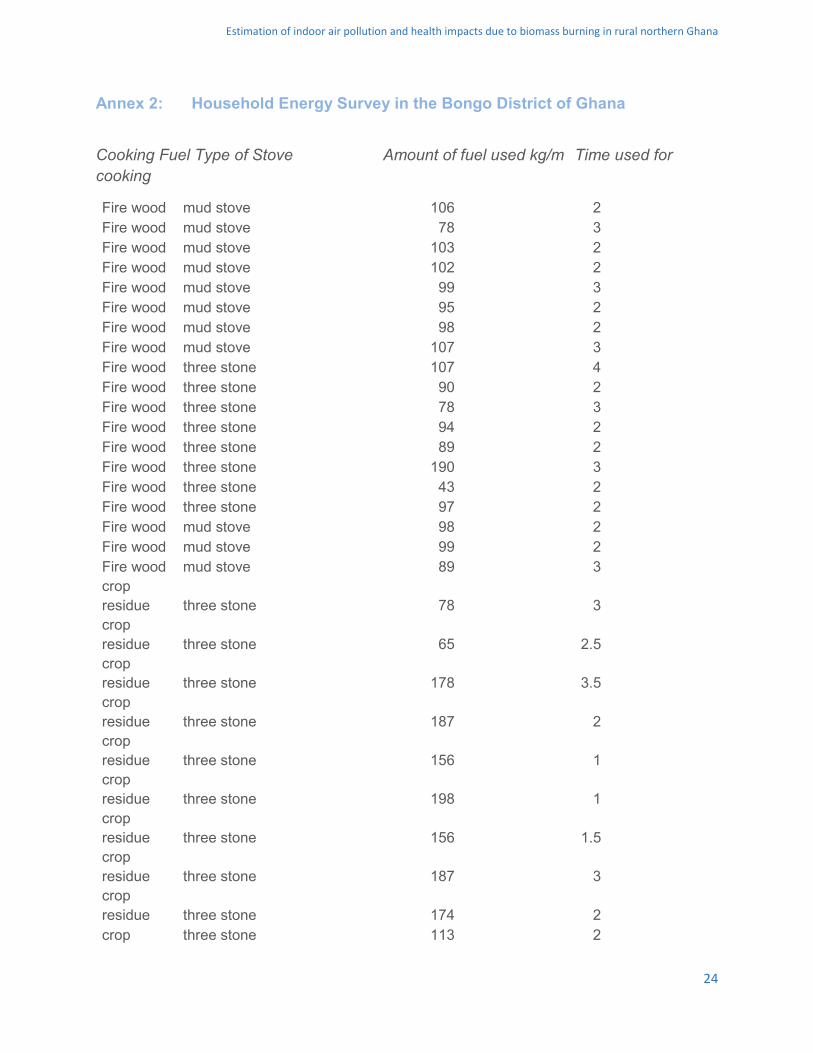
Estimation of indoor air pollution and health impacts due to biomass burning in rural northern Ghana
Annex 2: Household Energy Survey in the Bongo District of Ghana
Cooking Fuel Type of Stove Amount of fuel used kg/m Time used for cooking
Fire wood mud stove 106 2 Fire wood mud stove 78 3 Fire wood mud stove 103 2 Fire wood mud stove 102 2 Fire wood mud stove 99 3 Fire wood mud stove 95 2 Fire wood mud stove 98 2 Fire wood mud stove 107 3 Fire wood three stone 107 4 Fire wood three stone 90 2 Fire wood three stone 78 3 Fire wood three stone 94 2 Fire wood three stone 89 2 Fire wood three stone 190 3 Fire wood three stone 43 2 Fire wood three stone 97 2 Fire wood mud stove 98 2 Fire wood mud stove 99 2 Fire wood mud stove 89 3 crop residue three stone 78 3 crop residue three stone 65 2.5 crop residue three stone 178 3.5 crop residue three stone 187 2 crop residue three stone 156 1 crop residue three stone 198 1 crop residue three stone 156 1.5 crop residue three stone 187 3 crop residue three stone 174 2 crop three stone 113 2
24
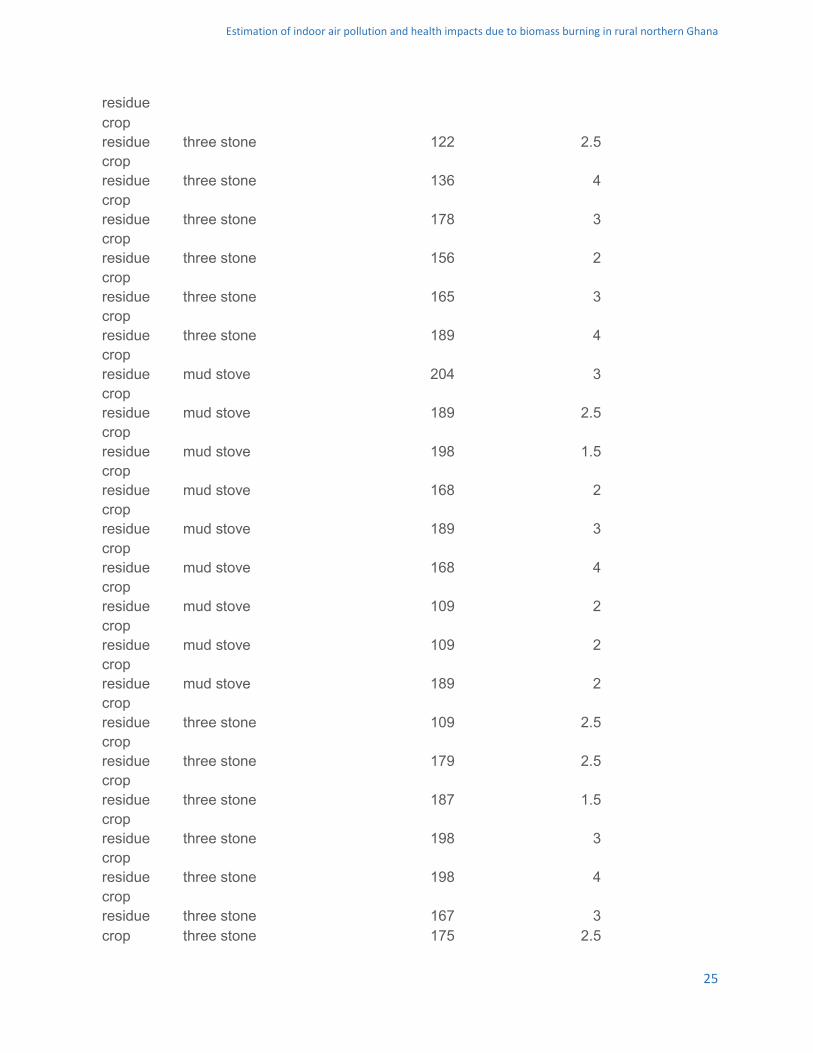
Estimation of indoor air pollution and health impacts due to biomass burning in rural northern Ghana
residue crop residue three stone 122 2.5 crop residue three stone 136 4 crop residue three stone 178 3 crop residue three stone 156 2 crop residue three stone 165 3 crop residue three stone 189 4 crop residue mud stove 204 3 crop residue mud stove 189 2.5 crop residue mud stove 198 1.5 crop residue mud stove 168 2 crop residue mud stove 189 3 crop residue mud stove 168 4 crop residue mud stove 109 2 crop residue mud stove 109 2 crop residue mud stove 189 2 crop residue three stone 109 2.5 crop residue three stone 179 2.5 crop residue three stone 187 1.5 crop residue three stone 198 3 crop residue three stone 198 4 crop residue three stone 167 3 crop three stone 175 2.5
25
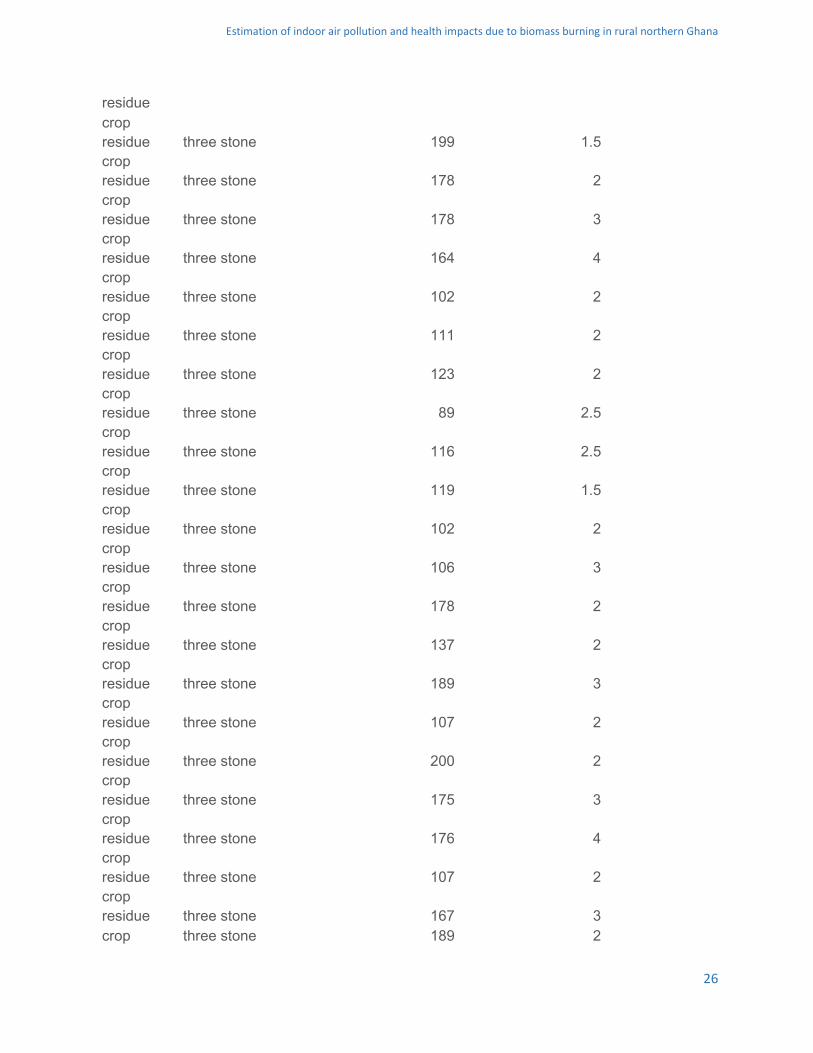
Estimation of indoor air pollution and health impacts due to biomass burning in rural northern Ghana
residue crop residue three stone 199 1.5 crop residue three stone 178 2 crop residue three stone 178 3 crop residue three stone 164 4 crop residue three stone 102 2 crop residue three stone 111 2 crop residue three stone 123 2 crop residue three stone 89 2.5 crop residue three stone 116 2.5 crop residue three stone 119 1.5 crop residue three stone 102 2 crop residue three stone 106 3 crop residue three stone 178 2 crop residue three stone 137 2 crop residue three stone 189 3 crop residue three stone 107 2 crop residue three stone 200 2 crop residue three stone 175 3 crop residue three stone 176 4 crop residue three stone 107 2 crop residue three stone 167 3 crop three stone 189 2
26
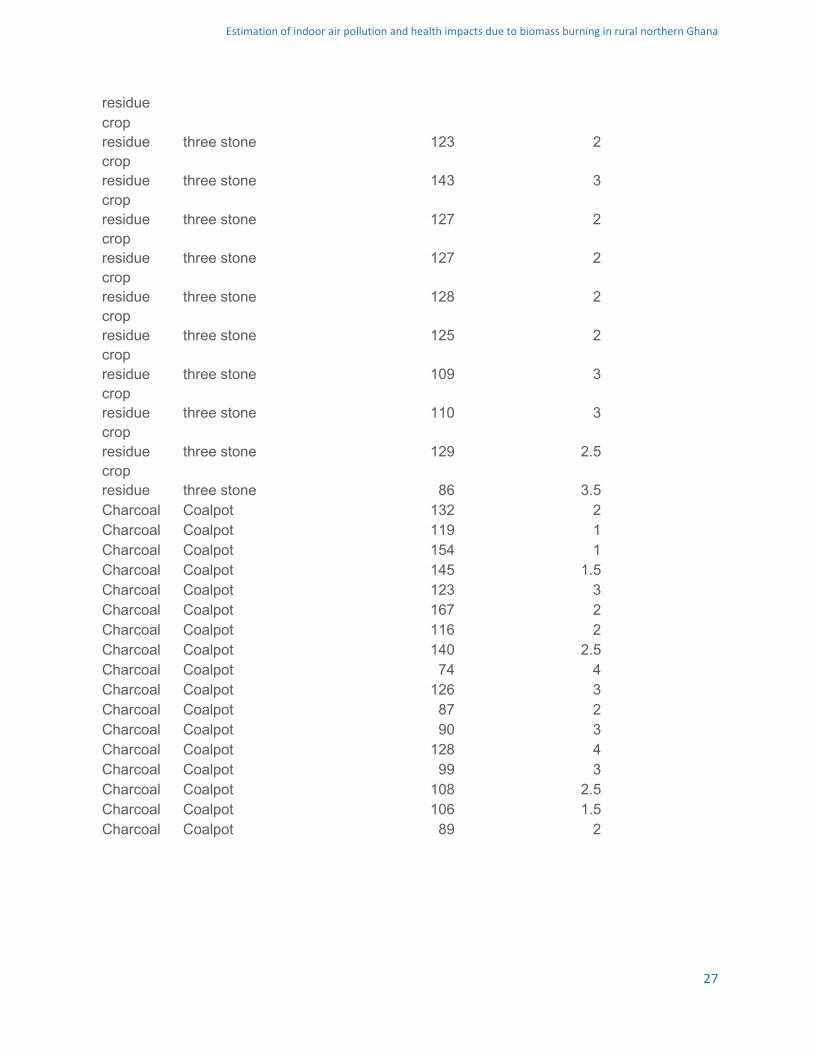
Estimation of indoor air pollution and health impacts due to biomass burning in rural northern Ghana
residue crop residue three stone 123 2 crop residue three stone 143 3 crop residue three stone 127 2 crop residue three stone 127 2 crop residue three stone 128 2 crop residue three stone 125 2 crop residue three stone 109 3 crop residue three stone 110 3 crop residue three stone 129 2.5 crop residue three stone 86 3.5 Charcoal Coalpot 132 2 Charcoal Coalpot 119 1 Charcoal Coalpot 154 1 Charcoal Coalpot 145 1.5 Charcoal Coalpot 123 3 Charcoal Coalpot 167 2 Charcoal Coalpot 116 2 Charcoal Coalpot 140 2.5 Charcoal Coalpot 74 4 Charcoal Coalpot 126 3 Charcoal Coalpot 87 2 Charcoal Coalpot 90 3 Charcoal Coalpot 128 4 Charcoal Coalpot 99 3 Charcoal Coalpot 108 2.5 Charcoal Coalpot 106 1.5 Charcoal Coalpot 89 2
27

Estimation of indoor air pollution and health impacts due to biomass burning in rural northern Ghana
Annex 3 Further Materials
http://www.statsghana.gov.gh/pop_stats.html
28
Estimation of indoor air pollution and health impacts due to biomass burning in rural northern Ghana
BIBLIOGRAPHY
Ballard-Tremeer, G. and Jawurek, H. (1999). Emissions and Efficiencies – Five Rural Cooking Devices. Biomass and Bioenergy , 11 (5), 419 - 430.
Bonjour S, Adair-Rohani H, Wolf J, Bruce NG, Mehta S, Prüss- Ustün A, et al. 2013. Solid fuel use for household cooking: country and regional estimates for 1980–2010. Environ Health Perspect 121:784–790; doi:10.1289/ehp.1205987.
Bruce, N., Perez-Padilla, R. and Albalak, R. (2002). Indoor Air Pollution in developing countries: a major environmental and public health challenge. Bulletin of the World Health Organisation , 78 (9), 1078-1092.
Desai, M., Mehta, S., & Smith, K. (2004) Indoor Smoke from Solid Fuels: Assessing the Environmental Burden of Disease at National and Local Levels Environmental Burden of Disease Series, No. 4. Geneva: World Health Organization.
Energy Commission, Ghana, 2014b. 2014 Energy (Supply and Demand) Outlook for Ghana. Accra: Energy Commission. Available at http://energycom.gov.gh/files/Energy%20Commission%20-%202014Energy%20Outlook%20for%20Ghana_final_2014.pdf. . [Accessed: 20th January 2015]
Ezzati, M., Saleh, H., and Kammen, D.M. (2000). The Contibution of emissions and spatial micro-environments to expousre to indoor air pollution from biomass combustion in Kenya. Environ Health Perspect , 108 (9), 833-839.
Ghana Statistical Service (2012) 2010 Population and Housing Census (PHC) Final Results, Accra: Ghana Statistical Service
Kaplan C (2010) Indoor air pollution from unprocessed solid fuels in developing countries. Reviews on Environmental Health 25(3):221–242
Matooane, M., John, J., Oosthuizen, R. and Binedell, M. (2004). Vulnerability of South African communities to air pollution. Proceedings of the 8th World Congress on Environmental Health. Durban, South Africa.
Prasad KK, Sangen E,Visser P. Woodburning Cookstoves. In: Hartnett JP, Thomas F. Irvine J, editors. Advances in Heat Transfer. Volume 17: Elsevier; 1985. p. 159-317.
Sharma, S., Sethi, G., Rohtagi, A., Chaudhary, A., Shankar, R., Bapna, J., Joshi, V. and Sapir, D. (1998). Indoor Air Quality and Acute Respiratory Infection in Indian Urban Slums. Environmental Health Perspectives , 106 (5), 291-297.
29
Estimation of indoor air pollution and health impacts due to biomass burning in rural northern Ghana
Sitara J, 2003, Cost of air pollution of Dhaka city, Unpublished Undergraduate Thesis, Environmental science discipline, Khulna University, Khulna.\
UNDP. (2002). World Energy Assessment: Energy and the Challenge of Sustainability. Retrieved November 12, 2006, from http://www.undp.org/seed/eap/activities/wea/drafts-frame.html.
Smith KR, Aggarwal AL,Dave RM. Air pollution and rural biomass fuels in developing countries: A pilot village study in India and implications for research and policy. Atmospheric Environment (1967). 1983;17(11):2343-62. doi: 10.1016/0004-6981(83)90234-2.
Warwick, H. and Doig, A. (2004). Smoke-the Killer in the Kitchen. Indoor Air Pollution in Developing Countries. London: ITDG.
World Health Organization (2007) Indoor Air Pollution: National Burden of Disease Estimates Year 2002, WHO Press: Geneva. Accessed on 16 January 2015. http://www.who.int/indoorair/publications/Indoor_air_national_burden_estimate_revised.pdf.
WHO (2002) The World Health Report 2002: Reducing Risks, Promoting Healthy Life (Geneva: World Health Organization).
Yassi, A., Kjellström,T., de Kok, T. and Guidotti, T. (2001). Basic Environmental Health. New York: Oxford University Press.
30

http://www.gdee.eu
This project is funded by
ImprovedCookstoves Assessment
Mike Cli�ord
PHOTO: A community testing out an improved cookstove in India. Practical Action.
CASE STUDIES

A.1
Improved Cookstoves Assessment
COORDINATED BYAgustí Pérez-Foguet, Enric Velo, Pol Arranz, Ricard Ginéand Boris Lazzarini (Universitat Politècnica de Catalunya)Manuel Sierra (Universidad Politécnica de Madrid)Alejandra Boni and Jordi Peris (Universitat Politècnica de València)Guido Zolezzi and Gabriella Trombino (Università degli Studi di Trento)Rhoda Trimingham (Loughborough University)Valentín Villarroel (ONGAWA)Neil Nobles and Meadhbh Bolger (Practical Action)Francesco Mongera (Training Center for International Cooperation)Katie Cresswell-Maynard (Engineering Without Border UK)
EDITED BY Global Dimension in Engineering Education
Citation: Cli�ord, M. (2015) 'Improved Cookstoves Assessment', in Case studies for developing globally responsible engineers, GDEE (eds.), Global Dimension in Engineering Education, Barcelona. Available from: http://gdee.eu/index.php/resources.html
This publication is distributedunder an Attribution- Noncommercial-Share Alike License for Creative Commons
DL B 10735-2015 ISBN 978-84-606-7546-4
CASE STUDIES
Disclaimer: This document has been produced with the financial assistance of the European UnionThe contents of this document are the sole responsibility of the authors and can under no circumstances be regarded as reflecting the position of the European Union
Improved Cookstoves Assessment
IMPROVED COOKSTOVES ASSESSMENT
Mike Clifford, University of Nottingham
1
Improved Cookstoves Assessment
INDEX 1. INTRODUCTION ........................................................................................................................... 3
1.1. DISCIPLINES COVERED ............................................................................................................. 3
1.2. LEARNING OUTCOMES .............................................................................................................. 3
1.3. ACTIVITIES .............................................................................................................................. 4
2. DESCRIPTION OF THE CONTEXT ............................................................................................. 4 3. CLASS ACTIVITY ....................................................................................................................... 10
4. HOMEWORK ACTIVITY ............................................................................................................. 11
BIBLIOGRAPHY ................................................................................................................................. 12 FURTHER/SUGGESTED MATERIAL ................................................................................................ 12
2
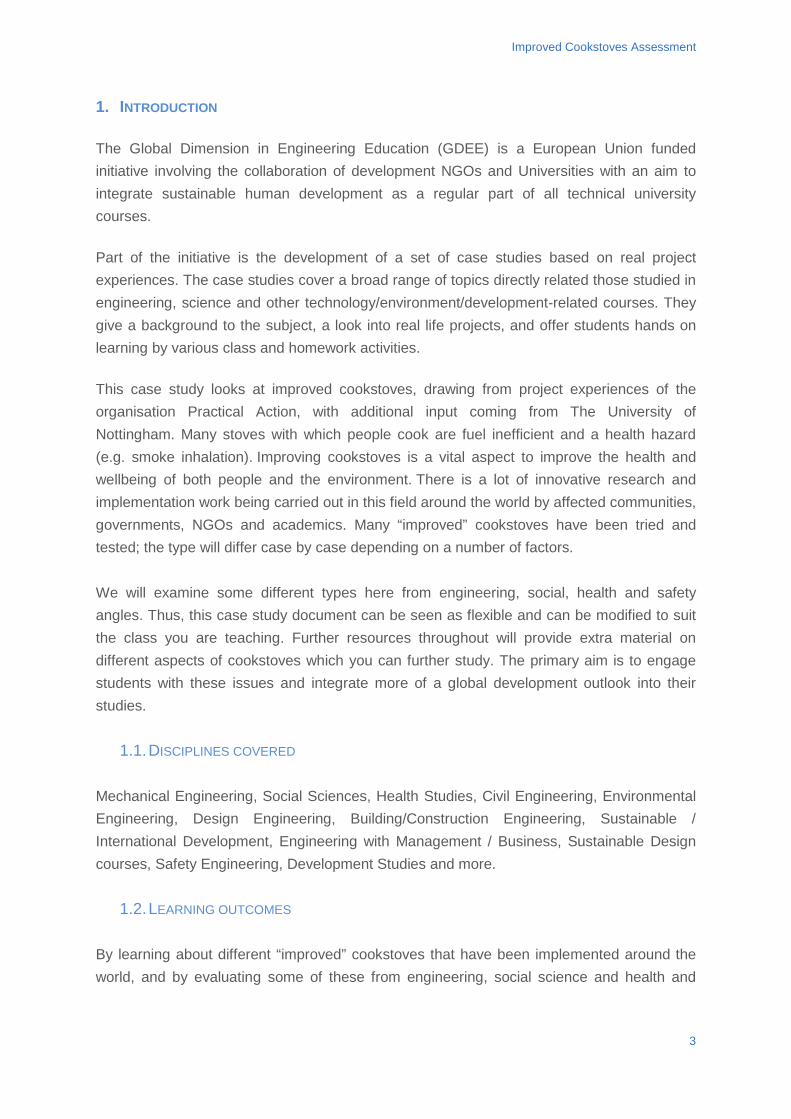
Improved Cookstoves Assessment
1. INTRODUCTION
The Global Dimension in Engineering Education (GDEE) is a European Union funded initiative involving the collaboration of development NGOs and Universities with an aim to integrate sustainable human development as a regular part of all technical university courses.
Part of the initiative is the development of a set of case studies based on real project experiences. The case studies cover a broad range of topics directly related those studied in engineering, science and other technology/environment/development-related courses. They give a background to the subject, a look into real life projects, and offer students hands on learning by various class and homework activities.
This case study looks at improved cookstoves, drawing from project experiences of the organisation Practical Action, with additional input coming from The University of Nottingham. Many stoves with which people cook are fuel inefficient and a health hazard (e.g. smoke inhalation). Improving cookstoves is a vital aspect to improve the health and wellbeing of both people and the environment. There is a lot of innovative research and implementation work being carried out in this field around the world by affected communities, governments, NGOs and academics. Many “improved” cookstoves have been tried and tested; the type will differ case by case depending on a number of factors. We will examine some different types here from engineering, social, health and safety angles. Thus, this case study document can be seen as flexible and can be modified to suit the class you are teaching. Further resources throughout will provide extra material on different aspects of cookstoves which you can further study. The primary aim is to engage students with these issues and integrate more of a global development outlook into their studies.
1.1. DISCIPLINES COVERED Mechanical Engineering, Social Sciences, Health Studies, Civil Engineering, Environmental Engineering, Design Engineering, Building/Construction Engineering, Sustainable / International Development, Engineering with Management / Business, Sustainable Design courses, Safety Engineering, Development Studies and more.
1.2. LEARNING OUTCOMES By learning about different “improved” cookstoves that have been implemented around the world, and by evaluating some of these from engineering, social science and health and
3
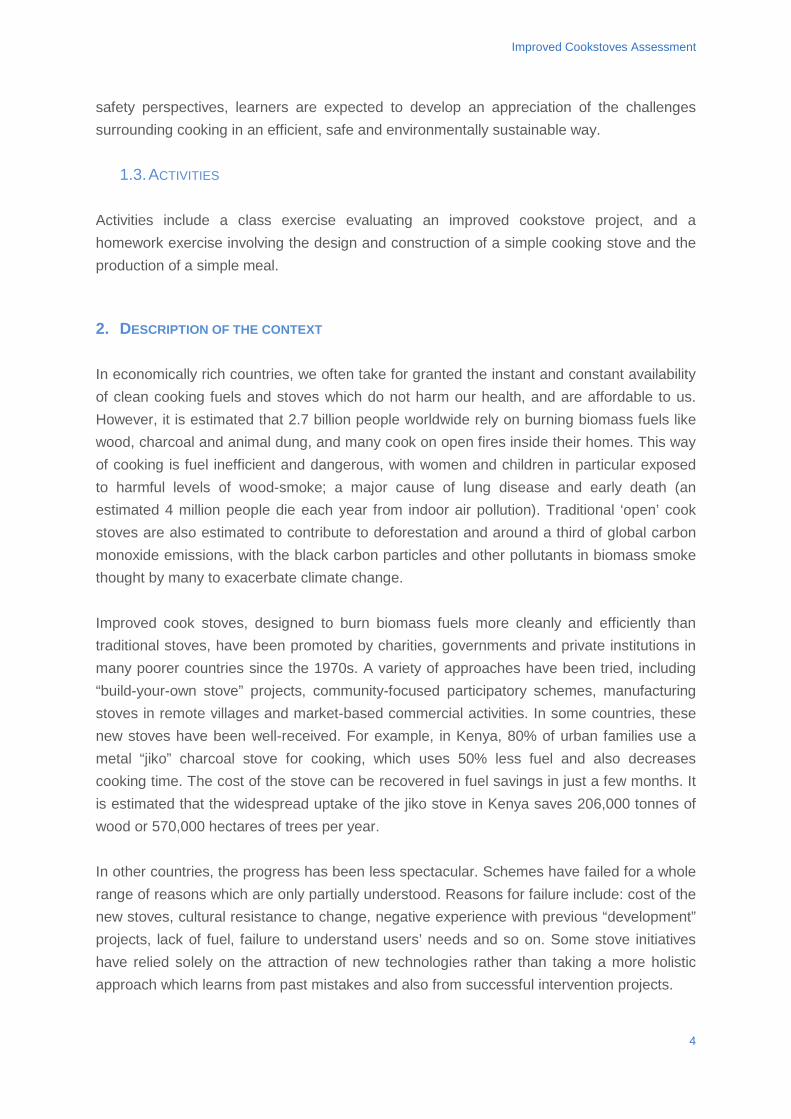
Improved Cookstoves Assessment
safety perspectives, learners are expected to develop an appreciation of the challenges surrounding cooking in an efficient, safe and environmentally sustainable way.
1.3. ACTIVITIES Activities include a class exercise evaluating an improved cookstove project, and a homework exercise involving the design and construction of a simple cooking stove and the production of a simple meal. 2. DESCRIPTION OF THE CONTEXT In economically rich countries, we often take for granted the instant and constant availability of clean cooking fuels and stoves which do not harm our health, and are affordable to us. However, it is estimated that 2.7 billion people worldwide rely on burning biomass fuels like wood, charcoal and animal dung, and many cook on open fires inside their homes. This way of cooking is fuel inefficient and dangerous, with women and children in particular exposed to harmful levels of wood-smoke; a major cause of lung disease and early death (an estimated 4 million people die each year from indoor air pollution). Traditional ‘open’ cook stoves are also estimated to contribute to deforestation and around a third of global carbon monoxide emissions, with the black carbon particles and other pollutants in biomass smoke thought by many to exacerbate climate change. Improved cook stoves, designed to burn biomass fuels more cleanly and efficiently than traditional stoves, have been promoted by charities, governments and private institutions in many poorer countries since the 1970s. A variety of approaches have been tried, including “build-your-own stove” projects, community-focused participatory schemes, manufacturing stoves in remote villages and market-based commercial activities. In some countries, these new stoves have been well-received. For example, in Kenya, 80% of urban families use a metal “jiko” charcoal stove for cooking, which uses 50% less fuel and also decreases cooking time. The cost of the stove can be recovered in fuel savings in just a few months. It is estimated that the widespread uptake of the jiko stove in Kenya saves 206,000 tonnes of wood or 570,000 hectares of trees per year. In other countries, the progress has been less spectacular. Schemes have failed for a whole range of reasons which are only partially understood. Reasons for failure include: cost of the new stoves, cultural resistance to change, negative experience with previous “development” projects, lack of fuel, failure to understand users’ needs and so on. Some stove initiatives have relied solely on the attraction of new technologies rather than taking a more holistic approach which learns from past mistakes and also from successful intervention projects.
4
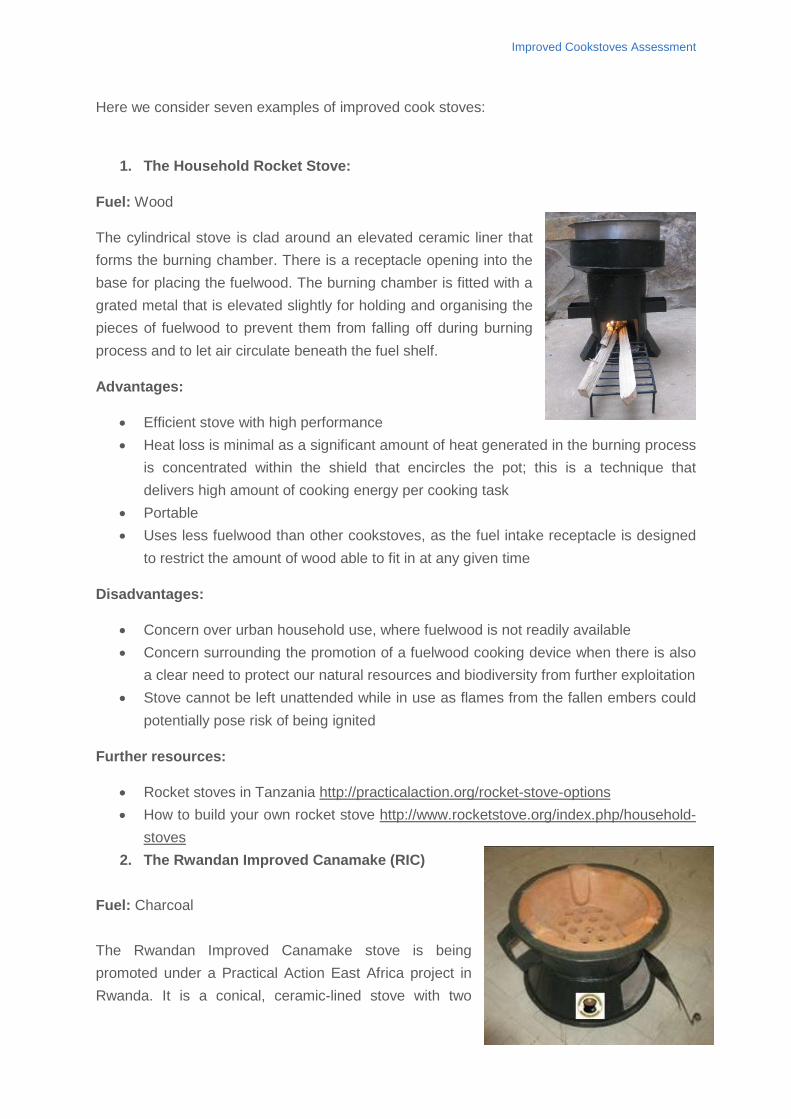
Improved Cookstoves Assessment
Here we consider seven examples of improved cook stoves:
1. The Household Rocket Stove:
Fuel: Wood
The cylindrical stove is clad around an elevated ceramic liner that forms the burning chamber. There is a receptacle opening into the base for placing the fuelwood. The burning chamber is fitted with a grated metal that is elevated slightly for holding and organising the pieces of fuelwood to prevent them from falling off during burning process and to let air circulate beneath the fuel shelf.
Advantages:
• Efficient stove with high performance • Heat loss is minimal as a significant amount of heat generated in the burning process
is concentrated within the shield that encircles the pot; this is a technique that delivers high amount of cooking energy per cooking task
• Portable • Uses less fuelwood than other cookstoves, as the fuel intake receptacle is designed
to restrict the amount of wood able to fit in at any given time
Disadvantages:
• Concern over urban household use, where fuelwood is not readily available • Concern surrounding the promotion of a fuelwood cooking device when there is also
a clear need to protect our natural resources and biodiversity from further exploitation • Stove cannot be left unattended while in use as flames from the fallen embers could
potentially pose risk of being ignited
Further resources:
• Rocket stoves in Tanzania http://practicalaction.org/rocket-stove-options • How to build your own rocket stove http://www.rocketstove.org/index.php/household-
stoves 2. The Rwandan Improved Canamake (RIC)
Fuel: Charcoal The Rwandan Improved Canamake stove is being promoted under a Practical Action East Africa project in Rwanda. It is a conical, ceramic-lined stove with two
5
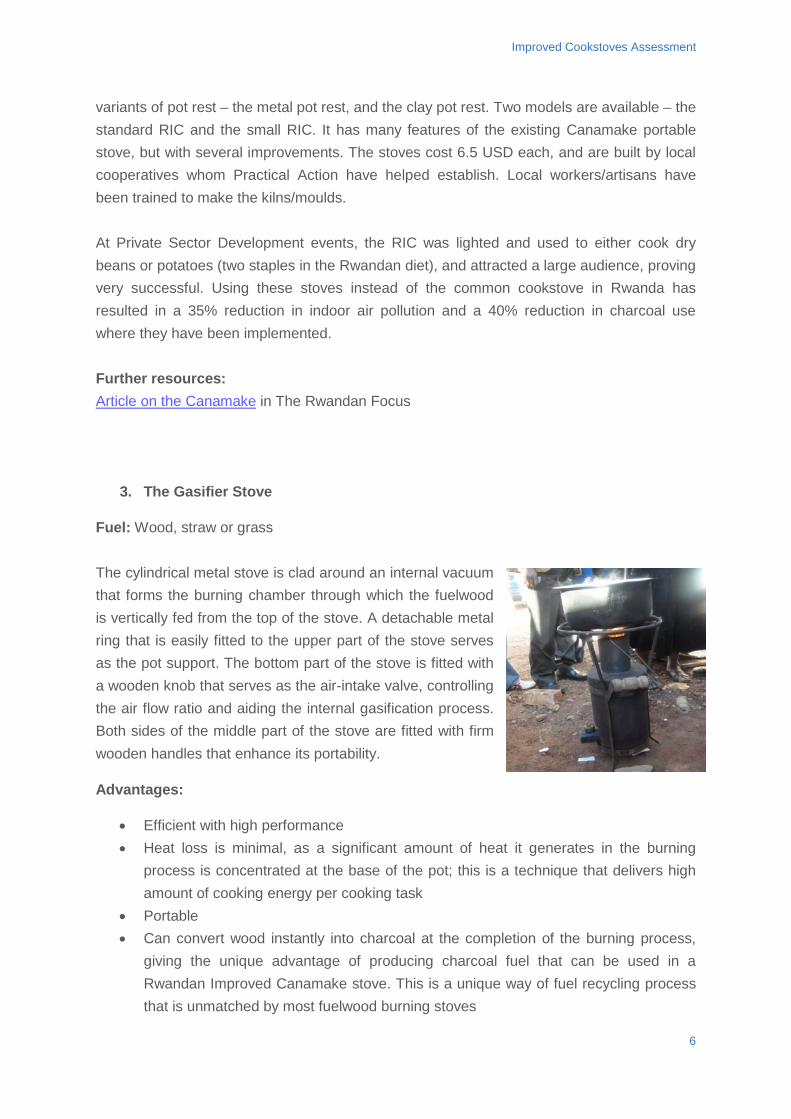
Improved Cookstoves Assessment
variants of pot rest – the metal pot rest, and the clay pot rest. Two models are available – the standard RIC and the small RIC. It has many features of the existing Canamake portable stove, but with several improvements. The stoves cost 6.5 USD each, and are built by local cooperatives whom Practical Action have helped establish. Local workers/artisans have been trained to make the kilns/moulds. At Private Sector Development events, the RIC was lighted and used to either cook dry beans or potatoes (two staples in the Rwandan diet), and attracted a large audience, proving very successful. Using these stoves instead of the common cookstove in Rwanda has resulted in a 35% reduction in indoor air pollution and a 40% reduction in charcoal use where they have been implemented. Further resources:
in The Rwandan Focus Article on the Canamake
3. The Gasifier Stove
Fuel: Wood, straw or grass The cylindrical metal stove is clad around an internal vacuum that forms the burning chamber through which the fuelwood is vertically fed from the top of the stove. A detachable metal ring that is easily fitted to the upper part of the stove serves as the pot support. The bottom part of the stove is fitted with a wooden knob that serves as the air-intake valve, controlling the air flow ratio and aiding the internal gasification process. Both sides of the middle part of the stove are fitted with firm wooden handles that enhance its portability.
Advantages:
• Efficient with high performance • Heat loss is minimal, as a significant amount of heat it generates in the burning
process is concentrated at the base of the pot; this is a technique that delivers high amount of cooking energy per cooking task
• Portable • Can convert wood instantly into charcoal at the completion of the burning process,
giving the unique advantage of producing charcoal fuel that can be used in a Rwandan Improved Canamake stove. This is a unique way of fuel recycling process that is unmatched by most fuelwood burning stoves
6
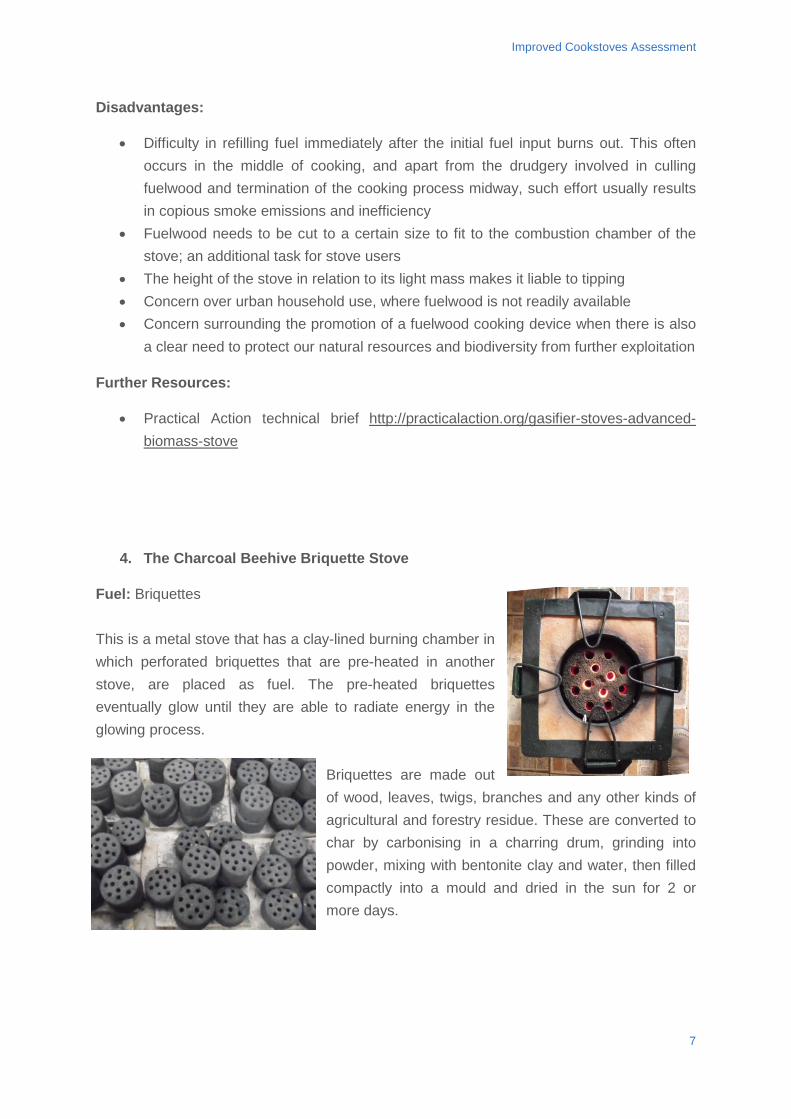
Improved Cookstoves Assessment
Disadvantages:
• Difficulty in refilling fuel immediately after the initial fuel input burns out. This often occurs in the middle of cooking, and apart from the drudgery involved in culling fuelwood and termination of the cooking process midway, such effort usually results in copious smoke emissions and inefficiency
• Fuelwood needs to be cut to a certain size to fit to the combustion chamber of the stove; an additional task for stove users
• The height of the stove in relation to its light mass makes it liable to tipping • Concern over urban household use, where fuelwood is not readily available • Concern surrounding the promotion of a fuelwood cooking device when there is also
a clear need to protect our natural resources and biodiversity from further exploitation
Further Resources:
• Practical Action technical brief http://practicalaction.org/gasifier-stoves-advanced-biomass-stove
4. The Charcoal Beehive Briquette Stove
Fuel: Briquettes This is a metal stove that has a clay-lined burning chamber in which perforated briquettes that are pre-heated in another stove, are placed as fuel. The pre-heated briquettes eventually glow until they are able to radiate energy in the glowing process.
Briquettes are made out of wood, leaves, twigs, branches and any other kinds of agricultural and forestry residue. These are converted to char by carbonising in a charring drum, grinding into powder, mixing with bentonite clay and water, then filled compactly into a mould and dried in the sun for 2 or more days.
7
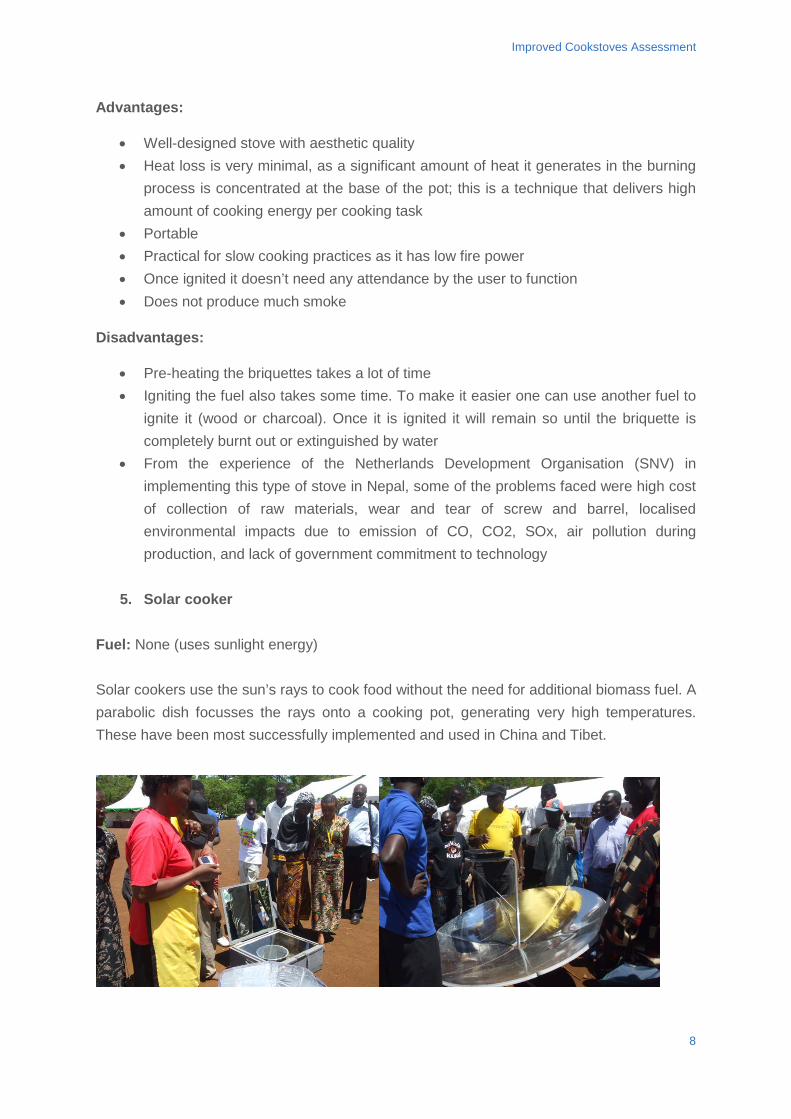
Improved Cookstoves Assessment
Advantages:
• Well-designed stove with aesthetic quality • Heat loss is very minimal, as a significant amount of heat it generates in the burning
process is concentrated at the base of the pot; this is a technique that delivers high amount of cooking energy per cooking task
• Portable • Practical for slow cooking practices as it has low fire power • Once ignited it doesn’t need any attendance by the user to function • Does not produce much smoke
Disadvantages:
• Pre-heating the briquettes takes a lot of time • Igniting the fuel also takes some time. To make it easier one can use another fuel to
ignite it (wood or charcoal). Once it is ignited it will remain so until the briquette is completely burnt out or extinguished by water
• From the experience of the Netherlands Development Organisation (SNV) in implementing this type of stove in Nepal, some of the problems faced were high cost of collection of raw materials, wear and tear of screw and barrel, localised environmental impacts due to emission of CO, CO2, SOx, air pollution during production, and lack of government commitment to technology
5. Solar cooker Fuel: None (uses sunlight energy) Solar cookers use the sun’s rays to cook food without the need for additional biomass fuel. A parabolic dish focusses the rays onto a cooking pot, generating very high temperatures. These have been most successfully implemented and used in China and Tibet.
8
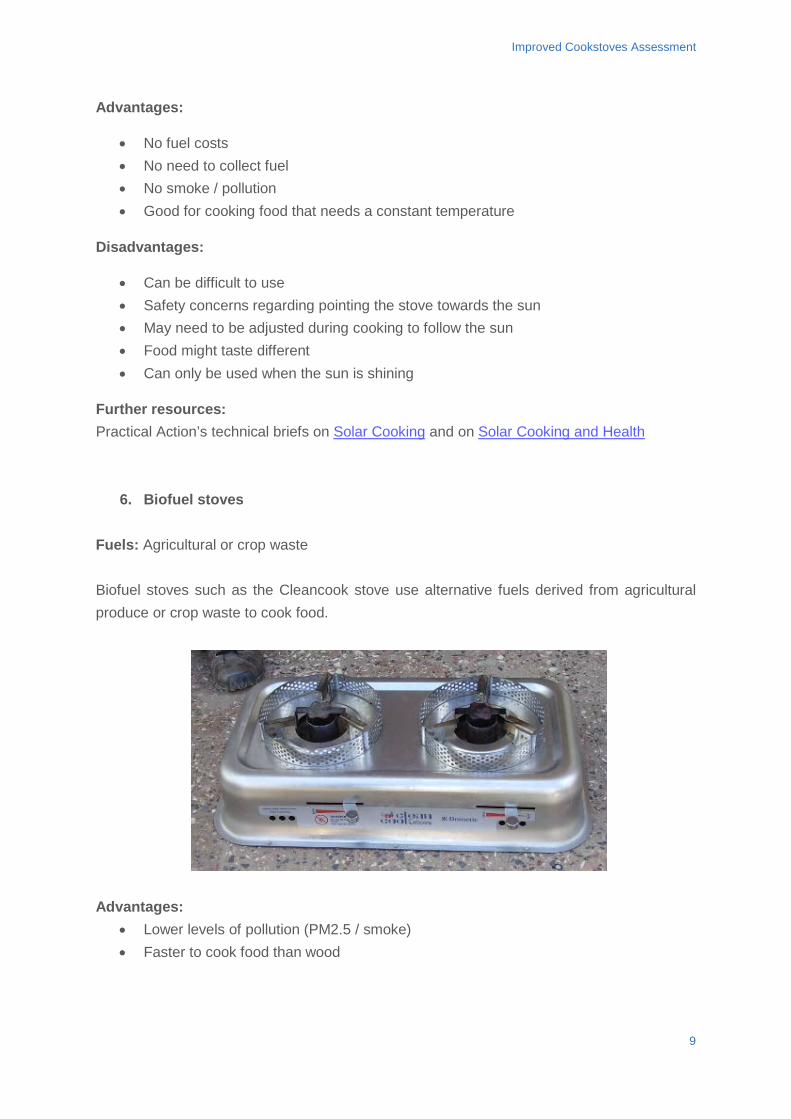
Improved Cookstoves Assessment
Advantages:
• No fuel costs • No need to collect fuel • No smoke / pollution • Good for cooking food that needs a constant temperature
Disadvantages:
• Can be difficult to use • Safety concerns regarding pointing the stove towards the sun • May need to be adjusted during cooking to follow the sun • Food might taste different • Can only be used when the sun is shining
Further resources: Practical Action’s technical briefs on and on Solar Cooking Solar Cooking and Health
6. Biofuel stoves Fuels: Agricultural or crop waste Biofuel stoves such as the Cleancook stove use alternative fuels derived from agricultural produce or crop waste to cook food.
Advantages:
• Lower levels of pollution (PM2.5 / smoke) • Faster to cook food than wood
9
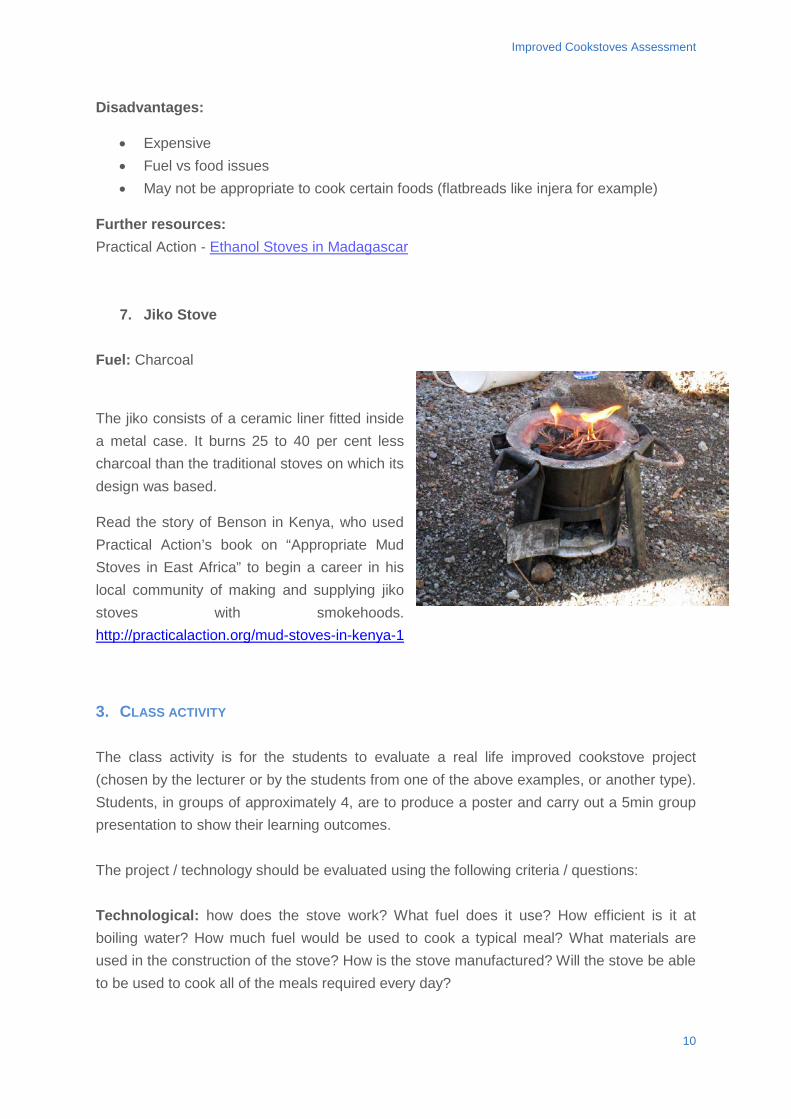
Improved Cookstoves Assessment
Disadvantages:
• Expensive • Fuel vs food issues • May not be appropriate to cook certain foods (flatbreads like injera for example)
Further resources: Practical Action - Ethanol Stoves in Madagascar
7. Jiko Stove Fuel: Charcoal
The jiko consists of a ceramic liner fitted inside a metal case. It burns 25 to 40 per cent less charcoal than the traditional stoves on which its design was based.
Read the story of Benson in Kenya, who used Practical Action’s book on “Appropriate Mud Stoves in East Africa” to begin a career in his local community of making and supplying jiko stoves with smokehoods. http://practicalaction.org/mud-stoves-in-kenya-1
3. CLASS ACTIVITY The class activity is for the students to evaluate a real life improved cookstove project (chosen by the lecturer or by the students from one of the above examples, or another type). Students, in groups of approximately 4, are to produce a poster and carry out a 5min group presentation to show their learning outcomes. The project / technology should be evaluated using the following criteria / questions: Technological: how does the stove work? What fuel does it use? How efficient is it at boiling water? How much fuel would be used to cook a typical meal? What materials are used in the construction of the stove? How is the stove manufactured? Will the stove be able to be used to cook all of the meals required every day?
10
Improved Cookstoves Assessment
Social: Where is the stove manufactured? Who benefits from the sales / distribution of the stoves? How does the project take into account the cultural factors surrounding cooking? Are gender issues addressed? How much does the stove cost? What is the pay-back period? What food will be cooked on the stove? Health / Safety: What levels of pollution are produced by the stove? How do these compare to the pollution generated by an open fire? What are the health impacts? Is the stove safe to use? Are detailed instructions provided? Are people trained how to use the stoves? Note: Questions and activities can be modified to suit class. Solution and Evaluation Criteria – the evaluation criteria should be based on how fully students have been able to answer the questions listed above. Additional evaluation criteria could include marks for presentation style (either for the poster or group presentation). 4. HOMEWORK ACTIVITY The homework activity is a group project (groups of approximately 4) to design and manufacture a simple cooking stove and to (safely) cook and share a meal produced using the stove. Stoves designs could be based on available plans for a rocket stove, or for a solar cooker, depending on the location of the class. Construction should use locally available / recycled materials and simple tools only. A risk assessment should be completed by the students for the activity. Participation and culture are key to this activity. How will the tasks be divided up? Will the group approach the task from the perspective of the stove or from the perspective of the food? Will gender stereotypes be reinforced – i.e. will female members of the group be expected to prepare the food / cook the meal? This activity is also open to modification. Solution and Evaluation Criteria – the homework could be evaluated in a variety of ways, depending on the resources available. Options include: individual reports including a reflective account of the student’s role in the activity, or a group presentation could be prepared, with other students asking questions during, or after the presentation. For a more innovative approach, the quality of the meal produced could form part of the evaluation criteria. Did the stove perform as expected? Was the food ready to eat at the allocated time? What governed the choice of stove / meal?
11
Improved Cookstoves Assessment
BIBLIOGRAPHY The Stove Project Manual By S Joseph, Y Shanahan, W Stewart ISBN: 9780946688265 Detailed guidelines for project managers interested or involved in stoves programs http://developmentbookshop.com/the-stove-project-manual-pb Stoves for People Edited By Roberto Caceres ISBN: 9781853390197 Firewood shortages, dwindling forests, and the effects on the low income population of the developing world - these are some of the subjects addressed here, together with details of the introduction of fuel-efficient popular stoves for domestic use. http://developmentbookshop.com/stoves-for-people-pb Kenya Ceramic Jiko By Hugh Allen ISBN: 9781853390838 The jiko, a charcoal-burning stove consisting of a ceramic liner fitted inside a metal case, burns 25 to 40 per cent less charcoal than the traditional stoves on which its design was based. This book provides guidance on its production and promotion. http://developmentbookshop.com/kenya-ceramic-jiko-pb Stove Images: A Documnetation of Improved and Traditional Stoves in Africa, Asia and Latin America by Beatrix Westhoff and Dorsi Germann, SFE http://hinfo.humaninfo.ro/gsdl/genus/documents/s20813en/s20813en.pdf
FURTHER/SUGGESTED MATERIAL Health impacts – World Health Organisation http://www.who.int/indoorair/health_impacts/disease/en/ Practical Answers Stoves and Ovens – Practical Action http://practicalaction.org/stoves-and-ovens-answers Health impacts – Practical Action http://practicalaction.org/meningitis-link-smoke HEDON www.hedon.info
12

Improved Cookstoves Assessment
Practical Action is a core member of the Household Energy Development Organizations Network (HEDON), set to act as a focal point for those working in the field in household energy. It aims to promote links among the diverse organizations working in this field, including NGOs, government agencies, and consultancies. GACC - The Global Alliance for Clean Cookstoves http://www.cleancookstoves.org/ The Global Alliance for Clean Cookstoves is a public-private partnership that seeks to save lives, improve livelihoods, empower women, and protect the environment by creating a thriving global market for clean and efficient household cooking solutions.
13

http://www.gdee.eu
This project is funded by
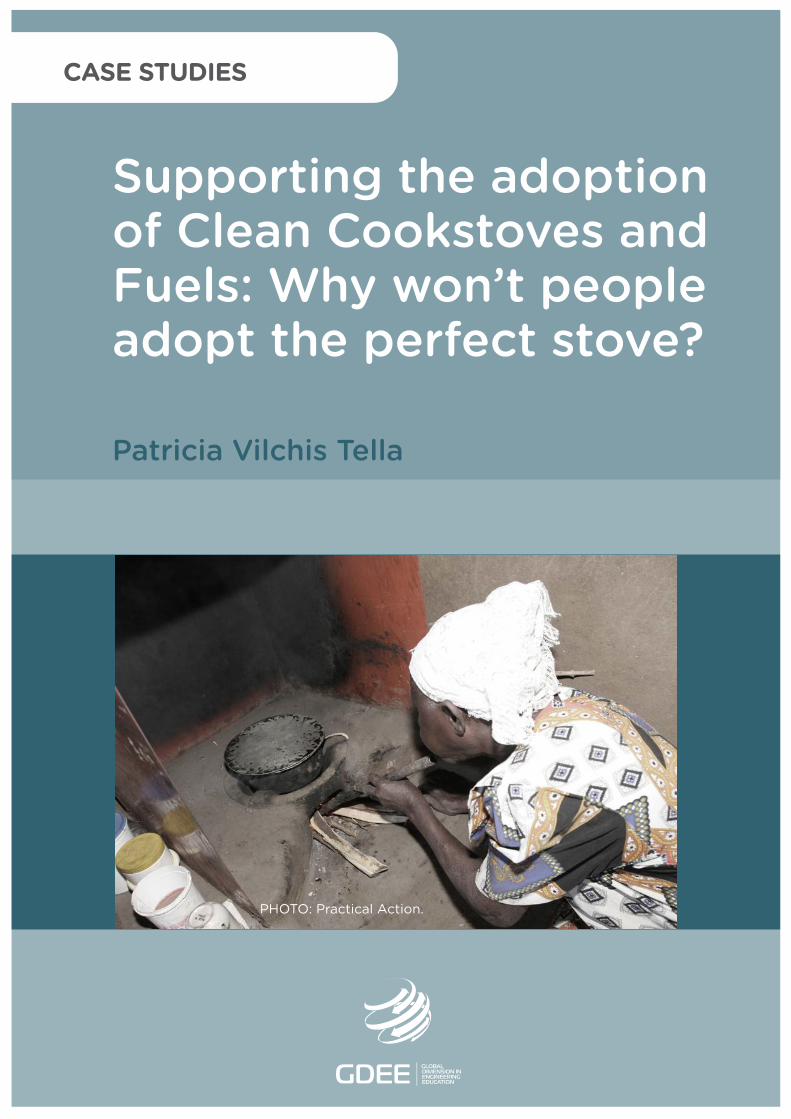
Patricia Vilchis Tella
PHOTO: Practical Action.
CASE STUDIES
Supporting the adoptionof Clean Cookstoves and Fuels: Why won’t peopleadopt the perfect stove?
DL B 10735-2015 ISBN 978-84-606-7546-4
Supporting the adoption of Clean Cookstoves and Fuels:Why won’t people adopt the perfect stove?
COORDINATED BYAgustí Pérez-Foguet, Enric Velo, Pol Arranz, Ricard Ginéand Boris Lazzarini (Universitat Politècnica de Catalunya)Manuel Sierra (Universidad Politécnica de Madrid)Alejandra Boni and Jordi Peris (Universitat Politècnica de València)Guido Zolezzi and Gabriella Trombino (Università degli Studi di Trento)Rhoda Trimingham (Loughborough University)Valentín Villarroel (ONGAWA)Neil Nobles and Meadhbh Bolger (Practical Action)Francesco Mongera (Training Center for International Cooperation)Katie Cresswell-Maynard (Engineering Without Border UK)
EDITED BY Global Dimension in Engineering Education
Citation: Vilchis Tella, P. (2015) ' Supporting the adoption of Clean Cookstoves and Fuels: Why won’t people adopt the perfect stove?', in Case studies for developing globally responsible engineers, GDEE (eds.), Global Dimension in Engineering Education, Barcelona. Available from: http://gdee.eu/index.php/resources.html
This publication is distributedunder an Attribution- Noncommercial-Share Alike License for Creative Commons
CASE STUDIES
Disclaimer: This document has been produced with the financial assistance of the European UnionThe contents of this document are the sole responsibility of the authors and can under no circumstances be regarded as reflecting the position of the European Union

Supporting the adoption of clean cookstoves and fuels: Why won’t people adopt the perfect stove?
SUPPORTING THE ADOPTION OF CLEAN COOKSTOVES AND FUELS: WHY WON’T PEOPLE ADOPT THE PERFECT STOVE? Patricia Vilchis Tella, Stockholm Environment Institute (SEI) Research Associate
1
Supporting the adoption of clean cookstoves and fuels: Why won’t people adopt the perfect stove?
INDEX 1. INTRODUCTION ........................................................................................................................... 3
1.1. DISCIPLINES COVERED IN THIS CASE STUDY .............................................................................. 3
1.2. LEARNING OUTCOMES .............................................................................................................. 3
1.3. ACTIVITIES .............................................................................................................................. 4
2. CONTEXT: ENERGY ACCESS.................................................................................................... 5
2.1.1. HUMAN DEVELOPMENTHEALTH ................................................................................................ 6
2.1.2. ENVIRONMENT ......................................................................................................................... 7
2.2. GENDER , HUMAN RIGHTS AND LIVELIHOODS ............................................................................. 9
3. CLASS ACTIVITY ....................................................................................................................... 10
3.1. EVALUATION CRITERIA AND FURTHER DISCUSSION ................................................................... 10
3.1.1. PREVIOUS RESEARCH ............................................................................................................ 11
3.1.2. POLICY IMPLICATIONS ............................................................................................................ 12
3.1.3. CONSUMER AT THE CENTER ................................................................................................... 13
4. HOMEWORK ACTIVITY ............................................................................................................. 17
4.1. SOLUTION AND EVALUATION CRITERIA ..................................................................................... 21
BIBLIOGRAPHY ................................................................................................................................. 23 FURTHER/SUGGESTED MATERIAL ................................................................................................ 25
2
Supporting the adoption of clean cookstoves and fuels: Why won’t people adopt the perfect stove?
1. INTRODUCTION
Today, 40% of the world population, rely on traditional use of biomass for cooking
(IEA n.d.).That means that around 3 billion people, mostly in rural and marginalised
urban areas; spend significant household income purchasing fuel or that the women
and children in these regions have spend many hours gathering fuel - up to 5 hours
per day. Switching from traditional biomass to modern clean, safe and efficient fuels
for cooking can enhance welfare for so many people worldwide while helping to
reduce the negative health and environmental impacts associated with traditional
biomass use; yet, the transition to improved cooking stoves and fuels has largely
stalled in many regions, but especially in Sub-Saharan Africa (SSA). Why is it that so
often, well designed, efficient and clean stoves fail to penetrate the market in
developing countries as expected?
The purpose of this case study is to help students understand the complexity of the
problem by summarizing the experiences on the field on different research projects
by the Stockholm Environment Institute, to address this knowledge gap.
1.1. DISCIPLINES COVERED IN THIS CASE STUDY
Multidisciplinary analysis and thinking; the aim of this case study is to guide the
students through the different sides of a very complex issue as it is Energy Access
for cooking and reflect and discuss about the barriers for improvement and the
possible solutions from different disciplines. In development and human well-being
problems the need of a holistic approach is crucial for a successful implementation.
The case study promotes teamwork since the two proposed activities are realized in
groups of 4 or 5 students.
1.2. LEARNING OUTCOMES
As a result of this case study, students are expected to be able to:
• Understand the problem of lack of modern cooking technologies and fuels
from different perspectives and disciplines.
3
Supporting the adoption of clean cookstoves and fuels: Why won’t people adopt the perfect stove?
• Be familiar with some research methodologies applied by our organization,
SEI (stated preference survey and discrete choice analysis, generative
methods, open interviews) for understanding decision making around
household energy.
1.3. ACTIVITIES
The first activity consists on a Group discussion to explore the different factors that
determine the success of a clean cookstove intervention. What is important when
planning an intervention to upscale the uptake of cleaner cook fuels and
technologies? Are there factors that are more important than others?
The second activity is a simulated intervention. In a group, with the background
information and extra material provided, the students are expected to design a
project to support the uptake of cleaner cooking technologies and fuels in a small
town in central Mexico.
4
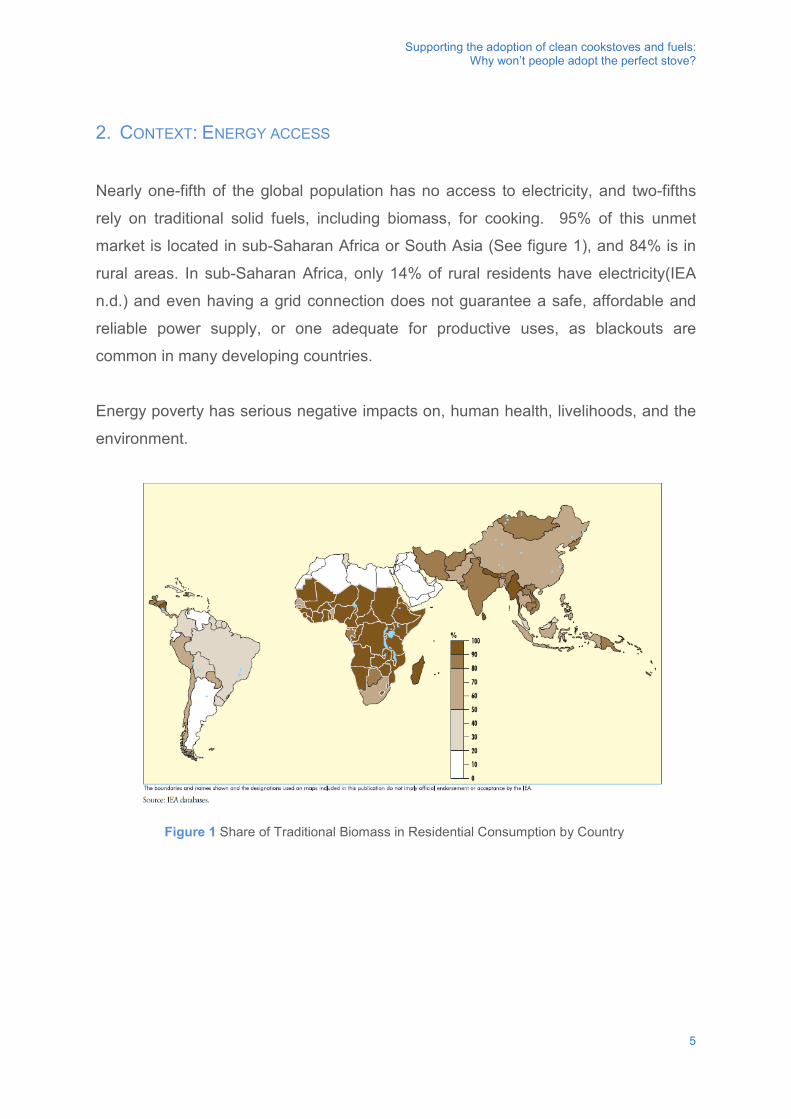
Supporting the adoption of clean cookstoves and fuels: Why won’t people adopt the perfect stove?
2. CONTEXT: ENERGY ACCESS
Nearly one-fifth of the global population has no access to electricity, and two-fifths
rely on traditional solid fuels, including biomass, for cooking. 95% of this unmet
market is located in sub-Saharan Africa or South Asia (See figure 1), and 84% is in
rural areas. In sub-Saharan Africa, only 14% of rural residents have electricity(IEA
n.d.) and even having a grid connection does not guarantee a safe, affordable and
reliable power supply, or one adequate for productive uses, as blackouts are
common in many developing countries.
Energy poverty has serious negative impacts on, human health, livelihoods, and the
environment.
Figure 1 Share of Traditional Biomass in Residential Consumption by Country
5
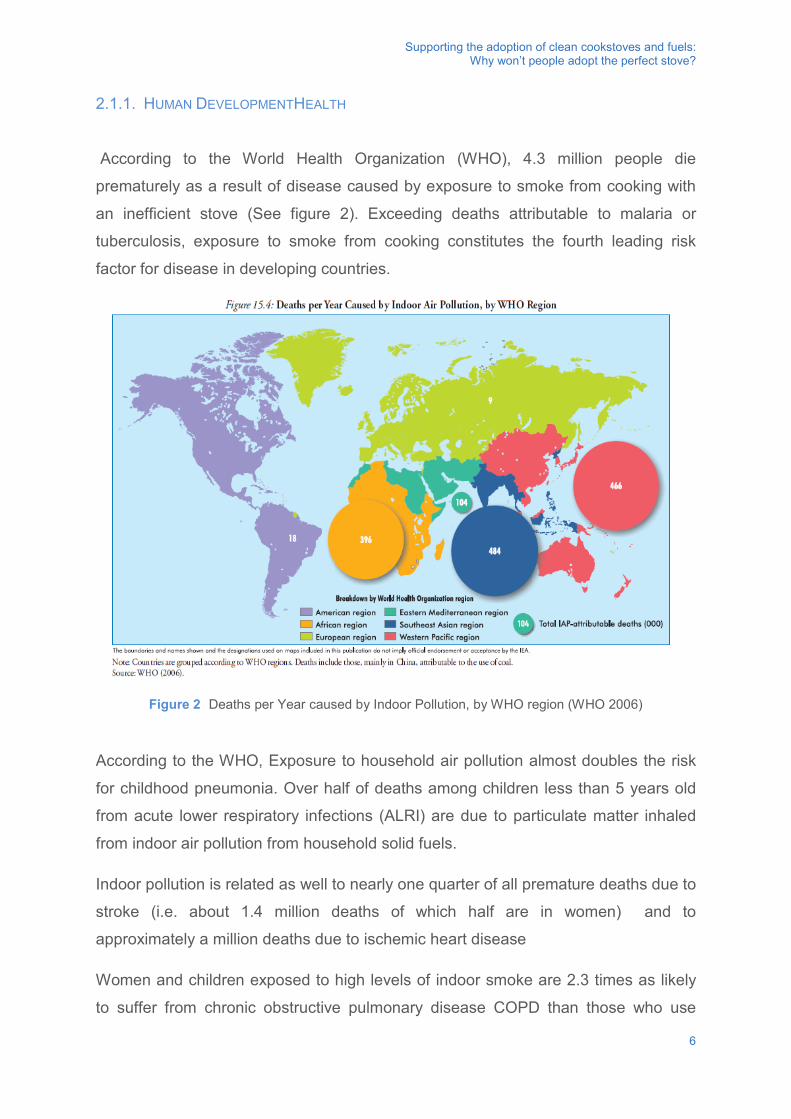
Supporting the adoption of clean cookstoves and fuels: Why won’t people adopt the perfect stove?
2.1.1. HUMAN DEVELOPMENTHEALTH
According to the World Health Organization (WHO), 4.3 million people die
prematurely as a result of disease caused by exposure to smoke from cooking with
an inefficient stove (See figure 2). Exceeding deaths attributable to malaria or
tuberculosis, exposure to smoke from cooking constitutes the fourth leading risk
factor for disease in developing countries.
Figure 2 Deaths per Year caused by Indoor Pollution, by WHO region (WHO 2006)
According to the WHO, Exposure to household air pollution almost doubles the risk
for childhood pneumonia. Over half of deaths among children less than 5 years old
from acute lower respiratory infections (ALRI) are due to particulate matter inhaled
from indoor air pollution from household solid fuels.
Indoor pollution is related as well to nearly one quarter of all premature deaths due to
stroke (i.e. about 1.4 million deaths of which half are in women) and to
approximately a million deaths due to ischemic heart disease
Women and children exposed to high levels of indoor smoke are 2.3 times as likely
to suffer from chronic obstructive pulmonary disease COPD than those who use
6
Supporting the adoption of clean cookstoves and fuels: Why won’t people adopt the perfect stove?
cleaner fuels. Among men (who already have a heightened risk of COPD due to their
higher rates of smoking), exposure to indoor smoke nearly doubles (i.e. 1.9) that risk.
Approximately 17% of annual premature lung cancer deaths in adults are attributable
to exposure to carcinogens from household air pollution caused by cooking with solid
fuels like wood, charcoal or coal. The risk for women is higher, due to their role in
food preparation.
There is also evidence of links between household air pollution and low birth weight,
tuberculosis, cataract, nasopharyngeal and laryngeal cancers. Spine and other back
injuries due to heavy lifting when transporting wood fuel are common amongst
women in poor households.
Burns from open fires and unsafe cookstoves are contributing to a substantial
percentage of the estimated 195,000 burn deaths that occur annually. Because
burns require prompt and sophisticated medical intervention often lacking in remote
areas of the world, such injuries often result in debilitating scarring and loss of
movement in their victims (GACC n.d.).
2.1.2. ENVIRONMENT
Unsustainable wood harvesting also contributes to deforestation, reducing carbon
uptake by forests. Although depletion of forest cover on a large scale has not been
found to be attributable to demand for fuel wood (Arnold et al. 2006). It is known as
much as two- thirds of fuelwood for cooking worldwide comes from non-forest
sources such as agricultural land and roadsides causing soil degradation. Clearing of
land for agricultural development and timber are the main causes of deforestation in
developing countries.
Reliance on charcoal for cooking has led to depletion of native forest cover to
support charcoal production. In most of the urban or peri-urban areas in developing
countries, charcoal is often the fuel of choice. The unsustainable collection of wood
for charcoal production can contribute loss to soil erosion, desertification,
contamination and loss of watersheds, and loss of productive land, which puts extra
pressure on regional food security (GACC n.d.).
7
Supporting the adoption of clean cookstoves and fuels: Why won’t people adopt the perfect stove?
Charcoal production is also increasing loss of forest canopy which leads to
biodiversity loss, especially in tropical forests while the construction of logging roads
damages the environment and exacerbates the declining habitat of endangered
species.
In addition to deforestation and air pollution, burning solid fuels releases emissions
of some of the most important contributors to global climate change: carbon dioxide,
methane, black carbon, and other short-lived climate pollutants (SLCPs).
Unsustainable wood harvesting also contributes to deforestation, reducing carbon
uptake by forests.
Black carbon, which results from incomplete combustion, is estimated to contribute
the equivalent of 25 to 50% of carbon dioxide warming globally, and residential solid
fuel burning accounts for 25% of global black carbon emissions, about 84% of which
is from households in developing countries. In India for example there are indications
that biofuel combustion is the largest source of black carbon (Venkataraman et al.
2005) and in the whole South Asia, more than half of black carbon comes from the
use of inefficient cookstoves.
The so called Brown clouds of black carbon can travel long distances and stay in the
atmosphere long enough to disrupt the monsoon; then the dark particles deposit on
the ice and accelerate the melting of the Himalayan-Tibetan glaciers. As a result,
water availability and food security are threatened for millions of people(Ramanathan
and Carmichael 2008).
8
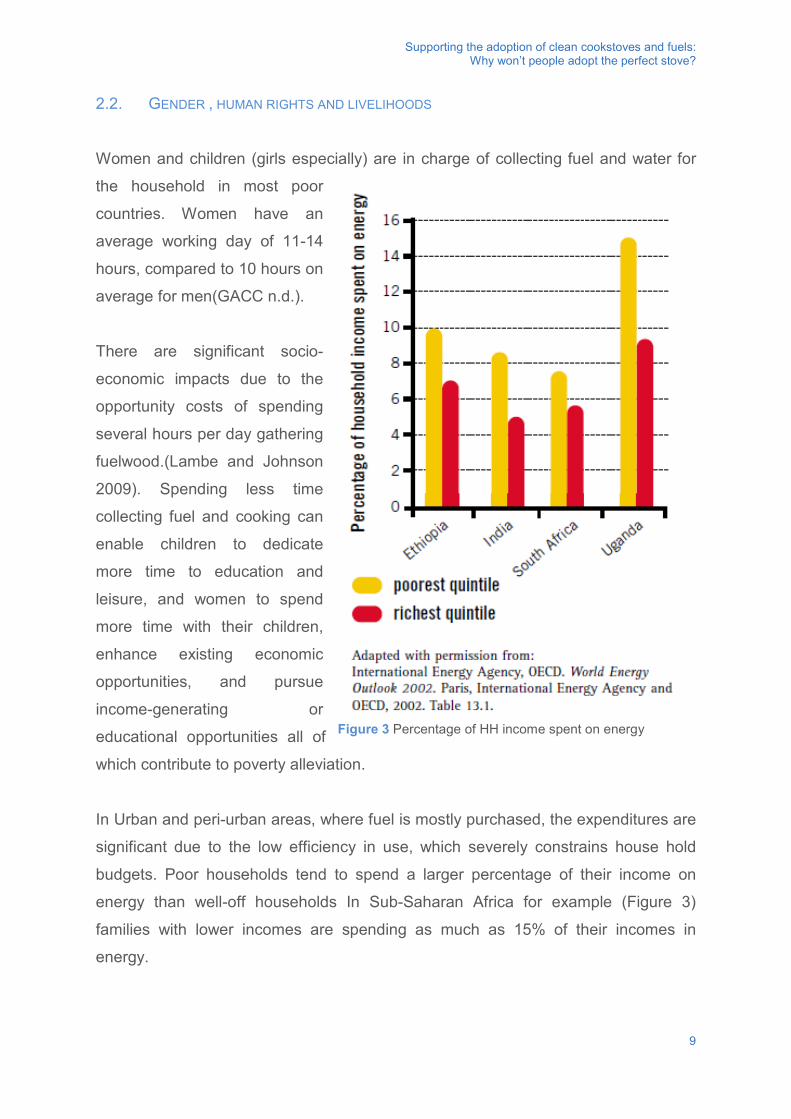
Supporting the adoption of clean cookstoves and fuels: Why won’t people adopt the perfect stove?
2.2. GENDER , HUMAN RIGHTS AND LIVELIHOODS
Women and children (girls especially) are in charge of collecting fuel and water for
the household in most poor
countries. Women have an
average working day of 11-14
hours, compared to 10 hours on
average for men(GACC n.d.).
There are significant socio-
economic impacts due to the
opportunity costs of spending
several hours per day gathering
fuelwood.(Lambe and Johnson
2009). Spending less time
collecting fuel and cooking can
enable children to dedicate
more time to education and
leisure, and women to spend
more time with their children,
enhance existing economic
opportunities, and pursue
income-generating or
educational opportunities all of
which contribute to poverty alleviation.
In Urban and peri-urban areas, where fuel is mostly purchased, the expenditures are
significant due to the low efficiency in use, which severely constrains house hold
budgets. Poor households tend to spend a larger percentage of their income on
energy than well-off households In Sub-Saharan Africa for example (Figure 3)
families with lower incomes are spending as much as 15% of their incomes in
energy.
Figure 3 Percentage of HH income spent on energy
9
Supporting the adoption of clean cookstoves and fuels: Why won’t people adopt the perfect stove?
3. CLASS ACTIVITY
Since the launch of the Sustainable Energy for All initiative back in 2011, there has
been a global push to rapidly scale up access to clean stoves-The governments of
India, China, and Brazil have initiated massive programmes to upscale the uptake of
clean stoves for example, and several international organisations such as the Global
Alliance for Clean Cookstoves have ongoing programs around the world, however,
despite the numerous apparent benefits of fuel switching, the transition to modern
fuels has been slower than expected. Indeed, the number of households relying on
traditional biomass in sub Saharan Africa is expected to increase in absolute terms
by 14% by 2015 although the share will decline slightly to 77%(IEA n.d.).
The promotion of energy efficiency measures and mitigation of the adverse
economic, environmental and health impacts associated with the use of traditional
biomass is an important policy issue in Developing Countries (Takama et al., 2011).
Get together in groups of 5 and discuss:
• What aspects do you consider are important to guarantee the success of a
clean cookstove programme?
• Consider more general aspects like socio economic situation at national and
local level, cultural characteristics of the country (e.g. gastronomy), but also
particular aspects like stove and fuel cost, stove design, possibilities for
financing
• Are there factors that are more important than others? Each group should write
a list of the top 5 factors they considered more important and present to the
whole group.
• Get creative! There are no wrong answers.
3.1. EVALUATION CRITERIA AND FURTHER DISCUSSION
As mentioned before, there are no wrong answers, access to clean, modern cooking
technologies and fuels is a complex issue. However, around the world there are
10
Supporting the adoption of clean cookstoves and fuels: Why won’t people adopt the perfect stove?
many examples of clean cookstove programmes that failed because their approach
does not consider consumers’ preferences when designing the programme.
From our experience at SEI, the preferences of the consumers regarding the fuel
and design of the stove, and how they trade-off between these to make a choice are
as important as consumer´s income, gender or level of education. Failing to
acknowledge stove users as consumers that make choices and have preferences
and desires, no matter how modern or efficient the stove is, is not likely to support
the switch towards sustainable energy.
3.1.1. PREVIOUS RESEARCH
Previous research on the determinants of stove choice at the household level has
focused mainly on socioeconomic factors, such as income, age, gender and
education, disregarding the role of product specific factors such as usage cost, stove
price, safety, indoor smoke, etc.; or the cultural and ethnological factors surrounding
consumer´s choice:
• Energy ladder approach: A number of studies have been conducted to
understand the factors that affect cooking stove choices and fuel consumption
patterns. Many studies have pointed to income or wealth as a key factor, with
increased income, households climb the “energy ladder” towards cleaner, more
modern alternatives(Leach 1992)(Douglas F. Barnes 1993) 1987(Pachauri et al.
2004)
• Fuel stacking approach: Other research has suggested that households don´t
entirely switch to more efficient options but change between different options
(“fuel stacking”)(Masera et al. 2000). The observed diversity in fuel-switching
patterns is due to the presence of various non-cost factors such as local food
habits and cooking frequency (Ouedraogo 2006) ethnicity (Heltberg 2005), local
traditions and institutions (Hiemstra-van der Horst and Hovorka 2008) and food
taste preferences.
11
Supporting the adoption of clean cookstoves and fuels: Why won’t people adopt the perfect stove?
The findings of these studies have illuminated the roles of socio-economic factors
and few product specific factors (such as stove price) as determinants of fuel and
stove, however, they have failed in understanding the relative strength or trade-off
among the factors affecting stove and fuel choices at the household level (Odihi,
2003; Pundo and Fraser, 2006). Although many factors have been identified and
evaluated, the relative strength of key factors (e.g. stove price, fuel price) in
influencing fuel/stove choices remains poorly understood.
Besides, socioeconomic factors tend to be fixed in the short-term for most individuals
and it takes time for an intervention to have an impact on them, whereas product-
specific factors can be influenced quickly based on the availability of new products or
alternatives (e.g. a new stove design that to save fuel, subsidies on fuels or stoves,
etc.) and on individuals’ changing (e.g. by supporting informed decision taking).
3.1.2. POLICY IMPLICATIONS
The gap of knowledge regarding how consumers choose a stove and fuel, and what
factors are important while making that choice have leaded to poorly designed
intervention programmes that fail in delivering a technology that will be adopted and
embraced by consumers.
In India for example, the central government subsidized stove producers so that
stoves would be affordable to consumers, yet it is apparent that many producers did
not consider consumer preferences when designing and marketing
stoves,(Bhattacharya and Jana 2009) And many households discarded the new
stoves within a matter of months. The government was also been criticised for failing
to ensure that the stoves, which were made by networks of trained local artisans,
met minimum quality standards, at the end the programme was cancelled few years
after it started. The lessons learned from this programme influenced new improved
cookstove programmes across India over the past decade initiated by domestic and
international non-government organizations and by business organisations at the
grassroots level, these generally adopted a more commercial and bottom-up
approach, based on demand-driven marketing techniques in rural communities
(Lambe and Atteridge 2012)(Greenglass and Smith 2006). However, to date these
12
Supporting the adoption of clean cookstoves and fuels: Why won’t people adopt the perfect stove?
initiatives have also failed to significantly transform the rural household energy
market (Balachandra 2011)
3.1.3. CONSUMER AT THE CENTER
To tackle this gap on knowledge, since 2008 the Stockholm Environment Institute
(SEI) has conducted a series of studies using an innovative approach to better
understand the most important influences over household energy choices, in order to
identify practical ways to support communities shifting to a cleaner and more efficient
energy use.
The study involved a stated preference survey to investigate household-level
preferences of cooking fuels and stoves; researchers polled 200 households in Addis
Ababa, Ethiopia, 564 in Dar es Salaam, Tanzania, and 402 in Maputo, Mozambique.
The research team applied an alternative methodology to commonly used
techniques in the energy field, named “discrete choice analysis” (DCA), which is
commonly used in transportation studies, to assess the trade-offs among attributes
affecting household cooking choice. There were focus group discussions as well as
individual interviews.
Discrete Choice Analysis and Stated preference survey
Accurate demand predictions are vital for the uptake of innovative clean cooking
alternatives such as ethanol or solar cooking stoves; without this information, stove
producers cannot risk producing new stoves, and policy makers are unable to give
suitable support to the projects.
SEIs team applied a discrete choice analysis model, often use in the transport
sector, in order to evaluate the trade-offs inherent in household choice of cooking
stoves and fuels, this model was selected as it allows for the quantitative
assessment of both socio-economic and product-specific factors, and because the
research team was interested in knowing not only whether a particular product-
specific factor is important, but also, how important it is in relation to other factors.
13
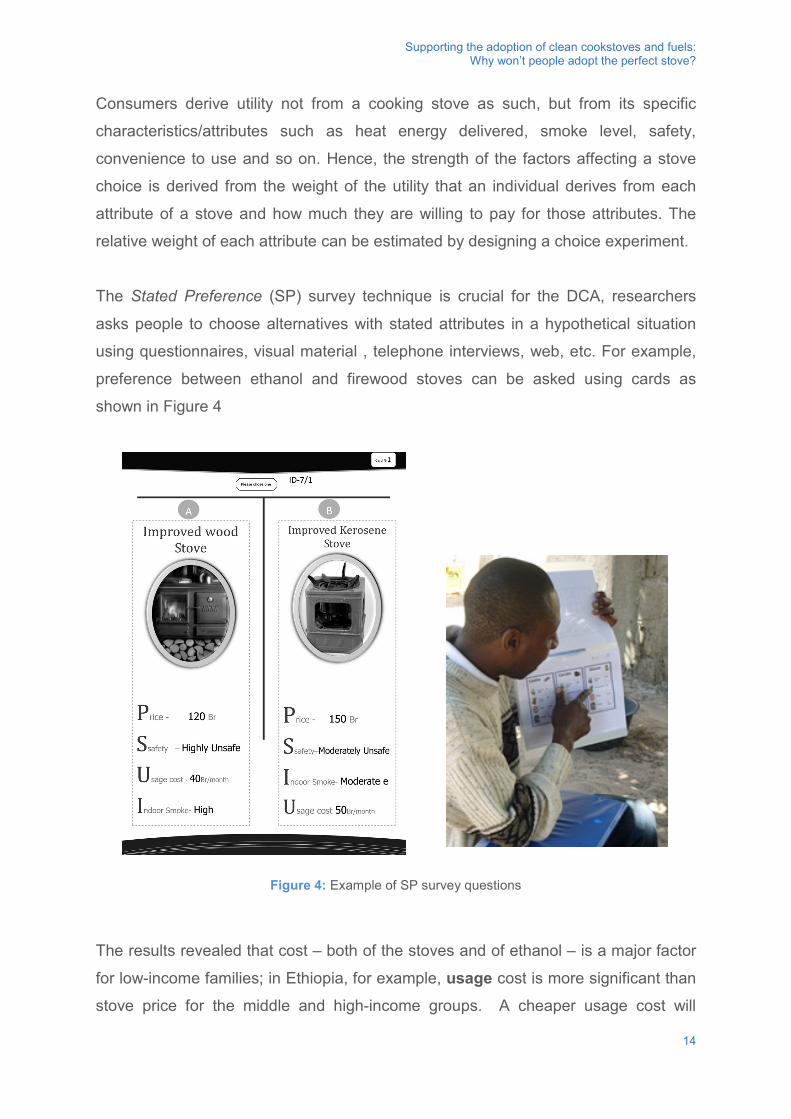
Supporting the adoption of clean cookstoves and fuels: Why won’t people adopt the perfect stove?
Consumers derive utility not from a cooking stove as such, but from its specific
characteristics/attributes such as heat energy delivered, smoke level, safety,
convenience to use and so on. Hence, the strength of the factors affecting a stove
choice is derived from the weight of the utility that an individual derives from each
attribute of a stove and how much they are willing to pay for those attributes. The
relative weight of each attribute can be estimated by designing a choice experiment.
The Stated Preference (SP) survey technique is crucial for the DCA, researchers
asks people to choose alternatives with stated attributes in a hypothetical situation
using questionnaires, visual material , telephone interviews, web, etc. For example,
preference between ethanol and firewood stoves can be asked using cards as
shown in Figure 4
Figure 4: Example of SP survey questions
The results revealed that cost – both of the stoves and of ethanol – is a major factor
for low-income families; in Ethiopia, for example, usage cost is more significant than
stove price for the middle and high-income groups. A cheaper usage cost will
14
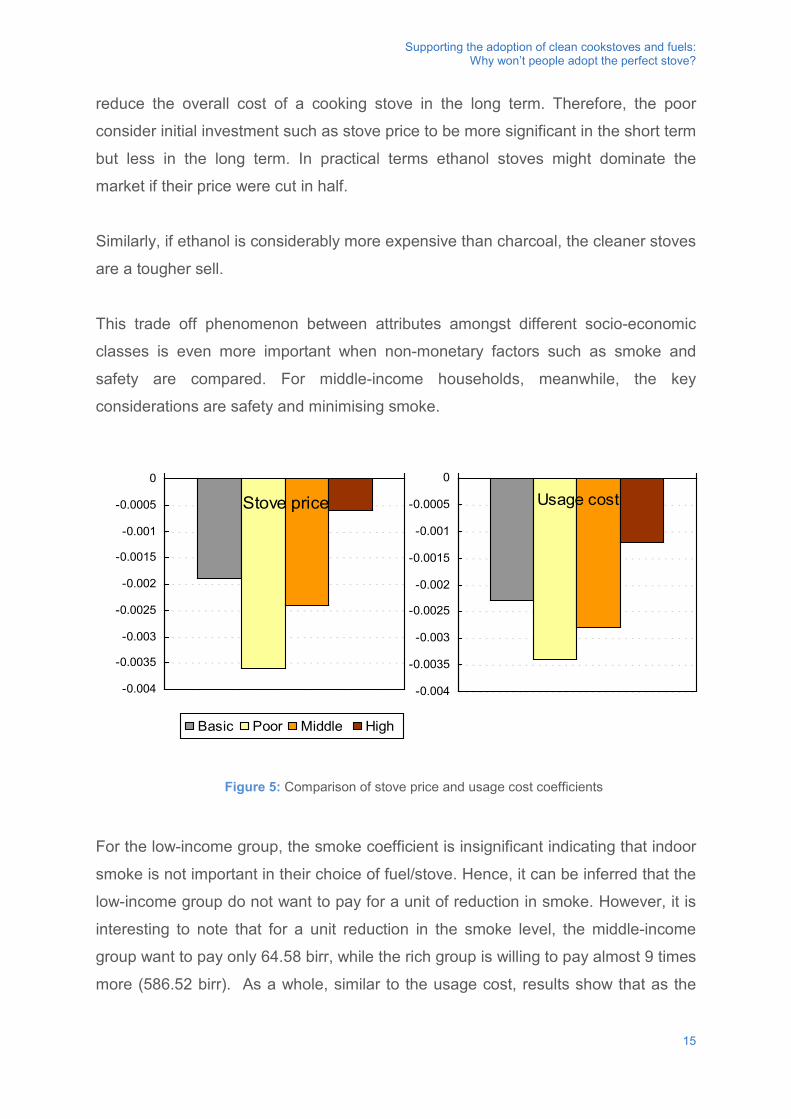
Supporting the adoption of clean cookstoves and fuels: Why won’t people adopt the perfect stove?
reduce the overall cost of a cooking stove in the long term. Therefore, the poor
consider initial investment such as stove price to be more significant in the short term
but less in the long term. In practical terms ethanol stoves might dominate the
market if their price were cut in half.
Similarly, if ethanol is considerably more expensive than charcoal, the cleaner stoves
are a tougher sell.
This trade off phenomenon between attributes amongst different socio-economic
classes is even more important when non-monetary factors such as smoke and
safety are compared. For middle-income households, meanwhile, the key
considerations are safety and minimising smoke.
For the low-income group, the smoke coefficient is insignificant indicating that indoor
smoke is not important in their choice of fuel/stove. Hence, it can be inferred that the
low-income group do not want to pay for a unit of reduction in smoke. However, it is
interesting to note that for a unit reduction in the smoke level, the middle-income
group want to pay only 64.58 birr, while the rich group is willing to pay almost 9 times
more (586.52 birr). As a whole, similar to the usage cost, results show that as the
Figure 4Comparison of stove price and usage cost coefficients
-0.004
-0.0035
-0.003
-0.0025
-0.002
-0.0015
-0.001
-0.0005
0
Stove price
Basic Poor Middle High
-0.004
-0.0035
-0.003
-0.0025
-0.002
-0.0015
-0.001
-0.0005
0
Usage cost
Figure 5: Comparison of stove price and usage cost coefficients
15
Supporting the adoption of clean cookstoves and fuels: Why won’t people adopt the perfect stove?
income level increases, so does the willingness to pay for a unit of reduced smoke
level.
In can then be concluded that policy design should depend on the target market; and
whenever Africa’s poorest families are targeted, affordability must be the priority. A
technologically perfect stove will not be adequate if people cannot afford it, or if the
fuel is too expensive. These findings are particularly valuable to stove project
operators designing clean cooking stoves and to policymakers setting subsidies for
fuels and stoves.
16
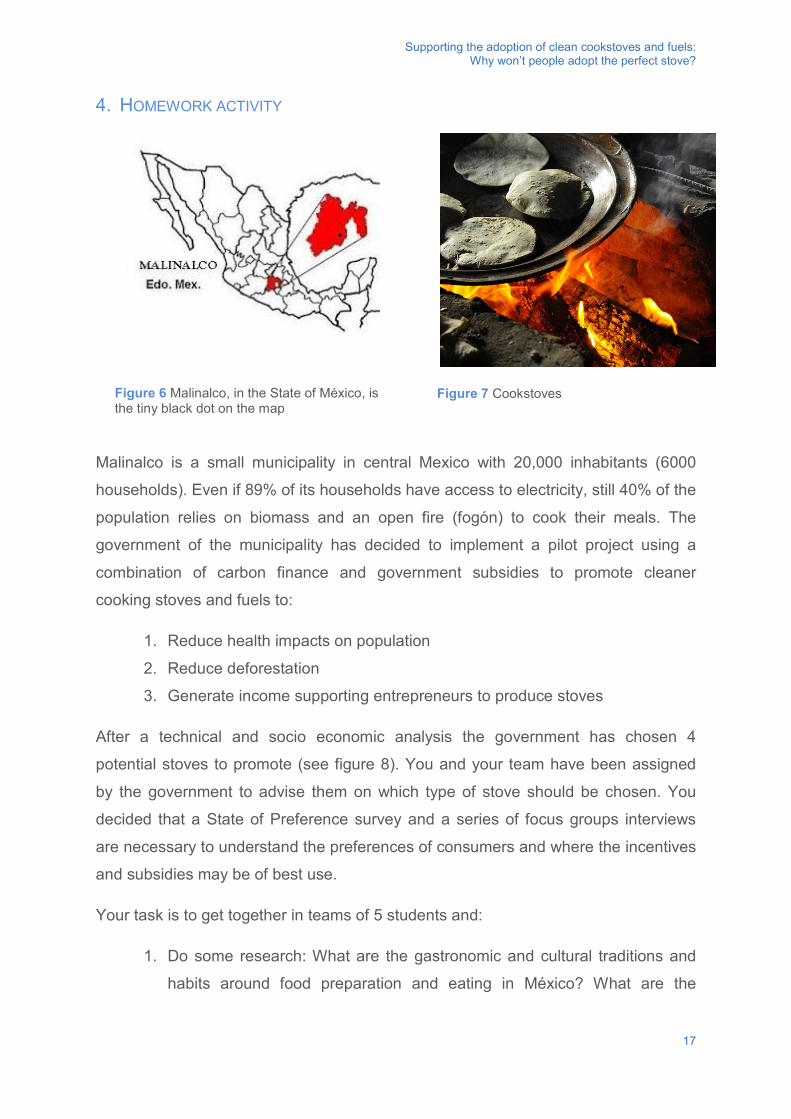
Supporting the adoption of clean cookstoves and fuels: Why won’t people adopt the perfect stove?
4. HOMEWORK ACTIVITY
Malinalco is a small municipality in central Mexico with 20,000 inhabitants (6000
households). Even if 89% of its households have access to electricity, still 40% of the
population relies on biomass and an open fire (fogón) to cook their meals. The
government of the municipality has decided to implement a pilot project using a
combination of carbon finance and government subsidies to promote cleaner
cooking stoves and fuels to:
1. Reduce health impacts on population
2. Reduce deforestation
3. Generate income supporting entrepreneurs to produce stoves
After a technical and socio economic analysis the government has chosen 4
potential stoves to promote (see figure 8). You and your team have been assigned
by the government to advise them on which type of stove should be chosen. You
decided that a State of Preference survey and a series of focus groups interviews
are necessary to understand the preferences of consumers and where the incentives
and subsidies may be of best use.
Your task is to get together in teams of 5 students and:
1. Do some research: What are the gastronomic and cultural traditions and
habits around food preparation and eating in México? What are the
Figure 7 Cookstoves Figure 6 Malinalco, in the State of México, is the tiny black dot on the map
17

Supporting the adoption of clean cookstoves and fuels: Why won’t people adopt the perfect stove?
traditional dishes in indigenous communities in particular in the State of
México? What kind of pots they use?
2. Design a State of Preference survey, using the 4 chosen stoves to:
a. Understand what are the attributes of the stoves that are important to
the end consumer
b. Understand if /how people are willing to trade off certain attributes
3. Design an open questionnaire for focus group interviews to
a. Understand how social and cultural and psychological characteristics of
population affect choices
b. Reaffirm the results of the survey
4. Role-play: Back to the classroom, the work of each group will be shared
with the rest of the class and tested by means of a role playing game. 2
student of each group will play the role of the surveyors (interviewers to
ask the questionnaires developed by his/her their group), 2 students of the
same group will act as representatives of the government; the rest of
students in the class will act as the families in Malinalco. Each surveyor
will apply the questionnaires to a group of families (3-4 depending on how
many students there are), then the surveyors will have 10 minutes to
discuss general findings to present to the government representatives.
Finally the group will discuss what they have learned during this exercise,
and present it to the whole class.
18
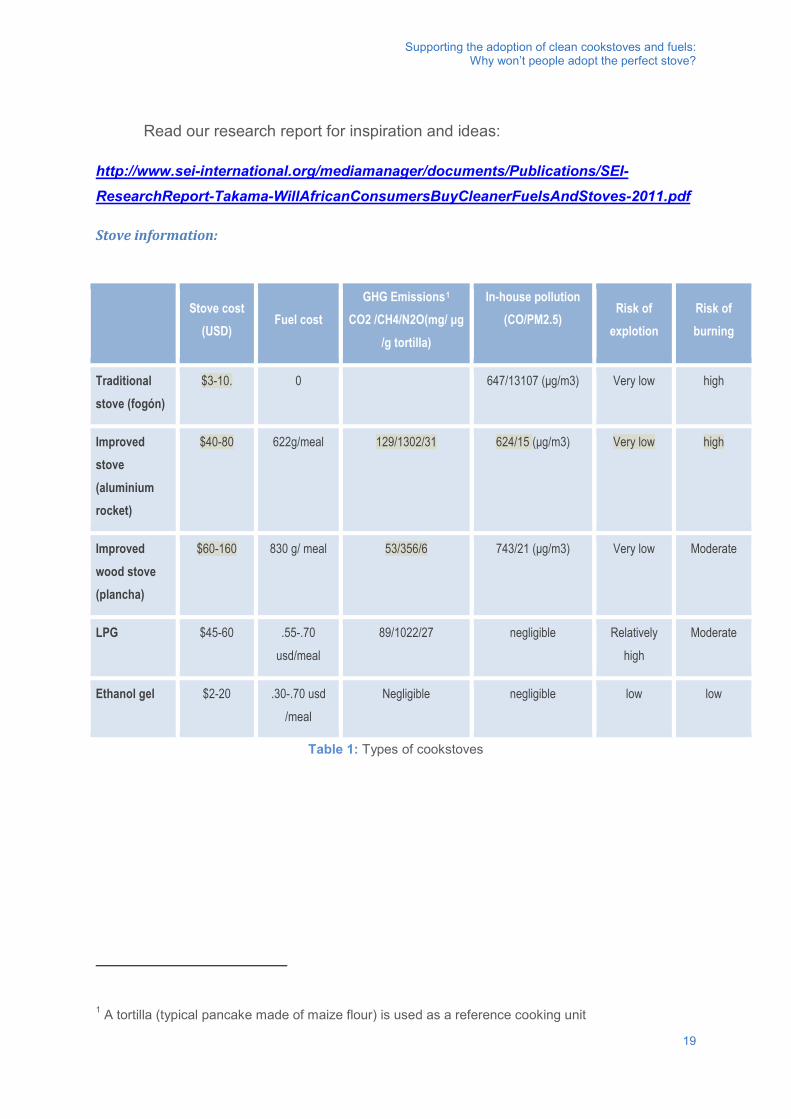
Supporting the adoption of clean cookstoves and fuels: Why won’t people adopt the perfect stove?
Read our research report for inspiration and ideas:
http://www.sei-international.org/mediamanager/documents/Publications/SEI-ResearchReport-Takama-WillAfricanConsumersBuyCleanerFuelsAndStoves-2011.pdf
Stove information:
Stove cost
(USD) Fuel cost
GHG Emissions1 CO2 /CH4/N2O(mg/ μg
/g tortilla)
In-house pollution (CO/PM2.5)
Risk of explotion
Risk of burning
Traditional stove (fogón)
$3-10. 0 647/13107 (μg/m3) Very low high
Improved stove (aluminium rocket)
$40-80 622g/meal 129/1302/31 624/15 (μg/m3) Very low high
Improved wood stove (plancha)
$60-160 830 g/ meal 53/356/6 743/21 (μg/m3) Very low Moderate
LPG $45-60 .55-.70 usd/meal
89/1022/27 negligible Relatively high
Moderate
Ethanol gel $2-20 .30-.70 usd /meal
Negligible negligible low low
Table 1: Types of cookstoves
1 A tortilla (typical pancake made of maize flour) is used as a reference cooking unit
19
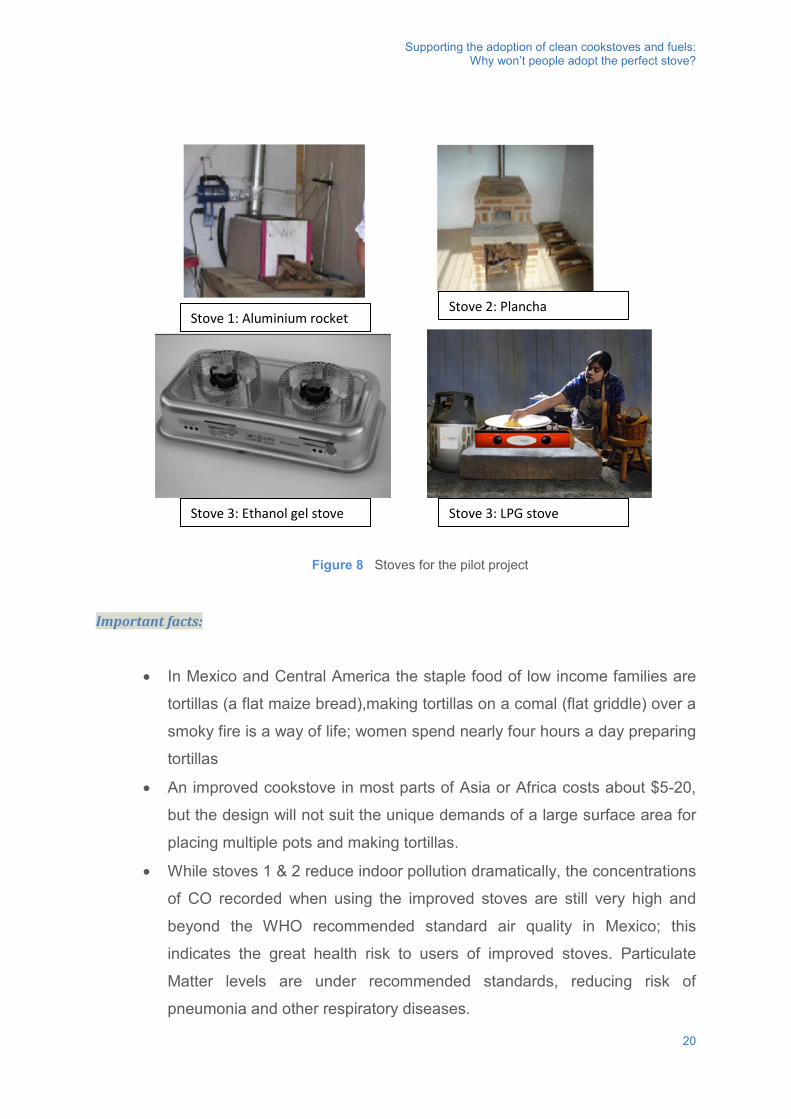
Supporting the adoption of clean cookstoves and fuels: Why won’t people adopt the perfect stove?
Important facts:
• In Mexico and Central America the staple food of low income families are
tortillas (a flat maize bread),making tortillas on a comal (flat griddle) over a
smoky fire is a way of life; women spend nearly four hours a day preparing
tortillas
• An improved cookstove in most parts of Asia or Africa costs about $5-20,
but the design will not suit the unique demands of a large surface area for
placing multiple pots and making tortillas.
• While stoves 1 & 2 reduce indoor pollution dramatically, the concentrations
of CO recorded when using the improved stoves are still very high and
beyond the WHO recommended standard air quality in Mexico; this
indicates the great health risk to users of improved stoves. Particulate
Matter levels are under recommended standards, reducing risk of
pneumonia and other respiratory diseases.
Figure 8 Stoves for the pilot project
Stove 1: Aluminium rocket Stove 2: Plancha
Stove 3: Ethanol gel stove Stove 3: LPG stove
20
Supporting the adoption of clean cookstoves and fuels: Why won’t people adopt the perfect stove?
• The government is willing to subsidize up to 25% of the price of the stoves
and some additional economic incentives may be obtained from carbon
credits. Try to design your survey and focus group so that you understand
how to better use these incentives (e.g. is people willing to pay for a more
expensive stove to save on fuels in the long run? Would people choose a
woodless stove if both stove and fuel are subsidized?)
• The LPG stove has two small burners that make it possible to cook two
things at the same time, however to make tortillas people will have to use
a smaller “comal” as the burner tends to concentrate heat in the middle.
• Ethanol stove is suited for making tortillas and using a smaller pot at the
same time.
• It is known that some of the households in Malinalco have more than one
stove and use it for different proposes ( e.g. one for heating water and
making tortillas with larger surface and a smaller one for cooking); think
about this when designing your questions for the focus group
• 17.5% of the women in Malinalco can´t read and write, consider that while
designing your survey
4.1. SOLUTION AND EVALUATION CRITERIA
The objective of the exercise is to make students reflect about the different
disciplines involved in solving the problem of lack of modern energy and discuss the
different dimensions of the case rather than make them experts on survey or
questionnaire design.
Some of the criteria to evaluate that I consider important are:
• Focus on comparing first the attributes of the two wood stoves and the
LPG and Ethanol stoves separately first and in second place the
preference between the fuels, to understand the important attributes to
switch to a woodless stove
• The questionnaire should cover preferences of non-economic attributes
independently and in relation to the economic attributes
21
Supporting the adoption of clean cookstoves and fuels: Why won’t people adopt the perfect stove?
• The proposed survey and questionnaires should consider illiteracy levels
of the target respondents, hence include pictures and images to help them
choose among attributes of the different stoves.
• The questionnaire for the focus groups is used to understand if there are
specific preferences influenced by cultural or social (gastronomic
traditions, gender factors) factors or individual perceptions (aesthetics,
flavour, etc.)
• See attached questionnaires and SP cards from another case for
reference
22
Supporting the adoption of clean cookstoves and fuels: Why won’t people adopt the perfect stove?
BIBLIOGRAPHY
Arnold, J. E. M., Köhlin, G. and Persson, R. (2006). Woodfuels, livelihoods, and
policy interventions: Changing Perspectives. World Development, 34(3). 596–611.
DOI:10.1016/j.worlddev.2005.08.008.
Bhattacharya, S. C. and Jana, C. (2009). Renewable energy in India: Historical
developments and prospects. Energy, 34(8). 981–91.
DOI:10.1016/j.energy.2008.10.017.
Douglas F. Barnes, K. O. (1993). THE DESIGN AND DIFFUSION OF IMPROVED
COOKING STOVES. DOI:10.1093/wbro/8.2.119.
GACC (n.d.). Global Alliance For Clean Cookstoves. Global Alliance for Clean Cook
Stoves. http://cleancookstoves.org/. [Accessed 19 November, 2014].
Greenglass, N. and Smith, K., R. (2006). Current Improved Cookstove (ICS)
Activities in South Asia: A Web-Based Survey. Version 1.1. Woods Hole Research
Center, Falmouth, MA. http://www.whrc.org/policy/cop12_pubs.html.
Heltberg, R. (2005). Factors determining household fuel choice in Guatemala.
Environment and Development Economics, null(03). 337–61.
DOI:10.1017/S1355770X04001858.
Hiemstra-van der Horst, G. and Hovorka, A. J. (2008). Reassessing the ‘energy
ladder’: Household energy use in Maun, Botswana. Energy Policy, 36(9). 3333–44.
DOI:10.1016/j.enpol.2008.05.006.
IEA (n.d.). IEA - Energy access database.
http://www.worldenergyoutlook.org/resources/energydevelopment/energyaccessdata
base/. [Accessed 9 March, 2015].
Lambe, F. and Atteridge, A. (2012). Putting the cook before the stove: A user-
centred approach to understanding household energy decision-making – A case
study of Haryana State, northern India. http://sei-
international.org/publications?pid=2106.
23
Supporting the adoption of clean cookstoves and fuels: Why won’t people adopt the perfect stove?
Lambe, F. and Johnson, F. (2009). Household Energy in Developing Countries: A
Burning Issue. http://www.sei-
international.org/mediamanager/documents/Projects/Climate/household_energy_pb_
090603_fxj.pdf.
Leach, G. (1992). The energy transition. Energy Policy, 20(2). 116–23.
DOI:10.1016/0301-4215(92)90105-B.
Masera, O. R., Saatkamp, B. D. and Kammen, D. M. (2000). From Linear Fuel
Switching to Multiple Cooking Strategies: A Critique and Alternative to the Energy
Ladder Model. World Development, 28(12). 2083–2103. DOI:10.1016/S0305-
750X(00)00076-0.
Ouedraogo, B. (2006). Household energy preferences for cooking in urban
Ouagadougou, Burkina Faso. Energy Policy, (18). 3787–95.
DOI:10.1016/j.enpol.2005.09.006.
Pachauri, S., Mueller, A., Kemmler, A. and Spreng, D. (2004). On Measuring Energy
Poverty in Indian Households. World Development, 32(12). 2083–2104.
DOI:10.1016/j.worlddev.2004.08.005.
Ramanathan, V. and Carmichael, G. (2008). Global and regional climate changes
due to black carbon. Nature Geoscience, 1(4). 221–27. DOI:10.1038/ngeo156.
24
Supporting the adoption of clean cookstoves and fuels: Why won’t people adopt the perfect stove?
FURTHER/SUGGESTED MATERIAL
• Global Alliance for Clean Cookstoves: http://cleancookstoves.org/Book:
• Video : Saving lives through clean cookstoves:
https://www.youtube.com/watch?v=J3Zsj4Lfs_o
• Report: Putting the cook before the stove http://www.sei-
international.org/mediamanager/documents/Publications/Atmospheric/sei-wp-
2012-03-cookstoves.pdf
25

http://www.gdee.eu
This project is funded by
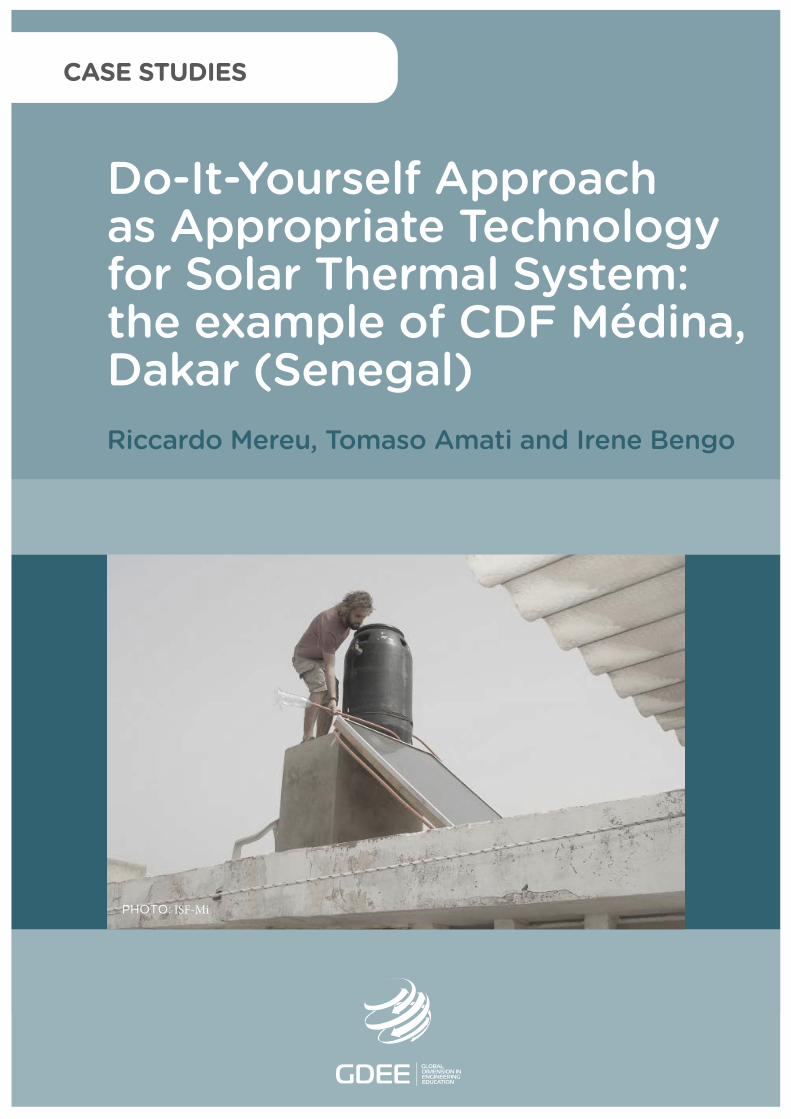
Do-It-Yourself Approachas Appropriate Technology for Solar Thermal System: the example of CDF Médina,Dakar (Senegal)Riccardo Mereu, Tomaso Amati and Irene Bengo
PHOTO: ISF-Mi
CASE STUDIES
Do-It-Yourself Approach as Appropriate Technology for Solar Thermal System: the example of CDF Médina, Dakar (Senegal)
DL B 10735-2015 ISBN 978-84-606-7546-4
COORDINATED BYAgustí Pérez-Foguet, Enric Velo, Pol Arranz, Ricard Ginéand Boris Lazzarini (Universitat Politècnica de Catalunya)Manuel Sierra (Universidad Politécnica de Madrid)Alejandra Boni and Jordi Peris (Universitat Politècnica de València)Guido Zolezzi and Gabriella Trombino (Università degli Studi di Trento)Rhoda Trimingham (Loughborough University)Valentín Villarroel (ONGAWA)Neil Nobles and Meadhbh Bolger (Practical Action)Francesco Mongera (Training Center for International Cooperation)Katie Cresswell-Maynard (Engineering Without Border UK)
EDITED BY Global Dimension in Engineering Education
Citation: Mereu, R., Amati, T. and Bengo, I. (2015) ' Do-It-Yourself Approach as Appropriate Technology for Solar Thermal System: the example of CDF Médina, Dakar (Senegal)', in Case studies for developing globally responsible engineers, GDEE (eds.), Global Dimension in Engineering Education, Barcelona. Available from: http://gdee.eu/index.php/resources.html
This publication is distributedunder an Attribution- Noncommercial-Share Alike License for Creative Commons
CASE STUDIES
Disclaimer: This document has been produced with the financial assistance of the European UnionThe contents of this document are the sole responsibility of the authors and can under no circumstances be regarded as reflecting the position of the European Union
Do-It-Yourself Approach As Appropriate Technology For Solar Thermal System The Example Of Cdf Médina, Dakar (Senegal)
DO-IT-YOURSELF APPROACH AS APPROPRIATE TECHNOLOGY FOR SOLAR THERMAL SYSTEM: THE EXAMPLE OF CDF MÉDINA, DAKAR (SENEGAL) Riccardo Mereu, Ingegneria Senza Frontiere – Milano (ISF-MI), Politecnico di Milano Tomaso Amati, Ingegneria Senza Frontiere – Milano (ISF-MI) Irene Bengo, Ingegneria Senza Frontiere – Milano (ISF-MI), Politecnico di Milano
1
Do-It-Yourself Approach As Appropriate Technology For Solar Thermal System The Example Of Cdf Médina, Dakar (Senegal)
INDEX
1. INTRODUCTION ........................................................................................................................... 3
1.1. DISCIPLINES COVERED ............................................................................................................. 3
1.2. LEARNING OUTCOMES .............................................................................................................. 3
1.3. ACTIVITIES .............................................................................................................................. 3
2. DESCRIPTION OF THE CONTEXT ............................................................................................. 4
2.1. SENEGAL OVERVIEW ................................................................................................................ 4
2.2. THE CAPITAL DAKAR AND THE MÉDINA AREA ............................................................................. 6
2.3. THE ‘CENTRO DI FORMAZIONE MÉDINA’ PROJECT ...................................................................... 7
2.4. THERMAL ENERGY NEEDS AND SOLAR WATER HEATER (SWH) TECHNOLOGY ............................ 9
3. CLASS ACTIVITY ....................................................................................................................... 10
ADDITIONAL INFO ABOUT HOT WATER NEED OF THE CDF MÉDINA ............................................................. 11
3.1. SOLUTION AND EVALUATION CRITERIA ..................................................................................... 11
4. HOMEWORK ACTIVITY ............................................................................................................. 17
INTRODUCTION ...................................................................................................................................... 17
MAIN ACTIVITY ....................................................................................................................................... 17
ADDITIONAL INFO ABOUT THE SWH ........................................................................................................ 18
4.1. SOLUTION AND EVALUATION CRITERIA ..................................................................................... 18
BIBLIOGRAPHY ................................................................................................................................. 26
2
Do-It-Yourself Approach As Appropriate Technology For Solar Thermal System The Example Of Cdf Médina, Dakar (Senegal)
1. INTRODUCTION In international projects in Developing Countries activities related to water treatment, energy, ICT, etc. topics often require the introduction or improvement of specific technologies. A large amount of literature and case studies about the characteristics of the technologies to be used is available nowadays and the concept of appropriate technology has been extensively studied and developed in recent years. The present case study is mainly focused on the application of the do-it-yourself approach to a solar thermal system in Dakar, Senegal. Beyond the technical aspects, the sustainability of the solution from the economic and social point of view is treated including the potential for the development of local enterprise.
1.1. DISCIPLINES COVERED The main topics covered by this case study are engineering and cooperation for global development and energy for development. The first topic is specifically related to the do-it-yourself technique as appropriate technology and as potential skill for local enterprise development, the latter one focuses on the use of this technique to provide energy for improving standards of living and local productive activities.
1.2. LEARNING OUTCOMES Learning outcomes expected from this case study are:
a) increase knowledge of the appropriate technology and its main characteristics; b) a better understanding of the economic and social dimensions of a technical project in developing countries.
1.3. ACTIVITIES
During the class activity students are involved in a preliminary analysis of the solar thermal system in the local context. This activity is mainly developed as a problem to be debated in order to identify involved stakeholders, energy resources and needs, the energy system and related indicators; based on the appropriate technology as defined and the local social context. In this step students should identify a reliable solution for the specific case study but also potentially replicable in the local context. The homework activity is focused on two different aspects concerning the technical part, including a do-it-yourself approach, for deciding the size of the solar thermal system and the
3
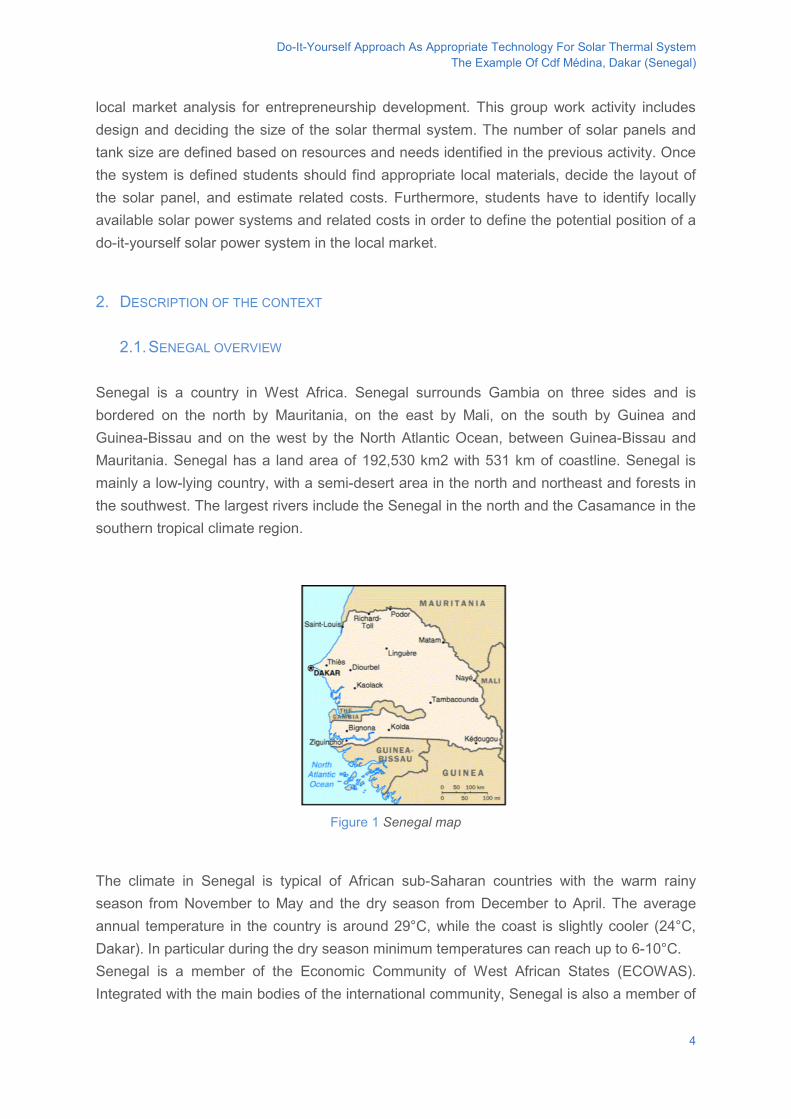
Do-It-Yourself Approach As Appropriate Technology For Solar Thermal System The Example Of Cdf Médina, Dakar (Senegal)
local market analysis for entrepreneurship development. This group work activity includes design and deciding the size of the solar thermal system. The number of solar panels and tank size are defined based on resources and needs identified in the previous activity. Once the system is defined students should find appropriate local materials, decide the layout of the solar panel, and estimate related costs. Furthermore, students have to identify locally available solar power systems and related costs in order to define the potential position of a do-it-yourself solar power system in the local market. 2. DESCRIPTION OF THE CONTEXT
2.1. SENEGAL OVERVIEW Senegal is a country in West Africa. Senegal surrounds Gambia on three sides and is bordered on the north by Mauritania, on the east by Mali, on the south by Guinea and Guinea-Bissau and on the west by the North Atlantic Ocean, between Guinea-Bissau and Mauritania. Senegal has a land area of 192,530 km2 with 531 km of coastline. Senegal is mainly a low-lying country, with a semi-desert area in the north and northeast and forests in the southwest. The largest rivers include the Senegal in the north and the Casamance in the southern tropical climate region.
Figure 1 Senegal map
The climate in Senegal is typical of African sub-Saharan countries with the warm rainy season from November to May and the dry season from December to April. The average annual temperature in the country is around 29°C, while the coast is slightly cooler (24°C, Dakar). In particular during the dry season minimum temperatures can reach up to 6-10°C. Senegal is a member of the Economic Community of West African States (ECOWAS). Integrated with the main bodies of the international community, Senegal is also a member of
4
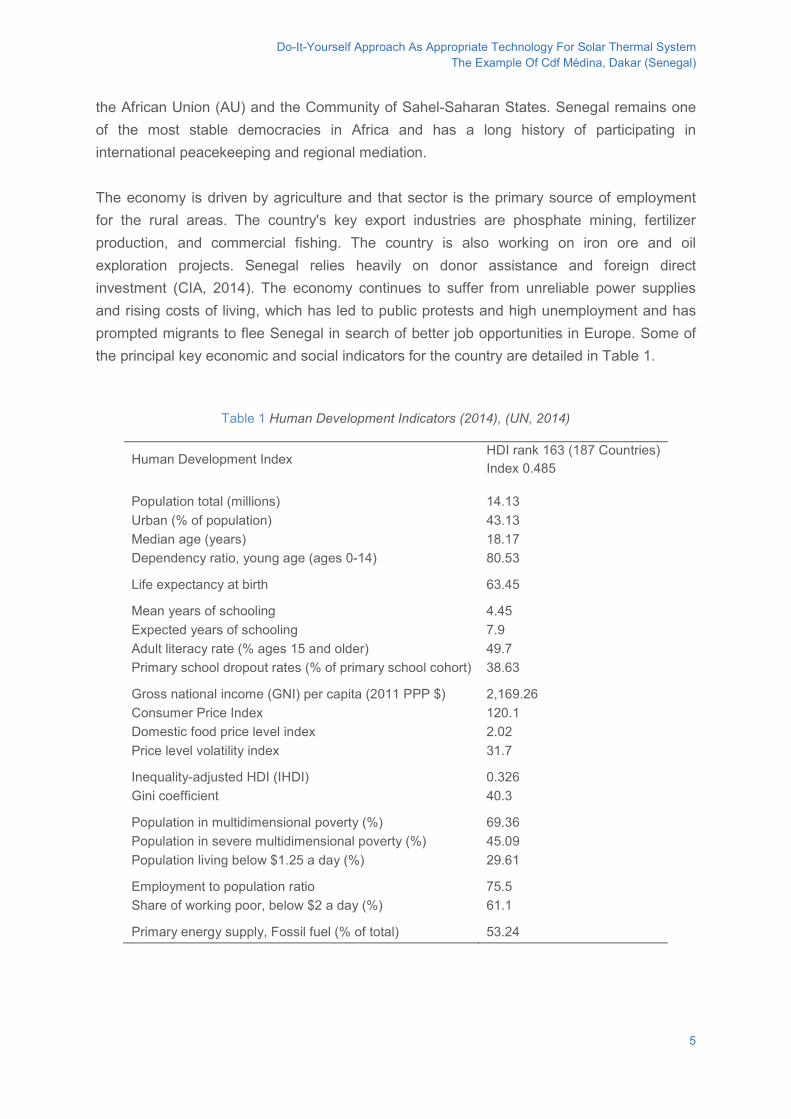
Do-It-Yourself Approach As Appropriate Technology For Solar Thermal System The Example Of Cdf Médina, Dakar (Senegal)
the African Union (AU) and the Community of Sahel-Saharan States. Senegal remains one of the most stable democracies in Africa and has a long history of participating in international peacekeeping and regional mediation. The economy is driven by agriculture and that sector is the primary source of employment for the rural areas. The country's key export industries are phosphate mining, fertilizer production, and commercial fishing. The country is also working on iron ore and oil exploration projects. Senegal relies heavily on donor assistance and foreign direct investment (CIA, 2014). The economy continues to suffer from unreliable power supplies and rising costs of living, which has led to public protests and high unemployment and has prompted migrants to flee Senegal in search of better job opportunities in Europe. Some of the principal key economic and social indicators for the country are detailed in Table 1.
Table 1 Human Development Indicators (2014), (UN, 2014)
Human Development Index HDI rank 163 (187 Countries) Index 0.485
Population total (millions)
14.13 Urban (% of population) 43.13 Median age (years) 18.17 Dependency ratio, young age (ages 0-14) 80.53 Life expectancy at birth 63.45 Mean years of schooling 4.45 Expected years of schooling 7.9 Adult literacy rate (% ages 15 and older) 49.7 Primary school dropout rates (% of primary school cohort) 38.63 Gross national income (GNI) per capita (2011 PPP $) 2,169.26 Consumer Price Index 120.1 Domestic food price level index 2.02 Price level volatility index 31.7 Inequality-adjusted HDI (IHDI) 0.326 Gini coefficient 40.3 Population in multidimensional poverty (%) 69.36 Population in severe multidimensional poverty (%)
45.09 Population living below $1.25 a day (%) 29.61 Employment to population ratio 75.5 Share of working poor, below $2 a day (%) 61.1 Primary energy supply, Fossil fuel (% of total) 53.24
5
Do-It-Yourself Approach As Appropriate Technology For Solar Thermal System The Example Of Cdf Médina, Dakar (Senegal)
2.2. THE CAPITAL DAKAR AND THE MÉDINA AREA Forty-three per-cent of the Senegalese population live in urban areas, and more than half of the urban population is concentrated in Dakar. Dakar is the capital of country and with its port represents a key trade center not only for the country, but also for the economy of the region. Médina, the traditional city within Dakar, is a neighborhood populated by poor people composed of various ethnic groups from the area (lébu, toucouleur, soninké, sereer, wolof, peul, mandinka, …) living side by side in an environment rich in tradition in which local craftsmanship is anchored to its origins. Security in the area remains critical in spite of the presence of basic infrastructure (water, telephone, internet, electricity, asphalt roads and public transport, a hospital,…), partly because of unemployment and juvenile distress. The neighborhood of Médina is characterized by a young population (19% of the population is under 12 years old, 22% are aged between 13 and 21 years, only 23% are more than 35) and families are extended and numerous, consisting of an average of 7 members or more. In this economically depressed context, 55% of the heads of households are employed, but youth unemployment is much higher, due to the lack of specific training. The economic activities of the Médina are mainly of three kinds:
- Commerce: The main focus of this activity is the marché de ethylene, the most African market of Dakar. The trade is a source of income for many of the local residents, but remains predominantly an informal activity, which does not generate sufficient profits to ensure sustainability or to make investments and develop the business;
- Handicraft: one area in constant development and involving almost all specializations, such as tanners and leather artisans, weavers, dyers, carpenters, tailors, jewelers, craftsmen working metal, wood, wicker...
- Tourism: is mainly another form of trade because it is mainly made up of the Artisan Village, a cooperative of more than 200 dealers (sometimes trades) is geared to tourists and, to a lesser extent, foreign residents.
Some aspects negatively influencing the main economic activities of the Médina are related to the reliability of the energy supply and the support for professional formation. The energy supply system in the Médina, as well as in other urban and peri-urban areas of Dakar, is characterized by the presence of a public network. The distribution of electricity in the neighbourhood is strongly dependent on the availability of electricity from the main network and national power plant. The presence of a capillary network in the neighbourhood
6
Do-It-Yourself Approach As Appropriate Technology For Solar Thermal System The Example Of Cdf Médina, Dakar (Senegal)
does not guarantee a reliable supply because of regular blackouts during the day and night in all seasons. These blackouts can last from a few hours (2-6) to days (1-2) and are usually not announced causing trouble for both residential and commercial activities. The main causes of the blackouts can be related to the lack of fuel for the power plant at national level or (rarely) specific issues in the national or local network. Another issue related to energy supply is the cost and environmental and health impact of sources used for thermal energy generation. Used mainly for cooking and heating purposes the main sources are wood and gas, unsuitable due to environmental and health issues and with high costs (gas). From the educational point of view the schools of the Médina are numerous: 6 kindergartens, 25 elementary, 11 secondary, as well as numerous informal schools: Koran, community-based and literacy of children and adults. The main lack of this system is the absence of training schools or technical institutes in the area. This aspect strongly affects the employment opportunities of young people living in a working class neighbourhood, with basically a poor and uncertain future because of the lack in Médina of formative pragmatic and concrete opportunities that will lead, in short order, to a useful qualification for the world of work.
2.3. THE ‘CENTRO DI FORMAZIONE MÉDINA’ PROJECT The project, ‘Centro di Formazione Médina’ (CdF Médina) or Médina Training Centre, is part of the context described in the previous paragraph ‘The capital Dakar and the Médina area’. From the beginning the main objective of the project has been to improve the living, health and economic conditions of the population in the Médina. This has been carried out through scholar education and qualifying training for young people, giving them the opportunity to be involved or to develop sustainable economic activities in the local context and within the community in which they operate. Specifically the ‘CdF Médina’ focuses on the education and training of young weavers and it is connected with the fair trade system. The first beneficiaries of the project were the unschooled and unemployed young people of the Médina who received a professional formation tailored to the work opportunities of the context. The CdF Médina is part of the wider Senegalese textile chain that has witnessed a growing effort to enhance the national product through the promotion of organic cotton and the rediscovery of traditional techniques for weaving and fabric dyeing. The project started involving qualified partners in fair trade (Karibuny), textile craftsmanship, local nongovernmental organization (Yaakaar G.I.E. and Domû Africa) and ISF-MI for the technological transfer and formation.
7
Do-It-Yourself Approach As Appropriate Technology For Solar Thermal System The Example Of Cdf Médina, Dakar (Senegal)
The project activities, while not having the specific objective of reducing gender disparity, are based on an accurate analysis of gender relationships and they develop specific strategies:
- the training courses were open to an equal number of men and women; - teachers commissions were equally distributed in order to provide to the
students positive female role models; - very important is the prospect of working in the craft and trade fair, sectors in
which there is usually a fair distribution of gender in terms of quantity (number of employees) but in which women are often relegated to an informal or subordinate position, with lower wages and very few business prospects. The project is scheduled for the active support of the students and most deserving producers with special attention given to girls and women (as well as other vulnerable groups).
In this description some aspects related to the sustainability of the project are not reported and attention is focused on the energy field. It is important to highlight that one of the main constraints identified for the overall sustainability of the Centre was the supply of energy. Indeed, due to its costs and discontinuity, the affordability and reliability of energy is not guaranteed. The need for electricity and heat provision has been studied in the local context and with the local actors with the aim of determining the kinds of intervention and eventually technology to be used and how to introduce them into the context. As far as supplying electricity is concerned, the continual and prolonged blackouts in the local electricity grid led to the design of an alternative system able to:
- compensate power shortage from the grid by working “off-grid”; - limit electricity consumption from the grid by working as a supplementary
system “on‐grid”. This need was faced with the design of a hybrid photovoltaic system characterized by the possibility to convert and store energy and to be used as a complementary system when the grid was regularly working and as an off-grid system during blackouts. The most important aspect in this case was to maximize the use of electricity from the photovoltaic system in order to decrease the running costs for the electricity supply and increase the amortization of the photovoltaic plant. Another important energy requirement for the Center was the supply of thermal energy, i.e. hot water both for domestic use (showers, cooking…) in the b&b of the Center and for textile production (dye fixing).
8
Do-It-Yourself Approach As Appropriate Technology For Solar Thermal System The Example Of Cdf Médina, Dakar (Senegal)
2.4. THERMAL ENERGY NEEDS AND SOLAR WATER HEATER (SWH) TECHNOLOGY In general, in most of the developing countries hot water supply is not considered a basic need due to their warm climates and Solar Water Heater (SWH) is not considered the ideal technology to enhance the living conditions of the poor population in these contexts (Langniß & Ince 2004). Despite that, hot water is increasingly seen as a fundamental aspect of a modern hygienic and healthy life in contemporary societies (Milton 2007) and, in some cases, has a key role in artisanal productive processes, incentivizing the growth of demand. Furthermore, SWH actually represents a competitive economic alternative in countries with high energy costs and sufficient irradiation, contributing to open up possibilities for sustainable socio-economic development (Sitzmann & Langenbruck 2003). For these reasons, many representatives of the international community believe that the SWH system is one of the most simple yet effective renewable energy technologies, characterized by being often constructed using locally available materials by technicians with no special expertise and skill (Milton 2007). The hot water requirements can be divided into three main categories: need for domestic hot water at the household level; commercial/services level which includes tourist accommodation (hotels, b&b ...), clinics and hospitals; production/manufacturing level. In Dakar there has emerged at the household level a fairly high and increasing sensitivity compared to some previous years in respect of hot water needs, especially during the coldest months (January, February, March). Most tourist facilities ensure the use of hot water for their customers. Hot water requirements have been identified also in commercial and productive activities both in urban and rural areas such as laundries, textile and agri-food production. In Dakar at the household level the domestic hot water needs are still satisfied with the use of the same gas bomb used for cooking. Especially in the more well-off social classes the use of electric boilers is well established (cost of 80-200 liters boiler: 130-190 €). Even at the commercial and tourist level and in the health clinics the boiler is the most common technology, while the solar thermal systems are beginning to spread. Especially in Dakar on the roofs of some of the hotels and houses in residential neighborhoods several installations of solar thermal systems are present, which after a greater initial investment incur no or almost no costs. Compared to the first analysis conducted in 2009, in 2013 the solar thermal market in Dakar has seen an increase of retailers and a slight drop in sales prices (about 10%). In Dakar official retailers of solar thermal systems are present and active, guaranteeing in most cases the installation and support that resellers related to the informal market cannot guarantee. In
9
Do-It-Yourself Approach As Appropriate Technology For Solar Thermal System The Example Of Cdf Médina, Dakar (Senegal)
Dakar you can find all the different configurations of solar thermal systems suitable for different contexts and needs - a thermosyphon and forced circulation; with flat plate collectors, vacuum and heat pipe - but certainly the most common configuration is the thermosyphon circulation with heat pipe collector. All types of systems are pre-assembled kits imported from abroad (China, in most cases, and Europe). Based on interviews conducted in Dakar, sometimes the installation of an imported kit does not provide the desired results mainly due to lack of know-how that leads to incorrect installation and maintenance. The prices of commercial solar thermal systems present in Dakar vary considerably depending on the type of plant and retailers. Although it is difficult to calculate a weighted average of the prices at the level of hot water demand as the technical characteristics of the systems are often not present, an average price of about € 1000-1150 can be estimated for solutions adapted to the needs of an average family with the cheapest ones at around € 700-850. 3. CLASS ACTIVITY This activity is mainly focused on a preliminary analysis of the use of solar water heater systems as a solution for hot water supply. Specifically, the technological appropriateness is evaluated for application to CdF Médina and its activities, with potential replication in the local context (Médina, Dakar). Different aspects have to be analysed in order to identify involved stakeholders, energy needs and resources, the potential energy systems and related indicators based on the appropriate technology, and the local social context. The first phase of the activity is developed via debate, in a kind of brainstorming, and the professor should stimulate and guide students in the process. Students should try to identify some technical and social characteristics from the context description reported in the previous section and their background:
- direct and indirect beneficiaries and involved stakeholders with their roles; - stakeholder matrix according to the Logical Framework Approach of the
Project Cycle Management (EC, 2004) and related graphic showing power and interest;
- needs of hot water in CdF Médina, and most representative specific needs in the Médina and Dakar;
10
Do-It-Yourself Approach As Appropriate Technology For Solar Thermal System The Example Of Cdf Médina, Dakar (Senegal)
- main advantages and limits of available resources and technologies for heating water from the point of view of sustainability.
At the end of this phase a list of potential beneficiaries and stakeholders with specific roles, a list of potential needs, and a table indicating advantages and limits of energy systems (resources+technologies) should be defined. Time required for this phase approx. 75’-90’ including the introduction to the context reported in the previous section. Finally, students should define a list of indicators based on social, economic and environmental dimensions and aim to characterize the energy system chosen as a solution. In this way the energy system can be evaluated and compared with other options in terms of its technological appropriateness.
ADDITIONAL INFO ABOUT HOT WATER NEED OF THE CDF MÉDINA The dye fixing in Cdf Médina, as well as in all other enterprises, is realized by heating the water up to the incipient boiling point. The water is mixed with the "khemé", which allows the agent to dissolve the dye, then added to the color and, finally, the ségéné (fixative). The tissues are then immersed for a few minutes (5 to 15 minutes, depending on the fabric and color) and subsequently rinsed in water and vinegar. The amount of water used for each day of normal production (thus excluding the periods in which they work on the sample for the creation of new collections) is about 150 liters. About half of the water is heated; the rest is used at room temperature for wet tissues before they are colored and to wash them after coloring, to wash pots and pans, bowls and utensils. The 75 liters submitted to heat treatment are used intermittently throughout the day: a first use of hot water, equal to about 40 liters, is used at noon and the remaining at 3pm.
3.1. SOLUTION AND EVALUATION CRITERIA Direct and indirect beneficiaries and involved stakeholders:
Beneficiaries and stakeholders can be identified at two different levels: people, organizations and Institutions involved in CdF Médina activities and the SWH installation in the Center, and those involved in the potential use of SWH for residential and productive end uses, as reported in Table 2.
11
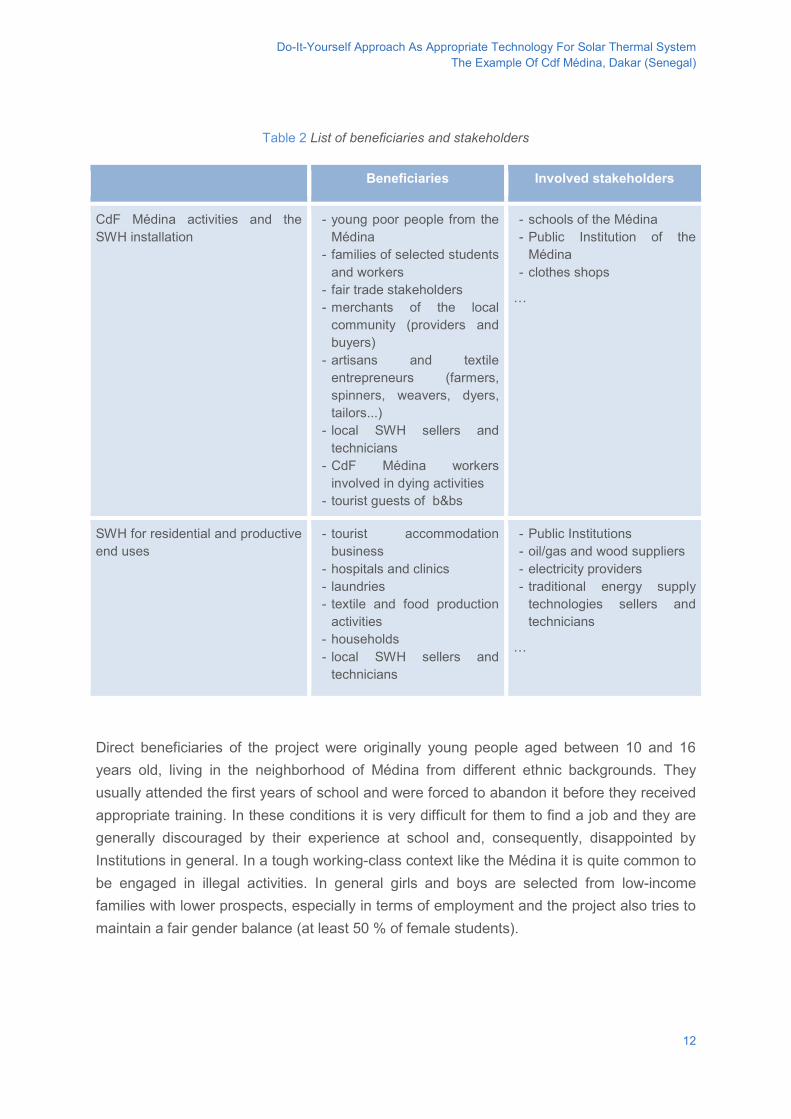
Do-It-Yourself Approach As Appropriate Technology For Solar Thermal System The Example Of Cdf Médina, Dakar (Senegal)
Table 2 List of beneficiaries and stakeholders
Beneficiaries Involved stakeholders
CdF Médina activities and the SWH installation
- young poor people from the Médina
- families of selected students and workers
- fair trade stakeholders - merchants of the local
community (providers and buyers)
- artisans and textile entrepreneurs (farmers, spinners, weavers, dyers, tailors...)
- local SWH sellers and technicians
- CdF Médina workers involved in dying activities
- tourist guests of b&bs
- schools of the Médina - Public Institution of the
Médina - clothes shops
…
SWH for residential and productive end uses
- tourist accommodation business
- hospitals and clinics - laundries - textile and food production
activities - households - local SWH sellers and
technicians
- Public Institutions - oil/gas and wood suppliers - electricity providers - traditional energy supply
technologies sellers and technicians
…
Direct beneficiaries of the project were originally young people aged between 10 and 16 years old, living in the neighborhood of Médina from different ethnic backgrounds. They usually attended the first years of school and were forced to abandon it before they received appropriate training. In these conditions it is very difficult for them to find a job and they are generally discouraged by their experience at school and, consequently, disappointed by Institutions in general. In a tough working-class context like the Médina it is quite common to be engaged in illegal activities. In general girls and boys are selected from low-income families with lower prospects, especially in terms of employment and the project also tries to maintain a fair gender balance (at least 50 % of female students).
12
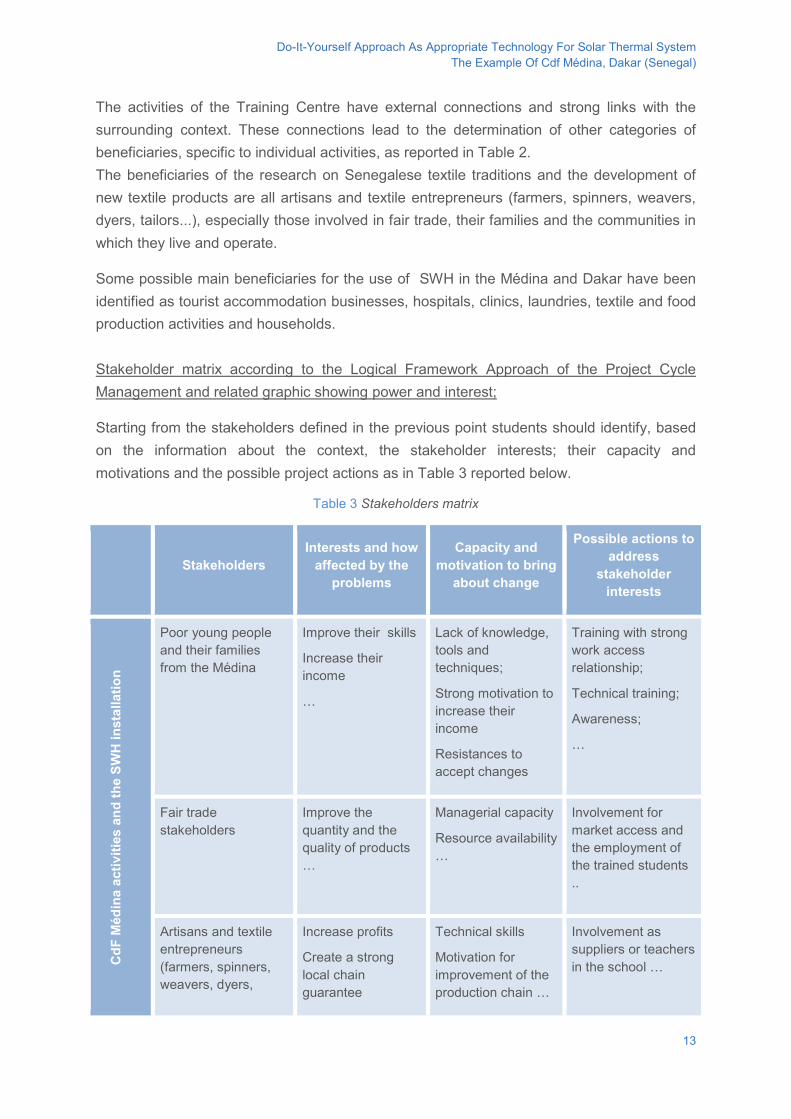
Do-It-Yourself Approach As Appropriate Technology For Solar Thermal System The Example Of Cdf Médina, Dakar (Senegal)
The activities of the Training Centre have external connections and strong links with the surrounding context. These connections lead to the determination of other categories of beneficiaries, specific to individual activities, as reported in Table 2. The beneficiaries of the research on Senegalese textile traditions and the development of new textile products are all artisans and textile entrepreneurs (farmers, spinners, weavers, dyers, tailors...), especially those involved in fair trade, their families and the communities in which they live and operate.
Some possible main beneficiaries for the use of SWH in the Médina and Dakar have been identified as tourist accommodation businesses, hospitals, clinics, laundries, textile and food production activities and households. Stakeholder matrix according to the Logical Framework Approach of the Project Cycle Management and related graphic showing power and interest;
Starting from the stakeholders defined in the previous point students should identify, based on the information about the context, the stakeholder interests; their capacity and motivations and the possible project actions as in Table 3 reported below.
Table 3 Stakeholders matrix
Stakeholders Interests and how
affected by the problems
Capacity and motivation to bring
about change
Possible actions to address
stakeholder interests
CdF
Méd
ina
activ
ities
and
the
SWH
inst
alla
tion
Poor young people and their families from the Médina
Improve their skills
Increase their income
…
Lack of knowledge, tools and techniques;
Strong motivation to increase their income
Resistances to accept changes
Training with strong work access relationship;
Technical training;
Awareness;
…
Fair trade stakeholders
Improve the quantity and the quality of products …
Managerial capacity
Resource availability …
Involvement for market access and the employment of the trained students ..
Artisans and textile entrepreneurs (farmers, spinners, weavers, dyers,
Increase profits
Create a strong local chain guarantee
Technical skills
Motivation for improvement of the production chain …
Involvement as suppliers or teachers in the school …
13
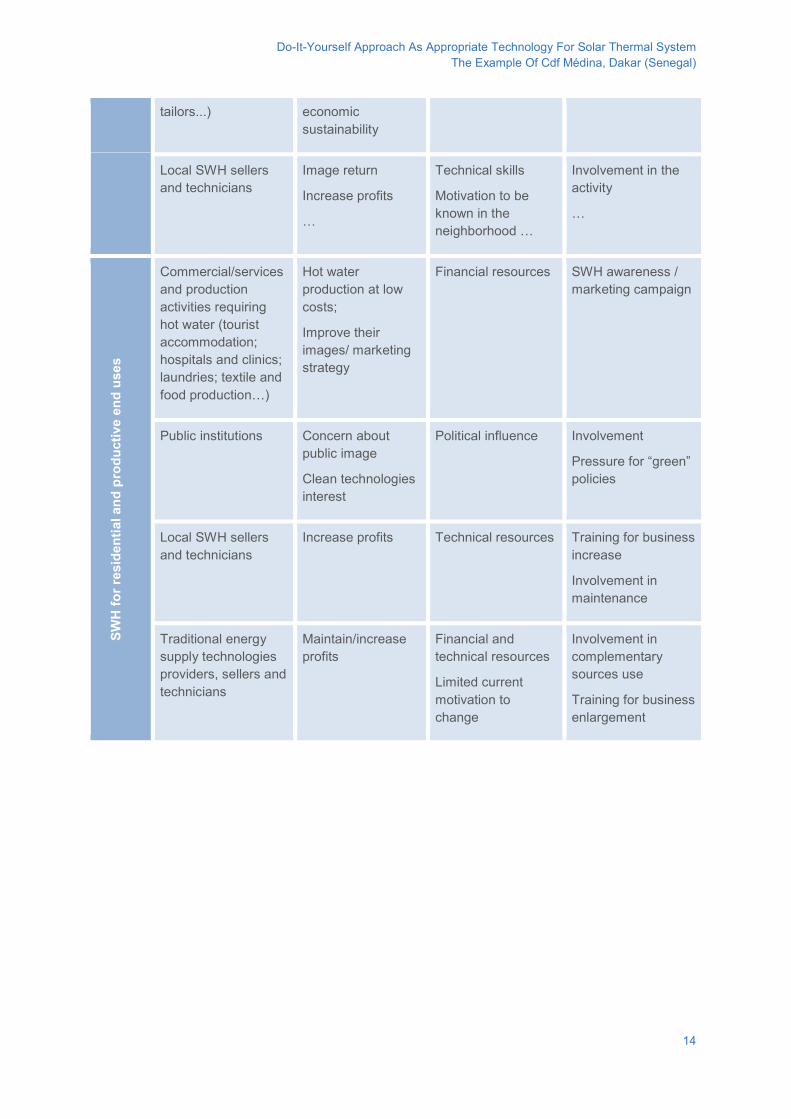
Do-It-Yourself Approach As Appropriate Technology For Solar Thermal System The Example Of Cdf Médina, Dakar (Senegal)
tailors...) economic sustainability
Local SWH sellers and technicians
Image return
Increase profits
…
Technical skills
Motivation to be known in the neighborhood …
Involvement in the activity
…
SWH
for r
esid
entia
l and
pro
duct
ive
end
uses
Commercial/services and production activities requiring hot water (tourist accommodation; hospitals and clinics; laundries; textile and food production…)
Hot water production at low costs;
Improve their images/ marketing strategy
Financial resources SWH awareness / marketing campaign
Public institutions Concern about public image
Clean technologies interest
Political influence Involvement
Pressure for “green” policies
Local SWH sellers and technicians
Increase profits Technical resources Training for business increase
Involvement in maintenance
Traditional energy supply technologies providers, sellers and technicians
Maintain/increase profits
Financial and technical resources
Limited current motivation to change
Involvement in complementary sources use
Training for business enlargement
14
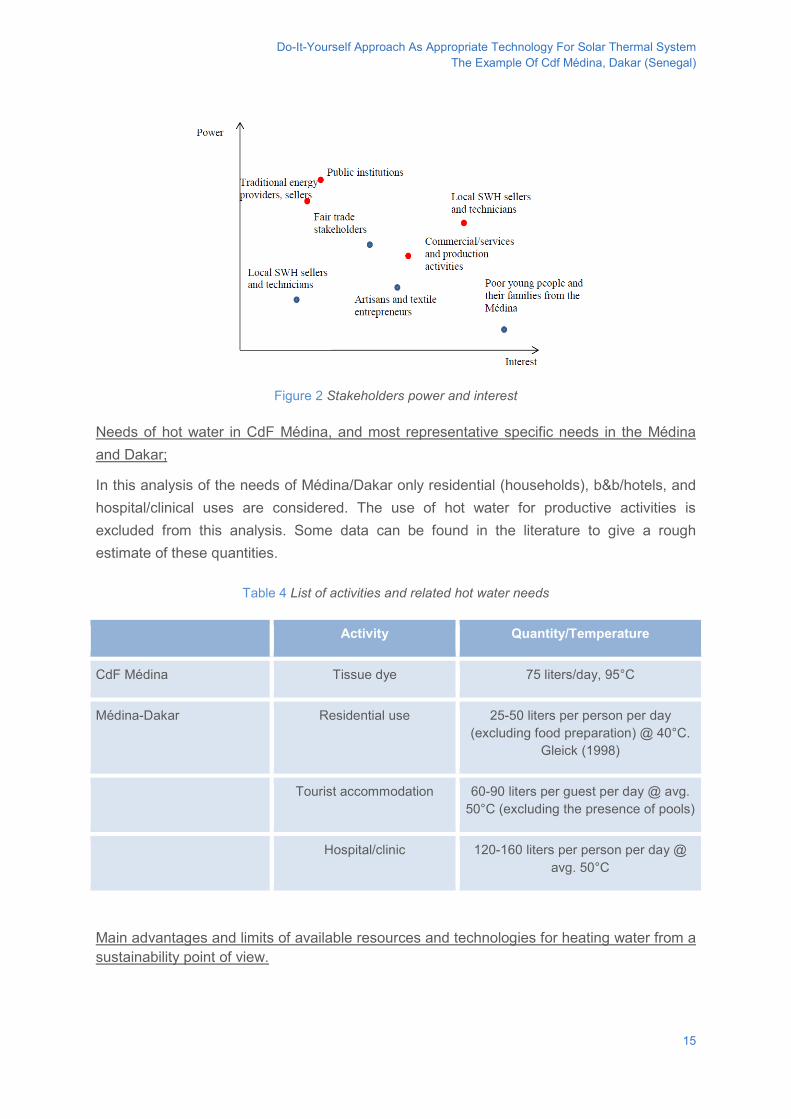
Do-It-Yourself Approach As Appropriate Technology For Solar Thermal System The Example Of Cdf Médina, Dakar (Senegal)
Figure 2 Stakeholders power and interest
Needs of hot water in CdF Médina, and most representative specific needs in the Médina and Dakar;
In this analysis of the needs of Médina/Dakar only residential (households), b&b/hotels, and hospital/clinical uses are considered. The use of hot water for productive activities is excluded from this analysis. Some data can be found in the literature to give a rough estimate of these quantities.
Table 4 List of activities and related hot water needs
Activity Quantity/Temperature
CdF Médina Tissue dye 75 liters/day, 95°C
Médina-Dakar Residential use 25-50 liters per person per day (excluding food preparation) @ 40°C.
Gleick (1998)
Tourist accommodation 60-90 liters per guest per day @ avg. 50°C (excluding the presence of pools)
Hospital/clinic 120-160 liters per person per day @ avg. 50°C
Main advantages and limits of available resources and technologies for heating water from a sustainability point of view.
15
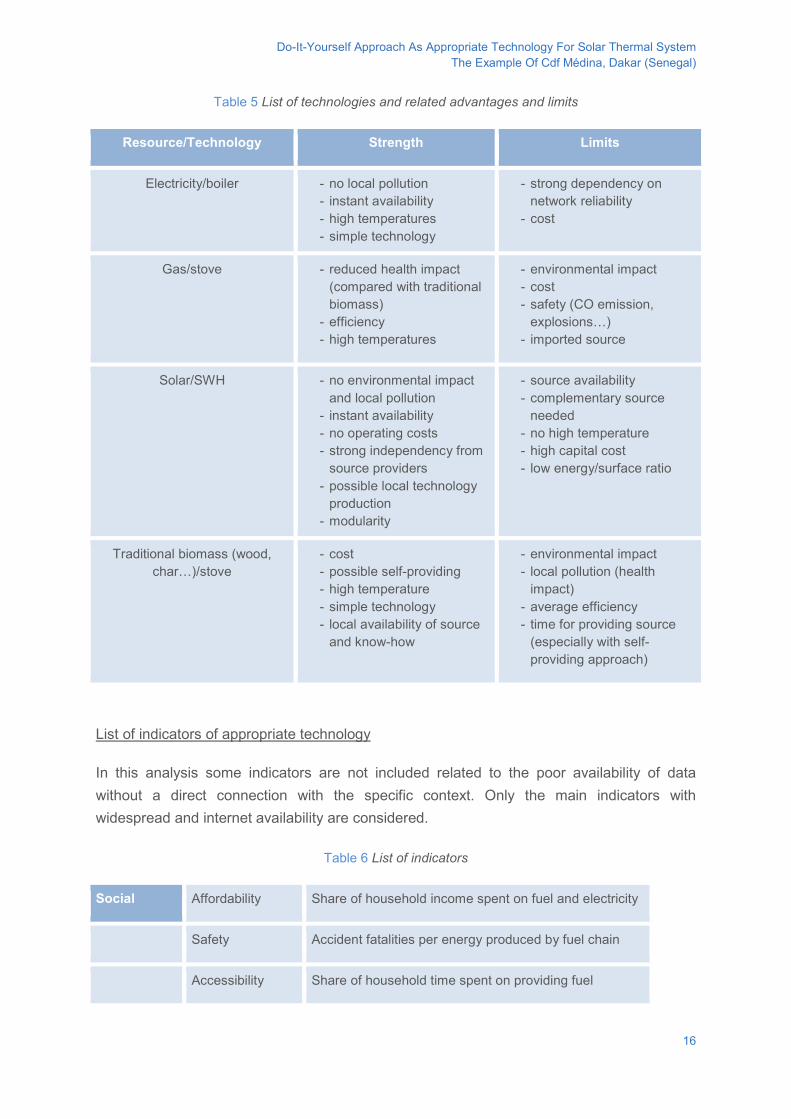
Do-It-Yourself Approach As Appropriate Technology For Solar Thermal System The Example Of Cdf Médina, Dakar (Senegal)
Table 5 List of technologies and related advantages and limits
Resource/Technology Strength Limits
Electricity/boiler - no local pollution - instant availability - high temperatures - simple technology
- strong dependency on network reliability
- cost
Gas/stove - reduced health impact (compared with traditional biomass)
- efficiency - high temperatures
- environmental impact - cost - safety (CO emission,
explosions…) - imported source
Solar/SWH - no environmental impact and local pollution
- instant availability - no operating costs - strong independency from
source providers - possible local technology
production - modularity
- source availability - complementary source
needed - no high temperature - high capital cost - low energy/surface ratio
Traditional biomass (wood, char…)/stove
- cost - possible self-providing - high temperature - simple technology - local availability of source
and know-how
- environmental impact - local pollution (health
impact) - average efficiency - time for providing source
(especially with self-providing approach)
List of indicators of appropriate technology
In this analysis some indicators are not included related to the poor availability of data without a direct connection with the specific context. Only the main indicators with widespread and internet availability are considered.
Table 6 List of indicators
Social Affordability Share of household income spent on fuel and electricity
Safety Accident fatalities per energy produced by fuel chain
Accessibility Share of household time spent on providing fuel
16
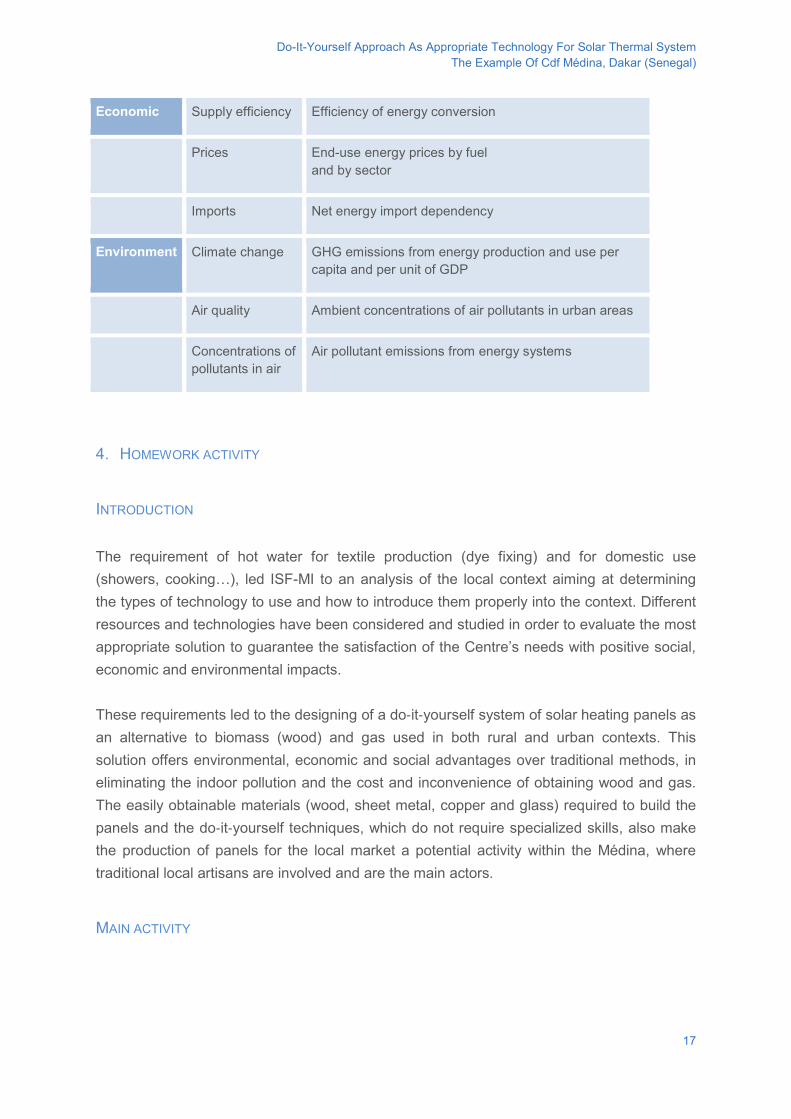
Do-It-Yourself Approach As Appropriate Technology For Solar Thermal System The Example Of Cdf Médina, Dakar (Senegal)
Economic Supply efficiency Efficiency of energy conversion
Prices End-use energy prices by fuel and by sector
Imports Net energy import dependency
Environment Climate change GHG emissions from energy production and use per capita and per unit of GDP
Air quality Ambient concentrations of air pollutants in urban areas
Concentrations of pollutants in air
Air pollutant emissions from energy systems
4. HOMEWORK ACTIVITY
INTRODUCTION The requirement of hot water for textile production (dye fixing) and for domestic use (showers, cooking…), led ISF-MI to an analysis of the local context aiming at determining the types of technology to use and how to introduce them properly into the context. Different resources and technologies have been considered and studied in order to evaluate the most appropriate solution to guarantee the satisfaction of the Centre’s needs with positive social, economic and environmental impacts. These requirements led to the designing of a do‐it‐yourself system of solar heating panels as an alternative to biomass (wood) and gas used in both rural and urban contexts. This solution offers environmental, economic and social advantages over traditional methods, in eliminating the indoor pollution and the cost and inconvenience of obtaining wood and gas. The easily obtainable materials (wood, sheet metal, copper and glass) required to build the panels and the do‐it‐yourself techniques, which do not require specialized skills, also make the production of panels for the local market a potential activity within the Médina, where traditional local artisans are involved and are the main actors.
MAIN ACTIVITY
17
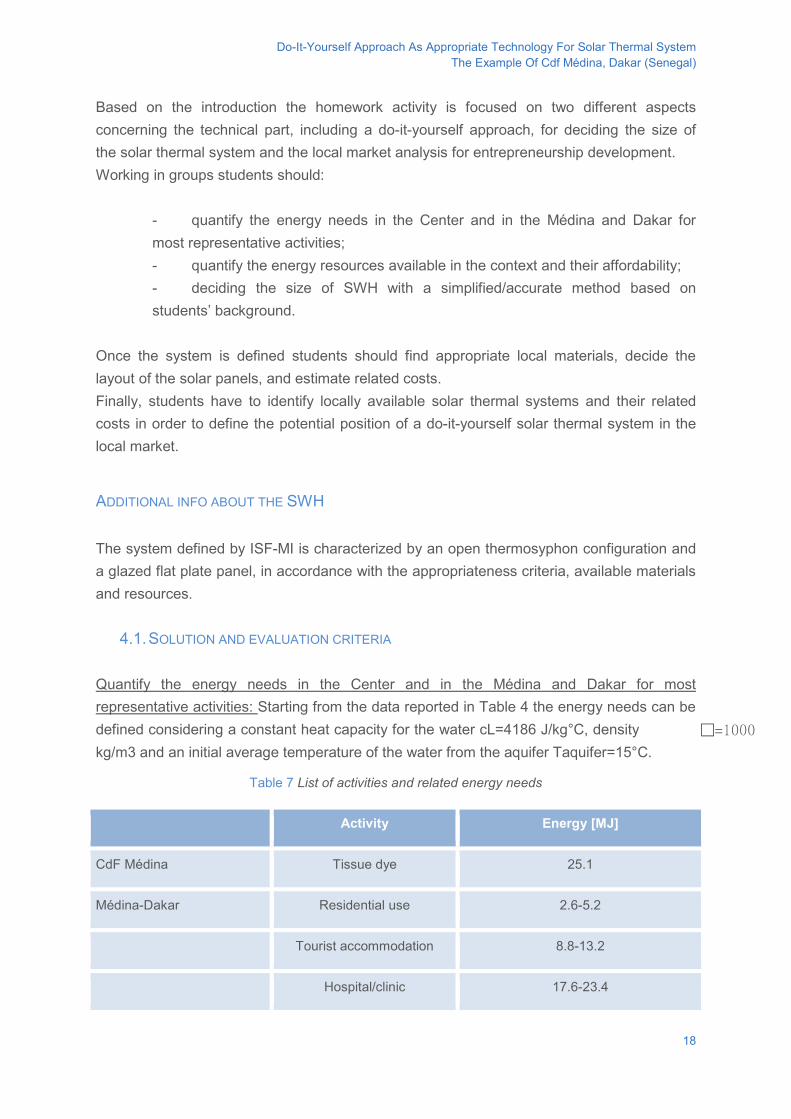
Do-It-Yourself Approach As Appropriate Technology For Solar Thermal System The Example Of Cdf Médina, Dakar (Senegal)
Based on the introduction the homework activity is focused on two different aspects concerning the technical part, including a do-it-yourself approach, for deciding the size of the solar thermal system and the local market analysis for entrepreneurship development. Working in groups students should:
- quantify the energy needs in the Center and in the Médina and Dakar for most representative activities; - quantify the energy resources available in the context and their affordability; - deciding the size of SWH with a simplified/accurate method based on students’ background.
Once the system is defined students should find appropriate local materials, decide the layout of the solar panels, and estimate related costs. Finally, students have to identify locally available solar thermal systems and their related costs in order to define the potential position of a do-it-yourself solar thermal system in the local market.
ADDITIONAL INFO ABOUT THE SWH The system defined by ISF-MI is characterized by an open thermosyphon configuration and a glazed flat plate panel, in accordance with the appropriateness criteria, available materials and resources.
4.1. SOLUTION AND EVALUATION CRITERIA Quantify the energy needs in the Center and in the Médina and Dakar for most representative activities: Starting from the data reported in Table 4 the energy needs can be defined considering a constant heat capacity for the water cL=4186 J/kg°C, density =1000
kg/m3 and an initial average temperature of the water from the aquifer Taquifer=15°C.
Table 7 List of activities and related energy needs
Activity Energy [MJ]
CdF Médina Tissue dye 25.1
Médina-Dakar Residential use 2.6-5.2
Tourist accommodation 8.8-13.2
Hospital/clinic 17.6-23.4
18
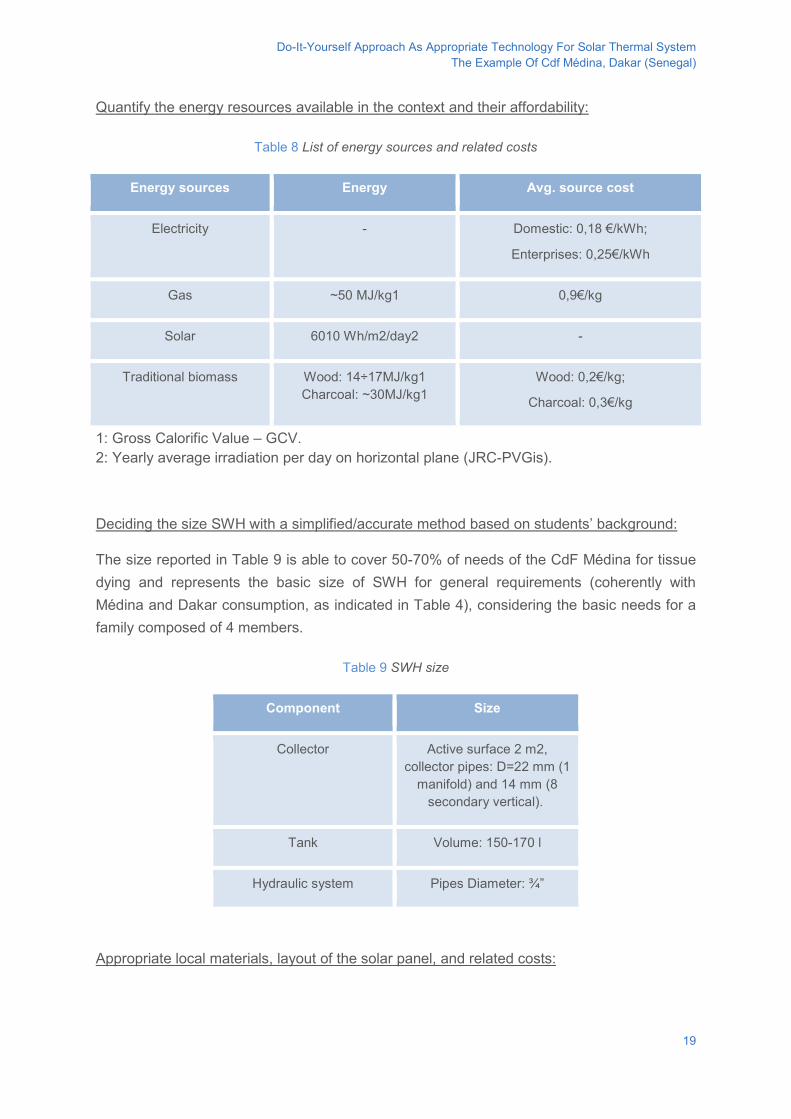
Do-It-Yourself Approach As Appropriate Technology For Solar Thermal System The Example Of Cdf Médina, Dakar (Senegal)
Quantify the energy resources available in the context and their affordability:
Table 8 List of energy sources and related costs
Energy sources Energy Avg. source cost
Electricity - Domestic: 0,18 €/kWh;
Enterprises: 0,25€/kWh
Gas ~50 MJ/kg1 0,9€/kg
Solar 6010 Wh/m2/day2 -
Traditional biomass Wood: 14÷17MJ/kg1 Charcoal: ~30MJ/kg1
Wood: 0,2€/kg;
Charcoal: 0,3€/kg
1: Gross Calorific Value – GCV. 2: Yearly average irradiation per day on horizontal plane (JRC-PVGis).
Deciding the size SWH with a simplified/accurate method based on students’ background:
The size reported in Table 9 is able to cover 50-70% of needs of the CdF Médina for tissue dying and represents the basic size of SWH for general requirements (coherently with Médina and Dakar consumption, as indicated in Table 4), considering the basic needs for a family composed of 4 members.
Table 9 SWH size
Component Size
Collector Active surface 2 m2, collector pipes: D=22 mm (1
manifold) and 14 mm (8 secondary vertical).
Tank Volume: 150-170 l
Hydraulic system Pipes Diameter: ¾”
Appropriate local materials, layout of the solar panel, and related costs:
19
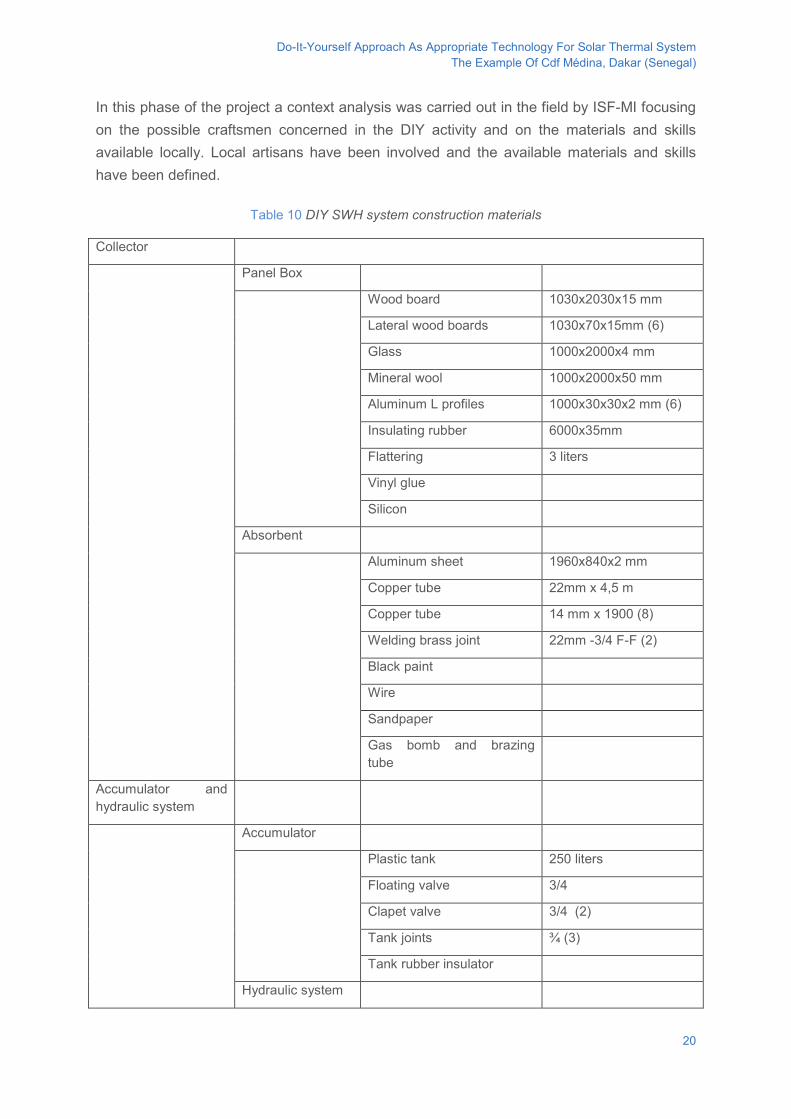
Do-It-Yourself Approach As Appropriate Technology For Solar Thermal System The Example Of Cdf Médina, Dakar (Senegal)
In this phase of the project a context analysis was carried out in the field by ISF-MI focusing on the possible craftsmen concerned in the DIY activity and on the materials and skills available locally. Local artisans have been involved and the available materials and skills have been defined.
Table 10 DIY SWH system construction materials
Collector
Panel Box
Wood board 1030x2030x15 mm
Lateral wood boards 1030x70x15mm (6)
Glass 1000x2000x4 mm
Mineral wool 1000x2000x50 mm
Aluminum L profiles 1000x30x30x2 mm (6)
Insulating rubber 6000x35mm
Flattering 3 liters
Vinyl glue
Silicon
Absorbent
Aluminum sheet 1960x840x2 mm
Copper tube 22mm x 4,5 m
Copper tube 14 mm x 1900 (8)
Welding brass joint 22mm -3/4 F-F (2)
Black paint
Wire
Sandpaper
Gas bomb and brazing tube
Accumulator and hydraulic system
Accumulator
Plastic tank 250 liters
Floating valve 3/4
Clapet valve 3/4 (2)
Tank joints ¾ (3)
Tank rubber insulator
Hydraulic system
20
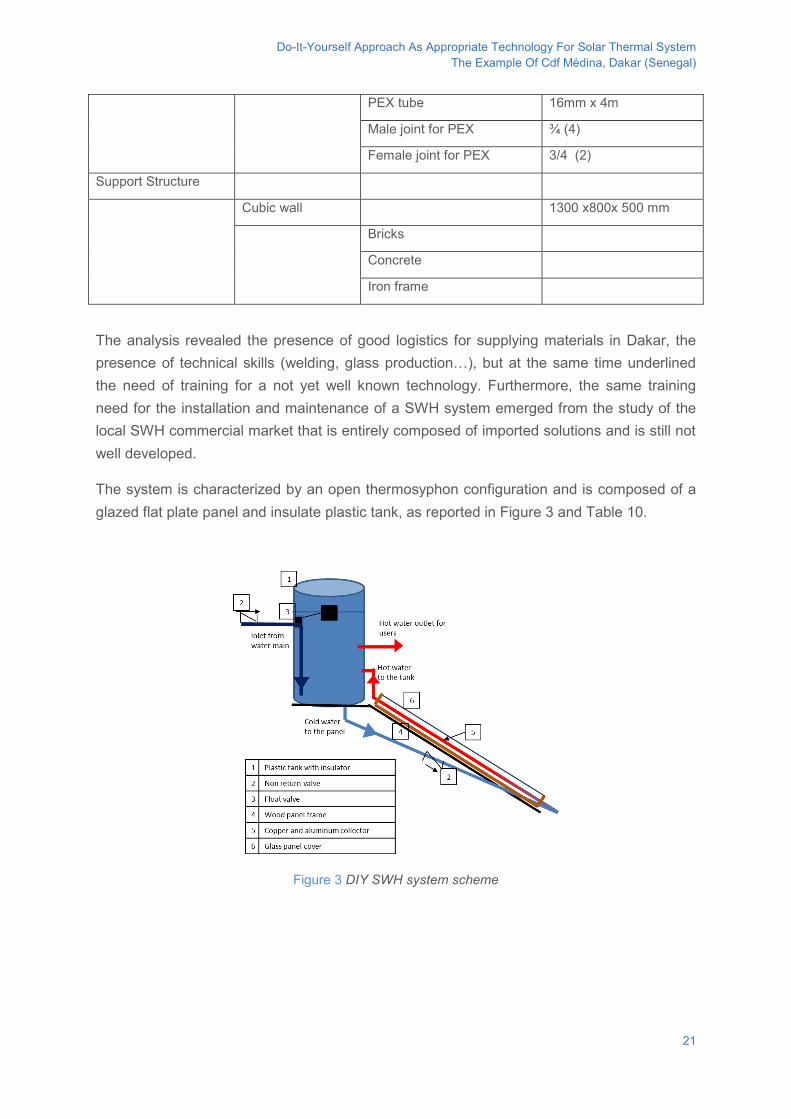
Do-It-Yourself Approach As Appropriate Technology For Solar Thermal System The Example Of Cdf Médina, Dakar (Senegal)
PEX tube 16mm x 4m
Male joint for PEX ¾ (4)
Female joint for PEX 3/4 (2)
Support Structure
Cubic wall 1300 x800x 500 mm
Bricks
Concrete
Iron frame
The analysis revealed the presence of good logistics for supplying materials in Dakar, the presence of technical skills (welding, glass production…), but at the same time underlined the need of training for a not yet well known technology. Furthermore, the same training need for the installation and maintenance of a SWH system emerged from the study of the local SWH commercial market that is entirely composed of imported solutions and is still not well developed.
The system is characterized by an open thermosyphon configuration and is composed of a glazed flat plate panel and insulate plastic tank, as reported in Figure 3 and Table 10.
Figure 3 DIY SWH system scheme
21
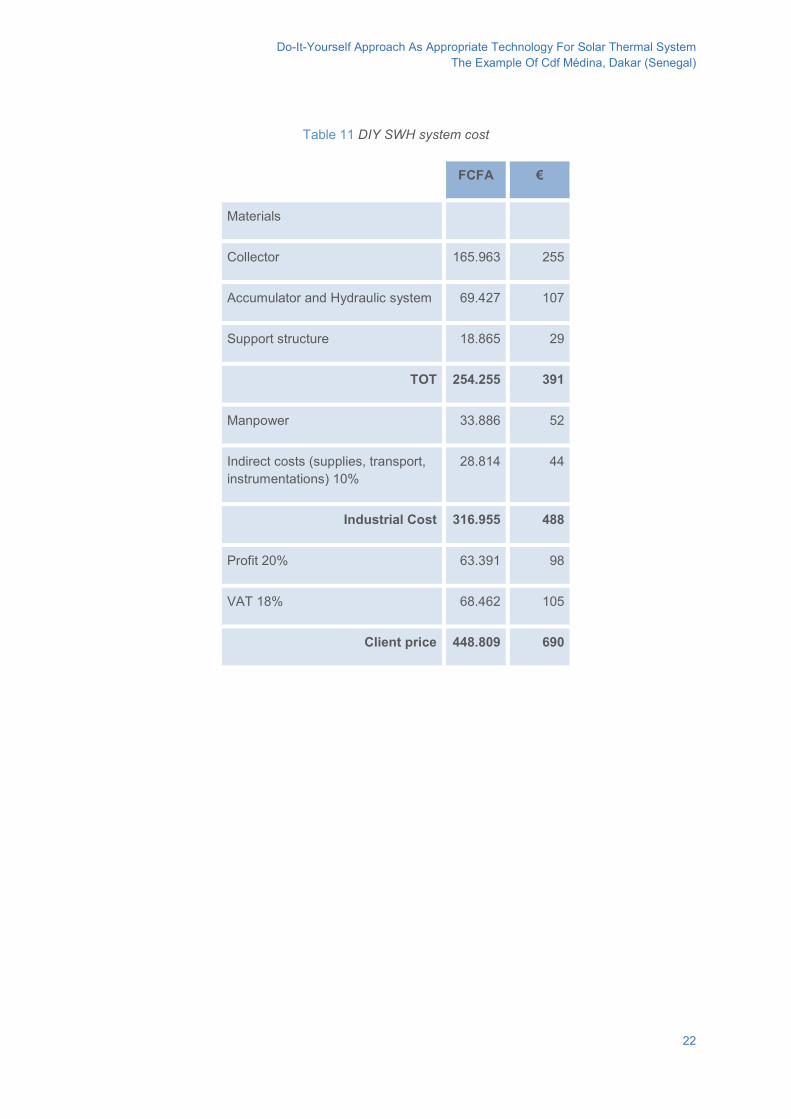
Do-It-Yourself Approach As Appropriate Technology For Solar Thermal System The Example Of Cdf Médina, Dakar (Senegal)
Table 11 DIY SWH system cost
FCFA €
Materials
Collector 165.963 255
Accumulator and Hydraulic system 69.427 107
Support structure 18.865 29
TOT 254.255 391
Manpower 33.886 52
Indirect costs (supplies, transport, instrumentations) 10%
28.814 44
Industrial Cost 316.955 488
Profit 20% 63.391 98
VAT 18% 68.462 105
Client price 448.809 690
22
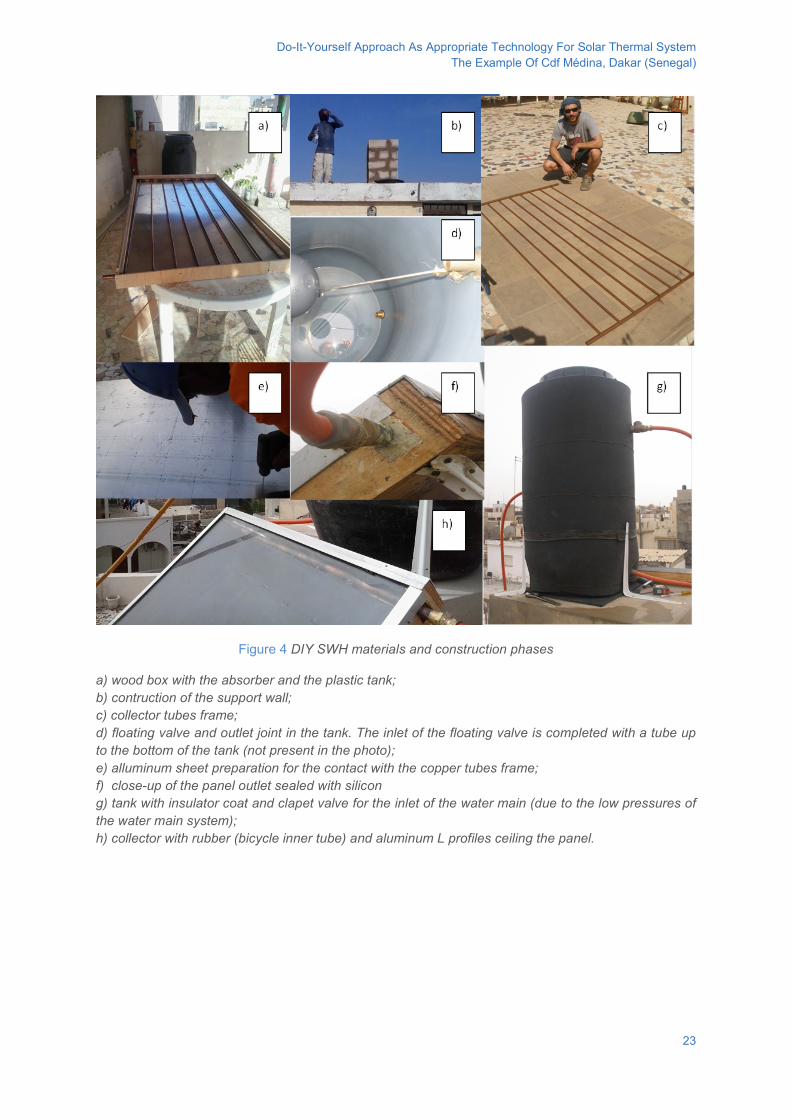
Do-It-Yourself Approach As Appropriate Technology For Solar Thermal System The Example Of Cdf Médina, Dakar (Senegal)
Figure 4 DIY SWH materials and construction phases
a) wood box with the absorber and the plastic tank; b) contruction of the support wall; c) collector tubes frame; d) floating valve and outlet joint in the tank. The inlet of the floating valve is completed with a tube up to the bottom of the tank (not present in the photo); e) alluminum sheet preparation for the contact with the copper tubes frame; f) close-up of the panel outlet sealed with silicon g) tank with insulator coat and clapet valve for the inlet of the water main (due to the low pressures of the water main system); h) collector with rubber (bicycle inner tube) and aluminum L profiles ceiling the panel.
23
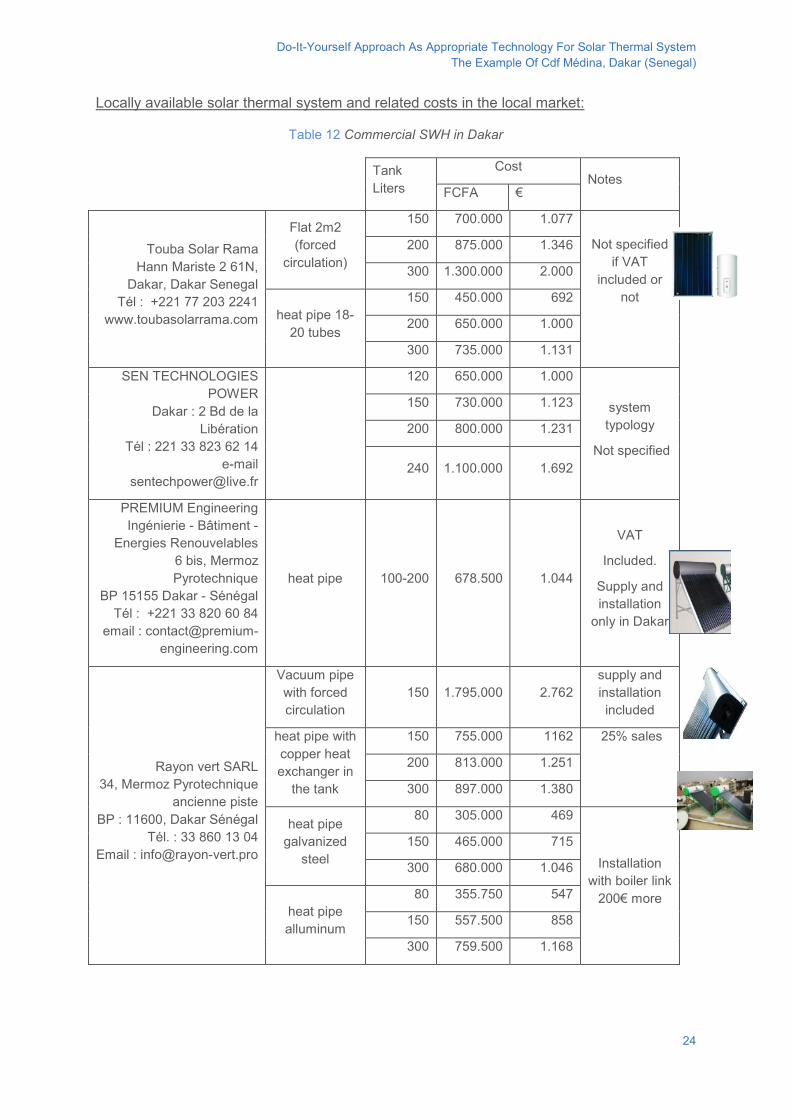
Do-It-Yourself Approach As Appropriate Technology For Solar Thermal System The Example Of Cdf Médina, Dakar (Senegal)
Locally available solar thermal system and related costs in the local market:
Table 12 Commercial SWH in Dakar
Tank Liters
Cost Notes
FCFA €
Touba Solar Rama Hann Mariste 2 61N,
Dakar, Dakar Senegal Tél : +221 77 203 2241
www.toubasolarrama.com
Flat 2m2 (forced
circulation)
150 700.000 1.077
Not specified if VAT
included or not
200 875.000 1.346
300 1.300.000 2.000
heat pipe 18-20 tubes
150 450.000 692
200 650.000 1.000
300 735.000 1.131
SEN TECHNOLOGIES POWER
Dakar : 2 Bd de la Libération
Tél : 221 33 823 62 14 e-mail
120 650.000 1.000
system typology
Not specified
150 730.000 1.123
200 800.000 1.231
240 1.100.000 1.692
PREMIUM Engineering Ingénierie - Bâtiment -
Energies Renouvelables 6 bis, Mermoz Pyrotechnique
BP 15155 Dakar - Sénégal Tél : +221 33 820 60 84
email : [email protected]
heat pipe 100-200 678.500 1.044
VAT
Included.
Supply and installation
only in Dakar
Rayon vert SARL 34, Mermoz Pyrotechnique
ancienne piste BP : 11600, Dakar Sénégal
Tél. : 33 860 13 04 Email : [email protected]
Vacuum pipe with forced circulation
150 1.795.000 2.762 supply and installation included
heat pipe with copper heat exchanger in
the tank
150 755.000 1162 25% sales
200 813.000 1.251
300 897.000 1.380
heat pipe galvanized
steel
80 305.000 469
Installation with boiler link
200€ more
150 465.000 715
300 680.000 1.046
heat pipe alluminum
80 355.750 547
150 557.500 858
300 759.500 1.168
24
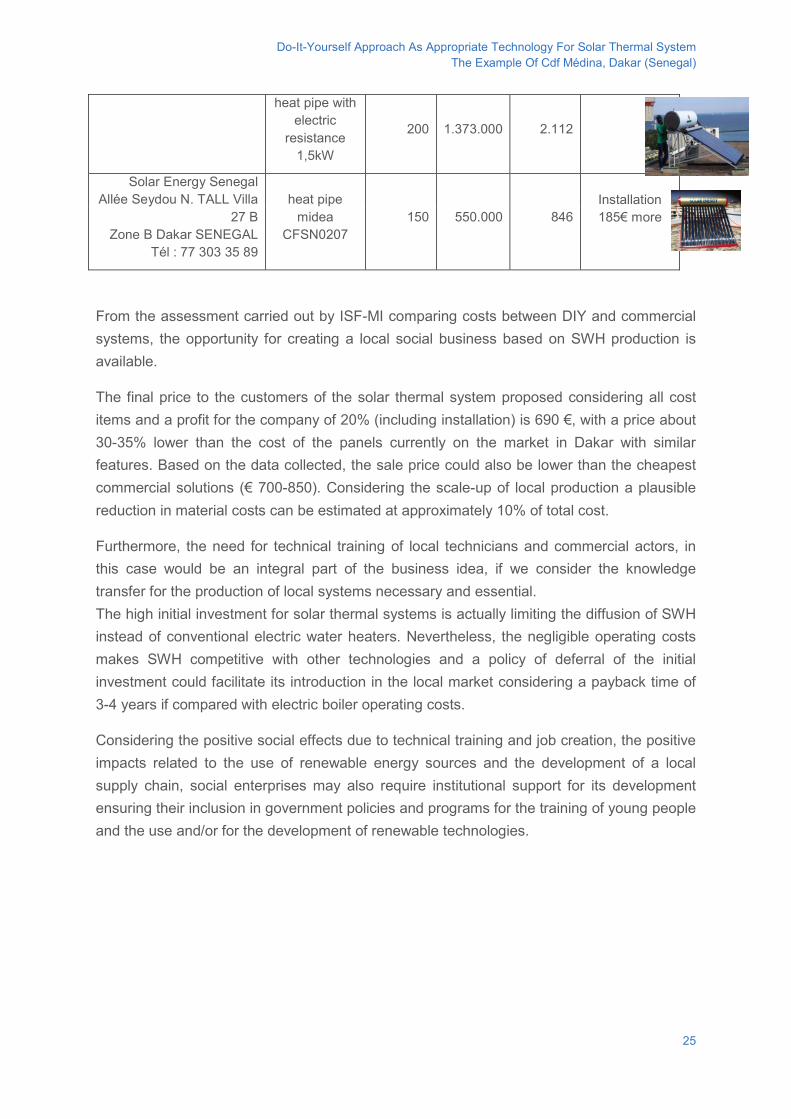
Do-It-Yourself Approach As Appropriate Technology For Solar Thermal System The Example Of Cdf Médina, Dakar (Senegal)
heat pipe with electric
resistance 1,5kW
200 1.373.000 2.112
Solar Energy Senegal Allée Seydou N. TALL Villa
27 B Zone B Dakar SENEGAL
Tél : 77 303 35 89
heat pipe midea
CFSN0207 150 550.000 846
Installation 185€ more
From the assessment carried out by ISF-MI comparing costs between DIY and commercial systems, the opportunity for creating a local social business based on SWH production is available.
The final price to the customers of the solar thermal system proposed considering all cost items and a profit for the company of 20% (including installation) is 690 €, with a price about 30-35% lower than the cost of the panels currently on the market in Dakar with similar features. Based on the data collected, the sale price could also be lower than the cheapest commercial solutions (€ 700-850). Considering the scale-up of local production a plausible reduction in material costs can be estimated at approximately 10% of total cost.
Furthermore, the need for technical training of local technicians and commercial actors, in this case would be an integral part of the business idea, if we consider the knowledge transfer for the production of local systems necessary and essential. The high initial investment for solar thermal systems is actually limiting the diffusion of SWH instead of conventional electric water heaters. Nevertheless, the negligible operating costs makes SWH competitive with other technologies and a policy of deferral of the initial investment could facilitate its introduction in the local market considering a payback time of 3-4 years if compared with electric boiler operating costs.
Considering the positive social effects due to technical training and job creation, the positive impacts related to the use of renewable energy sources and the development of a local supply chain, social enterprises may also require institutional support for its development ensuring their inclusion in government policies and programs for the training of young people and the use and/or for the development of renewable technologies.
25
Do-It-Yourself Approach As Appropriate Technology For Solar Thermal System The Example Of Cdf Médina, Dakar (Senegal)
BIBLIOGRAPHY CENTRAL INTELLIGENCE AGENGY (2014) The World Factbook
EUROPEAN COMMISSION (2004) Project Cycle Management Guidelines. EuropeAid Cooperation Office.
Gleick, P. H. 1998. The World’s Water 1998-199. Washington, DC: Island Press.
Langniß, O., & Ince D., 2004. Solar water heating A Viable Industry in Developing Countries. Refocus.
Milton, S., 2007. Sustainable Development and Solar Water Heating Systems: An analysis of barriers to technology diffusion and recommendations for policy interventions. IDEAS. http://fletcher.tufts.edu/ierp/ideas/default.html
Sitzmann, B., & Langenbruck, Ö., 2003. Solar water heater with thermosyphon circulation. Infogate GTZ. http://leebell.net/packratworkshop/pdf/solar_water_heating.pdf. Accessed January 2014.
UNITED NATIONS DEVELOPMENT PROGRAMME (2014) Human Development Report
26
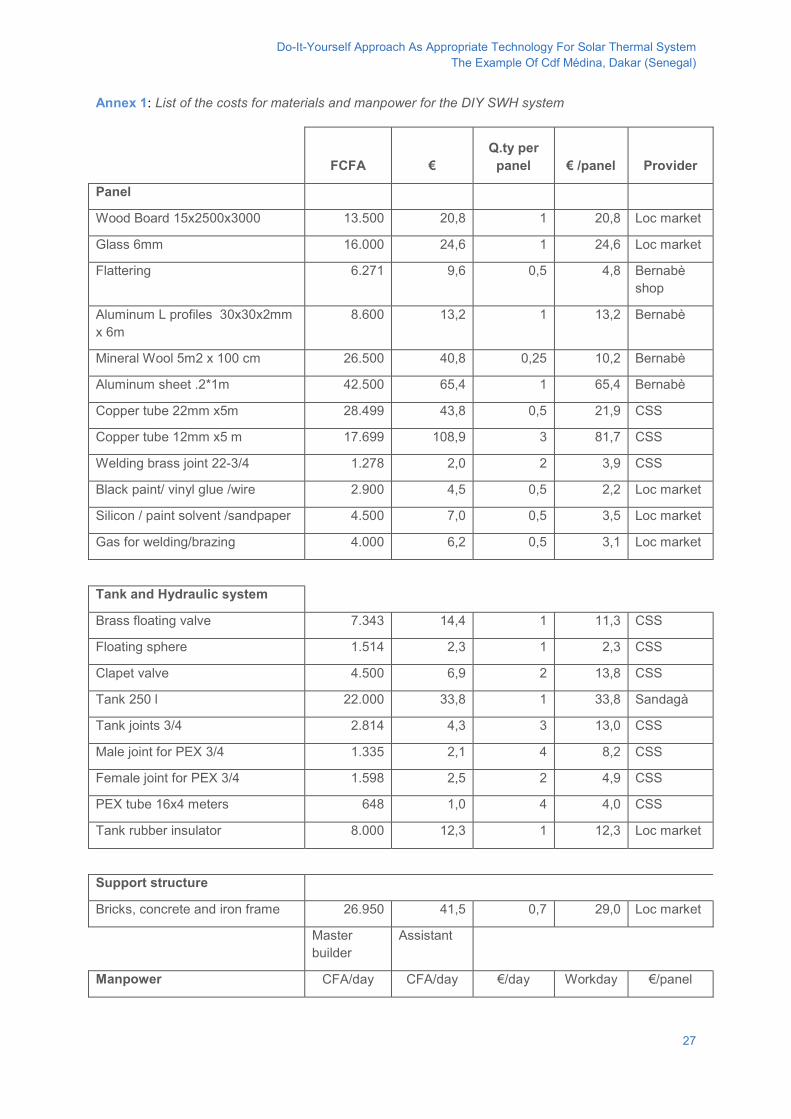
Do-It-Yourself Approach As Appropriate Technology For Solar Thermal System The Example Of Cdf Médina, Dakar (Senegal)
Annex 1: List of the costs for materials and manpower for the DIY SWH system
FCFA € Q.ty per
panel € /panel Provider
Panel
Wood Board 15x2500x3000 13.500 20,8 1 20,8 Loc market
Glass 6mm 16.000 24,6 1 24,6 Loc market
Flattering 6.271 9,6 0,5 4,8 Bernabè shop
Aluminum L profiles 30x30x2mm x 6m
8.600 13,2 1 13,2 Bernabè
Mineral Wool 5m2 x 100 cm 26.500 40,8 0,25 10,2 Bernabè
Aluminum sheet .2*1m 42.500 65,4 1 65,4 Bernabè
Copper tube 22mm x5m 28.499 43,8 0,5 21,9 CSS
Copper tube 12mm x5 m 17.699 108,9 3 81,7 CSS
Welding brass joint 22-3/4 1.278 2,0 2 3,9 CSS
Black paint/ vinyl glue /wire 2.900 4,5 0,5 2,2 Loc market
Silicon / paint solvent /sandpaper 4.500 7,0 0,5 3,5 Loc market
Gas for welding/brazing 4.000 6,2 0,5 3,1 Loc market
Tank and Hydraulic system
Brass floating valve 7.343 14,4 1 11,3 CSS
Floating sphere 1.514 2,3 1 2,3 CSS
Clapet valve 4.500 6,9 2 13,8 CSS
Tank 250 l 22.000 33,8 1 33,8 Sandagà
Tank joints 3/4 2.814 4,3 3 13,0 CSS
Male joint for PEX 3/4 1.335 2,1 4 8,2 CSS
Female joint for PEX 3/4 1.598 2,5 2 4,9 CSS
PEX tube 16x4 meters 648 1,0 4 4,0 CSS
Tank rubber insulator 8.000 12,3 1 12,3 Loc market
Support structure
Bricks, concrete and iron frame 26.950 41,5 0,7 29,0 Loc market
Master builder
Assistant
Manpower CFA/day CFA/day €/day Workday €/panel
27

Do-It-Yourself Approach As Appropriate Technology For Solar Thermal System The Example Of Cdf Médina, Dakar (Senegal)
/panel
Bricklayer 3182 1590 7,34 1,5 11,0
Woodworker 3636 1818 8,39 1 8,4
Plumber 5455 1636 10,90 3 32,7
28

http://www.gdee.eu
This project is funded by
Essential oilextraction with concentrating Solar Thermal EnergyFrançois Veynandt
PHOTO: Image Author: Dupont, 2008 Sche�er Concentrator.
CASE STUDIES

Essential oil extraction with concentrating Solar Thermal Energy
DL B 10735-2015 ISBN 978-84-606-7546-4
COORDINATED BYAgustí Pérez-Foguet, Enric Velo, Pol Arranz, Ricard Ginéand Boris Lazzarini (Universitat Politècnica de Catalunya)Manuel Sierra (Universidad Politécnica de Madrid)Alejandra Boni and Jordi Peris (Universitat Politècnica de València)Guido Zolezzi and Gabriella Trombino (Università degli Studi di Trento)Rhoda Trimingham (Loughborough University)Valentín Villarroel (ONGAWA)Neil Nobles and Meadhbh Bolger (Practical Action)Francesco Mongera (Training Center for International Cooperation)Katie Cresswell-Maynard (Engineering Without Border UK)
EDITED BY Global Dimension in Engineering Education
Citation: Veynandt, F. (2015) ' Essential oil extraction with concentrating Solar Thermal Energy', in Case studies for developing globally responsible engineers, GDEE (eds.), Global Dimension in Engineering Education, Barcelona. Available from: http://gdee.eu/index.php/resources.html
This publication is distributedunder an Attribution- Noncommercial-Share Alike License for Creative Commons
CASE STUDIES
Disclaimer: This document has been produced with the financial assistance of the European UnionThe contents of this document are the sole responsibility of the authors and can under no circumstances be regarded as reflecting the position of the European Union

Essential oil extraction with concentrating Solar Thermal Energy
ESSENTIAL OIL EXTRACTION WITH CONCENTRATING SOLAR THERMAL ENERGY
François Veynandt, Rapsodee Laboratory, Ecole des Mines Albi, France
1
Essential oil extraction with concentrating Solar Thermal Energy
INDEX 1. INTRODUCTION ............................................................................................................................... 3 1.1. LEARNING OUTCOMES .............................................................................................................. 3 1.2. ACTIVITIES .............................................................................................................................. 4
2. DESCRIPTION OF THE CONTEXT ................................................................................................. 4 3. CLASS ACTIVITY: DISTILLATION OF PEPPERMINT IN FRANCE ........................................... 10 3.1 CORRECTION OF CLASS ACTIVITY: DISTILLATION OF PEPPERMINT IN FRANCE ........................... 11
4 HOMEWORK ACTIVITY: DISTILLATION OF OREGANO IN PERU ............................................ 17 4.1. Correction of Homework activity: Distillation of Oregano in Peru ....................................... 19
BIBLIOGRAPHY ................................................................................................................................. 39 FURTHER SUGGESTED MATERIAL ................................................................................................ 40
2
Essential oil extraction with concentrating Solar Thermal Energy
1. INTRODUCTION The modern world economy is based on growth: investing today to generate more revenues tomorrow. The creation of debt is borrowing from future work and to pay the interest, it is assumed that more work will be done in the future than today. As a result, growth is required to sustain the modern economy (Jones et Vollrath, 2013). To improve performance, a common solution is for companies to become specialized (Taylorism) and grow in size (economies of scale). This works well to a certain extent, but in reality, exponential growth is not sustainable (Heinberg, 2011) and centralizing production is not always efficient. For example, large scale mechanized agriculture consumes 10 calories (mainly in form of fossil fuels) to provide 1 calorie (in food) (Thomas L. Acker et al. 2009). This is very inefficient compared to a small scale farmer that produces more calories than he spends in his fields: less than 1 calorie is used to produce 1 calorie of food. From the organizational point of view, small scale also makes more sense: “Small is beautiful” (Schumacher, 1993). Over-centralized modern society relies on a lot of energy to sustain its complex systems (electrical grid, transportation, administration...). Decentralization can bring benefits to a certain extent, like improving people’s resilience (capacity to adapt, resist to a change), which contributes to a more socially equal economy (Edward Goldsmith, 2014). In the field of energy, solar energy is available worldwide and so is fundamentally decentralized. Many regions have good solar radiation for at least some part of the year. This makes solar energy a good candidate as a source of heat energy for various applications. Using small scale systems can make energy accessible to people with little resources.
This case study investigates the production capacity of a distillation unit using concentrated solar energy. The opportunity of small scale decentralized technology is discussed.
1.1. LEARNING OUTCOMES
The students will:
• Study a solar concentrator based on a portion of a parabola curve, with interesting optical characteristics.
• Study optical losses on a concentrating solar technology. • Search for information on solar resources and agricultural production. • Evaluate the solar resource of two sites based on online databases, one in the
Northern hemisphere, and the other in the Southern hemisphere. • Establish a simple heat transfer model. • Size the system based on calculations of the production capacity of the solar
process.
3
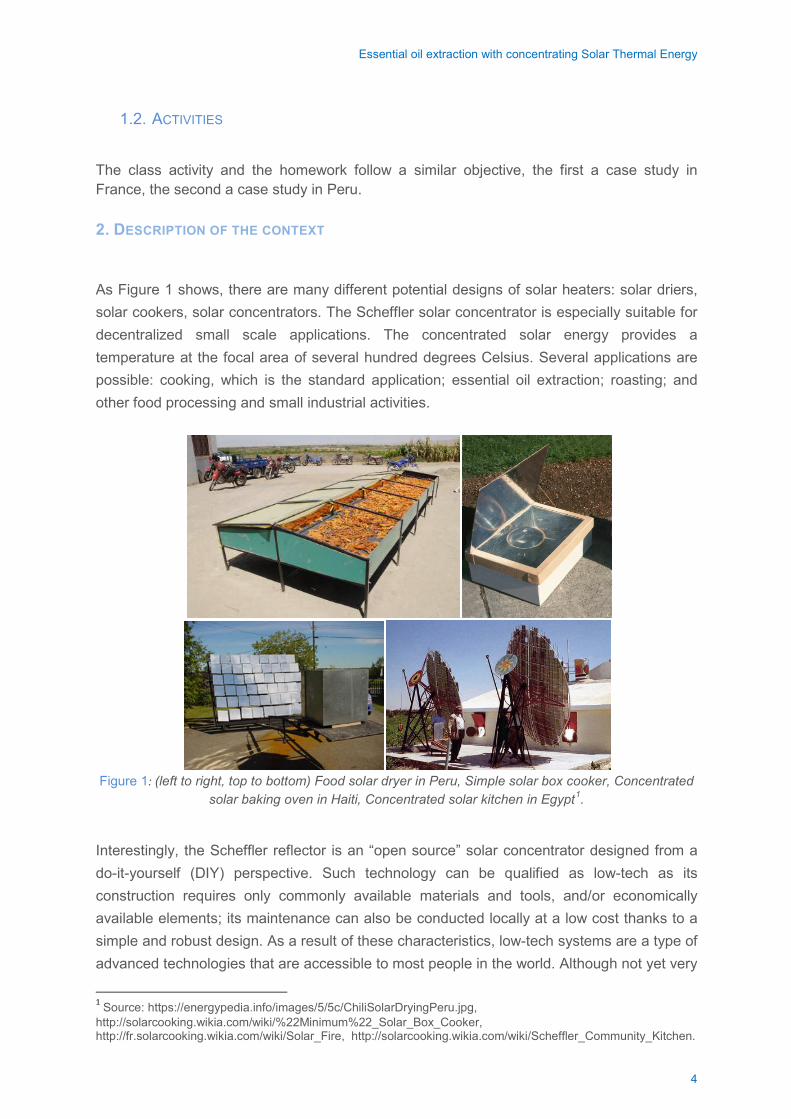
Essential oil extraction with concentrating Solar Thermal Energy
1.2. ACTIVITIES
The class activity and the homework follow a similar objective, the first a case study in France, the second a case study in Peru.
2. DESCRIPTION OF THE CONTEXT
As Figure 1 shows, there are many different potential designs of solar heaters: solar driers, solar cookers, solar concentrators. The Scheffler solar concentrator is especially suitable for decentralized small scale applications. The concentrated solar energy provides a temperature at the focal area of several hundred degrees Celsius. Several applications are possible: cooking, which is the standard application; essential oil extraction; roasting; and other food processing and small industrial activities.
Figure 1: (left to right, top to bottom) Food solar dryer in Peru, Simple solar box cooker, Concentrated
solar baking oven in Haiti, Concentrated solar kitchen in Egypt1.
Interestingly, the Scheffler reflector is an “open source” solar concentrator designed from a do-it-yourself (DIY) perspective. Such technology can be qualified as low-tech as its construction requires only commonly available materials and tools, and/or economically available elements; its maintenance can also be conducted locally at a low cost thanks to a simple and robust design. As a result of these characteristics, low-tech systems are a type of advanced technologies that are accessible to most people in the world. Although not yet very
1 Source: https://energypedia.info/images/5/5c/ChiliSolarDryingPeru.jpg, http://solarcooking.wikia.com/wiki/%22Minimum%22_Solar_Box_Cooker, http://fr.solarcooking.wikia.com/wiki/Solar_Fire, http://solarcooking.wikia.com/wiki/Scheffler_Community_Kitchen.
4
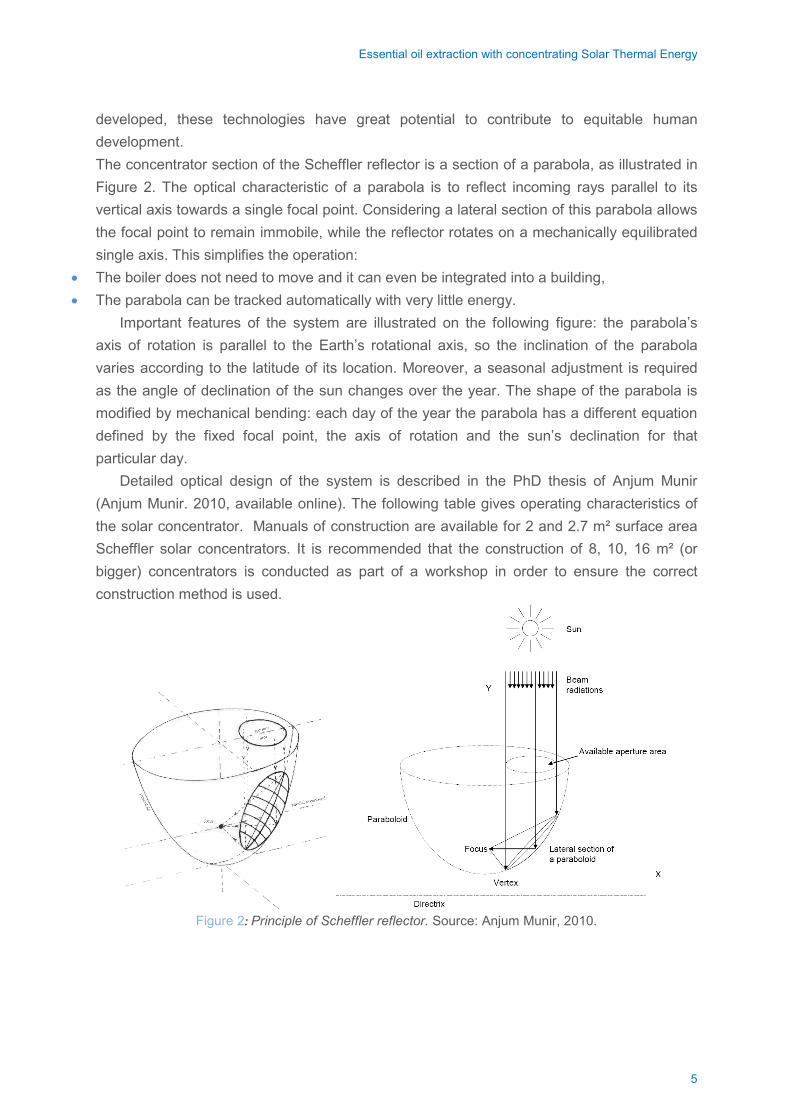
Essential oil extraction with concentrating Solar Thermal Energy
developed, these technologies have great potential to contribute to equitable human development. The concentrator section of the Scheffler reflector is a section of a parabola, as illustrated in Figure 2. The optical characteristic of a parabola is to reflect incoming rays parallel to its vertical axis towards a single focal point. Considering a lateral section of this parabola allows the focal point to remain immobile, while the reflector rotates on a mechanically equilibrated single axis. This simplifies the operation:
• The boiler does not need to move and it can even be integrated into a building, • The parabola can be tracked automatically with very little energy.
Important features of the system are illustrated on the following figure: the parabola’s axis of rotation is parallel to the Earth’s rotational axis, so the inclination of the parabola varies according to the latitude of its location. Moreover, a seasonal adjustment is required as the angle of declination of the sun changes over the year. The shape of the parabola is modified by mechanical bending: each day of the year the parabola has a different equation defined by the fixed focal point, the axis of rotation and the sun’s declination for that particular day.
Detailed optical design of the system is described in the PhD thesis of Anjum Munir (Anjum Munir. 2010, available online). The following table gives operating characteristics of the solar concentrator. Manuals of construction are available for 2 and 2.7 m² surface area Scheffler solar concentrators. It is recommended that the construction of 8, 10, 16 m² (or bigger) concentrators is conducted as part of a workshop in order to ensure the correct construction method is used.
Figure 2: Principle of Scheffler reflector. Source: Anjum Munir, 2010.
5
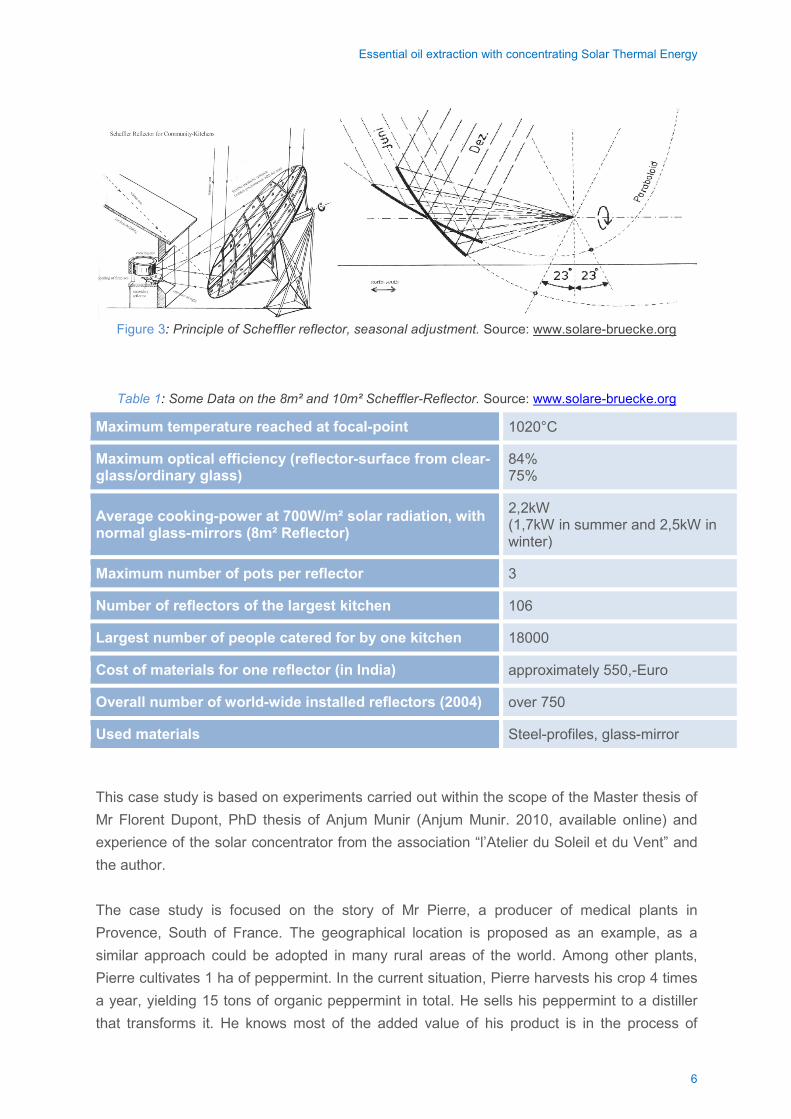
Essential oil extraction with concentrating Solar Thermal Energy
Figure 3: Principle of Scheffler reflector, seasonal adjustment. Source: www.solare-bruecke.org
Table 1: Some Data on the 8m² and 10m² Scheffler-Reflector. Source: www.solare-bruecke.org
Maximum temperature reached at focal-point 1020°C
Maximum optical efficiency (reflector-surface from clear-glass/ordinary glass)
84% 75%
Average cooking-power at 700W/m² solar radiation, with normal glass-mirrors (8m² Reflector)
2,2kW (1,7kW in summer and 2,5kW in winter)
Maximum number of pots per reflector 3
Number of reflectors of the largest kitchen 106
Largest number of people catered for by one kitchen 18000
Cost of materials for one reflector (in India) approximately 550,-Euro
Overall number of world-wide installed reflectors (2004) over 750
Used materials Steel-profiles, glass-mirror
This case study is based on experiments carried out within the scope of the Master thesis of Mr Florent Dupont, PhD thesis of Anjum Munir (Anjum Munir. 2010, available online) and experience of the solar concentrator from the association “l’Atelier du Soleil et du Vent” and the author. The case study is focused on the story of Mr Pierre, a producer of medical plants in Provence, South of France. The geographical location is proposed as an example, as a similar approach could be adopted in many rural areas of the world. Among other plants, Pierre cultivates 1 ha of peppermint. In the current situation, Pierre harvests his crop 4 times a year, yielding 15 tons of organic peppermint in total. He sells his peppermint to a distiller that transforms it. He knows most of the added value of his product is in the process of
6
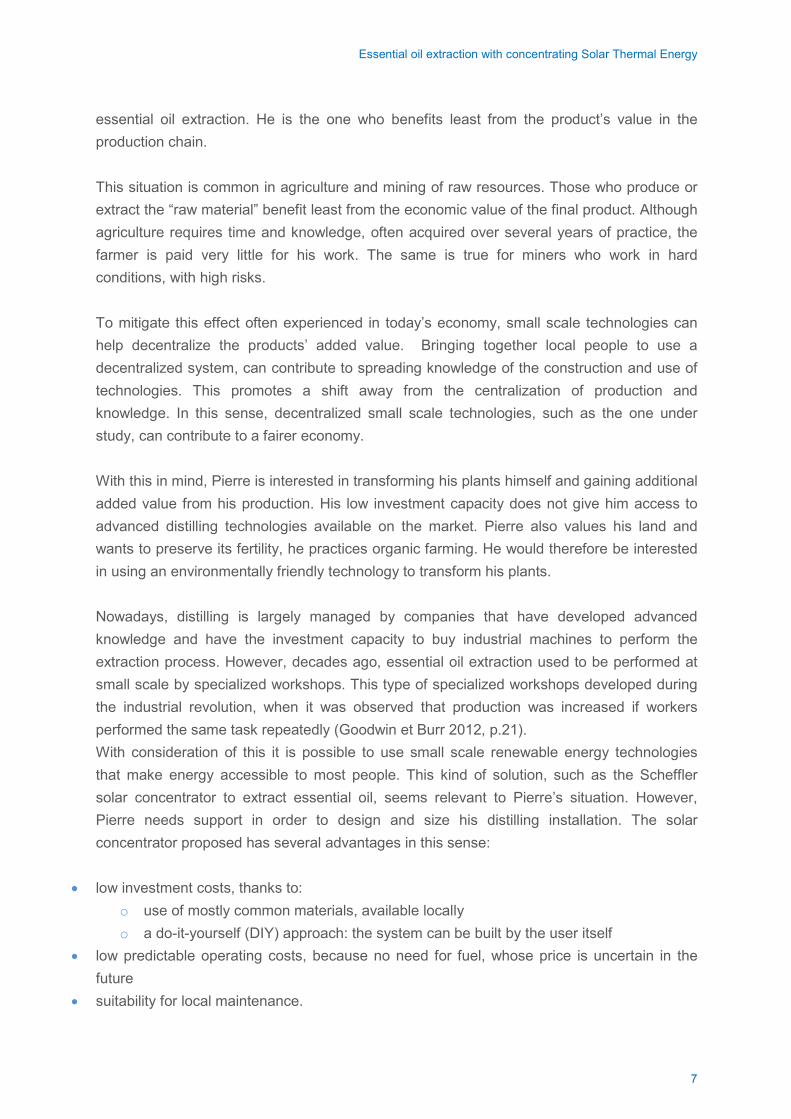
Essential oil extraction with concentrating Solar Thermal Energy
essential oil extraction. He is the one who benefits least from the product’s value in the production chain. This situation is common in agriculture and mining of raw resources. Those who produce or extract the “raw material” benefit least from the economic value of the final product. Although agriculture requires time and knowledge, often acquired over several years of practice, the farmer is paid very little for his work. The same is true for miners who work in hard conditions, with high risks. To mitigate this effect often experienced in today’s economy, small scale technologies can help decentralize the products’ added value. Bringing together local people to use a decentralized system, can contribute to spreading knowledge of the construction and use of technologies. This promotes a shift away from the centralization of production and knowledge. In this sense, decentralized small scale technologies, such as the one under study, can contribute to a fairer economy. With this in mind, Pierre is interested in transforming his plants himself and gaining additional added value from his production. His low investment capacity does not give him access to advanced distilling technologies available on the market. Pierre also values his land and wants to preserve its fertility, he practices organic farming. He would therefore be interested in using an environmentally friendly technology to transform his plants. Nowadays, distilling is largely managed by companies that have developed advanced knowledge and have the investment capacity to buy industrial machines to perform the extraction process. However, decades ago, essential oil extraction used to be performed at small scale by specialized workshops. This type of specialized workshops developed during the industrial revolution, when it was observed that production was increased if workers performed the same task repeatedly (Goodwin et Burr 2012, p.21). With consideration of this it is possible to use small scale renewable energy technologies that make energy accessible to most people. This kind of solution, such as the Scheffler solar concentrator to extract essential oil, seems relevant to Pierre’s situation. However, Pierre needs support in order to design and size his distilling installation. The solar concentrator proposed has several advantages in this sense:
• low investment costs, thanks to: o use of mostly common materials, available locally o a do-it-yourself (DIY) approach: the system can be built by the user itself
• low predictable operating costs, because no need for fuel, whose price is uncertain in the future
• suitability for local maintenance.
7
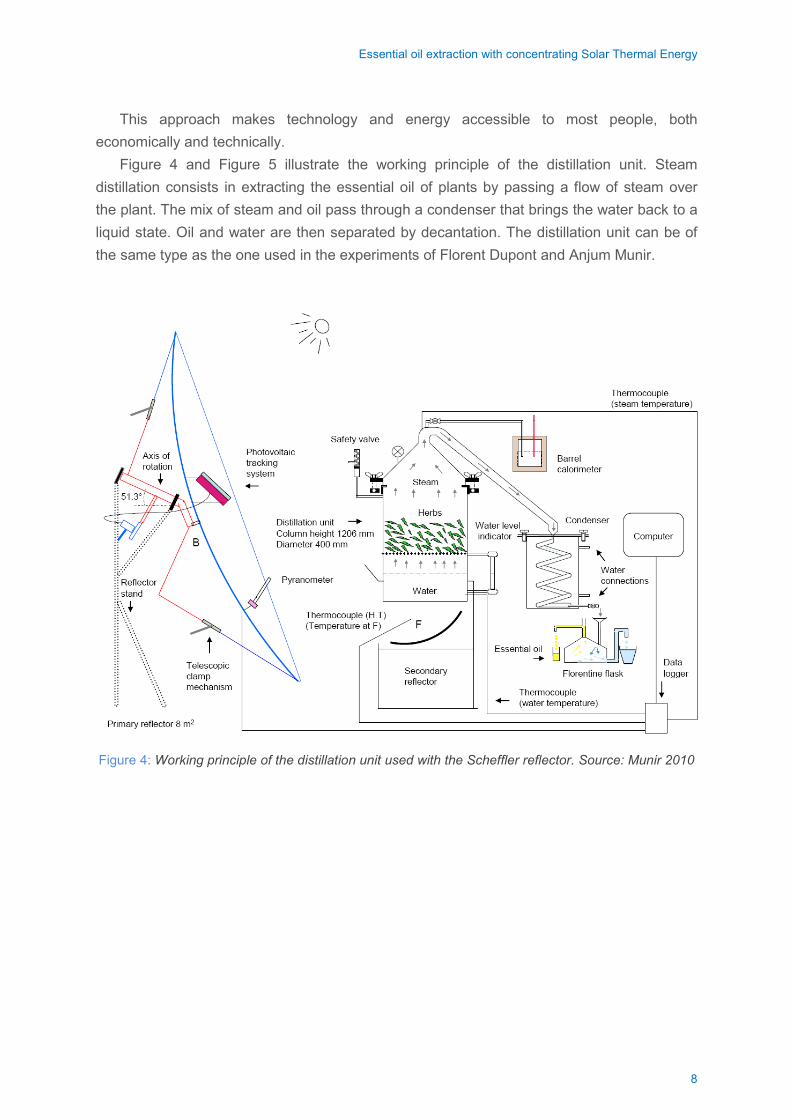
Essential oil extraction with concentrating Solar Thermal Energy
This approach makes technology and energy accessible to most people, both economically and technically.
Figure 4 and Figure 5 illustrate the working principle of the distillation unit. Steam distillation consists in extracting the essential oil of plants by passing a flow of steam over the plant. The mix of steam and oil pass through a condenser that brings the water back to a liquid state. Oil and water are then separated by decantation. The distillation unit can be of the same type as the one used in the experiments of Florent Dupont and Anjum Munir.
Figure 4: Working principle of the distillation unit used with the Scheffler reflector. Source: Munir 2010
8
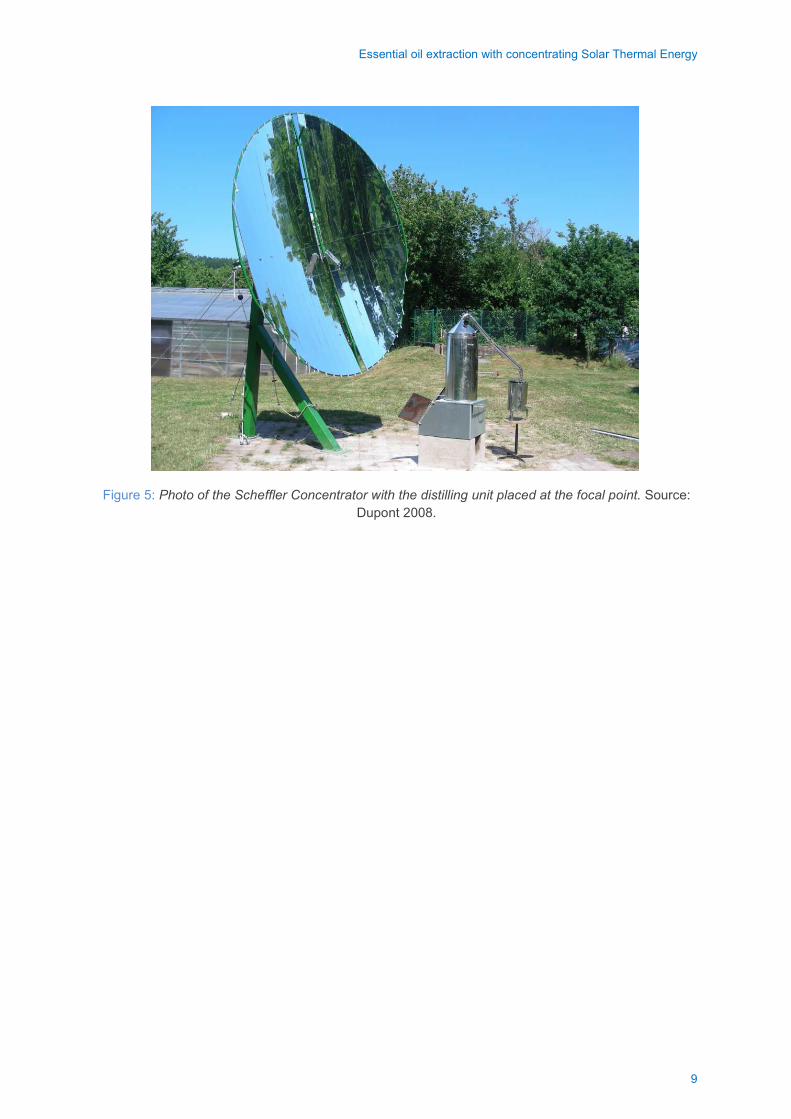
Essential oil extraction with concentrating Solar Thermal Energy
Figure 5: Photo of the Scheffler Concentrator with the distilling unit placed at the focal point. Source: Dupont 2008.
9
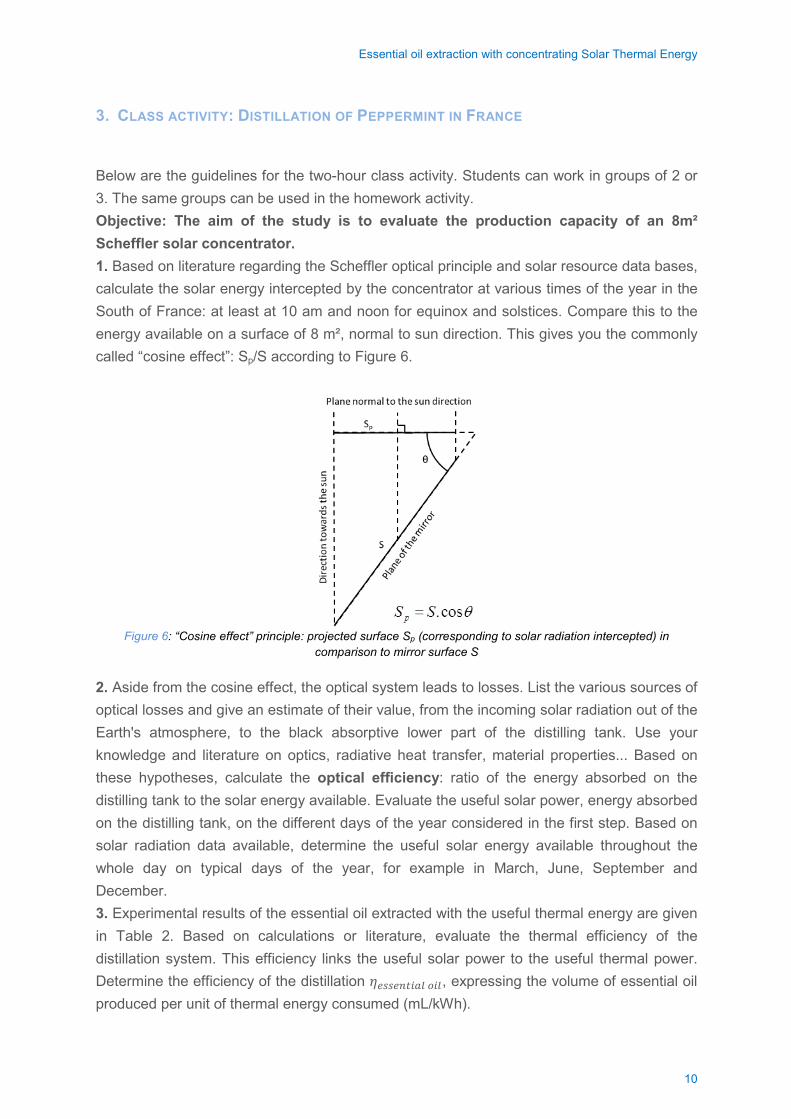
Essential oil extraction with concentrating Solar Thermal Energy
3. CLASS ACTIVITY: DISTILLATION OF PEPPERMINT IN FRANCE
Below are the guidelines for the two-hour class activity. Students can work in groups of 2 or 3. The same groups can be used in the homework activity. Objective: The aim of the study is to evaluate the production capacity of an 8m² Scheffler solar concentrator. 1. Based on literature regarding the Scheffler optical principle and solar resource data bases, calculate the solar energy intercepted by the concentrator at various times of the year in the South of France: at least at 10 am and noon for equinox and solstices. Compare this to the energy available on a surface of 8 m², normal to sun direction. This gives you the commonly called “cosine effect”: Sp/S according to Figure 6.
Figure 6: “Cosine effect” principle: projected surface Sp (corresponding to solar radiation intercepted) in
comparison to mirror surface S
2. Aside from the cosine effect, the optical system leads to losses. List the various sources of optical losses and give an estimate of their value, from the incoming solar radiation out of the Earth's atmosphere, to the black absorptive lower part of the distilling tank. Use your knowledge and literature on optics, radiative heat transfer, material properties... Based on these hypotheses, calculate the optical efficiency: ratio of the energy absorbed on the distilling tank to the solar energy available. Evaluate the useful solar power, energy absorbed on the distilling tank, on the different days of the year considered in the first step. Based on solar radiation data available, determine the useful solar energy available throughout the whole day on typical days of the year, for example in March, June, September and December. 3. Experimental results of the essential oil extracted with the useful thermal energy are given in Table 2. Based on calculations or literature, evaluate the thermal efficiency of the distillation system. This efficiency links the useful solar power to the useful thermal power. Determine the efficiency of the distillation 𝜂𝜂𝑒𝑒𝑒𝑒𝑒𝑒𝑒𝑒𝑒𝑒𝑒𝑒𝑒𝑒𝑒𝑒𝑒𝑒 𝑜𝑜𝑒𝑒𝑒𝑒, expressing the volume of essential oil produced per unit of thermal energy consumed (mL/kWh).
10
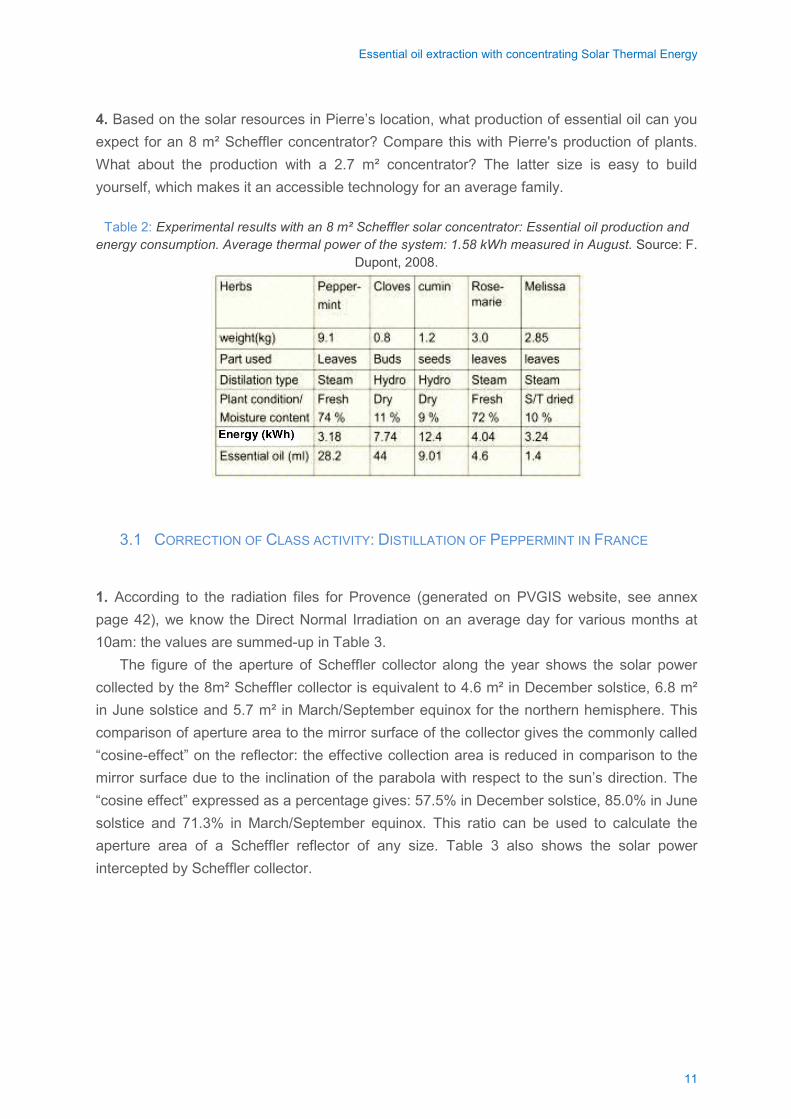
Essential oil extraction with concentrating Solar Thermal Energy
4. Based on the solar resources in Pierre’s location, what production of essential oil can you expect for an 8 m² Scheffler concentrator? Compare this with Pierre's production of plants. What about the production with a 2.7 m² concentrator? The latter size is easy to build yourself, which makes it an accessible technology for an average family.
Table 2: Experimental results with an 8 m² Scheffler solar concentrator: Essential oil production and energy consumption. Average thermal power of the system: 1.58 kWh measured in August. Source: F.
Dupont, 2008.
3.1 CORRECTION OF CLASS ACTIVITY: DISTILLATION OF PEPPERMINT IN FRANCE
1. According to the radiation files for Provence (generated on PVGIS website, see annex page 42), we know the Direct Normal Irradiation on an average day for various months at 10am: the values are summed-up in Table 3.
The figure of the aperture of Scheffler collector along the year shows the solar power collected by the 8m² Scheffler collector is equivalent to 4.6 m² in December solstice, 6.8 m² in June solstice and 5.7 m² in March/September equinox for the northern hemisphere. This comparison of aperture area to the mirror surface of the collector gives the commonly called “cosine-effect” on the reflector: the effective collection area is reduced in comparison to the mirror surface due to the inclination of the parabola with respect to the sun’s direction. The “cosine effect” expressed as a percentage gives: 57.5% in December solstice, 85.0% in June solstice and 71.3% in March/September equinox. This ratio can be used to calculate the aperture area of a Scheffler reflector of any size. Table 3 also shows the solar power intercepted by Scheffler collector.
11
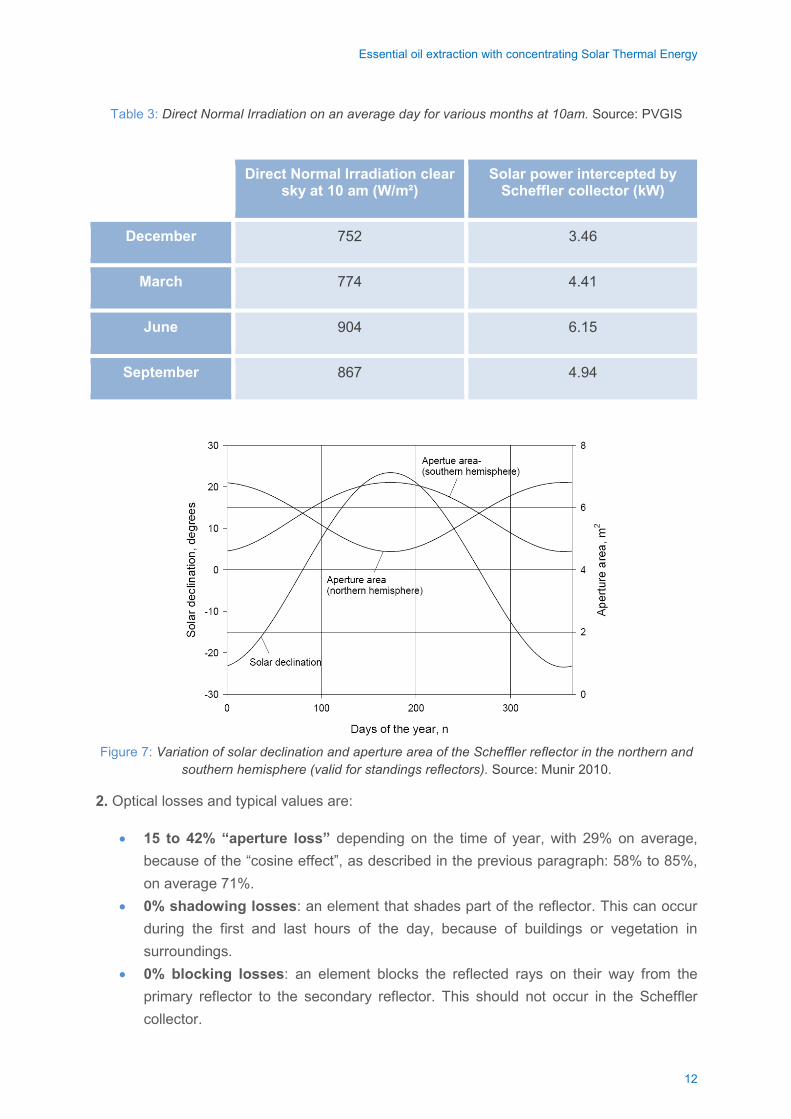
Essential oil extraction with concentrating Solar Thermal Energy
Table 3: Direct Normal Irradiation on an average day for various months at 10am. Source: PVGIS
Direct Normal Irradiation clear sky at 10 am (W/m²)
Solar power intercepted by Scheffler collector (kW)
December 752 3.46
March 774 4.41
June 904 6.15
September 867 4.94
Figure 7: Variation of solar declination and aperture area of the Scheffler reflector in the northern and
southern hemisphere (valid for standings reflectors). Source: Munir 2010.
2. Optical losses and typical values are:
• 15 to 42% “aperture loss” depending on the time of year, with 29% on average, because of the “cosine effect”, as described in the previous paragraph: 58% to 85%, on average 71%.
• 0% shadowing losses: an element that shades part of the reflector. This can occur during the first and last hours of the day, because of buildings or vegetation in surroundings.
• 0% blocking losses: an element blocks the reflected rays on their way from the primary reflector to the secondary reflector. This should not occur in the Scheffler collector.
12
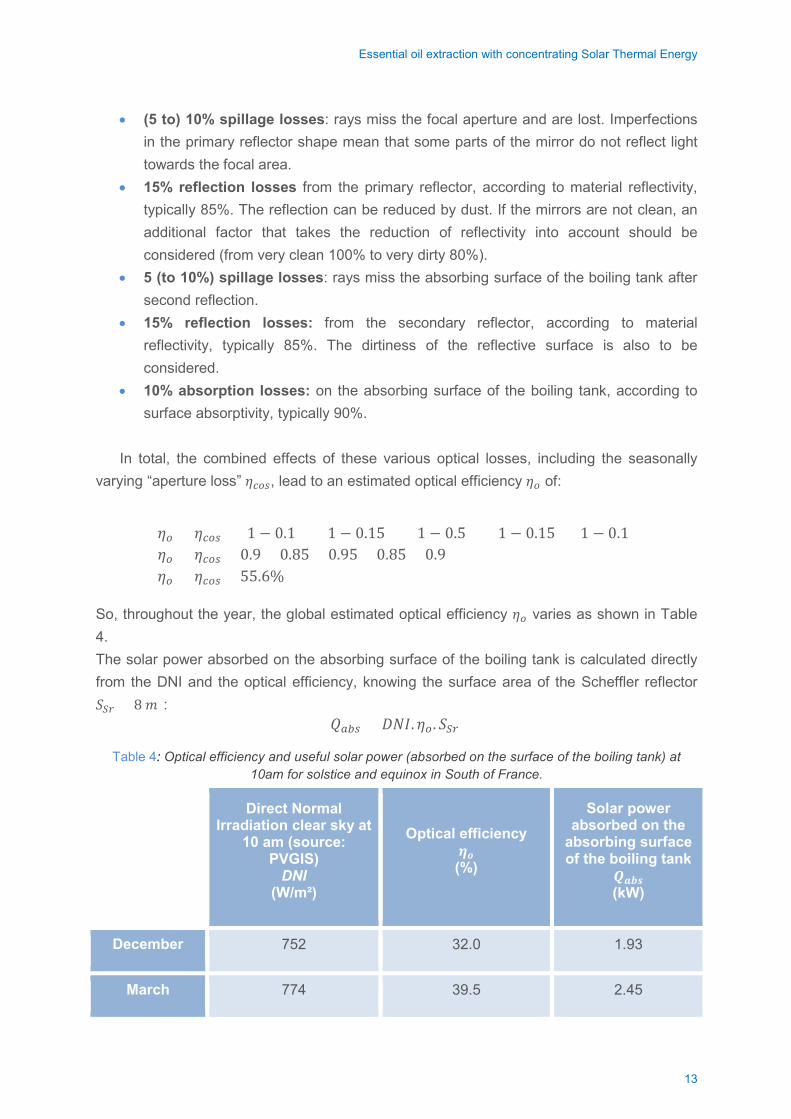
Essential oil extraction with concentrating Solar Thermal Energy
• (5 to) 10% spillage losses: rays miss the focal aperture and are lost. Imperfections in the primary reflector shape mean that some parts of the mirror do not reflect light towards the focal area.
• 15% reflection losses from the primary reflector, according to material reflectivity, typically 85%. The reflection can be reduced by dust. If the mirrors are not clean, an additional factor that takes the reduction of reflectivity into account should be considered (from very clean 100% to very dirty 80%).
• 5 (to 10%) spillage losses: rays miss the absorbing surface of the boiling tank after second reflection.
• 15% reflection losses: from the secondary reflector, according to material reflectivity, typically 85%. The dirtiness of the reflective surface is also to be considered.
• 10% absorption losses: on the absorbing surface of the boiling tank, according to surface absorptivity, typically 90%.
In total, the combined effects of these various optical losses, including the seasonally varying “aperture loss” 𝜂𝜂𝑐𝑐𝑜𝑜𝑒𝑒, lead to an estimated optical efficiency 𝜂𝜂𝑜𝑜 of:
𝜂𝜂𝑜𝑜 = 𝜂𝜂𝑐𝑐𝑜𝑜𝑒𝑒 · (1 − 0.1) · (1 − 0.15) · (1 − 0.5) · (1 − 0.15) · (1 − 0.1) 𝜂𝜂𝑜𝑜 = 𝜂𝜂𝑐𝑐𝑜𝑜𝑒𝑒 · 0.9 · 0.85 · 0.95 · 0.85 · 0.9 𝜂𝜂𝑜𝑜 = 𝜂𝜂𝑐𝑐𝑜𝑜𝑒𝑒 · 55.6%
So, throughout the year, the global estimated optical efficiency 𝜂𝜂𝑜𝑜 varies as shown in Table 4. The solar power absorbed on the absorbing surface of the boiling tank is calculated directly from the DNI and the optical efficiency, knowing the surface area of the Scheffler reflector 𝑆𝑆𝑆𝑆𝑆𝑆 = 8 𝑚𝑚²:
𝑄𝑄𝑒𝑒𝑎𝑎𝑒𝑒 = 𝐷𝐷𝐷𝐷𝐷𝐷. 𝜂𝜂𝑜𝑜 . 𝑆𝑆𝑆𝑆𝑆𝑆
Table 4: Optical efficiency and useful solar power (absorbed on the surface of the boiling tank) at 10am for solstice and equinox in South of France.
Direct Normal Irradiation clear sky at
10 am (source: PVGIS)
DNI (W/m²)
Optical efficiency 𝜼𝜼𝒐𝒐 (%)
Solar power absorbed on the
absorbing surface of the boiling tank
𝑸𝑸𝒂𝒂𝒂𝒂𝒂𝒂 (kW)
December 752 32.0 1.93
March 774 39.5 2.45
13
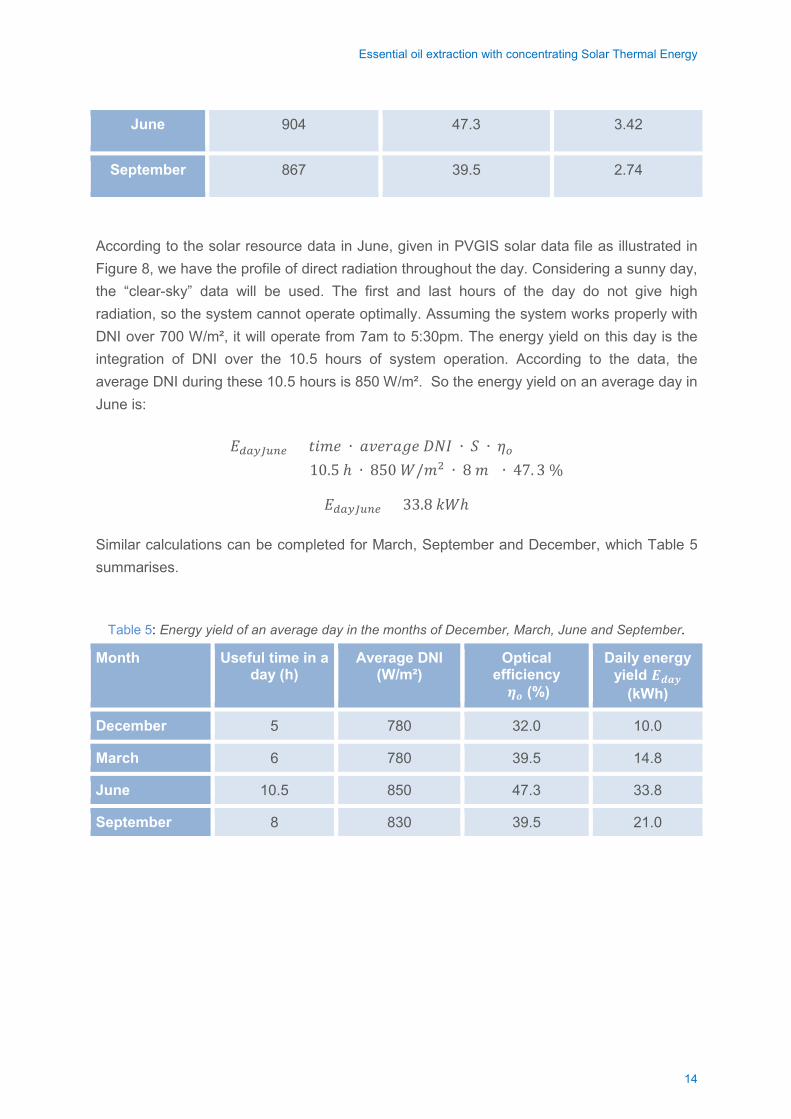
Essential oil extraction with concentrating Solar Thermal Energy
June 904 47.3 3.42
September 867 39.5 2.74
According to the solar resource data in June, given in PVGIS solar data file as illustrated in Figure 8, we have the profile of direct radiation throughout the day. Considering a sunny day, the “clear-sky” data will be used. The first and last hours of the day do not give high radiation, so the system cannot operate optimally. Assuming the system works properly with DNI over 700 W/m², it will operate from 7am to 5:30pm. The energy yield on this day is the integration of DNI over the 10.5 hours of system operation. According to the data, the average DNI during these 10.5 hours is 850 W/m². So the energy yield on an average day in June is:
𝐸𝐸𝑑𝑑𝑒𝑒𝑑𝑑𝑑𝑑𝑑𝑑𝑒𝑒𝑒𝑒 = 𝑡𝑡𝑡𝑡𝑚𝑚𝑡𝑡 ∙ 𝑎𝑎𝑎𝑎𝑡𝑡𝑎𝑎𝑎𝑎𝑎𝑎𝑡𝑡 𝐷𝐷𝐷𝐷𝐷𝐷 ∙ 𝑆𝑆 ∙ 𝜂𝜂𝑜𝑜 = 10.5 ℎ ∙ 850 𝑊𝑊/𝑚𝑚2 ∙ 8 𝑚𝑚² ∙ 47. 3 %
𝐸𝐸𝑑𝑑𝑒𝑒𝑑𝑑𝑑𝑑𝑑𝑑𝑒𝑒𝑒𝑒 = 33.8 𝑘𝑘𝑊𝑊ℎ
Similar calculations can be completed for March, September and December, which Table 5 summarises.
Table 5: Energy yield of an average day in the months of December, March, June and September.
Month Useful time in a day (h)
Average DNI (W/m²)
Optical efficiency
𝜼𝜼𝒐𝒐 (%)
Daily energy yield 𝑬𝑬𝒅𝒅𝒂𝒂𝒅𝒅
(kWh)
December 5 780 32.0 10.0
March 6 780 39.5 14.8
June 10.5 850 47.3 33.8
September 8 830 39.5 21.0
14
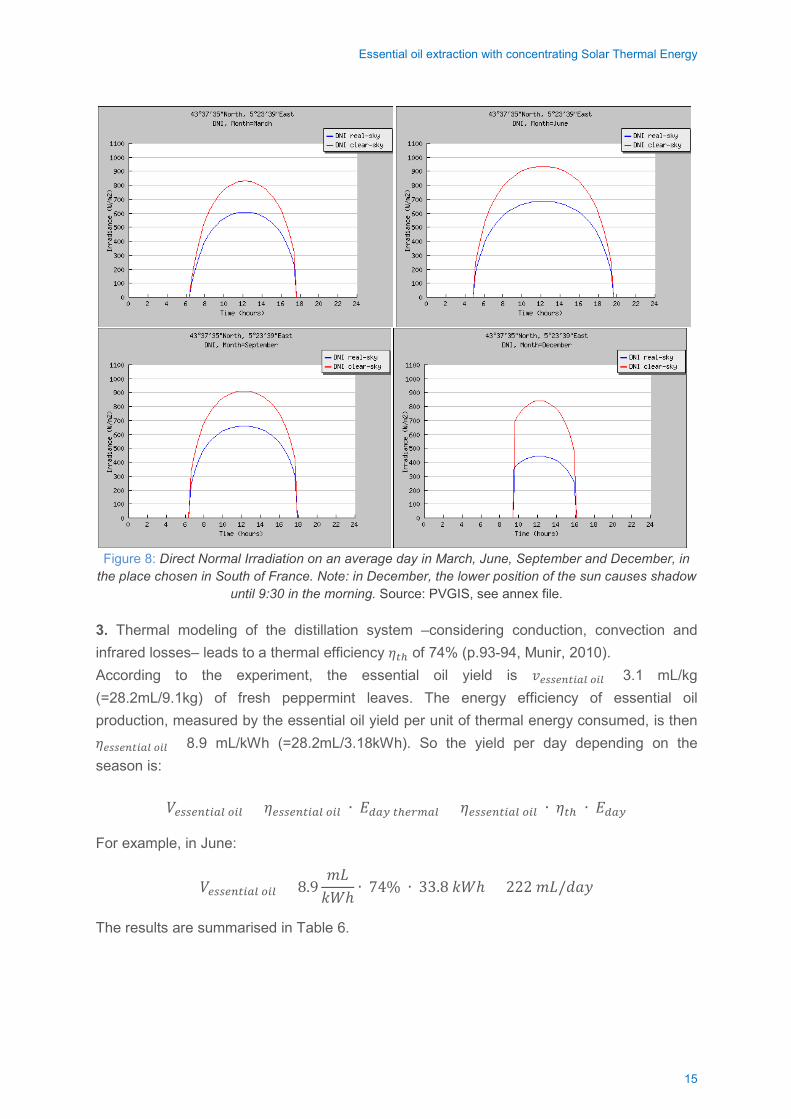
Essential oil extraction with concentrating Solar Thermal Energy
Figure 8: Direct Normal Irradiation on an average day in March, June, September and December, in
the place chosen in South of France. Note: in December, the lower position of the sun causes shadow until 9:30 in the morning. Source: PVGIS, see annex file.
3. Thermal modeling of the distillation system –considering conduction, convection and infrared losses– leads to a thermal efficiency 𝜂𝜂𝑒𝑒ℎ of 74% (p.93-94, Munir, 2010). According to the experiment, the essential oil yield is 𝑎𝑎𝑒𝑒𝑒𝑒𝑒𝑒𝑒𝑒𝑒𝑒𝑒𝑒𝑒𝑒𝑒𝑒𝑒𝑒 𝑜𝑜𝑒𝑒𝑒𝑒 = 3.1 mL/kg (=28.2mL/9.1kg) of fresh peppermint leaves. The energy efficiency of essential oil production, measured by the essential oil yield per unit of thermal energy consumed, is then 𝜂𝜂𝑒𝑒𝑒𝑒𝑒𝑒𝑒𝑒𝑒𝑒𝑒𝑒𝑒𝑒𝑒𝑒𝑒𝑒 𝑜𝑜𝑒𝑒𝑒𝑒 = 8.9 mL/kWh (=28.2mL/3.18kWh). So the yield per day depending on the season is:
𝑉𝑉𝑒𝑒𝑒𝑒𝑒𝑒𝑒𝑒𝑒𝑒𝑒𝑒𝑒𝑒𝑒𝑒𝑒𝑒 𝑜𝑜𝑒𝑒𝑒𝑒 = 𝜂𝜂𝑒𝑒𝑒𝑒𝑒𝑒𝑒𝑒𝑒𝑒𝑒𝑒𝑒𝑒𝑒𝑒𝑒𝑒 𝑜𝑜𝑒𝑒𝑒𝑒 ∙ 𝐸𝐸𝑑𝑑𝑒𝑒𝑑𝑑 𝑒𝑒ℎ𝑒𝑒𝑆𝑆𝑒𝑒𝑒𝑒𝑒𝑒 = 𝜂𝜂𝑒𝑒𝑒𝑒𝑒𝑒𝑒𝑒𝑒𝑒𝑒𝑒𝑒𝑒𝑒𝑒𝑒𝑒 𝑜𝑜𝑒𝑒𝑒𝑒 ∙ 𝜂𝜂𝑒𝑒ℎ ∙ 𝐸𝐸𝑑𝑑𝑒𝑒𝑑𝑑
For example, in June:
𝑉𝑉𝑒𝑒𝑒𝑒𝑒𝑒𝑒𝑒𝑒𝑒𝑒𝑒𝑒𝑒𝑒𝑒𝑒𝑒 𝑜𝑜𝑒𝑒𝑒𝑒 = 8.9𝑚𝑚𝑚𝑚𝑘𝑘𝑊𝑊ℎ
∙ 74% ∙ 33.8 𝑘𝑘𝑊𝑊ℎ = 222 𝑚𝑚𝑚𝑚/𝑑𝑑𝑎𝑎𝑑𝑑
The results are summarised in Table 6.
15
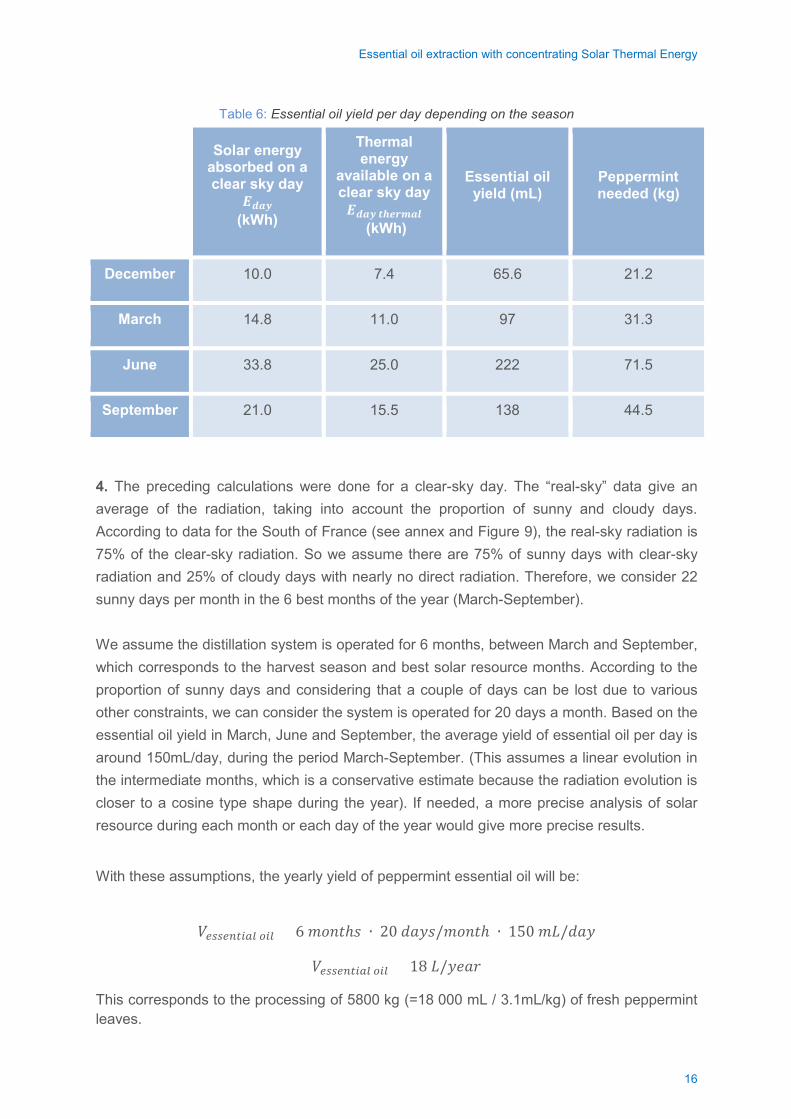
Essential oil extraction with concentrating Solar Thermal Energy
Table 6: Essential oil yield per day depending on the season
Solar energy absorbed on a clear sky day
𝑬𝑬𝒅𝒅𝒂𝒂𝒅𝒅 (kWh)
Thermal energy
available on a clear sky day 𝑬𝑬𝒅𝒅𝒂𝒂𝒅𝒅 𝒕𝒕𝒉𝒉𝒆𝒆𝒆𝒆𝒆𝒆𝒂𝒂𝒆𝒆
(kWh)
Essential oil yield (mL)
Peppermint needed (kg)
December 10.0 7.4 65.6 21.2
March 14.8 11.0 97 31.3
June 33.8 25.0 222 71.5
September 21.0 15.5 138 44.5
4. The preceding calculations were done for a clear-sky day. The “real-sky” data give an average of the radiation, taking into account the proportion of sunny and cloudy days. According to data for the South of France (see annex and Figure 9), the real-sky radiation is 75% of the clear-sky radiation. So we assume there are 75% of sunny days with clear-sky radiation and 25% of cloudy days with nearly no direct radiation. Therefore, we consider 22 sunny days per month in the 6 best months of the year (March-September). We assume the distillation system is operated for 6 months, between March and September, which corresponds to the harvest season and best solar resource months. According to the proportion of sunny days and considering that a couple of days can be lost due to various other constraints, we can consider the system is operated for 20 days a month. Based on the essential oil yield in March, June and September, the average yield of essential oil per day is around 150mL/day, during the period March-September. (This assumes a linear evolution in the intermediate months, which is a conservative estimate because the radiation evolution is closer to a cosine type shape during the year). If needed, a more precise analysis of solar resource during each month or each day of the year would give more precise results.
With these assumptions, the yearly yield of peppermint essential oil will be:
𝑉𝑉𝑒𝑒𝑒𝑒𝑒𝑒𝑒𝑒𝑒𝑒𝑒𝑒𝑒𝑒𝑒𝑒𝑒𝑒 𝑜𝑜𝑒𝑒𝑒𝑒 = 6 𝑚𝑚𝑚𝑚𝑚𝑚𝑡𝑡ℎ𝑠𝑠 ∙ 20 𝑑𝑑𝑎𝑎𝑑𝑑𝑠𝑠/𝑚𝑚𝑚𝑚𝑚𝑚𝑡𝑡ℎ ∙ 150 𝑚𝑚𝑚𝑚/𝑑𝑑𝑎𝑎𝑑𝑑
𝑉𝑉𝑒𝑒𝑒𝑒𝑒𝑒𝑒𝑒𝑒𝑒𝑒𝑒𝑒𝑒𝑒𝑒𝑒𝑒 𝑜𝑜𝑒𝑒𝑒𝑒 = 18 𝑚𝑚/𝑑𝑑𝑡𝑡𝑎𝑎𝑎𝑎
This corresponds to the processing of 5800 kg (=18 000 mL / 3.1mL/kg) of fresh peppermint leaves.
16
Essential oil extraction with concentrating Solar Thermal Energy
So, our farmer Mr. Pierre can process almost 40% of his 15 tons annual production using the distiller. Transforming a significant part of his production can help improve his income. Another approach would be opting for a bigger concentrator of 10 m², to process 50% of his production, or 2 systems of 10 m² to process his entire production. On a smaller concentrator of 2.7 m², the same optical efficiency can be achieved. It could even be higher due to the smaller and easier to manage parabola. The thermal efficiency might also be somewhat higher because the smaller distilling unit leads to a higher ratio of external surface to internal volume. Assuming the same efficiency is achieved, the 2.7 m² Scheffler concentrator would enable the processing of around 2000 kg per year (5800 ∙ 2.7 8⁄ = 1960), for a 6 L peppermint essential oil production. This is an interesting yield for a family scale system. 4 HOMEWORK ACTIVITY: DISTILLATION OF OREGANO IN PERU The homework consists of developing the same method to analyze the efficiency and production of a solar distilling system in a different context. The production of oregano in Peru is important. Producers dry their leaves and sell their raw product, which is distillated at industrial scale. Distilling the fresh plant in the farm enables the extraction of more essential oil from the plant. The extraction is also more energy efficient with fresh plants (Munir, 2010). The solar distillation technology proposed in this study could enable small farmers to distillate their oregano to produce essential oil on their farm. 1. Based on literature, which geographical area would you recommend for solar distillation of oregano at the farm level? Explain the various reasons that justify this choice. 2. What solar resource is available? 2.1. Investigate the global horizontal solar irradiation of Peru, its geographical repartition, yearly distribution…
• Give the annual average of the daily solar energy resource in the area considered. • Give monthly averages of the daily solar energy resource in the same area.
What conclusions can be drawn regarding the variation of solar resource during the year? 2.2. In the case of the solar application under study, is the global horizontal solar irradiation adequate? What information do you actually need in our case of concentrating solar technology? Why? Identify an appropriate database and give the accurate yearly solar resource in the selected region. 2.3. Using the results of 2.1 and 2.2, try to estimate the monthly average for daily DNI in the selected region. 3. Efficiency of the Scheffler solar concentrator
17
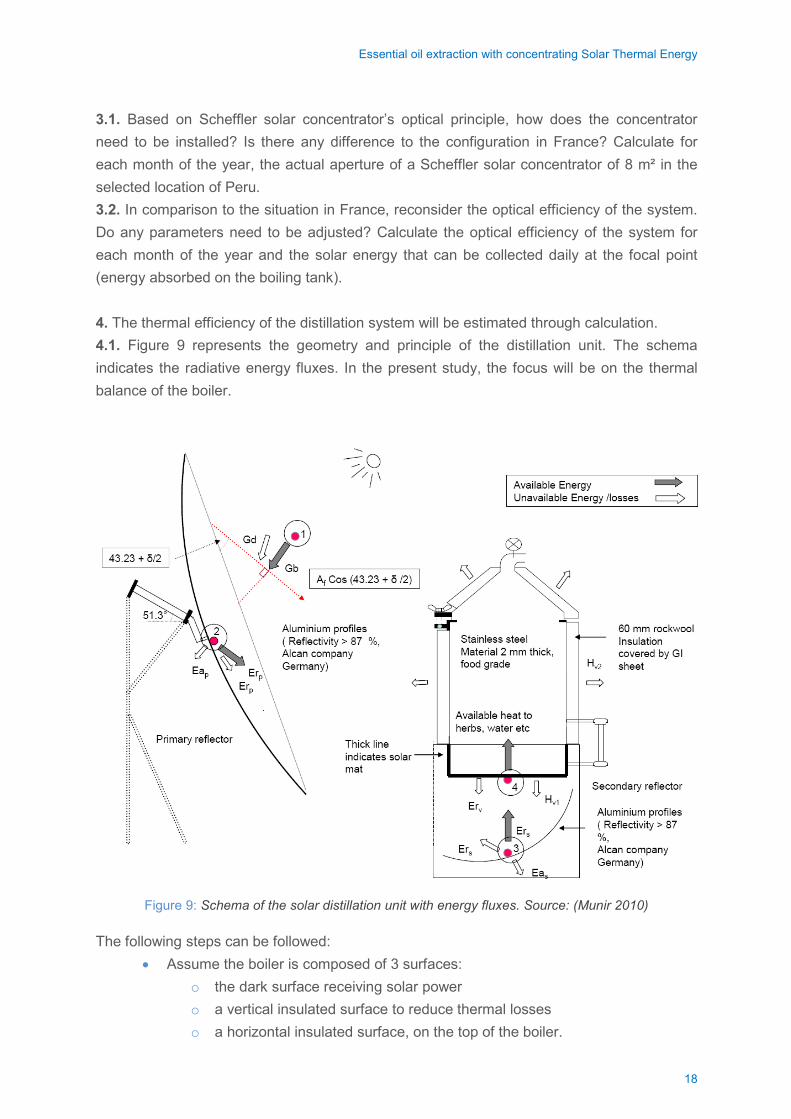
Essential oil extraction with concentrating Solar Thermal Energy
3.1. Based on Scheffler solar concentrator’s optical principle, how does the concentrator need to be installed? Is there any difference to the configuration in France? Calculate for each month of the year, the actual aperture of a Scheffler solar concentrator of 8 m² in the selected location of Peru. 3.2. In comparison to the situation in France, reconsider the optical efficiency of the system. Do any parameters need to be adjusted? Calculate the optical efficiency of the system for each month of the year and the solar energy that can be collected daily at the focal point (energy absorbed on the boiling tank). 4. The thermal efficiency of the distillation system will be estimated through calculation. 4.1. Figure 9 represents the geometry and principle of the distillation unit. The schema indicates the radiative energy fluxes. In the present study, the focus will be on the thermal balance of the boiler.
Figure 9: Schema of the solar distillation unit with energy fluxes. Source: (Munir 2010)
The following steps can be followed: • Assume the boiler is composed of 3 surfaces:
o the dark surface receiving solar power o a vertical insulated surface to reduce thermal losses o a horizontal insulated surface, on the top of the boiler.
18
Essential oil extraction with concentrating Solar Thermal Energy
• Identify the energy fluxes in the system when boiling is in process (steady-state operation with boiling water in the boiler).
• Draw an equivalent electrical resistance circuit. • Write the equations of the simplified energy balance of the boiler. • Calculate the thermal resistances of this simplified thermal model of the boiler. • Resolve the energy balance of the boiler. • Give the temperatures and the corresponding heat fluxes in the system. • Comment on the relative values of the different energy fluxes.
4.2. Deduce the thermal efficiency of distillation, linking the useful solar power to the useful thermal power. Comment on this value and compare it with the value used in the first case (class activity). 5. Experimental results have been carried out with the solar distillation unit. A yield of 27.9 mL/10kg fresh oregano has been achieved (Munir 2010). The corresponding energy consumption has been of 3.36 kWh with chopped oregano. Unchopped oregano gives the same amount of essential oil, but consumes 6.46 kWh. 5.1. From the experimental results, express the efficiency of the distillation 𝜂𝜂𝑒𝑒𝑒𝑒𝑒𝑒𝑒𝑒𝑒𝑒𝑒𝑒𝑒𝑒𝑒𝑒𝑒𝑒 𝑜𝑜𝑒𝑒𝑒𝑒, expressing the volume of essential oil produced per unit of thermal energy consumed (mL/kWh). 5.2. Using bibliography research, how much oregano can a farmer in Peru produce on a surface of 2 ha? Express the production in kg of fresh oregano. 5.3. Based on previous calculations, what quantity of oregano can be processed yearly with the 8 m² solar concentrator? How much essential oil can be extracted in a year? Conclude on the reasons to promote the use of the system. Note: Alternatively, to diversify the study, each group of students could choose a developing country and a plant produced by small farmers in this country. A small literature review should enable the students to identify interesting production opportunities. For example, lemon in Ethiopia, mint in India, eucalyptus..., lavender..., rose... Examples can be found in India, Latin America, Africa… There are a lot of data on essential oil distillation in the USA, because the production is on a large scale in highly mechanized farms, but. this large scale processing is outside of the scope of this study.
4.1. CORRECTION OF HOMEWORK ACTIVITY: DISTILLATION OF OREGANO IN PERU
1. Some studies available online like (Tacna, primer productor de oregano del Perú 2015), indicate the region of Tacna concentrates 60% of Peru’s production of oregano. Additionally, the Peruvian national organization of meteorology SENAMHI has edited a study of solar resources of Peru2. Solar data is also available on SolarGIS3. Figure 11 presents the annual
2 Presentation page: http://www.senamhi.gob.pe/index.php?p=0801 with the report available here: http://www.senamhi.gob.pe/pdf/Atlas%20_de_Radiacion_Solar.pdf and the solar maps can be downloaded from
19
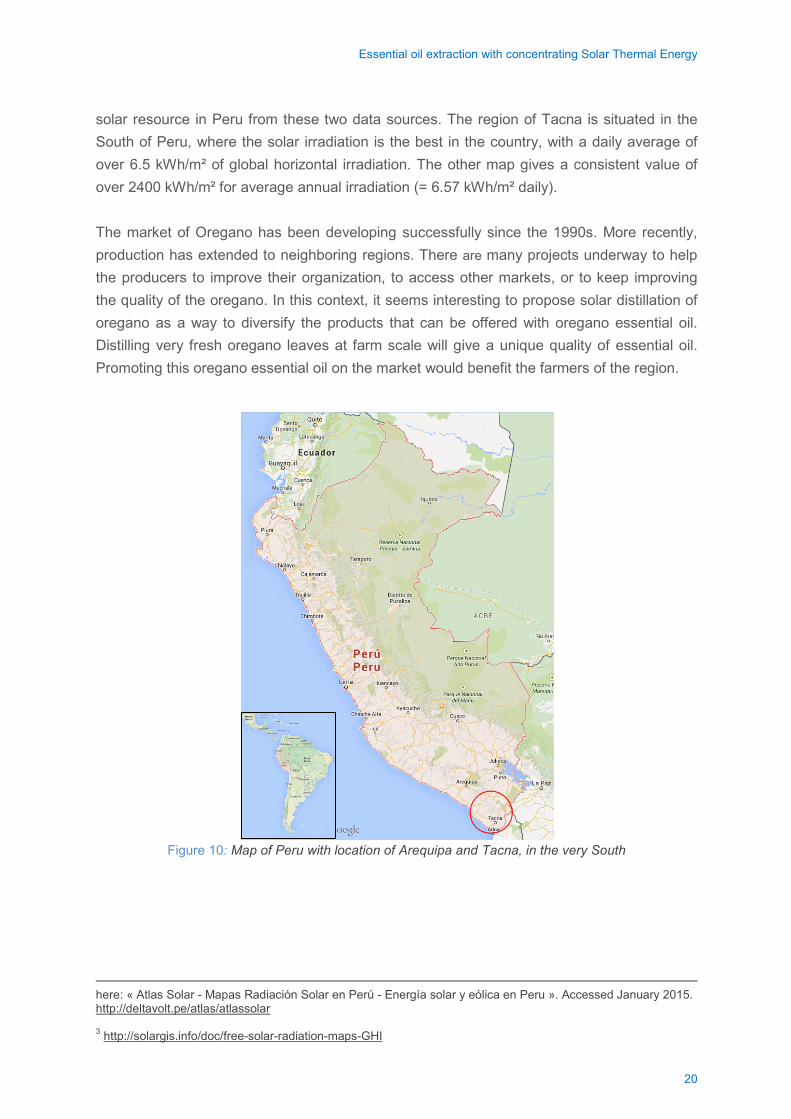
Essential oil extraction with concentrating Solar Thermal Energy
solar resource in Peru from these two data sources. The region of Tacna is situated in the South of Peru, where the solar irradiation is the best in the country, with a daily average of over 6.5 kWh/m² of global horizontal irradiation. The other map gives a consistent value of over 2400 kWh/m² for average annual irradiation (= 6.57 kWh/m² daily). The market of Oregano has been developing successfully since the 1990s. More recently, production has extended to neighboring regions. There are many projects underway to help the producers to improve their organization, to access other markets, or to keep improving the quality of the oregano. In this context, it seems interesting to propose solar distillation of oregano as a way to diversify the products that can be offered with oregano essential oil. Distilling very fresh oregano leaves at farm scale will give a unique quality of essential oil. Promoting this oregano essential oil on the market would benefit the farmers of the region.
Figure 10: Map of Peru with location of Arequipa and Tacna, in the very South
here: « Atlas Solar - Mapas Radiación Solar en Perú - Energía solar y eólica en Peru ». Accessed January 2015. http://deltavolt.pe/atlas/atlassolar 3 http://solargis.info/doc/free-solar-radiation-maps-GHI
20
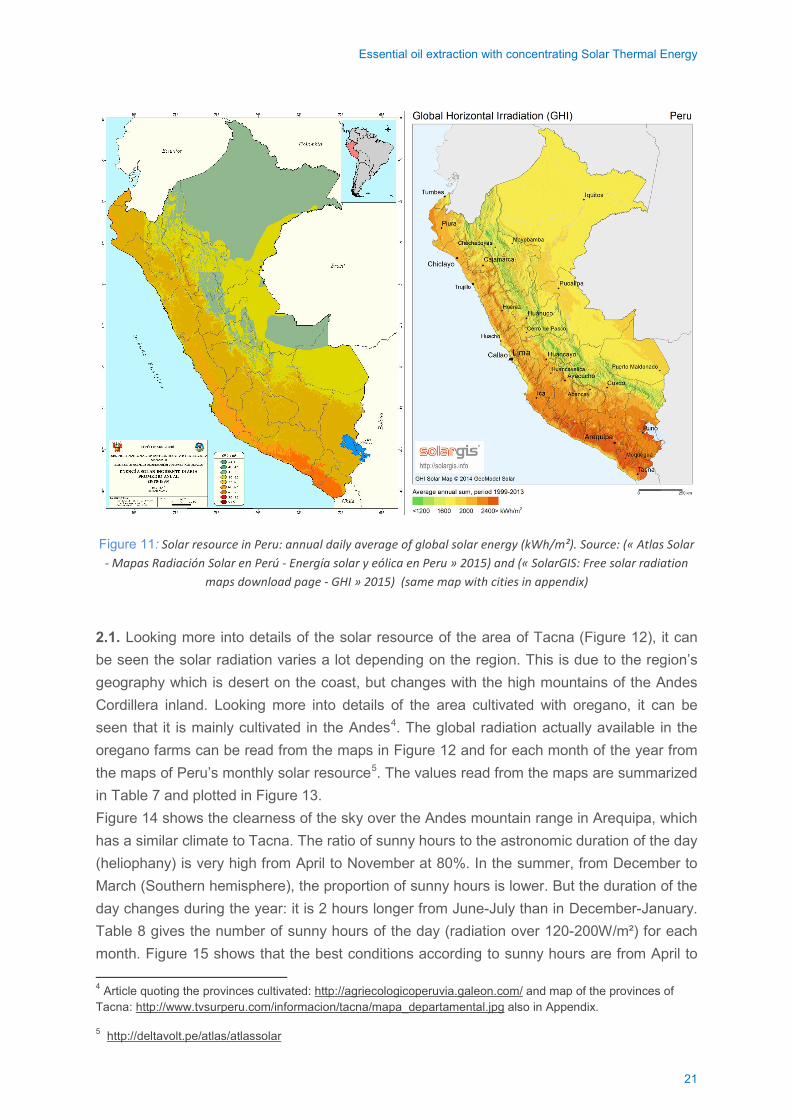
Essential oil extraction with concentrating Solar Thermal Energy
Figure 11: Solar resource in Peru: annual daily average of global solar energy (kWh/m²). Source: (« Atlas Solar - Mapas Radiación Solar en Perú - Energía solar y eólica en Peru » 2015) and (« SolarGIS: Free solar radiation
maps download page - GHI » 2015) (same map with cities in appendix)
2.1. Looking more into details of the solar resource of the area of Tacna (Figure 12), it can be seen the solar radiation varies a lot depending on the region. This is due to the region’s geography which is desert on the coast, but changes with the high mountains of the Andes Cordillera inland. Looking more into details of the area cultivated with oregano, it can be seen that it is mainly cultivated in the Andes4. The global radiation actually available in the oregano farms can be read from the maps in Figure 12 and for each month of the year from the maps of Peru’s monthly solar resource5. The values read from the maps are summarized in Table 7 and plotted in Figure 13. Figure 14 shows the clearness of the sky over the Andes mountain range in Arequipa, which has a similar climate to Tacna. The ratio of sunny hours to the astronomic duration of the day (heliophany) is very high from April to November at 80%. In the summer, from December to March (Southern hemisphere), the proportion of sunny hours is lower. But the duration of the day changes during the year: it is 2 hours longer from June-July than in December-January. Table 8 gives the number of sunny hours of the day (radiation over 120-200W/m²) for each month. Figure 15 shows that the best conditions according to sunny hours are from April to
4 Article quoting the provinces cultivated: http://agriecologicoperuvia.galeon.com/ and map of the provinces of Tacna: http://www.tvsurperu.com/informacion/tacna/mapa_departamental.jpg also in Appendix.
5 http://deltavolt.pe/atlas/atlassolar
21
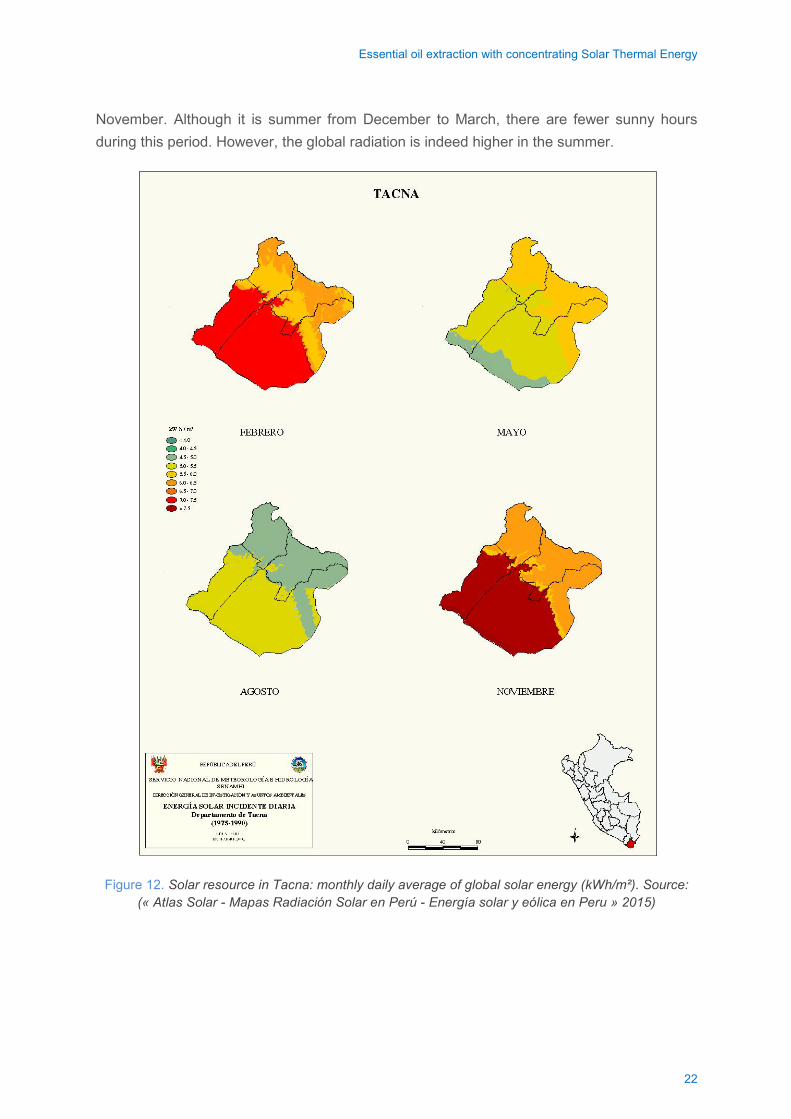
Essential oil extraction with concentrating Solar Thermal Energy
November. Although it is summer from December to March, there are fewer sunny hours during this period. However, the global radiation is indeed higher in the summer.
Figure 12. Solar resource in Tacna: monthly daily average of global solar energy (kWh/m²). Source: (« Atlas Solar - Mapas Radiación Solar en Perú - Energía solar y eólica en Peru » 2015)
22
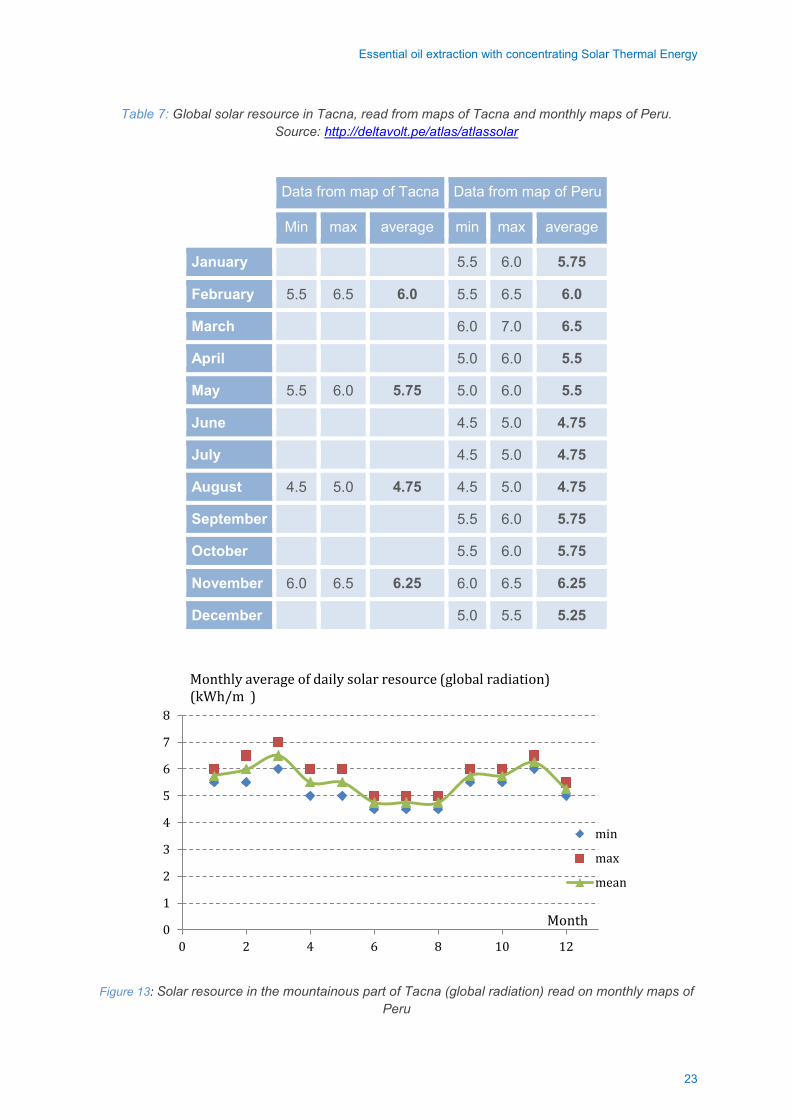
Essential oil extraction with concentrating Solar Thermal Energy
Table 7: Global solar resource in Tacna, read from maps of Tacna and monthly maps of Peru. Source: http://deltavolt.pe/atlas/atlassolar
Data from map of Tacna Data from map of Peru
Min max average min max average
January 5.5 6.0 5.75
February 5.5 6.5 6.0 5.5 6.5 6.0
March 6.0 7.0 6.5
April 5.0 6.0 5.5
May 5.5 6.0 5.75 5.0 6.0 5.5
June 4.5 5.0 4.75
July 4.5 5.0 4.75
August 4.5 5.0 4.75 4.5 5.0 4.75
September 5.5 6.0 5.75
October 5.5 6.0 5.75
November 6.0 6.5 6.25 6.0 6.5 6.25
December 5.0 5.5 5.25
Figure 13: Solar resource in the mountainous part of Tacna (global radiation) read on monthly maps of Peru
0
1
2
3
4
5
6
7
8
0 2 4 6 8 10 12
min
max
mean
Month
Monthly average of daily solar resource (global radiation) (kWh/m²)
23
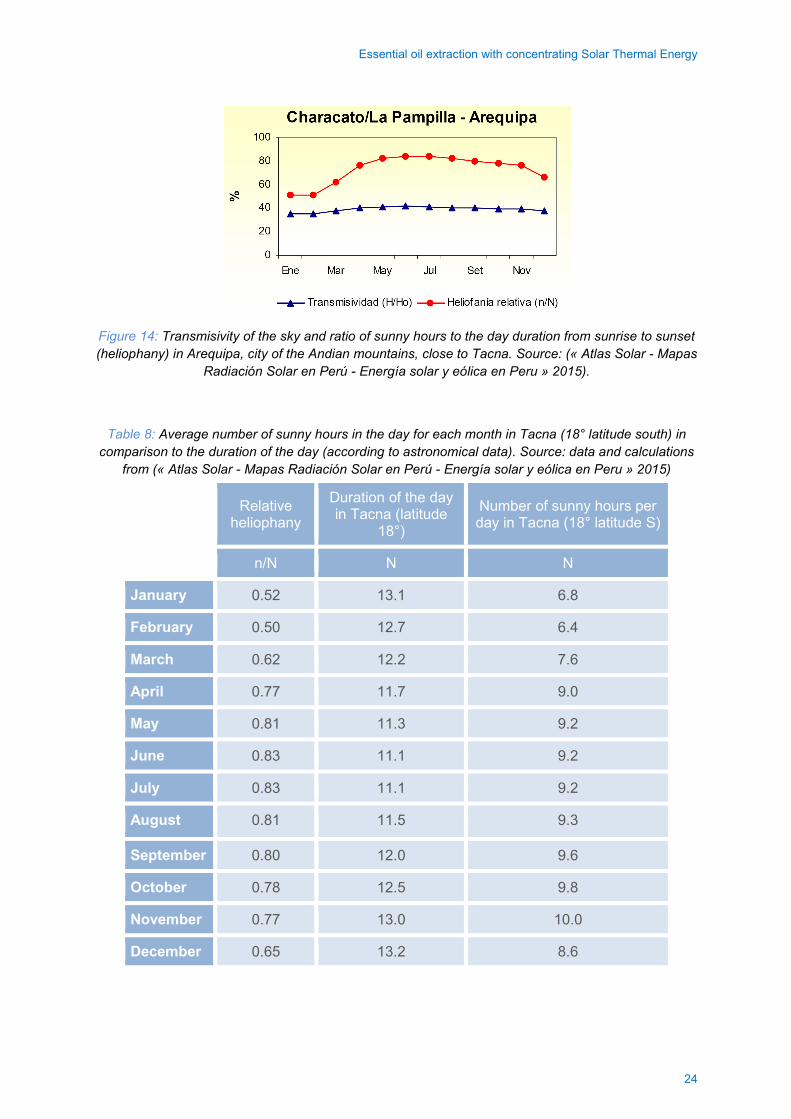
Essential oil extraction with concentrating Solar Thermal Energy
Figure 14: Transmisivity of the sky and ratio of sunny hours to the day duration from sunrise to sunset (heliophany) in Arequipa, city of the Andian mountains, close to Tacna. Source: (« Atlas Solar - Mapas
Radiación Solar en Perú - Energía solar y eólica en Peru » 2015).
Table 8: Average number of sunny hours in the day for each month in Tacna (18° latitude south) in comparison to the duration of the day (according to astronomical data). Source: data and calculations
from (« Atlas Solar - Mapas Radiación Solar en Perú - Energía solar y eólica en Peru » 2015)
Relative heliophany
Duration of the day in Tacna (latitude
18°)
Number of sunny hours per day in Tacna (18° latitude S)
n/N N N
January 0.52 13.1 6.8
February 0.50 12.7 6.4
March 0.62 12.2 7.6
April 0.77 11.7 9.0
May 0.81 11.3 9.2
June 0.83 11.1 9.2
July 0.83 11.1 9.2
August 0.81 11.5 9.3
September 0.80 12.0 9.6
October 0.78 12.5 9.8
November 0.77 13.0 10.0
December 0.65 13.2 8.6
24
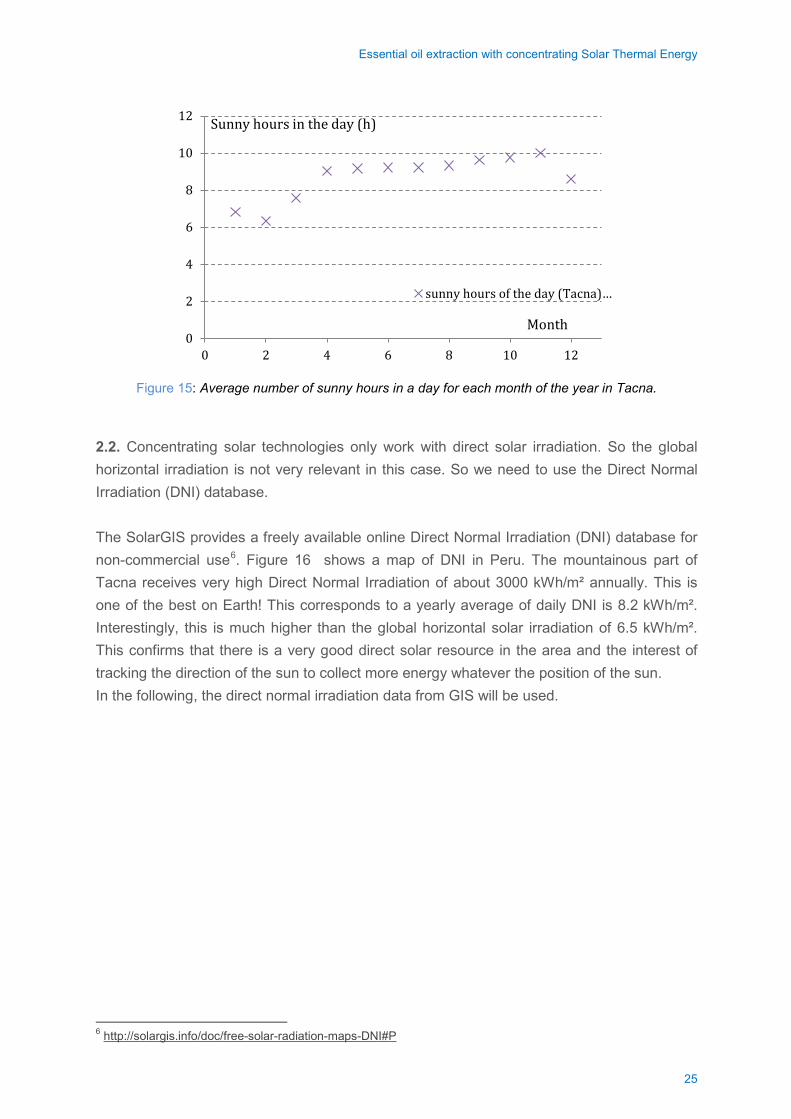
Essential oil extraction with concentrating Solar Thermal Energy
Figure 15: Average number of sunny hours in a day for each month of the year in Tacna.
2.2. Concentrating solar technologies only work with direct solar irradiation. So the global horizontal irradiation is not very relevant in this case. So we need to use the Direct Normal Irradiation (DNI) database. The SolarGIS provides a freely available online Direct Normal Irradiation (DNI) database for non-commercial use6. Figure 16 shows a map of DNI in Peru. The mountainous part of Tacna receives very high Direct Normal Irradiation of about 3000 kWh/m² annually. This is one of the best on Earth! This corresponds to a yearly average of daily DNI is 8.2 kWh/m². Interestingly, this is much higher than the global horizontal solar irradiation of 6.5 kWh/m². This confirms that there is a very good direct solar resource in the area and the interest of tracking the direction of the sun to collect more energy whatever the position of the sun. In the following, the direct normal irradiation data from GIS will be used.
6 http://solargis.info/doc/free-solar-radiation-maps-DNI#P
0
2
4
6
8
10
12
0 2 4 6 8 10 12
sunny hours of the day (Tacna)…
Month
Sunny hours in the day (h)
25
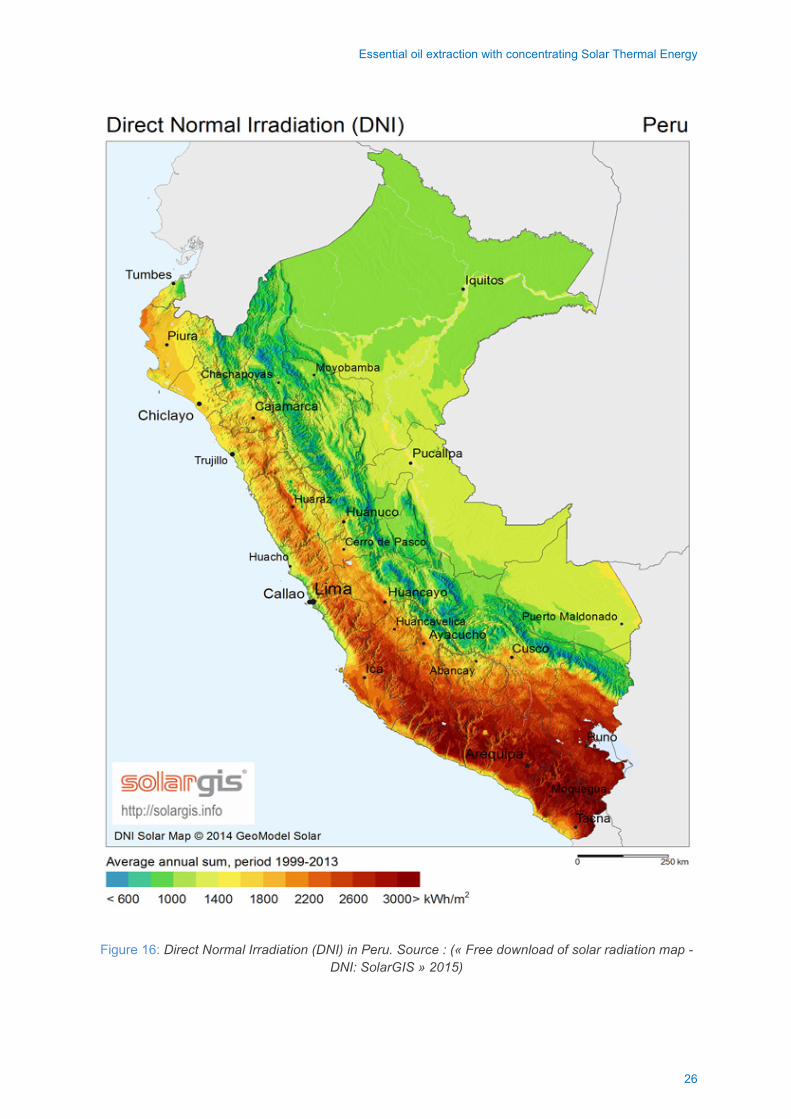
Essential oil extraction with concentrating Solar Thermal Energy
Figure 16: Direct Normal Irradiation (DNI) in Peru. Source : (« Free download of solar radiation map - DNI: SolarGIS » 2015)
26
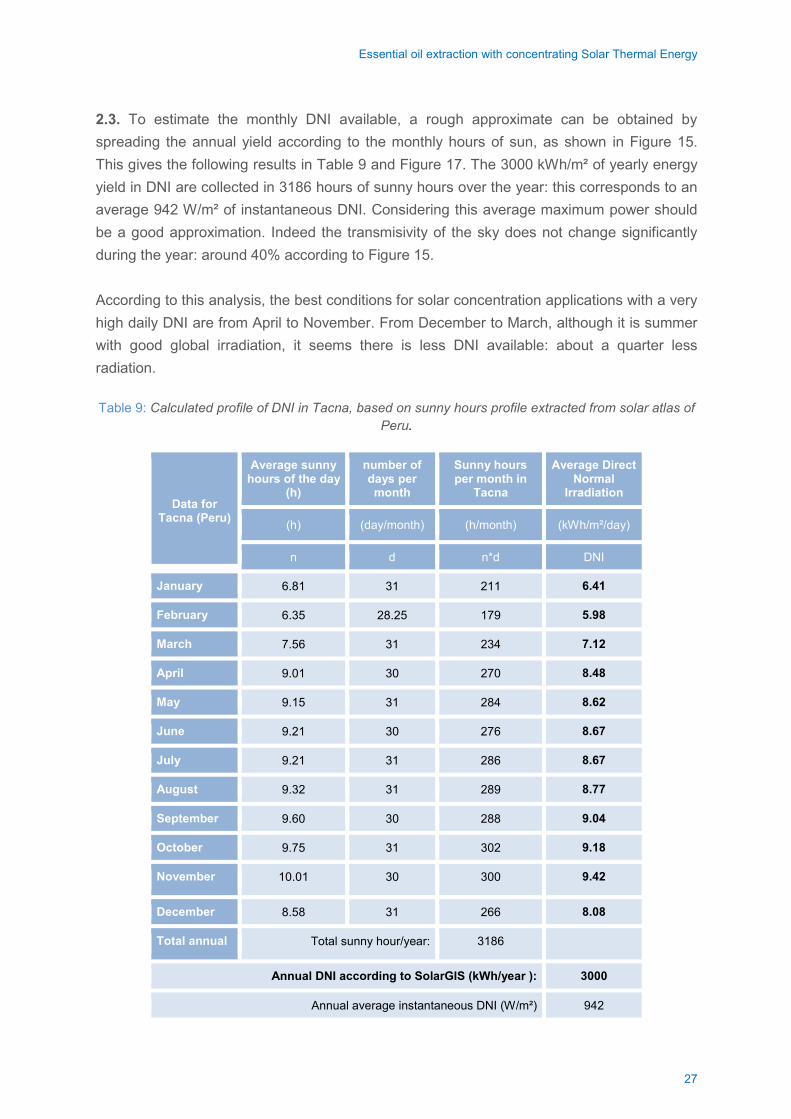
Essential oil extraction with concentrating Solar Thermal Energy
2.3. To estimate the monthly DNI available, a rough approximate can be obtained by spreading the annual yield according to the monthly hours of sun, as shown in Figure 15. This gives the following results in Table 9 and Figure 17. The 3000 kWh/m² of yearly energy yield in DNI are collected in 3186 hours of sunny hours over the year: this corresponds to an average 942 W/m² of instantaneous DNI. Considering this average maximum power should be a good approximation. Indeed the transmisivity of the sky does not change significantly during the year: around 40% according to Figure 15. According to this analysis, the best conditions for solar concentration applications with a very high daily DNI are from April to November. From December to March, although it is summer with good global irradiation, it seems there is less DNI available: about a quarter less radiation. Table 9: Calculated profile of DNI in Tacna, based on sunny hours profile extracted from solar atlas of
Peru.
Data for Tacna (Peru)
Average sunny hours of the day
(h)
number of days per month
Sunny hours per month in
Tacna
Average Direct Normal
Irradiation
(h) (day/month) (h/month) (kWh/m²/day)
n d n*d DNI
January 6.81 31 211 6.41
February 6.35 28.25 179 5.98
March 7.56 31 234 7.12
April 9.01 30 270 8.48
May 9.15 31 284 8.62
June 9.21 30 276 8.67
July 9.21 31 286 8.67
August 9.32 31 289 8.77
September 9.60 30 288 9.04
October 9.75 31 302 9.18
November 10.01 30 300 9.42
December 8.58 31 266 8.08
Total annual Total sunny hour/year: 3186
Annual DNI according to SolarGIS (kWh/year ): 3000
Annual average instantaneous DNI (W/m²) 942
27
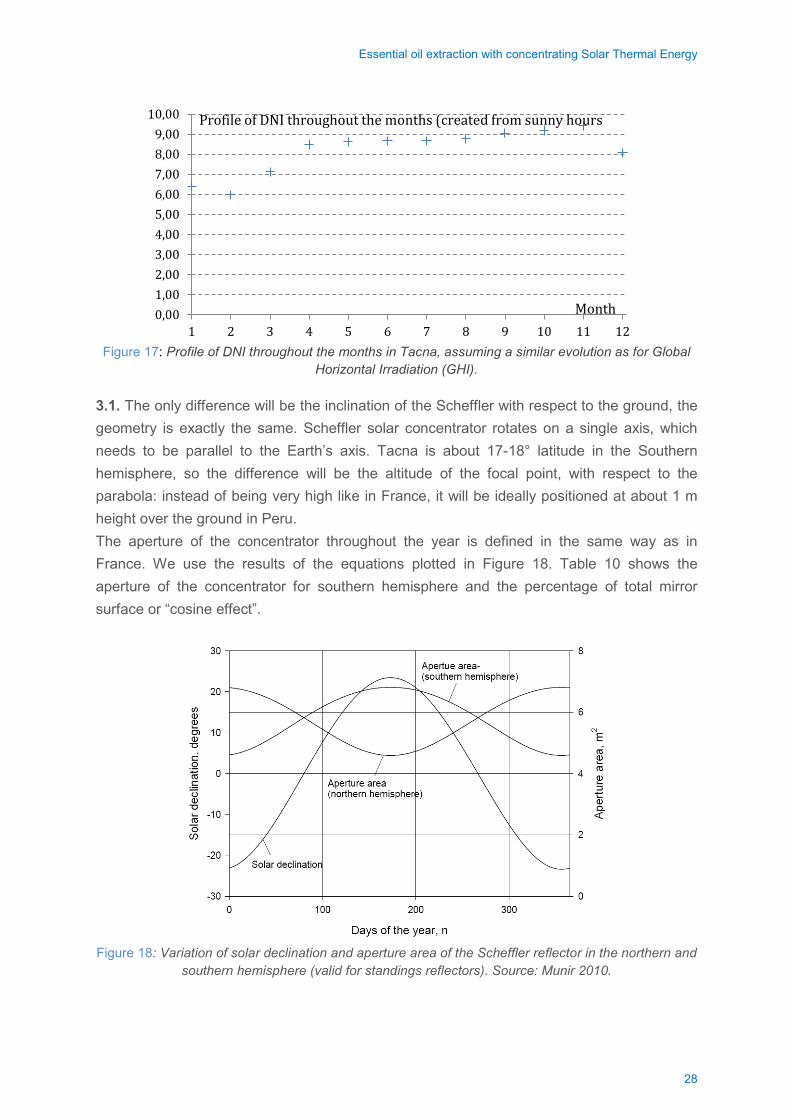
Essential oil extraction with concentrating Solar Thermal Energy
Figure 17: Profile of DNI throughout the months in Tacna, assuming a similar evolution as for Global
Horizontal Irradiation (GHI).
3.1. The only difference will be the inclination of the Scheffler with respect to the ground, the geometry is exactly the same. Scheffler solar concentrator rotates on a single axis, which needs to be parallel to the Earth’s axis. Tacna is about 17-18° latitude in the Southern hemisphere, so the difference will be the altitude of the focal point, with respect to the parabola: instead of being very high like in France, it will be ideally positioned at about 1 m height over the ground in Peru. The aperture of the concentrator throughout the year is defined in the same way as in France. We use the results of the equations plotted in Figure 18. Table 10 shows the aperture of the concentrator for southern hemisphere and the percentage of total mirror surface or “cosine effect”.
Figure 18: Variation of solar declination and aperture area of the Scheffler reflector in the northern and
southern hemisphere (valid for standings reflectors). Source: Munir 2010.
0,001,002,003,004,005,006,007,008,009,00
10,00
1 2 3 4 5 6 7 8 9 10 11 12
Profile of DNI throughout the months (created from sunny hours
Month
28
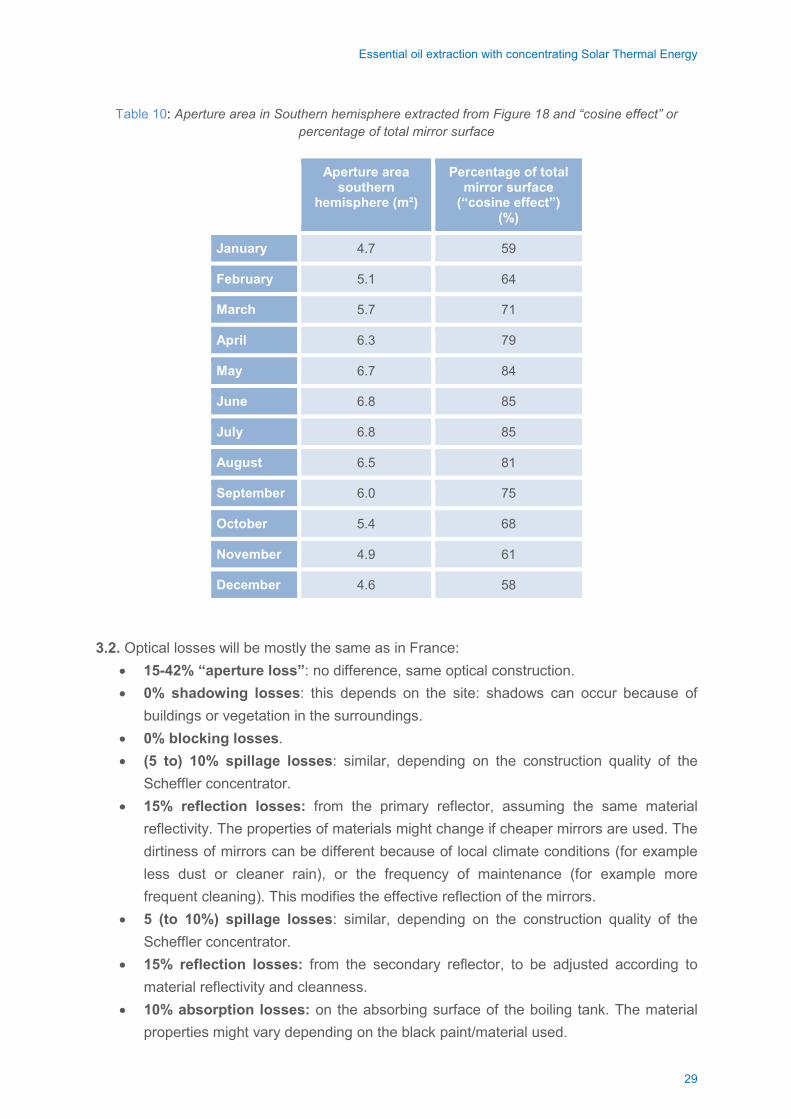
Essential oil extraction with concentrating Solar Thermal Energy
Table 10: Aperture area in Southern hemisphere extracted from Figure 18 and “cosine effect” or percentage of total mirror surface
Aperture area southern
hemisphere (m²)
Percentage of total mirror surface
(“cosine effect”) (%)
January 4.7 59
February 5.1 64
March 5.7 71
April 6.3 79
May 6.7 84
June 6.8 85
July 6.8 85
August 6.5 81
September 6.0 75
October 5.4 68
November 4.9 61
December 4.6 58
3.2. Optical losses will be mostly the same as in France: • 15-42% “aperture loss”: no difference, same optical construction. • 0% shadowing losses: this depends on the site: shadows can occur because of
buildings or vegetation in the surroundings. • 0% blocking losses. • (5 to) 10% spillage losses: similar, depending on the construction quality of the
Scheffler concentrator. • 15% reflection losses: from the primary reflector, assuming the same material
reflectivity. The properties of materials might change if cheaper mirrors are used. The dirtiness of mirrors can be different because of local climate conditions (for example less dust or cleaner rain), or the frequency of maintenance (for example more frequent cleaning). This modifies the effective reflection of the mirrors.
• 5 (to 10%) spillage losses: similar, depending on the construction quality of the Scheffler concentrator.
• 15% reflection losses: from the secondary reflector, to be adjusted according to material reflectivity and cleanness.
• 10% absorption losses: on the absorbing surface of the boiling tank. The material properties might vary depending on the black paint/material used.
29
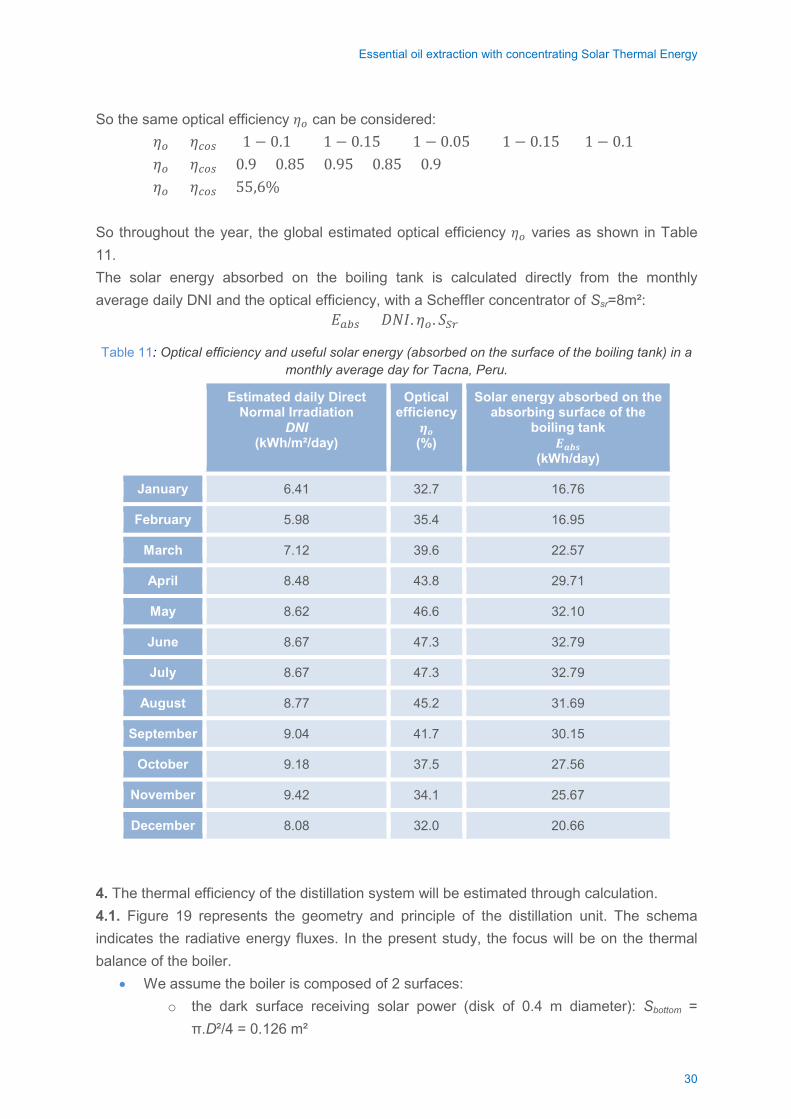
Essential oil extraction with concentrating Solar Thermal Energy
So the same optical efficiency 𝜂𝜂𝑜𝑜 can be considered: 𝜂𝜂𝑜𝑜 = 𝜂𝜂𝑐𝑐𝑜𝑜𝑒𝑒 · (1 − 0.1) · (1 − 0.15) · (1 − 0.05) · (1 − 0.15) · (1 − 0.1) 𝜂𝜂𝑜𝑜 = 𝜂𝜂𝑐𝑐𝑜𝑜𝑒𝑒 · 0.9 · 0.85 · 0.95 · 0.85 · 0.9 𝜂𝜂𝑜𝑜 = 𝜂𝜂𝑐𝑐𝑜𝑜𝑒𝑒 · 55,6%
So throughout the year, the global estimated optical efficiency 𝜂𝜂𝑜𝑜 varies as shown in Table 11. The solar energy absorbed on the boiling tank is calculated directly from the monthly average daily DNI and the optical efficiency, with a Scheffler concentrator of Ssr=8m²:
𝐸𝐸𝑒𝑒𝑎𝑎𝑒𝑒 = 𝐷𝐷𝐷𝐷𝐷𝐷. 𝜂𝜂𝑜𝑜 . 𝑆𝑆𝑆𝑆𝑆𝑆
Table 11: Optical efficiency and useful solar energy (absorbed on the surface of the boiling tank) in a monthly average day for Tacna, Peru.
Estimated daily Direct Normal Irradiation
DNI (kWh/m²/day)
Optical efficiency
𝜼𝜼𝒐𝒐 (%)
Solar energy absorbed on the absorbing surface of the
boiling tank 𝑬𝑬𝒂𝒂𝒂𝒂𝒂𝒂
(kWh/day)
January 6.41 32.7 16.76
February 5.98 35.4 16.95
March 7.12 39.6 22.57
April 8.48 43.8 29.71
May 8.62 46.6 32.10
June 8.67 47.3 32.79
July 8.67 47.3 32.79
August 8.77 45.2 31.69
September 9.04 41.7 30.15
October 9.18 37.5 27.56
November 9.42 34.1 25.67
December 8.08 32.0 20.66
4. The thermal efficiency of the distillation system will be estimated through calculation. 4.1. Figure 19 represents the geometry and principle of the distillation unit. The schema indicates the radiative energy fluxes. In the present study, the focus will be on the thermal balance of the boiler.
• We assume the boiler is composed of 2 surfaces: o the dark surface receiving solar power (disk of 0.4 m diameter): Sbottom =
π.D²/4 = 0.126 m²
30

Essential oil extraction with concentrating Solar Thermal Energy
o the boiler’s insulated surface (vertical cylinder of 0.8 m height and top cone of 0.2 m height, with 0.4 m internal diameter and 0.06 m thickness of insulation) 𝑆𝑆𝑇𝑇𝑜𝑜𝑇𝑇𝑇𝑇𝑒𝑒𝑒𝑒𝑒𝑒𝑆𝑆𝑒𝑒𝑒𝑒𝑒𝑒 = 0.8 ∙ 𝜋𝜋 ∙ 0.4 + 0.2 ∙ 𝜋𝜋 ∙ 0.4
2= 1.13 𝑚𝑚²
𝑆𝑆𝑇𝑇𝑜𝑜𝑇𝑇𝑇𝑇𝑇𝑇𝑒𝑒𝑒𝑒𝑆𝑆𝑒𝑒𝑒𝑒𝑒𝑒 = 0.8 ∙ 𝜋𝜋 ∙ (0.4 + 0.06 ∙ 2) + 0.2 ∙ 𝜋𝜋 ∙ 0.4+0.06∙22
= 1.47 𝑚𝑚²
• The energy fluxes in the system in steady-state operation, with boiling water in the boiler, are shown on the equivalent electrical circuit in Figure 19. Infrared losses through the insulated external surface are neglected.
31
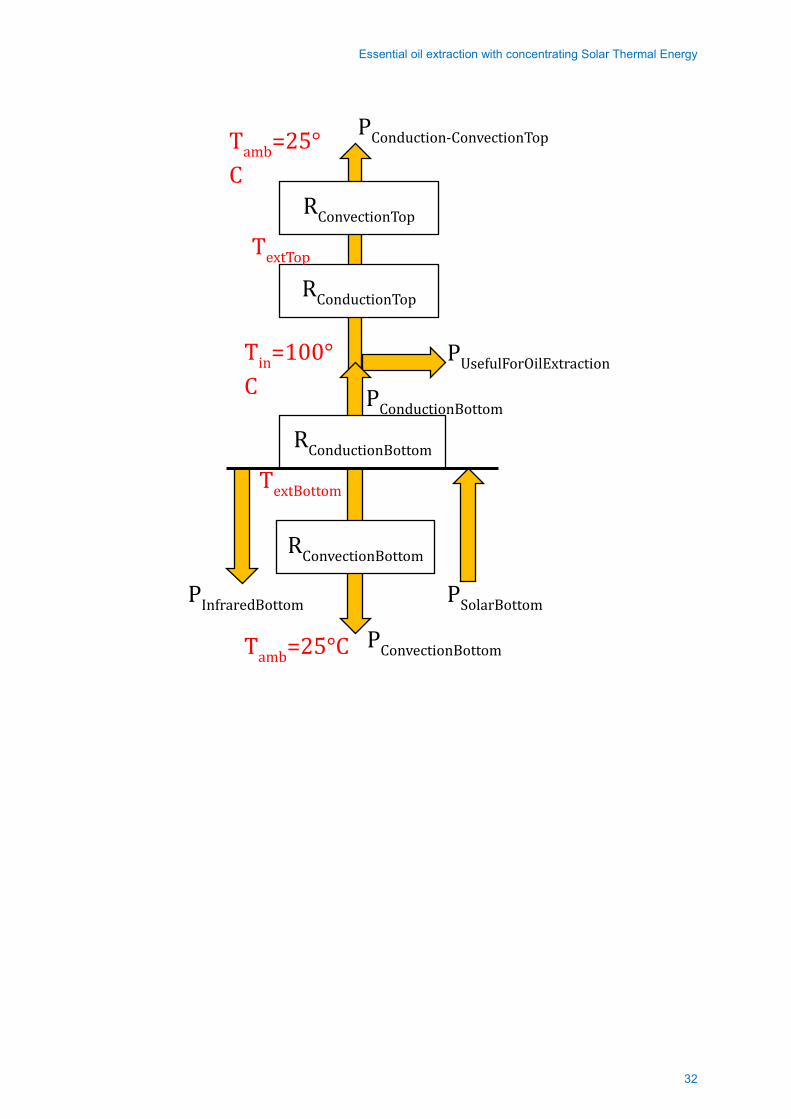
Essential oil extraction with concentrating Solar Thermal Energy
RConductionTop
RConvectionTop
Tin=100°C
Tamb=25°C
RConvectionBottom
PConvectionBottom
PInfraredBottom
PUsefulForOilExtraction
PConduction-ConvectionTop
PSolarBottom
Tamb=25°C
TextTop
TextBottom
PConductionBottom
RConductionBottom
32
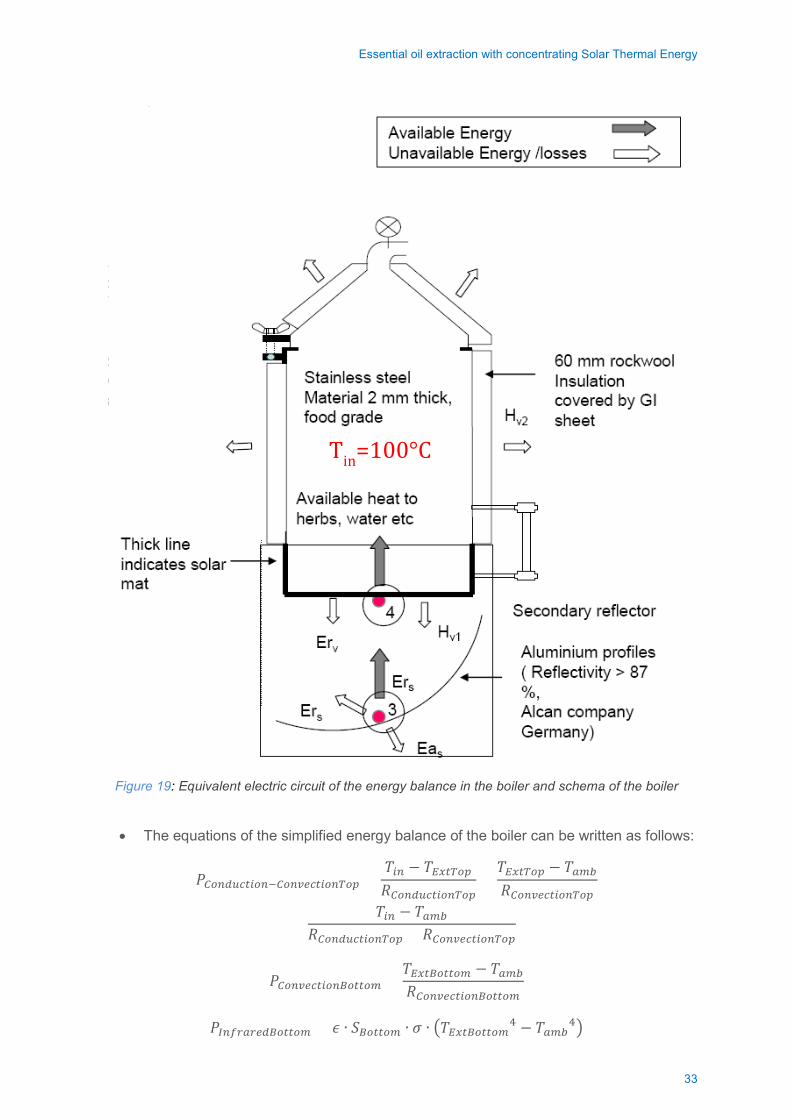
Essential oil extraction with concentrating Solar Thermal Energy
Figure 19: Equivalent electric circuit of the energy balance in the boiler and schema of the boiler
• The equations of the simplified energy balance of the boiler can be written as follows:
𝑃𝑃𝐶𝐶𝑜𝑜𝑒𝑒𝑑𝑑𝑑𝑑𝑐𝑐𝑒𝑒𝑒𝑒𝑜𝑜𝑒𝑒−𝐶𝐶𝑜𝑜𝑒𝑒𝐶𝐶𝑒𝑒𝑐𝑐𝑒𝑒𝑒𝑒𝑜𝑜𝑒𝑒𝑇𝑇𝑜𝑜𝑇𝑇 =𝑇𝑇𝑒𝑒𝑒𝑒 − 𝑇𝑇𝑇𝑇𝑇𝑇𝑒𝑒𝑇𝑇𝑜𝑜𝑇𝑇𝑅𝑅𝐶𝐶𝑜𝑜𝑒𝑒𝑑𝑑𝑑𝑑𝑐𝑐𝑒𝑒𝑒𝑒𝑜𝑜𝑒𝑒𝑇𝑇𝑜𝑜𝑇𝑇
=𝑇𝑇𝑇𝑇𝑇𝑇𝑒𝑒𝑇𝑇𝑜𝑜𝑇𝑇 − 𝑇𝑇𝑒𝑒𝑒𝑒𝑎𝑎𝑅𝑅𝐶𝐶𝑜𝑜𝑒𝑒𝐶𝐶𝑒𝑒𝑐𝑐𝑒𝑒𝑒𝑒𝑜𝑜𝑒𝑒𝑇𝑇𝑜𝑜𝑇𝑇
=𝑇𝑇𝑒𝑒𝑒𝑒 − 𝑇𝑇𝑒𝑒𝑒𝑒𝑎𝑎
𝑅𝑅𝐶𝐶𝑜𝑜𝑒𝑒𝑑𝑑𝑑𝑑𝑐𝑐𝑒𝑒𝑒𝑒𝑜𝑜𝑒𝑒𝑇𝑇𝑜𝑜𝑇𝑇 + 𝑅𝑅𝐶𝐶𝑜𝑜𝑒𝑒𝐶𝐶𝑒𝑒𝑐𝑐𝑒𝑒𝑒𝑒𝑜𝑜𝑒𝑒𝑇𝑇𝑜𝑜𝑇𝑇
𝑃𝑃𝐶𝐶𝑜𝑜𝑒𝑒𝐶𝐶𝑒𝑒𝑐𝑐𝑒𝑒𝑒𝑒𝑜𝑜𝑒𝑒𝐶𝐶𝑜𝑜𝑒𝑒𝑒𝑒𝑜𝑜𝑒𝑒 =𝑇𝑇𝑇𝑇𝑇𝑇𝑒𝑒𝐶𝐶𝑜𝑜𝑒𝑒𝑒𝑒𝑜𝑜𝑒𝑒 − 𝑇𝑇𝑒𝑒𝑒𝑒𝑎𝑎𝑅𝑅𝐶𝐶𝑜𝑜𝑒𝑒𝐶𝐶𝑒𝑒𝑐𝑐𝑒𝑒𝑒𝑒𝑜𝑜𝑒𝑒𝐶𝐶𝑜𝑜𝑒𝑒𝑒𝑒𝑜𝑜𝑒𝑒
𝑃𝑃𝑇𝑇𝑒𝑒𝐼𝐼𝑆𝑆𝑒𝑒𝑆𝑆𝑒𝑒𝑑𝑑𝐶𝐶𝑜𝑜𝑒𝑒𝑒𝑒𝑜𝑜𝑒𝑒 = 𝜖𝜖 ∙ 𝑆𝑆𝐶𝐶𝑜𝑜𝑒𝑒𝑒𝑒𝑜𝑜𝑒𝑒 ∙ 𝜎𝜎 ∙ �𝑇𝑇𝑇𝑇𝑇𝑇𝑒𝑒𝐶𝐶𝑜𝑜𝑒𝑒𝑒𝑒𝑜𝑜𝑒𝑒4 − 𝑇𝑇𝑒𝑒𝑒𝑒𝑎𝑎4�
Tin=100°C
33

Essential oil extraction with concentrating Solar Thermal Energy
𝑃𝑃𝐶𝐶𝑜𝑜𝑒𝑒𝑑𝑑𝑑𝑑𝑐𝑐𝑒𝑒𝑒𝑒𝑜𝑜𝑒𝑒𝐶𝐶𝑜𝑜𝑒𝑒𝑒𝑒𝑜𝑜𝑒𝑒 = 𝑃𝑃𝑆𝑆𝑜𝑜𝑒𝑒𝑒𝑒𝑆𝑆𝐶𝐶𝑜𝑜𝑒𝑒𝑒𝑒𝑜𝑜𝑒𝑒 − 𝑃𝑃𝑇𝑇𝑒𝑒𝐼𝐼𝑆𝑆𝑒𝑒𝑆𝑆𝑒𝑒𝑑𝑑𝐶𝐶𝑜𝑜𝑒𝑒𝑒𝑒𝑜𝑜𝑒𝑒 − 𝑃𝑃𝐶𝐶𝑜𝑜𝑒𝑒𝐶𝐶𝑒𝑒𝑐𝑐𝑒𝑒𝑒𝑒𝑜𝑜𝑒𝑒𝐶𝐶𝑜𝑜𝑒𝑒𝑒𝑒𝑜𝑜𝑒𝑒
=𝑇𝑇𝑇𝑇𝑇𝑇𝑒𝑒𝐶𝐶𝑜𝑜𝑒𝑒𝑒𝑒𝑜𝑜𝑒𝑒 − 𝑇𝑇𝑒𝑒𝑒𝑒𝑅𝑅𝐶𝐶𝑜𝑜𝑒𝑒𝑑𝑑𝑑𝑑𝑐𝑐𝑒𝑒𝑒𝑒𝑜𝑜𝑒𝑒𝐶𝐶𝑜𝑜𝑒𝑒𝑒𝑒𝑜𝑜𝑒𝑒
𝑃𝑃𝑈𝑈𝑒𝑒𝑒𝑒𝐼𝐼𝑑𝑑𝑒𝑒𝑈𝑈𝑜𝑜𝑆𝑆𝑈𝑈𝑒𝑒𝑒𝑒𝑒𝑒𝑒𝑒𝑒𝑒𝑒𝑒𝑒𝑒𝑒𝑒𝑒𝑒𝑜𝑜𝑒𝑒= 𝑃𝑃𝑆𝑆𝑜𝑜𝑒𝑒𝑒𝑒𝑆𝑆𝐶𝐶𝑜𝑜𝑒𝑒𝑒𝑒𝑜𝑜𝑒𝑒 − 𝑃𝑃𝑇𝑇𝑒𝑒𝐼𝐼𝑆𝑆𝑒𝑒𝑆𝑆𝑒𝑒𝑑𝑑𝐶𝐶𝑜𝑜𝑒𝑒𝑒𝑒𝑜𝑜𝑒𝑒 − 𝑃𝑃𝐶𝐶𝑜𝑜𝑒𝑒𝐶𝐶𝑒𝑒𝑐𝑐𝑒𝑒𝑒𝑒𝑜𝑜𝑒𝑒𝐶𝐶𝑜𝑜𝑒𝑒𝑒𝑒𝑜𝑜𝑒𝑒− 𝑃𝑃𝐶𝐶𝑜𝑜𝑒𝑒𝑑𝑑𝑑𝑑𝑐𝑐𝑒𝑒𝑒𝑒𝑜𝑜𝑒𝑒−𝐶𝐶𝑜𝑜𝑒𝑒𝐶𝐶𝑒𝑒𝑐𝑐𝑒𝑒𝑒𝑒𝑜𝑜𝑒𝑒𝑇𝑇𝑜𝑜𝑇𝑇
with the energy fluxes (powers) and temperatures defined in Figure 19 and:
ε=0.9 the infrared emissivity of the bottom surface of the boiler, assuming it is a simple black painting, without selective properties. Selective coatings have high absorptivity in the solar wavelengths’ range and small emissivity in the infrared range. A regular black paint is likely to have high absorptivity in both ranges in wavelengths. So, high absorptivity means high emissivity in the infrared, because absorptivity = emissivity at a given wavelength (see Kirchhoff’s laws).
σ=5.67 . 10-8 W.K-4.m-2 the Stefan-Boltzmann constant.
• The thermal resistances of this simplified thermal model of the boiler are:
o As a rough estimate for conduction, we will consider the average surface area between internal and external surfaces: . 𝑆𝑆𝑇𝑇𝑜𝑜𝑇𝑇𝑇𝑇𝐶𝐶𝑒𝑒𝑆𝑆𝑒𝑒𝑇𝑇𝑒𝑒 = 1.3 𝑚𝑚²
𝑅𝑅𝐶𝐶𝑜𝑜𝑒𝑒𝑑𝑑𝑑𝑑𝑐𝑐𝑒𝑒𝑒𝑒𝑜𝑜𝑒𝑒𝑇𝑇𝑜𝑜𝑇𝑇 =0.06 𝑚𝑚
0.04 Wm. K ∙ 1.3 m²
= 1.15 𝐾𝐾/𝑊𝑊
o For conduction in the lower part, the surface area is 𝑆𝑆𝐶𝐶𝑜𝑜𝑒𝑒𝑒𝑒𝑜𝑜𝑒𝑒 = 0.126 𝑚𝑚² of metal:
𝑅𝑅𝐶𝐶𝑜𝑜𝑒𝑒𝑑𝑑𝑑𝑑𝑐𝑐𝑒𝑒𝑒𝑒𝑜𝑜𝑒𝑒𝐶𝐶𝑜𝑜𝑒𝑒𝑒𝑒𝑜𝑜𝑒𝑒 =0.002 𝑚𝑚
40 Wm. K ∙ 0.126 m²
= 3.98 ∙ 10−4 𝐾𝐾/𝑊𝑊
o For convection out of the insulated surface
𝑅𝑅𝐶𝐶𝑜𝑜𝑒𝑒𝐶𝐶𝑒𝑒𝑐𝑐𝑒𝑒𝑒𝑒𝑜𝑜𝑒𝑒𝑇𝑇𝑜𝑜𝑇𝑇 =1
htop ∙ 1.47 m²
with htop (W.m-2.K-1) considered similar on the vertical wall and on the top cone.
The convection coefficient in natural convection for a vertical wall and high Grashof numbers is determined as follows, using the adequate correlation as presented in Table 12:
𝐷𝐷𝑁𝑁𝑒𝑒𝑜𝑜𝑇𝑇 = 0.021 ∙ (𝐺𝐺𝑎𝑎𝑃𝑃𝑎𝑎)0.4
With Prandtl number Pr = 0.7 and Grashof number defined from geometry and properties of the fluid:
34
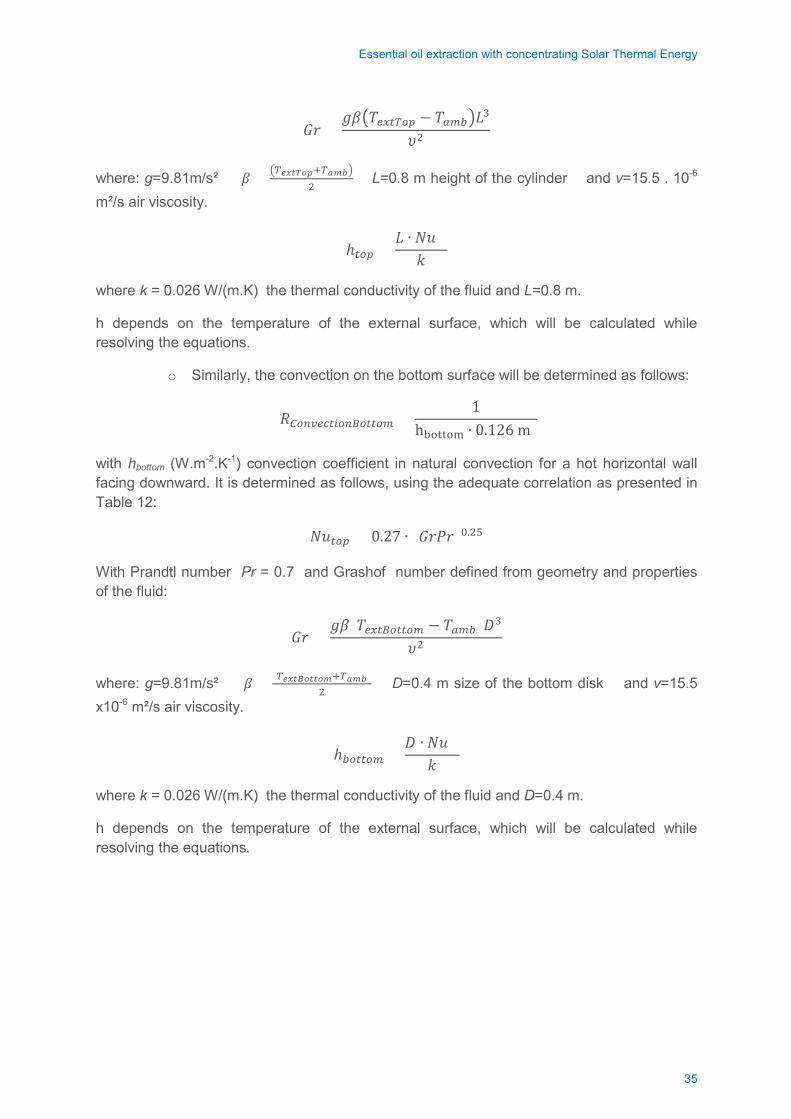
Essential oil extraction with concentrating Solar Thermal Energy
𝐺𝐺𝑎𝑎 =𝑎𝑎𝑔𝑔�𝑇𝑇𝑒𝑒𝑇𝑇𝑒𝑒𝑇𝑇𝑜𝑜𝑇𝑇 − 𝑇𝑇𝑒𝑒𝑒𝑒𝑎𝑎�𝑚𝑚3
𝜐𝜐2
where: g=9.81m/s² 𝑔𝑔 = �𝑇𝑇𝑒𝑒𝑒𝑒𝑒𝑒𝑒𝑒𝑒𝑒𝑒𝑒+𝑇𝑇𝑎𝑎𝑎𝑎𝑎𝑎�2
L=0.8 m height of the cylinder and ν=15.5 . 10-6 m²/s air viscosity.
ℎ𝑒𝑒𝑜𝑜𝑇𝑇 =𝑚𝑚 ∙ 𝐷𝐷𝑁𝑁
𝑘𝑘
where k = 0.026 W/(m.K) the thermal conductivity of the fluid and L=0.8 m.
h depends on the temperature of the external surface, which will be calculated while resolving the equations.
o Similarly, the convection on the bottom surface will be determined as follows:
𝑅𝑅𝐶𝐶𝑜𝑜𝑒𝑒𝐶𝐶𝑒𝑒𝑐𝑐𝑒𝑒𝑒𝑒𝑜𝑜𝑒𝑒𝐶𝐶𝑜𝑜𝑒𝑒𝑒𝑒𝑜𝑜𝑒𝑒 =1
hbottom ∙ 0.126 m²
with hbottom (W.m-2.K-1) convection coefficient in natural convection for a hot horizontal wall facing downward. It is determined as follows, using the adequate correlation as presented in Table 12:
𝐷𝐷𝑁𝑁𝑒𝑒𝑜𝑜𝑇𝑇 = 0.27 ∙ (𝐺𝐺𝑎𝑎𝑃𝑃𝑎𝑎)0.25
With Prandtl number Pr = 0.7 and Grashof number defined from geometry and properties of the fluid:
𝐺𝐺𝑎𝑎 =𝑎𝑎𝑔𝑔(𝑇𝑇𝑒𝑒𝑇𝑇𝑒𝑒𝐶𝐶𝑜𝑜𝑒𝑒𝑒𝑒𝑜𝑜𝑒𝑒 − 𝑇𝑇𝑒𝑒𝑒𝑒𝑎𝑎)𝐷𝐷3
𝜐𝜐2
where: g=9.81m/s² 𝑔𝑔 = (𝑇𝑇𝑒𝑒𝑒𝑒𝑒𝑒𝑒𝑒𝑒𝑒𝑒𝑒𝑒𝑒𝑒𝑒𝑎𝑎+𝑇𝑇𝑎𝑎𝑎𝑎𝑎𝑎)2
D=0.4 m size of the bottom disk and ν=15.5 x10⁻⁶ m²/s air viscosity.
ℎ𝑎𝑎𝑜𝑜𝑒𝑒𝑒𝑒𝑜𝑜𝑒𝑒 =𝐷𝐷 ∙ 𝐷𝐷𝑁𝑁
𝑘𝑘
where k = 0.026 W/(m.K) the thermal conductivity of the fluid and D=0.4 m.
h depends on the temperature of the external surface, which will be calculated while resolving the equations.
35
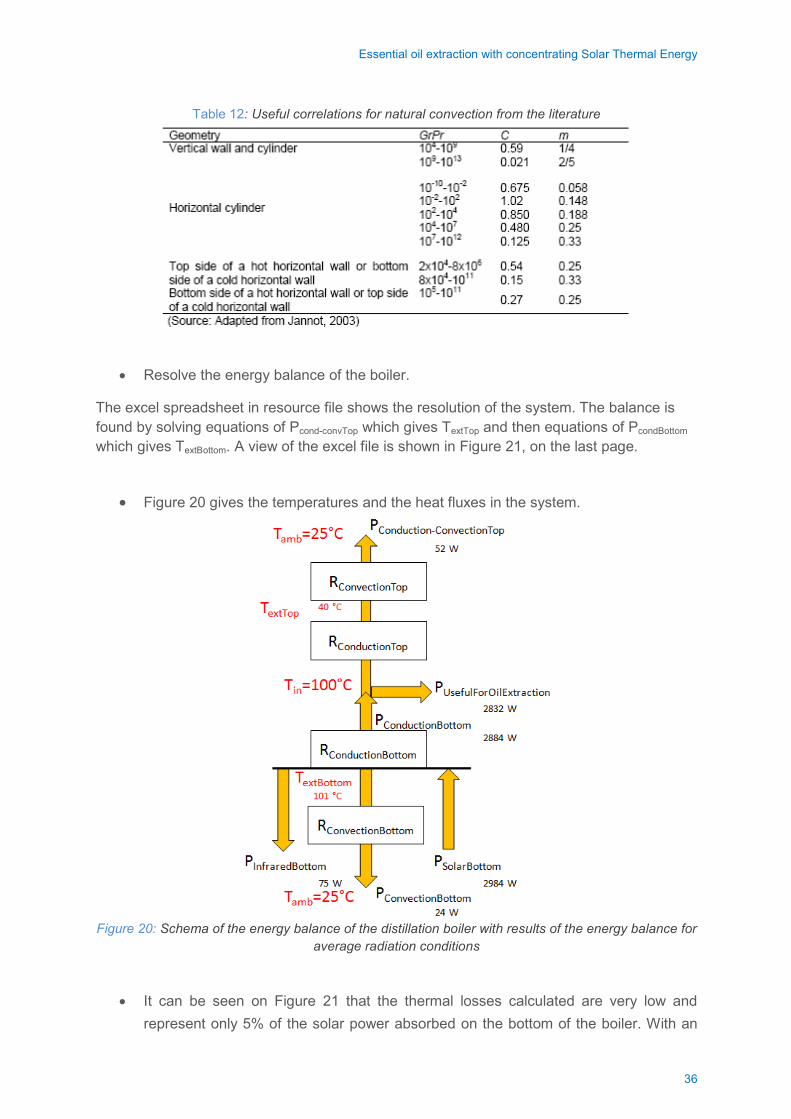
Essential oil extraction with concentrating Solar Thermal Energy
Table 12: Useful correlations for natural convection from the literature
• Resolve the energy balance of the boiler.
The excel spreadsheet in resource file shows the resolution of the system. The balance is found by solving equations of Pcond-convTop which gives TextTop and then equations of PcondBottom which gives TextBottom. A view of the excel file is shown in Figure 21, on the last page.
• Figure 20 gives the temperatures and the heat fluxes in the system.
Figure 20: Schema of the energy balance of the distillation boiler with results of the energy balance for
average radiation conditions
• It can be seen on Figure 21 that the thermal losses calculated are very low and represent only 5% of the solar power absorbed on the bottom of the boiler. With an
36
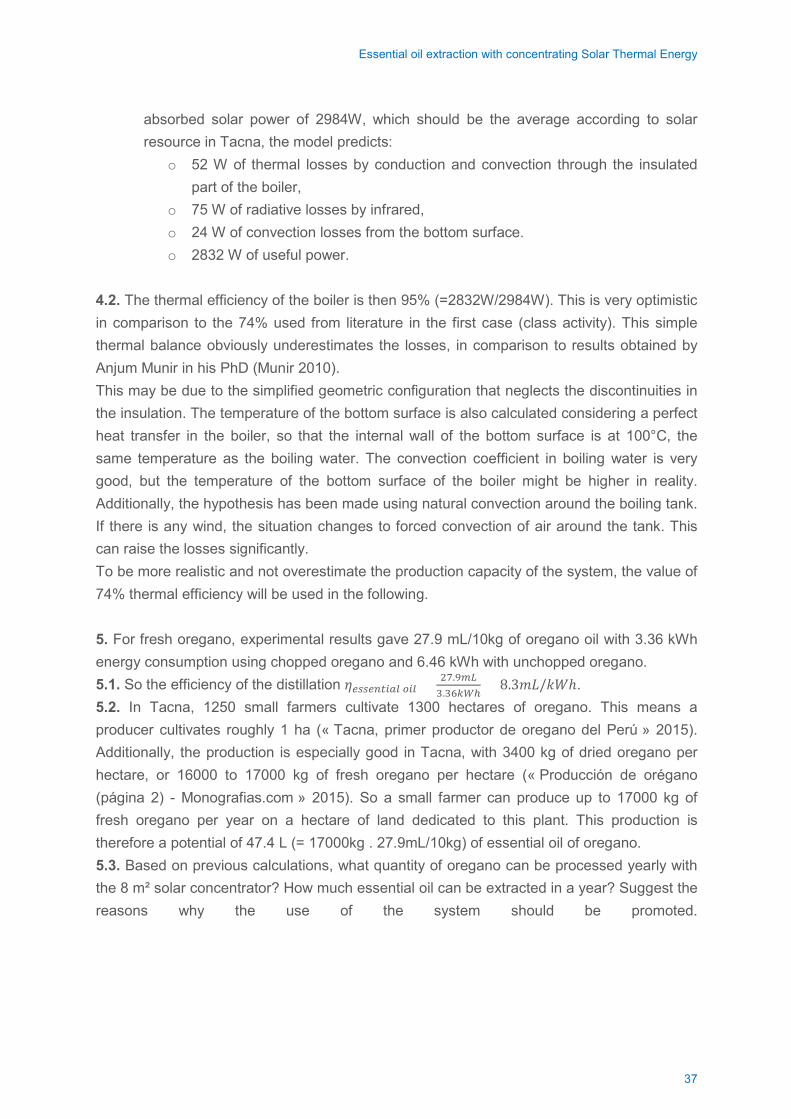
Essential oil extraction with concentrating Solar Thermal Energy
absorbed solar power of 2984W, which should be the average according to solar resource in Tacna, the model predicts:
o 52 W of thermal losses by conduction and convection through the insulated part of the boiler,
o 75 W of radiative losses by infrared, o 24 W of convection losses from the bottom surface. o 2832 W of useful power.
4.2. The thermal efficiency of the boiler is then 95% (=2832W/2984W). This is very optimistic in comparison to the 74% used from literature in the first case (class activity). This simple thermal balance obviously underestimates the losses, in comparison to results obtained by Anjum Munir in his PhD (Munir 2010). This may be due to the simplified geometric configuration that neglects the discontinuities in the insulation. The temperature of the bottom surface is also calculated considering a perfect heat transfer in the boiler, so that the internal wall of the bottom surface is at 100°C, the same temperature as the boiling water. The convection coefficient in boiling water is very good, but the temperature of the bottom surface of the boiler might be higher in reality. Additionally, the hypothesis has been made using natural convection around the boiling tank. If there is any wind, the situation changes to forced convection of air around the tank. This can raise the losses significantly. To be more realistic and not overestimate the production capacity of the system, the value of 74% thermal efficiency will be used in the following. 5. For fresh oregano, experimental results gave 27.9 mL/10kg of oregano oil with 3.36 kWh energy consumption using chopped oregano and 6.46 kWh with unchopped oregano. 5.1. So the efficiency of the distillation 𝜂𝜂𝑒𝑒𝑒𝑒𝑒𝑒𝑒𝑒𝑒𝑒𝑒𝑒𝑒𝑒𝑒𝑒𝑒𝑒 𝑜𝑜𝑒𝑒𝑒𝑒 = 27.9𝑒𝑒𝑚𝑚
3.36𝑘𝑘𝑘𝑘ℎ= 8.3𝑚𝑚𝑚𝑚/𝑘𝑘𝑊𝑊ℎ.
5.2. In Tacna, 1250 small farmers cultivate 1300 hectares of oregano. This means a producer cultivates roughly 1 ha (« Tacna, primer productor de oregano del Perú » 2015). Additionally, the production is especially good in Tacna, with 3400 kg of dried oregano per hectare, or 16000 to 17000 kg of fresh oregano per hectare (« Producción de orégano (página 2) - Monografias.com » 2015). So a small farmer can produce up to 17000 kg of fresh oregano per year on a hectare of land dedicated to this plant. This production is therefore a potential of 47.4 L (= 17000kg . 27.9mL/10kg) of essential oil of oregano. 5.3. Based on previous calculations, what quantity of oregano can be processed yearly with the 8 m² solar concentrator? How much essential oil can be extracted in a year? Suggest the reasons why the use of the system should be promoted.
37
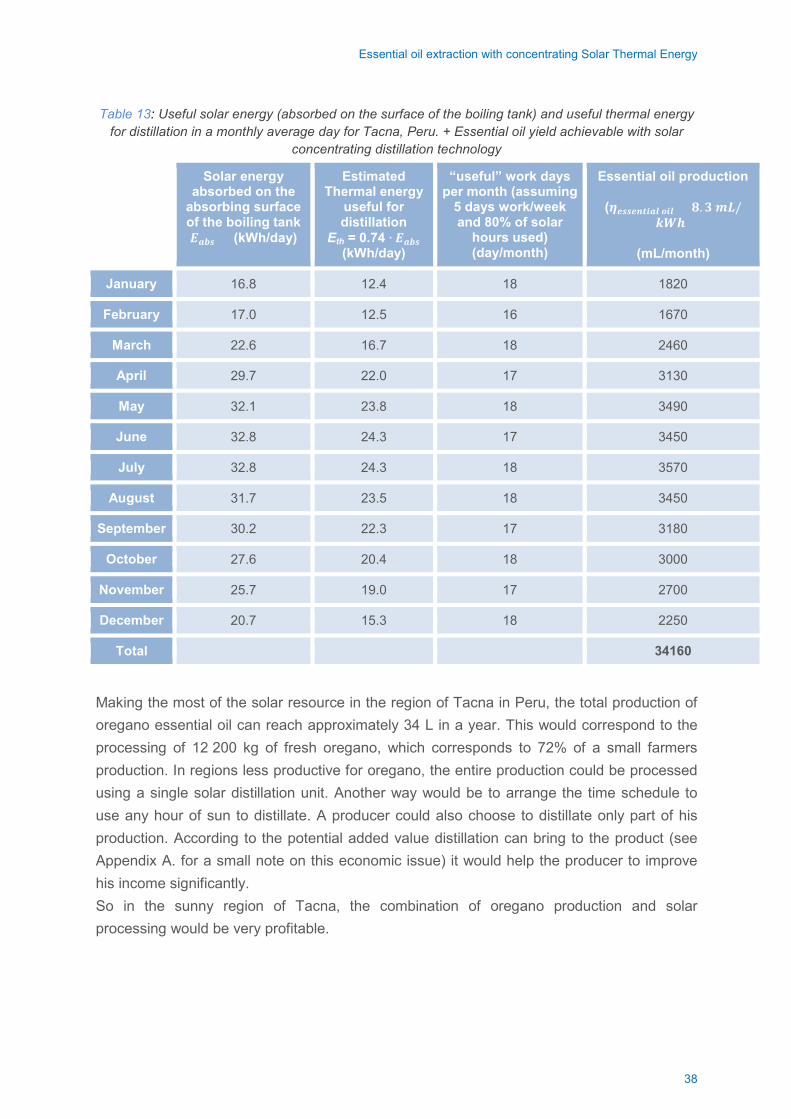
Essential oil extraction with concentrating Solar Thermal Energy
Table 13: Useful solar energy (absorbed on the surface of the boiling tank) and useful thermal energy for distillation in a monthly average day for Tacna, Peru. + Essential oil yield achievable with solar
concentrating distillation technology
Solar energy absorbed on the
absorbing surface of the boiling tank 𝑬𝑬𝒂𝒂𝒂𝒂𝒂𝒂 (kWh/day)
Estimated Thermal energy
useful for distillation
Eth = 0.74 ∙ 𝑬𝑬𝒂𝒂𝒂𝒂𝒂𝒂 (kWh/day)
“useful” work days per month (assuming
5 days work/week and 80% of solar
hours used) (day/month)
Essential oil production
(𝜼𝜼𝒆𝒆𝒂𝒂𝒂𝒂𝒆𝒆𝒆𝒆𝒕𝒕𝒆𝒆𝒂𝒂𝒆𝒆 𝒐𝒐𝒆𝒆𝒆𝒆 = 𝟖𝟖.𝟑𝟑 𝒆𝒆𝒎𝒎/𝒌𝒌𝒌𝒌𝒉𝒉)
(mL/month)
January 16.8 12.4 18 1820
February 17.0 12.5 16 1670
March 22.6 16.7 18 2460
April 29.7 22.0 17 3130
May 32.1 23.8 18 3490
June 32.8 24.3 17 3450
July 32.8 24.3 18 3570
August 31.7 23.5 18 3450
September 30.2 22.3 17 3180
October 27.6 20.4 18 3000
November 25.7 19.0 17 2700
December 20.7 15.3 18 2250
Total 34160
Making the most of the solar resource in the region of Tacna in Peru, the total production of oregano essential oil can reach approximately 34 L in a year. This would correspond to the processing of 12 200 kg of fresh oregano, which corresponds to 72% of a small farmers production. In regions less productive for oregano, the entire production could be processed using a single solar distillation unit. Another way would be to arrange the time schedule to use any hour of sun to distillate. A producer could also choose to distillate only part of his production. According to the potential added value distillation can bring to the product (see Appendix A. for a small note on this economic issue) it would help the producer to improve his income significantly. So in the sunny region of Tacna, the combination of oregano production and solar processing would be very profitable.
38
Essential oil extraction with concentrating Solar Thermal Energy
BIBLIOGRAPHY
Florent Dupont. 2008. Essential oil extraction from herbs using solar energy. Witzenhausen: Universität Witzenhausen.
Patil, Rupesh, Gajanan Awari, et Mahendra Singh. 2011. « Experimental Analysis of Scheffler
Reflector Water Heater ». Thermal Science 15 (3): 599-604. doi:10.2298/TSCI100225058P. Dr Hazel MacTavish, et Mr David Harris. 2002. An economic study of essential oil production in
the UK: A case study comparing non-UK lavender/lavandin production and peppermint/spearmint production with UK production techniques and costs. Government Industry Forum for Non- Food Crops. UK: ADAS Consulting Ltd.
Jones, Charles I., et Dietrich Vollrath. 2013. Introduction to Economic Growth. Third Edition
edition. New York: W. W. Norton & Company. Heinberg, Richard. 2011. The End of Growth : Adapting to Our New Economic Reality. Gabriola,
B.C. : New Society Publishers. http://archive.org/details/endgrowthadaptin00hein_574. Thomas L. Acker, Chelsea Atwater, et Dean Howard Smith. 2009. « Energy Inefficiency in
Industrial Agriculture: You Are What You Eat ». Northern Arizona University, The W.A. Franke College of Business, Working Paper Series—09 09, , juillet.
Schumacher, E. F. 1993. Small Is Beautiful: A Study of Economics as if People Mattered. Édition :
New Ed. London: Vintage. Edward Goldsmith. 2014. The Way - An Ecological Worldview. 3rd (special) edition. GB: Veltune
Publishing Ltd. Goodwin, Michael, et Dan E. Burr. 2012. Economix: How and Why Our Economy Works (And
Doesn’t Work), in Words and Pictures. New York: Abrams. « Oregano ». 2015. Accessed January 17. http://www.herbs-info.com/oregano.html « Tacna, primer productor de oregano del Perú ». 2015. Consulté le janvier 18.
http://agriecologicoperuvia.galeon.com/ « Atlas Solar - Mapas Radiación Solar en Perú - Energía solar y eólica en Peru ». 2015. Consulté
le janvier 17. http://deltavolt.pe/atlas/atlassolar « Free download of solar radiation map - DNI: SolarGIS ». 2015. Consulté le janvier 18.
http://solargis.info/doc/free-solar-radiation-maps-DNI#P
39
Essential oil extraction with concentrating Solar Thermal Energy
FURTHER SUGGESTED MATERIAL
• MANUAL OF CONSTRUCTION OF SCHEFFLER SOLAR CONCENTRATOR Ruelas, José, Gabriel Pando, Baldomero Lucero, et Juan Tzab. 2014. « Ray Tracing Study to Determine the Characteristics of the Solar Image in the Receiver for a Scheffler-type Solar Concentrator Coupled with a Stirling Engine ». Energy Procedia, 2013 ISES Solar World Congress, 57: 2858-66. doi:10.1016/j.egypro.2014.10.319.
• DOCTORATE ON SOLAR DISTILLATION SYSTEM USING SCHEFFLER SOLAR CONCENTRATOR Anjum Munir. 2010. « Design, Development and Modeling of a Solar Distillation System for the Processing of Medicinal and Aromatic Plants ». Witzenhausen: Universität Kassel / Witzenhausen. http://kobra.bibliothek.uni-kassel.de/bitstream/urn:nbn:de:hebis:34-2010081033973/3/DissertationMunir.pdf
• MONOGRAPHY ON OREGANO PRODUCTION IN PERU, 2012 Spanish versión (in a web page): « Producción de orégano - Monografias.com ». Accessed January 18. 2015. http://www.monografias.com/trabajos57/produccion-oregano/produccion-oregano.shtml « Producción de orégano (página 2) - Monografias.com ». Accessed January 18. 2015. http://www.monografias.com/trabajos57/produccion-oregano/produccion-oregano2.shtml
English version (without figures and tables): « Production of oregano | Akimoo ». Accessed January 17. 2015. http://www.akimoo.com/2012/production-of-oregano/
• EXCEL FILE WITH THERMAL MODEL OF THE SOLAR DISTILLATION UNIT See the annexed file.
40
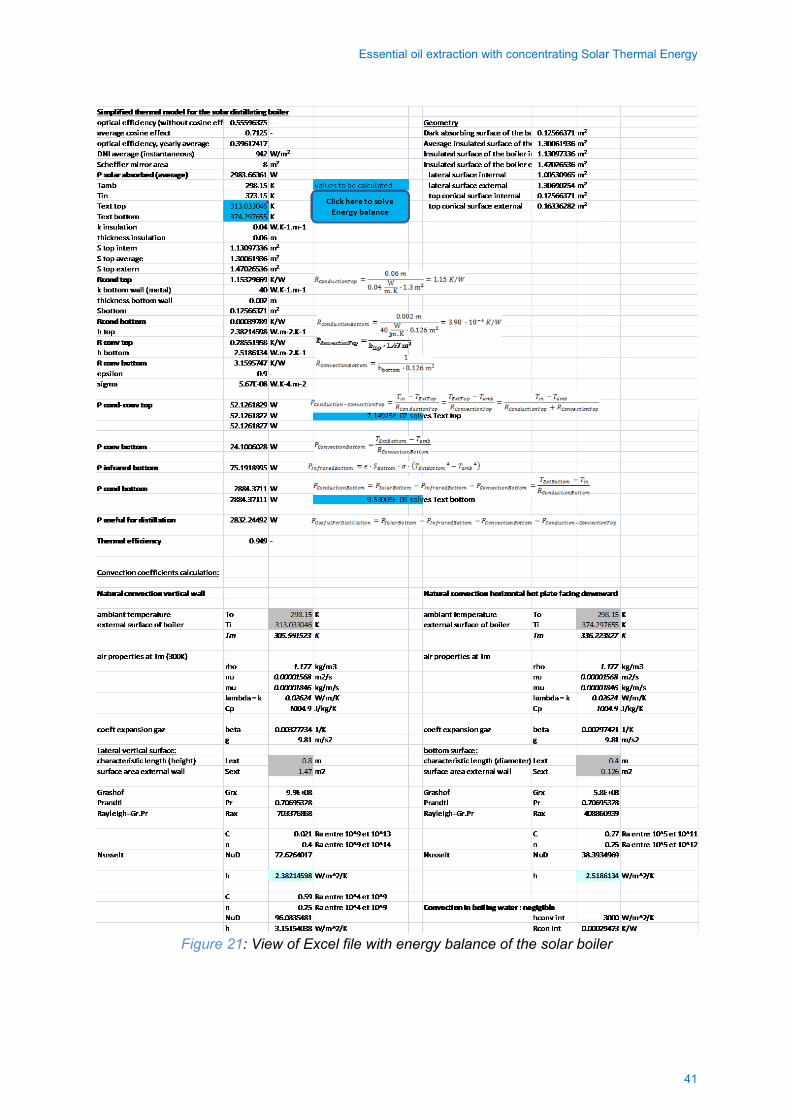
Essential oil extraction with concentrating Solar Thermal Energy
Figure 21: View of Excel file with energy balance of the solar boiler
41
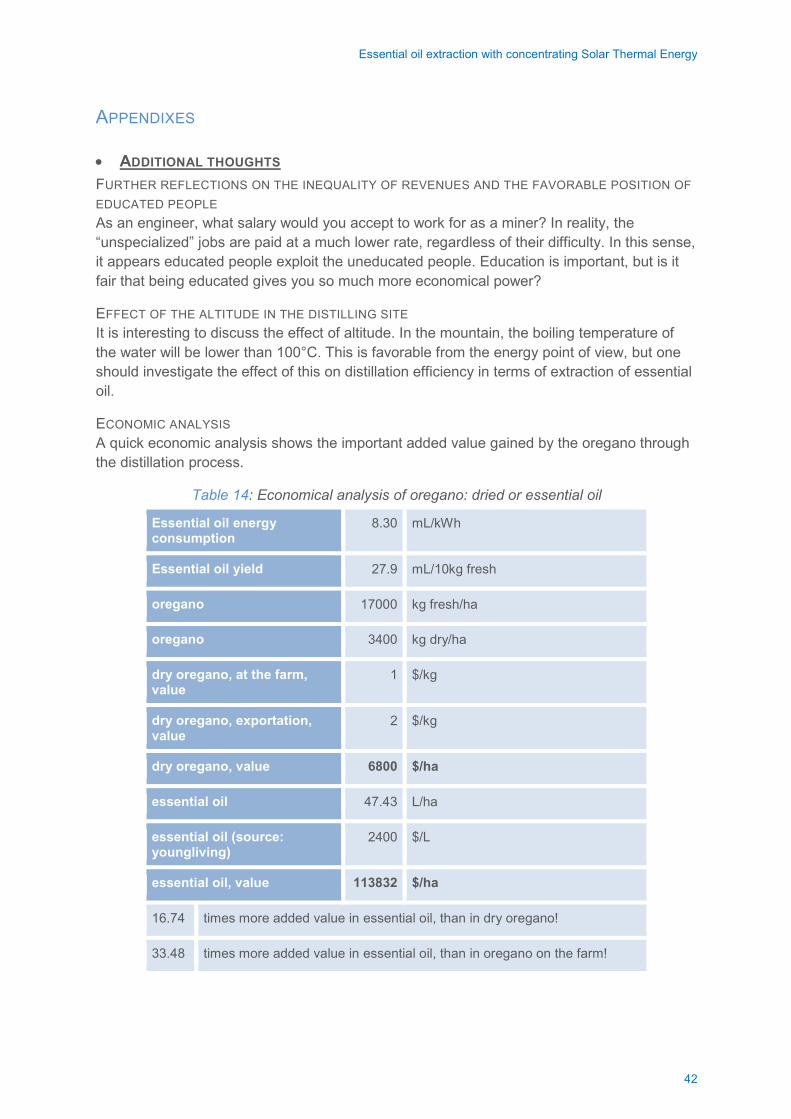
Essential oil extraction with concentrating Solar Thermal Energy
APPENDIXES
• ADDITIONAL THOUGHTS FURTHER REFLECTIONS ON THE INEQUALITY OF REVENUES AND THE FAVORABLE POSITION OF EDUCATED PEOPLE As an engineer, what salary would you accept to work for as a miner? In reality, the “unspecialized” jobs are paid at a much lower rate, regardless of their difficulty. In this sense, it appears educated people exploit the uneducated people. Education is important, but is it fair that being educated gives you so much more economical power?
EFFECT OF THE ALTITUDE IN THE DISTILLING SITE It is interesting to discuss the effect of altitude. In the mountain, the boiling temperature of the water will be lower than 100°C. This is favorable from the energy point of view, but one should investigate the effect of this on distillation efficiency in terms of extraction of essential oil.
ECONOMIC ANALYSIS A quick economic analysis shows the important added value gained by the oregano through the distillation process.
Table 14: Economical analysis of oregano: dried or essential oil
Essential oil energy consumption
8.30 mL/kWh
Essential oil yield 27.9 mL/10kg fresh
oregano 17000 kg fresh/ha
oregano 3400 kg dry/ha
dry oregano, at the farm, value
1 $/kg
dry oregano, exportation, value
2 $/kg
dry oregano, value 6800 $/ha
essential oil 47.43 L/ha
essential oil (source: youngliving)
2400 $/L
essential oil, value 113832 $/ha
16.74 times more added value in essential oil, than in dry oregano!
33.48 times more added value in essential oil, than in oregano on the farm!
42
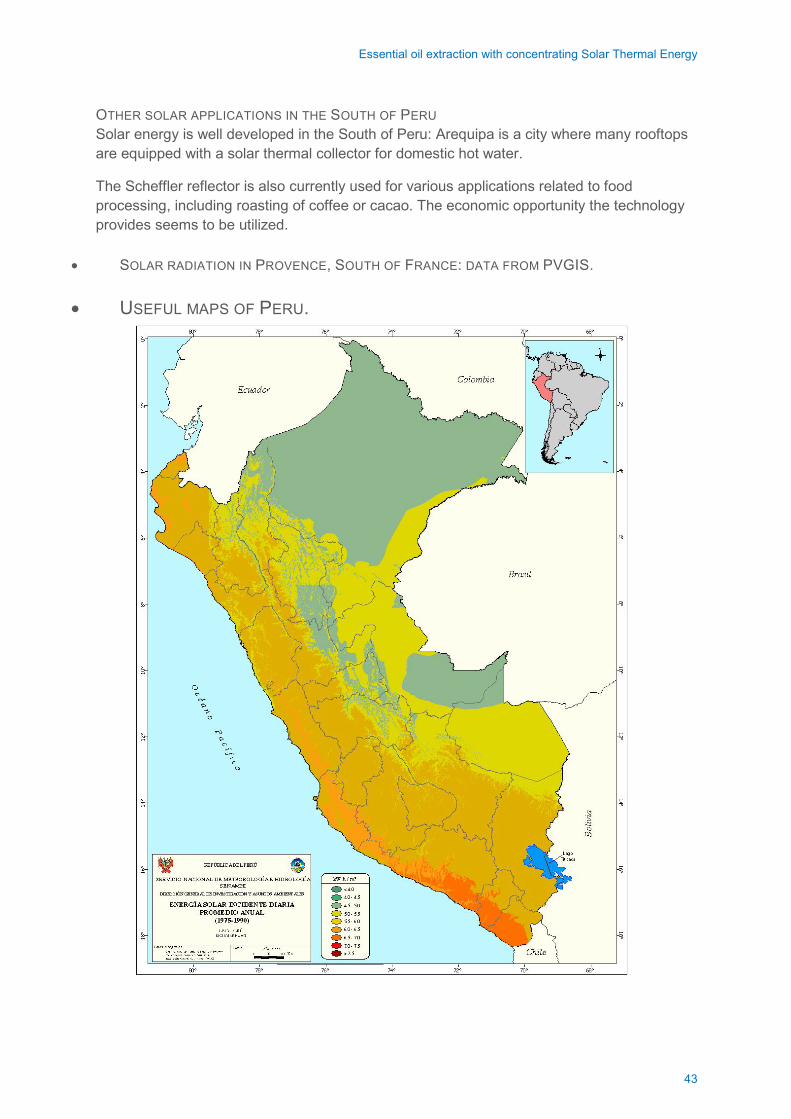
Essential oil extraction with concentrating Solar Thermal Energy
OTHER SOLAR APPLICATIONS IN THE SOUTH OF PERU Solar energy is well developed in the South of Peru: Arequipa is a city where many rooftops are equipped with a solar thermal collector for domestic hot water.
The Scheffler reflector is also currently used for various applications related to food processing, including roasting of coffee or cacao. The economic opportunity the technology provides seems to be utilized.
• SOLAR RADIATION IN PROVENCE, SOUTH OF FRANCE: DATA FROM PVGIS.
• USEFUL MAPS OF PERU.
43
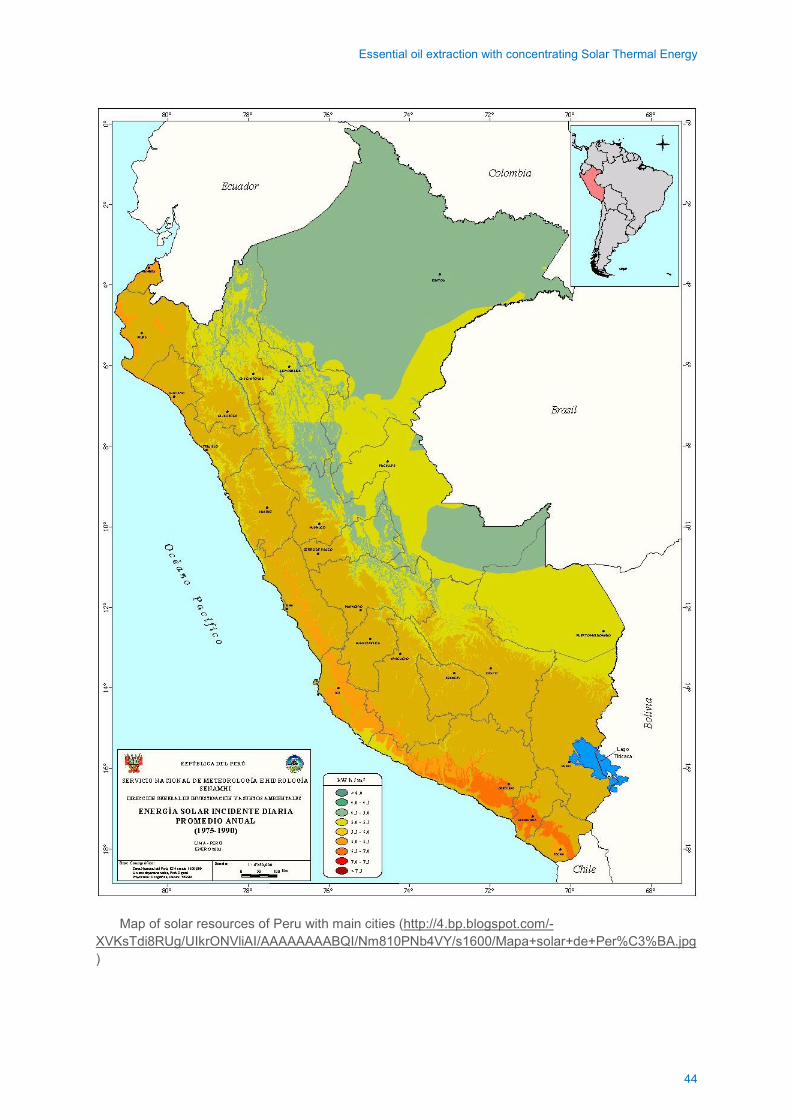
Essential oil extraction with concentrating Solar Thermal Energy
Map of solar resources of Peru with main cities (http://4.bp.blogspot.com/-XVKsTdi8RUg/UIkrONVliAI/AAAAAAAABQI/Nm810PNb4VY/s1600/Mapa+solar+de+Per%C3%BA.jpg )
44
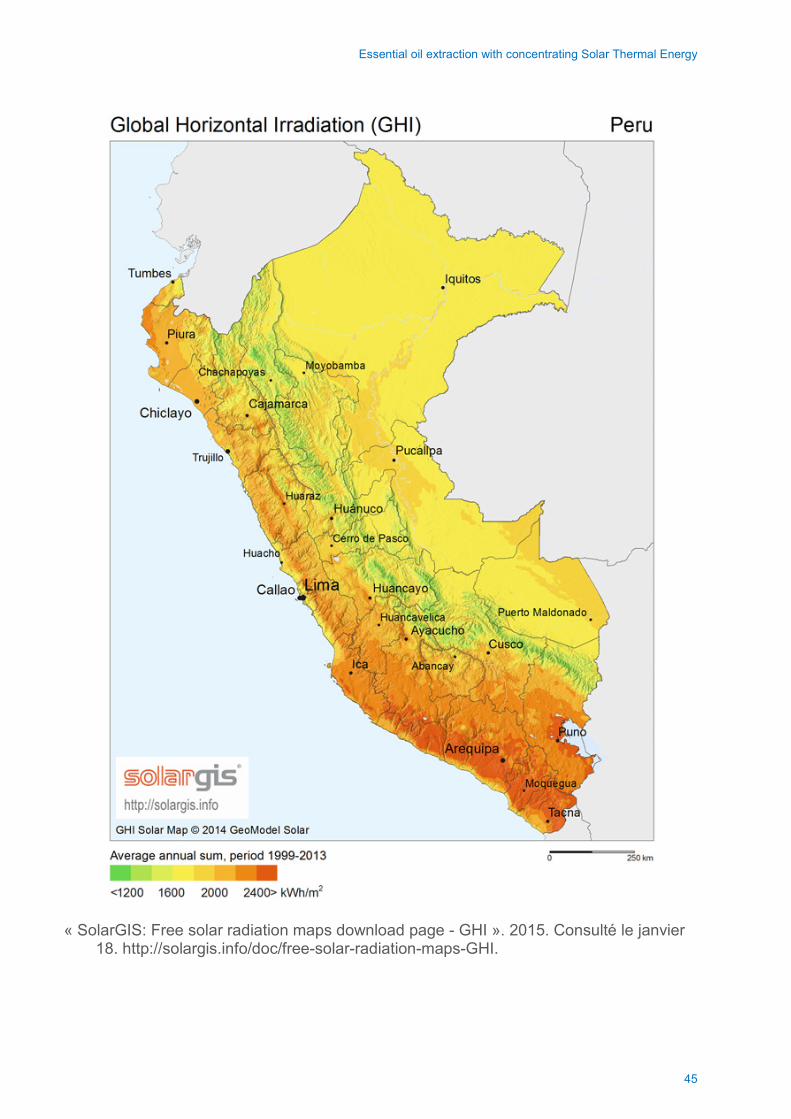
Essential oil extraction with concentrating Solar Thermal Energy
« SolarGIS: Free solar radiation maps download page - GHI ». 2015. Consulté le janvier
18. http://solargis.info/doc/free-solar-radiation-maps-GHI.
45
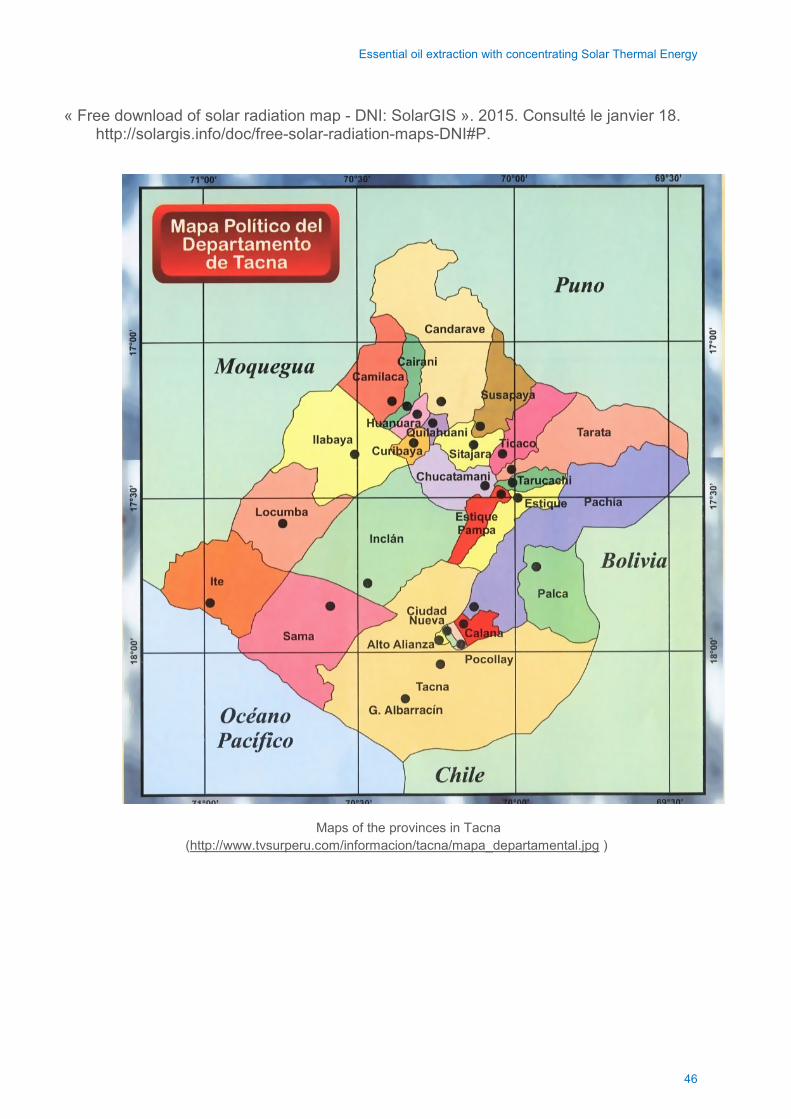
Essential oil extraction with concentrating Solar Thermal Energy
« Free download of solar radiation map - DNI: SolarGIS ». 2015. Consulté le janvier 18. http://solargis.info/doc/free-solar-radiation-maps-DNI#P.
Maps of the provinces in Tacna (http://www.tvsurperu.com/informacion/tacna/mapa_departamental.jpg )
46

http://www.gdee.eu
This project is funded by
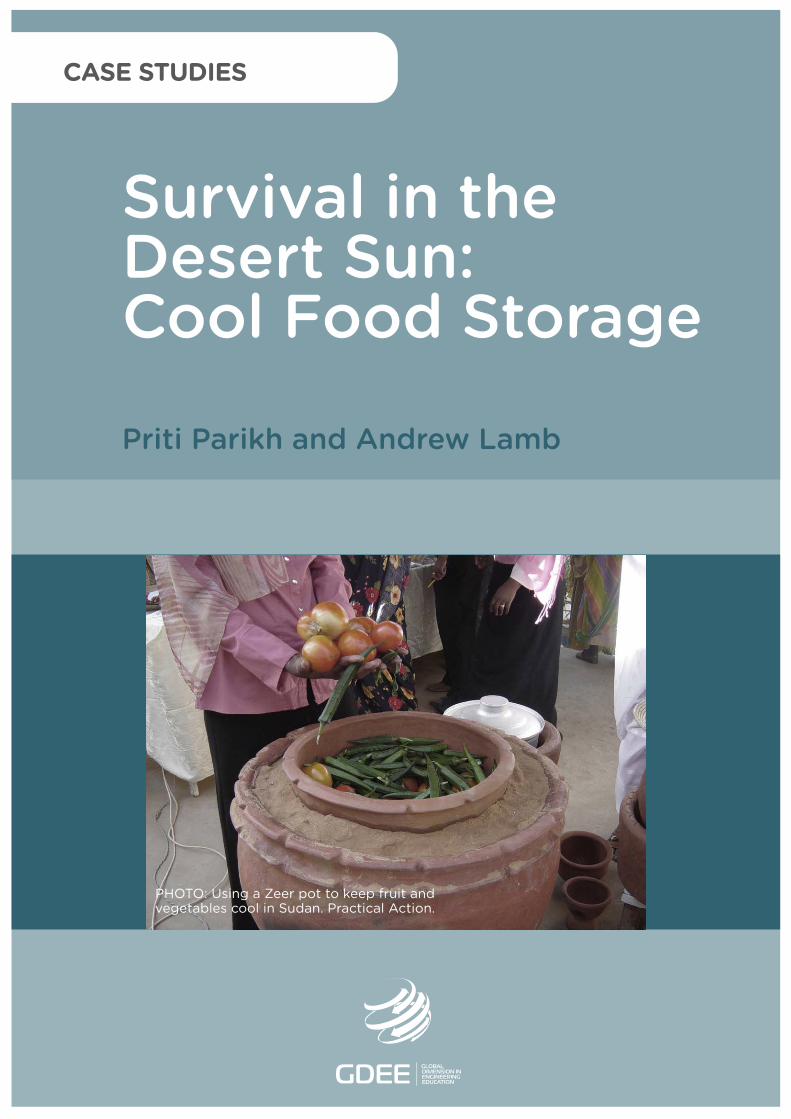
Survival in the Desert Sun: Cool Food Storage
Priti Parikh and Andrew Lamb
PHOTO: Using a Zeer pot to keep fruit andvegetables cool in Sudan. Practical Action.
CASE STUDIES
DL B 10735-2015 ISBN 978-84-606-7546-4
Survival in the Desert Sun: Cool Food Storage
COORDINATED BYAgustí Pérez-Foguet, Enric Velo, Pol Arranz, Ricard Ginéand Boris Lazzarini (Universitat Politècnica de Catalunya)Manuel Sierra (Universidad Politécnica de Madrid)Alejandra Boni and Jordi Peris (Universitat Politècnica de València)Guido Zolezzi and Gabriella Trombino (Università degli Studi di Trento)Rhoda Trimingham (Loughborough University)Valentín Villarroel (ONGAWA)Neil Nobles and Meadhbh Bolger (Practical Action)Francesco Mongera (Training Center for International Cooperation)Katie Cresswell-Maynard (Engineering Without Border UK)
EDITED BY Global Dimension in Engineering Education
Citation: Parikh, P. and Lamb, A. (2015) 'Survival in the Desert Sun: Cool Food Storage', in Case studies for developing globally responsible engineers, GDEE (eds.), Global Dimension in Engineering Education, Barcelona. Available from: http://gdee.eu/index.php/resources.html
This publication is distributedunder an Attribution- Noncommercial-Share Alike License for Creative Commons
CASE STUDIES
Disclaimer: This document has been produced with the financial assistance of the European UnionThe contents of this document are the sole responsibility of the authors and can under no circumstances be regarded as reflecting the position of the European Union
Survival in the Desert Sun: Cool Food Storage
SURVIVAL IN THE DESERT SUN: COOL FOOD STORAGE
Dr. Priti Parikh, University College London. Andrew Lamb, Engineers Without Borders UK.
1
Survival in the Desert Sun: Cool Food Storage
INDEX
1. INTRODUCTION ........................................................................................................................... 3
1.1. DISCIPLINES COVERED ............................................................................................................. 3
1.2. LEARNING OUTCOMES .............................................................................................................. 3
1.3. ACTIVITIES .............................................................................................................................. 4
2. DESCRIPTION OF THE CONTEXT ............................................................................................. 4
2.1. LIVING IN NORTH DARFUR ........................................................................................................ 4
2.2. EVAPORATIVE COOLING ........................................................................................................... 6
2.3. ZEER POT CLAY REFRIGERATOR ............................................................................................... 6
2.4. OTHER DESIGNS OF EVAPORATIVE COOLERS ............................................................................ 8
2.5. PRACTICAL ACTION SUDAN ...................................................................................................... 9
3. CLASS ACTIVITY ....................................................................................................................... 10
3.1. ACTIVITY ............................................................................................................................... 10
3.2. SOLUTION AND EVALUATION CRITERIA ..................................................................................... 13
4. HOMEWORK ACTIVITY ............................................................................................................. 16
4.1. TASK .................................................................................................................................... 16
4.2. PREPARATION ....................................................................................................................... 17
4.3. EVALUATION CRITERIA ........................................................................................................... 17
4.4. USING WIKIS IN EDUCATION - RESOURCES ............................................................................. 19
BIBLIOGRAPHY ................................................................................................................................. 20
2
Survival in the Desert Sun: Cool Food Storage
1. INTRODUCTION The Global Dimension in Engineering Education (GDEE) is a European Union funded initiative involving the collaboration of development NGOs and universities, with an aim to integrate sustainable human development as a regular part of all technical university courses. Part of the initiative is the development of a set of case studies based on real field experiences of development projects. The case studies cover a broad range of topics directly related those studied in engineering, science and other technology, environment or development-related courses. This case study looks at a technology that people who live in the heat and dust of North Darfur use to preserve their food. It is a clay and sand pot called a Zeer Pot. When placed in the sunshine, it uses the phenomena of evaporative cooling to cool the vegetables stored inside it. This is of vital importance to people for their own food supplies and for affordably preserving food for market. The case study is based on work by Practical Action Sudan (Practical Action Nepal, 2014). The case study allows students at any level to: understand factors influencing the performance of evaporative cooling pots; learn about another use of solar energy (other than photovoltaics and water heating etc) in enabling sustainable human development; realise the extreme vulnerability to disaster of many millions of people and how good engineering can help reduce their vulnerability; appreciate the beginner’s confusion over technology choice; experience the challenges of communicating the design of even a simple technology. Images for this case study can be found in the associated PowerPoint presentation.
1.1. DISCIPLINES COVERED Thermodynamics; Materials Science; Sustainability; Economics; Appropriate Technology. Other aspects include: Development; Entrepreneurship; Social Sciences.
1.2. LEARNING OUTCOMES 1. The positive impact of even a ‘basic technology’ (uses basic principles) on people’s lives. 2. An understanding of the engineer’s role in technology choice. 3. The challenge and importance of effectively communicating know-how about technology
ensure that the technology is used properly.
3
Survival in the Desert Sun: Cool Food Storage
1.3. ACTIVITIES Class Activity: Individual work, and calculations about the performance of refrigeration pots for a variety of storage conditions. Homework Activity: Individual work, and a web activity – writing an online guide for making a cooling device. 2. DESCRIPTION OF THE CONTEXT
The following sections outline the situation in the North Darfur region of Sudan, evaporative cooling, the Zeer Pot and a number of other evaporative cooler designs. The case study is therefore, in itself, a demonstration of the issue of technology choice; there are many ways to cool vegetables without needing power, but which one should be used? Hopefully, the case study will offer some surprising and inspiring ideas to students: that the sun can be used to cool; that there are so many ways to cool food without power; that communicating how to make even a simple pot can be very hard; the vulnerability of people over food; etc. The case study could be extended to include: practical activities where groups of students make, use and analyse Zeer Pots themselves; issues of climate change; the role of engineers in communicating and sharing technology; the ironies in the history of technology – such as that we live in a world that uses electrical cooling thanks to the advancement of technology in rich, cold countries but that we now need to re-discover evaporative cooling from poor, hot countries to help reduce climate change (caused by rich country technologies). The final activity will also allow for the exploration of issues surrounding wikis.
2.1. LIVING IN NORTH DARFUR Sudan is Africa’s third largest country and the third largest Arab country (Wikipedia, 2014). About 85% of poor people in Sudan depend on agriculture or animal husbandry or both. Recurrent drought and flash floods can cause food insecurity for farmers, pastoralists and their families. Limited natural resources also contribute to conflict at local level. Sudan’s Darfur region in the west is made up of five states. North Darfur is the largest of these with an area roughly equivalent to the total area of United Kingdom and Ireland together. The northern part of the state is desert, and the west and the south are dominated by the Marrah mountains. The eastern part of the state has low sandy hills and plains, and it is here that the state’s 1,500,000 people is concentrated (Wikipedia, 2014). 80% of North Darfur’s population lives in rural areas practicing agriculture and animal rearing.
4
Survival in the Desert Sun: Cool Food Storage
North Darfur is geographically remote from the rest of the country; El Fasher, the capital of North Darfur is more than 1,000 km from Sudan’s capital, Khartoum. This remoteness – combined with the insecurity and marginalisation – contributes to poor services delivery, lack of markets access and the slow pace of humanitarian aid. The disruptive effects of the Darfur conflict are most felt in the areas of agriculture, food security, livestock, education, health, and personal security. Ongoing asset stripping, restriction of movement, rape and harassment, further impinge on these sectors. Each renewed conflict means a break in the food aid pipeline, and increased prices of essential supplies (including fuel). This situation has meant collapse of traditional and supplementary livelihoods and general food insecurity. Vulnerability has increased, especially of women and children. On the southern edge of the Sahara desert and lying within Africa's arid zone, North Darfur State offers extremely difficult conditions for growing food, raising livestock and living. Declining rainfall over recent years has led to low production of crops, which makes households vulnerable to food crises. When there is a good production season, farmers often need technical know-how on food processing and storage to help overcome supply problems in poor growing years. The staple crop is millet, planted on large areas of sandy goz soil as well as on smaller areas of alluvial soils. Households grow part of their annual consumption requirements. Watermelon is the main intercrop, which provides useful cash income. Livestock have traditionally been part of the North Darfur rural production system, with camels, sheep, cattle and goats all owned in small numbers by farming households. Other livelihoods that supplement agriculture and livestock rearing are labour migration, trade and collection of firewood and fodder. Few families have alternative livelihood skills to rely on during bad harvests. Traditional coping mechanisms such as reducing the number of meals eaten in a day, over-grazing and over-cultivation can be harmful to the families and to the environment. In hot climates such as that in North Darfur, food doesn’t stay fresh for long. Tomatoes go off in just two days. After four days carrots and okra are rotten. With no means of preserving their crops, poverty stricken families battle hunger and even famine. Much of the post-harvest loss of fruits and vegetables in developing countries like Sudan is due to the lack of proper storage facilities. While refrigerated cool stores are the best method of preserving fruits and vegetables, they are expensive to buy and run. Consequently in developing countries there is interest in low-cost alternatives, many of which depend on evaporative cooling which is simple and does not require a power supply.
5
Survival in the Desert Sun: Cool Food Storage
According to a 2014 report, it is estimated that about 25% of food waste in developing countries could be eliminated with better refrigeration equipment and that up to 50% of fruit and vegetables are lost in sub-Saharan Africa (IMechE, 2014).
2.2. EVAPORATIVE COOLING The basic principle relies on cooling by evaporation, which is a process of heat exchange. When water evaporates, its relatively high specific heat capacity draws energy from its surroundings and produces a considerable cooling effect. Evaporative cooling occurs when air (that is not too humid) passes over a wet surface; the faster the rate of evaporation the greater the cooling. Evaporative coolers need to be replenished with water for cooling to continue. The efficiency of an evaporative cooler depends on the humidity of the surrounding air. Very dry air can absorb a lot of moisture so greater cooling occurs. In the extreme case of air that is totally saturated with water, no evaporation can take place and no cooling occurs. Side Note on Biomimicry: Human bodies sweat in hot temperatures to allow for evaporative cooling from the skin. In dry heat sweating can be very effective (indeed, evaporation can happen so quickly that you may not even notice that you are sweating). In humid weather sweating is far less effective. Staying hydrated whilst sweating is essential to allow the process of evaporative cooling to continue. The use of evaporative cooling to cool food is therefore an example of ‘biomimicry’ where the design of a technology is inspired and informed by natural biological solutions.
2.3. ZEER POT CLAY REFRIGERATOR A Nigerian teacher called Mohammed Bah Abba first developed the Zeer pot in the 1990s. It consists of a small-scale storage ‘pot-in-pot’ system that uses two pots of slightly different size made of local materials. The smaller pot (which can be glazed) is placed inside the larger pot and the gap between the two pots is filled with sand, which is kept moist with water. As the sun shines on the outer pot, water evaporates from the sand through the porous ceramic and the food in the smaller pot inside is cooled. Up to 12kg of fruit and vegetables can be stored. Mohammed won the Rolex 200 Award for Enterprise for his design. Zeer is the Arabic name for the pots used. In Sudan, Practical Action and the Women’s Association for Earthenware Manufacturing have conducted experiments on the effectiveness of the Zeer Pot storage design of Mohammed Bah Abba. The results are shown in the following table:
6
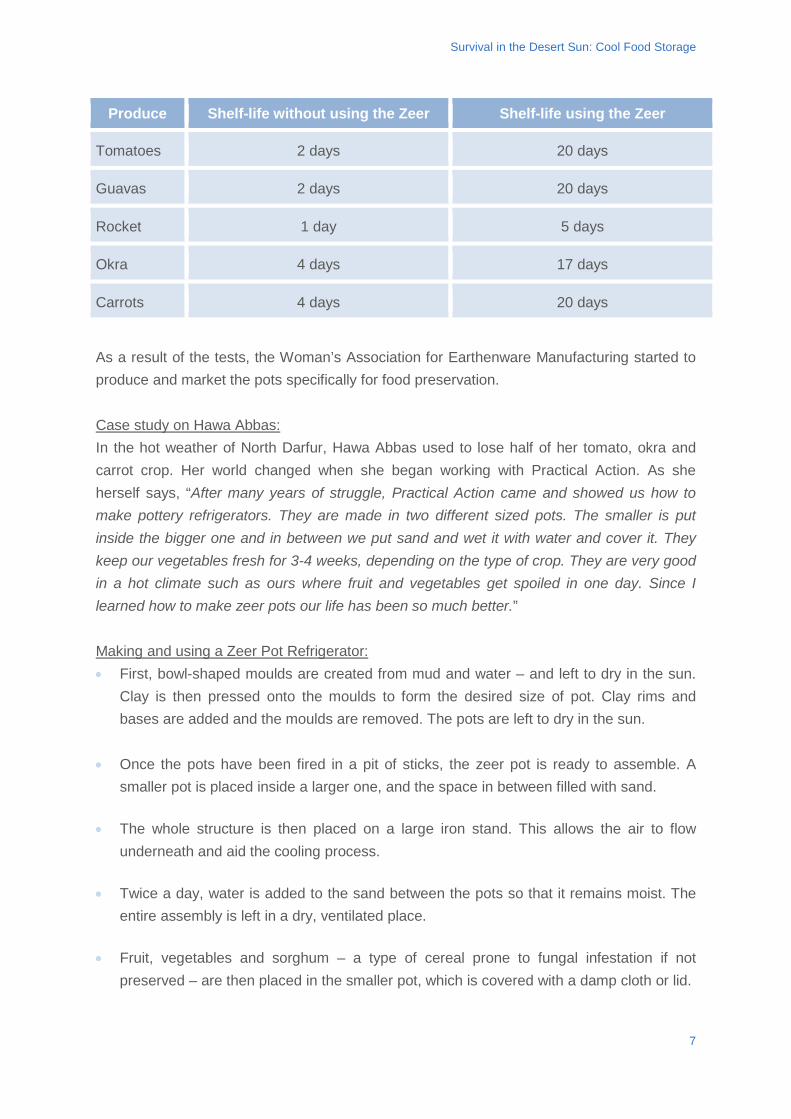
Survival in the Desert Sun: Cool Food Storage
Produce Shelf-life without using the Zeer Shelf-life using the Zeer
Tomatoes 2 days 20 days
Guavas 2 days 20 days
Rocket 1 day 5 days
Okra 4 days 17 days
Carrots 4 days 20 days
As a result of the tests, the Woman’s Association for Earthenware Manufacturing started to produce and market the pots specifically for food preservation. Case study on Hawa Abbas: In the hot weather of North Darfur, Hawa Abbas used to lose half of her tomato, okra and carrot crop. Her world changed when she began working with Practical Action. As she herself says, “After many years of struggle, Practical Action came and showed us how to make pottery refrigerators. They are made in two different sized pots. The smaller is put inside the bigger one and in between we put sand and wet it with water and cover it. They keep our vegetables fresh for 3-4 weeks, depending on the type of crop. They are very good in a hot climate such as ours where fruit and vegetables get spoiled in one day. Since I learned how to make zeer pots our life has been so much better.” Making and using a Zeer Pot Refrigerator: • First, bowl-shaped moulds are created from mud and water – and left to dry in the sun.
Clay is then pressed onto the moulds to form the desired size of pot. Clay rims and bases are added and the moulds are removed. The pots are left to dry in the sun.
• Once the pots have been fired in a pit of sticks, the zeer pot is ready to assemble. A
smaller pot is placed inside a larger one, and the space in between filled with sand.
• The whole structure is then placed on a large iron stand. This allows the air to flow underneath and aid the cooling process.
• Twice a day, water is added to the sand between the pots so that it remains moist. The
entire assembly is left in a dry, ventilated place.
• Fruit, vegetables and sorghum – a type of cereal prone to fungal infestation if not preserved – are then placed in the smaller pot, which is covered with a damp cloth or lid.
7
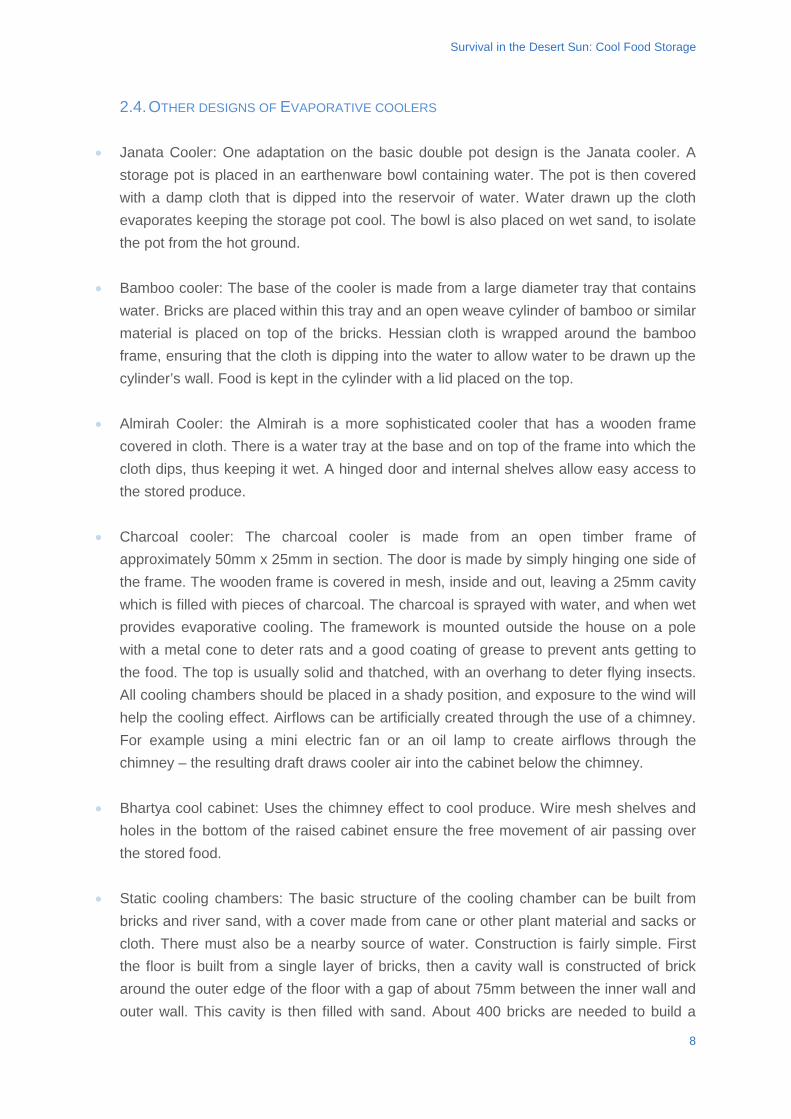
Survival in the Desert Sun: Cool Food Storage
2.4. OTHER DESIGNS OF EVAPORATIVE COOLERS • Janata Cooler: One adaptation on the basic double pot design is the Janata cooler. A
storage pot is placed in an earthenware bowl containing water. The pot is then covered with a damp cloth that is dipped into the reservoir of water. Water drawn up the cloth evaporates keeping the storage pot cool. The bowl is also placed on wet sand, to isolate the pot from the hot ground.
• Bamboo cooler: The base of the cooler is made from a large diameter tray that contains water. Bricks are placed within this tray and an open weave cylinder of bamboo or similar material is placed on top of the bricks. Hessian cloth is wrapped around the bamboo frame, ensuring that the cloth is dipping into the water to allow water to be drawn up the cylinder’s wall. Food is kept in the cylinder with a lid placed on the top.
• Almirah Cooler: the Almirah is a more sophisticated cooler that has a wooden frame covered in cloth. There is a water tray at the base and on top of the frame into which the cloth dips, thus keeping it wet. A hinged door and internal shelves allow easy access to the stored produce.
• Charcoal cooler: The charcoal cooler is made from an open timber frame of approximately 50mm x 25mm in section. The door is made by simply hinging one side of the frame. The wooden frame is covered in mesh, inside and out, leaving a 25mm cavity which is filled with pieces of charcoal. The charcoal is sprayed with water, and when wet provides evaporative cooling. The framework is mounted outside the house on a pole with a metal cone to deter rats and a good coating of grease to prevent ants getting to the food. The top is usually solid and thatched, with an overhang to deter flying insects. All cooling chambers should be placed in a shady position, and exposure to the wind will help the cooling effect. Airflows can be artificially created through the use of a chimney. For example using a mini electric fan or an oil lamp to create airflows through the chimney – the resulting draft draws cooler air into the cabinet below the chimney.
• Bhartya cool cabinet: Uses the chimney effect to cool produce. Wire mesh shelves and
holes in the bottom of the raised cabinet ensure the free movement of air passing over the stored food.
• Static cooling chambers: The basic structure of the cooling chamber can be built from
bricks and river sand, with a cover made from cane or other plant material and sacks or cloth. There must also be a nearby source of water. Construction is fairly simple. First the floor is built from a single layer of bricks, then a cavity wall is constructed of brick around the outer edge of the floor with a gap of about 75mm between the inner wall and outer wall. This cavity is then filled with sand. About 400 bricks are needed to build a
8
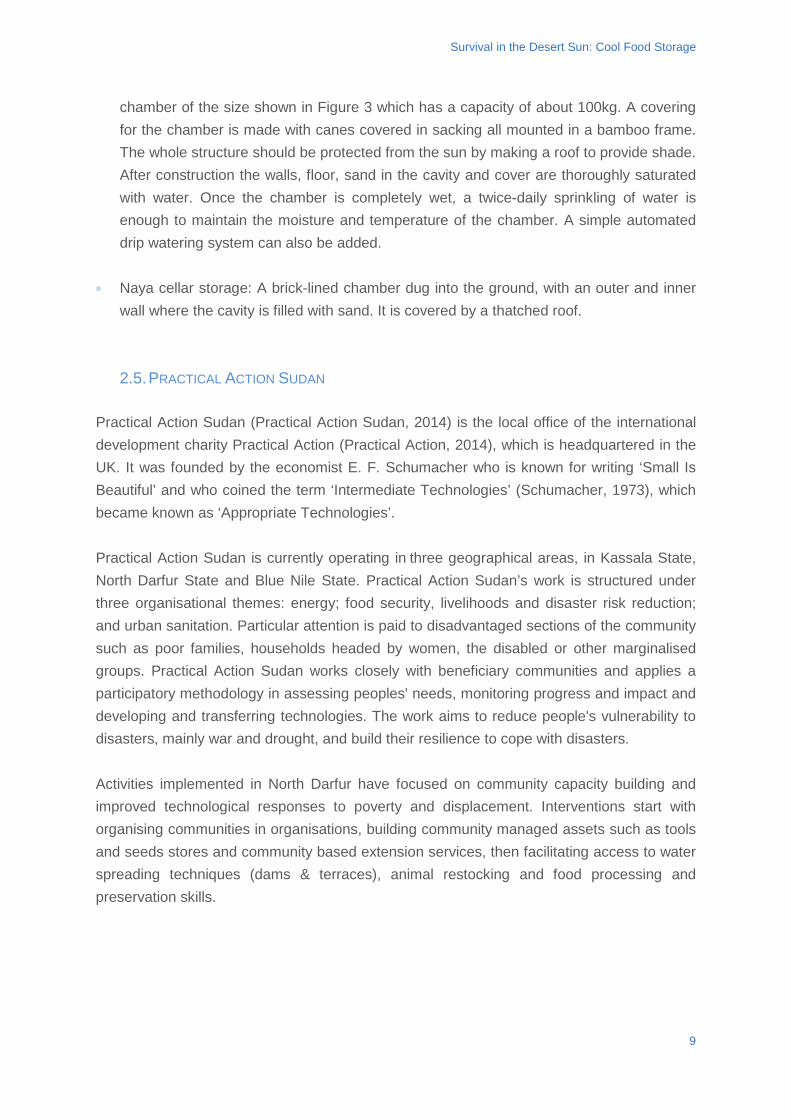
Survival in the Desert Sun: Cool Food Storage
chamber of the size shown in Figure 3 which has a capacity of about 100kg. A covering for the chamber is made with canes covered in sacking all mounted in a bamboo frame. The whole structure should be protected from the sun by making a roof to provide shade. After construction the walls, floor, sand in the cavity and cover are thoroughly saturated with water. Once the chamber is completely wet, a twice-daily sprinkling of water is enough to maintain the moisture and temperature of the chamber. A simple automated drip watering system can also be added.
• Naya cellar storage: A brick-lined chamber dug into the ground, with an outer and inner
wall where the cavity is filled with sand. It is covered by a thatched roof.
2.5. PRACTICAL ACTION SUDAN Practical Action Sudan (Practical Action Sudan, 2014) is the local office of the international development charity Practical Action (Practical Action, 2014), which is headquartered in the UK. It was founded by the economist E. F. Schumacher who is known for writing ‘Small Is Beautiful’ and who coined the term ‘Intermediate Technologies’ (Schumacher, 1973), which became known as ‘Appropriate Technologies’. Practical Action Sudan is currently operating in three geographical areas, in Kassala State, North Darfur State and Blue Nile State. Practical Action Sudan’s work is structured under three organisational themes: energy; food security, livelihoods and disaster risk reduction; and urban sanitation. Particular attention is paid to disadvantaged sections of the community such as poor families, households headed by women, the disabled or other marginalised groups. Practical Action Sudan works closely with beneficiary communities and applies a participatory methodology in assessing peoples' needs, monitoring progress and impact and developing and transferring technologies. The work aims to reduce people's vulnerability to disasters, mainly war and drought, and build their resilience to cope with disasters. Activities implemented in North Darfur have focused on community capacity building and improved technological responses to poverty and displacement. Interventions start with organising communities in organisations, building community managed assets such as tools and seeds stores and community based extension services, then facilitating access to water spreading techniques (dams & terraces), animal restocking and food processing and preservation skills.
9
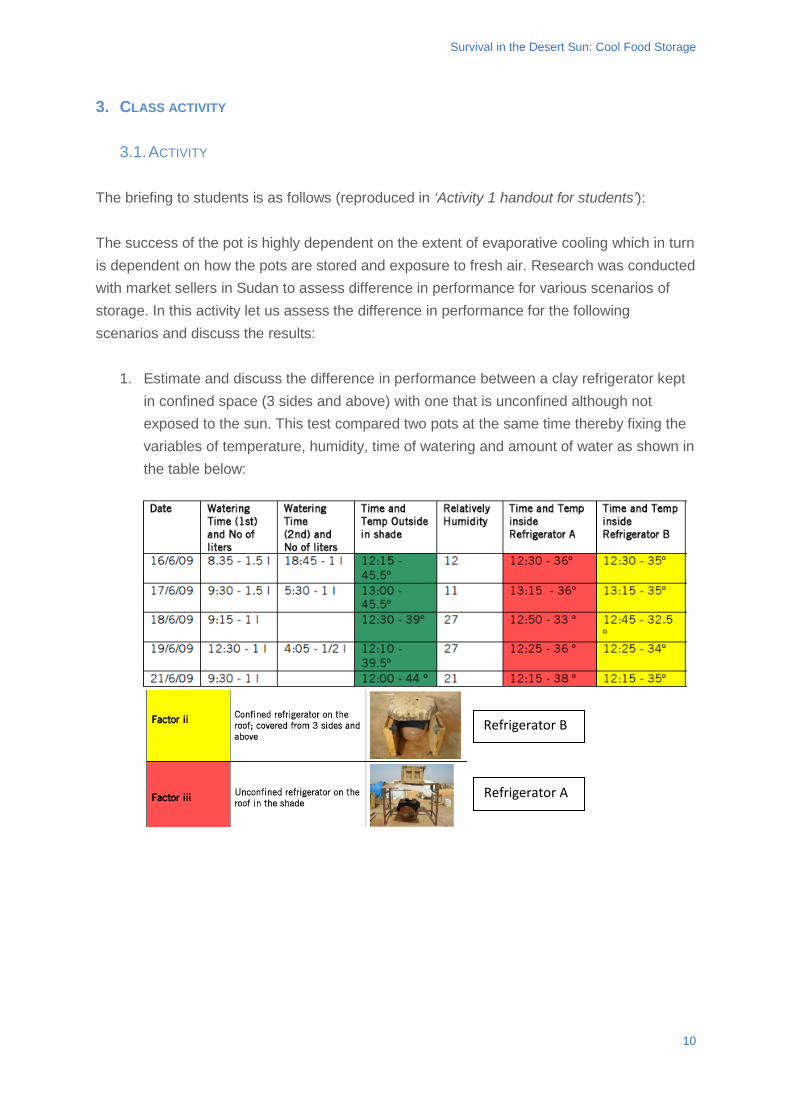
Survival in the Desert Sun: Cool Food Storage
3. CLASS ACTIVITY
3.1. ACTIVITY
The briefing to students is as follows (reproduced in ‘Activity 1 handout for students’): The success of the pot is highly dependent on the extent of evaporative cooling which in turn is dependent on how the pots are stored and exposure to fresh air. Research was conducted with market sellers in Sudan to assess difference in performance for various scenarios of storage. In this activity let us assess the difference in performance for the following scenarios and discuss the results:
1. Estimate and discuss the difference in performance between a clay refrigerator kept
in confined space (3 sides and above) with one that is unconfined although not exposed to the sun. This test compared two pots at the same time thereby fixing the variables of temperature, humidity, time of watering and amount of water as shown in the table below:
Refrigerator A
Refrigerator B
10
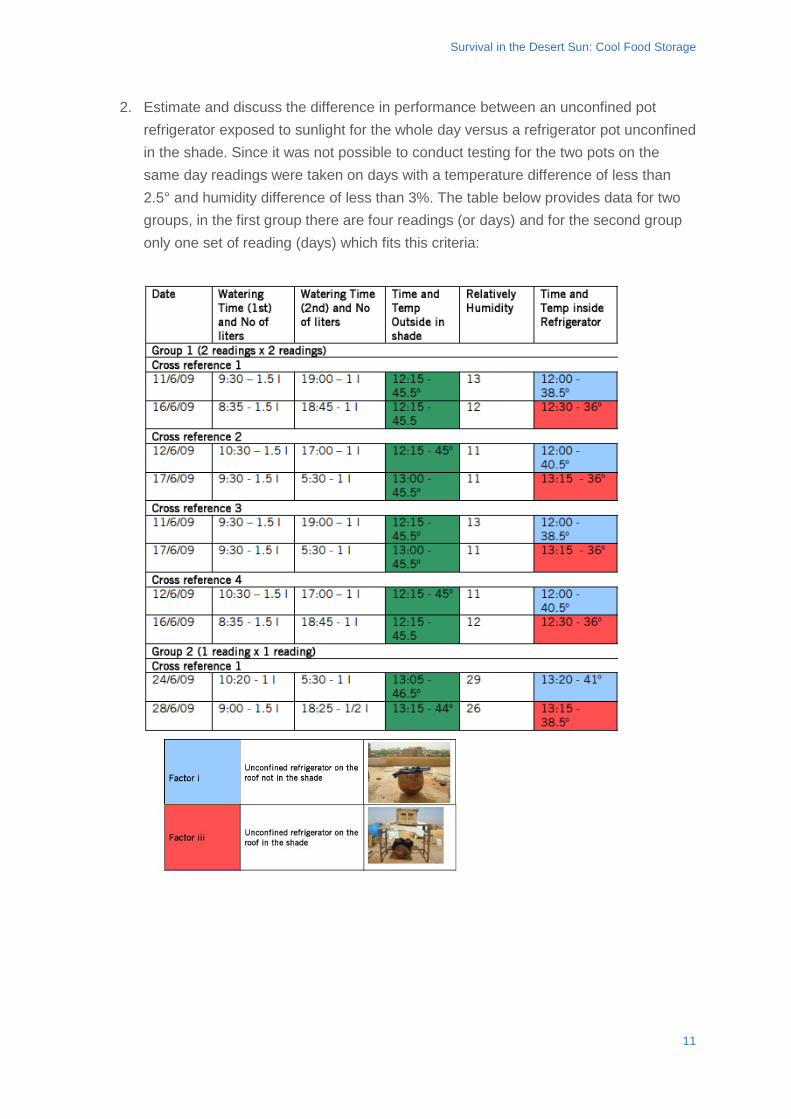
Survival in the Desert Sun: Cool Food Storage
2. Estimate and discuss the difference in performance between an unconfined pot refrigerator exposed to sunlight for the whole day versus a refrigerator pot unconfined in the shade. Since it was not possible to conduct testing for the two pots on the same day readings were taken on days with a temperature difference of less than 2.5° and humidity difference of less than 3%. The table below provides data for two groups, in the first group there are four readings (or days) and for the second group only one set of reading (days) which fits this criteria:
11
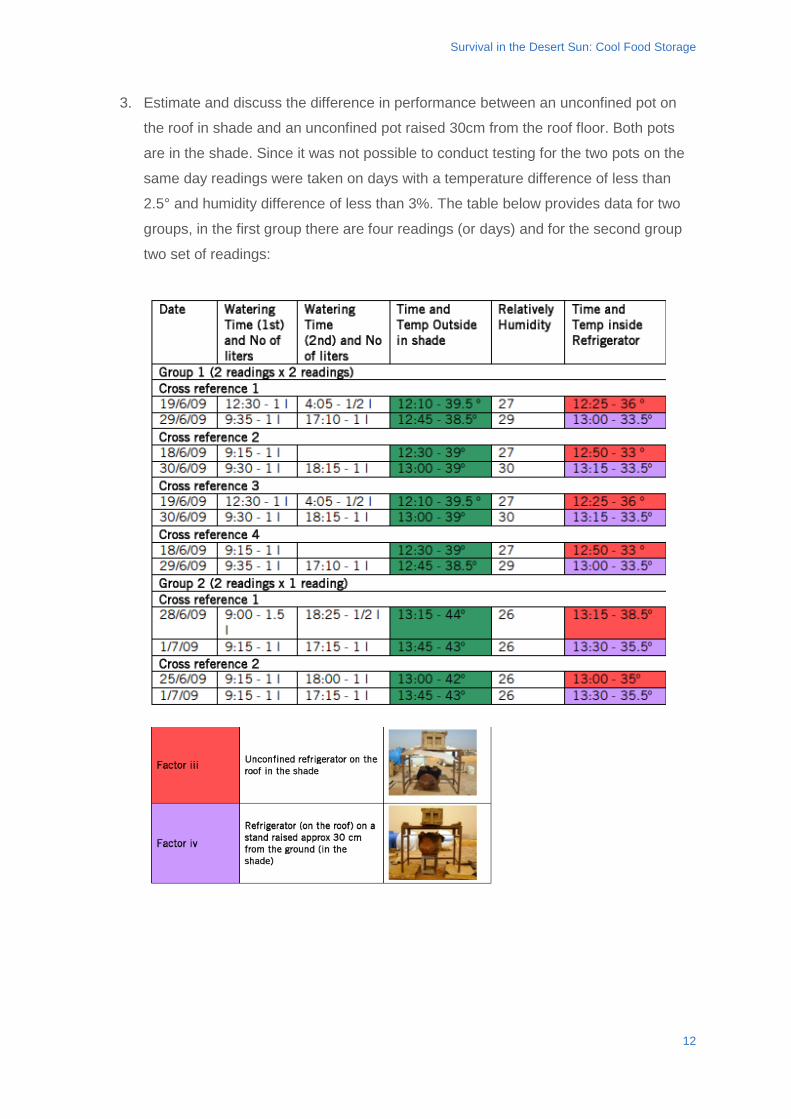
Survival in the Desert Sun: Cool Food Storage
3. Estimate and discuss the difference in performance between an unconfined pot on
the roof in shade and an unconfined pot raised 30cm from the roof floor. Both pots
are in the shade. Since it was not possible to conduct testing for the two pots on the
same day readings were taken on days with a temperature difference of less than
2.5° and humidity difference of less than 3%. The table below provides data for two
groups, in the first group there are four readings (or days) and for the second group
two set of readings:
12
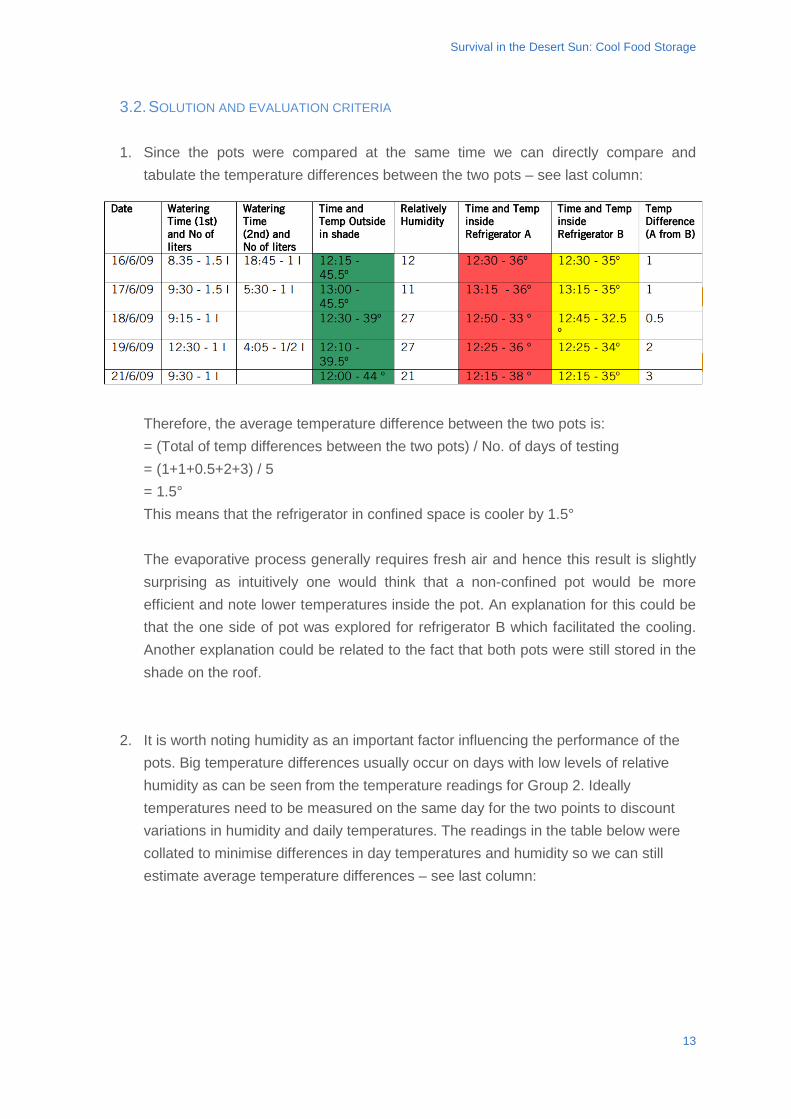
Survival in the Desert Sun: Cool Food Storage
3.2. SOLUTION AND EVALUATION CRITERIA
1. Since the pots were compared at the same time we can directly compare and tabulate the temperature differences between the two pots – see last column:
Therefore, the average temperature difference between the two pots is: = (Total of temp differences between the two pots) / No. of days of testing = (1+1+0.5+2+3) / 5 = 1.5° This means that the refrigerator in confined space is cooler by 1.5° The evaporative process generally requires fresh air and hence this result is slightly surprising as intuitively one would think that a non-confined pot would be more efficient and note lower temperatures inside the pot. An explanation for this could be that the one side of pot was explored for refrigerator B which facilitated the cooling. Another explanation could be related to the fact that both pots were still stored in the shade on the roof.
2. It is worth noting humidity as an important factor influencing the performance of the pots. Big temperature differences usually occur on days with low levels of relative humidity as can be seen from the temperature readings for Group 2. Ideally temperatures need to be measured on the same day for the two points to discount variations in humidity and daily temperatures. The readings in the table below were collated to minimise differences in day temperatures and humidity so we can still estimate average temperature differences – see last column:
13
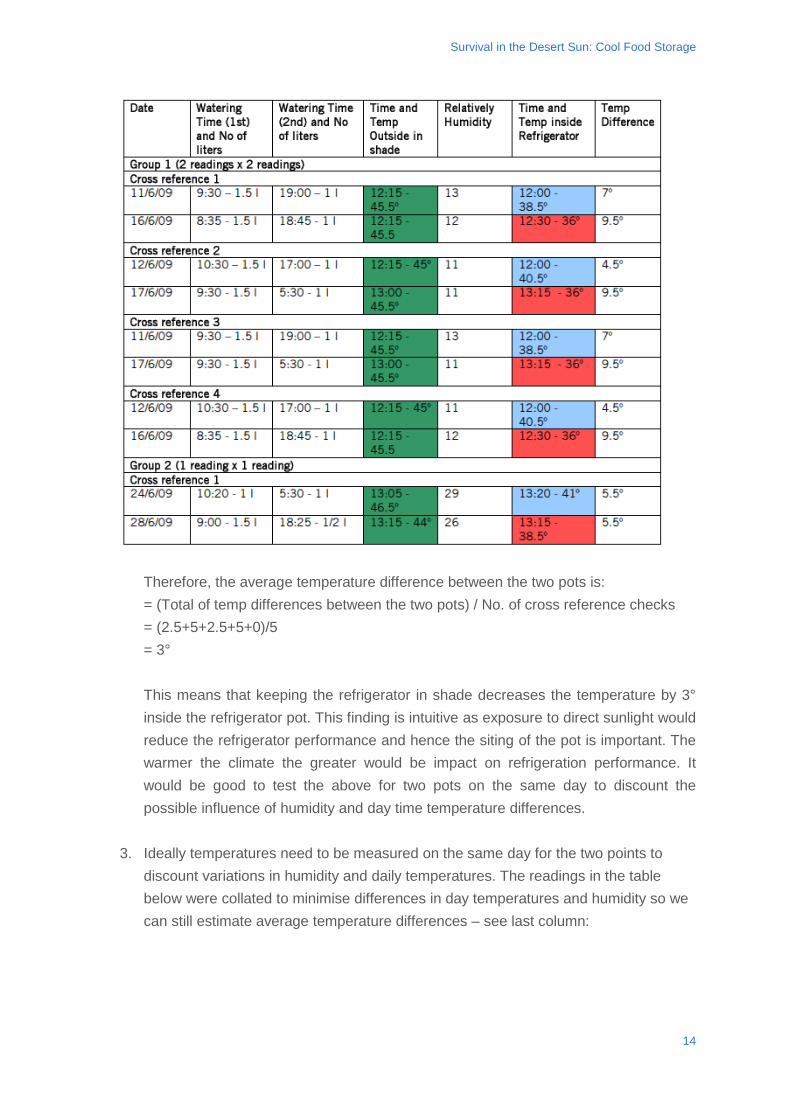
Survival in the Desert Sun: Cool Food Storage
Therefore, the average temperature difference between the two pots is: = (Total of temp differences between the two pots) / No. of cross reference checks = (2.5+5+2.5+5+0)/5 = 3° This means that keeping the refrigerator in shade decreases the temperature by 3° inside the refrigerator pot. This finding is intuitive as exposure to direct sunlight would reduce the refrigerator performance and hence the siting of the pot is important. The warmer the climate the greater would be impact on refrigeration performance. It would be good to test the above for two pots on the same day to discount the possible influence of humidity and day time temperature differences.
3. Ideally temperatures need to be measured on the same day for the two points to discount variations in humidity and daily temperatures. The readings in the table below were collated to minimise differences in day temperatures and humidity so we can still estimate average temperature differences – see last column:
14
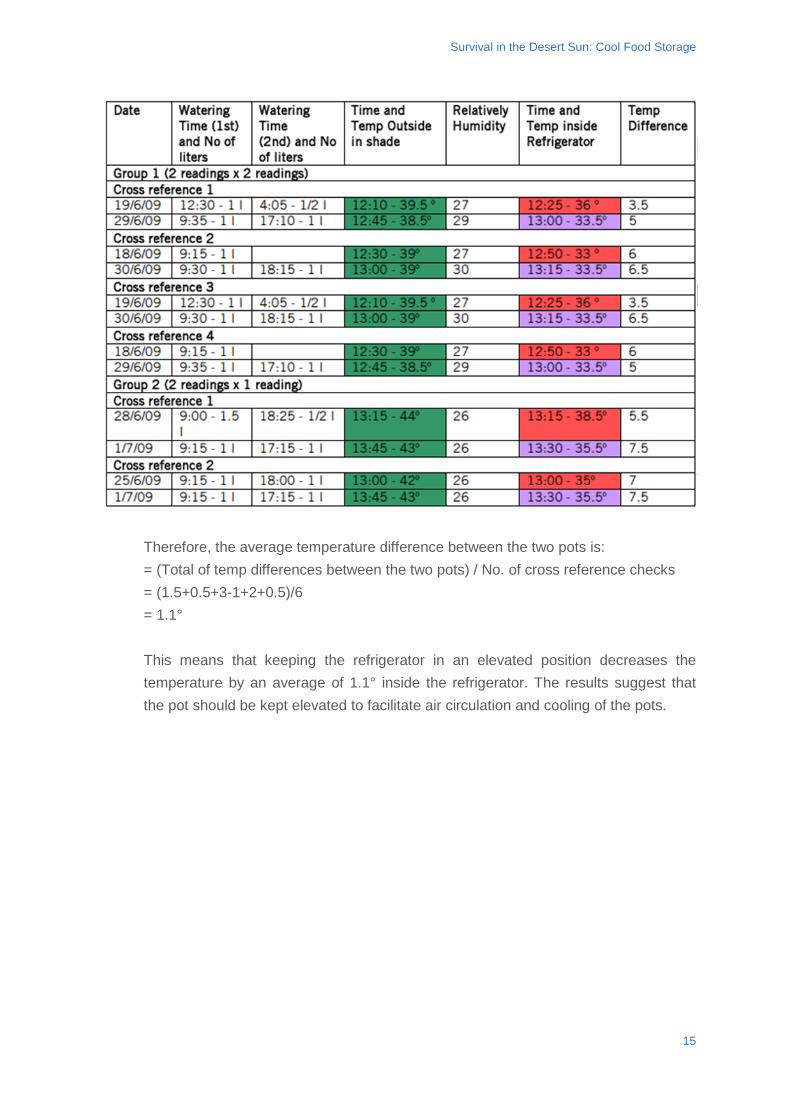
Survival in the Desert Sun: Cool Food Storage
Therefore, the average temperature difference between the two pots is: = (Total of temp differences between the two pots) / No. of cross reference checks = (1.5+0.5+3-1+2+0.5)/6 = 1.1° This means that keeping the refrigerator in an elevated position decreases the temperature by an average of 1.1° inside the refrigerator. The results suggest that the pot should be kept elevated to facilitate air circulation and cooling of the pots.
15
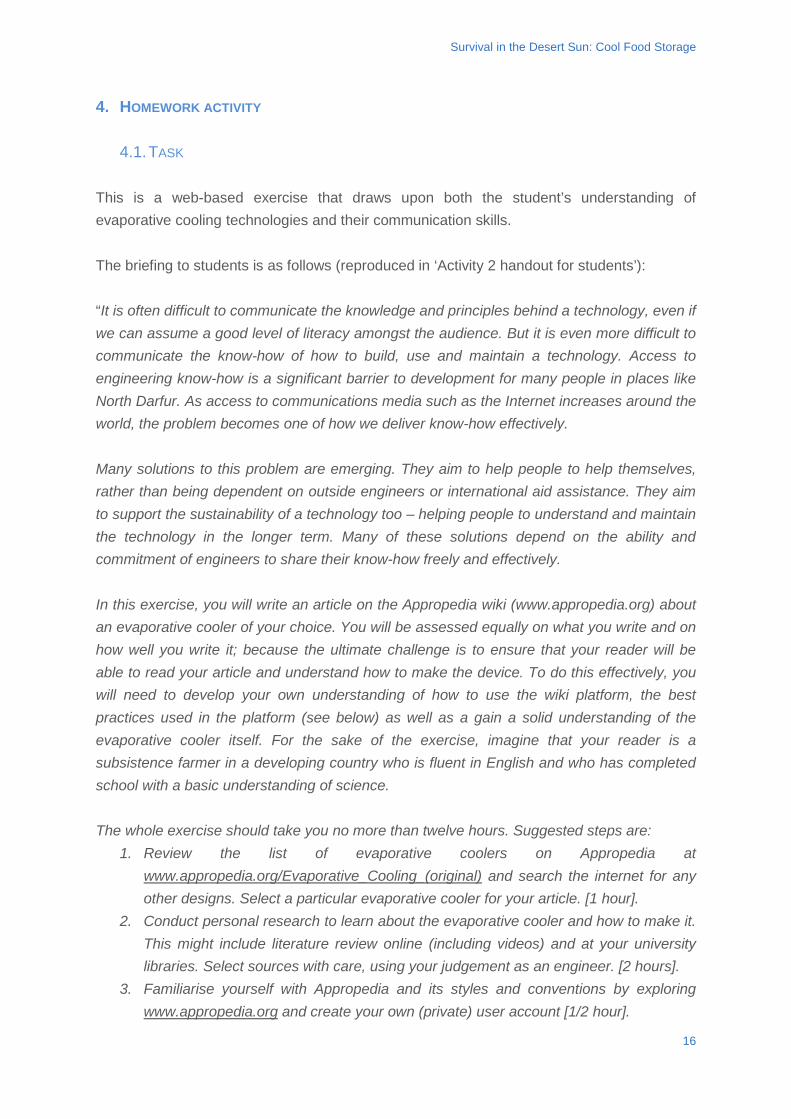
Survival in the Desert Sun: Cool Food Storage
4. HOMEWORK ACTIVITY
4.1. TASK This is a web-based exercise that draws upon both the student’s understanding of evaporative cooling technologies and their communication skills. The briefing to students is as follows (reproduced in ‘Activity 2 handout for students’): “It is often difficult to communicate the knowledge and principles behind a technology, even if we can assume a good level of literacy amongst the audience. But it is even more difficult to communicate the know-how of how to build, use and maintain a technology. Access to engineering know-how is a significant barrier to development for many people in places like North Darfur. As access to communications media such as the Internet increases around the world, the problem becomes one of how we deliver know-how effectively. Many solutions to this problem are emerging. They aim to help people to help themselves, rather than being dependent on outside engineers or international aid assistance. They aim to support the sustainability of a technology too – helping people to understand and maintain the technology in the longer term. Many of these solutions depend on the ability and commitment of engineers to share their know-how freely and effectively. In this exercise, you will write an article on the Appropedia wiki (www.appropedia.org) about an evaporative cooler of your choice. You will be assessed equally on what you write and on how well you write it; because the ultimate challenge is to ensure that your reader will be able to read your article and understand how to make the device. To do this effectively, you will need to develop your own understanding of how to use the wiki platform, the best practices used in the platform (see below) as well as a gain a solid understanding of the evaporative cooler itself. For the sake of the exercise, imagine that your reader is a subsistence farmer in a developing country who is fluent in English and who has completed school with a basic understanding of science. The whole exercise should take you no more than twelve hours. Suggested steps are:
1. Review the list of evaporative coolers on Appropedia at www.appropedia.org/Evaporative_Cooling_(original) and search the internet for any
your article. [1 hour]. other designs. Select a particular evaporative cooler for 2. Conduct personal research to learn about the evaporative cooler and how to make it.
This might include literature review online (including videos) and at your university libraries. Select sources with care, using your judgement as an engineer. [2 hours].
3. Familiarise yourself with Appropedia and its styles and conventions by exploring www.appropedia.org your own (private) user account [1/2 hour]. and create
16
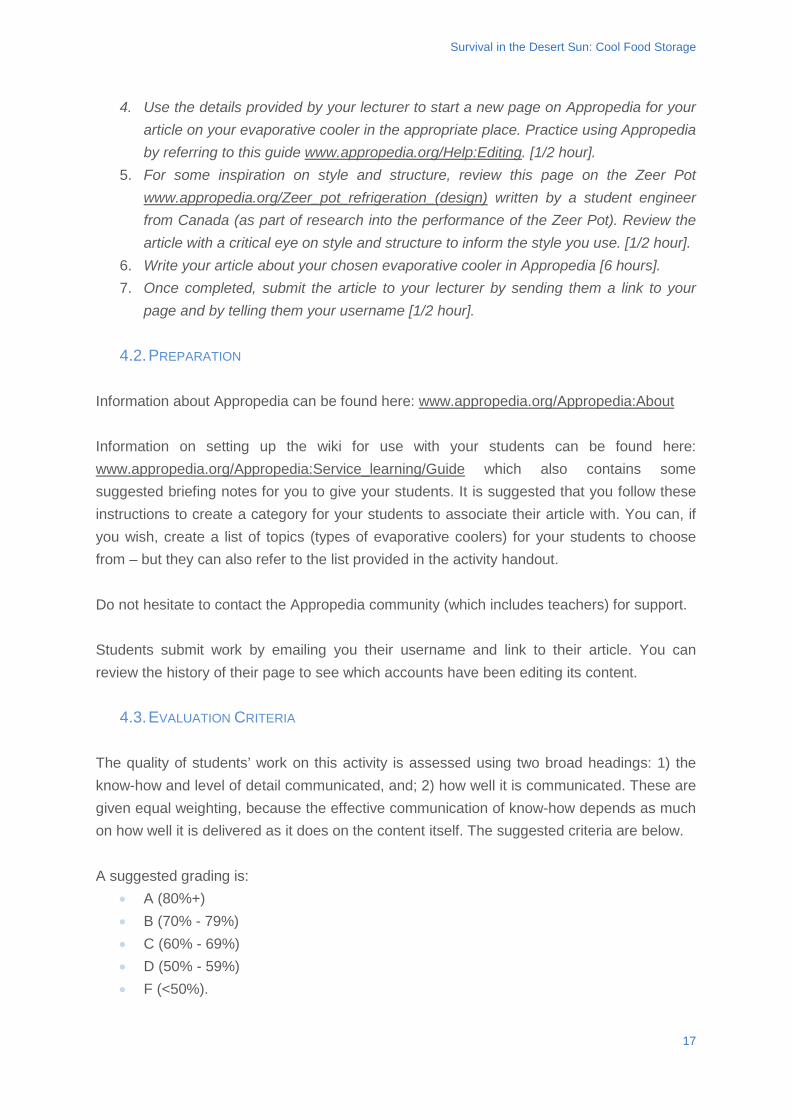
Survival in the Desert Sun: Cool Food Storage
Use the details provided by your lecturer to start a new page on Appropedia for your 4.article on your evaporative cooler in the appropriate place. Practice using Appropedia by referring to this guide www.appropedia.org/Help:Editing. [1/2 hour].
5. For some inspiration on style and structure, review this page on the Zeer Pot www.appropedia.org/Zeer_pot_refrigeration_(design) written by a student engineer
of the Zeer Pot). Review the from Canada (as part of research into the performance article with a critical eye on style and structure to inform the style you use. [1/2 hour].
6. Write your article about your chosen evaporative cooler in Appropedia [6 hours]. 7. Once completed, submit the article to your lecturer by sending them a link to your
page and by telling them your username [1/2 hour].
4.2. PREPARATION Information about Appropedia can be found here: www.appropedia.org/Appropedia:About Information on setting up the wiki for use with your students can be found here: www.appropedia.org/Appropedia:Service_learning/Guide which also contains some
suggested that you follow these suggested briefing notes for you to give your students. It is instructions to create a category for your students to associate their article with. You can, if you wish, create a list of topics (types of evaporative coolers) for your students to choose from – but they can also refer to the list provided in the activity handout. Do not hesitate to contact the Appropedia community (which includes teachers) for support. Students submit work by emailing you their username and link to their article. You can review the history of their page to see which accounts have been editing its content.
4.3. EVALUATION CRITERIA The quality of students’ work on this activity is assessed using two broad headings: 1) the know-how and level of detail communicated, and; 2) how well it is communicated. These are given equal weighting, because the effective communication of know-how depends as much on how well it is delivered as it does on the content itself. The suggested criteria are below. A suggested grading is:
• A (80%+) • B (70% - 79%) • C (60% - 69%) • D (50% - 59%) • F (<50%).
17
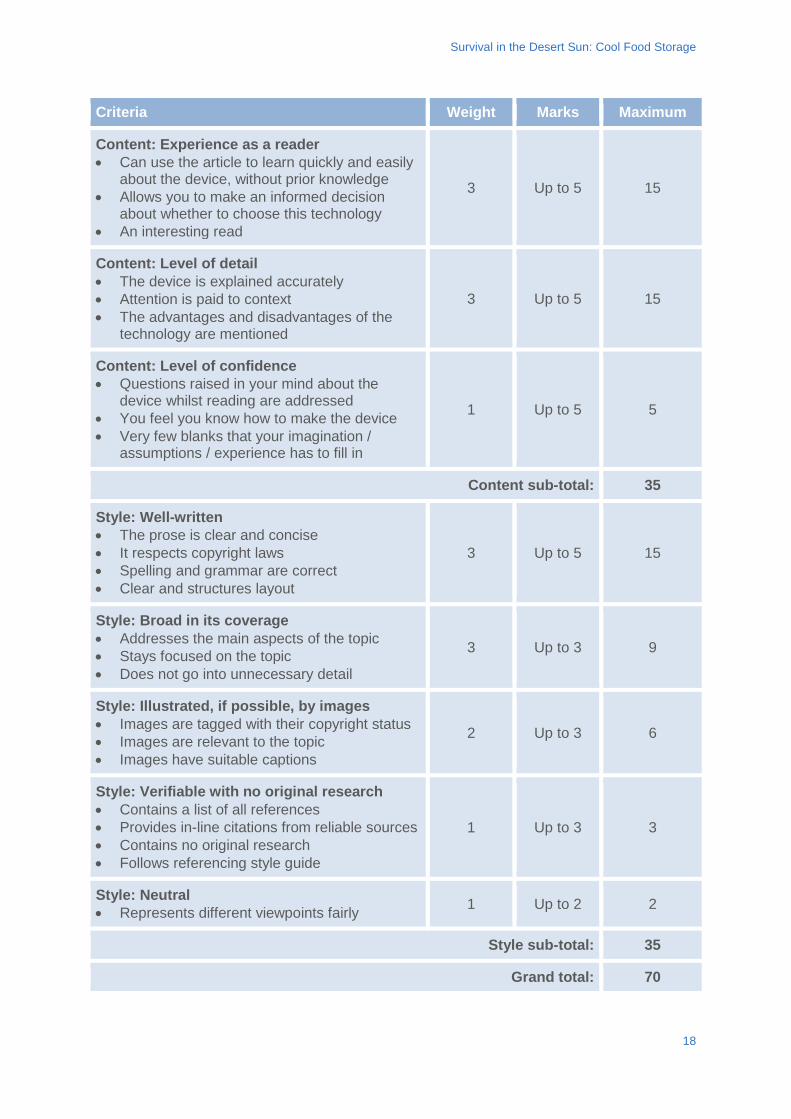
Survival in the Desert Sun: Cool Food Storage
Criteria Weight Marks Maximum
Content: Experience as a reader • Can use the article to learn quickly and easily
about the device, without prior knowledge • Allows you to make an informed decision
about whether to choose this technology • An interesting read
3 Up to 5 15
Content: Level of detail • The device is explained accurately • Attention is paid to context • The advantages and disadvantages of the
technology are mentioned
3 Up to 5 15
Content: Level of confidence • Questions raised in your mind about the
device whilst reading are addressed • You feel you know how to make the device • Very few blanks that your imagination /
assumptions / experience has to fill in
1 Up to 5 5
Content sub-total: 35
Style: Well-written • The prose is clear and concise • It respects copyright laws • Spelling and grammar are correct • Clear and structures layout
3 Up to 5 15
Style: Broad in its coverage • Addresses the main aspects of the topic • Stays focused on the topic • Does not go into unnecessary detail
3 Up to 3 9
Style: Illustrated, if possible, by images • Images are tagged with their copyright status • Images are relevant to the topic • Images have suitable captions
2 Up to 3 6
Style: Verifiable with no original research • Contains a list of all references • Provides in-line citations from reliable sources • Contains no original research • Follows referencing style guide
1 Up to 3 3
Style: Neutral • Represents different viewpoints fairly 1 Up to 2 2
Style sub-total: 35
Grand total: 70
18
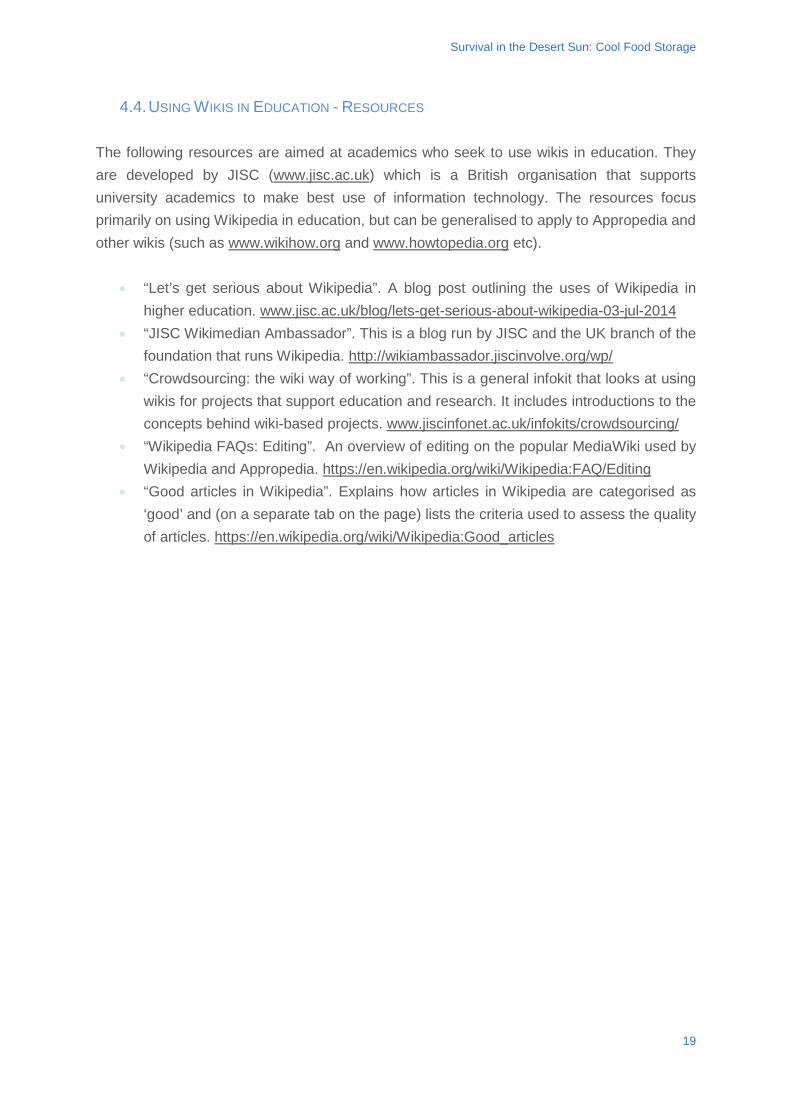
Survival in the Desert Sun: Cool Food Storage
4.4. USING WIKIS IN EDUCATION - RESOURCES The following resources are aimed at academics who seek to use wikis in education. They are developed by JISC (www.jisc.ac.uk) which is a British organisation that supports university academics to make best use of information technology. The resources focus primarily on using Wikipedia in education, but can be generalised to apply to Appropedia and other wikis (such as www.wikihow.org and www.howtopedia.org etc).
• “Let’s get serious about Wikipedia”. A blog post outlining the uses of Wikipedia in higher education. www.jisc.ac.uk/blog/lets-get-serious-about-wikipedia-03-jul-2014
• “JISC Wikimedian Ambassador”. This is a blog run by JISC and the UK branch of the foundation that runs Wikipedia. http://wikiambassador.jiscinvolve.org/wp/
• “Crowdsourcing: the wiki way of working”. This is a general infokit that looks at using wikis for projects that support education and research. It includes introductions to the concepts behind wiki-based projects. www.jiscinfonet.ac.uk/infokits/crowdsourcing/
• “Wikipedia FAQs: Editing”. An overview of editing on the popular MediaWiki used by Wikipedia and Appropedia. https://en.wikipedia.org/wiki/Wikipedia:FAQ/Editing
• “Good articles in Wikipedia”. Explains how articles in Wikipedia are categorised as ‘good’ and (on a separate tab on the page) lists the criteria used to assess the quality of articles. https://en.wikipedia.org/wiki/Wikipedia:Good_articles
19
Survival in the Desert Sun: Cool Food Storage
BIBLIOGRAPHY Benyus, J. M. (1992). Biomimicry - Innovation Inspired by Nature. New York: HarperCollins.
IMechE. (2014). A tank of cold: Cleantech Leapfrog to a more Food Secure world. London: Institution of Mechanical Engineers.
Practical Action. (2014, August). Practical Action homepage. Retrieved August 12, 2014, from Practical Action: www.practicalaction.org
Practical Action. (2014, August). The Clay Refrigerator. Retrieved August 12, 2014, from Practical Action: https://practicalaction.org/media/preview/10769
Practical Action. (2014, August). Zeer pot fridge. Retrieved August 12, 2014, from Practical Action Zeer Pot: https://practicalaction.org/zeer-pot-fridge
Practical Action Nepal. (2014, August). Retrieved August 2014, from Practical Action Nepal homepage: www.practicalaction.org/nepal
Practical Action Sudan. (2014, August). Practical Action Sudan homepage. Retrieved August 12, 2014, from Practical Action Sudan: www.practicalaction.org/sudan
Schumacher, E. F. (1973). Small is Beautiful: A study of economics as if people mattered. London: Blond & Briggs.
TBC. (1997, June). Cooling your cucumbers. (D. Dixon, Ed.) Appropriate Technology, 24(1), 27.
TBC. (2000, October-December). TBC. (D. Dixon, Ed.) Appropriate Technology, 27(4).
Wikipedia. (2014, August). North Darfur page. Retrieved August 12, 2014, from Wikipedia: https://en.wikipedia.org/wiki/North_Darfur
Wikipedia. (2014, August). Sudan country page. Retrieved August 12, 2014, from Wikipedia: https://en.wikipedia.org/wiki/Sudan
FURTHER/SUGGESTED MATERIAL
• Video: Zeer Pot Clay Fridge www.youtube.com/watch?v=ZNKifJHqScc • Video: Zeer Pot hobbyist experiment www.youtube.com/watch?v=ZNLPeb3qIhc
20

http://www.gdee.eu
This project is funded by
Emmanuel Essah
PHOTO: Practical Action.
CASE STUDIES
Energy roadmapin Ghana and Botswana

DL B 10735-2015 ISBN 978-84-606-7546-4
Energy roadmap in Ghana and Botswana
COORDINATED BYAgustí Pérez-Foguet, Enric Velo, Pol Arranz, Ricard Ginéand Boris Lazzarini (Universitat Politècnica de Catalunya)Manuel Sierra (Universidad Politécnica de Madrid)Alejandra Boni and Jordi Peris (Universitat Politècnica de València)Guido Zolezzi and Gabriella Trombino (Università degli Studi di Trento)Rhoda Trimingham (Loughborough University)Valentín Villarroel (ONGAWA)Neil Nobles and Meadhbh Bolger (Practical Action)Francesco Mongera (Training Center for International Cooperation)Katie Cresswell-Maynard (Engineering Without Border UK)
EDITED BY Global Dimension in Engineering Education
Citation: Essah, E. (2015) ' Energy roadmap in Ghana and Botswana', in Case studies for developing globally responsible engineers, GDEE (eds.), Global Dimension in Engineering Education, Barcelona. Available from: http://gdee.eu/index.php/resources.html
This publication is distributedunder an Attribution- Noncommercial-Share Alike License for Creative Commons
CASE STUDIES
Disclaimer: This document has been produced with the financial assistance of the European UnionThe contents of this document are the sole responsibility of the authors and can under no circumstances be regarded as reflecting the position of the European Union
Energy Roadmap in Ghana and Botswana
ENERGY ROADMAP IN GHANA AND BOTSWANA
Dr. Emmanuel Essah, University of Reading, Reading, UK.
1
Energy Roadmap in Ghana and Botswana
INDEX
1. INTRODUCTION ........................................................................................................................... 3
1.1. DISCIPLINES COVERED ............................................................................................................. 4
1.2. LEARNING OUTCOMES .............................................................................................................. 4
1.3. ACTIVITIES .............................................................................................................................. 5
2. DESCRIPTION OF THE CONTEXT ............................................................................................. 7
3. CLASS ACTIVITY ......................................................................................................................... 7
3.1. SOLUTION AND EVALUATION CRITERIA ....................................................................................... 9
4. HOMEWORK ACTIVITY ............................................................................................................... 9
4.1. SOLUTION AND EVALUATION CRITERIA ..................................................................................... 11
BIBLIOGRAPHY ................................................................................................................................. 18 FURTHER/SUGGESTED MATERIAL ................................................................................................ 19
APPENDIX - MAPS ............................................................................................................................ 20
2
Energy Roadmap in Ghana and Botswana
1. INTRODUCTION
The relationship between energy and economic development has been the centre of
debate over the past 30 years with many researchers arguing that there are
conflicting views as to the exact relationship between the two (e.g. Kraft and Kraft,
1978; Yu and Choi, 1985; Ang, 2008; Apergis and Payne, 2009). Nonetheless the
underlying argument is that, access to affordable and reliable energy services
especially electricity is a significant aid to human, social and economic development
in every country. Intermittency of supply, increasing demand and lack of access to
energy have been acknowledged to undermine energy security hence are major
challenges for policymakers and organizations all over the world. These challenges
became more prominent in the 1970’s when energy became a major concern due to
the aftermath of the oil crisis (Bhattacharyya and Timilsina, 2010). It goes without
saying that underdeveloped and developing countries suffer the most when it comes
to energy shortage and the lack of energy security. Notably, 95% of the 1.3 billion
people in the world who do not have access to electricity and 2.6 billion people who
are without clean cooking facilities reside in either sub-Saharan Africa (made up of
47 Countries most of which are either developing or underdeveloped) or developing
Asia (IEA, 2014). This is a substantial percentage which will eventually impact on the
economic development and growth of these countries. With these challenges,
energy conservation and efficient use does not only make good economic sense but
is also a matter of economic survival.
Pertaining to energy management, attention has to be paid to all sectors of the
economy. Nevertheless, the domestic (residential) sector has proven to be a
substantial consumer of energy in almost all countries (developed and developing).
Values quoted in different countries are within a range of 16-50% of the total energy
demand and averages to 30% worldwide (Saidur et al., 2007).Considering the fact
that energy forms are diverse (e.g. electricity, gas etc), for the purpose of this case
study, the main focus will be on electricity use. Here after electricity and energy may
be used interchangeably.
Ghana and Botswana (both sub-Saharan countries) are currently faced with a
widespread dearth of electricity supply. Current generation and imports are able to
3
Energy Roadmap in Ghana and Botswana
meet only 30-40% of the population’s needs. This has resulted in prolonged power
cuts that last for many hours and/or days. It is in the light of this that the aim of this
case study is to develop a critical understanding of electricity consumption in Ghana
and Botswana’s domestic sector, through the identification of household profiling and
appliance usage and its impact on national electricity use.
1.1. DISCIPLINES COVERED
The main discipline covered by this case study is the issue surrounding energy
efficiency through the profiling of domestic appliances and energy use and how that
fits into the national profile. A background of basic mathematics would be required as
well as basic Ohm’s law equations in Physics. The aim is that students would be
able to understand the demand loads from domestic energy usages’ considering
profiling of appliance. This would then be used to extrapolate to the national level
assuming all parameters stay the same in that year.
To do this it is important that research is carried out to determine how much energy
households use and which of their appliances use more energy. In this case
householders can make informed decisions towards energy management which will
contribute to reducing energy shortage.
1.2. LEARNING OUTCOMES
The main learning outcomes expected draws on the student(s):
• Understanding through literature review, the predicament of the lack of
access to electricity in sub-Sahara countries and its consequences on
human development.
• Developed learning through the development of a critical understanding of
energy use in Ghana and Botswana’s domestic sector using quantitative
methods.
• Ability to analyse the impact of household energy use and to establish the
level of understanding required for any variables (age, gender, etc) to be
integrated in the exploration of the total energy use.
4
Energy Roadmap in Ghana and Botswana
1.3. ACTIVITIES
Phase 1
Students must be set up in groups of two persons. Between them, one should opt for
Ghana (Accra) and the other Botswana (Gaborone). As a team, investigate (your
individual assigned countries) through literature review the following;
a) Location, yearly energy consumption, source of energy to meet the
country’s demand.
b) Type of energy sources and percentage configuration,
c) Population size, population percentage with or without electricity
d) Reasons for lack of electricity supply in places
e) Possible alternative energy sources to findings in “a” above
f) Any additional relevant information
Write this up as the background section of the literature review report.
Phase 2
This phase would involve the design of a grid system of appliances in 3 domestic
properties ideally for varying household types (say 1 person household to a 5 person
household) should be considered (see section 2.1 of the Project design approach).
In particular, the details of home appliances must be considered in relation to the
categorization of individual components as illustrated in the figure 1. By no means is
this an exhaustive list. Preferably there should be the same groups of 2 persons; one
investigating the appliance usage for Botswana and the other for Ghana (following
on with choices from Phase 1).
5
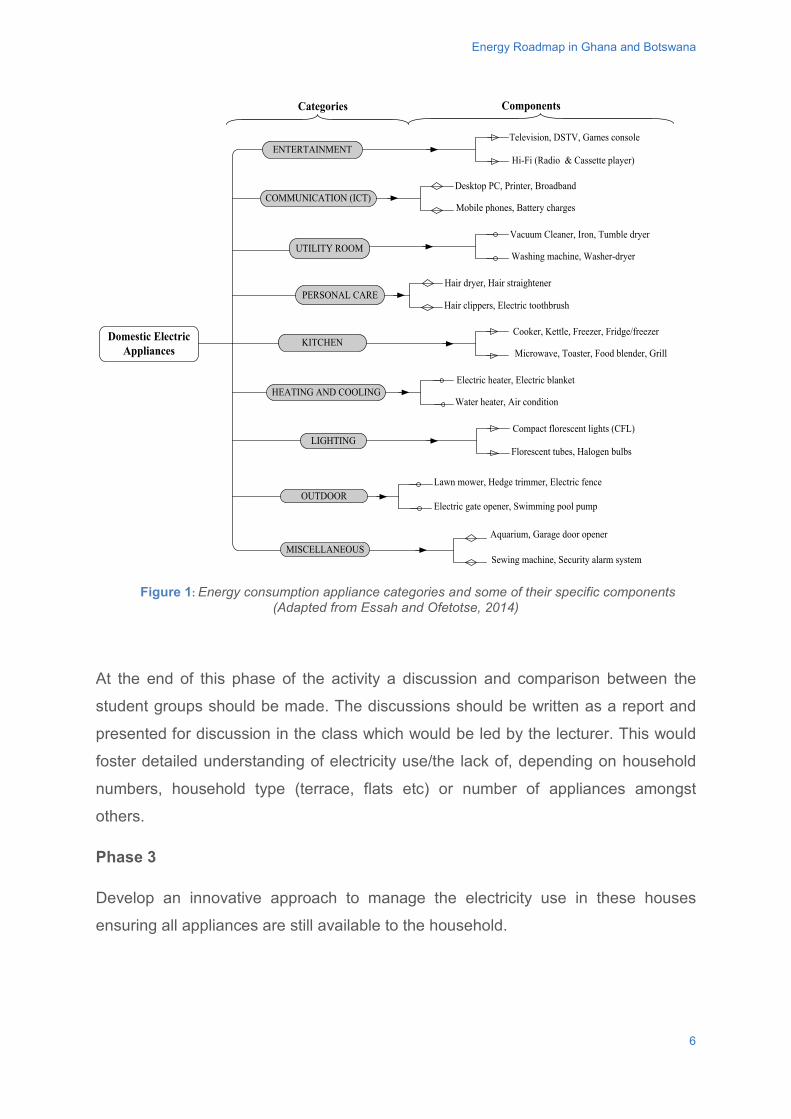
Energy Roadmap in Ghana and Botswana
Figure 1: Energy consumption appliance categories and some of their specific components
(Adapted from Essah and Ofetotse, 2014)
At the end of this phase of the activity a discussion and comparison between the
student groups should be made. The discussions should be written as a report and
presented for discussion in the class which would be led by the lecturer. This would
foster detailed understanding of electricity use/the lack of, depending on household
numbers, household type (terrace, flats etc) or number of appliances amongst
others.
Phase 3
Develop an innovative approach to manage the electricity use in these houses
ensuring all appliances are still available to the household.
Domestic ElectricAppliances
Television, DSTV, Games console
Hi-Fi (Radio & Cassette player)ENTERTAINMENT
Categories
Hair dryer, Hair straightener
Hair clippers, Electric toothbrush
Compact florescent lights (CFL)
Florescent tubes, Halogen bulbs
Cooker, Kettle, Freezer, Fridge/freezer
Microwave, Toaster, Food blender, Grill
Vacuum Cleaner, Iron, Tumble dryer
Mobile phones, Battery chargesCOMMUNICATION (ICT)
UTILITY ROOM
PERSONAL CARE
LIGHTING
KITCHEN
Components
OUTDOOR
HEATING AND COOLING
MISCELLANEOUS
Desktop PC, Printer, Broadband
Washing machine, Washer-dryer
Electric heater, Electric blanket
Water heater, Air condition
Lawn mower, Hedge trimmer, Electric fence
Electric gate opener, Swimming pool pump
Aquarium, Garage door opener
Sewing machine, Security alarm system
6
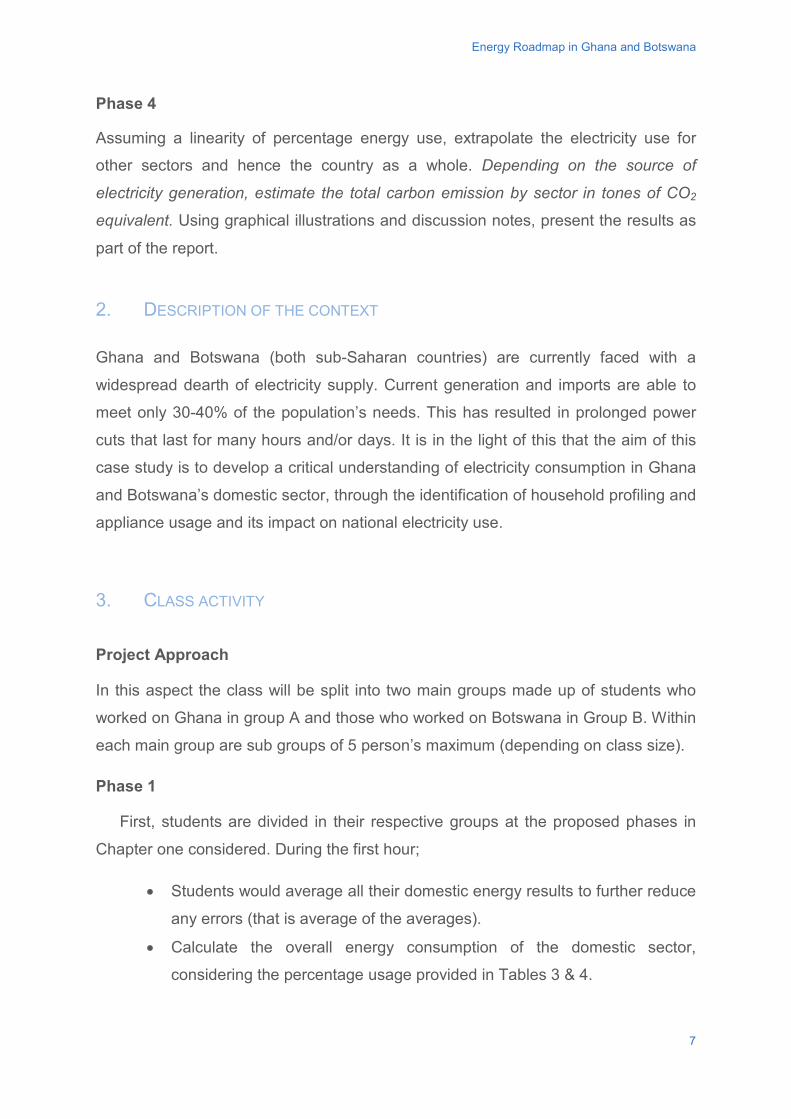
Energy Roadmap in Ghana and Botswana
Phase 4
Assuming a linearity of percentage energy use, extrapolate the electricity use for
other sectors and hence the country as a whole. Depending on the source of
electricity generation, estimate the total carbon emission by sector in tones of CO2
equivalent. Using graphical illustrations and discussion notes, present the results as
part of the report.
2. DESCRIPTION OF THE CONTEXT
Ghana and Botswana (both sub-Saharan countries) are currently faced with a
widespread dearth of electricity supply. Current generation and imports are able to
meet only 30-40% of the population’s needs. This has resulted in prolonged power
cuts that last for many hours and/or days. It is in the light of this that the aim of this
case study is to develop a critical understanding of electricity consumption in Ghana
and Botswana’s domestic sector, through the identification of household profiling and
appliance usage and its impact on national electricity use.
3. CLASS ACTIVITY
Project Approach
In this aspect the class will be split into two main groups made up of students who
worked on Ghana in group A and those who worked on Botswana in Group B. Within
each main group are sub groups of 5 person’s maximum (depending on class size).
Phase 1
First, students are divided in their respective groups at the proposed phases in
Chapter one considered. During the first hour;
• Students would average all their domestic energy results to further reduce
any errors (that is average of the averages).
• Calculate the overall energy consumption of the domestic sector,
considering the percentage usage provided in Tables 3 & 4.
7
Energy Roadmap in Ghana and Botswana
• Assuming all sector percentages provided stays the same and are grid
connected, calculate the percentage energy consumption of the other
sectors. This is assuming the consumption percentages stay constant and
it is a linear representation of the country’s energy consumption.
This aspect would consist of a 2 hour class session each being supervised by the
lecturers. This session requirements will be explained by the lecturer(s) for clarity to
help solve the problem if required.
Phase 2
For the first hour, all sub-group members must work together as a united team (A or
B) to discuss their results and summarise the key outcomes. For instance
• What has caused the variation in energy consumptions
• Would the results change if a different city, number of household was
considered
• Etc.
Summary reports must not be more than 2-sides of an A4 sheet. Group B must
engage with the above steps as Group A Simultaneously.
The second hour must be organized as a class debate/discussion with team Group A
against team Group B. Each group must select 3 representatives and a secretary (4
members in total). Topics to be considered in the debate are;
• The relevance of location
• Domestic demand-challenges, limitations etc. Students must at this stage
make reference to the literature survey in Section 1
• How does the energy consumption compare with developed counties?
What are the main differences
• Is energy security really an issue in Ghana Vrs Botswana? If yes why, if
no why not?
• Discuss strategies that can be put in place to improve the infrastructure in
the country’s under research
8
Energy Roadmap in Ghana and Botswana
3.1. SOLUTION AND EVALUATION CRITERIA
The lecturer remains the coordinator and assessor of this session. A group summary
of key points would be submitted after the debate within a stipulated period (to be
confirmed by lecturer (s)). This does not involve any further work than such is written
by the secretary.
At the end of each session, the lecturer gathers the summary reports from each
group for their evaluation and feedback. At the end of the final group session, the
final reports are submitted within reason (as per the lectures advice) for assessment.
Most activities overlap with the Homework calculations. The only outstanding
activities in this section are;
• The report writing
• Debate/discussion
Debate/Discussions
This aspect should be assessed for coordination, coherency in storyline and
responses to arguments and counter arguments.
This session must be coordinated by the teachers and bust be aligned with points
raised in Phase 2 of Section 3.
4. HOMEWORK ACTIVITY
This activity is prepared for a dedication time of around 10 hours for each member in
the group. Its designed and prepared for both individual work (homework) and class
activities. Altogether it is estimated that there would be a total of 5 -10 hours spent
on individual home work. This would include the literature review in phase 1,
completing the home appliance grid (Table 1) analysis (Phase 1 & 2) and the writing-
up of reports (Phase 3).
9
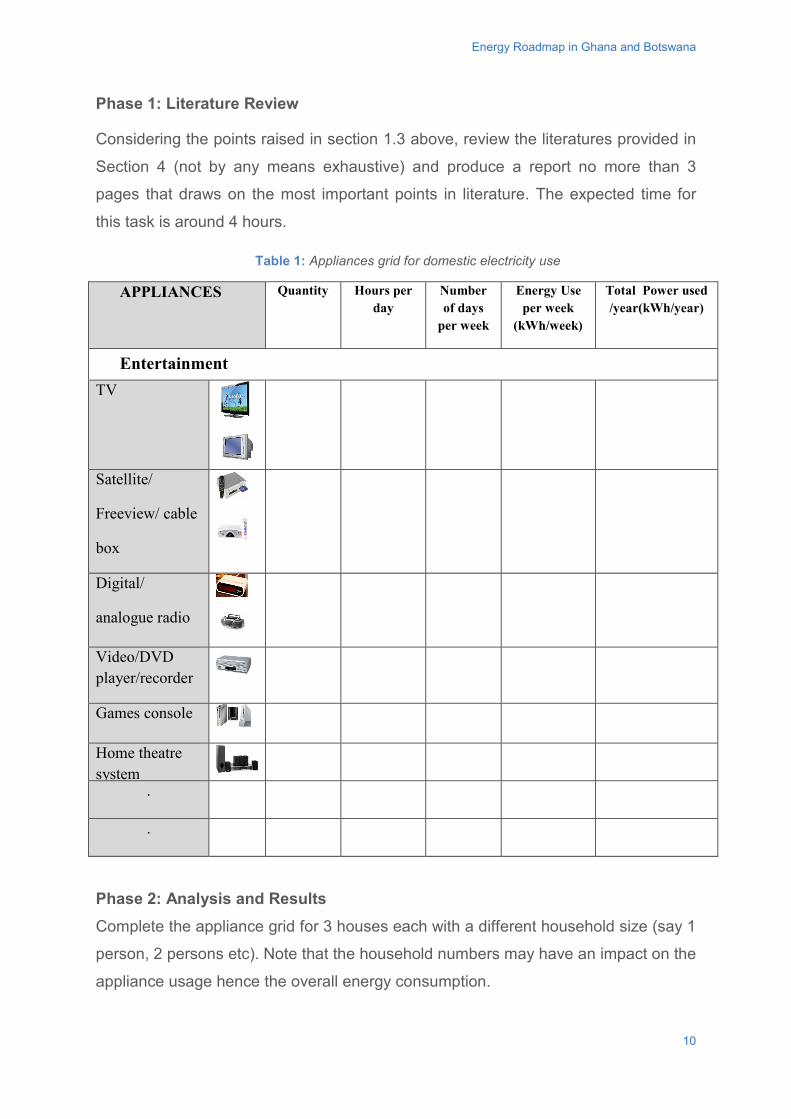
Energy Roadmap in Ghana and Botswana
Phase 1: Literature Review
Considering the points raised in section 1.3 above, review the literatures provided in
Section 4 (not by any means exhaustive) and produce a report no more than 3
pages that draws on the most important points in literature. The expected time for
this task is around 4 hours.
Table 1: Appliances grid for domestic electricity use
APPLIANCES Quantity Hours per day
Number of days
per week
Energy Use per week
(kWh/week)
Total Power used /year(kWh/year)
Entertainment TV
Satellite/
Freeview/ cable
box
Digital/
analogue radio
Video/DVD player/recorder
Games console
Home theatre system
.
.
Phase 2: Analysis and Results Complete the appliance grid for 3 houses each with a different household size (say 1
person, 2 persons etc). Note that the household numbers may have an impact on the
appliance usage hence the overall energy consumption.
10
Energy Roadmap in Ghana and Botswana
A simplified relation between appliance, its rating and duration of use was developed
(Essah and Ofetotse, 2014) to investigate the energy consumption per appliance per
week. This relation is as illustrated in Equations 1.
Ee = Na × Ar × Hu (1)
Where:
Ee = energy use per appliance per week
Na = the number of appliances (of same kind)
Ar = the power rating of appliances in watts
Hu = the duration of an appliance usage in hours per week
Equation 1 is applicable to all categories of domestic appliances but for cold
appliances where this is not applicable because even though the appliances are in
continuous use (i.e. switched on all the hours of the day) their compressors do not
run continuously hence they do not draw a constant amount of power. Conduct a research into cold appliance usage for this exercise and each household. The
expected time for this task is around 4 hours. Once each group member has
completed their grid, compute the individual totals and discuss your findings with
your group member.
Phase 3: Calculations and Report
Compute the average domestic electricity consumption assuming insignificant
deviation across the entire population. Using this average, estimate the total energy
consumption using the percentages cited in Tables 3 & 4 Write a report of the
outcome of your results focusing only on the domestic sector of your chosen country,
stating all necessary assumptions. This exercise is estimated to last for a maximum
of 2 hours.
4.1. SOLUTION AND EVALUATION CRITERIA
11
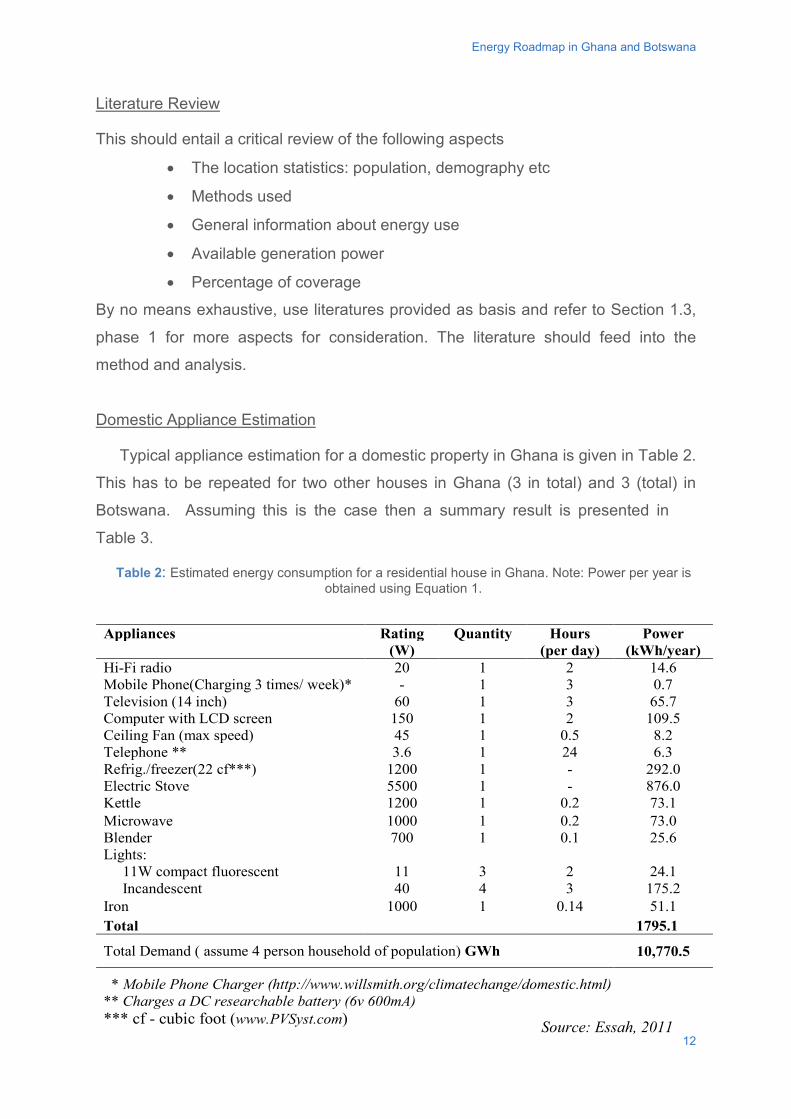
Energy Roadmap in Ghana and Botswana
Literature Review
This should entail a critical review of the following aspects
• The location statistics: population, demography etc
• Methods used
• General information about energy use
• Available generation power
• Percentage of coverage
By no means exhaustive, use literatures provided as basis and refer to Section 1.3,
phase 1 for more aspects for consideration. The literature should feed into the
method and analysis.
Domestic Appliance Estimation
Typical appliance estimation for a domestic property in Ghana is given in Table 2.
This has to be repeated for two other houses in Ghana (3 in total) and 3 (total) in
Botswana. Assuming this is the case then a summary result is presented in
Table 3.
Source: Essah, 2011
Appliances Rating Quantity Hours Power (W) (per day) (kWh/year) Hi-Fi radio 20 1 2 14.6 Mobile Phone(Charging 3 times/ week)* - 1 3 0.7 Television (14 inch) 60 1 3 65.7 Computer with LCD screen 150 1 2 109.5 Ceiling Fan (max speed) 45 1 0.5 8.2 Telephone ** 3.6 1 24 6.3 Refrig./freezer(22 cf***) 1200 1 - 292.0 Electric Stove 5500 1 - 876.0 Kettle 1200 1 0.2 73.1 Microwave 1000 1 0.2 73.0 Blender 700 1 0.1 25.6 Lights: 11W compact fluorescent 11 3 2 24.1 Incandescent 40 4 3 175.2 Iron 1000 1 0.14 51.1 Total 1795.1
Total Demand ( assume 4 person household of population) GWh 10,770.5
* Mobile Phone Charger (http://www.willsmith.org/climatechange/domestic.html) ** Charges a DC researchable battery (6v 600mA) *** cf - cubic foot (www.PVSyst.com)
Table 2: Estimated energy consumption for a residential house in Ghana. Note: Power per year is obtained using Equation 1.
12
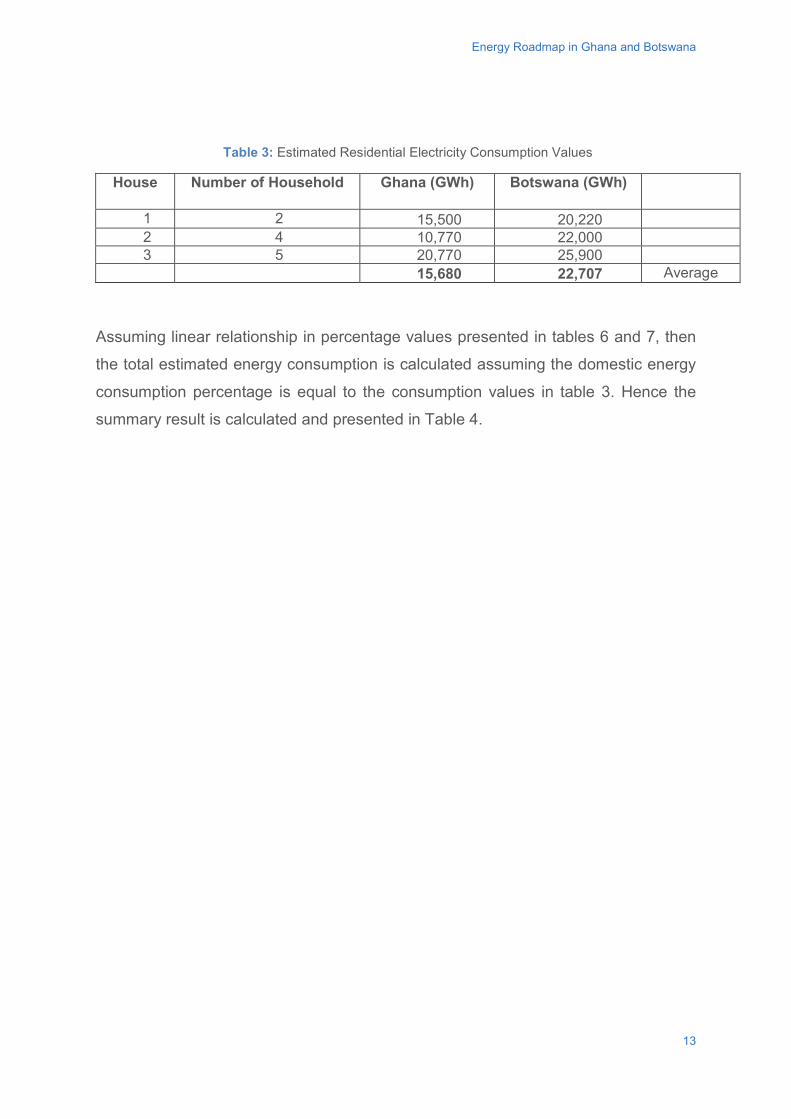
Energy Roadmap in Ghana and Botswana
Table 3: Estimated Residential Electricity Consumption Values
House Number of Household Ghana (GWh) Botswana (GWh)
1 2 15,500 20,220 2 4 10,770 22,000 3 5 20,770 25,900 15,680 22,707 Average
Assuming linear relationship in percentage values presented in tables 6 and 7, then
the total estimated energy consumption is calculated assuming the domestic energy
consumption percentage is equal to the consumption values in table 3. Hence the
summary result is calculated and presented in Table 4.
13
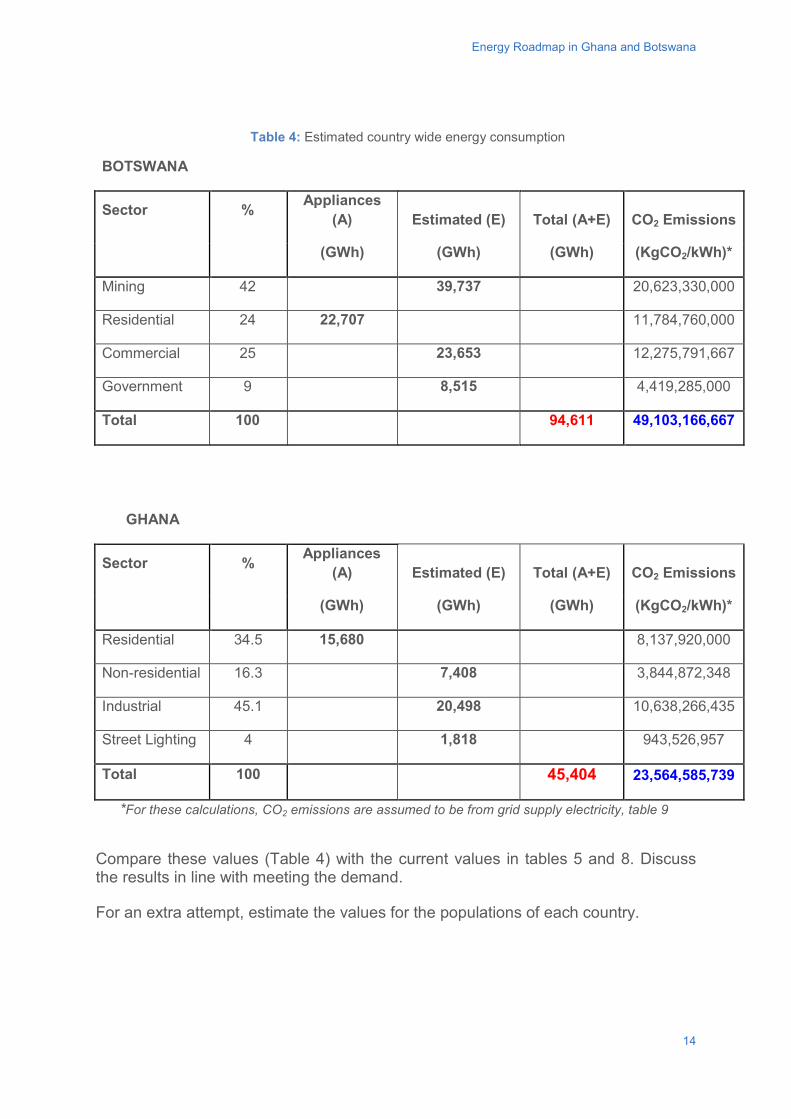
Energy Roadmap in Ghana and Botswana
Table 4: Estimated country wide energy consumption
BOTSWANA
Sector % Appliances (A) Estimated (E) Total (A+E) CO2 Emissions
(GWh) (GWh) (GWh) (KgCO2/kWh)*
Mining 42
39,737
20,623,330,000
Residential 24 22,707
11,784,760,000
Commercial 25
23,653
12,275,791,667
Government 9
8,515
4,419,285,000
Total 100
94,611 49,103,166,667
GHANA
Sector % Appliances (A) Estimated (E) Total (A+E) CO2 Emissions
(GWh) (GWh) (GWh) (KgCO2/kWh)*
Residential 34.5 15,680
8,137,920,000
Non-residential 16.3
7,408
3,844,872,348
Industrial 45.1
20,498
10,638,266,435
Street Lighting 4
1,818
943,526,957
Total 100
45,404 23,564,585,739
*For these calculations, CO2 emissions are assumed to be from grid supply electricity, table 9 Compare these values (Table 4) with the current values in tables 5 and 8. Discuss the results in line with meeting the demand.
For an extra attempt, estimate the values for the populations of each country.
14
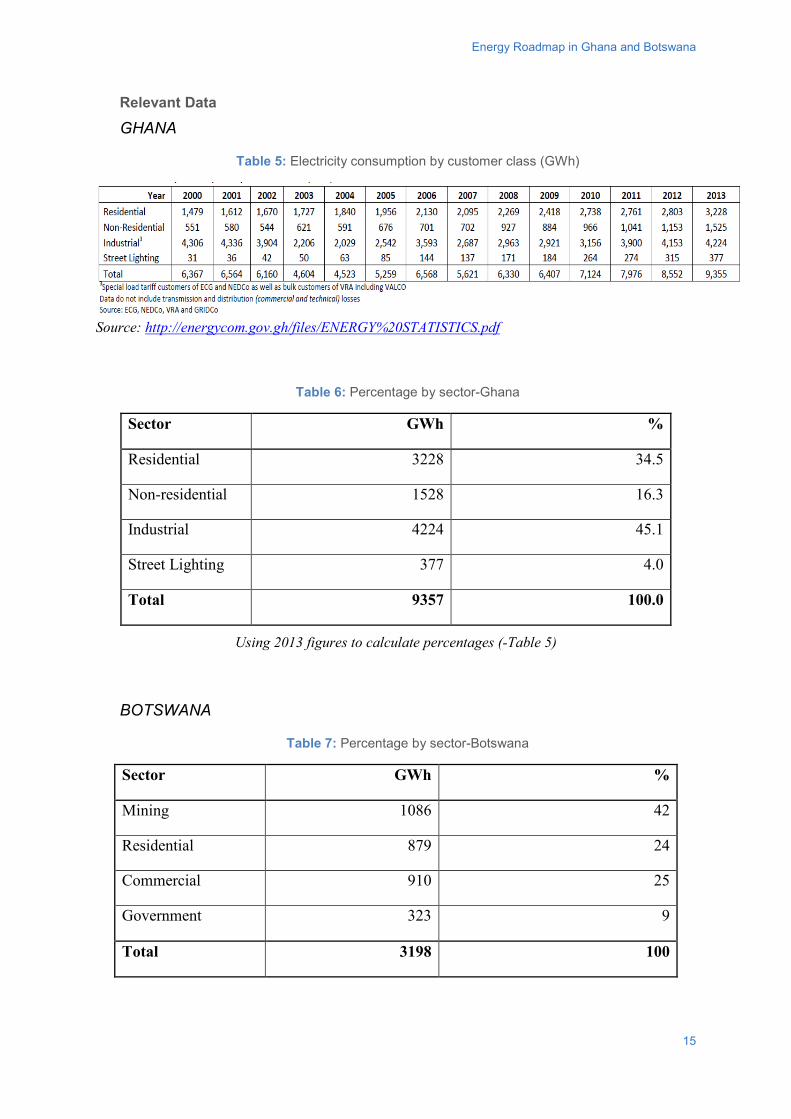
Energy Roadmap in Ghana and Botswana
Relevant Data
GHANA
Table 5: Electricity consumption by customer class (GWh)
Source: http://energycom.gov.gh/files/ENERGY%20STATISTICS.pdf
Table 6: Percentage by sector-Ghana
Sector GWh %
Residential 3228 34.5
Non-residential 1528 16.3
Industrial 4224 45.1
Street Lighting 377 4.0
Total 9357 100.0
Using 2013 figures to calculate percentages (-Table 5)
BOTSWANA
Table 7: Percentage by sector-Botswana
Sector GWh %
Mining 1086 42
Residential 879 24
Commercial 910 25
Government 323 9
Total 3198 100
15
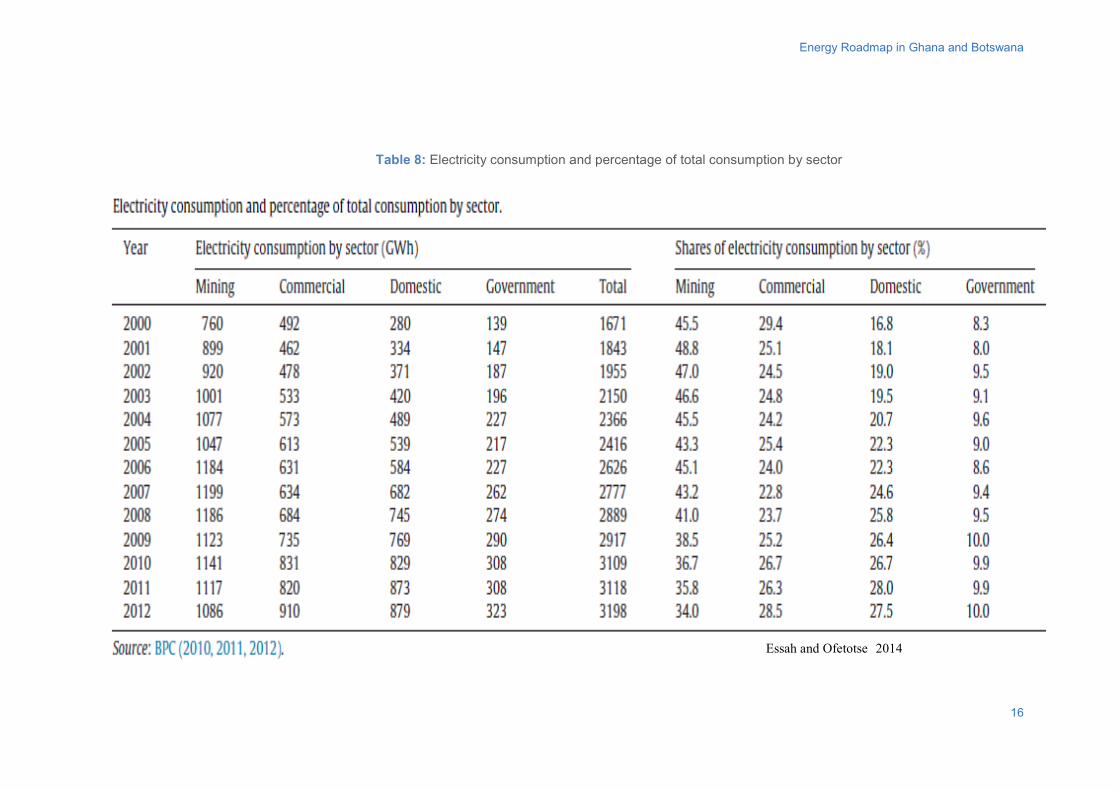
Energy Roadmap in Ghana and Botswana
Essah and Ofetotse 2014
Table 8: Electricity consumption and percentage of total consumption by sector
16
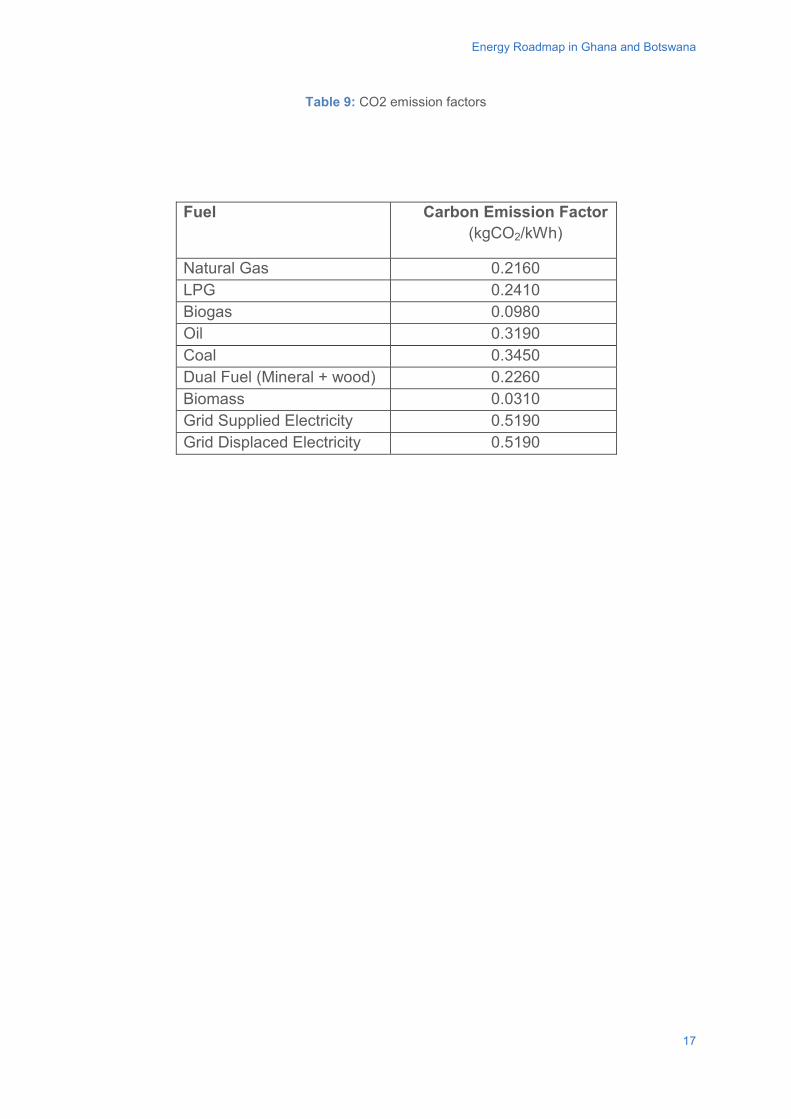
Energy Roadmap in Ghana and Botswana
Table 9: CO2 emission factors
Fuel Carbon Emission Factor (kgCO2/kWh)
Natural Gas 0.2160 LPG 0.2410 Biogas 0.0980 Oil 0.3190 Coal 0.3450 Dual Fuel (Mineral + wood) 0.2260 Biomass 0.0310 Grid Supplied Electricity 0.5190 Grid Displaced Electricity 0.5190
17
Energy Roadmap in Ghana and Botswana
BIBLIOGRAPHY
Ang, J.B., 2008. Economic development, pollutant emissions and energy consumption in Malaysia. Policy modelling, 30 (2), pp. 271-278.
Apergis, N. and Payne, J. E., 2009. Energy consumption and economic growth in Central America: Evidence from a panel co-integration and error correction model. Energy economics, 31(2), pp. 211-216.
Bhattacharyya, S. C. and Timilsina, G. R., 2010. Modelling energy demand of developing countries: Are the specific features captured. Energy policy, 38 (4), pp. 1979-1990.
Essah, E.A. (2011) Energy generation and consumption in Ghana In: Laryea, S., Leiringer, R. and Hughes, W. (Eds) Procs West Africa Built Environment Research (WABER) Conference, 19-21 July 2011, Accra, Ghana, 1-7.
Essah, E. A. and Ofetotse, E. L. (2014) Energy supply, consumption and access dynamics in Botswana. Sustainable Cities and Society, 12. pp. 76-84. ISSN 2210-6707 doi: 10.1016/j.scs.2014.01.006IEA (The International Energy Agency), Key World Energy Statistics. Available at: http://www.iea.org/publications/freepublications/publication/KeyWorld2014.pdf
Kraft, J. and Kraft, A., 1978. On the relationship between energy and GNP. Journal of Energy and Development, 3(2), pp. 401-403.
Saidur, R., Masjuki, H. H. and Jamaluddin M. Y., 2007. An application of energy and exergy analysis in residential sector of Malaysia. Energy policy, 35 (2), pp. 1050-1063.
Yu, E. S. H., Choi, J.-Y. 1985. The causal relationship between energy and GNP: an international comparison. Journal of Energy and Development, 10 (2), pp. 249-272.
18
Energy Roadmap in Ghana and Botswana
FURTHER/SUGGESTED MATERIAL The literature to be reviewed has been attached in a folder labelled as Papers.
Other sources of reference are the internet links below;
Internet Links
Ghana
• http://energycom.gov.gh/ • http://energycom.gov.gh/files/ENERGY%20STATISTICS.pdf • http://energycom.gov.gh/Energy-Statistics/2012-energy-outlook-for-
ghana.html • http://energycom.gov.gh/files/Energy%20Commission%20%202014En
ergy%20Outlook%20for%20Ghana_final_2014.pdf
Bostwana
• http://sustainabledevelopment.un.org/content/documents/1009National%20Report%20(Energy)%20-%20Botswana.pdf
• http://www.laurea.fi/en/connect/results/Documents/Botswana%20Country%20Report.pdf
• BPC, 2014a. Saving electricity at home. http://www.bpc.bw/Pages/saving_electricity.aspx.
• BPC, 2014b. Network map. http://www.bpc.bw/Pages/network_map.aspx
• CSO, 2011. Statistics brief 2011. http://www.cso.gov.bw/templates/cso/file/File/BCWIS%20_Poverty_%20Survey%20Statsbrief%20Nov%202011..pdf
19
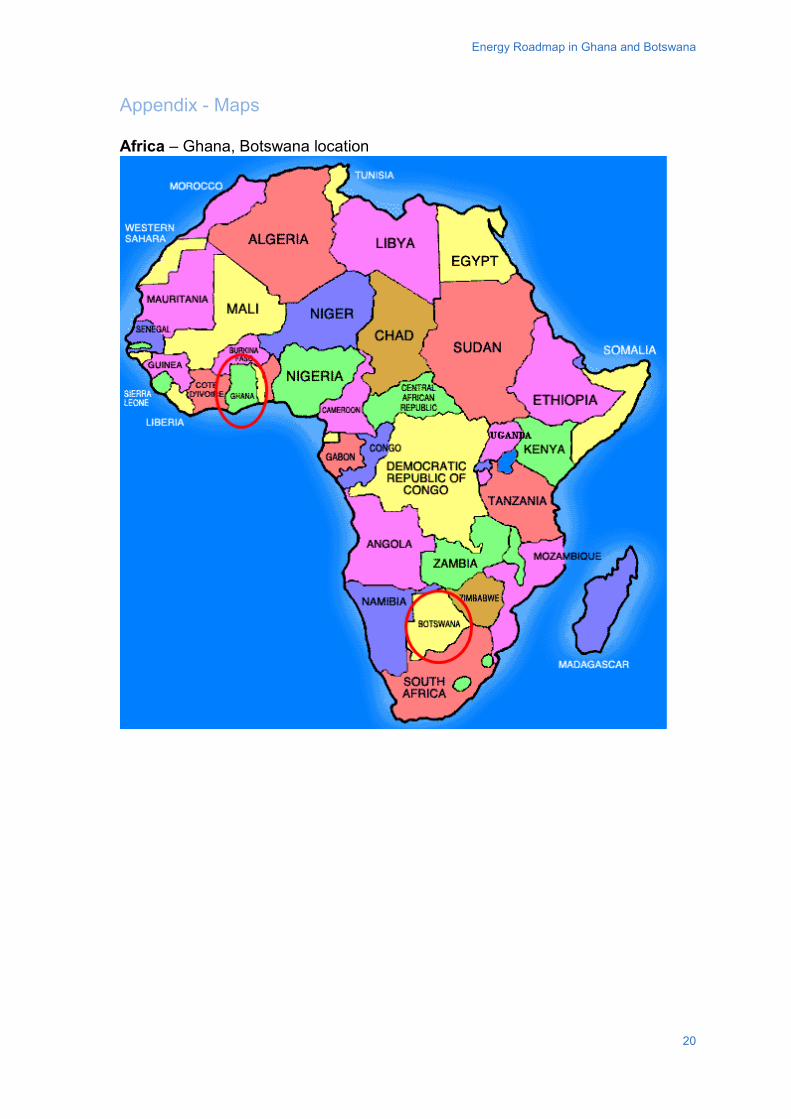
Energy Roadmap in Ghana and Botswana
Appendix - Maps Africa – Ghana, Botswana location
20
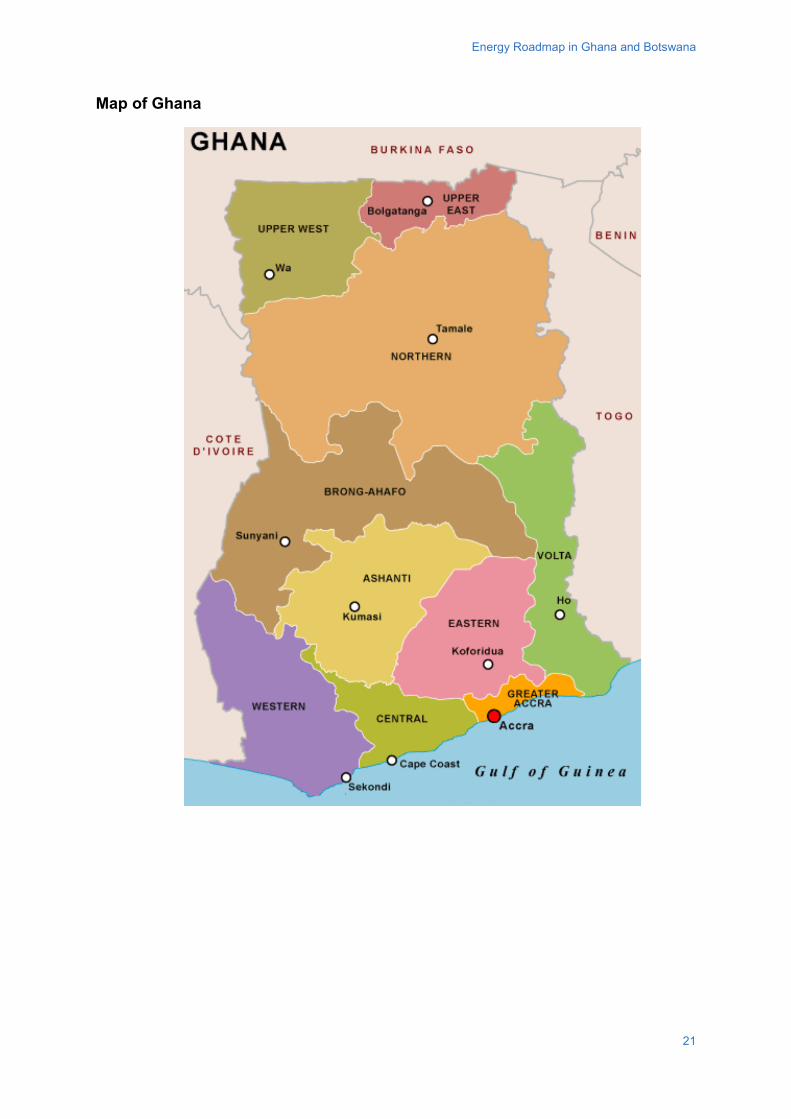
Energy Roadmap in Ghana and Botswana
Map of Ghana
21
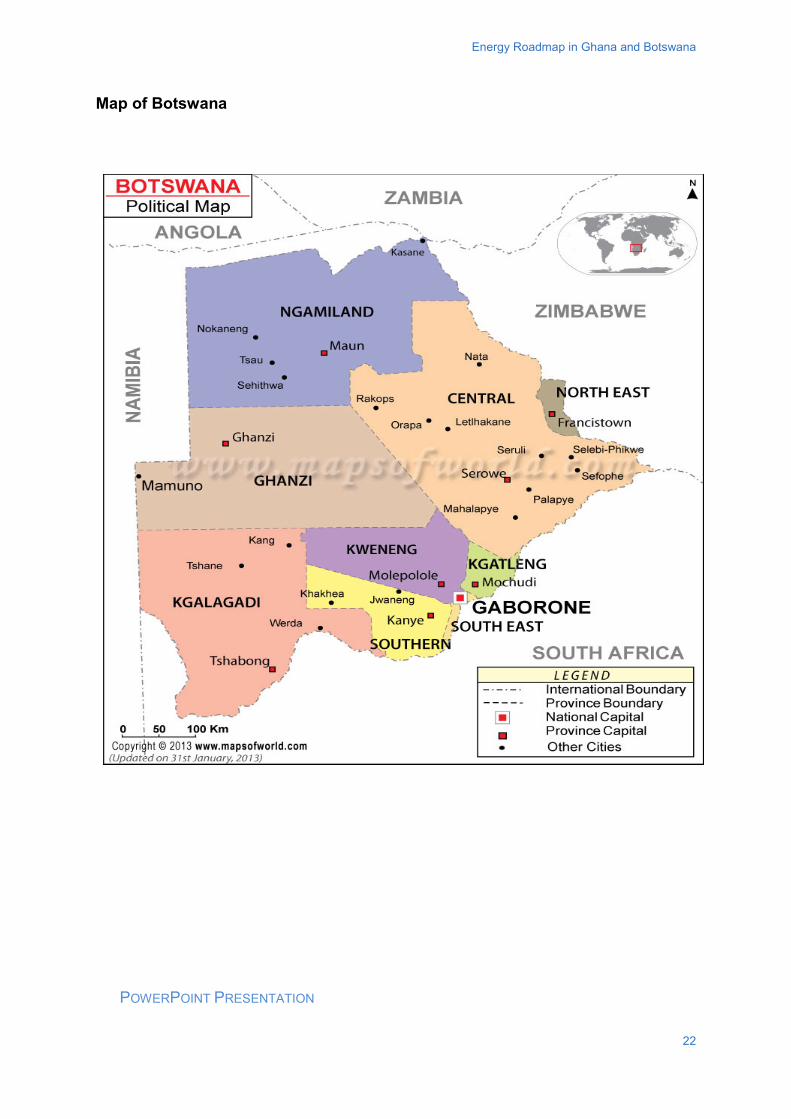
Energy Roadmap in Ghana and Botswana
Map of Botswana
POWERPOINT PRESENTATION
22

http://www.gdee.eu
This project is funded by
Celia Fernández Aller and Rafael Miñano Rubio
PHOTO: Practical Action.
CASE STUDIES
Social and Ethical Issues in Engineering
DL B 10735-2015 ISBN 978-84-606-7546-4
Social and Ethical Issues in Engineering
COORDINATED BYAgustí Pérez-Foguet, Enric Velo, Pol Arranz, Ricard Ginéand Boris Lazzarini (Universitat Politècnica de Catalunya)Manuel Sierra (Universidad Politécnica de Madrid)Alejandra Boni and Jordi Peris (Universitat Politècnica de València)Guido Zolezzi and Gabriella Trombino (Università degli Studi di Trento)Rhoda Trimingham (Loughborough University)Valentín Villarroel (ONGAWA)Neil Nobles and Meadhbh Bolger (Practical Action)Francesco Mongera (Training Center for International Cooperation)Katie Cresswell-Maynard (Engineering Without Border UK)
EDITED BY Global Dimension in Engineering Education
Citation: Fernández Aller, C. and Miñano Rubio, R. (2015) ' Social and Ethical Issues in Engineering', in Case studies for developing globally responsible engineers, GDEE (eds.), Global Dimension in Engineering Education, Barcelona. Available from: http://gdee.eu/index.php/resources.html
This publication is distributedunder an Attribution- Noncommercial-Share Alike License for Creative Commons
CASE STUDIES
Disclaimer: This document has been produced with the financial assistance of the European UnionThe contents of this document are the sole responsibility of the authors and can under no circumstances be regarded as reflecting the position of the European Union
Ethical & social issues in engineering
ETHICAL & SOCIAL ISSUES IN ENGINEERING
Celia Fernández Aller and Rafael Miñano Rubio, Universidad Politécnica de Madrid
1
Ethical & social issues in engineering
INDEX 1. INTRODUCTION ........................................................................................................................... 3
1.1. DISCIPLINES COVERED ............................................................................................................. 4
1.2. LEARNING OUTCOMES .............................................................................................................. 4
1.3. ACTIVITIES .............................................................................................................................. 4
2. DESCRIPTION OF THE CONTEXT ............................................................................................. 5
2.1. PERU AT A GLANCE .................................................................................................................. 5
2.2. TELECOMMUNICATION SECTOR ................................................................................................. 6
2.3. GOVERNANCE IN PERU ............................................................................................................ 7
2.4. HEALTH................................................................................................................................... 7
2.5. THE WILLAY PROGRAM ............................................................................................................ 8
3. CLASS ACTIVITY ......................................................................................................................... 9
3.1. SOLUTION AND EVALUATION CRITERIA ..................................................................................... 10
4. HOMEWORK ACTIVITY ............................................................................................................. 15
4.1. SOLUTION AND EVALUATION CRITERIA ..................................................................................... 16
BIBLIOGRAPHY ................................................................................................................................. 20 FURTHER/SUGGESTED MATERIAL ................................................................................................ 22
2
Ethical & social issues in engineering
1. INTRODUCTION
The ethical and social issues involved in engineering projects are now included in
engineering degree programs across many universities. In the present globalised world, the
impact of the engineering profession is growing in importance and society is becoming more
aware of engineers’ role. Both engineering professionals and institutions should assume the
responsibility that their expertise affords them and that the impacts of their actions reflect
their responsibilities.
Several accrediting agencies include the following skills as necessaries for engineering
professionals:
● An understanding of professional and ethical responsibility (ABET)
● The broad education necessary to understand the impact of engineering
solutions in a global, economic, environmental and societal context (ABET)
● Demonstrate awareness of the responsibility involved in the practice of
engineering, the social and environmental impacts, and commitment to
professional ethics, responsibility and norms of engineering practice (EUR-
RACE).
One of the methodologies considered most successful in developing these skills is the case
study approach. The example presented in this activity is a suitable case study to enhance
these skills.
The context presented is the Willay programme, which has been active in Peru since 2007.
Willay was developed by a Spanish NGO, ONGAWA, with the support of many Peruvian
partners (universities and NGOs). The goal of the programme is to promote the use of
Information and Communication Technologies (ICT) in isolated rural areas to facilitate
democratic governance, citizen participation and improve the quality of basic services such
as health and education.
The class activity refers to work completed in small groups that involves analysing different
professional ethical dilemmas that are related to the context described. Issues related to
data protection, corruption and usability of technological tools are considered. References
for the analysis include some engineering deontological codes and laws related to the issue
presented. The objective is for the student to develop the skills to identify and analyse these
issues and propose suitable solutions drawing on engineers’ ethical and professional
responsibilities.
3
Ethical & social issues in engineering
As a homework activity, it is proposed that students should reflect on possible improvements
of the Willay program from different perspectives: the principles of professional engineering
ethics, the principles of Social Responsibility of a technological company working in the
sector in this context, and the Human Rights Based Approach (HRBA) used in human
development policies. The objective is for the students to know the basic principles of
professional ethics in both a personal and institutional (company, public administration)
capacity.
The authors use the activities presented here within their teaching on “Social, Legal, Ethical
and Professional Aspects”, which is mandatory in degree programmes in software
engineering and computer engineering at the Technical University of Madrid.
1.1. DISCIPLINES COVERED
Social and ethical issues in engineering, ethical principles of engineering, professional code
of ethics, some specific social problems in engineering practice: privacy and data protection,
corruption, user orientation, digital divide, human rights, access to basic services.
Economics and business in engineering, mainly related to Corporative Social Responsibility
(CSR).
1.2. LEARNING OUTCOMES
● Awareness of professional, social and ethical responsibility in the practice of engineering.
● Ability to identify relevant ethical and social issues in the practice of engineering.
● Knowledge and use of some tools and references available to analyse ethical and social issues in the practice of engineering.
1.3. ACTIVITIES
The class activity (2 hours) consists in analysing different social and ethical dilemmas in
small groups (4-6 students) and each group then sharing their conclusions and reflections
with the class. The dilemmas presented are related to professional situations in the context
of the case study: the first concerns the introduction of free software rather than priced; the
second is related to the use of personal data and confidentiality; the final one deals with
corruption versus transparency issues.
The homework activity (8-12 hours) is an individual essay that considers possible
improvements of the Willay program from different perspectives: principles of professional
engineering ethics, principles of Corporate Social Responsibility (CSR) of a technological
4
Ethical & social issues in engineering
company working in this context, and the Human Rights Based Approach (HRBA) used in
human development policies.
2. DESCRIPTION OF THE CONTEXT
2.1. PERU AT A GLANCE
Peru is the third largest country in Latin America after Brazil and Argentina, with an area of
1,285,216 km2 (2.5 times the area of Spain). It is the fifth most populous country in Latin
America after Brazil, Mexico, Colombia and Argentina, and has a population density of 23.7
inhabitants/km², which is 4 times lower than in Spain. In Peru deep social inequalities persist
and there is a sharp contrast between the Human Development Index scores in the capital
and provinces, as well as between urban and rural areas. Although in recent years the
country has experienced steady economic growth, there are still major challenges to
overcome in the fields of social inclusion and gender equality, for example. Many social
conflicts, uprisings and protests from people living in the interior of Peru have resulted as
people in this area are not benefited from investment and economic boom like others. There
are severe limitations in access to good quality basic services such as education, health,
water, housing and electricity for much of the population in rural areas; as well as poor
promotion of economic opportunity and progress.
Peru is divided into 25 regions, 194 provinces and 1,624 districts. The elections of regional
and local (provincial and district) authorities are held every five years. The complex and
rugged geography of the country, along with the implementation of population concentration
policies, has created an unequal and asymmetric occupation of the territory; this makes it
difficult to overcome the various spatial dimensions of development, promote social cohesion
and ensure state presence. In addition, an expensive transport and communications
infrastructure is required to ensure connectivity.
The country has been experiencing major demographic transition since the mid-1960s. A
population explosion has been coupled with increasing migration to the big cities, in
particular Lima. It is estimated that the population of Peru in 2014 was 30,814,175
inhabitants, with an annual average growth rate of 1.11%. There is a high concentration of
the population in urban areas (73%), especially in Lima, where more than a third of the total
population lives. The World Bank report "Peru 2012" stated that 53% of the rural population
lives below the national rural poverty line. Peru is characterised by a Human Development
Index (HDI) of 0.741 according to 2013 data, which puts it in the group of countries with high
HDI, ranking 77 of 185, below Cuba, and above Turkey and Brazil. The Adjusted HDI, which
5
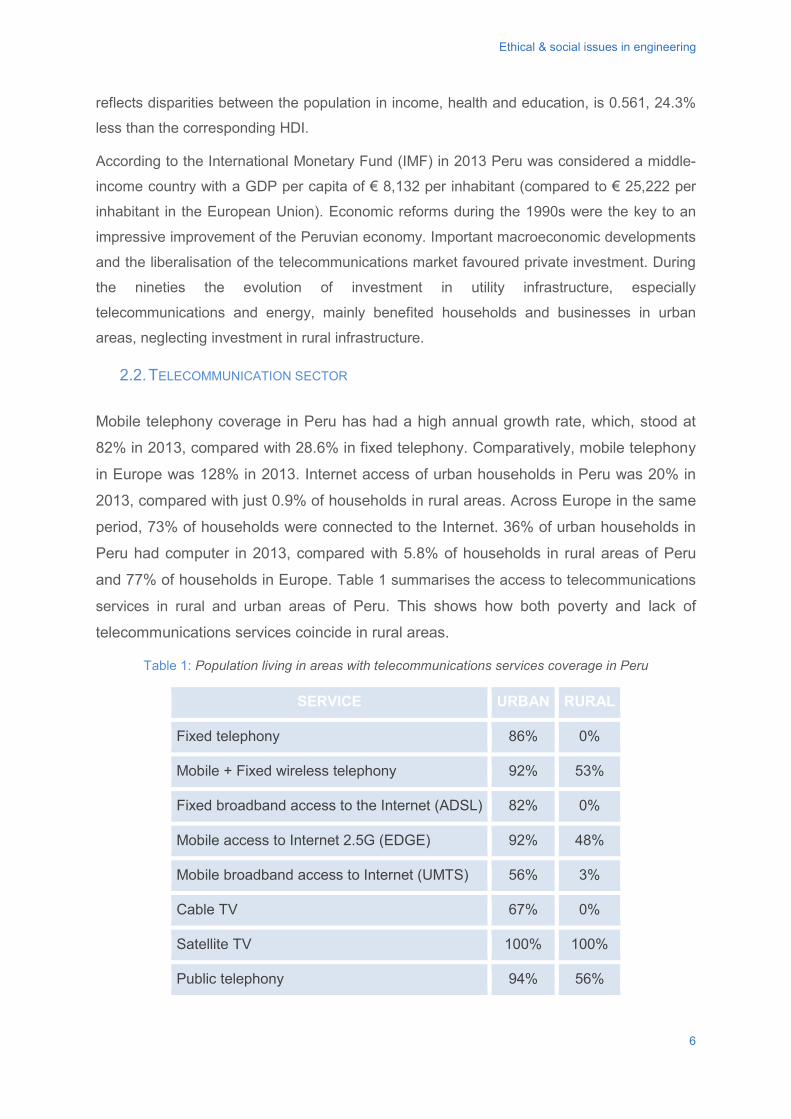
Ethical & social issues in engineering
reflects disparities between the population in income, health and education, is 0.561, 24.3%
less than the corresponding HDI.
According to the International Monetary Fund (IMF) in 2013 Peru was considered a middle-
income country with a GDP per capita of € 8,132 per inhabitant (compared to € 25,222 per
inhabitant in the European Union). Economic reforms during the 1990s were the key to an
impressive improvement of the Peruvian economy. Important macroeconomic developments
and the liberalisation of the telecommunications market favoured private investment. During
the nineties the evolution of investment in utility infrastructure, especially
telecommunications and energy, mainly benefited households and businesses in urban
areas, neglecting investment in rural infrastructure.
2.2. TELECOMMUNICATION SECTOR
Mobile telephony coverage in Peru has had a high annual growth rate, which, stood at
82% in 2013, compared with 28.6% in fixed telephony. Comparatively, mobile telephony
in Europe was 128% in 2013. Internet access of urban households in Peru was 20% in
2013, compared with just 0.9% of households in rural areas. Across Europe in the same
period, 73% of households were connected to the Internet. 36% of urban households in
Peru had computer in 2013, compared with 5.8% of households in rural areas of Peru
and 77% of households in Europe. Table 1 summarises the access to telecommunications
services in rural and urban areas of Peru. This shows how both poverty and lack of
telecommunications services coincide in rural areas.
Table 1: Population living in areas with telecommunications services coverage in Peru
SERVICE URBAN RURAL
Fixed telephony 86% 0%
Mobile + Fixed wireless telephony 92% 53%
Fixed broadband access to the Internet (ADSL) 82% 0%
Mobile access to Internet 2.5G (EDGE) 92% 48%
Mobile broadband access to Internet (UMTS) 56% 3%
Cable TV 67% 0%
Satellite TV 100% 100%
Public telephony 94% 56%
6
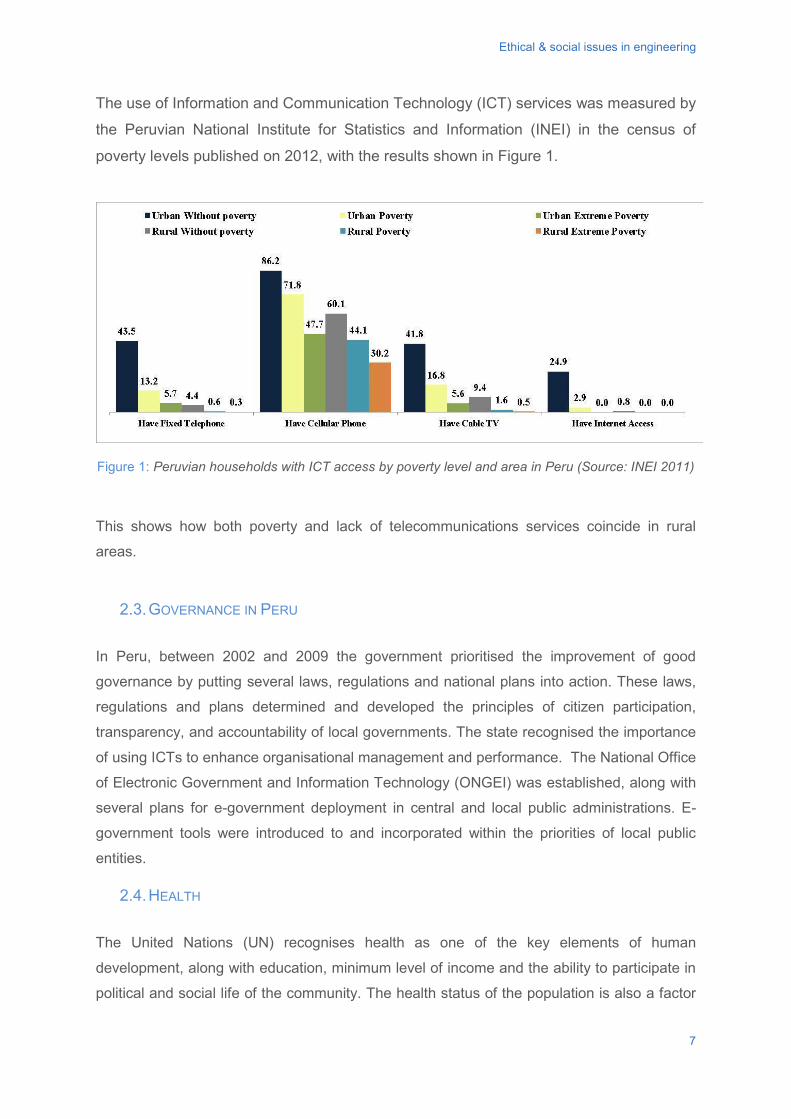
Ethical & social issues in engineering
The use of Information and Communication Technology (ICT) services was measured by
the Peruvian National Institute for Statistics and Information (INEI) in the census of
poverty levels published on 2012, with the results shown in Figure 1.
Figure 1: Peruvian households with ICT access by poverty level and area in Peru (Source: INEI 2011)
This shows how both poverty and lack of telecommunications services coincide in rural
areas.
2.3. GOVERNANCE IN PERU
In Peru, between 2002 and 2009 the government prioritised the improvement of good
governance by putting several laws, regulations and national plans into action. These laws,
regulations and plans determined and developed the principles of citizen participation,
transparency, and accountability of local governments. The state recognised the importance
of using ICTs to enhance organisational management and performance. The National Office
of Electronic Government and Information Technology (ONGEI) was established, along with
several plans for e-government deployment in central and local public administrations. E-
government tools were introduced to and incorporated within the priorities of local public
entities.
2.4. HEALTH
The United Nations (UN) recognises health as one of the key elements of human
development, along with education, minimum level of income and the ability to participate in
political and social life of the community. The health status of the population is also a factor
7
Ethical & social issues in engineering
that affects development. Poor health reduces work capacity and productivity of people and
affects the physical development, schooling and learning of children. There is a link between
the improvement in nutrition and health with the increase in productivity and school
performance. In relative terms, the economic and education advantages that produce an
improvement in health generate greater benefits in the poorest population. This is the reason
why health was one of the key issues considered in the Millennium Development Goals
(MDGs).
According to the World Health Organisation most inequalities in health are due to the
conditions in which people are born, live and work, as well as the health system they have
access to. That is, access to safe water and adequate sanitation, an adequate supply of safe
food, adequate nutrition, adequate housing, healthy working conditions and environment,
and adequate social protection. Improving these social determinants of health and reducing
inequalities of power, money and resources may help to improve population health.
Often women and men are affected by different social determinants of health, producing
gender inequality in access to health. For example, domestic tasks cause women be in
contact with contaminated water, fatigue and stress of "double day" of women inside and
outside the home, health problems during pregnancy, childbirth and postpartum, etc.
Health is recognised as a Human Right, so governments that have signed international
covenants on human rights are obliged to create the conditions that allow all people to live
as healthily as possible, including the social determinants of health. The Right to Health is
not to be understood as the right to be healthy. Rather, international regulations on the Right
to Health require governments to provide access to health care with quality care, non-
discrimination and economic conditions that do not prevent access of the poor.
2.5. THE WILLAY PROGRAM
The Willay program is implemented in two distinct regions; San Pablo in Cajamarca and
Acomayo in Cusco, together having a combined population of 50,000 people. The majority of
the population belong to indigenous communities whose main economic activity is farming
(84% of the active population).
In Acomayo, 46% of the population does not have access to electricity, 23% do not have
access to running water, and 62% do not have access to appropriate sanitation. In terms of
the Human Development Index, Acomayo is ranked ninth out of the thirteen provinces
located in the department of Cuzco, with medium-low HDI similar to that of Sudan. Life
expectancy is 63 years, 91% of children between 5 and 18 are in school and the illiteracy
rate among women is 42%.
8
Ethical & social issues in engineering
Government implementation of national initiatives related to the use of ICT, which are
designed based on a developed urban perspective, generated unexpected results in these
communities because of the lack of connectivity, capacity for management, and technology
at the local level. Since there were neither good connections nor qualified technical staff in
rural areas, the rural municipalities opted to establish offices in the respective districts’
capitals. These satellite offices added to the municipalities’ costs and complicated the
human resources management process. There was limited knowledge regarding regulations
on adequate use of management tools and deficiencies in using an appropriate language
with the population in public entities. Regarding civil society organisations, they had
organisational weaknesses; were unaware of their democratic governance rights and
experienced limitations in leadership building. Spaces for consensus existed although they
were not properly utilised due to a lack of satisfaction on the citizens’ side.
The Willay program, meaning “to inform” in Quechua, proposes the use of ICTs in rural
areas for democratic governance and citizen participation. The project explores how ICTs
could enhance the processes of transparency, citizen participation and the accountability
and effectiveness of local governments. This is achieved by building capacities of the
stakeholders involved (civil society organisations and public entities like local government,
health centres and schools).
In total, 44 local government institutions have been provided with a telecommunication
infrastructure shared between them, based on WiFi for Long-Distance (WiLD) technology
that offers Internet access and Internet Protocol (IP) telephony. Besides this, it has installed
information systems and software, and implemented a system of continuous improvement.
Public workers and community leaders have also been trained in participatory budgeting,
accountability and transparency of institutions public, citizen surveillance, education
management and health management.
3. CLASS ACTIVITY
This class activity is designed for a two-hour class session. The methodology for the class
activity may be adjusted to better-fit the needs of the specific discipline it is taught within.
The goals for this activity are for the students to:
● Identify relevant ethical, legal and social issues in the practice of engineering.
● Know and use some tools and references to analyse and address ethical and
social issues in the practice of engineering: code of ethics, laws, etc.
9
Ethical & social issues in engineering
● Be aware of the social and ethical responsibility involved in decision making
within the practice of engineering.
Methodology:
In the first part (60 minutes) the students work in small groups (4 to 6 students) on the
following tasks:
Each group should receive the following documents
● A description of a case study that presents a problematic situation related to the
practice of engineering in the context described above and a worksheet on
which the group can write answers and reflections (see ANNEX2 – DilemmaN
– DescriptionWorksheet.pdf)
● Some engineering laws, ethic and deontological codes related to the case study
(see ANNEX1-DOCn_Title.pdf and ANNEX2- DilemmaN -DOCm_ Title.pdf )
Each group should carry out the following work:
● Read and understand the situation presented.
● Identify and describe the dilemma and the major ethical and social issues that
are related to the situation.
● Identify ethical principles, norms, laws etc. that may help them to analyse the
problem.
● Analyse the situation by taking all the actors and points of view into account.
● Make a decision regarding what a good professional engineer should do in that
situation.
Three dilemmas are given so that different groups work on different situations. In this way,
when the groups’ work is shared with the rest of the class, a wider range of situations and
proposals can be experienced. Depending on the particular needs of the context in which
this activity is used, the most appropriate dilemma/s may be chosen.
In the second part (60 minutes), each small group should share their findings with the big
group and discuss potential solutions. 15-20 minutes should be allowed for the discussion of
each dilemma.
3.1. SOLUTION AND EVALUATION CRITERIA
There is no single or unique solutions of the dilemmas, but some guidelines on how to
assess the student’s work are presented here.
10

Ethical & social issues in engineering
● On the identification of the issues
They may identify the most relevant issues, the main dilemmas and describe
them correctly.
● On use of the ethical codes and norms related to the dilemma
They should correctly explain the ethical principles and laws related to the case
concerned. They may use the most relevant codes and norms in their
argumentation and decision making process.
● On analysis of the dilemma
They should identify every relevant actor involved in the situation; consider their
different points of view and corresponding benefits, risks and negative
consequences of a potential solution.
● On decision making
They should make a feasible and coherent decision, drawing from professional
engineering ethical principles and local norms and legislation. They must
consider the consequences or eventual risks of their proposed solutions. They
may design a “win-win” solution, which benefits every actor involved in the
situation.
Besides an oral presentation, each group should submit an essay either at the end of the
session or some days afterwards, explaining their thoughts and opinions on each of the
points outline above.
If grading is required, equal weight is given to every item outlined above, but different
weighting may be chosen depending on the particular teaching context.
Some guidelines for each case are given below:
Dilemma 1: Should the Peruvian Health System sell medical information as a way of gaining
additional income?
The main issue is the right to privacy. There is a conflict of interest between the
economic needs of the Peruvian Health System and the population’s right to privacy.
Some references to inform the issue:
● “The States must respect and protect the right to privacy, including in the
context of digital communication”; “unlawful or arbitrary collection of personal
data, is a highly intrusive act, violates the rights to privacy and freedom of
expression, and may contradict the tenets of a democratic society” (UN-Privacy
Rights),
11

Ethical & social issues in engineering
● The right to privacy is recognised in Peru’s Data Protection Law as a
fundamental right (Article 1) and is applicable in the context of this dilemma
because personal health data are sensitive (Article 3). Personal data can be
communicated to third parties only with previous consent of the data subject (in
this case the patient) (Article 5) and treatment of the data should not be
extended to other purposes that were not established at the time of collection
(Article 6).
● “It is the responsibility of professionals to maintain the privacy and integrity of
data describing individuals. This includes taking precautions to ensure the
accuracy of data, as well as protecting it from unauthorised access or accidental
disclosure to inappropriate individuals” (see more in 1.7 of ACM).
● The engineer “shall observe proper duties of confidentiality” (FEANI).
● “Professional Engineers should give due weight to all relevant law, facts and
published guidance, and the wider public interest” (RAE-UK).
In this case the point of view of the Peruvian Health System as institution, the insurance
company and, of course, the patients of the Peruvian Health System must all be
considered.
Information about health is sensitive personal data and needs a high level of security. No
one can access these data without legitimate reason (for example, being medical
professionals). This is why Peru’s Public Health System should not sell medical data to
third parties without previous and informed consent of the data subject (in this case the
patient). A “win-win” option could be to implement a process to inform patients about
offers of health insurance in relation to their medical situation in return for data sharing.
Dilemma 2: Should “extra-payments” asked for by some Peruvian civil servants working in
municipalities be accepted?
There is a conflict of interest because in order to reach some of the goals of the Willay
programme (i.e. improve health services) the project team is asked to support some
unethical actions (i.e. corruption).
Some references to inform the issue:
● “Honesty is an essential component of trust. Without trust an organization
cannot function effectively”. “A computer professional has a duty to be honest
about his or her own qualifications, and about any circumstances that might
lead to conflicts of interest” (ACM).
12
Ethical & social issues in engineering
● Engineers “shall respect […] the legal and cultural values of the societies in
which they carry out assignments” (FEANI).
● Engineers should “avoid deceptive acts, take steps to prevent corrupt practices
or professional misconduct, and declare conflicts of interest” (RAE-UK).
● “This Convention is applicable to the following acts of corruption: The solicitation
or acceptance, directly or indirectly, by a government official or a person who
performs public functions, of any article of monetary value, or other benefit, such
as a gift, favor, promise or advantage for himself or for another person or entity,
in exchange for any act or omission in the performance of his public functions”
(Article VI, Inter-American convention against corruption)
● “the States Parties agree to consider the applicability of measures within their
own institutional systems to create, maintain and strengthen: […] 8. Systems for
protecting public servants and private citizens who, in good faith, report acts of
corruption, including protection of their identities, in accordance with their
Constitutions and the basic principles of their domestic legal systems” (Article
III, Inter-American Convention Against Corruption)
● “An official who, in the performance of their duties, illegally increased their
heritage in relation to his lawful income, shall be liable to a penalty of not less
than 5 nor more than 10 years” (Article 104. Illegal enrichment. Law 29703
Peru),
● “Transparency and accountability: […] Observance of strict standards must be
maintained in accounting activities and financial records. all economic
transactions, whatever their value, should be properly documented so that they
reflect the facts transparently”, “Anticorruption Policy: [...] In appropriate
circumstances, workers ONGAWA invitations or gifts may be made to third
parties, always in accordance with the laws and upon local customs, within
reason and approval of the most senior level hierarchical at home” (ONGAWA
Code of Conduct)
In this case the points of view of the NGO and others partners of the Willay program, the
civil servants of the municipalities, the government of Peru and the beneficiaries of the
Willay program must all be considered. In this case, there is no other institution offering
the services that the Willay programme provides.
The decision must be clear to not support corrupt requests but should provide some
ethical alternatives to reach the goals of the Willay program. Perhaps, it may be
13
Ethical & social issues in engineering
necessary to report this circumstances ("blow the whistle") to the appropriate Peruvian
governmental institutions.
Dilemma 3: The technical team must reach a decision on which technology (free or
private/priced software) would be more appropriate for the context.
In this case, there is a conflict between the interest of the Board of the NGO to remain
faithful to their principles regarding free software and the interest of the users and
managers of the hospital, who are reluctant to use free software. Also involved, are
issues related to the impartiality and objectivity of technical judgments, and professional
responsibility of avoiding risks.
Related to conflict of interest and impartiality the following references indicate:
● “A computer professional has a duty to be honest about his or her own
qualifications, and about any circumstances that might lead to conflicts of
interest.” (ACM)
● Engineers “shall provide impartial analysis and judgment to an employer or
clients, avoid conflicts of interest” (FEANI).
● Engineers should “present and review engineering evidence, theory and
interpretation honestly, accurately and without bias” , “be objective and truthful
in any statement made in their professional capacity” (RAE-UK).
Related to professional responsibility on avoiding risks:
● “The honest computing professional […] will provide full disclosure of all
pertinent system limitations and problems”. “Well-intended actions […] may lead
to harm unexpectedly. In such an event the responsible person or persons are
obligated to undo or mitigate the negative consequences as much as possible.
One way to avoid unintentional harm is to carefully consider potential impacts
on all those affected by decisions made during design and implementation”
(ACM).
● Engineers “shall accept appropriate responsibility for their work”, “Shall carry out
their tasks so as to prevent avoidable danger to health and safety” (FEANI).
● Engineers should “be aware of the issues that engineering and technology raise
for society, and listen to the aspirations and concerns of others”, “identify and
evaluate and, where possible, quantify risks” (RAE-UK).
14

Ethical & social issues in engineering
In this case the points of view of the NGO’ s Board, the technical team, the users and
managers of the hospital must be considered, as well as the people who will use the
hospital’s services.
The priority of the final decision must be to ensure proper functioning of the information
systems, including ease of use, user acceptance, robustness, ease of maintenance, etc.
4. HOMEWORK ACTIVITY
The proposed activity involves reflection on possible improvements of the Willay program
from different stakeholders’ perspectives: the principles of the professional engineering
ethics, the principles of Corporate Social Responsibility (CSR) of a technological company
working in the sector and the particular context of the Willay programme, and the Human
Rights Based Approach (HRBA) used in human development policies.
Different activities are proposed depending on the particularities of the class taught.
A1: Comparison and reflection on Corporate Social Responsibility principles and professional engineering responsibility principles.
Professional responsibility principles were already seen in the class work, primarily:
● General Moral Imperatives. Association for Computing Machinery (ACM)
(see ANNEX1-DOC1_ACM-Moral_Imperatives.pdf)
● The Royal Academy of Engineering UK. Statement of Ethical Principles
(see ANNEX1-DOC3_RAE-UK-Statement_of_Ethical_Principles.pdf)
As Corporate Social Responsibility principles, the example of Telefonica, an ICT Company
which operates in Peru, may be used:
● Telefonica. Our Business Principles
(see ANNEX1-DOC4_TELEFONICA-OurBusinessPrinciples.pdf)
The students should submit an essay (of no more than 1000 words) in which they outline the
similarities and differences between Corporate Social Responsibility (CSR) principles of a
technological company and professional engineering responsibility principles. They should
also make some coherent propositions of principles that could be added to either the
Corporate Social Responsibility (CSR) principles of Telefonica, or to professional
engineering responsibility principles of the RAE-UK or ACM.
A2. Reflection on the possible actions that may be implemented in the context presented by a technological company committed to social responsibility principles.
15
Ethical & social issues in engineering
The students should submit an essay (of no more than 1000 words) in which they list
possible actions that could be implemented by Telefonica to support the Willay programme’s
goals. These actions should be oriented to areas such as wider access to ICTs and their
contributions to social development, especially, in health, security and democratic
governance. The proposals should be be justified on the basis of the principles of CSR and
professional ethics analysed in A1.
A3. Reflection on the possible actions that may be implemented in the context presented according to the Human Rights Based Approach (HRBA) used in human development policies.
The following could be used as references:
● Guiding Principles on Business and Human Rights: Implementing the United
Nations “Protect, Respect and Remedy” Framework.
(see ANNEX1-DOC5_UN-GuidingPrinciplesHHRRandBusiness-2011)
● Chapters III and IV (pg 15 to 30) of: HIGH COMMISSIONER ON HUMAN
RIGHTS (2006). Frequently asked questions about the human rights based
approach in development programming.
(see ANNEX1-DOC6_UN-HumanRightsBasedApproach-FAQen.pdf)
The students should submit an essay (of no more than 1000 words) in which they address
how commitment to Corporate Social Responsibility principles may integrate principles of the
human rights based approach (HRBA). They may also make propositions to improve the
way in which the Willay programme incorporates HRBA principles.
4.1. SOLUTION AND EVALUATION CRITERIA This is an open activity where the following can be assessed:
● Understanding of the main principles of professional ethics, Corporate Social
Responsibility and Human Right Based Approach.
● Capacity to link the different approaches mentioned in the previous point,
identify differences and similarities between them, and make a coherent
justification of points raised,
● Capacity, coherency and originality of propositions drawn from the different
principles analysed.
16
Ethical & social issues in engineering
As a reference, below are ideas for possible solutions.
A1: Comparison and reflection on Corporate Social Responsibility principles and professional engineering responsibility principles.
Numerous similarities can be found between the approaches:
Values of honesty, integrity, trust, competence or talent; respect for laws, human rights and
diversity; avoidance and declaration of conflict of interest, rejection of corruption; contribution
to the development of society; prevention of health risks; protection of the environment and
avoidance of negative impacts; respect for confidentiality and information security.
Some differences can also be found:
Telefonica’s Principles include an explicit mention of UN Human Rights Declaration and
declarations of the International Labour Organisation, whilst professional ethics mention
general principles only.
Telefonica’s Principles are more explicit in relation to possible corrupt practices.
Professional principles give more weight to avoidance and minimisation of risks, both
intentional and unintentional; alertness to potential damage; awareness of the issues that
engineering and technology raise for society, and listening to the aspirations and concerns of
others. These indicate a deeper social commitment compared to Telefonica’s principles.
Professional principles also show more environmental commitment, with awareness of
limited natural resources and rights of future generations.
Professional principles more explicitly include the values of accuracy, rigour, impartiality, and
objectivity. They also emphasise the obligation to report any signs of potential damage.
A2. Reflection on the possible actions that can be implemented in the context presented by a technological company committed to social responsibility principles.
Some paragraphs from Telefonica’s document that may help to this work are presented
below.
Our vision:
“Improving people’s lives around the world by transforming possibilities into reality - building
a better future for everyone: our customers, employees, society, shareholders and partners.”
Forming an active part of the societies and markets in which we operate, offering our
experience and perspectives as professionals in the telecommunications world. We show
17
Ethical & social issues in engineering
the global and local reality exactly as it is, coherently and with commitment, whilst being
innovative, open, committed and honest in everything we do.
Our values:
We understand the realities and diversity of the regions we work in.
We drive progress in the countries, regions and communities where we operate.
Development of Society:
We contribute to the social, technological and economic development of the countries where
we operate, investing in telecommunications infrastructure, creating jobs and developing
products and service that contribute to the development of society.
We collaborate in civic, community and not for profit organizations and with public initiatives
aimed at eradicating social problems in those local communities in which we operate by
providing our capabilities and our technology.
A3. Reflection on the possible actions that can be implemented in the context presented according to the Human Rights Based Approach (HRBA) used in human development policies.
The Human Rights Based Approach complements and reinforces the focus of Human
Development. It has implications for development goals, which must enable the full
realisation of the human rights of all people. The relevant development goals here are
political and policy commitment.
One of the main strengths of this approach is that it involves dealing with the international
regulatory framework of Human Rights. Thus, any development cooperation should
contribute to the improvement of both the capacities of 'duty-bearers’ to meet their
obligations and the capabilities of the ‘rights holders’ to claim for their rights.
The roles of the duty bearers in the Willay project (the State, the municipalities, the NGO,
some IT companies) and the right holders (the citizens) both need to be considered.
The orientation of the Willay project could change. It could focus not only on improving
governance, but also on improving transparency, accountability and citizen participation. It is
not sufficient to provide the public sector with new technologies and systems; it is also
important to both train civil servants to take advantage of them and empower citizens to seek
their active participation.
18

Ethical & social issues in engineering
Another possible change relates to the most vulnerable and disadvantaged population.
Willay should find a way in which it may have a positive impact on the lives of this sector of
the population.
19
Ethical & social issues in engineering
BIBLIOGRAPHY ABET. Criteria for Accrediting Engineering Programs 2014-15. Available from: <http://www.abet.org/eac-criteria-2014-2015/> [20 July 2014] ACM (Association for Computing Machinery) Code of Ethics and Professional Conduct. <http://www.acm.org/about/code-of-ethics> [25 June 2014] ACM. (Association for Computing Machinery) Software Engineering Code of Ethics and Professional Practice. Available from: <http://www.acm.org/about/se-code> [25 June 2014] Anguera, A., Davara, E., Fernández, C., Miñano, R., 2013. La ingeniería informática: aspectos éticos, jurídicos y sociales. Universitas. Madrid.
Bilbao, G., Fuertes, J., Guibert, J. M. 2006. Ética para ingenieros. Desclée De Brouwer. Bilbao.
COMMITTEE ON ECONOMIC, SOCIAL AND CULTURAL RIGHTS (2000). General Comment 14: The right to the highest attainable standard of health. U.N. Doc. E/C.12/2000/4. Available from: <http://www1.umn.edu/humanrts/gencomm/escgencom14.htm>. [23 July 2014] Data Protection Law (2011). Ley de Protección de Datos personales, Nº 29733. Perú. Available from: <http://datospersonales.pe/legislacion/ley-n%C2%B0-29733-ley-de-protecci%C3%B3n-de-datos-personales > [23 July 2014]
DECRETO LEGISLATIVO Nº 635 (1991). Penal Code Perú. Available from: <https://www.oas.org/juridico/mla/sp/per/sp_per_cod_pen.pdf> [23 July 2014] EUR-ACE. Framework Standards. Available from: <http://www.enaee.eu/wp-content/uploads/2012/01/EUR-ACE_Framework-Standards_2008-11-0511.pdf> [20 July 2014] European Comission. Corporate Social Responsibility. Available from: <http://ec.europa.eu/enterprise/policies/sustainable-business/corporate-social-responsibility/index_en.htm > [20 July 2014]
HIGH COMMISSIONER ON HUMAN RIGHTS (2006). Frequently asked questions about the human rights based approach in development programming. Geneva. HR/PUB/06/8. Available from: <http://www.ohchr.org/Documents/Publications/FAQen.pdf > [1 July 2014] ISO 26000. Social Responsibility. Available from: <http://www.iso.org/iso/home/standards/iso26000.htm > , < http://www.iso.org/iso/sr_schematic-overview.pdf > [20 July 2014] Lozano, J.F. 2011. Qué es la ética de la empresa. Proteus Editorial. Barcelona.
20
Ethical & social issues in engineering
Martin, M., Schinzinger, R., 2005. Ethics in Engineering, 4th edition, McGraw-Hill. Moreno, A., Uriarte, L.M., Topa, G., et als, 2010. La Responsabilidad Social Empresarial. Oportunidades estratégicas, organizativas y de recursos humanos, Ed Pirámide, Madrid. OAS (1996) INTER-AMERICAN CONVENTION AGAINST CORRUPTION. Available from <http://www.oas.org/juridico/english/Treaties/b-58.html> [20 july 2014] Telefonica. Our Business Principles. Available from:
< http://www.telefonica.com/en/about_telefonica/pdf/OurBusinessPrinciples.pdf > [25 June 2014]
Telefonica. New Sustainability Report 2013. Available from: < http://www.crandsustainability.telefonica.com/ > [20 July 2014] The Royal Academy of Engineering UK. Ethics and engineering in practice. Available from: <https://www.raeng.org.uk/societygov/engineeringethics/principles.htm > [25 June 2014] TRANSPARENCY INTERNATIONAL. It is a global civil society organization leading the fight against corruption. Available from: < www.transparency.org> [1 july 2014] Transparency Law (2002). Ley de Transparencia, Nº 27806. Perú. Available from: <http://www.peru.gob.pe/normas/docs/LEY_27806.pdf> [20 July 2014] United Nations (1948). Universal Declaration on Human Rights. Available from: < http://www.un.org/en/documents/udhr/index.shtml> [23 July 2014] United Nations (2011). Guiding Principles on Business and Human Rights: Implementing the United Nations “Protect, Respect and Remedy” Framework. John Ruggie. United Nations. Available from: < http://www.business-humanrights.org/media/documents/ruggie/ruggie-guiding-principles-21-mar-2011.pdf > [27 June 2014]
United Nations (2013). The right to privacy in the digital age. Available from: < http://www.ohchr.org/EN/Issues/DigitalAge/Pages/DigitalAgeIndex.aspx> [23 July 2014] Willay Program. Available from: < http://willay.org.pe/ > [20 July 2014]
21

Ethical & social issues in engineering
FURTHER/SUGGESTED MATERIAL
• Video: Data protection-Back from the breach. Information Commissioner´s Office.
<http://ico.org.uk/for_organizations/training> [10 july 2014]
• Video : La ruta de las TIC (Spanish)
<http://www.youtube.com/watch?feature=player_embedded&v=yV-deA2uUwo> [23
july 2014]
• Video : Story of Stuff Project. < http://storyofstuff.org/movies/ > [10 july 2014]
22

http://www.gdee.eu
This project is funded by
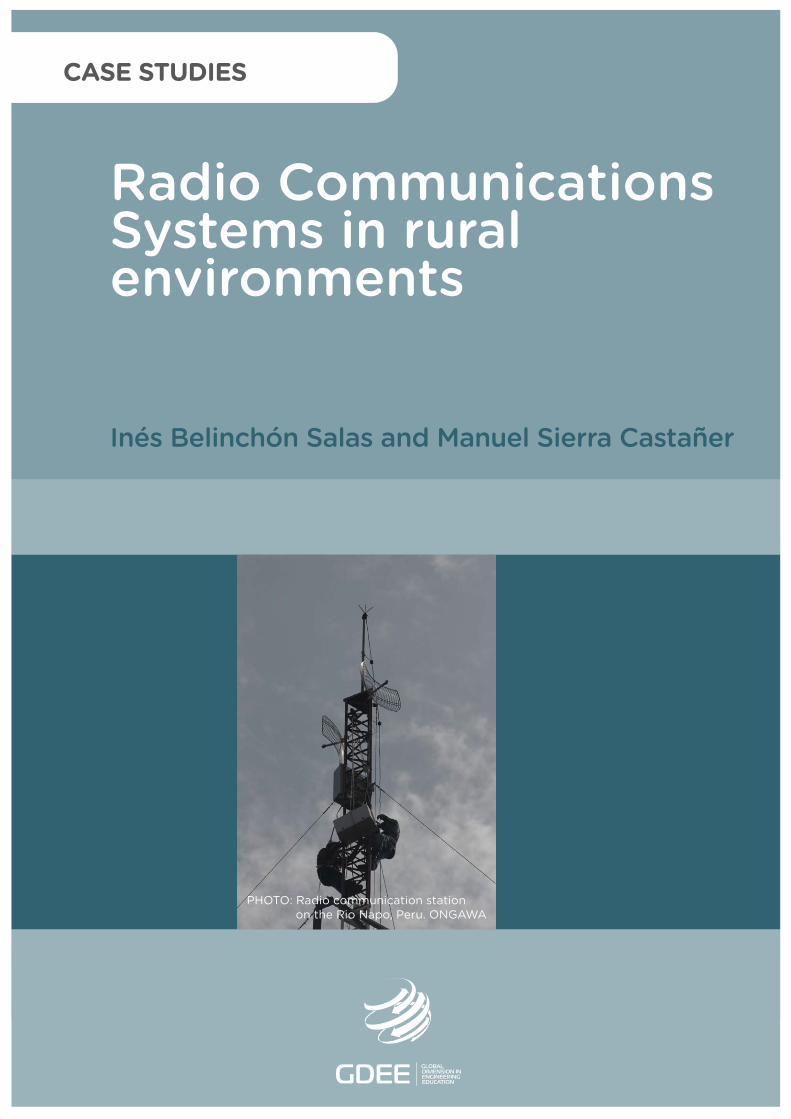
PHOTO: Radio communication stationon the Rio Napo, Peru. ONGAWA
CASE STUDIES
Radio Communications Systems in ruralenvironments
Inés Belinchón Salas and Manuel Sierra Castañer

Inés Belinchón Salas and Manuel Sierra Castañer
DL B 10735-2015 ISBN 978-84-606-7546-4
Radio Communications Systems in rural environments
COORDINATED BYAgustí Pérez-Foguet, Enric Velo, Pol Arranz, Ricard Ginéand Boris Lazzarini (Universitat Politècnica de Catalunya)Manuel Sierra (Universidad Politécnica de Madrid)Alejandra Boni and Jordi Peris (Universitat Politècnica de València)Guido Zolezzi and Gabriella Trombino (Università degli Studi di Trento)Rhoda Trimingham (Loughborough University)Valentín Villarroel (ONGAWA)Neil Nobles and Meadhbh Bolger (Practical Action)Francesco Mongera (Training Center for International Cooperation)Katie Cresswell-Maynard (Engineering Without Border UK)
EDITED BY Global Dimension in Engineering Education
Citation: Belinchón Salas, I. and Sierra Castañer, M. (2015) ' Radio Communications Systems in rural environments', in Case studies for developing globally responsible engineers, GDEE (eds.), Global Dimension in Engineering Education, Barcelona. Available from: http://gdee.eu/index.php/resources.html
This publication is distributedunder an Attribution- Noncommercial-Share Alike License for Creative Commons
CASE STUDIES
Disclaimer: This document has been produced with the financial assistance of the European UnionThe contents of this document are the sole responsibility of the authors and can under no circumstances be regarded as reflecting the position of the European Union
Radio Communication Systems in rural environments
RADIO COMMUNICATIONS SYSTEMS IN RURAL ENVIRONMENTS
Inés Belinchón Salas, Student. ETSI Telecomunicación. Universidad Politécnica de Madrid.
Manuel Sierra Castañer, Associate Professor. ETSI Telecomunicación. Universidad Politécnica de Madrid.
1
Radio Communication Systems in rural environments
INDEX 1. INTRODUCTION ........................................................................................................................... 3
1.1. DISCIPLINES COVERED ............................................................................................................. 3
1.2. LEARNING OUTCOMES .............................................................................................................. 3
1.3. ACTIVITIES .............................................................................................................................. 3
2. DESCRIPTION OF THE CONTEXT ............................................................................................. 4
2.1. PERU AT A GLANCE .................................................................................................................. 4
2.2. PERU TELECOMMUNICATION SECTOR ........................................................................................ 5
2.3. GOVERNANCE IN PERU ............................................................................................................ 6
2.4. HEALTH................................................................................................................................... 7
2.5 THE WILLAY PROGRAM ............................................................................................................ 7
3. CLASSROOM ACTIVITY ................................................................................................................ 8
3.1 . SOLUTION AND EVALUATION CRITERIA ................................................................................. 10
4. HOMEWORK ACTIVITY............................................................................................................... 15
4.1. SOLUTION AND EVALUATION CRITERIA ..................................................................................... 16
BIBLIOGRAPHY ................................................................................................................................. 22 WEB PAGES ...................................................................................................................................... 22
2
Radio Communication Systems in rural environments
1. INTRODUCTION
In this case study the advantages and disadvantages of different designs of radio communication systems for rural applications are discussed, using the example of Acomayo province, Cuzco Region, Peru. First, the context of the area is explained and then, two types of exercises are proposed: a classroom activity and a team homework exercise.
1.1. DISCIPLINES COVERED
This project covers subjects based on a basic approach of Radio Communication Systems and Wave Propagation for Electronic or Telecommunication Engineering.
1.2. LEARNING OUTCOMES
• The student will know how to design a radio communication system for a rural environment in the context of a developing country.
• The student will be able to design telecommunication services for a rural environment in the context of a developing country.
1.3. ACTIVITIES
The first exercise is to be conducted in the classroom by the lecturer, consists of analysing two different radio communication systems. The different ways of designing and building this radio system are explained, depending on the frequency band. In the second exercise, the advantages of the different proposals are analysed to improve the specific solutions proposed. The third activity, addresses questions about the relative level of appropriateness of the radio systems proposed.
The first activity embodies the analysis of the zone in which the case study is based, the education of the inhabitants, the available technologies, the number of hospitals, the health of the families, especially in children and pregnant women, human development and all the aspects that students may consider necessary to determine the context of the area.
In the second activity, students explain the different radio telecommunication systems that can be used in this area, after that, they must select the two best proposals for the case of study, explaining both advantages and disadvantages. The students should be divided into teams of four or five for this exercise.
Finally, in the third activity students select one of the two last proposals and explain why this one is better than the other for this case of study.
3
Radio Communication Systems in rural environments
2. DESCRIPTION OF THE CONTEXT
The context is based on real field experience. The description of the context has two objectives: to give relevant information to understand the later activities and to show a poverty situation from the Human Development perspective. To fulfil the second objective, the description of the poverty situation must be done from the following perspectives (even if they are ultimately not used in the activities):
• Human development • Rights-based approach • Gender approach
2.1. PERU AT A GLANCE
Peru is the third largest country in Latin America after Brazil and Argentina, with an area of 1,285,216 km2 (2.5 times the area of Spain). It is the fifth most populous country in Latin America after Brazil, Mexico, Colombia and Argentina, with a population density of 23.7 inhabitants/km², four times lower than Spain. In Peru socially deep inequalities persist. There is a large contrast in Human Development Index (HDI) scores between the capital and the provinces and between urban and rural areas. Although the country has experienced steady economic growth in recent years, there are still major challenges related to social inclusion and gender equality, for example. Many social conflicts, uprisings and protests from people living in the interior of Peru have taken place as a result of a lack of economic investment in this area, despite the economic boom. There are severe limitations on access to good quality basic services such as education, health, water, housing and electricity; as well as poor promotion of economic opportunity and progress for much of the rural population.
Administratively, Peru is divided into 25 regions, 194 provinces and 1624 districts. The elections of regional and local (provincial and district) authorities are held every five years. The complex and rugged geography and the implementation of population concentration policies has created an unequal and asymmetric occupation of the country. This makes it difficult to overcome the various spatial dimensions of development, promote social cohesion and ensure state presence. In addition, an expensive transport and communications infrastructure is required to ensure connectivity.
The country has been experiencing major demographic transition since the mid-1960s. A population explosion has been coupled with increasing migration to the big cities, in particular Lima. It is estimated that the population of Peru in 2014 was 30,814,175 inhabitants, with an annual average growth rate of 1.11%. There is a high concentration of the population in urban areas (73%), especially in Lima, where more than a third of the total population lives. The World Bank report "Peru 2012" stated that 53% of the rural population lives below the national rural poverty line. Peru is characterised by a Human Development Index (HDI) of 0.741 according to 2013 data, which puts it in the group of countries with high HDI, ranking 77 of 185, below Cuba, and above Turkey and Brazil. The Adjusted HDI, which
4
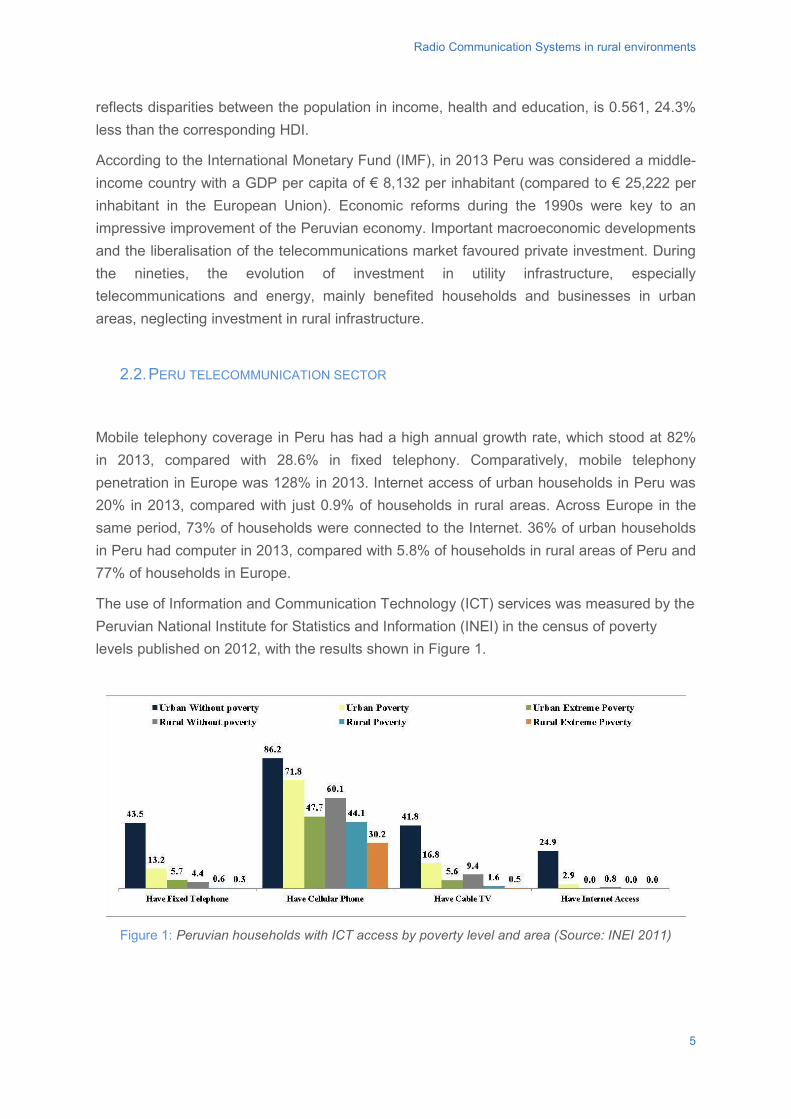
Radio Communication Systems in rural environments
reflects disparities between the population in income, health and education, is 0.561, 24.3% less than the corresponding HDI.
According to the International Monetary Fund (IMF), in 2013 Peru was considered a middle-income country with a GDP per capita of € 8,132 per inhabitant (compared to € 25,222 per inhabitant in the European Union). Economic reforms during the 1990s were key to an impressive improvement of the Peruvian economy. Important macroeconomic developments and the liberalisation of the telecommunications market favoured private investment. During the nineties, the evolution of investment in utility infrastructure, especially telecommunications and energy, mainly benefited households and businesses in urban areas, neglecting investment in rural infrastructure.
2.2. PERU TELECOMMUNICATION SECTOR
Mobile telephony coverage in Peru has had a high annual growth rate, which stood at 82% in 2013, compared with 28.6% in fixed telephony. Comparatively, mobile telephony penetration in Europe was 128% in 2013. Internet access of urban households in Peru was 20% in 2013, compared with just 0.9% of households in rural areas. Across Europe in the same period, 73% of households were connected to the Internet. 36% of urban households in Peru had computer in 2013, compared with 5.8% of households in rural areas of Peru and 77% of households in Europe.
The use of Information and Communication Technology (ICT) services was measured by the Peruvian National Institute for Statistics and Information (INEI) in the census of poverty levels published on 2012, with the results shown in Figure 1.
Figure 1: Peruvian households with ICT access by poverty level and area (Source: INEI 2011)
5
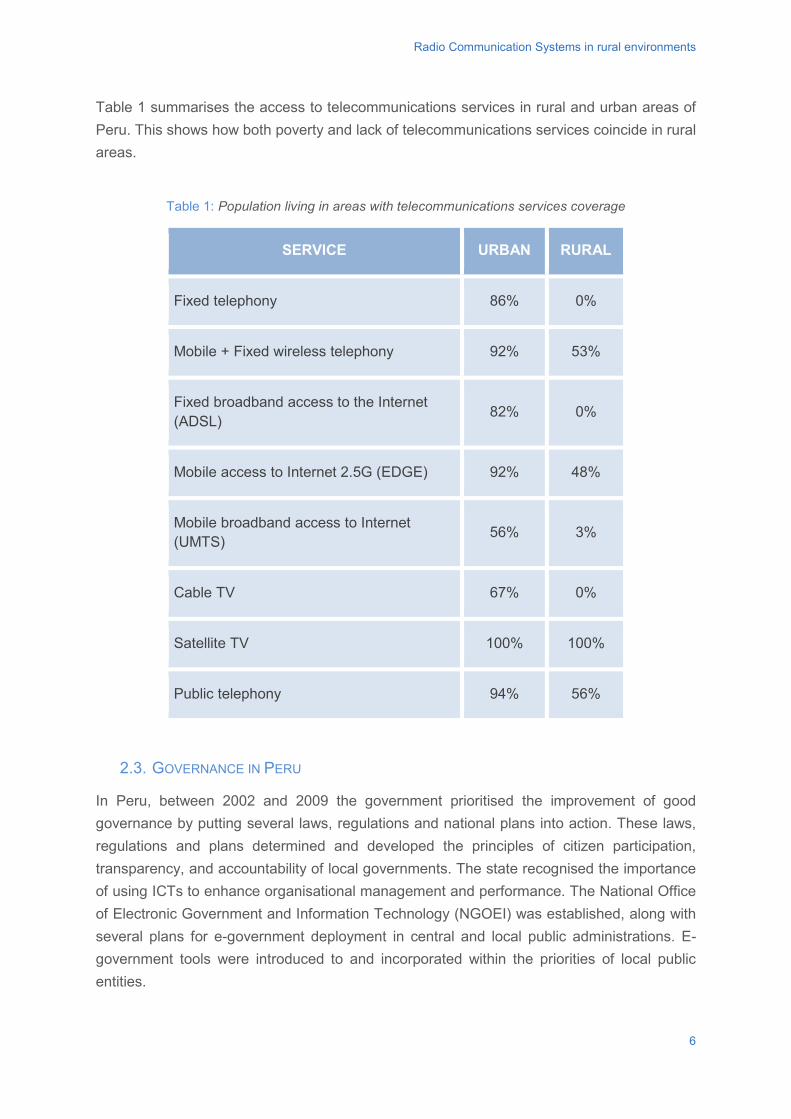
Radio Communication Systems in rural environments
Table 1 summarises the access to telecommunications services in rural and urban areas of Peru. This shows how both poverty and lack of telecommunications services coincide in rural areas.
Table 1: Population living in areas with telecommunications services coverage
SERVICE URBAN RURAL
Fixed telephony 86% 0%
Mobile + Fixed wireless telephony 92% 53%
Fixed broadband access to the Internet (ADSL) 82% 0%
Mobile access to Internet 2.5G (EDGE) 92% 48%
Mobile broadband access to Internet (UMTS) 56% 3%
Cable TV 67% 0%
Satellite TV 100% 100%
Public telephony 94% 56%
2.3. GOVERNANCE IN PERU
In Peru, between 2002 and 2009 the government prioritised the improvement of good governance by putting several laws, regulations and national plans into action. These laws, regulations and plans determined and developed the principles of citizen participation, transparency, and accountability of local governments. The state recognised the importance of using ICTs to enhance organisational management and performance. The National Office of Electronic Government and Information Technology (NGOEI) was established, along with several plans for e-government deployment in central and local public administrations. E-government tools were introduced to and incorporated within the priorities of local public entities.
6
Radio Communication Systems in rural environments
2.4. HEALTH
The United Nations (UN) recognises health as one of the key elements of human development, along with education, minimum level of income and the ability to participate in political and social life of the community. The health status of the population is also a factor that affects development. Poor health reduces work capacity and productivity of people and affects the physical development, schooling and learning of children. There is a link between the improvement in nutrition and health with the increase in productivity and school performance. In relative terms, the economic and education advantages that produce an improvement in health generate greater benefits in the poorest population. This is the reason why health was one of the key issues considered in the Millennium Development Goals (MDGs).
According to the World Health Organisation most inequalities in health are due to the conditions in which people are born, live and work, as well as the health system they have access to. That is, access to safe water and adequate sanitation, an adequate supply of safe food, adequate nutrition, adequate housing, healthy working conditions and environment, and adequate social protection. Improving these social determinants of health and reducing inequalities of power, money and resources may help to improve population health.
Often women and men are affected by different social determinants of health, producing gender inequality in access to health. For example, domestic tasks cause women be in contact with contaminated water, fatigue and stress of "double day" of women inside and outside the home, health problems during pregnancy, childbirth and postpartum, etc..
Health is recognised as a Human Right, so governments that have signed international covenants on human rights are obliged to create the conditions that allow all people to live as healthily as possible, including the social determinants of health. The Right to Health is not to be understood as the right to be healthy. Rather, international regulations on the Right to Health require governments to provide access to health care with quality care, non-discrimination and economic conditions that do not prevent access of the poor.
2.5 THE WILLAY PROGRAM
The Willay program is implemented in two distinct regions; San Pablo in Cajamarca and Acomayo in Cusco, together having a combined population of 50,000 people. The majority of the population belongs to indigenous communities, whose main economic activity is farming (84% of the active population).
In Acomayo, 46% of the population does not have access to electricity, 23% do not have access to running water, and 62% do not have access to appropriate sanitation. In terms of human development index, Acomayo is ranked ninth out of the thirteen provinces located in the department of Cuzco, with medium-low HDI similar to that of Sudan. Life expectancy is
7
Radio Communication Systems in rural environments
63 years, 91% of children between 5 and 18 are in school and the illiteracy rate among women is 42%.
Government implementation of national initiatives related to the use of ICT, which are designed based on a developed urban perspective, generated unexpected results in these communities because of the lack of connectivity, capacity for management, and technology at the local level. Since there were neither good connections nor qualified technical staff in rural areas, the rural municipalities opted to establish offices in the respective districts’ capitals. These satellite offices added to the municipalities’ costs and complicated the human resources management process. There was limited knowledge regarding regulations on adequate use of management tools and deficiencies in using an appropriate language with the population in public entities. Regarding civil society organisations, they had organisational weaknesses; were unaware of their democratic governance rights and experienced limitations in leadership building. Spaces for consensus existed although they were not properly utilised due to a lack of satisfaction on the citizens’ side.
The Willay program, meaning “to inform” in Quechua, proposes the use of ICTs in rural areas for democratic governance and citizen participation. The project explores how ICTs could enhance the processes of transparency, citizen participation and the accountability and effectiveness of local governments. This is achieved by building capacities of the stakeholders involved (civil society organisations and public entities like local government, health centres and schools).
In total, 44 local government institutions have been provided with a telecommunication infrastructure shared between them, based on WiFi for Long-Distance (WiLD) technology that offers Internet access and Internet Protocol (IP) telephony. Besides this, it has installed information systems and software, and implemented a system of continuous improvement. Public workers and community leaders have also been trained in participatory budgeting, accountability and transparency of institutions public, citizen surveillance, education management and health management.
3. CLASSROOM ACTIVITY
Internet access is low in regions like Acomayo in Peru, so public institutions, hospitals or schools cannot be linked to one another with a connection of high enough quality. The following activity will involve the design of a radio communication system that solves this problem.
The objective of this exercise is the analysis of advantages and disadvantages related to different types of radio communication systems. The student will solve two basic problems: one related to a radio link to connect an isolated area with the network using Wifi-based Long Distance (WiLD) technologies, and the other a satellite link.
1. Analysis of Radio communications systems:
8
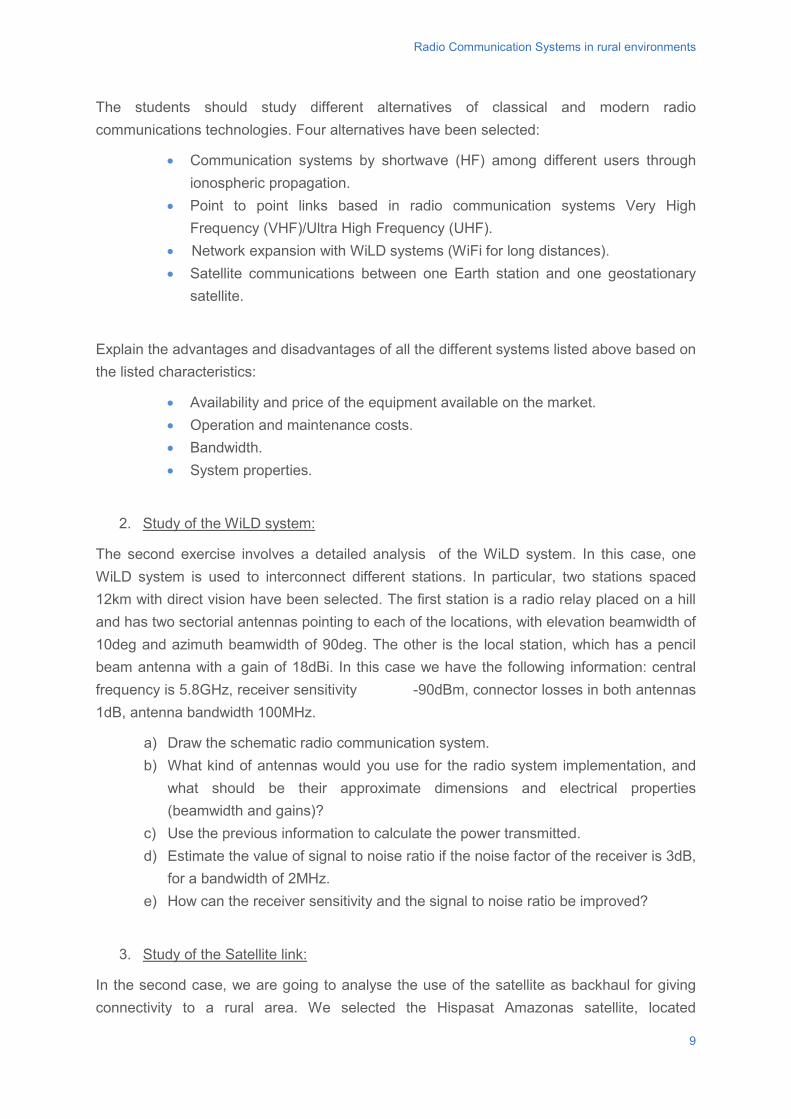
Radio Communication Systems in rural environments
The students should study different alternatives of classical and modern radio communications technologies. Four alternatives have been selected:
• Communication systems by shortwave (HF) among different users through ionospheric propagation.
• Point to point links based in radio communication systems Very High Frequency (VHF)/Ultra High Frequency (UHF).
• Network expansion with WiLD systems (WiFi for long distances). • Satellite communications between one Earth station and one geostationary
satellite.
Explain the advantages and disadvantages of all the different systems listed above based on the listed characteristics:
• Availability and price of the equipment available on the market. • Operation and maintenance costs. • Bandwidth. • System properties.
2. Study of the WiLD system:
The second exercise involves a detailed analysis of the WiLD system. In this case, one WiLD system is used to interconnect different stations. In particular, two stations spaced 12km with direct vision have been selected. The first station is a radio relay placed on a hill and has two sectorial antennas pointing to each of the locations, with elevation beamwidth of 10deg and azimuth beamwidth of 90deg. The other is the local station, which has a pencil beam antenna with a gain of 18dBi. In this case we have the following information: central frequency is 5.8GHz, receiver sensitivity -90dBm, connector losses in both antennas 1dB, antenna bandwidth 100MHz.
a) Draw the schematic radio communication system. b) What kind of antennas would you use for the radio system implementation, and
what should be their approximate dimensions and electrical properties (beamwidth and gains)?
c) Use the previous information to calculate the power transmitted. d) Estimate the value of signal to noise ratio if the noise factor of the receiver is 3dB,
for a bandwidth of 2MHz. e) How can the receiver sensitivity and the signal to noise ratio be improved?
3. Study of the Satellite link:
In the second case, we are going to analyse the use of the satellite as backhaul for giving connectivity to a rural area. We selected the Hispasat Amazonas satellite, located
9
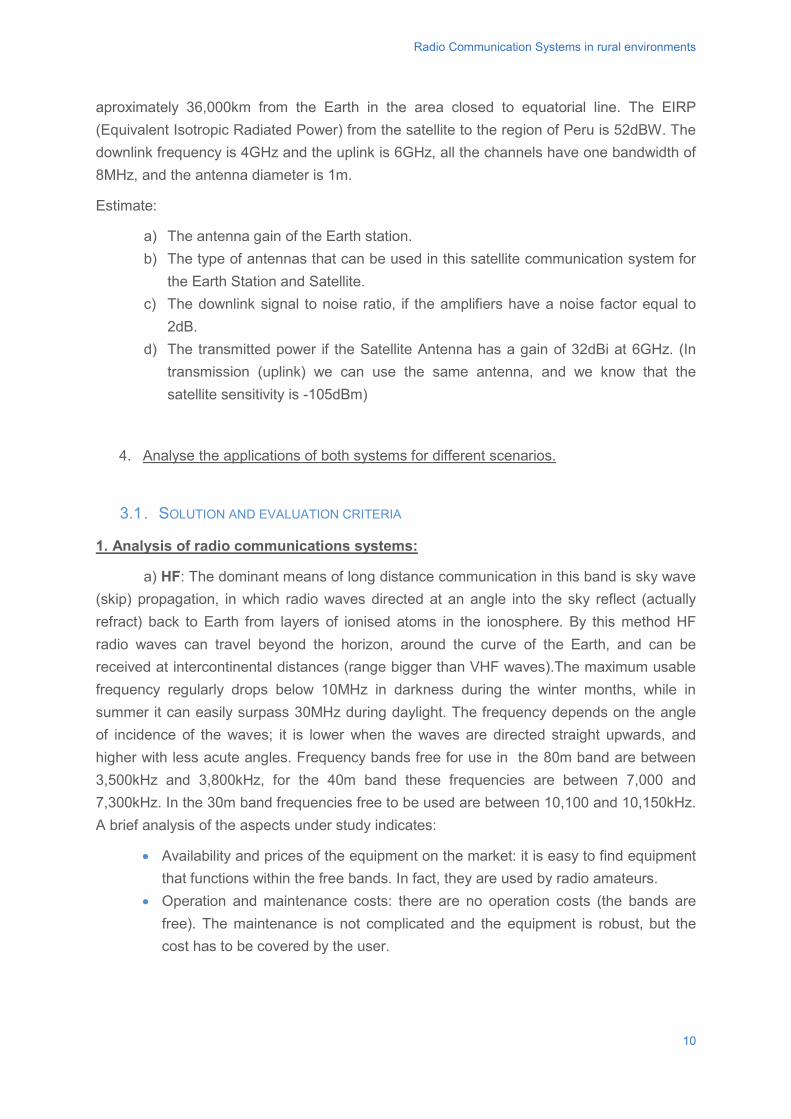
Radio Communication Systems in rural environments
aproximately 36,000km from the Earth in the area closed to equatorial line. The EIRP (Equivalent Isotropic Radiated Power) from the satellite to the region of Peru is 52dBW. The downlink frequency is 4GHz and the uplink is 6GHz, all the channels have one bandwidth of 8MHz, and the antenna diameter is 1m.
Estimate:
a) The antenna gain of the Earth station. b) The type of antennas that can be used in this satellite communication system for
the Earth Station and Satellite. c) The downlink signal to noise ratio, if the amplifiers have a noise factor equal to
2dB. d) The transmitted power if the Satellite Antenna has a gain of 32dBi at 6GHz. (In
transmission (uplink) we can use the same antenna, and we know that the satellite sensitivity is -105dBm)
4. Analyse the applications of both systems for different scenarios.
3.1 . SOLUTION AND EVALUATION CRITERIA
1. Analysis of radio communications systems:
a) HF: The dominant means of long distance communication in this band is sky wave (skip) propagation, in which radio waves directed at an angle into the sky reflect (actually refract) back to Earth from layers of ionised atoms in the ionosphere. By this method HF radio waves can travel beyond the horizon, around the curve of the Earth, and can be received at intercontinental distances (range bigger than VHF waves).The maximum usable frequency regularly drops below 10MHz in darkness during the winter months, while in summer it can easily surpass 30MHz during daylight. The frequency depends on the angle of incidence of the waves; it is lower when the waves are directed straight upwards, and higher with less acute angles. Frequency bands free for use in the 80m band are between 3,500kHz and 3,800kHz, for the 40m band these frequencies are between 7,000 and 7,300kHz. In the 30m band frequencies free to be used are between 10,100 and 10,150kHz. A brief analysis of the aspects under study indicates:
• Availability and prices of the equipment on the market: it is easy to find equipment that functions within the free bands. In fact, they are used by radio amateurs.
• Operation and maintenance costs: there are no operation costs (the bands are free). The maintenance is not complicated and the equipment is robust, but the cost has to be covered by the user.
10
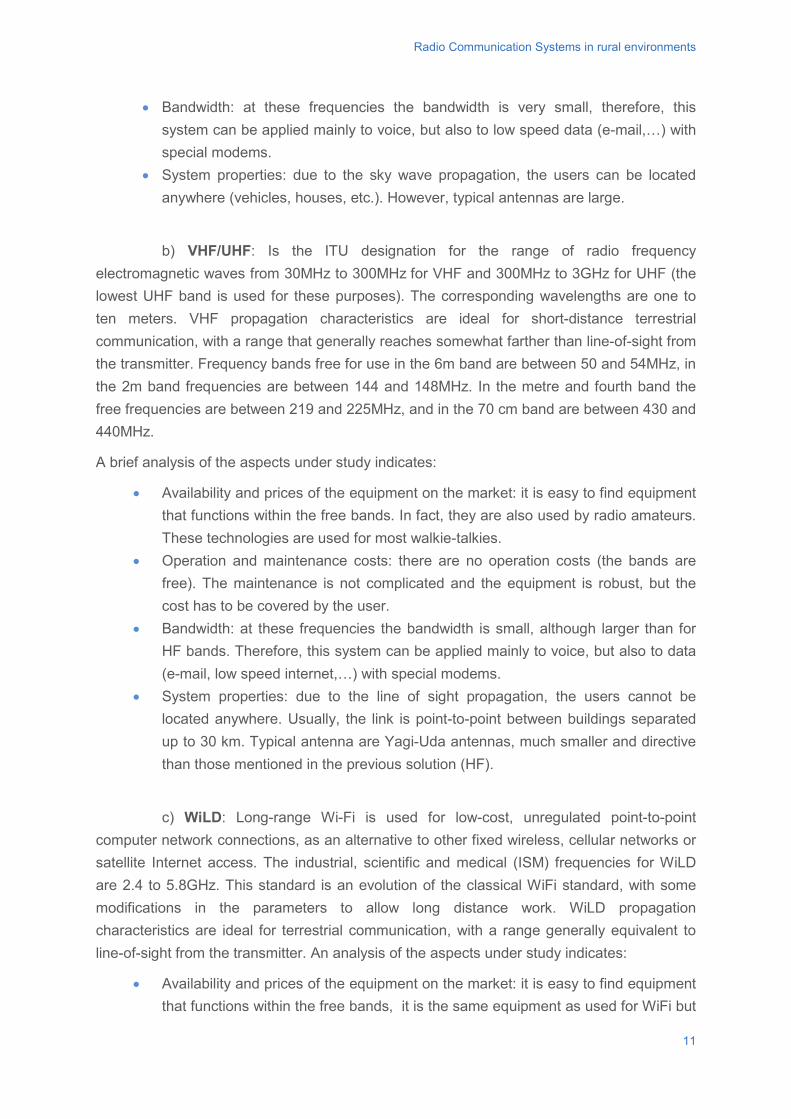
Radio Communication Systems in rural environments
• Bandwidth: at these frequencies the bandwidth is very small, therefore, this system can be applied mainly to voice, but also to low speed data (e-mail,…) with special modems.
• System properties: due to the sky wave propagation, the users can be located anywhere (vehicles, houses, etc.). However, typical antennas are large.
b) VHF/UHF: Is the ITU designation for the range of radio frequency electromagnetic waves from 30MHz to 300MHz for VHF and 300MHz to 3GHz for UHF (the lowest UHF band is used for these purposes). The corresponding wavelengths are one to ten meters. VHF propagation characteristics are ideal for short-distance terrestrial communication, with a range that generally reaches somewhat farther than line-of-sight from the transmitter. Frequency bands free for use in the 6m band are between 50 and 54MHz, in the 2m band frequencies are between 144 and 148MHz. In the metre and fourth band the free frequencies are between 219 and 225MHz, and in the 70 cm band are between 430 and 440MHz.
A brief analysis of the aspects under study indicates:
• Availability and prices of the equipment on the market: it is easy to find equipment that functions within the free bands. In fact, they are also used by radio amateurs. These technologies are used for most walkie-talkies.
• Operation and maintenance costs: there are no operation costs (the bands are free). The maintenance is not complicated and the equipment is robust, but the cost has to be covered by the user.
• Bandwidth: at these frequencies the bandwidth is small, although larger than for HF bands. Therefore, this system can be applied mainly to voice, but also to data (e-mail, low speed internet,…) with special modems.
• System properties: due to the line of sight propagation, the users cannot be located anywhere. Usually, the link is point-to-point between buildings separated up to 30 km. Typical antenna are Yagi-Uda antennas, much smaller and directive than those mentioned in the previous solution (HF).
c) WiLD: Long-range Wi-Fi is used for low-cost, unregulated point-to-point computer network connections, as an alternative to other fixed wireless, cellular networks or satellite Internet access. The industrial, scientific and medical (ISM) frequencies for WiLD are 2.4 to 5.8GHz. This standard is an evolution of the classical WiFi standard, with some modifications in the parameters to allow long distance work. WiLD propagation characteristics are ideal for terrestrial communication, with a range generally equivalent to line-of-sight from the transmitter. An analysis of the aspects under study indicates:
• Availability and prices of the equipment on the market: it is easy to find equipment that functions within the free bands, it is the same equipment as used for WiFi but
11
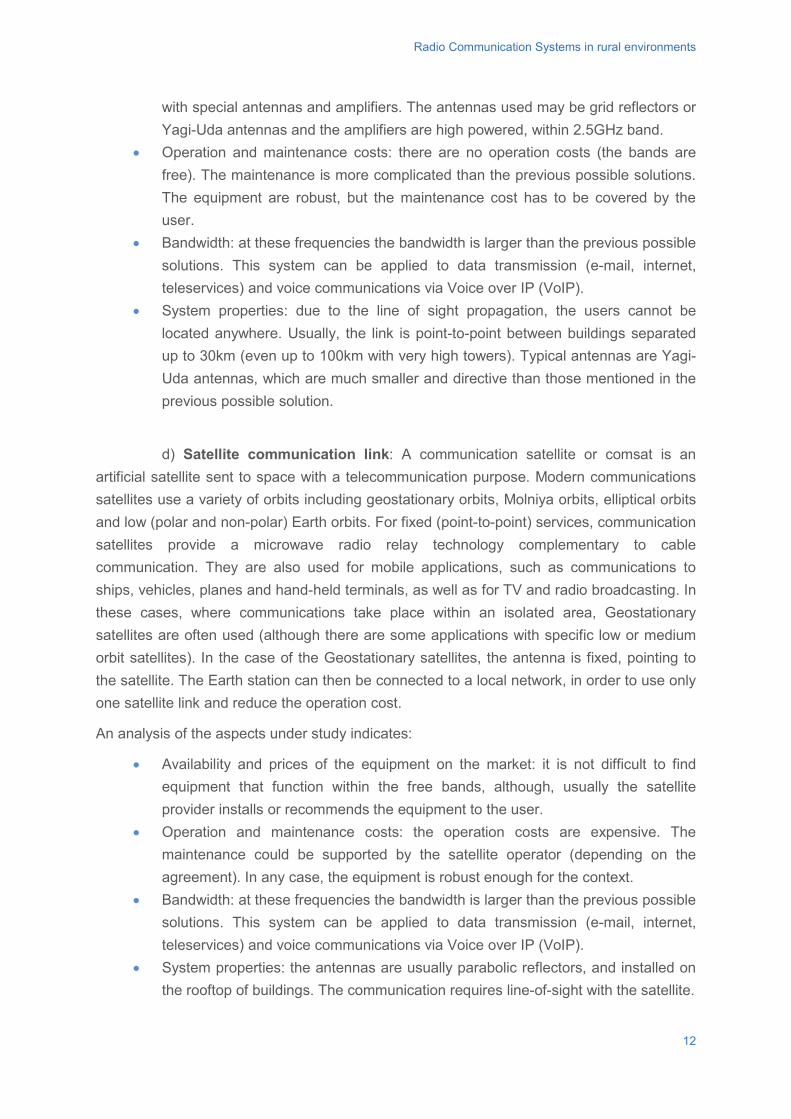
Radio Communication Systems in rural environments
with special antennas and amplifiers. The antennas used may be grid reflectors or Yagi-Uda antennas and the amplifiers are high powered, within 2.5GHz band.
• Operation and maintenance costs: there are no operation costs (the bands are free). The maintenance is more complicated than the previous possible solutions. The equipment are robust, but the maintenance cost has to be covered by the user.
• Bandwidth: at these frequencies the bandwidth is larger than the previous possible solutions. This system can be applied to data transmission (e-mail, internet, teleservices) and voice communications via Voice over IP (VoIP).
• System properties: due to the line of sight propagation, the users cannot be located anywhere. Usually, the link is point-to-point between buildings separated up to 30km (even up to 100km with very high towers). Typical antennas are Yagi-Uda antennas, which are much smaller and directive than those mentioned in the previous possible solution.
d) Satellite communication link: A communication satellite or comsat is an artificial satellite sent to space with a telecommunication purpose. Modern communications satellites use a variety of orbits including geostationary orbits, Molniya orbits, elliptical orbits and low (polar and non-polar) Earth orbits. For fixed (point-to-point) services, communication satellites provide a microwave radio relay technology complementary to cable communication. They are also used for mobile applications, such as communications to ships, vehicles, planes and hand-held terminals, as well as for TV and radio broadcasting. In these cases, where communications take place within an isolated area, Geostationary satellites are often used (although there are some applications with specific low or medium orbit satellites). In the case of the Geostationary satellites, the antenna is fixed, pointing to the satellite. The Earth station can then be connected to a local network, in order to use only one satellite link and reduce the operation cost.
An analysis of the aspects under study indicates:
• Availability and prices of the equipment on the market: it is not difficult to find equipment that function within the free bands, although, usually the satellite provider installs or recommends the equipment to the user.
• Operation and maintenance costs: the operation costs are expensive. The maintenance could be supported by the satellite operator (depending on the agreement). In any case, the equipment is robust enough for the context.
• Bandwidth: at these frequencies the bandwidth is larger than the previous possible solutions. This system can be applied to data transmission (e-mail, internet, teleservices) and voice communications via Voice over IP (VoIP).
• System properties: the antennas are usually parabolic reflectors, and installed on the rooftop of buildings. The communication requires line-of-sight with the satellite.
12
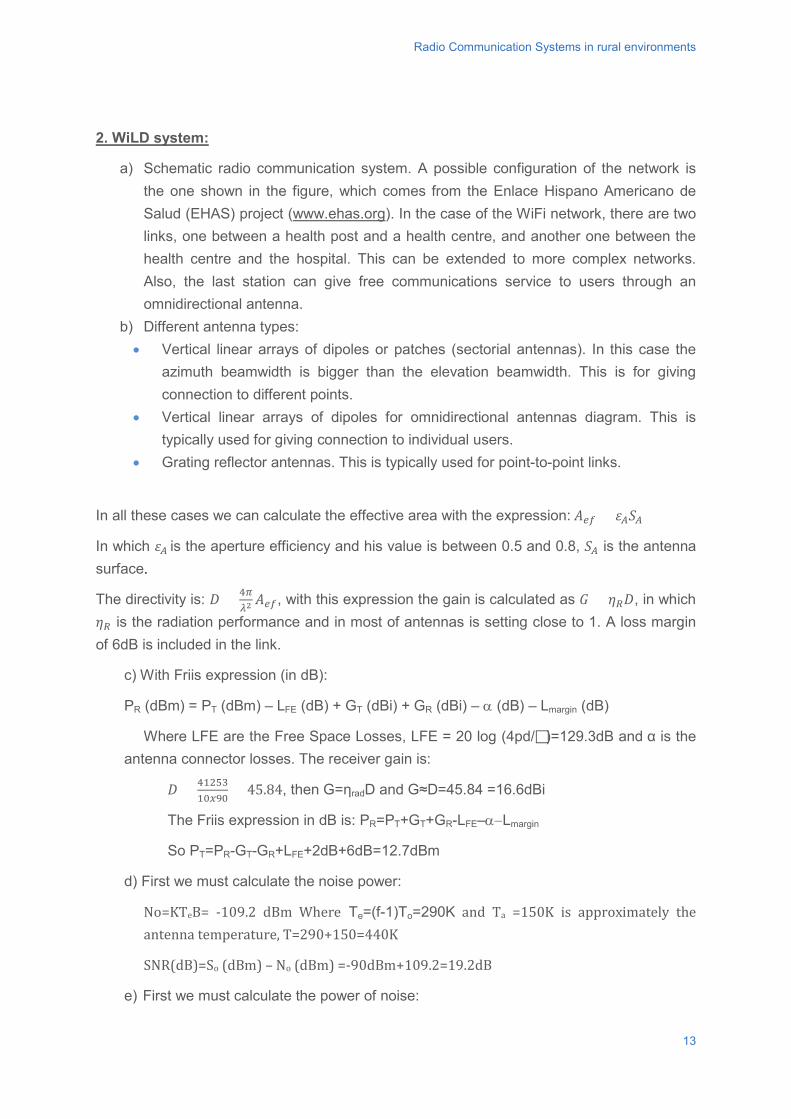
Radio Communication Systems in rural environments
2. WiLD system:
a) Schematic radio communication system. A possible configuration of the network is the one shown in the figure, which comes from the Enlace Hispano Americano de Salud (EHAS) project (www.ehas.org). In the case of the WiFi network, there are two links, one between a health post and a health centre, and another one between the health centre and the hospital. This can be extended to more complex networks. Also, the last station can give free communications service to users through an omnidirectional antenna.
b) Different antenna types: • Vertical linear arrays of dipoles or patches (sectorial antennas). In this case the
azimuth beamwidth is bigger than the elevation beamwidth. This is for giving connection to different points.
• Vertical linear arrays of dipoles for omnidirectional antennas diagram. This is typically used for giving connection to individual users.
• Grating reflector antennas. This is typically used for point-to-point links.
In all these cases we can calculate the effective area with the expression: 𝐴𝐴𝑒𝑒𝑒𝑒 = 𝜀𝜀𝐴𝐴𝑆𝑆𝐴𝐴
In which 𝜀𝜀𝐴𝐴 is the aperture efficiency and his value is between 0.5 and 0.8, 𝑆𝑆𝐴𝐴 is the antenna surface.
The directivity is: 𝐷𝐷 = 4𝜋𝜋𝜆𝜆2𝐴𝐴𝑒𝑒𝑒𝑒, with this expression the gain is calculated as 𝐺𝐺 = 𝜂𝜂𝑅𝑅𝐷𝐷, in which
𝜂𝜂𝑅𝑅 is the radiation performance and in most of antennas is setting close to 1. A loss margin of 6dB is included in the link.
c) With Friis expression (in dB):
PR (dBm) = PT (dBm) – LFE (dB) + GT (dBi) + GR (dBi) – α (dB) – Lmargin (dB)
Where LFE are the Free Space Losses, LFE = 20 log (4pd/)=129.3dB and α is the antenna connector losses. The receiver gain is:
𝐷𝐷 = 4125310𝑥𝑥90
= 45.84, then G=ηradD and G≈D=45.84 =16.6dBi
The Friis expression in dB is: PR=PT+GT+GR-LFE–α−Lmargin
So PT=PR-GT-GR+LFE+2dB+6dB=12.7dBm
d) First we must calculate the noise power:
No=KTeB= -109.2 dBm Where Te=(f-1)To=290K and Ta =150K is approximately the antenna temperature, T=290+150=440K
SNR(dB)=So (dBm) – No (dBm) =-90dBm+109.2=19.2dB
e) First we must calculate the power of noise:
13
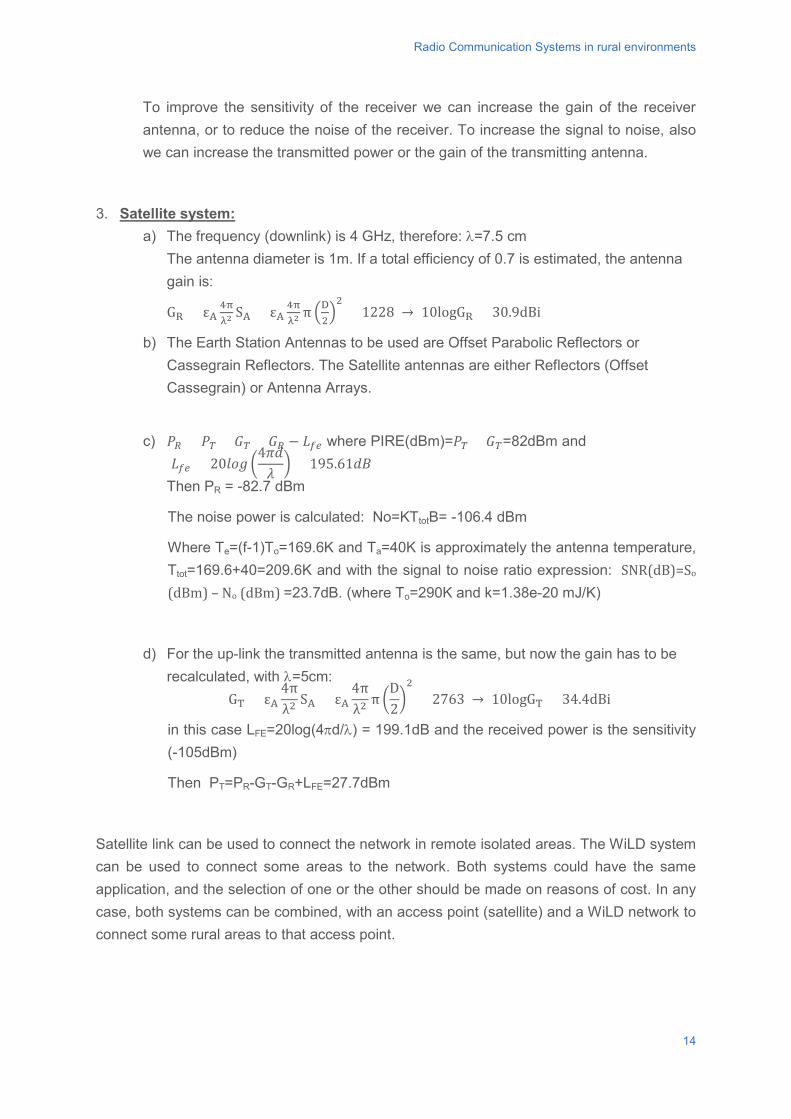
Radio Communication Systems in rural environments
To improve the sensitivity of the receiver we can increase the gain of the receiver antenna, or to reduce the noise of the receiver. To increase the signal to noise, also we can increase the transmitted power or the gain of the transmitting antenna.
3. Satellite system: a) The frequency (downlink) is 4 GHz, therefore: λ=7.5 cm
The antenna diameter is 1m. If a total efficiency of 0.7 is estimated, the antenna gain is:
GR = εA4πλ2
SA = εA4πλ2π �D
2�2
= 1228 → 10logGR = 30.9dBi
b) The Earth Station Antennas to be used are Offset Parabolic Reflectors or Cassegrain Reflectors. The Satellite antennas are either Reflectors (Offset Cassegrain) or Antenna Arrays.
c) 𝑃𝑃𝑅𝑅 = 𝑃𝑃𝑇𝑇 + 𝐺𝐺𝑇𝑇 + 𝐺𝐺𝑅𝑅 − 𝐿𝐿𝑒𝑒𝑒𝑒 where PIRE(dBm)=𝑃𝑃𝑇𝑇 + 𝐺𝐺𝑇𝑇=82dBm and 𝐿𝐿𝑒𝑒𝑒𝑒 = 20𝑙𝑙𝑙𝑙𝑙𝑙 �
4𝜋𝜋𝜋𝜋𝜆𝜆� = 195.61𝜋𝜋𝑑𝑑
Then PR = -82.7 dBm
The noise power is calculated: No=KTtotB= -106.4 dBm
Where Te=(f-1)To=169.6K and Ta=40K is approximately the antenna temperature, Ttot=169.6+40=209.6K and with the signal to noise ratio expression: SNR(dB)=So (dBm) – No (dBm) =23.7dB. (where To=290K and k=1.38e-20 mJ/K)
d) For the up-link the transmitted antenna is the same, but now the gain has to be recalculated, with λ=5cm:
GT = εA4πλ2
SA = εA4πλ2π �
D2�2
= 2763 → 10logGT = 34.4dBi
in this case LFE=20log(4πd/λ) = 199.1dB and the received power is the sensitivity (-105dBm)
Then PT=PR-GT-GR+LFE=27.7dBm
Satellite link can be used to connect the network in remote isolated areas. The WiLD system can be used to connect some areas to the network. Both systems could have the same application, and the selection of one or the other should be made on reasons of cost. In any case, both systems can be combined, with an access point (satellite) and a WiLD network to connect some rural areas to that access point.
14
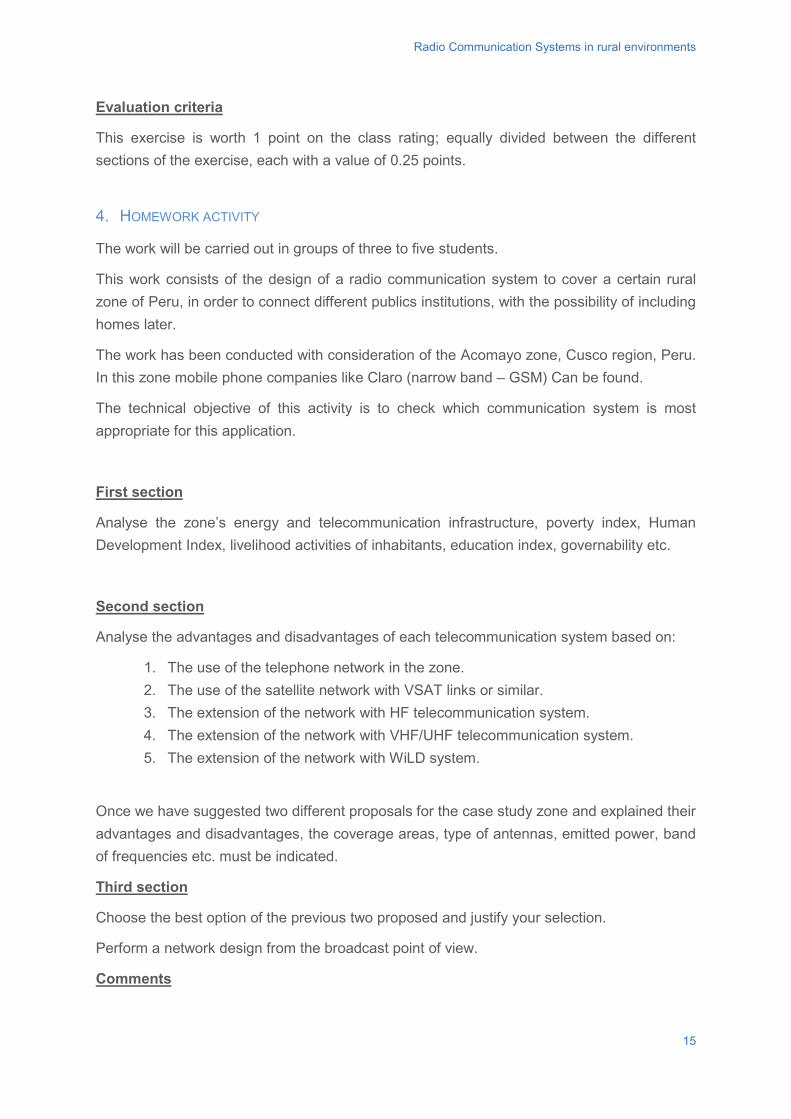
Radio Communication Systems in rural environments
Evaluation criteria
This exercise is worth 1 point on the class rating; equally divided between the different sections of the exercise, each with a value of 0.25 points.
4. HOMEWORK ACTIVITY
The work will be carried out in groups of three to five students.
This work consists of the design of a radio communication system to cover a certain rural zone of Peru, in order to connect different publics institutions, with the possibility of including homes later.
The work has been conducted with consideration of the Acomayo zone, Cusco region, Peru. In this zone mobile phone companies like Claro (narrow band – GSM) Can be found.
The technical objective of this activity is to check which communication system is most appropriate for this application.
First section
Analyse the zone’s energy and telecommunication infrastructure, poverty index, Human Development Index, livelihood activities of inhabitants, education index, governability etc.
Second section
Analyse the advantages and disadvantages of each telecommunication system based on:
1. The use of the telephone network in the zone. 2. The use of the satellite network with VSAT links or similar. 3. The extension of the network with HF telecommunication system. 4. The extension of the network with VHF/UHF telecommunication system. 5. The extension of the network with WiLD system.
Once we have suggested two different proposals for the case study zone and explained their advantages and disadvantages, the coverage areas, type of antennas, emitted power, band of frequencies etc. must be indicated.
Third section
Choose the best option of the previous two proposed and justify your selection.
Perform a network design from the broadcast point of view.
Comments
15
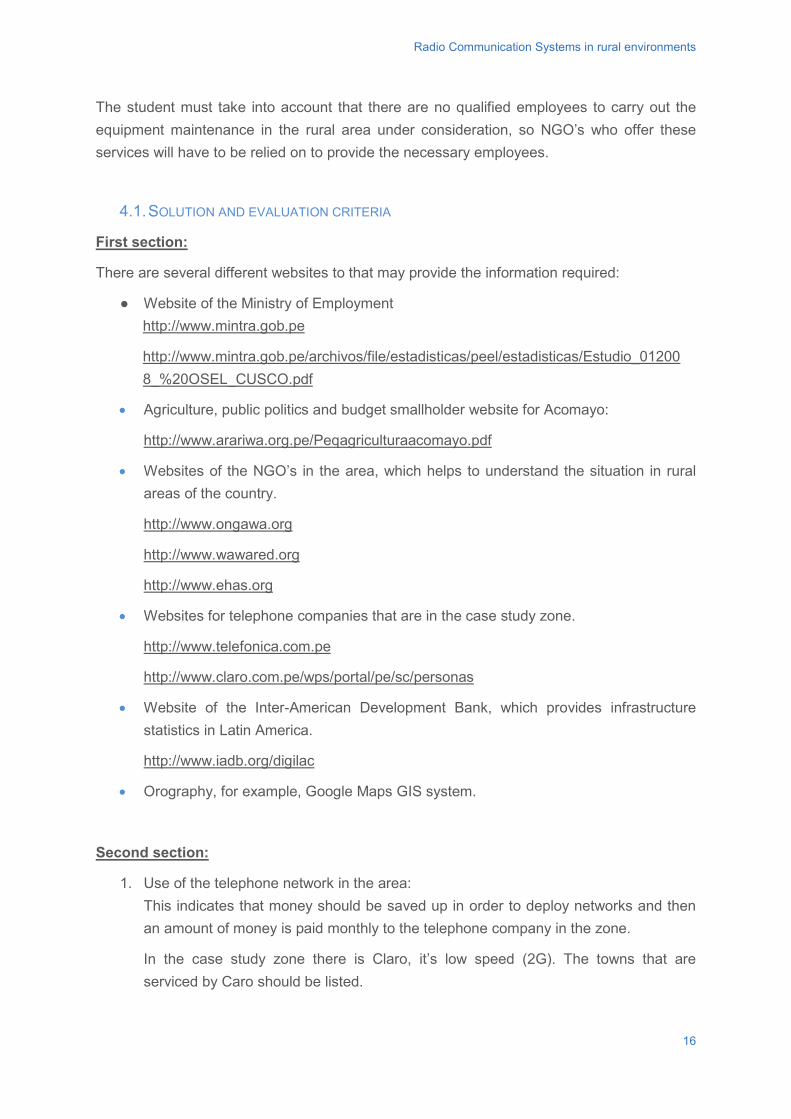
Radio Communication Systems in rural environments
The student must take into account that there are no qualified employees to carry out the equipment maintenance in the rural area under consideration, so NGO’s who offer these services will have to be relied on to provide the necessary employees.
4.1. SOLUTION AND EVALUATION CRITERIA
First section:
There are several different websites to that may provide the information required:
● Website of the Ministry of Employment http://www.mintra.gob.pe
http://www.mintra.gob.pe/archivos/file/estadisticas/peel/estadisticas/Estudio_01200 8_%20OSEL_CUSCO.pdf
• Agriculture, public politics and budget smallholder website for Acomayo:
http://www.arariwa.org.pe/Peqagriculturaacomayo.pdf
• Websites of the NGO’s in the area, which helps to understand the situation in rural areas of the country.
http://www.ongawa.org
http://www.wawared.org
http://www.ehas.org
• Websites for telephone companies that are in the case study zone.
http://www.telefonica.com.pe
http://www.claro.com.pe/wps/portal/pe/sc/personas
• Website of the Inter-American Development Bank, which provides infrastructure statistics in Latin America.
http://www.iadb.org/digilac
• Orography, for example, Google Maps GIS system.
Second section:
1. Use of the telephone network in the area: This indicates that money should be saved up in order to deploy networks and then an amount of money is paid monthly to the telephone company in the zone.
In the case study zone there is Claro, it’s low speed (2G). The towns that are serviced by Caro should be listed.
16
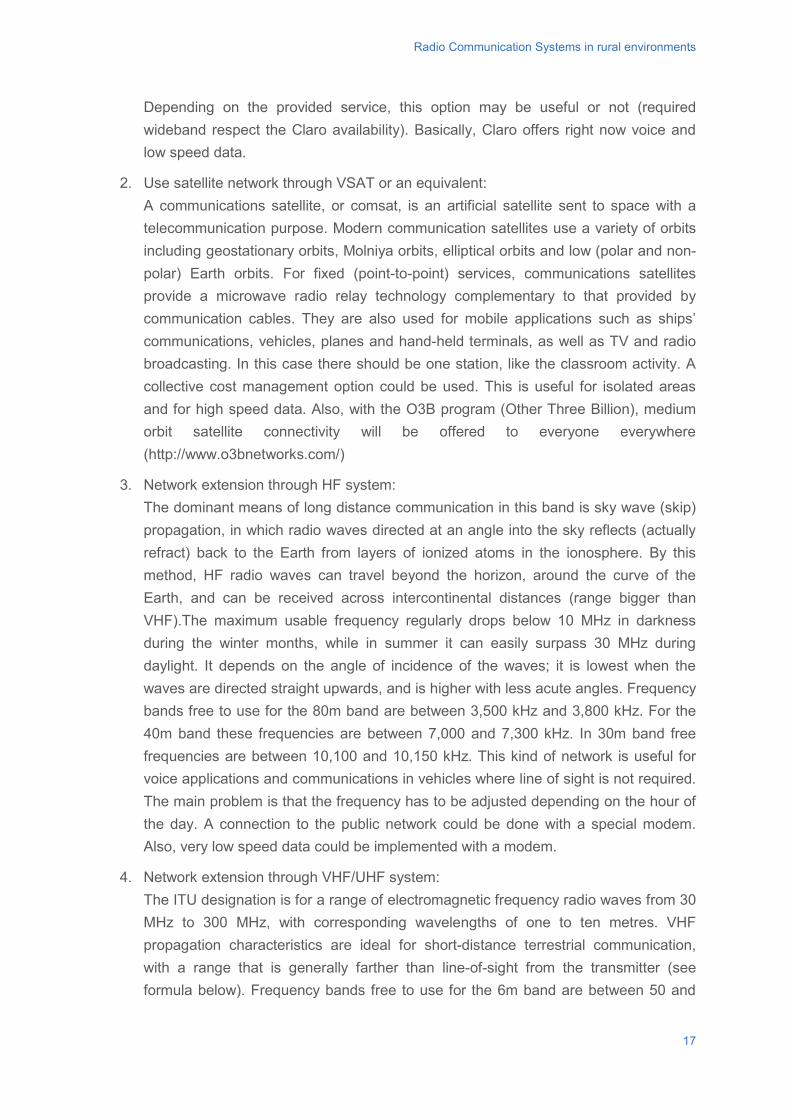
Radio Communication Systems in rural environments
Depending on the provided service, this option may be useful or not (required wideband respect the Claro availability). Basically, Claro offers right now voice and low speed data.
2. Use satellite network through VSAT or an equivalent: A communications satellite, or comsat, is an artificial satellite sent to space with a telecommunication purpose. Modern communication satellites use a variety of orbits including geostationary orbits, Molniya orbits, elliptical orbits and low (polar and non-polar) Earth orbits. For fixed (point-to-point) services, communications satellites provide a microwave radio relay technology complementary to that provided by communication cables. They are also used for mobile applications such as ships’ communications, vehicles, planes and hand-held terminals, as well as TV and radio broadcasting. In this case there should be one station, like the classroom activity. A collective cost management option could be used. This is useful for isolated areas and for high speed data. Also, with the O3B program (Other Three Billion), medium orbit satellite connectivity will be offered to everyone everywhere (http://www.o3bnetworks.com/)
3. Network extension through HF system: The dominant means of long distance communication in this band is sky wave (skip) propagation, in which radio waves directed at an angle into the sky reflects (actually refract) back to the Earth from layers of ionized atoms in the ionosphere. By this method, HF radio waves can travel beyond the horizon, around the curve of the Earth, and can be received across intercontinental distances (range bigger than VHF).The maximum usable frequency regularly drops below 10 MHz in darkness during the winter months, while in summer it can easily surpass 30 MHz during daylight. It depends on the angle of incidence of the waves; it is lowest when the waves are directed straight upwards, and is higher with less acute angles. Frequency bands free to use for the 80m band are between 3,500 kHz and 3,800 kHz. For the 40m band these frequencies are between 7,000 and 7,300 kHz. In 30m band free frequencies are between 10,100 and 10,150 kHz. This kind of network is useful for voice applications and communications in vehicles where line of sight is not required. The main problem is that the frequency has to be adjusted depending on the hour of the day. A connection to the public network could be done with a special modem. Also, very low speed data could be implemented with a modem.
4. Network extension through VHF/UHF system: The ITU designation is for a range of electromagnetic frequency radio waves from 30 MHz to 300 MHz, with corresponding wavelengths of one to ten metres. VHF propagation characteristics are ideal for short-distance terrestrial communication, with a range that is generally farther than line-of-sight from the transmitter (see formula below). Frequency bands free to use for the 6m band are between 50 and
17
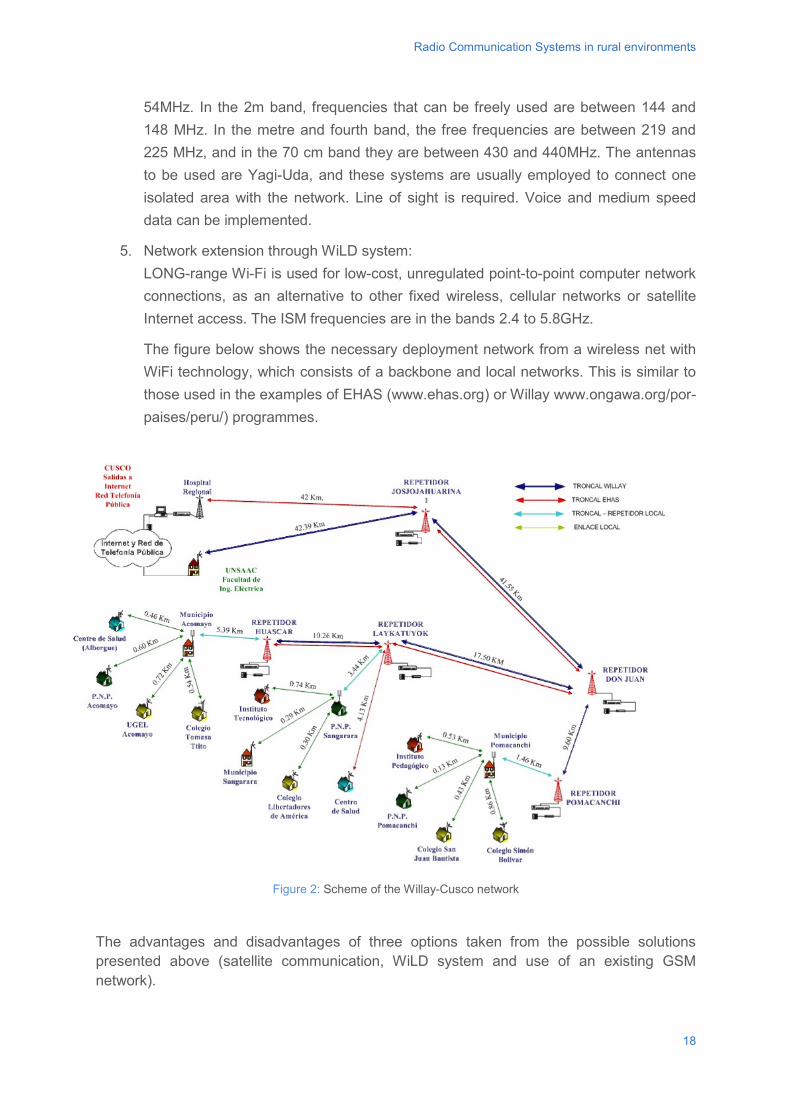
Radio Communication Systems in rural environments
54MHz. In the 2m band, frequencies that can be freely used are between 144 and 148 MHz. In the metre and fourth band, the free frequencies are between 219 and 225 MHz, and in the 70 cm band they are between 430 and 440MHz. The antennas to be used are Yagi-Uda, and these systems are usually employed to connect one isolated area with the network. Line of sight is required. Voice and medium speed data can be implemented.
5. Network extension through WiLD system: LONG-range Wi-Fi is used for low-cost, unregulated point-to-point computer network connections, as an alternative to other fixed wireless, cellular networks or satellite Internet access. The ISM frequencies are in the bands 2.4 to 5.8GHz.
The figure below shows the necessary deployment network from a wireless net with WiFi technology, which consists of a backbone and local networks. This is similar to those used in the examples of EHAS (www.ehas.org) or Willay www.ongawa.org/por-paises/peru/) programmes.
Figure 2: Scheme of the Willay-Cusco network
The advantages and disadvantages of three options taken from the possible solutions presented above (satellite communication, WiLD system and use of an existing GSM network).
18
Radio Communication Systems in rural environments
Geostationary Satellite System:
Advantages:
• Flexible (if transparent transponders)
• Easy to install new circuits
• Circuit costs independent from distance
• Broadcast possibilities
• Temporary applications (restoration)
• Niche applications
• Mobile applications (especially "fill-in")
• Terrestrial network "by-pass"
• Provision of service to remote or underdeveloped areas
• User has control over their own network
• 1-for-N multipoint standby possibilities
Disadvantages
• Large up-front capital costs (space segment and launch)
• Terrestrial breaks even distance expanding (now approx. size of Europe)
• Interference and propagation
• Congestion of frequencies and orbit
• Operation cost
WILD System:
Advantages:
• Wireless means lower costs for network setup, specifically in large areas of coverage.
• The more nodes you install, the bigger and faster your wireless network becomes.
• They rely on the same WiFi standards (802.11a, b and g) already in place for most wireless networks.
• They are convenient where Ethernet wall connections are lacking, for instance in outdoor concert venues, warehouses or transportation settings.
• They are useful for Non-Line-of-Sight (NLoS) network configurations where wireless signals are intermittently blocked (using relays).
• Mesh networks are "self configuring;" the network automatically incorporates a new node into the existing structure without needing any adjustments by a network administrator.
19
Radio Communication Systems in rural environments
• Mesh networks are "self healing," since the network automatically finds the fastest and most reliable path to send data, even if nodes are blocked or lose their signal.
• Wireless mesh configurations allow local networks to run faster, because local packets do not have to travel back to a central server.
• Wireless mesh nodes are easy to install and uninstall, making the network extremely adaptable and expandable as more or less coverage is needed.
Disadvantages
The main reason why the use of mesh is not advised is related to the negative sides of mesh: bandwidth consumption and lack of interoperability
Existing GSM network:
Advantages:
▪ Using a GSM network means less CAPEX (infrastructure cost), but more OPEX (at least with respect to the WiLD networks).
▪ The user does not worry about the operation and maintenance.
Disadvantages
The user depends on the availability (coverage) and the quality (wideband) of the network. Nowadays, it is possible to have GSM (2G) in rural areas, but 3G is not possible. However, there are some cellular extension plans, and those ones should be checked.
Third section
A WILD system is chosen so the signal arrives to the repeater station and then goes to the different users. In the first project, these users are public institutions within the zone, which streamlines the procedure and allows for the attainment of a global connection between builds.
A grating reflector antenna with point-to-point vision is used.
For this project the Telefonica wire network that is going to be installed in the next months in all the capital cities of provinces is connected to. If this plan is not possible, the national fibre optic plan could be used, which is a project to be implemented by the Peruvian government.
In the future, the acceptance of the project by habitants in the project zone would be observed and depending on the level of advancement of technologies in the zone the possibility to expand the objectives achieved with the project could be considered.
20

Radio Communication Systems in rural environments
Evaluation criteria
This exercise is worth 3 points; equally divided across the different section of the exercise, each with a value of 1 point.
21
Radio Communication Systems in rural environments
BIBLIOGRAPHY
UNITED NATIONS DEVELOPMENT PROGRAMME (2006) Human Development Report 2006: Beyond scarcity: Power, poverty and the global water crisis. New York. United Nations Development Programme.
“Radiación y Propagación”. M. Sierra Castañer, J.L. Besada, L. de Haro. Edited by FUNDETEL (ETSI Telecomunicación), 2004. ISBN: 84-7402-301-6
“Transmisión por radio” José María Hernando Rábanos, José Manuel Riera Salís, Luis Mendo Tomás. Edited by editorial universitaria, ISBN:978-84-9961-106-8
WEB PAGES:
www.ehas.org
www.mintra.gob.pe
www.ongawa.org
www.wawared.org
www.satbeams.com
www.frequencyplansatellites.altervista.org
www.intelsat.com/wp-content/uploads/2013/01/5941-SatellitePrimer-2010.pdf
22

http://www.gdee.eu
This project is funded by
Javier Simó-Reigadas
PHOTO: Radio station in Rio Napo , Peru. ONGAWA.
CASE STUDIES
A Di�Serv transport network to bring 3Gaccessto villages inthe Amazon forest
DL B 10735-2015 ISBN 978-84-606-7546-4
A Di�Serv transport network to bring 3G accessto villages in the Amazon forest
COORDINATED BYAgustí Pérez-Foguet, Enric Velo, Pol Arranz, Ricard Ginéand Boris Lazzarini (Universitat Politècnica de Catalunya)Manuel Sierra (Universidad Politécnica de Madrid)Alejandra Boni and Jordi Peris (Universitat Politècnica de València)Guido Zolezzi and Gabriella Trombino (Università degli Studi di Trento)Rhoda Trimingham (Loughborough University)Valentín Villarroel (ONGAWA)Neil Nobles and Meadhbh Bolger (Practical Action)Francesco Mongera (Training Center for International Cooperation)Katie Cresswell-Maynard (Engineering Without Border UK)
EDITED BY Global Dimension in Engineering Education
Citation: Simó-Reigadas, J. (2015) ' A Di�¬Serv transport network to bring 3G access to villages in the Amazon forest', in Case studies for developing globally responsible engineers, GDEE (eds.), Global Dimension in Engineering Education, Barcelona. Available from: http://gdee.eu/index.php/resources.html
This publication is distributedunder an Attribution- Noncommercial-Share Alike License for Creative Commons
CASE STUDIES
Disclaimer: This document has been produced with the financial assistance of the European UnionThe contents of this document are the sole responsibility of the authors and can under no circumstances be regarded as reflecting the position of the European Union
A Diffserv transport network to bring 3G access to villages in the Amazon forest
A DIFFSERV TRANSPORT NETWORK TO BRING 3G ACCESS TO VILLAGES IN THE AMAZON FOREST
Javier Simó-Reigadas, Universidad Rey Juan Carlos.
1
A Diffserv transport network to bring 3G access to villages in the Amazon forest
INDEX
1. INTRODUCTION ........................................................................................................................... 3
1.1. DISCIPLINES COVERED ............................................................................................................. 3
1.2. LEARNING OUTCOMES .............................................................................................................. 4
1.3. ACTIVITIES .............................................................................................................................. 4
2. DESCRIPTION OF THE CONTEXT ............................................................................................. 5
2.1. URBAN AND RURAL AREAS IN THE DEVELOPING WORLD .............................................................. 5
2.2. THE PERUVIAN CASE ................................................................................................................ 5
2.3. THE TUCAN3G PROJECT ........................................................................................................ 8
2.4. SCENARIO OF THE CASE STUDY ................................................................................................ 9
3. CLASS ACTIVITY ........................................................................................................................... 10
3.1. PRESENTATION OF THE CONTEXT OF THIS CASE STUDY ............................................................ 10
3.2. QUALITY OF SERVICE (QOS) IN IP NETWORKS ......................................................................... 11
3.3. THE DIFFSERV ARCHITECTURE ............................................................................................... 14
3.4. QUEUING DISCIPLINES ............................................................................................................ 19
3.5. SOLUTION AND EVALUATION CRITERIA ..................................................................................... 22
4. HOMEWORK ACTIVITY ................................................................................................................. 23
2
A Diffserv transport network to bring 3G access to villages in the Amazon forest
1. INTRODUCTION Since their conception, Internet Protocol (IP) networks have been generally used under the best-effort paradigm. Several Quality of Service-aware (QoS-aware) IP network architectures have been proposed in the last two decades by the Internet Engineering Task Force (IETF) and other actors, DiffServ being the most successful. Modern network technologies covering layers 1 and 2 such as Asynchronous Transfer Mode (ATM), Ethernet, WiFi or WiMAX have included mechanisms for traffic differentiation and some support for QoS. However, it is still uncommon to find a scenario were a QoS-aware network architecture, such as DiffServ, is adopted and implementation is simple enough to be fully understood by undergraduate students. This case study helps the student to understand what problems arise in an IP network when several terminals that need QoS guarantees share an IP infrastructure, and how the DiffServ architecture helps to solve the problem. Moreover, a practical implementation of queuing disciplines in the network nodes is proposed. The student will learn how a simple embedded computer with Linux may become a DiffServ router, and how this can be applied to propose an appropriate communications solution for rural deployments in developing regions. This case study is based in the TUCAN3G project, a FP7 research project that aims to propose a low-cost solution for 3G coverage in rural areas of developing countries (TUCAN3G, 2013). It comprises a theoretical session about the fundamentals, followed by a problem resolution activity in which the theoretical concepts must be applied to a well-defined scenario. This case study is not intended to provide the student with a deep understanding of DiffServ and queuing disciplines. Students must have a good understanding on IP networks prior to this case study, and it may be useful if they have already studied DiffServ and queuing disciplines from a theoretical perspective. The case study helps students to integrate all related information and associate the functionality of these tools with the needs identified in a real life scenario.
1.1. DISCIPLINES COVERED This case study covers the implementation of a QoS-aware IP network. The case study proposes a clear example in which a 'common' IP network is not appropriate, and the use of the DiffServ architecture converts the network in an appropriate solution. The case also shows how to implement it, and demonstrates a case in which the local support of DiffServ is valuable, no matter what happens beyond. The clues for implementing
3

A Diffserv transport network to bring 3G access to villages in the Amazon forest
DiffServ nodes are simple and permit any student to go further on his/her own by building low-cost DiffServ routers.
1.2. LEARNING OUTCOMES
● The student will learn how DiffServ contributes (qualitatively and quantitatively) to make an IP network QoS-aware.
● The student will learn how to identify QoS limitations in an IP network, and to propose appropriate actions to improve the overall performance.
● The student will learn how to apply well-known queuing disciplines to implement the Per-Hop Behaviour (PHB)) desired for a particular case in a DiffServ domain.
● The student will learn how QoS-aware IP networks based on WiFi and WiMAX may become a key solution for the deployment of low-cost communications infrastructures in rural areas in developing regions.
1.3. ACTIVITIES The following learning activities are proposed:
1. Theoretical session: 2 hour class on QoS (Quality of Service), the DiffServ architecture and the implementation of a basic DiffServ solution. The case study presented is a means to understand the detailed performance problems to be tackled in an IP network in which certain traffic classes require QoS guarantees. Prior to this session, the student will have read basic materials on QoS, DiffServ (referenced below) and queuing disciplines, or have received basic training on these subjects. It is also advisable for students to read the context of this case study in advance.
2. Problem resolution activity: the students are organised in working groups and presented with a communications problem based on the same context explained in the theoretical session. Several basic communications elements and techniques are proposed, and each group discusses the best way to solve the problem, as well as define all details for network implementation. The outcome is a technical report produced by each group.
4
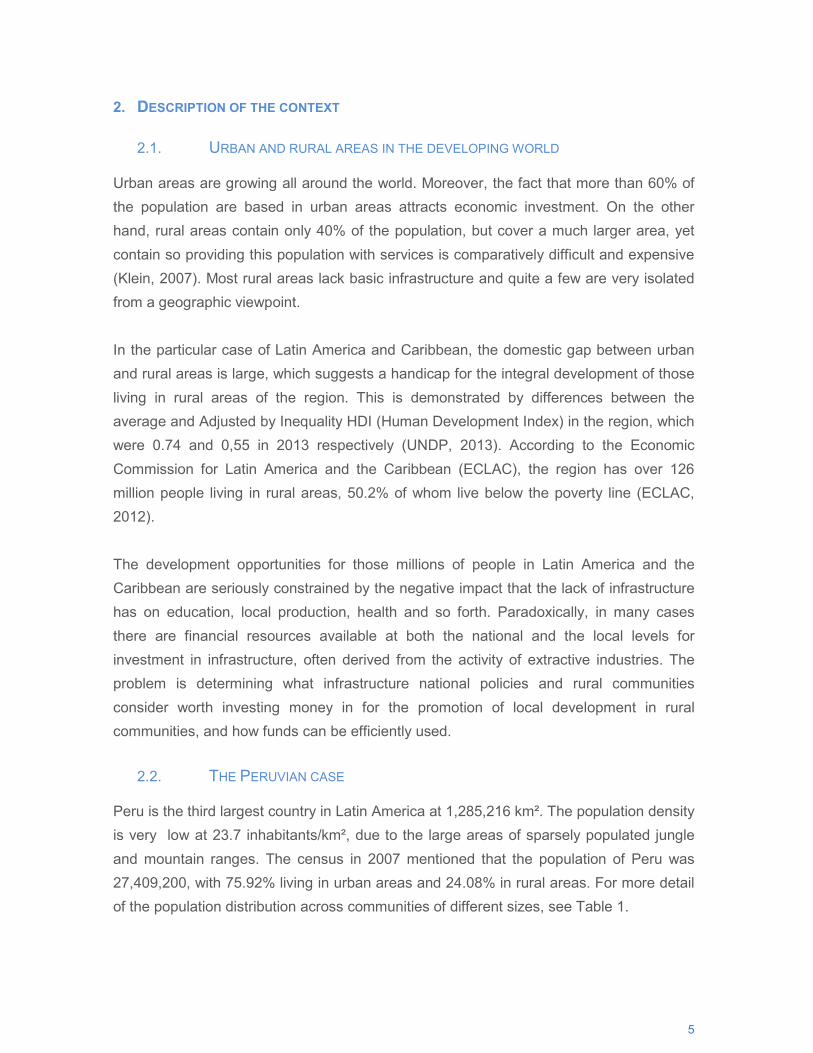
A Diffserv transport network to bring 3G access to villages in the Amazon forest
2. DESCRIPTION OF THE CONTEXT
2.1. URBAN AND RURAL AREAS IN THE DEVELOPING WORLD Urban areas are growing all around the world. Moreover, the fact that more than 60% of the population are based in urban areas attracts economic investment. On the other hand, rural areas contain only 40% of the population, but cover a much larger area, yet contain so providing this population with services is comparatively difficult and expensive (Klein, 2007). Most rural areas lack basic infrastructure and quite a few are very isolated from a geographic viewpoint. In the particular case of Latin America and Caribbean, the domestic gap between urban and rural areas is large, which suggests a handicap for the integral development of those living in rural areas of the region. This is demonstrated by differences between the average and Adjusted by Inequality HDI (Human Development Index) in the region, which were 0.74 and 0,55 in 2013 respectively (UNDP, 2013). According to the Economic Commission for Latin America and the Caribbean (ECLAC), the region has over 126 million people living in rural areas, 50.2% of whom live below the poverty line (ECLAC, 2012). The development opportunities for those millions of people in Latin America and the Caribbean are seriously constrained by the negative impact that the lack of infrastructure has on education, local production, health and so forth. Paradoxically, in many cases there are financial resources available at both the national and the local levels for investment in infrastructure, often derived from the activity of extractive industries. The problem is determining what infrastructure national policies and rural communities consider worth investing money in for the promotion of local development in rural communities, and how funds can be efficiently used.
2.2. THE PERUVIAN CASE Peru is the third largest country in Latin America at 1,285,216 km². The population density is very low at 23.7 inhabitants/km², due to the large areas of sparsely populated jungle and mountain ranges. The census in 2007 mentioned that the population of Peru was 27,409,200, with 75.92% living in urban areas and 24.08% in rural areas. For more detail of the population distribution across communities of different sizes, see Table 1.
5
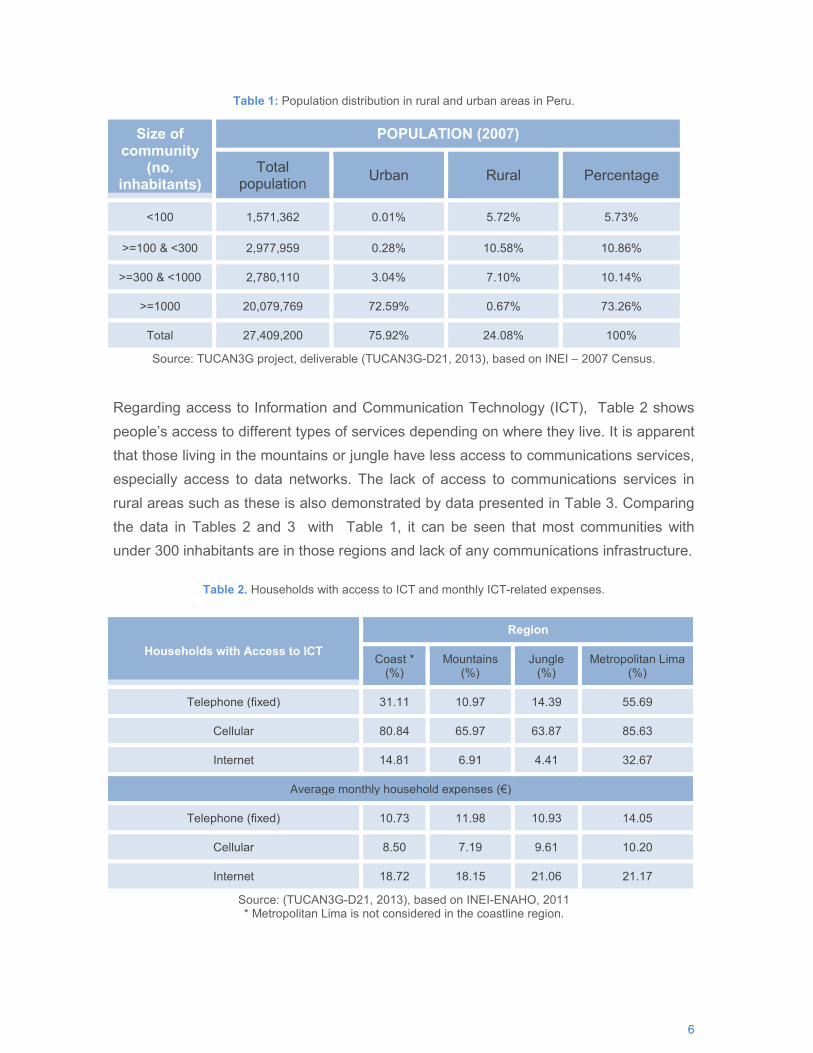
A Diffserv transport network to bring 3G access to villages in the Amazon forest
Table 1: Population distribution in rural and urban areas in Peru.
Size of community
(no. inhabitants)
POPULATION (2007)
Total population Urban Rural Percentage
<100 1,571,362 0.01% 5.72% 5.73%
>=100 & <300 2,977,959 0.28% 10.58% 10.86%
>=300 & <1000 2,780,110 3.04% 7.10% 10.14%
>=1000 20,079,769 72.59% 0.67% 73.26%
Total 27,409,200 75.92% 24.08% 100%
Source: TUCAN3G project, deliverable (TUCAN3G-D21, 2013), based on INEI – 2007 Census. Regarding access to Information and Communication Technology (ICT), Table 2 shows people’s access to different types of services depending on where they live. It is apparent that those living in the mountains or jungle have less access to communications services, especially access to data networks. The lack of access to communications services in rural areas such as these is also demonstrated by data presented in Table 3. Comparing the data in Tables 2 and 3 with Table 1, it can be seen that most communities with under 300 inhabitants are in those regions and lack of any communications infrastructure.
Table 2. Households with access to ICT and monthly ICT-related expenses.
Households with Access to ICT
Region
Coast * (%)
Mountains (%)
Jungle (%)
Metropolitan Lima (%)
Telephone (fixed) 31.11 10.97 14.39 55.69
Cellular 80.84 65.97 63.87 85.63
Internet 14.81 6.91 4.41 32.67
Average monthly household expenses (€)
Telephone (fixed) 10.73 11.98 10.93 14.05
Cellular 8.50 7.19 9.61 10.20
Internet 18.72 18.15 21.06 21.17
Source: (TUCAN3G-D21, 2013), based on INEI-ENAHO, 2011 * Metropolitan Lima is not considered in the coastline region.
6
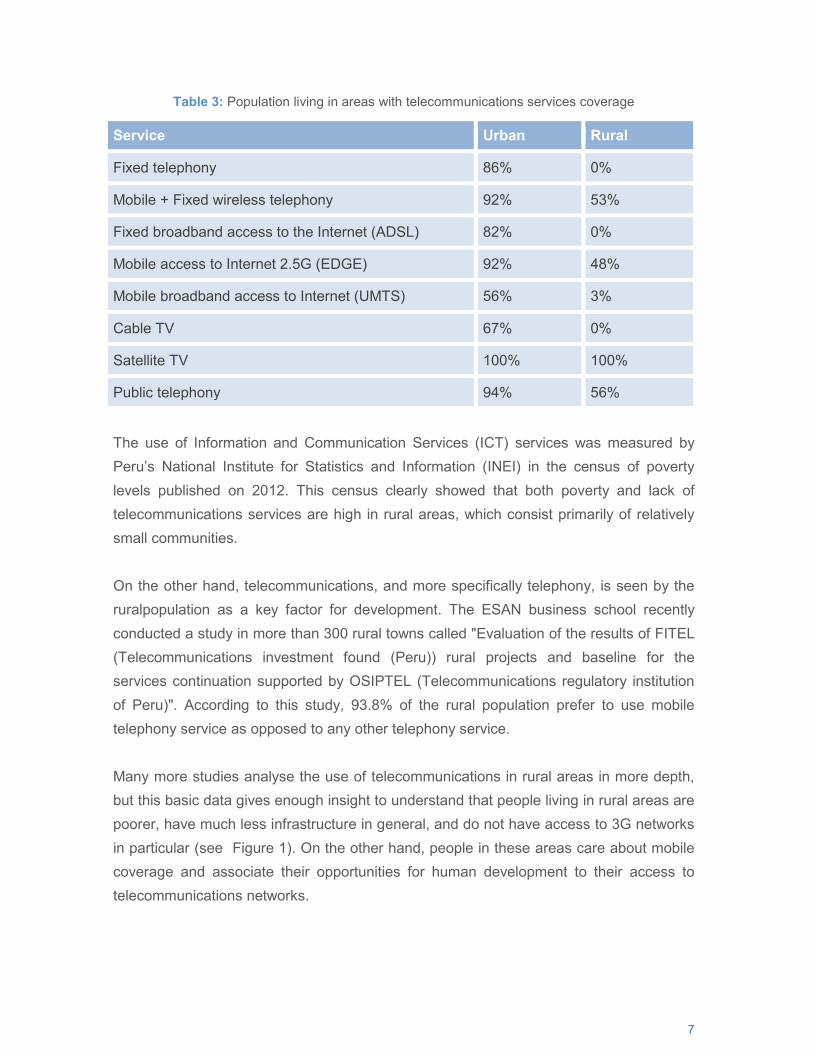
A Diffserv transport network to bring 3G access to villages in the Amazon forest
Table 3: Population living in areas with telecommunications services coverage
Service Urban Rural
Fixed telephony 86% 0%
Mobile + Fixed wireless telephony 92% 53%
Fixed broadband access to the Internet (ADSL) 82% 0%
Mobile access to Internet 2.5G (EDGE) 92% 48%
Mobile broadband access to Internet (UMTS) 56% 3%
Cable TV 67% 0%
Satellite TV 100% 100%
Public telephony 94% 56%
The use of Information and Communication Services (ICT) services was measured by Peru’s National Institute for Statistics and Information (INEI) in the census of poverty levels published on 2012. This census clearly showed that both poverty and lack of telecommunications services are high in rural areas, which consist primarily of relatively small communities. On the other hand, telecommunications, and more specifically telephony, is seen by the ruralpopulation as a key factor for development. The ESAN business school recently conducted a study in more than 300 rural towns called "Evaluation of the results of FITEL (Telecommunications investment found (Peru)) rural projects and baseline for the services continuation supported by OSIPTEL (Telecommunications regulatory institution of Peru)". According to this study, 93.8% of the rural population prefer to use mobile telephony service as opposed to any other telephony service.
Many more studies analyse the use of telecommunications in rural areas in more depth, but this basic data gives enough insight to understand that people living in rural areas are poorer, have much less infrastructure in general, and do not have access to 3G networks in particular (see Figure 1). On the other hand, people in these areas care about mobile coverage and associate their opportunities for human development to their access to telecommunications networks.
7
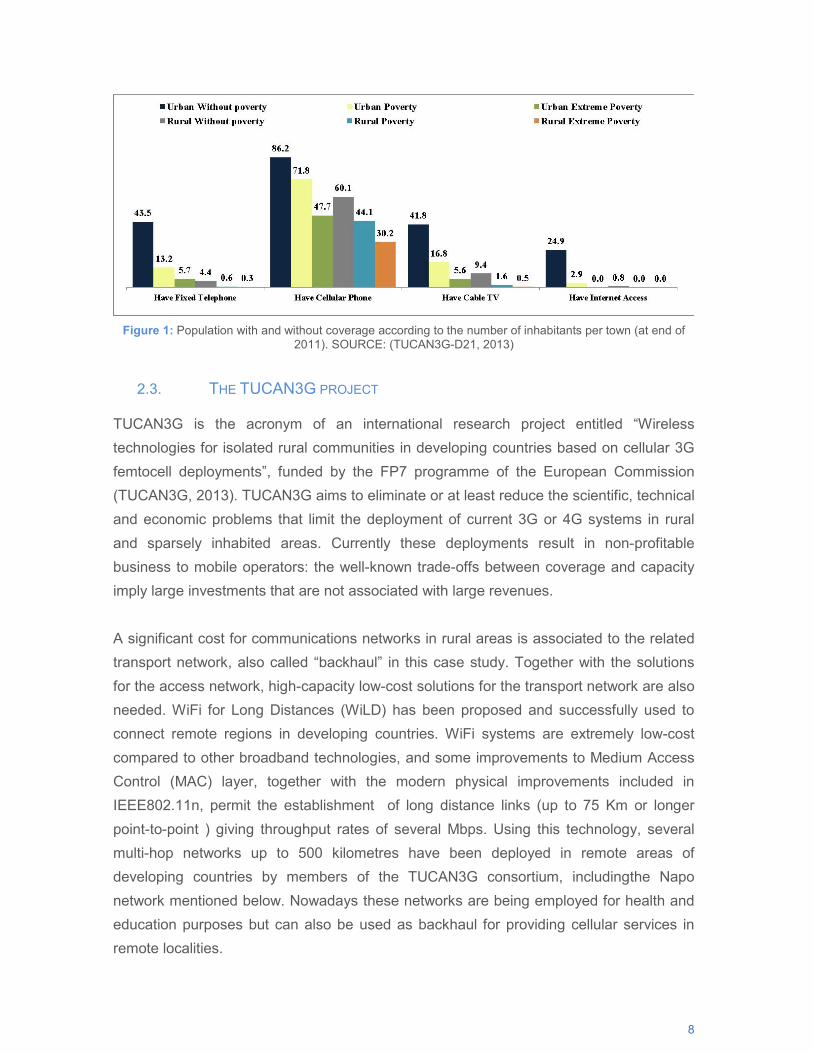
A Diffserv transport network to bring 3G access to villages in the Amazon forest
Figure 1: Population with and without coverage according to the number of inhabitants per town (at end of
2011). SOURCE: (TUCAN3G-D21, 2013)
2.3. THE TUCAN3G PROJECT
TUCAN3G is the acronym of an international research project entitled “Wireless technologies for isolated rural communities in developing countries based on cellular 3G femtocell deployments”, funded by the FP7 programme of the European Commission (TUCAN3G, 2013). TUCAN3G aims to eliminate or at least reduce the scientific, technical and economic problems that limit the deployment of current 3G or 4G systems in rural and sparsely inhabited areas. Currently these deployments result in non-profitable business to mobile operators: the well-known trade-offs between coverage and capacity imply large investments that are not associated with large revenues. A significant cost for communications networks in rural areas is associated to the related transport network, also called “backhaul” in this case study. Together with the solutions for the access network, high-capacity low-cost solutions for the transport network are also needed. WiFi for Long Distances (WiLD) has been proposed and successfully used to connect remote regions in developing countries. WiFi systems are extremely low-cost compared to other broadband technologies, and some improvements to Medium Access Control (MAC) layer, together with the modern physical improvements included in IEEE802.11n, permit the establishment of long distance links (up to 75 Km or longer point-to-point ) giving throughput rates of several Mbps. Using this technology, several multi-hop networks up to 500 kilometres have been deployed in remote areas of developing countries by members of the TUCAN3G consortium, includingthe Napo network mentioned below. Nowadays these networks are being employed for health and education purposes but can also be used as backhaul for providing cellular services in remote localities.
8
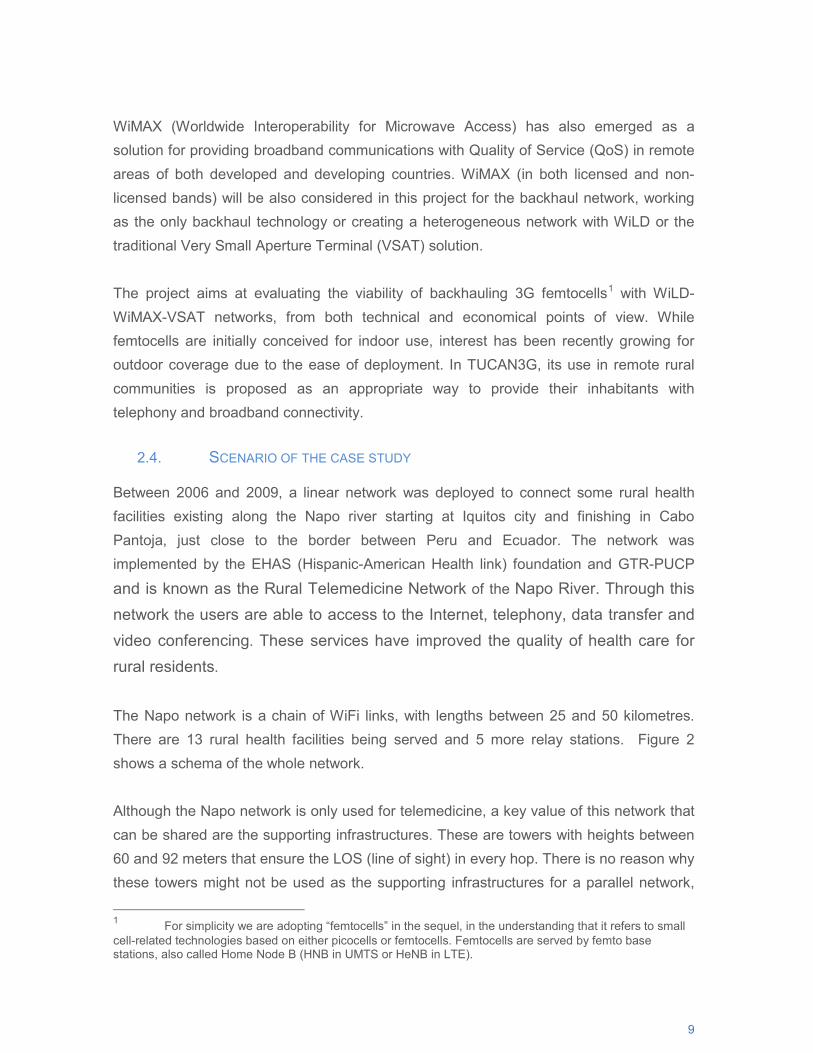
A Diffserv transport network to bring 3G access to villages in the Amazon forest
WiMAX (Worldwide Interoperability for Microwave Access) has also emerged as a solution for providing broadband communications with Quality of Service (QoS) in remote areas of both developed and developing countries. WiMAX (in both licensed and non-licensed bands) will be also considered in this project for the backhaul network, working as the only backhaul technology or creating a heterogeneous network with WiLD or the traditional Very Small Aperture Terminal (VSAT) solution. The project aims at evaluating the viability of backhauling 3G femtocells1 with WiLD-WiMAX-VSAT networks, from both technical and economical points of view. While femtocells are initially conceived for indoor use, interest has been recently growing for outdoor coverage due to the ease of deployment. In TUCAN3G, its use in remote rural communities is proposed as an appropriate way to provide their inhabitants with telephony and broadband connectivity.
2.4. SCENARIO OF THE CASE STUDY Between 2006 and 2009, a linear network was deployed to connect some rural health facilities existing along the Napo river starting at Iquitos city and finishing in Cabo Pantoja, just close to the border between Peru and Ecuador. The network was implemented by the EHAS (Hispanic-American Health link) foundation and GTR-PUCP and is known as the Rural Telemedicine Network of the Napo River. Through this network the users are able to access to the Internet, telephony, data transfer and video conferencing. These services have improved the quality of health care for rural residents.
The Napo network is a chain of WiFi links, with lengths between 25 and 50 kilometres. There are 13 rural health facilities being served and 5 more relay stations. Figure 2 shows a schema of the whole network. Although the Napo network is only used for telemedicine, a key value of this network that can be shared are the supporting infrastructures. These are towers with heights between 60 and 92 meters that ensure the LOS (line of sight) in every hop. There is no reason why these towers might not be used as the supporting infrastructures for a parallel network,
1 For simplicity we are adopting “femtocells” in the sequel, in the understanding that it refers to small cell-related technologies based on either picocells or femtocells. Femtocells are served by femto base stations, also called Home Node B (HNB in UMTS or HeNB in LTE).
9
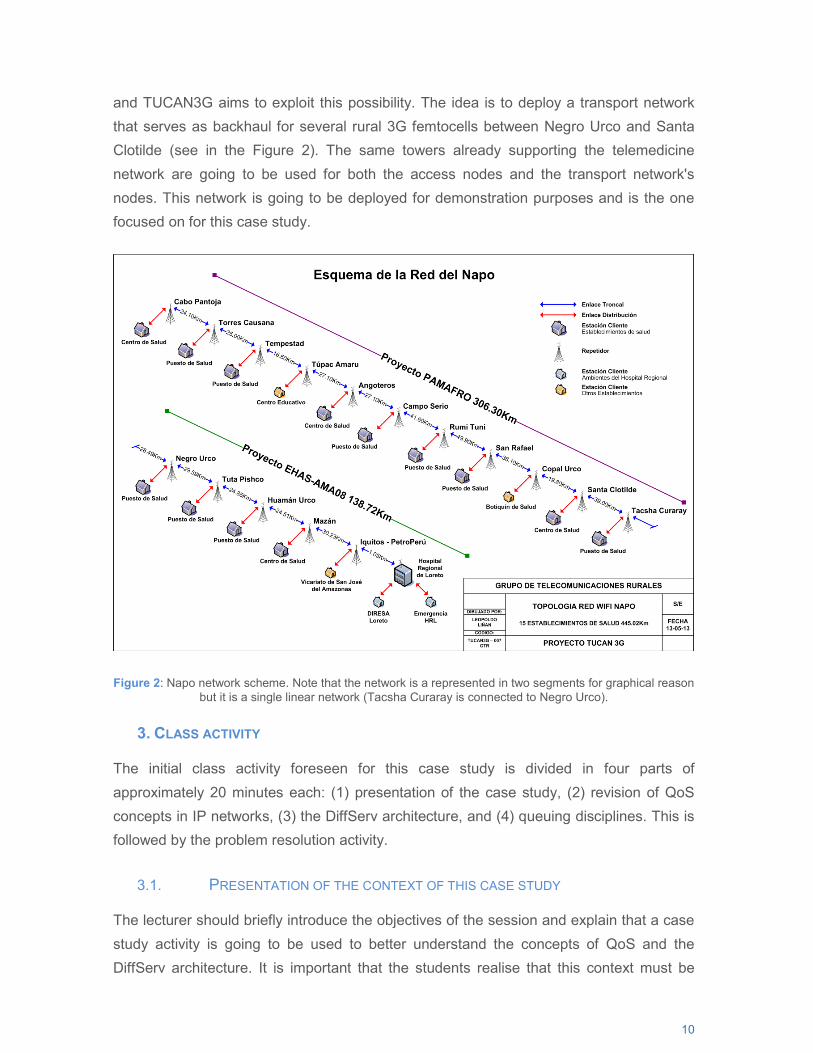
A Diffserv transport network to bring 3G access to villages in the Amazon forest
and TUCAN3G aims to exploit this possibility. The idea is to deploy a transport network that serves as backhaul for several rural 3G femtocells between Negro Urco and Santa Clotilde (see in the Figure 2). The same towers already supporting the telemedicine network are going to be used for both the access nodes and the transport network's nodes. This network is going to be deployed for demonstration purposes and is the one focused on for this case study.
Figure 2: Napo network scheme. Note that the network is a represented in two segments for graphical reason but it is a single linear network (Tacsha Curaray is connected to Negro Urco).
3. CLASS ACTIVITY
The initial class activity foreseen for this case study is divided in four parts of approximately 20 minutes each: (1) presentation of the case study, (2) revision of QoS concepts in IP networks, (3) the DiffServ architecture, and (4) queuing disciplines. This is followed by the problem resolution activity.
3.1. PRESENTATION OF THE CONTEXT OF THIS CASE STUDY The lecturer should briefly introduce the objectives of the session and explain that a case study activity is going to be used to better understand the concepts of QoS and the DiffServ architecture. It is important that the students realise that this context must be
10
A Diffserv transport network to bring 3G access to villages in the Amazon forest
understood first because several examples used along the rest of the class will be based on it. The students must also know that the classroom session will be followed by a group homework in which they must apply these concepts and propose a valid solution. The lecturer should then introduce the context of the case study and use the slides provided for introducing the scenario and the technologies used in it. The context part of this case study should be available to the students prior to the class activity, so that they can read it in advance and make this part of the class activity much more fluent and short.
3.2. QUALITY OF SERVICE (QOS) IN IP NETWORKS The Internet was conceived in the last century as a data communication network with a best-effort philosophy, which means that the network did not assume any engagement with the users in terms of quality of the services offered. The Internet has always aimed to do just “its best effort”. On the other hand, telecommunications operators used to have large infrastructures for real-time services such as telephony in which circuit switching ensured certain service parameters. In this sense, once a circuit was established between users in the public switched telephone network the quality was ensured – except in case of exceptional events – because communications resources were dedicated for the duration of that communication. However, in the 90's a few real-time services started to be offered in the Internet, and this trend became increasingly important in the first years of the 21st century due to their flexibility and cost effectiveness of these. However, the unpredictable nature of the Internet in terms of offered end-to-end capacity, delay, packet-loss, etc. showed that the “best-effort” behavior was clearly invalid for modern communications services such as IP telephony, video-conferencing, etc., which used to have the circuit-switching networks as the quality assurance. The concept “Quality of Service” was then defined as the objective value ensured by the network according to certain parameters. This concept is closely related with “Quality of Experience” (QoE), which is a more subjective concept related to the users' perception of the quality of services. The International Telecommunications Union (ITU-T (Telecommunication Standardization Sector) defines the QoS as the “totality of characteristics of a telecommunications service that bear on its ability to satisfy stated and implied needs of the user of the service” [E-800]. However, the QoE is more commonly understood as a set of user-driven performance requirements. The ITU-T establishes in the Recommendation [G-1010] that the key parameters to consider for QoS are the following:
11
A Diffserv transport network to bring 3G access to villages in the Amazon forest
● Delay is defined as the time taken to establish a particular service from the initial user
request, and also as the time to receive specific information once the service is established. Delay has a very direct impact on user satisfaction depending on the application, and includes delays in the terminal, network, and any servers.
● Delay variation is generally included as a performance parameter since it is very important at the transport layer in packetised data systems due to the inherent variability in arrival times of individual packets. However, services that are highly intolerant of delay variation will usually take steps to remove (or at least significantly reduce) the delay variation by means of buffering, effectively eliminating delay variation as perceived at the user level (although at the expense of adding additional fixed delay).
● Information loss has a very direct effect on the quality of the information finally presented to the user, whether it be voice, image, video or data. In this context, information loss is not limited to the effects of bit errors or packet loss during transmission, but also includes the effects of any degradation introduced by media coding for more efficient transmission (e.g. the use of low bit-rate speech codecs for voice). Another parameter that is commonly considered is the throughput, understood as the rate in bits per second of data successfully sent and received. The throughput is actually a relative performance indicator, because it can only be tagged as good or bad when compared with the expected value for a given service. For example, a voice codec generating 64 kbps and producing a throughput of the same value is very good, while a video service expecting 384 kbps and obtaining only 350 kbps is very bad (although the value is higher than in the first example). When the throughput is lower than the traffic injected by the transmitter, this may increase the delay in the short-term if there are queues that can store packets temporary, but in the long-term it will increase the information loss (because queues are finite and, once they are full, packets have to be dropped). The G-1010 ITU-T recommendation contains a detailed relation of services with a short description of their specific requirements in this sense, and it also contains several tables with quantitative thresholds for the performance indicators of the most important services. Depending on the specific nature of a particular communication, it may have strict requirements on all these parameters, some of them, or none of them.
12
A Diffserv transport network to bring 3G access to villages in the Amazon forest
● Elastic traffic: traffic flows that may adapt to the existing resources and that are very
tolerant to the QoS offered. A typical case is a web page. If the throughput is higher, the web page will be presented sooner by the web navigator, and the same thing can be said if the delay or the delay variation are low. A significant packet-loss can be tackled by the transport protocol that is in charge of the retransmission of lost packets, and can also be translated into a higher delay. Obviously, the user wants to get the web page as fast as possible, but the range of acceptable values for each QoS parameter is quite large.
● Soft real-time traffic: traffic flows with some restrictions to the QoS parameters. A typical case is a video-streaming system: the throughput is defined by the codecs used, and no more throughput is generated if there are more resources available. The delay is not significant, the user may wait a little while until the video is played, but once it starts it must not be interrupted. Hence, throughput and delay variation are restricted, but the delay is generally flexible. Regarding the packet-loss, it is acceptable at a given threshold without having a great impact on the Quality of Experience (QoE).
● Hard real-time traffic: traffic flows that have hard constraints on minimum throughput, maximum delay, maximum delay variation and maximum packet-loss. The most typical case in the telephony. DISCUSSION: The lecturer should discuss with the students about the effects of an insufficient available capacity, a higher delay, a high delay variation or a higher packet-loss than required on the QoE of users for the services mentioned (web navigation, video streaming and telephony). Students should also identify other services that can be classified as elastic, soft real-time and hard real-time. FROM THE CASE STUDY: take the case of an operator willing to deploy 3G services in the context presented above. The operator has just deployed 3G services in Iquitos, which is one of the biggest cities in the Amazon Forest. Now they want to provide services in villages along the Napo River from Mazán to Santa-Clotilde. We will look later at the details of the transport network required for that, for now, imagine that there is IP connectivity good enough in each village. The access network consists of small cells (one or two per village) powered with solar photo-voltaic systems. Each cell exchanges three kinds of traffic with a controller that resides in the operator's network:
13
A Diffserv transport network to bring 3G access to villages in the Amazon forest
● Voice traffic (telephony). Each small cell has 16-24 channels for phone calls. Each phone call in a 3G small cell consists of two IP traffic flows: the upstream and the downstream. The cell does circuit multiplexing in the uplink for the sake of efficiency, building bigger packets in the upstream because each packet contains a fragment with voice samples for each active phone call. On the other hand, the downstream is not multiplexed, each voice packet in the downlink belongs to a single flow. Although the throughput depends on the number of active phone calls, as well as on other factors, for the sake of simplicity we are going to consider that a voice call generates 20 kbps in the upstream and 60 kbps in the downstream.
● Signaling. The cell exchanges signaling traffic with the controller. The rest of the traffic makes no sense unless the signaling packets are successfully transmitted and received. The amount of signaling traffic is much lower than 1% of the rest of the traffic.
● Data traffic. All data applications are in this block. Although this set is very heterogeneous, we are considering data traffic as flexible traffic very adaptive to the available resources. DISCUSSION: How must each type of traffic in the case study be characterised ?
3.3. THE DIFFSERV ARCHITECTURE DiffServ was proposed in the 1990's as a means to give an IP network QoS support (Kilkki, 1999). An alternative approach called IntServ (which stands for Integrated Services) was also proposed in the same period, but due to scalability problems IntServ was not as successful as DiffServ has been. This QoS architecture sees all the traffic in the network as formed by traffic aggregates. DiffServ does not care about individual flows, and knows nothing about the state of each communications. IP packets are just classified in groups depending on the type of traffic. For example, a voice packet belongs to the same traffic class no matter which traffic flow it belongs to. The keys for this architecture to work are two:
● Each packet must receive a mark that is respected along is way through the DiffServ domain. This mark may be set by the transmitting user or by the fist system in the domain,which is called edge node. A byte in the IP header previously called ToS (Type of Service) is now called DS (Differentiated Services) and its first 6 bits are called DSCP (Differentiated Services Code Point). Although the standards recommend certain DSCP
14
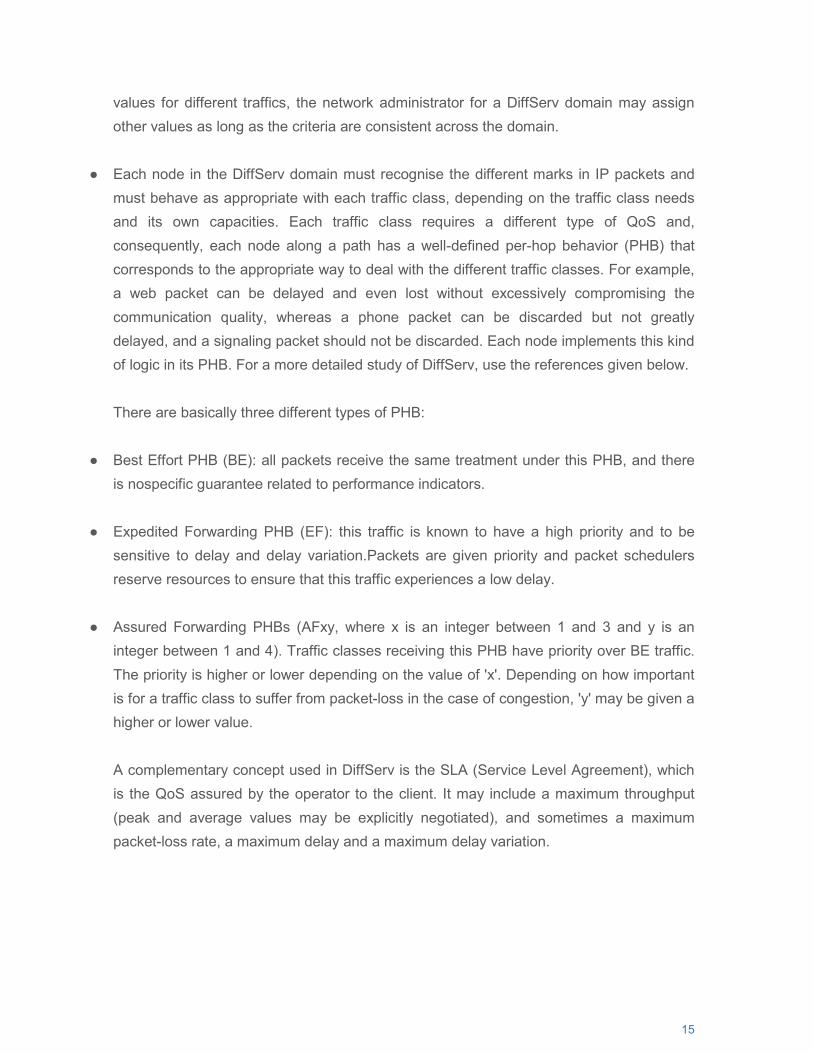
A Diffserv transport network to bring 3G access to villages in the Amazon forest
values for different traffics, the network administrator for a DiffServ domain may assign other values as long as the criteria are consistent across the domain.
● Each node in the DiffServ domain must recognise the different marks in IP packets and must behave as appropriate with each traffic class, depending on the traffic class needs and its own capacities. Each traffic class requires a different type of QoS and, consequently, each node along a path has a well-defined per-hop behavior (PHB) that corresponds to the appropriate way to deal with the different traffic classes. For example, a web packet can be delayed and even lost without excessively compromising the communication quality, whereas a phone packet can be discarded but not greatly delayed, and a signaling packet should not be discarded. Each node implements this kind of logic in its PHB. For a more detailed study of DiffServ, use the references given below. There are basically three different types of PHB:
● Best Effort PHB (BE): all packets receive the same treatment under this PHB, and there is nospecific guarantee related to performance indicators.
● Expedited Forwarding PHB (EF): this traffic is known to have a high priority and to be sensitive to delay and delay variation.Packets are given priority and packet schedulers reserve resources to ensure that this traffic experiences a low delay.
● Assured Forwarding PHBs (AFxy, where x is an integer between 1 and 3 and y is an integer between 1 and 4). Traffic classes receiving this PHB have priority over BE traffic. The priority is higher or lower depending on the value of 'x'. Depending on how important is for a traffic class to suffer from packet-loss in the case of congestion, 'y' may be given a higher or lower value. A complementary concept used in DiffServ is the SLA (Service Level Agreement), which is the QoS assured by the operator to the client. It may include a maximum throughput (peak and average values may be explicitly negotiated), and sometimes a maximum packet-loss rate, a maximum delay and a maximum delay variation.
15
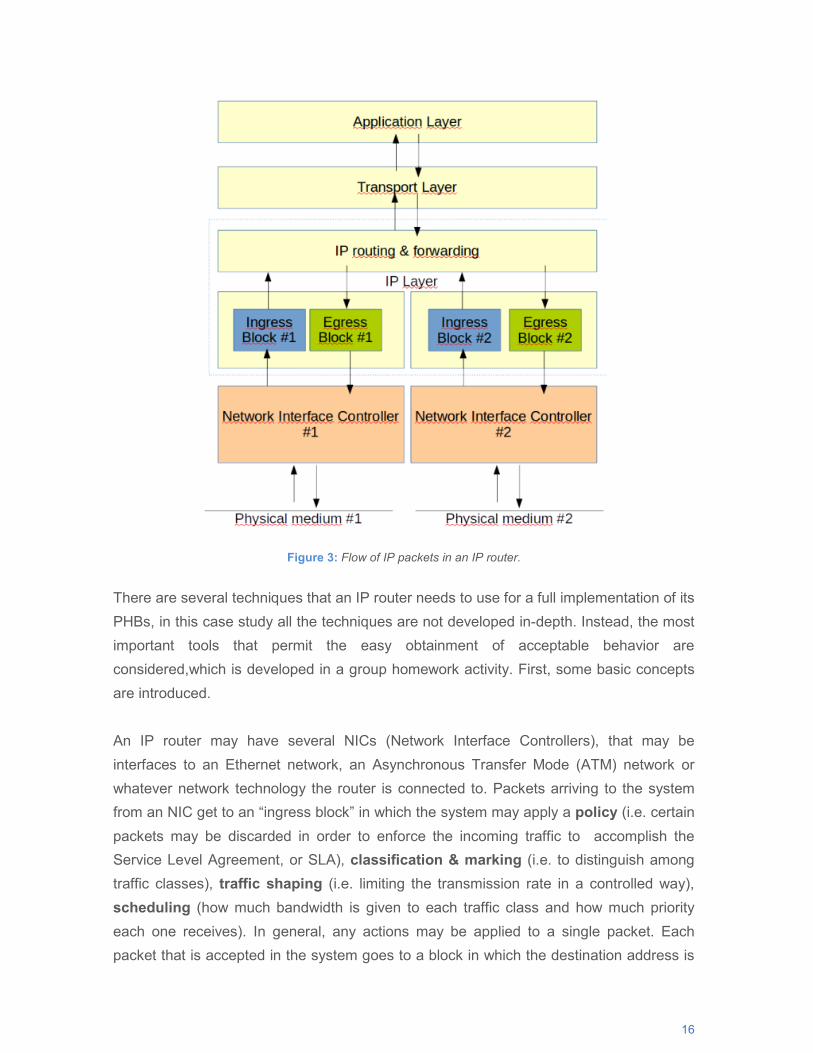
A Diffserv transport network to bring 3G access to villages in the Amazon forest
Figure 3: Flow of IP packets in an IP router.
There are several techniques that an IP router needs to use for a full implementation of its PHBs, in this case study all the techniques are not developed in-depth. Instead, the most important tools that permit the easy obtainment of acceptable behavior are considered,which is developed in a group homework activity. First, some basic concepts are introduced. An IP router may have several NICs (Network Interface Controllers), that may be interfaces to an Ethernet network, an Asynchronous Transfer Mode (ATM) network or whatever network technology the router is connected to. Packets arriving to the system from an NIC get to an “ingress block” in which the system may apply a policy (i.e. certain packets may be discarded in order to enforce the incoming traffic to accomplish the Service Level Agreement, or SLA), classification & marking (i.e. to distinguish among traffic classes), traffic shaping (i.e. limiting the transmission rate in a controlled way), scheduling (how much bandwidth is given to each traffic class and how much priority each one receives). In general, any actions may be applied to a single packet. Each packet that is accepted in the system goes to a block in which the destination address is
16

A Diffserv transport network to bring 3G access to villages in the Amazon forest
examined in order to decide if the packet must be forwarded to another system or must be passed to the upper layer instead. In the former case, the routing table is used to determine the outgoing Network Interface Controller (NIC) to which the packet must be forwarded, and then the packet passes to its egress block. An egress block contains a queuing discipline in which outgoing packets are queued. There are many types of queuing disciplines, in the reference below, the student may revise the most important disciplines and understand what each one is used for. DISCUSSION: The students should discuss where in the diagram above a system applies its PHB. FROM THE CASE STUDY: Remote 3G cells are spread over sparsely populated areas. Each cell has very few simultaneous users. The use of a common infrastructure for the transport network lowers its cost, and the low demand of each individual small cell makes it possible to do this.
17
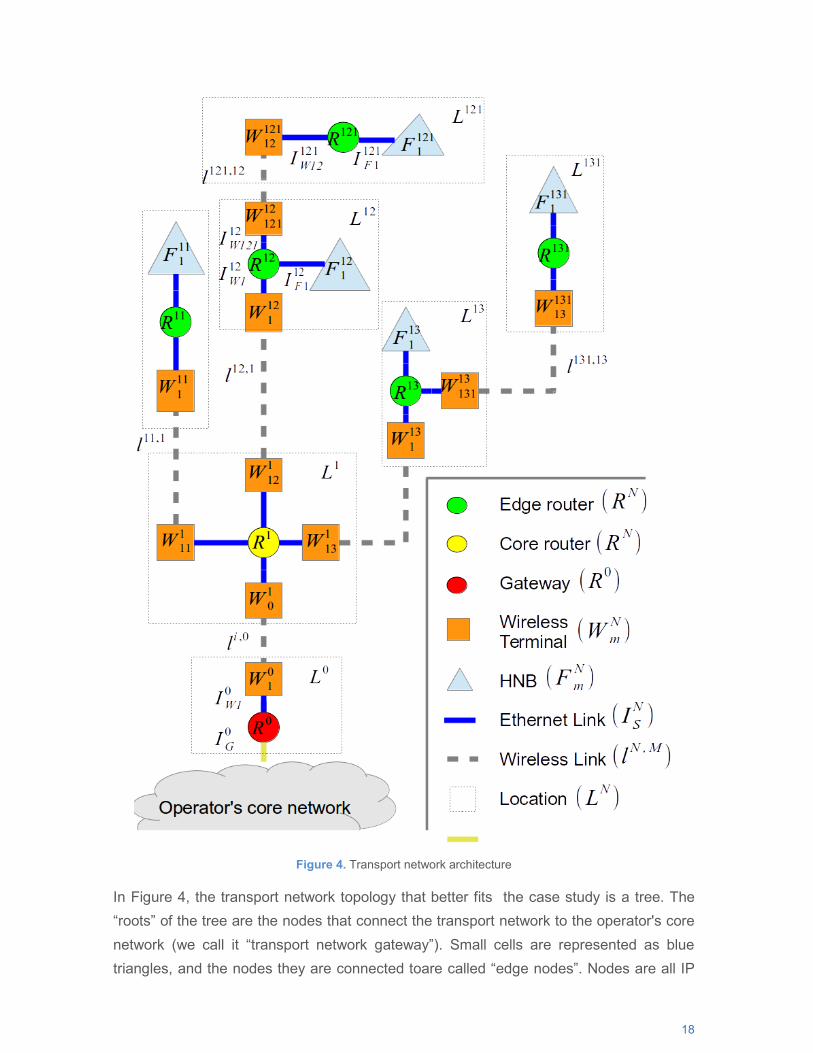
A Diffserv transport network to bring 3G access to villages in the Amazon forest
Figure 4. Transport network architecture
In Figure 4, the transport network topology that better fits the case study is a tree. The “roots” of the tree are the nodes that connect the transport network to the operator's core network (we call it “transport network gateway”). Small cells are represented as blue triangles, and the nodes they are connected toare called “edge nodes”. Nodes are all IP
18
A Diffserv transport network to bring 3G access to villages in the Amazon forest
routers and are represented by circles. In this project, research activities have shown that WiFi or WiMAX links may be used to link any pair of nodes that are fifty kilometres away or even more. The only important condition is that the router has a limit for the maximum throughput that it can present to the link, in order to ensure that the link works with very low delay, negligible packet loss and stable behavior. Hence, each node must receive packets, decide what link it must forward them to, classify them, differentiate traffic classes and give them different priorities, and restrict the maximum throughput that is presented to each node. This is done with DiffServ. The small cells (called HNBs in the figure) mark all IP packets with a DSCP that indicates the traffic class each packet belongs to. DISCUSSION: What should nodes do with the traffic? In what block -ingress, egress- should they apply these operations? Take Figure 3 and try to specify how things happen as much as possible, provided that the whole transport network is a DiffServ domain.
3.4. QUEUING DISCIPLINES IP routers switch IP packets, which means that individual IP packets get into the router through an interface (or are originated by upper layers in that router). Figure 3 shows how packets are guided through the system. Once packets are sent to the egress block for transmission, the system must put them in a queue so that packets are not lost if the channel is busy. The problem of QoS then arises, because packets in a queue are subject to several problems:
● If a packet has several other packets in front of it in the queue, it is going to be significantly delayed. Depending on how constant the delay experienced by consecutive packets in the same flow is, this may impact on the delay, the variation of the delay, or both.
● If the number of packets arriving to the queue is higher that the number of packets that can be transmitted in average, the queue will eventually be full and packets will be dropped. A packet arrived to a full queue is dropped, no matter how important it is. In order to combine the necessity of queuing the packets and the QoS requirements, a complex queuing discipline may be required (LARTC, 2014). A queuing discipline (also commonly called qdisc) determines how packets are managed. The simpler qdisc is a FIFO queuing discipline that puts each new packet always at the
19
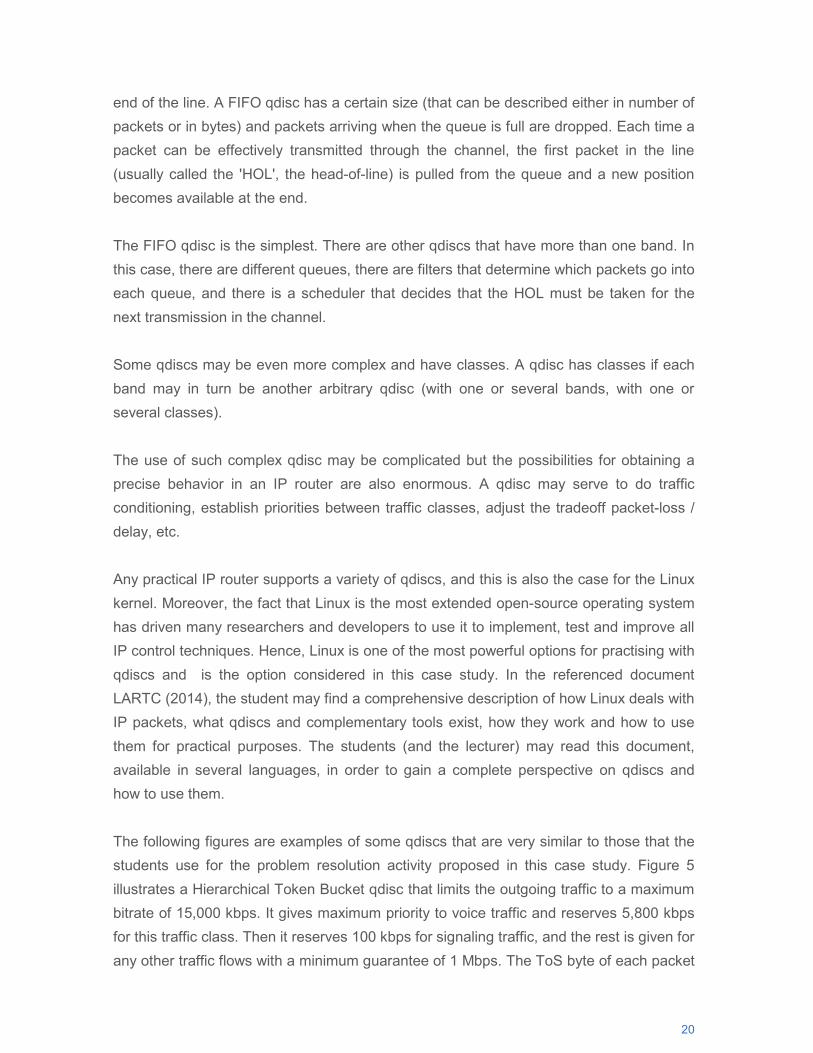
A Diffserv transport network to bring 3G access to villages in the Amazon forest
end of the line. A FIFO qdisc has a certain size (that can be described either in number of packets or in bytes) and packets arriving when the queue is full are dropped. Each time a packet can be effectively transmitted through the channel, the first packet in the line (usually called the 'HOL', the head-of-line) is pulled from the queue and a new position becomes available at the end. The FIFO qdisc is the simplest. There are other qdiscs that have more than one band. In this case, there are different queues, there are filters that determine which packets go into each queue, and there is a scheduler that decides that the HOL must be taken for the next transmission in the channel. Some qdiscs may be even more complex and have classes. A qdisc has classes if each band may in turn be another arbitrary qdisc (with one or several bands, with one or several classes). The use of such complex qdisc may be complicated but the possibilities for obtaining a precise behavior in an IP router are also enormous. A qdisc may serve to do traffic conditioning, establish priorities between traffic classes, adjust the tradeoff packet-loss / delay, etc. Any practical IP router supports a variety of qdiscs, and this is also the case for the Linux kernel. Moreover, the fact that Linux is the most extended open-source operating system has driven many researchers and developers to use it to implement, test and improve all IP control techniques. Hence, Linux is one of the most powerful options for practising with qdiscs and is the option considered in this case study. In the referenced document LARTC (2014), the student may find a comprehensive description of how Linux deals with IP packets, what qdiscs and complementary tools exist, how they work and how to use them for practical purposes. The students (and the lecturer) may read this document, available in several languages, in order to gain a complete perspective on qdiscs and how to use them. The following figures are examples of some qdiscs that are very similar to those that the students use for the problem resolution activity proposed in this case study. Figure 5 illustrates a Hierarchical Token Bucket qdisc that limits the outgoing traffic to a maximum bitrate of 15,000 kbps. It gives maximum priority to voice traffic and reserves 5,800 kbps for this traffic class. Then it reserves 100 kbps for signaling traffic, and the rest is given for any other traffic flows with a minimum guarantee of 1 Mbps. The ToS byte of each packet
20
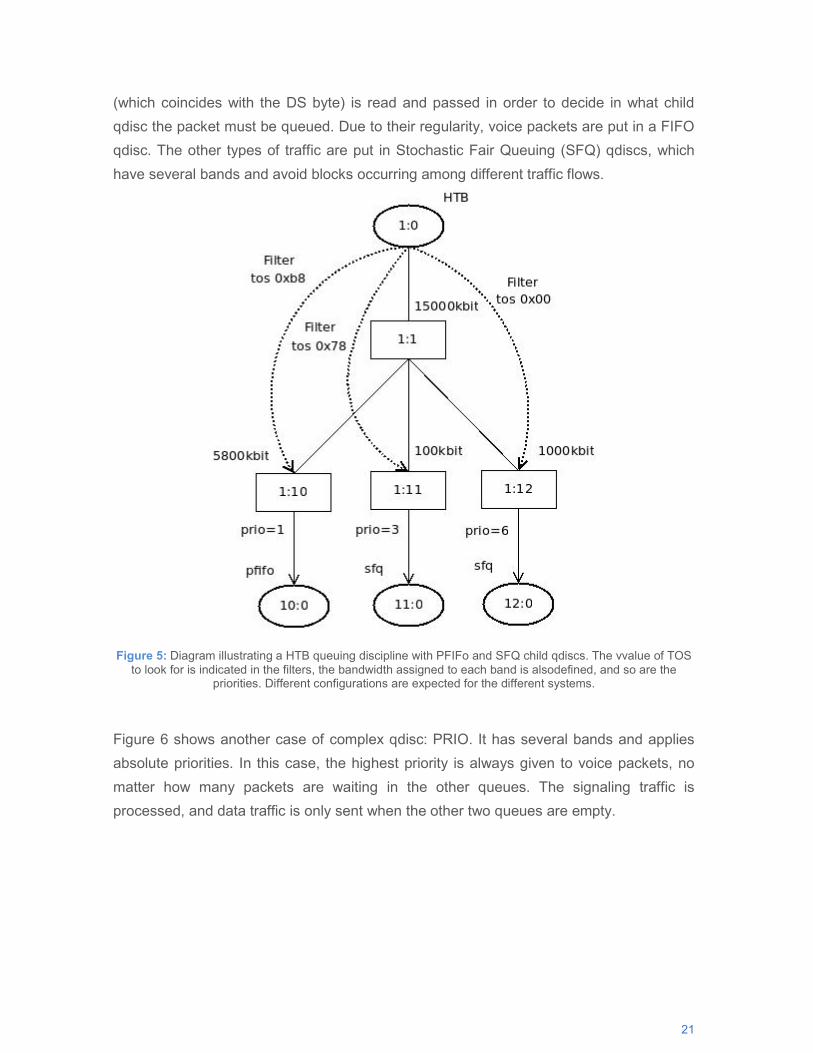
A Diffserv transport network to bring 3G access to villages in the Amazon forest
(which coincides with the DS byte) is read and passed in order to decide in what child qdisc the packet must be queued. Due to their regularity, voice packets are put in a FIFO qdisc. The other types of traffic are put in Stochastic Fair Queuing (SFQ) qdiscs, which have several bands and avoid blocks occurring among different traffic flows.
Figure 5: Diagram illustrating a HTB queuing discipline with PFIFo and SFQ child qdiscs. The vvalue of TOS to look for is indicated in the filters, the bandwidth assigned to each band is alsodefined, and so are the
priorities. Different configurations are expected for the different systems. Figure 6 shows another case of complex qdisc: PRIO. It has several bands and applies absolute priorities. In this case, the highest priority is always given to voice packets, no matter how many packets are waiting in the other queues. The signaling traffic is processed, and data traffic is only sent when the other two queues are empty.
21
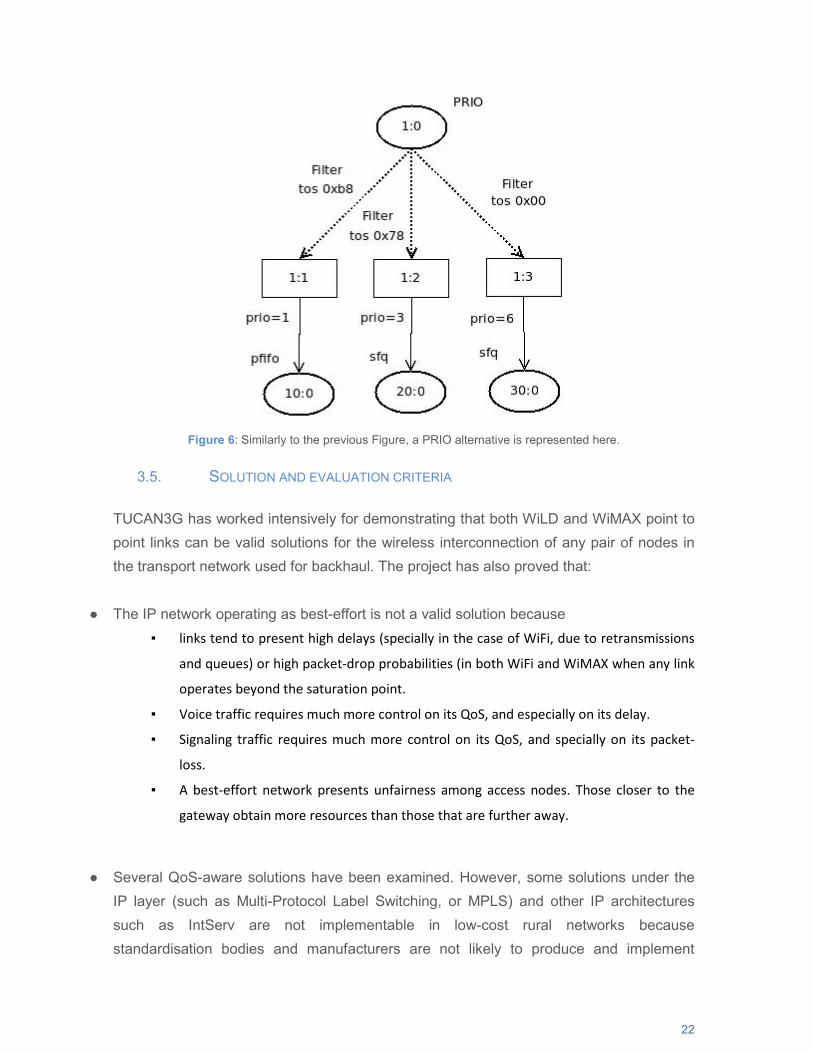
A Diffserv transport network to bring 3G access to villages in the Amazon forest
Figure 6: Similarly to the previous Figure, a PRIO alternative is represented here.
3.5. SOLUTION AND EVALUATION CRITERIA TUCAN3G has worked intensively for demonstrating that both WiLD and WiMAX point to point links can be valid solutions for the wireless interconnection of any pair of nodes in the transport network used for backhaul. The project has also proved that:
● The IP network operating as best-effort is not a valid solution because ▪ links tend to present high delays (specially in the case of WiFi, due to retransmissions
and queues) or high packet-drop probabilities (in both WiFi and WiMAX when any link
operates beyond the saturation point.
▪ Voice traffic requires much more control on its QoS, and especially on its delay.
▪ Signaling traffic requires much more control on its QoS, and specially on its packet-
loss.
▪ A best-effort network presents unfairness among access nodes. Those closer to the
gateway obtain more resources than those that are further away.
● Several QoS-aware solutions have been examined. However, some solutions under the
IP layer (such as Multi-Protocol Label Switching, or MPLS) and other IP architectures such as IntServ are not implementable in low-cost rural networks because standardisation bodies and manufacturers are not likely to produce and implement
22

A Diffserv transport network to bring 3G access to villages in the Amazon forest
solutions for these “poor markets”. On the other hand, DiffServ is supported by barely any network device nowadays, and DiffServ routers can be developed with few resources. Hence, DiffServ is a feasible solution.
● It is not efficient that traffic occupies several links in a chain for eventual discarding. Similarly, it is not efficient that packets enter a node, enter the egress queue, generate delay to other packets, and are eventually discarded.
● The limitations on delay imposed by the voice traffic require that all nodes conduct traffic shaping in order to prevent links from operating under saturation conditions. Hence,
● Edge nodes must apply ingress policing, which means that traffic exceeding certain thresholds must be discarded before it can cause damage to legitimate traffic.
● All nodes must know the maximum capacity of the links under unsaturated conditions, and egress queuing disciplines must perform traffic shaping.
● The available bandwidth must be assigned differently for the three aggregated traffic classes:
▪ Signaling must have maximum priority, with a long queue to prevent packet-drop and a share of 1% of the total bandwidth.
▪ Voice must have priority on data and shall be assigned a guarantee corresponding to the maximum occupation of telephony channels.
▪ Data must have the rest of all available resources, with minimum priority. The lecturer may use the TUCAN3G deliverable TUCAN3G-D51 (2014), especially Chapter 6, for exhaustive explanations regarding the most appropriate solution to the case study.
4. HOMEWORK ACTIVITY Students should be srganized in groups of 3-4 student. It is advisable, though not necessary, that two of them have a laptop computer available with Linux or alternately with a Live-linux pendrive. See Ubuntu (2014) for guidance on how to use it.
23
A Diffserv transport network to bring 3G access to villages in the Amazon forest
STEP 1.- Understand how advanced queuing disciplines behave. Students must visit the LARTC (2014) site and read about queuing disciplines in general, and particularly on HTB, TBF and SFQ qdiscs. The students must also understand how filters work, especially DSCP filtering. If the students have access to a Linux system, it is a good idea to test the different qdiscs, individually and combined, with the assistance of a traffic injector like (D-ITG, 2014). However, this experimental part is not obligatory. Either after theoretical study or after testing, the students must describe the behaviour of each queuing discipline. STEP 2.- Formally define the types of traffic that the network must differentiate between, how priorities should be assigned, and how and where traffic is differentiated. What DSCP values would you assign to each traffic class? Why? Where should packets be marked? BONUS: how should filters be configured in queuing disciplines in order to recognise the different DSCP marks? STEP 3.- Take the transport network architecture illustrated in Figure 4, and apply it to a segment of the Napo network. Consider that each village between Santa Clotilde and Tuta Pishco has a 3G small cell, except Santa Clotilde, which has two cells and consider also that the gateway is connected to a satellite communications system in Negro Urco. Design the specific network architecture for the network described. Identify all systems and links, and describe each system's functions. STEP 4.- Consider that each HNB generates a maximum voice traffic throughput of 320 kbps in the uplink and 960 kbps in the downlink. It also requires a capacity of 500 kbps in the uplink and 2500 kbps in the downlink for data traffic (although the data traffic may be higher if the available capacity allows it), and the signalling traffic is always below 1% of the rest of the traffic in eac direction. The delay for signaling and for voice must be under 50 ms, and the packet loss must be 0% for signalling and <1% for voice traffic. Links generate a delay of 5 ms each. Calculate what capacity is required for each link in order to bear all the traffic properly. STEP 5.- Policing: the transport network is going to accept a limited amount of traffic from/to each HNB. Traffic exceeding these maximums must be discarded in order to prevent the transport network becoming saturated. Say exactly where these limitations need to be imposed and what the limits imposed in each point are.
24
A Diffserv transport network to bring 3G access to villages in the Amazon forest
STEP 6.- Traffic shaping and bandwidth sharing:Use either Hierarchical Token Bucket (HTB) or PRIO queuing disciplines for the root queue in the egress block of each router. Both queuing disciplines have classes, so they have several bands and choose what child queuing discipline manages the traffic in each band. Consider only three possibilities for the child qdiscs: FIFO, TBF and SFQ. The traffic offered to each link must be limited to the maximum previously calculated.How much is this limitation for each system and ho can this be done in the proposed queuing disciplines? What is the share that each traffic class has in each system? What are the differences between HTB and PRIO in the way they support both the traffic shaping and the bandwidth sharing? What child queuing disciplines should be used in each case? STEP 7.- Put everything together and propose a complete configuration for a correct QoS management in the network. In the proposal, should IP packets be marked before entering the transport network? Can packets keep their marks after abandoning the transport network? With the answer to all the previous questions, compose a technical proposal on how the transport network may be implemented. Solution and evaluation criteria The network has four routers in a row, with wireless links connecting each hop. Each wireless link needs to have a capacity higher than the maximum throughput expected across that link. The link starting in Santa Clotilde only bears the traffic exchanged by the two HNB in that town, but the next one must add the traffic exchanged with Tachsa's traffic. The link from Negro Urco to Tuta Pishco only bears Tuta's traffic. Finally, the gateway in Negro Urco aggregates all the traffic at the interface to the satellite link. The policing must be done in the ingress blocks to which HNB are connected. Packets discarded later will impact negatively on the network's performance. Then, each egress block must use a traffic shaper to limit the traffic to the maximum expected in the design. HTB allows this maximum in the root qdisc to be imposed, while PRIO does not. Hence, in the case of using PRIO the traffic in child queues must be shaped using TBF. In HTB, the bands for voice and signalling must be dimensioned for 100% of traffic expected, and the rest must be assigned to data. Child queues for voice and signalling should be FIFO, but SFQ should be used for data traffic.
25
A Diffserv transport network to bring 3G access to villages in the Amazon forest
Regarding the traffic marking and unmarking, HNB may mark the DSCP of each packet (this is what actually happens in the reality). Alternatively the edge node may classify the traffic, but this is a difficult task. DSCP are referred to as hexadecimal or decimal numbers that represent the 6 highest bits in the DS field. Hence, filters must read the DS byte, do a two-bit shift (introducing zeros on the two left-most bits) and interpret the value obtained. Last but not least, the students must understand the importance of unmarking the DSCP in all packets in the gateway for the outgoing traffic. Packets with non-zero DSCP may be interpreted differently out of the transport network. The semantics of the DSCP are internal to the DiffServ domain. The lecturer may use the TUCAN3G deliverable TUCAN3G-D52 (2014), particularly 8.2, for full explanations regarding the most appropriate solution to the case study problem.
26
A Diffserv transport network to bring 3G access to villages in the Amazon forest
BIBLIOGRAPHY D-ITG, Available from: <http://traffic.comics.unina.it/software/ITG/> (Last visit: July 2014). ECONOMIC COMMISSION FOR LATIN AMERICA AND THE CARIBBEAN (2012) Anuario Estadístico de América Latina y el Caribe 2012. Santiago de Chile. ECLAC. INTERNET ENGINEERING TASK FORCE (1998) RFC 2475: An Architecture for Differentiated Services. IETF. INTERNET ENGINEERING TASK FORCE (1998) RFC 2474: Definition of the Differentiated Services Field (DS Field) in the IPv4 and IPV6 Headers. IETF. INTERNET ENGINEERING TASK FORCE (1999) RFC 2597: Assured Forwarding PHB Group. IETF. INTERNATIONAL TELECOMMUNICATIONS UNION (2001) Recommendation ITU-T G-1010: End-user multimedia QoS categories. Geneve. ITU-T. INTERNET ENGINEERING TASK FORCE (2002) RFC 3246: An Expedited Forwarding PHB (Per-Hop Behavior). IETF. INTERNATIONAL TELECOMMUNICATIONS UNION (2008) Recommendation ITU-T E-800: Quality of telecommunication services: concepts, models, objectives and dependability planning – Terms and definitions related to the quality of telecommunication services. Geneve. ITU-T. Kilkki K 1999, Differentiated services for the Internet. Macmillan Technical Publishing. Klein G et al. 2007, Diagnóstico Regional en Materia de Políticas, Estrategias y Regulaciones de las Telecomunicaciones y Desarrollo de las Tecnologías de la Comunicación e Información (TIC). Aplicaciones en las áreas de Educación, Salud y Catástrofes en Zonas Rurales, Regiones Aisladas y Urbano-Marginales: Final Report ITU, Brasilia. LARTC, Available from: <http://www.lartc.org> (Last visit: July 2014). TUCAN3G (2013) Wireless technologies for isolated rural communities in developing countries based on cellular 3G femtocell deployments. Project funded by FP7, European Commission. Available from: <http://www.ict-tucan3g.eu/>. TUCAN3G-D21 (2013) Socio-economic scenarios, technical specifications and architecture for the proof of concept. Deliverable D21 of TUCAN3G project. Available from: <http://www.ict-tucan3g.eu/index.php?option=com_ckforms&view=ckforms&id=4&Itemid=88&doct=deliverables&doc=TUCAN3G_D21EHASd.pdf> (June 2013). TUCAN3G-D51 (2013) Technical requirements and evaluation of WiLD, WIMAX and VSAT for backhauling rural femtocells networks. Deliverable D51 of TUCAN3G project. Available from: <http://www.ict-tucan3g.eu/index.php?option=com_ckforms&view=ckforms&id=4&Itemid=88&doct=deliverables&doc=TUCAN3G_D51URJCa.pdf> (October 2013).
27
A Diffserv transport network to bring 3G access to villages in the Amazon forest
TUCAN3G-D52 (2014) Heterogeneous transport network testbed deployed and validated in laboratory. Deliverable D52 of TUCAN3G project. Available from: <http://www.ict-tucan3g.eu/index.php?option=com_spcom&Itemid=88> (October 2014). Ubuntu. Available from: <http://www.ubuntu.com> (Last visit: July 2014). UNITED NATIONS DEVELOPMENT PROGRAMME (2013) Human Development Report 2013: The raise of the South: Human progress in a diverse world. New York. United Nations Development Programme.
28

http://www.gdee.eu
This project is funded by
Ignacio Echeveste Guzmán and Manuel Lambea Olgado
PHOTO: Mobile telephony supports medical consultation in Cusco, Peru. ONGAWA.
CASE STUDIES
Finding the Poynting´s Theorem in a Health Centrein San Pablo (Peru)

DL B 10735-2015 ISBN 978-84-606-7546-4
Finding the Poynting´s Theorem in a Health Centre in San Pablo (Peru)
COORDINATED BYAgustí Pérez-Foguet, Enric Velo, Pol Arranz, Ricard Ginéand Boris Lazzarini (Universitat Politècnica de Catalunya)Manuel Sierra (Universidad Politécnica de Madrid)Alejandra Boni and Jordi Peris (Universitat Politècnica de València)Guido Zolezzi and Gabriella Trombino (Università degli Studi di Trento)Rhoda Trimingham (Loughborough University)Valentín Villarroel (ONGAWA)Neil Nobles and Meadhbh Bolger (Practical Action)Francesco Mongera (Training Center for International Cooperation)Katie Cresswell-Maynard (Engineering Without Border UK)
EDITED BY Global Dimension in Engineering Education
Citation: Echeveste Guzmán, I. and Lambea Olgado, M. (2015) ' Finding the Poynting´s Theorem in a Health Centre in San Pablo (Peru)',in Case studies for developing globally responsible engineers, GDEE (eds.), Global Dimension in Engineering Education, Barcelona. Available from: http://gdee.eu/index.php/resources.html
This publication is distributedunder an Attribution- Noncommercial-Share Alike License for Creative Commons
CASE STUDIES
Disclaimer: This document has been produced with the financial assistance of the European UnionThe contents of this document are the sole responsibility of the authors and can under no circumstances be regarded as reflecting the position of the European Union
Finding the Poynting´s Theorem in a Health Centre in San Pablo (Peru)
FINDING THE POYNTING´S THEOREM IN A HEALTH CENTRE IN SAN PABLO (PERU)
Ignacio Echeveste Guzmán, PhD Student at Signals, Systems and Radiocommunications (SSR) Department in “Escuela Técnica Superior de Ingenieros de Telecomunicación, Universidad Politécnica de Madrid” (ETSIT-UPM). Manuel Lambea Olgado, Assistant Professor at SSR Department in ETSIT-UPM.
1
Finding the Poynting´s Theorem in a Health Centre in San Pablo (Peru)
INDEX
1. INTRODUCTION ........................................................................................................................... 3
1.1. DISCIPLINES COVERED ............................................................................................................. 3
1.2. LEARNING OUTCOMES .............................................................................................................. 3
1.3. ACTIVITIES .............................................................................................................................. 3
2. DESCRIPTION OF THE CONTEXT ............................................................................................. 4
2.1. PERU AT A GLANCE .................................................................................................................. 4
2.2. TELECOMMUNICATION SECTOR ...................................................................................... 5
2.3. GOVERNANCE IN PERU ..................................................................................................... 7
2.4. HEALTH ................................................................................................................................ 7
2.5. WILLAY PROGRAM .............................................................................................................. 8
3. CLASS ACTIVITY ......................................................................................................................... 9
3.1. SOLUTION AND EVALUATION CRITERIA ..................................................................................... 15
4. HOMEWORK ACTIVITY ............................................................................................................. 15
4.1. SOLUTION AND EVALUATION CRITERIA ..................................................................................... 22
BIBLIOGRAPHY ................................................................................................................................. 27 ANNEX 1 DETAILED SOLUTION OF CLASS ACTIVITY (PROBLEM 1) ........................................ 29
ANNEX 2 DETAILED SOLUTION OF HOMEWORK ACTIVITY (PROBLEMS 2, 3, 4, 5, AND 6) ... 31
2
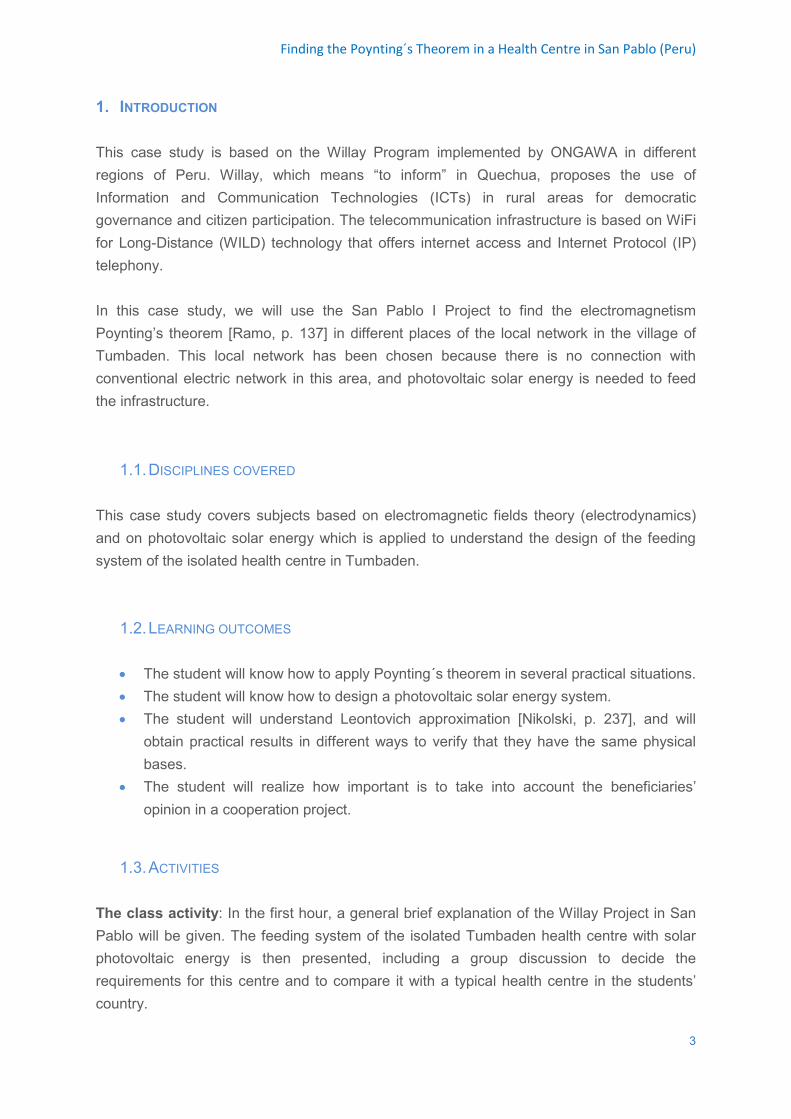
Finding the Poynting´s Theorem in a Health Centre in San Pablo (Peru)
1. INTRODUCTION This case study is based on the Willay Program implemented by ONGAWA in different regions of Peru. Willay, which means “to inform” in Quechua, proposes the use of Information and Communication Technologies (ICTs) in rural areas for democratic governance and citizen participation. The telecommunication infrastructure is based on WiFi for Long-Distance (WILD) technology that offers internet access and Internet Protocol (IP) telephony. In this case study, we will use the San Pablo I Project to find the electromagnetism Poynting’s theorem [Ramo, p. 137] in different places of the local network in the village of Tumbaden. This local network has been chosen because there is no connection with conventional electric network in this area, and photovoltaic solar energy is needed to feed the infrastructure.
1.1. DISCIPLINES COVERED This case study covers subjects based on electromagnetic fields theory (electrodynamics) and on photovoltaic solar energy which is applied to understand the design of the feeding system of the isolated health centre in Tumbaden.
1.2. LEARNING OUTCOMES
• The student will know how to apply Poynting´s theorem in several practical situations. • The student will know how to design a photovoltaic solar energy system. • The student will understand Leontovich approximation [Nikolski, p. 237], and will
obtain practical results in different ways to verify that they have the same physical bases.
• The student will realize how important is to take into account the beneficiaries’ opinion in a cooperation project.
1.3. ACTIVITIES
The class activity: In the first hour, a general brief explanation of the Willay Project in San Pablo will be given. The feeding system of the isolated Tumbaden health centre with solar photovoltaic energy is then presented, including a group discussion to decide the requirements for this centre and to compare it with a typical health centre in the students’ country.
3
Finding the Poynting´s Theorem in a Health Centre in San Pablo (Peru)
In the second hour, the first Poynting problem is proposed to the students (Problem 1: The sunlight incising on the solar panel). They will try to solve it, through group work, and finally, every student will deliver the solution individually to the teacher. Lastly, the teacher solves the proposed problem and briefly presents the homework activity. The homework activity consists of five problems to be delivered individually by the students, although some group work is allowed: Problem 2 is to design the solar photovoltaic feeding system of the health centre in Tumbaden (the dimensioning of the solar panels and the battery). Problem 3 is to apply Poynting´s theorem to a part of the feeding system of the health centre in Tumbaden. Problem 4 is to apply Poynting´s theorem to the radio communication system between the secondary school and the health centre. Problem 5 is to apply Poynting´s theorem and the Leontovich approximation to the coaxial cable that connects the antenna with the receptor in the health centre. Problem 6 is to discover the real physical characteristics of the coaxial cable used by means of the transmission lines theory and to verify the attenuation obtained in Problem 5 using Poynting´s theorem. 2. DESCRIPTION OF THE CONTEXT
2.1. PERU AT A GLANCE Peru is the third largest country in Latin America after Brazil and Argentina, with an area of 1,285,216 km2 (2.5 times the area of Spain). It is the fifth most populous country in Latin America after Brazil, Mexico, Colombia and Argentina, with a population density of 23.7 inhabitants / Km ², four times lower than Spain. In Peru socially deep inequalities persist. There is a large contrast in Human Development Index (HDI) scores between the capital and the provinces and between urban and rural areas. Although the country has experienced steady economic growth in recent years, there are still major challenges related to social inclusion and gender equality, for example. Many social conflicts, uprisings and protests from people living in the interior of Peru have taken place as a result of a lack of economic investment in this area, despite the economic boom. There are severe limitations on access to good quality basic services such as education, health, water, housing and electricity; as
4
Finding the Poynting´s Theorem in a Health Centre in San Pablo (Peru)
well as poor promotion of economic opportunity and progress for much of the rural population. Administratively, Peru is divided into 25 regions, 194 provinces and 1624 districts. The elections of regional and local (provincial and district) authorities are held every five years. The complex and rugged geography and the implementation of population concentration policies have created an unequal and asymmetric occupation of the country. This makes it difficult to overcome the various spatial dimensions of development, promote social cohesion and ensure state presence. In addition, expensive transport and communications infrastructure is required to ensure connectivity. The country has been experiencing major demographic transition since the mid-1960s. A population explosion has been coupled with increasing migration to the big cities, in particular Lima. It is estimated that the population of Peru in 2014 was 30,814,175 inhabitants, with an annual average growth rate of 1.11%. There is a high concentration of the population in urban areas (73%), especially in Lima, where more than a third of the total population lives. The World Bank report "Peru 2012" stated that 53% of the rural population lives below the national rural poverty line. Peru is characterised by a Human Development Index (HDI) of 0.741 according to data in 2013, which places it in the group of countries with high HDI, ranking 77 of 185, below Cuba, and above Turkey and Brazil. The Adjusted HDI (IDHI), which reflects disparities between the population in income, health and education, is 0.561, 24.3% less than the corresponding HDI. According to the International Monetary Fund (IMF) in 2013 Peru is considered a middle-income country with a GDP per capita of € 8,132 per inhabitant (compared to € 25,222 per inhabitant in the European Union). Economic reforms during the 1990s were key to an impressive improvement of the Peruvian economy. Important macroeconomic developments and the liberalization of the telecommunications market favoured private investment. During the 1990s the evolution of investment in utility infrastructure, especially telecommunications and energy, mainly benefited households and businesses in urban areas, neglecting investment in rural infrastructure.
2.2. TELECOMMUNICATION SECTOR Mobile telephony coverage in Peru has had a high annual growth rate, which stood at 82% in 2013, compared with 28.6% in fixed telephony. In comparison, mobile telephony penetration in Europe was 128% in 2013. Internet access of urban households in Peru was 20% in 2013 compared with just 0.9% of households in rural areas. Across Europe in the same period, 73% of households were connected to the Internet. 36% of urban households
5
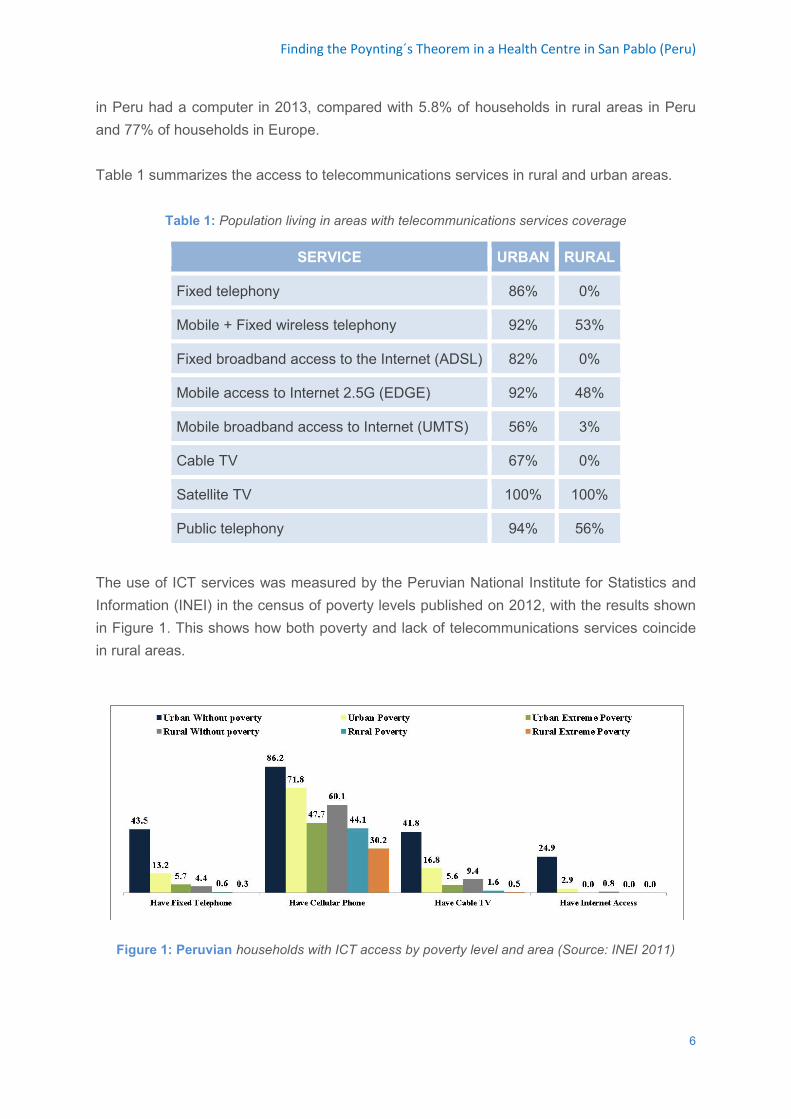
Finding the Poynting´s Theorem in a Health Centre in San Pablo (Peru)
in Peru had a computer in 2013, compared with 5.8% of households in rural areas in Peru and 77% of households in Europe. Table 1 summarizes the access to telecommunications services in rural and urban areas.
Table 1: Population living in areas with telecommunications services coverage
SERVICE URBAN RURAL
Fixed telephony 86% 0%
Mobile + Fixed wireless telephony 92% 53%
Fixed broadband access to the Internet (ADSL) 82% 0%
Mobile access to Internet 2.5G (EDGE) 92% 48%
Mobile broadband access to Internet (UMTS) 56% 3%
Cable TV 67% 0%
Satellite TV 100% 100%
Public telephony 94% 56%
The use of ICT services was measured by the Peruvian National Institute for Statistics and Information (INEI) in the census of poverty levels published on 2012, with the results shown in Figure 1. This shows how both poverty and lack of telecommunications services coincide in rural areas.
Figure 1: Peruvian households with ICT access by poverty level and area (Source: INEI 2011)
6
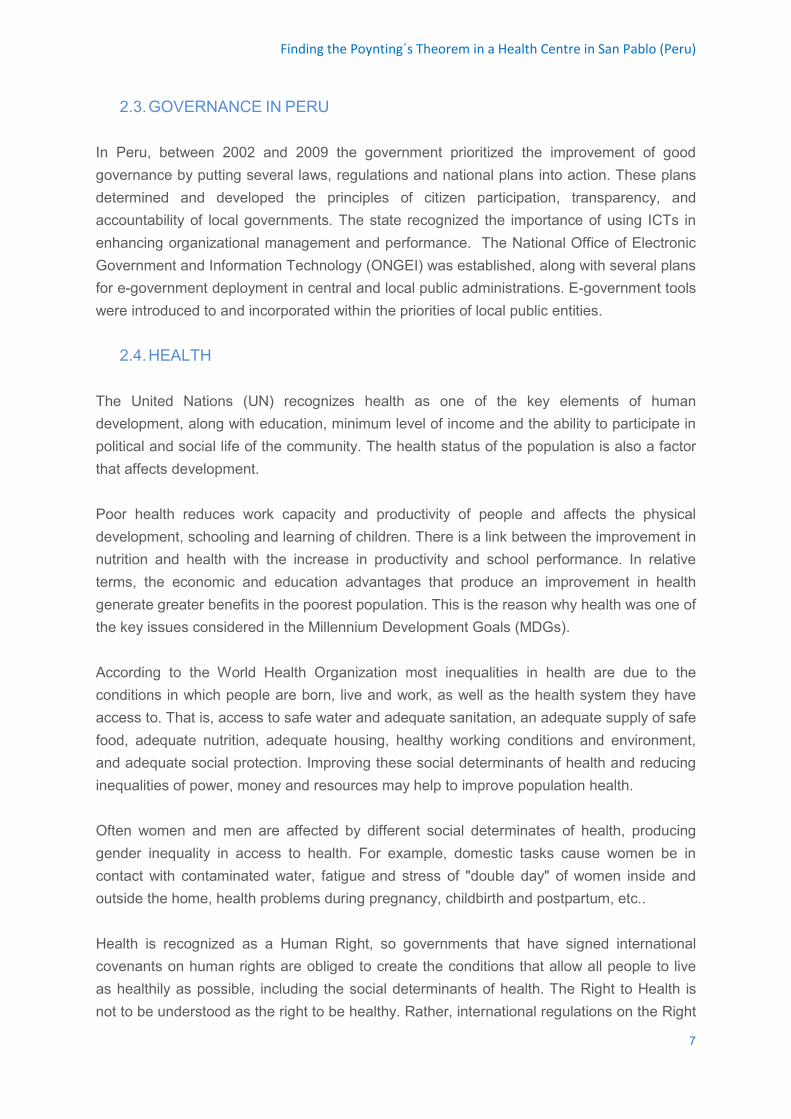
Finding the Poynting´s Theorem in a Health Centre in San Pablo (Peru)
2.3. GOVERNANCE IN PERU In Peru, between 2002 and 2009 the government prioritized the improvement of good governance by putting several laws, regulations and national plans into action. These plans determined and developed the principles of citizen participation, transparency, and accountability of local governments. The state recognized the importance of using ICTs in enhancing organizational management and performance. The National Office of Electronic Government and Information Technology (ONGEI) was established, along with several plans for e-government deployment in central and local public administrations. E-government tools were introduced to and incorporated within the priorities of local public entities.
2.4. HEALTH The United Nations (UN) recognizes health as one of the key elements of human development, along with education, minimum level of income and the ability to participate in political and social life of the community. The health status of the population is also a factor that affects development. Poor health reduces work capacity and productivity of people and affects the physical development, schooling and learning of children. There is a link between the improvement in nutrition and health with the increase in productivity and school performance. In relative terms, the economic and education advantages that produce an improvement in health generate greater benefits in the poorest population. This is the reason why health was one of the key issues considered in the Millennium Development Goals (MDGs). According to the World Health Organization most inequalities in health are due to the conditions in which people are born, live and work, as well as the health system they have access to. That is, access to safe water and adequate sanitation, an adequate supply of safe food, adequate nutrition, adequate housing, healthy working conditions and environment, and adequate social protection. Improving these social determinants of health and reducing inequalities of power, money and resources may help to improve population health. Often women and men are affected by different social determinates of health, producing gender inequality in access to health. For example, domestic tasks cause women be in contact with contaminated water, fatigue and stress of "double day" of women inside and outside the home, health problems during pregnancy, childbirth and postpartum, etc.. Health is recognized as a Human Right, so governments that have signed international covenants on human rights are obliged to create the conditions that allow all people to live as healthily as possible, including the social determinants of health. The Right to Health is not to be understood as the right to be healthy. Rather, international regulations on the Right
7
Finding the Poynting´s Theorem in a Health Centre in San Pablo (Peru)
to Health require governments to provide access to health care with quality care, non-discrimination and economic conditions that do not prevent access of the poor.
2.5. WILLAY PROGRAM The Willay program is implemented in two distinct regions; San Pablo in Cajamarca and Acomayo in Cuzco, together having a combined population of 50,000 people. The majority of the population belong to indigenous communities whose main economic activity is farming (84% of the active population). In Acomayo, 46% of the population does not have access to electricity, 23% do not have access to running water, and 62% do not have access to appropriate sanitation. In terms of HDI, Acomayo is ranked ninth out of the thirteen provinces located in the department of Cuzco, with medium-low HDI similar to that in Sudan. Life expectancy is 63 years, 91% of children between 5 and 18 are in school and the illiteracy rate among women is 42%. Government implementation of national initiatives related to the use of ICT, which are designed based on a developed urban perspective generated unexpected results in these communities because of the lack of connectivity, capacity for management, and technology at the local level. Since there were neither good connections nor qualified technical staff in rural areas, the rural municipalities opted to establish offices in the respective districts’ capitals. These satellite offices added to the municipalities’ costs and complicated the human resources management process. There was limited knowledge regarding regulations on adequate use of management tools and deficiencies in using an appropriate language with the population in public entities. Regarding civil society organizations, they had organizational weaknesses; were unaware of their democratic governance rights and experienced limitations in leadership building. Spaces for consensus existed although they were not properly utilized due to a lack of satisfaction on the citizens’ side. The Willay program, meaning “to inform” in Quechua, proposes the use of ICTs in rural areas for democratic governance and citizen participation. The project explores how ICTs could enhance the processes of transparency, citizen participation and the accountability and effectiveness of local governments. This is achieved by building capacities of the stakeholders involved (civil society organizations and public entities like local government, health centres and schools). In total, 44 local government institutions have been provided with a telecommunication infrastructure shared between them, based on WiFi for Long-Distance (WiLD) technology that offers Internet access and IP telephony. Besides this, it has installed information systems and software and implemented a system of continuous improvement. Public workers and community leaders have also been trained in participatory budgeting,
8
Finding the Poynting´s Theorem in a Health Centre in San Pablo (Peru)
accountability and transparency of institutions public, citizen surveillance, education management and health management. 3. CLASS ACTIVITY The class activity consists of: In the first hour: A general brief explanation (15 minutes) of the context outlined before and the presentation of the Willay Project in San Pablo [Araujo]: This project was developed in Cajamarca department, San Pablo province, in five different districts: San Pablo, San Bernardino, San Luis, Tumbaden and Rodeo Pampa. The project offers internet access and IP telephony in municipalities, health centres and schools in several villages located within the different districts. The telecommunication infrastructure is based on WiFi for Long-Distance (WILD) technology. The telecommunication network is ordered by trunk and local networks as shown in Figure 2.
9
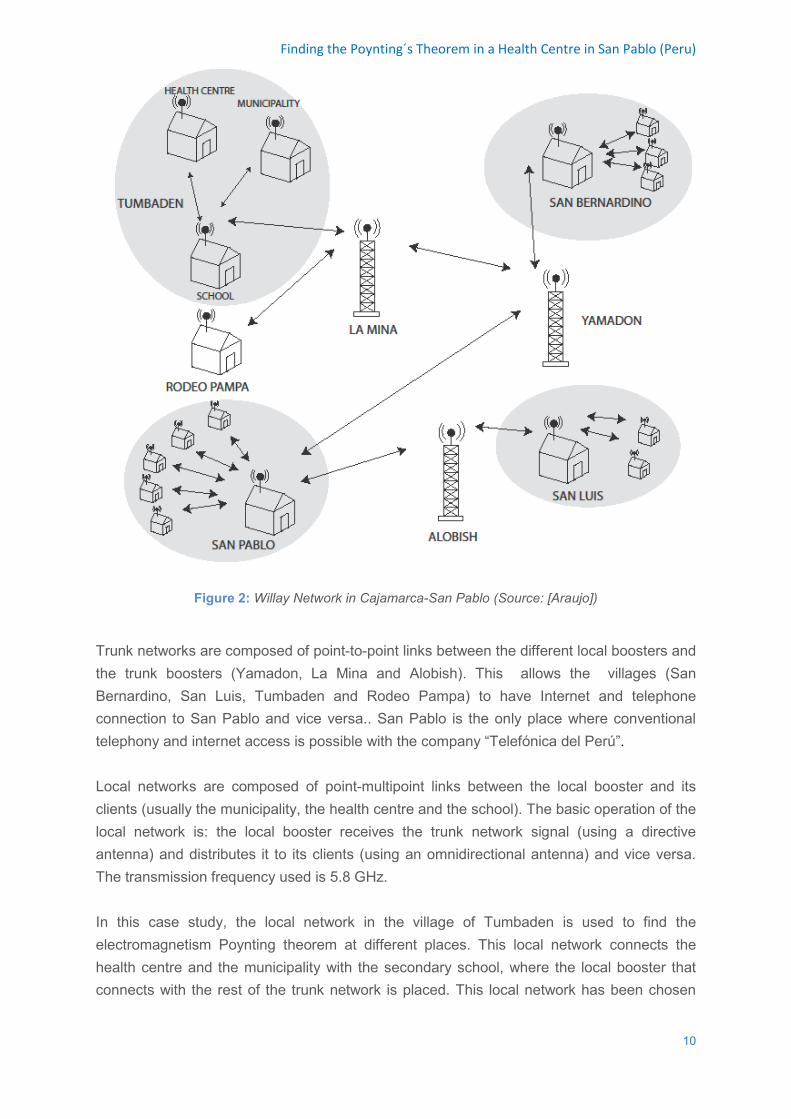
Finding the Poynting´s Theorem in a Health Centre in San Pablo (Peru)
Figure 2: Willay Network in Cajamarca-San Pablo (Source: [Araujo])
Trunk networks are composed of point-to-point links between the different local boosters and the trunk boosters (Yamadon, La Mina and Alobish). This allows the villages (San Bernardino, San Luis, Tumbaden and Rodeo Pampa) to have Internet and telephone connection to San Pablo and vice versa.. San Pablo is the only place where conventional telephony and internet access is possible with the company “Telefónica del Perú”. Local networks are composed of point-multipoint links between the local booster and its clients (usually the municipality, the health centre and the school). The basic operation of the local network is: the local booster receives the trunk network signal (using a directive antenna) and distributes it to its clients (using an omnidirectional antenna) and vice versa. The transmission frequency used is 5.8 GHz. In this case study, the local network in the village of Tumbaden is used to find the electromagnetism Poynting theorem at different places. This local network connects the health centre and the municipality with the secondary school, where the local booster that connects with the rest of the trunk network is placed. This local network has been chosen
10

Finding the Poynting´s Theorem in a Health Centre in San Pablo (Peru)
because there is no connection via a conventional electric network in this area, and photovoltaic solar energy is needed to feed the infrastructure. Some services that the Willay-Cajamarca network can provide are:
• Tele-education: on-line courses, tutorials, libraries access … • Tele-medicine: Tele-assistance, transmission of information as medical images or
digitalized electrocardiograms … • Connection with other institutional offices in different districts, audio conferences,
applications as Skype … There will be a group discussion of 25 minutes to decide the requirements of the health centre in Tumbaden, and compare it with the typical health centre in the students’ country. The idea is to think about people’s needs, taking into account different genders and the different limitations that the students can imagine. Similar group work provided the basis for a participative design meeting that took place with municipality, education and health authorities of the district, the rural telecommunication group of “Pontificia Universidad Católica” of Peru and ONGAWA members. A role playing methodology can be used to help students hold their own participative design meeting, assigning roles to different student groups which have expressed previous views regarding the most important problem to be solved in the region… As an example:
• The municipality members think the most important thing is to have broadband Internet in the Town Hall.
• The education members believe that an antenna in the school will be dangerous for student safety.
• The local health authorities think that it is better to use the money to have a new drainage system.
• The University group shows the advantages of similar projects carried out in other Peruvian regions.
• The ONGAWA members try to give a voice to a local NGO member that was not invited to the meeting…
The lecturer moderates the meeting (no more than 15 minutes) and encourages the students to meet a common agreement. If this is difficult, it will emphasise that making decisions in light of these social problems is not easy, given the different points of view of participants. Furthermore, it highlights that it is essential that range of different people involved participate in the meeting to ensure the project is accepted by the beneficiaries. In the following 10 minutes, the students will compare the situation in their own country with this case.
11
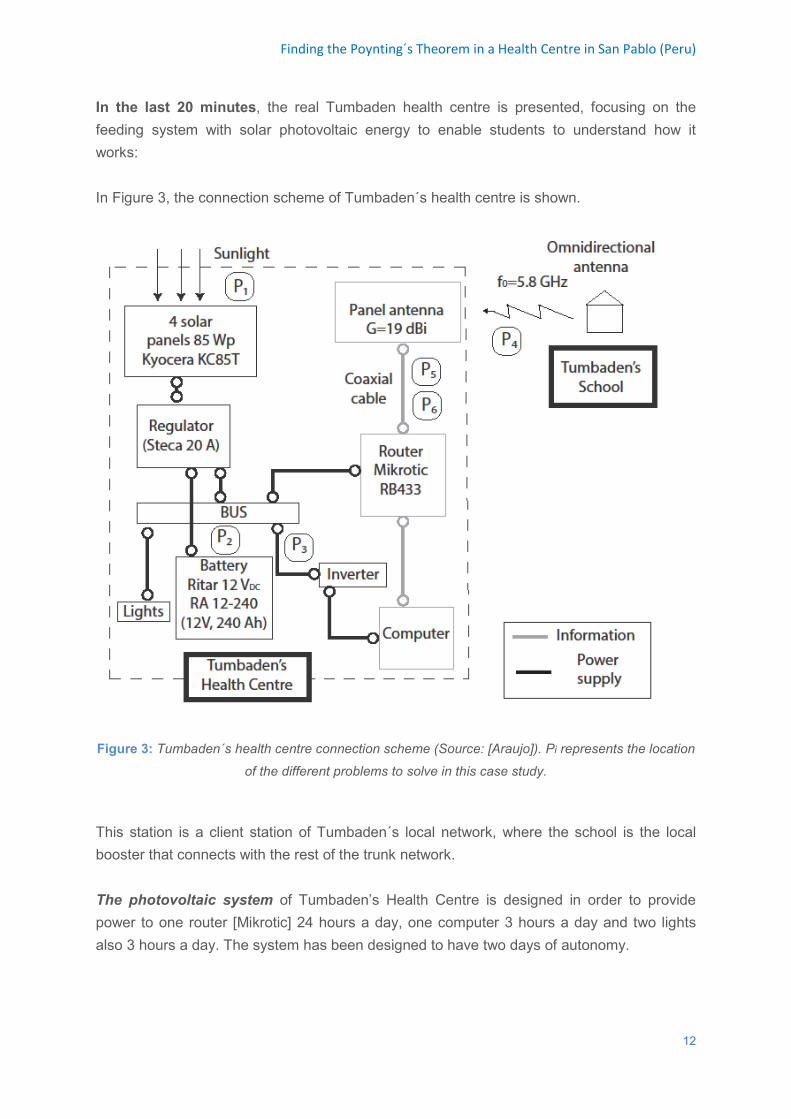
Finding the Poynting´s Theorem in a Health Centre in San Pablo (Peru)
In the last 20 minutes, the real Tumbaden health centre is presented, focusing on the feeding system with solar photovoltaic energy to enable students to understand how it works: In Figure 3, the connection scheme of Tumbaden´s health centre is shown.
Figure 3: Tumbaden´s health centre connection scheme (Source: [Araujo]). Pi represents the location
of the different problems to solve in this case study.
This station is a client station of Tumbaden´s local network, where the school is the local booster that connects with the rest of the trunk network. The photovoltaic system of Tumbaden’s Health Centre is designed in order to provide power to one router [Mikrotic] 24 hours a day, one computer 3 hours a day and two lights also 3 hours a day. The system has been designed to have two days of autonomy.
12
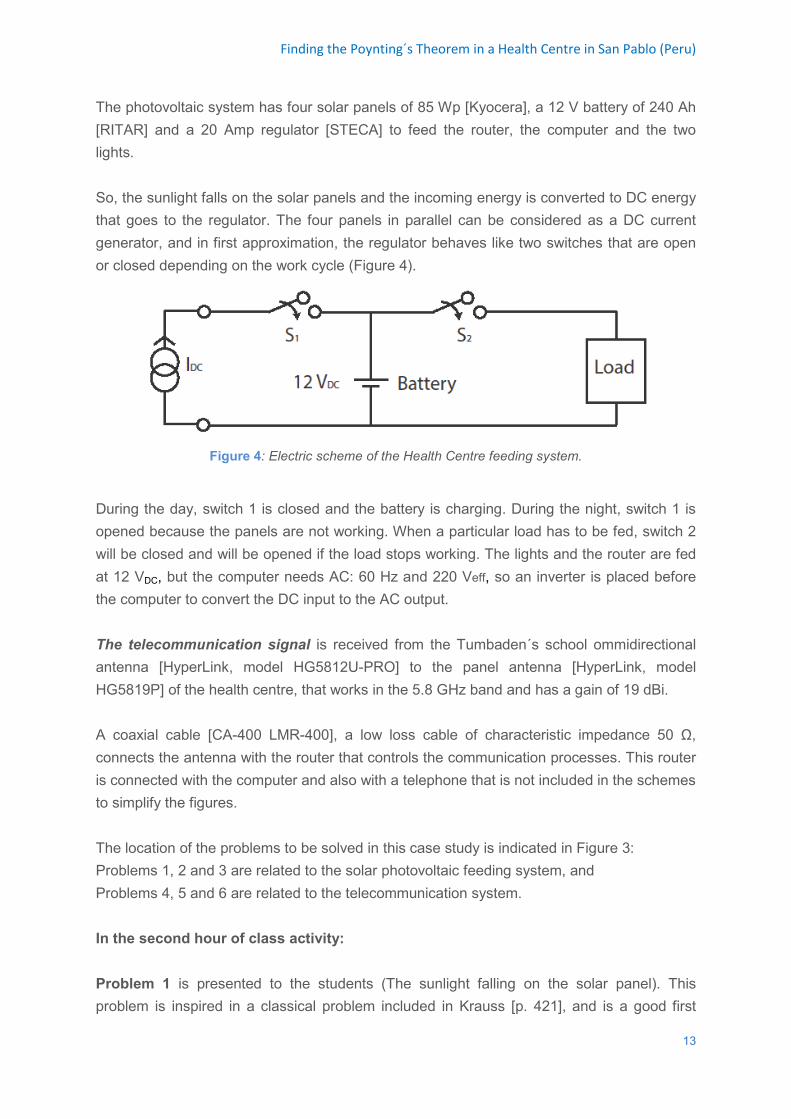
Finding the Poynting´s Theorem in a Health Centre in San Pablo (Peru)
The photovoltaic system has four solar panels of 85 Wp [Kyocera], a 12 V battery of 240 Ah [RITAR] and a 20 Amp regulator [STECA] to feed the router, the computer and the two lights. So, the sunlight falls on the solar panels and the incoming energy is converted to DC energy that goes to the regulator. The four panels in parallel can be considered as a DC current generator, and in first approximation, the regulator behaves like two switches that are open or closed depending on the work cycle (Figure 4).
Figure 4: Electric scheme of the Health Centre feeding system.
During the day, switch 1 is closed and the battery is charging. During the night, switch 1 is opened because the panels are not working. When a particular load has to be fed, switch 2 will be closed and will be opened if the load stops working. The lights and the router are fed at 12 VDC, but the computer needs AC: 60 Hz and 220 Veff, so an inverter is placed before the computer to convert the DC input to the AC output. The telecommunication signal is received from the Tumbaden´s school ommidirectional antenna [HyperLink, model HG5812U-PRO] to the panel antenna [HyperLink, model HG5819P] of the health centre, that works in the 5.8 GHz band and has a gain of 19 dBi. A coaxial cable [CA-400 LMR-400], a low loss cable of characteristic impedance 50 Ω, connects the antenna with the router that controls the communication processes. This router is connected with the computer and also with a telephone that is not included in the schemes to simplify the figures. The location of the problems to be solved in this case study is indicated in Figure 3: Problems 1, 2 and 3 are related to the solar photovoltaic feeding system, and Problems 4, 5 and 6 are related to the telecommunication system. In the second hour of class activity: Problem 1 is presented to the students (The sunlight falling on the solar panel). This problem is inspired in a classical problem included in Krauss [p. 421], and is a good first
13
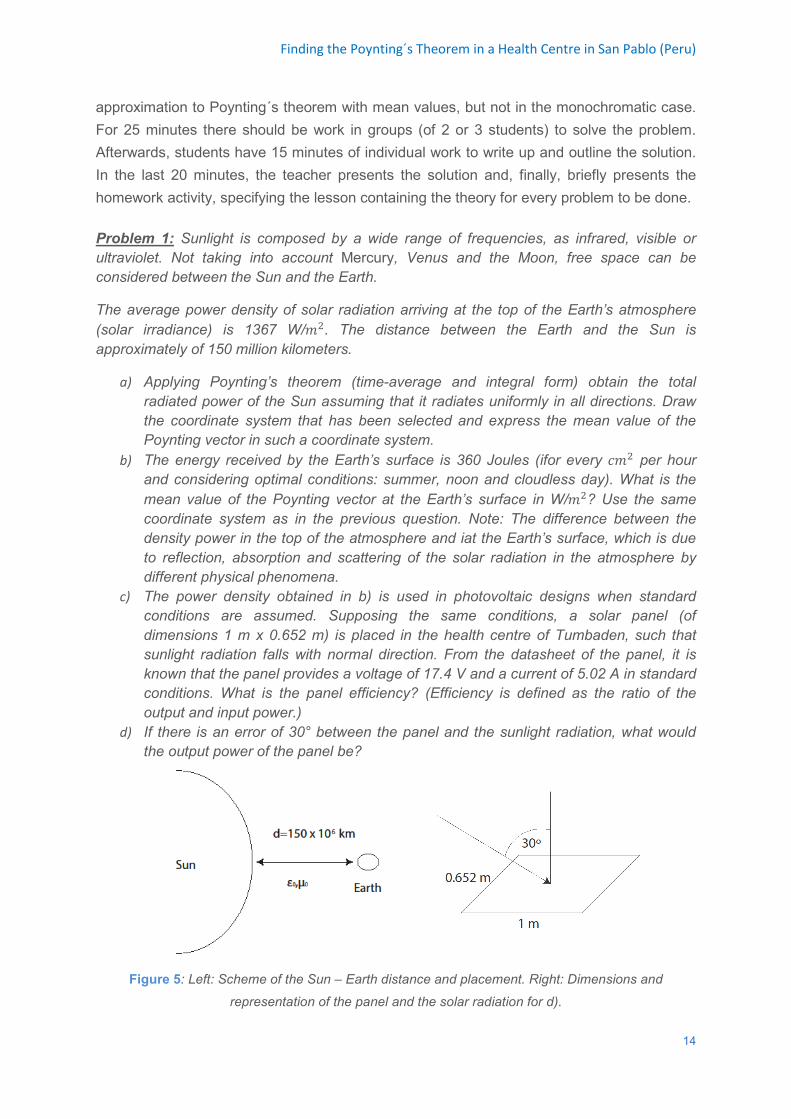
Finding the Poynting´s Theorem in a Health Centre in San Pablo (Peru)
approximation to Poynting´s theorem with mean values, but not in the monochromatic case. For 25 minutes there should be work in groups (of 2 or 3 students) to solve the problem. Afterwards, students have 15 minutes of individual work to write up and outline the solution. In the last 20 minutes, the teacher presents the solution and, finally, briefly presents the homework activity, specifying the lesson containing the theory for every problem to be done. Problem 1: Sunlight is composed by a wide range of frequencies, as infrared, visible or ultraviolet. Not taking into account Mercury, Venus and the Moon, free space can be considered between the Sun and the Earth.
The average power density of solar radiation arriving at the top of the Earth’s atmosphere (solar irradiance) is 1367 W/𝑚𝑚2. The distance between the Earth and the Sun is approximately of 150 million kilometers.
a) Applying Poynting’s theorem (time-average and integral form) obtain the total radiated power of the Sun assuming that it radiates uniformly in all directions. Draw the coordinate system that has been selected and express the mean value of the Poynting vector in such a coordinate system.
b) The energy received by the Earth’s surface is 360 Joules (ifor every 𝑐𝑐𝑚𝑚2 per hour and considering optimal conditions: summer, noon and cloudless day). What is the mean value of the Poynting vector at the Earth’s surface in W/𝑚𝑚2? Use the same coordinate system as in the previous question. Note: The difference between the density power in the top of the atmosphere and iat the Earth’s surface, which is due to reflection, absorption and scattering of the solar radiation in the atmosphere by different physical phenomena.
c) The power density obtained in b) is used in photovoltaic designs when standard conditions are assumed. Supposing the same conditions, a solar panel (of dimensions 1 m x 0.652 m) is placed in the health centre of Tumbaden, such that sunlight radiation falls with normal direction. From the datasheet of the panel, it is known that the panel provides a voltage of 17.4 V and a current of 5.02 A in standard conditions. What is the panel efficiency? (Efficiency is defined as the ratio of the output and input power.)
d) If there is an error of 30° between the panel and the sunlight radiation, what would the output power of the panel be?
Figure 5: Left: Scheme of the Sun – Earth distance and placement. Right: Dimensions and
representation of the panel and the solar radiation for d).
14
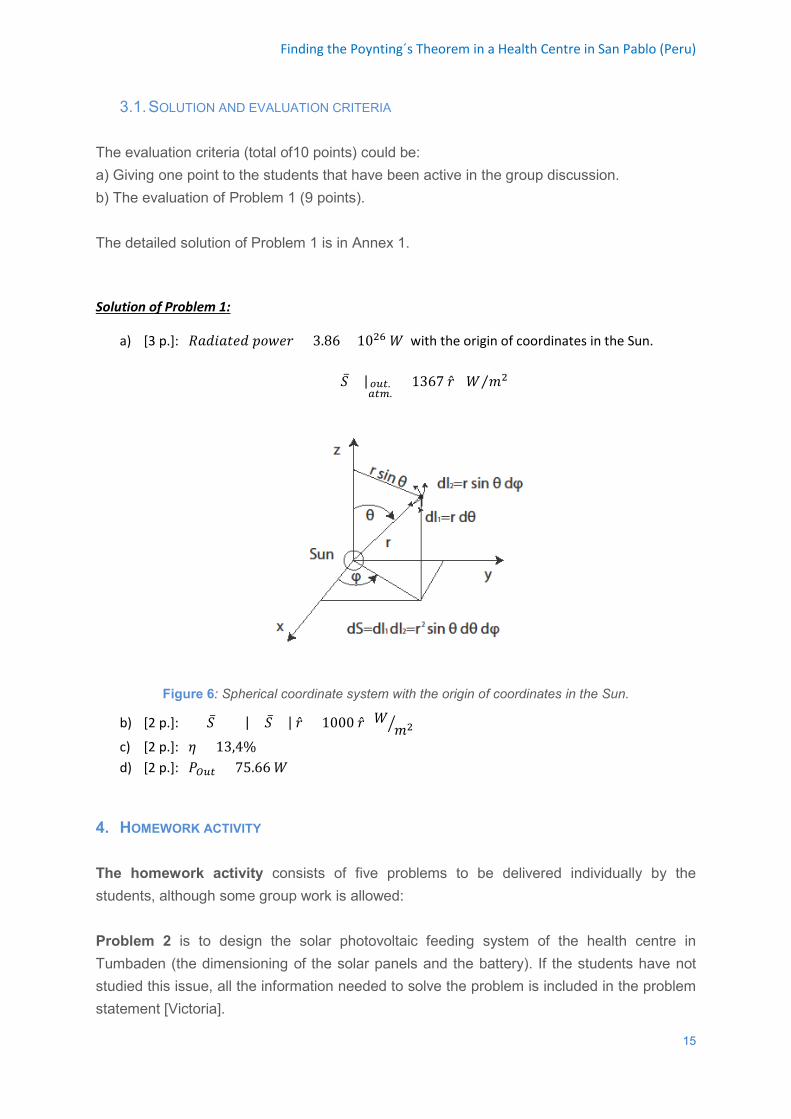
Finding the Poynting´s Theorem in a Health Centre in San Pablo (Peru)
3.1. SOLUTION AND EVALUATION CRITERIA
The evaluation criteria (total of10 points) could be: a) Giving one point to the students that have been active in the group discussion. b) The evaluation of Problem 1 (9 points). The detailed solution of Problem 1 is in Annex 1. Solution of Problem 1:
a) [3 p.]: 𝑅𝑅𝑅𝑅𝑅𝑅𝑅𝑅𝑅𝑅𝑅𝑅𝑅𝑅𝑅𝑅 𝑝𝑝𝑝𝑝𝑝𝑝𝑅𝑅𝑝𝑝 = 3.86 × 1026 𝑊𝑊 with the origin of coordinates in the Sun.
< 𝑆𝑆̅ >|𝑜𝑜𝑜𝑜𝑜𝑜.𝑎𝑎𝑜𝑜𝑎𝑎.
= 1367 �̂�𝑝 (𝑊𝑊 𝑚𝑚2)⁄
Figure 6: Spherical coordinate system with the origin of coordinates in the Sun.
b) [2 p.]: < 𝑆𝑆̅ >= |< 𝑆𝑆̅ >| �̂�𝑝 = 1000 �̂�𝑝 (𝑊𝑊 𝑚𝑚2� )
c) [2 p.]: 𝜂𝜂 = 13,4% d) [2 p.]: 𝑃𝑃𝑂𝑂𝑜𝑜𝑜𝑜 = 75.66 𝑊𝑊
4. HOMEWORK ACTIVITY The homework activity consists of five problems to be delivered individually by the students, although some group work is allowed: Problem 2 is to design the solar photovoltaic feeding system of the health centre in Tumbaden (the dimensioning of the solar panels and the battery). If the students have not studied this issue, all the information needed to solve the problem is included in the problem statement [Victoria].
15
Finding the Poynting´s Theorem in a Health Centre in San Pablo (Peru)
The rest of the problems to be solved (3, 4, 5, 6) cover subjects based on electromagnetic fields theory (electrodynamics). Different topics are included in these problems, so, the idea is that the students will do every problem at the time when they have studied the corresponding theme. The order of the problems presented in this case study corresponds with the implementation sequence of the subject “Fields and waves in Telecommunication”, which is taught in the second course of “Degree in Engineering Technology and Telecommunication Services” at ETSIT-UPM: The first lesson consists of an introduction to electrodynamics, where Poynting´s theorem in time and frequency domains and the active and reactive power balances in the monochromatic case are studied. Lessons 2 and 3 introduce the homogeneous plane wave and the normal incidence on stratified media. In lesson 4, fields in conducting media are studied and lesson 5 introduces transmission lines. Problem 3 is to apply Poynting´s theorem to a part of the feeding system of the health centre in Tumbaden and to complete the understanding of the feeding system of the health centre, covered by problems 1 (class activity), 2 and 3. Poynting´s theorem is applied in a very simple case, where there is no radiated power. As a result, it can be seen as the application of the conservation of energy theorem in a simple low frequency circuit Problem 4 is a typical Poynting problem in the monochromatic case, applied to the communication between the local booster in the school and the health centre in Tumbaden Problem 5 is to apply Poynting´s theorem and the Leontovich approximation to the coaxial cable that connects the antenna with the receptor in the health centre. It is also a typical Poynting problem: the study of the propagation of an incident field in a coaxial cable, but includes Leontovich approximation that is studied in lesson 4.As a result, this type of Poynting problem cannot be done at the beginning of the semester, and the teacher should propose it at the appropriate moment in the course. Problem 6 is to discover the real physical characteristics of the used coaxial cable by means of the transmission lines theory and to verify the attenuation obtained in Problem 5 using Poynting´s theorem. It is a typical problem of lesson 5, where transmission line concepts have to be applied to the coaxial cable. To find the attenuation of the coaxial used in Tumbaden´s health centre, the high frequency resistance per unit length of the coaxial has to be used [Ramo, p. 154 or Collin, p. 87]. The attenuation constant obtained in this case can be compared with that calculated in Problem 5, applying Leontovich approximation and Poynting´s theorem. Both expressions agree because in the high frequency resistance method Leontovich approximation is also applied.
16
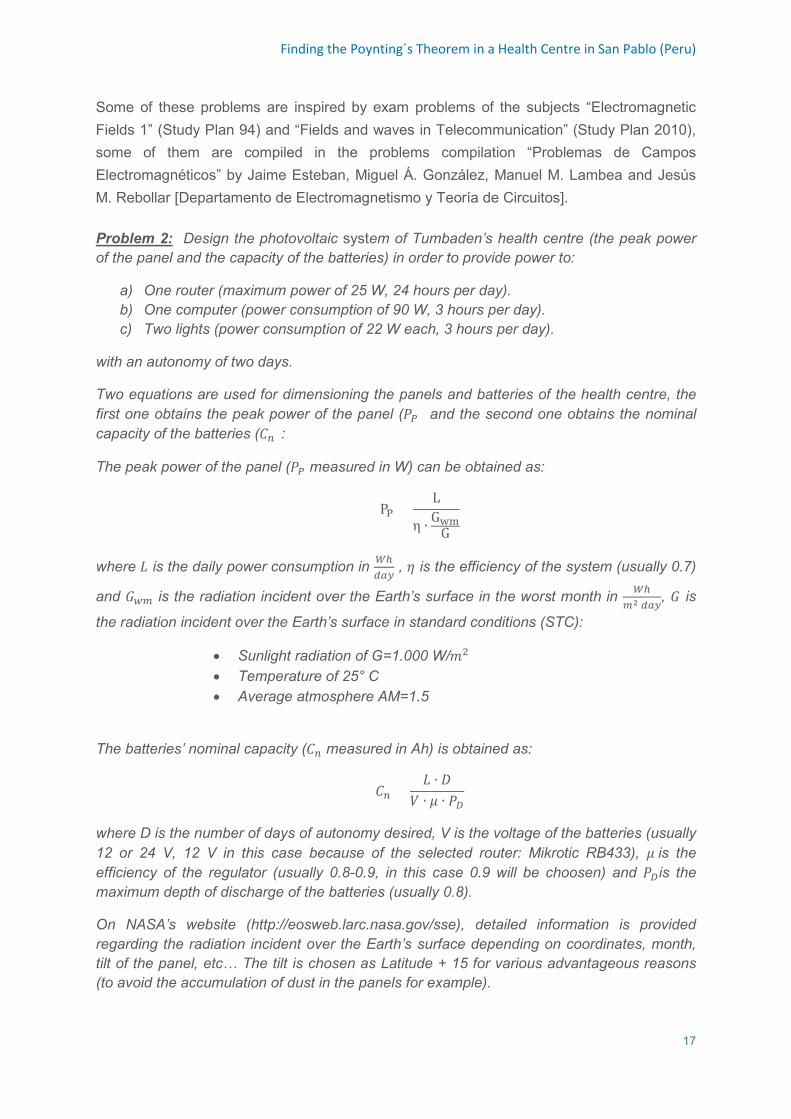
Finding the Poynting´s Theorem in a Health Centre in San Pablo (Peru)
Some of these problems are inspired by exam problems of the subjects “Electromagnetic Fields 1” (Study Plan 94) and “Fields and waves in Telecommunication” (Study Plan 2010), some of them are compiled in the problems compilation “Problemas de Campos Electromagnéticos” by Jaime Esteban, Miguel Á. González, Manuel M. Lambea and Jesús M. Rebollar [Departamento de Electromagnetismo y Teoría de Circuitos]. Problem 2: Design the photovoltaic system of Tumbaden’s health centre (the peak power of the panel and the capacity of the batteries) in order to provide power to:
a) One router (maximum power of 25 W, 24 hours per day). b) One computer (power consumption of 90 W, 3 hours per day). c) Two lights (power consumption of 22 W each, 3 hours per day).
with an autonomy of two days.
Two equations are used for dimensioning the panels and batteries of the health centre, the first one obtains the peak power of the panel (𝑃𝑃𝑃𝑃) and the second one obtains the nominal capacity of the batteries (𝐶𝐶𝑛𝑛):
The peak power of the panel (𝑃𝑃𝑃𝑃 measured in W) can be obtained as:
PP =L
η ∙ GwmG
where 𝐿𝐿 is the daily power consumption in 𝑊𝑊ℎ𝑑𝑑𝑎𝑎𝑑𝑑
, 𝜂𝜂 is the efficiency of the system (usually 0.7)
and 𝐺𝐺𝑤𝑤𝑎𝑎 is the radiation incident over the Earth’s surface in the worst month in 𝑊𝑊ℎ𝑎𝑎2 𝑑𝑑𝑎𝑎𝑑𝑑
, 𝐺𝐺 is
the radiation incident over the Earth’s surface in standard conditions (STC):
• Sunlight radiation of G=1.000 W/𝑚𝑚2 • Temperature of 25° C • Average atmosphere AM=1.5
The batteries’ nominal capacity (𝐶𝐶𝑛𝑛 measured in Ah) is obtained as:
𝐶𝐶𝑛𝑛 =𝐿𝐿 ∙ 𝐷𝐷
𝑉𝑉 ∙ 𝜇𝜇 ∙ 𝑃𝑃𝐷𝐷
where D is the number of days of autonomy desired, V is the voltage of the batteries (usually 12 or 24 V, 12 V in this case because of the selected router: Mikrotic RB433), 𝜇𝜇 is the efficiency of the regulator (usually 0.8-0.9, in this case 0.9 will be choosen) and 𝑃𝑃𝐷𝐷is the maximum depth of discharge of the batteries (usually 0.8).
On NASA’s website (http://eosweb.larc.nasa.gov/sse), detailed information is provided regarding the radiation incident over the Earth’s surface depending on coordinates, month, tilt of the panel, etc… The tilt is chosen as Latitude + 15 for various advantageous reasons (to avoid the accumulation of dust in the panels for example).
17
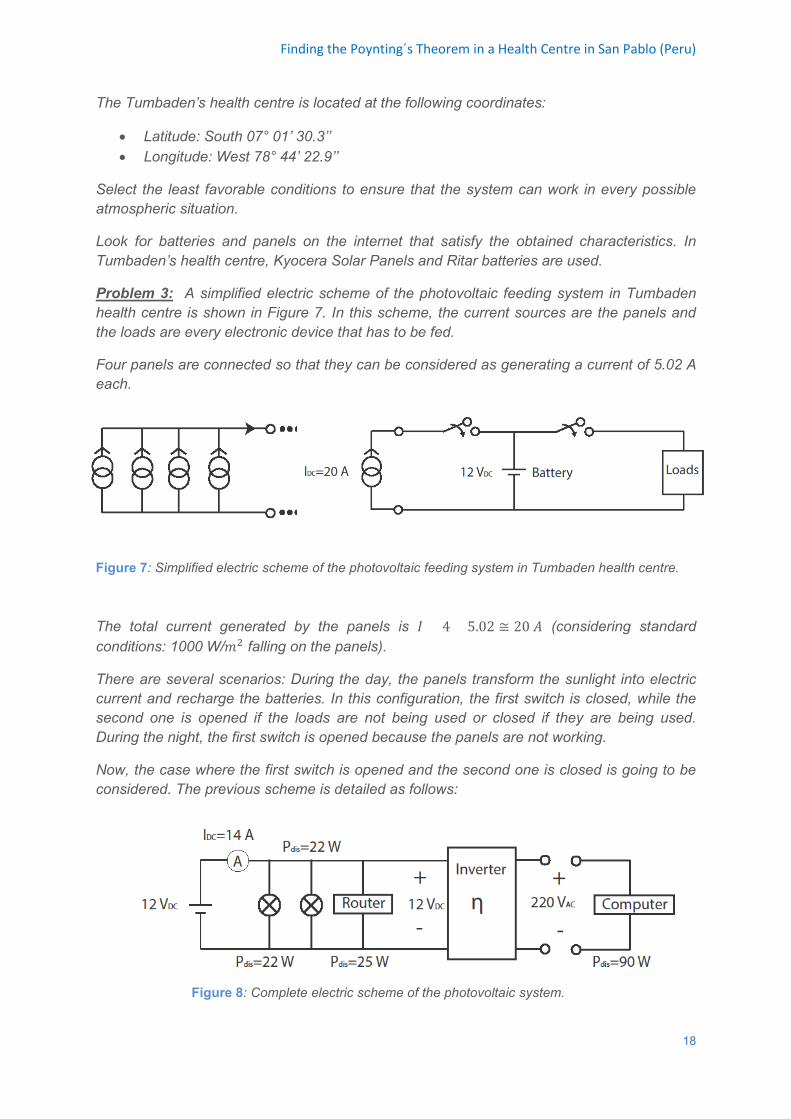
Finding the Poynting´s Theorem in a Health Centre in San Pablo (Peru)
The Tumbaden’s health centre is located at the following coordinates:
• Latitude: South 07° 01’ 30.3’’ • Longitude: West 78° 44’ 22.9’’
Select the least favorable conditions to ensure that the system can work in every possible atmospheric situation.
Look for batteries and panels on the internet that satisfy the obtained characteristics. In Tumbaden’s health centre, Kyocera Solar Panels and Ritar batteries are used.
Problem 3: A simplified electric scheme of the photovoltaic feeding system in Tumbaden health centre is shown in Figure 7. In this scheme, the current sources are the panels and the loads are every electronic device that has to be fed.
Four panels are connected so that they can be considered as generating a current of 5.02 A each.
Figure 7: Simplified electric scheme of the photovoltaic feeding system in Tumbaden health centre.
The total current generated by the panels is 𝐼𝐼 = 4 × 5.02 ≅ 20 𝐴𝐴 (considering standard conditions: 1000 W/𝑚𝑚2 falling on the panels).
There are several scenarios: During the day, the panels transform the sunlight into electric current and recharge the batteries. In this configuration, the first switch is closed, while the second one is opened if the loads are not being used or closed if they are being used. During the night, the first switch is opened because the panels are not working.
Now, the case where the first switch is opened and the second one is closed is going to be considered. The previous scheme is detailed as follows:
Figure 8: Complete electric scheme of the photovoltaic system.
18
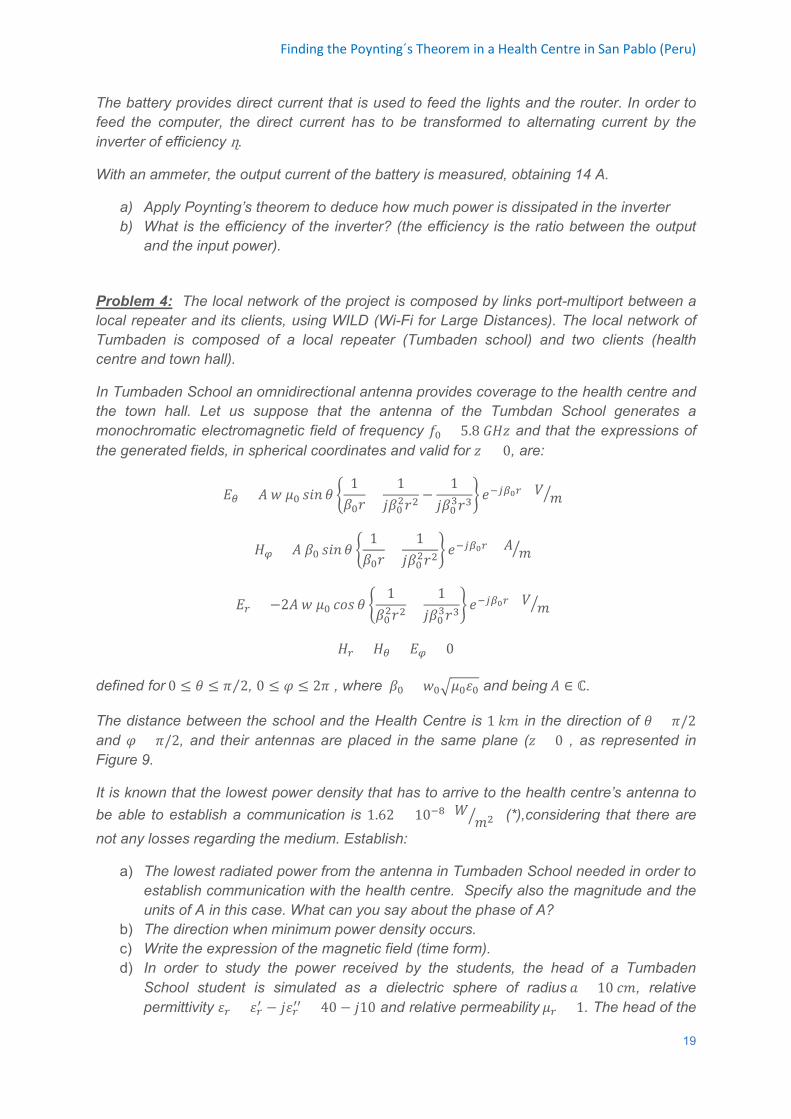
Finding the Poynting´s Theorem in a Health Centre in San Pablo (Peru)
The battery provides direct current that is used to feed the lights and the router. In order to feed the computer, the direct current has to be transformed to alternating current by the inverter of efficiency ɳ.
With an ammeter, the output current of the battery is measured, obtaining 14 A.
a) Apply Poynting’s theorem to deduce how much power is dissipated in the inverter b) What is the efficiency of the inverter? (the efficiency is the ratio between the output
and the input power).
Problem 4: The local network of the project is composed by links port-multiport between a local repeater and its clients, using WILD (Wi-Fi for Large Distances). The local network of Tumbaden is composed of a local repeater (Tumbaden school) and two clients (health centre and town hall).
In Tumbaden School an omnidirectional antenna provides coverage to the health centre and the town hall. Let us suppose that the antenna of the Tumbdan School generates a monochromatic electromagnetic field of frequency 𝑓𝑓0 = 5.8 𝐺𝐺𝐺𝐺𝐺𝐺 and that the expressions of the generated fields, in spherical coordinates and valid for 𝐺𝐺 > 0, are:
𝐸𝐸𝜃𝜃 = 𝐴𝐴 𝑝𝑝 𝜇𝜇0 𝑠𝑠𝑅𝑅𝑠𝑠 𝜃𝜃 �1𝛽𝛽0𝑝𝑝
+1
𝑗𝑗𝛽𝛽02𝑝𝑝2−
1𝑗𝑗𝛽𝛽03𝑝𝑝3
� 𝑅𝑅−𝑗𝑗𝛽𝛽0𝑟𝑟 (𝑉𝑉 𝑚𝑚� )
𝐺𝐺𝜑𝜑 = 𝐴𝐴 𝛽𝛽0 𝑠𝑠𝑅𝑅𝑠𝑠 𝜃𝜃 �1𝛽𝛽0𝑝𝑝
+1
𝑗𝑗𝛽𝛽02𝑝𝑝2� 𝑅𝑅−𝑗𝑗𝛽𝛽0𝑟𝑟 (𝐴𝐴 𝑚𝑚� )
𝐸𝐸𝑟𝑟 = −2𝐴𝐴 𝑝𝑝 𝜇𝜇0 𝑐𝑐𝑝𝑝𝑠𝑠 𝜃𝜃 �1
𝛽𝛽02𝑝𝑝2+
1𝑗𝑗𝛽𝛽03𝑝𝑝3
� 𝑅𝑅−𝑗𝑗𝛽𝛽0𝑟𝑟 (𝑉𝑉 𝑚𝑚� )
𝐺𝐺𝑟𝑟 = 𝐺𝐺𝜃𝜃 = 𝐸𝐸𝜑𝜑 = 0
defined for 0 ≤ 𝜃𝜃 ≤ 𝜋𝜋 2⁄ , 0 ≤ 𝜑𝜑 ≤ 2𝜋𝜋 , where 𝛽𝛽0 = 𝑝𝑝0�𝜇𝜇0𝜀𝜀0 and being 𝐴𝐴 ∈ ℂ.
The distance between the school and the Health Centre is 1 𝑘𝑘𝑚𝑚 in the direction of 𝜃𝜃 = 𝜋𝜋/2 and 𝜑𝜑 = 𝜋𝜋/2, and their antennas are placed in the same plane (𝐺𝐺 = 0), as represented in Figure 9.
It is known that the lowest power density that has to arrive to the health centre’s antenna to be able to establish a communication is 1.62 × 10⁻⁸ (𝑊𝑊 𝑚𝑚2� ) (*),considering that there are not any losses regarding the medium. Establish:
a) The lowest radiated power from the antenna in Tumbaden School needed in order to establish communication with the health centre. Specify also the magnitude and the units of A in this case. What can you say about the phase of A?
b) The direction when minimum power density occurs. c) Write the expression of the magnetic field (time form). d) In order to study the power received by the students, the head of a Tumbaden
School student is simulated as a dielectric sphere of radius 𝑅𝑅 = 10 𝑐𝑐𝑚𝑚, relative permittivity 𝜀𝜀𝑟𝑟 = 𝜀𝜀𝑟𝑟′ − 𝑗𝑗𝜀𝜀𝑟𝑟′′ = 40 − 𝑗𝑗10 and relative permeability 𝜇𝜇𝑟𝑟 = 1. The head of the
19
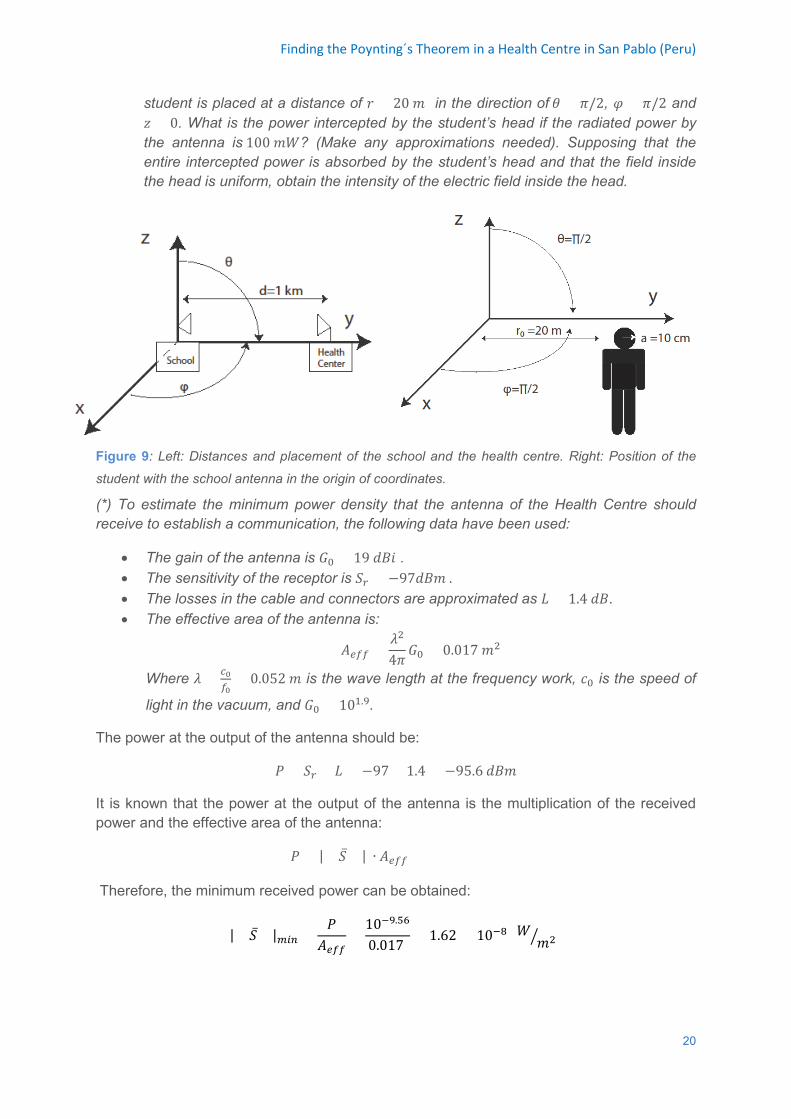
Finding the Poynting´s Theorem in a Health Centre in San Pablo (Peru)
student is placed at a distance of 𝑝𝑝 = 20 𝑚𝑚 in the direction of 𝜃𝜃 = 𝜋𝜋/2, 𝜑𝜑 = 𝜋𝜋/2 and 𝐺𝐺 > 0. What is the power intercepted by the student’s head if the radiated power by the antenna is 100 𝑚𝑚𝑊𝑊? (Make any approximations needed). Supposing that the entire intercepted power is absorbed by the student’s head and that the field inside the head is uniform, obtain the intensity of the electric field inside the head.
Figure 9: Left: Distances and placement of the school and the health centre. Right: Position of the
student with the school antenna in the origin of coordinates.
(*) To estimate the minimum power density that the antenna of the Health Centre should receive to establish a communication, the following data have been used:
• The gain of the antenna is 𝐺𝐺0 = 19 𝑅𝑅𝑑𝑑𝑅𝑅 . • The sensitivity of the receptor is 𝑆𝑆𝑟𝑟 = −97𝑅𝑅𝑑𝑑𝑚𝑚 . • The losses in the cable and connectors are approximated as 𝐿𝐿 = 1.4 𝑅𝑅𝑑𝑑. • The effective area of the antenna is:
𝐴𝐴𝑒𝑒𝑒𝑒𝑒𝑒 =𝜆𝜆2
4𝜋𝜋𝐺𝐺0 = 0.017 𝑚𝑚2
Where 𝜆𝜆 = 𝑐𝑐0𝑒𝑒0
= 0.052 𝑚𝑚 is the wave length at the frequency work, 𝑐𝑐0 is the speed of
light in the vacuum, and 𝐺𝐺0 = 101.9.
The power at the output of the antenna should be:
𝑃𝑃 = 𝑆𝑆𝑟𝑟 + 𝐿𝐿 = −97 + 1.4 = −95.6 𝑅𝑅𝑑𝑑𝑚𝑚
It is known that the power at the output of the antenna is the multiplication of the received power and the effective area of the antenna:
𝑃𝑃 = |< 𝑆𝑆̅ >| ∙ 𝐴𝐴𝑒𝑒𝑒𝑒𝑒𝑒
Therefore, the minimum received power can be obtained:
|< 𝑆𝑆̅ >|𝑎𝑎𝑚𝑚𝑛𝑛 =𝑃𝑃
𝐴𝐴𝑒𝑒𝑒𝑒𝑒𝑒=
10−9.56
0.017 = 1.62 × 10⁻⁸ (𝑊𝑊 𝑚𝑚2� )
20
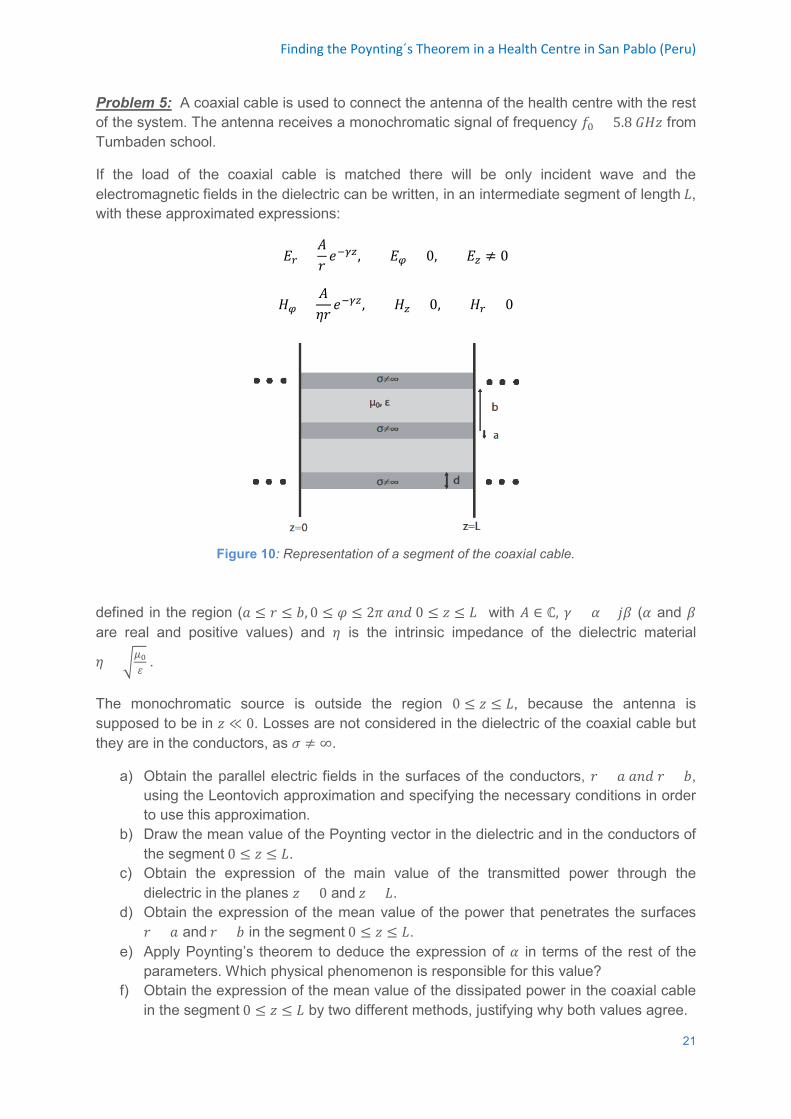
Finding the Poynting´s Theorem in a Health Centre in San Pablo (Peru)
Problem 5: A coaxial cable is used to connect the antenna of the health centre with the rest of the system. The antenna receives a monochromatic signal of frequency 𝑓𝑓0 = 5.8 𝐺𝐺𝐺𝐺𝐺𝐺 from Tumbaden school.
If the load of the coaxial cable is matched there will be only incident wave and the electromagnetic fields in the dielectric can be written, in an intermediate segment of length 𝐿𝐿, with these approximated expressions:
𝐸𝐸𝑟𝑟 =𝐴𝐴𝑝𝑝𝑅𝑅−𝛾𝛾𝛾𝛾, 𝐸𝐸𝜑𝜑 = 0, 𝐸𝐸𝛾𝛾 ≠ 0
𝐺𝐺𝜑𝜑 =𝐴𝐴𝜂𝜂𝑝𝑝𝑅𝑅−𝛾𝛾𝛾𝛾, 𝐺𝐺𝛾𝛾 = 0, 𝐺𝐺𝑟𝑟 = 0
Figure 10: Representation of a segment of the coaxial cable.
defined in the region (𝑅𝑅 ≤ 𝑝𝑝 ≤ 𝑏𝑏, 0 ≤ 𝜑𝜑 ≤ 2𝜋𝜋 𝑅𝑅𝑠𝑠𝑅𝑅 0 ≤ 𝐺𝐺 ≤ 𝐿𝐿) with 𝐴𝐴 ∈ ℂ, 𝛾𝛾 = 𝛼𝛼 + 𝑗𝑗𝛽𝛽 (𝛼𝛼 and 𝛽𝛽 are real and positive values) and 𝜂𝜂 is the intrinsic impedance of the dielectric material
𝜂𝜂 = �𝜇𝜇0𝜀𝜀
.
The monochromatic source is outside the region 0 ≤ 𝐺𝐺 ≤ 𝐿𝐿, because the antenna is supposed to be in 𝐺𝐺 ≪ 0. Losses are not considered in the dielectric of the coaxial cable but they are in the conductors, as 𝜎𝜎 ≠ ∞.
a) Obtain the parallel electric fields in the surfaces of the conductors, 𝑝𝑝 = 𝑅𝑅 𝑅𝑅𝑠𝑠𝑅𝑅 𝑝𝑝 = 𝑏𝑏, using the Leontovich approximation and specifying the necessary conditions in order to use this approximation.
b) Draw the mean value of the Poynting vector in the dielectric and in the conductors of the segment 0 ≤ 𝐺𝐺 ≤ 𝐿𝐿.
c) Obtain the expression of the main value of the transmitted power through the dielectric in the planes 𝐺𝐺 = 0 and 𝐺𝐺 = 𝐿𝐿.
d) Obtain the expression of the mean value of the power that penetrates the surfaces 𝑝𝑝 = 𝑅𝑅 and 𝑝𝑝 = 𝑏𝑏 in the segment 0 ≤ 𝐺𝐺 ≤ 𝐿𝐿.
e) Apply Poynting’s theorem to deduce the expression of 𝛼𝛼 in terms of the rest of the parameters. Which physical phenomenon is responsible for this value?
f) Obtain the expression of the mean value of the dissipated power in the coaxial cable in the segment 0 ≤ 𝐺𝐺 ≤ 𝐿𝐿 by two different methods, justifying why both values agree.
21
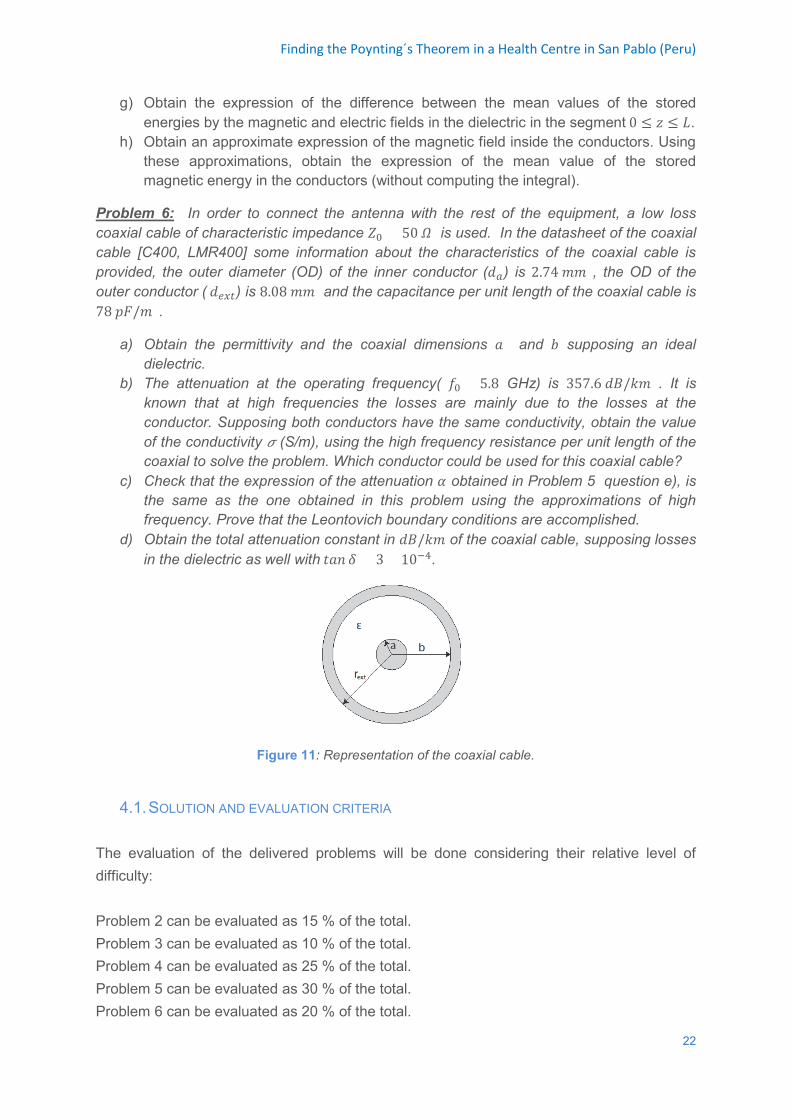
Finding the Poynting´s Theorem in a Health Centre in San Pablo (Peru)
g) Obtain the expression of the difference between the mean values of the stored energies by the magnetic and electric fields in the dielectric in the segment 0 ≤ 𝐺𝐺 ≤ 𝐿𝐿.
h) Obtain an approximate expression of the magnetic field inside the conductors. Using these approximations, obtain the expression of the mean value of the stored magnetic energy in the conductors (without computing the integral).
Problem 6: In order to connect the antenna with the rest of the equipment, a low loss coaxial cable of characteristic impedance 𝑍𝑍0 = 50 𝛺𝛺 is used. In the datasheet of the coaxial cable [C400, LMR400] some information about the characteristics of the coaxial cable is provided, the outer diameter (OD) of the inner conductor (𝑅𝑅𝑎𝑎) is 2.74 𝑚𝑚𝑚𝑚 , the OD of the outer conductor ( 𝑅𝑅𝑒𝑒𝑒𝑒𝑜𝑜) is 8.08 𝑚𝑚𝑚𝑚 and the capacitance per unit length of the coaxial cable is 78 𝑝𝑝𝑝𝑝/𝑚𝑚 .
a) Obtain the permittivity and the coaxial dimensions 𝑅𝑅 and 𝑏𝑏 supposing an ideal dielectric.
b) The attenuation at the operating frequency( 𝑓𝑓0 = 5.8 GHz) is 357.6 𝑅𝑅𝑑𝑑/𝑘𝑘𝑚𝑚 . It is known that at high frequencies the losses are mainly due to the losses at the conductor. Supposing both conductors have the same conductivity, obtain the value of the conductivity 𝜎𝜎 (S/m), using the high frequency resistance per unit length of the coaxial to solve the problem. Which conductor could be used for this coaxial cable?
c) Check that the expression of the attenuation 𝛼𝛼 obtained in Problem 5 question e), is the same as the one obtained in this problem using the approximations of high frequency. Prove that the Leontovich boundary conditions are accomplished.
d) Obtain the total attenuation constant in 𝑅𝑅𝑑𝑑/𝑘𝑘𝑚𝑚 of the coaxial cable, supposing losses in the dielectric as well with 𝑅𝑅𝑅𝑅𝑠𝑠 𝛿𝛿 = 3 × 10⁻⁴.
Figure 11: Representation of the coaxial cable.
4.1. SOLUTION AND EVALUATION CRITERIA
The evaluation of the delivered problems will be done considering their relative level of difficulty: Problem 2 can be evaluated as 15 % of the total. Problem 3 can be evaluated as 10 % of the total. Problem 4 can be evaluated as 25 % of the total. Problem 5 can be evaluated as 30 % of the total. Problem 6 can be evaluated as 20 % of the total.
22
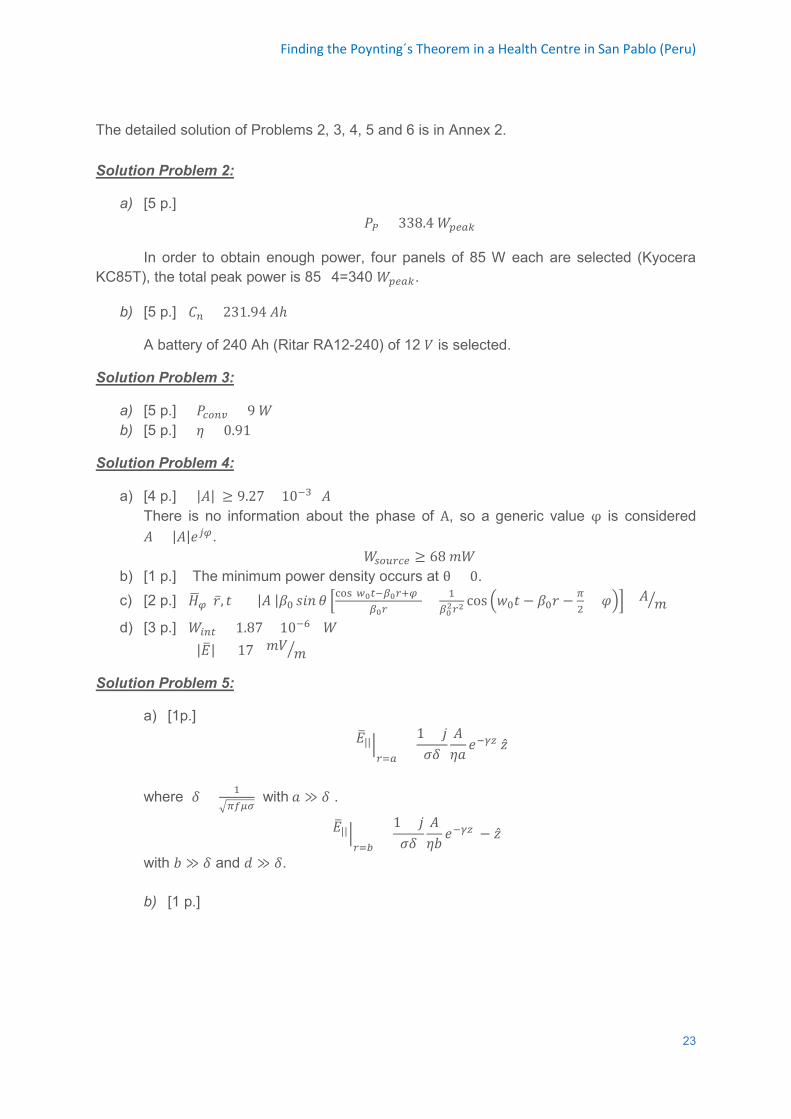
Finding the Poynting´s Theorem in a Health Centre in San Pablo (Peru)
The detailed solution of Problems 2, 3, 4, 5 and 6 is in Annex 2. Solution Problem 2:
a) [5 p.] 𝑃𝑃𝑃𝑃 = 338.4 𝑊𝑊𝑝𝑝𝑒𝑒𝑎𝑎𝑝𝑝
In order to obtain enough power, four panels of 85 W each are selected (Kyocera KC85T), the total peak power is 85×4=340 𝑊𝑊𝑝𝑝𝑒𝑒𝑎𝑎𝑝𝑝.
b) [5 p.] 𝐶𝐶𝑛𝑛 = 231.94 𝐴𝐴ℎ
A battery of 240 Ah (Ritar RA12-240) of 12 𝑉𝑉 is selected.
Solution Problem 3:
a) [5 p.] 𝑃𝑃𝑐𝑐𝑜𝑜𝑛𝑛𝑐𝑐 = 9 𝑊𝑊 b) [5 p.] 𝜂𝜂 = 0.91
Solution Problem 4:
a) [4 p.] |𝐴𝐴| ≥ 9.27 × 10⁻³ (𝐴𝐴) There is no information about the phase of A, so a generic value φ is considered 𝐴𝐴 = |𝐴𝐴|𝑅𝑅𝑗𝑗𝜑𝜑.
𝑊𝑊𝑠𝑠𝑜𝑜𝑜𝑜𝑟𝑟𝑐𝑐𝑒𝑒 ≥ 68 𝑚𝑚𝑊𝑊 b) [1 p.] The minimum power density occurs at θ = 0. c) [2 p.] 𝐺𝐺�𝜑𝜑(�̅�𝑝, 𝑅𝑅) = |𝐴𝐴 |𝛽𝛽0 𝑠𝑠𝑅𝑅𝑠𝑠 𝜃𝜃 �
cos(𝑤𝑤0𝑜𝑜−𝛽𝛽0𝑟𝑟+𝜑𝜑)𝛽𝛽0𝑟𝑟
+ 1𝛽𝛽02𝑟𝑟2
cos �𝑝𝑝0𝑅𝑅 − 𝛽𝛽0𝑝𝑝 −𝜋𝜋2
+ 𝜑𝜑�� (𝐴𝐴 𝑚𝑚� )
d) [3 p.] 𝑊𝑊𝑚𝑚𝑛𝑛𝑜𝑜 = 1.87 × 10⁻⁶ (𝑊𝑊) |𝐸𝐸�| = 17 (𝑚𝑚𝑉𝑉 𝑚𝑚 � )
Solution Problem 5:
a) [1p.] 𝐸𝐸�|| �𝑟𝑟=𝑎𝑎
=1 + 𝑗𝑗𝜎𝜎𝛿𝛿
𝐴𝐴𝜂𝜂𝑅𝑅
𝑅𝑅−𝛾𝛾𝛾𝛾 �̂�𝐺
where 𝛿𝛿 = 1
�𝜋𝜋𝑒𝑒𝜇𝜇𝜋𝜋 with 𝑅𝑅 ≫ 𝛿𝛿 .
𝐸𝐸�|| �𝑟𝑟=𝑏𝑏
=1 + 𝑗𝑗𝜎𝜎𝛿𝛿
𝐴𝐴𝜂𝜂𝑏𝑏
𝑅𝑅−𝛾𝛾𝛾𝛾(− �̂�𝐺)
with 𝑏𝑏 ≫ 𝛿𝛿 and 𝑅𝑅 ≫ 𝛿𝛿. b) [1 p.]
23
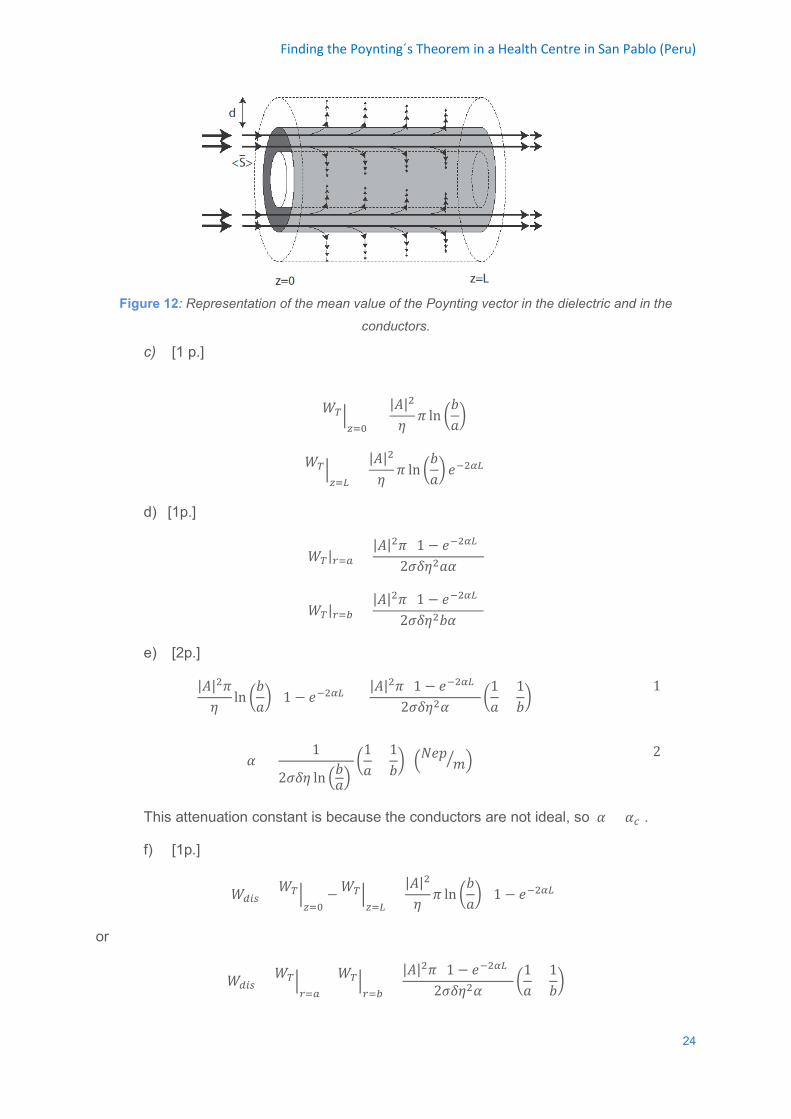
Finding the Poynting´s Theorem in a Health Centre in San Pablo (Peru)
Figure 12: Representation of the mean value of the Poynting vector in the dielectric and in the
conductors.
c) [1 p.]
𝑊𝑊𝑇𝑇 �𝛾𝛾=0
=|𝐴𝐴|2
𝜂𝜂𝜋𝜋 ln �
𝑏𝑏𝑅𝑅�
𝑊𝑊𝑇𝑇 �𝛾𝛾=𝐿𝐿
=|𝐴𝐴|2
𝜂𝜂𝜋𝜋 ln �
𝑏𝑏𝑅𝑅� 𝑅𝑅−2𝛼𝛼𝐿𝐿
d) [1p.]
𝑊𝑊𝑇𝑇|𝑟𝑟=𝑎𝑎 =|𝐴𝐴|2𝜋𝜋 (1 − 𝑅𝑅−2𝛼𝛼𝐿𝐿)
2𝜎𝜎𝛿𝛿𝜂𝜂2𝑅𝑅𝛼𝛼
𝑊𝑊𝑇𝑇|𝑟𝑟=𝑏𝑏 =|𝐴𝐴|2𝜋𝜋 (1 − 𝑅𝑅−2𝛼𝛼𝐿𝐿)
2𝜎𝜎𝛿𝛿𝜂𝜂2𝑏𝑏𝛼𝛼
e) [2p.]
|𝐴𝐴|2𝜋𝜋𝜂𝜂
ln �𝑏𝑏𝑅𝑅�
(1 − 𝑅𝑅−2𝛼𝛼𝐿𝐿) =
|𝐴𝐴|2𝜋𝜋 (1 − 𝑅𝑅−2𝛼𝛼𝐿𝐿)2𝜎𝜎𝛿𝛿𝜂𝜂2𝛼𝛼
�1𝑅𝑅
+1𝑏𝑏�
[1]
𝛼𝛼 =1
2𝜎𝜎𝛿𝛿𝜂𝜂 ln �𝑏𝑏𝑅𝑅� �
1𝑅𝑅
+1𝑏𝑏� �𝑁𝑁𝑅𝑅𝑝𝑝 𝑚𝑚� � [2]
This attenuation constant is because the conductors are not ideal, so 𝛼𝛼 = 𝛼𝛼𝑐𝑐 .
f) [1p.]
𝑊𝑊𝑑𝑑𝑚𝑚𝑠𝑠 = 𝑊𝑊𝑇𝑇 �𝛾𝛾=0
−𝑊𝑊𝑇𝑇 �𝛾𝛾=𝐿𝐿
=|𝐴𝐴|2
𝜂𝜂𝜋𝜋 ln �
𝑏𝑏𝑅𝑅�
(1 − 𝑅𝑅−2𝛼𝛼𝐿𝐿)
or
𝑊𝑊𝑑𝑑𝑚𝑚𝑠𝑠 = 𝑊𝑊𝑇𝑇 �𝑟𝑟=𝑎𝑎
+ 𝑊𝑊𝑇𝑇 �𝑟𝑟=𝑏𝑏
=|𝐴𝐴|2𝜋𝜋 (1 − 𝑅𝑅−2𝛼𝛼𝐿𝐿)
2𝜎𝜎𝛿𝛿𝜂𝜂2𝛼𝛼�
1𝑅𝑅
+1𝑏𝑏�
24
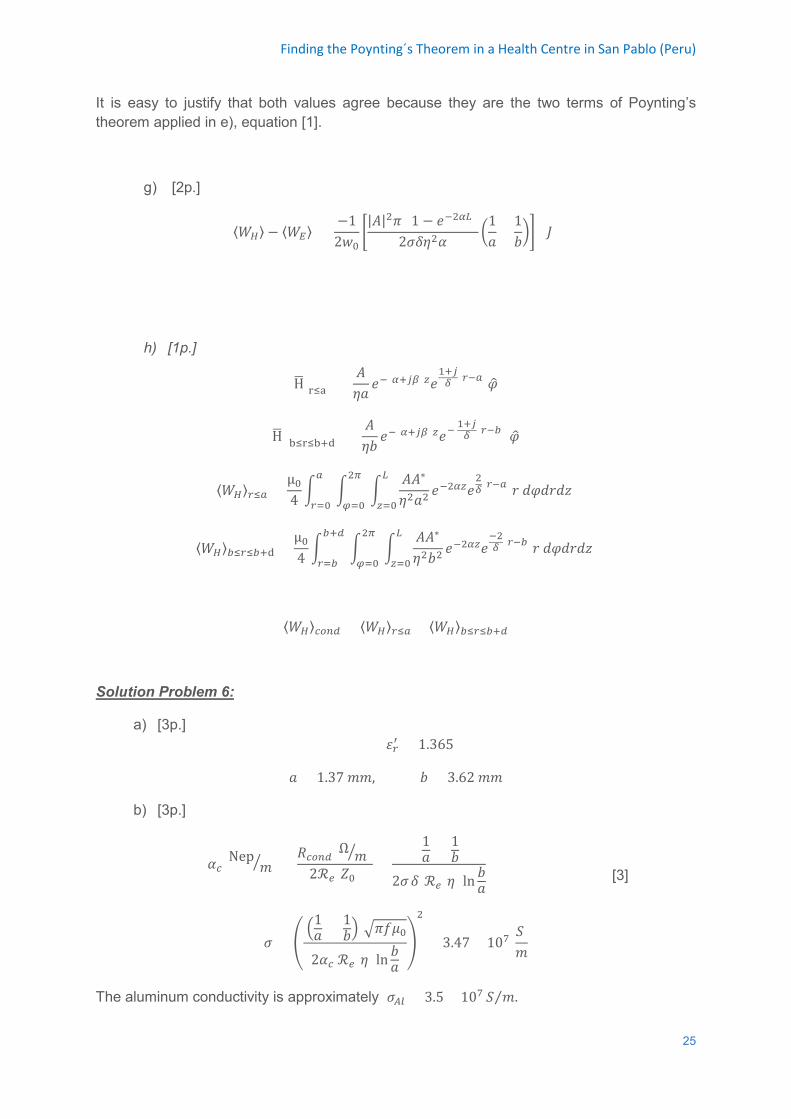
Finding the Poynting´s Theorem in a Health Centre in San Pablo (Peru)
It is easy to justify that both values agree because they are the two terms of Poynting’s theorem applied in e), equation [1].
g) [2p.]
⟨𝑊𝑊𝐻𝐻⟩ − ⟨𝑊𝑊𝐸𝐸⟩ = −12𝑝𝑝0
�|𝐴𝐴|2𝜋𝜋 (1 − 𝑅𝑅−2𝛼𝛼𝐿𝐿)
2𝜎𝜎𝛿𝛿𝜂𝜂2𝛼𝛼�
1𝑅𝑅
+1𝑏𝑏�� (𝐽𝐽)
h) [1p.]
H� (r≤a)
=𝐴𝐴𝜂𝜂𝑅𝑅
𝑅𝑅−(𝛼𝛼+𝑗𝑗𝛽𝛽)𝛾𝛾𝑅𝑅1+𝑗𝑗𝛿𝛿 (𝑟𝑟−𝑎𝑎)𝜑𝜑�
H� (b≤r≤b+d)
=𝐴𝐴𝜂𝜂𝑏𝑏
𝑅𝑅−(𝛼𝛼+𝑗𝑗𝛽𝛽)𝛾𝛾𝑅𝑅− 1+𝑗𝑗𝛿𝛿 (𝑟𝑟−𝑏𝑏) 𝜑𝜑�
⟨𝑊𝑊𝐻𝐻⟩𝑟𝑟≤𝑎𝑎 =µ04� 𝑎𝑎
𝑟𝑟=0� 2𝜋𝜋
𝜑𝜑=0�
𝐴𝐴𝐴𝐴∗
𝜂𝜂2𝑅𝑅2𝐿𝐿
𝛾𝛾=0𝑅𝑅−2𝛼𝛼𝛾𝛾𝑅𝑅
2𝛿𝛿(𝑟𝑟−𝑎𝑎)𝑝𝑝 𝑅𝑅𝜑𝜑𝑅𝑅𝑝𝑝𝑅𝑅𝐺𝐺
⟨𝑊𝑊𝐻𝐻⟩𝑏𝑏≤𝑟𝑟≤𝑏𝑏+d =µ04� 𝑏𝑏+𝑑𝑑
𝑟𝑟=𝑏𝑏� 2𝜋𝜋
𝜑𝜑=0�
𝐴𝐴𝐴𝐴∗
𝜂𝜂2𝑏𝑏2𝐿𝐿
𝛾𝛾=0𝑅𝑅−2𝛼𝛼𝛾𝛾𝑅𝑅
−2𝛿𝛿 (𝑟𝑟−𝑏𝑏)𝑝𝑝 𝑅𝑅𝜑𝜑𝑅𝑅𝑝𝑝𝑅𝑅𝐺𝐺
⟨𝑊𝑊𝐻𝐻⟩𝑐𝑐𝑜𝑜𝑛𝑛𝑑𝑑 = ⟨𝑊𝑊𝐻𝐻⟩𝑟𝑟≤𝑎𝑎 + ⟨𝑊𝑊𝐻𝐻⟩𝑏𝑏≤𝑟𝑟≤𝑏𝑏+𝑑𝑑
Solution Problem 6:
a) [3p.] 𝜀𝜀𝑟𝑟′ = 1.365
𝑅𝑅 = 1.37 𝑚𝑚𝑚𝑚, 𝑏𝑏 = 3.62 𝑚𝑚𝑚𝑚
b) [3p.]
𝛼𝛼𝑐𝑐(Nep𝑚𝑚� ) =
𝑅𝑅𝑐𝑐𝑜𝑜𝑛𝑛𝑑𝑑(Ω 𝑚𝑚� )2ℛ𝑒𝑒[𝑍𝑍0] =
1𝑅𝑅 + 1𝑏𝑏2𝜎𝜎 𝛿𝛿 ℛ𝑒𝑒[𝜂𝜂] ln 𝑏𝑏𝑅𝑅
[3]
𝜎𝜎 = � �1𝑅𝑅 + 1
𝑏𝑏� �𝜋𝜋𝑓𝑓𝜇𝜇0
2𝛼𝛼𝑐𝑐 ℛ𝑒𝑒[𝜂𝜂] ln 𝑏𝑏𝑅𝑅�
2
= 3.47 × 10⁷ 𝑆𝑆 𝑚𝑚
The aluminum conductivity is approximately 𝜎𝜎𝐴𝐴𝐴𝐴 = 3.5 × 10⁷ 𝑆𝑆 𝑚𝑚⁄ .
25
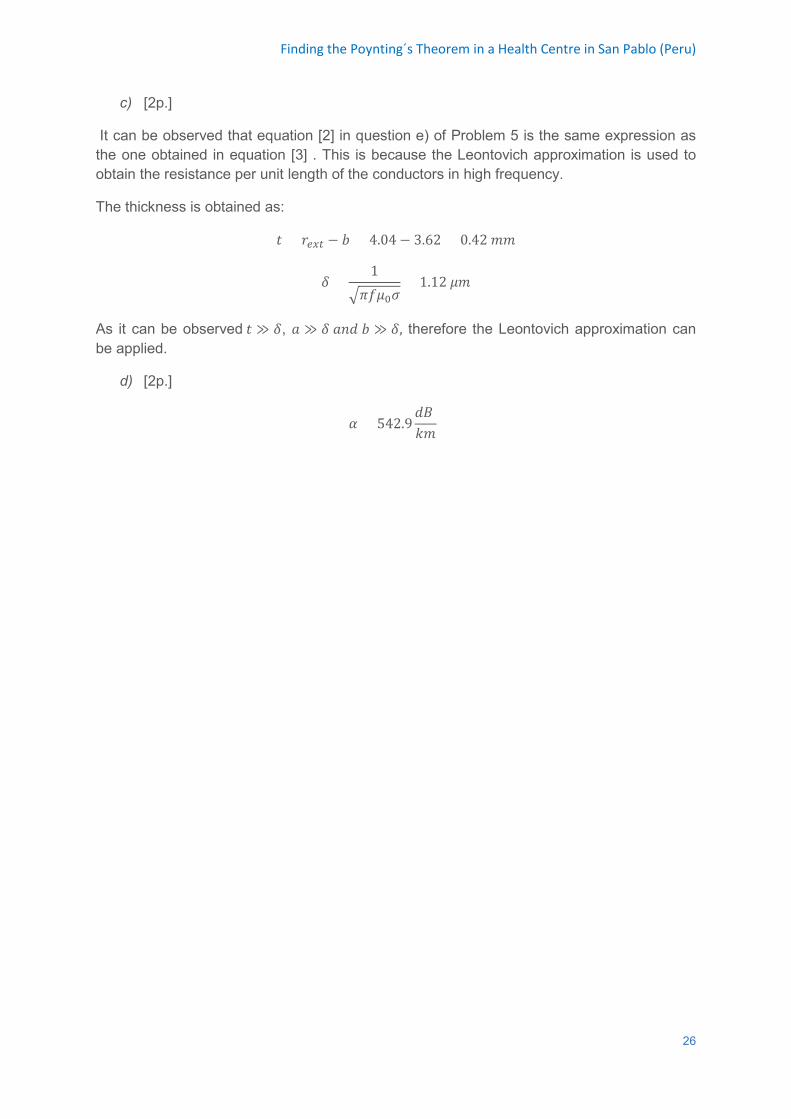
Finding the Poynting´s Theorem in a Health Centre in San Pablo (Peru)
c) [2p.]
It can be observed that equation [2] in question e) of Problem 5 is the same expression as the one obtained in equation [3] . This is because the Leontovich approximation is used to obtain the resistance per unit length of the conductors in high frequency.
The thickness is obtained as:
𝑅𝑅 = 𝑝𝑝𝑒𝑒𝑒𝑒𝑜𝑜 − 𝑏𝑏 = 4.04− 3.62 = 0.42 𝑚𝑚𝑚𝑚
𝛿𝛿 =1
�𝜋𝜋𝑓𝑓𝜇𝜇0𝜎𝜎= 1.12 𝜇𝜇𝑚𝑚
As it can be observed 𝑅𝑅 ≫ 𝛿𝛿, 𝑅𝑅 ≫ 𝛿𝛿 𝑅𝑅𝑠𝑠𝑅𝑅 𝑏𝑏 ≫ 𝛿𝛿, therefore the Leontovich approximation can be applied.
d) [2p.]
𝛼𝛼 = 542.9𝑅𝑅𝑑𝑑 𝑘𝑘𝑚𝑚
26
Finding the Poynting´s Theorem in a Health Centre in San Pablo (Peru)
BIBLIOGRAPHY Araujo Díaz, G., Córdova Bernuy, C., Paco Fernández, J., Fernández Inga, G., Proyecto San Pablo I, Diseño de la Red Willay-San Pablo I, Programa WIllay, Enero 2010, GTR-PUPC (“Grupo de Telecomunicaciones rurales de la Pontificia Universidad Católica del Perú”) CA-400 LMR-400 Coaxial cable datasheet, Available from: <http://www.ondamania.com/b2c/producto/02phlmr400/1/ca-400-cable-coaxial-50-ohm-baja-perdida-tipo-lmr-400>. Collin, R. E. 1966, Foundations for Microwave Engineering, 1ed. McGraw-Hill Inc. Departamento de Electromagnetismo y Teoría de Circuitos, 2006, Problemas de Campos Electromagnéticos, 1ed, Fundación Rogelio Segovia para el Desarrollo de las Telecomunicaciones, Ciudad Universitaria, s/n, 28040-Madrid., ISBN: 84-7402-337-8.
HyperLink, model HG5812U-PRO datasheet, Available from: <http://www.ds3comunicaciones.com/DS_HG5812U-PRO.PDF>. HyperLink, model HG5819P datasheet, Available from: <http://datasheet.octopart.com/HG5819P-L-Com-datasheet-21203269.pdf> Kraus, J.D., Carver, K.R., 1973, Electromagnetics, 2ed. McGraw-Hill Inc. Kyocera, Solar Panel KC85T datasheet. Available from: < http://pdf.wholesalesolar.com/module%20pdf%20folder/KC85T.pdf >. Microtik RB 433 datasheet. Available from: < http://i.mt.lv/routerboard/files/rb433.pdf>. NASA website. Available from: < http://eosweb.larc.nasa.gov/sse>. Nikolski, V.V., 1973, Electrodinámica y propagación de ondas de radio, Traducción al español. Ed. Mir 1976. Ramo, S., Whinnery, J.R., Van Duzer, T., 1984, Fields and Waves in Communication Electronics, 2ed. John Wiley & Sons, Inc.
27

Finding the Poynting´s Theorem in a Health Centre in San Pablo (Peru)
Ritar RA12-240 datasheet. Available from: <http://www.ritarpower.com/upload/pdf/2013030210424975101672.pdf>. Steca 20A Model datasheet. Available from: <http://www.steca.com/index.php?Solarix-PRS--PRS-1010--PRS-1515--PRS-2020--PRS-303537c996b959a5>. Victoria Pérez, M., Tecnologías apropiadas: Fotovoltaica y minieólica. Available from: https://moodle.upm.es/titulaciones/oficiales/pluginfile.php/573190/mod_resource/content/2/CLASE%20III%20Fotovolt%C3%A1ica%20y%20e%C3%B3lica.pdf [23 April 2013].
28
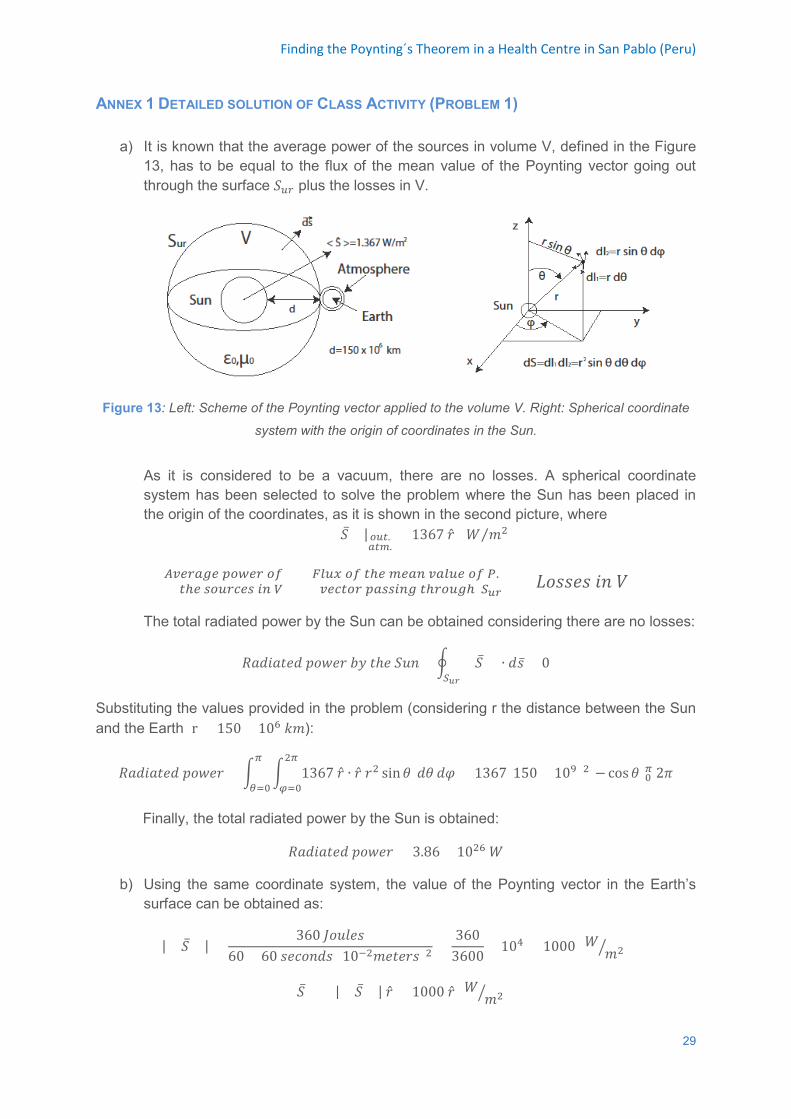
Finding the Poynting´s Theorem in a Health Centre in San Pablo (Peru)
ANNEX 1 DETAILED SOLUTION OF CLASS ACTIVITY (PROBLEM 1)
a) It is known that the average power of the sources in volume V, defined in the Figure 13, has to be equal to the flux of the mean value of the Poynting vector going out through the surface 𝑆𝑆𝑜𝑜𝑟𝑟 plus the losses in V.
Figure 13: Left: Scheme of the Poynting vector applied to the volume V. Right: Spherical coordinate
system with the origin of coordinates in the Sun.
As it is considered to be a vacuum, there are no losses. A spherical coordinate system has been selected to solve the problem where the Sun has been placed in the origin of the coordinates, as it is shown in the second picture, where
< 𝑆𝑆̅ >|𝑜𝑜𝑜𝑜𝑜𝑜.𝑎𝑎𝑜𝑜𝑎𝑎.
= 1367 �̂�𝑝 (𝑊𝑊 𝑚𝑚2)⁄
𝑜𝑜ℎ𝑒𝑒 𝑠𝑠𝑜𝑜𝑜𝑜𝑟𝑟𝑐𝑐𝑒𝑒𝑠𝑠 𝑚𝑚𝑛𝑛 𝑉𝑉𝐴𝐴𝑐𝑐𝑒𝑒𝑟𝑟𝑎𝑎𝐴𝐴𝑒𝑒 𝑝𝑝𝑜𝑜𝑤𝑤𝑒𝑒𝑟𝑟 𝑜𝑜𝑒𝑒 = 𝑐𝑐𝑒𝑒𝑐𝑐𝑜𝑜𝑜𝑜𝑟𝑟 𝑝𝑝𝑎𝑎𝑠𝑠𝑠𝑠𝑚𝑚𝑛𝑛𝐴𝐴 𝑜𝑜ℎ𝑟𝑟𝑜𝑜𝑜𝑜𝐴𝐴ℎ 𝑆𝑆𝑢𝑢𝑢𝑢
𝐹𝐹𝐴𝐴𝑜𝑜𝑒𝑒 𝑜𝑜𝑒𝑒 𝑜𝑜ℎ𝑒𝑒 𝑎𝑎𝑒𝑒𝑎𝑎𝑛𝑛 𝑐𝑐𝑎𝑎𝐴𝐴𝑜𝑜𝑒𝑒 𝑜𝑜𝑒𝑒 𝑃𝑃. + 𝐿𝐿𝑝𝑝𝑠𝑠𝑠𝑠𝑅𝑅𝑠𝑠 𝑅𝑅𝑠𝑠 𝑉𝑉
The total radiated power by the Sun can be obtained considering there are no losses:
𝑅𝑅𝑅𝑅𝑅𝑅𝑅𝑅𝑅𝑅𝑅𝑅𝑅𝑅𝑅𝑅 𝑝𝑝𝑝𝑝𝑝𝑝𝑅𝑅𝑝𝑝 𝑏𝑏𝑏𝑏 𝑅𝑅ℎ𝑅𝑅 𝑆𝑆𝑆𝑆𝑠𝑠= � < 𝑆𝑆̅ >
𝑆𝑆𝑢𝑢𝑢𝑢∙ 𝑅𝑅�̅�𝑠 + 0
Substituting the values provided in the problem (considering r the distance between the Sun and the Earth r = 150 × 106 𝑘𝑘𝑚𝑚):
𝑅𝑅𝑅𝑅𝑅𝑅𝑅𝑅𝑅𝑅𝑅𝑅𝑅𝑅𝑅𝑅 𝑝𝑝𝑝𝑝𝑝𝑝𝑅𝑅𝑝𝑝 = � � 1367 �̂�𝑝 ∙ �̂�𝑝 𝑝𝑝2 sin𝜃𝜃 𝑅𝑅𝜃𝜃 𝑅𝑅𝜑𝜑2𝜋𝜋
𝜑𝜑=0
𝜋𝜋
𝜃𝜃=0= 1367(150 × 109)2[− cos𝜃𝜃]0𝜋𝜋 2𝜋𝜋
Finally, the total radiated power by the Sun is obtained:
𝑅𝑅𝑅𝑅𝑅𝑅𝑅𝑅𝑅𝑅𝑅𝑅𝑅𝑅𝑅𝑅 𝑝𝑝𝑝𝑝𝑝𝑝𝑅𝑅𝑝𝑝 = 3.86 × 1026 𝑊𝑊
b) Using the same coordinate system, the value of the Poynting vector in the Earth’s surface can be obtained as:
|< 𝑆𝑆̅ >| =360 𝐽𝐽𝑝𝑝𝑆𝑆𝐽𝐽𝑅𝑅𝑠𝑠
60 × 60 𝑠𝑠𝑅𝑅𝑐𝑐𝑝𝑝𝑠𝑠𝑅𝑅𝑠𝑠 (10−2𝑚𝑚𝑅𝑅𝑅𝑅𝑅𝑅𝑝𝑝𝑠𝑠)2=
3603600
× 104 = 1000 (𝑊𝑊 𝑚𝑚2� )
< 𝑆𝑆̅ >= |< 𝑆𝑆̅ >| �̂�𝑝 = 1000 �̂�𝑝 (𝑊𝑊 𝑚𝑚2� )
29

Finding the Poynting´s Theorem in a Health Centre in San Pablo (Peru)
c) In order to obtain the efficiency, the input and output power must be previously obtained.
𝑃𝑃𝑂𝑂𝑜𝑜𝑜𝑜(𝐷𝐷𝐷𝐷) = 𝑉𝑉 × 𝐼𝐼 = 17.4 × 5.02 = 87.35 𝑊𝑊
𝑃𝑃𝐼𝐼𝑛𝑛 = 𝑅𝑅𝑅𝑅𝑠𝑠𝑠𝑠𝑅𝑅𝑅𝑅𝑏𝑏 𝑝𝑝𝑝𝑝𝑝𝑝𝑅𝑅𝑝𝑝 × 𝑅𝑅𝑝𝑝𝑅𝑅𝑅𝑅 = 1000 × 0.652 = 652 𝑊𝑊
𝜂𝜂 =𝑃𝑃𝑂𝑂𝑜𝑜𝑜𝑜𝑃𝑃𝐼𝐼𝑛𝑛
=87.35652
= 13,4%
d) In case of an error of 30°, the input and output power in that scenario would be:
𝑃𝑃𝐼𝐼𝑛𝑛 = � < 𝑆𝑆̅ > ∙ 𝑅𝑅�̅�𝑠
𝑆𝑆𝑢𝑢𝑢𝑢𝑝𝑝𝑎𝑎𝑛𝑛𝑒𝑒𝐴𝐴
= � |< 𝑆𝑆̅ >| cos𝜓𝜓
𝑆𝑆𝑢𝑢𝑢𝑢𝑝𝑝𝑎𝑎𝑛𝑛𝑒𝑒𝐴𝐴
𝑅𝑅𝑠𝑠 = 1000 × √32
× 0.652
𝑃𝑃𝐼𝐼𝑛𝑛 = 326√3 𝑊𝑊
𝑃𝑃𝑂𝑂𝑜𝑜𝑜𝑜 = 𝜂𝜂 ∙ 𝑃𝑃𝐼𝐼𝑛𝑛 = 0.134 × 326√3 = 75.66 𝑊𝑊
30
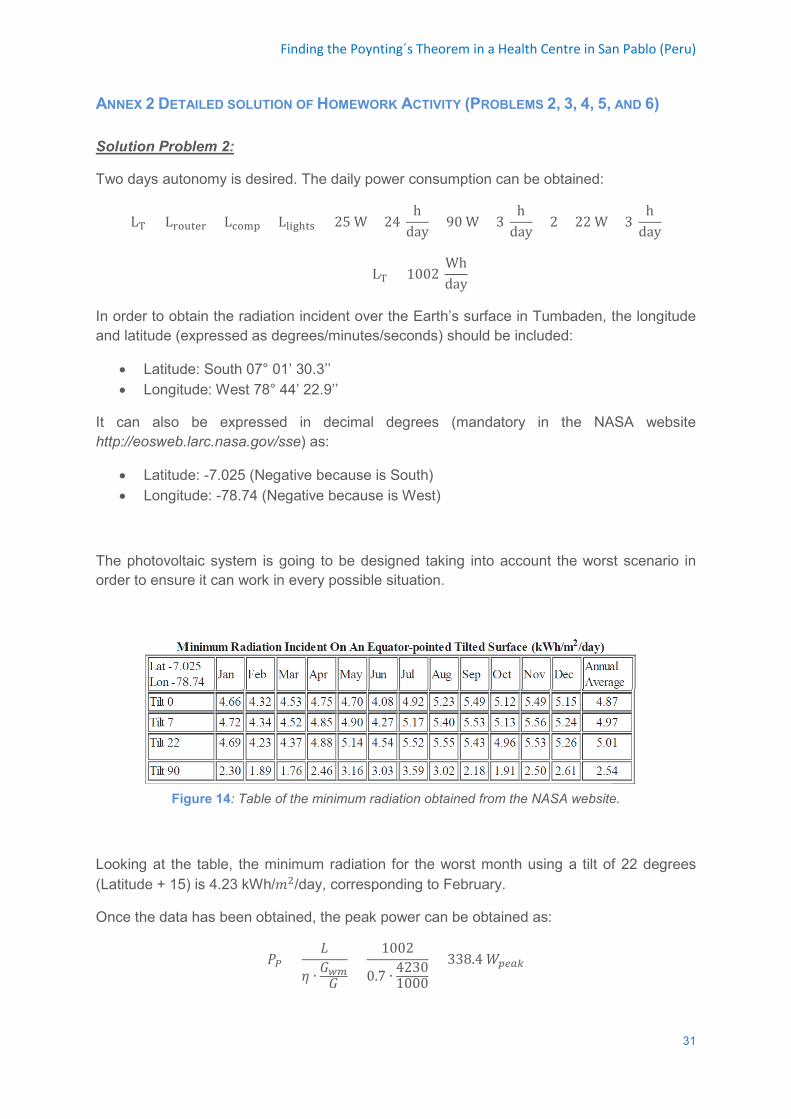
Finding the Poynting´s Theorem in a Health Centre in San Pablo (Peru)
ANNEX 2 DETAILED SOLUTION OF HOMEWORK ACTIVITY (PROBLEMS 2, 3, 4, 5, AND 6) Solution Problem 2:
Two days autonomy is desired. The daily power consumption can be obtained:
LT = Lrouter + Lcomp + Llights = 25 W × 24 h
day+ 90 W × 3
hday
+ 2 × 22 W × 3 h
day
LT = 1002 Whday
In order to obtain the radiation incident over the Earth’s surface in Tumbaden, the longitude and latitude (expressed as degrees/minutes/seconds) should be included:
• Latitude: South 07° 01’ 30.3’’ • Longitude: West 78° 44’ 22.9’’
It can also be expressed in decimal degrees (mandatory in the NASA website http://eosweb.larc.nasa.gov/sse) as:
• Latitude: -7.025 (Negative because is South) • Longitude: -78.74 (Negative because is West)
The photovoltaic system is going to be designed taking into account the worst scenario in order to ensure it can work in every possible situation.
Figure 14: Table of the minimum radiation obtained from the NASA website.
Looking at the table, the minimum radiation for the worst month using a tilt of 22 degrees (Latitude + 15) is 4.23 kWh/𝑚𝑚2/day, corresponding to February.
Once the data has been obtained, the peak power can be obtained as:
𝑃𝑃𝑃𝑃 =𝐿𝐿
𝜂𝜂 ∙ 𝐺𝐺𝑤𝑤𝑎𝑎𝐺𝐺=
1002
0.7 ∙ 42301000
= 338.4 𝑊𝑊𝑝𝑝𝑒𝑒𝑎𝑎𝑝𝑝
31
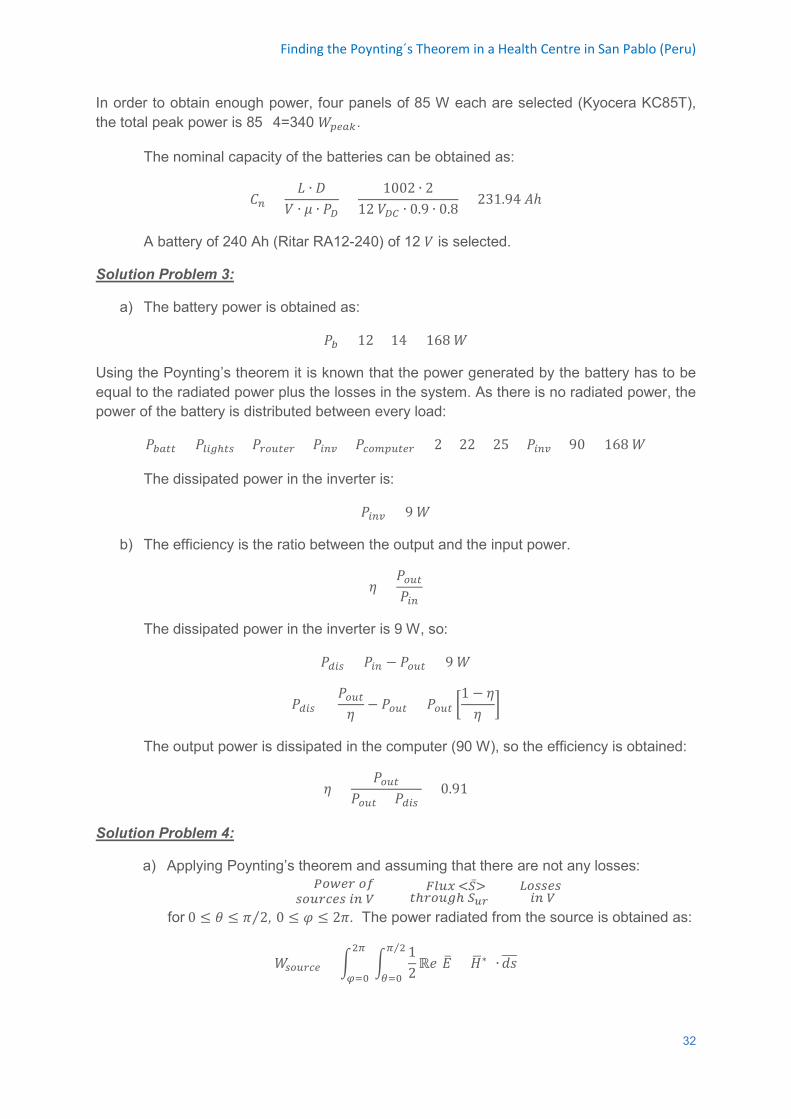
Finding the Poynting´s Theorem in a Health Centre in San Pablo (Peru)
In order to obtain enough power, four panels of 85 W each are selected (Kyocera KC85T), the total peak power is 85×4=340 𝑊𝑊𝑝𝑝𝑒𝑒𝑎𝑎𝑝𝑝.
The nominal capacity of the batteries can be obtained as:
𝐶𝐶𝑛𝑛 =𝐿𝐿 ∙ 𝐷𝐷
𝑉𝑉 ∙ 𝜇𝜇 ∙ 𝑃𝑃𝐷𝐷=
1002 ∙ 212 𝑉𝑉𝐷𝐷𝐷𝐷 ∙ 0.9 ∙ 0.8
= 231.94 𝐴𝐴ℎ
A battery of 240 Ah (Ritar RA12-240) of 12 𝑉𝑉 is selected.
Solution Problem 3:
a) The battery power is obtained as:
𝑃𝑃𝑏𝑏 = 12 × 14 = 168 𝑊𝑊
Using the Poynting’s theorem it is known that the power generated by the battery has to be equal to the radiated power plus the losses in the system. As there is no radiated power, the power of the battery is distributed between every load:
𝑃𝑃𝑏𝑏𝑎𝑎𝑜𝑜𝑜𝑜 = 𝑃𝑃𝐴𝐴𝑚𝑚𝐴𝐴ℎ𝑜𝑜𝑠𝑠 + 𝑃𝑃𝑟𝑟𝑜𝑜𝑜𝑜𝑜𝑜𝑒𝑒𝑟𝑟 + 𝑃𝑃𝑚𝑚𝑛𝑛𝑐𝑐 + 𝑃𝑃𝑐𝑐𝑜𝑜𝑎𝑎𝑝𝑝𝑜𝑜𝑜𝑜𝑒𝑒𝑟𝑟 = 2 × 22 + 25 + 𝑃𝑃𝑚𝑚𝑛𝑛𝑐𝑐 + 90 = 168 𝑊𝑊
The dissipated power in the inverter is:
𝑃𝑃𝑚𝑚𝑛𝑛𝑐𝑐 = 9 𝑊𝑊
b) The efficiency is the ratio between the output and the input power.
𝜂𝜂 =𝑃𝑃𝑜𝑜𝑜𝑜𝑜𝑜𝑃𝑃𝑚𝑚𝑛𝑛
The dissipated power in the inverter is 9 W, so:
𝑃𝑃𝑑𝑑𝑚𝑚𝑠𝑠 = 𝑃𝑃𝑚𝑚𝑛𝑛 − 𝑃𝑃𝑜𝑜𝑜𝑜𝑜𝑜 = 9 𝑊𝑊
𝑃𝑃𝑑𝑑𝑚𝑚𝑠𝑠 = 𝑃𝑃𝑜𝑜𝑜𝑜𝑜𝑜𝜂𝜂
− 𝑃𝑃𝑜𝑜𝑜𝑜𝑜𝑜 = 𝑃𝑃𝑜𝑜𝑜𝑜𝑜𝑜 �1 − 𝜂𝜂𝜂𝜂 �
The output power is dissipated in the computer (90 W), so the efficiency is obtained:
𝜂𝜂 =𝑃𝑃𝑜𝑜𝑜𝑜𝑜𝑜
𝑃𝑃𝑜𝑜𝑜𝑜𝑜𝑜 + 𝑃𝑃𝑑𝑑𝑚𝑚𝑠𝑠 = 0.91
Solution Problem 4:
a) Applying Poynting’s theorem and assuming that there are not any losses:
𝑠𝑠𝑜𝑜𝑜𝑜𝑟𝑟𝑐𝑐𝑒𝑒𝑠𝑠 𝑚𝑚𝑛𝑛 𝑉𝑉𝑃𝑃𝑜𝑜𝑤𝑤𝑒𝑒𝑟𝑟 𝑜𝑜𝑒𝑒 = 𝑜𝑜ℎ𝑟𝑟𝑜𝑜𝑜𝑜𝐴𝐴ℎ 𝑆𝑆𝑢𝑢𝑢𝑢
𝐹𝐹𝐴𝐴𝑜𝑜𝑒𝑒 <𝑆𝑆̅> + 𝑚𝑚𝑛𝑛 𝑉𝑉 𝐿𝐿𝑜𝑜𝑠𝑠𝑠𝑠𝑒𝑒𝑠𝑠
for 0 ≤ 𝜃𝜃 ≤ 𝜋𝜋 2⁄ , 0 ≤ 𝜑𝜑 ≤ 2𝜋𝜋. The power radiated from the source is obtained as:
𝑊𝑊𝑠𝑠𝑜𝑜𝑜𝑜𝑟𝑟𝑐𝑐𝑒𝑒 = � 2𝜋𝜋
𝜑𝜑=0�
12ℝ𝑅𝑅[𝐸𝐸� × 𝐺𝐺�
∗] ∙𝜋𝜋 2⁄
𝜃𝜃=0𝑅𝑅𝑠𝑠���
32

Finding the Poynting´s Theorem in a Health Centre in San Pablo (Peru)
where 𝑅𝑅𝑠𝑠���� = 𝑝𝑝2 sin𝜃𝜃 𝑅𝑅𝜃𝜃 𝑅𝑅𝜑𝜑 �̂�𝑝. We are only interested in the mean value of the Poynting vector in the �̂�𝑝 direction. The Poynting vector is:
< 𝑆𝑆�̅�𝑟(�̅�𝑝, 𝑅𝑅) >=12ℝ𝑅𝑅�𝐸𝐸�𝜃𝜃 × 𝐺𝐺�𝜑𝜑∗ �
where 𝐸𝐸�𝜃𝜃 and 𝐺𝐺�𝜑𝜑 are the components of the electric and magnetic field provided.
< 𝑆𝑆�̅�𝑟(�̅�𝑝, 𝑅𝑅) >=12ℝ𝑅𝑅 �𝐴𝐴𝑝𝑝𝜇𝜇0 sin2 𝜃𝜃 �
1β0r
+1
jβ02r2−
1jβ03r3
� e−jβ0r A∗ β0 �1β0r
+1
−jβ02r2� e+jβ0r� �̂�𝑝
=|𝐴𝐴|2
2𝑝𝑝𝜇𝜇0 sin2 𝜃𝜃 β0 ℝ𝑅𝑅 �
1β02r2
+1
β04r4−
1β04r4
+ j�1
β03r3−
1β03r3
−1
β05r5�� �̂�𝑝
=|𝐴𝐴|2
2𝑝𝑝𝜇𝜇0 sin2 𝜃𝜃 β0
1β02r2
�̂�𝑝 =|𝐴𝐴|2𝑝𝑝𝜇𝜇0 sin2 𝜃𝜃
2β0 r2�̂�𝑝
Once the Poynting vector has been obtained, we are going to integrate it to obtain the power of the sources:
𝑊𝑊𝑠𝑠𝑜𝑜𝑜𝑜𝑟𝑟𝑐𝑐𝑒𝑒 = � 2𝜋𝜋
𝜑𝜑=0� 𝜋𝜋 2⁄
𝜃𝜃=0
|𝐴𝐴|2𝑝𝑝𝜇𝜇0 sin2 𝜃𝜃
2β0 r2 𝑝𝑝2 sin𝜃𝜃 𝑅𝑅𝜃𝜃 𝑅𝑅𝜑𝜑 �̂�𝑝 ∙ �̂�𝑝 =
|𝐴𝐴|2 2
𝑝𝑝𝜇𝜇01β0 � 𝑅𝑅𝜑𝜑 �
𝜋𝜋 2⁄
𝜃𝜃=0
2𝜋𝜋
𝜑𝜑=0sin3 𝜃𝜃 𝑅𝑅𝜃𝜃
=|𝐴𝐴|2
2𝑝𝑝𝜇𝜇0
1β0
2𝜋𝜋23
= |𝐴𝐴|280𝜋𝜋2
The lowest power density has to be greater than the threshold provided:
|< 𝑆𝑆̅(�̅�𝑝, 𝑅𝑅) >|𝜃𝜃=𝜋𝜋 2⁄𝑟𝑟=1𝑝𝑝𝑎𝑎
=|𝐴𝐴|2𝑝𝑝𝜇𝜇0 sin2 𝜃𝜃
2β0 r2�𝜃𝜃=𝜋𝜋 2⁄𝑟𝑟=1𝑝𝑝𝑎𝑎
=|𝐴𝐴|2𝑝𝑝𝜇𝜇0 sin2 𝜋𝜋 2⁄
2β0 106=
|𝐴𝐴|26𝜋𝜋
105≥
≥ 1.62 × 10⁻⁸ �𝑊𝑊 𝑚𝑚2� �
If a communication is going to be established, |𝐴𝐴| should be greater than:
|𝐴𝐴|2 ≥1.62 × 10⁻³
6𝜋𝜋= 8.59 × 10⁻⁵
|𝐴𝐴| ≥ 9.27 × 10⁻³ (𝐴𝐴)
There is no information about the phase of A, so a generic value φ is considered 𝐴𝐴 = |𝐴𝐴|𝑅𝑅𝑗𝑗𝜑𝜑. In that way, the power will be:
𝑊𝑊𝑠𝑠𝑜𝑜𝑜𝑜𝑟𝑟𝑐𝑐𝑒𝑒 ≥ |𝐴𝐴|280𝜋𝜋2 = 68 𝑚𝑚𝑊𝑊 b) The minimum power density occurs at θ = 0 as it depends of sin2 θ. c) The expression of the magnetic field in time form is:
𝐺𝐺�𝜑𝜑(�̅�𝑝, 𝑅𝑅) = ℝ𝑅𝑅 �𝐴𝐴 𝛽𝛽0 𝑠𝑠𝑅𝑅𝑠𝑠 𝜃𝜃 �1𝛽𝛽0𝑝𝑝
+1
𝑗𝑗𝛽𝛽02𝑝𝑝2� 𝑅𝑅−𝑗𝑗𝛽𝛽0𝑟𝑟𝑅𝑅𝑗𝑗𝑤𝑤0𝑜𝑜�
= |𝐴𝐴 |𝛽𝛽0 𝑠𝑠𝑅𝑅𝑠𝑠 𝜃𝜃 �cos(𝑝𝑝0𝑅𝑅 − 𝛽𝛽0𝑝𝑝 + 𝜑𝜑)
𝛽𝛽0𝑝𝑝
+1
𝛽𝛽02𝑝𝑝2cos�𝑝𝑝0𝑅𝑅 − 𝛽𝛽0𝑝𝑝 −
𝜋𝜋2
+ 𝜑𝜑�� (𝐴𝐴 𝑚𝑚� )
33
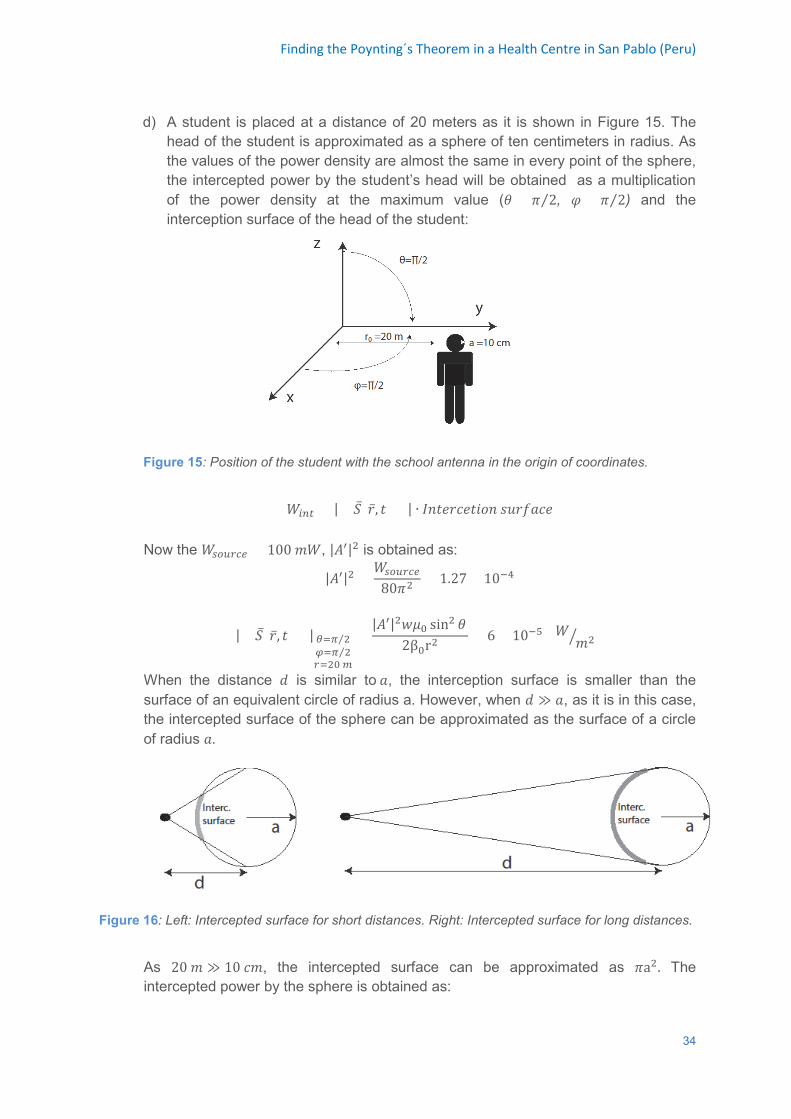
Finding the Poynting´s Theorem in a Health Centre in San Pablo (Peru)
d) A student is placed at a distance of 20 meters as it is shown in Figure 15. The
head of the student is approximated as a sphere of ten centimeters in radius. As the values of the power density are almost the same in every point of the sphere, the intercepted power by the student’s head will be obtained as a multiplication of the power density at the maximum value (𝜃𝜃 = 𝜋𝜋 2⁄ , 𝜑𝜑 = 𝜋𝜋 2⁄ ) and the interception surface of the head of the student:
Figure 15: Position of the student with the school antenna in the origin of coordinates.
𝑊𝑊𝑚𝑚𝑛𝑛𝑜𝑜 = |< 𝑆𝑆̅(�̅�𝑝, 𝑅𝑅) >| ∙ 𝐼𝐼𝑠𝑠𝑅𝑅𝑅𝑅𝑝𝑝𝑐𝑐𝑅𝑅𝑅𝑅𝑅𝑅𝑝𝑝𝑠𝑠 𝑠𝑠𝑆𝑆𝑝𝑝𝑓𝑓𝑅𝑅𝑐𝑐𝑅𝑅
Now the 𝑊𝑊𝑠𝑠𝑜𝑜𝑜𝑜𝑟𝑟𝑐𝑐𝑒𝑒 = 100 𝑚𝑚𝑊𝑊, |𝐴𝐴′|2 is obtained as:
|𝐴𝐴′|2 =𝑊𝑊𝑠𝑠𝑜𝑜𝑜𝑜𝑟𝑟𝑐𝑐𝑒𝑒
80𝜋𝜋2= 1.27 × 10⁻⁴
|< 𝑆𝑆̅(�̅�𝑝, 𝑅𝑅) >| 𝜃𝜃=𝜋𝜋 2⁄𝜑𝜑=𝜋𝜋 2⁄𝑟𝑟=20 𝑎𝑎
=|𝐴𝐴′|2𝑝𝑝𝜇𝜇0 sin2 𝜃𝜃
2β0 r2= 6 × 10⁻⁵ (𝑊𝑊 𝑚𝑚2� )
When the distance 𝑅𝑅 is similar to 𝑅𝑅, the interception surface is smaller than the surface of an equivalent circle of radius a. However, when 𝑅𝑅 ≫ 𝑅𝑅, as it is in this case, the intercepted surface of the sphere can be approximated as the surface of a circle of radius 𝑅𝑅.
Figure 16: Left: Intercepted surface for short distances. Right: Intercepted surface for long distances.
As 20 𝑚𝑚 ≫ 10 𝑐𝑐𝑚𝑚, the intercepted surface can be approximated as 𝜋𝜋a2. The intercepted power by the sphere is obtained as:
34
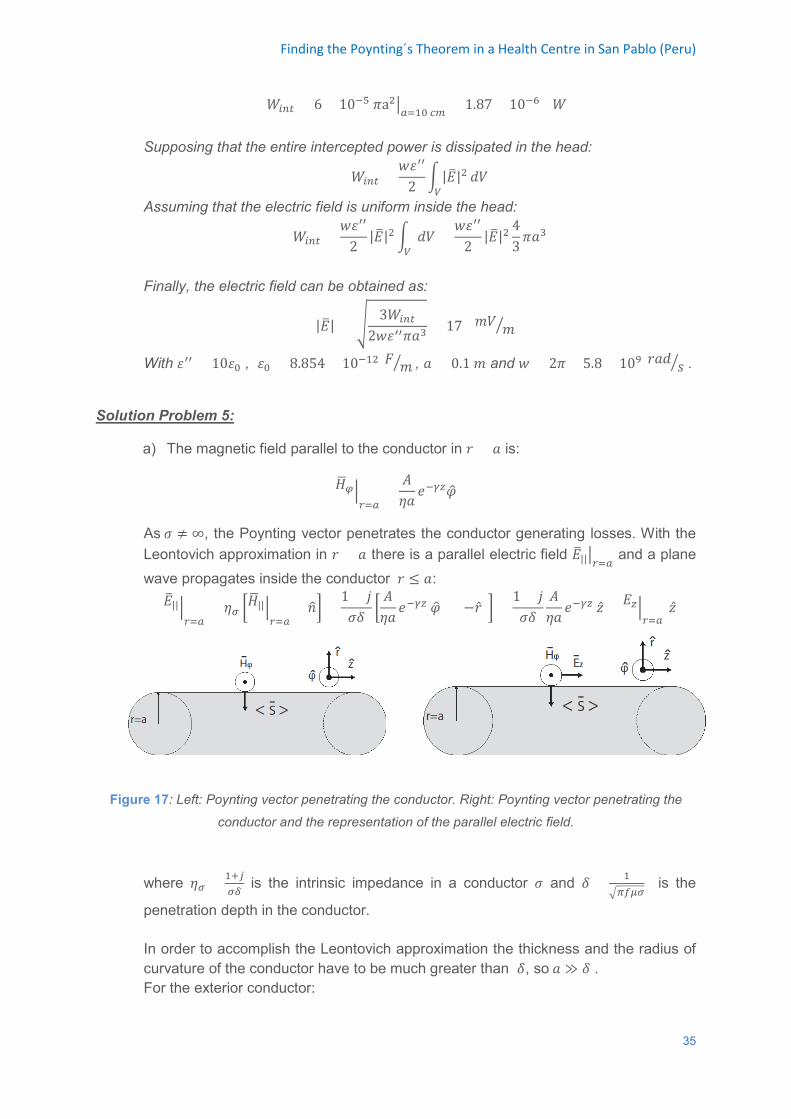
Finding the Poynting´s Theorem in a Health Centre in San Pablo (Peru)
𝑊𝑊𝑚𝑚𝑛𝑛𝑜𝑜 = 6 × 10⁻⁵ 𝜋𝜋a2�𝑎𝑎=10 𝑐𝑐𝑎𝑎 = 1.87 × 10⁻⁶ (𝑊𝑊) Supposing that the entire intercepted power is dissipated in the head:
𝑊𝑊𝑚𝑚𝑛𝑛𝑜𝑜 =𝑝𝑝𝜀𝜀′′
2� |𝐸𝐸�|2
𝑉𝑉𝑅𝑅𝑉𝑉
Assuming that the electric field is uniform inside the head:
𝑊𝑊𝑚𝑚𝑛𝑛𝑜𝑜 =𝑝𝑝𝜀𝜀′′
2|𝐸𝐸�|2 �
𝑉𝑉𝑅𝑅𝑉𝑉 =
𝑝𝑝𝜀𝜀′′
2|𝐸𝐸�|2
43𝜋𝜋𝑅𝑅3
Finally, the electric field can be obtained as:
|𝐸𝐸�| = � 3𝑊𝑊𝑚𝑚𝑛𝑛𝑜𝑜
2𝑝𝑝𝜀𝜀′′𝜋𝜋𝑅𝑅3= 17 (𝑚𝑚𝑉𝑉 𝑚𝑚 � )
With 𝜀𝜀′′ = 10𝜀𝜀0 , 𝜀𝜀0 = 8.854 × 10⁻¹² 𝑝𝑝 𝑚𝑚 � , 𝑅𝑅 = 0.1 𝑚𝑚 and 𝑝𝑝 = 2𝜋𝜋 × 5.8 × 109 𝑝𝑝𝑅𝑅𝑅𝑅 𝑠𝑠� .
Solution Problem 5:
a) The magnetic field parallel to the conductor in 𝑝𝑝 = 𝑅𝑅 is:
𝐺𝐺�𝜑𝜑 �𝑟𝑟=𝑎𝑎
=𝐴𝐴𝜂𝜂𝑅𝑅
𝑅𝑅−𝛾𝛾𝛾𝛾𝜑𝜑�
As 𝜎𝜎 ≠ ∞, the Poynting vector penetrates the conductor generating losses. With the Leontovich approximation in 𝑝𝑝 = 𝑅𝑅 there is a parallel electric field 𝐸𝐸�||�𝑟𝑟=𝑎𝑎 and a plane wave propagates inside the conductor 𝑝𝑝 ≤ 𝑅𝑅:
𝐸𝐸�|| �𝑟𝑟=𝑎𝑎
= 𝜂𝜂𝜋𝜋 �𝐺𝐺�|| �𝑟𝑟=𝑎𝑎
× 𝑠𝑠�� =1 + 𝑗𝑗𝜎𝜎𝛿𝛿 �
𝐴𝐴𝜂𝜂𝑅𝑅
𝑅𝑅−𝛾𝛾𝛾𝛾 𝜑𝜑� × (−�̂�𝑝)� =1 + 𝑗𝑗𝜎𝜎𝛿𝛿
𝐴𝐴𝜂𝜂𝑅𝑅
𝑅𝑅−𝛾𝛾𝛾𝛾 �̂�𝐺 = 𝐸𝐸𝛾𝛾 �𝑟𝑟=𝑎𝑎
�̂�𝐺
Figure 17: Left: Poynting vector penetrating the conductor. Right: Poynting vector penetrating the
conductor and the representation of the parallel electric field.
where 𝜂𝜂𝜋𝜋 = 1+𝑗𝑗𝜋𝜋𝛿𝛿
is the intrinsic impedance in a conductor 𝜎𝜎 and 𝛿𝛿 = 1�𝜋𝜋𝑒𝑒𝜇𝜇𝜋𝜋
is the
penetration depth in the conductor. In order to accomplish the Leontovich approximation the thickness and the radius of curvature of the conductor have to be much greater than 𝛿𝛿, so 𝑅𝑅 ≫ 𝛿𝛿 . For the exterior conductor:
35
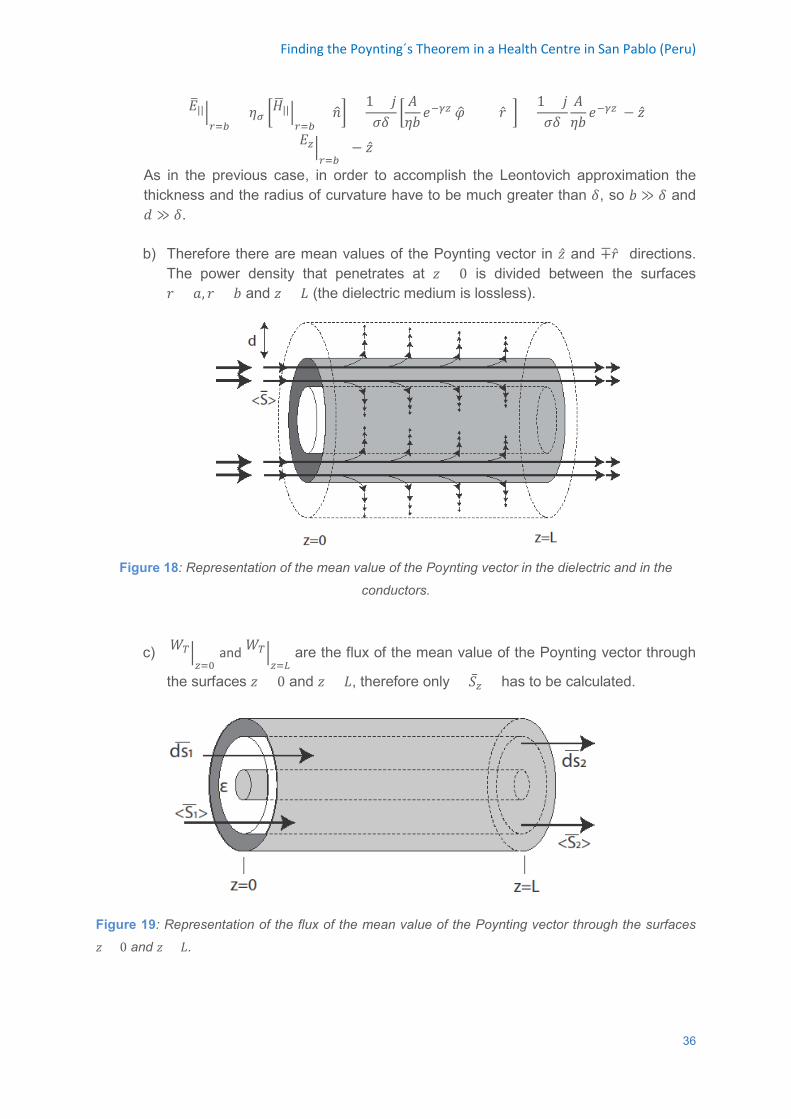
Finding the Poynting´s Theorem in a Health Centre in San Pablo (Peru)
𝐸𝐸�|| �𝑟𝑟=𝑏𝑏
= 𝜂𝜂𝜋𝜋 �𝐺𝐺�|| �𝑟𝑟=𝑏𝑏
× 𝑠𝑠�� =1 + 𝑗𝑗𝜎𝜎𝛿𝛿 �
𝐴𝐴𝜂𝜂𝑏𝑏𝑅𝑅−𝛾𝛾𝛾𝛾 𝜑𝜑� × (+�̂�𝑝)� =
1 + 𝑗𝑗𝜎𝜎𝛿𝛿
𝐴𝐴𝜂𝜂𝑏𝑏
𝑅𝑅−𝛾𝛾𝛾𝛾(− �̂�𝐺)
= 𝐸𝐸𝛾𝛾 �𝑟𝑟=𝑏𝑏
( − �̂�𝐺)
As in the previous case, in order to accomplish the Leontovich approximation the thickness and the radius of curvature have to be much greater than 𝛿𝛿, so 𝑏𝑏 ≫ 𝛿𝛿 and 𝑅𝑅 ≫ 𝛿𝛿. b) Therefore there are mean values of the Poynting vector in �̂�𝐺 and ∓�̂�𝑝 directions.
The power density that penetrates at 𝐺𝐺 = 0 is divided between the surfaces 𝑝𝑝 = 𝑅𝑅, 𝑝𝑝 = 𝑏𝑏 and 𝐺𝐺 = 𝐿𝐿 (the dielectric medium is lossless).
Figure 18: Representation of the mean value of the Poynting vector in the dielectric and in the
conductors.
c) 𝑊𝑊𝑇𝑇 �𝛾𝛾=0
and 𝑊𝑊𝑇𝑇 �𝛾𝛾=𝐿𝐿
are the flux of the mean value of the Poynting vector through
the surfaces 𝐺𝐺 = 0 and 𝐺𝐺 = 𝐿𝐿, therefore only < 𝑆𝑆�̅�𝛾 > has to be calculated.
Figure 19: Representation of the flux of the mean value of the Poynting vector through the surfaces
𝐺𝐺 = 0 and 𝐺𝐺 = 𝐿𝐿.
36
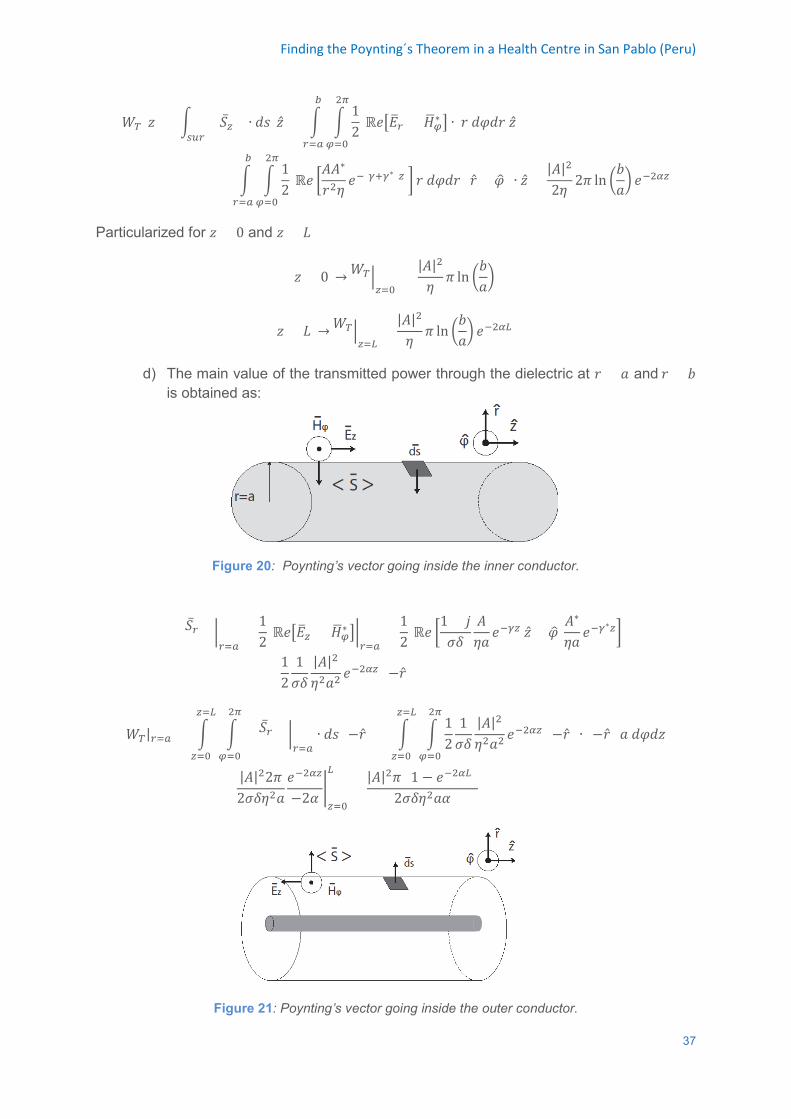
Finding the Poynting´s Theorem in a Health Centre in San Pablo (Peru)
𝑊𝑊𝑇𝑇(𝐺𝐺) = � < 𝑆𝑆�̅�𝛾 >∙ 𝑅𝑅𝑠𝑠 �̂�𝐺
𝑠𝑠𝑜𝑜𝑟𝑟= � �
12
2𝜋𝜋
𝜑𝜑=0
𝑏𝑏
𝑟𝑟=𝑎𝑎
ℝ𝑅𝑅�𝐸𝐸�𝑟𝑟 × 𝐺𝐺�𝜑𝜑∗ � ∙ 𝑝𝑝 𝑅𝑅𝜑𝜑𝑅𝑅𝑝𝑝 �̂�𝐺
= � �12
2𝜋𝜋
𝜑𝜑=0
𝑏𝑏
𝑟𝑟=𝑎𝑎
ℝ𝑅𝑅 �𝐴𝐴𝐴𝐴∗
𝑝𝑝2𝜂𝜂𝑅𝑅−(𝛾𝛾+𝛾𝛾∗)𝛾𝛾 � 𝑝𝑝 𝑅𝑅𝜑𝜑𝑅𝑅𝑝𝑝 (�̂�𝑝 × 𝜑𝜑�) ∙ �̂�𝐺 =
|𝐴𝐴|2
2𝜂𝜂2𝜋𝜋 ln �
𝑏𝑏𝑅𝑅� 𝑅𝑅−2𝛼𝛼𝛾𝛾
Particularized for 𝐺𝐺 = 0 and 𝐺𝐺 = 𝐿𝐿
𝐺𝐺 = 0 →𝑊𝑊𝑇𝑇
�𝛾𝛾=0 =
|𝐴𝐴|2
𝜂𝜂𝜋𝜋 ln �
𝑏𝑏𝑅𝑅�
𝐺𝐺 = 𝐿𝐿 →𝑊𝑊𝑇𝑇
�𝛾𝛾=𝐿𝐿=
|𝐴𝐴|2
𝜂𝜂𝜋𝜋 ln �
𝑏𝑏𝑅𝑅� 𝑅𝑅−2𝛼𝛼𝐿𝐿
d) The main value of the transmitted power through the dielectric at 𝑝𝑝 = 𝑅𝑅 and 𝑝𝑝 = 𝑏𝑏 is obtained as:
Figure 20: Poynting’s vector going inside the inner conductor.
< 𝑆𝑆�̅�𝑟 >
�𝑟𝑟=𝑎𝑎
=12
ℝ𝑅𝑅�𝐸𝐸�𝛾𝛾 × 𝐺𝐺�𝜑𝜑∗ ��𝑟𝑟=𝑎𝑎
=12
ℝ𝑅𝑅 �1 + 𝑗𝑗𝜎𝜎𝛿𝛿
𝐴𝐴𝜂𝜂𝑅𝑅
𝑅𝑅−𝛾𝛾𝛾𝛾 �̂�𝐺 × 𝜑𝜑� 𝐴𝐴∗
𝜂𝜂𝑅𝑅𝑅𝑅−𝛾𝛾∗𝛾𝛾�
=12
1𝜎𝜎𝛿𝛿
|𝐴𝐴|2
𝜂𝜂2𝑅𝑅2𝑅𝑅−2𝛼𝛼𝛾𝛾 (−�̂�𝑝)
𝑊𝑊𝑇𝑇|𝑟𝑟=𝑎𝑎 = � � < 𝑆𝑆�̅�𝑟 >
�𝑟𝑟=𝑎𝑎
∙ 𝑅𝑅𝑠𝑠2𝜋𝜋
𝜑𝜑=0
𝛾𝛾=𝐿𝐿
𝛾𝛾=0
(−�̂�𝑝) = � �12
1𝜎𝜎𝛿𝛿
|𝐴𝐴|2
𝜂𝜂2𝑅𝑅2𝑅𝑅−2𝛼𝛼𝛾𝛾 (−�̂�𝑝)
2𝜋𝜋
𝜑𝜑=0
𝛾𝛾=𝐿𝐿
𝛾𝛾=0
∙ (−�̂�𝑝) 𝑅𝑅 𝑅𝑅𝜑𝜑𝑅𝑅𝐺𝐺
=|𝐴𝐴|22𝜋𝜋2𝜎𝜎𝛿𝛿𝜂𝜂2𝑅𝑅
𝑅𝑅−2𝛼𝛼𝛾𝛾
−2𝛼𝛼�𝛾𝛾=0
𝐿𝐿
=|𝐴𝐴|2𝜋𝜋 (1 − 𝑅𝑅−2𝛼𝛼𝐿𝐿)
2𝜎𝜎𝛿𝛿𝜂𝜂2𝑅𝑅𝛼𝛼
Figure 21: Poynting’s vector going inside the outer conductor.
37
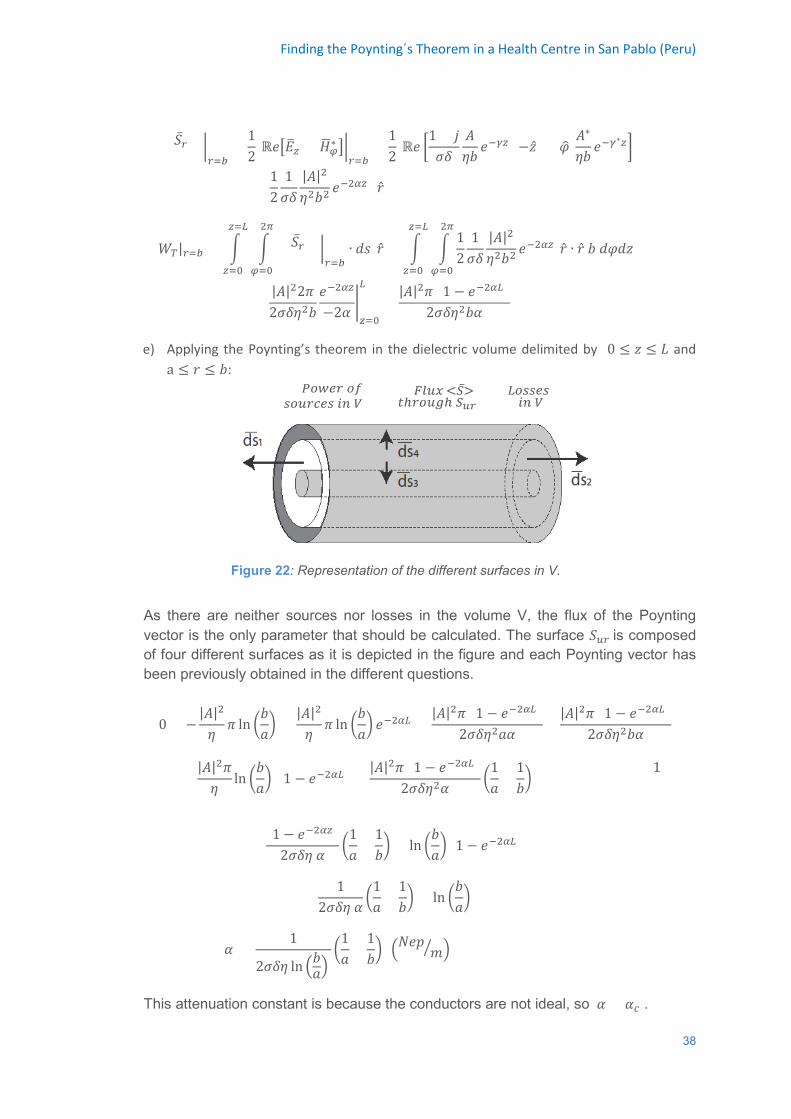
Finding the Poynting´s Theorem in a Health Centre in San Pablo (Peru)
< 𝑆𝑆�̅�𝑟 >
�𝑟𝑟=𝑏𝑏
=12
ℝ𝑅𝑅�𝐸𝐸�𝛾𝛾 × 𝐺𝐺�𝜑𝜑∗ ��𝑟𝑟=𝑏𝑏
=12
ℝ𝑅𝑅 �1 + 𝑗𝑗𝜎𝜎𝛿𝛿
𝐴𝐴𝜂𝜂𝑏𝑏
𝑅𝑅−𝛾𝛾𝛾𝛾 (−�̂�𝐺) × 𝜑𝜑� 𝐴𝐴∗
𝜂𝜂𝑏𝑏𝑅𝑅−𝛾𝛾∗𝛾𝛾�
=12
1𝜎𝜎𝛿𝛿
|𝐴𝐴|2
𝜂𝜂2𝑏𝑏2𝑅𝑅−2𝛼𝛼𝛾𝛾 (�̂�𝑝)
𝑊𝑊𝑇𝑇|𝑟𝑟=𝑏𝑏 = � � < 𝑆𝑆�̅�𝑟 >
�𝑟𝑟=𝑏𝑏
∙ 𝑅𝑅𝑠𝑠 2𝜋𝜋
𝜑𝜑=0
𝛾𝛾=𝐿𝐿
𝛾𝛾=0
�̂�𝑝 = � �12
1𝜎𝜎𝛿𝛿
|𝐴𝐴|2
𝜂𝜂2𝑏𝑏2𝑅𝑅−2𝛼𝛼𝛾𝛾
2𝜋𝜋
𝜑𝜑=0
𝛾𝛾=𝐿𝐿
𝛾𝛾=0
�̂�𝑝 ∙ �̂�𝑝 𝑏𝑏 𝑅𝑅𝜑𝜑𝑅𝑅𝐺𝐺
=|𝐴𝐴|22𝜋𝜋2𝜎𝜎𝛿𝛿𝜂𝜂2𝑏𝑏
𝑅𝑅−2𝛼𝛼𝛾𝛾
−2𝛼𝛼�𝛾𝛾=0
𝐿𝐿
=|𝐴𝐴|2𝜋𝜋 (1 − 𝑅𝑅−2𝛼𝛼𝐿𝐿)
2𝜎𝜎𝛿𝛿𝜂𝜂2𝑏𝑏𝛼𝛼
e) Applying the Poynting’s theorem in the dielectric volume delimited by 0 ≤ 𝐺𝐺 ≤ 𝐿𝐿 and a ≤ 𝑝𝑝 ≤ 𝑏𝑏:
𝑠𝑠𝑜𝑜𝑜𝑜𝑟𝑟𝑐𝑐𝑒𝑒𝑠𝑠 𝑚𝑚𝑛𝑛 𝑉𝑉𝑃𝑃𝑜𝑜𝑤𝑤𝑒𝑒𝑟𝑟 𝑜𝑜𝑒𝑒 = 𝑜𝑜ℎ𝑟𝑟𝑜𝑜𝑜𝑜𝐴𝐴ℎ 𝑆𝑆𝑢𝑢𝑢𝑢
𝐹𝐹𝐴𝐴𝑜𝑜𝑒𝑒 <𝑆𝑆̅> + 𝑚𝑚𝑛𝑛 𝑉𝑉 𝐿𝐿𝑜𝑜𝑠𝑠𝑠𝑠𝑒𝑒𝑠𝑠
Figure 22: Representation of the different surfaces in V.
As there are neither sources nor losses in the volume V, the flux of the Poynting vector is the only parameter that should be calculated. The surface 𝑆𝑆𝑜𝑜𝑟𝑟 is composed of four different surfaces as it is depicted in the figure and each Poynting vector has been previously obtained in the different questions.
0 = −|𝐴𝐴|2
𝜂𝜂𝜋𝜋 ln �
𝑏𝑏𝑅𝑅�
+|𝐴𝐴|2
𝜂𝜂𝜋𝜋 ln �
𝑏𝑏𝑅𝑅� 𝑅𝑅−2𝛼𝛼𝐿𝐿
+|𝐴𝐴|2𝜋𝜋 (1 − 𝑅𝑅−2𝛼𝛼𝐿𝐿)
2𝜎𝜎𝛿𝛿𝜂𝜂2𝑅𝑅𝛼𝛼+
|𝐴𝐴|2𝜋𝜋 (1 − 𝑅𝑅−2𝛼𝛼𝐿𝐿)2𝜎𝜎𝛿𝛿𝜂𝜂2𝑏𝑏𝛼𝛼
|𝐴𝐴|2𝜋𝜋𝜂𝜂
ln �𝑏𝑏𝑅𝑅�
(1 − 𝑅𝑅−2𝛼𝛼𝐿𝐿) =
|𝐴𝐴|2𝜋𝜋 (1 − 𝑅𝑅−2𝛼𝛼𝐿𝐿)2𝜎𝜎𝛿𝛿𝜂𝜂2𝛼𝛼
�1𝑅𝑅
+1𝑏𝑏�
[1]
(1 − 𝑅𝑅−2𝛼𝛼𝛾𝛾)2𝜎𝜎𝛿𝛿𝜂𝜂 𝛼𝛼
�1𝑅𝑅
+1𝑏𝑏� = ln �
𝑏𝑏𝑅𝑅� (1 − 𝑅𝑅−2𝛼𝛼𝐿𝐿)
12𝜎𝜎𝛿𝛿𝜂𝜂 𝛼𝛼
�1𝑅𝑅
+1𝑏𝑏� = ln �
𝑏𝑏𝑅𝑅�
𝛼𝛼 =1
2𝜎𝜎𝛿𝛿𝜂𝜂 ln �𝑏𝑏𝑅𝑅� �
1𝑅𝑅
+1𝑏𝑏� �𝑁𝑁𝑅𝑅𝑝𝑝 𝑚𝑚� �
This attenuation constant is because the conductors are not ideal, so 𝛼𝛼 = 𝛼𝛼𝑐𝑐 .
38
Finding the Poynting´s Theorem in a Health Centre in San Pablo (Peru)
f) The dissipated power in the coaxial cable can be obtained in two different ways. In both cases it is assumed that the power through 𝑝𝑝 = 𝑅𝑅 and 𝑝𝑝 = 𝑏𝑏 are completely dissipated in the conductor because 𝑅𝑅 ≫ 𝛿𝛿 and 𝑅𝑅 ≫ 𝛿𝛿. The first method involves obtaining the difference between the power in 𝐺𝐺 = 0 and the power in 𝐺𝐺 = 𝐿𝐿. The second method involves calculating the power that goes through 𝑝𝑝 = 𝑅𝑅 and 𝑝𝑝 = 𝑏𝑏 because there are only losses in the conductors. Using the first method:
𝑊𝑊𝑑𝑑𝑚𝑚𝑠𝑠 = 𝑊𝑊𝑇𝑇 �𝛾𝛾=0
−𝑊𝑊𝑇𝑇 �𝛾𝛾=𝐿𝐿
=|𝐴𝐴|2
𝜂𝜂𝜋𝜋 ln �
𝑏𝑏𝑅𝑅�
−|𝐴𝐴|2
𝜂𝜂𝜋𝜋 ln �
𝑏𝑏𝑅𝑅� 𝑅𝑅−2𝛼𝛼𝐿𝐿
=|𝐴𝐴|2
𝜂𝜂𝜋𝜋 ln �
𝑏𝑏𝑅𝑅�
(1 − 𝑅𝑅−2𝛼𝛼𝐿𝐿)
Using the second method:
𝑊𝑊𝑑𝑑𝑚𝑚𝑠𝑠 = 𝑊𝑊𝑇𝑇 �𝑟𝑟=𝑎𝑎
+ 𝑊𝑊𝑇𝑇 �𝑟𝑟=𝑏𝑏
=|𝐴𝐴|2𝜋𝜋 (1 − 𝑅𝑅−2𝛼𝛼𝐿𝐿)
2𝜎𝜎𝛿𝛿𝜂𝜂2𝑅𝑅𝛼𝛼+
|𝐴𝐴|2𝜋𝜋 (1 − 𝑅𝑅−2𝛼𝛼𝐿𝐿)2𝜎𝜎𝛿𝛿𝜂𝜂2𝑏𝑏𝛼𝛼
=|𝐴𝐴|2𝜋𝜋 (1 − 𝑅𝑅−2𝛼𝛼𝐿𝐿)
2𝜎𝜎𝛿𝛿𝜂𝜂2𝛼𝛼�
1𝑅𝑅
+1𝑏𝑏�
It is easy to justify that both values agree because they are the two terms of Poynting’s theorem applied in e) (Equation [1]).
g) Applying the reactive power balance in the dielectric volume, the following relationship is obtained:
𝑜𝑜𝑒𝑒 𝑠𝑠𝑜𝑜𝑜𝑜𝑟𝑟𝑐𝑐𝑒𝑒𝑠𝑠 𝑚𝑚𝑛𝑛 𝑉𝑉𝑅𝑅𝑒𝑒𝑎𝑎𝑐𝑐𝑜𝑜𝑚𝑚𝑐𝑐𝑒𝑒 𝑝𝑝𝑜𝑜𝑤𝑤𝑒𝑒𝑟𝑟 = 𝑜𝑜ℎ𝑟𝑟𝑜𝑜𝑜𝑜𝐴𝐴ℎ 𝑆𝑆𝑢𝑢𝑢𝑢
𝐹𝐹𝐴𝐴𝑜𝑜𝑒𝑒 12ℑ𝑎𝑎�𝐸𝐸� ×𝐺𝐺� ∗�
+ 2𝑝𝑝0 [⟨𝑊𝑊𝐻𝐻⟩ − ⟨𝑊𝑊𝐸𝐸⟩]
where ⟨WH⟩ and ⟨WE⟩ are the mean value of the magnetic and electric energies stored in V respectively.
As in question e), the surface 𝑆𝑆𝑜𝑜𝑟𝑟 is composed of four different surfaces concerning the two conductors and the limits of the segment, delimited by 𝐺𝐺 = 0 and and 𝐺𝐺 = 𝐿𝐿. In 𝐺𝐺 = 0 and 𝐺𝐺 = 𝐿𝐿 the term 1
2ℑm�𝐸𝐸�𝑟𝑟 ×𝐺𝐺�𝜑𝜑∗ � is null because the product �𝐸𝐸�𝑟𝑟 × 𝐺𝐺�𝜑𝜑∗ � is real. At the
conductor surfaces, at 𝑝𝑝 = 𝑅𝑅 and 𝑝𝑝 = 𝑏𝑏, 12ℑm�𝐸𝐸�𝛾𝛾 × 𝐺𝐺�𝜑𝜑∗ � = 1
2 ℝ𝑅𝑅�𝐸𝐸�𝛾𝛾 × 𝐺𝐺�𝜑𝜑∗ � so, the fluxes have
the same results as calculated in question d). Obtaining:
⟨𝑊𝑊𝐻𝐻⟩ − ⟨𝑊𝑊𝐸𝐸⟩ = −12𝑝𝑝0
�|𝐴𝐴|2𝜋𝜋 (1 − 𝑅𝑅−2𝛼𝛼𝐿𝐿)
2𝜎𝜎𝛿𝛿𝜂𝜂2𝛼𝛼�
1𝑅𝑅
+1𝑏𝑏�� (𝐽𝐽)
h) Leontovich approximation: Inside the conductor, the electromagnetic field is an homogeneus plane wave that becomes vanishing as it goes inside the conductor, with a 𝛾𝛾𝑐𝑐𝑜𝑜𝑛𝑛𝑑𝑑 = 𝛾𝛾𝜋𝜋 = 1+𝑗𝑗
𝛿𝛿
𝐺𝐺� �𝑟𝑟=𝑎𝑎
=𝐴𝐴𝜂𝜂𝑅𝑅
𝑅𝑅−𝛾𝛾𝛾𝛾 𝜑𝜑�
𝐺𝐺 �
�𝑟𝑟=𝑏𝑏
=𝐴𝐴𝜂𝜂𝑏𝑏𝑅𝑅−𝛾𝛾𝛾𝛾 𝜑𝜑�
39
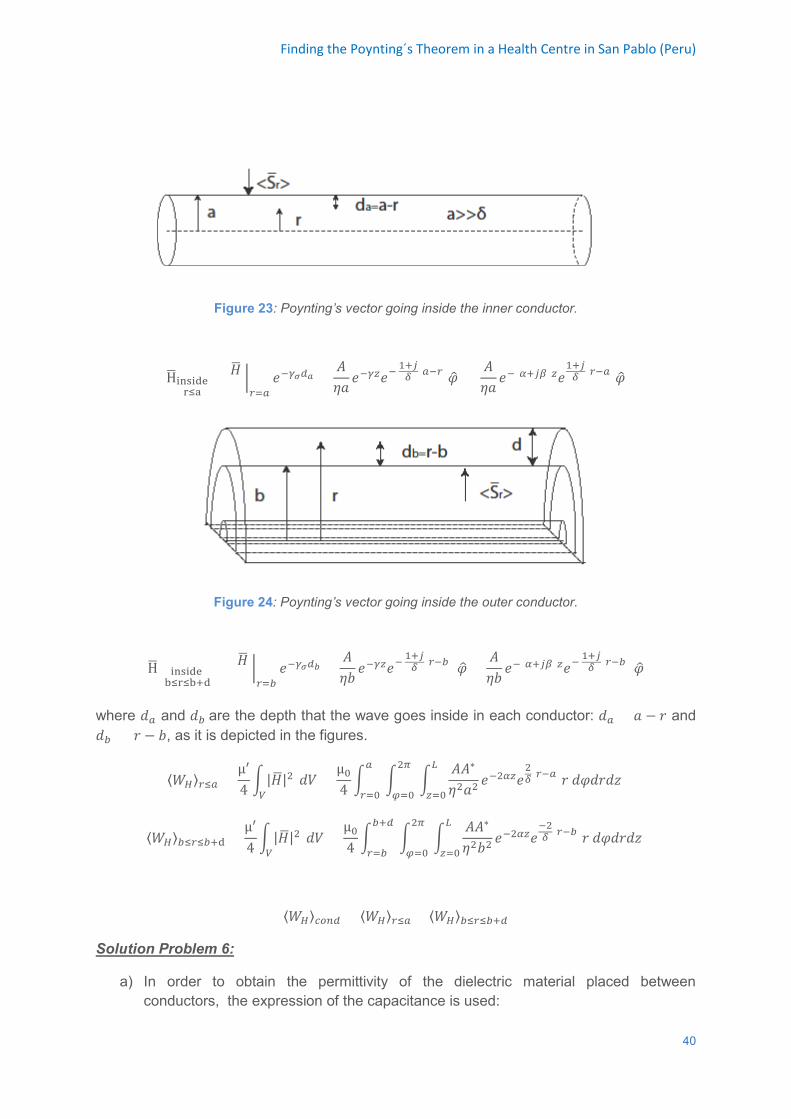
Finding the Poynting´s Theorem in a Health Centre in San Pablo (Peru)
Figure 23: Poynting’s vector going inside the inner conductor.
H�inside(r≤a)
= 𝐺𝐺 �
�𝑟𝑟=𝑎𝑎
𝑅𝑅−𝛾𝛾𝜎𝜎𝑑𝑑𝑎𝑎 =𝐴𝐴𝜂𝜂𝑅𝑅
𝑅𝑅−𝛾𝛾𝛾𝛾𝑅𝑅− 1+𝑗𝑗𝛿𝛿 (𝑎𝑎−𝑟𝑟)𝜑𝜑� =𝐴𝐴𝜂𝜂𝑅𝑅
𝑅𝑅−(𝛼𝛼+𝑗𝑗𝛽𝛽)𝛾𝛾𝑅𝑅1+𝑗𝑗𝛿𝛿 (𝑟𝑟−𝑎𝑎)𝜑𝜑�
Figure 24: Poynting’s vector going inside the outer conductor.
H� inside (b≤r≤b+d)
= 𝐺𝐺 �
�𝑟𝑟=𝑏𝑏
𝑅𝑅−𝛾𝛾𝜎𝜎𝑑𝑑𝑏𝑏 =𝐴𝐴𝜂𝜂𝑏𝑏
𝑅𝑅−𝛾𝛾𝛾𝛾𝑅𝑅− 1+𝑗𝑗𝛿𝛿 (𝑟𝑟−𝑏𝑏) 𝜑𝜑� =𝐴𝐴𝜂𝜂𝑏𝑏
𝑅𝑅−(𝛼𝛼+𝑗𝑗𝛽𝛽)𝛾𝛾𝑅𝑅− 1+𝑗𝑗𝛿𝛿 (𝑟𝑟−𝑏𝑏) 𝜑𝜑�
where 𝑅𝑅𝑎𝑎 and 𝑅𝑅𝑏𝑏 are the depth that the wave goes inside in each conductor: 𝑅𝑅𝑎𝑎 = 𝑅𝑅 − 𝑝𝑝 and 𝑅𝑅𝑏𝑏 = 𝑝𝑝 − 𝑏𝑏, as it is depicted in the figures.
⟨𝑊𝑊𝐻𝐻⟩𝑟𝑟≤𝑎𝑎 =µ′
4� |𝐺𝐺�|2 𝑅𝑅𝑉𝑉
𝑉𝑉=µ04� 𝑎𝑎
𝑟𝑟=0� 2𝜋𝜋
𝜑𝜑=0�
𝐴𝐴𝐴𝐴∗
𝜂𝜂2𝑅𝑅2𝐿𝐿
𝛾𝛾=0𝑅𝑅−2𝛼𝛼𝛾𝛾𝑅𝑅
2𝛿𝛿(𝑟𝑟−𝑎𝑎)𝑝𝑝 𝑅𝑅𝜑𝜑𝑅𝑅𝑝𝑝𝑅𝑅𝐺𝐺
⟨𝑊𝑊𝐻𝐻⟩𝑏𝑏≤𝑟𝑟≤𝑏𝑏+d =µ′
4� |𝐺𝐺�|2 𝑅𝑅𝑉𝑉
𝑉𝑉=µ04� 𝑏𝑏+𝑑𝑑
𝑟𝑟=𝑏𝑏� 2𝜋𝜋
𝜑𝜑=0�
𝐴𝐴𝐴𝐴∗
𝜂𝜂2𝑏𝑏2𝐿𝐿
𝛾𝛾=0𝑅𝑅−2𝛼𝛼𝛾𝛾𝑅𝑅
−2𝛿𝛿 (𝑟𝑟−𝑏𝑏)𝑝𝑝 𝑅𝑅𝜑𝜑𝑅𝑅𝑝𝑝𝑅𝑅𝐺𝐺
⟨𝑊𝑊𝐻𝐻⟩𝑐𝑐𝑜𝑜𝑛𝑛𝑑𝑑 = ⟨𝑊𝑊𝐻𝐻⟩𝑟𝑟≤𝑎𝑎 + ⟨𝑊𝑊𝐻𝐻⟩𝑏𝑏≤𝑟𝑟≤𝑏𝑏+𝑑𝑑
Solution Problem 6:
a) In order to obtain the permittivity of the dielectric material placed between conductors, the expression of the capacitance is used:
40
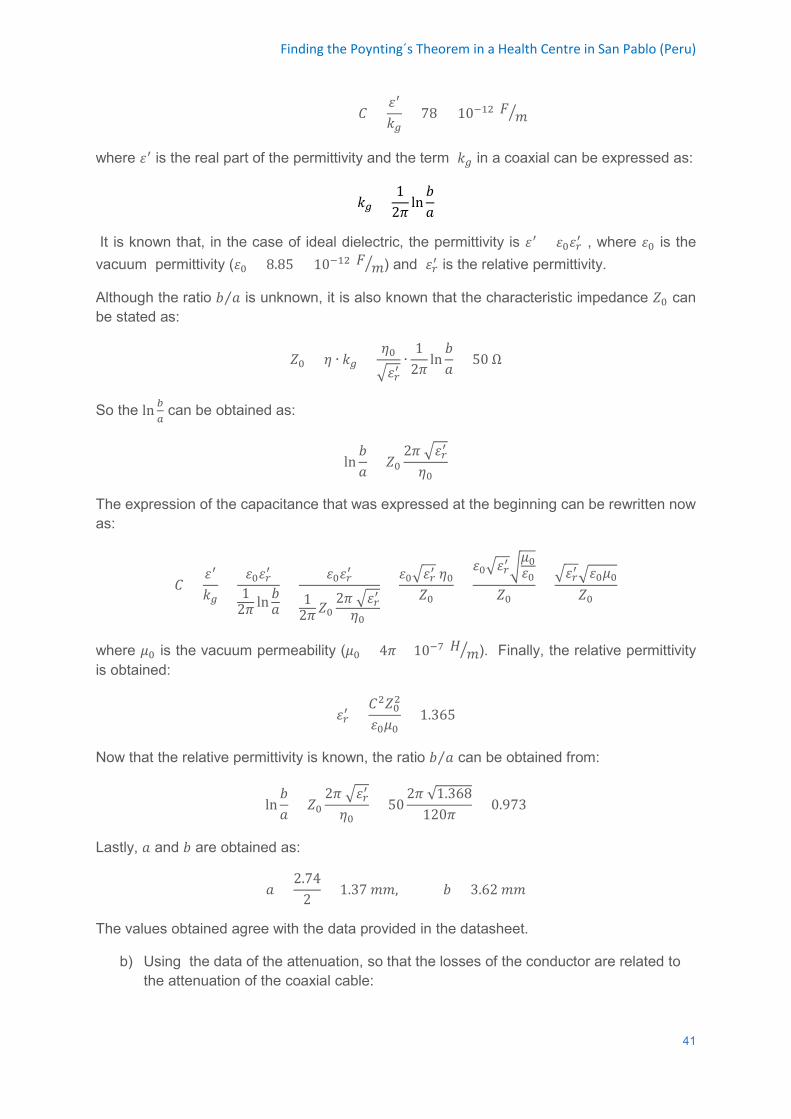
Finding the Poynting´s Theorem in a Health Centre in San Pablo (Peru)
𝐶𝐶 =𝜀𝜀′
𝑘𝑘𝐴𝐴= 78 × 10−12 𝑝𝑝 𝑚𝑚�
where 𝜀𝜀′ is the real part of the permittivity and the term 𝑘𝑘𝐴𝐴 in a coaxial can be expressed as:
𝑘𝑘𝐴𝐴 =1
2𝜋𝜋ln𝑏𝑏𝑅𝑅
It is known that, in the case of ideal dielectric, the permittivity is 𝜀𝜀′ = 𝜀𝜀0𝜀𝜀𝑟𝑟′ , where 𝜀𝜀0 is the vacuum permittivity (𝜀𝜀0 = 8.85 × 10⁻¹² 𝑝𝑝 𝑚𝑚� ) and 𝜀𝜀𝑟𝑟′ is the relative permittivity.
Although the ratio 𝑏𝑏 𝑅𝑅⁄ is unknown, it is also known that the characteristic impedance 𝑍𝑍0 can be stated as:
𝑍𝑍0 = 𝜂𝜂 ∙ 𝑘𝑘𝐴𝐴 =𝜂𝜂0�𝜀𝜀𝑟𝑟′
∙1
2𝜋𝜋ln𝑏𝑏𝑅𝑅
= 50 Ω
So the ln 𝑏𝑏𝑎𝑎 can be obtained as:
ln𝑏𝑏𝑅𝑅
= 𝑍𝑍02𝜋𝜋 �𝜀𝜀𝑟𝑟′
𝜂𝜂0
The expression of the capacitance that was expressed at the beginning can be rewritten now as:
𝐶𝐶 =𝜀𝜀′
𝑘𝑘𝐴𝐴=
𝜀𝜀0𝜀𝜀𝑟𝑟′
12𝜋𝜋 ln 𝑏𝑏𝑅𝑅
=𝜀𝜀0𝜀𝜀𝑟𝑟′
12𝜋𝜋 𝑍𝑍0
2𝜋𝜋 �𝜀𝜀𝑟𝑟′𝜂𝜂0
=𝜀𝜀0�𝜀𝜀𝑟𝑟′ 𝜂𝜂0
𝑍𝑍0=𝜀𝜀0�𝜀𝜀𝑟𝑟′�
𝜇𝜇0𝜀𝜀0
𝑍𝑍0=�𝜀𝜀𝑟𝑟′�𝜀𝜀0𝜇𝜇0
𝑍𝑍0
where 𝜇𝜇0 is the vacuum permeability (𝜇𝜇0 = 4𝜋𝜋 × 10−7 𝐺𝐺 𝑚𝑚� ). Finally, the relative permittivityis obtained:
𝜀𝜀𝑟𝑟′ =𝐶𝐶2𝑍𝑍02
𝜀𝜀0𝜇𝜇0= 1.365
Now that the relative permittivity is known, the ratio 𝑏𝑏 𝑅𝑅⁄ can be obtained from:
ln𝑏𝑏𝑅𝑅
= 𝑍𝑍02𝜋𝜋 �𝜀𝜀𝑟𝑟′
𝜂𝜂0= 50
2𝜋𝜋 √1.368120𝜋𝜋
= 0.973
Lastly, 𝑅𝑅 and 𝑏𝑏 are obtained as:
𝑅𝑅 =2.74
2= 1.37 𝑚𝑚𝑚𝑚, 𝑏𝑏 = 3.62 𝑚𝑚𝑚𝑚
The values obtained agree with the data provided in the datasheet.
b) Using the data of the attenuation, so that the losses of the conductor are related tothe attenuation of the coaxial cable:
41
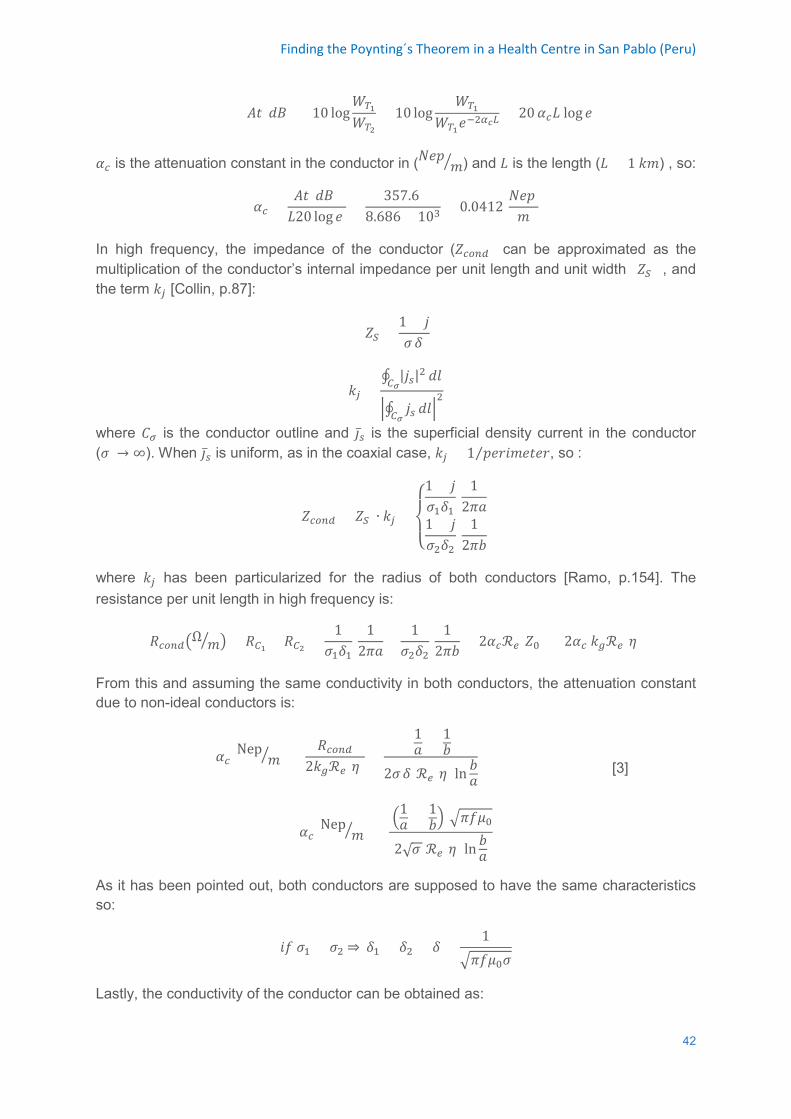
Finding the Poynting´s Theorem in a Health Centre in San Pablo (Peru)
𝐴𝐴𝑅𝑅(𝑅𝑅𝑑𝑑) = 10 log𝑊𝑊𝑇𝑇1𝑊𝑊𝑇𝑇2
= 10 log𝑊𝑊𝑇𝑇1
𝑊𝑊𝑇𝑇1𝑅𝑅−2𝛼𝛼𝑐𝑐𝐿𝐿= 20𝛼𝛼𝑐𝑐𝐿𝐿 log 𝑅𝑅
𝛼𝛼𝑐𝑐 is the attenuation constant in the conductor in (𝑁𝑁𝑅𝑅𝑝𝑝 𝑚𝑚� ) and 𝐿𝐿 is the length (𝐿𝐿 = 1 𝑘𝑘𝑚𝑚) , so:
𝛼𝛼𝑐𝑐 =𝐴𝐴𝑅𝑅(𝑅𝑅𝑑𝑑)𝐿𝐿20 log 𝑅𝑅
=357.6
8.686 × 103= 0.0412
𝑁𝑁𝑅𝑅𝑝𝑝 𝑚𝑚
In high frequency, the impedance of the conductor (𝑍𝑍𝑐𝑐𝑜𝑜𝑛𝑛𝑑𝑑) can be approximated as the multiplication of the conductor’s internal impedance per unit length and unit width (𝑍𝑍𝑆𝑆) , and the term 𝑘𝑘𝑗𝑗 [Collin, p.87]:
𝑍𝑍𝑆𝑆 =1 + 𝑗𝑗𝜎𝜎 𝛿𝛿
𝑘𝑘𝑗𝑗 =∮ |𝑗𝑗𝑠𝑠|2 𝐷𝐷𝜎𝜎
𝑅𝑅𝐽𝐽
�∮ 𝑗𝑗𝑠𝑠 𝐷𝐷𝜎𝜎
𝑅𝑅𝐽𝐽�2
where 𝐶𝐶𝜋𝜋 is the conductor outline and 𝚥𝚥�̅�𝑠 is the superficial density current in the conductor (𝜎𝜎 → ∞). When 𝚥𝚥�̅�𝑠 is uniform, as in the coaxial case, 𝑘𝑘𝑗𝑗 = 1 𝑝𝑝𝑅𝑅𝑝𝑝𝑅𝑅𝑚𝑚𝑅𝑅𝑅𝑅𝑅𝑅𝑝𝑝⁄ , so :
𝑍𝑍𝑐𝑐𝑜𝑜𝑛𝑛𝑑𝑑 = 𝑍𝑍𝑆𝑆 ∙ 𝑘𝑘𝑗𝑗 =
⎩⎨
⎧1 + 𝑗𝑗𝜎𝜎1𝛿𝛿1
12𝜋𝜋𝑅𝑅
1 + 𝑗𝑗𝜎𝜎2𝛿𝛿2
12𝜋𝜋𝑏𝑏
where 𝑘𝑘𝑗𝑗 has been particularized for the radius of both conductors [Ramo, p.154]. The resistance per unit length in high frequency is:
𝑅𝑅𝑐𝑐𝑜𝑜𝑛𝑛𝑑𝑑�Ω 𝑚𝑚� � = 𝑅𝑅𝐷𝐷1 + 𝑅𝑅𝐷𝐷2 =1
𝜎𝜎1𝛿𝛿11
2𝜋𝜋𝑅𝑅+
1𝜎𝜎2𝛿𝛿2
12𝜋𝜋𝑏𝑏
= 2𝛼𝛼𝑐𝑐ℛ𝑒𝑒[𝑍𝑍0] = 2𝛼𝛼𝑐𝑐 𝑘𝑘𝐴𝐴ℛ𝑒𝑒[𝜂𝜂]
From this and assuming the same conductivity in both conductors, the attenuation constant due to non-ideal conductors is:
𝛼𝛼𝑐𝑐(Nep𝑚𝑚� ) =
𝑅𝑅𝑐𝑐𝑜𝑜𝑛𝑛𝑑𝑑2𝑘𝑘𝐴𝐴ℛ𝑒𝑒[𝜂𝜂] =
1𝑅𝑅 + 1𝑏𝑏2𝜎𝜎 𝛿𝛿 ℛ𝑒𝑒[𝜂𝜂] ln 𝑏𝑏𝑅𝑅
[3]
𝛼𝛼𝑐𝑐(Nep𝑚𝑚� ) =
�1𝑅𝑅 + 1
𝑏𝑏� �𝜋𝜋𝑓𝑓𝜇𝜇0
2√𝜎𝜎 ℛ𝑒𝑒[𝜂𝜂] ln 𝑏𝑏𝑅𝑅
As it has been pointed out, both conductors are supposed to have the same characteristics so:
𝑅𝑅𝑓𝑓 𝜎𝜎1 = 𝜎𝜎2 ⇒ 𝛿𝛿1 = 𝛿𝛿2 = 𝛿𝛿 =1
�𝜋𝜋𝑓𝑓𝜇𝜇0𝜎𝜎
Lastly, the conductivity of the conductor can be obtained as:
42
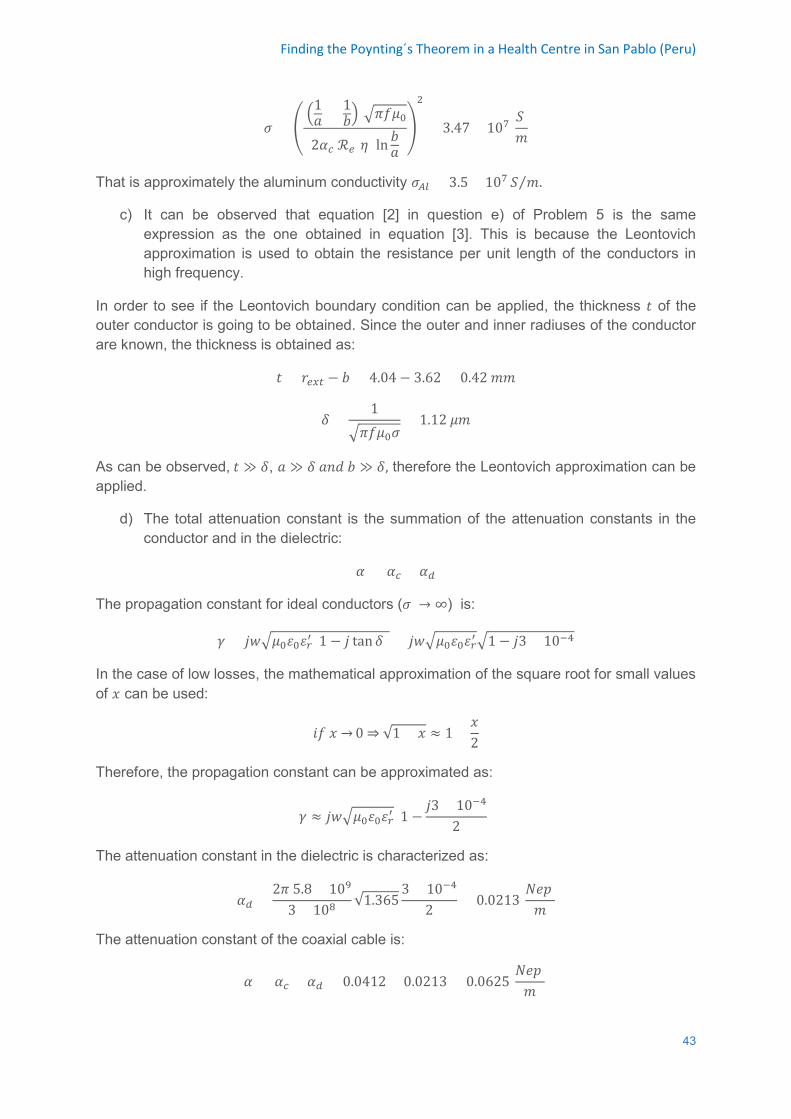
Finding the Poynting´s Theorem in a Health Centre in San Pablo (Peru)
𝜎𝜎 = ��1𝑅𝑅 + 1
𝑏𝑏� �𝜋𝜋𝑓𝑓𝜇𝜇0
2𝛼𝛼𝑐𝑐 ℛ𝑒𝑒[𝜂𝜂] ln 𝑏𝑏𝑅𝑅�
2
= 3.47 × 10⁷ 𝑆𝑆 𝑚𝑚
That is approximately the aluminum conductivity 𝜎𝜎𝐴𝐴𝐴𝐴 = 3.5 × 10⁷ 𝑆𝑆 𝑚𝑚⁄ .
c) It can be observed that equation [2] in question e) of Problem 5 is the sameexpression as the one obtained in equation [3]. This is because the Leontovichapproximation is used to obtain the resistance per unit length of the conductors inhigh frequency.
In order to see if the Leontovich boundary condition can be applied, the thickness 𝑅𝑅 of the outer conductor is going to be obtained. Since the outer and inner radiuses of the conductor are known, the thickness is obtained as:
𝑅𝑅 = 𝑝𝑝𝑒𝑒𝑒𝑒𝑜𝑜 − 𝑏𝑏 = 4.04− 3.62 = 0.42 𝑚𝑚𝑚𝑚
𝛿𝛿 =1
�𝜋𝜋𝑓𝑓𝜇𝜇0𝜎𝜎= 1.12 𝜇𝜇𝑚𝑚
As can be observed, 𝑅𝑅 ≫ 𝛿𝛿, 𝑅𝑅 ≫ 𝛿𝛿 𝑅𝑅𝑠𝑠𝑅𝑅 𝑏𝑏 ≫ 𝛿𝛿, therefore the Leontovich approximation can be applied.
d) The total attenuation constant is the summation of the attenuation constants in theconductor and in the dielectric:
𝛼𝛼 = 𝛼𝛼𝑐𝑐 + 𝛼𝛼𝑑𝑑
The propagation constant for ideal conductors (𝜎𝜎 → ∞) is:
𝛾𝛾 = 𝑗𝑗𝑝𝑝�𝜇𝜇0𝜀𝜀0𝜀𝜀𝑟𝑟′(1 − 𝑗𝑗 tan𝛿𝛿) = 𝑗𝑗𝑝𝑝�𝜇𝜇0𝜀𝜀0𝜀𝜀𝑟𝑟′�1− 𝑗𝑗3 × 10⁻⁴
In the case of low losses, the mathematical approximation of the square root for small values of 𝑥𝑥 can be used:
𝑅𝑅𝑓𝑓 𝑥𝑥 →0 ⇒√1 + 𝑥𝑥 ≈ 1 +𝑥𝑥2
Therefore, the propagation constant can be approximated as:
𝛾𝛾 ≈ 𝑗𝑗𝑝𝑝�𝜇𝜇0𝜀𝜀0𝜀𝜀𝑟𝑟′(1 −𝑗𝑗3 × 10⁻⁴
2)
The attenuation constant in the dielectric is characterized as:
𝛼𝛼𝑑𝑑 =2𝜋𝜋 5.8 × 10⁹
3 × 10⁸√1.365
3 × 10⁻⁴
2= 0.0213
𝑁𝑁𝑅𝑅𝑝𝑝 𝑚𝑚
The attenuation constant of the coaxial cable is:
𝛼𝛼 = 𝛼𝛼𝑐𝑐 + 𝛼𝛼𝑑𝑑 = 0.0412 + 0.0213 = 0.0625 𝑁𝑁𝑅𝑅𝑝𝑝 𝑚𝑚
43

Finding the Poynting´s Theorem in a Health Centre in San Pablo (Peru)
Expressed in 𝑅𝑅𝑑𝑑 𝑘𝑘𝑚𝑚⁄ :
𝛼𝛼 = 542.9𝑅𝑅𝑑𝑑 𝑘𝑘𝑚𝑚
44

http://www.gdee.eu
This project is funded by
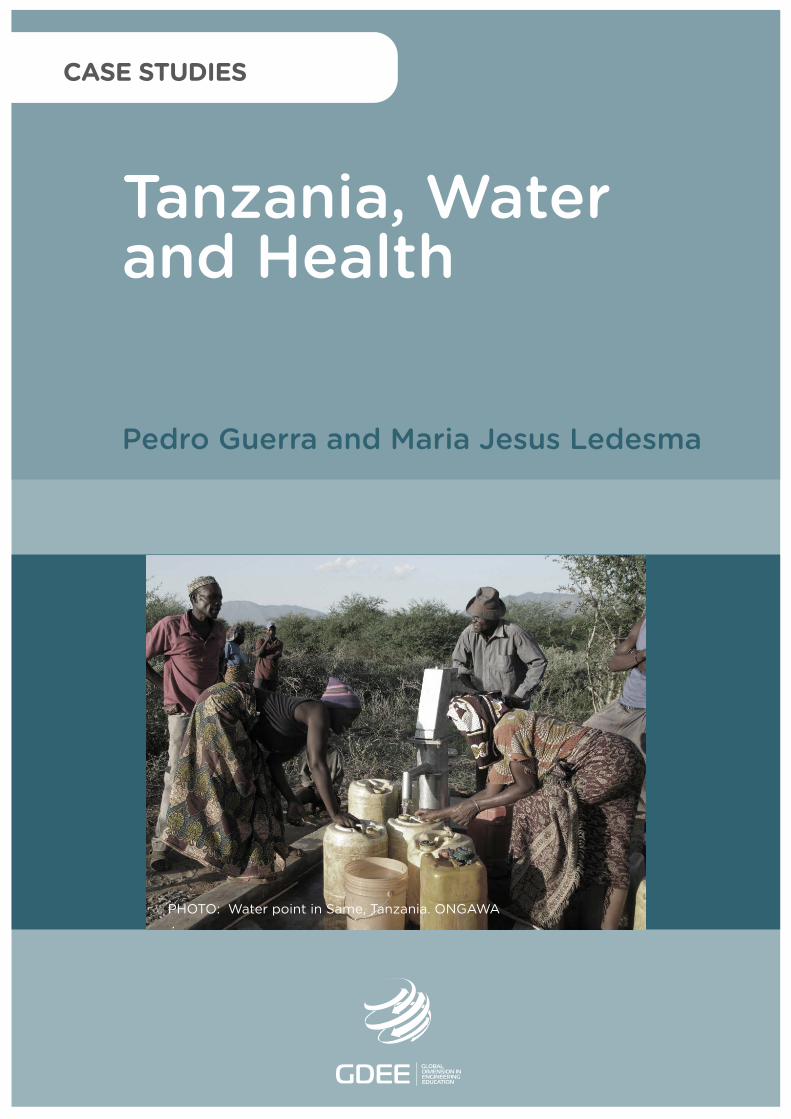
Tanzania, Water and Health
Pedro Guerra and Maria Jesus Ledesma
PHOTO: Water point in Same, Tanzania. ONGAWA .
CASE STUDIES
DL B 10735-2015 ISBN 978-84-606-7546-4
Tanzania, Water and Health
COORDINATED BYAgustí Pérez-Foguet, Enric Velo, Pol Arranz, Ricard Ginéand Boris Lazzarini (Universitat Politècnica de Catalunya)Manuel Sierra (Universidad Politécnica de Madrid)Alejandra Boni and Jordi Peris (Universitat Politècnica de València)Guido Zolezzi and Gabriella Trombino (Università degli Studi di Trento)Rhoda Trimingham (Loughborough University)Valentín Villarroel (ONGAWA)Neil Nobles and Meadhbh Bolger (Practical Action)Francesco Mongera (Training Center for International Cooperation)Katie Cresswell-Maynard (Engineering Without Border UK)
EDITED BY Global Dimension in Engineering Education
Citation: Guerra, P. and Ledesma, M.J. (2015) ' Tanzania, Water and Health', in Case studies for developing globally responsible engineers, GDEE (eds.), Global Dimension in Engineering Education, Barcelona. Available from: http://gdee.eu/index.php/resources.html
This publication is distributedunder an Attribution- Noncommercial-Share Alike License for Creative Commons
CASE STUDIES
Disclaimer: This document has been produced with the financial assistance of the European UnionThe contents of this document are the sole responsibility of the authors and can under no circumstances be regarded as reflecting the position of the European Union
Tanzania, Water and Health
TANZANIA, WATER AND HEALTH
Pedro Guerra and Maria Jesus Ledesma, Department of Electronic Engineering, Universidad Politécnica de Madrid.
1
Tanzania, Water and Health
INDEX
1. INTRODUCTION ................................................................................................................ 3
1.1. DISCIPLINES COVERED ........................................................................................................... 4
1.2. LEARNING OUTCOMES ............................................................................................................ 4
1.3. ACTIVITIES .............................................................................................................................. 4
2. DESCRIPTION OF THE CONTEXT ........................................................................................ 5
3. ELECTRICAL INFRASTRUCTURE AND COMMUNICATION NETWORKS IN TANZANIA ............... 10
4. CLASS ACTIVITY ............................................................................................................ 12
4.1. SOLUTION AND EVALUATION CRITERIA ................................................................................ 18
5. HOMEWORK ACTIVITY .................................................................................................... 19
5.1. SOLUTION AND EVALUATION CRITERIA ................................................................................ 19
BIBLIOGRAPHY ..................................................................................................................... 21
2
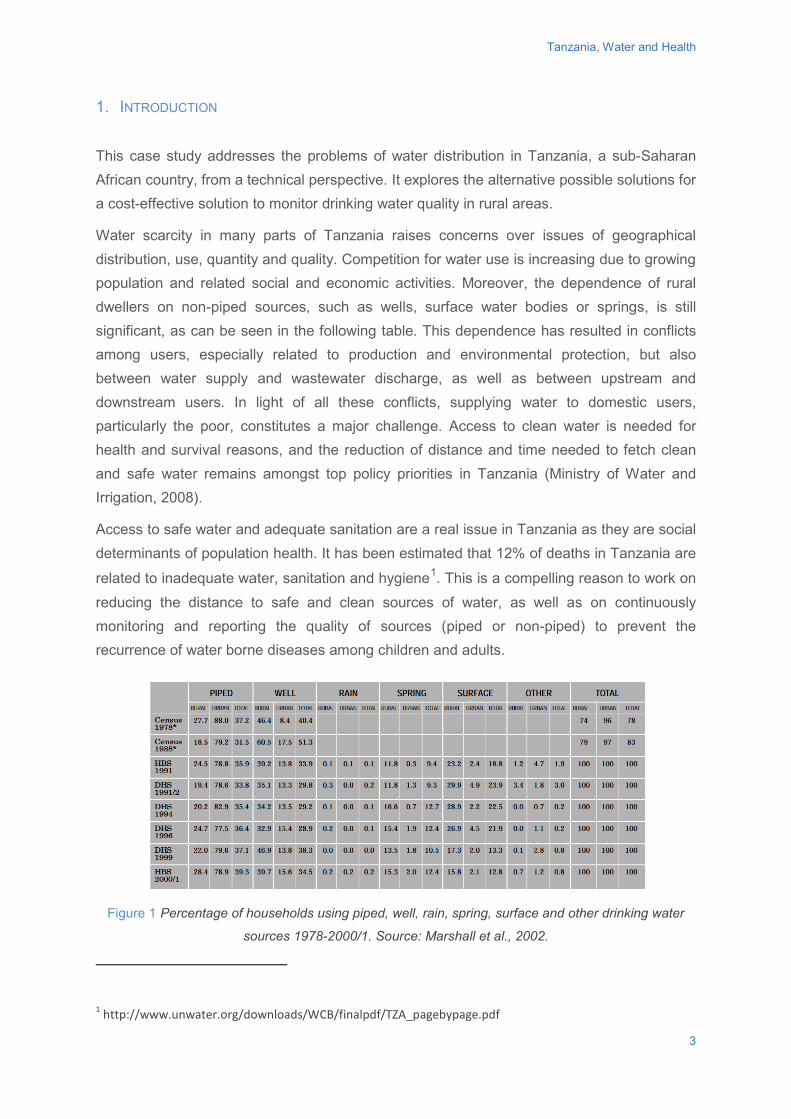
Tanzania, Water and Health
1. INTRODUCTION
This case study addresses the problems of water distribution in Tanzania, a sub-Saharan African country, from a technical perspective. It explores the alternative possible solutions for a cost-effective solution to monitor drinking water quality in rural areas.
Water scarcity in many parts of Tanzania raises concerns over issues of geographical distribution, use, quantity and quality. Competition for water use is increasing due to growing population and related social and economic activities. Moreover, the dependence of rural dwellers on non-piped sources, such as wells, surface water bodies or springs, is still significant, as can be seen in the following table. This dependence has resulted in conflicts among users, especially related to production and environmental protection, but also between water supply and wastewater discharge, as well as between upstream and downstream users. In light of all these conflicts, supplying water to domestic users, particularly the poor, constitutes a major challenge. Access to clean water is needed for health and survival reasons, and the reduction of distance and time needed to fetch clean and safe water remains amongst top policy priorities in Tanzania (Ministry of Water and Irrigation, 2008).
Access to safe water and adequate sanitation are a real issue in Tanzania as they are social determinants of population health. It has been estimated that 12% of deaths in Tanzania are
related to inadequate water, sanitation and hygiene1. This is a compelling reason to work on reducing the distance to safe and clean sources of water, as well as on continuously monitoring and reporting the quality of sources (piped or non-piped) to prevent the recurrence of water borne diseases among children and adults.
Figure 1 Percentage of households using piped, well, rain, spring, surface and other drinking water
sources 1978-2000/1. Source: Marshall et al., 2002.
1 http://www.unwater.org/downloads/WCB/finalpdf/TZA_pagebypage.pdf
3

Tanzania, Water and Health
1.1. DISCIPLINES COVERED
This case study covers different aspects of the electronic engineering curriculum, including the following:
• Embedded system and digital electronics• Sensors and instrumentation• Power electronics• Digital communications• System engineering
1.2. LEARNING OUTCOMES
The following outcomes are expected after completing the case study:
• Demonstrate an understanding of the controlling circuits and systems interfaced in anembedded electronic board
• Demonstrate the ability to analyse alternative solutions for a wireless sensor network.• Demonstrate the ability to understand design constraints and adapt a design to
assume the trade-offs and restrictions imposed by the application.
1.3. ACTIVITIES
This case study proposes two related group activities, one to be carried out in class and the
other outside the class.
The class activity follows a design thinking approach, where students are encouraged to
analyse the problem from a global perspective. Students are required to identify the needs
and motivations of end-users, generate as many ideas as possible to serve these identified
needs and then converge on a proposed solution.
The second activity reinforces the learning outcomes by asking students to develop the
implementation of a prototype that incorporates their proposed solutions. This activity forces
the student to converge and transform ideas and concepts into a potentially working solution.
This exercise will put their knowledge in electronics into practice to demonstrate their
understanding of the problem and ability to analyse the implementation alternatives.
4
Tanzania, Water and Health
2. DESCRIPTION OF THE CONTEXT To make students aware of the context, it is necessary to present the reality in Tanzania with regards to water, health and infrastructure, which are very different to those in developed western countries.
Tanzania at a glance
Tanzania is a country in East Africa, in the African Great Lakes region. It has been divided
into 30 administrative regions: five on the semi-autonomous islands of Zanzibar and 25 on
the mainland in the former Tanganyika.
As of 20132, Tanzania remains considered as a poor country, with a per capita gross
domestic product (GDP) of $1,715 (PPP), a figure on par with other sub-Saharan African
countries. The economy is heavily based on agriculture, which accounts for more than 25%
of the GDP, provides 85% of exports, and employs 80% of the workforce; 12.25% of the land
is arable, but only 1.79% of the land is planted with permanent crops.
Governance in Tanzania The Government of Tanzania has embarked on a major sector reform process since 2002.
An ambitious National Water Sector Development Strategy, which promotes integrated water
resources management and the development of urban and rural water supply, was adopted
in 2006. Decentralisation has meant that responsibility for water and sanitation service
provision has shifted to local government authorities. Service provision is now carried out by
20 urban utilities and approximately 100 district utilities, as well as by Community Owned
Water Supply Organisations in rural areas.
These reforms have been backed by a significant increase in allocated budget in 2006, when
the water sector was included among the priority sectors of the National Strategy for Growth
and Reduction of Poverty MKUKUTA. However, the Tanzanian water sector remains heavily
dependent on external donors: 88% of the available funds are provided by external donor
organisations.
In this context, effective policy monitoring is essential for measuring progress towards
national targets for water and sanitation (as well as towards the Millennium Development
2 Data from wikipedia, http://en.wikipedia.org/wiki/Tanzania
5
Tanzania, Water and Health
Goals (MDGs)), to ensure effective targeting of investment, and to inform sector policies and
strategies.
Health and water as Human Rights
According to the World Health Organization (WHO), most inequalities in health are due to
the conditions in which people are born, live and work, as well as the health system they
have access to. That is, access to safe water and adequate sanitation, an adequate supply
of safe food, adequate nutrition, adequate housing, healthy working conditions and
environment, and adequate social protection. Improving these social determinants of health
and reducing inequalities of power, money and resources are likely to help to improve the
population’s health.
Similarly, the UN recognizes health as one of the key elements of human development,
along with education, a minimum level of income and the ability to participate in political and
social life of the community. In fact, health and water have even been recognized as Human
Rights3, which bind governments that have signed international covenants related to human
rights. Regarding health, the right to health shall not be understood as the right to be
healthy, but rather as a government’s obligation to create the conditions that allow all people
to live as healthily as possible, including the social determinants of health. International
regulations on the right to health require governments to provide access to health care with
quality care, non-discrimination and economic conditions that do not prevent access by the
poor.
The health status of the population is also a factor that affects a country’s development. Poor
health reduces capacity to work and productivity of people, and affects the physical
development, schooling and learning of children. Conversely, there is evidence to illustrate a
link between the improvement of children’s nutrition and health with an increase in
productivity and school performance. In relative terms, the economic and education
advantages that are produced by improvements in health generate greater benefits for the
poorest sectors of the population. This is why, health was one of the key issues considered
as part of the Millennium Development Goals.
The Human Right to Water places the main responsibility of to ensuring that people can
enjoy "sufficient, safe, accessible and affordable water, without discrimination" upon national
governments. In particular, governments are expected to take reasonable steps to
3 United Nations General Assembly Resolution 64/292, 28 July 2010,
6
Tanzania, Water and Health
avoid contaminated water supply and to ensure there are no water access inequalities
among its citizens.
Gender issues on health and water
Gender refers to the different roles, rights, and responsibilities of men and women and the
relations between them. Gender does not simply refer to women or men, but to the way their
qualities, behaviours, and identities are determined through the process of socialization.
Gender is generally associated with unequal power and access to choices and resources.
The different positions of women and men are influenced by historical, religious, economic
and cultural realities. These relations and responsibilities can and do change over time.
Women and men often experience different social determinates of health, which leads to
gender inequality in access to health. For example, domestic tasks cause women be in
contact with contaminated water, fatigue and stress related to a "double day" inside and
outside the home, as well as health problems during pregnancy, childbirth and postpartum,
etc.
In most developing countries, women and girls are responsible for the collection and use of
household water, while men make decisions about water resources management and
development at both local and national levels. In a rapidly changing world where water
scarcity, climate variability and climate change, disasters and conflicts are affecting access
to safe and sustainable water resources, women are especially vulnerable. Prevailing social
inequalities mean women typically have a lower capacity to cope with and adapt to changes
in access to water resources. Consequently, women bear a disproportional burden of
increased competition and climate change induced consequences on water.
Water distribution infrastructure sector
Drinking water (a.k.a potable water) is safe enough to be consumed by humans with low risk
of immediate or long term harm. In most developed countries, the water supplied to
households meets drinking water standards. However, over large parts of the world, people
have inadequate access to potable water and must resort to using contaminated sources. As
an example, access to water and sanitation remains low in Tanzania and only slightly more
than half the population is estimated to have access to an improved water source. In
Tanzania, there are also stark differences in access between urban areas (about 79% in
7
Tanzania, Water and Health
2010) and rural areas (about 44% in 2010)4. In rural areas, access is defined as meaning
that households have to travel less than one kilometre to a protected drinking water source
in the dry season.
According to data from the Household Budget Surveys5 in 2000/2001 and 2007, access to
an improved water source in mainland Tanzania decreased from 55% in 2000 to 52% in
2007. Although, using a broader definition of access that also includes standpipes and
protected springs, there has been a slight increase in the proportion of households reporting
a drinking water source within one kilometre.
Water quality varies significantly within the country: colour and turbidity levels are
problematic during the rainy season in the semi-arid regions (Dodoma, Singida, Tabora,
Shinyanga, and Arusha), while fluoride concentration is a matter of concern at rivers around
Arusha, Kilimanjaro, Singida, and Shinyanga regions of the Rift Valley. The waters of Lakes
Tanganyika and Nyasa have good water quality overall, except in the vicinity of urban areas
where effluent and storm water cause local contamination. Nevertheless, the water quality of
Lake Victoria is poor: high turbidity and nutrient levels lead to frequent blooms of algae and
infestations of water weeds.
Water quality and safety indicators
The WHO/UNICEF Joint Monitoring Program, JMP (WHO/UNICEF Joint Monitoring
Programme for Water Supply and Sanitation), uses the classification of
improved/unimproved sources and facilities as a proxy indicator to assess the use of safe
water, because improved infrastructure, due to its construction, is more likely to provide safe
water. However, the JMP recognises the limits of this indicator and its inefficiency for
assessing water safety.
Some of the difficulties in monitoring water quality include6:
• Experience shows that most people do not have the knowledge to determine
whether water from a particular source is safe or not.
4 http://en.wikipedia.org/wiki/Water_supply_and_sanitation_in_Tanzania - cite_note-JMP-2 5 National Bureau of Statistics- National Statistical Office of Tanzania. http://nbs.go.tz/tnada/index.php/catalog 6 http://www.wateraid.org/~/media/Publications/east-africa-data-reconciliation-workshop.pdf
8
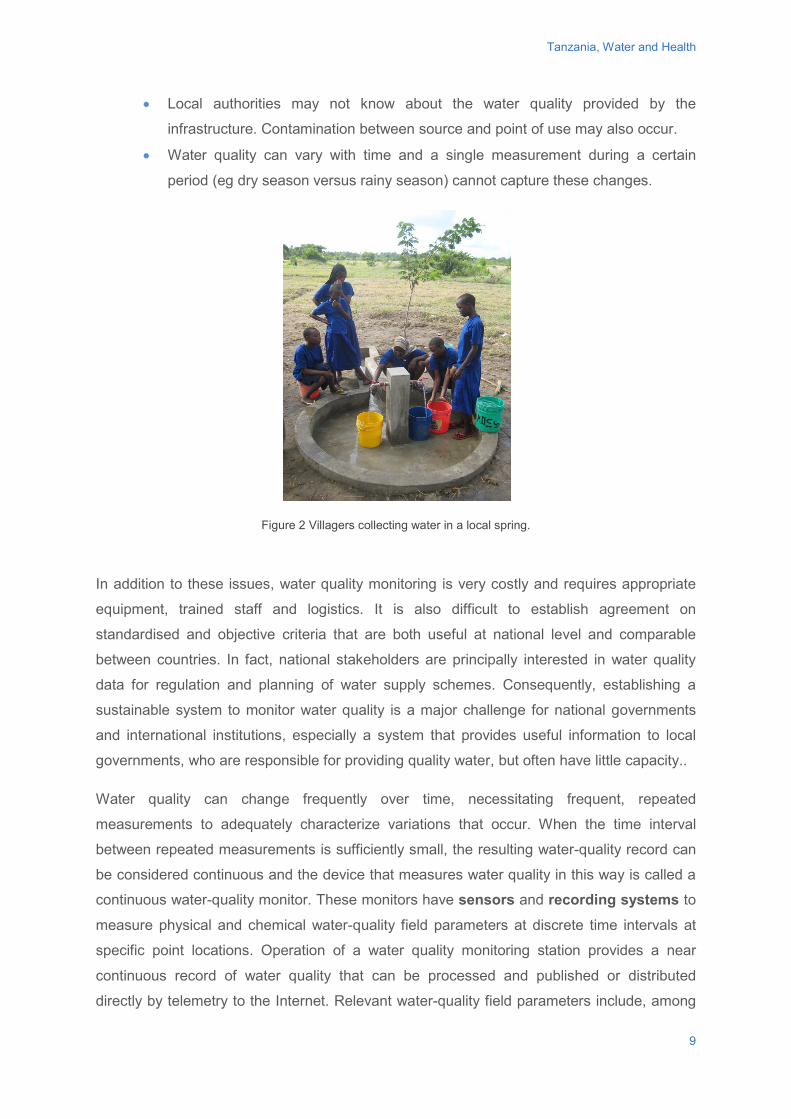
Tanzania, Water and Health
• Local authorities may not know about the water quality provided by the
infrastructure. Contamination between source and point of use may also occur.
• Water quality can vary with time and a single measurement during a certain
period (eg dry season versus rainy season) cannot capture these changes.
Figure 2 Villagers collecting water in a local spring.
In addition to these issues, water quality monitoring is very costly and requires appropriate
equipment, trained staff and logistics. It is also difficult to establish agreement on
standardised and objective criteria that are both useful at national level and comparable
between countries. In fact, national stakeholders are principally interested in water quality
data for regulation and planning of water supply schemes. Consequently, establishing a
sustainable system to monitor water quality is a major challenge for national governments
and international institutions, especially a system that provides useful information to local
governments, who are responsible for providing quality water, but often have little capacity..
Water quality can change frequently over time, necessitating frequent, repeated
measurements to adequately characterize variations that occur. When the time interval
between repeated measurements is sufficiently small, the resulting water-quality record can
be considered continuous and the device that measures water quality in this way is called a
continuous water-quality monitor. These monitors have sensors and recording systems to
measure physical and chemical water-quality field parameters at discrete time intervals at
specific point locations. Operation of a water quality monitoring station provides a near
continuous record of water quality that can be processed and published or distributed
directly by telemetry to the Internet. Relevant water-quality field parameters include, among
9
Tanzania, Water and Health
others7, temperature, specific conductance, pH, dissolved oxygen (DO), and turbidity.
Procedures for continuous monitoring in pristine, freshwater streams differ from those
needed in coastal environments. Continuous monitoring in coastal environments can be
challenging because of rapid biofouling from microscopic and macroscopic organisms,
corrosion of electronic components from salt and high humidity, and the wide range in value
of field parameters associated with changing weather and tidal conditions.
Temperature and conductivity are true physical properties of water bodies, whereas DO and
pH are concentrations, and turbidity is an expression of the optical properties of water.
Sensors are also available to measure other field parameters, such as oxidation-reduction
potential, water level, depth, ammonia, nitrate, chloride, and fluorescence.
In addition to the measured field parameters, some monitors may include algorithms to
report calculated parameters, such as specific conductance, salinity, total dissolved solids,
and percentage of DO saturation.
3. ELECTRICAL INFRASTRUCTURE AND COMMUNICATION NETWORKS IN TANZANIA
Most electricity in Tanzania is generated using gas, although hydropower is also a significant
source. Currently, most Tanzanians are outside the electrical grid despite the country’s
efforts to double supply between 2005 and 2011. The country’s high dependence on
hydropower generation causes disruptions during prolonged droughts that have affected the
country for several years. During these periods, supply is unreliable and shortages lead to
power rationing. To deal with the problem, the government have hired private companies to
generate more than 300 megawatts of power daily on a short-term basis - about a fifth of the
country's electricity needs.
This generating capacity is to be replaced by other facilities, including Tanzania's first natural
gas-fired plant. The 240 billion Tanzanian shilling ($183 million) plant being built at Kinyerezi
in Dar es Salaam is expected to meet some 20 percent of national electricity demand.
Tanzania has proven reserves of natural gas in excess of 50 trillion cubic feet - more than
enough to put the country on a faster economic development path and help it build energy
independence. Currently, natural gas accounts for about a third of Tanzania's electricity
7 http://people.eng.unimelb.edu.au/jgl/Papers/2013WaterQuality-ICACCI.pdf
10
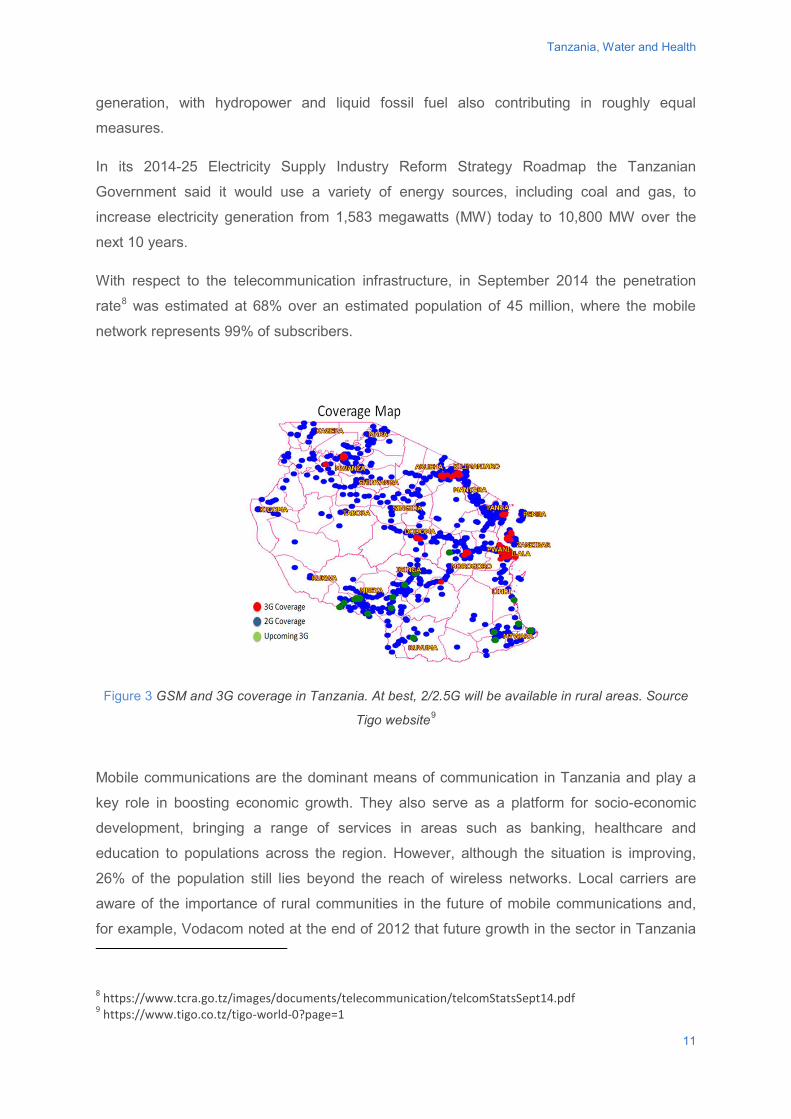
Tanzania, Water and Health
generation, with hydropower and liquid fossil fuel also contributing in roughly equal
measures.
In its 2014-25 Electricity Supply Industry Reform Strategy Roadmap the Tanzanian
Government said it would use a variety of energy sources, including coal and gas, to
increase electricity generation from 1,583 megawatts (MW) today to 10,800 MW over the
next 10 years.
With respect to the telecommunication infrastructure, in September 2014 the penetration
rate8 was estimated at 68% over an estimated population of 45 million, where the mobile
network represents 99% of subscribers.
Figure 3 GSM and 3G coverage in Tanzania. At best, 2/2.5G will be available in rural areas. Source
Tigo website9
Mobile communications are the dominant means of communication in Tanzania and play a
key role in boosting economic growth. They also serve as a platform for socio-economic
development, bringing a range of services in areas such as banking, healthcare and
education to populations across the region. However, although the situation is improving,
26% of the population still lies beyond the reach of wireless networks. Local carriers are
aware of the importance of rural communities in the future of mobile communications and,
for example, Vodacom noted at the end of 2012 that future growth in the sector in Tanzania
8 https://www.tcra.go.tz/images/documents/telecommunication/telcomStatsSept14.pdf 9 https://www.tigo.co.tz/tigo-world-0?page=1
11
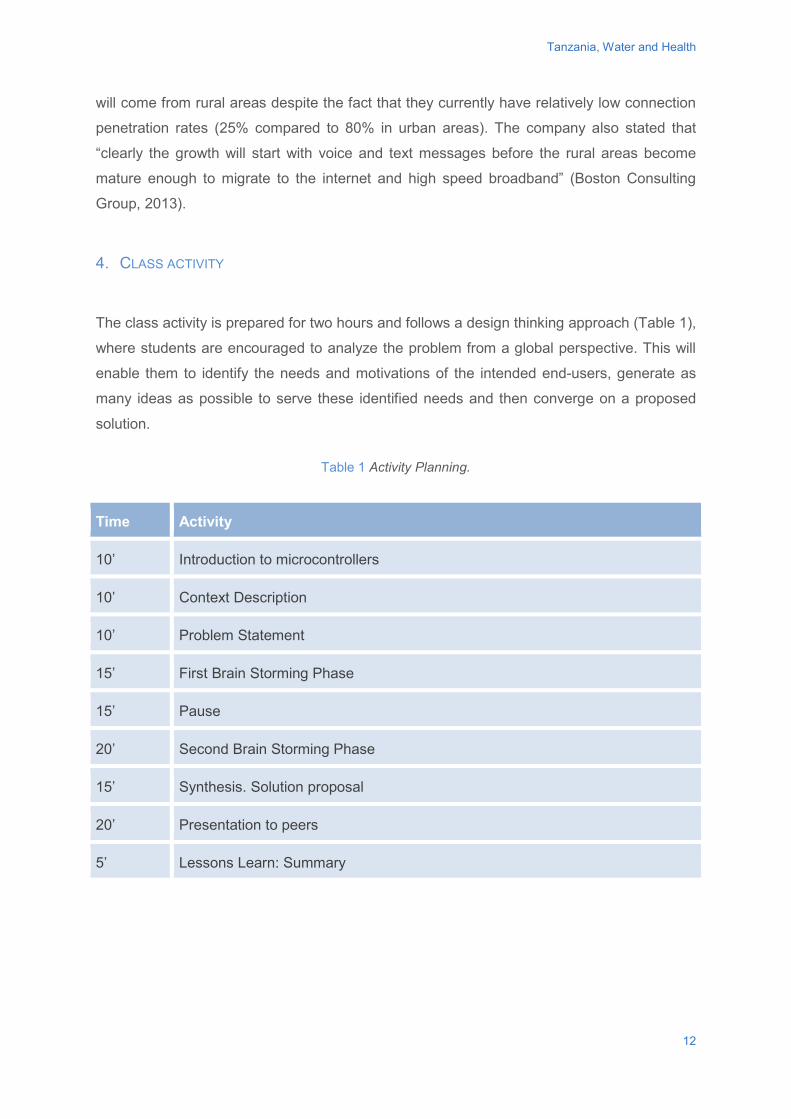
Tanzania, Water and Health
will come from rural areas despite the fact that they currently have relatively low connection
penetration rates (25% compared to 80% in urban areas). The company also stated that
“clearly the growth will start with voice and text messages before the rural areas become
mature enough to migrate to the internet and high speed broadband” (Boston Consulting
Group, 2013).
4. CLASS ACTIVITY
The class activity is prepared for two hours and follows a design thinking approach (Table 1),
where students are encouraged to analyze the problem from a global perspective. This will
enable them to identify the needs and motivations of the intended end-users, generate as
many ideas as possible to serve these identified needs and then converge on a proposed
solution.
Table 1 Activity Planning.
Time Activity
10’ Introduction to microcontrollers
10’ Context Description
10’ Problem Statement
15’ First Brain Storming Phase
15’ Pause
20’ Second Brain Storming Phase
15’ Synthesis. Solution proposal
20’ Presentation to peers
5’ Lessons Learn: Summary
12
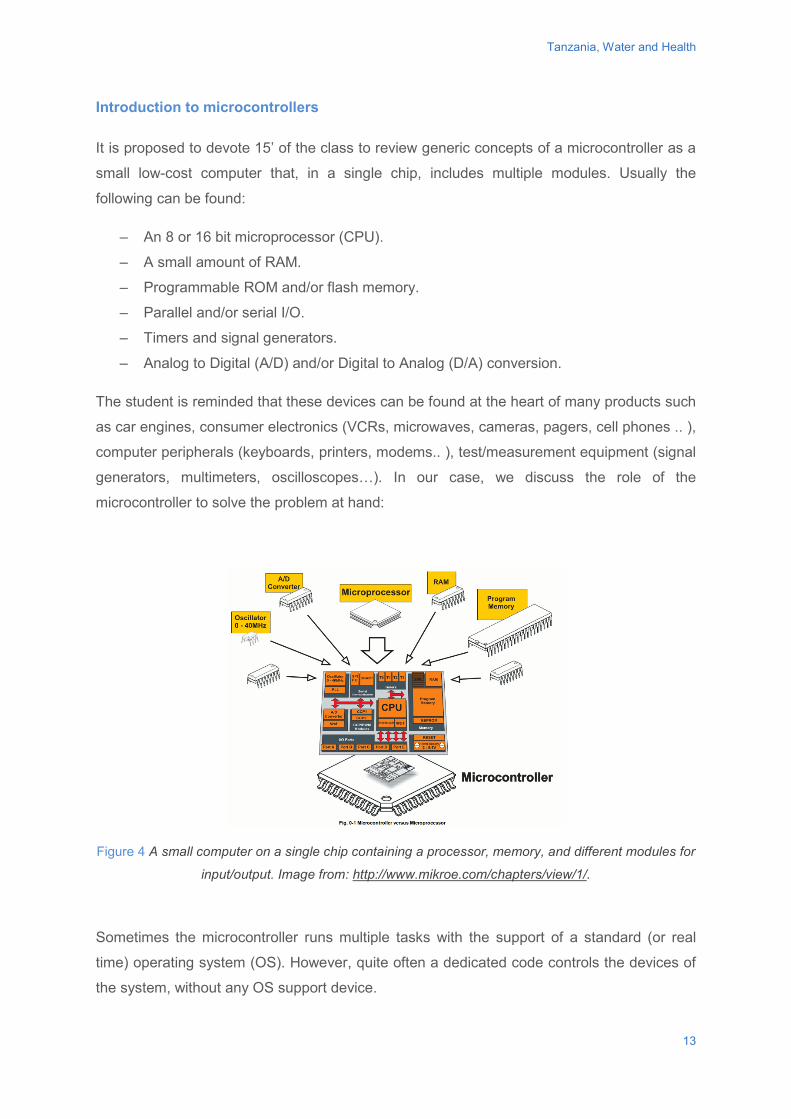
Tanzania, Water and Health
Introduction to microcontrollers It is proposed to devote 15’ of the class to review generic concepts of a microcontroller as a
small low-cost computer that, in a single chip, includes multiple modules. Usually the
following can be found:
– An 8 or 16 bit microprocessor (CPU).
– A small amount of RAM.
– Programmable ROM and/or flash memory.
– Parallel and/or serial I/O.
– Timers and signal generators.
– Analog to Digital (A/D) and/or Digital to Analog (D/A) conversion.
The student is reminded that these devices can be found at the heart of many products such
as car engines, consumer electronics (VCRs, microwaves, cameras, pagers, cell phones .. ),
computer peripherals (keyboards, printers, modems.. ), test/measurement equipment (signal
generators, multimeters, oscilloscopes…). In our case, we discuss the role of the
microcontroller to solve the problem at hand:
Figure 4 A small computer on a single chip containing a processor, memory, and different modules for
input/output. Image from: http://www.mikroe.com/chapters/view/1/.
Sometimes the microcontroller runs multiple tasks with the support of a standard (or real
time) operating system (OS). However, quite often a dedicated code controls the devices of
the system, without any OS support device.
13
Tanzania, Water and Health
In contrast to high performance processors used in desktop computers, microcontrollers are
usually meant to operate on batteries, and therefore have low-power requirements (~. 0.5 - 1
W).
The programming of a microprocessor generally requires detailed knowledge of the device
internals, including memory mapping, peripheral configuration registers, etc. However, in the
last years new concepts, such as Wiring and Arduino10, have become popular approaches to
microcontroller programming. In this session, examples refer to the Arduino platform, an
open-source physical computing platform based on a simple microcontroller board, and a
development environment for writing software for the board.
Context Description
The context for the access to water is presented to the student: It is important to highlight the
following aspects:
• Access to water remains low in Tanzania. Only just over half the population of
Tanzania is estimated to have access to an improved water source, with stark
differences between urban areas and rural areas.
• Water quality varies significantly within the country: colour and turbidity levels are
problematic during the rainy season in the semi-arid regions, fluoride concentration is
a matter of concern in other areas, and high turbidity and nutrient levels lead to
frequent blooms of algae and weeds. Experience shows that most people do not
have the knowledge to determine whether a water source is safe or not.
• Local authorities, responsible for the infrastructure, may not know about poor water
quality or overuse of existing wells, which may compromise quality and sustainability.
• Water quality can vary with time and a single measurement during a certain period
(eg dry season versus rainy season) cannot capture these changes.
• ICT access is mostly restricted to mobile phone infrastructure, however coverage is
far from global and low payment capability of individuals in remote areas limits its
deployment.
10 Alan G. Smith , Introduction to Arduino, September 30, 2011, available at
http://www.introtoarduino.com/downloads/IntroArduinoBook.pdf
14

Tanzania, Water and Health
Problem Statement
According to the context description, establishing a sustainable system to monitor water
quality is a major need, especially in providing useful information to local governments as
well as local users.
A self-contained low-cost and light weight system for continuous water quality measurement
is needed to inform users about potential hazards, as well as to provide information to local
governments, which are responsible for providing quality water but have little capacity.
Ideally, the system needs take into account the reality of Tanzania: it should work for both
manual and electrically (grid or sun) powered pumps and in areas with or without data
network coverage.
During this activity, students can pose questions about the country, the limitations and so on.
Brainstorming Phase 1 To carry out this activity, students are grouped into teams of 4 or 5.
During an initial brain storming phase, students will read the documentation for 10 minutes
and individually propose alternative options to solve each of the problems for 5 minutes: at
least 3 ideas per point. No idea should be discarded at this point.
Students are encouraged to highlight new problems that they may be considered relevant for
the purpose of the activity (max 1 new problem per group).
Ideally, students will write their proposals on sticky notes, such as Post-it® notes, otherwise
cards or paper sheets will be supplied by the lecturer, who will then collect and arrange them
on the black/whiteboard during the pause.
Table 2 Problem and constraints.
PROBLEM CONSTRAINTS
Sensing Water operational monitoring parameters
The parameters selected for operational monitoring should reflect the
effectiveness of each control measure, provide a timely indication of
performance, be readily measured and provide opportunity for an
15
Tanzania, Water and Health
appropriate response (World Health Organization, 2008).
A range of parameters can be used in operational monitoring. For
source waters, these include pH, turbidity, UV absorbency, dissolved
oxygen, conductivity, organic carbon content, algal growth, flow and
retention time, color, conductivity and the occurrence of local
meteorological events.
Ideally, a means to estimate the presence and/or concentrations of coliform bacteria should also be considered.
Each sensor takes up space. We need to monitor at least the following: temperature, specific conductance, pH, dissolved oxygen, and turbidity.
Communications The device has to provide readings to external devices either wirelessly of by direct connection.
Recording The system records water quality readings and water usage with the aid of an embedded system.
Warning user The system will warn the user if the quality does not meet a minimum standard
Fixation The system has to be fixed in place so that it cannot be easily removed
Powering The device needs to power the electronics in all conditions
Software The service has to be automated with software that retrieves data from local water sources and compiles information in a server run and owned by local authorities.
Brainstorming Phase 2
During this second phase, students will analyze their proposals as a whole group and
determine (from a global perspective) which combination of ideas is most suitable given the
constraints currently present in Tanzania. For each of the ideas proposed in Phase 1,
students must analyze its pros and cons and describe the implications of adopting this idea
into the overall solution (follow - what?, why?, who?, where? logic).
To guide the discussion, each idea will be classified on a scale of 1-5 in terms of feasibility,
originality, robustness, logic (coherence with the overall problem) and scalability.
16

Tanzania, Water and Health
Synthesis: Solution proposal Given the problem at hand and the constraints in the country, teams have to identify which
combination of ideas will best meet the needs of users and local authorities responsible for
water supply. To remind, the reader:
• Users need a reliable source of water and for such purpose the system should inform
them about water quality. The system has to work 24/7 without any external support
or intervention.
• Local authorities need a system that provides regular readings of water quality at
springs and wells in rural and remote areas, with as little intervention as possible and
reliant on existing infrastructure.
Presentation to peers Each group will present their solution to the rest of the class making a short pitch and if
possible a first draft device design to envision usability. The extension of the presentation
will depend on the number of groups. At the very least, each group will provide an elevator
pitch with their proposal, summarizing the key factors that make their solution original and
feasible.
Lessons Learned: Summary The lecturer will analyze the solutions presented by the different groups to summarize
common points and identify innovative or unfeasible solutions.
If this session is to be continued with the homework activity, the lecturer will provide
indications on how students should continue with the homework, otherwise the lecturer will
address the aspects of the group’s solutions that are more relevant for an application based
on an embedded processor.
In the homework activity, students should take their proposal developed in class as the
starting point, although they may supplement this with ideas from other groups to improve
their solution.
17
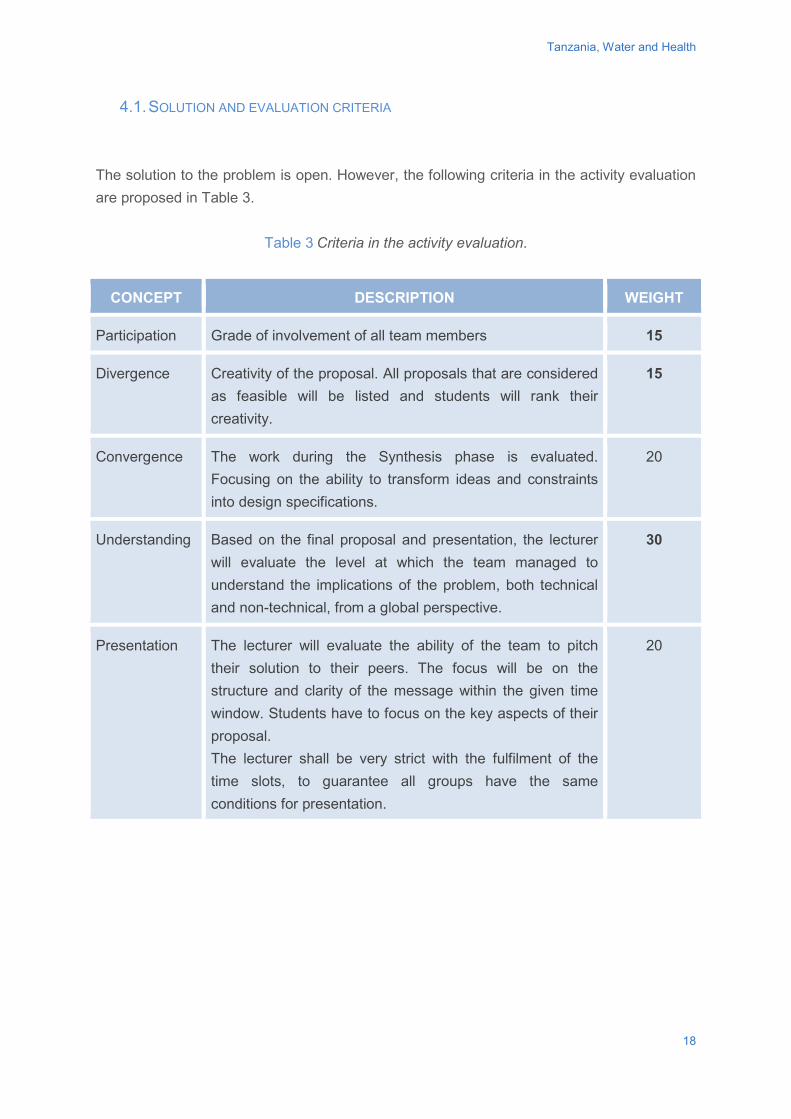
Tanzania, Water and Health
4.1. SOLUTION AND EVALUATION CRITERIA The solution to the problem is open. However, the following criteria in the activity evaluation are proposed in Table 3.
Table 3 Criteria in the activity evaluation.
CONCEPT DESCRIPTION WEIGHT
Participation Grade of involvement of all team members 15
Divergence Creativity of the proposal. All proposals that are considered as feasible will be listed and students will rank their creativity.
15
Convergence The work during the Synthesis phase is evaluated. Focusing on the ability to transform ideas and constraints into design specifications.
20
Understanding Based on the final proposal and presentation, the lecturer will evaluate the level at which the team managed to understand the implications of the problem, both technical and non-technical, from a global perspective.
30
Presentation The lecturer will evaluate the ability of the team to pitch their solution to their peers. The focus will be on the structure and clarity of the message within the given time window. Students have to focus on the key aspects of their proposal. The lecturer shall be very strict with the fulfilment of the time slots, to guarantee all groups have the same conditions for presentation.
20
18
Tanzania, Water and Health
5. HOMEWORK ACTIVITY Students are asked to develop, in groups, a conceptual prototype of the solution proposed
following the brainstorming phase. This prototype, whose electronics should be based on the
Arduino platform (Smith, 2011), has to cover the following aspects:
• (2 hours) Appearance: mock-up of the proposed device, to show the expected
dimensions of the device and the way it would integrate with an existing water pipe.
• (2 hours) Provide a conceptual design (wiring and components) to sense water
quality of the embedded system using components from atlas scientific11.
• (2 hours) Provide a conceptual design (connections and components) to solve data
reporting to local agencies.
• (2 hours) Provide a conceptual design (connections and components) to solve water
status reporting to the user.
• (2 hours) Provide a conceptual design (connections and components) to powering
the solution.
• (1 hours) Provide a conceptual sketch of the complete service (how all pieces fit
together and satisfy the needs of the stakeholders).
Teams will present (10mins per presentation) in class their final prototype of the system and
service. Each bullet point should be covered with a maximum of 2 slides and students. In
their presentation students have to highlight the limitations of their solution and how the
address them (for instance, how the fact that sensors have to be calibrated once a year fits
into their proposal) and also what the main assumptions in their design that would need
further validation are.
5.1. SOLUTION AND EVALUATION CRITERIA
The solution to the homework activity is open. However, it is propose to consider the
following criteria in the activity evaluation (Table 4).
11 https://www.atlas-scientific.com/
19
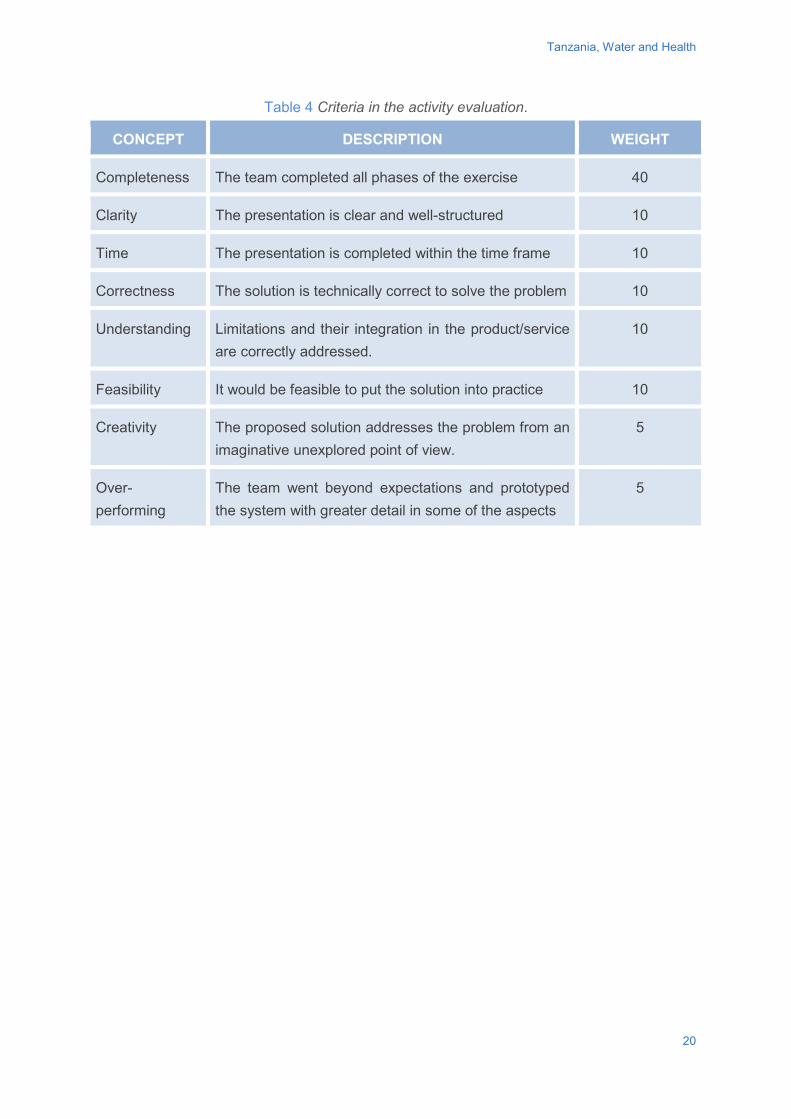
Tanzania, Water and Health
Table 4 Criteria in the activity evaluation.
CONCEPT DESCRIPTION WEIGHT
Completeness The team completed all phases of the exercise 40
Clarity The presentation is clear and well-structured 10
Time The presentation is completed within the time frame 10
Correctness The solution is technically correct to solve the problem 10
Understanding Limitations and their integration in the product/service are correctly addressed.
10
Feasibility It would be feasible to put the solution into practice 10
Creativity The proposed solution addresses the problem from an imaginative unexplored point of view.
5
Over-performing
The team went beyond expectations and prototyped the system with greater detail in some of the aspects
5
20
Tanzania, Water and Health
BIBLIOGRAPHY BOSTON CONSULTING GROUP (2013) Sub-Saharan Africa Mobile Economy 2013, The
Boston Consulting Group. Avaliable from: http://www.gsmamobileeconomy.com/ssa2013/Sub-Saharan%20Africa_ME_ExecSummary_English_2013.pdf [28 April 2015]
Marshall, J., Msokwa, Z., Ngamlagosi, F. 2002. Water and Sanitation in Tanzania Poverty Monitoring for the sector using national surveys. collaborative project report, MoWLD, WaterAid, EASTC and NBS, Tanzania 2002. Available from: < http://www.povertymonitoring.go.tz/researchreport/watsan_report.pdf> [28 April 2015]
MINISTRY OF WATER AND IRRIGATION (2008) The United Republic of Tanzania. Water Sector Performance Report for the year 2007/2008, Ministry of Water and Irrigation, 2008
Smith, A.G., 2011. Introduction to Arduino, September 30, 2011. Available from: <http://www.introtoarduino.com/downloads/IntroArduinoBook.pdf> [28 April 2015]
WORLD HEALTH ORGANIZATION (2008) Guidelines for Drinking-water Quality, 3rd Edition Volume 1, WHO Library Cataloguing. Geneva, Switzerland. Available from: <http://www.who.int/water_sanitation_health/dwq/fulltext.pdf> [28 April 2015]
21

http://www.gdee.eu
This project is funded by
Flood assessment and warning system
Aaron Ciaghi
PHOTO: Boane Bridge on the River, Mozambique. Pietro Molini.
CASE STUDIES

Flood assessment and warning system
DL B 10735-2015 ISBN 978-84-606-7546-4
COORDINATED BYAgustí Pérez-Foguet, Enric Velo, Pol Arranz, Ricard Ginéand Boris Lazzarini (Universitat Politècnica de Catalunya)Manuel Sierra (Universidad Politécnica de Madrid)Alejandra Boni and Jordi Peris (Universitat Politècnica de València)Guido Zolezzi and Gabriella Trombino (Università degli Studi di Trento)Rhoda Trimingham (Loughborough University)Valentín Villarroel (ONGAWA)Neil Nobles and Meadhbh Bolger (Practical Action)Francesco Mongera (Training Center for International Cooperation)Katie Cresswell-Maynard (Engineering Without Border UK)
EDITED BY Global Dimension in Engineering Education
Citation: Ciaghi, A. (2015) ' Flood assessment and warning system', in Case studies for developing globally responsible engineers, GDEE (eds.), Global Dimension in Engineering Education, Barcelona. Available from: http://gdee.eu/index.php/resources.html
This publication is distributedunder an Attribution- Noncommercial-Share Alike License for Creative Commons
CASE STUDIES
Disclaimer: This document has been produced with the financial assistance of the European UnionThe contents of this document are the sole responsibility of the authors and can under no circumstances be regarded as reflecting the position of the European Union
Flood Assessment and Warning System
FLOOD ASSESSMENT AND WARNING SYSTEM
Aaron Ciaghi, Project Manager and Developer at ICT4G - Fondazione Bruno Kessler, Trento (Italy).
1
Flood Assessment and Warning System
INDEX 1. INTRODUCTION ........................................................................................................................... 3 1.1. DISCIPLINES COVERED ............................................................................................................. 3 1.2. LEARNING OUTCOMES .............................................................................................................. 4 1.3. ACTIVITIES .............................................................................................................................. 4
2. DESCRIPTION OF THE CONTEXT ............................................................................................. 5 2.1. HUMAN DEVELOPMENT IN MOZAMBIQUE ................................................................................... 5 2.2. NATURAL DISASTERS IN MOZAMBIQUE ...................................................................................... 6 2.3. RISK MANAGEMENT PROCESS .................................................................................................. 8 2.4. THE DELPHI METHOD .............................................................................................................. 9
3. CLASS ACTIVITY ....................................................................................................................... 10 3.1. PRESENTATION OF THE REQUIREMENTS (20 MINUTES) ............................................................ 10 3.2. OVERVIEW OF THE CONSTRAINTS AND SUSTAINABILITY ISSUES (30 MINUTES) .......................... 11 3.3. USER STORIES ELICITATION (40 MINUTES) .............................................................................. 13 3.4. DISCUSSION AND PRIORITISATION (30 MINUTES) ..................................................................... 13 3.5. SOLUTION AND EVALUATION CRITERIA ..................................................................................... 14
4. HOMEWORK ACTIVITY ............................................................................................................. 16 4.1. SOLUTION AND EVALUATION CRITERIA ..................................................................................... 17
BIBLIOGRAPHY ................................................................................................................................. 18
2
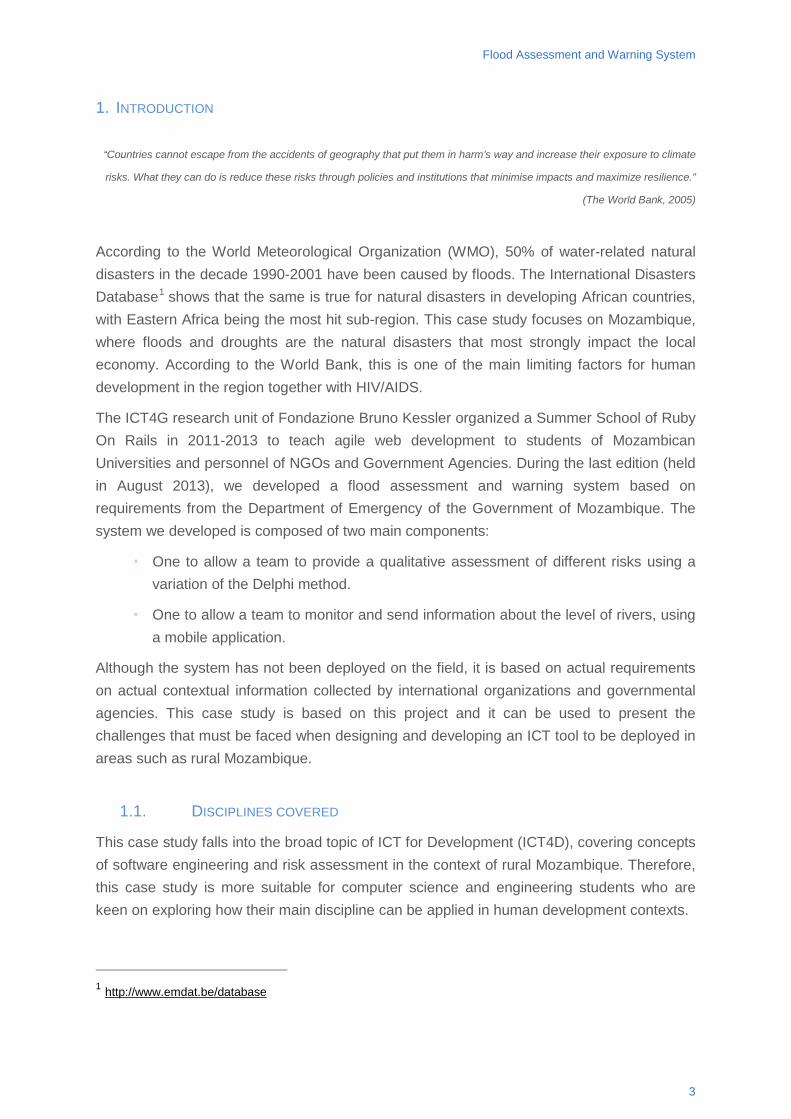
Flood Assessment and Warning System
1. INTRODUCTION
“Countries cannot escape from the accidents of geography that put them in harm’s way and increase their exposure to climate
risks. What they can do is reduce these risks through policies and institutions that minimise impacts and maximize resilience.”
(The World Bank, 2005)
According to the World Meteorological Organization (WMO), 50% of water-related natural disasters in the decade 1990-2001 have been caused by floods. The International Disasters Database1 shows that the same is true for natural disasters in developing African countries, with Eastern Africa being the most hit sub-region. This case study focuses on Mozambique, where floods and droughts are the natural disasters that most strongly impact the local economy. According to the World Bank, this is one of the main limiting factors for human development in the region together with HIV/AIDS.
The ICT4G research unit of Fondazione Bruno Kessler organized a Summer School of Ruby On Rails in 2011-2013 to teach agile web development to students of Mozambican Universities and personnel of NGOs and Government Agencies. During the last edition (held in August 2013), we developed a flood assessment and warning system based on requirements from the Department of Emergency of the Government of Mozambique. The system we developed is composed of two main components:
• One to allow a team to provide a qualitative assessment of different risks using a variation of the Delphi method.
• One to allow a team to monitor and send information about the level of rivers, using a mobile application.
Although the system has not been deployed on the field, it is based on actual requirements on actual contextual information collected by international organizations and governmental agencies. This case study is based on this project and it can be used to present the challenges that must be faced when designing and developing an ICT tool to be deployed in areas such as rural Mozambique.
1.1. DISCIPLINES COVERED
This case study falls into the broad topic of ICT for Development (ICT4D), covering concepts of software engineering and risk assessment in the context of rural Mozambique. Therefore, this case study is more suitable for computer science and engineering students who are keen on exploring how their main discipline can be applied in human development contexts.
1 http://www.emdat.be/database
3

Flood Assessment and Warning System
The case study can be solved at different levels of detail that correspond to the ideal development process of an ICT4D solution:
1. Understanding the context and the risk assessment process for floods and other water related natural disasters.
2. Understanding the design constraints due to the geographical, social and technological environments in which the solution will be deployed.
3. Developing the software solution addressing the identified constraints.
The work proposed in this case study should be carried out in teams of 3-4 people, ideally with a software design/development background.
1.2. LEARNING OUTCOMES
• Gain a basic understanding of risk assessment.
• Understand the constraints and requirements of ICT projects in a development context vs. a “traditional” developed context.
• Understand the common design considerations that should be incorporated in an ICT4D project.
1.3. ACTIVITIES
The two activities proposed in the case study are for groups of 3-4 students and are structured as follows:
• The activity in class will allow students to get acquainted with the risk assessment process using the Delphi-like methodology that will be implemented in the project. This will allow them to subsequently elicit the requirements for the ICT solution. The students will be presented with the methodology and the general requirements of the system to be implemented and will be asked to transform the requirements into User Stories, considering all the peculiarities of the deployment region.
• The homework activity will use the outputs of the activity in class as starting point, allowing the teams to design and develop a prototype for an ICT risk assessment and warning system. The teams can choose their preferred technology for the implementation and can design and develop the solution at different levels of detail.
4
Flood Assessment and Warning System
2. DESCRIPTION OF THE CONTEXT
In the context of the Summer School of ICTs, where we teach Ruby On Rails to students of the Mozambican Universities, we develop applications whose requirements come from various NGOs and Government Agencies. During the last edition (held in August 2013), we developed a flood assessment and warning system based on requirements coming from the Department of Emergency of the Government of Mozambique. The system we developed is composed of two main components. The first component allows a team to provide a qualitative assessment of different risks using a variation of the Delphi method. The second component allows a team to monitor and send information about the level of rivers, using a mobile application.
Although the system has not been deployed in the field, it is based on actual requirements. The first component has also been implemented by the students during the one-month training they had.
2.1. HUMAN DEVELOPMENT IN MOZAMBIQUE
Mozambique is one of the poorest countries in the world, listed 170th out of 173 in the UN Human Development Index, with 69% of the population living below the poverty line of USD 0.40 per day.
When the country became independent from Portugal in 1975, the Portuguese rapidly left a highly undeveloped country with very low levels of education and training and an economy and transport system skewed to the rest of southern Africa’s economic needs. The creation of the rebel Renamo (Resistência Nacional Moçambicana) movement by the Rhodesian government in 1976, which was subsequently backed by South Africa, led to a 17 year Civil War and an extended period of attack and destabilisation by South Africa in defence of its apartheid system. The war resulted in at least one million deaths and devastated many parts of the country and its infrastructure. Over one third of the population was displaced at some point, and 1.7 million lived as refugees in neighbouring countries. 60% of primary schools and 40% of primary health posts were destroyed.
A peace agreement in 1992 and elections in 1994 ended the conflict, with the UN supervising the return of refugees and internally displaced people.
Mozambique remains a developing democracy with substantial tensions between the Renamo areas of the north and center and the Frelimo areas of the south, including the capital Maputo. Second general elections were held in 1999 and Renamo, disappointed by the result, challenged the validity of the elections and threatened to set up its own government. These political developments were overtaken by the 2000 floods, but the
5
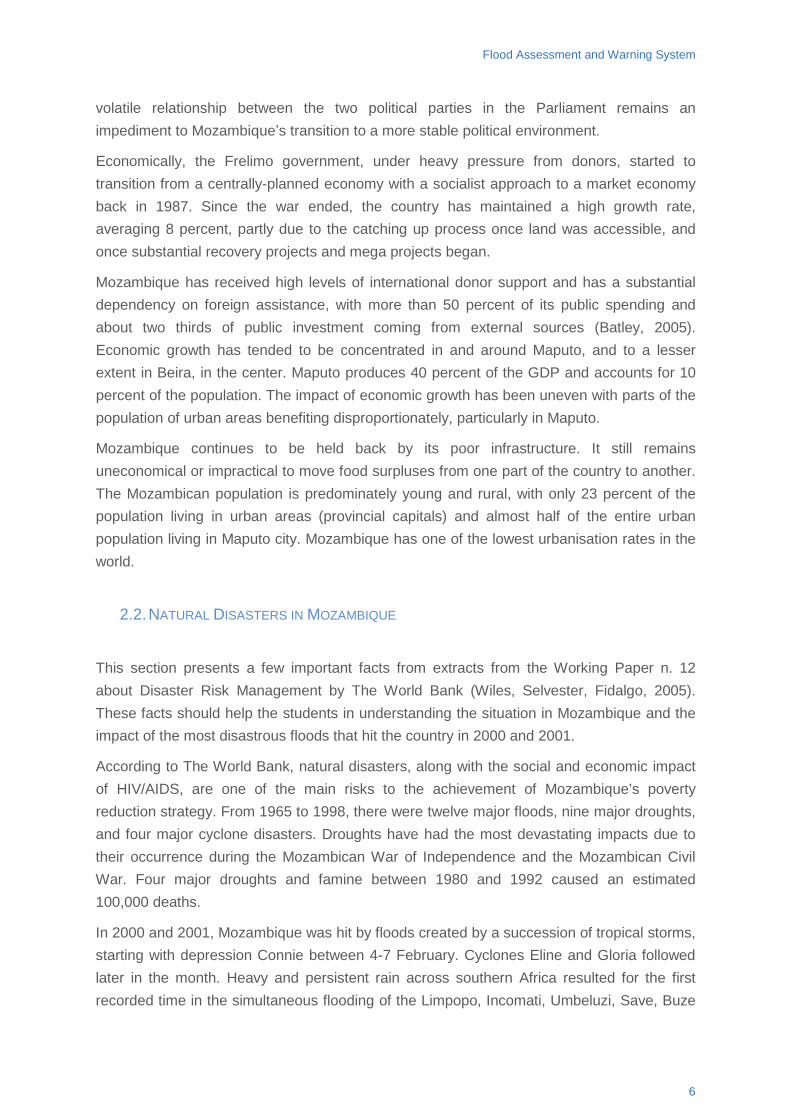
Flood Assessment and Warning System
volatile relationship between the two political parties in the Parliament remains an impediment to Mozambique’s transition to a more stable political environment.
Economically, the Frelimo government, under heavy pressure from donors, started to transition from a centrally-planned economy with a socialist approach to a market economy back in 1987. Since the war ended, the country has maintained a high growth rate, averaging 8 percent, partly due to the catching up process once land was accessible, and once substantial recovery projects and mega projects began.
Mozambique has received high levels of international donor support and has a substantial dependency on foreign assistance, with more than 50 percent of its public spending and about two thirds of public investment coming from external sources (Batley, 2005). Economic growth has tended to be concentrated in and around Maputo, and to a lesser extent in Beira, in the center. Maputo produces 40 percent of the GDP and accounts for 10 percent of the population. The impact of economic growth has been uneven with parts of the population of urban areas benefiting disproportionately, particularly in Maputo.
Mozambique continues to be held back by its poor infrastructure. It still remains uneconomical or impractical to move food surpluses from one part of the country to another. The Mozambican population is predominately young and rural, with only 23 percent of the population living in urban areas (provincial capitals) and almost half of the entire urban population living in Maputo city. Mozambique has one of the lowest urbanisation rates in the world.
2.2. NATURAL DISASTERS IN MOZAMBIQUE
This section presents a few important facts from extracts from the Working Paper n. 12 about Disaster Risk Management by The World Bank (Wiles, Selvester, Fidalgo, 2005). These facts should help the students in understanding the situation in Mozambique and the impact of the most disastrous floods that hit the country in 2000 and 2001.
According to The World Bank, natural disasters, along with the social and economic impact of HIV/AIDS, are one of the main risks to the achievement of Mozambique’s poverty reduction strategy. From 1965 to 1998, there were twelve major floods, nine major droughts, and four major cyclone disasters. Droughts have had the most devastating impacts due to their occurrence during the Mozambican War of Independence and the Mozambican Civil War. Four major droughts and famine between 1980 and 1992 caused an estimated 100,000 deaths.
In 2000 and 2001, Mozambique was hit by floods created by a succession of tropical storms, starting with depression Connie between 4-7 February. Cyclones Eline and Gloria followed later in the month. Heavy and persistent rain across southern Africa resulted for the first recorded time in the simultaneous flooding of the Limpopo, Incomati, Umbeluzi, Save, Buze
6
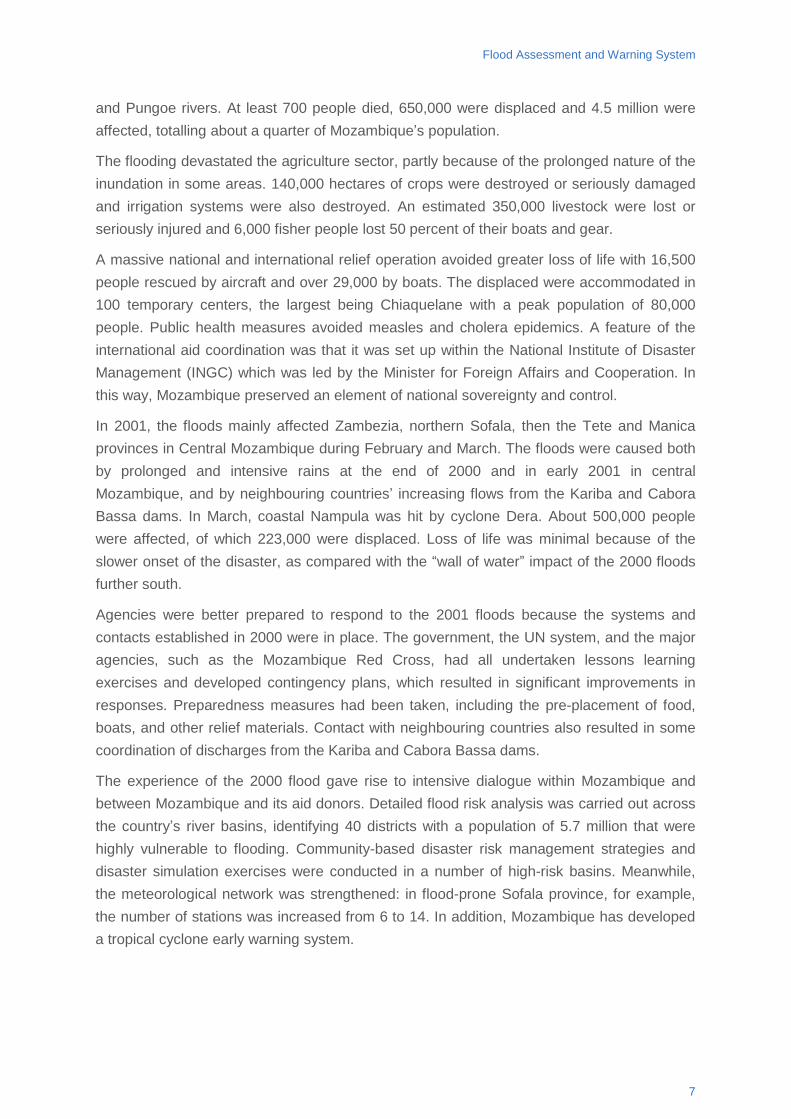
Flood Assessment and Warning System
and Pungoe rivers. At least 700 people died, 650,000 were displaced and 4.5 million were affected, totalling about a quarter of Mozambique’s population.
The flooding devastated the agriculture sector, partly because of the prolonged nature of the inundation in some areas. 140,000 hectares of crops were destroyed or seriously damaged and irrigation systems were also destroyed. An estimated 350,000 livestock were lost or seriously injured and 6,000 fisher people lost 50 percent of their boats and gear.
A massive national and international relief operation avoided greater loss of life with 16,500 people rescued by aircraft and over 29,000 by boats. The displaced were accommodated in 100 temporary centers, the largest being Chiaquelane with a peak population of 80,000 people. Public health measures avoided measles and cholera epidemics. A feature of the international aid coordination was that it was set up within the National Institute of Disaster Management (INGC) which was led by the Minister for Foreign Affairs and Cooperation. In this way, Mozambique preserved an element of national sovereignty and control.
In 2001, the floods mainly affected Zambezia, northern Sofala, then the Tete and Manica provinces in Central Mozambique during February and March. The floods were caused both by prolonged and intensive rains at the end of 2000 and in early 2001 in central Mozambique, and by neighbouring countries’ increasing flows from the Kariba and Cabora Bassa dams. In March, coastal Nampula was hit by cyclone Dera. About 500,000 people were affected, of which 223,000 were displaced. Loss of life was minimal because of the slower onset of the disaster, as compared with the “wall of water” impact of the 2000 floods further south.
Agencies were better prepared to respond to the 2001 floods because the systems and contacts established in 2000 were in place. The government, the UN system, and the major agencies, such as the Mozambique Red Cross, had all undertaken lessons learning exercises and developed contingency plans, which resulted in significant improvements in responses. Preparedness measures had been taken, including the pre-placement of food, boats, and other relief materials. Contact with neighbouring countries also resulted in some coordination of discharges from the Kariba and Cabora Bassa dams.
The experience of the 2000 flood gave rise to intensive dialogue within Mozambique and between Mozambique and its aid donors. Detailed flood risk analysis was carried out across the country’s river basins, identifying 40 districts with a population of 5.7 million that were highly vulnerable to flooding. Community-based disaster risk management strategies and disaster simulation exercises were conducted in a number of high-risk basins. Meanwhile, the meteorological network was strengthened: in flood-prone Sofala province, for example, the number of stations was increased from 6 to 14. In addition, Mozambique has developed a tropical cyclone early warning system.
7
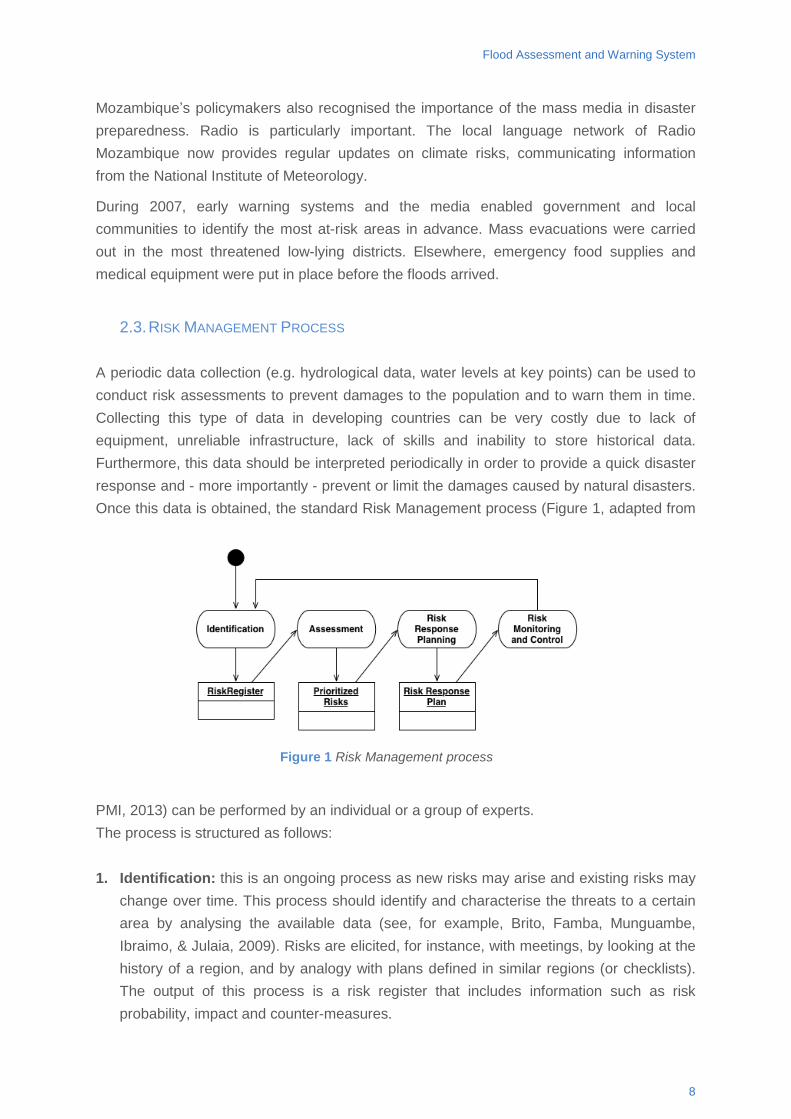
Flood Assessment and Warning System
Mozambique’s policymakers also recognised the importance of the mass media in disaster preparedness. Radio is particularly important. The local language network of Radio Mozambique now provides regular updates on climate risks, communicating information from the National Institute of Meteorology.
During 2007, early warning systems and the media enabled government and local communities to identify the most at-risk areas in advance. Mass evacuations were carried out in the most threatened low-lying districts. Elsewhere, emergency food supplies and medical equipment were put in place before the floods arrived.
2.3. RISK MANAGEMENT PROCESS
A periodic data collection (e.g. hydrological data, water levels at key points) can be used to conduct risk assessments to prevent damages to the population and to warn them in time. Collecting this type of data in developing countries can be very costly due to lack of equipment, unreliable infrastructure, lack of skills and inability to store historical data. Furthermore, this data should be interpreted periodically in order to provide a quick disaster response and - more importantly - prevent or limit the damages caused by natural disasters. Once this data is obtained, the standard Risk Management process (Figure 1, adapted from
PMI, 2013) can be performed by an individual or a group of experts. The process is structured as follows: 1. Identification: this is an ongoing process as new risks may arise and existing risks may
change over time. This process should identify and characterise the threats to a certain area by analysing the available data (see, for example, Brito, Famba, Munguambe, Ibraimo, & Julaia, 2009). Risks are elicited, for instance, with meetings, by looking at the history of a region, and by analogy with plans defined in similar regions (or checklists). The output of this process is a risk register that includes information such as risk probability, impact and counter-measures.
Figure 1 Risk Management process
8
Flood Assessment and Warning System
2. Assessment: not all risks are equally important and not all of them deserve the same attention. Therefore, this process assigns each risk a probability and an impact, commonly using five-scale values (qualitative assessment) such as the ones below:
• Probability: Very Low, Low, Normal, High, Very High • Impact: Negligible, Minor, Major, Severe, Catastrophic • Impact on people:
o None o Few minor injuries o Multiple minor injuries or a major injury o Multiple major injuries or a death o Multiple deaths and major injuries o
3. Response Planning: also called Mitigation Planning, this process aims at developing options and actions to enhance the opportunities to reduce threats (PMI, 2013). For each risk previously identified and evaluated (possibly both qualitatively and quantitatively), an appropriate response is chosen among the following:
• Avoid • Transfer • Mitigate • Accept
4. Monitoring and Control: this process monitors risks according to the response plan(s),
identifies new risks and monitors residual risks. The Project Management Body of Knowledge (PMI, 2013) is an excellent resource to expand the students’ knowledge on the subject as the PMBOK includes a Risk Management knowledge area. However, in this case study we are more interested in the first two steps of the process.
2.4. THE DELPHI METHOD
The project and the activities presented in this case study use the Delphi method for risk identification and assessment.
The Delphi method is a structured communication technique, originally developed as a systematic, interactive forecasting method which relies on a panel of experts (Dalkey,& Helmer, 1963). The process is the following:
1. The experts answer questionnaires in two or more rounds. 2. After each round, a facilitator provides an anonymous summary of the experts’ forecasts
from the previous round as well as the reasons they provided for their judgments.
9
Flood Assessment and Warning System
3. Experts are encouraged to revise their earlier answers in light of the replies of other members of their panel.
The range of the answers is expected to decrease and the group should converge towards the "correct" answer. The process is stopped after a pre-defined stop criterion (e.g. number of rounds, achievement of consensus, stability of results) and the mean or median scores of the final rounds determine the results (Rowe, & Wright, 1999). 3. CLASS ACTIVITY In this class activity, the students should be divided in teams of 3-4 people. After a presentation of the risk management process, the students are given the task of coming up with a set of user stories for an ICT tool to be used in Mozambique to conduct risk assessment using a Delphi-based approach. The following subsections present the four steps in which the activity is structured.
3.1. PRESENTATION OF THE REQUIREMENTS (20 MINUTES) In this phase, the instructor presents the scope of the tool to be developed and discusses it with the students. Below is a possible scope definition that can be adapted to the level of the class.
• Context: we are building an application to meet the Emergency Department needs to assess different types of risks in Mozambique, in particular in rural areas.
• Goal: we want to develop an application to manage a risk register and to collect data from rural and remote areas. A risk register is a list of risks (characterised by different information) and to which an expert assigns priority and impact. The information we want to collect are simple reports by citizens or by volunteers around the country such as “the water level of the Limpopo river is unusually high at Macarretane”.
• Why: o The application will help the Emergency Department simplify the
management of the risk register, possibly enabling forms of online collaboration.
o Having updated data is crucial for being able to assess risks. However, rural areas are often cut off from the more urbanised areas of the country due to a very limited infrastructure. We can use local knowledge (experience and tradition) to get early warnings and aid experts in their risk assessment.
10
Flood Assessment and Warning System
o In the long term, integration with other systems will simplify monitoring and alerting.
We thus want to develop three components for our system:
• Risk Reporting: a component that allows citizens to report potential risks. • Risk Identification: a component that lists the risks reported by citizens and
identified by experts from the available data. • Risk Assessment: a component that allows the experts to classify and prioritise
risks using the Delphi-method described in Section 2.4. Other functions could be added as a bonus (for instance, attaching a risk response plan to a risk, attaching monitoring data to a risk).
3.2. OVERVIEW OF THE CONSTRAINTS AND SUSTAINABILITY ISSUES (30 MINUTES)
Following the scope definition, it is important to discuss with the class the characteristics of the deployment environment. This is especially relevant for the Risk Reporting component as it involves the population in urban, peri-urban and rural areas. Having updated information is important for experts to be able to assess risks. However, the information available is often not up to date and monitoring stations are either not functioning or data is transmitted with so much delay that it becomes useless.
In this activity we are particularly interested in ICTs in Mozambique. Figure 2 shows how only limited broadband is available in the country while mobile telephony is widely available. This presents interesting opportunities to use less sophisticated tools such as SMSes to allow volunteers to communicate from remote areas. A more sophisticated approach could require the system to be designed so that data is stored on a device that can either be sent physically to the experts or that stores data until connectivity is available.
The students should be made aware of the fact that mobile connectivity is currently the main form of communication in Africa. In Mozambique, 56% of the population has access to mobile phones as opposed to only 0.3% of the population with access to a fixed telephone line. Internet is available only to 7.9% of the population2.
2 http://www.budde.com.au/Research/Mozambique-Telecoms-Mobile-and-Broadband-Market-Insights-Statistics-
and-Forecasts.html
11
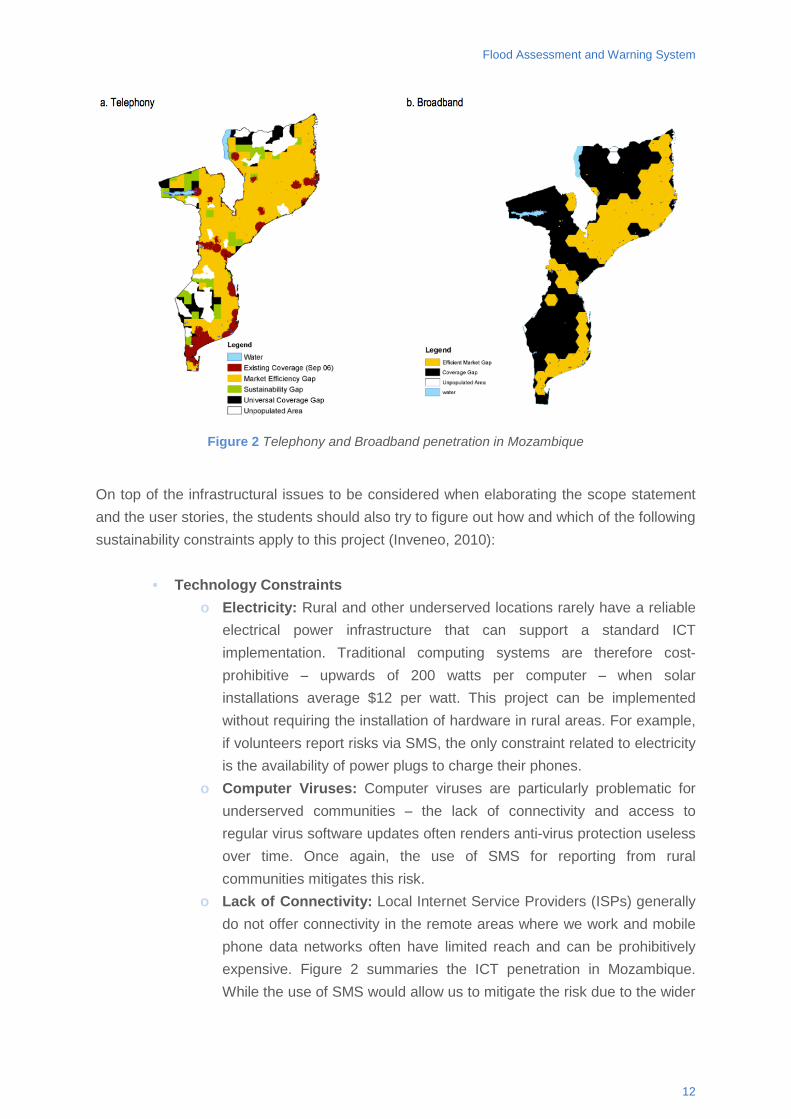
Flood Assessment and Warning System
On top of the infrastructural issues to be considered when elaborating the scope statement and the user stories, the students should also try to figure out how and which of the following sustainability constraints apply to this project (Inveneo, 2010):
• Technology Constraints o Electricity: Rural and other underserved locations rarely have a reliable
electrical power infrastructure that can support a standard ICT implementation. Traditional computing systems are therefore cost-prohibitive – upwards of 200 watts per computer – when solar installations average $12 per watt. This project can be implemented without requiring the installation of hardware in rural areas. For example, if volunteers report risks via SMS, the only constraint related to electricity is the availability of power plugs to charge their phones.
o Computer Viruses: Computer viruses are particularly problematic for underserved communities – the lack of connectivity and access to regular virus software updates often renders anti-virus protection useless over time. Once again, the use of SMS for reporting from rural communities mitigates this risk.
o Lack of Connectivity: Local Internet Service Providers (ISPs) generally do not offer connectivity in the remote areas where we work and mobile phone data networks often have limited reach and can be prohibitively expensive. Figure 2 summaries the ICT penetration in Mozambique. While the use of SMS would allow us to mitigate the risk due to the wider
Figure 2 Telephony and Broadband penetration in Mozambique
12
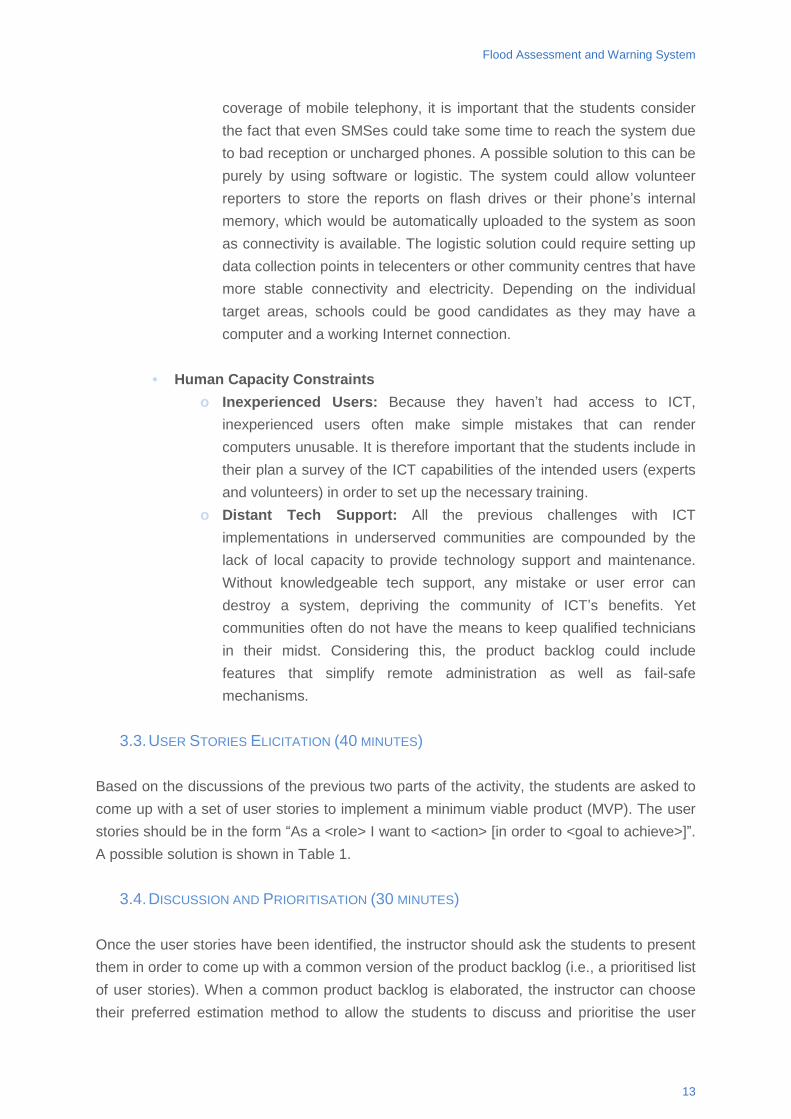
Flood Assessment and Warning System
coverage of mobile telephony, it is important that the students consider the fact that even SMSes could take some time to reach the system due to bad reception or uncharged phones. A possible solution to this can be purely by using software or logistic. The system could allow volunteer reporters to store the reports on flash drives or their phone’s internal memory, which would be automatically uploaded to the system as soon as connectivity is available. The logistic solution could require setting up data collection points in telecenters or other community centres that have more stable connectivity and electricity. Depending on the individual target areas, schools could be good candidates as they may have a computer and a working Internet connection.
• Human Capacity Constraints o Inexperienced Users: Because they haven’t had access to ICT,
inexperienced users often make simple mistakes that can render computers unusable. It is therefore important that the students include in their plan a survey of the ICT capabilities of the intended users (experts and volunteers) in order to set up the necessary training.
o Distant Tech Support: All the previous challenges with ICT implementations in underserved communities are compounded by the lack of local capacity to provide technology support and maintenance. Without knowledgeable tech support, any mistake or user error can destroy a system, depriving the community of ICT’s benefits. Yet communities often do not have the means to keep qualified technicians in their midst. Considering this, the product backlog could include features that simplify remote administration as well as fail-safe mechanisms.
3.3. USER STORIES ELICITATION (40 MINUTES)
Based on the discussions of the previous two parts of the activity, the students are asked to come up with a set of user stories to implement a minimum viable product (MVP). The user stories should be in the form “As a <role> I want to <action> [in order to <goal to achieve>]”. A possible solution is shown in Table 1.
3.4. DISCUSSION AND PRIORITISATION (30 MINUTES) Once the user stories have been identified, the instructor should ask the students to present them in order to come up with a common version of the product backlog (i.e., a prioritised list of user stories). When a common product backlog is elaborated, the instructor can choose their preferred estimation method to allow the students to discuss and prioritise the user
13

Flood Assessment and Warning System
stories. For the estimation, story points can be used as they can provide a relative measure for each story without having to estimate man-hours or monetary costs.
3.5. SOLUTION AND EVALUATION CRITERIA The class activity should be evaluated based on the discussion during the four parts of the activity. Another parameter for evaluation is the level of detail of the motivations for the user stories produced by the students. An example backlog is provided in Table 1.
14
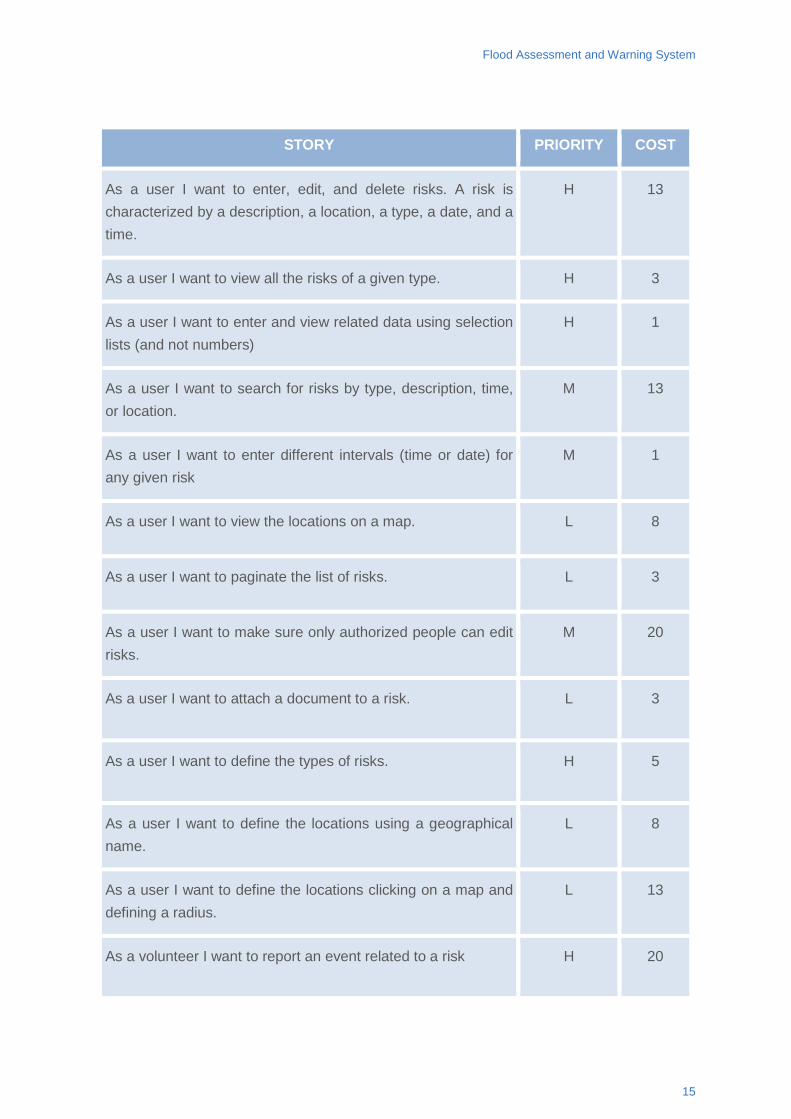
Flood Assessment and Warning System
STORY PRIORITY COST
As a user I want to enter, edit, and delete risks. A risk is characterized by a description, a location, a type, a date, and a time.
H 13
As a user I want to view all the risks of a given type. H 3
As a user I want to enter and view related data using selection lists (and not numbers)
H 1
As a user I want to search for risks by type, description, time, or location.
M 13
As a user I want to enter different intervals (time or date) for any given risk
M 1
As a user I want to view the locations on a map. L 8
As a user I want to paginate the list of risks. L 3
As a user I want to make sure only authorized people can edit risks.
M 20
As a user I want to attach a document to a risk. L 3
As a user I want to define the types of risks. H 5
As a user I want to define the locations using a geographical name.
L 8
As a user I want to define the locations clicking on a map and defining a radius.
L 13
As a volunteer I want to report an event related to a risk H 20
15
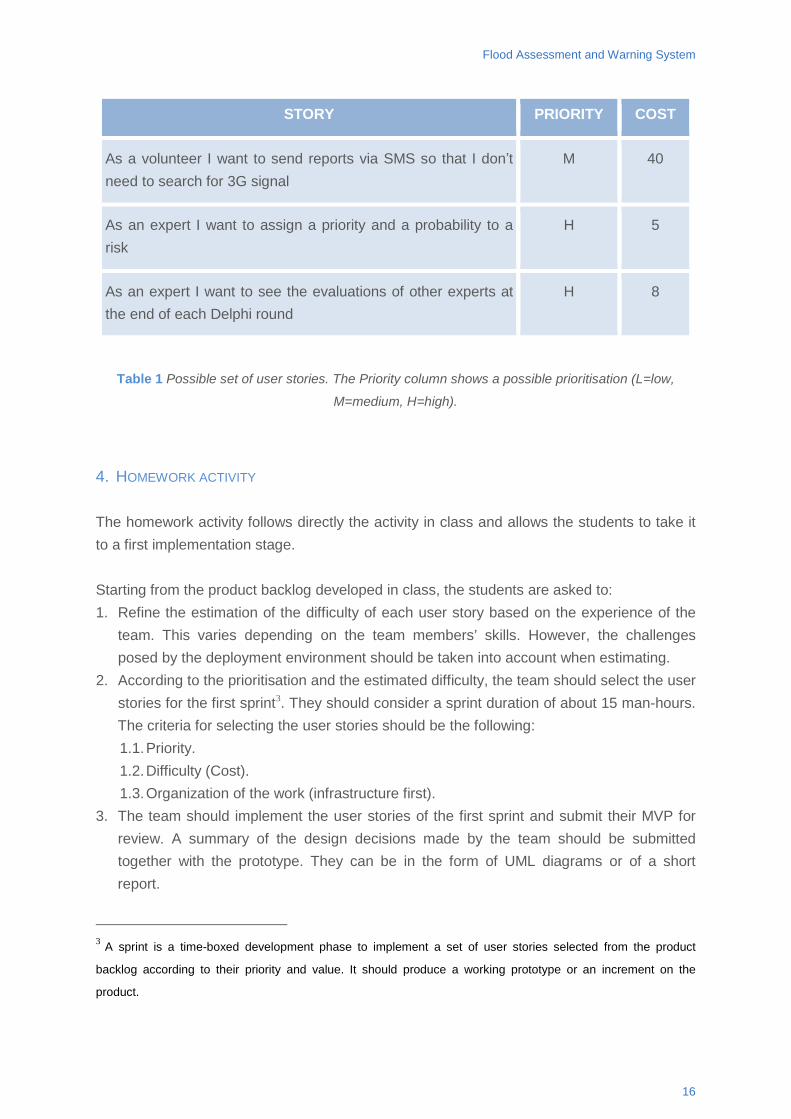
Flood Assessment and Warning System
STORY PRIORITY COST
As a volunteer I want to send reports via SMS so that I don’t need to search for 3G signal
M 40
As an expert I want to assign a priority and a probability to a risk
H 5
As an expert I want to see the evaluations of other experts at the end of each Delphi round
H 8
Table 1 Possible set of user stories. The Priority column shows a possible prioritisation (L=low,
M=medium, H=high).
4. HOMEWORK ACTIVITY The homework activity follows directly the activity in class and allows the students to take it to a first implementation stage. Starting from the product backlog developed in class, the students are asked to: 1. Refine the estimation of the difficulty of each user story based on the experience of the
team. This varies depending on the team members’ skills. However, the challenges posed by the deployment environment should be taken into account when estimating.
2. According to the prioritisation and the estimated difficulty, the team should select the user stories for the first sprint3. They should consider a sprint duration of about 15 man-hours. The criteria for selecting the user stories should be the following: 1.1. Priority. 1.2. Difficulty (Cost). 1.3. Organization of the work (infrastructure first).
3. The team should implement the user stories of the first sprint and submit their MVP for review. A summary of the design decisions made by the team should be submitted together with the prototype. They can be in the form of UML diagrams or of a short report.
3 A sprint is a time-boxed development phase to implement a set of user stories selected from the product
backlog according to their priority and value. It should produce a working prototype or an increment on the
product.
16
Flood Assessment and Warning System
The submission to the instructors should include:
• The specification for the prototype, indicating the design choices made and how they address the infrastructural and cultural characteristics of the deployment environment.
• The backlog for the first sprint and a plan of the following sprint with motivations. • A link to a public repository with the implemented prototype and a link to a
working demo.
4.1. SOLUTION AND EVALUATION CRITERIA There is no given solution for this homework activity. However, a possible working implementation can be found at http://dev.ict4g.org/crato and the code for an example solution implemented in Ruby on Rails is available at https://github.com/ict4g/ssror13_material/tree/master/exercises/rima. Below are some evaluation criteria to use for inspiration that can be used to evaluate the projects from two perspectives:
• Project management perspective o Adherence to the original specification. o Adherence to the user stories identified during the class activity. o Accuracy of the estimations.
• ICT4D perspective o How the design of the solution takes into consideration the infrastructural
challenges and opportunities of developing countries. Some quantitative and qualitative metrics that can be used to evaluate this include:
▪ Resources required by the technology and the implementation of the intended final system.
▪ Technologies supported by the system (e.g. low-end smartphones, feature phones, SMS, etc.)
▪ Solution adopted for storing and sharing information. o Whether or not and how was local knowledge, traditions and languages
taken into account when designing the solution. For example: ▪ If volunteers can send risk reports, do they have to send
quantitative data? What about warning signs that are recognised by village elders and farmers?
▪ Are there any plans to localise the interface of the system? Or has it already been localised?
17
Flood Assessment and Warning System
BIBLIOGRAPHY Batley, R. (2005). Mozambique: the costs of ‘owning’ aid. Public Administration and Development, 25(5), 415-424. Brito, R., Famba, S., Munguambe, P., Ibraimo, N., & Julaia, C. (2009). Profile of the Limpopo basin in Mozambique. Dalkey, N., & Helmer, O. (1963). An experimental application of the Delphi method to the use of experts. Management science, 9(3), 458-467. Domínguez-Torres, C., & Briceño-Garmendia, C. (2011). Mozambique’s Infrastructure: A Continental Perspective. © The World Bank. (available at: https://openknowledge.worldbank.org/bitstream/handle/10986/3653/WPS5885.pdf) Inveneo (2010). ICT Sustainability Primer: What to consider when designing ICT projects for low-resource environments. Project Management Institute (PMI). (2013). A Guide to the Project Management Body of Knowledge (PMBOK® Guide) - Fifth Edition. Rowe, G., & Wright, G. (1999). The Delphi technique as a forecasting tool: issues and analysis. International journal of forecasting, 15(4), 353-375. Wiles, P., Selvester, K., Fidalgo, L. (2005). Disaster Risk Management Series. Working Paper n. 12. © The World Bank. (available at: http://www.incidenciapolitica.info/biblioteca/mozambique.pdf)
18

http://www.gdee.eu
This project is funded by
Mentore Vaccari and Francesco Vitali
PHOTO: Somaliland collectors. Francesco Vitali.
CASE STUDIES
Technical aspects of municipal solid waste collection: case studies fromEast Africa
DL B 10735-2015 ISBN 978-84-606-7546-4
Technical aspects of municipal solid wastecollection: case studies from East Africa
COORDINATED BYAgustí Pérez-Foguet, Enric Velo, Pol Arranz, Ricard Ginéand Boris Lazzarini (Universitat Politècnica de Catalunya)Manuel Sierra (Universidad Politécnica de Madrid)Alejandra Boni and Jordi Peris (Universitat Politècnica de València)Guido Zolezzi and Gabriella Trombino (Università degli Studi di Trento)Rhoda Trimingham (Loughborough University)Valentín Villarroel (ONGAWA)Neil Nobles and Meadhbh Bolger (Practical Action)Francesco Mongera (Training Center for International Cooperation)Katie Cresswell-Maynard (Engineering Without Border UK)
EDITED BY Global Dimension in Engineering Education
Citation: Vaccari, M. and Vitali, F. (2015) ' Technical aspects of municipal solid waste collection: case studies from East Africa', in Case studies for developingglobally responsible engineers, GDEE (eds.), Global Dimension in Engineering Education, Barcelona. Available from: http://gdee.eu/index.php/resources.html
This publication is distributedunder an Attribution- Noncommercial-Share Alike License for Creative Commons
CASE STUDIES
Disclaimer: This document has been produced with the financial assistance of the European UnionThe contents of this document are the sole responsibility of the authors and can under no circumstances be regarded as reflecting the position of the European Union
Technical aspects of municipal solid waste management: case studies from East Africa
TECHNICAL ASPECTS OF MUNICIPAL SOLID WASTE COLLECTION: CASE STUDIES FROM EAST AFRICA Mentore Vaccari, assistant professor, CeTAmb LAB - Research Laboratory on Appropriate Technologies for Environmental Management in resource-limited Countries, DICATAM, University of Brescia.Francesco Vitali, research fellowship, CeTAmb LAB - Research Laboratory on Appropriate Technologies for Environmental Management in resource-limited Countries, DICATAM, University of Brescia.
1
Technical aspects of municipal solid waste management: case studies from East Africa
INDEX
1. INTRODUCTION ........................................................................................................................... 3
1.1. DISCIPLINES COVERED ............................................................................................................. 3
1.2. LEARNING OUTCOMES .............................................................................................................. 3
1.3. ACTIVITIES .............................................................................................................................. 4
2. DEFINING THE CHARACTERISTICS OF SOLID WASTE ......................................................... 4
2.1. SOME DEFINITIONS .................................................................................................................. 4
2.2. PRINCIPLES ............................................................................................................................. 5
2.3. RISKS LINKED TO BAD MANAGEMENT OF WASTE ........................................................................ 5
2.4. STAGES IN THE SOLID WASTE MANAGEMENT SYSTEM ................................................................. 6
2.5. TYPICAL SOURCES OF WASTE ................................................................................................... 8
2.6. HOW TO EVALUATE WASTE PRODUCTION ................................................................................... 9
2.7. HOW TO EVALUATE THE WASTE DENSITY ................................................................................... 9
2.8. HOW TO EVALUATE THE COMPOSITION OF THE WASTE.............................................................. 11
3. SIZING DIFFERENT ALTERNATIVES FOR SOLID WASTE COLLECTION ........................... 14
3.1. ALTERNATIVE 1 ..................................................................................................................... 14
3.2. ALTERNATIVE 2 ..................................................................................................................... 21
4. HOMEWORK ACTIVITY ............................................................................................................. 34
4.1. EVALUATION CRITERIA ............................................................................................................ 34
BIBLIOGRAPHY ................................................................................................................................. 35
2
Technical aspects of municipal solid waste management: case studies from East Africa
1. INTRODUCTION
The present case study aims at presenting alternatives to improve the solid waste collection services in resource limited Countries. The contents of the case study were elaborated within the following projects in East Africa, implemented by the Italian NGO CESVI with the technical support of CeTAmb LAB - Research Laboratory on Appropriate Technologies for Environmental Management in resource-limited Countries of the University of Brescia:
• “Somalia Urban Development Programme (SUDP)” (2005-2008); • “Support to Improved Service Delivery in Somali Cities (SISDISC)” (2009-2010); • “Environmental protection and sustainable development: building local capacities on
solid waste management in South Sudan” (2010-2012).
The approach and activities carried out by Cesvi and CeTAmb LAB - University of Brescia were aimed at priority basic services in the Solid Waste Management sector (Collivignarelli et al., 2011a, Collivignarelli et al., 2011b, Di Bella and Vaccari, 2014). In particular, the activities of CeTAmb LAB dealt with the technical aspects relating to appropriate technologies to be adopted in the collection, treatment, recycling and disposal of municipal solid waste.
1.1. DISCIPLINES COVERED
The main discipline covered in this case study is environmental engineering. The aim is to evaluate different waste management systems according to quantitative analysis and calculations but also on the basis of socio-cultural aspects. The trained students have to develop a problem-solving approach that takes into account not only the technical side but that leads to the choice of a solution which sounds appropriate for the local context and its peculiarities and constraints.
1.2. LEARNING OUTCOMES
The teaching material will present how to assess different solid waste management systems on the basis of data collected in the field or through experimental measuring activities. As a result of this case study, students are expected to be able to:
• Evaluate production and composition analysis as a basis to choose the most appropriate system;
• Assess different solid waste (primary and secondary) collection systems in terms of vehicles and staff.
3
Technical aspects of municipal solid waste management: case studies from East Africa
1.3. ACTIVITIES
The design of a municipal solid waste collection system is a complex task that needs a deep knowledge of the local context not only under a technical point of view but also under a social and cultural perspective. Local daily practice, habits, preferences and eventual taboos related to solid waste handling needs to be taken into account as well as institutional and geographical constraints and local regulation sectorial guidelines.
In the first activity (in classroom) the trainer will give the technical background, introducing the basics on solid waste (definitions, effects of inadequate management, main characteristics) and present the different solutions for collection with the numerical solution for one of them (2 hours). This activity may come with a field assessment with practical data collection for waste characterization (for example waste weighting in the school or waste density or composition assessment) (4 hours in groups).
Finally, students will be divided in groups (2-4 students per group) and a data set will be assigned to each group: in this activity (to be carried out at home) each group will study and propose an appropriate solution for the solid waste collection according to data and information given. A final report will be produced by each group for evaluation.
2. DEFINING THE CHARACTERISTICS OF SOLID WASTE
According to the WHO definition “Sanitation generally refers to the provision of facilities and services for the safe disposal of human urine and faeces. Inadequate sanitation is a major cause of disease world-wide and improving sanitation is known to have a significant beneficial impact on health both in households and across communities. The word 'sanitation' also refers to the maintenance of hygienic conditions, through services such as garbage collection and wastewater disposal. (WHO)”
2.1. SOME DEFINITIONS
Waste: an item that has become worthless to the initial user, and needs to be thrown away
Solid waste: all those wastes which are neither wastewater discharges nor atmospheric emissions. It can also be defined as any waste which is not liquid according to the extent of its flow and which needs to be removed from the surroundings.
Municipal solid waste: refuse from households, non-hazardous solid waste from industrial, commercial and institutional establishments (including hospitals; e.g., remains of food, office paper, etc.), market waste, yard waste and street sweepings
Municipal solid waste management: collection, transfer, treatment, recycling, resource recovery and disposal of solid waste
Integrated solid waste management: selection and application of sustainable technologies, and management system to achieve specific waste management objectives
4
Technical aspects of municipal solid waste management: case studies from East Africa
and goals. It is based on the concept that all aspects of a waste management system (technical and non-technical) should be analysed together, since they are in fact interrelated and developments in one area frequently affect practices or activities in another area.
2.2. PRINCIPLES
The principles of sustainable solid waste management are the following:
• minimization of waste generation and hazardousness; • maximization of waste reuse and recycling; • safe and environmentally correct collection and disposal of waste.
However, ensuring public health and safety is the prime reason for the existence of municipal solid waste management. In particular, the specific goals of solid waste management are:
• to protect environmental health; • to promote the quality of urban surroundings; • to support the efficiency and productivity of the economy; • to generate employment and income.
At the moment, in most African countries solid waste management is insufficient due to several reasons, such as inadequate means (skips, trucks) to collect and transport the waste, inappropriate landfills, lack of adequately trained personnel, or environmental education, absence of clear environmental policies, or authorities’ control.
2.3. RISKS LINKED TO BAD MANAGEMENT OF WASTE
Poor solid waste management can pose serious risks to the health and safety of both the local population and the people who work with the waste. These risks, which are illustrated in Figure 2.1, include (WEDC, 2010):
• injuries and infection from direct contact with solid waste; • the spread of disease by vectors: heaps of discarded waste provide a breeding
ground for flies and rats; • the spread of disease by other animals: foraging animals are likely to eat waste
which may contain infectious diseases that are passed on when the meat is eaten; • contaminated air: burning waste generates a large amount of smoke which can
cause respiratory problems; • accidents and injuries: traffic accidents and lifting injuries are frequent during the
phases of collection and recycling; • groundwater contamination: groundwater can become contaminated by polluted
water from unsatisfactory disposal sites; • fire and explosion: waste decomposition produces methane, which can support long-
lasting fires and reach potentially explosive levels.
5
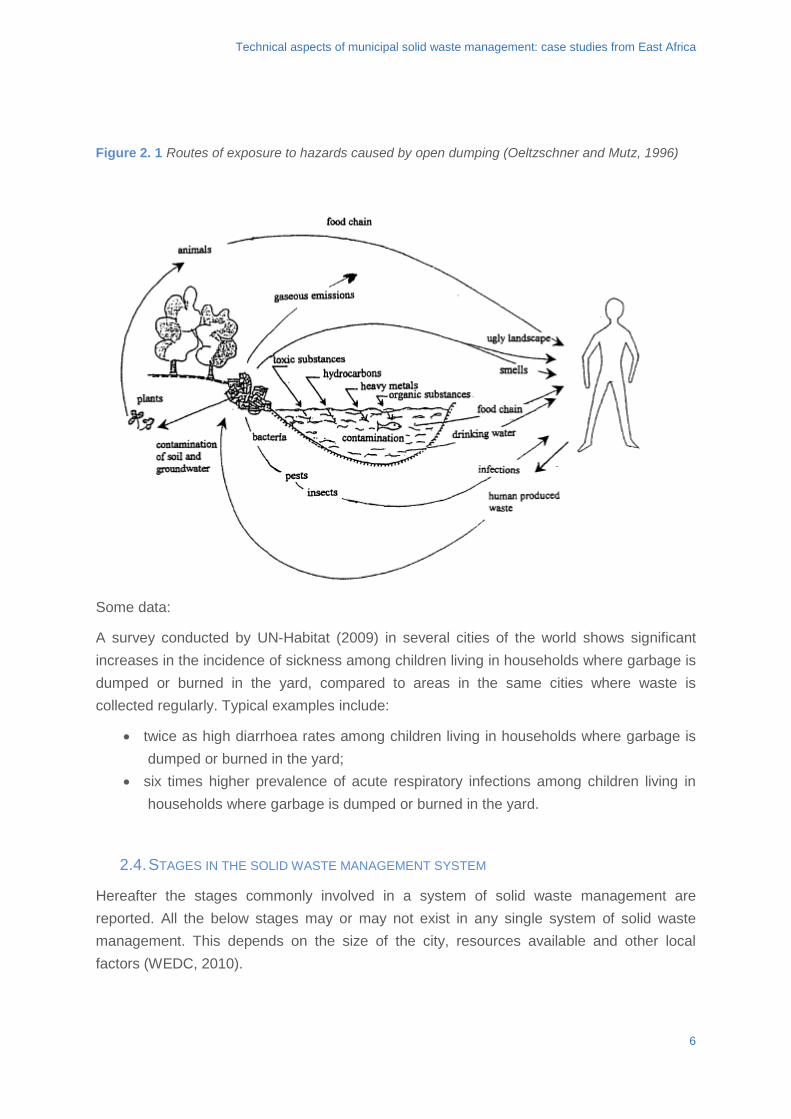
Technical aspects of municipal solid waste management: case studies from East Africa
Figure 2. 1 Routes of exposure to hazards caused by open dumping (Oeltzschner and Mutz, 1996)
Some data:
A survey conducted by UN-Habitat (2009) in several cities of the world shows significant increases in the incidence of sickness among children living in households where garbage is dumped or burned in the yard, compared to areas in the same cities where waste is collected regularly. Typical examples include:
• twice as high diarrhoea rates among children living in households where garbage is dumped or burned in the yard;
• six times higher prevalence of acute respiratory infections among children living in households where garbage is dumped or burned in the yard.
2.4. STAGES IN THE SOLID WASTE MANAGEMENT SYSTEM
Hereafter the stages commonly involved in a system of solid waste management are reported. All the below stages may or may not exist in any single system of solid waste management. This depends on the size of the city, resources available and other local factors (WEDC, 2010).
6
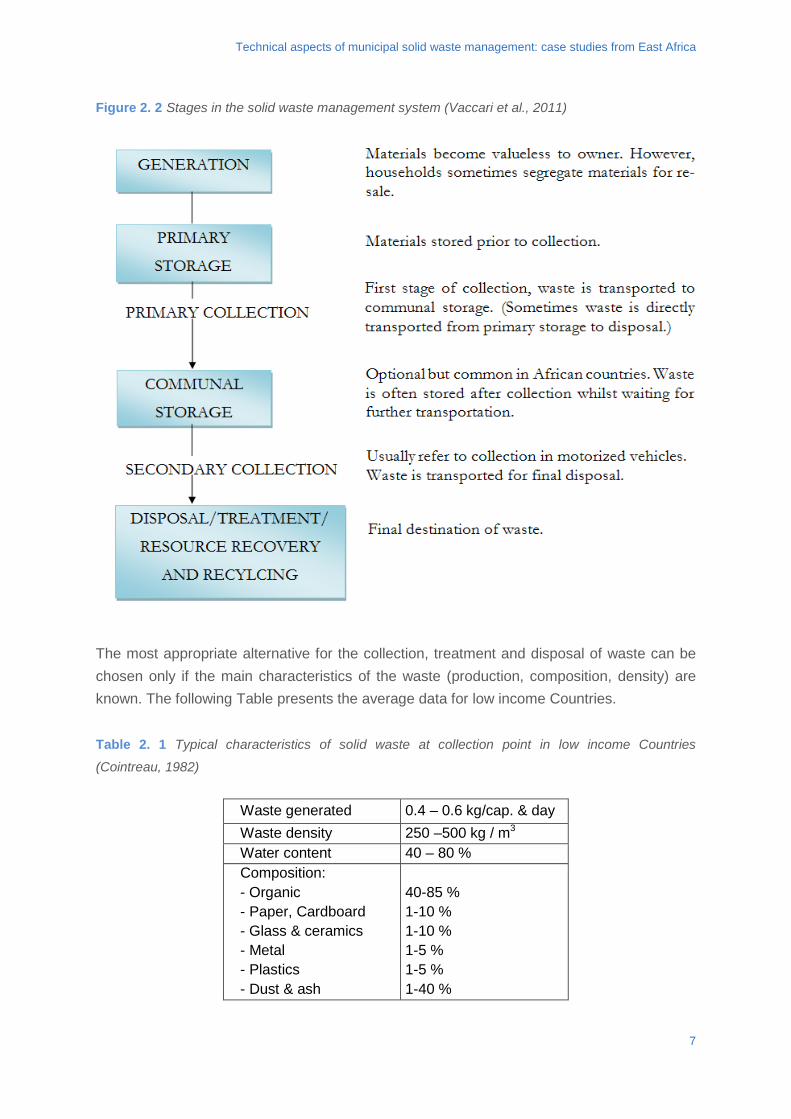
Technical aspects of municipal solid waste management: case studies from East Africa
Figure 2. 2 Stages in the solid waste management system (Vaccari et al., 2011)
The most appropriate alternative for the collection, treatment and disposal of waste can be chosen only if the main characteristics of the waste (production, composition, density) are known. The following Table presents the average data for low income Countries. Table 2. 1 Typical characteristics of solid waste at collection point in low income Countries
(Cointreau, 1982)
Waste generated 0.4 – 0.6 kg/cap. & day Waste density 250 –500 kg / m3
Water content 40 – 80 % Composition: - Organic - Paper, Cardboard - Glass & ceramics - Metal - Plastics - Dust & ash
40-85 % 1-10 % 1-10 % 1-5 % 1-5 % 1-40 %
7
Technical aspects of municipal solid waste management: case studies from East Africa
The above data are just a generic reference, but it is necessary to define the specific characteristics of the waste that has to be managed.
The following paragraphs illustrates synthetically which are the typical sources of waste in urban areas and how the main characteristics of MSW can be evaluated
2.5. TYPICAL SOURCES OF WASTE
HOUSEHOLD GARBAGE
This category comprises wastes that are the consequence of household activities. They proceed from food preparation, sweeping, cleaning, gardening wastes, old clothing, old furnishings, packaging and reading matter, faecal material (where bucket latrines are used).
Usually, the production of residential refuse varies from 0.3 to 0.6 kg/inh.*per day
Street sweepings
This category of waste always includes dirt and litter. However it may also contain appreciable amounts of household refuse, drain cleanings, human faecal matter and animal manure.
Usually, the production of street sweepings varies from 0.05 to 0.2 kg/inh.*per day
CONSTRUCTION AND DEMOLITION DEBRIS
Construction and demolition (C&D) debris consists of the materials generated during the construction, renovation, and demolition of buildings, roads, and bridges. C&D debris often contains bulky, heavy materials that include: concrete, wood, asphalt, gypsum, metals, bricks, glass, plastics, salvaged building components (doors, windows, etc.), trees, earth, rock, etc. from clearing sites.
The production and composition of this type of waste is site-specific.
SANITATION RESIDUES
Where sewerage is not the major means of managing human excreta and sludge, there are sanitation residues from latrines.
INDUSTRIAL WASTES
Industrial wastes come from processing and non-processing industries, as well as utilities: packaging materials, food wastes, spoiled metal, plastic and textiles, fuel burning residuals, and spent processing chemicals are among the wastes within this category.
The production and composition is site-specific, and depends on either the industrial processes, or natural resources or markets.
8
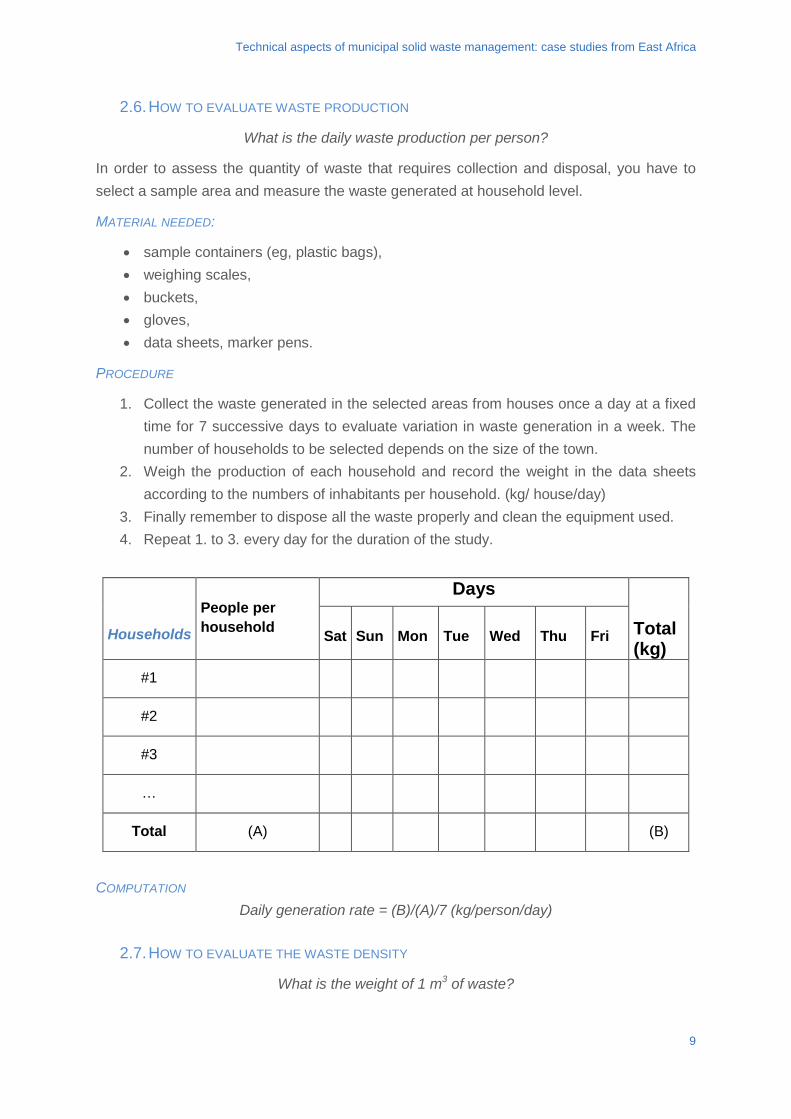
Technical aspects of municipal solid waste management: case studies from East Africa
2.6. HOW TO EVALUATE WASTE PRODUCTION
What is the daily waste production per person?
In order to assess the quantity of waste that requires collection and disposal, you have to select a sample area and measure the waste generated at household level.
MATERIAL NEEDED:
• sample containers (eg, plastic bags), • weighing scales, • buckets, • gloves, • data sheets, marker pens.
PROCEDURE
1. Collect the waste generated in the selected areas from houses once a day at a fixed time for 7 successive days to evaluate variation in waste generation in a week. The number of households to be selected depends on the size of the town.
2. Weigh the production of each household and record the weight in the data sheets according to the numbers of inhabitants per household. (kg/ house/day)
3. Finally remember to dispose all the waste properly and clean the equipment used. 4. Repeat 1. to 3. every day for the duration of the study.
Households
People per household
Days
Total (kg)
Sat
Sun
Mon
Tue
Wed
Thu
Fri
#1
#2
#3
…
Total (A) (B)
COMPUTATION
Daily generation rate = (B)/(A)/7 (kg/person/day)
2.7. HOW TO EVALUATE THE WASTE DENSITY
What is the weight of 1 m3 of waste?
9
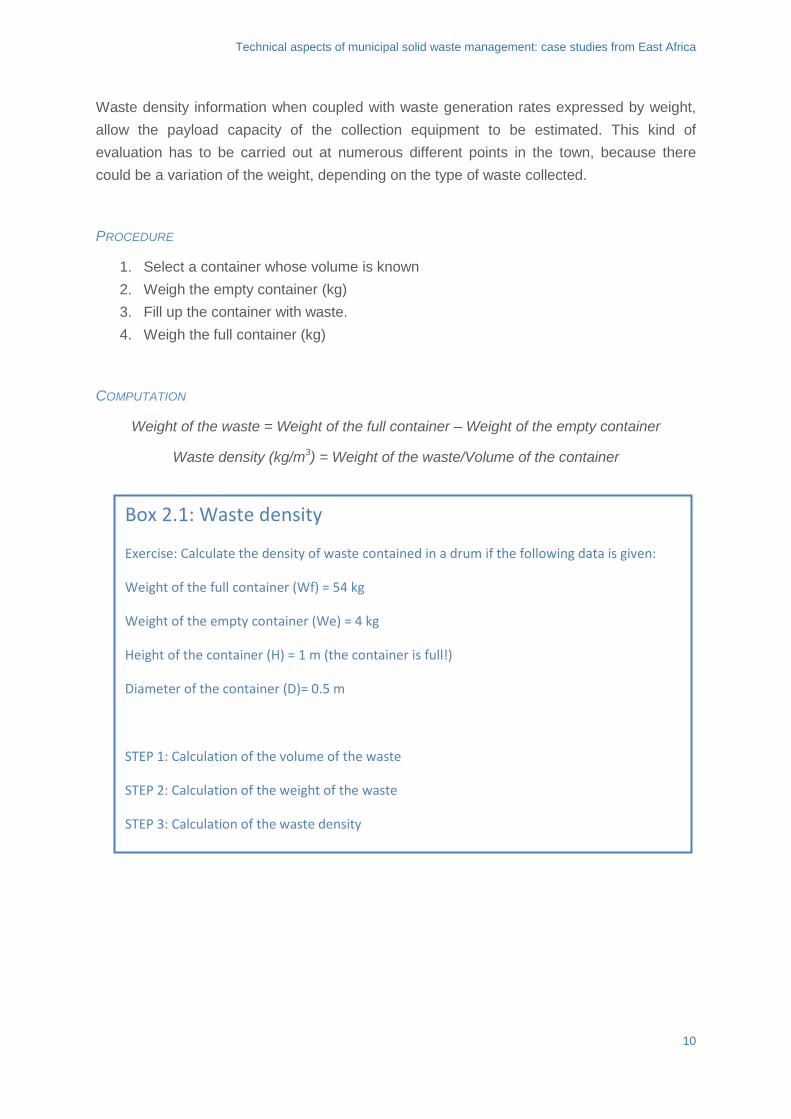
Technical aspects of municipal solid waste management: case studies from East Africa
Waste density information when coupled with waste generation rates expressed by weight, allow the payload capacity of the collection equipment to be estimated. This kind of evaluation has to be carried out at numerous different points in the town, because there could be a variation of the weight, depending on the type of waste collected.
PROCEDURE
1. Select a container whose volume is known 2. Weigh the empty container (kg) 3. Fill up the container with waste. 4. Weigh the full container (kg)
COMPUTATION
Weight of the waste = Weight of the full container – Weight of the empty container
Waste density (kg/m3) = Weight of the waste/Volume of the container
Box 2.1: Waste density
Exercise: Calculate the density of waste contained in a drum if the following data is given:
Weight of the full container (Wf) = 54 kg
Weight of the empty container (We) = 4 kg
Height of the container (H) = 1 m (the container is full!)
Diameter of the container (D)= 0.5 m
STEP 1: Calculation of the volume of the waste
STEP 2: Calculation of the weight of the waste
STEP 3: Calculation of the waste density
10
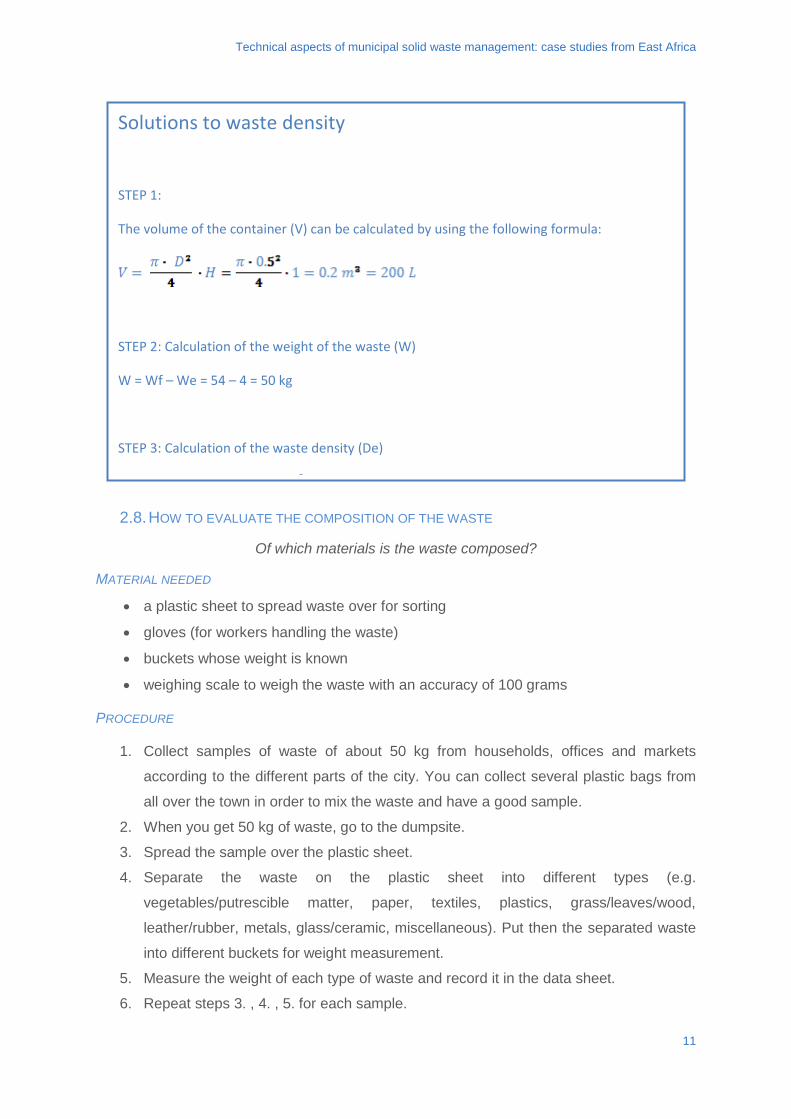
Technical aspects of municipal solid waste management: case studies from East Africa
2.8. HOW TO EVALUATE THE COMPOSITION OF THE WASTE
Of which materials is the waste composed?
MATERIAL NEEDED
• a plastic sheet to spread waste over for sorting
• gloves (for workers handling the waste)
• buckets whose weight is known
• weighing scale to weigh the waste with an accuracy of 100 grams
PROCEDURE
1. Collect samples of waste of about 50 kg from households, offices and markets
according to the different parts of the city. You can collect several plastic bags from
all over the town in order to mix the waste and have a good sample.
2. When you get 50 kg of waste, go to the dumpsite.
3. Spread the sample over the plastic sheet.
4. Separate the waste on the plastic sheet into different types (e.g.
vegetables/putrescible matter, paper, textiles, plastics, grass/leaves/wood,
leather/rubber, metals, glass/ceramic, miscellaneous). Put then the separated waste
into different buckets for weight measurement.
5. Measure the weight of each type of waste and record it in the data sheet.
6. Repeat steps 3. , 4. , 5. for each sample.
Solutions to waste density
STEP 1:
The volume of the container (V) can be calculated by using the following formula:
STEP 2: Calculation of the weight of the waste (W)
W = Wf – We = 54 – 4 = 50 kg
STEP 3: Calculation of the waste density (De)
3
11
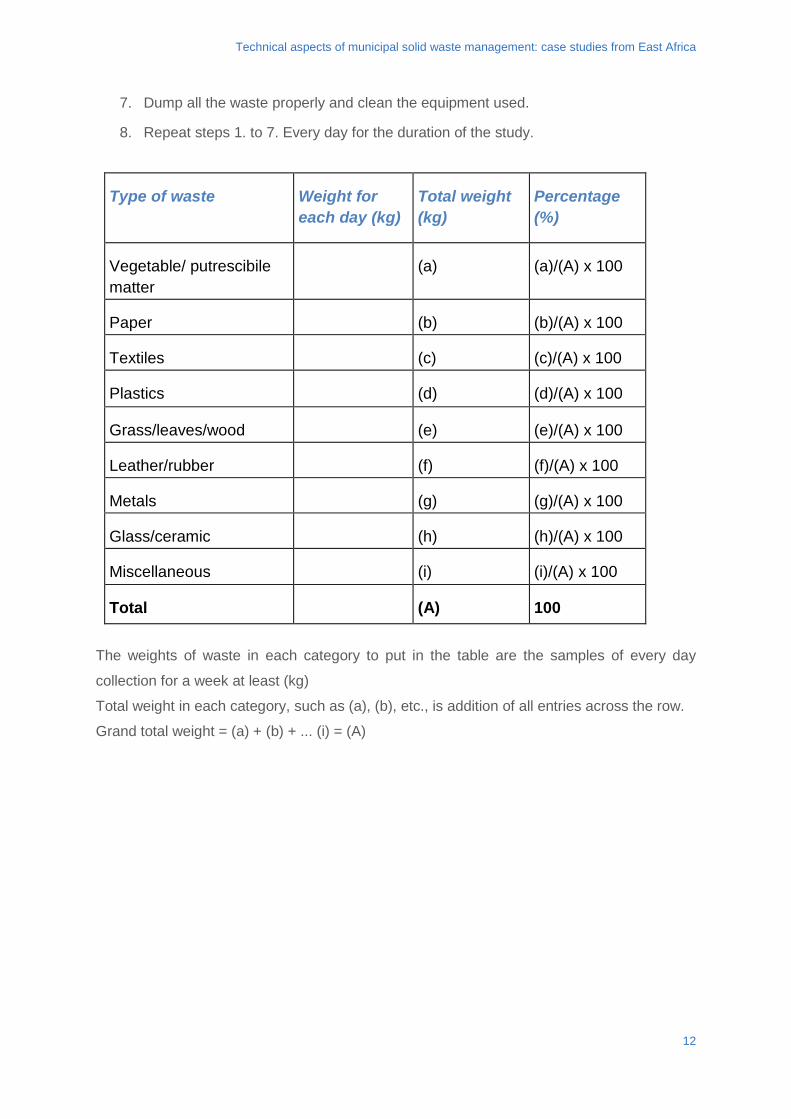
Technical aspects of municipal solid waste management: case studies from East Africa
7. Dump all the waste properly and clean the equipment used.
8. Repeat steps 1. to 7. Every day for the duration of the study.
Type of waste
Weight for each day (kg)
Total weight (kg)
Percentage (%)
Vegetable/ putrescibile matter
(a) (a)/(A) x 100
Paper (b) (b)/(A) x 100
Textiles (c) (c)/(A) x 100
Plastics (d) (d)/(A) x 100
Grass/leaves/wood (e) (e)/(A) x 100
Leather/rubber (f) (f)/(A) x 100
Metals (g) (g)/(A) x 100
Glass/ceramic (h) (h)/(A) x 100
Miscellaneous (i) (i)/(A) x 100
Total (A) 100
The weights of waste in each category to put in the table are the samples of every day
collection for a week at least (kg)
Total weight in each category, such as (a), (b), etc., is addition of all entries across the row.
Grand total weight = (a) + (b) + ... (i) = (A)
12
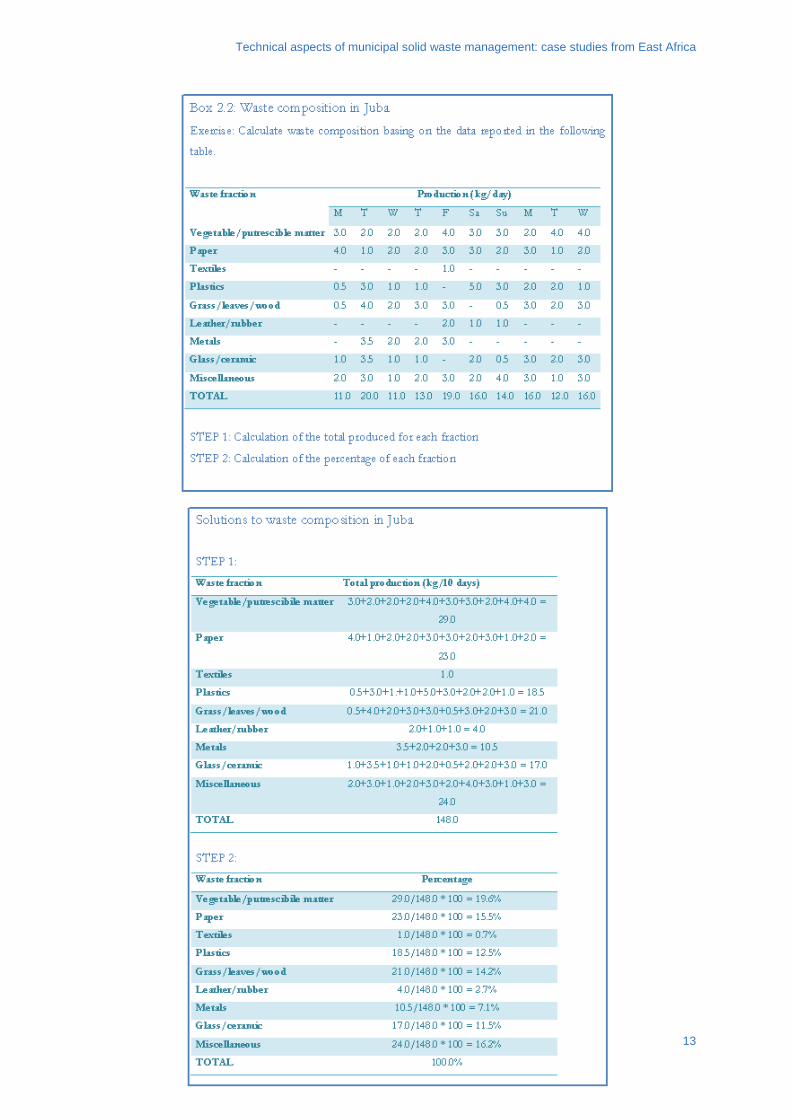
Technical aspects of municipal solid waste management: case studies from East Africa
13
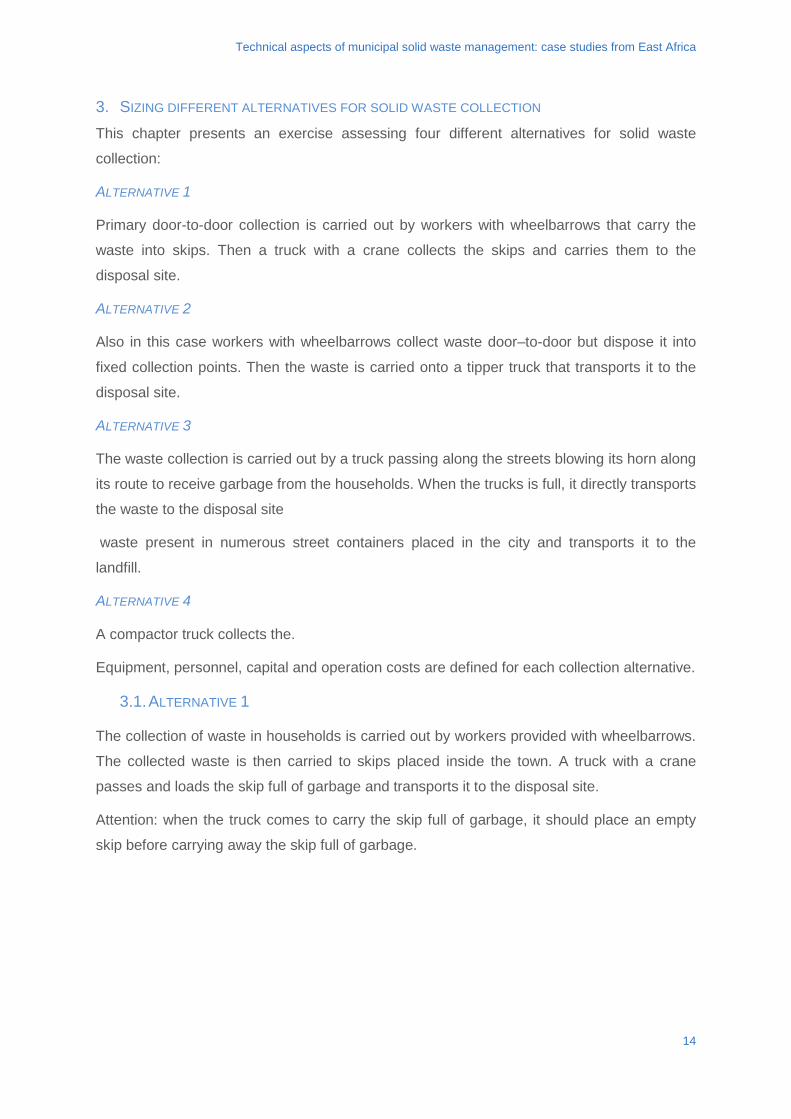
Technical aspects of municipal solid waste management: case studies from East Africa
3. SIZING DIFFERENT ALTERNATIVES FOR SOLID WASTE COLLECTION This chapter presents an exercise assessing four different alternatives for solid waste
collection:
ALTERNATIVE 1
Primary door-to-door collection is carried out by workers with wheelbarrows that carry the
waste into skips. Then a truck with a crane collects the skips and carries them to the
disposal site.
ALTERNATIVE 2
Also in this case workers with wheelbarrows collect waste door–to-door but dispose it into
fixed collection points. Then the waste is carried onto a tipper truck that transports it to the
disposal site.
ALTERNATIVE 3
The waste collection is carried out by a truck passing along the streets blowing its horn along
its route to receive garbage from the households. When the trucks is full, it directly transports
the waste to the disposal site
waste present in numerous street containers placed in the city and transports it to the
landfill.
ALTERNATIVE 4
A compactor truck collects the.
Equipment, personnel, capital and operation costs are defined for each collection alternative.
3.1. ALTERNATIVE 1
The collection of waste in households is carried out by workers provided with wheelbarrows.
The collected waste is then carried to skips placed inside the town. A truck with a crane
passes and loads the skip full of garbage and transports it to the disposal site.
Attention: when the truck comes to carry the skip full of garbage, it should place an empty
skip before carrying away the skip full of garbage.
14
Technical aspects of municipal solid waste management: case studies from East Africa
A wheelbarrow A truck carrying a skip
Figure 3.1 Collection means for alternative 1
The first step is to quantify how many skips one truck can transport to the landfill in one day.
This quantification needs some data:
• Time to go from the town to the landfill and to come back
• Time to place an empty skip and to load the full skip on the truck
• Time to discharge the full skip in the landfill
In this exercise, we suppose that:
- Time to go to the landfill and to come back = 100 min1
- Time to place an empty skip and to load the full skip on the truck = 10 min
- Time to discharge the skip in the landfill = 10 min
Then the time necessary for the truck to place an empty skip, to load one full skip, go to the
landfill, discharge the skip and come back to the town is:
Time for one skip = 100 + 10 + 10 = 120 min = 2 hours
Another important datum is:
• the work shift of the truck (i.e. how many hours does the truck work per day?)
In this exercise we suppose that the work shift of the truck is equal to 12 hours per day.
1 If this time is not known, you have to suppose: 1. the distance d between the city and the landfill 2. the velocity v of the truck
If we assume that the distance is 10 km and the velocity is 12 km/h, the time necessary to go to the landfill is:
hhkm
kmvdT 83.0
/1210
=== , that means: min50min/6083.0 =×= hhT
Since the truck has to go and to come back from the landfill, it needs 50 min x 2 times = 100 minutes
15
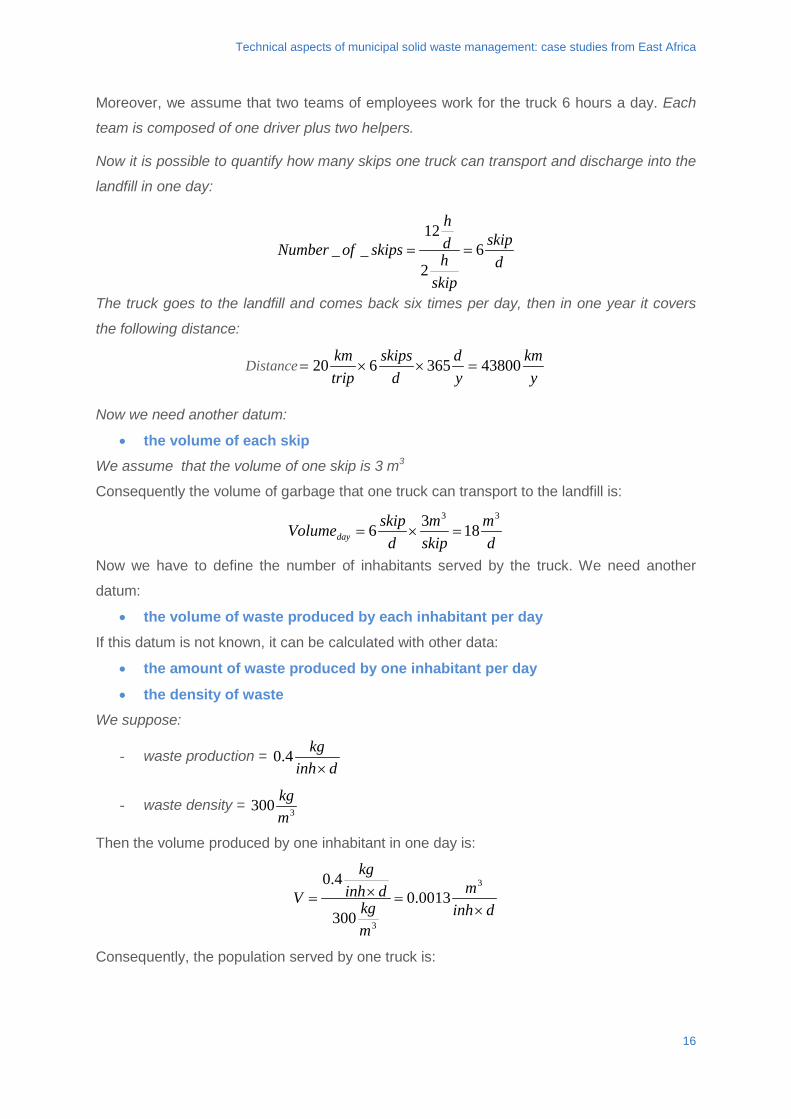
Technical aspects of municipal solid waste management: case studies from East Africa
Moreover, we assume that two teams of employees work for the truck 6 hours a day. Each
team is composed of one driver plus two helpers.
Now it is possible to quantify how many skips one truck can transport and discharge into the
landfill in one day:
dskip
skiphdh
skipsofNumber 62
12__ ==
The truck goes to the landfill and comes back six times per day, then in one year it covers
the following distance:
Distancey
kmyd
dskips
tripkm 43800365620 =××=
Now we need another datum:
• the volume of each skip We assume that the volume of one skip is 3 m3
Consequently the volume of garbage that one truck can transport to the landfill is:
dm
skipm
dskipVolumeday
33
1836 =×=
Now we have to define the number of inhabitants served by the truck. We need another
datum:
• the volume of waste produced by each inhabitant per day If this datum is not known, it can be calculated with other data:
• the amount of waste produced by one inhabitant per day
• the density of waste We suppose:
- waste production = dinh
kg×
4.0
- waste density = 3300mkg
Then the volume produced by one inhabitant in one day is:
dinhm
mkg
dinhkg
V×
=×=3
3
0013.0300
4.0
Consequently, the population served by one truck is:
16
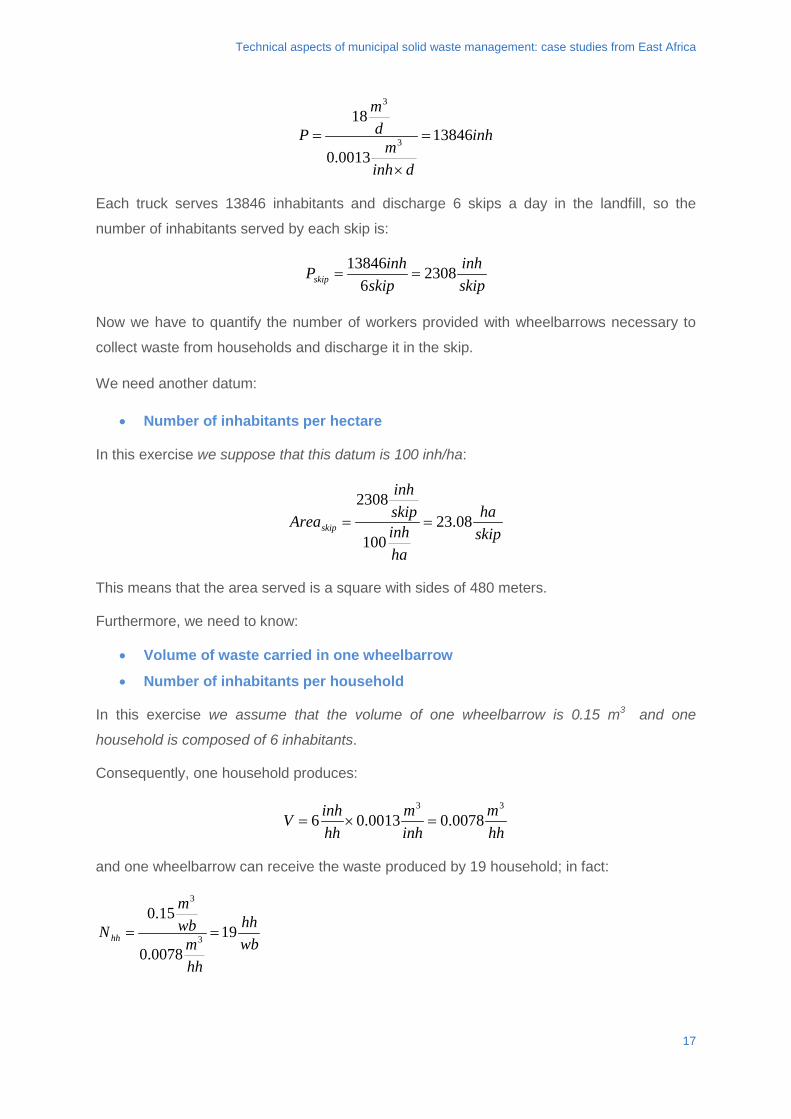
Technical aspects of municipal solid waste management: case studies from East Africa
inh
dinhm
dm
P 138460013.0
183
3
=
×
=
Each truck serves 13846 inhabitants and discharge 6 skips a day in the landfill, so the
number of inhabitants served by each skip is:
skipinh
skipinhPskip 2308
613846
==
Now we have to quantify the number of workers provided with wheelbarrows necessary to
collect waste from households and discharge it in the skip.
We need another datum:
• Number of inhabitants per hectare
In this exercise we suppose that this datum is 100 inh/ha:
skipha
hainhskipinh
Areaskip 08.23100
2308==
This means that the area served is a square with sides of 480 meters.
Furthermore, we need to know:
• Volume of waste carried in one wheelbarrow
• Number of inhabitants per household
In this exercise we assume that the volume of one wheelbarrow is 0.15 m3 and one
household is composed of 6 inhabitants.
Consequently, one household produces:
hhm
inhm
hhinhV
33
0078.00013.06 =×=
and one wheelbarrow can receive the waste produced by 19 household; in fact:
wbhh
hhm
wbm
Nhh 190078.0
15.03
3
==
17
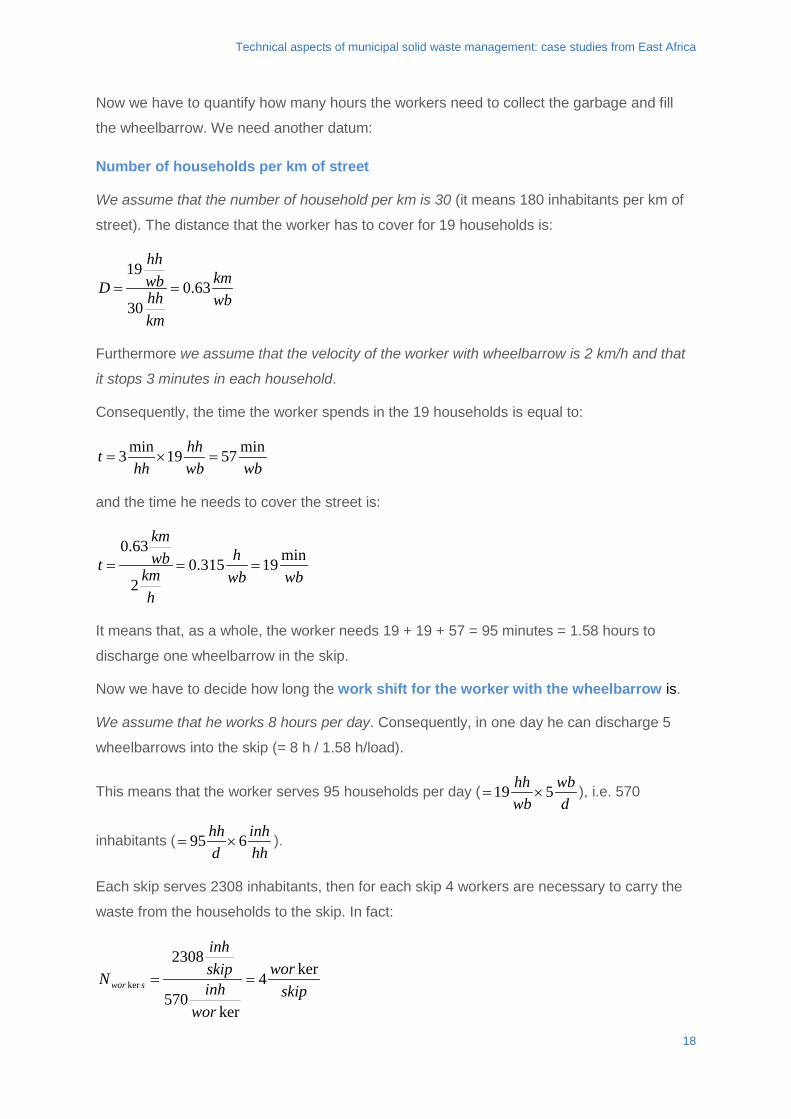
Technical aspects of municipal solid waste management: case studies from East Africa
Now we have to quantify how many hours the workers need to collect the garbage and fill
the wheelbarrow. We need another datum:
Number of households per km of street
We assume that the number of household per km is 30 (it means 180 inhabitants per km of
street). The distance that the worker has to cover for 19 households is:
wbkm
kmhhwbhh
D 63.030
19==
Furthermore we assume that the velocity of the worker with wheelbarrow is 2 km/h and that
it stops 3 minutes in each household.
Consequently, the time the worker spends in the 19 households is equal to:
wbwbhh
hht min5719min3 =×=
and the time he needs to cover the street is:
wbwbh
hkm
wbkm
t min19315.02
63.0===
It means that, as a whole, the worker needs 19 + 19 + 57 = 95 minutes = 1.58 hours to
discharge one wheelbarrow in the skip.
Now we have to decide how long the work shift for the worker with the wheelbarrow is.
We assume that he works 8 hours per day. Consequently, in one day he can discharge 5
wheelbarrows into the skip (= 8 h / 1.58 h/load).
This means that the worker serves 95 households per day (d
wbwbhh 519 ×= ), i.e. 570
inhabitants (hhinh
dhh 695 ×= ).
Each skip serves 2308 inhabitants, then for each skip 4 workers are necessary to carry the
waste from the households to the skip. In fact:
skipwor
worinhskipinh
N sworker4
ker570
2308ker ==
18
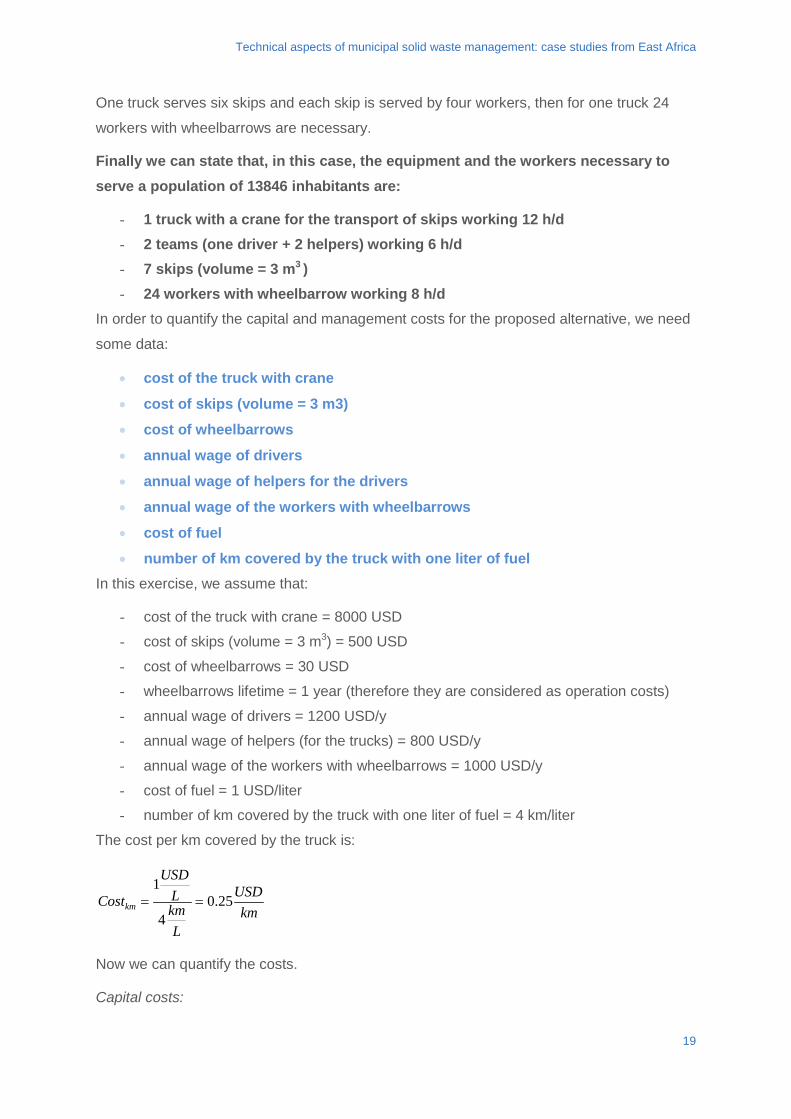
Technical aspects of municipal solid waste management: case studies from East Africa
One truck serves six skips and each skip is served by four workers, then for one truck 24
workers with wheelbarrows are necessary.
Finally we can state that, in this case, the equipment and the workers necessary to serve a population of 13846 inhabitants are:
- 1 truck with a crane for the transport of skips working 12 h/d - 2 teams (one driver + 2 helpers) working 6 h/d - 7 skips (volume = 3 m3 ) - 24 workers with wheelbarrow working 8 h/d
In order to quantify the capital and management costs for the proposed alternative, we need
some data:
• cost of the truck with crane
• cost of skips (volume = 3 m3)
• cost of wheelbarrows
• annual wage of drivers
• annual wage of helpers for the drivers
• annual wage of the workers with wheelbarrows
• cost of fuel
• number of km covered by the truck with one liter of fuel In this exercise, we assume that:
- cost of the truck with crane = 8000 USD
- cost of skips (volume = 3 m3) = 500 USD
- cost of wheelbarrows = 30 USD
- wheelbarrows lifetime = 1 year (therefore they are considered as operation costs)
- annual wage of drivers = 1200 USD/y
- annual wage of helpers (for the trucks) = 800 USD/y
- annual wage of the workers with wheelbarrows = 1000 USD/y
- cost of fuel = 1 USD/liter
- number of km covered by the truck with one liter of fuel = 4 km/liter
The cost per km covered by the truck is:
kmUSD
LkmL
USD
Costkm 25.04
1==
Now we can quantify the costs.
Capital costs:
19
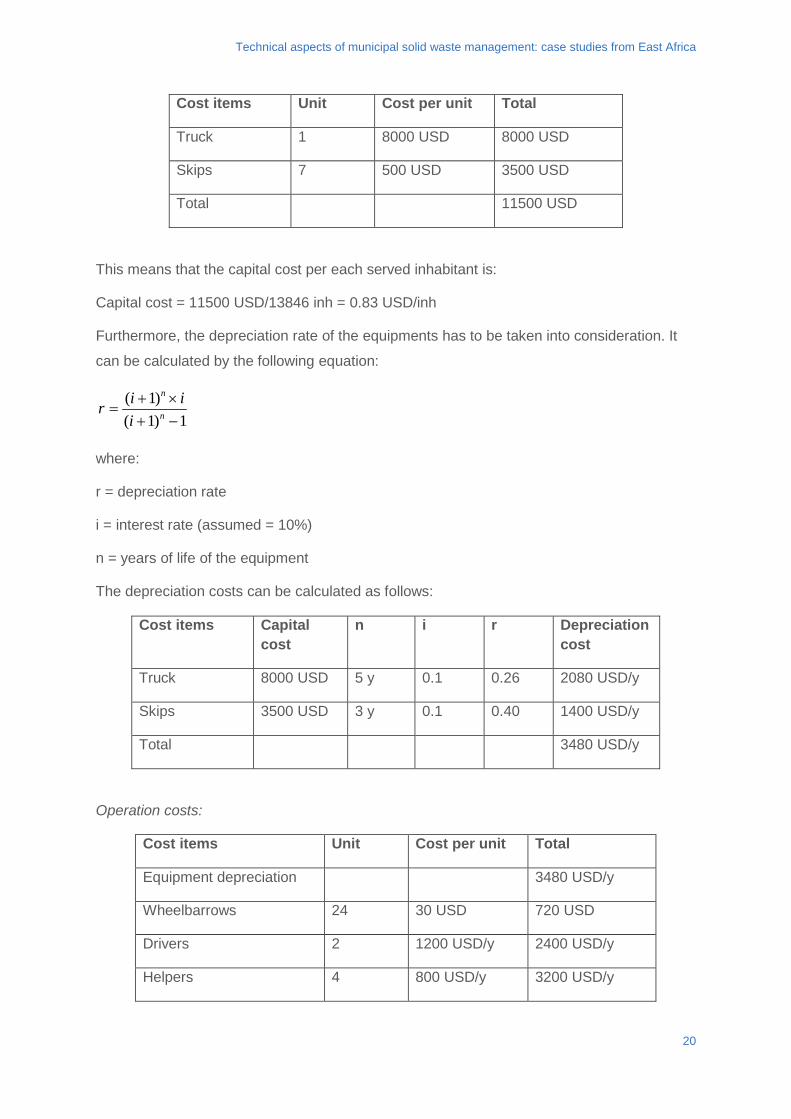
Technical aspects of municipal solid waste management: case studies from East Africa
Cost items Unit Cost per unit Total
Truck 1 8000 USD 8000 USD
Skips 7 500 USD 3500 USD
Total 11500 USD
This means that the capital cost per each served inhabitant is:
Capital cost = 11500 USD/13846 inh = 0.83 USD/inh
Furthermore, the depreciation rate of the equipments has to be taken into consideration. It
can be calculated by the following equation:
1)1()1(−+×+
= n
n
iiir
where:
r = depreciation rate
i = interest rate (assumed = 10%)
n = years of life of the equipment
The depreciation costs can be calculated as follows:
Cost items Capital cost
n i r Depreciation cost
Truck 8000 USD 5 y 0.1 0.26 2080 USD/y
Skips 3500 USD 3 y 0.1 0.40 1400 USD/y
Total 3480 USD/y
Operation costs:
Cost items Unit Cost per unit Total
Equipment depreciation 3480 USD/y
Wheelbarrows 24 30 USD 720 USD
Drivers 2 1200 USD/y 2400 USD/y
Helpers 4 800 USD/y 3200 USD/y
20
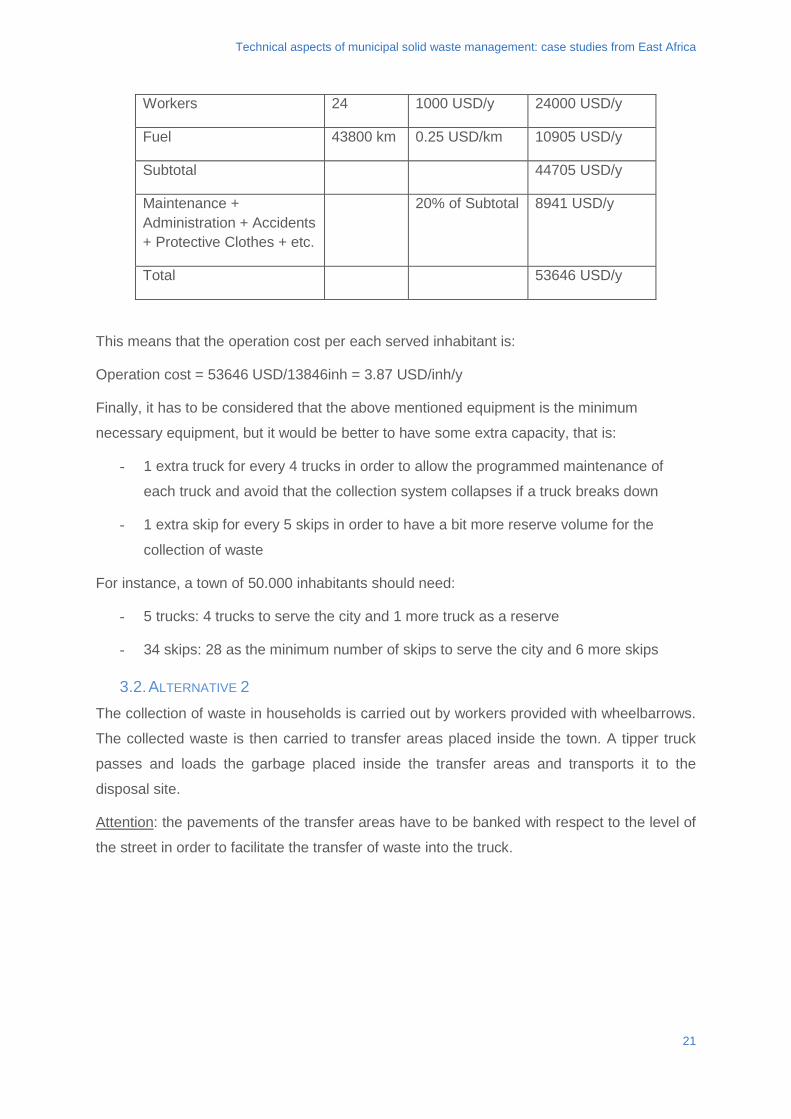
Technical aspects of municipal solid waste management: case studies from East Africa
Workers 24 1000 USD/y 24000 USD/y
Fuel 43800 km 0.25 USD/km 10905 USD/y
Subtotal 44705 USD/y
Maintenance + Administration + Accidents + Protective Clothes + etc.
20% of Subtotal 8941 USD/y
Total 53646 USD/y
This means that the operation cost per each served inhabitant is:
Operation cost = 53646 USD/13846inh = 3.87 USD/inh/y
Finally, it has to be considered that the above mentioned equipment is the minimum
necessary equipment, but it would be better to have some extra capacity, that is:
- 1 extra truck for every 4 trucks in order to allow the programmed maintenance of
each truck and avoid that the collection system collapses if a truck breaks down
- 1 extra skip for every 5 skips in order to have a bit more reserve volume for the
collection of waste
For instance, a town of 50.000 inhabitants should need:
- 5 trucks: 4 trucks to serve the city and 1 more truck as a reserve
- 34 skips: 28 as the minimum number of skips to serve the city and 6 more skips
3.2. ALTERNATIVE 2 The collection of waste in households is carried out by workers provided with wheelbarrows.
The collected waste is then carried to transfer areas placed inside the town. A tipper truck
passes and loads the garbage placed inside the transfer areas and transports it to the
disposal site.
Attention: the pavements of the transfer areas have to be banked with respect to the level of
the street in order to facilitate the transfer of waste into the truck.
21
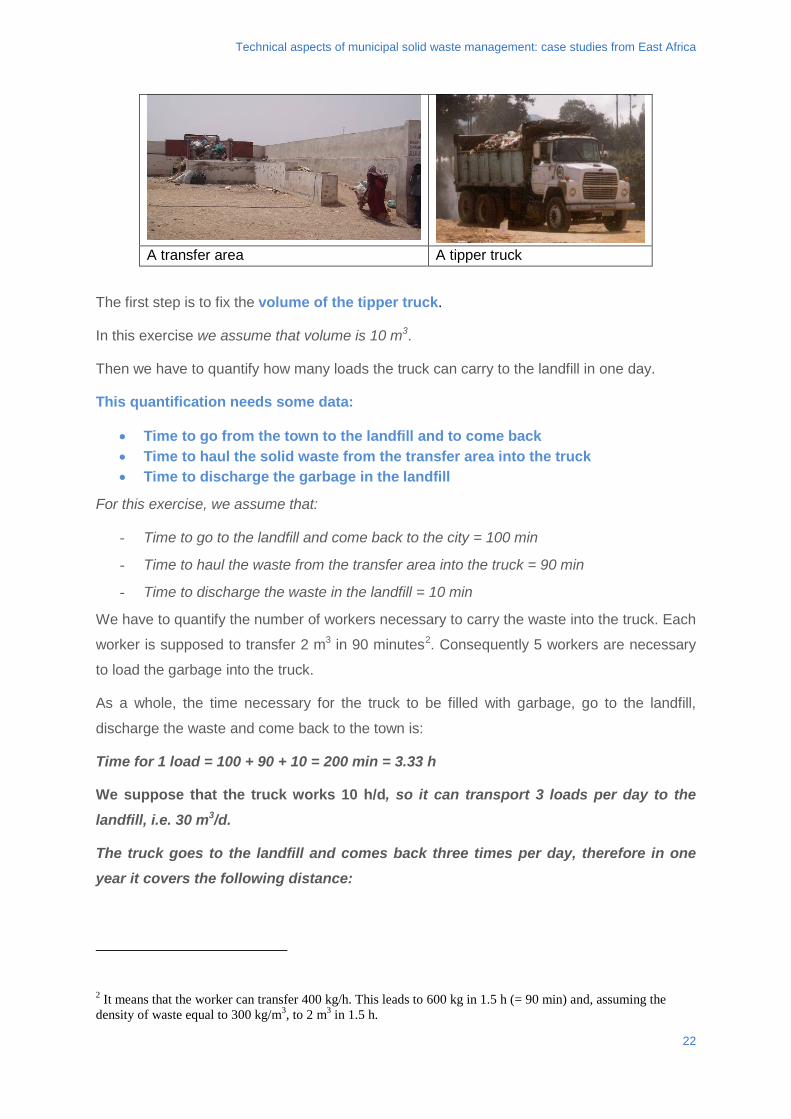
Technical aspects of municipal solid waste management: case studies from East Africa
A transfer area A tipper truck
The first step is to fix the volume of the tipper truck.
In this exercise we assume that volume is 10 m3.
Then we have to quantify how many loads the truck can carry to the landfill in one day.
This quantification needs some data:
• Time to go from the town to the landfill and to come back • Time to haul the solid waste from the transfer area into the truck • Time to discharge the garbage in the landfill
For this exercise, we assume that:
- Time to go to the landfill and come back to the city = 100 min
- Time to haul the waste from the transfer area into the truck = 90 min
- Time to discharge the waste in the landfill = 10 min
We have to quantify the number of workers necessary to carry the waste into the truck. Each
worker is supposed to transfer 2 m3 in 90 minutes2. Consequently 5 workers are necessary
to load the garbage into the truck.
As a whole, the time necessary for the truck to be filled with garbage, go to the landfill,
discharge the waste and come back to the town is:
Time for 1 load = 100 + 90 + 10 = 200 min = 3.33 h
We suppose that the truck works 10 h/d, so it can transport 3 loads per day to the landfill, i.e. 30 m3/d.
The truck goes to the landfill and comes back three times per day, therefore in one year it covers the following distance:
2 It means that the worker can transfer 400 kg/h. This leads to 600 kg in 1.5 h (= 90 min) and, assuming the density of waste equal to 300 kg/m3, to 2 m3 in 1.5 h.
22
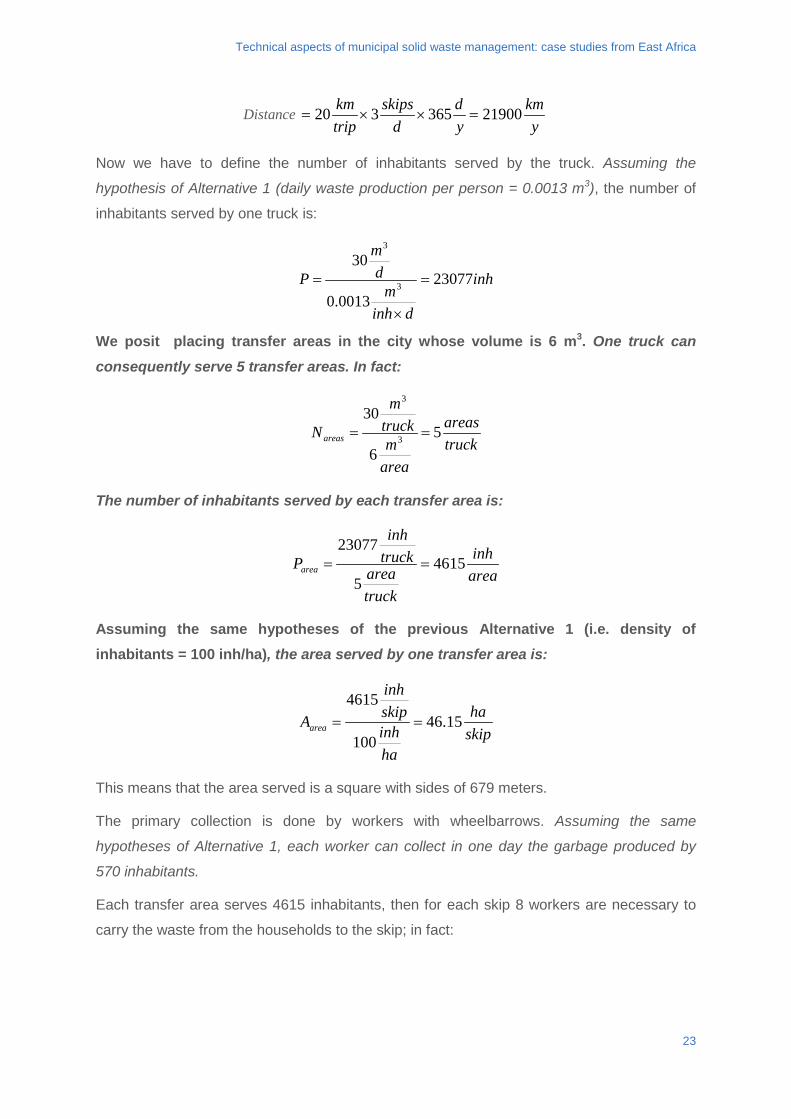
Technical aspects of municipal solid waste management: case studies from East Africa
Distance y
kmyd
dskips
tripkm 21900365320 =××=
Now we have to define the number of inhabitants served by the truck. Assuming the
hypothesis of Alternative 1 (daily waste production per person = 0.0013 m3), the number of
inhabitants served by one truck is:
inh
dinhm
dm
P 230770013.0
303
3
=
×
=
We posit placing transfer areas in the city whose volume is 6 m3. One truck can consequently serve 5 transfer areas. In fact:
truckareas
aream
truckm
Nareas 56
303
3
==
The number of inhabitants served by each transfer area is:
areainh
truckarea
truckinh
Parea 46155
23077==
Assuming the same hypotheses of the previous Alternative 1 (i.e. density of inhabitants = 100 inh/ha), the area served by one transfer area is:
skipha
hainhskipinh
Aarea 15.46100
4615==
This means that the area served is a square with sides of 679 meters.
The primary collection is done by workers with wheelbarrows. Assuming the same
hypotheses of Alternative 1, each worker can collect in one day the garbage produced by
570 inhabitants.
Each transfer area serves 4615 inhabitants, then for each skip 8 workers are necessary to
carry the waste from the households to the skip; in fact:
23
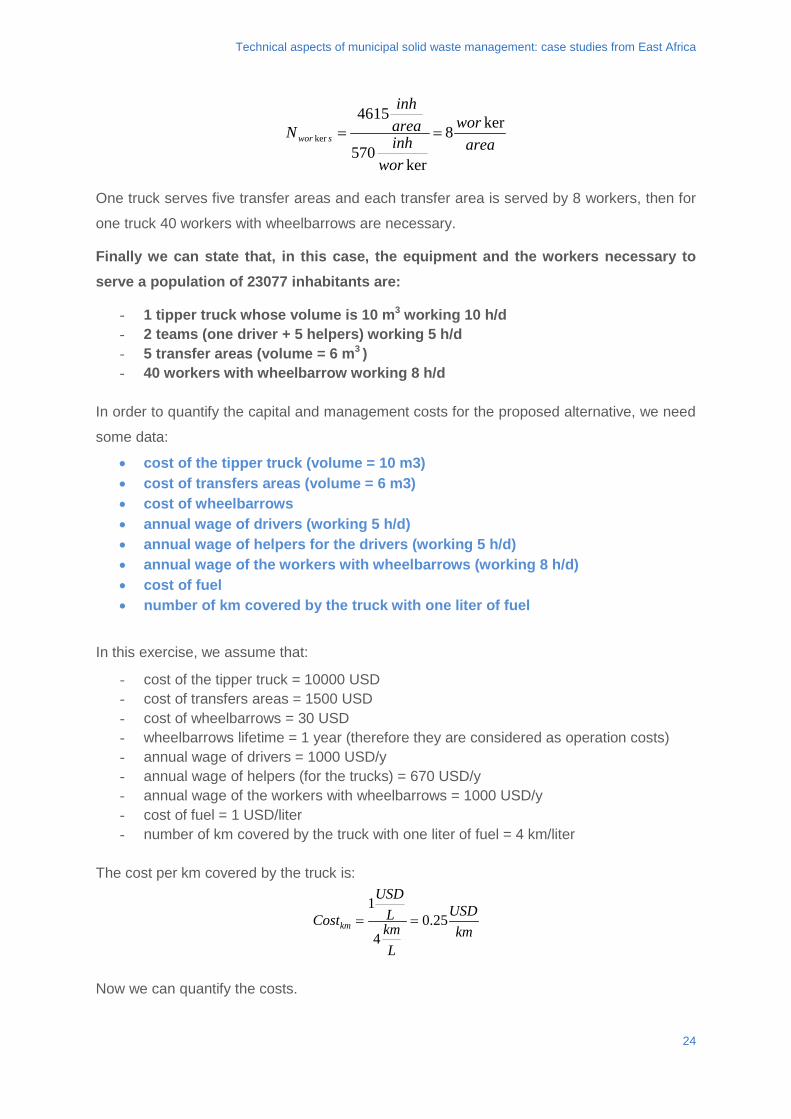
Technical aspects of municipal solid waste management: case studies from East Africa
areawor
worinhareainh
N sworker8
ker570
4615ker ==
One truck serves five transfer areas and each transfer area is served by 8 workers, then for
one truck 40 workers with wheelbarrows are necessary.
Finally we can state that, in this case, the equipment and the workers necessary to serve a population of 23077 inhabitants are:
- 1 tipper truck whose volume is 10 m3 working 10 h/d - 2 teams (one driver + 5 helpers) working 5 h/d - 5 transfer areas (volume = 6 m3 ) - 40 workers with wheelbarrow working 8 h/d
In order to quantify the capital and management costs for the proposed alternative, we need
some data:
• cost of the tipper truck (volume = 10 m3) • cost of transfers areas (volume = 6 m3) • cost of wheelbarrows • annual wage of drivers (working 5 h/d) • annual wage of helpers for the drivers (working 5 h/d) • annual wage of the workers with wheelbarrows (working 8 h/d) • cost of fuel • number of km covered by the truck with one liter of fuel
In this exercise, we assume that:
- cost of the tipper truck = 10000 USD - cost of transfers areas = 1500 USD - cost of wheelbarrows = 30 USD - wheelbarrows lifetime = 1 year (therefore they are considered as operation costs) - annual wage of drivers = 1000 USD/y - annual wage of helpers (for the trucks) = 670 USD/y - annual wage of the workers with wheelbarrows = 1000 USD/y - cost of fuel = 1 USD/liter - number of km covered by the truck with one liter of fuel = 4 km/liter
The cost per km covered by the truck is:
kmUSD
LkmL
USD
Costkm 25.04
1==
Now we can quantify the costs.
24
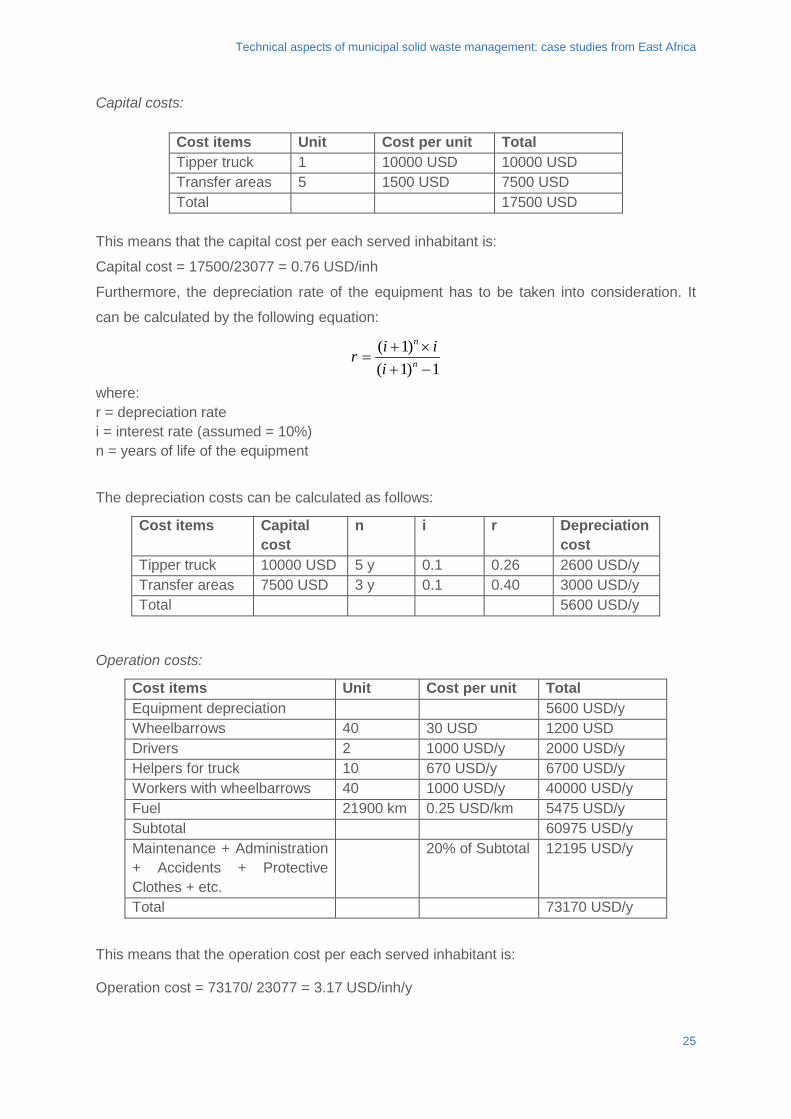
Technical aspects of municipal solid waste management: case studies from East Africa
Capital costs:
Cost items Unit Cost per unit Total Tipper truck 1 10000 USD 10000 USD Transfer areas 5 1500 USD 7500 USD Total 17500 USD
This means that the capital cost per each served inhabitant is:
Capital cost = 17500/23077 = 0.76 USD/inh
Furthermore, the depreciation rate of the equipment has to be taken into consideration. It
can be calculated by the following equation:
1)1()1(−+×+
= n
n
iiir
where: r = depreciation rate i = interest rate (assumed = 10%) n = years of life of the equipment
The depreciation costs can be calculated as follows:
Cost items Capital cost
n i r Depreciation cost
Tipper truck 10000 USD 5 y 0.1 0.26 2600 USD/y Transfer areas 7500 USD 3 y 0.1 0.40 3000 USD/y Total 5600 USD/y
Operation costs:
Cost items Unit Cost per unit Total Equipment depreciation 5600 USD/y Wheelbarrows 40 30 USD 1200 USD Drivers 2 1000 USD/y 2000 USD/y Helpers for truck 10 670 USD/y 6700 USD/y Workers with wheelbarrows 40 1000 USD/y 40000 USD/y Fuel 21900 km 0.25 USD/km 5475 USD/y Subtotal 60975 USD/y Maintenance + Administration + Accidents + Protective Clothes + etc.
20% of Subtotal 12195 USD/y
Total 73170 USD/y
This means that the operation cost per each served inhabitant is:
Operation cost = 73170/ 23077 = 3.17 USD/inh/y
25
Technical aspects of municipal solid waste management: case studies from East Africa
Finally, it has to be considered that the above mentioned equipment is the minimum
necessary equipment, but it would be better to have greater capacity, that is:
- 1 extra truck for every 4 trucks in order to allow the programmed maintenance of each truck and avoid that the collection system collapses if a truck breaks down
- 1 extra transfer area for every 3 transfer areas in order to have a bit more reserve volume for the collection of waste
For instance, a town of 50.000 inhabitants should need:
- 3 trucks: 2 trucks to serve the city and 1 more truck as a reserve
- 15 transfer areas: 11 as the minimum number of areas to serve the city and 5 more transfer areas
3.3. ALTERNATIVE 3
In this case the waste collection is carried out by one truck that passes through the main
routes around the city and stops every 100 meters. During its trip the truck blows its horn to
get the attention of inhabitants to carry their own garbage to the truck.
In every stop, the truck can collect the waste from an area: 100m x 100m = 10000 m2 = 1 ha
The number of inhabitants served in each stop can be quantified by knowing:
• Number of inhabitants per hectare
In this exercise we assume that the number of inhabitants per hectare is 100 inh/ha.
Moreover, we assume that the time necessary for the truck to move between two collection
points and to wait for the inhabitants coming with their own waste is 15 minutes.
So, in one hour the truck stops 4 times and, consequently, serves 400 inhabitants.
Now we have to quantify the volume of the truck. We need some data:
• Time to go from the town to the landfill and to come back • Time to discharge the waste in the landfill • Work shift of the truck
We suppose that:
- the round trip to the landfill is 100 minutes
- the time to discharge the waste in the landfill is 10 minutes
- the truck works 12 hours per day
So time necessary for the truck to go to the landfill, discharge the waste and come back to the town is:
Time for one load = 100 min + 10 min = 110 min = 1.8 hours
The time remaining to collect waste is: 12 h – 1.8 h = 10.2 h
26
Technical aspects of municipal solid waste management: case studies from East Africa
As stated before, the truck can serve 400 inh/h, so in 10.2 hours it can serve:
dinh
dh
hinhP 40802.10400 =×=
Assuming the hypothesis of Alternative 1 (daily waste production per person = 0.0013 m3), the volume of waste collected by the truck is:
dm
dinh
inhmVwaste
33
3.540800013.0 =×=
So we need a truck with a volume of at least 5.5 m3 to collect the garbage of 4080 inhabitants for one day.
The truck works 12 hours per day, so it needs two teams (composed of one driver plus three helpers) working 6 hours per day each.
The truck goes to the landfill and comes back once per day (it means 20 km/d);
moreover, the truck stops 41 times a day (d
stopsh
stopsdh 4142.10 =×= ). That means
that it covers a distance equal to:
kmmstopm
dstopsd 1.4410010041 ==×=
So, in one day the truck cover 24.1 km (4.1 km for the waste collection + 20 km to go and come back from the landfill). Then in one year it covers the following distance:
Distance y
kmyd
dkm 87973651.24 =×=
Finally we can state that, in this case, the equipment and the workers necessary to serve a population of 4080 inhabitants are:
- 1 tipper truck with a volume of at least 5.5 m3 working 12 h/d - 2 teams (one driver + 3 helpers) working 6 h/d
In order to quantify the capital and operation costs for the proposed alternative, we need
some data:
• cost of the tipper truck (volume = 5.5 m3) • annual wage of drivers (working 6 h/d) • annual wage of helpers for the drivers (working 6 h/d) • number of km covered by the truck with one litre of fuel
27
Technical aspects of municipal solid waste management: case studies from East Africa
In this exercise, we assume that:
- cost of the tipper truck = 8000 USD
- annual wage of drivers = 1200 USD/y
- annual wage of helpers (for the trucks) = 800 USD/y
- cost of fuel = 1 USD/litre
- number of km covered by the truck with one litre of fuel = 4 km/litre
The cost per km covered by the truck is:
kmUSD
LkmL
USD
Costkm 25.04
1==
Now we can quantify the costs.
Capital costs:
Cost items Unit Cost per unit Total Truck 1 8000 USD 8000 USD Total 8000 USD
This means that the capital cost per each served inhabitant is:
Capital cost = 8000/4080= 1.96 USD/inh
Furthermore, the depreciation rate of the equipments has to be taken into consideration. It
can be calculated by the following equation:
1)1()1(−+×+
= n
n
iiir
where: r = depreciation rate i = interest rate (assumed = 10%) n = years of life of the equipment The depreciation costs can be calculated as follows:
Cost items Capital cost
n i r Depreciation cost
Truck 8000 USD 5 y 0.1 0.26 2080 USD/y Total 2080 USD/y
Operation costs:
28
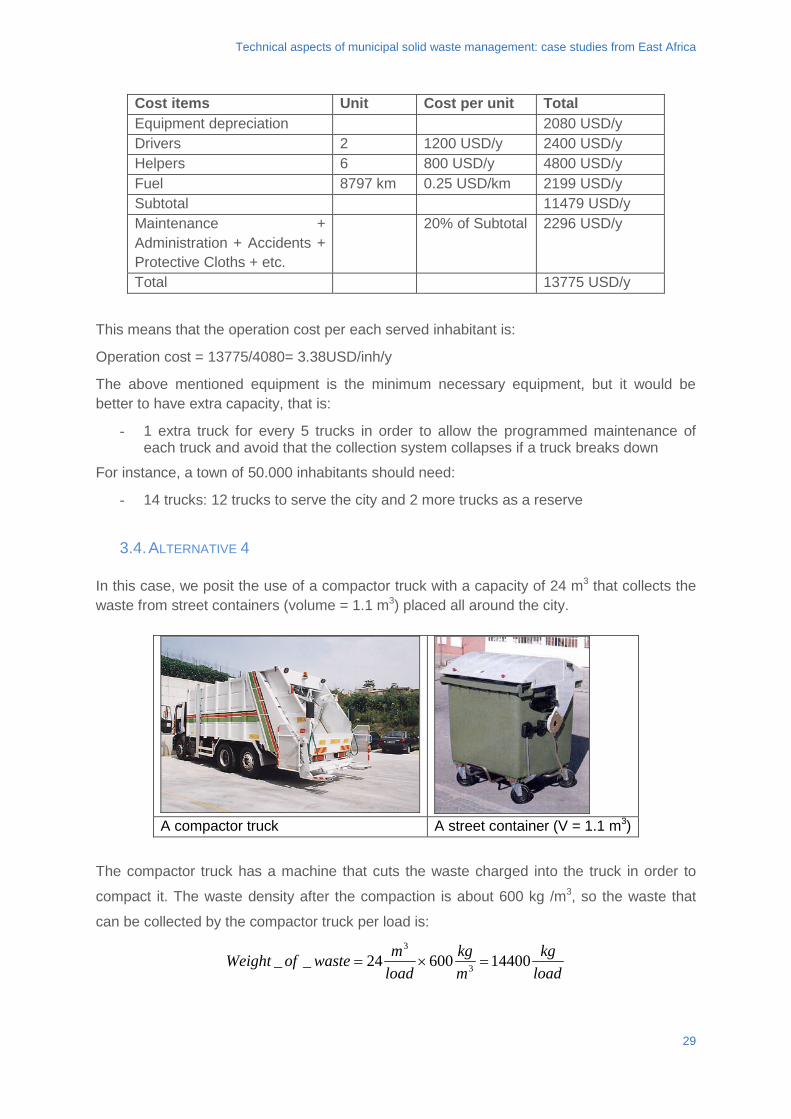
Technical aspects of municipal solid waste management: case studies from East Africa
Cost items Unit Cost per unit Total Equipment depreciation 2080 USD/y Drivers 2 1200 USD/y 2400 USD/y Helpers 6 800 USD/y 4800 USD/y Fuel 8797 km 0.25 USD/km 2199 USD/y Subtotal 11479 USD/y Maintenance + Administration + Accidents + Protective Cloths + etc.
20% of Subtotal 2296 USD/y
Total 13775 USD/y
This means that the operation cost per each served inhabitant is:
Operation cost = 13775/4080= 3.38USD/inh/y
The above mentioned equipment is the minimum necessary equipment, but it would be better to have extra capacity, that is:
- 1 extra truck for every 5 trucks in order to allow the programmed maintenance of each truck and avoid that the collection system collapses if a truck breaks down
For instance, a town of 50.000 inhabitants should need:
- 14 trucks: 12 trucks to serve the city and 2 more trucks as a reserve
3.4. ALTERNATIVE 4
In this case, we posit the use of a compactor truck with a capacity of 24 m3 that collects the waste from street containers (volume = 1.1 m3) placed all around the city.
A compactor truck A street container (V = 1.1 m3)
The compactor truck has a machine that cuts the waste charged into the truck in order to
compact it. The waste density after the compaction is about 600 kg /m3, so the waste that
can be collected by the compactor truck per load is:
loadkg
mkg
loadmwasteofWeight 1440060024__ 3
3
=×=
29
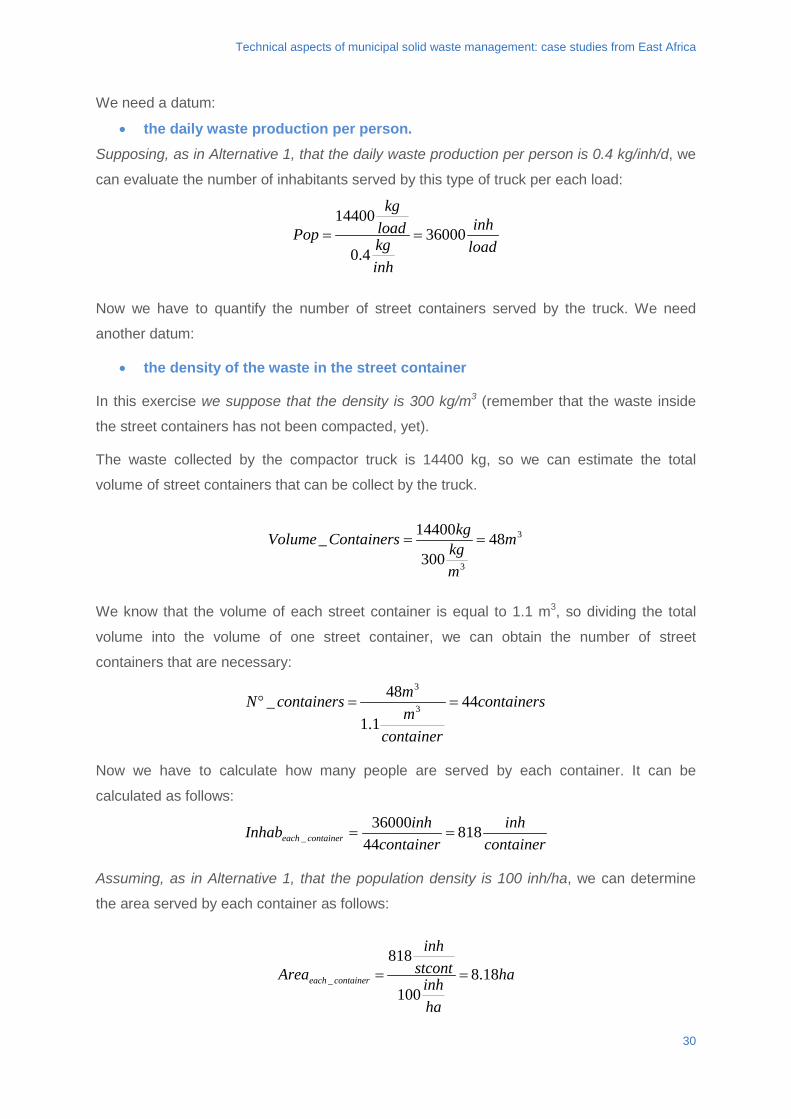
Technical aspects of municipal solid waste management: case studies from East Africa
We need a datum:
• the daily waste production per person. Supposing, as in Alternative 1, that the daily waste production per person is 0.4 kg/inh/d, we
can evaluate the number of inhabitants served by this type of truck per each load:
loadinh
inhkgloadkg
Pop 360004.0
14400==
Now we have to quantify the number of street containers served by the truck. We need
another datum:
• the density of the waste in the street container
In this exercise we suppose that the density is 300 kg/m3 (remember that the waste inside
the street containers has not been compacted, yet).
The waste collected by the compactor truck is 14400 kg, so we can estimate the total
volume of street containers that can be collect by the truck.
3
3
48300
14400_ m
mkgkgContainersVolume ==
We know that the volume of each street container is equal to 1.1 m3, so dividing the total
volume into the volume of one street container, we can obtain the number of street
containers that are necessary:
containers
containermmcontainersN 44
1.1
48_ 3
3
==°
Now we have to calculate how many people are served by each container. It can be
calculated as follows:
containerinh
containerinhInhab containereach 818
4436000
_ ==
Assuming, as in Alternative 1, that the population density is 100 inh/ha, we can determine
the area served by each container as follows:
ha
hainh
stcontinh
Area containereach 18.8100
818_ ==
30
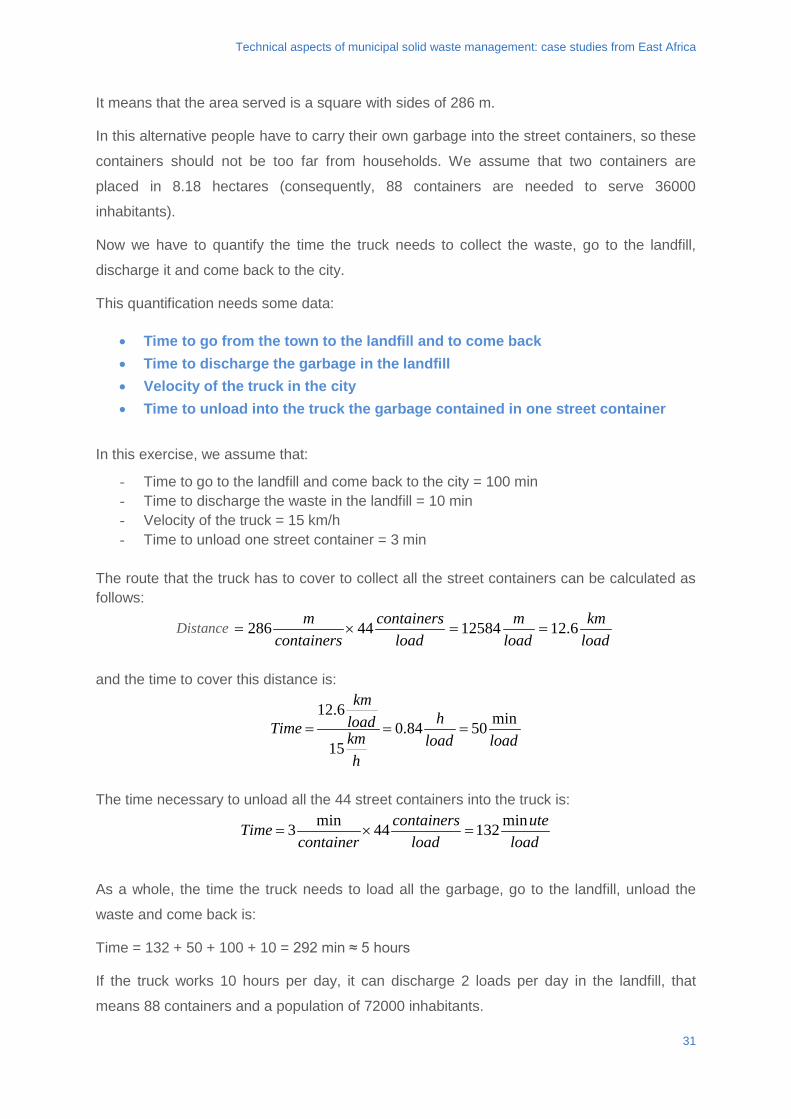
Technical aspects of municipal solid waste management: case studies from East Africa
It means that the area served is a square with sides of 286 m.
In this alternative people have to carry their own garbage into the street containers, so these
containers should not be too far from households. We assume that two containers are
placed in 8.18 hectares (consequently, 88 containers are needed to serve 36000
inhabitants).
Now we have to quantify the time the truck needs to collect the waste, go to the landfill,
discharge it and come back to the city.
This quantification needs some data:
• Time to go from the town to the landfill and to come back • Time to discharge the garbage in the landfill • Velocity of the truck in the city • Time to unload into the truck the garbage contained in one street container
In this exercise, we assume that:
- Time to go to the landfill and come back to the city = 100 min - Time to discharge the waste in the landfill = 10 min - Velocity of the truck = 15 km/h - Time to unload one street container = 3 min
The route that the truck has to cover to collect all the street containers can be calculated as follows:
Distance loadkm
loadm
loadcontainers
containersm 6.121258444286 ==×=
and the time to cover this distance is:
loadloadh
hkmloadkm
Time min5084.015
6.12===
The time necessary to unload all the 44 street containers into the truck is:
loadute
loadcontainers
containerTime min13244min3 =×=
As a whole, the time the truck needs to load all the garbage, go to the landfill, unload the
waste and come back is:
Time = 132 + 50 + 100 + 10 = 292 min ≈ 5 hours
If the truck works 10 hours per day, it can discharge 2 loads per day in the landfill, that
means 88 containers and a population of 72000 inhabitants.
31
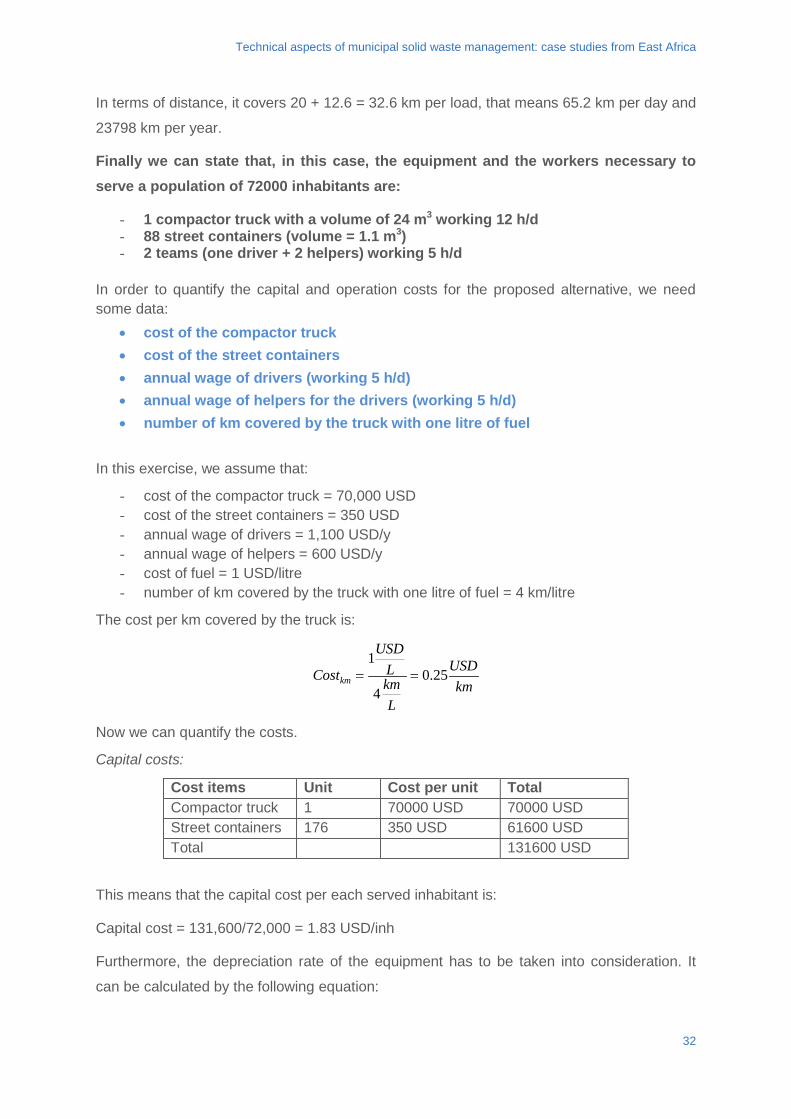
Technical aspects of municipal solid waste management: case studies from East Africa
In terms of distance, it covers 20 + 12.6 = 32.6 km per load, that means 65.2 km per day and
23798 km per year.
Finally we can state that, in this case, the equipment and the workers necessary to serve a population of 72000 inhabitants are:
- 1 compactor truck with a volume of 24 m3 working 12 h/d - 88 street containers (volume = 1.1 m3) - 2 teams (one driver + 2 helpers) working 5 h/d
In order to quantify the capital and operation costs for the proposed alternative, we need some data:
• cost of the compactor truck • cost of the street containers • annual wage of drivers (working 5 h/d) • annual wage of helpers for the drivers (working 5 h/d) • number of km covered by the truck with one litre of fuel
In this exercise, we assume that:
- cost of the compactor truck = 70,000 USD - cost of the street containers = 350 USD - annual wage of drivers = 1,100 USD/y - annual wage of helpers = 600 USD/y - cost of fuel = 1 USD/litre - number of km covered by the truck with one litre of fuel = 4 km/litre
The cost per km covered by the truck is:
kmUSD
LkmL
USD
Costkm 25.04
1==
Now we can quantify the costs.
Capital costs:
Cost items Unit Cost per unit Total Compactor truck 1 70000 USD 70000 USD Street containers 176 350 USD 61600 USD Total 131600 USD
This means that the capital cost per each served inhabitant is:
Capital cost = 131,600/72,000 = 1.83 USD/inh
Furthermore, the depreciation rate of the equipment has to be taken into consideration. It
can be calculated by the following equation:
32
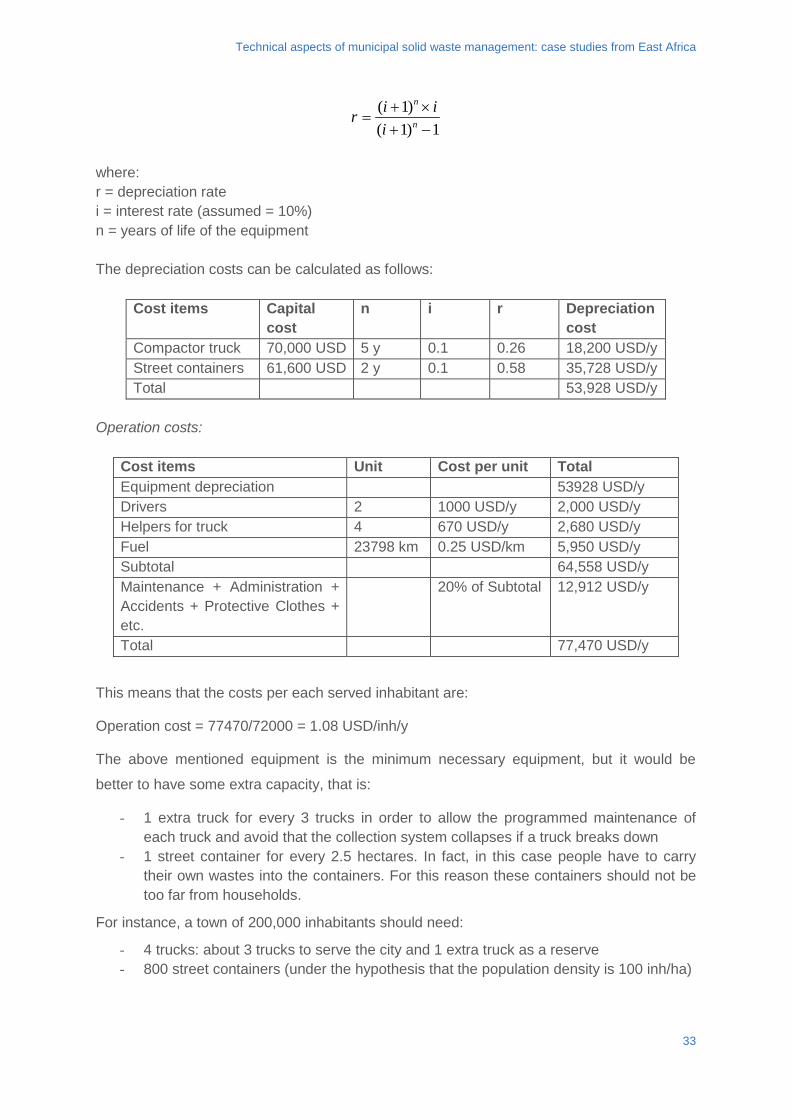
Technical aspects of municipal solid waste management: case studies from East Africa
1)1()1(−+×+
= n
n
iiir
where: r = depreciation rate i = interest rate (assumed = 10%) n = years of life of the equipment The depreciation costs can be calculated as follows:
Cost items Capital cost
n i r Depreciation cost
Compactor truck 70,000 USD 5 y 0.1 0.26 18,200 USD/y Street containers 61,600 USD 2 y 0.1 0.58 35,728 USD/y Total 53,928 USD/y
Operation costs:
Cost items Unit Cost per unit Total Equipment depreciation 53928 USD/y Drivers 2 1000 USD/y 2,000 USD/y Helpers for truck 4 670 USD/y 2,680 USD/y Fuel 23798 km 0.25 USD/km 5,950 USD/y Subtotal 64,558 USD/y Maintenance + Administration + Accidents + Protective Clothes + etc.
20% of Subtotal 12,912 USD/y
Total 77,470 USD/y
This means that the costs per each served inhabitant are:
Operation cost = 77470/72000 = 1.08 USD/inh/y
The above mentioned equipment is the minimum necessary equipment, but it would be
better to have some extra capacity, that is:
- 1 extra truck for every 3 trucks in order to allow the programmed maintenance of each truck and avoid that the collection system collapses if a truck breaks down
- 1 street container for every 2.5 hectares. In fact, in this case people have to carry their own wastes into the containers. For this reason these containers should not be too far from households.
For instance, a town of 200,000 inhabitants should need:
- 4 trucks: about 3 trucks to serve the city and 1 extra truck as a reserve - 800 street containers (under the hypothesis that the population density is 100 inh/ha)
33
Technical aspects of municipal solid waste management: case studies from East Africa
4. HOMEWORK ACTIVITY The trainer will divide the students in groups of 3-4 people. Each group will be provided with data and information concerning a specific context in a developing Country (see Annexes as an instance; alternative context descriptions may be prepared according to the trainer’s experiences or according to specific requirements). Info and data should regard not only the technical aspects but also the socio-economic level of the population and some geographical or institutional constraints. According to the given data, each team group will design the waste collection system, giving a proper justification for the solutions proposed.
4.1. EVALUATION CRITERIA
Each group will have to produce the following deliverables:
• technical report of the collection system proposed with assumptions and calculation • financial plan for the creation and management of the system (therefore including
capital and operative costs)
The work done by each group has to be assessed according to the following criteria:
• completeness of materials to be delivered; • justification of choices; • correct calculation; • concordance with constraints given; • feasibility and soundness of the solution proposed; • appropriateness of the solution proposed for the given context.
34
Technical aspects of municipal solid waste management: case studies from East Africa
BIBLIOGRAPHY Cointreau S. (1982):. “Environmental Management of Urban Solid Waste in Developing Countires – A project guide”, Urban Development Department, The World Bank, Washington. Collivignarelli, C., Vaccari, M., Di Bella, V., Giardina, D. (2011a) Techno‐economic evaluation for the improvement of MSW collection in Somaliland and Puntland. Waste Management & Research, 29(5), pp. 521–531 Collivignarelli, C., Di Bella, V., Vaccari, M. (2011b) Generation and composition of household waste in a South Sudanese city: updated data from Juba. Proceedings of “WasteSafe 2011 ‐ 2nd International Conference on Solid Waste Management in Developing Countries”, 13‐15 February 2011, Khulna, Bangladesh Di Bella, V., Vaccari, M., 2014. Constraints for solid waste management in Somaliland. Proceedings of Institution of Civil Engineers: Waste and Resource Management 167 (2), pp. 62-71 Oelzchner H. and Mutz D. (1996): Guidelines for an appropriate management of domestic sanitary landfills, Gesselschaft fur Technische Zusammenarbeit, Eschborn, Germany UN-Habitat (2009): Solid Waste Management in the World’s Cities, Pre-publication presentation, Nairobi, Kenya Vaccari, M., Di Bella, V., Giardina, D. (2011) Municipal Solid Waste Management in Somaliland and Puntland: building local capacities on technical aspects. CeTAmb Publishing, 2011. All rights reserved. ISBN 978-88-97307-04-4. Available from: http://www.ing.unibs.it/~cetamb/index.php/it/archivio-pubblicazioni-online.html. [17 October 2014]. WEDC (2010): Solid Waste Managment, Handouts from postgraduate module on solid waste management, Loughborough University, Loughborough UK WHO n.d., WHO | Sanitation. Available from: < http://www.who.int/topics/sanitation/en/ >. [6 October 2014].
35
Technical aspects of municipal solid waste management: case studies from East Africa
FURTHER/SUGGESTED MATERIAL Zurbrügg, C., Caniato, M.,Vaccari, M., 2014. How assessment methods can support solid waste management in developing countries-a critical review. Sustainability (Switzerland). 6 (2), pp. 545-570 Caniato, M., Vaccari, M., 2014. How to assess solid waste management in armed conflicts? A new methodology applied to the Gaza Strip, Palestine . Waste Management and Research. 32 (9) pp. 908-917 Vaccari, M., Bella, V.D., Vitali, F., Collivignarelli, C., 2013. From mixed to separate collection of solid waste: Benefits for the town of Zavidovići (Bosnia and Herzegovina) Waste Management. 33 (2), pp. 277-286
36

http://www.gdee.eu
This project is funded by
Plastic Recycling
Alistair Cook
PHOTO: Man operating shredding machine used to recycle plastic in Nakuru. Practical Action.
CASE STUDIES
DL B 10735-2015 ISBN 978-84-606-7546-4
Plastic Recycling
COORDINATED BYAgustí Pérez-Foguet, Enric Velo, Pol Arranz, Ricard Ginéand Boris Lazzarini (Universitat Politècnica de Catalunya)Manuel Sierra (Universidad Politécnica de Madrid)Alejandra Boni and Jordi Peris (Universitat Politècnica de València)Guido Zolezzi and Gabriella Trombino (Università degli Studi di Trento)Rhoda Trimingham (Loughborough University)Valentín Villarroel (ONGAWA)Neil Nobles and Meadhbh Bolger (Practical Action)Francesco Mongera (Training Center for International Cooperation)Katie Cresswell-Maynard (Engineering Without Border UK)
EDITED BY Global Dimension in Engineering Education
Citation: Cook, A. (2015) 'Plastic Recycling', in Case studies for developing globally responsible engineers, GDEE (eds.), Global Dimension in Engineering Education, Barcelona. Available from: http://gdee.eu/index.php/resources.html
This publication is distributedunder an Attribution- Noncommercial-Share Alike License for Creative Commons
CASE STUDIES
Disclaimer: This document has been produced with the financial assistance of the European UnionThe contents of this document are the sole responsibility of the authors and can under no circumstances be regarded as reflecting the position of the European Union
Plastic Recycling
PLASTIC RECYCLING
Alistair Cook: MBA candidate Global Social Sustainable Enterprise, Colorado State University
1
Plastic Recycling
INDEX 1. INTRODUCTION ........................................................................................................................... 3
1.1. DISCIPLINES COVERED ............................................................................................................. 3
1.2. LEARNING OUTCOMES .............................................................................................................. 4
1.3. ACTIVITIES .............................................................................................................................. 4
2. DESCRIPTION OF THE CONTEXT ............................................................................................. 4
2.1. INTRODUCTION TO RECYCLING PLASTICS AND RELEVANCE IN THE GLOBAL SOUTH ..................... 4
PROPERTIES AND TYPES OF PLASTICS ..................................................................................................... 5
2.2. . IDENTIFYING WASTE PLASTICS ............................................................................................... 8
2.3. PROCESSING WASTE PLASTIC.................................................................................................. 9
2.4. CRADLE TO CRADLE AND LIFE CYCLE ASSESSMENT .................................................................. 12
2.5. CASE STUDIES OF PLASTIC RECYCLING .................................................................................. 13
3. CLASS ACTIVITY ....................................................................................................................... 15
3.1. SOLUTION AND EVALUATION CRITERIA ..................................................................................... 15
4. HOMEWORK ACTIVITY ............................................................................................................. 16 5. BIBLIOGRAPHY ......................................................................................................................... 17
2
Plastic Recycling
1. INTRODUCTION The Global Dimension in Engineering Education (GDEE) is a European Union funded initiative involving the collaboration of development NGOs and Universities, with an aim to integrate sustainable human development as a regular part of all technical University courses. Part of the initiative is the development of a set of case studies based on real field experiences of development projects. The case studies cover a broad range of topics directly linked to those studied in engineering, science and other technology/environment/development-related courses. They give a background to the topic, a look into the real life project, and offer students hands on learning by various class and homework activities.
This case study looks into plastic recycling in the Global South. The world’s production of plastic materials has been increasing at a rate of nearly 5% per annum over the past 20 years (UNEP, n.d.). In many economically poorer countries, the increase in use of plastics has been higher than the world average and waste plastics are becoming a major waste stream. They are often found as litter across cities; they are burned, buried or disposed of in open dumps along with other waste. The high quantities being generated and the lack of efficient end-of-life management means plastics are now posing serious threats to the environment and human health. Awareness is growing of the need to reduce plastic use, and to deal effectively with plastic waste by recycling, reusing or upcycling. Many viable plastic recycling businesses have been set up in the Global South with the double result of reducing hazards of plastics, and providing a livelihood.
The process of recycling plastics and setting up a viable business contains many challenges, including technical challenges such as questions of efficient energy usage and machinery, and management challenges such as organisational structure and collection systems. Understanding the process of recycling for plastic is an important consideration in design, as designers and engineers strive to achieve ‘closed loop’ cycles, where waste is reduced or eliminated, and products are designed for re-use.
1.1. DISCIPLINES COVERED
• Product Design Engineering • Chemical / Process Engineering • Mechanical Engineering • Environmental Engineering • Engineering Business Management (or similar)
3
Plastic Recycling
1.2. LEARNING OUTCOMES • Understand the importance of recycling plastics and the real life complications in doing
so, particularly in the context of countries in the Global South • Understand the stages and processes of recycling plastic • Learn how to do a basic life cycle assessment of a material or product and use the tool
to compare options • Develop a basic understanding of business economics
1.3. ACTIVITIES There are three activities attached to this case study, which can be run as discrete activities or joined into a project;
1. Consider and research the cradle to cradle life of a household plastic object. Compare the use of new or recycled plastic as a manufacturing material
2. Complete a Life Cycle Analysis for a new and recycled plastic product and compare the results
3. Develop a basic business plan for a recycling company in Kenya or Uganda
These activities require access to a computer and the internet, as students will be required to download and utilise an open source LCA program.
2. DESCRIPTION OF THE CONTEXT
2.1. INTRODUCTION TO RECYCLING PLASTICS AND RELEVANCE IN THE GLOBAL SOUTH Plastics are inexpensive, lightweight and durable materials, which can be easily manufactured into lots of products that are used throughout the world. Because of this, the production of plastics has increased markedly over the last 60 years. A major portion of plastic produced each year is used to make disposable items of packaging or other short-lived products that are discarded within a year of manufacture. These current levels of usage and disposal are not sustainable and generate many environmental and health problems. For example, producing plastics account for around 7-8% of world oil and gas use, both as feedstock for plastics and to provide energy for their manufacture (Hopewell, et al., 2009), contributing to global warming; substantial quantities of discarded plastics accumulate as debris in landfills and in natural habitats worldwide causing methane leakage, starvation of marine mammals due to plastic consumption, and contamination of groundwater supplies due to chemical seepage. In order to mitigate these effects, reducing our consumption of plastic, and thus the creation of plastic, is key; not using plastic needlessly, using recycled /
4
Plastic Recycling
bio-degradable packaging if we must, supporting campaigns which encourage businesses, workplaces, factories etc. to reduce their use. Of course, large-scale behavioural change does not happen overnight. This is where waste management strategies come into play, such as plastic recycling, reduction in material use through down gauging or product reuse, and the use of alternative biodegradable materials and energy recovery as fuel. Here, we will talk about plastic recycling. In addition to the advantages of reducing the environmental and health impacts stated above, the process of plastic recycling provides livelihoods for millions of people and communities in the Global South, either in the form of formal employment or informal economic activities. The collecting, sorting and recycling plastic waste is a viable activity to generate income. There is a wide scope for recycling in these countries due to several factors:
• In many countries there is an existing culture of reuse and recycling, with the associated system of collection, sorting, cleaning and reuse of ‘waste’ or used materials.
• There is often an ‘informal sector’ which is ideally suited to taking on small-scale recycling activities. Such opportunities to earn a small income are rarely missed by members of the urban poor.
• There are fewer laws to control the standards of recycled materials. (This is not to say that standards can be low – the consumer will always demand a certain level of quality).
• Innovative use of scrap machinery often leads to low entry costs for processing or manufacture.
PROPERTIES AND TYPES OF PLASTICS
5
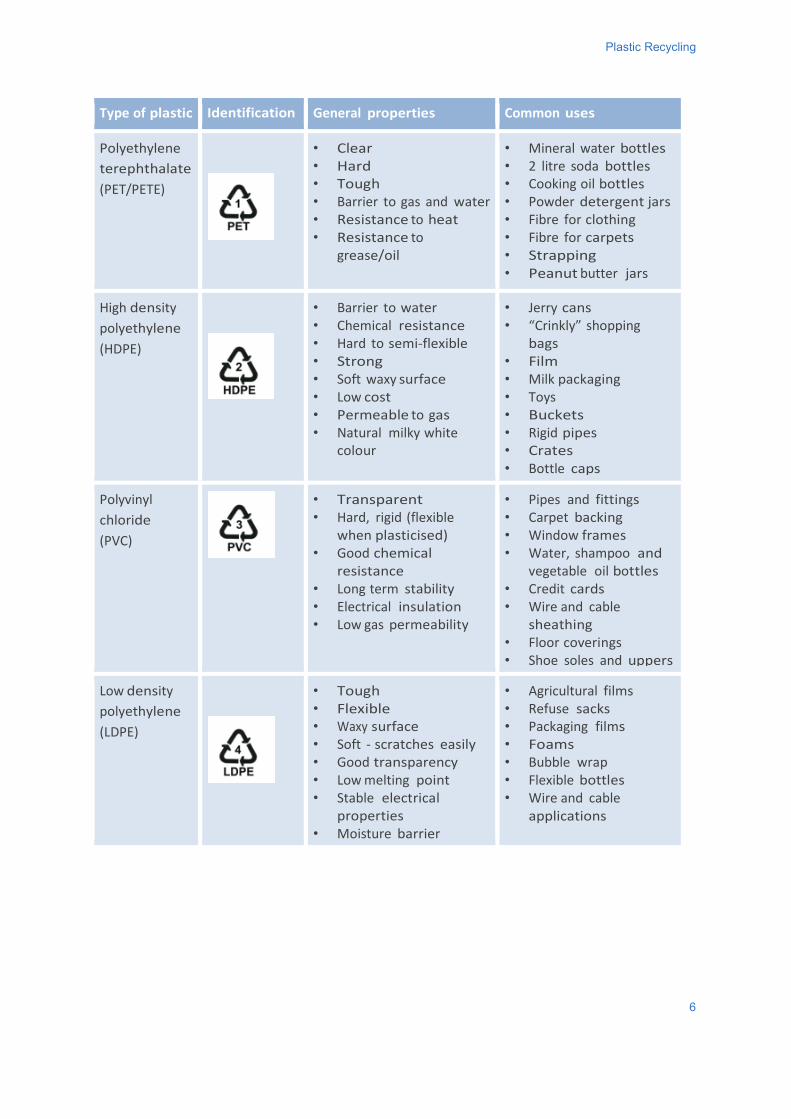
Plastic Recycling
Type of plastic Identification
General properties Common uses
Polyethylene terephthalate (PET/PETE)
• Clear • Hard • Tough • Barrier to gas and water • Resistance to heat • Resistance to
grease/oil
• Mineral water bottles • 2 litre soda bottles • Cooking oil bottles • Powder detergent jars • Fibre for clothing • Fibre for carpets • Strapping • Peanut butter jars
High density polyethylene (HDPE)
• Barrier to water • Chemical resistance • Hard to semi-flexible • Strong • Soft waxy surface • Low cost • Permeable to gas • Natural milky white
colour
• Jerry cans • “Crinkly” shopping
bags • Film • Milk packaging • Toys • Buckets • Rigid pipes • Crates • Bottle caps
Polyvinyl chloride (PVC)
• Transparent • Hard, rigid (flexible
when plasticised) • Good chemical
resistance • Long term stability • Electrical insulation • Low gas permeability
• Pipes and fittings • Carpet backing • Window frames • Water, shampoo and
vegetable oil bottles • Credit cards • Wire and cable
sheathing • Floor coverings • Shoe soles and uppers
Low density polyethylene (LDPE)
• Tough • Flexible • Waxy surface • Soft - scratches easily • Good transparency • Low melting point • Stable electrical
properties • Moisture barrier
• Agricultural films • Refuse sacks • Packaging films • Foams • Bubble wrap • Flexible bottles • Wire and cable
applications
6
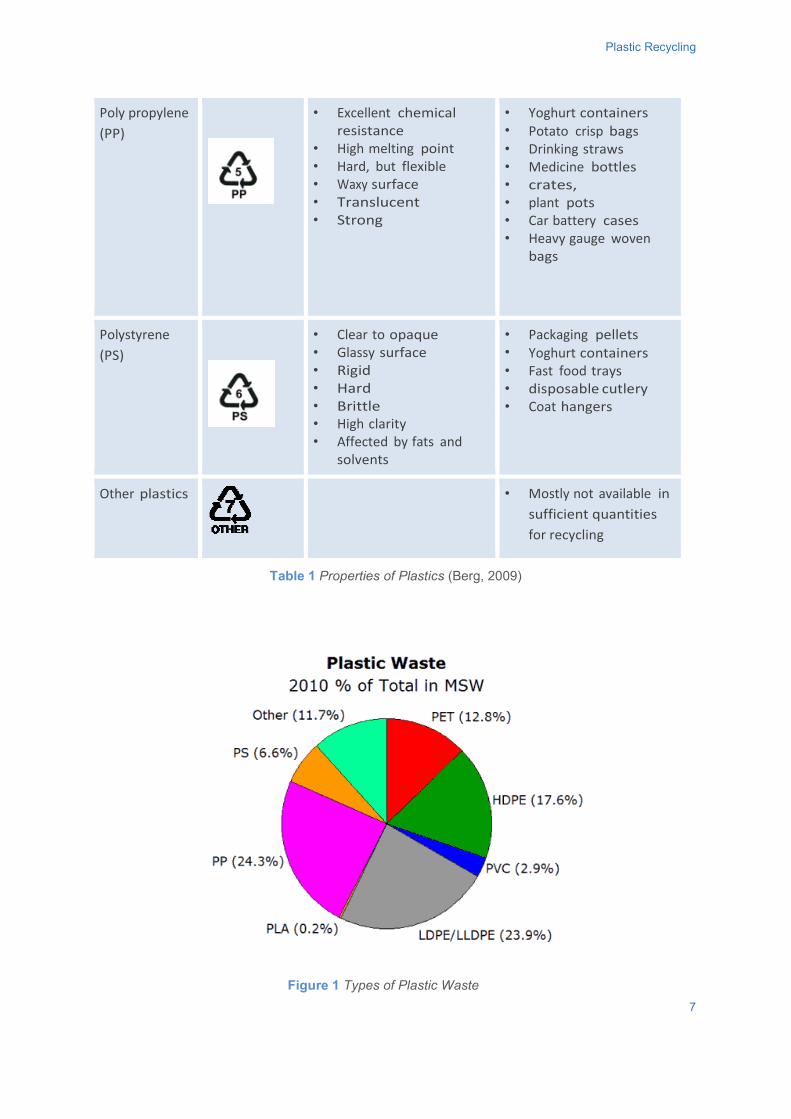
Plastic Recycling
Table 1 Properties of Plastics (Berg, 2009)
Figure 1 Types of Plastic Waste
Poly propylene (PP)
• Excellent chemical resistance
• High melting point • Hard, but flexible • Waxy surface • Translucent • Strong
• Yoghurt containers • Potato crisp bags • Drinking straws • Medicine bottles • crates, • plant pots • Car battery cases • Heavy gauge woven
bags
Polystyrene (PS)
• Clear to opaque • Glassy surface • Rigid • Hard • Brittle • High clarity • Affected by fats and
solvents
• Packaging pellets • Yoghurt containers • Fast food trays • disposable cutlery • Coat hangers
Other plastics
• Mostly not available in sufficient quantities for recycling
7
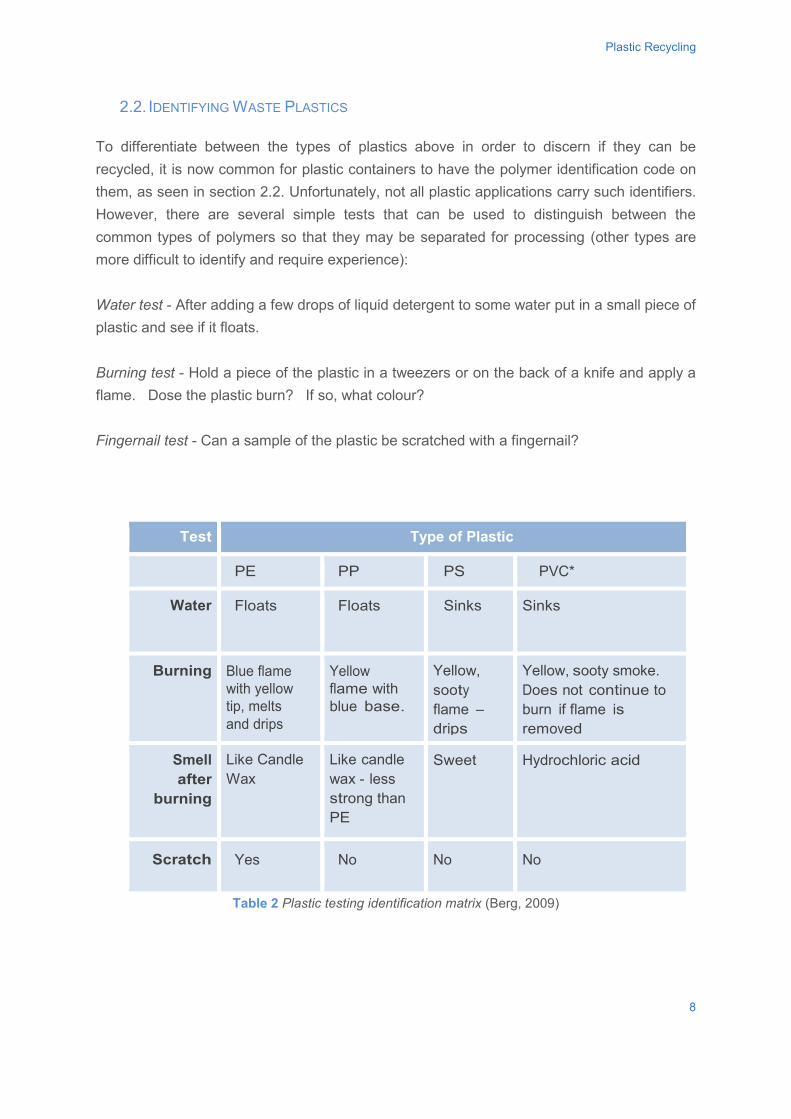
Plastic Recycling
2.2. IDENTIFYING WASTE PLASTICS
To differentiate between the types of plastics above in order to discern if they can be recycled, it is now common for plastic containers to have the polymer identification code on them, as seen in section 2.2. Unfortunately, not all plastic applications carry such identifiers. However, there are several simple tests that can be used to distinguish between the common types of polymers so that they may be separated for processing (other types are more difficult to identify and require experience): Water test - After adding a few drops of liquid detergent to some water put in a small piece of plastic and see if it floats. Burning test - Hold a piece of the plastic in a tweezers or on the back of a knife and apply a flame. Dose the plastic burn? If so, what colour? Fingernail test - Can a sample of the plastic be scratched with a fingernail?
Test Type of Plastic
PE PP PS PVC*
Water
Floats Floats
Sinks
Sinks
Burning
Blue flame with yellow tip, melts and drips
Yellow flame with blue base.
Yellow, sooty flame – drips
Yellow, sooty smoke. Does not continue to burn if flame is removed
Smell after
burning
Like Candle Wax
Like candle wax - less strong than PE
Sweet Hydrochloric acid
Scratch Yes No No No
Table 2 Plastic testing identification matrix (Berg, 2009)
8
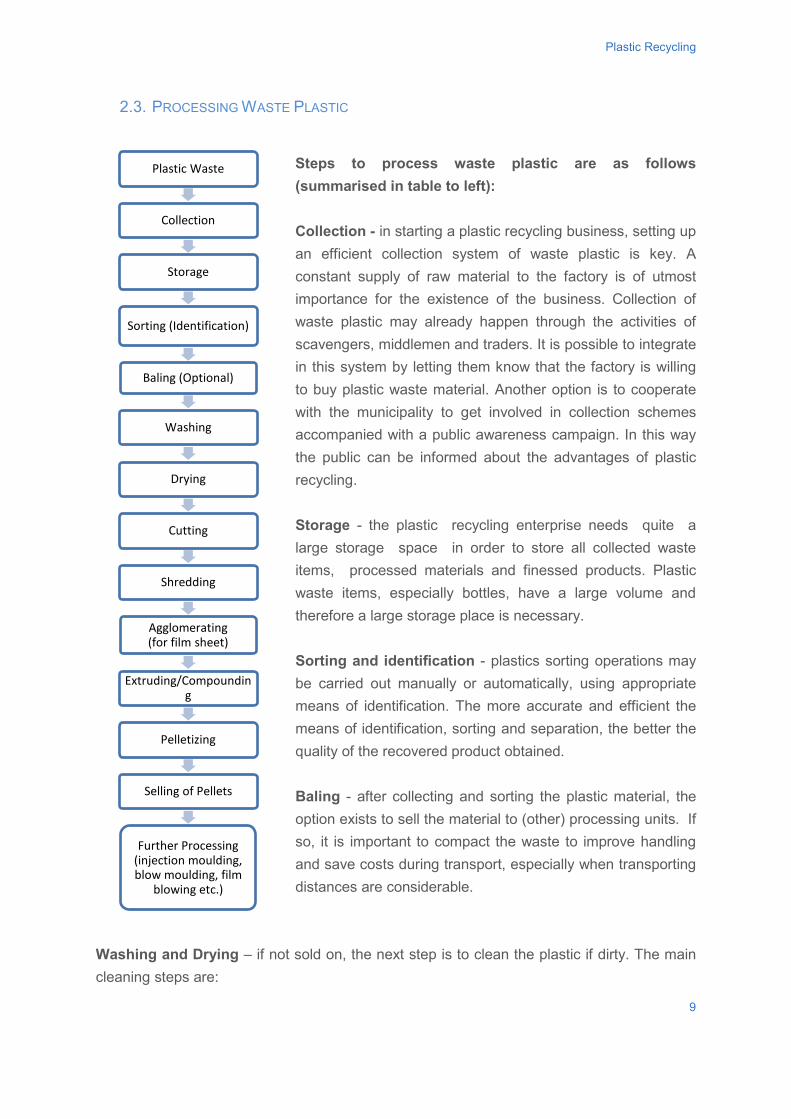
Plastic Recycling
2.3. PROCESSING WASTE PLASTIC
Steps to process waste plastic are as follows (summarised in table to left): Collection - in starting a plastic recycling business, setting up an efficient collection system of waste plastic is key. A constant supply of raw material to the factory is of utmost importance for the existence of the business. Collection of waste plastic may already happen through the activities of scavengers, middlemen and traders. It is possible to integrate in this system by letting them know that the factory is willing to buy plastic waste material. Another option is to cooperate with the municipality to get involved in collection schemes accompanied with a public awareness campaign. In this way the public can be informed about the advantages of plastic recycling. Storage - the plastic recycling enterprise needs quite a large storage space in order to store all collected waste items, processed materials and finessed products. Plastic waste items, especially bottles, have a large volume and therefore a large storage place is necessary. Sorting and identification - plastics sorting operations may be carried out manually or automatically, using appropriate means of identification. The more accurate and efficient the means of identification, sorting and separation, the better the quality of the recovered product obtained. Baling - after collecting and sorting the plastic material, the option exists to sell the material to (other) processing units. If so, it is important to compact the waste to improve handling and save costs during transport, especially when transporting distances are considerable.
Washing and Drying – if not sold on, the next step is to clean the plastic if dirty. The main cleaning steps are:
9
Plastic Waste
Collection
Storage
Sorting (Identification)
Baling (Optional)
Washing
Drying
Cutting
Shredding
Agglomerating (for film sheet)
Extruding/Compounding
Pelletizing
Selling of Pellets
Further Processing (injection moulding, blow moulding, film
blowing etc.)
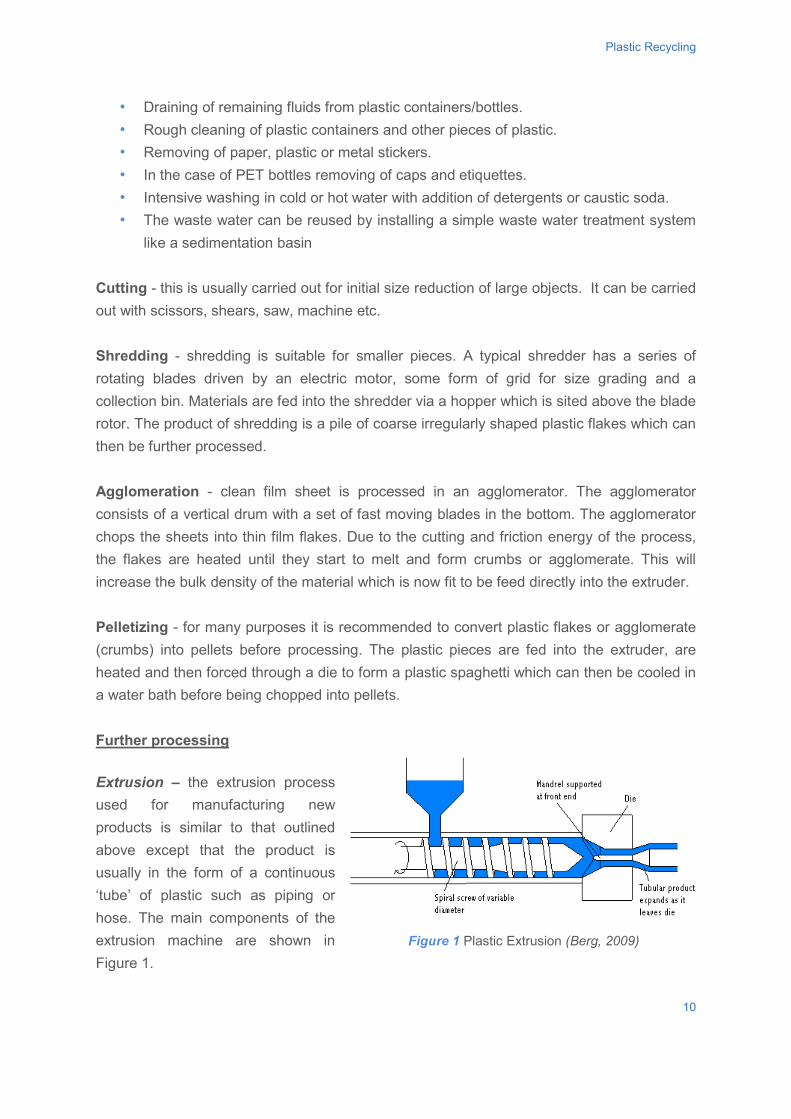
Plastic Recycling
• Draining of remaining fluids from plastic containers/bottles. • Rough cleaning of plastic containers and other pieces of plastic. • Removing of paper, plastic or metal stickers. • In the case of PET bottles removing of caps and etiquettes. • Intensive washing in cold or hot water with addition of detergents or caustic soda. • The waste water can be reused by installing a simple waste water treatment system
like a sedimentation basin
Cutting - this is usually carried out for initial size reduction of large objects. It can be carried out with scissors, shears, saw, machine etc. Shredding - shredding is suitable for smaller pieces. A typical shredder has a series of rotating blades driven by an electric motor, some form of grid for size grading and a collection bin. Materials are fed into the shredder via a hopper which is sited above the blade rotor. The product of shredding is a pile of coarse irregularly shaped plastic flakes which can then be further processed. Agglomeration - clean film sheet is processed in an agglomerator. The agglomerator consists of a vertical drum with a set of fast moving blades in the bottom. The agglomerator chops the sheets into thin film flakes. Due to the cutting and friction energy of the process, the flakes are heated until they start to melt and form crumbs or agglomerate. This will increase the bulk density of the material which is now fit to be feed directly into the extruder. Pelletizing - for many purposes it is recommended to convert plastic flakes or agglomerate (crumbs) into pellets before processing. The plastic pieces are fed into the extruder, are heated and then forced through a die to form a plastic spaghetti which can then be cooled in a water bath before being chopped into pellets. Further processing Extrusion – the extrusion process used for manufacturing new products is similar to that outlined above except that the product is usually in the form of a continuous ‘tube’ of plastic such as piping or hose. The main components of the extrusion machine are shown in Figure 1.
Figure 1 Plastic Extrusion (Berg, 2009)
10
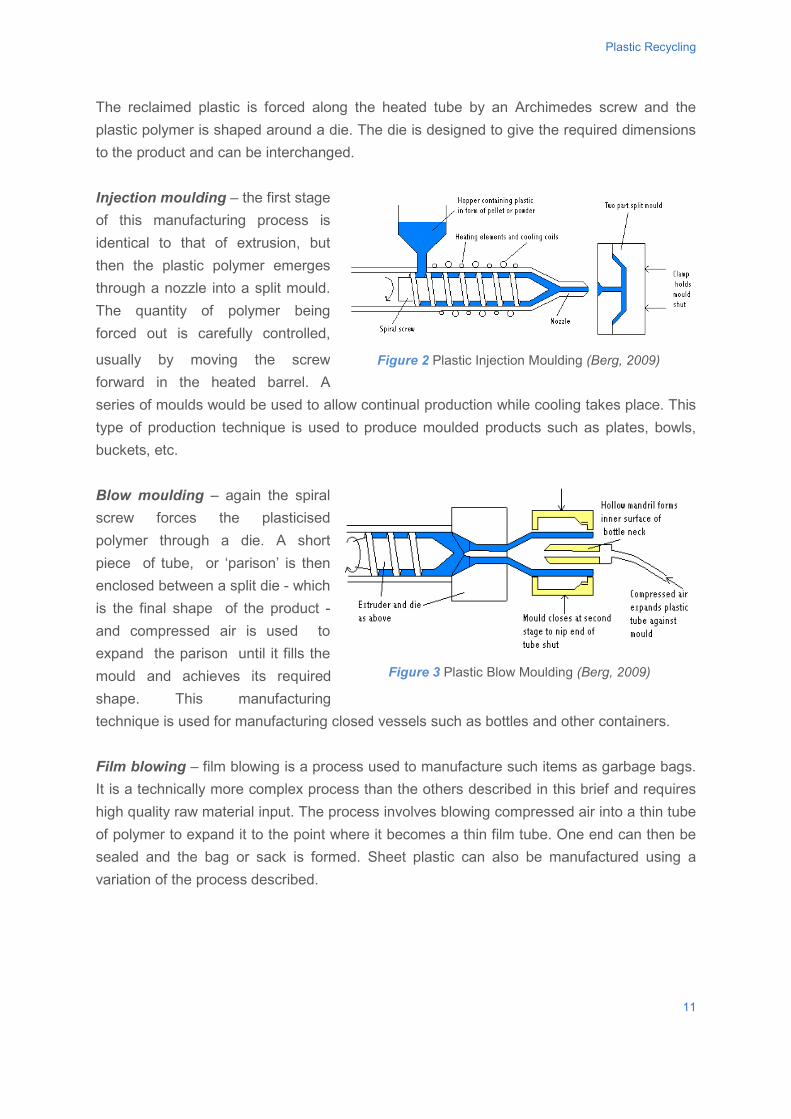
Plastic Recycling
The reclaimed plastic is forced along the heated tube by an Archimedes screw and the plastic polymer is shaped around a die. The die is designed to give the required dimensions to the product and can be interchanged. Injection moulding – the first stage of this manufacturing process is identical to that of extrusion, but then the plastic polymer emerges through a nozzle into a split mould. The quantity of polymer being forced out is carefully controlled,
usually by moving the screw forward in the heated barrel. A series of moulds would be used to allow continual production while cooling takes place. This type of production technique is used to produce moulded products such as plates, bowls, buckets, etc. Blow moulding – again the spiral screw forces the plasticised polymer through a die. A short piece of tube, or ‘parison’ is then enclosed between a split die - which is the final shape of the product - and compressed air is used to expand the parison until it fills the mould and achieves its required shape. This manufacturing technique is used for manufacturing closed vessels such as bottles and other containers. Film blowing – film blowing is a process used to manufacture such items as garbage bags. It is a technically more complex process than the others described in this brief and requires high quality raw material input. The process involves blowing compressed air into a thin tube of polymer to expand it to the point where it becomes a thin film tube. One end can then be sealed and the bag or sack is formed. Sheet plastic can also be manufactured using a variation of the process described.
Figure 2 Plastic Injection Moulding (Berg, 2009)
Figure 3 Plastic Blow Moulding (Berg, 2009)
11
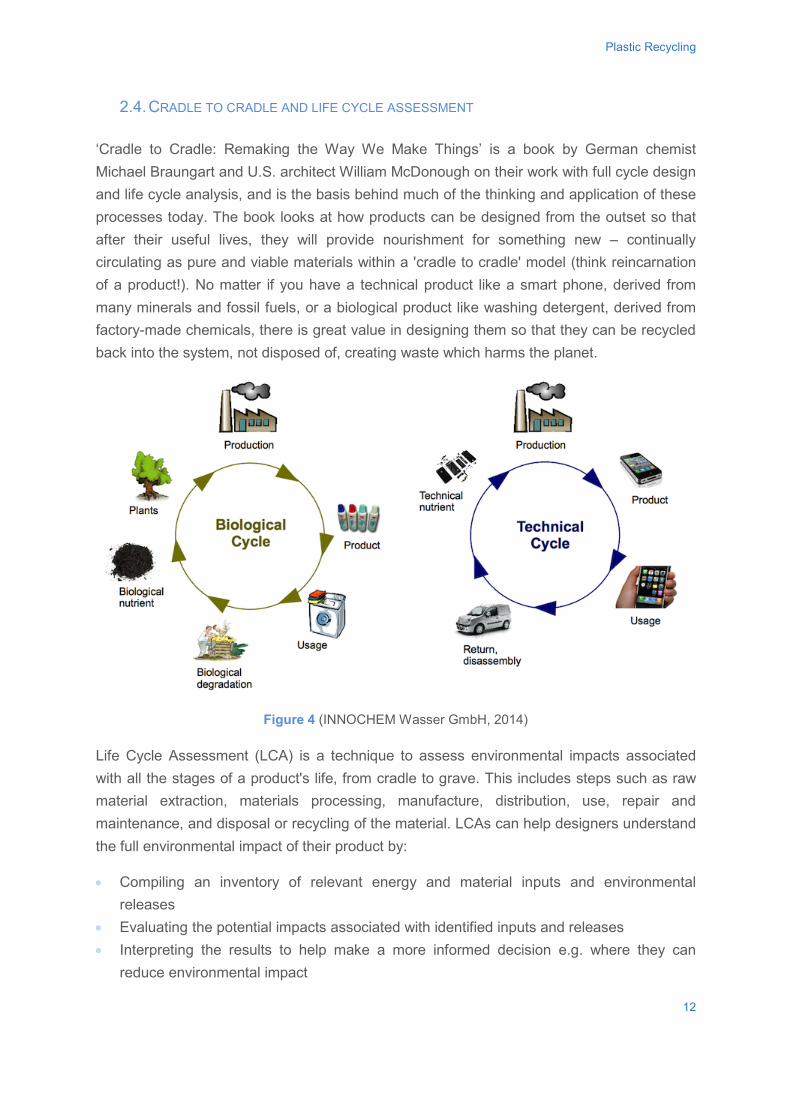
Plastic Recycling
2.4. CRADLE TO CRADLE AND LIFE CYCLE ASSESSMENT ‘Cradle to Cradle: Remaking the Way We Make Things’ is a book by German chemist Michael Braungart and U.S. architect William McDonough on their work with full cycle design and life cycle analysis, and is the basis behind much of the thinking and application of these processes today. The book looks at how products can be designed from the outset so that after their useful lives, they will provide nourishment for something new – continually circulating as pure and viable materials within a 'cradle to cradle' model (think reincarnation of a product!). No matter if you have a technical product like a smart phone, derived from many minerals and fossil fuels, or a biological product like washing detergent, derived from factory-made chemicals, there is great value in designing them so that they can be recycled back into the system, not disposed of, creating waste which harms the planet.
Figure 4 (INNOCHEM Wasser GmbH, 2014)
Life Cycle Assessment (LCA) is a technique to assess environmental impacts associated with all the stages of a product's life, from cradle to grave. This includes steps such as raw material extraction, materials processing, manufacture, distribution, use, repair and maintenance, and disposal or recycling of the material. LCAs can help designers understand the full environmental impact of their product by:
• Compiling an inventory of relevant energy and material inputs and environmental releases
• Evaluating the potential impacts associated with identified inputs and releases • Interpreting the results to help make a more informed decision e.g. where they can
reduce environmental impact
12
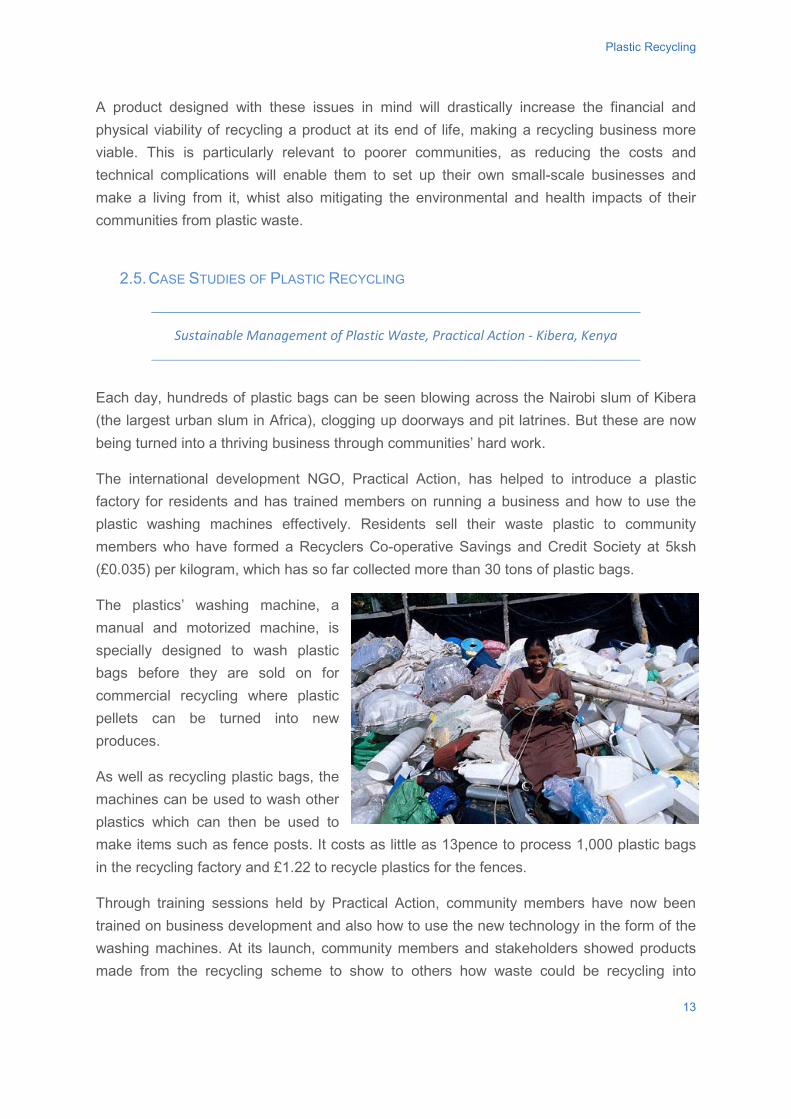
Plastic Recycling
A product designed with these issues in mind will drastically increase the financial and physical viability of recycling a product at its end of life, making a recycling business more viable. This is particularly relevant to poorer communities, as reducing the costs and technical complications will enable them to set up their own small-scale businesses and make a living from it, whist also mitigating the environmental and health impacts of their communities from plastic waste.
2.5. CASE STUDIES OF PLASTIC RECYCLING
Sustainable Management of Plastic Waste, Practical Action - Kibera, Kenya
Each day, hundreds of plastic bags can be seen blowing across the Nairobi slum of Kibera (the largest urban slum in Africa), clogging up doorways and pit latrines. But these are now being turned into a thriving business through communities’ hard work.
The international development NGO, Practical Action, has helped to introduce a plastic factory for residents and has trained members on running a business and how to use the plastic washing machines effectively. Residents sell their waste plastic to community members who have formed a Recyclers Co-operative Savings and Credit Society at 5ksh (£0.035) per kilogram, which has so far collected more than 30 tons of plastic bags.
The plastics’ washing machine, a manual and motorized machine, is specially designed to wash plastic bags before they are sold on for commercial recycling where plastic pellets can be turned into new produces.
As well as recycling plastic bags, the machines can be used to wash other plastics which can then be used to make items such as fence posts. It costs as little as 13pence to process 1,000 plastic bags in the recycling factory and £1.22 to recycle plastics for the fences.
Through training sessions held by Practical Action, community members have now been trained on business development and also how to use the new technology in the form of the washing machines. At its launch, community members and stakeholders showed products made from the recycling scheme to show to others how waste could be recycling into
13
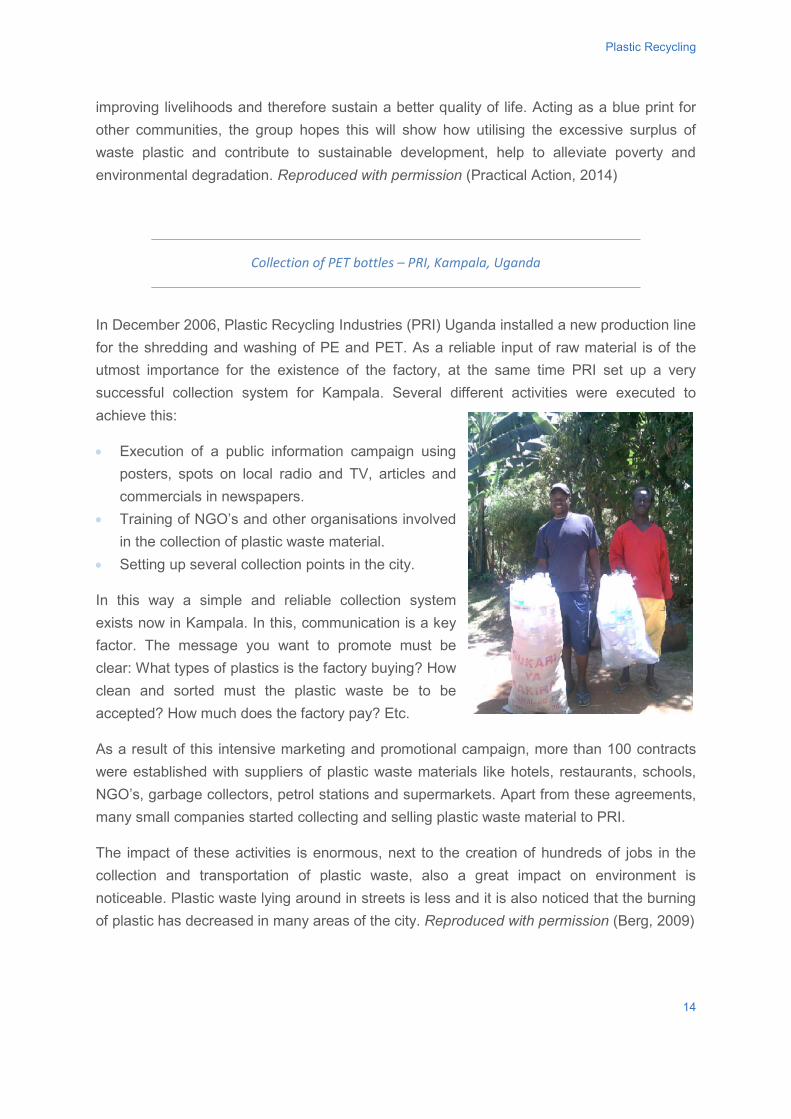
Plastic Recycling
improving livelihoods and therefore sustain a better quality of life. Acting as a blue print for other communities, the group hopes this will show how utilising the excessive surplus of waste plastic and contribute to sustainable development, help to alleviate poverty and environmental degradation. Reproduced with permission (Practical Action, 2014)
Collection of PET bottles – PRI, Kampala, Uganda
In December 2006, Plastic Recycling Industries (PRI) Uganda installed a new production line for the shredding and washing of PE and PET. As a reliable input of raw material is of the utmost importance for the existence of the factory, at the same time PRI set up a very successful collection system for Kampala. Several different activities were executed to achieve this:
• Execution of a public information campaign using posters, spots on local radio and TV, articles and commercials in newspapers.
• Training of NGO’s and other organisations involved in the collection of plastic waste material.
• Setting up several collection points in the city.
In this way a simple and reliable collection system exists now in Kampala. In this, communication is a key factor. The message you want to promote must be clear: What types of plastics is the factory buying? How clean and sorted must the plastic waste be to be accepted? How much does the factory pay? Etc.
As a result of this intensive marketing and promotional campaign, more than 100 contracts were established with suppliers of plastic waste materials like hotels, restaurants, schools, NGO’s, garbage collectors, petrol stations and supermarkets. Apart from these agreements, many small companies started collecting and selling plastic waste material to PRI.
The impact of these activities is enormous, next to the creation of hundreds of jobs in the collection and transportation of plastic waste, also a great impact on environment is noticeable. Plastic waste lying around in streets is less and it is also noticed that the burning of plastic has decreased in many areas of the city. Reproduced with permission (Berg, 2009)
14
Plastic Recycling
3. CLASS ACTIVITY The first activity will be to map out ‘cradle to cradle’ lifespan of a common product or plastic material used in the individual student’s home. The student should select two alternatives: the product as if made from new material and the product as if it is made from recycled material (processing the plastic, from oil or recycled waste, should be included) including all the steps and processes along the way, this will underpin the following LCA exercise. Students should also explain how or if they can think of ways to reduce the impact by changes in design or process that may remove or reduce the impact of the processes the item being investigated.
An example of how this process can be carried out is at http://www.openlca.org/documentation/index.php/Case_study:_Beer_Bottle – a case study of how to compare an aluminium can with a PET bottle.
The second activity will be to conduct a simple lifecycle assessment of the two options utilising open source online tools – an LCA program, available from http://www.openlca.org/download_page, and data sets for their required processes and materials at https://nexus.openlca.org/searchds/plastic. The tutor will need to spend some time learning from the tutorials how these tools operate. These results can then be compared and discussed to assess if using new grade or recycled grade plastic is the more sustainable option, depending on the different products the students have chosen to assess. This is either an individual exercise with a group discussion component, or a group exercise. It should be kept in mind that there is no absolute answer generated, as the numbers will depend on the level of detail and assumptions the students make. There should however be a clear difference, of at least a 50-70% reduction in impact by the use of recycled materials.
For the exercises, it is suggested that the item chosen for examination by the student is simple, with only one or two plastics and processes (such as a plastic water bottle) as LCA’s, in particular, can be very complex.
3.1. SOLUTION AND EVALUATION CRITERIA
There are no absolute answers for the above activities as the purpose is for students to understand the complexities and subtleties of measuring environmental impact. Thus, grading can be based on how well the students engaged with, and used, the tools and processes to produce a detailed comprehensive response and analyses.
15
Plastic Recycling
4. HOMEWORK ACTIVITY Based on one of the two case studies in Kenya or Uganda, create a basic business plan using the separate word template and excel documents attached. This is a simplified business plan with financial projections for two years – for the sake of simplicity, financing complications have been removed.
It will be particularly important for students to research and justify their hypothesis, for example;
• Salaries in the city chosen • Amount of recycling collected per day • Delivery methods • Capital (equipment) costs to start the business.
16
Plastic Recycling
5. BIBLIOGRAPHY
Berg, S. v. d., 2009. Technical Brief - Recycling Plastics, Rugby: Practical Action.
Hopewell, J., Dvorak, R. & Kosior, E., 2009. Plastics recycling: challenges and opportunities. Plastics, the environment and human health, 14 06.
INNOCHEM Wasser GmbH, 2014. About Us - Cradle to Cradle. [Online] Available at: http://www.innochem-online.de/en/about-us/cradle-to-cradle/
Practical Action, 2014. Plastic Recycling. [Online] Available at: http://practicalaction.org/plastics-recycling [Accessed 14 08 2014].
The Economist, 2007. The truth about recycling. Technology Quarterly.
UNEP, n.d. IETC - Project converting waste plastic into fuel. [Online] Available at: http://www.unep.org/ietc/ourwork/wastemanagement/projects/wasteplasticsproject/tabid/79203/default.aspx [Accessed 14 07 2014].
Vest, H., 2000. Small Scale Recycling of Plastic Waste, s.l.: Gate Infortmation Service.
17

http://www.gdee.eu
This project is funded by