carbonate dissolution and temporal abundances of foraminifera in long island sound sediments
TRANSCRIPT
Limnol. Oceanogr., 38(2), 1993, 33 l-345 0 1993, by the American Society of Limnology and Oceanography, Inc.
Carbonate dissolution and temporal abundances of Foraminifera in Long Island Sound sediments
Mark A. Green, Robert C. Aller, and Josephine Y. Aller Marine Sciences Research Center, SUNY at Stony Brook, Stony Brook, New York 11794
Abstract
The dynamics of benthic Foraminifera assemblages can be used to examine carbonate dissolution processes in nearshore sediments and as a general assay of physical-chemical factors affecting survival of juvenile benthos. Abundances of total Foraminifera (live and dead) fluctuate regularly throughout the year in Long Island Sound (LIS) mud deposits, with highest numbers in spring-summer and lowest in winter. Essentially all forams disappear each year. Pore-water undersaturation with respect to carbonate minerals coincides with periods of rapid disappearance of forams and suggests that these fluctuations reflect a balance between the rate of production-recruitment and the rates of death and dissolution of the calcareous tests of the animals. Reworking by macrofauna in LIS central basin sediments inhibits accu- mulation or depletion of pore-water solutes and is responsible for minimizing pore-water carbonate saturation states. Quantitative estimates of seasonal patterns of foram dissolution with a simple mass balance model give a minimum average annual flux of Caz+ in LIS sediments of -6 mmol Ca2+ m-2 d- 1 (due solely to Foraminifera dissolution). Abandoned tests have a maximum mean residence time of -86+ 13 d. Dissolution-precipitation of forams may significantly affect benthic ZCO, fluxes and likely accounts for a large proportion (>30%) during some seasons or at some locales. Other organisms with carbonate tests of similar size, particularly juvenile bivalves, may also be affected by periods of under- saturated pore waters. Conditions promotinn dissolution of tests may represent an important source of mortality for calcareous meiofauna.
Relatively little attention has been focused on carbonate dissolution in estuarine and shelf sediments because shallow marine waters are generally saturated with respect to calcite and aragonite, the common low-temperature poly- morphs of CaC03 (Morse 1983). If, however, this state of saturation does not continue below the sediment-water interface, there are im- portant consequences for the preservation of carbonate shells and processes sensitive to changes in pH and alkalinity. Several previous studies have concluded that substantial dis- solution occurs in nearshore sediments under- lying supersaturated water (e.g. Aller 1982; Walters and Burton 1990). Dissolution results primarily from organic matter or mineral ox- idation and the corresponding increases in ac- ids such as H2CO3, HNO,, and H2S04.
In the present study, we investigated car- bonate dissolution in surface sediments of Long
Acknowledgments We thank P. D. Rude, H. Vigil, B. Rizitello, M. Sun,
Q. Xia, S. Wirick, J. Mackin, and I. Stupakoff for assis- tance in the field. P. D. Rude provided additional help in the laboratory. We also thank R. Keir for a review.
This work was supported by U.S. EPA grant CE002870026, NSF grant OCE 90-O 1397, and DEC grant PN82 173A.
Marine Sciences Research Center contribution 830.
Island Sound, an estuarine environment on the northeastern U.S. coast. Although dissolution is known to occur extensively in these sedi- ments (Aller 1982), the effect on benthos with carbonate tests is not well understood. This study focused on the soundwide population dynamics of benthic Foraminifera and pore- water saturation states to elucidate the spatial and temporal patterns of carbonate produc- tion, dissolution, and preservation. Because of their small size, the pristine appearance of live individuals, and their extremely high densities in the mud deposits of Long Island Sound, Foraminifera are ideal indicator organisms in the study of shallow-water carbonate dissolu- tion; they offer greater resolution of related processes than would be possible studying only the large carbonate debris of macrobenthic or- ganisms. They may also act as a useful indi- cator of conditions faced by colonizing calcar- eous benthos of comparable size and life position.
Study area Long Island Sound is a shallow estuary (Fig.
1). The Connecticut River is the major fresh- water contributor to the sound, adding a vol- ume of -0.03 km3 d-l. Freshwater inputs sig- nificantly influence circulation, producing an
331
332 Green et al.
CONNECTICUT 41015’
JEFFERSON
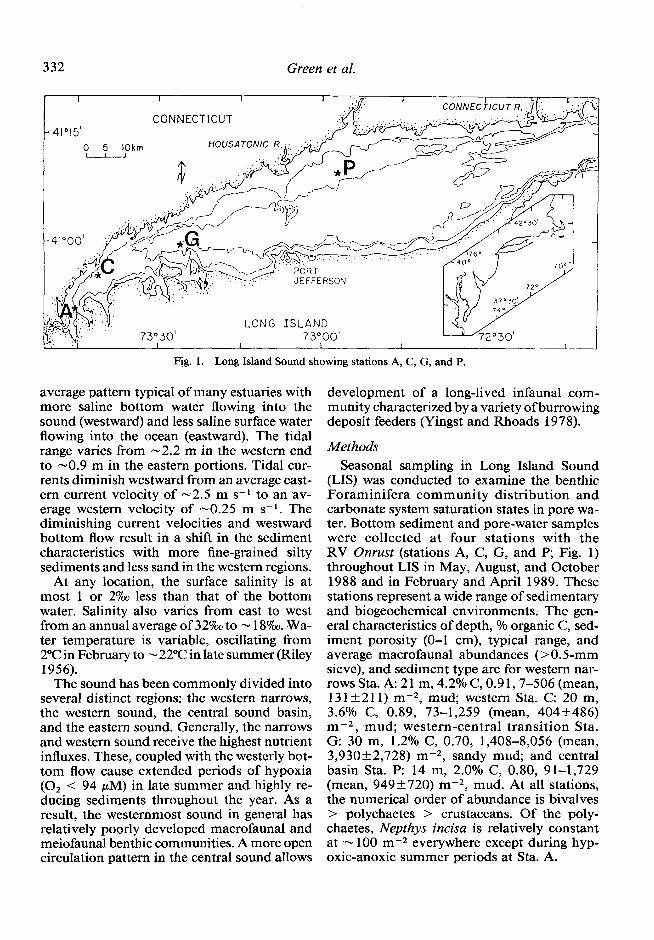
Fig. 1. Long Island Sound showing stations A, C, G, and P.
average pattern typical of many estuaries with more saline bottom water flowing into the sound (westward) and less saline surface water flowing into the ocean (eastward). The tidal range varies from -2.2 m in the western end to -0.9 m in the eastern portions. Tidal cur- rents diminish westward from an average east- ern current velocity of - 2.5 m s- l to an av- erage western velocity of -0.25 m s-l. The diminishing current velocities and westward bottom flow result in a shift in the sediment characteristics with more fine-grained silty sediments and less sand in the western regions.
At any location, the surface salinity is at most 1 or 29~ less than that of the bottom water. Salinity also varies from east to west from an annual average of 329m to - 189~. Wa- ter temperature is variable, oscillating from 2°C in February to - 22°C in late summer (Riley 1956).
The sound has been commonly divided into several distinct regions: the western narrows, the western sound, the central sound basin, and the eastern sound. Generally, the narrows and western sound receive the highest nutrient influxes. These, coupled with the westerly bot- tom flow cause extended periods of hypoxia (0, < 94 PM) in late summer and highly re- ducing sediments throughout the year. As a result, the westernmost sound in general has relatively poorly developed macrofaunal and meiofaunal benthic communities. A more open circulation pattern in the central sound allows
development of a long-lived infaunal com- munity characterized by a variety of burrowing deposit feeders (Yingst and Rhoads 1978).
Methods Seasonal sampling in Long Island Sound
(LIS) was conducted to examine the benthic Foraminifera community distribution and carbonate system saturation states in pore wa- ter. Bottom sediment and pore-water samples were collected at four stations with the RV Onrust (stations A, C, G, and P; Fig. 1) throughout LIS in May, August, and October 1988 and in February and April 1989. These stations represent a wide range of sedimentary and biogeochemical environments. The gen- eral characteristics of depth, % organic C, sed- iment porosity (O-l cm), typical range, and average macrofaunal abundances (> 0.5-mm sieve), and sediment type are for western nar- rows Sta. A: 2 1 m, 4.2% C, 0.9 1,7-506 (mean, 13 1+2 11) rnm2, mud; western Sta. C: 20 m, 3.6% C, 0.89, 73-1,259 (mean, 404+486) rnm2, mud; western-central transition Sta. G: 30 m, 1.2% C, 0.70, 1,408-8,056 (mean, 3,930 k 2,728) m-2, sandy mud; and central basin Sta. P: 14 m, 2.0% C, 0.80, 91-1,729 (mean, 949f720) m-2, mud. At all stations, the numerical order of abundance is bivalves > polychaetes > crustaceans. Of the poly- chaetes, Nepthys incisa is relatively constant at - 100 me2 everywhere except during hyp- oxic-anoxic summer periods at Sta. A.
Forum dissolution 333
Meiofauna sampling-Three butyrate sub- cores (4.5cm i.d.) for meiofaunal sampling were removed from a Soutar-type box corer (N 0.1 m2), extruded upward, and sectioned at sixdepthintervals(O-O.5,0.5-1.0,1.0-2.0,2.0- 3.0, 3.0-5.0, and 5.0-7.0 cm). After gentle mixing by hand, 3-cm3 subsamples from each depth interval were placed into each of three preweighed plastic scintillation vials and fixed with 10 ml of 0.3% glutaraldehyde made up in a 3% NaCl solution. Sediment water content was estimated by weight loss of water on a subsample of the remaining sediment dried at 60°C.
In the laboratory, prior to identification, samples were stained with Rose Bengal follow- ing the procedure of Walton (1952), lightly vortexed to ensure even distribution of the stain, and sieved through a 62-pm-mesh screen after 24 h. Foraminifera were sorted under a dissecting microscope, identified, and enu- merated. Abundances are reported as No. g-l (sediment dry wt). Forams were further cate- gorized by differentiating between live and dead individuals. Aside from the absence of stain indicator, dead forams were distinctly trans- lucent in contrast to the nearly transparent ap- pearance of tests of live forams.
Pore- water sampling and analysis - Sub- cores similar to those described above were sectioned under nitrogen in a glove bag and pore water was separated without air contact by means of centrifugation (20 min, 5,000 rpm). Pore water was filtered through a 0.2-pm Nu- clepore filter, acidified with concentrated HCl (10 ~1 of 12 N HCl per 1 .O-ml sample) to pre- vent precipitation of solid phase minerals, stored in acid and distilled water-rinsed scin- tillation vials, and refrigerated. Overlying wa- ter chloride (Cl-) concentrations were also de- termined with a Radiometer CMT chloride titrator on overlying water taken from each box core at the time of sampling (precision < 1% RSD, relative standard deviation).
Portions of acidified sample were diluted in La2+ buffer (2.25 mg ml-l) and calcium (Ca2+ ) analyzed with a precision of 2% (RSD) by atomic absorption spectrometry on a Perkin- Elmer 5000 atomic absorption spectropho- tometer. Bromine (Br-) was analyzed colori- metrically with a precision of 2% (RSD). Total alkalinity was determined on unacidified, fil- tered samples with the technique ,of Edmond
(1970). Samples were stored in the dark at 4°C before analysis (within 3 weeks). pH (NBS ref- erenced standards) was measured in the cen- trifuged sediment samples with an Orion Re- search digital pH/mV meter (model 70 1A) equipped with a combination punch-in elec- trode. Measurements were made immediately after pore-water removal to minimize the pH change due to degassing. Separate experiments demonstrated that punch-in pH measure- ments of centrifuged samples agree well with those of fresh sediment. Results
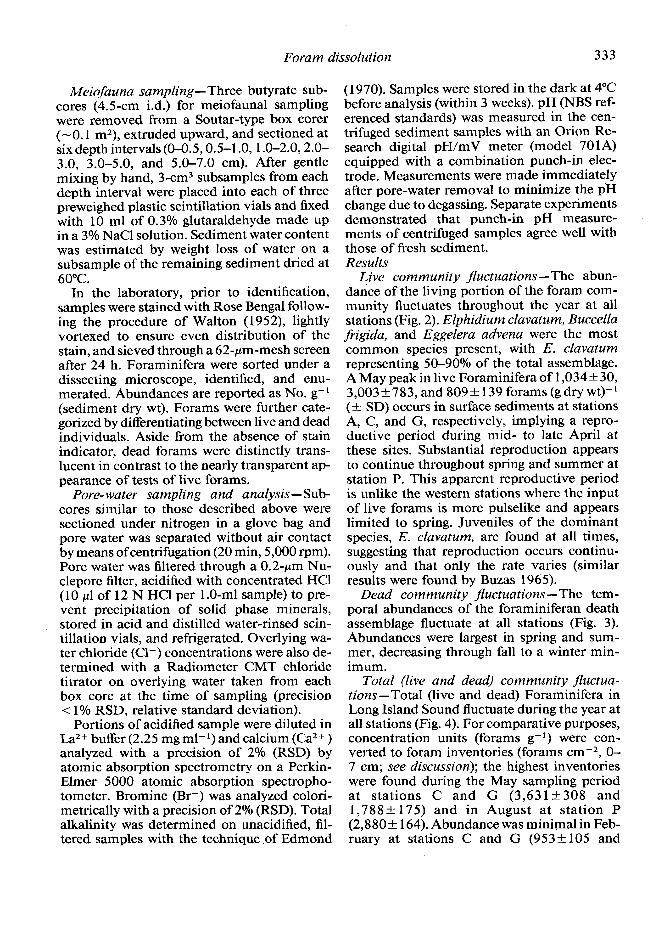
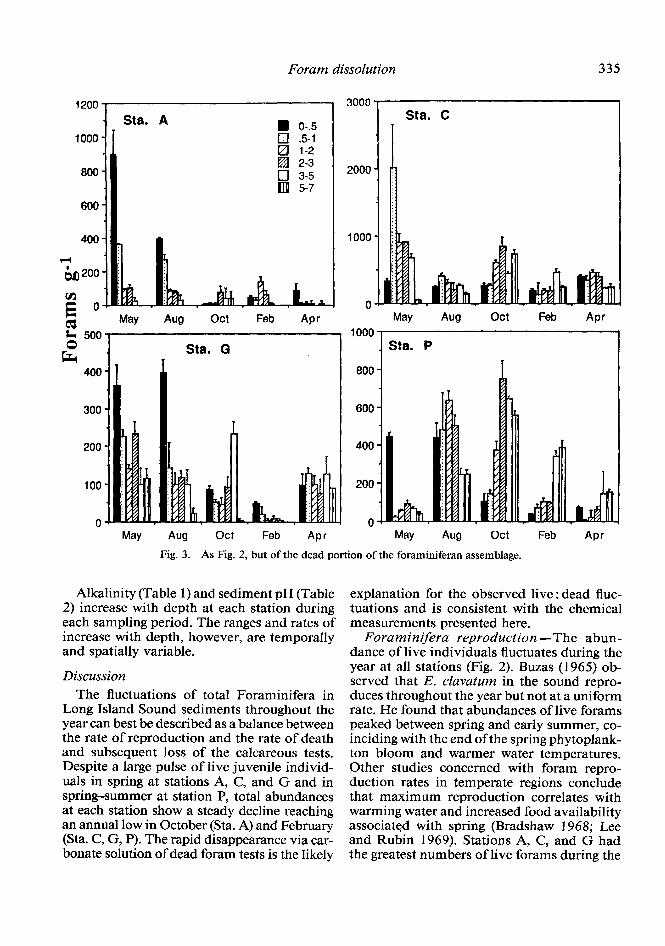
hive community fluctuations-The abun- dance of the living portion of the foram com- munity fluctuates throughout the year at all stations (Fig. 2). Elphidium clavatum, Buccella frigida, and Eggelera advena were the most common species present, with E. clavatum representing 50-90% of the total assemblage. A May peak in live Foraminifera of 1,034 f 30, 3,003+783, and 809& 139 forams (g dry wt)-’ (4 SD) occurs in surface sediments at stations A, C, and G, respectively, implying a repro- ductive period during mid- to late April at these sites. Substantial reproduction appears to continue throughout spring and summer at station P. This apparent reproductive period is unlike the western stations where the input of live forams is more pulselike and appears limited to spring. Juveniles of the dominant species, E. clavatum, are found at all times, suggesting that reproduction occurs continu- ously and that only the rate varies (similar results were found by Buzas 1965).
Dead community fluctuations-The tem- poral abundances of the foraminiferan death assemblage fluctuate at all stations (Fig. 3). Abundances were largest in spring and sum- mer, decreasing through fall to a winter min- imum.
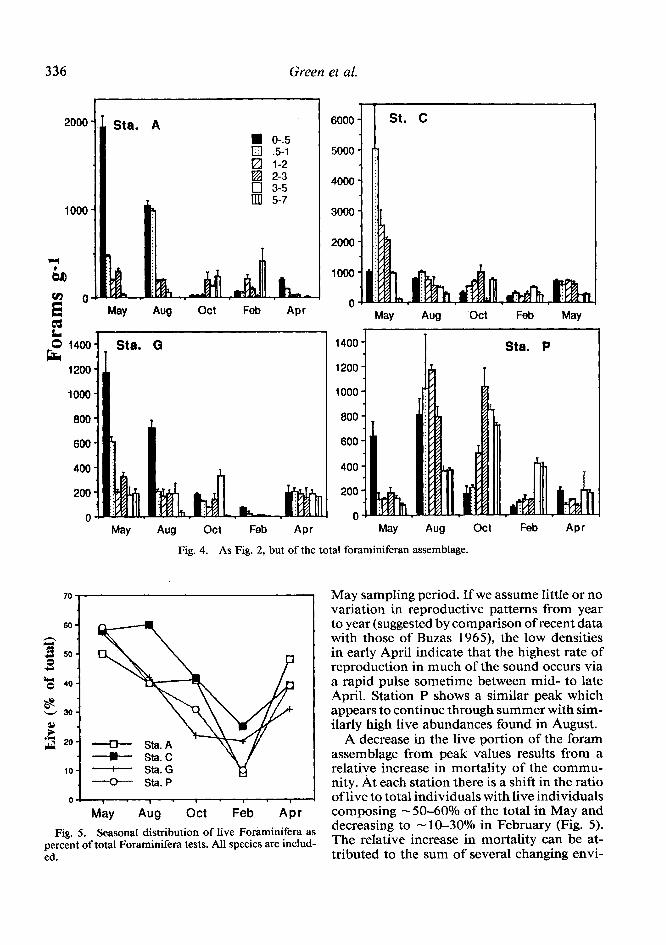
Total (live and dead) community jluctua- tions-Total (live and dead) Foraminifera in Long Island Sound fluctuate during the year at all stations (Fig. 4). For comparative purposes, concentration units (forams g-l) were con- verted to foram inventories (forams cmm2, O- 7 cm; see discussion); the highest inventories were found during the May sampling period at stations C and G (3,63 l&308 and 1,788_+ 175) and in August at station P (2,880_+ 164). Abundance was minimal in Feb- ruary at stations C and G (95 3 +: 105 and
334 Green et al.
800-
600-
800
600
Sta. A
May WI Ott Feb APT
Sta. G 900
800
700
600
500
400
300
200
100
0 May Aw Ott Feb APT May Aw Ott Feb Av
Sta. C
May Aw act Feb Apr
Fig. 2. Temporal variability of the live portion of the foraminiferan assemblage. Units are forams (g dry wt sediment)-’ (-I SD).
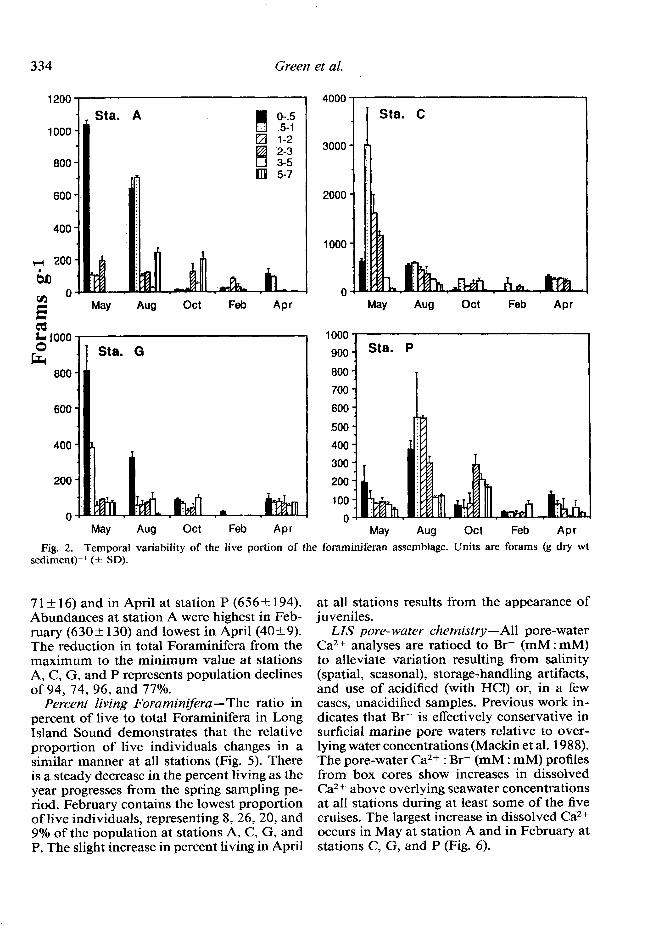
7 1 + 16) and in April at station P (656& 194). Abundances at station A were highest in Feb- ruary (6302 130) and lowest in April (405 9). The reduction in total ForaminiFera from the maximum to the minimum value at stations A, C, G, and P represents population declines of 94, 74, 96, and 77%.
Percent living Foraminifera -The ratio in percent of live to total Foraminifera in Long Island Sound demonstrates that the relative proportion of live individuals changes in a similar manner at all stations (Fig. 5). There is a steady decrease in the percent living as the year progresses from the spring sampling pe- riod. February contains the lowest proportion of live individuals, representing 8, 26, 20, and 9% of the population at stations A, C, G, and P. The slight increase in percent living in April
at all stations results from the appearance of juveniles.
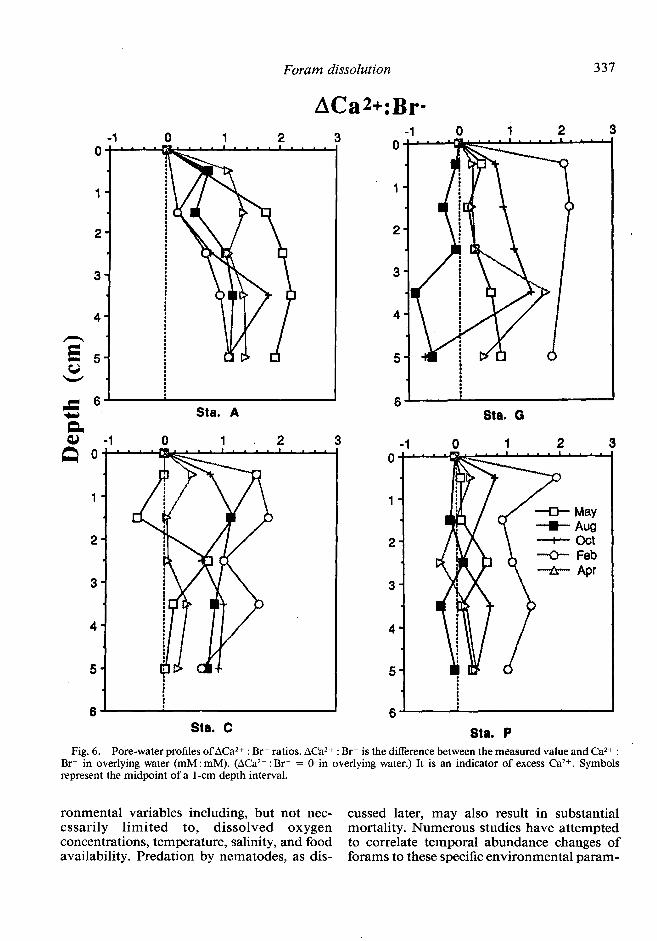
LIS pore- water chemistry-All pore-water Ca2+ analyses are ratioed to Br- (mM : mM) to alleviate variation resulting from salinity (spatial, seasonal), storage-handling artifacts, and use of acidified (with HCl) or, in a few cases, unacidified samples. Previous work in- dicates that Br- is effectively conservative in surficial marine pore waters relative to over- lying water concentrations (Ma&in et al. 1988). The pore-water Ca2+ : Br- (mM : mM) profiles from box cores show increases in dissolved Ca2+ above overlying seawater concentrations at all stations during at least some of the five cruises. The largest increase in dissolved Ca2+ occurs in May at station A and in February at stations C, G, and P (Fig. 6).
Forum dissolution 335
600
400
l4 &200
VI c 0
zi May Ott Feb APT
8 5oo k
400
100
0 May Aw Ott Feb Apr
I Sta. C
May Aw Ott F&I APT
Sta. P
800 I
600
400
200
0 May Aw Ott Feb Apr
Fig. 3. As Fig. 2, but of the dead portion of the foraminiferan assemblage.
Alkalinity (Table 1) and sediment pH (Table 2) increase with depth at each station during each sampling period. The ranges and rates of increase with depth, however, are temporally and spatially variable.
Discussion The fluctuations of total Foraminifera in
Long Island Sound sediments throughout the year can best be described as a balance between the rate of reproduction and the rate of death and subsequent loss of the calcareous tests. Despite a large pulse of live juvenile individ- uals in spring at stations A, C, and G and in spring-summer at station P, total abundances at each station show a steady decline reaching an annual low in October (Sta. A) and February (Sta. C, G, P). The rapid disappearance via car- bonate solution of dead foram tests is the likely
explanation for the observed live : dead fluc- tuations and is consistent with the chemical measurements presented here.
Foraminifera reproduction -The abun- dance of live individuals fluctuates during the year at all stations (Fig. 2). Buzas (1965) ob- served that E. clavatum in the sound repro- duces throughout the year but not at a uniform rate. He found that abundances of live forams peaked between spring and early summer, co- inciding with the end of the spring phytoplank- ton bloom and warmer water temperatures. Other studies concerned with foram repro- duction rates in temperate regions conclude that maximum reproduction correlates with warming water and increased food availability associated with spring (Bradshaw 1968; Lee and Rubin 1969). Stations A, C, and G had the greatest numbers of live forams during the
336 Green et al.
May Aw Feb APT
May Aw Feb Apr
- 6000 -
May Feb May
1200
1000
800
600
400
200
0 May Aw Feb Apr
Fig. 4. As Fig. 2, but of the total foraminiferan assemblage.
‘O’
G !%.A + Sta. C + Sta. G --O--- Sta. P
o! , . , . 1 . I - I J
May Aw Ott Feb APr Fig. 5. Seasonal distribution of live Foraminifera as
percent of total Foraminifera tests. All species are includ- ed.
May sampling period. If we assume little or no variation in reproductive patterns from year to year (suggested by comparison of recent data with those of Buzas 1965), the low densities in early April indicate that the highest rate of reproduction in much of the sound occurs via a rapid pulse sometime between mid- to late April. Station P shows a similar peak which appears to continue through summer with sim- ilarly high live abundances found in August.
A decrease in the live portion of the foram assemblage from peak values results from a relative increase in mortality of the commu- nity. At each station there is a shift in the ratio of live to total individuals with live individuals composing -5O-60% of the total in May and decreasing to - lo-30% in February (Fig. 5). The relative increase in mortality can be at- tributed to the sum of several changing envi-
Forum dissolution 337
ACaz+:Br-
1
2
3
4
Sta. A
Sta. C
: :
6 i
Sta. G
2-
3-
4-
5-
-I3- May -I)- Aug + act --Cl- Feb --dk-- Apr
6 I
Sta. P Fig. 6. Pore-water profiles ofACa2-t : Br- ratios. ACa2+ : Br- is the difference between the measured value and Ca2+ :
Br- in overlying water (mM: mM). (ACa 2+ * Br- = 0 in overlying water.) It is an indicator of excess Ca2+. Symbols . represent the midpoint of a l-cm depth interval.
ronmental variables including, but not nec- cussed later, may also result in substantial essarily limited to, dissolved oxygen mortality. Numerous studies have attempted concentrations, temperature, salinity, and food to correlate temporal abundance changes of availability. Predation by nematodes, as dis- forams to these specific environmental param-

338 Green et al.
Table 1. Pore-water alkalinity (meq liter-‘) at Long Island Sound stations.
Depth (cm) May A@ Ott Feb
o-1 3.04 l-2 5.82 2-3 11.2 3-4 15.2 4-5 20.3 5-6 24.0
O-l 3.62 l-2 5.29 2-3 6.22 3-4 6.91 4-5 7.33 5-6 7.88
O-l 2.15 l-2 3.02 2-3 3.63 3-4 2.30 4-5 4.01 5-6 -
O-l 2.13 l-2 1 .oo 2-3 1.89 3-4 2.21 4-5 2.61 5-6 2.83
Sta. A 3.31 4.37 4.93 5.74 6.60 7.66
Sta. C 3.62 5.29 6.22 6.91 6.33
-
Sta. G 2.73 2.74 2.93 3.34 3.05
-
Sta. P 2.30 2.36 2.63 2.37 2.34 2.69
6.64 5.07 10.6 8.47 16.7 12.1 22.1 14.9 24.9 19.4 25.0 25.1
2.81 3.56 3.16 5.63 3.49 3.52 3.83 3.93 3.59 4.62 4.02 5.97
1.68 1.65 3.21 3.82 4.38 5.11
2.33 2.27 2.50 2.42 2.44
-
2.30 2.44 2.54 2.59 2.63
-
2.30 2.52 3.12 3.24 3.66 3.66
Table 2. Sediment pH at Long Island Sound stations.
Depth (cm) May A@ Ott Feb Apr
O-l 6.77 l-2 6.83 2-3 7.20 3-4 7.60 4-5 7.54 5-6 7.96
O-l 7.34 l-2 7.23 2-3 7.77 3-4 7.75 4-5 7.68 5-6 7.96
o-1 l-2 2-3 34 4-5 5-6
7.79 7.75 7.53 7.96 7.95
-
O-l 7.42 l-2 7.51 2-3 7.47 3-4 7.52 4-5 7.52 5-6 7.74
Sta. A 7.89 7.77 7.72 8.11 7.87 7.91 7.86 7.71 7.87 7.88 7.91 7.70
Sta. C 7.50 7.50 7.57 7.63 7.81 7.55 7.93 7.58 7.87 7.72 7.82 7.74
Sta. G 7.83 7.55 7.80 7.62 8.05 7.50 7.74 7.55 7.96 7.56
7.57
Sta. P 7.69 7.40 7.75 7.46 7.64 7.43 7.67 7.41 7.95 7.37 8.13 7.41
7.58 7.79 7.57 7.81 7.78 7.82 7.81 7.81 7.70 7.78
- 7.79
7.24 7.77 7.40 7.76 7.50 7.78 7.51 7.77 7.56 7.78
- 7.79
7.53 7.83 7.70 7.85 7.76 7.82 7.57 7.70 7.20 7.56
- 7.63
7.27 7.52 7.53 7.62 7.60
-
7.49 7.52 7.49 7.54 7.55 7.54
eters and concluded that as a set, but not in- dividually, they can explain abundance differ- ences (Bradshaw 1968; Akpati 1975).
Fluctuations in total Foraminifera (Fig. 4) suggest that as individuals die, their tests dis- solve. This dissolution has been reported in other studies as a possible mechanism for con- trolling total abundances in salt marshes, bays, and estuaries as well as the transition from live to fossil assemblages (Buzas 1965; Bradshaw 1968; Akpati 1975). In this study, dissolution is thought to be the dominant agent controlling temporal fluctuations of the total foram assem- blage in the sound. The extremely low levels of total Foraminifera in February at all sites strongly suggest that essentially the entire pro- duction dissolves each year.
Additional evidence for dissolution -Car- bonate dissolution is demonstrated by pore- water Ca2+ : Br- ratios which are greater than overlying water values during certain periods of the year at each station. The largest accu-
mulation of dissolved Ca2+ seems to occur in February at stations C, G, and P (overlying water assigned a relative Ca2+ : Br- value of 0) (Fig. 6). Similar seasonal increases of Ca2+ in LIS pore waters were found by Aller (1982).
Total molarities of Ca2+ and COs2- were determined and compared to the apparent sol- ubilities, Kfsp, for calcite and aragonite calcu- lated according to the temperature and chlo- rinity at the time of sampling (Miller0 1979). Carbonate alkalinity was estimated for each depth interval by subtracting the contribution of ammonia, phosphoric acid, boric acid, and silicic acid from titration alkalinity (Ham- mond 1973). There was no detectable sulfide present at any station except for Sta. A during spring, summer, and fall. Sulfide at Sta. A dur- ing these periods may have resulted in slightly high estimates of carbonate alkalinity (Table 1). Ca2+ concentrations were back-calculated from Ca2+ : Br- ratios by using the overlying water Cl- concentration at each station and the corresponding Br- concentration in aver-
Foram dissolution 339
age seawater. There is little vertical salinity variation in LIS sediments, so this procedure should not cause significant error (Aller 1980). Excess pore-water Ca2+ is assumed to be sup- plied from the dissolution of carbonates.
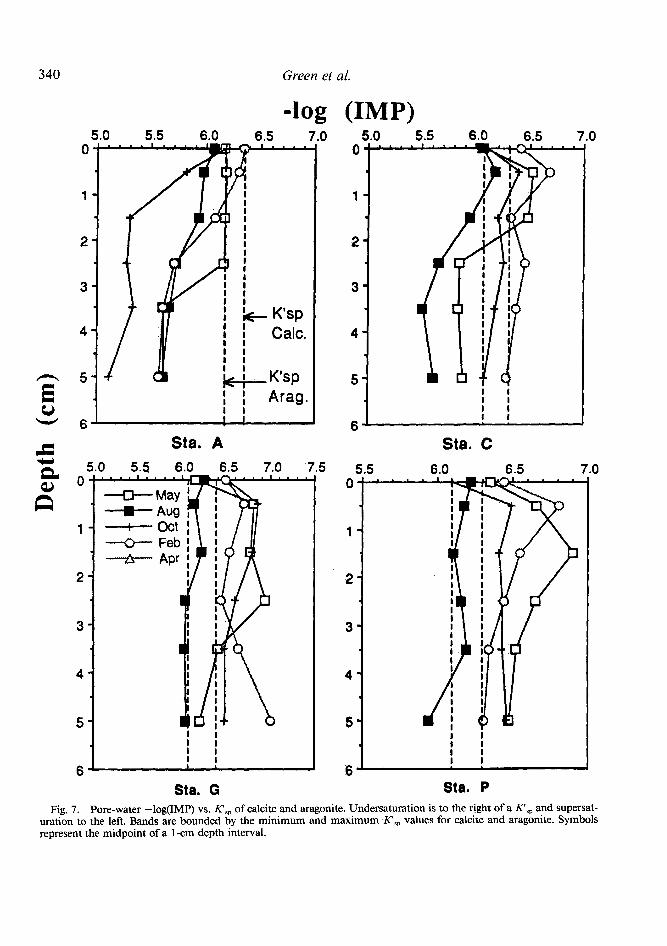
The ion molarity products (mcamc-,3 = IMP) from the pore water at each station are plotted along with the apparent solubilities, Ktsp, of calcite and aragonite (Fig. 7). Ktsp values varied throughout the year due to fluctuations of chlorinity and temperature. However, small variations caused by temperature and chlorini- ty were generally offsetting, resulting in a near- ly constant average annual apparent solubility value at each station.
Saturation states change throughout the year at all stations. Undersaturation with respect to calcite at station A occurs in the surface sed- iments in February. Undersaturation despite high alkalinity concentrations (Table 1) results predominantly from a decrease in sediment pH and is probably related to greater oxygen- ation of these sulfidic sediments in winter. Un- dersaturation at stations C, G, and P occurs in the upper l-3 cm of sediments in May, Oc- tober, and February. There is a tendency for saturation or supersaturation below 3-4-cm depth in each deposit. Similar saturation states for both calcite and aragonite were found by Aller (1982). Supersaturation is greatest at each site in August. Supersaturation results from the higher accumulation of anaerobic decom- position products with warmer temperature, particularly alkalinity generated via sulfate re- duction, and increased pH. Overlying water has a higher IMP than the top centimeter of deposits at all stations except A. The differ- ences between overlying water and surface sed- iment saturation states are due mostly to dis- continuities in pH (Table 2).
Greatest undersaturation with respect to cal- cite and aragonite occurs in the top l-3 cm of each deposit during most sampling periods (Fig. 7). Morse (1978) and Keir (1980) have shown that sedimentary carbonates follow a disso- lution rate law of the form
R = k( 1 - n)n (1) where k is a rate constant, fl = IMP/K’,,, and n is the empirical reaction order. Experiments by Keir (1980) determined n = 4.5kO.7 for calcite and 4.2 for aragonite. The exact value of n depends on the assumed K’,, for the dis-
solving phases (Walters and Morse 1984). Giv- en that this rate law is proportional to carbon- ate undersaturation, maximum rates of foram dissolution should occur in the top 3 cm of most deposits where undersaturation is great- est and where the total Foraminifera com- munity, particularly springtime juveniles, is concentrated (Fig. 4). Although no data exist, the small size (high surface : volume ratio) of juveniles suggests that they are likely to be less resistant to solution than adults. Benthic fo- rams, and presumably all carbonate-bearing juvenile benthos, may be placed in a precari- ous position in this regard early in their life history.
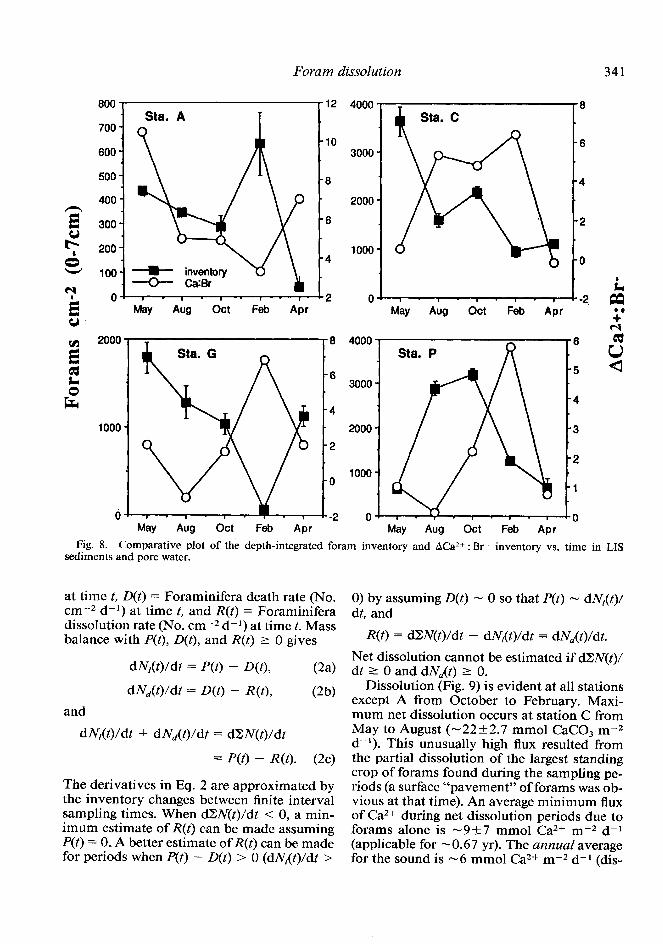
A comparative plot of the depth-integrated foram inventory and the Ca2+ excess inventory from 0 to 7 cm at each site over the entire sampling period clearly shows that disappear- ance of forams coincides with excess pore-wa- ter Ca2+ in a near-perfect offset cyclic rela- tionship (Fig. 8). The inventories were obtained by converting the abundances of forams as No. Foraminifera (g dry sediment)-’ to No. Fo- raminifera cm-2 with bulk density measure- ments from each station (J. Aller unpubl. data). Although only a fraction of the total excess Ca2+ seen in Fig. 8 probably results from the dissolution of forams, these data support the idea that temporal patterns of abundances in the sound muds are best described by a balance between the rate of production-recruitment and the rates of death and dissolution of the cal- careous tests of the animals. Foraminifera dis- solution is a previously undocumented piece of the annual cycle of CaCO, precipitation and dissolution reported in LIS deposits (Aller 1982).
Quantitative estimates of dissolution - Quantitative estimates of seasonal patterns of production and dissolution of foraminiferan CaC03 were calculated for each station. The average empty test weight for natural mixed populations of LIS Foraminifera was - 10 + 4.8 pg CaCO, (CaCO 3 I 95% total weight) mea- sured on five samples of 250, 452, 456, 56 1, and 557 forams from stations C and P (all seasons). From these values and the foram in- ventories we calculated Ca fluxes as follows. Let N,(t) = No. of living Foraminifera (No. cm-2) at time t, Nd(t) = No. of dead Forami- nifera (No. cm-2) at time t, P(t) = Foraminif- era recruitment-production rate (No. cm-2 d-l)
340 Green et al.
I log 5.0 5.5 6.0 6.5 7.0
l-
2-
3-
4-
i i I f
ArEi@ 6 I I
Sta. A 5.0 5.5 6.0 6.5 7.0 7.5
2
3
4
5
6
Sta. G
(IMP) 5.0 5.5 6.0 6.5 '
6' i i
Sta. C
5.5 6.0 6.5 7.0
Fig. 7. Pore-water -log(IMP) vs. K’,, of calcite and aragonite. Undersaturation is to the right of a Klsp and supersat- uration to the left. Bands are bounded by the minimum and maximum K’,, values for calcite and aragonite. Symbols represent the midpoint of a l-cm depth interval.
Foram dissolution 341
800
700
600
500
400
300
200
100
0
0
w 2000
E 2
z
1000
6
J I. IL
Sta. A T
- --W- inventory . --o-- cam
I - I - I - I - I
-8
-6
May ml Ott Feb Av May Aw Ott Feb APT
4000 -7 -8
-6 3000 -
May Aw Ott Feb Apr
--I
-l
-4
-F
B 4000
May Aw Ott Feb APT Fig. 8. Comparative plot of the depth-integrated foram inventory and ACa2’ : Br- inventory vs. time in LIS
sediments and pore water.
at time t, D(t) = Foraminifera death rate (No. cm-2 d-l) at time t, and R(t) = Foraminifera
0) by assuming D(t) - 0 so that P(t) - dN,(t)/ dt and
’ dissolution rate (No. cm-2 d-l) at time t. Mass balance with P(t), D(t), and R(t) 2 0 gives R(t) = dZN(t)/dt - dN,(t)/dt = dN,(t)/dt.
dN/(t)ldt = P(t) - D(t), (2a) Net dissolution cannot be estimated if dZN(t)/ dt 1 0 and dN,(t) Z- 0.
dl\r,(t)/dt = D(t) - R(t), CW Dissolution (Fig. 9) is evident at all stations
and except A from October to February. Maxi- mum net dissolution occurs at station C from
dN/(t)/dt + dNJt)/dt = dIZN(t)/dt
= P(t) - R(t). (2~)
The derivatives in Eq. 2 are approximated by the inventory changes between finite interval sampling times. When dZN(t)/dt < 0, a min- imum estimate of R(t) can be made assuming P(t) = 0. A better estimate of R(t) can be made for periods when P(t) - D(t) > 0 (dN,(t)/dt >
May to August (-22k2.7 mmol CaCO, m-2 d-r). This unusually high flux resulted from the partial dissolution of the largest standing crop of forams found during the sampling pe- riods (a surface “pavement” of forams was ob- vious at that time). An average minimum flux of Ca2+ during net dissolution periods due to forams alone is -9_+7 mmol Ca2+ m-2 d-l (applicable for -0.67 yr). The annual average for the sound is -6 mmol Ca2+ m-2 d-r (dis-
342 Green et al.
Precipitation
Dissolution -30. 1 . 1 I ’ *
May-Aug Aug-Ott Ott-Feb Feb-Apr
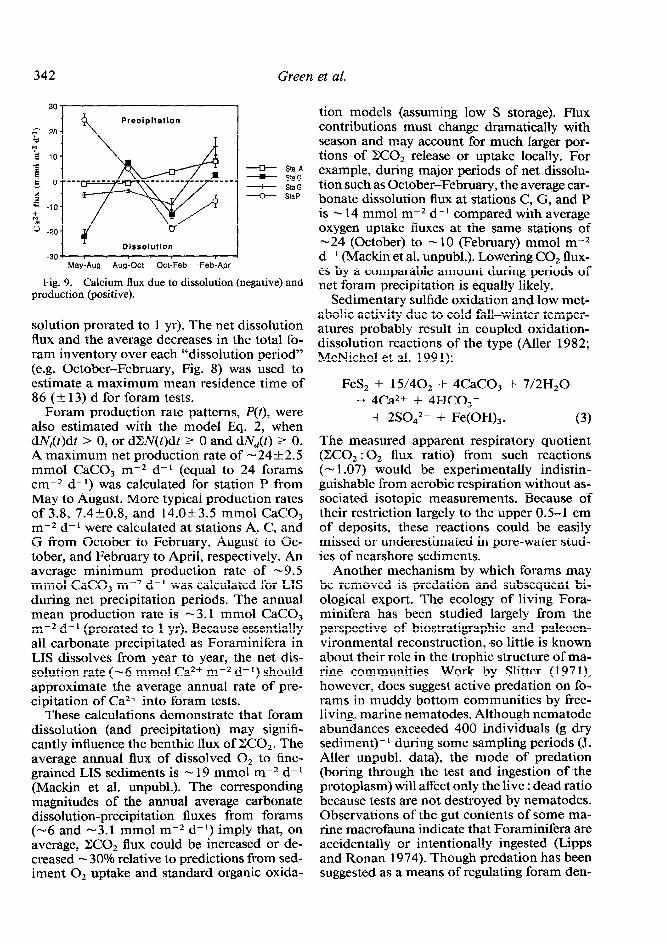
Fig. 9. Calcium flux production (positive).
due to dissolution (negative) and
--II- Sla A - StaC - StaG ---O--- StaP
solution prorated to 1 yr). The net dissolution flux and the average decreases in the total fo- ram inventory over each “dissolution period” (e.g. October-February, Fig. 8) was used to estimate a maximum mean residence time of 86 (& 13) d for foram tests.
Foram production rate patterns, P(t), were also estimated with the model Eq. 2, when dN,(t)dt > 0, or dZV(t)dt L 0 and dN,(t) 1 0. A maximum net production rate of - 24 + 2.5 mmol CaCO, m-2 d-l (equal to 24 forams cm-2 d-l) was calculated for station P from May to August. More typical production rates of 3.8, 7.4kO.8, and 14.Ok3.5 mmol CaCO, m-2 d- l were calculated at stations A, C, and G from October to February, August to Oc- tober, and February to April, respectively. An average minimum production rate of - 9.5 mmol CaCO, m-2 d-l was calculated for LIS during net precipitation periods. The annual mean production rate is -3.1 mmol CaCO, m-2 d- l (prorated to 1 yr). Because essentially all carbonate precipitated as Foraminifera in LIS dissolves from year to year, the net dis- solution rate (- 6 mmol Ca2+ m-2 d- I) should approximate the average annual rate of pre- cipitation of Ca2+ into foram tests.
These calculations demonstrate that foram dissolution (and precipitation) may signifi- cantly influence the benthic flux of X02. The average annual flux of dissolved O2 to fine- grained LIS sediments is - 19 mmol m-2 d-l (Ma&in et al. unpubl.). The corresponding magnitudes of the annual average carbonate dissolution-precipitation fluxes from forams (-6 and -3.1 mmol m-2 d-l) imply that, on average, X02 flux could be increased or de- creased - 30% relative to predictions from sed- iment O2 uptake and standard organic oxida-
tion models (assuming low S storage). Flux contributions must change dramatically with season and may account for much larger por- tions of ZC02 release or uptake locally. For example, during major periods of net dissolu- tion such as October-February, the average car- bonate dissolution flux at stations C, G, and P is - 14 mmol m- 2 d- l compared with average oxygen uptake fluxes at the same stations of -24 (October) to - 10 (February) mmol m-2 d- l (Ma&in et al. unpubl.). Lowering CO, flux- es by a comparable amount during periods of net foram precipitation is equally likely.
Sedimentary sulfide oxidation and low met- abolic activity due to cold fall-winter temper- atures probably result in coupled oxidation- dissolution reactions of the type (Aller 1982; McNichol et al. 1991):
FeS, i- 15/402 -t- 4CaC0, i- 7/2H20 --, 4Ca2+ + 4HCO,-
+ 2SOd2- + Fe(OH)3. (3) The measured apparent respiratory quotient @CO2 : O2 flux ratio) from such reactions (- 1.07) would be experimentally indistin- guishable from aerobic respiration without as- sociated isotopic measurements. Because of their restriction largely to the upper 0.5-l cm of deposits, these reactions could be easily missed or underestimated in pore-water stud- ies of nearshore sediments.
Another mechanism by which forams may be removed is predation and subsequent bi- ological export. The ecology of living Fora- minifera has been studied largely from the perspective of biostratigraphic and paleoen- vironmental reconstruction, so little is known about their role in the trophic structure of ma- rine communities. Work by Slitter (1971), however, does suggest active predation on fo- rams in muddy bottom communities by free- living, marine nematodes. Although nematode abundances exceeded 400 individuals (g dry sediment)-’ during some sampling periods (J. Aller unpubl. data), the mode of predation (boring through the test and ingestion of the protoplasm) will affect only the live : dead ratio because tests are not destroyed by nematodes. Observations of the gut contents of some ma- rine macrofauna indicate that Foraminifera are accidentally or intentionally ingested (Lipps and Ronan 1974). Though predation has been suggested as a means of regulating foram den-
Forum dissolution 343
sities (Buzas 1977), estimates vary widely as to their overall trophic contribution. It is gen- erally agreed that predation and export via in- gestion (intentional or accidental) are only small contributors to fluctuations of foraminiferan communities (Lankford and Phleger 1973; Young and Young 1977).
The destruction of dead forams may proceed in several possible ways. The initial stage pre- sumably involves solution and weakening of tests due to chemical processes. Fragmentation of weakened tests may sometimes occur through physical processes such as wave ac- tion, bottom currents, bioturbation activities, and ingestion by deposit feeders. From a phys- ical perspective, LIS is most disturbed in fall and winter months. Surface storm energies could be transferred to the sediment-water in- terface of all stations studied. The rolling of foram tests along the bottom or jostling be- tween sediment grains may provide adequate force to fragment those in the latter stages of dissolution. Increasing carbonate surface area would increase the rate of dissolution and pro- mote rapid loss of fragments (Keir 1980; Morse 1983). These suppositions regarding dissolu- tion and fragmentation are supported by the fact that very few fragmented tests were found during sample processing, and tests in the lat- ter stages of dissolution were extremely fragile, coming apart at the slightest touch with for- ceps.
Contrasting dissolution processes in the central and western regions
Although the overall seasonal pattern of dis- solution appears to be similar throughout LIS (Fig. 8), the seasonal balances of processes con- trolling dissolution in the central and western regions must be somewhat different. Some of the major differences are presumably related to differences in macrobenthic communities, their activities, and the environments they re- flect. Macrofaunal reworking is critical to pro- moting carbonate dissolution as it prevents re- action product buildup and stimulates aerobic metabolites, FeS oxidation, and nitrification (H2C03, H2S04, HNO, release) during expo- sure near the sediment-water interface (Aller 1982; Green et al. 1992).
The regions east of station A and particularly central LIS have well-established macroben- thic communities (McCall 1978; Yingst and Rhoads 1978). The highest biogenic reworking
typically occurs in the top 4 cm of sediment, with slower more episodic reworking below this depth to > 12 cm (Aller and Cochran 1976). The rate of reworking varies seasonally and is highest in late summer or fall in these types of deposits. Typical apparent solute diffusion val- ues obtained from modeling pore-water data in bioturbated regions have been found to be - 1 O-l 00 times higher than abiogenic bulk sediment diffusion coefficients (Aller 1978). The increased transport due to bioturbation in much of central LIS must influence the sea- sonality and extent of carbonate dissolution (Aller 1982; Green et al. 1992).
In contrast, station A lies in a region of pe- riodic summer hypoxia (Parker and O’Reilly 199 1). Benthic macrofauna are minimal, with ranges of 7 m-2 in October to 506 m-2 in February (J. Aller unpubl. data). Enhanced dis- solution due to biogenic reworking is presum- ably relatively small during summer in this region. Beggiatoa mats were present at the sed- iment-water interface of station A in summer and a macroscopic surficial oxidized layer was absent. Generally, accumulation of alkalinity associated with sulfate reduction tends to sat- urate pore water and prevent carbonate dis- solution. However, because of reoxygenation of the overlying water in fall, the accumulated sulfides produced in summer at this site are also subject to oxidation in the near-interface zone where the bulk of the residual foram as- semblage is concentrated (Fig. 4, Eq. 2). Re- colonization of the area by macrofauna from unaffected localities must further stimulate this process, resulting in a net seasonal dissolution pattern (at our sampling resolution) similar to the rest of LIS despite the several-month pe- riod of hypoxia.
Conclusions The abundances of foraminiferans in LIS
fluctuate seasonally. Abundances are largest in spring and summer and decrease through fall to a winter minimum. These fluctuations result from variations in recruitment, death, and ex- tensive dissolution of foram tests. Essentially all the carbonate material in the form of Fo- raminifera disappears on a yearly time scale. Annual net dissolution is -6.0 mmol m-2 d-1 based on estimates from population dynamics, with seasonally varying periods ranging from no net dissolution up to -22 mmol m-2 d-1 at one site. As expected from the lack of pres-
344 Green et al.
ervation, annual net production (predominant- diagenetic time scales. Earth Planet. Sci. Lett. 20: 37- ly late spring and summer) is comparable to net 50. dissolution (predominantly fall and winter). BRADSHAW, J. S. 1968. Environmental parameters and
Dissolution occurs near the sediment-water marsh Foraminifera. Limnol. Oceanogr. 13: 26-38.
Bum, M. A. 1965. The distribution and abundance of interface where a lowered pH associated with organic matter decomposition and sulfide-am- monium oxidation drives reactions. Dissolu- tion is maximal in the period directly following highest recruitment to an area. It is likely that juveniles adults.
are less resistant to solution than
The timing and mechanisms of dissolution in the central and western basins appear to be different. Foram recruitment in portions of the central region lasts for a longer period of time relative to the western sound, as favorable con- ditions extend into summer months. Surface sediment pH is generally higher in the central than western sound but alkalinity is lower. Dis- solution of forams in the central region is driv- en in part by high rates of biogenic reworking, preventing accumulation of reaction products (e.g. Ca2+, alkalinity) that inhibit dissolution. Bioturbation also enhances solid-phase sulfide oxidation and nitrification, which lowers al- kalinity during formation of H,SO, and HN03. The same types of dissolution processes pre- sumably occur in the western sound. However, these processes probably occur in more intense periods in late spring and during fall-winter reoxygenation of the water column with as- sociated benthic recolonization by infauna. Some small preservation of Foraminifera is possible in that reworking can also result in tests bypassing the dissolution zone either through biogenic subduction or by falling into tubes and burrows.
References AKPATI, B. J. 1975. Foraminifera1 distribution and en-
vironmental variables in eastern Long Island Sound, New York. J. Foram. Res. 5: 127-144.
ALLER, R. C. 1978. Experimental studies of changes pro- duced by deposit feeders on pore water, sediment, and overlying water chemistry. Am. J. Sci. 278: 1185- 1234.
-. 1980. Diagenetic processes near the sediment- water interface of Long Island Sound. 1. Decompo- sition and nutrient element geochemistry (S, N, P). Adv. Geophys. 22: 237-350.
-. 1982. Carbonate dissolution in nearshore ter- rigenous muds: The role of physical and biological reworking. J. Geol. 90: 79-95.
-, AND J. K. COCHFWN. 1976. 234Th : 238U disequi- librium in nearshore sediment: Particle reworking and
Foraminifera in Long Island Sound. Smithson. Misc. Collect. 149(l): l-89.
-. 1977. Vertical distribution of Foraminifera in the India River, Florida. J. Foram. Res. 7: 234-237.
EDMOND, J. M. 1970. High precision determination of titration alkalinity and total carbon dioxide content of seawater by potentiometric titration. Deep-Sea Res. 17: 737-750.
GREEN, M. A., R. C. ALLER, AND J. Y. ALLER. 1992. Experimental evaluation of the influences of biogenic reworking on carbonate preservation in nearshore sediments. Mar. Geol. 107: 175-181.
HAMMOND, C. E. 1973. Interstitial water studies, Leg 15-a comparison of the major element and carbon- ate chemistry data from sites 147, 148, and 149. Ini- tial Rep. Deep-Sea Drilling Project 20: 83 l-850.
KEIR, R. S. 1980. The dissolution kinetics of biogenic calcium carbonates in seawater. Geochim. Cosmo- chim. Acta 44: 241-252.
LANKFORD, R. R., AND F. B. PHLEGER. 1973. Forami- nifera from the near-shore turbulent zone, western North America. J. Foram. Res. 3: 101-l 32.
LEE, J. J., AND H. RIJBIN. 1969. Quantitative studies on the growth of Allogromia laticollaris. J. Protozool. 16: 377-395.
LIPPS, J. H., AND T. E. RONAN, JR. 1974. Predation on Foraminifera by the polychaete worm, Diopatra. J. Foram. Res. 4: 139-143.
MCCALL, P. L. 1978. Spatial-temporal distributions of Long Island Sound infauna: The role of bottom dis- turbance in a nearshore marine habitat, p. 19 l-2 19. Zn M. L. Wiley [ed.], Estuarine interactions. Academ-
MA~GN,J. E., R. C. ALLER, AND W. J. ULLMAN. 1988. The effects of iron reduction and non steady-state diagenesis on iodine, ammonium, and boron distri- butions in sediments from the Amazon continental shelf. Cont. Shelf Res. 8: 363-386.
MCNICHOL, A. P., R. M. DRUFFEL, AND C. LEE. 1991. Carbon cycling in coastal sediments: 2. An investi- gation of the sources of X0, to pore water using carbon isotopes, p. 249-272. Zn R. A. Barker [ed.], Organic substances and sediments in water. V. 2. Lew- is.
MILLERO, F. J. 1979. The thermodynamics of the car- bonate system in seawater. Geochim. Cosmochim. Acta 43: 1651-1661.
MORSE, J. W. 1978. Dissolution kinetics of calcium car- bonate in sea water. 6: The near-equilibrium disso- lution kinetics of calcium carbonate-rich deep sea sed- iments. Am. J. Sci. 278: 344-355.
1983. The kinetics of calcium carbonate disso- lution and precipitation. Rev. Mineral. 11: 227-264.
PARKER, C. A., AND J. E. O'REILLY. 1991. Oxygen de- pletion in Long Island Sound: A historical perspec- tive. Estuaries 14: 248-264.
RILEY, G. A. 1956. Oceanography of Long Island Sound, 1952-l 954. 2. Physical oceanography. Bull. Bingham Oceanogr. Collect. 15: 15-46.
Foram dissolution 345
SLITTER, W. V. 197 1. Predation on benthic foraminifers. J. Foram. Res. 1: 20-29.
WALTERS, L. M., AND E. A. BURTON. 1990. Dissolution of recent platform carbonate sediments in marine pore fluids. Am. J. Sci. 290: 601-643.
-, AND J. W. MORSE. 1984. Reactive surface area ofskeletal carbonate during dissolution: Effect ofgrain size. J. Sediment. Petrol. 54: 108 l-1090.
WALTON, W. R. 1952. Techniques for the recognition of living Foraminifera. Contrib. Cushman Found. Fo- ram. Res. 3: 55-60.
YINGST, J. Y., AND D. C. RHOADS. 1978. Seafloor sta- bility in central Long Island Sound: 2. Biological in-
teractions and their potential importance for seafloor erodibility, p. 245-260. In M. L. Wiley red.], Estua- rinc interactions. Academic.
Yo~G, D. K., AND M. W. YOUNG. 1977. Community structure of the macrobenthos associated with sea- grass of the Indian River estuary, Florida, p. 359- 38 1. In B. C. Coull [ed.], Ecology of marine benthos. Univ. South Carolina.
Submitted: I3 May 1991 Accepted: 8 July 1992
Revised: 27 August I992