cams regional production qa/qc for aq assessment
TRANSCRIPT
Atmosphere Monitoring
CAMS Regional Production
QA/QC for AQ Assessment
Augustin Colette (INERIS, FR)
Fairmode Plenary, March, 1st, 2021
AtmosphereMonitoring
C A M S Q A / Q C f o r A Q A s s e s s m e n t
• Quality Assurance
– Model Documentation
– EIONET observations
• Quality Control
– Evaluation reports
– Continuous improvement
AtmosphereMonitoring
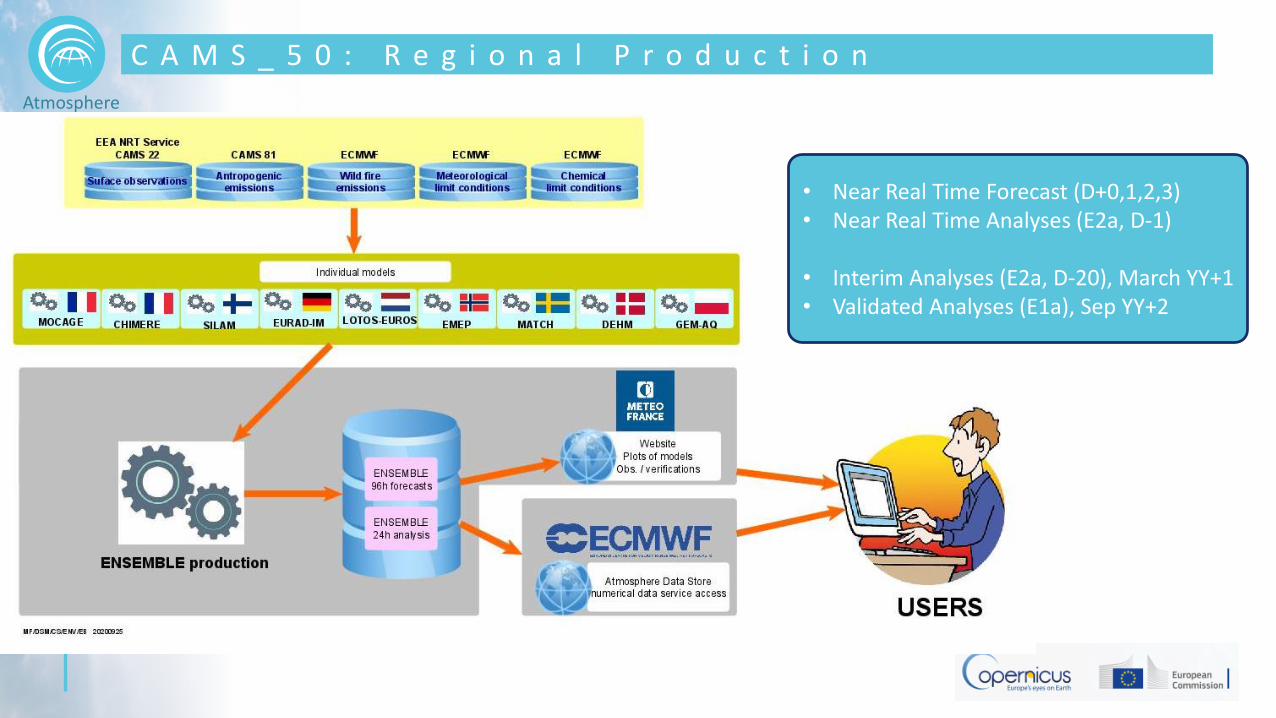
C A M S _ 5 0 : R e g i o n a l P r o d u c t i o n
• Near Real Time Forecast (D+0,1,2,3)• Near Real Time Analyses (E2a, D-1)
• Interim Analyses (E2a, D-20), March YY+1• Validated Analyses (E1a), Sep YY+2
AtmosphereMonitoring
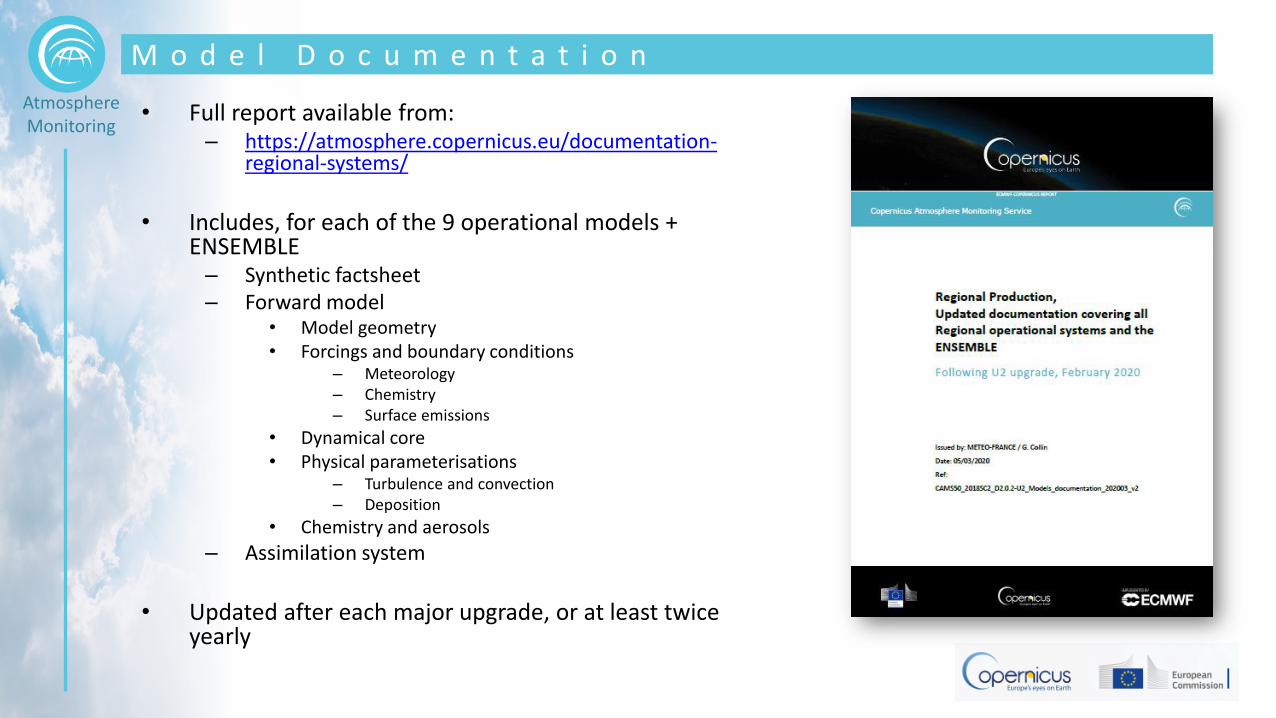
• Full report available from: – https://atmosphere.copernicus.eu/documentation-
regional-systems/
• Includes, for each of the 9 operational models + ENSEMBLE– Synthetic factsheet– Forward model
• Model geometry• Forcings and boundary conditions
– Meteorology– Chemistry– Surface emissions
• Dynamical core• Physical parameterisations
– Turbulence and convection– Deposition
• Chemistry and aerosols
– Assimilation system
• Updated after each major upgrade, or at least twiceyearly
M o d e l D o c u m e n t a t i o n
AtmosphereMonitoring
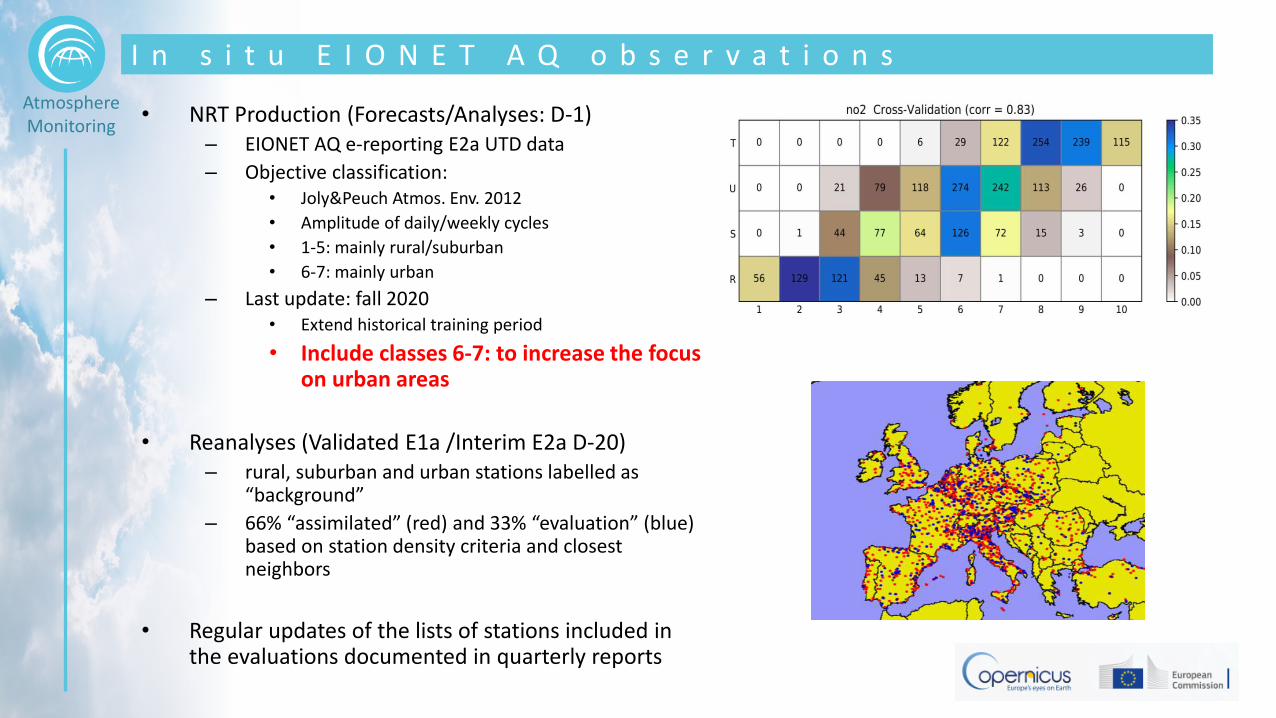
• NRT Production (Forecasts/Analyses: D-1)– EIONET AQ e-reporting E2a UTD data
– Objective classification: • Joly&Peuch Atmos. Env. 2012
• Amplitude of daily/weekly cycles
• 1-5: mainly rural/suburban
• 6-7: mainly urban
– Last update: fall 2020• Extend historical training period
• Include classes 6-7: to increase the focus on urban areas
• Reanalyses (Validated E1a /Interim E2a D-20)– rural, suburban and urban stations labelled as
“background”
– 66% “assimilated” (red) and 33% “evaluation” (blue) based on station density criteria and closest neighbors
• Regular updates of the lists of stations included in the evaluations documented in quarterly reports
I n s i t u E I O N E T A Q o b s e r v a t i o n s
AtmosphereMonitoring
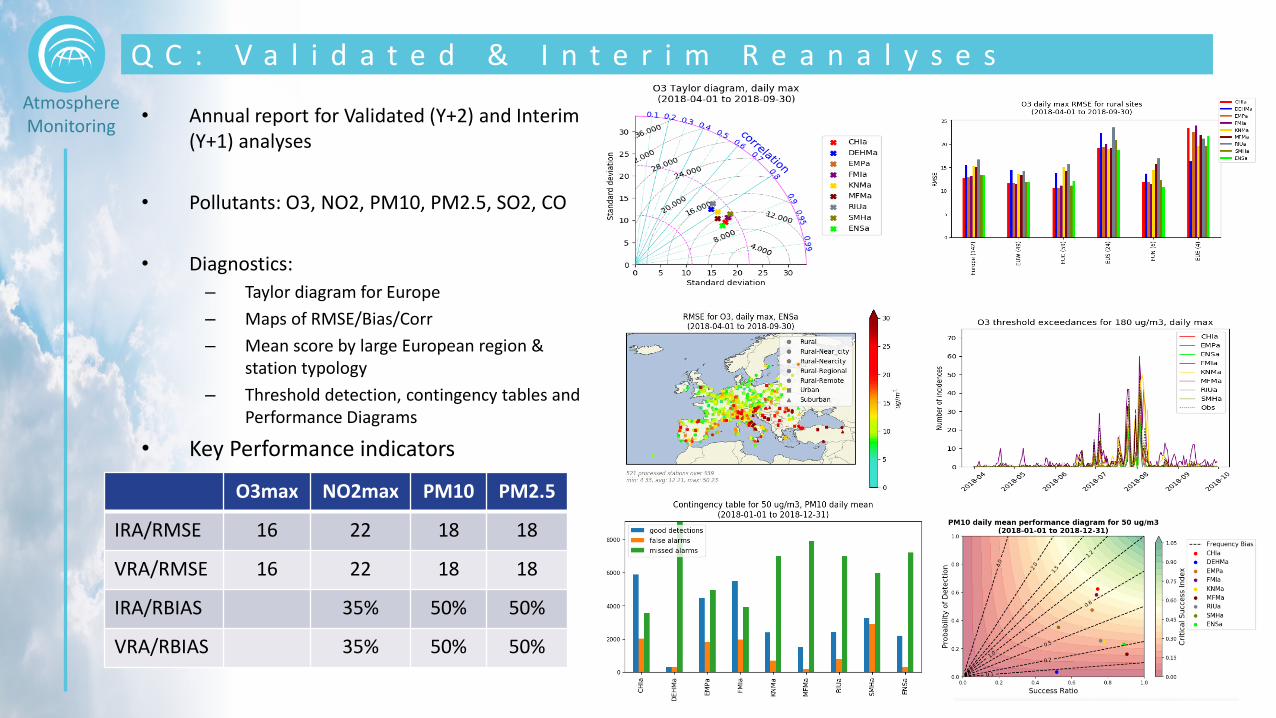
• Annual report for Validated (Y+2) and Interim(Y+1) analyses
• Pollutants: O3, NO2, PM10, PM2.5, SO2, CO
• Diagnostics:
– Taylor diagram for Europe
– Maps of RMSE/Bias/Corr
– Mean score by large European region & station typology
– Threshold detection, contingency tables and Performance Diagrams
• Key Performance indicators
Q C : V a l i d a t e d & I n t e r i m R e a n a l y s e s
O3max NO2max PM10 PM2.5
IRA/RMSE 16 22 18 18
VRA/RMSE 16 22 18 18
IRA/RBIAS 35% 50% 50%
VRA/RBIAS 35% 50% 50%
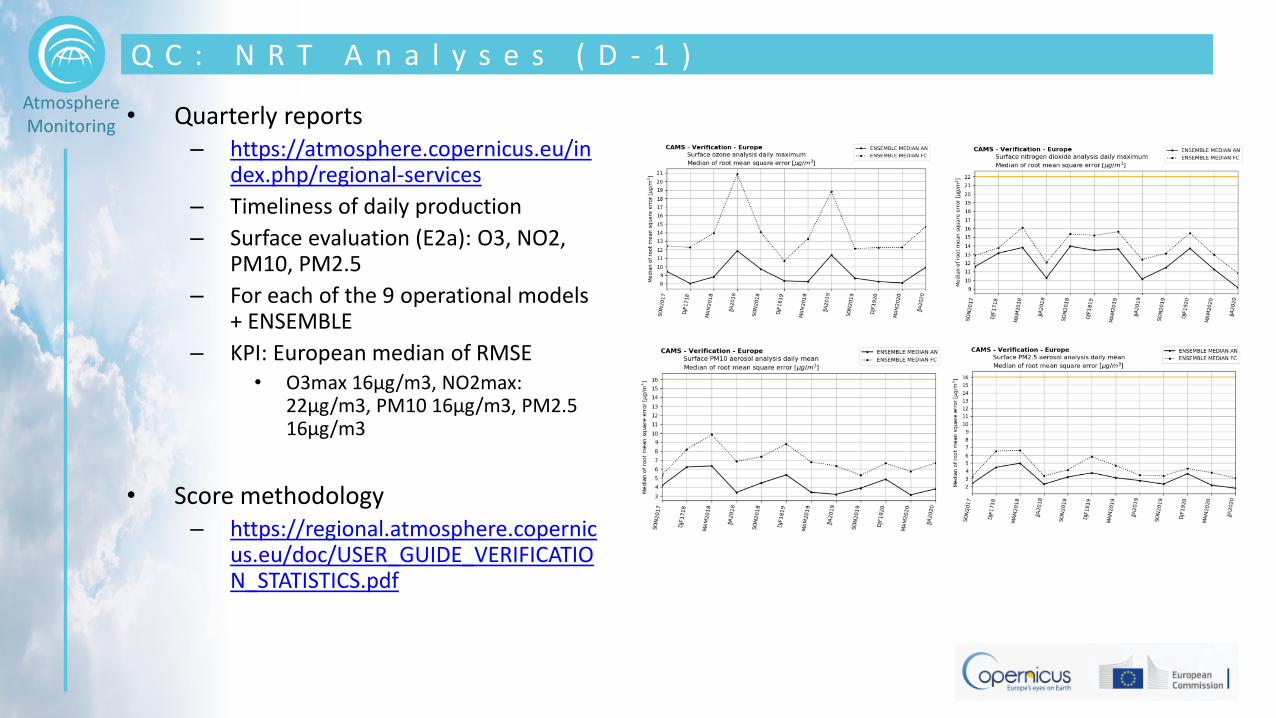
AtmosphereMonitoring • Quarterly reports
– https://atmosphere.copernicus.eu/index.php/regional-services
– Timeliness of daily production
– Surface evaluation (E2a): O3, NO2, PM10, PM2.5
– For each of the 9 operational models+ ENSEMBLE
– KPI: European median of RMSE• O3max 16µg/m3, NO2max:
22µg/m3, PM10 16µg/m3, PM2.5 16µg/m3
• Score methodology– https://regional.atmosphere.copernic
us.eu/doc/USER_GUIDE_VERIFICATION_STATISTICS.pdf
Q C : N R T A n a l y s e s ( D - 1 )
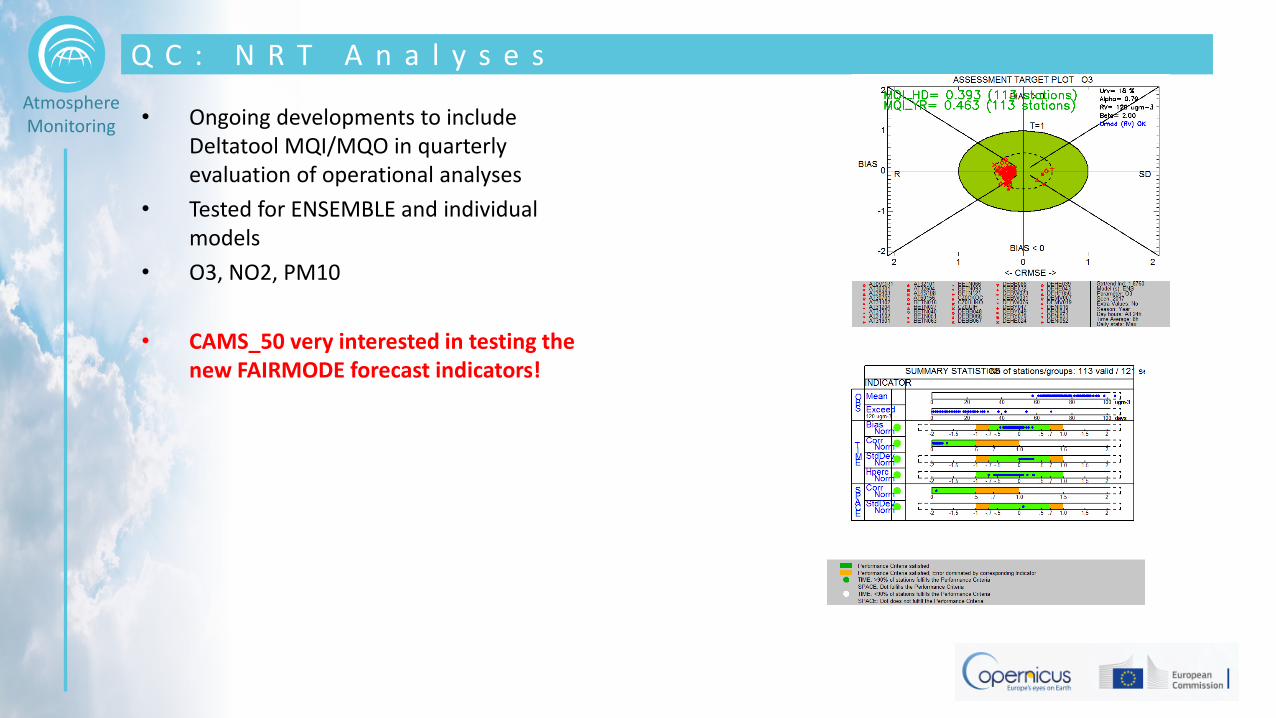
AtmosphereMonitoring • Ongoing developments to include
Deltatool MQI/MQO in quarterlyevaluation of operational analyses
• Tested for ENSEMBLE and individualmodels
• O3, NO2, PM10
• CAMS_50 very interested in testing the new FAIRMODE forecast indicators!
Q C : N R T A n a l y s e s
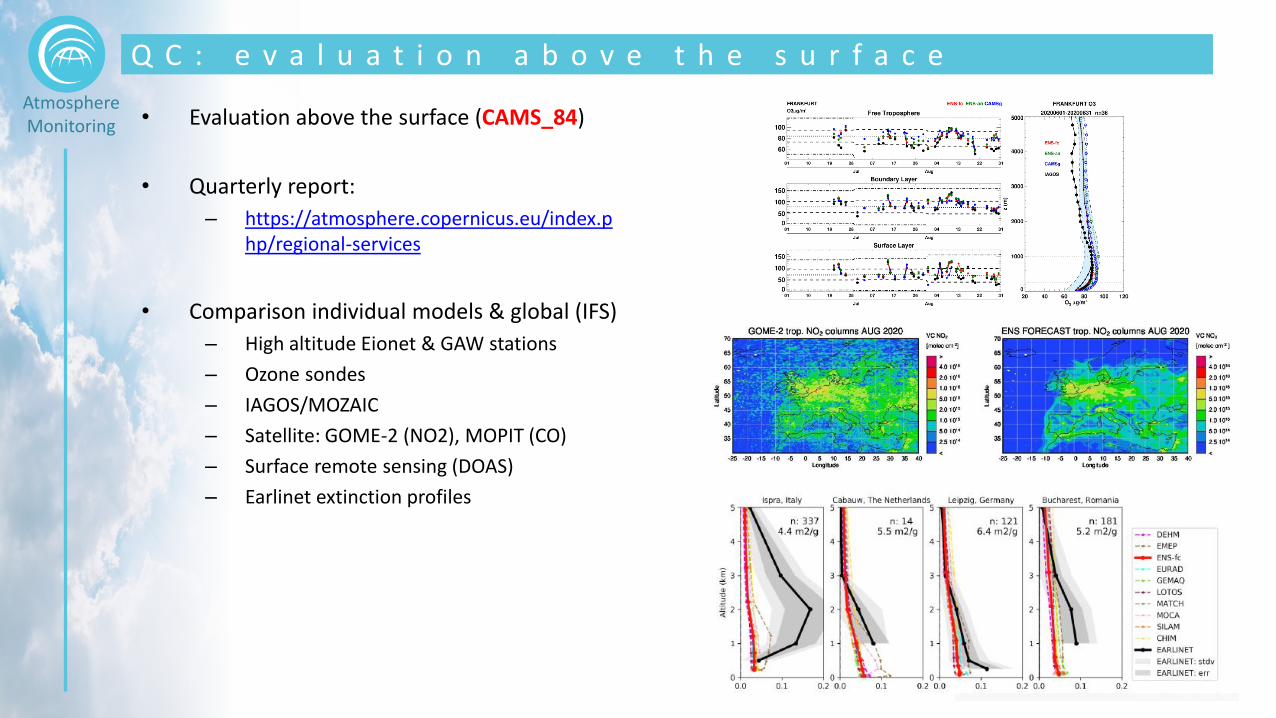
AtmosphereMonitoring • Evaluation above the surface (CAMS_84)
• Quarterly report:
– https://atmosphere.copernicus.eu/index.php/regional-services
• Comparison individual models & global (IFS)
– High altitude Eionet & GAW stations
– Ozone sondes
– IAGOS/MOZAIC
– Satellite: GOME-2 (NO2), MOPIT (CO)
– Surface remote sensing (DOAS)
– Earlinet extinction profiles
Q C : e v a l u a t i o n a b o v e t h e s u r f a c e
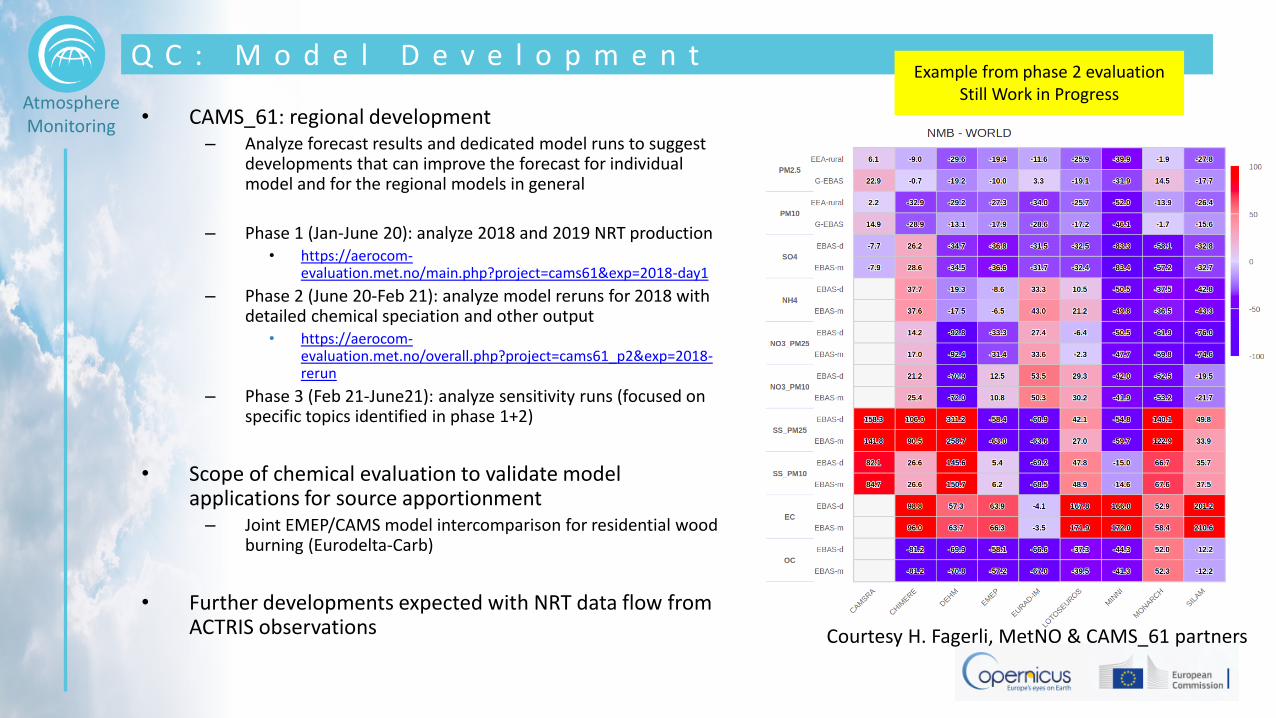
AtmosphereMonitoring • CAMS_61: regional development
– Analyze forecast results and dedicated model runs to suggest developments that can improve the forecast for individual model and for the regional models in general
– Phase 1 (Jan-June 20): analyze 2018 and 2019 NRT production• https://aerocom-
evaluation.met.no/main.php?project=cams61&exp=2018-day1
– Phase 2 (June 20-Feb 21): analyze model reruns for 2018 with detailed chemical speciation and other output
• https://aerocom-evaluation.met.no/overall.php?project=cams61_p2&exp=2018-rerun
– Phase 3 (Feb 21-June21): analyze sensitivity runs (focused on specific topics identified in phase 1+2)
• Scope of chemical evaluation to validate model applications for source apportionment– Joint EMEP/CAMS model intercomparison for residential wood
burning (Eurodelta-Carb)
• Further developments expected with NRT data flow fromACTRIS observations
Q C : M o d e l D e v e l o p m e n tExample from phase 2 evaluation
Still Work in Progress
Courtesy H. Fagerli, MetNO & CAMS_61 partners
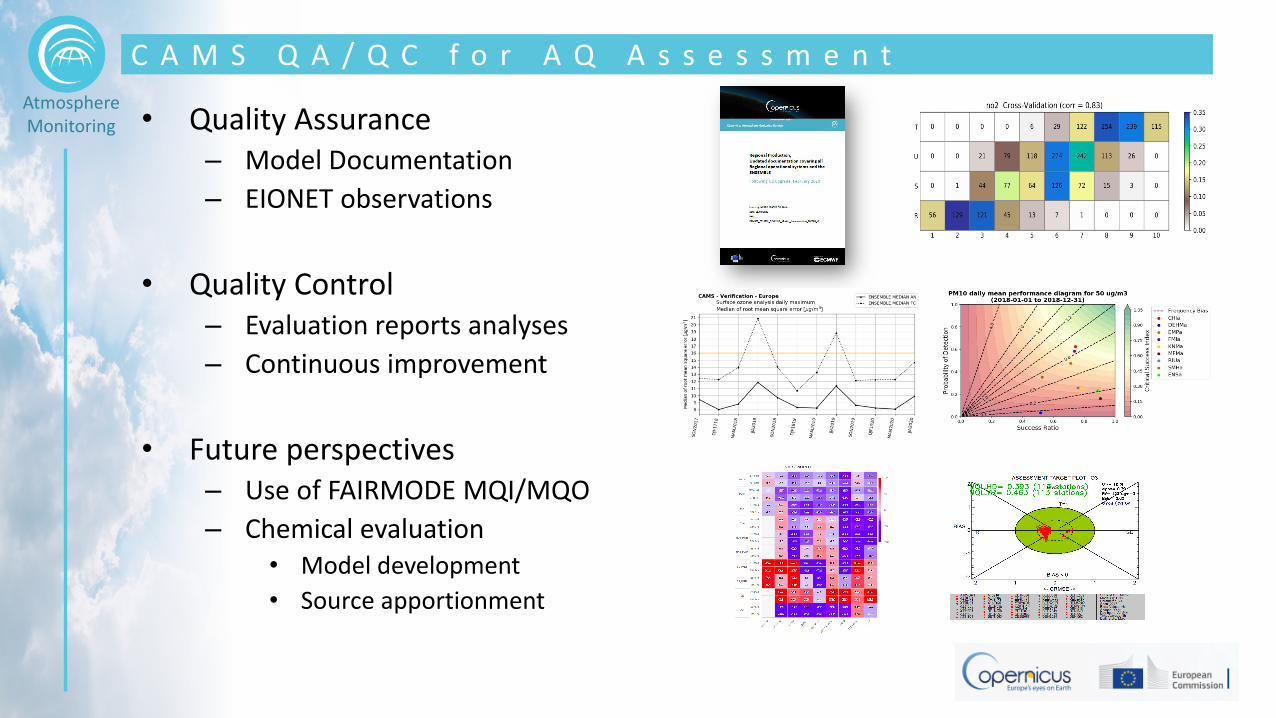
AtmosphereMonitoring • Quality Assurance
– Model Documentation
– EIONET observations
• Quality Control– Evaluation reports analyses
– Continuous improvement
• Future perspectives– Use of FAIRMODE MQI/MQO
– Chemical evaluation• Model development
• Source apportionment
C A M S Q A / Q C f o r A Q A s s e s s m e n t

AtmosphereMonitoring
T H A N K Y O U F O R Y O U R A T T E N T I O N
A u g u s t i n . C o l e t t e @ i n e r i s . f r