bulk plasma rotation in the tcv tokamak in the absence of external momentum input
TRANSCRIPT

This article has been downloaded from IOPscience. Please scroll down to see the full text article.
(http://iopscience.iop.org/0741-3335/49/12B/S18)
is available
Download details:
IP Address: 128.178.84.136
The article was downloaded on 02/12/2007 at 18:09
Please note that terms and conditions apply.
More related content
HOME | SEARCH | PACS & MSC | JOURNALS | ABOUT | CONTACT US
IOP PUBLISHING PLASMA PHYSICS AND CONTROLLED FUSION
Plasma Phys. Control. Fusion 49 (2007) B195–B209 doi:10.1088/0741-3335/49/12B/S18
Bulk plasma rotation in the TCV tokamak in theabsence of external momentum input
B P Duval, A Bortolon, A Karpushov, R A Pitts, A Pochelon,A Scarabosio1 and the TCV Team
Centre de Recherches en Physique des Plasmas (CRPP), Association EURATOM-ConfederationSuisse, Ecole Polytechnique Federale de Lausanne (EPFL), CH-1015 Lausanne, Switzerland
Received 6 July 2007Published 15 November 2007Online at stacks.iop.org/PPCF/49/B195
AbstractCarbon ion velocity profiles are measured in TCV with a charge exchangediagnostic using a negligibly perturbing diagnostic neutral beam. These‘intrinsic’ rotation profiles are measured up to the plasma edge in the toroidaland poloidal directions for both limited and diverted plasma configurationsin Ohmic plasmas and in the presence of strong second harmonic electroncyclotron heating (ECH). Absolute toroidal velocities are shown to scale withpeak ion temperature and inversely with plasma current. The plasma edgerotation is always small in limited configurations but evolves smoothly with thecore density for diverted configurations. A strong intrinsic rotation builds up inthe plasma core in the counter-current direction for limited configurations but isobserved in the co-current direction for diverted plasmas. Unexpectedly, abovea given density threshold, the rotation profile reverses to the co-current directionfor limited configurations (and surprisingly, in the counter-current direction fordiverted configurations). This threshold density is found to depend on plasmacurrent, the presence of ECH and the magnetic topology. Poloidal velocitymeasurements are used to deduce the radial electric field change across thetransition. A strong dependence of the rotation profile on plasma triangularity isreported and possible physics models for these observations are discussed. Theorigin of the momentum drive, its reversal and its magnitude are not yet clearlyunderstood even for these relatively ‘simple’ experimental configurations.
(Some figures in this article are in colour only in the electronic version)
1 Presently at: Max Planck Institut fur Plasmaphysik, Garching, Germany.
0741-3335/07/SB0195+15$30.00 © 2007 IOP Publishing Ltd Printed in the UK B195
B196 B P Duval et al
1. Introduction
Plasma rotation and velocity shear are known to play an important role in the transition fromthe L- to the H-mode and in the formation of other transport barriers [1–3]. Velocity shearis thought to stabilize some of the instabilities associated with poor plasma performance and,with a particular view to advanced reactor test experiments such as ITER, plasma rotation mayhelp stabilize resistive wall mode (RWM) instabilities due to low-n magnetohydrodynamicmodes (MHD) that are also partially stabilized by the proximity of a conducting wall [4, 5].Bulk plasma rotation is observed to change synchronously with other changes in plasmabehaviour [6, 7] and velocity shearing rates above a threshold are thought to stabilize micro-turbulence, decreasing, at least in part, transport towards neo-classical levels [8]. A largemajority of these observations are performed in the presence of strong neutral beam injection(NBI) [7–10], ion cyclotron [2] heating and/or electron cyclotron (EC) heating [11] which isboth a reflection of the operational scenarios of most interest to fusion related research and, inparticular, the use of charge exchange (CX) rotation measurements that require the presenceof NBI. Plasma rotation in machines like ITER is not expected to have a profile that maybe externally determined by NBI [12], unlike many present devices, so considerable presentday effort is expended in the prediction of a possible ‘intrinsic’ plasma rotation (the rotationin the absence of external torque) and on the level of toroidal rotation required to suppressthe deleterious effects of RWM instabilities. It has, to date, not been possible to develop atheoretical model that may predict these values so empirical databases from experiments areused [13]. The current view is that there will be a strong intrinsic rotation in ITER [13] andthat the required velocity for RWM stabilization may be lower than previously thought [14].
This recent correction is based on the conclusion that the RWM was, in part, beingstimulated by the magnetic braking that was being used to control the rotation velocity. Thisis an example of much work in the field of generation and transport of momentum in magneticconfinement experiments where the effect of measurement technique (often NBI based) onthe measurement must be accounted for. For plasma rotation, these techniques vary fromthe Doppler shift measurements of line radiation from intrinsic plasma emission to chargeexchange spectroscopy methods that balance the NBI external momentum input from twolarge, but oppositely directed, NBI sources or NBI blips, to extract a measure of the intrinsicmomentum in the approximation that they have no direct effect on the momentum plasmaphysics [15–18].
In general, the resulting range of measurements and hypotheses is extremely varied.Toroidal rotation and momentum transport are generally found to be anomalous and closelyrelated to the ion transport [16] whereas the poloidal rotation is generally smaller in magnitudeand thought to be close to neo-classical in value (several recent experiments are reporting cleardeviations from this especially in the presence of the strong plasma gradients associated with thesought after improved confinement regimes, [19] and within). Although detailed models for themain fusion relevant plasma parameters have been constructed, plasma momentum modelling,uniting parallel and perpendicular particle flows, turbulence suppression, plasma electric fieldsand confinement regime changes, suffer from, apparently, contradictory experimental data.
This paper describes measurements of bulk ion rotation performed in the TCV tokamakwhere the CX technique has been used to obtain time-resolved poloidal and toroidal velocityprofiles with a low power diagnostic neutral beam that does not perturb the intrinsic momentumbalance. Using TCV’s wide plasma shaping capabilities [20], these observations may then beextended in a gradual manner to help in the construction of a theoretical model. Strong secondEC heating further allows extension of these observations to plasmas with tailored parameterprofiles.
Bulk plasma rotation in the TCV tokamak B197
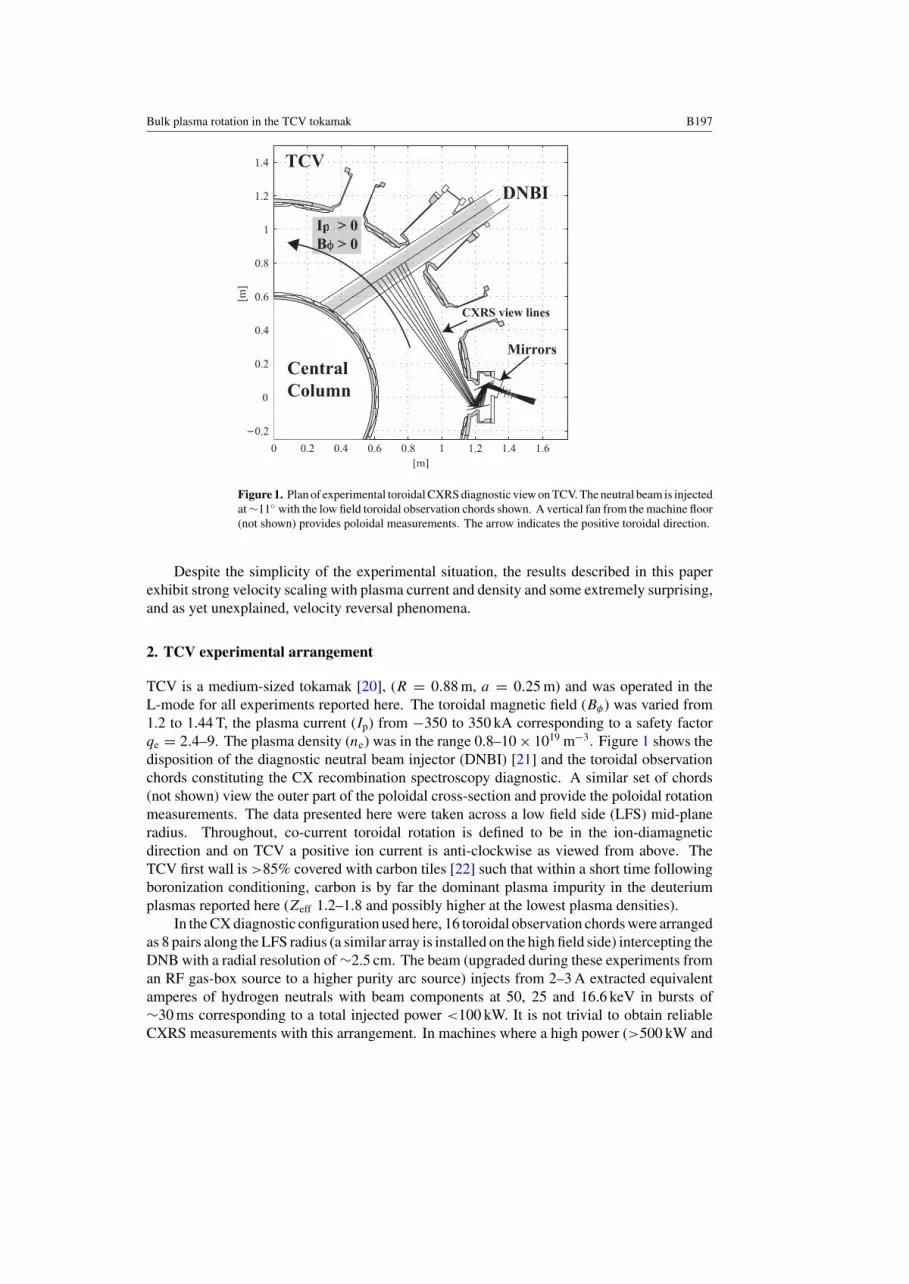
Figure 1. Plan of experimental toroidal CXRS diagnostic view on TCV. The neutral beam is injectedat ∼11◦ with the low field toroidal observation chords shown. A vertical fan from the machine floor(not shown) provides poloidal measurements. The arrow indicates the positive toroidal direction.
Despite the simplicity of the experimental situation, the results described in this paperexhibit strong velocity scaling with plasma current and density and some extremely surprising,and as yet unexplained, velocity reversal phenomena.
2. TCV experimental arrangement
TCV is a medium-sized tokamak [20], (R = 0.88 m, a = 0.25 m) and was operated in theL-mode for all experiments reported here. The toroidal magnetic field (Bφ) was varied from1.2 to 1.44 T, the plasma current (Ip) from −350 to 350 kA corresponding to a safety factorqe = 2.4–9. The plasma density (ne) was in the range 0.8–10 × 1019 m−3. Figure 1 shows thedisposition of the diagnostic neutral beam injector (DNBI) [21] and the toroidal observationchords constituting the CX recombination spectroscopy diagnostic. A similar set of chords(not shown) view the outer part of the poloidal cross-section and provide the poloidal rotationmeasurements. The data presented here were taken across a low field side (LFS) mid-planeradius. Throughout, co-current toroidal rotation is defined to be in the ion-diamagneticdirection and on TCV a positive ion current is anti-clockwise as viewed from above. TheTCV first wall is >85% covered with carbon tiles [22] such that within a short time followingboronization conditioning, carbon is by far the dominant plasma impurity in the deuteriumplasmas reported here (Zeff 1.2–1.8 and possibly higher at the lowest plasma densities).
In the CX diagnostic configuration used here, 16 toroidal observation chords were arrangedas 8 pairs along the LFS radius (a similar array is installed on the high field side) intercepting theDNB with a radial resolution of ∼2.5 cm. The beam (upgraded during these experiments froman RF gas-box source to a higher purity arc source) injects from 2–3 A extracted equivalentamperes of hydrogen neutrals with beam components at 50, 25 and 16.6 keV in bursts of∼30 ms corresponding to a total injected power <100 kW. It is not trivial to obtain reliableCXRS measurements with this arrangement. In machines where a high power (>500 kW and

B198 B P Duval et al
upwards) neutral beam is employed, the CX signal from the observed 529.1 nm CVI n = 8–7spectral feature can be several times larger than that from the background plasma (i.e. in theabsence of the beam). In the TCV arrangement, CX contributions to the spectral intensity ofless than 5%, compared with the passive signal level, are achieved using numerical extraction.To achieve this, spectra are typically taken in groups of three, with one spectrum before, oneduring and another following DNB injection, allowing the background signal and its first ordertemporal intensity derivative to be subtracted. With the relatively weak beam, a 30 ms beampulse is necessary to accumulate enough signal on the spectrometer’s CCD so that only timeresolutions of ∼90 ms are usually possible. To obtain reliable absolute rotation measurements,the spectral calibration and spectrometer resolution were measured immediately following eachplasma observation. A total uncertainty in the absolute velocity of ∼2 km s−1 in the plasmacore rising to ∼5 km s−1 at the edge is estimated, although changes over short time scaleswithin these margins are still expected to have statistical significance.
This arrangement was accepted with the goal of minimizing the beam driven plasmamomentum and energy deposition. As previously described [23], the TCV DNB is expectedto drive a toroidal velocity of less than ∼1 km s−1 across the density range of the experimentspresented. For a low target density, a large fraction of the beam ‘shines through’ onto thevessel central column tiles and the momentum per particle from the beam does not increaseconsiderably for full beam absorption at the higher densities. It is to be recalled that the highbeam particle velocity, and relatively low ion temperatures, result in an initially preferentialpower deposition onto the plasma electrons reducing the direct ion heating [24].
The experimental setup has consequences: in situations where the plasma parametersvary, or fluctuate, quickly (minor disruptions, abrupt confinement changes, ELMs, etc) there isinsufficient temporal/statistical resolution to ‘unfold’ the rotation profiles. Where the DNB CXcontribution is small, the background subtraction algorithm cannot cope with time-nonlinearspectral intensity changes and our analysis procedure reflects this by evaluating an error marginat every sample time. Although these experiments benefit from the relatively low TCV iontemperatures and consequent small thermal Doppler line widths, this system remains, to theauthors’ knowledge, one of the only systems employing a DNB that has obtained routine ionvelocity profiles.
3. Principal rotation characteristics
Since the main features of the TCV toroidal plasma rotation for limited plasmas, in the absenceof significant MHD oscillations, have already been reported [23], this paper will only reviewthe principal features of these previous findings, summarised in figure 2.
I. A large (up to 50 km s−1), plasma current magnitude dependent, toroidal counter-currentcore rotation is observed, the profile of which reverses nearly symmetrically upon reversalof the plasma current direction.
II. The rotation profile can be divided into three main regions: a relatively flat core regionfrom the sawtooth inversion radius inwards, an edge region that is approximately stationary(possibly slightly co-rotating) and a monotonic intermediate region.
III. The core plasma rotation, limited by the effect of sawteeth to approximately its value atthe sawtooth inversion radius, empirically scales as Uφ(max) (km s−1) = −12.5 T0i/Ip
(eV kA−1) where Uφ(max) is the maximum rotation velocity and T0i the core iontemperature (where the rotation is shown in angular units we use ωφ = Uφ/R). There areindications that the sawteeth induced momentum transport may be masking an otherwisecore peaked velocity profile.
Bulk plasma rotation in the TCV tokamak B199
0 0.2 0.4 0.6 0.8 1
–50
–40
–30
–20
–10
0
qe=8.8
qe=6.0
qe=4.2
qe=3.4
qe=2.9
ωφ (
kHz)
ρψ
inversion radius(a)
TCV 27502TCV 27098TCV 27094TCV 27494TCV 27095
0 0.2 0.4 0.6 0.8 1
–10
0
10
20
30
40
50
qe=7.7
qe=6.0
qe=4.5
qe=3.2
qe=2.6
ωφ (
kHz)
ρψ
inversion radius
(b) TCV 27488TCV 27484TCV 27483TCV 27477TCV 27478
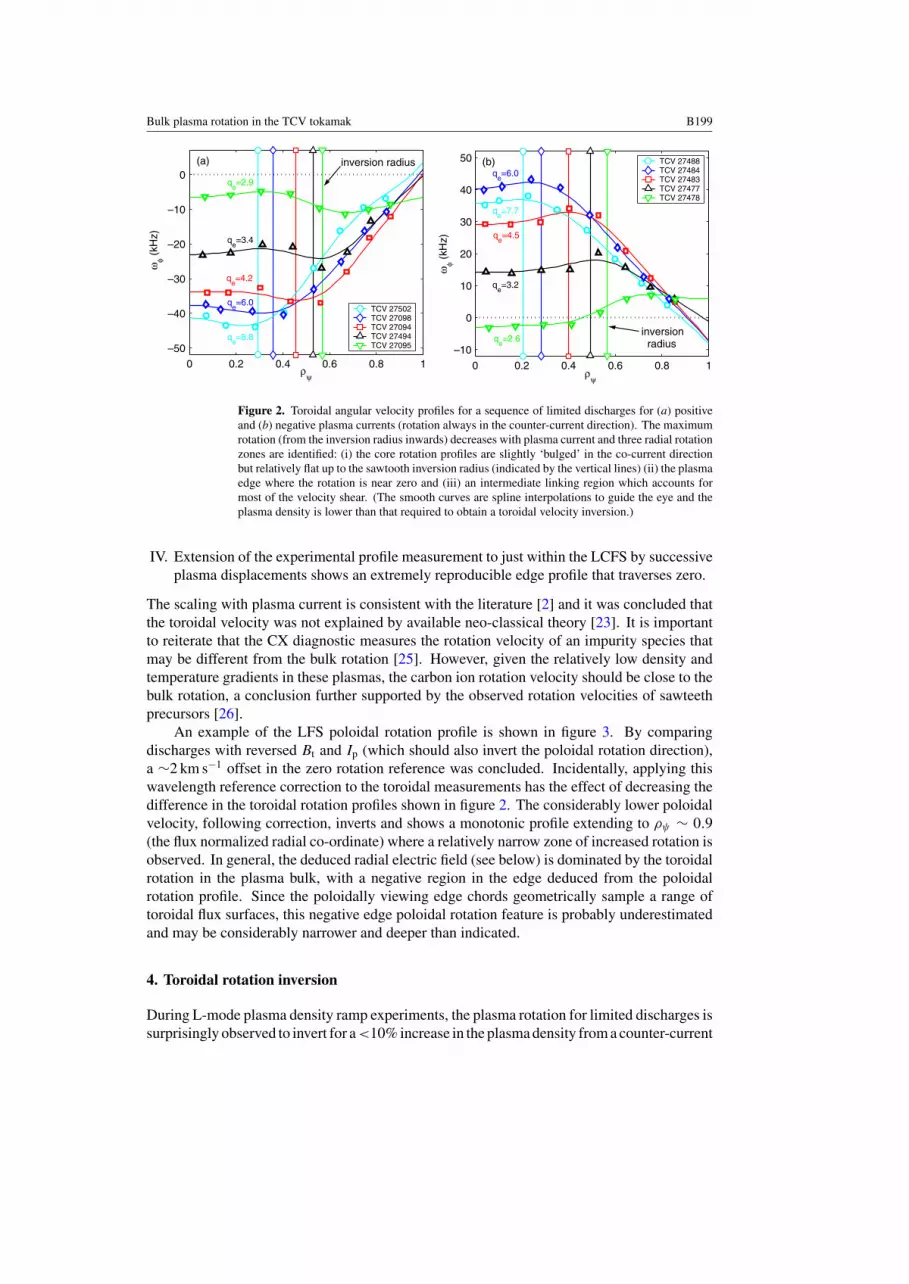
Figure 2. Toroidal angular velocity profiles for a sequence of limited discharges for (a) positiveand (b) negative plasma currents (rotation always in the counter-current direction). The maximumrotation (from the inversion radius inwards) decreases with plasma current and three radial rotationzones are identified: (i) the core rotation profiles are slightly ‘bulged’ in the co-current directionbut relatively flat up to the sawtooth inversion radius (indicated by the vertical lines) (ii) the plasmaedge where the rotation is near zero and (iii) an intermediate linking region which accounts formost of the velocity shear. (The smooth curves are spline interpolations to guide the eye and theplasma density is lower than that required to obtain a toroidal velocity inversion.)
IV. Extension of the experimental profile measurement to just within the LCFS by successiveplasma displacements shows an extremely reproducible edge profile that traverses zero.
The scaling with plasma current is consistent with the literature [2] and it was concluded thatthe toroidal velocity was not explained by available neo-classical theory [23]. It is importantto reiterate that the CX diagnostic measures the rotation velocity of an impurity species thatmay be different from the bulk rotation [25]. However, given the relatively low density andtemperature gradients in these plasmas, the carbon ion rotation velocity should be close to thebulk rotation, a conclusion further supported by the observed rotation velocities of sawteethprecursors [26].
An example of the LFS poloidal rotation profile is shown in figure 3. By comparingdischarges with reversed Bt and Ip (which should also invert the poloidal rotation direction),a ∼2 km s−1 offset in the zero rotation reference was concluded. Incidentally, applying thiswavelength reference correction to the toroidal measurements has the effect of decreasing thedifference in the toroidal rotation profiles shown in figure 2. The considerably lower poloidalvelocity, following correction, inverts and shows a monotonic profile extending to ρψ ∼ 0.9(the flux normalized radial co-ordinate) where a relatively narrow zone of increased rotation isobserved. In general, the deduced radial electric field (see below) is dominated by the toroidalrotation in the plasma bulk, with a negative region in the edge deduced from the poloidalrotation profile. Since the poloidally viewing edge chords geometrically sample a range oftoroidal flux surfaces, this negative edge poloidal rotation feature is probably underestimatedand may be considerably narrower and deeper than indicated.
4. Toroidal rotation inversion
During L-mode plasma density ramp experiments, the plasma rotation for limited discharges issurprisingly observed to invert for a<10% increase in the plasma density from a counter-current

B200 B P Duval et al
0.4 0.6 0.8 1–4
–2
0
2
4
6
8
ρψ
Poloidal rotation uθ (km/s) (a)
TCV 32126 Ip>0 Bφ>0TCV 32458 Ip<0 Bφ<0
0 0.2 0.4 0.6 0.8 1
–6
–4
–2
0
2
4
TCV 32126
Radial electric field Er (kV/m)
ρψ
(b)
Er–uθ Bφ+uφ Bθ∇p/nZe
Figure 3. (a) Typical poloidal rotation profile for a low density (∼2 × 10¹⁹ m−3) limitedconfiguration (corresponding to figure 2, Ip > 0qe∼6). A second discharge with reversed plasmatoroidal field and plasma current is shown (lower velocity, red–online). A re-estimation of thespectral wavelength reference corresponding to ∼2 km s−1 is required to obtain the required zerocore poloidal rotation. The strong poloidal feature in the plasma edge determines the edge radialelectric field where the toroidal rotation is close to zero. (b) The ion force balance equation is usedto calculate the typical shape of the radial electric field (Er ) where the poloidal rotation, toroidalrotation and plasma pressure contributions are shown together with the total Er .
direction to a co-current direction [23] (the direction observed for H-mode discharges and fora large proportion of the other published intrinsic plasma rotation estimations), figure 4. Uponextending these experiments to diverted configurations, which at low plasma densities rotatein the co-current direction, a new rotation inversion is observed, again over a small range ofplasma densities, with the plasma now rotating in the counter-current direction. The divertedconfigurations in this paper have similar shape parameters to the limited discharges with thedivertor leg onto the TCV floor. In these experiments, there was a negligible change in thenormalized plasma density profile shape. Changes in the toroidal rotation direction are notnew [2,7] but this rotation bifurcation occurs for a particularly small change in a single plasmaparameter.
It is pertinent to list some of the general features of these velocity inversions, initially forlimited configurations [27–29]:
I. For a particular magnetic configuration, the transition occurs at a reproducible value ofthe plasma density. After several months of machine operation with and without anintervening boronization wall conditioning, the transition occurred at almost exactly thesame plasma density for the same plasma current and shape.
II. A threshold plasma current was observed below which no rotation inversion was obtainedat any plasma density (∼290 kA for the magnetic configuration used for figure 2).
III. Although experimentally difficult to demonstrate on TCV, which does not featurecryo-pump density control, the rotation profile re-inverts when the density is lowered,with some indication of hysteresis that might, in part, be explained by density profilechanges.
IV. The inverted profile exhibits the same three rotation regions, as noted in the previoussection, with strong rotation velocity redistribution within the sawtooth inversion radius.The rotation profile within this radius shows a small co-current ∼3 km s−1 ‘bulge’ in
Bulk plasma rotation in the TCV tokamak B201
100
200
300
400Plasma current Ip (kA)
(a)
2
4
6
8 Central electron density ne0 (1019 m–3)
(b)
0.6
0.8
1
1.2Central electron and carbon temperature (keV)
(c)
TeTC
–20
–10
0
10
20 Central carbon toroidal velocity vφ (km/s)
(d)
0.5 1 1.5 2
–1
–0.5
0
0.5
1Total carbon angular momentum Pφ (10 –3 J s)
(e) TCV #28355
time (s)
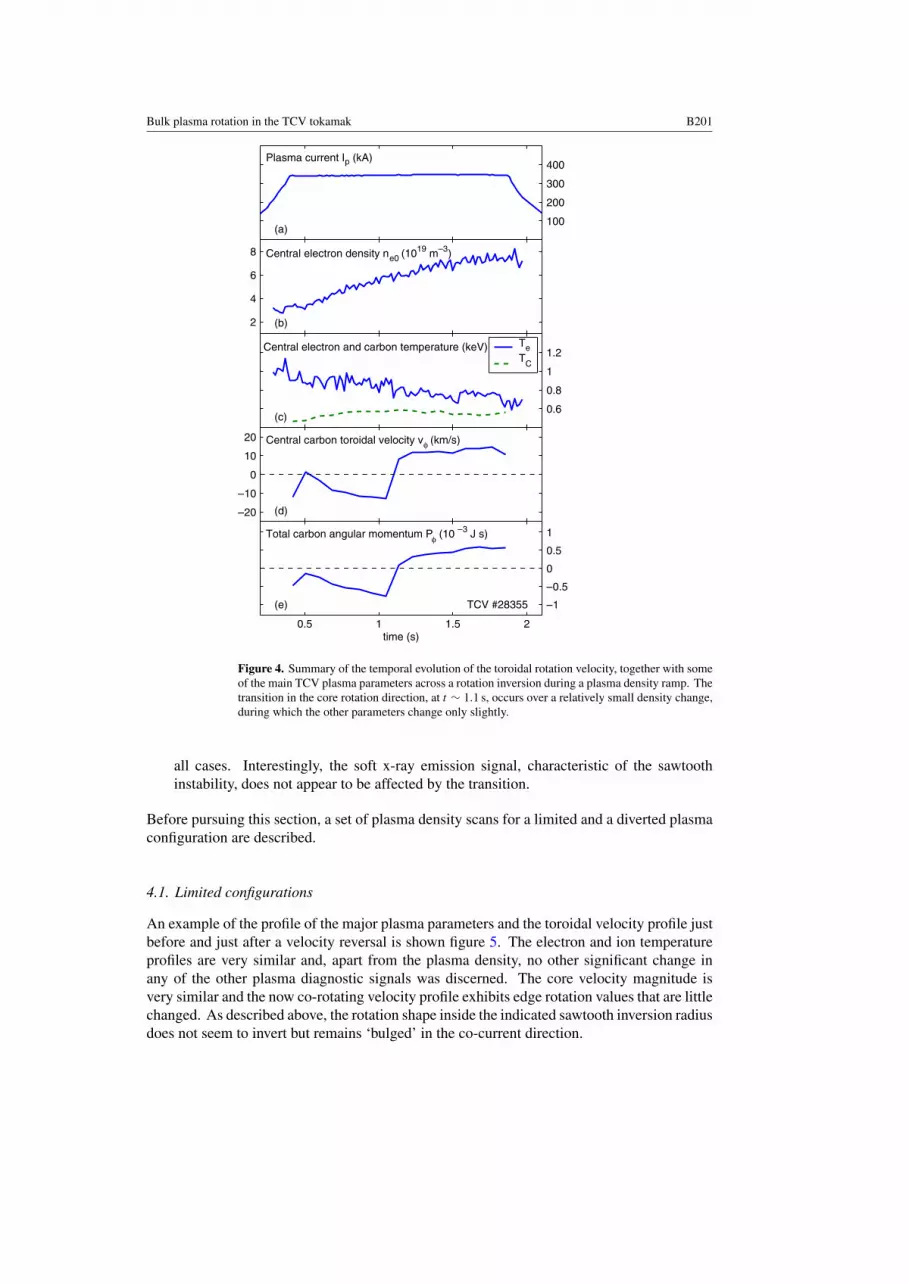
Figure 4. Summary of the temporal evolution of the toroidal rotation velocity, together with someof the main TCV plasma parameters across a rotation inversion during a plasma density ramp. Thetransition in the core rotation direction, at t ∼ 1.1 s, occurs over a relatively small density change,during which the other parameters change only slightly.
all cases. Interestingly, the soft x-ray emission signal, characteristic of the sawtoothinstability, does not appear to be affected by the transition.
Before pursuing this section, a set of plasma density scans for a limited and a diverted plasmaconfiguration are described.
4.1. Limited configurations
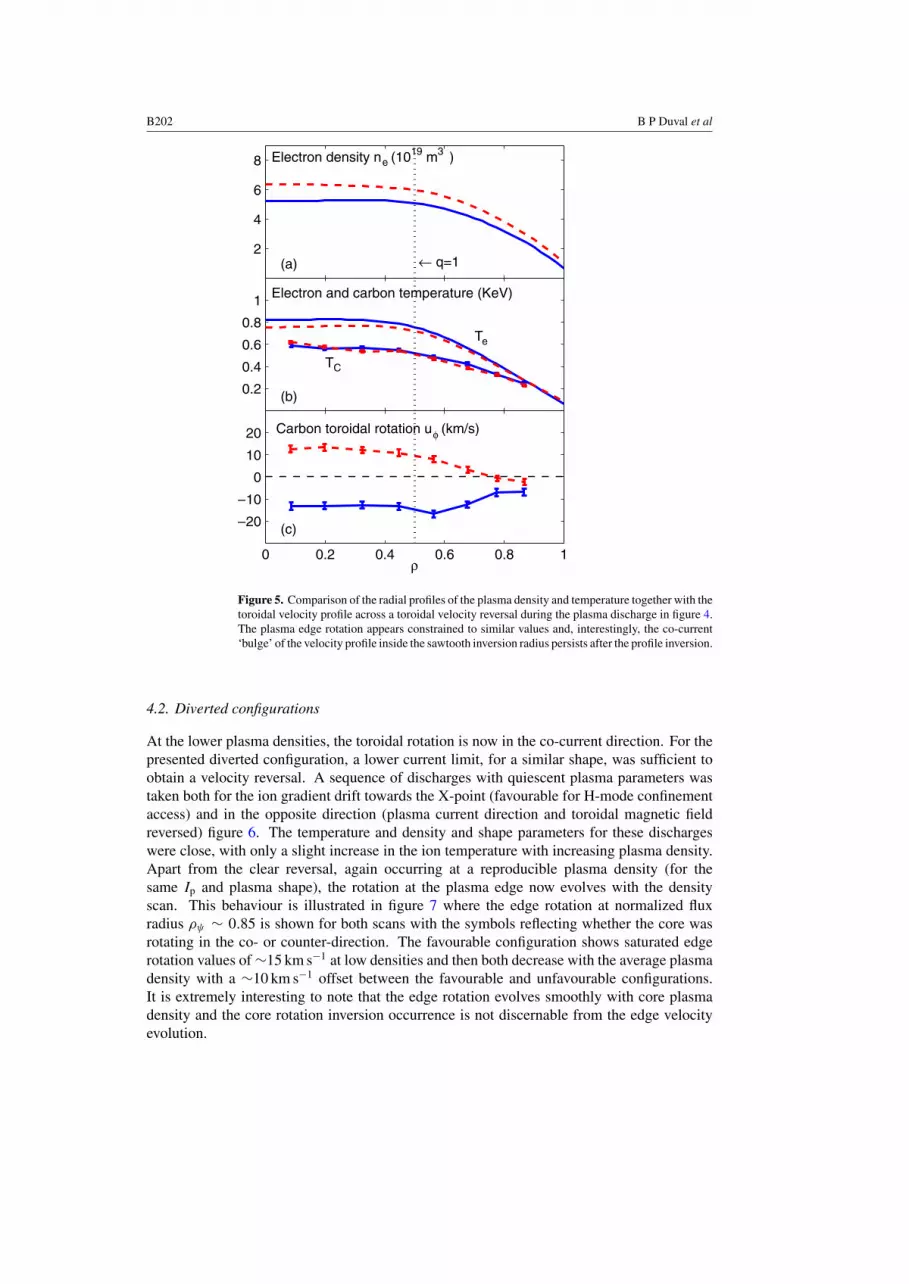
An example of the profile of the major plasma parameters and the toroidal velocity profile justbefore and just after a velocity reversal is shown figure 5. The electron and ion temperatureprofiles are very similar and, apart from the plasma density, no other significant change inany of the other plasma diagnostic signals was discerned. The core velocity magnitude isvery similar and the now co-rotating velocity profile exhibits edge rotation values that are littlechanged. As described above, the rotation shape inside the indicated sawtooth inversion radiusdoes not seem to invert but remains ‘bulged’ in the co-current direction.
B202 B P Duval et al
2
4
6
8 Electron density ne (1019 m3 )
(a) ← q=1
0.2
0.4
0.6
0.8
1 Electron and carbon temperature (KeV)
TC
Te
(b)
0 0.2 0.4 0.6 0.8 1
–20
–10
0
10
20
ρ
Carbon toroidal rotation uφ (km/s)
(c)
Figure 5. Comparison of the radial profiles of the plasma density and temperature together with thetoroidal velocity profile across a toroidal velocity reversal during the plasma discharge in figure 4.The plasma edge rotation appears constrained to similar values and, interestingly, the co-current‘bulge’ of the velocity profile inside the sawtooth inversion radius persists after the profile inversion.
4.2. Diverted configurations
At the lower plasma densities, the toroidal rotation is now in the co-current direction. For thepresented diverted configuration, a lower current limit, for a similar shape, was sufficient toobtain a velocity reversal. A sequence of discharges with quiescent plasma parameters wastaken both for the ion gradient drift towards the X-point (favourable for H-mode confinementaccess) and in the opposite direction (plasma current direction and toroidal magnetic fieldreversed) figure 6. The temperature and density and shape parameters for these dischargeswere close, with only a slight increase in the ion temperature with increasing plasma density.Apart from the clear reversal, again occurring at a reproducible plasma density (for thesame Ip and plasma shape), the rotation at the plasma edge now evolves with the densityscan. This behaviour is illustrated in figure 7 where the edge rotation at normalized fluxradius ρψ ∼ 0.85 is shown for both scans with the symbols reflecting whether the core wasrotating in the co- or counter-direction. The favourable configuration shows saturated edgerotation values of ∼15 km s−1 at low densities and then both decrease with the average plasmadensity with a ∼10 km s−1 offset between the favourable and unfavourable configurations.It is extremely interesting to note that the edge rotation evolves smoothly with core plasmadensity and the core rotation inversion occurrence is not discernable from the edge velocityevolution.

Bulk plasma rotation in the TCV tokamak B203
0 0.2 0.4 0.6 0.8 1
–30
–20
–10
0
10
20
30 Carbon toroidal rotation uφ (km/s)
ρψ
2
4
6
8
Electron density ne (1019 m–3)
Density scan at Ip = 250kA, q95
=3.6, δ=0.5, κ=1.6
← q=1
TCV 33380TCV 33379TCV 33376TCV 33375TCV 33384
ne
0 0.2 0.4 0.6 0.8 1
–30
–20
–10
0
10
20
30 Carbon toroidal rotation uφ (km/s)
ρψ
2
4
6
8
Electron density ne (1019 m 3)
Density scan at Ip = 250kA, q95
=3.6, δ=0.5, κ=1.6
← q=1
TCV 33342TCV 33341TCV 33340TCV 33337TCV 33332
ne
Figure 6. Resume of stationary toroidal rotation profiles for a range of plasma densities forsimilar diverted configurations with ‘unfavourable’ (left) and ‘favourable’ (right) ion drift directionsobtained by reversing the plasma current. In both cases a velocity inversion is again observed but,in contrast to the limited configurations, the profile transits from a co-current to a counter-currentdirection with increasing plasma density. The plasma density at the velocity inversion is higherfor the favourable ion drift direction and there is a difference between the rotation profiles at theplasma edge (profiles shown to ρψ ∼ 0.85).
With a slow density evolution, a preliminary modelled estimation of the momentumtransport was obtained by matching the intermediate rotation profiles across the inversionevent (this will be the subject of a future publication). A reasonable match to the observationswas obtained by invoking a ‘pinch-like’ flux (i.e. not simply proportional to the local plasmavelocity) that changed direction spontaneously at the time of the velocity inversion. This kindof flux model determines the shape of the profile where the edge rotation is taken from theexperimental measurement. Thus, no identification of the momentum drive physics is impliedalthough the mechanism would not be consistent with a sole change from the plasma edge.Unsurprisingly, in view of the plotted rotation profiles, only minor changes in the transportparameters were obtained between analyses of the diverted and limited experiments apart froma change of sign in the inward flux term. Put more directly, the plasma rotation direction maychange, but the processes that distribute the plasma momentum seem to remain similar andhave time scales comparable to other ion transport processes such as the energy equipartitionalthough changes in the velocities occur faster than predicted from neo-classical theory.
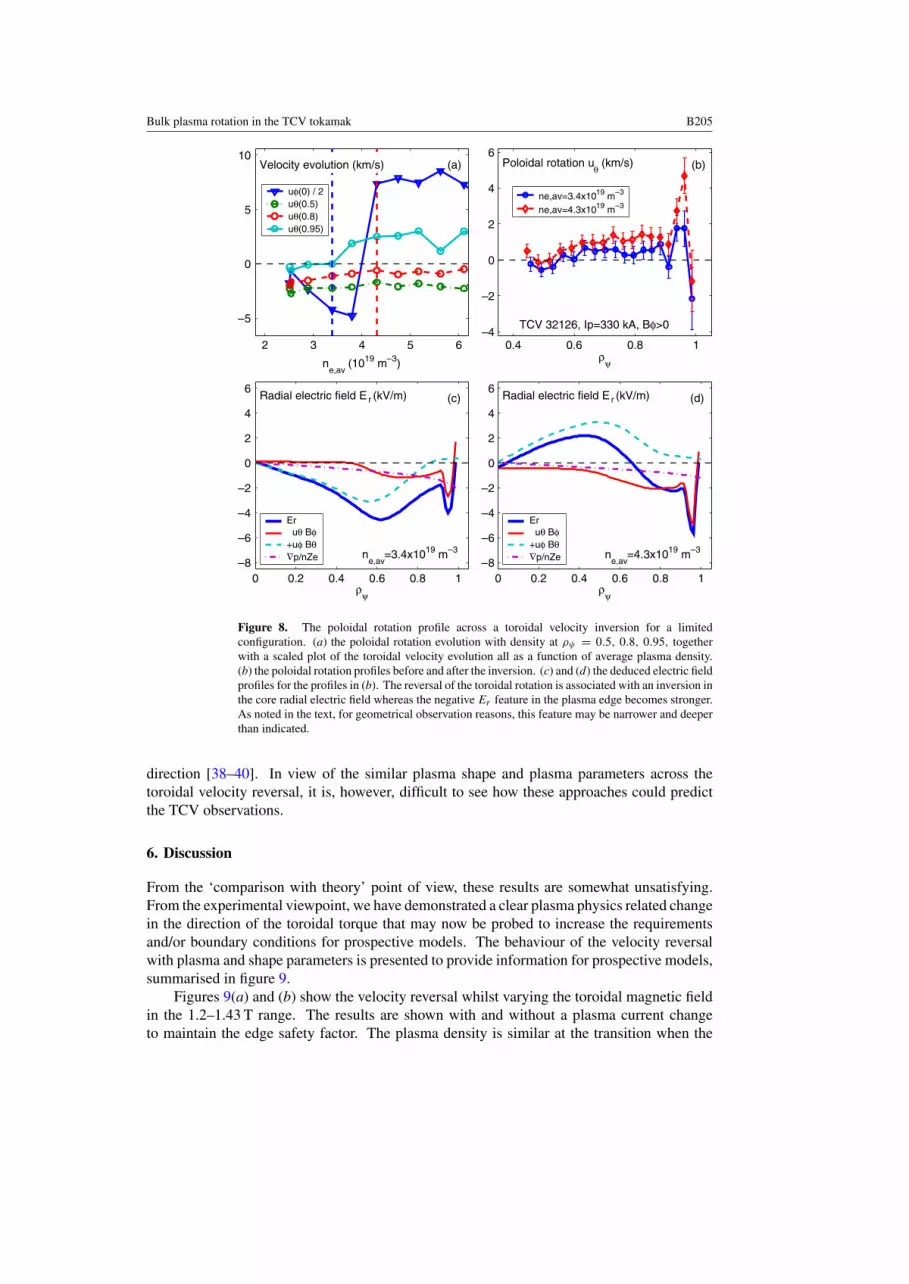
This description of the rotation inversion is completed with a plot of the poloidal velocitybehaviour, measured across the LFS mid-plane, across the toroidal rotation profile inversionfor a limited configuration. Figure 8 shows two radial profiles of the poloidal rotation togetherwith the time evolution of the poloidal rotation at three radial positions across a toroidalinversion event. Although there is an increase in the poloidal rotation across the wholeradial profile, it is in the far edge region where there is the strongest increase in the deducednegative radial electric field. Some caution is necessary concerning this preliminary data.

B204 B P Duval et al
2 3 4 5 6
–10
–5
0
5
10
15
20
ne,av (1019 m–3)
uφ(ρ=0.85) (km/s)
FAV
UNFAV
UNFAVFAV
Figure 7. The outermost rotation values (ρψ ∼ 0.85 symptomatic of the edge rotation) are shownfor the stationary rotation profiles of diverted discharges in figure 6 for both favourable (FAV—circles) and unfavourable (UNFAV—triangles) ion drift directions. At lower densities the toroidalrotation at the centre saturates at ∼15 km s−1 but both decrease with plasma density with thefavourable discharges rotating ∼10 km s−1 faster than the unfavourable configurations for a givenplasma density. It is interesting to note that the edge rotation does not appear to mirror the corerotation before and after inversion indicated by the hollow and full symbols, respectively. For theintermediate plasma densities it seems like the increasing plasma density behaves as a ‘brake’ butthe plasma edge rotation becomes increasingly counter-current at the higher densities indicating amore complex momentum flow in the near SOL region.
The calculated edge electric field excursion (assuming the calibration correction describedearlier) is most certainly underestimated, as explained above. As expected, the magnitudeof the core plasma poloidal rotation is close to that calculated from models used on othermachines [30, 31].
5. Model comparison
The comparison of this data with existing theory for momentum generation and transport israpid. Since, in these experiments, we do not have a clear drive term such as NBI heating or ionor electron cyclotron heating (ECH) or strong gradients of plasma parameters associated withthe H-mode or ITB regimes, the comparison with many of the published models is inappropriateas they focus on some dominant torque present in these regimes [30–35]. A comparison withneo-classical predictions for the limited discharges could not even explain the static velocityprofiles of the limited discharges [23] let alone the inversion of the rotation for a relativelyminor change in one plasma parameter. Although the Ohmic H-mode threshold data fromTCV is consistent with the empirical ITER related scaling [13], most of the rotation featuresreported in this paper remain unexplained. Of the recent theoretical approaches, models arebeing suggested that cite the need for a ‘symmetry breaking’ [36, 37] in the propagation oftoroidal momentum waves to produce a net torque either from processes in regions of strongplasma gradients or as a result of the magnetic field line configuration. These models note thatthe torque direction depends on the direction of any dominant mode. There is some furthersuggestion that these plasmas may be transiting by stabilizing the trapped electron mode(TEM) with increasing collisionality (density) to ion temperature gradient (ITG) dominantmicro instabilities that would provide the necessary change in the wave, and thus the torque,
Bulk plasma rotation in the TCV tokamak B205
0.4 0.6 0.8 1–4
–2
0
2
4
6
ρψ
Poloidal rotation uθ (km/s)
TCV 32126, Ip=330 kA, Bφ>0
(b)
ne,av=3.4x10¹⁹ m–3
ne,av=4.3x10¹⁹ m–3
2 3 4 5 6
–5
0
5
10
ne,av
(1019 m–3)
Velocity evolution (km/s) (a)
uφ(0) / 2uθ(0.5)uθ(0.8)uθ(0.95)
0 0.2 0.4 0.6 0.8 1–8
–6
–4
–2
0
2
4
6Radial electric field E r (kV/m)
ρψ
ne,av
=3.4x10¹⁹ m–3
(c)
Er uθ Bφ+uφ Bθ∇p/nZe
0 0.2 0.4 0.6 0.8 1–8
–6
–4
–2
0
2
4
6Radial electric field E r (kV/m)
ρψ
ne,av
=4.3x10¹⁹ m–3
(d)
Er uθ Bφ+uφ Bθ∇p/nZe
Figure 8. The poloidal rotation profile across a toroidal velocity inversion for a limitedconfiguration. (a) the poloidal rotation evolution with density at ρψ = 0.5, 0.8, 0.95, togetherwith a scaled plot of the toroidal velocity evolution all as a function of average plasma density.(b) the poloidal rotation profiles before and after the inversion. (c) and (d) the deduced electric fieldprofiles for the profiles in (b). The reversal of the toroidal rotation is associated with an inversion inthe core radial electric field whereas the negative Er feature in the plasma edge becomes stronger.As noted in the text, for geometrical observation reasons, this feature may be narrower and deeperthan indicated.
direction [38–40]. In view of the similar plasma shape and plasma parameters across thetoroidal velocity reversal, it is, however, difficult to see how these approaches could predictthe TCV observations.
6. Discussion
From the ‘comparison with theory’ point of view, these results are somewhat unsatisfying.From the experimental viewpoint, we have demonstrated a clear plasma physics related changein the direction of the toroidal torque that may now be probed to increase the requirementsand/or boundary conditions for prospective models. The behaviour of the velocity reversalwith plasma and shape parameters is presented to provide information for prospective models,summarised in figure 9.
Figures 9(a) and (b) show the velocity reversal whilst varying the toroidal magnetic fieldin the 1.2–1.43 T range. The results are shown with and without a plasma current changeto maintain the edge safety factor. The plasma density is similar at the transition when the

B206 B P Duval et al
3 4 5
–30
–20
–10
0
10
20
Ip = 331kA
ne,av (1019 m–3)
Central toroidal rotation uφ0
(km/s) (a)
TCV 33881 Bφ=1.21 qe=2.5TCV 33884 Bφ=1.31 qe=2.7TCV 33764 Bφ=1.45 qe=3.0
3 3.5 4 4.5 5 5.5
–30
–20
–10
0
10
20
qe = 3.0
ne,av (1019 m–3)
Central toroidal rotation uφ0
(km/s) (b)
TCV 33880 Bφ=1.21 Ip=273TCV 33887 Bφ=1.31 Ip=302TCV 33764 Bφ=1.45 Ip=331
3 3.5 4 4.5 5 5.5
–30
–20
–10
0
10
20
ρECH
~ 0.7
ne,av (1019 m–3)
Central toroidal rotation uφ0
(km/s) (d)
TCV 28977 OhmicTCV 28981 250 kW ECHTCV 28976 500 kW ECH
0 0.2 0.4 0.6 0.8
–40
–30
–20
–10
0 Toroidal rotation uφ (km/s)
ρψ
(c)
ρinv
TCV 27767
t=0.6s (Ohmic)t=1.2s (ECH)
Figure 9. Collection of scans of the toroidal velocity inversion density threshold as a function ofsome plasma parameters for limited discharges. (a) and (b) Toroidal field and plasma current: herethe toroidal rotation is plotted as a function of the average plasma density for a range of Bφ with(a) constant plasma current and (b) constant edge safety factor qe. Although at the lower field thetransition was more difficult to obtain, the density at the transition was little changed for the samesafety factor. (c) X2 ECH: the addition of second harmonic (X2) EC heating at ρψ ∼ 0.65 movesthe sawtooth inversion radius towards the core. The toroidal rotation profile now peaks, almostdoubling its maximum value. There is some indication of reduced rotation in the outer plasmaregion. (d) The toroidal rotation velocity is shown as a function of average plasma density for 0,250, 500 kW of X2 heating. The density threshold for velocity inversion increases with EC power.
edge safety factor is reproduced. The toroidal velocity profile is found to peak more stronglyafter the sawteeth inversion radius was reduced by 500 kW of off-axis second harmonic ECheating, figure 9(c). The reduction in the core momentum radial transport, that may only bepartial, peaks the rotation profile but NOT the ion temperature which actually decreases due tolower ion-electron coupling (not shown). In figure 9(d) second harmonic EC heating appearsto increase the density threshold for the velocity inversion. The central toroidal velocity isshown for three discharges with 0, 250 and 500 kW of EC heating. The density at which thetransition occurs appears to increase with increased EC power. Although tempting, the scalingof the threshold inversion density with EC power was not accounted for solely by the changein the plasma collisionality.
Bulk plasma rotation in the TCV tokamak B207
2 2.5 3 3.5 4 4.5 5 5.5
–10
0
10
20
ne,av (1019 m–3)
Central toroidal rotation uφ0 (km/s) (a)
TCV 30500TCV 32127
0 0.2 0.4 0.6 0.8 1
–20
–10
0
10
20
before inv.after inv.
ρψ
Toroidal rotation uφ (km/s) (b)
δ=0.48 δ=0.00
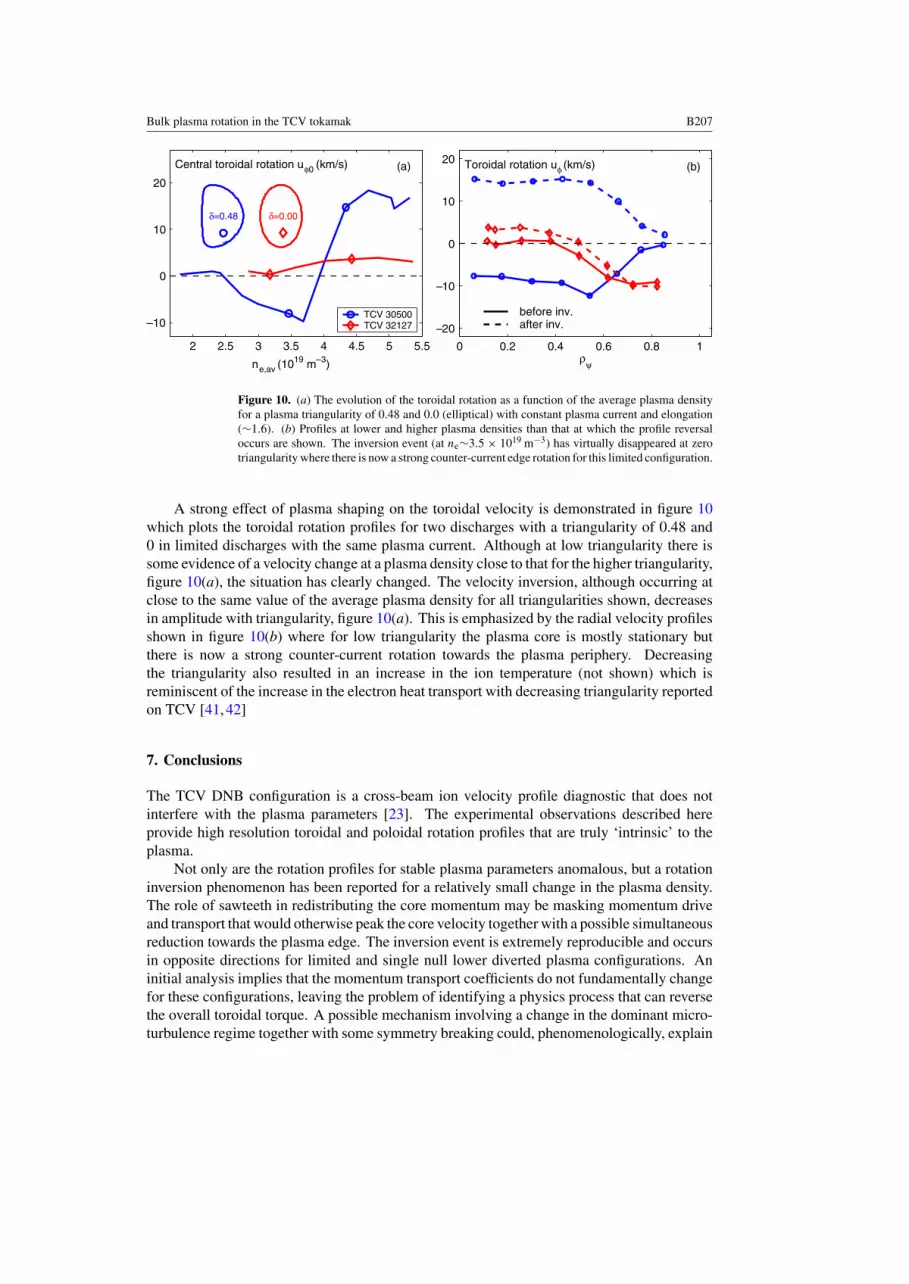
Figure 10. (a) The evolution of the toroidal rotation as a function of the average plasma densityfor a plasma triangularity of 0.48 and 0.0 (elliptical) with constant plasma current and elongation(∼1.6). (b) Profiles at lower and higher plasma densities than that at which the profile reversaloccurs are shown. The inversion event (at ne∼3.5 × 10¹⁹ m−3) has virtually disappeared at zerotriangularity where there is now a strong counter-current edge rotation for this limited configuration.
A strong effect of plasma shaping on the toroidal velocity is demonstrated in figure 10which plots the toroidal rotation profiles for two discharges with a triangularity of 0.48 and0 in limited discharges with the same plasma current. Although at low triangularity there issome evidence of a velocity change at a plasma density close to that for the higher triangularity,figure 10(a), the situation has clearly changed. The velocity inversion, although occurring atclose to the same value of the average plasma density for all triangularities shown, decreasesin amplitude with triangularity, figure 10(a). This is emphasized by the radial velocity profilesshown in figure 10(b) where for low triangularity the plasma core is mostly stationary butthere is now a strong counter-current rotation towards the plasma periphery. Decreasingthe triangularity also resulted in an increase in the ion temperature (not shown) which isreminiscent of the increase in the electron heat transport with decreasing triangularity reportedon TCV [41, 42]
7. Conclusions
The TCV DNB configuration is a cross-beam ion velocity profile diagnostic that does notinterfere with the plasma parameters [23]. The experimental observations described hereprovide high resolution toroidal and poloidal rotation profiles that are truly ‘intrinsic’ to theplasma.
Not only are the rotation profiles for stable plasma parameters anomalous, but a rotationinversion phenomenon has been reported for a relatively small change in the plasma density.The role of sawteeth in redistributing the core momentum may be masking momentum driveand transport that would otherwise peak the core velocity together with a possible simultaneousreduction towards the plasma edge. The inversion event is extremely reproducible and occursin opposite directions for limited and single null lower diverted plasma configurations. Aninitial analysis implies that the momentum transport coefficients do not fundamentally changefor these configurations, leaving the problem of identifying a physics process that can reversethe overall toroidal torque. A possible mechanism involving a change in the dominant micro-turbulence regime together with some symmetry breaking could, phenomenologically, explain
B208 B P Duval et al
these observations, but none of the currently published models appears to be as sensitive tothe plasma density as the observations presented. This is partially supported by the initialtriangularity scan reported here that demonstrates a strong plasma shape effect, in this caseclosely associated with a decrease in the electron heat transport possibly related to TEMstabilization [42]. A quantifiable comparison would require the identification of a momentumdrive (possibly several competing terms) and a model for any momentum transport throughthe plasma SOL.
A direct measurement of the radial electric field from the toroidal and poloidal rotationand ion pressure profiles, together with the strong shaping and ECH profile tailoring availableon TCV, provides a rich environment for further experimental study of tokamak momentumbehaviour.
Although, at the time of writing, it would appear that the problem with RWM stabilizationfor ITER may have been overestimated, the methodology used to predict the plasma rotationin such a device does not explain the physical forces and processes involved which result inthe observations described in this paper.
Acknowledgments
This work was partially funded by the Swiss National Science Foundation.
References
[1] Groebner R J et al 1990 Phys. Rev. Lett. 64 3015[2] Rice J E et al 2001 Nucl. Fusion 41 277[3] Crombe K et al 2005 Phys. Rev. Lett. 95 155003[4] Strait E J et al 1995 Phys. Rev. Lett. 74 2483[5] Taylor T S et al 1995 Phys. Plasmas 2 2390[6] Noterdaeme J-M et al 2003 Nucl. Fusion 43 274[7] Duval B P et al 1992 Nucl. Fusion 32 1405[8] Burrell K et al 1997 Phys. Plasmas 4 1499[9] Gohil P et al 1997 Plasma Phys. Control. Fusion 38 1243
[10] Nishijima D et al 2005 Plasma Phys. Control. Fusion 47 89[11] Porte L et al 2007 Nucl. Fusion 47 952–60[12] Doyle E J et al 2007 Nucl. Fusion 47 S18–127[13] Rice J E et al 2007 Nucl. Fusion 47 at press[14] Takechi M et al 2007 Phys. Rev. Lett. 98 055002[15] deGrassie J S et al 2007 Phys. Plasmas 14 056115[16] Sakamoto Y et al 2004 Plasma Phys. Control. Fusion 46 A299[17] Yoshida M et al 2006 Plasma Phys. Control. Fusion 48 1673[18] de Vries P et al 2006 Plasma Phys. Control. Fusion 48 1693[19] Solomon W et al 2006 Phys. Plasmas 13 056116[20] Moret J-M et al 1997 Phys. Rev. Lett. 79 2057[21] Karpushov A et al 2003 Fusion Eng. Des. 66–68 899[22] Pitts R et al 1999 Nucl. Fusion 39 1433[23] Scarabosio A et al 2006 Plasma Phys. Control. Fusion 48 663–83[24] Wesson J Tokamaks vol 5.4, 3rd edn (Oxford: Clarendon)[25] Testa D et al 2002 Phys. Plasmas 9 1 243[26] Scarabosio A et al 2006 33rd EPS Conf. on Plasma Physics (Rome, 2006) vol 30I (ECA) P-1.151[27] Bortolon A et al 2006 Phys. Rev. Lett. 97 235003[28] Bortolon A et al 2006 32nd EPS Conf. on Plasma Physics (Tarragona, 2005) vol 29C (ECA) P-4.048[29] Bortolon A et al 2006 33rd EPS Conf. on Plasma Physics (Rome, 2006) vol 30I (ECA) P-1.154[30] Kim Y et al 1991 Phys. Fluids B 3 2050[31] Testa D et al 2006 Nucl. Fusion 46 562[32] Mattor N et al 1988 Phys. Fluids 31 1180

Bulk plasma rotation in the TCV tokamak B209
[33] Rogister A L et al 2002 Nucl. Fusion 42 1144[34] Peeters A G et al 2006 Plasma Phys. Control. Fusion 48 B413–20[35] Coppi B 2002 Nucl. Fusion 42 1[36] Gurcan O D et al 2007 Phys. Plasmas 14 042304[37] Hahm T S et al 2007 Phys. Plasmas 14 72302[38] Peeters A G et al 2007 Phys. Rev. Lett. 98 265003[39] Shaing K C 2001 Phys. Rev. Lett. 86 650[40] Diamond P H 2007 private communication[41] Camenen Y et al 2005 Plasma Phys. Control. Fusion 47 1971[42] Camenen Y et al 2007 Nucl. Fusion 47 510