bridge damage survey in banda aceh and surrounding areas and earthquake and tsunami questionnaires
TRANSCRIPT
4th International Conference on Earthquake Engineering Taipei, Taiwan
October 12-13, 2006
Paper No. 276
BRIDGE DAMAGE SURVEY IN BANDA ACEH AND SURROUNDING AREAS AND EARTHQUAKE AND TSUNAMI QUESTIONNAIRES
Hirokazu Iemura1 and Mulyo Harris Pradono2
ABSTRACT
Bridge surveys show the condition of bridges near the seashore in Banda Aceh city. The bridge decks were slightly displaced (inland direction). Calculations show that the minimum water velocity capable of displacing the decks is around 13.4 km/hour. In fact, the tsunami run up velocity is larger than the minimum velocity above. However, since the deck movements were not uniform in the lateral direction, they were locked to each other and prevented from being washed away. However, bridges along the west coast of Aceh Provinces were mostly washed away. They were experiencing direct and much higher tsunami runoff. One result of the questionnaire is the seismic intensity. The intensity is estimated at 5.52 or 6− in Japanese Meteorological Agency scale (or around VIII in the MMI scale) in Banda Aceh city. Other questionnaires consist of questions asking their experience during and after the earthquake and tsunami. One important result is that even if people had started running away just after the big earthquake, the percentage of expected survivors would have been less than 100%, according to the respondents. The practical implication is that education, socialization (software) and escape structures, warning system, wave resisting structures (hardware) are among important factors for people to be safer against future earthquake and tsunami attacks. Keywords: tsunami, bridge damage, seismic intensity, questionnaires
INTRODUCTION The fourth largest earthquake in the world since 1900 has occurred on December 26, 2004, at 00:58:53 UTC (or 07:58:53 a.m. local time), off the west coast of Northern Sumatra, Indonesia. The magnitude was reported as 9.0, the focal depth was 30 km, and the epicenter position is Latitude 3.30 North and Longitude 95.96 East (USGS, 2005). The epicenter is 255 km from Banda Aceh, the nearest provincial capital in Sumatra. The earthquake tremor caused some structural damages and casualties in Banda Aceh and Meulaboh. The subsequent tsunami killed more than 125,468 people, and left 94,550 people missing in Northern Sumatra region (Bakornas PBP, 2005). In total, at least 283,100 people were killed by the earthquake and subsequent tsunami in 10 countries in South Asia and East Africa. The tsunami caused more casualties than any other in recorded history. The disaster has attracted attentions from the world. Lessons from this huge disaster shall be learnt by locals and people all around the world. In a quick response to the disaster, a Japanese group of researchers led by the first author departed to Banda Aceh and surrounding areas in attempt to study the lessons by the huge earthquake and tsunami. Bridge damage surveys and questionnaires distribution were among to be carried out.
1 Professor, Graduate School of Civil Engineering, Kyoto University, Kyoto, [email protected] 2 Research Fellow, Graduate School of Civil Engineering, Kyoto University, Kyoto, [email protected]
BRIDGE DAMAGE SURVEYS Ulee Lheue Bridge Damages
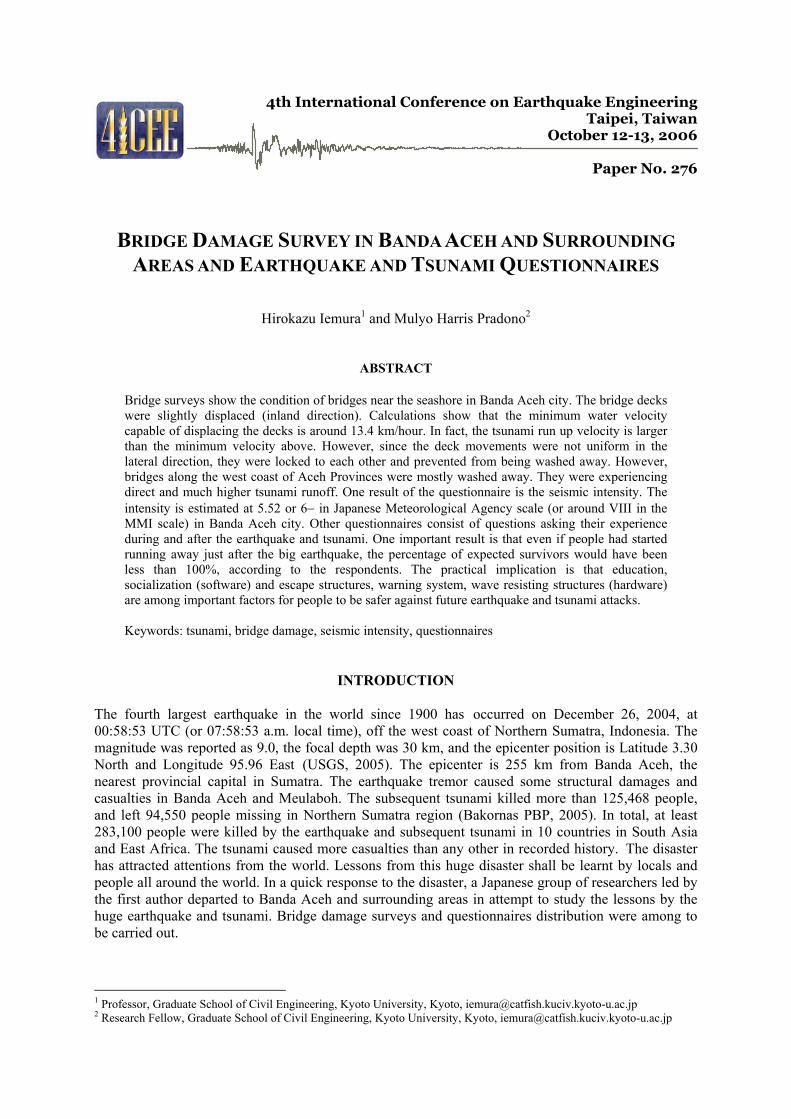
Figure 1 shows the satellite photos of Meuraxa ward, Banda Aceh city, before and after the tsunami. Massive damage is seen on the area caused by the tsunami. Bridges shown in the figure were surveyed on March 3rd and 4th, 2005. The bridges surveyed are numbered as Nos. 2, 1, and 20. Maximum water height is 12 meter near the shore and become around 6 meters above the ground near the bridge No. 20.
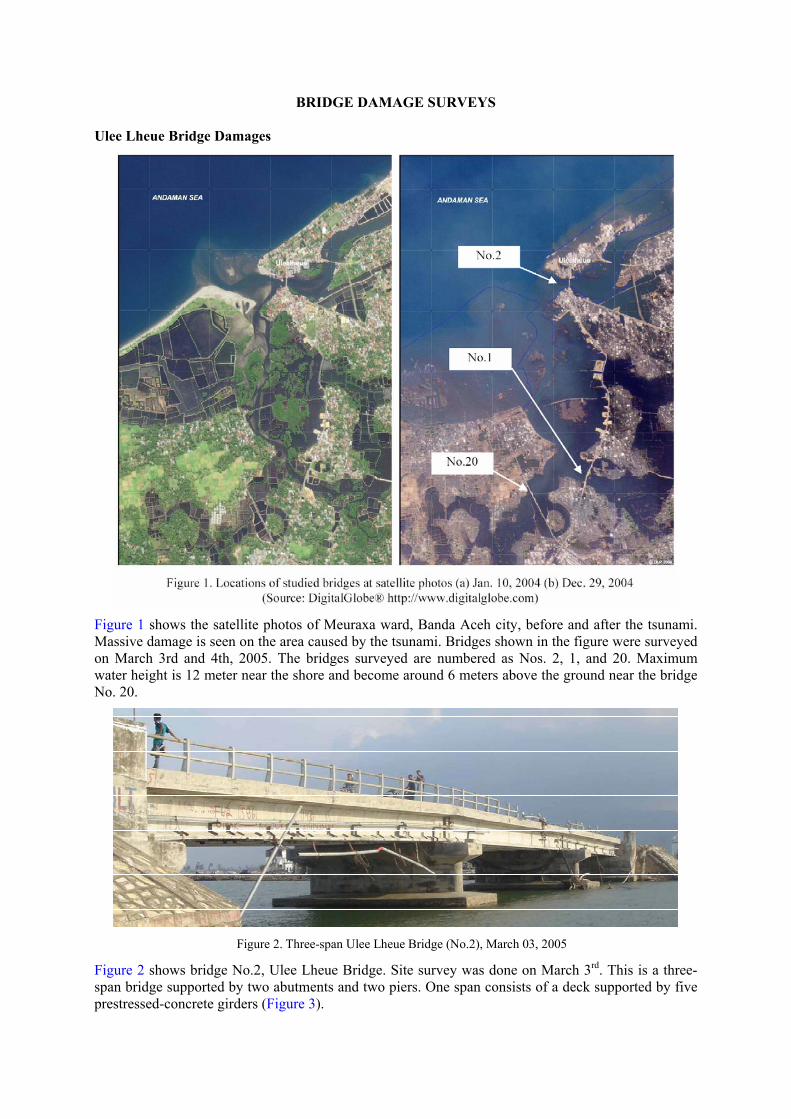
Figure 2. Three-span Ulee Lheue Bridge (No.2), March 03, 2005 Figure 2 shows bridge No.2, Ulee Lheue Bridge. Site survey was done on March 3rd. This is a three-span bridge supported by two abutments and two piers. One span consists of a deck supported by five prestressed-concrete girders (Figure 3).
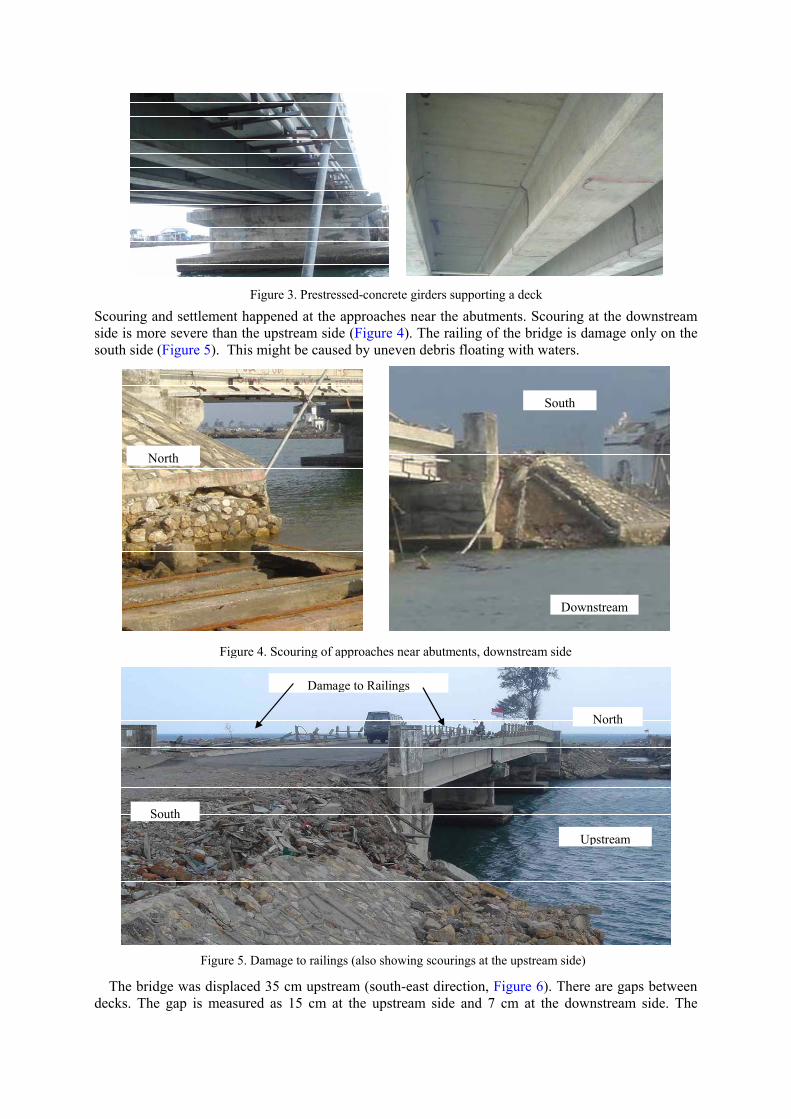
Figure 3. Prestressed-concrete girders supporting a deck
Scouring and settlement happened at the approaches near the abutments. Scouring at the downstream side is more severe than the upstream side (Figure 4). The railing of the bridge is damage only on the south side (Figure 5). This might be caused by uneven debris floating with waters.
Downstream
South
North
Figure 4. Scouring of approaches near abutments, downstream side
Upstream
North
South
Damage to Railings
Figure 5. Damage to railings (also showing scourings at the upstream side) The bridge was displaced 35 cm upstream (south-east direction, Figure 6). There are gaps between
decks. The gap is measured as 15 cm at the upstream side and 7 cm at the downstream side. The
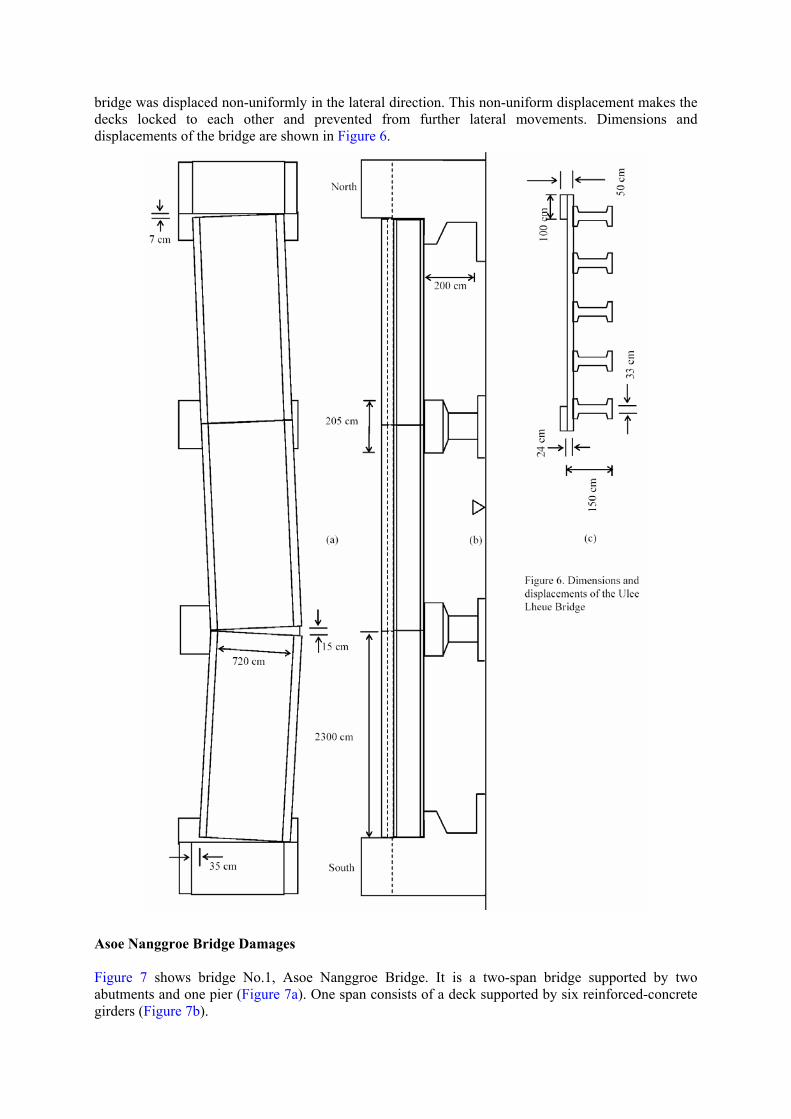
bridge was displaced non-uniformly in the lateral direction. This non-uniform displacement makes the decks locked to each other and prevented from further lateral movements. Dimensions and displacements of the bridge are shown in Figure 6.
Asoe Nanggroe Bridge Damages Figure 7 shows bridge No.1, Asoe Nanggroe Bridge. It is a two-span bridge supported by two abutments and one pier (Figure 7a). One span consists of a deck supported by six reinforced-concrete girders (Figure 7b).
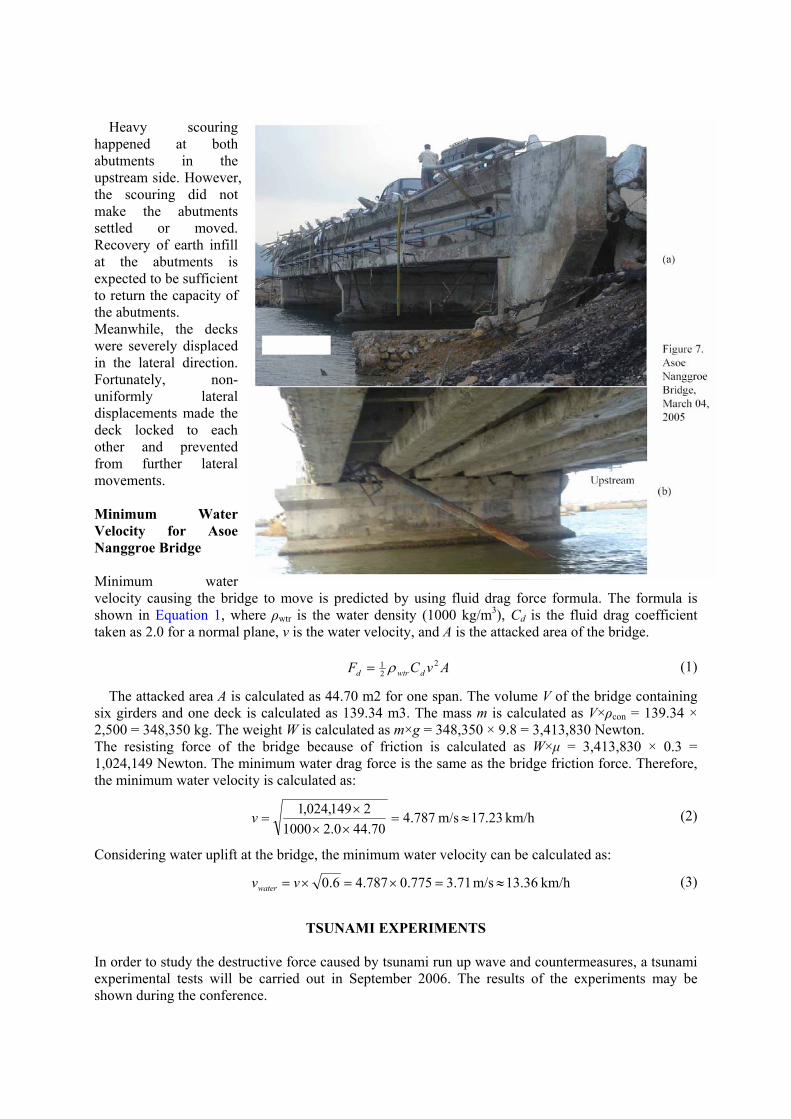
Heavy scouring happened at both abutments in the upstream side. However, the scouring did not make the abutments settled or moved. Recovery of earth infill at the abutments is expected to be sufficient to return the capacity of the abutments. Meanwhile, the decks were severely displaced in the lateral direction. Fortunately, non-uniformly lateral displacements made the deck locked to each other and prevented from further lateral movements. Minimum Water Velocity for Asoe Nanggroe Bridge Minimum water velocity causing the bridge to move is predicted by using fluid drag force formula. The formula is shown in Equation 1, where ρwtr is the water density (1000 kg/m3), Cd is the fluid drag coefficient taken as 2.0 for a normal plane, v is the water velocity, and A is the attacked area of the bridge.
AvCF dwtrd2
21 ρ= (1)
The attacked area A is calculated as 44.70 m2 for one span. The volume V of the bridge containing six girders and one deck is calculated as 139.34 m3. The mass m is calculated as V×ρcon = 139.34 × 2,500 = 348,350 kg. The weight W is calculated as m×g = 348,350 × 9.8 = 3,413,830 Newton. The resisting force of the bridge because of friction is calculated as W×µ = 3,413,830 × 0.3 = 1,024,149 Newton. The minimum water drag force is the same as the bridge friction force. Therefore, the minimum water velocity is calculated as:
km/h 17.23 m/s 787.470.440.21000
2149,024,1≈=
×××
=v (2)
Considering water uplift at the bridge, the minimum water velocity can be calculated as:
km/h 13.36 m/s 71.3775.0787.46.0 ≈=×=×= vvwater (3)
TSUNAMI EXPERIMENTS
In order to study the destructive force caused by tsunami run up wave and countermeasures, a tsunami experimental tests will be carried out in September 2006. The results of the experiments may be shown during the conference.

QUESTIONNAIRES Questionnaires on Earthquake The seismic intensity was calculated based on questionnaires carried out in Banda Aceh city. Professor Ota’s method is used to calculate the local intensity. There are 35 questions, such as: Feel the quake? Where? Duration? Could you move? Structures were damaged? Hanging stuff swinging? Unstable stuff falling? Heavy stuff moving? and other 27 questions. The results show the seismic intensity in Banda Aceh is around 5+ in Japan Meteorological Agency scale, or around VIII in the MMI scale.
Figure 8. Seismic Intensity in Banda Aceh based on Questionnaires
Questionnaires on Tsunami The first question asks where the respondent was at that time. The next two questions are related to the strength and duration of the earthquake. As for the strength, 42 respondents (64.6%) say the earthquake was “very strong”, 22 respondents (33.8%) say it was “strong”, and one respondent says it was “weak”. This respondent saying “weak” was at Mata Ie which is in mountainous area. It is understandable, since earthquake amplification is usually larger at relatively soft soil area (i.e., plane shore area) than that at relatively harder soil (i.e., mountainous area) (Scawthorn, 2003). Meanwhile, as for the duration, 61 respondents (93.8%) say the earthquake shaking was more than 2 minutes, and only 4 respondents (6.2%) say it was 2 minutes. Figure 9 shows the results in diagrams.
The rest of the questions are related to the tsunami. It seems that the awareness of people in Banda Aceh to the tsunami was very low (Figure 10). Only two respondents (3.1%) had knowledge that tsunami would probably come after a big earthquake. In contrary, 61 respondents (93.8%) say they did not know tsunami could have happened after a big earthquake.
Figure 10. Knowledge about Tsunami
Figure 9. Strength and Duration of the Earthquake
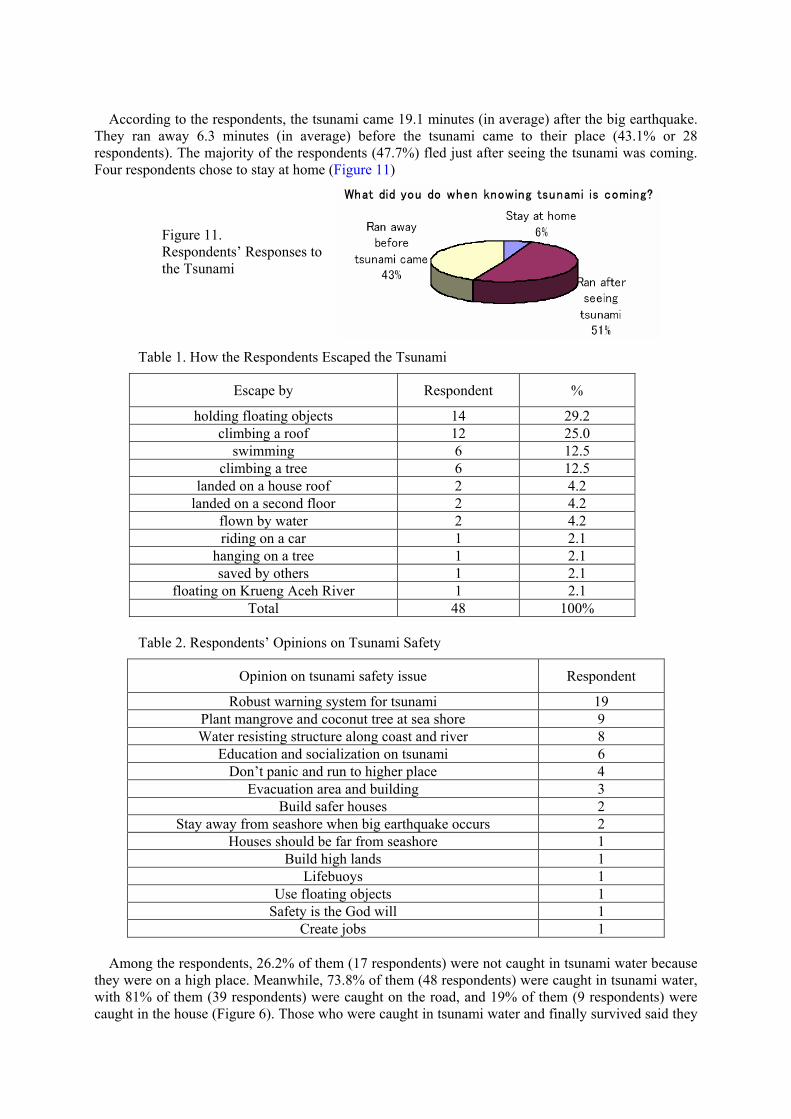
According to the respondents, the tsunami came 19.1 minutes (in average) after the big earthquake.
They ran away 6.3 minutes (in average) before the tsunami came to their place (43.1% or 28 respondents). The majority of the respondents (47.7%) fled just after seeing the tsunami was coming. Four respondents chose to stay at home (Figure 11)
Table 1. How the Respondents Escaped the Tsunami
Escape by Respondent %
holding floating objects 14 29.2 climbing a roof 12 25.0
swimming 6 12.5 climbing a tree 6 12.5
landed on a house roof 2 4.2 landed on a second floor 2 4.2
flown by water 2 4.2 riding on a car 1 2.1
hanging on a tree 1 2.1 saved by others 1 2.1
floating on Krueng Aceh River 1 2.1 Total 48 100%
Table 2. Respondents’ Opinions on Tsunami Safety
Opinion on tsunami safety issue Respondent
Robust warning system for tsunami 19 Plant mangrove and coconut tree at sea shore 9 Water resisting structure along coast and river 8
Education and socialization on tsunami 6 Don’t panic and run to higher place 4
Evacuation area and building 3 Build safer houses 2
Stay away from seashore when big earthquake occurs 2 Houses should be far from seashore 1
Build high lands 1 Lifebuoys 1
Use floating objects 1 Safety is the God will 1
Create jobs 1 Among the respondents, 26.2% of them (17 respondents) were not caught in tsunami water because
they were on a high place. Meanwhile, 73.8% of them (48 respondents) were caught in tsunami water, with 81% of them (39 respondents) were caught on the road, and 19% of them (9 respondents) were caught in the house (Figure 6). Those who were caught in tsunami water and finally survived said they
Figure 11. Respondents’ Responses to the Tsunami
held floating objects (29.2% or 14 respondents), they climbed on house roofs (25.0% or 12 respondents), they swam (12.5% or 6 respondents), they climbed up trees (12.5% or 6 respondents), or they had no choices and just felt lucky they survived (10 respondents). The results are in Table 1.
When they were asked their opinion on safety issue regarding tsunami (Question No. 12), most respondents want a robust tsunami warning system (19 respondents), mangrove and trees along the coast (9 respondents), and water resisting structures along the coast and rivers (8 respondents). Surprisingly, education and socialization on tsunami is not their highest priority (6 respondents), although their knowledge on tsunami is low. Table 2 shows their opinions in sequence.
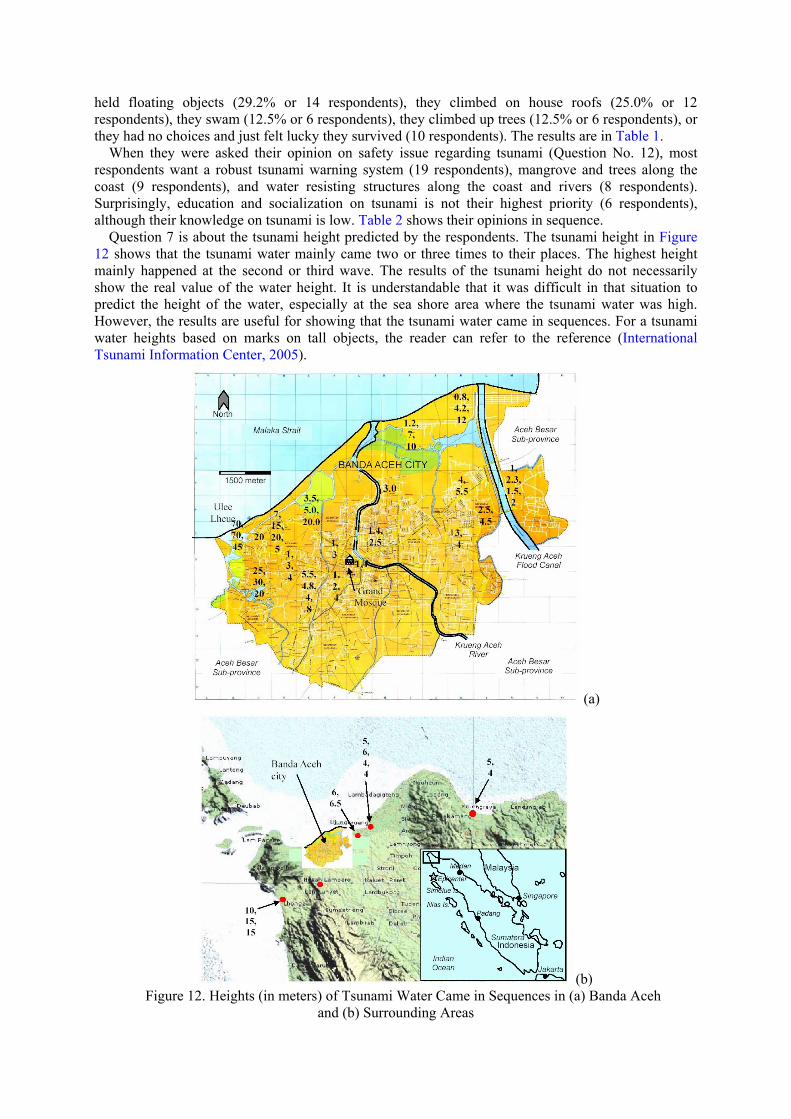
Question 7 is about the tsunami height predicted by the respondents. The tsunami height in Figure 12 shows that the tsunami water mainly came two or three times to their places. The highest height mainly happened at the second or third wave. The results of the tsunami height do not necessarily show the real value of the water height. It is understandable that it was difficult in that situation to predict the height of the water, especially at the sea shore area where the tsunami water was high. However, the results are useful for showing that the tsunami water came in sequences. For a tsunami water heights based on marks on tall objects, the reader can refer to the reference (International Tsunami Information Center, 2005).
(a)
(b) Figure 12. Heights (in meters) of Tsunami Water Came in Sequences in (a) Banda Aceh
and (b) Surrounding Areas
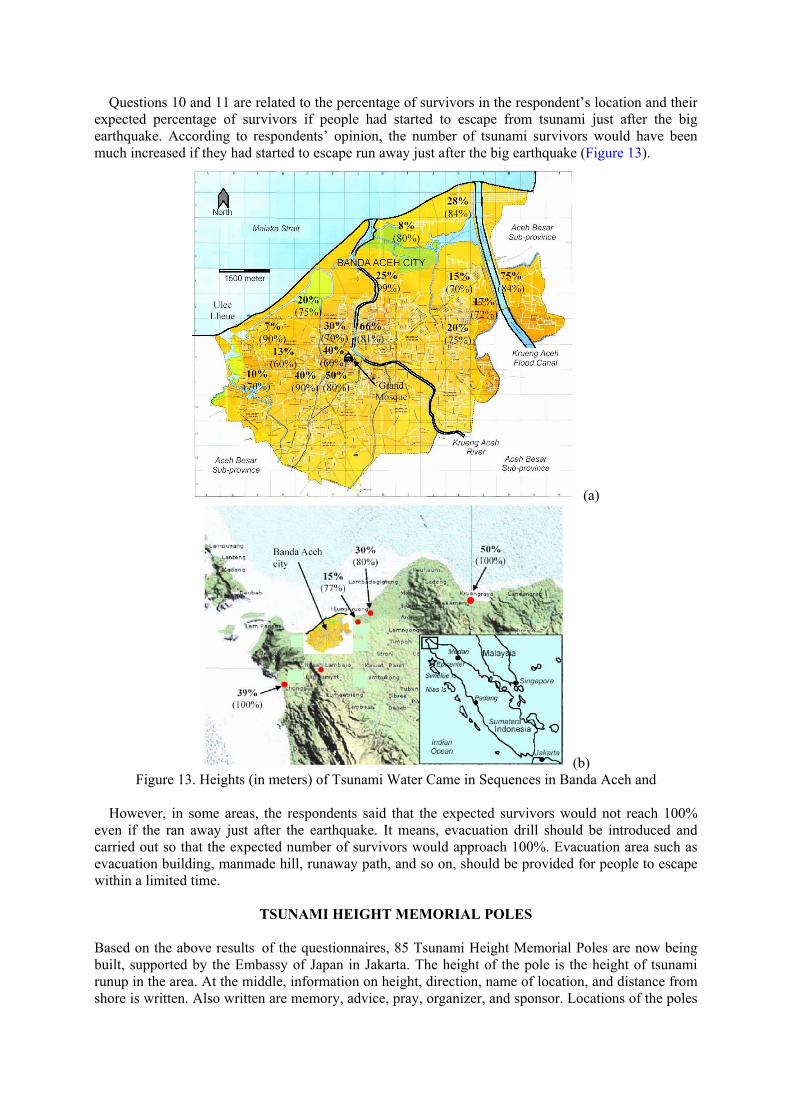
Questions 10 and 11 are related to the percentage of survivors in the respondent’s location and their expected percentage of survivors if people had started to escape from tsunami just after the big earthquake. According to respondents’ opinion, the number of tsunami survivors would have been much increased if they had started to escape run away just after the big earthquake (Figure 13).
(a)
(b) Figure 13. Heights (in meters) of Tsunami Water Came in Sequences in Banda Aceh and
However, in some areas, the respondents said that the expected survivors would not reach 100%
even if the ran away just after the earthquake. It means, evacuation drill should be introduced and carried out so that the expected number of survivors would approach 100%. Evacuation area such as evacuation building, manmade hill, runaway path, and so on, should be provided for people to escape within a limited time.
TSUNAMI HEIGHT MEMORIAL POLES Based on the above results of the questionnaires, 85 Tsunami Height Memorial Poles are now being built, supported by the Embassy of Japan in Jakarta. The height of the pole is the height of tsunami runup in the area. At the middle, information on height, direction, name of location, and distance from shore is written. Also written are memory, advice, pray, organizer, and sponsor. Locations of the poles
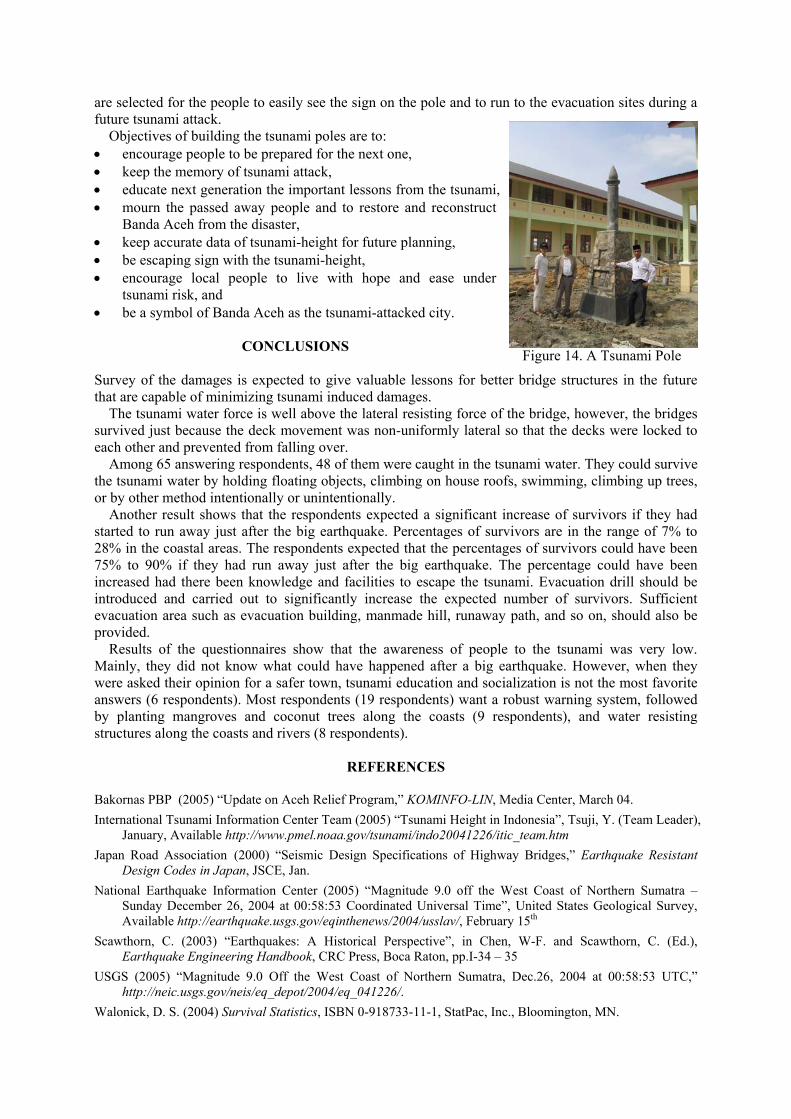
are selected for the people to easily see the sign on the pole and to run to the evacuation sites during a future tsunami attack.
Objectives of building the tsunami poles are to: • encourage people to be prepared for the next one, • keep the memory of tsunami attack, • educate next generation the important lessons from the tsunami, • mourn the passed away people and to restore and reconstruct
Banda Aceh from the disaster, • keep accurate data of tsunami-height for future planning, • be escaping sign with the tsunami-height, • encourage local people to live with hope and ease under
tsunami risk, and • be a symbol of Banda Aceh as the tsunami-attacked city.
CONCLUSIONS
Survey of the damages is expected to give valuable lessons for better bridge structures in the future that are capable of minimizing tsunami induced damages.
The tsunami water force is well above the lateral resisting force of the bridge, however, the bridges survived just because the deck movement was non-uniformly lateral so that the decks were locked to each other and prevented from falling over.
Among 65 answering respondents, 48 of them were caught in the tsunami water. They could survive the tsunami water by holding floating objects, climbing on house roofs, swimming, climbing up trees, or by other method intentionally or unintentionally.
Another result shows that the respondents expected a significant increase of survivors if they had started to run away just after the big earthquake. Percentages of survivors are in the range of 7% to 28% in the coastal areas. The respondents expected that the percentages of survivors could have been 75% to 90% if they had run away just after the big earthquake. The percentage could have been increased had there been knowledge and facilities to escape the tsunami. Evacuation drill should be introduced and carried out to significantly increase the expected number of survivors. Sufficient evacuation area such as evacuation building, manmade hill, runaway path, and so on, should also be provided.
Results of the questionnaires show that the awareness of people to the tsunami was very low. Mainly, they did not know what could have happened after a big earthquake. However, when they were asked their opinion for a safer town, tsunami education and socialization is not the most favorite answers (6 respondents). Most respondents (19 respondents) want a robust warning system, followed by planting mangroves and coconut trees along the coasts (9 respondents), and water resisting structures along the coasts and rivers (8 respondents).
REFERENCES Bakornas PBP (2005) “Update on Aceh Relief Program,” KOMINFO-LIN, Media Center, March 04. International Tsunami Information Center Team (2005) “Tsunami Height in Indonesia”, Tsuji, Y. (Team Leader),
January, Available http://www.pmel.noaa.gov/tsunami/indo20041226/itic_team.htm Japan Road Association (2000) “Seismic Design Specifications of Highway Bridges,” Earthquake Resistant
Design Codes in Japan, JSCE, Jan. National Earthquake Information Center (2005) “Magnitude 9.0 off the West Coast of Northern Sumatra –
Sunday December 26, 2004 at 00:58:53 Coordinated Universal Time”, United States Geological Survey, Available http://earthquake.usgs.gov/eqinthenews/2004/usslav/, February 15th
Scawthorn, C. (2003) “Earthquakes: A Historical Perspective”, in Chen, W-F. and Scawthorn, C. (Ed.), Earthquake Engineering Handbook, CRC Press, Boca Raton, pp.I-34 – 35
USGS (2005) “Magnitude 9.0 Off the West Coast of Northern Sumatra, Dec.26, 2004 at 00:58:53 UTC,” http://neic.usgs.gov/neis/eq_depot/2004/eq_041226/.
Walonick, D. S. (2004) Survival Statistics, ISBN 0-918733-11-1, StatPac, Inc., Bloomington, MN.
Figure 14. A Tsunami Pole