braun3e ch04 st
TRANSCRIPT

Copyright © 2013 Pearson Education, Inc. Publishing as Prentice Hall.
Activity-Based Costing, Lean Operations, and the Costs of
QualityChapter 4
1
Copyright © 2013 Pearson Education, Inc. Publishing as Prentice Hall.
Objective 1Develop and use
departmental overhead rates to allocate indirect costs
2
Copyright © 2013 Pearson Education, Inc. Publishing as Prentice Hall.
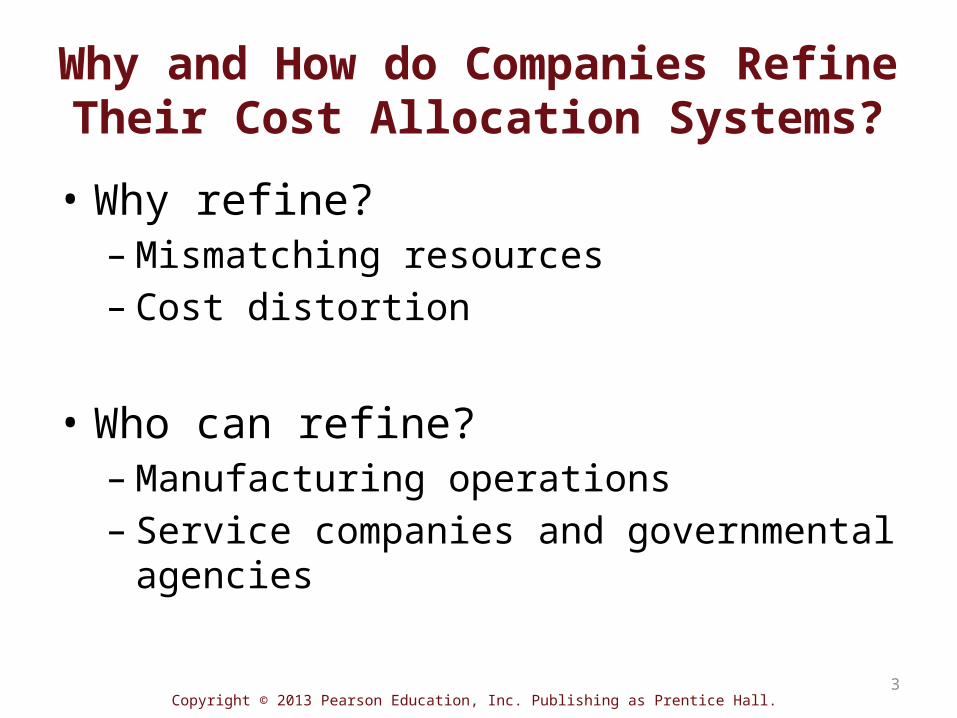
Why and How do Companies Refine Their Cost Allocation Systems?• Why refine?
– Mismatching resources– Cost distortion
• Who can refine?– Manufacturing operations– Service companies and governmental agencies
3
Copyright © 2013 Pearson Education, Inc. Publishing as Prentice Hall.
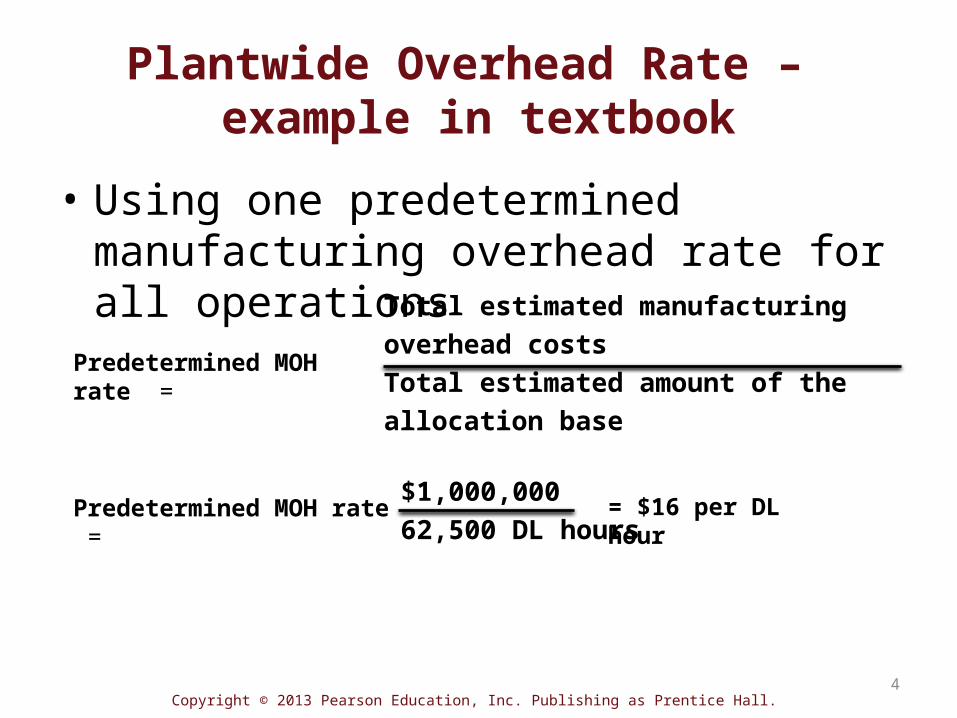
Plantwide Overhead Rate – example in textbook
• Using one predetermined manufacturing overhead rate for all operations
Predetermined MOH rate =
Total estimated manufacturing overhead costsTotal estimated amount of the allocation base
Predetermined MOH rate =
$1,000,00062,500 DL hours
= $16 per DL hour
4
Copyright © 2013 Pearson Education, Inc. Publishing as Prentice Hall.
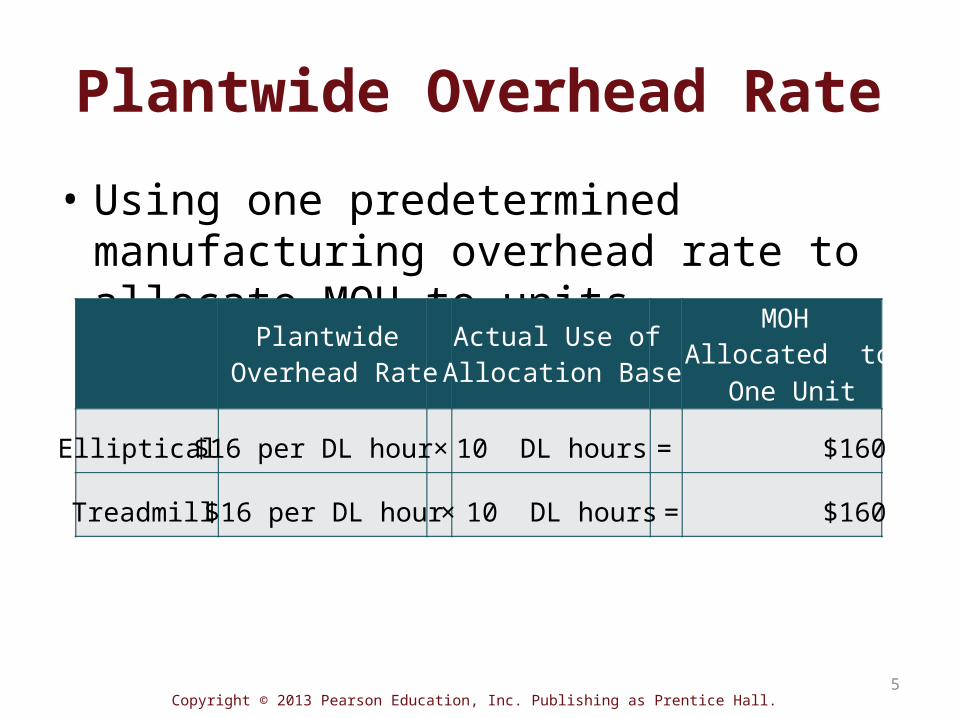
Plantwide Overhead Rate• Using one predetermined manufacturing overhead rate to allocate MOH to units
5
Plantwide Overhead Rate
Actual Use of Allocation Base
MOH Allocated to
One Unit
Elliptical ×$16 per DL hour 10 DL hours = $160
Treadmill ×$16 per DL hour 10 DL hours = $160
Copyright © 2013 Pearson Education, Inc. Publishing as Prentice Hall.
Departmental Overhead Rates
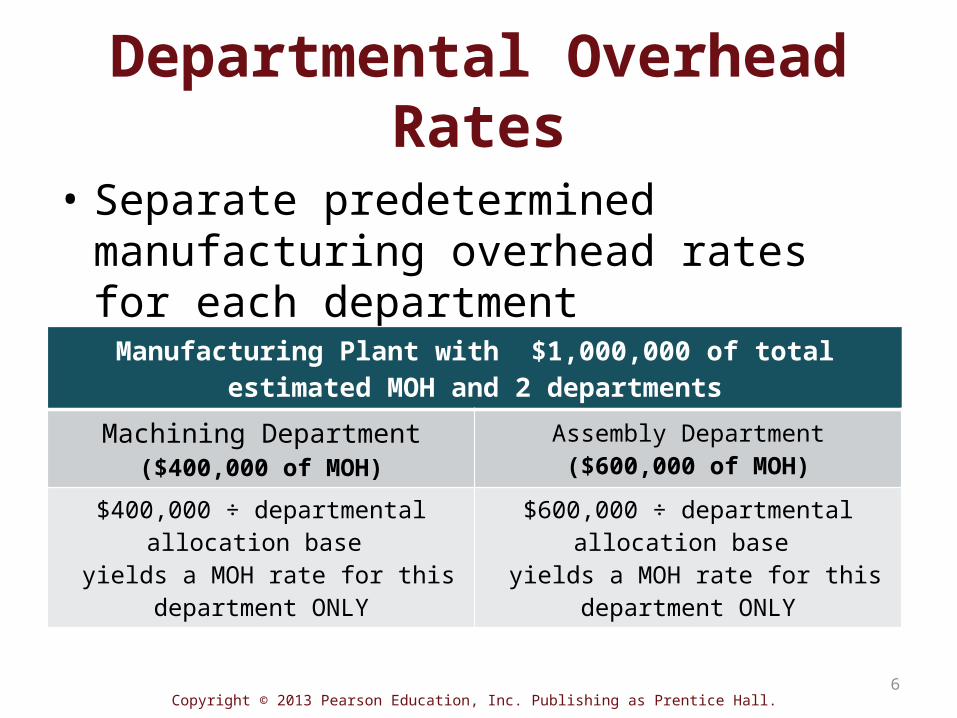
• Separate predetermined manufacturing overhead rates for each departmentManufacturing Plant with $1,000,000 of total
estimated MOH and 2 departmentsMachining Department
($400,000 of MOH)Assembly Department($600,000 of MOH)
$400,000 ÷ departmental allocation base
yields a MOH rate for this department ONLY
$600,000 ÷ departmental allocation base
yields a MOH rate for this department ONLY
6
Copyright © 2013 Pearson Education, Inc. Publishing as Prentice Hall.
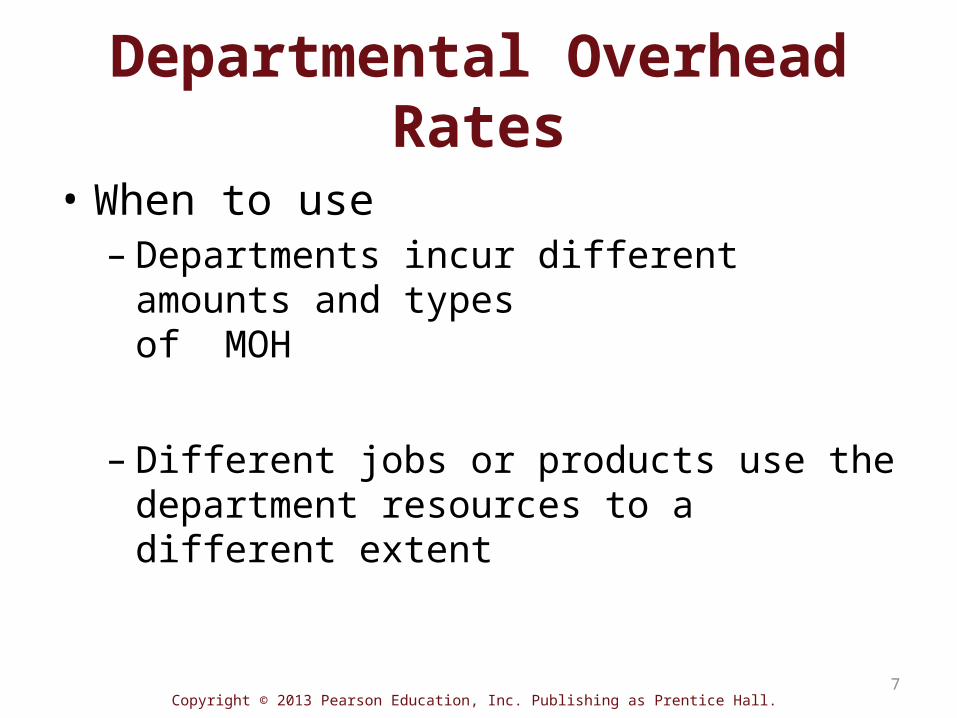
Departmental Overhead Rates
• When to use– Departments incur different amounts and types of MOH
– Different jobs or products use the department resources to a different extent
7
Copyright © 2013 Pearson Education, Inc. Publishing as Prentice Hall.
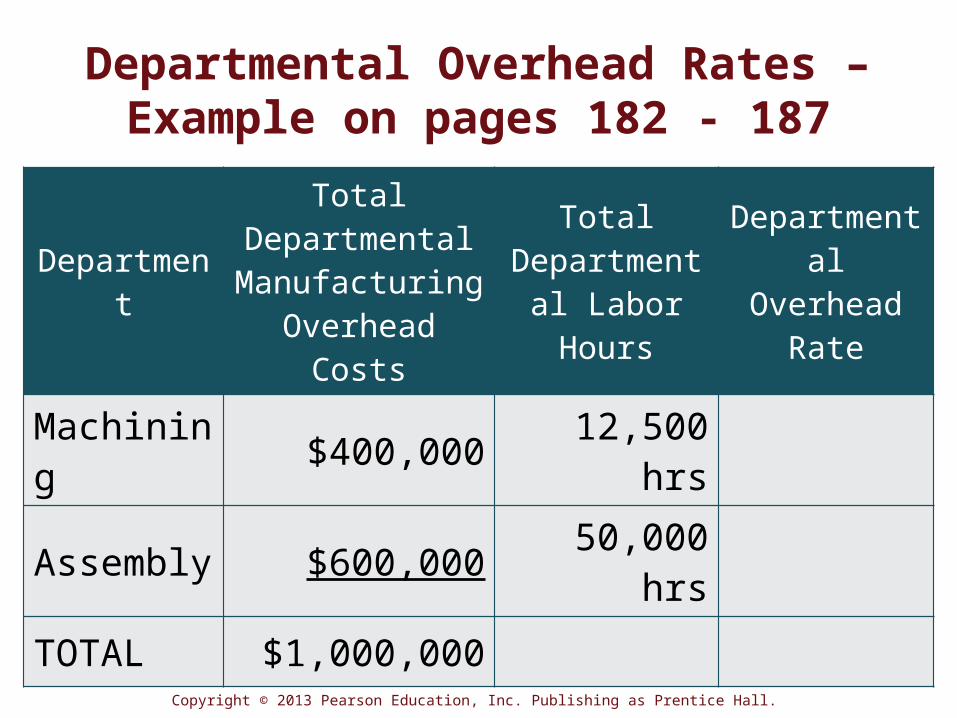
Departmental Overhead Rates – Example on pages 182 - 187
Department
Total Departmental Manufacturing
Overhead Costs
Total Departmental Labor Hours
Departmental
Overhead Rate
Machining $400,000 12,500
hrs
Assembly $600,000 50,000 hrs
TOTAL $1,000,000
Copyright © 2013 Pearson Education, Inc. Publishing as Prentice Hall.
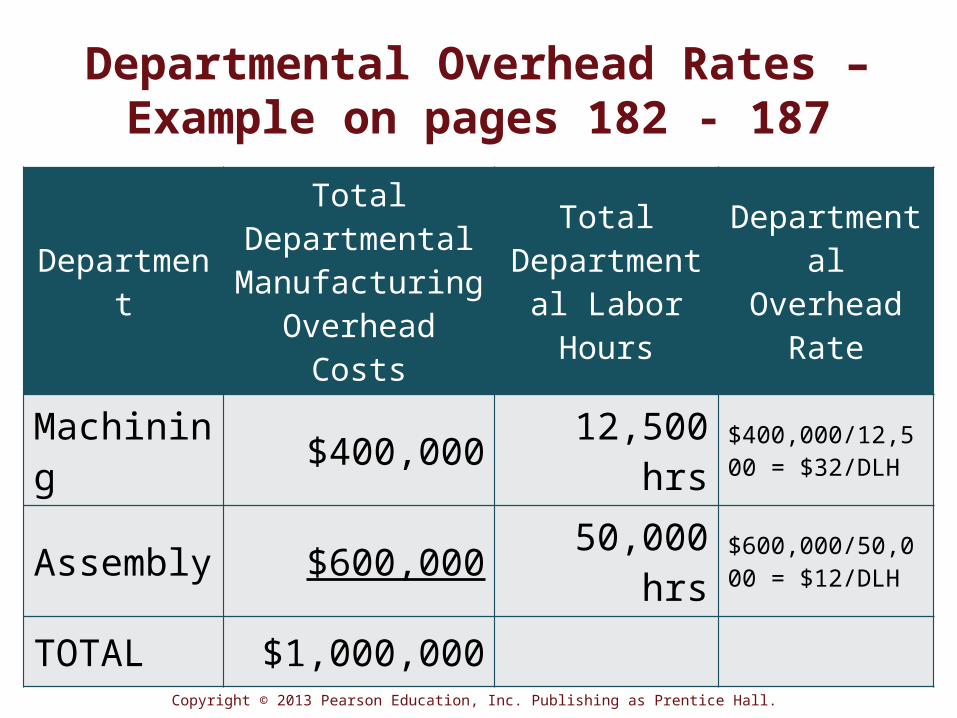
Departmental Overhead Rates – Example on pages 182 - 187
Department
Total Departmental Manufacturing
Overhead Costs
Total Departmental Labor Hours
Departmental
Overhead Rate
Machining $400,000 12,500
hrs$400,000/12,500 = $32/DLH
Assembly $600,000 50,000 hrs
$600,000/50,000 = $12/DLH
TOTAL $1,000,000
Copyright © 2013 Pearson Education, Inc. Publishing as Prentice Hall.
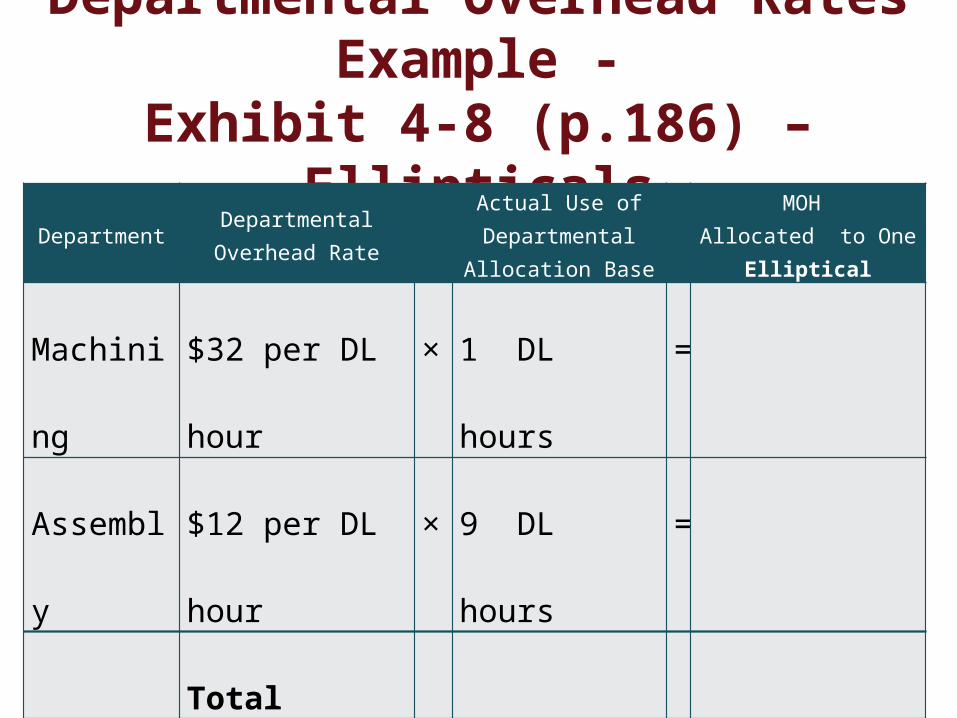
Departmental Overhead Rates Example -
Exhibit 4-8 (p.186) – Ellipticals
Department Departmental Overhead Rate
Actual Use of Departmental
Allocation Base
MOH Allocated to One
Elliptical
Machini
ng
$32 per DL
hour
× 1 DL
hours
=
Assembl
y
$12 per DL
hour
× 9 DL
hours
=
Total
Copyright © 2013 Pearson Education, Inc. Publishing as Prentice Hall.
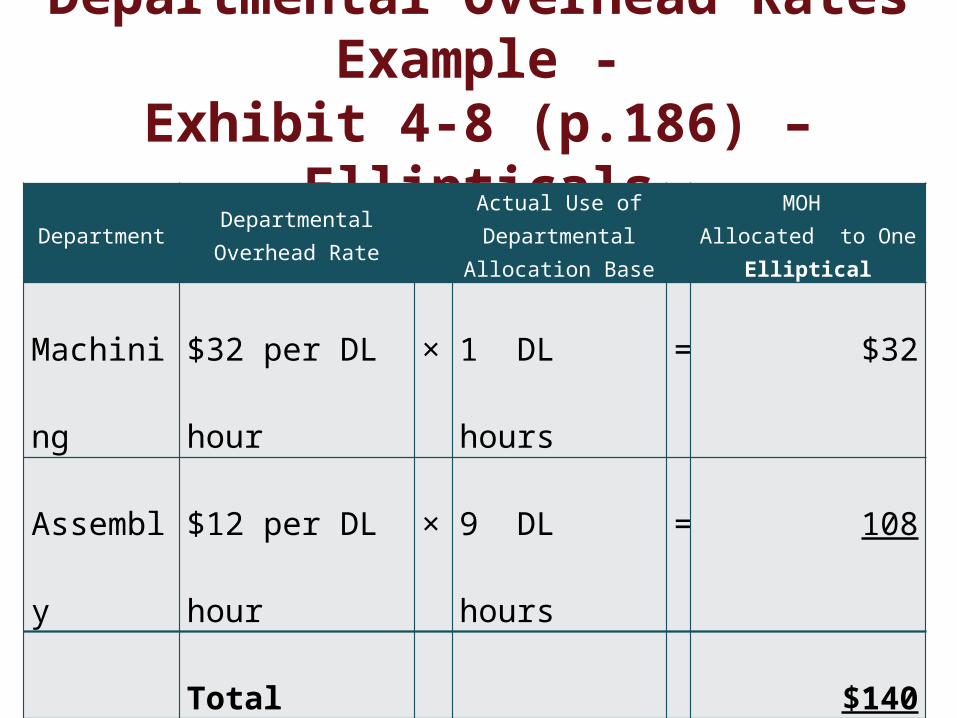
Departmental Overhead Rates Example -
Exhibit 4-8 (p.186) – Ellipticals
Department Departmental Overhead Rate
Actual Use of Departmental
Allocation Base
MOH Allocated to One
Elliptical
Machini
ng
$32 per DL
hour
× 1 DL
hours
= $32
Assembl
y
$12 per DL
hour
× 9 DL
hours
= 108
Total $140
Copyright © 2013 Pearson Education, Inc. Publishing as Prentice Hall.
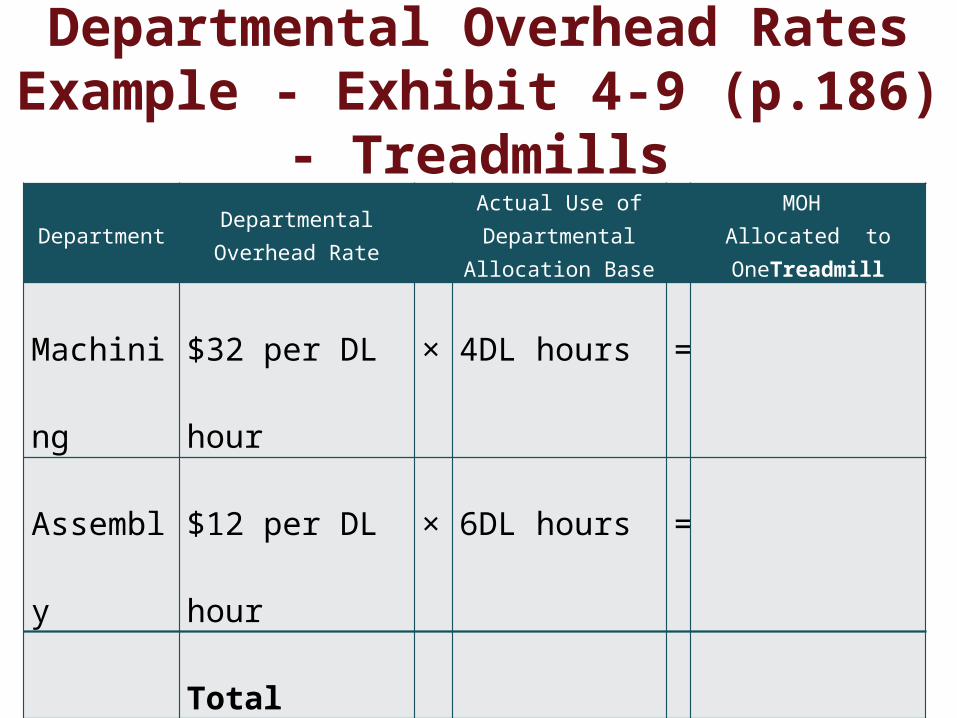
Departmental Overhead Rates Example - Exhibit 4-9 (p.186)
- TreadmillsDepartment Departmental
Overhead Rate
Actual Use of Departmental
Allocation Base
MOH Allocated to OneTreadmill
Machini
ng
$32 per DL
hour
× 4DL hours =
Assembl
y
$12 per DL
hour
× 6DL hours =
Total
Copyright © 2013 Pearson Education, Inc. Publishing as Prentice Hall.
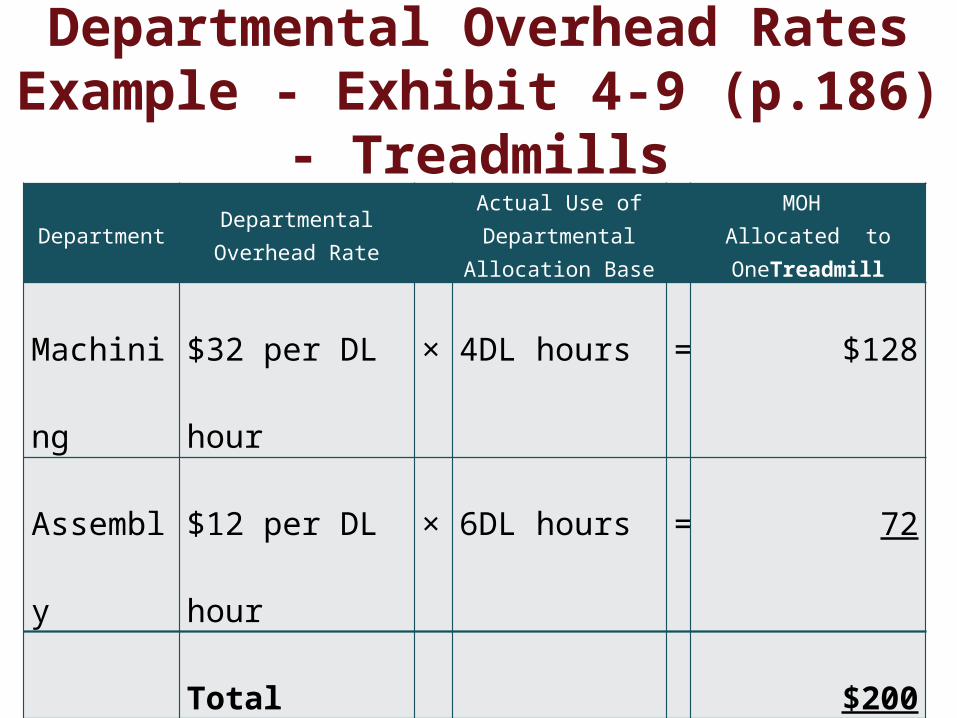
Departmental Overhead Rates Example - Exhibit 4-9 (p.186)
- TreadmillsDepartment Departmental
Overhead Rate
Actual Use of Departmental
Allocation Base
MOH Allocated to OneTreadmill
Machini
ng
$32 per DL
hour
× 4DL hours = $128
Assembl
y
$12 per DL
hour
× 6DL hours = 72
Total $200
Copyright © 2013 Pearson Education, Inc. Publishing as Prentice Hall.
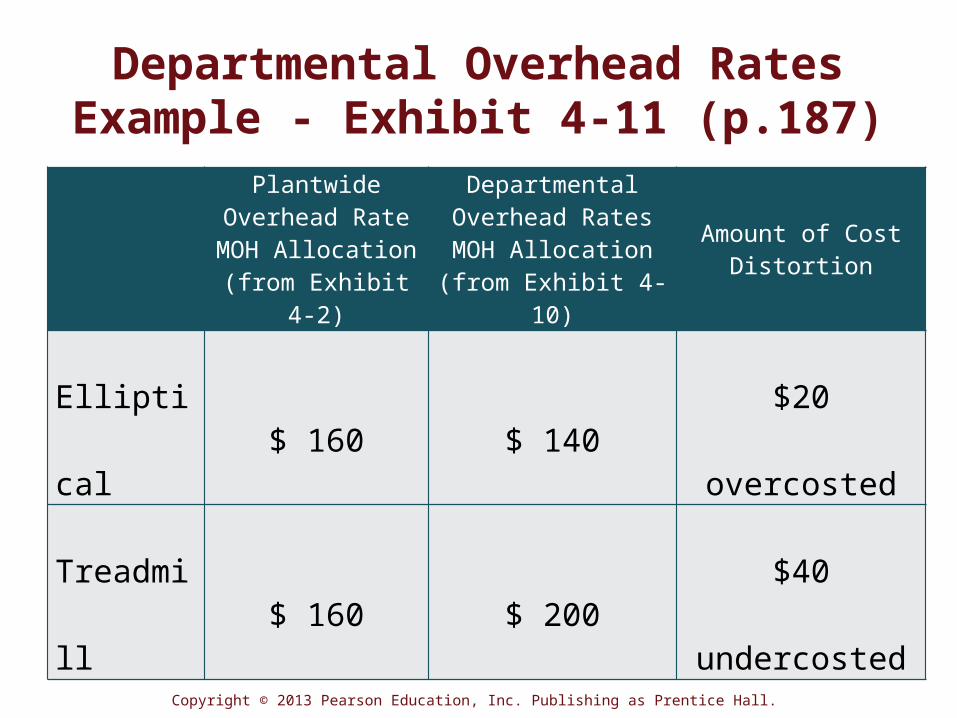
Departmental Overhead Rates Example - Exhibit 4-11 (p.187)
PlantwideOverhead RateMOH Allocation(from Exhibit
4-2)
Departmental Overhead Rates MOH Allocation(from Exhibit 4-
10)
Amount of Cost Distortion
Ellipti
cal$ 160 $ 140
$20
overcosted
Treadmi
ll$ 160 $ 200
$40
undercosted
Copyright © 2013 Pearson Education, Inc. Publishing as Prentice Hall.
Now turn to S4-3
Copyright © 2013 Pearson Education, Inc. Publishing as Prentice Hall.
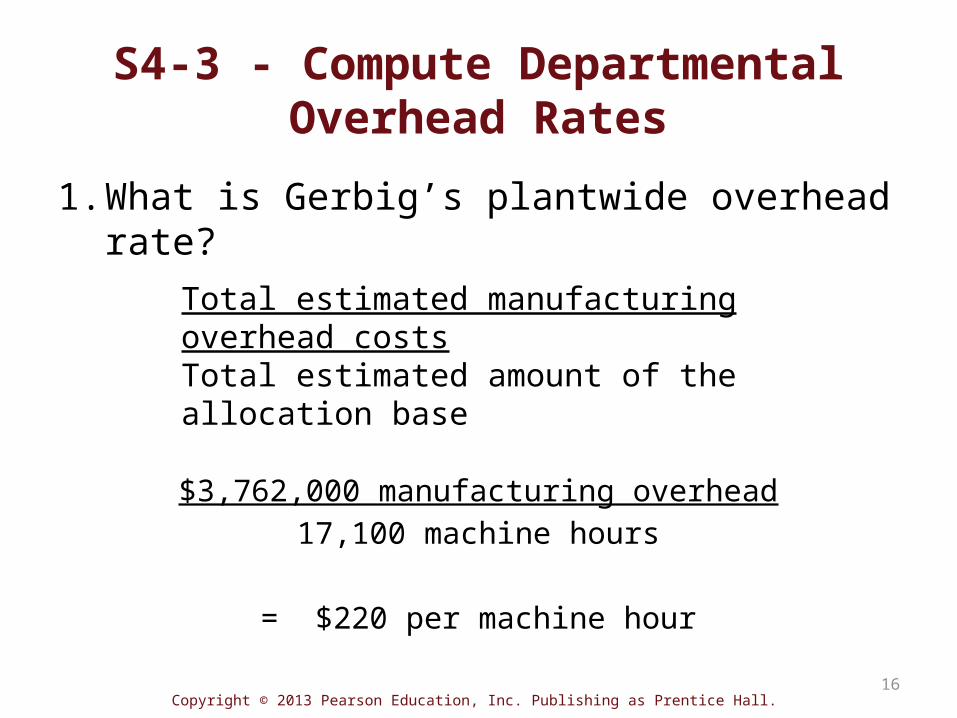
S4-3 - Compute Departmental Overhead Rates
1.What is Gerbig’s plantwide overhead rate?
$3,762,000 manufacturing overhead 17,100 machine hours
= $220 per machine hour
Total estimated manufacturing overhead costsTotal estimated amount of the allocation base
16
Copyright © 2013 Pearson Education, Inc. Publishing as Prentice Hall.
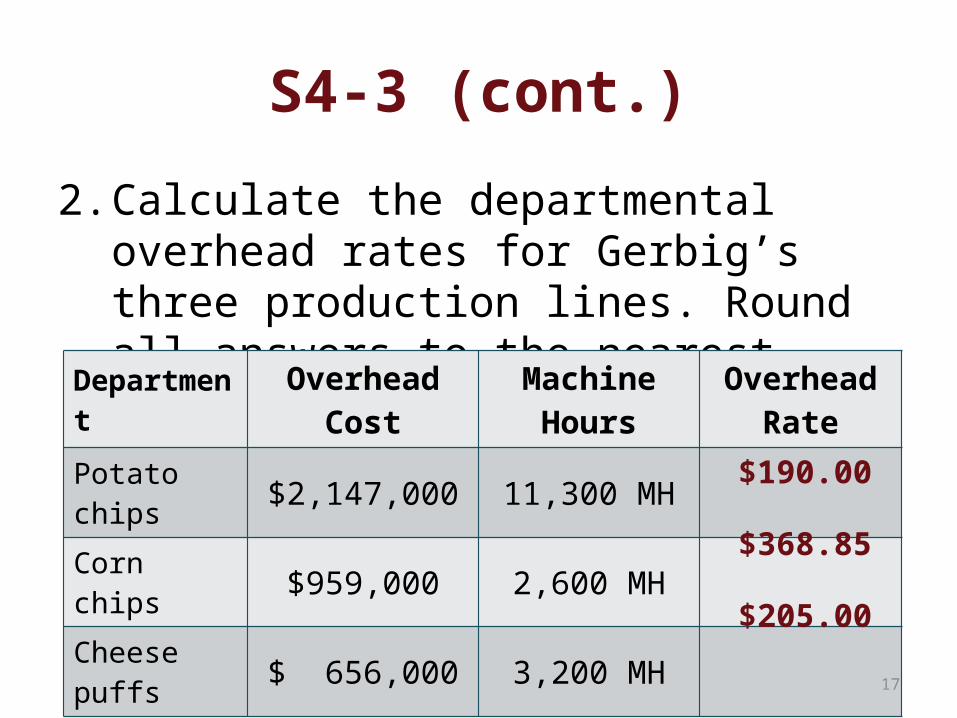
S4-3 (cont.)2.Calculate the departmental
overhead rates for Gerbig’s three production lines. Round all answers to the nearest cent.Departmen
tOverhead Cost
Machine Hours
Overhead Rate
Potato chips $2,147,000 11,300 MH
Corn chips $959,000 2,600 MH
Cheese puffs $ 656,000 3,200 MH 17
$190.00
$368.85
$205.00
Copyright © 2013 Pearson Education, Inc. Publishing as Prentice Hall.
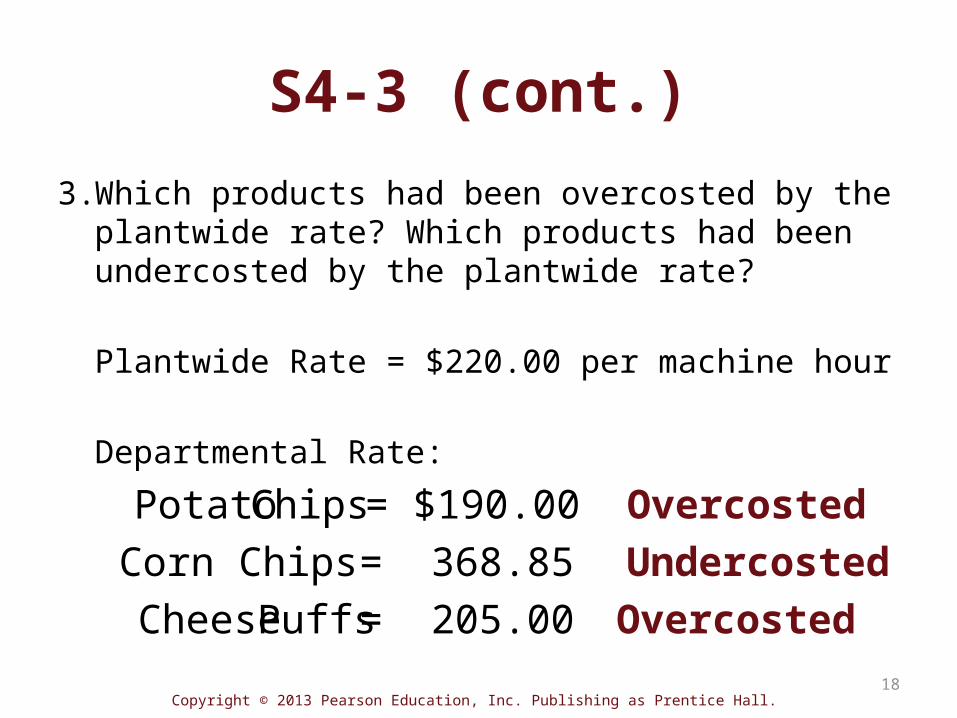
S4-3 (cont.)3.Which products had been overcosted by the plantwide rate? Which products had been undercosted by the plantwide rate?
Plantwide Rate = $220.00 per machine hour
Departmental Rate:
18
PotatoChips= $190.00 OvercostedCorn Chips= 368.85 UndercostedCheesePuffs= 205.00 Overcosted
Copyright © 2013 Pearson Education, Inc. Publishing as Prentice Hall.
Objective 2Develop and use activity-based costing (ABC) to allocate indirect costs
19
Copyright © 2013 Pearson Education, Inc. Publishing as Prentice Hall.
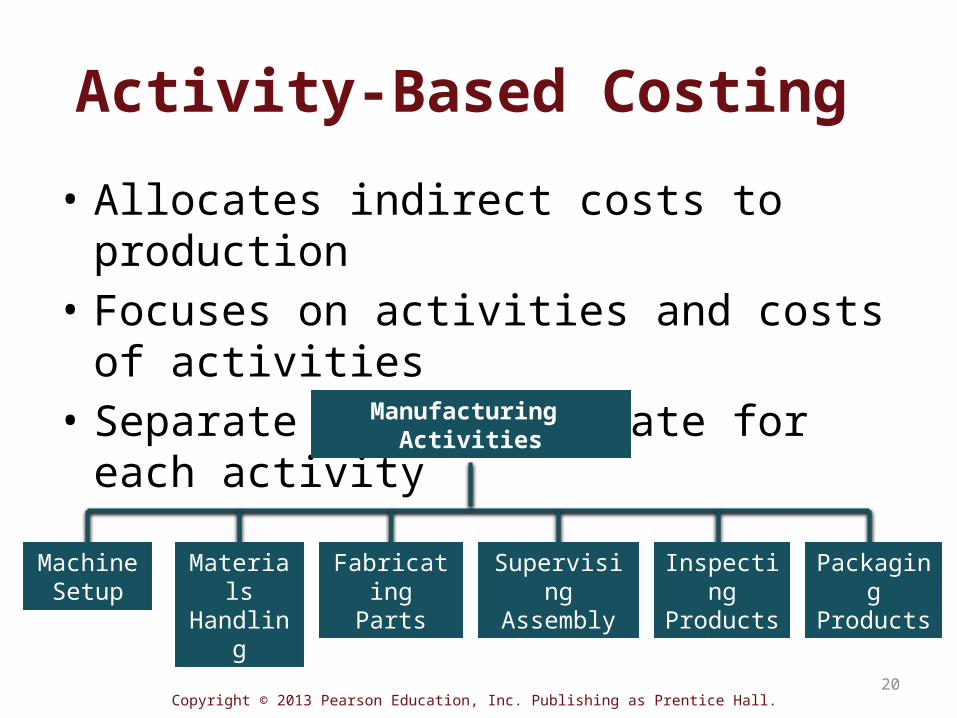
Activity-Based Costing • Allocates indirect costs to production
• Focuses on activities and costs of activities
• Separate allocation rate for each activity
Manufacturing Activities
Machine Setup
Materials
Handling
Fabricating
Parts
Supervising
Assembly
Inspecting
Products
Packaging
Products
20
Copyright © 2013 Pearson Education, Inc. Publishing as Prentice Hall.
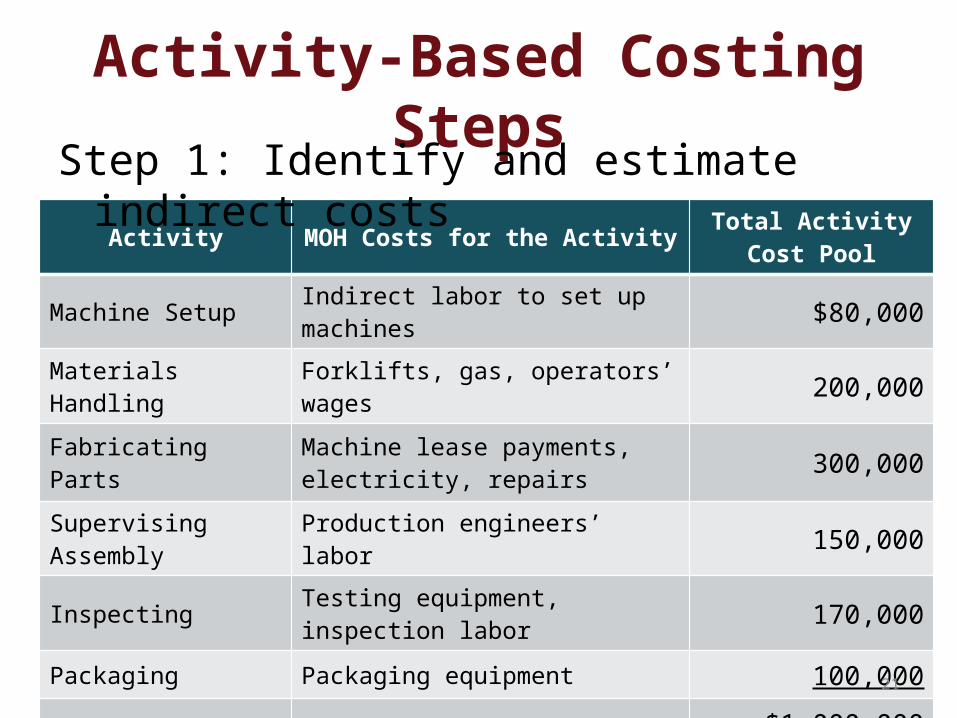
Activity MOH Costs for the Activity Total Activity Cost Pool
Machine Setup Indirect labor to set up machines $80,000
Materials Handling
Forklifts, gas, operators’ wages 200,000
Fabricating Parts
Machine lease payments, electricity, repairs 300,000
Supervising Assembly
Production engineers’ labor 150,000
Inspecting Testing equipment, inspection labor 170,000
Packaging Packaging equipment 100,000$1,000,000
Activity-Based Costing StepsStep 1: Identify and estimate
indirect costs
21
Copyright © 2013 Pearson Education, Inc. Publishing as Prentice Hall.
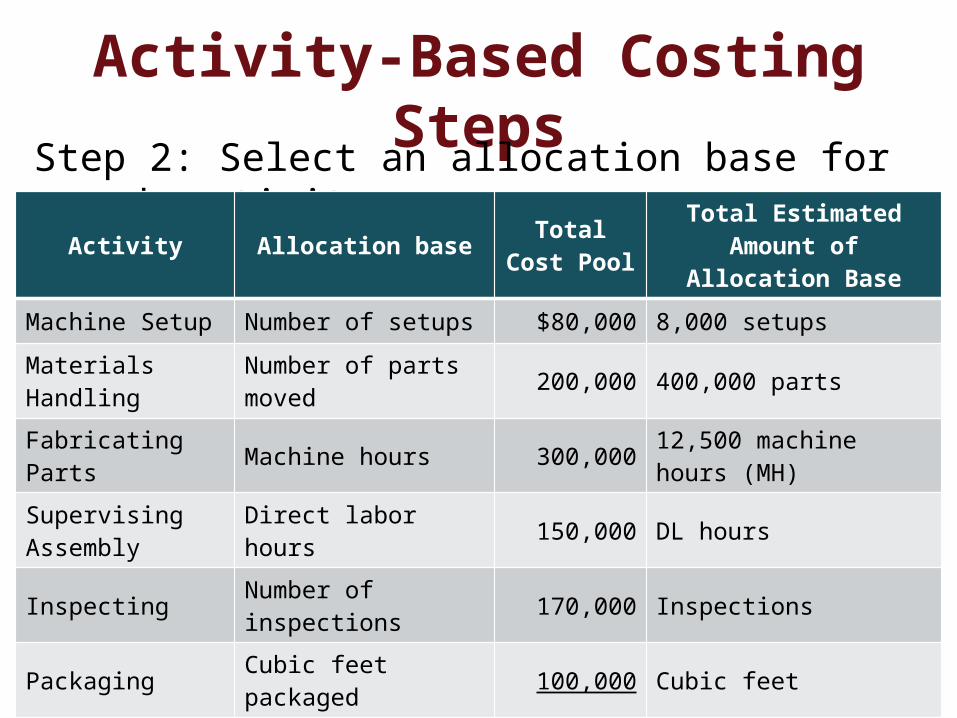
Activity-Based Costing StepsStep 2: Select an allocation base for
each activity
22
Activity Allocation base Total Cost Pool
Total Estimated Amount of
Allocation BaseMachine Setup Number of setups $80,000 8,000 setupsMaterials Handling
Number of parts moved 200,000 400,000 parts
Fabricating Parts Machine hours 300,000 12,500 machine
hours (MH)Supervising Assembly
Direct labor hours 150,000 DL hours
Inspecting Number of inspections 170,000 Inspections
Packaging Cubic feet packaged 100,000 Cubic feet
$1,000,000
Copyright © 2013 Pearson Education, Inc. Publishing as Prentice Hall.
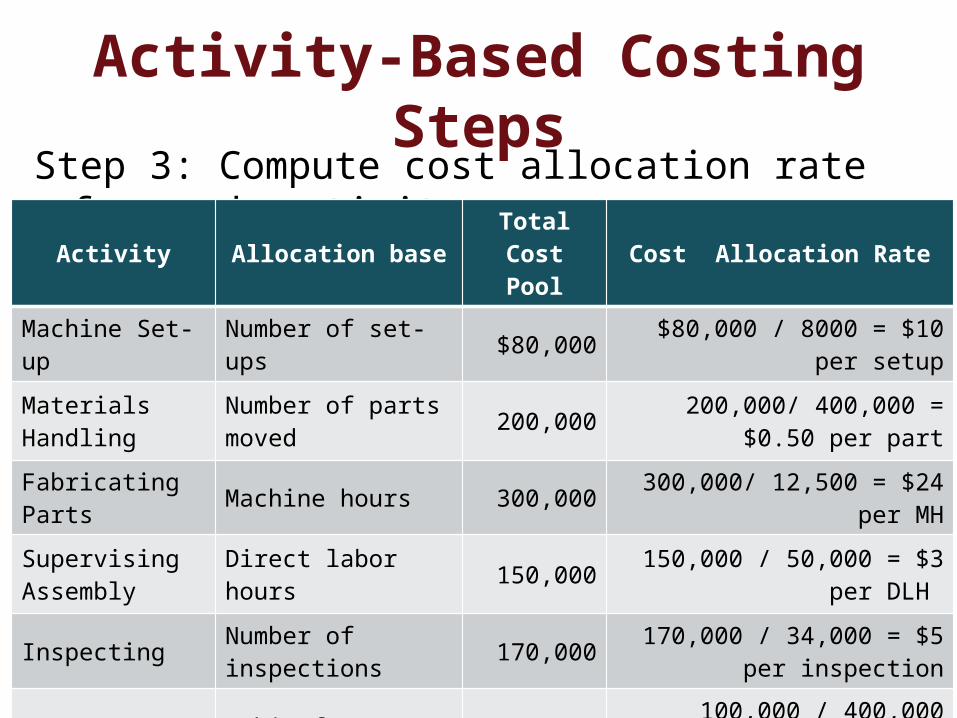
Activity-Based Costing Steps
Step 3: Compute cost allocation rate for each activity
23
Activity Allocation baseTotal Cost Pool
Cost Allocation Rate
Machine Set-up
Number of set-ups $80,000 $80,000 / 8000 = $10
per setupMaterials Handling
Number of parts moved 200,000 200,000/ 400,000 =
$0.50 per partFabricating Parts Machine hours 300,000 300,000/ 12,500 = $24
per MHSupervising Assembly
Direct labor hours 150,000 150,000 / 50,000 = $3
per DLH
Inspecting Number of inspections 170,000 170,000 / 34,000 = $5
per inspection
Packaging Cubic feet packaged 100,000
100,000 / 400,000 =$0.25 per cubic foot
1,000,00
0
Copyright © 2013 Pearson Education, Inc. Publishing as Prentice Hall.
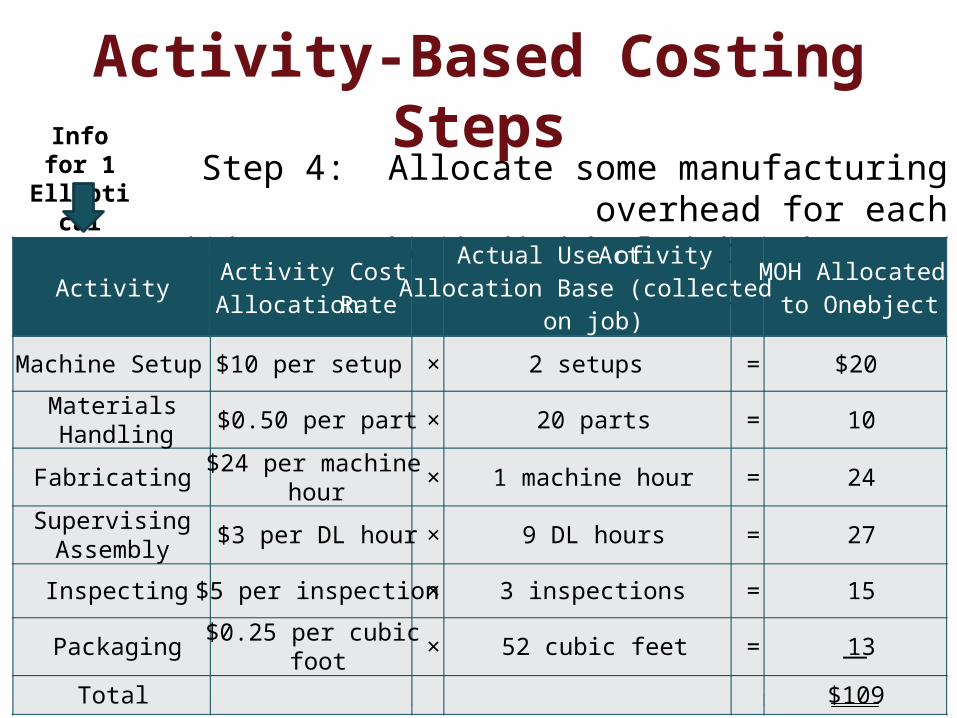
Step 4: Allocate some manufacturing overhead for each
activity to the individual jobs that use the activities.
Activity-Based Costing Steps
24
Info for 1 Elliptical
Activity Activity Cost Allocation Rate
Actual Use of Activity Allocation Base (collected
on job)
MOH Allocated to One object
Machine Setup $10 per setup × 2 setups = $20Materials Handling $0.50 per part × 20 parts = 10
Fabricating $24 per machine hour × 1 machine hour = 24Supervising Assembly $3 per DL hour × 9 DL hours = 27
Inspecting $5 per inspection× 3 inspections = 15
Packaging $0.25 per cubic foot × 52 cubic feet = 13
Total $109

Copyright © 2013 Pearson Education, Inc. Publishing as Prentice Hall.
Step 4: Allocate some manufacturing overhead for each
activity to the individual jobs that use the activities.
Activity-Based Costing Steps
25
Info for 1 Treadmi
ll
Activity Activity Cost Allocation Rate
Actual Use of Activity Allocation Base (collected
on job)
MOH Allocated to One object
Machine Setup $10 per setup × 4 setups = $40Materials Handling $0.50 per part × 26 parts = 13
Fabricating $24 per machine hour × 4 machine hour = 96Supervising Assembly $3 per DL hour × 6 DL hours = 18
Inspecting $5 per inspection× 6 inspections = 30
Packaging $0.25 per cubic foot × 60 cubic feet = 15
Total $212
Copyright © 2013 Pearson Education, Inc. Publishing as Prentice Hall.
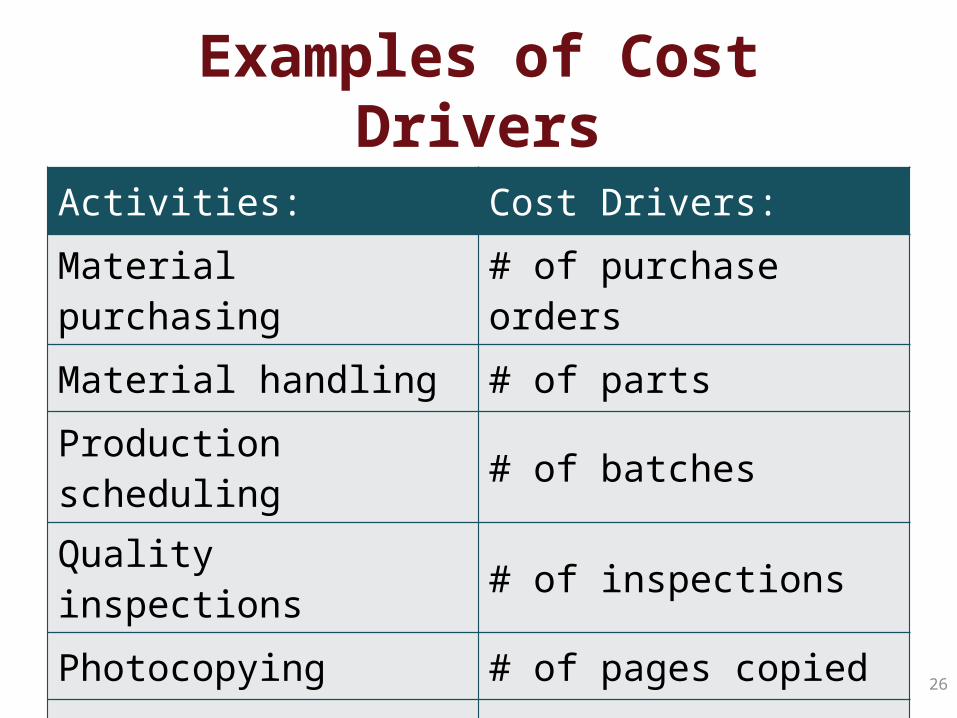
Examples of Cost Drivers
Activities: Cost Drivers:Material purchasing
# of purchase orders
Material handling # of partsProduction scheduling # of batches
Quality inspections # of inspections
Photocopying # of pages copiedWarranty service # of service calls
26
Copyright © 2013 Pearson Education, Inc. Publishing as Prentice Hall.
Now turn to E4-36B ABC Example
27
Copyright © 2013 Pearson Education, Inc. Publishing as Prentice Hall.
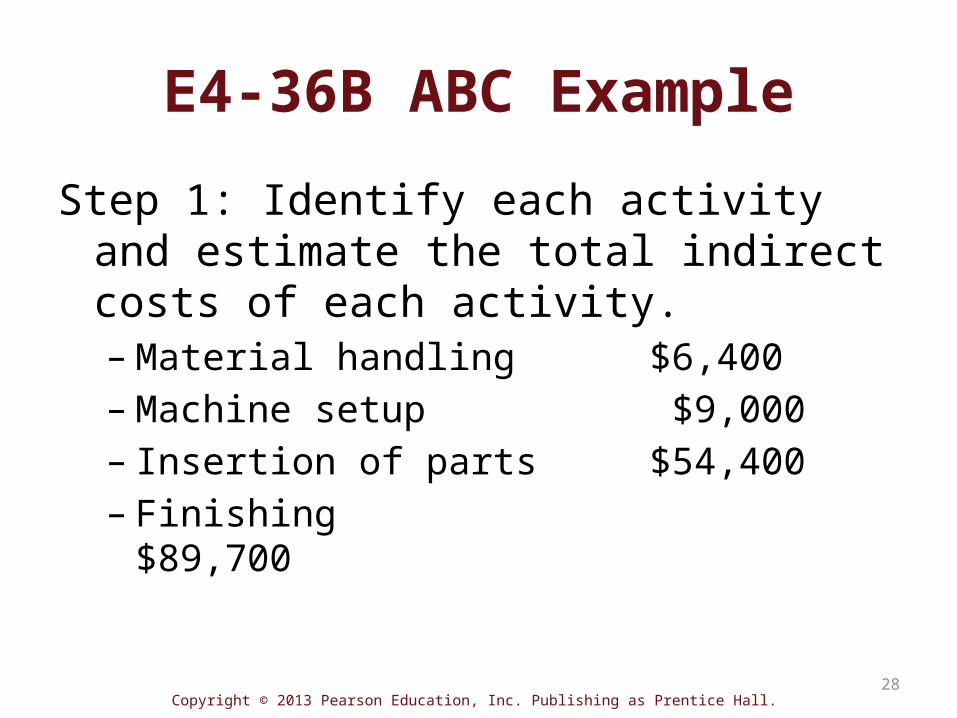
E4-36B ABC ExampleStep 1: Identify each activity and estimate the total indirect costs of each activity.– Material handling $6,400– Machine setup $9,000– Insertion of parts $54,400– Finishing $89,700
28
Copyright © 2013 Pearson Education, Inc. Publishing as Prentice Hall.
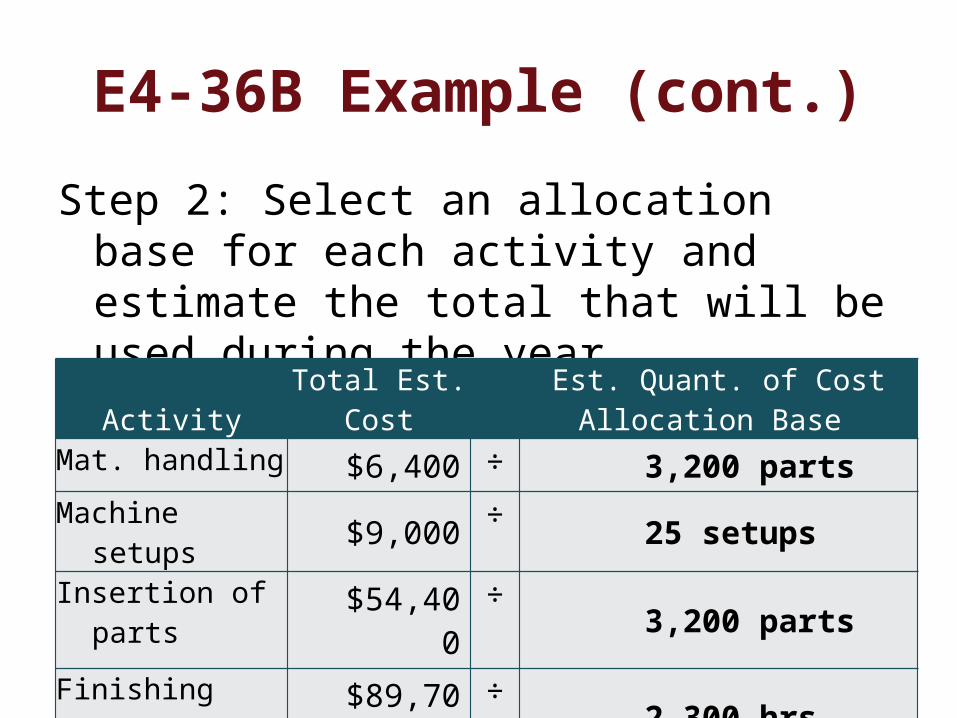
E4-36B Example (cont.)Step 2: Select an allocation base for each activity and estimate the total that will be used during the year.Activity
Total Est.Cost
Est. Quant. of Cost Allocation Base
Mat. handling $6,400 ÷ 3,200 partsMachine
setups $9,000 ÷ 25 setupsInsertion of
parts$54,40
0÷
3,200 parts
Finishing $89,700
÷2,300 hrs
Copyright © 2013 Pearson Education, Inc. Publishing as Prentice Hall.
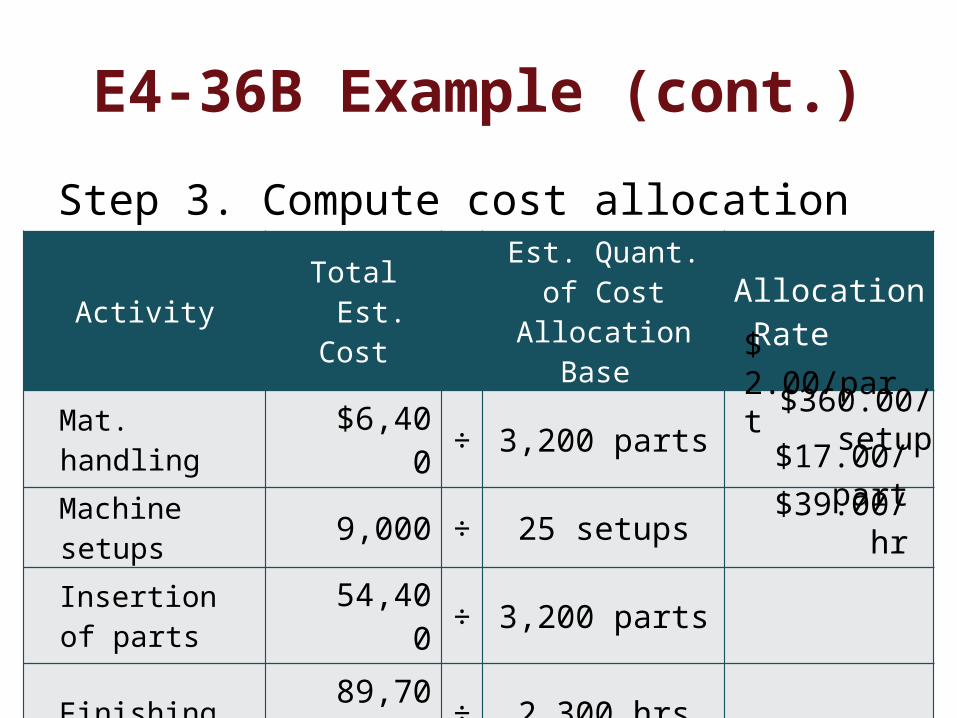
E4-36B Example (cont.)Step 3. Compute cost allocation rate for each. activity
ActivityTotal Est.
Cost
Est. Quant. of Cost
Allocation Base
AllocationRate
Mat. handling
$6,400 ÷ 3,200 parts
Machine setups 9,000 ÷ 25 setups
Insertion of parts
54,400 ÷ 3,200 parts
Finishing 89,700 ÷ 2,300 hrs
$ 2.00/part $360.00/
setup$17.00/part$39.00/hr
Copyright © 2013 Pearson Education, Inc. Publishing as Prentice Hall.
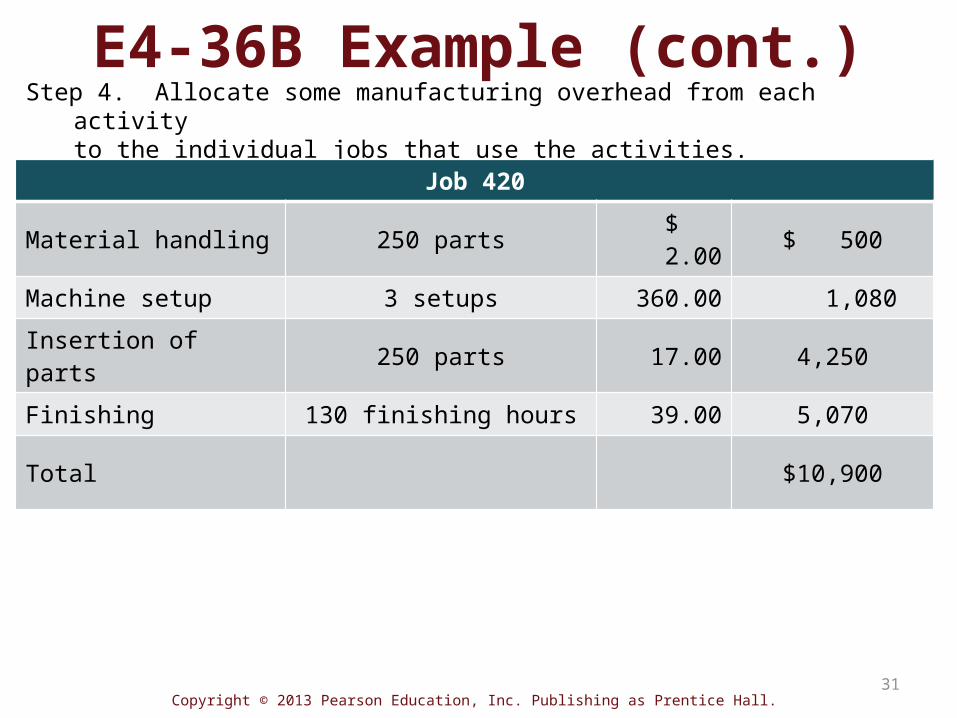
E4-36B Example (cont.)Step 4. Allocate some manufacturing overhead from each
activity to the individual jobs that use the activities.
Job 420
Material handling 250 parts $ 2.00 $ 500
Machine setup 3 setups 360.00 1,080Insertion of parts 250 parts 17.00 4,250
Finishing 130 finishing hours 39.00 5,070
Total $10,900
31
Copyright © 2013 Pearson Education, Inc. Publishing as Prentice Hall.
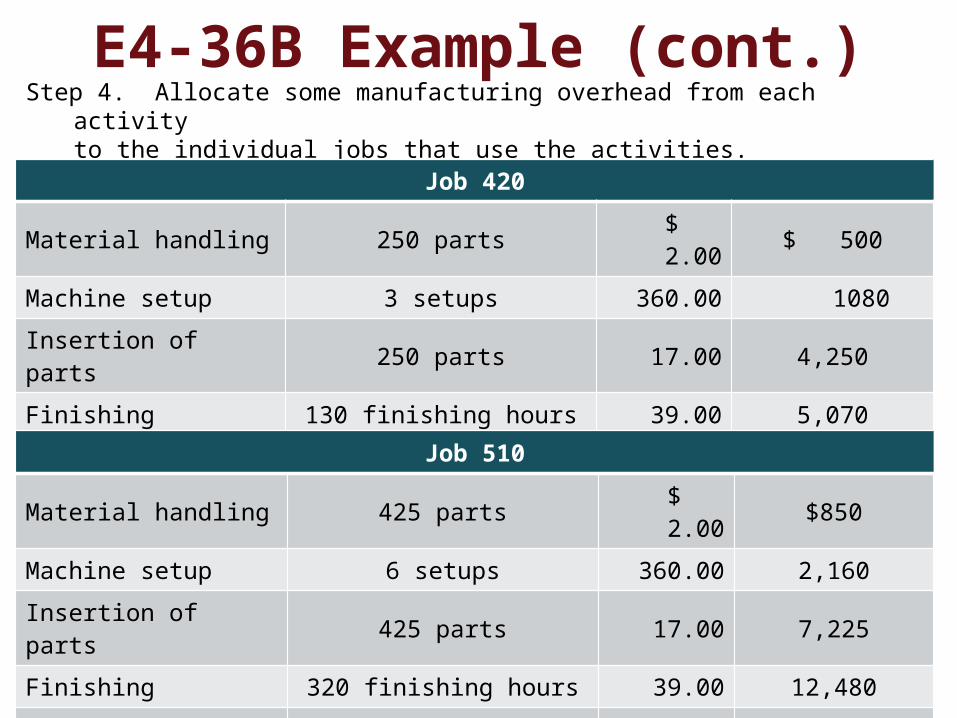
E4-36B Example (cont.)Step 4. Allocate some manufacturing overhead from each
activity to the individual jobs that use the activities.
Job 420
Material handling 250 parts $ 2.00 $ 500
Machine setup 3 setups 360.00 1080Insertion of parts 250 parts 17.00 4,250
Finishing 130 finishing hours 39.00 5,070
Total $10,900
32
Job 510
Material handling 425 parts $ 2.00 $850
Machine setup 6 setups 360.00 2,160Insertion of parts 425 parts 17.00 7,225
Finishing 320 finishing hours 39.00 12,480
Total $22,715
Copyright © 2013 Pearson Education, Inc. Publishing as Prentice Hall.
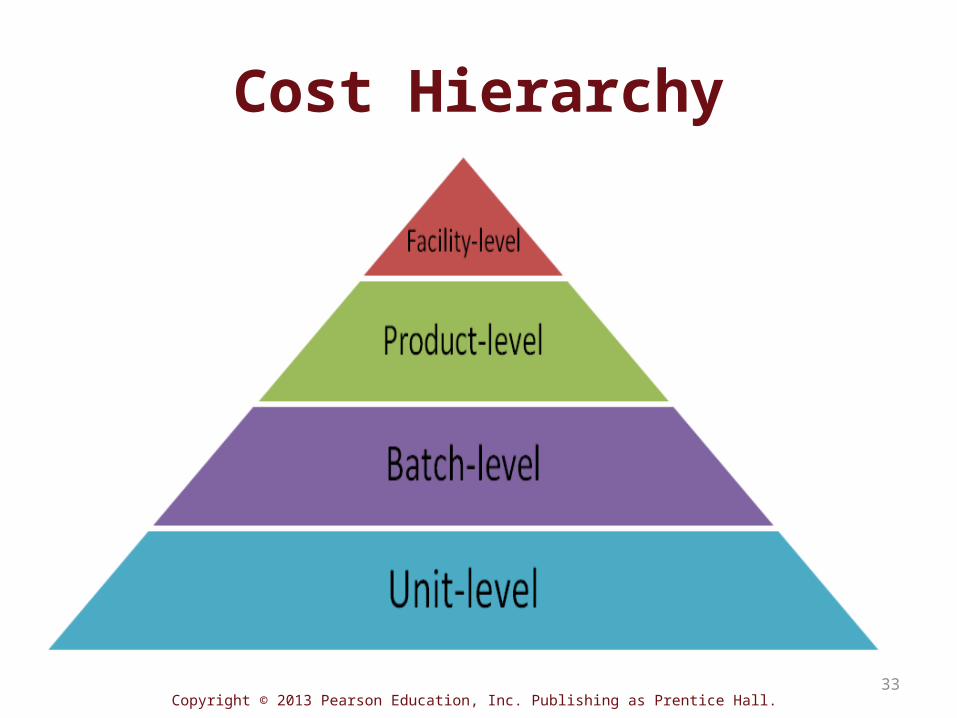
Cost Hierarchy
33
Copyright © 2013 Pearson Education, Inc. Publishing as Prentice Hall.
Now turn to S4-9
34
Copyright © 2013 Pearson Education, Inc. Publishing as Prentice Hall.
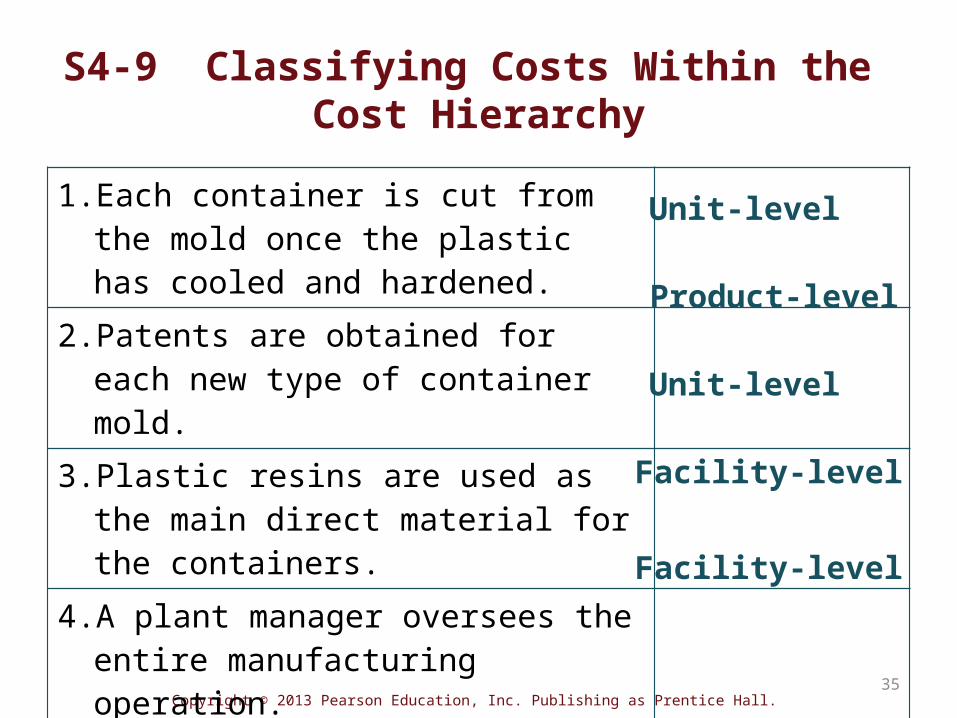
S4-9 Classifying Costs Within the Cost Hierarchy
1.Each container is cut from the mold once the plastic has cooled and hardened.
2.Patents are obtained for each new type of container mold.
3.Plastic resins are used as the main direct material for the containers.
4.A plant manager oversees the entire manufacturing operation.
5.The sales force incurs travel expenses to attend various trade shows throughout the country to market the containers.
35
Unit-level
Unit-level
Product-level
Facility-level
Facility-level
Copyright © 2013 Pearson Education, Inc. Publishing as Prentice Hall.
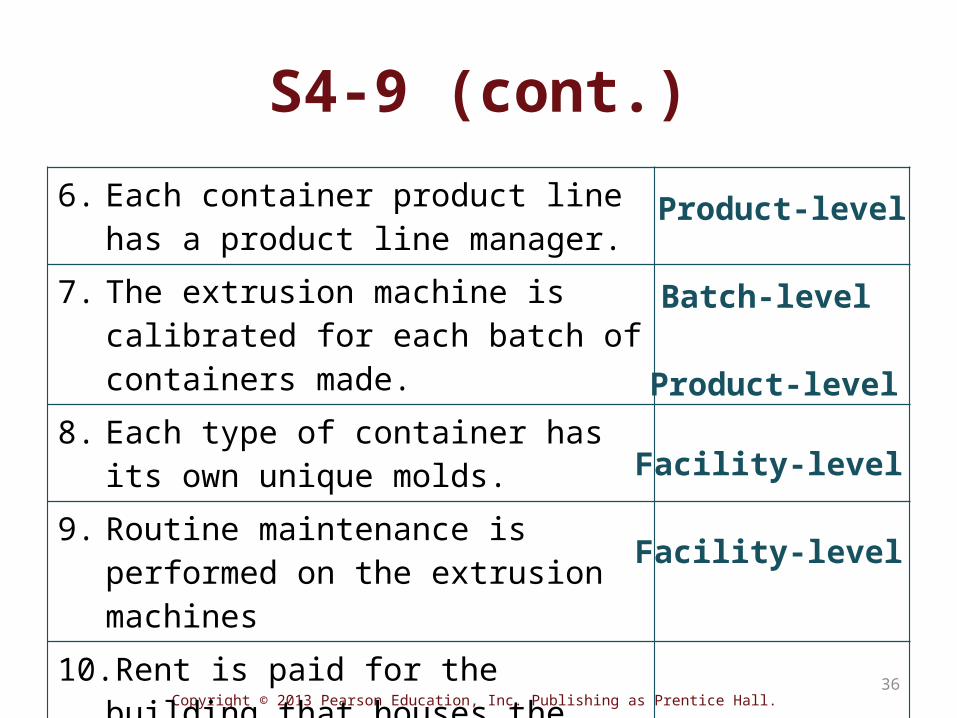
S4-9 (cont.)6. Each container product line
has a product line manager.7. The extrusion machine is
calibrated for each batch of containers made.
8. Each type of container has its own unique molds.
9. Routine maintenance is performed on the extrusion machines
10.Rent is paid for the building that houses the manufacturing processes.
36
Facility-level
Facility-level
Product-level
Product-level
Batch-level
Copyright © 2013 Pearson Education, Inc. Publishing as Prentice Hall.
Objective 3Understand the benefits and
limitations of ABC/ABM systems
37
Copyright © 2013 Pearson Education, Inc. Publishing as Prentice Hall.
Activity-Based Management (ABM)
• Using ABC information to make decisions– Pricing and product mix– Cost cutting– Planning and control
38
Copyright © 2013 Pearson Education, Inc. Publishing as Prentice Hall.
Pricing and Product Mix Decisions
• Change the prices for products after identifying the different total cost
• Decide to market the higher profitability product
• Shift the product mix away from less-profitable products
39
Copyright © 2013 Pearson Education, Inc. Publishing as Prentice Hall.
Cutting Costs• Analyze costs in value chain
– Value-added activities– Non–value-added activities
• Value-added vs. non–value-added
40
Copyright © 2013 Pearson Education, Inc. Publishing as Prentice Hall.
Planning and Control Decisions
• Uses the costs of activities to create budgets
• Compare with actual activities to see if goals are being met
41
Copyright © 2013 Pearson Education, Inc. Publishing as Prentice Hall.
Using ABC Outside of Manufacturing
• Merchandising and service: find the most profitable product or service
• Manufacturers: allocate operating activities
42
Copyright © 2013 Pearson Education, Inc. Publishing as Prentice Hall.
Sustainability and Refined Costing Systems
• Environmental overhead should be allocated to different activities that drive their costs.
• Creates better transparency
43
Copyright © 2013 Pearson Education, Inc. Publishing as Prentice Hall.
Cost Benefit Test• Do the benefits of adopting ABC/ABM exceed the costs?
• Benefits are higher for companies in competitive markets:– Accurate product cost information is essential– ABM can pinpoint cost savings opportunities
• Benefits are higher when risk of cost distortion high:– Many different products, many different types/amounts of resources
– High indirect costs– High- and low-volume products
44
Copyright © 2013 Pearson Education, Inc. Publishing as Prentice Hall.
Costs of Adopting ABC• Generally lower with
– Accounting and information system expertise to develop the system
– Information technology
• Are companies glad they adopted ABC?– 89% of the companies say that it was worth the cost
– Not a cure-all, helps managers understand costs better
45
Copyright © 2013 Pearson Education, Inc. Publishing as Prentice Hall.
Signs the Old System May Be Distorting Costs
• Cost system may need repair when– Managers don’t understand costs and profits
– Bids are lost when expected to win– Win bids expected to lose– Competitors price similar products much higher or much lower
• The cost system may be outdated if there is a diversified product line
46
Copyright © 2013 Pearson Education, Inc. Publishing as Prentice Hall.
Objective 4Describe lean operations
47
Copyright © 2013 Pearson Education, Inc. Publishing as Prentice Hall.
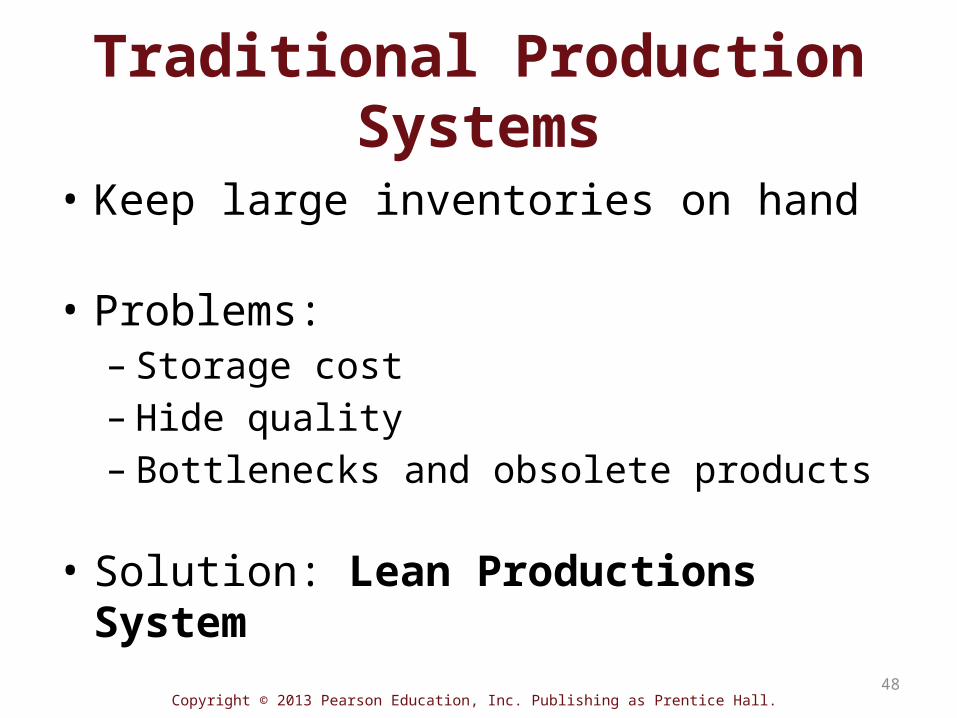
Traditional Production Systems
• Keep large inventories on hand
• Problems:– Storage cost– Hide quality– Bottlenecks and obsolete products
• Solution: Lean Productions System
48
Copyright © 2013 Pearson Education, Inc. Publishing as Prentice Hall.
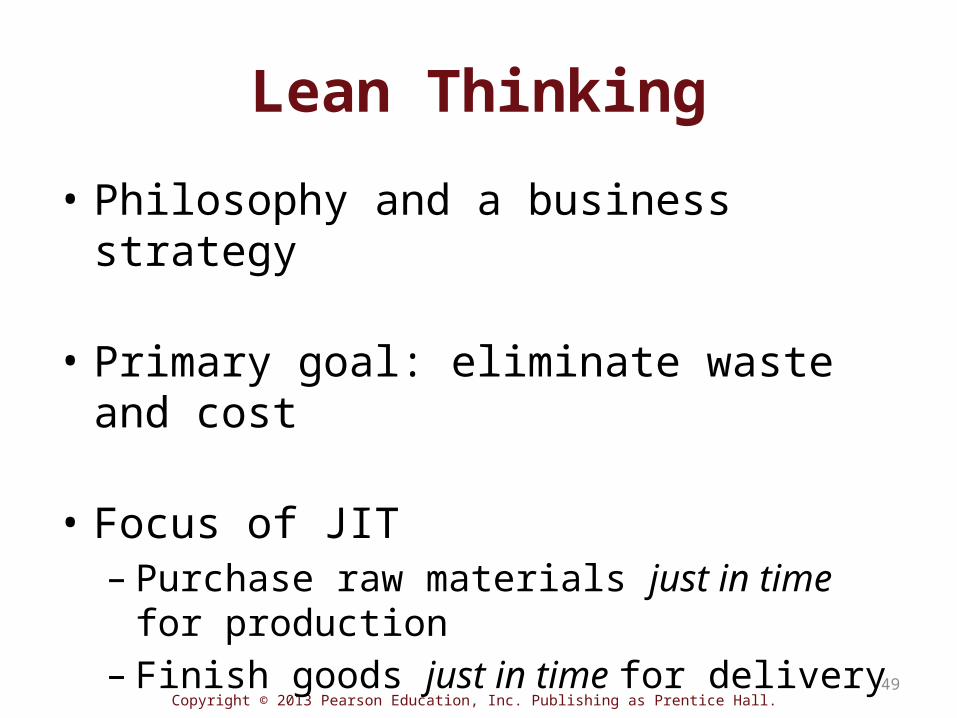
Lean Thinking• Philosophy and a business strategy
• Primary goal: eliminate waste and cost
• Focus of JIT– Purchase raw materials just in time for production
– Finish goods just in time for delivery49
Copyright © 2013 Pearson Education, Inc. Publishing as Prentice Hall.
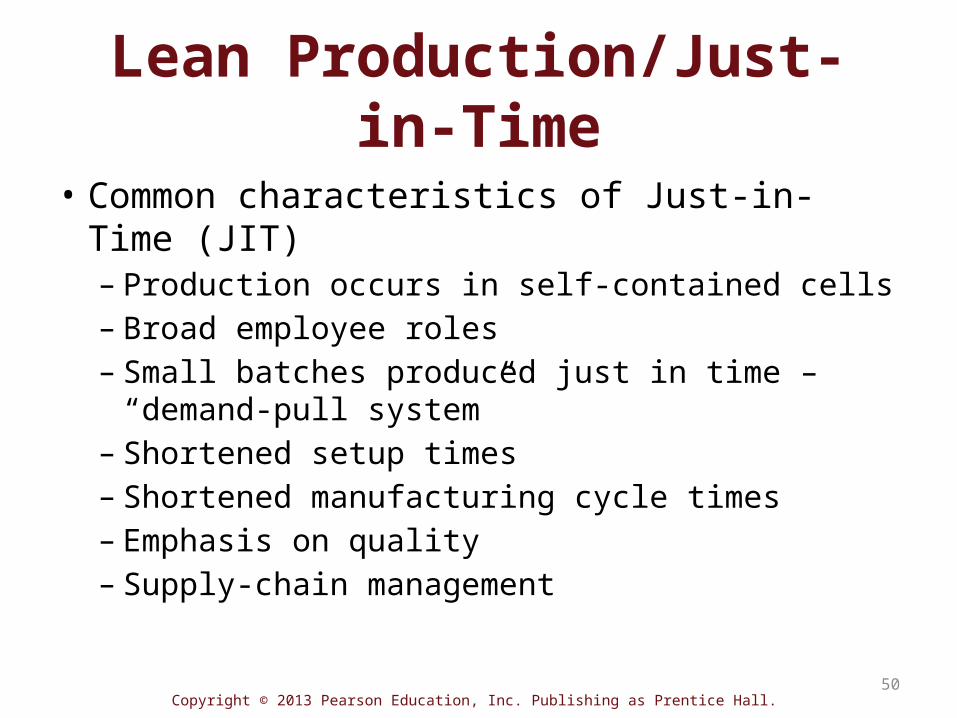
Lean Production/Just-in-Time
• Common characteristics of Just-in-Time (JIT)– Production occurs in self-contained cells– Broad employee roles– Small batches produced just in time – “demand-pull system”
– Shortened setup times– Shortened manufacturing cycle times– Emphasis on quality– Supply-chain management
50
Copyright © 2013 Pearson Education, Inc. Publishing as Prentice Hall.
Drawbacks to Lean Production Systems
• Vulnerable when problems strike suppliers or distributors
• Examples– Delays in delivery – Personnel problems – union strikes– Shortage of parts due to recalled products
– Weather related issues51
Copyright © 2013 Pearson Education, Inc. Publishing as Prentice Hall.
Sustainability and Lean Thinking
• Both seek to reduce waste• Lean focus on internal• Green focus on external• Lean and Green
52
Copyright © 2013 Pearson Education, Inc. Publishing as Prentice Hall.
Objective 5Describe and use the cost
of quality framework
53
Copyright © 2013 Pearson Education, Inc. Publishing as Prentice Hall.
Total Quality Management
• Goal: Provide customers with superior products and services
• Continuous improvement
• More investment up front to generate savings in the back end of the value chain
54
Copyright © 2013 Pearson Education, Inc. Publishing as Prentice Hall.
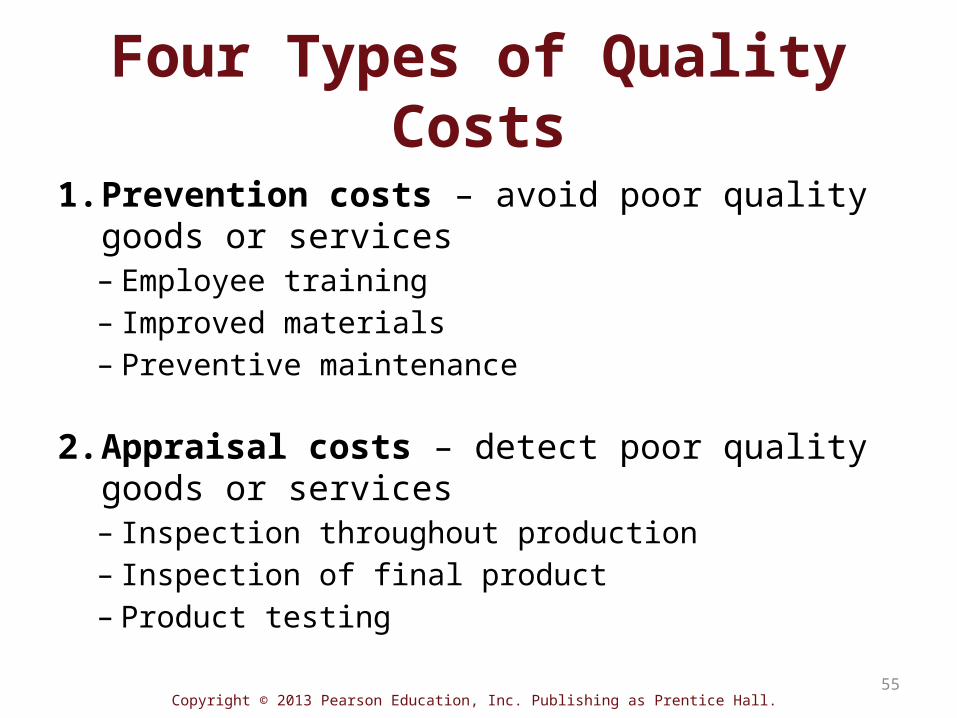
Four Types of Quality Costs
1.Prevention costs – avoid poor quality goods or services – Employee training– Improved materials– Preventive maintenance
2.Appraisal costs – detect poor quality goods or services– Inspection throughout production– Inspection of final product– Product testing
55
Copyright © 2013 Pearson Education, Inc. Publishing as Prentice Hall.
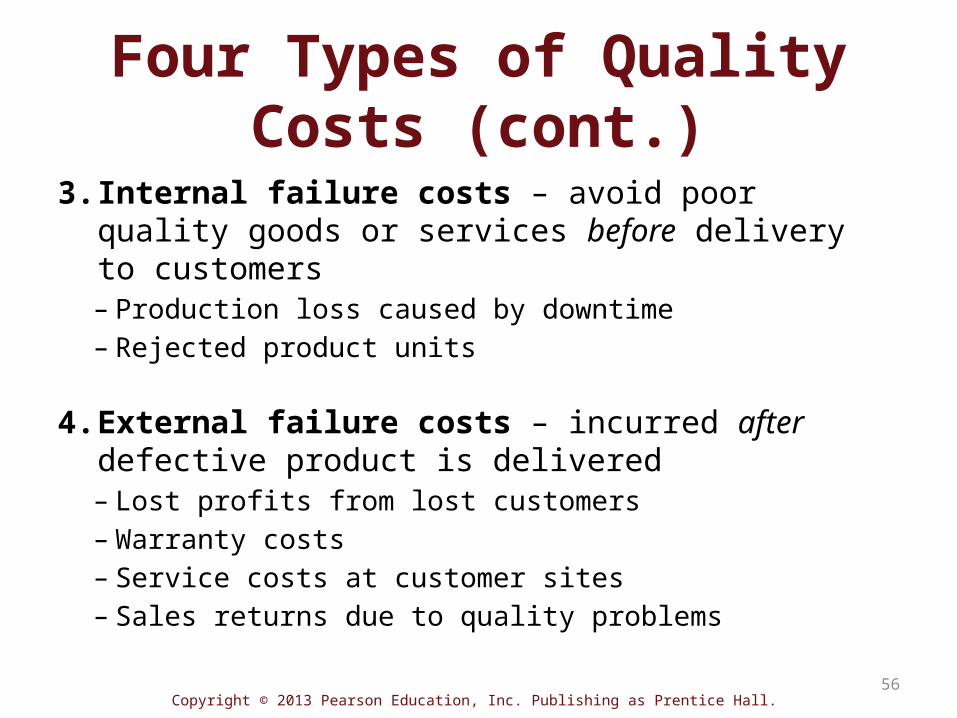
Four Types of Quality Costs (cont.)
3.Internal failure costs – avoid poor quality goods or services before delivery to customers– Production loss caused by downtime– Rejected product units
4.External failure costs – incurred after defective product is delivered– Lost profits from lost customers– Warranty costs– Service costs at customer sites– Sales returns due to quality problems
56
Copyright © 2013 Pearson Education, Inc. Publishing as Prentice Hall.
Non-Manufacturing Costs of Quality
• Service firms and merchandising companies also incur costs of quality
• Prevention– Professional training to their staff – Develop standardized service checklists
• Appraisal costs – Review work continuously– Inspect before releasing
57
Copyright © 2013 Pearson Education, Inc. Publishing as Prentice Hall.
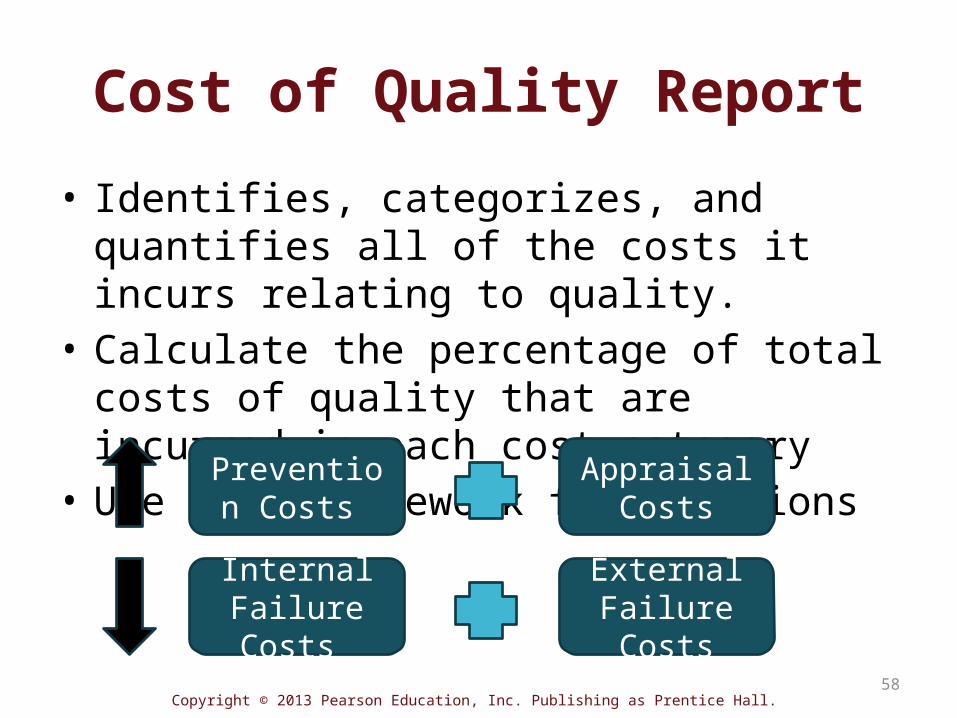
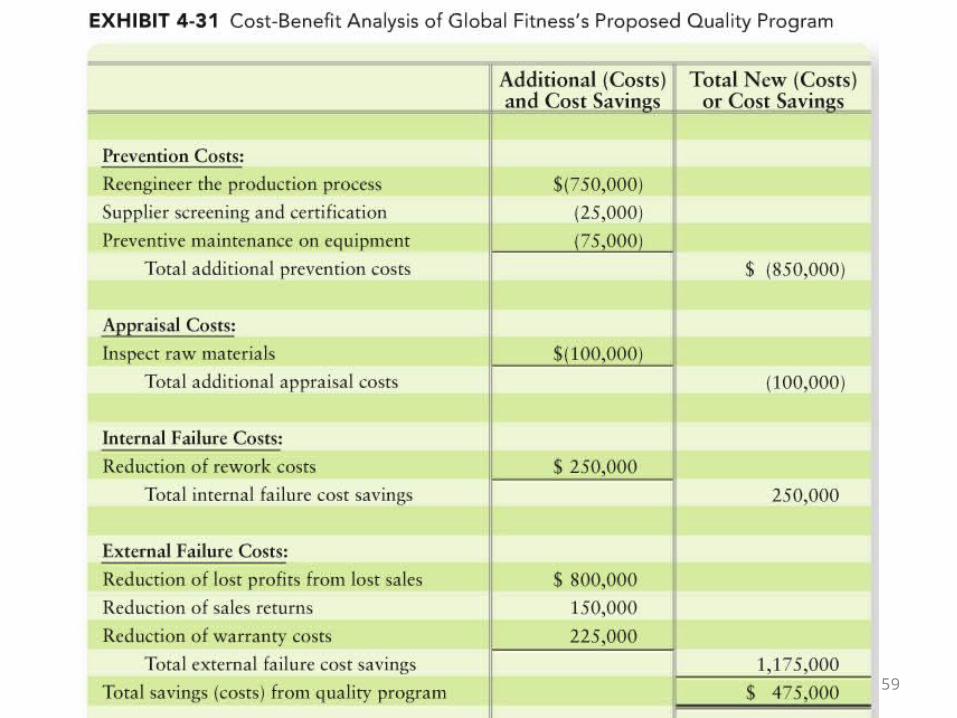
Cost of Quality Report• Identifies, categorizes, and quantifies all of the costs it incurs relating to quality.
• Calculate the percentage of total costs of quality that are incurred in each cost category
• Use as a framework for decisions
58
Prevention Costs
Appraisal Costs
Internal Failure Costs
External Failure Costs
Copyright © 2013 Pearson Education, Inc. Publishing as Prentice Hall. 59
Copyright © 2013 Pearson Education, Inc. Publishing as Prentice Hall.
Now turn to E4-34A
60
Copyright © 2013 Pearson Education, Inc. Publishing as Prentice Hall.
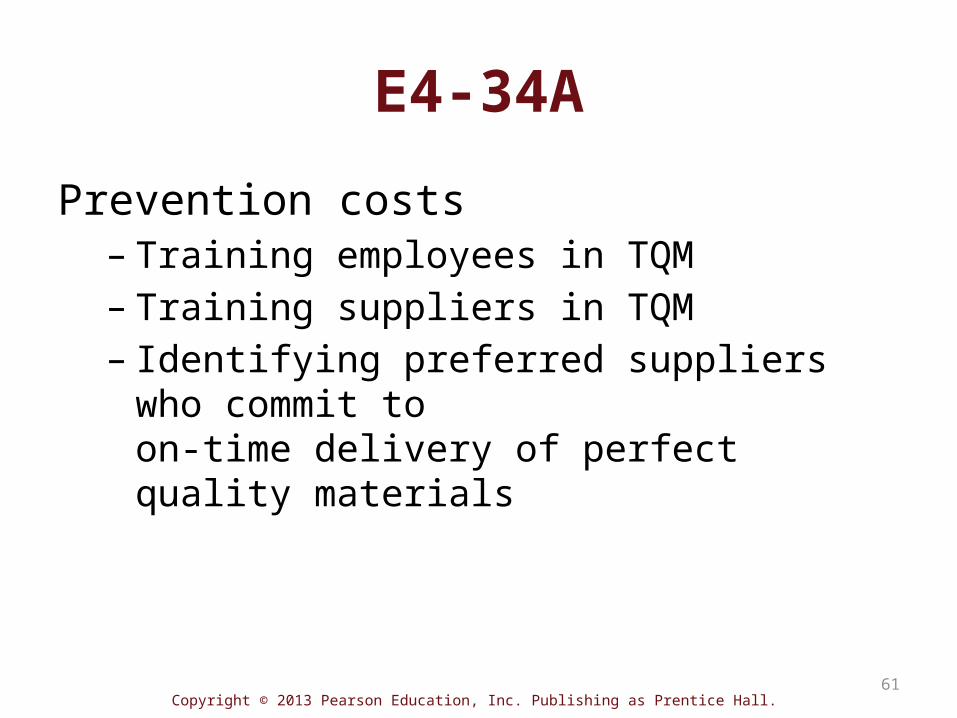
E4-34APrevention costs
– Training employees in TQM– Training suppliers in TQM– Identifying preferred suppliers who commit to on-time delivery of perfect quality materials
61
Copyright © 2013 Pearson Education, Inc. Publishing as Prentice Hall.
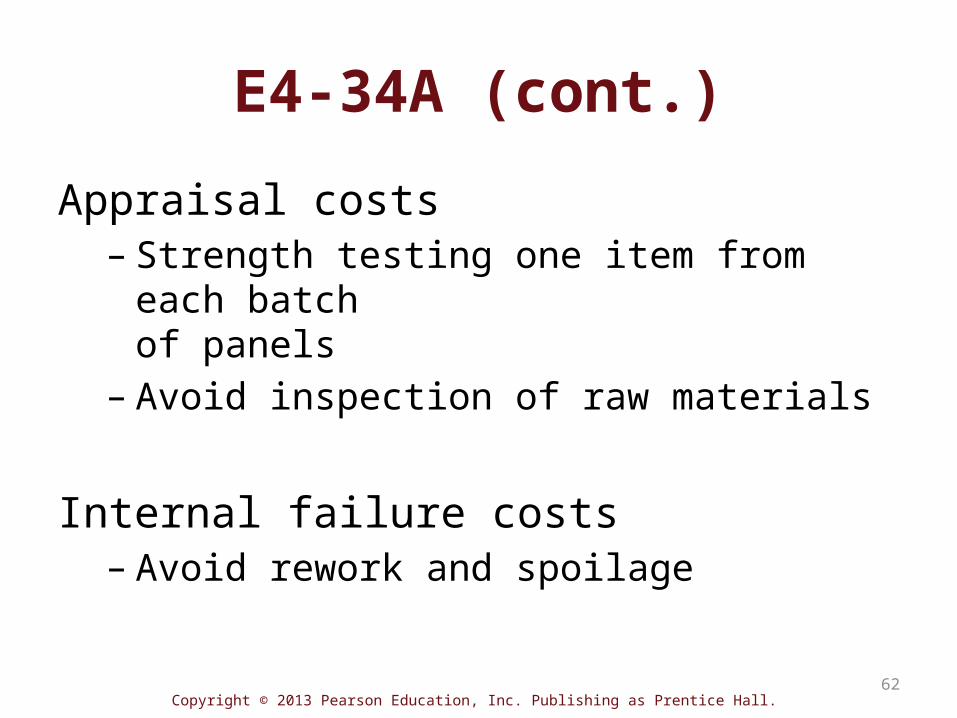
E4-34A (cont.)Appraisal costs
– Strength testing one item from each batch of panels
– Avoid inspection of raw materials
Internal failure costs– Avoid rework and spoilage
62
Copyright © 2013 Pearson Education, Inc. Publishing as Prentice Hall.
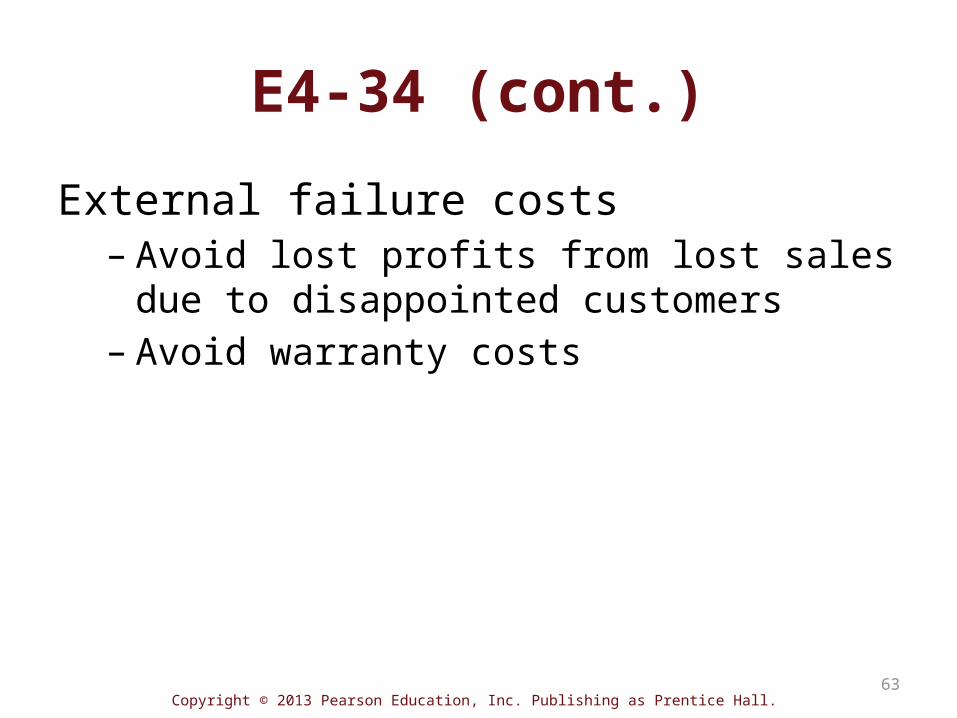
E4-34 (cont.)External failure costs
– Avoid lost profits from lost sales due to disappointed customers
– Avoid warranty costs
63
Copyright © 2013 Pearson Education, Inc. Publishing as Prentice Hall.
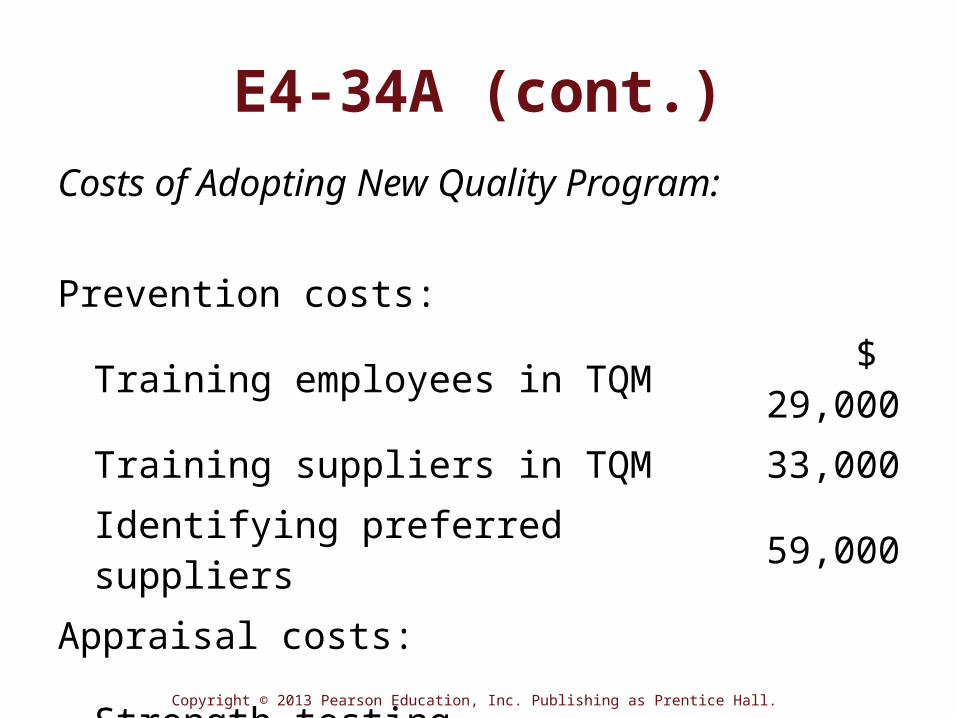
E4-34A (cont.)Costs of Adopting New Quality Program:
Prevention costs:
Training employees in TQM $ 29,000
Training suppliers in TQM 33,000Identifying preferred suppliers 59,000
Appraisal costs:
Strength testing 64,000
Savings on inspection of raw materials (51,000)
Copyright © 2013 Pearson Education, Inc. Publishing as Prentice Hall.
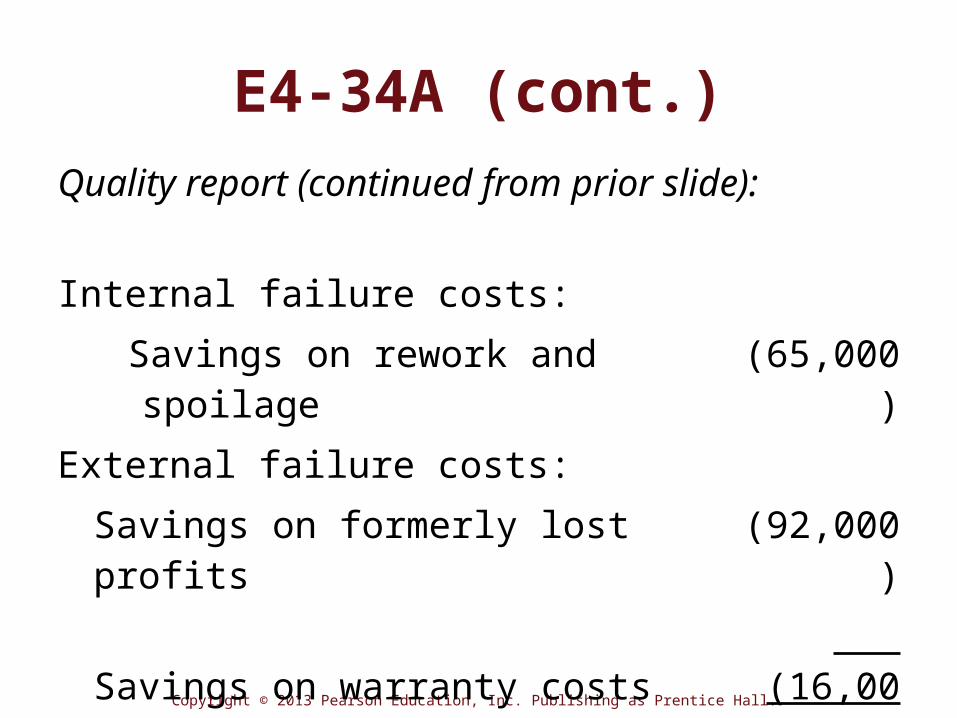
E4-34A (cont.)Quality report (continued from prior slide):
Internal failure costs: Savings on rework and spoilage
(65,000)
External failure costs:Savings on formerly lost profits
(92,000)
Savings on warranty costs
(16,000)
Net (Benefit) ($39,000)

Copyright © 2013 Pearson Education, Inc. Publishing as Prentice Hall.
End of Chapter 4
66