blood pressure patterns in normal pregnancy, gestational hypertension, and preeclampsia
TRANSCRIPT
Silva, Rafael Ucieda and Manuel IglesiasRamón C. Hermida, Diana E. Ayala, Artemio Mojón, José R. Fernández, Ignacio Alonso, Inés
PreeclampsiaBlood Pressure Patterns in Normal Pregnancy, Gestational Hypertension, and
Print ISSN: 0194-911X. Online ISSN: 1524-4563 Copyright © 2000 American Heart Association, Inc. All rights reserved.
is published by the American Heart Association, 7272 Greenville Avenue, Dallas, TX 75231Hypertension doi: 10.1161/01.HYP.36.2.149
2000;36:149-158Hypertension.
http://hyper.ahajournals.org/content/36/2/149World Wide Web at:
The online version of this article, along with updated information and services, is located on the
http://hyper.ahajournals.org//subscriptions/
is online at: Hypertension Information about subscribing to Subscriptions:
http://www.lww.com/reprints Information about reprints can be found online at: Reprints:
document. Permissions and Rights Question and Answer this process is available in the
click Request Permissions in the middle column of the Web page under Services. Further information aboutOffice. Once the online version of the published article for which permission is being requested is located,
can be obtained via RightsLink, a service of the Copyright Clearance Center, not the EditorialHypertensionin Requests for permissions to reproduce figures, tables, or portions of articles originally publishedPermissions:
by guest on March 27, 2014http://hyper.ahajournals.org/Downloaded from by guest on March 27, 2014http://hyper.ahajournals.org/Downloaded from
Blood Pressure Patterns in Normal Pregnancy, GestationalHypertension, and Preeclampsia
Ramon C. Hermida, Diana E. Ayala, Artemio Mojon, Jose R. Fernandez, Ignacio Alonso, Ines Silva,Rafael Ucieda, Manuel Iglesias
Abstract—With the aim to describe the daily pattern of blood pressure during the trimesters of pregnancy in clinicallyhealthy women as well as in pregnant women who developed gestational hypertension or preeclampsia, we analyzed1494 blood pressure series systematically sampled by ambulatory monitoring for 48 hours every 4 weeks after the firstobstetric visit in 124 women with uncomplicated pregnancies, 55 with gestational hypertension, and 23 with a finaldiagnosis of preeclampsia. The circadian pattern of blood pressure variation for each group and trimester of gestationwas established by population multiple-component analysis. A highly statistically significant circadian patternrepresented by a linear model that includes components with periods of 24 and 12 hours is demonstrated for systolic anddiastolic blood pressure for all groups of pregnant women in all trimesters (P,0.001 in all cases). The differences incircadian rhythm–adjusted mean between complicated and uncomplicated pregnancies are highly statistically significantin all trimesters (alwaysP,0.001). There is also a statistically significant difference in circadian amplitude (extent ofdaily change) of blood pressure between healthy and complicated pregnancies in all trimesters (alwaysP,0.004).Results further indicate similar circadian characteristics between women who later developed gestational hypertensionor preeclampsia in the first trimester of pregnancy. The difference between these 2 groups in circadian mean isstatistically significant in the second trimester for systolic (P50.022) but not for diastolic blood pressure (P50.986).In the third trimester, the difference in circadian mean is highly statistically significant for both variables (P,0.001).The differences in blood pressure between healthy and complicated pregnancies can be observed as early as in the firsttrimester of pregnancy. Those highly significant differences are found when both systolic and diastolic blood pressurefor women with a later diagnosis of gestational hypertension or preeclampsia are well within the accepted normalphysiological range of blood pressure variability. These differing changes in the circadian pattern of blood pressure withadvancing gestational age between healthy and complicated pregnancies offer new end points that may lead to an earlyidentification of hypertensive complications in pregnancy as well as to the establishment of prophylactic intervention.(Hypertension. 2000;36:149-158.)
Key Words: blood pressuren circadian rhythmn pregnancyn hypertension, gestationaln normotensionn preeclampsia
Blood pressure (BP) assessment in pregnant women hasrelied mostly on a few measurements taken in the
physician’s office. These casual time-unspecified measure-ments perform poorly, even in the third trimester of preg-nancy, in selection of a population for potential detection ofpreeclampsia.1–6 Isolated BP measurement is, however, stillthe mainstay of the diagnosis of preeclampsia. The use of areliable and accurate automated device for ambulatory BPmonitoring (ABPM) is the logical approach to overcomingmany of the problems associated with conventional BPmeasurement.7,8 ABPM has the added advantage that inaddition to the immediate presentation of absolute BP values,it gives the extra dimension of facilitating analysis of the
circadian variation of BP in pregnancy.1,2 Both systolic BP(SBP) and diastolic BP (DBP) vary in adulthood on theaverage.50 mm Hg within each day.9,10 Such circadian BPvariability also characterizes clinically healthy pregnantwomen as well as women who developed gestational hyper-tension or preeclampsia.1,2,11During gestation, another sourceof variability comes from the predictable pattern of BPchanges along pregnancy.12,13 In clinically healthy pregnantwomen, BP steadily decreases up to the middle of gestationand then increases up to the day of delivery, with final BPvalues similar to those found early in pregnancy in the samewomen. For women who developed gestational hypertensionor preeclampsia, BP is stable during the first half of preg-
Received October 13, 1999; first decision November 8, 1999; revision accepted March 3, 2000.From Bioengineering and Chronobiology Laboratories, University of Vigo, Campus Universitario, Vigo, Spain (R.C.H., D.E.A., A.M., J.R.F., I.A.),
and the Department of Obstetrics and Gynecology, Hospital General Clınico Universitario de Galicia, Medical School, University of Santiago, Santiagode Compostela, Spain (I.S., R.U., M.I.).
Correspondence to Prof Ramon C. Hermida, PhD, Director, Bioengineering and Chronobiology Labs, E.T.S.I. Telecomunicacion, CampusUniversitario, Vigo (Pontevedra) 36200, Spain. E-mail [email protected]
© 2000 American Heart Association, Inc.
Hypertensionis available at http://www.hypertensionaha.org
149
Scientific Contributions
by guest on March 27, 2014http://hyper.ahajournals.org/Downloaded from
nancy and then continuously increases until delivery.12 Thesepredictable patterns of BP variability during pregnancy aresomehow independent from the continuous linear increase inmaternal weight with gestational age.12
Changes in circadian variation of BP could be used eitherto predict preeclampsia or to assess its severity.14 Althoughreference values are now available for 24-hour ABPM innonpregnant patients,10,15only a few studies have been madeon the normal pattern of ABPM in uncomplicated pregnan-cies,16–21most of them without comparison with the circadianpattern of BP in complicated pregnancies, an issue onlyoccasionally addressed.1,2,11,14,20,22Normal values for 24-hourABPM have been determined in at least 2 of the mostextensive studies done so far in pregnancy, the first in aprimigravid population of 98 women sampled at 5 differentgestational ages19 and the second in 71 normotensive preg-nant women systematically sampled every 4 weeks startingon the first trimester of pregnancy.1 This later study alsoprovided comparison for the circadian BP variation betweenhealthy and complicated pregnancies. Results indicated sta-tistically significant differences in BP between healthy andcomplicated pregnancies as early as in the first trimester ofpregnancy; at this stage of gestation, both SBP and DBP forwomen with a later diagnosis of gestational hypertension andpreeclampsia were still well within the accepted normalphysiological range of BP variability.1,2 Moreover, by the useof ABPM, several authors have found a reduced drop in BPby night in preeclamptic patients,1,2,11 whereas others evenreport an inversion of the circadian pattern of change in BPassociated with preeclampsia.14,22,23Most of the later studieshave usually been performed during the last stages of preg-nancy. Limitations of these studies came also from theinability to properly describe the nonsinusoidal waveform ofcircadian BP variability.1 In the attempt to corroborate andextend conclusions from previous studies,1 we report resultsfrom a prospective study of BP variability during pregnancy.In particular, we have used a recently developed method foranalysis of nonsinusoidal time series with unequidistantsampling24 to examine and compare characteristics of circa-dian variability in BP of clinically healthy pregnant women aswell as women with gestational hypertension or preeclampsiawho were systematically monitored throughout gestation.
MethodsSubjectsWe studied 202 (126 primipara) white pregnant women (124 withuncomplicated pregnancies, 55 who developed gestational hyperten-sion, and 23 who developed preeclampsia) who fulfilled all requiredcriteria for this trial (see below). Diagnosis of gestational hyperten-sion (conventional BP values.140/90 mm Hg for SBP/DBP after
the 20th week of gestation without clinical record of hypertensionprevious to pregnancy) or preeclampsia (gestational hypertensionand proteinuria,.300 mg in 24 hours of urine collection, with orwithout edema, diagnosed after the 20th week of gestation in apreviously normotensive women) was done with information fromthe conventional obstetric examinations and routine analyses ofurine. The demographic baseline characteristics of the womeninvestigated are included in the Table. All women received obstetriccare at the Obstetric Physiopathology Unit, Hospital Clinico Univer-sitario, Santiago de Compostela, Spain. Reasons for receivingmedical care at this unit include, among others, family or personalhistory of either gestational hypertension, preeclampsia or chronichypertension; cardiovascular, endocrine, bleeding, or metabolic dis-ease; a personal history of spontaneous abortion; and multiplepregnancy, obesity, and adolescent or middle-aged nulliparous preg-nancy (,18 or.35 years). The relative risk of gestational hyper-tension and preeclampsia in this unit is'3.5 times that of the generalobstetric population in our setting.1 All issues related to ABPM,including handling and preparation of the monitors, individualizedexplanation about their use to each patient, and processing of the dataprovided by any given pregnant woman after monitoring, werealways carried out by the same members of the research group in oneroom of the unit. Conventional obstetric examinations of the preg-nant women, usually done on the same day just before startingABPM, were carried out by other members of the research group indifferent rooms of the unit. Inclusion criteria were absence of anycondition requiring the use of antihypertensive medication, maternalage (18 to 40 years), and gestational age (,16 weeks at the time ofinclusion). Exclusion criteria were, among others, multiple preg-nancy, chronic hypertension, chronic liver disease, any diseaserequiring the use of antiinflammatory medication, diabetes or anyother endocrine disease such as hyperthyroidism, and intolerance tothe use of an ABPM device. Apart from the 202 women providing allrequired information, 11 subjects who provided,5 profiles ofABPM (3 spontaneous abortions and 8 who withdrew from the trial)were eliminated from the study. The State Ethics Committee ofClinical Research approved the study. All volunteers signed consentforms before entering the study.
BP AssessmentThe SBP and DBP of each of the 202 subjects who completed thetrial were automatically monitored every 30 minutes during the day(9 AM to 10 PM) and hourly during the night for 48 hours with anABPM-630 Colin device at the time of recruitment and then every 4weeks until delivery. BP series were eliminated from analysis whenthey showed an irregular schedule during the days of sampling, anodd sampling with spans of.3 hours without BP measurement, ora night resting span,6 hours or.12 hours. The total number of BPseries provided by the women under investigation fulfilling allmentioned requirements set a priori was 1494. During sampling, allwomen were living on their usual diurnal waking ('9AM toapproximately midnight) and nocturnal resting routine, followingeveryday life conditions with minimal restrictions. They were told tofollow a similar schedule during the days of sampling and to avoidthe use of medication for the duration of the trial. The monitormeasures BP by dual microphone auscultation by means of Korot-koff phase 1 for SBP and phase 5 for DBP; it also provides a moresensitive oscillometric mode to assess BP. The clinical evaluation ofthe monitor according to the standards published by the Association
Demographic Characteristics of Subjects Investigated
Group Subjects, n BP Series, n Age, y Weight, kg Height, cmSBP at
Inclusion, mm HgDBP at
Inclusion, mm Hg
Normotension 124 971 30.065.5 62.869.5 161.965.5 119.669.8 65.067.2
Gestational hypertension 55 382 30.664.9 74.2618.3 162.466.9 121.369.1 66.267.7
Preeclampsia 23 141 32.265.6 76.5612.8 162.965.1 120.468.8 64.368.5
All values given in mean6SD, when appropriate.
150 Hypertension August 2000
by guest on March 27, 2014http://hyper.ahajournals.org/Downloaded from
for Advancement of Medical Instrumentation25 has been previouslyestablished.18,26 The BP cuff was worn on the nondominant arm.ABPM was performed in addition to the woman’s routine antenatalcare, and no person was hospitalized during monitoring. Cuff sizewas determined by upper arm circumference at the time of each visit.ABPM always started between 10AM and 1PM. During monitoring,each subject maintained a diary regarding information about theiractivity cycle, dietary consumption, physical activity, emotionalstate, and other external or internal stimuli possibly affecting BP.
Statistical MethodsOriginal oscillometric data from each BP series were first synchro-nized according to the rest-activity cycle of each individual byrecomputing all times of sampling in hours from bedtime to avoiddifferences among subjects in actual times of daily activity and toexpress results in circadian time rather than in less meaningful clockhours. After synchronization, BP values were edited according tocommonly used criteria for the removal of outliers and measurementerrors.27,28The remaining data were analyzed by the use of Chrono-lab,29 a software package for biological signal processing by linearand nonlinear least-squares estimation. The circadian rhythm in BPfor each group of women (healthy or complicated pregnancies, aswell as gestational hypertension and preeclampsia separately) in eachtrimester of gestation was established by population multiple-component analysis,24 a method designed for analysis of nonsinu-soidal hybrid data (time series of data collected from a group ofsubjects) with unequidistant observations.
The method provides estimates of the rhythm-adjusted mean orMESOR (midline estimating statistic of rhythm, defined as theaverage value of the rhythmic function fitted to the data), as well asthe amplitude (defined as half the extent of rhythmic change in acycle approximated by the fitted curve) and acrophase (lag from adefined reference time point of the crest time in the curve fitted to thedata) for every fitted component. When all fitted components areharmonics from a fundamental period, the method of multiplecomponents also provides 3 additional parameters: the overallamplitude, defined as half the difference between the maximum andthe minimum of the best fitted curve in one fundamental period; theorthophase, defined as the lag from a defined reference time point ofthe crest time, within a fundamental period, in the curve of multiplecomponents fitted to the data24; and the bathyphase, defined as thelag from a defined reference time point of the time of the lowestvalue, within a fundamental period, in the curve of multiplecomponents fitted to the data. The orthophase (similar to theacrophase of each component) and the bathyphase are usuallyexpressed as negative angular degrees, with 360°51 fundamentalperiod (here, 24 hours). Circadian parameters were subsequentlycompared between groups of women in each trimester of pregnancywith a nonparametric test developed to compare parameters obtainedfrom population multiple components analysis.30 Additionally, thedemographic characteristics included in the Table were comparedbetween groups of pregnant women by ANOVA.
ResultsResults from ANOVA for the data included in the Tableindicate statistically significant differences in baseline char-acteristics between the 3 groups of pregnant women investi-gated in maternal weight (P,0.001) but not in age
(P50.219), height (P50.749), or casual BP values at the timeof the first visit to the hospital (P50.624 and 0.588 for SBPand DBP, respectively). The Table further indicates statisti-cally significant differences in casual BP at the time ofdelivery (P,0.001 for both SBP and DBP), gestational age atdelivery (P50.024), newborn weight (P50.007), and Apgarscores at 1, 5, and 10 minutes after birth (P50.074, 0.003,and 0.003, respectively).
For the normotensive pregnant women, no difference wasfound between circadian BP characteristics obtained as afunction of parity or age for any trimester of pregnancy.31
Data from the whole database were therefore pooled forsubsequent analysis and only divided according to gestationalage and pregnancy outcome. Individually, a statisticallysignificant 24-hour component was obtained for 96% of theSBP and 94% of the DBP profiles sampled from normoten-sive pregnant women, with a significant second harmonic (12hours component) characterizing 55% and 57% of the pro-files for SBP and DBP, respectively. For women withcomplicated pregnancies, the 24-hour component was statis-tically significant for 91% and 92% of the profiles for SBPand DBP, respectively, whereas the 12-hour component wassignificant for 56% of the SBP profiles and for 59% of theDBP profiles. Other ultradian harmonic components weresignificant in,17% of the profiles for any group or trimesterof pregnancy. A statistically significant increase in thecoefficient of determination (percentage of overall variabilityexplained by the function fitted to the data) was only obtainedafter including in the model of multiple components periodsof 24 and 12 hours for both SBP and DBP for any group ofwomen and trimester of gestation. From the population pointof view, although other ultradian components can be demon-strated as statistically significant in a small percentage ofsubjects, a rather simple model including only the 2 firstharmonics of the 24-hour period describes sufficiently well,at the specified sampling rate, the circadian pattern of BP inboth healthy and complicated pregnancies.
The parameters of the circadian rhythm (obtained bypopulation multiple component analysis) for SBP and DBP ineach trimester of pregnancy for clinically healthy women aswell as for pregnant women with a final diagnosis ofgestational hypertension or preeclampsia are indicated in thetables at the bottom of Figures 1 through 3. Compared withuncomplicated pregnancies, a statistically significant eleva-tion of the circadian MESOR of BP is found in pregnancieswith gestational hypertension or preeclampsia in all trimes-ters (P,0.001 for both SBP and DBP). There is also astatistically significant difference in the circadian amplitudeof both SBP and DBP between healthy and complicated
SBP atDelivery, mm Hg
DBP atDelivery, mm Hg
Gestational Ageat Delivery, wk
NewbornWt, g
Newborn Apgar Score at
1 min 5 min 10 min
118.3612.2 67.269.7 39.761.4 33156457 8.8660.94 9.9260.31 9.9860.14
126.6613.0 72.0610.5 39.063.7 31396542 8.9660.21 9.9160.28 10
130.2612.5 75.8610.7 38.262.8 29186844 8.2662.60 9.1662.50 9.3762.31
Hermida et al BP Variability in Pregnancy 151
by guest on March 27, 2014http://hyper.ahajournals.org/Downloaded from
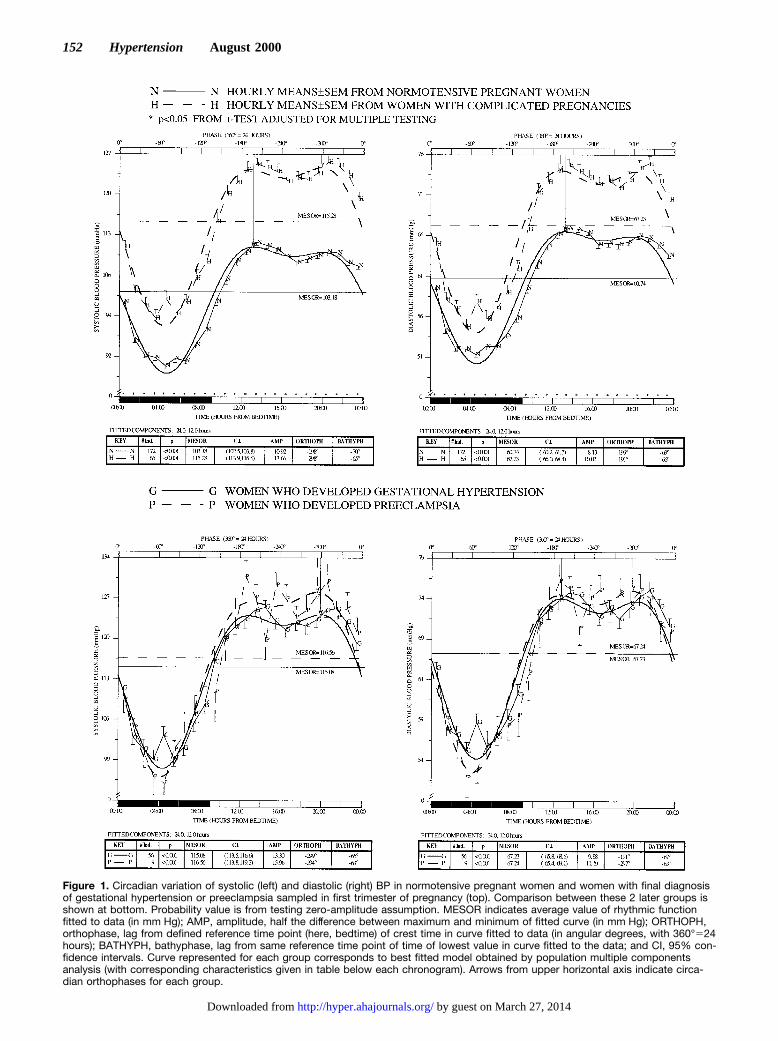
Figure 1. Circadian variation of systolic (left) and diastolic (right) BP in normotensive pregnant women and women with final diagnosisof gestational hypertension or preeclampsia sampled in first trimester of pregnancy (top). Comparison between these 2 later groups isshown at bottom. Probability value is from testing zero-amplitude assumption. MESOR indicates average value of rhythmic functionfitted to data (in mm Hg); AMP, amplitude, half the difference between maximum and minimum of fitted curve (in mm Hg); ORTHOPH,orthophase, lag from defined reference time point (here, bedtime) of crest time in curve fitted to data (in angular degrees, with 360°524hours); BATHYPH, bathyphase, lag from same reference time point of time of lowest value in curve fitted to the data; and CI, 95% con-fidence intervals. Curve represented for each group corresponds to best fitted model obtained by population multiple componentsanalysis (with corresponding characteristics given in table below each chronogram). Arrows from upper horizontal axis indicate circa-dian orthophases for each group.
152 Hypertension August 2000
by guest on March 27, 2014http://hyper.ahajournals.org/Downloaded from
pregnancies in all trimesters of gestation (P,0.004 for bothcardiovascular variables in all trimesters).
The elevation of SBP and DBP during the first trimester ofpregnancy in subjects with a later diagnosis of gestationalhypertension or preeclampsia as compared with clinicallyhealthy pregnant women is shown in Figure 1 (top). Thisfigure represents a circadian population chronogram (displayof data as a function of time), with hourly means and standarderrors of data computed as follows: First, hourly means arecomputed from each individual series, after stacking all datasampled during a 48-hour monitoring span in only 1 idealized24-hour span (given the highly statistically significant rhythmwith a period of 24 hours demonstrated in about 94% of allBP series studied). In a second step, the average of thoseindividual means at each interval is computed averagingacross the total number of series for any given population.The lower horizontal axis represents circadian time in hoursafter bedtime; the resting span is indicated by the dark bar inthe lower horizontal axis. The nonsinusoidal curve represent-ed for each group corresponds to the best fitted modelobtained by population multiple components analysis appliedto all original BP values (not just to the hourly means). Thearrow from the upper horizontal axis indicates the circadianorthophase for each group. Statistically significant differ-ences between hourly means for each group (detected byt testadjusted for multiple testing) at any given interval areindicated by an asterisk above the lower horizontal axis.Differences in rhythm characteristics (as is the case here forthe circadian MESOR and amplitude) as well as the generalwaveform of circadian variability in SBP and DBP can bereadily seen from this graphic representation. The character-istics of the circadian rhythm, including information on thenumber of BP series analyzed for each group, are representedin the tables below each chronogram. Figure 1 also includes,on the bottom, chronograms comparing the circadian patternof SBP (left) and DBP (right) between women who devel-oped gestational hypertension and preeclampsia. The com-parison of circadian characteristics indicates similar parame-ters between these 2 groups of complicated pregnant womensampled in the first trimester of their gestation (alwaysP.0.189 for comparisons of MESOR and amplitude of SBPand DBP).
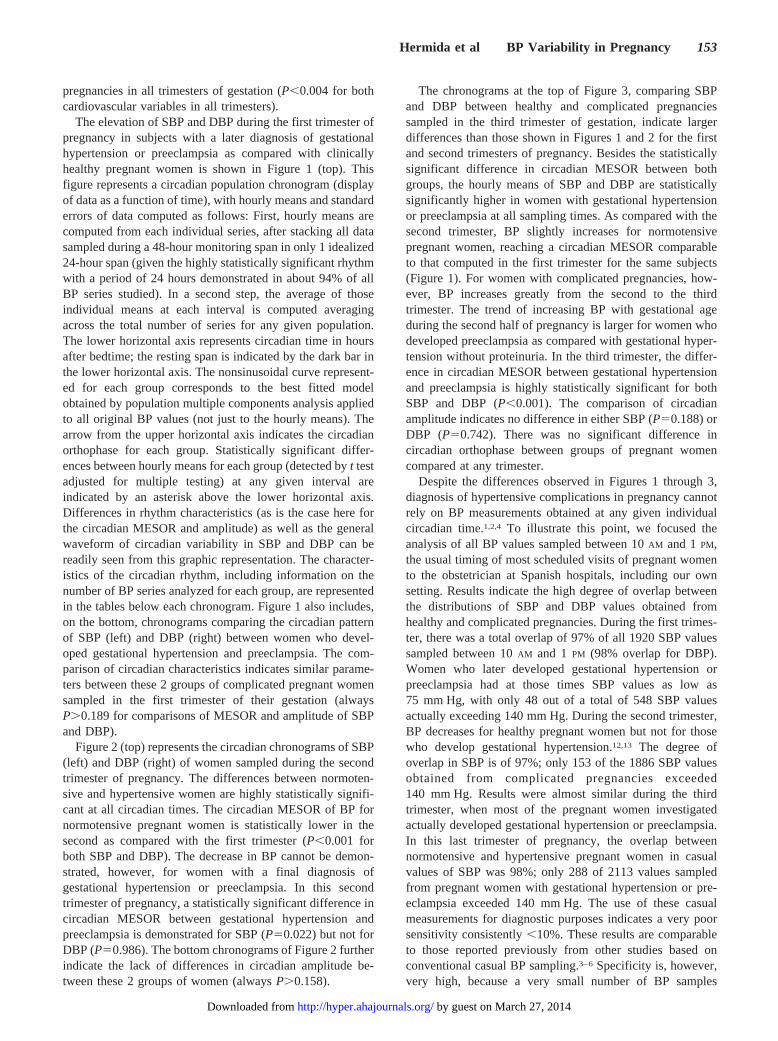
Figure 2 (top) represents the circadian chronograms of SBP(left) and DBP (right) of women sampled during the secondtrimester of pregnancy. The differences between normoten-sive and hypertensive women are highly statistically signifi-cant at all circadian times. The circadian MESOR of BP fornormotensive pregnant women is statistically lower in thesecond as compared with the first trimester (P,0.001 forboth SBP and DBP). The decrease in BP cannot be demon-strated, however, for women with a final diagnosis ofgestational hypertension or preeclampsia. In this secondtrimester of pregnancy, a statistically significant difference incircadian MESOR between gestational hypertension andpreeclampsia is demonstrated for SBP (P50.022) but not forDBP (P50.986). The bottom chronograms of Figure 2 furtherindicate the lack of differences in circadian amplitude be-tween these 2 groups of women (alwaysP.0.158).
The chronograms at the top of Figure 3, comparing SBPand DBP between healthy and complicated pregnanciessampled in the third trimester of gestation, indicate largerdifferences than those shown in Figures 1 and 2 for the firstand second trimesters of pregnancy. Besides the statisticallysignificant difference in circadian MESOR between bothgroups, the hourly means of SBP and DBP are statisticallysignificantly higher in women with gestational hypertensionor preeclampsia at all sampling times. As compared with thesecond trimester, BP slightly increases for normotensivepregnant women, reaching a circadian MESOR comparableto that computed in the first trimester for the same subjects(Figure 1). For women with complicated pregnancies, how-ever, BP increases greatly from the second to the thirdtrimester. The trend of increasing BP with gestational ageduring the second half of pregnancy is larger for women whodeveloped preeclampsia as compared with gestational hyper-tension without proteinuria. In the third trimester, the differ-ence in circadian MESOR between gestational hypertensionand preeclampsia is highly statistically significant for bothSBP and DBP (P,0.001). The comparison of circadianamplitude indicates no difference in either SBP (P50.188) orDBP (P50.742). There was no significant difference incircadian orthophase between groups of pregnant womencompared at any trimester.
Despite the differences observed in Figures 1 through 3,diagnosis of hypertensive complications in pregnancy cannotrely on BP measurements obtained at any given individualcircadian time.1,2,4 To illustrate this point, we focused theanalysis of all BP values sampled between 10AM and 1PM,the usual timing of most scheduled visits of pregnant womento the obstetrician at Spanish hospitals, including our ownsetting. Results indicate the high degree of overlap betweenthe distributions of SBP and DBP values obtained fromhealthy and complicated pregnancies. During the first trimes-ter, there was a total overlap of 97% of all 1920 SBP valuessampled between 10AM and 1PM (98% overlap for DBP).Women who later developed gestational hypertension orpreeclampsia had at those times SBP values as low as75 mm Hg, with only 48 out of a total of 548 SBP valuesactually exceeding 140 mm Hg. During the second trimester,BP decreases for healthy pregnant women but not for thosewho develop gestational hypertension.12,13 The degree ofoverlap in SBP is of 97%; only 153 of the 1886 SBP valuesobtained from complicated pregnancies exceeded140 mm Hg. Results were almost similar during the thirdtrimester, when most of the pregnant women investigatedactually developed gestational hypertension or preeclampsia.In this last trimester of pregnancy, the overlap betweennormotensive and hypertensive pregnant women in casualvalues of SBP was 98%; only 288 of 2113 values sampledfrom pregnant women with gestational hypertension or pre-eclampsia exceeded 140 mm Hg. The use of these casualmeasurements for diagnostic purposes indicates a very poorsensitivity consistently,10%. These results are comparableto those reported previously from other studies based onconventional casual BP sampling.3–6 Specificity is, however,very high, because a very small number of BP samples
Hermida et al BP Variability in Pregnancy 153
by guest on March 27, 2014http://hyper.ahajournals.org/Downloaded from
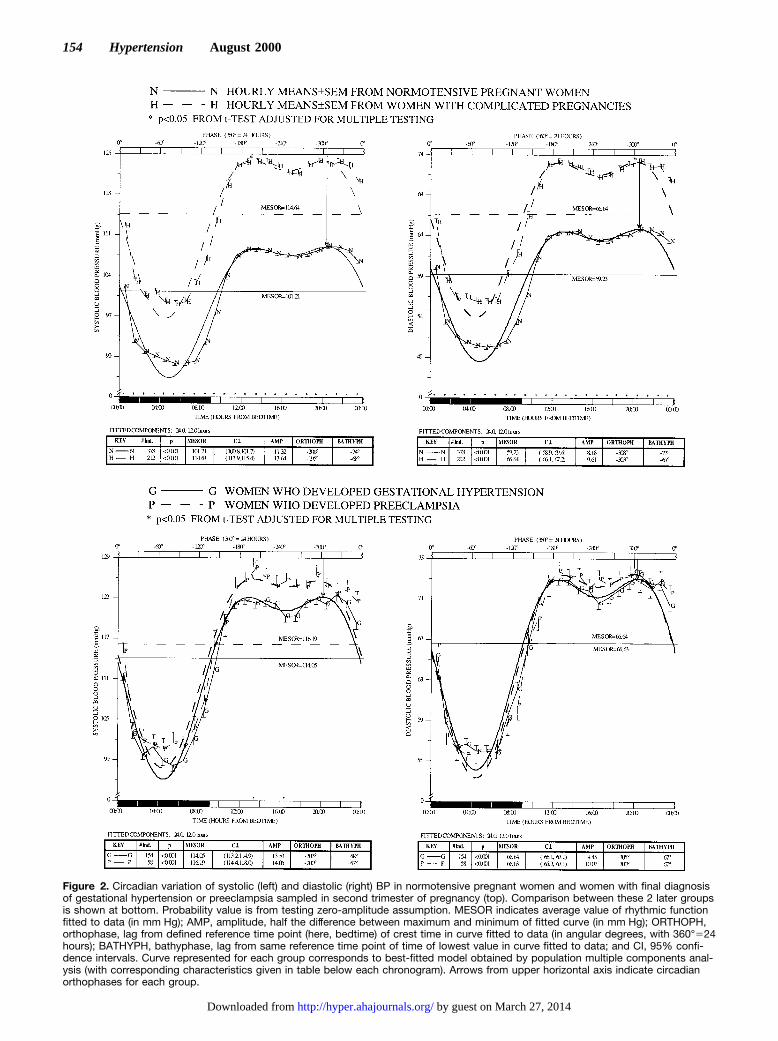
Figure 2. Circadian variation of systolic (left) and diastolic (right) BP in normotensive pregnant women and women with final diagnosisof gestational hypertension or preeclampsia sampled in second trimester of pregnancy (top). Comparison between these 2 later groupsis shown at bottom. Probability value is from testing zero-amplitude assumption. MESOR indicates average value of rhythmic functionfitted to data (in mm Hg); AMP, amplitude, half the difference between maximum and minimum of fitted curve (in mm Hg); ORTHOPH,orthophase, lag from defined reference time point (here, bedtime) of crest time in curve fitted to data (in angular degrees, with 360°524hours); BATHYPH, bathyphase, lag from same reference time point of time of lowest value in curve fitted to data; and CI, 95% confi-dence intervals. Curve represented for each group corresponds to best-fitted model obtained by population multiple components anal-ysis (with corresponding characteristics given in table below each chronogram). Arrows from upper horizontal axis indicate circadianorthophases for each group.
154 Hypertension August 2000
by guest on March 27, 2014http://hyper.ahajournals.org/Downloaded from
Figure 3. Circadian variation of systolic (left) and diastolic (right) blood pressure in normotensive pregnant women and women withfinal diagnosis of gestational hypertension or preeclampsia sampled in third trimester of pregnancy (top). Comparison between these 2later groups is shown at bottom. Probability value is from testing zero-amplitude assumption. MESOR indicates average value of rhyth-mic function fitted to data (in mm Hg); AMP, amplitude, half the difference between maximum and minimum of fitted curve (in mm Hg);ORTHOPH, orthophase, lag from defined reference time point (here, bedtime) of crest time in curve fitted to data (in angular degrees,with 360°524 hours); BATHYPH, bathyphase, lag from same reference time point of time of lowest value in curve fitted to data; and CI,95% confidence intervals. Curve represented for each group corresponds to best-fitted model obtained by population multiple compo-nents analysis (with corresponding characteristics given in table below each chronogram). Arrows from upper horizontal axis indicatecircadian orthophases for each group.
Hermida et al BP Variability in Pregnancy 155
by guest on March 27, 2014http://hyper.ahajournals.org/Downloaded from
actually exceeds the limit of 140/90 mm Hg for SBP/DBP,even in the third trimester.
DiscussionThe fit of multiple components that are statistically andbiologically significant accounts for nonsinusoidal wave-forms and provides parameters characterizing them. Whenthe data are nonsinusoidal, as in the case of BP, the least-squares fit of a cosine curve, frequently used before also inthe context of pregnancy,1,2,11 may be used for rhythmdetection, although this approach is not as powerful as thesimultaneous fit of all statistically significant components.24
The probability value obtained in testing the zero-amplitudeassumption in fitting a unique component by population-mean cosinor should thus be regarded as reflecting whetherthe data are better approximated by a cosine curve than by ahorizontal line. When more than 1 period is statisticallysignificant over the span of time investigated or when thewaveform is nonsinusoidal, the use of a population multiplecomponents analysis to fit a model consisting of severalcosine functions, preferably harmonics from 1 fundamentalperiod, to data sampled from several individuals is recom-mended.24 The use of multiple components analysis has beenlimited by the fact that the method was only applicable for theanalysis of longitudinal time series (data sampled from only1 individual). On the other hand, the advantages of usingrhythm parameters (MESOR and amplitude) compared withusual statistics (mean and range) when describing the patternof circadian BP variability have already been described.9,10
Since the data were obtained at an unequidistant samplingrate covering'2 cycles (48 hours), the MESOR provides abetter estimation of the true 24-hour mean than the average ofall BP values (usually overestimating the true mean as theresult of the denser sampling during activity). The MESORand the mean are only mathematically equal when the data areobtained at an equidistant sampling rate covering an integernumber of cycles, a situation far from real in most clinicalapplications. The double amplitude provides informationabout the extent of total predictable change in BP along the 24hours. Since the amplitude but not the range is computedfrom the best fitted curve to original values, it containsinformation about BP variability obtained from the wholedata series. The range, on the contrary, only reflects thedifference between the maximum and minimum single val-ues. These extreme values are too frequently associated tomeasurement errors or samples influenced by externalstimuli.10,27
Results from Figure 1 indicate a highly statistically signif-icant difference in the circadian variability of SBP and DBPbetween complicated and uncomplicated pregnant womensampled by ABPM during the first 14 weeks of gestation.These differences could not be demonstrated, however, byrelying on the casual BP measurements obtained at the timeof the first visit to the hospital (Table). The differences in BPduring the first trimester of pregnancy are statistically signif-icant at each and every hourly interval in which the 24-hourspan was divided for comparative analysis. These differencesare found several months before the actual clinical diagnosisof gestational hypertension was made (usually obtained well
advanced the third trimester of pregnancy). Moreover, thedifferences of about 12 mm Hg in the circadian MESOR ofSBP and of'7 mm Hg in DBP are found when both SBP andDBP for women with a later diagnosis of gestational hyper-tension or preeclampsia are well within the accepted normalphysiological range of BP variability.32 The circadianMESOR for the group of women with complicated pregnan-cies was 115.3/67.2 mm Hg for SBP/DBP; the hourly meanswere always,127/76 mm Hg for the same variables. Al-though women with a final diagnosis of gestational hyperten-sion or preeclampsia have higher weight at the time ofrecruitment than normotensive pregnant women (Table),maternal weight alone cannot explain the highly statisticallysignificant differences in BP found as early as in the firsttrimester of pregnancy among those 2 groups of women(Figure 1, top). On the one hand, for normotensive pregnantwomen, the correlation between the circadian MESOR of BPand maternal weight or body mass index, although significant(P50.008) is very small (correlation coefficientr50.132).On the other hand, weight increases linearly with gestationalage in all groups of pregnant women; as indicated before, BPis characterized, however, by predictable patterns of variationalong pregnancy markedly different for healthy and compli-cated pregnant women.12,13 Thus, although weight increases,for normotensive pregnant women, BP steadily decreases upto the middle of gestation, whereas for women with hyper-tensive complications in pregnancy, BP is stable during thefirst half of pregnancy.
As in the first trimester, the highly statistically significantdifferences between healthy and complicated pregnanciesdocumented in the second trimester (Figure 2), exceeding13 mm Hg in the circadian MESOR of SBP and 7 mm Hg inthe circadian MESOR of DBP, are found with BP values wellbelow 140/90 mm Hg even for the hypertensive women. Thedocumented differences in the circadian MESOR betweenhealthy pregnant women and pregnant women with compli-cations sampled during the third trimester are'16 mm Hgfor SBP and 9 mm Hg for DBP. The comparison of circadianBP variability between gestational hypertension and pre-eclampsia indicates, however, similar patterns for both SBPand DBP in the first trimester of pregnancy (bottom of Figure1). Differences are statistically significant in the secondtrimester for the circadian MESOR of SBP but not for DBP(bottom of Figure 2). A larger increase in BP with advancinggestational age during the second half of pregnancy charac-terizes preeclampsia as compared with gestational hyperten-sion. Differences in circadian MESOR are therefore statisti-cally significant for both SBP and DBP in the third trimester(bottom of Figure 3), which may be too late for a proper earlyidentification and further prophylactic intervention of pre-eclampsia as compared with gestational hypertension.
Figures 1 through 3 also show differences in circadianamplitude between healthy and complicated pregnancies inall trimesters of gestation. Figures 1 and 2 indicate that duringthe first and second trimesters of pregnancy, before theclinical diagnosis of disease for most women investigated, thecircadian amplitude of BP is statistically higher in compli-cated pregnancies, specially for the subgroup of women whodeveloped preeclampsia. An increase in circadian amplitude
156 Hypertension August 2000
by guest on March 27, 2014http://hyper.ahajournals.org/Downloaded from
of BP before the actual onset of hypertension (elevation incircadian MESOR) was also noted in several previous stud-ies.9 The circadian amplitude of BP is statistically higher inneonates with a family history of hypertension and cardio-vascular disease as compared with those without such histo-ry.33 By 14 years of age, correlations are found between thecircadian amplitude of DBP and target organ involvement,namely the thickness of the interventricular cardiac septumdetermined by M-mode echocardiography.34 Figure 3 indi-cates that in the third trimester of pregnancy, the difference incircadian amplitude of BP between the groups compared isstill statistically significant. For the pregnant women withcomplications, the amplitude decreases from the second to thethird trimester. This is mainly due to the reduced drop in BPby night (and therefore reduced circadian amplitude) withadvancing gestational age in the patients who developedpreeclampsia. The differences in amplitude between healthyand complicated pregnancies in this last trimester stand fromthe lack of reduction in amplitude for the women whodeveloped gestational hypertension but not preeclampsia(bottom graphs of Figures 1 through 3). A decrease in BPamplitude could then provide useful information in theidentification of those women with an elevated BP in preg-nancy that could also develop proteinuria, an issue that needsfurther investigation in larger groups of women studiedlongitudinally throughout gestation.
Results from this prospective study on pregnant womensystematically sampled by ABPM along gestation corrobo-rate earlier conclusions indicating that diagnosis of hyperten-sive complications in pregnancy cannot rely on casual BPmeasurements obtained at the physicians office.1–6 Moreover,despite the highly statistically significant differences in thecircadian MESOR of BP between healthy and complicatedpregnancies illustrated in Figures 1 through 3, results fromprevious retrospective2 and prospective studies35,36 indicatethat due to the large overlap in the distributions of thecircadian MESOR between these 2 groups of pregnantwomen, an individualized diagnosis cannot rely on just the24-hour mean of BP. These poor results from the use of a testbased on mean BP values have led many authors to extrap-olate erroneously that ABPM is not a valid approach inpregnancy.36
Other indexes obtained from the BP series have beenshown, however, to identify early in pregnancy those womenwho subsequently will develop gestational hypertension orpreeclampsia.37 The circadian pattern with large amplitudethat characterizes BP in healthy pregnancies, as indicated inFigures 1 through 3, suggests that the constant thresholdcurrently used for diagnosing hypertension in pregnancyshould be replaced by a time-specified reference limit reflect-ing the mostly predictable BP variability. This circadianpattern of BP also indicates that diagnosis should not bebased on average values, such as the daily, diurnal, ornocturnal means, which do not take into account most of thevariability in BP. Once the time-varying threshold, given forinstance by the upper limit of a tolerance interval,10 isavailable, the hyperbaric index, as a proper determinant of BPexcess,37 can be calculated as the total area of any givenpatient’s BP above the threshold. This so-called tolerance-
hyperbaric test has been shown prospectively to provide highsensitivity and specificity for the very early identification ofsubsequent hypertensive complications in pregnancy. For thewomen investigated in this study, sensitivity of the tolerance-hyperbaric test was 94% for women sampled during the firsttrimester of gestation and increased up to 99% in the thirdtrimester. The positive and negative predictive values were.97% in all trimesters. The relative risk was 44 in the firsttrimester and increased 5-fold in the third trimester ofpregnancy. However, results from the use of this test did notprovide information on an individualized diagnosis of pre-eclampsia as compared with gestational hypertension only.Along these lines, the differing changes in the circadianpattern of BP with advancing gestational age in normalpregnancy, gestational hypertension, and preeclampsia dem-onstrated offer new end points for the design and futureprospective evaluation of a test for the early diagnosis ofpreeclampsia based on information obtained from ABPM,which could also be used as a guide for establishing preven-tive interventions.38,39
AcknowledgmentsThis research was supported in part by grants from Xunta de Galicia(XUGA-32202B97 and PGICT99-PXI-32202B); Direccion Generalde Ensenanza Superior e Investigacion Cientıfica, DGES (PM98-0106); and Vicerrectorado de Investigacion, University of Vigo.
References1. Ayala DE, Hermida RC, Mojon A, Fernandez JR, Iglesias M. Circadian
blood pressure variability in healthy and complicated pregnancies.Hyper-tension. 1997;30:603–610.
2. Hermida RC, Ayala DE, Mojon A, Iglesias M. High sensitivity test for theearly diagnosis of gestational hypertension and preeclampsia, II: circadianblood pressure variability in healthy and hypertensive pregnant women.JPerinat Med. 1997;25:153–167.
3. Moutquin JM, Rainville C, Giroux L, Raynauld P, Amyot G, Bilodeau R,Pelland N. A prospective study of blood pressure in pregnancy: predictionof preeclampsia.Am J Obstet Gynecol. 1985;151:191–196.
4. O’Brien WF. Predicting pre-eclampsia.Obstet Gynecol.1990;75:445–452.
5. Reiss RE, O’Shaughnessy RW, Quilligan TJ, Zuspan FP. Retrospectivecomparison of blood pressure course during preeclamptic and matchedcontrol pregnancies.Am J Obstet Gynecol. 1987;156:894–898.
6. Villar MA, Sibai BM. Clinical significance of elevated mean arterialblood pressure in second trimester and threshold increase in systolic ordiastolic blood pressure during the third trimester.Am J Obstet Gynecol.1989;160:419–423.
7. Halligan A, Shennan A, Thurston H, de Swiet M, Taylor D. Ambulatoryblood pressure measurement in pregnancy: the current state of the art.Hypertens Preg. 1995;14:1–16.
8. Shennan A, Halligan A. Ambulatory blood pressure monitoring inpregnancy.Fetal Maternal Med Rev. 1998;10:69–89.
9. Cornelissen G, Haus E, Halberg F. Chronobiologic blood pressureassessment from womb to tomb. In: Touitou Y, Haus E, eds.BiologicRhythms in Clinical and Laboratory Medicine.Berlin, Germany: Spring-er-Verlag; 1992:428–452.
10. Hermida RC, Fernandez JR. Computation of time-specified toleranceintervals for ambulatorily monitored blood pressure.Biomed InstrumTechnol. 1996;30:257–266.
11. Benedetto C, Zonca M, Marozio L, Dolco C, Carandente F, Massobrio M.Blood pressure patterns in normal pregnancy and in pregnancy-inducedhypertension, preeclampsia, and chronic hypertension.Obstet Gynecol.1996;88:503–510.
12. Ayala DE, Hermida RC, Mojon A, Fernandez JR, Silva I, Ucieda R,Iglesias M. Blood pressure variability during gestation in healthy andcomplicated pregnancies.Hypertension. 1997;30:611–618.
13. Hermida RC, Ayala DE, Mojon A, Fernandez JR, Silva I, Ucieda R,Iglesias M. High sensitivity test for the early diagnosis of gestational
Hermida et al BP Variability in Pregnancy 157
by guest on March 27, 2014http://hyper.ahajournals.org/Downloaded from
hypertension and preeclampsia, I: predictable variability of cardiovascu-lar characteristics during gestation in healthy and hypertensive pregnantwomen.J Perinat Med. 1997;25:101–109.
14. Miyamoto S, Shimokawa H, Sumioki H, Touno A, Nakano H. Circadianrhythm of plasma atrial natriuretic peptide, aldosterone, and bloodpressure during the third trimester in normal and preeclamptic pregnancy.Am J Obstet Gynecol. 1988;158:393–399.
15. Staessen J, Bulpitt CJ, O’Brien E, Cox J, Fagard R, Stanton A, Thijs L,Van Hulle S, Vyncke G, Amery A. The diurnal blood pressure profile: apopulation study.Am J Hypertens. 1992;5:386–392.
16. Contard S, Chanudet X, Coisne D, Battistella P, Marichal JF, Pitiot M,Gaudemaris R, Ribstein J. Ambulatory monitoring of blood pressure innormal pregnancy.Am J Hypertens. 1993;6:880–884.
17. Cugini P, Di Palma L, Battisti P, Leone G, Pachi A, Paesano R, MasellaC, Stirati G, Pierucci A, Rocca AR, Morabito S. Describing and inter-preting 24-hour blood pressure patterns in physiologic pregnancy.Am JObstet Gynecol. 1992;166:54–60.
18. Ferrazzani S, Caruso A, De Carolis S, Pometti A, Tocci A, Mancinelli S,Halberg F, Cornelissen G. Blood pressure monitoring over 24 hours inpregnancy. In: Romanini C, Garzetti GG, Tranquilli AL, Valensise H,eds.Experimental Models in Obstetrics and Gynecology.Carnforth, Lan-cashire, UK: The Parthenon Publishing Group; 1991:113–119.
19. Halligan A, O’Brien E, O’Malley K, Mee F, Atkins N, Conroy R, WalsheJJ, Darling M. Twenty-four-hour ambulatory blood pressure mea-surement in a primigravid population.J Hypertens. 1993;11:869–873.
20. Kyle PM, Clark SJ, Buckley D, Kissane J, Coats AJS, De Swiet M,Redman CWG. Second trimester ambulatory blood pressure in nul-liparous pregnancy: a useful screening test for pre-eclampsia?Br J ObstetGynaecol. 1993;100:914–919.
21. Margulies M, Zin C, Margulies ND, Voto LS. Noninvasive ambulatoryblood pressure control in normotensive pregnant women.Am JHypertens. 1989;2:924–926.
22. Beilin LJ, Deacon J, Michael CA, Vandongen R, Lalor CM, Barden AE,Davidson L. Circadian rhythms of blood pressure and pressor hormonesin normal and hypertensive pregnancy.Clin Exp Pharmacol Physiol.1982;9:321–326.
23. Redman C, Beilin LJ, Bonnar J. Reversed diurnal blood pressure rhythmin hypertensive pregnancies.Clin Sci Mol Med. 1976;51:687s–689s.
24. Fernandez JR, Hermida RC. Inferential statistical method for analysis ofnonsinusoidal hybrid time series with unequidistant observations.Chro-nobiol Int. 1998;15:191–204.
25. Association for the Advancement of Medical Instrumentation. AmericanNational Standard for Electronic or Automated Sphygmomanometers.Washington DC: AAMI; 1987.
26. White WB, Lund-Johansen P, McCabe EJ. Clinical evaluation of theColin ABPM 630 at rest and during exercise: an ambulatory blood
pressure monitor with gas-powered cuff inflation.J Hypertens. 1989;7:477–483.
27. Cornelissen G. Instrumentation and data analysis methods needed forblood pressure monitoring in chronobiology. In: Scheving LE, Halberg F,Ehret CF, eds.Chronobiotechnology and Chronobiological Engineering.Dordrecht, The Netherlands: Martinus Nijhoff; 1987:241–261.
28. Staessen J, Fagard R, Lijnen P, Thijs L, Vaa Hoof R, Amery A. Ambu-latory blood pressure monitoring in clinical trials.J Hypertens. 1991;9(suppl 1):s13–s19.
29. Mojon A, Fernandez JR, Hermida RC. Chronolab. An interactivesoftware package for chronobiologic time series analysis written for theMacintosh computer. Chronobiol Int. 1992;9:403–412.
30. Fernandez JR. Nonparametric method for comparison of parameters fromrhythmometric models with multiple components.Biol Rhythm Res.1995;26:387. Abstract.
31. Hermida RC, Ayala DE, Mojon A, Fernandez JR, Alonso I, Silva I,Ucieda R, Codesido J, Iglesias M. Influence of parity and age in thecircadian variability of blood pressure in clinically healthy pregnantwomen.Chronobiol Int. 1999;16(suppl 1):49. Abstract.
32. Guidelines for study of mild hypertension.Bull WHO. 1986;64:31–35.33. Hermida RC, Ayala DE, Fernandez JR, Fraga JM. Hardware-software
approach for neonatal cardiovascular risk estimation.Biomed InstrumTechnol. 1994;28:43–51.
34. Croppi E, Livi R, Scarpelli L, Romano S, de Leonardis V, Cagnoni M,Scarpelli PT. Chronobiologically assessed blood pressure (BP) and leftventricular wall thickness in children with and without a family history ofhigh blood pressure. In: Tarquini B, Vergassola R, eds.Social Diseasesand Chonobiology.Bologna, Italy: Esculapio; 1986:55–56.
35. Hermida RC, Ayala DE. Diagnosing gestational hypertension and pre-eclampsia with the 24-hour mean of blood pressure.Hypertension. 1997;30:1531–1537.
36. Higgins JR, Walshe JJ, Halligan A, O’Brien E, Conroy R, Darling MRN.Can 24-hour ambulatory blood pressure measurement predict the devel-opment of hypertension in primigravidae?Br J Obstet Gynaecol. 1997;104:356–362.
37. Hermida RC, Ayala DE, Mojon A, Fernandez JR, Silva I, Ucieda R,Iglesias M. Blood pressure excess for the early identification of gesta-tional hypertension and preeclampsia.Hypertension. 1998;31:83–88.
38. Hermida RC, Ayala DE, Iglesias M, Mojon A, Silva I, Ucieda R,Fernandez JR. Time-dependent effects of low-dose aspirin administrationon blood pressure in pregnant women.Hypertension. 1997;30:589–595.
39. Hermida RC, Ayala DE, Fernandez JR, Mojon A, Alonso I, Silva I,Ucieda R, Codesido J, Iglesias M. Administration time-dependent effectsof aspirin in women at differing risk for preeclampsia.Hypertension.1999;34:1016–1023.
158 Hypertension August 2000
by guest on March 27, 2014http://hyper.ahajournals.org/Downloaded from