birhanu kenate malaria urveillance ataanlaysis
TRANSCRIPT
Malaria Surveillance Data Analysis
West shoa Zone, Oromia Region, from 2008 to
2012
Addis Ababa University
College of Health Science
School Of Public Health
Ethiopian Field Epidemiology Training Program
By
Birhanu kenate Sori
EFETP Resident -Cohort 4
Oromia Health Bureau Field Base
February, 2013
Addis Ababa, Ethiopia
List of Tables.................................................2List of Figures................................................3Abbreviations and Acronyms.....................................4Acknowledgement................................................5Abstract.......................................................61. Introduction................................................72 .Objectives...................................................92.1 Genera Objectives..........................................................92.2 Specific Objectives........................................................9
Figure1a: Map of West shoa Zone...............................103 .Materials and Method.......................................103.1 Study Area................................................................103.2 Study period:...........................................................11
3.2 Case Definition:..........................................................113.3 Study design and Data Collection Procedure................................11
3.4 Data processing and analysis technique:...................................123.5 Data dissemination:.......................................................12
3.6 Ethical consideration.....................................................12
4. Result:....................................................125. Discussion.................................................335.1. Limitations..............................................................34
5.2. Conclusion...............................................................345.3 . Recommendations.........................................................34
6 References:................................................35
[Type text] Page 1
List of Tables
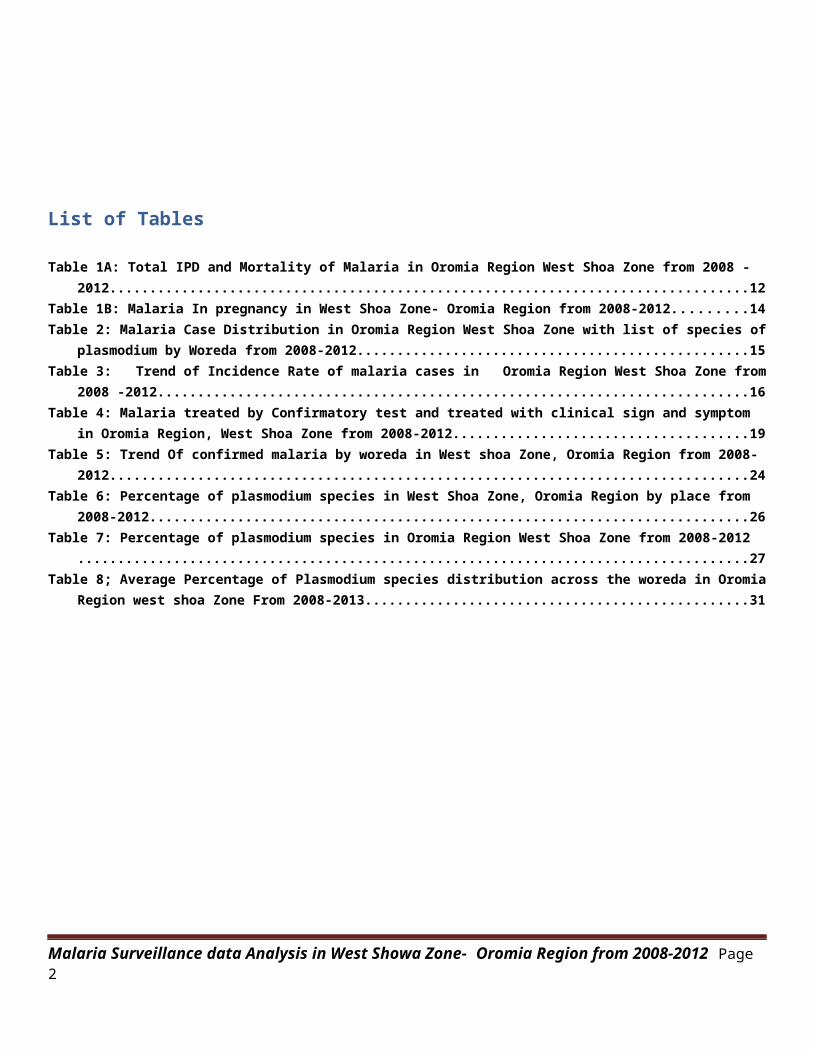
Table 1A: Total IPD and Mortality of Malaria in Oromia Region West Shoa Zone from 2008 -2012................................................................................12
Table 1B: Malaria In pregnancy in West Shoa Zone- Oromia Region from 2008-2012.........14Table 2: Malaria Case Distribution in Oromia Region West Shoa Zone with list of species of
plasmodium by Woreda from 2008-2012.................................................15Table 3: Trend of Incidence Rate of malaria cases in Oromia Region West Shoa Zone from
2008 -2012..........................................................................16Table 4: Malaria treated by Confirmatory test and treated with clinical sign and symptom
in Oromia Region, West Shoa Zone from 2008-2012.....................................19Table 5: Trend Of confirmed malaria by woreda in West shoa Zone, Oromia Region from 2008-
2012................................................................................24Table 6: Percentage of plasmodium species in West Shoa Zone, Oromia Region by place from
2008-2012...........................................................................26Table 7: Percentage of plasmodium species in Oromia Region West Shoa Zone from 2008-2012
....................................................................................27Table 8; Average Percentage of Plasmodium species distribution across the woreda in Oromia
Region west shoa Zone From 2008-2013................................................31
Malaria Surveillance data Analysis in West Showa Zone- Oromia Region from 2008-2012 Page2
List of Figures
Figure 1: Malaria trend in Oromia Region in West shoa Zone from 2005-2012..............13
Figure 1a: IPD and Death rates of malaria cases in Oromia Region West Shoa Zone from 2008-
2012................................................................................13
Figure 2: The total Malaria incidence and confirmed Rate in the West Shoa Zone from 2008
to 2012.............................................................................17
Figure 3: Malaria slide positivity rate of West Shoa Zone - Oromia Region from 2008-2012
....................................................................................18
Figure 4: Trend of Confirmed malaria cases in Oromia Region West Shoa Zone from 2008-2012
....................................................................................20
Figure 5: Trend of Confirmed malaria cases and Expect threshold in Oromia Region West Shoa
Zone from 2008-2012.................................................................21
Figure 6: percentage of malaria cases treated typically by Sign and symptoms and By
Laboratory Investigation in West Shoa Zone, Oromia Region from 2008-2012............22
Figure 7: Confirmed malaria cases by sex in Oromia Region, West Shoa Zone from 2008-2012
....................................................................................23
Figure 8: Trend Of malaria by place in West shoa Zone, Oromia Region From 2008-2012... .25
Figure 9: Malaria cases compared to the Months Over the past five years in the West Shoa
Zone from 2008-2012.................................................................29
Figure 10: Average Percentage of Plasmodium distribution across the woreda in Oromia
Region west shoa Zone From 2008-2012................................................31
Malaria Surveillance data Analysis in West Showa Zone- Oromia Region from 2008-2012 Page3
Figure 11: Malaria cases Distribution by age in Oromia Region, West Shoa Zone from 2008-
2012................................................................................32
Abbreviations and Acronyms
Malaria Surveillance data Analysis in West Showa Zone- Oromia Region from 2008-2012 Page4
AcknowledgementI would like to thank all facilitators from AAU for their dedicated and
unreserved support for the accomplishment of the surveillance data analysis
, at the same time my heartfelt thanks goes to Oromia Health Bureau for
good coordination and facilitation to the end of this work.
Malaria Surveillance data Analysis in West Showa Zone- Oromia Region from 2008-2012 Page5
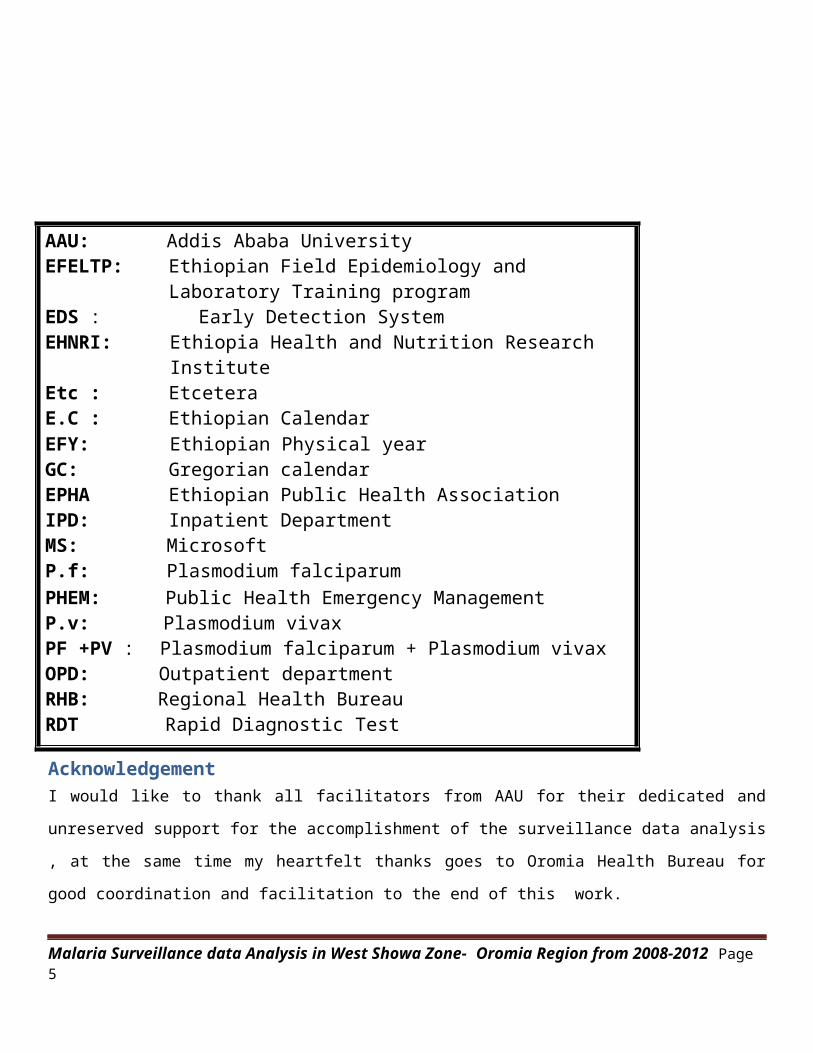
AAU: Addis Ababa UniversityEFELTP: Ethiopian Field Epidemiology and
Laboratory Training programEDS : Early Detection SystemEHNRI: Ethiopia Health and Nutrition Research
InstituteEtc : EtceteraE.C : Ethiopian CalendarEFY: Ethiopian Physical yearGC: Gregorian calendarEPHA Ethiopian Public Health Association IPD: Inpatient DepartmentMS: MicrosoftP.f: Plasmodium falciparumPHEM: Public Health Emergency ManagementP.v: Plasmodium vivaxPF +PV : Plasmodium falciparum + Plasmodium vivaxOPD: Outpatient departmentRHB: Regional Health BureauRDT Rapid Diagnostic Test
I would also like to extend my gratitude to Academic coordinators and
advisors for provide me support and constructive suggestion during the
preparation of this output. Last but not least, I would like to thank EPHA,
West shoa Zonal Health Department and others for giving me essential
information.
Authors: 1Birhanu K. Sori , 2Tesfaye G. Ideti. 3Dr. Daddi .Jima.
Malaria Surveillance data Analysis in West Showa Zone- Oromia Region from 2008-2012 Page6
Address: 1Addis Ababa University School of Public health Fourth cohortEthiopian Field Epidemiology Training program Residents
2Oromia
Health Bureau PHEM core process Owner, 3 Ethiopian Health and Nutrition Research Institute Deputy Director and program coordinator.
Email: 1Birhanu [email protected], 2Tesfaye G. Ideti [email protected], 3Dr. Daddi .Jima- [email protected]
Title: Malaria Surveillance Data Analysis in West shoa Zone, Oromia Region,
Addis Ababa, Ethiopia, from 2008 to 2012
AbstractBackground: More than a million people die of malaria disease each yearin the world, most of them in Africa. I conducted a descriptive malaria
surveillance data analysis in west shoa zone and proposed recommendations
useful for malaria control and Prevention activities.
Methods: Data on malaria indicators were collected from the Integrated Disease Surveillance and Response system database and Public Health
Emergency Management core process from 2008 to 2012 . Reporting units
were standardized over time with 2007 census populations. The data was
analyzed to indicate the trend of malaria Morbidity and Mortality rate in
the Zone
Results: The total average annual malaria incidence rate for the
calendar years 2008 to 2012 was 63 per 1000 , and the Incidence rate
of confirmed malaria cases for the same period accounts for 24 per 1000
population . The Average Reported malaria in-patient admissions and death
rates in this zone during the same period were 7 per 100,000 and 1 per
Malaria Surveillance data Analysis in West Showa Zone- Oromia Region from 2008-2012 Page7
100,000 per year respectively. Although the average malaria incidence rate
among men's and women's were (55%) and (45%) respectively. The data also
showed cases treated clinically decreased from 88% in 2008 to 24 % in 2012.
Conclusion: Malaria continued to be a major cause of ill-health in westshoa zone. Even though different malaria control strategies were designed
to rollback to its minimum level, the malaria cases were not decreased
as expected that the incidence rate of total malaria and confirmed
malaria cases would be not only high but rising from 2008 through 2011
and showed slight decline to 2012. Therefore, the zonal health
department should evaluate again their weakness and strength the reason why
the malaria incidence rate was elevated through 2008-2011, unless
otherwise this will be a threat for the community in the coming year.
1. IntroductionMalaria still remains one of the most important parasitic diseases of the
developing world although it is known to human kind since ancient times in
different forms. It is caused by Plasmodium malaria parasite and kills
approximately 1-3 million people and causes disease in 300- 500 million
people annually. Pregnant women are the main adult risk group in most
endemic areas of the world [1-3]. The disease poses a major public health
challenge, which restricts the development in the poorest countries [3].
In low-transmission areas when there is appreciable heterogeneity in the
distribution of malaria, it becomes increasingly important to identify the
population groups most susceptible to infection and to target resources
appropriately. When the case incidence is reduced sufficiently, health
facilities can begin to report details of individual malaria cases toMalaria Surveillance data Analysis in West Showa Zone- Oromia Region from 2008-2012 Page8
district level. These reports can be used to construct a case register that
provides more detailed information on the principal locations and
population groups affected by malaria...
Ethiopia is among the few countries with unstable malaria transmission.
Consequently, malaria epidemics are serious public health emergencies. In
most situations, malaria epidemics develop over several weeks, allowing
some lead-time to act proactively to avoid larger numbers of illnesses and
to prevent transmission. Approximately over 58 million people (68%) live
malaria-endemic areas in Ethiopia, chiefly at altitudes below 2,000 meters.
Malaria is mainly seasonal in the highland fringe areas and of relatively
longer transmission duration in lowland areas, river basins and valleys.
Although historically there have been an estimated 10 million clinical
malaria cases annually, cases have reduced since 2006. Malaria is a public
health priority problems and also have high Epidemic potential which causes
high Outpatient morbidity which leads to high socio economic impacts in
Ethiopia.[4- 6 ,7 ].
The main malaria parasites are Plasmodium falciparum and Plasmodium vivax,
accounting for 60% and 40% of all cases, respectively. Anopheles arabiensis
is the main vector; Anopheles pharoensis is also widely distributed in the
country and is considered to play a secondary role in malaria transmission.
[4, 5, 8].
Information on the number and distribution of malaria cases and deaths is
critical for the design and implementation of malaria control program. It
is needed to determine which areas or population groups are most affected
by malaria, so that resources can be targeted to the populations most in
Malaria Surveillance data Analysis in West Showa Zone- Oromia Region from 2008-2012 Page9
need. Information on the incidence of disease in relation to past levels is
needed to alert program about epidemics, so that control measures can be
intensified. Data on changes in disease incidence and mortality are also
needed in order to judge the success of a program and to determine whether
it is performing as expected or whether adjustments in the scale or blend
of interventions are required. The capacity of malaria surveillance systems
to provide information on the distribution and trends in malaria varies
widely across the globe. Surveillance systems can help program managers to do this, by providing
information on the populations in which the incidence of malaria is highest
(and therefore to whom resources should be targeted) and on changes in
incidence over time that require attention.
The main source of information for malaria surveillance in the control
phase is reports of confirmed malaria cases, malaria inpatients and malaria
deaths obtained from all or selected public sector health facilities. These
may be complemented by data from household surveys on the prevalence of
parasitaemia and intervention coverage. In high- and moderate-transmission
areas, monthly counts of malaria cases, inpatients and deaths can be used
to determine trends over time and the geographical distribution of malaria.
At health facility level, data on individual patients are used to
investigate the circumstances surrounding each admitted case and death, so
as to identify program weaknesses and potential improvements. As
transmission is reduced and the risk of epidemics increases, more frequent
analysis of cases is undertaken at health facility level to allow early
Malaria Surveillance data Analysis in West Showa Zone- Oromia Region from 2008-2012 Page10
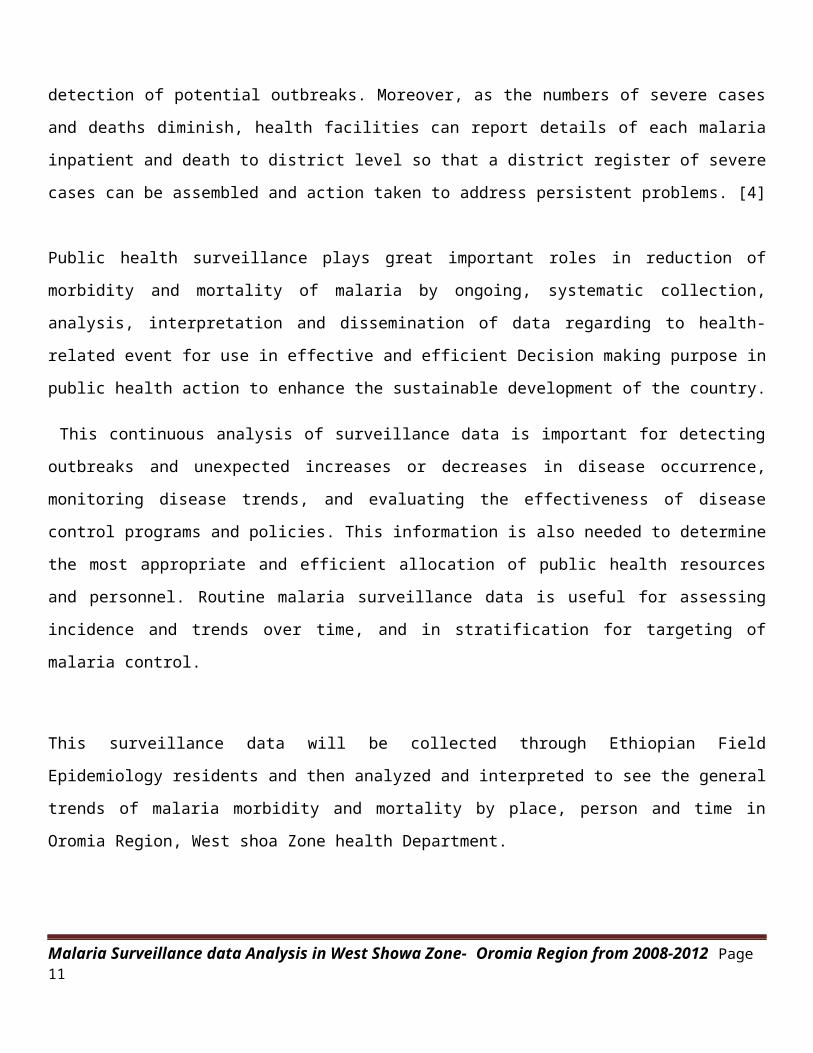
detection of potential outbreaks. Moreover, as the numbers of severe cases
and deaths diminish, health facilities can report details of each malaria
inpatient and death to district level so that a district register of severe
cases can be assembled and action taken to address persistent problems. [4]
Public health surveillance plays great important roles in reduction of
morbidity and mortality of malaria by ongoing, systematic collection,
analysis, interpretation and dissemination of data regarding to health-
related event for use in effective and efficient Decision making purpose in
public health action to enhance the sustainable development of the country.
This continuous analysis of surveillance data is important for detecting
outbreaks and unexpected increases or decreases in disease occurrence,
monitoring disease trends, and evaluating the effectiveness of disease
control programs and policies. This information is also needed to determine
the most appropriate and efficient allocation of public health resources
and personnel. Routine malaria surveillance data is useful for assessing
incidence and trends over time, and in stratification for targeting of
malaria control.
This surveillance data will be collected through Ethiopian Field
Epidemiology residents and then analyzed and interpreted to see the general
trends of malaria morbidity and mortality by place, person and time in
Oromia Region, West shoa Zone health Department.
Malaria Surveillance data Analysis in West Showa Zone- Oromia Region from 2008-2012 Page11
2 .Objectives
2.1 Genera Objectives The main objective of this project is to assess malaria morbidity and
mortality in West shoa Zone, Oromia region.
2.2 Specific Objectives To establish malaria trend in the zone from 2008-2012.
To describe the data by place, person and time in west shoa zone from
2008-2012.
To anticipate recommendations linked to action in the zone
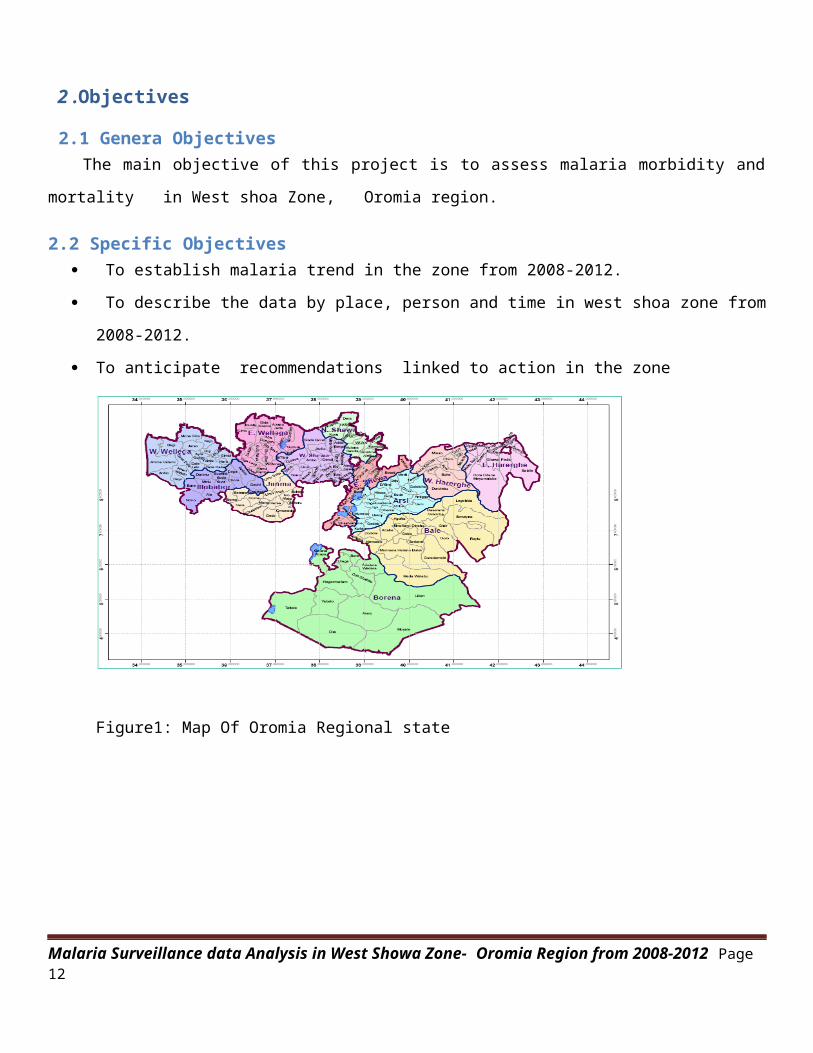
Figure1: Map Of Oromia Regional state
Malaria Surveillance data Analysis in West Showa Zone- Oromia Region from 2008-2012 Page12
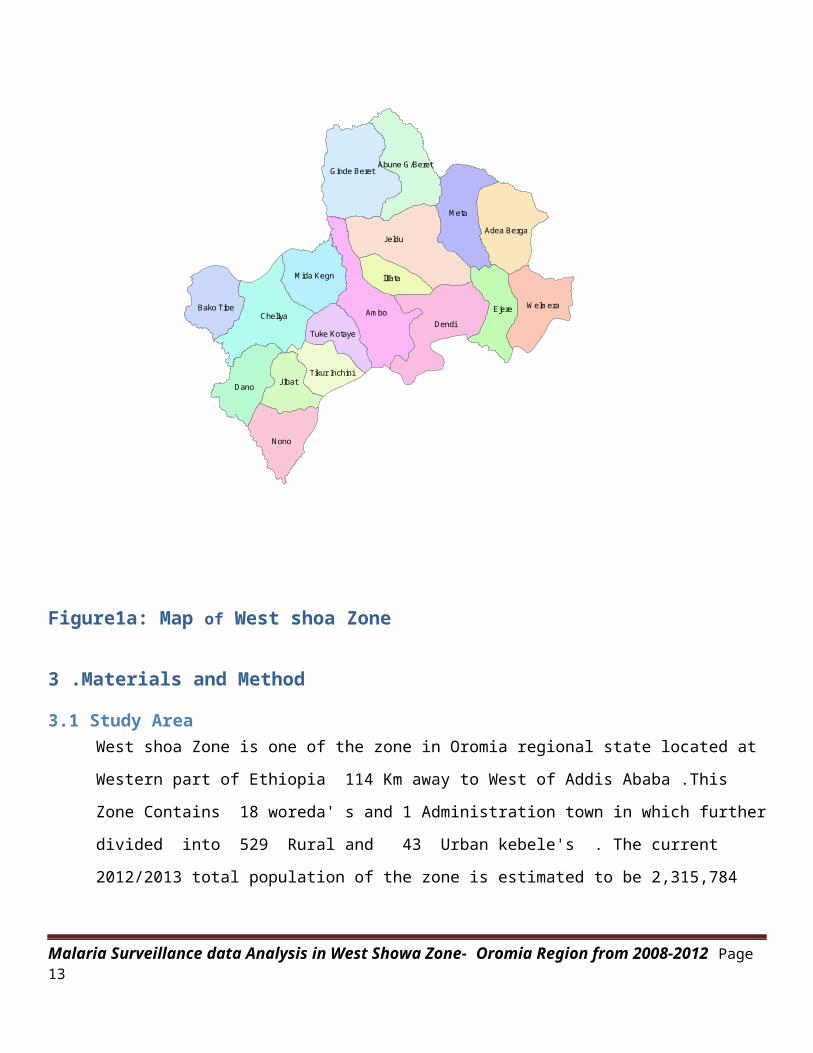
Figure1a: Map of West shoa Zone
3 .Materials and Method
3.1 Study AreaWest shoa Zone is one of the zone in Oromia regional state located at
Western part of Ethiopia 114 Km away to West of Addis Ababa .This
Zone Contains 18 woreda' s and 1 Administration town in which further
divided into 529 Rural and 43 Urban kebele's . The current
2012/2013 total population of the zone is estimated to be 2,315,784
Malaria Surveillance data Analysis in West Showa Zone- Oromia Region from 2008-2012 Page13
Jeldu
Am boDendi
M eta
Cheliya
Nono
Dano
Ejere
Ginde Beret
JIbat
W elm era
Ilfata
Adea Berga
M ida Kegn
Bako Tibe
Tikur Inchini
Abune G /Beret
Tuke Kotaye
having land area of 14,921.19 km2 with population density of 155 per
KM2.
3.2 Study period: Malaria five years data from 2008 to 2012 were Collected, Organized,
analyzed and interpreted accordingly Using Microsoft excels 2007.
3.2 Case Definition: Suspected Case Definition:
Any person with fever or fever with headache, rigor, back pain, chills,
sweats, Myalgias, nausea, and vomiting diagnosed clinically as malaria. [8]
Confirmed Case Definition:
A suspected case confirmed by microscopy or RDT for plasmodium parasites.
[8]
Presumed malaria (clinical malaria):
Suspected malaria case without a diagnostic test to confirm malaria but
nevertheless treated presumptively as malaria. [2]
Total Malaria Outpatient -it is the total malaria (either clinical or byconfirmation)
3.3 Study design and Data Collection Procedure
Malaria Surveillance data Analysis in West Showa Zone- Oromia Region from 2008-2012 Page14
Descriptive retrospective cross sectional study design were used to assess
data from PHEM reporting format which includes malaria items
encompassing total malaria cases (clinical and confirmed) for out-patients,
in-patients and deaths; confirmed out-patient malaria cases by species;
in-patient cases and deaths for malaria; and out-patients, in-patients and
deaths for malaria in pregnancy. All are given by age group <5 years and >
5 years except malaria in pregnancy indicators which only apply to women of
childbearing age. Incidence estimates for summary malaria indicators by
year and month were obtained by summing the appropriate indicator over the
time period in question using the relevant population denominator
(population at malaria's area) for each reporting unit.
3.4 Data processing and analysis technique:
Microsoft Excel 2007 was used and all eligible key indicators were entered
manually and finally data were organized, analyzed and displayed in
different Figures.
3.5 Data dissemination: Written report (both hard and soft copies) was prepared and shared to Addis
Ababa University/School of Public Health Ethiopia Field Epidemiology
Training Program Resident advisors and coordinators , Oromia Regional
Health Bureau, and finally to West shoa Zone Health department .
Malaria Surveillance data Analysis in West Showa Zone- Oromia Region from 2008-2012 Page15
3.6 Ethical considerationThis five year data were collected after having written consent letter from
Oromia Regional Health Bureau to zone to get ethical clearance. After
discussing the purpose and method of the study, permission was sought from
the West Shoa Zonal health department head before the data collection.
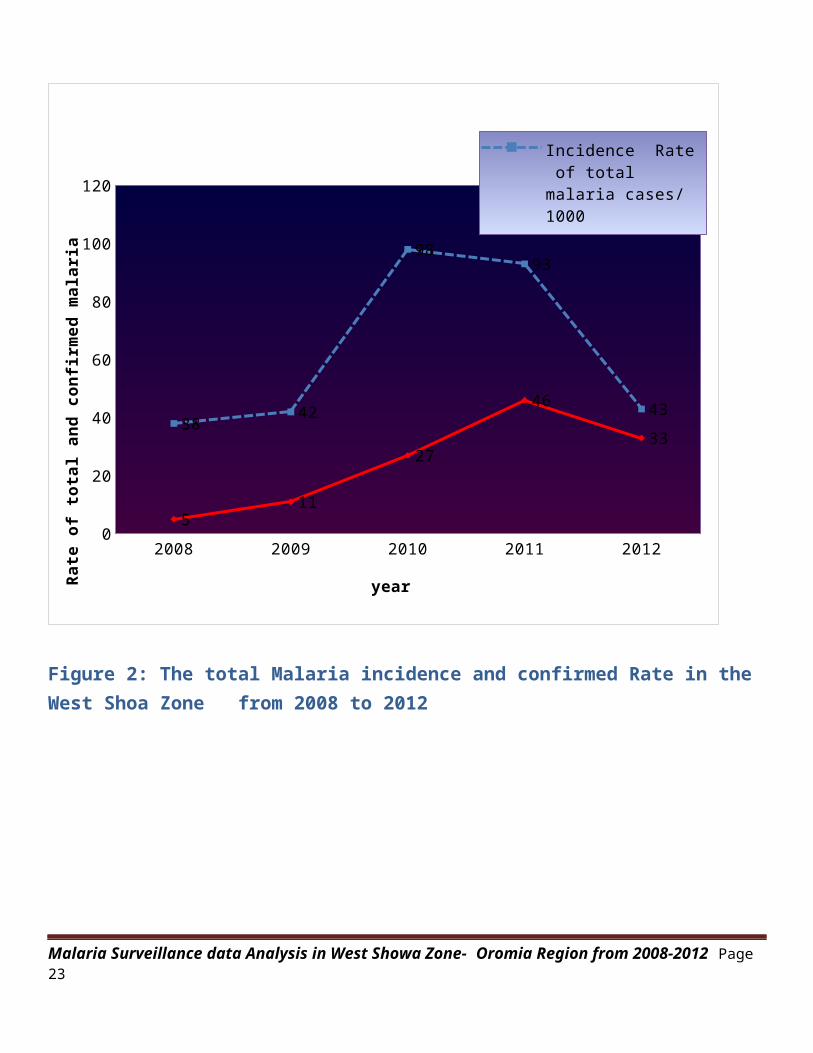
4. Result:The total malaria outpatient during 2008 was 38/1000 which was then raised
to reach its maximum point in 2011 which was 98/1000. However, this was
then decreased by half in the year 2012 and reaches 43/1000 in malaria
population. In West shoa Zone the total Average annual malaria
Incidence rate for the calendar years 2008 to the fourth quarter of 2012
was 63 per 1000 , and the Incidence Rate of confirmed malaria cases for
the same period accounts for 24 cases per 1000 population . The Average
Reported malaria in-patient admissions and deaths in this zone were 7 per
100,000 and 1 per 100,000 per year respectively.
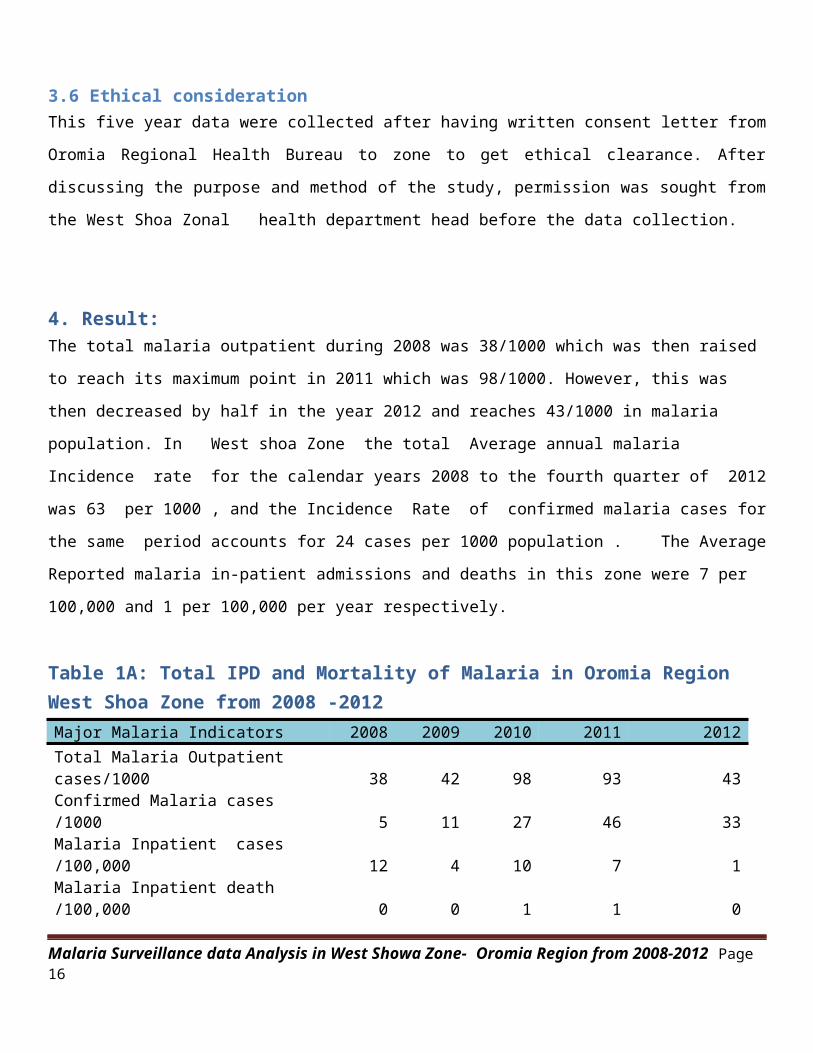
Table 1A: Total IPD and Mortality of Malaria in Oromia Region West Shoa Zone from 2008 -2012Major Malaria Indicators 2008 2009 2010 2011 2012Total Malaria Outpatient cases/1000 38 42 98 93 43Confirmed Malaria cases /1000 5 11 27 46 33Malaria Inpatient cases /100,000 12 4 10 7 1Malaria Inpatient death /100,000 0 0 1 1 0
Malaria Surveillance data Analysis in West Showa Zone- Oromia Region from 2008-2012 Page16
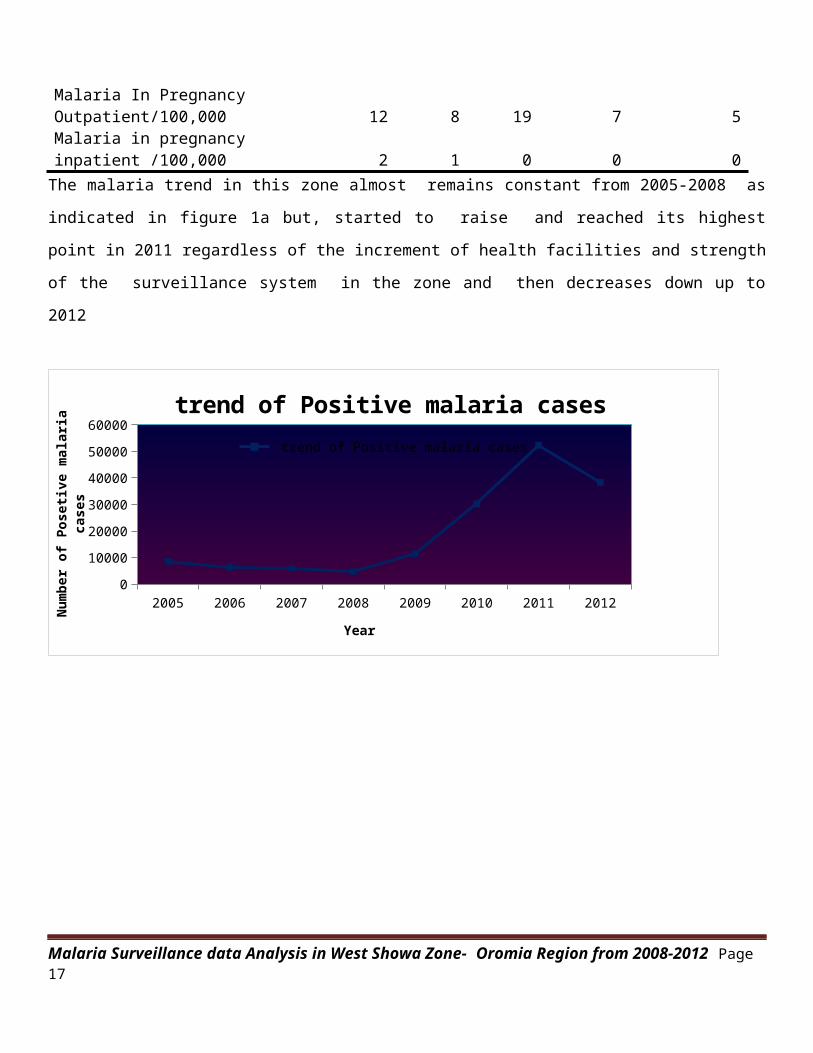
Malaria In Pregnancy Outpatient/100,000 12 8 19 7 5Malaria in pregnancy inpatient /100,000 2 1 0 0 0The malaria trend in this zone almost remains constant from 2005-2008 as
indicated in figure 1a but, started to raise and reached its highest
point in 2011 regardless of the increment of health facilities and strength
of the surveillance system in the zone and then decreases down up to
2012
2005 2006 2007 2008 2009 2010 2011 20120
100002000030000400005000060000
trend of Positive malaria cases trend of Positive malaria cases
Year
Numb
er o
f Po
seti
ve m
alaria
ca
ses
Malaria Surveillance data Analysis in West Showa Zone- Oromia Region from 2008-2012 Page17
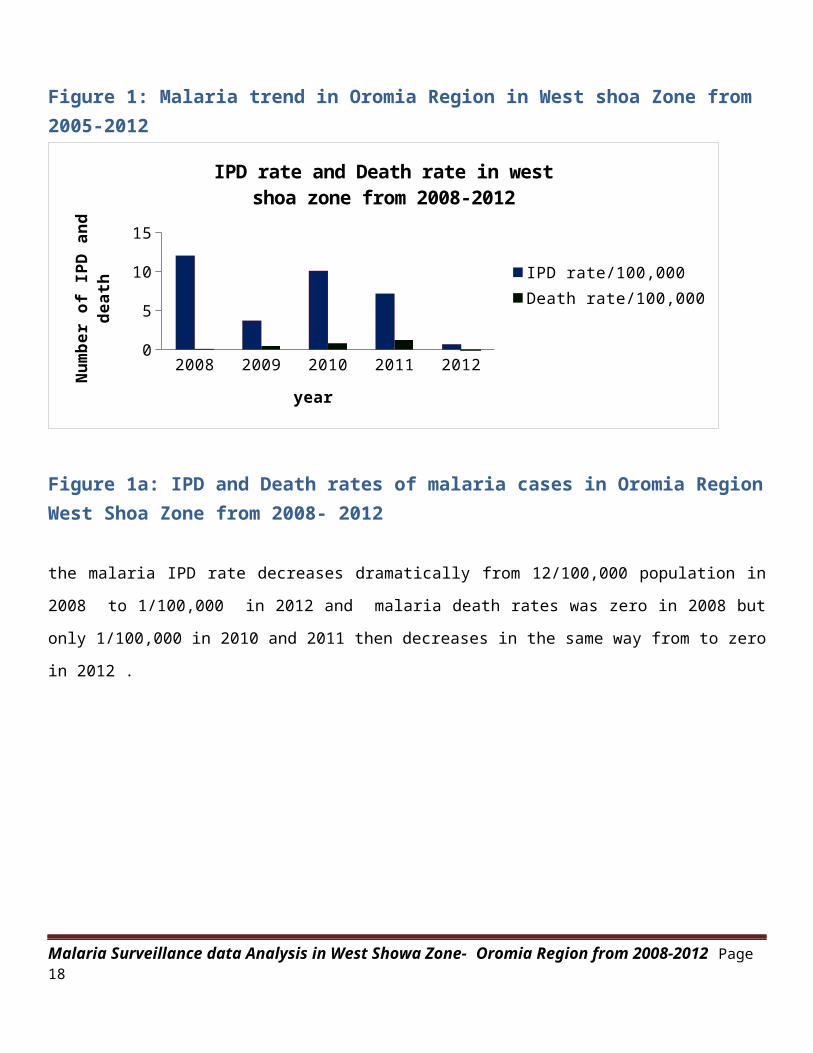
Figure 1: Malaria trend in Oromia Region in West shoa Zone from 2005-2012
2008 2009 2010 2011 20120
5
10
15
IPD rate and Death rate in westshoa zone from 2008-2012
IPD rate/100,000 Death rate/100,000
year
Numb
er o
f IP
D an
d de
ath
Figure 1a: IPD and Death rates of malaria cases in Oromia RegionWest Shoa Zone from 2008- 2012
the malaria IPD rate decreases dramatically from 12/100,000 population in
2008 to 1/100,000 in 2012 and malaria death rates was zero in 2008 but
only 1/100,000 in 2010 and 2011 then decreases in the same way from to zero
in 2012 .
Malaria Surveillance data Analysis in West Showa Zone- Oromia Region from 2008-2012 Page18
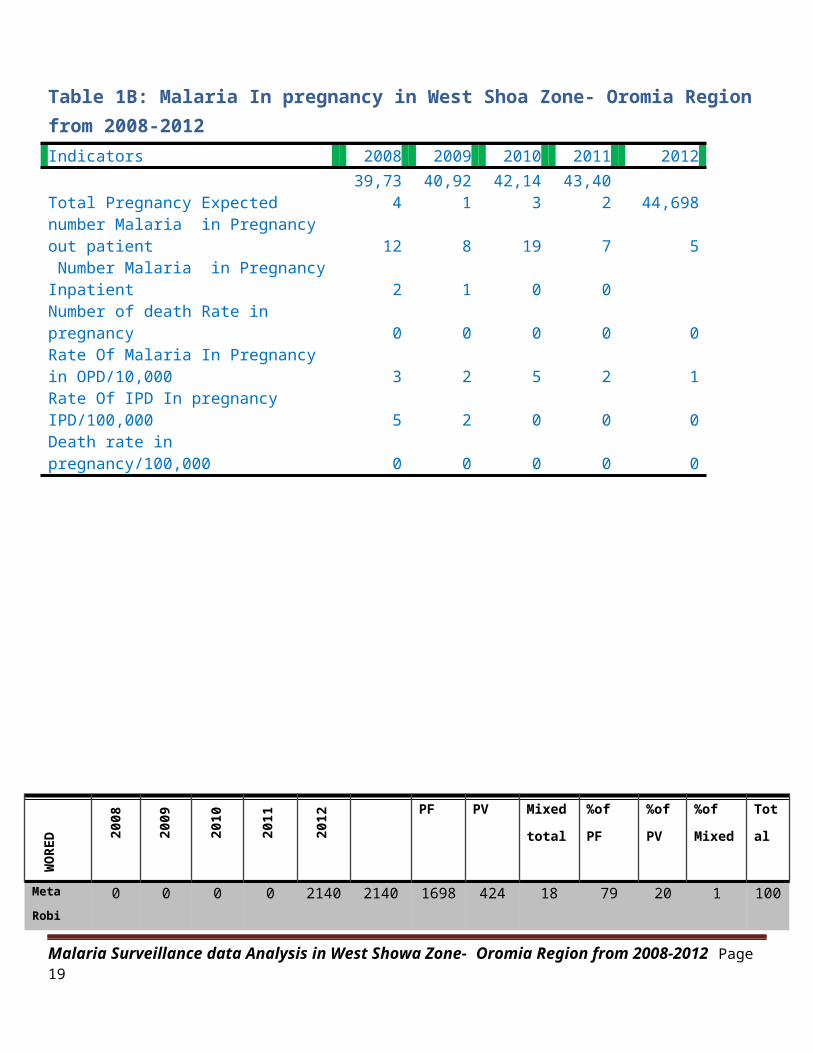
Table 1B: Malaria In pregnancy in West Shoa Zone- Oromia Region from 2008-2012
WORED 20
08
2009
2010
2011
2012 total
Posit
ive
PF PV Mixed
total
%of
PF
%of
PV
%of
Mixed
Tot
al
Meta
Robi0 0 0 0 2140 2140 1698 424 18 79 20 1 100
Malaria Surveillance data Analysis in West Showa Zone- Oromia Region from 2008-2012 Page19
Indicators 2008 2009 2010 2011 2012
Total Pregnancy Expected39,73
440,92
142,14
343,40
2 44,698number Malaria in Pregnancy out patient 12 8 19 7 5 Number Malaria in PregnancyInpatient 2 1 0 0Number of death Rate in pregnancy 0 0 0 0 0Rate Of Malaria In Pregnancy in OPD/10,000 3 2 5 2 1Rate Of IPD In pregnancy IPD/100,000 5 2 0 0 0Death rate in pregnancy/100,000 0 0 0 0 0
Ambo
town112
6
2019 3971 7866 37 15019 1817 4857 8345 12 32 56 100
Ambo
Rural5 10 15 30 463 523 351 172 0 67 33 0 100
Dandi 51 164 1974 3533 1027 6749 1788 4114 847 26 61 13 100A/G/
Barat52 32 289 1101 701 2175 1133 906 136 52 42 6 100
Nono 110
1
23 0 5446 1058
3
17153 8976 7420 757 52 43 4 100
Jibat 60 261 794 429 1543 3087 2271 640 176 74 21 6 100A/Barga 2 91 202 758 680 1733 914 613 206 53 35 12 100Mida 2 16 111 2018 2743 4889.
5
2449 1656 966 48 33 19 100
Ilfeta 132 30 119 459 181 921 513 380 28 56 41 3 100B/Tibe 499 1870 2795 4575 4954 14693 5411 7108 2174 37 48 15 100Caliya 196 158 646 567 121 1688 493 849 346 29 50 20 100Dano 361 432 1026 4266 2270 8355 3256 3400 1699 39 41 20 100Jaldu 10 10 319 3056 570 3965 2058 1649 258 52 42 7 100G/Barat 33 272 2955 7176 3162 13598 8919 3843 836 66 28 6 100Ejere 9 138 357 435 332 1271 459 712 100 36 56 8 100T/
Kutaye32 170 2073 2075 1301 5651 2555 2588 508 45 46 9 100
Ilu-
galan110
3
5751 1266
9
8975 4957 33455 1575
9
1376
1
3935 47 41 12 100
Total 477
4
1144
7
3031
5
5236
2
3834
9
13724
7
6082
0
5509
2
21335 44 40 16 100
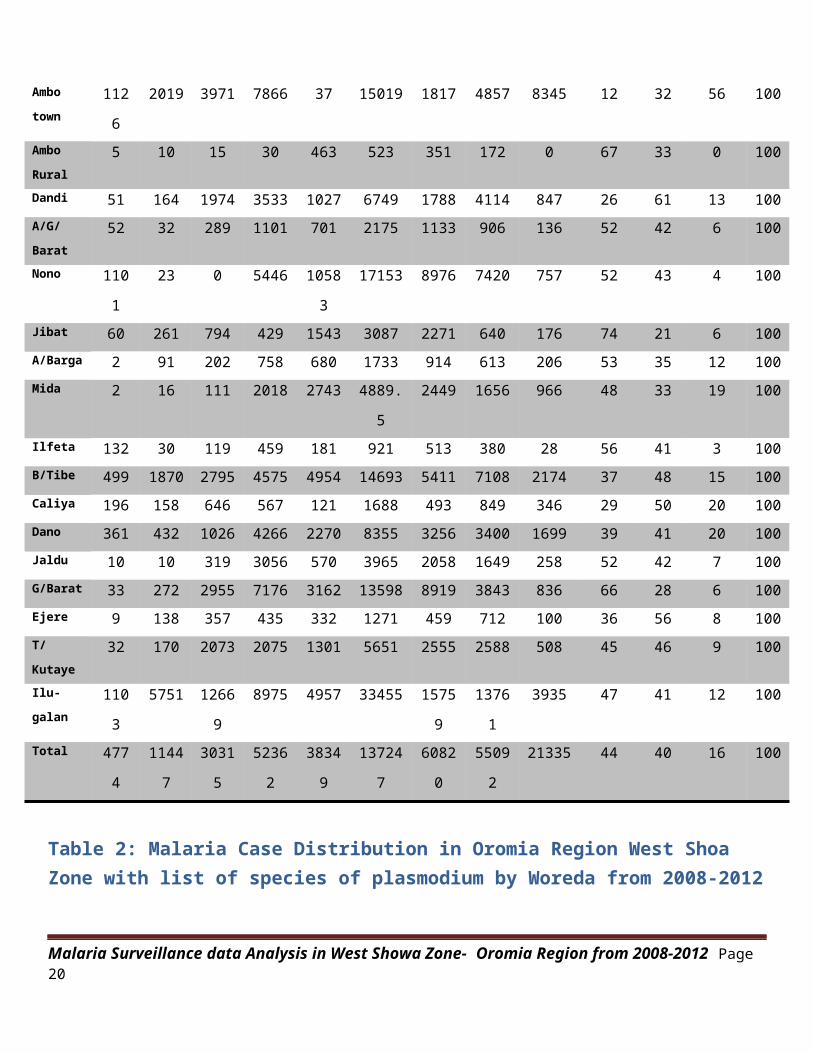
Table 2: Malaria Case Distribution in Oromia Region West Shoa Zone with list of species of plasmodium by Woreda from 2008-2012
Malaria Surveillance data Analysis in West Showa Zone- Oromia Region from 2008-2012 Page20
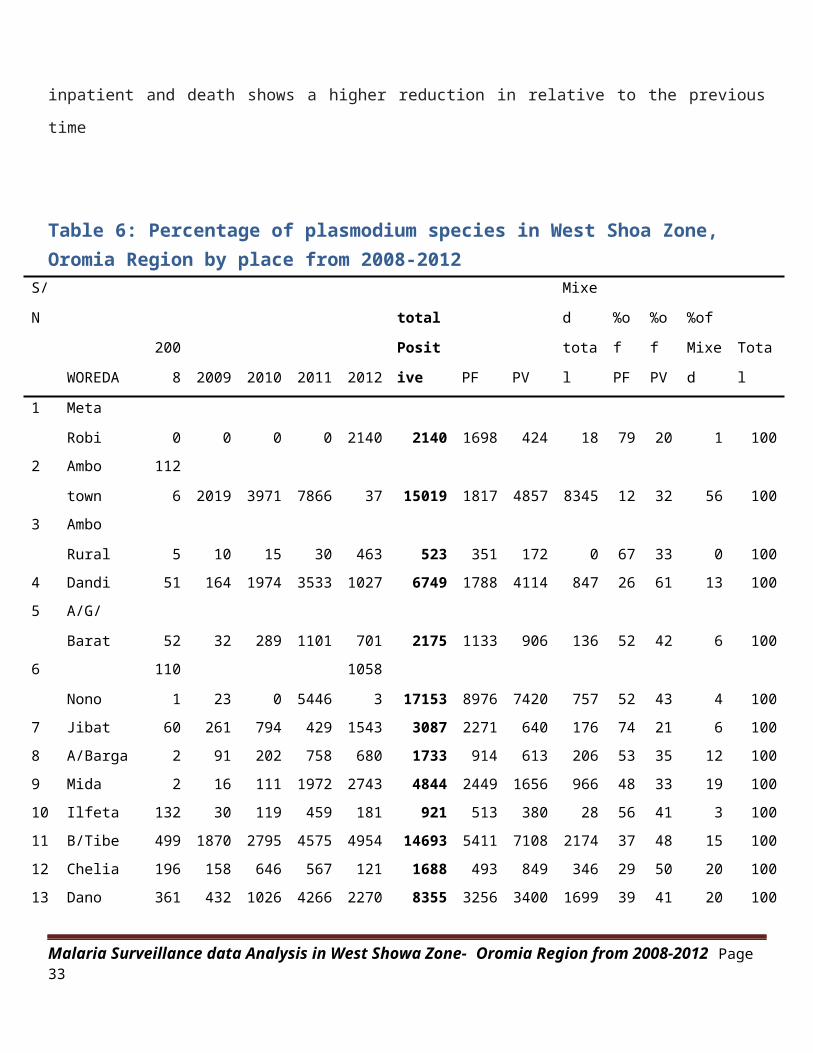
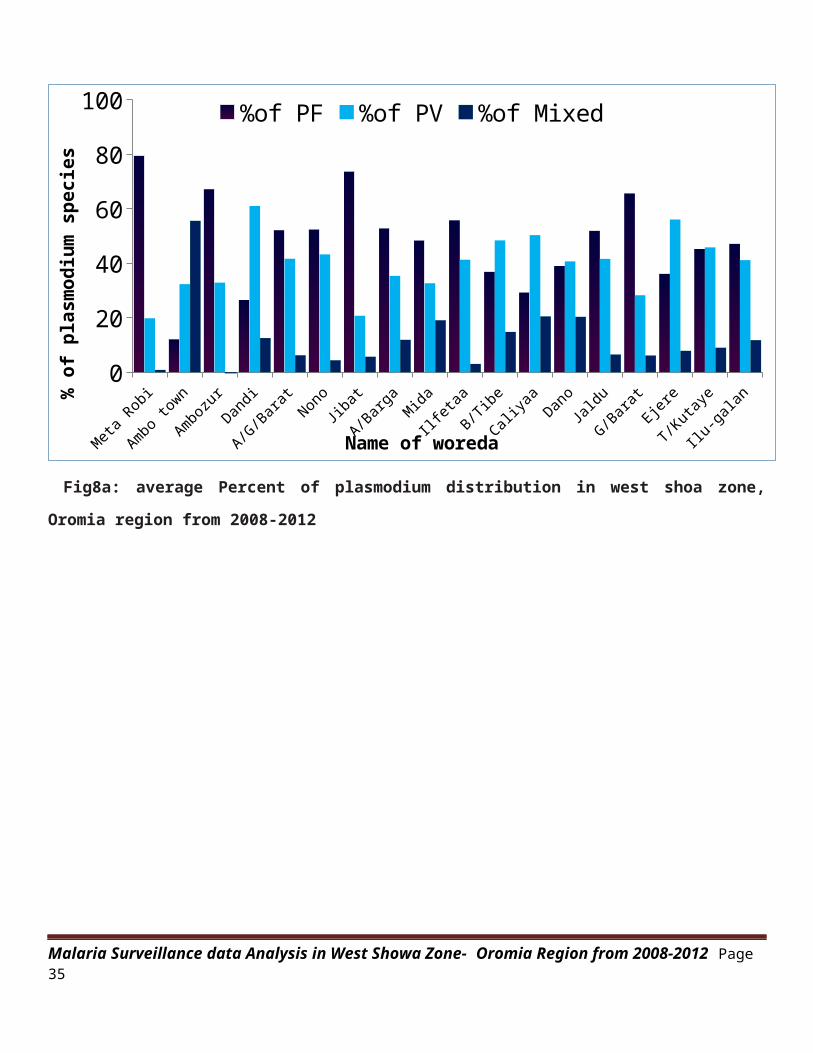
In this zone the average distribution of plasmodium species from 2008 to
2012 was 44%, 40% and 16% falciparum, Vivax and mixed respectively.
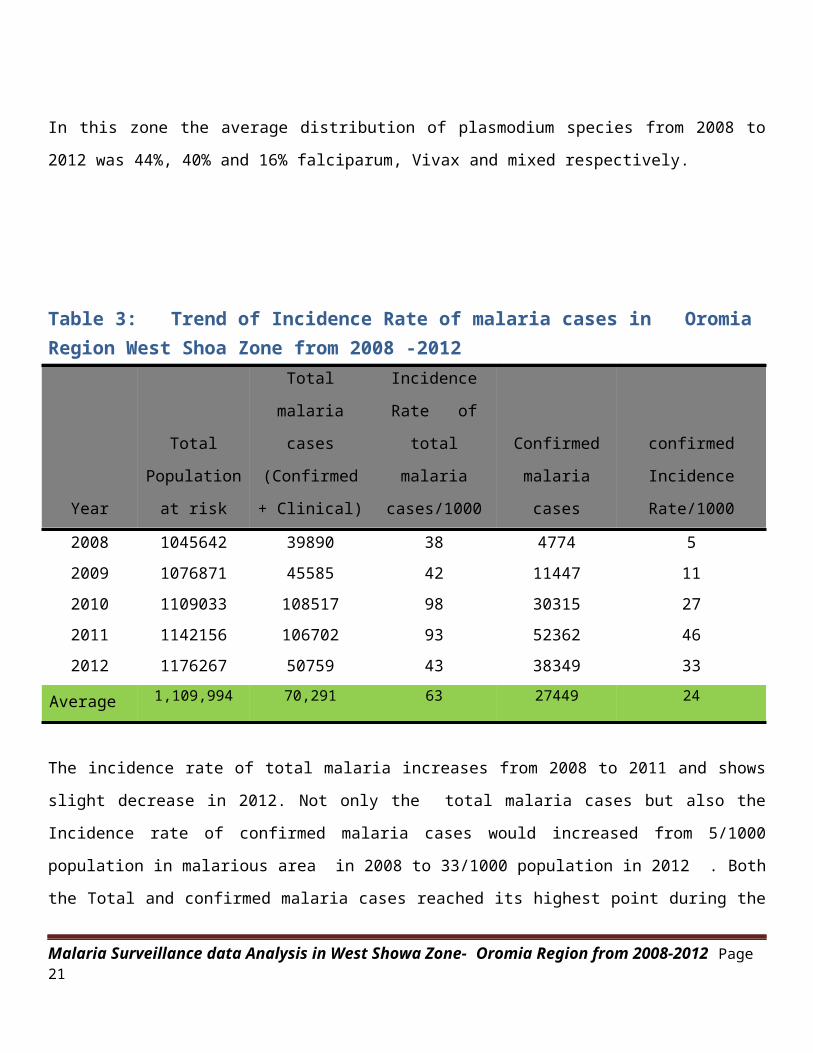
Table 3: Trend of Incidence Rate of malaria cases in Oromia Region West Shoa Zone from 2008 -2012
Year
Total
Population
at risk
Total
malaria
cases
(Confirmed
+ Clinical)
Incidence
Rate of
total
malaria
cases/1000
Confirmed
malaria
cases
confirmed
Incidence
Rate/1000
2008 1045642 39890 38 4774 52009 1076871 45585 42 11447 112010 1109033 108517 98 30315 272011 1142156 106702 93 52362 462012 1176267 50759 43 38349 33
Average 1,109,994 70,291 63 27449 24
The incidence rate of total malaria increases from 2008 to 2011 and shows
slight decrease in 2012. Not only the total malaria cases but also the
Incidence rate of confirmed malaria cases would increased from 5/1000
population in malarious area in 2008 to 33/1000 population in 2012 . Both
the Total and confirmed malaria cases reached its highest point during the
Malaria Surveillance data Analysis in West Showa Zone- Oromia Region from 2008-2012 Page21
year 2011. But it shows slight decreases from the same year to current
situation. Confirmed malaria cases in 2012 were six times higher than the
of in 2008.
Malaria Surveillance data Analysis in West Showa Zone- Oromia Region from 2008-2012 Page22
2008 2009 2010 2011 20120
20
40
60
80
100
120
38 42
9893
43
511
27
46
33
Incidence Rate of total malaria cases/1000
yearRate
of
tota
l an
d co
nfir
med
mala
ria
Figure 2: The total Malaria incidence and confirmed Rate in the West Shoa Zone from 2008 to 2012
Malaria Surveillance data Analysis in West Showa Zone- Oromia Region from 2008-2012 Page23
2008 2009 2010 2011 20120
10
20
30
40
50
60
70
80
4246
70
38
50
Posetivity Rate
year
pere
cent
age
of s
lide
po
siti
vity
rat
e
Figure 3: Malaria slide positivity rate of West Shoa Zone - Oromia Region from 2008-2012
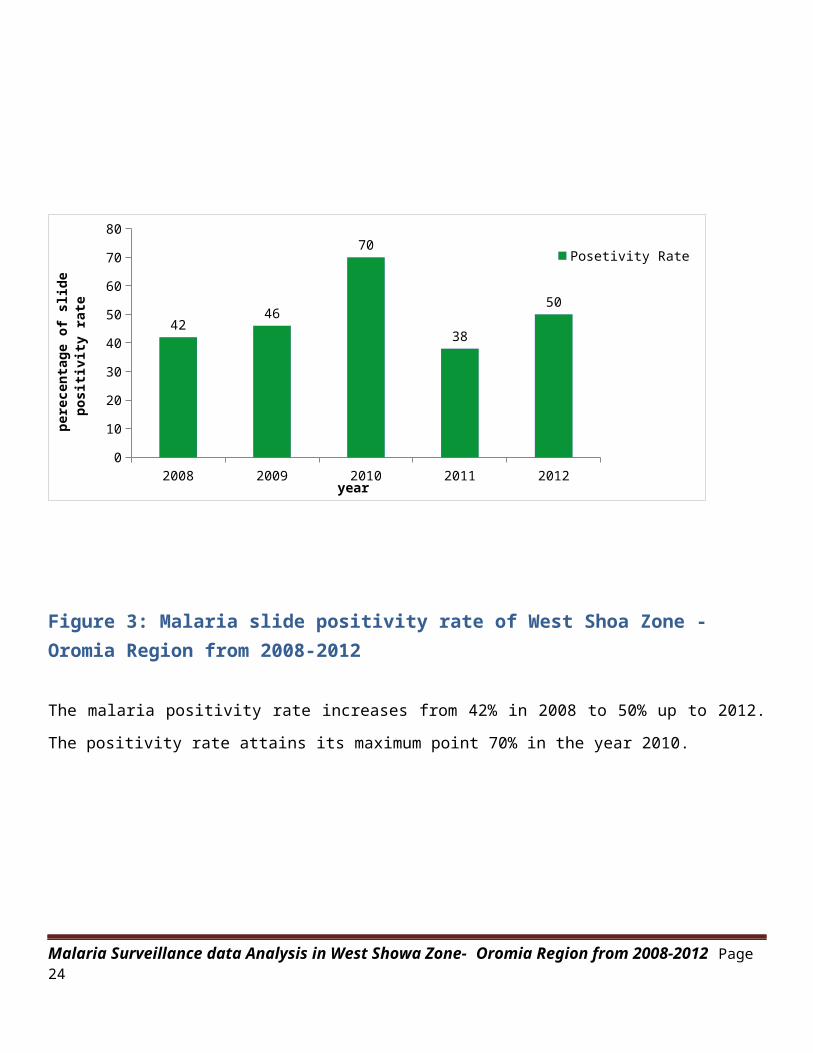
The malaria positivity rate increases from 42% in 2008 to 50% up to 2012.
The positivity rate attains its maximum point 70% in the year 2010.
Malaria Surveillance data Analysis in West Showa Zone- Oromia Region from 2008-2012 Page24
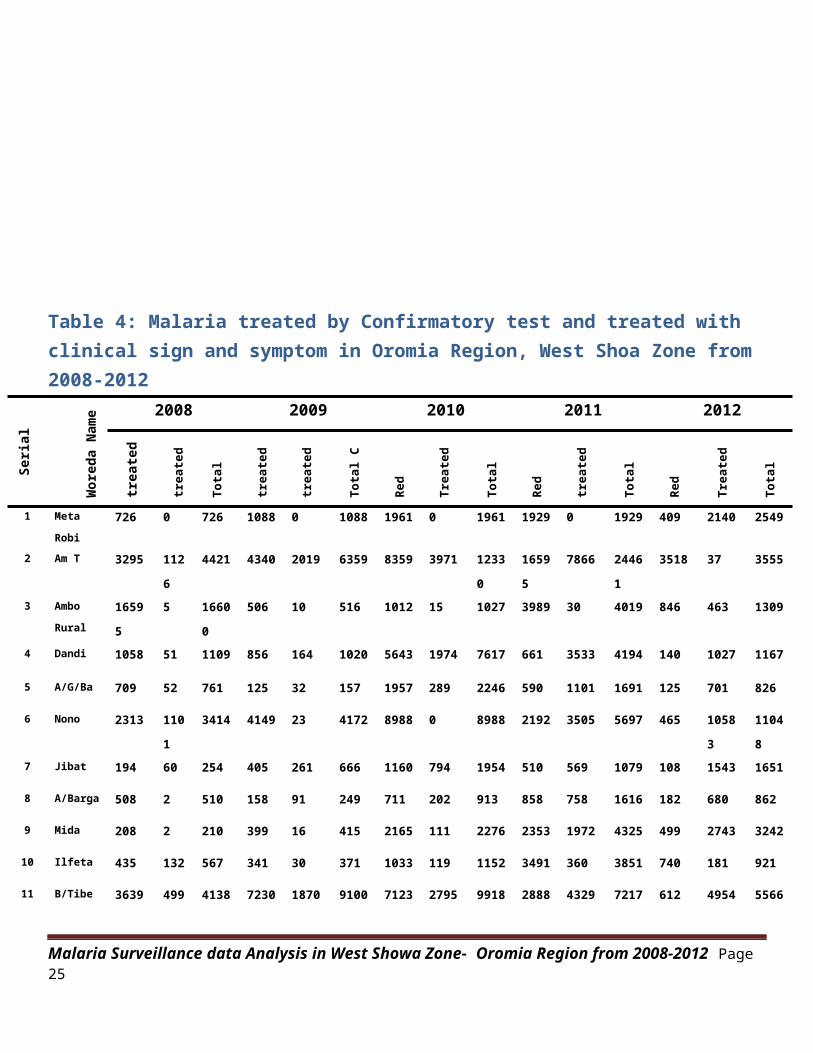
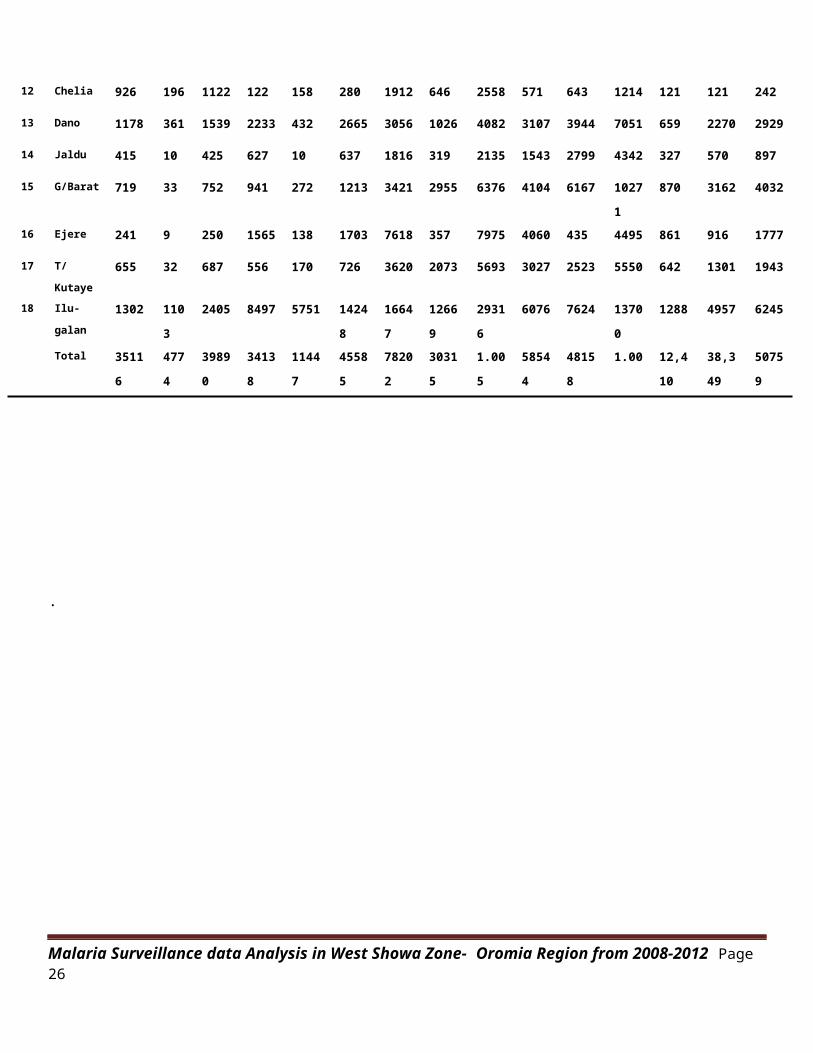
Table 4: Malaria treated by Confirmatory test and treated with clinical sign and symptom in Oromia Region, West Shoa Zone from 2008-2012
Serial
Number
Woreda Name 2008 2009 2010 2011 2012
treated
Clinica
trea
ted
by t
est
Tota
l
Case
s trea
ted
clin
ical
trea
ted
By
Tota
l C
trea
ted
Red
Clan
Trea
ted
By
Tota
l
trea
ted
Red
Clan
trea
ted
By
Tota
l
trea
ted
Red
Clan
Trea
ted
by t
est
Tota
l
Case
s
1 Meta
Robi726 0 726 1088 0 1088 1961 0 1961 1929 0 1929 409 2140 2549
2 Am T 3295 112
6
4421 4340 2019 6359 8359 3971 1233
0
1659
5
7866 2446
1
3518 37 3555
3 Ambo
Rural1659
5
5 1660
0
506 10 516 1012 15 1027 3989 30 4019 846 463 1309
4 Dandi 1058 51 1109 856 164 1020 5643 1974 7617 661 3533 4194 140 1027 1167
5 A/G/Ba 709 52 761 125 32 157 1957 289 2246 590 1101 1691 125 701 826
6 Nono 2313 110
1
3414 4149 23 4172 8988 0 8988 2192 3505 5697 465 1058
3
1104
87 Jibat 194 60 254 405 261 666 1160 794 1954 510 569 1079 108 1543 1651
8 A/Barga 508 2 510 158 91 249 711 202 913 858 758 1616 182 680 862
9 Mida 208 2 210 399 16 415 2165 111 2276 2353 1972 4325 499 2743 3242
10 Ilfeta 435 132 567 341 30 371 1033 119 1152 3491 360 3851 740 181 921
11 B/Tibe 3639 499 4138 7230 1870 9100 7123 2795 9918 2888 4329 7217 612 4954 5566
Malaria Surveillance data Analysis in West Showa Zone- Oromia Region from 2008-2012 Page25
12 Chelia 926 196 1122 122 158 280 1912 646 2558 571 643 1214 121 121 242
13 Dano 1178 361 1539 2233 432 2665 3056 1026 4082 3107 3944 7051 659 2270 2929
14 Jaldu 415 10 425 627 10 637 1816 319 2135 1543 2799 4342 327 570 897
15 G/Barat 719 33 752 941 272 1213 3421 2955 6376 4104 6167 1027
1
870 3162 4032
16 Ejere 241 9 250 1565 138 1703 7618 357 7975 4060 435 4495 861 916 1777
17 T/
Kutaye655 32 687 556 170 726 3620 2073 5693 3027 2523 5550 642 1301 1943
18 Ilu-
galan1302 110
3
2405 8497 5751 1424
8
1664
7
1266
9
2931
6
6076 7624 1370
0
1288 4957 6245
Total 3511
6
477
4
3989
0
3413
8
1144
7
4558
5
7820
2
3031
5
1.00
5
5854
4
4815
8
1.00 12,4
10
38,3
49
5075
9
.
Malaria Surveillance data Analysis in West Showa Zone- Oromia Region from 2008-2012 Page26
July
Augu
stSe
ptem
ber
Octo
ber
Nove
mber
Dece
mber
Janu
ary
Febr
uary
Marc
hApri
lMa
yJu
neJu
lyAugu
stSept
embe
rOcto
ber
Nove
mber
Dece
mber
Janu
ary
Febr
uary
Marc
hApri
lMay
June
July
Augu
stSe
ptem
ber
Octo
ber
Nove
mber
Dece
mber
Janu
ary
Febr
uary
Marc
hAp
ril
May
June
July
Augu
stSe
ptem
ber
Octo
ber
Nove
mber
Dece
mber
Janu
ary
Febr
uary
Marc
hApri
lMay
June
July
Augu
stSe
ptem
ber
Octo
ber
Nove
mber
Dece
mber
Janu
ary
Febr
uary
Marc
hAp
ril
May
June
2000/2008 2001/2009 2002/2010 2003/2011 2004/2012
0200040006000800010000
confirmed malaria cases
month
conf
irme
d ma
lari
a ca
ses
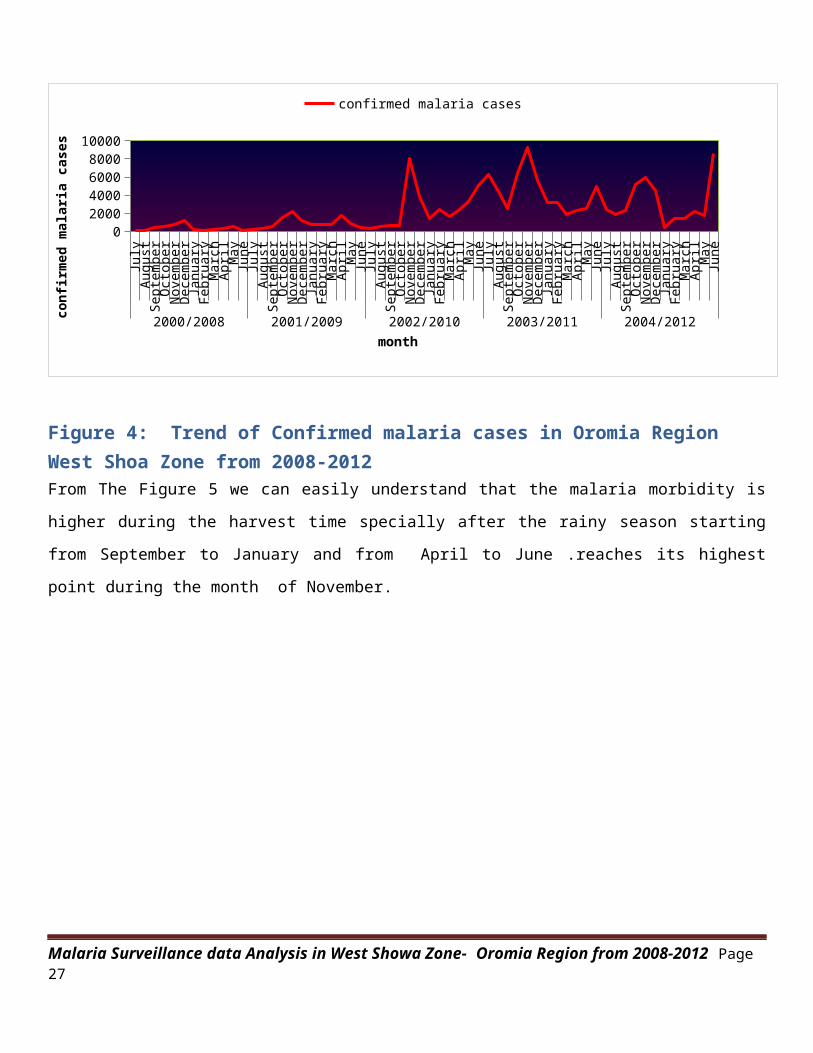
Figure 4: Trend of Confirmed malaria cases in Oromia Region West Shoa Zone from 2008-2012From The Figure 5 we can easily understand that the malaria morbidity is
higher during the harvest time specially after the rainy season starting
from September to January and from April to June .reaches its highest
point during the month of November.
Malaria Surveillance data Analysis in West Showa Zone- Oromia Region from 2008-2012 Page27
July
August
September
October
November
December
January
February
March
April
May
June
July
August
September
October
November
December
January
February
March
April
May
June
July
August
September
October
November
December
January
February
March
April
May
June
July
August
September
October
November
December
January
February
March
April
May
June
July
August
September
October
November
December
January
February
March
April
May
June
2000/2008 2001/2009 2002/2010 2003/2011 2004/2012
0
2000
4000
6000
8000
10000Epidemic occurrence
confirmed malaria cases
months
conf
irme
d ma
lari
a ca
ses
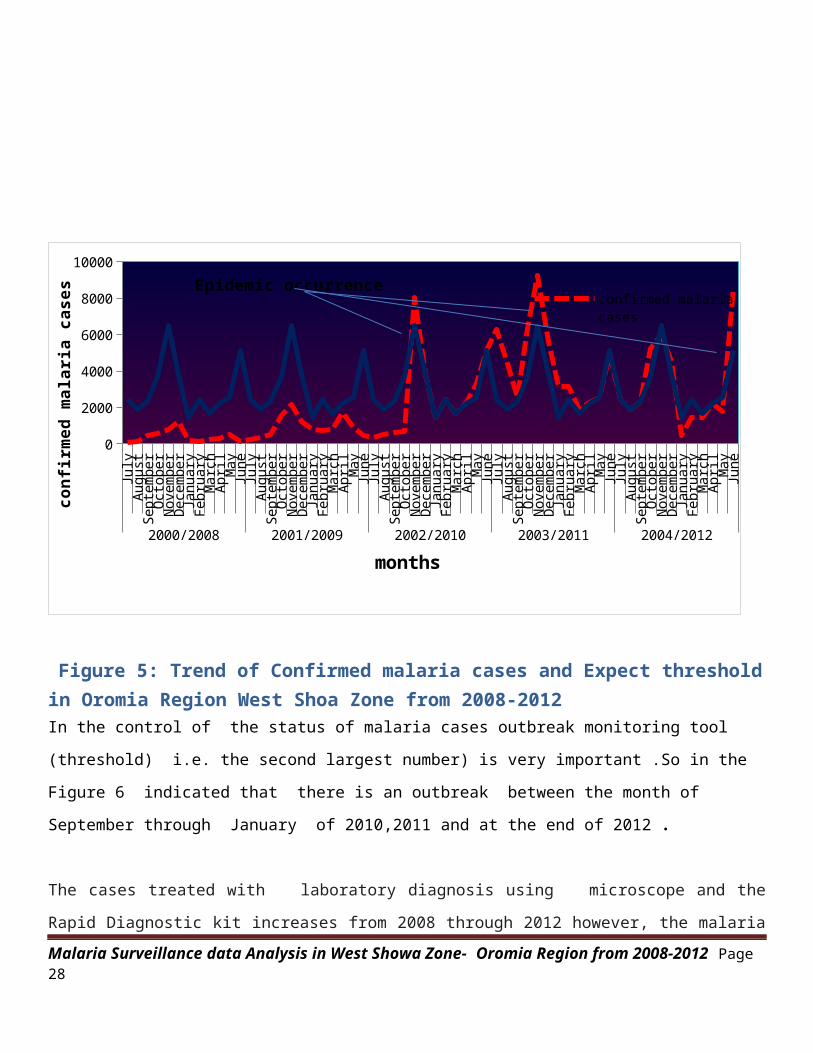
Figure 5: Trend of Confirmed malaria cases and Expect thresholdin Oromia Region West Shoa Zone from 2008-2012In the control of the status of malaria cases outbreak monitoring tool
(threshold) i.e. the second largest number) is very important .So in the
Figure 6 indicated that there is an outbreak between the month of
September through January of 2010,2011 and at the end of 2012 .
The cases treated with laboratory diagnosis using microscope and the
Rapid Diagnostic kit increases from 2008 through 2012 however, the malariaMalaria Surveillance data Analysis in West Showa Zone- Oromia Region from 2008-2012 Page28
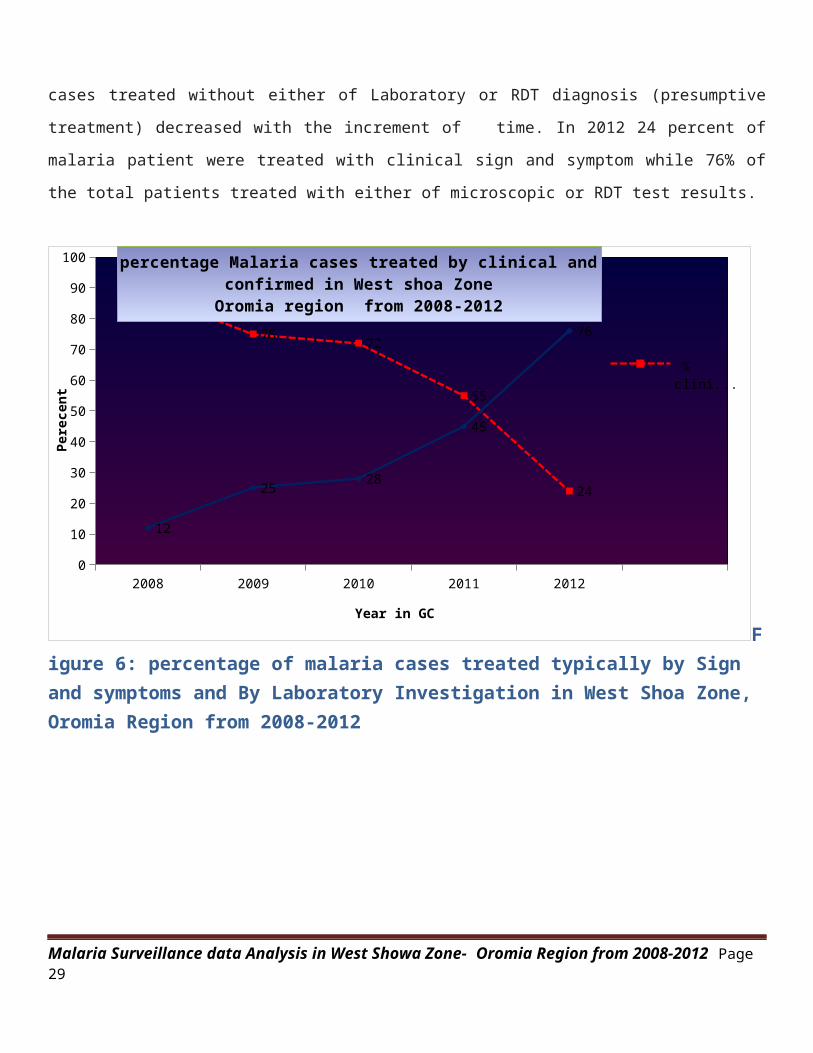
cases treated without either of Laboratory or RDT diagnosis (presumptive
treatment) decreased with the increment of time. In 2012 24 percent of
malaria patient were treated with clinical sign and symptom while 76% of
the total patients treated with either of microscopic or RDT test results.
2008 2009 2010 2011 20120
10
20
30
40
50
60
70
80
90
100
88
75 72
55
24
12
25 28
45
76
percentage Malaria cases treated by clinical and confirmed in West shoa Zone
Oromia region from 2008-2012
% clini...
Year in GC
Perecent
Figure 6: percentage of malaria cases treated typically by Sign and symptoms and By Laboratory Investigation in West Shoa Zone, Oromia Region from 2008-2012
Malaria Surveillance data Analysis in West Showa Zone- Oromia Region from 2008-2012 Page29
M F M F M F M F M F2008 2009 2010 2011 2012
0
20000
40000
60000 confirmed malaria cases by Sex
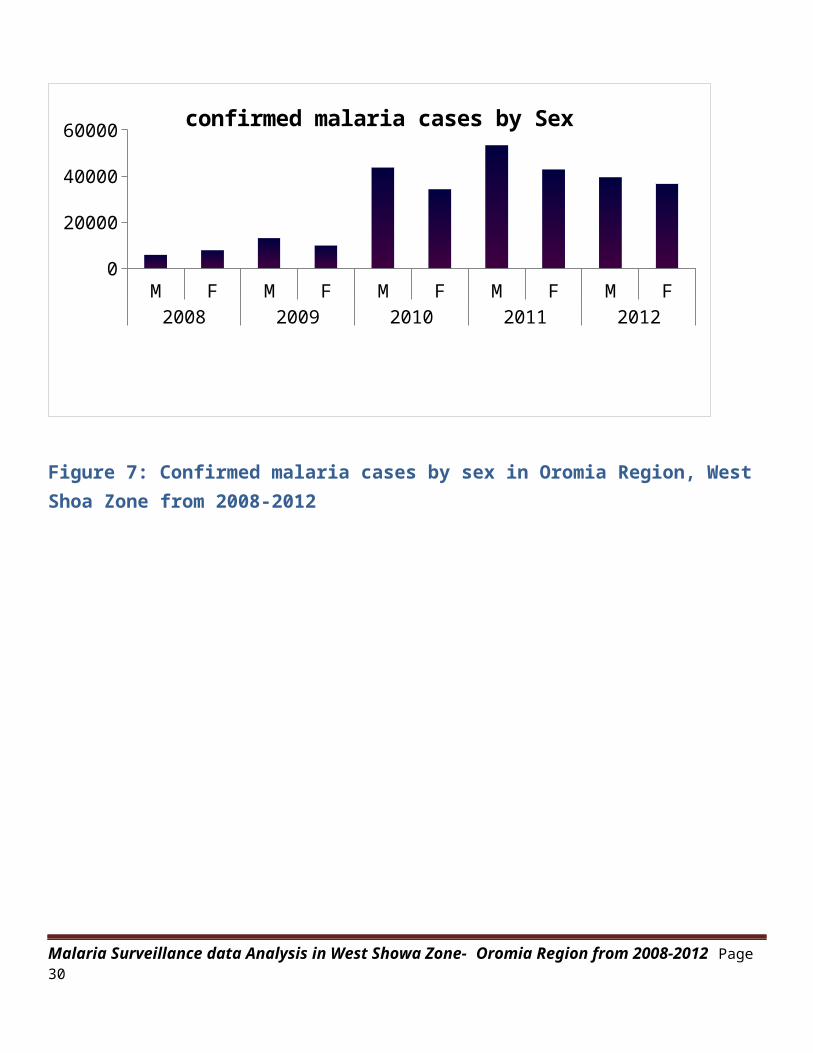
Figure 7: Confirmed malaria cases by sex in Oromia Region, West Shoa Zone from 2008-2012
Malaria Surveillance data Analysis in West Showa Zone- Oromia Region from 2008-2012 Page30
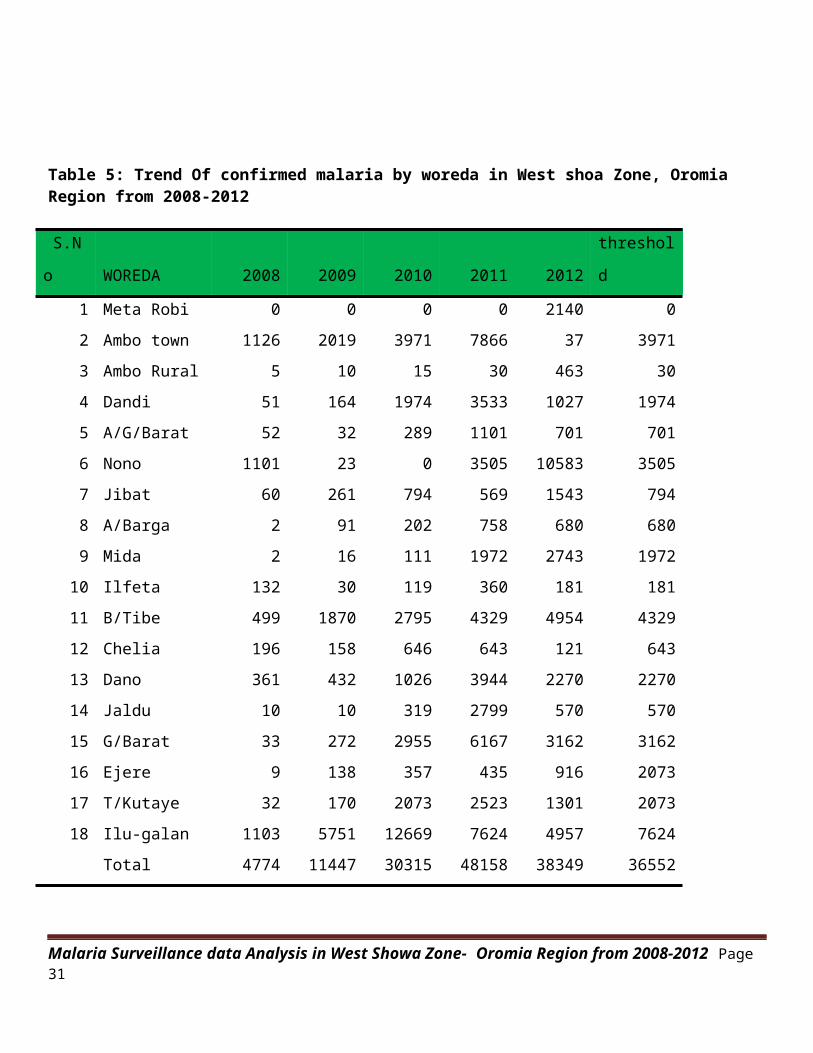
Table 5: Trend Of confirmed malaria by woreda in West shoa Zone, Oromia Region from 2008-2012
S.N
o WOREDA 2008 2009 2010 2011 2012
threshol
d
1 Meta Robi 0 0 0 0 2140 02 Ambo town 1126 2019 3971 7866 37 39713 Ambo Rural 5 10 15 30 463 304 Dandi 51 164 1974 3533 1027 19745 A/G/Barat 52 32 289 1101 701 7016 Nono 1101 23 0 3505 10583 35057 Jibat 60 261 794 569 1543 7948 A/Barga 2 91 202 758 680 6809 Mida 2 16 111 1972 2743 1972
10 Ilfeta 132 30 119 360 181 18111 B/Tibe 499 1870 2795 4329 4954 432912 Chelia 196 158 646 643 121 64313 Dano 361 432 1026 3944 2270 227014 Jaldu 10 10 319 2799 570 57015 G/Barat 33 272 2955 6167 3162 316216 Ejere 9 138 357 435 916 207317 T/Kutaye 32 170 2073 2523 1301 207318 Ilu-galan 1103 5751 12669 7624 4957 7624
Total 4774 11447 30315 48158 38349 36552
Malaria Surveillance data Analysis in West Showa Zone- Oromia Region from 2008-2012 Page31
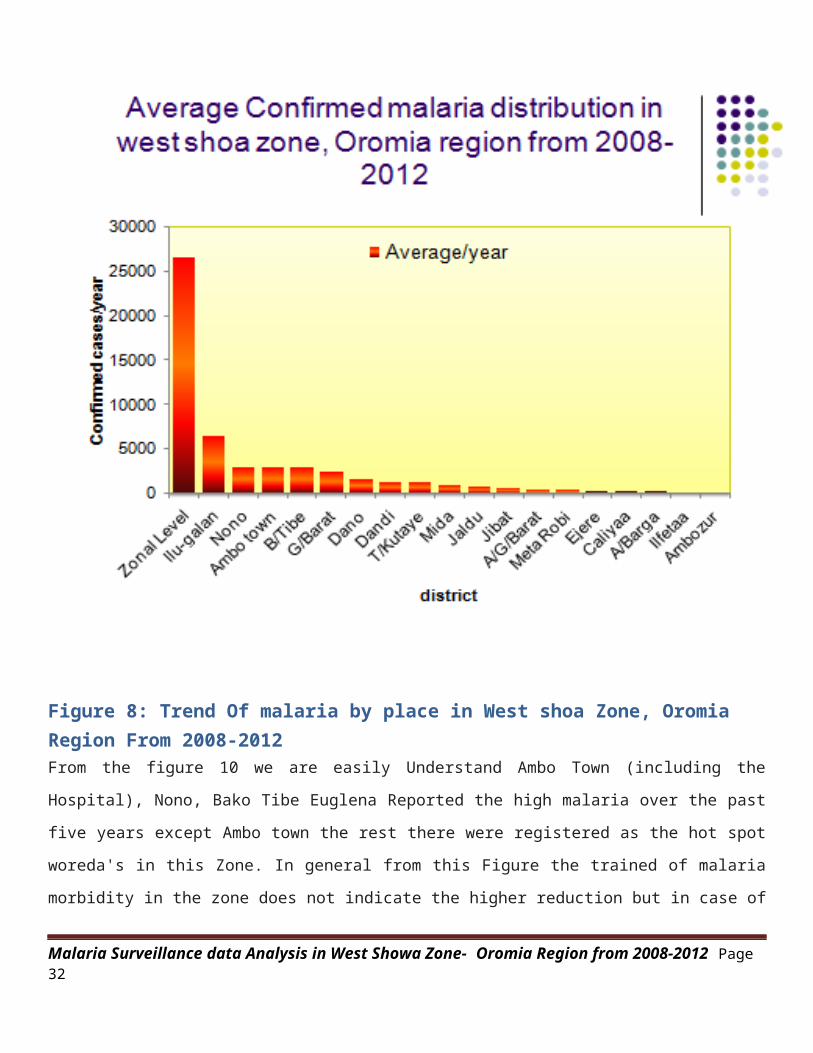
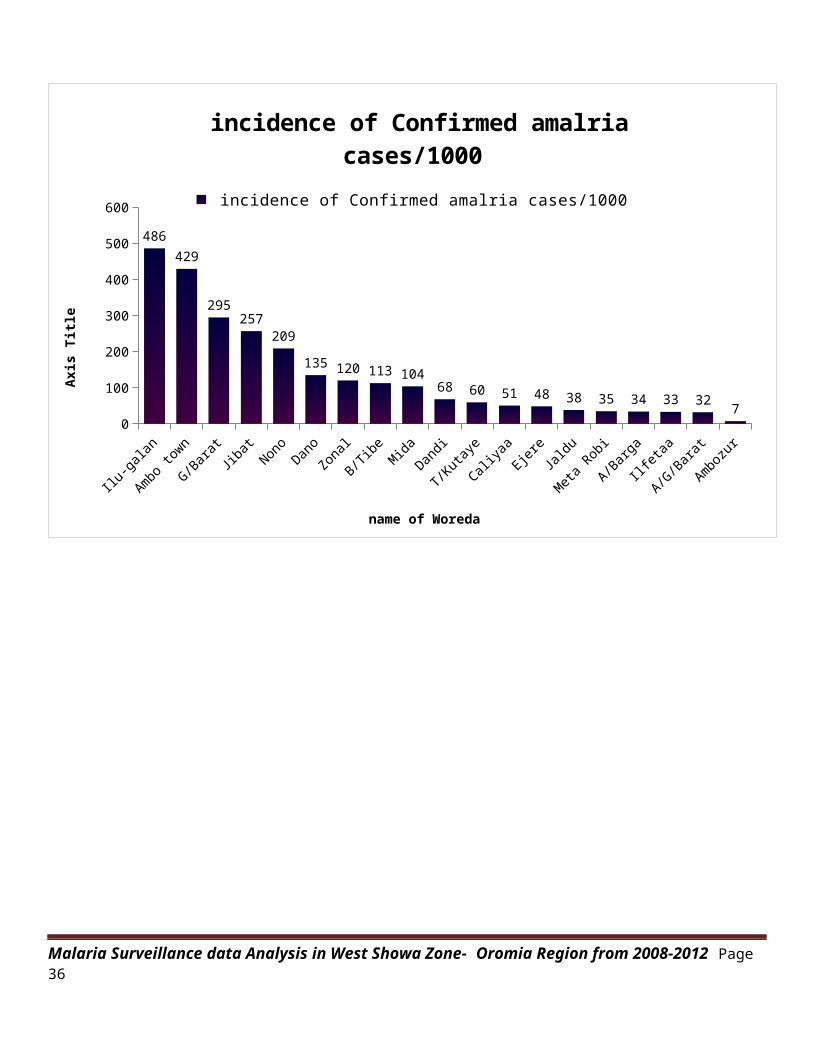
Figure 8: Trend Of malaria by place in West shoa Zone, Oromia Region From 2008-2012From the figure 10 we are easily Understand Ambo Town (including the
Hospital), Nono, Bako Tibe Euglena Reported the high malaria over the past
five years except Ambo town the rest there were registered as the hot spot
woreda's in this Zone. In general from this Figure the trained of malaria
morbidity in the zone does not indicate the higher reduction but in case of
Malaria Surveillance data Analysis in West Showa Zone- Oromia Region from 2008-2012 Page32
inpatient and death shows a higher reduction in relative to the previous
time
Table 6: Percentage of plasmodium species in West Shoa Zone, Oromia Region by place from 2008-2012
S/
N
WOREDA
200
8 2009 2010 2011 2012
total
Posit
ive PF PV
Mixe
d
tota
l
%o
f
PF
%o
f
PV
%of
Mixe
d
Tota
l
1 Meta
Robi 0 0 0 0 2140 2140 1698 424 18 79 20 1 1002 Ambo
town
112
6 2019 3971 7866 37 15019 1817 4857 8345 12 32 56 1003 Ambo
Rural 5 10 15 30 463 523 351 172 0 67 33 0 1004 Dandi 51 164 1974 3533 1027 6749 1788 4114 847 26 61 13 1005 A/G/
Barat 52 32 289 1101 701 2175 1133 906 136 52 42 6 1006
Nono
110
1 23 0 5446
1058
3 17153 8976 7420 757 52 43 4 1007 Jibat 60 261 794 429 1543 3087 2271 640 176 74 21 6 1008 A/Barga 2 91 202 758 680 1733 914 613 206 53 35 12 1009 Mida 2 16 111 1972 2743 4844 2449 1656 966 48 33 19 10010 Ilfeta 132 30 119 459 181 921 513 380 28 56 41 3 10011 B/Tibe 499 1870 2795 4575 4954 14693 5411 7108 2174 37 48 15 10012 Chelia 196 158 646 567 121 1688 493 849 346 29 50 20 10013 Dano 361 432 1026 4266 2270 8355 3256 3400 1699 39 41 20 100
Malaria Surveillance data Analysis in West Showa Zone- Oromia Region from 2008-2012 Page33
14 Jaldu 10 10 319 3056 570 3965 2058 1649 258 52 42 7 10015 G/Barat 33 272 2955 7176 3162 13598 8919 3843 836 66 28 6 10016 Ejere 9 138 357 435 332 1271 459 712 100 36 56 8 10017 T/Kutaye 32 170 2073 2075 1301 5651 2555 2588 508 45 46 9 10018 Ilu-
galan
110
3 5751
1266
9 8975 4957 33455
1575
9
1376
1 3935 47 41 12 100
Total
477
4
1144
7
3031
5
5236
2
3834
9
13724
7
6082
0
5509
2
2133
5 44 40 16 100
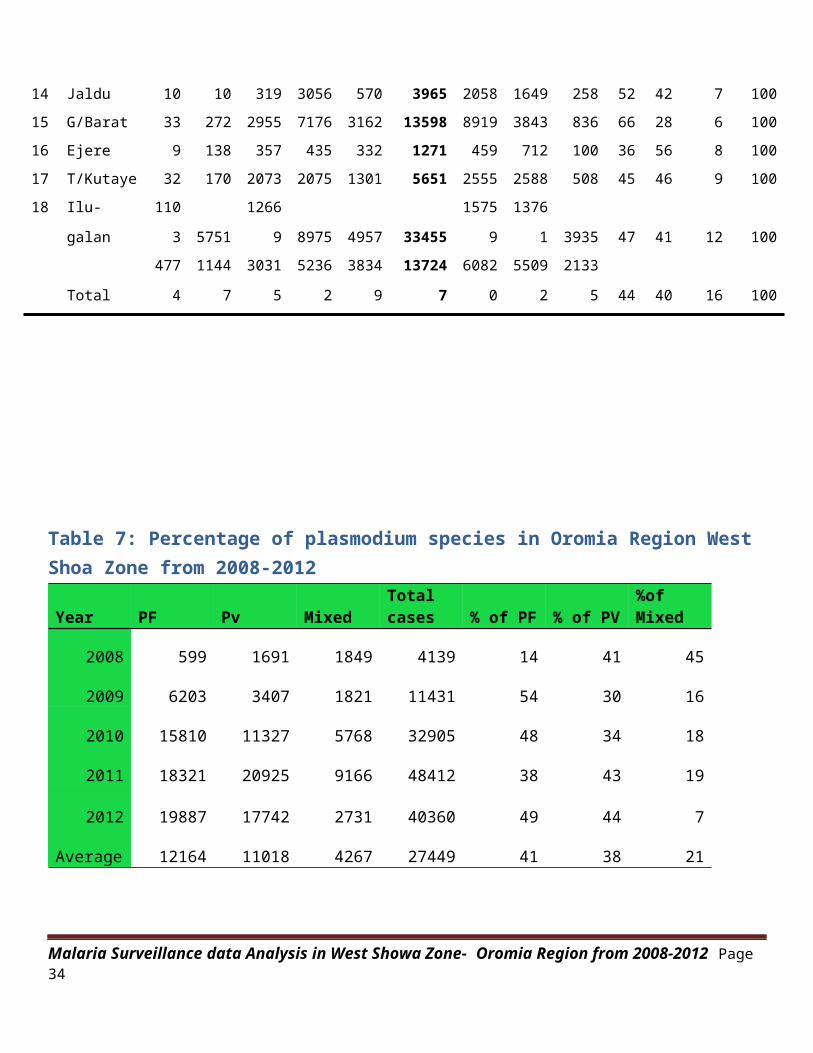
Table 7: Percentage of plasmodium species in Oromia Region West Shoa Zone from 2008-2012
Year PF Pv MixedTotal cases % of PF % of PV
%of Mixed
2008 599 1691 1849 4139 14 41 45
2009 6203 3407 1821 11431 54 30 16
2010 15810 11327 5768 32905 48 34 18
2011 18321 20925 9166 48412 38 43 19
2012 19887 17742 2731 40360 49 44 7
Average 12164 11018 4267 27449 41 38 21
Malaria Surveillance data Analysis in West Showa Zone- Oromia Region from 2008-2012 Page34
Meta Robi
Ambo town
AmbozurDandi
A/G/BaratNonoJibat
A/BargaMida
Ilfetaa
B/Tibe
CaliyaaDanoJaldu
G/BaratEjere
T/Kutaye
Ilu-galan
0
20
40
60
80
100 %of PF %of PV %of Mixed
Name of woreda
% of plasmodium species
Fig8a: average Percent of plasmodium distribution in west shoa zone,
Oromia region from 2008-2012
Malaria Surveillance data Analysis in West Showa Zone- Oromia Region from 2008-2012 Page35
Ilu-galan
Ambo town
G/BaratJibatNono
DanoZonal
B/Tibe
MidaDandi
T/Kutaye
CaliyaaEjereJaldu
Meta Robi
A/Barga
Ilfetaa
A/G/Barat
Ambozur
0
100
200
300
400
500
600
486429
295257
209135 120 113 104
68 60 51 48 38 35 34 33 32 7
incidence of Confirmed amalria cases/1000
incidence of Confirmed amalria cases/1000
name of Woreda
Axis Title
Malaria Surveillance data Analysis in West Showa Zone- Oromia Region from 2008-2012 Page36
JULY
AUGST
SEPTEMBER
OCTOBER
NOVEMBET
DEC.
JANUSRY
FEBUIRAY
MARCH
APRIL
MAY
JUN.
0
1000
2000
3000
4000
5000
6000
7000
8000
9000
10000 2008 2009 20102011 2012 Thershold
month
trend of confirmed positive malaria cases
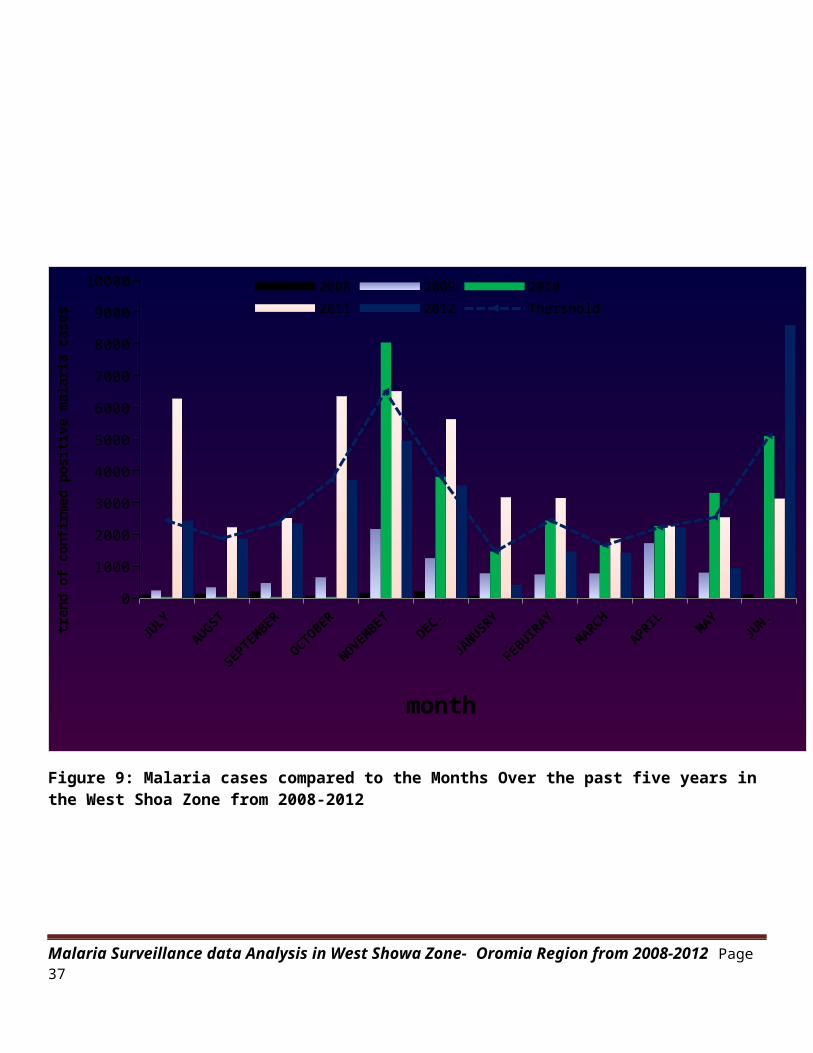
Figure 9: Malaria cases compared to the Months Over the past five years in the West Shoa Zone from 2008-2012
Malaria Surveillance data Analysis in West Showa Zone- Oromia Region from 2008-2012 Page37
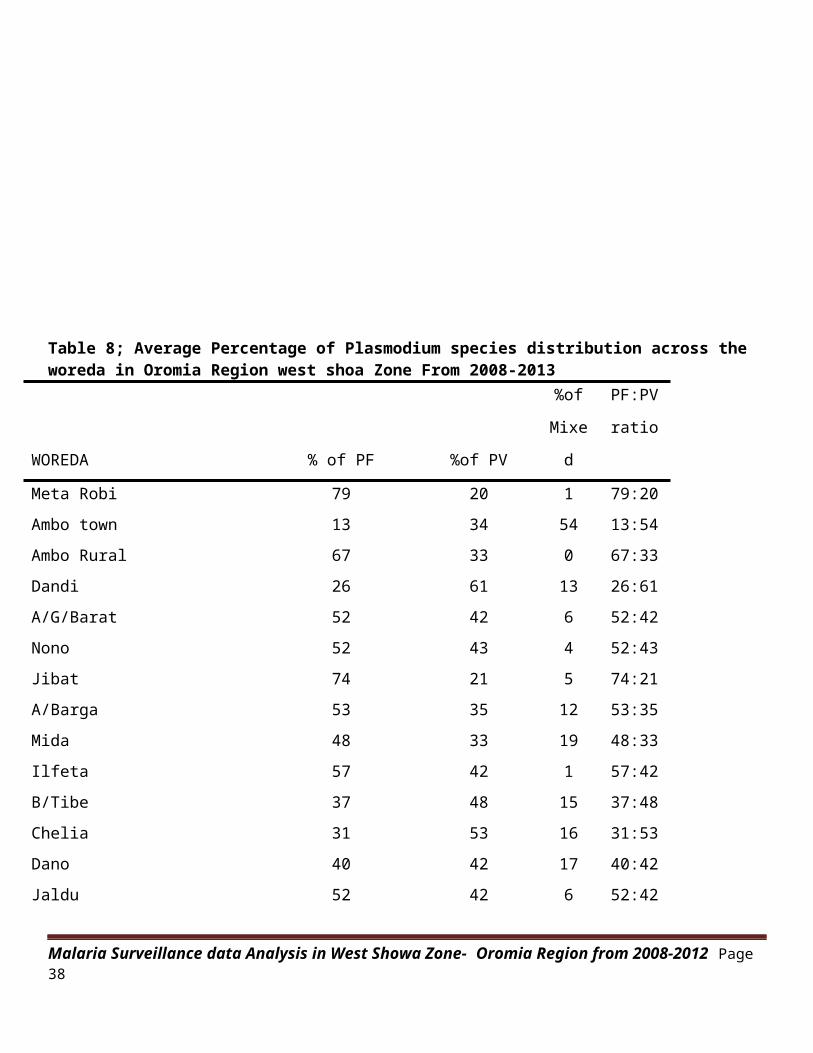
Table 8; Average Percentage of Plasmodium species distribution across the woreda in Oromia Region west shoa Zone From 2008-2013
WOREDA % of PF %of PV
%of
Mixe
d
PF:PV
ratio
Meta Robi 79 20 1 79:20Ambo town 13 34 54 13:54Ambo Rural 67 33 0 67:33Dandi 26 61 13 26:61A/G/Barat 52 42 6 52:42Nono 52 43 4 52:43Jibat 74 21 5 74:21A/Barga 53 35 12 53:35Mida 48 33 19 48:33Ilfeta 57 42 1 57:42B/Tibe 37 48 15 37:48Chelia 31 53 16 31:53Dano 40 42 17 40:42Jaldu 52 42 6 52:42
Malaria Surveillance data Analysis in West Showa Zone- Oromia Region from 2008-2012 Page38
G/Barat 66 28 6 66:28Ejere 36 56 8 36:56T/Kutaye 45 46 9 45:46Ilu-galan 48 42 10 48:42
Average 43 39 18 44:39
The plasmodium falciparum is one of the cause for the occurrence of
outbreak, provided that it important to know its distribution across the
zone for its control and prevention, however the distribution of plasmodium
species in some woreda varies from the prior knowledge of the falciparium
to Vivax (60:40) ratio, so that the distribution of plasmodium species
across the woreda in the zone is greatly vary from each other. From the
data Ambo town, Dandi, B/Tibe, Cheliya, Dano, Ejere and Toke Kutaye are
relatively the plasmodium Vivax is higher than that of Falciparum.
Malaria Surveillance data Analysis in West Showa Zone- Oromia Region from 2008-2012 Page39
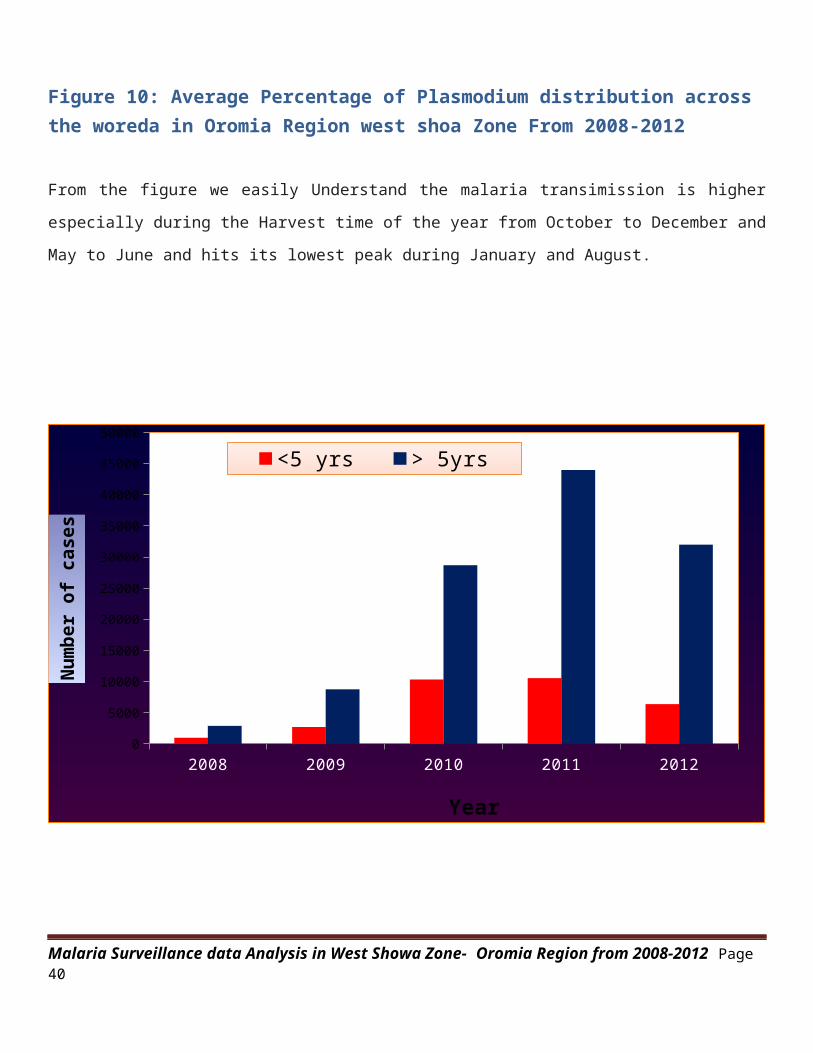
Figure 10: Average Percentage of Plasmodium distribution across the woreda in Oromia Region west shoa Zone From 2008-2012
From the figure we easily Understand the malaria transimission is higher
especially during the Harvest time of the year from October to December and
May to June and hits its lowest peak during January and August.
2008 2009 2010 2011 20120
5000
10000
15000
20000
25000
30000
35000
40000
45000
50000
<5 yrs > 5yrs
Year
Number of cases
Malaria Surveillance data Analysis in West Showa Zone- Oromia Region from 2008-2012 Page40
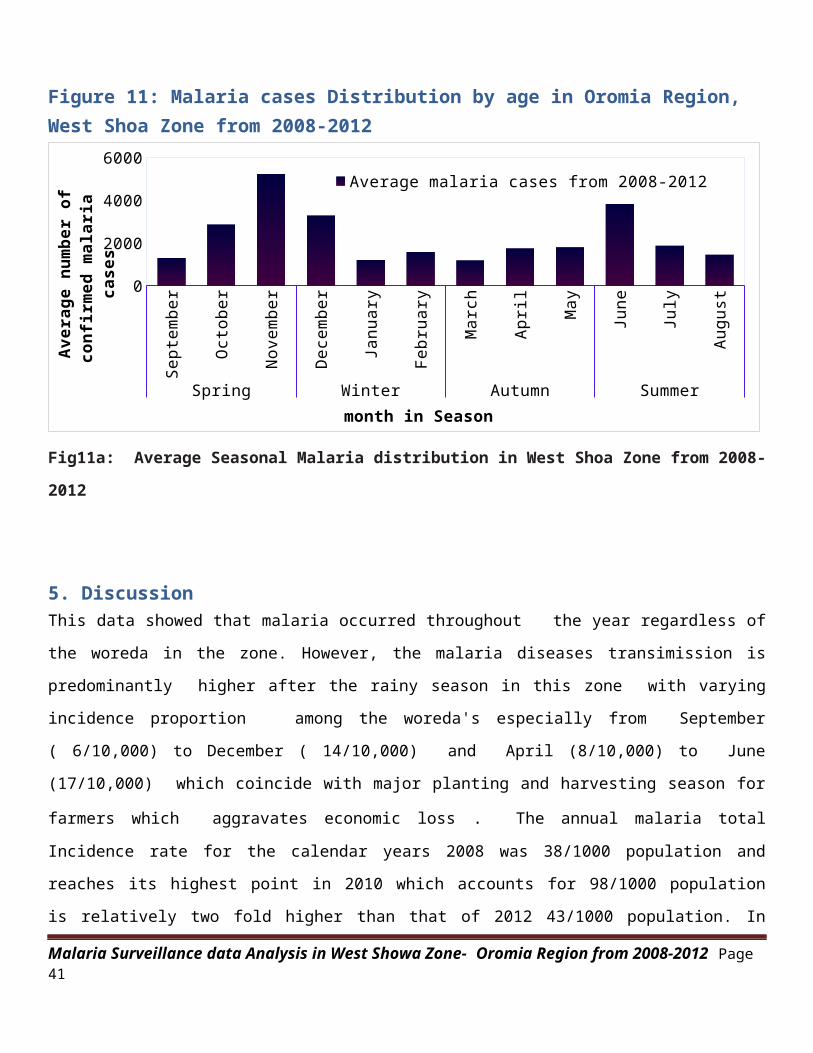
Figure 11: Malaria cases Distribution by age in Oromia Region, West Shoa Zone from 2008-2012
Sept
embe
r
Octo
ber
Nove
mber
Dece
mber
Janu
ary
Febr
uary
Marc
h
Apri
l
May
June
July
Augu
st
Spring Winter Autumn Summer
0
2000
4000
6000Average malaria cases from 2008-2012
month in Season
Aver
age
numb
er o
f co
nfir
med
mala
ria
ca
ses
Fig11a: Average Seasonal Malaria distribution in West Shoa Zone from 2008-
2012
5. DiscussionThis data showed that malaria occurred throughout the year regardless of
the woreda in the zone. However, the malaria diseases transimission is
predominantly higher after the rainy season in this zone with varying
incidence proportion among the woreda's especially from September
( 6/10,000) to December ( 14/10,000) and April (8/10,000) to June
(17/10,000) which coincide with major planting and harvesting season for
farmers which aggravates economic loss . The annual malaria total
Incidence rate for the calendar years 2008 was 38/1000 population and
reaches its highest point in 2010 which accounts for 98/1000 population
is relatively two fold higher than that of 2012 43/1000 population. In
Malaria Surveillance data Analysis in West Showa Zone- Oromia Region from 2008-2012 Page41
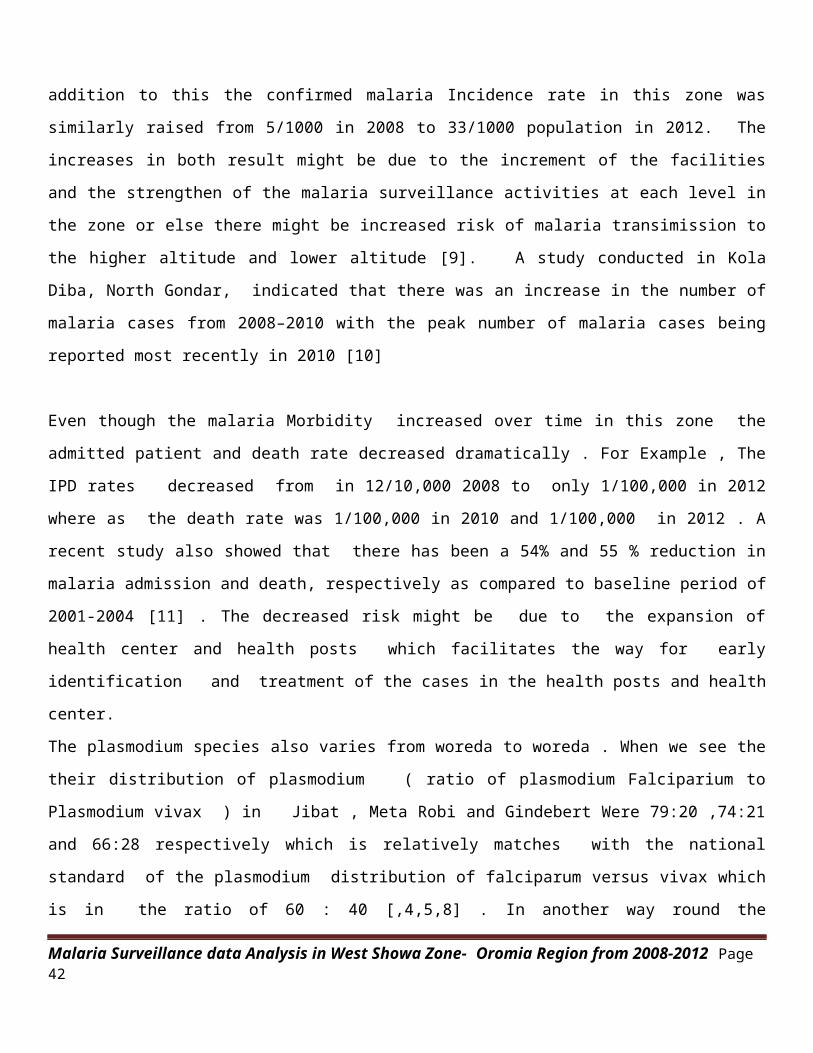
addition to this the confirmed malaria Incidence rate in this zone was
similarly raised from 5/1000 in 2008 to 33/1000 population in 2012. The
increases in both result might be due to the increment of the facilities
and the strengthen of the malaria surveillance activities at each level in
the zone or else there might be increased risk of malaria transimission to
the higher altitude and lower altitude [9]. A study conducted in Kola
Diba, North Gondar, indicated that there was an increase in the number of
malaria cases from 2008–2010 with the peak number of malaria cases being
reported most recently in 2010 [10]
Even though the malaria Morbidity increased over time in this zone the
admitted patient and death rate decreased dramatically . For Example , The
IPD rates decreased from in 12/10,000 2008 to only 1/100,000 in 2012
where as the death rate was 1/100,000 in 2010 and 1/100,000 in 2012 . A
recent study also showed that there has been a 54% and 55 % reduction in
malaria admission and death, respectively as compared to baseline period of
2001-2004 [11] . The decreased risk might be due to the expansion of
health center and health posts which facilitates the way for early
identification and treatment of the cases in the health posts and health
center.
The plasmodium species also varies from woreda to woreda . When we see the
their distribution of plasmodium ( ratio of plasmodium Falciparium to
Plasmodium vivax ) in Jibat , Meta Robi and Gindebert Were 79:20 ,74:21
and 66:28 respectively which is relatively matches with the national
standard of the plasmodium distribution of falciparum versus vivax which
is in the ratio of 60 : 40 [,4,5,8] . In another way round the
Malaria Surveillance data Analysis in West Showa Zone- Oromia Region from 2008-2012 Page42
distribution of plasmodium vivax species is higher than that of the
distribution of falciparum which completely disagree with the national
guideline standards . This woreda Includes Bako Tibe, Chelia and Dano. Some
studies also supported this findings which dedicated an increased
proportion of vivax malaria is consistent with a study at high altitude in
the Butajira area [12], and a study in the Akaki area [13]. Recent studies
also show a shift from falciparum to vivax malaria [14,15]. However, other
studies report the consistent dominance of Plasmodium falciparum [9,16-18].
The increase in vivax malaria in highland-fringe areas could be explained
by the high transmissibility of P. vivax . in this zone also there is the
shift of plasmodium falciparum to the vivax . when we analyzed the average
plasmodium species from 2008-2012 GC is 43:39 which is relatively similar.
The malaria slide positivity rate (SPR) increases from 42% in 2008 to 50%
up to the fourth quarter of 2012. The positivity rate attains its maximum
point 70% in the year 2010. The increment of the slide positivity rate
strongly predicts the raise of the incidence rate . So Slide Positivity
Rate (SPR) is well associated with the raise of the case in the
population , therefore this study also indicated that slide
positivity rate helps as alarming tool for malaria outbreak .
5.1. Limitations
Malaria Surveillance data Analysis in West Showa Zone- Oromia Region from 2008-2012 Page43
The data segregated by sex and age was limited only to two categories;
above and under 5 years.
We use the secondary data/source .
5.2. Conclusion Even though different malaria control strategies were designed to
rollback to its minimum level the malaria status were increasing during
the study period except slight decline in 2012. Therefore, the zonal
health Department should assess and identify the reason why the malaria
incidence rate was increased , Unless otherwise this will be a threat
for the community in the coming year.
5.3 . Recommendations. The zonal health department should conduct a training for the woreda
PHEM officers especially on how to report and respond in emergency
situation .
The recent reporting format lacks some important indicator variables
such as different age category for analysis so it should be incorporated
.
Supportive Supervision was important for routine surveillance by Prepare
standardized and comprehensive supervisory check list to be used at all
level
Malaria Surveillance data Analysis in West Showa Zone- Oromia Region from 2008-2012 Page44
continuous monitoring and evaluation approach of the program
intervention should be mandatory to know whether it were successful or
not in the zone so as to know the effectiveness of each intervention .
Close follow up and technical assistance Should be needed when no
reports are coming from the woreda. Having complete report helps the
analysis and interpretation to be more meaningful and acceptable.
Not the least but the last , PHEM office in the zone were not recording
, documenting and reporting well as of expected enough to detect the
outbreak early as far as possible. The malaria surveillance data were
not well integrated so as to monitor the occurrence of outbreak .
Therefore, the concerned bodies should solve the assignment to overcome
the challenges against burden of malaria in the community.
Further study should be plan for prevention and control to come to
elimination
Malaria Surveillance data Analysis in West Showa Zone- Oromia Region from 2008-2012 Page45
6 References:1. Ridley, R. G. Nature 2002, 415,686-693.
2. Wirth, D.F. Nature 2002, 419, 495-496.
3. Medicinal and Process Chemistry Division, Central Drug Research
Institute, Lucknow-226001, India
4. Disease Surveillance for Malaria Control by Robert D. Newman,
MD, MPH WHO An operational manual 2012
5. Federal Ministry of Health Malaria Guide line 2012
6. SUMMARY PROCEEDINGS 3rd ANNUAL MALARIA CONTROL PROGRAM REVIEW
Ethiopia and Nigeria Held on February 24, 2012 at September
7. PRESIDENT’S MALARIA INITIATIVE MALARIA OPERATIONAL PLAN (MOP)
ETHIOPIA FY2012
8. Public Emergency Management Guide Line for Ethiopia February
2012Addis Ababa Ethiopia
9. A recent WHO rapid impact assessment (November/December 2007)
10. Ten year trend analysis of malaria prevalence in Kola Diba,
North Gondar, Northwest Ethiopia
11. Health Sector Development Program IV 2010/11 – 2014/15
Malaria Surveillance data Analysis in West Showa Zone- Oromia Region from 2008-2012 Page46
12. Tesfaye S, Belyhun Y, Teklu T, Mengesha T, Petros B: Malaria
prevalence pattern observed in the highland fringe of Butajira,
Southern Ethiopia: a longitudinal study from parasitological
and entomological survey. Malar J 2011, 10:153
13. Woyessa A, Gebre-Michael T, Ali A: An indigenous malaria
transmission in the outskirts of Addis Ababa, Akaki Town and
its
14. Microsoft ® Encarta ® 2009. © 1993-2008 Microsoft
Corporation.
15. Adugna Woyessa1,2*, Wakgari Deressa2, Ahmed Ali2 and Bernt
Lindtjørn3
16. Ghebreyesus T, Haile M, Witten KH, Getachew A, Yohannes M,
Lindsay SW, Byass P: Household risk factors for malaria among
children in the Ethiopian highlands. Trans R Soc Trop Med Hyg
2000, 94:17-21.
17. Karunamoorthi K, Bekele M: Prevalence of malaria from
peripheral blood
18. smears examination: A 1-year retorspective study from the
Serbo Health
Malaria Surveillance data Analysis in West Showa Zone- Oromia Region from 2008-2012 Page47