biologically active filtration for treatment of
TRANSCRIPT
BIOLOGICALLY ACTIVE FILTRATION FOR TREATMENT OF
PRODUCED WATER AND FRACTURING FLOWBACK
WASTEWATER IN THE O&G INDUSTRY
by
Daniel E. Freedman
ii
A thesis submitted to the Faculty and the Board of Trustees of the Colorado School of
Mines in partial fulfillment of the requirements for the degree of Master of Science (Civil and
Environmental Engineering)
Golden, Colorado
Date _____________
Signed: __________________________
Daniel E. Freedman
Signed: __________________________
Dr. Tzahi Y. Cath
Thesis Advisor
Golden, Colorado
Date _____________
Signed: __________________________
Dr. John McCray
Professor and Department Head
Department of Civil and Environmental Engineering
iii
ABSTRACT
Sustainable development of unconventional oil and gas reserves, particularly tight oil,
tight gas, and shale gas, requires prudent management of water resources used during drilling,
well completion, and production activities. Economic viability of unconventional resource de-
velopment can be attributed to technical advancements in horizontal drilling and hydraulic frac-
turing, both of which are water-intensive operations. On average, 2 to 5 million gallons of water
are required for multistage hydraulic fracturing of a single horizontal well. This raises concerns
about freshwater acquisition and management of the wastewater generated. The associated risks
to water resources are of major interest and concern to water utilities, stakeholders, and environ-
mentalists. Mitigation of such risks can be achieved through a comprehensive water management
plan that integrates robust treatment technologies aimed at recovering water for recycling in field
operations.
Recycling of flowback and produced water is presently becoming a more widely applied
management practice, as it protects freshwater resources by eliminating surface water discharge
and reducing demand on high quality sources. Recycling is potentially cost-effective because it
often requires a lower level of treatment than would surface water discharge or other beneficial
reuse application. Yet, significant challenges remain in rendering these waste streams amenable
for reuse.
Reduction of organic matter has been a notable wastewater treatment engineering chal-
lenge and has limited practical opportunities for reuse. This research focuses on harnessing the
propensity of microorganisms for biodegradation of organic carbon present at high concentra-
tions in fracturing flowback and produced water. Bench-scale and pilot-scale biofiltration sys-
tems were investigated to determine adaptability of a specific biofilm and measure biodegrada-
tion of organic carbon at different operating conditions. The biologically active media was grad-
ually acclimated to a produced water stream from the Piceance Basin. Following the successful
conditioning and acclimation, up to 90% DOC removal and 80% COD removal was achieved.
Results from the performance evaluation demonstrated scalability and flexibility of the system to
maintain treatment efficiency, as well as the impacts of variable operating conditions.
iv
TABLE OF CONTENTS
ABSTRACT ................................................................................................................................... iii
LIST OF FIGURES ....................................................................................................................... vi
LIST OF TABLES ......................................................................................................................... ix
ACKNOWLEDGMENTS .............................................................................................................. x
CHAPTER 1 INTRODUCTION ............................................................................................... 1
1.1 Water Use in the Upstream Sector of the Oil and Gas Industry ...................................... 2
1.2 Exploration and Production Wastewater Generation ....................................................... 4
1.3 Wastewater Management Practices .................................................................................. 4
1.4 Recycling and Reuse ........................................................................................................ 7
1.4.1 Major Opportunities .................................................................................................. 7
1.4.2 Reuse Challenges and Limitations ............................................................................ 8
1.5 Biological Treatment Systems ....................................................................................... 12
1.5.1 Biologically Active Filtration ................................................................................. 15
1.5.2 Application for Exploration and Production Wastewater Treatment ..................... 16
CHAPTER 2 MATERIALS & METHODS ............................................................................ 17
Filter Media .................................................................................................................... 18 2.3
Wastewater Feed Streams .............................................................................................. 19 2.4
2.4.1 Produced Water ....................................................................................................... 19
2.4.2 Flowback Water ...................................................................................................... 20
2.4.3 Simulated Fracturing Flowback Water ................................................................... 21
Operating Conditions ..................................................................................................... 22 2.5
Sampling and Analytical Procedures ............................................................................. 24 2.6
CHAPTER 3 RESULTS & DISCUSSION ............................................................................. 27
3.1 Bench-scale Filtration System ........................................................................................ 27
v
3.1.1 Bench-scale BAF Treatment of Diluted Piceance Basin Produced Water ............. 27
3.1.2 Bench-scale BAF Treatment of Undiluted Piceance Basin Produced Water ......... 29
3.1.3 Bench-scale BAF Treatment of Denver-Julesburg Basin Produced Water ............ 31
3.2 Lab-scale Filtration System ............................................................................................ 33
3.2.1 Lab-scale BAF Treatment of Diluted Produced Water ........................................... 33
3.2.2 Lab-scale BAF Treatment of Undiluted Produced Water ....................................... 35
3.2.2.1 Impacts of Temperature on BAF Performance ................................................... 38
3.2.2.2 Microbial Community Assessment ..................................................................... 41
3.2.2.3 System Flexibility ............................................................................................... 45
3.2.2.4 Impacts of Variable Empty-Bed Contact Time ................................................... 46
3.2.3 Performance Evaluation with Simulated and Real Flowback Water ...................... 49
CHAPTER 4 CONCLUSIONS ............................................................................................... 53
REFERENCES ............................................................................................................................. 56
vi
LIST OF FIGURES
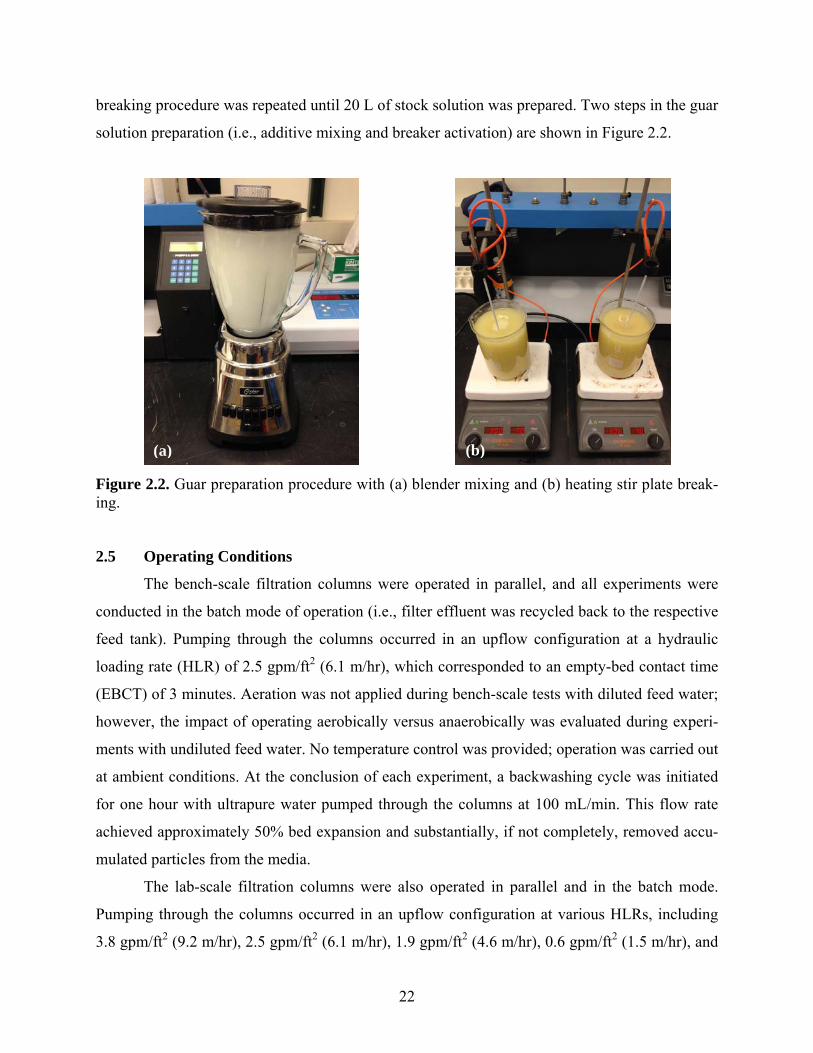
Figure 2.2. Guar preparation procedure with (a) blender mixing and (b) heating stir plate
breaking................................................................................................................. 22
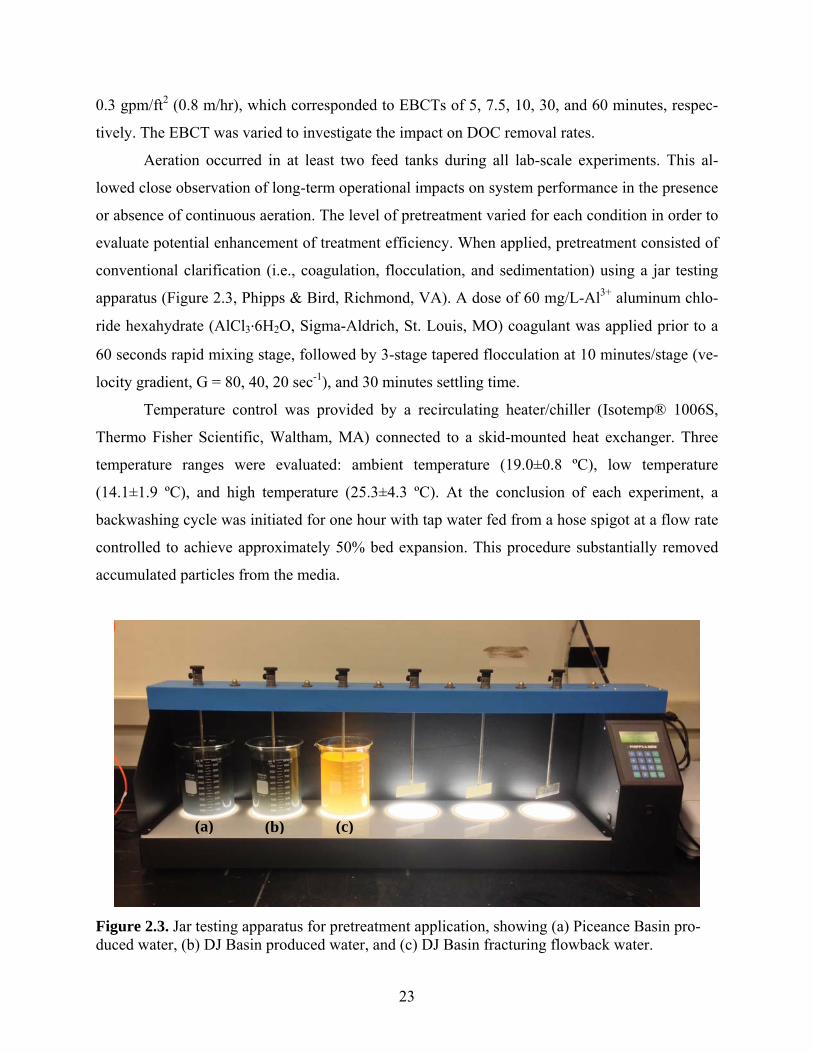
Figure 2.3. Jar testing apparatus for pretreatment application, showing (a) Piceance Basin
produced water, (b) DJ Basin produced water, and (c) DJ Basin fracturing
flowback water. ..................................................................................................... 23
Figure 3.1. DOC concentration as a function of time for 2x dilution experiments (a) without
pretreatment (test 5a) and (b) with pretreatment (test 5b). BAF-1 is the abiotic
control. Operating conditions: Batch volume 1 L per filter, ambient temperature
(20.3±0.8 ºC), HLR 2.5 gpm/ft2 (6.1 m/hr), and EBCT 3 minutes. ..................... 29
Figure 3.2. DOC concentration as a function of time for undiluted experiments (a) without
aeration (test 6a) and (c) with aeration (test 6b); DO concentration as a function of
time for experiments (b) without aeration (test 6a) and (d) with aeration (test 6b).
BAF-1 is the abiotic control. Operating conditions: Batch volume 1 L per filter,
ambient temperature (20.2±1.0 ºC), HLR 2.5 gpm/ft2 (6.1 m/hr), and EBCT 3
minutes. ................................................................................................................. 31
Figure 3.3. (a) DOC concentration and (b) DO concentration as functions of time for
undiluted experiments with DJ Basin produced water. BAF-1 is the abiotic
control. BAF-2 contained no filter media. Operating conditions: Batch volume 1
L per filter, aeration applied to all feed tanks, ambient temperature (22.1±0.9 ºC),
HLR 2.5 gpm/ft2 (6.1 m/hr), and EBCT 3 minutes. ............................................. 32
Figure 3.4. (a) DOC concentration and (b) DO concentration as functions of time for 2x
dilution experiments. Operating conditions: Batch volume 10 L per filter, aeration
applied to feed tanks for BAF-1 and BAF-2, ambient temperature (18.5±2.0 ºC),
HLR 0.6 gpm/ft2 (1.5 m/hr), and EBCT 30 minutes. ........................................... 34
Figure 3.5. (a) DOC concentration and (b) DO concentration as functions of time for
undiluted experiments. Operating conditions: Batch volume 10 L per filter,
pretreatment applied to feed water for BAF-2 and BAF-4, aeration applied to feed
tanks for BAF-1 and BAF-2, ambient temperature (19.0±0.8 ºC), HLR 0.6
gpm/ft2 (1.5 m/hr), and EBCT 30 minutes. .......................................................... 36
vii
Figure 3.6. (a) Initial and final COD concentrations and (b) total COD removal for undiluted
experiments. Operating conditions as stated in Figure 3.5. .................................. 37
Figure 3.7. 3D fluorescence EEM scans of (a) untreated produced water feed and (b) filtered
effluent following 72 hours of treatment in BAF-1. ............................................. 38
Figure 3.8. Relative DOC concentration as a function of time for undiluted experiments (a) at
low temperature conditions (14.1±1.9 ºC, Co,avg = 251.4 mg/L) and (b) high
temperature conditions (25.3±4.3 ºC, Co,avg = 157.7 mg/L). Operating
conditions: Batch volume 10 L per filter, pretreatment applied to feed water for
BAF-2 and 4, aeration applied to feed tanks for BAF-1 and BAF-2, HLR 0.6
gpm/ft2 (1.5 m/hr), and EBCT 30 minutes. .......................................................... 39
Figure 3.9. Relative abundance of microorganisms in DNA extracted from Piceance Basin
produced water; extant GAC biofilm; and GAC media from filtration columns
tested in this research after two months of operation with a single water type.
Microorganisms are classified at the class taxonomic rank. BAF-1: aeration, no
pretreatment; BAF-2: aeration, pretreatment; BAF-3: no aeration, no
pretreatment; and BAF-4: no aeration, pretreatment. ........................................... 43
Figure 3.10. (a) Initial and final COD concentrations and (b) total COD removal for
experiments with new feed water type. BAF-1 and BAF-2 treated Piceance Basin
produced water; BAF-3 and BAF-4 treated DJ Basin produced water. Operating
conditions: Batch vol. 10 L, ambient temp., aeration applied to all feed tanks,
HLR = 0.6 gpm/ft2 (1.5 m/hr), and 30 min EBCT. .............................................. 46
Figure 3.11. DOC removal after 30 hours of operation, comparing dominant removal
mechanisms of adsorption and biodegradation. .................................................... 47
Figure 3.12. (a) Relative DOC concentrations (Co,avg = 216.4 mg/L) and (b) effluent DO
concentrations as functions of time for biodegradable portion of removal (i.e.,
excluding initial rapid removal due to adsorption) at varying empty-bed contact
times. Operating conditions: Batch volume 10 L per filter, ambient temperature
(21.2±1.3 ºC), and aeration applied to all feed tanks. HLR varied to achieve
desired EBCT. ....................................................................................................... 48
viii
Figure 3.13. (a) COD concentrations and (b) guar gel concentrations as functions of time for
experiments with simulated fracturing flowback water. Operating conditions:
Batch volume 10 L, ambient temperature, aeration applied to feed tank, HLR =
2.5 gpm/ft2 (6.1 m/hr), and 7.5 minutes EBCT. ................................................... 50
Figure 3.14. Organics removal results from experiment with real fracturing flowback water,
displaying (a) effluent DOC concentrations as a function of time and (b) overall
COD removal. Operating conditions: Batch volume 10 L, ambient temperature,
aeration applied to feed tank, HLR = 2.5 gpm/ft2 (6.1 m/hr), and 7.5 minutes
EBCT. ................................................................................................................... 52
ix
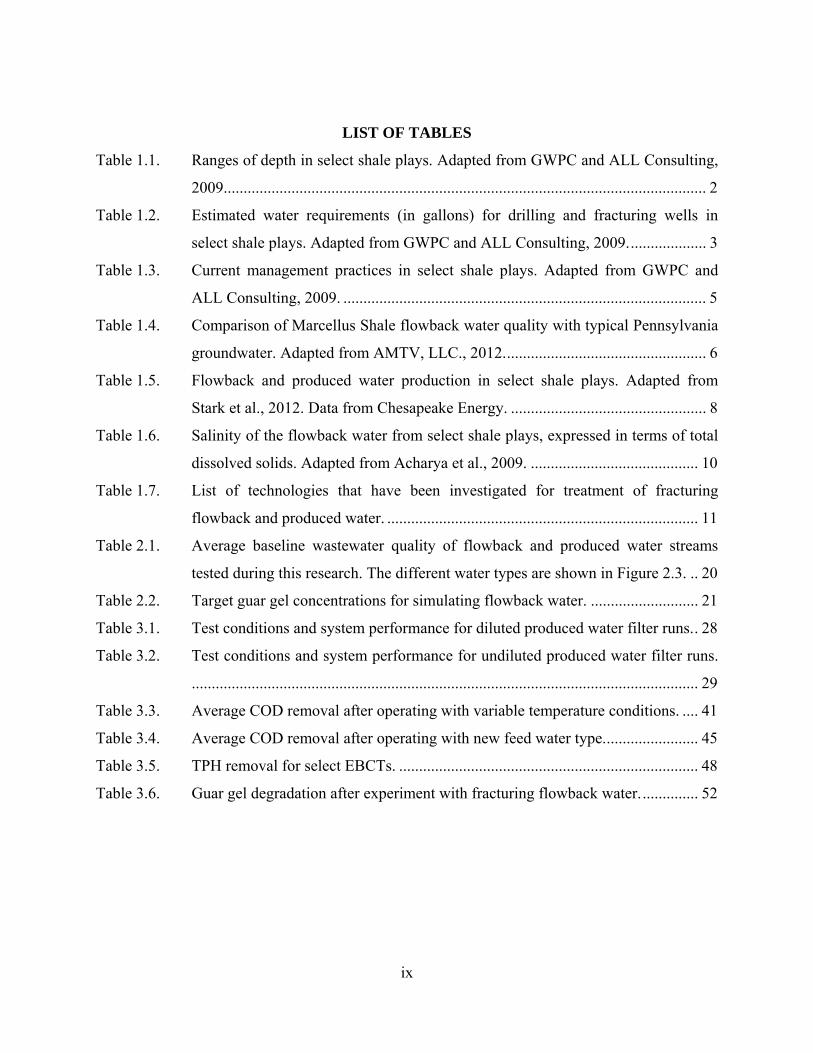
LIST OF TABLES
Table 1.1. Ranges of depth in select shale plays. Adapted from GWPC and ALL Consulting,
2009......................................................................................................................... 2
Table 1.2. Estimated water requirements (in gallons) for drilling and fracturing wells in
select shale plays. Adapted from GWPC and ALL Consulting, 2009. ................... 3
Table 1.3. Current management practices in select shale plays. Adapted from GWPC and
ALL Consulting, 2009. ........................................................................................... 5
Table 1.4. Comparison of Marcellus Shale flowback water quality with typical Pennsylvania
groundwater. Adapted from AMTV, LLC., 2012. .................................................. 6
Table 1.5. Flowback and produced water production in select shale plays. Adapted from
Stark et al., 2012. Data from Chesapeake Energy. ................................................. 8
Table 1.6. Salinity of the flowback water from select shale plays, expressed in terms of total
dissolved solids. Adapted from Acharya et al., 2009. .......................................... 10
Table 1.7. List of technologies that have been investigated for treatment of fracturing
flowback and produced water. .............................................................................. 11
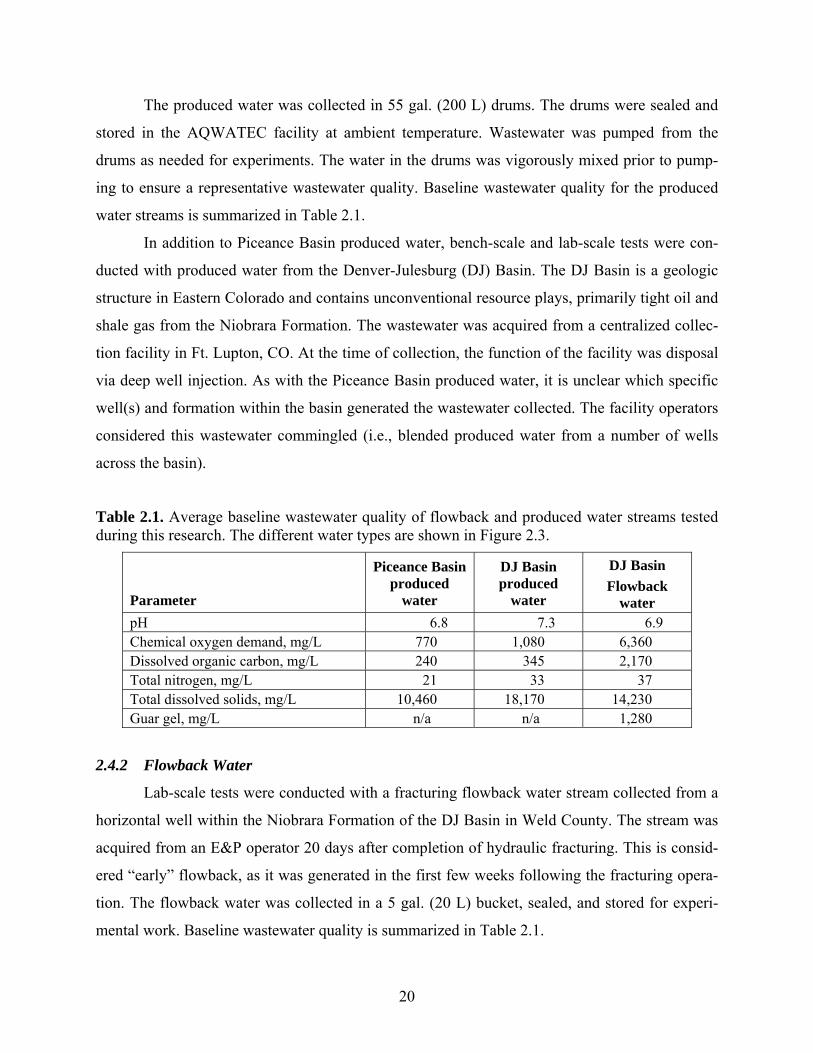
Table 2.1. Average baseline wastewater quality of flowback and produced water streams
tested during this research. The different water types are shown in Figure 2.3. .. 20
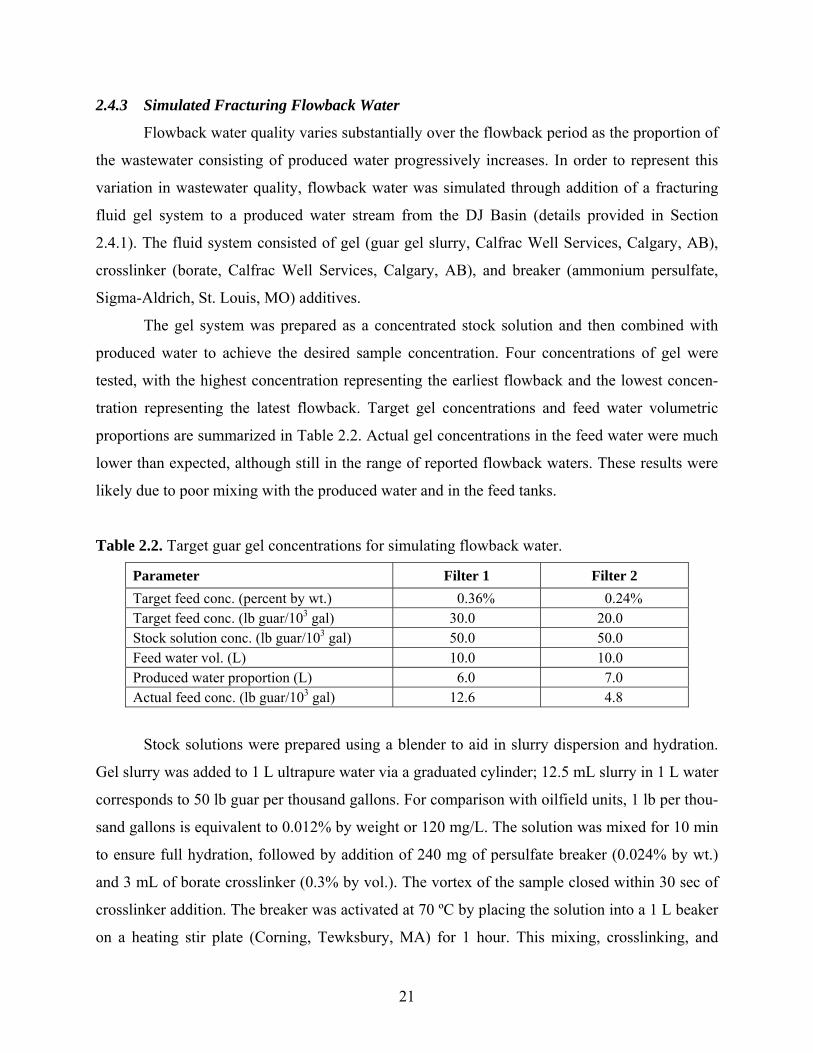
Table 2.2. Target guar gel concentrations for simulating flowback water. ........................... 21
Table 3.1. Test conditions and system performance for diluted produced water filter runs. . 28
Table 3.2. Test conditions and system performance for undiluted produced water filter runs.
............................................................................................................................... 29
Table 3.3. Average COD removal after operating with variable temperature conditions. .... 41
Table 3.4. Average COD removal after operating with new feed water type. ....................... 45
Table 3.5. TPH removal for select EBCTs. ........................................................................... 48
Table 3.6. Guar gel degradation after experiment with fracturing flowback water. .............. 52
x
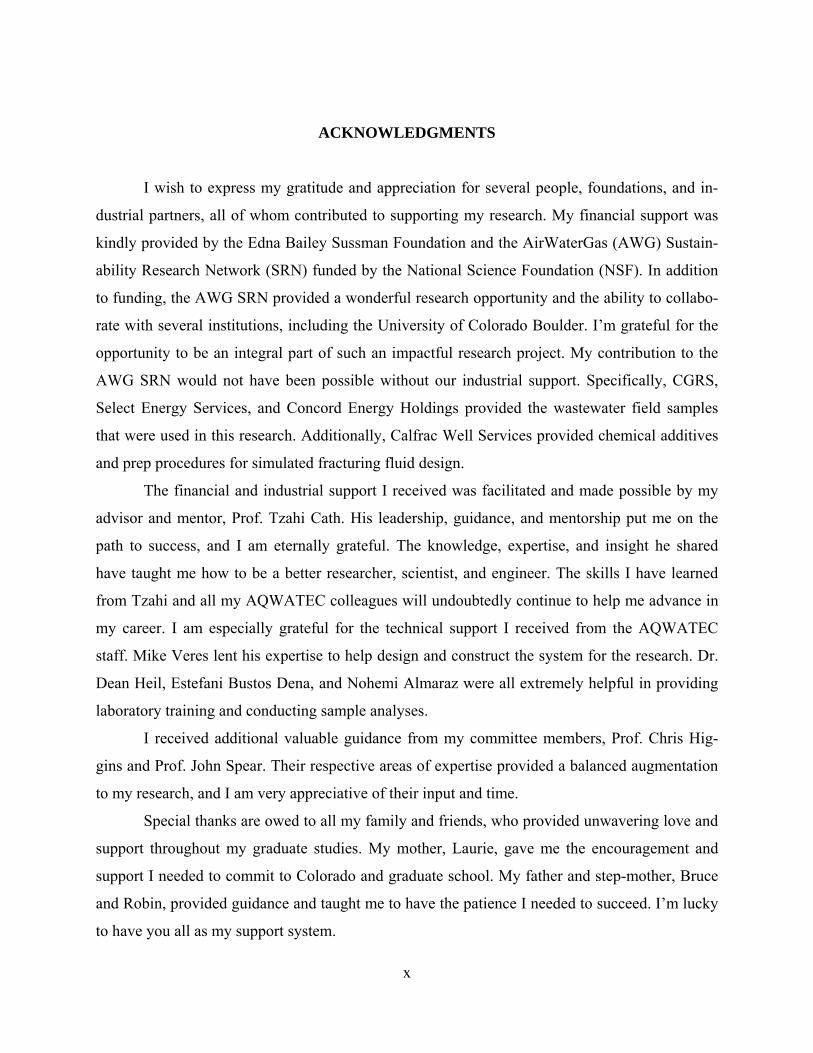
ACKNOWLEDGMENTS
I wish to express my gratitude and appreciation for several people, foundations, and in-
dustrial partners, all of whom contributed to supporting my research. My financial support was
kindly provided by the Edna Bailey Sussman Foundation and the AirWaterGas (AWG) Sustain-
ability Research Network (SRN) funded by the National Science Foundation (NSF). In addition
to funding, the AWG SRN provided a wonderful research opportunity and the ability to collabo-
rate with several institutions, including the University of Colorado Boulder. I’m grateful for the
opportunity to be an integral part of such an impactful research project. My contribution to the
AWG SRN would not have been possible without our industrial support. Specifically, CGRS,
Select Energy Services, and Concord Energy Holdings provided the wastewater field samples
that were used in this research. Additionally, Calfrac Well Services provided chemical additives
and prep procedures for simulated fracturing fluid design.
The financial and industrial support I received was facilitated and made possible by my
advisor and mentor, Prof. Tzahi Cath. His leadership, guidance, and mentorship put me on the
path to success, and I am eternally grateful. The knowledge, expertise, and insight he shared
have taught me how to be a better researcher, scientist, and engineer. The skills I have learned
from Tzahi and all my AQWATEC colleagues will undoubtedly continue to help me advance in
my career. I am especially grateful for the technical support I received from the AQWATEC
staff. Mike Veres lent his expertise to help design and construct the system for the research. Dr.
Dean Heil, Estefani Bustos Dena, and Nohemi Almaraz were all extremely helpful in providing
laboratory training and conducting sample analyses.
I received additional valuable guidance from my committee members, Prof. Chris Hig-
gins and Prof. John Spear. Their respective areas of expertise provided a balanced augmentation
to my research, and I am very appreciative of their input and time.
Special thanks are owed to all my family and friends, who provided unwavering love and
support throughout my graduate studies. My mother, Laurie, gave me the encouragement and
support I needed to commit to Colorado and graduate school. My father and step-mother, Bruce
and Robin, provided guidance and taught me to have the patience I needed to succeed. I’m lucky
to have you all as my support system.
1
CHAPTER 1
INTRODUCTION
The abundance of technically recoverable oil and gas (O&G) reserves in the United
States has resulted in rapid development of unconventional resources.1 Expansion of the O&G
industry, particularly tight oil, tight gas, and shale gas, has prompted policy debates regarding
energy independence and reducing greenhouse gas emissions.2, 3 Considered a “bridge fuel” to a
low-carbon future,2 natural gas has a carbon intensity substantially less than coal or petroleum,4
and the increase in the rate of natural gas production positions the U.S. to become a net exporter
by 2019.5 However, this rapid exploitation of resources has not been without scrutiny. The eco-
nomic, energy security, and climate change benefits are often countered by the potential envi-
ronmental impacts,6 including contamination of drinking water aquifers,7-10 leakage of methane
to the atmosphere,11 and depletion of freshwater resources.3, 12
Water has emerged as the highest visibility environmental issue within unconventional
O&G development.13 As the industry continues its rapid expansion in response to recent energy
independence policies, advancements in hydrocarbon recovery techniques, and growing demand
for energy, the management of water resources faces considerable challenges. Both water quanti-
ty and water quality management are critical to the sustainability of the O&G industry. Water
availability becomes a concern as O&G operators compete for limited resources in often water-
stressed regions.12, 14 Water quality impacts in many O&G producing regions are of great con-
cern, as the hydraulic fracturing process has the potential to cause contamination of surface water
and groundwater resources.7, 8, 15-22
The water resources challenges facing the O&G industry will require comprehensive en-
gineered solutions, including the development of water management portfolios that pragmatical-
ly consider cost-effective wastewater treatment technologies. With these challenges in mind, this
thesis seeks to elucidate the role of biological filtration as a unit process in treatment schemes
directed towards recycling and reuse of wastewater generated during exploration and production
(E&P) of O&G. Results of a performance assessment are presented that demonstrate the tech-
nical feasibility of biologically active filters for treatment of complex and difficult-to-treat O&G
waste streams.
2
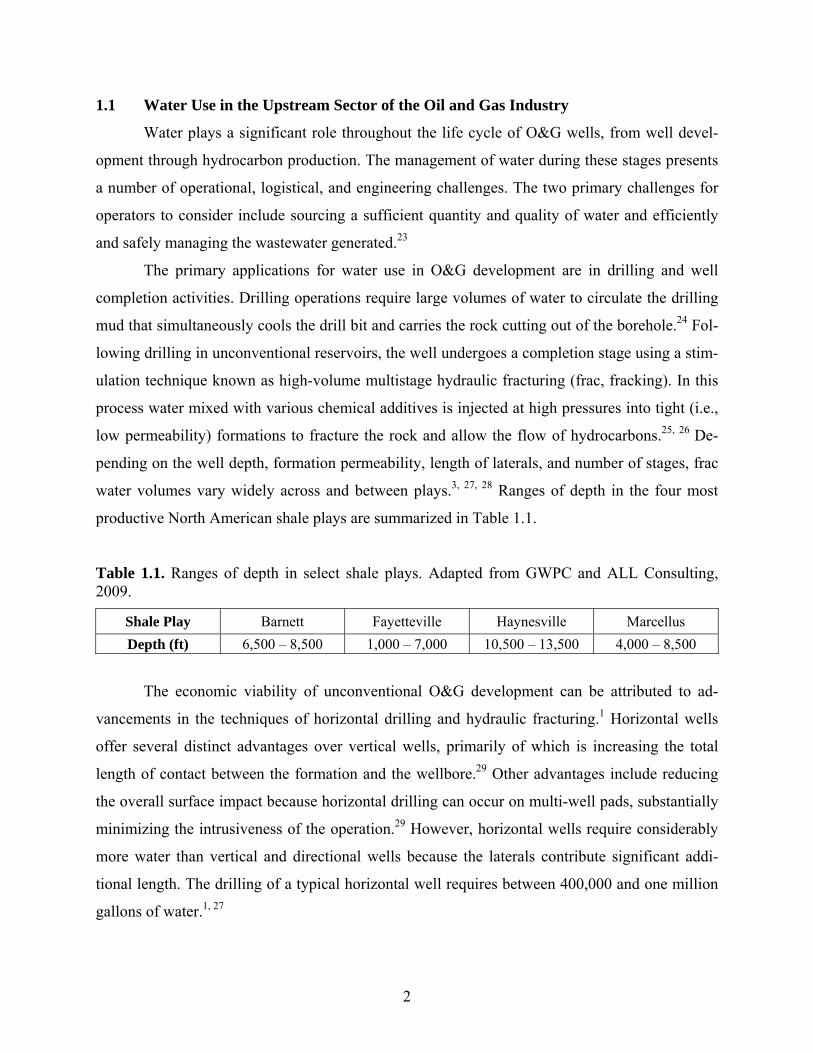
1.1 Water Use in the Upstream Sector of the Oil and Gas Industry
Water plays a significant role throughout the life cycle of O&G wells, from well devel-
opment through hydrocarbon production. The management of water during these stages presents
a number of operational, logistical, and engineering challenges. The two primary challenges for
operators to consider include sourcing a sufficient quantity and quality of water and efficiently
and safely managing the wastewater generated.23
The primary applications for water use in O&G development are in drilling and well
completion activities. Drilling operations require large volumes of water to circulate the drilling
mud that simultaneously cools the drill bit and carries the rock cutting out of the borehole.24 Fol-
lowing drilling in unconventional reservoirs, the well undergoes a completion stage using a stim-
ulation technique known as high-volume multistage hydraulic fracturing (frac, fracking). In this
process water mixed with various chemical additives is injected at high pressures into tight (i.e.,
low permeability) formations to fracture the rock and allow the flow of hydrocarbons.25, 26 De-
pending on the well depth, formation permeability, length of laterals, and number of stages, frac
water volumes vary widely across and between plays.3, 27, 28 Ranges of depth in the four most
productive North American shale plays are summarized in Table 1.1.
Table 1.1. Ranges of depth in select shale plays. Adapted from GWPC and ALL Consulting, 2009.
Shale Play Barnett Fayetteville Haynesville Marcellus
Depth (ft) 6,500 – 8,500 1,000 – 7,000 10,500 – 13,500 4,000 – 8,500
The economic viability of unconventional O&G development can be attributed to ad-
vancements in the techniques of horizontal drilling and hydraulic fracturing.1 Horizontal wells
offer several distinct advantages over vertical wells, primarily of which is increasing the total
length of contact between the formation and the wellbore.29 Other advantages include reducing
the overall surface impact because horizontal drilling can occur on multi-well pads, substantially
minimizing the intrusiveness of the operation.29 However, horizontal wells require considerably
more water than vertical and directional wells because the laterals contribute significant addi-
tional length. The drilling of a typical horizontal well requires between 400,000 and one million
gallons of water.1, 27
3
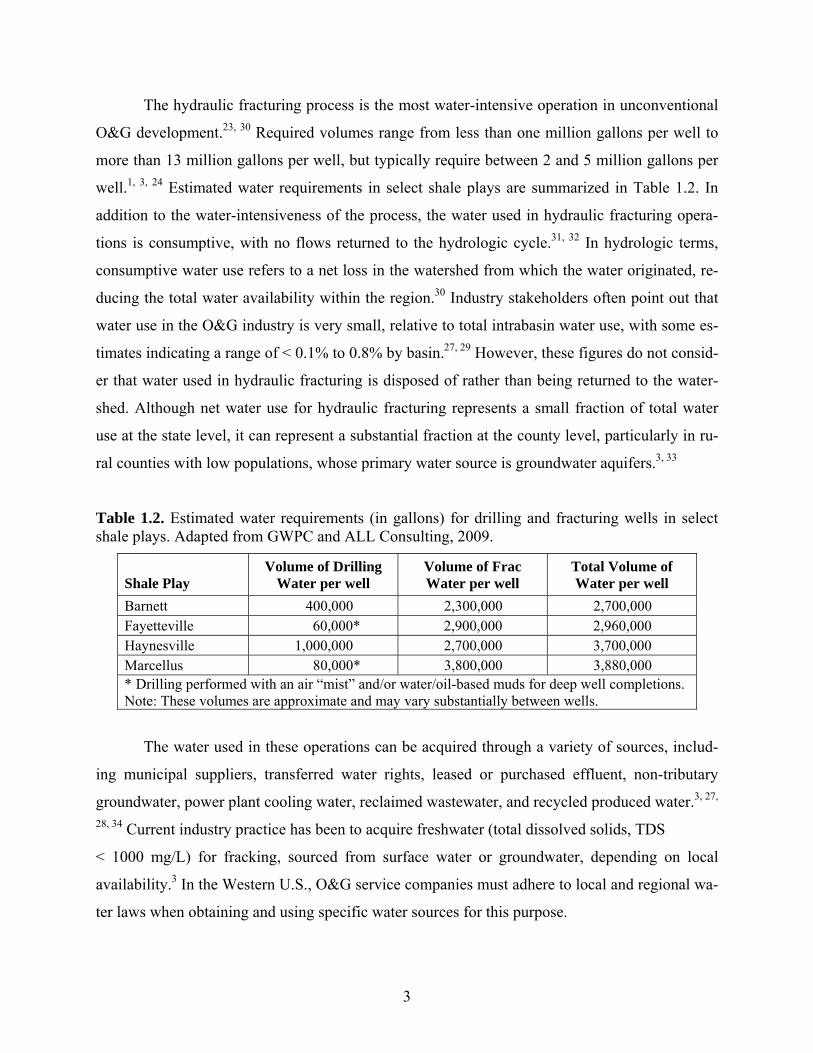
The hydraulic fracturing process is the most water-intensive operation in unconventional
O&G development.23, 30 Required volumes range from less than one million gallons per well to
more than 13 million gallons per well, but typically require between 2 and 5 million gallons per
well.1, 3, 24 Estimated water requirements in select shale plays are summarized in Table 1.2. In
addition to the water-intensiveness of the process, the water used in hydraulic fracturing opera-
tions is consumptive, with no flows returned to the hydrologic cycle.31, 32 In hydrologic terms,
consumptive water use refers to a net loss in the watershed from which the water originated, re-
ducing the total water availability within the region.30 Industry stakeholders often point out that
water use in the O&G industry is very small, relative to total intrabasin water use, with some es-
timates indicating a range of < 0.1% to 0.8% by basin.27, 29 However, these figures do not consid-
er that water used in hydraulic fracturing is disposed of rather than being returned to the water-
shed. Although net water use for hydraulic fracturing represents a small fraction of total water
use at the state level, it can represent a substantial fraction at the county level, particularly in ru-
ral counties with low populations, whose primary water source is groundwater aquifers.3, 33
Table 1.2. Estimated water requirements (in gallons) for drilling and fracturing wells in select shale plays. Adapted from GWPC and ALL Consulting, 2009.
Shale Play Volume of Drilling
Water per well Volume of Frac Water per well
Total Volume of Water per well
Barnett 400,000 2,300,000 2,700,000 Fayetteville 60,000* 2,900,000 2,960,000 Haynesville 1,000,000 2,700,000 3,700,000 Marcellus 80,000* 3,800,000 3,880,000 * Drilling performed with an air “mist” and/or water/oil-based muds for deep well completions. Note: These volumes are approximate and may vary substantially between wells.
The water used in these operations can be acquired through a variety of sources, includ-
ing municipal suppliers, transferred water rights, leased or purchased effluent, non-tributary
groundwater, power plant cooling water, reclaimed wastewater, and recycled produced water.3, 27,
28, 34 Current industry practice has been to acquire freshwater (total dissolved solids, TDS
< 1000 mg/L) for fracking, sourced from surface water or groundwater, depending on local
availability.3 In the Western U.S., O&G service companies must adhere to local and regional wa-
ter laws when obtaining and using specific water sources for this purpose.
4
1.2 Exploration and Production Wastewater Generation
Following hydraulic fracturing, the pumping pressure is released and the injected mixture
of water and chemicals, referred to as frac fluid, ultimately returns to the surface in the form of
flowback water, the majority of which is recovered over the course of several days to weeks.1, 23
Following this initial high-rate flowback period, the volume of wastewater generated gradually
decreases as production begins.23 During pumping, frac fluid may be lost to surrounding for-
mation, with the amount lost depending on the geological properties of the formation in which
the pumping occurs.35 Typically, only 10-40% of the original volume of injected frac fluid re-
turns to the surface as flowback following hydraulic fracturing.36
Over time, the flowback water gradually mixes with naturally present formation water,
thus generating the waste stream commonly referred to as produced water. The volume of pro-
duced water generated from a given well depends on the formation characteristics, geographic
location of the well, the type of hydrocarbon produced, and the method of production.26 In 2007,
U.S. onshore O&G production operations generated over 20 billion barrels (bbl; 840 billion gal-
lons, or 2.3 billion gallons/day) of produced water.37 This represents the largest waste stream
generated by the O&G industry,38 and its management is often referred to as one of the biggest
challenges in sustainable shale gas development.2, 24, 39
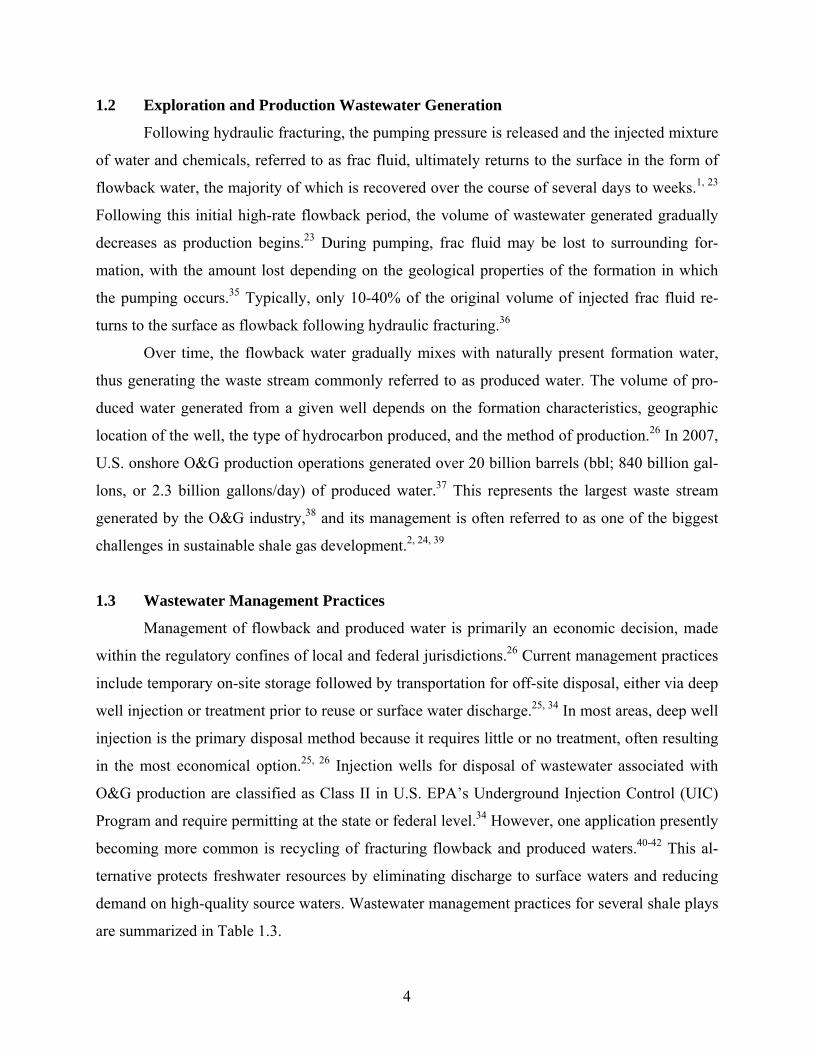
1.3 Wastewater Management Practices
Management of flowback and produced water is primarily an economic decision, made
within the regulatory confines of local and federal jurisdictions.26 Current management practices
include temporary on-site storage followed by transportation for off-site disposal, either via deep
well injection or treatment prior to reuse or surface water discharge.25, 34 In most areas, deep well
injection is the primary disposal method because it requires little or no treatment, often resulting
in the most economical option.25, 26 Injection wells for disposal of wastewater associated with
O&G production are classified as Class II in U.S. EPA’s Underground Injection Control (UIC)
Program and require permitting at the state or federal level.34 However, one application presently
becoming more common is recycling of fracturing flowback and produced waters.40-42 This al-
ternative protects freshwater resources by eliminating discharge to surface waters and reducing
demand on high-quality source waters. Wastewater management practices for several shale plays
are summarized in Table 1.3.
5
Table 1.3. Current management practices in select shale plays. Adapted from GWPC and ALL Consulting, 2009.
Shale Play
Water Management Technology Availability Comments
Barnett Class II injection wells
Commercial and non-commercial
Disposal into the Barnett and underlying Ellenberger Group
Recycling On-site recycling For reuse in subsequent fracturing jobs
Fayetteville Class II injection wells
Non-commercial Water is transported to two injection wells, owned and operated by a single producing company
Recycling On-site recycling For reuse in subsequent fracturing jobs
Haynesville Class II injection wells
Commercial and non-commercial
Marcellus
Class II injection wells
Commercial and non-commercial
Limited use of Class II injection wells
Treatment and discharge
Centralized wastewater treatment facilities
Primarily in Pennsylvania
Recycling On-site recycling For reuse in subsequent fracturing jobs
In cases where treatment is either cost-competitive or necessitated by regulations, chal-
lenges exist in rendering the waste streams amenable for surface water discharge or on-site reuse.
Typical challenges include removal of oil and grease, soluble organics, volatile organic com-
pounds (VOCs), total petroleum hydrocarbons (TPH), total suspended solids (TSS), total dis-
solved solids (TDS), heavy metals, naturally occurring radioactive materials (NORM), hardness,
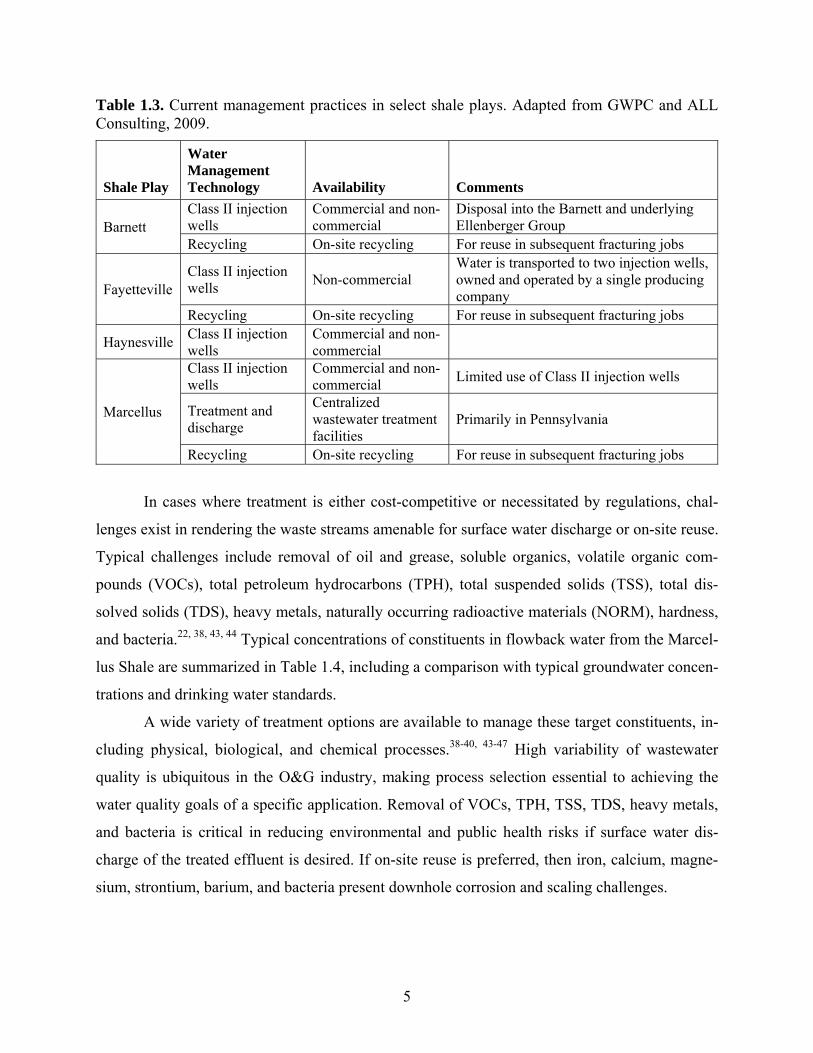
and bacteria.22, 38, 43, 44 Typical concentrations of constituents in flowback water from the Marcel-
lus Shale are summarized in Table 1.4, including a comparison with typical groundwater concen-
trations and drinking water standards.
A wide variety of treatment options are available to manage these target constituents, in-
cluding physical, biological, and chemical processes.38-40, 43-47 High variability of wastewater
quality is ubiquitous in the O&G industry, making process selection essential to achieving the
water quality goals of a specific application. Removal of VOCs, TPH, TSS, TDS, heavy metals,
and bacteria is critical in reducing environmental and public health risks if surface water dis-
charge of the treated effluent is desired. If on-site reuse is preferred, then iron, calcium, magne-
sium, strontium, barium, and bacteria present downhole corrosion and scaling challenges.
6
Table 1.4. Comparison of Marcellus Shale flowback water quality with typical Pennsylvania groundwater. Adapted from AMTV, LLC., 2012.
Parameter
Drinking Water Standards
(mg/L)
Approximate Median Concentration in Typical
PA Groundwater
(mg/L)
Approx. Median Conc. in Typical Marcellus Shale
Wastewater
(mg/L)
TDS < 500 163 67,300 TSS - 1 99 Barium < 2.0 0.07 686 Iron < 0.30 0.2 39 Manganese < 0.05 0.01 2.63 Sodium - 6.87 18,000 Hardness (as CaCO3) - 86.1 17,700 Strontium - 0.26 1,080 Chloride < 250 5.3 41,850 Sulfate < 250 18 2.4 to 106 Nitrate (as N) < 10 0.5 0.1 to 0.2 Bromide - 0.016 445 Total organic carbon varies < 1.0 63 Oil & grease - < 5.0 6.3
Discharge to municipal wastewater treatment plants has been historically utilized for di-
lution and treatment of flowback water,22, 48 although this is not considered an acceptable or sus-
tainable approach to wastewater management,36 leading this practice to become obsolete.49 Exist-
ing wastewater treatment plants were designed to handle municipal and commercial waste, so the
unit processes are not capable of removing target constituents present in fracturing flowback and
produced waters. In a typical industrial treatment scheme, the flowback or produced water first
undergoes primary de-oiling, which takes advantage of the physical difference between water
and oil, and gravity-separation through processes such as skimming and separators. Once the
primary de-oiling is complete, the water passes through a secondary de-oiling treatment that is
non-gravity based, such as flocculation or gas flotation. Tertiary treatment removes fine particles
through filter or centrifuge processes.50 Once the water passes through these processes, it is often
considered acceptable for reuse in subsequent fracturing operations, depending on the salinity
tolerance of the application. However, logistical challenges exist in cost-effectively delivering
treated water to a job site, rendering freshwater acquisition the more economical alternative.39, 51
7
1.4 Recycling and Reuse
On-site reclamation and reuse offers an effective wastewater management practice for
operators to consider. In many cases, it has been both practical and economical to partially treat
the wastewater to a quality that is sufficient for use in subsequent field operations, rather than
treating to surface water discharge permit requirements.34 In rare cases, the flowback water is
stored at the surface and recycled directly or following dilution with freshwater.36 Reuse applica-
tions include well drilling, hydraulic fracturing, enhanced oil recovery, and water flooding.52
Freshwater consumption in these operations can be minimized through treatment and recycling
of flowback and produced waters.
Because O&G development often occurs in areas where water resources have been his-
torically scarce,12 freshwater availability may impact an operator’s decision to recycle water. In
dry regions of Texas, water demands for O&G development are viewed as competing with water
use for agricultural and domestic applications.23 Nearly half of hydraulically fractured wells
since 2011 are in regions with high or extremely high water stress and over 55 percent were in
areas experiencing drought.12 In this case, water stress is defined as the ratio of water withdraw-
als to mean annual availability. Extremely high water stress, using the World Resources Insti-
tute’s definition, means over 80 percent of available surface and groundwater is already allocated
for municipal, industrial, and agricultural uses.
The ability to implement a reuse scheme into a wastewater management plan largely de-
pends on the degree of treatment required, which varies by play and by operator, and the volume
of make-up water required.34 Additional factors to consider include anticipated flow rates,
wastewater influent quality, and total volumes required for treatment, all of which have inherent
spatial and temporal variations.34 Reuse offers a particularly attractive alternative in regions
where deep-well injection sites are limited or where freshwater availability is limited.36
1.4.1 Major Opportunities
Opportunities for recycling and reuse are highly dependent on the amount of injected wa-
ter that returns to the surface as flowback water, which is always a small fraction relative to the
original amount injected.33, 36 This fraction is highly variable and a function of the formation
characteristics, location within the formation, and the design and operation of the hydraulic frac-
turing process.3 Water production for several shale plays is summarized in Table 1.5. Continued

8
well pad operations render the use of fracturing flowback and produced water feasible only in the
early life of the well (i.e., the first several weeks following stimulation).3 As such, the total vol-
ume of reusable water is often much less than the total flowback and produced water volume.
Table 1.5. Flowback and produced water production in select shale plays. Adapted from Stark et al., 2012. Data from Chesapeake Energy.
Shale Play
Initial Water Production
(first 10 days, gallons/well) Long-term
Water Production*
Barnett 500,000 – 600,000 High Fayetteville 500,000 – 600,000 Moderate Haynesville 250,000 Moderate Marcellus 500,000 – 600,000 Low * High > 1,000; Moderate 200 – 1,000; Low < 200 gal/MMCF The unit of measurement used for comparison of long-term produced water is gallons of water per million cubic feet (MMCF) of gas or hydrocarbon liquid equivalent.
Wells that produce substantial volumes of wastewater during the initial high-rate flow-
back period are generally preferred for reuse due to the logistics involved in storage and trans-
portation of water.53 These higher flows keep storage tanks full and trucks moving, increasing
the efficiency of recycling wastewater between collection facilities and well pads.53 This effi-
ciency is further enhanced if the duration of the initial high-rate flowback period is sustained for
a longer duration of the production phase.53 The greatest opportunity, and the focus of most reuse
efforts, is therefore on wastewater generated during this period.23 The fracturing flowback gener-
ated during early well development and production phases ensures a continuous waste stream
available for recycling and reuse. Most reuse opportunities become less attractive as the wells
start generating progressively smaller volumes of produced water.23
1.4.2 Reuse Challenges and Limitations
There are two primary limitations to practical reuse of fracturing flowback and produced
waters: the availability of Class II injection wells in close proximity to the well pads, and the
quality of the fracturing flowback and produced water.36, 53 The economics of deep well injection
relative to treatment for reuse often render it the more attractive alternative. For this reason, un-
derground injection has historically been the primary disposal method for fracturing flowback
and produced waters.1 Reuse typically becomes a practical opportunity only in the absence of
9
such disposal wells. In this situation, as is the case in the Marcellus Shale of Pennsylvania,24 the
limitations to practical reuse become focused on the quality of the wastewater.
The major water quality restrictions with reuse of fracturing flowback and produced wa-
ter for make-up of frac water are the very high concentrations of TDS and other scale-forming
constituents, including barium, calcium, iron, magnesium, manganese, and strontium (Ba, Ca,
Fe, Mg, Mn, and Sr). These cations are solubilized from formation minerals and can readily form
carbonate and sulfate precipitates in the wellbore or within the fractures in hydrocarbon-bearing
formations, potentially reducing production from the well.24, 36 Barium and strontium are particu-
larly problematic, forming very low-solubility sulfate compounds, while high levels of calcium
often lead to formation of calcite or gypsum. The presence of such scale-formers may necessitate
pretreatment by precipitative softening in order to reduce concentrations of divalent cations.36
According to Halliburton, a major oilfield service company, flowback water for reuse should
have a maximum total hardness of 2,500 mg/L measured as CaCO3.24
Reducing TDS is a considerable challenge for treating fracturing flowback and produced
water to a quality suitable for on-site reuse, as high TDS concentrations can limit the effective-
ness of friction reducers and viscosifiers in frac fluid.54 The development of additives that retain
their effectiveness in high TDS solutions are likely to expand the opportunity for reuse of frac-
turing flowback and produced water for subsequent hydraulic fracturing.36 Promising research is
currently underway to commercialize the development of such additives.55-57 Alternatively, TDS
can be managed by blending flowback with freshwater to dilute the TDS concentrations, or
through the use of desalination treatment technologies such as membrane separation, evaporative
crystallizers, or mechanical vapor compression.39, 58 Variable levels of TDS between and within
different shale plays will impact operator decision-making when considering the available alter-
natives. This high variability is highlighted in Table 1.6.
The TDS concentration of fracturing flowback and produced water limits the application
of available desalination technologies. Reverse osmosis (RO) membrane treatment is commonly
used for seawater desalination (TDS ~34,000 to 38,000 mg/L),59-61 and as such this technology
can be applied for wastewater with TDS levels in this range. At higher concentrations, the hy-
draulic pressure required to overcome the osmotic pressure of the solution can exceed the allow-
able pressure of the RO membrane module.59, 60 As this is often the case with fracturing flowback
and produced waters, these wastewaters must be desalinated with more energy-intensive, ther-
10
mally-based technologies. Thermal desalination technologies work by evaporating water from a
saline solution and then condensing the vapor (steam) to produce distilled water.62 These include
multistage flash (MSF), multiple effect distillation (MSD), and vapor compression distillation
(VCD). Thermally-based processes have the capability to produce water with very low salt con-
centrations (TDS < 10 mg/L) from very high TDS levels (> 40,000 mg/L).58 The implementation
of such technologies is limited by the energy requirement of the vaporization step and the high
capital costs associated with installation.62, 63 Substantial pretreatment to reduce fouling and scal-
ing potential is required before produced water may be desalinated using membranes or thermal-
ly-based technologies.39, 64
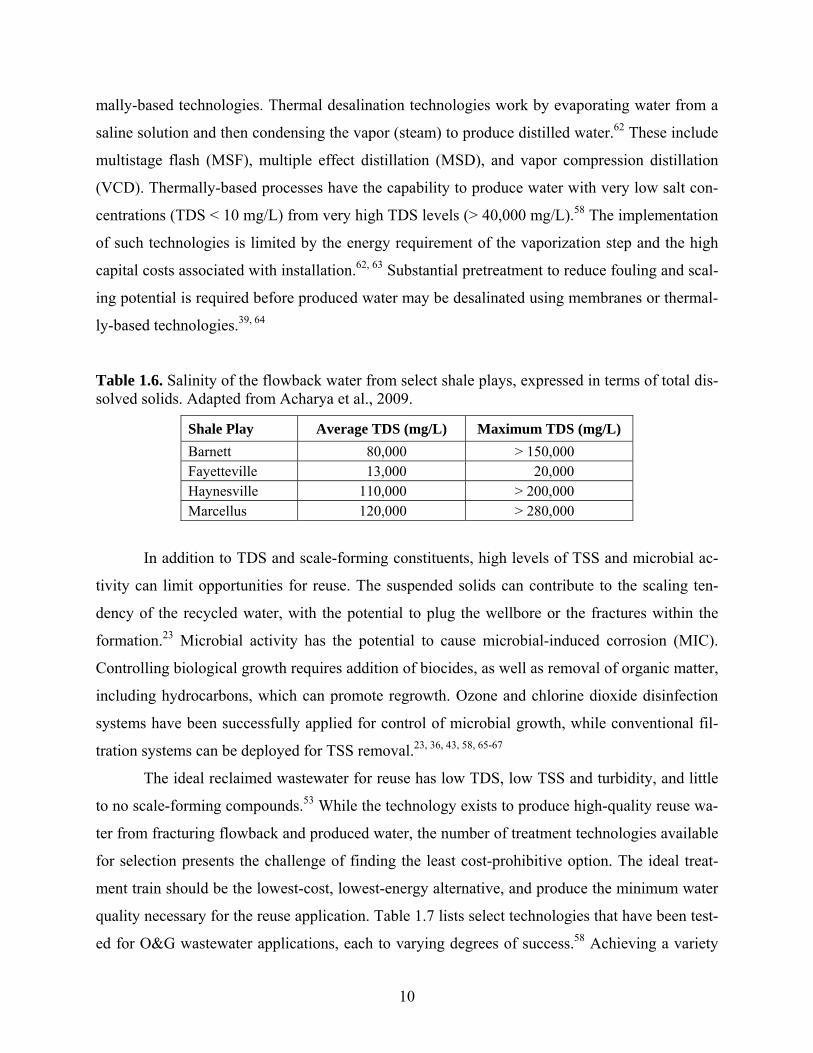
Table 1.6. Salinity of the flowback water from select shale plays, expressed in terms of total dis-solved solids. Adapted from Acharya et al., 2009.
Shale Play Average TDS (mg/L) Maximum TDS (mg/L)
Barnett 80,000 > 150,000 Fayetteville 13,000 20,000 Haynesville 110,000 > 200,000 Marcellus 120,000 > 280,000
In addition to TDS and scale-forming constituents, high levels of TSS and microbial ac-
tivity can limit opportunities for reuse. The suspended solids can contribute to the scaling ten-
dency of the recycled water, with the potential to plug the wellbore or the fractures within the
formation.23 Microbial activity has the potential to cause microbial-induced corrosion (MIC).
Controlling biological growth requires addition of biocides, as well as removal of organic matter,
including hydrocarbons, which can promote regrowth. Ozone and chlorine dioxide disinfection
systems have been successfully applied for control of microbial growth, while conventional fil-
tration systems can be deployed for TSS removal.23, 36, 43, 58, 65-67
The ideal reclaimed wastewater for reuse has low TDS, low TSS and turbidity, and little
to no scale-forming compounds.53 While the technology exists to produce high-quality reuse wa-
ter from fracturing flowback and produced water, the number of treatment technologies available
for selection presents the challenge of finding the least cost-prohibitive option. The ideal treat-
ment train should be the lowest-cost, lowest-energy alternative, and produce the minimum water
quality necessary for the reuse application. Table 1.7 lists select technologies that have been test-
ed for O&G wastewater applications, each to varying degrees of success.58 Achieving a variety
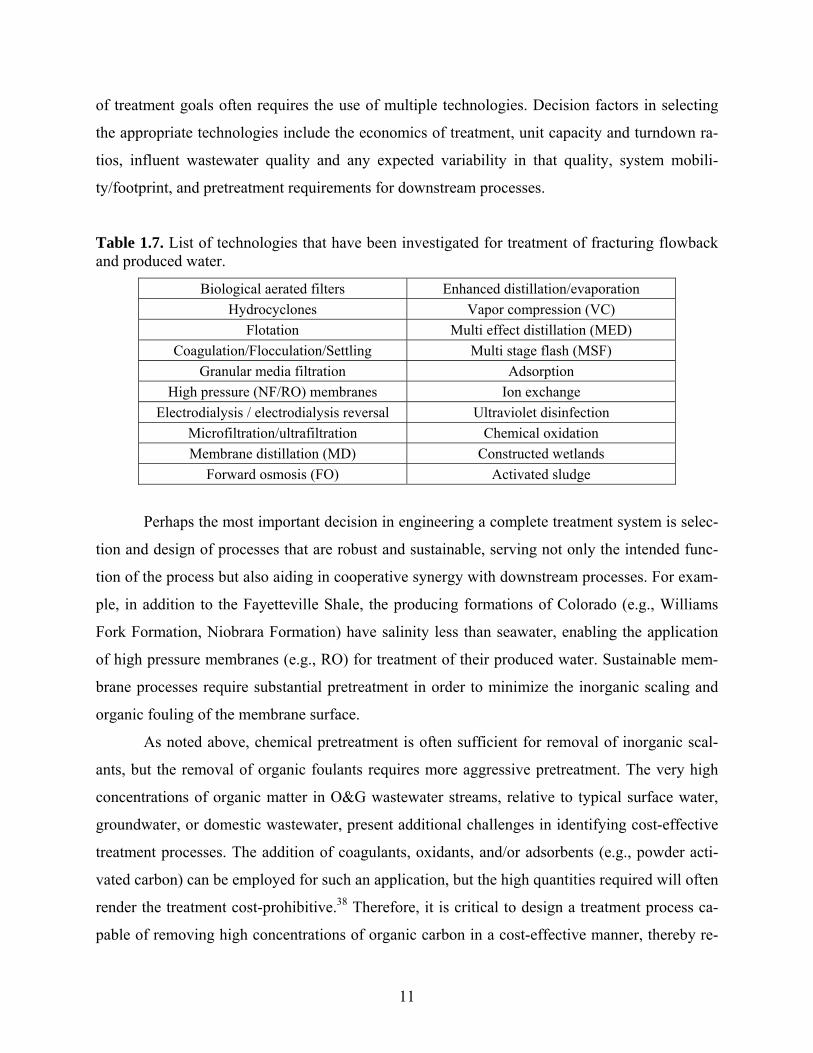
11
of treatment goals often requires the use of multiple technologies. Decision factors in selecting
the appropriate technologies include the economics of treatment, unit capacity and turndown ra-
tios, influent wastewater quality and any expected variability in that quality, system mobili-
ty/footprint, and pretreatment requirements for downstream processes.
Table 1.7. List of technologies that have been investigated for treatment of fracturing flowback and produced water.
Biological aerated filters Enhanced distillation/evaporation
Hydrocyclones Vapor compression (VC)
Flotation Multi effect distillation (MED)
Coagulation/Flocculation/Settling Multi stage flash (MSF)
Granular media filtration Adsorption
High pressure (NF/RO) membranes Ion exchange
Electrodialysis / electrodialysis reversal Ultraviolet disinfection
Microfiltration/ultrafiltration Chemical oxidation
Membrane distillation (MD) Constructed wetlands
Forward osmosis (FO) Activated sludge
Perhaps the most important decision in engineering a complete treatment system is selec-
tion and design of processes that are robust and sustainable, serving not only the intended func-
tion of the process but also aiding in cooperative synergy with downstream processes. For exam-
ple, in addition to the Fayetteville Shale, the producing formations of Colorado (e.g., Williams
Fork Formation, Niobrara Formation) have salinity less than seawater, enabling the application
of high pressure membranes (e.g., RO) for treatment of their produced water. Sustainable mem-
brane processes require substantial pretreatment in order to minimize the inorganic scaling and
organic fouling of the membrane surface.
As noted above, chemical pretreatment is often sufficient for removal of inorganic scal-
ants, but the removal of organic foulants requires more aggressive pretreatment. The very high
concentrations of organic matter in O&G wastewater streams, relative to typical surface water,
groundwater, or domestic wastewater, present additional challenges in identifying cost-effective
treatment processes. The addition of coagulants, oxidants, and/or adsorbents (e.g., powder acti-
vated carbon) can be employed for such an application, but the high quantities required will often
render the treatment cost-prohibitive.38 Therefore, it is critical to design a treatment process ca-
pable of removing high concentrations of organic carbon in a cost-effective manner, thereby re-
12
ducing the fouling potential of the effluent for downstream membrane processes. One such
method to achieve this goal is the application of biological treatment systems. These systems are
generally considered the most cost-effective method for removal of organics from wastewater,68
offering the potential to increase the economic viability of treatment for reuse in the oilfield.
1.5 Biological Treatment Systems
Biological treatment processes are designed to remove biodegradable compounds, includ-
ing biodegradable organic matter (BOM) and inorganic electron donors (e.g., ammonium, nitrate,
sulfate, bisulfide, and ferrous iron) that can foster the growth of microorganisms. Commonly re-
ferred to as biological instability,68-70 these compounds have the potential to promote fouling of
filters and membranes, accelerated corrosion, and regrowth in distribution systems or wellbores.
With proper design analysis and process control, almost all wastewaters containing biodegrada-
ble compounds can be treated biologically.69
The primary objective of biological treatment is to remove or substantially reduce the
concentration of organic and inorganic compounds present in wastewater. The specific processes
used for biological treatment systems can be classified in terms of either their metabolic function
or the type of treatment process. Metabolic functions of microorganisms in these processes in-
clude aerobic (oxic), anaerobic, and anoxic. Aerobic systems operate in the presence of oxygen,
anaerobic systems operate in the absence of oxygen, and anoxic systems operate in the presence
of nitrate but the absence of oxygen. These metabolic functions can be further classified as facul-
tative or obligate; the former referring to a process in which the microorganisms can function in
either the presence or the absence of oxygen, the latter referring to a process in which aerobic
growth requires the presence of oxygen and anaerobic growth is inhibited in the presence of ox-
ygen.
The types of treatment processes for these systems are classified into two categories: sus-
pended-growth and attached-growth processes. In suspended-growth processes, the microorgan-
isms responsible for biological treatment are maintained in suspension with the wastewater. In
this manner, the wastewater flows around and through the suspended mass of microorganisms
(i.e., biomass), providing high contact with the target constituents. The most common suspend-
ed-growth process used for municipal wastewater treatment is the activated-sludge process.69
Conventional activated-sludge consists of three basic components: (1) a bioreactor in which the
13
biomass is suspended, retained, and aerated; (2) liquid-solids separation in a clarifier; and (3) a
wasting/recycling system for either removal or return of biomass to the bioreactor. Limited re-
search has been conducted to evaluate the effectiveness of this process for treatment of oilfield
produced or fracturing flowback waters.71-74 More recently, research studies have been conduct-
ed to evaluate the membrane bioreactor (MBR) process for treatment of O&G wastewater
streams.75-78 The MBR process is similar to conventional activated-sludge, with integrated mem-
brane filtration in lieu of a clarification basin for liquid-solids separation.
In attached-growth processes, the microorganisms responsible for biological treatment
are attached to a medium that serves as a surface on which the biomass is grown and retained.
The developed attached-growth microorganisms, in combination with extracellular polymeric
substances (EPS), are referred to as biofilm. Media used in these processes include sand, gravel,
wood, anthracite coal, granular activated carbon (GAC), and other synthetic plastic materials.
These media can be completely submerged or unsubmerged with head space above the liquid
surface. The most common aerobic attached-growth process used for municipal wastewater
treatment is the trickling filter, in which the wastewater is evenly distributed over the surface ar-
ea of a vessel containing unsubmerged media.69
Both classes of biological treatment processes consist of diverse communities of micro-
organisms that include bacteria, archaea, protozoa, fungi, rotifers, algae, and viruses. These or-
ganisms are then divided into either prokaryotes or eukaryotes. Eukaryotes are typically larger
and more structurally complex than prokaryotic cells. Eukaryotic organisms include algae, fungi,
and protozoa; prokaryotic cells include bacteria and archaea. All cells contain DNA and ribo-
somes that are responsible for genetic coding and protein synthesis, respectively, which ultimate-
ly determines the functionality of the microorganism in wastewater treatment applications. Pro-
tein synthesis leads to the production of enzymes, which determine the metabolic capacity of the
microorganism by accelerating intercellular chemical reactions.
Many factors have important effects on the survival, growth, and proliferation of micro-
organisms. These include environmental conditions, such as pH, temperature, pressure, and sa-
linity, but perhaps most important is the availability of critical nutrients. Historically, the under-
standing of nutrient requirements has been accomplished through examination of cellular com-
position. Major cell elements are carbon, oxygen, and nitrogen, but phosphorus also plays an im-
portant role. Hoover and Porges (1952) originally proposed what is now considered the most
14
widely used empirical formula for biomass, which is C5H7O2N.69, 79, 80 The formula
C60H87O23N12P can be used when phosphorus is also considered.69 However, these formulas are
only approximations but have been used for practical purposes. A deficiency of any of these nu-
trients will limit or alter microbial growth and development.
The organic loading to the process (kg TOC/m3/day) is also important to maintaining a
healthy, functioning ecosystem in which the microorganisms can thrive. Suspended-growth pro-
cesses may struggle treating waste streams with highly variable organic loading because the bi-
omass adapts to a consistent level of food (i.e., BOM). If this substrate became unavailable, the
biomass can develop cannibalistic behavior and begin to consume other microorganisms in order
to survive. This is not the case in attached-growth processes, where the microorganisms exhibit
more stable behavior. Biofilms have greater ability to adapt to sudden variations in ecosystem
conditions, such as pH, temperature, salinity, and substrate type or availability. In addition to
biofilm adaptability, attached-growth processes generally require simpler operation, less mainte-
nance, and less energy than suspended-growth processes. Attached-growth systems have also
been found to contain biomass in higher concentrations than in suspended-growth systems.68
Additional advantages include higher metabolic activity, greater resistance to toxicity, and better
sludge properties.68 For these reasons, an attached-growth system was selected as the biological
treatment process for this research.
The primary disadvantage associated with attached-growth processes relates to the re-
moval of substrate within a biofilm. In a suspended-growth process, growth and substrate utiliza-
tion kinetics are directly related to the dissolved substrate concentration in the process flow. For
attached-growth processes, a diffusion layer of stagnant liquid separates the process flow from
the biofilm. Substrates, oxygen, and nutrients must diffuse across this layer in order to be con-
sumed by the biofilm. The substrate concentration at the surface of the biofilm decreases with
biofilm depth as the substrate is consumed and diffuses into the biofilm layer. This phenomenon
is referred to as diffusion-limited utilization.69, 70 The substrate and oxygen concentrations are
lower within the diffusion layer than the bulk process flow. The overall substrate utilization rate
is therefore lower than would be predicted based on the dissolved substrate concentration in the
bulk process flow.
Other disadvantages attributed to attached-growth processes include larger footprint re-
quirements and the inability to handle higher hydraulic loading rates. The complexity of model-
15
ing attached-growth processes also presents process design challenges. As a result, empirical re-
lationships based on observed performance are typically used for design.69 Despite these disad-
vantages, and especially considering the many advantages of attached-growth processes, biologi-
cally active filtration was selected as the specific biological treatment system for evaluation in
this research. This process may provide filtration of colloidal particles and TSS, in addition to
the primary function of biological degradation, simple operation, and low maintenance.
1.5.1 Biologically Active Filtration
Biologically active filtration (BAF), sometimes referred to as simply biofiltration, is an
attached-growth biofilm process used for treatment of drinking water and wastewater.81-83 BAF
differs from conventional granular media filtration in that a microbial community is allowed to
grow and attach on the filter media as a biofilm. With this configuration, removal of contami-
nants can be accomplished in several ways. Colloidal and suspended particles can be physically
separated by filtration, dissolved material can be adsorbed to the filter media or to the biomass,
but the most predominant removal mechanism in biological filtration systems is through biodeg-
radation.81-83 In this manner, the constituents are incorporated into the biomass or used as energy
sources through biological oxidation. The end products of this oxidation are carbon dioxide, wa-
ter, biomass, and simpler organic molecules.
In drinking water treatment applications, ozone is often applied upstream of the filters to
aid in biological activity. The ozonation (i.e., oxidation) of total organic carbon (TOC) results in
end products of biodegradable dissolved organic carbon (BDOC) and assimilable organic carbon
(AOC). BDOC refers to the fraction of organic carbon that can be mineralized by heterotrophic
microorganisms, and AOC refers to the organics fraction that can be converted to cellular bio-
mass.84 In general, a higher fraction of BDOC and AOC translates to higher biological activity
and therefore better treatment performance.
In addition to biological activity, key performance factors in biofiltration include opera-
tional parameters such as empty-bed contact time, backwashing techniques, and filter media
depth and characteristics; and water quality parameters such as temperature, pH, alkalinity, sub-
strate concentrations, and dissolved oxygen levels. Temperature, in particular, has a great effect
on growth kinetics and substrate utilization. Biological activity and kinetics are higher in warmer
temperatures and decrease during colder temperature conditions.69, 70
16
A number of research studies have been conducted to evaluate biofiltration for treatment
of drinking water and domestic wastewater,68, 81-94 but very few have been reported for applica-
tions in the O&G industry.95-98 In fact, no such studies exist that evaluate traditional biologically
activated carbon (BAC) for treatment of O&G wastewater streams. This presented an opportuni-
ty to evaluate a cost-effective, robust, proven treatment process for a new, challenging applica-
tion: treatment of wastewater generated during E&P of O&G.
1.5.2 Application for Exploration and Production Wastewater Treatment
The potential application of BAF for the O&G industry is to enhance the economic via-
bility of treatment for recycling and reuse in E&P operations. The greatest potential of BAF in a
treatment scheme is in pretreatment for membrane separation processes. Reducing the fouling
potential of the feed water will lead to more sustainable membrane treatment operations, increas-
ing the cost-effectiveness of the full treatment system. Other benefits of this treatment applica-
tion include rejection of colloidal and suspended material, adsorption of trace organic chemicals,
and enhanced biological stability of the filtered effluent. Biologically stable effluent also has a
lower potential for fouling and accelerated corrosion of downhole infrastructure.
The primary objective of this research was to determine the efficacy and technical feasi-
bility of a bench-scale biological filtration system for treatment of produced water and fracturing
flowback. This objective was evaluated by following an experimental plan with several specific
steps, including (1) acclimate a pre-existing biofilm to a new water type (i.e., produced water),
(2) investigate the benefits of pretreatment, and (3) investigate system flexibility.
Following verification of the bench-scale system performance, a new set of objectives
was established for a lab-scale system evaluation. The primary objectives of this evaluation in-
cluded (1) investigate system scalability, (2) investigate system flexibility, and (3) investigate the
impacts of variable operating conditions on system performance. The experimental plan for this
evaluation included verifying comparable system performance and the necessity of biofilm ac-
climation. Specific operating conditions that were evaluated include level of pretreatment need-
ed, presence/absence of aeration, variable temperatures, and empty-bed contact time.
17
CHAPTER 2
MATERIALS & METHODS
A bench-scale filtration system was tested between September 2013 and January 2014.
Following successful operation, a lab-scale filtration system was constructed in January 2014
and operated through July 2014. Testing occurred in Golden, CO at the Advanced Water Tech-
nology Center (AQWATEC) research facility. The systems were designed for operation in the
biologically active filtration mode. The BAF process was evaluated for viability in biodegrada-
tion of organic constituents present at high concentrations in wastewater generated during E&P
operations. The experimental and analytical materials and methods used to execute the perfor-
mance evaluation are described in this chapter.
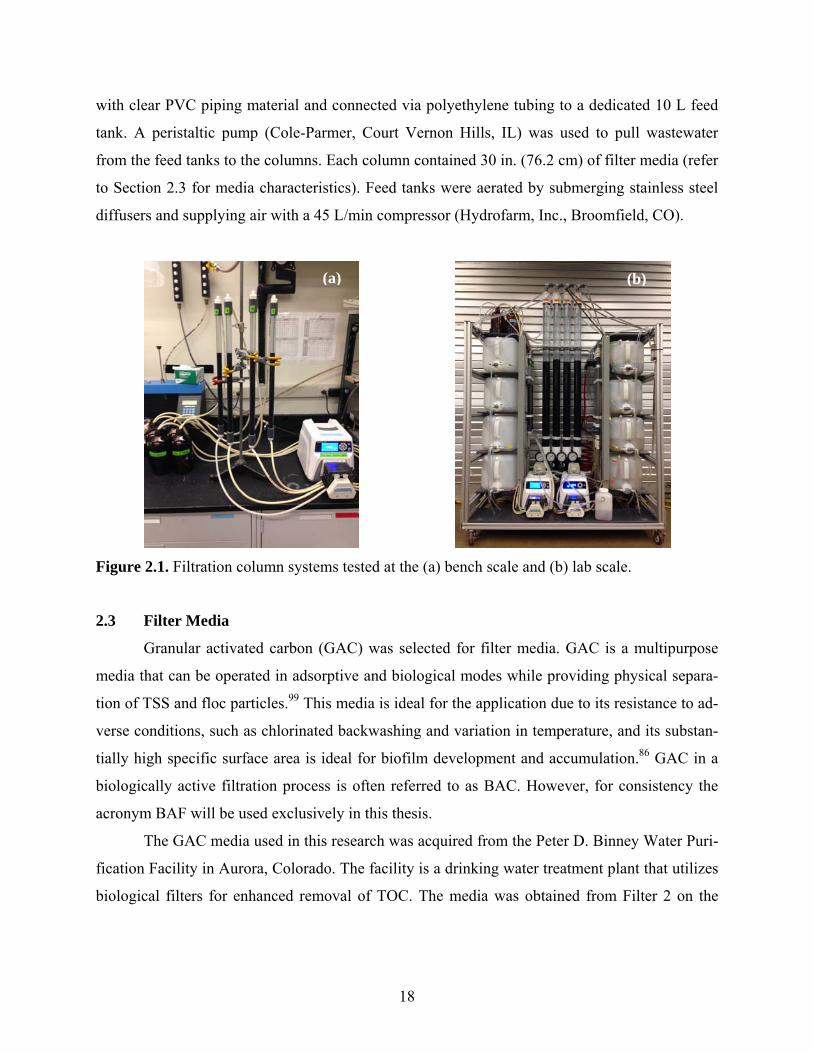
Bench-scale Filtration System 2.1
A bench-scale system (Figure 2.1a) consisting of four (4) 0.5 in. (1.27 cm) diameter fil-
tration columns was utilized for conducting preliminary experiments. Each column was assem-
bled with clear polyvinylchloride (PVC) piping material and connected via neoprene tubing to a
dedicated 1 L feed tank. A peristaltic pump (Cole-Parmer, Court Vernon Hills, IL) was used to
pull wastewater from the feed tanks to the columns. Each column contained 12 in. (30.5 cm) of
filter media (refer to Section 2.3 for media characteristics). One column was designated an abiot-
ic control by adding sodium azide (0.1% by wt. NaN3) to the feed water. The primary function of
the control column was to differentiate removal mechanisms (i.e., adsorption or biodegradation).
The secondary function was to determine if volatile organic compounds (VOCs) were being re-
moved via oxidative air stripping. VOC removal in the control column was possible for experi-
ments during which feed tanks were aerated. Aeration was applied by submerging stone diffusers
in the feed tanks and supplying air with a 45 L/min compressor (Hydrofarm, Inc., Broomfield,
CO).
Lab-scale Filtration System 2.2
A skid-mounted system (Figure 2.1b) consisting of four (4) 2 in. (5.1 cm) diameter filtra-
tion columns was utilized for conducting lab-scale experiments. Each column was assembled
18
with clear PVC piping material and connected via polyethylene tubing to a dedicated 10 L feed
tank. A peristaltic pump (Cole-Parmer, Court Vernon Hills, IL) was used to pull wastewater
from the feed tanks to the columns. Each column contained 30 in. (76.2 cm) of filter media (refer
to Section 2.3 for media characteristics). Feed tanks were aerated by submerging stainless steel
diffusers and supplying air with a 45 L/min compressor (Hydrofarm, Inc., Broomfield, CO).
Figure 2.1. Filtration column systems tested at the (a) bench scale and (b) lab scale.
Filter Media 2.3
Granular activated carbon (GAC) was selected for filter media. GAC is a multipurpose
media that can be operated in adsorptive and biological modes while providing physical separa-
tion of TSS and floc particles.99 This media is ideal for the application due to its resistance to ad-
verse conditions, such as chlorinated backwashing and variation in temperature, and its substan-
tially high specific surface area is ideal for biofilm development and accumulation.86 GAC in a
biologically active filtration process is often referred to as BAC. However, for consistency the
acronym BAF will be used exclusively in this thesis.
The GAC media used in this research was acquired from the Peter D. Binney Water Puri-
fication Facility in Aurora, Colorado. The facility is a drinking water treatment plant that utilizes
biological filters for enhanced removal of TOC. The media was obtained from Filter 2 on the
(a) (b)
19
Aurora Reservoir treatment train, which had been in operation for 3 years prior to collection for
this research. Aurora Reservoir functions as a recreational area and surface water supply.
During operation of the bench-scale system, the biologically active media was gradually
acclimated to a produced water stream from the Piceance Basin (detailed characteristics provided
in Section 2.4.1). Extant biofilm was naturally developed during contact with surface water from
Aurora Reservoir, with average TOC concentration of 3.0 mg/L and TDS concentration of less
than 500 mg/L. The initial expectation was that the extant biofilm was not adequate to treat pro-
duced water with average TOC of 240 mg/L and TDS of more than 10,000 mg/L. Enhancement
of the biofilm for treatment of produced water was accomplished by exposure to stepwise in-
creases in feed concentrations via decreasing dilution factor. Feed water was diluted through ad-
dition of ultrapure Milli-Q™ water (EMD Millipore Corporation, Billerica, MA).
Wastewater Feed Streams 2.4
Due to the highly variable nature of O&G wastewater quality, it was important to confirm
system flexibility and consistent treatment performance by testing a variety of feed streams. Ra-
ther than attempt to make correlations to potential treatment efficiency within all North Ameri-
can O&G plays, this study limited the focus area to the Rocky Mountain Region, specifically to
produced water and fracturing flowback from the State of Colorado. Through industry partner-
ships and collaboration, various fracturing flowback and produced water streams generated in
Colorado O&G plays were provided for this research. Specific details of each stream are provid-
ed below.
2.4.1 Produced Water
Bench-scale and lab-scale tests were conducted with produced water from the Piceance Basin.
The Piceance Basin is a geologic structure on the Western Slope of the Rocky Mountains in Col-
orado and contains unconventional resource plays, primarily tight gas in the Williams Fork sand-
stone formation. The wastewater was acquired from a centralized produced water treatment facil-
ity in Rifle, CO. At the time of collection the facility was treating produced water for surface
discharge. Operators within the basin would manage the logistics associated with collection,
storage, and transportation of produced water to the facility. It is unclear which well(s), and
therefore which formation, within the basin generated the wastewater collected for this research.
20
The produced water was collected in 55 gal. (200 L) drums. The drums were sealed and
stored in the AQWATEC facility at ambient temperature. Wastewater was pumped from the
drums as needed for experiments. The water in the drums was vigorously mixed prior to pump-
ing to ensure a representative wastewater quality. Baseline wastewater quality for the produced
water streams is summarized in Table 2.1.
In addition to Piceance Basin produced water, bench-scale and lab-scale tests were con-
ducted with produced water from the Denver-Julesburg (DJ) Basin. The DJ Basin is a geologic
structure in Eastern Colorado and contains unconventional resource plays, primarily tight oil and
shale gas from the Niobrara Formation. The wastewater was acquired from a centralized collec-
tion facility in Ft. Lupton, CO. At the time of collection, the function of the facility was disposal
via deep well injection. As with the Piceance Basin produced water, it is unclear which specific
well(s) and formation within the basin generated the wastewater collected. The facility operators
considered this wastewater commingled (i.e., blended produced water from a number of wells
across the basin).
Table 2.1. Average baseline wastewater quality of flowback and produced water streams tested during this research. The different water types are shown in Figure 2.3.
Parameter
Piceance Basin produced
water
DJ Basin produced
water
DJ Basin
Flowback water
pH 6.8 7.3 6.9 Chemical oxygen demand, mg/L 770 1,080 6,360 Dissolved organic carbon, mg/L 240 345 2,170 Total nitrogen, mg/L 21 33 37 Total dissolved solids, mg/L 10,460 18,170 14,230 Guar gel, mg/L n/a n/a 1,280
2.4.2 Flowback Water
Lab-scale tests were conducted with a fracturing flowback water stream collected from a
horizontal well within the Niobrara Formation of the DJ Basin in Weld County. The stream was
acquired from an E&P operator 20 days after completion of hydraulic fracturing. This is consid-
ered “early” flowback, as it was generated in the first few weeks following the fracturing opera-
tion. The flowback water was collected in a 5 gal. (20 L) bucket, sealed, and stored for experi-
mental work. Baseline wastewater quality is summarized in Table 2.1.
21
2.4.3 Simulated Fracturing Flowback Water
Flowback water quality varies substantially over the flowback period as the proportion of
the wastewater consisting of produced water progressively increases. In order to represent this
variation in wastewater quality, flowback water was simulated through addition of a fracturing
fluid gel system to a produced water stream from the DJ Basin (details provided in Section
2.4.1). The fluid system consisted of gel (guar gel slurry, Calfrac Well Services, Calgary, AB),
crosslinker (borate, Calfrac Well Services, Calgary, AB), and breaker (ammonium persulfate,
Sigma-Aldrich, St. Louis, MO) additives.
The gel system was prepared as a concentrated stock solution and then combined with
produced water to achieve the desired sample concentration. Four concentrations of gel were
tested, with the highest concentration representing the earliest flowback and the lowest concen-
tration representing the latest flowback. Target gel concentrations and feed water volumetric
proportions are summarized in Table 2.2. Actual gel concentrations in the feed water were much
lower than expected, although still in the range of reported flowback waters. These results were
likely due to poor mixing with the produced water and in the feed tanks.
Table 2.2. Target guar gel concentrations for simulating flowback water.
Parameter Filter 1 Filter 2
Target feed conc. (percent by wt.) 0.36% 0.24% Target feed conc. (lb guar/103 gal) 30.0 20.0 Stock solution conc. (lb guar/103 gal) 50.0 50.0 Feed water vol. (L) 10.0 10.0 Produced water proportion (L) 6.0 7.0 Actual feed conc. (lb guar/103 gal) 12.6 4.8
Stock solutions were prepared using a blender to aid in slurry dispersion and hydration.
Gel slurry was added to 1 L ultrapure water via a graduated cylinder; 12.5 mL slurry in 1 L water
corresponds to 50 lb guar per thousand gallons. For comparison with oilfield units, 1 lb per thou-
sand gallons is equivalent to 0.012% by weight or 120 mg/L. The solution was mixed for 10 min
to ensure full hydration, followed by addition of 240 mg of persulfate breaker (0.024% by wt.)
and 3 mL of borate crosslinker (0.3% by vol.). The vortex of the sample closed within 30 sec of
crosslinker addition. The breaker was activated at 70 ºC by placing the solution into a 1 L beaker
on a heating stir plate (Corning, Tewksbury, MA) for 1 hour. This mixing, crosslinking, and
22
breaking procedure was repeated until 20 L of stock solution was prepared. Two steps in the guar
solution preparation (i.e., additive mixing and breaker activation) are shown in Figure 2.2.
Figure 2.2. Guar preparation procedure with (a) blender mixing and (b) heating stir plate break-ing.
Operating Conditions 2.5
The bench-scale filtration columns were operated in parallel, and all experiments were
conducted in the batch mode of operation (i.e., filter effluent was recycled back to the respective
feed tank). Pumping through the columns occurred in an upflow configuration at a hydraulic
loading rate (HLR) of 2.5 gpm/ft2 (6.1 m/hr), which corresponded to an empty-bed contact time
(EBCT) of 3 minutes. Aeration was not applied during bench-scale tests with diluted feed water;
however, the impact of operating aerobically versus anaerobically was evaluated during experi-
ments with undiluted feed water. No temperature control was provided; operation was carried out
at ambient conditions. At the conclusion of each experiment, a backwashing cycle was initiated
for one hour with ultrapure water pumped through the columns at 100 mL/min. This flow rate
achieved approximately 50% bed expansion and substantially, if not completely, removed accu-
mulated particles from the media.
The lab-scale filtration columns were also operated in parallel and in the batch mode.
Pumping through the columns occurred in an upflow configuration at various HLRs, including
3.8 gpm/ft2 (9.2 m/hr), 2.5 gpm/ft2 (6.1 m/hr), 1.9 gpm/ft2 (4.6 m/hr), 0.6 gpm/ft2 (1.5 m/hr), and
(a) (b)
23
0.3 gpm/ft2 (0.8 m/hr), which corresponded to EBCTs of 5, 7.5, 10, 30, and 60 minutes, respec-
tively. The EBCT was varied to investigate the impact on DOC removal rates.
Aeration occurred in at least two feed tanks during all lab-scale experiments. This al-
lowed close observation of long-term operational impacts on system performance in the presence
or absence of continuous aeration. The level of pretreatment varied for each condition in order to
evaluate potential enhancement of treatment efficiency. When applied, pretreatment consisted of
conventional clarification (i.e., coagulation, flocculation, and sedimentation) using a jar testing
apparatus (Figure 2.3, Phipps & Bird, Richmond, VA). A dose of 60 mg/L-Al3+ aluminum chlo-
ride hexahydrate (AlCl3∙6H2O, Sigma-Aldrich, St. Louis, MO) coagulant was applied prior to a
60 seconds rapid mixing stage, followed by 3-stage tapered flocculation at 10 minutes/stage (ve-
locity gradient, G = 80, 40, 20 sec-1), and 30 minutes settling time.
Temperature control was provided by a recirculating heater/chiller (Isotemp® 1006S,
Thermo Fisher Scientific, Waltham, MA) connected to a skid-mounted heat exchanger. Three
temperature ranges were evaluated: ambient temperature (19.0±0.8 ºC), low temperature
(14.1±1.9 ºC), and high temperature (25.3±4.3 ºC). At the conclusion of each experiment, a
backwashing cycle was initiated for one hour with tap water fed from a hose spigot at a flow rate
controlled to achieve approximately 50% bed expansion. This procedure substantially removed
accumulated particles from the media.
Figure 2.3. Jar testing apparatus for pretreatment application, showing (a) Piceance Basin pro-duced water, (b) DJ Basin produced water, and (c) DJ Basin fracturing flowback water.
(a) (b) (c)
24
Sampling and Analytical Procedures 2.6
Samples were collected intermittently throughout each experiment. Initial samples were
collected from the feed tanks and subsequent samples were collected from the effluent piping of
the filter column during system operation. Dissolved oxygen (YSI 55, Yellow Springs, OH), pH,
and temp (Oakton Instruments, Vernon Hills, IL) were measured with handheld probes. Approx-
imately 20 mL of each sample was filtered through a 0.45 μm filter, preserved with concentrated
phosphoric (H3PO4) or hydrochloric acid (HCl), and stored at 4 ºC prior to analysis using a car-
bon analyzer (Shimadzu TOC-L, Columbia, MD). Initial and final samples were collected for
determination of chemical oxygen demand (COD) using a Hach (Loveland, CO) reagent kit
(TNT821 LR, TNT822 HR) and a spectrophotometer (DR 2800). Concentrations of chloride
above 2,000 mg/L cause interferences in the COD analysis; therefore, samples were diluted ac-
cordingly with ultrapure water.
Cation and anion concentrations were analyzed using inductively coupled plasma atomic
emission spectroscopy (ICP-AES; Optima 5300, Perkin-Elmer, Fremont, CA) and ion chroma-
tography (IC; ICS-90, Dionex, Sunnyvale, CA), respectively. The maximum allowable sodium
concentration by the ICP-AES instrument is 500 mg/L; therefore, samples were diluted accord-
ingly using ultrapure water and then acidified to a pH of less than 2 using nitric acid. The maxi-
mum allowable chloride concentration by the IC instrument is 300 mg/L; therefore, samples
were diluted accordingly using ultrapure water. Analytical results were used to calculate TDS of
the feed water.
Three-dimensional (3D) fluorescence excitation-emission matrix (EEM) spectroscopy
was applied to investigate the fluorescence characterization of dissolved organic matter (DOM)
present in the untreated and treated produced water and fracturing flowback water. In this spec-
troscopic method, organic molecules are excited by irradiation over a range of wavelengths and
the emitted radiation wavelengths are measured. Three major groups are usually detected: tryp-
tophan-, humic- and fulvic-like fluorophores;100 although the method has also been used to detect
polycyclic aromatic hydrocarbons (PAHs).101-103 Samples were filtered through a 0.45 μm filter,
preserved with concentrated phosphoric acid, stored at 4 ºC directly following collection, and
diluted to a DOC concentration of 5 mg/L using ultrapure water prior to fluorescence measure-
ments. The fluorescence intensities were measured in a 1.0 cm quartz cell using a self-contained,
fully automated spectrofluorometer system (Aqualog®, Horiba, Kyoto, Japan). EEMs were gen-
25
erated for each sample by scanning over excitation wavelengths between 240 and 600 nm at in-
tervals of 3 nm and emission wavelengths between 249.73 and 832.10 nm at intervals of 2.33 nm
(4 pixels). The charge-couple device (CCD) gain was set at medium and the integration time was
set to 1 second. An EEM of ultrapure water blank was obtained and subtracted from the EEM of
each sample in order to remove most of the Raman scatter peaks. Each blank subtracted EEM
was normalized by dividing by the maximum peak detected in the scan. This normalization al-
lowed for semi-quantitative comparison between EEM scans. Corrections were applied to each
sample-blank waterfall plot, including first- and second-order Rayleigh masking and inner filter
effects. The corrected waterfall plot was used to generate a 3D contour plot.
Duplicate media samples were collected for DNA extraction immediately following a
backwashing cycle, with the intent to extract only DNA from attached-growth microorganisms.
DNA was extracted from 0.25 g of GAC sample using the PowerSoil® DNA Isolation Kit (MO
BIO Laboratories, Carlsbad, CA) per manufacturer’s protocol. The PowerBiofilm® kit was also
tested; however, the best performance, with respect to the quantity of DNA extracted, was
achieved with the PowerSoil® kit. Extracted DNA was polymerase chain reaction (PCR) ampli-
fied in triplicate 25 µL reactions without adaptors or primer pads on a LightCycler® 480 Instru-
ment II (Roche, Indianapolis, IN). A portion of the 16S rRNA gene was amplified using
Phusion® Master Mix (New England BioLabs, Ipswich, MA), 3% final volume dimethylsulfox-
ide (DMSO), 0.4x final concentration Power SYBR® Green PCR Master Mix (Life Technolo-
gies™, Thermo Fisher Scientific, Grand Island, NY), 200 nM 515F primer (5’-
GTGYCAGCMGCCGCGGTAA-3’), and 12bp Golay-barcoded 806R primer (5’-
XXXXXXXXXXXXCCGGACTACHVGGGTWTCTAAT-3’).104 The PCR program was: initial
denaturation for 3 min. at 94 ºC and amplification cycle of 45 sec. at 94 ºC, 10 sec. at 50 ºC, and
90 sec. at 72 ºC. The cycles continued until all samples had amplified. Triplicates were pooled
and purified using Agencourt AMPure XP (Beckman Coulter, Brea, CA) and quantified using a
Qubit® 2.0 Fluorometer (Life Technologies™, Thermo Fisher Scientific, Grand Island, NY).
Normalized amplicons were sequenced on the MiSeq platform (Illumina, San Diego, CA) using
the TruSeq Ultra DNA Library Prep Kit and MiSeq Reagent Kit v2 (2x250 output, 500-cycle
kit). Sequences were analyzed with QIIME 1.8-dev.105 The pairs of 250 bp sequences were
stitched together using join_paired_ends.py with a minimum overlap of 100 bp. Stitched se-
quences were then processed with extract_barcodes.py in order to orient all the sequences cor-
26
rectly and create a barcode file. The resulting sequence and barcode files were demultiplexed
using split_libraries_fastq.py with default parameters, except for “--barcode 12,” to negate error
correcting of barcodes, as any sequences with errors would have been filtered out by ex-
tract_barcodes.py. Operational taxonomic units (OTUs) were picked de novo using Usearch 6.1
and chimeras were filtered out using the Greengenes Gold database.106, 107 Representative se-
quences were aligned using PyNAST and Greengenes 13_5 aligned reference database.108 Tax-
onomy was assigned using the RDP classifier and Greengenes 13_5 OTU taxonomy database
and the OTU table was then rarified before further diversity analysis.
Total petroleum hydrocarbons (TPH) were extracted from 50 mL of produced water with
5 mL of methylene chloride. Following methylene chloride addition, samples were placed on a
mechanical shaker for 10 minutes at 300 RPM, followed by 10 minutes in a sonication bath. The
solvent layer was then extracted and passed through steel wool and sodium sulfate to remove the
remaining water. The recovered solvent was then concentrated down to 2 mL and analyzed by
gas chromatography-flame ionization detection (GC-FID, Agilent Technologies 7890a, Santa
Clara, California). The column used was a Restek Rxi-1ms column (20m, 0.18mm ID, 0.18μm).
The GC was operated with a 2 μL injection volume, carrier gas (helium) pressure of 14.505 psi,
splitless flow, injector temperature of 275 ºC, and detector (FID) temperature of 350 ºC. The
ramp program was 40 ºC for 2 minutes followed by 20 ºC per minute up to 330 ºC and held for
20 minutes. Extraction efficiency was verified for all samples using o-terphenyl and phenan-
thrine, with recoveries ranging from 50-65% for both compounds.
Degradation of guar was quantified using the colorimetric Anthrone method of measuring
total carbohydrates developed by Dreywood (1946) and described by El Shaari et al. (2005).109
There is a linear relationship between absorbance (at 610 nm) and the concentration of carbohy-
drate in the sample. Absorbance was measured by UV/Visible spectroscopy (DU 800, Beckman
Coulter, Fullerton, CA).
27
CHAPTER 3
RESULTS & DISCUSSION
Performance of the biologically active filtration process was evaluated based on trends in
degradation of organic carbon, the efficiency of biodegradation, and the operating conditions,
which allow for optimal system functionality. Results of the BAF performance assessment are
presented in chronological order, first with the data from bench-scale testing, then with the data
from lab-scale testing. Lab-scale testing data is further broken down to highlight the impacts of
variable operating conditions and system flexibility in treating variable feed water quality.
3.1 Bench-scale Filtration System
The bench-scale filtration system was evaluated to determine the technical feasibility of
removing organic carbon from produced water. Preliminary experiments were conducted with
progressively decreasing dilution factors, the primary objective being acclimation of the biologi-
cally active filter media to produced water. Following successful acclimation, biodegradation of
DOC in Piceance Basin produced water was monitored while considering the impacts of pre-
treatment and aeration on system performance. System flexibility and the impact of air stripping
were evaluated with DJ Basin produced water. In all cases, system operation continued either
until no further DOC removal was observed or for a maximum duration of 72 hours. Experi-
mental durations are reported for the sample in which the lowest effluent concentration was de-
tected.
3.1.1 Bench-scale BAF Treatment of Diluted Piceance Basin Produced Water
Experimental conditions and average treatment efficiency of preliminary bench-scale
tests are summarized in Table 3.1. The first test was conducted with a 10x diluted produced wa-
ter as the feed and resulted in approximately 80% removal after 19 hours of operation. Because it
was the first exposure of the biofilm to a produced water feed, the favorable response was quite
promising for future experiments. The second test was conducted with a 5x diluted produced wa-
ter as the feed and resulted in approximately 90% removal after 22 hours. This continued favora-
ble response of the biofilm is highlighted by an additional 10% removal despite a 61% increase
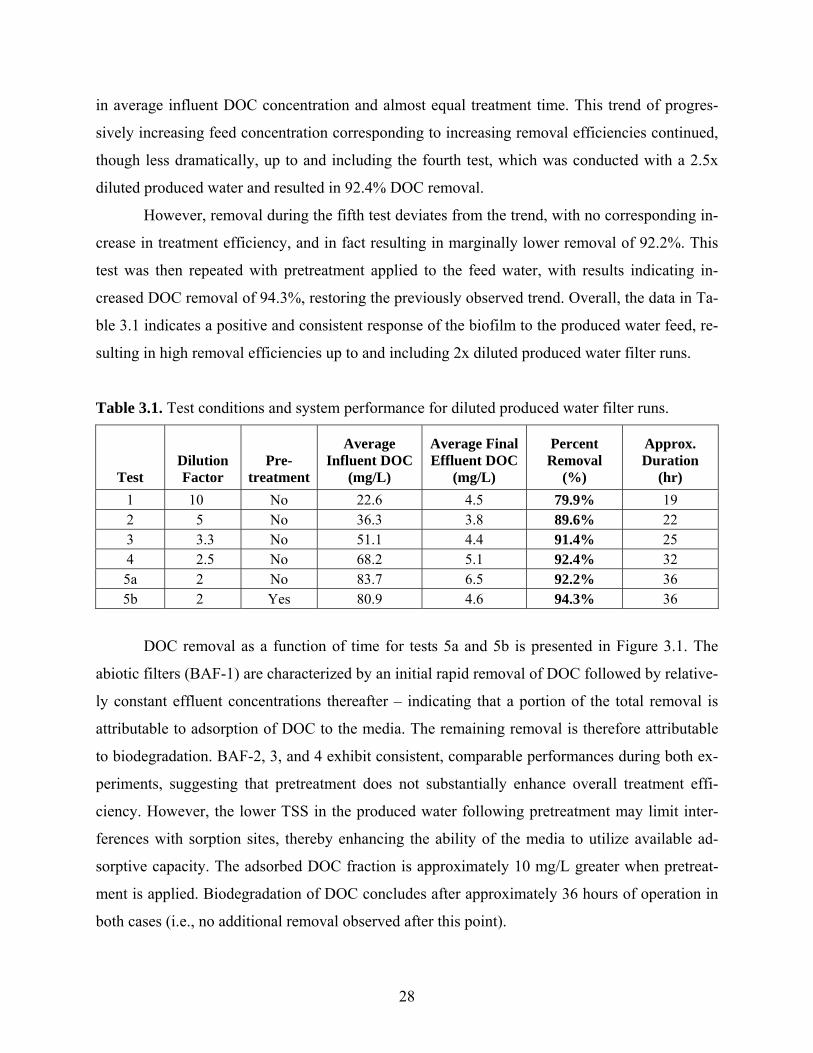
28
in average influent DOC concentration and almost equal treatment time. This trend of progres-
sively increasing feed concentration corresponding to increasing removal efficiencies continued,
though less dramatically, up to and including the fourth test, which was conducted with a 2.5x
diluted produced water and resulted in 92.4% DOC removal.
However, removal during the fifth test deviates from the trend, with no corresponding in-
crease in treatment efficiency, and in fact resulting in marginally lower removal of 92.2%. This
test was then repeated with pretreatment applied to the feed water, with results indicating in-
creased DOC removal of 94.3%, restoring the previously observed trend. Overall, the data in Ta-
ble 3.1 indicates a positive and consistent response of the biofilm to the produced water feed, re-
sulting in high removal efficiencies up to and including 2x diluted produced water filter runs.
Table 3.1. Test conditions and system performance for diluted produced water filter runs.
Test Dilution Factor
Pre-treatment
Average Influent DOC
(mg/L)
Average Final Effluent DOC
(mg/L)
Percent Removal
(%)
Approx. Duration
(hr)
1 10 No 22.6 4.5 79.9% 19 2 5 No 36.3 3.8 89.6% 22 3 3.3 No 51.1 4.4 91.4% 25 4 2.5 No 68.2 5.1 92.4% 32 5a 2 No 83.7 6.5 92.2% 36 5b 2 Yes 80.9 4.6 94.3% 36
DOC removal as a function of time for tests 5a and 5b is presented in Figure 3.1. The
abiotic filters (BAF-1) are characterized by an initial rapid removal of DOC followed by relative-
ly constant effluent concentrations thereafter – indicating that a portion of the total removal is
attributable to adsorption of DOC to the media. The remaining removal is therefore attributable
to biodegradation. BAF-2, 3, and 4 exhibit consistent, comparable performances during both ex-
periments, suggesting that pretreatment does not substantially enhance overall treatment effi-
ciency. However, the lower TSS in the produced water following pretreatment may limit inter-
ferences with sorption sites, thereby enhancing the ability of the media to utilize available ad-
sorptive capacity. The adsorbed DOC fraction is approximately 10 mg/L greater when pretreat-
ment is applied. Biodegradation of DOC concludes after approximately 36 hours of operation in
both cases (i.e., no additional removal observed after this point).
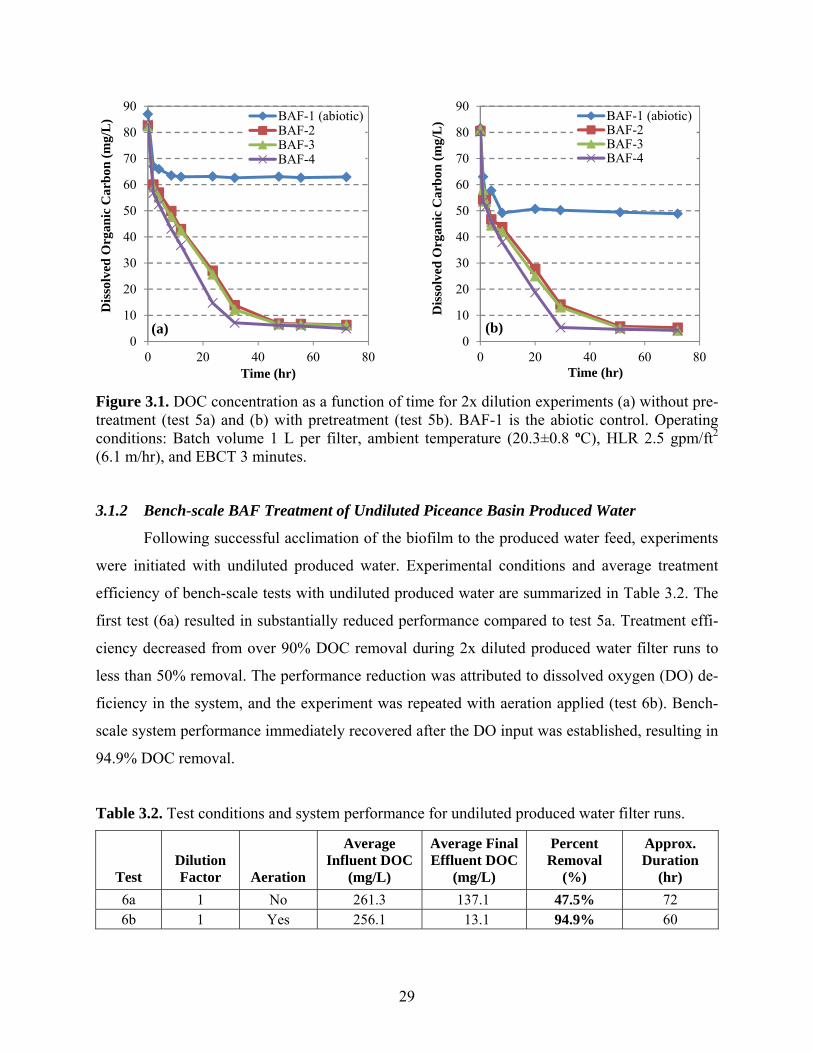
29
Figure 3.1. DOC concentration as a function of time for 2x dilution experiments (a) without pre-treatment (test 5a) and (b) with pretreatment (test 5b). BAF-1 is the abiotic control. Operating conditions: Batch volume 1 L per filter, ambient temperature (20.3±0.8 ºC), HLR 2.5 gpm/ft2 (6.1 m/hr), and EBCT 3 minutes.
3.1.2 Bench-scale BAF Treatment of Undiluted Piceance Basin Produced Water
Following successful acclimation of the biofilm to the produced water feed, experiments
were initiated with undiluted produced water. Experimental conditions and average treatment
efficiency of bench-scale tests with undiluted produced water are summarized in Table 3.2. The
first test (6a) resulted in substantially reduced performance compared to test 5a. Treatment effi-
ciency decreased from over 90% DOC removal during 2x diluted produced water filter runs to
less than 50% removal. The performance reduction was attributed to dissolved oxygen (DO) de-
ficiency in the system, and the experiment was repeated with aeration applied (test 6b). Bench-
scale system performance immediately recovered after the DO input was established, resulting in
94.9% DOC removal.
Table 3.2. Test conditions and system performance for undiluted produced water filter runs.
Test Dilution Factor Aeration
Average Influent DOC
(mg/L)
Average Final Effluent DOC
(mg/L)
Percent Removal
(%)
Approx. Duration
(hr)
6a 1 No 261.3 137.1 47.5% 72 6b 1 Yes 256.1 13.1 94.9% 60
0
10
20
30
40
50
60
70
80
90
0 20 40 60 80
Dis
solv
ed O
rgan
ic C
arb
on (
mg/
L)
Time (hr)
BAF-1 (abiotic)BAF-2BAF-3BAF-4
(a)0
10
20
30
40
50
60
70
80
90
0 20 40 60 80
Dis
solv
ed O
rgan
ic C
arb
on (
mg/
L)
Time (hr)
BAF-1 (abiotic)BAF-2BAF-3BAF-4
(b)
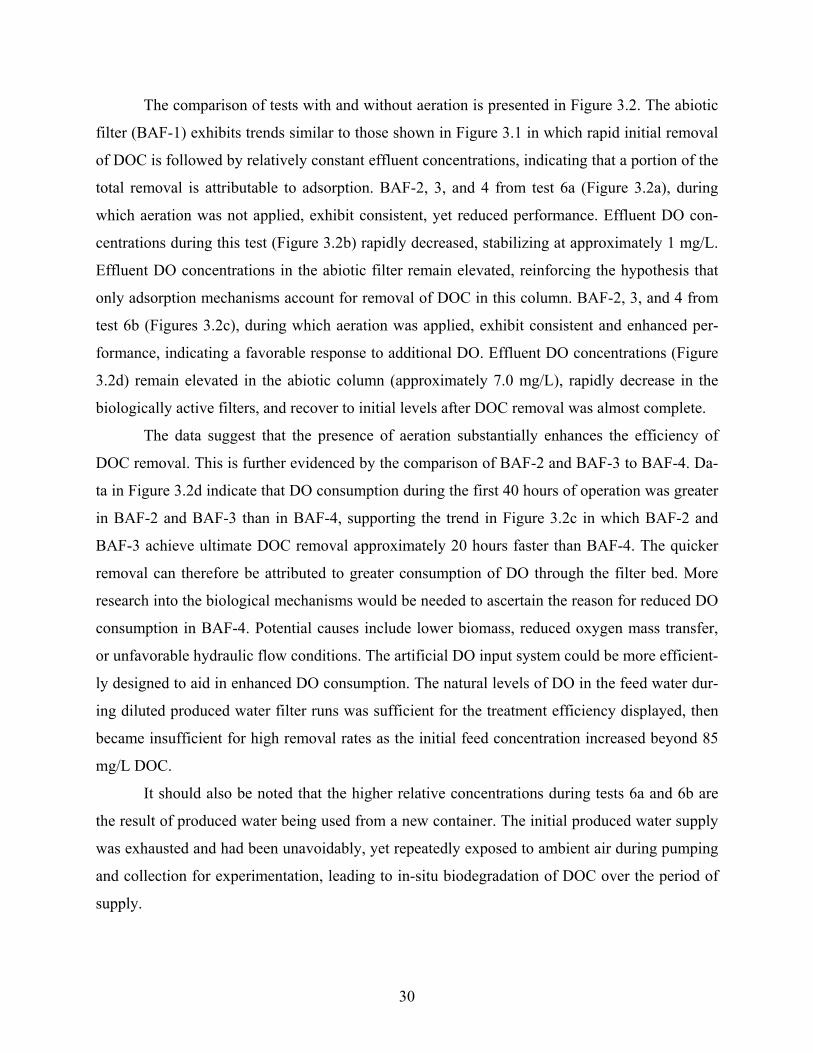
30
The comparison of tests with and without aeration is presented in Figure 3.2. The abiotic
filter (BAF-1) exhibits trends similar to those shown in Figure 3.1 in which rapid initial removal
of DOC is followed by relatively constant effluent concentrations, indicating that a portion of the
total removal is attributable to adsorption. BAF-2, 3, and 4 from test 6a (Figure 3.2a), during
which aeration was not applied, exhibit consistent, yet reduced performance. Effluent DO con-
centrations during this test (Figure 3.2b) rapidly decreased, stabilizing at approximately 1 mg/L.
Effluent DO concentrations in the abiotic filter remain elevated, reinforcing the hypothesis that
only adsorption mechanisms account for removal of DOC in this column. BAF-2, 3, and 4 from
test 6b (Figures 3.2c), during which aeration was applied, exhibit consistent and enhanced per-
formance, indicating a favorable response to additional DO. Effluent DO concentrations (Figure
3.2d) remain elevated in the abiotic column (approximately 7.0 mg/L), rapidly decrease in the
biologically active filters, and recover to initial levels after DOC removal was almost complete.
The data suggest that the presence of aeration substantially enhances the efficiency of
DOC removal. This is further evidenced by the comparison of BAF-2 and BAF-3 to BAF-4. Da-
ta in Figure 3.2d indicate that DO consumption during the first 40 hours of operation was greater
in BAF-2 and BAF-3 than in BAF-4, supporting the trend in Figure 3.2c in which BAF-2 and
BAF-3 achieve ultimate DOC removal approximately 20 hours faster than BAF-4. The quicker
removal can therefore be attributed to greater consumption of DO through the filter bed. More
research into the biological mechanisms would be needed to ascertain the reason for reduced DO
consumption in BAF-4. Potential causes include lower biomass, reduced oxygen mass transfer,
or unfavorable hydraulic flow conditions. The artificial DO input system could be more efficient-
ly designed to aid in enhanced DO consumption. The natural levels of DO in the feed water dur-
ing diluted produced water filter runs was sufficient for the treatment efficiency displayed, then
became insufficient for high removal rates as the initial feed concentration increased beyond 85
mg/L DOC.
It should also be noted that the higher relative concentrations during tests 6a and 6b are
the result of produced water being used from a new container. The initial produced water supply
was exhausted and had been unavoidably, yet repeatedly exposed to ambient air during pumping
and collection for experimentation, leading to in-situ biodegradation of DOC over the period of
supply.
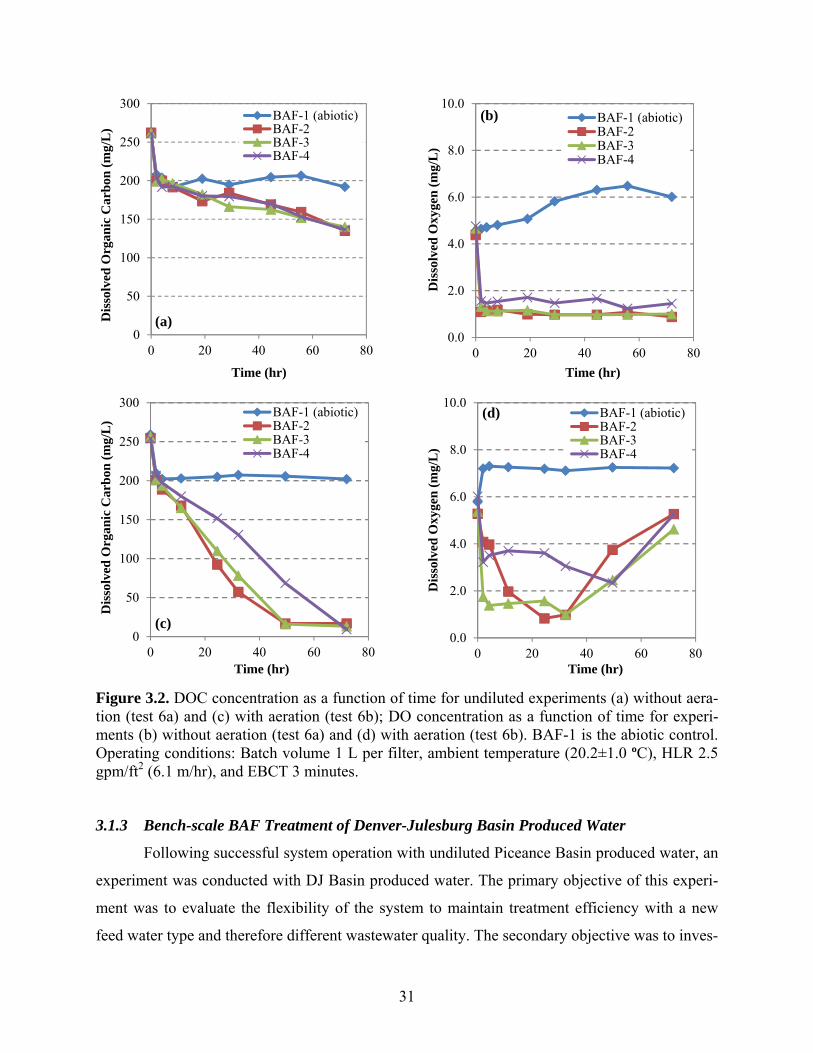
31
Figure 3.2. DOC concentration as a function of time for undiluted experiments (a) without aera-tion (test 6a) and (c) with aeration (test 6b); DO concentration as a function of time for experi-ments (b) without aeration (test 6a) and (d) with aeration (test 6b). BAF-1 is the abiotic control. Operating conditions: Batch volume 1 L per filter, ambient temperature (20.2±1.0 ºC), HLR 2.5 gpm/ft2 (6.1 m/hr), and EBCT 3 minutes.
3.1.3 Bench-scale BAF Treatment of Denver-Julesburg Basin Produced Water
Following successful system operation with undiluted Piceance Basin produced water, an
experiment was conducted with DJ Basin produced water. The primary objective of this experi-
ment was to evaluate the flexibility of the system to maintain treatment efficiency with a new
feed water type and therefore different wastewater quality. The secondary objective was to inves-
0
50
100
150
200
250
300
0 20 40 60 80
Dis
solv
ed O
rgan
ic C
arb
on (
mg/
L)
Time (hr)
BAF-1 (abiotic)BAF-2BAF-3BAF-4
(a)0.0
2.0
4.0
6.0
8.0
10.0
0 20 40 60 80
Dis
solv
ed O
xyge
n (
mg/
L)
Time (hr)
BAF-1 (abiotic)BAF-2BAF-3BAF-4
(b)
0
50
100
150
200
250
300
0 20 40 60 80
Dis
solv
ed O
rgan
ic C
arb
on (
mg/
L)
Time (hr)
BAF-1 (abiotic)BAF-2BAF-3BAF-4
(c)0.0
2.0
4.0
6.0
8.0
10.0
0 20 40 60 80
Dis
solv
ed O
xyge
n (
mg/
L)
Time (hr)
BAF-1 (abiotic)BAF-2BAF-3BAF-4
(d)
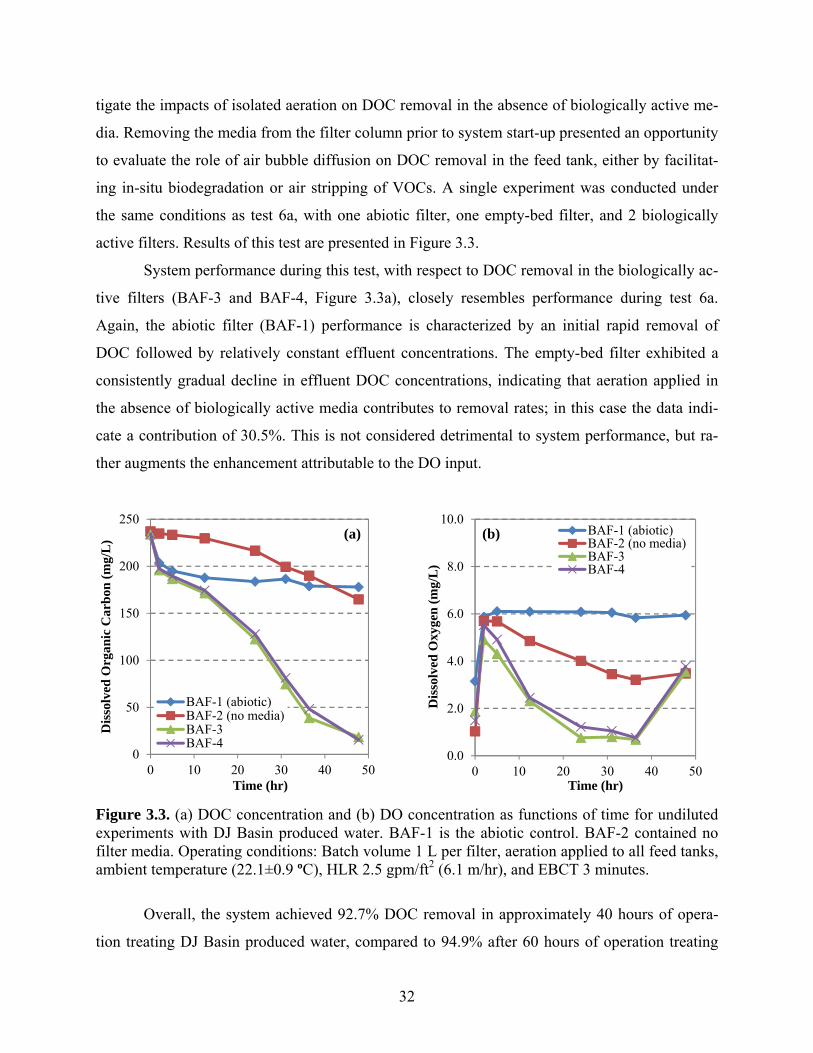
32
tigate the impacts of isolated aeration on DOC removal in the absence of biologically active me-
dia. Removing the media from the filter column prior to system start-up presented an opportunity
to evaluate the role of air bubble diffusion on DOC removal in the feed tank, either by facilitat-
ing in-situ biodegradation or air stripping of VOCs. A single experiment was conducted under
the same conditions as test 6a, with one abiotic filter, one empty-bed filter, and 2 biologically
active filters. Results of this test are presented in Figure 3.3.
System performance during this test, with respect to DOC removal in the biologically ac-
tive filters (BAF-3 and BAF-4, Figure 3.3a), closely resembles performance during test 6a.
Again, the abiotic filter (BAF-1) performance is characterized by an initial rapid removal of
DOC followed by relatively constant effluent concentrations. The empty-bed filter exhibited a
consistently gradual decline in effluent DOC concentrations, indicating that aeration applied in
the absence of biologically active media contributes to removal rates; in this case the data indi-
cate a contribution of 30.5%. This is not considered detrimental to system performance, but ra-
ther augments the enhancement attributable to the DO input.
Figure 3.3. (a) DOC concentration and (b) DO concentration as functions of time for undiluted experiments with DJ Basin produced water. BAF-1 is the abiotic control. BAF-2 contained no filter media. Operating conditions: Batch volume 1 L per filter, aeration applied to all feed tanks, ambient temperature (22.1±0.9 ºC), HLR 2.5 gpm/ft2 (6.1 m/hr), and EBCT 3 minutes.
Overall, the system achieved 92.7% DOC removal in approximately 40 hours of opera-
tion treating DJ Basin produced water, compared to 94.9% after 60 hours of operation treating
0
50
100
150
200
250
0 10 20 30 40 50
Dis
solv
ed O
rgan
ic C
arb
on (
mg/
L)
Time (hr)
BAF-1 (abiotic)BAF-2 (no media)BAF-3BAF-4
(a)
0.0
2.0
4.0
6.0
8.0
10.0
0 10 20 30 40 50
Dis
solv
ed O
xyge
n (
mg/
L)
Time (hr)
BAF-1 (abiotic)BAF-2 (no media)BAF-3BAF-4
(b)
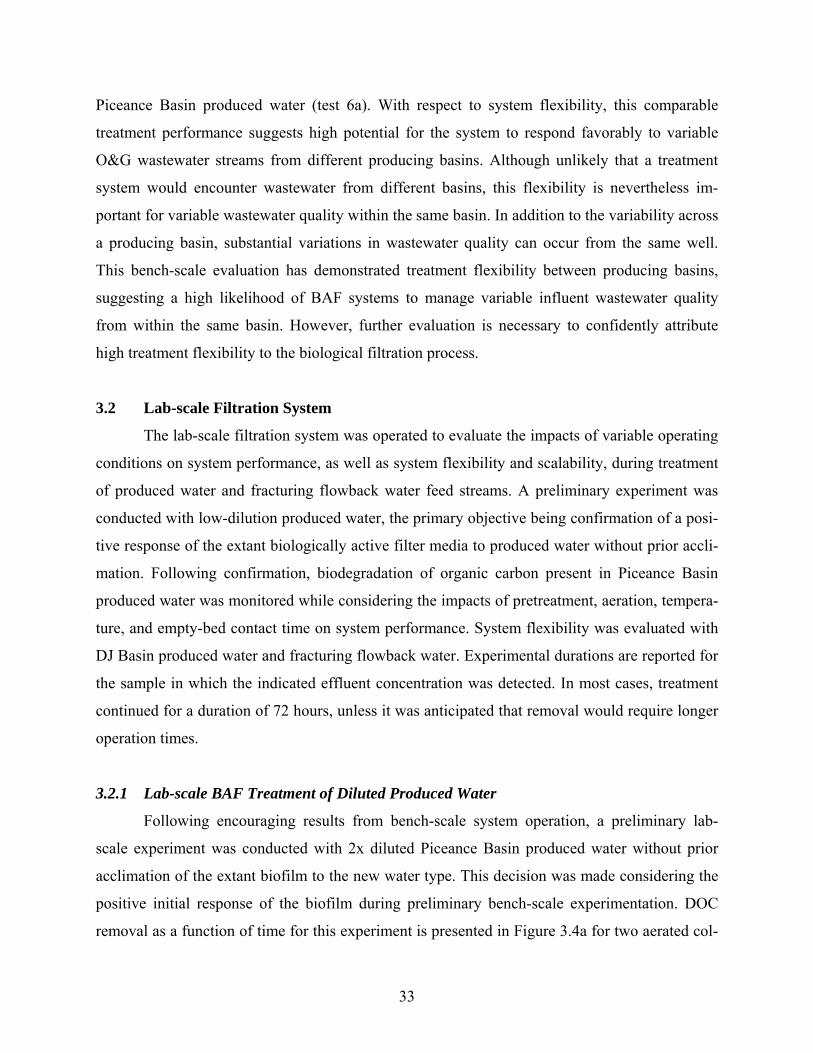
33
Piceance Basin produced water (test 6a). With respect to system flexibility, this comparable
treatment performance suggests high potential for the system to respond favorably to variable
O&G wastewater streams from different producing basins. Although unlikely that a treatment
system would encounter wastewater from different basins, this flexibility is nevertheless im-
portant for variable wastewater quality within the same basin. In addition to the variability across
a producing basin, substantial variations in wastewater quality can occur from the same well.
This bench-scale evaluation has demonstrated treatment flexibility between producing basins,
suggesting a high likelihood of BAF systems to manage variable influent wastewater quality
from within the same basin. However, further evaluation is necessary to confidently attribute
high treatment flexibility to the biological filtration process.
3.2 Lab-scale Filtration System
The lab-scale filtration system was operated to evaluate the impacts of variable operating
conditions on system performance, as well as system flexibility and scalability, during treatment
of produced water and fracturing flowback water feed streams. A preliminary experiment was
conducted with low-dilution produced water, the primary objective being confirmation of a posi-
tive response of the extant biologically active filter media to produced water without prior accli-
mation. Following confirmation, biodegradation of organic carbon present in Piceance Basin
produced water was monitored while considering the impacts of pretreatment, aeration, tempera-
ture, and empty-bed contact time on system performance. System flexibility was evaluated with
DJ Basin produced water and fracturing flowback water. Experimental durations are reported for
the sample in which the indicated effluent concentration was detected. In most cases, treatment
continued for a duration of 72 hours, unless it was anticipated that removal would require longer
operation times.
3.2.1 Lab-scale BAF Treatment of Diluted Produced Water
Following encouraging results from bench-scale system operation, a preliminary lab-
scale experiment was conducted with 2x diluted Piceance Basin produced water without prior
acclimation of the extant biofilm to the new water type. This decision was made considering the
positive initial response of the biofilm during preliminary bench-scale experimentation. DOC
removal as a function of time for this experiment is presented in Figure 3.4a for two aerated col-
34
umns (BAF-1 and BAF-2) and two non-aerated columns (BAF-3 and BAF-4). Consistent with
bench-scale observations, initial system response was characterized by rapid DOC adsorption, in
this case an average of 34.9%, followed by a more consistent, gradual decline in effluent DOC
concentrations, resulting in average removal of 90.8% after 72 hours of operation. DOC removal
after filtration runs in which aeration was applied was approximately 44% faster than in those
filters without aeration, concluding after 50 hours of operation.
The improved response with the application of aeration is consistent with the bench-scale
observations, reinforcing the conclusion that addition of oxygen provides enhanced performance.
However, in contrast to bench-scale observations, effluent DO concentrations (Figure 3.4b) were
elevated throughout the duration of the experiment. As expected, filters operated with aeration
(BAF-1 and BAF-2) exhibit elevated effluent DO concentrations relative to filters without aera-
tion (BAF-3 and BAF-4); still, the effluent DO concentration of the non-aerated filters remained
above 2 mg/L for the majority of the experiment, with BAF-4 remaining well above 3 mg/L de-
spite the lack of aeration. This data suggests that system performance could be further enhanced
with improved DO consumption, independent of an additional DO input. Further studies would
be helpful to investigate the optimum conditions for efficient DO utilization.
Figure 3.4. (a) DOC concentration and (b) DO concentration as functions of time for 2x dilution experiments. Operating conditions: Batch volume 10 L per filter, aeration applied to feed tanks for BAF-1 and BAF-2, ambient temperature (18.5±2.0 ºC), HLR 0.6 gpm/ft2 (1.5 m/hr), and EBCT 30 minutes.
0
20
40
60
80
100
120
0 20 40 60 80
Dis
solv
ed O
rgan
ic C
arb
on (
mg/
L)
Time (hr)
BAF-1 (aerated)BAF-2 (aerated)BAF-3BAF-4
(a)0.0
1.0
2.0
3.0
4.0
5.0
6.0
0 20 40 60 80
Dis
solv
ed O
xyge
n (
mg/
L)
Time (hr)
BAF-1 (aerated)BAF-2 (aerated)BAF-3BAF-4(b)
35
Despite less than optimal system performance, specifically with lower than expected DO
consumption, the extant biomass responded favorably to the low-dilution produced water stream
– without the need for prior acclimation and conditioning. This observation is encouraging for
pilot- or field-scale system design, suggesting that long-term development of a stable, acclimated
biomass can be potentially avoided in favor of utilization of a biologically active media from an
existing facility as a seeding vessel for biofilm proliferation within a GAC filter bed.
3.2.2 Lab-scale BAF Treatment of Undiluted Produced Water
Following confirmation that biomass acclimation was practically unnecessary for effec-
tive system performance, experiments were resumed with undiluted Piceance Basin produced
water. The first test was conducted to evaluate the impacts of pretreatment (coagula-
tion/flocculation/sedimentation, 60 mg/L (Al3+) AlCl3 dose) and aeration on lab-scale system
performance. Results for DOC removal during this test are presented in Figure 3.5a for two pre-
treated filters (BAF-2 and BAF-4), two aerated filters (BAF-1 and BAF-2), and one filter (BAF-
3) with neither pretreatment nor aeration. Consistent with all previous observations, each filter
exhibited an initial rapid removal of DOC, attributable to adsorption and in this case accounting
for an average of 28.1%, followed by consistent, gradual decline in effluent concentrations, re-
sulting in average removal of 94.8% in BAF-1, BAF-2, and BAF-4 after 72 hours of operation;
BAF-3, which lacked both pretreatment and aeration, removed only 77.9% DOC after 72 hours.
Data from this test correspond to the expectation of superior performance in filters with
the DO input (BAF-1, BAF-2). Feed water for BAF-2 was pretreated prior to biological filtra-
tion; yet, this did not result in any notable performance enhancement. This suggests that in the
presence of aeration, pretreatment will not offer any meaningful improvements in treatment effi-
ciency. However, in the absence of aeration this is not the case, evidenced by the superior per-
formance of BAF-4 compared to BAF-3. In fact, BAF-4, which lacked aeration but received pre-
treatment, performs more similar to BAF-1 and BAF-2 than BAF-3, which lacked both aeration
and pretreatment. This is not surprising when considering the effluent DO concentrations (Figure
3.5b), which are characterized by consistently elevated levels of more than 3 mg/L in BAF-1,
BAF-2, and BAF-4; although these levels in BAF-1 and BAF-2 do, in fact, remain higher than in
BAF-4. As expected, effluent DO concentrations in BAF-3 remain comparably lower and con-
tinue to decline for the duration of the experiment.
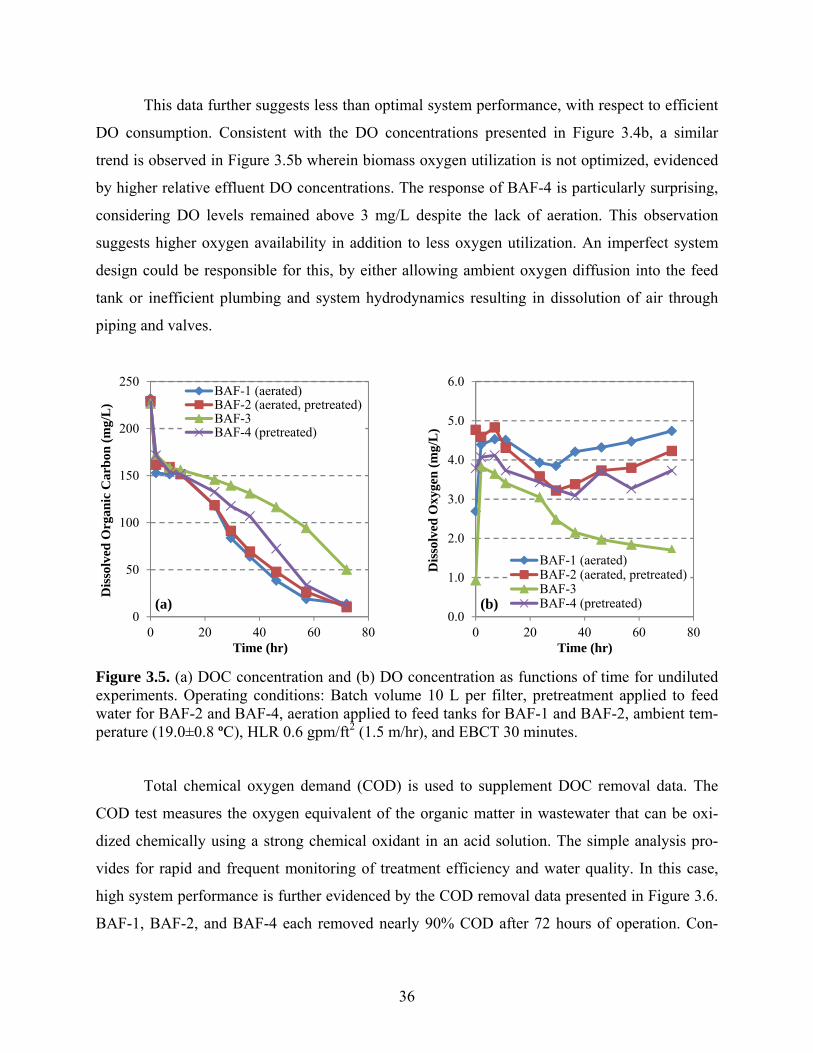
36
This data further suggests less than optimal system performance, with respect to efficient
DO consumption. Consistent with the DO concentrations presented in Figure 3.4b, a similar
trend is observed in Figure 3.5b wherein biomass oxygen utilization is not optimized, evidenced
by higher relative effluent DO concentrations. The response of BAF-4 is particularly surprising,
considering DO levels remained above 3 mg/L despite the lack of aeration. This observation
suggests higher oxygen availability in addition to less oxygen utilization. An imperfect system
design could be responsible for this, by either allowing ambient oxygen diffusion into the feed
tank or inefficient plumbing and system hydrodynamics resulting in dissolution of air through
piping and valves.
Figure 3.5. (a) DOC concentration and (b) DO concentration as functions of time for undiluted experiments. Operating conditions: Batch volume 10 L per filter, pretreatment applied to feed water for BAF-2 and BAF-4, aeration applied to feed tanks for BAF-1 and BAF-2, ambient tem-perature (19.0±0.8 ºC), HLR 0.6 gpm/ft2 (1.5 m/hr), and EBCT 30 minutes.
Total chemical oxygen demand (COD) is used to supplement DOC removal data. The
COD test measures the oxygen equivalent of the organic matter in wastewater that can be oxi-
dized chemically using a strong chemical oxidant in an acid solution. The simple analysis pro-
vides for rapid and frequent monitoring of treatment efficiency and water quality. In this case,
high system performance is further evidenced by the COD removal data presented in Figure 3.6.
BAF-1, BAF-2, and BAF-4 each removed nearly 90% COD after 72 hours of operation. Con-
0
50
100
150
200
250
0 20 40 60 80
Dis
solv
ed O
rgan
ic C
arb
on (
mg/
L)
Time (hr)
BAF-1 (aerated)BAF-2 (aerated, pretreated)BAF-3BAF-4 (pretreated)
(a)0.0
1.0
2.0
3.0
4.0
5.0
6.0
0 20 40 60 80
Dis
solv
ed O
xyge
n (
mg/
L)
Time (hr)
BAF-1 (aerated)BAF-2 (aerated, pretreated)BAF-3BAF-4 (pretreated)(b)
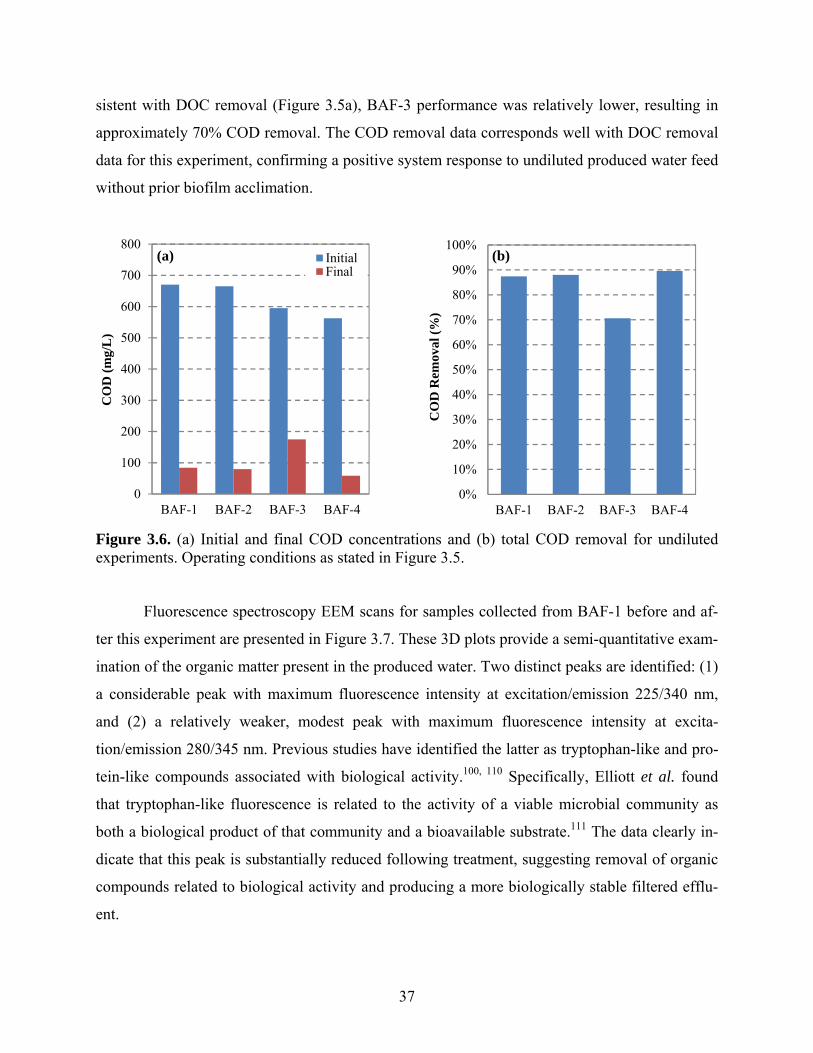
37
sistent with DOC removal (Figure 3.5a), BAF-3 performance was relatively lower, resulting in
approximately 70% COD removal. The COD removal data corresponds well with DOC removal
data for this experiment, confirming a positive system response to undiluted produced water feed
without prior biofilm acclimation.
Figure 3.6. (a) Initial and final COD concentrations and (b) total COD removal for undiluted experiments. Operating conditions as stated in Figure 3.5.
Fluorescence spectroscopy EEM scans for samples collected from BAF-1 before and af-
ter this experiment are presented in Figure 3.7. These 3D plots provide a semi-quantitative exam-
ination of the organic matter present in the produced water. Two distinct peaks are identified: (1)
a considerable peak with maximum fluorescence intensity at excitation/emission 225/340 nm,
and (2) a relatively weaker, modest peak with maximum fluorescence intensity at excita-
tion/emission 280/345 nm. Previous studies have identified the latter as tryptophan-like and pro-
tein-like compounds associated with biological activity.100, 110 Specifically, Elliott et al. found
that tryptophan-like fluorescence is related to the activity of a viable microbial community as
both a biological product of that community and a bioavailable substrate.111 The data clearly in-
dicate that this peak is substantially reduced following treatment, suggesting removal of organic
compounds related to biological activity and producing a more biologically stable filtered efflu-
ent.
0
100
200
300
400
500
600
700
800
BAF-1 BAF-2 BAF-3 BAF-4
CO
D (
mg/
L)
InitialFinal
(a)
0%
10%
20%
30%
40%
50%
60%
70%
80%
90%
100%
BAF-1 BAF-2 BAF-3 BAF-4
CO
D R
emov
al (
%)
(b)
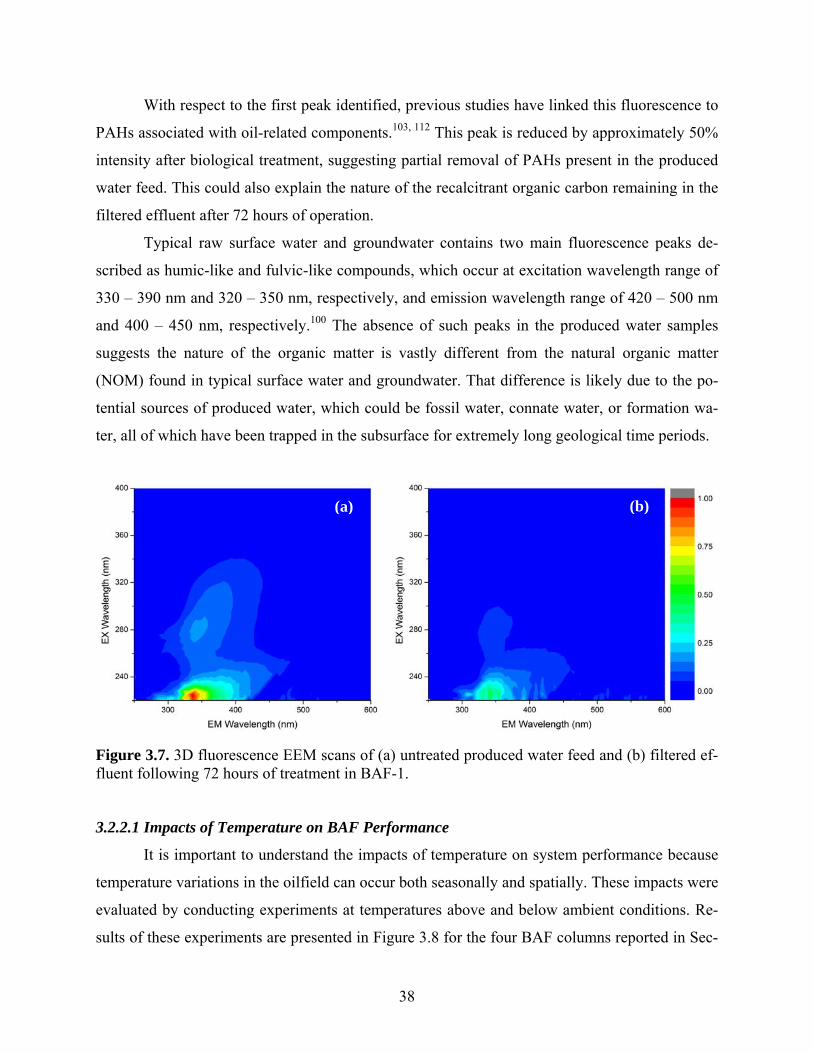
38
With respect to the first peak identified, previous studies have linked this fluorescence to
PAHs associated with oil-related components.103, 112 This peak is reduced by approximately 50%
intensity after biological treatment, suggesting partial removal of PAHs present in the produced
water feed. This could also explain the nature of the recalcitrant organic carbon remaining in the
filtered effluent after 72 hours of operation.
Typical raw surface water and groundwater contains two main fluorescence peaks de-
scribed as humic-like and fulvic-like compounds, which occur at excitation wavelength range of
330 – 390 nm and 320 – 350 nm, respectively, and emission wavelength range of 420 – 500 nm
and 400 – 450 nm, respectively.100 The absence of such peaks in the produced water samples
suggests the nature of the organic matter is vastly different from the natural organic matter
(NOM) found in typical surface water and groundwater. That difference is likely due to the po-
tential sources of produced water, which could be fossil water, connate water, or formation wa-
ter, all of which have been trapped in the subsurface for extremely long geological time periods.
Figure 3.7. 3D fluorescence EEM scans of (a) untreated produced water feed and (b) filtered ef-fluent following 72 hours of treatment in BAF-1.
3.2.2.1 Impacts of Temperature on BAF Performance
It is important to understand the impacts of temperature on system performance because
temperature variations in the oilfield can occur both seasonally and spatially. These impacts were
evaluated by conducting experiments at temperatures above and below ambient conditions. Re-
sults of these experiments are presented in Figure 3.8 for the four BAF columns reported in Sec-
(a) (b)
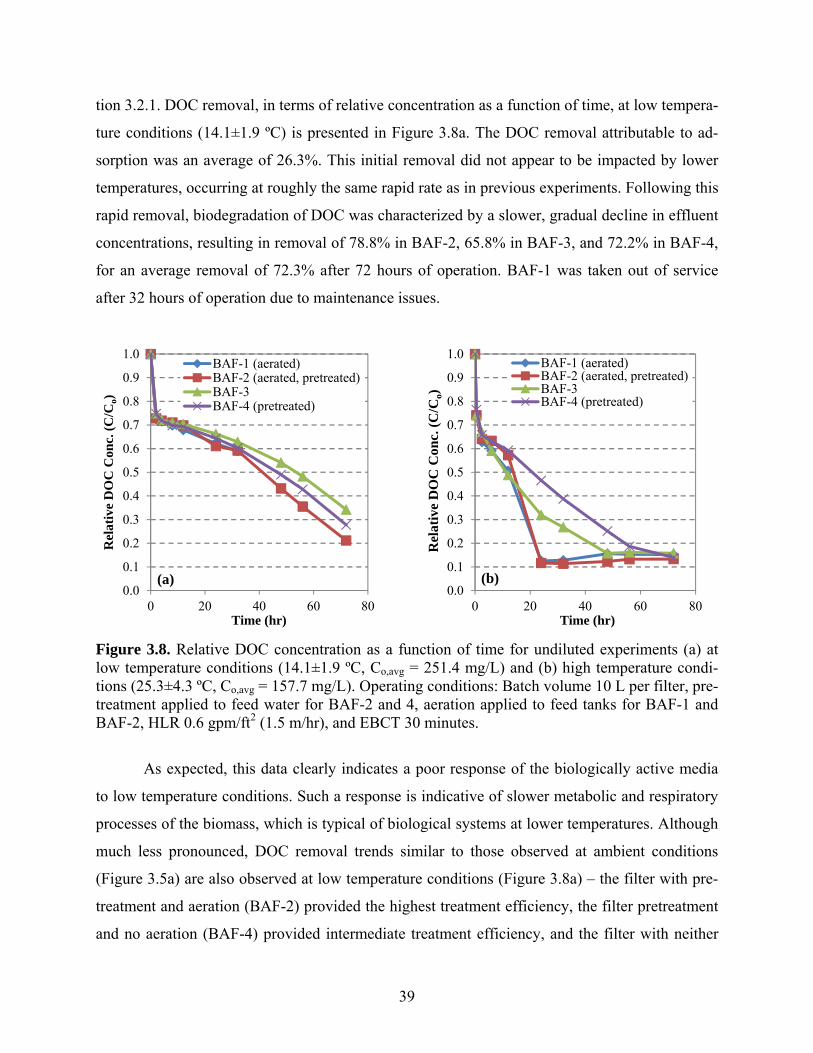
39
tion 3.2.1. DOC removal, in terms of relative concentration as a function of time, at low tempera-
ture conditions (14.1±1.9 ºC) is presented in Figure 3.8a. The DOC removal attributable to ad-
sorption was an average of 26.3%. This initial removal did not appear to be impacted by lower
temperatures, occurring at roughly the same rapid rate as in previous experiments. Following this
rapid removal, biodegradation of DOC was characterized by a slower, gradual decline in effluent
concentrations, resulting in removal of 78.8% in BAF-2, 65.8% in BAF-3, and 72.2% in BAF-4,
for an average removal of 72.3% after 72 hours of operation. BAF-1 was taken out of service
after 32 hours of operation due to maintenance issues.
Figure 3.8. Relative DOC concentration as a function of time for undiluted experiments (a) at low temperature conditions (14.1±1.9 ºC, Co,avg = 251.4 mg/L) and (b) high temperature condi-tions (25.3±4.3 ºC, Co,avg = 157.7 mg/L). Operating conditions: Batch volume 10 L per filter, pre-treatment applied to feed water for BAF-2 and 4, aeration applied to feed tanks for BAF-1 and BAF-2, HLR 0.6 gpm/ft2 (1.5 m/hr), and EBCT 30 minutes.
As expected, this data clearly indicates a poor response of the biologically active media
to low temperature conditions. Such a response is indicative of slower metabolic and respiratory
processes of the biomass, which is typical of biological systems at lower temperatures. Although
much less pronounced, DOC removal trends similar to those observed at ambient conditions
(Figure 3.5a) are also observed at low temperature conditions (Figure 3.8a) – the filter with pre-
treatment and aeration (BAF-2) provided the highest treatment efficiency, the filter pretreatment
and no aeration (BAF-4) provided intermediate treatment efficiency, and the filter with neither
0.0
0.1
0.2
0.3
0.4
0.5
0.6
0.7
0.8
0.9
1.0
0 20 40 60 80
Rel
ativ
e D
OC
Con
c. (
C/C
o)
Time (hr)
BAF-1 (aerated)BAF-2 (aerated, pretreated)BAF-3BAF-4 (pretreated)
(a)0.0
0.1
0.2
0.3
0.4
0.5
0.6
0.7
0.8
0.9
1.0
0 20 40 60 80
Rel
ativ
e D
OC
Con
c. (
C/C
o)
Time (hr)
BAF-1 (aerated)BAF-2 (aerated, pretreated)BAF-3BAF-4 (pretreated)
(b)
40
pretreatment nor aeration (BAF-3) provided the lowest treatment efficiency. Because the trend is
less pronounced, this suggests that aeration does not provide much benefit at lower operating
temperatures. This is important for operators to consider, as the energy-intensiveness of the sys-
tem could be potentially reduced in the winter months, assuming no climate control was integrat-
ed into system design.
DOC removal, in terms of relative concentration as a function of time, at high tempera-
ture conditions (25.3±4.3 ºC) is presented in Figure 3.8b. The DOC removal attributed to adsorp-
tion was on average 25.2%, displaying similar rapid removal to ambient and low temperature
system performance; the similar initial removals suggest adsorption mechanisms are less suscep-
tible to temperature variation. Following this initial rapid removal, biodegradation of DOC was
characterized by considerably faster decline in effluent concentrations compared to ambient and
low temperature conditions. Removal in BAF-1 and BAF-2 concluded after 24 hours of opera-
tion, resulting in an average removal of 87.9%. Removal in BAF-3 concluded after 48 hours of
operation, resulting in an 84.8% reduction. Removal in BAF-4 concluded after 64 hours of oper-
ation, resulting in an 86.0% reduction.
These results visibly indicate an enhanced response of the biologically active media to
high temperature conditions. In contrast to the response at lower temperatures, this is indicative
of notably faster metabolic and respiratory processes of the biomass. With respect to filters hav-
ing aeration applied to feed tanks (BAF-1 and BAF-2), DOC removal trends observed at high
temperature conditions (Figure 3.8b) are similar to, yet much more pronounced than those ob-
served at ambient conditions (Figure 3.5a). However, DOC removal trends for filters without
aeration, although more pronounced than those observed at ambient conditions, somewhat devi-
ate from the previously established trend. Specifically, the filter with neither aeration nor pre-
treatment (BAF-3) concluded removal 33% faster than the filter without aeration and with pre-
treatment applied to the feed water. This deviation is potentially due to the removal of TSS dur-
ing pretreatment, much of which contained microorganisms that contribute to in-situ biodegrada-
tion. This extant biological activity of the produced water feed was possibly enhanced due to the
increase in temperature, allowing in-situ biodegradation within the feed tank in addition to within
the filter bed. This enhancement of biological activity in the feed tank could explain the reduced
performance of the filter with pretreatment and no aeration.
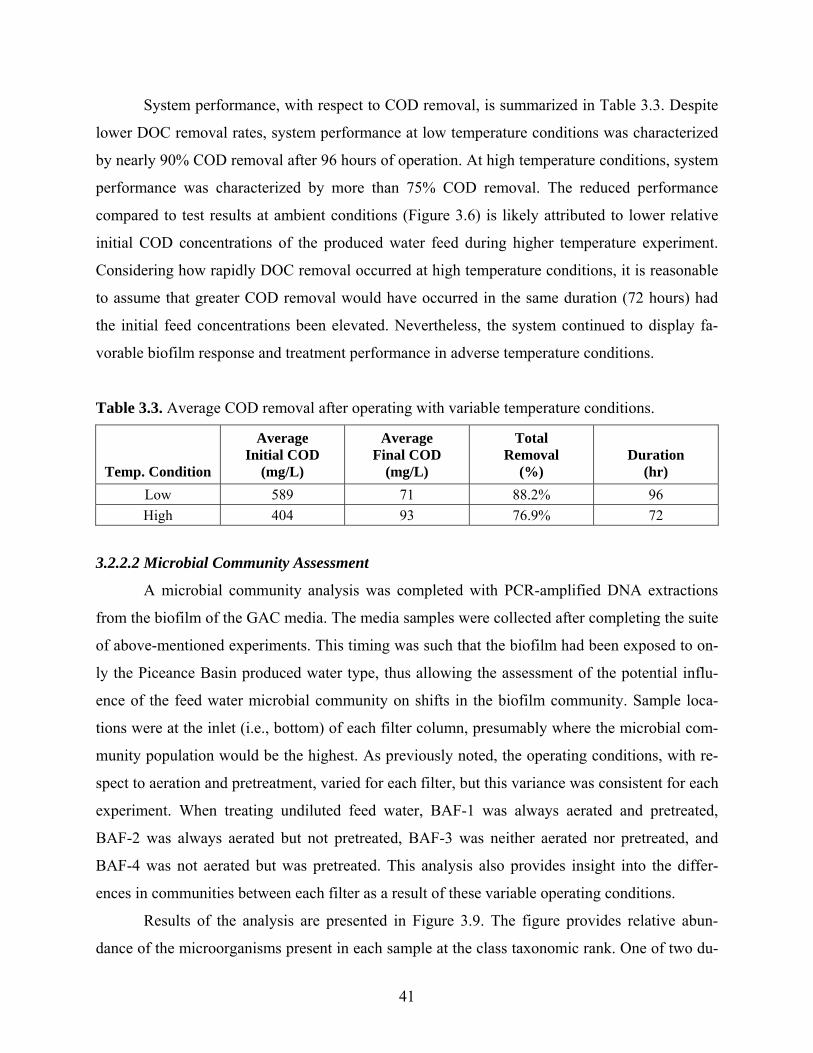
41
System performance, with respect to COD removal, is summarized in Table 3.3. Despite
lower DOC removal rates, system performance at low temperature conditions was characterized
by nearly 90% COD removal after 96 hours of operation. At high temperature conditions, system
performance was characterized by more than 75% COD removal. The reduced performance
compared to test results at ambient conditions (Figure 3.6) is likely attributed to lower relative
initial COD concentrations of the produced water feed during higher temperature experiment.
Considering how rapidly DOC removal occurred at high temperature conditions, it is reasonable
to assume that greater COD removal would have occurred in the same duration (72 hours) had
the initial feed concentrations been elevated. Nevertheless, the system continued to display fa-
vorable biofilm response and treatment performance in adverse temperature conditions.
Table 3.3. Average COD removal after operating with variable temperature conditions.
Temp. Condition
Average Initial COD
(mg/L)
Average Final COD
(mg/L)
Total Removal
(%) Duration
(hr)
Low 589 71 88.2% 96
High 404 93 76.9% 72
3.2.2.2 Microbial Community Assessment
A microbial community analysis was completed with PCR-amplified DNA extractions
from the biofilm of the GAC media. The media samples were collected after completing the suite
of above-mentioned experiments. This timing was such that the biofilm had been exposed to on-
ly the Piceance Basin produced water type, thus allowing the assessment of the potential influ-
ence of the feed water microbial community on shifts in the biofilm community. Sample loca-
tions were at the inlet (i.e., bottom) of each filter column, presumably where the microbial com-
munity population would be the highest. As previously noted, the operating conditions, with re-
spect to aeration and pretreatment, varied for each filter, but this variance was consistent for each
experiment. When treating undiluted feed water, BAF-1 was always aerated and pretreated,
BAF-2 was always aerated but not pretreated, BAF-3 was neither aerated nor pretreated, and
BAF-4 was not aerated but was pretreated. This analysis also provides insight into the differ-
ences in communities between each filter as a result of these variable operating conditions.
Results of the analysis are presented in Figure 3.9. The figure provides relative abun-
dance of the microorganisms present in each sample at the class taxonomic rank. One of two du-
42
plicates from BAF-2 did not amplify and is therefore not included in the figure. The produced
water community is dominated by Alphaproteobacteria (15.5%), Gammaproteobacteria
(22.6%), and Thermotogae (16.7%). The class Thermotogae is generally composed of Gram-
negative, anaerobic, thermophilic bacteria.113 It is therefore not surprising to find an abundance
of such microorganisms in the formation water produced from the deep subsurface, which in the
Piceance Basin range from 7,000 to 12,500 ft. The extant GAC biofilm community is the most
diverse in terms of dominant relative abundance, with Alphaproteobacteria (11.4%) and Betap-
roteobacteria (14.9%) representing the two most dominant classes of microorganisms. Consider-
ing the higher relative abundance of Alphaproteobacteria in both the produced water and the ex-
tant biofilm, it is expected that a similar abundance would be present in the BAF media. The data
indicate that this is, in fact, the case, with relative abundance of at least 11.8% (BAF-1 B) and at
most 21.2% (BAF-2 A). A general increase in the abundance of Betaproteobacteria was ob-
served in all filters, compared to the extant biofilm. With respect to the Gammaproteobacteria
present in the produced water, the relative abundance is somewhat reduced in the aerated filters
(BAF-1 and BAF-2, < 15%) and substantially reduced in the non-aerated filters (BAF-3 and
BAF-4, < 9%), although still present in high relative abundances in both cases. The Thermotogae
was present in none of the filters. Overall, the data indicate a general shift from the extant bio-
film, with little to some influence from the microbial community of the produced water.
There are some noticeable observations of new microorganisms populating the BAF me-
dia that were present in low relative abundance in both the produced water and the extant bio-
film. For example, Deltaproteobacteria had a dramatic increase in relative abundance in the non-
aerated filters (BAF-3 and BAF-4 both 13.4 – 13.9%) compared to the abundance identified in
the produced water (3.3%) and the extant biofilm (2.2%). Overall, this is not a surprise because
the Deltaproteobacteria are home to a number of dominant organisms with anaerobic metabo-
lisms, including the sulfate-reducing bacteria and members of the geobacter sub-phylum. No sig-
nificant increase in relative abundance was observed in the aerated filters (BAF-1 and BAF-2,
2.2 – 5.2%).
Of particular interest is the substantial increase in relative abundance of Flavobacteria in
BAF-1 (i.e., aerated filter). Very low relative abundance was observed in both the water (2.1%)
and the extant biofilm (0.9%); yet, an average of 14% relative abundance was observed in BAF-
1. Flavobacteria are reportedly able to biodegrade petroleum hydrocarbons under aerobic condi-
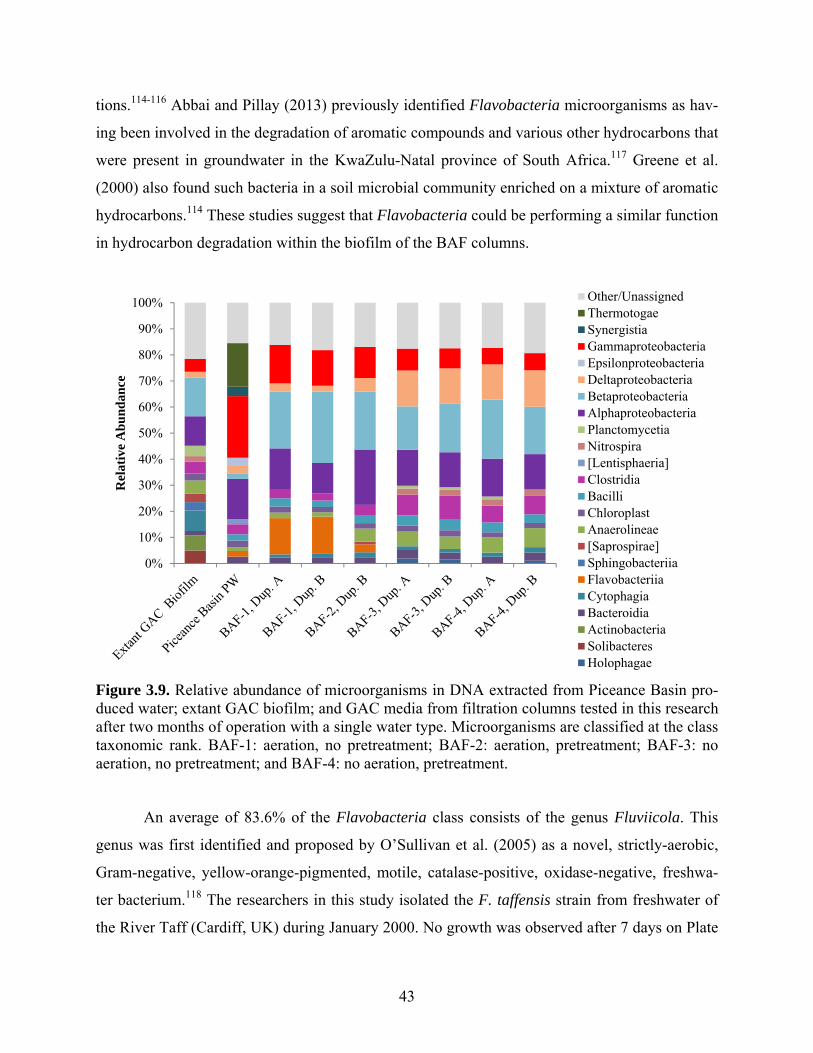
43
tions.114-116 Abbai and Pillay (2013) previously identified Flavobacteria microorganisms as hav-
ing been involved in the degradation of aromatic compounds and various other hydrocarbons that
were present in groundwater in the KwaZulu-Natal province of South Africa.117 Greene et al.
(2000) also found such bacteria in a soil microbial community enriched on a mixture of aromatic
hydrocarbons.114 These studies suggest that Flavobacteria could be performing a similar function
in hydrocarbon degradation within the biofilm of the BAF columns.
Figure 3.9. Relative abundance of microorganisms in DNA extracted from Piceance Basin pro-duced water; extant GAC biofilm; and GAC media from filtration columns tested in this research after two months of operation with a single water type. Microorganisms are classified at the class taxonomic rank. BAF-1: aeration, no pretreatment; BAF-2: aeration, pretreatment; BAF-3: no aeration, no pretreatment; and BAF-4: no aeration, pretreatment.
An average of 83.6% of the Flavobacteria class consists of the genus Fluviicola. This
genus was first identified and proposed by O’Sullivan et al. (2005) as a novel, strictly-aerobic,
Gram-negative, yellow-orange-pigmented, motile, catalase-positive, oxidase-negative, freshwa-
ter bacterium.118 The researchers in this study isolated the F. taffensis strain from freshwater of
the River Taff (Cardiff, UK) during January 2000. No growth was observed after 7 days on Plate
0%
10%
20%
30%
40%
50%
60%
70%
80%
90%
100%
Rel
ativ
e A
bu
nd
ance
Other/UnassignedThermotogaeSynergistiaGammaproteobacteriaEpsilonproteobacteriaDeltaproteobacteriaBetaproteobacteriaAlphaproteobacteriaPlanctomycetiaNitrospira[Lentisphaeria]ClostridiaBacilliChloroplastAnaerolineae[Saprospirae]SphingobacteriiaFlavobacteriiaCytophagiaBacteroidiaActinobacteriaSolibacteresHolophagae
44
Count Agar in the presence of sodium ions. The fact that this genus was identified in high rela-
tive abundance in a biofilm treating produced water of salinity greater than 10 g/L TDS suggests
that microorganisms of this genus are not strictly freshwater bacteria, but rather can be brackish
water bacteria as well. Indeed, this genus was also identified after extracting and sequencing
DNA of samples collected from the Northern Baltic Sea,119 further suggesting Fluviicola species
can be brackish water bacteria in addition to freshwater bacteria. Additionally, a bacterium was
found in the uppermost stratified water layer of the Arctic fjord Storfjorden (Svalbard, Norway)
that could be assigned to the genus Fluviicola with a 0.81 confidence level.120 These findings
may help to further support the hypothesis of a brackish water Fluviicola species.
The Fluviicola genus has been associated with hydrocarbon degradation in several stud-
ies. It was identified in seawater samples collected along the coastline of the Gulf of Mexico,
specifically at Terrebonne Bay (Louisiana, USA), in July 2011.121 These samples were collected
to examine the in situ microbial compositions in response to the crude oil and methane discharg-
es that resulted from the Deepwater Horizon disaster. Another study identified the Fluviicola ge-
nus in a biofilm community that had developed on calcinated bentonite during aerobic bioreme-
diation of phenanthrene,122 a PAH composed of 3 benzene rings. The identification of the Flu-
viicola genus in hydrocarbon-rich, aerobic, and saline environments suggests that bacteria within
this genus play an important role in biodegradation under such conditions. It is therefore reason-
able to assume that a similar function is being performed by these microorganisms in the BAF
media.
Overall, the data in Figure 3.9 indicate a distinguishable difference between aerated fil-
ters (BAF-1 and BAF-2) and non-aerated filters (BAF-3 and BAF-4), in terms of the dominant
microorganisms. The aerated filters have a preference for Gammaproteobacteria and Flavobac-
teria, which are likely aerobic species, while the non-aerated filters have a preference for Deltap-
roteobacteria, Clostridia, and Anaerolineae, all of which contain anaerobic genera and species.
This difference in community composition could assist in explaining the differences in system
performance. The higher relative abundance of Gammaproteobacteria and Flavobacteria in the
aerated filters suggests that these bacteria are responsible for higher substrate utilization, which
is a function of their metabolic processes and enzymatic production. Although the impact of aer-
ation is quite clear, the impact of the level of pretreatment is less clear. Without the BAF-2 sam-
ple replicate data, the differences with BAF-1 samples are difficult to confidently ascertain.
45
BAF-2 in some respects appears as a transition between BAF-1 and BAF-3/BAF-4. Excluding
the aerated filters from the comparison, a difference between BAF-3 replicates and BAF-4 repli-
cates is much less apparent, suggesting that the level of pretreatment has little, if any, impact on
microbial composition within the biofilm. In general, these trends indicate a noticeable differ-
ence in overall composition based on the aeration operating condition. Further long-term studies
would be valuable to better understand the function of each class of bacteria. This understanding
would then aid in evaluating the ability to engineer an optimally performing biofilm. Additional
insight into biofilm community development and diversity would be provided by future work
that included sampling media at intermediate and outlet locations, in addition to the inlet.
3.2.2.3 System Flexibility
System performance, in terms of COD removal, after introducing a new feed water type
(i.e., DJ Basin produced water) is presented in Figure 3.10, with average COD removal compari-
son summarized in Table 3.4. This feed water was characterized by approximately double the
concentration of DOC and COD present in the Piceance Basin produced water, presenting a val-
uable opportunity to evaluate the flexibility of the system to treat a different, more impaired
wastewater. The filters were essentially operated in duplicate, with BAF-1 and BAF-2 treating
Piceance Basin produced water, and BAF-3 and BAF-4 treating DJ Basin produced water. The
data indicate a positive response of the system to the new feed water, evidenced by similar per-
formance to the original water type. In fact, the COD removal percentage was slightly greater in
the filters treating DJ Basin produced water (82.0%) than in filters treating Piceance Basin pro-
duced water (78.4%). This comparable performance supports the conclusion from bench-scale
testing of high potential for favorable system response to variable wastewater quality.
Table 3.4. Average COD removal after operating with new feed water type.
Feed Water
Average Initial COD
(mg/L)
Average Final COD
(mg/L)
Total Removal
(%) Duration
(hr)
Piceance Basin produced water 554.4 120.5 78.4% 72
DJ Basin produced water 1,064.2 191.3 82.0% 72
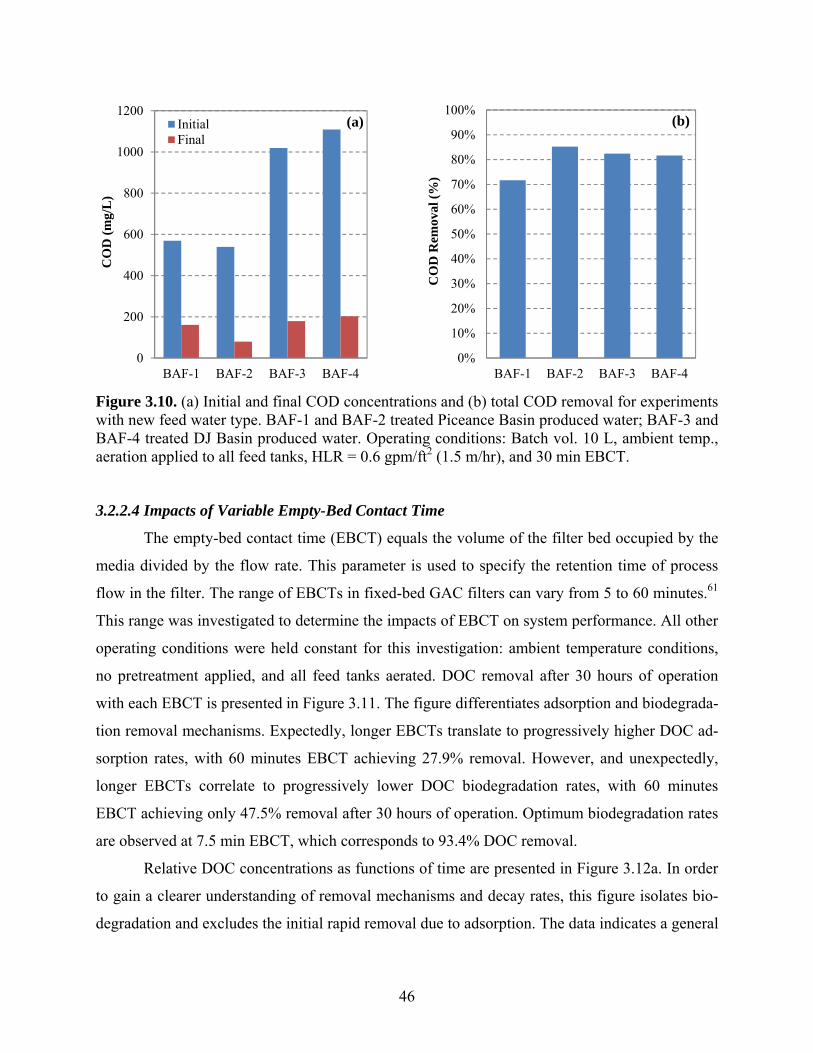
46
Figure 3.10. (a) Initial and final COD concentrations and (b) total COD removal for experiments with new feed water type. BAF-1 and BAF-2 treated Piceance Basin produced water; BAF-3 and BAF-4 treated DJ Basin produced water. Operating conditions: Batch vol. 10 L, ambient temp., aeration applied to all feed tanks, HLR = 0.6 gpm/ft2 (1.5 m/hr), and 30 min EBCT.
3.2.2.4 Impacts of Variable Empty-Bed Contact Time
The empty-bed contact time (EBCT) equals the volume of the filter bed occupied by the
media divided by the flow rate. This parameter is used to specify the retention time of process
flow in the filter. The range of EBCTs in fixed-bed GAC filters can vary from 5 to 60 minutes.61
This range was investigated to determine the impacts of EBCT on system performance. All other
operating conditions were held constant for this investigation: ambient temperature conditions,
no pretreatment applied, and all feed tanks aerated. DOC removal after 30 hours of operation
with each EBCT is presented in Figure 3.11. The figure differentiates adsorption and biodegrada-
tion removal mechanisms. Expectedly, longer EBCTs translate to progressively higher DOC ad-
sorption rates, with 60 minutes EBCT achieving 27.9% removal. However, and unexpectedly,
longer EBCTs correlate to progressively lower DOC biodegradation rates, with 60 minutes
EBCT achieving only 47.5% removal after 30 hours of operation. Optimum biodegradation rates
are observed at 7.5 min EBCT, which corresponds to 93.4% DOC removal.
Relative DOC concentrations as functions of time are presented in Figure 3.12a. In order
to gain a clearer understanding of removal mechanisms and decay rates, this figure isolates bio-
degradation and excludes the initial rapid removal due to adsorption. The data indicates a general
0
200
400
600
800
1000
1200
BAF-1 BAF-2 BAF-3 BAF-4
CO
D (
mg/
L)
InitialFinal
(a)
0%
10%
20%
30%
40%
50%
60%
70%
80%
90%
100%
BAF-1 BAF-2 BAF-3 BAF-4
CO
D R
emov
al (
%)
(b)
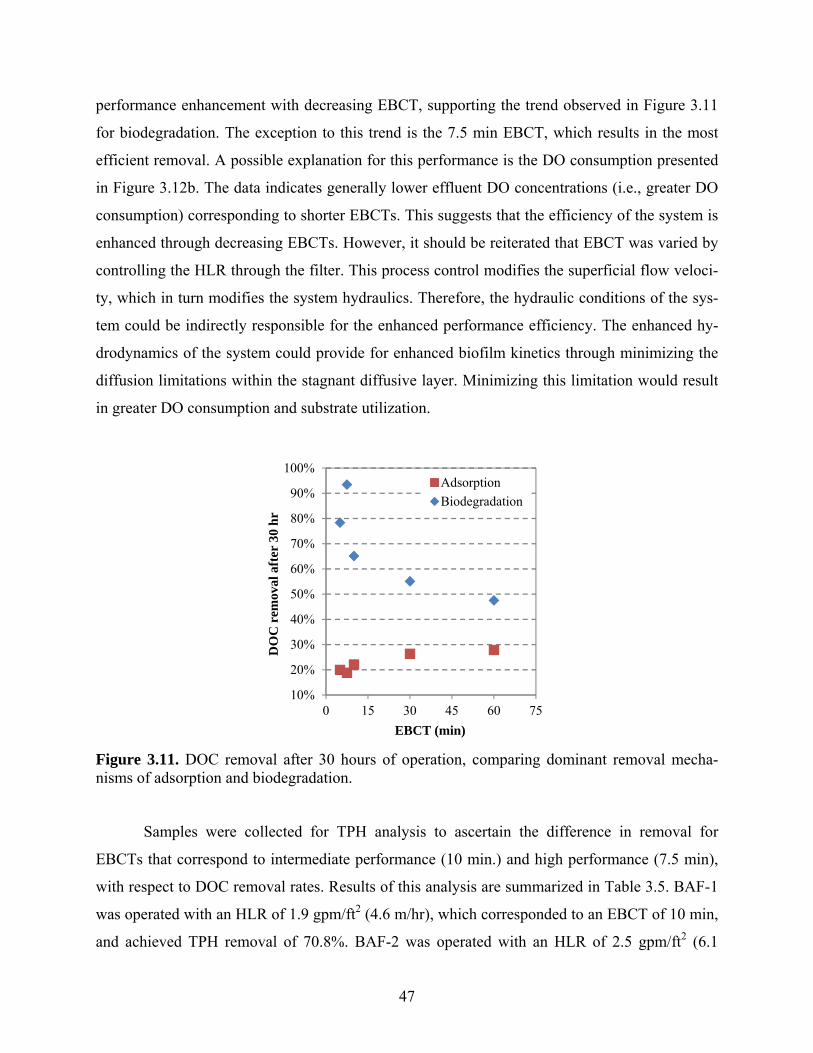
47
performance enhancement with decreasing EBCT, supporting the trend observed in Figure 3.11
for biodegradation. The exception to this trend is the 7.5 min EBCT, which results in the most
efficient removal. A possible explanation for this performance is the DO consumption presented
in Figure 3.12b. The data indicates generally lower effluent DO concentrations (i.e., greater DO
consumption) corresponding to shorter EBCTs. This suggests that the efficiency of the system is
enhanced through decreasing EBCTs. However, it should be reiterated that EBCT was varied by
controlling the HLR through the filter. This process control modifies the superficial flow veloci-
ty, which in turn modifies the system hydraulics. Therefore, the hydraulic conditions of the sys-
tem could be indirectly responsible for the enhanced performance efficiency. The enhanced hy-
drodynamics of the system could provide for enhanced biofilm kinetics through minimizing the
diffusion limitations within the stagnant diffusive layer. Minimizing this limitation would result
in greater DO consumption and substrate utilization.
Figure 3.11. DOC removal after 30 hours of operation, comparing dominant removal mecha-nisms of adsorption and biodegradation.
Samples were collected for TPH analysis to ascertain the difference in removal for
EBCTs that correspond to intermediate performance (10 min.) and high performance (7.5 min),
with respect to DOC removal rates. Results of this analysis are summarized in Table 3.5. BAF-1
was operated with an HLR of 1.9 gpm/ft2 (4.6 m/hr), which corresponded to an EBCT of 10 min,
and achieved TPH removal of 70.8%. BAF-2 was operated with an HLR of 2.5 gpm/ft2 (6.1
10%
20%
30%
40%
50%
60%
70%
80%
90%
100%
0 15 30 45 60 75
DO
C r
emov
al a
fter
30
hr
EBCT (min)
Adsorption
Biodegradation
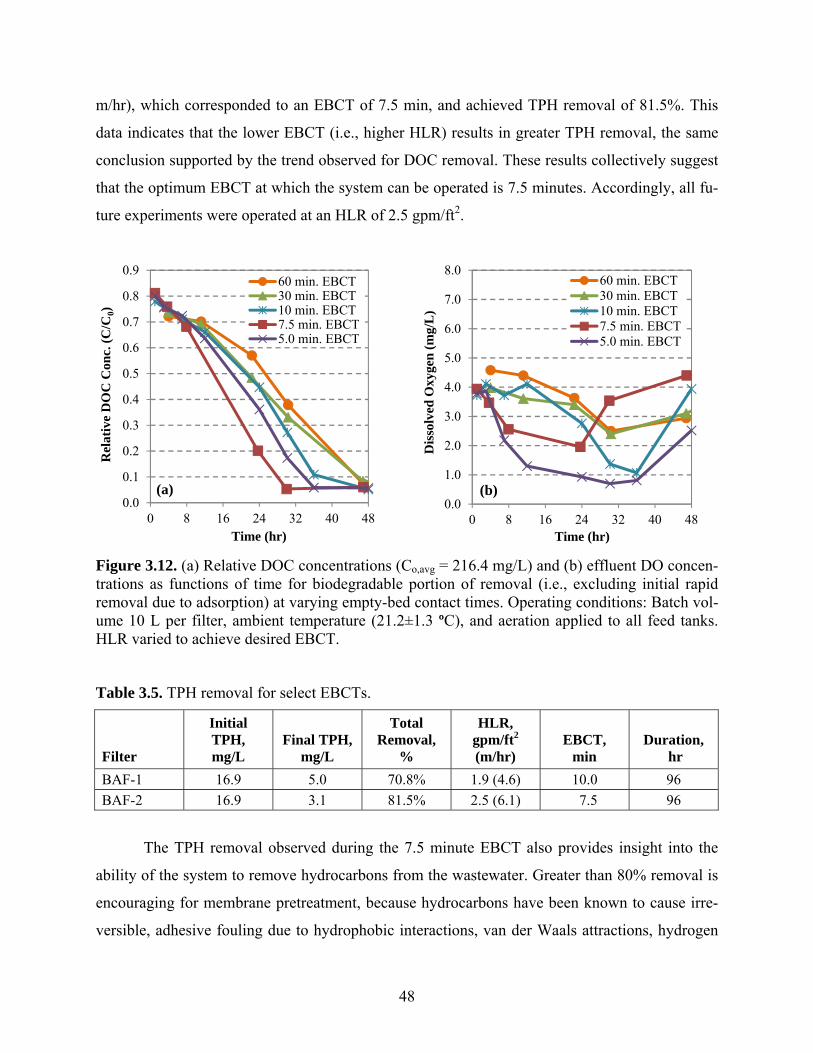
48
m/hr), which corresponded to an EBCT of 7.5 min, and achieved TPH removal of 81.5%. This
data indicates that the lower EBCT (i.e., higher HLR) results in greater TPH removal, the same
conclusion supported by the trend observed for DOC removal. These results collectively suggest
that the optimum EBCT at which the system can be operated is 7.5 minutes. Accordingly, all fu-
ture experiments were operated at an HLR of 2.5 gpm/ft2.
Figure 3.12. (a) Relative DOC concentrations (Co,avg = 216.4 mg/L) and (b) effluent DO concen-trations as functions of time for biodegradable portion of removal (i.e., excluding initial rapid removal due to adsorption) at varying empty-bed contact times. Operating conditions: Batch vol-ume 10 L per filter, ambient temperature (21.2±1.3 ºC), and aeration applied to all feed tanks. HLR varied to achieve desired EBCT.
Table 3.5. TPH removal for select EBCTs.
Filter
Initial TPH, mg/L
Final TPH, mg/L
Total Removal,
%
HLR, gpm/ft2 (m/hr)
EBCT, min
Duration, hr
BAF-1 16.9 5.0 70.8% 1.9 (4.6) 10.0 96
BAF-2 16.9 3.1 81.5% 2.5 (6.1) 7.5 96
The TPH removal observed during the 7.5 minute EBCT also provides insight into the
ability of the system to remove hydrocarbons from the wastewater. Greater than 80% removal is
encouraging for membrane pretreatment, because hydrocarbons have been known to cause irre-
versible, adhesive fouling due to hydrophobic interactions, van der Waals attractions, hydrogen
0.0
0.1
0.2
0.3
0.4
0.5
0.6
0.7
0.8
0.9
0 8 16 24 32 40 48
Rel
ativ
e D
OC
Con
c. (
C/C
0)
Time (hr)
60 min. EBCT30 min. EBCT10 min. EBCT7.5 min. EBCT5.0 min. EBCT
(a)0.0
1.0
2.0
3.0
4.0
5.0
6.0
7.0
8.0
0 8 16 24 32 40 48
Dis
solv
ed O
xyge
n (
mg/
L)
Time (hr)
60 min. EBCT30 min. EBCT10 min. EBCT7.5 min. EBCT5.0 min. EBCT
(b)
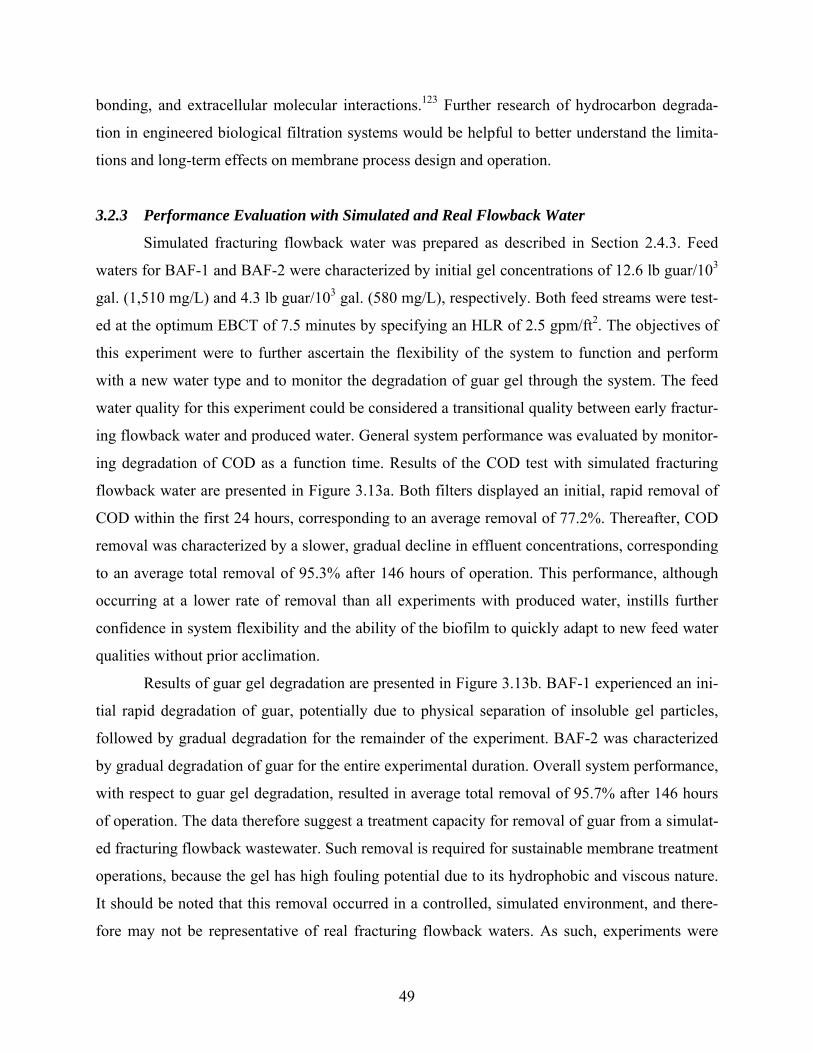
49
bonding, and extracellular molecular interactions.123 Further research of hydrocarbon degrada-
tion in engineered biological filtration systems would be helpful to better understand the limita-
tions and long-term effects on membrane process design and operation.
3.2.3 Performance Evaluation with Simulated and Real Flowback Water
Simulated fracturing flowback water was prepared as described in Section 2.4.3. Feed
waters for BAF-1 and BAF-2 were characterized by initial gel concentrations of 12.6 lb guar/103
gal. (1,510 mg/L) and 4.3 lb guar/103 gal. (580 mg/L), respectively. Both feed streams were test-
ed at the optimum EBCT of 7.5 minutes by specifying an HLR of 2.5 gpm/ft2. The objectives of
this experiment were to further ascertain the flexibility of the system to function and perform
with a new water type and to monitor the degradation of guar gel through the system. The feed
water quality for this experiment could be considered a transitional quality between early fractur-
ing flowback water and produced water. General system performance was evaluated by monitor-
ing degradation of COD as a function time. Results of the COD test with simulated fracturing
flowback water are presented in Figure 3.13a. Both filters displayed an initial, rapid removal of
COD within the first 24 hours, corresponding to an average removal of 77.2%. Thereafter, COD
removal was characterized by a slower, gradual decline in effluent concentrations, corresponding
to an average total removal of 95.3% after 146 hours of operation. This performance, although
occurring at a lower rate of removal than all experiments with produced water, instills further
confidence in system flexibility and the ability of the biofilm to quickly adapt to new feed water
qualities without prior acclimation.
Results of guar gel degradation are presented in Figure 3.13b. BAF-1 experienced an ini-
tial rapid degradation of guar, potentially due to physical separation of insoluble gel particles,
followed by gradual degradation for the remainder of the experiment. BAF-2 was characterized
by gradual degradation of guar for the entire experimental duration. Overall system performance,
with respect to guar gel degradation, resulted in average total removal of 95.7% after 146 hours
of operation. The data therefore suggest a treatment capacity for removal of guar from a simulat-
ed fracturing flowback wastewater. Such removal is required for sustainable membrane treatment
operations, because the gel has high fouling potential due to its hydrophobic and viscous nature.
It should be noted that this removal occurred in a controlled, simulated environment, and there-
fore may not be representative of real fracturing flowback waters. As such, experiments were
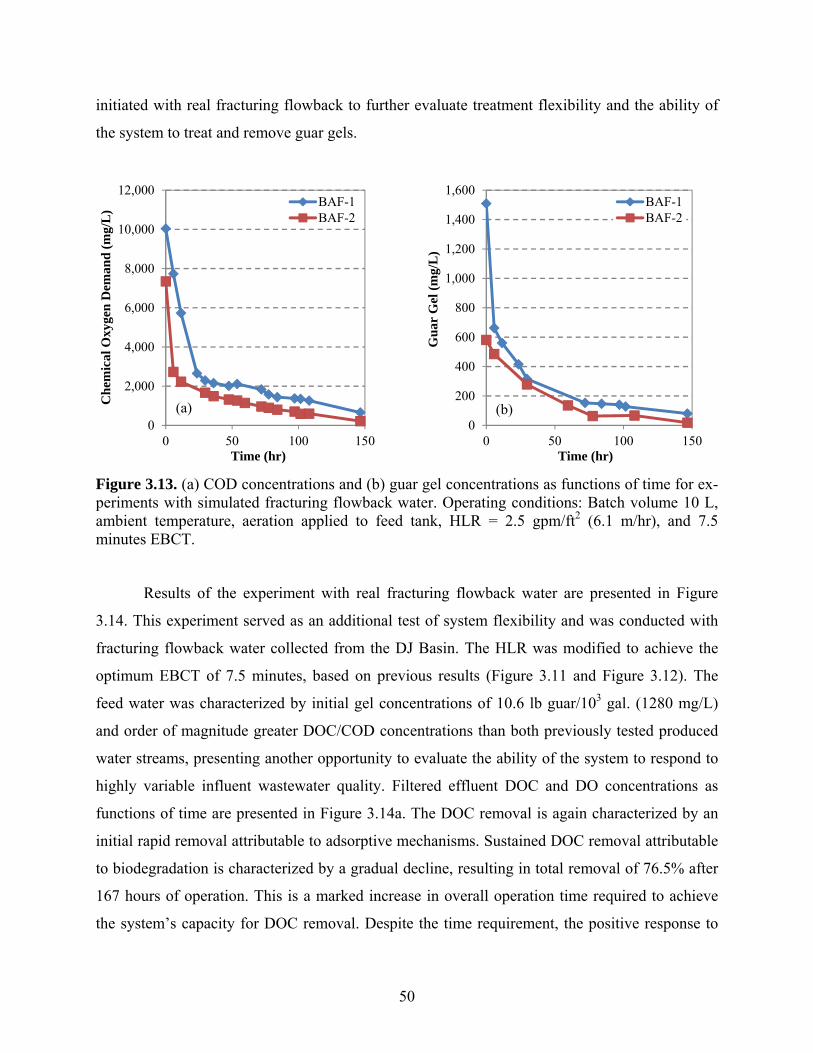
50
initiated with real fracturing flowback to further evaluate treatment flexibility and the ability of
the system to treat and remove guar gels.
Figure 3.13. (a) COD concentrations and (b) guar gel concentrations as functions of time for ex-periments with simulated fracturing flowback water. Operating conditions: Batch volume 10 L, ambient temperature, aeration applied to feed tank, HLR = 2.5 gpm/ft2 (6.1 m/hr), and 7.5 minutes EBCT.
Results of the experiment with real fracturing flowback water are presented in Figure
3.14. This experiment served as an additional test of system flexibility and was conducted with
fracturing flowback water collected from the DJ Basin. The HLR was modified to achieve the
optimum EBCT of 7.5 minutes, based on previous results (Figure 3.11 and Figure 3.12). The
feed water was characterized by initial gel concentrations of 10.6 lb guar/103 gal. (1280 mg/L)
and order of magnitude greater DOC/COD concentrations than both previously tested produced
water streams, presenting another opportunity to evaluate the ability of the system to respond to
highly variable influent wastewater quality. Filtered effluent DOC and DO concentrations as
functions of time are presented in Figure 3.14a. The DOC removal is again characterized by an
initial rapid removal attributable to adsorptive mechanisms. Sustained DOC removal attributable
to biodegradation is characterized by a gradual decline, resulting in total removal of 76.5% after
167 hours of operation. This is a marked increase in overall operation time required to achieve
the system’s capacity for DOC removal. Despite the time requirement, the positive response to
0
2,000
4,000
6,000
8,000
10,000
12,000
0 50 100 150
Ch
emic
al O
xyge
n D
eman
d (
mg/
L)
Time (hr)
BAF-1BAF-2
(a)0
200
400
600
800
1,000
1,200
1,400
1,600
0 50 100 150G
uar
Gel
(m
g/L
)
Time (hr)
BAF-1BAF-2
(b)
51
this feed water further supports the flexibility of the system to maintain treatment performance
when subjected to variable influent wastewater quality. This flexibility is attributed to the highly
adaptable nature of the biofilm to utilize different types of substrates without any prior acclima-
tion or conditioning. The adaptability demonstrated for this biofilm shows promise for full-scale
implementation in the oilfield.
However, the longer treatment time requirement may preclude the BAF process from be-
ing implemented for fracturing flowback wastewater, unless the operator can afford the operating
costs associated with longer operation time. A larger system design would offer additional treat-
ment efficiency, provided the system is not limited by mobility or footprint requirements. The
balance of treatment time and system size presents another challenge for design. With respect to
system sizing, 336 filter bed volumes were required to achieve the 76.5% DOC removal. At
1,540 cm3 per bed volume, a total of 0.5 m3 of filter bed were used for treatment. Theoretically,
each factor by which the filter bed volume increases will result in a treatment time decrease by
the same factor. In other words, if the filter bed volume of this system were doubled to 3,080 cm3
per bed volume, the treatment time would be reduced by half to 83.5 hours. Maintaining a con-
stant HLR in this example would increase the EBCT while not impacting the hydrodynamics of
the system. A total of 1.0 m3 of filter bed would therefore be required. This example highlights
the balance between sizing and capacity that operators and design engineers must manage in or-
der to implement a viable system.
System performance, in terms of COD removal, is presented in Figure 3.14b. The system
achieved an overall removal of 78.6% after 167 hours of operation. This COD removal is similar
to that achieved in previous experiments with produced water feeds, although after a longer
treatment duration. This result suggests that the system has the flexibility to quickly respond to
new water types, sacrificing treatment time but not overall treatment performance. This flexibil-
ity is further evidenced through the results of guar gel degradation, summarized in Table 3.6. The
system had the capacity to remove 90% of the guar gel present in the fracturing flowback, de-
spite no conditioning or acclimation to perform removal of such constituents. This ability pro-
vides additional encouragement for biological filtration systems to respond favorably and main-
tain performance in treating diverse, impaired water types.
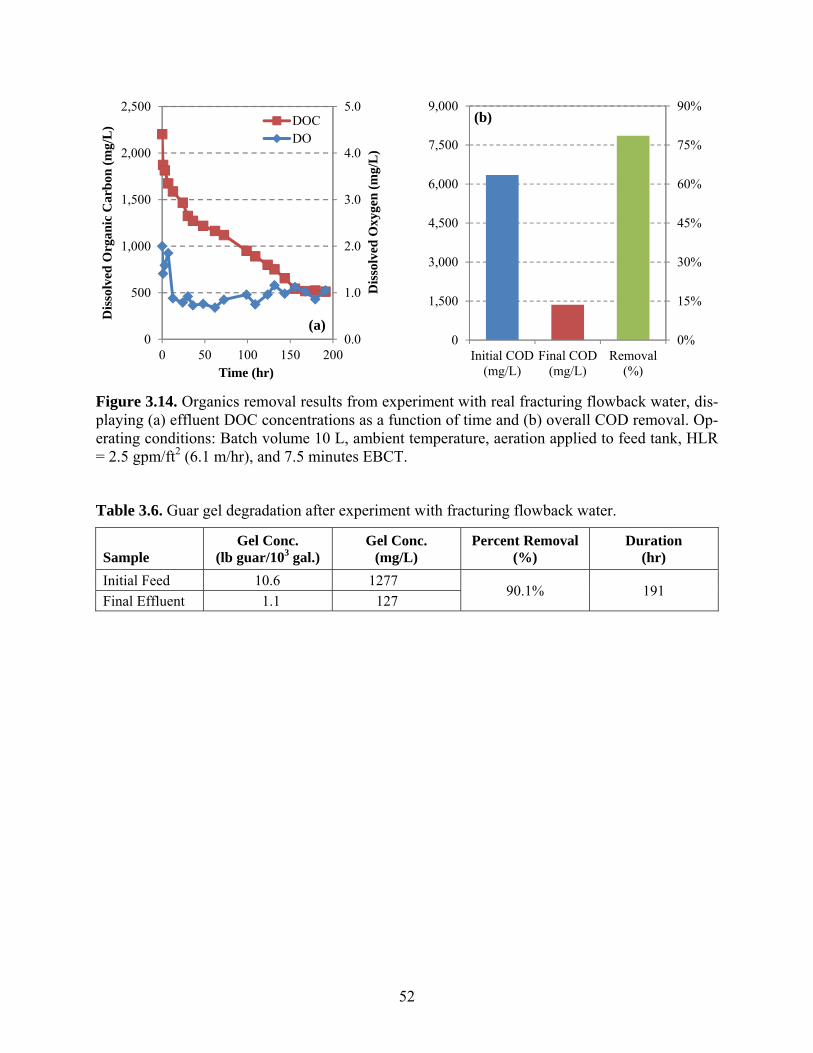
52
Figure 3.14. Organics removal results from experiment with real fracturing flowback water, dis-playing (a) effluent DOC concentrations as a function of time and (b) overall COD removal. Op-erating conditions: Batch volume 10 L, ambient temperature, aeration applied to feed tank, HLR = 2.5 gpm/ft2 (6.1 m/hr), and 7.5 minutes EBCT.
Table 3.6. Guar gel degradation after experiment with fracturing flowback water.
Sample Gel Conc.
(lb guar/103 gal.) Gel Conc.
(mg/L) Percent Removal
(%) Duration
(hr)
Initial Feed 10.6 1277 90.1% 191
Final Effluent 1.1 127
0.0
1.0
2.0
3.0
4.0
5.0
0
500
1,000
1,500
2,000
2,500
0 50 100 150 200D
isso
lved
Oxy
gen
(m
g/L
)
Dis
solv
ed O
rgan
ic C
arb
on (
mg/
L)
Time (hr)
DOCDO
(a)0%
15%
30%
45%
60%
75%
90%
0
1,500
3,000
4,500
6,000
7,500
9,000
Initial COD(mg/L)
Final COD(mg/L)
Removal(%)
(b)
53
CHAPTER 4
CONCLUSIONS
This research focused on the technical evaluation of biologically active filtration for
treatment of highly impaired wastewater streams generated during O&G exploration and produc-
tion operations. Bench-scale and lab-scale systems were tested with various produced water and
fracturing flowback wastewater streams. Results of this testing strongly suggest that BAF has
high potential for treatment applications in the O&G industry. The data have shown that BAF
systems can effectively remove up to 90% DOC and 80% COD from these wastewater streams,
even under adverse operation conditions. The systems responded favorably to produced water
feed streams from different producing basins, as well as simulated and real fracturing flowback
wastewater. This performance indicates solid flexibility of the system to maintain treatment per-
formance under variable influent wastewater quality. This performance is promising for full-
scale implementation, because any on-site system must demonstrate such flexibility.
Bench-scale system results indicated the ability of the extant biofilm to adapt and accli-
mate to a vastly different influent water quality. The system consistently produced final effluent
DOC concentrations of less than 6 mg/L. The impact of conventional pretreatment on system
performance was negligible, suggesting chemical costs can be minimized, if not completely
eliminated. System flexibility was also demonstrated through comparable treatment efficiency
after switching to produced water from a different basin.
Lab-scale system results indicated comparable performance to results observed at the
bench scale, suggesting treatment scalability of the system. High treatment efficiencies were ob-
served with initially low-dilution and then zero-dilution produced water, suggesting long-term
conditioning and acclimation of the biofilm can be avoided. Low temperatures notably inhibited
DOC removal rates, but longer treatment times still achieved high overall removals. Conversely,
high temperatures increased removal rates. The temperature impacts provide operators and engi-
neers insight into the necessity of climate controlled systems. The hydrodynamics of the system
were also enhanced, allowing for higher biofilm utilization of substrate and oxygen.
The lab-scale system also displayed the ability to treat simulated and real fracturing
flowback waters, characterized by very high organics concentrations and the presence of gelling
54
agents (i.e., guar). The higher concentrations resulted in longer treatment durations, but still re-
sulted in DOC and COD removals of greater than 75%. Although the system achieved greater
than 75% removal of DOC and COD, and because the initial concentrations were very high, the
final filtered effluent still contained substantially high concentrations of organic carbon (520
mg/L DOC, 1,360 mg/L COD). These high concentrations could potentially limit the application
of membrane separation processes due to their fouling potential. A treatment scheme designed to
manage such extreme concentrations could incorporate a chemical treatment process, such as
oxidation, as either pretreatment or post-treatment to BAF. The nature of these organics should
also be better understood, allowing design engineers to target more promising treatment technol-
ogies. The challenge remains of variable wastewater quality, which will undoubtedly result in
variable characterization of the organic compounds associated with hydrocarbon extraction,
making treatment technology selection even more difficult. This challenge further necessitates
the development of flexible treatment processes, and the results of this performance evaluation
suggest much promise and encouragement for biologically active filtration to effectively treat
produced water and fracturing flowback water.
Ultimately, the level of recycling and reuse applied in any hydrocarbon producing basin
revolves around the economics relative to other disposal practices, such as deep well injection.
The identification and development of cost-effective treatment technologies is therefore critical
to the successful implementation of water reuse strategies in the O&G industry. This study has
provided results that indicate a technically feasible treatment process, but future work should fo-
cus on the economics of specific treatment performance and capacity. Such information will aid
in the design of a complete treatment system that can be implemented for a reuse scheme in the
oilfield.
Additional full-scale implementation factors to consider include the design of a highly
mobile filtration system with a relatively small footprint; the flexibility of the system to treat var-
iable flows, in addition to variable influent quality; and the level of treatment required for oilfield
reuse. These factors will greatly impact an operator’s decision to implement BAF into a reuse
treatment scheme. A more thorough understanding will undoubtedly provide information for bet-
ter decision-making, leading to more recycling and reuse in the O&G industry.
Future directions of the research presented in this thesis should be aimed at improving the
performance of the system and ultimately aid in field-scale implementation. The determination
55
of the optimum HLR is perhaps one of the most important operation parameters identified in this
study. The HLR should be applied to future experiments, preferably in filtration columns with
sampling ports at intermediate depths. This would allow for evaluation of a range of EBCTs at
constant HLR. The balance of HLR and EBCT will lead to enhanced system performance and
optimal removal rates. Additionally, the quantification of biomass developed on the filter media,
and its role in total TOC/DOC removal, may help to explain relative performance. Modeling the
removal as a function of bed volume would assist in field-scale implementation by providing an
understanding of surface area and media depth/volume requirements. Further system optimiza-
tion can be achieved by designing an improved air bubble diffusion system, either in the feed
tanks or the filtration columns. A better understanding of these parameters will ultimately lead to
more efficient engineered biological systems.
56
REFERENCES
1. Gupta, D. V. S.; Hlidek, B. T., Frac-Fluid Recycling and Water Conservation: A Case History. SPE Production & Operations 2010, 25, (1), 65-69.
2. MIT Energy Initiative The Future of Natural Gas: An Interdisciplinary MIT Study; Massachusetts Institute of Technology: Cambridge, MA, 2011.
3. Nicot, J.-P.; Scanlon, B. R., Water Use for Shale-Gas Production in Texas, U.S. Environ. Sci. Technol. 2012, 46, 3580-3586.
4. United States Energy Information Association. Emissions of Greenhouse Gases in the United States: 2009; United States Department of Energy: Washington, D.C., 2011.
5. Clark, C. E.; Veil, J. A. Produced Water Volumes and Management Practices in the United States; ANL/EVS/R-09/1; Argonne National Laboratory, Environmental Science Division, Prepared for the United States Department of Energy: Washington, D.C., 2009.
6. Howarth, R. W.; Ingraffea, A.; Engelder, T., Natural gas: Should fracking stop? Nature 2011, 477, 271-275.
7. Jackson, R. B.; Vengosh, A.; Darrah, T. H.; Warner, N. R.; Down, A.; Poreda, R. J.; Osborn, S. G.; Zhao, K.; Karr, J. D., Increased stray gas abundance in a subset of drinking water wells near Marcellus shale gas extraction. Proc. Natl. Acad. Sci. 2013, 110, (28), 11250-11255.
8. Osborn, S.; Vengosh, A.; Warner, N. R.; Jackson, R. B., Methane contamination of drinking water accompanying gas-well drilling and hydraulic fracturing. Proc. Natl. Acad. Sci. 2011, 108, (20), 8172-8176.
9. Vengosh, A.; Warner, N.; Jackson, R.; Darrah, T., The effects of shale gas exploration and hydraulic fracturing on the quality of water resources in the United States. Procedia Earth and Planetary Science 2013, 7, 863-866.
10. Vidic, R.; Brantley, S.; Vandenbossche, J.; Yoxtheimer, D.; Abad, J., Impact of Shale Gas Development on Regional Water Quality. Science 2013, 340.
11. Howarth, R. W.; Santoro, R.; Ingraffea, A., Methane and the greenhouse-gas footprint of natural gas from shale formations. Climatic Change 2011, 106, 679-690.
12. Freyman, M. Hydraulic Fracturing & Water Stress: Water Demand by the Numbers; Ceres: Boston, MA, 2014.
13. Fueling North America's Energy Future: The Unconventional Natural Gas Revolution and the Carbon Agenda; IHS CERA Inc.: Cambridge, Massachusetts, 2010.
14. Carroll, J., Worst Drought in More than a Century Strikes Texas Oil Boom. Bloomberg June 13, 2011, 2011.
57
15. EPA, U. S. Study of the Potential Impacts of Hydraulic Fracturing on Drinking Water Resources: Progress Report; United States Environmental Protection Agency: Washington, D.C., 2012.
16. Vengosh, A.; Werner, N.; Jackson, R.; Darrah, T., The effects of shale gas exploration and hydraulic fracturing on the quality of water resources in the United States. Procedia Earth and Planetary Science 2013, 7, 863-866.
17. Olmstead, S. M.; Muehlenbachs, L. A.; Shih, J.-S.; Chu, Z.; Krupnick, A., Shale gas development impacts on surface water quality in Pennsylvania. Proc. Natl. Acad. Sci. 2013, 110, (13), 4962-4967.
18. Earthworks et al. Pavillion-area citizens, national groups oppose Wyoming’s control of the Pavillion groundwater contamination investigation. http://www.earthworksaction.org/media/detail/pavillion_area_citizens_national_groups_oppose_wyomings_control_of_the_pavi#.Uks86IakqOA
19. USGS. The Potential Effects of Sodium Bicarbonate, a Major Constituent of Produced Waters from Coalbed Natural Gas Production, on Aquatic Life; Prepared in cooperation with Montana Fish, Wildlife, and Parks, U.S. Bureau of Land Management, and the U.S. Environmental Protection Agency: 2012.
20. United States Energy Information Association. Annual Energy Outlook; United States Department of Energy: Washington, D.C., 2013.
21. DiGiulio, D. C.; Wilkin, R. T.; Miller, C.; Oberley, G. Investigation of Ground Water Contamination near Pavillion, Wyoming; United States Environmental Protection Agency, Office of Research and Development, National Risk Management Research Laboratory: Ada, Oklahoma, 2011.
22. Warner, N. R.; Christie, C. A.; Jackson, R. B.; Vengosh, A., Impacts of Shale Gas Wastewater Disposal on Water Quality in Western Pennsylvania. Environ. Sci. Technol. 2013, 47, (20), 11849-11857.
23. Stark, M.; Allingham, R.; Calder, J.; Lennartz-Walker, T.; Wai, K.; Thompson, P.; Zhao, S. Water and Shale Gas Development: Leveraging the US experience in new shale developments; Accenture: 2012.
24. Kargbo, D. M.; Wilhelm, R. G.; Campbell, D. J., Natural Gas Plays in the Marcellus Shale: Challenges and Potential Opportunities. Environ. Sci. Technol. 2010, 44, (15), 5679-5684.
25. Gold, R.; Campoy, A., Oil's Growing Thirst For Water. The Wall Street Journal 2011.
26. United States Government Accountability Office. Information on the Quantity, Quality, and Management of Water Produced during Oil and Gas Production; Washington, D.C., 2012.
27. Colorado Oil & Gas Association, Water Use Fast Facts. In www.coga.org, 2013.
28. Colorado Oil & Gas Conservation Commission, Oil and Gas Water Resources Fact Sheet. In http://cogcc.state.co.us, 2010.
29. Arthur, J. D.; Bohm, B.; Layne, M. Hydraulic Fracturing Considerations for Natural Gas Wells of the Marcellus Shale; ALL Consulting, LLC: Tulsa, Oklahoma, 2009.
58
30. Jianh, M.; Hendrickson, C. T.; VanBriesen, J. M., Life Cycle Water Consumption and Wastewater Generation Impacts of a Marcellus Shale Gas Well. Environ. Sci. Technol. 2013, 48, 1911-1920.
31. Belanger, L. Fracking Our Future: Measuring Water & Community Impacts from Hydraulic Fracturing; Western Resource Advocates: Boulder, Colorado, 2012.
32. Ridlington, E.; Rumpler, J. Fracking by the Numbers: Key Impacts of Dirty Drilling at the State and National Level; Environment America Research & Policy Center: 2013.
33. Nicot, J.-P.; Hebel, A. K.; Ritter, S. M.; Walden, S.; Baier, R.; Glunsky, P.; Beach, J.; Kyle, R.; Symank, L.; Breton, C. Current and Projected Water Use in the Texas Mining and Oil and Gas Industry; Prepared for the Texas Water Development Board: The University of Texas at Austin, Bureau of Economic Geology, 2011.
34. American Petroleum Institute, Water Management Associated with Hydraulic Fracturing. In API Guidance Document HF2, API Publishing Services: Washington D.C., 2010.
35. King, G., Hydraulic Fracturing 101: What Every Representative, Environmentalist, Regulator, Reporter, Investor, University Researcher, Neighbor and Engineer Should Know About Estimating Frac Risk and Improving Frac Performance in Unconventional Gas and Oil Wells. In SPE Hydraulic Fracturing Technology Conference, Society of Petroleum Engineers: Woodlands, Texas, 2012.
36. Gregory, K. B.; Vidic, R. D.; Dzombak, D. A., Water Management Challenges Associated with the Production of Shale Gas by Hydraulic Fracturing. Elements 2011, 7, 181-186.
37. Ground Water Protection Council; ALL Consulting Modern Shale Gas Development in the United States: a Primer; Prepared for U.S. DOE Office of Fossil Energy and NETL: 2009.
38. Ahmadun, F.-R.; Pendashteh, A.; Abdullah, L. C.; Biak, D. R. A.; Madaeni, S. S.; Abidin, Z. Z., Review of technologies for oil and gas produced water treatment. Journal of Hazardous Materials 2009, 170, 530-551.
39. Shaffer, D. L.; Chavez, L. H. A.; Ben-Sasson, M.; Castrillon, S. R.-V.; Yip, N. Y.; Elimelech, M., Desalination and Reuse of High-Salinity Shale Gas Produced Water: Drivers, Technologies, and Future Directions. Environ. Sci. Technol. 2013, 47, 9569-9583.
40. Cooley, H.; Donnelly, K. Hydraulic Fracturing and Water Resources: Separating the Frack from the Fiction; Pacific Institute: 2012.
41. Ely, J. W.; Horn, A.; Cathey, R.; Fraim, M.; Jakhete, S., Game Changing Technology For Treating And Recycling Frac Water. In SPE Annual Technical Conference and Exhibition, Society of Petroleum Engineers: Denver, Colorado, 2011.
42. Fontelle, L.; Weston, M.; Lord, P.; Haggstrom, J., Recycling Water: Case Studies in Designing Fracturing Fluids Using Flowback, Produced, and Nontraditional Water Sources. In SPE Latin American and Caribbean Health, Safety, Social Responsibility, and Environment Conference, Society of Petroleum Engineers: Lima, Peru, 2013.
43. Arthur, J. D.; Langhus, B. G.; Patel, C. Technical Summary of Oil & Gas Produced Water Treatment Technologies; ALL Consulting, Prepared for the U.S. DOE NETL: 2005.
59
44. Duraisamy, R. T.; Beni, A. H.; Henni, A., State of the Art Treatment of Produced Water. In Water Treatment, Elshorbagy, W.; Chowdhury, R. K., Eds. InTech: Rijeka, Croatia, 2013.
45. Horner, P.; Halldorson, B.; Slutz, J., Shale Gas Water Treatment Value Chain - A Review of Technologies, including Case Studies. In SPE Annual Technical Conference and Exhibition, Society of Petroleum Engineers: Denver, CO, 2011.
46. Hughes, S. W.; Sehsuvaroglu, S. A.; Slater, J. M., Produced Water Treatment Technologies: A Case Study. In Second International Conference on Health, Safety & Environment in Oil & Gas Exploration & Production, Society of Petroleum Engineers: Jakarta, Indonesia, 1994.
47. Igunnu, E. T.; Chen, G. Z., Produced water treatment technologies. Int. J. Low-Carbon Tech. 2012, 0, 1-21.
48. Wilson, J. M.; VanBriesen, J. M., Oil and Gas Produced Water Management and Surface Drinking Water Sources in Pennsylvania. Environmental Practice 2012, 14, (4), 288-300.
49. Ernstoff, A. S.; Ellis, B. R., Clearing the Waters of the Fracking Debate. Michigan Journal of Sustainability 2013, 1, (Fall), 109-129.
50. Walsh, J.; Frankiewics, T. The Science and Technology of Water Treating: SPE Produced Water Handling Workshop; Society of Petroleum Engineers: 2012.
51. Veil, J. A. Water Management Practices Used by Fayetteville Shale Gas Producers; ANL/EVS/R-11/5; Argonne National Laboratory, Environmental Science Division, Prepared for U.S. DOE NETL: Argonne, IL, 2011.
52. Guerra, K.; Dahm, K.; Dundorf, S., Oil and Gas Produced Water Management and Beneficial Use in the Western United States. In U.S. Department of the Interior, B. o. R., Ed. Denver, Colorado, 2011.
53. Mantell, M. E., Deep Shale Natural Gas and Water Use, Part Two: Abundant, Affordable, and Still Water Efficient. In Water/Energy Sustainability Symposium at the 2010 GWPC Annual Forum, Chesapeake Energy Corporation: Pittsburgh, Pennsylvania, 2010.
54. Kamel, A.; Shah, S. N., Effects of salinity and temperature on drag reduction characteristics of polymer in straight circular pipes. Journal of Petroleum Science and Engineering 2009, 67, 23-33.
55. Blauch, M. E., Developing Effective and Environmentally Suitable Fracturing Fluids Using Hydraulic Fracturing Flowback Waters. In SPE Unconventional Gas Conference, Society of Petroleum Engineers: Pittsburgh, Pennsylvania, 2010.
56. LeBas, R.; Lord, P.; Luna, D.; Shahan, T., Development and Use of High-TDS Recycled Produced Water for Crosslinked-Gel-Based Hydraulic Fracturing. In SPE Hydarulic Fracturing Technology Conference, Society of Petroleum Engineers: The Woodlands, Texas, 2013.
57. Ferguson, M. L.; Anderson, C. C.; Eichelberger, P. B.; Hallock, J. K.; Qiu, X.; Roell, R. L., Innovative Friction Reducer Provides Improved Performance and Greater Flexibility in Recycling Highly Mineralized Produced Brines. In Unconventional Resources Conference, Society of Petroleum Engineers: The Woodlands, Texas, 2013.
60
58. Colorado School of Mines. Technical Assessment of Produced Water Treatment Technologies; RPSEA Project 07122-12: Golden, CO, 2009.
59. Greenlee, L. F.; Lawler, D. F.; Freeman, B. D.; Marrot, B.; Moulin, P., Reverse osmosis desalination: Water sources, technology, and today’s challenges. Water Research 2009, 43, 2317-2348.
60. Fritzmann, C.; Lowenberg, J.; Wintgens, T.; Melin, T., State-of-the-art of reverse osmois desalination. Desalination 2007, 216, 1-76.
61. MWH, Water Treatment: Principles and Design, Second Edition. John Wiley & Sons: Hoboken, NJ, 2005.
62. American Water Works Association, Desalination of Seawater. In Manual of Water Supply Practices - M61, First Edition, 2011.
63. Ghaffour, N.; Missimer, T. M.; Amy, G. L., Technical review and evaluation of the economics of water desalination: Current and future challenges for better water supply sustainability. Desalination 2013, 309, 197-207.
64. Coday, B. D.; Xu, P.; Beaudry, E. G.; Herron, J.; Lampi, K.; Hancock, N. T.; Cath, T. Y., The sweet spot of forward osmosis: Treatment of produced water, drilling wastewater, and other complex and difficult liquid streams. Desalination 2014, 333, 23-35.
65. Baker Hughes, H2prO HD Water Treatment Service Treated Waste Water for Reuse. In www.bakerhughes.com, 2012.
66. Baker Hughes, H2prO HMS Water Management Service. In www.bakerhughes.com, 2012.
67. Baker Hughes, H2prO HMS Water Managment Service Treated Water for Reuse. In www.bakerhughes.com, 2012.
68. Cohen, Y., Biofiltration – the treatment of fluids by microorganisms immobilized into the filter bedding material: a review. Bioresource Technology 2001, 77, (3), 257-274.
69. Metcalf & Eddy, I., Wastewater Engineering: Treatment and Reuse. Fourth Edition ed.; McGraw-Hill: New York, NY, 2003.
70. Rittmann, B. E. M. P. L., Environmental biotechnology : principles and applications. McGraw-Hill: Boston, 2001.
71. Woolard, C. R.; Irvine, R. L., Treatment of hypersaline wastewater in the sequencing batch reactor. Water Research 1995, 29, (4), 1159-1168.
72. Tellez, G. T.; Nirmalakhandan, N.; Gardea-Torresdey, J. L., Kinetic evaluation of a field-scale activated sludge system for removing petroleum hydrocarbons from oilfield-produced water. Environmental Progress 2005, 24, (1), 96-104.
73. Freire, D. D. C.; Cammarota, M. C.; Sant'Anna, G. L., Biological Treatment of Oil Field Wastewater in a Sequencing Batch Reactor. Environmental Technology 2001, 22, (10), 1125-1135.
61
74. Tellez, G. T.; Nirmalakhandan, N.; Gardea-Torresdey, J. L., Performance evaluation of an activated sludge system for removing petroleum hydrocarbons from oilfield produced water. Advances in Environmental Research 2002, 6, (4), 455-470.
75. Scholz, W.; Fuchs, W., Treatment of oil contaminated wastewater in a membrane bioreactor. Water Research 2000, 34, (14), 3621-3629.
76. Pendashteh, A. R.; Abdullah, L. C.; Fakhru’l-Razi, A.; Madaeni, S. S.; Zainal Abidin, Z.; Awang Biak, D. R., Evaluation of membrane bioreactor for hypersaline oily wastewater treatment. Process Safety and Environmental Protection 2012, 90, (1), 45-55.
77. Soltani, S.; Mowla, D.; Vossoughi, M.; Hesampour, M., Experimental investigation of oily water treatment by membrane bioreactor. Desalination 2010, 250, (2), 598-600.
78. Fakhru’l-Razi, A.; Pendashteh, A.; Abidin, Z. Z.; Abdullah, L. C.; Biak, D. R. A.; Madaeni, S. S., Application of membrane-coupled sequencing batch reactor for oilfield produced water recycle and beneficial re-use. Bioresource Technology 2010, 101, (18), 6942-6949.
79. Hoover, S. R.; Porges, N., Assimilation of Dairy Wastes by Activated Sludge: II. The Equation of Synthesis and Rate of Oxygen Utilization. Sewage and Industrial Wastes 1952, 24, (3), 306-312.
80. Thompson, L. J.; Gray, V.; Lindsay, D.; Von Holy, A., Carbon : nitrogen : phosphorus ratios influence biofilm formation by Enterobacter cloacae and Citrobacter freundii. Journal of Applied Microbiology 2006, 101, (5), 1105-1113.
81. Chaudhary, D.; Vigneswaran, S.; Ngo, H.-H.; Shim, W.; Moon, H., Biofilter in water and wastewater treatment. Korean J. Chem. Eng. 2003, 20, (6), 1054-1065.
82. Simpson, D. R., Biofilm processes in biologically active carbon water purification. Water Research 2008, 42, (12), 2839-2848.
83. Xiaojian, Z.; Zhansheng, W.; Xiasheng, G., Simple combination of biodegradation and carbon adsorption—the mechanism of the biological activated carbon process. Water Research 1991, 25, (2), 165-172.
84. Huck, P. M., Measurement of Biodegradable Organic Matter and Bacterial Growth Potential in Drinking Water. Journal - American Water Works Association 1990, 82, (7), 78-86.
85. Lauderdale, C.; Chadik, P.; Kirisits, M. J.; Brown, J., Engineered biofiltration: Enhanced biofilter performance through nutrient and peroxide addition. Journal - American Water Works Association 2012, 104, (5), E298-E309.
86. Liu, X.; Huck, P. M.; Slawson, R. M., Factors Affecting Drinking Water Biofiltration. Journal - American Water Works Association 2001, 93, (12), 90-101.
87. Carlson, K. H.; Amy, G. L., BOM removal during biofiltration. Journal - American Water Works Association 1998, 90, (12), 42-52.
88. Velten, S.; Boller, M.; Köster, O.; Helbing, J.; Weilenmann, H.-U.; Hammes, F., Development of biomass in a drinking water granular active carbon (GAC) filter. Water Research 2011, 45, (19), 6347-6354.
62
89. Yapsakli, K.; Mertoglu, B.; Çeçen, F., Identification of nitrifiers and nitrification performance in drinking water biological activated carbon (BAC) filtration. Process Biochemistry 2010, 45, (9), 1543-1549.
90. Walker, G. M.; Weatherley, L. R., A simplified predictive model for biologically activated carbon fixed beds. Process Biochemistry 1997, 32, (4), 327-335.
91. Rittmann, B. E.; Stilwell, D., Modelling biological processes in water treatment: the integrated biofiltration model. Journal of Water Supply and Research Technology - Aqua 2002, 51, 1-14.
92. Xing, W.; Ngo, H. H.; Kim, S. H.; Guo, W. S.; Hagare, P., Adsorption and bioadsorption of granular activated carbon (GAC) for dissolved organic carbon (DOC) removal in wastewater. Bioresource Technology 2008, 99, (18), 8674-8678.
93. Ho, L.; Meyn, T.; Keegan, A.; Hoefel, D.; Brookes, J.; Saint, C. P.; Newcombe, G., Bacterial degradation of microcystin toxins within a biologically active sand filter. Water Research 2006, 40, (4), 768-774.
94. Chaudhary, D. S.; Vigneswaran, S.; Ngo, H. H.; Shim, W. G.; Moon, H., Granular Activated Carbon (GAC) Biofilter For Low Strength Wastewater Treatement. Environ. Eng. Res. 2003, 8, (4), 184-192.
95. Campos, J. C.; Borges, R. M. H.; Oliveira Filho, A. M.; Nobrega, R.; Sant’Anna Jr, G. L., Oilfield wastewater treatment by combined microfiltration and biological processes. Water Research 2002, 36, (1), 95-104.
96. Zhao, X.; Wang, Y.; Ye, Z.; Borthwick, A. G. L.; Ni, J., Oil field wastewater treatment in Biological Aerated Filter by immobilized microorganisms. Process Biochemistry 2006, 41, (7), 1475-1483.
97. Tong, K.; Zhang, Y.; Liu, G.; Ye, Z.; Chu, P. K., Treatment of heavy oil wastewater by a conventional activated sludge process coupled with an immobilized biological filter. International Biodeterioration & Biodegradation 2013, 84, (0), 65-71.
98. Liu, G.-h.; Ye, Z.; Tong, K.; Zhang, Y.-h., Biotreatment of heavy oil wastewater by combined upflow anaerobic sludge blanket and immobilized biological aerated filter in a pilot-scale test. Biochemical Engineering Journal 2013, 72, (0), 48-53.
99. Chowdhury, Z. K.; Summers, R. S.; Westerhoff, G. P.; Leto, B. J.; Nowack, K. O.; Corwin, C. J., Activated Carbon: Solutions for Improving Water Quality. American Water Works Association: Denver, Colorado, 2013.
100. Matilainen, A.; Gjessing, E. T.; Lahtinen, T.; Hed, L.; Bhatnagar, A.; Sillanpää, M., An overview of the methods used in the characterisation of natural organic matter (NOM) in relation to drinking water treatment. Chemosphere 2011, 83, (11), 1431-1442.
101. Barron, M. G.; Carls, M. G.; Short, J. W.; Rice, S. D., Photoenhanced toxicity of aqueous phase and chemically dispersed weathered Alaska North Slope crude oil to Pacific herring eggs and larvae. Environmental Toxicology and Chemistry 2003, 22, (3), 650-660.
63
102. Yamada, M.; Takada, H.; Toyoda, K.; Yoshida, A.; Shibata, A.; Nomura, H.; Wada, M.; Nishimura, M.; Okamoto, K.; Ohwada, K., Study on the fate of petroleum-derived polycyclic aromatic hydrocarbons (PAHs) and the effect of chemical dispersant using an enclosed ecosystem, mesocosm. Marine Pollution Bulletin 2003, 47, (1–6), 105-113.
103. Zhou, Z.; Liu, Z.; Guo, L., Chemical evolution of Macondo crude oil during laboratory degradation as characterized by fluorescence EEMs and hydrocarbon composition. Marine Pollution Bulletin 2013, 66, (1–2), 164-175.
104. Caporaso, J. G.; Lauber, C. L.; Walters, W. A.; Berg-Lyons, D.; Huntley, J.; Fierer, N.; Owens, S. M.; Betley, J.; Fraser, L.; Bauer, M.; Gormley, N.; Gilbert, J. A.; Smith, G.; Knight, R., Ultra-high-throughput microbial community analysis on the Illumina HiSeq and MiSeq platforms. ISME J 2012, 6, (8), 1621-1624.
105. Bittinger, K.; Bushman, F. D.; Caporaso, J. G.; Costello, E. K.; Fierer, N.; Goodrich, J. K.; Gordon, J. I.; Huttley, G. A.; Kelley, S. T.; Knight, R.; Knights, D.; Koenig, J. E.; Kuczynski, J.; Ley, R. E.; Lozupone, C. A.; McDonald, D.; Muegge, B. D.; Pena, A. G.; Pirrung, M.; Reeder, J.; Sevinsky, J. R.; Stombaugh, J.; Turnbaugh, P. J.; Walters, W. A.; Widmann, J.; Yatsunenko, T.; Zaneveld, J., QIIME allows analysis of high-throughput community sequencing data. Nature Methods 2010, 7, 335+.
106. DeSantis, T. Z.; Hugenholtz, P.; Larsen, N.; Rojas, M.; Brodie, E. L.; Keller, K.; Huber, T.; Dalevi, D.; Hu, P.; Andersen, G. L., Greengenes, a Chimera-Checked 16S rRNA Gene Database and Workbench Compatible with ARB. Applied and Environmental Microbiology 2006, 72, (7), 5069-5072.
107. Edgar, R. C., Search and clustering orders of magnitude faster than BLAST. Bioinformatics 2010, 26, (19), 2460-2461.
108. Caporaso, J. G.; Bittinger, K.; Bushman, F. D.; DeSantis, T. Z.; Andersen, G. L.; Knight, R., PyNAST: a flexible tool for aligning sequences to a template alignment. Bioinformatics 2010, 26, (2), 266-267.
109. Shaari, N. E.; Kedzierski, M.; Gorham, T. L., Quantifying Guar Polymer Recovery Post Hydarulic Fracturing to Determine the Degree of Fracture Cleanup: A Field Study of the Point of Rocks Formation, California. In SPE Western Regional Meeting, Society of Petroleum Engineers: Irvine, CA, 2005.
110. Hudson, N.; Baker, A.; Reynolds, D., Fluorescence analysis of dissolved organic matter in natural, waste and polluted waters—a review. River Research and Applications 2007, 23, (6), 631-649.
111. Elliott, S.; Lead, J. R.; Baker, A., Thermal quenching of fluorescence of freshwater, planktonic bacteria. Analytica Chimica Acta 2006, 564, (2), 219-225.
112. Zhou, Z.; Guo, L.; Shiller, A. M.; Lohrenz, S. E.; Asper, V. L.; Osburn, C. L., Characterization of oil components from the Deepwater Horizon oil spill in the Gulf of Mexico using fluorescence EEM and PARAFAC techniques. Marine Chemistry 2013, 148, (0), 10-21.
113. HUber, R.; Hannig, M., Thermotogales. Prokaryotes 2006, 7, 889-922.
114. Greene, E. A.; Kay, J. G.; Jaber, K.; Stehmeier, L. G.; Voordouw, G., Composition of Soil Microbial Communities Enriched on a Mixture of Aromatic Hydrocarbons. Applied and Environmental Microbiology 2000, 66, (12), 5282-5289.
64
115. Kao, C. M.; Chen, C. Y.; Chen, S. C.; Chien, H. Y.; Chen, Y. L., Application of in situ biosparging to remediate a petroleum-hydrocarbon spill site: Field and microbial evaluation. Chemosphere 2008, 70, (8), 1492-1499.
116. Watanabe, K.; Watanabe, K.; Kodama, Y.; Syutsubo, K.; Harayama, S., Molecular Characterization of Bacterial Populations in Petroleum-Contaminated Groundwater Discharged from Underground Crude Oil Storage Cavities. Applied and Environmental Microbiology 2000, 66, (11), 4803-4809.
117. Abbai, N. S.; Pillay, B., Analysis of Hydrocarbon-Contaminated Groundwater Metagenomes as Revealed by High-Throughput Sequencing. Mol Biotechnol 2013, 54, (3), 900-912.
118. O'Sullivan, L. A.; Rinna, J.; Humphreys, G.; Weightman, A. J.; Fry, J. C., Fluviicola taffensis gen. nov., sp. nov., a novel freshwater bacterium of the family Cryomorphaceae in the phylum ‘Bacteroidetes’. International Journal of Systematic and Evolutionary Microbiology 2005, 55, (5), 2189-2194.
119. Koskinen, K.; Hultman, J.; Paulin, L.; Auvinen, P.; Kankaanpää, H., Spatially differing bacterial communities in water columns of the northern Baltic Sea. FEMS Microbiology Ecology 2011, 75, (1), 99-110.
120. Mau, S.; Blees, J.; Helmke, E.; Niemann, H.; Damm, E., Vertical distribution of methane oxidation and methanotrophic response to elevated methane concentrations in stratified waters of the Arctic fjord Storfjorden (Svalbard, Norway). Biogeosciences 2013, 10, (10), 6267-6278.
121. Olapade, O. A., Molecular Characterization of Bacterial Phylogenetic and Functional Groups at Terrebonne Bay along the Coastline of the Gulf of Mexico. J Pet Environ Biotechnol 2013, 4, (3).
122. Huang, Y.; Zhang, J.; Zhu, L., Evaluation of the application potential of bentonites in phenanthrene bioremediation by characterizing the biofilm community. Bioresource Technology 2013, 134, (0), 17-23.
123. Ma, H.; Bowman, C. N.; Davis, R. H., Membrane fouling reduction by backpulsing and surface modification. Journal of Membrane Science 2000, 173, (2), 191-200.