design of biologically active binary protein 2d materials
TRANSCRIPT
Nature | www.nature.com | 1
Article
Design of biologically active binary protein 2D materials
Ariel J. Ben-Sasson1,2, Joseph L. Watson3, William Shef!ler1,2, Matthew Camp Johnson1, Alice Bittleston3, Logeshwaran Somasundaram4, Justin Decarreau1,2, Fang Jiao5, Jiajun Chen5,6, Ioanna Mela7, Andrew A. Drabek8, Sanchez M. Jarrett8, Stephen C. Blacklow8,9, Clemens F. Kaminski7, Greg L. Hura10, James J. De Yoreo5,6, Justin M. Kollman1, Hannele Ruohola-Baker1,4, Emmanuel Derivery3ಞᅒ & David Baker1,2,11ಞᅒ
Ordered two-dimensional arrays such as S-layers1,2 and designed analogues3–5 have intrigued bioengineers6,7, but with the exception of a single lattice formed with !exible linkers8, they are constituted from just one protein component. Materials composed of two components have considerable potential advantages for modulating assembly dynamics and incorporating more complex functionality9–12. Here we describe a computational method to generate co-assembling binary layers by designing rigid interfaces between pairs of dihedral protein building blocks, and use it to design a p6m lattice. The designed array components are soluble at millimolar concentrations, but when combined at nanomolar concentrations, they rapidly assemble into nearly crystalline micrometre-scale arrays nearly identical to the computational design model in"vitro and in cells without the need for a two- dimensional support. Because the material is designed from the ground up, the components can be readily functionalized and their symmetry recon#gured, enabling formation of ligand arrays with distinguishable surfaces, which we demonstrate can drive extensive receptor clustering, downstream protein recruitment and signalling. Using atomic force microscopy on supported bilayers and quantitative microscopy on living cells, we show that arrays assembled on membranes have component stoichiometry and structure similar to arrays formed in"vitro, and that our material can therefore impose order onto fundamentally disordered substrates such as cell membranes. In contrast to previously characterized cell surface receptor binding assemblies such as antibodies and nanocages, which are rapidly endocytosed, we #nd that large arrays assembled at the cell surface suppress endocytosis in a tunable manner, with potential therapeutic relevance for extending receptor engagement and immune evasion. Our work provides a foundation for a synthetic cell biology in which multi-protein macroscale materials are"designed to modulate cell responses and reshape synthetic and living systems.
Genetically programmable materials that spontaneously co-assemble into ordered structures following mixture of two or more components are far more controllable than materials that constitutively form from one component. They offer control over assembly onset in ambient con-ditions, thereby enabling rigorous characterization and manipulation of components, which lend the system to a wide variety of applications9,13. Most previously described 2D protein materials, such as S-layers14,15 and de"novo-designed arrays, primarily involve single protein components which spontaneously self-assemble, complicating characterization and
repurposing for specific tasks3,16–21. A two-component array has been generated by flexibly linking a Strep-tag to one homo-oligomer and mixing with the tetrameric dihedral streptavidin8, but owing to its flex-ibility, the structure of the designed material was not fully specifiable in advance, and because both building-blocks have dihedral symmetry, the array has identical upper and lower surfaces. A de"novo interface design between rigid domains that is stabilized by extensive non-covalent interactions would provide more control over atomic structure and a robust starting point for further structural and functional modulation.
https://doi.org/10.1038/s41586-020-03120-8
Received: 19 April 2019
Accepted: 6 November 2020
Published online: xx xx xxxx
Check for updates
1Department of Biochemistry, University of Washington, Seattle, WA, USA. 2Institute for Protein Design, University of Washington, Seattle, WA, USA. 3MRC Laboratory of Molecular Biology, Cambridge, UK. 4Institute for Stem Cell and Regenerative Medicine, University of Washington, School of Medicine, Seattle, WA, USA. 5Department of Materials Science and Engineering, University of Washington, Seattle, WA, USA. 6Physical Sciences Division, Paci!ic Northwest National Laboratory, Richland, WA, USA. 7Department of Chemical Engineering and Biotechnology, University of Cambridge, Cambridge, UK. 8Department of Biological Chemistry and Molecular Pharmacology, Harvard Medical School, Boston, MA, USA. 9Department of Cancer Biology, Dana-Farber Cancer Institute, Boston, MA, USA. 10Molecular Biophysics and Integrated Bioimaging, Lawrence Berkeley National Laboratory, Berkeley, CA, USA. 11Howard Hughes Medical Institute, University of Washington, Seattle, WA, USA. ᅒe-mail: [email protected]; [email protected]
2 | Nature | www.nature.com
Article
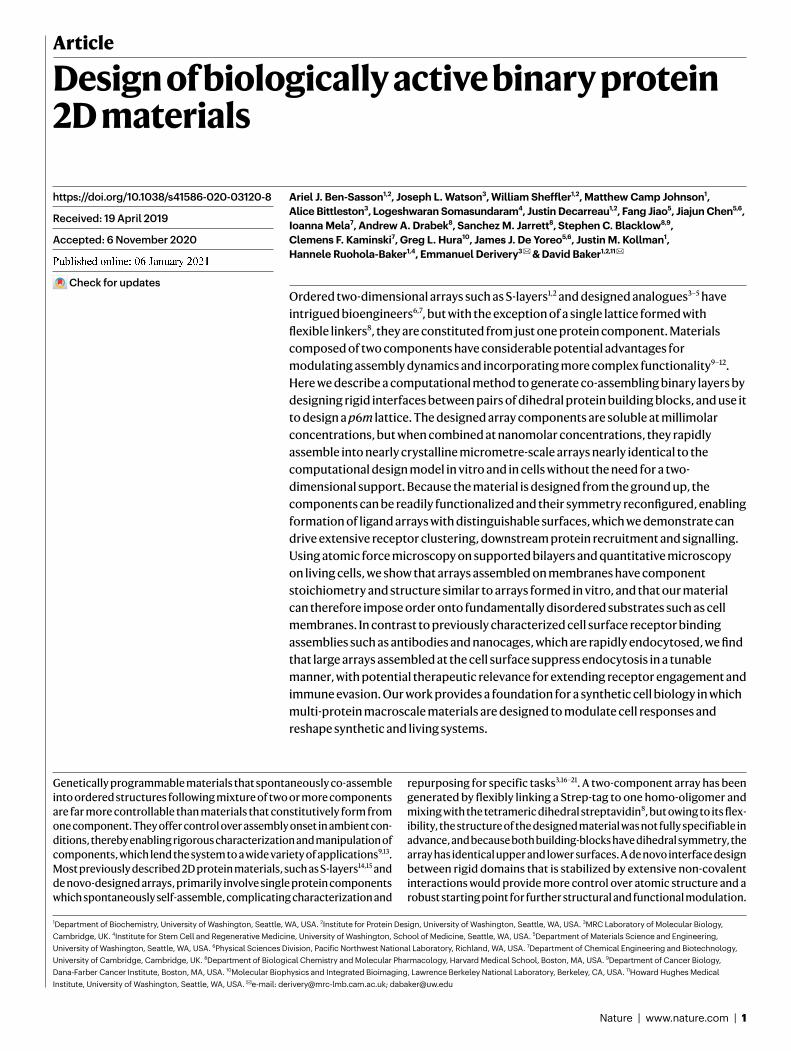
We set out to generate two-component 2D arrays by designing interfaces between two different dihedral protein building blocks10,22. There are 17 distinct plane symmetry groups that define 2D repeti-tive patterns (a broader set of unique geometries is available using 3D objects; 33 distinct planar geometries can be generated by combining two objects)15. The building blocks can be either cyclic or dihedral homo-oligomers oriented in space such that their highest-order rota-tion symmetry (Cx: xÎ{2,3,4,6}) is perpendicular to the plane. We chose a subset of the 17 plane symmetry groups (p3m1, p4m and p6m) that can be generated by designing a single additional interface between building blocks with dihedral symmetry11,12. We chose to use objects with dihedral rather than cyclic symmetry because"their additional in-plane two-fold rotation axes (Fig."1a, dashed lines) intrinsically cor-rect for any deviation from the design model that might otherwise result in out-of-plane curvature (further discussion in Extended Data Fig."1). This higher symmetry comes at a cost in the number of degrees of freedom (DOFs) available for a pair of objects to associate: whereas cyclic components are constrained in a plane to four DOFs, for dihe-drals the only DOFs are the lattice spacing and discrete rotations of the building blocks (a"two-fold rotation"axis of the two dihedral"compo-nents must be aligned). For example, Fig."1a shows a two-component 2D lattice generated by placing D3 and D2 building blocks on the C3 and C2 rotation centres of the p6m(*632) symmetry group, such that their
in-plane C2 axes coincide (see Supplementary Video"1 for an illustration of the docking process). We sampled 2D arrays in the p3m1[D3–D3], p4m [D4–D4, D4–D2] and p6m[D6–D3, D6–D2, D3–D2] symmetry groups built from 965 dihedral building blocks available in the Protein Data Bank23 with D2, D3, D4 and D6 symmetry and X-ray resolution better than 2.5"Å. For each group, all pairs of dihedral building blocks were placed with their symmetry axes aligned to those of the group, and the lattice spacing (Fig."1a, middle) and the discrete rotations (Fig."1a, left) were sampled to identify arrangements with contact regions"larger than 400"Å2 and composed primarily of aligned helices. The amino acid sequences at the resulting interfaces between the two building blocks were optimized using Rosetta combinatorial sequence design24 to generate low-energy interfaces with a hydrophobic centre surrounded by polar residues25.
We selected 45 of the lowest-energy designs (2 in group p3m1, 10 in group p4m and 33 in group p6m) with high shape complementarity and few buried polar groups not making hydrogen bonds (Fig."1b), and co-expressed the proteins in Escherichia coli after mRNA optimiza-tion26–28 (Methods, Supplementary Figs."1, 2, Supplementary Tables"1, 2). Cells were lysed, and soluble and insoluble fractions were separated. Insoluble fractions containing both proteins, as determined by SDS–PAGE, were examined by negative-stain electron microscopy. Design 13 displayed the clearest hexagonal lattice (Fig."1d, top left; other design shown in Supplementary Fig."3, Supplementary Table"3). Design 13 belongs to the p6m symmetry group and is composed of D3 and D2 homo-oligomers (hereafter referred to as A and B components, respec-tively). The computational design model and the averaged electron microscopy density match closely (Fig."1d, top right), suggesting that the designed interface drives assembly of the intended array geometry.
To determine whether co-assembly occurs in cells or after lysis, we genetically fused superfolder green fluorescent protein (sfGFP, hereaf-ter GFP) to the N terminus of the A component, forming A–GFP (Fig."1c). GFP fusion did not affect array assembly (Fig."1d), and consistent with the design model, the added GFP resulted in the appearance of addi-tional density near the trimeric hubs. In cells expressing both A–GFP and B, but not in those expressing A–GFP alone, GFP fluorescence was concentrated in patches, suggesting that the arrays can assemble in cells (Fig."1e).
An advantage of two-component materials is that if the isolated components are soluble, co-assembly can in principle be initiated by mixing9. This is important for unbounded crystalline materials, which typically undergo phase separation as they crystallize, complicating their usage in solution. A measure of binary-system quality is the ratio of the maximum concentration at which both components are individu-ally soluble to the minimum concentration at which they co-assemble when mixed; the higher this ratio, the easier it is to prepare, functional-ize and store the components in ambient conditions. To evaluate the components’ self-assembly and the system co-assembly ratio (SACAr), we separately expressed and purified the A and B components. After stabilization of both components by evolution-guided design29, we found that both components could be stored individually at concentra-tions higher than 2"mM at room temperature and for durations longer than 3 months without aggregation"(see"Methods, and Supplementary Figs."4, 5, Supplementary Tables"5, 6 for circular dichroism results), but rapidly assembled into the 2D array when mixed at concentrations as low as approximately 10"nM. Thus for this system, SACAr">"105; a value at which, upon assembly from stock solutions at millimolar concen-trations, the distance between each component increases (within the plane) to about twice the estimated mean nearest-neighbour distance30 (further discussed in Extended Data Fig."2) and the solution instantane-ously forms a gel (Supplementary Video"2).
Upon mixing the two purified proteins in"vitro at equimolar concen-trations, even larger and more regular hexagonal arrays were formed compared with in"vivo assembly in bacteria (comparing Fig."2a, c with Fig."1d). The arrays survive transferring to the transmission electron
A–GFP
B
D2
p6m (*632)
A
BB90°
A–GFP + B A–GFP
D2
D31 2
2 31
D3D2d
d
d
A–G
FP +
BA
+ B
a
b
c d
e
31 nm
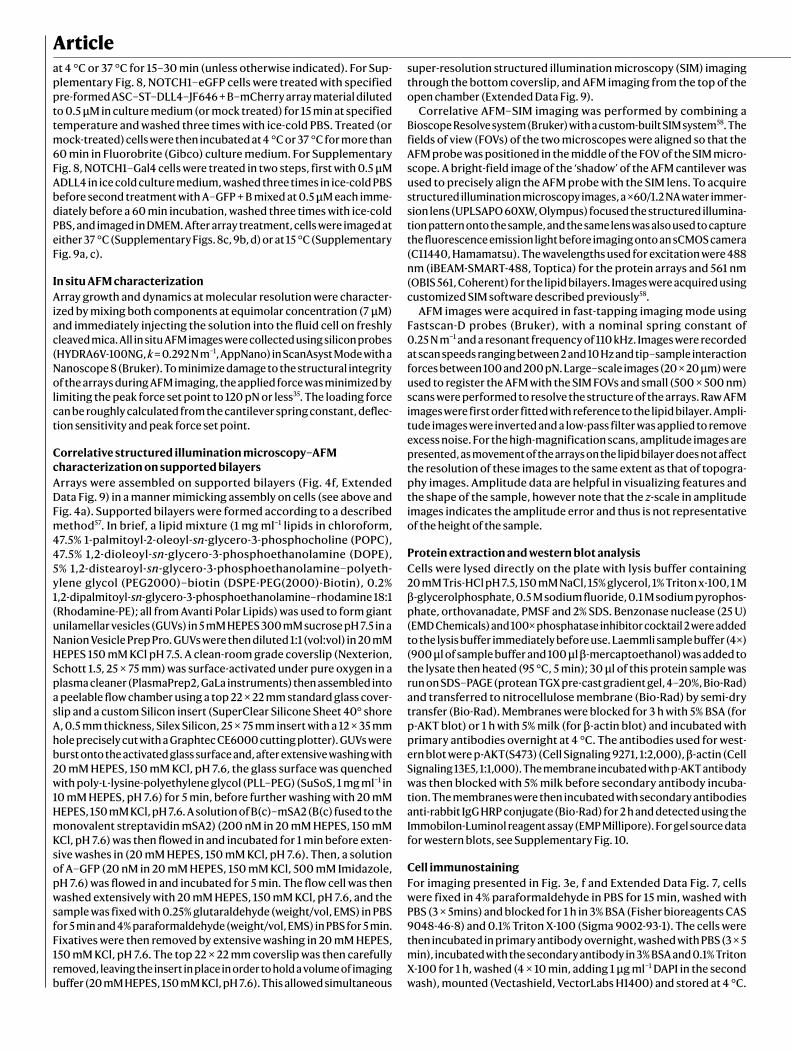
Fig. 1 | Design strategy and characterization of in!vivo assembly. a, Left, orientations of D3 and D2"building blocks for generating"p6m lattice. One two-fold symmetry axis of each"building block must coincide with each other and with"a plane reflection axis (dashed line). Middle, top view of the p6m symmetry operators and the lattice spacing DOF (dashed line, d). Right, a possible p6m array configuration using D3 and D2 building blocks. Dashed lines indicate the direction along which building blocks slide into contact; outlined shapes indicate the symmetry group to which the building blocks belong. b, Left, top view of building-block configurations. In-plane close-up view of the configuration of residues at the hetero-interface (middle) and view rotated 90°, perpendicular to the plane (right). c, Model of A–GFP, with A in magenta and GFP in light green. d, Negative-stain TEM images of 2D arrays formed in E. coli coexpressing A and B (top left) or A–GFP and B (bottom left). Right, corresponding averaged images superimposed with the design model (A, magenta; B, green; GFP is omitted). e, Confocal microscopy imaging of cells expressing A–GFP (right) or A–GFP and B (left). Scale bars, 100"nm (d), 5"µm (e).
Nature | www.nature.com | 3
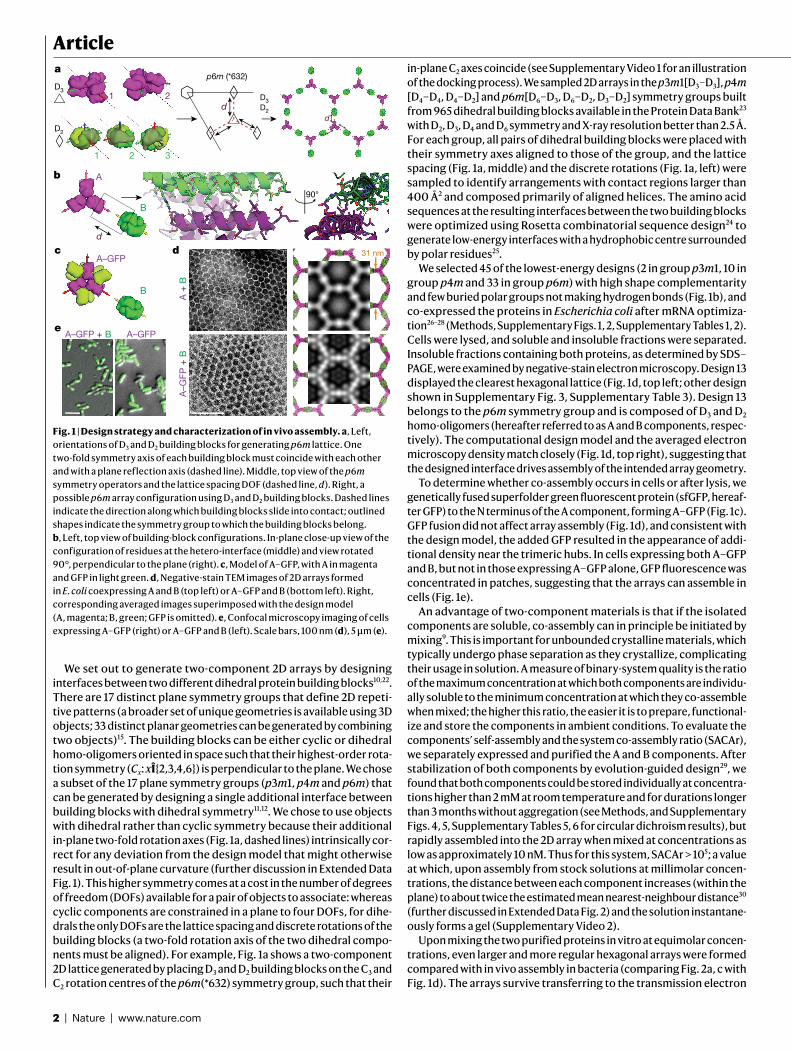
microscopy (TEM) grid and incubation with negative stain despite being only about 4"nm thick (design model and atomic force micros-copy (AFM) cross-section in Extended Data Fig. 3b), suggesting that they have considerable in-plane strength. No assembly was observed with either component alone (see Extended Data Figs."3a"and 5a for light scattering"and SAXS, respectively, and Supplementary Fig."6 for TEM). The array density is closely superimposable on the design model, with the outlines of both components evident (Fig."2b), suggesting that the structure of the material is very close to that of the model. To probe the array structure in solution (Fig."2d, Extended Data Fig."5), we used SAXS. Scattering rings appear in SAXS spectra at Bragg peaks consistent with P6 symmetry, and unit cell spacing of 303"Å (Supple-mentary Table"7), in close agreement with the designed 2D array model (310"Å) and AFM data (315"Å) (Extended Data Fig."3f, g), but not with a
3D-stacked arrangement (Fig."2d, inset, Extended Data Fig."5c). The agreement between the experimental SAXS profiles and theoretical profiles computed from the design model increases with increasing numbers of subunits (Extended Data Fig."5c–e), suggesting that arrays in solution are at least 1.8"µm in diameter. Some array stacking with a discrete number of symmetry-preserving packing arrangements was observed by electron microscopy (Fig."2c). On the basis of the SAXS results in solution and further structural analysis, we attribute these observations to sample preparation processing conditions for electron microscopy (addressed further in Extended Data Fig."4).
We then investigated the kinetics and assembly mechanism in"vitro by mixing the two components and monitoring growth in solution by light scattering and SAXS, and on a substrate by AFM (Fig."2f, Extended Data Figs."3, 5). Upon mixing the two components at micromolar con-centrations, lattice assembly in solution occurred in minutes, with concentration-dependent kinetics (Extended Data Fig."3a). SAXS analysis indicated rapid growth of the arrays to 0.4"µm in diameter within the first 2"min after mixing the components (at 10"µM) and to 0.7"µm"within 6"min (Extended Data Fig."5f, g, Methods). The hexagonal lattice could be readily visualized by AFM, and the pathway of assem-bly could be assessed by in"situ AFM imaging at different time points (Fig."2e, Extended Data Fig."3b, c). The designed 2D material exhibited self-healing: cracked edges reformed (Fig."2e, upper right corner) and point defects and vacancies in the interior of the lattice that were evi-dent at early time points were filled at later time points (Fig."2f, Extended Data Fig."3c). To determine whether the rate-limiting step for growth is initiation or completion of hexagonal units, we counted the numbers of each of the possible edge states in a set of AFM images. A units bound to two B units (designated A-II sites) comprised the most stable edge sites, while A units with only one neighbouring B unit (designated A-I sites) were the least stable, occurring far less frequently than exposed B units with only one neighbouring A unit (B-I sites) (Extended Data Fig."3h). The results imply that attachment of a B unit to an A-I site to create a (most) stable A-II site is rate-limiting during assembly (quantitative analysis in Extended Data Fig."3d, f, g).
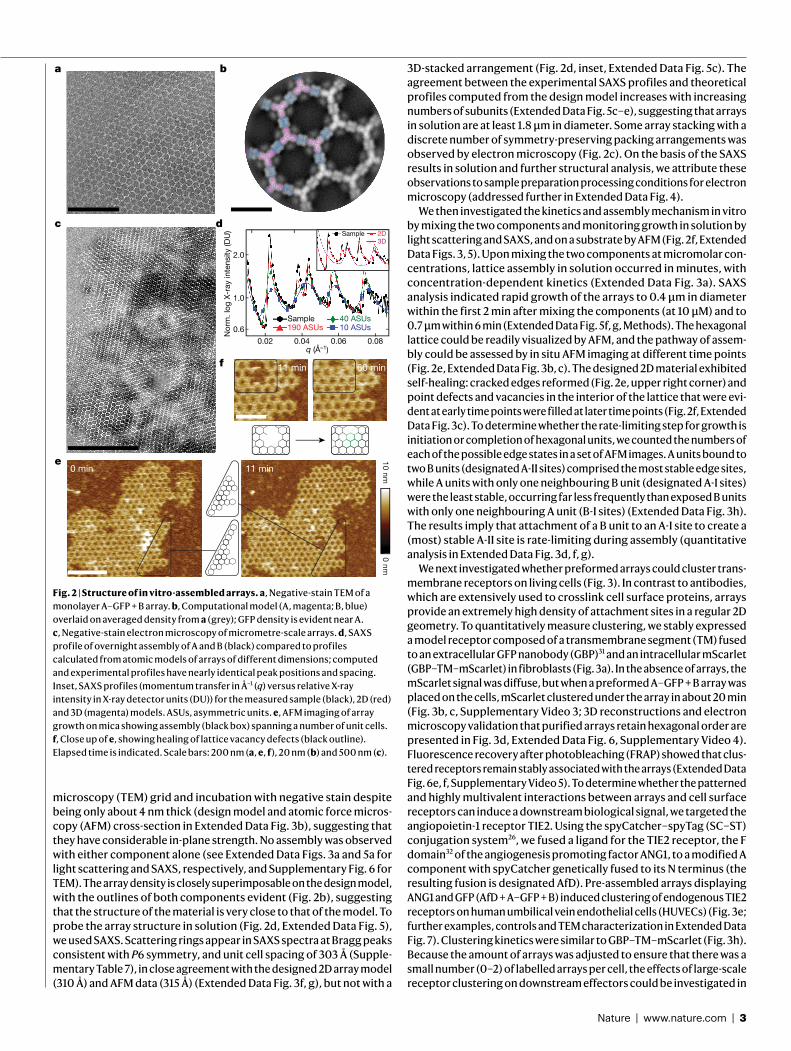
We next investigated whether preformed arrays could cluster trans-membrane receptors on living cells (Fig."3). In contrast to antibodies, which are extensively used to crosslink cell surface proteins, arrays provide an extremely high density of attachment sites in a regular 2D geometry. To quantitatively measure clustering, we stably expressed a model receptor composed of a transmembrane segment (TM) fused to an extracellular GFP nanobody (GBP)31 and an intracellular mScarlet (GBP–TM–mScarlet) in fibroblasts (Fig."3a). In the absence of arrays, the mScarlet signal was diffuse, but when a preformed A–GFP"+"B array was placed on the cells, mScarlet clustered under the array in about 20"min (Fig."3b, c, Supplementary Video"3; 3D reconstructions and electron microscopy validation that purified arrays retain hexagonal order are presented in Fig."3d, Extended Data Fig."6, Supplementary Video"4). Fluorescence recovery after photobleaching (FRAP) showed that clus-tered receptors remain stably associated with the arrays (Extended Data Fig."6e, f, Supplementary Video"5). To determine whether the patterned and highly multivalent interactions between arrays and cell surface receptors can induce a downstream biological signal, we targeted the angiopoietin-1 receptor TIE2. Using the spyCatcher–spyTag (SC–ST) conjugation system26, we fused a ligand for the TIE2 receptor, the F domain32 of the angiogenesis promoting factor ANG1, to a modified A component with spyCatcher genetically fused to its N terminus (the resulting fusion is designated AfD). Pre-assembled arrays displaying ANG1 and GFP (AfD"+"A–GFP"+"B) induced clustering of endogenous TIE2 receptors on human umbilical vein endothelial cells (HUVECs) (Fig."3e; further examples, controls and TEM characterization in Extended Data Fig."7). Clustering kinetics were similar to GBP–TM–mScarlet (Fig."3h). Because the amount of arrays was adjusted to ensure that there was a small number (0–2) of labelled arrays per cell, the effects of large-scale receptor clustering on downstream effectors could be investigated in
a b
c d
e 10 nm0 nm
0.060.040.02 0.08q (Å–1)
Nor
m. l
og X
-ray
inte
nsity
(DU
)
0 min 11 min
60 min
2D3D
Sample
f 11 min
2.0
1.0
0.6Sample190 ASUs
40 ASUs10 ASUs
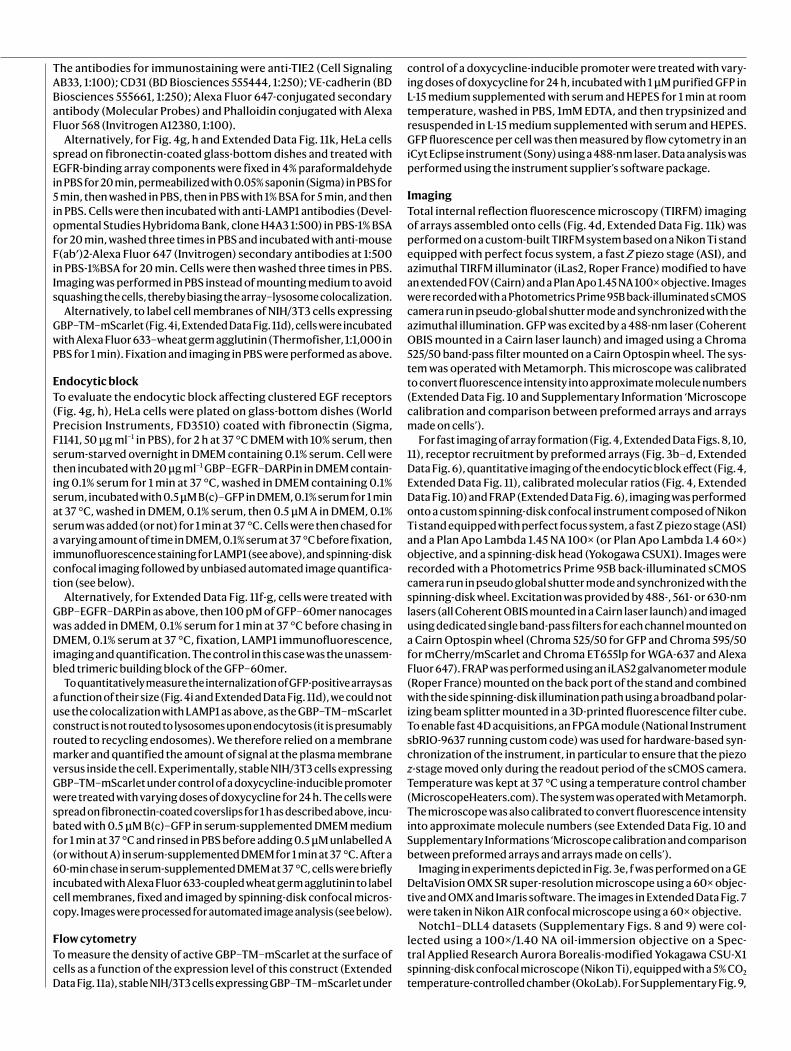
Fig. 2 | Structure of in!vitro-assembled arrays. a, Negative-stain TEM of a monolayer A–GFP"+"B array. b, Computational model (A, magenta; B, blue) overlaid on averaged density"from a (grey); GFP density is evident near A. c, Negative-stain electron microscopy of micrometre-scale arrays. d, SAXS profile of overnight assembly of A and B (black) compared to profiles calculated"from atomic models of arrays of different dimensions; computed and experimental profiles"have nearly identical peak positions and"spacing. Inset, SAXS profiles (momentum transfer in Å$1 (q) versus relative X-ray intensity in X-ray detector units (DU)) for the measured sample (black), 2D (red) and 3D (magenta) models. ASUs, asymmetric units. e, AFM imaging of array growth on mica showing assembly (black box) spanning a number of unit cells. f, Close up of e, showing healing of lattice vacancy defects (black outline). Elapsed time is indicated. Scale bars: 200"nm (a, e, f), 20"nm (b) and 500"nm (c).
4 | Nature | www.nature.com
Article
detail. Super-resolution microscopy revealed extensive remodelling of the actin cytoskeleton underneath the TIE2 clusters after 60"min (Fig."3f), which could reflect adherens junction formation (Extended Data Fig."7c). The ANG1 arrays, but not the individual functionalized array component, induce AKT signalling (Fig."3g, h), showing that the arrays can have biological activities beyond those of their components.
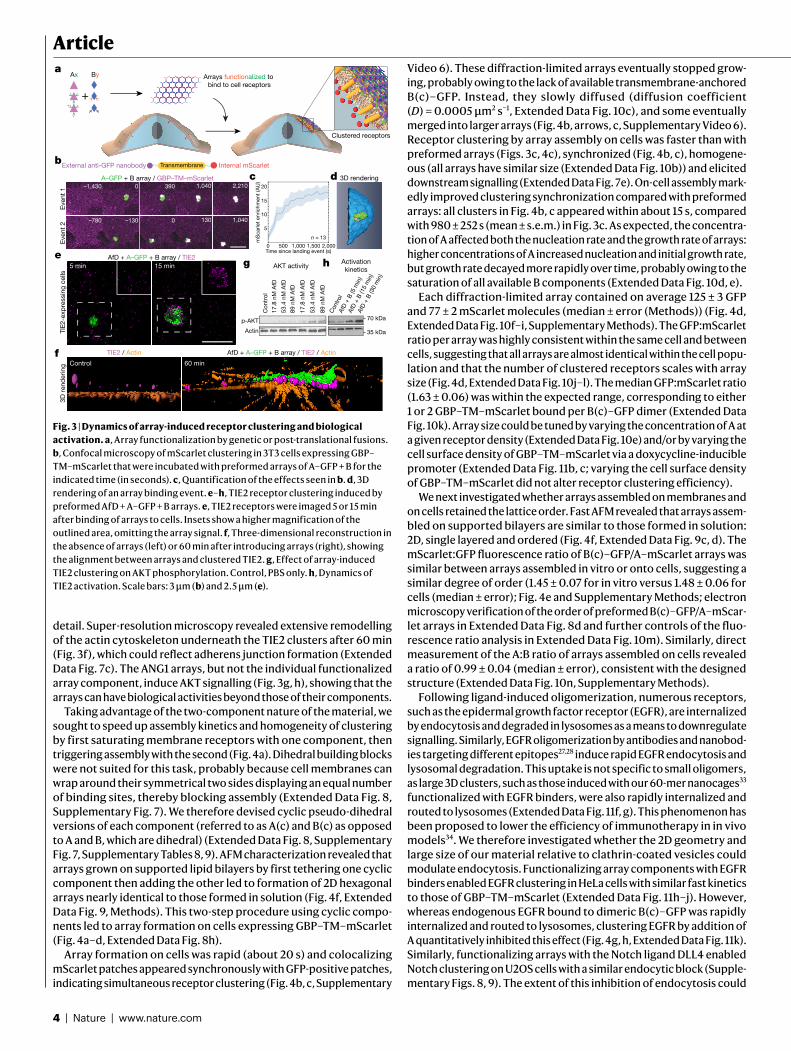
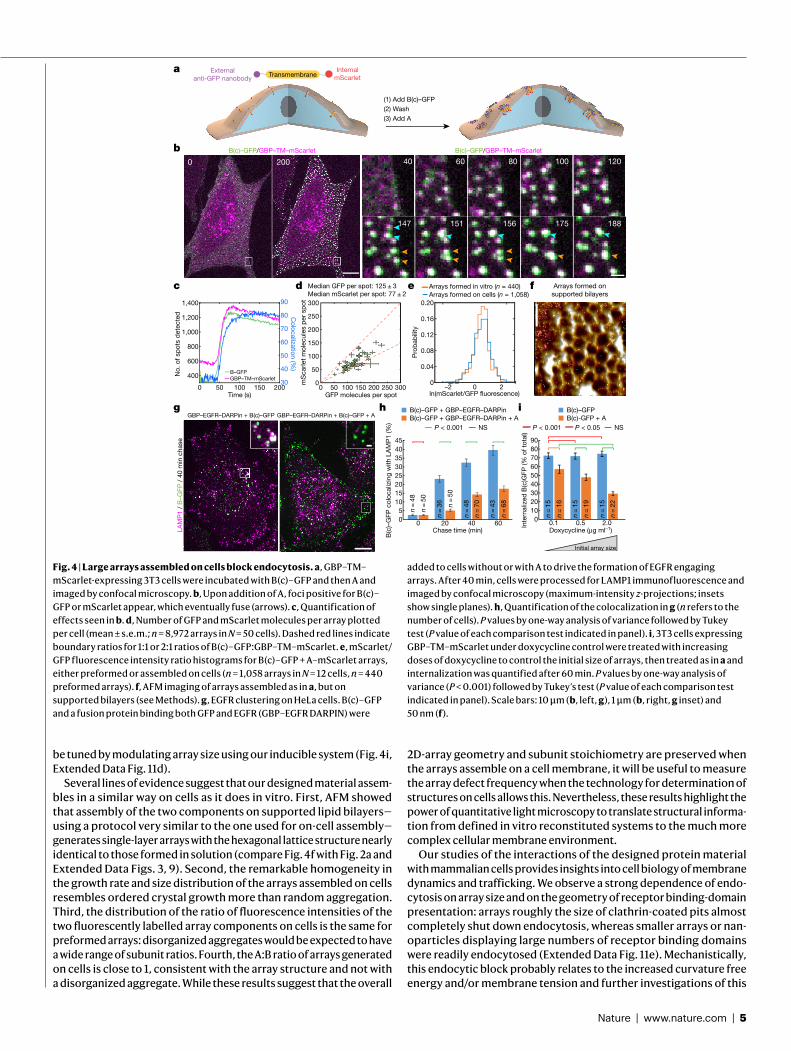
Taking advantage of the two-component nature of the material, we sought to speed up assembly kinetics and homogeneity of clustering by first saturating membrane receptors with one component, then triggering assembly with the second (Fig."4a). Dihedral building blocks were not suited for this task, probably because cell membranes can wrap around their symmetrical two sides displaying an equal number of binding sites, thereby blocking assembly (Extended Data Fig."8, Supplementary Fig."7). We therefore devised cyclic pseudo-dihedral versions of each component (referred to as A(c) and B(c) as opposed to A and B, which are dihedral) (Extended Data Fig."8, Supplementary Fig."7, Supplementary Tables"8, 9). AFM characterization revealed that arrays grown on supported lipid bilayers by first tethering one cyclic component then adding the other led to formation of 2D hexagonal arrays nearly identical to those formed in solution (Fig."4f, Extended Data Fig."9, Methods). This two-step procedure using cyclic compo-nents led to array formation on cells expressing GBP–TM–mScarlet (Fig."4a–d, Extended Data Fig."8h).
Array formation on cells was rapid (about 20"s) and colocalizing mScarlet patches appeared synchronously with GFP-positive patches, indicating simultaneous receptor clustering (Fig."4b, c, Supplementary
Video"6). These diffraction-limited arrays eventually stopped grow-ing, probably owing to the lack of available transmembrane-anchored B(c)–GFP. Instead, they slowly diffused (diffusion coefficient (D)"="0.0005"µm2"s$1, Extended Data Fig."10c), and some eventually merged into larger arrays (Fig."4b, arrows, c, Supplementary Video"6). Receptor clustering by array assembly on cells was faster than with preformed arrays (Figs."3c, 4c), synchronized (Fig."4b, c), homogene-ous (all arrays have similar size (Extended Data Fig."10b)) and elicited downstream signalling (Extended Data Fig."7e). On-cell assembly mark-edly improved clustering synchronization compared with preformed arrays: all clusters in"Fig."4b, c appeared within about 15"s, compared with 980"±"252"s (mean"±"s.e.m.) in Fig."3c. As expected, the concentra-tion of A affected both the nucleation rate and the growth rate of arrays: higher concentrations of A increased nucleation and initial growth rate, but growth rate decayed more rapidly over time, probably owing to the saturation of all available B components (Extended Data Fig."10d, e).
Each diffraction-limited array contained on average 125"±"3 GFP and 77"±"2 mScarlet molecules (median"±"error (Methods)) (Fig."4d, Extended Data Fig."10f–i, Supplementary Methods). The GFP:mScarlet ratio per array was highly consistent within the same cell and between cells, suggesting that all arrays are almost identical within the cell popu-lation and that the number of clustered receptors scales with array size (Fig."4d, Extended Data Fig."10j–l). The median GFP:mScarlet ratio (1.63"±"0.06) was within the expected range, corresponding to either 1 or 2 GBP–TM–mScarlet bound per B(c)–GFP dimer (Extended Data Fig."10k). Array size could be tuned by varying the concentration of A at a given receptor density (Extended Data Fig."10e) and/or by varying the cell surface density of GBP–TM–mScarlet via a doxycycline-inducible promoter (Extended Data Fig."11b, c; varying the cell surface density of GBP–TM–mScarlet did not alter receptor clustering efficiency).
We next investigated whether arrays assembled on membranes and on cells retained the lattice order. Fast AFM revealed that arrays assem-bled on supported bilayers are similar to those formed in solution: 2D, single layered and ordered (Fig."4f, Extended Data Fig."9c, d). The mScarlet:GFP fluorescence ratio of B(c)–GFP/A–mScarlet arrays was similar between arrays assembled in"vitro or onto cells, suggesting a similar degree of order (1.45"±"0.07 for in"vitro versus 1.48"±"0.06 for cells (median ± error); Fig."4e and Supplementary Methods; electron microscopy verification of the order of preformed B(c)–GFP/A–mScar-let arrays in Extended Data Fig."8d and further controls of the fluo-rescence ratio analysis in Extended Data Fig."10m). Similarly, direct measurement of the A:B ratio of arrays assembled on cells revealed a ratio of 0.99"±"0.04 (median"±"error), consistent with the designed structure (Extended Data Fig."10n, Supplementary Methods).
Following ligand-induced oligomerization, numerous receptors, such as the epidermal growth factor receptor (EGFR), are internalized by endocytosis and degraded in lysosomes as a means to downregulate signalling. Similarly, EGFR oligomerization by antibodies and nanobod-ies"targeting different epitopes27,28 induce rapid EGFR endocytosis and lysosomal degradation. This uptake is not specific to small oligomers, as large 3D clusters, such as those induced with our 60-mer nanocages33 functionalized with EGFR binders, were also rapidly internalized and routed to lysosomes (Extended Data Fig."11f, g). This phenomenon has been proposed to lower the efficiency of immunotherapy in in"vivo models34. We therefore investigated whether the 2D geometry and large size of our material relative to clathrin-coated vesicles could modulate endocytosis. Functionalizing array components with EGFR binders enabled EGFR clustering in HeLa cells with similar fast kinetics to those of GBP–TM–mScarlet (Extended Data Fig."11h–j). However, whereas endogenous EGFR bound to dimeric B(c)–GFP was rapidly internalized and routed to lysosomes, clustering EGFR by addition of A quantitatively inhibited this effect (Fig."4g, h, Extended Data Fig."11k). Similarly, functionalizing arrays with the Notch ligand DLL4 enabled Notch clustering on U2OS cells with a similar endocytic block (Supple-mentary Figs."8, 9). The extent of this inhibition of endocytosis could
a
b
eActivationkineticsAKT activity h
TIE2
-exp
ress
ing
cells
g15 min5 min
f
Actin
89 n
M A
fD
53.4
nM
AfD
AfD
+ B
(30
min
)
AfD
+ B
(15
min
)
AfD
+ B
(5 m
in)
Con
trol
Con
trol
17.8
nM
AfD
53.4
nM
AfD
89 n
M A
fD
17.8
nM
AfD
p-AKT 70 kDa
35 kDa
5
10
15
20
0
mS
carle
t enr
ichm
ent (
AU
)
500 1,000 1,500 2,000Time since landing event (s)
n = 13
c d
Even
t 1Ev
ent 2
–780 –130 0 130 1,040
–1,430 0 390 1,040 2,210
External anti-GFP nanobody Internal mScarletTransmembrane
Ax By
+
Arrays functionalized to bind to cell receptors
Clustered receptors
A–GFP + B array / GBP–TM–mScarlet
AfD + A–GFP + B array / TIE2
3D re
nder
ing Control
TIE2 / Actin
60 min
AfD + A–GFP + B array / TIE2 / Actin
3D rendering
Fig. 3 | Dynamics of array-induced receptor clustering and biological activation. a, Array functionalization by genetic or post-translational fusions. b, Confocal microscopy of mScarlet clustering in 3T3 cells expressing GBP–TM–mScarlet that were incubated with preformed arrays of A–GFP"+"B for the indicated time (in"seconds). c, Quantification of the effects seen in b. d, 3D rendering of an array binding event. e–h, TIE2 receptor clustering induced by preformed AfD"+"A–GFP"+"B arrays. e, TIE2 receptors were imaged 5 or 15 min after binding of arrays to cells. Insets show a higher magnification of the outlined area, omitting the array signal. f, Three-dimensional reconstruction in the absence of arrays (left) or 60"min after introducing arrays (right), showing the alignment between arrays and clustered TIE2. g, Effect of array-induced TIE2 clustering on AKT phosphorylation. Control, PBS only. h, Dynamics of TIE2 activation. Scale bars: 3"µm (b) and 2.5 µm (e).
Nature | www.nature.com | 5
be tuned by modulating array size using our inducible system (Fig."4i, Extended Data Fig."11d).
Several lines of evidence suggest that our designed material assem-bles in a similar way on cells as it does in"vitro. First, AFM showed that assembly of the two components on supported lipid bilayers—using a protocol very similar to the one used for on-cell assembly— generates single-layer arrays with the hexagonal lattice structure nearly identical to those formed in solution (compare Fig."4f with Fig."2a and Extended Data Figs."3, 9). Second, the remarkable homogeneity in the growth rate and size distribution of the arrays assembled on cells resembles ordered crystal growth more than random aggregation. Third, the distribution of the ratio of fluorescence intensities of the two fluorescently labelled array components on cells is the same for preformed arrays: disorganized aggregates would be expected to have a wide range of subunit ratios. Fourth, the A:B ratio of arrays generated on cells is close to 1, consistent with the array structure and not with a disorganized aggregate. While these results suggest that the overall
2D-array geometry and subunit stoichiometry are preserved when the arrays assemble on a cell membrane, it will be useful to measure the array defect frequency when the technology for determination of structures on cells allows this. Nevertheless, these results highlight the power of quantitative light microscopy to translate structural informa-tion from defined in"vitro reconstituted systems to the much more complex cellular membrane environment.
Our studies of the interactions of the designed protein material with mammalian cells provides insights into cell biology of membrane dynamics and trafficking. We observe a strong dependence of endo-cytosis on array size and on the geometry of receptor binding-domain presentation: arrays roughly the size of clathrin-coated pits almost completely shut down endocytosis, whereas smaller arrays or nan-oparticles displaying large numbers of receptor binding domains were readily endocytosed (Extended Data Fig."11e). Mechanistically, this endocytic block probably relates to the increased curvature free energy and/or membrane tension and further investigations of this
147 151 156 175 188
40 60 80 100 120
a
b
(1) Add B(c)–GFP(2) Wash(3) Add A
B(c)–GFP/GBP–TM–mScarlet
0 200B(c)–GFP/GBP–TM–mScarlet
800
1,000
0
No.
of s
pots
det
ecte
d
50 100 150 200Time (s)
600
400
50
60
70
80 Colocalization (%
)40
30
1,200
1,400 90
B–GFP GBP–TM–mScarlet
c
Externalanti-GFP nanobody
InternalmScarletTransmembrane
d
h
Initial array size
P < 0.001 NS
B(c
)–G
FP c
oloc
aliz
ing
with
LA
MP
1 (%
)
0 20 40 60Chase time (min)
0
20
40
30
105
15
25
35
45
B(c)–GFP + GBP–EGFR–DARPinB(c)–GFP + GBP–EGFR–DARPin + A
n =
48
n =
36
n =
48
n =
43
n =
50
n =
50
n =
70
n =
68
P < 0.05
Inte
rnal
ized
B(c
)GFP
(% o
f tot
al)
0
40
80
60
2010
30
50
70
90
B(c)–GFPB(c)-GFP + A
0.1 0.5Doxycycline (!g ml–1)
2.0
NSP < 0.001
n =
15
n =
15
n =
15
n =
16
n =
19
n =
22
g i
LAM
P1
/ B–G
FP /
40 m
in c
hase
200
mS
carle
t mol
ecul
es p
er s
pot
150
100
0
50
250
300
0 20015010050 250 300GFP molecules per spot
Median GFP per spot: 125 ± 3 Median mScarlet per spot: 77 ± 2
e
Pro
babi
lity
0 2ln(mScarlet/GFP !uorescence)
0–2
0.04
0.08
0.12
0.16
0.20Arrays formed on cells (n = 1,058)Arrays formed in vitro (n = 440) f Arrays formed on
supported bilayers
GBP–EGFR–DARPin + B(c)–GFP GBP–EGFR–DARPin + B(c)–GFP + A
Fig. 4 | Large arrays assembled on cells block endocytosis. a, GBP–TM–mScarlet-expressing 3T3 cells were incubated with B(c)–GFP and then A and imaged by confocal microscopy. b, Upon addition of A, foci positive for B(c)–GFP or mScarlet appear, which eventually fuse (arrows). c, Quantification of effects seen in b. d, Number of GFP and mScarlet molecules per array plotted per cell (mean"±"s.e.m.; n"="8,972 arrays in N"="50 cells). Dashed red lines indicate boundary ratios for 1:1 or 2:1 ratios of B(c)–GFP:GBP–TM–mScarlet. e, mScarlet/GFP fluorescence intensity ratio histograms for B(c)–GFP"+"A–mScarlet arrays, either preformed or assembled on cells (n"="1,058 arrays in N"="12 cells, n"="440 preformed arrays). f, AFM imaging of arrays assembled as in a, but on supported bilayers"(see Methods). g, EGFR clustering"on HeLa cells. B(c)–GFP and a fusion protein binding both GFP and EGFR (GBP–EGFR DARPIN) were
added to cells without or with A to drive the formation of EGFR engaging arrays."After 40"min, cells were processed for LAMP1 immunofluorescence and imaged by confocal microscopy (maximum-intensity z-projections; insets show single planes). h, Quantification of the colocalization in g (n refers to the number of cells). P values by one-way analysis of variance followed by Tukey test"(P value of each comparison test indicated in panel). i, 3T3 cells expressing GBP–TM–mScarlet under doxycycline control were treated with increasing doses of doxycycline to control the initial size of arrays, then treated as in a and internalization was quantified after 60 min. P values by one-way analysis of variance (P"<"0.001) followed by Tukey’s test (P value of each comparison test indicated in panel). Scale bars: 10"µm (b, left, g), 1"µm (b, right, g inset) and 50"nm (f).
6 | Nature | www.nature.com
Articlephenomenon may shed light on the mechanisms of cellular uptake. From a therapeutic perspective, the ability to shut down endocytosis without inducing signalling, as in our EGFR-binding arrays, could help extend the efficacy of signalling-pathway antagonists, which can be limited by turnover owing to endocytosis. Furthermore, the ability to assemble designed proteins around cells opens up new approaches for reducing immune responses to introduced cells, for example in therapy for type 1 diabetes.
The long-range almost-crystalline order, tight control over the tim-ing of assembly and the ability to generate complexity by functional-izing array components differentiate this designed 2D material from naturally occurring and other designed protein 2D lattices and opens many areas for investigation. The stepwise assembly approach offers a fine level of control to cluster receptors compared with pre-assembled materials or aggregates: the receptor density in the clusters is fixed and the fluorescence intensity of the array component can be directly converted into the absolute number of receptors being clustered. Together with the localization of activation to regions underneath the arrays, this should facilitate investigation of the molecular events downstream of receptor clustering. Imposition of a predetermined order onto transmembrane proteins could open up new approaches to structure determination. More generally, these binary biopolymers and methods to generate new ones provide novel tools and paradigms for the emerging field of engineered living materials35, in which combina-tions of programmable cells produce building blocks of de"novo binary scaffolds to continuously regenerate or remodel their extracellular structure and function in response to environmental cues. We expect the methodology developed here, combined with the rapid develop-ments in de"novo design of protein building-blocks and quantitative microscopy techniques, will provide the basis for a future of program-mable biomaterials for synthetic and living systems.
Online contentAny methods, additional references, Nature Research reporting sum-maries, source data, extended data, supplementary information, acknowledgements, peer review information; details of author contri-butions and competing interests; and statements of data and code avail-ability are available at https://doi.org/10.1038/s41586-020-03120-8.
1. Sleytr, U. B., Schuster, B., Egelseer, E.-M. & Pum, D. S-layers: principles and applications. FEMS Microbiol. Rev. 38, 823–864 (2014).
2. Zhu, C. et"al. Diversity in S-layers. Prog. Biophys. Mol. Biol. 123, 1–15 (2017).3. Gonen, S., DiMaio, F., Gonen, T. & Baker, D. Design of ordered two-dimensional arrays
mediated by noncovalent protein-protein interfaces. Science 348, 1365–1368 (2015).4. Liljeström, V., Mikkilä, J. & Kostiainen, M. A. Self-assembly and modular functionalization
of three-dimensional crystals from oppositely charged proteins. Nat. Commun. 5, 4445 (2014).
5. Alberstein, R., Suzuki, Y., Paesani, F. & Tezcan, F. A. Engineering the entropy-driven free-energy landscape of a dynamic, nanoporous protein assembly. Nat. Chem. 10, 732–739 (2018).
6. Charrier, M. et"al. Engineering the S-layer of Caulobacter crescentus as a foundation for stable, high-density, 2D living materials. ACS Synth. Biol. 8, 181–190 (2019).
7. Comerci, C. J. et"al. Topologically-guided continuous protein crystallization controls bacterial surface layer self-assembly. Nat. Commun. 10, 1–10 (2019).
8. Sinclair, J. C., Davies, K. M., Vénien-Bryan, C. & Noble, M. E. M. Generation of protein lattices by fusing proteins with matching rotational symmetry. Nat. Nanotechnol. 6, 558–562 (2011).
9. Vantomme, G. & Meijer, E. W. The construction of supramolecular systems. Science 363, 1396–1397 (2019).
10. Bale, J. B. et"al. Accurate design of megadalton-scale two-component icosahedral protein complexes. Science 353, 389–394 (2016).
11. Butter!ield, G. L. et"al. Evolution of a designed protein assembly encapsulating its own RNA genome. Nature 552, 415–420 (2017).
12. Marcandalli, J. et"al. Induction of potent neutralizing antibody responses by a designed protein nanoparticle vaccine for respiratory syncytial virus. Cell 176, 1420–1431.e17 (2019).
13. Tan, R., Zhu, H., Cao, C. & Chen, O. Multi-component superstructures self-assembled from nanocrystal building blocks. Nanoscale 8, 9944–9961 (2016).
14. Yeates, T. O. Geometric principles for designing highly symmetric self-assembling protein nanomaterials. Annu. Rev. Biophys. 46, 23–42 (2017).
15. Yeates, T. O., Liu, Y. & Laniado, J. The design of symmetric protein nanomaterials comes of age in theory and practice. Curr. Opin. Struct. Biol. 39, 134–143 (2016).
16. Matthaei, J. F. et"al. Designing two-dimensional protein arrays through fusion of multimers and interface mutations. Nano Lett. 15, 5235–5239 (2015).
17. Garcia-Seisdedos, H., Empereur-Mot, C., Elad, N. & Levy, E. D. Proteins evolve on the edge of supramolecular self-assembly. Nature 548, 244–247 (2017).
18. Suzuki, Y. et"al. Self-assembly of coherently dynamic, auxetic, two-dimensional protein crystals. Nature 533, 369–373 (2016).
19. Du, M. et"al. Precise fabrication of de"novo nanoparticle lattices on dynamic 2D protein crystalline lattices. Nano Lett. 2, 1154–1160 (2019).
20. Chen, Z. et"al. Self-assembling 2D arrays with de"novo protein building blocks. J. Am. Chem. Soc. 141, 8891–8895 (2019).
21. Herrmann, J. et"al. A bacterial surface layer protein exploits multistep crystallization for rapid self-assembly. Proc. Natl Acad. Sci. USA 117, 388–394 (2020).
22. King, N. P. et"al. Accurate design of co-assembling multi-component protein nanomaterials. Nature 510, 103–108 (2014).
23. Berman, H. M. et"al. The Protein Data Bank. Nucleic Acids Res. 28, 235–242 (2000).24. DiMaio, F., Leaver-Fay, A., Bradley, P., Baker, D. & André, I. Modeling symmetric
macromolecular structures in Rosetta3. PLoS ONE 6, e20450 (2011).25. Fleishman, S. J. et"al. RosettaScripts: a scripting language interface to the Rosetta
macromolecular modeling suite. PLoS ONE 6, e20161 (2011).26. Zakeri, B. et"al. Peptide tag forming a rapid covalent bond to a protein, through
engineering a bacterial adhesin. Proc. Natl Acad. Sci. USA 109, E690–E697 (2012).27. Pedersen, M. W. et"al. Sym004: a novel synergistic anti–epidermal growth factor
receptor antibody mixture with superior anticancer ef!icacy. Cancer Res. 70, 588–597 (2010).
28. Heukers, R. et"al. Endocytosis of EGFR requires its kinase activity and N-terminal transmembrane dimerization motif. J. Cell Sci. 126, 4900–4912 (2013).
29. Goldenzweig, A. et"al. Automated structure- and sequence-based design of proteins for high bacterial expression and stability. Mol. Cell 63, 337–346 (2016).
30. Chandrasekhar, S. Stochastic problems in physics and astronomy. Rev. Mod. Phys. 15, 1–89 (1943).
31. Kirchhofer, A. et"al. Modulation of protein properties in living cells using nanobodies. Nat. Struct. Mol. Biol. 17, 133–138 (2010).
32. Zhao, Y. T. et"al. F-domain valency determines outcome of signaling through the angiopoietin pathway. Preprint at https://doi.org/10.1101/2020.09.19.304188 (2020).
33. Hsia, Y. et"al. Design of a hyperstable 60-subunit protein icosahedron. Nature 535, 136–139 (2016).
34. Chew, H. Y. et"al. Endocytosis inhibition in humans to improve responses to ADCC-mediating antibodies. Cell 180, 895–914 (2020).
35. Nguyen, P. Q., Courchesne, N.-M. D., Duraj-Thatte, A., Praveschotinunt, P. & Joshi, N. S. Engineered living materials: prospects and challenges for using biological systems to direct the assembly of smart materials. Adv. Mater. 30, e1704847 (2018).
Publisher’s note Springer Nature remains neutral with regard to jurisdictional claims in published maps and institutional af!iliations.
© The Author(s), under exclusive licence to Springer Nature Limited 2021
MethodsComputational designCrystal structures of 628 D2, 261 D3, 63 D4 and 13 D6 dihedral homo- oligomers with resolution better than 2.5"Å were selected from the Protein Data Bank23 to be used as building blocks. Combinatorial pairs of building blocks were selected such that they afford the two rotation centres required in a selected subset of plane symmetries (p3m1 [C3–C3], p4m [C4–C4, C4–C2], p6m [C6–C2, C6–C3, C3–C2]). The highest-order rotation symmetry axis of each building block was aligned perpendicular to the plane and an additional two-fold symme-try axis was aligned with the plane symmetry reflection axis. Preserving these constraints allows positioning the D2, D3, D4 and D6 building blocks in 6, 2, 2 and 2 unique conformations, respectively, and results in a total of ~2.6 million unique docking trajectories. In a first iteration, sym-metric Rosetta design24 was applied to construct the building blocks dihedral homo-oligomers, position them in the correct configura-tion in space and slide them into contact along the plane symmetry group reflection axes. Docking trajectories were discarded if clashing between building blocks was detected, if a fraction greater than 20% of contact positions (residues belonging to one building block within 10"Å of their partner building block residues) did not belong to a rigid secondary structure (helix or beta sheet), or if the surface area buried by the formation of the contact was smaller than 400"Å2. These initial filtering parameters narrowed the number of potential design trajec-tories to approximately 1% of the original number of trajectories. In a second iteration, the selected docks (building blocks pairs and"contact orientations) were regenerated by symmetric Rosetta design, slide into contact and retract in steps of 0.05"Å to a maximum distance of 1.5"Å. For each position, layer-sequence design calculations, implemented by a Rosetta script25, were made to generate low-energy interfaces with buried hydrophobic contacts surrounded by hydrophilic contacts. Designed substitutions not substantially contributing to the interface were reverted to their original identities. Resulting designs were filtered on the basis of shape complementarity, interface surface area, buried unsatisfied hydrogen bonds, binding energy (ddG), and number of hydrophobic residues at the interface core. A negative design approach that includes an asymmetric docking was used to identify potential alternative interacting surfaces. Designs that exhibited a non-ideal energy funnel were also discarded. Forty-five best-scoring designs belonging to p3m1 (2 designs), p4m (10 designs) and p6m (33 designs) were selected for experiments. Protein monomeric stabilization was done to the D2 and D3 homo-oligomers of design 13 using the PROSS server29 (Supplementary Figs."4, 5, Supplementary Table"5).
Pyrosetta36 and RosettaRemodel37 were used to model and generate linkers to render the D2 and D3 working homo-oligomers into C2 and C3 (cyclic pseudo-dihedral) homo-oligomers (Extended Data Fig."8, Sup-plementary Fig."7, Supplementary Tables"8, 9 for details and further discussion). Linkers for non-structural fusions, that is, optical labels and binding sites such as SC–ST, were not modelled computationally. All Rosetta scripts used are available upon request.
Expression construct generationGenes encoding the 45 designs"pairs were initially codon optimized using DNAWorks v3.2.438 followed by RNA ddG minimization of the 50 first nucleotides of each gene using mRNAOptimiser39 and Nupack3.2.2 programs40 (Supplementary Fig."1). For screening in an in-vivo expression setup, bicistronic constructs were cloned (Gen-Script) in pET28b+ (kanamycin resistant), between NcoI and XhoI endonuclease restriction sites and separated by an intergenic region: TAAAGAAGGAGATATCATATG. For the working design, separately expressing constructs were prepared by PCR from sets of synthetic oligonucleotides (Integrated DNA Technologies) to generate linear DNA fragments with overhangs compatible with a Gibson assembly41 to obtain circular plasmids. Additional labels (His tag, sfGFP, mCherry,
mScarlet, spyTag, spyCatcher, mSA242 and AVI tag) were either geneti-cally fused by a combination of PCR and Gibson processes or through post expression conjugation using the SC–ST system26 or biotinyla-tion43. Note that the variant of GFP used throughout the paper, on A and B components and the 60-mer nanocages is sfGFP.
The transmembrane nanobody construct (Figs."3, 4) consists of an N-terminal signal peptide from the Drosophila Echinoid protein, fol-lowed by His6–PC (PC is the protein-C tag EDQVDPRLIDGK) tandem affinity tags, a nanobody against GFP31 (GFP-binding peptide (GBP)), a TEV cleavage site, the transmembrane domain from the Drosophila Echinoid protein, the VSV-G export sequence44,45 and the mScarlet protein46. The protein expressed by this construct thus consists of an extracellular anti-GFP nanobody linked to an intracellular mScarlet by a transmembrane domain (named GBP–TM–mScarlet in the main text for simplicity). This custom construct was synthesized (Integrated DNA Technologies) and cloned into a modified pCDNA5-FRT-V5-His vector, as previously described47 for homologous recombination into the FRT site. A version without the mScarlet (GBP–TM) was similarly derived. We also modified the backbone to allow doxycycline-inducible expres-sion by first replacing the EF1a promoter with a Tet promoter, then by making the backbone compatible with the MXS chaining system48 and ligating in the CMV::rtTA3 bGHpA cassette.
For the GBP–mScarlet and GBP–EGFR–DARPin fusions, we modified a pGEX vector to express a protein of interest fused to GBP downstream of the gluthatione S-transferase (GST) purification tag followed by TEV and 3C cleavage sequences. We then cloned mScarlet and a published DARPin against EGFR49 (clone E01) into this vector, which thus express GST-3C-TEV-GBP-mScarlet and GST-3C-TEV-GBP-EGFR-DARPin fusions, respectively.
Protein expression and purificationUnless stated otherwise, all steps were performed at 4%°C. Protein con-centration was determined either by absorbance at 280"nm (NanoDrop 8000 Spectrophotometer, Fisher Scientific), or by densitometry on Coomassie-stained SDS page gel against a BSA ladder.
For initial screening of the 45 designs for A and B, bicistronic plasmids were transformed into BL21 Star (DE3) E. coli. cells (Invitrogen) and cultures grown in LB medium. Protein expression was induced with 1 mM isopropyl &-'-1-thiogalactopyranoside (IPTG) for 3 h at 37%°C or 15 h at 22%°C, followed by cell lysis in Tris buffer (TBS) (25 mM Tris, 300 mM NaCl, 1 mM dithiothreitol (DTT), 1 mM phenylmethylsulfonyl fluoride (PMSF) and lysozyme (0.1"mg"ml$1) using sonication (Fisher Scientific) at 20 W for 5 min total ‘on’ time, using cycles of 10 s on, 10 s off. Soluble and insoluble fractions were separated by centrifugation at 20,000g for 30 min and protein expression was screened by running both fractions on SDS–PAGE (Bio-Rad) (see Supplementary Fig."3) and for selected samples also by negative-stain electron microscopy. All subsequent experiments done on separately expressed components were performed on His6-tagged proteins. Following similar expression protocols (22%°C, 15 h), cultures were resuspended in 20"mM supple-mented Tris-buffer and lysed by microfluidizer at 18,000 PSI (M-110P Microfluidics). The soluble fraction was passed through 3 ml of nickel nitrilotriacetic acid agarose (Ni-NTA) (Qiagen), washed with 20 mM imidazole, and eluted with 500 mM imidazole. Pure proteins with the correct homo-oligomeric conformation were collected from a Superose 6 10/300 GL SEC column (GE Healthcare) in Tris-buffer (TBS; 25 mM Tris, 150 mM NaCl, 5% glycerol). Separately expressed components were kept at a concentration of about 200 µM at 4%°C.
SC–ST conjugation was done by mixing a tagged protein and the com-plementary tagged array component at a 1.3:1 molar ratio, overnight incubation (about 10 h) at 4%°C followed by Superose 6 10/300 GL SEC column purification to obtain only fully conjugated homo-oligomers. Sub-loaded conjugation was done at tag:array protein 0.17:1 molar ratio and used as is. Biotinylation of AVI-tagged components was performed with BirA as described43 and followed by Superose 6 10/300 GL SEC
Articlecolumn purification. In"vitro array assembly was induced by mixing both array components at equimolar concentration.
GFP-tagged 60mer nanocages were expressed and purified as previ-ously33. GBP–mScarlet was expressed in E. coli BL21 Rosetta 2 (Strata-gene) by induction with 1 mM IPTG in 2X YT medium at 20%°C overnight. Bacteria were lysed with a microfluidizer at 20kPsi in lysis buffer (20 mM HEPES, 150 mM KCl, 1% Triton X-100, 5% glycerol, 5 mM MgCl2, pH 7.6) enriched with protease inhibitors (Roche Mini) and 1 mg"ml$1 lysozyme (Sigma) and 10 µg"ml$1 DNase I (Roche). After clarification (20,000 rpm, Beckman JA 25.5, 30 min 4%°C), lysate was incubated with glutathione S-sepharose 4B resin (GE Healthcare) for 2 h at 4%°C and washed exten-sively with (20 mM HEPES, 150 mM KCl, 5% glycerol, pH7.6), and eluted in (20 mM HEPES, 150 mM KCl, 5% glycerol, 10m M reduced glutathione, pH7.6). Eluted protein was then cleaved by adding 1:50 (vol:vol) of 2 mg"ml$1 His6–TEV protease and a final concentration of 1 mM DTT, 0.5 mM EDTA overnight at 4%°C. The buffer of the cleaved protein was then exchanged for (20"mM HEPES, 150"mM KCl, 5% glycerol, pH 7.6) using a ZebaSpin column (Pierce), and free GST was removed by incu-bation with glutathione S-sepharose 4B resin. Tag-free GBP–mScarlet was then ultracentrifuged at 100,000g for 5 min at 4%°C to remove aggregates. GBP–mScarlet was then incubated with GFP–60mer nanoc-ages33, followed by size exclusion chromatography (see Supplementary Information, ‘Microscope calibration’), which further removed the TEV protease from the final mScarlet–GBP or GFP-60mer.
GBP–EGFR–DARPin was expressed similarly as GBP–mScarlet, except that lysis was performed using sonication, lysate clarification was per-formed at 16,000 rpm in a Beckman JA 25.5 rotor for 30 min at 4%°C). After TEV cleavage buffer was exchanged for (20 mM HEPES, 150 mM KCl, 5% glycerol, pH 7.6) by dialysis, free GST and TEV proteases were removed by sequential incubation with glutathione S-sepharose 4B resin and Ni-NTA resin. Tag-free GBP-EGFR–DARPin was then flash fro-zen in liquid N2 and kept at $80%°C.
DLL4 was prepared from a fragment of the human delta ectodomain (1–405) with a C-terminal GS–SpyTag–His6 sequence (Supplemen-tary Table"7). The protein was purified by immobilized metal affinity chromatography from culture medium from transiently transfected Expi293F cells (Thermo Fisher), then further purified to homogeneity by size exclusion chromatography on a Superdex 200 column in 50 mM Tris, pH 8.0, 150 mM NaCl, and 5% glycerol, and flash frozen before storage at $80%°C. DLL4 was conjugated to the SpyCatcher-tagged A homo-oligomers (ASC) at 1.5:1 molar ratio of DLL4 to ASC. The ASC–ST–DLL4 conjugate was purified by size exclusion chromatography on a Superose 6 column. The ASC–ST–DLL4–JF646 conjugate was produced by coupling of 1.5 µM ASC–ST–DLL4 to excess Janelia Fluor 646 SE (Tocris) overnight at 4%°C in 25 mM HEPES, pH 7.5, 150 mM NaCl. The labelled ASC–ST–DLL4 was then purified by desalting on a P-30 column (Bio-Rad). The final molar ratio of JF646 to ASC–ST–DLL4 was 5:1.
Negative-stain electron microscopyFor initial screening of coexpressed designs insoluble fractions were centrifuged at 12,000g for 15 min and resuspended in Tris-buffer (TBS; 25 mM Tris, 300 mM NaCl) twice before grid preparation. Samples were applied to glow-discharged electron microscopy grids with continuous carbon, after which grids were washed with distilled, deionized water, and stained with 2% uranyl formate. Electron micros-copy grids were screened using an FEI Morgagni 100 kV transmission electron microscope possessed of a Gatan Orius CCD camera. For the working design, electron microscopy grids were initially screened using the Morgagni electron microscope. Micrographs of well-stained electron microscopy grids were then obtained with an FEI Tecnai G2 Spirit transmission electron microscope (equipped with a LaB6 fila-ment and Gatan UltraScan 4k ( 4k CCD camera) operating at 120 kV and magnified pixel size of 1.6 Å. Data collection was performed via the Leginon software package50. Single-particle style image process-ing (including contrast transfer function estimation, particle picking,
particle extraction and 2D alignment and averaging) was accomplish-ing using the Relion software package51.
Characterization of kinetics of in!vitro assemblyArray-formation kinetics was determined by turbidity caused light scattering, monitored by absorption at 330 nm, using an Agilent Tech-nologies Cary 8454 UV-Vis spectrophotometer. Absorption spectrum in the range 190 nm to 1,100 nm was acquired every 5 s for 25 min imme-diately following an initial blank. Absorption curves at 330 nm were constructed using measurements of blank samples (buffer: 25 mM Tris-HCl, 150 mM NaCL, 5% glycerol and 500 mM imidazole) as control, B components at 5 µM, and A"+"B mixtures (5, 10 or 15 µM). Curves were acquired for three experimental replicates for each experimental con-dition (two for blank control). Curves were processed as follows: the respective initial value (first time point) was first subtracted from each curve to account for initial background; then, a nonlinear offset was applied by subtracting the averaged curve of the blank measurements from each and all the other curves. Extended Data Fig."3a shows the average absorption of each group of samples and standard deviation (n"="3 experimental replicates). All data were processed using python Dataframe and Numpy packages.
Characterization of protein stabilizationFar-ultraviolet circular dichroism (CD) measurements were carried out with an AVIV spectrometer, model 420. Wavelength scans were measured from 260 to 195 nm at temperatures between 25 and 95%°C. Temperature melts were monitored via the absorption signal at 220 nm in steps of 2%°C"min$1 and 30 s of equilibration time. For wavelength scans and temperature melts, a protein solution in PBS buffer (pH 7.4) of con-centration 0.2–0.4 mg"ml$1 was used in a cuvette with 1 mm path length.
SAXS experimentsSmall angle X-ray scattering data were collected at the SIBYLS beamline at the Advanced Light Source in Berkeley, CA, USA52. Components A and B were measured independently and as a mixture in 25 Tris, 150 NaCl and 5% glycerol. Imidazole was added to the mixture in a stepwise fashion after A and B were mixed at 1:1. These solutions were prepared 24 h before collection. Before collection, samples were placed in a 96-well plate. Each sample was presented to the X-ray beam using an automated robotics platform. The 10.2"keV monochromatic X-rays at a flux of 1012"photons"s$1 struck the sample with a 1 ( 0.3mm rectangular profile that converged at the detector to a 100"µm ( 100"µm spot. The detector-to-sample distance was 2 m and nearly centred on the detec-tor. Each sample was exposed for a total of 10 s. The Pilatus 2M detector framed the 10 s exposure in 300"ms frames for a total of 33 frames. No radiation damage was observed during exposures.
Components A and B were independently collected at 4 concentra-tions (40, 80, 120 and 160 µM). No concentration dependence was observed so the 160 µM SAXS measurement (the one with the highest signal) SAXS measurement was analysed using the Scatter program developed by Rambo et"al. (https://www.bioisis.net/) at SIBYLS and the Diamond Light Source. SAXS profiles were calculated using FOXS53 and compared with the measured data with excellent agreement !2"<"1 for hexameric A and tetrameric B (Extended Data Fig."5a). No further processing was performed, as the agreement between calculated SAXS from the model and the experiment was sufficient to verify close agree-ment of the atomic model.
Mixtures of components A and B were measured at 4 concentrations (0.5, 2, 5, and 10 µM). The scattering profiles all had peaks (Extended Data Fig."5a, d, f) at q spacings as indicated in Supplementary Table"7. The scattering can be described in several ways, according to the scat-tering theory. In crystalline systems, the diffraction intensity is the convolution of the lattice and the asymmetric unit within the lattice54. Below we will distinguish the peaks as a diffraction component and the asymmetric unit as the scattering component. We obtain a very good
match of Bragg spacings with the observed diffraction by calculating a p6 lattice with a 303"Å spacing as shown in Supplementary Table"7 (compared with 315"Å spacing measured by AFM and 310"Å predicted by the design model). The calculation was done using a CCP4 script based on the ‘unique’ command, which generates a unique set of reflec-tions given a symmetry and distances (http://legacy.ccp4.ac.uk/html/unique.html).
The measured SAXS profile was also matched by calculations of the SAXS from atomic models (Fig."2e, Extended Data Fig."5c). Atomic model sheets were created by increasing the number of ASUs defined as 12 monomers: 6 belonging to the A hexamer and 6 belonging to 3 halves of the surrounding B tetramers (Extended Data Fig."5a, far right). Array counting 10, 13, 17, 21, 26, 31, 37, 75, 113 and 188 ASUs along the P6 lattice were used for SAXS profiles modelling using FOXS. The calculated SAXS profiles had diffraction peaks placed in agreement with the measured data. In line with scattering theory55, the diffraction from the lattice increased relative to the scattering from the asym-metric unit as the sheet size increased. The diffraction-to-scattering ratios in the measured profiles were larger than those in all calculated profiles, indicating that the sheets were larger in solution than the largest models we created.
We used the trend in the ratio of the diffraction to scattering from the models to estimate the size of the sheets observed in solution. All calculations and the experimental SAXS profiles were scaled by the underlying scattering. The higher the angle, the smaller the contribu-tion of the diffraction, so the highest angle experimental signal with sufficient signal to noise was used (0.1"<"q"<"0.15Å) to scale all profiles relative to one another. Once scaled, the curves are divided by the ASU defined above. This division removed the exponential decay of the scattering profile and yielded a set of peaks that oscillate about a con-stant background, which was further normalized so that it oscillated about a value of 1 (Fig."2e, Extended Data Fig."5d) over a useful q range between 0.01"<q"<"0.1"Å$1. The intensity difference between the first minimum and first maximum peak from all calculated profiles was tabulated and the trend was fit to the number of ASUs (x) using two simple formulas: (1) exponential form: k e k( +k x
1 32 , (k1"="2.2, k2"="3.5,
k3"="$1.6); (2) polynomial form: k x k+k1 3
2 , (k1"="64.5, k2"="4.3, k3"="8.9). A reasonable fit was obtained for the exponential form, as shown in Extended Data Fig."5e. Extrapolating from this fit, the average array consists of 6,000 ASUs (2,000 using the polynomial fit) and assuming a circular array, the average array size would be 1.8"µm in diameter (1.05 using the polynomial fit).
Time-resolved SAXS measurements were obtained for 10"µM mix-tures at several time points ranging from 30 s to 15 min. Each measure-ment was collected from a separate well to avoid accumulated damage to the samples. SAXS profiles were scaled (including the overnight SAXS profile to which a fit was obtained) and the ASU was divided. The minimum to maximum peak height was calculated after scaling all pro-files to the common sample (the overnight sample the fit was obtained for is shown in Extended Data Fig."5e). The exponential fit above was then applied to estimate the transient dimensions at each time point obtained by the SAXS measurement (Extended Data Fig."5f, g).
Cell cultureFlp-In NIH/3T3 cells (Invitrogen, R76107) were cultured in DMEM (Gibco, 31966021) supplemented with 10% Donor Bovine Serum (Gibco, 16030074) and 100 U"ml$1 penicillin-streptomycin at 37%°C with 5% CO2. Cells were transfected with Lipofectamine 2000 (Invitrogen, 11668). Stable transfectants obtained according to the manufacturer’s instruc-tions by homologous recombination at the FRT site were selected using 100 µg"ml$1 Hygromycin B Gold (Invivogen, 31282-04-9). HeLa cells were cultured in DMEM supplemented with 10% fetal bovine serum and 100 U"ml$1 penicillin-streptomycin at 37%°C with 5% CO2.
HUVECs (Lonza, Germany) were grown on 0.1% gelatin-coated 35-mm cell culture dishes in EGM2 media (20% fetal bovine serum,
1% penicillin-streptomycin, 1% Glutamax (Gibco, 35050061), 1% endothelial cell growth factors (ECGS), 1"mM sodium pyruvate, 7.5"mM HEPES, 0.08"mg"ml$1 heparin, 0.01% amphotericin B, a mixture of 1( RPMI 1640 with and without glucose to reach 5.6 mM glucose in final volume). HUVECs were expanded until passage 4 and cryopreserved.
ECGS was extracted from 25 mature whole bovine pituitary glands (Pel-Freeze Biologicals, 57133-2). Pituitary glands were homogenized with 187.5 ml ice-cold 150 mM NaCl and the pH was adjusted to pH"4.5 with HCl. The solution was stirred in a cold room for 2 h and centrifuged at 4,000 rpm at 4%°C for 1 h. The supernatant was collected and adjusted to pH 7.6. 5 g"l$1 streptomycin sulfate (Sigma, S9137) was added, stirred in the cold room overnight and centrifuged at 4,000 rpm at 4%°C for 1 h. The supernatant was filtered using a 0.45- to 0.2-µm filter.
The HUVEC cells were expanded until passage 8, followed by 16 h starvation in DMEM low-glucose medium before protein scaffold treat-ment. The cells were then treated with the desired concentrations of protein scaffolds in DMEM low-glucose medium for 30 min or 60 min. Cells were cultured at 37%°C, 5% CO2 and 20% O2.
U2OS cells (ATCC, HTB-96) were cultured in DMEM (Corn-ing) supplemented with 10% fetal bovine serum (Gemini) and 1% penicillin-streptomycin (Gibco) at 37%°C with 5% CO2. U2OS cells expressing NOTCH1–Gal4 or Flag–NOTCH1-eGFP chimeric recep-tors56 were maintained in the same way as the parental cell lines, and additionally were selected on 50 µg"ml$1 hygromycin B (Thermo) and 15 µg"ml$1 blasticidin (Invitrogen). Expi293F (Thermo Fisher) cells were cultured in Expi293 medium (Thermo Fisher) on an orbital shaker at 125 rpm at 37%°C with 5% CO2.
Fluorescence microscopy of in!vivo assemblies in bacteriaGlycerol stocks of E. coli strain BL21(DE3) harbouring the single cistronic A–GFP and the bicistronic A–GFP"+"B were used to grow overnight cultures in LB medium containing kanamycin at 37%°C. To avoid GFP signal saturation, leaky expression was used by allowing the culture to remain at 37%°C for another 24 h before being spotted onto a 1% agarose LB kanamycin pad. Agarose pads were imaged using the Leica SP8X confocal system to obtain bright- and dark-field images.
Characterization of array-induced protein relocalization and array growth dynamics on cellsAll live imaging of NIH-3T3 cells (Figs."3a–d, 4a–e, i, Extended Data Figs."6c–f, 8g, h, 10 and 11a–d) was performed in Leibovitz’s L-15 medium (Gibco, 11415064) supplemented with 10% donor bovine serum and 20"mM HEPES (Gibco, 1563080) using the custom spinning-disk setup described below. For protein relocalization by preformed arrays experi-ments, GBP–TM–mScarlet expressing NIH/3T3 cells were spread on glass-bottom dishes (World Precision Instruments, FD3510) coated with fibronectin (Sigma, F1141, 50"µg"ml$1 in PBS), for 1 h at 37%°C then incubated with 10 µl"ml$1 of preformed arrays. Cells were either imaged immediately (Fig."3b, c) or incubated with the arrays for 30 min (Fig."3). Preformed arrays were obtained by mixing equimolar amounts (1"µM) of A–GFP mixed with B in the presence of 0.5 M imidazole overnight at room temperature in a 180 µl total volume. This solution was then centrifuged at 250,000g for 30 min at 4%°C and resuspended in 50 µl PBS. For assembly on the surface of cells (Fig."4), spread cells were incubated with B(c)–GFP (1 µM in PBS) for 1 min, rinsed in PBS, and imaged in L-15 medium supplemented with serum and HEPES. A was then added (0.2 µM in L-15 medium supplemented with serum and HEPES) during image acquisition.
For the formation of Notch-binding"arrays, the A and B components were mixed in equimolar concentration. For example, to generate ASC–ST-DLL4 + A–GFP + B arrays, components were mixed in molar ratios of (4:1:5). For DLL4–NOTCH1 array experiments, U2OS cells stably expressing NOTCH1–Gal4 or NOTCH1–eGFP chimaeric receptors56 grown in culture medium with 2 µg"ml$1 doxycycline were transferred to coverslip bottom dishes for 18–24 h (MatTek), and then incubated
Articleat 4%°C or 37%°C for 15–30 min (unless otherwise indicated). For Sup-plementary Fig."8, NOTCH1–eGFP cells were treated with specified pre-formed ASC–ST–DLL4–JF646"+"B–mCherry array material diluted to 0.5 µM in culture medium (or mock treated) for 15 min at specified temperature and washed three times with ice-cold PBS. Treated (or mock-treated) cells were then incubated at 4%°C or 37%°C for more than 60 min in Fluorobrite (Gibco) culture medium. For Supplementary Fig."8, NOTCH1–Gal4 cells were treated in two steps, first with 0.5 µM ADLL4 in ice cold culture medium, washed three times in ice-cold PBS before second treatment with A–GFP"+"B mixed at 0.5 µM each imme-diately before a 60 min incubation, washed three times with ice-cold PBS, and imaged in DMEM. After array treatment, cells were imaged at either 37%°C (Supplementary Figs."8c, 9b, d) or at 15%°C (Supplementary Fig."9a, c).
In!situ AFM characterizationArray growth and dynamics at molecular resolution were character-ized by mixing both components at equimolar concentration (7"µM) and immediately injecting the solution into the fluid cell on freshly cleaved mica. All in"situ AFM images were collected using silicon probes (HYDRA6V-100NG, k"="0.292 N"m$1, AppNano) in ScanAsyst Mode with a Nanoscope 8 (Bruker). To minimize damage to the structural integrity of the arrays during AFM imaging, the applied force was minimized by limiting the peak force set point to 120 pN or less35. The loading force can be roughly calculated from the cantilever spring constant, deflec-tion sensitivity and peak force set point.
Correlative structured illumination microscopy–AFM characterization on supported bilayersArrays were assembled on supported bilayers (Fig."4f, Extended Data Fig."9) in a manner mimicking assembly on cells (see above and Fig."4a). Supported bilayers were formed according to a described method57. In brief, a lipid mixture (1 mg"ml$1 lipids in chloroform, 47.5% 1-palmitoyl-2-oleoyl-sn-glycero-3-phosphocholine (POPC), 47.5% 1,2-dioleoyl-sn-glycero-3-phosphoethanolamine (DOPE), 5% 1,2-distearoyl-sn-glycero-3-phosphoethanolamine–polyeth-ylene glycol (PEG2000)–biotin (DSPE-PEG(2000)-Biotin), 0.2% 1,2-dipalmitoyl-sn-glycero-3-phosphoethanolamine–rhodamine 18:1 (Rhodamine-PE); all from Avanti Polar Lipids) was used to form giant unilamellar vesicles (GUVs) in 5 mM HEPES 300 mM sucrose pH 7.5 in a Nanion Vesicle Prep Pro. GUVs were then diluted 1:1 (vol:vol) in 20 mM HEPES 150 mM KCl pH 7.5. A clean-room grade coverslip (Nexterion, Schott 1.5, 25"("75 mm) was surface-activated under pure oxygen in a plasma cleaner (PlasmaPrep2, GaLa instruments) then assembled into a peelable flow chamber using a top 22"("22 mm standard glass cover-slip and a custom Silicon insert (SuperClear Silicone Sheet 40° shore A, 0.5 mm thickness, Silex Silicon, 25"("75 mm insert with a 12"("35"mm hole precisely cut with a Graphtec CE6000 cutting plotter). GUVs were burst onto the activated glass surface and, after extensive washing with 20 mM HEPES, 150 mM KCl, pH 7.6, the glass surface was quenched with poly-)-lysine-polyethylene glycol (PLL–PEG) (SuSoS, 1 mg"ml$1 in 10 mM HEPES, pH 7.6) for 5 min, before further washing with 20 mM HEPES, 150 mM KCl, pH 7.6. A solution of B(c)–mSA2 (B(c) fused to the monovalent streptavidin mSA2) (200 nM in 20 mM HEPES, 150 mM KCl, pH 7.6) was then flowed in and incubated for 1 min before exten-sive washes in (20 mM HEPES, 150 mM KCl, pH 7.6). Then, a solution of A–GFP (20 nM in 20 mM HEPES, 150 mM KCl, 500 mM Imidazole, pH 7.6) was flowed in and incubated for 5 min. The flow cell was then washed extensively with 20 mM HEPES, 150 mM KCl, pH 7.6, and the sample was fixed with 0.25% glutaraldehyde (weight/vol, EMS) in PBS for 5 min and 4% paraformaldehyde (weight/vol, EMS) in PBS for 5 min. Fixatives were then removed by extensive washing in 20 mM HEPES, 150 mM KCl, pH 7.6. The top 22"("22 mm coverslip was then carefully removed, leaving the insert in place in order to hold a volume of imaging buffer (20 mM HEPES, 150 mM KCl, pH 7.6). This allowed simultaneous
super-resolution structured illumination microscopy (SIM) imaging through the bottom coverslip, and AFM imaging from the top of the open chamber (Extended Data Fig."9).
Correlative AFM–SIM imaging was performed by combining a Bioscope Resolve system (Bruker) with a custom-built"SIM system58. The fields of view (FOVs) of the two microscopes were aligned so that the AFM probe was positioned in the middle of the FOV of the SIM micro-scope. A bright-field image of the ‘shadow’ of the AFM cantilever was used to precisely align the AFM probe with the SIM lens. To acquire structured illumination microscopy images, a (60/1.2 NA water immer-sion lens (UPLSAPO 60XW, Olympus) focused the structured illumina-tion pattern onto the sample, and the same lens was also used to capture the fluorescence emission light before imaging onto an sCMOS camera (C11440, Hamamatsu). The wavelengths used for excitation were 488 nm (iBEAM-SMART-488, Toptica) for the protein arrays and 561 nm (OBIS 561, Coherent) for the lipid bilayers. Images were acquired using customized SIM software described previously58.
AFM images were acquired in fast-tapping imaging mode using Fastscan-D probes (Bruker), with a nominal spring constant of 0.25 N"m$1 and a resonant frequency of 110 kHz. Images were recorded at scan speeds ranging between 2 and 10 Hz and tip–sample interaction forces between 100 and 200 pN. Large–scale images (20 ( 20 µm) were used to register the AFM with the SIM FOVs and small (500 ( 500 nm) scans were performed to resolve the structure of the arrays. Raw AFM images were first order fitted with reference to the lipid bilayer. Ampli-tude images were inverted and a low-pass filter was applied to remove excess noise. For the high-magnification scans, amplitude images are presented, as movement of the arrays on the lipid bilayer does not affect the resolution of these images to the same extent as that of topogra-phy images. Amplitude data are helpful in visualizing features and the shape of the sample, however note that the z-scale in amplitude images indicates the amplitude error and thus is not representative of the height of the sample.
Protein extraction and western blot analysisCells were lysed directly on the plate with lysis buffer containing 20 mM Tris-HCl pH 7.5, 150 mM NaCl, 15% glycerol, 1% Triton x-100, 1 M &-glycerolphosphate, 0.5 M sodium fluoride, 0.1 M sodium pyrophos-phate, orthovanadate, PMSF and 2% SDS. Benzonase nuclease (25 U) (EMD Chemicals) and 100( phosphatase inhibitor cocktail 2 were added to the lysis buffer immediately before use. Laemmli sample buffer (4() (900 µl of sample buffer and 100 µl &-mercaptoethanol) was added to the lysate then heated (95%°C, 5 min); 30 µl of this protein sample was run on SDS–PAGE (protean TGX pre-cast gradient gel, 4–20%, Bio-Rad) and transferred to nitrocellulose membrane (Bio-Rad) by semi-dry transfer (Bio-Rad). Membranes were blocked for 3 h with 5% BSA (for p-AKT blot) or 1 h with 5% milk (for &-actin blot) and incubated with primary antibodies overnight at 4%°C. The antibodies used for west-ern blot were p-AKT(S473) (Cell Signaling 9271, 1:2,000), &-actin (Cell Signaling 13E5, 1:1,000). The membrane incubated with p-AKT antibody was then blocked with 5% milk before secondary antibody incuba-tion. The membranes were then incubated with secondary antibodies anti-rabbit IgG HRP conjugate (Bio-Rad) for 2 h and detected using the Immobilon-Luminol reagent assay (EMP Millipore). For gel source data for western blots, see Supplementary Fig."10.
Cell immunostainingFor imaging presented in Fig."3e, f and Extended Data Fig."7, cells were fixed in 4% paraformaldehyde in PBS for 15 min, washed with PBS (3"("5mins) and blocked for 1 h in 3% BSA (Fisher bioreagents CAS 9048-46-8) and 0.1% Triton X-100 (Sigma 9002-93-1). The cells were then incubated in primary antibody overnight, washed with PBS (3"("5 min), incubated with the secondary antibody in 3% BSA and 0.1% Triton X-100 for 1 h, washed (4"("10 min, adding 1 µg"ml$1 DAPI in the second wash), mounted (Vectashield, VectorLabs H1400) and stored at 4%°C.
The antibodies for immunostaining were anti-TIE2 (Cell Signaling AB33, 1:100); CD31 (BD Biosciences 555444, 1:250); VE-cadherin (BD Biosciences 555661, 1:250); Alexa Fluor 647-conjugated secondary antibody (Molecular Probes) and Phalloidin conjugated with Alexa Fluor 568 (Invitrogen A12380, 1:100).
Alternatively, for Fig."4g, h and Extended Data Fig."11k, HeLa cells spread on fibronectin-coated glass-bottom dishes and treated with EGFR-binding array components were fixed in 4% paraformaldehyde in PBS for 20 min, permeabilized with 0.05% saponin (Sigma) in PBS for 5 min, then washed in PBS, then in PBS with 1% BSA for 5 min, and then in PBS. Cells were then incubated with anti-LAMP1 antibodies (Devel-opmental Studies Hybridoma Bank, clone H4A3 1:500) in PBS-1% BSA for 20 min, washed three times in PBS and incubated with anti-mouse F(ab*)2-Alexa Fluor 647 (Invitrogen) secondary antibodies at 1:500 in PBS-1%BSA for 20 min. Cells were then washed three times in PBS. Imaging was performed in PBS instead of mounting medium to avoid squashing the cells, thereby biasing the array–lysosome colocalization.
Alternatively, to label cell membranes of NIH/3T3 cells expressing GBP–TM–mScarlet (Fig."4i, Extended Data Fig."11d), cells were incubated with Alexa Fluor 633–wheat germ agglutinin (Thermofisher, 1:1,000 in PBS for 1 min). Fixation and imaging in PBS were performed as above.
Endocytic blockTo evaluate the endocytic block affecting clustered EGF receptors (Fig."4g, h), HeLa cells were plated on glass-bottom dishes (World Precision Instruments, FD3510) coated with fibronectin (Sigma, F1141, 50 µg"ml$1 in PBS), for 2 h at 37%°C DMEM with 10% serum, then serum-starved overnight in DMEM containing 0.1% serum. Cell were then incubated with 20 µg"ml$1 GBP–EGFR–DARPin in DMEM contain-ing 0.1% serum for 1 min at 37%°C, washed in DMEM containing 0.1% serum, incubated with 0.5 µM B(c)–GFP in DMEM, 0.1% serum for 1 min at 37%°C, washed in DMEM, 0.1% serum, then 0.5 µM A in DMEM, 0.1% serum was added (or not) for 1 min at 37%°C. Cells were then chased for a varying amount of time in DMEM, 0.1% serum at 37%°C before fixation, immunofluorescence staining for LAMP1 (see above), and spinning-disk confocal imaging followed by unbiased automated image quantifica-tion"(see below).
Alternatively, for Extended Data Fig."11f-g, cells were treated with GBP–EGFR–DARPin as above, then 100 pM of GFP–60mer nanocages was added in DMEM, 0.1% serum for 1 min at 37%°C before chasing in DMEM, 0.1% serum at 37%°C, fixation, LAMP1 immunofluorescence, imaging and quantification. The control in this case was the unassem-bled trimeric building block of the GFP–60mer.
To quantitatively measure the internalization of GFP-positive arrays as a function of their size (Fig."4i and Extended Data Fig."11d), we could not use the colocalization with LAMP1 as above, as the GBP–TM–mScarlet construct is not routed to lysosomes upon endocytosis (it is presumably routed to recycling endosomes). We therefore relied on a membrane marker and quantified the amount of signal at the plasma membrane versus inside the cell. Experimentally, stable NIH/3T3 cells expressing GBP–TM–mScarlet under control of a doxycycline-inducible promoter were treated with varying doses of doxycycline for 24 h. The cells were spread on fibronectin-coated coverslips for 1 h as described above, incu-bated with 0.5 µM B(c)–GFP in serum-supplemented DMEM medium for 1 min at 37%°C and rinsed in PBS before adding 0.5 µM unlabelled A (or without A) in serum-supplemented DMEM for 1 min at 37%°C. After a 60-min chase in serum-supplemented DMEM at 37%°C, cells were briefly incubated with Alexa Fluor 633-coupled wheat germ agglutinin to label cell membranes, fixed and imaged by spinning-disk confocal micros-copy. Images were processed for automated image analysis"(see below).
Flow cytometryTo measure the density of active GBP–TM–mScarlet at the surface of cells as a function of the expression level of this construct (Extended Data Fig."11a), stable NIH/3T3 cells expressing GBP–TM–mScarlet under
control of a doxycycline-inducible promoter were treated with vary-ing doses of doxycycline for 24 h, incubated with 1 µM purified GFP in L-15 medium supplemented with serum and HEPES for 1 min at room temperature, washed in PBS, 1mM EDTA, and then trypsinized and resuspended in L-15 medium supplemented with serum and HEPES. GFP fluorescence per cell was then measured by flow cytometry in an iCyt Eclipse instrument (Sony) using a 488-nm laser. Data analysis was performed using the instrument supplier’s software package.
ImagingTotal internal reflection fluorescence microscopy (TIRFM) imaging of arrays assembled onto cells (Fig."4d, Extended Data Fig."11k) was performed on a custom-built TIRFM system based on a Nikon Ti stand equipped with perfect focus system, a fast Z piezo stage (ASI), and azimuthal TIRFM illuminator (iLas2, Roper France) modified to have an extended FOV (Cairn) and a Plan Apo 1.45 NA 100( objective. Images were recorded with a Photometrics Prime 95B back-illuminated sCMOS camera run in pseudo-global shutter mode and synchronized with the azimuthal illumination. GFP was excited by a 488-nm laser (Coherent OBIS mounted in a Cairn laser launch) and imaged using a Chroma 525/50 band-pass filter mounted on a Cairn Optospin wheel. The sys-tem was operated with Metamorph. This microscope was calibrated to convert fluorescence intensity into approximate molecule numbers (Extended Data Fig."10 and Supplementary Information ‘Microscope calibration and comparison between preformed arrays and arrays made on cells’).
For fast imaging of array formation (Fig."4, Extended Data Figs."8, 10, 11), receptor recruitment by preformed arrays (Fig."3b–d, Extended Data Fig."6), quantitative imaging of the endocytic block effect (Fig."4, Extended Data Fig."11), calibrated molecular ratios (Fig."4, Extended Data Fig."10) and FRAP (Extended Data Fig."6), imaging was performed onto a custom spinning-disk confocal instrument composed of Nikon Ti stand equipped with perfect focus system, a fast Z piezo stage (ASI) and a Plan Apo Lambda 1.45 NA 100( (or Plan Apo Lambda 1.4 60() objective, and a spinning-disk head (Yokogawa CSUX1). Images were recorded with a Photometrics Prime 95B back-illuminated sCMOS camera run in pseudo global shutter mode and synchronized with the spinning-disk wheel. Excitation was provided by 488-, 561- or 630-nm lasers (all Coherent OBIS mounted in a Cairn laser launch) and imaged using dedicated single band-pass filters for each channel mounted on a Cairn Optospin wheel (Chroma 525/50 for GFP and Chroma 595/50 for mCherry/mScarlet and Chroma ET655lp for WGA-637 and Alexa Fluor 647). FRAP was performed using an iLAS2 galvanometer module (Roper France) mounted on the back port of the stand and combined with the side spinning-disk illumination path using a broadband polar-izing beam splitter mounted in a 3D-printed fluorescence filter cube. To enable fast 4D acquisitions, an FPGA module (National Instrument sbRIO-9637 running custom code) was used for hardware-based syn-chronization of the instrument, in particular to ensure that the piezo z-stage moved only during the readout period of the sCMOS camera. Temperature was kept at 37%°C using a temperature control chamber (MicroscopeHeaters.com). The system was operated with Metamorph. The microscope was also calibrated to convert fluorescence intensity into approximate molecule numbers (see Extended Data Fig."10 and Supplementary Informations ‘Microscope calibration and comparison between preformed arrays and arrays made on cells’).
Imaging in experiments depicted in Fig."3e, f was performed on a GE DeltaVision OMX SR super-resolution microscope using a 60( objec-tive and OMX and Imaris software. The images in Extended Data Fig."7 were taken in Nikon A1R confocal microscope using a 60( objective.
Notch1–DLL4 datasets (Supplementary Figs."8 and 9) were col-lected using a 100(/1.40 NA oil-immersion objective on a Spec-tral Applied Research Aurora Borealis-modified Yokagawa CSU-X1 spinning-disk confocal microscope (Nikon Ti), equipped with a 5% CO2 temperature-controlled chamber (OkoLab). For Supplementary Fig."9,
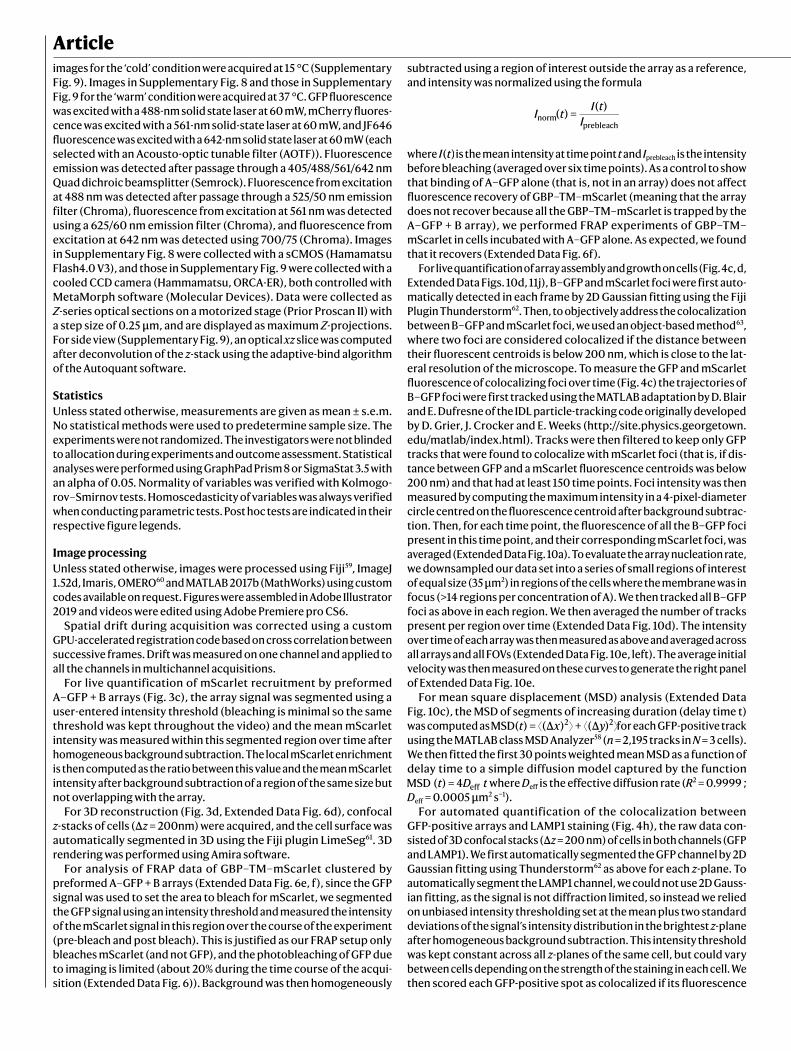
Articleimages for the ‘cold’ condition were acquired at 15%°C (Supplementary Fig."9). Images in Supplementary Fig."8 and those in Supplementary Fig."9 for the ‘warm’ condition were acquired at 37%°C. GFP fluorescence was excited with a 488-nm solid state laser at 60 mW, mCherry fluores-cence was excited with a 561-nm solid-state laser at 60 mW, and JF646 fluorescence was excited with a 642-nm solid state laser at 60 mW (each selected with an Acousto-optic tunable filter (AOTF)). Fluorescence emission was detected after passage through a 405/488/561/642 nm Quad dichroic beamsplitter (Semrock). Fluorescence from excitation at 488 nm was detected after passage through a 525/50 nm emission filter (Chroma), fluorescence from excitation at 561 nm was detected using a 625/60 nm emission filter (Chroma), and fluorescence from excitation at 642 nm was detected using 700/75 (Chroma). Images in Supplementary Fig."8 were collected with a sCMOS (Hamamatsu Flash4.0 V3), and those in Supplementary Fig."9 were collected with a cooled CCD camera (Hammamatsu, ORCA-ER), both controlled with MetaMorph software (Molecular Devices). Data were collected as Z-series optical sections on a motorized stage (Prior Proscan II) with a step size of 0.25 µm, and are displayed as maximum Z-projections. For side view (Supplementary Fig."9), an optical xz slice was computed after deconvolution of the z-stack using the adaptive-bind algorithm of the Autoquant software.
StatisticsUnless stated otherwise, measurements are given as mean"±"s.e.m. No statistical methods were used to predetermine sample size. The experiments were not randomized. The investigators were not blinded to allocation during experiments and outcome assessment. Statistical analyses were performed using GraphPad Prism 8 or SigmaStat 3.5 with an alpha of 0.05. Normality of variables was verified with Kolmogo-rov–Smirnov tests. Homoscedasticity of variables was always verified when conducting parametric tests. Post hoc tests are indicated in their respective figure legends.
Image processingUnless stated otherwise, images were processed using Fiji59, ImageJ 1.52d, Imaris, OMERO60 and MATLAB 2017b (MathWorks) using custom codes available on request. Figures were assembled in Adobe Illustrator 2019 and videos were edited using Adobe Premiere pro CS6.
Spatial drift during acquisition was corrected using a custom GPU-accelerated registration code based on cross correlation between successive frames. Drift was measured on one channel and applied to all the channels in multichannel acquisitions.
For live quantification of mScarlet recruitment by preformed A–GFP"+"B arrays (Fig."3c), the array signal was segmented using a user-entered intensity threshold (bleaching is minimal so the same threshold was kept throughout the video) and the mean mScarlet intensity was measured within this segmented region over time after homogeneous background subtraction. The local mScarlet enrichment is then computed as the ratio between this value and the mean mScarlet intensity after background subtraction of a region of the same size but not overlapping with the array.
For 3D reconstruction (Fig."3d, Extended Data Fig."6d), confocal z-stacks of cells (+z"="200nm) were acquired, and the cell surface was automatically segmented in 3D using the Fiji plugin LimeSeg61. 3D rendering was performed using Amira software.
For analysis of FRAP data of GBP–TM–mScarlet clustered by preformed A–GFP"+"B arrays (Extended Data Fig."6e, f), since the GFP signal was used to set the area to bleach for mScarlet, we segmented the GFP signal using an intensity threshold and measured the intensity of the mScarlet signal in this region over the course of the experiment (pre-bleach and post bleach). This is justified as our FRAP setup only bleaches mScarlet (and not GFP), and the photobleaching of GFP due to imaging is limited (about 20% during the time course of the acqui-sition (Extended Data Fig."6)). Background was then homogeneously
subtracted using a region of interest outside the array as a reference, and intensity was normalized using the formula
I tI t
I( ) =
( )norm
prebleach
where I t( ) is the mean intensity at time point t and Iprebleach is the intensity before bleaching (averaged over six time points). As a control to show that binding of A–GFP alone (that is, not in an array) does not affect fluorescence recovery of GBP–TM–mScarlet (meaning that the array does not recover because all the GBP–TM–mScarlet is trapped by the A–GFP"+"B array), we performed FRAP experiments of GBP–TM– mScarlet in cells incubated with A–GFP alone. As expected, we found that it recovers (Extended Data Fig."6f).
For live quantification of array assembly and growth on cells (Fig."4c, d, Extended Data Figs."10d, 11j), B–GFP and mScarlet foci were first auto-matically detected in each frame by 2D Gaussian fitting using the Fiji Plugin Thunderstorm62. Then, to objectively address the colocalization between B–GFP and mScarlet foci, we used an object-based method63, where two foci are considered colocalized if the distance between their fluorescent centroids is below 200 nm, which is close to the lat-eral resolution of the microscope. To measure the GFP and mScarlet fluorescence of colocalizing foci over time (Fig."4c) the trajectories of B–GFP foci were first tracked using the MATLAB adaptation by D. Blair and E. Dufresne of the IDL particle-tracking code originally developed by D. Grier, J. Crocker and E. Weeks (http://site.physics.georgetown.edu/matlab/index.html). Tracks were then filtered to keep only GFP tracks that were found to colocalize with mScarlet foci (that is, if dis-tance between GFP and a mScarlet fluorescence centroids was below 200 nm) and that had at least 150 time points. Foci intensity was then measured by computing"the maximum intensity in a 4-pixel-diameter circle centred on the fluorescence centroid after background subtrac-tion. Then, for each time point, the fluorescence of all the B–GFP foci present in this time point, and their corresponding mScarlet foci, was averaged (Extended Data Fig."10a). To evaluate the array nucleation rate, we downsampled our data set into a series of small regions of interest of equal size (35 µm2) in regions of the cells where the membrane was in focus (>14 regions per concentration of A). We then tracked all B–GFP foci as above in each region. We then averaged the number of tracks present per region over time (Extended Data Fig."10d). The intensity over time of each array was then measured as above and averaged across all arrays and all FOVs (Extended Data Fig."10e, left). The average initial velocity was then measured on these curves to generate the right panel of Extended Data Fig."10e.
For mean square displacement (MSD) analysis (Extended Data Fig."10c), the MSD of segments of increasing duration (delay time t) was computed as t x yMSD( ) = (, ) + (, )2 2 for each GFP-positive track using the MATLAB class MSD Analyzer58 (n"="2,195 tracks in N"="3 cells). We then fitted the first 30 points weighted mean MSD as a function of delay time to a simple diffusion model captured by the function
t D tMSD ( ) = 4 eff where Deff is the effective diffusion rate (R2"="0.9999 ; Deff"="0.0005 µm2"s$1).
For automated quantification of the colocalization between GFP-positive arrays and LAMP1 staining (Fig."4h), the raw data con-sisted of 3D confocal stacks (+z"="200 nm) of cells in both channels (GFP and LAMP1). We first automatically segmented the GFP channel by 2D Gaussian fitting using Thunderstorm62 as above for each z-plane. To automatically segment the LAMP1 channel, we could not use 2D Gauss-ian fitting, as the signal is not diffraction limited, so instead we relied on unbiased intensity thresholding set at the mean plus two standard deviations of the signal’s intensity distribution in the brightest z-plane after homogeneous background subtraction. This intensity threshold was kept constant across all z-planes of the same cell, but could vary between cells depending on the strength of the staining in each cell. We then scored each GFP-positive spot as colocalized if its fluorescence

centroid was contained within a LAMP1-positive segmented region. The percentage of colocalization is then computed as:
Percent of colocalization =Sum of colocalizing particles
Total particles( 100
This measurement was then averaged for all z-planes of a given cell, and this average percentage of colocalization per cell was averaged between different cells and compared between conditions. Quantita-tively similar values of the percentage of colocalization were obtained if the analysis was performed in 3D (using our previously described method)64 rather than in 2D then averaged across the cell, or conversely, if the percentage of colocalization per z-plane was summed rather than averaged, indicating that data are not biased due to some z-plane having fewer GFP-positive spots than others (data not shown).
For automated quantification of the colocalization between GFP-positive nanocages and LAMP1 staining (Extended Data Fig."11f, g), we used a similar approach as the one described above to quantify the array–LAMP1 colocalization, except that the planes corresponding to the ventral side of the cell were excluded, as we noticed that nanocages had a tendency to stick to the dish, and thus when seeing a nanocage on the ventral plane of the cell, we could not know if it was bound to the cell surface, but not internalized, or simply stuck onto the dish. In addition, in this case, we expressed the percentage of colocalization as the fraction of signals that do colocalize, that is:
Percent of colocalization
=Sum intensity of colocalizing particles
Sum intensityof all particles( 100
Indeed, as 60-mers are internalized, they accumulate in lysosomes, which thus display more signal than isolated 60-mers. Using a particle-based calculation would thus not be accurate.
For automated quantification of the fraction of GFP-positive arrays associated with WGA-positive plasma membranes (Fig."4i and Extended Data Fig."11d), the raw data consisted of 3D confocal stacks (+z"="200 nm) of cells in both channels (GFP and wheat germ agglutinin). To automati-cally segment the membrane channel, we used an unbiased intensity threshold set at the mean plus one standard deviation of the WGA signal intensity distribution in the brightest plane after homogene-ous background subtraction. We then measured the intensity of the GFP channel either for each z-plane in the entire cell, or within the membrane-segmented regions. To avoid noise, we measured GFP inten-sities only above an intensity threshold set automatically to the mean plus two standard deviations of the GFP signal intensity distribution in the brightest plane (after homogeneous background subtraction). We then scored for each z-plane the percentage of internalized signal as the fraction of the total signal not associated with membrane, that is:
Percent of internalized signal
=Integrated intensity $ Integrated intensity
Integrated intensity( 100wholecell membrane
wholecell
This measurement was then averaged for all z-planes of a given cell, and this average percentage of colocalization per cell was averaged between different cells and compared between conditions.
Reporting summaryFurther information on research design is available in the"Nature Research Reporting Summary linked to this paper.
Data availabilityRosetta build, Rosetta build database, and all scripts used in this work are available upon request.
36. Chaudhury, S., Lyskov, S. & Gray, J. J. PyRosetta: a script-based interface for implementing molecular modeling algorithms using Rosetta. Bioinformatics 26, 689–691 (2010).
37. Huang, P.-S. et"al. RosettaRemodel: a generalized framework for !lexible backbone protein design. PLoS ONE 6, e24109 (2011).
38. Hoover, D. M. & Lubkowski, J. DNAWorks: an automated method for designing oligonucleotides for PCR-based gene synthesis. Nucleic Acids Res. 30, e43 (2002).
39. Gaspar, P., Moura, G., Santos, M. A. S. & Oliveira, J. L. mRNA secondary structure optimization using a correlated stem–loop prediction. Nucleic Acids Res. 41, e73 (2013).
40. Zadeh, J. N. et"al. NUPACK: analysis and design of nucleic acid systems. J. Comput. Chem. 32, 170–173 (2011).
41. Gibson, D. G. et"al. Enzymatic assembly of DNA molecules up to several hundred kilobases. Nat. Methods 6, 343–345 (2009).
42. Demonte, D., Dundas, C. M. & Park, S. Expression and puri!ication of soluble monomeric streptavidin in Escherichia coli. Appl. Microbiol. Biotechnol. 98, 6285–6295 (2014).
43. de Boer, E. et"al. Ef!icient biotinylation and single-step puri!ication of tagged transcription factors in mammalian cells and transgenic mice. Proc. Natl Acad. Sci. USA 100, 7480–7485 (2003).
44. Sevier, C. S., Weisz, O. A., Davis, M. & Machamer, C. E. Ef!icient export of the vesicular stomatitis virus G protein from the endoplasmic reticulum requires a signal in the cytoplasmic tail that includes both tyrosine-based and di-acidic motifs. Mol. Biol. Cell 11, 13–22 (2000).
45. Nishimura, N. & Balch, W. E. A di-acidic signal required for selective export from the endoplasmic reticulum. Science 277, 556–558 (1997).
46. Bindels, D. S. et"al. mScarlet: a bright monomeric red !luorescent protein for cellular imaging. Nat. Methods 14, 53–56 (2017).
47. Derivery, E. et"al. The Arp2/3 activator WASH controls the !ission of endosomes through a large multiprotein complex. Dev. Cell 17, 712–723 (2009).
48. Sladitschek, H. L. & Neveu, P. A. MXS-chaining: a highly ef!icient cloning platform for imaging and !low cytometry approaches in mammalian systems. PLoS ONE 10, e0124958 (2015).
49. Boersma, Y. L., Chao, G., Steiner, D., Wittrup, K. D. & Plückthun, A. Bispeci!ic designed ankyrin repeat proteins (DARPins) targeting epidermal growth factor receptor inhibit A431 cell proliferation and receptor recycling. J. Biol. Chem. 286, 41273–41285 (2011).
50. Suloway, C. et"al. Automated molecular microscopy: the new Leginon system. J. Struct. Biol. 151, 41–60 (2005).
51. Scheres, S. H. W. RELION: Implementation of a Bayesian approach to cryo-EM structure determination. J. Struct. Biol. 180, 519–530 (2012).
52. Hura, G. L. et"al. Robust, high-throughput solution structural analyses by small angle X-ray scattering (SAXS). Nat. Methods 6, 606–612 (2009).
53. Schneidman-Duhovny, D., Hammel, M., Tainer, J. A. & Sali, A. FoXS, FoXSDock and MultiFoXS: Single-state and multi-state structural modeling of proteins and their complexes based on SAXS pro!iles. Nucleic Acids Res. 44, W424–W429 (2016).
54. Drenth, J. Principles of Protein X-Ray Crystallography (Springer-Verlag, 2007).55. Feigin, L. A. & Svergun, D. I. Structure Analysis by Small-Angle X-Ray and Neutron
Scattering (Springer, 1987).56. Malecki, M. J. et"al. Leukemia-associated mutations within the NOTCH1
heterodimerization domain fall into at least two distinct mechanistic classes. Mol. Cell. Biol. 26, 4642–4651 (2006).
57. Chiaruttini, N. et"al. Relaxation of loaded ESCRT-III spiral springs drives membrane deformation. Cell 163, 866–879 (2015).
58. Young, L. J., Ströhl, F. & Kaminski, C. F. A guide to structured illumination TIRF microscopy at high speed with multiple colors J. Vis. Exp. 111, 53988 (2016).
59. Schindelin, J. et"al. Fiji: an open-source platform for biological-image analysis. Nat. Methods 9, 676–682 (2012).
60. Allan, C. et"al. OMERO: !lexible, model-driven data management for experimental biology. Nat. Methods 9, 245–253 (2012).
61. Machado, S., Mercier, V. & Chiaruttini, N. LimeSeg: a coarse-grained lipid membrane simulation for 3D image segmentation. BMC Bioinformatics 20, 2 (2019).
62. Ovesn#, M., K$í%ek, P., Borkovec, J., Svindrych, Z. & Hagen, G. M. ThunderSTORM: a comprehensive ImageJ plug-in for PALM and STORM data analysis and super-resolution imaging. Bioinformatics 30, 2389–2390 (2014).
63. Bolte, S. & Cordelières, F. P. A guided tour into subcellular colocalization analysis in light microscopy. J. Microsc. 224, 213–232 (2006).
64. Derivery, E. et"al. Polarized endosome dynamics by spindle asymmetry during asymmetric cell division. Nature 528, 280–285 (2015).
65. Chandrasekhar, S. et"al. Stochastic problems in physics and astronomy. Rev. Mod. Phys. 15, 1–89 (1943).
66. Schneidman-Duhovny, D., Hammel, M. Tainer, J. A. & Sali, A. FoXS, FoXSDock and MultiFoXS: Single-state and multi-state structural modelling of proteins and their complexes based on SAXS pro!iles. Nucleic Acids Res. 44, W424–W429 (2016).
Acknowledgements This work has been supported by the Medical Research Council (MC_UP_1201/13 to E.D.), HFSP (Career Development Award CDA00034/2017-C to E.D. and Cross-Disciplinary Fellow LT000162/2014-C to A.J.B.-S.), HHMI (D.B.), NIGMS and NHLBI (R01GM12764 and R01GM118396 to J.M.K. and 1P01GM081619, R01GM097372, R01GM083867, 1P01GM081619, U01HL099997 and UO1HL099993 to H.R.-B.), NCI (R35 CA220340 to S.C.B.) and a grant from AHA (19IPLOI34760143 to H.R.-B). We thank L. McKeane for artwork in Figs. 3 and 4, N. Chiaruttini for help with image segmentation and supported bilayers; A. Colomb for sharing his expertise in AFM on supported bilayers; H. McMahon, R. Mittal and F. Perez for their help with EGFR traf!icking; A. Picco for help with microscope calibration; D. Levi for discussions; the Arnold and Mabel Beckman CryoEM Center at the University of Washington for access to electron microscopy equipment; the Mike and Lynn Garvey Cell Imaging Laboratory at the Institute for Stem Cell and Regenerative Medicine, University of Washington. AFM imaging was supported by the Department of Energy (DOE) Of!ice of Basic Energy Sciences (BES) Biomolecular Materials Program (BMP) at Paci!ic Northwest National Laboratory (PNNL). PNNL is a multi-program national laboratory operated for DOE by Battelle

Articleunder contract no. DE-AC05-76RL01830. Analysis of AFM data was supported by the DOE BES BMP at the University of Washington (DE-SC0018940). High speed AFM/SIM in the laboratory of C.F.K. was supported by the MRC (MR/K015850/1/ MR/K02292X/1), the Engineering and Physical Sciences Research Council (EP/ H018301/1, EP/L015889/1), Wellcome Trust (089703/Z/ 09/Z and 3!3249/Z/16/Z), MedImmune and In!initus. C.F.K. and I.M. acknowledge Bruker Nanosurfaces for the kind support for the Bioscope Resolve. We thank the Nikon Imaging Center at Harvard Medical School, in particular J. Waters, A. Jost and G. Campbell. SAXS at SIBYLS was made possible by the IDAT grant from DOE BER and NIH ALS-ENABLE (P30 GM124169) with support from beamline staff J. Bierma and J. Holton. We thank I. Xavier Raj for support to L.S. We thank L. Carter, C. Chow and the Institute for Protein Design (IPD) protein production core for support in expressing and purifying some of the design and experimental components.
Author contributions A.J.B.-S. and D.B. designed the research and experimental approach for protein assemblies. A.J.B.-S. and W.S. wrote program code and performed the docking and design calculations. A.J.B.-S. performed the experimental designs screening, electron microscopy, UV-vis and CD characterization. A.J.B.-S., M.C.J. and J.M.K. designed and analysed the results of electron microscopy, and M.C.J. performed electron microscopy sample preparation, imaging and image processing. F.J. and J.C. performed AFM imaging on mica substrates. F.J., J.C. and J.J.D.Y. analysed AFM data and contributed to manuscript preparation. A.J.B.-S., E.D., J.L.W., H.R.-B., S.C.B. and D.B. designed and developed experimental approach for arrays–synthetic membranes and arrays–cells assemblies. J.L.W. performed the imaging
and analysis of array assembly onto supported lipid bilayers and living cells and all calibration measurements. E.D. developed image processing methods for arrays-membrane characterization. I.M. and C.F.K. performed correlative AFM–SIM on supported bilayers and subsequent analysis. A.B. performed the EGFR endocytic block experiments. G.L.H. and A.J.B.-S. performed the SAXS experiments and analysis. L.S. performed the TIE2 F domain–arrays binding and optical characterization with J.D. and with guidance from H.R.-B. S.M.J. prepared the spyTag–DLL4 protein, A.J.B.-S. and A.A.D. prepared the A–DLL4 conjugate, and A.A.D. performed the NOTCH1–A–DLL4 experiments and analysis. A.J.B.-S., E.D. and D.B. wrote the manuscript and produced the !igures. All authors discussed the results and commented on the manuscript.
Competing interests S.C.B. receives funding for unrelated projects from the Novartis Institutes for Biomedical Research and from Erasca. He is on the Scienti!ic Advisory Board for Erasca, and is a consultant on unrelated projects for IFM and Ayala Therapeutics.
Additional informationSupplementary information is available for this paper at https://doi.org/10.1038/s41586-020-03120-8.Correspondence and requests for materials should be addressed to E.D. or D.B.Peer review information Nature thanks Philippe Bastiaens and the other, anonymous, reviewer(s) for their contribution to the peer review of this work.Reprints and permissions information is available at http://www.nature.com/reprints.