binocular interactions in striate cortical neurons of cats
TRANSCRIPT
The Journal of Neuroscience, August 1994, 14(8): 5050-5067
Binocular Interactions in Striate Cortical Neurons of Cats Reared with Discordant Visual Inputs
Yuzo M. Chino, Earl L. Smith III, Kazuyuki Yoshida, Han Cheng, and Junji Hamamoto
College of Optometry, University of Houston, Houston, Texas 77204-6052
The postnatal development of cortical binocularity is known to be adversely affected by early abnormal visual experi- ence. However, little information exists on how the signals from the two eyes are combined in individual cortical neu- rons of animals reared with early discordant binocular visual experience. Since this is a fundamental issue in understand- ing visual cortical development, we used extracellular sin- gle-unit recording methods to study binocular integration in striate cortical neurons of strabismic cats. Specifically, we measured the sensitivity of individual cells to the relative interocular spatial phase of dichoptically presented drifting sinusoidal gratings (i.e., to binocular retinal image disparity).
Clear alterations in ocular dominance were observed in all strabismic subjects. Nevertheless, the majority of cortical neurons exhibited some form of binocular interactions when both eyes were stimulated together. The most prominent aspect of cortical physiology in the strabismic animals was the relatively high prevalence of suppressive binocular in- teractions. Suppression was most frequently found in kittens reared with 2 weeks of early optical dissociation and among adult cats that received 2 weeks of early optical dissociation and a prolonged recovery period. However, substantial ex- citatory binocular interactions were also maintained in these animals. With an extended period of interocular misalign- ment (3 or 8 months), all forms of binocular interactions, excitatory and suppressive, were drastically reduced and a greater number of neurons were truly monocular. Although the reduction in the strength of binocular interactions oc- curred in all units irrespective of their monocular spatial properties, the effect was more pronounced among those units tuned to higher spatial frequencies and this spatial- frequency-dependent effect was larger in the subjects re- ceiving longer periods of binocular dissociation. The results suggest that the “breakdown” of cortical binocular proper- ties in strabismic subjects is not an all-or-none process, and that suppressive binocular interactions may be closely as- sociated with the abnormal binocular interactions exhibited by strabismic humans. Furthermore, our findings are con- sistent with the notion that cortical disparity-detecting mechanisms are spatial-frequency dependent and, thus, can
Received Sept. 2 1, 1993: revised Feb. 11, 1994; accepted Feb. 24, 1994. We thank H. Bedell, R. Harwerth, and D. Levi for comments on an earlier
draft. This work was supported by NIH Research Grants EY-08 128, EY-0361 I, and RR-07 146.
Correspondence should be addressed to Yuro M. Chino, College of Optometry, University of Houston, 4901 Calhoun Boulevard, Houston, TX 77204-6052. Copyright 0 1994 Society for Neuroscience 0270-6474/94/145050-18$05.00/O
be selectively altered depending on an animal’s early visual experience.
[Key words: striate cortical neurons, cat, binocular inter- action, strabismus, suppression]
Humans view their environment through two horizontally sep- arated eyes. Neural signals originating from each eye, however, are efficiently combined in the visual cortex producing a uniform visual percept. In the early stages of cortical processing, the signals from the two eyes appear to be combined in a linear manner in the majority of neurons (Ohzawa and Freeman, 1986a,b; Smith et al., 1992a,b) and interocular differences in the position and/or structure of the receptive fields of binocular cortical neurons provide potentially critical cues for stereopsis and vergence eye movements (Barlow et al., 1967; Ferster, 198 1; Cynader et al., 1984; LeVay and Voigt, 1988; Poggio et al., 1988; Freeman and Ohzawa, 1990; Ohzawa et al., 1991; DeAngelis et al., 199 1).
The basic connections required for binocular signal interac- tions are present very early during maturation (for reviews, see Movshon and Van Sluyters, 198 1; Sherman and Spear, 1982; Mitchell and Timney, 1984; Boothe et al., 1985; Friedlander and Tootle, 1990; Kiorpes and Movshon, 1990; Movshon and Kiorpes, 1990). Ocular dominance columns are present at birth in the primate visual cortex, although the anatomical segregation of ocular dominance columns in layer IV is not complete until the end of the 6th week (Hubel et al., 1977; LeVay et al., 1980). Similarly, ocular dominance column formation in cats begins before 3 weeks of age and is normally complete by about 6 weeks (LeVay et al., 1978). In kittens, disparity-selective cells have been claimed to appear around 5 weeks of age (Pettigrew, 1974), and behavioral sensitivity to retinal disparity can be clearly demonstrated between 5 and 7 weeks of age (Timney, 198 1). A more recent study indicates, however, that nearly 40% of the cells in cat area 17 are disparity selective at 2 weeks of age, and within 1 additional week, the proportion of disparity- sensitive units abruptly doubles to the adult level (Freeman and Ohzawa, 1992).
The maturation and refinement of the existing binocular neu- ral mechanisms in the kitten visual cortex continue during post- natal development, a process that is known to require normal visual experience. During this period, cortical binocularity can be readily perturbed by the presence ofcohflicting visual images between the two eyes. Discordant binocular visual experience may arise from early unilateral form deprivation, optical de- focus (anisometropia), or an interocular misalignment of the visual axes (strabismus) (Movshon and Van Sluyters, 1981; Mitchell and Timney, 1984; Friedlander and Tootle, 1990;
The Journal of Neuroscience, August 1994, 14(E) 5051
Movshon and Kiorpes, 1990). Among the forms of early ab- normal visual experience routinely investigated, strabismus ap- pears to pose unique problems for cortical development. Al- though the retinal images in each eye can be relatively well focused at the same time, the interocular misalignment prevents binocular fusion and results in diplopia (double vision) and confusion. The conflicting signals from the two eyes presumably initiate abnormal binocular interactions in individual cortical units, leading to permanent alterations in their physiology. In- deed, rearing animals with an interocular misalignment is known to cause a wholesale loss of binocularly activated cortical neu- rons and, in some cases, a shift in ocular dominance toward one eye (Hubel and Wiesel, 1965; Smith et al., 1979; Chino et al., 1983, 1988, 1991). In addition, early onset unilateral stra- bismus can cause monocular spatial vision deficits (amblyopia) and a spatial-frequency-dependent loss of contrast sensitivity in cortical neurons (Chino et al., 1983, 199 1; Eggers et al., 1984; Crewther and Crewther, 1990).
In most previous studies ofthe effects ofstrabismus on cortical binocularity, an interocular misalignment was surgically or op- tically induced around the time of eye opening and maintained throughout the sensitive period of cortical binocularity until adulthood. Although this strategy effectively produces a severe loss of binocularly activated cortical units and/or alterations in the monocular spatial properties of cortical units, it can not be used to uncover the nature of the early cortical events that lead to these severe anomalies in adults. Moreover, the previous assessments of cortical binocularity in strabismic animals have consisted mostly of qualitative monocular tests of ocular dom- inance that are potentially inadequate for studying the nature of residual binocular interactions. Moreover, the relationship between the monocular and binocular cortical deficits in stra- bismic animals has rarely been examined in individual cortical units.
In this study, we investigated how signals from the two eyes interact in striate cortical neurons of strabismic cats under di- choptic stimulus conditions. To determine the status of binoc- ular signal interactions at different stages of “abnormal devel- opment,” four different animal models were created in which the duration of binocular dissociation and the timing of the recording experiments were varied. We found that despite the severe shifts in cortical ocular dominance, the majority of neu- rons exhibited substantial residual binocular interactions. The nature and degree of binocular signal interactions in individual units, however, varied with the timing and duration of the ex- perimental binocular dissociation. A brief period (2 weeks) of optically induced strabismus in young kittens initiated strong suppressive interactions in the cortex, which persisted even after the removal of optical dissociation and a prolonged recovery period. In contrast, extended periods of interocular misalign- ment, either optically or surgically induced, drastically reduced binocular interactions, including interocular suppression. Con- sequently, the majority of cortical neurons became truly mon- ocular ,and often exhibited a spatial-frequency-dependent con- trast sensitivity loss.
Some of the data have been presented briefly elsewhere (Yo- shida et al., 1993).
Materials and Methods
Subjects The exact nature and extent of the deficits in cortical binocularity pro- duced by experimental strabismus are expected to be influenced by a
number of variables (e.g., age of onset, the duration of the discordant binocular visual experience, the magnitude of the interocular deviation, and the manner in which the misalignment is produced). In this study, we kept the onset of strabismus constant, and manipulated a number of the remaining experimental variables in order to produce a range of binocular deficits in our subject population.
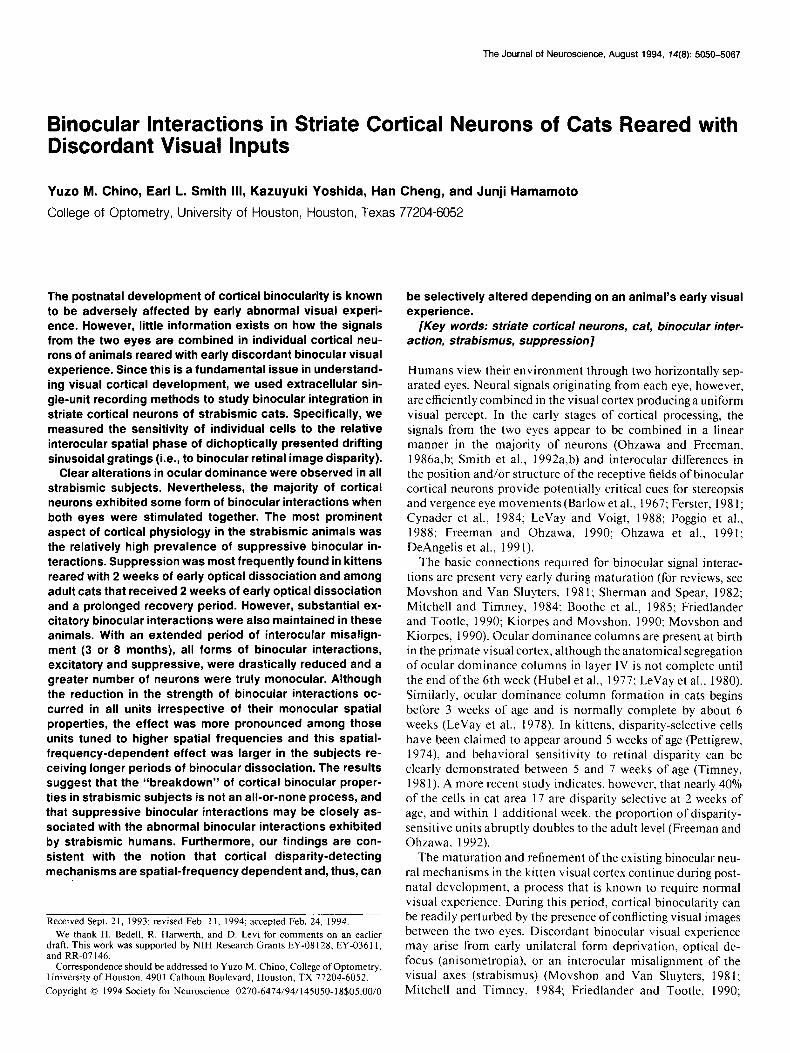
The animal rearing procedures are summarized in Figure 1A. In ad- dition to normal controls (NORM. N = 5). four different binocular dissociating conditions were initiated at the’age of 4 weeks.
(1) Two weeks qfopticaldissociation followed by a long recovery period (P-REC; N = 5). Animals in this group wore goggles containing a 1.5 diopter base-in prism in front of one eye for 4-6 hr/d (Smith et al., 1979; Bennet et al., 1980; Chino et al., 199 I); at all other times during the rearing period, the animals were kept in total darkness. The optical dissociation was maintained for 2 weeks, after which the goggles were removed and kittens were reared under normal visual conditions. Dur- ing the rearing period, the kittens’ behavior was continuously monitored to ensure that the goggles were securely in place at all times. Moreover, the subjects were stimulated with visually interesting toys by one of the investigators in order to keep the animals alert. The recording experi- ments were conducted when the kittens were adults (i.e.. at 9 months or older).
I
(2) Two weeks ofoptical dissociation and no recovery (P-KIT; N = 2). These kittens served as control animals for the P-REC cats: data from these animals documented the status of the visual cortex prior to any potential recovery associated with the restoration of normal visual ex- perience. We conducted recording experiments in these animals at the end of the 2 week prism rearing period.
(3) Long-term optical dissociation (P-LONG; N = 3). To determine the effects of a prolonged period of discordant visual experience on the development of cortical binocularity, kittens received the identical op- tical dissociation described above, but for a period of 3 months (i.e., through most of the known sensitive period for binocularity in cats; Mitchell and Timney, 1984; Movshon and Kiorpes, 1990; but see Daw et al., I99 1). The recording experiments were conducted after 9 months of age.
(4) Surgical esotropia (ET; N = 3). To create a potentially more dis- ruptive form of strabismus than optical dissociation (i.e., longer dura- tion and usually a larger angle of image misalignment), unilateral eso- tropia (convergent misalignment) was surgically induced by sectioning the tendon of the lateral rectus muscle under ketamine (30 mg/kg) an- esthesia (Chino et al., 1983, 199 1).
Animals were reared under normal laboratory lighting conditions (12 hr light/l2 hr dark) for at least 9 months before the recording experi- ments were conducted.
During the recording experiments, we estimated the degree of inter- ocular misalignment in individual animals by measuring the relative positions of the projections of the right and left optic discs following anesthesia and paralysis (Sherman, 1972). The results are shown in Figure IB. The mean optic disk separation for normal controls was similar to the values found in our previous studies (Bennet et al., 1980; Chino et al., 1983, 1991). The P-LONG and ET subjects typically ex- hibited small optic disk separations, indicative of a convergent misa- lignment. It should be emphasized that the optic disk separations for our prism-reared animals represented permanent ocular deviations in- duced by the rearing procedures and should not be confused with the optical image misalignment that was sustained while the animals were wearing the prisms. These data are generally consistent with previous reports (Sherman, 1972; Bennet et al., 1980; Chino et al., 1983). On the other hand, most of the short-term, prism-reared kittens (P-KIT and P-REC) exhibited normal or near normal optic disk separations.
Animal preparation
The cats were premeditated with atropine sulfate (0.05 mg/kg, s.c.) and initially anesthetized with an intraperitoneal injection of sodium pen- tobarbital (40-50 mg/kg). A femoral vein was cannulated with an in- dwelling catheter for the subsequent infusion of drugs. A tracheotomy was performed to facilitate artificial respiration, and the subjects were secured in a stereotaxic instrument. A rectal thermistor and electroni- cally controlled heating pads were used to maintain core temperature at 38°C. A craniotomy and durotomy (5 mm in diameter) were made at H-C coordinates P-5, L-3 to expose area 17. A plastic cylinder was fitted over the hole and was fixed onto the skull with acrylic cement. After all surgical procedures were completed, the animal was paralyzed by an intravenous infusion of pancuronium bromide (a loading dose of
5052 Chino et al. * Cortical Binocular Interactions in Strabismic Cats
A
0 3 6 29 (Postnatal Months) t : ! : : : : : : I
Recording Experiments v
71 CD CD NORM
0 P-KIT
4 0 P-REC
4 1 0 P-LONG
0 am
= Treatment Period
1 t 1 1
20 10 0 10 20 R
Optic Disc Separation (desk
0 4.0 ] NORM (X=32.9 f 5.2 deg)
9 ] P-KIT (57=35.3 f 1 .O deg)
,a A 0 ] P-REC (X=27.1 f 7.1 deg)
dp ] P-LONG (X=27.9 f 2.0 deg)
A 10 1 ET (si=l9.9 k 6.1 deg)
Figure 1. A, Animal groups and their rearing histories. NORM, normal controls; P-KIT. kittens receiving 2 weeks of optical dissociation, but no recovery; P-REC. cats receiving 2 weeks of optical dissociation fol- lowed by a prolonged recovery period; P-LONG, cats receiving 3 months of optical dissociation with a prolonged recovery period; ET, surgical esotropic cats. All rearing procedures began at the age of 4 weeks. Solid arrowheads indicate the time when the recording experiments were con- ducted. Note that except for the prism-reared kittens (P-KIT), all ex- periments were conducted when the animals were 9 months of age or older. B, Optic disk separations of individual animals following anes- thesia and paralysis. The positions of the projected optic disks were marked on the tangent screen located 57 cm in front of the animals using standard methods (Pettigrew and Cooper, 1979). The vertical line at 0” separation indicates the mid-point between the right (R) and left (L) optic disks for each cat. Animal groups and their mean separations (LSD) are indicated on the right.
0.1 mg/kg followed by continuous infusion of 0.1-0.2 mg/kg/hr) in a 5% dextrose Ringer’s solution (2.5 ml/kg/hr). The animal was artificially respired with a mixture of 59% N,O, 39% 02, and 2% CO,. The res- piration volume was adjusted to maintain the end-tidal CO2 between 3.5% and 4.0%. Ventilation pressure was monitored with a respiration meter. When the respiratory pressure exceeded about 20-30 cm H20, the trachea tube was cleared via a specially designed removable insert.
Anesthesia was maintained by the continuous intravenous infusion of sodium pentobarbital (Nembutal, 1-4 mg/kg/hr in the 5% dextrose Ringer’s solution). The anesthesia level was continuously monitored by observing the EEG, EKG, and heart rate, particularly in response to a periodic paw pad pinch.
The nictitating membranes were retracted by the topical application of phenylephrine hydrochloride (1 O%), and cycloplegia and mydriasis were produced by 1% atropine sulfate topically instilled into the eyes. The animal’s corneas were protected with rigid, gas-permeable extend- ed-wear contact lenses. Retinoscopy was used to refract the eyes for the 57 cm viewing distance used in all experiments. Additional lenses were used to correct refractive errors (spherical or cylindrical) of0.50 diopters or greater. In addition, when a cell with a high spatial-frequency cutoff was encountered, its responses were recorded as a function of lens power to verify the proper refractive correction. The contact lenses were re- moved and cleaned periodically throughout the experiment. A topical antibiotic and steroid solution (e.g., Poly-DEX, Neomycin, Polymyxin B sulfates or dexamethasone ophthalmic suspension) was instilled in the animal’s eyes when the contact lenses were being cleaned to reduce the potential for infection and inflammation. A fiber optic from a high- intensity light source was used to illuminate the retina and project the images of the optic disk, the major blood vessels, and the area centralis onto the tangent screen (Pettigrew et al., 1979).
Recording procedures
An epoxy-insulated tungsten microelectrode (5-7 Ma impedance at I kHz) was introduced into the brain through an electrically shielded guide tube. The plastic chamber was filled with 5% agar and sealed with melted wax. Action potentials were extracellularly recorded and amplified by the use of conventional technology. A window discriminator provided standard pulses that were accumulated by a PDP- 1 l/73 computer. At- tempts were made to study every unit that was well isolated during an electrode penetration and efforts were made to ensure that samples from the different animal groups were matched for cortical location. Electro- lytic lesions (5-10 PA, 5-10 set, tip negative) were made at selected locations along the electrode penetrations to aid in the identification of recording sites. At the end of recording experiments, an overdose of sodium pentobarbital was administered intravenously to induce a deep level of anesthesia and the animals were killed by a perfusion through the heart with normal saline followed by IO% formalin. The brains were sectioned at 50 Mm and stained with cresyl violet. Since the sample size was relatively small in most of our animal groups, a conclusive laminae analysis was not possible. However, we found that our sampling was similar in all animal groups and that there were no systematic differences in the number and type of neurons sampled between supragranular, input, and infragranular layers.
Visual stimulation
For each well-isolated neuron, the minimum response fields (Barlow et al., 1967) were mapped on the tangent screen with hand-held stimuli. Two gimbaled mirrors were used to project the neuron’s receptive fields onto the centers of the two matched cathode ray tube (CRT) screens (Phosphor P3l). The CRTs had a space-average luminance of 30 cd/ m’. Two translucent plastic covers that had approximately the same luminance as the CRTs were used to define the circular display areas that were 9 cm in diameter (9” visual angles at the viewing distance of 57 cm).
Sinusoidal gratings were generated on the monitors with a micro- processor-based function generator that was controlled by the PDP-111 73 computer. The parameters of the drifting sinusoidal gratings (ori- entation, direction of drift, spatial frequency, temporal frequency, and contrast) could be controlled independently for each CRT. A Pritchard Spectra Photometer equipped with an automated scanning slit was used to calibrate the luminance and contrast ofthe display. Stimulus contrast was defined as (L,,,, - L,,,,,,YW,~,, + LJ, where L,,, and L,, were the maximum and minimum luminance levels, respectively. For most ex- periments, the contrast was held constant at 0.3 for both stimuli. The temporal frequency of all stimuli was also kept constant at 3.12 Hz, unless specified otherwise.
Data analysis
The neurons’ responses were sampled at a rate of 100 Hz (10 msec bin widths) and compiled into peristimulus time histograms (PSTHs) that were equal in duration to, and synchronized with, the temporal cycle
Response (spike/set)
1
m
I
f7-f Area 17 LGN Retina Relative phase (deg)
j 25 g 20
Y 4 15
g s
10
:: 2
5
0
30
25
20
15
10
5
0
0 90 180 270 360 0.1 1 Direction [Orientation] (deg) Spatial Frequency (c/d)
30 - 0 Maximum binocular
MaX/Monoc-1.97 \ Mean/Monoc=l .Ol
$ 20 - \ \O EN-0.95 S/N=657 / ./
42
4 l \ l / .- :: ____ -\ - - _ _ /- _ _ _ I%! bi!oc_u!aI - - - _ _ - - _ 4L1
0 60 120 180 240 300 360
Relative Phase (deg)
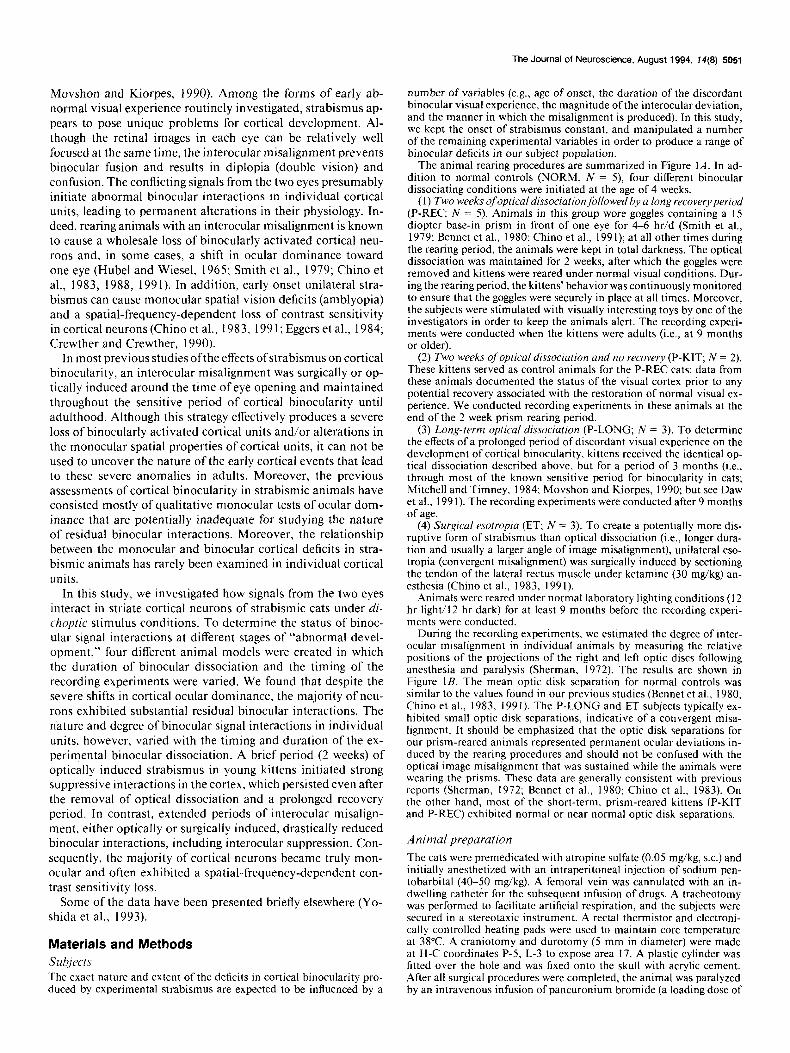
Figure 2. A, Schematic diagram showing the recording and visual stimulation methods. Lqft, Recording setup. Extracellular single-cell recordings were made with tungsten microelectrode in area 17 of anes- thetized and paralyzed cats. Right, Visual stimulation methods. A pair of identical sinusoidal gratings (corresponding to the cell’s optimal ori- entation and spatial frequency) were drifted in the unit’s preferred di- rection (temporal frequency = 3. I2 Hz) for the right and left eye, and the relative interocular spatial phase of the two gratings was system- atically changed (by 22.5” steps). The contrast of the gratings was held constant at 0.3 and the mean luminance of the screen was 30 cd/m’. B, Monocular and binocular responses of a typical simple cell from a normal cat. Top, Monocular responses. Left, Direction (orientation) response functions. Response amplitude is plotted as a function of the direction of stimulus drift. The drift was always orthogonal to the ori- entation of the stimulus grating. At O”, vertical gratings moved right- waid, and at 90”, horizontal gratings moved upward. Right, Spatial frequency response functions. This unit had no spontaneous activity. Optimal orientation, direction, and spatial frequency were determined from these functions for the binocular phase experiments. Bottom, Bin- ocular responses. The phase tuning function (so/id circles) was obtained by plotting the response amplitude of the cell as a function of relative interocular spatial phase. The thick dashed line indicates the fitted sine wave from which the maximum (peak) and minimum (trough) binocular responses were determined. The level of the mean binocular responses is also indicated (thin dashed line). Monocular response levels for the
The Journal of Neuroscience, August 1994, 14(8) 5053
ofthe grating stimuli. The amplitude and phase ofthe temporal response components in the PSTHs were determined by Fourier analysis. To facilitate the comparisons of the relative effectiveness of different visual stimuli, the potential impact of variations in the responsiveness of the cortical neurons over time was minimized by collecting the quantitative data using a multihistogram technique similar to those described by Henry et al. (1973) and Movshon et al. (1978a,b). In all experiments, the stimuli were presented at multiple times in a randomly ordered sequence for relatively short periods (e.g., 10 cycles ofa sine wave grating were drifted across the receptive field). During a given experiment, the rerandomized stimulus sequence was usually repeated three to six times, producing PSTHs for each stimulus that represented the neuron’s re- sponse to 30-60 grating cycles. One or two blank stimuli (i.e., zero contrast control) were included in each repeat of the rerandomized sequence to provide a measure of the neuron’s maintained firing rate.
Experimental procedures A4onocular properties. Cells were classified as simple or complex on the basis of the temporal characteristics of their responses to a drifting sinusoidal grating of the optimal spatial frequency and orientation. The units were classified as simple cells if they exhibited a high degree of response modulation ([the amplitude of the first harmonic response/ (the average response - the average spontaneous activity)] > I); oth- erwise, the neurons were classified as complex cells (Skottun et al., 199 1). For simple cells, the amplitude of the first harmonic component was used as the response measure, and, for complex cells, the amplitude of the DC component (i.e., the average discharge rate) was used for all subsequent analyses.
The orientation tuning characteristics, that is, optimal orientation and bandwidth, were determined by measuring orientation response functions (stimulus orientation versus response amplitude). Responses were measured with the grating of the optimal spatial frequency for 12 different orientations. Both directions ofstimulus movement orthogonal to the grating’s bars were assessed separately at each orientation. The optimal orientation was defined as the stimulus orientation and the direction of drift that produced the highest response amplitude.
Spatial frequency response functions were measured using the optimal orientation and the preferred drift direction. The optimal spatial fre- quency for each cell was determined for both eyes using a parameter file that contained 12 different spatial frequencies that ranged from 0 (i.e., whole field modulation) to 6.4 cycles/degree. The optimal spatial frequency was defined as the spatial frequency that produced the highest response amplitude. The spatial resolution (high-frequency cutoff) of each cell was measured by determining the highest spatial frequency that produced a reliable response above the mean noise level.
Binocular properties Ocular dominance of each unit was determined qualitatively and quantitatively. Hand-held stimuli were used to assess qualitatively the relative effectiveness of stimuli presented to the right and left eyes in exciting a given cell. A seven-category scheme was used to characterize each cell’s ocular dominance (Hubel and Wiesel, 1962). In addition, since it has been reported that there is a high degree of variance between subjective and objective measurements (Leventhal and Hirsch, 1980; Macy et al., 1982; Orban, 199 I), ocular dominance was also quantitatively determined from each cell’s spatial frequency response functions. An ocular dominance index (ODI) was calculated as follows: ODI = Ipsi/(Contra + Ipsi), where Ipsi is the response amplitude for the ipsilateral eye and Contra is the response amplitude for the contralateral eye. The ocular dominance index varied continu- ously from 0.0 (contralateral eye excitation only) to I .O (ipsilateral eye excitation only).
Binocular interactions in individual cortical neurons were investi- gated by measuring a given cell’s response as a function of the relative interocular spatial phase of drifting dichoptic sinusoidal gratings (Free- man and Robson, 1982; Ohzawa and Freeman, 1986a,b). Figure 2A
t
left (LI) and right (RI) eyes are indicated by so/id triangles. The bin- ocular interaction index (BII) was 0.95 and the signal-to-noise ratio (.S/ IV) was 6.57 in this neuron. Open circles show the binocular responses obtained when the grating for the left eye was rotated by 90” from the cell’s optimum orientation (orthogonal orientation). Monocular re- sponses for this measurement are indicated by L2 and R2. Units were classified as phase tuned if the BII was 20.3 and S/N was >2.0. Noise indicates the level of spontaneous activity (Noise = 0 in this unit).
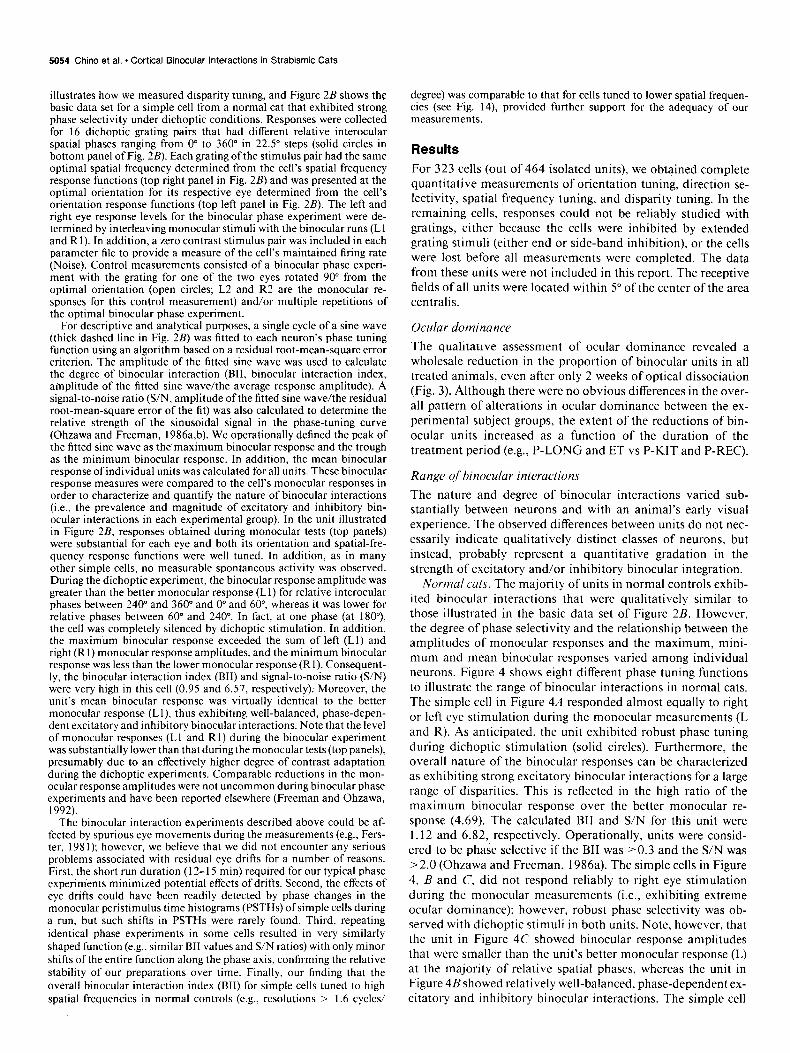
5054 Chino et al. - Cortical Binocular Interactions in Strabismic Cats
illustrates how we measured disparity tuning, and Figure 2B shows the basic data set for a simple cell from a normal cat that exhibited strong phase selectivity under dichoptic conditions. Responses were collected for 16 dichoptic grating pairs that had different relative interocular spatial phases ranging from 0” to 360” in 22.5” steps (solid circles in bottom panel of Fig. 2B). Each grating of the stimulus pair had the same optimal spatial frequency determined from the cell’s spatial frequency response functions (top right panel in Fig. 2B) and was presented at the optimal orientation for its respective eye determined from the cell’s orientation response functions (top left panel in Fig. 2B). The left and right eye response levels for the binocular phase experiment were de- termined by interleaving monocular stimuli with the binocular runs (Ll and R 1). In addition, a zero contrast stimulus pair was included in each parameter file to provide a measure of the cell’s maintained firing rate (Noise). Control measurements consisted of a binocular phase experi- ment with the grating for one of the two eyes rotated 90” from the optimal orientation (open circles; L2 and R2 are the monocular re- sponses for this control measurement) and/or multiple repetitions of the optimal binocular phase experiment.
For descriptive and analytical purposes, a single cycle of a sine wave (thick dashed line in Fig. 2B) was fitted to each neuron’s phase tuning function using an algorithm based on a residual root-mean-square error criterion. The amplitude of the fitted sine wave was used to calculate the degree of binocular interaction (BII, binocular interaction index, amplitude of the fitted sine wave/the average response amplitude). A signal-to-noise ratio (S/N, amplitude ofthe fitted sine wave/the residual root-mean-square error of the fit) was also calculated to determine the relative strength of the sinusoidal signal in the phase-tuning curve (Ohzawa and Freeman, 1986a,b). We operationally defined the peak of the fitted sine wave as the maximum binocular response and the trough as the minimum binocular response. In addition, the mean binocular response of individual units was calculated for all units. These binocular response measures were compared to the cell’s monocular responses in order to characterize and quantify the nature of binocular interactions (i.e., the prevalence and magnitude of excitatory and inhibitory bin- ocular interactions in each experimental group). In the unit illustrated in Figure 2B, responses obtained during monocular tests (top panels) were substantial for each eye and both its orientation and spatial-fre- quency response functions were well tuned. In addition, as in many other simple cells, no measurable spontaneous activity was observed. During the dichoptic experiment, the binocular response amplitude was greater than the better monocular response (Ll) for relative interocular phases between 240” and 360” and 0” and 60”, whereas it was lower for relative phases between 60” and 240”. In fact, at one phase (at 180”), the cell was completely silenced by dichoptic stimulation. In addition, the maximum binocular response exceeded the sum of left (Ll) and right (R 1) monocular response amplitudes, and the minimum binocular response was less than the lower monocular response (Rl). Consequent- ly, the binocular interaction index (BII) and signal-to-noise ratio (S/N) were very high in this cell (0.95 and 6.57, respectively). Moreover, the unit’s mean binocular response was virtually identical to the better monocular response (Ll), thus exhibiting well-balanced, phase-depen- dent excitatory and inhibitory binocular interactions. Note that the level of monocular responses (Ll and Rl) during the binocular experiment was substantially lower than that during the monocular tests (top panels), presumably due to an effectively higher degree of contrast adaptation during the dichoptic experiments. Comparable reductions in the mon- ocular response amplitudes were not uncommon during binocular phase experiments and have been reported elsewhere (Freeman and Ohzawa, 1992).
The binocular interaction experiments described above could be af- fected by spurious eye movements during the measurements (e.g., Fers- ter, 198 1); however, we believe that we did not encounter any serious problems associated with residual eye drifts for a number of reasons. First, the short run duration (12-I 5 min) required for our typical phase experim’ents minimized potential effects of drifts. Second, the effects of eye drifts could have been readily detected by phase changes in the monocular peristimulus time histograms (PSTHs) of simple cells during a run, but such shifts in PSTHs were rarely found. Third, repeating identical phase experiments in some cells resulted in very similarly shaped function (e.g., similar BII values and S/N ratios) with only minor shifts of the entire function along the phase axis, confirming the relative stability of our preparations over time. Finally, our finding that the overall binocular interaction index (BII) for simple cells tuned to high spatial frequencies in normal controls (e.g., resolutions > 1.6 cycles/
degree) was comparable to that for cells tuned to lower spatial frequen- cies (see Fig. 14), provided further support for the adequacy of our measurements.
Results
For 323 cells (out of 464 isolated units), we obtained complete quantitative measurements of orientation tuning, direction se- lectivity, spatial frequency tuning, and disparity tuning. In the remaining cells, responses could not be reliably studied with gratings, either because the cells were inhibited by extended grating stimuli (either end or side-band inhibition), or the cells were lost before all measurements were completed. The data from these units were not included in this report. The receptive fields of all units were located within 5” of the center of the area centralis.
Ocular dominance
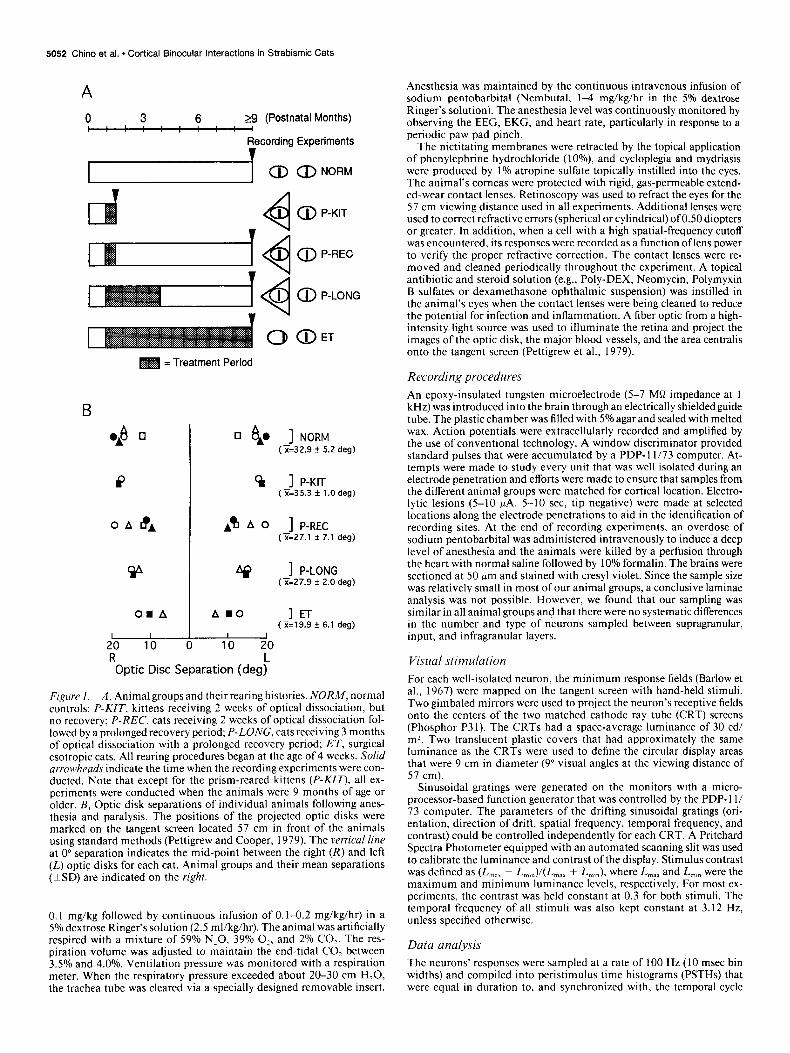
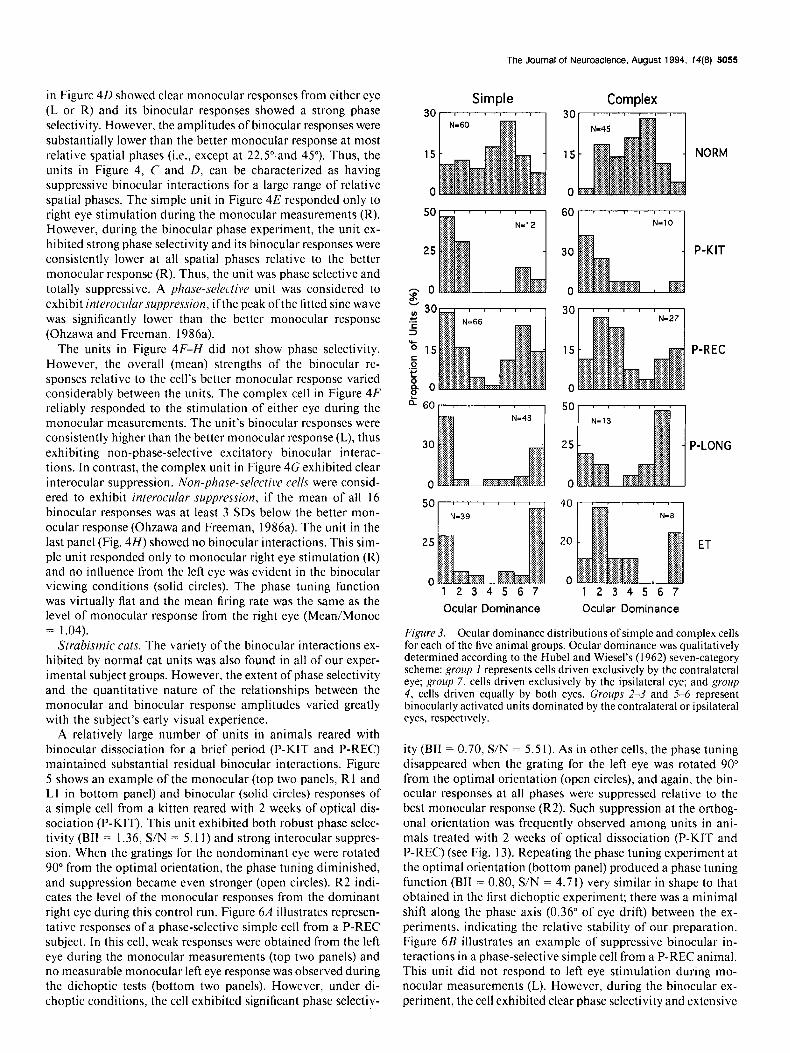
The qualitative assessment of ocular dominance revealed a wholesale reduction in the proportion of binocular units in all treated animals, even after only 2 weeks of optical dissociation (Fig. 3). Although there were no obvious differences in the over- all pattern of alterations in ocular dominance between the ex- perimental subject groups, the extent of the reductions of bin- ocular units increased as a function of the duration of the treatment period (e.g., P-LONG and ET vs P-KIT and P-REC).
Range qf binocular interactions
The nature and degree of binocular interactions varied sub- stantially between neurons and with an animal’s early visual experience. The observed differences between units do not nec- essarily indicate qualitatively distinct classes of neurons, but instead, probably represent a quantitative gradation in the strength of excitatory and/or inhibitory binocular integration.
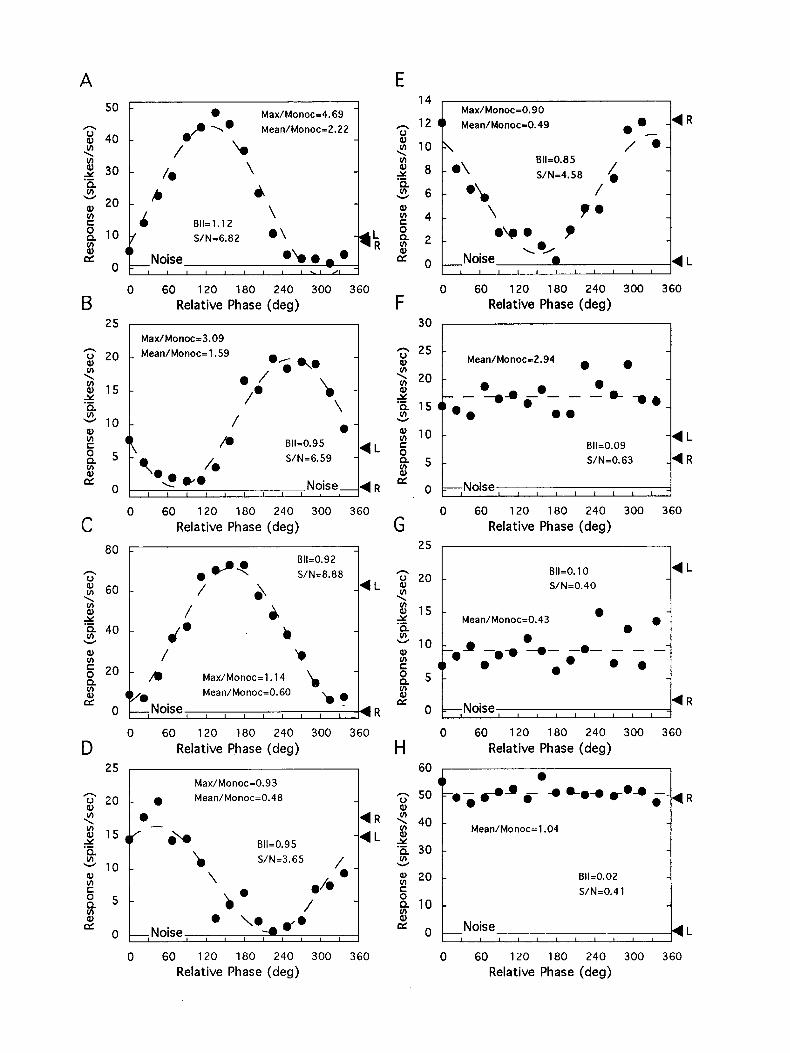
Normal cats. The majority of units in normal controls exhib- ited binocular interactions that were qualitatively similar to those illustrated in the basic data set of Figure 2B. However, the degree of phase selectivity and the relationship between the amplitudes of monocular responses and the maximum, mini- mum and mean binocular responses varied among individual neurons. Figure 4 shows eight different phase tuning functions to illustrate the range of binocular interactions in normal cats. The simple cell in Figure 4A responded almost equally to right or left eye stimulation during the monocular measurements (L and R). As anticipated, the unit exhibited robust phase tuning during dichoptic stimulation (solid circles). Furthermore, the overall nature of the binocular responses can be characterized as exhibiting strong excitatory binocular interactions for a large range of disparities. This is reflected in the high ratio of the maximum binocular response over the better monocular re- sponse (4.69). The calculated BII and S/N for this unit were 1.12 and 6.82, respectively. Operationally, units were consid- ered to be phase selective if the BII was ~0.3 and the S/N was > 2.0 (Ohzawa and Freeman, 1986a). The simple cells in Figure 4, B and C, did not respond reliably to right eye stimulation during the monocular measurements (i.e., exhibiting extreme ocular dominance); however, robust phase selectivity was ob- served with dichoptic stimuli in both units. Note, however, that the unit in Figure 4C showed binocular response amplitudes that were smaller than the unit’s better monocular response (L) at the majority of relative spatial phases, whereas the unit in Figure 4B showed relatively well-balanced, phase-dependent ex- citatory and inhibitory binocular interactions. The simple cell
The Journal of Neuroscience, August 1994,
in Figure 40 showed clear monocular responses from either eye (L or R) and its binocular responses showed a strong phase selectivity. However, the amplitudes of binocular responses were substantially lower than the better monocular response at most relative spatial phases (i.e., except at 22.5”,and 45”). Thus, the units in Figure 4, C and D, can be characterized as having suppressive binocular interactions for a large range of relative spatial phases. The simple unit in Figure 4E responded only to right eye stimulation during the monocular measurements (R). However, during the binocular phase experiment, the unit ex- hibited strong phase selectivity and its binocular responses were consistently lower at all spatial phases relative to the better monocular response (R). Thus, the unit was phase selective and totally suppressive. A phase-selective unit was considered to exhibit intcrocularsuppression, ifthe peak ofthe fitted sine wave was significantly lower than the better monocular response (Ohzawa and Freeman, 1986a).
The units in Figure 4F-H did not show phase selectivity. However, the overall (mean) strengths of the binocular re- sponses relative to the cell’s better monocular response varied considerably between the units. The complex cell in Figure 4F reliably responded to the stimulation of either eye during the monocular measurements. The unit’s binocular responses were consistently higher than the better monocular response (L), thus exhibiting non-phase-selective excitatory binocular interac- tions. In contrast, the complex unit in Figure 4G exhibited clear interocular suppression. Non-phase-selective cells were consid- ered to exhibit interocular suppression, if the mean of all 16 binocular responses was at least 3 SDS below the better mon- ocular response (Ohzawa and Freeman, 1986a). The unit in the last panel (Fig. 4H) showed no binocular interactions. This sim- ple unit responded only to monocular right eye stimulation (R) and no influence from the left eye was evident in the binocular viewing conditions (solid circles). The phase tuning function was virtually flat and the mean firing rate was the same as the level of monocular response from the right eye (Mean/Monoc = 1.04).
Strabismic cats. The variety of the binocular interactions ex- hibited by normal cat units was also found in all of our exper- imental subject groups. However, the extent of phase selectivity and the quantitative nature of the relationships between the monocular and binocular response amplitudes varied greatly with the subject’s early visual experience.
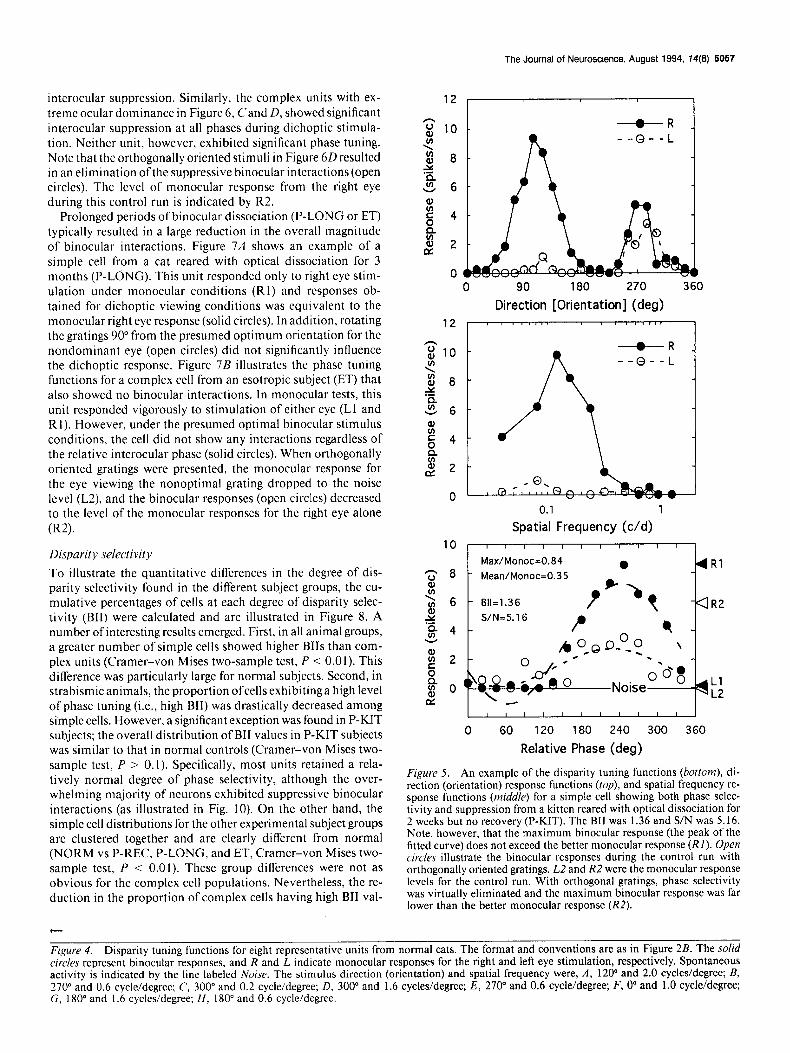
A relatively large number of units in animals reared with binocular dissociation for a brief period (P-KIT and P-REC) maintained substantial residual binocular interactions. Figure 5 shows an example of the monocular (top two panels, Rl and Ll in bottom panel) and binocular (solid circles) responses of a simple cell from a kitten reared with 2 weeks of optical dis- sociation (P-KIT). This unit exhibited both robust phase selec- tivity (BII = 1.36, S/N = 5.1 I) and strong interocular suppres- sion. When the gratings for the nondominant eye were rotated 90” from the optimal orientation, the phase tuning diminished, and suppression became even stronger (open circles). R2 indi- cates the level of the monocular responses from the dominant right eye during this control run. Figure 6A illustrates represen- tative responses of a phase-selective simple cell from a P-REC subject. In this cell, weak responses were obtained from the left eye during the monocular measurements (top two panels) and no measurable monocular left eye response was observed during the dichoptic tests (bottom two panels). However, under di- choptic conditions, the cell exhibited significant phase selectiv-
Simple Complex
f4(8) 5055
NORM
P-KIT
P-REC
1234567
Ocular Dominance
1234567
Ocular Dominance
Figure 3. Ocular dominance distributions of simple and complex cells for each of the five animal groups. Ocular dominance was qualitatively determined according to the Hubel and Wiesel’s (1962) seven-category scheme: group I represents cells driven exclusively by the contralateral eye; group 7, cells driven exclusively by the ipsilateral eye; and group 4, cells driven equally by both eyes. Groups 2-3 and 5-6 represent binocularly activated units dominated by the contralateral or ipsilateral eyes, respectively.
ity (BII = 0.70, S/N = 5.5 1). As in other cells, the phase tuning disappeared when the grating for the left eye was rotated 90” from the optimal orientation (open circles), and again, the bin- ocular responses at all phases were suppressed relative to the best monocular response (R2). Such suppression at the orthog- onal orientation was frequently observed among units in ani- mals treated with 2 weeks of optical dissociation (P-KIT and P-REC) (see Fig. 13). Repeating the phase tuning experiment at the optimal orientation (bottom panel) produced a phase tuning function (BII = 0.80, S/N = 4.7 1) very similar in shape to that obtained in the first dichoptic experiment; there was a minimal shift along the phase axis (0.36” of eye drift) between the ex- periments, indicating the relative stability of our preparation. Figure 6B illustrates an example of suppressive binocular in- teractions in a phase-selective simple cell from a P-REC animal. This unit did not respond to left eye stimulation during mo- nocular measurements (L). However, during the binocular ex- periment, the cell exhibited clear phase selectivity and extensive
E
B 25
C 80
s
< 60
8 Y Q 40
2.5
D 25
0 Max/Monoc=4.69
@/@ 1. Mean/Monoc=Z.ZZ
/ L
h \
A
\ Bll=l.lZ
S/N=6.82 l \ -qL R
Noise *Lo.@ I I I I I I I I-I/I
0 60 120 180 240 300 360
Relative Phase (deg)
Max/Monoc=3.09
_ Mean/Monoc=l.59 0% $0
l / /. \. -
\ / l -
4 4 Bll=O.95 4L
-7 l * A
S/N=6.59 -
*. Noise-4 R I1 I I I t I I I I I
0 60 120 180 240 300 360
Relative Phase (deg)
*g-l! Bll=O.92
S/N=8.88
/ A -4L
A
b
/ L
- D Max/Monoc= 1.14 b
Mean/Monoc=0.60
Noise v
I , I 1 I I I fR
0 60 120 180 240 300 360
Relative Phase (deg)
Max/Monoc=0.93
- 0 Mean/Monoc=O.48
0 4R -
c oh Bll=O.95 -4L
b S/N=3.65
\ l h /.-
&a / _ Noise I s I I I I I
0 60 120 180 240 300 360
Relative Phase (deg)
F 30
G 25
H 60
Max/Monoc=0.90
4 Mean/Monoc=O.49
A / l -
- l \ Bll=O.85
S/N=4.58 /. - .\, /
\ 1.
l LO 7
-Noise \?B 4L 1 I I I I I I I I 1 I
0 60 120 180 240 300 360
Relative Phase (deg)
Mean/Monoc=2.94 . 0
jhOiSl, , , , , “;“‘: , 1: 0 60 120 180 240 300 360
Relative Phase (deg)
Bll=O. 10 4L
S/N=0.40
Mean/Monoc=0.43 0 0 .
z- * -**f- -*- - - _- 0
0 0 0 l l
-Noise 4R
I I d I f I L
0 60 120 180 240 300 360
Relative Phase (deg)
Mean/Monoc=l.O4
Bll=O.OZ
S/N=0.4 1 1
0 60 120 180 240 300 360
Relative Phase (deg)
The Journal of Neuroscience, August 1994, f4(8) 5057
interocular suppression. Similarly, the complex units with ex- treme ocular dominance in Figure 6, Cand D, showed significant interocular suppression at all phases during dichoptic stimula- tion. Neither unit, however, exhibited significant phase tuning. Note that the orthogonally oriented stimuli in Figure 60 resulted in an elimination ofthe suppressive binocular interactions (open circles). The level of monocular response from the right eye during this control run is indicated by R2.
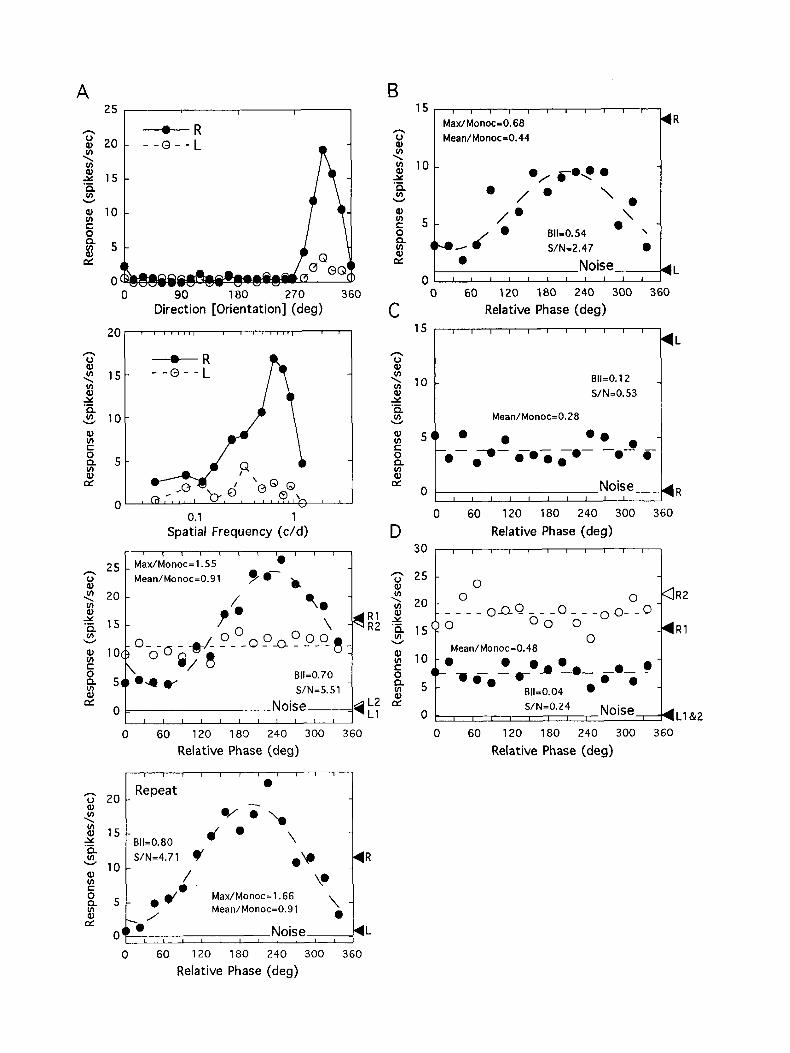
Prolonged periods of binocular dissociation (P-LONG or ET) typically resulted in a large reduction in the overall magnitude of binocular interactions. Figure 7A shows an example of a simple cell from a cat reared with optical dissociation for 3 months (P-LONG). This unit responded only to right eye stim- ulation under monocular conditions (RI) and responses ob- tained for dichoptic viewing conditions was equivalent to the monocular right eye response (solid circles). In addition, rotating the gratings 90” from the presumed optimum orientation for the nondominant eye (open circles) did not significantly influence the dichoptic response. Figure 7B illustrates the phase tuning functions for a complex cell from an esotropic subject (ET) that also showed no binocular interactions. In monocular tests, this unit responded vigorously to stimulation of either eye (Ll and RI). However, under the presumed optimal binocular stimulus conditions, the cell did not show any interactions regardless of the relative interocular phase (solid circles). When orthogonally oriented gratings were presented, the monocular response for the eye viewing the nonoptimal grating dropped to the noise level (L2), and the binocular responses (open circles) decreased to the level of the monocular responses for the right eye alone W).
Disparity selectivity
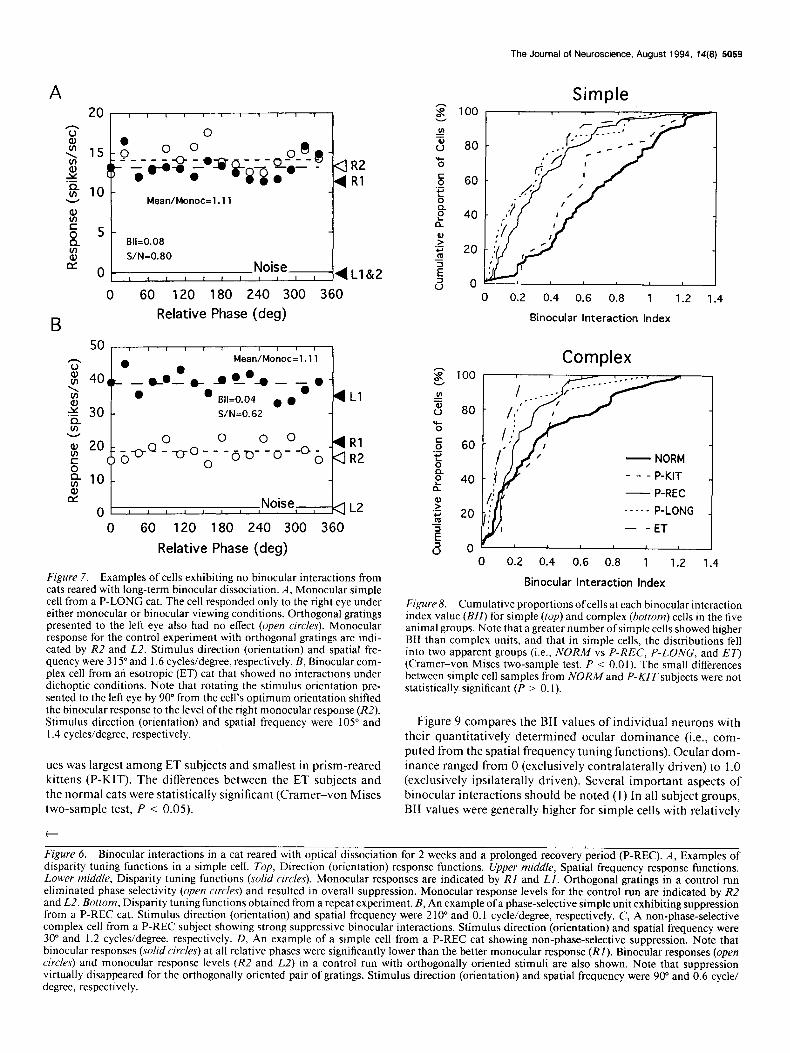
To illustrate the quantitative differences in the degree of dis- parity selectivity found in the different subject groups, the cu- mulative percentages of cells at each degree of disparity selec- tivity (BII) were calculated and are illustrated in Figure 8. A number of interesting results emerged. First, in all animal groups, a greater number of simple cells showed higher BIIs than com- plex units (Cramer-von Mises two-sample test, P < 0.0 I). This difference was particularly large for normal subjects. Second, in strabismic animals, the proportion ofcells exhibiting a high level of phase tuning (i.e., high BII) was drastically decreased among simple cells. However, a significant exception was found in P-KIT subjects; the overall distribution of BII values in P-KIT subjects was similar to that in normal controls (Cramer-von Mises two- sample test, P > 0.1). Specifically, most units retained a rela- tively normal degree of phase selectivity, although the over- whelming majority of neurons exhibited suppressive binocular interactions (as illustrated in Fig. IO). On the other hand, the simple cell distributions for the other experimental subject groups are clustered together and are clearly different from normal (NORM vs P-REC, P-LONG, and ET, Cramer-von Mises two- sample test, P < 0.01). These group differences were not as obvious for the complex cell populations. Nevertheless, the re- duction in the proportion of complex cells having high BII val-
c
l2 I
0 90 180 270 360
Direction [Orientation] (deg)
z s 4
82
0 /
0.1 1
Spatial Frequency (c/d) 10 I I I , I I I, I, I
Max/Monoc=0.84 0 flR1 ';; 8 - Mean/Monoc=0.35
: > 6- B11=1.36
s t-t -4R2
S/N=& 16 'E. 4 - /@ 3
* -
0 60 120 180 240 300 360
Relative Phase (deg)
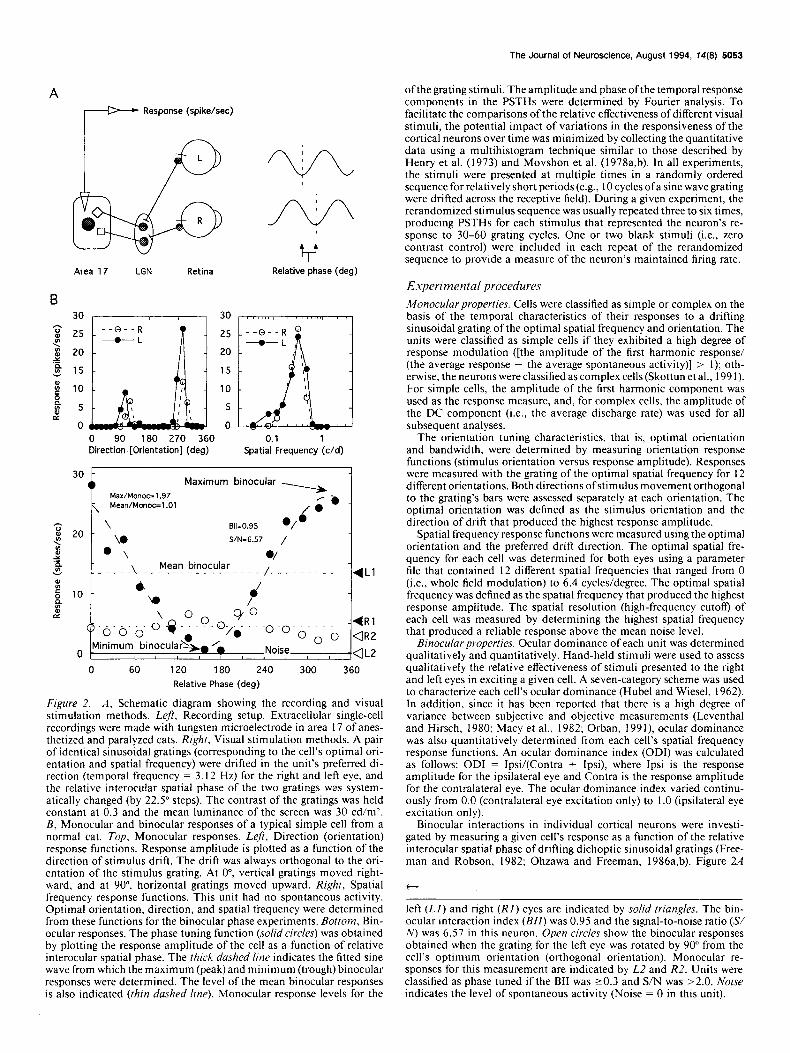
Figure 5. An example of the disparity tuning functions (bottom), di- rection (orientation) response functions (top), and spatial frequency re- sponse functions (mid&) for a simple cell showing both phase selec- tivity and suppression from a kitten reared with optical dissociation for 2 weeks but no recovery (P-KIT). The BII was 1.36 and S/N was 5.16. Note, however, that the maximum binocular response (the peak of the fitted curve) does not exceed the better monocular response (RI). Open circles illustrate the binocular responses during the control run with orthogonally oriented gratings. L2 and R2 were the monocular response levels for the control run. With orthogonal gratings, phase selectivity was virtually eliminated and the maximum binocular response was far lower than the better monocular response (RZ).
Figure 4. Disparity tuning functions for eight representative units from normal cats. The format and conventions are as in Figure 2B. The solid circles represent binocular responses, and R and L indicate monocular responses for the right and left eye stimulation, respectively. Spontaneous activity is indicated by the line labeled Noise. The stimulus direction (orientation) and spatial frequency were, A, 120” and 2.0 cycles/degree; B, 270” and 0.6 cycle/degree: C, 300” and 0.2 cycle/degree; D, 300” and 1.6 cycles/degree; E, 270” and 0.6 cycle/degree; F, 0” and 1.0 cycle/degree; G, 180” and I .6 cycles/degree; H, 180” and 0.6 cycle/degree.
A 25, I I
0 0 90 180 270 360
20
';;
p 15
M Y .-
6 10
ifi
5 z: 5
2
0
Direction [Orientation] (deg)
1 I
+R --Q--L h
0.1 1
Spatial Frequency (c/d)
1 I I 1 I 1 1 , a’ ’ ’ Max/Monoc=l.SS _
2
25
Mean/Monoc=0.91 PC b
1
0 ;o ‘. 5 /.
#-do Bll=0.54
.' \
S/N=2.47 a I 0 Noise L
0 I, 1, I I I, I I I 0 60 120 180 240 300 360
Relative Phase (deg)
I I I II I I, I I I
Bll=O. 12
S/N=0.53
Mean/Monoc=0.28
4L
4R
0 60 120 180 240 300 360
D Relative Phase (deg)
3o 1
0 Noise L2 d
I I I I I I I I I I I 4Ll 0
0 0 <lR2
_---- r-Jno--O--oo-?o
(2 0 00 0
0 -dRl
Mean/Monoc=0.48
-e l @- -r.-,-c
l 3 t*- p !, 811=0.04 l
0 _ S/N=0.24
I I I I I I I I Noise-4 L1&2
0 60 120 189 240 300 360 0 60 120 180 240 300 360
Relative Phase (deg) Relative Phase (deg)
iz -2
Y5‘\ 2 15-
Bll=O.80 do \ .-
2 S/N=4.71 Y 10 - l V (R
iz /
5 5- .".
\@
Max/Monoc=l.66 %
2 ./
Mean/Monoc=0.91 \.
oq,, , , , , , , Noise 4 L
0 60 120 180 240 300 360
Relative Phase (deg)
The Journal of Neuroscience, August 1994, 14(8) 5059
Simple
B
6+ lo- Mean/Monoc=l .11
iz
s 5- 0 611=0.08
3 S/N=0.80 E
o-, ( , , , ( Noise
, , ( , , : 4L1&2
0 60 120 180 240 300 360
Relative Phase (deg)
s! 811=0.04 . l 4 Ll 30- S/N=0.62
:: V
Q, E
20 0 0 0 0
- ,~Q-*O---CID--O--OO- g 0
M lo-
oc 0
Noise I 1 I I I I I I q L2
0 60 120 180 240 300 360
Relative Phase (deg)
Figure 7. Examples of cells exhibiting no binocular interactions from cats reared with long-term binocular dissociation. A, Monocular simple cell from a P-LONG cat. The cell responded only to the right eye under either monocular or binocular viewing conditions. Orthogonal gratings presented to the left eye also had no effect (open circles). Monocular response for the control experiment with orthogonal gratings are indi- cated by R2 and L2. Stimulus direction (orientation) and spatial fre- quency were 3 15” and 1.6 cycles/degree, respectively. B, Binocular com- plex cell from an esotropic (ET) cat that showed no interactions under dichoptic conditions. Note that rotating the stimulus orientation pre- sented to the left eye by 90” from the cell’s optimum orientation shifted the binocular response to the level ofthe right monocular response (R2). Stimulus direction (orientation) and spatial frequency were 105” and 1.4 cycles/degree, respectively.
ues was largest among ET subjects and smallest in prism-reared kittens (P-KIT). The differences between the ET subjects and the normal cats were statistically significant (Cramer-von Mises two-sample test, P < 0.05).
8 100
cn 5 v 80
75
: 60 .- tl i2 E! 40 rz
P ‘S m
20
i a 0
- NORM
- - - P-KIT
- P-REC
.---- P-LONG
- -ET
-I 0 0.2 0.4 0.6 0.8 1 1.2 1.4
0 0.2 0.4 0.6 0.8 1 1.2 1.4
Binocular Interaction Index
Complex
Binocular Interaction Index
Figure 8. Cumulative proportions ofcells at each binocular interaction index value (HZ) for simple (top) and complex (bottom) cells in the five animal groups. Note that a greater number ofsimple cells showed higher BII than complex units, and that in simple cells, the distributions fell into two apparent groups (i.e., NORM vs P-REC, P-LONG, and ET) (Cramer-von Mises two-sample test, P < 0.01). The small differences between simple cell samples from NORM and P-KIT subjects were not statistically significant (P > 0. I).
Figure 9 compares the BII values of individual neurons with their quantitatively determined ocular dominance (i.e., com- puted from the spatial frequency tuning functions). Ocular dom- inance ranged from 0 (exclusively contralaterally driven) to 1 .O (exclusively ipsilaterally driven). Several important aspects of binocular interactions should be noted (1) In all subject groups, BII values were generally higher for simple cells with relatively
Figure 6. Binocular interactions in a cat reared with optica! dissociation for 2 weeks and a prolonged recovery period (P-REC). A, Examples of disparity tuning functions in a simple cell. Top, Direction (orientation) response functions. Upper middle, Spatial frequency response functions. Lower middle, Disparity tuning functions (solid circles). Monocular responses are indicated by RI and LZ. Orthogonal gratings in a control run eliminated phase selectivity (open kc/es) and resulted in overall suppression. Monocular response levels for the control run are indicated by R2 and L2. Bottom, Disparity tuning functions obtained from a repeat experiment. B, An example of a phase-selective simple unit exhibiting suppression from a P-REC cat. Stimulus direction (orientation) and spatial frequency were 2 10” and 0. I cycle/degree, respectively. C, A non-phase-selective complex cell from a P-REC subject showing strong suppressive binocular interactions. Stimulus direction (orientation) and spatial frequency were 30” and 1.2 cycles/degree, respectively. D, An example of a simple cell from a P-REC cat showing non-phase-selective suppression. Note that binocular responses (solid circles) at all relative phases were significantly lower than the better monocular response (RI). Binocular responses (open circles) and monocular response levels (R2 and L2) in a control run with orthogonally oriented stimuli are also shown. Note that suppression virtually disappeared for the orthogonally oriented pair of gratings. Stimulus direction (orientation) and spatial frequency were 90” and 0.6 cycle/ degree, respectively.
5060 Chino et al. * Cortical Binocular Interactions in Strabismic Cats
1.2 .
0 0
0.8
a?. 4 0.4
r-----l
00 . 0 ____-------------
.
0.8
”
0 0.2 0.4 0.6 0.8 1 Ocular Dominance
Complex
P-KIT
P-REC
P-LONG
ET
0 0.2 0.4 0.6 0.8 1 Ocular Dominance
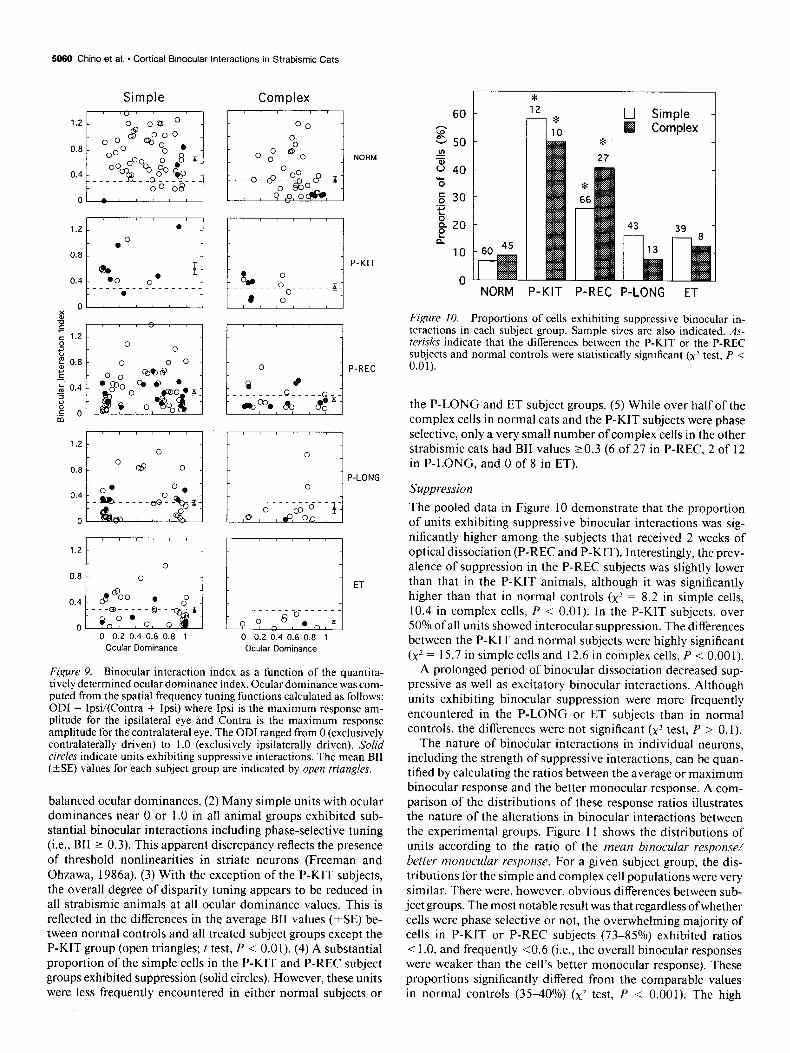
Figure 9. Binocular interaction index as a function of the quantita- tively determined ocular dominance index. Ocular dominance was com- puted from the spatial frequency tuning functions calculated as follows: ODI = Ipsi/(Contra + Ipsi) where Ipsi is the maximum response am- plitude for the ipsilateral eye and Contra is the maximum response amplitude for the contralateral eye. The ODI ranged from 0 (exclusively contralaterally driven) to 1 .O (exclusively ipsilaterally driven). Solid circles indicate units exhibiting suppressive interactions. The mean BII (+SE) values for each subject group are indicated by open triangles.
balanced ocular dominances. (2) Many simple units with ocular dominances near 0 or 1.0 in all animal groups exhibited sub- stantial binocular interactions including phase-selective tuning (i.e., BII 2 0.3). This apparent discrepancy reflects the presence of threshold nonlinearities in striate neurons (Freeman and Ohzawa, 1986a). (3) With the exception of the P-KIT subjects, the overall degree of disparity tuning appears to be reduced in all strabismic animals at all ocular dominance values. This is reflected in the differences in the average BII values (*SE) be- tween normal controls and all treated subject groups except the P-KIT group (open triangles; t test, P < 0.01). (4) A substantial proportion of the simple cells in the P-KIT and P-REC subject groups exhibited suppression (solid circles). However, these units were less frequently encountered in either normal subjects or
* 0 Simple
Complex *
NORM P-KIT P-REC P-LONG ET
Figure 10. Proportions of cells exhibiting suppressive binocular in- teractions in each subject group. Sample sizes are also indicated. As- terisks indicate that the differences between the P-KIT or the P-REC subjects and normal controls were statistically significant (x2 test, P < 0.01).
the P-LONG and ET subject groups. (5) While over half of the complex cells in normal cats and the P-KIT subjects were phase selective, only a very small number of complex cells in the other strabismic cats had BII values ~0.3 (6 of 27 in P-REC, 2 of 12 in P-LONG, and 0 of 8 in ET).
Suppression
The pooled data in Figure 10 demonstrate that the proportion of units exhibiting suppressive binocular interactions was sig- nificantly higher among the subjects that received 2 weeks of optical dissociation (P-REC and P-KIT). Interestingly, the prev- alence of suppression in the P-REC subjects was slightly lower than that in the P-KIT animals, although it was significantly higher than that in normal controls (x2 = 8.2 in simple cells, 10.4 in complex cells, P < 0.01). In the P-KIT subjects, over 50% ofall units showed interocular suppression. The differences between the P-KIT and normal subjects were highly significant (x2 = 15.7 in simple cells and 12.6 in complex cells, P < 0.001).
A prolonged period of binocular dissociation decreased sup- pressive as well as excitatory binocular interactions. Although units exhibiting binocular suppression were more frequently encountered in the P-LONG or ET subjects than in normal controls, the differences were not significant (x2 test, P > 0.1).
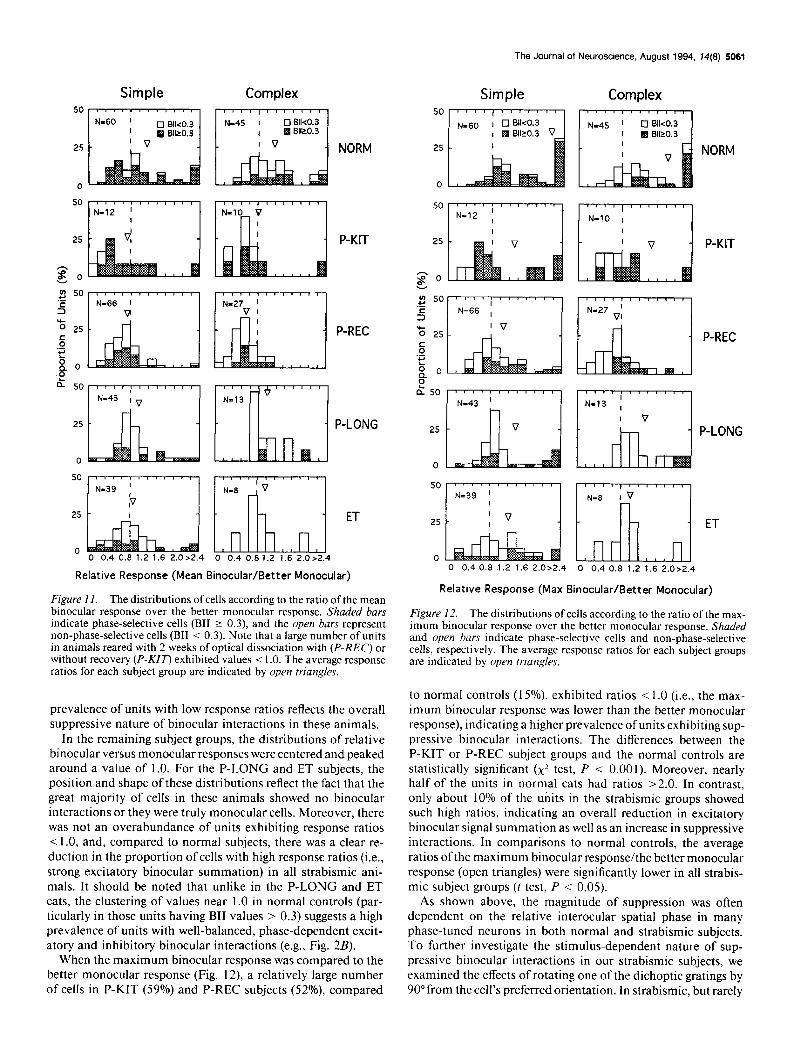
The nature of binocular interactions in individual neurons, including the strength of suppressive interactions, can be quan- tified by calculating the ratios between the average or maximum binocular response and the better monocular response. A com- parison of the distributions of these response ratios illustrates the nature of the alterations in binocular interactions between the experimental groups. Figure 11 shows the distributions of units according to the ratio of the mean binocular response/ better monocular response. For a given subject group, the dis- tributions for the simple and complex cell populations were very similar. There were, however, obvious differences between sub- ject groups. The most notable result was that regardless ofwhether cells were phase selective or not, the overwhelming majority of cells in P-KIT or P-REC subjects (73-85%) exhibited ratios < 1 .O, and frequently ~0.6 (i.e., the overall binocular responses were weaker than the cell’s better monocular response). These proportions significantly differed from the comparable values in normal controls (35-40%) (xl test, P < 0.001). The high
The Journal of Neuroscience, August 1994, M(8) 5061
Simple Complex
25 NORM
I I N-10 V I-II
Simple Complex
25 NORM
0
25
g0
P-KIT P-KIT
P-REC
P-LONG
0
50
25 ET
0 0 0.4 0.8 1.2 1.6 2.0>2.4 0 0.4 0.8 1.2 1.6 2.0>2.4
Relative Response (Mean Binocular/Better Monocular)
Figure 1 I. The distributions of cells according to the ratio of the mean binocular response over the better monocular response. Shaded bars indicate phase-selective cells (BII 2 0.3), and the open bavs represent non-phase-selective cells (BII < 0.3). Note that a large number of units in animals reared with 2 weeks of optical dissociation with (P-REC) or without recovery (P-KU’) exhibited values < 1 .O. The average response ratios for each subject group are indicated by open triangles.
prevalence of units with low response ratios reflects the overall suppressive nature of binocular interactions in these animals.
In the remaining subject groups, the distributions of relative binocular versus monocular responses were centered and peaked around a value of 1.0. For the P-LONG and ET subjects, the position and shape of these distributions reflect the fact that the great majority of cells in these animals showed no binocular interactions or they were truly monocular cells. Moreover, there was not an overabundance of units exhibiting response ratios < 1 .O, and, compared to normal subjects, there was a clear re- duction in the proportion of cells with high response ratios (i.e., strong excitatory binocular summation) in all strabismic ani- mals. It should be noted that unlike in the P-LONG and ET cats, the clustering of values near 1.0 in normal controls (par- ticularly in those units having BII values > 0.3) suggests a high prevalence of units with well-balanced, phase-dependent excit- atory and inhibitory binocular interactions (e.g., Fig. 2B).
When the maximum binocular response was compared to the better monocular response (Fig. 12), a relatively large number of cells in P-KIT (59%) and P-REC subjects (52%), compared
25
0
P-LONG
25
0 0 0.4 0.8 1.2 1.6 2.0>2.4 0 0.4 0.8 1.2 1.6 2.0>2.4
ET
Relative Response (Max Binocular/Better Monocular)
Figure 12. The distributions of cells according to the ratio of the max- imum binocular response over the better monocular response. Shaded and open bars indicate phase-selective cells and non-phase-selective cells, respectively. The average response ratios for each subject groups are indicated by open triangles.
to normal controls (15%) exhibited ratios < 1.0 (i.e., the max- imum binocular response was lower than the better monocular response), indicating a higher prevalence of units exhibiting sup- pressive binocular interactions. The differences between the P-KIT or P-REC subject groups and the normal controls are statistically significant (x’ test, P < 0.001). Moreover, nearly half of the units in normal cats had ratios >2.0. In contrast, only about 10% of the units in the strabismic groups showed such high ratios, indicating an overall reduction in excitatory binocular signal summation as well as an increase in suppressive interactions. In comparisons to normal controls, the average ratios ofthe maximum binocular response/the better monocular response (open triangles) were significantly lower in all strabis- mic subject groups (t test, P < 0.05).
As shown above, the magnitude of suppression was often dependent on the relative interocular spatial phase in many phase-tuned neurons in both normal and strabismic subjects. To further investigate the stimulus-dependent natute of sup- pressive binocular interactions in our strabismic subjects, we examined the effects of rotating one of the dichoptic gratings by 90” from the cell’s preferred orientation. In strabismic, but rarely
5062 Chino et al. * Cortical Binocular Interactions in Strabismic Cats
n1 III 1 II IIII ’ 1
0 60 120 180 240 300 360 Relative Phase (deg)
B
NORM P-KIT P-REC P-LONG ET
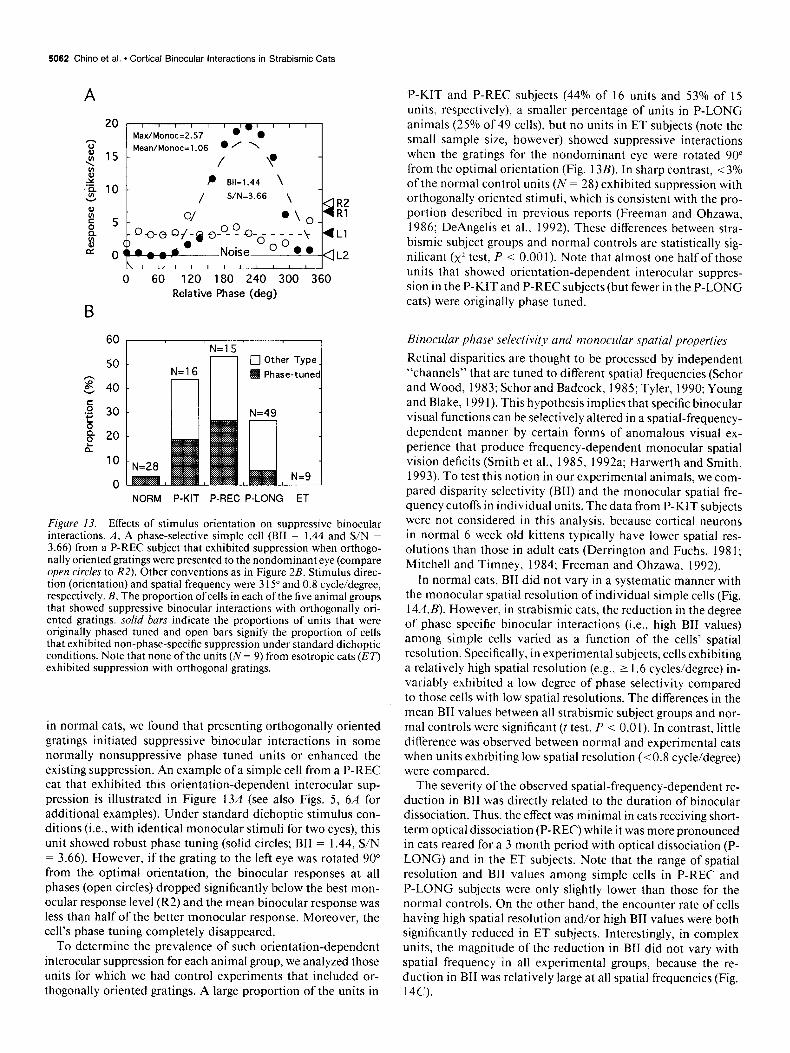
Figure 13. Effects of stimulus orientation on suppressive binocular interactions. A, A phase-selective simple cell (BII = 1.44 and S/N = 3.66) from a P-REC subject that exhibited suppression when orthogo- nally oriented gratings were presented to the nondominant eye (compare open circles to RZ). Other conventions as in Figure 2B. Stimulus direc- tion (orientation) and spatial frequency were 3 15” and 0.8 cycle/degree, respectively. B, The proportion of cells in each of the five animal groups that showed suppressive binocular interactions with orthogonally ori- ented gratings. solid bars indicate the proportions of units that were originally phased tuned and open bars signify the proportion of cells that exhibited non-phase-specific suppression under standard dichoptic conditions. Note that none of the units (N = 9) from esotropic cats (ET) exhibited suppression with orthogonal gratings.
in normal cats, we found that presenting orthogonally oriented gratings initiated suppressive binocular interactions in some normally nonsuppressive phase tuned units or enhanced the existing suppression. An example of a simple cell from a P-REC cat that exhibited this orientation-dependent interocular sup- pression is illustrated in Figure 13A (see also Figs. 5, 6A for additional examples). Under standard dichoptic stimulus con- ditions (i.e., with identical monocular stimuli for two eyes), this unit showed robust phase tuning (solid circles; BII = 1.44, S/N = 3.66). However, if the grating to the left eye was rotated 90” from the- optimal orientation, the binocular responses at all phases (open circles) dropped significantly below the best mon- ocular response level (R2) and the mean binocular response was less than half of the better monocular response. Moreover, the cell’s phase tuning completely disappeared.
To determine the prevalence of such orientation-dependent interocular suppression for each animal group, we analyzed those units for which we had control experiments that included or- thogonally oriented gratings. A large proportion of the units in
P-KIT and P-REC subjects (44% of 16 units and 53% of I5 units, respectively), a smaller percentage of units in P-LONG animals (25% of 49 cells), but no units in ET subjects (note the small sample size, however) showed suppressive interactions when the gratings for the nondominant eye were rotated 90 from the optimal orientation (Fig. 13B). In sharp contrast, ~3% of the normal control units (N = 28) exhibited suppression with orthogonally oriented stimuli, which is consistent with the pro- portion described in previous reports (Freeman and Ohzawa, 1986; DeAngelis et al., 1992). These differences between stra- bismic subject groups and normal controls are statistically sig- nificant (x2 test, P < 0.00 1). Note that almost one half of those units that showed orientation-dependent interocular suppres- sion in the P-KIT and P-REC subjects (but fewer in the P-LONG cats) were originally phase tuned.
Binocular phase selectivity and monocular spatial properties
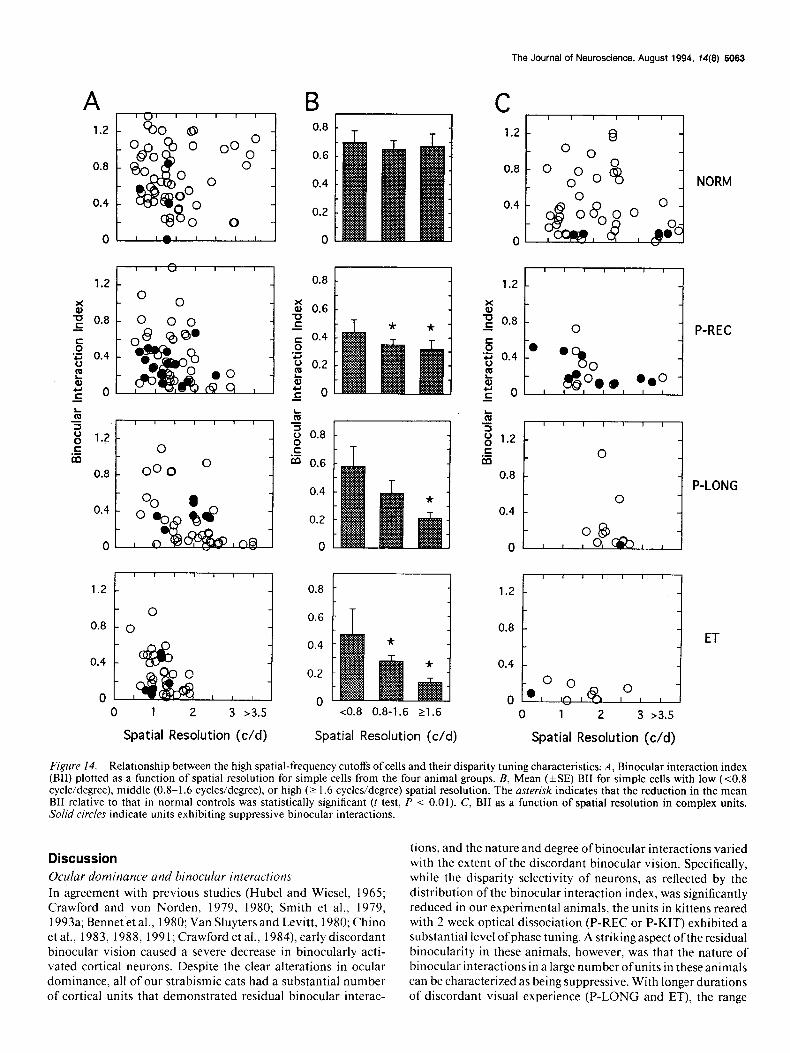
Retinal disparities are thought to be processed by independent “channels” that are tuned to different spatial frequencies (Schor and Wood, 1983; Schor and Badcock, 1985; Tyler, 1990; Young and Blake, 199 1). This hypothesis implies that specific binocular visual functions can be selectively altered in a spatial-frequency- dependent manner by certain forms of anomalous visual ex- perience that produce frequency-dependent monocular spatial vision deficits (Smith et al., 1985, 1992a; Harwerth and Smith, 1993). To test this notion in our experimental animals, we com- pared disparity selectivity (BII) and the monocular spatial fre- quency cutoffs in individual units. The data from P-KIT subjects were not considered in this analysis, because cortical neurons in normal 6 week old kittens typically have lower spatial res- olutions than those in adult cats (Derrington and Fuchs, 198 1; Mitchell and Timney, 1984; Freeman and Ohzawa, 1992).
In normal cats, BII did not vary in a systematic manner with the monocular spatial resolution of individual simple cells (Fig. 14A,B). However, in strabismic cats, the reduction in the degree of phase specific binocular interactions (i.e., high BII values) among simple cells varied as a function of the cells’ spatial resolution. Specifically, in experimental subjects, cells exhibiting a relatively high spatial resolution (e.g., 11.6 cycles/degree) in- variably exhibited a low degree of phase selectivity compared to those cells with low spatial resolutions. The differences in the mean BII values between all strabismic subject groups and nor- mal controls were significant (t test, P < 0.0 1). In contrast, little difference was observed between normal and experimental cats when units exhibiting low spatial resolution (~0.8 cycle/degree) were compared.
The severity of the observed spatial-frequency-dependent re- duction in BII was directly related to the duration of binocular dissociation. Thus, the effect was minimal in cats receiving short- term optical dissociation (P-REC) while it was more pronounced in cats reared for a 3 month period with optical dissociation (P- LONG) and in the ET subjects. Note that the range of spatial resolution and BII values among simple cells in P-REC and P-LONG subjects were only slightly lower than those for the normal controls. On the other hand, the encounter rate of cells having high spatial resolution and/or high BII values were both significantly reduced in ET subjects. Interestingly, in complex units, the magnitude of the reduction in BII did not vary with spatial frequency in all experimental groups, because the re- duction in BII was relatively large at all spatial frequencies (Fig. 14C).
The Journal of Neuroscience, August 1994, 14(E) 5063
0.6
0
0.8
0.2
0
0.8
0.6
” 0 1 2 3 >3.5 <0.8 0.8-1.6 21.6
Spatial Resolution (c/d) Spatial Resolution (c/d)
C 1.2
0.8
0.4
0
I ’ ’ ’ ’ ’ ’ I @
O 0 0
_i
o” 0 % 0
9 oao 0 I 0
0
.”
NORM
I I I I I I I
1.2 -
E E 0.8 -
0 P-REC 5 l 0 *g 0.4 -
! ! 73
r O , $,
0
s 0.Q 0.0 - , , , ,
k 2 I I I I I I /
E 1.2 -
.- m 0
0.8 - P-LONG
0 0.4 -
1.2
0.8
0 1 2 3 z-3.5
Spatial Resolution (c/d)
Figure 14. Relationship between the high spatial-frequency cutoffs of cells and their disparity tuning characteristics; A, Binocular interaction index (BII) plotted as a function of spatial resolution for simple cells from the four animal groups. B, Mean (&SE) BII for simple cells with low (co.8 cycle/degree), middle (0.8-1.6 cycles/degree), or high (2 1.6 cycles/degree) spatial resolution. The asterisk indicates that the reduction in the mean BII relative to that in normal controls was statistically significant (t test, P < 0.01). C, BII as a function of spatial resolution in complex units. Solid circles indicate units exhibiting suppressive binocular interactions.
Discussion Ocular dominance and binocular interactions In agreement with previous studies (Hubel and Wiesel, 1965; Crawford and von Norden, 1979, 1980; Smith et al., 1979, 1993a; Bennet et al., 1980; Van Sluyters and Levitt, 1980; Chino et al., 1983, 1988, 1991; Crawford et al., 1984) early discordant binocular vision caused a severe decrease in binocularly acti- vated cortical neurons. Despite the clear alterations in ocular dominance, all of our strabismic cats had a substantial number of cortical units that demonstrated residual binocular interac-
tions, and the nature and degree of binocular interactions varied with the extent of the discordant binocular vision. Specifically, while the disparity selectivity of neurons, as reflected by the distribution o,f the binocular interaction index, was significantly reduced in our experimental animals, the units in kittens reared with 2 week optical dissociation (P-REC or P-KIT) exhibited a substantial level ofphase tuning. A striking aspect ofthe residual binocularity in these animals, however, was that the nature of binocular interactions in a large number ofunits in these animals can be characterized as being suppressive. With longer durations of discordant visual experience (P-LONG and ET), the range
5064 Chino et al. * Cortical Binocular Interactions in Strabismic Cats
ofresidual binocular interactions was substantially reduced. The majority of cells in these animals were truly monocular, and binocular suppressive interactions were far less prevalent. Thus, one of the major conclusions of this study is that alterations in binocularity of cortical units due to early strabismus may occur in several stages prior to its total elimination. Residual func- tional connections from the nondominant eye have been ob- served in kittens following early and brief periods of monocular form deprivation (Freeman and Ohzawa, 1988) or surgical stra- bismus (Xue et al., 1987). However, in these studies the influ- ences of the nondominant eye was rarely suppressive in nature.
The graded loss of binocularity was observed primarily in simple cells. The reduction in binocular interactions were more extensive in complex cells of all strabismic cats, presumably because phase selectivity in complex neurons is more readily disrupted by early discordant visual experience than it is in simple cells. The level of phase selectivity in complex units probably reflects an orderly convergence ofphase tuned subunits onto a single complex unit (Movshon et al., 1978b; Ohzawa and Freeman, 1986b; DeAngelis et al., 1993b). Thus, phase tuning in complex cells would prevail only if integration in each in- dividual subunit and the orderly spatial convergence of subunits in each eye were unaffected by abnormal visual experience.
Suppression
A significant finding ofthis study was that suppressive binocular interactions dominated cortical physiology of strabismic sub- jects, particularly among those animals reared with a relatively brief period of optical dissociation (the P-REC and P-KIT cats). Suppression has been widely assumed to be the primary cause of deficits in binocular and monocular visual functions associ- ated with strabismus (e.g., Sireteanu and Fronius, 1981; Sire- teanu, 1982; Holopigian et al., 1986). Our results presumably represent neural correlates of the interocular suppression com- monly observed behaviorally in strabismic humans (also see Sengpiel et al., 1993, for a preliminary report on binocular sup- pression in the striate cortex of strabismic cats and Smith et al., 1992a. for a similar demonstration of suppression in Vl com- plex cells of strabismic monkeys).
Our results clearly indicate that suppressive binocular inter- actions are highly prevalent among cortical units after experi- encing early, briefbinocular dissociation (the P-KIT and P-REC subjects) and decrease if the period of dissociation is prolonged (the P-LONG and ET subjects) (Figs. 10-13). Further, the ex- periments in the P-KIT and P-REC subjects suggest that the high level of interocular suppression in the P-REC subjects is a permanent effect of the early, brief dissociation, and that the prolonged recovery period had very little effect on suppression in these animals.
Since we did not perform comparable analyses in normal young kittens, it is important to examine the possibility that the prevalent suppression in our P-KIT subjects may be the dom- inant property of striate cortical neurons in normal 6 week old kittc!zs:If this were true, it could be argued that the early, brief optical dissociation has “frozen” the normal state of cortical development in the P-REC animals. A number of observations suggest that it is a highly unlikely possibility. Specifically, we found that the P-KIT subjects exhibited a large reduction in binocular units relative to normal adults (Fig. 3) while cortical ocular dominance in normal young (4-6 weeks old) kittens is known to be very similar to that ofnormal adults (LeVay, 1978; Smith et al., 1979; Freeman and Ohzawa, 1988a). Thus, cortical
binocularity in the P-KIT subjects was not normal. Our con- clusion is also supported by previous findings. Specifically, the overall nature of binocular interactions in normal 3-5 week old kittens was reported to be nearly identical to those of adult cats (Freeman and Ohzawa, 1988a, 1992). Perhaps, the most sig- nificant observation in these studies was that there was no in- dication of an increased level of suppressive binocular inter- actions in normal kittens (Freeman and Ohzawa, 1992). The relative proportions of units exhibiting suppression in normal kittens at 3 weeks and 4 weeks were about 9% and 1 l%, re- spectively, compared to 8% in their normal adults. We employed experimental methods that were virtually identical to those used by Freeman and Ohzawa (i.e., recording methods, anesthesia, visual stimulation methods, and data analysis). When we ap- plied the same classification scheme to this study, over 50% of the units in the P-KIT subjects, compared to 7% (simple) and 9% (complex) ofour normal adult controls, were found to exhibit suppressive binocular interactions (Fig. 10). Taken together, the prevalent binocular suppression found in our P-KIT and P-REC subjects does not represent a normal neuronal property of 6 week old kittens, but it is a response property that is a char- acteristic of early strabismus.
In sharp contrast to the findings in our strabismic kittens, stimulus-dependent binocular suppression was reported to be virtually absent in monocularly deprived kittens (Freeman and Ohzawa, 1988a). In fact, the proportion of cells exhibiting sup- pressive interactions in Freeman and Ohzawa’s monocularly deprived kittens was the same or lower than that in their normal controls regardless of the onset or duration of monocular de- privation. Thus, these contrasting findings support the notion that the neural changes underlying alterations in cortical bin- ocularity are very different in monocularly deprived cats and strabismic animals. This idea may also explain the widely dif- ferent patterns of ocular dominance shifts observed between monocularly form-deprived cats and cats reared with experi- mental strabismus (Movshon and Kiorpes, 1990).
Regardless of the specific underlying mechanisms, our results are consistent with the well-accepted notion that the presence of correlated activities in both presynaptic and postsynaptic neurons, which occur as a result ofcorrelated visual inputs from both eyes, is necessary to maintain cortical binocularity (Raus- checker, 199 1; Friedlander et al., 1993). Suppression could dis- rupt the maintenance ofnormal ocular dominance by inhibiting or altering the neuronal firing patterns of one or both eyes’ inputs, or directly affecting the activity of postsynaptic units and, thus, create a decorrelation of signals between the two eyes or between pre- and postsynaptic neurons (Movshon and Kiorpes, 1990).
What could generate strong non-phase-specific suppression in the cortex following the induction of an interocular misalign- ment? Although the exact mechanisms are yet to be uncovered, suppression appears to be mediated by a large pool of local inhibitory neurons organized in a spatially incoherent manner. Such diffuse inhibitory pools of cortical neurons may act as a “floating-threshold mechanism” (Bonds, 1989) that initiates suppression when both eyes are stimulated together, regardless of relative interocular spatial phase or stimulus orientation (Fig. 13). Moreover, it is possible that such a large pool or pools of local inhibitory neurons may receive inputs from outside of the classical receptive field via long-range intrinsic horizontal con- nections (e.g., Eysel et al., 1987; Lowe1 and Singer, 1992) thus providing a cortical network that is highly sensitive to a small
The Journal of Neuroscience, August 1994, f4(8) 5065
spatial displacement between the two focused images (diplopia). In fact, most cortical layers of the cat and monkey visual cortex contain long-range horizontal connections whose physiological influences are excitatory or inhibitory, but largely subthreshold (Gilbert and Wiesel, 1989, 1990; Hirsch and Gilbert, 199 1; Katz and Calloway, 1992; Burkhalter et al., 1993).
Consistent with our hypothesis, the normal developmental pattern of long-range horizontal connections interconnecting oc- ular dominance columns was shown to require normal patterned visual activity (Calloway and Katz, 199 1) and to be disrupted by early surgical strabismus in cats (Lowell and Singer, 1992) and in monkeys with congenital strabismus (Tychsen and Burk- halter, 1992; Burkhalter and Tychsen, 1993). Unlike in normal animals, the developing long-range horizontal connections pref- erentially interconnected the ocular dominance columns inner- vated by one eye, and avoided the contralateral eye columns, thus becoming strictly monocular. Based on their anatomical data, Burkhalter and Tychsen (1993) suggested that extensive suppression due to early discordant visual inputs in their nat- urally strabismic monkeys appeared to be responsible for the observed loss of binocular inputs to intracortical connections. Our physiological results support this notion.
.44onocular spatial properties
Direct comparisons in the same cells between monocular spatial properties and binocular phase tuning yielded valuable new in- formation. Specifically, the development ofbinocular phase tun- ing was closely associated with the monocular spatial properties of cortical units in strabismic animals, particularly for simple cells. Simple cells tuned to higher spatial frequencies exhibited a relatively more severe reduction in binocular phase selectivity (BII) than units tuned to lower spatial frequencies. Furthermore, this spatial-frequency-dependent loss was more pronounced in animals reared with longer periods of binocular dissociation (i.e., ET > P-LONG > P-REC). Both of these results provide evidence for the hypothesis that disparity tuning may be altered in a spatial-frequency-dependent manner and could be selec- tively affected by the nature of an animal’s early visual expe- rience (Norcia et al., 1985; Tyleret al., 1990). However, it should be remembered that all spatial frequencies were affected in our strabismic animals, but not equally, presumably due to an initial widespread suppression that affected all neurons regardless of their spatial tuning characteristics. Obviously, the limit imposed by a neuron’s ability to resolve fine details (resolution) would also constrain its ability to detect interocular phase shifts (dis- parity) between dichoptic gratings (disparity threshold) as evi- denced in our ET animals (see Chino et al., 1983, for a more complete demonstration of spatial resolution loss in both eyes of ET cats) and in normal young kittens (Freeman and Ohzawa, 1992).
Behaviorally, while we have no psychophysical data for these cats, it is reasonable to speculate that their fine stereopsis would be severely reduced, whereas coarse stereopsis may have been maintained. Recently. Harwerth and Smith (1993) have re- ported a substantial reduction in fine stereopsis with a sparing of coarse disparity processing mechanisms in their strabismic (esotropic) monkeys. Although the level of disparity tuning in cortical units may not necessarily indicate the functional status of stereoscopic vision in a given animal, it is widely assumed that the presence of highly sensitive disparity detection mech- anisms in the early stages ofcortical processing is a fundamental requirement for stereopsis.
Conclusions
We conclude that the breakdown in cortical binocularity pro- duced by early discordant binocular visual experience is not an all-or-none process. Instead, the occurrence of extensive sup- pressive binocular interactions precedes the total breakdown of cortical binocularity. Moreover, the functional class of a cell (i.e., simple vs complex), its monocular spatial properties, and duration of the early abnormal visual experience strongly influ- ence the overall characteristics ofthe binocular deficits in a given cell.
References Barlow HB, Blakemore C, Pettigrew JD (1967) The neural mecha-
nisms of binocular depth discrimination. J Physiol (Lond) 193:327- 342.
Bauman LA, Bonds AB (1991) Inhibitory refinement of spatial fre- quency selectivity in single cells of the cat striate cortex. Vision Res 3 1:933-944.
Bennet MJ, Smith EL III, Harwerth RS, Crawford MLJ (1980) Ocular dominance, eye alignment and visual acuity in kittens reared with an optically induced squint. Brain Res 193:33-45.
Bonds AB (1989) Role of inhibition in the specification of orientation selectivity of cells in the cat striate cortex. Vis Neurosci 2:4l-55.
Boothe RG. Dobson V. Teller DY (1985) Postnatal development of vision in human and nonhuman primates. Annu Rev Neurosci 8:495- 545.
Burkhalter A, Tychsen L (1993) Alterations of intracortical connec- tions in monkeys who lacked normal binocular experience in infancy. Invest Ophthalmol Vis Sci [Suppl] 34: I 173.
Burkhalter AB, Bernard0 KL, Charles V (1993) Development of local circuits in human visual cortex. J Neurosci 13: I9 16-l 93 1.
Calloway EM, Katz LC (199 1) Effects of binocular deprivation on the development of clustered horizontal connections in cat striate cortex. Proc Nat1 Acad Sci USA 88:745-749.
Chino YM, Shansky MS, Jankowski WL, Banser FA (1983) Effects of rearing kittens with convergent strabismus on the development of receptive field properties in striate cortex neurons. J Neurophysiol 50:265-286.
Chino YM, Ridder WH III, Czora EA (1988) Effects of convergent strabismus on spatio-temporal properties and contrast sensitivity of neurons in area 18. Exp Brain Res 72:264-278.
Chino YM, Smith EL III, Wada H, Ridder WL, Langston AL, Lesher GA (199 I) Disruption of binocularly correlated input leads to def- icits in spatial properties of striate cortical neurons in cats. J Neu- rophysiol 65:841-859.
Crawford MLJ, von Noorden GK (1979) The effects of short-term experimental strabismus on the visual system in Mucaca muhtta. Invest Ophthalmol Vis Sci 18:496-505.
Crawford MLJ, von Noorden GK (1980) Optically induced commitant strabismus in monkevs. Invest Ophthalmol Vis Sci 19: I 105-l 109.
Crawford MLJ, Smith EL, HarwerthRS, von Norden GK (I 984) Ster- eoblind monkeys have few binocular neurons. Invest Ophthalmol Vis Sci 251779-78 I.
Crewther DP, Crewther SG (1990) Neural site of strabismic amblyopia in cats: spatial frequency deficit in primary cortical neurons. Exp Brain Res 7916 15-622.
Cynader M, Gardner JC, Mustrari M (1984) Effects of neonatally induced strabismus on binocular responses in cat area 18. Exp Brain Res 53:384-399.
Daw NW, Fox K, Sato H, Czepita D (199 I) Critical period for mon- ocular deprivation in the cat visual cortex. J Neurophysiol 67:197- 202.
DeAngelis GC, Ohzawa I, Freeman RD (1991) Depth is encoded in the visual cortex by a specialized receptive field structure. Nature 352: 156-159.
DeAngelis GC, Robson JG, Ohzawa I, Freeman RD (1992) Organi- zation of suppression in receptive fields of neurons in cat visual cortex. J Neurophysiol 68: 144-l 631
DeAnnelis GC. Ohzawa I. Freeman RD (1993a) Spatiotemporal or- ga&ation of simple-cell receptive fields‘in the’cat’s striate cortex. I. General characteristics and postnatal development. J Neurophysiol 69:1091-l 117.
5066 Chino et al. * Cortical Binocular Interactions in Strabismic Cats
DeAngelis GC, Ohzawa I, Freeman RD (1993b) Spatiotemporal or- ganization of simple-cell receptive fields in the cat’s striate cortex. II. Linearitv of temporal and spatial summation. J Neurophysiol 69: 11184135. -
Derrington AM, Fuchs AF (198 1) The development of spatial-fre- auencv selectivitv in kitten striate cortex. J Phvsiol (Lond) 3 16:1-10.
Edgers HM, Gizzi MS, Movshon JA (1984) Spatial properties of striate cortical neurons in esotropic macaques. Invest Ophthalmol Vis Sci [Suppl] 25:278.
Eysel UT, Worgotter F, Pape H-C (1987) Local cortical lesions abolish lateral inhibition at direction selective cells in cat visual cortex. Exp Brain Res 68:606-612.
Ferster D (1981) A comparison of binocular depth mechanisms in areas 17 and 18 of the cat visual cortex. J Physiol (Lond) 311:623- 655.
Ferster D (I 988) Spatially opponent excitation and inhibition in sim- ple cells of the cat visual cortex. J Neurosci 8: 1172-l 180.
Ferster D (1990) X- and Y-mediated synaptic potentials in neurons of areas 17 and 18 of cat visual cortex. Vis Neurosci 4: 115-l 33.
Freeman RD, Ohzawa I (1988) Monocularly deprived cats: binocular tests of cortical cells reveal functional connections from the deprived eye. J Neurosci 8:249 l-2506.
Freeman RD. Ohzawa I (1990) On the neurophysiological organiza- tion of binocular vision. Vision Res 30: 166 1-l 676.
Freeman RD. Ohzawa I (1992) Development of binocular vision in the kitten’s striate cortex. J Neurosci I??:472 l-4736.
Freeman RD. Robson JG (1982) A new approach to the study of binocular interaction in visual cortex: normal and monocularly de- prived cats. Exp Brain Res 48:296-300.
Friedlander M J. Tootle JS (1990) Postnatal anatomical and physio- logical development of the visual system. In: Development of sensory systems in mammals (Coleman JR, ed), pp 61-124.
Friedlander MJ, Fregnac Y, Burke JP (1993) Temporal covariance of postsynaptic membrane potential and synaptic input- role in synaptic etlicacv in visual cortex. In: Progress in brain research, Vol 95 (Hicks TP. MblotchnikoffS, Ohno T, eds), pp 207-223. New York: Elsevier.
Gilbert CD, Wiesel TN (1989) Columnar specificity of intrinsic hor- izontal and corticocortical connections in cat visual cortex of the cat. J Neurosci 9:2432-2442.
Gilbert CD, Wiesel TN (I 990) The influence of contextual stimuli on the orientation selectivity of cells in the primary visual cortex of cats. Vision Res 30: 1689-l 70 1.
Hamamoto J, Chino Y, Smith EL III, Cheng H, Yoshida K (1992) Temporal characteristics of signal transfer in the LGN of normal and strabismic cats. Invest Ophthalmol Vis Sci [Suppl] 33: 1215.
Harwerth RS, Smith EL (1993) Binocular disparity processing in mon- keys with abnormal early vision. Invest Ophthalmol Vis Sci [Suppl] 34:1188.
Harwerth RS, Smith EL, Crawford MLJ, von Noorden GK (1990) Behavioral studies of the sensitive periods of development of visual functions in monkeys. Behav Brain Res 4 1: 179-l 98.
Henry GH, Bishop PO, Tupper RM, Dreher B (1973) Orientation specificity and response variability ofcells in the striate cortex. Vision Res 13:1771-1779.
Hirsch JA, Gilbert CD (199 1) Synaptic physiology of horizontal con- nections in the cat’s visual cortex. J Neurosci 11: 1800-I 809.
Hoffman K-P, Cynader M (1977) Functional aspects of plasticity in the visual system of adult cats after early monocular deprivation. Philos Trans R Sot Lond [Biol] 278:4 1 I-424.
Holouieian K. Blake R (1983) Spatial vision in strabismic cats. J Neuriphysiol 50:287-296. ’ .
Holopigian K, Blake R, Greenwald MJ (1986) Selective losses in binocular vision in anisometropic amblyopes. Vision Res 26:621- 630.
Hubel DH, Wiesel TN (I 962) Receptive fields, binocular interactions and functional architecture in the cat’s visual cortex. J Physiol (Lond) 160:106-154.
Hubel DH, Wiesel TN (1965) Binocular interactions in striate cortex of kittens reared with artificial squint. J Neurophysiol28: 104 1-l 05 1.
Hubel DH. Wiesel TN. LeVav S (I 977) Plasticitv of ocular dominance in monkey striate cortex. Phil& Trans R Sot iond [Biol] 278:377- 409.
Katz LC, Galloway EM (I 992) Development of local circuits in mam- malian visual cortex. Annu Rev Neurosci 15:3 l-56.
Kiorpes L, Movshon JA (1990) Behavioral analysis of visual devel-
opment. In: Development of sensory systems in mammals (Coleman JR, ed), pp 125-154.
Kratz KE, Spear PD, Smith DC (1976) Postcritical period reversal of effects of monocular deprivation on striate cortex cells in the cat. J Neurophysiol 39:501-5 11.
LeVay S, Voigt T (1988) Ocular dominance and disparity coding in cat visual cortex. Vis Neurosci 1:395-4 14.
LeVay S, Stryker MP, Shatz CJ (1978) Ocular dominance columns and their development in layer IV of the cat’s visual cortex: a quan- titative study. J Comp Neurol 179:223-244.
LeVay S, Wiesel TN, Hubel DH (1980) The development of ocular dominance columns in normal and visually deprived monkeys. J Comp Neurol 19 I : l-5 1.
Leventhal AG, Hirsch HVB (1980) Receptive field properties of dif- ferent classes of neurons in visual cortex of normal and dark-reared cats. J Neurophysiol 43: 111 l-l 132.
Lowell S, Singer W (1992) Selection of intrinsic horizontal connections in the visual cortex by correlated neuronal activity. Science 255:209- 255.
Macy A, Ohzawa I, Freeman RD (1982) A quantitative study of the classification and stability of ocular dominance in the cat visual cor- tex. Exp Brain Res 48:401-408.
Mitchell DE, Timney B (1984) Postnatal development of function in the mammalian visual system. In: Handbook of physiology, Vol 3, Set I, Nervous system III (Darian-Smith I, ed), pp 507-555. Wash- ington, DC: American Physiological Society.
Movshon JA, Kiorpes L (1990) The role of experience in visual de- velopment. In: Development of sensory systems in mammals (Cole- man JR, ed), pp 156-202. New York: Wiley.
Movshon JA, Van Sluyters RC (I 98 1) Visual neural development. Annu Rev Psycho1 321477-522.
Movshon JA, Thompson ID, Tolhurst DJ (I 978a) Spatial summation in the receptive fields of simple cells in the cat’s striate cortex. J Physiol (Lond) 283~53-77.
Movshon JA, Thompson ID, Tolhurst DJ (1978b) Receptive field organization of complex cells in the cat’s striate cortex. J Physiol (Lond) 283:78-99.
Mower GD, Burchfiel JL, Duffy FH (1982) Animal models of stra- bismic amblyopia: physiological studies of visual cortex and the lat- eral geniculate nucleus. Dev Brain Res 5:3 1 l-327.
Norcia AM, Sutter EE, Tyler CW (1985) Electrophysiological evidence for the existence of coarse and fine disparity mechanisms in human vision. Vision Res 25:1603-I61 I.
Ohzawa I, Freeman RD (1986a) The binocular organization of simple cells in the cat’s visual cortex. J Neurophysiol 56:221-242.
Ohzawa I, Freeman RD (1986b) The binocular organization of com- olex cells in the cat’s visual cortex. J Neurophvsiol 56:243-259.
Ohzawa I, DeAngelis GC, Freeman RD (1991) Stereoscopic depth discrimination in the visual cortex: neurons ideally suited as disparity detectors. Science 249: 1037-104 I.
Orban GA (I 99 1) Quantitative electrophysiology of visual cortical neurons. In: Vision and visual disfunction, Vol4, Chapt 8, The neural basis of visual function (Leventhal AG, ed). Boca Raton, FL: CRC.
Pettigrew JD ( 1974) The effect of visual experience on the development of stimulus specificity by kitten cortical neurons. J Physiol (Lond) 237~49-74.
Pettigrew JD, Cooper ML, Blasdel GG (1979) Improved use of tapetal reflection for eye position monitoring. Invest Ophthalmol Vis Sci 18: 490-495.
Poggio GF, Gonzalez F, Krause F (1988) Stereoscopic mechanisms in monkey visual cortex: binocular correlation and disparity selectiv- ity. J Neurosci 8:453 I-4550.
Rauschecker JP (199 1) Mechanisms of visual plasticity: Hebb syn- apses, NMDA receptors, and beyond. Physiol Rev 7 1:587-6 15.
Schor CM, Badcock DR (1985) A comparison of stereo and vernier acuity within spatial channels as a function of distance from fixation. Vision Res 25: 1113-l 119.
Schor CM, Wood I (1983) Disparity range for local stereopsis as a function of luminance spatial frequency. Vision Res 23:1649-1654.
Shatz CJ, Stryker MP (1978) Ocular dominance in layer IV ofthe cat’s visual cortex and the effects of monocular deprivation. J Physiol (Lond) 28 1:267-283.
Sherman SM (1972) Development of interocular alignment in cats. Brain Res 37: 187-203.
The Journal of Neuroscience, August 1994, M(8) 5067
Sherman SM, Spear PD (1982) Organization of visual pathways in normal and visually deprived cats. Physiol Rev 62:738-855.
Sireteanu R (1982) Binocular vision in strabismic humans with al- ternating fixation. Vision Res 22:889-894.
Sireteanu R, Fronius M (198 1) Naso-temporal asymmetries in human amblyopia: consequence of long-term interocular suppression. Vision Res 21:1055-1063.
Skottun BC, De Valois RL, Grosf DH, Movshon JA, Albrecht DG, Bonds AB (199 1) Minireview: classifying simple and complex cells on the basis of response modulation. Vision Res 3 1: 1079-1086.
Smith DC, Spear PD, Kratz KE (1978) Role of visual experience in postcritical period reversal of effects of monocular deprivation in the cat. J Comp Neurol 178:313-328.
Smith EL, Harwerth RS (1993) Vernier discrimination thresholds in monkeys with anisometropic amblyopia. Invest Ophthalmol Vis Sci [Suppl] 43:7 11.
Smith EL, Bennet MJ, Harwerth RS, Crawford MLJ (1979) Binocu- larity in kittens reared with optically induced squint. Science 204: 875-877.
Smith EL, Harwerth RS, Crawford MLJ (1985) Spatial contrast sen- sitivity deficits in monkeys produced by anisometropic amblyopia. Invest Ophthalmol Vis Sdi 26:330-342..
Smith EL III, Chino YM, Ridder WH III, Kitagawa K, Langston A (199 1) Orientation bias of neurons in the lateral geniculate nucleus of macaque monkeys. Vis Neurosci 555-545.
Smith EL, Chino YM, Cheng H, Hamamoto J, Crawford MLJ (1992a)
Cortical binocular interactions in monkeys with anisometropic am- blyopia. Invest Ophthalmol Vis Sci [Suppl] 33:869.
Smith EL, Chino YM, Ni J, Cheng H (1992b) Binocular combination of contrast signals in the striate cortex of macaque monkeys. Sot Neurosci Abstr 18:296.
Timney B (198 1) The development of binocular depth perception in kittens. Invest Ophthalmol Vis Sci 2 1:493-496.
Tychsen L, Burkhalter A (1992) Naturally strabismic primate lacks intrinsic horizontal connections in striate cortex. Sot Neurosci Abstr 18:1455.
Tyler CW (1990) A stereoscopic view of visual processing streams. Vision Res 30: 1877-1990.
Van Sluyters RC (1978) Reversal of the physiological effects of brief period of monocular deprivation in kitten. J Physiol (Lond) 284: l- 17.
Van Sluyters RC, Levitt F (1980) Experimental strabismus in kittens. J Neurophysiol 43:686-699.
Wiesel TN, Hubel DH (1965) Extent of recovery from the effects of visual deprivations in the kitten. J Neurophysiol 28:1060-1072.
Wood ICJ (198 1) Stereonsis with snatiallv-dearaded imaaes. Onhthal- mol Physiol Opt 3:3371340. _ - -
I I
Young Y, Blake R (1991) Spatial frequency tuning of human stere- opsis. Vision Res 3 1: 117-l 189.
Yoshida K, Chino YM, Smith EL, Hamamoto J, Cheng H, Diaz Y (1993) Effects of neonatally induced strabismus on cortical binocular interactions in cats. Invest Ophthalmol Vis Sci [Suppl] 34:792.