extraction of perceptually salient contours by striate cortical networks
TRANSCRIPT
To appear in Vision Research.
Extraction of Perceptually Salient Contours by StriateCortical Networks
Shih-Cheng Yen, Leif H. Finkel
Department of Bioengineering and Institute of Neurological SciencesUniversity of Pennsylvania
3320 Smith Walk, Philadelphia, PA 19104
Abstract
We present a cortical-based model for computing the perceptual salience of contours embedded in noisyimages. It has been suggested (Gilbert, 1992; Field, Hayes & Hess, 1993) that horizontal intra-corticalconnections in primary visual cortex may modulate contrast detection thresholds and pre-attentive “pop-out”. In our model, horizontal connections mediate context-dependent facilitatory and inhibitoryinteractions among oriented cells. Strongly facilitated cells undergo temporal synchronization; andperceptual salience is determined by the level of synchronized activity. The model accounts for a range ofreported psychophysical and physiological effects of contour salience (Polat & Sagi, 1993, 1994; Kapadia,Ito, Gilbert & Westheimer, 1995; Field et al., 1993; Kovács, Polat & Norcia, 1996; Pettet, McKee &Grzywacz, 1996). In particular, the model proposes that intrinsic properties of synchronization account forthe increased salience of smooth, closed contours (Kovács & Julesz, 1993, 1994). Application of the modelto real images is demonstrated.
Keywords:closure contour salience striate cortex synchronization
Running Head: Extraction of Perceptually Salient Contours
1 Introduction
The idea that perceptual salience depends upon context originated with the Gestalt psychologists. TheGestalt laws describe the influence of global context on the perception of local features. Elements tend tobe perceptually grouped and made salient if they are close to each other (proximity), similar to one another(similarity), form a continuous contour (good continuation), form a closed contour (closure), or movetogether in the same direction (common fate) (Rock & Palmer, 1990). This tradition has motivated anumber of recent psychophysical and physiological studies which have investigated context-dependentmodification of contrast sensitivity thresholds, pre-attentive “pop-out”, and the extraction of smoothcontours and coherent motion trajectories from cluttered backgrounds (Field et al., 1993; Kovács & Julesz,1993, 1994; Pettet et al., 1996; Newsome, Britten & Movshon, 1989; Watamaniuk & Sekuler, 1992).Recent anatomical and physiological studies (Rockland & Lund, 1982, 1983; Kapadia et al., 1995; Singer& Gray, 1995; Gilbert, Das, Ito, Kapadia & Westheimer, 1996; Fitzpatrick, 1996) have suggestedmechanisms by which these context-dependent effects may be carried out in striate cortex. It has beenproposed that long-range horizontal connections may provide the means of modulating cell responses basedon the structure of the distant surround (Gilbertet al., 1996). Evidence suggests that the same cortical cellswhich are inter-connected by long-range horizontal connections are also involved in synchronization (seeSinger & Gray, 1995, for a review; Gray & McCormick, 1996). We test the ability of a model composedof units modeled after striate cortical cells, embedded in an anatomical network of long-range connections,and capable of temporal synchronization, to account for reported psychophysical results on contour salience.
The salience of a stimulus depends in part on its contrast relative to that of surrounding stimuli. However,contrast sensitivity can be modulated by the structure of stimulation in the surround. Polat and Sagi (1993,1994) measured changes in detection thresholds for a low contrast Gabor patch when two high contrast
2
Gabor patches of the same orientation were placed on either side of it . When the flanking stimuli arepositioned at distances beyond 2λ (where λ is the standard deviation of the Gaussian window of the Gaborfunction), local contrast sensitivity is increased. This facilitatory effect peaks at a separation of 3λ andremains above baseline out to 12λ. At the lowest spatial frequency tested (λ = 0.3˚), this corresponds to amaximal range of 3.6˚ for the facilitation. At separations less than 2λ, the flanking stimuli decreasecontrast sensitivity, presumably, as suggested by Polat and Sagi (1993), as a result of encroachment on theinhibitory surround of the classical receptive field (CRF) (DeAngelis, Freeman & Ohazawa, 1994, providesupporting physiological evidence for this effect). All effects scale with λ. When the three Gabor patchesare oriented orthogonal to the orientation axis, similar effects are obtained, although extending over ashorter spatial range (returning to baseline around 3λ, which is 0.225˚ for λ = 0.075˚).
In more complex images, these same spatial interactions between oriented elements are thought to mediateperceptual “pop-out”. Using a 2AFC paradigm, Field et al. (1993) tested the ability of subjects to detect atarget embedded in a large field of randomly oriented Gabor function elements. The target was composed ofa small set of the oriented Gabor functions aligned to form a smooth contour. They found that targetdetectability depended on several factors, most importantly, the relative orientations of the elements.Targets could be detected if the orientations of adjacent contour elements differed by as much as 60˚. Asimilar but weaker effect on detectability was observed when the elements were oriented perpendicular to thecontour. All effects were robust over a range of element densities and presentation times.
Using a similar experimental paradigm, Kovács and Julesz (1993, 1994) demonstrated that closed contoursare more salient than open contours. They reported that on a closed contour, the maximum inter-elementseparation, ∆c, (defined to be at 75% correct performance for detection), is larger than the maximumdetectable spacing for elements on an open contour, ∆o.
1 They also found a striking difference in the effectof adding additional contour elements at threshold separations to closed versus open contours. The saliencyof open contours increased monotonically as elements spaced at ∆o were added; but for elements spaced at∆c, the saliency remained very low and dramatically increased only when the contour was closed. Pettet etal. (1996) further showed that the smoothness of the contour plays a large role in determining saliency.Contours with sharp curves have decreased salience whether they are open or closed.
More recent experiments by Kovács et al. (1996) suggest that the critical factor in detecting a contourembedded in noise is the relative distance between elements of the contour and elements of the background.If target and background elements are indistinguishable, e.g., identical small circular dots, then a targetcontour can only be detected when its elements are spaced more closely than the spacing betweenbackground elements (Kovács et al., 1996). However, when the elements are oriented, they can be separatedup to 1.5 times the average separation of background (oriented) elements, and the contour can still bedetected. Kovács and colleagues found that at threshold, the ratio between the separation of backgroundelements and the separation of contour elements, ϕ, was approximately 0.65. These experiments suggestthat background elements contribute a certain amount of “noise”, which sets a lower limit for signaldetection. Within some broad anatomical limit, the distance over which elements can be grouped intocontours is therefore totally context-dependent.
The orientation specific nature of these effects, as well as the observation that contours can be integratedstereoptically across depth planes (Hess & Field, 1995), suggest that these effects are mediated at thecortical level. Given that the influence of surrounding elements extends over several degrees of visual angleit has been suggested that long-range horizontal connections in striate cortex may underlie these effects(Field et al., 1993; Kovács & Julesz, 1993, 1994; Kapadia et al., 1995; Gilbert et al., 1996).2 Horizontalconnections have been observed to spread over 5 - 8 millimeters of cortex (Gilbert & Wiesel, 1979, 1983,1989; Rockland & Lund, 1982, 1983; Martin & Whitteridge, 1984; Ts’o, Gilbert & Wiesel, 1986; Ts’o &Gilbert, 1988). Considering that there is no overlap in the receptive fields for cells separated by 1.5 mm 1 If the target elements differ in another feature, such as color, they can be spaced farther apart.2 These connections have also been implicated in texture segmentation (Knierim & Van Essen, 1992) and context-dependent receptive field reorganization (Pettet and Gilbert, 1992).
3
(Hubel & Wiesel, 1974), this represents connections between cells separated by distances four to five timestheir receptive field sizes. Depending on visual eccentricity, receptive field sizes vary from less than 1˚ toseveral degrees (Gilbert & Wiesel, 1979, 1983; DeAngelis et al., 1994). This suggests that connectionsbetween cells separated by more than 10˚ are highly plausible over most of primary visual cortex. Indeed,interactions spanning 15˚ of visual cortex have been reported in the literature (Gilbert & Wiesel, 1979;Fitzpatrick, 1996). Thus the range of these connections are well within the range of the interactionsdescribed in the psychophysical experiments (Polat & Sagi: 0.225˚ - 3.6˚, Field et al.: 0.25 ̊- 0.9˚, Kovács& Julesz: 0.4 ̊- 0.72˚). Cross-correlation studies (Toyama, Kimura & Tanaka, 1981a,b; Gilbert & Wiesel,1989; Hata, Tsumoto, Sato, Hagihara & Tamura, 1993) suggest that these horizontal connections areprimarily between cells of like orientation tuning. They also match the topography of axonal projectionsrecently identified using intracellular labels (Fitzpatrick, 1996).
Several physiological studies have reported changes in cell activity that may be mediated by these horizontalconnections. Nelson and Frost (1985) found that when recording from striate cortex of anesthetized cats, theresponse to an optimally oriented bar presented inside the CRF could be suppressed by a drifting gratingoutside the CRF. They noted that the response showed periodic relief from inhibition at those times whencollinear regions outside the receptive field were stimulated. These effects extended out to 5˚ of visual spacefrom the center of the receptive field. They proposed that the flanking regions were contributing excitatoryinputs that periodically countered the inhibitory inputs from the surround. Kapadia et al., (1995)systematically investigated these effects in awake behaving macaque monkeys by recording the responses ofcomplex cells in the superficial layers of V1 to elongated bars outside CRF. They found significantfacilitation of cell responses to a low contrast bar when a collinear high contrast bar was placed outside theCRF. This facilitation varied as a function of separation, alignment, and relative orientation between thetwo bars (see Figure 4). They found a close correspondence between these physiological effects andpsychophysical responses in human observers.
In striate cortex, 80% of the long distance connections synapse onto excitatory cells and the other 20%target inhibitory interneurons (McGuire, Gilbert, Rivlin & Wiesel, 1991). Using optical recordings,Weliky, Kandler, Fitzpatrick and Katz (1995) observed short-latency excitation followed by a longer latency,presumably di-synaptic, inhibition following stimulation of cells separated by up to 1300 µm (Weliky etal., 1995).3 Evidence suggests that this inhibition is more broadly tuned in orientation compared toexcitatory inputs (Nelson & Frost, 1978, 1985; DeAngelis, Robson, Ohzawa & Freeman, 1992; DeAngeliset al., 1994). The results also suggest that the magnitude of the inhibition is similar to that of long-distance excitation, but inhibition arises from regions that are more isotropically distributed with respect tothe CRF. Kapadia et al. (1995) also reported inhibitory effects on a target bar surrounded by randomlyoriented bars in the distant surround. This inhibition was converted to strong facilitation with the additionof collinear bars in the surround. Similar inhibitory effects from outside the classical receptive field havebeen observed with other experimental paradigms (Knierim & Van Essen, 1992; Sillito, Grieve, Jones,Cudeiro & Davis, 1995).
These same long-distance horizontal connections have also been implicated in the context-dependenttemporal synchronization of cells with non-overlapping receptive fields, sometimes even separated byseveral millimeters of cortex (Gray, König, Engel & Singer, 1989; Engel, König, Gray & Singer, 1990;Engel, Kreiter, König & Singer, 1991; Livingstone, 1996). These investigators and others have suggestedthat temporal synchronization may be used to group related features together across the visual field, as wellas in other domains of sensory input. The mechanism underlying the generation of these synchronizedresponses has been debated, but recent evidence suggests that a certain subtype of cortical cells in thesupragranular layers of striate cortex, termed “chattering” cells, may participate in the synchronization ofcortical responses (Gray & McCormick, 1996).
3 Direct inhibitory connections spread only 200-600 µm (Kisvárday & Eysel, 1992).
4
2 The Model
These accumulated studies suggest that perceptual salience may arise from temporal synchronization ofcortical cells, which in turn depends upon the spatial relationship between stimulus elements as mediated bylong-range horizontal connections. Horizontal connections can carry out modulatory interactions betweencells, but temporal mechanisms are required to represent global context, such as closure. Our model iscomposed of an array of units modeled after cortical cells, which extract orientation and spatial frequencyinformation at each location in the scene. Units are interconnected by long range horizontal connectionswhich provide both facilitation and inhibition. Only cells which receive both local input (to the CRF) andsupport from stimuli in the surround can be facilitated. A longer-latency inhibition suppresses theresponses of weakly facilitated cells, allowing only the strongly facilitated cells to remain active. Weassume that facilitation “promotes” cells into a bursting state, similar to the “chattering” behavior observedin Gray and McCormick (1996). Cells in the bursting mode can then undergo synchronization. In themodel, facilitated cells are modeled as neural oscillators (Kopell & Ermentrout, 1986; Baldi & Meir, 1990;Somers & Kopell, 1993; Terman & Wang, 1995). The strength of the coupling between oscillatorsdetermines which cells synchronize with one another, and also determines the degree of synchronizationachieved among the cells. We propose that perceptual salience is directly related to the level ofsynchronized activity among a group of cells. Based on the coherence of the synchronization, the networkcan generate an estimate of the salience of all contours in the image. The network’s estimate be comparedto human psychophysics using the paradigms in the experiments discussed above.
2.1 Model CellsQuadrature pair linear steerable filter pyramids (Freeman & Adelson, 1991) are used to efficiently representthe responses of oriented cells in primary visual cortex. Steerable filters allow the energy at any orientationand spatial frequency to be efficiently calculated from the responses of a set of basis filters. Steerable filtersalso allow the direct determination of the dominant orientation (i.e., the orientation preference of themaximally responding cell) at each spatial frequency and position (Freeman & Adelson, 1991). Steerablefilters are used here for computational efficiency - they differ in aspect ratio and bandwidth from corticalcells. Nonetheless, they provide an adequate model of local orientation extraction for our purposes and theircomputational advantage will become significant in the sections described below.
We used the G4 (fourth derivative of a Gaussian) and H4 (Hilbert transform of the G4 filter) filters, whichhave been shown to be reasonable approximations to the shape of receptive fields in V1 (Young, 1987;Young & Lesperance, 1993). The squared responses of the cells at the dominant orientation at eachposition in the image is illustrated in Figure 11b.
2.2 FacilitationUnits are interconnected by long-range horizontal connections. The sign, magnitude and time course of thesynaptic interactions depend upon the position and orientation of the target cell, creating separate spatialzones of excitation and inhibition. The connection field is shown in Figure 1b. Excitatory connections areconfined to two regions, one flaring out along the axis of orientation of the cell (co-axial), and anotherconfined to a narrow zone extending orthogonally to the axis of orientation (trans-axial). The co-axialconnections are similar to the “association field” proposed by Field et al. (1993), and are generated by asimple equation (see Appendix) modified from Parent and Zucker’s (1989) “co-circular” connection scheme.For a cell of orientation θA at location “A”, there is a “preferred” orientation at location “B”, φB, given bythe tangent to the unique circle which passes through both “A” and “B”, and whose tangent at “A” agreeswith the local orientation, θA, at “A” (see Figure 1a).4 If the local orientation activity distribution at “B”peaks at φB, the cell with orientation θA at “A” will be strongly facilitated. As the local orientation at “B”deviates from φB, the degree of facilitation decreases. The “preferred” orientation at “B” can thus be thoughtof as providing “support” for the orientation, θA, at “A”. Connection weights also decrease for positionswith increasing angular deviation from the orientation axis of the cell, reflecting a preference for straight 4 The “co-circular” connection pattern uses a circle as a model for all the possible smooth curves that could passthrough both “A” and “B” and is not a circle or curvature detector.
5
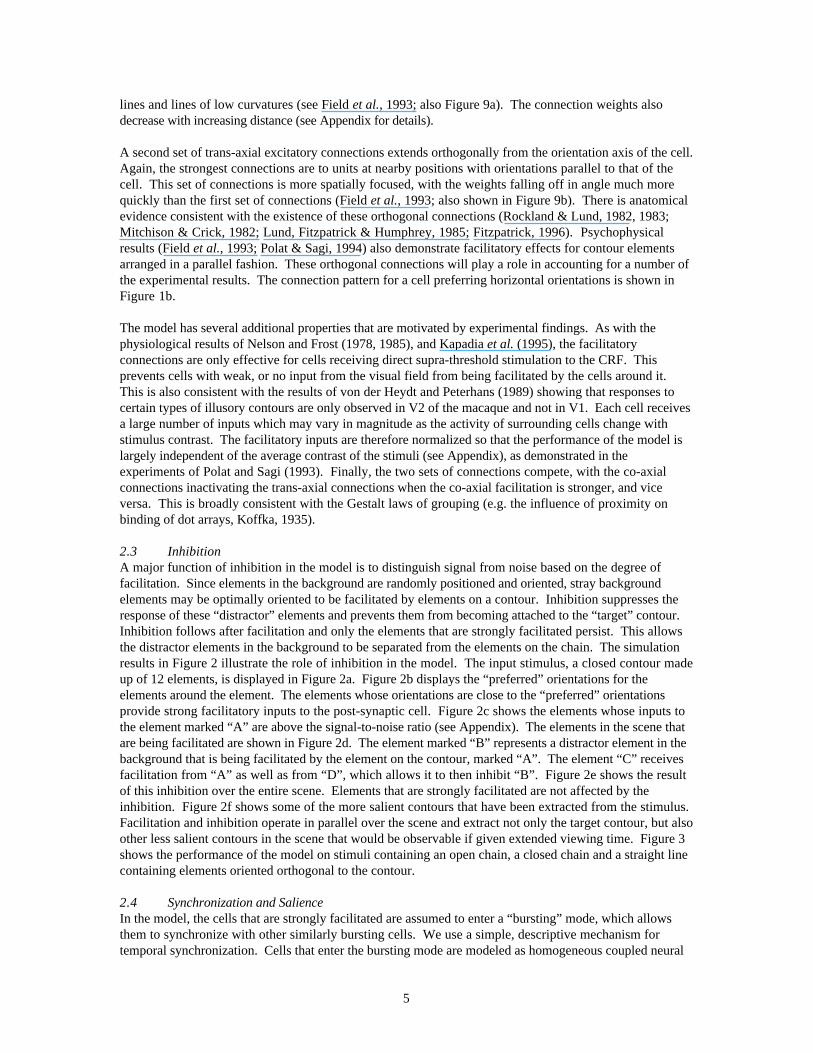
lines and lines of low curvatures (see Field et al., 1993; also Figure 9a). The connection weights alsodecrease with increasing distance (see Appendix for details).
A second set of trans-axial excitatory connections extends orthogonally from the orientation axis of the cell.Again, the strongest connections are to units at nearby positions with orientations parallel to that of thecell. This set of connections is more spatially focused, with the weights falling off in angle much morequickly than the first set of connections (Field et al., 1993; also shown in Figure 9b). There is anatomicalevidence consistent with the existence of these orthogonal connections (Rockland & Lund, 1982, 1983;Mitchison & Crick, 1982; Lund, Fitzpatrick & Humphrey, 1985; Fitzpatrick, 1996). Psychophysicalresults (Field et al., 1993; Polat & Sagi, 1994) also demonstrate facilitatory effects for contour elementsarranged in a parallel fashion. These orthogonal connections will play a role in accounting for a number ofthe experimental results. The connection pattern for a cell preferring horizontal orientations is shown inFigure 1b.
The model has several additional properties that are motivated by experimental findings. As with thephysiological results of Nelson and Frost (1978, 1985), and Kapadia et al. (1995), the facilitatoryconnections are only effective for cells receiving direct supra-threshold stimulation to the CRF. Thisprevents cells with weak, or no input from the visual field from being facilitated by the cells around it.This is also consistent with the results of von der Heydt and Peterhans (1989) showing that responses tocertain types of illusory contours are only observed in V2 of the macaque and not in V1. Each cell receivesa large number of inputs which may vary in magnitude as the activity of surrounding cells change withstimulus contrast. The facilitatory inputs are therefore normalized so that the performance of the model islargely independent of the average contrast of the stimuli (see Appendix), as demonstrated in theexperiments of Polat and Sagi (1993). Finally, the two sets of connections compete, with the co-axialconnections inactivating the trans-axial connections when the co-axial facilitation is stronger, and viceversa. This is broadly consistent with the Gestalt laws of grouping (e.g. the influence of proximity onbinding of dot arrays, Koffka, 1935).
2.3 InhibitionA major function of inhibition in the model is to distinguish signal from noise based on the degree offacilitation. Since elements in the background are randomly positioned and oriented, stray backgroundelements may be optimally oriented to be facilitated by elements on a contour. Inhibition suppresses theresponse of these “distractor” elements and prevents them from becoming attached to the “target” contour.Inhibition follows after facilitation and only the elements that are strongly facilitated persist. This allowsthe distractor elements in the background to be separated from the elements on the chain. The simulationresults in Figure 2 illustrate the role of inhibition in the model. The input stimulus, a closed contour madeup of 12 elements, is displayed in Figure 2a. Figure 2b displays the “preferred” orientations for theelements around the element. The elements whose orientations are close to the “preferred” orientationsprovide strong facilitatory inputs to the post-synaptic cell. Figure 2c shows the elements whose inputs tothe element marked “A” are above the signal-to-noise ratio (see Appendix). The elements in the scene thatare being facilitated are shown in Figure 2d. The element marked “B” represents a distractor element in thebackground that is being facilitated by the element on the contour, marked “A”. The element “C” receivesfacilitation from “A” as well as from “D”, which allows it to then inhibit “B”. Figure 2e shows the resultof this inhibition over the entire scene. Elements that are strongly facilitated are not affected by theinhibition. Figure 2f shows some of the more salient contours that have been extracted from the stimulus.Facilitation and inhibition operate in parallel over the scene and extract not only the target contour, but alsoother less salient contours in the scene that would be observable if given extended viewing time. Figure 3shows the performance of the model on stimuli containing an open chain, a closed chain and a straight linecontaining elements oriented orthogonal to the contour.
2.4 Synchronization and SalienceIn the model, the cells that are strongly facilitated are assumed to enter a “bursting” mode, which allowsthem to synchronize with other similarly bursting cells. We use a simple, descriptive mechanism fortemporal synchronization. Cells that enter the bursting mode are modeled as homogeneous coupled neural

6
oscillators with a common fundamental frequency but different phases (Li & Hopfield, 1989; Kopell &Ermentrout, 1986; Kammen, Holmes & Koch, 1989; Baldi & Meir, 1990; König & Schillen, 1991;Schillen & König, 1991; Grossberg & Somers, 1991; von der Malsburg & Buhmann, 1992; Terman &Wang, 1995). The phase of each oscillator is modulated by the phase of the oscillators to which it iscoupled. Oscillators are coupled only to other oscillators with which they have strong, reciprocal,facilitated connections (see Appendix). A set of coupled oscillators together form a contour. Sinceoscillators on different contours are not generally inter-connected, this allows each contour in the scene tosynchronize independently. We use neural oscillators only as a simple functional means of computingsynchronization and make no assumption regarding their possible functional role in cortex.
We propose that the saliency of a contour can only be computed when all the oscillators on the contour aresynchronized. The salience of the contour is then represented by the sum of the activities of all thesynchronized elements. The longer the chain of synchronized elements, the more perceptually salient it is.Synchronization occurs in parallel over the whole scene and the longest synchronized chain in the scene isidentified as being the most salient, and the network selects it as its output.
3 Results
All simulations were conducted with the same parameter set, which was chosen based on optimizing resultsfor the stimulus in Figure 2. Details of how the simulations were carried out are described in the Appendix.
3.1 Experiment 1 : Co-Axial Connection Pattern (Kapadia et al., 1995)Simulation of the psychophysical experiments of Kapadia et al. (1995) provides a test of the model’s co-axial pattern of excitatory horizontal connections (see Methods section in the Appendix). The response of aunit was determined as a function of the position and orientation preference of the pre-synaptic cell. Figure4 shows the effect of varying the co-axial distance, off-axis misalignment, and angular orientation of thepre-synaptic cell. The pre-synaptic cell is assumed to have constant activity, and so the changes infacilitation are due only to the differences in the connection weights between the post-synaptic cell and pre-synaptic cells at different positions and orientations. Figure 4a shows the effect of the decrease infacilitatory connection weights with increasing co-axial separation between the pre- and post-synaptic cells.The results show a decreased post-synaptic response in qualitative agreement with the data. The results arealso in qualitative agreement with those of Polat and Sagi (1993). Our simulations show an overestimationof the activation for closely spaced elements (Figure 4a) that would be compensated by local, short-rangeinhibition, which is not included in this simulation. Such inhibition would correspond to Polat and Sagi’s(1993, 1994) observation of increased contrast detection thresholds at small separations.
The input also decreases as a function of off-axis misalignment. This is due to the smaller connectionweights from off-axis locations where the “preferred” orientation differs from that of the pre-synaptic cell.In the second simulation (Figure 4b), the agreement between the model and the data on the effects of off-axial misalignment is good except at large lateral offsets. At large offsets the results of Kapadia et al.(1995) show that the influence of the surround becomes largely inhibitory. In the model, the facilitation atlarge lateral offsets becomes very weak and would be overwhelmed by the longer latency inhibition that isalso not included in this particular simulation.
As the orientation of the pre-synaptic cell increasingly deviates from the “preferred” orientation, the weightsdecrease correspondingly. The results of the third simulation (Figure 4c) show qualitative agreement withthe data as the orientation of the pre-synaptic cell rotates over 70˚. The co-axial connections are thusconsistent with the reported psychophysical effects due to the structure of the surround.
3.2 Experiment 2 : Contrast Sensitivity Modulations (Kovács & Julesz, 1993, 1994)We believe the trans-axial connections in our model may be responsible for a surprising result of Kovácsand Julesz (1993, 1994). They measured changes in contrast sensitivity to a low contrast Gabor targetplaced at various locations inside and outside a circular (Figure 5b) and elliptical (Figure 5c) contour. Thecontour itself was formed from aligned Gabor patches. They found a sharp peak in contrast sensitivity at
7
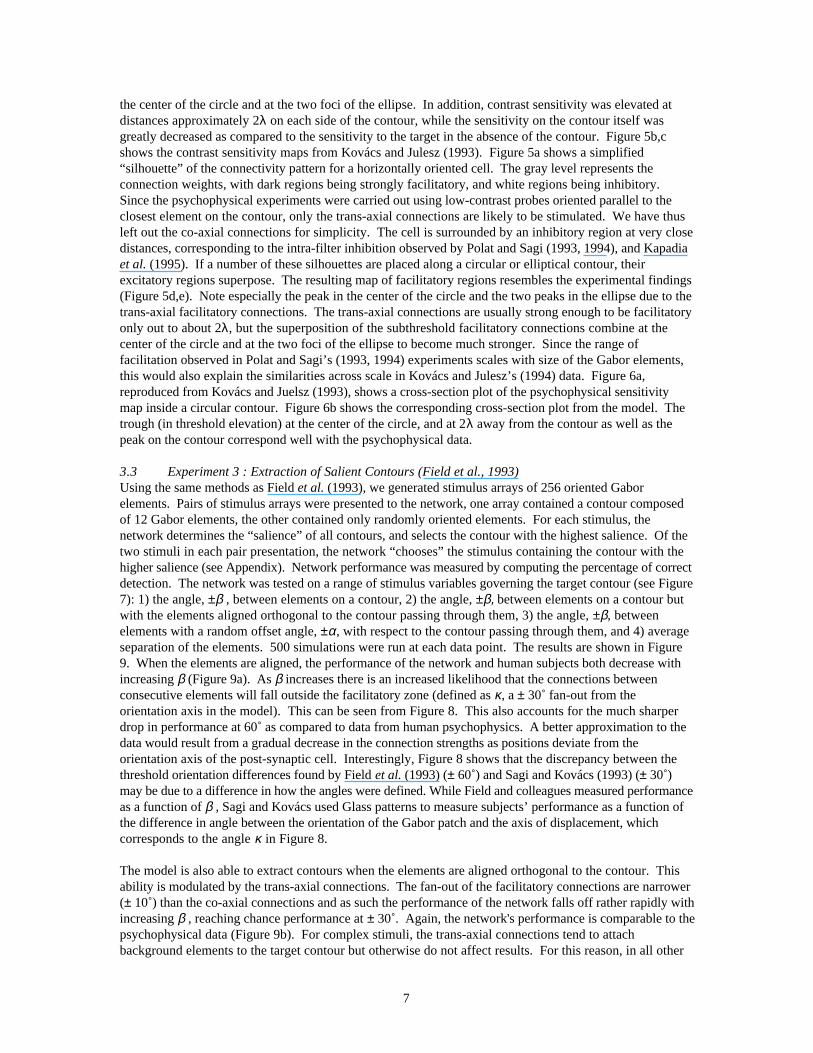
the center of the circle and at the two foci of the ellipse. In addition, contrast sensitivity was elevated atdistances approximately 2λ on each side of the contour, while the sensitivity on the contour itself wasgreatly decreased as compared to the sensitivity to the target in the absence of the contour. Figure 5b,cshows the contrast sensitivity maps from Kovács and Julesz (1993). Figure 5a shows a simplified“silhouette” of the connectivity pattern for a horizontally oriented cell. The gray level represents theconnection weights, with dark regions being strongly facilitatory, and white regions being inhibitory.Since the psychophysical experiments were carried out using low-contrast probes oriented parallel to theclosest element on the contour, only the trans-axial connections are likely to be stimulated. We have thusleft out the co-axial connections for simplicity. The cell is surrounded by an inhibitory region at very closedistances, corresponding to the intra-filter inhibition observed by Polat and Sagi (1993, 1994), and Kapadiaet al. (1995). If a number of these silhouettes are placed along a circular or elliptical contour, theirexcitatory regions superpose. The resulting map of facilitatory regions resembles the experimental findings(Figure 5d,e). Note especially the peak in the center of the circle and the two peaks in the ellipse due to thetrans-axial facilitatory connections. The trans-axial connections are usually strong enough to be facilitatoryonly out to about 2λ, but the superposition of the subthreshold facilitatory connections combine at thecenter of the circle and at the two foci of the ellipse to become much stronger. Since the range offacilitation observed in Polat and Sagi’s (1993, 1994) experiments scales with size of the Gabor elements,this would also explain the similarities across scale in Kovács and Julesz’s (1994) data. Figure 6a,reproduced from Kovács and Juelsz (1993), shows a cross-section plot of the psychophysical sensitivitymap inside a circular contour. Figure 6b shows the corresponding cross-section plot from the model. Thetrough (in threshold elevation) at the center of the circle, and at 2λ away from the contour as well as thepeak on the contour correspond well with the psychophysical data.
3.3 Experiment 3 : Extraction of Salient Contours (Field et al., 1993)Using the same methods as Field et al. (1993), we generated stimulus arrays of 256 oriented Gaborelements. Pairs of stimulus arrays were presented to the network, one array contained a contour composedof 12 Gabor elements, the other contained only randomly oriented elements. For each stimulus, thenetwork determines the “salience” of all contours, and selects the contour with the highest salience. Of thetwo stimuli in each pair presentation, the network “chooses” the stimulus containing the contour with thehigher salience (see Appendix). Network performance was measured by computing the percentage of correctdetection. The network was tested on a range of stimulus variables governing the target contour (see Figure7): 1) the angle, ±β , between elements on a contour, 2) the angle, ±β, between elements on a contour butwith the elements aligned orthogonal to the contour passing through them, 3) the angle, ±β, betweenelements with a random offset angle, ±α, with respect to the contour passing through them, and 4) averageseparation of the elements. 500 simulations were run at each data point. The results are shown in Figure9. When the elements are aligned, the performance of the network and human subjects both decrease withincreasing β (Figure 9a). As β increases there is an increased likelihood that the connections betweenconsecutive elements will fall outside the facilitatory zone (defined as κ, a ± 30˚ fan-out from theorientation axis in the model). This can be seen from Figure 8. This also accounts for the much sharperdrop in performance at 60˚ as compared to data from human psychophysics. A better approximation to thedata would result from a gradual decrease in the connection strengths as positions deviate from theorientation axis of the post-synaptic cell. Interestingly, Figure 8 shows that the discrepancy between thethreshold orientation differences found by Field et al. (1993) (± 60˚) and Sagi and Kovács (1993) (± 30˚)may be due to a difference in how the angles were defined. While Field and colleagues measured performanceas a function of β , Sagi and Kovács used Glass patterns to measure subjects’ performance as a function ofthe difference in angle between the orientation of the Gabor patch and the axis of displacement, whichcorresponds to the angle κ in Figure 8.
The model is also able to extract contours when the elements are aligned orthogonal to the contour. Thisability is modulated by the trans-axial connections. The fan-out of the facilitatory connections are narrower(± 10˚) than the co-axial connections and as such the performance of the network falls off rather rapidly withincreasing β , reaching chance performance at ± 30˚. Again, the network's performance is comparable to thepsychophysical data (Figure 9b). For complex stimuli, the trans-axial connections tend to attachbackground elements to the target contour but otherwise do not affect results. For this reason, in all other
8
simulations reported in this paper, the trans-axial connections were inactivated. In vivo, this inactivationwould require segregated inputs to a cell, or the involvement of separate populations of cells mediating co-axial and trans-axial connectivity.
When the orientation of the elements are randomly offset with respect to the path of the contour, the pre-synaptic orientations deviate from the “preferred” orientations and thus reduce the strength of the inputs.This increases the likelihood that these inputs may fall below the threshold imposed by the backgroundnoise. This leads to “breakage” in the chains and to a decrease in the saliency of the contours. The modeldemonstrates the same qualitative behavior as the data for both α = 15 ̊and α = 30˚ (Figure 9c,d).
As the average separation between all elements increases, the degree of facilitation is decreased. However,since inputs from background elements also decrease, the signal-to-noise ratio is not altered. This allowsthe model to continue to detect the contour regardless of the absolute separation between elements. Thisbehavior agrees well with the psychophysical data (Figure 9e,f).
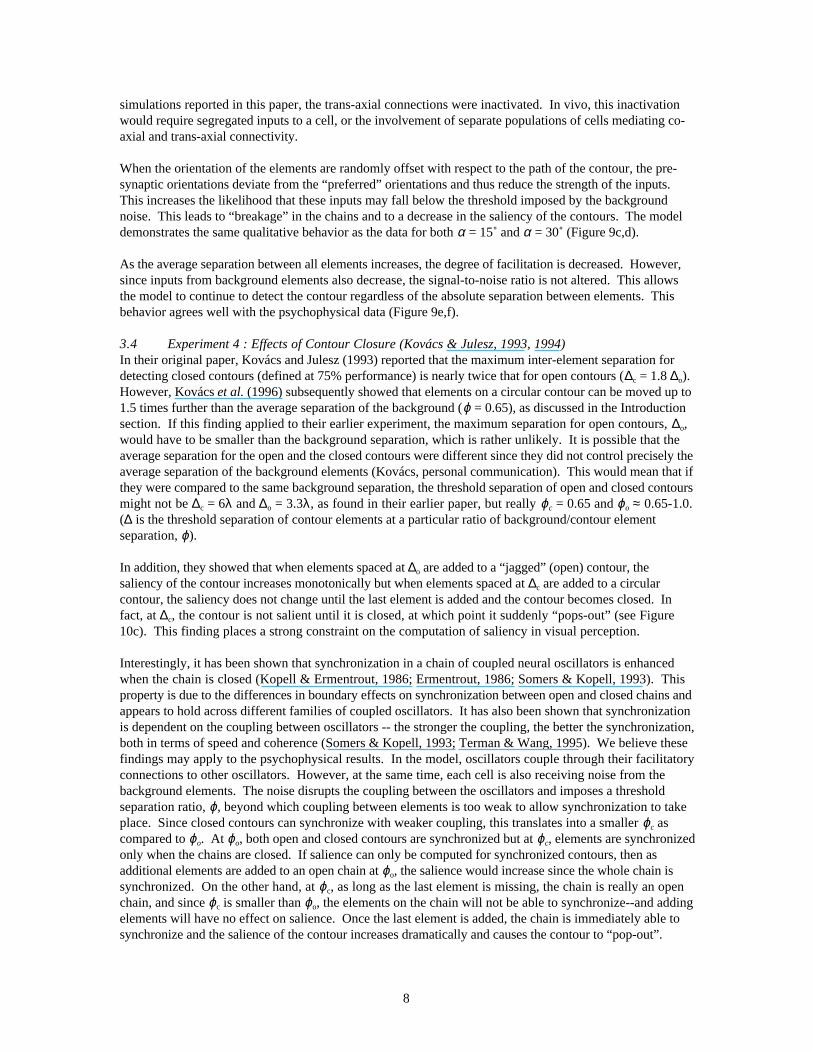
3.4 Experiment 4 : Effects of Contour Closure (Kovács & Julesz, 1993, 1994)In their original paper, Kovács and Julesz (1993) reported that the maximum inter-element separation fordetecting closed contours (defined at 75% performance) is nearly twice that for open contours (∆c = 1.8 ∆o).However, Kovács et al. (1996) subsequently showed that elements on a circular contour can be moved up to1.5 times further than the average separation of the background (ϕ = 0.65), as discussed in the Introductionsection. If this finding applied to their earlier experiment, the maximum separation for open contours, ∆o,would have to be smaller than the background separation, which is rather unlikely. It is possible that theaverage separation for the open and the closed contours were different since they did not control precisely theaverage separation of the background elements (Kovács, personal communication). This would mean that ifthey were compared to the same background separation, the threshold separation of open and closed contoursmight not be ∆c = 6λ and ∆o = 3.3λ, as found in their earlier paper, but really ϕc = 0.65 and ϕo ≈ 0.65-1.0.(∆ is the threshold separation of contour elements at a particular ratio of background/contour elementseparation, ϕ).
In addition, they showed that when elements spaced at ∆o are added to a “jagged” (open) contour, thesaliency of the contour increases monotonically but when elements spaced at ∆c are added to a circularcontour, the saliency does not change until the last element is added and the contour becomes closed. Infact, at ∆c, the contour is not salient until it is closed, at which point it suddenly “pops-out” (see Figure10c). This finding places a strong constraint on the computation of saliency in visual perception.
Interestingly, it has been shown that synchronization in a chain of coupled neural oscillators is enhancedwhen the chain is closed (Kopell & Ermentrout, 1986; Ermentrout, 1986; Somers & Kopell, 1993). Thisproperty is due to the differences in boundary effects on synchronization between open and closed chains andappears to hold across different families of coupled oscillators. It has also been shown that synchronizationis dependent on the coupling between oscillators -- the stronger the coupling, the better the synchronization,both in terms of speed and coherence (Somers & Kopell, 1993; Terman & Wang, 1995). We believe thesefindings may apply to the psychophysical results. In the model, oscillators couple through their facilitatoryconnections to other oscillators. However, at the same time, each cell is also receiving noise from thebackground elements. The noise disrupts the coupling between the oscillators and imposes a thresholdseparation ratio, ϕ, beyond which coupling between elements is too weak to allow synchronization to takeplace. Since closed contours can synchronize with weaker coupling, this translates into a smaller ϕc ascompared to ϕo. At ϕo, both open and closed contours are synchronized but at ϕc, elements are synchronizedonly when the chains are closed. If salience can only be computed for synchronized contours, then asadditional elements are added to an open chain at ϕo, the salience would increase since the whole chain issynchronized. On the other hand, at ϕc, as long as the last element is missing, the chain is really an openchain, and since ϕc is smaller than ϕo, the elements on the chain will not be able to synchronize--and addingelements will have no effect on salience. Once the last element is added, the chain is immediately able tosynchronize and the salience of the contour increases dramatically and causes the contour to “pop-out”.
9
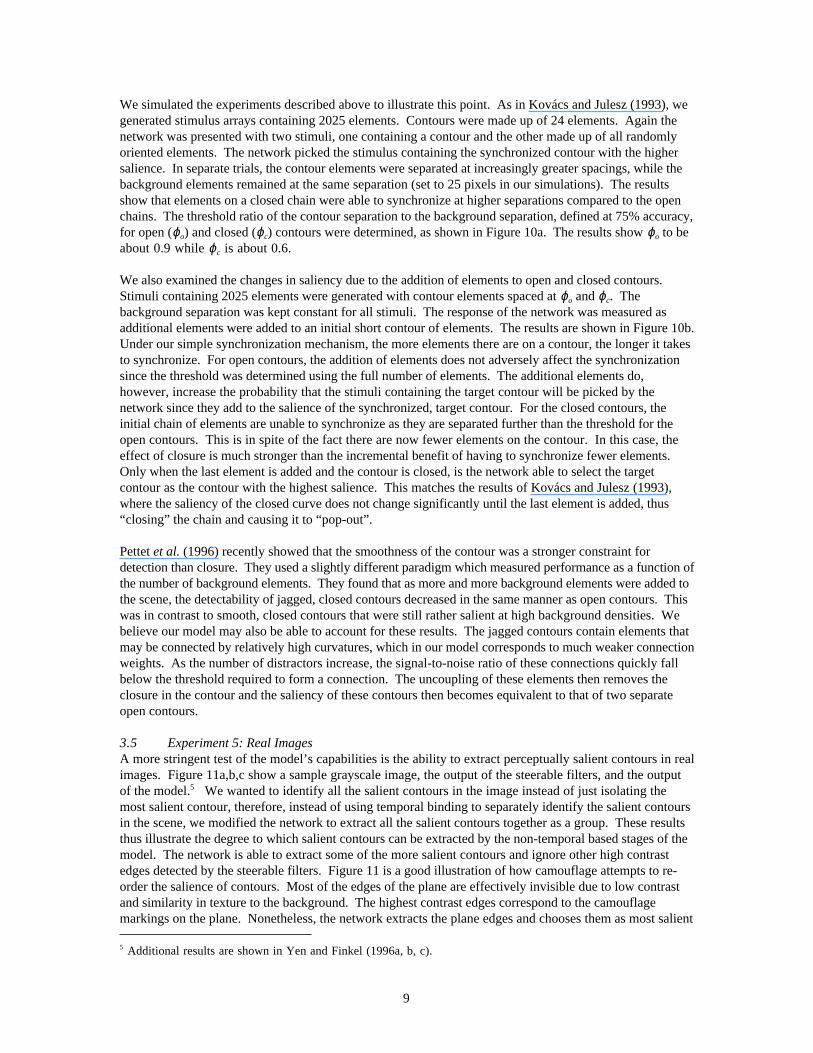
We simulated the experiments described above to illustrate this point. As in Kovács and Julesz (1993), wegenerated stimulus arrays containing 2025 elements. Contours were made up of 24 elements. Again thenetwork was presented with two stimuli, one containing a contour and the other made up of all randomlyoriented elements. The network picked the stimulus containing the synchronized contour with the highersalience. In separate trials, the contour elements were separated at increasingly greater spacings, while thebackground elements remained at the same separation (set to 25 pixels in our simulations). The resultsshow that elements on a closed chain were able to synchronize at higher separations compared to the openchains. The threshold ratio of the contour separation to the background separation, defined at 75% accuracy,for open (ϕo) and closed (ϕc) contours were determined, as shown in Figure 10a. The results show ϕo to beabout 0.9 while ϕc is about 0.6.
We also examined the changes in saliency due to the addition of elements to open and closed contours.Stimuli containing 2025 elements were generated with contour elements spaced at ϕo and ϕc. Thebackground separation was kept constant for all stimuli. The response of the network was measured asadditional elements were added to an initial short contour of elements. The results are shown in Figure 10b.Under our simple synchronization mechanism, the more elements there are on a contour, the longer it takesto synchronize. For open contours, the addition of elements does not adversely affect the synchronizationsince the threshold was determined using the full number of elements. The additional elements do,however, increase the probability that the stimuli containing the target contour will be picked by thenetwork since they add to the salience of the synchronized, target contour. For the closed contours, theinitial chain of elements are unable to synchronize as they are separated further than the threshold for theopen contours. This is in spite of the fact there are now fewer elements on the contour. In this case, theeffect of closure is much stronger than the incremental benefit of having to synchronize fewer elements.Only when the last element is added and the contour is closed, is the network able to select the targetcontour as the contour with the highest salience. This matches the results of Kovács and Julesz (1993),where the saliency of the closed curve does not change significantly until the last element is added, thus“closing” the chain and causing it to “pop-out”.
Pettet et al. (1996) recently showed that the smoothness of the contour was a stronger constraint fordetection than closure. They used a slightly different paradigm which measured performance as a function ofthe number of background elements. They found that as more and more background elements were added tothe scene, the detectability of jagged, closed contours decreased in the same manner as open contours. Thiswas in contrast to smooth, closed contours that were still rather salient at high background densities. Webelieve our model may also be able to account for these results. The jagged contours contain elements thatmay be connected by relatively high curvatures, which in our model corresponds to much weaker connectionweights. As the number of distractors increase, the signal-to-noise ratio of these connections quickly fallbelow the threshold required to form a connection. The uncoupling of these elements then removes theclosure in the contour and the saliency of these contours then becomes equivalent to that of two separateopen contours.
3.5 Experiment 5: Real ImagesA more stringent test of the model’s capabilities is the ability to extract perceptually salient contours in realimages. Figure 11a,b,c show a sample grayscale image, the output of the steerable filters, and the outputof the model.5 We wanted to identify all the salient contours in the image instead of just isolating themost salient contour, therefore, instead of using temporal binding to separately identify the salient contoursin the scene, we modified the network to extract all the salient contours together as a group. These resultsthus illustrate the degree to which salient contours can be extracted by the non-temporal based stages of themodel. The network is able to extract some of the more salient contours and ignore other high contrastedges detected by the steerable filters. Figure 11 is a good illustration of how camouflage attempts to re-order the salience of contours. Most of the edges of the plane are effectively invisible due to low contrastand similarity in texture to the background. The highest contrast edges correspond to the camouflagemarkings on the plane. Nonetheless, the network extracts the plane edges and chooses them as most salient 5 Additional results are shown in Yen and Finkel (1996a, b, c).
10
due to their length and straightness. These simulations used filters at only one spatial scale and could beimproved through interactions across multiple spatial frequencies. Nevertheless, the model shows promisefor automated image processing applications.
4 Discussion
The model’s estimation of salience depends upon a number of factors. The most critical of these are thespatial structure of the anatomical connections, and the balance of facilitatory and inhibitory inputs fromcontour versus background elements. The most distinguishing characteristic of our model, however, is theuse of temporal synchronization to determine salience. In general, temporal mechanisms offer two greatadvantages--they provide a flexible representation for context-dependent groupings, and they allow effects ofglobal properties to be represented locally (Singer & Gray, 1995; Eckhorn, 1994). In particular, we believethat the experimental results of Kovács and Julesz (1993, 1994) can be explained by the use of a temporalmechanism. Based on analytical results from Kopell and Ermentrout (1986), we have argued that closedcontours can synchronize at greater element separations. We have demonstrated this effect in simulations,and shown that the absolute value of the maximum allowable separation depends upon the density ofbackground elements. Closure affects the boundary conditions on synchronization, and in much the sameway as standing waves are affected by open or closed boundaries, changing the topology of the oscillatorchain leads to dramatically different results
How might one attempt to account for the Kovács and Julesz results without resorting to temporalmechanisms? Salience could be defined solely on the basis of activity--cells responding to smooth contourswould be strongly facilitated and after multiple iterations, contour elements could be differentiated fromthose of the background. In this case, the effects of facilitation might propagate along a chain of elements,and closed chains would develop a greater degree of facilitation due to the absence of weakly supported endelements. This mechanism assumes that each additional element increases the total facilitation that everyelement receives. In simulations of such an activity-based mechanism, we have found that the time requiredfor activity levels to converge increases with the number of elements on the chain, unless there is totalconnectivity between elements. Activity-based representations also lead to a potential confusion betweencontrast and salience. If the cell is already maximally activated due to the use of maximum contraststimuli, the cell may be unable to further increase its firing rate to represent increasing salience. Thepresence of distractors is also problematic for an activity-based representation. In a temporal representation,once the cells representing the contour synchronize, they exclusively facilitate each other, since the cellsrepresenting the distractor elements are not simultaneously active. This allows the representation of thecontour to be maintained without interference from the background distractors. On the other hand, in anactivity-based representation, as the contour elements increase in activity, distractor elements will receiveincreasing support and distinguishing them from the contour becomes difficult--particularly with respect toelements at the ends of the contour which may receive less support than the distractors. One possiblesolution might be to introduce inhibitory mechanisms that will allow strongly facilitated contour elementsto inhibit other elements but we found that mechanisms of this sort cause contours that are close to eachother to inhibit each other and thus disrupt the representation of multiple contours in nearby or overlappingregions. We also found that with an activity-based representation, the threshold separation betweenelements varies with the number of elements on the contour. This might be true of contours with smallnumbers of elements -- contours containing two or three elements might appear salient if the elements arespaced much closer together than the background elements. However, the match with longer contours issignificantly poorer: the results of Kovács and Julesz show that closed contours made up of 12 elements arejust as salient as contours made up of 24 elements. Using a temporal representation, although shortercontours synchronize better, the probability that the salience of such a contour will exceed those found in arandom stimulus array is rather low. The increase in salience with additional elements is thus linked to theincrease in this probability. With longer chains, so long as the contour is able to synchronize, the salienceis reliably higher than those from the random array. Thus, the perceptual threshold of the contour isdetermined only by the separation that allows synchronization of the elements to take place.

11
Most critically, we found that while an activity-based mechanism can generate incremental differencesbetween open and closed contours, it cannot produce a qualitative change in salience, particularly atthreshold (ϕ) separations. For a synchronization mechanism, the change from open to closed contoursrepresents a transition between different “states”. This results in differences in the threshold separation foropen and closed contours, but more importantly, provides a mechanism to account for the dramaticdifference in salience that accompanies closure. In the simulations of Figure 10, addition of the last fewelements results in a gradual increase in salience rather than a sharp transition. We attribute the gradualnature of the transition to the phase-coupled synchronization mechanism, and believe that a more realisticmechanism, such as relaxation oscillators (Somers & Kopell, 1993; Terman & Wang, 1995) wouldgenerate a sharper transition.
Activity-based models may be more applicable in accounting for changes in long-range interactions withstimulus contrast. Stemmler, Usher and Niebur (1995) recently proposed that at low contrast levels, long-range interactions are primarily excitatory and result in contour completion; at high contrasts, inhibitiondominates and the resulting suppression leads to pop-out. Recent experimental evidence has shown thatfacilitation and inhibition vary with the level of contrast (Mizobe, Polat, Kasamatsu & Norcia, 1996;Weliky et al., 1995). We did not incorporate this property into our model since the relevantpsychophysical experiments were conducted with suprathreshold stimuli of equal contrast.
There may, in addition, be non-temporal mechanisms that contribute to the extraordinary salience of circles.Figure 12a shows the static connectivity pattern used in the current model--these connections favor straightlines, with weaker connections to cells off the orientation axis. Figure 12b shows a dynamic mechanismthat could increase the salience of curved contours. The mechanism involves a context-dependent change inlong-range connection strengths such as to optimally tune the cell’s input to the structure of the surround.The elements labeled A-D form part of a circular contour. Element B may have facilitatory interactionsfrom elements A and C, but not D, as the angular difference between B and D exceeds the fan-out, κ, of theconnections. However, element B and element D may be indirectly joined by a smooth contour goingthrough element C. This is illustrated in Figure 12b. The connectivity pattern may be dynamicallypotentiated by the surrounding elements in such a way as to “steer” the connections to suit the context. Inthis case, this would correspond to not only the strengthening of the connection between B and D, but alsoto change the relative weighting of the connections so that the connections corresponding to the curvaturerepresented by elements B-C-D become the strongest connections. Although this mechanism does notexplain the difference between open and closed curves (Kovács & Julesz, 1993), it might help account forthe fact that circles are at least as salient as straight lines.
Relationship to Cortical DataAs first pointed out by Sha’ashua and Ullman (1988), the relative salience of different contours suggestssomething about the cortical mechanisms used to extract them. Sha’ashua and Ullman defined saliencebased on several heuristic features--contour length, curvature, discontinuities, and gap sizes. They showedthat the salient contours in a noisy image can be identified by maximizing an objective function based onthese features over all possible contours. Our model measures salience based on these same contourproperties--but is implemented using biologically plausible mechanisms
Although we have attempted to use experimental data to guide our selection of parameters, the model isonly intended as a functional description of the operations occurring in visual cortex. For example themodel is not specific as to the type of cortical cell used to determine salience. Independent evidencesupports the participation of both simple and complex cells. Kapadia et al. (1995) identified complex cellsin the supragranular layers of striate cortex as undergoing modulation by stimuli outside the receptive field.Field et al. (1993) found that contour extraction was not significantly affected if the Gabor elements wererandomly phase-shifted. This also suggests that complex cells, which are not sensitive to spatial phase,might be responsible. However, the complex cells would require rather small receptive fields in order todetect deviations from collinearity. In this regard, simple cells are better suited to detecting collinearity,since any misalignment would greatly reduce the activity of the cells involved. The “chattering” cells in thesuperficial layers of striate cortex have been found to have properties of simple cells (Gray & McCormick,
12
1996). Both simple cells and complex cells are found in the superficial layers of cortex where the majorityof long-distance horizontal connections are located (Mangini & Pearlman, 1980; Mullikin, Jones & Palmer,1984; Gray & McCormick, 1996). It is therefore possible that both of these cell types could be involved orthat the complex cells respond due to recruitment by the “chattering” simple cells. Livingstone (1996)recently reported correlated activity across layers of striate cortex in macaque monkeys which could beevidence in support of the latter.
We have assumed that only cells with strong local thalamic input can be facilitated by the long rangehorizontal connections. We base this assumption on the observation that facilitatory effects from outsidethe classical receptive field must be coupled with direct stimulation within the classical receptive field(Nelson & Frost, 1978, 1985; Kapadia et al., 1995). Facilitation could depend upon a voltage-dependentgating mechanism in which horizontal inputs alter the gain of the cell (De Weerd, Gattass, Desimone &Ungerleider, 1995). Alternatively, horizontal inputs could provide subthreshold activation which requiresdirect thalamic input to exceed threshold. Psychophysical evidence shows that detection of subthresholdstimuli may be facilitated when superposed on other subthreshold stimuli or on illusory contours(Kulikowski & King-Smith, 1973; Dresp & Bonnet, 1995).6 Optical recordings of striate cortex have alsorevealed broad regions of subthreshold activity consistent with the anatomy of the long-distance connections(Das & Gilbert, 1995). Differentiating between the two mechanisms remains an experimental question, andthe model is not predisposed towards either mechanism.
Modulation of cell firing rates by horizontal inputs can result in an alteration of the perceived “brightness”of the contour. While this effect may be consistent with increased saliency, the orientation-specific natureof the long-range inputs may also lead to skewing of the local orientation representation (Westheimer,1986; Gilbert & Wiesel, 1990). In our simulations the ratio of the steerable filter responses always reflectthe local orientation information. However, at locations without orientation information, facilitation fromneighboring locations can “steer” the basis responses to the orientations that best complement the surround.For instance, if a location is flanked by elements with strong vertical information, the local vertical basisfilter receives the greatest facilitation and the local orientation becomes “steered” to vertical. Thissubthreshold “steered” response could become supra-threshold in higher cortical areas--in much the sameway as illusory contours are found to evoke responses in area V2 but not V1 (von der Heydt & Peterhans,1989).
In the model, inhibition is used to suppress the responses of distractor elements. Although long-rangeinhibitory effects have been observed physiologically (Nelson & Frost, 1978; Kapadia et al., 1995; Welikyat al., 1995), they were not observed in the experiments of Polat and Sagi (1993, 1994). This may be dueto the reduced nature of the stimulus display--the stimulus consisted of only three Gabor patches, ascompared to the use of arrays of oriented elements and gratings in the physiological experiments. Wespeculate that inhibitory effects would emerge with more complex stimuli and would lead to a decrease incontrast sensitivity at locations in the “inhibitory field” of elements on a contour.
Based on reported anatomical and psychophysical studies, we have also included a set of long-distance trans-axial connections. These connections are responsible, in the model, for some of the effects observed byField et al. (1993), as well as the increase in contrast sensitivity observed at the center of closed circles andat the foci of ellipses (Kovács & Julesz, 1994). This latter result strongly depends upon the narrow fan-outof the trans-axial connections, such that a significant intersection is achieved only at the foci. Thestrengths of these connections decrease rapidly with distance, and the superposition of many subthresholdfacilitation is thus required to alter contrast sensitivity. Our model would thus predict that the peak willweaken as the number of elements on the contour is decreased. Misalignment or “wobbling” of the contourelements should also lead to a decrease in the effect. Due to the orientation dependence of the trans-axialfacilitation, only elements on a limited arc of the circle contribute to the change in contrast sensitivity.The effect of these elements may be enhanced by the synchronized nature of their inputs. We would predict 6 The facilitation reported by Dresp and Bonnet (1995) was independent of contrast polarity, which may be furtherevidence that complex cells are involved.
13
that two isolated antipodal arcs that synchronize independently would not lead to changes in contrastsensitivity. Use of trans-axial connections is compatible with the “brush-fire” representation suggested byKovács and Julesz (1993), and might also be involved in the effects of figure-ground segregation on theresponses of striate cortical cells observed by Lamme (1995), Lee, Mumford and Schiller (1995) and Zipser,Lamme and Schiller (1996). These connections may also be involved in the detection of symmetryproperties.
Synchronization and SalienceThe phase-coupled synchronization mechanism represents the simplest possible model of a temporal-basedbinding mechanism. It most likely does not reflect how synchronization is achieved in cortex. We haveused phase coupled oscillators following the work by Kopell and Ermentrout (1986), Kammen et al. (1989)and Baldi and Meir (1990). Recent work has shown that relaxation oscillators converge much more rapidly(Somers & Kopell, 1993; Terman & Wang, 1995). There is evidence both supporting (Gray & Singer,1995; Livingstone, 1996; Gray & McCormick, 1996) and arguing against (Ghose & Freeman, 1992; Bair,Koch, Newsome and Britten, 1994) the significance of actual oscillations in visual cortex. A number ofmore biologically plausible synchronization mechanisms exist, some depending solely on burstingproperties of cells (Traub, Whittington, Stanford and Jefferys, 1996). These may serve as a means ofdistinguishing different contours and equally importantly, as a mechanism for determining saliency andother global properties of the stimulus (for example, closure).
The link between synchronization and salience can be tested experimentally. Synchronization could bemeasured between two cells in striate cortex with widely displaced, non-overlapping receptive fields. Anoptimally oriented element is positioned in each receptive field, and randomly positioned elements fill thebackground as in Field et al.(1993) and Kovács and Julesz (1993, 1994). If the optimal orientations aredissimilar, the cells should be de-synchronized, but when the orientations of intervening elements are rotatedto form a smooth contour between the receptive fields, the activity should become synchronized.7 As theintervening contour elements are spaced farther apart synchronization should abruptly cease at the thresholdseparation, ϕ, which will depend upon the density of background elements.
We have employed the simplest possible algorithm for computing salience--the unweighted linear sum ofactivities. Since salience is relative (a long contour might look salient against a field of short contours, butnot against longer contours) a normalized salience measure might be more appropriate. The sum of theactivities of a synchronized populations should really be compared to the average length of the backgroundcontours to provide an accurate measure of salience. The absolute magnitude of the activities should also betaken into account, thus a statistical measure such as the χ2 value, as suggested by Grzywacz, Watamaniukand McKee (1995), might be appropriate. We believe the results of the model discussed in the paper willremain unaffected by such a change in the salience measure.
One crucial requirement of any synchronization mechanism is to prevent different contours from mergingand becoming synchronized. In addition, cells should be able to simultaneously synchronize with differentpopulations, representing multiple contours, for example at a “Y”-junction. This requires an explicitmechanism for de-synchronization. Previous studies have used global inhibition to separate synchronizedpopulations (von der Malsburg & Buhmann, 1992; Terman & Wang, 1995; Campbell & Wang, 1996) ortime-delayed inhibition (Schillen & König, 1991). These mechanisms work for populations that aresynchronized independently and only need to be distinct in phase from each other. However, thesynchronization mechanism must also involve a local de-synchronization that allows separate contours tobe segregated from each other. One possible mechanism might involve separately synchronizedsubpopulations within an orientation column. Figure 13 illustrates an alternative mechanism in which asingle cell can synchronize with multiple different populations. In the figure, elements A, B, C lie alongtwo different contours bifurcating at element A. Elements A and B would normally synchronize since theyare interconnected, and so would Elements A and C. However, Elements B and C are incompatible witheach other and would actively desynchronize. This incompatibility between B and C thus causes A, and the 7 A related prediction was made by Hummel and Biederman (1992).
14
cells already synchronized to A, to represent both the phases at B and at C separately. This allows twocontours to be stably represented at A and could also have implication for the generation of bi-stablepercepts, like the Necker cube.
The model has focused on feature-based influences on salience. In our model, these “bottom-up” processestake place in parallel and provide a salience ranking for all the contours in the image. A selectiveattentional process could identify each contour based on its temporal pattern, and sequentially visit contoursin rank order (Koch & Ullman, 1985). Salience can also be modulated in a top-down manner by attention.Visual search has been modeled as a competition between targets and non-targets for access to short-termmemory (Duncan & Humphreys, 1989; Wolfe, 1994), where the rejection of one distractor leads to thesuppression of all similar distractors. Temporal mechanisms offer a means of implementing such aprocess. In addition, temporal mechanisms might allow high level conjunctions and disjunctions offeatures to be represented. One possible physiological mechanism for these attentional effects may involvecholinergic inputs which are known to alter the bursting properties of cortical cells (McCormick, 1993;Sillito, 1993; Cox, Metherate & Ashe, 1994; McCormick & Gray, 1996). Salience may thus ultimatelyreflect the contributions of several classes of cortical connections: ascending, descending, horizontal, andneuromodulatory.
AcknowledgmentsWe thank Ilona Kovács, Mitesh Kapadia, and Nancy Kopell for helpful discussions of this work. Supportedby the Office of Naval Research N00014-93-1-0681 and the Whitaker Foundation.
References
Bair, W., Koch, C., Newsome, W. & Britten, K. (1994). Power spectrum analysis of bursting cells in areaMT in the behaving monkey. Journal of Neuroscience, 14, 2870-2892.
Baldi, P. & Meir, R. (1990). Computing with arrays of coupled oscillators: An application to preattentivetexture discrimination. Neural Computation, 2, 458-471.
Campbell, S. & Wang, D. L. (1996). Synchronization and desynchronization in a network of locallycoupled Wilson-Cowan oscillators. IEEE Transactions on Neural Networks, 7, 541-554.
Cox, C. L., Metherate, R. & Ashe, J. H. (1994). Modulation of cellular excitability in neocortex:Muscarinic receptor and second messenger-mediated actions of acetylcholine. Synapse, 16, 123-136.
Das, A. & Gilbert, C. D. (1995). Long-range horizontal connections and their role in cortical reorganizationrevealed by optical recording of cat primary visual cortex. Nature, 375, 780-784.
DeAngelis, G. C., Robson, J. G., Ohzawa, I. & Freeman, R. D. (1992). Organization of suppression inreceptive fields of neurons in cat visual cortex. Journal of Neurophysiology, 68, 144-163.
DeAngelis, G. C., Freeman, R. D. & Ohazawa, I. (1994). Length and width tuning of neurons in the cat’sprimary visual cortex. Journal of Neurophysiology, 71, 347-374.
De Weerd, P. Gattass, R., Desimone, R. & Ungerleider, L. G. (1995). Responses of cells in monkey visualcortex during perceptual filling-in of an artificial scotoma. Nature, 377, 731-734.
Dresp, B. & Bonnet, C. (1995). Subthreshold summation with illusory contours. Vision Research, 35,1071-1078.
15
Duncan, J. & Humphreys, G. W. (1989). Visual search and stimulus similarity. Psychological Review, 96,433-458.
Eckhorn, R. (1994). Oscillatory and non-oscillatory synchronizations in the visual cortex and their possibleroles in associations of visual features. Progress in Brain Research, 102, 405-426.
Engel, A. K., König, P., Gray, C. M. & Singer, W. (1990).Stimulus-dependent neuronal oscillations incat visual cortex: Intercolumnar interaction as determined by cross-correlational analysis. European Journalof Neuroscience, 2, 558-606.
Engel, A. K., Kreiter, A. K., König, P. & Singer, W. (1991). Synchronization of oscillatory neuronalresponses between striate and extrastriate visual cortical areas of the cat. Proceedings of the NationalAcademy of Sciences USA, 88, 6048-6052.
Ermentrout, G. B. (1985). The behavior of rings of coupled oscillators. Journal of Mathematical Biology,23, 55-74.
Field, D. J., Hayes, A. & Hess, R. F. (1993). Contour integration by the human visual system: Evidencefor a local “Association Field”. Vision Research, 33, 173-193.
Field, D. J., Hayes, A. & Hess, R. F. (1997). The role of phase and contrast polarity in contourintegration. Investigative Ophthalmology and Visual Science, 38, 4643.
Fitzpatrick, D. (1996). The functional-organization of local circuits in visual-cortex --insights from thestudy of tree shrew striate cortex. Cerebral Cortex, 6, 329-341.
Freeman, W. T. & Adelson, E. H. (1991). The design and use of steerable filters. IEEE Transactions onPattern Analysis and Machine Intelligence, 13, 891-906.
Ghose, G. M. & Freeman, R. D. (1992). Oscillatory discharge in the visual system: Does it have afunctional role? Journal of Neurophysiology, 68, 1558-1574.
Gilbert, C. D. (1992). Horizontal integration and cortical dynamics. Neuron, 9, 1-20.
Gilbert, C. D. & Wiesel, T. N. (1979). Morphology and intracortical projections of functionally identifiedneurons in cat visual cortex. Nature, 280, 120-125.
Gilbert, C. D. & Wiesel, T. N. (1983). Clustered intrinsic connections in cat visual cortex. Journal ofNeuroscience, 3, 1116-1133.
Gilbert, C. D. & Wiesel, T. N. (1989). Columnar specificity of intrinsic horizontal and corticocorticalconnections in cat visual cortex. Journal of Neuroscience, 9, 2432-2442.
Gilbert, C. D. & Wiesel, T. N. (1990). The influence of contextual stimuli on the orientation selectivity ofcells in primary visual cortex of the cat. Vision Research, 30, 1689-1701.
Gilbert, C. D., Das, A., Ito, M., Kapadia, M. & Westheimer, G. (1996). Spatial integration and corticaldynamics. Proceedings of the National Academy of Sciences USA, 93, 615-622.
Gray, C. M., König, P., Engel, A. K. & Singer, W. (1989). Oscillatory responses in cat visual cortexexhibit inter-columnar synchronization which reflects global stimulus properties. Nature, 338, 334-337.
Gray, C. M. & McCormick, D. A. (1996). Chattering cells -- superficial pyramidal neurons contributing tothe generation of synchronous oscillations in the visual-cortex. Science, 274, 109-113.

16
Grossberg, S. & Somers, D. (1991). Synchronized oscillations during cooperative feature linking in acortical model of visual perception. Neural Networks, 4, 453-466.
Grzywacz, N. M., Watamaniuk, S. N. & McKee, S. P. (1995). Temporal coherence theory for the detectionand measurement of visual motion. Vision Research, 35, 3183-3203.
Hata, Y., Tsumoto, T., Sato, H., Hagihara, K. & Tamura, H. (1993). Development of local horizontalinteractions in cat visual cortex studied by cross-correlation analysis. Journal of Neurophysiology, 69, 40-56.
Heeger, D. J. (1992). Normalization of cell responses in cat striate cortex. Visual Neuroscience, 9, 181-197.
Hess, R. F. & Field, D. J. (1995). Contour integration across depth. Vision Research, 35, 1699-1711.
Hubel, D. H. & Wiesel, T. N. (1974). Uniformity of monkey striate cortex: a parallel relationship betweenfield size, scatter and magnification factor. Journal of Comparative Neurology, 158, 295-306.
Hummel, J. E. & Biederman, I. (1992). Dynamic binding in a nerual network for shape recognition.Psychological Review, 99, 480-517.
Kammen, D. M., Holmes, P. J. & Koch, C. (1989). Origin of oscillations in visual cortex: Feedbackversus local coupling. In Cotterill (Ed), Models of brain functions (pp. 273-284). Cambridge: CambridgeUniversity Press.
Kapadia, M. K., Ito, M., Gilbert, C. D. & Westheimer. G. (1995). Improvement in visual sensitivity bychanges in local context: Parallel studies in human observers and in V1 of alert monkeys. Neuron,15, 843-856.
Kisvárday, Z. F. & Eysel, U. T. (1992). Cellular organization of reciprocal patchy networks in layer III ofcat visual cortex (area 17). Neuroscience, 46, 275-286.
Knierim, J. J. & Van Essen, D. C. (1992). Neuronal responses to static texture patterns in area V1 of thealert macaque monkey. Journal of Neurophysiology, 67, 961-980.
Koch, C. & Ullman, S. (1985). Shifts in selective visual attention: Towards the underlying neuralcircuitry. Human Neurobiology, 4, 219-227.
Koffka, K. (1935). Principles of Gestalt psychology. New York: Harcourt Brace Janovich.
König, P. & Schillen, T. B. (1991). Stimulus-dependent assembly formation of oscillatory responses: I.Synchronization. Neural Computation, 3, 155-166.
Kopell, N. & Ermentrout, G. B. (1986). Symmetry and phaselocking in chains of weakly coupledoscillators. Communications on Pure and Applied Mathematics, 39, 623-660.
Kovács, I. & Julesz, B. (1993). A closed curve is much more than an incomplete one: Effect of closure infigure-ground segmentation. Proceedings of National Academy of Sciences, USA, 90, 7495-7497.
Kovács, I. & Julesz, B. (1994). Perceptual sensitivity maps within globally defined visual shapes. Nature,370, 644-646.

17
Kovács, I., Polat, U. & Norcia, A. M. (1996). Breakdown of binding mechanisms in amblyopia.Investigative Ophthalmology & Visual Science, 37, 3078.
Kulikowski, J. J. & King-Smith, P. E. (1973). Spatial arrangement of line, edge and grating detectorsrevealed by subthreshold summation. Vision Research, 13, 1455-1478.
Lamme, V. A. (1995). The neurophysiology of figure-ground segregation in primary visual cortex. Journalof Neuroscience, 15, 1605-1615.
Lee, T. S., Mumford, D. & Schiller, P. H. (1995). Neural correlates of boundary and medial axisrepresentations in primate striate cortex. Investigative Ophthalmology & Visual Science, 36, 477.
Li, Z. & Hopfield, J. J. (1989). Modeling the olfactory bulb and its neural oscillatory processings.Biological Cybernetics, 61, 379-392.
Livingstone, M. S. (1996). Oscillatory firing and interneuronal correlations in squirrel-monkey striatecortex. Journal of Neurophysiology, 75, 2467-2485.
Lund, J., Fitzpatrick, D. & Humphrey, A. L. (1985). The striate visual cortex of the tree shrew. In Jones,E. G. & Peters, A. (Eds), Cerebral Cortex (pp. 157-205). New York: Plenum.
Mangini, N. J. & Pearlman, A. L. (1980). Laminar distribution of receptive field properties in the primaryvisual cortex of the mouse. Journal of Comparative Neurology. 193, 203-222.
Martin, K. A. & Whitteridge, D. (1984). Form, function and intracortical projections of spiny neurones inthe striate visual cortex of the cat. Journal of Physiology, 353, 463-504.
McCormick, D. A. (1993). Actions of acetylcholine in the cerebral cortex and thalamus and implicationsfor function. Progress in Brain Research, 98, 303-308.
McGuire, B. A., Gilbert, C. D., Rivlin, P. K. & Wiesel, T. N. (1991). Targets of horizontal connectionsin macaque primary visual cortex. Journal of Comparative Neurology, 305, 370-392.
Mitchison, G. & Crick, F. (1982). Long axons within the striate cortex: Their distribution, orientation, andpatterns of connection. Proceedings of National Academy of Sciences USA, 79, 3661-3665.
Mizobe, K., Polat, U., Kasamatsu, T. & Norcia, A. M. (1996). Lateral masking reveals facilitation andsuppression from the same single cells in cat area-17. Investigative Ophthalmology & Visual Science, 37,2188.
Mullikin, W. H., Jones, J. P. & Palmer, L. A. (1984). Receptive-field properties and laminar distributionof X-like and Y-like simple cells in cat area 17. Journal of Neurophysiology, 52, 350-371.
Nelson, J. I. & Frost, B. J. (1978). Orientation-selective inhibition from beyond the classic visual receptivefield. Brain Research, 139, 359-365.
Nelson, J. I. & Frost, B. J. (1985). Intracortical facilitation among co-oriented, co-axially aligned simplecells in cat striate cortex. Experimental Brain Research, 61, 54-61.
Newsome, W. T., Britten, K. H. & Movshon, J. A. (1989). Neuronal correlates of a perceptual decision.Nature, 341, 52-4.
Parent, P. & Zucker, S. W. (1989). Trace inference, curvature consistency, and curve detection. IEEETransactions on Pattern Analysis and Machine Intelligence, 11, 823-839.

18
Pettet, M. W. & Gilbert, C. D. (1992). Dynamic changes in receptive field size in cat primary visualcortex. Proceedings of the National Academy of Science USA, 89, 8366-8370.
Pettet, M. W., McKee, S. P. & Grzywacz, N. M. (1996). Smoothness constrains long-range interactionsmediating contour-detection. Investigative Ophthalmology and Visual Science, 37, 4368.
Polat, U. & Sagi, D. (1993). Lateral interactions between spatial channels: Suppression and facilitationrevealed by lateral masking experiments. Vision Research, 33, 993-999.
Polat, U. & Sagi, D. (1994). The architecture of perceptual spatial interactions. Vision Research, 34, 73-78.
Rock, I. & Palmer, S. (1990). The legacy of Gestalt psychology. Scientific American, 263, 84-90.
Rockland, K. S. & Lund, J. S. (1982). Widespread periodic intrinsic connections in the tree shrew visualcortex. Science, 215, 532-534.
Rockland, K. S. & Lund, J. S. (1983). Intrinsic laminar lattice connections in primate visual cortex.Journal of Comparative Neurology, 216, 303-318.
Sagi, D. & Kovács, I. (1993). Long range processes involved in the perception of Glass patterns.Investigative Ophthalmology and Visual Science, 34, 2106.
Schillen, T. B. & König, R. (1991). Stimulus-dependent assembly formation of oscillatory responses: II.Desynchronization. Neural Computation, 3, 167-177.
Sha'ashua, A. & Ullman, S. (1988). Structural saliency: the detection of globally salient structures using alocally connected network. Proceedings of the second international conference on computer vision, 321-327.
Sillito, A. M. (1993). The cholinergic neuromodulatory system: an evaluation of its functional roles.Progress in Brain Research, 98, 371-378.
Sillito, A. M., Grieve, K. L., Jones, H. E., Cudeiro, J. & Davis, J. (1995). Visual cortical mechanismsdetecting focal orientation discontinuities. Nature, 378, 492-496.
Singer, W. & Gray, C. M. (1995). Visual feature integration and the temporal correlation hypothesis.Annual Review of Neuroscience, 18, 555-586.
Somers, D. & Kopell, N. (1993). Rapid synchronization through fast threshold modulation. BiologicalCybernetics, 68, 393-407.
Stemmler, M., Usher, M. & Niebur, E. (1995). Lateral interactions in primary visual cortex: A modelbridging physiology and psychophysics. Science, 269, 1877-1880.
Terman, D. & Wang, D. L. (1995). Global competition and local cooperation in a network of neuraloscillators. Physica D, 81, 148-176.
Toyama, K., Kimura, M. & Tanaka, K. (1981a). Cross-correlation analysis of interneuronal connectivity incat visual cortex. Journal of Neurophysiology, 46, 191-201.
Toyama, K., Kimura, M. & Tanaka, K. (1981b). Organization of cat visual cortex as investigated by cross-correlation techniques. Journal of Neurophysiology, 46, 202-214.

19
Traub, R. D., Whittington, M. A., Stanford, I. M. & Jefferys, J. G. R. (1996). A mechanism forgeneration of long-range synchronous fast oscillations in the cortex. Nature, 383, 621-624.
Ts’o, D. & Gilbert, C. D. (1988). The organization of chromatic and spatial interactions in the primatestriate cortex. Journal of Neuroscience, 8, 1712-1727.
Ts’o, D., Gilbert, C. D. & Wiesel, T. N. (1986). Relationships between horizontal and functionalarchitecture in cat striate cortex as revealed by cross-correlation analysis. Journal of Neuroscience, 6, 1160-1170.
von der Heydt, R. & Peterhans, E. (1989). Mechanisms of contour perception in monkey visual cortex. I.Lines of pattern discontinuity. Journal of Neuroscience, 9, 1731-1748.
von der Malsburg, C. & Buhmann, J. (1992). Sensory segmentation with coupled neural oscillators.Biological Cybernetics, 67, 233-242.
Watamaniuk, S. N. & Sekuler, R. (1992). Temporal and spatial integration in dynamic random-dot stimuli.Vision Research, 32, 2341-2347.
Weliky M., Kandler, K., Fitzpatrick, D. & Katz, L. C. (1995). Patterns of excitation and inhibition evokedby horizontal connections in visual cortex share a common relationship to orientation columns. Neuron,15, 541-552.
Westheimer, G. (1986). Spatial interaction in the domain of disparity signals in human stereoscopic vision.Journal of Physiology, 370, 619-629.
Wolfe, J. M. (1994). Guided search 2.0: A revised model of visual search. Psychonomic Bulletin andReview, 1, 202-238.
Yen, S-C. & Finkel, L. H. (1996a). Pop-Out of Salient Contours in a network based on Striate CorticalConnectivity. Investigative Ophthalmology and Visual Science, 37, 1348.
Yen, S-C. & Finkel, L. H. (1996b). Cortical Synchronization Mechanisms for “Pop-Out” of Salient ImageContours. In Bower, J. M. (Eds), The Neurobiology of Computation. Massachusetts: Kluwer AcademicPublisher.
Yen, S-C. & Finkel, L. H. (1996c). Salient Contour Extraction by Temporal Binding in a Cortically-BasedNetwork. In Jordan, M. I., Mozer, M. C. & Petsche, T. (Eds), Advances in Neural Information ProcessingSystems 9. Massachusetts: MIT Press.
Young, R. A. (1987). The Gaussian derivative model for spatial vision: I. Retinal mechanisms. SpatialVision, 2, 273-293.
Young, R. A. & Lesperance, R. M. (1993). A physiological model of motion analysis for machine vision.Proceedings of the SPIE - The International Society for Optical Engineering, 1913, 48-123.
Zipser, K., Lamme, V. A. F. & Schiller, P. H. (1996). Contextual modulation in primary visual-cortex.Journal of Neuroscience, 16(22), 7376-7389.

20
Appendix
Model CellsThe cells in the model are represented by linearly separable G4 and H4 steerable filters. The responses ofthe filters are represented as:
A x y f x y I x y dx dy( , , ) ( , , ) ( , )θ θ= ∫∫where f(x,y,θ) is the kernel of a steerable filter oriented at θ, and I(x,y) is the input image. The dominantorientation at each position is computed directly from the basis responses using the method proposed inFreeman and Adelson (1991). The facilitation is then computed at only the dominant orientation as asimplification. The responses at the dominant orientation are also squared to allow interactions betweencells of opposite contrast polarity. This is consistent with results from Dresp and Bonnet (1995), whoshowed that the facilitation of contrast sensitivity to a subthreshold bar does not depend on the direction ofcontrast.
FacilitationEach cell in the model receives weighted inputs from other oriented cells in its surround. The connectionweights are dependent on position as well as orientation. The facilitation that a post-synaptic cell oforientation θ receives may be represented by:
F x y W i j A x i y j d di dji j N
( , , ) ( , , , ) ( , , )( , )
θ θ ψ ψ ψ= + +∈
∫∫∫
where ψ is the orientation of the pre-synaptic cell, i and j represent positions in a neighborhood N, aroundthe post-synaptic cell. W(θ,i,j,ψ) is the connection weight between the post-synaptic cell oriented at θ, anda pre-synaptic cell of orientation ψ, and A(x+i,y+j,ψ) is the activity of the pre-synaptic cell.
The connection weight between the pre-synaptic and post-synaptic cell depends on their relative locations aswell as their respective orientations. The co-circularity rule imposes the constraint that for two pointslying on a circle, the average of their tangent orientations equals the slope of the line between them. Giventhe orientation, θ, of the post-synaptic cell, the “preferred” orientation, φ, at the position (i,j) of the pre-synaptic cell is specified by:
φ θ θ( , , ) tani jj
i=
−−2 1
where θ is the orientation of the post-synaptic cell, and i, j are positions relative to the post-synaptic cell(see Figure 1a). The connection weights peak at φ and fall off as a Gaussian function of the difference inthe acute angle (||acute) between φ and ψ, with half-width at half-height, σ ψ
c , for the co-axial connections:
B i j G i jacute
c( , , , ) ( ( , , ) , )θ ψ ψ φ θ σψ= −
The connection weights also fall off as a Gaussian function of distance, similar to the effects observed inpsychophysical studies by Polat and Sagi (1993) as well as in cortical cells by Kapadia et al., (1995):
D i j G i j dc( , ) ,= +( )2 2 σ
where σ dc represents the half-width at half-height of the Gaussian function.
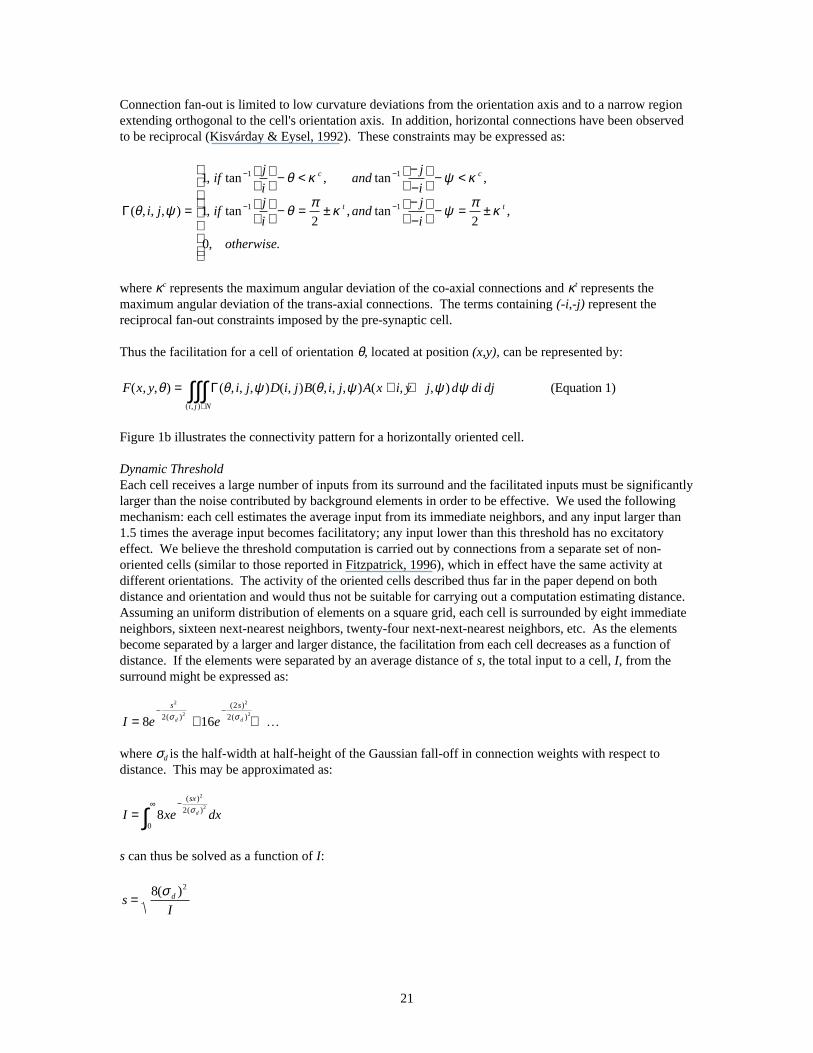
21
Connection fan-out is limited to low curvature deviations from the orientation axis and to a narrow regionextending orthogonal to the cell's orientation axis. In addition, horizontal connections have been observedto be reciprocal (Kisvárday & Eysel, 1992). These constraints may be expressed as:
Γ( , , , )
, tan , tan ,
, tan , tan ,
, .
θ ψ
θ κ ψ κ
θ π κ ψ π κi j
ifj
iand
j
i
ifj
iand
j
i
otherwise
c c
t t=
− < −
−
− <
− = ± −
−
− = ±
− −
− −
1
12 2
0
1 1
1 1
where κc represents the maximum angular deviation of the co-axial connections and κt represents themaximum angular deviation of the trans-axial connections. The terms containing (-i,-j) represent thereciprocal fan-out constraints imposed by the pre-synaptic cell.
Thus the facilitation for a cell of orientation θ, located at position (x,y), can be represented by:
F x y i j D i j B i j A x i y j d di dji j N
( , , ) ( , , , ) ( , ) ( , , , ) ( , , )( , )
θ θ ψ θ ψ ψ ψ= + +∈
∫∫∫ Γ (Equation 1)
Figure 1b illustrates the connectivity pattern for a horizontally oriented cell.
Dynamic ThresholdEach cell receives a large number of inputs from its surround and the facilitated inputs must be significantlylarger than the noise contributed by background elements in order to be effective. We used the followingmechanism: each cell estimates the average input from its immediate neighbors, and any input larger than1.5 times the average input becomes facilitatory; any input lower than this threshold has no excitatoryeffect. We believe the threshold computation is carried out by connections from a separate set of non-oriented cells (similar to those reported in Fitzpatrick, 1996), which in effect have the same activity atdifferent orientations. The activity of the oriented cells described thus far in the paper depend on bothdistance and orientation and would thus not be suitable for carrying out a computation estimating distance.Assuming an uniform distribution of elements on a square grid, each cell is surrounded by eight immediateneighbors, sixteen next-nearest neighbors, twenty-four next-next-nearest neighbors, etc. As the elementsbecome separated by a larger and larger distance, the facilitation from each cell decreases as a function ofdistance. If the elements were separated by an average distance of s, the total input to a cell, I, from thesurround might be expressed as:
I e es s
d d= + +− −
8 16
2
2
2
22
2
2( )
( )
( )σ σK
where σd is the half-width at half-height of the Gaussian fall-off in connection weights with respect todistance. This may be approximated as:
I xe dxsx
d=−∞
∫ 8
2
22
0
( )
( )σ
s can thus be solved as a function of I:
sId=
8 2( )σ
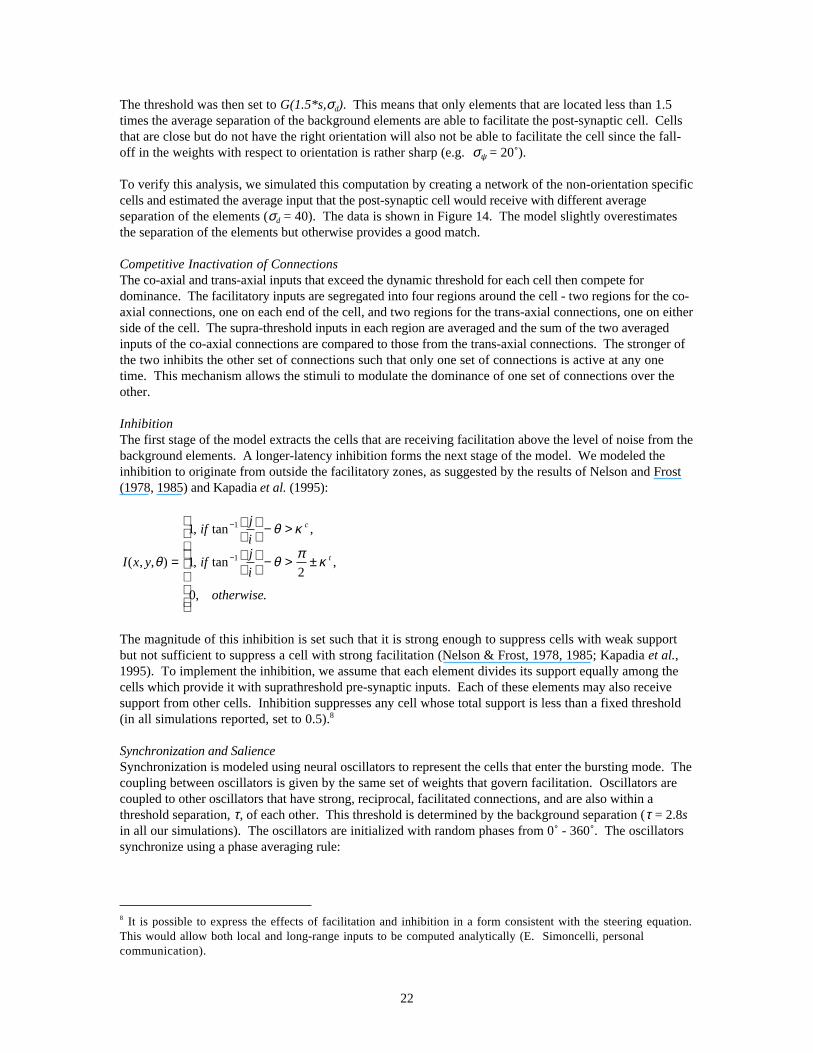
22
The threshold was then set to G(1.5*s,σd). This means that only elements that are located less than 1.5times the average separation of the background elements are able to facilitate the post-synaptic cell. Cellsthat are close but do not have the right orientation will also not be able to facilitate the cell since the fall-off in the weights with respect to orientation is rather sharp (e.g. σψ = 20˚).
To verify this analysis, we simulated this computation by creating a network of the non-orientation specificcells and estimated the average input that the post-synaptic cell would receive with different averageseparation of the elements (σd = 40). The data is shown in Figure 14. The model slightly overestimatesthe separation of the elements but otherwise provides a good match.
Competitive Inactivation of ConnectionsThe co-axial and trans-axial inputs that exceed the dynamic threshold for each cell then compete fordominance. The facilitatory inputs are segregated into four regions around the cell - two regions for the co-axial connections, one on each end of the cell, and two regions for the trans-axial connections, one on eitherside of the cell. The supra-threshold inputs in each region are averaged and the sum of the two averagedinputs of the co-axial connections are compared to those from the trans-axial connections. The stronger ofthe two inhibits the other set of connections such that only one set of connections is active at any onetime. This mechanism allows the stimuli to modulate the dominance of one set of connections over theother.
InhibitionThe first stage of the model extracts the cells that are receiving facilitation above the level of noise from thebackground elements. A longer-latency inhibition forms the next stage of the model. We modeled theinhibition to originate from outside the facilitatory zones, as suggested by the results of Nelson and Frost(1978, 1985) and Kapadia et al. (1995):
I x y
ifj
i
ifj
i
otherwise
c
t( , , )
, tan ,
, tan ,
, .
θ
θ κ
θ π κ=
− >
− > ±
−
−
1
12
0
1
1
The magnitude of this inhibition is set such that it is strong enough to suppress cells with weak supportbut not sufficient to suppress a cell with strong facilitation (Nelson & Frost, 1978, 1985; Kapadia et al.,1995). To implement the inhibition, we assume that each element divides its support equally among thecells which provide it with suprathreshold pre-synaptic inputs. Each of these elements may also receivesupport from other cells. Inhibition suppresses any cell whose total support is less than a fixed threshold(in all simulations reported, set to 0.5).8
Synchronization and SalienceSynchronization is modeled using neural oscillators to represent the cells that enter the bursting mode. Thecoupling between oscillators is given by the same set of weights that govern facilitation. Oscillators arecoupled to other oscillators that have strong, reciprocal, facilitated connections, and are also within athreshold separation, τ, of each other. This threshold is determined by the background separation (τ = 2.8sin all our simulations). The oscillators are initialized with random phases from 0˚ - 360˚. The oscillatorssynchronize using a phase averaging rule:
8 It is possible to express the effects of facilitation and inhibition in a form consistent with the steering equation.This would allow both local and long-range inputs to be computed analytically (E. Simoncelli, personalcommunication).

23
ΘΘ
i
jt
t
n( )
( )=
−∑ 1
where Θ represents the phase of the oscillator and n represents the number of oscillators affecting the phaseof oscillator i..
The oscillators synchronize iteratively and synchronization is defined as the following condition:
Θ Θi j acutet t i j C t t( ) ( ) , , , max− < ∈ <δ
where C represents all the coupled oscillators on the same contour, δ represents the maximum phasedifference between oscillators, and tmax represents the maximum number of time steps the oscillators areallowed to synchronize. Only if the chain synchronizes does the chain become reliably and coherentlyrepresented. The salience, Sc, of the chain is represented by the sum of the activities of all the synchronizedelements in the group, C :
S A i Cc i= ∈∑ ,
A summary of the parameters used in our simulations is presented in the following table:σ d
c (change in weights with distance of the co-axial connections) 40
σ ψc (change in weights with angle of the co-axial connections) 20˚
κc (fan-out of the co-axial connections) 30˚σ d
t (change in weights with distance of the trans-axial connections) 30
σ ψt (change in weights with angle of the trans-axial connections) 20˚
κt (fan-out of the trans-axial connections) 10˚σd (change in weights with distance of the non-oriented connections) σ d
c (40)
Facilitatory threshold 1.5Threshold separation for coupling 2.8sMaximum time steps for synchronization 100Maximum phase difference for synchronization 10˚
Methods
Experiment 1In our simulations of Experiment 1, we compared the facilitation in the model to the psychophysical resultsfrom Kapadia et al. (1995). We computed the facilitation that a vertically oriented cell would receive from apre-synaptic cell as we varied the pre-synaptic cell's orientation and position. Since there is only one pre-synaptic cell, whose contrast is equal to unity, Equation 1 reduces to:
F x y x x y y G x x y y
Gy y
x x
center center center center center center center center dc
center
centercenter
c
( , , ) ( , , , ) ( ) ( ) ,
tan ,
θ θ ψ σ
ψ θ σψ
= − − − + −( )− −
−
−
−
Γ 2 2
12
The three sets of simulations included:
1) 0 ≤ y - ycenter ≤ 175 arcmin2) 0 ≤ x - xcenter ≤ 35 arcmin3) 90˚ ≤ ψ ≤ 160˚
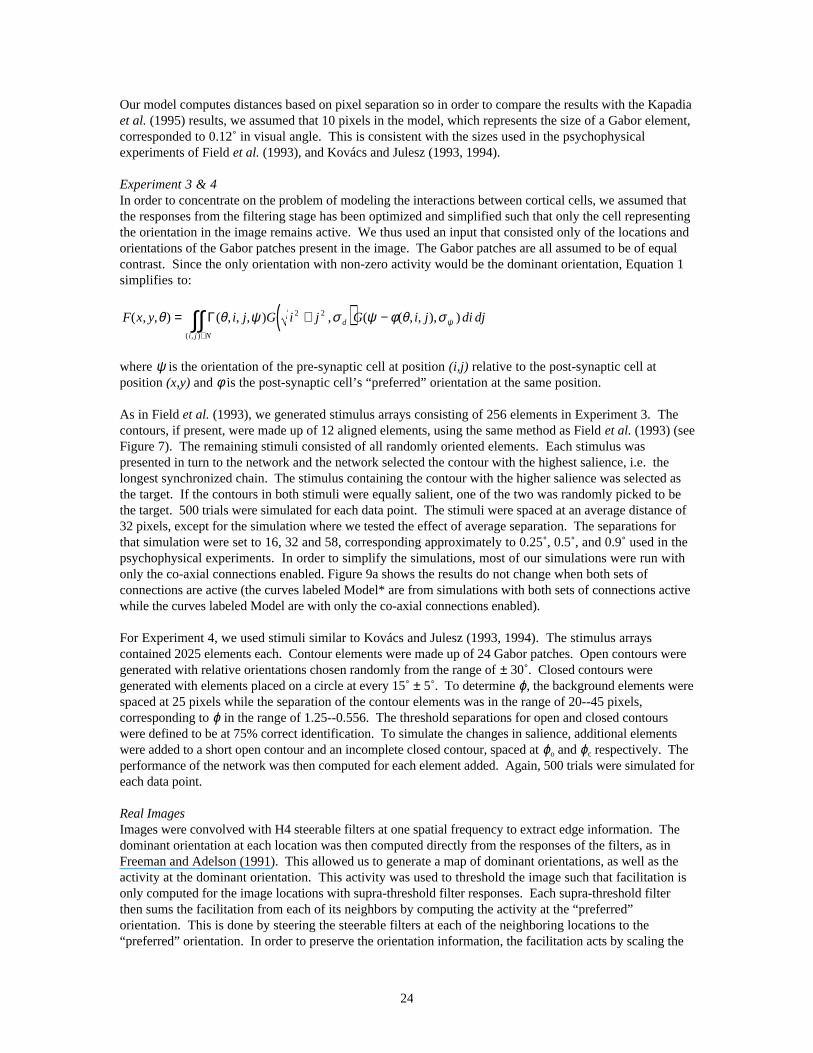
24
Our model computes distances based on pixel separation so in order to compare the results with the Kapadiaet al. (1995) results, we assumed that 10 pixels in the model, which represents the size of a Gabor element,corresponded to 0.12˚ in visual angle. This is consistent with the sizes used in the psychophysicalexperiments of Field et al. (1993), and Kovács and Julesz (1993, 1994).
Experiment 3 & 4In order to concentrate on the problem of modeling the interactions between cortical cells, we assumed thatthe responses from the filtering stage has been optimized and simplified such that only the cell representingthe orientation in the image remains active. We thus used an input that consisted only of the locations andorientations of the Gabor patches present in the image. The Gabor patches are all assumed to be of equalcontrast. Since the only orientation with non-zero activity would be the dominant orientation, Equation 1simplifies to:
F x y i j G i j G i j di djd
i j N
( , , ) ( , , , ) , ( ( , , ), )( , )
θ θ ψ σ ψ φ θ σ ψ= +( ) −∈
∫∫ Γ 2 2
where ψ is the orientation of the pre-synaptic cell at position (i,j) relative to the post-synaptic cell atposition (x,y) and φ is the post-synaptic cell’s “preferred” orientation at the same position.
As in Field et al. (1993), we generated stimulus arrays consisting of 256 elements in Experiment 3. Thecontours, if present, were made up of 12 aligned elements, using the same method as Field et al. (1993) (seeFigure 7). The remaining stimuli consisted of all randomly oriented elements. Each stimulus waspresented in turn to the network and the network selected the contour with the highest salience, i.e. thelongest synchronized chain. The stimulus containing the contour with the higher salience was selected asthe target. If the contours in both stimuli were equally salient, one of the two was randomly picked to bethe target. 500 trials were simulated for each data point. The stimuli were spaced at an average distance of32 pixels, except for the simulation where we tested the effect of average separation. The separations forthat simulation were set to 16, 32 and 58, corresponding approximately to 0.25˚, 0.5˚, and 0.9˚ used in thepsychophysical experiments. In order to simplify the simulations, most of our simulations were run withonly the co-axial connections enabled. Figure 9a shows the results do not change when both sets ofconnections are active (the curves labeled Model* are from simulations with both sets of connections activewhile the curves labeled Model are with only the co-axial connections enabled).
For Experiment 4, we used stimuli similar to Kovács and Julesz (1993, 1994). The stimulus arrayscontained 2025 elements each. Contour elements were made up of 24 Gabor patches. Open contours weregenerated with relative orientations chosen randomly from the range of ± 30˚. Closed contours weregenerated with elements placed on a circle at every 15˚ ± 5˚. To determine ϕ, the background elements werespaced at 25 pixels while the separation of the contour elements was in the range of 20--45 pixels,corresponding to ϕ in the range of 1.25--0.556. The threshold separations for open and closed contourswere defined to be at 75% correct identification. To simulate the changes in salience, additional elementswere added to a short open contour and an incomplete closed contour, spaced at ϕo and ϕc respectively. Theperformance of the network was then computed for each element added. Again, 500 trials were simulated foreach data point.
Real ImagesImages were convolved with H4 steerable filters at one spatial frequency to extract edge information. Thedominant orientation at each location was then computed directly from the responses of the filters, as inFreeman and Adelson (1991). This allowed us to generate a map of dominant orientations, as well as theactivity at the dominant orientation. This activity was used to threshold the image such that facilitation isonly computed for the image locations with supra-threshold filter responses. Each supra-threshold filterthen sums the facilitation from each of its neighbors by computing the activity at the “preferred”orientation. This is done by steering the steerable filters at each of the neighboring locations to the“preferred” orientation. In order to preserve the orientation information, the facilitation acts by scaling the

25
basis responses proportionally. The facilitation is then followed by a global normalization to re-scale theresponses of all the filters into the range of 0.0--1.0. This normalization is similar to Heeger (1992) whereeach cell’s response is divided by the average of the cell activities in the scene. The activity after everycycle is also thresholded so the facilitation is computed only for the cells with supra-threshold activity. Weallowed the process to iterate repeatedly until the network stabilizes.
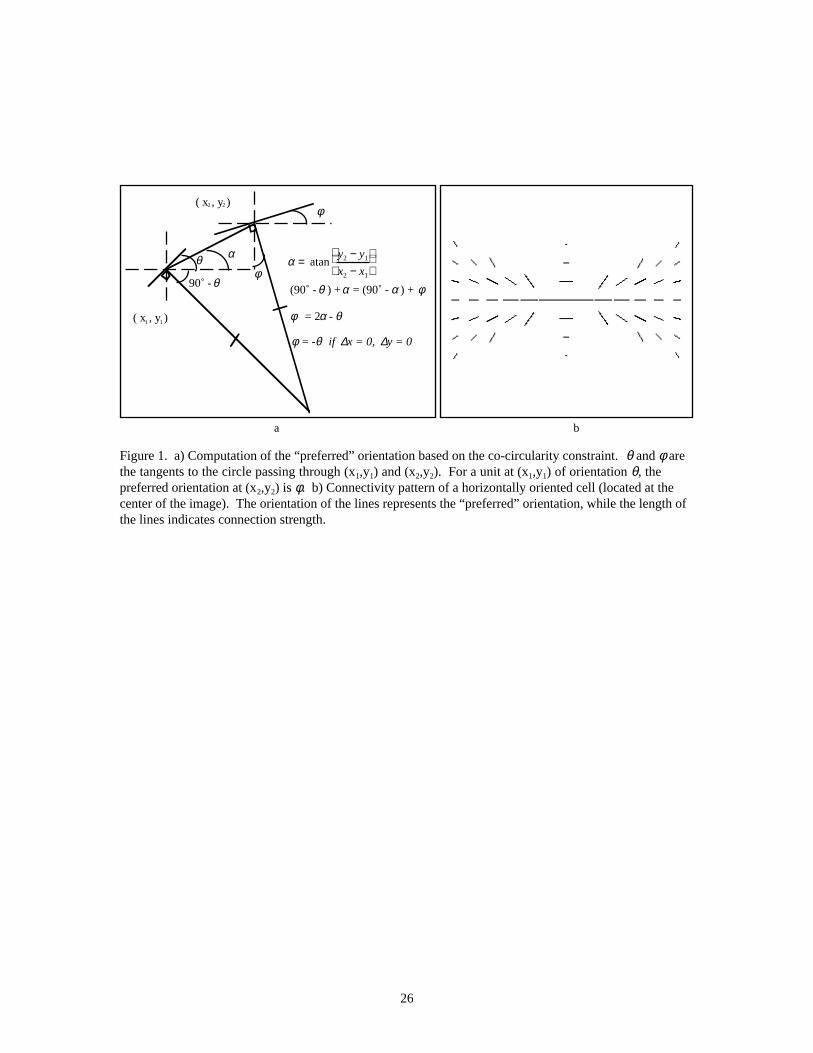
26
( x1 , y1 )
( x2 , y2 )
θ
φ
α
φ90˚ - θ
(90˚ - θ ) + α = (90˚ - α ) + φ
φ = 2α - θ
φ = -θ if ∆x = 0, ∆y = 0
α = atany2 − y1
x2 − x1
a b
Figure 1. a) Computation of the “preferred” orientation based on the co-circularity constraint. θ and φ arethe tangents to the circle passing through (x1,y1) and (x2,y2). For a unit at (x1,y1) of orientation θ, thepreferred orientation at (x2,y2) is φ. b) Connectivity pattern of a horizontally oriented cell (located at thecenter of the image). The orientation of the lines represents the “preferred” orientation, while the length ofthe lines indicates connection strength.
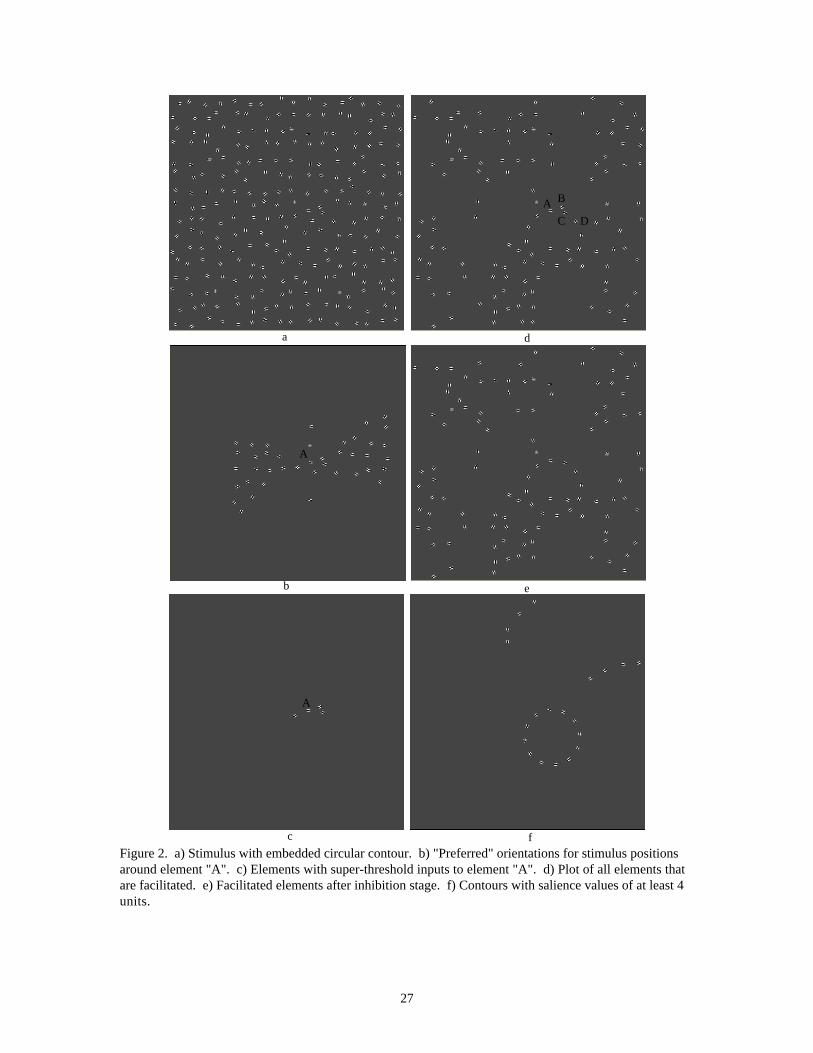
27
a
BA
C D
d
e
c
A
f
b
A
Figure 2. a) Stimulus with embedded circular contour. b) "Preferred" orientations for stimulus positionsaround element "A". c) Elements with super-threshold inputs to element "A". d) Plot of all elements thatare facilitated. e) Facilitated elements after inhibition stage. f) Contours with salience values of at least 4units.
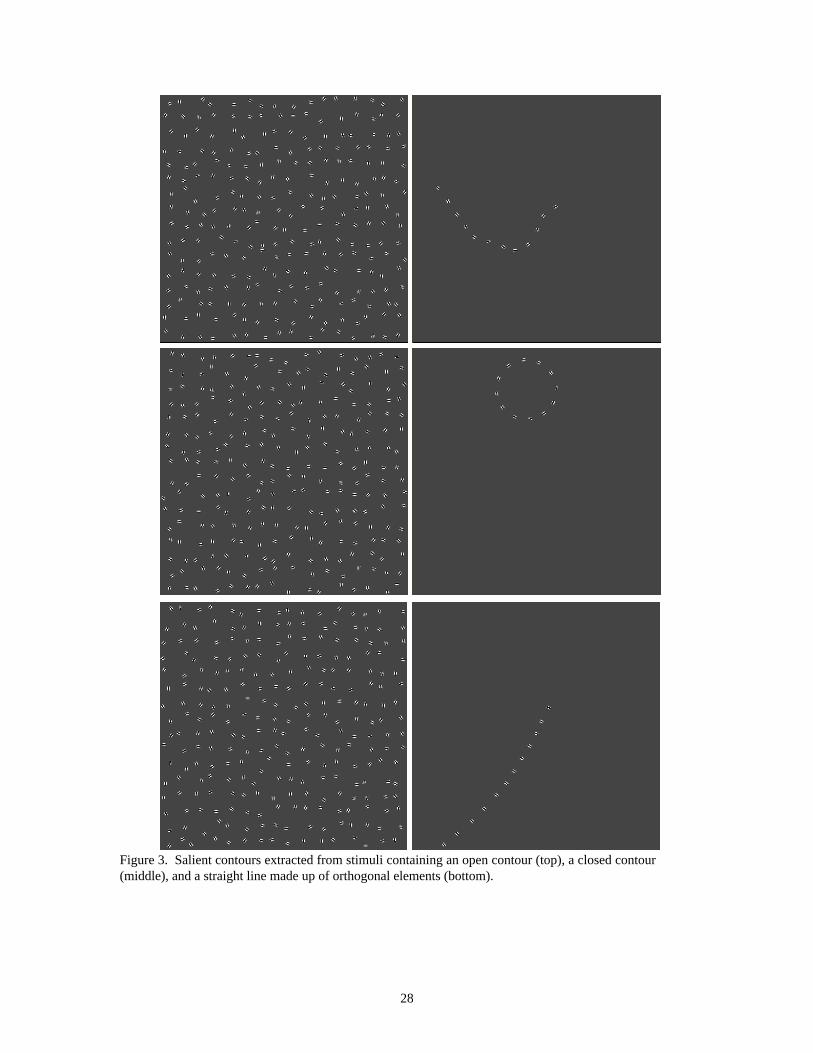
28
Figure 3. Salient contours extracted from stimuli containing an open contour (top), a closed contour(middle), and a straight line made up of orthogonal elements (bottom).
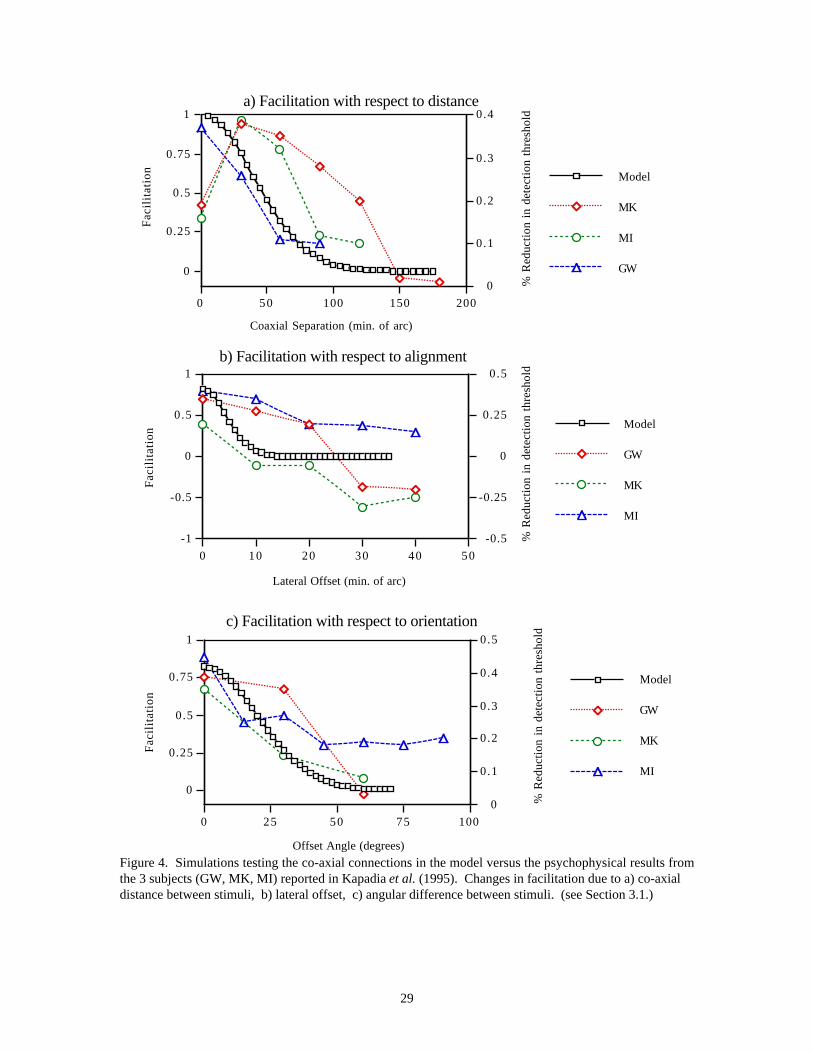
29
0
0.1
0.2
0.3
0.4
% R
ed
uct
ion
in
de
tect
ion
th
resh
old
0
0.25
0.5
0.75
1
Fa
cilit
ati
on
0 50 100 150 200
Coaxial Separation (min. of arc)
a) Facilitation with respect to distance
GW
MI
MK
Model
-0.5
-0.25
0
0.25
0.5
% R
ed
uct
ion
in
de
tect
ion
th
resh
old
-1
-0.5
0
0.5
1
Fa
cilit
ati
on
0 10 20 30 40 50
Lateral Offset (min. of arc)
b) Facilitation with respect to alignment
MI
MK
GW
Model
0
0.1
0.2
0.3
0.4
0.5
% R
ed
uct
ion
in
de
tect
ion
th
resh
old
0
0.25
0.5
0.75
1
Fa
cilit
ati
on
0 25 50 75 100
Offset Angle (degrees)
c) Facilitation with respect to orientation
MI
MK
GW
Model
Figure 4. Simulations testing the co-axial connections in the model versus the psychophysical results fromthe 3 subjects (GW, MK, MI) reported in Kapadia et al. (1995). Changes in facilitation due to a) co-axialdistance between stimuli, b) lateral offset, c) angular difference between stimuli. (see Section 3.1.)
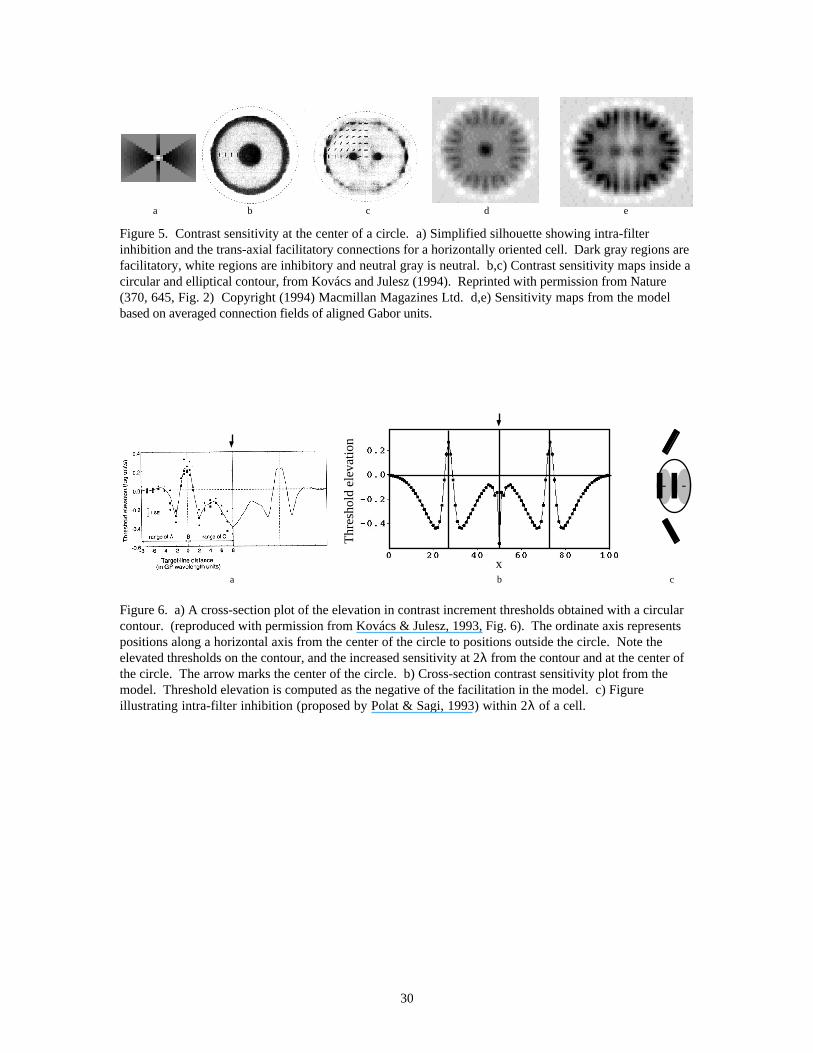
30
a b ec d
Figure 5. Contrast sensitivity at the center of a circle. a) Simplified silhouette showing intra-filterinhibition and the trans-axial facilitatory connections for a horizontally oriented cell. Dark gray regions arefacilitatory, white regions are inhibitory and neutral gray is neutral. b,c) Contrast sensitivity maps inside acircular and elliptical contour, from Kovács and Julesz (1994). Reprinted with permission from Nature(370, 645, Fig. 2) Copyright (1994) Macmillan Magazines Ltd. d,e) Sensitivity maps from the modelbased on averaged connection fields of aligned Gabor units.
--
a b c
x
Thr
esho
ld e
leva
tion
Figure 6. a) A cross-section plot of the elevation in contrast increment thresholds obtained with a circularcontour. (reproduced with permission from Kovács & Julesz, 1993, Fig. 6). The ordinate axis representspositions along a horizontal axis from the center of the circle to positions outside the circle. Note theelevated thresholds on the contour, and the increased sensitivity at 2λ from the contour and at the center ofthe circle. The arrow marks the center of the circle. b) Cross-section contrast sensitivity plot from themodel. Threshold elevation is computed as the negative of the facilitation in the model. c) Figureillustrating intra-filter inhibition (proposed by Polat & Sagi, 1993) within 2λ of a cell.
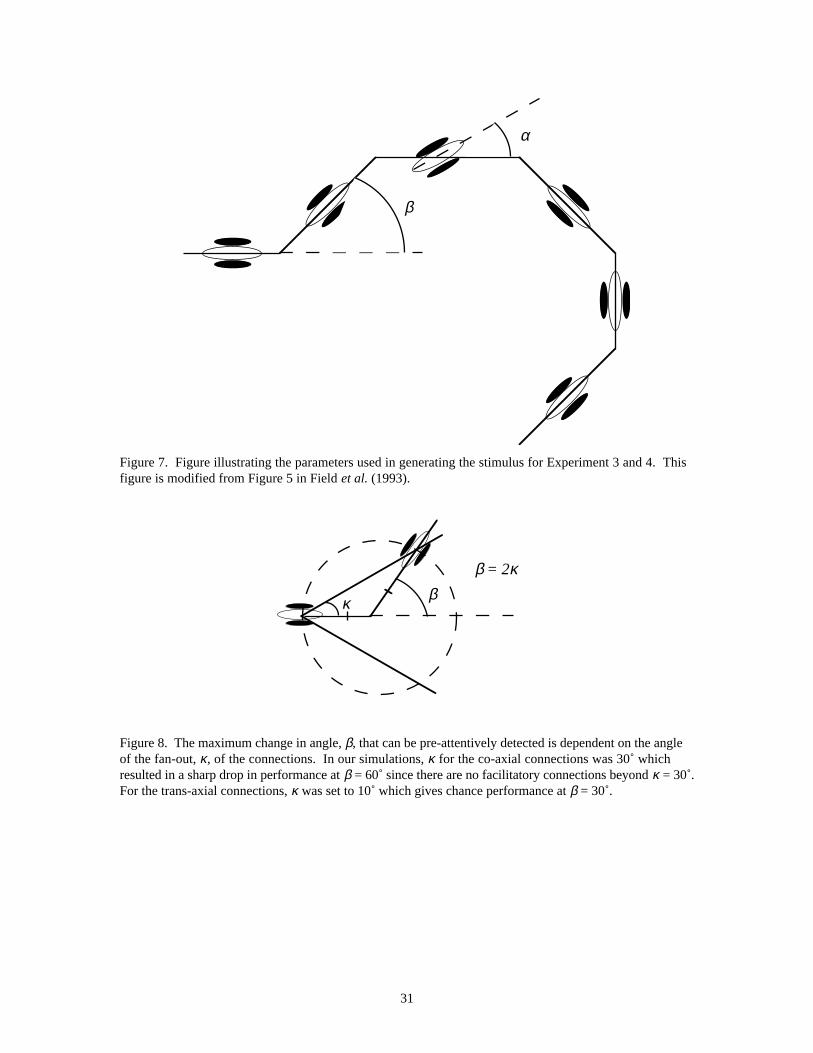
31
β
α
Figure 7. Figure illustrating the parameters used in generating the stimulus for Experiment 3 and 4. Thisfigure is modified from Figure 5 in Field et al. (1993).
βκ
β = 2κ
Figure 8. The maximum change in angle, β, that can be pre-attentively detected is dependent on the angleof the fan-out, κ, of the connections. In our simulations, κ for the co-axial connections was 30˚ whichresulted in a sharp drop in performance at β = 60˚ since there are no facilitatory connections beyond κ = 30˚.For the trans-axial connections, κ was set to 10˚ which gives chance performance at β = 30˚.
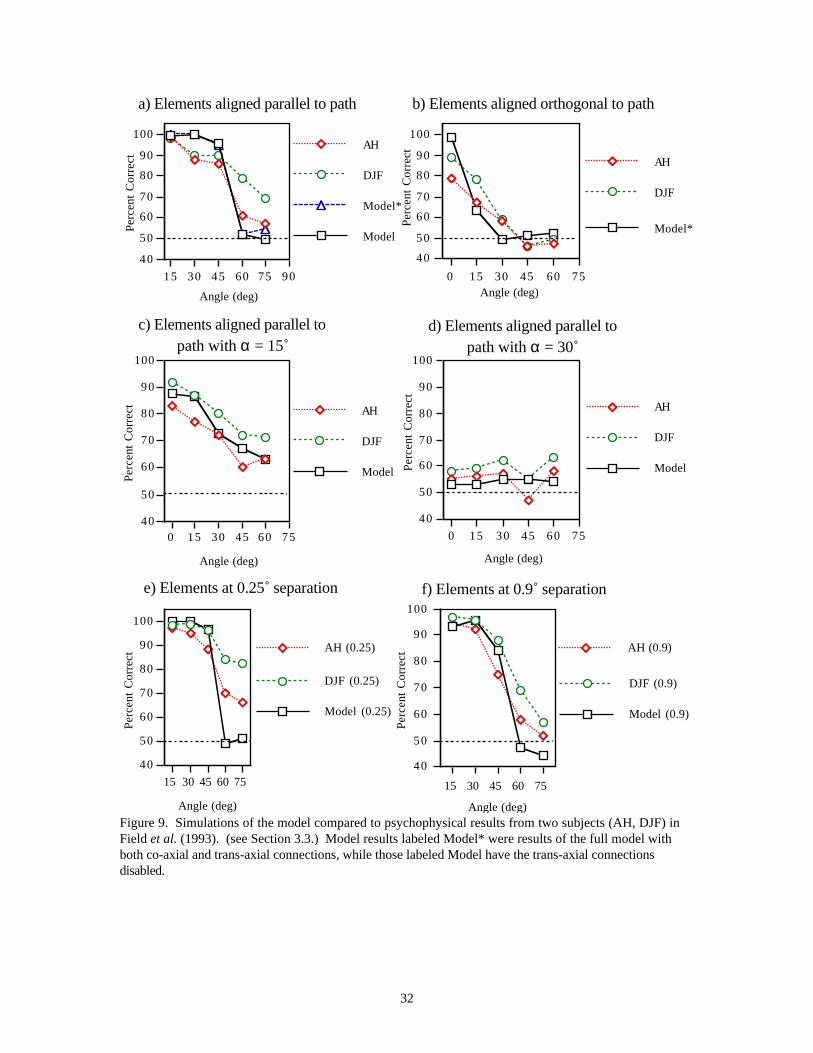
32
40
50
60
70
80
90
100
Pe
rce
nt
Co
rre
ct
0 15 30 45 60 75
Angle (deg)
c) Elements aligned parallel topath with α = 15˚
Model
DJF
AH
40
50
60
70
80
90
100P
erc
en
t C
orr
ect
15 30 45 60 75 90
Angle (deg)
a) Elements aligned parallel to path
Model*
DJF
AH
Model
40
50
60
70
80
90
100
Pe
rce
nt
Co
rre
ct
0 15 30 45 60 75Angle (deg)
b) Elements aligned orthogonal to path
Model*
DJF
AH
40
50
60
70
80
90
100
Pe
rce
nt
Co
rre
ct
0 15 30 45 60 75
Angle (deg)
d) Elements aligned parallel topath with α = 30˚
DJF
AH
Model
40
50
60
70
80
90
100
Pe
rce
nt
Co
rre
ct
15 30 45 60 75
Angle (deg)
f) Elements at 0.9˚ separation
AH (0.9)
Model (0.9)
DJF (0.9)
40
50
60
70
80
90
100
Pe
rce
nt
Co
rre
ct
15 30 45 60 75
Angle (deg)
e) Elements at 0.25˚ separation
AH (0.25)
Model (0.25)
DJF (0.25)
Figure 9. Simulations of the model compared to psychophysical results from two subjects (AH, DJF) inField et al. (1993). (see Section 3.3.) Model results labeled Model* were results of the full model withboth co-axial and trans-axial connections, while those labeled Model have the trans-axial connectionsdisabled.
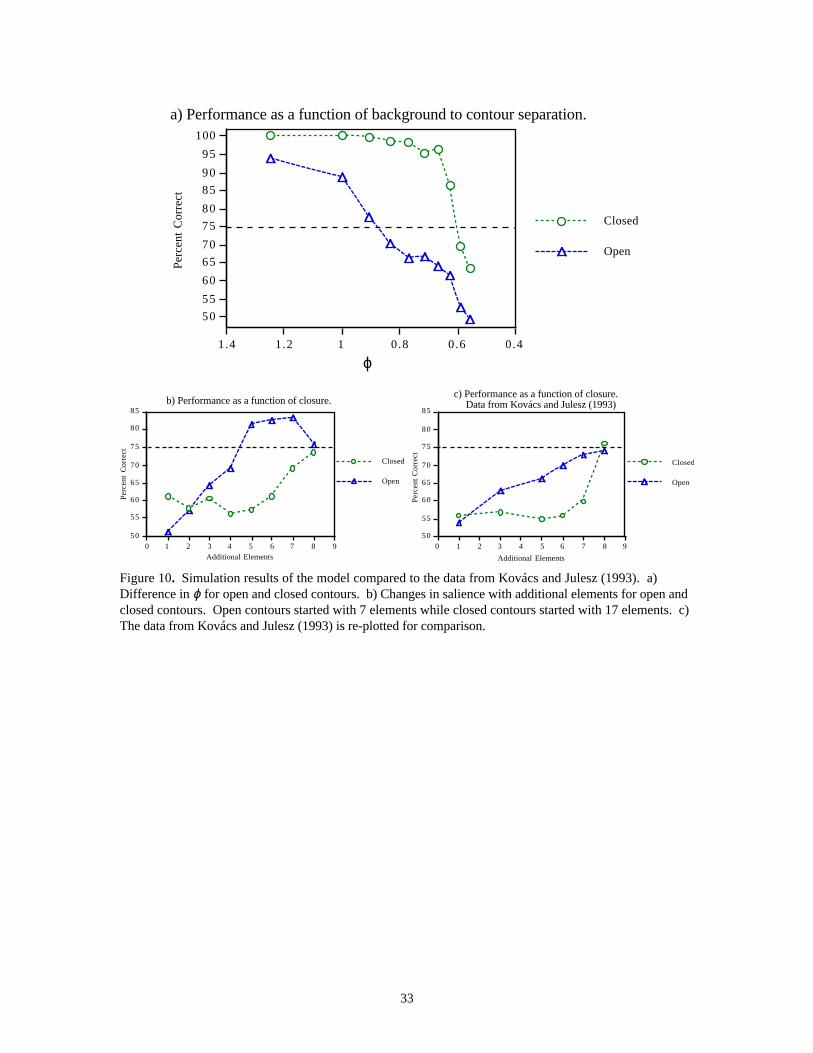
33
50
55
60
65
70
75
80
85
90
95
100
Pe
rce
nt
Co
rre
ct
0 .40.60.811.21.4
ϕ
a) Performance as a function of background to contour separation.
Open
Closed
50
55
60
65
70
75
80
85P
erc
en
t C
orr
ect
0 1 2 3 4 5 6 7 8 9
Additional Elements
c) Performance as a function of closure.Data from Kovács and Julesz (1993)
Open
Closed
50
55
60
65
70
75
80
85
Pe
rce
nt C
orr
ect
0 1 2 3 4 5 6 7 8 9Additional Elements
b) Performance as a function of closure.
Open
Closed
Figure 10. Simulation results of the model compared to the data from Kovács and Julesz (1993). a)Difference in ϕ for open and closed contours. b) Changes in salience with additional elements for open andclosed contours. Open contours started with 7 elements while closed contours started with 17 elements. c)The data from Kovács and Julesz (1993) is re-plotted for comparison.
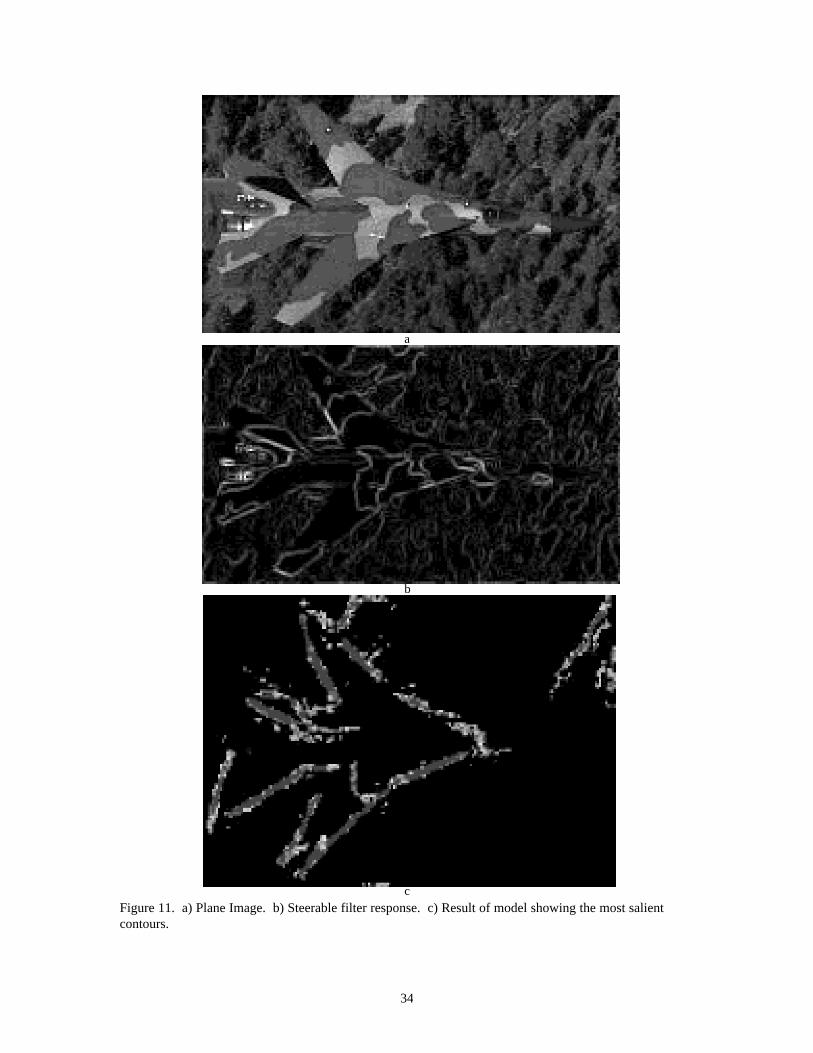
34
a
b
cFigure 11. a) Plane Image. b) Steerable filter response. c) Result of model showing the most salientcontours.
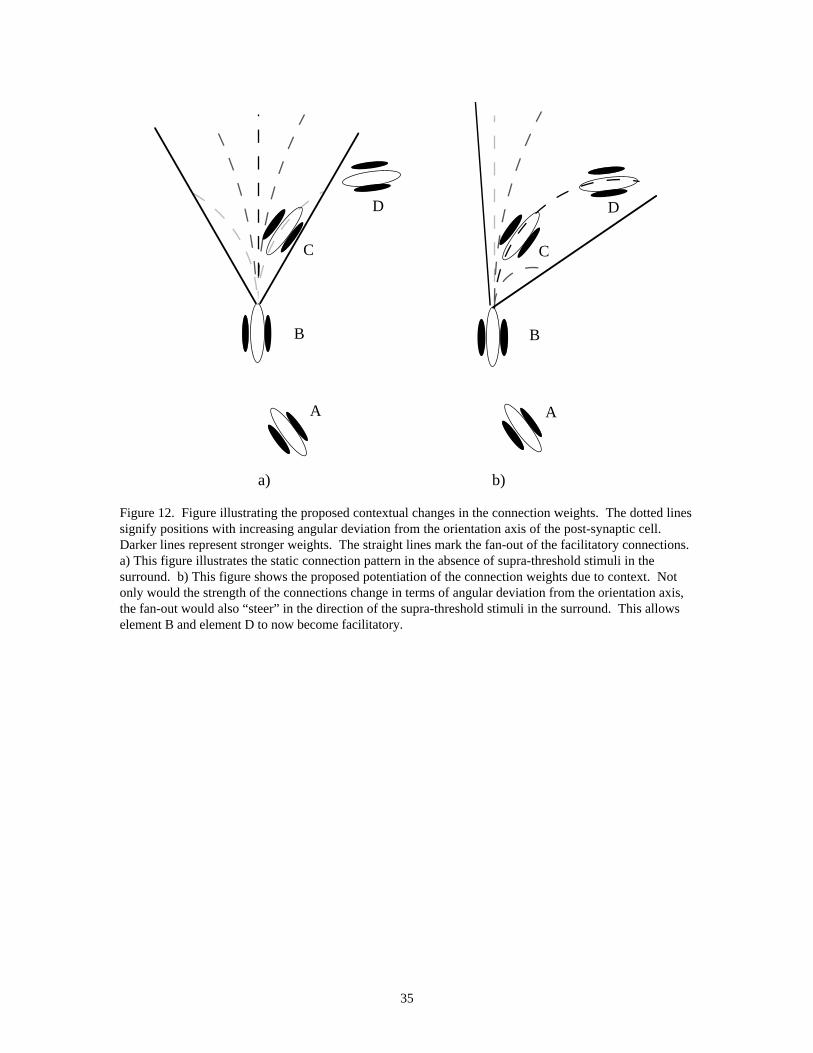
35
A
B
C
D
A
B
C
D
a) b)
Figure 12. Figure illustrating the proposed contextual changes in the connection weights. The dotted linessignify positions with increasing angular deviation from the orientation axis of the post-synaptic cell.Darker lines represent stronger weights. The straight lines mark the fan-out of the facilitatory connections.a) This figure illustrates the static connection pattern in the absence of supra-threshold stimuli in thesurround. b) This figure shows the proposed potentiation of the connection weights due to context. Notonly would the strength of the connections change in terms of angular deviation from the orientation axis,the fan-out would also “steer” in the direction of the supra-threshold stimuli in the surround. This allowselement B and element D to now become facilitatory.
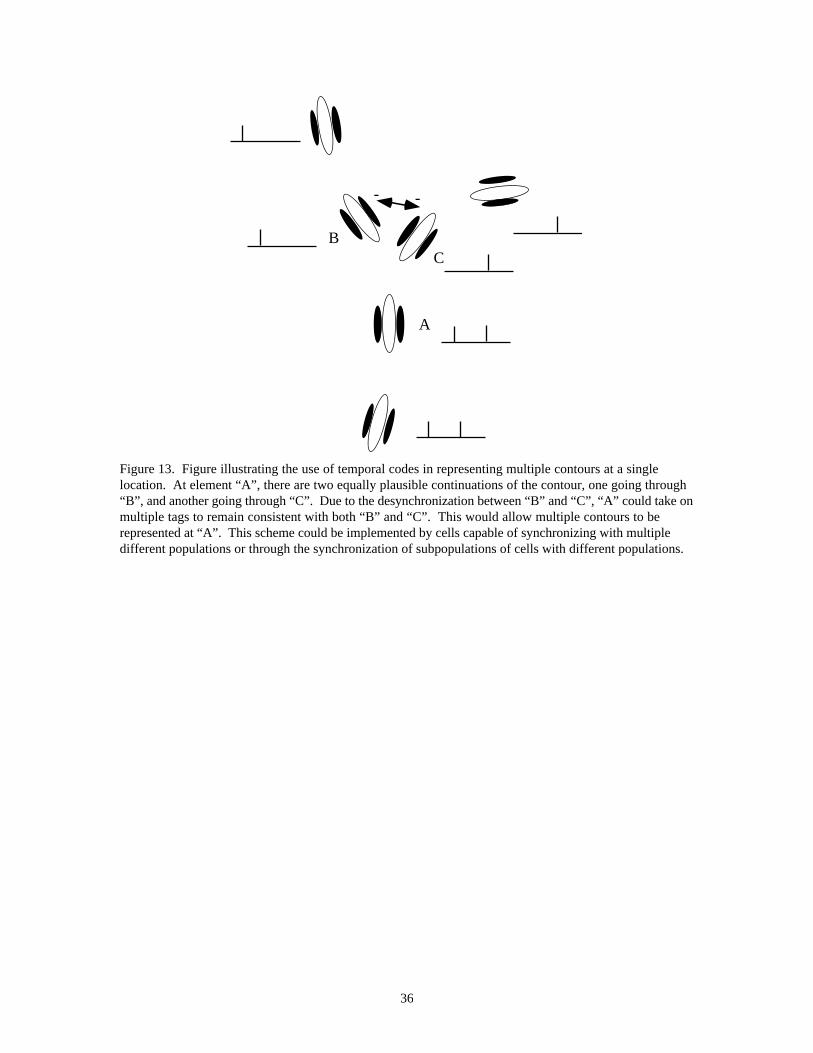
36
A
BC
- -
Figure 13. Figure illustrating the use of temporal codes in representing multiple contours at a singlelocation. At element “A”, there are two equally plausible continuations of the contour, one going through“B”, and another going through “C”. Due to the desynchronization between “B” and “C”, “A” could take onmultiple tags to remain consistent with both “B” and “C”. This would allow multiple contours to berepresented at “A”. This scheme could be implemented by cells capable of synchronizing with multipledifferent populations or through the synchronization of subpopulations of cells with different populations.
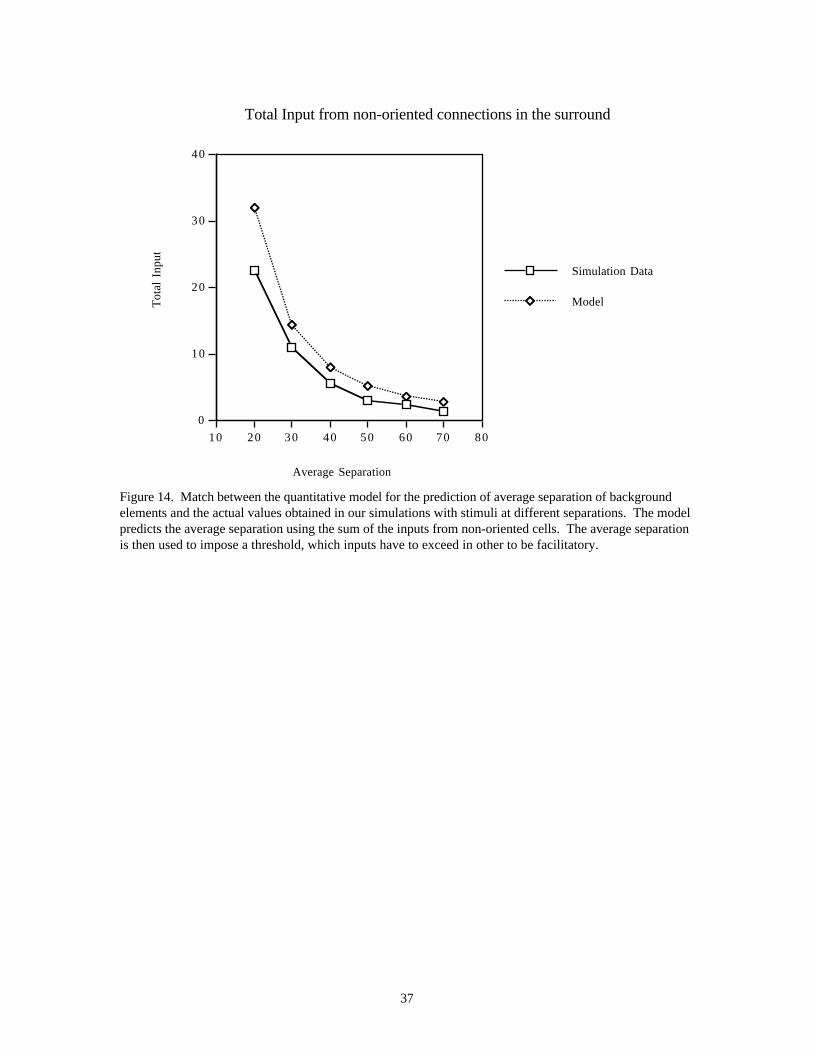
37
0
10
20
30
40T
ota
l In
pu
t
10 20 30 40 50 60 70 80
Average Separation
Total Input from non-oriented connections in the surround
Model
Simulation Data
Figure 14. Match between the quantitative model for the prediction of average separation of backgroundelements and the actual values obtained in our simulations with stimuli at different separations. The modelpredicts the average separation using the sum of the inputs from non-oriented cells. The average separationis then used to impose a threshold, which inputs have to exceed in other to be facilitatory.