bidirectional beam propagation method based on the method of lines for the analysis of photonic band...
TRANSCRIPT

Bidirectional beam propagation method based
on the method of lines for the analysis of photonic
band gap structures
A N T O N E L L A D ’ O R A Z I O , M A R C O D E S A R I O , V I N C E N Z O
P E T R U Z Z E L L I * A N D F R A N C E S C O P R U D E N Z A N O
Dipartimento di Elettrotecnica ed Elettronica, Politecnico di Bari, Via Re David n. 200, 70125 Bari, Italy
(*author for correspondence: E-mail: [email protected])
Received 19 August 2002; accepted 29 October 2002
Abstract. The bidirectional beam propagation method based on the method of lines is proposed as an
innovative and efficient algorithm to investigate the optical properties of photonic band gap (PBG)
structures. A few examples illustrate the application of this technique to the modeling of passive, lossy and
active one-dimensional and index confined PBG structures. The algorithm results are validated by com-
parison with those obtained via the transfer matrix method, the mode-matching method and the finite
difference time domain method. With respect to these methods, the present algorithm exhibits accurate
results with reduced computer resources.
Key words: bidirectional beam propagation method, method of lines, photonic band gap structures
1. Introduction
The beam propagation method (BPM) is at present the most widely usedtechnique for the study of light propagation in longitudinally varying opticalstructures. As is well known, BPM is mainly limited to structures havingsmall refractive index contrast or exhibiting dominant paraxial propagation.
An intriguing aspect of the electromagnetic (e.m.) propagation analysis,that demands particular attention in terms of modeling, consists of the re-flection and the transmission phenomena occurring at the interface betweentwo media characterized by a strong refractive index contrast along thelongitudinal direction, such as laser diode facets, antireflection coatings,passive and active waveguides including Bragg gratings and, more recently,the photonic band gap (PBG) structures (Joannopoulos et al. 1995). Severalnumerical procedures have been implemented to account for the reflectionproblems in integrated optics such as the free space radiation mode techniquefor facet reflection and the transfer matrix method for distributed-feedbackstructures as well as general algorithms such as the finite difference time
Optical and Quantum Electronics 35: 629–640, 2003.
� 2003 Kluwer Academic Publishers. Printed in the Netherlands. 629

domain (FDTD) method (Taflove et al. 2000) and other methods based onthe finite elements or finite difference methods (Scarmozzino et al. 2000). Thedrawback of these last methods consists of the requirement of extremelyexpensive time and memory resources.
The bidirectional beam propagation method (BBPM) (Gerdes 1994),generally, consists of propagating the field in both the forward and backwardlongitudinal directions through the structure by accounting for the reflectionalgorithm at the discontinuity interfaces. Recently, Rao et al. (1999) pro-posed a BBPM-based transfer matrix approach which treats multiple di-electric interfaces and significantly reduces time and memory resourcescompared to other multi-interface techniques.
D’Orazio et al. (2000) have investigated the performance of lasers andactive switches including Fabry–Perot cavity by means of a BBPM based onthe method of lines (MoL-BBPM). The MoL-BBPM, with respect to theconventional FFT-BBPM, gives more accurate results to the parity ofcomputational parameter numerical values and offers the possibility of re-ducing the computer CPU time by means of a nonuniform discretization ofthe transversal computational window. To this aim, the bidirectional versionof MoL-BPM was implemented by home-made codes in order to account forboth the forward and backward waves in order to design Fabry–Perot lasers.The developed algorithm, suitably modified in order to account for a largenumber of discontinuity interfaces, can be applied equally well to the analysisof PBG structures.
In this paper, we give an outline of our modeling approach to the analysisof PBG structures and illustrate it with a number of examples on passive,lossy and active one-dimensional (1D) PBG structures and on index-confined(IC) 1D-PBG waveguides.
2. Description of the model
The MoL-BBPM algorithm is based on two operators and works in twosteps. The first operator describes the one-way propagation (positive longi-tudinal þz direction), while the latter determines the reflection from a genericdiscontinuity along the structure longitudinal direction. In the first step, thetwo operators are used in the forward propagation to calculate the trans-mitted and the reflected fields at each discontinuity along the structure byimposing the continuity of the e.m. field tangential components at the dis-continuity interfaces. Successively, in the second step (negative longitudinal�z direction), the backward propagation is accounted for and the newtransmitted and reflected fields are evaluated, taking into account the re-flection contribution calculated in the previous step. Then, all the forwardand the backward waves, thus calculated at each computational longitudinal
630 A. D’ORAZIO ET AL.

section, are added up. This procedure is iteratively applied till the desiredconvergence is reached. The convergence criterion is based on the compari-son between the fields at the output section (z ¼ L) calculated in two suc-cessive iterations. In each discontinuity section along the longitudinal z axis,the MoL-BBPM code assumes, for the wave equation along each line, thefollowing expression for the vector u the component of which is the scalarpotential ui in the original domain:
d2udu2
�Qu ¼ 0; ð1Þ
where Q is the matrix of the discretized difference operator, and u ¼ k0z is thenormalized longitudinal axis, k0 being the vacuum wavenumber. Because thematrix Q is not diagonal, the potentials ui are coupled with each other andthe wave equation (1) cannot be solved in this form. By diagonalizingQ, boththe vector of the eigenvalue k and the matrix of the eigenvector are evaluated:
d2�uudu2
� k2�uu ¼ 0: ð2Þ
Equation (2) is analytically solved:
�uuðuÞ ¼ F expð�kuÞ þ B expðkuÞ; ð3Þ
where F expð�kuÞ and B expðkuÞ are the contributions of the forward and thebackward fields in the transformed domain, respectively. The field uðuÞ in theoriginal domain can be obtained by the inverse domain transformation. Inorder to obtain the reflection operator, Equation (2) is analytically solved forthe forward and backward travelling waves in both the left (L) and the right(R) regions of the generic discontinuity. After having calculated the forwardcoefficient FL of Equation (3) in the left region, the unknown left backwardand right forward coefficients BL, FR are evaluated by placing the rightbackward coefficient BR ¼ 0 and by matching the e.m. field transversecomponents at the discontinuity interface.
3. Numerical results
The previous discussion shows that the developed algorithm can be appliedto model photonic crystal structures characterized by arbitrary 2D cartesiangeometries. We will now illustrate the model with two examples. The formerdeals with 1D–PBG structures constituted by a dielectric stack having alimited number of periods of alternating active and passive (or lossy) layers,
MoL-BBPM FOR THE ANALYSIS OF PBG STRUCTURES 631
whereas the latter treats the propagation characteristics in an index-confined1D-PBG waveguide i.e. a periodically strongly etched waveguide grating.
3.1. 1D-PBG STACK MODELLING BY MoL-BBPM
The examined 1D-PBG structure stacked along the z longitudinal directionconsists of N layers of medium 1, having a thickness d1 and permittivity e1,alternated to N layers of medium 2, having a thickness d2 and permittivity e2,and a further end layer of medium 1, thus obtaining the whole stack made ofn ¼ 2N + 1 layers. Both the reflection and transmission coefficients at theinput and output discontinuities, respectively, are evaluated by launchingperpendicularly to the input section a Gaussian pulse having a widthdG ¼ 18 lm. For this purpose, the MoL-BBPM calculation transverse win-dow Xw along the x direction has been chosen to be at least equal to twice theGaussian pulse width: In our case, it is Xw ¼ 60 lm for all the simulations.Moreover, in order to propagate guided modes, our home-made computercode is able to analyze the structure with each of the n layers constituted of aslab symmetrical waveguide three-layered along the x transverse direction,characterized by a guiding film having a permittivity efi ¼ ei + Dei (i ¼ 1,2)and width w. Thus, by changing the refractive index of the external layer withrespect to that of the central waveguiding film, the fundamental TE-modesupported by the first slab of the PBG stack can be launched in the inputsection. Finally, the contribution of losses and the effects of the optical gainon the transmittance and reflectance are also included by considering acomplex refractive index for the layers constituting the PBG structure.
A preliminary sensitivity analysis of the MoL-BBPM has been carried outin order to choose the optimum value of the computation parameters: thelongitudinal step Dz in each layer and the line number Nx. This last parameterdepends on both the transverse calculation window Xw and the transversediscretization step that is chosen nonuniformly. In particular, we adopt twovalues of the discretization step, thicker in the central region of width dg,where the field is more intense, and rarer in the external region. In the case of1D-PBG stacks with homogeneous media (without three-layered waveguide),we verify that the transmittance and the reflectance values do not depend onthe calculation parameters. Their choice is only imposed by the necessity ofrepresenting the three-dimensional evolution of the e.m. field along the PBGstructure. On the contrary, the choice of the calculation parameters is criticalfor the case of nonhomogeneous layers, for which the results are more ac-curate for the MoL-BBPM calculation transverse window Xw greater thantwice the waveguiding film width w, while we must choose a line number Nx
greater than 20. Moreover, the choice of the longitudinal calculation step Dzis not stringent owing to the semi-analytical nature of the MoL-BBPM.
632 A. D’ORAZIO ET AL.
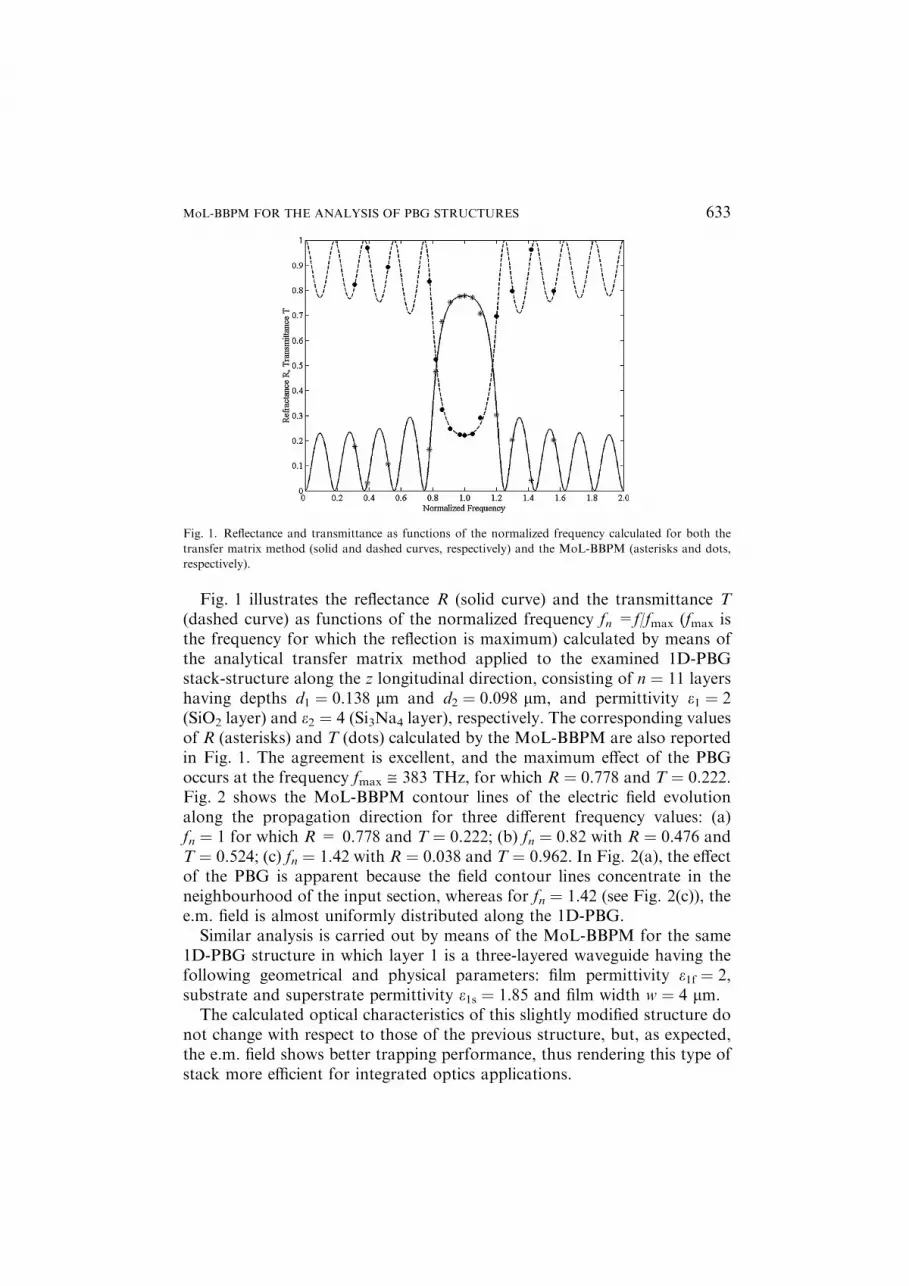
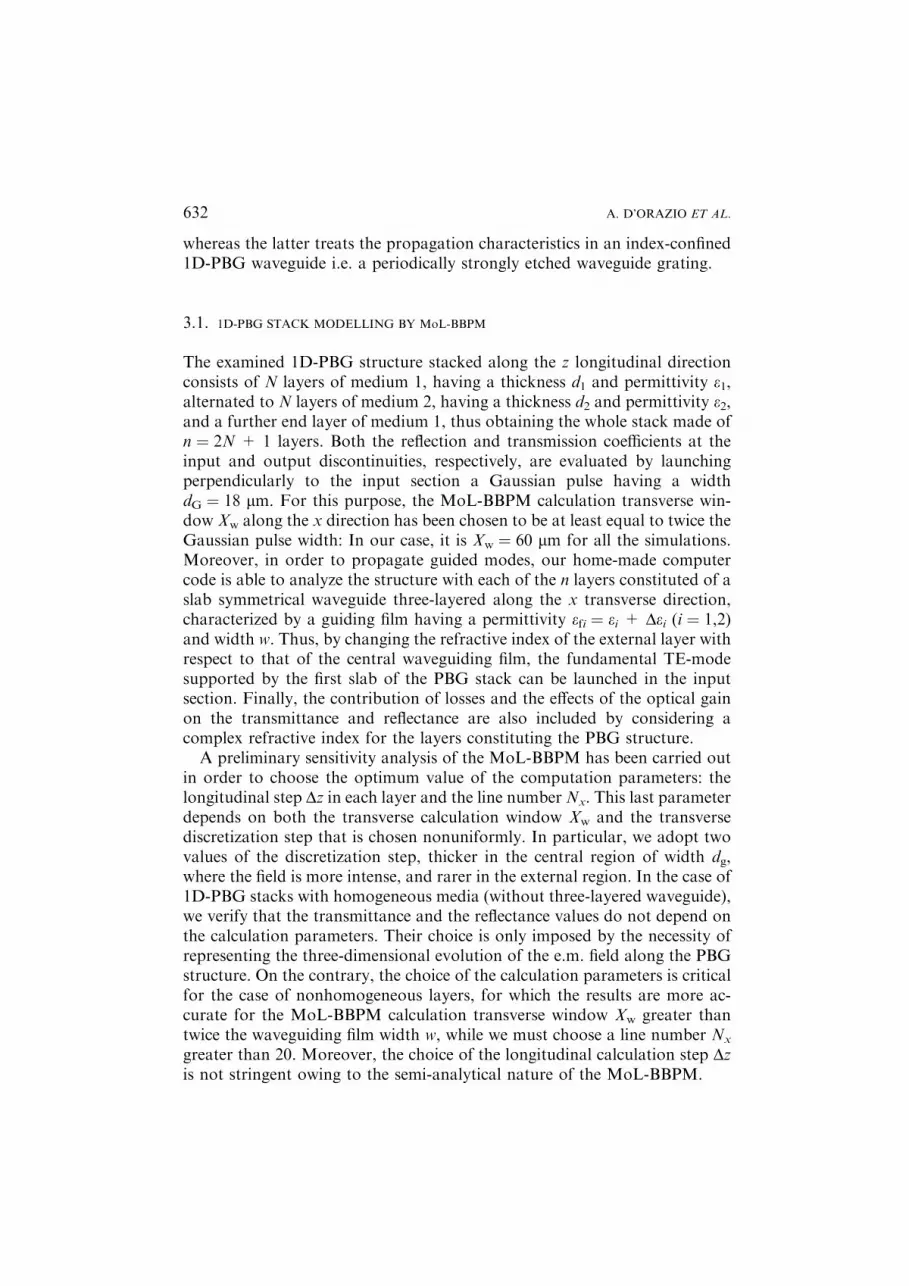
Fig. 1 illustrates the reflectance R (solid curve) and the transmittance T(dashed curve) as functions of the normalized frequency fn =f/fmax (fmax isthe frequency for which the reflection is maximum) calculated by means ofthe analytical transfer matrix method applied to the examined 1D-PBGstack-structure along the z longitudinal direction, consisting of n ¼ 11 layershaving depths d1 ¼ 0.138 lm and d2 ¼ 0.098 lm, and permittivity e1 ¼ 2(SiO2 layer) and e2 ¼ 4 (Si3Na4 layer), respectively. The corresponding valuesof R (asterisks) and T (dots) calculated by the MoL-BBPM are also reportedin Fig. 1. The agreement is excellent, and the maximum effect of the PBGoccurs at the frequency fmax @ 383 THz, for which R ¼ 0.778 and T ¼ 0.222.Fig. 2 shows the MoL-BBPM contour lines of the electric field evolutionalong the propagation direction for three different frequency values: (a)fn ¼ 1 for which R = 0.778 and T ¼ 0.222; (b) fn ¼ 0.82 with R ¼ 0.476 andT ¼ 0.524; (c) fn ¼ 1.42 with R ¼ 0.038 and T ¼ 0.962. In Fig. 2(a), the effectof the PBG is apparent because the field contour lines concentrate in theneighbourhood of the input section, whereas for fn ¼ 1.42 (see Fig. 2(c)), thee.m. field is almost uniformly distributed along the 1D-PBG.
Similar analysis is carried out by means of the MoL-BBPM for the same1D-PBG structure in which layer 1 is a three-layered waveguide having thefollowing geometrical and physical parameters: film permittivity e1f ¼ 2,substrate and superstrate permittivity e1s ¼ 1.85 and film width w ¼ 4 lm.
The calculated optical characteristics of this slightly modified structure donot change with respect to those of the previous structure, but, as expected,the e.m. field shows better trapping performance, thus rendering this type ofstack more efficient for integrated optics applications.
Fig. 1. Reflectance and transmittance as functions of the normalized frequency calculated for both the
transfer matrix method (solid and dashed curves, respectively) and the MoL-BBPM (asterisks and dots,
respectively).
MoL-BBPM FOR THE ANALYSIS OF PBG STRUCTURES 633

In order to account for the contribution of both the gain and the loss effects inthe 1D-BPG stack-structure, medium 1 is modelled by a permittivity complexvalue: e1 ¼ 2 ± j0.1, the sign + or ) must be considered for the gain and losseffects, respectively. Fig. 3 illustrates the reflectance R (solid curve) and thetransmittanceT (dashed curve) as functions of the normalized frequency fn ¼ f/fmax calculated by means of the analytical transfer matrix method applied to theaforesaid examined 1D-PBG structure (stack without three-layered wave-guide) for the cases: (a) lossy 1D-PBG stacks and e1 ¼ 2 � j0:1 and e2 ¼ 4 and(b) active 1D-PBG stacks with e1 ¼ 2+j0.1 alternated to layers with e2 ¼ 4. Thecorresponding values of R (asterisks) and T (dots) calculated by the MoL-BBPM, are also reported in Fig. 3. Also, a perfect agreement between the twomethods is now apparent. In particular, for fn ¼ 1, it is R ¼ 0.619 andT ¼ 0.142 in the lossy case and R ¼ 1.099 and T ¼ 0.251 in the active case. Wecan see in Fig. 3 that, in contrast to Fig. 1, the R andT behaviours are no moresymmetrical around the value fn ¼ 1, but, in the case of the lossy case, theR andT envelopes strongly decrease as the normalized frequency increases, whereas,in the active case, they increase as the frequency increases.
Fig. 2. Electric field evolution contour lines for three frequency values: (a) fn ¼ 1; (b) fn ¼ 0.82; (c)
fn ¼ 1.42.
634 A. D’ORAZIO ET AL.

3.2. INDEX-CONFINED 1D-PBG WAVEGUIDE MODELLING BY MoL-BBPM
Fig. 4 shows the index confined 1D-PBG waveguide characterized by a PBGlayer consisting of a finite number of 40 alternating layers of air and Si3N4
(ng ¼ 2) having the same width (h1 ¼ h2, K ¼ h1 þ h2 ¼ 430 nm); the depth ofthe periodic layer h ¼ (dg � de) varying in the range 0–500 nm. The wave-guide core is Si3N4 having a thickness dg ¼ 500 nm, the substrate is SiO2
(ns ¼ 1.45), the operation wavelength is k ¼ 1550 nm.
Fig. 3. Reflectance and transmittance as functions of the normalized frequency calculated via the transfer
matrix method (solid and dashed solid curves, respectively) and the MoL-BBPM (asterisks and dots,
respectively): (a) lossy 1D-PBG stack having e1 ¼ 2 � j0:1 and e2 ¼ 4; (b) active 1D-PBG stack having
e1 ¼ 2+j0.1 and e2 ¼ 4.
MoL-BBPM FOR THE ANALYSIS OF PBG STRUCTURES 635

Fig. 5 shows the transmittance (dashed line) and reflectance (solid line) ofthe index confined 1D-PBG waveguide of Fig. 4, having a periodic layerdepth de ¼ 250 nm: a good band gap in the range of 1400–1525 nm is ap-parent. Fig. 6 depicts the electric field standing wave evolution for differentwavelength values in the neighbourhood of the band gap. It is interesting tonotice the confinement of the field in the grating dielectric layer. In particular,Fig. 6(a) illustrates the field evolution for k ¼ 1450 nm where R ¼ 0.93 andT ¼ 0.07. For these values, the structure acts as a filter, and the standingwave is concentrated near the input region (z ¼ 0 represents the input sec-tion). For a wavelength value maintained on the inferior edge of the band gapk ¼ 1417 nm (here the reflection and transmission coefficients assume almostequal values: R ¼ 0.45 and T ¼ 0.55), the standing wave, shown in Fig. 6(b),propagates along the waveguide by assuming significant values even at theoutput region. Finally, Fig. 6(c) shows the field evolution evaluated for awavelength value k ¼ 1700 nm where R ¼ 0.06 and T ¼ 0.96. In this case, theoperation occurs out from the band gap, and for this reason, the pure
Fig. 4. Sketch of the index confined 1D-PBG waveguide under examination.
Fig. 5. Reflectance (solid line) and transmittance (dashed line) as functions of the wavelength k for the IC-
1D-PBG waveguide having 40 alternating layers of air and Si3N4.
636 A. D’ORAZIO ET AL.
standing wave assumes lower amplitudes with respect to the forward pro-pagation wave. This is due to the fact that the groove was designed byfollowing the Bragg condition thus acting as a reflector only in the wave-length range defining the band gap.
On a personal computer Pentium III (800 MHz), the computer code ob-tains the reflectance–transmittance spectra in about 3 min. However, longercomputing CPU times of about 10 min are needed for the calculation of thefield evolution at any wavelength. The same structure was evaluated bymeans of a home-made simulator based on the 2D FDTD method (D’Orazioet al. 2002). The computational FDTD domain used for analyzing thestructure was represented by a lattice having pitches Dx ¼ 0.0625 lm,Dz ¼ 0.0716 lm in space and Dt ¼ 0.07856 fs in time, with the source(no ¼ 80 and nd ¼ 20) located 1.72 lm away from the first layer. The numberof the computational cells assumed for the simulation was 41 · 148 in the xand z axes, respectively. The evaluated total simulation time, equal to about180 min, is enormously longer than that required by the MoL-BBPM
Fig. 6. Contour lines of the electric field propagating along the IC-1D-PBG waveguide at the following
wavelength values: (a) k ¼ 1450 nm; (b) k ¼ 1417 nm; (c) k ¼ 1700 nm.
MoL-BBPM FOR THE ANALYSIS OF PBG STRUCTURES 637
simulation. Moreover, even though the transfer matrix method requiresshorter computational CPU times (less than 60 s) with respect to the othertwo techniques, in the case of index confined periodic structures, it gives onlyapproximated and incomplete results. In fact, it needs a first step where thestratified waveguiding structure is substituted with an equivalent layer havingan effective refractive index, thereby slightly increasing the computationaltime and, mainly, disregarding both the actual geometrical shape of thewaveguide and the corresponding reflection effects.
In order to demonstrate the efficiency of the MoL-BBPM for the analysisof index-confined 1D-PBG waveguides, we have changed the geometricalparameters of the structure. As an example, the performance of the IC-1D-PBG waveguide to act as a filter is strongly influenced by the number ofperiods: we have verified that, for a 10-period structure, the reflection andtransmission coefficients in the band gap are about 50% while the trans-mittance increases to about 0.7 when a 6-period waveguide is analyzed.Moreover, we have analyzed the 20-period 1D-PBG waveguide by changingthe depth of the periodic layer h ¼ (dg ) de) in the range 0–500 nm. For asmall depth value h ¼ 100 nm, the band gap appears to have a centralwavelength of about 1500 nm, but the transmission and reflection coefficientsassume not too good values (T ¼ 0.6 and R ¼ 0.35). The transmissionspectrum significantly changes when deeper grooves are considered (h isgreater than 300 nm), the reflection spectrum remaining practically un-changed. In fact, even though the minimum value of the transmittance in theband gap reaches a value of 0.05 (R being 0.9), for wavelength values outsidethe band gap range, it sets itself around 0.5, clearly demonstrating the in-crease of the diffraction losses.
To conclude, we put in evidence the MoL-BBPM strength for the design ofIC-PBG waveguides useful for DWDM applications. The first examined 68-period IC-1D-PBG waveguide exhibits the following parameters: 136 alter-nating layers of air and Si3N4 (ng ¼ 2) having different widths h1 ¼ 0.305 lmand h2 ¼ 0.125 lm with a spatial period of L = h1 + h2 ¼ 430 nm; SiO2
substrate refractive index ns ¼ 1.45; depth of the periodic layers dg ¼ 500 nmand de = 400 nm. Fig. 7 shows the calculated transmittance and the reflec-tance spectra of this structure: we can observe the drastic reduction of thespectral width Dk of the band gap with respect to that reported in Fig. 5. Inparticular, the spectral width decreases from Dk ¼ 90 nm to Dk ¼ 40 nm and,correspondingly, the central wavelength of the band gap shifts fromk ¼ 1450 nm to k ¼ 1500 nm, thus giving an intriguing insight for DWDMapplications. More interesting results are obtained by including a defect inthe centre of the 68-period IC-1D-PBG waveguide. The defect consists of asegment of Si3N4/SiO2 waveguide having a length L ¼ 184 lm and a coredepth dg ¼ 500 nm. This structure assumes the typical geometry of a DBR
638 A. D’ORAZIO ET AL.
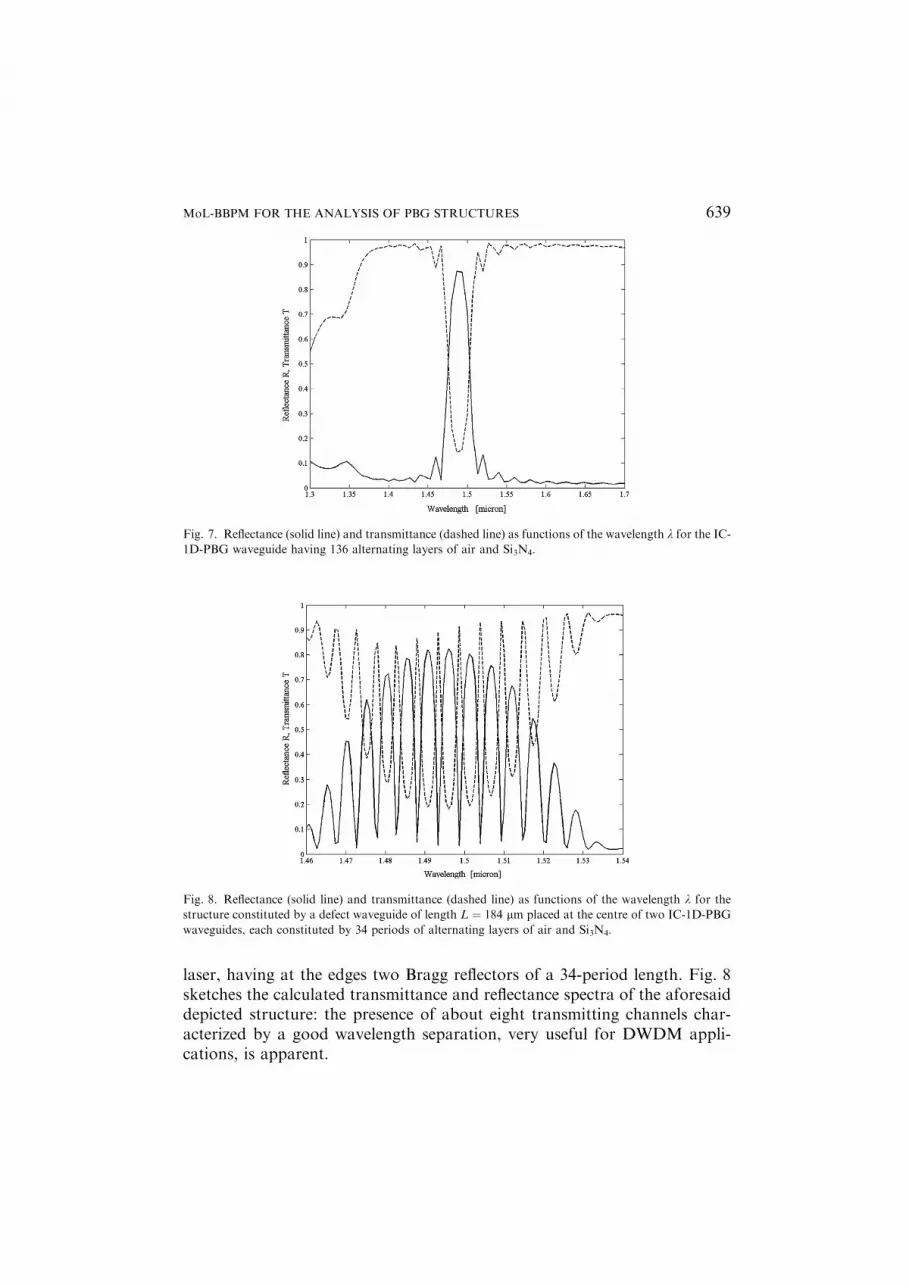
laser, having at the edges two Bragg reflectors of a 34-period length. Fig. 8sketches the calculated transmittance and reflectance spectra of the aforesaiddepicted structure: the presence of about eight transmitting channels char-acterized by a good wavelength separation, very useful for DWDM appli-cations, is apparent.
Fig. 7. Reflectance (solid line) and transmittance (dashed line) as functions of the wavelength k for the IC-
1D-PBG waveguide having 136 alternating layers of air and Si3N4.
Fig. 8. Reflectance (solid line) and transmittance (dashed line) as functions of the wavelength k for the
structure constituted by a defect waveguide of length L ¼ 184 lm placed at the centre of two IC-1D-PBG
waveguides, each constituted by 34 periods of alternating layers of air and Si3N4.
MoL-BBPM FOR THE ANALYSIS OF PBG STRUCTURES 639

4. Conclusions
An efficient MoL-BBPM numerical code has been set up in order to accu-rately evaluate the optical properties of PBG structures. The excellentagreement between the results of our computer code and those obtained byother methods makes the MoL-BBPM algorithm a valid tool for the analysisof more complex PBG structures including, as an example, the opticalnonlinear effects. Moreover, the MoL-BBPM allows us to calculate the dis-tribution of the e.m. field evolution along the structure also in the presence ofarbitrary optical input signal.
References
D’Orazio, A., M. De Sario, V. Petruzzelli, F. Prudenzano and L. Sassi. IEEE Melecon 2000, 10th Med-
iterranean Electrotechnical Conference Cyprus, 265, 2000.
D’Orazio, A., M. De Sario, V. Petruzzelli and F. Prudenzano. In: Recent Research Developments in Optics,
ed. Pandalai S.G. 2002.
Gerdes, J. Electr. Lett. 30 550, 1994.
Joannopoulos, J.D., R.D. Meade and J.N. Wien. Photonic Crystals – Molding the flow of light, Princeton
University Press, NJ, 1995.
Rao, H., R. Scarmozzino and R.M. Osgood. IEEE Photon. Technol. Lett. 11 830, 1999.
Scarmozzino, R., A. Gopinath, R. Pregla and S. Helfert. IEEE J. Sel. Top. Quant. 6 150, 2000.
Taflove, A. and S.C. Hagness. Computational Electrodynamics: The Finite Difference Time-Domain
Method, 2nd edn. Artech House, Boston-London, 2000.
640 A. D’ORAZIO ET AL.