beyond muscular effects: depression of spinal recurrent inhibition after botulinum neurotoxin a
TRANSCRIPT

Beyond muscular effects: depression of spinal recurrent inhibition
after botulinum neurotoxin A
Véronique Marchand-Pauvert1, Claire Aymard1,2, Louis-Solal Giboin1, Federica Dominici3,
Alessandro Rossi3, and Riccardo Mazzocchio3
1UPMC Univ Paris 06, Er 6, F-75005, Paris, France 2Service MPR, Centre Paris Sud, Fondation hospitalière Sainte Marie, Paris, France 3Sezione di Neurofisiologia Clinica, Dipartimento di Scienze Neurologiche, Neurochirurgiche e del Comportamento, Università di Siena, Siena, Italy
Additional information:
Running title: Recurrent inhibition after BoNT-A
Key words: Spinal recurrent inhibition, Botulinum neurotoxin, Humans
Word number: 5318 words
Corresponding author: V. Marchand-Pauvert: Er 6 UPMC, Service MPR Hôpital Pitié-Salpêtrière, 47 bd de l’Hôpital, 75651 Paris cedex 13, France. Email: [email protected]
Table of contents: Neuroscience – Behavioural/Systems/Cognitive
Key points (105 words, < 150)
• BoNT-A is known to block central synapses after muscular injection due to retrograde
transport in animal models.
• BoNT-A-induced changes in the human central nervous system activity have been attributed
so far to indirect mechanisms involving peripheral afferent inputs modified after muscular
injection.
• The question of a possible direct central action of BoNT-A in humans was further addressed
by investigating the modification of spinal recurrent inhibition in stroke patients after
BoNT-A muscular injection.
• Recurrent inhibition from soleus motor axons to motoneurones supplying quadriceps was
found depressed after BoNT-A injection in ankle plantarflexors.
• BoNT-A, through retrograde transport, affects spinal synaptic transmission in humans.

Recurrent inhibition after BoNT-A
Marchand-Pauvert et al. - 2/32
Abstract The natural target of the botulinum neurototoxin type A (BoNT-A) is the neuromuscular
junction. When injected into a muscle, BoNT-A is internalized by motoneurone terminals where it
functions as an endopeptidase, cleaving protein components of the synaptic machinery responsible
for vesicle docking and exocytosis. As a result, BoNT-A induces a characteristic flaccid paralysis of
the affected muscle. In animal models, BoNT-A applied in the periphery can also influence central
activity via retrograde transport and transcytosis. An analogous direct central effect in humans is
still debated. The present study was designed to address the question whether BoNT-A modifies the
activity of the spinal recurrent inhibitory pathways, when injected at muscular level, in humans. To
avoid methodological bias, the recurrent inhibition from an injected muscle (soleus) was
investigated on an untreated muscle (quadriceps), and stimulation parameters (producing recurrent
inhibition) were monitored on a third non injected muscle but innervated by the same nerve as the
soleus (flexor digitorum brevis, FDB). The experiments were performed on 14 post-stroke patients
exhibiting spasticity in ankle plantarflexors, candidates for BoNT-A. One month after BoNT-A, the
level of recurrent inhibition was found depressed. It is suggested that the depression of recurrent
inhibition was induced by BoNT-A, injected peripherally, through axonal transport and blockade of
the cholinergic synapse between motoneurone recurrent collaterals and Renshaw cells. (217 words)
Abbreviation list: BoNT-A, Botulinum neurotoxin type A; EMG, electromyogram; FDB, flexor
digitorum brevis; FN, femoral nerve; H-reflex, Hoffmann reflex; ISI, interstimulus interval; LG,
lateral gastrocnemius; MG, medial gastrocnemius; Mmax, maximal motor response; PTN, posterior
tibial nerve; TP, tibial posterior; VL, vastus lateralis

Recurrent inhibition after BoNT-A
Marchand-Pauvert et al. - 3/32
Introduction
Botulinum neurotoxins produced by anaerobic bacteria of the genus Clostridium, are the most
poisonous proteins known, inducing flaccid paralysis by inhibiting synaptic transmission in
cholinergic synapses. Once bound to the nerve cell membrane, botulinum neurotoxins are
internalised into the cell and cleave a protein complex, preventing the exocytosis and the
neurotransmitter release (Schiavo et al. 2000; Turton et al. 2002; Montal 2010). The extended
action duration of BoNT-A at the neuromuscular junction has driven the widespread use of this
serotype as a therapeutic agent in various neurological diseases with the aim at weakening the
contraction of overactive muscles (Jankovic, 2004). Besides its well-known action at peripheral
level, there are at least three possible mechanisms by which BoNT-A may affect central activity: i)
blockade of the gamma motor endings, reducing the spindle afferent inputs from the injected
muscle (Filippi et al. 1993; Rosales et al. 1996), ii) plastic changes following the blockade of the
neuromuscular transmission (Abbruzzese & Berardelli, 2006; Caleo et al. 2009), and iii) retrograde
transport and transcytosis, i.e. the release of the ligand in the synaptic cleft with possible uptake by
second-order neurons (Antonucci et al. 2008; Torii et al. 2011).
Retrograde axonal transport was first detected with radiolabelled BoNT-A in animal
intraspinal motor axons, after injection in gastrocnemius muscles (Habermann, 1974; Wiegand &
Wellhoner, 1977; Black & Dolly, 1986). Later, catalytically active BoNT-A was visualized in the
facial nucleus after injection of the toxin into rat whisker muscles and attributed to long-distance
retrograde axonal transport of BoNT-A inside vesicles (Antonucci et al. 2008; Caleo et al. 2009).
Using the visual pathway as a model system, it has been conclusively shown that at least a fraction
of the injected BoNT-A undergoes retrograde and anterograde axonal transport in neurons and, is
then preferentially taken up in a catalytically active form by cholinergic afferent terminals
(Antonucci et al. 2008; Restani et al. 2011). It has been speculated that transfer of BoNT-A in this
way may reach the CNS and cause central effects in peripherally-injected patients, though

Recurrent inhibition after BoNT-A
Marchand-Pauvert et al. - 4/32
indications of this have never been observed in humans (Currà & Berardelli, 2009). Instead,
alteration by BoNT-A of neuron excitability or synaptic transmission centrally is usually attributed
to indirect consequences of its peripheral action (Priori et al. 1995; Girlanda et al. 1997; Modugno
et al. 1998). In summary, the current belief is that BoNT-A has no direct effect on central synapses
in humans (Curra et al. 2004; Rosales & Dressler, 2010).
Alpha motoneurones innervating the neuromuscular junction have cholinergic intraspinal
recurrent collaterals projecting on Renshaw cells mediating recurrent inhibition to spinal
motoneurones (Renshaw, 1941; Eccles et al. 1954; Alvarez et al. 1999; Fig. 1). Therefore, Renshaw
cells are potential targets for a possible direct effect of BoNT-A on central synapses. Accordingly,
animal studies have revealed that BoNT-A depressed recurrent inhibition (Hagenah et al. 1977;
Wiegand et al. 1977) and interfered with the functional link between Renshaw cells and
motoneurones (Sanna et al. 1993; Gonzalez-Forero et al. 2005; Clowry et al. 2006). Similarly,
recurrent inhibition of soleus motoneurones was depressed after BoNT-A injection in the soleus
muscle in patients with lower limb spasticity, but the results were difficult to interpret because low
doses of BoNT-A were used to avoid peripheral changes in the soleus, and the effect at the
neuromuscular junction could not be monitored (Mazzocchio et al. 2007).
The present study was designed to address the question whether BoNT-A muscular injection
directly influences the activity of central circuits, such as the spinal recurrent inhibitory pathways in
humans. Given the widespread projections of motoneurone recurrent collaterals to Renshaw cells
impinging on motor nuclei supplying muscles acting at the same joint or transjoint (Meunier et al.
1994), it is possible to test the effect of BoNT-A from one injected muscle (soleus) to motoneurones
supplying another muscle, distant from the injection site (quadriceps; Fig. 1). This experimental
design makes possible to test BoNT-A at doses used routinely in post-stroke patients for spasticity
of ankle plantarflexors and, to monitor central effects of BoNT-A, assessed as a change in the
recurrent inhibition at quadriceps level, without methodological bias due to the peripheral effects of

Recurrent inhibition after BoNT-A
Marchand-Pauvert et al. - 5/32
BoNT-A at the soleus neuromuscular junction. This protocol implies a retrograde and, possibly, an
anterograde transport of catalytically active BoNT-A in the central nervous system, both of which
have been recently demonstrated in animals (Antonucci et al. 2008; Restani et al. 2011).
Figure 1 near here
Methods
Ethical approval
The experiments were carried out on 14 stroke patients (4 females), all of whom had given
informed written consent to the experimental procedures, which had been approved by the ethics
committee of Pitié-Salpêtrière Hospital (CPP Ile de France VI), and of the University of Siena
(Italy). The study conformed to the standards set by the latest revision of the Declaration of
Helsinki.
Patients
Inclusion criteria for study enrolment were spastic leg paresis, a marked increase in tone
involving the ankle joint, consistent with a score of 4-5 on the 5-point Ashworth Scale, and a
required interval since stroke of 6 weeks. Exclusion criteria included BoNT-A injection within the
previous 4 months, previous alcohol or phenol blocks, surgical intervention, or casting of the lower
limb; fixed contractures in the limb(s), or profound atrophy of the muscle(s) to be injected. The
mean subject age was 61.5 ± 2.6 years old (range: 49-75), and mean interval since stroke was 15.9
± 3.2 months (range: 2-42; Table 1). Ongoing treatments (physical therapy and medication)
remained unchanged throughout the study.
Table 1 near here
BoNT-A was injected in spastic lower limb muscles with the exception of quadriceps (Table
1). Each subject was assessed by the same evaluator before and 1 month after BoNT-A injection.

Recurrent inhibition after BoNT-A
Marchand-Pauvert et al. - 6/32
The target muscles for BoNT-A were determined according to the clinical features of the patients.
The injection site was guided by electromyography (EMG) to localize motor end plates and muscle
hyperactivity in soleus, medial head of the gastrocnemius (MG), lateral head of the gastrocnemius
(LG), and tibialis posterior (TP; Table 1). Doses were established by the physicians based on their
experience, muscle activity and degree of function, and the Worldwide Education and Awareness
for Movement Disorders (WEMOVE, www.mdvu.org) guidelines.
Recordings
The patients were sitting in a comfortable reclining armchair, with head support. The hip was
almost extended (110-135°), the knee semi flexed (30°) and the ankle in plantar flexion (120°).
EMG activity was collected using bipolar surface electrodes (ZeroWire EMG, Aurion Srl, Milan,
Italy) positioned on the lateral aspect the thigh (10-15 cm above the knee) over vastus lateralis (VL,
lateral head of quadriceps), on the posterior aspect of the leg (7-10 cm above the malleolus) over
soleus, and on the plantar aspect of the foot, below the metatarsal eminence, over flexor digitorum
brevis (FDB). The EMG activity was filtered (10-1000 Hz), amplified (x 1000) and digitalized for
off-line analysis (Power 1401 and Signal Sofware, CED, Cambridge, UK). The patients were at
rest, and EMG silence was monitored.
Electrical stimulations
Rectangular electrical pulses (1 ms duration) were delivered through surface electrodes placed
along the nerve trajectory, and delivered by constant current stimulators (DS7A, Digitimer Ltd,
Hertfordshire, UK). To stimulate the femoral nerve (FN), a 21-cm2 brass plaque was placed on the
posterior aspect of the thigh (below the buttock) and a 7-cm2 brass hemisphere, in the femoral
triangle. For the posterior tibial nerve (PTN), the plaque was above the patella and the hemisphere
in the popliteal fossa. FN and PTN stimulation intensities were adjusted in relation to the muscular
responses evoked in VL and FDB, respectively.

Recurrent inhibition after BoNT-A
Marchand-Pauvert et al. - 7/32
Experimental procedure
The protocol for the study of heteronymous recurrent inhibition from soleus to quadriceps
motoneurones (Fig. 1) is based on the pattern of distribution of recurrent inhibition in human lower
limbs, first described by studying the discharge of single motor units (Meunier et al. 1994).
Inhibition with similar characteristics was then revealed by testing the influence of PTN stimulation
on quadriceps H-reflex amplitude (Iles & Pardoe, 1999; Iles et al. 2000). In these previous studies,
PTN stimulation was adjusted according to the responses evoked in soleus EMG. The novelty of
introducing FDB measures was necessary for the present study because soleus (and other calf
muscles in some patients; Table 1) received BoNT-A making it difficult to ensure that PTN-evoked
EMG responses would be comparable before and after BoNT-A. Therefore, PTN stimulation was
adjusted according to the EMG response of FDB, a distant muscle from the injection site
(preventing possible diffusive effect of BoNT-A; Carli et al. 2009), which is innervated by PTN, as
soleus. Because the correlation between the EMG responses evoked by PTN stimulation in soleus
and FDB was unknown, the protocol was first tested in 4 healthy subjects. It was found that the
threshold intensity for a M response in soleus was lower than in FDB (on average, M in soleus was
5.7 ± 2.0 % the soleus maximal motor response -Mmax- at the threshold intensity for M response in
FDB) and the intensity to evoke Mmax in soleus and FDB was similar (cf. supplementary
materials). These results supported the use of FDB EMG measures to monitor PTN stimulation for
inhibiting the VL H-reflex as in previous studies (Iles & Pardoe, 1999; Iles et al. 2000).
At the beginning of the experiment, Mmax was evoked in VL, soleus and FDB by FN and
PTN stimulation, respectively. FN stimulation intensity was then adjusted so as to evoke a sizeable
H-reflex in VL, with or without a preceding M response (< 10 % Mmax; Fig. 2A-C). PTN
stimulation intensity was adjusted so as to evoke an M response of 50 % Mmax in FDB (FDB50),
and its effect on VL H-reflex was investigated at inter-stimulus intervals (ISI) between PTN and FN
at 15, 20 and 25 ms (Iles & Pardoe 1999; Fig. 2A-D). The effect of varying the intensity of PTN

Recurrent inhibition after BoNT-A
Marchand-Pauvert et al. - 8/32
stimulation was then investigated at the ISI at which the inhibition of VL H-reflex was the
strongest. The intensity of PTN stimulation was adjusted at the threshold intensity for an M
response in FDB (FDB0), or so as to evoke an M response of 25 (FDB25), 50 (FDB50), 75
(FDB75), or 100 % Mmax (FDB100; Fig. 2E). For each investigation (changing ISI or PTN
stimulation intensity), 20 test (isolated FN stimulation) and 20 conditioned (combined PTN + FN
stimulations) VL H-reflexes were randomly alternated (0.3 Hz). The experiment was performed
twice in each patient: before BoNT-A injection (preBoNT-A) and 1 month later (postBoNT-A), i.e.
when clinical effects are seen in most patients (Kaji et al. 2010).
Analysis
Peak-to-peak amplitudes of VL H-reflex and M response in VL, soleus and FDB were
measured for quantitative analysis. The mean size of the test H-reflex was expressed as a
percentage of Mmax in VL. The level of inhibition was evaluated using the difference [mean test H-
reflex - conditioned H-reflexes], expressed as a percentage of the mean test H-reflex (Figs. 2DE, 3).
The change in inhibition after BoNT-A was evaluated in each patient using the difference
[inhibition postBoNT-A - inhibition preBoNT-A], expressed as a percentage of the level of
inhibition preBoNT-A (Column Inh. in Table 1; Figs. 4A, 6).
In each individual, paired t tests were performed to compare the test and conditioned H-
reflexes, and to compare the inhibition before and after BoNT-A. Grouped data were analysed using
two-ways repeated-measures ANOVA to study the effects of PTN stimulation intensity on VL H-
reflex before and after BoNT-A. If the tests provided significant P values, post hoc Fisher LSD tests
were performed for comparison of two means. Maximal inhibition, Mmax in VL, soleus and FDB,
PTN and FN stimulation intensity, and H-reflex test size before and after BoNT-A were compared
using paired t tests. Pearson correlation analyses were performed to test the relationship between i)
the difference [inhibition postBoNT-A - inhibition preBoNT-A] and the level of inhibition before
BoNT-A (both expressed as a % mean test H-reflex; Fig. 4B), and between ii) the change in

Recurrent inhibition after BoNT-A
Marchand-Pauvert et al. - 9/32
inhibition after BoNT-A and the date of stroke. Unpaired t tests were performed to compare the
change in inhibition i) in patients who had BoNT-A at least 3 months before the study and those for
whom it was the first injection (Column BoNT in Table 1; Re-injection vs. First injection in Fig.
6A), and ii) according to the number of injection sites. Because the cohort was too small for a valid
statistical analysis, it was divided in 2 groups: patients with 3-4 injection sites (3 sites in soleus + 1
site in another calf muscle) vs. patients with 5-6 injection sites (3 in soleus and 2 or 3 other calf
muscles; Columns soleus, MG, LG and TP in Table 1; Fig. 6B). As the resulting subgroups of
patients were too small to test the normality, non-parametric methods were used to compare the
change in inhibition after BoNT-A according to the change in muscle tone (Columns PreBoNT and
PostBoNT in Table 1; Fig. 6C). Chi2 test was performed to determine if the group of patients with
5-6 injection sites exhibited a better improvement of muscle tone than the group with 3-4 injection
sites (Fig. 6D). Tests were performed using StatEL software (www.adscience.eu), and the
significance level was set at P < 0.05. Mean data are indicated ± 1 standard error of the mean
(SEM).
Results
Characteristics of the PTN-induced inhibition of VL H-reflex
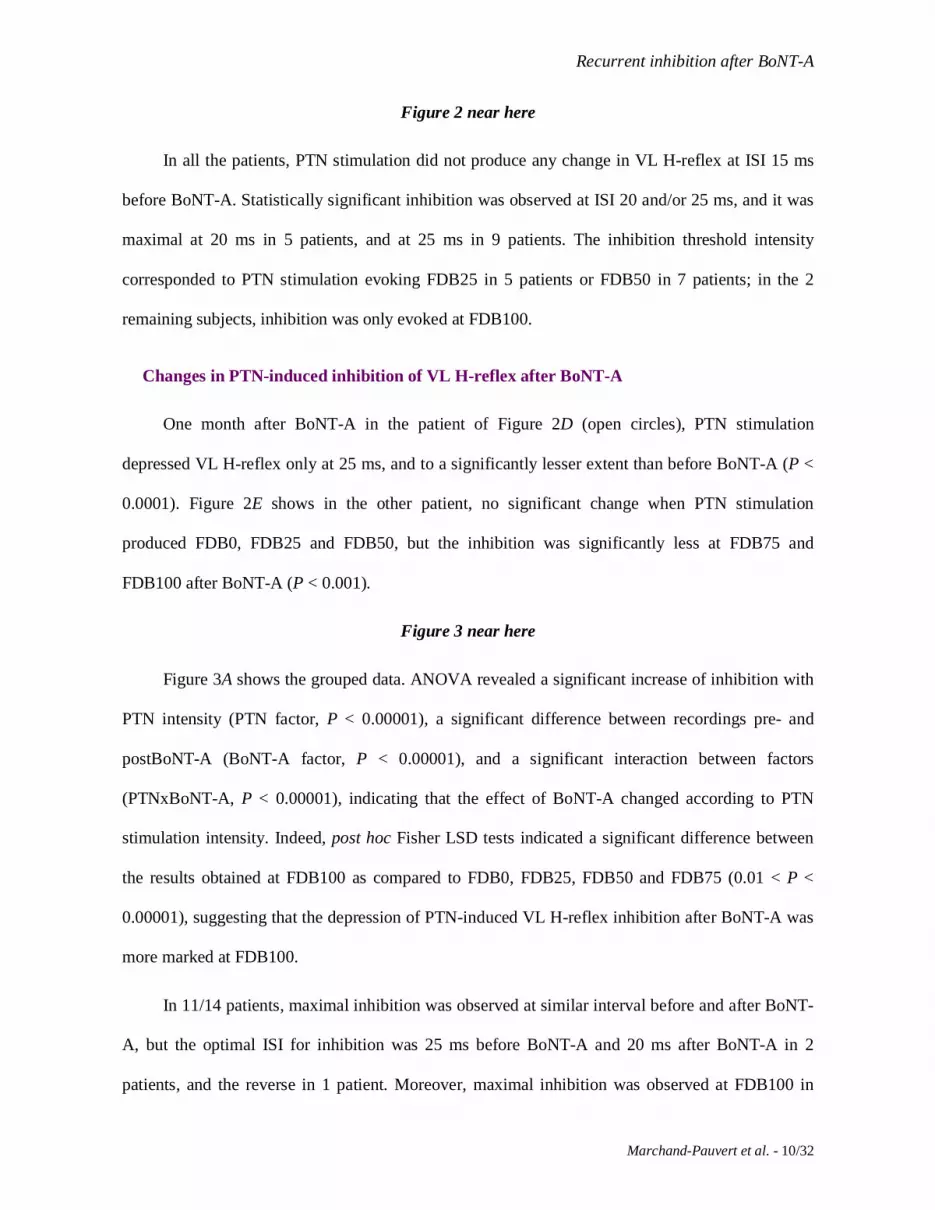
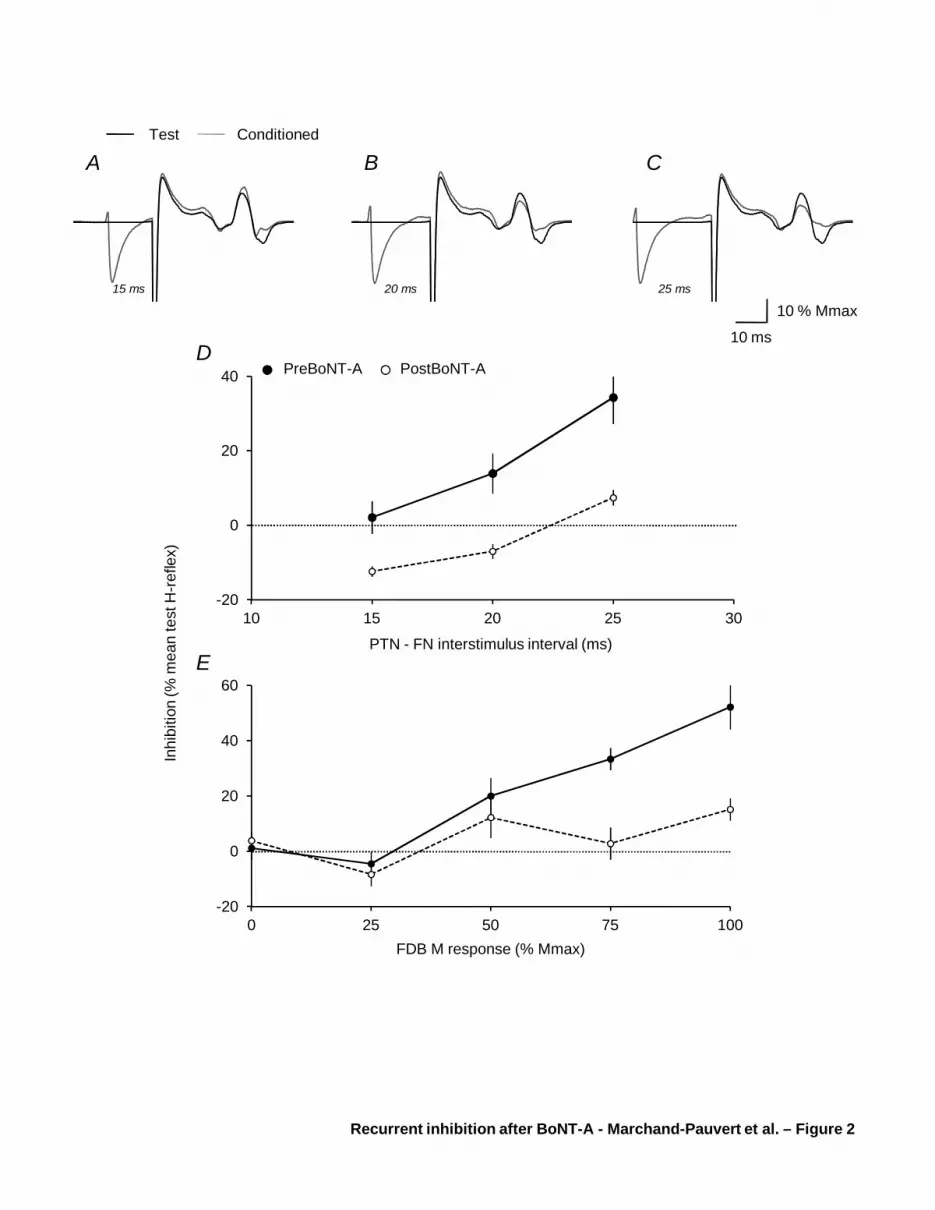
Figure 2A-C shows the mean test and mean conditioned (by PTN at FDB50) VL H-reflexes at
ISI 15 (A), 20 (B) and 25 ms (C) in one patient before BoNT-A, and Figure 2D, the level of
inhibition plotted against the same ISIs, in another patient (filled circles). In both patients, PTN
stimulation did not produce any change in VL H-reflex at ISI 15 ms, but depressed it significantly
at 20 and 25 ms (paired t test, P < 0.05 and 0.0001, respectively). Figure 2E shows in a third
patient, that PTN stimulation produced inhibition of VL H-reflex at ISI 20 ms, before BoNT-A
(filled circles), only when it evoked FDB50 and above; inhibition was significant only at FDB75
and FDB100 (P < 0.001).
Recurrent inhibition after BoNT-A
Marchand-Pauvert et al. - 10/32
Figure 2 near here
In all the patients, PTN stimulation did not produce any change in VL H-reflex at ISI 15 ms
before BoNT-A. Statistically significant inhibition was observed at ISI 20 and/or 25 ms, and it was
maximal at 20 ms in 5 patients, and at 25 ms in 9 patients. The inhibition threshold intensity
corresponded to PTN stimulation evoking FDB25 in 5 patients or FDB50 in 7 patients; in the 2
remaining subjects, inhibition was only evoked at FDB100.
Changes in PTN-induced inhibition of VL H-reflex after BoNT-A
One month after BoNT-A in the patient of Figure 2D (open circles), PTN stimulation
depressed VL H-reflex only at 25 ms, and to a significantly lesser extent than before BoNT-A (P <
0.0001). Figure 2E shows in the other patient, no significant change when PTN stimulation
produced FDB0, FDB25 and FDB50, but the inhibition was significantly less at FDB75 and
FDB100 after BoNT-A (P < 0.001).
Figure 3 near here
Figure 3A shows the grouped data. ANOVA revealed a significant increase of inhibition with
PTN intensity (PTN factor, P < 0.00001), a significant difference between recordings pre- and
postBoNT-A (BoNT-A factor, P < 0.00001), and a significant interaction between factors
(PTNxBoNT-A, P < 0.00001), indicating that the effect of BoNT-A changed according to PTN
stimulation intensity. Indeed, post hoc Fisher LSD tests indicated a significant difference between
the results obtained at FDB100 as compared to FDB0, FDB25, FDB50 and FDB75 (0.01 < P <
0.00001), suggesting that the depression of PTN-induced VL H-reflex inhibition after BoNT-A was
more marked at FDB100.
In 11/14 patients, maximal inhibition was observed at similar interval before and after BoNT-
A, but the optimal ISI for inhibition was 25 ms before BoNT-A and 20 ms after BoNT-A in 2
patients, and the reverse in 1 patient. Moreover, maximal inhibition was observed at FDB100 in

Recurrent inhibition after BoNT-A
Marchand-Pauvert et al. - 11/32
24/28 experiments, and at FDB75 in 4 experiments. The maximal inhibition observed in each
patient, before and after BoNT-A, was thus tested using paired t test. Figure 3B shows a significant
depression of the maximal inhibition after BoNT-A (48.8 ± 6.0 vs. 28.0 ± 9.8 % mean test reflex; P
< 0.001).
Figure 4 near here
Figure 4A shows the change in inhibition after BoNT-A in each patient (black columns; see
also Column Inh. in Table 1). In all patients but one, the inhibition was depressed after BoNT-A.
On average (white column), the inhibition was depressed by 45.8 ± 9.2 % its level recorded before
BoNT-A (t test, P < 0.001). Because the inhibition before BoNT-A was different between patients,
Pearson correlation analysis was performed to determine whether the level of inhibition before
BoNT-A influenced the difference observed after BoNT-A, but no significant relationship was
found (P = 0.07; Fig. 4B).
Stimulation parameters before and after BoNT-A
Figure 5A shows the mean size of Mmax in VL, soleus and FDB observed in the 14 patients
before and after BoNT-A. As could be expected, only Mmax in soleus (injection site) was
significantly depressed after BoNT-A (7.6 ± 1.2 vs. 5.1 ± 0.9 mV; paired t test, P < 0.05); Mmax in
FDB and VL being comparable between the two recordings (FDB: 5.1 ± 0.7 vs. 5.3 ± 0.8 mV, P =
0.76; VL: 3.4 ± 0.5 vs. 2.6 ± 0.4 mV, P = 0.12). The PTN stimulation intensity at M threshold and
Mmax in FDB was also compared before and after BoNT-A and no significant difference was
found (P = 0.26 and 0.35 for PTN intensity at FDB0 and FDB100, respectively; Fig. 5B).
Figure 5 near here
FN stimulation intensity was adjusted so as to evoke H-reflex in VL of similar size before and
after BoNT-A. Accordingly, no significant difference was found between recordings (21.4 ± 4.7 vs.
27.7 ± 5.0 % Mmax in VL, during pre- and postBoNT-A experiments; P = 0.22). Moreover, FN

Recurrent inhibition after BoNT-A
Marchand-Pauvert et al. - 12/32
stimulation intensity required to evoke the test H-reflex did not significantly change between
recordings too (36.4 ± 6.8 vs. 42.0 ± 8.6 mA, P = 0.18; Fig. 5B).
Lastly, the H-reflex and M response evoked in soleus at the different PTN stimulation
intensities were compared before and after BoNT-A, and due to the peripheral changes after BoNT-
A injection and for interindividual comparison, the amplitudes were normalised to the
corresponding Mmax in soleus. Figure 5C shows that the mean soleus M response (circles) and H-
reflex (triangles) recruitment curves before (filled symbols) and after BoNT-A (open symbols) are
superimposed (two-way repeated-measures ANOVA; M response: BoNT-A P = 0.76, PTN
intensity P < 0.00001, BoNT-AxPTN intensity P = 0.93; H-reflex: BoNT-A P = 0.31, PTN
intensity P < 0.00001, BoNT-AxPTN intensity P = 0.96). On average, i) the M threshold in soleus
was lower than in FDB: at FDB0, M in soleus was 5.8 ± 1.6 vs. 6.4 ± 1.2 % Mmax before and after
BoNT, respectively, ii) Mmax in soleus and FDB were evoked at similar PTN intensity, and iii) at
FDB25 and FDB50, i.e. about the threshold for the PTN-induced inhibition of VL H-reflex, the M
response in soleus was about 40-60 % Mmax.
Correlation with clinical features
The change in inhibition after BoNT-A was compared between patients according to the date
of stroke, if the patients had already received BoNT-A before the investigation, the number of
injection sites, and the level of muscle tone. Other factor analyses (using crossing factors) could not
be performed because the resulting subgroups of patients were too small for a valid statistical
analysis (only 1 or 2 patients in some subgroups).
Significant negative relationship was found between the date of stroke and the loss of
inhibition after BoNT-A: the older the lesion, the less the depression of the inhibition after BoNT-A
(Pearson correlation analysis, P < 0.05, R2 = 0.36). However, most of the patients with the oldest
lesions had already received BoNT-A before the investigation (3 months for the patients 1.M.70

Recurrent inhibition after BoNT-A
Marchand-Pauvert et al. - 13/32
and 4.M.51, and more than 4 months for the other ones; Table 1). The change in inhibition after
BoNT-A was thus compared in patients who had already received BoNT-A before the investigation
and those who were not treated before (Re-injection vs. First injection in Fig. 6A; Column BoNT in
Table 1). Unpaired t test revealed a loss of inhibition significantly stronger in patients who had not
received BoNT-A before the investigation (-25.2 ± 10.2 vs. -66.4 ± 11.0 % the level of inhibition
preBoNT-A, P < 0.02). Correlation analysis was thus performed in each group, and no more
relationship was found between the date of stroke and the loss of inhibition (Re-injection group, P =
0.67; First injection group P = 0.17).
Figure 6 near here
All the patients received BoNT-A in soleus at 3 sites, and 10/14 patients were injected in
other calf muscles (Table 1). Because this could have influenced the electrophysiological results,
unpaired t test was performed to compare the loss of inhibition according to the number of injection
sites. The loss of inhibition was significantly stronger in patients who had 5-6 injection sites than in
patients who had 3-4 injection sites (-73.0 ± 10.4 vs. -25.4 ± 8.8 % the level of inhibition preBoNT-
A, P < 0.05; Fig. 6B).
Lastly, we tested whether the change in inhibition after BoNT-A was related to the change in
muscle tone in soleus. The cohort was first divided in 3 groups: patients with no change in
Ashworth score (0), patient with -1 point and patients with -2 points 1 month after BoNT-A
(difference between columns PreBoNT and PostBoNT in Table 1). Kruskal-Wallis H test did not
reveal any significant difference between the 3 groups (0 point: -27.9 ± 21.8 vs. -1 point: -30.4 ±
13.2 vs. -2 points: -67.2 ± 12.1 % the level of inhibition preBoNT-A, P = 0.12). We therefore
grouped the patients with 0 and -1 points to compare with the patients with -2 points (Fig. 6c).
Mann-Whitney U test revealed a loss of inhibition significantly stronger in the patients with -2
points than in the patients with 0-1 point (-67.2 ± 12.1 vs. -29.7 ± 10.5 % the level of inhibition
preBoNT-A, P < 0.05). Chi2 test revealed that the improvement of muscle tone was better in the

Recurrent inhibition after BoNT-A
Marchand-Pauvert et al. - 14/32
subgroup of patients who had 5-6 injection sites (P < 0.05; Fig. 6d).
Discussion
This study has shown that the PTN-induced inhibition of VL H-reflex in stroke patients at rest
was depressed after BoNT-A injection in the triceps surae muscle. The loss of inhibition was more
marked in patients who received BoNT-A for the first time and/or through a larger number of
injection sites.
Origin of H-reflex inhibition
In cats, heteronymous recurrent inhibition is distributed to motoneurones of synergistic
muscles acting at the same joint or even at another joint, and there is a striking overlap between the
distribution of recurrent inhibition and monosynaptic Ia excitation (Hultborn et al. 1971; Hultborn,
1989). While the heteronymous connections are more largely distributed in the human lower limbs,
the same rule has been observed. Accordingly, soleus group Ia afferents and Renshaw cells
activated by soleus motoneurone recurrent collaterals, project onto quadriceps motoneurones
(Meunier et al. 1993; 1994; Katz & Pierrot-Deseilligny 1998; Pierrot-Deseilligny & Burke 2005).
In the present study, the PTN-induced inhibition of VL H-reflex was evoked at ISI > 15 ms,
and exhibited a threshold intensity above that for motor axons, as measured by the M threshold in
FDB and soleus. Inhibition with similar characteristics has been observed in healthy subjects, first
by testing the discharge of single motor units in post-stimulus time histograms: inhibition of the
motor unit discharge was observed only when motor axons in the nerve stimulated for conditioning,
were activated (H-reflex response and/or direct M response). As a result, this inhibition was
attributed to Renshaw cell activation (Meunier et al. 1994). Later, the inhibition from soleus motor
axons to quadriceps motoneurones was further addressed using the H-reflex method, as in the
present study, in healthy subjects at rest and during various contractions (Iles & Pardoe, 1999; Iles

Recurrent inhibition after BoNT-A
Marchand-Pauvert et al. - 15/32
et al. 2000). The PTN-induced inhibition of quadriceps H-reflex had the same characteristics as
those reported in the present study (ISI, threshold intensity); we just added a monitoring of PTN
stimulation parameters by recording FDB EMG activity to allow the comparison pre- vs. post-
BoNT-A (cf. supplementary material). Interestingly, the level of inhibition we found, both in
healthy subjects (cf. supplementary material) and stroke patients, were comparable to that reported
in healthy subjects at rest by Iles and collaborators. Because recurrent inhibition has been found
unchanged in resting stroke patients (Katz & Pierrot-Deseilligny, 1982), this further supports that
the PTN-induced inhibition of VL H-reflex investigated here, was likely mediated by Renshaw
cells. This inhibition could also be due to presynaptic inhibition of group Ia terminals, but this
would manifest at lower stimulus intensity, below M threshold (Faist et al, 1994; Aymard et al.
2000). Moreover, BoNT-A did not affect presynaptic inhibition in the upper limbs of stroke patients
(Girlanda et al. 1997) nor did it strengthen it in patients with dystonia or essential tremor (Priori et
al. 1995; Modugno et al. 1998). Alternatively, group Ib inhibition can overlap with the beginning of
recurrent inhibition, but such inhibition was found depressed or even reversed to facilitation in
stroke patients (Delwaide & Oliver, 1988).
Because VL H-reflex was similarly inhibited by activating selectively the nervous branches of
soleus and medial gasctrocnemius (Meunier et al. 1994), and because there are no intraspinal
recurrent collaterals in motor axons supplying intrinsic foot muscles (Cullheim & Kellerth, 1978;
Rossi & Mazzocchio, 1991), the level of VL H-reflex inhibition likely reflects the level of
activation of Renshaw cells impinging on VL motoneurones, activated by motor axons from ankle
plantarflexors (Fig. 1).
Influence of experimental conditions
Extrinsic (equipment, EMG sensor location) and intrinsic factors (tissue characteristics)
influence the EMG signals (De Luca, 2008), and this makes difficult the comparison of the raw
EMG activity collected in different subjects, and from one experiment to another. Normalisation to

Recurrent inhibition after BoNT-A
Marchand-Pauvert et al. - 16/32
a physiological constant recorded in similar conditions is thus required (Finsterer, 2001). Mmax, the
maximal compound muscle action potential evoked when all motor axons in the nerve are activated,
is commonly used in electrophyiological studies to monitor the size of EMG responses (Crone et al.
1990; Lackmy & Marchand-Pauvert, 2010). Although the size of Mmax has to be interpreted
carefully, it was significantly decreased only in soleus receiving BoNT-A, but not in distant FDB
and quadriceps muscles, which supports a low local diffusion of BoNT-A, restricted to the muscle
near the injection site (Carli et al. 2009).
The superimposed soleus M and H-reflex recruitment curves before and after BoNT-A
indicate that the ratio H/M did not change after BoNT-A in leg muscles, as observed in forearm
muscles (Priori et al. 1995; Girlanda et al. 1997; Modugno et al. 1998), and that BoNT-A did not
interfere with the gradual activation of motor and sensory axons, and with the recruitment of spinal
motoneurones. In addition, the test size of VL H-reflex was similar between recordings, suggesting
that recurrent inhibition was investigated on the same proportion of VL motoneurones (Crone et al.
1990). Lastly, the fact that PTN and FN stimulation intensities were comparable between recordings
further validates the comparison of the results observed before and after BoNT-A, and that the
depression of recurrent inhibition cannot be attributed to experimental bias.
Possible mechanisms underlying depression of recurrent inhibition after BoNT-A
As mentioned in Introduction, there are three possible mechanisms by which BoNT-A could
affect central activity (Caleo et al. 2009): 1) blockade of the gamma motor endings, 2) plastic
changes following the blockade of the neuromuscular transmission, and 3) retrograde transport and
transcytosis:
1) BoNT-A is known to affect muscle spindle activity by blocking gamma motor endings in
animals (Filippi et al. 1993; Rosales et al. 1996). In humans, changes in spinal (Priori et al. 1995;
Modugno et al. 1998) and supraspinal excitability (Klim et al. 2006) after BoNT-A muscular

Recurrent inhibition after BoNT-A
Marchand-Pauvert et al. - 17/32
injection have been attributed to modifications in muscle spindle afferent input (Currà et al. 2004).
Although Renshaw cells receive supraspinal (Mazzocchio et al. 1994) and segmental afferent inputs
(Ryall & Piercey, 1971; Piercey & Goldfarb, 1974; Wilson et al. 1964; Fromm et al. 1977; Rossi et
al. 2003), it is unlikely that BoNT-A depressed recurrent inhibition through these indirect
mechanisms because:
a) Collaterals of corticospinal neurons make monosynaptic connections with reticulospinal neurons
(Canedo & Lamas, 1993) which, in turn, contact Renshaw cells (Peterson, 1984). A lesion
interrupting corticospinal but not reticulospinal projections, as in stroke patients, would cause a loss
of supraspinal modulation of Renshaw cell activity (Katz & Pierrot-Deseilligny, 1982), but not a
reduction in the level of excitability of these cells (Mazzocchio & Rossi, 1997).
b) Muscle spindle group Ia afferents produce disynaptic excitation in Renshaw cells only via the
activation of motor axon collaterals by the reflex loop (Ross et al. 1972). If reduced group Ia
afferent input after BoNT-A influenced Renshaw cell activity, recurrent inhibition would be less
prominent at low PTN stimulus intensity, when evoking FDB0 or FDB25 (Fig. 3) corresponding to
the highest reflex activity in the soleus (Fig. 5C).
c) Muscle spindle group II afferents have direct inhibitory control on Renshaw cells (Wilson et al.
1964; Fromm et al. 1977). Reduced group II inputs would lead to a disinhibition of Renshaw cells,
and thus an increase in recurrent inhibition.
d) BoNT-A may also block group III–IV nociceptive free endings at muscular level and/or reduce
the release of neuromodulators from central terminals of nociceptive afferents (Pavone & Luvisetto,
2010; Matak et al. 2011). Reduced sensitization at peripheral level and, possibly at central level,
could lead to decreased activation of Renshaw cells (Piercey & Goldfarb, 1974; Rossi et al. 2003).
However, it is not known whether BoNT-A may be operating on pain terminals in the absence of
pain, as in our patients. In any case, the net effect of conditions c) i.e. increased recurrent inhibition
and d) i.e. decreased recurrent inhibition, would be minimal on Renshaw cell activity. It is thus

Recurrent inhibition after BoNT-A
Marchand-Pauvert et al. - 18/32
unlikely that a change in muscle spindle afferent activity be responsible for the consistent
depression of recurrent inhibition after BoNT-A.
2) Transitory loss of functional innervation at the neuromuscular junction may trigger
rearrangements at the motoneuronal site and at the muscle itself (see Caleo et al. 2009). However, it
is unlikely that these contributed to the depression of recurrent inhibition of VL motoneurones after
BoNT-A because the toxin was injected in triceps surae muscle and had no distant effect on VL
muscle and motoneurones. Moreover, any change at pre- and motoneuronal level would be revealed
by a difference in the soleus H-reflex recruitment curve before and after BoNT-A. This was not so.
Similarly, any change at muscle level, would be offset by the reproducibility of stimulation and
recording procedures after BoNT-A.
3) In animal models, axonal transport and transcytosis of catalytically active BoNT-A from
periphery to the central nervous system has been demonstrated in the visual system and facial
motoneurones (Antonucci et al. 2008; Restani et al. 2011), and central projections of nociceptive
sensory neurones (see Pavone & Luvisetto, 2010). Specifically, axonally transported BoNT-A or its
catalytically active fragments appeared in the trigeminal nucleus caudalis even at low peripheral
anti-nociceptive doses suggesting that BoNT-A, peripherally applied, can affect second order
central sensory neurons, either presynaptically by cleaving its substrate in central terminals of
primary afferent neurons, or following transcytosis (Matak et al. 2011). Further, in a model of
peripheral autonomic neurones, it has been demonstrated that BoNT-A, applied at distal neurites,
moves retrogradely into cell bodies and then, anterogradely, passes through to neurites on the other
side (Lawrence et al. 2012). Allowing for the much greater distance from injection sites to neuronal
cell bodies in human recipients compared to the animal models, a similar migration of BoNT-A
may still be replicated within the axons of our patients. Thus, extrapolation from animal model
systems makes possible to suggest that catalytically active BoNT-A may act presynaptically,
reducing acetylcholine release in motoneurone recurrent terminals projecting on Renshaw

Recurrent inhibition after BoNT-A
Marchand-Pauvert et al. - 19/32
impinging on VL motoneurones (Fig. 1). Transcytosis affecting presynaptic terminals of Renshaw
cells is a further possible mechanism, as BoNT-A has the potential to interfere with release of
several neurotransmitters other than acetylcholine from central neurons (Verderio et al. 2007). This,
however, would be more likely to occur in Renshaw cells projecting to homonymous motoneurones
(in our case, the soleus motoneurones) than in Renshaw cells projecting to heteronymous
motoneurones (the quadriceps motoneurones), given the preferential uptake of BoNT-A by the
cholinergic synapse.
Characteristics of BoNT-A induced depression of recurrent inhibition
The extent of neuromuscular block depends on the dose of BoNT-A (Pascual-Pascual et al.
1997; Dressler & Rothwell, 2000). Assuming a similar mechanism of action of BoNT-A at central
level, the higher the dose, the larger the number of central synapses blocked, the stronger the
depression of recurrent inhibition. Dose-dependent effects could not be addressed in this study for
ethical reasons; nevertheless, the depression of recurrent inhibition after BoNT-A was stronger in
patients who had more injection sites.
Depression of recurrent inhibition was observed at FDB50 and reached significant values at
FDB100. At FDB100, recurrent inhibition was mostly elicited by antidromic activation of all motor
axons, including those of fast-type motoneurones, generating more recurrent axon collaterals and
synaptic swellings and, therefore a larger activation of the Renshaw cell pool (Windhorst, 1996).
Similarly, in animals, depressed recurrent inhibition after BoNT-A muscle injection was observed
when the global activity of Renshaw cells was tested (Wiegand & Wellhoner, 1977). It is possible
that at intensity below FDB100, Renshaw cells were partly activated via the reflex loop (Ross et al.
1972), i.e. orthodromically, via recurrent collaterals not affected by BoNT-A, given that the
engaged motoneurones were able to elicit a sizeable H-reflex in the soleus EMG (see Fig. 5C). This
activation may partly offset the effect of BoNTA on the Renshaw cell pool.

Recurrent inhibition after BoNT-A
Marchand-Pauvert et al. - 20/32
The depression of VL recurrent inhibition was greater in the patients receiving the first dose
of BoNT-A than in the re-injected patients. This might be due to BoNT-A induced plastic changes
at soleus motoneurone level (Caleo et al. 2009), and the possible resulting change in the activation
of Renshaw cells projecting onto VL motoneurones, and/or the sensitivity of the central synapse to
BoNT-A that could have changed after the first injection. While this alternative is debated, the less
central efficacy of the toxin in re-injected patients could also be related to an immune response
(Atassi, 2004).
Lastly, the depression of recurrent inhibition was stronger in patients who had more injection
sites and who exhibited the largest reduction in muscle tone. This might be due to a possible dose
effect on recurrent inhibition, as observed for neuromuscular block (Pascual-Pascual et al. 1997;
Dressler & Rothwell, 2000), given that no relationship between changes in muscle tone and in
recurrent inhibition has been found so far.
Functional significance
Recurrent inhibition is normally depressed to assist the upright posture (Barbeau et al. 2000)
and during the stance phase of walking (Lamy et al. 2008), partly via the inhibitory corticospinal
control on Renshaw cells (Mazzocchio et al. 1994). The modulation of Renshaw cell activity may
contribute to the shaping of muscle synergy through an increase in motoneurone synchronization
(Mattei et al. 2003). After stroke, an altered descending drive may be responsible for the lack in
task-dependent modulation of Renshaw cell activity (Katz & Pierrot-Deseilligny 1982). The loss of
Renshaw cell adaptability to the motor task may make muscle synergies less flexible or abnormal
(Mazzocchio & Rossi 1997). The BoNT-A induced depression of recurrent inhibition could thus
compensate for the lack of inhibitory corticospinal control after stroke and could contribute to the
tuning of motor synergy (Dipietro et al. 2007) in the process of functional recovery of locomotion
and upright posture.

Recurrent inhibition after BoNT-A
Marchand-Pauvert et al. - 21/32
Conclusion
Although the data were obtained with indirect electrophysiological methods, we present
experimental evidence in support of a direct central effect of BoNT-A when injected at muscular
level for the treatment of spasticity, in humans. Specifically, one month after peripheral injection,
the activity of spinal recurrent inhibitory pathways was found depressed. We suggest that such
modification occur through axonal transport and blockade of the cholinergic synapse between
motor axon recurrent collaterals and Renshaw cells. The method we developed can be used to
assess BoNT-A dose-dependent effects and to investigate the functional significance of BoNT-A
central effects in humans.
References
Abbruzzese G & Berardelli A (2006). Neurophysiological effects of botulinum toxin type A.
Neurotox Res 9, 109-114.
Alvarez FJ, Dewey DE, McMillin P & Fyffe RE (1999). Distribution of cholinergic contacts on
Renshaw cells in the rat spinal cord: a light microscopic study. J Physiol 515, 787-797.
Antonucci F, Rossi C, Gianfranceschi L, Rossetto O & Caleo M (2008). Long-distance retrograde
effects of botulinum neurotoxin A. J Neurosci 28, 3689-3696.
Atassi MZ (2004). Basic immunological aspects of botulinum toxin therapy. Mov Disord 9, S68-84.
Aymard C, Katz R, Lafitte C, Lo E, Pénicaud A, Pradat-Diehl P & Raoul S (2000). Presynaptic
inhibition and homosynaptic depression: a comparison between lower and upper limbs in
normal human subjects and patients with hemiplegia. Brain 123, 1688-1702.
Barbeau H, Marchand-Pauvert V, Meunier S, Nicolas G & Pierrot-Deseilligny E (2000). Posture-
related changes in heteronymous recurrent inhibition from quadriceps to ankle muscles in
humans. Exp Brain Res 130, 345-61.
Black JD & Dolly JO (1986). Interaction of 125I-labeled botulinum neurotoxins with nerve

Recurrent inhibition after BoNT-A
Marchand-Pauvert et al. - 22/32
terminals. II. Autoradiographic evidence for its uptake into motor nerves by acceptor-
mediated endocytosis. J Cell Biol 103, 535-544.
Caleo M, Antonucci F, Restani L & Mazzocchio R (2009). A reappraisal of the central effects of
botulinum neurotoxin type A: by what mechanism? J Neurochem 109, 15-24.
Canedo A & Lamas JA (1993). Pyramidal and corticospinal synaptic effects over reticulospinal
neurones in the cat. J Physiol 463, 475-489.
Carli L, Montecucco C & Rossetto O (2009). Assay of diffusion of different botulinum neurotoxin
type a formulations injected in the mouse leg. Muscle Nerve 40, 374-830.
Clowry GJ, Walker L & Davies P (2006). The effects of botulinum neurotoxin A induced muscle
paresis during a critical period upon muscle and spinal cord development in the rat. Exp
Neurol 202, 456-469.
Crone C, Hultborn H, Mazières L, Morin C, Nielsen J & Pierrot-Deseilligny E (1990). Sensitivity
of monosynaptic test reflexes to facilitation and inhibition as a function of the test reflex size:
a study in man and the cat. Exp Brain Res 81, 35-45.
Cullheim S & Kellerth JO (1978). A morphological study of the axons and recurrent axon
collaterals of cat alpha-motoneurones supplying different hind-limb muscles. J Physiol 281,
285-99.
Currà A, Berardelli A (2009). Do the unintended actions of botulinum toxin at distant sites have
clinical implications? Neurology 72, 1095-1099.
Currà A, Trompetto C, Abbruzzese G & Berardelli A (2004). Central effects of botulinum toxin
type A: evidence and supposition. Mov Disord 19, S60-4.
De Luca CJ (2008). A practicum on the use of sEMG signals in movement sciences. Delsys Inc.,
http://www.delsys.com/KnowledgeCenter/Practicum.html.
Delwaide PJ & Oliver E (1988). Short-latency autogenic inhibition (IB inhibition) in human
spasticity. J Neurol Neurosurg Psychiatry 51, 1546-1550.

Recurrent inhibition after BoNT-A
Marchand-Pauvert et al. - 23/32
Dipietro L, Krebs HI, Fasoli SE, Volpe BT, Stein J, Bever C & Hogan N (2007). Changing motor
synergies in chronic stroke. J Neurophysiol 98, 757-68.
Dressler D & Rothwell JC (2000). Electromyographic quantification of the paralysing effect of
botulinum toxin in the sternocleidomastoid muscle. Eur Neurol 43, 13-16.
Eccles JC, Fatt P & Koketsu K (1954). Cholinergic and inhibitory synapses in a pathway from
motor-axon collaterals to motoneurones. J Physiol 126, 524-562.
Faist M, Mazevet D, Dietz V & Pierrot-Deseilligny E (1994). A quantitative assessment of
presynaptic inhibition of Ia afferents in spastics. Differences in hemiplegics and paraplegics.
Brain 117, 1449-1455.
Filippi GM, Errico P, Santarelli R, Bagolini B & Manni E (1993). Botulinum A toxin effects on rat
jaw muscle spindles. Acta Otolaryngol 113, 400-404.
Fromm C, Haase J & Wolf E (1977). Depression of the recurrent inhibition of extensor
motoneurons by the action of group II afferents. Brain Res 120, 459-468.
Girlanda P, Quartarone A, Sinicropi S, Nicolosi C, Roberto ML, Picciolo G, Macaione V, Battaglia
F, Ruggeri M & Messina C (1997). Botulinum toxin in upper limb spasticity: study of
reciprocal inhibition between forearm muscles. Neuroreport 8, 3039-3044.
Gonzalez-Forero D, Pastor AM, Geiman EJ, Benitez-Temino B & Alvarez FJ (2005). Regulation of
gephyrin cluster size and inhibitory synaptic currents on Renshaw cells by motor axon
excitatory inputs. J Neurosci 25, 417-429.
Habermann E (1974). 125I-labeled neurotoxin from Clostridium botulinum A: preparation, binding
to synaptosomes and ascent to the spinal cord. Naunyn Schmiedebergs Arch Pharmacol 281,
47-56.
Hagenah R, Benecke R & Wiegand H (1977). Effects of type A botulinum toxin on the cholinergic
transmission at spinal Renshaw cells and on the inhibitory action at Ia inhibitory
interneurones. Naunyn Schmiedebergs Arch Pharmacol 299, 267-272.

Recurrent inhibition after BoNT-A
Marchand-Pauvert et al. - 24/32
Hultborn H (1989). Overview and critiques of Chapters 22 and 23: Recurrent inhibition – in search
of a function. In Progress in Brain Research 80, ed. Allum JHJ & Hulliger M, pp. 269–271.
Elsevier, Amsterdam.
Hultborn H, Jankowska E & Lindström S (1971). Relative contribution from different nerves to
recur- rent depression of Ia IPSPs in motoneurones. J Physiol 215, 637–664.
Iles JF & Pardoe J (1999). Changes in transmission in the pathway of heteronymous spinal
recurrent inhibition from soleus to quadriceps motor neurons during movement in man. Brain
122, 1757-1764.
Iles JF, Ali A & Pardoe J (2000). Task-related changes of transmission in the pathway of
heteronymous spinal recurrent inhibition from soleus to quadriceps motor neurones in man.
Brain 123, 2264-2272.
Jankovic J (2004). Botulinum toxin in clinical practice. J Neurol Neurosurg Psychiatry 75, 951-
957.
Kaji R, Osako Y, Suyama K, Maeda T, Uechi Y & Iwasaki M; GSK1358820 Spasticity Study
Group (2010). Botulinum toxin type A in post-stroke lower limb spasticity: a multicenter,
double-blind, placebo-controlled trial. J Neurol 257: 1330-1337. Erratum in: J Neurol (2010)
257, 1416.
Katz R & Pierrot-Deseilligny E (1982). Recurrent inhibition of alpha-motoneurons in patients with
upper motor neuron lesions. Brain 105, 103-24.
Katz R & Pierrot-Deseilligny E (1998). Recurrent inhibition in humans. Prog Neurobiol 57, 325–
355.
Kim DY, Oh BM & Paik NJ (2006). Central effect of botulinum toxin type A in humans. Int J
Neurosci 116, 667-680.
Lackmy A & Marchand-Pauvert V (2010). The estimation of short intra-cortical inhibition depends
on the proportion of spinal motoneurones activated by corticospinal inputs. Clin Neurophysiol

Recurrent inhibition after BoNT-A
Marchand-Pauvert et al. - 25/32
121, 612-621.
Lamy JC, Iglesias C, Lackmy A, Nielsen JB, Katz R & Marchand-Pauvert V (2008). Modulation of
recurrent inhibition from knee extensors to ankle motoneurones during human walking. J
Physiol 586, 5931-46.
Lawrence GW, Ovsepian SV, Wang J, Aoki KR & Dolly JO (2012). Extravesicular intraneuronal
migration of internalized botulinum neurotoxins without detectable inhibition of distal
neurotransmission. Biochem J 441, 443-452.
Matak I, Bach-Rojecky L, Filipovic’ B & Lackovic Z (2011). Behavioral and immunohistochemical
evidence for central antinociceptive activity of botulinum toxin A. Neuroscience 186, 201–
207.
Mattei B, Schmied A, Mazzocchio R, Decchi B, Rossi A & Vedel JP (2003). Pharmacologically
induced enhancement of recurrent inhibition in humans: effects on motoneurone discharge
patterns. J Physiol 548, 615-29.
Mazzocchio R & Rossi A (1997). Involvement of spinal recurrent inhibition in spasticity. Further
insight into the regulation of Renshaw cell activity. Brain 120, 991-1003.
Mazzocchio R, Rossi A & Rothwell JC (1994). Depression of Renshaw recurrent inhibition by
activation of corticospinal fibres in human upper and lower limb. J Physiol 481, 487-498.
Mazzocchio R, Spidalieri R, Dominici F, Popa T, Hallett M & Rossi A (2007). Putative central
effects of botulinum toxin, possibly mediated by changes in Renshaw cell activity, following
intramuscular injection in humans. Movement Disorders 22, S122.
Meunier S, Pierrot-Deseilligny E & Simonetta M (1993). Pattern of monosynaptic heteronymous Ia
connections in the human lower limb. Exp Brain Res 96, 533–544.
Meunier S, Pierrot-Deseilligny E & Simonetta-Moreau M (1994). Pattern of heteronymous
recurrent inhibition in the human lower limb. Exp Brain Res 102, 149-159.
Modugno N, Priori A, Berardelli A, Vacca L, Mercuri B & Manfredi M (1998). Botulinum toxin

Recurrent inhibition after BoNT-A
Marchand-Pauvert et al. - 26/32
restores presynaptic inhibition of group Ia afferents in patients with essential tremor. Muscle
Nerve 21, 1701-1705.
Montal M (2010). Botulinum neurotoxin: a marvel of protein design. Annu Rev Biochem 79, 591-
617.
Pascual-Pascual SI, Sánchez de Muniain P, Roche MC & Pascual-Castroviejo I (1997). Botulinum
toxin as a treatment for infantile cerebral palsy. Rev Neurol 25, 1369-1375.
Pavone F & Luvisetto S (2010). Botulinum Neurotoxin for Pain Management: Insights from
Animal Models. Toxins 2, 2890-2913.
Peterson BW (1984). The reticulospinal system and its role in the control of movement. In Brain
stem control of spinal cord function, ed. Barnes CD, pp. 141-214. Academic Press, Orlando.
Piercey MF & Goldfarb J (1974). Discharge patterns of Renshaw cells evoked by volleys in
ipsilateral cutaneous and high-threshold muscle afferents and their relationship to reflexes
recorded in ventral roots. J Neurophysiol 37, 294-302.
Pierrot-Deseilligny E & Burke D (2005). Recurrent inhibition. In The circuitry of the human spinal
cord, pp. 151-196. Cambridge University Press, New York.
Priori A, Berardelli A, Mercuri B & Manfredi M (1995). Physiological effects produced by
botulinum toxin treatment of upper limb dystonia. Changes in reciprocal inhibition between
forearm muscles. Brain 118, 801-807.
Renshaw B (1941). Influence of discharge of motoneurons upon excitation of neighboring
motoneurons. J Neurophysiol 4, 67-183.
Restani L, Antonucci F, Gianfranceschi L, Rossi C, Rossetto O & Caleo M (2011). Evidence for
anterograde transport and transcytosis of botulinum neurotoxin A (BoNT/A). J Neurosci 31,
15650-15659.
Rosales RL & Dressler D (2010). On muscle spindles, dystonia and botulinum toxin. Eur J Neurol
17, 71-80.

Recurrent inhibition after BoNT-A
Marchand-Pauvert et al. - 27/32
Rosales RL, Arimura K, Takenaga S & Osame M (1996). Extrafusal and intrafusal muscle effects
in experimental botulinum toxin-A injection. Muscle Nerve 19, 488-496.
Ross HG, Cleveland S & Haase J (1972). Quantitative relation of Renshaw cell discharges to
monosynaptic reflex height. Pflugers Arch 332, 73-79.
Rossi A & Mazzocchio R (1991). Presence of homonymous recurrent inhibition in motoneurones
supplying different lower limb muscles in humans. Exp Brain Res 84, 367-373.
Rossi A, Mazzocchio R & Decchi B (2003). Effect of chemically activated fine muscle afferents on
spinal recurrent inhibition in humans. Clin Neurophysiol 114, 279-287.
Ryall RW & Piercey MF (1971). Excitation and inhibition of Renshaw cells by impulses in
peripheral afferent nerve fibers. J Neurophysiol 34, 242-51.
Sanna PP, Celio MR, Bloom FE & Rende M (1993). Presumptive Renshaw cells contain decreased
calbindin during recovery from sciatic nerve lesions. Proc Natl Acad Sci USA 90, 3048-3052.
Schiavo G, Matteoli M, & Montecucco C (2000). Neurotoxins affecting neuroexocytosis. Physiol
Rev 80, 717-766.
Torii Y, Akaike N, Harakawa T, Kato K, Sugimoto N, Goto Y, Nakahira S, Kohda T, Kozaki S,
Kaji R & Ginnaga A (2011). Type A1 but not type A2 botulinum toxin decreases the grip
strength of the contralateral foreleg through axonal transport from the toxin-treated foreleg of
rats. J Pharmacol Sci 117, 275-285.
Turton K, Chaddock JA & Acharya KR (2002). Botulinum and tetanus neurotoxins: structure,
function and therapeutic utility. Trends Biochem Sci 27, 552-558.
Verderio C, Grumelli C, Raiteri L, Coco S, Paluzzi S, Caccin P, Rossetto O, Bonanno G,
Montecucco C & Matteoli M (2007). Traffic of botulinum toxins A and E in excitatory and
inhibitory neurons. Traffic 8, 142-153.
Wiegand H & Wellhoner HH (1977). The action of botulinum A neurotoxin on the inhibition by
antidromic stimulation of the lumbar monosynaptic reflex. Naunyn Schmiedebergs Arch

Recurrent inhibition after BoNT-A
Marchand-Pauvert et al. - 28/32
Pharmacol 298, 235-238.
Wilson VJ, Talbot WH & Kato M (1964). Inhibitory convergence upon Renshaw cells. J
Neurophysiol 27, 1063-1079.
Windhorst U (1996). On the role of recurrent inhibitory feedback in motor control. Prog Neurobiol
49, 517-587.
Acknowledgments
The authors wish to express their gratitude to all the patients who participated in this study
and to Alexandra Lackmy for her valuable technical assistance. LSG was supported by a grant from
UPMC Université Paris 6 (Ministère de l’Enseignement Supérieur et de la Recherche). The study
was supported by UPMC Université Paris 6, Assistance Publique-Hôpitaux de Paris (AP-HP),
Institut pour la Recherche sur la Moelle Epinière (IRME), and INSERM.
Author contribution
VMP, CA, AR & RM conceived the conceptual framework and designed the experiments.
VMP, LSG, CA, FD & RM performed the experiments, participated in the data analysis and
interpretation. VMP & RM wrote the manuscript. All the authors have approved the final version of
the manuscript.

Recurrent inhibition after BoNT-A
Marchand-Pauvert et al. - 29/32
Tables
Table 1 Clinical features of the patients
Lesion soleus Ashworth score
Patients BoNT Time Type Site soleus MG LG TP PreBoNT PostBoNT Inh.
1.M.70 Y 10 Isch. R 3 - - - 4 3 8.6
2.M.56 Y 42 Hem. L 3 - - - 5 5 -6.1
3.M.71 Y 21 Isch. R 3 1 - - 5 4 -11.0
4.M.51 Y 38 HI+Hem. L 3 - - - 5 4 -14.4
5.F.73 - 8 Hem. L 3 - - - 5 4 -26.7
6.M.61 - 15 Hem. L 3 1 1 1 4 2 -31.4
7.F.75 Y 21 Isch. R 3 1 - - 5 3 -36.3
8.M.73 Y 20 Isch. R 3 - 1 - 3 3 -49.6
9.M.49 - 5 Isch. L 3 1 1 - 4 2 -58.9
10.F.51 Y 18 Isch.+Hem. R 3 - - 1 5 4 -67.7
11.M.64 - 14 Isch. L 3 1 1 - 4 3 -71.0
12.M.63 - 3 Isch. R 3 1 1 - 4 2 -80.2
13.M.50 - 6 Isch. R 3 1 1 1 4 2 -96.4
14.F.54 - 2 Isch. R 3 1 1 - 4 2 -100
Patients: rank, gender (M, male; F, female), and age of the patients at the time of the investigation
(years); BoNT indicates if the patients had received BoNT-A at least 3 months before the
investigation (Y), or not (-); Lesion: Time = Time lapse between stroke and the first
electrophysiological investigation, before BoNT-A (months); Type = origin of the lesion (Isch.,
ischemia; Hem., haemorrhage; HI, head injury); Site = cerebral hemisphere affected; Number of
injection sites in muscles receiving BoNT-A: soleus, MG (medial gasctrocnemius), LG (lateral
gasctrocnemius), and TP (tibialis posterior); soleus Ashworth score: estimation of muscle tone in
soleus before (PreBoNT) and 1 month after toxin injection (PostBoNT); Inh. = change in
inhibition 1 month after BoNT-A (RI postBoNT-A - RI preBoNT-A % RI preBoNT-A).

Recurrent inhibition after BoNT-A
Marchand-Pauvert et al. - 30/32
FIGURE LEGENDS
Figure 1 Schematic diagram of the spinal connexions
Open circles represent spinal motoneurones innervating FDB, soleus (Sol), and VL. Filled circles
represent Renshaw cells activated by recurrent collaterals of soleus motoneurones. FDB and soleus
motor axons run into the sciatic nerve and can be activated simultaneously by stimulating the PTN
at the level of the plopliteal fossa. Grey line and open circle represent the muscle spindle group Ia
afferents from VL, mediating H-reflex; VL sensory and motor axons run into the FN. BoNT-A was
injected in soleus and leg muscles. Dotted line indicates the putative retrograde transport of BoNT-
A.
Figure 2 Characteristics of PTN-induced inhibition of VL H-reflex
(A-C). Dark line represents the VL test H-reflex in one patient after FN stimulation, and grey line,
the conditioned reflex by PTN stimulation evoking FDB50 at ISI 15 (A), 20 (B), and 25 ms (C); all
reflex responses are normalised to Mmax in VL. (D) The difference between test and conditioned
reflex (% mean test reflex), illustrating the level of inhibition (horizontal dotted line above 0 %) in
another patient, is plotted against the ISI (ms) between PTN (evoking FDB50) and FN stimulations.
Filled circle and dark line show the result before BoNT-A, and open circles and interrupted line, the
results after BoNT-A. Vertical bars are ± 1 SEM. (E) The level of inhibition (as in D) in a third
patient, is plotted against the intensity of PTN stimulation (abscissa indicating the size of the M
response in FDB expressed as a % Mmax in FDB) when ISI between PTN and FN stimulations was
20 ms. Filled circle, dark line, open circles, interrupted line and vertical bars as in D.
Figure 3 Changes in PTN-induced inhibition of VL H-reflex after BoNT-A
(A) Grouped data (14 patients) illustrating the level of inhibition (difference between test and
conditioned reflex as a % mean test reflex; horizontal dotted line above 0 %) observed at the
optimal ISI, according to the size of the M response in FDB produced by PTN stimulation (%

Recurrent inhibition after BoNT-A
Marchand-Pauvert et al. - 31/32
Mmax in FDB), before (filled circle and dark line) and after BoNT-A (open circles and interrupted
line). (B) Mean maximal inhibition before (PreBoNT-A) and after BoNT-A (PostBoNT-A). Vertical
bars are ± 1 SEM. *** P < 0.001.
Figure 4 Loss of PTN-induced inhibition of VL H-reflex after BoNT-A
(A) The change in inhibition after BoNT-A was estimated using the difference (inhibition
postBoNT-A - inhibition preBoNT-A) expressed as a % inhibition preBoNT-A. Each dark column
represents one patient, and the last open column, the mean difference (14 patients). Vertical bar is ±
1 SEM. *** P < 0.001. (B) Relationship between the change in inhibition (inhibition postBoNT-A -
inhibition preBoNT-A) and the level of inhibition preBoNT-A (both expressed as a % mean test H-
reflex). Each dot represents one patient.
Figure 5 Characteristics of stimulation parameters
(A) Mean (14 patients) size (mV) of Mmax in VL, Soleus and FDB before (open column) and after
BoNT-A (grey column). Vertical bars are ± 1 SEM. * P < 0.05. (B) Mean intensity (mA) of PTN
stimulation at FDB0 (M threshold) and FDB100 (Mmax), and of FN stimulation evoking the test H-
reflex in VL, before (open column) and after BoNT-A (grey column). Vertical bars as in A. (C)
Soleus M response (circles) and H-reflex (triangles) recruitment curves before (filled symbols) and
after BoNT-A (open circles). Intensity of PTN stimulation was adjusted according to the M
response in FDB.
Figure 6 Correlation with clinical features
The change in inhibition after BoNT-A [(inhibition postBoNT-A - inhibition preBoNT-A) %
inhibition preBoNT-A]: (A) in patients who had already received BoNT-A at least 3 months before
the investigation (Re-injection) and patients who had never been treated (First injection); (B)
according to the number of injection sites (3 in soleus + 1 in another calf muscle = 3-4 sites vs. 3 in

Recurrent inhibition after BoNT-A
Marchand-Pauvert et al. - 32/32
soleus + 2-3 in other calf muscles = 5-6 sites); (C) according to the difference in Ashworth score
after BoNT-A patients with (0 or -1 point) vs. patients with (-2 points). Vertical bars are ± 1 SEM. *
P < 0.05, ** P < 0.01. (D) Distribution of the patients in the various subgroups.

Recurrent inhibition after BoNT-A - Marchand-Pauvert et al. - Figure 1
Renshaw
FN
Sol
FDB
VL
PTN
BoNT-A
Group Ia
-20
0
20
40
10 15 20 25 30
PTN - FN interstimulus interval (ms)
Inhi
bitio
n (%
mea
n te
st H
-ref
lex)
-20
0
20
40
60
0 25 50 75 100
FDB M response (% Mmax)
D
E
PreBoNT-A PostBoNT-A
Recurrent inhibition after BoNT-A - Marchand-Pauvert et al. – Figure 2
10 ms
10 % Mmax
Test Conditioned
15 ms 20 ms 25 ms
A B C

A PreBoNT-A PostBoNT-A
Recurrent inhibition after BoNT-A - Marchand-Pauvert et al. - Figure 3
0
20
40
60
Pre BoNT-A Post BoNT-A
Inhi
bitio
n (%
mea
n te
st H
-ref
lex)
***
-10
0
10
20
30
40
50
0 25 50 75 100
Inhi
bitio
n (%
mea
n te
st H
-ref
lex)
FDB M response (% Mmax)
***
B

A
Recurrent inhibition after BoNT-A - Marchand-Pauvert et al. – Figure 4
-100
-80
-60
-40
-20
0
20
***
-80
-60
-40
-20
0
20
0 20 40 60 80 100
Inhibition PreBoNT-A (% mean test H-reflex)
B
Inhi
bitio
n po
stB
oNT
-A –
preB
oNT
-A(%
inhi
bitio
n pr
eBoN
T-A
)In
hibi
tion
post
BoN
T-A
–pr
eBoN
T-A
(% m
ean
test
H-r
efle
x)

0
20
40
60
80
100
0 25 50 75 100
0
2
4
6
8
10
VL Soleus FDB
Sol
eus
resp
onse
s (%
Mm
ax)
A
M – PreBoNT-A
H reflex – PreBoNT-A
Recurrent inhibition after BoNT-A - Marchand-Pauvert et al. - Figure 5
*
B
C
Mm
ax(m
V)
0
20
40
60
80
PTN M threshold PTN Mmax FN VL H reflex
Inte
nsity
(mA
)
PreBoNT-A PostBoNT-A
FDB M response (% Mmax)
H reflex – PostBoNT-A
M – PostBoNT-A
FDB0 FDB100

-80
-60
-40
-20
0Re-injection First injection
A
Recurrent inhibition after BoNT-A - Marchand-Pauvert et al. – Figure 6
**
Inhi
bitio
n po
stB
oNT
-A –
preB
oNT
-A (%
inhi
bitio
n pr
eBoN
T-A
)
Re-injection First injection
C
-80
-60
-40
-20
00-1 2
*Score 0-1 Score -2
B
-80
-60
-40
-20
03-4 sites 5-6 sites
3-4 sites 5-6 sites*
3-4 sites 5-6 sites
Score 0-1 7 1
Score -2 1 6
D