benchmarks for the forward observables at rhic, the tevatron-run ii, and the lhc
TRANSCRIPT
arX
iv:h
ep-p
h/02
0617
2v1
19
Jun
2002
Benchmarks for the Forward Observables at RHIC, the
Tevatron-run II and the LHC
J.R. Cudell,1 V.V. Ezhela,2 P. Gauron,3 K. Kang,4 Yu.V. Kuyanov,2 S.B. Lugovsky,2
E. Martynov,1, 5 B. Nicolescu,3 E.A. Razuvaev,2 and N.P. Tkachenko2
(COMPETE [*] collaboration)
1Institut de Physique, Bat. B5, Universite de Liege,
Sart Tilman, B4000 Liege, Belgium
2COMPAS group, IHEP, Protvino, Russia
3LPNHE [**]-Theory Group, Universite Pierre et Marie Curie,
Tour 12 E3, 4 Place Jussieu, 75252 Paris Cedex 05, France
4Physics Department, Brown University, Providence, RI 02912, U.S.A.
5Bogolyubov Institute for Theoretical Physics, 03143 Kiev, Ukraine
(Dated: February 7, 2008)
Abstract
We present predictions on the total cross sections and on the ratio of the real part to the
imaginary part of the elastic amplitude (ρ parameter) for present and future pp and pp colliders, and
on total cross sections for γp → hadrons at cosmic-ray energies and for γγ → hadrons up to√
s = 1
TeV. These predictions are based on an extensive study of possible analytic parametrisations
invoking the biggest hadronic dataset available at t = 0. The uncertainties on total cross sections,
including the systematic errors due to contradictory data points from FNAL, can reach 1.9%
at RHIC, 3.1% at the Tevatron, and 4.8% at the LHC, whereas those on the ρ parameter are
respectively 5.4%, 5.2%, and 5.4%.
PACS numbers: 13.85.-t, 11.55.-m, 12.40.Nn, 13.60.Hb
1
In recent works [1, 2], we have performed an exhaustive study of the analytic parametri-
sations of soft data at t = 0. For this purpose, we gathered the largest available set of data
at t = 0, which includes all measured total cross sections and ratios of the real part to the
imaginary part of the elastic amplitude (ρ parameter) for the scattering of pp, pp, π±p, K±p,
and total cross sections for γp, γγ and Σ−p [3, a].
Several experiments are under way [4], or being planned, to measure the hadronic am-
plitudes at t = 0. Some authors [5, 6] also presented what they feel are reference values for
the total γp and γγ → hadrons cross sections. Thus it is timely and appropriate to present
independently our predictions for the forward observables at RHIC, the Tevatron-run II and
the LHC as well as for γp total cross section at cosmic-ray energies and for γγ total cross
sections up to 1 TeV.
We can summarize the general form of the parametrisations by quoting the form of total
cross sections, from which the ρ parameter is obtained via analyticity. The ingredients are
the contribution Y ab of the highest meson trajectories (ρ, ω, a and f) and the rising C = +1
term Hab from the pomeron contribution to the total cross section, which can be written for
the scattering of a on b:
σabtot = (Y ab + Hab)/s (1)
The first term is parametrised via Regge theory, and we allow the lower trajectories to be
partially degenerate, i.e. our experience shows that it is enough to introduce one intercept
for the C = +1 trajectories, and another one for the C = −1 [7]. A further lifting of the
degeneracy is certainly possible, but does not seem to modify significantly the results [8].
Hence we use
Y ab = Y ab+ (s/s1)
α+ ± Y ab−
(s/s1)α− (2)
with s1 = 1 GeV2. The contribution of these trajectories is represented by RR in the model
abbreviations.
As for the part rising with energy, we consider here two main options: it can rise as a
log s, or as a log2 s, with in each case the possibility to add a constant term. We shall not
consider the simple-pole parametrisation [9], not only because it is disfavored by our ranking
procedure (see below), but also because we want to make predictions at very high energies,
where unitarisation must set in [b]. In the following, we shall only refer explicitly to our
2
preferred parametrisation of Hab, which we note as PL2:
Hab = s(Bab ln2(s/s0) + P ab) (3)
where s0 is a universal scale parameter (to be determined by the fits) identical for all colli-
sions.
We have considered several possible constraints on the parameters of Eqs. (2-3): degen-
eracy of the reggeon trajectories (α+ = α−); universality of rising terms (Bab independent
of the hadrons) [10, 11]; factorization for the residues in the case of the γγ and γp cross
sections (Hγγ = δHγp = δ2Hpp); quark counting rules [12] (predicting the Σp cross section
from pp, Kp and πp); and finally the Johnson-Treiman-Freund [13] relation for the cross
section differences.
Out of the 256 possible variants, we showed that 24 met our criteria for applicability (an
overall χ2/dof ≤ 1.0 and a non-negative pomeron contribution at all energies) if one fitted
only to σtot for√
s ≥ 10 GeV, and 5 did for√
s ≥ 4 GeV (see Table XI from [1]), whereas 20
(resp. 4) variants obeyed this criterion when a fit to both σtot and ρ was performed, for√
s ≥
10 (resp. 5) GeV (see Table XIV from [1]). We shall neither give here the list of models, nor
spell out ranking criteria based on new indicators that quantify certain qualities of the fits,
but simply mention that the triple-pole parametrisation RRPnfL2u [10, 11] was determined
to be the highest-ranking model leading to the most satisfactory description of the data (see
similar conclusions in [14]). This parameterization has a universal (u) B log2(s/s0) term, a
non-factorizing (nf) constant term and non-degenerate lower trajectories.
We start by giving the predictions of this model, adjusted for (√
s ≥ 5 GeV), with
updated data points from ZEUS [15]. These predictions include statistical errors calculated
from the full error matrix Eij. We define
∆Q =∑
ij
Eij
∂2Q
∂xi∂xj
(4)
with Q = σtot or ρ and xi the parameters of the model. These errors are shown in Figs. 1
and 2 by a filled band, and in Tables II, III, and IV.
In these figures and tables, we also give our estimate of the systematic uncertainty coming
from the discrepancy between different FNAL measurements of σtot: we fit RRPnfL2u either
to the high data (CDF) or to the low ones (E710/E811), and get two error bands. The
distances from the central value of the combined fit to the upper (resp. lower) border of
3
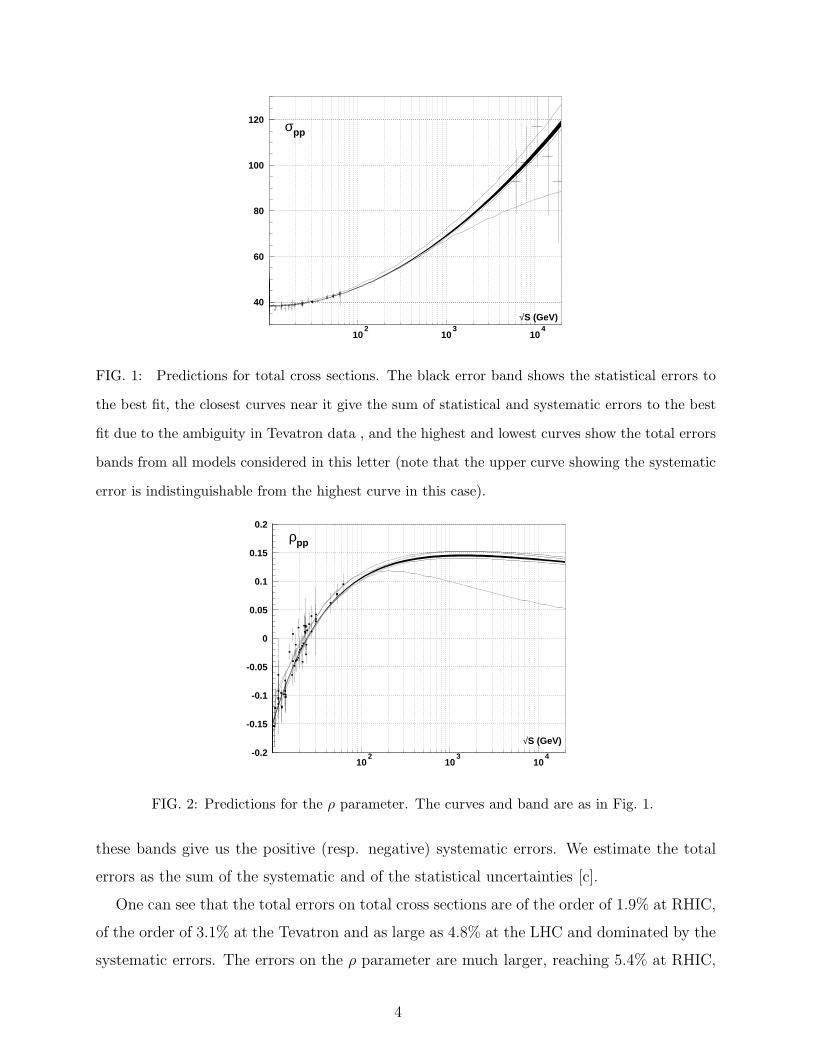
40
60
80
100
120
102
103
104
σpp
√S (GeV)
FIG. 1: Predictions for total cross sections. The black error band shows the statistical errors to
the best fit, the closest curves near it give the sum of statistical and systematic errors to the best
fit due to the ambiguity in Tevatron data , and the highest and lowest curves show the total errors
bands from all models considered in this letter (note that the upper curve showing the systematic
error is indistinguishable from the highest curve in this case).
-0.2
-0.15
-0.1
-0.05
0
0.05
0.1
0.15
0.2
102
103
104
ρpp
√S (GeV)
FIG. 2: Predictions for the ρ parameter. The curves and band are as in Fig. 1.
these bands give us the positive (resp. negative) systematic errors. We estimate the total
errors as the sum of the systematic and of the statistical uncertainties [c].
One can see that the total errors on total cross sections are of the order of 1.9% at RHIC,
of the order of 3.1% at the Tevatron and as large as 4.8% at the LHC and dominated by the
systematic errors. The errors on the ρ parameter are much larger, reaching 5.4% at RHIC,
4
5.2% at the Tevatron and 5.4% at the LHC. This is due to the fact that experimental errors
are bigger, hence less constraining, but this also stems from the incompatibility of some
low-energy determinations of ρ [1]. This means that the systematic error is always bigger
than the statistical one.
Concerning the contradictory data, we are forced to use them in our fits until the discrep-
ancy is resolved by further experiments. In the case of the Tevatron data, one can see that
the discrepancy results in a big shift (of more than 1σ) in the central value of the coefficient
B of the log2 s term, which controls the asymptotic behavior, and hence that asymptotic
predictions are appreciably weakened by the present situation. The opportunities to measure
σtot and ρ will be scarce in the future, hence any new measurement at RHIC, the Tevatron
run II and the LHC should not be missed. Unfortunately, the recent publication of E-811
[16] does not clear the problem as their value for ρ is fully compatible with our preferred
model, whereas their number for σtot (which is highly correlated with ρ) has hardly changed.
It is interesting to note that the choice of one FNAL result or the others leads to a
variation of the overall fit quality, as shown in Table I (last two columns) [d]: the variant
with CDF data has slightly better overall χ2/dof and better χ2/nop distribution over sub-
samples. We can consider this as an indication that the global picture emerging from fits to
all data on forward observables supports the CDF data and disfavors the E710/E811 data
at√
s = 1.8 TeV (see also an analogous conclusion based on the other arguments in [17]).
Finally, we also present in Figs. 1 and 2 our estimate of the region where new physics
would be discovered. For each of the 20 parametrisations which satisfy our criteria for
applicability [1] for√
s ≥ 10 GeV, and which obey the Froissart-Martin bound [18, b], we
construct errors bands according to Eq. (4). This gives us 20 1σ-error bands. Their union
represents the “allowed region” where analytic models built according to (1) can reproduce
the data. A measurement outside of this region would imply that new physics ingredients
are needed.
To conclude, we believe that we have given here the best possible estimates for present
and future pp and pp facilities. Although one might be tempted to use only data in an
energy range close to the one measured, one must realize that analytic parametrisations
are constrained both by lower-energy data, and by their asymptotic regime. Because the
pomeron mixes (physically and numerically) with the f trajectory, fits to all data help to
disentangle the two contributions.
5

TABLE I: Summary of the quality of the fits at different stages of the Review of Particle Physics
(RPP) database (DB): DB02 – The 2002 RPP DB; DB02Z – the 2002 RPP DB with new ZEUS
data, DB02Z-CDF – with the CDF point removed; DB02Z-E710/E811 with E710/E811 points
removed. The first line gives the overall χ2/dof for the global fits, the other lines give the χ2/nop
for data sub-samples, the last line gives in each case the parameter controlling the asymptotic form
of cross sections.
DB02 DB02Z DB02Z DB02Z
Sample −CDF −E710/E811
total 0.968 0.966 0.964 0.951
total cross sections
pp 1.15 1.15 1.12 1.05
pp 0.84 0.84 0.84 0.84
π−p 0.96 0.96 0.96 0.96
π+p 0.71 0.71 0.71 0.71
K−p 0.62 0.62 0.62 0.61
K+p 0.71 0.71 0.71 0.71
Σ−p 0.38 0.38 0.38 0.38
γp 0.61 0.58 0.58 0.58
γγ 0.65 0.64 0.64 0.63
elastic forward Re/Im
pp 0.52 0.52 0.52 0.53
pp 1.83 1.83 1.83 1.80
π−p 1.10 1.10 1.09 1.14
π+p 1.50 1.50 1.52 1.46
K−p 1.00 0.99 1.01 0.96
K+p 1.07 1.07 1.10 0.98
values of the parameter B
0.307(10) 0.307(10) 0.301(10) 0.327(10)
6
A sharpening of our error bars would enable one to decide if the unitarisation plays an
essential role and what form it takes. This in turn can have an impact on the determination
of the survival of probability gaps in hard scattering, and on the usefulness of pomeron
exchange as a detection tool.
Any significant deviation from the predictions based on model RRPnfL2u will lead to a re-
evaluation of the hierarchy of models and presumably change the preferred parametrisation
to another one. A deviation from the “allowed region” would be an indication that strong
interactions demand a generalization of the analytic models discussed so far, e.g. by adding
odderon terms, or new pomeron terms, as suggested by QCD.
Acknowledgments
The COMPAS group was supported in part by the Russian Foundation
for Basic Research grants RFBR-98-07-90381 and RFBR-01-07-90392. K.K.
is in part supported by the U.S. D.o.E. Contract DE-FG-02-91ER40688-
Task A. We thank Professor Jean-Eudes Augustin for the hospitality at
LPNHE-Universite Paris 6, where part of this work was done. We thank
O. Selyugin for his corrections to the database, A. Sobol for discussions on the soft
physics program of the TOTEM &CMS, and Yu.Kharlov for discussions on possibilities for
γγ physics at RHIC and at the LHC.
[*] COmputerised Models, Parameter Evaluation for Theory and Experiment.
[**] Unite de Recherche des Universites Paris 6 et Paris 7, Associee au CNRS.
[1] J. R. Cudell, V. V. Ezhela, P. Gauron, K. Kang, Yu. V. Kuyanov, S. B. Lugovsky, B. Nicolescu,
and N. P. Tkachenko, Phys. Rev. D 65, 074024 (2002).
[2] J. R. Cudell et al., Phys. Rev. D 61, 034019 (2000); Phys. Rev. D 63. 059901 (E) (2001).
[3] K. Hagiwara et al. (Particle Data Group), Review of Particle Physics, to appear in Phys. Rev.
D.
[4] see e.g. http://www.rhic.bnl.gov/pp2pp/ and http://totem.web.cern.ch/Totem/.
[5] S. I. Dutta, M. H. Reno, I. Sarcevic and D. Seckel, Phys. Rev. D 63, 094020 (2001) [arXiv:hep-
7
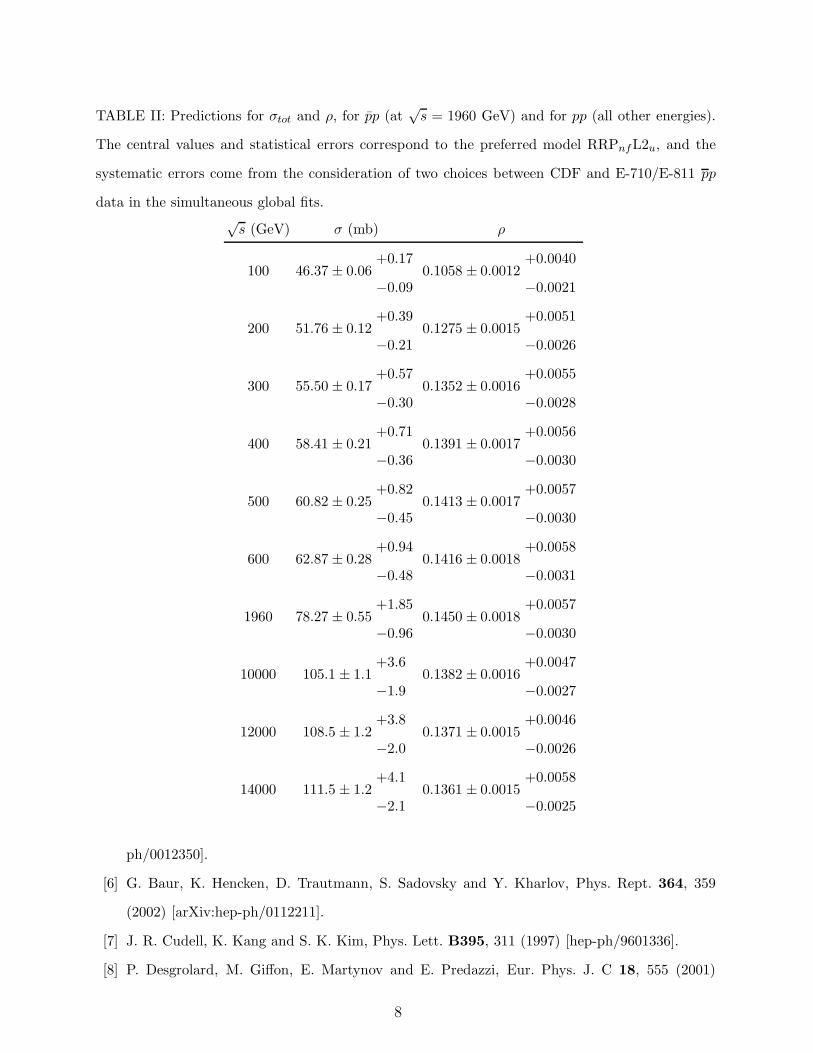
TABLE II: Predictions for σtot and ρ, for pp (at√
s = 1960 GeV) and for pp (all other energies).
The central values and statistical errors correspond to the preferred model RRPnfL2u, and the
systematic errors come from the consideration of two choices between CDF and E-710/E-811 pp
data in the simultaneous global fits.√
s (GeV) σ (mb) ρ
100 46.37 ± 0.06+0.17
−0.090.1058 ± 0.0012
+0.0040
−0.0021
200 51.76 ± 0.12+0.39
−0.210.1275 ± 0.0015
+0.0051
−0.0026
300 55.50 ± 0.17+0.57
−0.300.1352 ± 0.0016
+0.0055
−0.0028
400 58.41 ± 0.21+0.71
−0.360.1391 ± 0.0017
+0.0056
−0.0030
500 60.82 ± 0.25+0.82
−0.450.1413 ± 0.0017
+0.0057
−0.0030
600 62.87 ± 0.28+0.94
−0.480.1416 ± 0.0018
+0.0058
−0.0031
1960 78.27 ± 0.55+1.85
−0.960.1450 ± 0.0018
+0.0057
−0.0030
10000 105.1 ± 1.1+3.6
−1.90.1382 ± 0.0016
+0.0047
−0.0027
12000 108.5 ± 1.2+3.8
−2.00.1371 ± 0.0015
+0.0046
−0.0026
14000 111.5 ± 1.2+4.1
−2.10.1361 ± 0.0015
+0.0058
−0.0025
ph/0012350].
[6] G. Baur, K. Hencken, D. Trautmann, S. Sadovsky and Y. Kharlov, Phys. Rept. 364, 359
(2002) [arXiv:hep-ph/0112211].
[7] J. R. Cudell, K. Kang and S. K. Kim, Phys. Lett. B395, 311 (1997) [hep-ph/9601336].
[8] P. Desgrolard, M. Giffon, E. Martynov and E. Predazzi, Eur. Phys. J. C 18, 555 (2001)
8

TABLE III: Predictions for σtot for γp → hadrons for cosmic ray photons. The central values, the
statistical errors and the systematic errors are as in Table II.
pγlab (GeV) σ (mb)
0.5 · 106 0.243 ± 0.009+0.011
−0.010
1.0 · 106 0.262 ± 0.010+0.013
−0.011
0.5 · 107 0.311 ± 0.014+0.019
−0.015
1.0 · 107 0.333 ± 0.016+0.021
−0.017
1.0 · 108 0.418 ± 0.022+0.030
−0.024
1.0 · 109 0.516 ± 0.029+0.042
−0.032
TABLE IV: Predictions for σtot for γγ → hadrons. The central values, the statistical errors and
the systematic errors are as in Table II.√
s (GeV) σ (µ b)
200 0.546 ± 0.027+0.027
−0.027
300 0.610 ± 0.035+0.037
−0.035
400 0.659 ± 0.042+0.044
−0.042
500 0.700 ± 0.047+0.050
−0.048
1000 0.840 ± 0.067+0.073
−0.069
9
[arXiv:hep-ph/0006244].
[9] A. Donnachie and P. V. Landshoff, Phys. Lett. B296, 227 (1992) [hep-ph/9209205].
[10] L. D. Soloviev, Pisma v ZHETF 18, 455 (1973); Pisma v ZHETF 19, 185 (1974) (in Russian);
JETP Lett. 19, 116 (1974).
[11] P. Gauron and B. Nicolescu, Phys. Lett. B486, 71 (2000) [hep-ph/0004066].
[12] E. M. Levin and L. L. Frankfurt, Pisma v ZHETF 3, 652 (1965) (in Russian), E. M. Levin
and L. L. Frankfurt, JETP Lett. 2, 65 (1965).
[13] K. Johnson and S.B. Treiman, Phys. Rev. Lett. 14, 189 (1965); P. G. O. Freund, Phys. Rev.
Lett. 15, 929 (1965).
[14] K. Igi and M. Ishida, arXiv:hep-ph/0204162.
[15] S. Chekanov et al. [ZEUS Collaboration], Nucl. Phys. B 627, 3 (2002) [arXiv:hep-ex/0202034].
[16] C. Avila et al. [E-811 Collaboration], Phys. Lett. B537, 41 (2002).
[17] P. Gauron and B. Nicolescu, Phys. Lett. B333, 142 (1994); M. G. Albrow, A. Beretvas,
L. Nodulman and P. Giromini, “Comparison of the total cross sections measurements of CDF
and E811,” preprint FERMILAB-TM-2071, 1999.
[18] M. Froissart, Phys. Rev. 123, 1053 (1961); A. Martin, Nuovo Cimento, A42, 930 (1966); see
also W. Heisenberg, Z. Phys. 133, 65 (1952).
[a] The latest ZEUS point [15] on σtot(γp → hadrons), that supersedes the previous two ZEUS
points, is included in the present study for RRPnfL2u. Also the whole database was changed
slightly since the last session of the cross assessment [1, 3] due to misprints and errata cor-
rections. This improves slightly the global fit and central values are shifted noticeably within
the error bars when one compares with results calculated from the parametrizations of [1, 2].
[b] Note that we checked [2] that the predictions of simple-pole models nevertheless fall into our
allowed region.
[c] Note that, apart from the tiny statistical error, none of the errors or bands given in this work
has a probabilistic interpretation.
[d] We have constructed a preliminary version of a Web-predictor, allowing one to obtain the
central values and fit errors without systematics from our highest rank models at any collision
energies√
s ≥ 5 GeV, see http://www.ihep.su/∼tka4ehko/CS/MODELS/.
10