bc geological survey assessment report 38836
TRANSCRIPT
AUTHOR(S): SIGNATURE(S):
STATEMENT OF WORK - CASH PAYMENTS EVENT NUMBER(S)/DATE(S):
NOTICE OF WORK PERMIT NUMBER(S)/DATE(S): YEAR OF WORK:
PROPERTY NAME:
CLAIM NAME(S) (on which the work was done):
COMMODITIES SOUGHT:
MINERAL INVENTORY MINFILE NUMBER(S), IF KNOWN:
NTS/BCGS:MINING DIVISION:
LATITUDE: o ' " LONGITUDE: o ' "
OWNER(S):1) 2)
OPERATOR(S) [who paid for the work]:1) 2)
MAILING ADDRESS:
TYPE OF REPORT [type of survey(s)]: TOTAL COST:
PROPERTY GEOLOGY KEYWORDS (lithology, age, stratigraphy, structure, alteration, mineralization, size and attitude):
REFERENCES TO PREVIOUS ASSESSMENT WORK AND ASSESSMENT REPORT NUMBERS:
Ministry of Energy, Mines & Petroleum ResourcesMining & Minerals DivisionBC Geological Survey
Assessment ReportTitle Page and Summary
(at centre of work)
MAILING ADDRESS:
Next Page
David G Mark
SOW #5761255 dated October 31, 2019
n/a 2019
Mount Burns (also Gold Panners Paradise)
339096, 363918
gold, silver, lead
93H/04 /// 093H.002Cariboo
53 04 01.00 121 37 55.87
Goldin Rock Resources Inc.
Goldin Rock Resources Inc.
P.O. Box 100
Houston, BC, V0J 1Z0
Magnetic, VLF-EM, Soil Geochemistry $39,641.00
Showshoe Group, Hardscrabble, Barkerville Terrane, replacement, quartz
P.O. Box 100
Houston, BC, V0J 1Z0
#'s 13252, 16315, 24336, 35651, 36548
GEOLOGICAL (scale, area)
Ground, mapping
Photo interpretation
GEOPHYSICAL (line-kilometres)Ground
Magnetic
Electromagnetic
Induced Polarization
Radiometric
Seismic
Other
Airborne
GEOCHEMICAL(number of samples analysed for...)
Soil
Silt
Rock
Other
DRILLING(total metres; number of holes, size)
Core
Non-core
RELATED TECHNICAL
Sampling/assaying
Petrographic
Mineralographic
Metallurgic
PROSPECTING (scale, area)
PREPARATORY / PHYSICAL
Line/grid (kilometres)
(scale, area)
Legal surveys (scale, area)
Road, local access (kilometres)/trail
Topographic/Photogrammetric
Trench (metres)
Underground dev. (metres)
Other
TYPE OF WORK INTHIS REPORT
EXTENT OF WORK(IN METRIC UNITS)
ON WHICH CLAIMS PROJECT COSTSAPPORTIONED
(incl. support)
TOTAL COST:
(scale, area)
Line/grid (kilometres)
PROSPECTING (scale, area)
Metallurgic
Mineralographic
Petrographic
Sampling/assaying
Non-core
Core
Other
Rock
Silt
Soil
Airborne
Other
Seismic
Radiometric
Induced Polarization
Electromagnetic
Magnetic
Photo interpretation
Ground, mapping
$39,641.00
$34,841.00339096, 363918116 samples analyzed for 53 elements
3.15 339096, 363918 $2,250.00
$2,550.00339096, 3639183.15
i
EXPLORATION REPORT
ON
MMI SOIL SAMPLING
AND
MAGNETIC AND VLF-EM SURVEYING
WITHIN THE
MOUNT BURNS PROPERTY
TUCKER LAKE, BARKERVILLE AREA
CARIBOO MINING DIVISION, BRITISH COLUMBIA
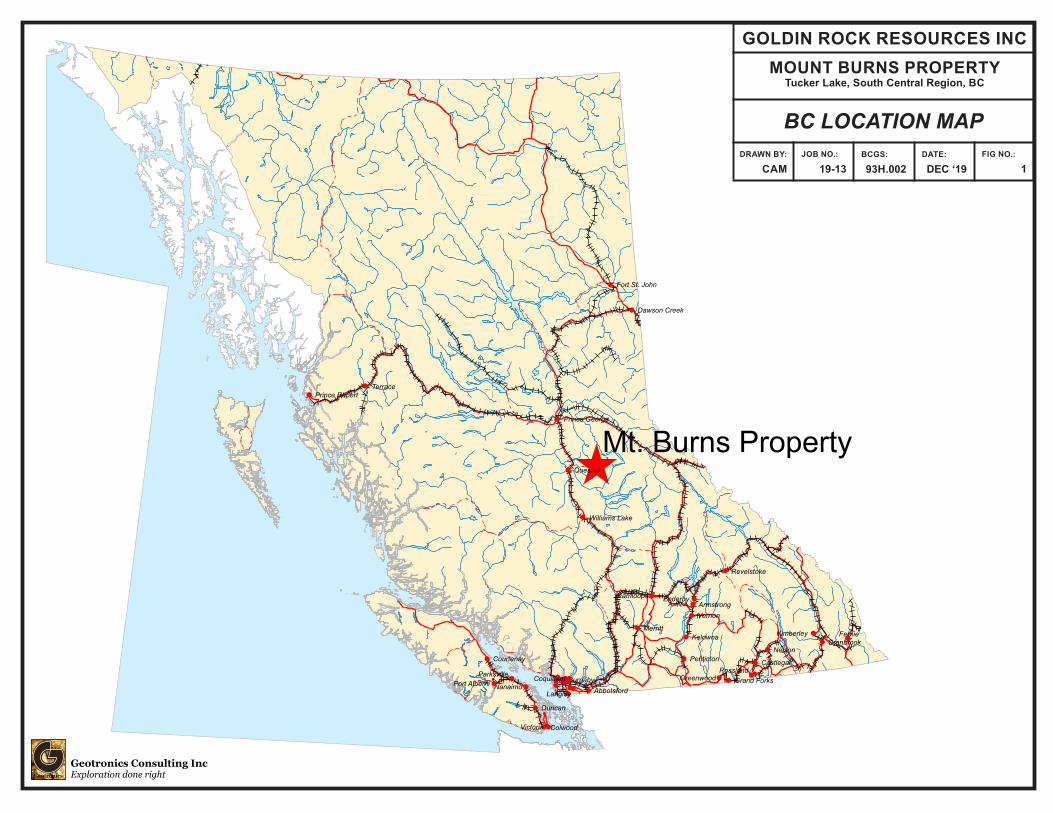
LOCATED: 6 km due west of the town of Barkerville, and 57 km east-northeast of the town of Quesnel, at southwest end of Jack of Clubs Lake
53°03’50” North Latitude and 121°38’50” Longitude
NTS: 93H/04 BCGS: 093H.002
WRITTEN FOR: GOLDIN ROCK RESOURCES INC. c/o PO Box 100 Houston, B.C., V0J 1Z0
WRITTEN BY: David G. Mark, P.Geo. GEOTRONICS CONSULTING INC. 6204 – 125th Street Surrey, British Columbia, V3X 2E1
ii
TABLE OF CONTENTS
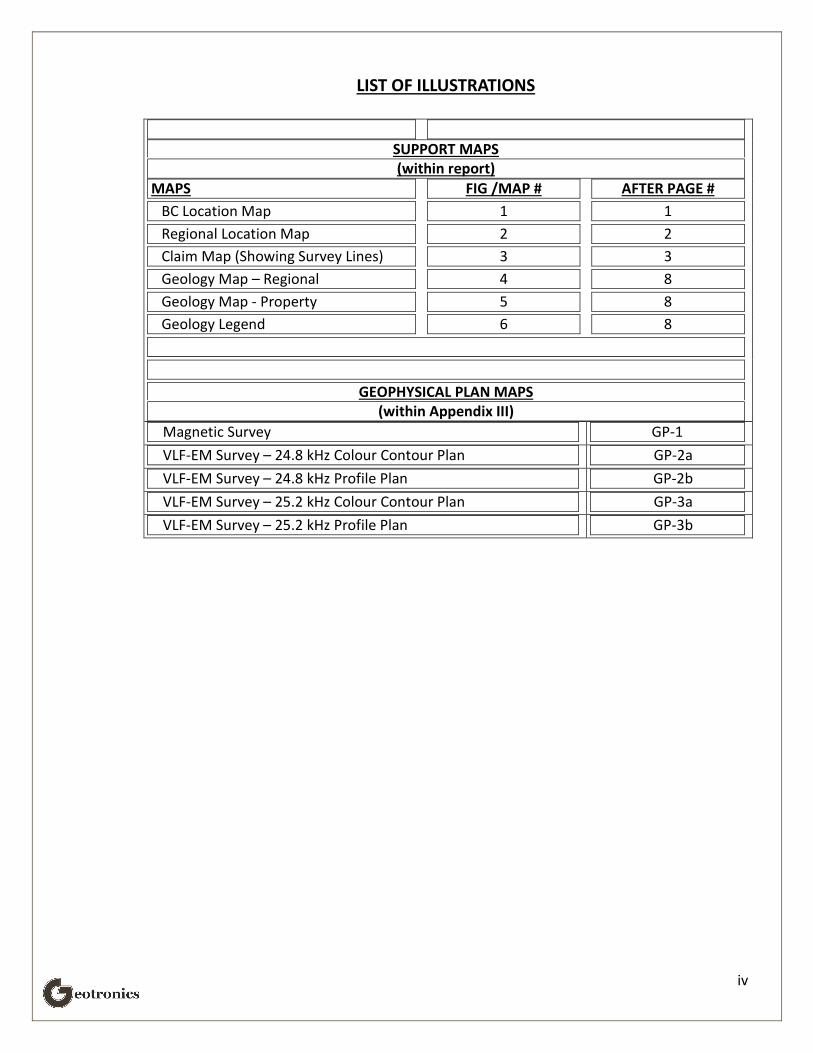
LIST OF ILLUSTRATIONS ................................................................................................... iv
1 SUMMARY ................................................................................................................ 1
2 CONCLUSIONS ........................................................................................................... 2
3 RECOMMENDATIONS ................................................................................................ 2
4 INTRODUCTION and GENERAL REMARKS ................................................................... 3
5 PROPERTY and OWNERSHIP ...................................................................................... 4
6 LOCATION AND ACCESS ............................................................................................. 4
7 PHYSIOGRAPHY ........................................................................................................ 5
8 HISTORY ................................................................................................................... 6
8.1 Select Mineral Exploration Timeline for the Property ........................................................ 6
9 GEOLOGY .................................................................................................................. 8
9.1 Regional Geology: Quesnel Highlands ............................................................................... 8
9.2 Local Geology: Barkerville Terrane.................................................................................... 9
9.3 Property Geology ............................................................................................................. 9
9.4 Deposit Types ................................................................................................................ 11 9.4.1 Quartz-Pyrite Veins ........................................................................................................................... 11 9.4.2 Pyritic Replacement in Limestone ..................................................................................................... 12 9.4.3 Pyritic Replacement in Metasedimentary Rocks ............................................................................... 13
10 MMI SOIL SAMPLING .............................................................................................. 13
10.1 Grid Emplacement ......................................................................................................... 13
10.2 Sampling Procedure ....................................................................................................... 13
10.3 Analytical Methods ........................................................................................................ 14
10.4 Compilation of Data ....................................................................................................... 14
10.5 Rock Sampling ............................................................................................................... 15
11 MAGNETIC SURVEY ................................................................................................. 15
11.1 Instrumentation ............................................................................................................. 15
11.2 Theory ........................................................................................................................... 16
11.3 Survey Procedure ........................................................................................................... 16
11.4 Data Reduction .............................................................................................................. 16
12 VLF-EM Survey ........................................................................................................ 17

iii
12.1 Instrumentation ............................................................................................................. 17
12.2 Theory ........................................................................................................................... 17
12.3 Survey Procedure ........................................................................................................... 18
12.4 Compilation of Data ....................................................................................................... 18
13 DISCUSSION OF RESULTS ......................................................................................... 18
13.1 Magnetic and VLF-EM Surveys ........................................................................................ 18
13.2 MMI Soil Sampling Survey .............................................................................................. 19
14 SELECTED BIBLIOGRAPHY ........................................................................................ 21
15 GEOPHYSICIST’S CERTIFICATE .................................................................................. 23
16 AFFIDAVIT OF EXPENSES ......................................................................................... 24
17 APPENDIX I – GEOCHEMISTRY DATA ........................................................................ 25
18 APPENDIX II – GEOCHEMISTRY CERTIFICATES .......................................................... 26
19 APPENDIX III – GEOPYSICAL SURVEY PLANS ............................................................. 27
20 APPENDIX IV – MMI SURVEY PLANS ........................................................................ 28
21 APPENDIX V – MMI HISTOGRAMS ........................................................................... 29
iv
LIST OF ILLUSTRATIONS
SUPPORT MAPS (within report)
MAPS FIG /MAP # AFTER PAGE # BC Location Map 1 1 Regional Location Map 2 2 Claim Map (Showing Survey Lines) 3 3 Geology Map – Regional 4 8 Geology Map - Property 5 8 Geology Legend 6 8
GEOPHYSICAL PLAN MAPS (within Appendix III)
Magnetic Survey GP-1 VLF-EM Survey – 24.8 kHz Colour Contour Plan GP-2a VLF-EM Survey – 24.8 kHz Profile Plan GP-2b VLF-EM Survey – 25.2 kHz Colour Contour Plan GP-3a VLF-EM Survey – 25.2 kHz Profile Plan GP-3b
v
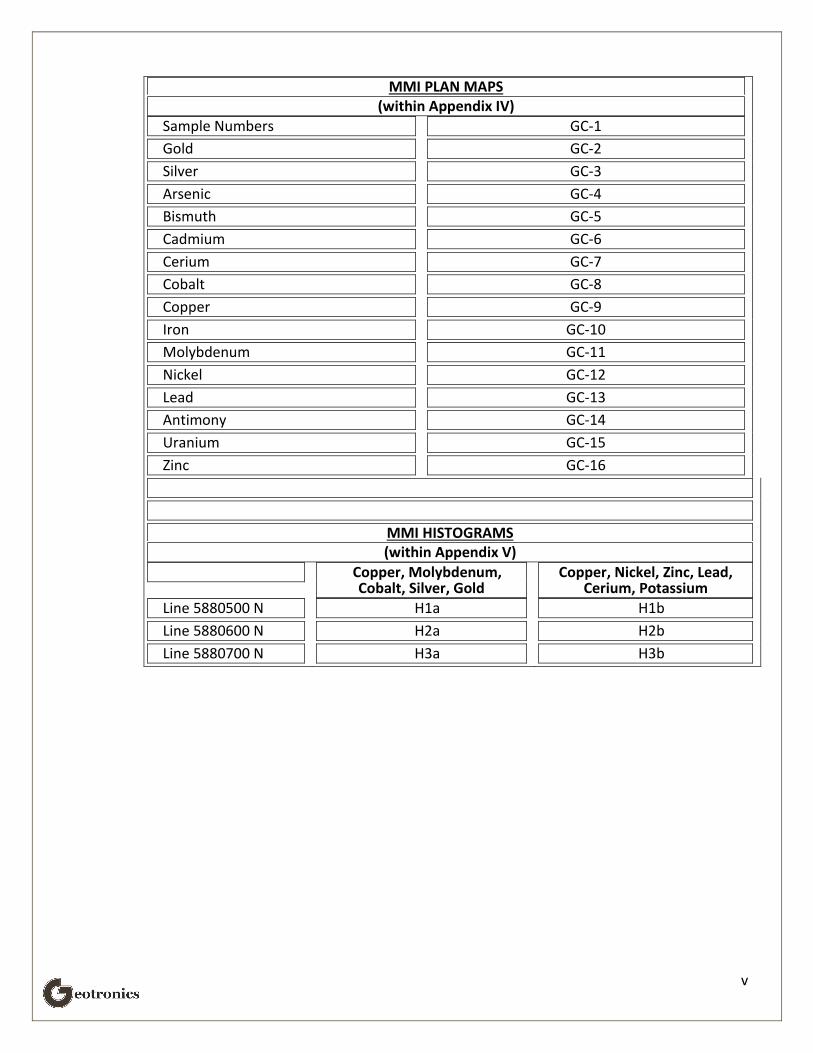
MMI PLAN MAPS (within Appendix IV)
Sample Numbers GC-1 Gold GC-2 Silver GC-3 Arsenic GC-4 Bismuth GC-5 Cadmium GC-6 Cerium GC-7 Cobalt GC-8 Copper GC-9 Iron GC-10 Molybdenum GC-11 Nickel GC-12 Lead GC-13 Antimony GC-14 Uranium GC-15 Zinc GC-16
MMI HISTOGRAMS (within Appendix V)
Copper, Molybdenum, Cobalt, Silver, Gold
Copper, Nickel, Zinc, Lead, Cerium, Potassium
Line 5880500 N H1a H1b Line 5880600 N H2a H2b Line 5880700 N H3a H3b
1
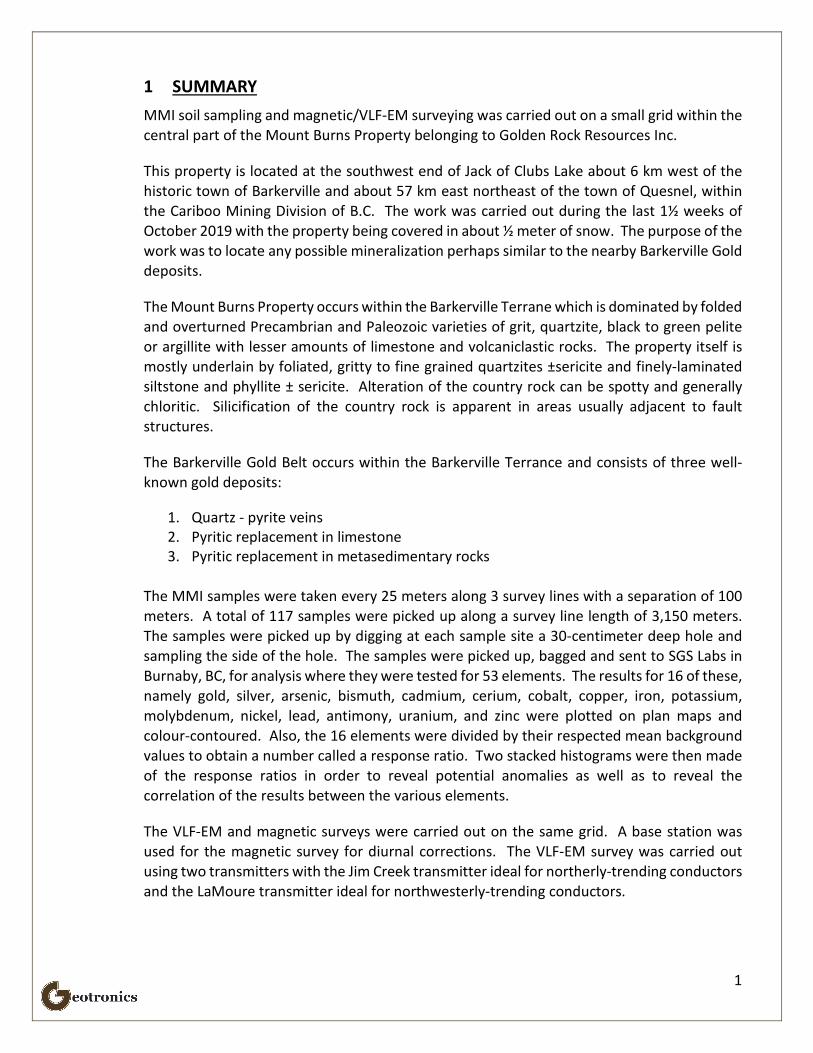
1 SUMMARY MMI soil sampling and magnetic/VLF-EM surveying was carried out on a small grid within the central part of the Mount Burns Property belonging to Golden Rock Resources Inc.
This property is located at the southwest end of Jack of Clubs Lake about 6 km west of the historic town of Barkerville and about 57 km east northeast of the town of Quesnel, within the Cariboo Mining Division of B.C. The work was carried out during the last 1½ weeks of October 2019 with the property being covered in about ½ meter of snow. The purpose of the work was to locate any possible mineralization perhaps similar to the nearby Barkerville Gold deposits.
The Mount Burns Property occurs within the Barkerville Terrane which is dominated by folded and overturned Precambrian and Paleozoic varieties of grit, quartzite, black to green pelite or argillite with lesser amounts of limestone and volcaniclastic rocks. The property itself is mostly underlain by foliated, gritty to fine grained quartzites ±sericite and finely-laminated siltstone and phyllite ± sericite. Alteration of the country rock can be spotty and generally chloritic. Silicification of the country rock is apparent in areas usually adjacent to fault structures.
The Barkerville Gold Belt occurs within the Barkerville Terrance and consists of three well-known gold deposits:
1. Quartz - pyrite veins 2. Pyritic replacement in limestone 3. Pyritic replacement in metasedimentary rocks
The MMI samples were taken every 25 meters along 3 survey lines with a separation of 100 meters. A total of 117 samples were picked up along a survey line length of 3,150 meters. The samples were picked up by digging at each sample site a 30-centimeter deep hole and sampling the side of the hole. The samples were picked up, bagged and sent to SGS Labs in Burnaby, BC, for analysis where they were tested for 53 elements. The results for 16 of these, namely gold, silver, arsenic, bismuth, cadmium, cerium, cobalt, copper, iron, potassium, molybdenum, nickel, lead, antimony, uranium, and zinc were plotted on plan maps and colour-contoured. Also, the 16 elements were divided by their respected mean background values to obtain a number called a response ratio. Two stacked histograms were then made of the response ratios in order to reveal potential anomalies as well as to reveal the correlation of the results between the various elements.
The VLF-EM and magnetic surveys were carried out on the same grid. A base station was used for the magnetic survey for diurnal corrections. The VLF-EM survey was carried out using two transmitters with the Jim Creek transmitter ideal for northerly-trending conductors and the LaMoure transmitter ideal for northwesterly-trending conductors.

2
2 CONCLUSIONS 1. The magnetic survey revealed a magnetic high that could be reflecting magnetite-
bearing phyllite which is a marker unit of replacement gold deposits within the Barkerville Gold Belt.
2. The VLF-EM survey revealed several conductors striking mainly in northwesterly and northerly directions. These may be reflecting shear zones or graphitic horizons which could be associated with gold mineralization.
3. The MMI survey revealed three gold anomalies that have been labelled A, B, and C, respectively.
4. Anomaly A is the strongest and largest gold anomaly striking north-northwesterly with a minimum strike length of 260 meters and a width of 60 to 100 meters. It occurs within the magnetic high indicating that its host rock is different than that of the other two gold anomalies. It also correlates with silver, arsenic, copper, molybdenum, lead, and antimony.
5. Anomaly B strikes northwesterly with a minimum strike length of 350 meters. It correlates directly with a VLF-EM conductor indicating that the gold mineralization occurs within a shear zone or is associated with graphite. This anomaly correlates with anomalous values in silver, copper, molybdenum, lead, antimony, cadmium, and zinc
6. Anomaly C strikes northerly with a minimum strike direction of 200 meters. It correlates with cadmium, cobalt, and partially with silver, copper, molybdenum, antimony, and zinc.
3 RECOMMENDATIONS The results are very encouraging and definitely warrant further work as follows:
1. Extend the MMI soil sampling in all directions in order to define the anomalies more accurately and thus prepare the targets for diamond drilling.
2. Carry out magnetic and VLF-EM surveys over the same area. Outcrops are few and thus these two surveys assist in mapping geology and thus increase the understanding of the
3. Test the resulting anomalies with IP and resistivity surveying. The purpose of the IP surveying is to map sulphides and that of the resistivity surveying is to map alteration, both of which are associated with gold mineralization in the Barkerville Gold Belt. These two surveys are particularly adept at optimizing drill targets especially with carrying out inversion interpretation.

3
EXPLORATION REPORT ON
MMI SOIL SAMPLING AND
MAGNETIC AND VLF-EM SURVEYING WITHIN THE
MOUNT BURNS PROPERTY TUCKER LAKE, BARKERVILLE AREA
CARIBOO MINING DIVISION, BRITISH COLUMBIA
4 INTRODUCTION and GENERAL REMARKS This report discusses survey procedure, compilation of data, interpretation methods, and the results of mobile metal ion (MMI) soil sampling as well as magnetic and VLF-EM surveying carried out over a grid within the central part of the Mount Burns Claim Group, which is located within the Barkerville/Wells area within the Cariboo district of BC.
The work was done along three survey lines for a total survey length of 3,150 meters in an east-west direction between October 17th and 31st, 2019, by a Geotronics crew of 2 men under supervision of the writer. Access to the property was hampered due to snow conditions. The field crew had to chain up each day. The snow also hampered the actual sampling as well since it made it more difficult to find a good spot for the digging. In addition, the sampling itself was quite difficult due to the rockiness of the soil. It took time to clean the rocks out of the sample so that enough it contained enough soil.
The general purpose of exploration on this property is to locate sulphide mineralization similar to that of the nearby Barkerville Mines property.
MMI stands for mobile metal ions and describes ions, which have moved in the weathering zone and that are weakly or loosely attached to surface soil particles. MMI, which requires special sampling and testing techniques, are particularly useful in responding to mineralization at depth probably in excess of 700 meters, though with gold this depth is only 300 meters. It also is not affected by glacial till, while standard soil sample techniques are. MMI is characterized in having a high signal to noise ratio and therefore can provide accurate drill targets. However, it may also move along fault lines and therefore could show the causative source to be laterally moved from where it actually is.
Geotronics Consulting IncExploration done rightGeotronics
Mt. Burns Property
Abbotsford
Armstrong
Burnaby
Castlegar
Colwood
Coquitlam
Courtenay
Cranbrook
Dawson Creek
Duncan
Enderby
Fernie
Fort St. John
Grand Forks Greenwood
Kamloops
Kelowna Kimberley
Langley
Merritt
Nanaimo
Nelson
Parksville
Penticton
Port Alberni
Prince George
Prince Rupert
Quesnel
Revelstoke
Rossland
Terrace
Vernon
Victoria
Williams Lake
GOLDIN ROCK RESOURCES INC
Tucker Lake, South Central Region, BCMOUNT BURNS PROPERTY
BC LOCATION MAP
DRAWN BY:
CAM 19-13
JOB NO.: BCGS:
93H.002
DATE:
DEC ‘19 1
FIG NO.:
4
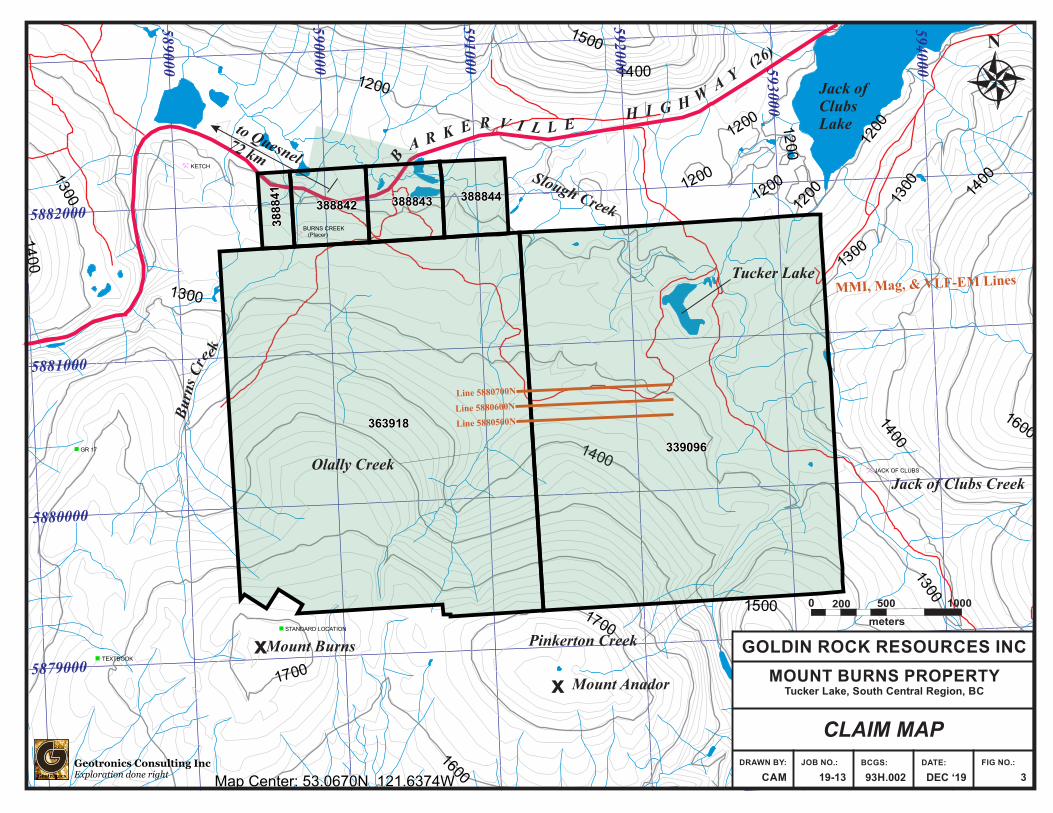
5 PROPERTY and OWNERSHIP The Mount Burns Property extends up to 3 km in a north direction and 4 km in an east direction. It consists of 6 legacy mineral claims with a total area of 1,100 hectares, as described in the table below and as shown on the claim map, figure 3. Because these are legacy claims, the actual area of the property as seen on the claim map is 1,067 hectares, though the required assessment value is for the greater area of 1,100 hectares.
Tenure No. Claim Name Good Until Area (ha) 339096 GOLD PANNERS PARADISE 2 December 23, 2020 500 363918 GEO - # ONE December 23, 2020 500 388841 KETCH 1 December 23, 2020 25 388842 KETCH 2 December 23, 2020 25 388843 KETCH 3 December 23, 2020 25 388844 KETCH 4 December 23, 2020 25
Total Area 1,100
The “Good Until” date shown includes the work described within this report as submitted for assessment work.
The registered owner of the claims is Goldin Rock Resources Inc of Houston, B.C.
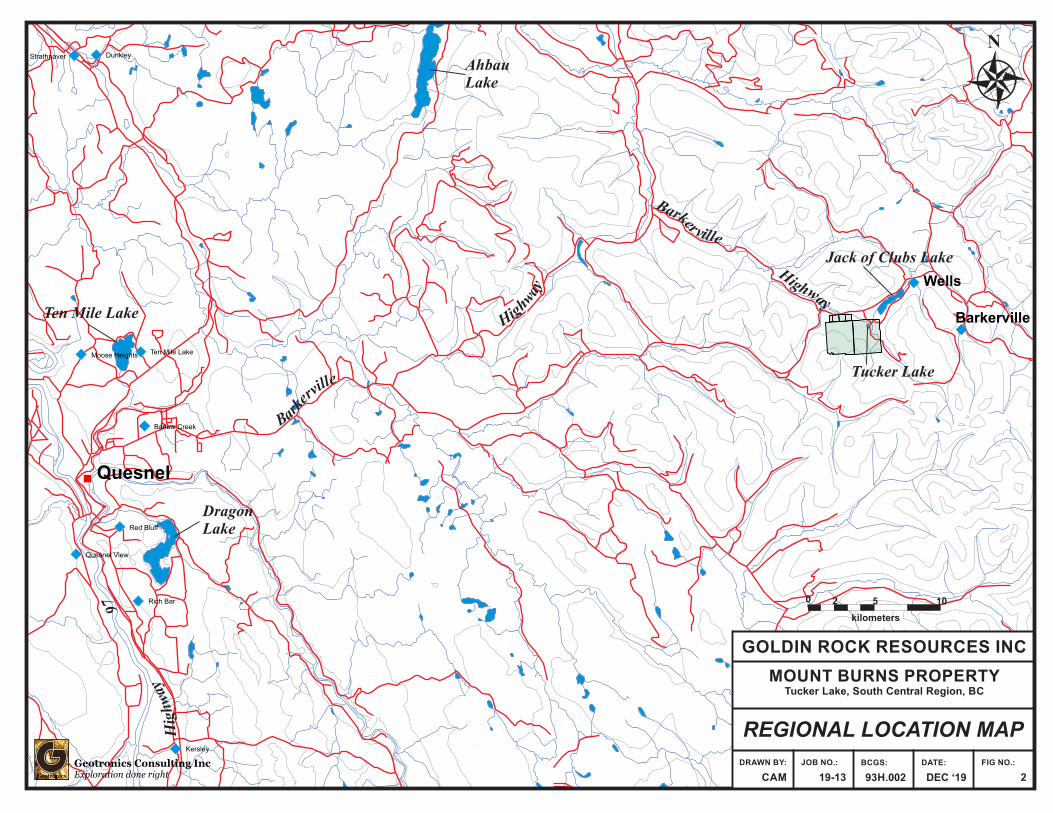
6 LOCATION AND ACCESS The Mount Burns Claim Group is located 6 km due west of the historic town of Barkerville, BC, and 57 km east-northeast of the town of Quesnel, BC, at the southwest end of Jack of Clubs Lake, as shown on the regional location map, fig 2.
The geographical coordinates for the center of the property are 53° 04' 01” north latitude and 121° 38' 14.6” west longitude with the NAD 83 UTM coordinates being 5880592 m N and 591301 m E NAD 83 within zone 10. The property occurs within NTS map number 92H/04 and within BCGS map number 093H.002.
Access to the property is easily gained since BC Highway 26, otherwise known as the Barkerville Highway, runs through its northern edge as can be seen on the claim map, fig 3. From downtown Quesnel, one travels easterly along Highway 26 towards Wells for 72 km to the northern part of the property. From this point, as seen on the claim map, one turns onto a bush road that leaves the highway running in a southeasterly direction. The exploration grid within the center of the property is just over 2 km along this road.
About 2 km further east along Highway 26 a second bush road runs southerly from the highway and accesses the eastern part of the property including the Tucker Lake area.
Barkerville
Barlow Creek
Dunkley
Kersley
Moose Heights
Quesnel
Quesnel View
Red Bluff
Rich Bar
Strathnaver
Ten Mile Lake
Wells
2 5 10
kilometers
0
Geotronics Consulting IncExploration done rightGeotronics
N
GOLDIN ROCK RESOURCES INC
Tucker Lake, South Central Region, BCMOUNT BURNS PROPERTY
REGIONAL LOCATION MAP
DRAWN BY:
CAM 19-13
JOB NO.: BCGS:
93H.002
DATE:
DEC ‘19
FIG NO.:
2
Jack of Clubs Lake
Tucker Lake
Barkerville
Highway
ellivrekraB
yawhgiH
79 yaw
hgiH
AhbauLake
Ten Mile Lake
DragonLake
200
1200
1200
1200
1200
1200
12
00
1300
1300
1300
1400
14
00
1400
1400
1500
1500
16001600
1700
1700
1300
1300 1400
1400
1500
1600
1
Geotronics Consulting IncExploration done rightGeotronics
200 500 1000
meters
0
N
GOLDIN ROCK RESOURCES INC
Tucker Lake, South Central Region, BCMOUNT BURNS PROPERTY
CLAIM MAP
DRAWN BY:
CAM
JOB NO.:
19-13
BCGS:
93H.002
DATE:
DEC ‘19 3
FIG NO.:
Map Center: 53.0670N 121.6374W Map Center: 53.0670N 121.6374W Map Center: 53.0670N 121.6374W Map Center: 53.0670N 121.6374W Map Center: 53.0670N 121.6374W
339096339096339096339096339096
363918363918363918363918363918
388841
388841
388841
388841
388841
388842388842388842388842388842 388843388843388843388843388843 388844388844388844388844388844
JACK OF CLUBS
STANDARD LOCATION
KETCH
GR 17
BURNS CREEK (Placer)
TEXTBOOK
5879000
5880000
5881000
5882000
589000
590000
591000
592000 593000
594000
MMI, Mag, & VLF-EM Lines
Line 5880700N
Line 5880600N
Line 5880500N
Jack of ClubsLake
Tucker Lake
to Quesnel72 km
Jack of Clubs Creek
Slough Creek
Mount Anador
Mount Burns
keerC s
nru
B
Olally Creek
Pinkerton Creek
x
x
5
7 PHYSIOGRAPHY The property area lies in the forested mountain region located southwest of the Jack of Clubs Lake and is situated within the Quesnel Highlands on the eastern margin of the Interior Plateau System. Elevations range from 1200 meters above sea level near the highway at Slough Creek to approximately 1700 meters at top of Mount Burns and Mount Amador at the south edge of the property. Mountain summits in the region and at the property are generally rounded, having been glaciated by continental ice sheets during the Pleistocene Epoch. Rock exposures are generally limited to road cuts, excavated placer pits, rare bluffs, incised creek beds and mountain summits. However, most overburden exists as a thin veneer at elevations over 1550-1600m.
Several creeks occur on the property being Burns, Olally, Jack of Clubs, and Pinkerton, all of which flow north northeasterly. Slough Creek flows west northwesterly across the northeast part of the property and drains Tucker Lake which also occurs within the northeast part of the property. Natural drainage of the area is mostly within mossy draws which in several places lead into gold-bearing placer creeks: These creeks have been extensively worked and mined by hydraulics in the past. Water also collects in historical hand-trenched ditches located along near flat contours (usually less than about 0.5% grade) of the mountainside. These ditches were used to collect runoff or divert water to and from historical placer mining operations. The area is in a moist climatic belt, subject to heavy snowfall in winter and generally rainy conditions in summer.
The District of Wells can see winter accumulations of snow from about eight to over twenty feet. The project area is usually snow free from late May to early November, providing a four- or five-month window for an exploration season where the ground can be readily accessed.
The Wildlife Habitat Area (WHA) 5-100 encumbers 225.09 hectares (21%) of the property, generally located above the 1500m elevation contour on the southern most portion of the property. An exemption is required to conduct exploration activities within this area and certain exploration activities, once permitted and bonded, can begin after mid-June and have specific conditions attached to the work program.
The Wells area is generally well-forested with hillside slopes being dominated by spruce, pine, sub-alpine fir. These are accompanied by alders and other deciduous foliage on lower, wetter slopes flanking river valleys. The destructive nature of Mountain Pine Beetle has had significant impacts on the forests surrounding the property. However, the property is generally located on the north slope of Mount Burns and, initially, it appears that the devastating impacts of the beetle readily observed on the south facing slopes adjacent to the property are not as obvious here. Prior to 2002, no ‘pine beetle kill’ was observed in the immediate area.
The community of Wells is home to a population of about 236 permanent residents (pers. comm., Deb MacKay, 2015, Deputy Clerk). The town houses one gas station, one Canada Post
6
postal outlet, two small grocery stores, an elementary school, several art galleries, a public library with publicly accessible high-speed internet computer kiosks, an RCMP detachment, an ambulance station, a volunteer Fire Brigade, one hotel, one motel, several restaurants and several other privately owned businesses. No cell service is available. Although a broad range of amenities can be found here, the City of Quesnel, located about a 55 minute drive to the west, provides a more complete range of services, such as a hospital, medical clinics, banking services and larger commercial stores. The economy of Wells is mainly supported by summer and winter tourism, followed by mining activities, mineral and placer exploration, forestry and other recreational activities.
A helipad is located next to the Wells RCMP detachment and a small airstrip is located at the junction of Highway 26 and the Bowron Lake Road, approximately 4 kilometers east of Wells. Float planes can access the Jack of Clubs Lake at Wells. A regional airport is also located in Quesnel.
8 HISTORY Interest in the region dates back to the early 1860’s when a surge of hopeful prospectors and miners arrived to the area in search of placer gold, after significant reports of gold discoveries were reported at Keithley Creek, then Antler Creek, Williams Creek and Lightning Creek. Interest in the hard rock located at and adjacent to the property dates back to 1864 when road engineers located visible gold in quartz veins they cut during road construction near Chisholm Creek, west of Mount Burns, at a time when quartz ‘excitement’ was just beginning in the region. A summary of the property’s known work history conducted by all known previous owners and operators is outlined below in detail. The following time line of historic hard rock exploration activities details only what is known to the author at the time of writing of this report and may not be an absolute history to the hard rock exploration and mining activities which occurred at or near the Goldin Rock Resources claim group. Note: select activities conducted at the Burns Mountain Mining Company’s shafts and drifts are listed below because they are located immediately adjacent to and on trend with prospective areas at Goldin Rock’s property. Descriptions of projects located outside the bounds of Goldin Rock’s property is italicized.
8.1 SELECT MINERAL EXPLORATION TIMELINE FOR THE PROPERTY 1861 - Michael Burns mined in the area before continuing north to Germansen Landing with partner, Vital LaForce, and making significant gold discoveries there in 1869. Mount Burns (or Burns Mountain) and Burns Creek are named after Michael Burns.
1864 - Gold bearing quartz veins, or quartz excitement, was found at Chisholm Creek during road construction. To date, this is the earliest mention of mineralized bedrock in the vicinity of Mount Burns (generally, about 3km southeast of the property).
1882 - More tunnel work carried out on Mount Burns (Report of the Minister of Mines 1882 - (pg 357). ) <author note, assumed to by the Lucky Cap Tunnel near the summit of Mount Burns> Fellows of California is running a tunnel into Burns Mountain to
7
intersect the quartz vein. He sunk upon the vein from the surface to a depth of 40 feet, and was so encouraged by the result that he has concluded to run a tunnel 800 feet into the mountain (Daily Colonist, May 20, 1882)
1883 - Burns Mountain Gold Quartz Mining Co. [begins work] on tunnel which is to be 600-700 feet when completed (Johnston and Uglow Memoir 149, pg 183). Also noted, is that C.P. O’Neil was awarded the contract for continuing the Lucky Cap Tunnel 600 feet further (Daily Colonist, May 22, 1883) <author note, this implies that the tunnel had 200’ worked prior to May 1883 and may or may not include drifting>
1884 - The Burns Mountain Mining Co. is reported to be making good progress on their Lucky Cap Tunnel (Daily Colonist, March 6, 1884) but halt work when they fail to hit the ledges (Johnston and Uglow Memoir 149, pg 184). The company applies for Crown Grants 62, 63 and 64 (BC Archives Survey Map and Daily Colonist, September 1884)
1885 - The 1884 season finished with the Burns Mountain Co’s Lucky Cap Tunnel at 750 feet total length, 50 feet short of their target but plans are to resume work when the 1885 - season advances. Mr Dodd has a piece of gold and quartz taken from the tunnel-a rich and pretty specimen (Daily Colonist, April 12, 1885)
1886 - Mr. Jacques drove [to] 800 feet [on the Lucky Cap Tunnel] with good indications (Johnston and Uglow Memoir 149, pg 184). Surface exploration for lode continues to south and northeast and drifting was conducted at different locations in the main tunnel (Jacques correspondence to the Directors of the Company, 1886)
1933 - BC Cariboo Gold Fields Ltd publish a map of their mineral property (EMPR Property File ID 47506) which partly overlaps into today’s Goldin Rock ground.
1948 - The BC Department of Mines geologist, Stuart Holland, published a geological report on the Stanley Area (Bulletin 26) and includes bedrock mapping conducted at and near O’lally Creek and Burns Creek. Harold McGowan, a later well-known local prospector, was his field assistant (pers. comms, McGowan, 2001, 2013)
1985 - Clifton Resources Ltd. Conducted a geochemical and geological survey over Devils Canyon, Mount Burns and Mount Nelson including detailed mapping along Burns Creek (Assessment Report 13252).
1987 - Lightning Creek Resources carried out an airborne mag, electromag, VLF survey over and area including the summit of Mount Burns (Assessment Report 16315).
1991 - Tom Hatton and Gunner Tjener unearth an 8.5oz gold nugget during placer operations east of Burns Creek (pers. comms, Hatton, 2002)
1996 - Gold City Mining Corp. conducted a Dighem Airborne survey with report and includes a small sliver of the north portion of Mount Burns (Assessment Report 24336).
1997 - Don Sutherland conducted a self-potential geophysical survey on his family’s placer claim located north of Tucker Lake. The southern half of the survey area lies within the bounds of Goldin Rock’s current (2015) mineral property. Note: the data from
8
this survey may be worthy of reinterpretation for exploration of the mineral claim group.
2013 - Trenching conducted southwest of Tucker Lake exposed little to no bedrock for sampling.
2015 - 130 vegetation samples over 7.0 line kilometers are ashed and analyzed.
2016 - 21 vegetation samples over 0.8 line kilometers are ashed and analyzed to infill the 2015 sampling program and 43 MMI samples were taken over 1.8 line kilometers were analyzed: all subject of this report.
2016 - Tenorex GeoServices on behalf of Goldin Rock Resources Inc carried out biogeochemical and soil sampling at two general areas of the property: (1) between Tucker Lake and O’lally Creek and (2) near the Blue Lead target area. 21 vegetation samples over 0.8 line kilometers were ashed and analyzed and 43 MMI samples were taken over 1.8 line kilometers. Access was partly mostly cleared but required some removal of deadfall to get in. Snow covered the ground during the sampling to the east and access was made by walking from the muster area adjacent the highway.
2018 - Barkerville Gold Mines Ltd conducted soil and rock sampling within the bounds of Goldin Rock's legacy claims and it was reported that anomalous gold values were assayed from over 15% of the 107 samples taken (ARIS 37744).
9 GEOLOGY
9.1 REGIONAL GEOLOGY: QUESNEL HIGHLANDS The geology of the Cariboo mining district has been presented in various reports / memoirs and maps presented by geologists such as Bowman (1889, 1895), Dawson (1894), Johnston and Uglow (1926), Hanson (1935), Sutherland Brown (1957), Struik (1988), Levson and Giles (1993) and Schiarizza (2004). Many mineral assessment reports of the area also state the regional geology of the area typically see paraphrasing of the region’s geological setting by the above noted geologists.
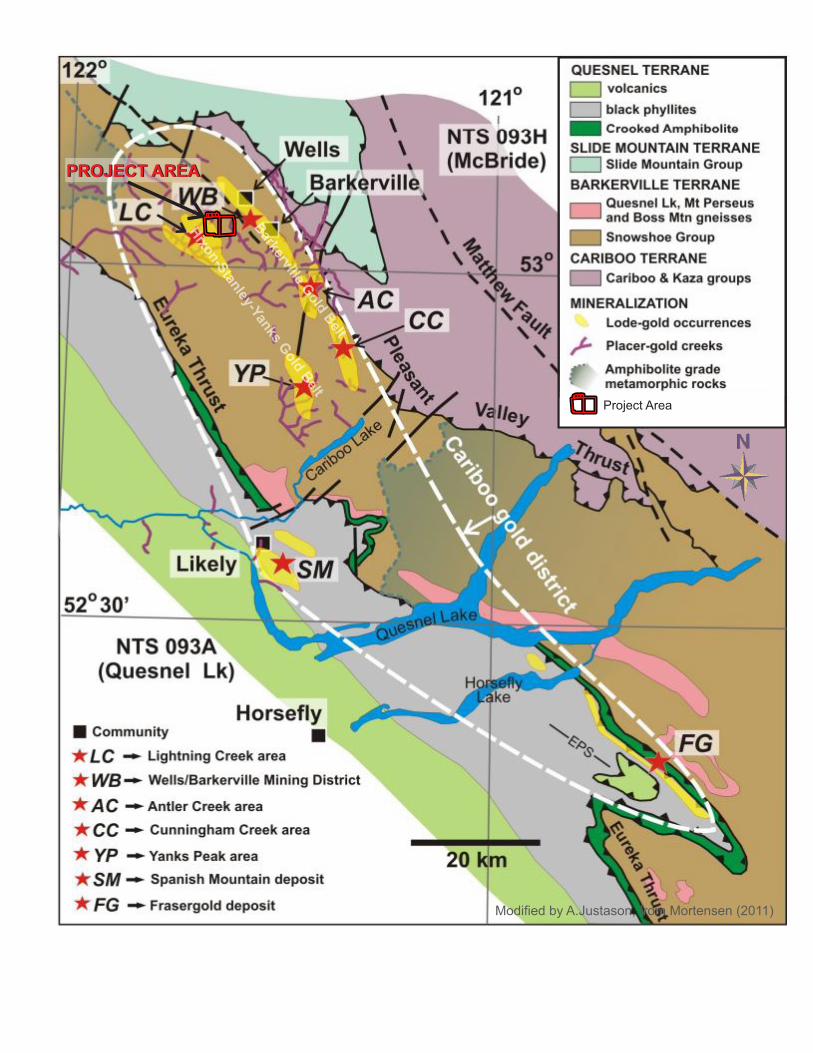
Struik (1988) describes the northern Quesnel Highlands as underlain by four geological terranes, three of which are fault bounded. The terranes are defined by their unique stratigraphic successions. The easternmost is the Cariboo Terrane consisting of sedimentary rocks in fault contact with the western margin of the Precambrian North American Craton along the Rocky Mountain Trench. The Barkerville Terrane consists of mostly sedimentary rocks and is west of, and in fault contact with, the Cariboo Terrane. The Barkerville and Cariboo Terranes are overthrust by the Slide Mountain Terrane [which is] composed of basic volcanics and intrusives [as well as] generally fine grained clastic rocks. The root zone of the Slide Mountain Terrane is considered to be serpentinite and sheared mafic rocks that exist locally at the western boundary of the Barkerville Terrane. West of that root zone is the Quesnel Terrane composed of volcanic, volcaniclastic and fine-grained clastic rocks.
PROJECT AREAPROJECT AREA
Project Area
Hixon-S
tanley-Yanks Gold B
elt
Barkerville G
old Belt
Modified by A.Justason, from Mortensen (2011)

Island Mountain
RichfieldMountain
121° 4
5' 0
0" W
53° 04' 00" N
121° 4
2' 0
0" W
121° 4
3' 0
0" W
121° 4
4' 0
0" W
121° 4
0' 0
0" W
121° 3
8' 0
0" W
121° 3
9' 0
0" W
121° 4
1' 0
0" W
121° 3
6' 0
0" W
121° 3
7' 0
0" W
121° 3
1' 0
0" W
121° 3
4' 0
0" W
121° 3
0' 0
0" W
121° 2
7' 0
0" W
121° 2
8' 0
0" W
121° 2
9' 0
0" W
121° 2
5' 0
0" W
121° 2
3' 0
0" W
121° 2
4' 0
0" W
121° 2
6' 0
0" W
53° 03' 00" N
53° 02' 00" N
53° 01' 00" N
53° 00' 00" N
52° 59' 00" N
52° 58' 00" N
52° 57' 00" N
WELLS
AntlerMountain
BarkervilleMountain
MountNelson
MountBurns
Mount Amador
Mount VanWinkle
Goldin Rock Resources Inc.Geology Map
modified by A.Justason from Open File 2004-12
CowMountain
Bonanza Ledge MineBonanza Ledge Mine
Cariboo Gold Quartz MineCariboo Gold Quartz Mine
PROJECT AREAPROJECT AREA
(see table of OF2004-12)
modified by A.Justason from Open File 2004-12 by Paul Schiarizza
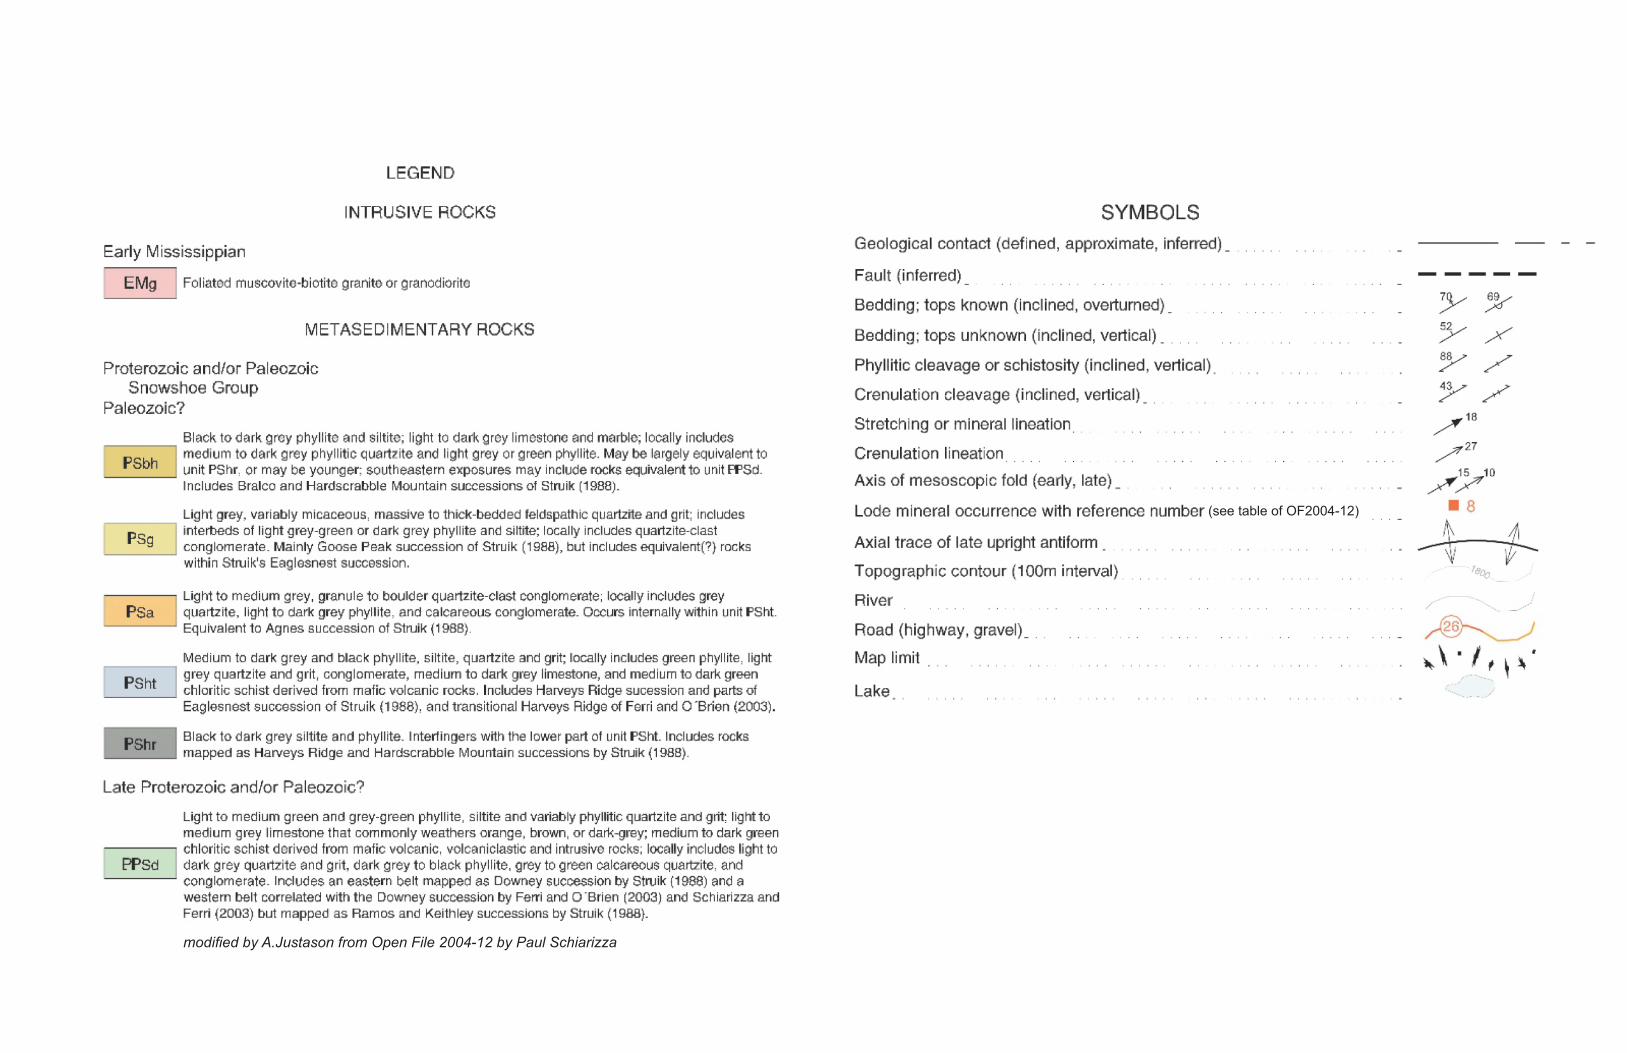
LEGENID
INTRUSIVE ROCKS
Early Mississippian
EMg I fol iatGd muscovito -biotitG granito or granodioritG
METASEDIMENTARY ROCKS
Proterozoic and/or Paleozoic Snowshoe Group
Paleozoic?
Black to dark grey phyllite and siltite; liglht to dark grey limestone and marble; locally includes __ P_S_b_h~ j medium to dark grey phyllitic qua.rtzite and light grey or green phyllite. May be largely equivalent to ___ ___._ unit PS hr, or may be younger; southeastern exposures may indude rocks equivalent to unit FflSd.
llncludes Bralco and Hardscrabble Mountain successions of Struilk (1988).
light grey, variably micaceous, massive to thick-bedded feldspathic quartzite and grit; includes ~--~ i1nterbeds of light grey-green or dark grey phyllite and siltite; locally indudes quartzite-clast conglomerate. Mainly Goose Peak succession of Struik. (1988), but includes equivalent(?) rocks
-------' Psg
within Struik's Eaglesnest succession.
I Light to medium grey, granule to boulder quartz.ite-clast conglomerate; locally includes grey PSa quartzite, light to dark grey phyllite,. and calcareous conglomerate. Occurs internally within unit PSht
Equivalent to Agnes succession of Struik (1988).
Medium to dark grey and black phyllite, siltite, quartzite and grit; llocally in.eludes green phyllite, light ,--P-S_h_t_,J grey quartzite and grit, conglomerate, medium to dark grey limestone, and medium to dark green ___ ___. chloritic schist derived from mafic volcanic rocks. Includes Harveys Ridge sucession and parts of
Eag las nest succession of St ru i k ( 1988), and transitiional Harveys Ridge of Ferri and O 'Brien (2003).
PShr Black to dark grey siltite and phyllite. lnterfingers with the lower part of unit PSht. Includes rocks .__ __ __, mapped as Harveys Ridge and Hardscrabble Mountain successions. by Struik {1988).
Late Proterozoic and/or Paleozoic?
Light to medium green anc! grey-green phyllite, siltite and variably phyillitic quartzite and grit light to medium grey limestone that commonly weathers orange. brown, or dark-grey; medium to dark green
I chloritic schist dGrivod from m;dic volcanic, volcaniclastic and intrusive rocks; locally includes light to
PPSd . dark grey quartzite and grit, dark grey to black phyllite, grey to green calcareous quartzite, and conglomerate. Includes an eastern belt mapped as Downey succession by Struik (1988) and a western bellt correlated with the Downey success.ion by Ferri and O ·srien (2003) and Schiarizza and Ferri {2003) but mapped as Ramos and Kei1thley success.ions by Struik (1988}.
SYMBOLS
Geological contact (defined, approximate, inferred)_ .
Fault (inferred)
Beddiing; tops known (inclined, overturned)_
Beddiing; tops unknown (inclined, vertical) . . . . .
Phyllitic cleavage or schistosity {inclined, vertical) .
Crenulation cleavage (inclined, vertical) . .
Stretching or mineral lineation . .
Crenulation lineation
Axis of mesoscopic fold (early, late) _
Lode mineral occurrence with reference number
Axial trace of late upright antif orm .
Topographic contour {100m interval} .
River
Road (highway, gravel)_ .
Map limit
Lake
~ ~ y / ~ / y /
/ _ ... -··
~ ~ \ · ,. ( .~ ~ \ I
·· ' /
9
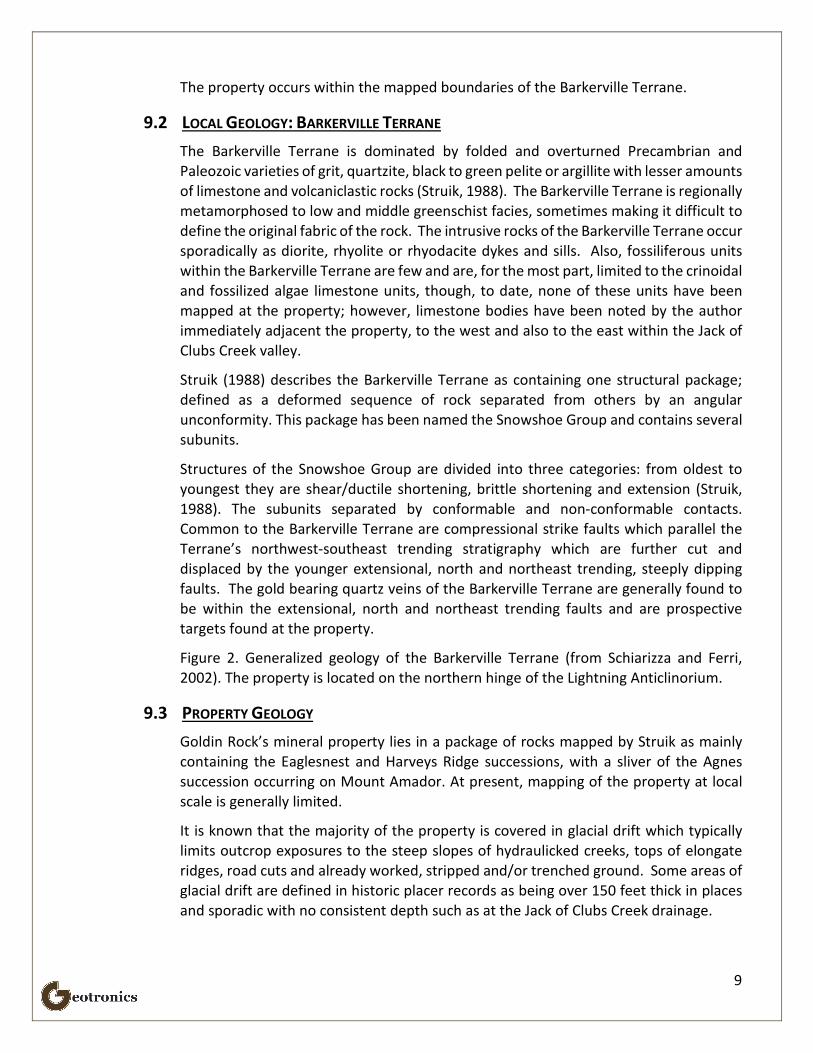
The property occurs within the mapped boundaries of the Barkerville Terrane.
9.2 LOCAL GEOLOGY: BARKERVILLE TERRANE The Barkerville Terrane is dominated by folded and overturned Precambrian and Paleozoic varieties of grit, quartzite, black to green pelite or argillite with lesser amounts of limestone and volcaniclastic rocks (Struik, 1988). The Barkerville Terrane is regionally metamorphosed to low and middle greenschist facies, sometimes making it difficult to define the original fabric of the rock. The intrusive rocks of the Barkerville Terrane occur sporadically as diorite, rhyolite or rhyodacite dykes and sills. Also, fossiliferous units within the Barkerville Terrane are few and are, for the most part, limited to the crinoidal and fossilized algae limestone units, though, to date, none of these units have been mapped at the property; however, limestone bodies have been noted by the author immediately adjacent the property, to the west and also to the east within the Jack of Clubs Creek valley.
Struik (1988) describes the Barkerville Terrane as containing one structural package; defined as a deformed sequence of rock separated from others by an angular unconformity. This package has been named the Snowshoe Group and contains several subunits.
Structures of the Snowshoe Group are divided into three categories: from oldest to youngest they are shear/ductile shortening, brittle shortening and extension (Struik, 1988). The subunits separated by conformable and non-conformable contacts. Common to the Barkerville Terrane are compressional strike faults which parallel the Terrane’s northwest-southeast trending stratigraphy which are further cut and displaced by the younger extensional, north and northeast trending, steeply dipping faults. The gold bearing quartz veins of the Barkerville Terrane are generally found to be within the extensional, north and northeast trending faults and are prospective targets found at the property.
Figure 2. Generalized geology of the Barkerville Terrane (from Schiarizza and Ferri, 2002). The property is located on the northern hinge of the Lightning Anticlinorium.
9.3 PROPERTY GEOLOGY Goldin Rock’s mineral property lies in a package of rocks mapped by Struik as mainly containing the Eaglesnest and Harveys Ridge successions, with a sliver of the Agnes succession occurring on Mount Amador. At present, mapping of the property at local scale is generally limited.
It is known that the majority of the property is covered in glacial drift which typically limits outcrop exposures to the steep slopes of hydraulicked creeks, tops of elongate ridges, road cuts and already worked, stripped and/or trenched ground. Some areas of glacial drift are defined in historic placer records as being over 150 feet thick in places and sporadic with no consistent depth such as at the Jack of Clubs Creek drainage.
10
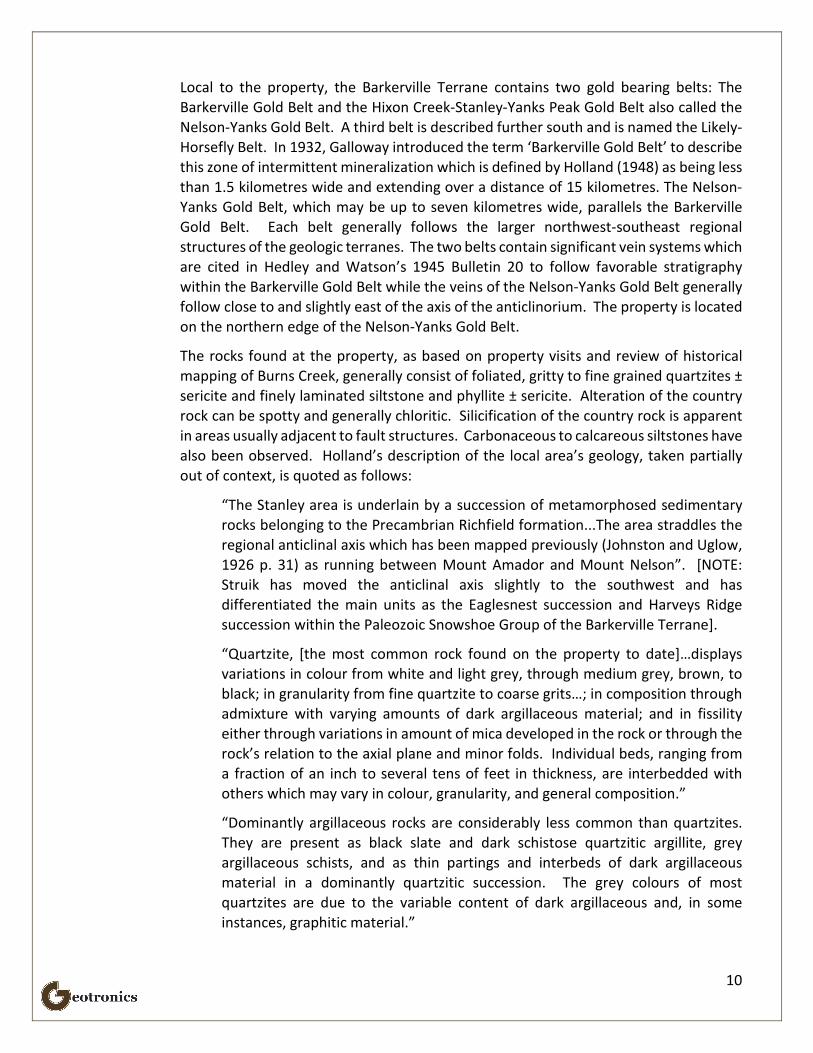
Local to the property, the Barkerville Terrane contains two gold bearing belts: The Barkerville Gold Belt and the Hixon Creek-Stanley-Yanks Peak Gold Belt also called the Nelson-Yanks Gold Belt. A third belt is described further south and is named the Likely-Horsefly Belt. In 1932, Galloway introduced the term ‘Barkerville Gold Belt’ to describe this zone of intermittent mineralization which is defined by Holland (1948) as being less than 1.5 kilometres wide and extending over a distance of 15 kilometres. The Nelson-Yanks Gold Belt, which may be up to seven kilometres wide, parallels the Barkerville Gold Belt. Each belt generally follows the larger northwest-southeast regional structures of the geologic terranes. The two belts contain significant vein systems which are cited in Hedley and Watson’s 1945 Bulletin 20 to follow favorable stratigraphy within the Barkerville Gold Belt while the veins of the Nelson-Yanks Gold Belt generally follow close to and slightly east of the axis of the anticlinorium. The property is located on the northern edge of the Nelson-Yanks Gold Belt.
The rocks found at the property, as based on property visits and review of historical mapping of Burns Creek, generally consist of foliated, gritty to fine grained quartzites ± sericite and finely laminated siltstone and phyllite ± sericite. Alteration of the country rock can be spotty and generally chloritic. Silicification of the country rock is apparent in areas usually adjacent to fault structures. Carbonaceous to calcareous siltstones have also been observed. Holland’s description of the local area’s geology, taken partially out of context, is quoted as follows:
“The Stanley area is underlain by a succession of metamorphosed sedimentary rocks belonging to the Precambrian Richfield formation...The area straddles the regional anticlinal axis which has been mapped previously (Johnston and Uglow, 1926 p. 31) as running between Mount Amador and Mount Nelson”. [NOTE: Struik has moved the anticlinal axis slightly to the southwest and has differentiated the main units as the Eaglesnest succession and Harveys Ridge succession within the Paleozoic Snowshoe Group of the Barkerville Terrane].
“Quartzite, [the most common rock found on the property to date]…displays variations in colour from white and light grey, through medium grey, brown, to black; in granularity from fine quartzite to coarse grits…; in composition through admixture with varying amounts of dark argillaceous material; and in fissility either through variations in amount of mica developed in the rock or through the rock’s relation to the axial plane and minor folds. Individual beds, ranging from a fraction of an inch to several tens of feet in thickness, are interbedded with others which may vary in colour, granularity, and general composition.”
“Dominantly argillaceous rocks are considerably less common than quartzites. They are present as black slate and dark schistose quartzitic argillite, grey argillaceous schists, and as thin partings and interbeds of dark argillaceous material in a dominantly quartzitic succession. The grey colours of most quartzites are due to the variable content of dark argillaceous and, in some instances, graphitic material.”

11
“For the most part the rocks are not calcareous. The few thin limestone beds could not be traced for any great distance and their correlation was not possible. Many of the rocks have a low to moderate amount of carbonate mineral which, when determined, was found to be ankerite.” The author has not yet located limestone or otherwise calcareous units on the property but has observed exposures on the west and east side of the property.
“Green chloritic schists, some weathering brown and some exceedingly brightly coloured, are also present... In several places pale, greenish-grey quartzite schists are exposed; their green caste evidently is a result of the development of small amounts of chlorite.”
“The rocks represent a sedimentary succession that has been subjected to regional metamorphism. Cleavage, in varying degrees of perfection, is developed in all rocks and is the result of the oriented development mainly of sericite and less commonly of chlorite. The perfection of the cleavage depends primarily on the initial composition of the rock and the amount of argillaceous material that was available to form mica. To a lesser extent the position of the rock in relation to the axial plane of a fold contributes to the degree to which the cleaner, more massive quartzites are cleaved.”
9.4 DEPOSIT TYPES There are currently three well known types of gold-bearing hard rock deposits within the Barkerville Terrane of the Cariboo Mining District:
1. Quartz - pyrite veins
2. Pyritic replacement in limestone
3. Pyritic replacement in metasedimentary rocks
9.4.1 Quartz-Pyrite Veins Quartz-pyrite vein deposits within the Barkerville Terrane are described in detail by Dunne and Ray (2001) and are quoted from their report as follows:
Vein ore typically comprises dominantly massive, white to translucent quartz, lesser dolomite/ankerite, muscovite (as sericite) and pyrite and rarely minor arsenopyrite, galena, sphalerite and/or scheelite (Skerl, 1948). Pyrrhotite and chalcopyrite have been reported as accessory minerals (Skerl, op. cit.; International Wayside Gold Mines Ltd., 2000). Wide veins, such as the BC Vein, can be greater than 15 metres in width and may have sheared graphitic margins. Sericite from quartz veins in the Cariboo Gold Quartz mine, Mosquito Creek Gold mine and Cariboo Hudson mine have been dated using the [potassium-argon] method at 140 Ma (International Wayside Gold Mines Ltd., 2000). Vein textures in the Wells-Barkerville Belt are highly variable. Massive, white to translucent ‘bull’ quartz veins comprise subhedral to anhedral crystals from less than 0.5 mm
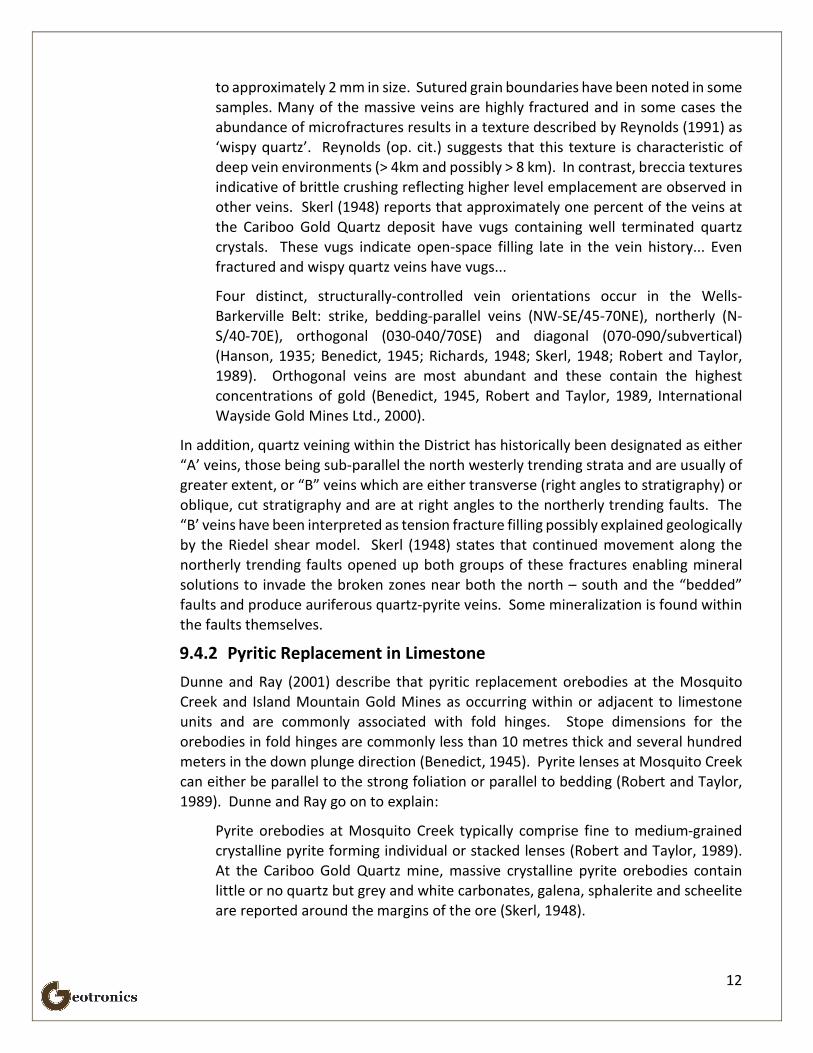
12
to approximately 2 mm in size. Sutured grain boundaries have been noted in some samples. Many of the massive veins are highly fractured and in some cases the abundance of microfractures results in a texture described by Reynolds (1991) as ‘wispy quartz’. Reynolds (op. cit.) suggests that this texture is characteristic of deep vein environments (> 4km and possibly > 8 km). In contrast, breccia textures indicative of brittle crushing reflecting higher level emplacement are observed in other veins. Skerl (1948) reports that approximately one percent of the veins at the Cariboo Gold Quartz deposit have vugs containing well terminated quartz crystals. These vugs indicate open-space filling late in the vein history... Even fractured and wispy quartz veins have vugs...
Four distinct, structurally-controlled vein orientations occur in the Wells-Barkerville Belt: strike, bedding-parallel veins (NW-SE/45-70NE), northerly (N-S/40-70E), orthogonal (030-040/70SE) and diagonal (070-090/subvertical) (Hanson, 1935; Benedict, 1945; Richards, 1948; Skerl, 1948; Robert and Taylor, 1989). Orthogonal veins are most abundant and these contain the highest concentrations of gold (Benedict, 1945, Robert and Taylor, 1989, International Wayside Gold Mines Ltd., 2000).
In addition, quartz veining within the District has historically been designated as either “A’ veins, those being sub-parallel the north westerly trending strata and are usually of greater extent, or “B” veins which are either transverse (right angles to stratigraphy) or oblique, cut stratigraphy and are at right angles to the northerly trending faults. The “B’ veins have been interpreted as tension fracture filling possibly explained geologically by the Riedel shear model. Skerl (1948) states that continued movement along the northerly trending faults opened up both groups of these fractures enabling mineral solutions to invade the broken zones near both the north – south and the “bedded” faults and produce auriferous quartz-pyrite veins. Some mineralization is found within the faults themselves.
9.4.2 Pyritic Replacement in Limestone Dunne and Ray (2001) describe that pyritic replacement orebodies at the Mosquito Creek and Island Mountain Gold Mines as occurring within or adjacent to limestone units and are commonly associated with fold hinges. Stope dimensions for the orebodies in fold hinges are commonly less than 10 metres thick and several hundred meters in the down plunge direction (Benedict, 1945). Pyrite lenses at Mosquito Creek can either be parallel to the strong foliation or parallel to bedding (Robert and Taylor, 1989). Dunne and Ray go on to explain:
Pyrite orebodies at Mosquito Creek typically comprise fine to medium-grained crystalline pyrite forming individual or stacked lenses (Robert and Taylor, 1989). At the Cariboo Gold Quartz mine, massive crystalline pyrite orebodies contain little or no quartz but grey and white carbonates, galena, sphalerite and scheelite are reported around the margins of the ore (Skerl, 1948).
13
9.4.3 Pyritic Replacement in Metasedimentary Rocks The most recently mined gold deposit, Bonanza Ledge, is located 6 kilomteres east of the Goldin Rock’s property and belongs to Barkerville Gold Mines Ltd (previously known as International Wayside Gold Mines Ltd). Historical documents refer to the historically named Bonanza Ledge as the gold bearing quartz ledge which is now referred to as the BC Vein, but today’s named Bonanza Ledge refers to the ore body located within a package of quartzitic and phyllitic rocks of the Lowhee unit. Rhys (2000) describes folded high-grade pyrite mineralization that is discordant to stratigraphy and locally more than 30 metres thick over a strike length of 130 metres. Pyritic ore at Bonanza Ledge comprises veinlets, concordant laminations and massive bands of pyrite, often with trace chalcopyrite and galena, in a gangue of muscovite, dolomite/ankerite and quartz. An underground bulk sample and Phase 1 of their open pit mining operations at Bonanza Ledge has been completed here to date.
At Goldin Rock’s property, the present exploration focus is mainly on the north trending faults and proximal quartz veining. The north striking faults are an important control for the gold vein mineralization (Hall, 1999). Favorable stratigraphy for replacement deposits may exist at the property as well. The main commodities historically found at the property are gold, silver and lead.
10 MMI SOIL SAMPLING
10.1 GRID EMPLACEMENT The soil samples were taken every 25 meters along 3 survey lines with a line separation of 100 meters. The total survey length was 3,150 meters resulting in 116 samples being picked up. The 3 survey lines were each emplaced in a UTM east-west direction as shown on the claim map, figure #3. The labelling of the lines and stations were the actual UTM coordinates, NAD 83.
10.2 SAMPLING PROCEDURE The sampling procedure was to first remove the organic material from the sample site (A0 layer) and then dig a pit over 25 cm deep with a shovel. The sides of the pit were then cleaned with a plastic garden shovel to take away any contaminating effects of the metal shovel. Sample material was then scraped from the sides of the pit over the measured depth interval of 10 centimeters to 25 centimeters. About 250 grams of sample material were collected and then placed into a plastic Zip-loc sandwich bag with the sample location marked thereon.
The samples were quite difficult to obtain since the ground was quite rocky. This made it difficult to dig as well as taking the sample since the rocks needed to be discarded so that there was enough soil. In addition, within the center of the grid, a number of samples could not be taken because of lack of soil. Snow cover hindered locating sample sites with enough soil.
14
The samples were then packaged and sent to SGS Minerals located at 3260 Production Way, Burnaby, BC. (This is the only lab in Canada and the only one of four labs in the world that do MMI analysis, one being in Perth, Australia where the MMI method was developed.)
10.3 ANALYTICAL METHODS At SGS Minerals, the testing procedure begins with weighing 50 grams of the sample into a plastic vial fitted with a screw cap. Next is added 50 ml of the MMI-M solution to the sample, which is then placed in trays and put into a shaker for 20 minutes. (The MMI-M solution is a neutral mixture of reagents that are used to detach loosely bound ions of any of the 53 elements from the soil substrate and formulated to keep the ions in solution.) These are allowed to sit overnight and subsequently centrifuged for 10 minutes. The solution is then diluted 20 times for a total dilution factor of 200 times and then transferred into plastic test tubes, which are then analyzed on ICP-MS instruments.
Results from the instruments for the 53 elements are processed automatically, loaded into the LIMS (laboratory information management system which is computer software used by laboratories) where the quality control parameters are checked before final reporting.
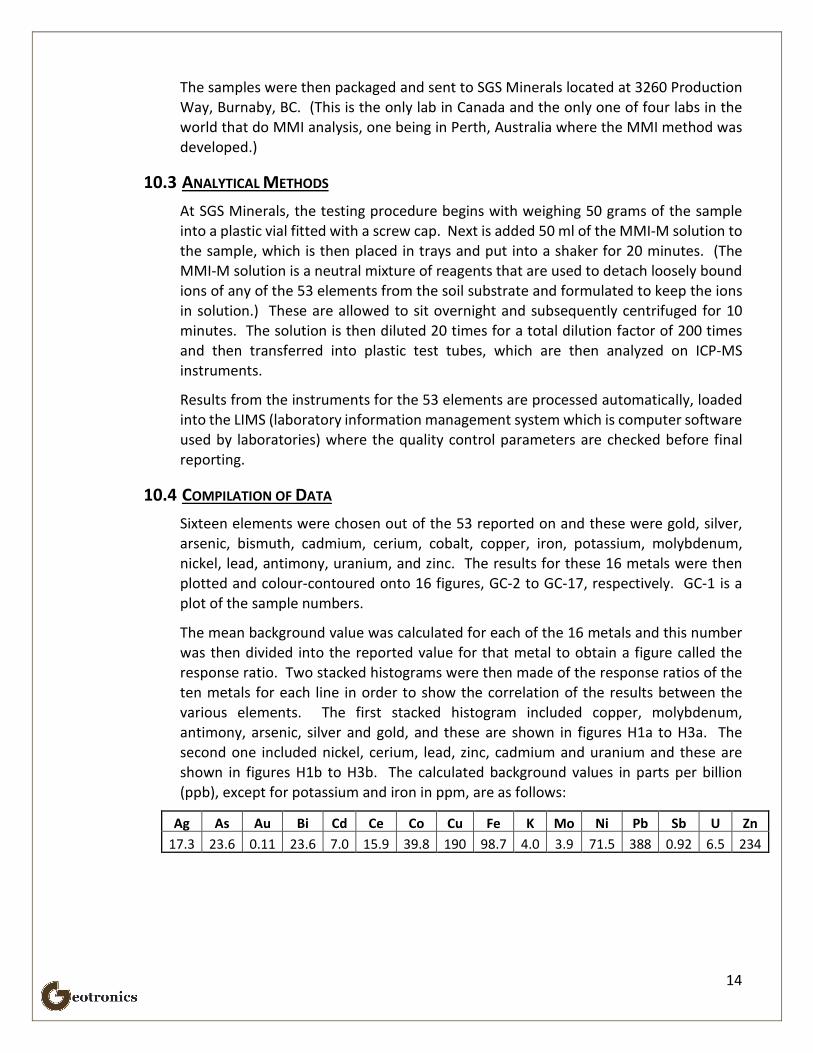
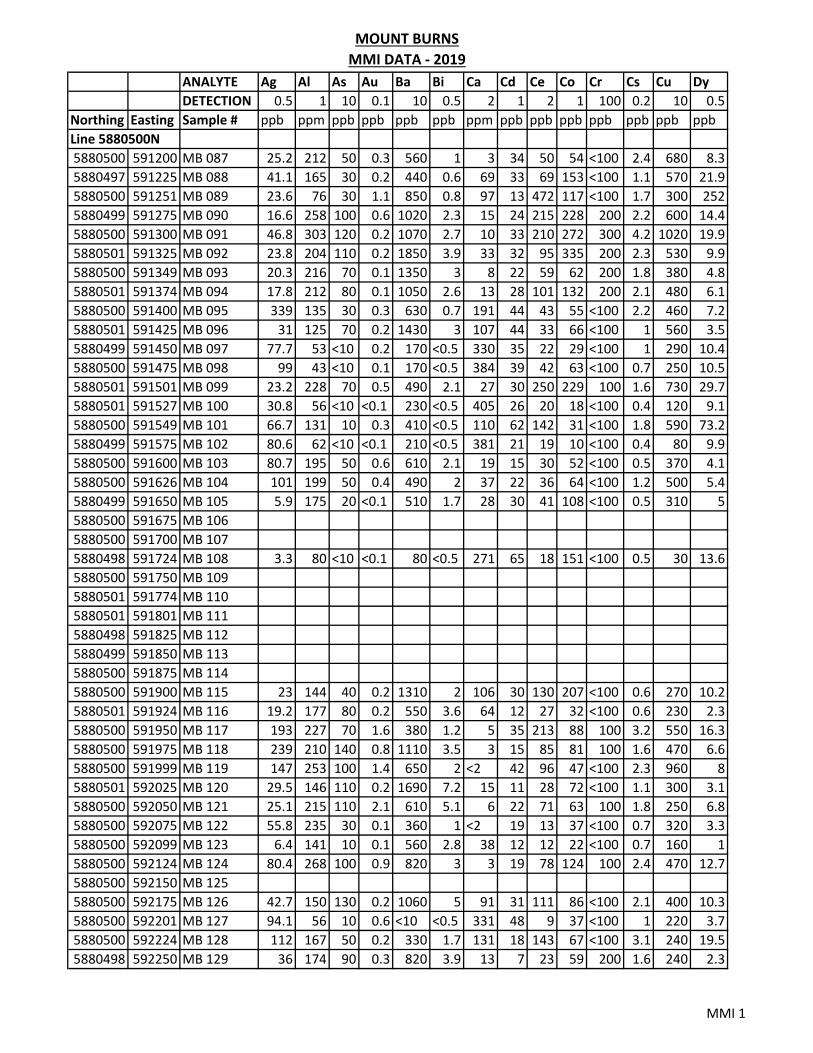
10.4 COMPILATION OF DATA Sixteen elements were chosen out of the 53 reported on and these were gold, silver, arsenic, bismuth, cadmium, cerium, cobalt, copper, iron, potassium, molybdenum, nickel, lead, antimony, uranium, and zinc. The results for these 16 metals were then plotted and colour-contoured onto 16 figures, GC-2 to GC-17, respectively. GC-1 is a plot of the sample numbers.
The mean background value was calculated for each of the 16 metals and this number was then divided into the reported value for that metal to obtain a figure called the response ratio. Two stacked histograms were then made of the response ratios of the ten metals for each line in order to show the correlation of the results between the various elements. The first stacked histogram included copper, molybdenum, antimony, arsenic, silver and gold, and these are shown in figures H1a to H3a. The second one included nickel, cerium, lead, zinc, cadmium and uranium and these are shown in figures H1b to H3b. The calculated background values in parts per billion (ppb), except for potassium and iron in ppm, are as follows:
Ag As Au Bi Cd Ce Co Cu Fe K Mo Ni Pb Sb U Zn 17.3 23.6 0.11 23.6 7.0 15.9 39.8 190 98.7 4.0 3.9 71.5 388 0.92 6.5 234
15
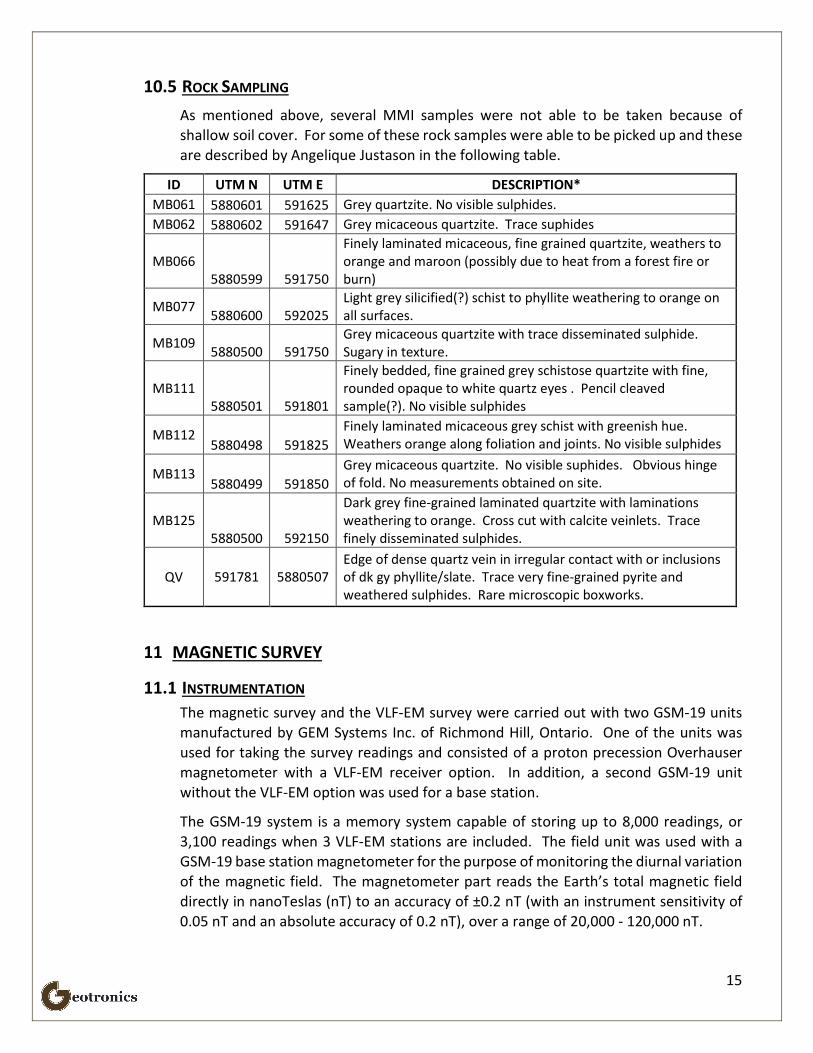
10.5 ROCK SAMPLING As mentioned above, several MMI samples were not able to be taken because of shallow soil cover. For some of these rock samples were able to be picked up and these are described by Angelique Justason in the following table.
ID UTM N UTM E DESCRIPTION* MB061 5880601 591625 Grey quartzite. No visible sulphides. MB062 5880602 591647 Grey micaceous quartzite. Trace suphides
MB066 5880599 591750
Finely laminated micaceous, fine grained quartzite, weathers to orange and maroon (possibly due to heat from a forest fire or burn)
MB077 5880600 592025 Light grey silicified(?) schist to phyllite weathering to orange on all surfaces.
MB109 5880500 591750 Grey micaceous quartzite with trace disseminated sulphide. Sugary in texture.
MB111 5880501 591801
Finely bedded, fine grained grey schistose quartzite with fine, rounded opaque to white quartz eyes . Pencil cleaved sample(?). No visible sulphides
MB112 5880498 591825
Finely laminated micaceous grey schist with greenish hue. Weathers orange along foliation and joints. No visible sulphides
MB113 5880499 591850
Grey micaceous quartzite. No visible suphides. Obvious hinge of fold. No measurements obtained on site.
MB125 5880500 592150
Dark grey fine-grained laminated quartzite with laminations weathering to orange. Cross cut with calcite veinlets. Trace finely disseminated sulphides.
QV 591781 5880507 Edge of dense quartz vein in irregular contact with or inclusions of dk gy phyllite/slate. Trace very fine-grained pyrite and weathered sulphides. Rare microscopic boxworks.
11 MAGNETIC SURVEY
11.1 INSTRUMENTATION The magnetic survey and the VLF-EM survey were carried out with two GSM-19 units manufactured by GEM Systems Inc. of Richmond Hill, Ontario. One of the units was used for taking the survey readings and consisted of a proton precession Overhauser magnetometer with a VLF-EM receiver option. In addition, a second GSM-19 unit without the VLF-EM option was used for a base station.
The GSM-19 system is a memory system capable of storing up to 8,000 readings, or 3,100 readings when 3 VLF-EM stations are included. The field unit was used with a GSM-19 base station magnetometer for the purpose of monitoring the diurnal variation of the magnetic field. The magnetometer part reads the Earth’s total magnetic field directly in nanoTeslas (nT) to an accuracy of ±0.2 nT (with an instrument sensitivity of 0.05 nT and an absolute accuracy of 0.2 nT), over a range of 20,000 - 120,000 nT.
16
The VLF-EM part can read up to three transmitters at the same time in the 15 to 30 kHz range with a resolution of 0.5% and a range of up to +/- 200%. For each transmitter station, the readings consist of (a) the vertical in-phase, (b) the vertical out-of-phase, (c) 2 horizontal components, and (d) the coordinates, date and time. Operating temperature range is -40° to +60° C. The VLF-EM unit was set up to read one transmitter being LaMaure, North Dakota, at a frequency of 25.2 kHz.
11.2 THEORY Only two commonly occurring minerals are strongly magnetic being magnetite and pyrrhotite. Therefore, magnetic surveys are used to detect the presence of these minerals in varying concentrations, as follows:
• Magnetite and pyrrhotite may occur with economic mineralization on a specific property and therefore a magnetic survey may be used to locate this mineralization.
• Different rock types have different background amounts of magnetite (and pyrrhotite in some rare cases) and thus a magnetic survey can be used to map lithology. Generally, the more basic a rock-type, the more magnetite it may contain, though this is not always the case. In mapping lithology, not only is the amount of magnetite important, but also the way it may occur. For example, young basic rocks are often characterized by thumbprint-type magnetic highs and lows.
• Magnetic surveys can also be used in mapping geologic structure. For example, the action of faults and shear zones will often chemically alter magnetite and thus these will show up as lineal-shaped lows. Or, sometimes lineal-shaped highs or a lineation of highs will be reflecting a fault since a magnetite-containing magmatic fluid has intruded along a zone of weakness, being the fault.
11.3 SURVEY PROCEDURE Readings of the earth’s total magnetic field were taken every 12.5 meters along the three survey lines on which the MMI sampling was carried out on, and thus the total amount of surveying was the same as that of the MMI survey, being 3,150 meters.
The diurnal variation was monitored in the field by a base station.
11.4 DATA REDUCTION The data was input into a computer and subsequently diurnally corrected. Using Geosoft software, it was next plotted with 55,500 nT subtracted from each posted value and colour-contoured onto a base map, labelled GP-1.
17
12 VLF-EM Survey
12.1 INSTRUMENTATION The VLF-EM survey was carried out with a combination magnetometer and VLF-EM receiver, described above under “B. Magnetic Survey, (a) Instrumentation. This instrument is designed to measure the electromagnetic component of the very low frequency field (VLF-EM), which for this survey, was done using 2 transmitters, one being transmitted at 24.8 kHz from Jim Creek, which is north of Seattle in the state of Washington, and the second being transmitted at 25.2 kHz from LaMoure, which is south-east of Bismarck in the state of North Dakota.
12.2 THEORY In all electromagnetic prospecting, a transmitter induces an alternating magnetic field (called the primary field) by having a strong alternating current move through a coil of wire. This primary field travels through any medium and if a conductive mass such as a sulphide body is present, the primary field induces a secondary alternating current in the conductor, and this current in turn induces a secondary magnetic field. The receiver picks up the primary field and, if a conductor is present, the secondary field distorts the primary field. The fields are expressed as a vector, which has two components, the “in-phase” (or real) component and the “out-of-phase” (or quadrature) component. For the VLF-EM receiver, the tilt angle in degrees of the distorted electromagnetic field with a conductor is measured from that which it would have been if the field was not distorted with a conductor.
Since the fields lose strength proportionally with the distance they travel, a distant conductor has less of an effect than a close conductor. Also, the lower the frequency of the primary field, the further the field can travel and therefore the greater the depth penetration.
The VLF-EM uses a frequency range from 13 to 30 kHz, whereas most EM instruments use frequencies ranging from a few hundred to a few thousand Hz. Because of its relatively high frequency, the VLF-EM can pick up bodies of a much lower conductivity and therefore is more susceptible to clay beds, electrolyte-filled fault or shear zones and porous horizons, graphite, carbonaceous sediments, lithological contacts as well as sulphide bodies of too low a conductivity for other EM methods to pick up. Consequently, the VLF-EM has additional uses in mapping structure and in picking up sulphide bodies of too low a conductivity for conventional EM methods and too small for induced polarization. (In places it can be used instead of IP). However, its susceptibility to lower conductive bodies results in a number of anomalies, many of them difficult to explain and, thus, VLF-EM preferably should not be interpreted without a good geological knowledge of the property and/or other geophysical and geochemical surveys.
18
12.3 SURVEY PROCEDURE The VLF-EM readings were taken at the same locations as the magnetic readings, that is, at 12.5-meter stations, resulting in the same total survey length of 3,150 meters. Two transmitter stations were read with one being 24.8 kHz from Jim Creek, Washington, which is located southerly of the property, and the second one being 25.2 kHz from LaMoure, North Dakota, which is located southeasterly of the property. The transmitter direction is optimal for conductors striking in the same direction. Therefore, the Jim Creek transmitter is optimal for north-south striking conductors and the La Moure transmitter is optimal for northwest-southeast striking conductors.
12.4 COMPILATION OF DATA The VLF-EM data were also edited, and the in-phase was then 4-point Fraser-filtered. The purpose of the Fraser filter is to smooth out high frequency noise, to take out the regional effect, and to turn the data into a contourable form so that conductors show up as highs. The Fraser-filtered data was then plotted and colour-contoured onto two plan maps, one for the 24.8 kHz transmitter labelled GP-2a, and one for the 25.2 transmitter labelled GP-3a. The in-phase, out-phase, and Fraser-filter data were also profiled onto two plan maps one for the 24.8 kHz transmitter labelled GP-2b, and one for the 25.2 transmitter labelled GP-3b. All of the above data reduction was carried out using software produced by Geotronics as well as Geosoft of Toronto, Ontario.
13 DISCUSSION OF RESULTS
13.1 MAGNETIC AND VLF-EM SURVEYS The magnetic data, in general, shows the grid area to have a very moderate field with it generally varying 100 nT from 55,050 to 55,150 nT. This is indicative of sedimentary rocks which are known to underlie most of the property.
The one exception is a weak magnetic high that occurs within the eastern side of the grid and a strong magnetic low that occurs on the northernmost line to the immediate west of the high. The high may be caused by an acidic intrusive or an intermediate basic rock-type that is low in magnetite. It could also be caused by a magnetite-bearing phyllite which is known to be a marker unit of replacement gold deposits within the Barkerville gold belt. The high weakens towards the east indicating that the causative source is dipping in this direction.
A strong magnetic low occurs on line 5880700 N to the immediate west of the magnetic high. It is quite probable that it is part of a dipole magnetic anomaly with the other part being a strong magnetic high that would occur to the north of the grid area. This dipole anomaly would be caused by a strong magnetic source, such as an ultrabasic rock-type.
The VLF-EM surveys have revealed several conductors striking northerly to northwesterly across the grid area. These have been drawn on the plan maps with short dashed lines for those picked up by the Jim Creek transmitter and by longer dashed lines
19
for those picked up by the LaMoure transmitter. Some of these correlate directly with gold anomalies indicating that the possible gold mineralization may be associated with shear zones and/or graphitic zones both of which are associated with gold mineralization within the Barkerville gold camp.
13.2 MMI SOIL SAMPLING SURVEY The survey revealed three gold anomalies that have been labelled by the upper-case letters A to C, inclusively, and that have each been outlined by yellow dashed lines.
Anomaly A is the strongest and largest anomaly with gold being up to 19 times background. It strikes north-northwesterly within the magnetic high with a minimum strike length of 260 meters being open to both the north and south. Its width varied from 60 to 100 meters.
Anomaly A correlates with a number of metals being silver, arsenic, copper, molybdenum, lead, and antimony. It occurs within the magnetic high indicating that the host rock is different than that of the anomalies B and C.
This anomaly has a particularly strong correlation with bismuth, lead, and copper, which is indicative of the mineral cosalite. Cosalite is known to occur with gold mineralization within the Barkerville gold camp.
Anomaly B occurs to the west of A and strikes northwesterly correlating directly with a VLF-EM conductor suggesting that the possible gold mineralization is associated with a shear zone or graphite. It has a minimum strike length of 600 meters with it being open to both the northwest and southeast and a width up to 70 meters. Gold reaches a high of 9 times background.
Anomaly B correlates with anomalous values in silver, copper, molybdenum, lead, antimony, cadmium, and zinc.
Anomaly C occurs along the western side of the grid striking in a northerly direction with a minimum strike direction of 200 meters being open both to the north and south. Its width is about 40 meters. Gold reaches a value of 10 times background. This anomaly is of particular interest because of its cumulative strong values in several metals.
It correlates with cadmium, cobalt, and partially with silver, copper, molybdenum, antimony, and zinc.
Cerium correlates quite well with all three gold anomalies with quite strong values. This indicates the possibility of rare earths occurring with the gold mineralization. Or this may simply indicate that the host rock for the gold mineralization is an acidic intrusive.
Potassium was mapped in order to determine the possibility of potassic alteration which often occurs with mineral deposits. The potassium map shows anomalous potassium occurring mostly alongside of all three gold anomalies.
20
There are some strongly anomalous values in nickel within the grid area that occur alongside of the gold anomalies. Within gold districts, this often reflects basic/ultrabasic rock-types, especially listwanite which is known to occur usually adjacent to gold mineralization.
One nickel anomaly occurs along the west side of the magnetic high therefore strongly suggesting the causative source is a basic rock-type.
21
14 SELECTED BIBLIOGRAPHY Ash, C.H. (2001). Chapter 6: Relationship Between Ophiolites and Gold-Quartz Veins in the
North American Cordillera. British Columbia Geological Survey Bulletin 108
Bowman, A. (1888). Report on the Geology of the Mining District of Cariboo, British Columbia. Geological and Natural History Survey of Canada.
Brown, A.S. (1957). Geology of the Antler Creek Area, Cariboo District, British Columbia. British Columbia Department of Mines Bulletin 38.
Brown, A.S and Ash, C.H. (2009). Great Mining Camps of Canada 3. The History and Geology of the Cariboo Goldfields, Barkerville and Wells, BC. Geoscience Canada: Volume 36, Number 1.
Galloway, J.D. (1931). Placer Mining in British Columbia. BC Dept of Mines Bulletin No. 1
Galloway, J.D. (1932). Lode Gold Deposits of British Columbia. British Columbia Department of Mines Bulletin 1932-1.
Hedley, M.S. and Watson K. (1945). Part III: Lode-gold Deposits, Central-southern British Columbia. British Columbia Geological Survey Bulletin 20
Holland, S.S. (1944). Part VI: Lode-Gold Deposits British Columbia, North-eastern British Columbia and Cariboo and Hobson Creek Areas. British Columbia Department of Mines Bulletin No. 20
Holland, S.S. (1948). Report on the Stanley Area: Cariboo Mining Division. British Columbia Department of Mines Bulletin 26.
Holland, S.S. (1950). Placer Gold Production of British Columbia. Ministry of Energy, Mines and Petroleum Resources Bulletin 28.
Johnston, W. and Uglow, W. (1926). Placer and Vein Gold Deposits of Barkerville, Cariboo District, British Columbia. Geological Survey of Canada, Memoir 149.
Justason, Angelique, (2015) Technical Report, Reconnaissance Biogeochemistry of Spruce Twigs, Tenures 339096, 363918, 388841, 388842, 388843, 388844, Cariboo Mining Division, Prepared for Goldin Rock Resources Inc, by Tenorex GeoServices, Aris Report No. 35651
Justason, Angelique, (2017) Technical Report, Reconnaissance Soil Sampling and Biogeochemistry of Spruce Twigs, Tenures 339096, 363918, 388841, 388842, 388843, 388844, Cariboo Mining Division, Prepared for Goldin Rock Resources Inc, by Tenorex GeoServices, Aris Report No. 36548
22
Justason, Angelique, (2017) Technical Report, Compilation of Airborne Geophysical Imagery at the Goldin Rock Claims, Tenures 339096, 363918, 388841, 388842, 388843, 388844, Cariboo Mining Division, Prepared for Goldin Rock Resources Inc, by Tenorex GeoServices, Aris Report No. 37034
Levson, V.M. and Giles, T.R. (1993). Geology of Tertiary and Quaternary Gold-Bearing Placers in the Cariboo Region, British Columbia (93A, B, G, H). Mineral Resources Division Geological Survey Branch Bulletin 89.
Reid, R. and Justason, A. (2006). Summary of Mineral Exploration Activities at the Mount Burns Claim Group. NI43-101 Compliant Technical Report
Rhys, D. and Ross, K. (2001). Evaluation of the Geology and Exploration Potential of the Bonanza Ledge Zone, and Adjacent Areas Between Wells and Barkerville, East Central British Columbia. Panterra Geoservices Inc., Report for International Wayside Gold Mines Ltd.
Schiarizza, P. and Ferri, F. (2003). Barkerville Terrane, Cariboo Lake to Wells: A New Look at Stratigraphy, Structure and Regional Correlations of the Snowshoe Group. British Columbia Geological Survey.
Struik, L.C. (1988). Structural Geology of the Cariboo Gold Mining District, East-Central British Columbia. Geological Survey of Canada, Memoir 421.
23
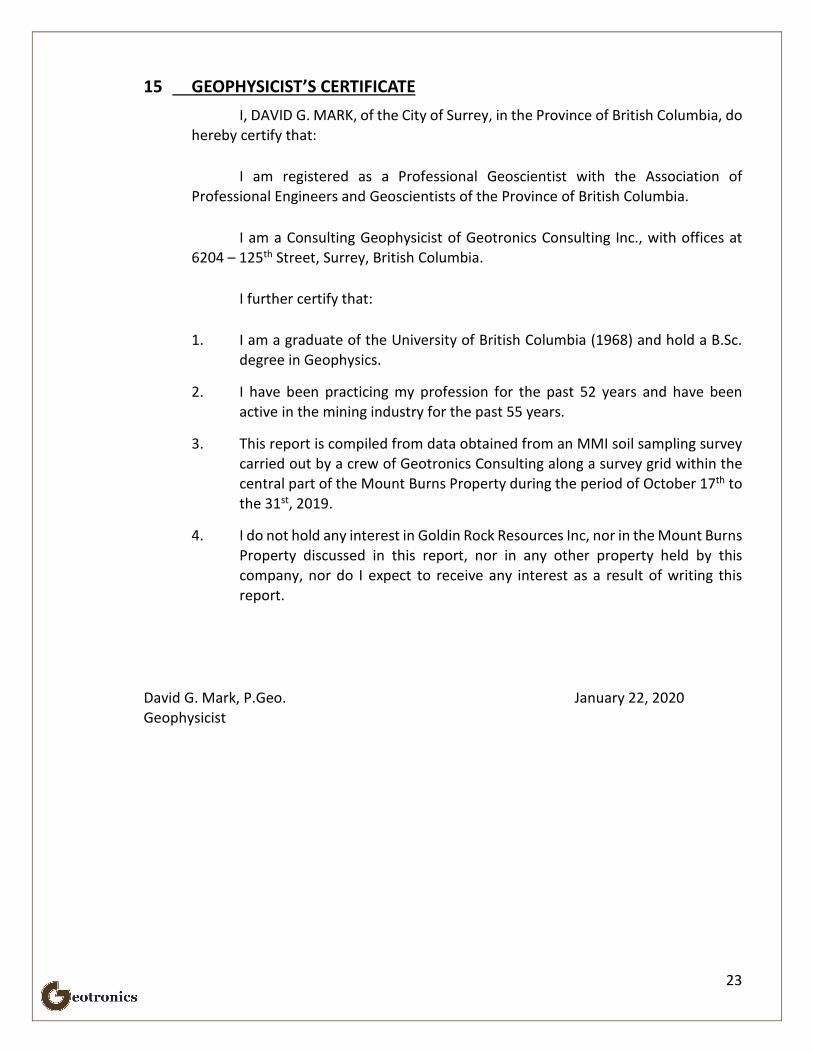
15 GEOPHYSICIST’S CERTIFICATE I, DAVID G. MARK, of the City of Surrey, in the Province of British Columbia, do hereby certify that:
I am registered as a Professional Geoscientist with the Association of Professional Engineers and Geoscientists of the Province of British Columbia.
I am a Consulting Geophysicist of Geotronics Consulting Inc., with offices at 6204 – 125th Street, Surrey, British Columbia.
I further certify that:
1. I am a graduate of the University of British Columbia (1968) and hold a B.Sc. degree in Geophysics.
2. I have been practicing my profession for the past 52 years and have been active in the mining industry for the past 55 years.
3. This report is compiled from data obtained from an MMI soil sampling survey carried out by a crew of Geotronics Consulting along a survey grid within the central part of the Mount Burns Property during the period of October 17th to the 31st, 2019.
4. I do not hold any interest in Goldin Rock Resources Inc, nor in the Mount Burns Property discussed in this report, nor in any other property held by this company, nor do I expect to receive any interest as a result of writing this report.
David G. Mark, P.Geo. January 22, 2020 Geophysicist
24
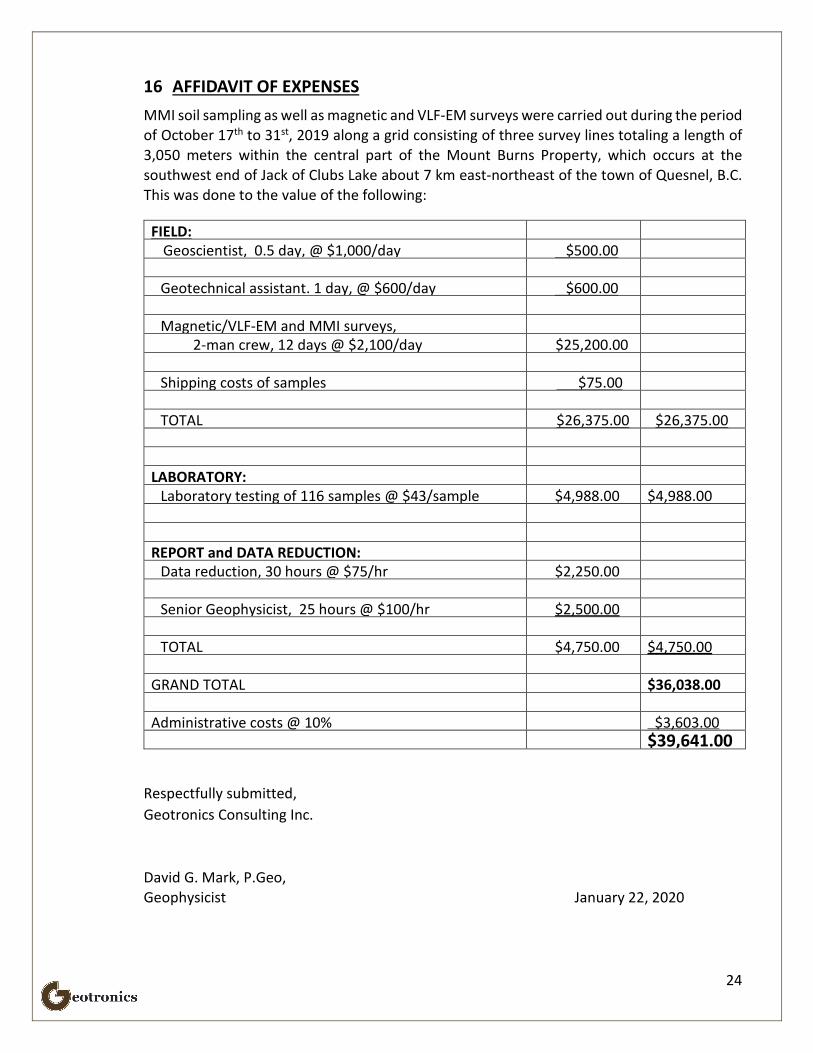
16 AFFIDAVIT OF EXPENSES MMI soil sampling as well as magnetic and VLF-EM surveys were carried out during the period of October 17th to 31st, 2019 along a grid consisting of three survey lines totaling a length of 3,050 meters within the central part of the Mount Burns Property, which occurs at the southwest end of Jack of Clubs Lake about 7 km east-northeast of the town of Quesnel, B.C. This was done to the value of the following:
FIELD: Geoscientist, 0.5 day, @ $1,000/day $500.00
Geotechnical assistant. 1 day, @ $600/day $600.00 Magnetic/VLF-EM and MMI surveys, 2-man crew, 12 days @ $2,100/day $25,200.00 Shipping costs of samples $75.00
TOTAL $26,375.00 $26,375.00
LABORATORY:
Laboratory testing of 116 samples @ $43/sample $4,988.00 $4,988.00
REPORT and DATA REDUCTION:
Data reduction, 30 hours @ $75/hr $2,250.00
Senior Geophysicist, 25 hours @ $100/hr $2,500.00 TOTAL $4,750.00 $4,750.00
GRAND TOTAL $36,038.00 Administrative costs @ 10% $3,603.00 $39,641.00
Respectfully submitted, Geotronics Consulting Inc.
David G. Mark, P.Geo, Geophysicist January 22, 2020

25
17 APPENDIX I – GEOCHEMISTRY DATA
MOUNT BURNS
MMI DATA ‐ 2019
ANALYTE Ag Al As Au Ba Bi Ca Cd Ce Co Cr Cs Cu Dy
DETECTION 0.5 1 10 0.1 10 0.5 2 1 2 1 100 0.2 10 0.5
Northing Easting Sample # ppb ppm ppb ppb ppb ppb ppm ppb ppb ppb ppb ppb ppb ppb
Line 5880500N
5880500 591200 MB 087 25.2 212 50 0.3 560 1 3 34 50 54 <100 2.4 680 8.3
5880497 591225 MB 088 41.1 165 30 0.2 440 0.6 69 33 69 153 <100 1.1 570 21.9
5880500 591251 MB 089 23.6 76 30 1.1 850 0.8 97 13 472 117 <100 1.7 300 252
5880499 591275 MB 090 16.6 258 100 0.6 1020 2.3 15 24 215 228 200 2.2 600 14.4
5880500 591300 MB 091 46.8 303 120 0.2 1070 2.7 10 33 210 272 300 4.2 1020 19.9
5880501 591325 MB 092 23.8 204 110 0.2 1850 3.9 33 32 95 335 200 2.3 530 9.9
5880500 591349 MB 093 20.3 216 70 0.1 1350 3 8 22 59 62 200 1.8 380 4.8
5880501 591374 MB 094 17.8 212 80 0.1 1050 2.6 13 28 101 132 200 2.1 480 6.1
5880500 591400 MB 095 339 135 30 0.3 630 0.7 191 44 43 55 <100 2.2 460 7.2
5880501 591425 MB 096 31 125 70 0.2 1430 3 107 44 33 66 <100 1 560 3.5
5880499 591450 MB 097 77.7 53 <10 0.2 170 <0.5 330 35 22 29 <100 1 290 10.4
5880500 591475 MB 098 99 43 <10 0.1 170 <0.5 384 39 42 63 <100 0.7 250 10.5
5880501 591501 MB 099 23.2 228 70 0.5 490 2.1 27 30 250 229 100 1.6 730 29.7
5880501 591527 MB 100 30.8 56 <10 <0.1 230 <0.5 405 26 20 18 <100 0.4 120 9.1
5880500 591549 MB 101 66.7 131 10 0.3 410 <0.5 110 62 142 31 <100 1.8 590 73.2
5880499 591575 MB 102 80.6 62 <10 <0.1 210 <0.5 381 21 19 10 <100 0.4 80 9.9
5880500 591600 MB 103 80.7 195 50 0.6 610 2.1 19 15 30 52 <100 0.5 370 4.1
5880500 591626 MB 104 101 199 50 0.4 490 2 37 22 36 64 <100 1.2 500 5.4
5880499 591650 MB 105 5.9 175 20 <0.1 510 1.7 28 30 41 108 <100 0.5 310 5
5880500 591675 MB 106
5880500 591700 MB 107
5880498 591724 MB 108 3.3 80 <10 <0.1 80 <0.5 271 65 18 151 <100 0.5 30 13.6
5880500 591750 MB 109
5880501 591774 MB 110
5880501 591801 MB 111
5880498 591825 MB 112
5880499 591850 MB 113
5880500 591875 MB 114
5880500 591900 MB 115 23 144 40 0.2 1310 2 106 30 130 207 <100 0.6 270 10.2
5880501 591924 MB 116 19.2 177 80 0.2 550 3.6 64 12 27 32 <100 0.6 230 2.3
5880500 591950 MB 117 193 227 70 1.6 380 1.2 5 35 213 88 100 3.2 550 16.3
5880500 591975 MB 118 239 210 140 0.8 1110 3.5 3 15 85 81 100 1.6 470 6.6
5880500 591999 MB 119 147 253 100 1.4 650 2 <2 42 96 47 <100 2.3 960 8
5880501 592025 MB 120 29.5 146 110 0.2 1690 7.2 15 11 28 72 <100 1.1 300 3.1
5880500 592050 MB 121 25.1 215 110 2.1 610 5.1 6 22 71 63 100 1.8 250 6.8
5880500 592075 MB 122 55.8 235 30 0.1 360 1 <2 19 13 37 <100 0.7 320 3.3
5880500 592099 MB 123 6.4 141 10 0.1 560 2.8 38 12 12 22 <100 0.7 160 1
5880500 592124 MB 124 80.4 268 100 0.9 820 3 3 19 78 124 100 2.4 470 12.7
5880500 592150 MB 125
5880500 592175 MB 126 42.7 150 130 0.2 1060 5 91 31 111 86 <100 2.1 400 10.3
5880500 592201 MB 127 94.1 56 10 0.6 <10 <0.5 331 48 9 37 <100 1 220 3.7
5880500 592224 MB 128 112 167 50 0.2 330 1.7 131 18 143 67 <100 3.1 240 19.5
5880498 592250 MB 129 36 174 90 0.3 820 3.9 13 7 23 59 200 1.6 240 2.3
MMI 1
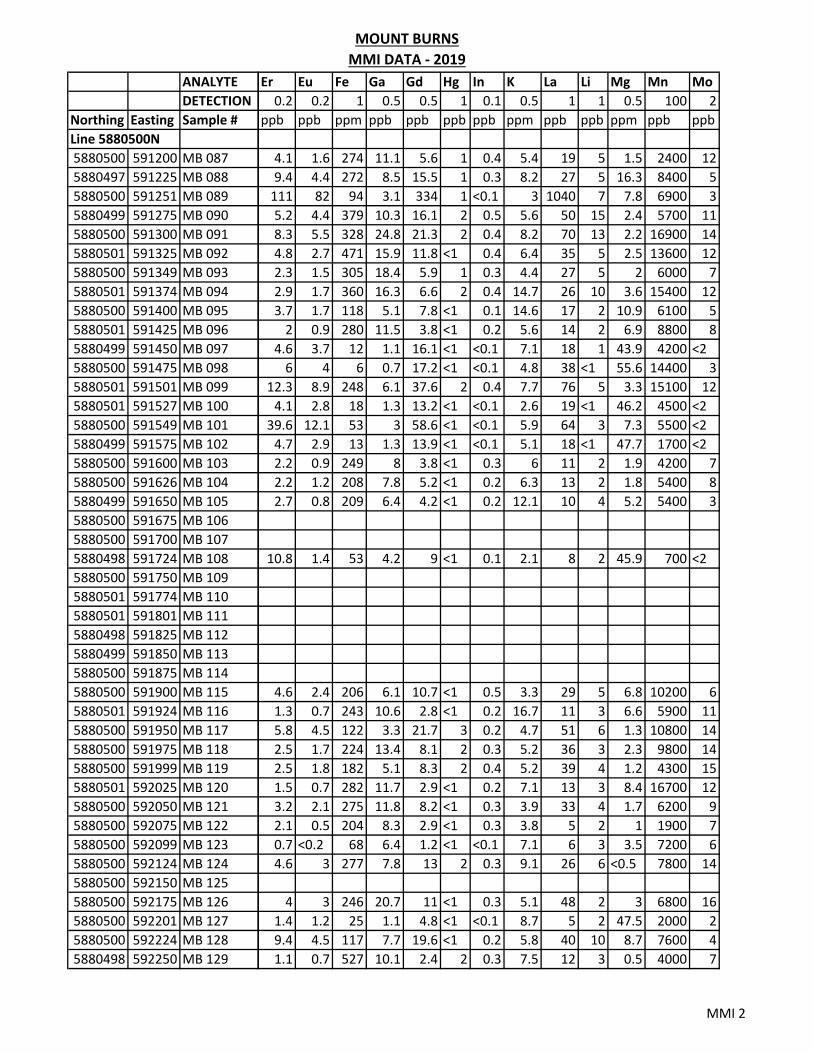
MOUNT BURNS
MMI DATA ‐ 2019
ANALYTE
DETECTION
Northing Easting Sample #
Line 5880500N
5880500 591200 MB 087
5880497 591225 MB 088
5880500 591251 MB 089
5880499 591275 MB 090
5880500 591300 MB 091
5880501 591325 MB 092
5880500 591349 MB 093
5880501 591374 MB 094
5880500 591400 MB 095
5880501 591425 MB 096
5880499 591450 MB 097
5880500 591475 MB 098
5880501 591501 MB 099
5880501 591527 MB 100
5880500 591549 MB 101
5880499 591575 MB 102
5880500 591600 MB 103
5880500 591626 MB 104
5880499 591650 MB 105
5880500 591675 MB 106
5880500 591700 MB 107
5880498 591724 MB 108
5880500 591750 MB 109
5880501 591774 MB 110
5880501 591801 MB 111
5880498 591825 MB 112
5880499 591850 MB 113
5880500 591875 MB 114
5880500 591900 MB 115
5880501 591924 MB 116
5880500 591950 MB 117
5880500 591975 MB 118
5880500 591999 MB 119
5880501 592025 MB 120
5880500 592050 MB 121
5880500 592075 MB 122
5880500 592099 MB 123
5880500 592124 MB 124
5880500 592150 MB 125
5880500 592175 MB 126
5880500 592201 MB 127
5880500 592224 MB 128
5880498 592250 MB 129
Er Eu Fe Ga Gd Hg In K La Li Mg Mn Mo
0.2 0.2 1 0.5 0.5 1 0.1 0.5 1 1 0.5 100 2
ppb ppb ppm ppb ppb ppb ppb ppm ppb ppb ppm ppb ppb
4.1 1.6 274 11.1 5.6 1 0.4 5.4 19 5 1.5 2400 12
9.4 4.4 272 8.5 15.5 1 0.3 8.2 27 5 16.3 8400 5
111 82 94 3.1 334 1 <0.1 3 1040 7 7.8 6900 3
5.2 4.4 379 10.3 16.1 2 0.5 5.6 50 15 2.4 5700 11
8.3 5.5 328 24.8 21.3 2 0.4 8.2 70 13 2.2 16900 14
4.8 2.7 471 15.9 11.8 <1 0.4 6.4 35 5 2.5 13600 12
2.3 1.5 305 18.4 5.9 1 0.3 4.4 27 5 2 6000 7
2.9 1.7 360 16.3 6.6 2 0.4 14.7 26 10 3.6 15400 12
3.7 1.7 118 5.1 7.8 <1 0.1 14.6 17 2 10.9 6100 5
2 0.9 280 11.5 3.8 <1 0.2 5.6 14 2 6.9 8800 8
4.6 3.7 12 1.1 16.1 <1 <0.1 7.1 18 1 43.9 4200 <2
6 4 6 0.7 17.2 <1 <0.1 4.8 38 <1 55.6 14400 3
12.3 8.9 248 6.1 37.6 2 0.4 7.7 76 5 3.3 15100 12
4.1 2.8 18 1.3 13.2 <1 <0.1 2.6 19 <1 46.2 4500 <2
39.6 12.1 53 3 58.6 <1 <0.1 5.9 64 3 7.3 5500 <2
4.7 2.9 13 1.3 13.9 <1 <0.1 5.1 18 <1 47.7 1700 <2
2.2 0.9 249 8 3.8 <1 0.3 6 11 2 1.9 4200 7
2.2 1.2 208 7.8 5.2 <1 0.2 6.3 13 2 1.8 5400 8
2.7 0.8 209 6.4 4.2 <1 0.2 12.1 10 4 5.2 5400 3
10.8 1.4 53 4.2 9 <1 0.1 2.1 8 2 45.9 700 <2
4.6 2.4 206 6.1 10.7 <1 0.5 3.3 29 5 6.8 10200 6
1.3 0.7 243 10.6 2.8 <1 0.2 16.7 11 3 6.6 5900 11
5.8 4.5 122 3.3 21.7 3 0.2 4.7 51 6 1.3 10800 14
2.5 1.7 224 13.4 8.1 2 0.3 5.2 36 3 2.3 9800 14
2.5 1.8 182 5.1 8.3 2 0.4 5.2 39 4 1.2 4300 15
1.5 0.7 282 11.7 2.9 <1 0.2 7.1 13 3 8.4 16700 12
3.2 2.1 275 11.8 8.2 <1 0.3 3.9 33 4 1.7 6200 9
2.1 0.5 204 8.3 2.9 <1 0.3 3.8 5 2 1 1900 7
0.7 <0.2 68 6.4 1.2 <1 <0.1 7.1 6 3 3.5 7200 6
4.6 3 277 7.8 13 2 0.3 9.1 26 6 <0.5 7800 14
4 3 246 20.7 11 <1 0.3 5.1 48 2 3 6800 16
1.4 1.2 25 1.1 4.8 <1 <0.1 8.7 5 2 47.5 2000 2
9.4 4.5 117 7.7 19.6 <1 0.2 5.8 40 10 8.7 7600 4
1.1 0.7 527 10.1 2.4 2 0.3 7.5 12 3 0.5 4000 7
MMI 2
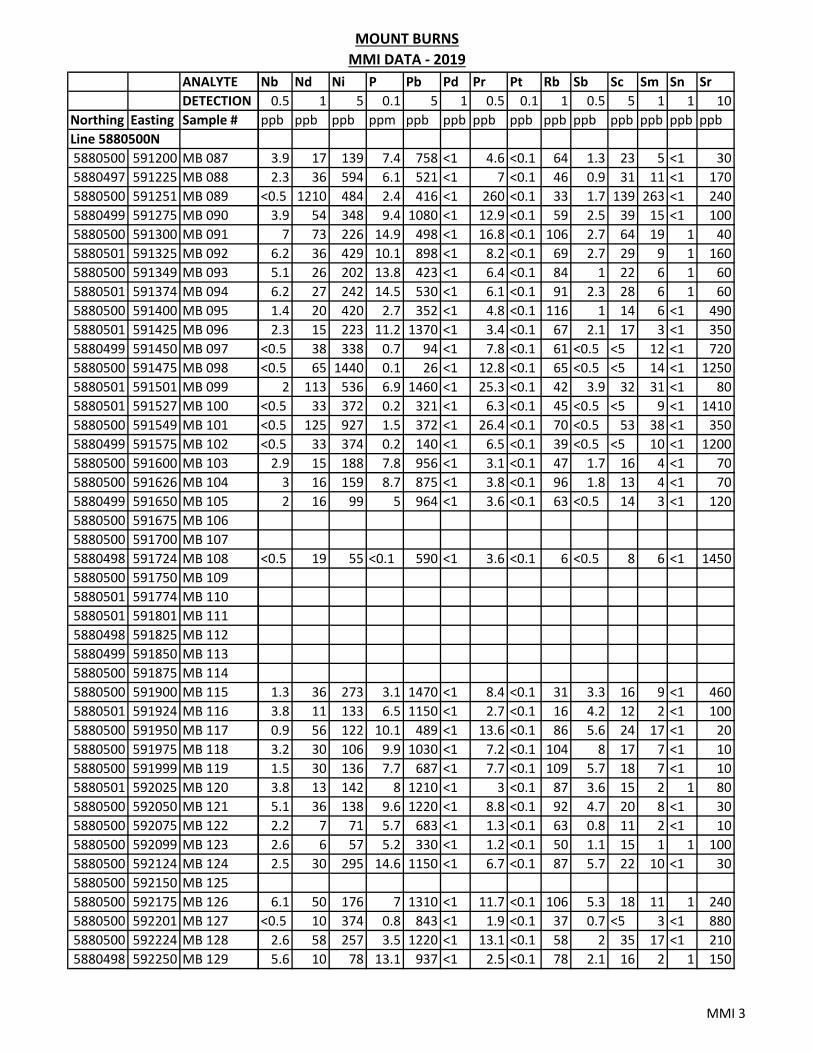
MOUNT BURNS
MMI DATA ‐ 2019
ANALYTE
DETECTION
Northing Easting Sample #
Line 5880500N
5880500 591200 MB 087
5880497 591225 MB 088
5880500 591251 MB 089
5880499 591275 MB 090
5880500 591300 MB 091
5880501 591325 MB 092
5880500 591349 MB 093
5880501 591374 MB 094
5880500 591400 MB 095
5880501 591425 MB 096
5880499 591450 MB 097
5880500 591475 MB 098
5880501 591501 MB 099
5880501 591527 MB 100
5880500 591549 MB 101
5880499 591575 MB 102
5880500 591600 MB 103
5880500 591626 MB 104
5880499 591650 MB 105
5880500 591675 MB 106
5880500 591700 MB 107
5880498 591724 MB 108
5880500 591750 MB 109
5880501 591774 MB 110
5880501 591801 MB 111
5880498 591825 MB 112
5880499 591850 MB 113
5880500 591875 MB 114
5880500 591900 MB 115
5880501 591924 MB 116
5880500 591950 MB 117
5880500 591975 MB 118
5880500 591999 MB 119
5880501 592025 MB 120
5880500 592050 MB 121
5880500 592075 MB 122
5880500 592099 MB 123
5880500 592124 MB 124
5880500 592150 MB 125
5880500 592175 MB 126
5880500 592201 MB 127
5880500 592224 MB 128
5880498 592250 MB 129
Nb Nd Ni P Pb Pd Pr Pt Rb Sb Sc Sm Sn Sr
0.5 1 5 0.1 5 1 0.5 0.1 1 0.5 5 1 1 10
ppb ppb ppb ppm ppb ppb ppb ppb ppb ppb ppb ppb ppb ppb
3.9 17 139 7.4 758 <1 4.6 <0.1 64 1.3 23 5 <1 30
2.3 36 594 6.1 521 <1 7 <0.1 46 0.9 31 11 <1 170
<0.5 1210 484 2.4 416 <1 260 <0.1 33 1.7 139 263 <1 240
3.9 54 348 9.4 1080 <1 12.9 <0.1 59 2.5 39 15 <1 100
7 73 226 14.9 498 <1 16.8 <0.1 106 2.7 64 19 1 40
6.2 36 429 10.1 898 <1 8.2 <0.1 69 2.7 29 9 1 160
5.1 26 202 13.8 423 <1 6.4 <0.1 84 1 22 6 1 60
6.2 27 242 14.5 530 <1 6.1 <0.1 91 2.3 28 6 1 60
1.4 20 420 2.7 352 <1 4.8 <0.1 116 1 14 6 <1 490
2.3 15 223 11.2 1370 <1 3.4 <0.1 67 2.1 17 3 <1 350
<0.5 38 338 0.7 94 <1 7.8 <0.1 61 <0.5 <5 12 <1 720
<0.5 65 1440 0.1 26 <1 12.8 <0.1 65 <0.5 <5 14 <1 1250
2 113 536 6.9 1460 <1 25.3 <0.1 42 3.9 32 31 <1 80
<0.5 33 372 0.2 321 <1 6.3 <0.1 45 <0.5 <5 9 <1 1410
<0.5 125 927 1.5 372 <1 26.4 <0.1 70 <0.5 53 38 <1 350
<0.5 33 374 0.2 140 <1 6.5 <0.1 39 <0.5 <5 10 <1 1200
2.9 15 188 7.8 956 <1 3.1 <0.1 47 1.7 16 4 <1 70
3 16 159 8.7 875 <1 3.8 <0.1 96 1.8 13 4 <1 70
2 16 99 5 964 <1 3.6 <0.1 63 <0.5 14 3 <1 120
<0.5 19 55 <0.1 590 <1 3.6 <0.1 6 <0.5 8 6 <1 1450
1.3 36 273 3.1 1470 <1 8.4 <0.1 31 3.3 16 9 <1 460
3.8 11 133 6.5 1150 <1 2.7 <0.1 16 4.2 12 2 <1 100
0.9 56 122 10.1 489 <1 13.6 <0.1 86 5.6 24 17 <1 20
3.2 30 106 9.9 1030 <1 7.2 <0.1 104 8 17 7 <1 10
1.5 30 136 7.7 687 <1 7.7 <0.1 109 5.7 18 7 <1 10
3.8 13 142 8 1210 <1 3 <0.1 87 3.6 15 2 1 80
5.1 36 138 9.6 1220 <1 8.8 <0.1 92 4.7 20 8 <1 30
2.2 7 71 5.7 683 <1 1.3 <0.1 63 0.8 11 2 <1 10
2.6 6 57 5.2 330 <1 1.2 <0.1 50 1.1 15 1 1 100
2.5 30 295 14.6 1150 <1 6.7 <0.1 87 5.7 22 10 <1 30
6.1 50 176 7 1310 <1 11.7 <0.1 106 5.3 18 11 1 240
<0.5 10 374 0.8 843 <1 1.9 <0.1 37 0.7 <5 3 <1 880
2.6 58 257 3.5 1220 <1 13.1 <0.1 58 2 35 17 <1 210
5.6 10 78 13.1 937 <1 2.5 <0.1 78 2.1 16 2 1 150
MMI 3

MOUNT BURNS
MMI DATA ‐ 2019
ANALYTE
DETECTION
Northing Easting Sample #
Line 5880500N
5880500 591200 MB 087
5880497 591225 MB 088
5880500 591251 MB 089
5880499 591275 MB 090
5880500 591300 MB 091
5880501 591325 MB 092
5880500 591349 MB 093
5880501 591374 MB 094
5880500 591400 MB 095
5880501 591425 MB 096
5880499 591450 MB 097
5880500 591475 MB 098
5880501 591501 MB 099
5880501 591527 MB 100
5880500 591549 MB 101
5880499 591575 MB 102
5880500 591600 MB 103
5880500 591626 MB 104
5880499 591650 MB 105
5880500 591675 MB 106
5880500 591700 MB 107
5880498 591724 MB 108
5880500 591750 MB 109
5880501 591774 MB 110
5880501 591801 MB 111
5880498 591825 MB 112
5880499 591850 MB 113
5880500 591875 MB 114
5880500 591900 MB 115
5880501 591924 MB 116
5880500 591950 MB 117
5880500 591975 MB 118
5880500 591999 MB 119
5880501 592025 MB 120
5880500 592050 MB 121
5880500 592075 MB 122
5880500 592099 MB 123
5880500 592124 MB 124
5880500 592150 MB 125
5880500 592175 MB 126
5880500 592201 MB 127
5880500 592224 MB 128
5880498 592250 MB 129
Ta Tb Te Th Ti Tl U W Y Yb Zn Zr
1 0.1 10 0.5 10 0.1 0.5 0.5 1 0.2 10 2
ppb ppb ppb ppb ppb ppb ppb ppb ppb ppb ppb ppb
<1 1.2 <10 24.9 940 0.4 11.5 1.2 28 2.8 340 104
<1 3.3 <10 19.8 620 0.2 10.7 0.9 76 5.5 550 81
<1 45.9 <10 44.2 200 0.1 10.9 1.3 1520 67.2 230 160
<1 2.7 <10 66.8 830 0.4 15.9 1.8 41 3.2 690 234
<1 3.5 <10 52 1810 0.7 19.4 3.5 71 5 720 193
<1 1.8 10 36.2 1790 <0.1 11.2 3 51 3.4 750 108
<1 0.9 <10 20.6 1520 <0.1 5.7 7 22 1.8 250 88
<1 1 <10 36 1830 <0.1 9.7 4.2 27 2.3 520 115
<1 1.2 <10 10.9 540 <0.1 14.3 0.7 40 2.4 540 34
<1 0.6 <10 18.3 720 <0.1 8.2 0.9 17 1.4 1430 52
<1 1.9 <10 4 80 <0.1 32.5 <0.5 54 3.3 220 12
<1 1.8 <10 0.9 <10 <0.1 184 <0.5 85 4.6 210 6
<1 5.5 <10 68.8 670 <0.1 29.9 1.1 122 8.6 570 126
<1 1.6 <10 1.5 30 <0.1 13.8 <0.5 45 2.8 370 6
<1 10.1 <10 15.1 200 0.3 49.9 0.6 439 30 990 28
<1 1.7 <10 2.1 20 <0.1 22.6 <0.5 51 3.1 100 7
<1 0.6 <10 18.6 580 <0.1 8.4 2.6 21 1.7 670 59
<1 0.8 <10 25.2 770 <0.1 13.5 2.4 22 1.6 730 83
<1 0.6 <10 29 300 <0.1 5.6 1.4 22 2.6 580 43
<1 1.6 <10 3.5 30 <0.1 258 <0.5 114 9.4 1220 2
<1 1.6 <10 30.7 490 <0.1 18.7 0.7 41 3.5 1820 42
<1 0.3 <10 17.8 930 <0.1 6.2 1.9 12 1.1 510 49
<1 3.1 <10 65.1 270 <0.1 33.9 3 52 3.5 390 164
<1 1.1 <10 40.6 1160 <0.1 15.7 13.3 27 1.9 540 109
<1 1.4 <10 80.7 470 <0.1 37.2 2.3 22 1.7 410 171
<1 0.4 <10 31.2 1420 <0.1 8.6 4.9 14 1.4 700 72
<1 1.1 <10 26.3 1350 <0.1 9 2.8 30 2.7 310 108
<1 0.4 <10 14.8 560 <0.1 9.6 0.7 17 1.9 200 42
<1 <0.1 <10 8.2 520 <0.1 2.3 1.1 7 0.7 510 40
<1 2.2 <10 53.8 550 1.1 25.3 1.2 41 2.5 650 123
<1 1.9 <10 43.3 2040 0.9 16 3.9 42 2.6 920 67
<1 0.7 <10 5.2 70 0.7 49.9 <0.5 12 0.8 240 10
<1 3.1 <10 31.4 990 0.8 94.8 0.8 85 5.8 160 68
<1 0.3 <10 39.6 680 1.2 8.5 1.3 8 0.8 380 93
MMI 4

MOUNT BURNS
MMI DATA ‐ 2019
ANALYTE Ag Al As Au Ba Bi Ca Cd Ce Co Cr Cs Cu Dy
DETECTION 0.5 1 10 0.1 10 0.5 2 1 2 1 100 0.2 10 0.5
Northing Easting Sample # ppb ppm ppb ppb ppb ppb ppm ppb ppb ppb ppb ppb ppb ppb
Line 5880600N
5880600 591200 MB 044 78.2 218 120 0.4 1270 3.9 27 21 36 58 200 1.9 440 4.1
5880601 591225 MB 045 50.7 179 110 0.2 700 2.7 8 19 30 88 200 1.4 410 4.8
5880599 591251 MB 046 80.3 210 200 1.2 650 3.4 7 27 102 161 100 2.8 660 13.7
5880598 591275 MB 047 30.7 144 70 1 510 2 19 13 41 54 <100 2.1 330 6
5880603 591299 MB 048 72.6 203 140 0.1 1260 3.5 3 10 24 85 100 1.3 320 3.2
5880600 591326 MB 049 27.5 196 160 0.3 740 2.4 <2 19 17 74 100 1.3 280 2.6
5880599 591349 MB 050 34.9 210 80 0.5 730 1.9 5 41 27 92 <100 1.3 1070 6.6
5880602 591375 MB 051 122 232 100 0.3 1370 2.1 25 31 59 141 100 1.5 630 8.4
5880600 591399 MB 052 145 271 90 0.9 660 2 <2 35 53 125 100 3.1 550 9.3
5880605 591426 MB 053 124 208 70 1.2 940 1.6 50 67 149 133 <100 2.4 1280 48.2
5880602 591450 MB 054 84.2 190 70 1.1 760 1.8 50 27 49 73 100 1.7 430 8.5
5880600 591476 MB 055 47.3 209 100 0.3 980 2.7 27 30 31 139 <100 1.5 560 5.8
5880600 591498 MB 056 66.1 127 100 1.1 1130 2.5 15 41 34 219 <100 1.9 510 4.6
5880601 591525 MB 057 43.6 94 80 0.8 530 2.2 140 16 81 143 <100 1.8 210 7.7
5880601 591550 MB 058 14.5 120 100 0.1 1360 3.7 60 15 27 407 <100 1.4 330 3.7
5880600 591575 MB 059 120 56 <10 2 140 <0.5 319 25 14 17 <100 1.7 340 13
5880601 591600 MB 060 38 83 <10 0.3 380 <0.5 267 67 243 261 <100 2.2 370 17.3
5880601 591625 MB 061
5880602 591647 MB 062
5880600 591673 MB 063 4.4 120 40 0.1 440 1.3 43 5 53 103 <100 1.6 610 6.3
5880600 591699 MB 064
5880600 591724 MB 065 46.5 71 <10 0.3 120 <0.5 306 30 41 63 <100 1.9 200 11.4
5880599 591750 MB 066
5880598 591776 MB 067 116 118 50 0.9 440 0.6 205 94 114 90 <100 1.5 1260 102
5880598 591801 MB 068 40.1 160 120 1 710 3.4 22 18 33 182 100 2.6 420 3.7
5880601 591824 MB 069 28.4 155 40 0.3 680 1.6 7 16 20 390 <100 1.3 660 2.2
5880600 591849 MB 070 17.3 183 60 0.1 590 2.3 4 4 10 58 <100 1.6 200 1.1
5880598 591874 MB 071 33.9 257 70 0.5 830 2.9 11 18 28 47 100 1.7 400 4.4
5880600 591901 MB 072 47.2 205 110 0.3 1200 4 12 25 32 122 100 3.1 470 3.8
5880599 591924 MB 073 73 245 90 0.9 640 2.9 3 15 40 90 100 1.5 420 5.3
5880600 591949 MB 074 17.4 235 110 0.2 1090 3 2 7 22 48 100 1.8 290 3.5
5880601 591975 MB 075 29.5 282 110 0.4 1150 3.5 7 18 26 104 200 2 380 3.8
5880598 591999 MB 076 54.5 169 80 0.3 810 3.7 15 23 33 110 <100 1.1 340 5.4
5880600 592025 MB 077
5880600 592049 MB 078 26.9 217 100 0.3 650 4.3 15 40 63 126 100 1.6 510 7.5
5880599 592074 MB 079 28.4 69 20 0.2 460 0.5 228 29 166 388 <100 1.2 170 7.8
5880600 592099 MB 080 19 13 <10 <0.1 130 <0.5 233 17 47 492 <100 0.4 50 15.1
5880601 592126 MB 081 12.2 188 130 0.2 670 3.1 32 14 28 62 100 1.3 370 4.7
5880600 592150 MB 082 43.3 147 120 0.4 930 4.7 6 8 32 71 200 2.6 240 3.4
5880600 592174 MB 083 44.4 170 100 0.1 610 3.9 6 6 25 56 200 2.1 250 2.5
5880601 592200 MB 084 65.8 199 110 0.2 490 4 <2 4 25 75 200 2.1 180 2.3
5880601 592226 MB 085 21 225 140 0.2 560 5.1 4 5 17 63 100 2.4 430 2.1
5880601 592250 MB 086 41.4 258 110 0.7 620 3.6 <2 19 52 156 200 4.9 470 5.5
MMI 5
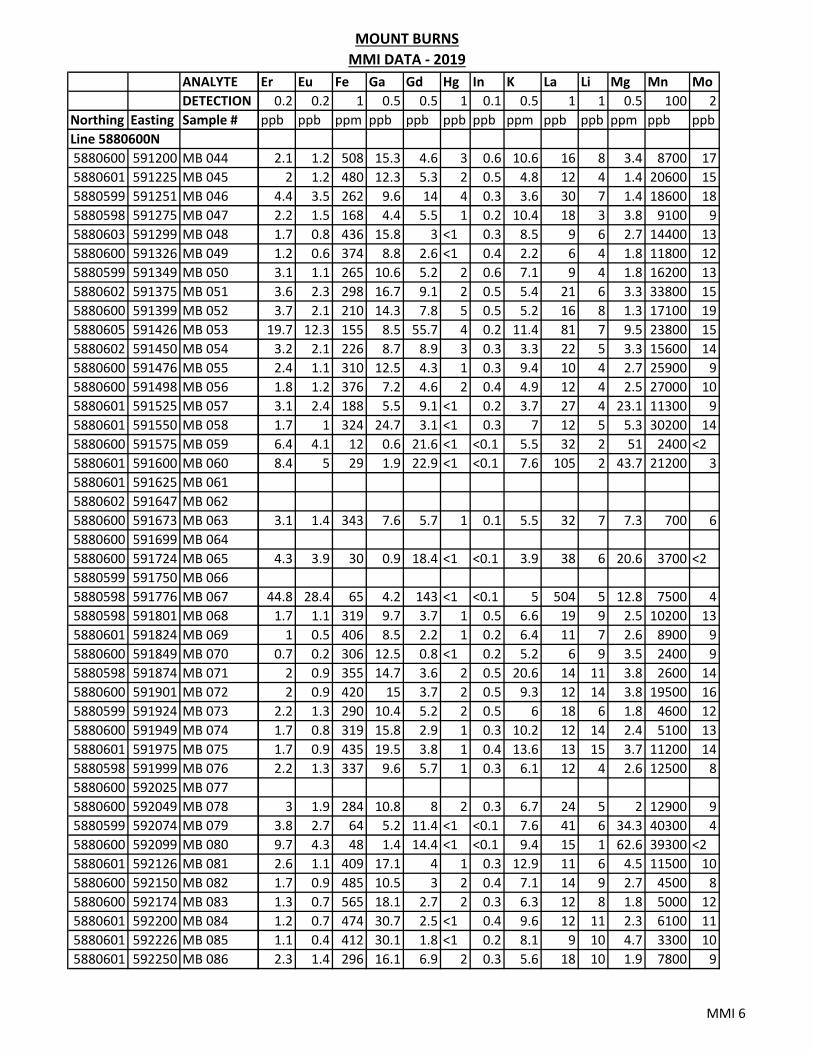
MOUNT BURNS
MMI DATA ‐ 2019
ANALYTE
DETECTION
Northing Easting Sample #
Line 5880600N
5880600 591200 MB 044
5880601 591225 MB 045
5880599 591251 MB 046
5880598 591275 MB 047
5880603 591299 MB 048
5880600 591326 MB 049
5880599 591349 MB 050
5880602 591375 MB 051
5880600 591399 MB 052
5880605 591426 MB 053
5880602 591450 MB 054
5880600 591476 MB 055
5880600 591498 MB 056
5880601 591525 MB 057
5880601 591550 MB 058
5880600 591575 MB 059
5880601 591600 MB 060
5880601 591625 MB 061
5880602 591647 MB 062
5880600 591673 MB 063
5880600 591699 MB 064
5880600 591724 MB 065
5880599 591750 MB 066
5880598 591776 MB 067
5880598 591801 MB 068
5880601 591824 MB 069
5880600 591849 MB 070
5880598 591874 MB 071
5880600 591901 MB 072
5880599 591924 MB 073
5880600 591949 MB 074
5880601 591975 MB 075
5880598 591999 MB 076
5880600 592025 MB 077
5880600 592049 MB 078
5880599 592074 MB 079
5880600 592099 MB 080
5880601 592126 MB 081
5880600 592150 MB 082
5880600 592174 MB 083
5880601 592200 MB 084
5880601 592226 MB 085
5880601 592250 MB 086
Er Eu Fe Ga Gd Hg In K La Li Mg Mn Mo
0.2 0.2 1 0.5 0.5 1 0.1 0.5 1 1 0.5 100 2
ppb ppb ppm ppb ppb ppb ppb ppm ppb ppb ppm ppb ppb
2.1 1.2 508 15.3 4.6 3 0.6 10.6 16 8 3.4 8700 17
2 1.2 480 12.3 5.3 2 0.5 4.8 12 4 1.4 20600 15
4.4 3.5 262 9.6 14 4 0.3 3.6 30 7 1.4 18600 18
2.2 1.5 168 4.4 5.5 1 0.2 10.4 18 3 3.8 9100 9
1.7 0.8 436 15.8 3 <1 0.3 8.5 9 6 2.7 14400 13
1.2 0.6 374 8.8 2.6 <1 0.4 2.2 6 4 1.8 11800 12
3.1 1.1 265 10.6 5.2 2 0.6 7.1 9 4 1.8 16200 13
3.6 2.3 298 16.7 9.1 2 0.5 5.4 21 6 3.3 33800 15
3.7 2.1 210 14.3 7.8 5 0.5 5.2 16 8 1.3 17100 19
19.7 12.3 155 8.5 55.7 4 0.2 11.4 81 7 9.5 23800 15
3.2 2.1 226 8.7 8.9 3 0.3 3.3 22 5 3.3 15600 14
2.4 1.1 310 12.5 4.3 1 0.3 9.4 10 4 2.7 25900 9
1.8 1.2 376 7.2 4.6 2 0.4 4.9 12 4 2.5 27000 10
3.1 2.4 188 5.5 9.1 <1 0.2 3.7 27 4 23.1 11300 9
1.7 1 324 24.7 3.1 <1 0.3 7 12 5 5.3 30200 14
6.4 4.1 12 0.6 21.6 <1 <0.1 5.5 32 2 51 2400 <2
8.4 5 29 1.9 22.9 <1 <0.1 7.6 105 2 43.7 21200 3
3.1 1.4 343 7.6 5.7 1 0.1 5.5 32 7 7.3 700 6
4.3 3.9 30 0.9 18.4 <1 <0.1 3.9 38 6 20.6 3700 <2
44.8 28.4 65 4.2 143 <1 <0.1 5 504 5 12.8 7500 4
1.7 1.1 319 9.7 3.7 1 0.5 6.6 19 9 2.5 10200 13
1 0.5 406 8.5 2.2 1 0.2 6.4 11 7 2.6 8900 9
0.7 0.2 306 12.5 0.8 <1 0.2 5.2 6 9 3.5 2400 9
2 0.9 355 14.7 3.6 2 0.5 20.6 14 11 3.8 2600 14
2 0.9 420 15 3.7 2 0.5 9.3 12 14 3.8 19500 16
2.2 1.3 290 10.4 5.2 2 0.5 6 18 6 1.8 4600 12
1.7 0.8 319 15.8 2.9 1 0.3 10.2 12 14 2.4 5100 13
1.7 0.9 435 19.5 3.8 1 0.4 13.6 13 15 3.7 11200 14
2.2 1.3 337 9.6 5.7 1 0.3 6.1 12 4 2.6 12500 8
3 1.9 284 10.8 8 2 0.3 6.7 24 5 2 12900 9
3.8 2.7 64 5.2 11.4 <1 <0.1 7.6 41 6 34.3 40300 4
9.7 4.3 48 1.4 14.4 <1 <0.1 9.4 15 1 62.6 39300 <2
2.6 1.1 409 17.1 4 1 0.3 12.9 11 6 4.5 11500 10
1.7 0.9 485 10.5 3 2 0.4 7.1 14 9 2.7 4500 8
1.3 0.7 565 18.1 2.7 2 0.3 6.3 12 8 1.8 5000 12
1.2 0.7 474 30.7 2.5 <1 0.4 9.6 12 11 2.3 6100 11
1.1 0.4 412 30.1 1.8 <1 0.2 8.1 9 10 4.7 3300 10
2.3 1.4 296 16.1 6.9 2 0.3 5.6 18 10 1.9 7800 9
MMI 6

MOUNT BURNS
MMI DATA ‐ 2019
ANALYTE
DETECTION
Northing Easting Sample #
Line 5880600N
5880600 591200 MB 044
5880601 591225 MB 045
5880599 591251 MB 046
5880598 591275 MB 047
5880603 591299 MB 048
5880600 591326 MB 049
5880599 591349 MB 050
5880602 591375 MB 051
5880600 591399 MB 052
5880605 591426 MB 053
5880602 591450 MB 054
5880600 591476 MB 055
5880600 591498 MB 056
5880601 591525 MB 057
5880601 591550 MB 058
5880600 591575 MB 059
5880601 591600 MB 060
5880601 591625 MB 061
5880602 591647 MB 062
5880600 591673 MB 063
5880600 591699 MB 064
5880600 591724 MB 065
5880599 591750 MB 066
5880598 591776 MB 067
5880598 591801 MB 068
5880601 591824 MB 069
5880600 591849 MB 070
5880598 591874 MB 071
5880600 591901 MB 072
5880599 591924 MB 073
5880600 591949 MB 074
5880601 591975 MB 075
5880598 591999 MB 076
5880600 592025 MB 077
5880600 592049 MB 078
5880599 592074 MB 079
5880600 592099 MB 080
5880601 592126 MB 081
5880600 592150 MB 082
5880600 592174 MB 083
5880601 592200 MB 084
5880601 592226 MB 085
5880601 592250 MB 086
Nb Nd Ni P Pb Pd Pr Pt Rb Sb Sc Sm Sn Sr
0.5 1 5 0.1 5 1 0.5 0.1 1 0.5 5 1 1 10
ppb ppb ppb ppm ppb ppb ppb ppb ppb ppb ppb ppb ppb ppb
7.8 15 238 18.8 1120 <1 3.6 <0.1 47 3.6 25 4 1 120
3.5 14 121 21 734 <1 3.2 <0.1 53 3.6 21 4 <1 50
2.3 37 183 12.3 1250 <1 8.6 <0.1 77 12.8 24 11 <1 30
<0.5 20 179 6.9 721 <1 4.1 <0.1 38 3.4 15 5 <1 50
6.5 10 88 18.5 785 <1 2.4 <0.1 27 4.4 26 2 1 40
2.1 8 119 16 1350 <1 1.7 <0.1 51 4.3 18 2 <1 <10
1.8 12 181 12.8 766 <1 2.6 <0.1 45 4.2 23 4 <1 30
4.2 27 358 14.5 570 <1 6.2 <0.1 73 5.1 28 7 <1 80
3.9 20 138 12.9 757 <1 4.4 <0.1 74 4.8 29 6 <1 10
1 129 1920 12.6 1090 <1 28.4 <0.1 105 4.7 42 39 <1 120
1.4 24 159 14.2 773 <1 5.9 <0.1 51 4.7 21 6 <1 90
2 12 248 19.1 1660 <1 2.5 <0.1 54 4.7 20 3 <1 80
0.7 14 281 17.9 1440 <1 3 <0.1 68 4.2 16 4 <1 100
0.7 35 157 3.7 2390 <1 8.3 <0.1 50 6.6 15 8 <1 400
6.6 14 158 4.7 1360 <1 3.3 <0.1 58 4.7 23 3 1 310
<0.5 53 536 0.6 805 <1 9.3 <0.1 60 0.7 <5 16 <1 1020
<0.5 121 799 1 427 <1 28.9 <0.1 90 0.6 9 24 <1 1080
2.6 28 172 4 193 <1 6.8 <0.1 56 1.5 11 6 <1 420
<0.5 56 495 0.8 443 <1 10.9 <0.1 57 <0.5 6 15 <1 960
1.1 557 1940 2.2 659 <1 125 <0.1 83 2.4 26 125 <1 470
2.2 18 147 8.8 2070 <1 4.1 <0.1 82 6 16 4 <1 70
2.8 8 178 7.4 440 <1 2.2 <0.1 55 2.1 13 2 <1 90
5.4 6 121 9.5 225 <1 1.1 <0.1 54 2.9 17 <1 1 60
6.3 14 230 8.4 1600 <1 3.5 <0.1 23 4.7 25 3 <1 80
5.4 13 128 19.4 1410 <1 2.5 <0.1 105 5 24 3 <1 50
3.8 21 106 6.6 3540 <1 4.7 <0.1 74 3.9 24 5 <1 20
6.3 10 175 12.9 916 <1 2.6 <0.1 86 3.6 23 2 1 50
9.7 12 93 17.5 708 <1 2.8 <0.1 57 4.1 27 3 1 50
2.2 14 134 12 1300 <1 3.2 <0.1 56 2 14 4 <1 50
1.6 28 147 9.9 1490 <1 6.4 <0.1 75 3.8 21 7 <1 40
0.5 65 313 1.5 325 <1 14.9 <0.1 45 0.8 12 14 <1 830
<0.5 36 4490 0.7 23 <1 5.9 <0.1 22 <0.5 14 12 <1 420
5.9 14 114 14.6 1320 <1 3 <0.1 21 3.5 22 3 1 90
3.9 13 229 15.9 1470 <1 3 <0.1 53 3.1 19 3 <1 50
6.4 10 176 15.2 1110 <1 2.5 <0.1 74 3.2 22 3 1 40
7.3 11 59 11.4 878 <1 2.8 <0.1 53 3.7 27 2 1 20
8.7 8 58 9.3 666 <1 1.8 <0.1 45 4.9 27 2 2 50
4.5 19 99 8.8 1550 <1 4.1 <0.1 122 3 28 6 <1 20
MMI 7
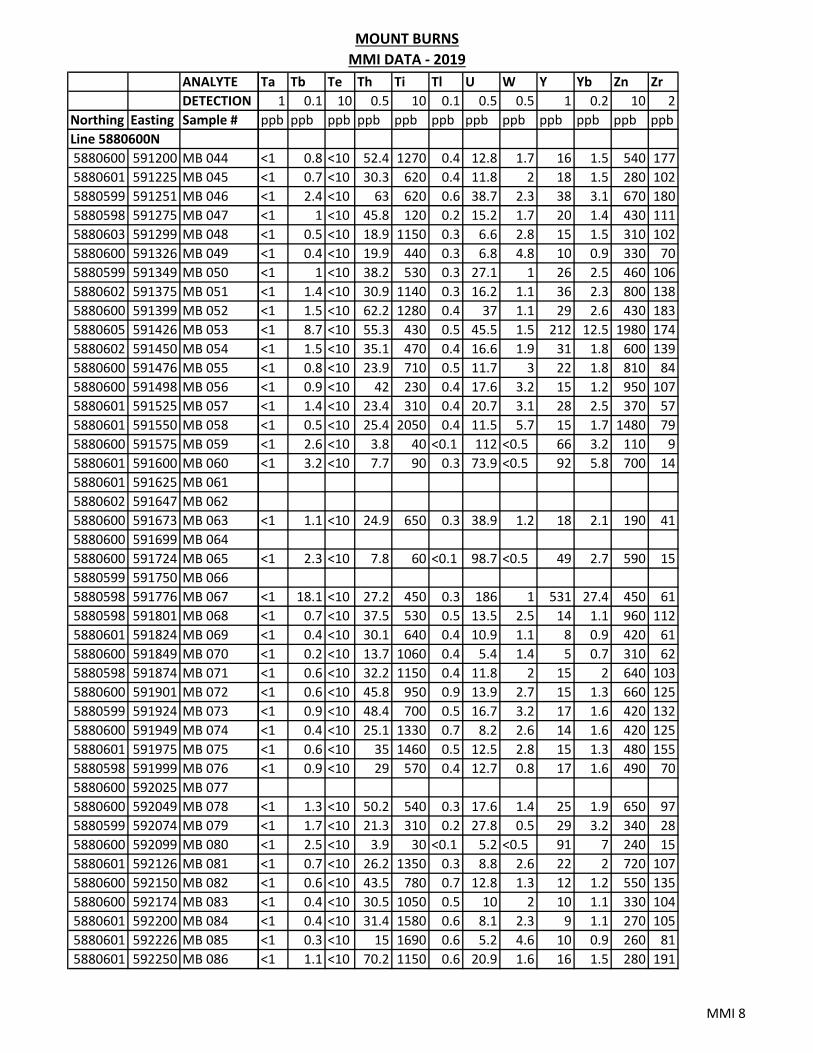
MOUNT BURNS
MMI DATA ‐ 2019
ANALYTE
DETECTION
Northing Easting Sample #
Line 5880600N
5880600 591200 MB 044
5880601 591225 MB 045
5880599 591251 MB 046
5880598 591275 MB 047
5880603 591299 MB 048
5880600 591326 MB 049
5880599 591349 MB 050
5880602 591375 MB 051
5880600 591399 MB 052
5880605 591426 MB 053
5880602 591450 MB 054
5880600 591476 MB 055
5880600 591498 MB 056
5880601 591525 MB 057
5880601 591550 MB 058
5880600 591575 MB 059
5880601 591600 MB 060
5880601 591625 MB 061
5880602 591647 MB 062
5880600 591673 MB 063
5880600 591699 MB 064
5880600 591724 MB 065
5880599 591750 MB 066
5880598 591776 MB 067
5880598 591801 MB 068
5880601 591824 MB 069
5880600 591849 MB 070
5880598 591874 MB 071
5880600 591901 MB 072
5880599 591924 MB 073
5880600 591949 MB 074
5880601 591975 MB 075
5880598 591999 MB 076
5880600 592025 MB 077
5880600 592049 MB 078
5880599 592074 MB 079
5880600 592099 MB 080
5880601 592126 MB 081
5880600 592150 MB 082
5880600 592174 MB 083
5880601 592200 MB 084
5880601 592226 MB 085
5880601 592250 MB 086
Ta Tb Te Th Ti Tl U W Y Yb Zn Zr
1 0.1 10 0.5 10 0.1 0.5 0.5 1 0.2 10 2
ppb ppb ppb ppb ppb ppb ppb ppb ppb ppb ppb ppb
<1 0.8 <10 52.4 1270 0.4 12.8 1.7 16 1.5 540 177
<1 0.7 <10 30.3 620 0.4 11.8 2 18 1.5 280 102
<1 2.4 <10 63 620 0.6 38.7 2.3 38 3.1 670 180
<1 1 <10 45.8 120 0.2 15.2 1.7 20 1.4 430 111
<1 0.5 <10 18.9 1150 0.3 6.6 2.8 15 1.5 310 102
<1 0.4 <10 19.9 440 0.3 6.8 4.8 10 0.9 330 70
<1 1 <10 38.2 530 0.3 27.1 1 26 2.5 460 106
<1 1.4 <10 30.9 1140 0.3 16.2 1.1 36 2.3 800 138
<1 1.5 <10 62.2 1280 0.4 37 1.1 29 2.6 430 183
<1 8.7 <10 55.3 430 0.5 45.5 1.5 212 12.5 1980 174
<1 1.5 <10 35.1 470 0.4 16.6 1.9 31 1.8 600 139
<1 0.8 <10 23.9 710 0.5 11.7 3 22 1.8 810 84
<1 0.9 <10 42 230 0.4 17.6 3.2 15 1.2 950 107
<1 1.4 <10 23.4 310 0.4 20.7 3.1 28 2.5 370 57
<1 0.5 <10 25.4 2050 0.4 11.5 5.7 15 1.7 1480 79
<1 2.6 <10 3.8 40 <0.1 112 <0.5 66 3.2 110 9
<1 3.2 <10 7.7 90 0.3 73.9 <0.5 92 5.8 700 14
<1 1.1 <10 24.9 650 0.3 38.9 1.2 18 2.1 190 41
<1 2.3 <10 7.8 60 <0.1 98.7 <0.5 49 2.7 590 15
<1 18.1 <10 27.2 450 0.3 186 1 531 27.4 450 61
<1 0.7 <10 37.5 530 0.5 13.5 2.5 14 1.1 960 112
<1 0.4 <10 30.1 640 0.4 10.9 1.1 8 0.9 420 61
<1 0.2 <10 13.7 1060 0.4 5.4 1.4 5 0.7 310 62
<1 0.6 <10 32.2 1150 0.4 11.8 2 15 2 640 103
<1 0.6 <10 45.8 950 0.9 13.9 2.7 15 1.3 660 125
<1 0.9 <10 48.4 700 0.5 16.7 3.2 17 1.6 420 132
<1 0.4 <10 25.1 1330 0.7 8.2 2.6 14 1.6 420 125
<1 0.6 <10 35 1460 0.5 12.5 2.8 15 1.3 480 155
<1 0.9 <10 29 570 0.4 12.7 0.8 17 1.6 490 70
<1 1.3 <10 50.2 540 0.3 17.6 1.4 25 1.9 650 97
<1 1.7 <10 21.3 310 0.2 27.8 0.5 29 3.2 340 28
<1 2.5 <10 3.9 30 <0.1 5.2 <0.5 91 7 240 15
<1 0.7 <10 26.2 1350 0.3 8.8 2.6 22 2 720 107
<1 0.6 <10 43.5 780 0.7 12.8 1.3 12 1.2 550 135
<1 0.4 <10 30.5 1050 0.5 10 2 10 1.1 330 104
<1 0.4 <10 31.4 1580 0.6 8.1 2.3 9 1.1 270 105
<1 0.3 <10 15 1690 0.6 5.2 4.6 10 0.9 260 81
<1 1.1 <10 70.2 1150 0.6 20.9 1.6 16 1.5 280 191
MMI 8
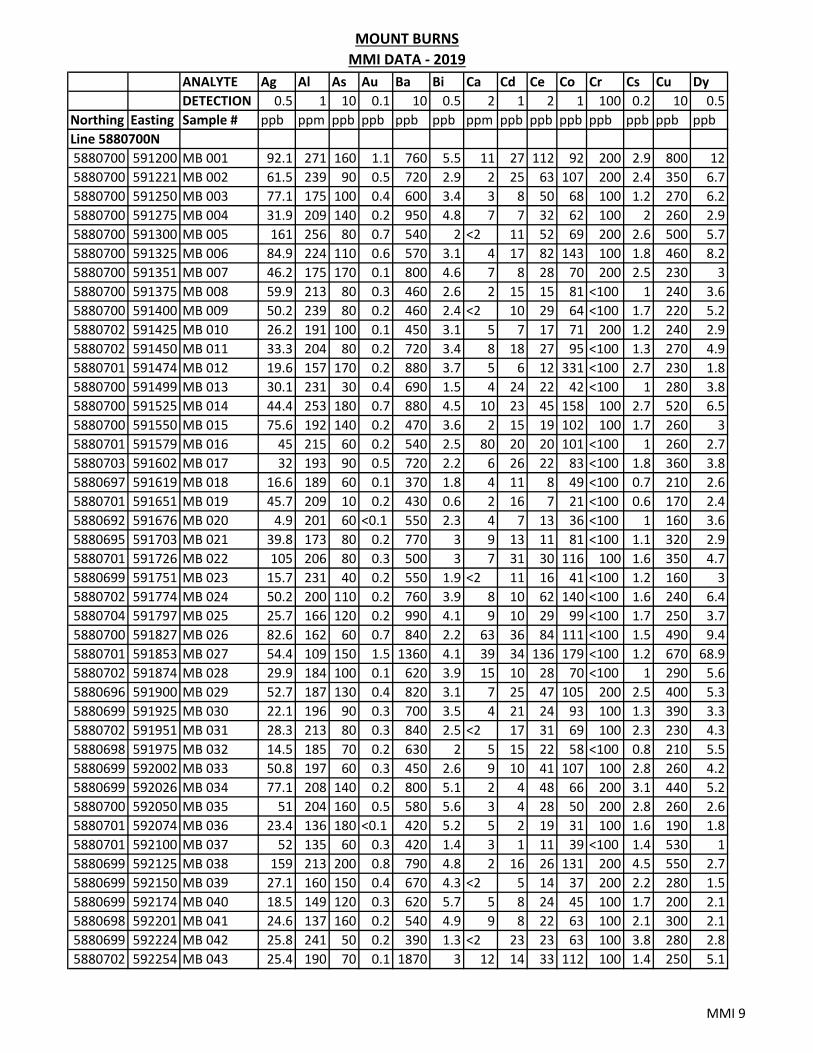
MOUNT BURNS
MMI DATA ‐ 2019
ANALYTE Ag Al As Au Ba Bi Ca Cd Ce Co Cr Cs Cu Dy
DETECTION 0.5 1 10 0.1 10 0.5 2 1 2 1 100 0.2 10 0.5
Northing Easting Sample # ppb ppm ppb ppb ppb ppb ppm ppb ppb ppb ppb ppb ppb ppb
Line 5880700N
5880700 591200 MB 001 92.1 271 160 1.1 760 5.5 11 27 112 92 200 2.9 800 12
5880700 591221 MB 002 61.5 239 90 0.5 720 2.9 2 25 63 107 200 2.4 350 6.7
5880700 591250 MB 003 77.1 175 100 0.4 600 3.4 3 8 50 68 100 1.2 270 6.2
5880700 591275 MB 004 31.9 209 140 0.2 950 4.8 7 7 32 62 100 2 260 2.9
5880700 591300 MB 005 161 256 80 0.7 540 2 <2 11 52 69 200 2.6 500 5.7
5880700 591325 MB 006 84.9 224 110 0.6 570 3.1 4 17 82 143 100 1.8 460 8.2
5880700 591351 MB 007 46.2 175 170 0.1 800 4.6 7 8 28 70 200 2.5 230 3
5880700 591375 MB 008 59.9 213 80 0.3 460 2.6 2 15 15 81 <100 1 240 3.6
5880700 591400 MB 009 50.2 239 80 0.2 460 2.4 <2 10 29 64 <100 1.7 220 5.2
5880702 591425 MB 010 26.2 191 100 0.1 450 3.1 5 7 17 71 200 1.2 240 2.9
5880702 591450 MB 011 33.3 204 80 0.2 720 3.4 8 18 27 95 <100 1.3 270 4.9
5880701 591474 MB 012 19.6 157 170 0.2 880 3.7 5 6 12 331 <100 2.7 230 1.8
5880700 591499 MB 013 30.1 231 30 0.4 690 1.5 4 24 22 42 <100 1 280 3.8
5880700 591525 MB 014 44.4 253 180 0.7 880 4.5 10 23 45 158 100 2.7 520 6.5
5880700 591550 MB 015 75.6 192 140 0.2 470 3.6 2 15 19 102 100 1.7 260 3
5880701 591579 MB 016 45 215 60 0.2 540 2.5 80 20 20 101 <100 1 260 2.7
5880703 591602 MB 017 32 193 90 0.5 720 2.2 6 26 22 83 <100 1.8 360 3.8
5880697 591619 MB 018 16.6 189 60 0.1 370 1.8 4 11 8 49 <100 0.7 210 2.6
5880701 591651 MB 019 45.7 209 10 0.2 430 0.6 2 16 7 21 <100 0.6 170 2.4
5880692 591676 MB 020 4.9 201 60 <0.1 550 2.3 4 7 13 36 <100 1 160 3.6
5880695 591703 MB 021 39.8 173 80 0.2 770 3 9 13 11 81 <100 1.1 320 2.9
5880701 591726 MB 022 105 206 80 0.3 500 3 7 31 30 116 100 1.6 350 4.7
5880699 591751 MB 023 15.7 231 40 0.2 550 1.9 <2 11 16 41 <100 1.2 160 3
5880702 591774 MB 024 50.2 200 110 0.2 760 3.9 8 10 62 140 <100 1.6 240 6.4
5880704 591797 MB 025 25.7 166 120 0.2 990 4.1 9 10 29 99 <100 1.7 250 3.7
5880700 591827 MB 026 82.6 162 60 0.7 840 2.2 63 36 84 111 <100 1.5 490 9.4
5880701 591853 MB 027 54.4 109 150 1.5 1360 4.1 39 34 136 179 <100 1.2 670 68.9
5880702 591874 MB 028 29.9 184 100 0.1 620 3.9 15 10 28 70 <100 1 290 5.6
5880696 591900 MB 029 52.7 187 130 0.4 820 3.1 7 25 47 105 200 2.5 400 5.3
5880699 591925 MB 030 22.1 196 90 0.3 700 3.5 4 21 24 93 100 1.3 390 3.3
5880702 591951 MB 031 28.3 213 80 0.3 840 2.5 <2 17 31 69 100 2.3 230 4.3
5880698 591975 MB 032 14.5 185 70 0.2 630 2 5 15 22 58 <100 0.8 210 5.5
5880699 592002 MB 033 50.8 197 60 0.3 450 2.6 9 10 41 107 100 2.8 260 4.2
5880699 592026 MB 034 77.1 208 140 0.2 800 5.1 2 4 48 66 200 3.1 440 5.2
5880700 592050 MB 035 51 204 160 0.5 580 5.6 3 4 28 50 200 2.8 260 2.6
5880701 592074 MB 036 23.4 136 180 <0.1 420 5.2 5 2 19 31 100 1.6 190 1.8
5880701 592100 MB 037 52 135 60 0.3 420 1.4 3 1 11 39 <100 1.4 530 1
5880699 592125 MB 038 159 213 200 0.8 790 4.8 2 16 26 131 200 4.5 550 2.7
5880699 592150 MB 039 27.1 160 150 0.4 670 4.3 <2 5 14 37 200 2.2 280 1.5
5880699 592174 MB 040 18.5 149 120 0.3 620 5.7 5 8 24 45 100 1.7 200 2.1
5880698 592201 MB 041 24.6 137 160 0.2 540 4.9 9 8 22 63 100 2.1 300 2.1
5880699 592224 MB 042 25.8 241 50 0.2 390 1.3 <2 23 23 63 100 3.8 280 2.8
5880702 592254 MB 043 25.4 190 70 0.1 1870 3 12 14 33 112 100 1.4 250 5.1
MMI 9

MOUNT BURNS
MMI DATA ‐ 2019
ANALYTE
DETECTION
Northing Easting Sample #
Line 5880700N
5880700 591200 MB 001
5880700 591221 MB 002
5880700 591250 MB 003
5880700 591275 MB 004
5880700 591300 MB 005
5880700 591325 MB 006
5880700 591351 MB 007
5880700 591375 MB 008
5880700 591400 MB 009
5880702 591425 MB 010
5880702 591450 MB 011
5880701 591474 MB 012
5880700 591499 MB 013
5880700 591525 MB 014
5880700 591550 MB 015
5880701 591579 MB 016
5880703 591602 MB 017
5880697 591619 MB 018
5880701 591651 MB 019
5880692 591676 MB 020
5880695 591703 MB 021
5880701 591726 MB 022
5880699 591751 MB 023
5880702 591774 MB 024
5880704 591797 MB 025
5880700 591827 MB 026
5880701 591853 MB 027
5880702 591874 MB 028
5880696 591900 MB 029
5880699 591925 MB 030
5880702 591951 MB 031
5880698 591975 MB 032
5880699 592002 MB 033
5880699 592026 MB 034
5880700 592050 MB 035
5880701 592074 MB 036
5880701 592100 MB 037
5880699 592125 MB 038
5880699 592150 MB 039
5880699 592174 MB 040
5880698 592201 MB 041
5880699 592224 MB 042
5880702 592254 MB 043
Er Eu Fe Ga Gd Hg In K La Li Mg Mn Mo
0.2 0.2 1 0.5 0.5 1 0.1 0.5 1 1 0.5 100 2
ppb ppb ppm ppb ppb ppb ppb ppm ppb ppb ppm ppb ppb
5.1 3 324 14.5 12.4 3 0.7 6 45 7 2.1 10200 31
2.6 2 319 13.7 7.9 2 0.5 5.9 28 5 1.3 14700 14
2.3 1.5 318 12.7 6.9 1 0.4 5.4 22 4 2.3 5400 17
1.6 0.7 441 21.1 3.2 1 0.4 6.2 15 9 3 9100 24
2.3 1.6 274 10.2 6.2 2 0.4 7.5 23 7 1.2 4200 13
2.9 2.1 293 11.6 8.4 2 0.4 8.9 32 5 2 10200 14
1.7 0.8 413 24.5 3 1 0.3 8 14 14 3.7 11400 21
2.1 0.5 269 13 2.3 <1 0.3 7.3 7 5 2 5200 13
2.6 1 257 16.6 3.9 <1 0.3 4.9 14 11 1.9 3100 12
1.3 0.6 302 14.3 2.8 <1 0.3 7.3 8 5 2.9 6200 11
2.5 1 272 15 4.8 1 0.2 6.2 12 7 3.3 8500 11
0.9 0.4 380 22.6 1.3 <1 0.2 11.7 7 12 4.2 43300 17
2.3 0.7 145 10.9 3.3 1 0.3 3.4 9 6 1.2 4000 10
3.2 1.4 332 22.6 5.4 1 0.5 13.1 21 15 3.9 17700 21
1.3 0.6 367 15.1 2.7 <1 0.2 5.7 10 9 2.4 5700 13
1.5 0.5 184 17.2 2.5 <1 0.1 18.4 8 5 11.9 17900 8
2 0.7 316 12.5 3.1 2 0.4 7.9 11 9 2.1 7900 13
1.4 0.3 231 10.1 1.4 <1 0.2 5.2 4 4 1.6 5600 7
1.4 0.3 148 6.9 1.5 <1 0.2 3.6 4 4 0.9 1900 5
1.9 0.5 304 11.8 2.4 <1 0.2 4.3 6 5 1.8 4300 9
1.5 0.4 343 13.7 1.9 1 0.3 6.6 6 6 2.1 14200 11
1.8 1 277 12.5 4.2 2 0.5 9.5 12 7 1.9 7900 14
1.4 0.6 179 13.3 2.4 <1 0.2 3.6 7 6 1.3 3700 9
2.7 1.6 269 14.1 7 1 0.3 7.6 26 11 3.2 10700 13
1.6 0.9 291 14 3.7 <1 0.2 8.2 11 7 3.1 12000 12
3.2 2.3 161 10.3 8.5 2 0.2 10.5 21 5 5.2 11300 9
33.8 18 211 10.4 92 3 0.2 7.7 101 9 5.9 19900 15
2.7 1.1 276 16.1 4.5 <1 0.3 6.6 11 4 2.8 21500 18
2.3 1.3 368 14.7 5.6 1 0.5 5.7 18 12 1.9 14300 16
1.9 0.7 311 14.3 2.8 1 0.3 7 12 7 1.7 9800 11
2 1.1 308 20.8 4.8 1 0.4 5.4 13 17 2.4 10400 15
2.1 1.1 270 12 6.4 1 0.3 8.4 11 4 1.4 6400 10
1.8 1.1 215 18 4.2 1 0.3 4.7 19 8 1.4 7500 6
2.2 1.5 415 26.4 5.8 <1 0.3 8.6 21 13 2.4 6500 14
1.3 0.7 410 26.7 2.6 <1 0.3 7.4 16 14 2.9 2900 13
1 0.5 329 18.4 1.7 <1 0.2 5.3 9 3 2.2 4100 13
0.7 <0.2 342 9.2 0.8 <1 0.1 4.3 7 5 1.6 1500 6
1.3 0.8 396 22.8 2.8 2 0.4 8.8 15 26 3.9 3600 11
0.8 0.3 480 25.2 1.3 <1 0.2 6.9 9 9 2.8 2700 9
1.1 0.6 273 23.1 1.8 <1 0.1 8 14 6 3 4800 15
1.1 0.5 442 24.1 1.8 <1 0.3 6.5 10 9 2 9500 10
1.6 0.6 251 11.5 2.4 2 0.4 3.9 13 9 1.1 2900 7
2.1 1.3 202 17.4 4.6 <1 0.2 8.5 15 7 2.8 10000 11
MMI 10
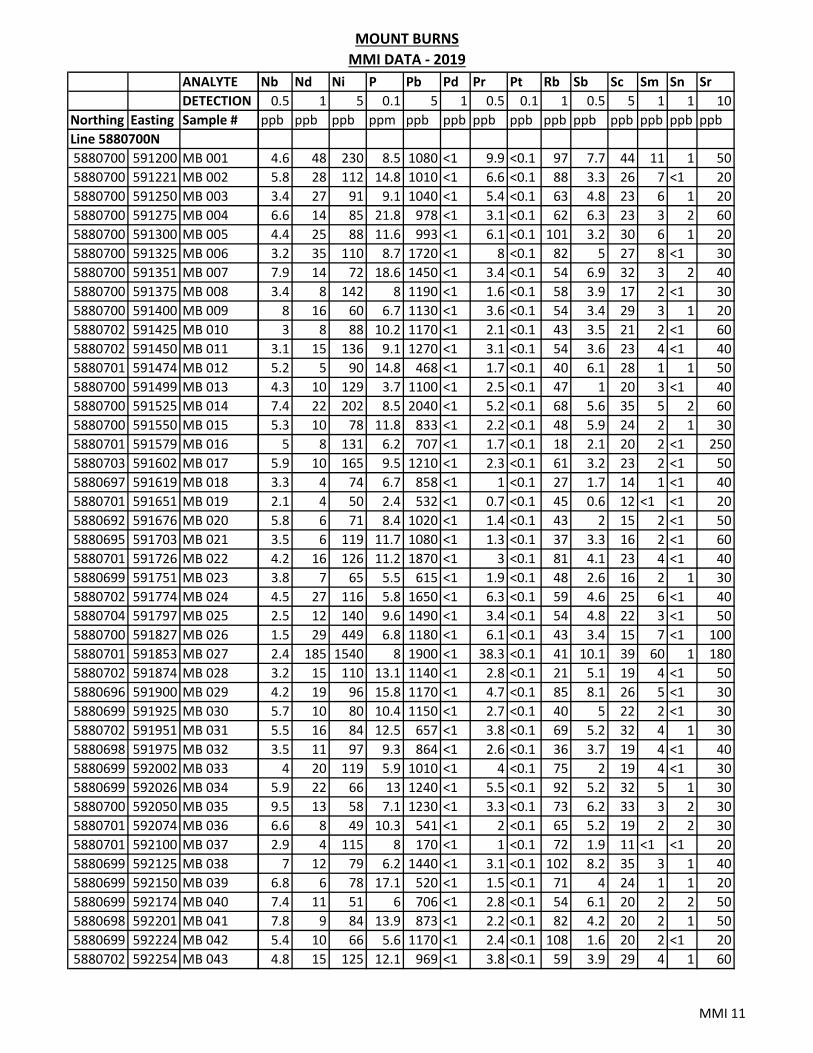
MOUNT BURNS
MMI DATA ‐ 2019
ANALYTE
DETECTION
Northing Easting Sample #
Line 5880700N
5880700 591200 MB 001
5880700 591221 MB 002
5880700 591250 MB 003
5880700 591275 MB 004
5880700 591300 MB 005
5880700 591325 MB 006
5880700 591351 MB 007
5880700 591375 MB 008
5880700 591400 MB 009
5880702 591425 MB 010
5880702 591450 MB 011
5880701 591474 MB 012
5880700 591499 MB 013
5880700 591525 MB 014
5880700 591550 MB 015
5880701 591579 MB 016
5880703 591602 MB 017
5880697 591619 MB 018
5880701 591651 MB 019
5880692 591676 MB 020
5880695 591703 MB 021
5880701 591726 MB 022
5880699 591751 MB 023
5880702 591774 MB 024
5880704 591797 MB 025
5880700 591827 MB 026
5880701 591853 MB 027
5880702 591874 MB 028
5880696 591900 MB 029
5880699 591925 MB 030
5880702 591951 MB 031
5880698 591975 MB 032
5880699 592002 MB 033
5880699 592026 MB 034
5880700 592050 MB 035
5880701 592074 MB 036
5880701 592100 MB 037
5880699 592125 MB 038
5880699 592150 MB 039
5880699 592174 MB 040
5880698 592201 MB 041
5880699 592224 MB 042
5880702 592254 MB 043
Nb Nd Ni P Pb Pd Pr Pt Rb Sb Sc Sm Sn Sr
0.5 1 5 0.1 5 1 0.5 0.1 1 0.5 5 1 1 10
ppb ppb ppb ppm ppb ppb ppb ppb ppb ppb ppb ppb ppb ppb
4.6 48 230 8.5 1080 <1 9.9 <0.1 97 7.7 44 11 1 50
5.8 28 112 14.8 1010 <1 6.6 <0.1 88 3.3 26 7 <1 20
3.4 27 91 9.1 1040 <1 5.4 <0.1 63 4.8 23 6 1 20
6.6 14 85 21.8 978 <1 3.1 <0.1 62 6.3 23 3 2 60
4.4 25 88 11.6 993 <1 6.1 <0.1 101 3.2 30 6 1 20
3.2 35 110 8.7 1720 <1 8 <0.1 82 5 27 8 <1 30
7.9 14 72 18.6 1450 <1 3.4 <0.1 54 6.9 32 3 2 40
3.4 8 142 8 1190 <1 1.6 <0.1 58 3.9 17 2 <1 30
8 16 60 6.7 1130 <1 3.6 <0.1 54 3.4 29 3 1 20
3 8 88 10.2 1170 <1 2.1 <0.1 43 3.5 21 2 <1 60
3.1 15 136 9.1 1270 <1 3.1 <0.1 54 3.6 23 4 <1 40
5.2 5 90 14.8 468 <1 1.7 <0.1 40 6.1 28 1 1 50
4.3 10 129 3.7 1100 <1 2.5 <0.1 47 1 20 3 <1 40
7.4 22 202 8.5 2040 <1 5.2 <0.1 68 5.6 35 5 2 60
5.3 10 78 11.8 833 <1 2.2 <0.1 48 5.9 24 2 1 30
5 8 131 6.2 707 <1 1.7 <0.1 18 2.1 20 2 <1 250
5.9 10 165 9.5 1210 <1 2.3 <0.1 61 3.2 23 2 <1 50
3.3 4 74 6.7 858 <1 1 <0.1 27 1.7 14 1 <1 40
2.1 4 50 2.4 532 <1 0.7 <0.1 45 0.6 12 <1 <1 20
5.8 6 71 8.4 1020 <1 1.4 <0.1 43 2 15 2 <1 50
3.5 6 119 11.7 1080 <1 1.3 <0.1 37 3.3 16 2 <1 60
4.2 16 126 11.2 1870 <1 3 <0.1 81 4.1 23 4 <1 40
3.8 7 65 5.5 615 <1 1.9 <0.1 48 2.6 16 2 1 30
4.5 27 116 5.8 1650 <1 6.3 <0.1 59 4.6 25 6 <1 40
2.5 12 140 9.6 1490 <1 3.4 <0.1 54 4.8 22 3 <1 50
1.5 29 449 6.8 1180 <1 6.1 <0.1 43 3.4 15 7 <1 100
2.4 185 1540 8 1900 <1 38.3 <0.1 41 10.1 39 60 1 180
3.2 15 110 13.1 1140 <1 2.8 <0.1 21 5.1 19 4 <1 50
4.2 19 96 15.8 1170 <1 4.7 <0.1 85 8.1 26 5 <1 30
5.7 10 80 10.4 1150 <1 2.7 <0.1 40 5 22 2 <1 30
5.5 16 84 12.5 657 <1 3.8 <0.1 69 5.2 32 4 1 30
3.5 11 97 9.3 864 <1 2.6 <0.1 36 3.7 19 4 <1 40
4 20 119 5.9 1010 <1 4 <0.1 75 2 19 4 <1 30
5.9 22 66 13 1240 <1 5.5 <0.1 92 5.2 32 5 1 30
9.5 13 58 7.1 1230 <1 3.3 <0.1 73 6.2 33 3 2 30
6.6 8 49 10.3 541 <1 2 <0.1 65 5.2 19 2 2 30
2.9 4 115 8 170 <1 1 <0.1 72 1.9 11 <1 <1 20
7 12 79 6.2 1440 <1 3.1 <0.1 102 8.2 35 3 1 40
6.8 6 78 17.1 520 <1 1.5 <0.1 71 4 24 1 1 20
7.4 11 51 6 706 <1 2.8 <0.1 54 6.1 20 2 2 50
7.8 9 84 13.9 873 <1 2.2 <0.1 82 4.2 20 2 1 50
5.4 10 66 5.6 1170 <1 2.4 <0.1 108 1.6 20 2 <1 20
4.8 15 125 12.1 969 <1 3.8 <0.1 59 3.9 29 4 1 60
MMI 11
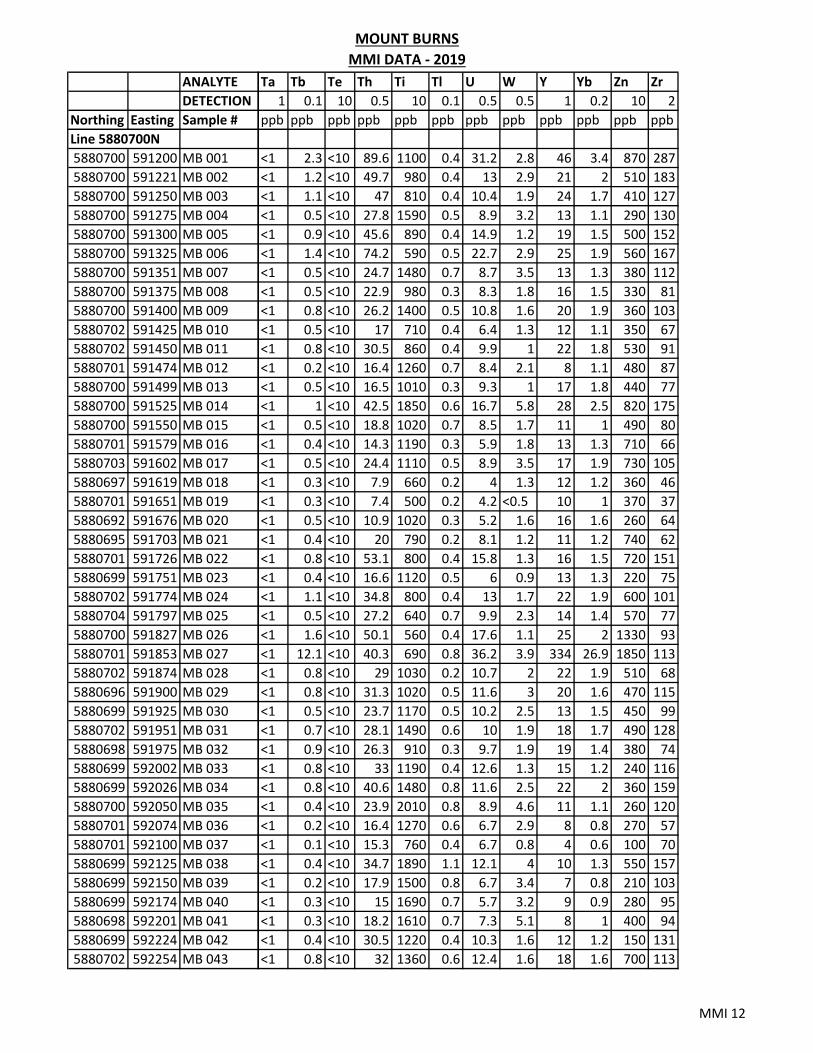
MOUNT BURNS
MMI DATA ‐ 2019
ANALYTE
DETECTION
Northing Easting Sample #
Line 5880700N
5880700 591200 MB 001
5880700 591221 MB 002
5880700 591250 MB 003
5880700 591275 MB 004
5880700 591300 MB 005
5880700 591325 MB 006
5880700 591351 MB 007
5880700 591375 MB 008
5880700 591400 MB 009
5880702 591425 MB 010
5880702 591450 MB 011
5880701 591474 MB 012
5880700 591499 MB 013
5880700 591525 MB 014
5880700 591550 MB 015
5880701 591579 MB 016
5880703 591602 MB 017
5880697 591619 MB 018
5880701 591651 MB 019
5880692 591676 MB 020
5880695 591703 MB 021
5880701 591726 MB 022
5880699 591751 MB 023
5880702 591774 MB 024
5880704 591797 MB 025
5880700 591827 MB 026
5880701 591853 MB 027
5880702 591874 MB 028
5880696 591900 MB 029
5880699 591925 MB 030
5880702 591951 MB 031
5880698 591975 MB 032
5880699 592002 MB 033
5880699 592026 MB 034
5880700 592050 MB 035
5880701 592074 MB 036
5880701 592100 MB 037
5880699 592125 MB 038
5880699 592150 MB 039
5880699 592174 MB 040
5880698 592201 MB 041
5880699 592224 MB 042
5880702 592254 MB 043
Ta Tb Te Th Ti Tl U W Y Yb Zn Zr
1 0.1 10 0.5 10 0.1 0.5 0.5 1 0.2 10 2
ppb ppb ppb ppb ppb ppb ppb ppb ppb ppb ppb ppb
<1 2.3 <10 89.6 1100 0.4 31.2 2.8 46 3.4 870 287
<1 1.2 <10 49.7 980 0.4 13 2.9 21 2 510 183
<1 1.1 <10 47 810 0.4 10.4 1.9 24 1.7 410 127
<1 0.5 <10 27.8 1590 0.5 8.9 3.2 13 1.1 290 130
<1 0.9 <10 45.6 890 0.4 14.9 1.2 19 1.5 500 152
<1 1.4 <10 74.2 590 0.5 22.7 2.9 25 1.9 560 167
<1 0.5 <10 24.7 1480 0.7 8.7 3.5 13 1.3 380 112
<1 0.5 <10 22.9 980 0.3 8.3 1.8 16 1.5 330 81
<1 0.8 <10 26.2 1400 0.5 10.8 1.6 20 1.9 360 103
<1 0.5 <10 17 710 0.4 6.4 1.3 12 1.1 350 67
<1 0.8 <10 30.5 860 0.4 9.9 1 22 1.8 530 91
<1 0.2 <10 16.4 1260 0.7 8.4 2.1 8 1.1 480 87
<1 0.5 <10 16.5 1010 0.3 9.3 1 17 1.8 440 77
<1 1 <10 42.5 1850 0.6 16.7 5.8 28 2.5 820 175
<1 0.5 <10 18.8 1020 0.7 8.5 1.7 11 1 490 80
<1 0.4 <10 14.3 1190 0.3 5.9 1.8 13 1.3 710 66
<1 0.5 <10 24.4 1110 0.5 8.9 3.5 17 1.9 730 105
<1 0.3 <10 7.9 660 0.2 4 1.3 12 1.2 360 46
<1 0.3 <10 7.4 500 0.2 4.2 <0.5 10 1 370 37
<1 0.5 <10 10.9 1020 0.3 5.2 1.6 16 1.6 260 64
<1 0.4 <10 20 790 0.2 8.1 1.2 11 1.2 740 62
<1 0.8 <10 53.1 800 0.4 15.8 1.3 16 1.5 720 151
<1 0.4 <10 16.6 1120 0.5 6 0.9 13 1.3 220 75
<1 1.1 <10 34.8 800 0.4 13 1.7 22 1.9 600 101
<1 0.5 <10 27.2 640 0.7 9.9 2.3 14 1.4 570 77
<1 1.6 <10 50.1 560 0.4 17.6 1.1 25 2 1330 93
<1 12.1 <10 40.3 690 0.8 36.2 3.9 334 26.9 1850 113
<1 0.8 <10 29 1030 0.2 10.7 2 22 1.9 510 68
<1 0.8 <10 31.3 1020 0.5 11.6 3 20 1.6 470 115
<1 0.5 <10 23.7 1170 0.5 10.2 2.5 13 1.5 450 99
<1 0.7 <10 28.1 1490 0.6 10 1.9 18 1.7 490 128
<1 0.9 <10 26.3 910 0.3 9.7 1.9 19 1.4 380 74
<1 0.8 <10 33 1190 0.4 12.6 1.3 15 1.2 240 116
<1 0.8 <10 40.6 1480 0.8 11.6 2.5 22 2 360 159
<1 0.4 <10 23.9 2010 0.8 8.9 4.6 11 1.1 260 120
<1 0.2 <10 16.4 1270 0.6 6.7 2.9 8 0.8 270 57
<1 0.1 <10 15.3 760 0.4 6.7 0.8 4 0.6 100 70
<1 0.4 <10 34.7 1890 1.1 12.1 4 10 1.3 550 157
<1 0.2 <10 17.9 1500 0.8 6.7 3.4 7 0.8 210 103
<1 0.3 <10 15 1690 0.7 5.7 3.2 9 0.9 280 95
<1 0.3 <10 18.2 1610 0.7 7.3 5.1 8 1 400 94
<1 0.4 <10 30.5 1220 0.4 10.3 1.6 12 1.2 150 131
<1 0.8 <10 32 1360 0.6 12.4 1.6 18 1.6 700 113
MMI 12

26
18 APPENDIX II – GEOCHEMISTRY CERTIFICATES
- not analysed | -- element not determined | I.S. insufficient sample | L.N.R. listed not received
4-Dec-2019 6:27PM BBM_U0001502092 MIN-M_COA_ROW-Last Modified Date: 05-Nov-2019 Page 1 of 42
Project MOUNT BURNS Submission Number GEOTRONICS/ 114 MMI Number of Samples 117
Date Received 04-Nov-2019 Date Analysed 07-Nov-2019 - 04-Dec-2019 Date Completed 04-Dec-2019 SGS Order Number BBM19-01561
To
SURREY V3X 2E1
GEOTRONICS CONSULTING INC.DAVID MARK6204-125th ST
BCCANADA
ANALYSIS REPORT BBM19-01561
Number of Samples Method Code DescriptionG_LOG Sample Registration FeeGE_MMIM Mobile Metal ION standard package,ICP-MS
117117
Methods Summary
Authorised Signatory
John ChiangLaboratory Operations Manager
This document is issued by the Company under its General Conditions of Service accessible at http://www.sgs.com/en/Terms-and-Conditions.aspx. Attention is drawn to the limitation of liability, indemnification and jurisdiction issues defined therein. Any holder of this document is advised that information contained hereon reflects the Company’s findings at the time of its intervention only and within the limits of Client’s instructions, if any. The Company’s sole responsibility is to its Client and this document does not exonerate parties to a transaction from exercising all their rights and obligations under the transaction documents. Any unauthorized alteration, forgery or falsification of the content or appearance of this document is unlawful and offenders may be prosecuted to the fullest extent of the law. WARNING: The sample(s) to which the findings recorded herein (the “Findings”) relate was(were) drawn and / or provided by the Client or by a third party acting at the Client’s direction. The Findings constitute no warranty of the sample’s representativeness of any goods and strictly relate to the sample(s). The Company accepts no liability with regard to the origin or source from which the sample(s) is/are said to be extracted. The findings report on the samples provided by the client and are not intended for commercial or contractual settlement puposes.
www.sgs.comCA MIN Burnaby, BC 3260 Production Way, Burnaby, BC V5A 4W4 Burnaby CANADA t +1 (604) 638 2349 f
Member of the SGS Group (SGS SA)
SGS Canada

Project MOUNT BURNS Submission Number GEOTRONICS/ 114 MMI Number of Samples 117
ANALYSIS REPORT BBM19-01561
Element Ag Al As Au Ba BiMethod GE_MMIM GE_MMIM GE_MMIM GE_MMIM GE_MMIM GE_MMIMLower Limit 0.5 100.1101 0.5Upper Limit -- -------- --Unit ppb ppbppbppbppm m / m ppbMB 001 5.5MB 002 2.9MB 003 3.4MB 004 4.8MB 005 2.0MB 006 3.1MB 007 4.6MB 008 2.6MB 009 2.4MB 010 3.1MB 011 3.4MB 012 3.7MB 013 1.5MB 014 4.5MB 015 3.6MB 016 2.5MB 017 2.2MB 018 1.8MB 019 0.6MB 020 2.3MB 021 3.0MB 022 3.0MB 023 1.9MB 024 3.9MB 025 4.1MB 026 2.2MB 027 4.1MB 028 3.9MB 029 3.1MB 030 3.5
- not analysed | -- element not determined | I.S. insufficient sample | L.N.R. listed not received
4-Dec-2019 6:27PM BBM_U0001502092 MIN-M_COA_ROW-Last Modified Date: 05-Nov-2019 Page 2 of 42
92.1 271 160 1.1 760
www.sgs.comCA MIN Burnaby, BC 3260 Production Way, Burnaby, BC V5A 4W4 Burnaby CANADA t +1 (604) 638 2349 f
Member of the SGS Group (SGS SA)
SGS Canada
61.5 239 90 0.5 720
77.1 175 100 0.4 600
31.9 209 140 0.2 950
161 256 80 0.7 540
84.9 224 110 0.6 570
46.2 175 170 0.1 800
59.9 213 80 0.3 460
50.2 239 80 0.2 460
26.2 191 100 0.1 450
33.3 204 80 0.2 720
19.6 157 170 0.2 880
30.1 231 30 0.4 690
44.4 253 180 0.7 880
75.6 192 140 0.2 470
45.0 215 60 0.2 540
32.0 193 90 0.5 720
16.6 189 60 0.1 370
45.7 209 10 0.2 430
4.9 201 60 <0.1 550
39.8 173 80 0.2 770
105 206 80 0.3 500
15.7 231 40 0.2 550
50.2 200 110 0.2 760
25.7 166 120 0.2 990
82.6 162 60 0.7 840
54.4 109 150 1.5 1360
29.9 184 100 0.1 620
52.7 187 130 0.4 820
22.1 196 90 0.3 700

Project MOUNT BURNS Submission Number GEOTRONICS/ 114 MMI Number of Samples 117
ANALYSIS REPORT BBM19-01561
Element Ag Al As Au Ba BiMethod GE_MMIM GE_MMIM GE_MMIM GE_MMIM GE_MMIM GE_MMIMLower Limit 0.5 100.1101 0.5Upper Limit -- -------- --Unit ppb ppbppbppbppm m / m ppbMB 031 2.5MB 032 2.0MB 033 2.6MB 034 5.1MB 035 5.6MB 036 5.2MB 037 1.4MB 038 4.8MB 039 4.3MB 040 5.7MB 041 4.9MB 042 1.3MB 043 3.0MB 044 3.9MB 045 2.7MB 046 3.4MB 047 2.0MB 048 3.5MB 049 2.4MB 050 1.9MB 051 2.1MB 052 2.0MB 053 1.6MB 054 1.8MB 055 2.7MB 056 2.5MB 057 2.2MB 058 3.7MB 059 <0.5MB 060 <0.5
- not analysed | -- element not determined | I.S. insufficient sample | L.N.R. listed not received
4-Dec-2019 6:27PM BBM_U0001502092 MIN-M_COA_ROW-Last Modified Date: 05-Nov-2019 Page 3 of 42
28.3 213 80 0.3 840
www.sgs.comCA MIN Burnaby, BC 3260 Production Way, Burnaby, BC V5A 4W4 Burnaby CANADA t +1 (604) 638 2349 f
Member of the SGS Group (SGS SA)
SGS Canada
14.5 185 70 0.2 630
50.8 197 60 0.3 450
77.1 208 140 0.2 800
51.0 204 160 0.5 580
23.4 136 180 <0.1 420
52.0 135 60 0.3 420
159 213 200 0.8 790
27.1 160 150 0.4 670
18.5 149 120 0.3 620
24.6 137 160 0.2 540
25.8 241 50 0.2 390
25.4 190 70 0.1 1870
78.2 218 120 0.4 1270
50.7 179 110 0.2 700
80.3 210 200 1.2 650
30.7 144 70 1.0 510
72.6 203 140 0.1 1260
27.5 196 160 0.3 740
34.9 210 80 0.5 730
122 232 100 0.3 1370
145 271 90 0.9 660
124 208 70 1.2 940
84.2 190 70 1.1 760
47.3 209 100 0.3 980
66.1 127 100 1.1 1130
43.6 94 80 0.8 530
14.5 120 100 0.1 1360
120 56 <10 2.0 140
38.0 83 <10 0.3 380

Project MOUNT BURNS Submission Number GEOTRONICS/ 114 MMI Number of Samples 117
ANALYSIS REPORT BBM19-01561
Element Ag Al As Au Ba BiMethod GE_MMIM GE_MMIM GE_MMIM GE_MMIM GE_MMIM GE_MMIMLower Limit 0.5 100.1101 0.5Upper Limit -- -------- --Unit ppb ppbppbppbppm m / m ppbMB 061 L.N.RMB 063 1.3MB 065 <0.5MB 067 0.6MB 068 3.4MB 069 1.6MB 070 2.3MB 071 2.9MB 072 4.0MB 073 2.9MB 074 3.0MB 075 3.5MB 076 3.7MB 078 4.3MB 079 0.5MB 080 <0.5MB 081 3.1MB 082 4.7MB 083 3.9MB 084 4.0MB 085 5.1MB 086 3.6MB 087 1.0MB 088 0.6MB 089 0.8MB 090 2.3MB 091 2.7MB 092 3.9MB 093 3.0MB 094 2.6
- not analysed | -- element not determined | I.S. insufficient sample | L.N.R. listed not received
4-Dec-2019 6:27PM BBM_U0001502092 MIN-M_COA_ROW-Last Modified Date: 05-Nov-2019 Page 4 of 42
L.N.R L.N.R L.N.R L.N.R L.N.R
www.sgs.comCA MIN Burnaby, BC 3260 Production Way, Burnaby, BC V5A 4W4 Burnaby CANADA t +1 (604) 638 2349 f
Member of the SGS Group (SGS SA)
SGS Canada
4.4 120 40 0.1 440
46.5 71 <10 0.3 120
116 118 50 0.9 440
40.1 160 120 1.0 710
28.4 155 40 0.3 680
17.3 183 60 0.1 590
33.9 257 70 0.5 830
47.2 205 110 0.3 1200
73.0 245 90 0.9 640
17.4 235 110 0.2 1090
29.5 282 110 0.4 1150
54.5 169 80 0.3 810
26.9 217 100 0.3 650
28.4 69 20 0.2 460
19.0 13 <10 <0.1 130
12.2 188 130 0.2 670
43.3 147 120 0.4 930
44.4 170 100 0.1 610
65.8 199 110 0.2 490
21.0 225 140 0.2 560
41.4 258 110 0.7 620
25.2 212 50 0.3 560
41.1 165 30 0.2 440
23.6 76 30 1.1 850
16.6 258 100 0.6 1020
46.8 303 120 0.2 1070
23.8 204 110 0.2 1850
20.3 216 70 0.1 1350
17.8 212 80 0.1 1050
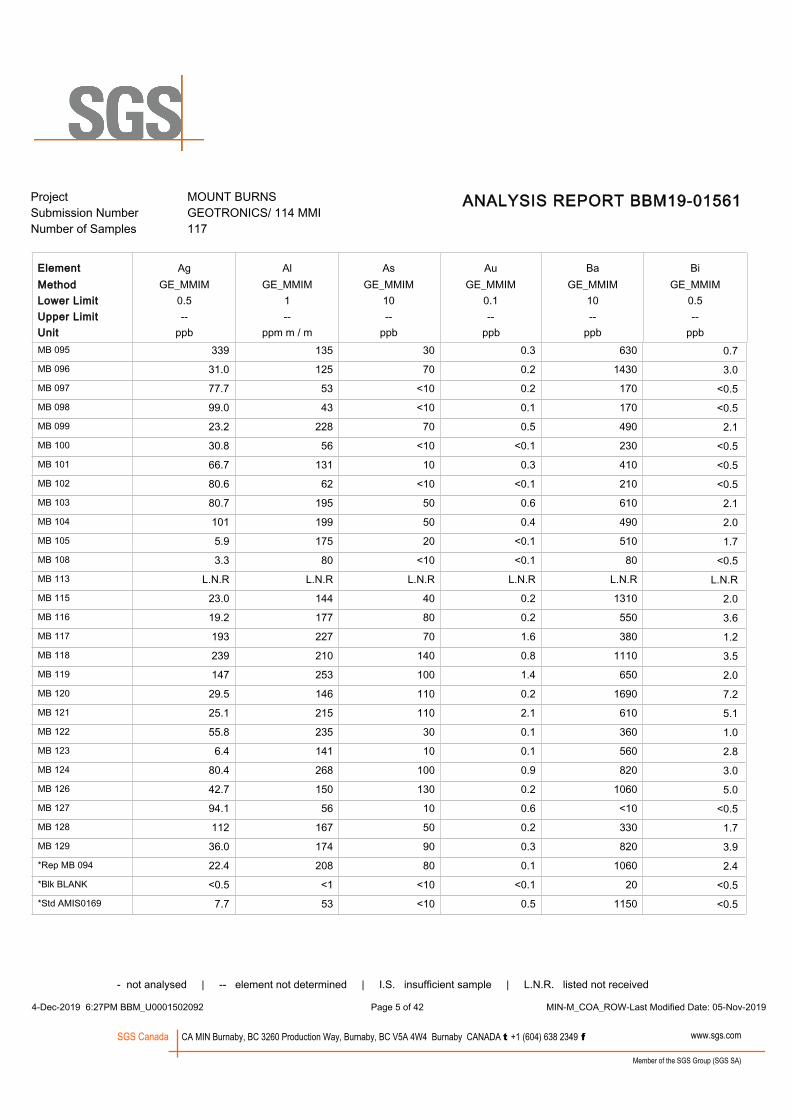
Project MOUNT BURNS Submission Number GEOTRONICS/ 114 MMI Number of Samples 117
ANALYSIS REPORT BBM19-01561
Element Ag Al As Au Ba BiMethod GE_MMIM GE_MMIM GE_MMIM GE_MMIM GE_MMIM GE_MMIMLower Limit 0.5 100.1101 0.5Upper Limit -- -------- --Unit ppb ppbppbppbppm m / m ppbMB 095 0.7MB 096 3.0MB 097 <0.5MB 098 <0.5MB 099 2.1MB 100 <0.5MB 101 <0.5MB 102 <0.5MB 103 2.1MB 104 2.0MB 105 1.7MB 108 <0.5MB 113 L.N.RMB 115 2.0MB 116 3.6MB 117 1.2MB 118 3.5MB 119 2.0MB 120 7.2MB 121 5.1MB 122 1.0MB 123 2.8MB 124 3.0MB 126 5.0MB 127 <0.5MB 128 1.7MB 129 3.9*Rep MB 094 2.4*Blk BLANK <0.5*Std AMIS0169 <0.5
- not analysed | -- element not determined | I.S. insufficient sample | L.N.R. listed not received
4-Dec-2019 6:27PM BBM_U0001502092 MIN-M_COA_ROW-Last Modified Date: 05-Nov-2019 Page 5 of 42
339 135 30 0.3 630
www.sgs.comCA MIN Burnaby, BC 3260 Production Way, Burnaby, BC V5A 4W4 Burnaby CANADA t +1 (604) 638 2349 f
Member of the SGS Group (SGS SA)
SGS Canada
31.0 125 70 0.2 1430
77.7 53 <10 0.2 170
99.0 43 <10 0.1 170
23.2 228 70 0.5 490
30.8 56 <10 <0.1 230
66.7 131 10 0.3 410
80.6 62 <10 <0.1 210
80.7 195 50 0.6 610
101 199 50 0.4 490
5.9 175 20 <0.1 510
3.3 80 <10 <0.1 80
L.N.R L.N.R L.N.R L.N.R L.N.R
23.0 144 40 0.2 1310
19.2 177 80 0.2 550
193 227 70 1.6 380
239 210 140 0.8 1110
147 253 100 1.4 650
29.5 146 110 0.2 1690
25.1 215 110 2.1 610
55.8 235 30 0.1 360
6.4 141 10 0.1 560
80.4 268 100 0.9 820
42.7 150 130 0.2 1060
94.1 56 10 0.6 <10
112 167 50 0.2 330
36.0 174 90 0.3 820
22.4 208 80 0.1 1060
<0.5 <1 <10 <0.1 20
7.7 53 <10 0.5 1150
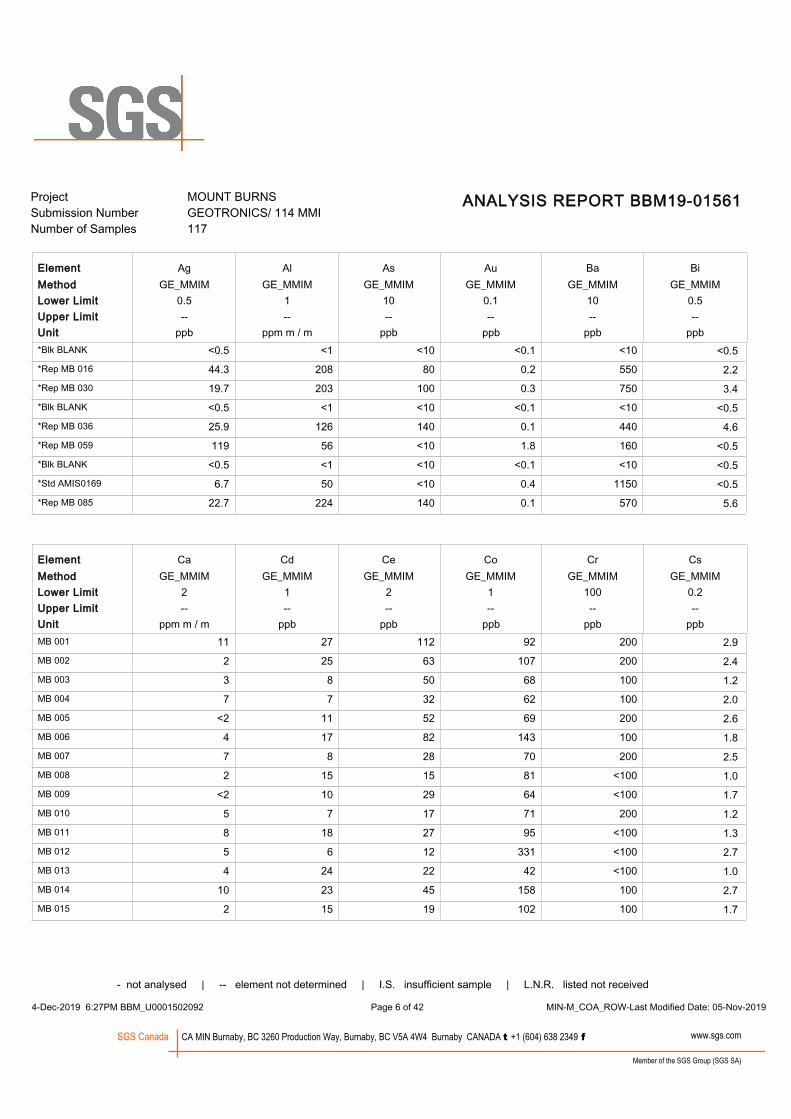
Project MOUNT BURNS Submission Number GEOTRONICS/ 114 MMI Number of Samples 117
ANALYSIS REPORT BBM19-01561
Element Ag Al As Au Ba BiMethod GE_MMIM GE_MMIM GE_MMIM GE_MMIM GE_MMIM GE_MMIMLower Limit 0.5 100.1101 0.5Upper Limit -- -------- --Unit ppb ppbppbppbppm m / m ppb*Blk BLANK <0.5*Rep MB 016 2.2*Rep MB 030 3.4*Blk BLANK <0.5*Rep MB 036 4.6*Rep MB 059 <0.5*Blk BLANK <0.5*Std AMIS0169 <0.5*Rep MB 085 5.6
Element Ca Cd Ce Co Cr CsMethod GE_MMIM GE_MMIM GE_MMIM GE_MMIM GE_MMIM GE_MMIMLower Limit 2 100121 0.2Upper Limit -- -------- --Unit ppm m / m ppbppbppbppb ppbMB 001 2.9MB 002 2.4MB 003 1.2MB 004 2.0MB 005 2.6MB 006 1.8MB 007 2.5MB 008 1.0MB 009 1.7MB 010 1.2MB 011 1.3MB 012 2.7MB 013 1.0MB 014 2.7MB 015 1.7
- not analysed | -- element not determined | I.S. insufficient sample | L.N.R. listed not received
4-Dec-2019 6:27PM BBM_U0001502092 MIN-M_COA_ROW-Last Modified Date: 05-Nov-2019 Page 6 of 42
<0.5 <1 <10 <0.1 <10
11 27 112 92 200
www.sgs.comCA MIN Burnaby, BC 3260 Production Way, Burnaby, BC V5A 4W4 Burnaby CANADA t +1 (604) 638 2349 f
Member of the SGS Group (SGS SA)
SGS Canada
44.3 208 80 0.2 550
19.7 203 100 0.3 750
<0.5 <1 <10 <0.1 <10
25.9 126 140 0.1 440
119 56 <10 1.8 160
<0.5 <1 <10 <0.1 <10
6.7 50 <10 0.4 1150
22.7 224 140 0.1 570
2 25 63 107 200
3 8 50 68 100
7 7 32 62 100
<2 11 52 69 200
4 17 82 143 100
7 8 28 70 200
2 15 15 81 <100
<2 10 29 64 <100
5 7 17 71 200
8 18 27 95 <100
5 6 12 331 <100
4 24 22 42 <100
10 23 45 158 100
2 15 19 102 100
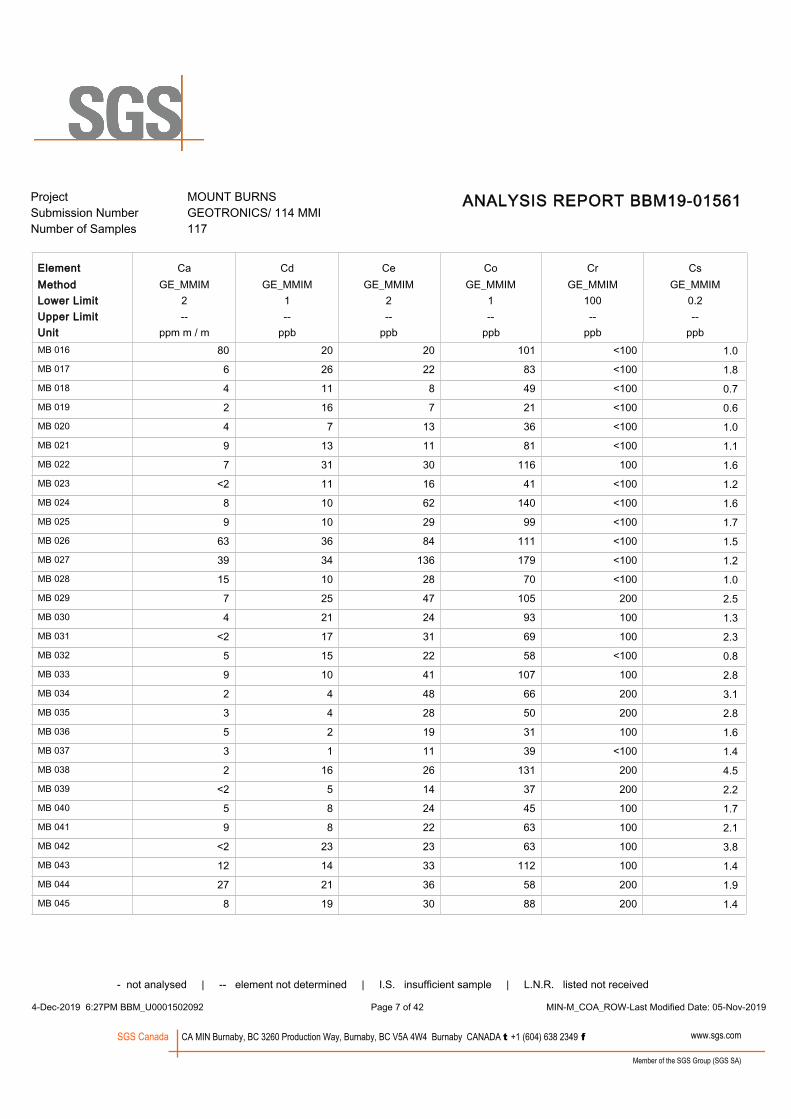
Project MOUNT BURNS Submission Number GEOTRONICS/ 114 MMI Number of Samples 117
ANALYSIS REPORT BBM19-01561
Element Ca Cd Ce Co Cr CsMethod GE_MMIM GE_MMIM GE_MMIM GE_MMIM GE_MMIM GE_MMIMLower Limit 2 100121 0.2Upper Limit -- -------- --Unit ppm m / m ppbppbppbppb ppbMB 016 1.0MB 017 1.8MB 018 0.7MB 019 0.6MB 020 1.0MB 021 1.1MB 022 1.6MB 023 1.2MB 024 1.6MB 025 1.7MB 026 1.5MB 027 1.2MB 028 1.0MB 029 2.5MB 030 1.3MB 031 2.3MB 032 0.8MB 033 2.8MB 034 3.1MB 035 2.8MB 036 1.6MB 037 1.4MB 038 4.5MB 039 2.2MB 040 1.7MB 041 2.1MB 042 3.8MB 043 1.4MB 044 1.9MB 045 1.4
- not analysed | -- element not determined | I.S. insufficient sample | L.N.R. listed not received
4-Dec-2019 6:27PM BBM_U0001502092 MIN-M_COA_ROW-Last Modified Date: 05-Nov-2019 Page 7 of 42
80 20 20 101 <100
www.sgs.comCA MIN Burnaby, BC 3260 Production Way, Burnaby, BC V5A 4W4 Burnaby CANADA t +1 (604) 638 2349 f
Member of the SGS Group (SGS SA)
SGS Canada
6 26 22 83 <100
4 11 8 49 <100
2 16 7 21 <100
4 7 13 36 <100
9 13 11 81 <100
7 31 30 116 100
<2 11 16 41 <100
8 10 62 140 <100
9 10 29 99 <100
63 36 84 111 <100
39 34 136 179 <100
15 10 28 70 <100
7 25 47 105 200
4 21 24 93 100
<2 17 31 69 100
5 15 22 58 <100
9 10 41 107 100
2 4 48 66 200
3 4 28 50 200
5 2 19 31 100
3 1 11 39 <100
2 16 26 131 200
<2 5 14 37 200
5 8 24 45 100
9 8 22 63 100
<2 23 23 63 100
12 14 33 112 100
27 21 36 58 200
8 19 30 88 200

Project MOUNT BURNS Submission Number GEOTRONICS/ 114 MMI Number of Samples 117
ANALYSIS REPORT BBM19-01561
Element Ca Cd Ce Co Cr CsMethod GE_MMIM GE_MMIM GE_MMIM GE_MMIM GE_MMIM GE_MMIMLower Limit 2 100121 0.2Upper Limit -- -------- --Unit ppm m / m ppbppbppbppb ppbMB 046 2.8MB 047 2.1MB 048 1.3MB 049 1.3MB 050 1.3MB 051 1.5MB 052 3.1MB 053 2.4MB 054 1.7MB 055 1.5MB 056 1.9MB 057 1.8MB 058 1.4MB 059 1.7MB 060 2.2MB 061 L.N.RMB 063 1.6MB 065 1.9MB 067 1.5MB 068 2.6MB 069 1.3MB 070 1.6MB 071 1.7MB 072 3.1MB 073 1.5MB 074 1.8MB 075 2.0MB 076 1.1MB 078 1.6MB 079 1.2
- not analysed | -- element not determined | I.S. insufficient sample | L.N.R. listed not received
4-Dec-2019 6:27PM BBM_U0001502092 MIN-M_COA_ROW-Last Modified Date: 05-Nov-2019 Page 8 of 42
7 27 102 161 100
www.sgs.comCA MIN Burnaby, BC 3260 Production Way, Burnaby, BC V5A 4W4 Burnaby CANADA t +1 (604) 638 2349 f
Member of the SGS Group (SGS SA)
SGS Canada
19 13 41 54 <100
3 10 24 85 100
<2 19 17 74 100
5 41 27 92 <100
25 31 59 141 100
<2 35 53 125 100
50 67 149 133 <100
50 27 49 73 100
27 30 31 139 <100
15 41 34 219 <100
140 16 81 143 <100
60 15 27 407 <100
319 25 14 17 <100
267 67 243 261 <100
L.N.R L.N.R L.N.R L.N.R L.N.R
43 5 53 103 <100
306 30 41 63 <100
205 94 114 90 <100
22 18 33 182 100
7 16 20 390 <100
4 4 10 58 <100
11 18 28 47 100
12 25 32 122 100
3 15 40 90 100
2 7 22 48 100
7 18 26 104 200
15 23 33 110 <100
15 40 63 126 100
228 29 166 388 <100
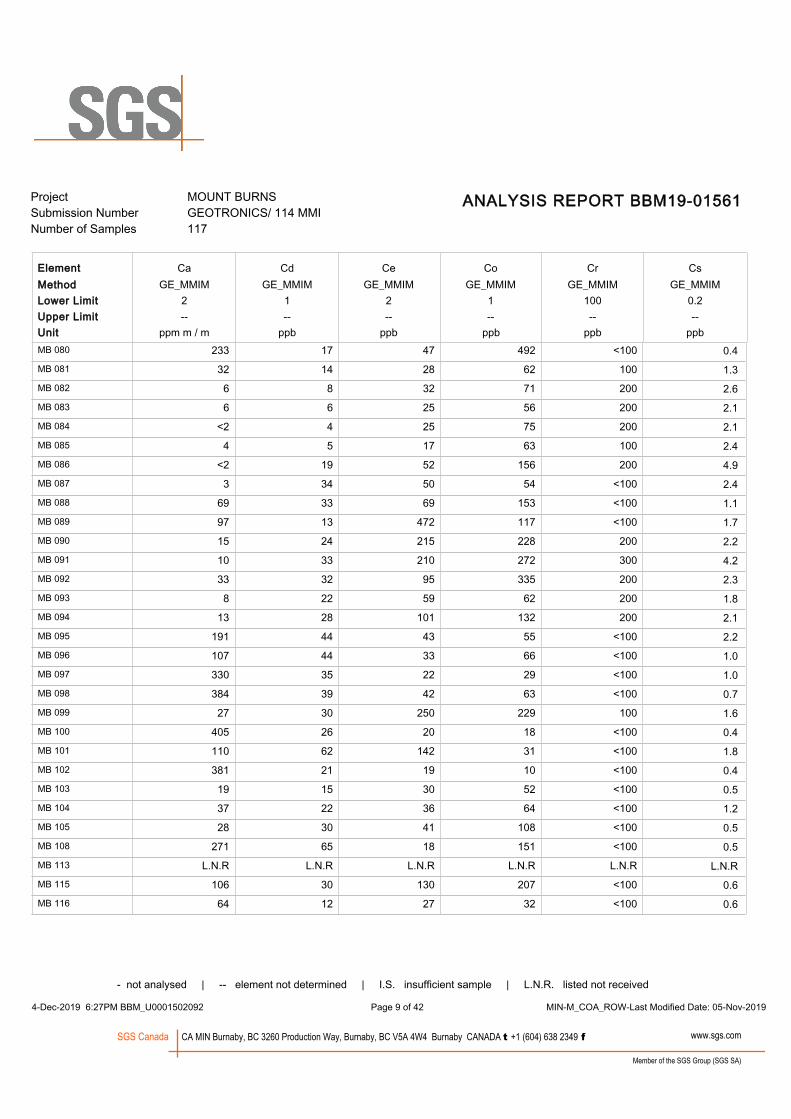
Project MOUNT BURNS Submission Number GEOTRONICS/ 114 MMI Number of Samples 117
ANALYSIS REPORT BBM19-01561
Element Ca Cd Ce Co Cr CsMethod GE_MMIM GE_MMIM GE_MMIM GE_MMIM GE_MMIM GE_MMIMLower Limit 2 100121 0.2Upper Limit -- -------- --Unit ppm m / m ppbppbppbppb ppbMB 080 0.4MB 081 1.3MB 082 2.6MB 083 2.1MB 084 2.1MB 085 2.4MB 086 4.9MB 087 2.4MB 088 1.1MB 089 1.7MB 090 2.2MB 091 4.2MB 092 2.3MB 093 1.8MB 094 2.1MB 095 2.2MB 096 1.0MB 097 1.0MB 098 0.7MB 099 1.6MB 100 0.4MB 101 1.8MB 102 0.4MB 103 0.5MB 104 1.2MB 105 0.5MB 108 0.5MB 113 L.N.RMB 115 0.6MB 116 0.6
- not analysed | -- element not determined | I.S. insufficient sample | L.N.R. listed not received
4-Dec-2019 6:27PM BBM_U0001502092 MIN-M_COA_ROW-Last Modified Date: 05-Nov-2019 Page 9 of 42
233 17 47 492 <100
www.sgs.comCA MIN Burnaby, BC 3260 Production Way, Burnaby, BC V5A 4W4 Burnaby CANADA t +1 (604) 638 2349 f
Member of the SGS Group (SGS SA)
SGS Canada
32 14 28 62 100
6 8 32 71 200
6 6 25 56 200
<2 4 25 75 200
4 5 17 63 100
<2 19 52 156 200
3 34 50 54 <100
69 33 69 153 <100
97 13 472 117 <100
15 24 215 228 200
10 33 210 272 300
33 32 95 335 200
8 22 59 62 200
13 28 101 132 200
191 44 43 55 <100
107 44 33 66 <100
330 35 22 29 <100
384 39 42 63 <100
27 30 250 229 100
405 26 20 18 <100
110 62 142 31 <100
381 21 19 10 <100
19 15 30 52 <100
37 22 36 64 <100
28 30 41 108 <100
271 65 18 151 <100
L.N.R L.N.R L.N.R L.N.R L.N.R
106 30 130 207 <100
64 12 27 32 <100
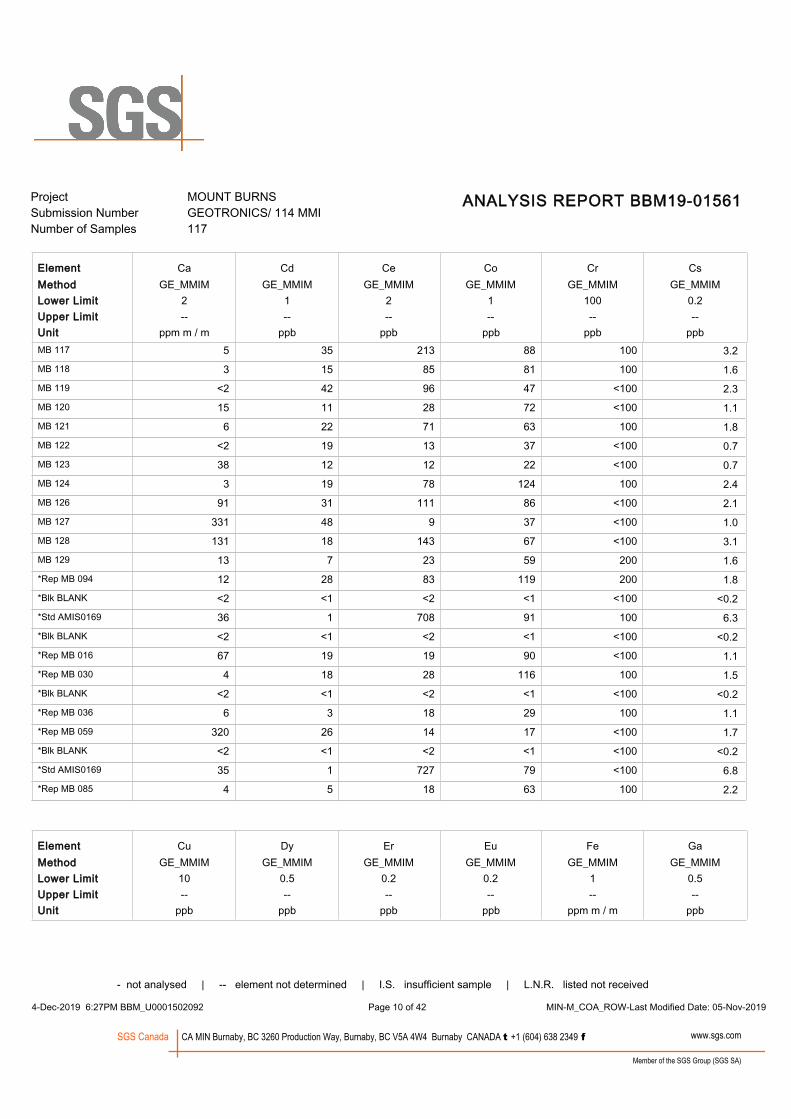
Project MOUNT BURNS Submission Number GEOTRONICS/ 114 MMI Number of Samples 117
ANALYSIS REPORT BBM19-01561
Element Ca Cd Ce Co Cr CsMethod GE_MMIM GE_MMIM GE_MMIM GE_MMIM GE_MMIM GE_MMIMLower Limit 2 100121 0.2Upper Limit -- -------- --Unit ppm m / m ppbppbppbppb ppbMB 117 3.2MB 118 1.6MB 119 2.3MB 120 1.1MB 121 1.8MB 122 0.7MB 123 0.7MB 124 2.4MB 126 2.1MB 127 1.0MB 128 3.1MB 129 1.6*Rep MB 094 1.8*Blk BLANK <0.2*Std AMIS0169 6.3*Blk BLANK <0.2*Rep MB 016 1.1*Rep MB 030 1.5*Blk BLANK <0.2*Rep MB 036 1.1*Rep MB 059 1.7*Blk BLANK <0.2*Std AMIS0169 6.8*Rep MB 085 2.2
Element Cu Dy Er Eu Fe GaMethod GE_MMIM GE_MMIM GE_MMIM GE_MMIM GE_MMIM GE_MMIMLower Limit 10 10.20.20.5 0.5Upper Limit -- -------- --Unit ppb ppm m / mppbppbppb ppb
- not analysed | -- element not determined | I.S. insufficient sample | L.N.R. listed not received
4-Dec-2019 6:27PM BBM_U0001502092 MIN-M_COA_ROW-Last Modified Date: 05-Nov-2019 Page 10 of 42
5 35 213 88 100
www.sgs.comCA MIN Burnaby, BC 3260 Production Way, Burnaby, BC V5A 4W4 Burnaby CANADA t +1 (604) 638 2349 f
Member of the SGS Group (SGS SA)
SGS Canada
3 15 85 81 100
<2 42 96 47 <100
15 11 28 72 <100
6 22 71 63 100
<2 19 13 37 <100
38 12 12 22 <100
3 19 78 124 100
91 31 111 86 <100
331 48 9 37 <100
131 18 143 67 <100
13 7 23 59 200
12 28 83 119 200
<2 <1 <2 <1 <100
36 1 708 91 100
<2 <1 <2 <1 <100
67 19 19 90 <100
4 18 28 116 100
<2 <1 <2 <1 <100
6 3 18 29 100
320 26 14 17 <100
<2 <1 <2 <1 <100
35 1 727 79 <100
4 5 18 63 100

Project MOUNT BURNS Submission Number GEOTRONICS/ 114 MMI Number of Samples 117
ANALYSIS REPORT BBM19-01561
Element Cu Dy Er Eu Fe GaMethod GE_MMIM GE_MMIM GE_MMIM GE_MMIM GE_MMIM GE_MMIMLower Limit 10 10.20.20.5 0.5Upper Limit -- -------- --Unit ppb ppm m / mppbppbppb ppbMB 001 14.5MB 002 13.7MB 003 12.7MB 004 21.1MB 005 10.2MB 006 11.6MB 007 24.5MB 008 13.0MB 009 16.6MB 010 14.3MB 011 15.0MB 012 22.6MB 013 10.9MB 014 22.6MB 015 15.1MB 016 17.2MB 017 12.5MB 018 10.1MB 019 6.9MB 020 11.8MB 021 13.7MB 022 12.5MB 023 13.3MB 024 14.1MB 025 14.0MB 026 10.3MB 027 10.4MB 028 16.1MB 029 14.7MB 030 14.3
- not analysed | -- element not determined | I.S. insufficient sample | L.N.R. listed not received
4-Dec-2019 6:27PM BBM_U0001502092 MIN-M_COA_ROW-Last Modified Date: 05-Nov-2019 Page 11 of 42
800 12.0 5.1 3.0 324
www.sgs.comCA MIN Burnaby, BC 3260 Production Way, Burnaby, BC V5A 4W4 Burnaby CANADA t +1 (604) 638 2349 f
Member of the SGS Group (SGS SA)
SGS Canada
350 6.7 2.6 2.0 319
270 6.2 2.3 1.5 318
260 2.9 1.6 0.7 441
500 5.7 2.3 1.6 274
460 8.2 2.9 2.1 293
230 3.0 1.7 0.8 413
240 3.6 2.1 0.5 269
220 5.2 2.6 1.0 257
240 2.9 1.3 0.6 302
270 4.9 2.5 1.0 272
230 1.8 0.9 0.4 380
280 3.8 2.3 0.7 145
520 6.5 3.2 1.4 332
260 3.0 1.3 0.6 367
260 2.7 1.5 0.5 184
360 3.8 2.0 0.7 316
210 2.6 1.4 0.3 231
170 2.4 1.4 0.3 148
160 3.6 1.9 0.5 304
320 2.9 1.5 0.4 343
350 4.7 1.8 1.0 277
160 3.0 1.4 0.6 179
240 6.4 2.7 1.6 269
250 3.7 1.6 0.9 291
490 9.4 3.2 2.3 161
670 68.9 33.8 18.0 211
290 5.6 2.7 1.1 276
400 5.3 2.3 1.3 368
390 3.3 1.9 0.7 311

Project MOUNT BURNS Submission Number GEOTRONICS/ 114 MMI Number of Samples 117
ANALYSIS REPORT BBM19-01561
Element Cu Dy Er Eu Fe GaMethod GE_MMIM GE_MMIM GE_MMIM GE_MMIM GE_MMIM GE_MMIMLower Limit 10 10.20.20.5 0.5Upper Limit -- -------- --Unit ppb ppm m / mppbppbppb ppbMB 031 20.8MB 032 12.0MB 033 18.0MB 034 26.4MB 035 26.7MB 036 18.4MB 037 9.2MB 038 22.8MB 039 25.2MB 040 23.1MB 041 24.1MB 042 11.5MB 043 17.4MB 044 15.3MB 045 12.3MB 046 9.6MB 047 4.4MB 048 15.8MB 049 8.8MB 050 10.6MB 051 16.7MB 052 14.3MB 053 8.5MB 054 8.7MB 055 12.5MB 056 7.2MB 057 5.5MB 058 24.7MB 059 0.6MB 060 1.9
- not analysed | -- element not determined | I.S. insufficient sample | L.N.R. listed not received
4-Dec-2019 6:27PM BBM_U0001502092 MIN-M_COA_ROW-Last Modified Date: 05-Nov-2019 Page 12 of 42
230 4.3 2.0 1.1 308
www.sgs.comCA MIN Burnaby, BC 3260 Production Way, Burnaby, BC V5A 4W4 Burnaby CANADA t +1 (604) 638 2349 f
Member of the SGS Group (SGS SA)
SGS Canada
210 5.5 2.1 1.1 270
260 4.2 1.8 1.1 215
440 5.2 2.2 1.5 415
260 2.6 1.3 0.7 410
190 1.8 1.0 0.5 329
530 1.0 0.7 <0.2 342
550 2.7 1.3 0.8 396
280 1.5 0.8 0.3 480
200 2.1 1.1 0.6 273
300 2.1 1.1 0.5 442
280 2.8 1.6 0.6 251
250 5.1 2.1 1.3 202
440 4.1 2.1 1.2 508
410 4.8 2.0 1.2 480
660 13.7 4.4 3.5 262
330 6.0 2.2 1.5 168
320 3.2 1.7 0.8 436
280 2.6 1.2 0.6 374
1070 6.6 3.1 1.1 265
630 8.4 3.6 2.3 298
550 9.3 3.7 2.1 210
1280 48.2 19.7 12.3 155
430 8.5 3.2 2.1 226
560 5.8 2.4 1.1 310
510 4.6 1.8 1.2 376
210 7.7 3.1 2.4 188
330 3.7 1.7 1.0 324
340 13.0 6.4 4.1 12
370 17.3 8.4 5.0 29

Project MOUNT BURNS Submission Number GEOTRONICS/ 114 MMI Number of Samples 117
ANALYSIS REPORT BBM19-01561
Element Cu Dy Er Eu Fe GaMethod GE_MMIM GE_MMIM GE_MMIM GE_MMIM GE_MMIM GE_MMIMLower Limit 10 10.20.20.5 0.5Upper Limit -- -------- --Unit ppb ppm m / mppbppbppb ppbMB 061 L.N.RMB 063 7.6MB 065 0.9MB 067 4.2MB 068 9.7MB 069 8.5MB 070 12.5MB 071 14.7MB 072 15.0MB 073 10.4MB 074 15.8MB 075 19.5MB 076 9.6MB 078 10.8MB 079 5.2MB 080 1.4MB 081 17.1MB 082 10.5MB 083 18.1MB 084 30.7MB 085 30.1MB 086 16.1MB 087 11.1MB 088 8.5MB 089 3.1MB 090 10.3MB 091 24.8MB 092 15.9MB 093 18.4MB 094 16.3
- not analysed | -- element not determined | I.S. insufficient sample | L.N.R. listed not received
4-Dec-2019 6:27PM BBM_U0001502092 MIN-M_COA_ROW-Last Modified Date: 05-Nov-2019 Page 13 of 42
L.N.R L.N.R L.N.R L.N.R L.N.R
www.sgs.comCA MIN Burnaby, BC 3260 Production Way, Burnaby, BC V5A 4W4 Burnaby CANADA t +1 (604) 638 2349 f
Member of the SGS Group (SGS SA)
SGS Canada
610 6.3 3.1 1.4 343
200 11.4 4.3 3.9 30
1260 102 44.8 28.4 65
420 3.7 1.7 1.1 319
660 2.2 1.0 0.5 406
200 1.1 0.7 0.2 306
400 4.4 2.0 0.9 355
470 3.8 2.0 0.9 420
420 5.3 2.2 1.3 290
290 3.5 1.7 0.8 319
380 3.8 1.7 0.9 435
340 5.4 2.2 1.3 337
510 7.5 3.0 1.9 284
170 7.8 3.8 2.7 64
50 15.1 9.7 4.3 48
370 4.7 2.6 1.1 409
240 3.4 1.7 0.9 485
250 2.5 1.3 0.7 565
180 2.3 1.2 0.7 474
430 2.1 1.1 0.4 412
470 5.5 2.3 1.4 296
680 8.3 4.1 1.6 274
570 21.9 9.4 4.4 272
300 252 111 82.0 94
600 14.4 5.2 4.4 379
1020 19.9 8.3 5.5 328
530 9.9 4.8 2.7 471
380 4.8 2.3 1.5 305
480 6.1 2.9 1.7 360
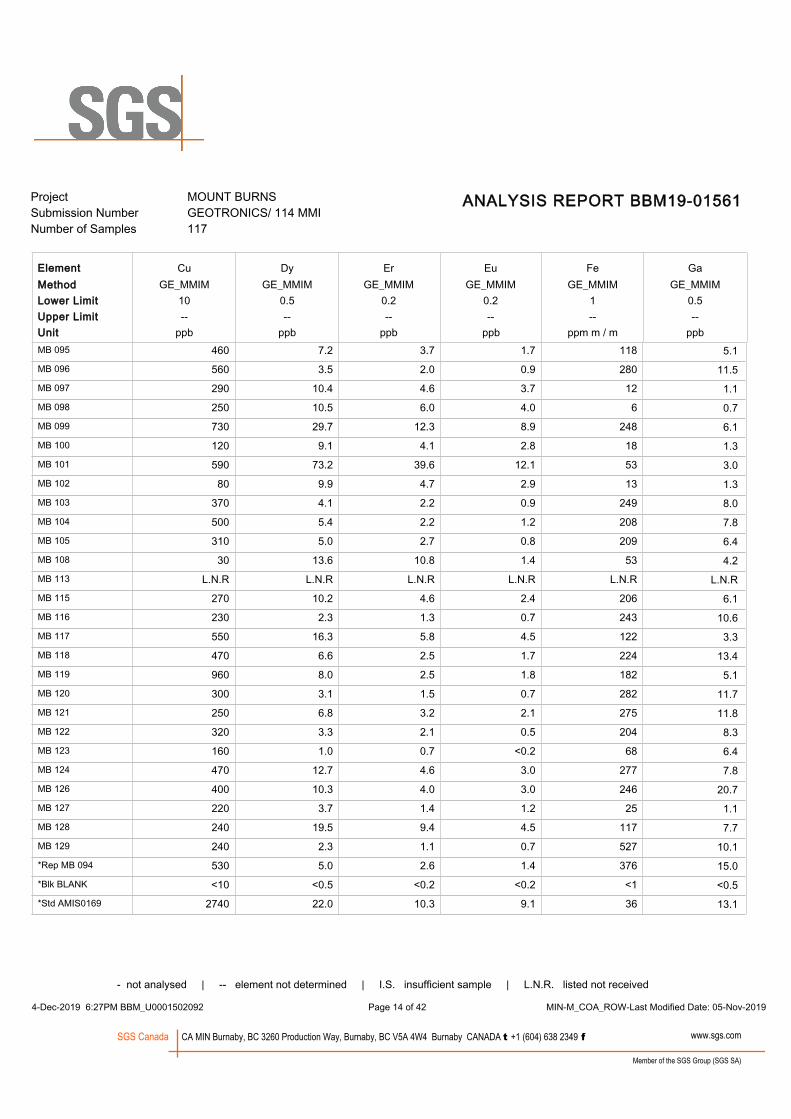
Project MOUNT BURNS Submission Number GEOTRONICS/ 114 MMI Number of Samples 117
ANALYSIS REPORT BBM19-01561
Element Cu Dy Er Eu Fe GaMethod GE_MMIM GE_MMIM GE_MMIM GE_MMIM GE_MMIM GE_MMIMLower Limit 10 10.20.20.5 0.5Upper Limit -- -------- --Unit ppb ppm m / mppbppbppb ppbMB 095 5.1MB 096 11.5MB 097 1.1MB 098 0.7MB 099 6.1MB 100 1.3MB 101 3.0MB 102 1.3MB 103 8.0MB 104 7.8MB 105 6.4MB 108 4.2MB 113 L.N.RMB 115 6.1MB 116 10.6MB 117 3.3MB 118 13.4MB 119 5.1MB 120 11.7MB 121 11.8MB 122 8.3MB 123 6.4MB 124 7.8MB 126 20.7MB 127 1.1MB 128 7.7MB 129 10.1*Rep MB 094 15.0*Blk BLANK <0.5*Std AMIS0169 13.1
- not analysed | -- element not determined | I.S. insufficient sample | L.N.R. listed not received
4-Dec-2019 6:27PM BBM_U0001502092 MIN-M_COA_ROW-Last Modified Date: 05-Nov-2019 Page 14 of 42
460 7.2 3.7 1.7 118
www.sgs.comCA MIN Burnaby, BC 3260 Production Way, Burnaby, BC V5A 4W4 Burnaby CANADA t +1 (604) 638 2349 f
Member of the SGS Group (SGS SA)
SGS Canada
560 3.5 2.0 0.9 280
290 10.4 4.6 3.7 12
250 10.5 6.0 4.0 6
730 29.7 12.3 8.9 248
120 9.1 4.1 2.8 18
590 73.2 39.6 12.1 53
80 9.9 4.7 2.9 13
370 4.1 2.2 0.9 249
500 5.4 2.2 1.2 208
310 5.0 2.7 0.8 209
30 13.6 10.8 1.4 53
L.N.R L.N.R L.N.R L.N.R L.N.R
270 10.2 4.6 2.4 206
230 2.3 1.3 0.7 243
550 16.3 5.8 4.5 122
470 6.6 2.5 1.7 224
960 8.0 2.5 1.8 182
300 3.1 1.5 0.7 282
250 6.8 3.2 2.1 275
320 3.3 2.1 0.5 204
160 1.0 0.7 <0.2 68
470 12.7 4.6 3.0 277
400 10.3 4.0 3.0 246
220 3.7 1.4 1.2 25
240 19.5 9.4 4.5 117
240 2.3 1.1 0.7 527
530 5.0 2.6 1.4 376
<10 <0.5 <0.2 <0.2 <1
2740 22.0 10.3 9.1 36
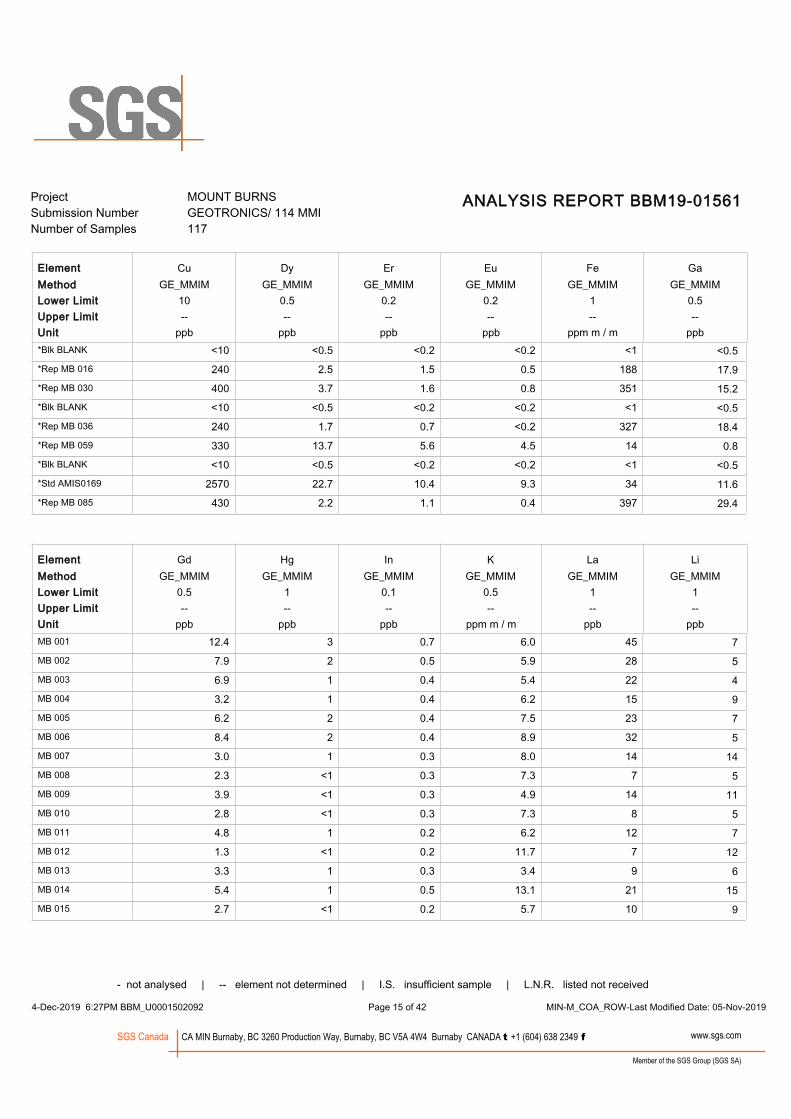
Project MOUNT BURNS Submission Number GEOTRONICS/ 114 MMI Number of Samples 117
ANALYSIS REPORT BBM19-01561
Element Cu Dy Er Eu Fe GaMethod GE_MMIM GE_MMIM GE_MMIM GE_MMIM GE_MMIM GE_MMIMLower Limit 10 10.20.20.5 0.5Upper Limit -- -------- --Unit ppb ppm m / mppbppbppb ppb*Blk BLANK <0.5*Rep MB 016 17.9*Rep MB 030 15.2*Blk BLANK <0.5*Rep MB 036 18.4*Rep MB 059 0.8*Blk BLANK <0.5*Std AMIS0169 11.6*Rep MB 085 29.4
Element Gd Hg In K La LiMethod GE_MMIM GE_MMIM GE_MMIM GE_MMIM GE_MMIM GE_MMIMLower Limit 0.5 10.50.11 1Upper Limit -- -------- --Unit ppb ppbppm m / mppbppb ppbMB 001 7MB 002 5MB 003 4MB 004 9MB 005 7MB 006 5MB 007 14MB 008 5MB 009 11MB 010 5MB 011 7MB 012 12MB 013 6MB 014 15MB 015 9
- not analysed | -- element not determined | I.S. insufficient sample | L.N.R. listed not received
4-Dec-2019 6:27PM BBM_U0001502092 MIN-M_COA_ROW-Last Modified Date: 05-Nov-2019 Page 15 of 42
<10 <0.5 <0.2 <0.2 <1
12.4 3 0.7 6.0 45
www.sgs.comCA MIN Burnaby, BC 3260 Production Way, Burnaby, BC V5A 4W4 Burnaby CANADA t +1 (604) 638 2349 f
Member of the SGS Group (SGS SA)
SGS Canada
240 2.5 1.5 0.5 188
400 3.7 1.6 0.8 351
<10 <0.5 <0.2 <0.2 <1
240 1.7 0.7 <0.2 327
330 13.7 5.6 4.5 14
<10 <0.5 <0.2 <0.2 <1
2570 22.7 10.4 9.3 34
430 2.2 1.1 0.4 397
7.9 2 0.5 5.9 28
6.9 1 0.4 5.4 22
3.2 1 0.4 6.2 15
6.2 2 0.4 7.5 23
8.4 2 0.4 8.9 32
3.0 1 0.3 8.0 14
2.3 <1 0.3 7.3 7
3.9 <1 0.3 4.9 14
2.8 <1 0.3 7.3 8
4.8 1 0.2 6.2 12
1.3 <1 0.2 11.7 7
3.3 1 0.3 3.4 9
5.4 1 0.5 13.1 21
2.7 <1 0.2 5.7 10

Project MOUNT BURNS Submission Number GEOTRONICS/ 114 MMI Number of Samples 117
ANALYSIS REPORT BBM19-01561
Element Gd Hg In K La LiMethod GE_MMIM GE_MMIM GE_MMIM GE_MMIM GE_MMIM GE_MMIMLower Limit 0.5 10.50.11 1Upper Limit -- -------- --Unit ppb ppbppm m / mppbppb ppbMB 016 5MB 017 9MB 018 4MB 019 4MB 020 5MB 021 6MB 022 7MB 023 6MB 024 11MB 025 7MB 026 5MB 027 9MB 028 4MB 029 12MB 030 7MB 031 17MB 032 4MB 033 8MB 034 13MB 035 14MB 036 3MB 037 5MB 038 26MB 039 9MB 040 6MB 041 9MB 042 9MB 043 7MB 044 8MB 045 4
- not analysed | -- element not determined | I.S. insufficient sample | L.N.R. listed not received
4-Dec-2019 6:27PM BBM_U0001502092 MIN-M_COA_ROW-Last Modified Date: 05-Nov-2019 Page 16 of 42
2.5 <1 0.1 18.4 8
www.sgs.comCA MIN Burnaby, BC 3260 Production Way, Burnaby, BC V5A 4W4 Burnaby CANADA t +1 (604) 638 2349 f
Member of the SGS Group (SGS SA)
SGS Canada
3.1 2 0.4 7.9 11
1.4 <1 0.2 5.2 4
1.5 <1 0.2 3.6 4
2.4 <1 0.2 4.3 6
1.9 1 0.3 6.6 6
4.2 2 0.5 9.5 12
2.4 <1 0.2 3.6 7
7.0 1 0.3 7.6 26
3.7 <1 0.2 8.2 11
8.5 2 0.2 10.5 21
92.0 3 0.2 7.7 101
4.5 <1 0.3 6.6 11
5.6 1 0.5 5.7 18
2.8 1 0.3 7.0 12
4.8 1 0.4 5.4 13
6.4 1 0.3 8.4 11
4.2 1 0.3 4.7 19
5.8 <1 0.3 8.6 21
2.6 <1 0.3 7.4 16
1.7 <1 0.2 5.3 9
0.8 <1 0.1 4.3 7
2.8 2 0.4 8.8 15
1.3 <1 0.2 6.9 9
1.8 <1 0.1 8.0 14
1.8 <1 0.3 6.5 10
2.4 2 0.4 3.9 13
4.6 <1 0.2 8.5 15
4.6 3 0.6 10.6 16
5.3 2 0.5 4.8 12
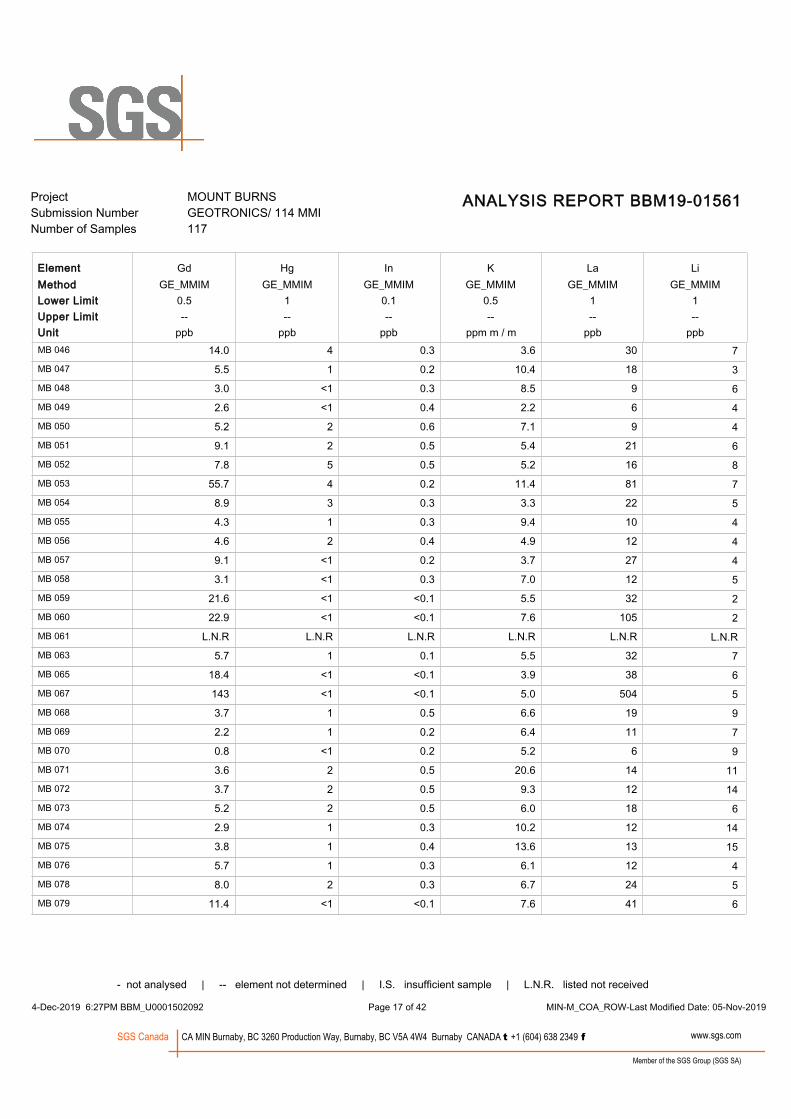
Project MOUNT BURNS Submission Number GEOTRONICS/ 114 MMI Number of Samples 117
ANALYSIS REPORT BBM19-01561
Element Gd Hg In K La LiMethod GE_MMIM GE_MMIM GE_MMIM GE_MMIM GE_MMIM GE_MMIMLower Limit 0.5 10.50.11 1Upper Limit -- -------- --Unit ppb ppbppm m / mppbppb ppbMB 046 7MB 047 3MB 048 6MB 049 4MB 050 4MB 051 6MB 052 8MB 053 7MB 054 5MB 055 4MB 056 4MB 057 4MB 058 5MB 059 2MB 060 2MB 061 L.N.RMB 063 7MB 065 6MB 067 5MB 068 9MB 069 7MB 070 9MB 071 11MB 072 14MB 073 6MB 074 14MB 075 15MB 076 4MB 078 5MB 079 6
- not analysed | -- element not determined | I.S. insufficient sample | L.N.R. listed not received
4-Dec-2019 6:27PM BBM_U0001502092 MIN-M_COA_ROW-Last Modified Date: 05-Nov-2019 Page 17 of 42
14.0 4 0.3 3.6 30
www.sgs.comCA MIN Burnaby, BC 3260 Production Way, Burnaby, BC V5A 4W4 Burnaby CANADA t +1 (604) 638 2349 f
Member of the SGS Group (SGS SA)
SGS Canada
5.5 1 0.2 10.4 18
3.0 <1 0.3 8.5 9
2.6 <1 0.4 2.2 6
5.2 2 0.6 7.1 9
9.1 2 0.5 5.4 21
7.8 5 0.5 5.2 16
55.7 4 0.2 11.4 81
8.9 3 0.3 3.3 22
4.3 1 0.3 9.4 10
4.6 2 0.4 4.9 12
9.1 <1 0.2 3.7 27
3.1 <1 0.3 7.0 12
21.6 <1 <0.1 5.5 32
22.9 <1 <0.1 7.6 105
L.N.R L.N.R L.N.R L.N.R L.N.R
5.7 1 0.1 5.5 32
18.4 <1 <0.1 3.9 38
143 <1 <0.1 5.0 504
3.7 1 0.5 6.6 19
2.2 1 0.2 6.4 11
0.8 <1 0.2 5.2 6
3.6 2 0.5 20.6 14
3.7 2 0.5 9.3 12
5.2 2 0.5 6.0 18
2.9 1 0.3 10.2 12
3.8 1 0.4 13.6 13
5.7 1 0.3 6.1 12
8.0 2 0.3 6.7 24
11.4 <1 <0.1 7.6 41

Project MOUNT BURNS Submission Number GEOTRONICS/ 114 MMI Number of Samples 117
ANALYSIS REPORT BBM19-01561
Element Gd Hg In K La LiMethod GE_MMIM GE_MMIM GE_MMIM GE_MMIM GE_MMIM GE_MMIMLower Limit 0.5 10.50.11 1Upper Limit -- -------- --Unit ppb ppbppm m / mppbppb ppbMB 080 1MB 081 6MB 082 9MB 083 8MB 084 11MB 085 10MB 086 10MB 087 5MB 088 5MB 089 7MB 090 15MB 091 13MB 092 5MB 093 5MB 094 10MB 095 2MB 096 2MB 097 1MB 098 <1MB 099 5MB 100 <1MB 101 3MB 102 <1MB 103 2MB 104 2MB 105 4MB 108 2MB 113 L.N.RMB 115 5MB 116 3
- not analysed | -- element not determined | I.S. insufficient sample | L.N.R. listed not received
4-Dec-2019 6:27PM BBM_U0001502092 MIN-M_COA_ROW-Last Modified Date: 05-Nov-2019 Page 18 of 42
14.4 <1 <0.1 9.4 15
www.sgs.comCA MIN Burnaby, BC 3260 Production Way, Burnaby, BC V5A 4W4 Burnaby CANADA t +1 (604) 638 2349 f
Member of the SGS Group (SGS SA)
SGS Canada
4.0 1 0.3 12.9 11
3.0 2 0.4 7.1 14
2.7 2 0.3 6.3 12
2.5 <1 0.4 9.6 12
1.8 <1 0.2 8.1 9
6.9 2 0.3 5.6 18
5.6 1 0.4 5.4 19
15.5 1 0.3 8.2 27
334 1 <0.1 3.0 1040
16.1 2 0.5 5.6 50
21.3 2 0.4 8.2 70
11.8 <1 0.4 6.4 35
5.9 1 0.3 4.4 27
6.6 2 0.4 14.7 26
7.8 <1 0.1 14.6 17
3.8 <1 0.2 5.6 14
16.1 <1 <0.1 7.1 18
17.2 <1 <0.1 4.8 38
37.6 2 0.4 7.7 76
13.2 <1 <0.1 2.6 19
58.6 <1 <0.1 5.9 64
13.9 <1 <0.1 5.1 18
3.8 <1 0.3 6.0 11
5.2 <1 0.2 6.3 13
4.2 <1 0.2 12.1 10
9.0 <1 0.1 2.1 8
L.N.R L.N.R L.N.R L.N.R L.N.R
10.7 <1 0.5 3.3 29
2.8 <1 0.2 16.7 11

Project MOUNT BURNS Submission Number GEOTRONICS/ 114 MMI Number of Samples 117
ANALYSIS REPORT BBM19-01561
Element Gd Hg In K La LiMethod GE_MMIM GE_MMIM GE_MMIM GE_MMIM GE_MMIM GE_MMIMLower Limit 0.5 10.50.11 1Upper Limit -- -------- --Unit ppb ppbppm m / mppbppb ppbMB 117 6MB 118 3MB 119 4MB 120 3MB 121 4MB 122 2MB 123 3MB 124 6MB 126 2MB 127 2MB 128 10MB 129 3*Rep MB 094 10*Blk BLANK <1*Std AMIS0169 3*Blk BLANK <1*Rep MB 016 6*Rep MB 030 9*Blk BLANK <1*Rep MB 036 3*Rep MB 059 2*Blk BLANK <1*Std AMIS0169 2*Rep MB 085 10
Element Mg Mn Mo Nb Nd NiMethod GE_MMIM GE_MMIM GE_MMIM GE_MMIM GE_MMIM GE_MMIMLower Limit 0.5 10.52100 5Upper Limit -- -------- --Unit ppm m / m ppbppbppbppb ppb
- not analysed | -- element not determined | I.S. insufficient sample | L.N.R. listed not received
4-Dec-2019 6:27PM BBM_U0001502092 MIN-M_COA_ROW-Last Modified Date: 05-Nov-2019 Page 19 of 42
21.7 3 0.2 4.7 51
www.sgs.comCA MIN Burnaby, BC 3260 Production Way, Burnaby, BC V5A 4W4 Burnaby CANADA t +1 (604) 638 2349 f
Member of the SGS Group (SGS SA)
SGS Canada
8.1 2 0.3 5.2 36
8.3 2 0.4 5.2 39
2.9 <1 0.2 7.1 13
8.2 <1 0.3 3.9 33
2.9 <1 0.3 3.8 5
1.2 <1 <0.1 7.1 6
13.0 2 0.3 9.1 26
11.0 <1 0.3 5.1 48
4.8 <1 <0.1 8.7 5
19.6 <1 0.2 5.8 40
2.4 2 0.3 7.5 12
5.5 2 0.4 15.6 21
<0.5 <1 <0.1 <0.5 <1
32.6 <1 <0.1 40.0 405
<0.5 <1 <0.1 <0.5 2
2.1 <1 0.1 16.9 7
3.0 1 0.3 6.9 15
<0.5 <1 <0.1 <0.5 <1
1.9 <1 0.2 5.0 8
20.7 <1 <0.1 4.8 34
<0.5 <1 <0.1 <0.5 <1
35.6 <1 <0.1 36.0 434
1.9 <1 0.2 7.7 11
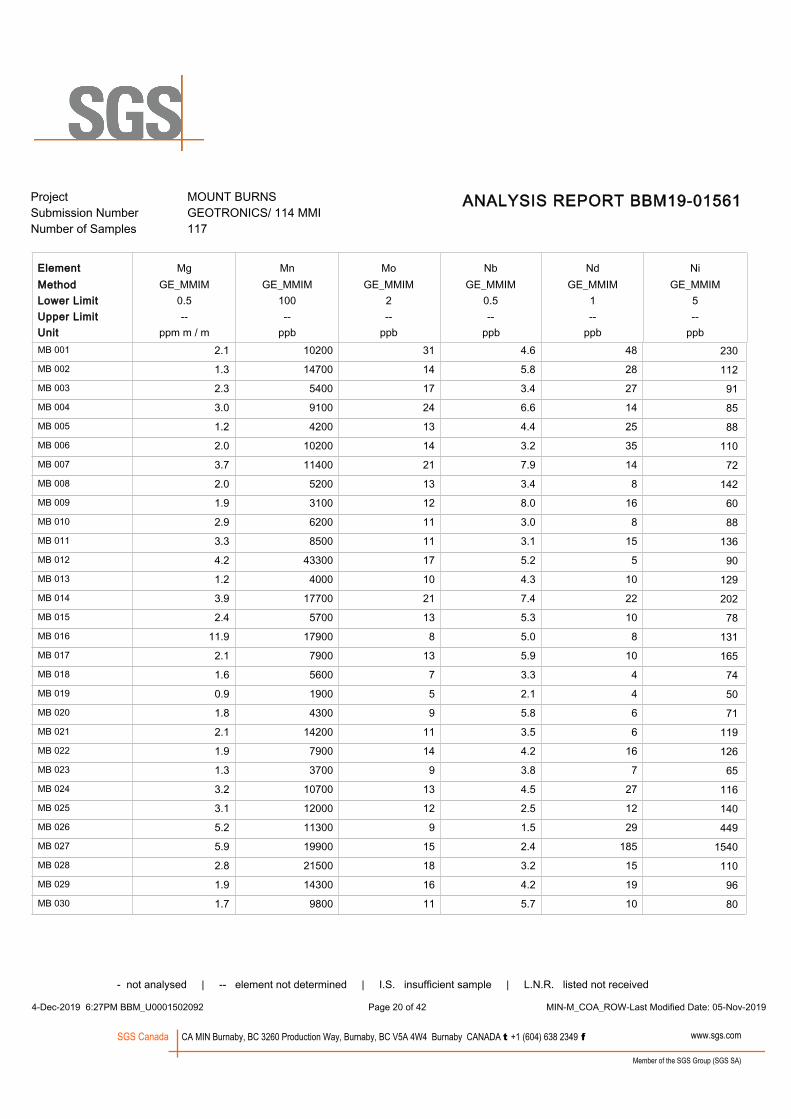
Project MOUNT BURNS Submission Number GEOTRONICS/ 114 MMI Number of Samples 117
ANALYSIS REPORT BBM19-01561
Element Mg Mn Mo Nb Nd NiMethod GE_MMIM GE_MMIM GE_MMIM GE_MMIM GE_MMIM GE_MMIMLower Limit 0.5 10.52100 5Upper Limit -- -------- --Unit ppm m / m ppbppbppbppb ppbMB 001 230MB 002 112MB 003 91MB 004 85MB 005 88MB 006 110MB 007 72MB 008 142MB 009 60MB 010 88MB 011 136MB 012 90MB 013 129MB 014 202MB 015 78MB 016 131MB 017 165MB 018 74MB 019 50MB 020 71MB 021 119MB 022 126MB 023 65MB 024 116MB 025 140MB 026 449MB 027 1540MB 028 110MB 029 96MB 030 80
- not analysed | -- element not determined | I.S. insufficient sample | L.N.R. listed not received
4-Dec-2019 6:27PM BBM_U0001502092 MIN-M_COA_ROW-Last Modified Date: 05-Nov-2019 Page 20 of 42
2.1 10200 31 4.6 48
www.sgs.comCA MIN Burnaby, BC 3260 Production Way, Burnaby, BC V5A 4W4 Burnaby CANADA t +1 (604) 638 2349 f
Member of the SGS Group (SGS SA)
SGS Canada
1.3 14700 14 5.8 28
2.3 5400 17 3.4 27
3.0 9100 24 6.6 14
1.2 4200 13 4.4 25
2.0 10200 14 3.2 35
3.7 11400 21 7.9 14
2.0 5200 13 3.4 8
1.9 3100 12 8.0 16
2.9 6200 11 3.0 8
3.3 8500 11 3.1 15
4.2 43300 17 5.2 5
1.2 4000 10 4.3 10
3.9 17700 21 7.4 22
2.4 5700 13 5.3 10
11.9 17900 8 5.0 8
2.1 7900 13 5.9 10
1.6 5600 7 3.3 4
0.9 1900 5 2.1 4
1.8 4300 9 5.8 6
2.1 14200 11 3.5 6
1.9 7900 14 4.2 16
1.3 3700 9 3.8 7
3.2 10700 13 4.5 27
3.1 12000 12 2.5 12
5.2 11300 9 1.5 29
5.9 19900 15 2.4 185
2.8 21500 18 3.2 15
1.9 14300 16 4.2 19
1.7 9800 11 5.7 10
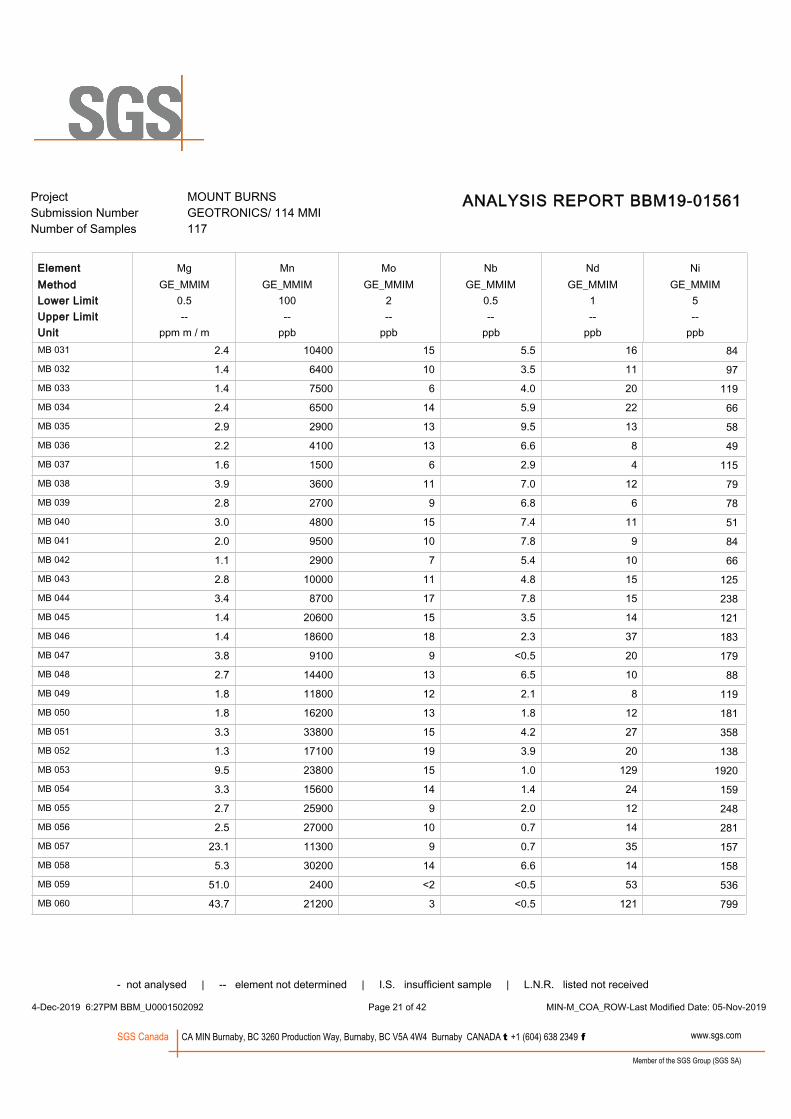
Project MOUNT BURNS Submission Number GEOTRONICS/ 114 MMI Number of Samples 117
ANALYSIS REPORT BBM19-01561
Element Mg Mn Mo Nb Nd NiMethod GE_MMIM GE_MMIM GE_MMIM GE_MMIM GE_MMIM GE_MMIMLower Limit 0.5 10.52100 5Upper Limit -- -------- --Unit ppm m / m ppbppbppbppb ppbMB 031 84MB 032 97MB 033 119MB 034 66MB 035 58MB 036 49MB 037 115MB 038 79MB 039 78MB 040 51MB 041 84MB 042 66MB 043 125MB 044 238MB 045 121MB 046 183MB 047 179MB 048 88MB 049 119MB 050 181MB 051 358MB 052 138MB 053 1920MB 054 159MB 055 248MB 056 281MB 057 157MB 058 158MB 059 536MB 060 799
- not analysed | -- element not determined | I.S. insufficient sample | L.N.R. listed not received
4-Dec-2019 6:27PM BBM_U0001502092 MIN-M_COA_ROW-Last Modified Date: 05-Nov-2019 Page 21 of 42
2.4 10400 15 5.5 16
www.sgs.comCA MIN Burnaby, BC 3260 Production Way, Burnaby, BC V5A 4W4 Burnaby CANADA t +1 (604) 638 2349 f
Member of the SGS Group (SGS SA)
SGS Canada
1.4 6400 10 3.5 11
1.4 7500 6 4.0 20
2.4 6500 14 5.9 22
2.9 2900 13 9.5 13
2.2 4100 13 6.6 8
1.6 1500 6 2.9 4
3.9 3600 11 7.0 12
2.8 2700 9 6.8 6
3.0 4800 15 7.4 11
2.0 9500 10 7.8 9
1.1 2900 7 5.4 10
2.8 10000 11 4.8 15
3.4 8700 17 7.8 15
1.4 20600 15 3.5 14
1.4 18600 18 2.3 37
3.8 9100 9 <0.5 20
2.7 14400 13 6.5 10
1.8 11800 12 2.1 8
1.8 16200 13 1.8 12
3.3 33800 15 4.2 27
1.3 17100 19 3.9 20
9.5 23800 15 1.0 129
3.3 15600 14 1.4 24
2.7 25900 9 2.0 12
2.5 27000 10 0.7 14
23.1 11300 9 0.7 35
5.3 30200 14 6.6 14
51.0 2400 <2 <0.5 53
43.7 21200 3 <0.5 121

Project MOUNT BURNS Submission Number GEOTRONICS/ 114 MMI Number of Samples 117
ANALYSIS REPORT BBM19-01561
Element Mg Mn Mo Nb Nd NiMethod GE_MMIM GE_MMIM GE_MMIM GE_MMIM GE_MMIM GE_MMIMLower Limit 0.5 10.52100 5Upper Limit -- -------- --Unit ppm m / m ppbppbppbppb ppbMB 061 L.N.RMB 063 172MB 065 495MB 067 1940MB 068 147MB 069 178MB 070 121MB 071 230MB 072 128MB 073 106MB 074 175MB 075 93MB 076 134MB 078 147MB 079 313MB 080 4490MB 081 114MB 082 229MB 083 176MB 084 59MB 085 58MB 086 99MB 087 139MB 088 594MB 089 484MB 090 348MB 091 226MB 092 429MB 093 202MB 094 242
- not analysed | -- element not determined | I.S. insufficient sample | L.N.R. listed not received
4-Dec-2019 6:27PM BBM_U0001502092 MIN-M_COA_ROW-Last Modified Date: 05-Nov-2019 Page 22 of 42
L.N.R L.N.R L.N.R L.N.R L.N.R
www.sgs.comCA MIN Burnaby, BC 3260 Production Way, Burnaby, BC V5A 4W4 Burnaby CANADA t +1 (604) 638 2349 f
Member of the SGS Group (SGS SA)
SGS Canada
7.3 700 6 2.6 28
20.6 3700 <2 <0.5 56
12.8 7500 4 1.1 557
2.5 10200 13 2.2 18
2.6 8900 9 2.8 8
3.5 2400 9 5.4 6
3.8 2600 14 6.3 14
3.8 19500 16 5.4 13
1.8 4600 12 3.8 21
2.4 5100 13 6.3 10
3.7 11200 14 9.7 12
2.6 12500 8 2.2 14
2.0 12900 9 1.6 28
34.3 40300 4 0.5 65
62.6 39300 <2 <0.5 36
4.5 11500 10 5.9 14
2.7 4500 8 3.9 13
1.8 5000 12 6.4 10
2.3 6100 11 7.3 11
4.7 3300 10 8.7 8
1.9 7800 9 4.5 19
1.5 2400 12 3.9 17
16.3 8400 5 2.3 36
7.8 6900 3 <0.5 1210
2.4 5700 11 3.9 54
2.2 16900 14 7.0 73
2.5 13600 12 6.2 36
2.0 6000 7 5.1 26
3.6 15400 12 6.2 27
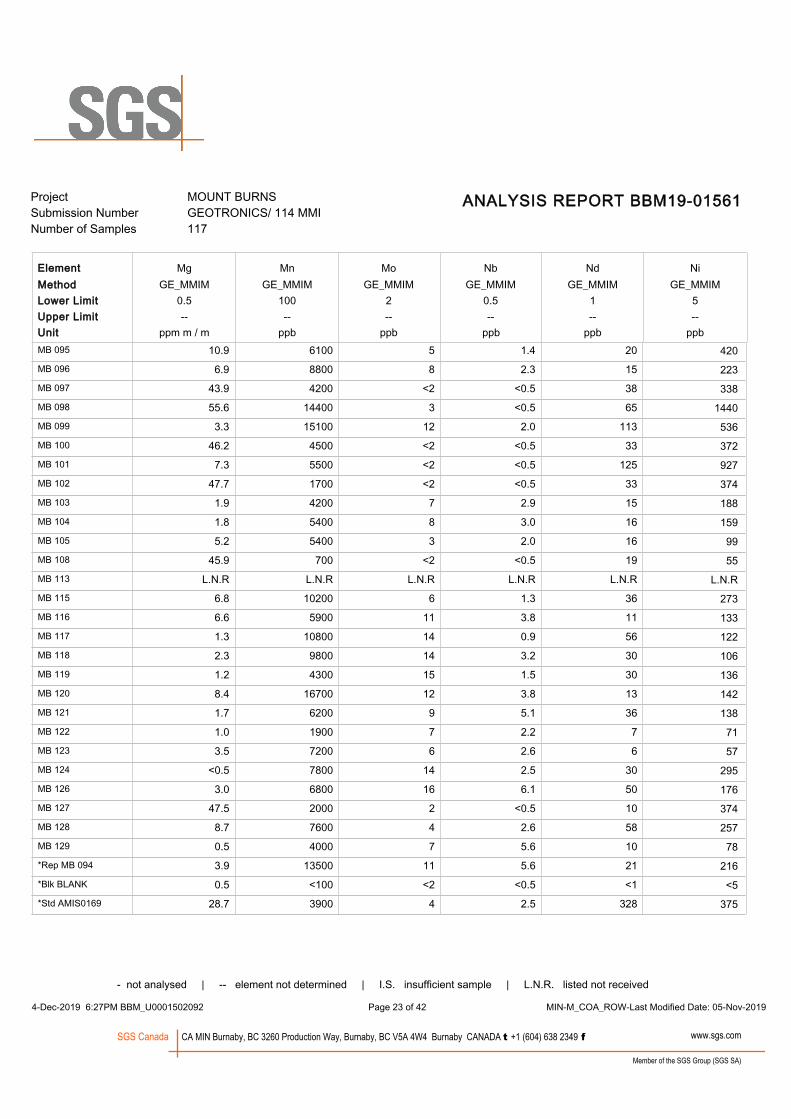
Project MOUNT BURNS Submission Number GEOTRONICS/ 114 MMI Number of Samples 117
ANALYSIS REPORT BBM19-01561
Element Mg Mn Mo Nb Nd NiMethod GE_MMIM GE_MMIM GE_MMIM GE_MMIM GE_MMIM GE_MMIMLower Limit 0.5 10.52100 5Upper Limit -- -------- --Unit ppm m / m ppbppbppbppb ppbMB 095 420MB 096 223MB 097 338MB 098 1440MB 099 536MB 100 372MB 101 927MB 102 374MB 103 188MB 104 159MB 105 99MB 108 55MB 113 L.N.RMB 115 273MB 116 133MB 117 122MB 118 106MB 119 136MB 120 142MB 121 138MB 122 71MB 123 57MB 124 295MB 126 176MB 127 374MB 128 257MB 129 78*Rep MB 094 216*Blk BLANK <5*Std AMIS0169 375
- not analysed | -- element not determined | I.S. insufficient sample | L.N.R. listed not received
4-Dec-2019 6:27PM BBM_U0001502092 MIN-M_COA_ROW-Last Modified Date: 05-Nov-2019 Page 23 of 42
10.9 6100 5 1.4 20
www.sgs.comCA MIN Burnaby, BC 3260 Production Way, Burnaby, BC V5A 4W4 Burnaby CANADA t +1 (604) 638 2349 f
Member of the SGS Group (SGS SA)
SGS Canada
6.9 8800 8 2.3 15
43.9 4200 <2 <0.5 38
55.6 14400 3 <0.5 65
3.3 15100 12 2.0 113
46.2 4500 <2 <0.5 33
7.3 5500 <2 <0.5 125
47.7 1700 <2 <0.5 33
1.9 4200 7 2.9 15
1.8 5400 8 3.0 16
5.2 5400 3 2.0 16
45.9 700 <2 <0.5 19
L.N.R L.N.R L.N.R L.N.R L.N.R
6.8 10200 6 1.3 36
6.6 5900 11 3.8 11
1.3 10800 14 0.9 56
2.3 9800 14 3.2 30
1.2 4300 15 1.5 30
8.4 16700 12 3.8 13
1.7 6200 9 5.1 36
1.0 1900 7 2.2 7
3.5 7200 6 2.6 6
<0.5 7800 14 2.5 30
3.0 6800 16 6.1 50
47.5 2000 2 <0.5 10
8.7 7600 4 2.6 58
0.5 4000 7 5.6 10
3.9 13500 11 5.6 21
0.5 <100 <2 <0.5 <1
28.7 3900 4 2.5 328
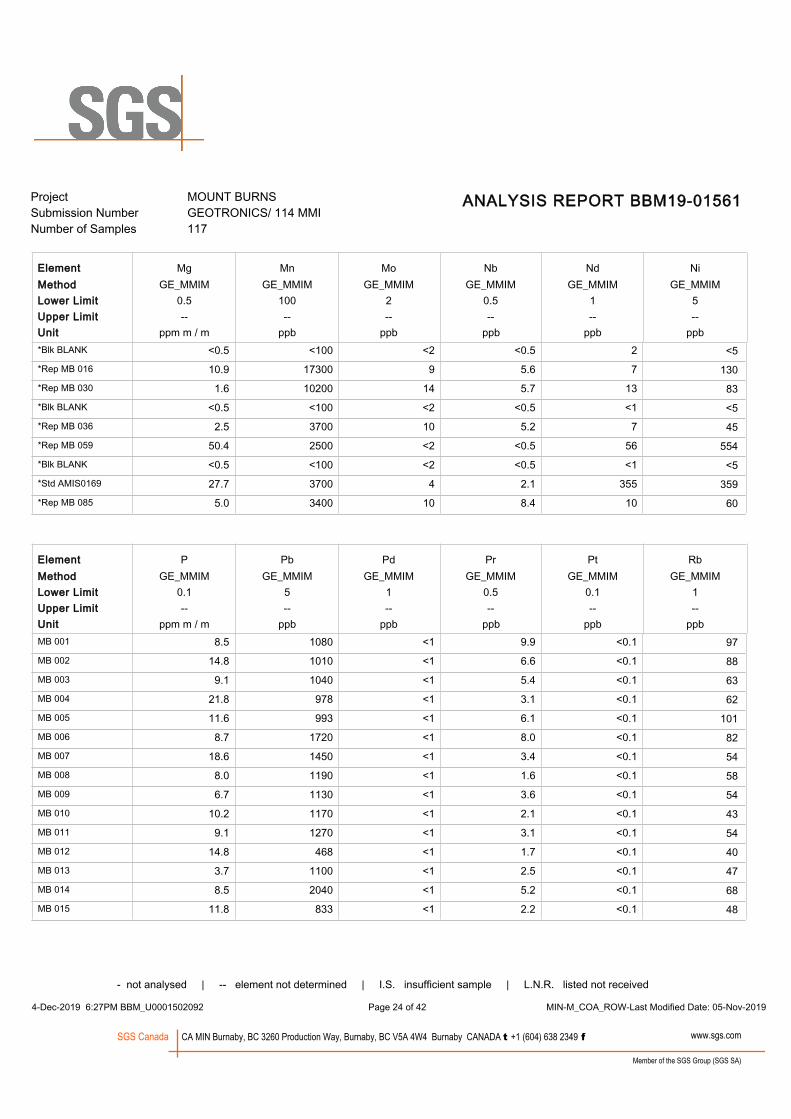
Project MOUNT BURNS Submission Number GEOTRONICS/ 114 MMI Number of Samples 117
ANALYSIS REPORT BBM19-01561
Element Mg Mn Mo Nb Nd NiMethod GE_MMIM GE_MMIM GE_MMIM GE_MMIM GE_MMIM GE_MMIMLower Limit 0.5 10.52100 5Upper Limit -- -------- --Unit ppm m / m ppbppbppbppb ppb*Blk BLANK <5*Rep MB 016 130*Rep MB 030 83*Blk BLANK <5*Rep MB 036 45*Rep MB 059 554*Blk BLANK <5*Std AMIS0169 359*Rep MB 085 60
Element P Pb Pd Pr Pt RbMethod GE_MMIM GE_MMIM GE_MMIM GE_MMIM GE_MMIM GE_MMIMLower Limit 0.1 0.10.515 1Upper Limit -- -------- --Unit ppm m / m ppbppbppbppb ppbMB 001 97MB 002 88MB 003 63MB 004 62MB 005 101MB 006 82MB 007 54MB 008 58MB 009 54MB 010 43MB 011 54MB 012 40MB 013 47MB 014 68MB 015 48
- not analysed | -- element not determined | I.S. insufficient sample | L.N.R. listed not received
4-Dec-2019 6:27PM BBM_U0001502092 MIN-M_COA_ROW-Last Modified Date: 05-Nov-2019 Page 24 of 42
<0.5 <100 <2 <0.5 2
8.5 1080 <1 9.9 <0.1
www.sgs.comCA MIN Burnaby, BC 3260 Production Way, Burnaby, BC V5A 4W4 Burnaby CANADA t +1 (604) 638 2349 f
Member of the SGS Group (SGS SA)
SGS Canada
10.9 17300 9 5.6 7
1.6 10200 14 5.7 13
<0.5 <100 <2 <0.5 <1
2.5 3700 10 5.2 7
50.4 2500 <2 <0.5 56
<0.5 <100 <2 <0.5 <1
27.7 3700 4 2.1 355
5.0 3400 10 8.4 10
14.8 1010 <1 6.6 <0.1
9.1 1040 <1 5.4 <0.1
21.8 978 <1 3.1 <0.1
11.6 993 <1 6.1 <0.1
8.7 1720 <1 8.0 <0.1
18.6 1450 <1 3.4 <0.1
8.0 1190 <1 1.6 <0.1
6.7 1130 <1 3.6 <0.1
10.2 1170 <1 2.1 <0.1
9.1 1270 <1 3.1 <0.1
14.8 468 <1 1.7 <0.1
3.7 1100 <1 2.5 <0.1
8.5 2040 <1 5.2 <0.1
11.8 833 <1 2.2 <0.1
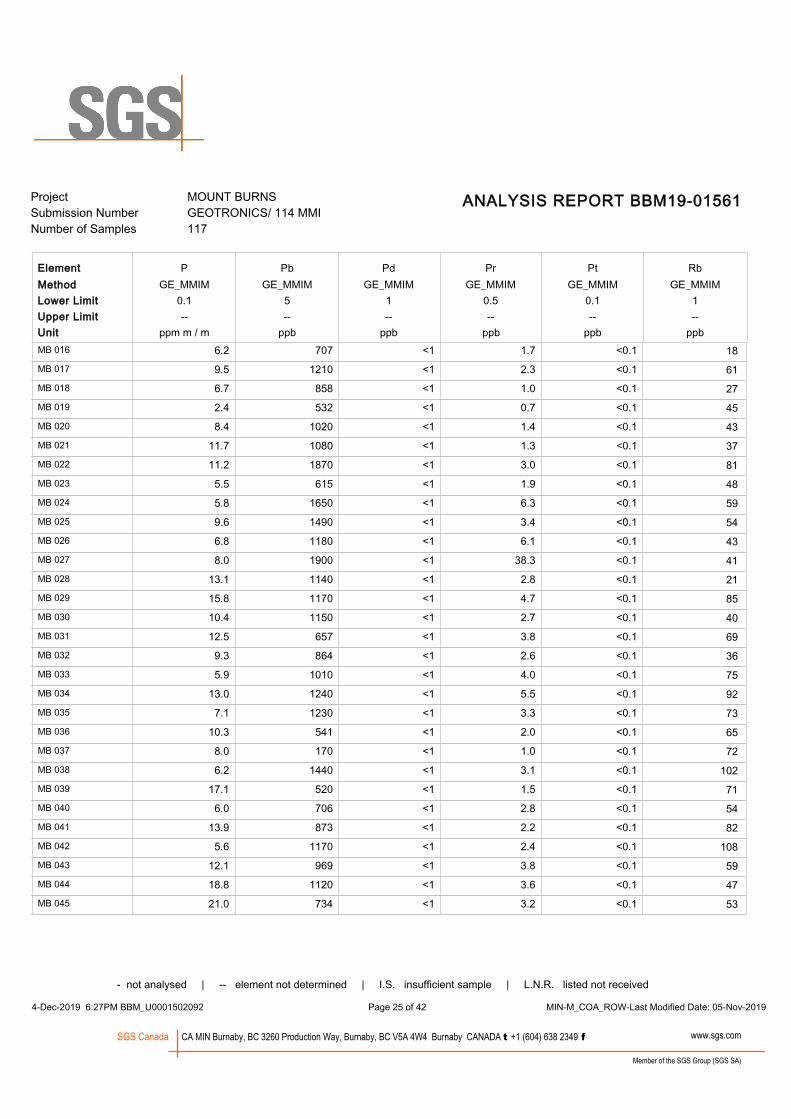
Project MOUNT BURNS Submission Number GEOTRONICS/ 114 MMI Number of Samples 117
ANALYSIS REPORT BBM19-01561
Element P Pb Pd Pr Pt RbMethod GE_MMIM GE_MMIM GE_MMIM GE_MMIM GE_MMIM GE_MMIMLower Limit 0.1 0.10.515 1Upper Limit -- -------- --Unit ppm m / m ppbppbppbppb ppbMB 016 18MB 017 61MB 018 27MB 019 45MB 020 43MB 021 37MB 022 81MB 023 48MB 024 59MB 025 54MB 026 43MB 027 41MB 028 21MB 029 85MB 030 40MB 031 69MB 032 36MB 033 75MB 034 92MB 035 73MB 036 65MB 037 72MB 038 102MB 039 71MB 040 54MB 041 82MB 042 108MB 043 59MB 044 47MB 045 53
- not analysed | -- element not determined | I.S. insufficient sample | L.N.R. listed not received
4-Dec-2019 6:27PM BBM_U0001502092 MIN-M_COA_ROW-Last Modified Date: 05-Nov-2019 Page 25 of 42
6.2 707 <1 1.7 <0.1
www.sgs.comCA MIN Burnaby, BC 3260 Production Way, Burnaby, BC V5A 4W4 Burnaby CANADA t +1 (604) 638 2349 f
Member of the SGS Group (SGS SA)
SGS Canada
9.5 1210 <1 2.3 <0.1
6.7 858 <1 1.0 <0.1
2.4 532 <1 0.7 <0.1
8.4 1020 <1 1.4 <0.1
11.7 1080 <1 1.3 <0.1
11.2 1870 <1 3.0 <0.1
5.5 615 <1 1.9 <0.1
5.8 1650 <1 6.3 <0.1
9.6 1490 <1 3.4 <0.1
6.8 1180 <1 6.1 <0.1
8.0 1900 <1 38.3 <0.1
13.1 1140 <1 2.8 <0.1
15.8 1170 <1 4.7 <0.1
10.4 1150 <1 2.7 <0.1
12.5 657 <1 3.8 <0.1
9.3 864 <1 2.6 <0.1
5.9 1010 <1 4.0 <0.1
13.0 1240 <1 5.5 <0.1
7.1 1230 <1 3.3 <0.1
10.3 541 <1 2.0 <0.1
8.0 170 <1 1.0 <0.1
6.2 1440 <1 3.1 <0.1
17.1 520 <1 1.5 <0.1
6.0 706 <1 2.8 <0.1
13.9 873 <1 2.2 <0.1
5.6 1170 <1 2.4 <0.1
12.1 969 <1 3.8 <0.1
18.8 1120 <1 3.6 <0.1
21.0 734 <1 3.2 <0.1
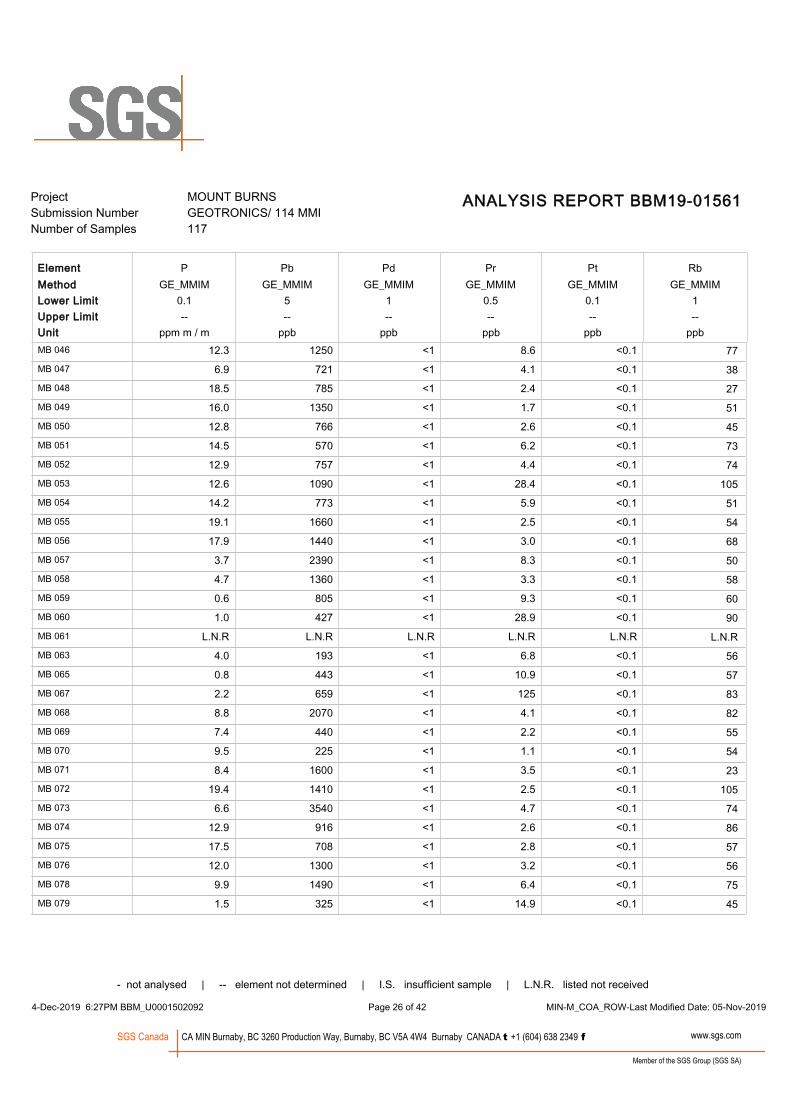
Project MOUNT BURNS Submission Number GEOTRONICS/ 114 MMI Number of Samples 117
ANALYSIS REPORT BBM19-01561
Element P Pb Pd Pr Pt RbMethod GE_MMIM GE_MMIM GE_MMIM GE_MMIM GE_MMIM GE_MMIMLower Limit 0.1 0.10.515 1Upper Limit -- -------- --Unit ppm m / m ppbppbppbppb ppbMB 046 77MB 047 38MB 048 27MB 049 51MB 050 45MB 051 73MB 052 74MB 053 105MB 054 51MB 055 54MB 056 68MB 057 50MB 058 58MB 059 60MB 060 90MB 061 L.N.RMB 063 56MB 065 57MB 067 83MB 068 82MB 069 55MB 070 54MB 071 23MB 072 105MB 073 74MB 074 86MB 075 57MB 076 56MB 078 75MB 079 45
- not analysed | -- element not determined | I.S. insufficient sample | L.N.R. listed not received
4-Dec-2019 6:27PM BBM_U0001502092 MIN-M_COA_ROW-Last Modified Date: 05-Nov-2019 Page 26 of 42
12.3 1250 <1 8.6 <0.1
www.sgs.comCA MIN Burnaby, BC 3260 Production Way, Burnaby, BC V5A 4W4 Burnaby CANADA t +1 (604) 638 2349 f
Member of the SGS Group (SGS SA)
SGS Canada
6.9 721 <1 4.1 <0.1
18.5 785 <1 2.4 <0.1
16.0 1350 <1 1.7 <0.1
12.8 766 <1 2.6 <0.1
14.5 570 <1 6.2 <0.1
12.9 757 <1 4.4 <0.1
12.6 1090 <1 28.4 <0.1
14.2 773 <1 5.9 <0.1
19.1 1660 <1 2.5 <0.1
17.9 1440 <1 3.0 <0.1
3.7 2390 <1 8.3 <0.1
4.7 1360 <1 3.3 <0.1
0.6 805 <1 9.3 <0.1
1.0 427 <1 28.9 <0.1
L.N.R L.N.R L.N.R L.N.R L.N.R
4.0 193 <1 6.8 <0.1
0.8 443 <1 10.9 <0.1
2.2 659 <1 125 <0.1
8.8 2070 <1 4.1 <0.1
7.4 440 <1 2.2 <0.1
9.5 225 <1 1.1 <0.1
8.4 1600 <1 3.5 <0.1
19.4 1410 <1 2.5 <0.1
6.6 3540 <1 4.7 <0.1
12.9 916 <1 2.6 <0.1
17.5 708 <1 2.8 <0.1
12.0 1300 <1 3.2 <0.1
9.9 1490 <1 6.4 <0.1
1.5 325 <1 14.9 <0.1
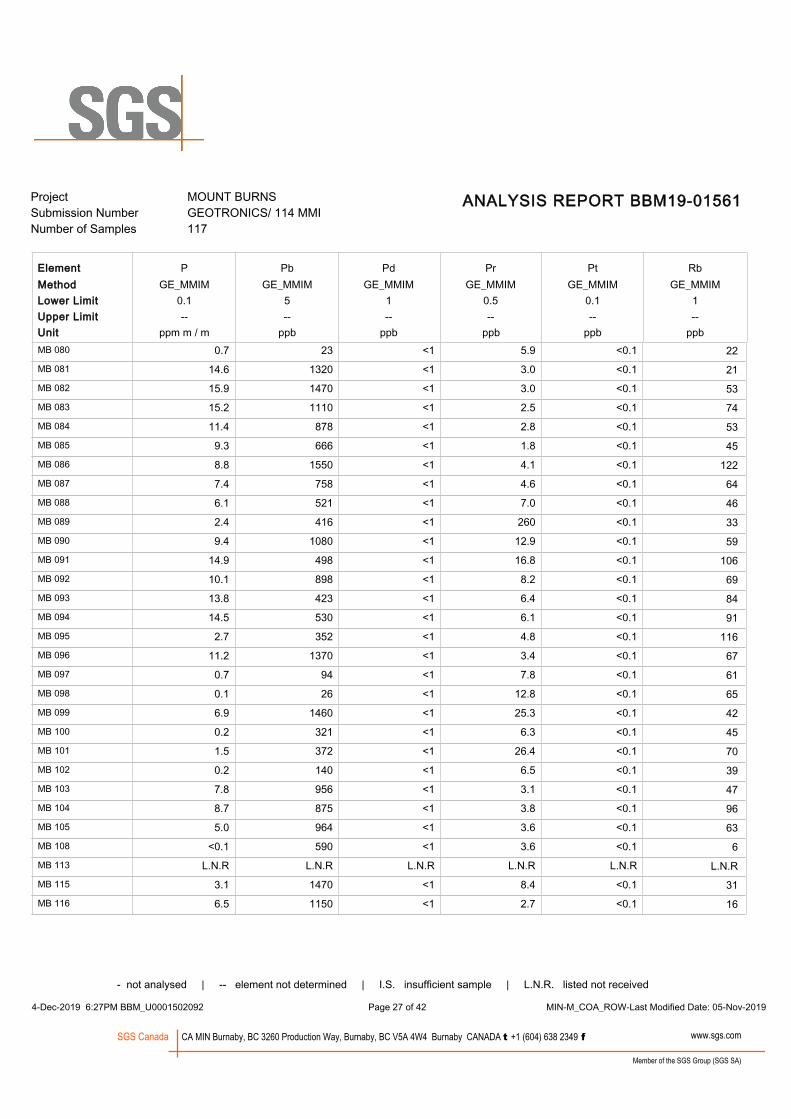
Project MOUNT BURNS Submission Number GEOTRONICS/ 114 MMI Number of Samples 117
ANALYSIS REPORT BBM19-01561
Element P Pb Pd Pr Pt RbMethod GE_MMIM GE_MMIM GE_MMIM GE_MMIM GE_MMIM GE_MMIMLower Limit 0.1 0.10.515 1Upper Limit -- -------- --Unit ppm m / m ppbppbppbppb ppbMB 080 22MB 081 21MB 082 53MB 083 74MB 084 53MB 085 45MB 086 122MB 087 64MB 088 46MB 089 33MB 090 59MB 091 106MB 092 69MB 093 84MB 094 91MB 095 116MB 096 67MB 097 61MB 098 65MB 099 42MB 100 45MB 101 70MB 102 39MB 103 47MB 104 96MB 105 63MB 108 6MB 113 L.N.RMB 115 31MB 116 16
- not analysed | -- element not determined | I.S. insufficient sample | L.N.R. listed not received
4-Dec-2019 6:27PM BBM_U0001502092 MIN-M_COA_ROW-Last Modified Date: 05-Nov-2019 Page 27 of 42
0.7 23 <1 5.9 <0.1
www.sgs.comCA MIN Burnaby, BC 3260 Production Way, Burnaby, BC V5A 4W4 Burnaby CANADA t +1 (604) 638 2349 f
Member of the SGS Group (SGS SA)
SGS Canada
14.6 1320 <1 3.0 <0.1
15.9 1470 <1 3.0 <0.1
15.2 1110 <1 2.5 <0.1
11.4 878 <1 2.8 <0.1
9.3 666 <1 1.8 <0.1
8.8 1550 <1 4.1 <0.1
7.4 758 <1 4.6 <0.1
6.1 521 <1 7.0 <0.1
2.4 416 <1 260 <0.1
9.4 1080 <1 12.9 <0.1
14.9 498 <1 16.8 <0.1
10.1 898 <1 8.2 <0.1
13.8 423 <1 6.4 <0.1
14.5 530 <1 6.1 <0.1
2.7 352 <1 4.8 <0.1
11.2 1370 <1 3.4 <0.1
0.7 94 <1 7.8 <0.1
0.1 26 <1 12.8 <0.1
6.9 1460 <1 25.3 <0.1
0.2 321 <1 6.3 <0.1
1.5 372 <1 26.4 <0.1
0.2 140 <1 6.5 <0.1
7.8 956 <1 3.1 <0.1
8.7 875 <1 3.8 <0.1
5.0 964 <1 3.6 <0.1
<0.1 590 <1 3.6 <0.1
L.N.R L.N.R L.N.R L.N.R L.N.R
3.1 1470 <1 8.4 <0.1
6.5 1150 <1 2.7 <0.1

Project MOUNT BURNS Submission Number GEOTRONICS/ 114 MMI Number of Samples 117
ANALYSIS REPORT BBM19-01561
Element P Pb Pd Pr Pt RbMethod GE_MMIM GE_MMIM GE_MMIM GE_MMIM GE_MMIM GE_MMIMLower Limit 0.1 0.10.515 1Upper Limit -- -------- --Unit ppm m / m ppbppbppbppb ppbMB 117 86MB 118 104MB 119 109MB 120 87MB 121 92MB 122 63MB 123 50MB 124 87MB 126 106MB 127 37MB 128 58MB 129 78*Rep MB 094 81*Blk BLANK <1*Std AMIS0169 250*Blk BLANK <1*Rep MB 016 17*Rep MB 030 51*Blk BLANK <1*Rep MB 036 67*Rep MB 059 64*Blk BLANK <1*Std AMIS0169 229*Rep MB 085 43
Element Sb Sc Sm Sn Sr TaMethod GE_MMIM GE_MMIM GE_MMIM GE_MMIM GE_MMIM GE_MMIMLower Limit 0.5 10115 1Upper Limit -- -------- --Unit ppb ppbppbppbppb ppb
- not analysed | -- element not determined | I.S. insufficient sample | L.N.R. listed not received
4-Dec-2019 6:27PM BBM_U0001502092 MIN-M_COA_ROW-Last Modified Date: 05-Nov-2019 Page 28 of 42
10.1 489 <1 13.6 <0.1
www.sgs.comCA MIN Burnaby, BC 3260 Production Way, Burnaby, BC V5A 4W4 Burnaby CANADA t +1 (604) 638 2349 f
Member of the SGS Group (SGS SA)
SGS Canada
9.9 1030 <1 7.2 <0.1
7.7 687 <1 7.7 <0.1
8.0 1210 <1 3.0 <0.1
9.6 1220 <1 8.8 <0.1
5.7 683 <1 1.3 <0.1
5.2 330 <1 1.2 <0.1
14.6 1150 <1 6.7 <0.1
7.0 1310 <1 11.7 <0.1
0.8 843 <1 1.9 <0.1
3.5 1220 <1 13.1 <0.1
13.1 937 <1 2.5 <0.1
14.2 484 <1 5.2 <0.1
<0.1 <5 <1 <0.5 <0.1
2.4 89 <1 93.7 <0.1
<0.1 <5 <1 0.7 <0.1
6.4 688 <1 1.5 <0.1
11.8 1160 <1 3.1 <0.1
<0.1 <5 <1 <0.5 <0.1
10.4 589 <1 1.4 <0.1
0.8 777 <1 10.0 <0.1
<0.1 <5 <1 <0.5 <0.1
2.1 93 <1 89.8 <0.1
9.0 712 <1 2.1 <0.1

Project MOUNT BURNS Submission Number GEOTRONICS/ 114 MMI Number of Samples 117
ANALYSIS REPORT BBM19-01561
Element Sb Sc Sm Sn Sr TaMethod GE_MMIM GE_MMIM GE_MMIM GE_MMIM GE_MMIM GE_MMIMLower Limit 0.5 10115 1Upper Limit -- -------- --Unit ppb ppbppbppbppb ppbMB 001 <1MB 002 <1MB 003 <1MB 004 <1MB 005 <1MB 006 <1MB 007 <1MB 008 <1MB 009 <1MB 010 <1MB 011 <1MB 012 <1MB 013 <1MB 014 <1MB 015 <1MB 016 <1MB 017 <1MB 018 <1MB 019 <1MB 020 <1MB 021 <1MB 022 <1MB 023 <1MB 024 <1MB 025 <1MB 026 <1MB 027 <1MB 028 <1MB 029 <1MB 030 <1
- not analysed | -- element not determined | I.S. insufficient sample | L.N.R. listed not received
4-Dec-2019 6:27PM BBM_U0001502092 MIN-M_COA_ROW-Last Modified Date: 05-Nov-2019 Page 29 of 42
7.7 44 11 1 50
www.sgs.comCA MIN Burnaby, BC 3260 Production Way, Burnaby, BC V5A 4W4 Burnaby CANADA t +1 (604) 638 2349 f
Member of the SGS Group (SGS SA)
SGS Canada
3.3 26 7 <1 20
4.8 23 6 1 20
6.3 23 3 2 60
3.2 30 6 1 20
5.0 27 8 <1 30
6.9 32 3 2 40
3.9 17 2 <1 30
3.4 29 3 1 20
3.5 21 2 <1 60
3.6 23 4 <1 40
6.1 28 1 1 50
1.0 20 3 <1 40
5.6 35 5 2 60
5.9 24 2 1 30
2.1 20 2 <1 250
3.2 23 2 <1 50
1.7 14 1 <1 40
0.6 12 <1 <1 20
2.0 15 2 <1 50
3.3 16 2 <1 60
4.1 23 4 <1 40
2.6 16 2 1 30
4.6 25 6 <1 40
4.8 22 3 <1 50
3.4 15 7 <1 100
10.1 39 60 1 180
5.1 19 4 <1 50
8.1 26 5 <1 30
5.0 22 2 <1 30

Project MOUNT BURNS Submission Number GEOTRONICS/ 114 MMI Number of Samples 117
ANALYSIS REPORT BBM19-01561
Element Sb Sc Sm Sn Sr TaMethod GE_MMIM GE_MMIM GE_MMIM GE_MMIM GE_MMIM GE_MMIMLower Limit 0.5 10115 1Upper Limit -- -------- --Unit ppb ppbppbppbppb ppbMB 031 <1MB 032 <1MB 033 <1MB 034 <1MB 035 <1MB 036 <1MB 037 <1MB 038 <1MB 039 <1MB 040 <1MB 041 <1MB 042 <1MB 043 <1MB 044 <1MB 045 <1MB 046 <1MB 047 <1MB 048 <1MB 049 <1MB 050 <1MB 051 <1MB 052 <1MB 053 <1MB 054 <1MB 055 <1MB 056 <1MB 057 <1MB 058 <1MB 059 <1MB 060 <1
- not analysed | -- element not determined | I.S. insufficient sample | L.N.R. listed not received
4-Dec-2019 6:27PM BBM_U0001502092 MIN-M_COA_ROW-Last Modified Date: 05-Nov-2019 Page 30 of 42
5.2 32 4 1 30
www.sgs.comCA MIN Burnaby, BC 3260 Production Way, Burnaby, BC V5A 4W4 Burnaby CANADA t +1 (604) 638 2349 f
Member of the SGS Group (SGS SA)
SGS Canada
3.7 19 4 <1 40
2.0 19 4 <1 30
5.2 32 5 1 30
6.2 33 3 2 30
5.2 19 2 2 30
1.9 11 <1 <1 20
8.2 35 3 1 40
4.0 24 1 1 20
6.1 20 2 2 50
4.2 20 2 1 50
1.6 20 2 <1 20
3.9 29 4 1 60
3.6 25 4 1 120
3.6 21 4 <1 50
12.8 24 11 <1 30
3.4 15 5 <1 50
4.4 26 2 1 40
4.3 18 2 <1 <10
4.2 23 4 <1 30
5.1 28 7 <1 80
4.8 29 6 <1 10
4.7 42 39 <1 120
4.7 21 6 <1 90
4.7 20 3 <1 80
4.2 16 4 <1 100
6.6 15 8 <1 400
4.7 23 3 1 310
0.7 <5 16 <1 1020
0.6 9 24 <1 1080

Project MOUNT BURNS Submission Number GEOTRONICS/ 114 MMI Number of Samples 117
ANALYSIS REPORT BBM19-01561
Element Sb Sc Sm Sn Sr TaMethod GE_MMIM GE_MMIM GE_MMIM GE_MMIM GE_MMIM GE_MMIMLower Limit 0.5 10115 1Upper Limit -- -------- --Unit ppb ppbppbppbppb ppbMB 061 L.N.RMB 063 <1MB 065 <1MB 067 <1MB 068 <1MB 069 <1MB 070 <1MB 071 <1MB 072 <1MB 073 <1MB 074 <1MB 075 <1MB 076 <1MB 078 <1MB 079 <1MB 080 <1MB 081 <1MB 082 <1MB 083 <1MB 084 <1MB 085 <1MB 086 <1MB 087 <1MB 088 <1MB 089 <1MB 090 <1MB 091 <1MB 092 <1MB 093 <1MB 094 <1
- not analysed | -- element not determined | I.S. insufficient sample | L.N.R. listed not received
4-Dec-2019 6:27PM BBM_U0001502092 MIN-M_COA_ROW-Last Modified Date: 05-Nov-2019 Page 31 of 42
L.N.R L.N.R L.N.R L.N.R L.N.R
www.sgs.comCA MIN Burnaby, BC 3260 Production Way, Burnaby, BC V5A 4W4 Burnaby CANADA t +1 (604) 638 2349 f
Member of the SGS Group (SGS SA)
SGS Canada
1.5 11 6 <1 420
<0.5 6 15 <1 960
2.4 26 125 <1 470
6.0 16 4 <1 70
2.1 13 2 <1 90
2.9 17 <1 1 60
4.7 25 3 <1 80
5.0 24 3 <1 50
3.9 24 5 <1 20
3.6 23 2 1 50
4.1 27 3 1 50
2.0 14 4 <1 50
3.8 21 7 <1 40
0.8 12 14 <1 830
<0.5 14 12 <1 420
3.5 22 3 1 90
3.1 19 3 <1 50
3.2 22 3 1 40
3.7 27 2 1 20
4.9 27 2 2 50
3.0 28 6 <1 20
1.3 23 5 <1 30
0.9 31 11 <1 170
1.7 139 263 <1 240
2.5 39 15 <1 100
2.7 64 19 1 40
2.7 29 9 1 160
1.0 22 6 1 60
2.3 28 6 1 60
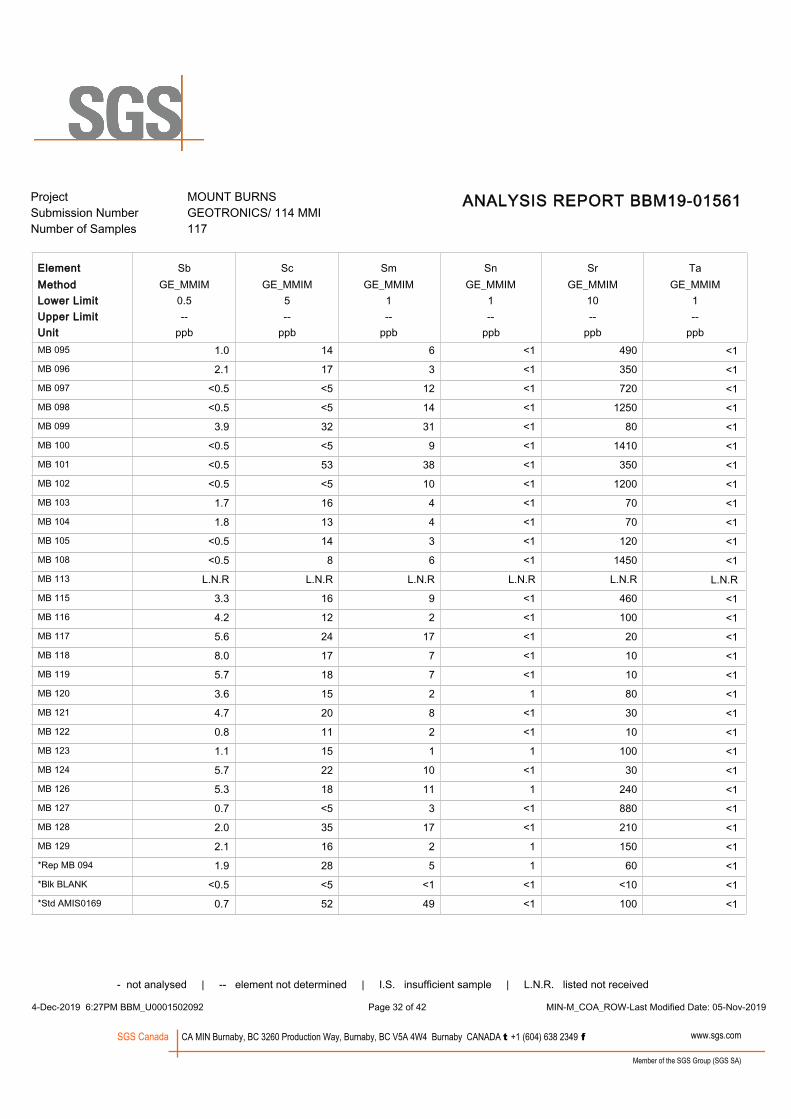
Project MOUNT BURNS Submission Number GEOTRONICS/ 114 MMI Number of Samples 117
ANALYSIS REPORT BBM19-01561
Element Sb Sc Sm Sn Sr TaMethod GE_MMIM GE_MMIM GE_MMIM GE_MMIM GE_MMIM GE_MMIMLower Limit 0.5 10115 1Upper Limit -- -------- --Unit ppb ppbppbppbppb ppbMB 095 <1MB 096 <1MB 097 <1MB 098 <1MB 099 <1MB 100 <1MB 101 <1MB 102 <1MB 103 <1MB 104 <1MB 105 <1MB 108 <1MB 113 L.N.RMB 115 <1MB 116 <1MB 117 <1MB 118 <1MB 119 <1MB 120 <1MB 121 <1MB 122 <1MB 123 <1MB 124 <1MB 126 <1MB 127 <1MB 128 <1MB 129 <1*Rep MB 094 <1*Blk BLANK <1*Std AMIS0169 <1
- not analysed | -- element not determined | I.S. insufficient sample | L.N.R. listed not received
4-Dec-2019 6:27PM BBM_U0001502092 MIN-M_COA_ROW-Last Modified Date: 05-Nov-2019 Page 32 of 42
1.0 14 6 <1 490
www.sgs.comCA MIN Burnaby, BC 3260 Production Way, Burnaby, BC V5A 4W4 Burnaby CANADA t +1 (604) 638 2349 f
Member of the SGS Group (SGS SA)
SGS Canada
2.1 17 3 <1 350
<0.5 <5 12 <1 720
<0.5 <5 14 <1 1250
3.9 32 31 <1 80
<0.5 <5 9 <1 1410
<0.5 53 38 <1 350
<0.5 <5 10 <1 1200
1.7 16 4 <1 70
1.8 13 4 <1 70
<0.5 14 3 <1 120
<0.5 8 6 <1 1450
L.N.R L.N.R L.N.R L.N.R L.N.R
3.3 16 9 <1 460
4.2 12 2 <1 100
5.6 24 17 <1 20
8.0 17 7 <1 10
5.7 18 7 <1 10
3.6 15 2 1 80
4.7 20 8 <1 30
0.8 11 2 <1 10
1.1 15 1 1 100
5.7 22 10 <1 30
5.3 18 11 1 240
0.7 <5 3 <1 880
2.0 35 17 <1 210
2.1 16 2 1 150
1.9 28 5 1 60
<0.5 <5 <1 <1 <10
0.7 52 49 <1 100
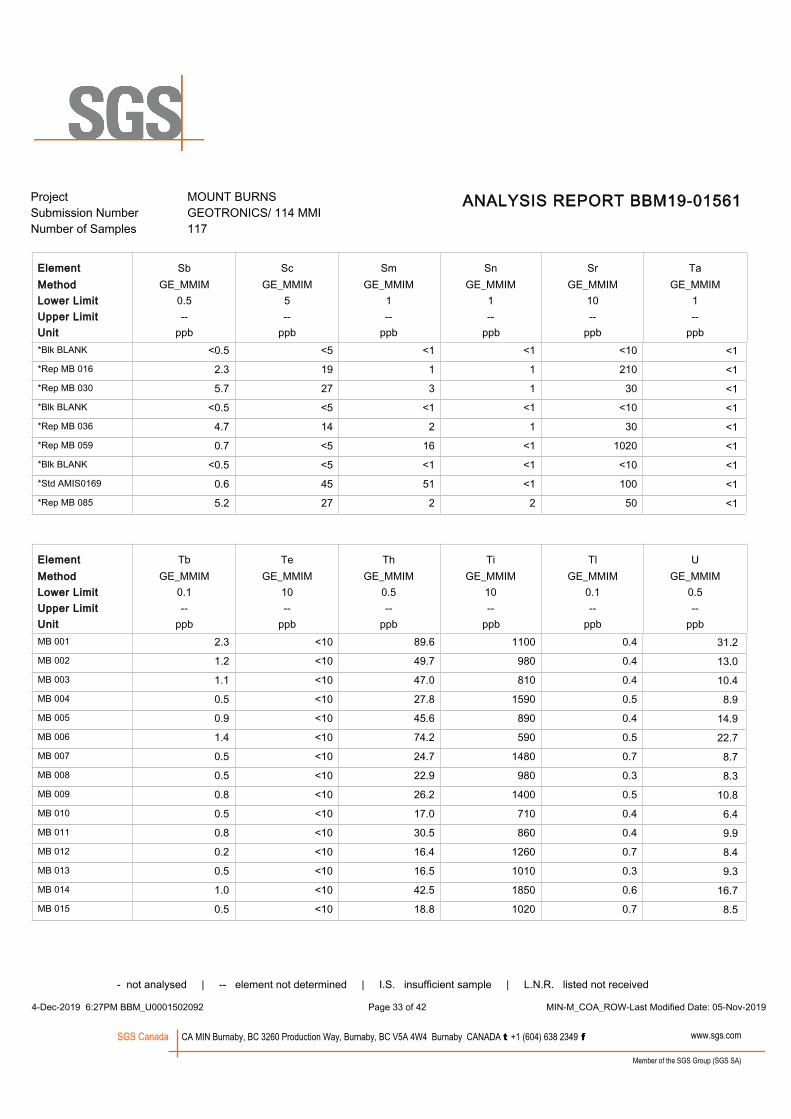
Project MOUNT BURNS Submission Number GEOTRONICS/ 114 MMI Number of Samples 117
ANALYSIS REPORT BBM19-01561
Element Sb Sc Sm Sn Sr TaMethod GE_MMIM GE_MMIM GE_MMIM GE_MMIM GE_MMIM GE_MMIMLower Limit 0.5 10115 1Upper Limit -- -------- --Unit ppb ppbppbppbppb ppb*Blk BLANK <1*Rep MB 016 <1*Rep MB 030 <1*Blk BLANK <1*Rep MB 036 <1*Rep MB 059 <1*Blk BLANK <1*Std AMIS0169 <1*Rep MB 085 <1
Element Tb Te Th Ti Tl UMethod GE_MMIM GE_MMIM GE_MMIM GE_MMIM GE_MMIM GE_MMIMLower Limit 0.1 0.1100.510 0.5Upper Limit -- -------- --Unit ppb ppbppbppbppb ppbMB 001 31.2MB 002 13.0MB 003 10.4MB 004 8.9MB 005 14.9MB 006 22.7MB 007 8.7MB 008 8.3MB 009 10.8MB 010 6.4MB 011 9.9MB 012 8.4MB 013 9.3MB 014 16.7MB 015 8.5
- not analysed | -- element not determined | I.S. insufficient sample | L.N.R. listed not received
4-Dec-2019 6:27PM BBM_U0001502092 MIN-M_COA_ROW-Last Modified Date: 05-Nov-2019 Page 33 of 42
<0.5 <5 <1 <1 <10
2.3 <10 89.6 1100 0.4
www.sgs.comCA MIN Burnaby, BC 3260 Production Way, Burnaby, BC V5A 4W4 Burnaby CANADA t +1 (604) 638 2349 f
Member of the SGS Group (SGS SA)
SGS Canada
2.3 19 1 1 210
5.7 27 3 1 30
<0.5 <5 <1 <1 <10
4.7 14 2 1 30
0.7 <5 16 <1 1020
<0.5 <5 <1 <1 <10
0.6 45 51 <1 100
5.2 27 2 2 50
1.2 <10 49.7 980 0.4
1.1 <10 47.0 810 0.4
0.5 <10 27.8 1590 0.5
0.9 <10 45.6 890 0.4
1.4 <10 74.2 590 0.5
0.5 <10 24.7 1480 0.7
0.5 <10 22.9 980 0.3
0.8 <10 26.2 1400 0.5
0.5 <10 17.0 710 0.4
0.8 <10 30.5 860 0.4
0.2 <10 16.4 1260 0.7
0.5 <10 16.5 1010 0.3
1.0 <10 42.5 1850 0.6
0.5 <10 18.8 1020 0.7

Project MOUNT BURNS Submission Number GEOTRONICS/ 114 MMI Number of Samples 117
ANALYSIS REPORT BBM19-01561
Element Tb Te Th Ti Tl UMethod GE_MMIM GE_MMIM GE_MMIM GE_MMIM GE_MMIM GE_MMIMLower Limit 0.1 0.1100.510 0.5Upper Limit -- -------- --Unit ppb ppbppbppbppb ppbMB 016 5.9MB 017 8.9MB 018 4.0MB 019 4.2MB 020 5.2MB 021 8.1MB 022 15.8MB 023 6.0MB 024 13.0MB 025 9.9MB 026 17.6MB 027 36.2MB 028 10.7MB 029 11.6MB 030 10.2MB 031 10.0MB 032 9.7MB 033 12.6MB 034 11.6MB 035 8.9MB 036 6.7MB 037 6.7MB 038 12.1MB 039 6.7MB 040 5.7MB 041 7.3MB 042 10.3MB 043 12.4MB 044 12.8MB 045 11.8
- not analysed | -- element not determined | I.S. insufficient sample | L.N.R. listed not received
4-Dec-2019 6:27PM BBM_U0001502092 MIN-M_COA_ROW-Last Modified Date: 05-Nov-2019 Page 34 of 42
0.4 <10 14.3 1190 0.3
www.sgs.comCA MIN Burnaby, BC 3260 Production Way, Burnaby, BC V5A 4W4 Burnaby CANADA t +1 (604) 638 2349 f
Member of the SGS Group (SGS SA)
SGS Canada
0.5 <10 24.4 1110 0.5
0.3 <10 7.9 660 0.2
0.3 <10 7.4 500 0.2
0.5 <10 10.9 1020 0.3
0.4 <10 20.0 790 0.2
0.8 <10 53.1 800 0.4
0.4 <10 16.6 1120 0.5
1.1 <10 34.8 800 0.4
0.5 <10 27.2 640 0.7
1.6 <10 50.1 560 0.4
12.1 <10 40.3 690 0.8
0.8 <10 29.0 1030 0.2
0.8 <10 31.3 1020 0.5
0.5 <10 23.7 1170 0.5
0.7 <10 28.1 1490 0.6
0.9 <10 26.3 910 0.3
0.8 <10 33.0 1190 0.4
0.8 <10 40.6 1480 0.8
0.4 <10 23.9 2010 0.8
0.2 <10 16.4 1270 0.6
0.1 <10 15.3 760 0.4
0.4 <10 34.7 1890 1.1
0.2 <10 17.9 1500 0.8
0.3 <10 15.0 1690 0.7
0.3 <10 18.2 1610 0.7
0.4 <10 30.5 1220 0.4
0.8 <10 32.0 1360 0.6
0.8 <10 52.4 1270 0.4
0.7 <10 30.3 620 0.4
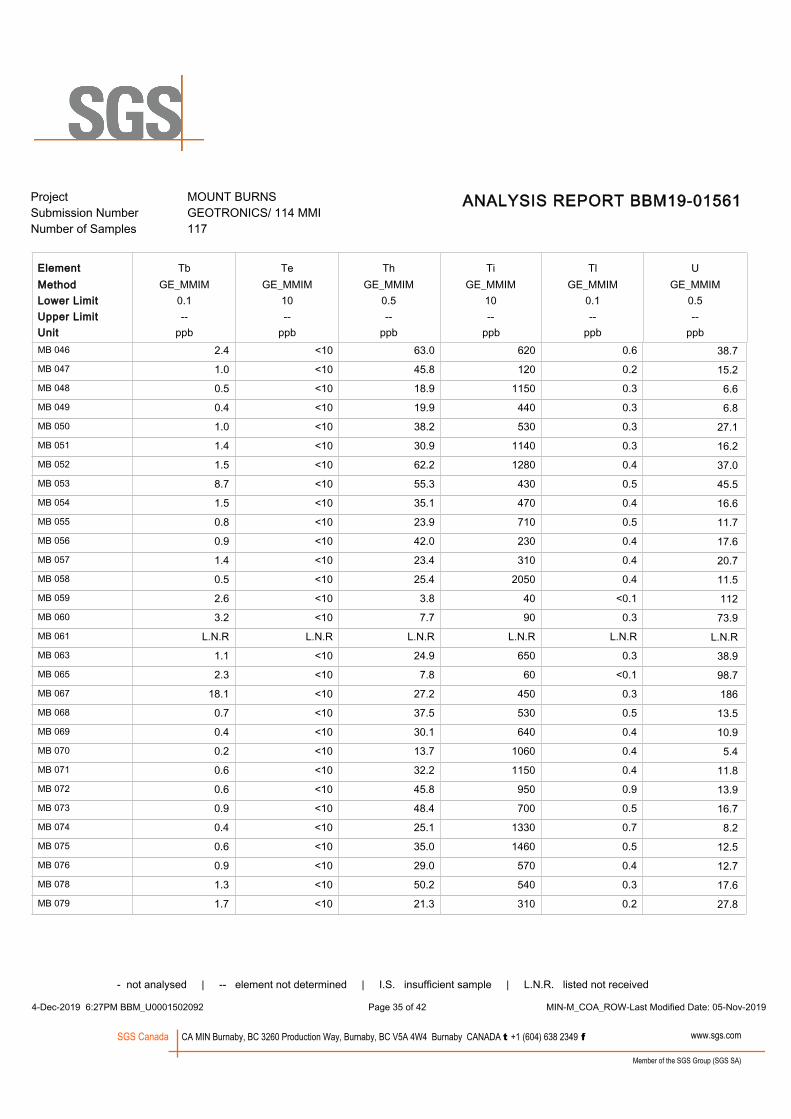
Project MOUNT BURNS Submission Number GEOTRONICS/ 114 MMI Number of Samples 117
ANALYSIS REPORT BBM19-01561
Element Tb Te Th Ti Tl UMethod GE_MMIM GE_MMIM GE_MMIM GE_MMIM GE_MMIM GE_MMIMLower Limit 0.1 0.1100.510 0.5Upper Limit -- -------- --Unit ppb ppbppbppbppb ppbMB 046 38.7MB 047 15.2MB 048 6.6MB 049 6.8MB 050 27.1MB 051 16.2MB 052 37.0MB 053 45.5MB 054 16.6MB 055 11.7MB 056 17.6MB 057 20.7MB 058 11.5MB 059 112MB 060 73.9MB 061 L.N.RMB 063 38.9MB 065 98.7MB 067 186MB 068 13.5MB 069 10.9MB 070 5.4MB 071 11.8MB 072 13.9MB 073 16.7MB 074 8.2MB 075 12.5MB 076 12.7MB 078 17.6MB 079 27.8
- not analysed | -- element not determined | I.S. insufficient sample | L.N.R. listed not received
4-Dec-2019 6:27PM BBM_U0001502092 MIN-M_COA_ROW-Last Modified Date: 05-Nov-2019 Page 35 of 42
2.4 <10 63.0 620 0.6
www.sgs.comCA MIN Burnaby, BC 3260 Production Way, Burnaby, BC V5A 4W4 Burnaby CANADA t +1 (604) 638 2349 f
Member of the SGS Group (SGS SA)
SGS Canada
1.0 <10 45.8 120 0.2
0.5 <10 18.9 1150 0.3
0.4 <10 19.9 440 0.3
1.0 <10 38.2 530 0.3
1.4 <10 30.9 1140 0.3
1.5 <10 62.2 1280 0.4
8.7 <10 55.3 430 0.5
1.5 <10 35.1 470 0.4
0.8 <10 23.9 710 0.5
0.9 <10 42.0 230 0.4
1.4 <10 23.4 310 0.4
0.5 <10 25.4 2050 0.4
2.6 <10 3.8 40 <0.1
3.2 <10 7.7 90 0.3
L.N.R L.N.R L.N.R L.N.R L.N.R
1.1 <10 24.9 650 0.3
2.3 <10 7.8 60 <0.1
18.1 <10 27.2 450 0.3
0.7 <10 37.5 530 0.5
0.4 <10 30.1 640 0.4
0.2 <10 13.7 1060 0.4
0.6 <10 32.2 1150 0.4
0.6 <10 45.8 950 0.9
0.9 <10 48.4 700 0.5
0.4 <10 25.1 1330 0.7
0.6 <10 35.0 1460 0.5
0.9 <10 29.0 570 0.4
1.3 <10 50.2 540 0.3
1.7 <10 21.3 310 0.2

Project MOUNT BURNS Submission Number GEOTRONICS/ 114 MMI Number of Samples 117
ANALYSIS REPORT BBM19-01561
Element Tb Te Th Ti Tl UMethod GE_MMIM GE_MMIM GE_MMIM GE_MMIM GE_MMIM GE_MMIMLower Limit 0.1 0.1100.510 0.5Upper Limit -- -------- --Unit ppb ppbppbppbppb ppbMB 080 5.2MB 081 8.8MB 082 12.8MB 083 10.0MB 084 8.1MB 085 5.2MB 086 20.9MB 087 11.5MB 088 10.7MB 089 10.9MB 090 15.9MB 091 19.4MB 092 11.2MB 093 5.7MB 094 9.7MB 095 14.3MB 096 8.2MB 097 32.5MB 098 184MB 099 29.9MB 100 13.8MB 101 49.9MB 102 22.6MB 103 8.4MB 104 13.5MB 105 5.6MB 108 258MB 113 L.N.RMB 115 18.7MB 116 6.2
- not analysed | -- element not determined | I.S. insufficient sample | L.N.R. listed not received
4-Dec-2019 6:27PM BBM_U0001502092 MIN-M_COA_ROW-Last Modified Date: 05-Nov-2019 Page 36 of 42
2.5 <10 3.9 30 <0.1
www.sgs.comCA MIN Burnaby, BC 3260 Production Way, Burnaby, BC V5A 4W4 Burnaby CANADA t +1 (604) 638 2349 f
Member of the SGS Group (SGS SA)
SGS Canada
0.7 <10 26.2 1350 0.3
0.6 <10 43.5 780 0.7
0.4 <10 30.5 1050 0.5
0.4 <10 31.4 1580 0.6
0.3 <10 15.0 1690 0.6
1.1 <10 70.2 1150 0.6
1.2 <10 24.9 940 0.4
3.3 <10 19.8 620 0.2
45.9 <10 44.2 200 0.1
2.7 <10 66.8 830 0.4
3.5 <10 52.0 1810 0.7
1.8 10 36.2 1790 <0.1
0.9 <10 20.6 1520 <0.1
1.0 <10 36.0 1830 <0.1
1.2 <10 10.9 540 <0.1
0.6 <10 18.3 720 <0.1
1.9 <10 4.0 80 <0.1
1.8 <10 0.9 <10 <0.1
5.5 <10 68.8 670 <0.1
1.6 <10 1.5 30 <0.1
10.1 <10 15.1 200 0.3
1.7 <10 2.1 20 <0.1
0.6 <10 18.6 580 <0.1
0.8 <10 25.2 770 <0.1
0.6 <10 29.0 300 <0.1
1.6 <10 3.5 30 <0.1
L.N.R L.N.R L.N.R L.N.R L.N.R
1.6 <10 30.7 490 <0.1
0.3 <10 17.8 930 <0.1

Project MOUNT BURNS Submission Number GEOTRONICS/ 114 MMI Number of Samples 117
ANALYSIS REPORT BBM19-01561
Element Tb Te Th Ti Tl UMethod GE_MMIM GE_MMIM GE_MMIM GE_MMIM GE_MMIM GE_MMIMLower Limit 0.1 0.1100.510 0.5Upper Limit -- -------- --Unit ppb ppbppbppbppb ppbMB 117 33.9MB 118 15.7MB 119 37.2MB 120 8.6MB 121 9.0MB 122 9.6MB 123 2.3MB 124 25.3MB 126 16.0MB 127 49.9MB 128 94.8MB 129 8.5*Rep MB 094 9.0*Blk BLANK <0.5*Std AMIS0169 17.4*Blk BLANK <0.5*Rep MB 016 5.1*Rep MB 030 11.2*Blk BLANK <0.5*Rep MB 036 5.8*Rep MB 059 110*Blk BLANK <0.5*Std AMIS0169 17.2*Rep MB 085 6.1
W Y Yb Zn ZrElementGE_MMIM GE_MMIM GE_MMIM GE_MMIM GE_MMIMMethod
0.5 1 0.2 10 2Lower Limit-- -- -- -- --Upper Limit
ppb ppb ppb ppb ppbUnit
- not analysed | -- element not determined | I.S. insufficient sample | L.N.R. listed not received
4-Dec-2019 6:27PM BBM_U0001502092 MIN-M_COA_ROW-Last Modified Date: 05-Nov-2019 Page 37 of 42
3.1 <10 65.1 270 <0.1
www.sgs.comCA MIN Burnaby, BC 3260 Production Way, Burnaby, BC V5A 4W4 Burnaby CANADA t +1 (604) 638 2349 f
Member of the SGS Group (SGS SA)
SGS Canada
1.1 <10 40.6 1160 <0.1
1.4 <10 80.7 470 <0.1
0.4 <10 31.2 1420 <0.1
1.1 <10 26.3 1350 <0.1
0.4 <10 14.8 560 <0.1
<0.1 <10 8.2 520 <0.1
2.2 <10 53.8 550 1.1
1.9 <10 43.3 2040 0.9
0.7 <10 5.2 70 0.7
3.1 <10 31.4 990 0.8
0.3 <10 39.6 680 1.2
0.9 10 31.2 1730 <0.1
<0.1 <10 <0.5 <10 <0.1
4.5 <10 51.0 470 1.3
<0.1 <10 <0.5 <10 <0.1
0.4 <10 13.2 1310 0.3
0.6 <10 25.4 1200 0.6
<0.1 <10 <0.5 <10 <0.1
<0.1 <10 17.9 1060 0.4
2.5 <10 4.2 60 0.1
<0.1 <10 <0.5 <10 <0.1
4.6 <10 54.4 460 1.4
0.3 <10 14.9 1660 0.7

Project MOUNT BURNS Submission Number GEOTRONICS/ 114 MMI Number of Samples 117
ANALYSIS REPORT BBM19-01561
W Y Yb Zn ZrElementGE_MMIM GE_MMIM GE_MMIM GE_MMIM GE_MMIMMethod
0.5 1 0.2 10 2Lower Limit-- -- -- -- --Upper Limit
ppb ppb ppb ppb ppbUnitMB 001
MB 002
MB 003
MB 004
MB 005
MB 006
MB 007
MB 008
MB 009
MB 010
MB 011
MB 012
MB 013
MB 014
MB 015
MB 016
MB 017
MB 018
MB 019
MB 020
MB 021
MB 022
MB 023
MB 024
MB 025
MB 026
MB 027
MB 028
MB 029
MB 030
- not analysed | -- element not determined | I.S. insufficient sample | L.N.R. listed not received
4-Dec-2019 6:27PM BBM_U0001502092 MIN-M_COA_ROW-Last Modified Date: 05-Nov-2019 Page 38 of 42
2.8 46 3.4 870 287
www.sgs.comCA MIN Burnaby, BC 3260 Production Way, Burnaby, BC V5A 4W4 Burnaby CANADA t +1 (604) 638 2349 f
Member of the SGS Group (SGS SA)
SGS Canada
2.9 21 2.0 510 183
1.9 24 1.7 410 127
3.2 13 1.1 290 130
1.2 19 1.5 500 152
2.9 25 1.9 560 167
3.5 13 1.3 380 112
1.8 16 1.5 330 81
1.6 20 1.9 360 103
1.3 12 1.1 350 67
1.0 22 1.8 530 91
2.1 8 1.1 480 87
1.0 17 1.8 440 77
5.8 28 2.5 820 175
1.7 11 1.0 490 80
1.8 13 1.3 710 66
3.5 17 1.9 730 105
1.3 12 1.2 360 46
<0.5 10 1.0 370 37
1.6 16 1.6 260 64
1.2 11 1.2 740 62
1.3 16 1.5 720 151
0.9 13 1.3 220 75
1.7 22 1.9 600 101
2.3 14 1.4 570 77
1.1 25 2.0 1330 93
3.9 334 26.9 1850 113
2.0 22 1.9 510 68
3.0 20 1.6 470 115
2.5 13 1.5 450 99
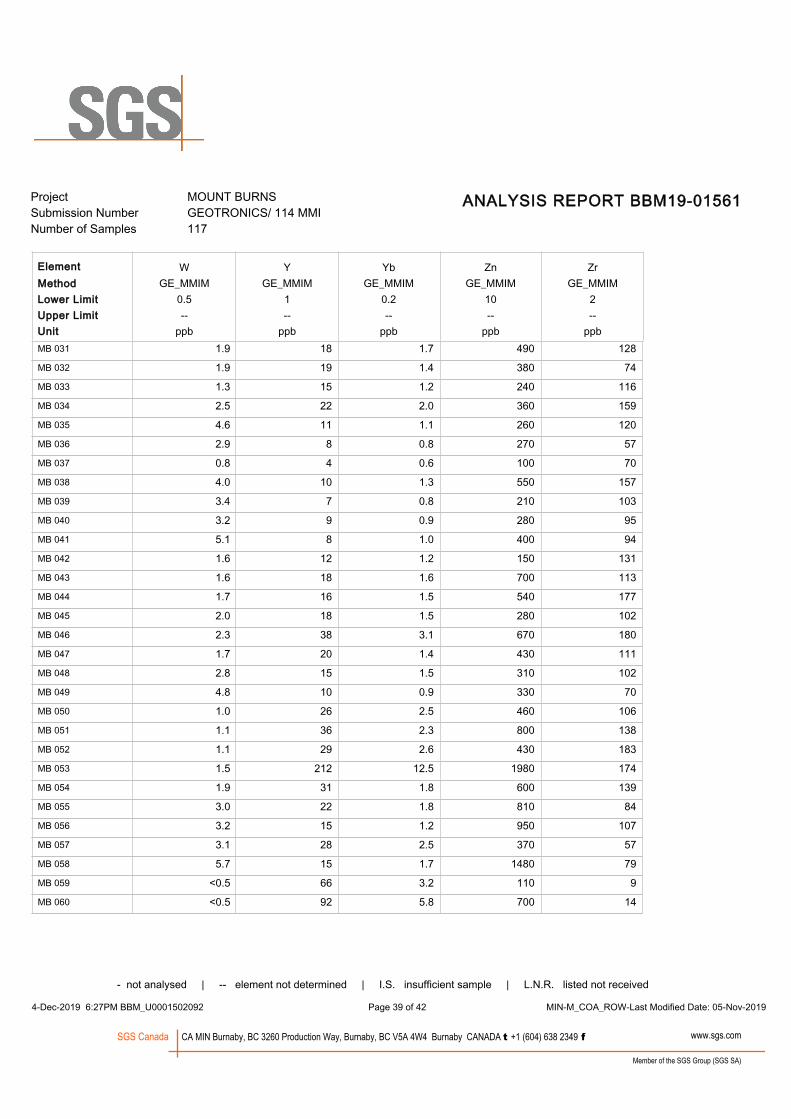
Project MOUNT BURNS Submission Number GEOTRONICS/ 114 MMI Number of Samples 117
ANALYSIS REPORT BBM19-01561
W Y Yb Zn ZrElementGE_MMIM GE_MMIM GE_MMIM GE_MMIM GE_MMIMMethod
0.5 1 0.2 10 2Lower Limit-- -- -- -- --Upper Limit
ppb ppb ppb ppb ppbUnitMB 031
MB 032
MB 033
MB 034
MB 035
MB 036
MB 037
MB 038
MB 039
MB 040
MB 041
MB 042
MB 043
MB 044
MB 045
MB 046
MB 047
MB 048
MB 049
MB 050
MB 051
MB 052
MB 053
MB 054
MB 055
MB 056
MB 057
MB 058
MB 059
MB 060
- not analysed | -- element not determined | I.S. insufficient sample | L.N.R. listed not received
4-Dec-2019 6:27PM BBM_U0001502092 MIN-M_COA_ROW-Last Modified Date: 05-Nov-2019 Page 39 of 42
1.9 18 1.7 490 128
www.sgs.comCA MIN Burnaby, BC 3260 Production Way, Burnaby, BC V5A 4W4 Burnaby CANADA t +1 (604) 638 2349 f
Member of the SGS Group (SGS SA)
SGS Canada
1.9 19 1.4 380 74
1.3 15 1.2 240 116
2.5 22 2.0 360 159
4.6 11 1.1 260 120
2.9 8 0.8 270 57
0.8 4 0.6 100 70
4.0 10 1.3 550 157
3.4 7 0.8 210 103
3.2 9 0.9 280 95
5.1 8 1.0 400 94
1.6 12 1.2 150 131
1.6 18 1.6 700 113
1.7 16 1.5 540 177
2.0 18 1.5 280 102
2.3 38 3.1 670 180
1.7 20 1.4 430 111
2.8 15 1.5 310 102
4.8 10 0.9 330 70
1.0 26 2.5 460 106
1.1 36 2.3 800 138
1.1 29 2.6 430 183
1.5 212 12.5 1980 174
1.9 31 1.8 600 139
3.0 22 1.8 810 84
3.2 15 1.2 950 107
3.1 28 2.5 370 57
5.7 15 1.7 1480 79
<0.5 66 3.2 110 9
<0.5 92 5.8 700 14
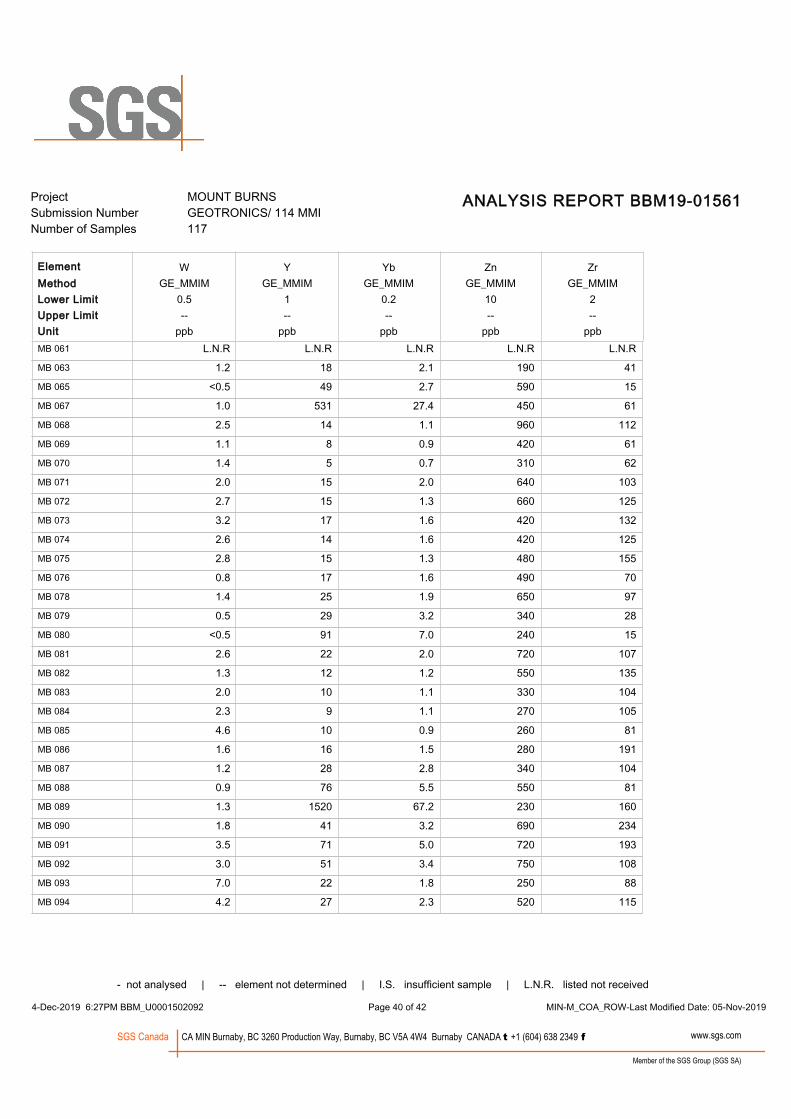
Project MOUNT BURNS Submission Number GEOTRONICS/ 114 MMI Number of Samples 117
ANALYSIS REPORT BBM19-01561
W Y Yb Zn ZrElementGE_MMIM GE_MMIM GE_MMIM GE_MMIM GE_MMIMMethod
0.5 1 0.2 10 2Lower Limit-- -- -- -- --Upper Limit
ppb ppb ppb ppb ppbUnitMB 061
MB 063
MB 065
MB 067
MB 068
MB 069
MB 070
MB 071
MB 072
MB 073
MB 074
MB 075
MB 076
MB 078
MB 079
MB 080
MB 081
MB 082
MB 083
MB 084
MB 085
MB 086
MB 087
MB 088
MB 089
MB 090
MB 091
MB 092
MB 093
MB 094
- not analysed | -- element not determined | I.S. insufficient sample | L.N.R. listed not received
4-Dec-2019 6:27PM BBM_U0001502092 MIN-M_COA_ROW-Last Modified Date: 05-Nov-2019 Page 40 of 42
L.N.R L.N.R L.N.R L.N.R L.N.R
www.sgs.comCA MIN Burnaby, BC 3260 Production Way, Burnaby, BC V5A 4W4 Burnaby CANADA t +1 (604) 638 2349 f
Member of the SGS Group (SGS SA)
SGS Canada
1.2 18 2.1 190 41
<0.5 49 2.7 590 15
1.0 531 27.4 450 61
2.5 14 1.1 960 112
1.1 8 0.9 420 61
1.4 5 0.7 310 62
2.0 15 2.0 640 103
2.7 15 1.3 660 125
3.2 17 1.6 420 132
2.6 14 1.6 420 125
2.8 15 1.3 480 155
0.8 17 1.6 490 70
1.4 25 1.9 650 97
0.5 29 3.2 340 28
<0.5 91 7.0 240 15
2.6 22 2.0 720 107
1.3 12 1.2 550 135
2.0 10 1.1 330 104
2.3 9 1.1 270 105
4.6 10 0.9 260 81
1.6 16 1.5 280 191
1.2 28 2.8 340 104
0.9 76 5.5 550 81
1.3 1520 67.2 230 160
1.8 41 3.2 690 234
3.5 71 5.0 720 193
3.0 51 3.4 750 108
7.0 22 1.8 250 88
4.2 27 2.3 520 115
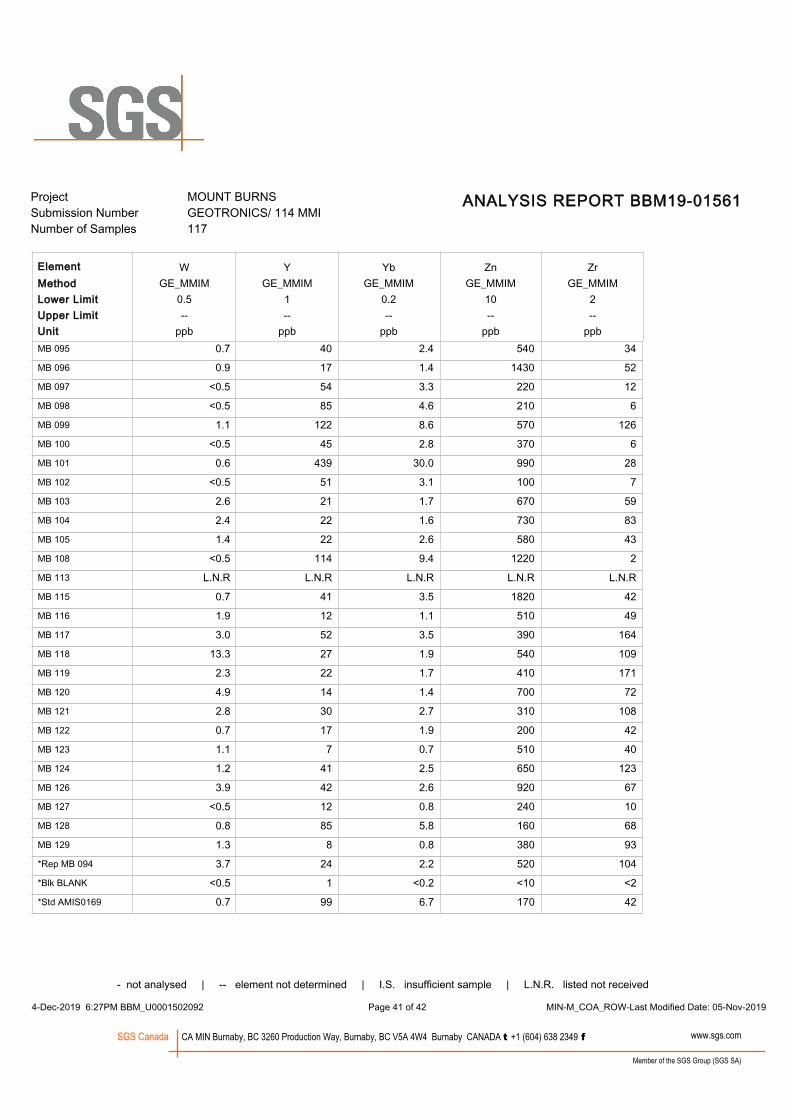
Project MOUNT BURNS Submission Number GEOTRONICS/ 114 MMI Number of Samples 117
ANALYSIS REPORT BBM19-01561
W Y Yb Zn ZrElementGE_MMIM GE_MMIM GE_MMIM GE_MMIM GE_MMIMMethod
0.5 1 0.2 10 2Lower Limit-- -- -- -- --Upper Limit
ppb ppb ppb ppb ppbUnitMB 095
MB 096
MB 097
MB 098
MB 099
MB 100
MB 101
MB 102
MB 103
MB 104
MB 105
MB 108
MB 113
MB 115
MB 116
MB 117
MB 118
MB 119
MB 120
MB 121
MB 122
MB 123
MB 124
MB 126
MB 127
MB 128
MB 129
*Rep MB 094
*Blk BLANK
*Std AMIS0169
- not analysed | -- element not determined | I.S. insufficient sample | L.N.R. listed not received
4-Dec-2019 6:27PM BBM_U0001502092 MIN-M_COA_ROW-Last Modified Date: 05-Nov-2019 Page 41 of 42
0.7 40 2.4 540 34
www.sgs.comCA MIN Burnaby, BC 3260 Production Way, Burnaby, BC V5A 4W4 Burnaby CANADA t +1 (604) 638 2349 f
Member of the SGS Group (SGS SA)
SGS Canada
0.9 17 1.4 1430 52
<0.5 54 3.3 220 12
<0.5 85 4.6 210 6
1.1 122 8.6 570 126
<0.5 45 2.8 370 6
0.6 439 30.0 990 28
<0.5 51 3.1 100 7
2.6 21 1.7 670 59
2.4 22 1.6 730 83
1.4 22 2.6 580 43
<0.5 114 9.4 1220 2
L.N.R L.N.R L.N.R L.N.R L.N.R
0.7 41 3.5 1820 42
1.9 12 1.1 510 49
3.0 52 3.5 390 164
13.3 27 1.9 540 109
2.3 22 1.7 410 171
4.9 14 1.4 700 72
2.8 30 2.7 310 108
0.7 17 1.9 200 42
1.1 7 0.7 510 40
1.2 41 2.5 650 123
3.9 42 2.6 920 67
<0.5 12 0.8 240 10
0.8 85 5.8 160 68
1.3 8 0.8 380 93
3.7 24 2.2 520 104
<0.5 1 <0.2 <10 <2
0.7 99 6.7 170 42
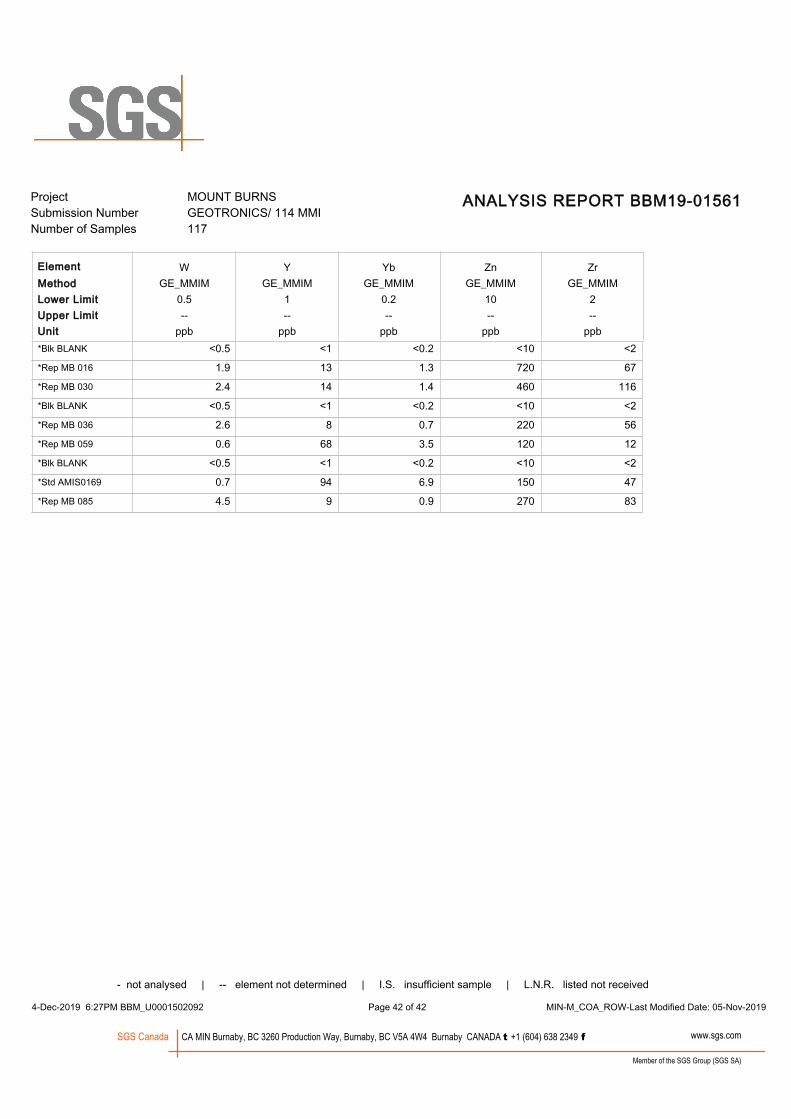
Project MOUNT BURNS Submission Number GEOTRONICS/ 114 MMI Number of Samples 117
ANALYSIS REPORT BBM19-01561
W Y Yb Zn ZrElementGE_MMIM GE_MMIM GE_MMIM GE_MMIM GE_MMIMMethod
0.5 1 0.2 10 2Lower Limit-- -- -- -- --Upper Limit
ppb ppb ppb ppb ppbUnit*Blk BLANK
*Rep MB 016
*Rep MB 030
*Blk BLANK
*Rep MB 036
*Rep MB 059
*Blk BLANK
*Std AMIS0169
*Rep MB 085
- not analysed | -- element not determined | I.S. insufficient sample | L.N.R. listed not received
4-Dec-2019 6:27PM BBM_U0001502092 MIN-M_COA_ROW-Last Modified Date: 05-Nov-2019 Page 42 of 42
<0.5 <1 <0.2 <10 <2
www.sgs.comCA MIN Burnaby, BC 3260 Production Way, Burnaby, BC V5A 4W4 Burnaby CANADA t +1 (604) 638 2349 f
Member of the SGS Group (SGS SA)
SGS Canada
1.9 13 1.3 720 67
2.4 14 1.4 460 116
<0.5 <1 <0.2 <10 <2
2.6 8 0.7 220 56
0.6 68 3.5 120 12
<0.5 <1 <0.2 <10 <2
0.7 94 6.9 150 47
4.5 9 0.9 270 83

27
19 APPENDIX III – GEOPYSICAL SURVEY PLANS
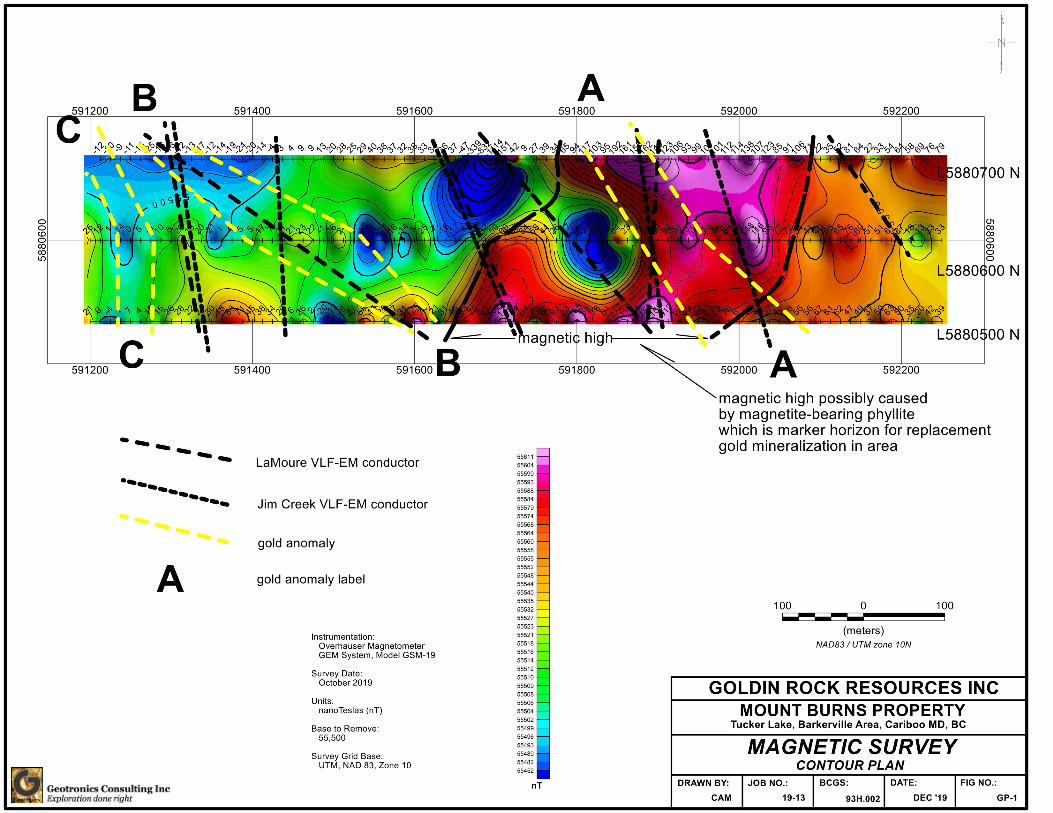
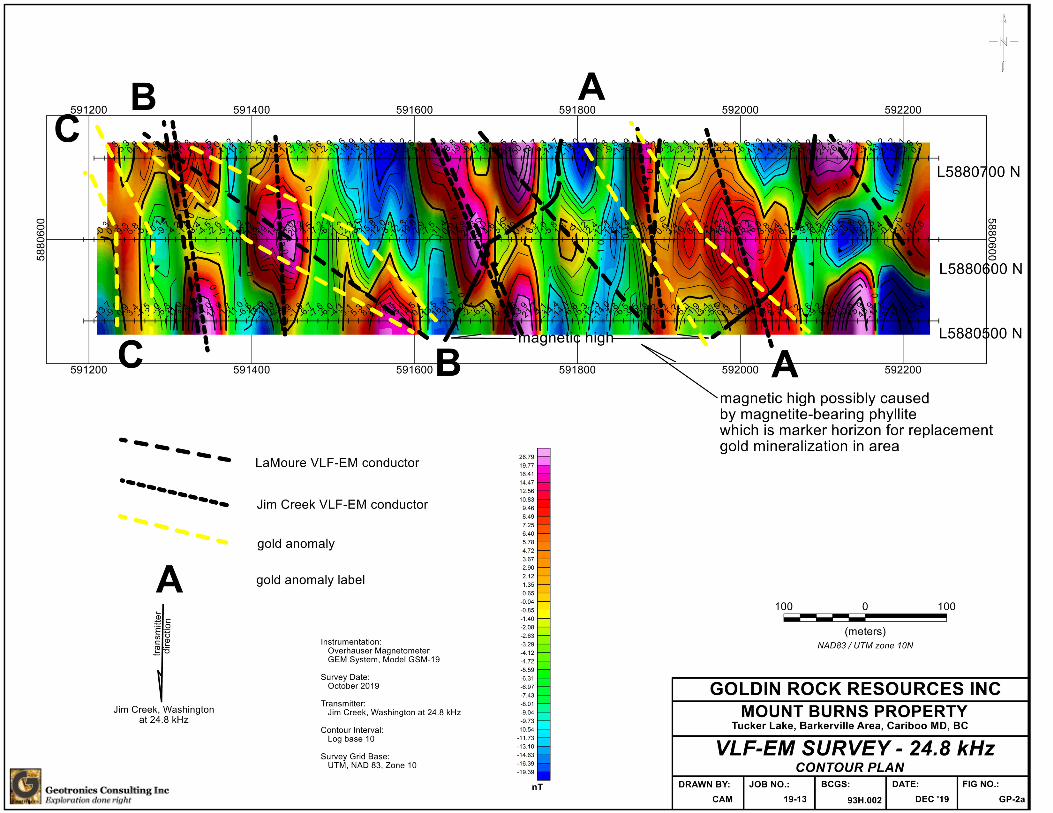
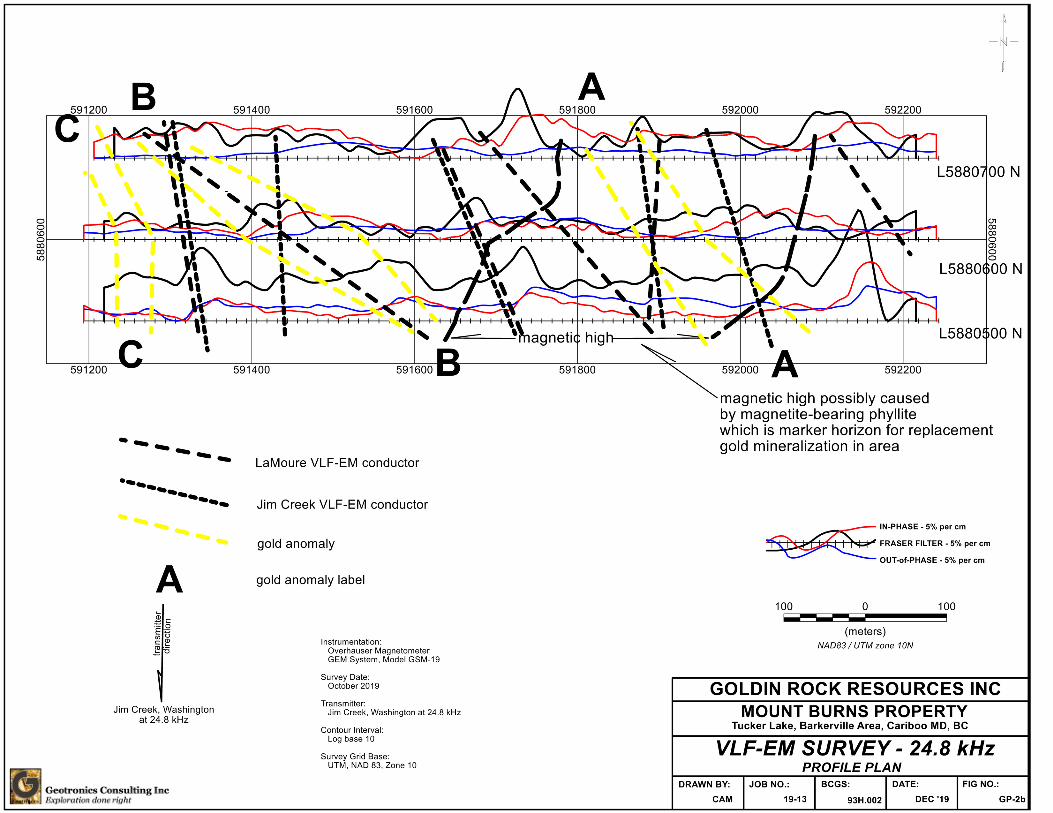
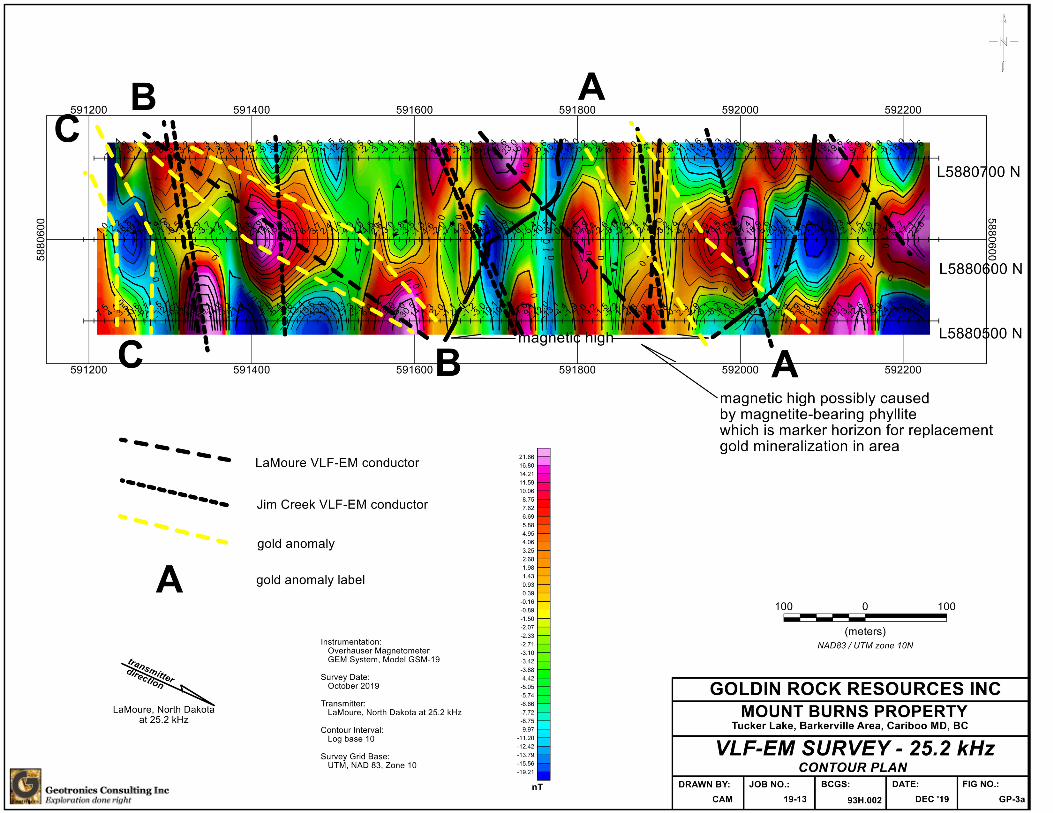
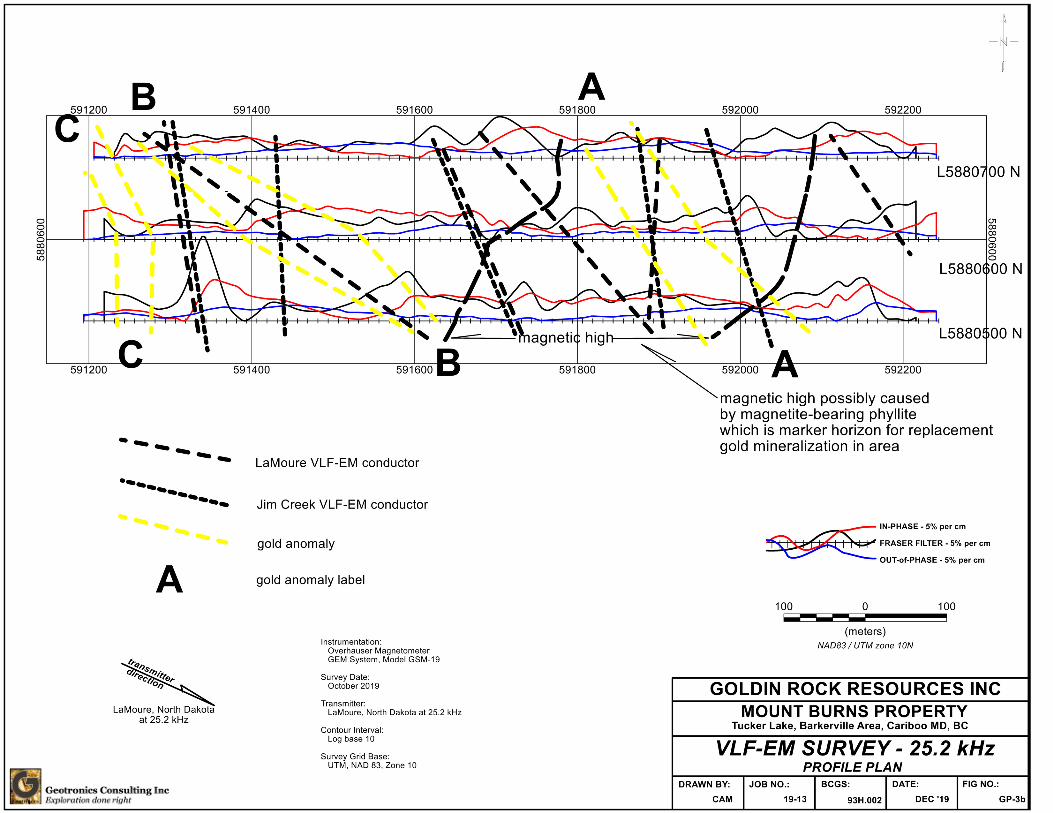

28
20 APPENDIX IV – MMI SURVEY PLANS
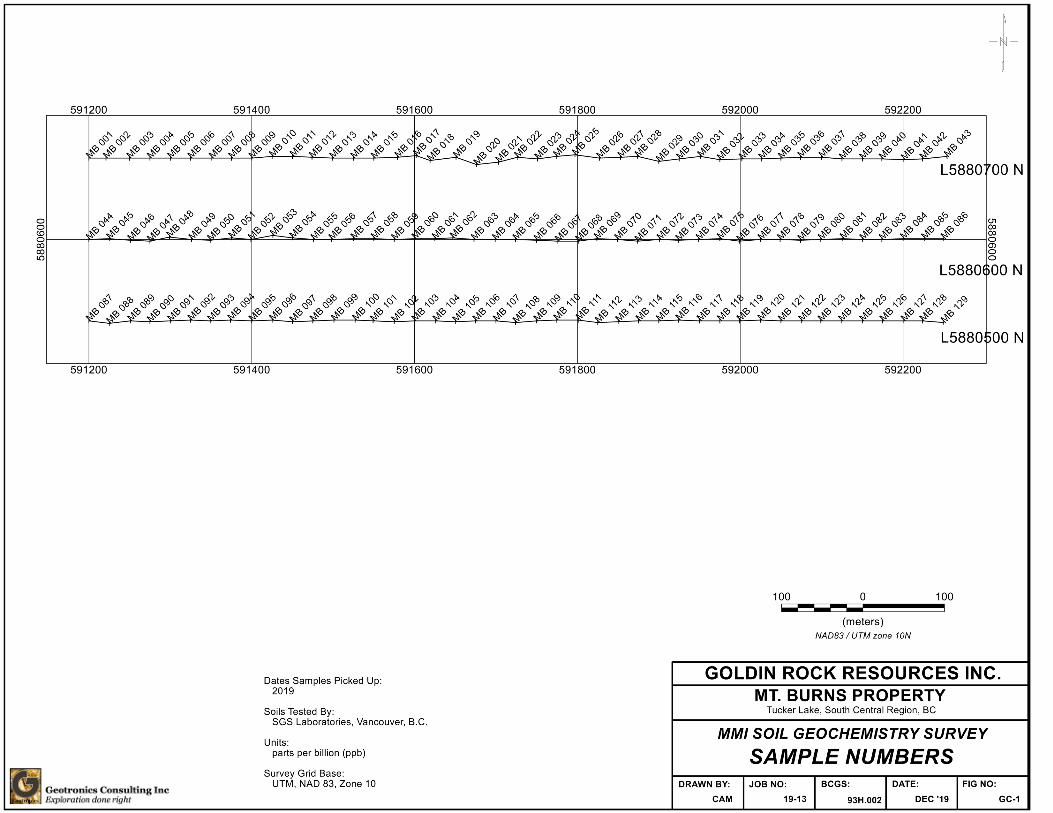
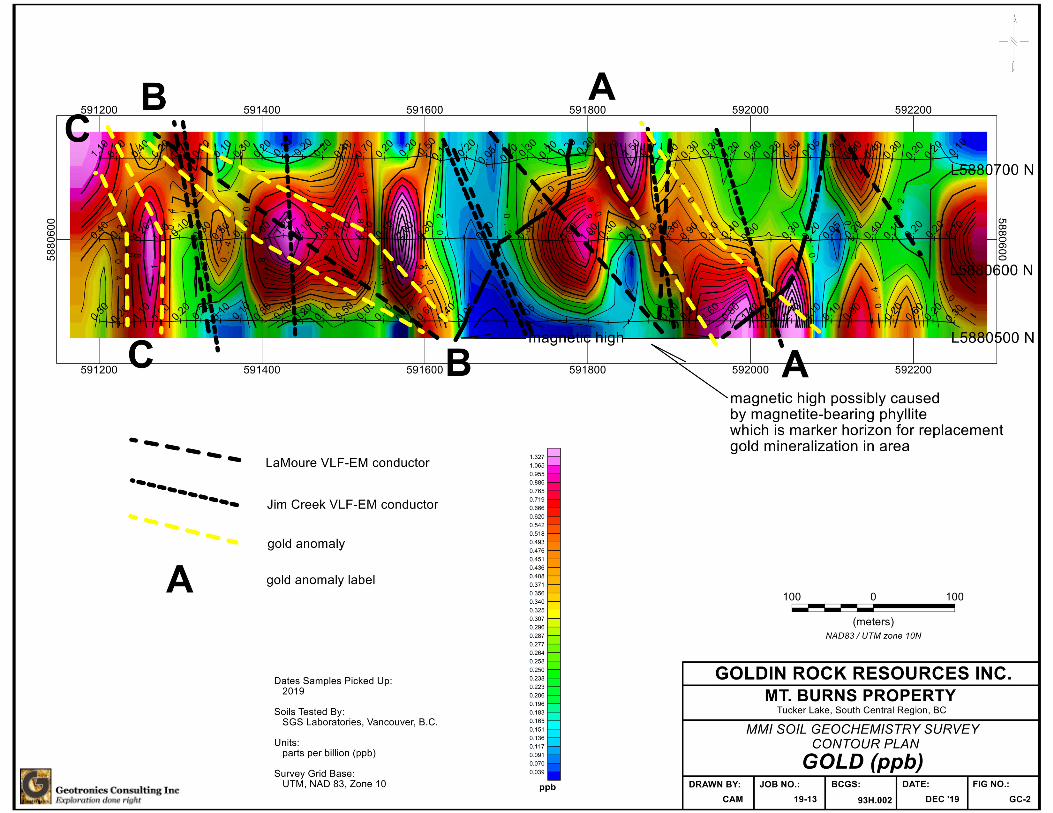
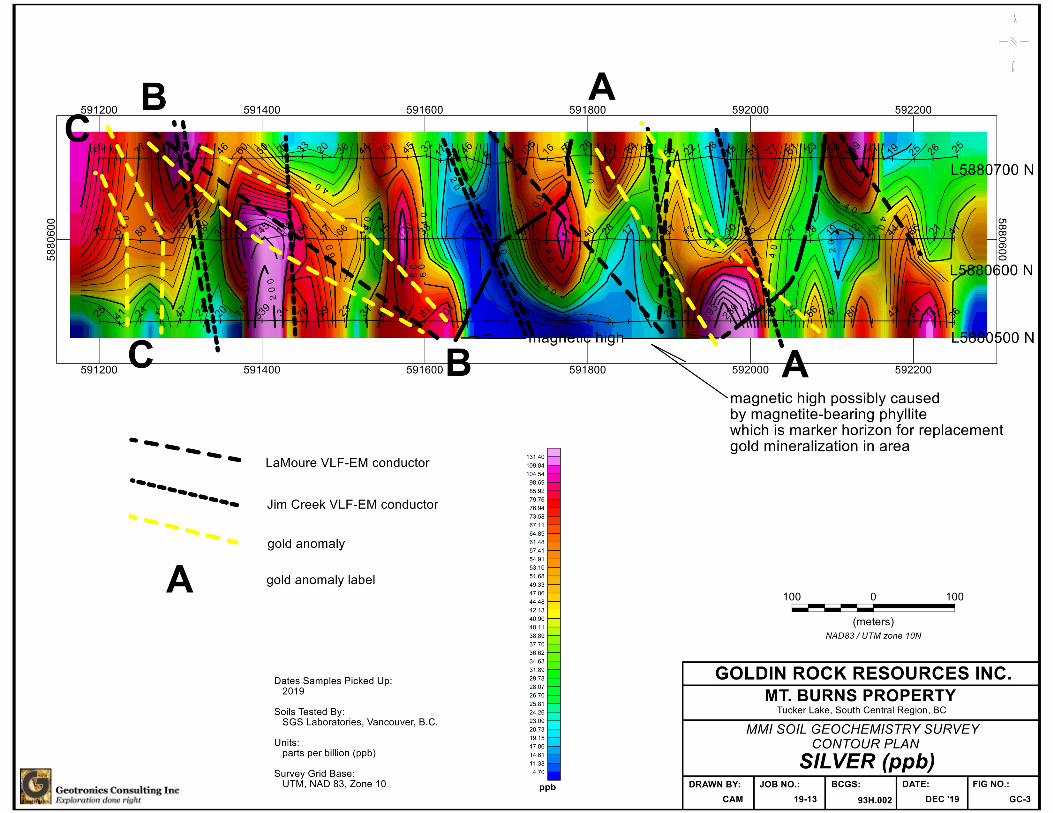

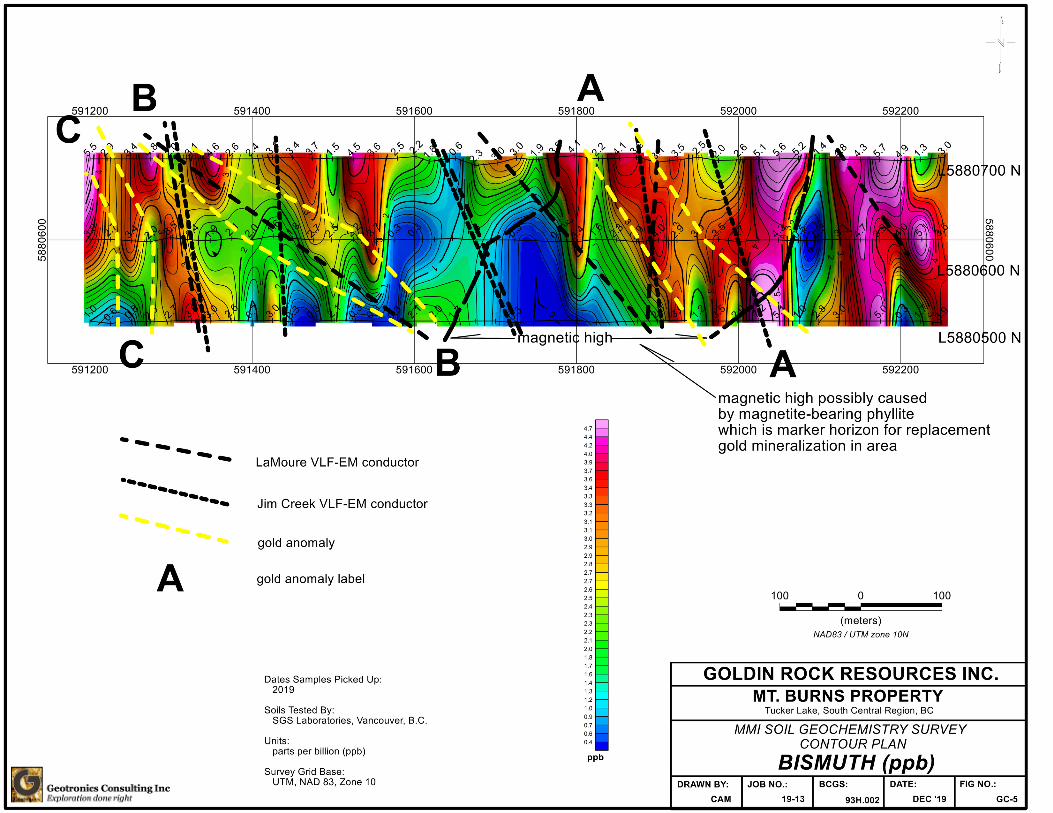

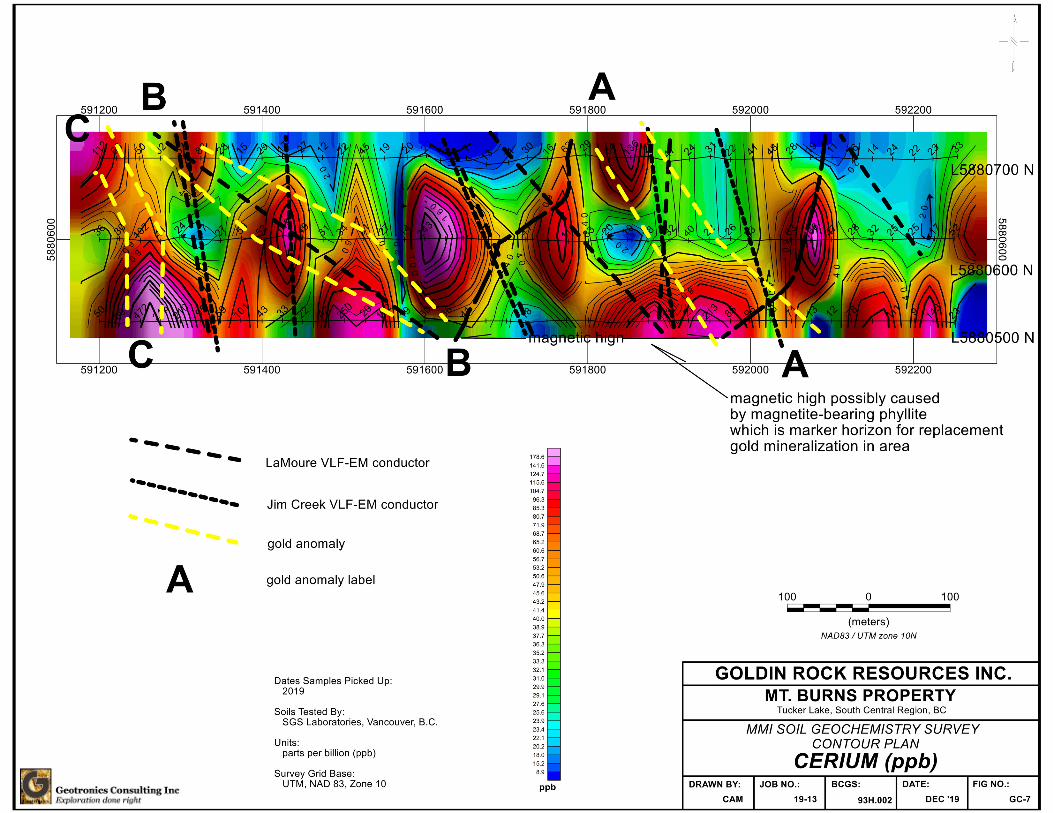
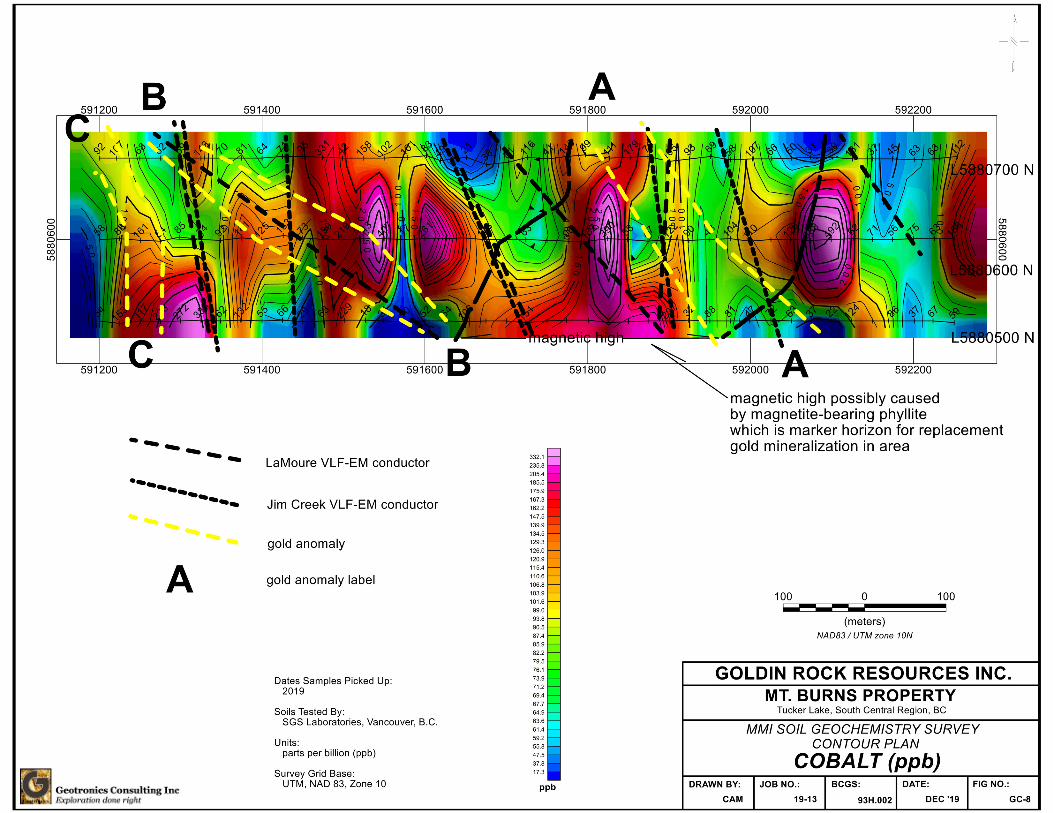
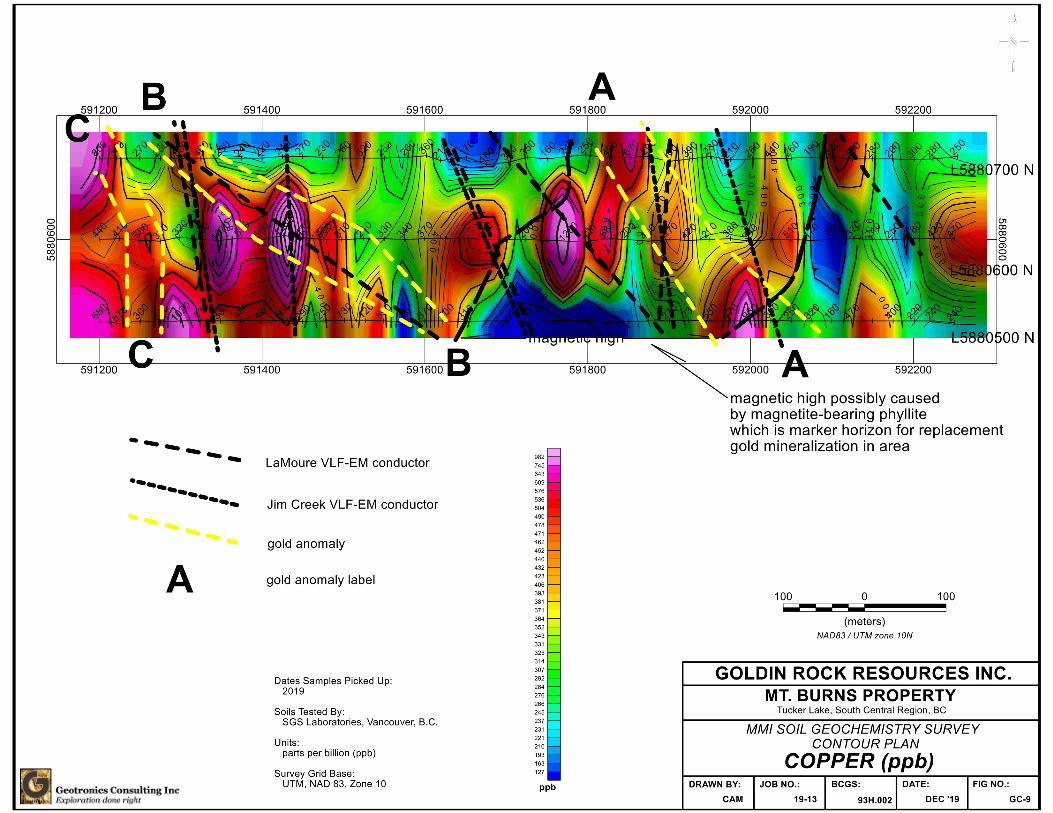
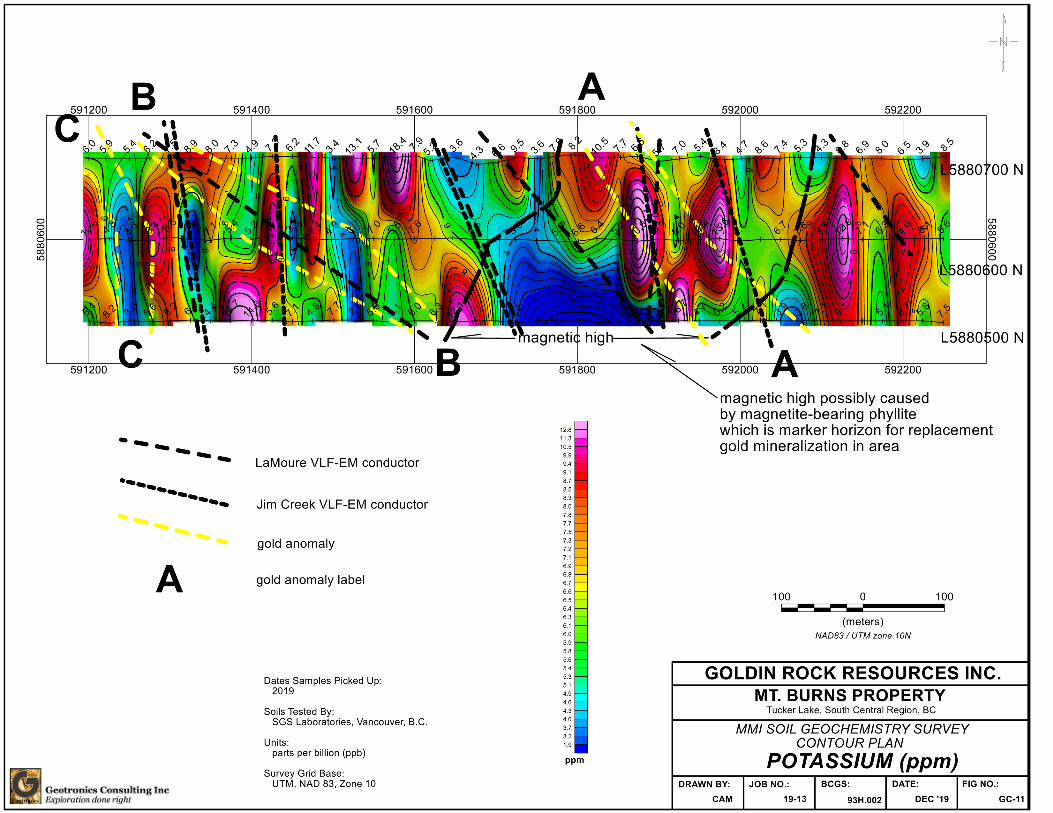
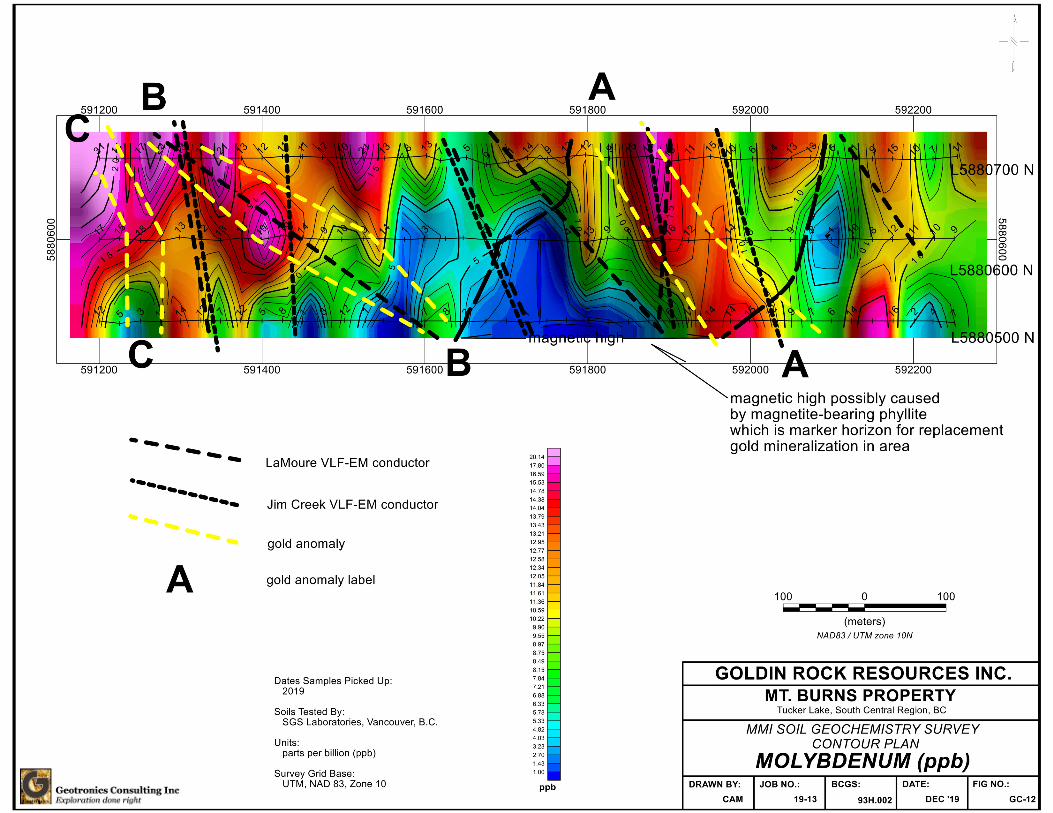

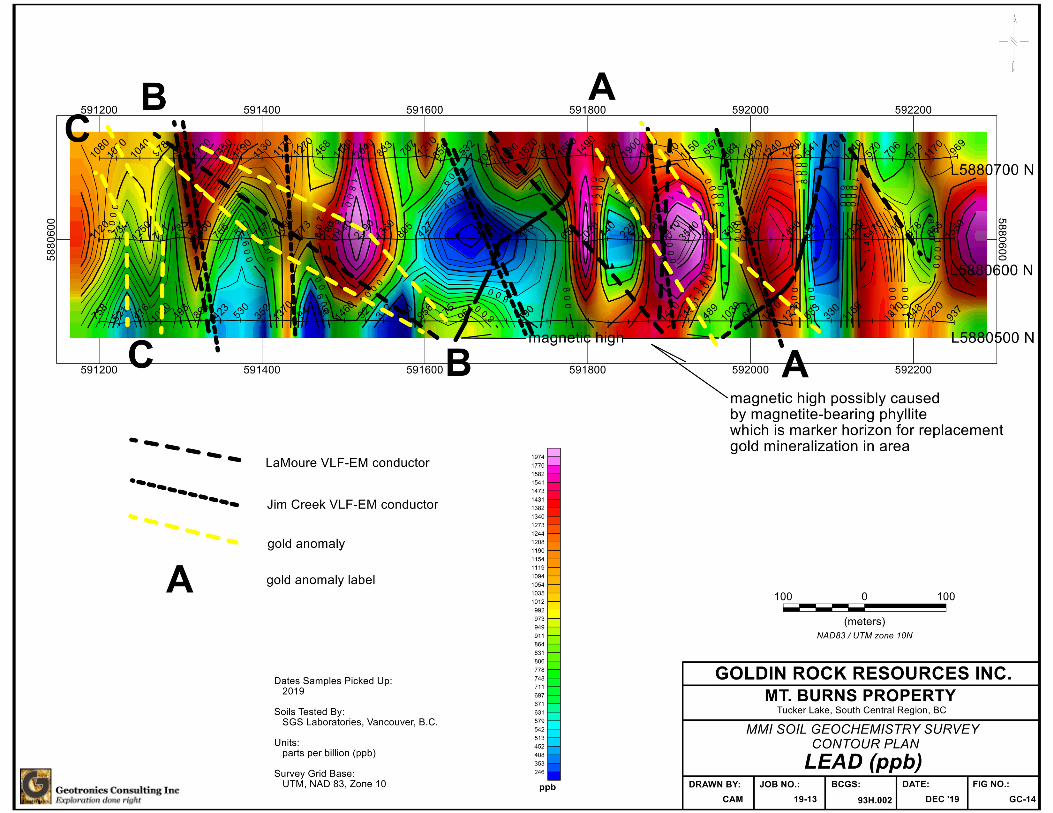
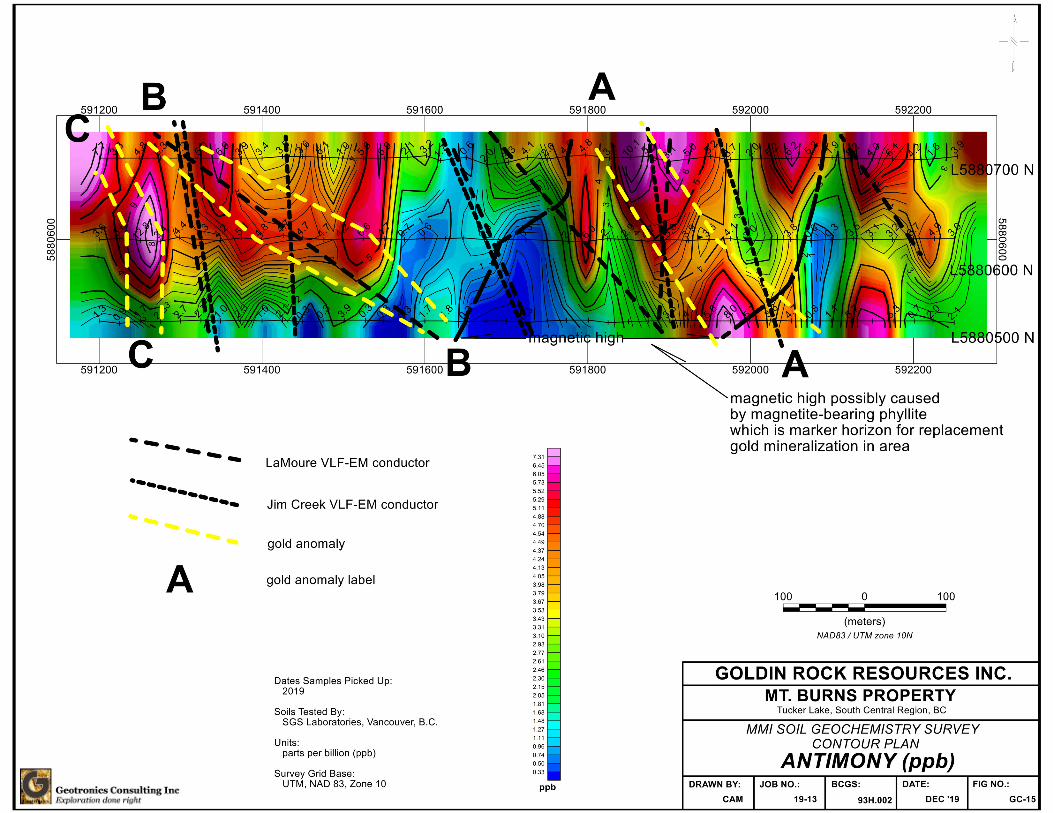
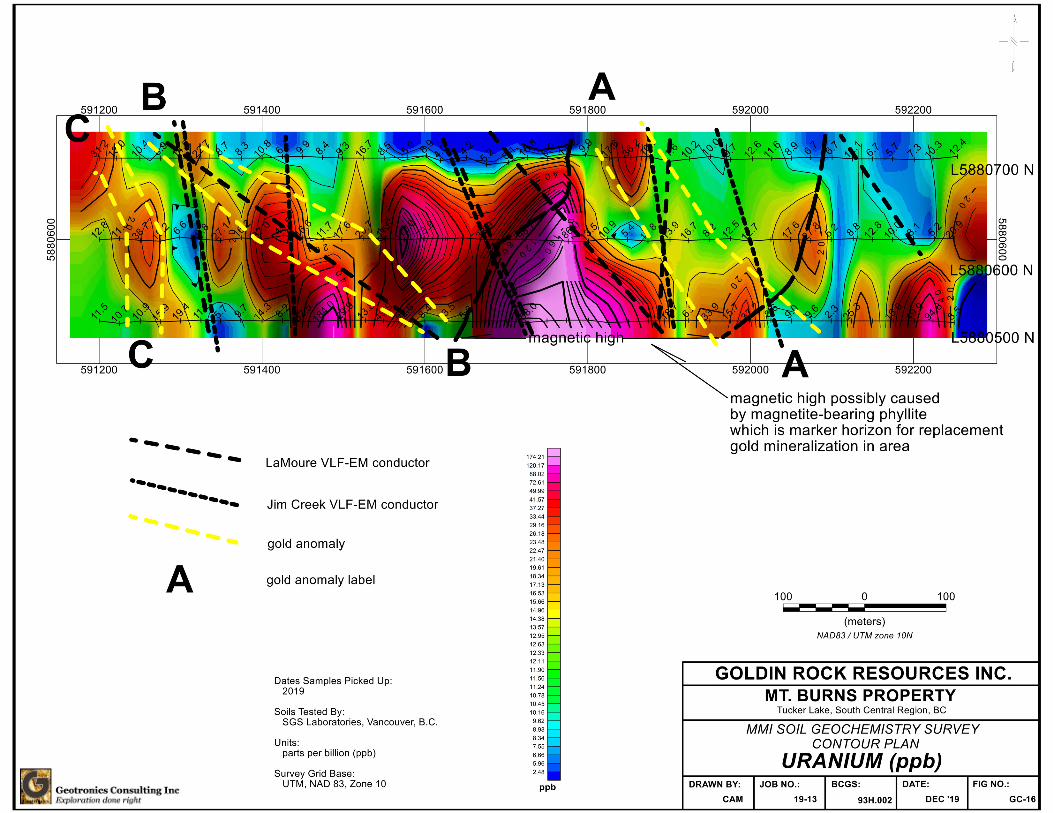
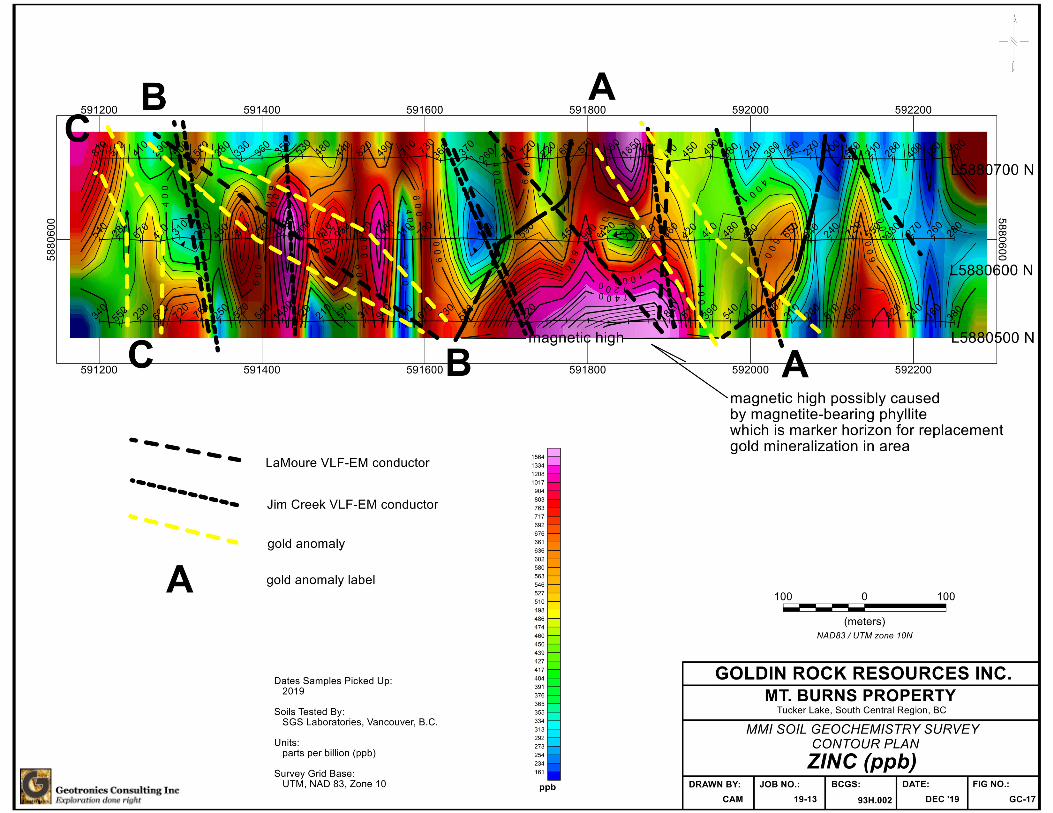
29
21 APPENDIX V – MMI HISTOGRAMS

Data Reduced by : GEOTRONICS CONSULTING INC.
0
5
10
15
20
25
30
35
40
45
50
55
60R
espo
nse
Rat
io
Survey Station
Cu Mo Sb As Ag Au
GOLDIN ROCK RESOURCES INC. MT. BURNS PROPERTY
Tucker Lake, South Central Region, BCMMI SOIL SAMPLING
Response Ratio - HistogramLine 500N
fig H1a
A
C
B
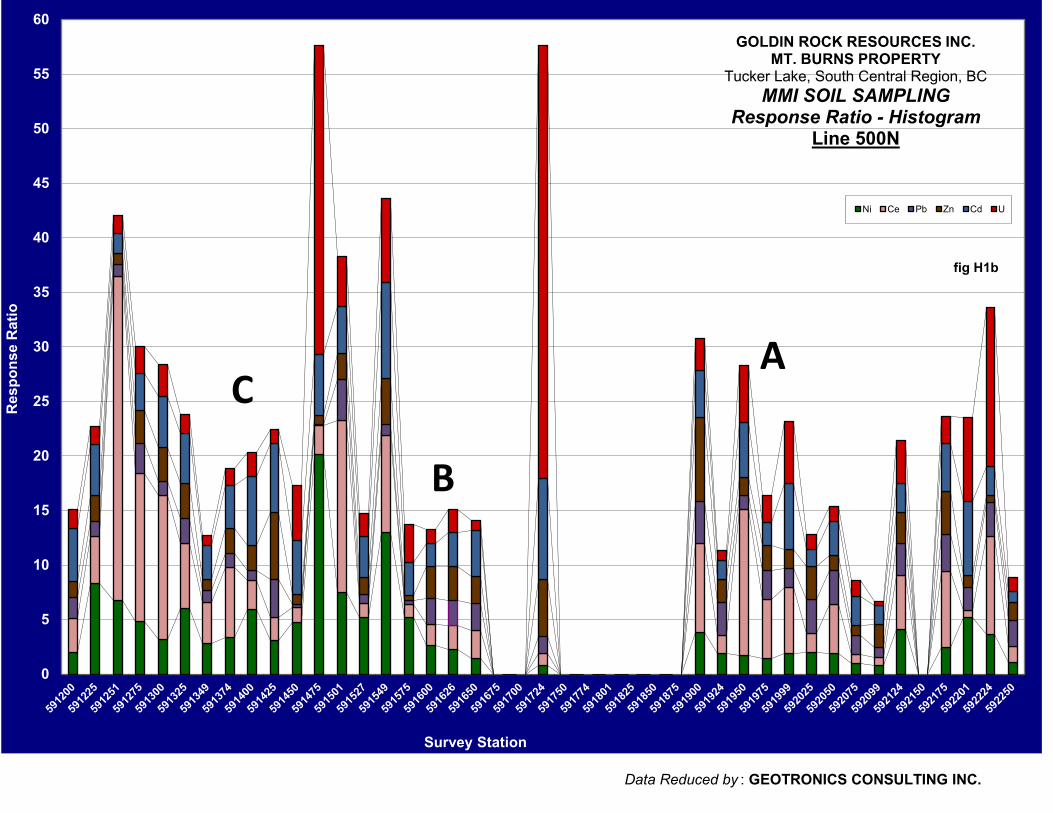
Data Reduced by : GEOTRONICS CONSULTING INC.
0
5
10
15
20
25
30
35
40
45
50
55
60R
espo
nse
Rat
io
Survey Station
Ni Ce Pb Zn Cd U
GOLDIN ROCK RESOURCES INC. MT. BURNS PROPERTY
Tucker Lake, South Central Region, BCMMI SOIL SAMPLING
Response Ratio - HistogramLine 500N
fig H1b
C
B
A
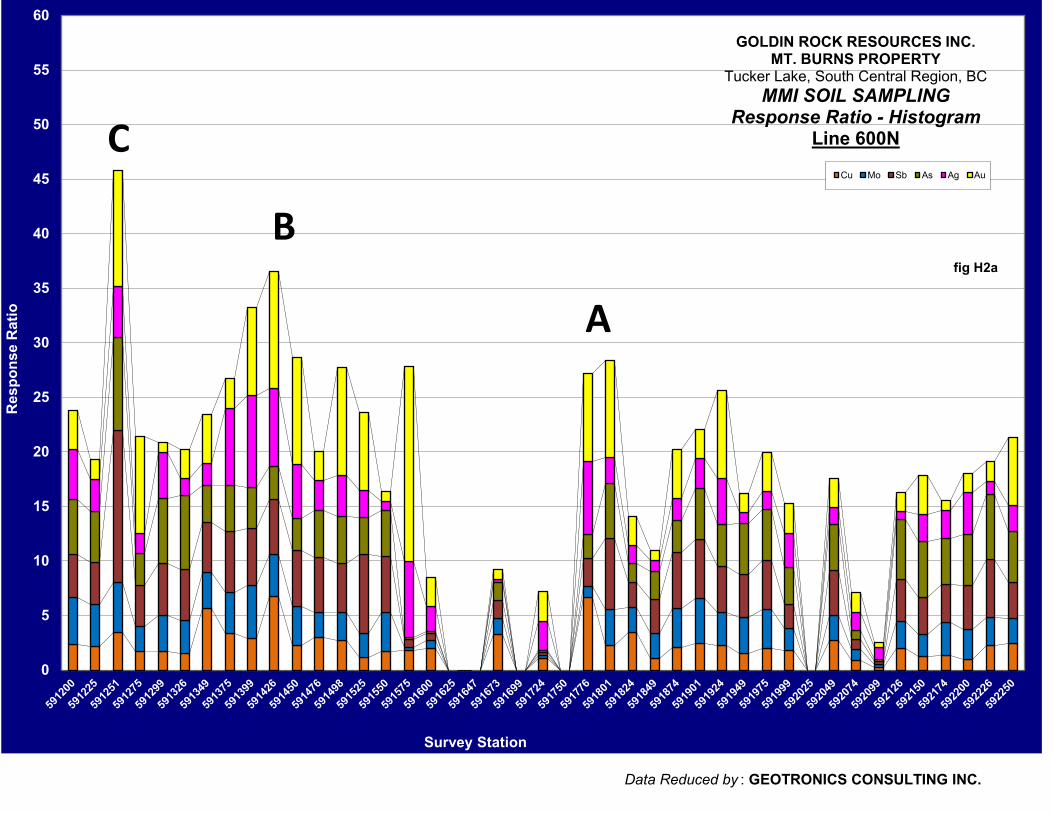
Data Reduced by : GEOTRONICS CONSULTING INC.
0
5
10
15
20
25
30
35
40
45
50
55
60R
espo
nse
Rat
io
Survey Station
Cu Mo Sb As Ag Au
GOLDIN ROCK RESOURCES INC. MT. BURNS PROPERTY
Tucker Lake, South Central Region, BCMMI SOIL SAMPLING
Response Ratio - HistogramLine 600N
fig H2a
A
C
B
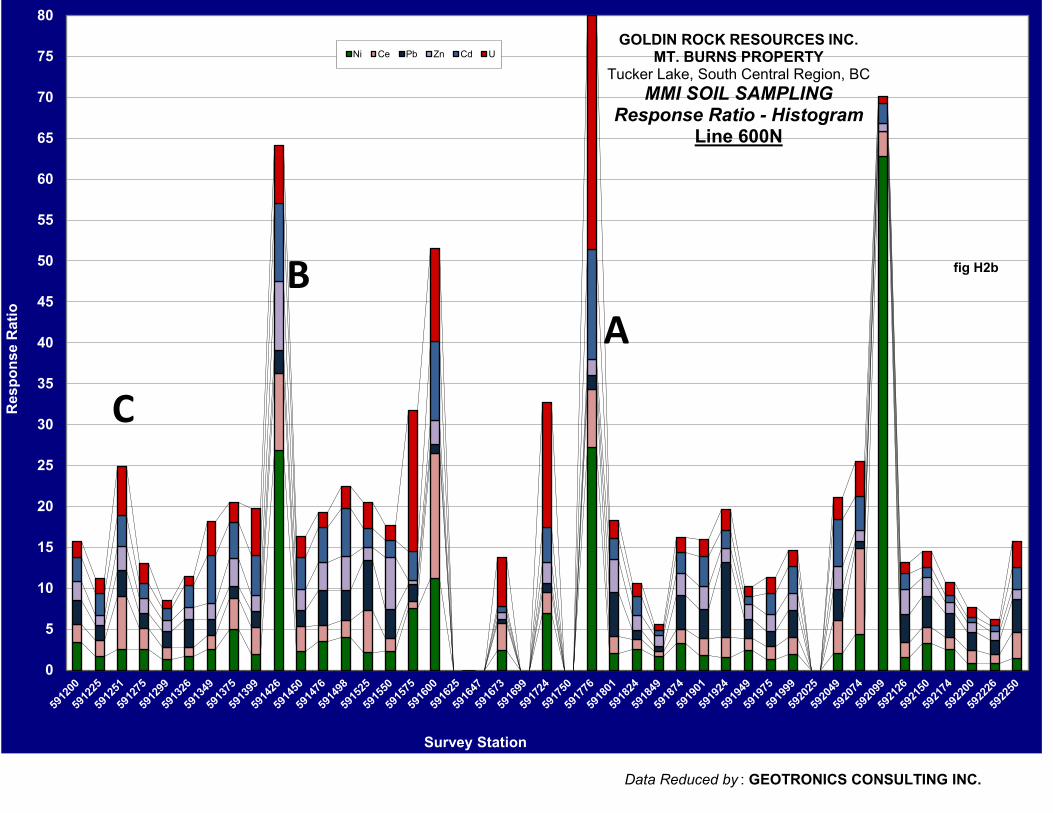
Data Reduced by : GEOTRONICS CONSULTING INC.
0
5
10
15
20
25
30
35
40
45
50
55
60
65
70
75
80R
espo
nse
Rat
io
Survey Station
Ni Ce Pb Zn Cd UGOLDIN ROCK RESOURCES INC.
MT. BURNS PROPERTYTucker Lake, South Central Region, BC
MMI SOIL SAMPLINGResponse Ratio - Histogram
Line 600N
fig H2b
AB
C
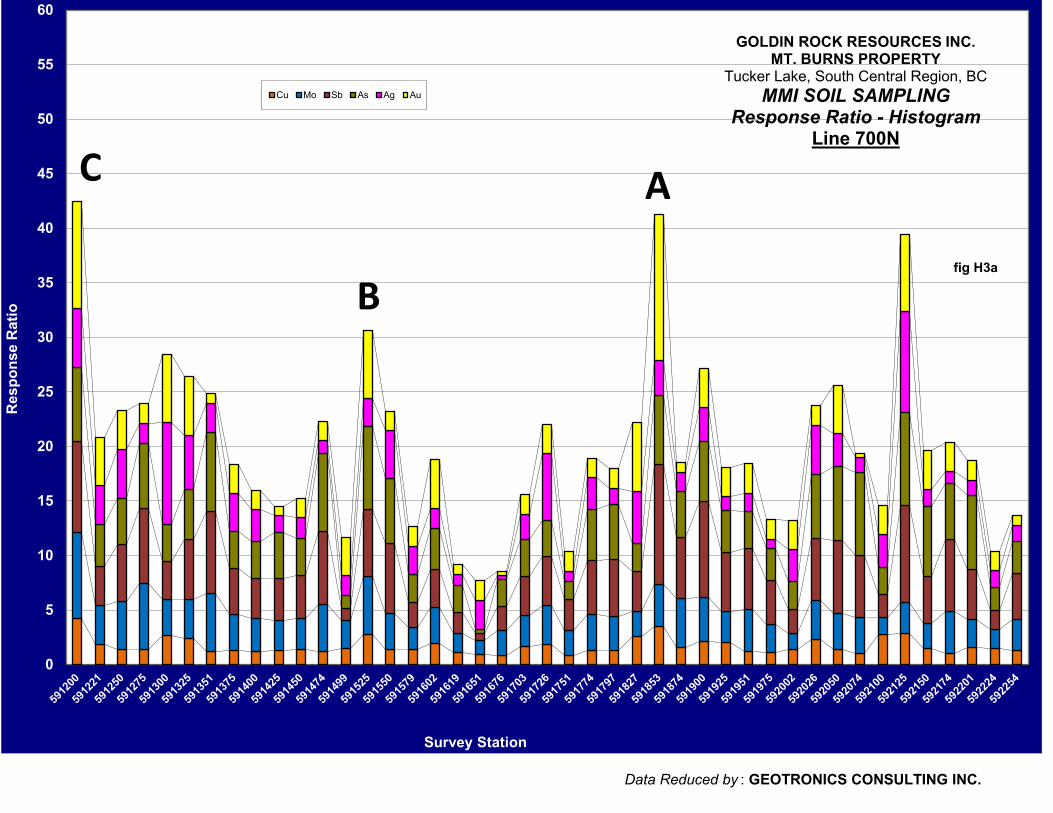
Data Reduced by : GEOTRONICS CONSULTING INC.
0
5
10
15
20
25
30
35
40
45
50
55
60R
espo
nse
Rat
io
Survey Station
Cu Mo Sb As Ag Au
GOLDIN ROCK RESOURCES INC. MT. BURNS PROPERTY
Tucker Lake, South Central Region, BCMMI SOIL SAMPLING
Response Ratio - HistogramLine 700N
fig H3a
A
B
C
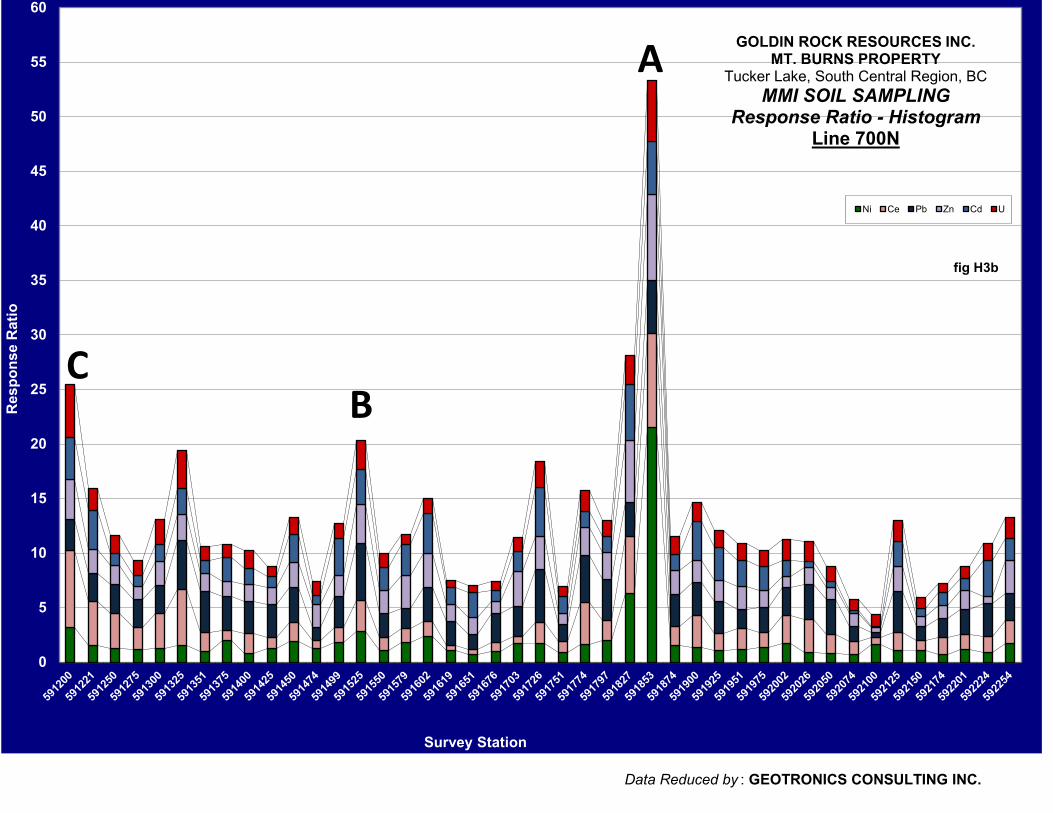
Data Reduced by : GEOTRONICS CONSULTING INC.
0
5
10
15
20
25
30
35
40
45
50
55
60R
espo
nse
Rat
io
Survey Station
Ni Ce Pb Zn Cd U
GOLDIN ROCK RESOURCES INC. MT. BURNS PROPERTY
Tucker Lake, South Central Region, BCMMI SOIL SAMPLING
Response Ratio - HistogramLine 700N
fig H3b
CB
A