batangas liner shipping developmental routes report - usaid
TRANSCRIPT
v
LINER SHIPPING ROUTE STUDY
FINAL REPORT
VOLUME XI I
BATANGAS LINER SHIPPING DEVELOPMENTAL
ROUTES REPORT
November 1991
BEST AVAILABLE COPY
Submitted to United States Agency for International Development
Manila, Philippines
Support for Development Program 11: Philippine Sea Transport Consultancy
Project No. 392-0150
Prepared by Nathan Associates Inc. under Contract No. 492-0450-C-00-2157-00
FOREWORD
The Liner Shipping Route Study (LSRS) ,and the MARINA and SHIPPERCON STUDY (MARSH Study) were conducted, during 1 9 9 3 - 1 9 9 4 , under the Philippine Sea Transport Consultancy (PSTC). The Final Report of the LSRS comprises 14 volumes and the Final Report of the MARSH Study comprises 5 volumes.
This technical assistance was made possible through the support provided by the Office of Program Economics, United States Agency for International Development (USAID) Mission in the Philippines. The views, expressions and opinions contained in this and other volumes of the LSRS Final Report are those of the authors and of Nathan Associates, and do not necessarily reflect the views of USAID.
TABLE OF CONTENTS
Pane Number
1 . INTRODUCTION
Developmental Route Reports Batangas Port & 1994 Shipping S e r v i c e s Organization of BLISDERR
2. BATANGAS PORT TRAFFIC POTENTIAL
Domestic Cargo Traffic
Sources of Batangas Port Domestic Cargo Traffic
Batangas Port Cargo Forecasts & Actual 1983-1993 Cargo Traffic Growth
Manila/B.atangas Cargo Attraction Comparisons
Passenger Services
3. BATANCAS PORT LINER SHIPPING SERVICES
Introduction Liner Shipping Service Proposals &
Evaluation
Batangas-Cebu Route Batangas-Cagayan de Oro Route Batangas-Davao Route Batangas-Panay Island Routes Batangas-Leyte Routes Batangas-Puerto Princesa Route Other Possible Liner Routes
4. FINDINGS & RECOMMENDATIONS
BLISDERR Findings Recommendations
ANNEXES
Annex A
Batangas Port Development Project
Annex B
CALAEARZON Project
Annex C
LSRS Survey Results
Annex D
Manila North Harbor Commodity Flows, 1931-1993 (National Statistics Office Cargo Origin-Destination Information)
1. INTRODUCTION
Developmental Route Reports
The Liner Shipping Route Study (LSRS) was conducted during 1993-1994, with financing from the United States Agency for International Development (USAID). The LSRS Final Report is in 14 volumes, and includes a 4-volume subset which examines several possible liner shipping and ferry services, which were not being operated in 1993. The objective of all of these "developmental route" investigations was to determine whether or not economically desirable and financially remunerative services might be operated on the several routes under examination, and, if so, to recommend that the Maritime Industry Authority (MARINA) proactively seek to induce shipping operators to apply for franchises to provide the services. The volumes of this developmental route subset are:
- Palawan Liner Shipping Developmental Routes Report (PALSDERR). This report examines current Palawan liner shipping services, and considers the possibilities for instituting new intraprovincial and interprovincial services.
- Cebu-Camiguin Liner Shipping Developmental Route Report (Camiguin Route Report). This report gives consideration to the possibility that fast ferry services linking Cebu and Camiguin Island might be desirable, perhaps with an intermediate call at the Bohol port of Tagbilaran.
- Romblon i% Marinduque Developmental Routes Report (ROMDERR). This report gives consideration to possible ferry routes that would link Marinduque and the Romblon island of Tablas to Mindoro, as well as a possible ferry connection between Romblon Province and Marinduque, and a new Romblon intraprovincial route. The possible reestablishment of a direct Marinduque-Manila connection is also given consideration in the report.
- Batangas Liner Shipping Developmental Routes Report (BLISDERR). This report considers a wide variety of possible liner shipping connections to Batangas.
In line with the common objective of the LSRS developmental route reports, the objective of BLISDERR is to identify the new interisland liner shipping service connections to Batangas Port that might desirably be franchised and instituted in the short to medium term. Specifically, the report is to examine the desirability of franchising new liner shipping services between Batangas and the ports of Cebu and Cagayan de Oro, as well as to one or more ports of the island of Panay.
Batangas Port & 1994 Shipping Services
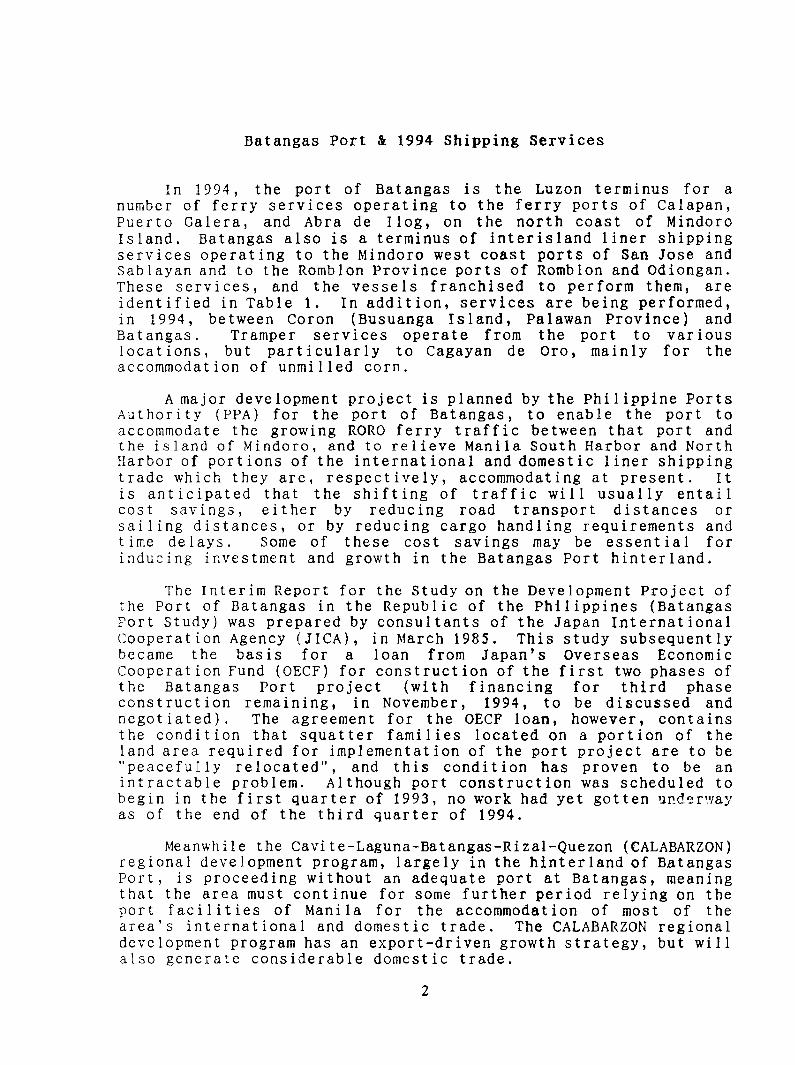
In 1993, the port of Batangas is the Luzon terminus for a number of ferry services operating to the ferry ports of Calapan, Puerto Galera, and Abra de Ilog, on the north coast of Mindoro Island. Batangas also is a terminus of interisland liner shipping services operating to the Mindoro west coast ports of San Jose and Sablayan and to the Romblon Province ports of Romblon and Odiongan. These services, and the vessels franchised to perform them, are identified in Table 1. In addition, services are being performed, in 1994, between Coron (Busuanga Island, Palawan Province) and Eatangas. Tramper services operate from the port to various locations, but particularly to Cagayan de Oro, mainly for the accommodation of unmilled corn.
A major development project is planned by the Philippine Ports Authority (PFA) for the port of Batangas, to enable the port to accommodate the growing RORO ferry traffic between that port and the island of Mindoro, and to relieve Manila South Harbor and North Harbor of portions of the international and domestic liner shipping trade which they are, respectively, accommodating at present. I t is anticipated that the shifting of traffic will usually entail cost savings, either by reducing road transport distances or sailing distances, or by reducing cargo handling requirements and time delays. Some of these cost savings may be essential for inducing investment and growth in the Batangas Port hinterland,
The Interim Report for the Study on the Development Project of the Port of Batangas in the Republic of the Philippines (Batangas Fort Study) was prepared by consultants of the Japan International Cooperation Agency (JICA), in March 1985. This study subsequently became the basis for a loan from Japan's Overseas Economic Cooperat ion Fund (OECF) for construct ion of the first two phases of the Batangas Port project (with financing for third phase construction remaining, in November, 1994, to be discussed and negotiated). The agreement for the OECF loan, however, contains the condition that squatter families located on a portion of the land area required for implementation of the port project are to be "peacefully relocated", and this condition has proven to be an intractable problem. Although port construction was scheduled to begin in the first quarter of 1993, no work had yet gotten ?zr?G",rT.vay as of the end of the third quarter of 1994,
Meanwh i 1 e the Cavi t e-Laguna-Bat angas-Rizal-Quezon (CALABARZON) regional development program, largely in the hinterland of Batangas Port, is proceeding without an adequate port at Batangas, meaning that the area must continue for some further period relying on the port facilities of Manila for the accommodation of most of the area's international and domestic trade. The CALABARZON regional development program has an export-driven growth strategy, but will also generate considerable domestic trade.
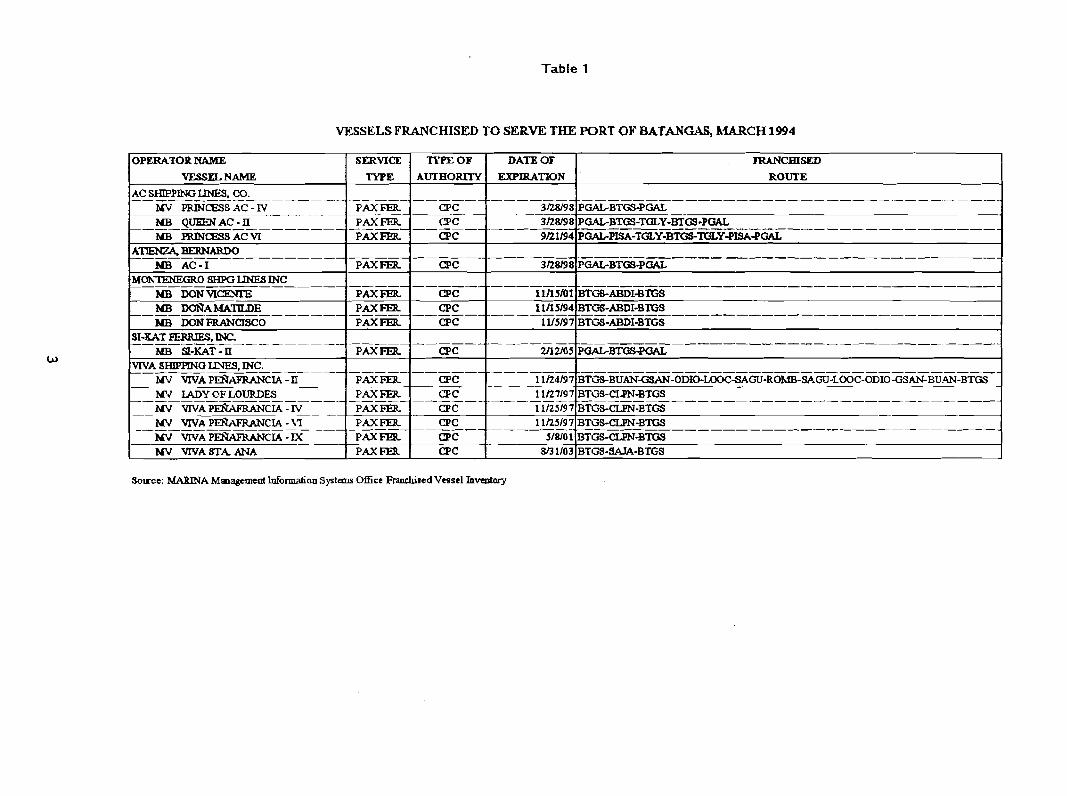
Table 1
VESSELS FRANCHISED TO SERVE THE PORT OF BATANGAS, h W H 1994
OPERATOR NAME
VESSEL NAME
AC SHIPPING UNES. CO. - - - - - - - - - -- - - - - - - - -- MV PRINCESS AC - N -- - MB QUEENAC -II MB PRINCESS ACVI
- - - - - - - - MB AC-I
MOhlENEGRO SHPG LINES INC MB DONVI- MB ~ A ~ U T K D E MB DONFRANCISCO
91-KAT FERRIES, INC MB SI-KAT- II
VIVA s m a LINES, INC. MV VNAPERMLWCLA -11 -- Wv' IADY OF LOURDES NV VNAPE~;WFRANCIA-IV -- - - NV W A PE&uXANCIA -\'I NV VNAPR~~UNCIA-DC NV VNASTA MA-
SERVICE
IYPE
- - - - - PAX FER PAX FER PAX=
- - -- - PAXFER
PAX- PAXFER PAXFER
PAX FER
PAX FER - 2!5--- PAX FER PAXFER PAX= PAX FER
TYPE OF AUTHORIN
- - - - - CPC CPC CPC
- - -- - - CPC
CPC CPC CPC
CPC
CPC CPC CPC
.
CPC CPC B C
DATE OF
EXPIRATION
. - - - - - - - 3/28/98 3/28/9 8 9121194
-- -- - --- 3/28l98
1 lfi i lm 1 11/15/94 1 MI97
2Jl2l05
1 1/24/97 -. 1 1/21/97 1 1/25/97 1 lJ25197 5/810 1
8l3 1103
FRANCHISED
ROUTE
- - - - - - - - - - - - - - - - - - - - - - - - -- - - - - -- - - -- .
PGALBTGSPGAL - PGAGBTGS-TQLY-BTGS -PGAL PGAtPISA-TGLY-BTGS-TQ.kkPISAPGAL
- - -- ----- - - - -- - -- -- -- - -- -- - - - - - -- - PGAGBTGS-PCfAL
BTGS-ABDI-BTGS BTGS-ABDI-BTGS BTGS-ABDI-BTGS
PGALBEBPCtAL.
-- ---------- - ------------------ BTm-BUAN-C;9M-ODIO-W-SA~T-ROhlB-GSAN-BU.4N-BTGS BTGS-CLPN-BTGS BTGS-CLPN-ET- - -- BTGS-CLPN-BTGS BTGS-CLPN-BTGS BTm-SAIA-BTGS
Organization of BLISDERR
Chapter 2 of this report presents a discussion of the traffic generating factors for Batangas Port cargo and passenger traffic, and of the potential for traffic growth at the port, including the diversion of traffic from the port of Manila. Chapter 3 discusses specific interisland liner shipping services which appear to be desirable between Batangas and other ports. The final chapter presents the LSRS findings and recommendations in regard to franchising services to Batangas Port.
Annex A provides background information on Batangas Port, including the ongoing project to expand and upgrade the port, and 1991 -1993 cargo origin-destination (0-D) information for Batangas Port, obtained from the National Statistics Office (NSO). Annex B provides background information on the CALABARZON development region. Annex C presents the results of LSRS surveys, which were conducted in an effort to identify the potential for diverting domestic cargo shipments and passengers from Manila to Batangas. Annex D presents NSO cargo 0-D information for Manila North Harbor (MNH), for the years, 1991 through 1993. The information is pertinent to this report, since much of the MNH traffic is potentially divertible to an upgraded and expanded Batangas Port, with the inauguration of additional liner shipping services.
2. BATANCAS PORT TPAPFIC POTENTIAL
Domestic Cargo Traffic
The discussion in this section looks, first, at the current sources and potential sources of Batangas Port cargo traffic. The cargo traffic forecasts of the Batangas Port Study are then reviewed, and compared with the traffic growth which actually occurred during 1983-1993. In November 1994, only Romblon Province and northern Palawan Province (Coron Port) have direct liner shipping connections to both Batangas and the MNH, and, therefore, offer insight into the relative attractions of Batangas and Manila for liner shipping cargo movements; these cargo attraction comparisons are made, and their applicability to other routes is discussed.
Sources of Batangas Port Domestic Cargo Traffic
The bases for the generation of cargo traffic at Batangas Port are:
- Natural Hinterland. The "natural" hinterland of Batangas Port is that portion of Luzon .which has shorter inland transport distances to Batangas than to any other comparable port. This hinterland includes a large portion of the CALABARZON region, i .e., at least Eatangas Province and the southern portions of Quezon and Laguna provinces. Also, unless and until a "Bicol regional port" (under consideration by the Philippine Government) is constructed, the entire area of Bicol is also within, the natural hinterland of Batangas Port. The CALABARZON regional development program has an export-driven growth strategy, but industrial development of the region will also stimulate the growth of domestic trade, as there will be sizable inflows of manufacturing inputs from other areas of the Philippines, and locally-produced and imported manufactured goods are likely to flow in the other direction.
- RORO Expanded Hinterland. RORO ferry services have effectively expanded the natural hinterland of Batangas Port to include most of the island of Mindoro. As indicated in Chapter 1, shippers interviewed by the LSRS in both Iloilo and Tacloban equated reaching Batangas to reaching Mindoro; i.e., with the objective of trade facilitation with Mindoro, they proposed the institution of 1 iner shipping services to Batangas (from Tacloban and
Iloilo). Once the road network of Mindoro is improved, the lower transport costs to the three Mindoro ferry ports (Calapan, Puerto Calera and Abra de Ilog) will increase the likelihood that Batangas will serve as the interisland port for the preponderence of Mindoro's interisland trade.
- Port of Transshipment. This involves both domestic cargoes and exports and imports. Where exports and imports are concerned, however, Batangas will only become an important port of transshipment when international cargo traffic at the port reaches the "threshold" levels that are required to attract frequent international shipping services. This is anticipated to occur within a few years because of the ongoing and anticipated CALABARZON industrial development, much of which is aimed at the export market. One advantage of Batangas over Manila, as a port of transshipment of exports and imports, is the avoidance of the need to transfer goods between the Manila South and North Harbors. Where the transshipments of domestic cargoes are concerned, the principal advantage of Batangas over Manila is the prospect of saving the incremental Manila-Batangas sailing distance twice. For example, many cargoes moving between Davao and Cebu, during 1992-1993, had to be transshipped at Manila; Davao-Batangas services coupled with Batangas-Cebu services would have eliminated six hours of sailing in both the northward and southward directions, for a total sailing time reduction of 12 hours. The LSRS also identified that containerized cargo moving between Zamboanga and Cebu was being transshipped at Manila, in 1993-1994, as was trade between Iloilo and Mindoro and at least a portion of the perishable cargo moving between Iloilo and Palawan.
- Alternative Route to Metro Manila. Sailing time from most points of the Philippines is about six hours shorter to Batangas than to Manila. However, if the point of final destination is within Metro Manila (or anywhere to the north of Metro Manila), then a road transport trip of three hours or so is required for cargo (as well as for passengers) to reach Metro Manila from Batangas. Thus, the net time saving in these cases is just three hours, and that estimate is before allowing for possible delay in modal transfer at Batangas. However, the principal reason for choosing to ship (or travel) by the alternative route to Manila via Batangas, in preference to choosing the direct route, will not be the relatively small potential for saving of sailing time, but rather the possibility of shipping (or traveling) one to several days earlier, i.e., Manila routes currently offering only once-a-week service will be especially vulnerable to the
loss of traffic to new services to Batangas. (Ey the same token, however, Batangas could fail to accommodate all of the traffic generated by its natural hinterland, if only infrequent services to some points are provided.)
Batangas Port Cargo Forecasts & Actual 1983-1993 Cargo Traffic Growth
Total Batangas Cargo Traffic. At the time that the Eatangas Port Study was conducted, RORO ferry services between Batangas and Mindoro had been operated for only two to three years (these RORO services were inaugurated in 1981). The latest traffic information available to the Eatangas Port Study was for 1983, and RORO ferry cargoes were not separately identified in the traffic il~foi~ndtion for that year. Cargo traffic totaled 395,000 tons at the port, in 1983, of which 357,000 tons comprised domestic cargo and 38,000 tons comprised foreign (export/import) cargo. PPA traffic data indicate that, in 1992, Batangas Port cargoes reached 1 . 1 million tons, most of which comprised domestic cargo (there were 48,000 tons of imports and just 10,000 tons of exports handled through the port in 1992). The average annual compound rate of cargo traffic growth at Batangas, from 1983 to 1992, was just slightly less than 12 percent. Domestic cargo traffic, alone, grew at the slightly faster rate of 12.5 percent per annum. In 1993, however, recorded cargo throughput dropped sharply to a level of approximately 830,000 tons, including 755,000 tons of domestic cargo and 86,000 tons of international cargo, with the latter being comprised almost entirely of imports. In both years all cargo was recorded as breakbulk, with no containerized or bulk cargo.
Batangas-Calapan Perry Route. The Batangas Port Study projected Eatangas-Calapan RORO ferry cargo volumes to reach 634,000 tons in 1990, and then to rise to slightly over one million, tons by the year 2000. The study projected that, in both of these years, slightly over one-half of the cargo volumes would be comprised of road vehicles, Actual cargo volumes on this route were 629,000 tons in 1991, and 695,000 tons in 1992, which means that the study's forecast of total RORO-accommodated cargo on the route was very close to the mark. The study was somewhat high, however, in its projection of the proportion of cargo that would comprise road vehicle weight, and, conversely, the tonnages of cargoes carried aboard road cargo vehicles were somewhat understated. In both 1991 and 1992, road vehicle weight constituted about 44 percent of total cargo tonnages on the route, in contrast to the study's expectation that vehicle weight would constitute 54 percent of cargo movement in 1990. This probably means that the ratio of cargo vehicles to passenger vehicles is higher than the study foresaw and/or the average cargo load per cargo vehicle is higher than expected by the study. Whereas the study projected trade cargoes e . , all cargoes moving by RORO
ferry other than road vehicles) to only approach 300,000 tons on the route in 1990, the actual 1991 volume exceeded 350,000 tons and the 1992 trade cargo total was 392,000 tons.
The differences noted above between the Batangas Port Study cargo traffic projections and actual traffic growth for the Batangas-Calapan route are not very large, and the study deserves a "good grade" for its medium-term Batangas-Calapan RORO ferry cargo forecasts. The study took a very conservative view of cargo growth potential on this route in the 1990s, however. Cargo volumes were projected by the study to continue to rise, after 1990, at a rate of somewhat under five percent per annum, to reach a year 2000 level of slightly more than one million tons. The actual 1932 growth of trade cargo on the route was approximately 11 percent. NSO trade information, presented in Table A . 4 of Annex A, indicates that the cargo volumes carried aboard road vehicles moved by RORO ferry in the Calapan-to-Batangas direction grew by nearly 200 percent from 1992 to 1993, after achieving 200 percent growth from 1991 to 1992. Thus, despite the overall decline in Eatangas Port cargo traffic recorded by PFA in 1993, as compared to the preceding year, i t appears that cargo movements accommodated by Batangas-Mindoro port ferries continued to grow.
Other RORO Ferry Routes. The Batangas Fort Study did not anticipate the establishment, by 1990, of other RORO ferry services, than only Batangas-Calapan, but presumed that RORO ferry services would be in operation between Batangas and Abra de Ilog by the year 2000. The study forecast that RORO ferries on this second route would accommodate 270,000 tons of cargo, in the year 2000, with road vehicle weight representing slightly less than one-half of the total.
RORO ferry operations have been established, since the Eatangas Port Study was conducted, between Batangas and both Abra de Ilog and Fuerto Calera. The NSO data on cargo traffic at these ports are incomplete, however, as they indicate cargo traffic in one direction only, which is extremely unlikely for ports thnt are accommodating the daily operation of RORO ferries. (LSRS fieldwork in Mindoro identified that road vehicles and other cargo traffic are, in fact, moving from Abra de Ilog to Batangas, as well as moving in the Batangas to Abra de Ilog direction. It is possible, however, that some significant proportion of the vehicles arriving at Mindoro from Batangas, through Abra de Ilog, then return to Batangas through another port, as discussed below in regard to the port of San Jose.)
Table A . 4 of Annex A of this report presents NSO traffic information for cargoes destined for Batangas Port, in 1991, 1992, and 1993, but no flows are shown from either Abra de Ilog or Puerto Calera. Table A.5, on the other hand, shows significant outflows from Eatangas to both Fuerto Calera and "other municipal ports of Occidental Mindoro", i.e., principally Abra de Ilog. The data for
the latter include nearly 4,000 tons of vehicles moved per annum, during 1991-1992, with this traffic then rising to approximately 8,600 tons, in 1993. Trade cargo volumes shipped from Batangas to Abra de I log, over the same three-year period, averaged around 5,000 tons per annum. The volume of cargo moving from Batangas to Puerto Calera, in 1992, was approximately 5,600 tons, of which road vehicle weight accounted for 1,100 tons. In 1993, total cargo moved from Batangas to Puerto Calera exceeded 8,000 tons, nearly equally divided between road vehicles and trade cargo.
Abra de Ilog could potentially serve a large portion of the province of Occidental Mindoro, if only the west coast highway were to be upgraded and the capacity of Abra de I log to accommodate RORO ferries were to be improved. Considering that the single direction for which traffic data are available from the NSO is the "light" direction (between Mindoro and Luzon), the two-way cargo volumes between Abra de Ilog are probably in excess of 20,000 tons per annum, despite severe road and port constraints. Removal of these constraints would certainly give impetus to rapid growth of cargo traffic at Abra de Ilog, but, even so, reaching the 270,000-ton- per-annum traffic level forecast by the Batangas Port Study for this route in the year 2000, now appears unlikely to be attained by that year.
Besides these ferry operations, there is one more heavy flow of road vehicles moving between Batangas and Mindoro, and this is through the port of San Jose, on Mindoro's southwest coast. This is a liner shipping route rather than a ferry route, with an approximate sailing time of 12 hours. As shown in Tables A.4 and A.5 of Annex A, an average of nearly 14,000 tons of road vehicles per annum moved in the San Jose-to-Batangas direct ion, during 1991- 1993, but much smaller tonnages of road vehicles moved from Batangas to San Jose. In 1991, about 5,300 tons of road vehicles were transported to San Jose by the direct sea route, and were off- loaded at two wharves. In 1992, nearly all of the 5,500 tons of, road vehicles arriving at San Jose were off-loaded at the Caminawit Pier, the principal port facility at San Jose. In 1993, the road vehicle tonnage off-loaded at San Jose grew to nearly 10,000 tons, which was more nearly in balance with outbound traffic of around 13,000 tons. The LSRS does not have an explanation for the imbalance of vehicle traffic in two directions, although i t is possible that many vehicles are arriving at Mindoro Island through Abra de Ilog and leaving through San Jose.
Liner Shipping Routes. The Batangas Port Study projected non- ferry (i.e., liner and tramper) cargoes at Batangas Port to reach the level of 132,000 tons in 1990, and then to grow rapidly (largely as a result of implementation of the port development project), to attain a year 2000 level of 1.7 million tons. The study foresaw a large flow imbalance, with only 32,000 tons of cargo being loaded at Batangas for outward domestic shipment to non-ferry ports, and only a very modest increase to 35,000 tons per
annum by the year 2000. The projected inward flows of cargo were 103,000 tons in f-990, rising to 1,656,000 tons in the year 2000. One commodity dominates the year 2000 inflow forecast of the study: a total of 1.5 million tons of basic iron and steel products was foreseen to be shipped from Iligan to Batangas, mostly for onward shipment by road to Metro Manila. Considering the importance of this commodity traffic projection relative to the overall cargo traffic projection for Batangas, i t would have been useful if the Eatangas Port Study had presented a transport cost comparison to support the study's view that steel would move primarily on the route through Batangas, rather than be shipped directly from Iligan to Manila by sea. Although the Port Study did not support its forecasts as thoroughly as might have been desirable, the LSRS views the steel cargo forecasts as reasonable in the light of the high levels of steel product cargoes that, in 1993, were already being shipped through Manila Port, from both domestic and foreign sources. The anticipated steel product shipments from Iligan to Eatangas are contingent, in part, on the extent to which the metal fabrication industry will be shifted to CALABARZON from Metro Manila.
All of the other projections of the Batangas Port Study (the Interim Report, at least) for domestic sea trade growth at Batangas Fort were low. Excluding steel product flows, the year 2000 domestic, non-ferry cargo volumes of the study were projected at 155,000 tons only, of which 150,000 tons were foreseen to be unloaded and 35,000 tons loaded at Batangas.
In contrast to these year 2000 forecasts of non-ferry domestic cargo at Batangas, actual 1991-1993 non-Mindoro cargo traffic at Eatangas included:
- Approximately 50,000 tons of cargo inflows per year from Cagayan de Oro, mainly unmilled corn.
- More than 9,000 tons of two-way coastal movement of cargo between Batangas and Manila in 1992.
- Approximately 19,000 tons of cargo from Iligan, in 1992, of which 15,000 tons comprised animal feeds materials.
- More than 10,000 tons of inflows from the island of Negros in 1992.
- An average of more than 10,000 tons of cargo inflows per year from Bislig, Surigao del Sur, mainly coal.
- Two-way flows of about 6,000 tons per year between Eatangas and Coron.
- Outward shipments of 15,000 tons to Romblon Province, in 1991, rising to an average of 25,000 tons per annum,
during 1992-1993, and about 14,000 tons per year moving in the opposite direction from Romblon ports.
- More than 73,000 tons of unprocessed wood from Butuan, in 1992, rising to 118,000 tons the following year.
- Approximately 18,000 tons per year of coconut oil and lubricants shipped from Legaspi.
- Shipment from Cebu of 9,000 tons of cargo, in 1992, rising to more than 32,000 tons in 1993.
- Somewhat more than 1,000 tons of cargo per year shipped from Batangas to ports of Antique, Panay.
From the foregoing, the cargo traffic projections of the Batangas Port Study (Interim Report) for domestic cargo traffic at Batangas, other than steel and cargo accommodated aboard RORO ferries, understate the traffic growth that already had occarrdd at the port, in both 1992 and 1993. On the other hand, even if these cargo flows attain, by the year 2000, a level that is 200 or 300 percent above what the Batangas Port Study anticipated for that year, they would not replace any substantial shortfall in the projected steel cargo, if that cargo should largely fail to materialize.
The LSRS notes that, even if the Batangas Port Study was correct in anticipating that 70 percent of steel product shipments from Iligan to Luzon will be made through Batangas Port once both the port and a planned integrated steel mill will have been developed, the long'and continuing delays in building one or the other of two proposed integrated steel mills in the vicinity of Iligan, may mean that sharply higher steel product flows will only begin to occur sometime after the year 2000. Once a schedule for developing one or the other of the proposed mills has been, "firmed", a survey to identify the optimal and probable spatial arrangement within the Metro Manila/CALABARZON area of existing and new metal fabrication plants would be needed to give a clear idea of the portions of shipments that might best be shipped through MNH and Batangas Port, to achieve minimization of delivery costs. The LSRS agrees that the CALABARZON region is more appropriate for new metal fabrication undertakings than would be any expansion of capacity within Metro Manila, so that Batangas Port is likely to increase its share of domestic steel product shipments from Iligan over time. In 1994, however, it is difficult both to project the year in which there will occur a substantial jump in the level of steel product shipments from Iligan to Luzon, or to identify the optimal split in shipments between Batangas and MNH.
Manila/Batangas Cargo Attraction Comparisons
The islands of Busuanga, Tablas and Romblon are provided with liner shipping connections to both Manila and Batangas, and accordingly it may be useful to identify how cargo volumes are spl i t between the service options for each of these islands. Cargo volumes between these islands and the ports of Batangas and MNH are identified in detail in Tables A.4 and A.5 of Annex A (Batangas) and Tables D.l and D.2 of Annex D (MNH). (Only the cargo traffic at the commercial wharf at Batangas is considered, since the petroleum products which also move to Coron are not pertinent to the ELISDERR objective of identifying potentials for new liner shipping services.)
Coron (Busuanga). From the 1991-1993 cargo traffic information, it appears that Manila is more important than Batangas ,
as a destination for Coron-generated cargoes, but Batangas is nearly as important as a source of supplies. As shown in Table 1 , cargo movement from Batangas to Coron was at a level of 4,600 tons in 1991, rising only slightly to 4,800 tons in 1992, and then declining in 1993; shipments from the MNH to Coron amounted to just 3,450 tons in 1991, but rose considerably to top 5,000 tons the following year, and grew to nearly 6,200 tons in 1993. In the opposite direction, Coron cargo shipments averaged approximately 4,500 tons per year to' MNH and just 1,400 tons per year to Batangas, during 1991-1993. Two-way trade volumes averaged 9,400 tons per year on the Coron-Manila route and 6,000 tons per year on the Coron-Batangas route. Thus, with twice-a-week services to both Luzon ports, Batangas has approximately a 40 percent share of Luzon/Eusuanga trade passing through Coron Port.
Odiongan ( T a b l a s ) . Odiongan is included among the "other municipal ports" of Romblon Province; although not all of the traffic under this heading in the Annex A and Annex D tables showing Batangas and MNH traffic can be presumed to be Odiongan traffic, i t is likely that most of the cargo volumes shown are going in and out of Odiongan since only this port among "other" Romblon ports has liner services. Even more than in the case of Coron Port, Batangas is an importance source of cargo for Tablas Island, as shown in Table 2. Batangas is also more important than MNH as a destination for shipments from Tablas. As shown in Table 2, shipments of cargo from Batangas to Odiongan amounted to more than 10,000 tons in 1991, grew to more than 16,000 tons in 1 9 9 2 , and then reached more than 19,000 tons in 1993. Of these totals, road vehicle weight (accommodated aboard the RORO vessel serving the Odiongan route) amounted to around 2200 tons in 1991, increased to 4800 tons the following year, and then to more than 7,100 tons in 1993. Ey contrast, shipments of cargo from MNH to Odiongan (mainly) were about 5,700 tons in 1991, and declined each of the next two years, to 5,200 tons and 3,100 tons, respectively. Cargo
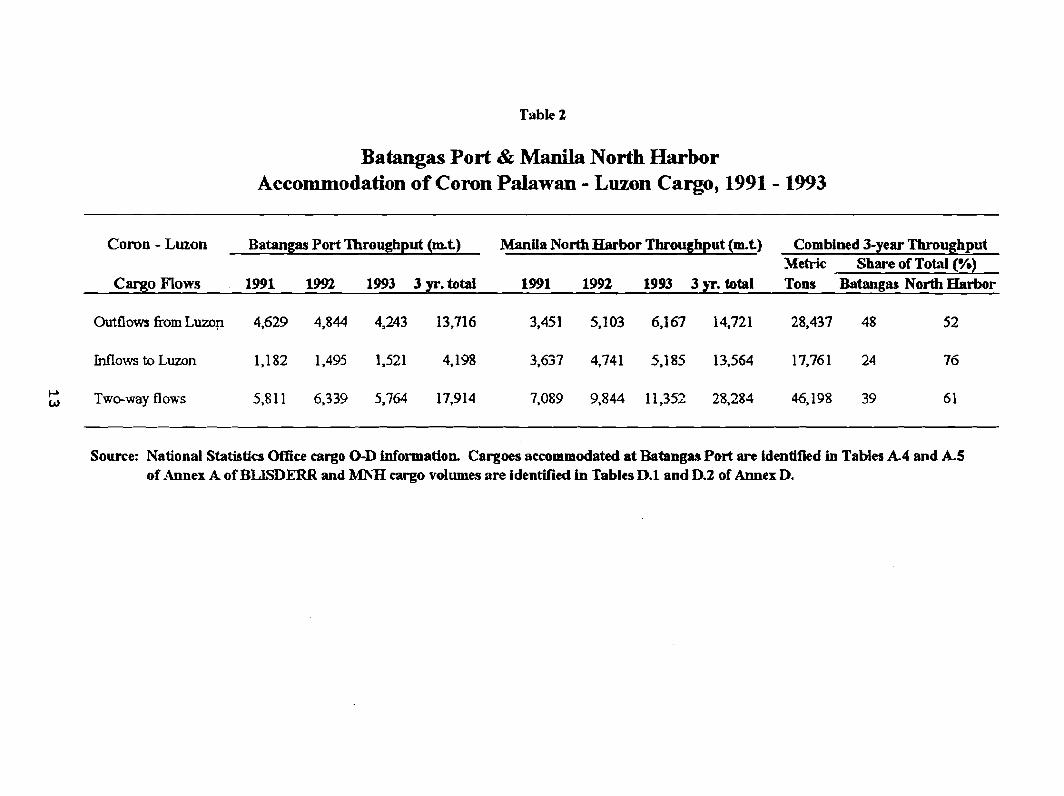
Table 2
Batangas Port & Manila North Harbor Accommodation of Coron Palawan - Luzon Cargo, 1991 - 1993
Coron - Luzon Batangas Port Throughput (rat) Manila North Harbor Throughput (m.t) Combined 3-year Throughput Metric Share of Tow
Cam0 Flows 1991 1992 1993 3 ST. total 1991 1 9 1993 3 YT. total Tons Batangas North Harbor
Outflows from Lu- 4,629 4,844 4,243 13,716 3,451 5,103 6,167 14,721 28,437 48 52
Inno~srs to Luzon 1,182 1,495 1,521 4,138 3,637 3,741 5,185 13,564 17,761 24 76
Two-way flows 5,811 6,339 5,764 17,914 7,089 9,844 11,352 28,283 46,198 39 61
Source: National Statistics Office cargo O-D information. Cargoes accommodated at Batangas Polt arc identified in Tables A4 and A S of Annex A of BLISDERR and MhH cargo volumes are identified in Tables D.1 and D.2 of Annex D.
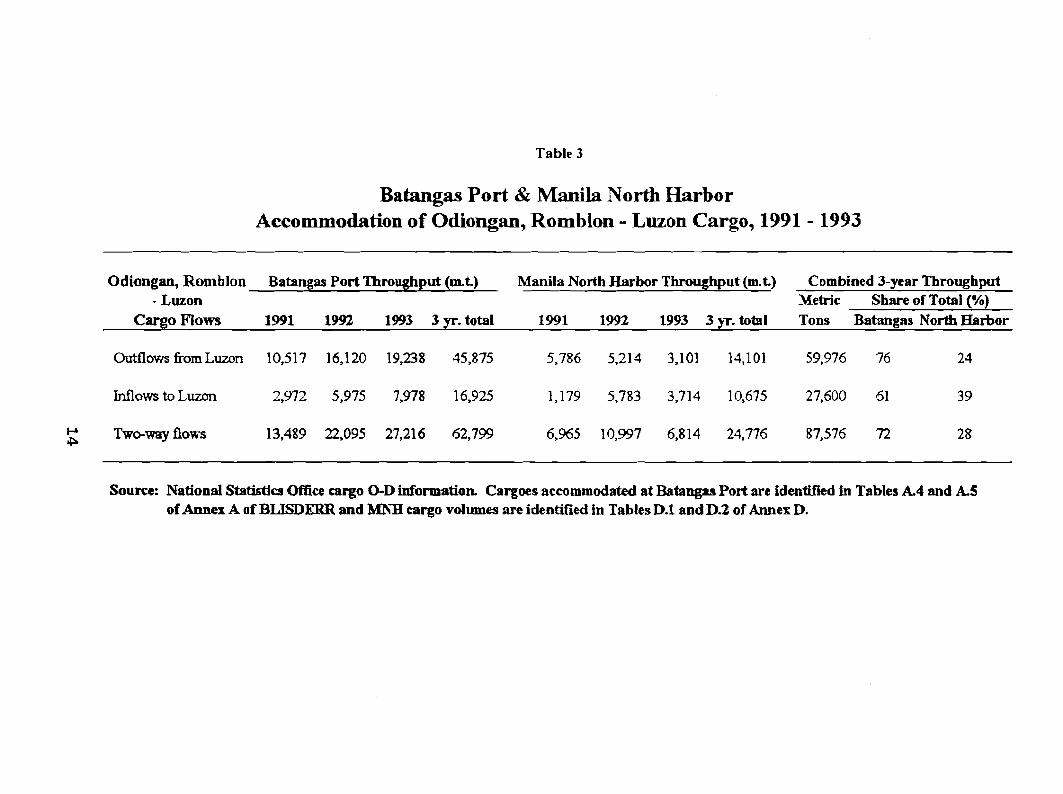
Table 3
Batangas Port & Manila North Harbor Accommodation of Odiongan, Romblon - Luzon Cargo, 199 1 - 1993
Odiongan, Romblon Batangas Port Throughput (mt) Manila North Harbor Throughput (m.t) Combined 3-year Throughput - Luzon Metric Share of Total (K)
Camo Flows 1991 1992 1993 3 vr. total 1991 1992 1993 3 PT. total Tons Batangas North Harbor
Outflows from Luzon 10,517 16,120 19,238 45,875 5,786 5,211 3,101 14,101 59,976 76
Inflows to Luzon 2,972 5,975 7,978 16,925 1,179 5,783 3,714 19,675 27,600 51 39
Source: National Statistics Office cargo 0-D information Cargoes accommodated at Batangas Port are identified in Tables A4 and A5 of Annex A of BIBDERR and Mh-B cargo vdumes are identified in Tables D.1 and D.2 of Annex D.
traffic was relatively lower on both routes in the opposite direction, in 1991, with trade cargo (excluding vehicles carried aboard the Odiongan-Batangas RORO vessel) amounting to only about 800 tons from Odiongan to Batangas, and a slightly high~r 1,200 tons to MNH. In 1992, however, shipments to MNH jumped to more than 5,700 tons, while trade cargo tons shipped to Eatangas languished at about 1,200 tons.
Romblon (port and island). The principal commodity shipped outward from Romblon is marble, and the MNH is much more important thanBatangas as a destination for this commodity. Cargo shipnlents from Romblon to MNH totaled 18,000 tons in 1991, as shown in Table 3, and rose to nearly 20,000 tons the following year, before declining by more than 50 percent in 1993. Marble and building stone represented more than 85 percent of the shipments in 1991, but not much over 60 percent in 1992. Romblon shipments to Batangas were in the neighborhood of 8,000 tons in both 1991 and 1992, with marble and building stone shipments averaging 5,600 tons over the two-year period. Excluding marble and building stone, Romblon average annual cargo shipments were 5,500 tons to MNH and 2,300 tons to Batangas, during 1991-1992. Whether marble shipments are included or excluded, Batangas has roughly about a 30 percent share of the Romblon shipments to MNH and Batangas. To a slightly greater extent than in the case of Odiongan, however, Batangas is the favored source of Romblon supplies. Whereas shipments in the Batangas-to-Romblon direction were at the level of 5,000 tons in 1991, and rose to more than 10,000 tons in 1992, shipments from MNH to Romblon amounted to about 2,450 tons in 1991, and fell to less than 900 tons the following year. In 1993, MNH was the port-of- choice for slightly over one-quarter of Romblon inflows from Luzon, as the overall level of such inflows fell by nearly 30 percent from the 1992 level. The Batangas-Romblon route now had a fairly well- balanced two-way traffic flow, over the 1991-1993 period, whereas approximately 90 percent of the cargo traffic on the MNH-Romblon route, during 1991-1993, was in the northward direction.
From the foregoing discussion of the relative attractiveness of shipping to, and sourcing from, the ports of Manila and Batangas, it appears that Manila has an edge as a shipment destination from other areas of the Philippines. This might well be due to the importance of Manila as an international port, i.e., the cargoes attracted directly to Manila may be primarily those cargoes that need to make shipping connections for export. Otherwise, Batangas Port, even with its current severe constraints, appears to be highly and increasingly competitive with MNH for the southward movement of cargo. If, then, the capacity and efficiency constraints of Batangas Port are removed, and sufficient international traffic is accommodated there to attract frequent direct international services (mainly to Kaohsiung, Hong Kong and Singapore), i t is likely that Batangas will attract at least an equal share of cargo with the MNH for many domestic routes.
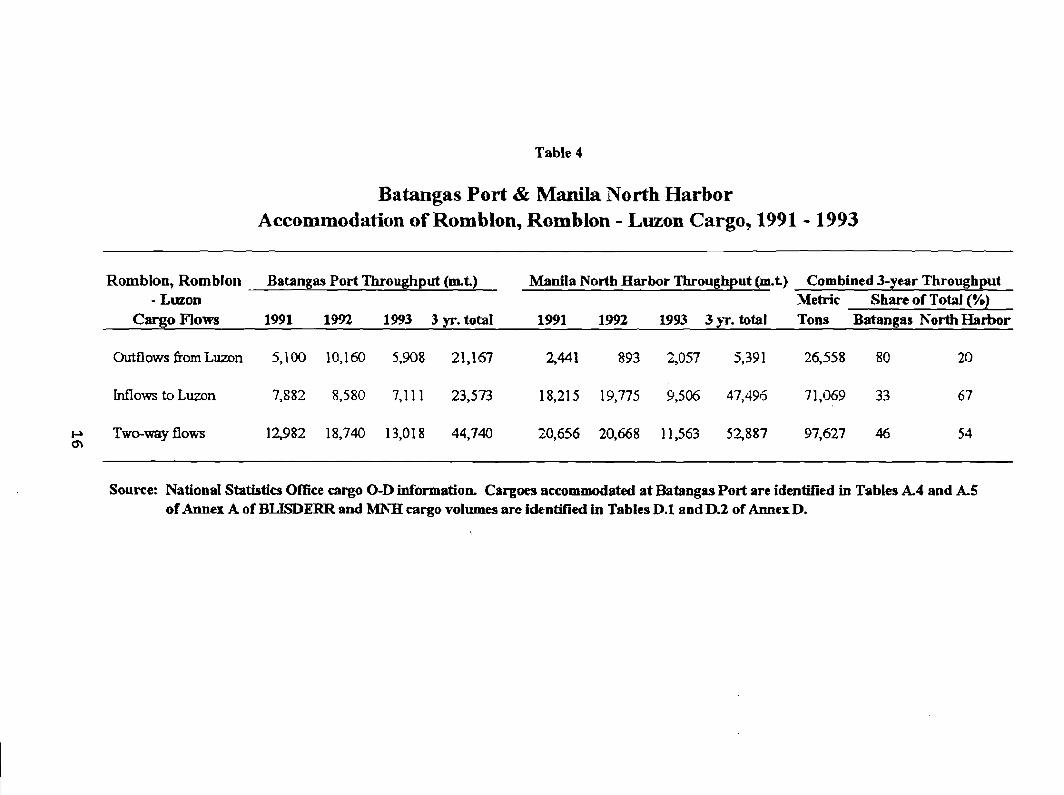
Table 4
Batangas Port & Manila North Harbor Accommodation of Romblon, Romblon - Luzon Cargo, 1991 - 1993
Romblon, Romblo~l Batangas Port Throughput (at) Manila Nortb Harbor Throughput (m.t) Combined 3-year Throughput - Luzon Metric Share of Total (%)
Cargo Flows 1991 1!W2 1993 3 yr. total 19Y1 1!N2 1993 3 y ~ . total Tons Batangas Korth Harbor
OutflowsfrOrnLuzon 5,100 10,160 5,908 21,157 2441 893 2,057 5,391 26,558 80 20
Mows to Luzon 7,882 8,580 7,111 23,5'73 18,215 19,775 4,506 47,496 71,069 33 67
P Twmwayflomx 12Q82 18,740 13,018 34,740 20,656 20,668 11,563 52,887 97,627 46 54 Q\
Source: National Statistics Office cargo 0-D information. Cargoes accommodated at Batangas Port are identified in Tables A4 and A5 of Annex A of BLTSDERR and MnH cargo volumes are identified in Tables D.l and D.2 of Annex D.
Passenger Services
The Batangas Port Study presumed (in its Interim Report at least) that passengers at Batangas would comprise only ferry passengers, with services being operated between Batangas and the three Mindoro north coast ferry ports of Calapan, Puerto Calera and Abra de Ilog. The study projected that these three routes would generate slightly over a million passengers in 1990, and then would experience rapid growth for another ten years, tripling to more than 3 million passengers in the year 2000. In contrast to the study's conservative growth estimate for cargo traffic on the Calapan-Batangas route (five percent per annum during the 1990s), the study forecast that passenger volumes on the route would rise by an average annual compound rate of 10.6 percent.
The study's forecast of total passenger traffic at Batangas in 1990 was 1,030,000, divided between 906,000 passengers on the Calapan route, 30,000 on the Puerto Galera route, and 94,000 on the Abra de Ilog route. Actual traffic growth on the Calapan route has been slower than projected, but the Puerto Galera route, in 1992, eclipsed its projected year 2000 traffic level, and traffic between Batangas and Abra de Ilog has grown at about the rate that the Batangas Port Study anticipated. Together, the three routes served just over one million passengers in 1992. Total passenger traffic at Sa'csngas Port, in 1992, was 1,145,500 passengers. This total is approximately ten percent higher than the study's forecast for 1990.
Whereas the year 2000 RORO ferry passenger forecasts of the Batangas Port Study Interim Report are probably considerably higher than what now can be expected to occur by that year, overall passenger growth at Batangas Port is likely to exceed the forecasts of the study. Liner shipping passengers at the port already exceeded 140,000 in 1992, in contrast to the study's ignoring the possibility of such traffic.
The potential for passenger diversion to liner services at Batangas from 1 iner services at Mani la is probably at least as good as the diversion prospects for cargo traffic, considering that:
- Passengers would be reducing their sailing time by at least five hours. On the basis of the passenger conversion record from liner shipping services to Maharlika Highway/RORO ferry travel, it appears that the majority of passengers like to shorten their sea voyages and sailing times when they can easily do so. A five- hour sai 1 ing time reduct ion could be especial ly attractive during the typhoon season. A rough LSRS estimate is that sea conditions north of Cebu are uncomfortable for passenger travel about 90 days per year, i.e., approximately one-quarter of the time.
- Passengers would be reducing their total travel time in one direction by somewhere in the range of 2 to 8 hours, with the current road network and travel conditions, depending on precisely where their Luzon ultimate trip- end would be. If their ultimate trip-.end is within Metro Manila or anywhere to the north of Metro Manila, then they will be saving only about two travel hours by going through Batangas. If, on the other hand, their ultimate trip-end is in Batangas Province or anywhere to the cast or south of Batangas, then they will be saving about eight travel hours. As the road network is improved, so that road travel between Batangas and Manila bec~rl~ss no more than two hours, the time saving range for passengers opting to pass through Batangas Port rather than the MNH will narrow to a range of 3 to 7 hours.
Provided that Batangas Port is made adequate for the accommodation of large numbers of liner shipping passengers, and a good modal interface (interprovincial buses and liner shipping and ferries) is provided at Batangas, and the expressway between Manila and Batangas is completed, then the franchising of new liner shipping services to Batangas is likely to divert between 50 and 100 percent of passenger traffic from existing routes to MNH. This statement does not mean that there will necessarily be 100 percent of the passengers on any route that would prefer to go through Eatangas rather than MNH, but passenger demand for direct service to Manila could decline sufficiently on some routes, as to make i t uneconomic to continue direct passenger services.
3. BATANGAS PORT LINER SHIPPING SERVICES
Introduction
Chapter 2 discussed, in general, the potential for the establishment of liner shipping services at Batangas, concluding that there are potentials for diverting 50 percent or more of passenger trips and domestic cargo movements, other than transit cargoes, that currently have a sea transport trip-end at MNH. Even the transit cargoes might be diverted to Batangas once international trade has developed sufficiently at the port to attract frequent international shipping services. In Chapter 3, the LSRS looks on a route-by-route basis at the prospects for instituting liner shipping services to Batangas. Because much of the potential cargo traffic that might be accommodated by such services would be diverted from routes to MNH, the MNH traffic information presented in the tables of Annex D is pertinent to the discussion in this chapter.
The terms of reference for the LSRS require that the study consider possible new services to 1 ink Batangas to Cebu', Cagayan de Oro, and the island of Panay. These possibilities are examined in this chapter, but LSRS fieldwork and analyses presented in other LSRS reports have also suggested that Batangas liner shipping linkages to Davao, a Leyte port, and Puerto Princesa, Palawan deserve consideration. The final section of the chapter tries to identify still other good liner shipping service possibilities for Batangas Port.
Liner Shipping Service Proposals & Evaluation
Batangas-Cebu Route
The MNH-Cebu route is 392 nautical miles (n.m. ) , and is served by a number of liner shipping operators,who employ passenger/cargo vessels and container or general cargo vessels to serve the route. Steaming time for large passenger/cargo vessels is around 21 hours. The Batangas-Cebu route has a route length of 303 n.m. The route is not franchised, in 1994, but would entail a steaming time of 16 hours for large passenger/cargo vessels. The potential voyage time reduction, with large passenger/cargo vessel diversion from a MNH terminus to a Batangas route terminus, would be 5 hours. Other types of vessels would realize greater time savings with diversion from MNH to Batangas.
There was a very sharp reduction in cargo volumes on the Cebu-
MNH route from 1991 to 1992. In 1991, approximately 729,000 tons of cargo were shipped from MNH to Cebu, and more than 405,000 tons were moved in the opposite direction. In 1992, these flows declined to 579,000 tons and 244,000 tons, respectively. The MNH decline in cargo inflows on this route was approximately 40 percent, while the decline in outflows was slightly over 20 percent. The LSRS has not had the opportunity to analyze the reasons for these declines of cargo traffic, but notes that Cebu exporters were reportedly facing difficulties due to the strength of the Philippine peso in 1992, and increased direct calls at Cebu by international shipping vessels probably reduced the extent to which Cebu-generated international trade had to be transshipped at Manila. There were also reasons related to individual industries; for example, the decentralization of bottling by beer and soft drink companies aceounted for a 49,000 ton reduct ion in the two-wa flow of bottles between Cebu and MNH in 1992, as compared to 1991. Y
The tonnages of mi 1 led rice shipped from MNH to Cebu rose from 31,000 tons in 1991, to 46,000 tons in 1992. With Batangas-Cebu liner shipping services, Batangas would likely replace Manila as a source for Cebu supplemental rice inflows, since the preponderance of the large rice surpluses of Mindoro Island go through Batangas. As identified in Chapter 2, Batangas can be expected to become Cebu's principal source for cargoes from Luzon, but the port ions of Cebu export/import trade that need to continue to be transshipped at another port are likely to continue to be accommodated on the MNH-Cebu route.
Cebu Port and Batangas Port have in common that they are probably the two most underdeveloped ports of the Philippines relative to the volumes of traffic that they might potentially be accommodating. It is urgent that Cebu-Davao, Cebu-Iloilo, and Cebu-Zamboanga liner shipping cargo services be expanded, yet the severe constraints of the port make the expansion of these services difficult to do. Once both ports have been upgraded and expanded,
A1 though the NSO information on cargo 0-D appears generally to be reasonably accurate, and has proven to be a boon for conduct of the LSRS, every once in a while the NSO provides a figure that appears to be incorrect. When a shift of three digits would produce a reasonable figure for annual trade of a commodity on a route, the LSPd has presumed that the NSO figure was erroneous1 y stated in kilograms instead of tonnages and the figure is adjusted accordingly. If a shift of fewer than three digits appears appropriate, however, the LSRS makes no adjustment, but lets the NSO figure stand as reported. In the case of Cebu-bW, the NSO reports the shipment of more than half a million tons of household utensils from MNH to Cebu in 1993, as shown in Table D.l of Annex D. Since the LSRS suspects that one or two digits should be shifted to the right of the decimal point, for an accurate indication of tonnages, no comparison is presented in this report of the magnitude of 1993 overall cargo traffic on the Cebu-bINH route to the levels of 1991 and 1992.
hopefully by the year 2000, liner shipping services between them are likely to accommodate at least 50 percent of Cebu-Central Luzon/Southern Tagalog trade, and probably as high or higher a proportion of the sea passenger traffic between the two areas.
The high passenger traffic diversion, however, will occur only if Batangas-Cebu services are provided on a several-times-per-week basis, as services between MNH and Cebu are in 1994. Passenger volumes on the MNH-Cebu route averaged nearly 1,000 passengers per direction per day, during 1992, and the route has good passenger growth prospects. By the time that both Batangas Port and Cebu Port (which currently has no passenger terminal) have been developed to accommodate new services between them, the combined Cebu-Central Luzon/SouthernTagalog passenger traffic will probably have eclipsed the million-per-annum mark. Thus, Batangas Fort is likely to have 500,000 liner shipping passengers per year, just fromthis single route, soon after the port development project has been fully implemented, i.e., in the year 2000 or soon thereafter.
Batangas-Cagayan de Oro Route
Cagayan de Oro shippers of grains are already asking that liner shipping services be instituted between Cagayan de Oro and Batangas, because they are shipping 50,000 tons of grain per year on the route, even in the absence of liner services. The large volumes of perishable goods being shipped from Cagayan de Oro to MNH are also susceptible to diversion to Batangas-Cagayan de Oro services, because the reduction of five or more hours of sailing time could be of importance for the preservation of quality of these commodities. This is why, for example, that Romblon fish traders prefer shipping through Batangas rather than directly shipping to Manila.
Much of the anticipated Iligan steel product flow to btetro Manila and the CALABARZON region (see Chapter 2 discussion of Batangas Port Study forecasts) may also go through Cagayan de Oro, since Iligan Port is unprotected from rough se'as, and is likely to remain so. Shipment through Cagayan de Oro might be essential, therefore, for ensuring highly reliable delivery schedules. Significant volumes of outward shipments of cargo originating from the Iligan area (and the Butuan/Nasipit area) were already, in 1993, going through the port of Cagayan de Oro, because of the more frequent and more reliable liner shipping services provided at that port .
Two-way cargo traffic between Cagayan de Oro and MNH grew by about 8 percent in 1992, from a 1991 total of 248,000 tons to a total of 269,000 tons, and then declined slightly to around 260,000 tons in 1993. The 1991 trade was almost perfectly balanced in two directions, but, in 1992, inflows at MNH from Cagayan de Oro

declined slightly to about 120,000 tons, while shipments to Cagayan de Oro were rising to a level of 149,000 tons. In 1993, MNH inflows from Cagayan de Or0 declined further, to a level of around 100,000 tons, and that decline more than offset a continuing rise in cargo flows in the other direction, with MNH outbound cargo destined for Cagayan de Oro nearly reaching 160,000 tons.
Dairy products represent the single most important commodity grouping among cargoes moving in the MNH-to-Cagayan de Oro direction. These shipments from MNH grew by nearly 8,000 tons between 1991 and 1992, reaching a total of 16,500 tons in the latter year, but dairy product shipments then declined in 1993, to a level of slightly more than 12,000 tons. The dairy industry, like the bottling industry, is in the process of national decentralization, so long-distance interisland shipments of these commodities might be expected to decline in the future.
The decline of cargo volumes shipped from Cagayan de Oro to MNH, from 1992 to 1993, was entirely due to a fall in the shipment of unmilled maize; whereas more than 43,000 tons had been shipped from Cagayan de Oro to MNH in 1992, the 1993 volume was less than 18,000 tons.
On the basis of the Chapter 2 conclusions regarding Batangas being a preferred source (in comparison to MNH) of the cargo inflows required by other areas of the Philippines, and being competitive with MNH for non-export/import cargo outflows of other areas, a minimum of 50 percent of Cagayan de Oro-MNH cargo flows is estimated to be potentially divertible to Batangas-Cagayan de Oro services. If CALABARZON development results in the rapid growth of international shipping services at Batangas, then a significantly larger proportion than 50 percent of MNH-Cagayan de Oro cargo traffic is likely to divert to the new services.
As passenger trips by either sea or air transport lengthen, the final few hours become ever more tiring, boring, and perhaps also nauseating, The LSRS estimated, above, that half or more of the passengers traveling between Cebu and Central Luzon/Southern Tagalog will divert from MNH-Cebu services when they have the option of reducing sailing time by five or more hours and their total travel time by 2 to 8 hours, with the inauguration of Cebu- Eatangas services. The sea distance from Cagayan de Oro to MNH is 501 n.m., and the voyage time is about 32 hours, i.e., about 10 or 1 1 hours longer than traveling between Cebu and MNH. The route distance for Eatangas-Cagayan de Oro is 425 n.m. The possibility of eliminating the final 5 or 6 hours of sailing between Cagayan de Oro and Luzon is likely to be very attractive to travellers at all times, and irresistible during much or all of typhoon season. Provided that frequent services are performed on the Batangas- Cagayan de Oro route, 60 to SO percent diversion of passengers from NNH to Batangas should be possible. The direct services between MNH and Cagayan de Oro accommodated about 102,000 passengers, in
1992, and other passengers were accommodated between these two ports by services making intermediate calls at Cebu, Iloilo, or Dumaguete. I t is probably reasonable to expect that passenger volumes between Batangas and Cagayan de Oro wi 1 1 reach the 100,000- per-year level soon after the port development project at Batangas has been completed.
Batangas-Davao Route
The LSRS is recommending in other volumes of the Final Report that additional liner shipping services be franchised between Cebu and both Davao and Zarnboanga. In the absence of such new services, Eatangas would be a preferable port, to the continued use of MNH, for the transshipment of cargoes between Cebu and the btindanao ports. A two-way total of 10 to 12 sailing hours would be saved per shipment by this change in the point of domestic transshipment. (Of course, the additional direct services recommended by the LSRS would still constitute the optimal improvement, and would eliminate the altogether the needs for transshipment.)
There are competing commercial ports at Davao and both accommodate large volumes of cargo traffic between Davao and MNH. The PPA port of Sasa Wharf accommodated 457,000 tons in the northward direct ion and 166,000 tons in the southward direct ion, in 1991, and these volumes grew the following year to 490,000 tons and 266,000 tons, respectively. Two-way cargo volumes grew by 21 percent, from 623,000 tons in 1991 to 756,000 tons in 1992. In 1993, however, cargo volumes moved between Sasa Wharf and MNH decined, principally because of a 55,000 ton reduction in the annual volume of corn shipments, and a 67,000 ton reduction of shipment of wood charcoal, from 1992 to 1993.
The private port of Tefasco accommodated mainly cargoes moving, in the northward direction, during 1991-1993. These MNH-bound cargoes totaled 133,000 in 1991, declined to 105,000 in 1992, and then to only 70,000 tons in 1993. As shown in Table D.1, no cargo was moved in the southward direction to Tefasco in either 1991 or 1993, and only about 2,000 tons were moved from MNH to Tefasco in 1992.
Some of the Davao-generated cargoes which would be likely to divert from Davao-MNH services to Davao-Batangas services include:
- Livestock shipments. In both 1991 and 1992 these totaled to around 16,000 tons, before declining, in 1993, to a level of 11,500 tons. Davao shippers complair~ of the weight loss suffered by their animals on their way to MNH, and many of the animals are moved to Cavite after arrival at MNH, to regain their health and weight. Shippers would like the shortening of the voyage and the
more direct route to the animal rehabilitation area.
- Horticultural crop shipments. One of the industrial undertakings in the CALABARZON region is scheduled to be a fruit processing plant to be built in Cavite by KLT Fruits Inc. By 1996, the processing plant is expected to require more than 165,000 tons of fruits per year for processing. Davao is the principal area of fruit production surpluses in the Philippines, and therefore a natural source of some of the production inputs for the processing plant. Horticultural commodities destined for sale on Luzon markets may also shift to Davao-Batangas liner service to avail of the shorter voyage time, which should help to preserve the value of these perishable commodities. In 1991, more than 100,000 tons of horticultural commodities were shipped from Davao to MNH, but tonnages dropped sharply to a range of 34,000-37,000 tons per annum, during 1992-1993.
Corn. Shipments of unmilled corn from Davao to Manila rose by more than 60,000 tons in 1992, from a 1991 level of 75,000 tons, to reach a level of 139,000 tons. In 1993, shipments declined again, almost to the level of 1991. None of these volumes were for export, and i t is likely that Davao-Batangas liner shipping services would cause some significant portion of these corn flows to divert to the livestock feeds industry in the area of Bat angas.
Where passengers are concerned, the start-up of Davao-Batangas liner shipping services would probably cause an immediate diversion of all of those passengers with an ultimate Southern Tagalog or Eicol trip-end, and other passengers currently being accommodated bq Davao-MNH services would be likely to divert more gradually to the services terminating at Eatangas, after experiencing voyages that they wished had been shorter. It is not beyond the realm of possibility that passenger traffic on the existing Davao-MNH route could decline to a level that would no longer warrant the continuat ion of passenger services on that route. In any case, the average annual passenger load factors for vessels operating between Eatangas and Davao are 1 ikely to be significantly higher than those for any services which continue to be operated directly to MNH, simply because the shorter voyage and travel times offered by the proposed new services represent significant advantages vis-a-vis the MNH-Davao services.
Batangas-Panay Island Routes
The route options being considered are a Batangas service connection to Iloilo and/or to a Panay north coast port. These
ports include Culasi, the port of Roxas City, Capiz, and the Aklan Province ports of Batan, Dumaguit, and New Washington. Route distances from MNH are 340 n.m. to Iloilo and 247-250 n.m. to Culasi, Dumaguit, Batan and New Washington. The route lengths from Batangas would shorten to 280 n.m. to Iloilo and to about 165 n.m. to the Panay north coast ports.
In 1991, trade between Manila and Iloilo was almost perfectly in balance, with more than 99,000 tons being shipped in the northward direction, and 102,000 tons moving in the opposite direction. The NSO data on 1992 flows from Iloilo (Table D.2) contain a large error, showing more than 230,000 tons of bottles being shipped in that year. From the NSO value figure of PSO million for this cargo flow, it appears that the correct tonnage figure is in the neighborhood of 10,000 tons, which would mean that approximately 164,000 tons of cargo were shipped from Iloilo to MNH in 1992, representing about a 65 percent jump in traffic from the previous year. In the opposite direction, traffic grew by almost 15 percent, to reach a level of more than 117,000 tons.
Portions of these cargo flows, but probably relatively minor portions, are goods that must be transshipped at MNH, to permit trade in perishable commodities between Panay and Palawan and to make possible a portion of the trade between Panay and Mindoro. These cargoes would benefit from shifting to proposed Batangas- Iloilo liner shipping services. The proposed services could be expected to divert, also, a significant proportion of the Panay- C3ctral Luzon/Southern Tagalog trade, especially in the southward direction, i.e., Batangas is more competitive with MNH as a source for cargo than as a destination. Northward shipments of those perishable commodities which are not for export would also be highly susceptible to diversion to the proposed services, because the shorter voyage would help to preserve their quality. Among these northward shipments, in 1992, were more than 16,000 tons of fresh/chilled fish and 3,000 tons of fruits.-
Passenger volumes were slightly higher on the MNH-Iloilo route, than on the MNH-Cebu route, in 1992. Provided only that Batangas Port and Iloilo-Batangas liner shipping services can accommodate them, the five-hour voyage time reduction offered by these services, and the 2- to 8-hour reduction in total travel time, would divert half of these passengers, at least, during all portions of the year, and a significantly higher proportion during the typhoon season. This diversion would add a minimum of 400,000 passengers per year to Batangas Port traffic, if start-up of the service were immediately possible, and, provided only that services are instituted to meet total demand for them, year 2000 passenger traffic on a Batangas-Iloilo route is likely to surpass the 500,000 passenger level.
Culasi Port ships fairly sizable quantities of cargo to MNH, but receives relatively less in return. In both 1991 and 1992,
about 25,000 tons of cargo left Culasi Port for MNH, and cargo volumes grew to 35,000 tons in 1993, Return cargo flows were at about a level of just 8,000 tons per year, over 1991-1992, but then rose to around 25,000 tons in 1993. Nearly one-quarter of the outflow from Culasi, during 1991-1993, was comprised of empty bottles, but seafood constituted the most important outflow (especially in value terms), reaching a level of about 10,000 tons in both 1991 and 1992, before increasing to more than 16,000 tons in 1993. During LSRS fieldwork on the north coast of Panay, in 1993, however, shippers of fish indicated that they were, at that time, shipping 70 percent of their fish through Iloilo, because of the frequent and reliable services at that port, and were shipping about ten percent of their fish to Manila by air.
The three Aklan ports received from MNH combined totals of 14,000 tons of cargo in 1991, about 9,500 tons in 1992, and nearly 9,000 tons the following year. The outward shipments from these ports to MNH declined by about the same extent, over the three years, from a 1991 total of more than 17,000 cargo tons to 1992 and 1993 totals of 13,300 tons and nearly 10,000 tons, respectively. The reduction in outward flows was due primarily to a fa11 in the level of empty bottle movements; these had totaled 7,500 tons in 1991, and fell to an average of 2,100 tons per annum, in 1992-1993.
The LSRS is recommending in other volumes of this Final Report that a master plan be developed for Iloilo Port, and that the plan preparation include the identification of the appropriate role of the port in serving the various portions of the island of Fanay. I t is the expectation of the LSRS that, with a well-developed Fanay road network, Iloilo Port could be appropriately developed to serve most or all of the island where export/import trade and domestic containerized cargo movements are concerned. Other ports of Panay would then mainly serve passenger and breakbulk cargo movements, including shipping services in a few long-distance routes. One of these latter would probably be a connection between Batangas and both Culasi and one of the Aklan ports. PPA officials indicated to LSRS team members, in 1993, that it is a PPA concern to more clearly define the role of Panay north coast ports, and to determine which, if any, merits a development effort in line with a future expanded role in serving Panay's interisland transport requirements,
Batangas-Leyte Routes
Eoth Tacloban and Ormoc are slightly less than 300 n.m. from Eat angas. The former port has the advantage of serving a hinterland that also includes much of Samar, whereas the latter port has the advantage of easy entrance and exit, in contrast to the navigation difficulties involved with reaching Tacloban from the north, i.e., through the shallow, narrow, 32-kilometer San
Juanico Strait. The LSRS is recommending in other volumes of this Final Report that PPA conduct a study to consider which of Leyte's ports (not necessarily either of these two) is eventually to be developed to serve the Eastern Visayas' international and domestic containerized cargo trade.
Currently, Tacloban is the dominant Leyte port. Table D.l shows that shipments from MNH to Tacloban amounted to 53,000 tons in 1991, grew by more than 50 percent in 1992, to reach a level in excess of 130,000 tons of cargo, and declined again to around 100,000 tons of cargo in 1993. There is a very large cargo imbalance on the route, with northbound cargo shipments from Tacloban to MNH being much smaller than the southbound cargo volumes. Northbound cargoes totaled less than 19,000 tons, in 1991, then dropped to around the 13,000-ton level in'both 1992- and 1993.
In contrast to the fairly large cargo levels on the MNH- Tacloban route, the two-way trade between Orrnoc and MNH was only about 12,000 tons per annurn, during 1991-1993, with southbound shipments being approximately three times the levels of northbound shipments.
The Batangas-Tacloban/Ormoc route is very promising, considering:
- Batangas appears to have a significant edge over MNH as a supplier port when a liner shipping connection is provided to Batangas (see Chapter 2 discussion of routes with existing liner services to both MNH and Batangas), and 85-90 percent of the traffic on this route is in Leyte's supply direction (i.e., inward).
- Leyte and Samar are also rice and salt deficit areas, and buyers on these islands would like to have services to. Batangas instituted to give them regular access to the rice surpluses and salt of Mindoro.
- MNH-Tacloban liner services have lost much of the passenger traffic between Central Luzon/Southern Tagalog and the Eastern Visayas to the competing road transport/RORO ferry services. Shortening the sea voyage by five or six hours would offer a chance for the sea transport option to regain portions of this passenger traffic.
Batangas-Puerto Princesa Route
In 1994, Puerto Princesa and the majority of Palawenos have sea transport access to Luzon just once a week. Most of the
benefits of instituting services on a Batangas-Puerto Frincesa route could, frankly, also be gained by doubling the frequency of services between Puerto Princesa and MNH. There would, however, be some incremental value of the Batangas-Puerto Princesa service, as compared to a second weekly voyage on the MNH-Puerto Frincesa route, since portions of the cargo and passenger traffic will have Southern Tagalog and Bicol ultimate trip-ends, rather than rrip- ends at Metro Manila or north of Metro Manila. That is, little or no cargo or passenger traffic would find Puerto Princesa-Batangas shipping services to be disadvantageous vis-a-vis Fuerto Princesa- MNH services, but some traffic would derive significant advantages from the proposed alternative services to Batangas.
AS shown in Tables D.l and D.2, cargo movements between MNH and Puerto Princesa amounted to more than 91,000 tons in 1991, grew to 104,000 tons in 1992, and then declined to somewhat less than 100,000 tons in 1993. Approximately 40 percent of the cargoes on the route moved from Puerto Princesa to MNH, during 1991-1992, with 60 percent moving in the opposite direction. In 1993, however, approximately three-quarters of the cargo on the route moved in the NNH-to-Fuerto Princesa direction.
Depending along which side of Mindoro Island a vessel serving the Puerto Princess-Batangas route would pass, the route distance would be either 315 n.m. or 322 n.m., whereas the MNH-Puerto Princesa route distance is 363 n.m. The distance advantage of the Eatangas route is, thus, about half of the advantage offered in the case of alternative Luzon service connections to Cebu. If the proposed Batangas-Puerto Frincesa services could have been inaugurated in 1994, they would probably have diverted half of the MNH-Fuerto Princesa cargo traffic, just because a second voyage was being offered per week. That is, shippers indicated that a second voyage per week was needed between Puerto Princesa and Luzos, sad that a terminus at Batangas would be satisfactory, although not preferable to a second operator instituting services between MNH and pverto Princesa. Using the Coron experience as a guide (see Table 2 ) , the Eatangas route might be expected to accommodate about half of the cargoes moving from Luzon to Puerto Princesa, once services have actually been inaugurated on the route, but to accommodate only some smaller proportion of the cargo moving in the other direction.
Other Possible Liner Services
Nearly any MNH interisland liner shipping route might usefully be paralleled by shipping services operating to Batangas, after that port has been developed to adequately accommodate such services. In addition to the Cebu, Cagayan de Oro, Davao, Panay Island, Leyte Island, and Puerto Princesa connections discussed in the foregoing sections of this chapter, a few additional useful
liner shipping connections to Batangas Port might include:
- Iligan. The Batangas Port Study projections of cargo traffic at Batangas identified prospects for a very heavy flow of traffic between Iligan and Batangas, principally annual shipments of 1.5 million tons of steel products. As shown in Table D.2, actual shipments of iron and steel products from Iligan to MNH totaled more than 76,000 tons, during 1991-1993, or an average of about 25,000 tons per year. Despite the delay which is occurring in developing Iligan-Luzon trade in basic metal products, the fairly heavy volumes of other cargoes on the route, and the volumes of Iligan-Manila passengers, make i t desirable to institute Batangas-Iligan services whenever this becomes possible.
- Ozamis. In addition to, or in preference to, establishing liner shipping services between Eatangas and Iligan, services might be instituted between Eatangas and the port city of Ozamis. The hinterland of the port of Ozamis is being expanded by virtue of the implementation of a number of road projects which result in improved access to the port. PPA has noted the growing potential for Ozamis Port, and has indicated to the LSRS that the port will be developed in line with its potential. The port and liner services operated to i t can greatly shorten the shipment and travel distances from the southeastern portion of the Zamboa-nga Peninsula to most points north of Mindanao. Grains, horticultural crops, and livestock might advantageously move from a sizeable area of Mindanao to Luzon through the ports of Ozamis and Bat angas.
- Bohol. The island of Bohol is not adequately served, in 1994, by the once-a-week passenger service connection it . has to Manila, and perishable cargoes would also benefit considerably from any expansion of shipping services connecting to Luzon. A connection to Eatangas would essentially provide all of the benefits of introducing a second operator to the MNH-Tabilaran route, but would in addition serve the Southern Tagalog region better than does the existing service.
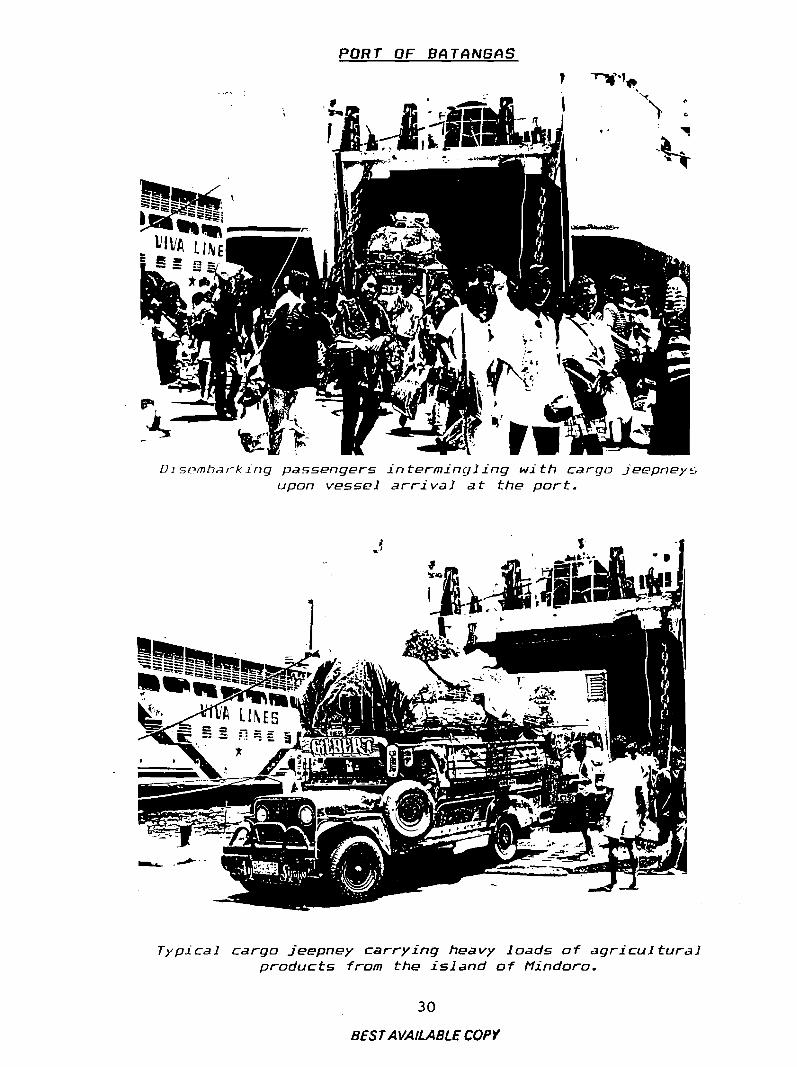
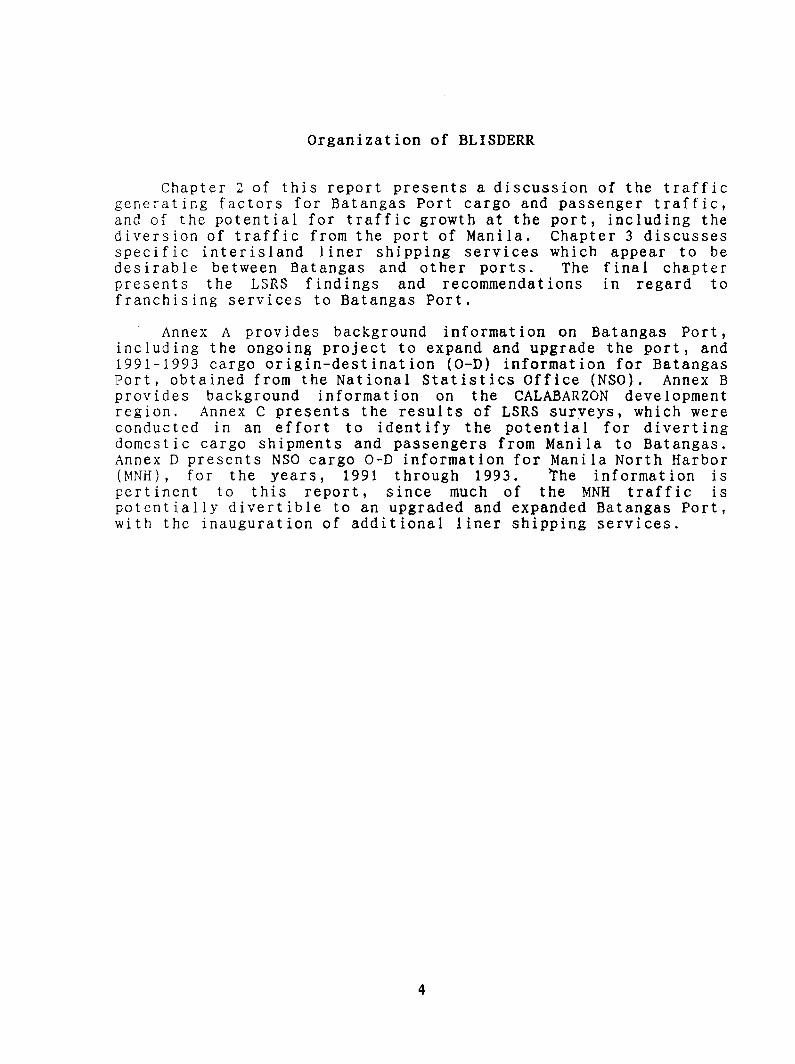
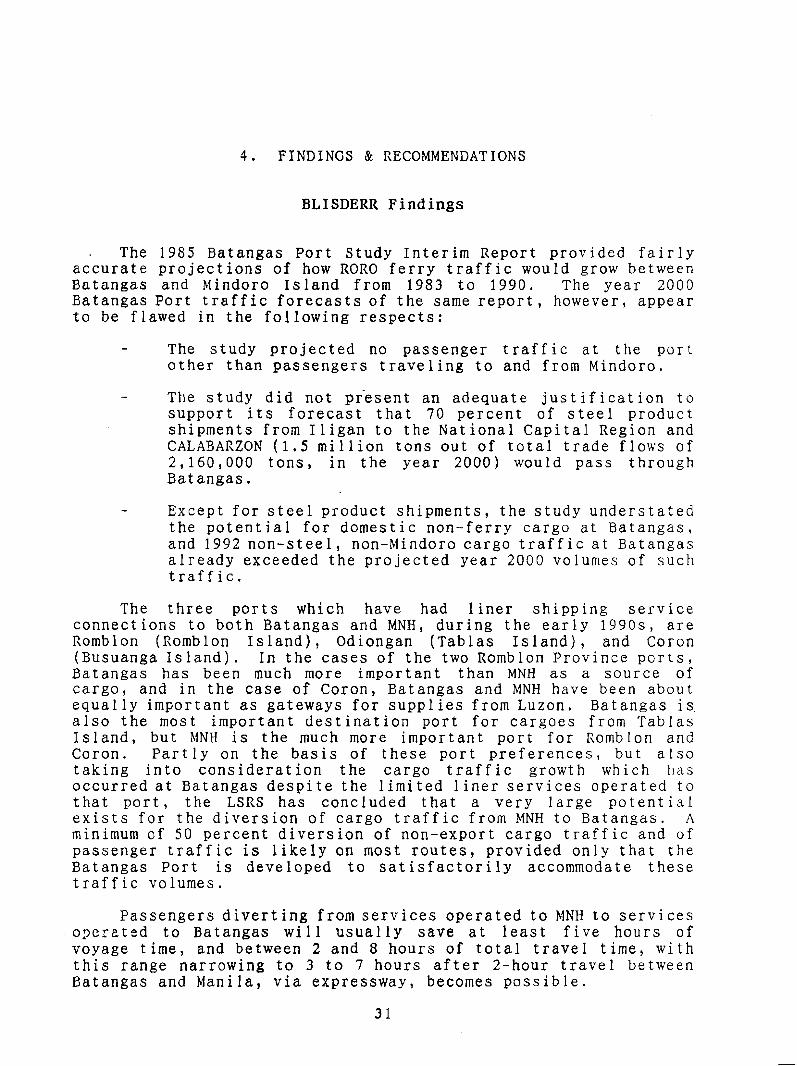
PORT OF B A T A N G A S
D i s c m l ~ a t - k i n g passengers i f f terming1 i n g wi t h cargo J-eepneys upon vessel a r r i vs l a t t h e p o r t .
Typ ica l cargo jeepney c a r r y i n g heavy loads o f a g r i c u l t u r a l products from t h e island o f Mindoro.
30
BEST AVAILABLE COPY
4. FINDINGS & RECOMMENDATIONS
BLISDERR Findings
. The 1985 Batangas Port Study Interim Report provided fairly accurate projections of how RORO ferry traffic would grow between Batangas and Mindoro Island from 1953 to 1990. The year 2000 Batangas Port traffic forecasts of the same report, however, appear to be flawed in the following respects:
- The study projected no passenger traffic at the port other than passengers traveling to and from Mindoro.
- The study did not present an adequate justification to support its forecast that 70 percent of steel product shipments from Iligan to the National Capital Region and CALABARZON (1.5 million tons out of total trade flows of 2,160,000 tons, in the year 2000) would pass through Bat angas.
- Except for steel product shipments, the study understated the potential for domestic non-ferry cargo at Batangas, and 1992 non-steel, non-Mindoro cargo traffic at Batangas already exceeded the projected year 2000 volumes of such traffic.
The three ports which have had liner shipping service connections to both Batangas and MNH, during the early 1990s, are Romblon (Romblon Island), Odiongan (Tablas Island), and Coron (Busuanga Island). In the cases of the two Romblon Province ports, Batangas has been much more important than MNH as a source of cargo, and in the case of Coron, Batangas and MNH have been about equally important as gateways for supplies from Luzon, Batangas is, also the most important destination port for cargoes from Tablas Island, but bINH is the much more important port for Romblon and Coron. Partly on the basis of these port preferences, but also taking into consideration the cargo traffic growth which has occurred at Batangas despite the limited liner services operated to that port, the LSRS has concluded that a very large potential exists for the diversion of cargo traffic from MNH to Eatangas. A minimum of 50 percent diversion of non-export cargo traffic and of passenger traffic is likely on most routes, provided only that the 13atangas Port is developed to satisfactorily accommodate these traffic volumes.
Passengers diverting from services operated to MNH to services oyereted to Batangas will usually save at least five hours of voyage time, and between 2 and 5 hours of total travel time, with this range narrowing to 3 to 7 hours after 2-hour travel between Batangas and Manila, via expressway, becomes possible.
Once the Eatangas Port development project has been completed, Batangas should have liner shipping connections to a nurnber of ports, among which the more important are Cebu, Iloilo, Cagayan de Oro, and Davao. In the view of the LSRS, these four routes, alone, will add more than one million tons of cargo traffic and well over one million passengers per annum to the port's traffic, almost as soon as the expansion and upgrading project can be completed ( i ..e., by about the year 2000).
Other services are certainly also desirable, and one of the most desirable would be between Batangas and a Leyte port, probably Tacloban, but perhaps Orrnoc. Services between Eatangas and the ports of Iligan, Ozamis, Tagbilaran, and Puerto Princesa would also be likely to divert large volumes of cargo and passenger traffic from existing routes to MNH.
Considering the prospects for high levels of domestic cargo and passenger traffic at Batangas Port, and the delay in implementing the first phase of the port development project, the port is likely to remain congested when that development phase has been completed. The limiting factor on traffic volumes at Batangas Port is likely to continue to be the port's capacity for traffic accommodation, notwithstanding the implementation of currently planned port development.
I t is possible that a significant portion of the traffic diversion identified in this report will pass, not through Eatangas, but through a port still farther to the south. Direct liner shipping services between Cebu and the Lucena City port of Dalahican is being promoted by the Philippine Government as a "flagship" project, and would offer greater diversion benefits than a Eatangas route for passengers currently sailing to and from MNH. The proposed ports of Pagbilao (near Lucena) and a "Bicol regional port" would also attract some portions of the cargo and passenger volumes being projected by BLISDERR for Batangas Port. Such "rediversions" of traffic, i.e., from Batangas to Dalahican, Pagbilao and a Bicol port, after diversion from MNH to Batangas, does not affect the medium-term desirability of instituting liner services to Batangas Port, but affects only the long-term growth prospects of interisland traffic at Batangas Port.
Recommendations
LSRS reconlmendations in regard to the development of liner shipping services at Batangas Port are:
- The Eatangas Port development project should be reexamined by PPA and MARINA to ensure that capacity to accommodate potential liner shipping cargo and passenger traffic can be provided in the shortest possible time.
This may involve more than only completing the planned work as quickly as possible. The planned 230-meter multi-purpose wharf, with 10-meter depth alongside, is likely to have to be devoted entirely to interisland liner shipping services, and 8-meter depth alongside may therefore be sufficient . The LSRS has made no investigationof international shipping traffic potential at Batangas, but notes that underprovision of international facilities is a national port problem at the present time. Most or all of the liner shipping services to be franchised at Eatangas will be performed with passenger/cargo vessels, and these vessels must be able to dock soon after their arrival at Eatangas; international cargo vessels will then need to queue for the single international ship berth planned for the port.
- If at all possible, Batangas-Tacloban (or Ormoc) liner shipping services should be franchised even before the Batangas Port development project is implemented. These services will facilitate trade between the Eastern Visayas and both Mindoro and CALABARZON, and may have the added effect of stemming the loss of sea transport passengers to competing road transport/RORO ferry services, since the service to Batangas would shorten the duration of the liner shipping voyage option by five or six hours.
- MARINA and PPA should discuss and agree upon a schedule for the franchising of other liner shipping services at Batangas. MARINA should make every effort to attempt to identify for PPA the sizes and types of vessels that w i 1 1 be calling at the port, and an optimal schedule for their calling. With the shift of large proportions of blNH cargo and passenger traffic to Batangas, some of the vessels on MNH routes might desirably shift, as well. The Batangas routes to Cebu, Iloilo, Cagayan de Oro and Davao wi 11, between them, generate at least a dozen calls a week by large domestic vessels, as soon as the port is able to accommodate them.
ANNEXE
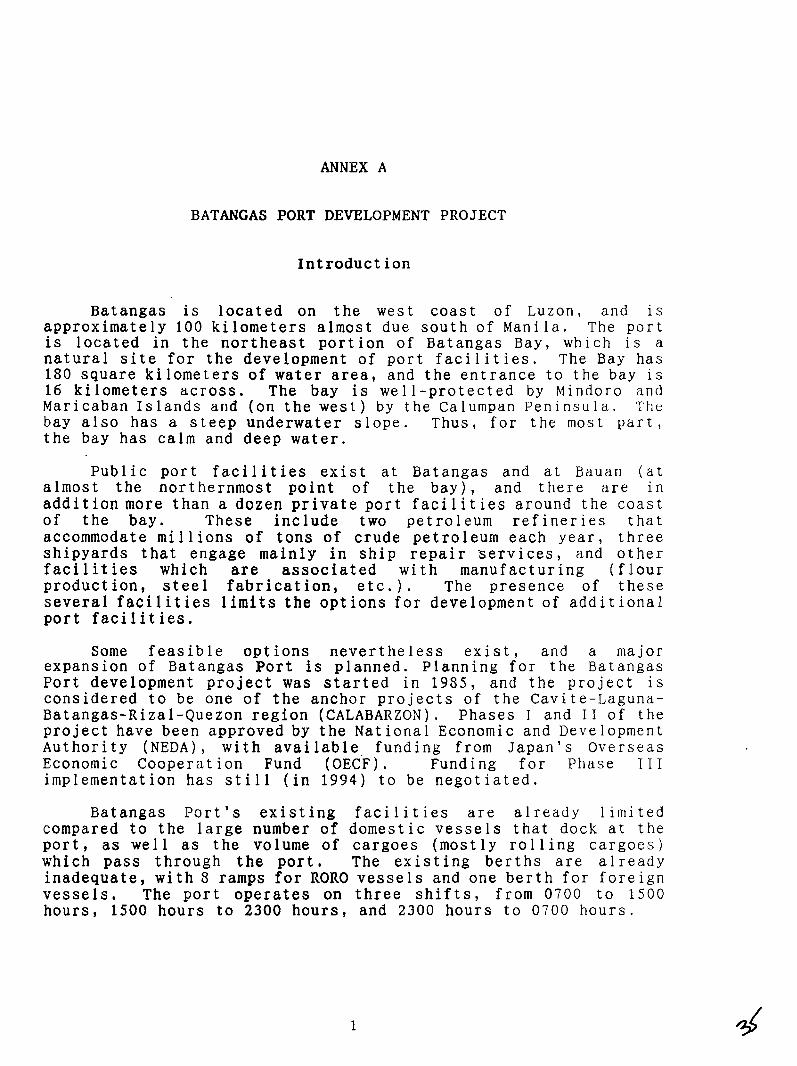
ANNEX A
BATANGAS PORT DEVELOPMENT PROJECT
Introduction
Batangas is located on the west coast of Luzon, and is approximately 100 kilometers almost due south of Manila. The port is located in the northeast portion of Batangas Bay, which is a natural site for the development of port facilities. The Bay has 180 square kilometers of water area, and the entrance to the bay is 16 kilometers across, The bay is well-protected by Mindoro and Maricaban Islands and (on the west) by the Calumpan Peninsula. The bay also has a steep underwater slope. Thus, for the most part, the bay has calm and deep water.
Public port facilities exist at Batangas and at Bauan (at almost the northernmost point of the bay), and there are in addition more than a dozen private port facilities around the coast of the bay. These include two petroleum refineries that accommodate millions of tons of crude petroleum each year, three shipyards that engage mainly in ship repair services, and other facilities which are associated with manufacturing (flour production, steel fabrication, etc.). The presence of these several facilities limits the options for development of additional port facilities.
Some feasible options nevertheless exist, and a major expansion of Batangas Port is planned. Planning for the Batangas Port development project was started in 1985, and the project is considered to be one of the anchor projects of the Cavite-Laguna- Batangas-Rizal-Quezon region (CALABARZON). Phases I and I 1 of the project have been approved by the National Economic and Development Authority (NEDA), with available funding from Japan's Overseas Economic Cooperat ion Fund (OECF) . Funding for Phase I 1 1 implementation has still (in 1994) to be negotiated.
Batangas Port's existing facilities are already limited compared to the large number of domestic vessels that dock at the port, as well as the volume of cargoes (mostly rolling cargoes) which pass through the port. The existing berths are already inadequate, with 8 ramps for RORO vessels and one berth for foreign vessels. The port operates on three shifts, from 0700 to 1500 hours, 1 5 0 0 hours to 2 3 0 0 hours, and 2300 hours to 0 7 0 0 hours.
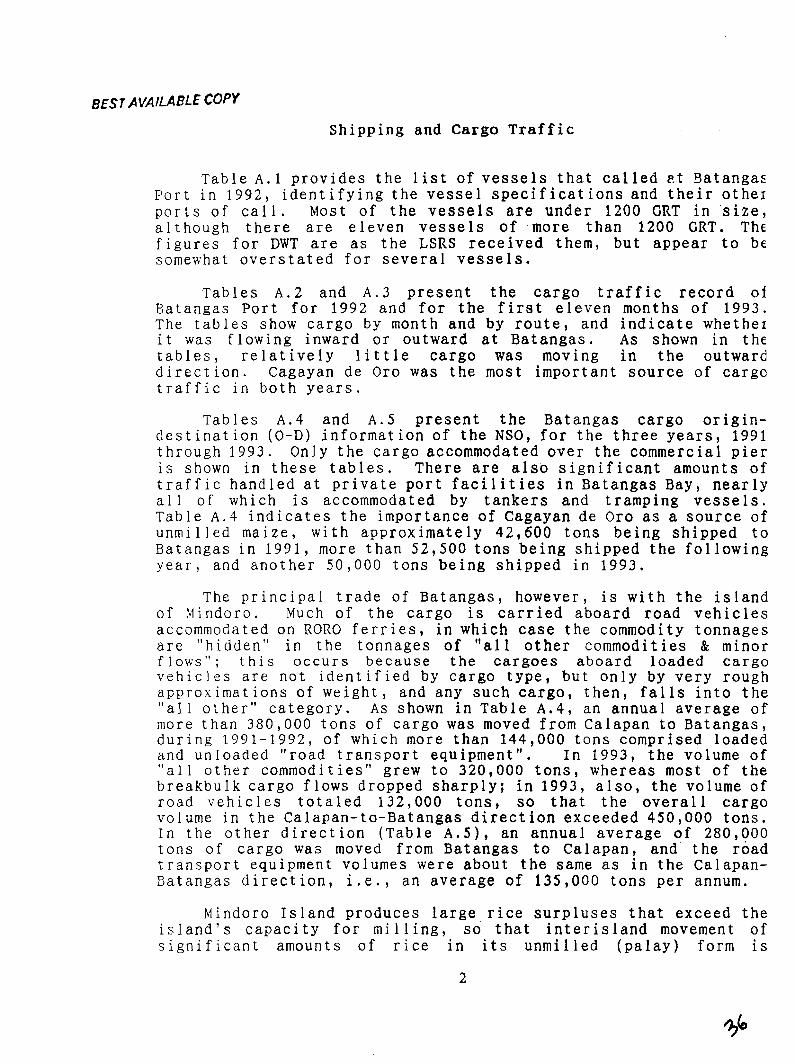
BEST AVAILABLE COPY
Shipping and Cargo Traffic
Table A. 1 provides the list of vessels that called Satangas port in 1992, identifying the vessel specifications and their other ports of call. Most of the vessels are under 1200 GRT in 'size, although there are eleven vessels of more than 1200 CRT. The figures for DWT are as the LSRS received them, but appear to be somewhat overstated for several vessels.
Tables A.2 and A.3 present the cargo traffic record of Eatangas Port for 1992 and for the first eleven months of 1993. The tables show cargo by month and by route, and indicate whethe1 i t was flowing inward or outward at Batangas. As shown in the tables, relatively little cargo was moving in the outward direction. Cagayan de Oro was the most important source of cargo traffic in both years.
Tables A.4 and A . 5 present the Batangas cargo origin- destination (0-D) informat ion of the NSO, for the three years, 1991 through 1993. OnIy the cargo accommodated over the commercial pier is shown in these tables. There are also significant amounts of traffic handled at private port facilities in Eatangas Bay, nearly all of which is accommodated by tankers and tramping vessels. Table A.1 indicates the importance of Cagayan de Oro as a source of unmilled maize, with approximately 42,600 tons being shipped to Batangas in 1991, more than 52,500 tons being shipped the following year, and another 50,000 tons being shipped in 1993.
The principal trade of Batangas, however, is with the island of Mindoro. Much of the cargo is carried aboard road vehicles accommodated on RORO ferries, in which case the commodity tonnages are "hidden" in the tonnages of "all other commodities St minor f l o w s " ; this occurs because the cargoes aboard loaded cargo vehicles are not identified by cargo type, but only by very rough approximations of weight, and any such cargo, then, falls into the "all other" category. As shown in Table A.4, an annual average of more than 350,000 tons of cargo was moved from Calapan to Batangas, during 1991-1992, of which more than 144,000 tons comprised loaded and unloaded "road transport equipment". In 1993, the volume of "all other commodities" grew to 320,000 tons, whereas most of the breakbuIk cargo flows dropped sharply; in 1993, also, the volume of road vehicles totaled 132,000 tons, so that the overall cargo volume in the Calapan-to-Batangas direction exceeded 450,000 tons. In the other direction (Table ~ . 5 ) , an annual average of 280,000 tons of cargo was moved from Batangas to Calapan, and the road transport equipment volumes were about the same as in the Calapan- Batangas direction, i.e., an average of 135,000 tons per annum.
Mindoro Island produces large rice surpluses that exceed the isIand's capacity for milling, so that interisland movement of significant amounts of rice in its unmilled (palay) form is

necessary. Table A.4 indicates that an average of more than 20,000 tons of palay per annum moved from Calapan to Batangas, during 1991-1992, and mi 1 led rice shipments averaged more than 26,000 tons per annum over the same period. Other major commodity movements from Calapan to Batangas, during 1991-1992, included an average of 32,000 tons of vegetables per year, more than 36,000 tons of fruit per annum, and approximately 24,000 tons of copra in the average year. Shipments of fish totaled nearly 4,000 tons per year. In addition to these breakbulk cargo volumes, large quantities of these commodities and other products were moved from Calapan to Batangas aboard cargo vehicles. As indicated above, the cargoes accommodated aboard vehicles shift to the "a1 1 other con~nlodity" category, since neither the ferry operators nor the FFA undertake to identify them by commodity type. For example, thousands of tons of bananas are shipped from Mindoro to Batangas each year, yet the volumes shown in Table A.4 average less than 500 tons per year; the bananas are mostly loaded in cargo jeepneys, with only small quantities shipped as breakbulk cargo, so that NSO statistics include the preponderance of these banana flows as "other cargo". In the opposite direction, i.e., from Batangas to Calapan, the principal commodities moved are cement, fertilizer, and bottled beverages.
San Jose, Occidental Mindoro, is another port of Mindoro with large volumes of cargo moving to and from Batangas. An average of nearly 30,000 tons of cargo was moved from San Jose to Batangas, during 1991-1993, with approximately one-half of the total being comprised of road vehicles. Batangas shipped more than 20,000 tons of cargo per annum in the opposite direction, during 1991-1993, with approximately 7,000 tons being comprised of road vehicles.
Other principal cargo inflows at Batangas, as shown in Table A.4, included: more than 70,000 tons of unprocessed wood moving from Butuan in 1992, rising to 118,000 tons in 1993; approximately 40,000 tons of coconut oil arriving from Legaspi during the three- year period; more than 5,000 tons of marble per year arriving from Romblon; and more than 30,000 tons of coal coming from Bislig, Surigao del Sur. Batangas shipped about 4,000 tons of cargo per annum by sea to Manila, during 1991-1992, but these cargo movements declined to less than 2,000 tons in 1993. An average of 3,000 tons of cargo per year was shipped through Batangas to the port of Coron, Palawan during 1991-1993.
Planned Batangas Port Development
The planned Batangas port project includes the construction of:
- A 185-meter wharf for foreign general cargo, with 11- meter water depth alongside, sufficient for the
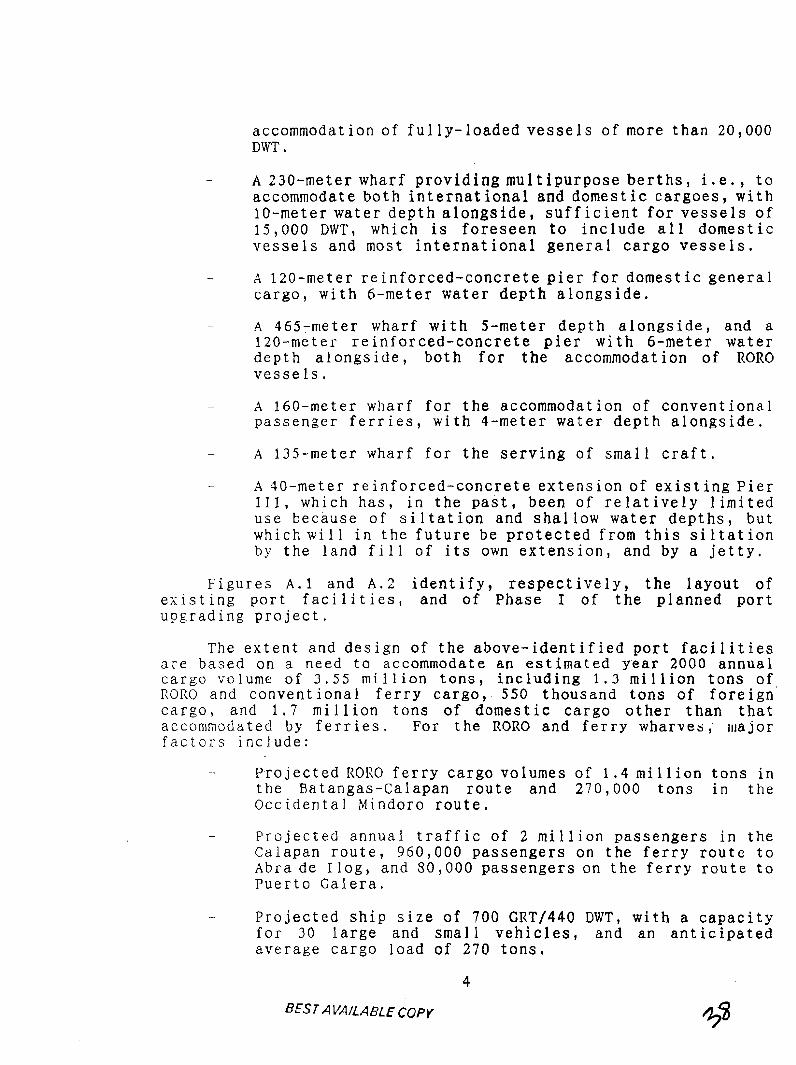
accommodation of fully-loaded vessels of more than 20,000 DWT .
- A 230-meter wharf providing multipurpose berths, i.e,, to accommodate both international and domestic cargoes, with 10-meter water depth alongside, sufficient for vessels of 15,000 DU'T, which is foreseen to include all domestic vessels and most international general cargo vessels.
- A 120-meter reinforced-concrete pier for domestic general cargo, with 6-meter water depth alongside.
- A 365-meter wharf with 5-meter depth alongside, and a 120-meter reinforced-concrete pier with 6-meter water depth alongside, both for the accommodation of RORO vesse 1s.
- A 160-meter wharf for the accommodation of conventional passenger ferries, with 4-meter water depth alongside.
- A 135-meter wharf for the serving of small craft.
- A 30-meter reinforced-concrete extension of existing Pier 1 1 1 , which has, in the past, been of relatively limited use because of siltation and shallow water depths, but which will in the future be protected from this siltation by the land fill of its own extension, and by a jetty.
Figures A.1 and A . 2 identify, respectively, the layout of existing port facilities, and of Phase I of the planned port upgrading project.
The extent and design of the above-identified port facilities are based on a need to accommodate an estimated year 2000 annual cargo volume of 3.55 million tons, including 1.3 million tons of, RORO and conventional ferry cargo, 550 thousand tons of foreign cargo, and 1.7 million tons of domestic cargo other than that accommodated by ferries. For the RORO and ferry wharves, rr~ajor factors include:
Projected RORO ferry cargo volumes of 1.4 million tons in the Batangas-Calapan route and 270,000 tons in the Occidental Mindoro route.
Projected annual traffic of 2 million passengers in the Calapan route, 960,000 passengers on the ferry route to Abra de I log, and 50,000 passengers on the ferry route to Puerto Galera.
Projected ship size of 700 CRT/440 DWT, with a capacity for 30 large and small vehicles, and an anticipated average cargo load of 270 tons.
BEST AVA/LABLE COPY
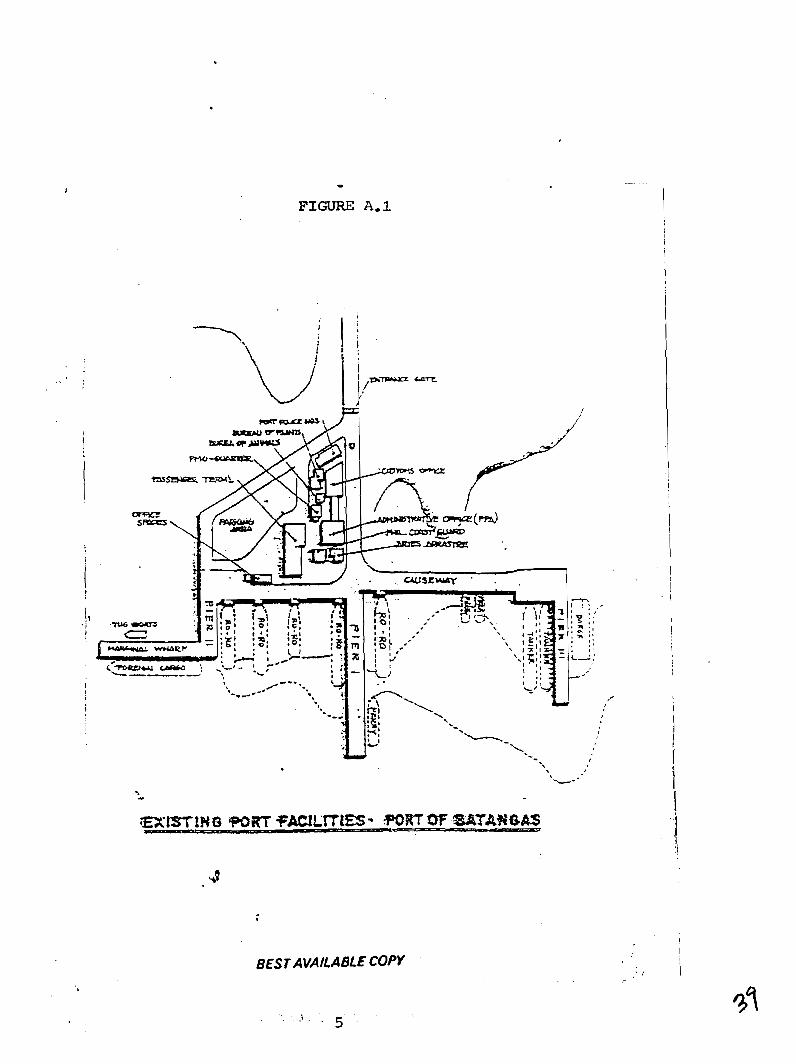
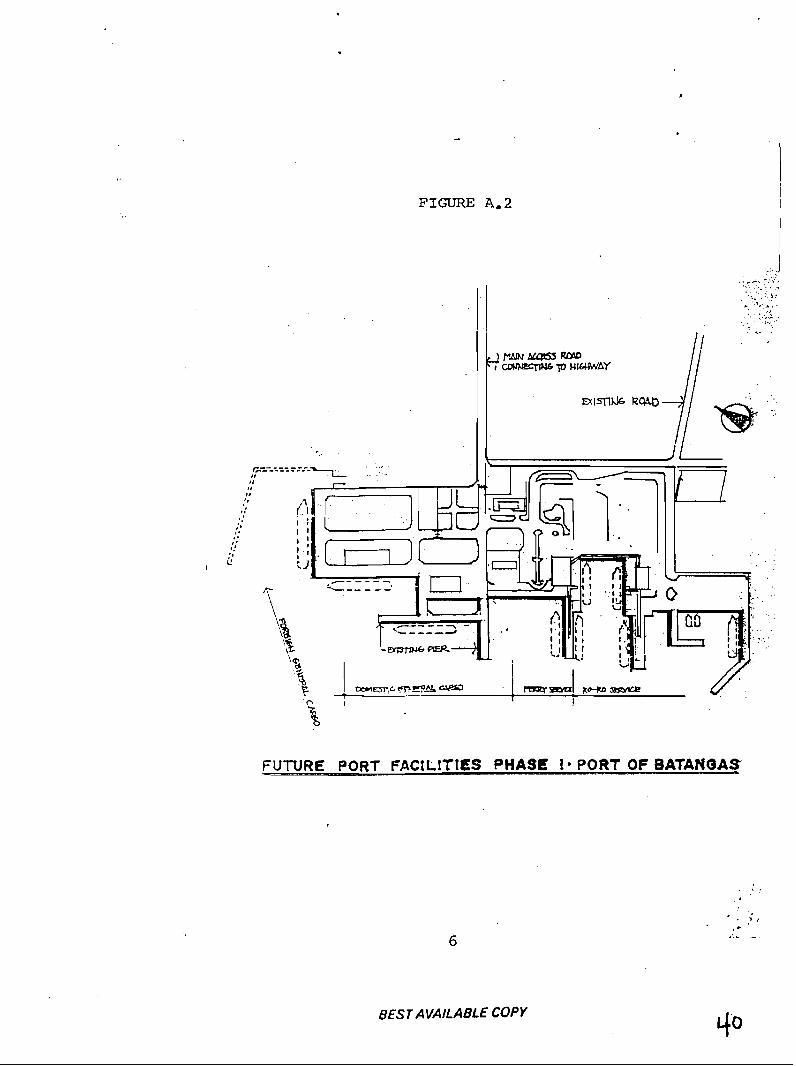
FIGURE A.2
(4 . . -.-- .\ .... ._ : . . . : ,.' , ... . ., .'+ ,.! . . . . ... : . ,.- . . A , .
BEST AVAILABLE COPY
For the foreign general cargo wharf, the cargo volume to be handled in the year 2000 is estimated to be 2 1 0 , 0 0 0 tons, comprising of cement, minerals, sugar and chemical cargoes which are loaded in 15,000 DWT vessels.
The PPA undertook negotiations, during 1993-1994 , with squatter families, who occupied about three hectares of the site. Since the project loan was contingent upon the squatters vacating the site, PPA could not give the selected contractor notice to proceed until the relocation had been agreed upon and implementation had been een largely completed.
Future Batangas Port Role
Batangas Port at present provides the transport link connecting Batangas with the islands of Mindoro, Palawan, Eusuanga, Tablas and Romblon. The port also serves foreign vessels which unload fertilizer and transport equipment, among other cargoes. It is envisioned by PPA that, along with the port's planned expansion, there will be additional domestic shipping routes that will link Batangas with Visayan and Mindanao ports.
The PPA officials interviewed noted that, due to the congestion at both the Manila North Harbor and South Harbor, Batangas port may serve as an alternative port for other domestic and foreign cargoes which are destined to Metro Manila, despite the three-hour land travel time between Metro Manila and Eatangas.
The LSRS team conducted a survey of five manufacturing companies to determine how these companies perceive the proposed upgrading of Batangas Port. These companies were At lant ic Gulf and Pacific Company (Bauan, Batangas), Tableria Tan Tao (Eatangas City), Batangas Pop Rice and Pop Corn Factory (Batangas City), Caltex Philippines (San Pascual, Batangas) and Purefoods Corporation (Mabini, Batangas).
The major manufacturing companies along the coast of Eatangas operate their own port facilities, which accommodate foreign vessels delivering their respective imported raw material requirements. These private ports likewise have their own bonded warehouses and offices for both Customs and Bureau of Internal Revenue (BIR) representatives. One of the private ports even serves the needs of government institutions ( e . g . , the Central Bank) and other private companies.
All five companies agreed that the Batangas port development project will facilitate the movement of both raw materials (particularly those locally sourced) and finished products. The majority of these companies noted that the port development project will contribute to the economic growth of Region IV and enhance
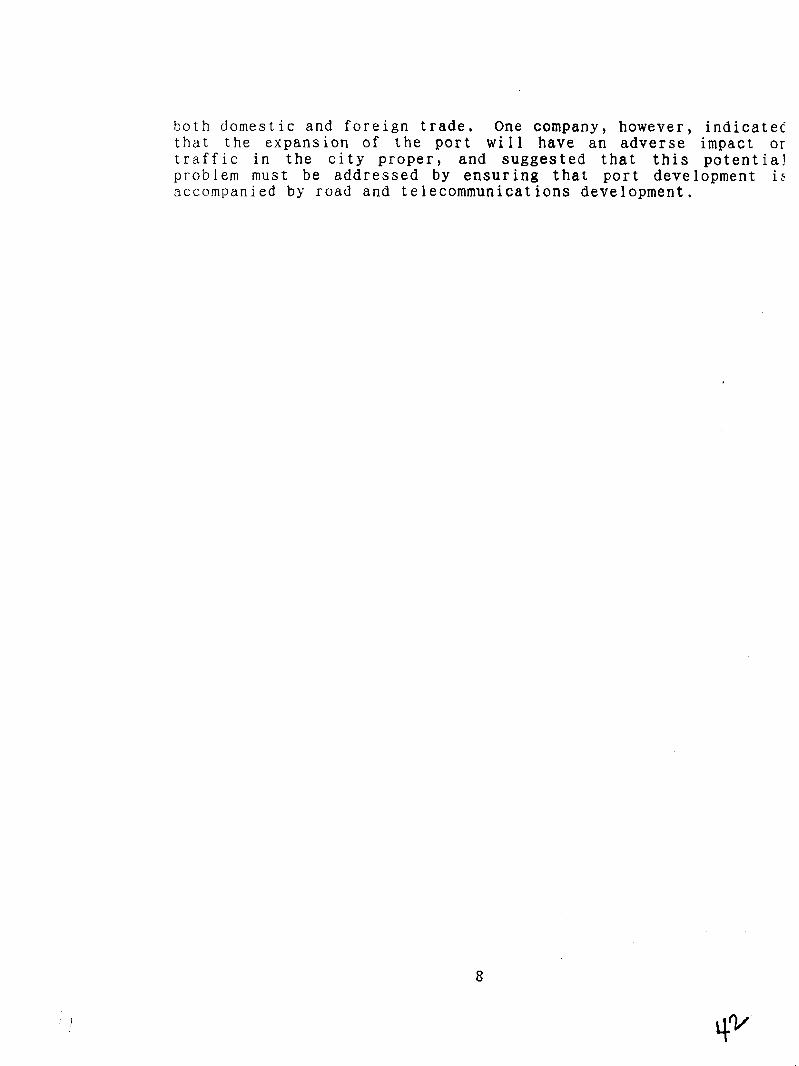
both domestic and foreign trade. One company, however, indicatec that the expansion of the port will have an adverse impact or traffic in the city proper, and suggested that this potential problem must be addressed by ensuring that port development i: accompanied by road and telecommunications development.
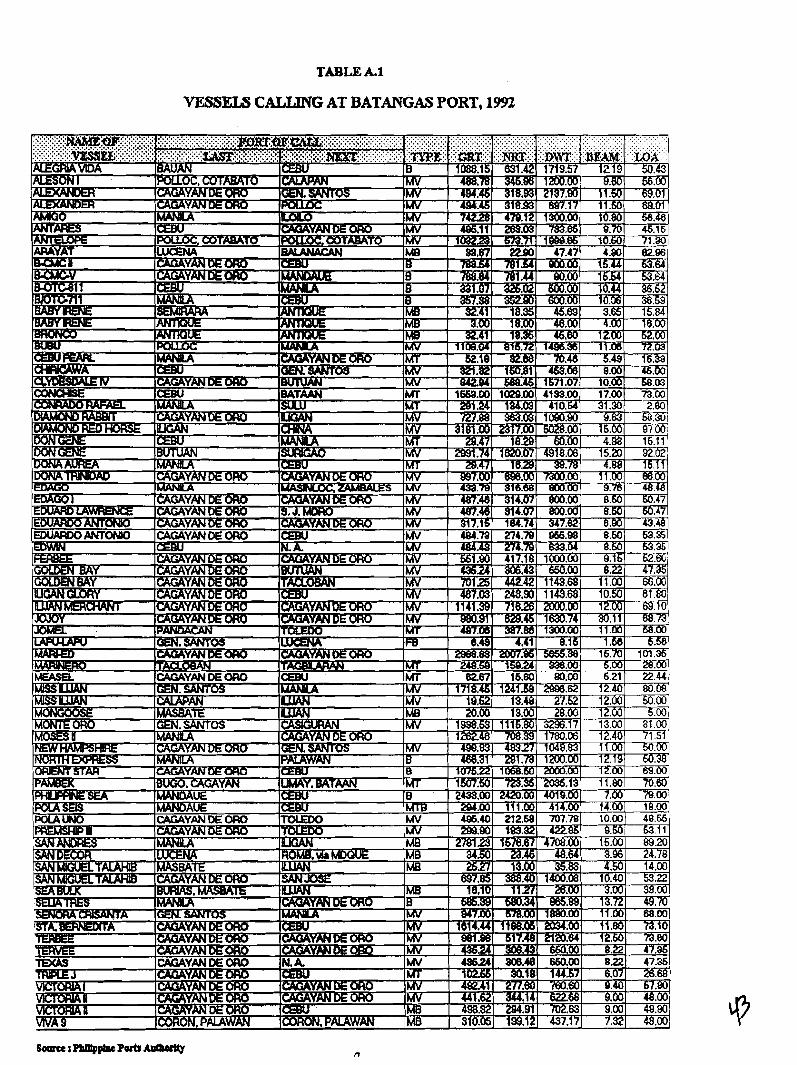
TABLE A1
VESSELS CALLING AT BATANGAS PORT, 1992

TABLE A 2
CARGO TRAFFIC AT BATANGAS PORT, BY SELEClED ROUTE, 1992 (mtmc trim)
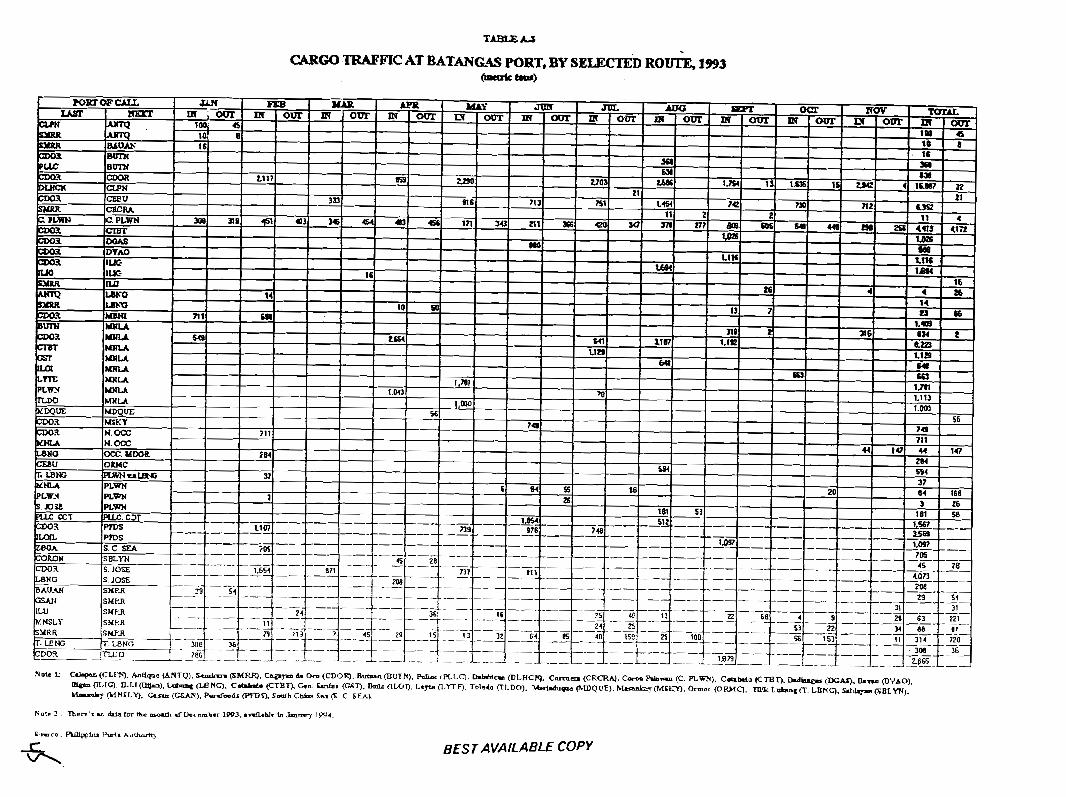
T A B L E U
CARGO TRAFFIC AT BATANGS PORT, BY SELECTED ROUTE, 1993 o=* -1
Nob L: Calqan(CLr'h>. An*. (ANTQJ. (SHPa. C a w & Om (CDI>R), B-(EUTW. PdLx (%LC). W c m (DLHCN). C-ca (CRCRA). Cora. (C. P L W ) . C&br(o ( C m T ) , ~dhyp. ( D C ~ hM (~ ,J*O) W = = ~ I Q . nu m). L- & a m . c- ( C T B ~ CAD -I (an. m won. L+ O,YTE). ~ o ~ s c ~ I . D O ) . FmQuE). vnstn. b r (ORLIC), ma L-,T. L B K q . mlqPI(EBLm,,'
(LIHSLY). C a m (-1. M o o d s (PFDn S d C h k ~ Ssr 6. C. SEA).
BEST AVAILABLE COPY
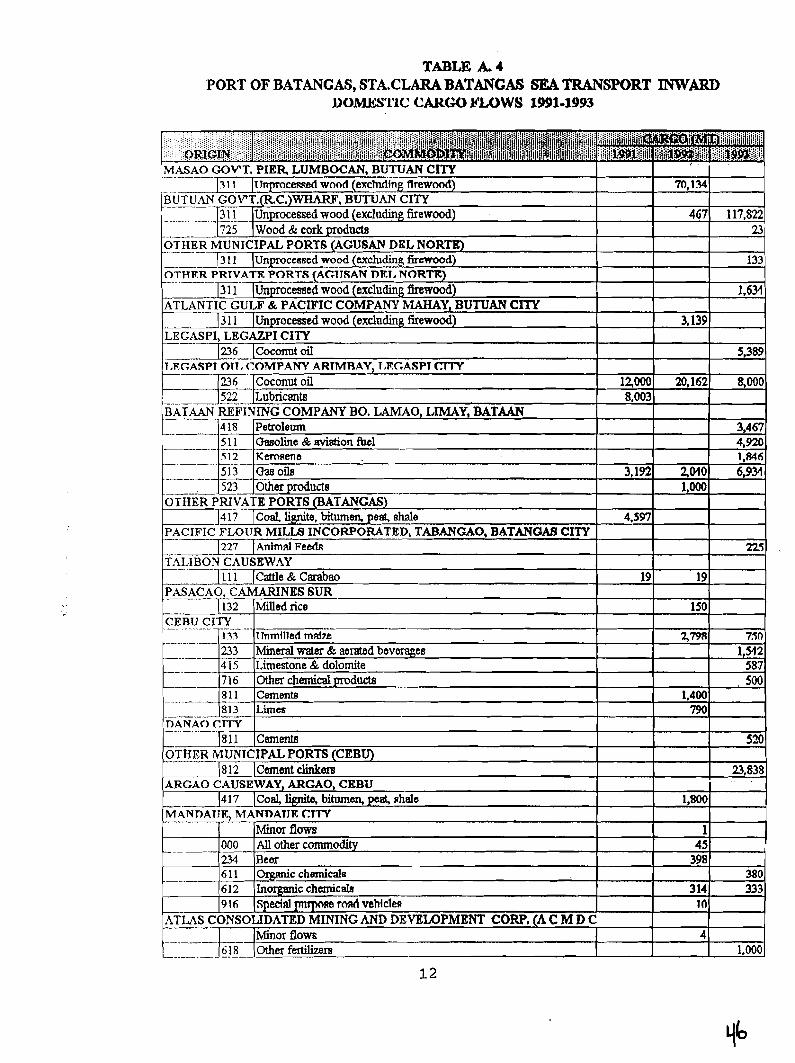
TABLE A. 4 PORT OF BATANCAS, STA.CLARA BATANGAS SEA TRANSPORT INWARD
I)OMES'l'lC CARGO E'LOWS 1991-1993
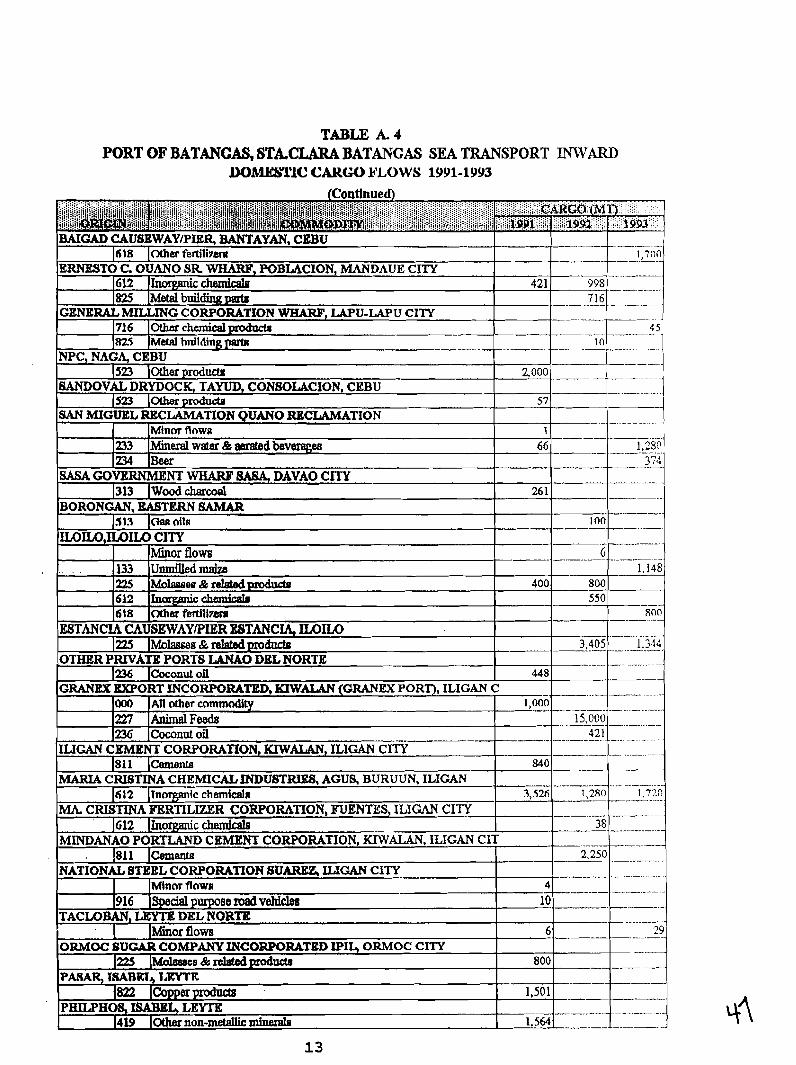
TABLE A. 4 PORT OF BATANCAS, STACLARA BATANCAS SEA TRANSPORT INYARD
l ) O ~ V r l c ' C.!AR<;Ok'LOWS 1991-1993
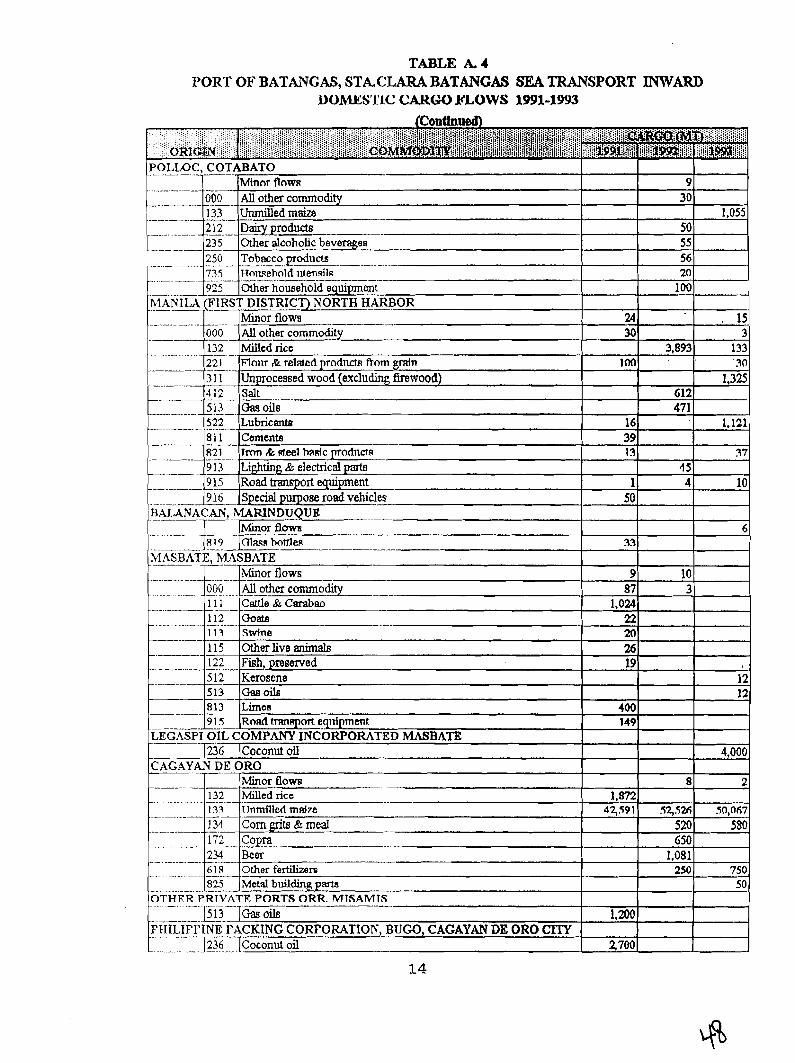
TABLE A. 4 PORT OF BATANCAS, STACLARA BATANGAS SEA TRANSPORT INWARJl
L)OIMES'J.'lC C A K W FLOWS 1991-1W3
POLWC, COTABATO
24 30
100
16 39 I3
1 50
33
- - - - .. - - -- - . . -. - - - - - . .- - -- - - - - .- - -- - - - - -. -. -- - . - -
- -- ......
...........
-. ...
I 1
- Minor flows
-. ~
9 87
1,024 22 m 26 19
400 149
1.872 42,591
1.200
2.700
9 30
50 55 56 20
100
3,893
612 471
I S 4
--
000 133 '?Ti -- - 235 -- -. 250 .-. 735
- - - AU other commodity _- - Cattle&Carabao - -- Oords .
- - - -. - - - - - -. - - . 000
1.055
. 15. 3
133 '30
1,325
1,121~
37
10
6
Minm f l o w All other commodity UNnilledmaite Dairy products Other alcohottc beverage# . T o b e c c ~ o d u c l . ~ - - . . . ...-.
Hoitsehold lltenuilfi 91-5 Other household equipment
10 3
8
52,52fi
520 650
1,081 250
............ .
. -. .-
- - - - - - - - - - - -
12 12
4,000
2
50,067
580
750 so
........ 111 - --A
112 - -. . - - - --- - - .
DISTRICT) NORTH HASBOR Minor flows -.- All other commodity Milledrice -
'-FIom & relaed prodncts ffo; &rdn --- -unprocessed wood (excluding firewood)
Salt Gas oils Lubricgnts Cements Tmn r9c Meel hMc p ~ o h l c l ~
MAN-ILA-(%%ST ... - - ...
. - - -. - - - C f l m honlen
.-............-.
................
1 1 1 .
--
000 132
....
22 I
Swfne Other live animals Fish, preserved Kerosene Oas& Limca R o d tmn~pon eyiipment.
- - 1 15 122
-. - . - - - G c 513 -
.... ..
- - - --
GKGXSPI + -. . -- OIL COMPANY INCORPOFUTED MASBATE ]coconut oil
CAGAYAN DE O R 0 -- Minor f l o w
-, ........................ - Milled rico - -- - - rhmilled m&e --
. . - -- - -- -. -. - Corn gits 8: meal PP
~03?3.-- Beer
6 18 Other fertilizem - 825 Metal buildin- - - - - - -- .... .... ... ...
OTHKR PRTVATP. PORTS ORR. MTSAMTS'." .-... - ... ------ h3-r- Gas oils i ;KKiFi;~~~ -. ... F!CKING CORPORATION, BUGO, CAGAYAN DE ORO CITY
oil ........
- - -- -
3 1 1 412
813 - - 9 1.7
- - - - -- - -- - - -. -- .... ..
- - - - . -- .- -. -- -. -
- 51_3_-. 522 81 1 - -- 821 -
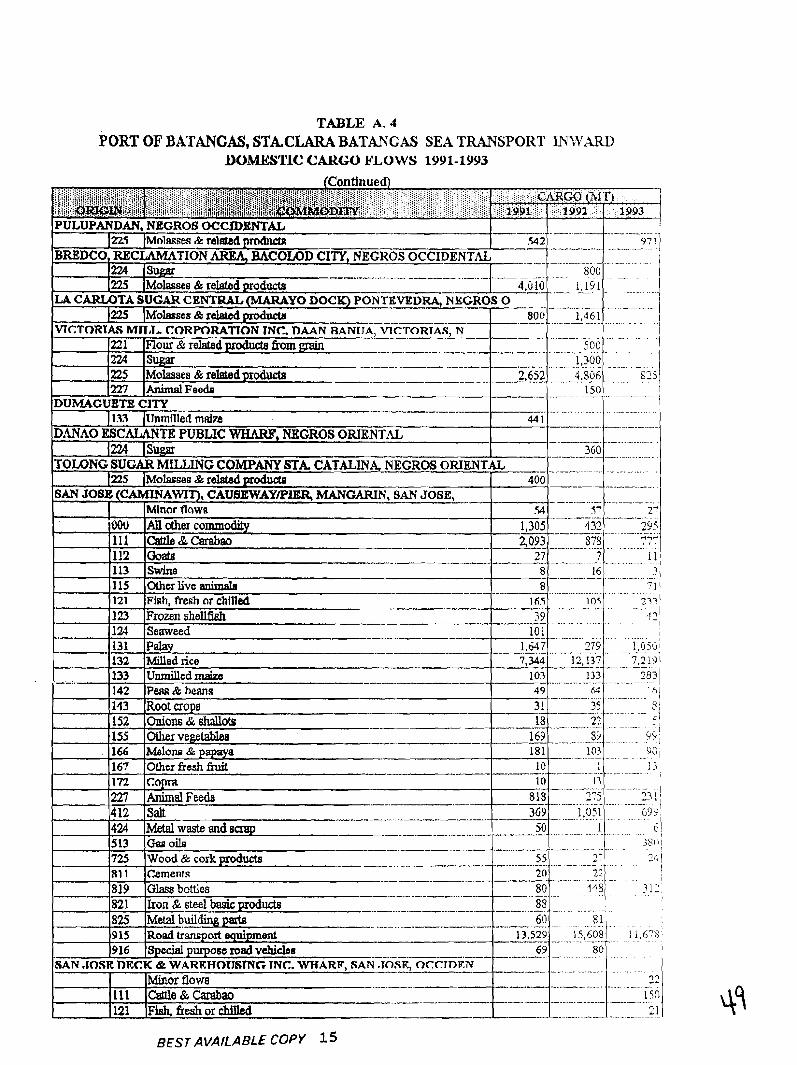
TABLE A. 4
PORT OF BATANGAS, STACLARA BATANGAS SEA TRANSPORT UOMES'l'lC CAKGO FLOWS 1991-1993
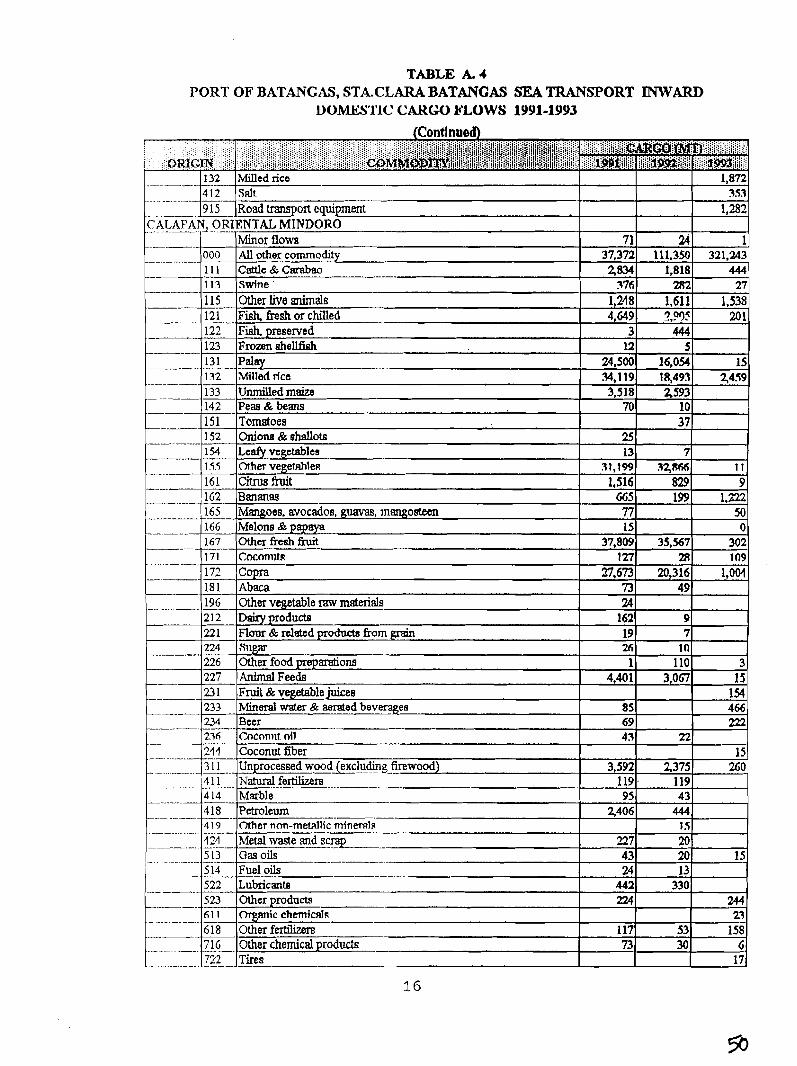
TABLE A. 4 PORT OF BATANCAS, STA.CLARA BATANCAS SEA TRANSPORT W A R D
1)OMES'l'lC CARGO FLOWS 1991-1993
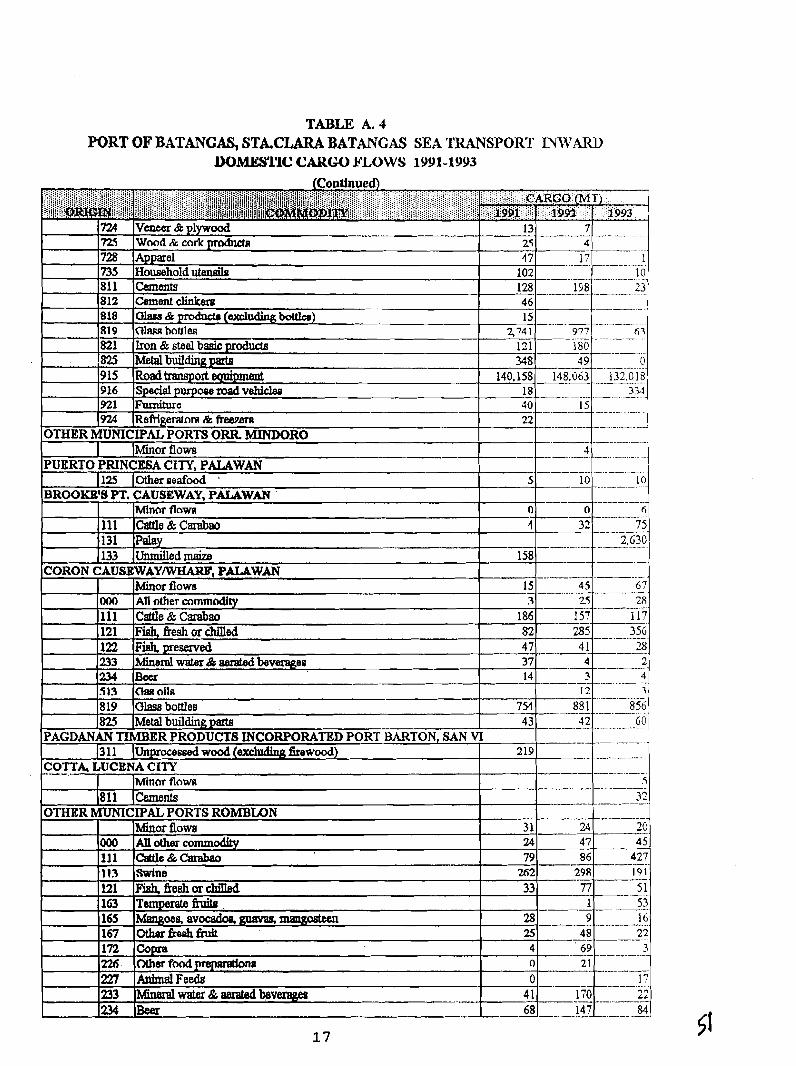
TABLE A. 4 PORT OF BATANGAS, STACLARA BATANCAS SEA TRANSPORT INWARD
IUIMESVl'lC CAKW FLOWS 1991-1993
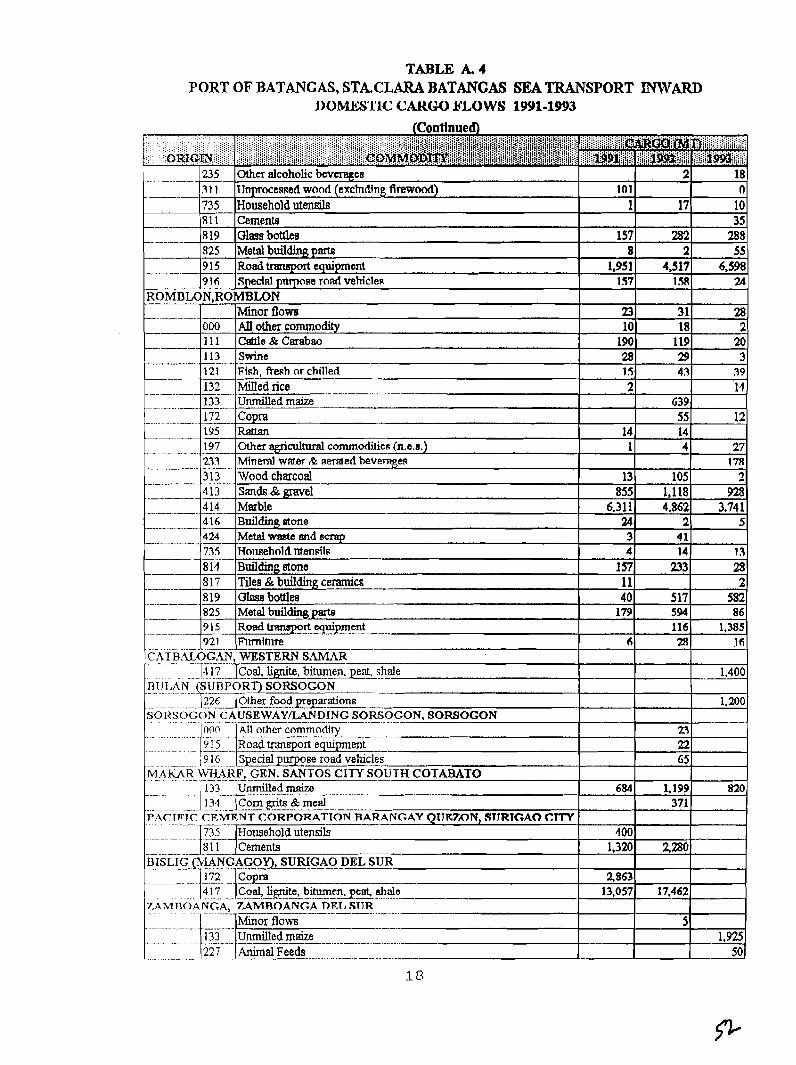
TABLE A. 4 PORT OF BATANCAS, STA.CLARA BATANCAS SEA TRANSPORT INWARD
L)OMES'l'lC CARGO HLO WS 1W1-1993
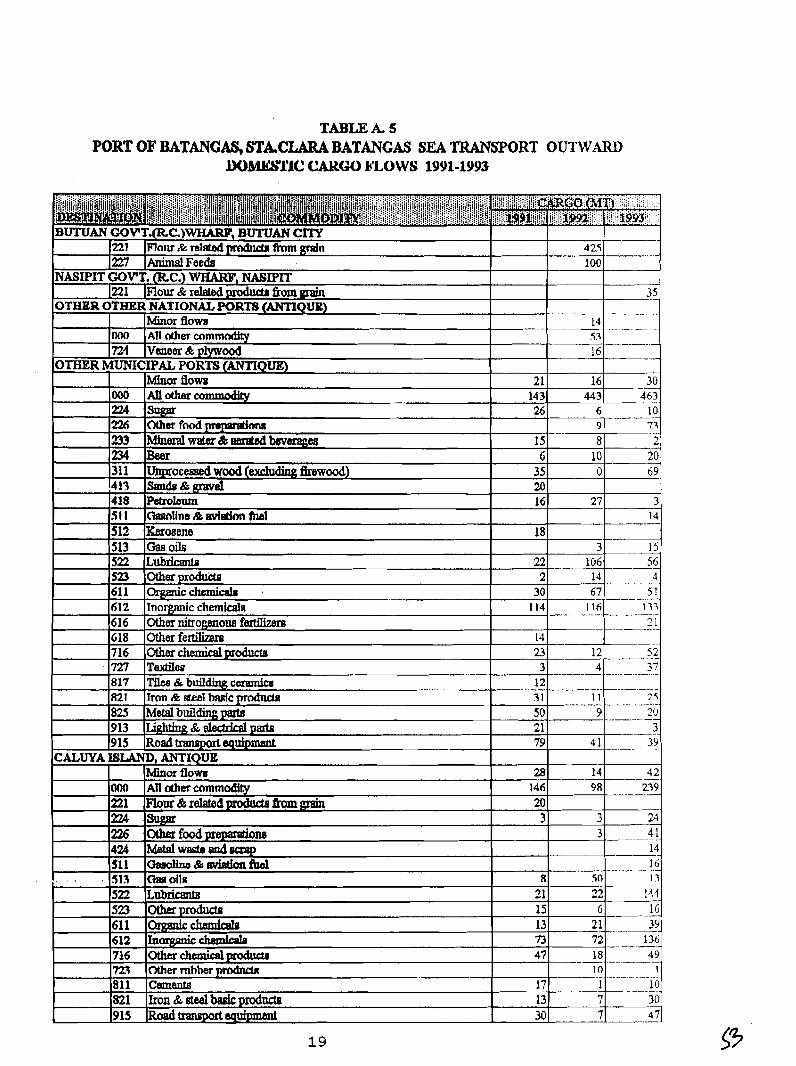
TABLE A. 5 PORT OF BATANGAS, STACLARA BATANGAS SEA TRANSPORT OUTWARD
mmwrlc CAKW FLOWS 1991-1993

TABLE A. 5 PORT OF BATANCAS, STkCLARA BATANGAS SEA TRANSPORT OUTWARD
U O W l ' l C CARGO h'U)W8 1991-1993
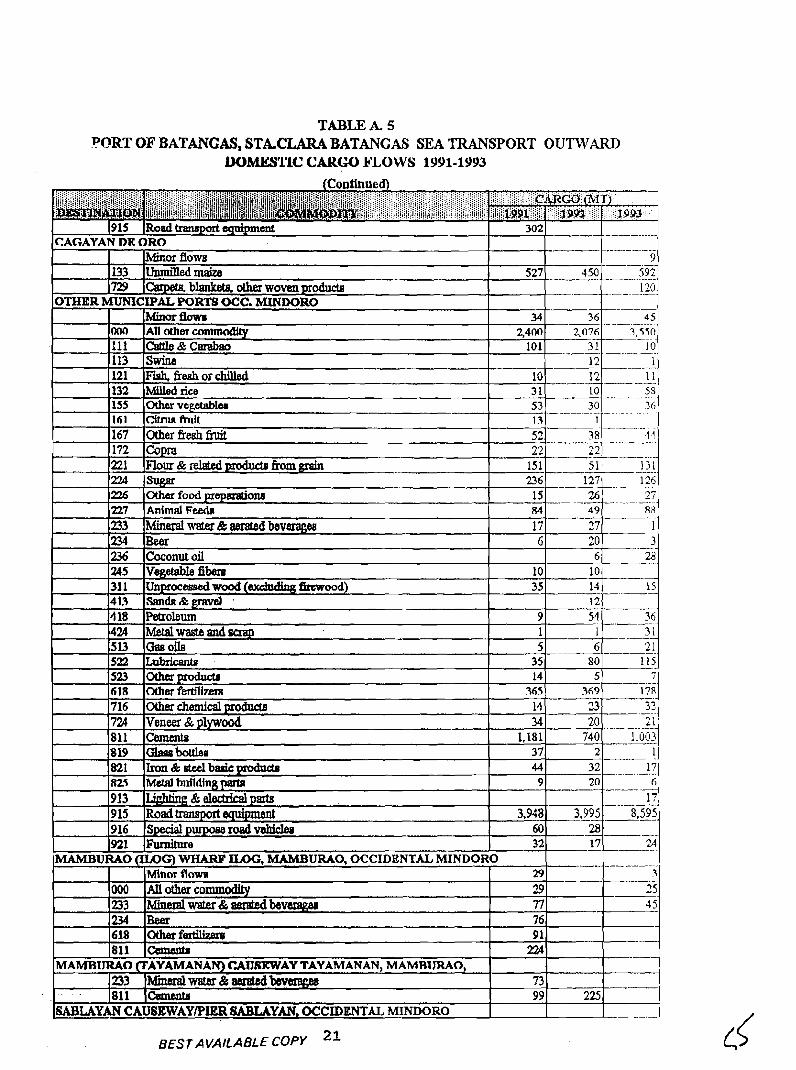
TABLE A. 5 PORT OF BATANGAS, STACLARA BATANGAS SEA TRANSPORT OUTWARD
UOMl!3'L'lCCAKW FLOWS 1991-1993

TABLE k 5 PORT OF BATANGAS, STACLARA BATANCAS SEA TRANSPORT OUTWARD
DOMES'I'IC C A K W FLOWS 1991-1993 (Contlnueb)
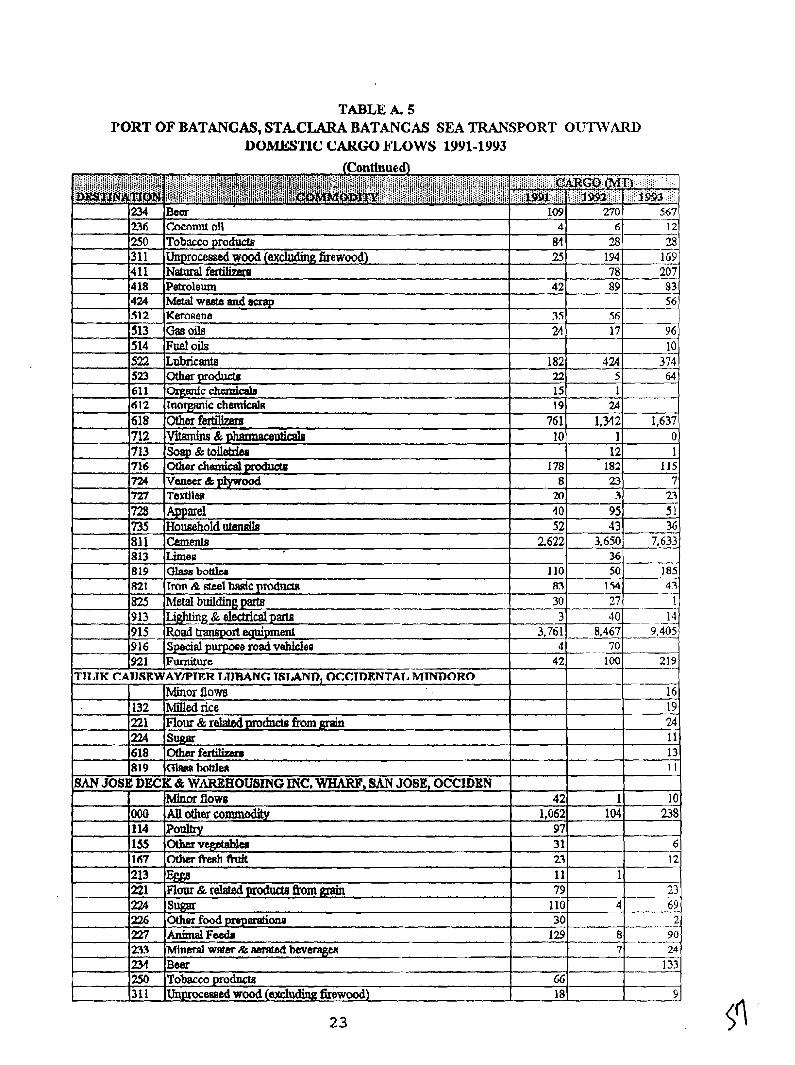
TABLE A. 5 PORT OF BATANCAS, STACLARA BATANCAS SEA TRANSPORT OUTIVARD
DOMES'l'lC C A K W FLOWS 1991-1993
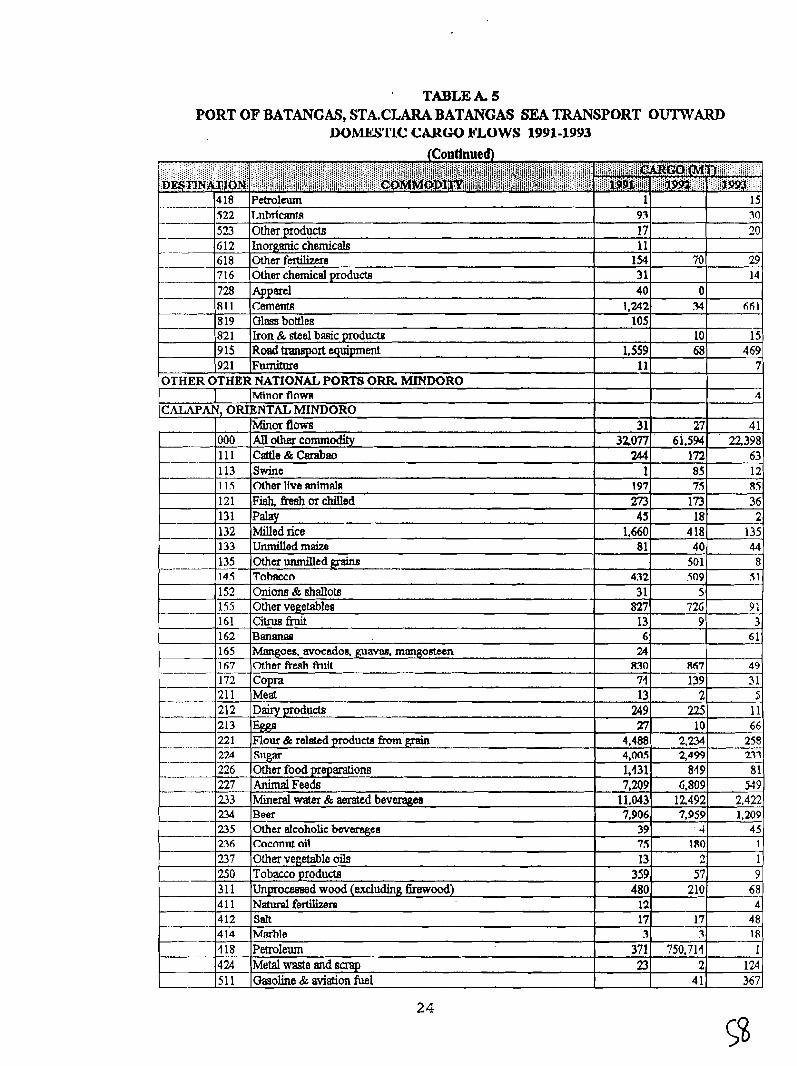
TABLEA. 5 PORT OF BATANCAS, STACLARA BATANCAS SEA TRANSPORT OUTWARD
MIMES'L'LC CAUW WLOWS 1991-1993
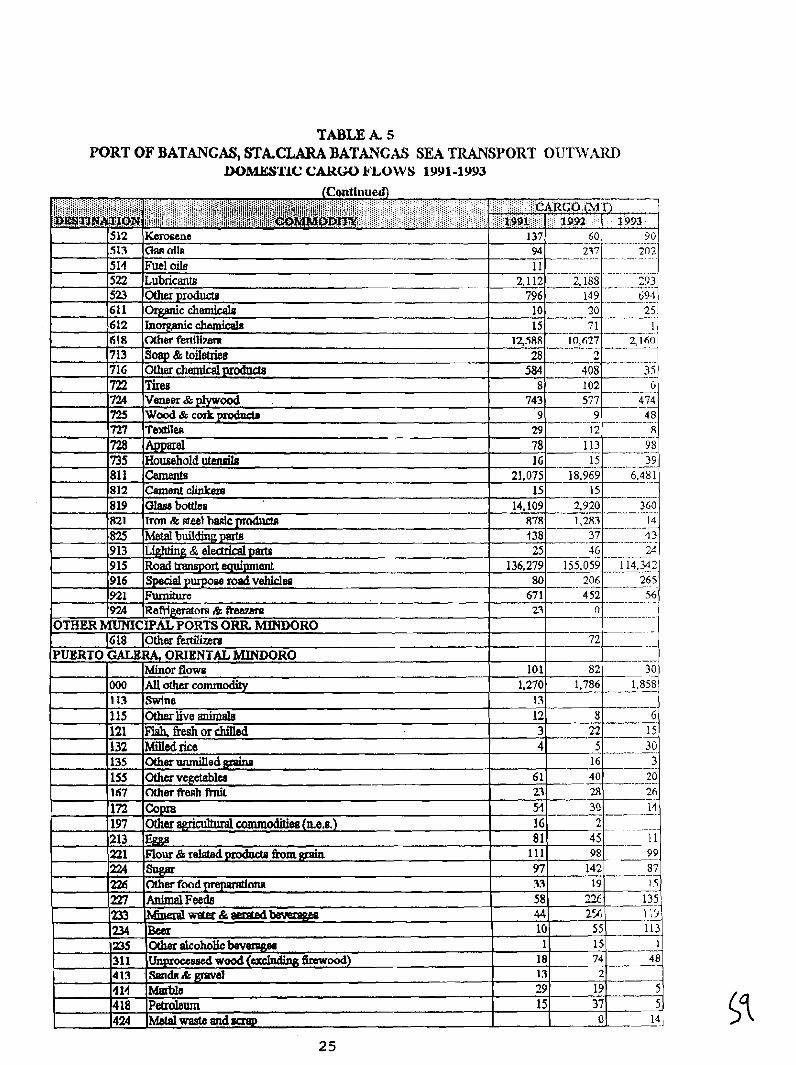
TABLE A. 5 PORT OF BATANCAS, STACLARA BATANCAS SEA TRANSPORT OUTWARD
IUIIMES'l'lC CAKC;ONLOWS 1991-1993
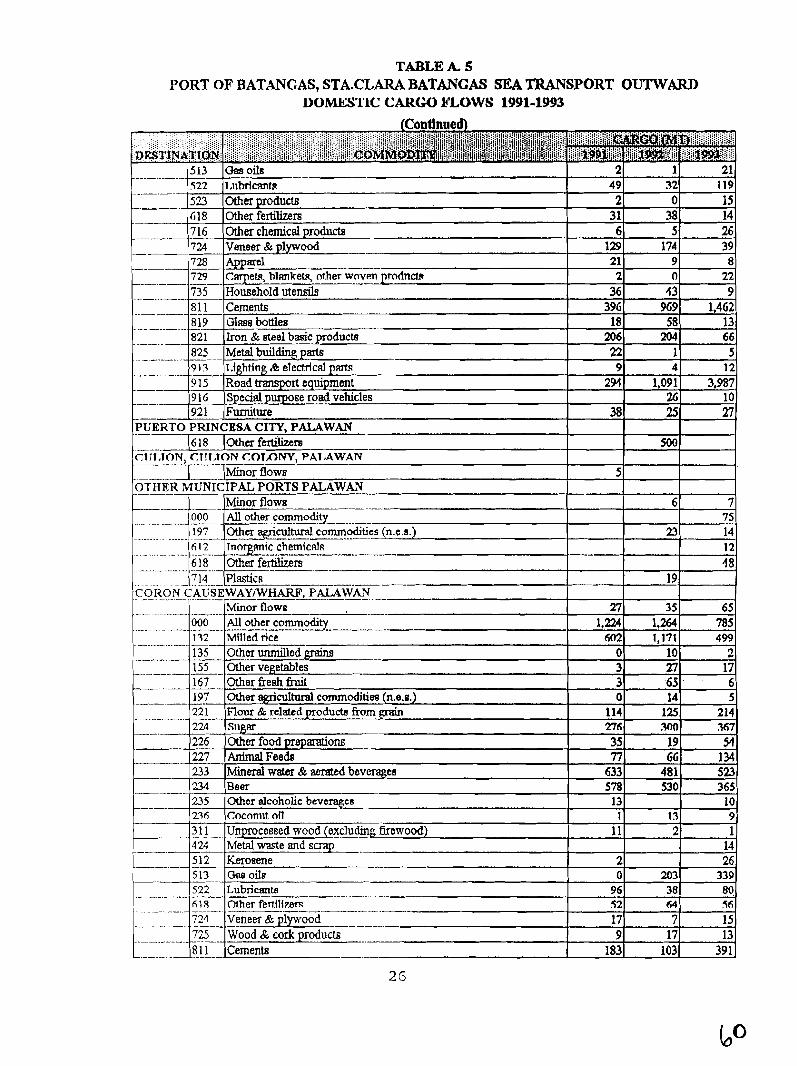
TABLE A. 5 PORT OF BATANCAS, STA.CL.4R.A BATANCAS SEA TRANSPORT OUTWARD
D O W I ' I C CARGO MLOWS 1991-1993
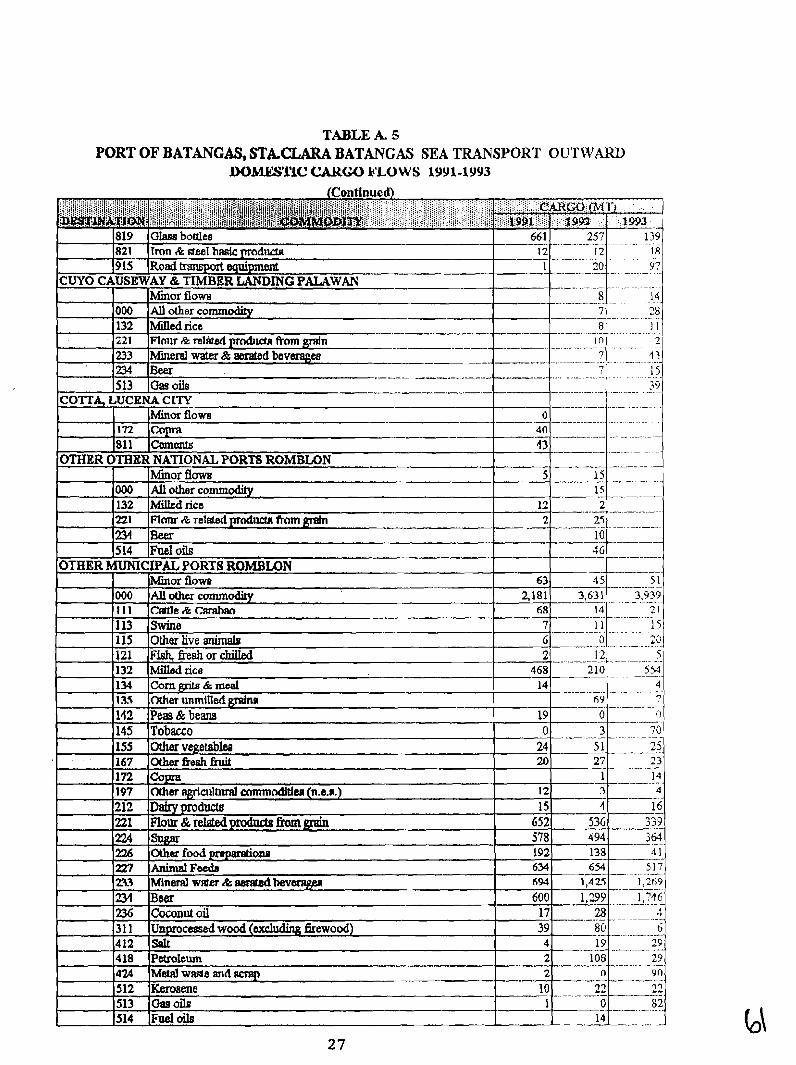
TABLE A. 5 PORT OF BATANGAS, STACLARA BATANGAS SEA TRANSPORT OUTWARD
1 W ) w ~ l C C A K w B ' L O W S 1991-1993
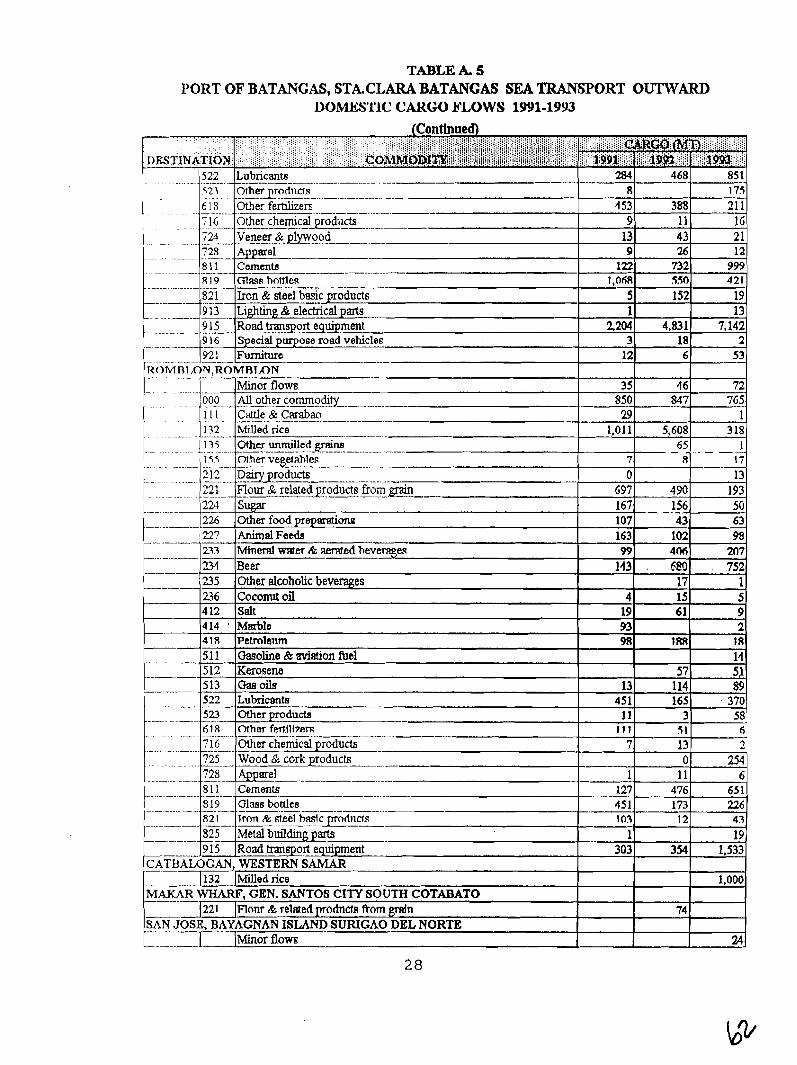
TABLE A. 5 PORT OF BATANCAS, STACLARA BATANCAS SEA TRANSPORT OUTWARD
L)OMES'l'lC CAKW NLOWS 1w1-1993
. . -. -. . . . - .. -. - ..
- - - - . . . . -. -- - -. .. Minor f lom 35
- 850 29
1,011
7
0 G97 167 107 163 99
143
. . - .~ ... -.. .
.. . - . .
. . . . . A -. . - .
. . - . . . . . . .
- - - - - - -
--
--
4 6 847
5,608
- 6 8 5J
490 156 - --- 43
102 406
. 689
000 AU other commodity 72
7G5 1
3 18 1
- 17 13
193 50 63 98
2117
- . 752
1 1.. . . _._ : ' 1 s s Othef vegetables
11 1 ---..--..-
132 -- - - . - -. 135 . . . -. .
235 236 412 4 14 '
418
51 1 512
. .. - - - . - - . . -. . .
. -. . . - . -. - - . .
. . -. - . . -. . --
. - - . - - -- -.
-- - -. - - - -. -. - . . --. .. - - -
Cattle & Carabao Milled rice . Other unmilled gains -- - - - -- - - - - . - . .. - - - - - - - -
. - . - -
-- othw fmlli7en:
.~ .. . - . -
. . - . . . .- -. .-
- -. -. .- - 819 Glass bodes
Minor flows
Other alcoholic beverages Coconutol Salt Marble Petmlenm h o l i n e & aviation fie1 Kerosene
- - - - - -- - - -. . - - . - 212 :D=roducts
13 451
11
.- 1 1 1
7
1 127 451 103
1 303
- - - -. - 221 . - - -. - 224 - . 226
,227 - - 213 -- .- 231
4 19 93 98
- --- - - -- Flour & related~roducts from gain - -- -
-%Is* -- Other food prepdono AnimalFeeds M i n d wafer m . e d hevemgm . Beer
114 165
3 5 1 13 0
11 476 1 73
12
354
74
89 370
58 6
2 254
6 651 226 43
19 1,533
1,000
24-
17 15 61
1 RR
57
1 5 9 2
18 14 5 )
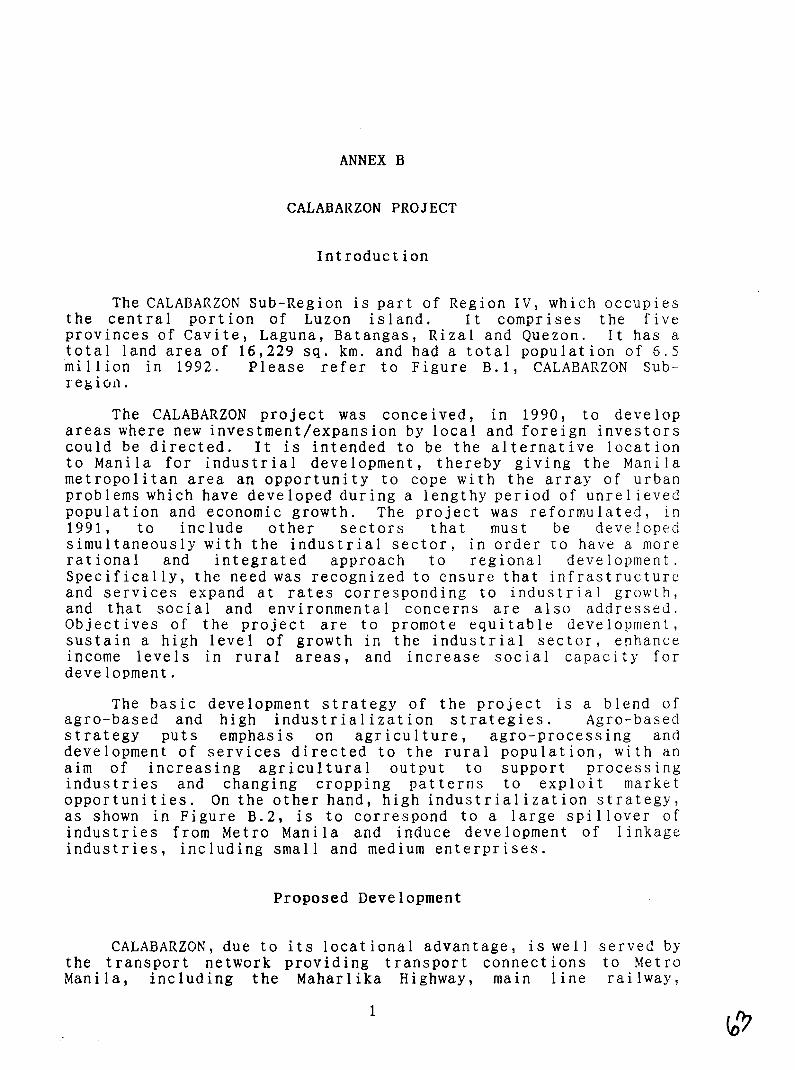
ANNEX B
CALABARZON PROJECT
Introduction
The CALABARZON Sub-Region is part of Region IV, which occupies the central portion of Luzon island. I t comprises the five provinces of Cavite, Laguna, Batangas, Rizal and Quezon. I t has a total land area of 16,229 sq. km. and had a total population of 6.5 'million in 1992. Please refer to Figure B.1, CALAEARZON Sub- ~.ekion.
The CALABARZON project was conceived, in 1990, to develop areas where new investment/expansion by local and foreign investors could be directed. It is intended to be the alternative location to Manila for industrial development, thereby giving the Manila metropolitan area an opportunity to cope with the array of urban problems which have developed during a lengthy period of unrelieved population and economic growth. The project was reformulated, in 1991, to include other sectors that must be developed simultaneously with the industrial sector, in order to have a more rational and integrated approach to regional development. Specifically, the need was recognized to ensure that infrastructure and services expand at rates corresponding to industrial growth, and that social and environmental concerns are also addressed. Objectives of the project are to promote equitable development, sustain a high level of growth in the industrial sector, enhance income levels in rural areas, and increase social capacity for development.
The basic development strategy of the project is a blend of agro-based and high industrialization strategies. Agro-based strategy puts emphasis on agriculture, agro-processing and development of services directed to the rural population, with an aim of increasing agricultural output to support processing industries and changing cropping patterns to exploit market opportunities. On the other hand, high industrialization strategy, as shown in Figure B.2, is to correspond to a large spillover of industries from Metro Manila and induce development of linkage industries, including small and medium enterprises.
Proposed Development
CALABARZON, due to its locational advantage, is well served by the transport network providing transport connections to Metro Manila, including the Maharlika Highway, main line railway,
international airport, international port of Filarii la, and the regional ports of Eatangas and Lucena. Roads co~np~ise the primarj- mode of transportation in CALAEARZON, providing access to international airport and seaport (Msnila International Corltainer Terminal and Manila South Harbor). Shown in Figure R.3 i the scheme for CALAEARZON port development, which calls for the. improvement of several ports - Eatangas Fort, Sangley Foint Container Transshipment Fort, and Real Fort and Dalahican Port in Quezon Province. Further, road and highway development p r o j e c t s include the South Luzon Expressway extension and the Cala~nbi r . - - Calauag road rehabilitation, both OECF funded, and the Noveleta- Rosario Diversion road and Einakayan Diversion Road, both locally funded.
Tables B.l through E.3 presents the lists of companies which were in operation, in April 1993, or which had signified their interest in the CALABARZON project, as compiled by DTI-Region IT<. The Board of Investments (EOI) registered 1 1 1 projects by April 1993, as shown in Figure E.4. Registered projects numbered 37 in Cavite, 32 in Laguna, 15 in B a t a n g a s , 2 5 i n R i z a l a n d 2 in Quezon province. Figure B.5 identifies the industrial estate locations and their road access.
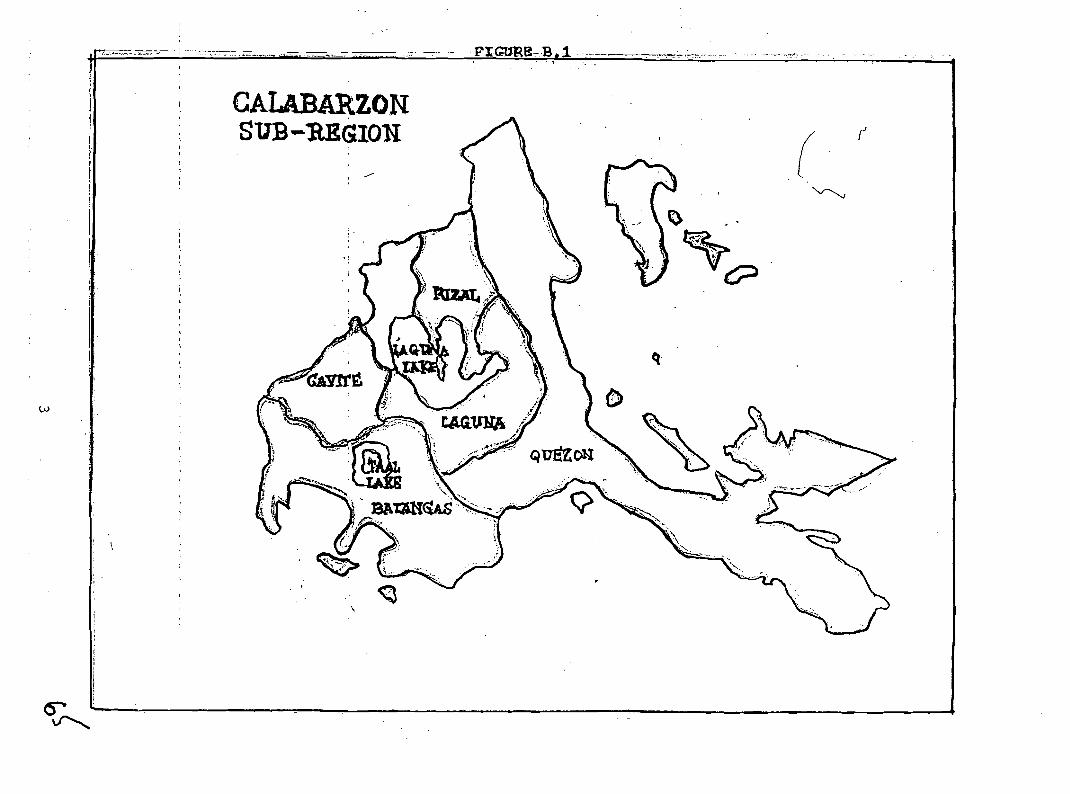
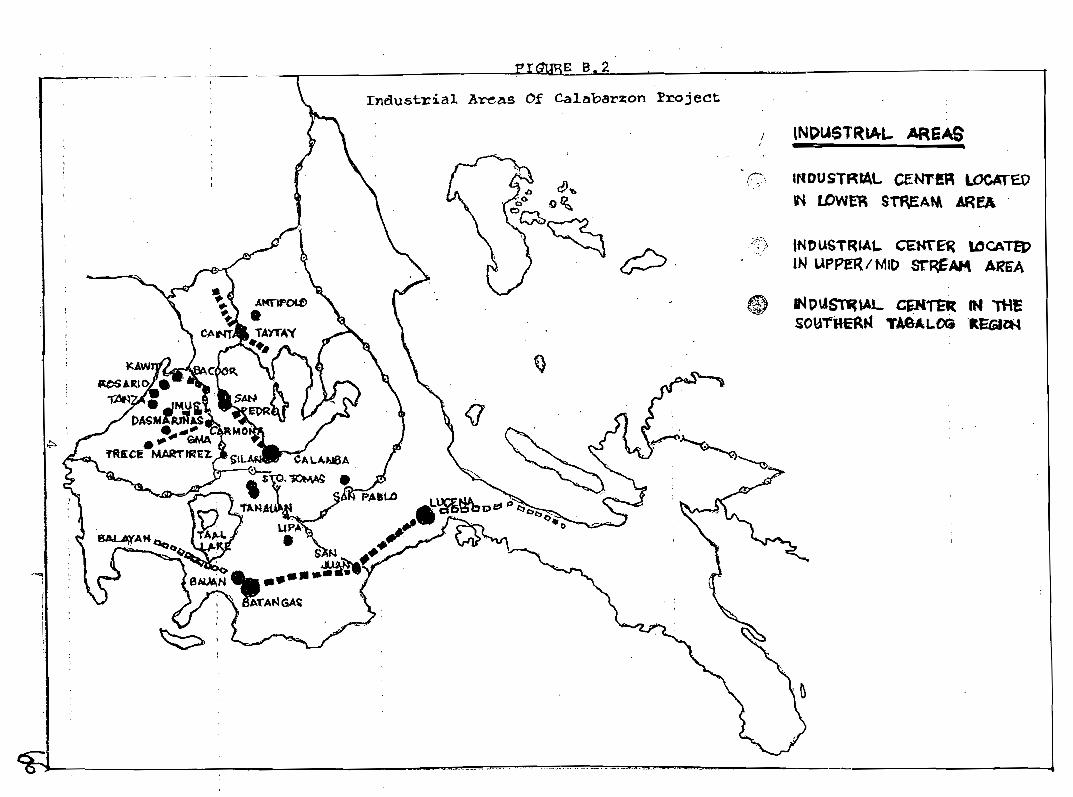
~ ~ d u s t ~ i a l A r e a s Of Calabarzon Project
P( D W E R S r q E A M AREA
J PJDUSTRlAL CENTm WCATW IN UPPEWMID A ~ A
@ NOWWM- C P i i m NTH€ S 0 U f r n M TAeALsm RWW
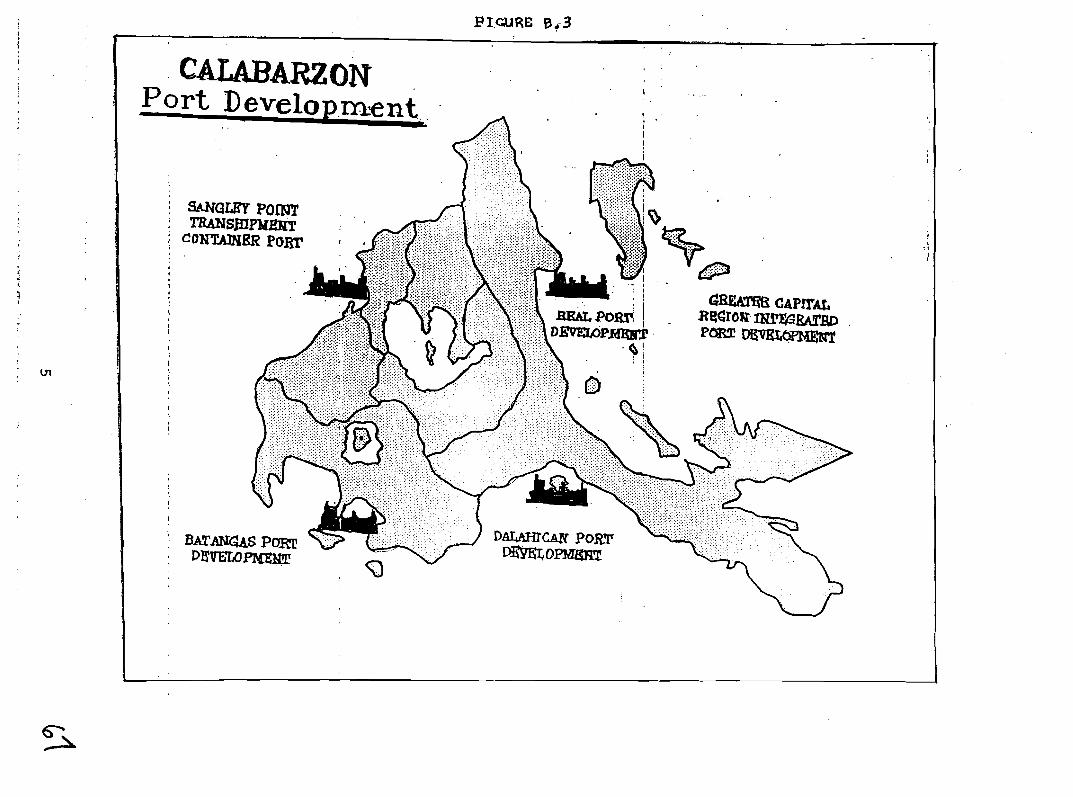
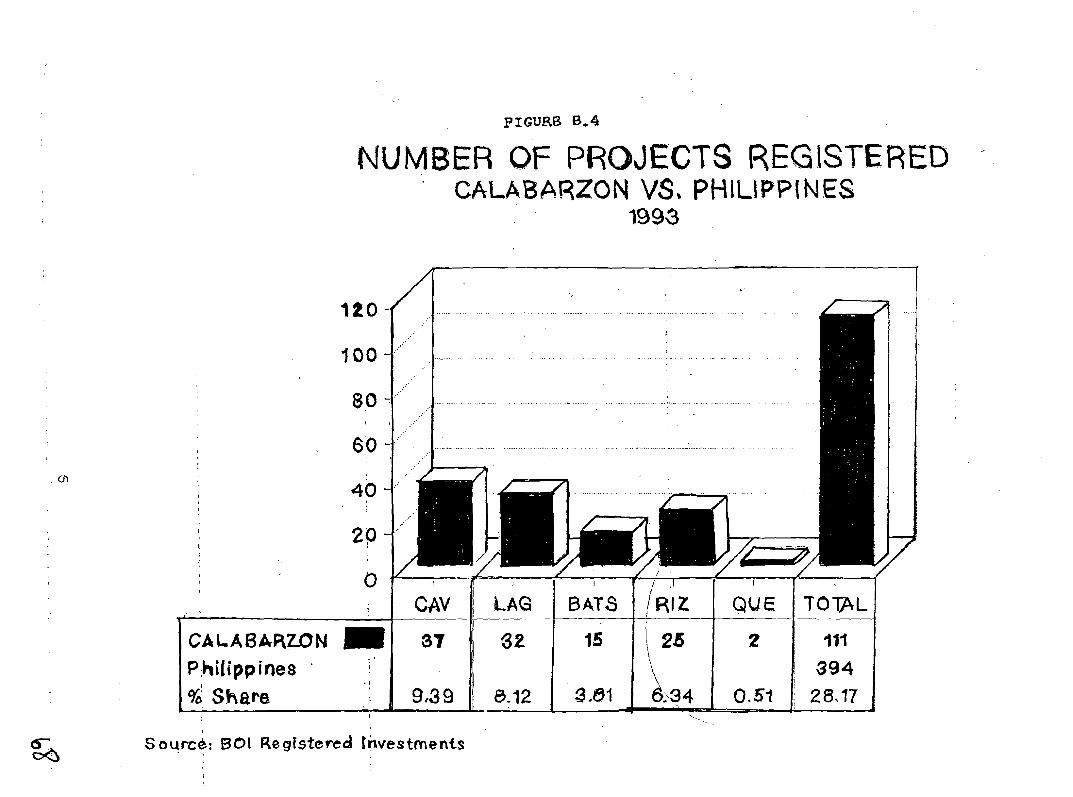
PIGURB 8.4
NUMBER OF PROJECTS REGISTERED -
CALABARZON VS. PHILIPPINES
CALABARZDN D Philippines . I
I
% Share
s our&: . I 601 Registered lhvestments ,
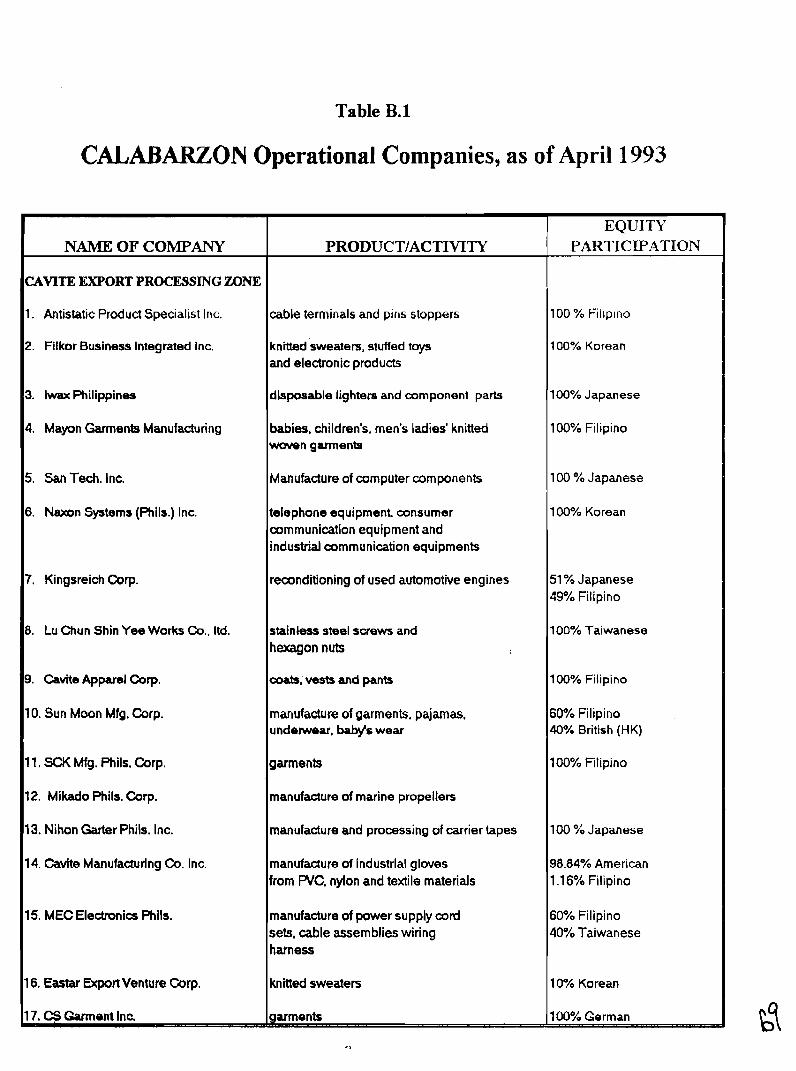
Table B.1
CALABARZON Operational Con~panies, as of April 1993
CAVITE EXPORT PROCESSING ZONE
1. Antistatic Product Special~st Inc. cable terminals and p ~ r ~ s stoppers
2. Filkor Business Integrated Inc knitted sweaters, stuffed toys and electronic products
3. lwax Philippines disposable lighten and component parts
4. Mayon Garments Manufacturing babies. children's, men's ladies' knitted wown garments
5. SanTech. lnc. Manufacture of computer components
6. Naxon Systems (mils.) Inc. telephone equipment. consumer communication equipment and industrial communication equipments
7. Kingsreich Corp. reconditioning of used automotive engines
8. Lu Chun Shin Yee Works Co., Itd.
9. Cavite Apparel Cop.
10. Sun Moon Mfg. Corp. manufacture of garments. pajamas.
11. SCK Mfg. mils. Corp.
12. Mikado Phils. Cop. manufacture of marine propellers
13. Nihon Garter Phils. Inc. manufacture and processing of carrier tapes
14. Cavhe Manufacturing Co. Inc manufacture of lndustrlal gloves 8.84% Amerlcan
15. MEC Electronics Phils. manufacture of power supply cord
nitted sweaters
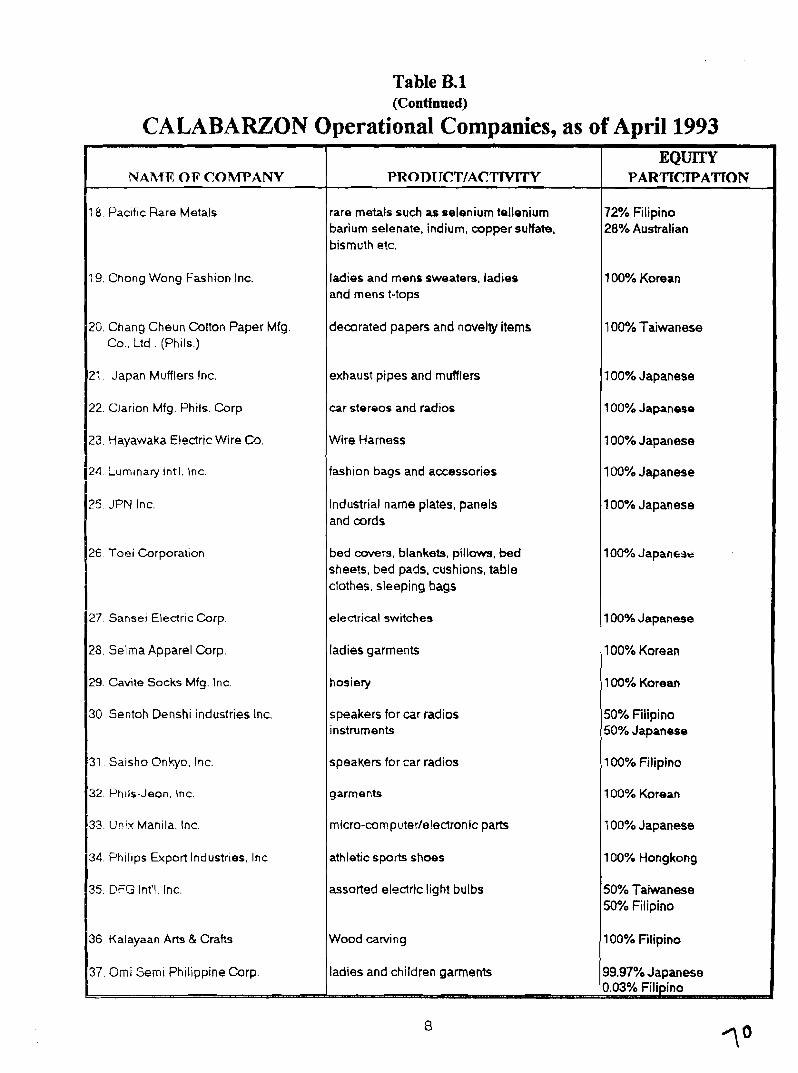
Table B.l (Continued)
CALABARZON Operational Companies, as of April 1993 - - - - - - - -
h
N A M F O F COMPANY
18. Pac~fic Rare Metals
19. Chong Wong Fashion Inc.
20. Chang Cheun Cotton Paper Mfg. Co.. Ltd . (Phils.)
21. Japan Mufflsrs Inc.
22. Clarion Mfg. Phils. Corp
23. Hayawaka Electric Wire Co.
24. Lurn~nary Int'l. Inc.
26 Toei Corporation
27. Sansei Electric Corp.
28. Selma Apparel Corp.
29. Cavite Socks Mfg. Inc.
30. Sentoh Denshi industries Inc.
31. Saisho Onkyo. Inc.
32. Phtls-Jeon, Inc.
33. Unix Manila, Inc.
34. Philips Export Industries. Inc
35. DFG Int'l. Inc. 50% Taiwanese
36. Kalayaan Arts & Crahs
37. Omi Semi Philippine Corp. ladies and children garments
PRODT JCIT/ACITTVITY
rare metals such as selenium tellenium barium selenate, indium, copper sutfate, bismuth etc.
ladies and mens sweaters. ladies and mens t-tops
decorated papers and novelty items
exhaust pipes and mufflers
car stereos and radios
Wire Harness
EQUITY PARTTCTPATTON
72% Filipino 28% Australian
100% Korean
100% Taiwanese
100% Japanese
100% Japanese
100% Japanese
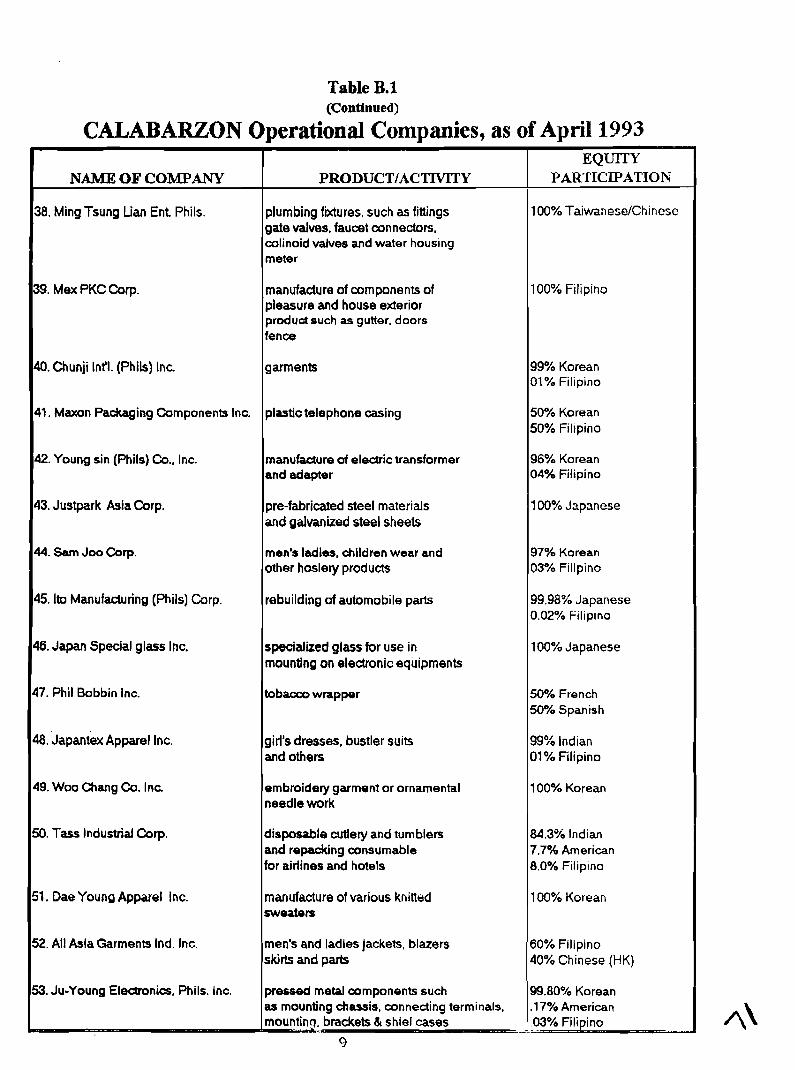
Table B.1 (Contlnued)
NAME OF COMPANY
38. Ming Tsung tian Ent Phils.
39. Mex PKC Corp.
40. Chunji Int'l. (Phils) Inc.
41. Mwon Packaging Components Inc.
42. Young sin (Phils) Co.. Inc.
43. Justpark Asia Corp.
44. Sam Joo Corp.
45. Ito Manufaduring (Phils) Corp.
46. Japan Special glass Inc.
47. Phil Bobbin Inc.
48. ~apantkx ~ p ~ a r e l Inc.
49. Woo Chang Co. Inc.
50. Tass Industrial Corp.
51. Dae Young Apparel Inc.
52. All Asla Garments Ind. Inc.
53. Ju-Young Electronics, Phils. Inc.
lperational Companies, as of April 1993 EQUITY
plumbing fixtures. such as fittings gate valves, faucet connectors. colinoid valves and water housing meter
manufacture of components of pleasure and house exterior produd such as gutter. doors fence
plastic telephone casing
manufacture of electric transformer and adapter
pre-fabricated steel materials and galvanized steel sheets
100% Filipino
99% Korean 01 % Filipino
50% Korean 50% Filipino
96% Korean 04OA Filipino
100% Japanese
men's ladies, children wear and 97% Korean other hoslety products 03% Filipino
rebuilding of automobile parts 99.98% Japanese 0.02% Filipino
specialized glass for use in 100% Japanese mounting on electronic equipments
tobacco wrapper
girl's dresses. bustler suits and others
50% French 50% Spanish
99% Indian 01 % Filipino
embroidery garment or ornamental needle work 1 l 0°% Korean
disposable cutlery and tumblers and repacking consumable for airlines and hotels
84.3% Indian 7.7% American 8.0% Filipino
mar~ufacture of various knitted 100% Korean rwoaien
men's and ladles jackets, blazers 60% Flllplno skirts and parts 40% Chinese (HK)
pressed metal components such 99.80% Korean as mounting chassis, connecting terminals. .17% American
.03% Filipino .A -
9
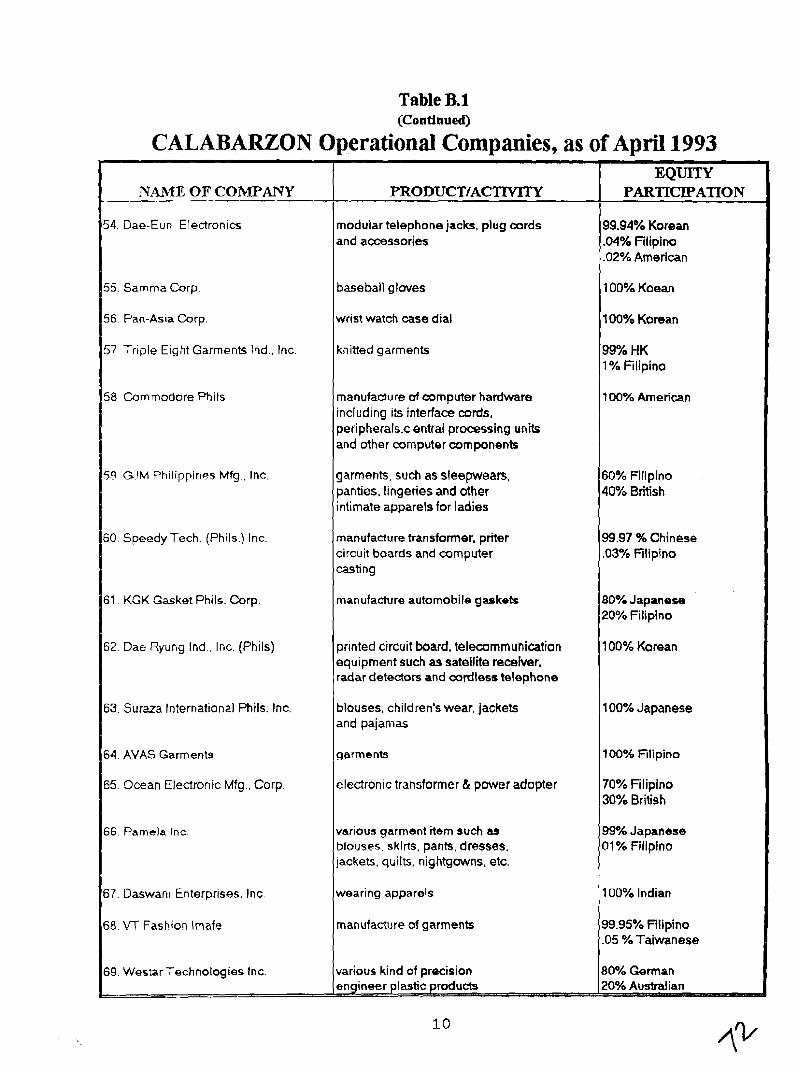
Table B.1 (Continued)
CALABARZON Operational Companies, as of April 1993
54. Dae-Eun Electronics
L
55. Samma Corp.
56 Pan-Asia Corp
NAME OF COMPANY
modular telephone jacks, plug cords and accessories
base ball gloves
wrist watch case dial
I I PRODUCT/ACTNITY
EQUITY PARTICIPATION
Commodore I 57 Triple Eight Garments Ind., Inc.
Phils
knitted garments
58 CAM Philippines Mfg , Inc.
60 Speedy Tech (Phils.) Inc
61 KGK Gasket Phils. Corp.
manufacture of computer hardware including its interface cords, periphera1s.c entral processing units and other computer components
99.94% Korean .04% Filipino .02% Amerlcan
100% Koean
100% Korean
99% HK 1 % Rlipino
100% American
manufacture transformer, priter circuit boards and computer casting
garments, such as sleepwears. panties, lingeries and other intimate apparels for ladies
99.97 % Chinese .03% Filipino
60% Flllplno 40% British
manufacture automobile gaskets 80% Japanese 20% Filipino
62. Dae Ryung Ind.. Inc. (Phils)
100% Japanese
1 00°/6 Filipino
63. Suraza International Phils. Inc.
64. AVAS Garments
printed circuit board, telecommunicatian equipment such as satellite receiver. radar detectors and cordless telephone
blouses, children's wear, jackets and pajamas
garments
100% Korean
I 65. Ocean Electronic Mfg., Corp.
I 67. Daswan~ Enterprises. Inc. wearing apparels I1 00% Indian
various garment item such as blouses. skirts, pants, dresses. jackets, quilts, nightgowns, etc.
electronic transformer & power adopter
9g0A Japanese 01 % Filipino
99.95% Filipino .05 %Taiwanese
70% Filipino 30% British
I 68. VT Fashion lmafe
169. Westar Technologies Inc. lvarious kind of precision (80% German
manufacture of garments
1 (enqineer plastic products (20% Australian 1
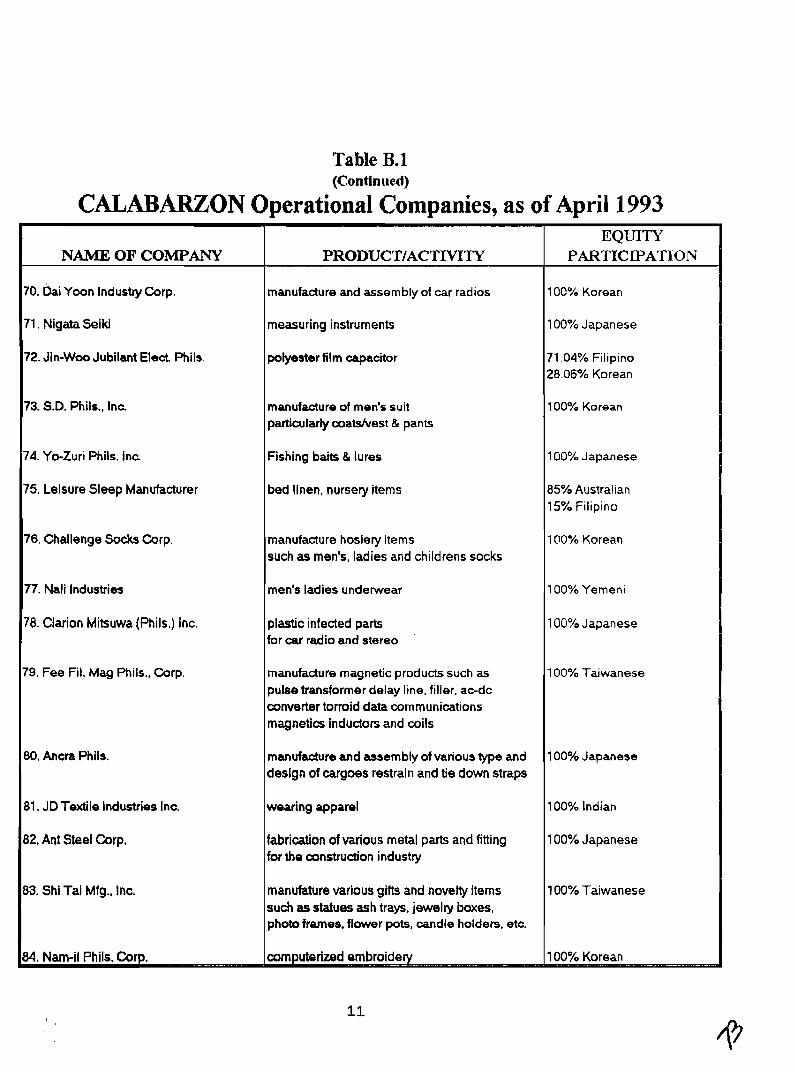
Table B. 1 (Continued)
CALABARZON Operational Companies, as of April 1993
70. Dai Yoon Industry Corp. manufacture and assembly of car radios 100% Korean
measuring instruments
72. Jin-Woo Jubilant Elact. mils. polyester film capacitor 28.06% Korean
73. S.D. Phils., Inc manufacture of men's suit 100% Korean particularly coatdvest & pants
74. Yo-Zuri Phils. Inc Fishing baits & lures
75. Leisure Sleep Manufacturer bed Ilnen, nursery items 85% Austral~an
76. Challenge Socks Corp. manufacture hosiery items 100% Korean such as men's, ladies and childrens socks
77. Nali Industries 100% Yemeni
78. Clarion Mitsuwa (Phils.) Inc.
79. Fee Fil. Mag Phils.. Corp. 100% Taiwanese
80. Ancra Phils.
81. ,ID T d l e Industries Inc.
rication of various metal parts and fitting r the construction industry
83. Shi Tai Mfg.. lnc. anufature various gifts and novelty items 100% Taiwanese uch as statues ash trays. jewelry boxes. hob frames. flower pots, candle holders, etc.
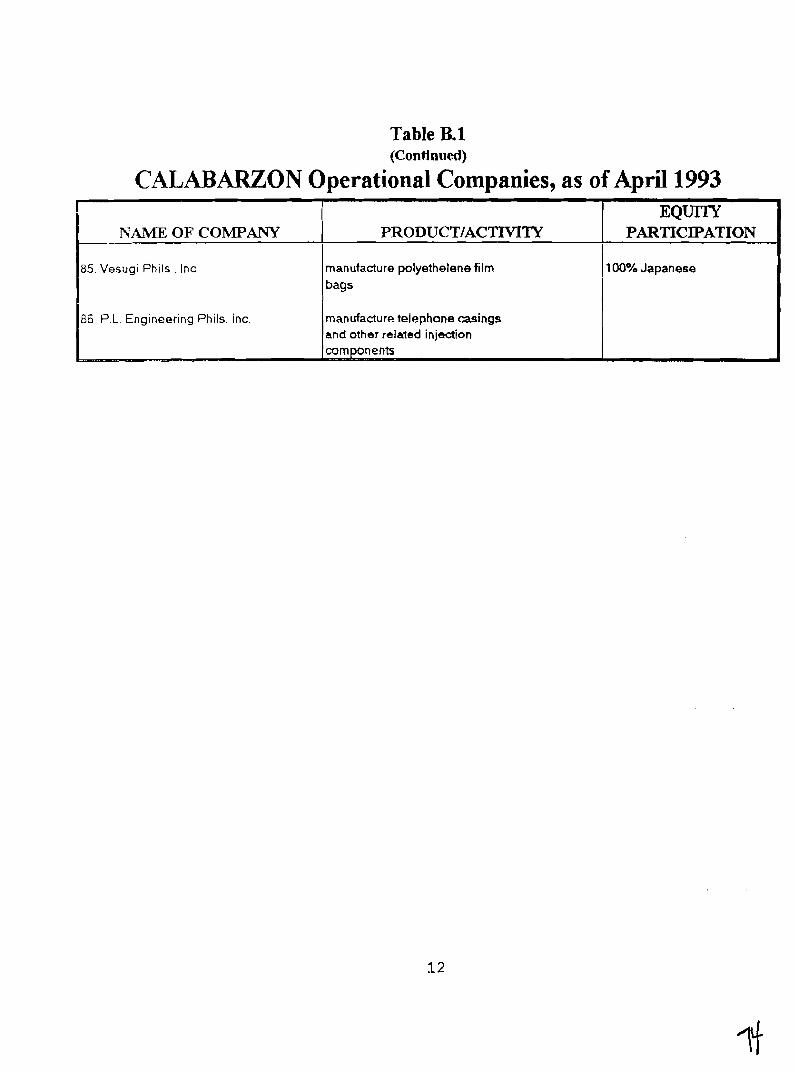
Table B.1 (Continrred)
CALABARZON Operational Companies, as of April 1993
85 Vesugi Phils.. Inc. anufacture polyethelene film
86. P.L. Engineering Phils. Inc. ufacture telephone casings other related injection
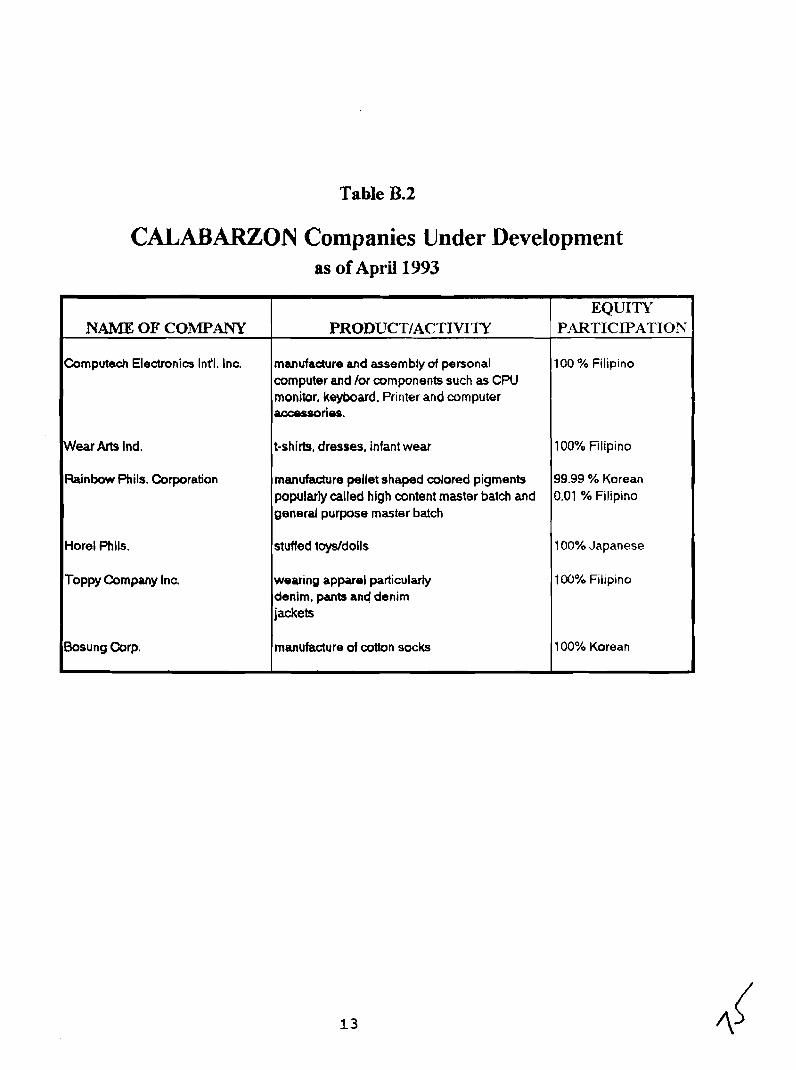
Table B.2
CALABARZON Companies Under Development as of April 1993
EQUITY PA4RTICIPATION
100 % Filipino
100% Filipino
99.99 % Korean 0.01 % Filipino
100% ,lapanese
100% Filipino
100% Korean
NAME OF COMPANY
Computech Electronics Int'l. Inc.
Wear Arts Ind.
Rainbow Phils. Corporation
Horel Phlls.
Toppy Company Inc
Bosung Carp.
PRODUCT/ACTIVITY
manufacture and assembly of personal computer and /or components such as C W monitor, keyboard. Printer and computer aaassories.
t-shirts. dresses, infant wear
manufacture pellet shaped colored pigments popularly called high content master batch and general purpose master batch
stuffed toys/dolls
wearing apparel particularly denim, pants and denim jackets
manufacture of cotton socks
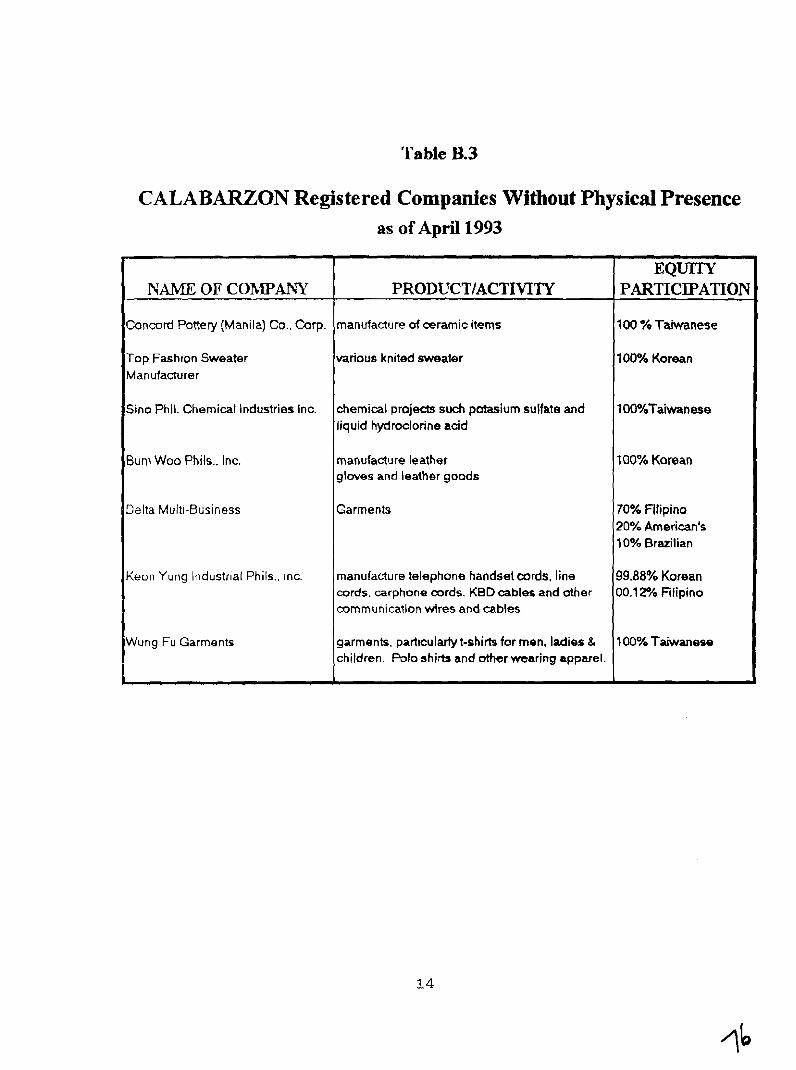
'l'able B.3
CALABARZON Registered Companies Without Physical Presence as of April 1993
. IVM OF COhITPANY
Cancord Pottery (Manila) Co., Carp.
Top Fashion Sweater Manufacturer
Sino Phil. Chemical Industries Inc.
Bun) Woo Phils.. Inc.
Delta Multi-Business
Keon Yung Industrial Phils., lnc.
Wung Fu Garments
PRODUCTIACTIVITY
manufacture of ceramic items
various knited sweater
chemical projects such potasium sulfate and liquid hydroclorine acid
manufacture leather gloves and leather goods
Garments
manufacture telephone handset cords, line cords. carphone cords. KBD cables and other communication wires and cables
garments, particularty t-shirts for men, ladies & children. Polo shirts and other wearing apparel.
EQUITY PARTICIPATION
100 % Taiwanese
100% Korean
100%Taiwanese
100% Korean
70% fllipino 20% American's 10% Brazilian
99.88% Korean 00.12% Filipino
1 00°?4 Taiwanese
.
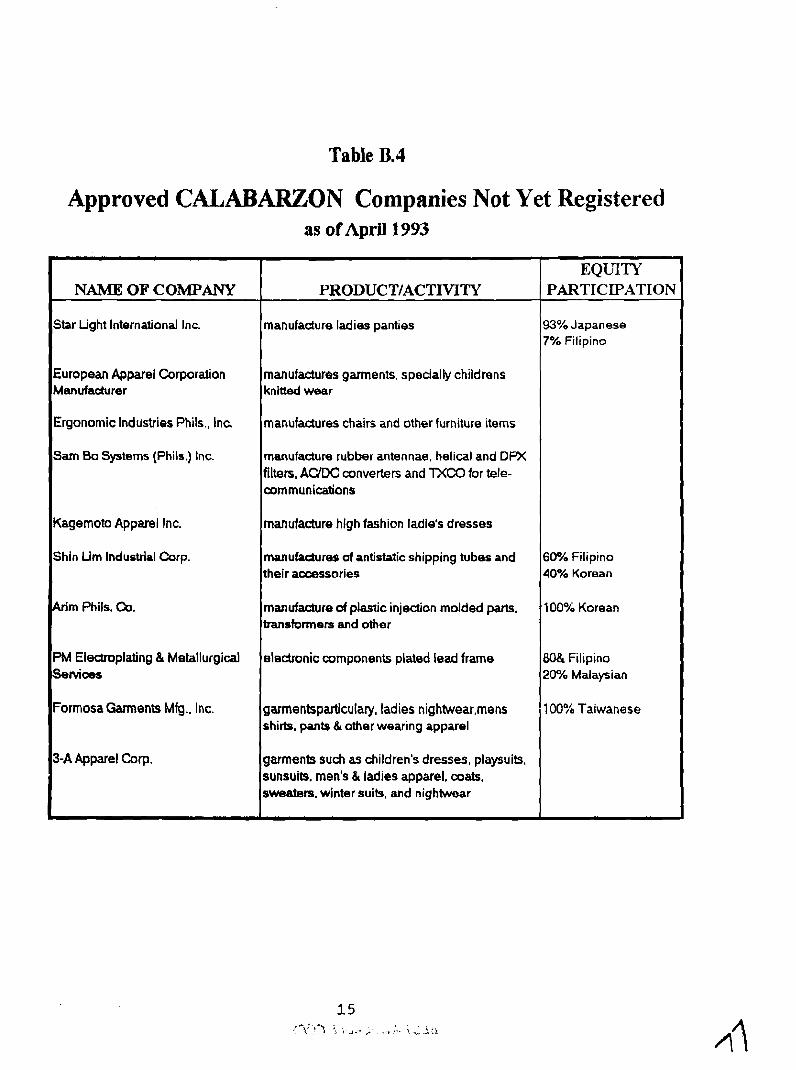
Table 13.4
Approved CALABARZON Companies Not Yet Registered as of April 1993
EQUITY PARTICIPATION
93% Japanese 7% Filipino
60% Filiplno 40% Korean
100% Korean
80& Filipino 20% Malaysian
100% Taiwanese
NAME OF COMPANY
Star Light International Inc
European Apparel Corporation Manufacturer
Ergonomic Industries Phils., Inc
Sam &, Systems (Phils.) Inc.
Kagemoto Apparel Inc.
Shin Lim lndustrlal Corp.
Arim Phils. Ctl.
PM Electroplating & Metallurgical Setvices
Formosa Garments Mfg.. Inc.
3-A Apparel Corp.
PRODUCT/ACTIVITY
manufacture ladies panties
manufactures garments. specially childrens knitted wear
manufadures chairs and other furniture items
manufacture rubber antennae, helical and DPX filters, ACYDC converten and TXCO for tele- communications
manufacture high fashion ladle's dresses
manufadures of antistatic shipping tubes and their accessories
manufacture of plastic injection molded parts, transformers and other
electronic components plated lead frame
garmentsparticulary, ladies n~ghtwear~mens shirts. pants & other wearlng apparel
garments such as children's dresses, playsuits, sunsuits. men's & ladies apparel, coats, sweaters. winter suits, and nightwear
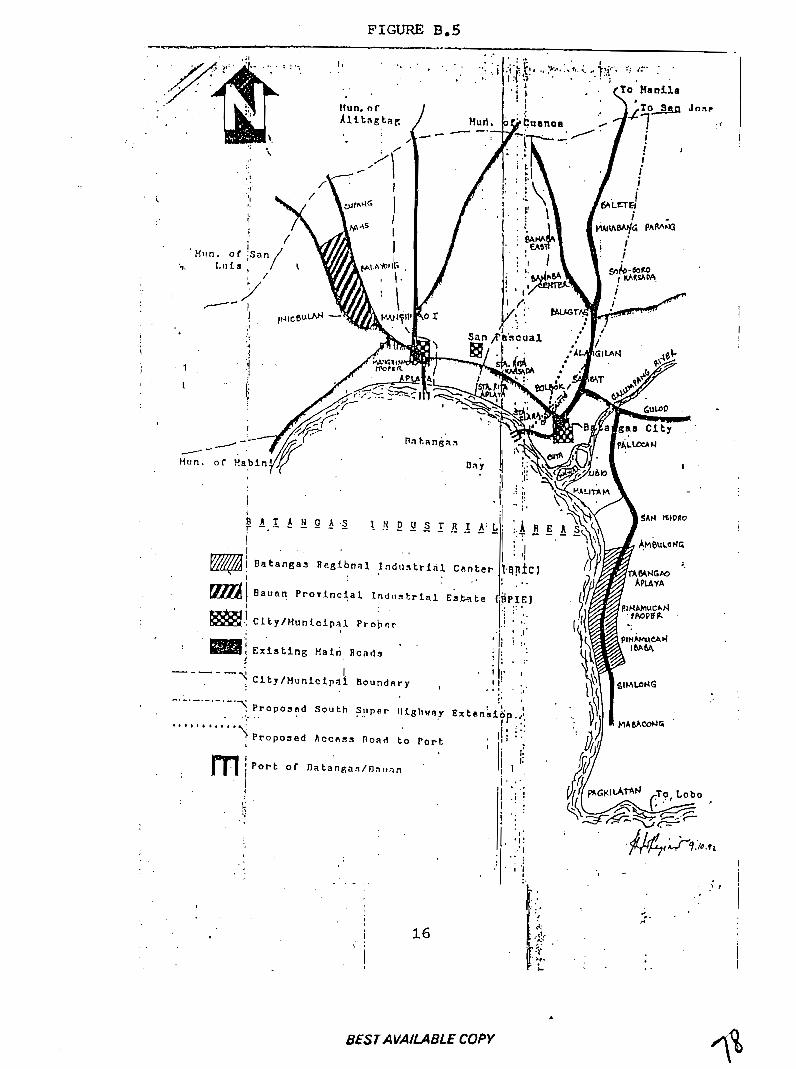
FIGURE B . 5 -.a -
BEST AVAILABLE COPY
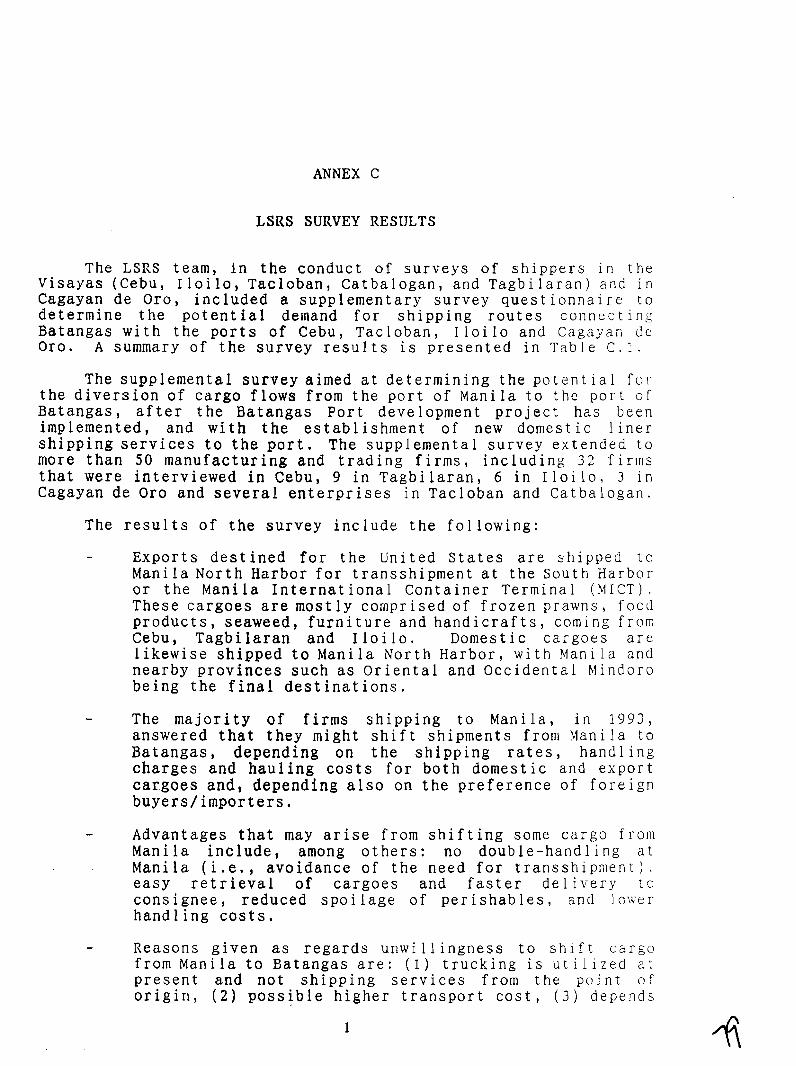
ANNEX C
LSRS SURVEY RESULTS
The LSRS team, in the conduct of surveys of shippers in the Visayas (Cebu, Iloilo, Tacloban, Catbalogan, and Tagbilaran) and in Cagayan de Oro, included a supplementary survey questionnaire to determine the potential demand for shipping routes connecting Batangas with the ports of Cebu, Tacloban, Iloilo and Cagayan de Oro. A summary of the survey results is presented in Table C . 1 .
The supplemental survey aimed at determining the potential fcr the diversion of cargo flows from the port of Manila to the port of Batangas, after the Batangas Port development project has been implemented, and with the establishment of new domestic liner shipping services to the port. The supplemental survey extended to more than 50 manufacturing and trading firms, including 32 firms that were interviewed in Cebu, 9 in Tagbilaran, 6 in Iloilo, 3 in Cagayan de Oro and several enterprises in Tacloban and Catbalogan.
The results of the survey include the following:
Exports destined for the United States are shipped lo Manila North Harbor for transshipment at the South Harbor or the Manila International Container Terminal (MICT). These cargoes are most ly comprised of frozen prawns, food products, seaweed, furniture and handicrafts, coming from Cebu, Tagbilaran and Iloilo. Domestic cargoes are likewise shipped to Manila North Harbor, with Manila and nearby provinces such as Oriental and Occidental Mindoro being the final destinations.
- The majority of firms . shipping to Manila., in 1993, answered that they might shift shipments from Manila to Batangas, depending on the shipping rates, handling charges and hauling costs for both domestic and export cargoes and, depending also on the preference of foreign buyers/importers.
- Advantages that may arise from shifting some cargo from Manila include, among others: no double-handling at Manila (i.e., avoidance of the need for transshipment), easy retrieval of cargoes and faster delivery to consignee, reduced spoi lage of perishables, snd 10;+~er handling costs.
- Reasons given as regards unwillingness to shift cargo from Manila to Batangas are: ( 1 ) trucking is utilized at present and not shipping services from the point of origin, (2) possible higher transport cost, (3) depends
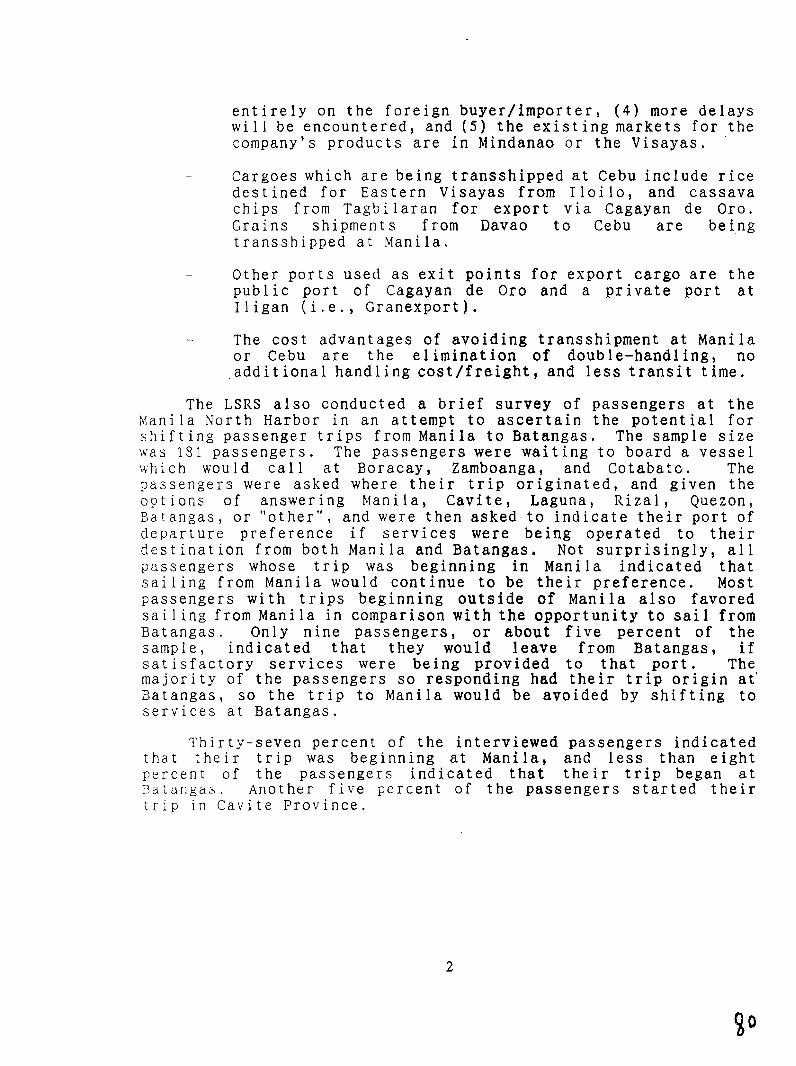
entirely on the foreign buyer/importer, (4) more delays will be encountered, and ( 5 ) the existing markets for the company's products are in Mindanao or the Visayas.
- Cargoes which are being transshipped at Cebu include rice destined for Eastern Visayas from Iloilo, and cassava chips from Tagbilaran for export via Cagayan de Oro. Grains shipments from Davao to Cebu are being transshipped at Manila.
- Other ports used as exit points for export cargo are the public port of Cagayan de Oro and a private port at Iligan (i.e., Cranexport).
- The cost advantages of avoiding transshipment at Manila or Cebu are the elimination of double-handling, no additional handling cost/freight, and less transit time.
The LSRS also conducted a brief survey of passengers at the Manila North Harbor in an attempt to ascertain the potential for shifting passenger trips from Manila to Batangas. The sample size was 181 passengers. The passengers were waiting to board a vessel which would call at Eoracay, Zamboanga, and Cotabatc. The passengers were asked where their trip originated, and given the options of answering Manila, Cavite, Laguna, Rizal, Quezon, Eatangas, or "other", and were then asked to indicate their port of departure preference if services were being operated to their destination from both Manila and Batangas, Not surprisingly, all passengers whose trip was beginning in Manila indicated that sailing from Manila would continue to be their preference. Most passengers with trips beginning outside of Manila also favored sailing from Manila in comparison with the opportunity to sail from Batangas. Only nine passengers, or about five percent of the sample, indicated that they would leave from Batangas, if satisfactory services were being provided to that port. The majority of the passengers so responding had their trip origin at' Batangas, so the trip to Manila would be avoided by shifting to services at Batangas.
Thirty-seven percent of the interviewed passengers indicated that their trip was beginning at Manila, and less than eight percent of the passengers indicated that their trip began at R a i a r i g a s . Another five percent of the passengers started their trip in Cavite Province.
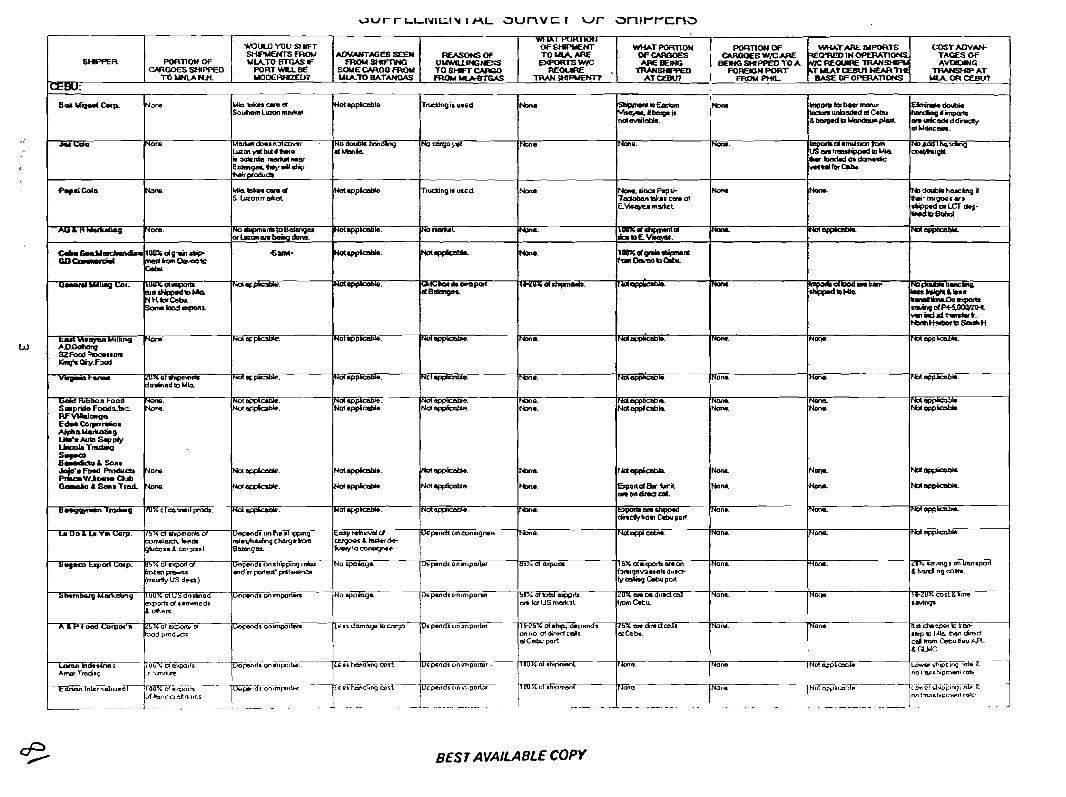
tmstwo)ranM~Mng Har W-pkge. Not app-. Not w. b s . N d q p l d z h mn LDodloq SZFoDd'acsraa lzlqb *.Faad
I I I I I 1 I I I VlpP- WqpbtYt. NOI Wpm. . b e . r.(dq,=4mb*. Now. NML N3l-P-.
b e . k Nmu. N a m M.. Non. No-
S-
BESTAVAILABLE COPY
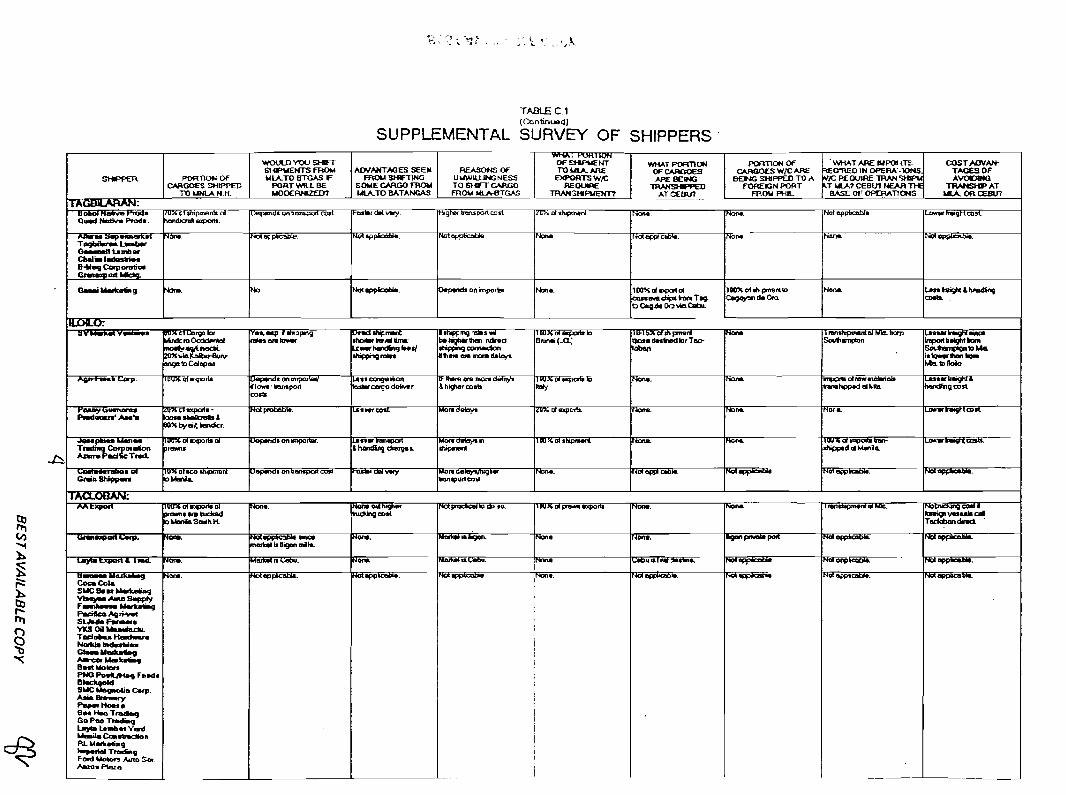
TABLE C.l (Cuniinued)
SUPPLEMENTAL SURVEY OF SHIPPERS -
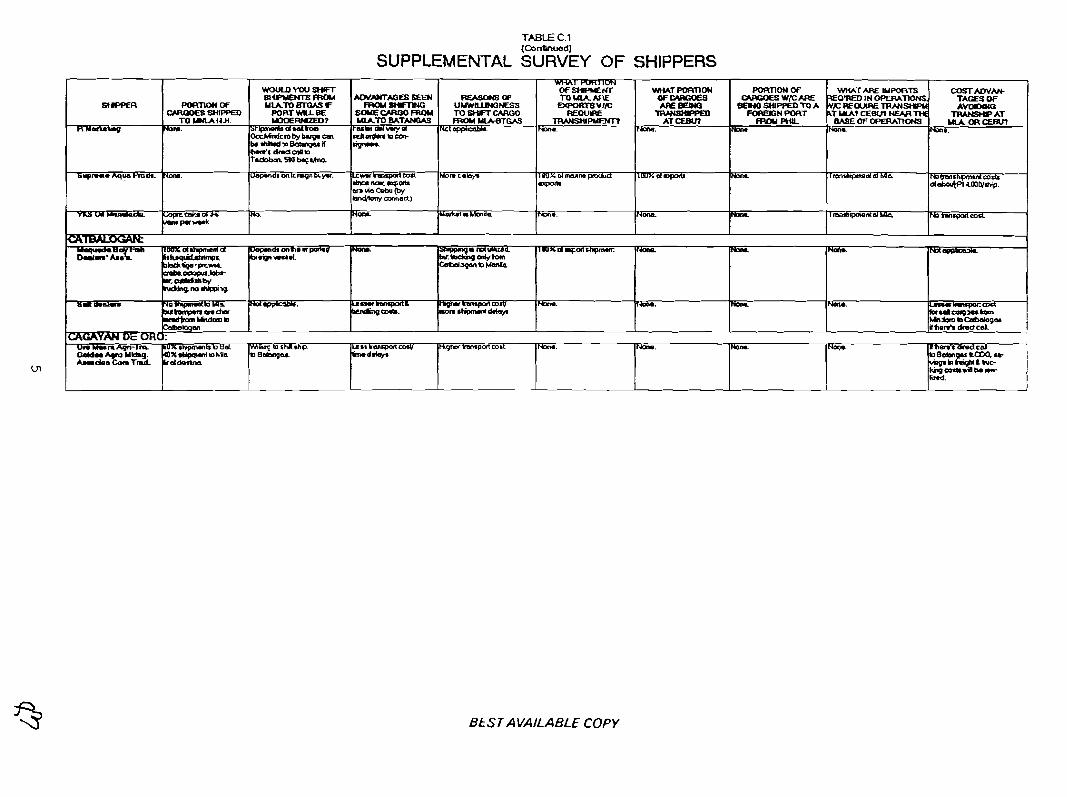
[cmdinoed)
SUPPLEMENTAL SURVEY OF SHIPPERS
BEST AVAILABLE COPY
ANNEX D
MANLLA NORTH HARBOR COMMODITY FLOWS, 1991-1993
(National Statistics Ofice Cargo Origin-1)estination Lntbrma tion)
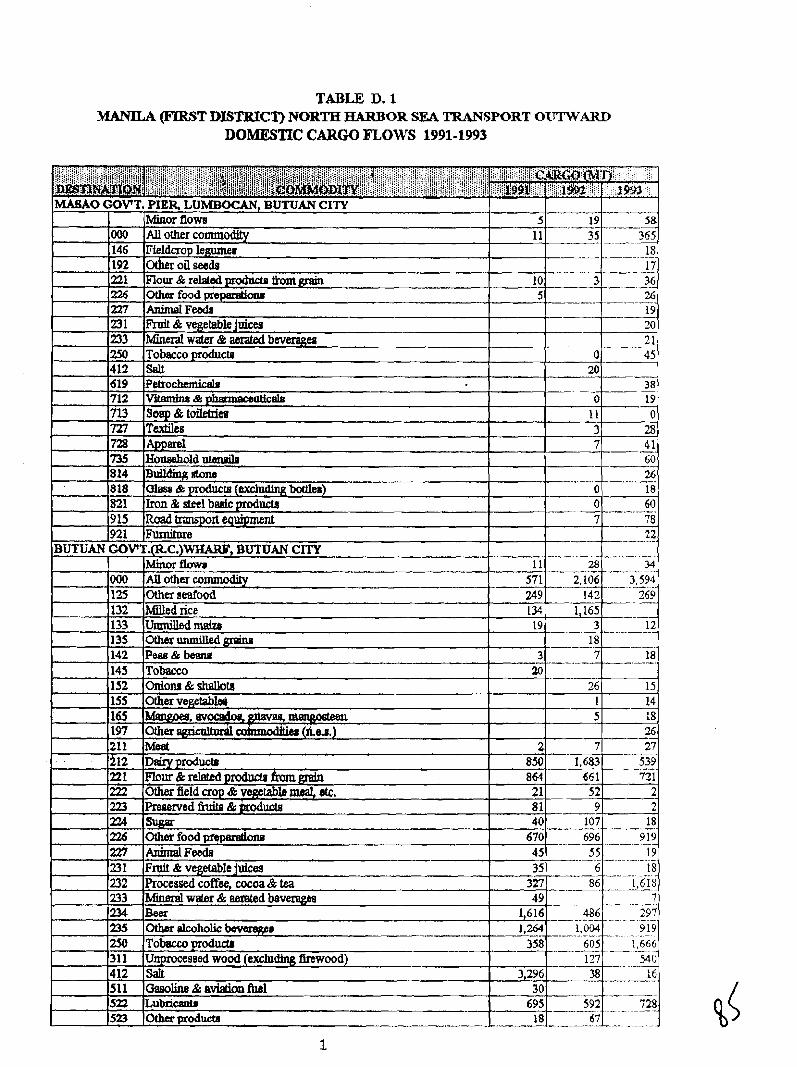
TABLE D. 1 MANILA (noR9T DLSTRICT) NORTH HARBOR SEA TRANSPORT O'CWWARD
DOMESTIC CARGO mows 1991-1993
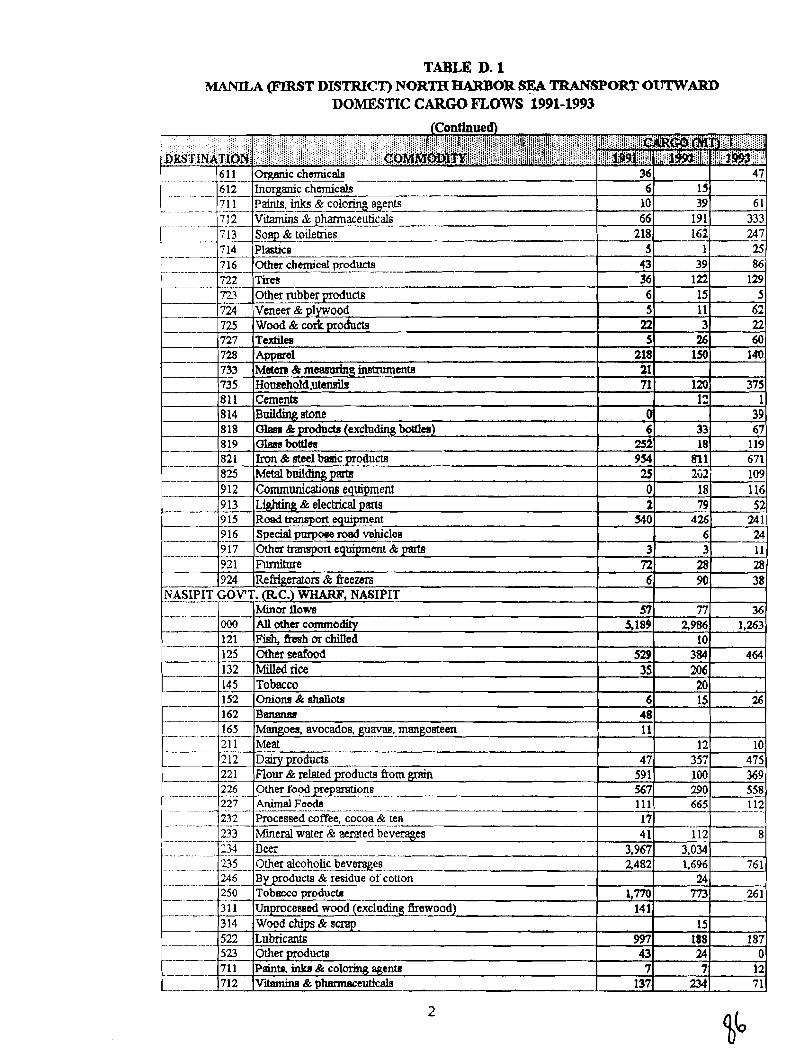
TABLE D. 1 MANILA (F'IRST DISTRICT) NORTH HARBOR @A TRANSPORT OUTWARD
DOMESTIC CARGO FLOWS 1991-1993
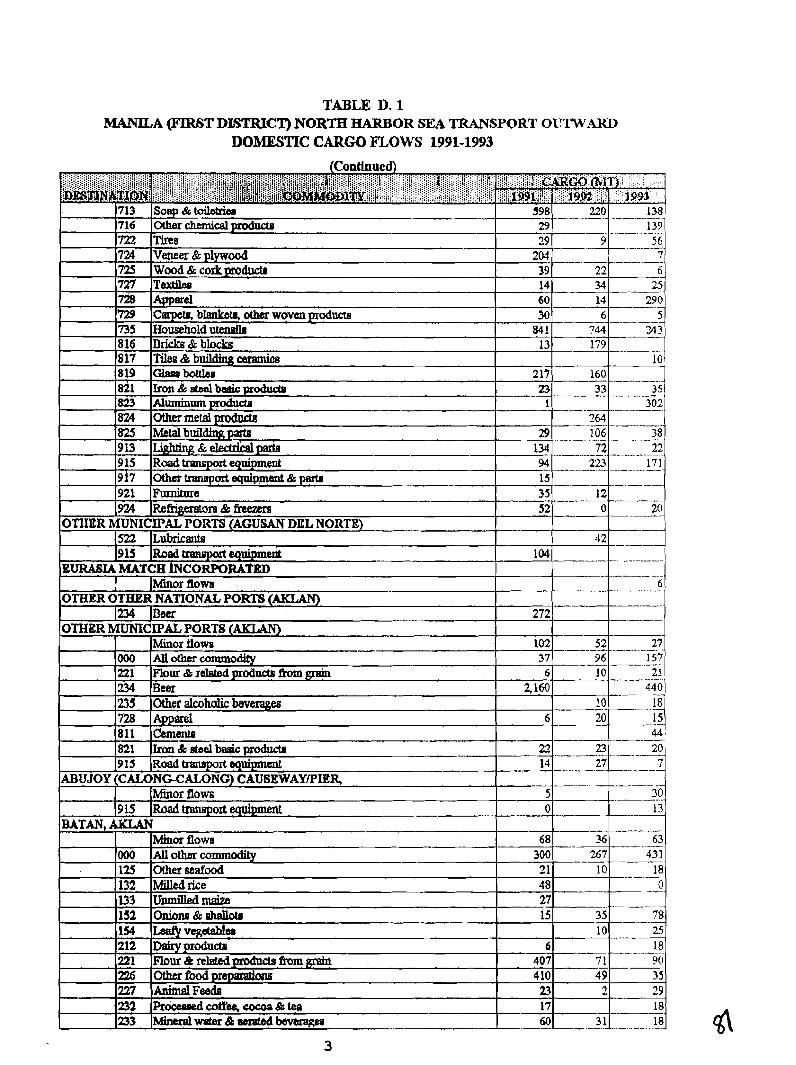
TABLE D. 1 MAMLA (FJlBT DLSTRICT) NORTH HARBOR SEA TRANSPORT OUTWARD
DOMESTIC CARGO mows 1991-1993
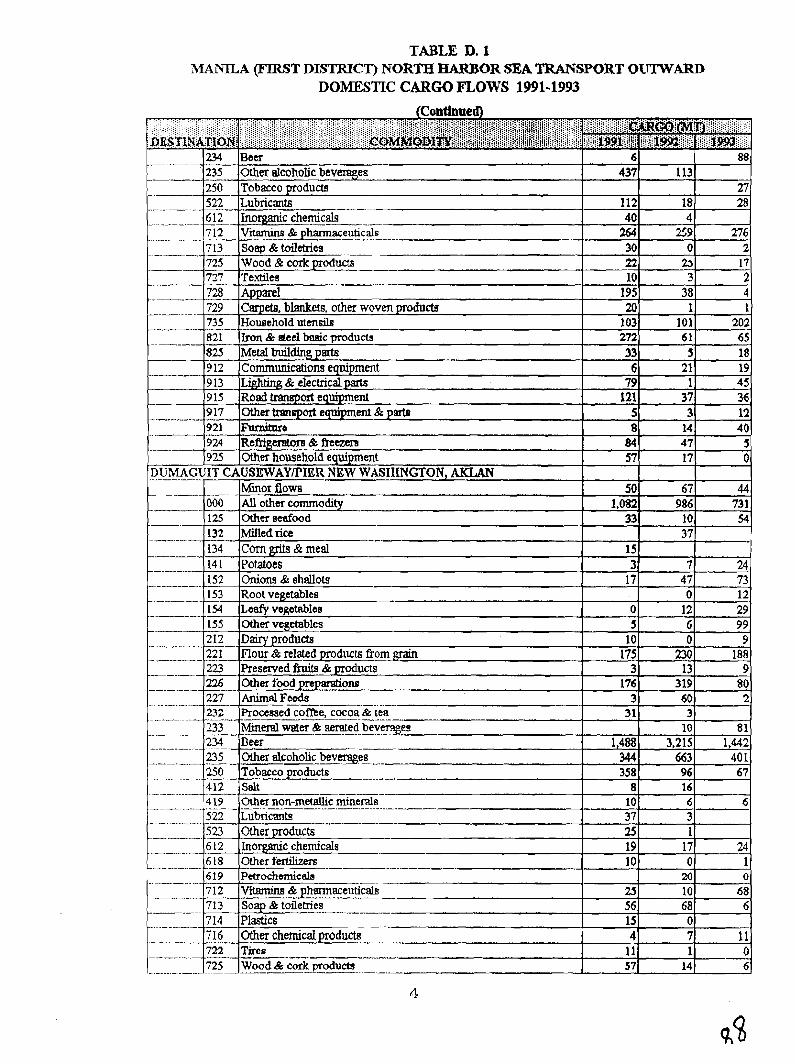
TABLE D. 1 MANILA @E&9T DLSTRICT) NORTH HARBOR SEA TRANSPORT 0ITTWA.D
DOMESTIC CARGO mows 1991-1993
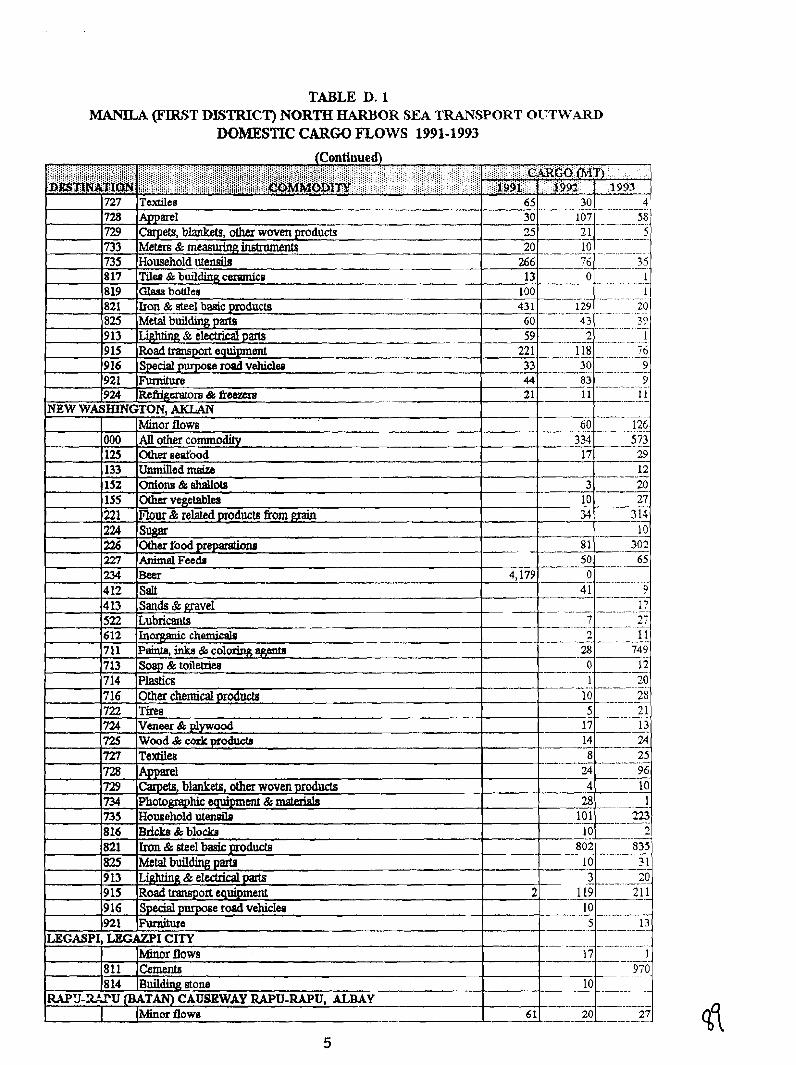
TABLE D. 1 MANILA (FIR5T D?b9TRICT) NORTH HARBOR SEA TRANSPORT OUTW.4RD
DOMESTIC CARGO mows 1991-1993
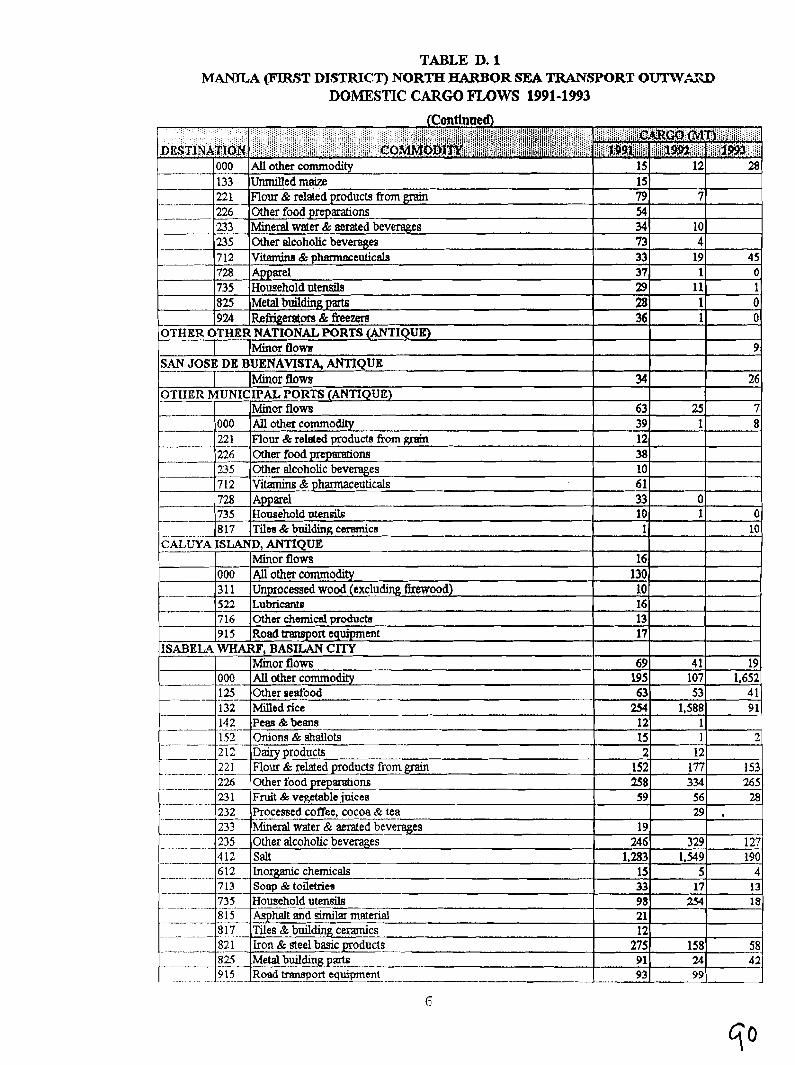
TABLE D. 1 MANILA (FIRST DISTRICT) NORTH HARBOR SEA TRANSPORT O ~ ~ V ~ ~
DOMESTIC CARGO FLOWS 1991-1993
258 334 265 23 1 Fruit & vegetable juice6 59 56 28 232 hocessed coffee, cocoa & t e a - - - --- . -- - -- - -- 29 . 233 hhera l water & aerated be=es 19
246 329 127 1.283 1.549 190
612 L n o r ~ c chemical6 . 15 5 4
735 Household uwmila 98 2% 18 21 12
275 158 58 9 1 24 42 93 99 -
000 All other commodity IS 12
... ---. -
. . -- - - --
-
133 221 . - 226 233 U S 712 728 735 825 924
OTHER OTHER NATIONAL PORTS (ANTIQUE) --- l ~ i n o r f low
SAN - JOSE DE BUENAVISTA, ANTIQUE I~ inor flows
OTIIPR MUNICIPAL PORTS (ANTIQUE)
Unmilled maize Flour & related p o d W from grain Other food preparations Mineral water & aerated beverages Other alcoholic beverages Vitatllina & pharmaceuticals Apparel Household nt& Metal building parts Refriseratom& fieem
Minor flows 63 25 7 000 AU other commodity 39> 1 8 ..-- 221 Flour & relatsd producta fiom gmin - .. - - - - - - -- 12
- .- 226 Otherfood d o n s -- 38 10 6 1
34
9
26
15 79 54 34 73 33 37 29 28 36
7
10 4
19 1
11 1 1
45 0 1 0 0
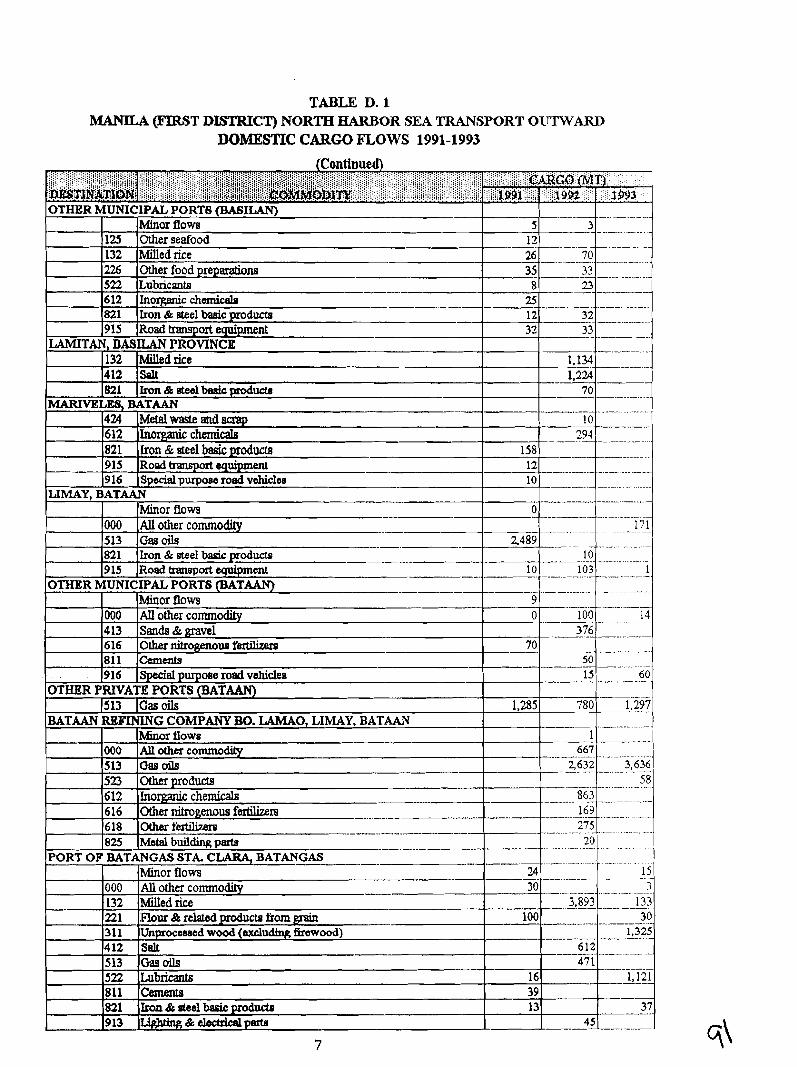
TABLE D. 1 MANILA (FILhgT DISTRICT) NORTH HARBOR SEA TRANSPORT OUTWARD
D O ~ C CARGO nows 1991-1993
(Continued)
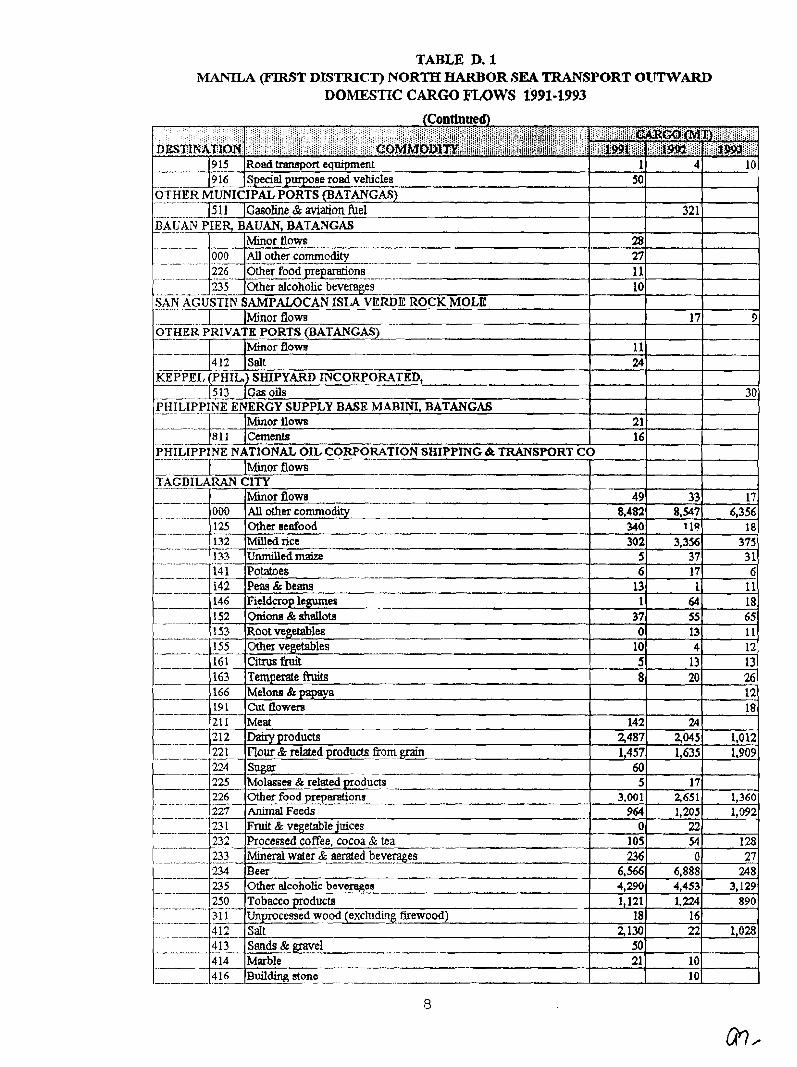
TABLE D. 1 MAMLA (J?lR,ST DISTRICT) NORTH HARBOR SEA TRANSPORT OITTWARD
DOMESTIC CARGO mows 1991-1993
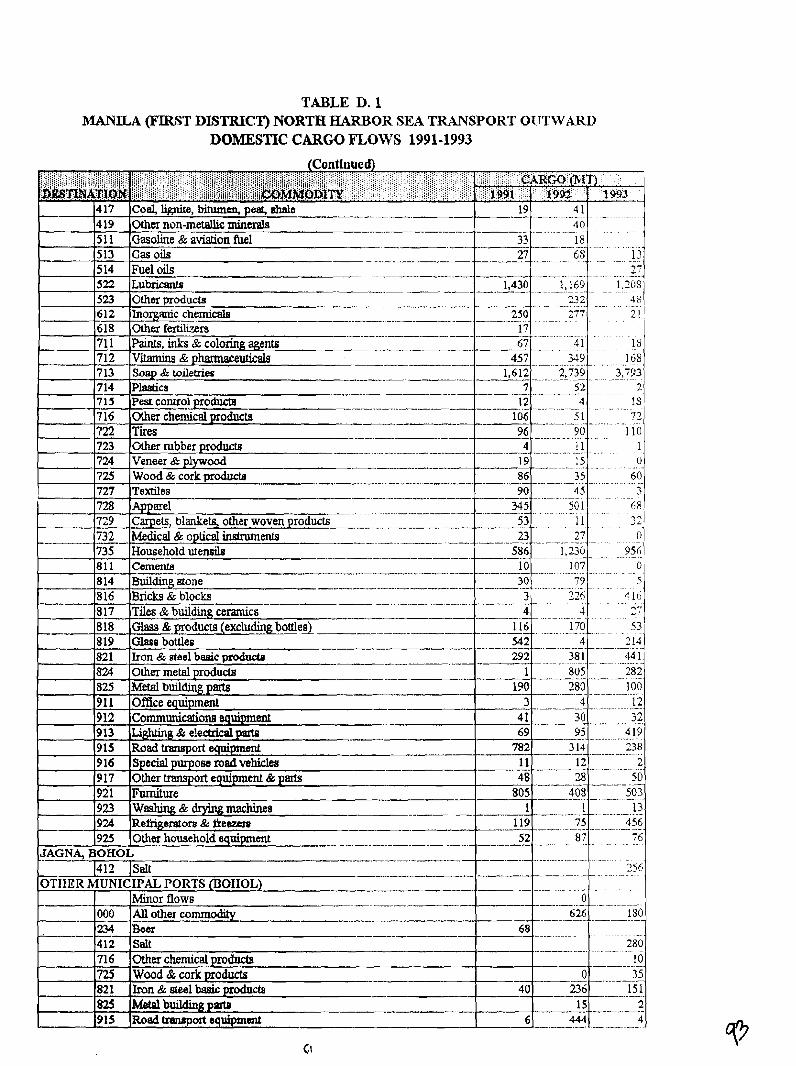
TABLE D. 1 MANILA W S T DISTRICT) NORTH HARBOR SEA TRANSPORT OUTWARD
DOMESTIC CARGO mows 1991-1993
(Continued) j:::::::::;::::: ..,.. ...... :. . . . . ..::.: :..:::: .... :: . . . .::.. .; .. :.. " : . ..:: .:... "I: ."" '.""'.. ......... .'.'.....' ..... iiii~ij2ii;i:il~ijji~iI;jj;jij;iji:;i;i;i;jjj~iiiiij~~jli~j;;;i;i~i;jj;ii;~I jiir;ii;;$;;i:i: o~t~:ji[;i;i;i;ijijij.~I~ijji~iiiiii;iii;i~~;;;;;;;;;: ;:;;:;::;:-:$$ij1::, ,.:.,. ... .,.
' ' " "
4 17 Coal, lignite, bitumen, peat, shale 19 4 1 -. -- ---- .................... .- ...... -. .. 4 19 Other non-metallic minerals 4 0 - ...........
5 1 1 Gasoline & aviation fClel - - . ..-. ..........
513 Gas oils
- - -- . .. -.-. .
-- ............-...........-
- - . - . - - . - ... --- ........... .....
.. - ......-...............
.... - ... - ................--.....-
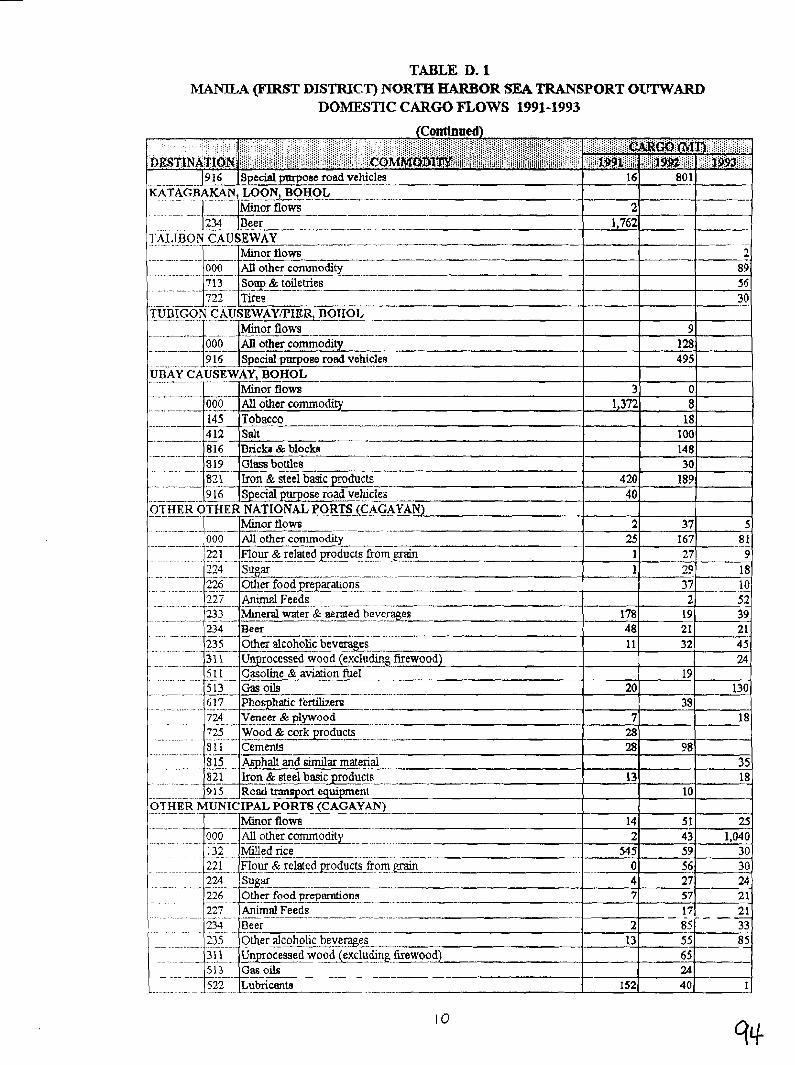
TABLE D. 1 MANILA (FIRST DLSTRZCT) NORTH HARBOR SEA TRANSPORT OIWWARD
DOMESTIC CARGO mows 1991-1993
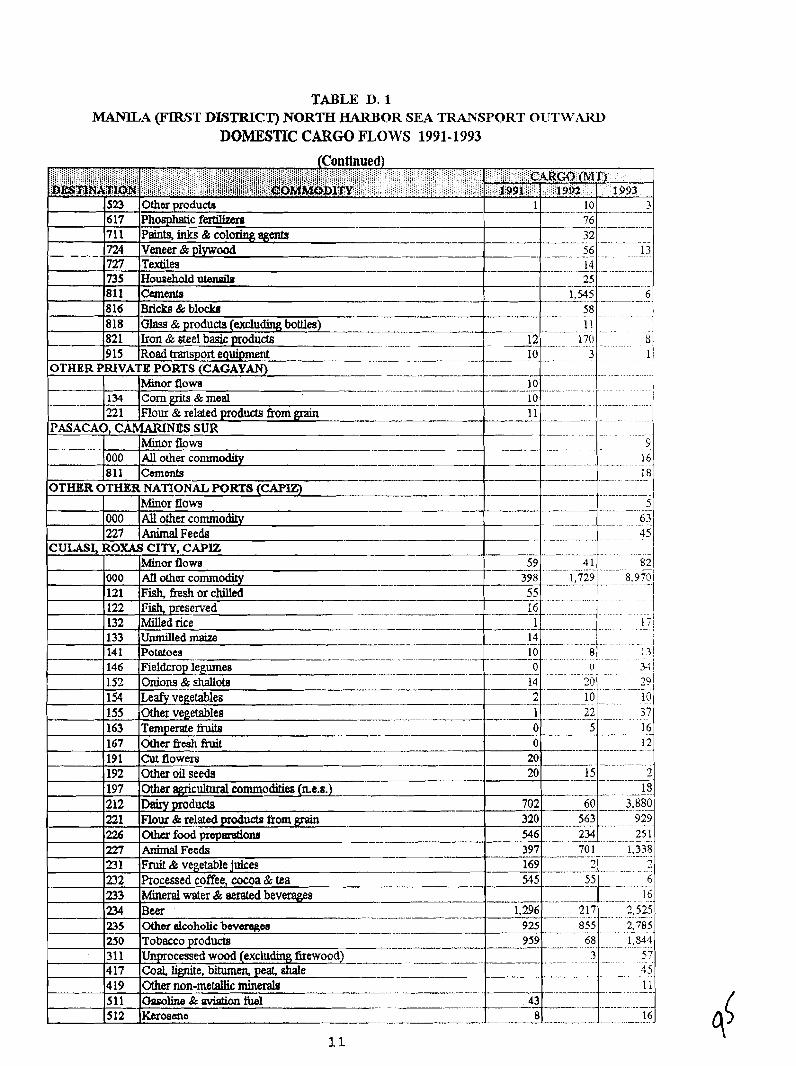
TABLE D. 1 MANILA (FIXST DL3TRIC.T) NORTH HARBOR SEA TRANSPORT OUTWARD
523 Othea producte 1 10 3 . -- -.. -.- -- 617 Phoqhatic fertibme -- -. 76 ..... - - - .- ... 711 Paints,inlrs&coloringagents - 33
...... -- - - - . -. - .
.- - 724 Veneer & plywood 56 ......... 13
816 Bricks & block^ .......................
818 Glass & products (exclu- bottles) . .- -- .... . ......... -. -- - 11 -- 821 Iron & steel basic products - 1 2 . 170 . . . . . . 8 1
3 9 15 Road -Port e q d w ..................... ! / OTHER PRIVATE PORTS (CACAYAN) . . _ 1
I .... 1
l ~ i n o r flows 1
.- -. - - ....
--- ..........
- ..............
CULASI. ROXAS CITY. C A P E I
I 1 163 I Temperate fiub - 1 167 lother fresh fruit
233 Mineral water & aerated beverages 234 Beer 235 Other alcoholic bworages ... -- - - - -. - - . - -- -
250 Tobacco prod- ...
31 1 Unprocessed wood (excludmg firewood) ---- 57 417 Coal, lignite, bitumen peat, shale .... ....
4 19 Other non-metallic m i n d -
511 Osroline&Pvisiion~l --- ...
512 Kerosena
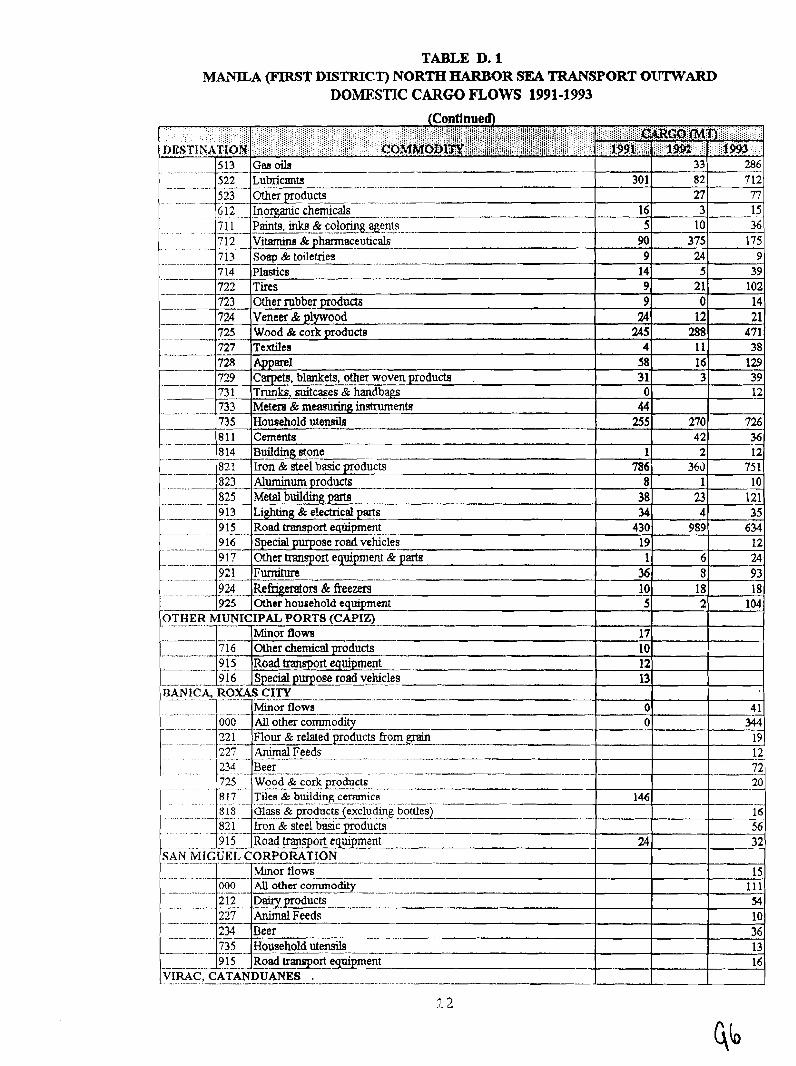
TABLE D. 1 MANILA @IE&f3T DISTRICT) NORTH HARBOR SEA TRANSPORT O I . ~ A R D
DOMESTIC CARGO mows 1991-1993 (Continued
513 Gaaoile -. --.- .- -- 33 286
522 Lubricrmw 30 1 82 712 .- -. --
. . . . . - .. .- . . - - - 523 Otherproducts - - .. . - -. .. . . . - - - - n 77 612 ko_~garuc chemicals . . . . . .. ~ . . ~
16 3 15 7 11 PSints. inks & c o l ~ a g e n t s
. . . - . . . .,. -- -------- 5 10 36 712 V i m & phmaceuticals 90 375 175
.
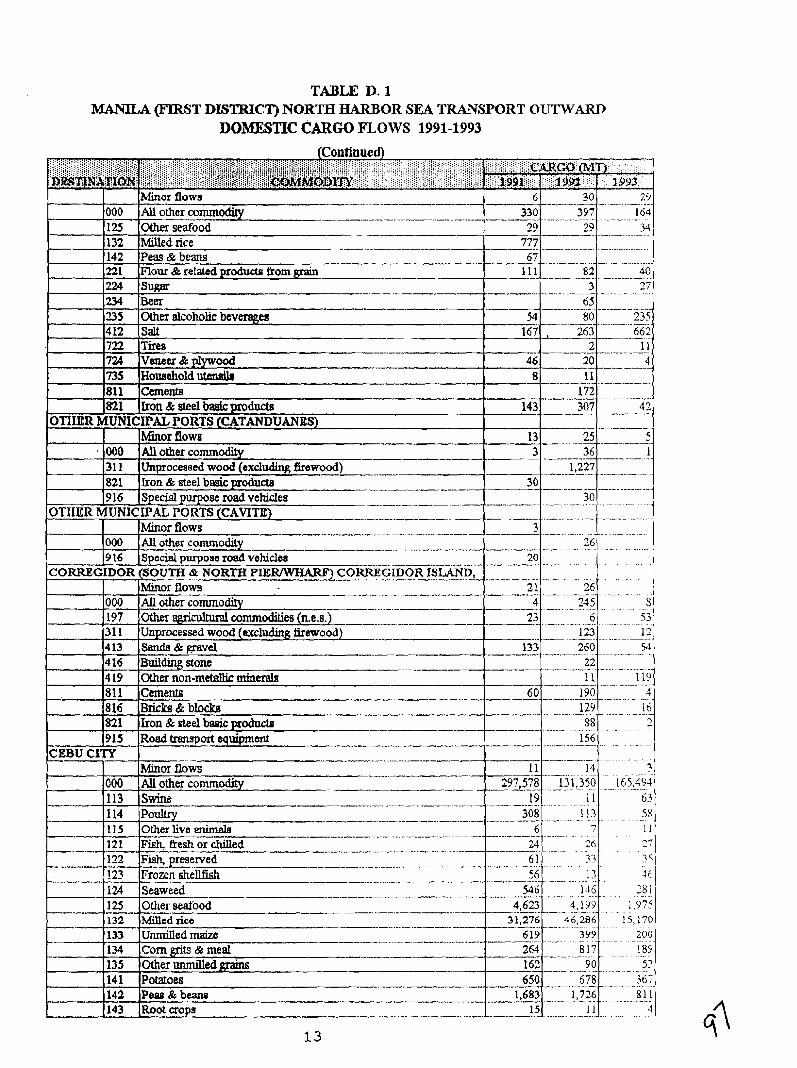
TABLE D. 1 MANILA m 9 T DISTRICT) NORTH HARBOR SEA TRANSPORT OUTWARD
DOMESTIC CARGO mows 1991-1993
osa road vehicles
... - - . - .- . - .
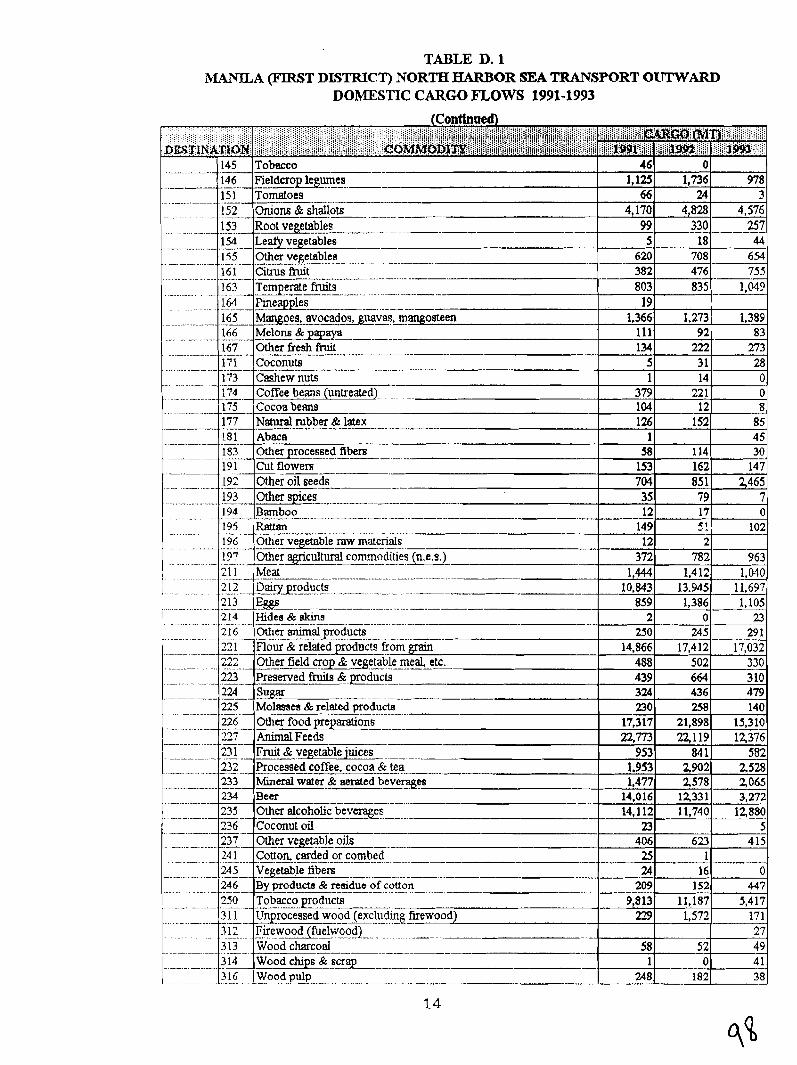
TABLE D. 1 MANILA (FIRST DLITRICT) NORTH HARBOR SEA TRANSPORT OUTWARD
DOMESTIC CARGO FLOWS 1991-1993
I 1 183 I Other urocessed fibers I 58 1 1141 30 1 191 Cut flowers
.. - ...... .- .- .- . - .-
:I92 Other oil seeds - -. .. --. ...... - 193 . w c e s -. .-.. . - -. .. -- ... -- - - 194 Bamboo ............
195 Rattan .............
196 Other ve~eetable raw materials .............................. -- 197 O t h e r ~ c u l t u r a l commodities (n.e.9.)
. - .-....... - . ........ - --. - -- --- - - -. - . 21 1 Meat 1. . . . . . . . .
................... - - ..-. .. ....... 2 1 2 - .Q~r_o_d_u~ts. . ts..ts..tsts
213 ...... .- ............. - . .m-- ..- - . ..-- - 214 Hides & &ins 1 . ......... _ - . . . . __ ... .---.. _. . _ ... .- -.-.-.. _ 2 16 Other animal poducts I ............-- .... .-- . ... .- . . -. . .- -. .-.- 331 ROUT & relatedpodncts fr
.. . - - - n n L ~ L . Other field crop 8 veg~eri ....... - .... -. - . - .. 223 Preserved fruits & p d u c t . . -. - - - - . -. . - . - - . . -. --- -- - .
224 Sugar -- 225 Molasses & related producta
... -. .- - .... .- . -. - - . - ... -. -. 226 Other food preparations . . - .... - ... - .. - - . - 337 AniTnalFeeds - - - . . - - - -. - -- 231 Fruit 8 vegetable juices - - . -. - . -. - . - - - -. - -
- . - .- - . . - - - - - 222,-. - .Processed coffee. cocoa & tea 233 Mineral water & aerated beverages
.. -. - . - . - - ---- -- - - 234 Beer .. -......-. . -- -- -. - ..
235 Other alcoholic b e v q s .- .- .. ... .-
336 Coconut oil
Tobacco products . ....
......... .... ..........
-- - -- ............ .
.... -- - -- - Wood chps & s c r ~ ... --- - 41
24 8 ..-----. -- 182
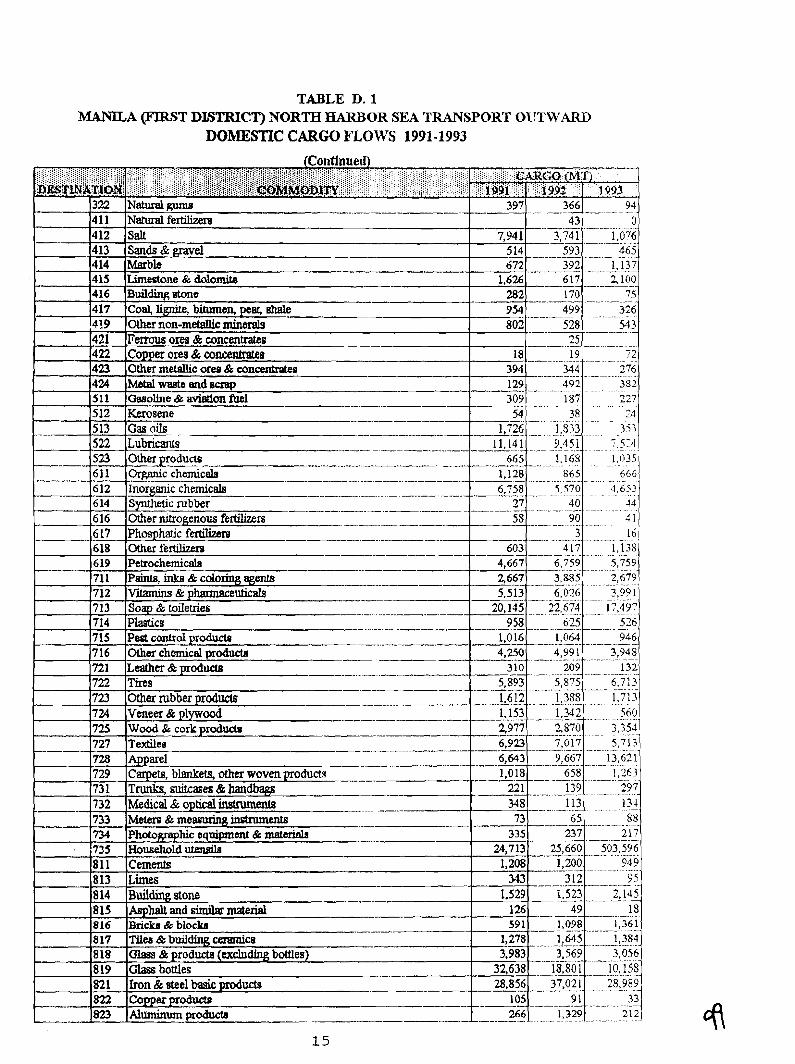
TABLE D. 1 MAMLA (FJRST DL'TRICT) NORTH HARBOR SEA TRANSPORT OUTWARD
DOMESTIC CARGO mows 1991-1993 (Continued)
322 411 412 413 414 Marble 672 392 . 1.137
617 2,100
..
.............. ..-..
417 1,138
............. 6,026 7,??1 ...................
- . -. .. .-
.. .- .................-.......
5,875 0,713 .. - . . - - - . . -. - . . - - . - - . . . -
1,388 1.713 .....................
9,667 13,611
...................
.........
Natural- ~sturalfe&ma Sdt Sands & wvel
- 397
-- 7,941
-14
. ..... .. ............ 366 94 --
43 - .. - 3,741 - -
- ..... - ........ 0
1,076 . . - .- - .
. 593 ....... _ ........ 465'
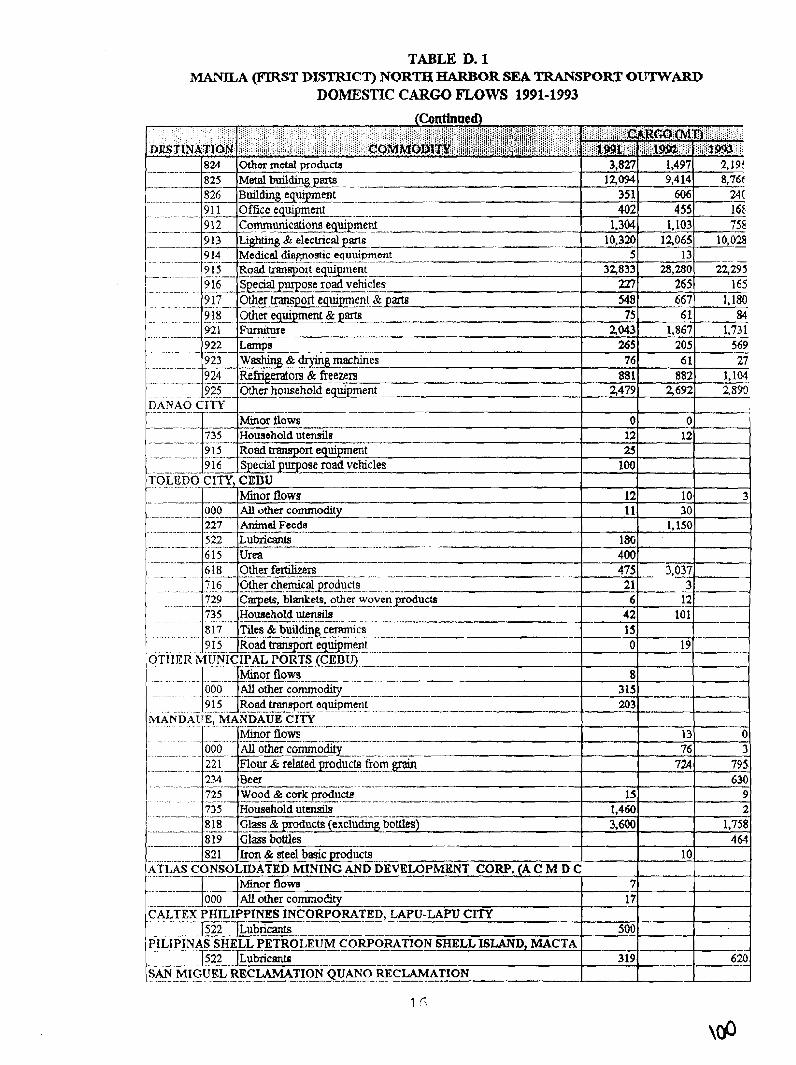
TABLE D. 1 MA.NILA (FIRST DZSI'R1C.T) NORTE HARBOR SEA TRANSPORT OUTWARD
DOMESTIC CARGO mows 1991-1993
~IANDAUE, MANDAUE c ~ n .-- -. . . . -. .- -. . . . - ..- - -
PILIPINAS SHELL P E T R O L E U M C O ~ G G ~ . . - - - . . .
522 ~ubricants s K ~ ~ c ~ ~ ~ - ~ ~ ~ ~ ~ ~ ~ ~ N ~ ~ ~ ~ ~ . . ~ . . ~~ -. .- ~. RE .
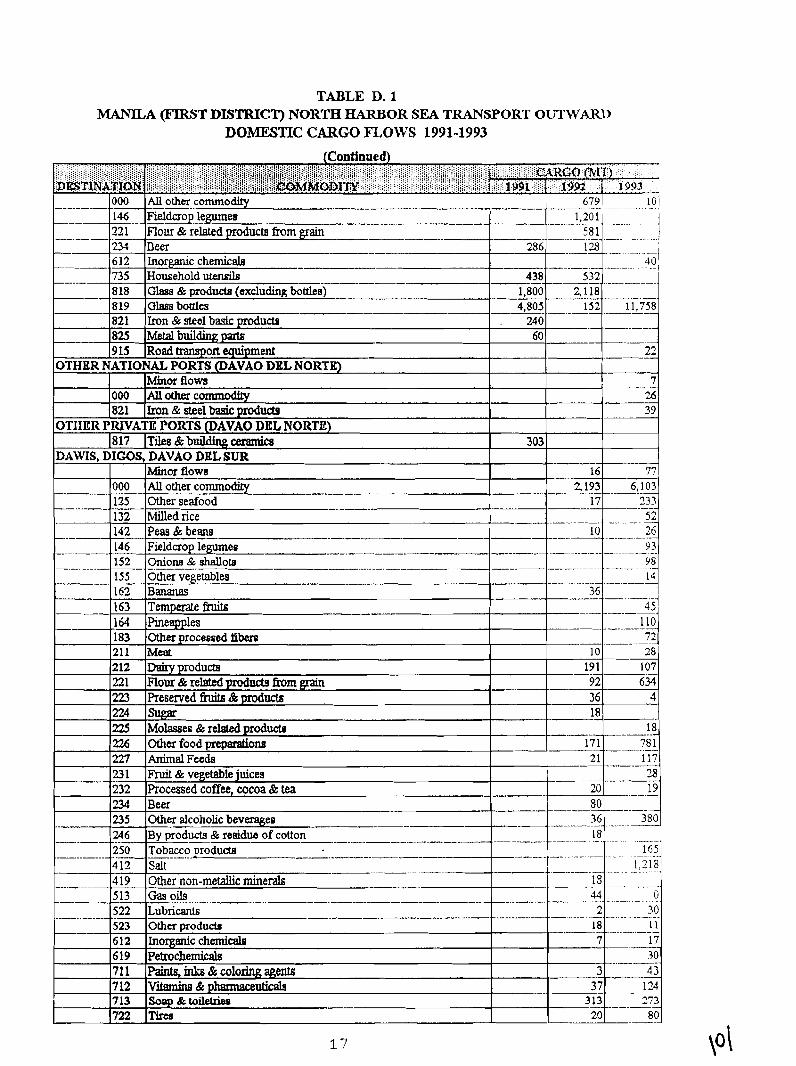
TABLE D. 1 MANlLA (FIRST DISTRICT) NORTH HARBOR SEA TRANSPORT OUTWARD
DOMESTIC CARGO mows 1991-1993
. . . . .. .,:.:::,:,, (Contfnued)
.:.:.:.:.;, ,,,, ,.. '.'...'.' :'.':'.~: .,:. ..,.:... "." ". ':..'.':':'.'.....:.:.:.;I:'..."..'.'..'... ' . . . . .. , , .................. , ,....... a,:.:.:.:.: .,.,,....,., ( \ii;i;i2;i;iiiii;;jij$ii~i:i,i,,il . . . . . . . . . . . . . . , . . . 'i;ii,iiiiii;iii;iiiiiii,j~ijijiji~fj/j~jifiji$<ij,j.i$~~~,jjj~i/~~ iD$ST;lNAzfOMj -". . . . i j i i~iiii~'i~~/~ii,ijjjjj~~~j~i$ijiii~j~tfijj,iiiiiij$&&~~~~~mij~i~~~~~i~ . '
- '000 All other commodity -.- 679 -. l o / -.
- 146 - F i e 1 9 legumes .- -- -. . 1,201 - - -- . .- - . - -. -. . . . . - -- 221 . Flour & related products from gram . -. - .. -- - - - . . . .- . 581
i j
Deer 1 -------a-
296 -128- . - .- 1
horganic chernicah . .?!I Household ucenrils -- -- 438 532
, - .- - - -- - - - . - .- - . -. - - - - - . G h s & hoducta (excludin~ bottles) -- 1,800 - - . -- 2,118 - - - - - - - - - .. - - . O b a bottles - 4,805 152 11,758 - Iron & steel basic products . 240 . . -- - - - Metal building pints 60 Road fransport equipment -- 22
221 612
-- 735 818 819 821 825 9 15
OTHER NATIONAL PORTS (DAVAO DEL NORTE) M ~ ~ O T n o w 7
000 AlloLher~ommodity 26 ,821 Iron&sf.eelba&pdW 39
OTIIER PRIVATE PORTS (DAVAO DEL NORTE) 1817 l~iles&buildingcemmka
DAWIS, DIGOS, DAVAO DEL SUR 303
-- -- --
000 125 132 142 146
Minor nowe 16 77 -a-
AU other commoctity - -.-- -- .- - - - Other seafood --- 17 . . - - - -. Milled rice - - - .. . - - . . - - - - . . Peas & beam - -. - - - -- - - -- - - - . 10
. - -- Fieldcrop legumec - --- - - - .- - -
- -- .- -- - - - -- -- -
-. - - - -- - .- - . -. - -- --. . - -
152 Onions & shallots . - --- - - - .- - -. . . . . - . - . . . . . . 155 Orher vepetables - . - . . .--. - - - - -.
---- . 163 Bananas 36 --
--- 163 Temp& finits -.
-- 164 Pineapples -. - .- -. -- -- 110 183 Other processed fi- 72
28 107 634
--- 4 - -
18 -
-
226 227
211 212 221 223 224 225
Meat 10 Dairy products Flour & related products 6-om grain Preserved fiuh & products m---.
Sugar Molasses & related products
191 92 36
--I?!
Other foodprepsmhm Animal Feeds
171 . - -. . - . - .. 78 . - 1 .. 2 1 117
23 1 Fruit & vegetable juices 2 19 20 ... -
-- - .
235 246 - - - 250 . -. --.
Other alcoholic beverages ------ 36 - -. -- - -. - - . -. .- - - 380
By products & remdue of cotton -- 18 ~ .
Tobacco ~roducts - - - - - - - . - - -- -- -. - - - - -- - - 1651 ~ - -
- - -- .. . -
17
Sd .---- OUler non-metallic minerals Gas oils - --- Lubri- --- -- - - - - - -- Other produds Inorganic chemicals Pettochemicals Paints,~&coloringae,ents V i & p l m m c e W SoPp&toiletrieP Tirw
412 4 19
- 5 1 3 . 522 523 6 12 619 711 712 713 722
1 . ~ 1 8 ~ - - .- - . - -- . . . - - . .- --
0 - . . - - . . - . - - - - . 30
-. - . . - . . - - - . - - - - - . 11 -
17
. . - - -- 30 - 43
124 273
-- -- 18 -.
44 -. . - - - 2
1 % T - - - 8 p J
- - --- -
--
- . . -. - . . -. .- 18 .-
7
3 37
313
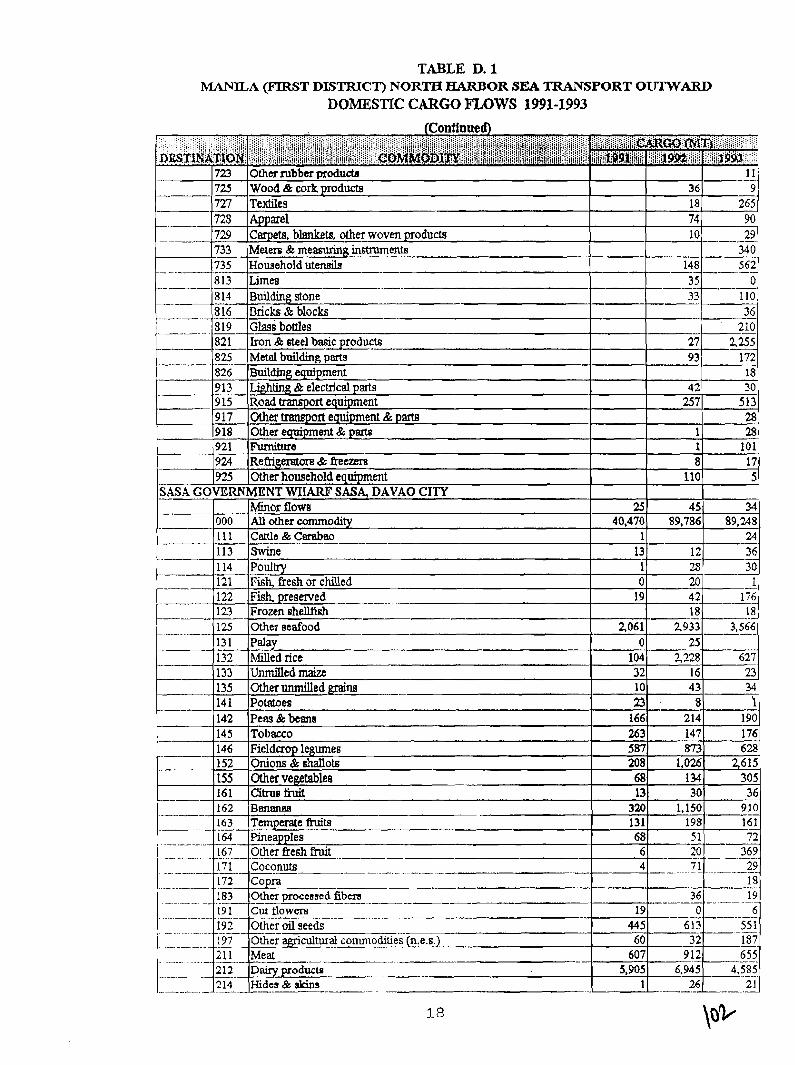
TABLE D. 1 MANILA (FIRST DLSTRICT) NORTH HARBOR SEA TRANSPORT OIJTWARD
DOMESTIC CARGO FLOWS 1991-1993
13 30 36 320 1,150 910
p-.
-- 131 198 161
.- 68 5 1 72 -- - 20 369. 6 - - .
7 1 29 4 .- - - . _. . - -. .. . - - - - -. .- -. 18
55 . - 19 19 1 Cut flowers 0 6
445 6 1 3 - - - 55 1 60 32---- 187
- -. . . - 607 912 655
------- 5,905 6.945 4.585
---- 1 26- --..A
2 1
3.8
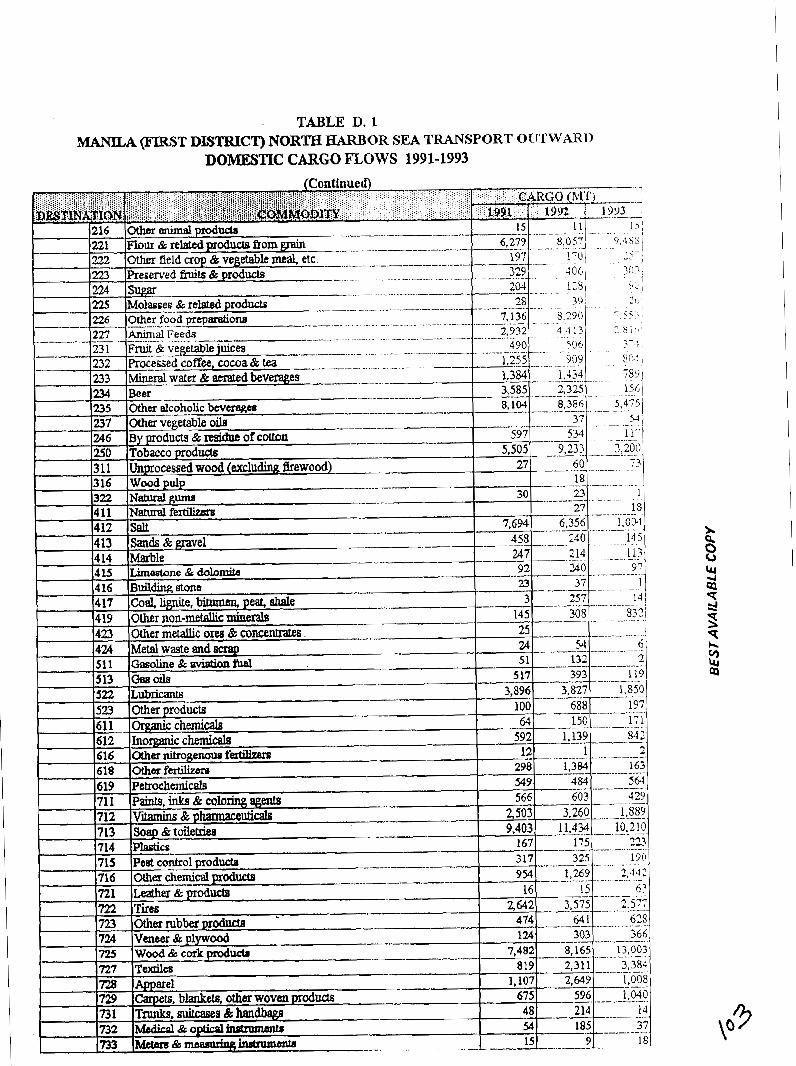
TABLE D. 1 MANTLA (FlRST DISTRICT) NORTH HARBOR SEA TRANSPORT OUTWARD
DOMESTIC CARGO nows 1991-1993
- - - ...-.........-.. -. .. ..-....-......
..- ......... .
.- . . -. -. . --. .
. ....... .. - - -.
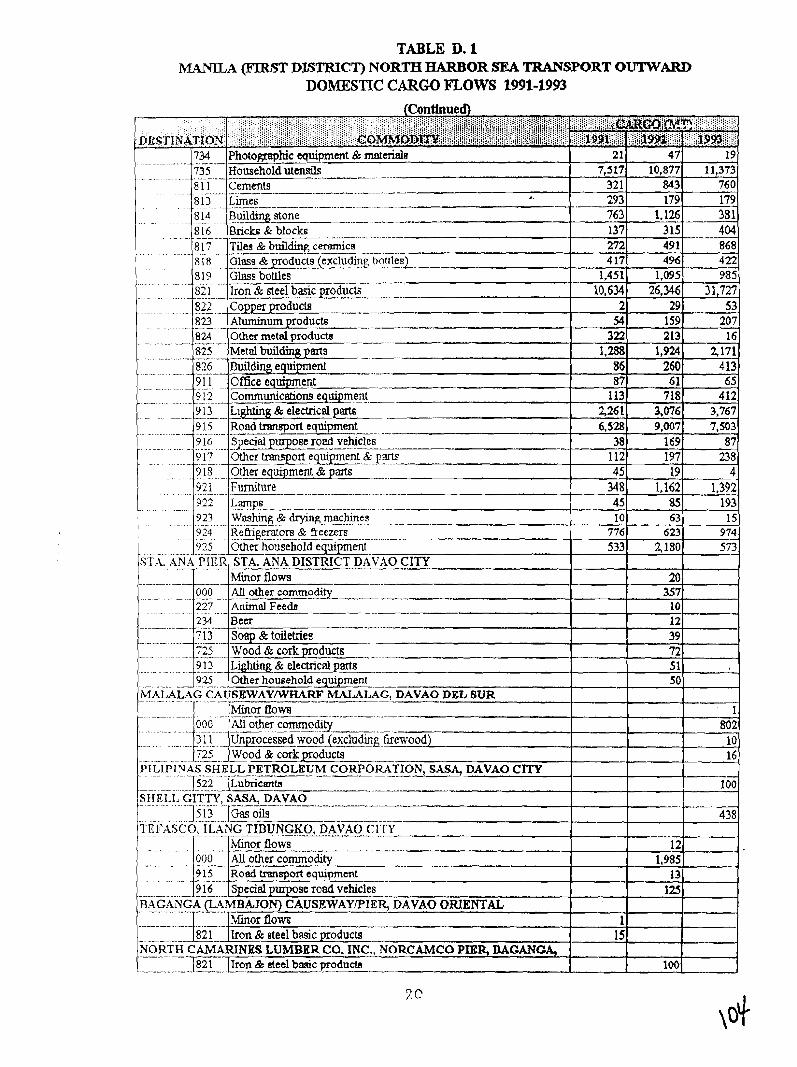
TABLE D. 1 MANILA (FIRST DISTRICT) NORTH HARBOR ,!SEA TRANSPORT O1WWA.D
DOMESTIC CARGO mows I~I -1993
.... :.::::::; :;:;: i...:,:.;; .:.: :; .... : ......... :::.; ::::., . . . :...;::::.:.::i;;::::.:::...:.:.:.:::.: i.. .......... [Continued)
. . . . . . . . . . . . . . . . . . . . . . . . . . . . . . . . . . . . . . . . . . . . . . I : ................................... 4 ......,. :.:.: . . . . . . . . : .................... : :.: ......... :::,:;::.:> ::;::.: ....... : : : ....... ::::::::::::!:,;:::>,k:::;:,:::,k:::;:::,:.? . . . . . . . . . . . . . . . . . :.: ... :. ..:I::.:.::::,::::,:;::j:/: . ....... .......... .......................I............. : . . . ,.:.;.:.. .......... ............ ,,.; ............................................... .: ........................... :,:. ;l::i::;!:::3!:!:i::::lii:
DftSTf,NATji~sj i::ii;$$/i/iii$iiiiii:iijjii;,i:iiii$~~ j:ij/ii$jjlieb~~a~1m~@g,m,ij, 734
-. - .- . -. - - - -. .. - - - - 735
.- .-- - . . . .... 81 1 Cements 32 1 843 760 - ........... 8 13 Limes 293 179 179 ,.
............
8 14 B u i l a stone 763 1.126 38 1 . .
8 16 Bricks & blocks - -- -. ......
8 17 Tiles & build in^ ceramics . . . . . . ..
. .~ 918 . . . . Oless &poducts (excluding botrle .-.-
8 19 Glass hues . . . . . . . . - .... .- . -.
821 Iron S: steel b a s i z d u c t s --- ... - - -- . . . . . . .
822 ~ c o ~ o d u c t s - . -. . - ..-.... -. - - .. - 823 +uminum products
... - . - . -. -. .. - - -. . -- 824 Other metd product~ --
. -. ...... -- 825 Metal bu.ild.mg parts - -..... -- P. -
- -- - 876 Building equipment . ...-.. ..
Xi- Office equipment - - .... 9 12 Communications equipment-. -. -. ...... - ..... ---
9 13 Lightm-mt6 . . - . - -. . - - - -- . - - - -
... .
-- DAVAO CITY .- -- -- - -- - -. . -
-- . -- - - - . .- -
Photogmphic equipment & materiala . -- Household utensils ---- --.----.-- --
21 7,517
47 10,877
19 11,373

TABLE D. 1 MANTLA (FIRST DISTRICT) NORTH HARBOR SEA TRANSPORT OTJTkVAKD
DOMESTIC CARGO FLOWS 1991-1993
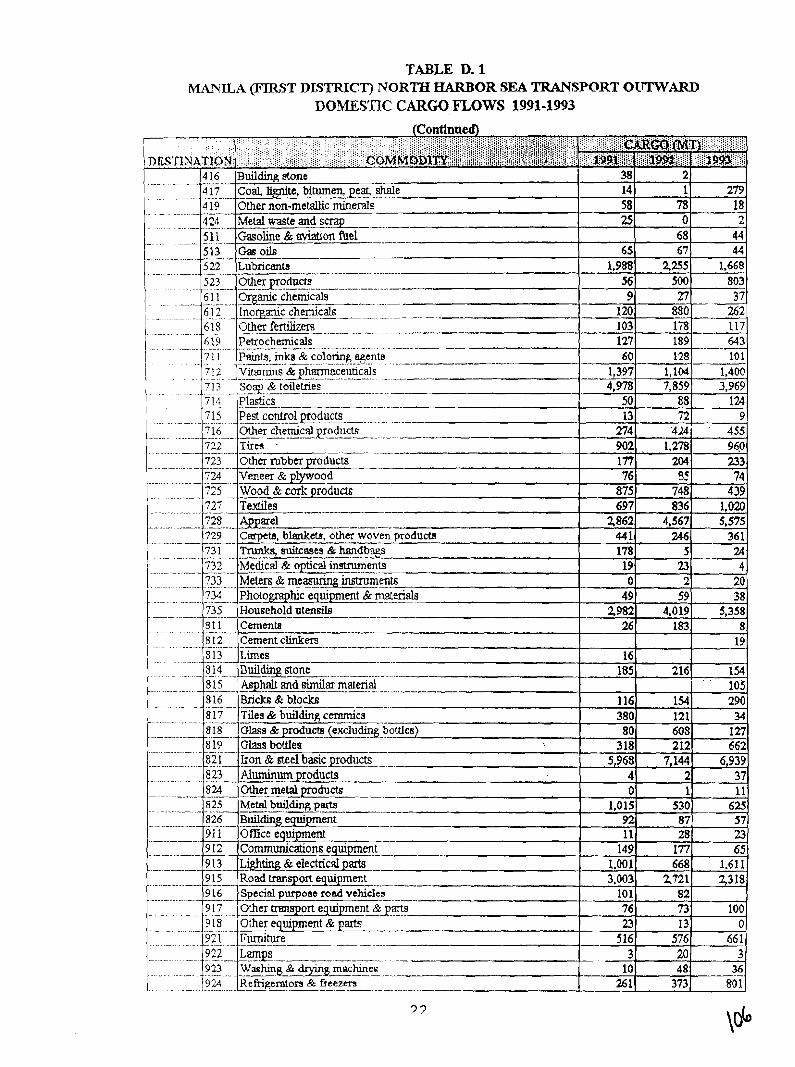
TABLE D. 1 MANlLA (FIRST DISTRICT) NORTH HARBOR SEA TRANSPORT OUTWARD
DOMESTIC CARGO mows 1991-1993 (Continued)
. . . ." DtL!FrlNATION : .. .:.:, .:$ .. .
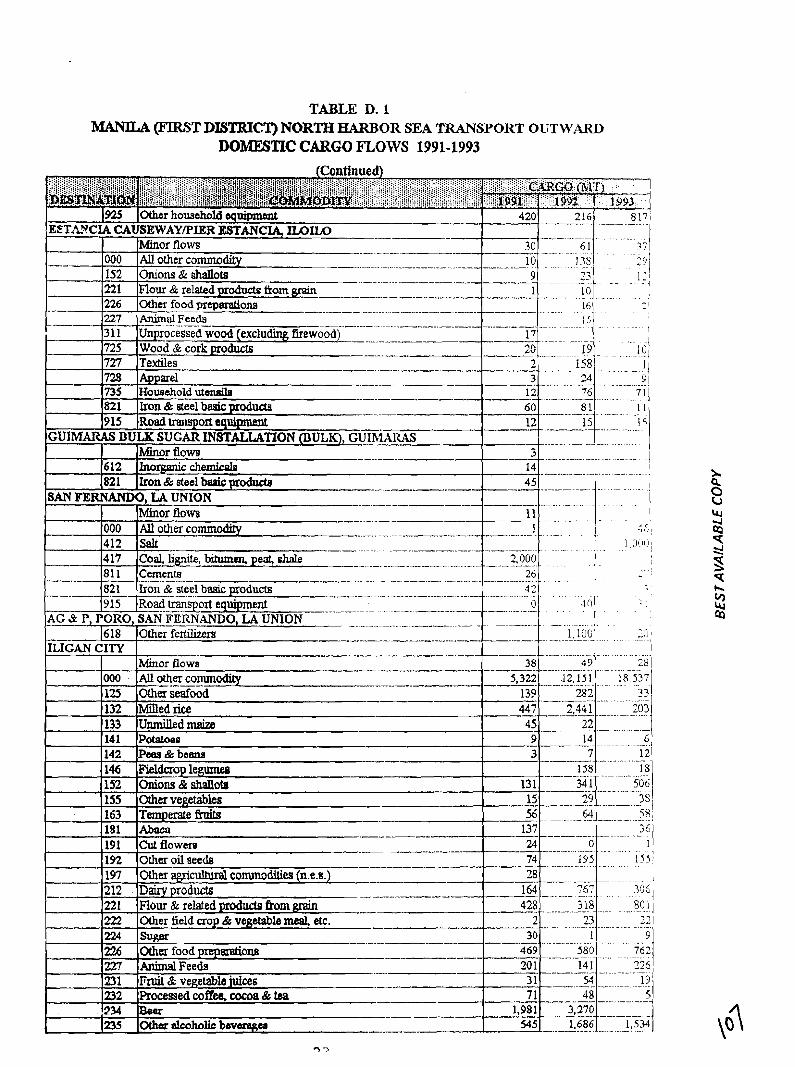
TABLE D. 1 M A N I U (FJRiiT DISTRICT) NORTH HARBOR SEA TRANSPORT OUTWARD
DOMESTIC CARGO mows 1991-1993
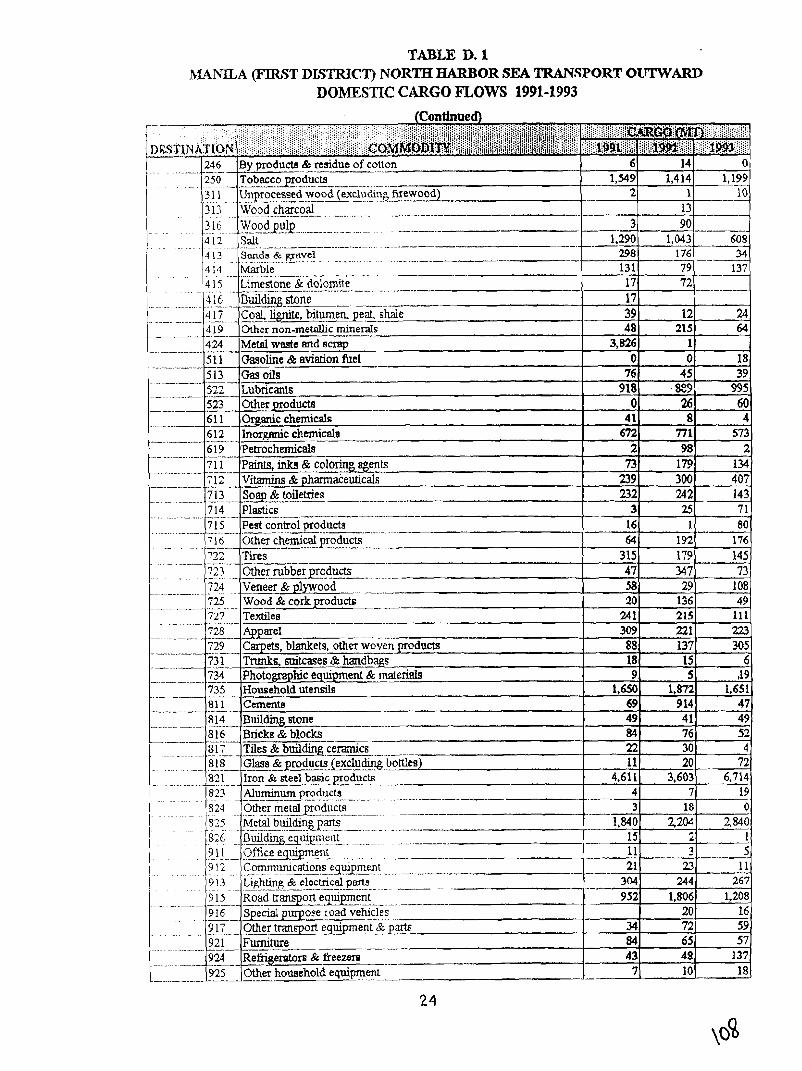
TABLE D. 1 hANJLA (FIRST DLYlXICT) NORTH HARBOR SEX TRANSPORT OZrTWARD
DOMESTIC CARGO FLOWS 1991-1993
(Continued) .
- 246
. . . . . . . . . . . . . . ............ .:.;.:.:...: .:..:. ;:: . :., .:.;.:.:.. .:.. ................. ;.i.i.j.j.j.i. ......'....... . ....................... ""...... .................................................................................... :,::::::::;:*: ::.:. ::!.:::.:.:: ::~::::::j~;:;~~:i!;!~jj . . . . . . . . . . . . . . : : : ::ii~::ii,iiiii~~~:iiiiiijifIIijiiiijiiii~i;jI~;,i,iitiii~~~i,j~i'i~~fi~jj;:~ii~~ ~ ~ i ~ ~ ~ ~ ~ ~ , : ~ ; ; ; ~ ; ~ ~ ' : ~ ~ ~ ! ~ ~ ~ ~ ~ ~ : ' : , ~ i ~ ; ~ : , : , : i , : ~ : ~ ~ ~ ~ ~ ~ ~ ~ ~ ~ c o ~ ~ o ~ l m : i : ; ~ ~ ~ ~ ~ : ~ : , ~ ~ : 8 : l ~ ,::l,~;::,::.:.::~lj:;j;iiiijji~~:,~:;:~i:i::~~;;~~~::,~,: 1 ,,:! l l l , i ~ ~ , i , i , l , i ~ ~ , j : ~ :,;,.; ~ i , ; ~ ; t v / c i l i : $ ~ ~ i < ~ ~ ~ -- ' -
- ........
. . . . . . . . . . . . . . . . .
By products & residue of cotton .------- - Tobacco p~oducte _ _ - 250
3 1 1 . . . . . . . . . . . . 3 13
6 - 1,549
2 Unprocessed wood @ l u b a filewood) ... -- -.- - -- -- . - -0 . . . . . Wood charcoal . ....... . . -- 13
14 1,414
1
----
0
1-,199 10 ----
Metal waste and a
..---
Wood & corkproducts
. --- ... .. - -. - - .----..---a
. . .
. -. -. .. - .. - ... - .- . . "t- .-
-. -. - ......
- .
24
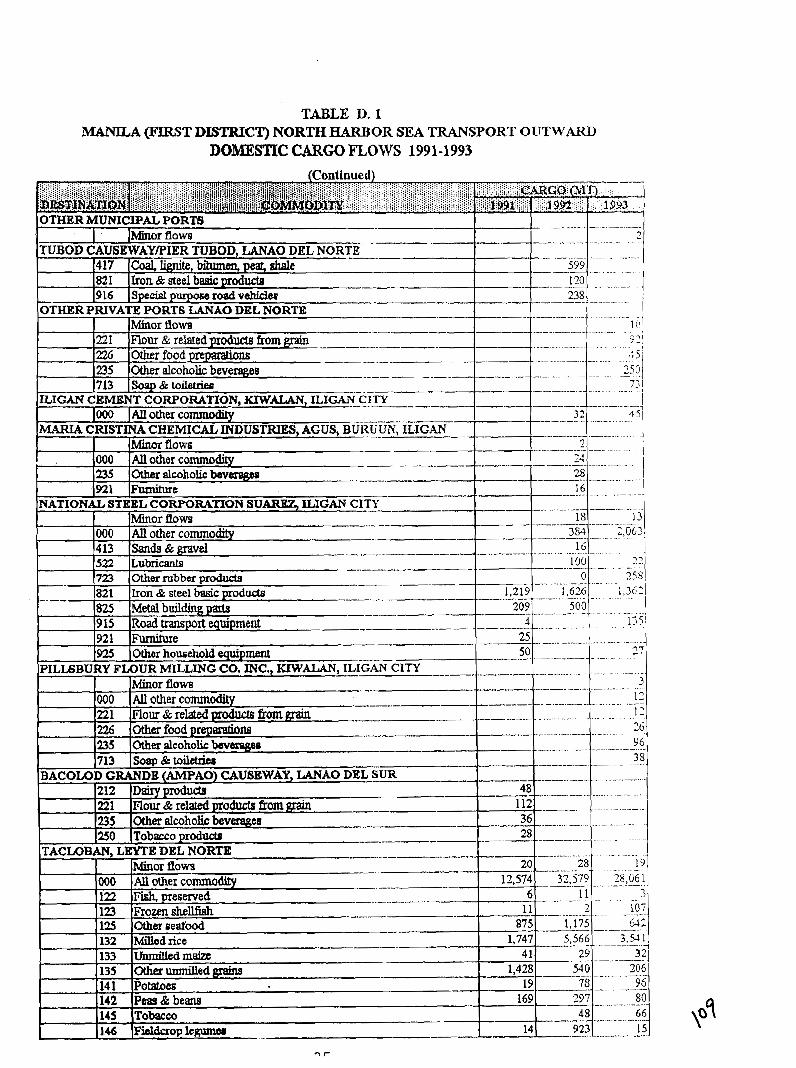
TABLE D. 1 MAMLA (FIRST DISTRZCT) NORTH W O R SEA TRANSPORT OlrTWARD
DOMESTIC CARGO mows 1991-1993
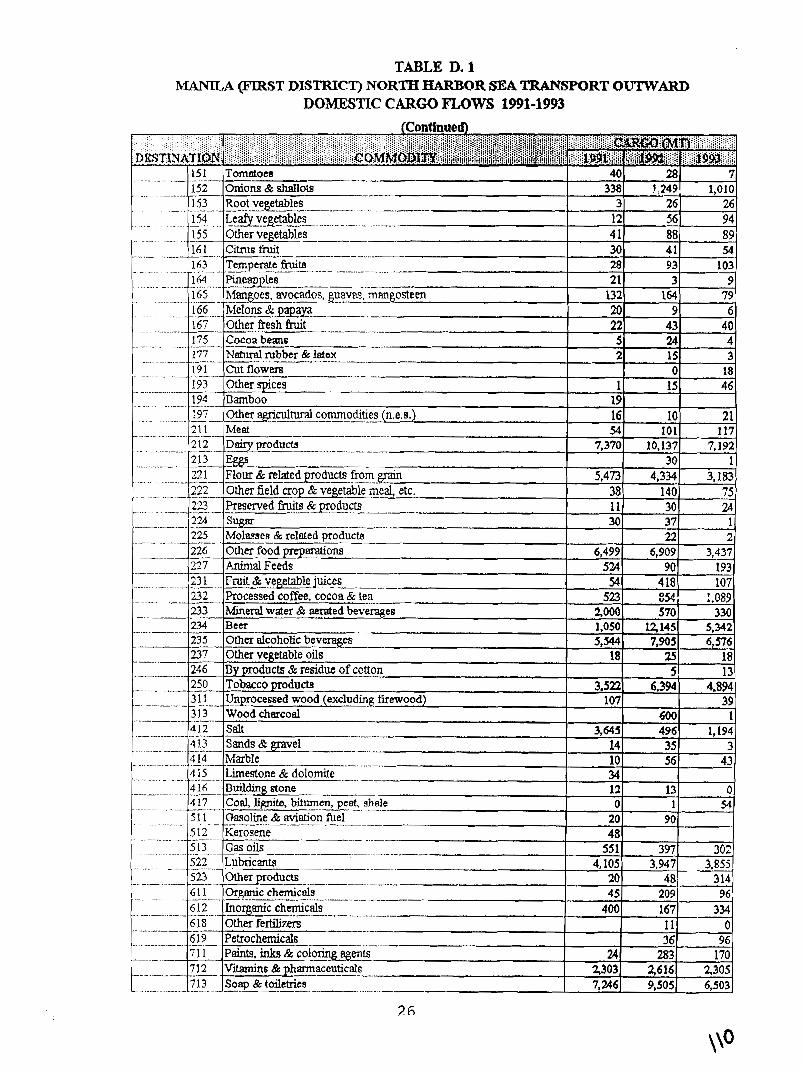
TABLE D. 1 MANlLA (FIRST DISTRICT) NORTH HARBOR SEA TRANSPORT OltTWARD
DOMESTIC CARGO IFLOWS 1991-1993
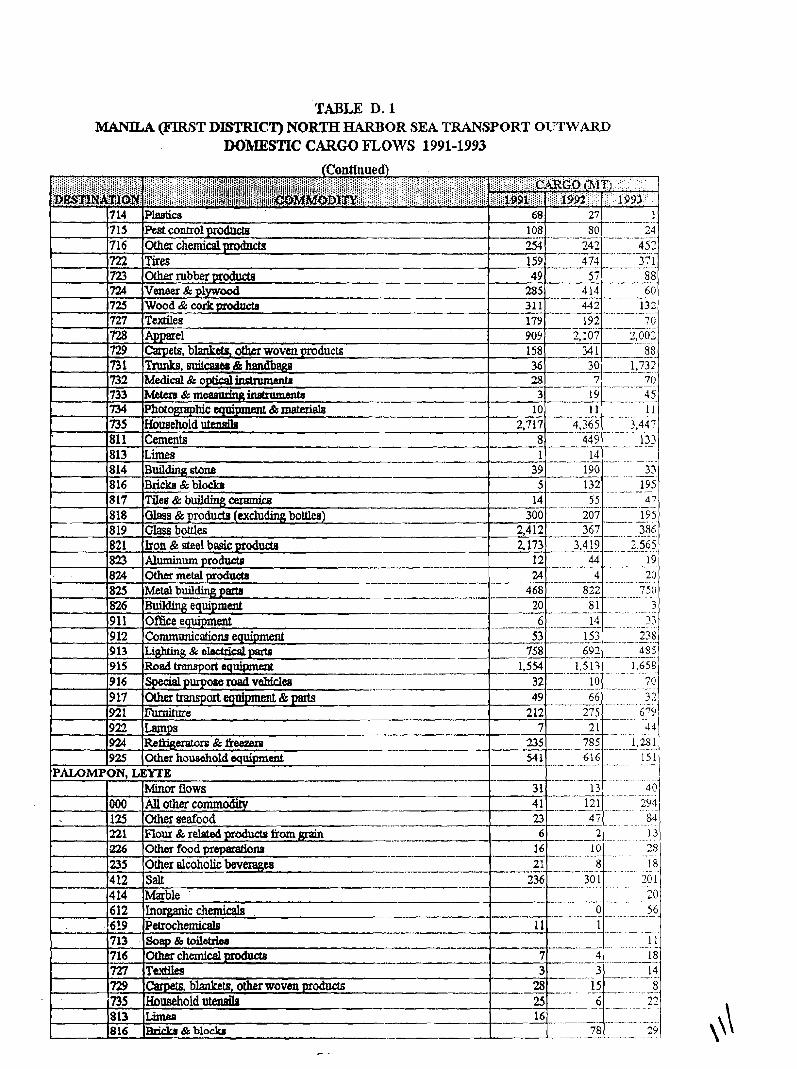
TABLE D. 1 MANILA (FJRiiT DISTRICT) NORTH HARBOR SEA TRANSPORT OIJTWARD
DOMESTIC CARGO mows 1991-1993 (Continued)
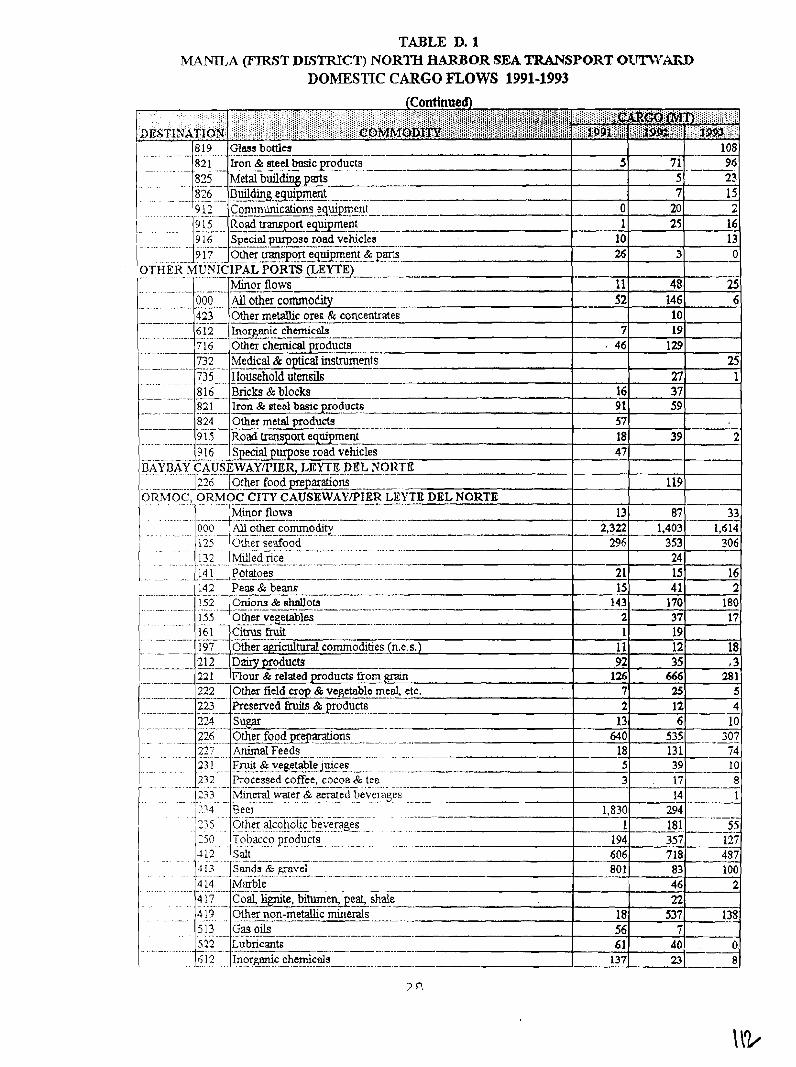
TABLE D. 1 IKWlLA (FIRST DL'3TRICT) NORTH HARBOR SEA TRANSPORT OlmYiLT&
DOMESTIC CARGO mows 1991-1993
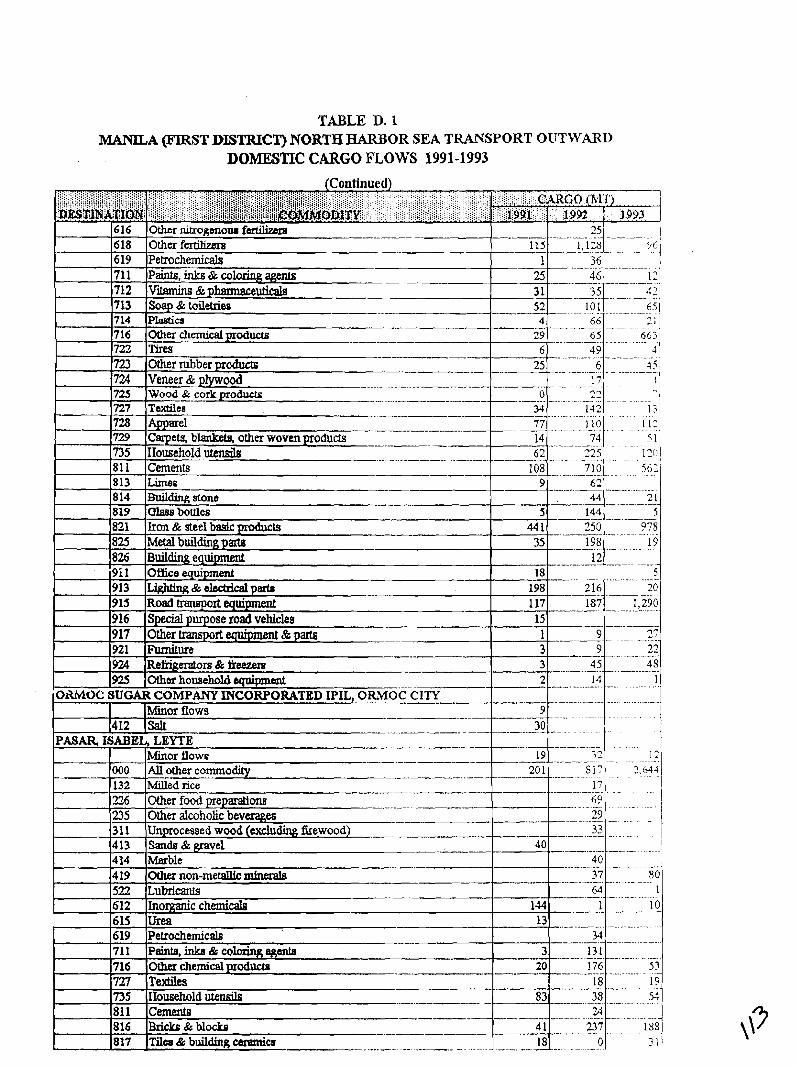
TABLE D. 1 MANILA (FIRYT DISTRICT) NORTH HARBOR SEA TRANSPORT OUTWARD
DOMESTIC CARGO FLOWS 1991-1993
Eontinued) .......................................... iii;ii;i;i;i;iiiii;iiiiiii:iiiiji;jiiii ........................................ nernrvkxl& Y . ' - - . - . . .-lt...
616 618 619 711 Paints,~&coloringagenls --- 25 4 6 - - -- .- - 12 - .
712 V.i&phmmace* 31 35 4 7
.. - - - . - - . . - . . . . - .. -. . .
:::::.:::::.::::::!:'.'.'. , ......... ..... .,...,.,....,.. ....... . . ..... , .; ,,.,...,., , , ,.,:,.,., , :.,: : .::; .;:i:i:::;l: :; : . : , : ' ; , i : i ; : i : ; : i :, :::,;, i ; i : i i i i i i . i : i : i : ; i ; j ; j i i ~ , ~ j : : : f i ~ : i < ; ~ ; ~ ; ~ ~ ; ; : ; : ; ! ; j ; ~ ; ~ i ~ i ; ; : : ~ ' : . ::i:~:;:,:::,:::-::::l:l:r2,:,~i8:ti,1::, \:fi; :! ::Ij(, , . . . .,.:.:,,: : . . . . . ... :..:..-.:.:.:.:;.I :.: .... . . . ..... 1: iii;iiii-i;-;:i~i;~iiiiiiiiiiiiii!jI~iiiiiliiiliij~~~~~~~~~iii~;~j:3:iiiii~i~i;;;:iiiii-;ii~i~~;j:~~~lsplf ,:.: ..,. :!; .... ::/:/i:i.:.:.l:. ,:: . - ................................ . . - - . .I..- Othm nhwgonoua fcrtihm Other fenikm Petrochemicals
:::,;.: ;: :::,:,:, :::::;::.::::1:1.1...' . . . .....O\RGO NI'I' 1
:.:..:. ,,,gaC iw ----
115 - 1
- 25 - - - - -- .- -
1,123 -- -- - - . .
yti i -- . . . . . -- -- 36
~..
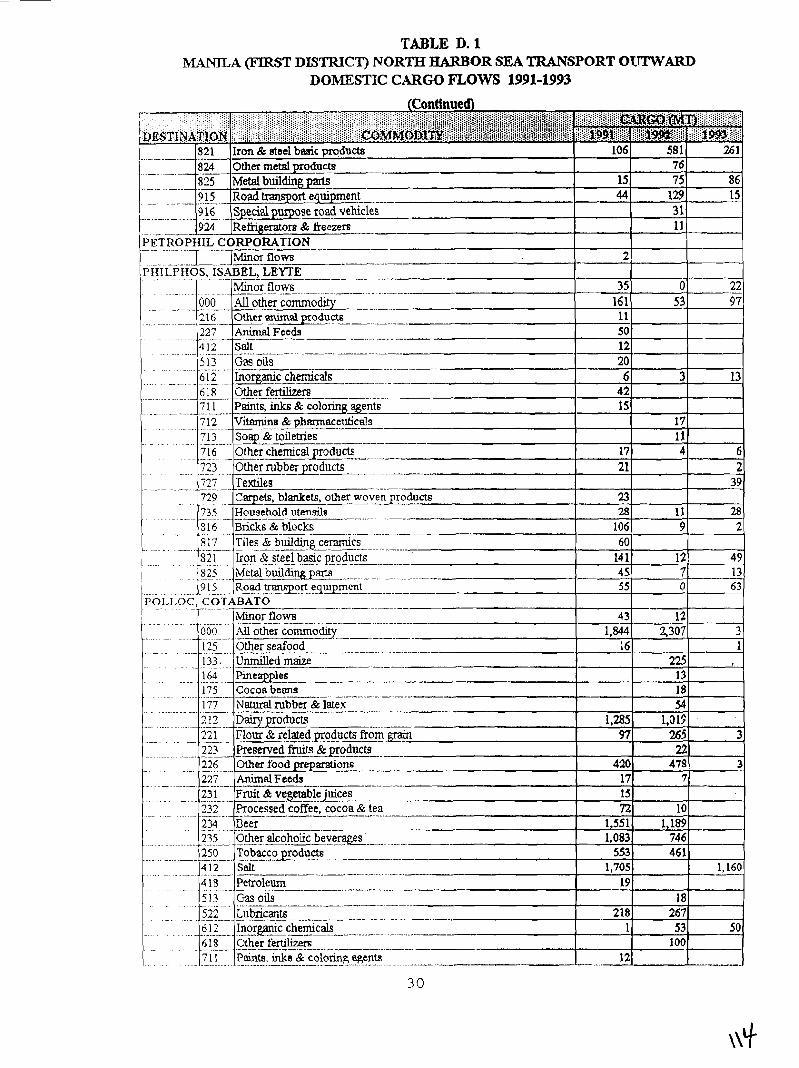
TABLE D. 1 MANILA (FIRST DISTRICT) NORTH HARBOR SEA TRANSPORT OtrJrWARD
DO~MESTIC CARGO mows 1991-1993
..............
, .... -.......-
.....................
POLLOC, COTABATO
133. Unmilled maize
226 Other food prepamtions -- .....-.......... ......... 227 Animal Feeds ......-. -......
.................
234 Deer
250 T o b a c ~ o d u c t s - .- - -- ........
412 Salt . . . . . . . . . . . . ~ ............ - ............
418 Petroleum 513 Gasoils
6 12 Inorgantc chemicals . . . . . . . . . ~ ..........
h 18 Other terhhsm ....... ....... ---- 7 1 1 Paints, ink8 & coloring egents ....................... . -- ...
30
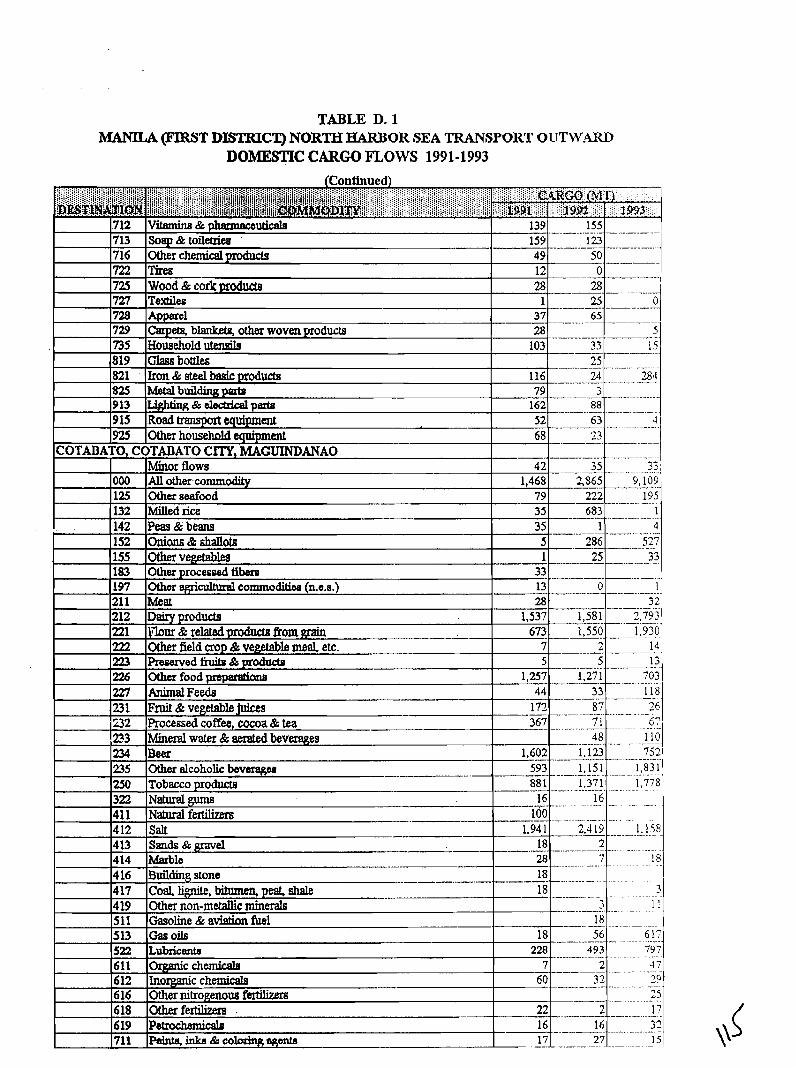
TABLE D. 1 MAMLA (FIRST DISTRICT) NORTH HARBOR SEA TRANSPORT OUTW.4RD
DOMESTIC CARGO mows 1991-1993
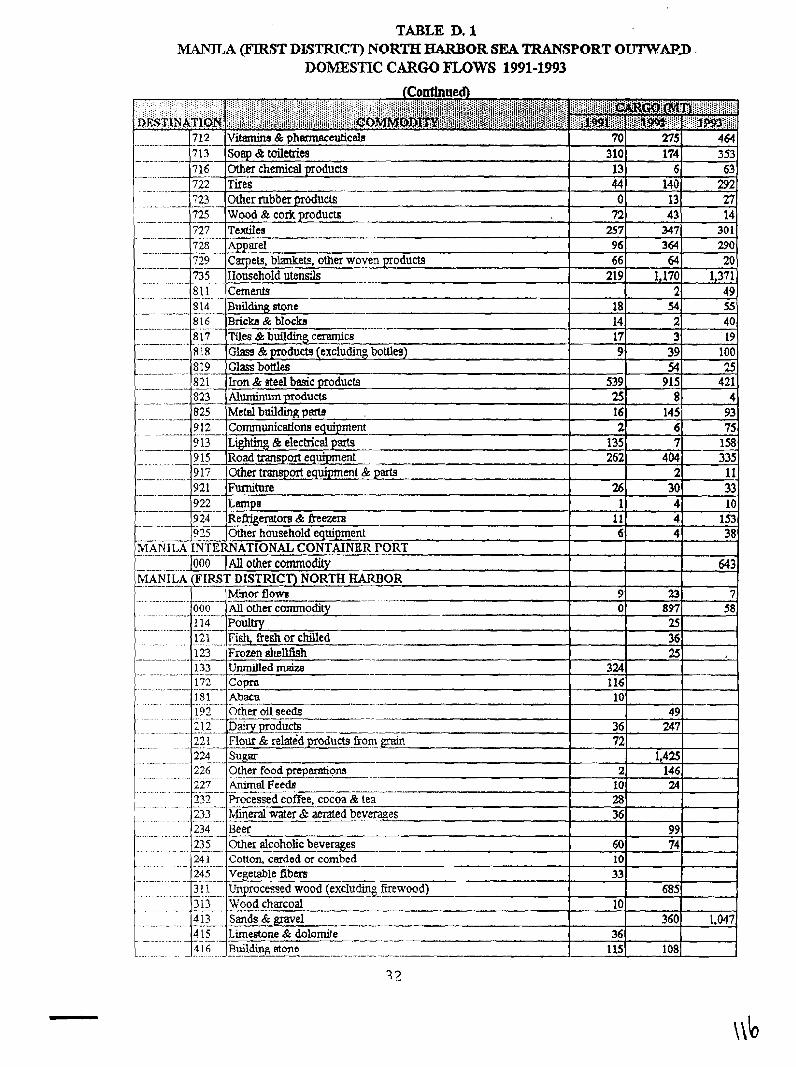
TABLE D. 1 MANILA (FIRST DL'3TRIC.T) NORTH HARBOR SEA TRANSPORT O T ~ ~ h P D
DOMESTIC CARGO F'LOWS 1991-1993
Mineral water 5: aerated bev
. - - - . . - -. . . - . -
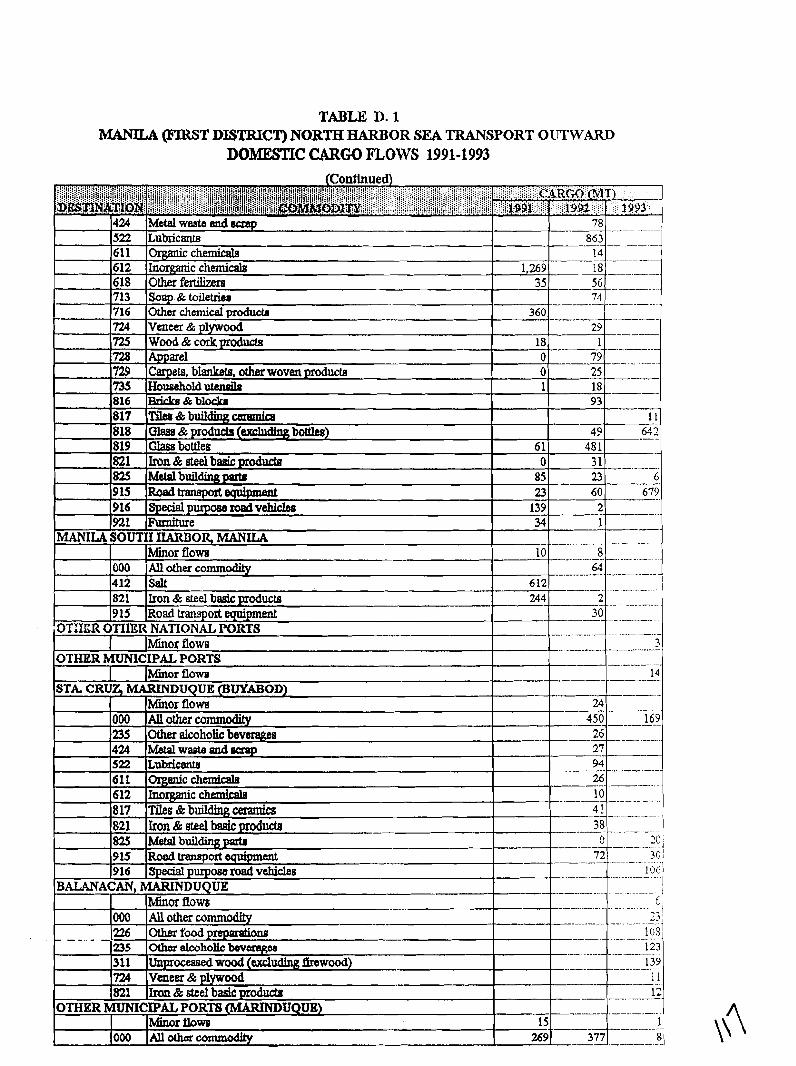
TABLE D. 1 MANlLA (FIRST DISTRICT) NORTH HARBOR SEA TRANSPORT OIJTWARD
DOMESTIC CARGO nows 1991-1993
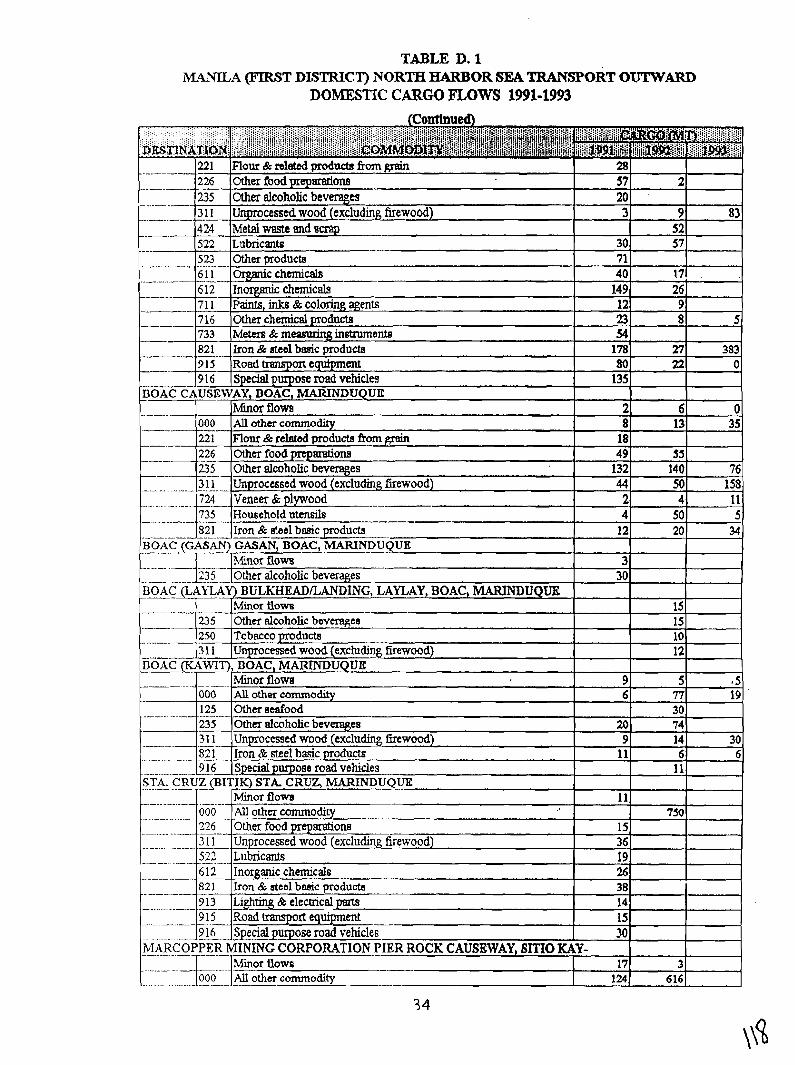
TABLE D. 1 MANILA (FIRST DISTRICT) NORTH HARBOR SEA TRANSPORT OUTWARD
DOMESTIC CARGO FLOWS 1991-1993
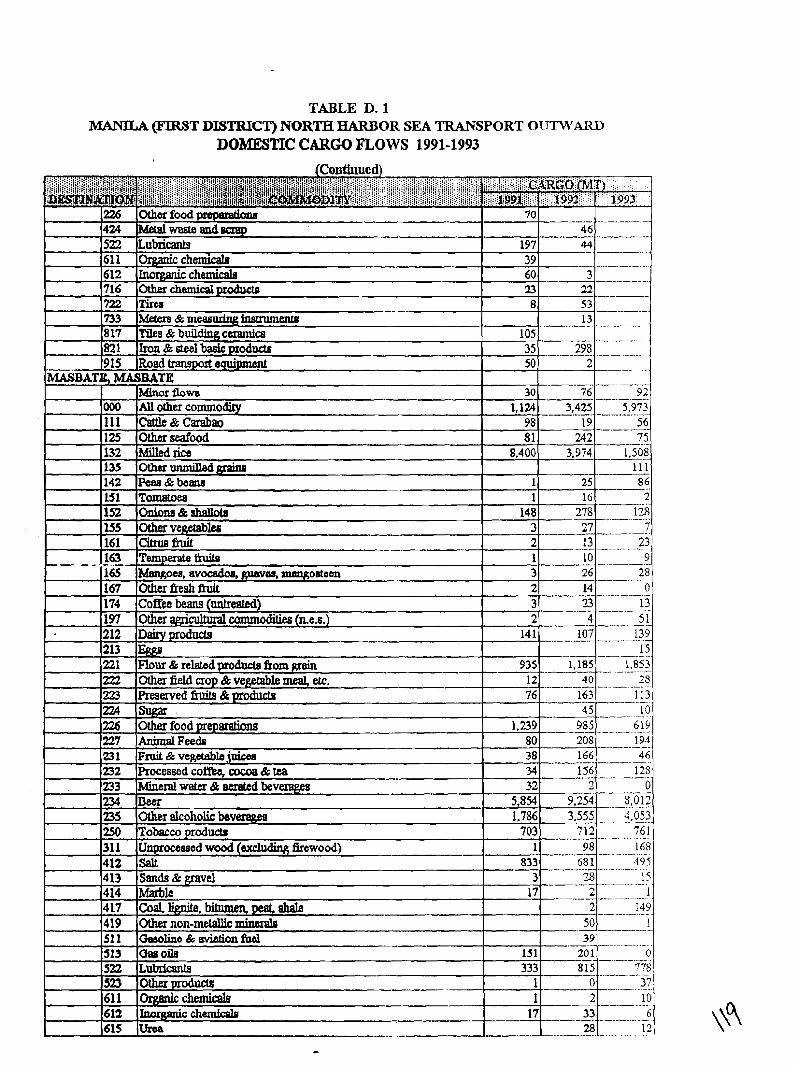
TABLE D. 1 MANILA (FIR~T DISTRICT) NORTH HARBOR SEA TRANSPORT O'CTTN~ARD
DOMESTIC CARGO mows 1991-1993
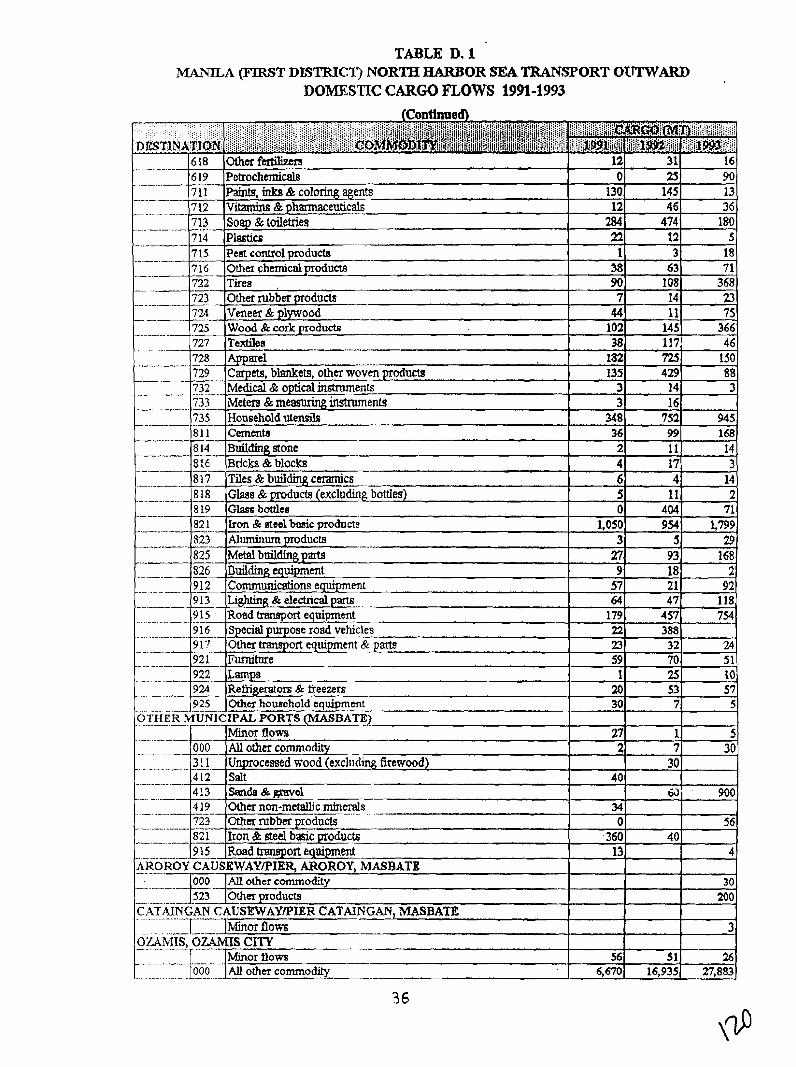
TABLE D. 1 MANILA (FIRST DL5TRICT) NOR= HARBOR SEA TRANSPORT OUTWARD
DOMESTIC CARGO JXOWS 1991-1993
- .- - -- -
MIS, OZAMIS crn
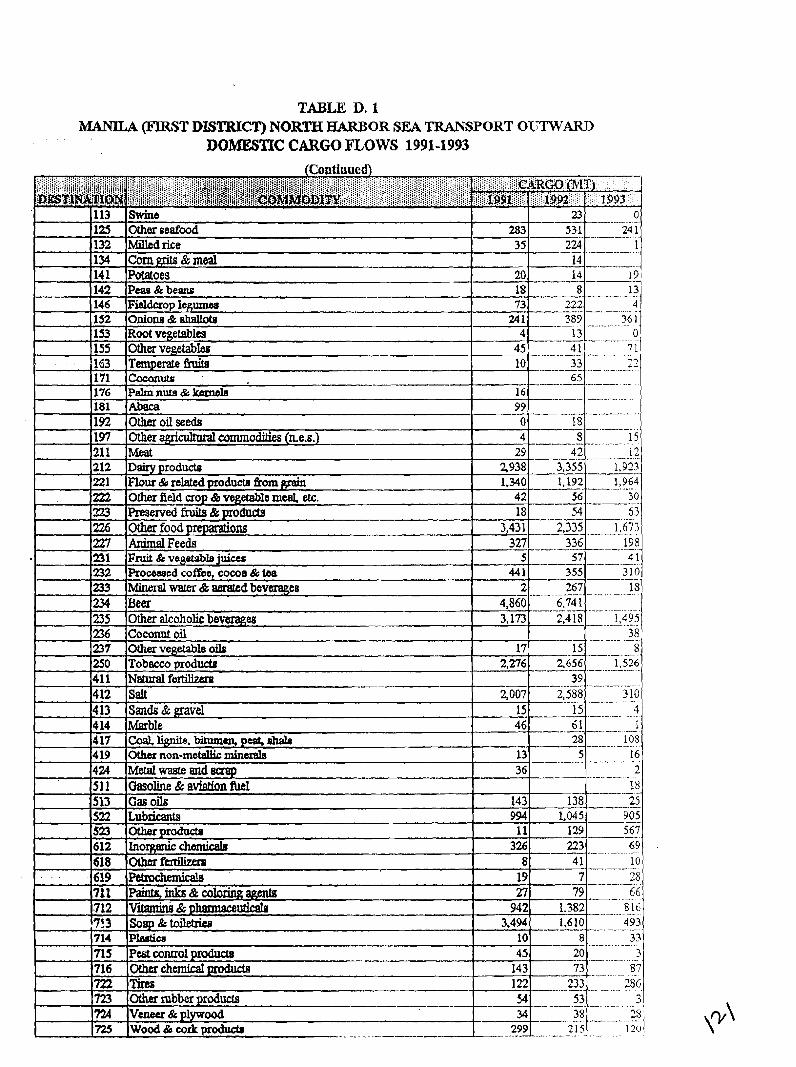
TABLE D. 1 MANILA (FD&9T DISTRICT) NORTH HARBOR SEA TRANSPORT OUTWARD
DOMESTIC CARGO FLOWS 1991-1993
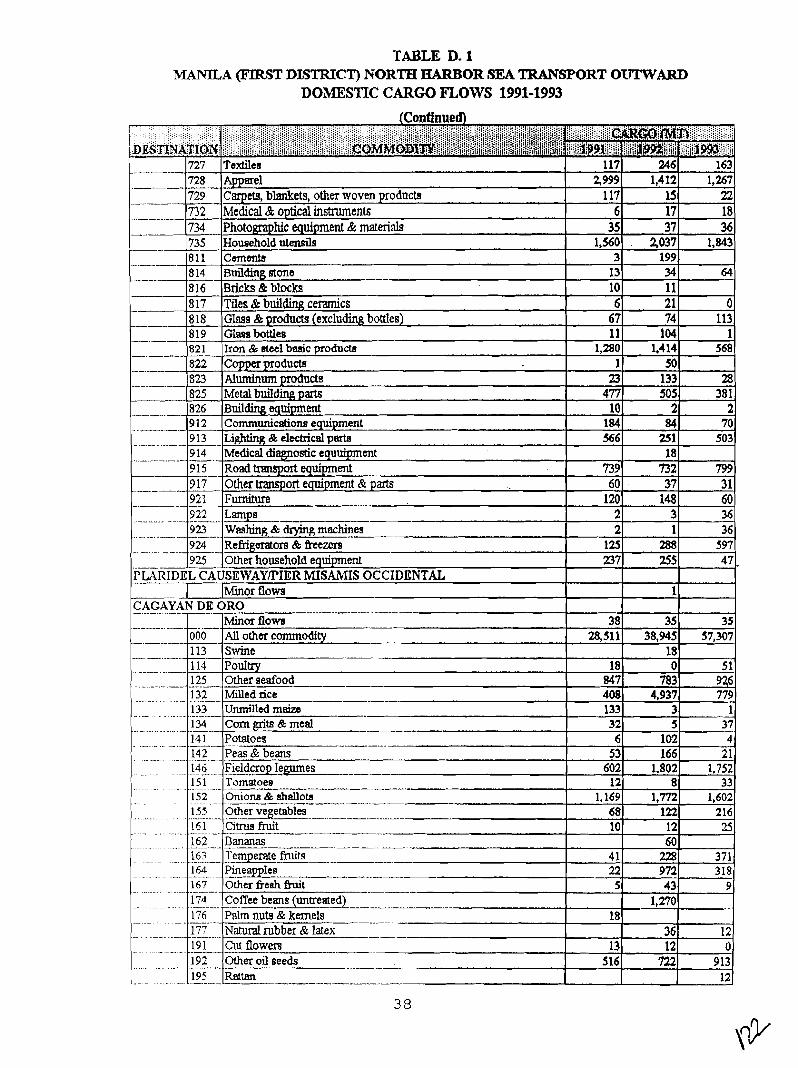
TABLE D. 1 MANiLA (FIRST DL5TRICT) NORTH HARBOR SEA TRANSPORT OUTWARD
DOMESTIC CARGO FLOWS 1991-1993
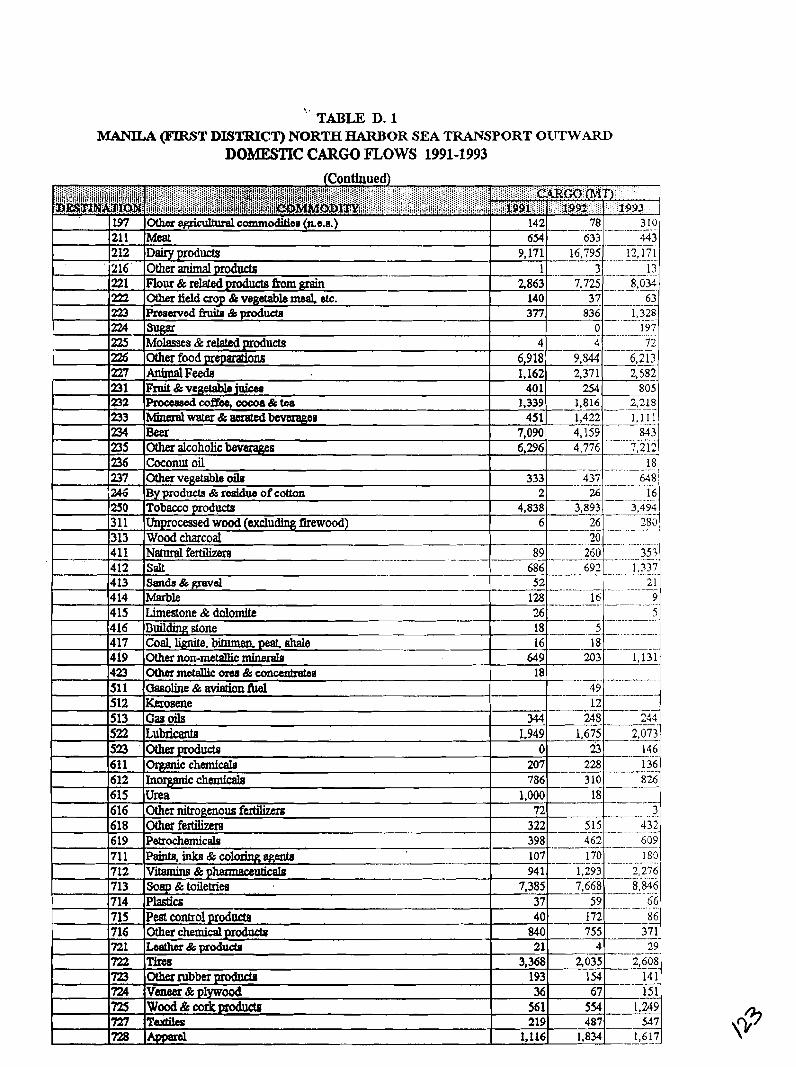
\ ' TABLE D. 1 M.ANlk% (FIRST DISTRICT) NORTH HARBOR SEA TRANSPORT OUTWARD
DOMESTIC CARGO nows 1991-1993
-
711 712 713 714 715 716 721 722 723 724 725 727 728
Psints,inke&cobring~enfn Vitamins &phamaceuticd~ - Soap&tdehies - Plastics Peat control producta Other chemicalproducta Laathsr&produdr Tiree Obxrubberprobuds Vmeca& plywood Wood & corkprodads c ax tile^ Apparel
107 94 I
7t385 37 40
840 21
3,368 193 36
56 1 219
1.116
170 .- -- 180 .. .- 1,293 2,276
7.668 - - . . 8,846
-- 59 - 172 - 7s5
4 2,035
1 54 67
554 487
1,834
66 -- ---- 86
371
- - . - 29 - - - ---.. 2,608
14 1
151_ 1.249
547 1,617 -- - -- --
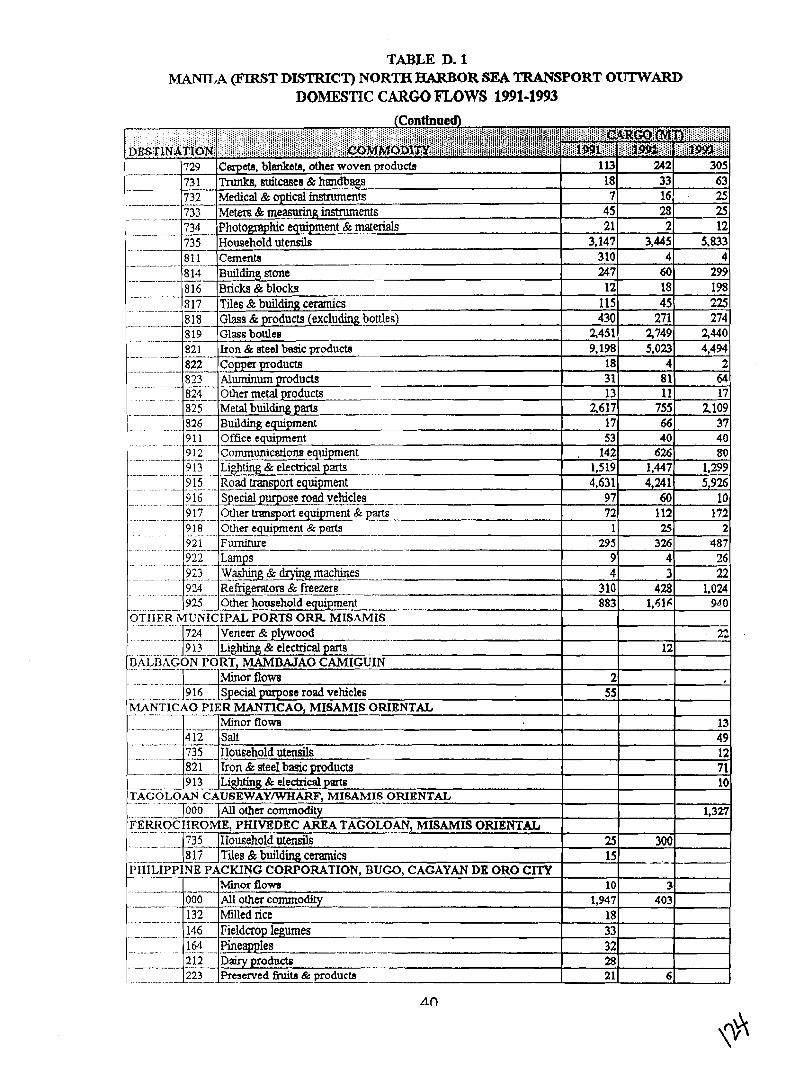
TABLE D. 1 MANILA W 9 T DL9TRICT) NORTH HARBOR SEA TRANSPORT OUTWARD
DOMESTIC CARGO mows 1991-1993
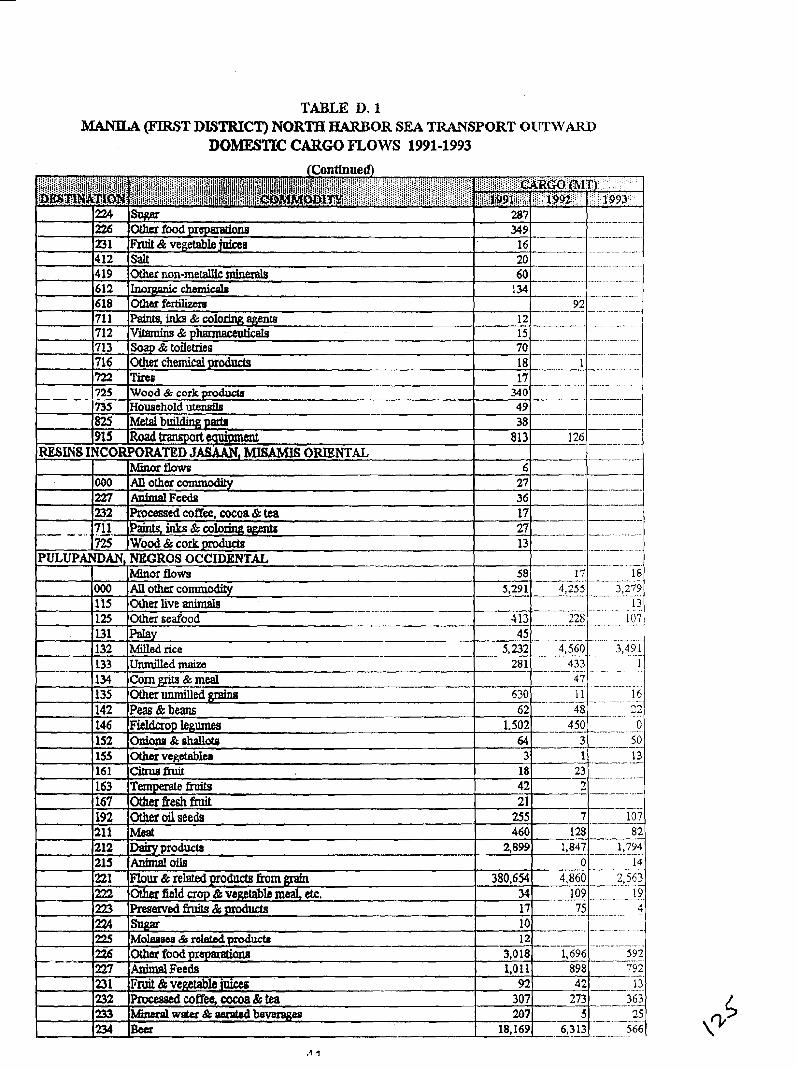
TABLE D. 1 MANaA (FlRi3T DISTRICT) NORTH HARBOR SEA TRANSPORT OUTWARD
DOMESTIC CARGO mows 1991-1993
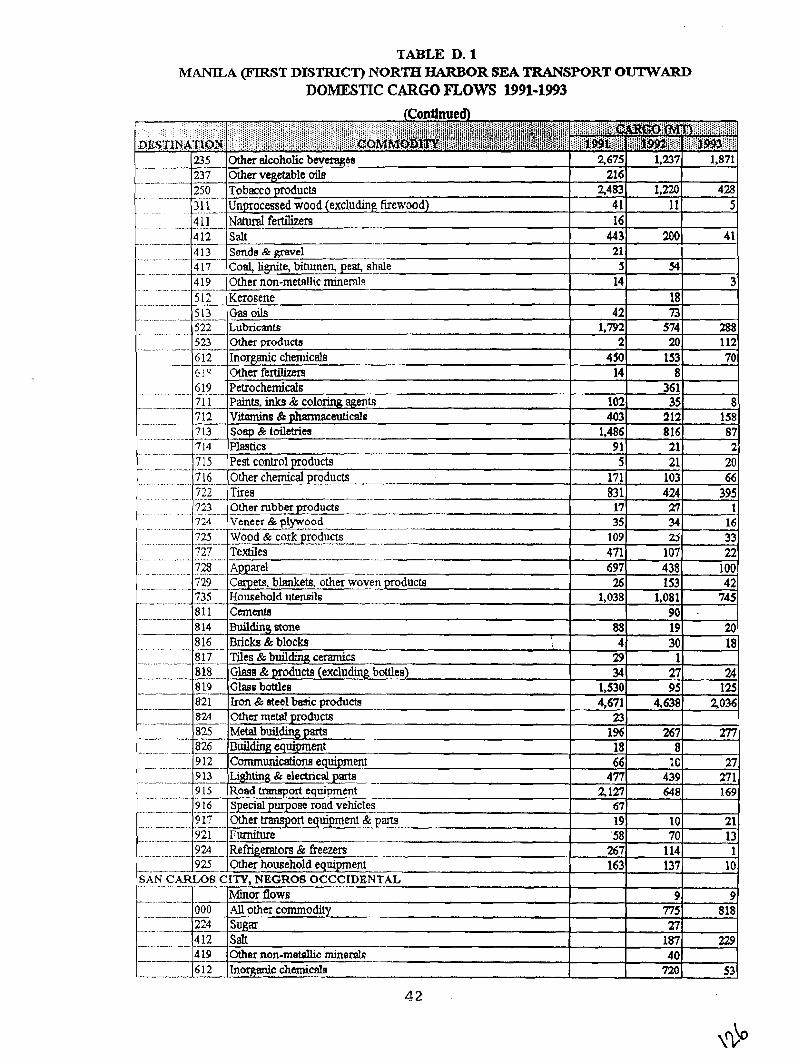
TABLE D. 1 hlANEA (FIRST DISTRICT) NORTH HARBOR SEA TRANSPORT OILITWARD
DOMESTIC CARGO mows 1991-1993
. . . (Contfnnned)
. . . . . . . ;. , ::::::.;.:: .:::..::i:i:i:.:::~:i:j:j:j;::i:j:::j:j:::::::::j:::j:::,:~:::,:::j:j;,1~:j:::::j:~:i:jj~j~~i':i;~;ij:j:j:~:i:i:;:::j~ii~~i~~~~~;~i~, ??!'fiI,:i:::i:::;:;. . . . . . . t . . .: : : ::.. . . . : ..:. :.:.;... :.:::: :.:. .:::ii:::::!::::::::::::;~ji~;j;ijj::jjj::::::~::.:.:;:::.:.:::::::::::: . ? .... ,.% .,.,.: ,,..,, , . :.::.:.::.::: . . . , . . . : : . . ......... . . . . . . . . . . .:.::i:i: ?i ::::,:,:.:,::,:,:, ::;:;!::~:j;;;;;:~;i;~;;:!~;:;;j~jjii;:~:::::!j:;:;~g:!;!~;:!:!~!~;;~;;~~;, ~ ~ ~ ; ~ l ~ : : ~ l ~ ~ ~ ~ j ~ ~ ~ ~ ~ ~ i ~ ! ~ ~ l ~ ~ ~ ~ ~ :D&$nNATsoB; iiii'iiiiiiiiiiiiiiiijiiiii~iiiiiii~iiii,iiiiiii~GOMMa~f,m:::I:~i~~:jj~~~fi:.:p~~~~~~~~'~~, ....... pii1:,pp~.:..
I-
.. - - - - - - .. - 235 Other alcoholic bevererftea 2,675 1,237 1,871 237 Other vegetable oils - 216 250 Tobacco products 2,483 1,220 428
..................
31 1 Unprocessed wood (excludingfirewood) 41 11 5, ................
...............
- . . - . - - - ..
--- Natural ferthm - -
Salt - Sande&e;revel - Coal, lignite, bitumen, pea, shale Other non-metallic mine& Kerosene Gasoils
4 1 1 412 .- 413
16 443 21 5
14
42
.- . ........ ..
- .........- .
- -- ............
....
- - 522 Lubricants .-......... .. 523 Other products
1,792 2
450 14
102 403
1,486 9 1 5
171 83 1
17 35
109 471 697 26
1,038
88 4
29 34
1,530 4,671
23 1% 18 66
477 2 127
67 19
'58 267 163
4 17 --A
3 19 - -- ... 512 513
..
-- ---
..........
200
54
18 73
4 1
3
574 20
153 8
361 35
212 816 21 21
103 424 27 34 Zj
107 438 153
1.081
19 30
1 27 95
4,638
267 8
1C 439 648
10 70
114 137
9 775 n
187 40
720
6 12 - - . - 6 : 6 19
288 112 70
8 158 87 2
20 66,
395 1
16 33 22
100 42
745 9 0 .
20 18
24 125
2,036
277
27 271 169
21 13 1
10
9 818
229
53
- -- Inorganic chmlicals Other fertilinm Petrochemicals Paints, inks & coloring agents Vitamins & pharmaceuticals Soap & toiletries ----- Plastics . Pest control products . -. other che?!ical~rodus --_.UU.UU ..... Tires ----------
71 1
. - - - - .....................
............. - - .........................
-. ... ............
. . . . . . . . .
7 12 .- 713 - 714 .. - 7 15 - 7 1 6 - -. -. - 722
. . . . . . . . . . . . . . . 723 Other rubbetyoducts - 724 Veneer & plywood ......... 72.3 Wood & corkgroducts ..............
?2? Textiles ............. ...... - --
728 . L l ! I 2 ! ? e L ---,--lllll.. ........--.............-....... - . 729 Catpets. blankets. other woven products
Household utensils Cements - Building stone Bricks & blocks Tiles Sc building ceramics Glass & products (exclu* bottles) Glass bottles - Iron & steel basic products Other metal products
.
Metal buildmg parts -- Building equipment Communications equipment .
Lighting & electrical pmts -- Road Lnmsport equipment -
.............
- - - . - .- - - 735 811 -- -..... .... ..
- ----- -. -- .. .......
- ............ ..-..
-- ..........
8 14 16 - - 8 17 - .. 818
....-.. - ...... - . -. ... ---
.- - .......-.. ....
- - - . - -. . - - - - . - - - . -. . - -- --- . -- -- - .- .. -. .. - ... -- .... -. -. .............
- .... - - ........
224 ~ e f n g m o n fhxzers -- 925 Other household equipment
BAN cARLOSCITY, NEGROS OCCCIDENTAL .......... -- Minor flows
.........
4 2
9 16 ... - - 0 17 . - - 921
8 19 - - - - 821 -- 824 . - - 825 ----. 8 - ... - 9 1 2 - - - 9 13
Special purpo~e road vehicles - Other tramport equQment & parts - Furniture
.. - ....... 9 15 ....-
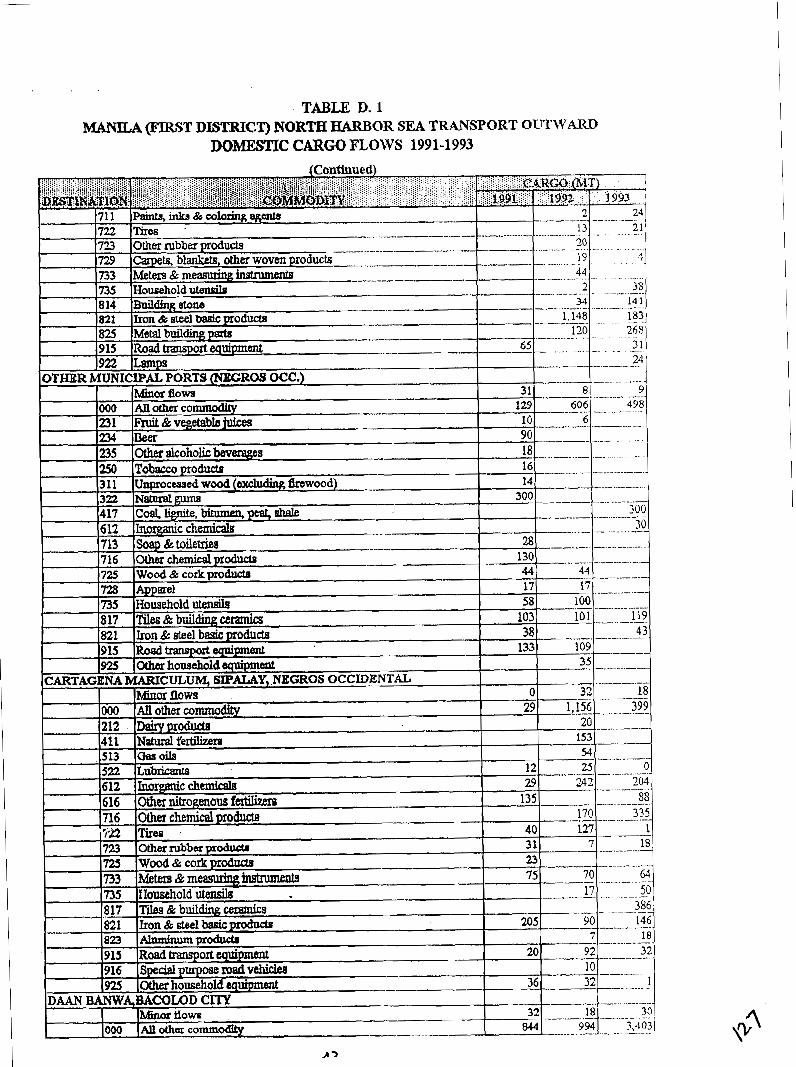
TABLE D. 1 MANILA (FIRST DISTRICT) NORTH HARBOR SEA TRANSPORT OUTWARD
DOMESTIC CARGO mows 1991-1993
. -- - - - -
733 Meters & measuting hrummts ----- --
- - - . . - -- - . . . - - OTHER MUNICIPAL PORTS (NXCROS OCC.) , -- -. . -. . .. . . - -
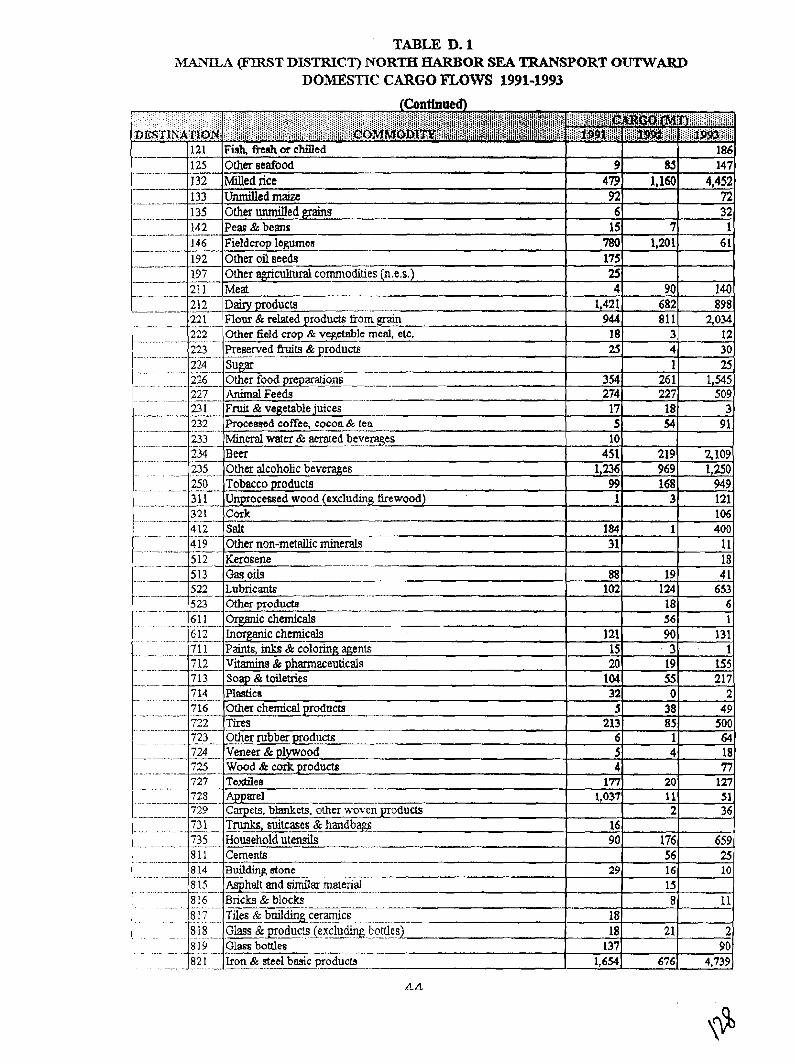
TABLE D. 1 MANlLA -9T DL9TRIC.T) NORTH HARBOR SEA TRANSPORT OTTTWARD
DOMESTIC CARGO mows 1991-1993

TABLE D. 1 MANILA (FIRST DISTRICT) NORTH HARBOR SEA TRANSPORT OtTTWARD
DOMESTIC CARGO mows 1991-1993
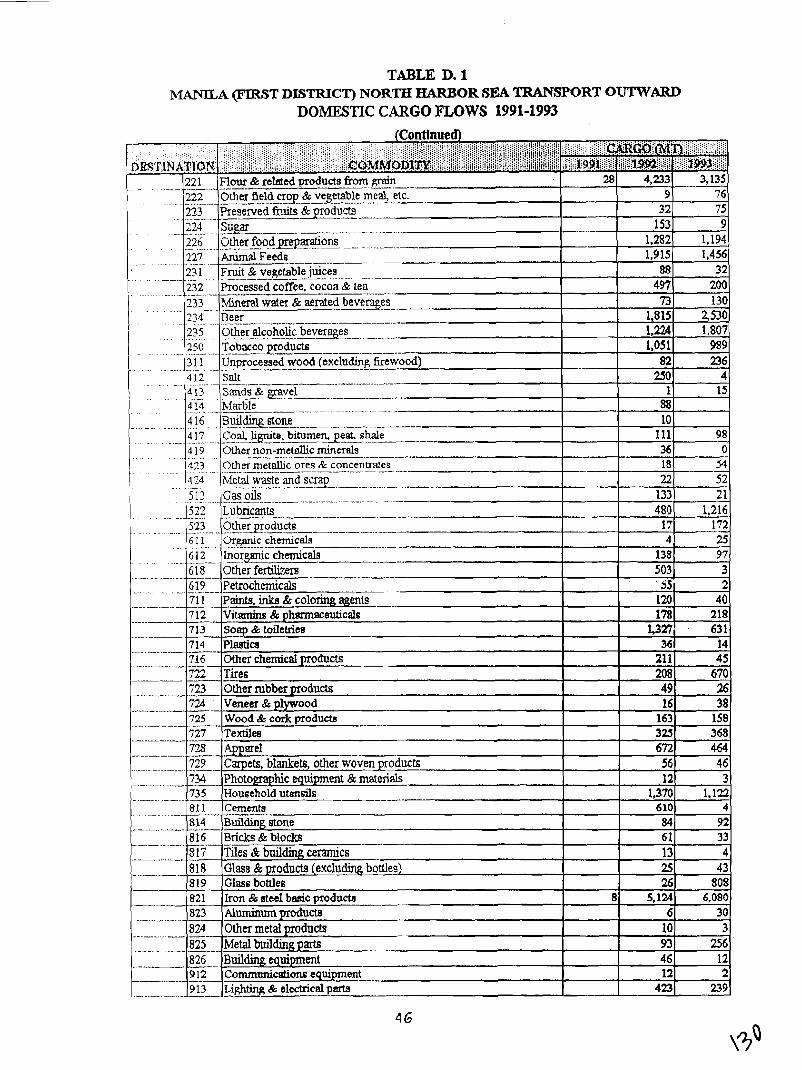
TABLE D. 1 MANlaA (FIRST DISTRICT) NORTH HARBOR SEA TRANSPORT OIrrWARD
DOMESTIC CARGO mows 1991-1993
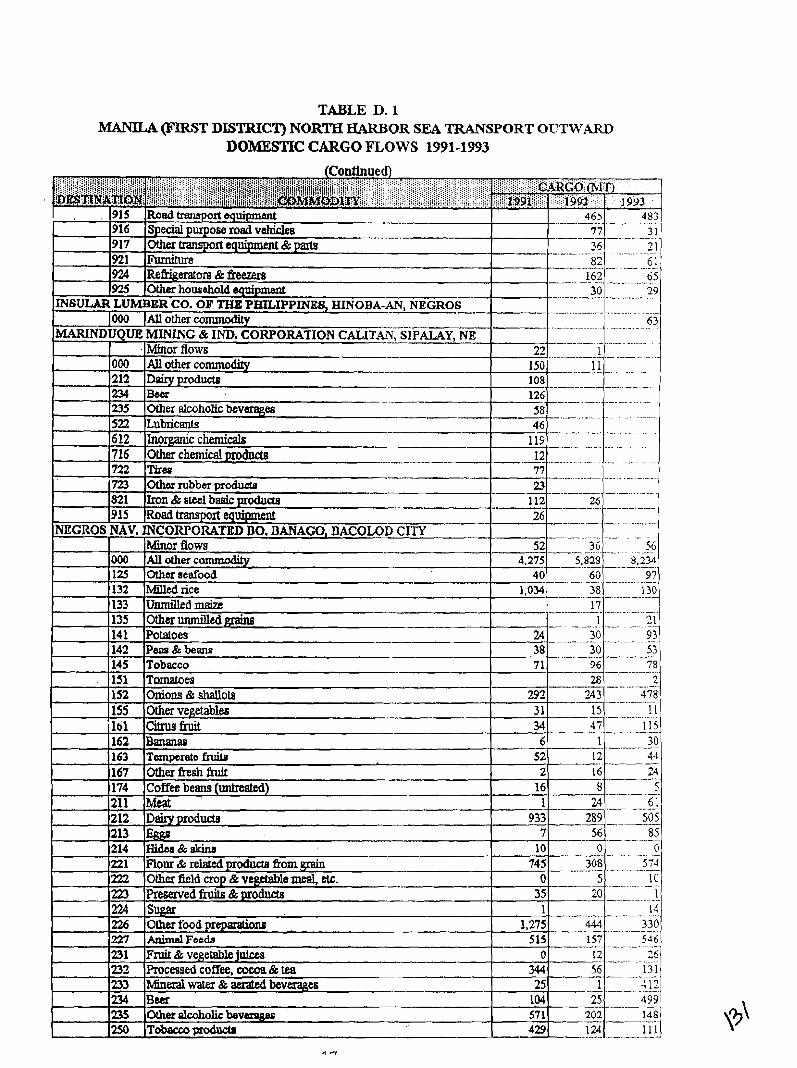
TABLE D. 1 MANILA (FIR3T DISTRICT) NORTH aARBOR SEA TRANSPORT OUTWARD
DOMESTIC CARGO FLOWS 1991-1993
(Continued\
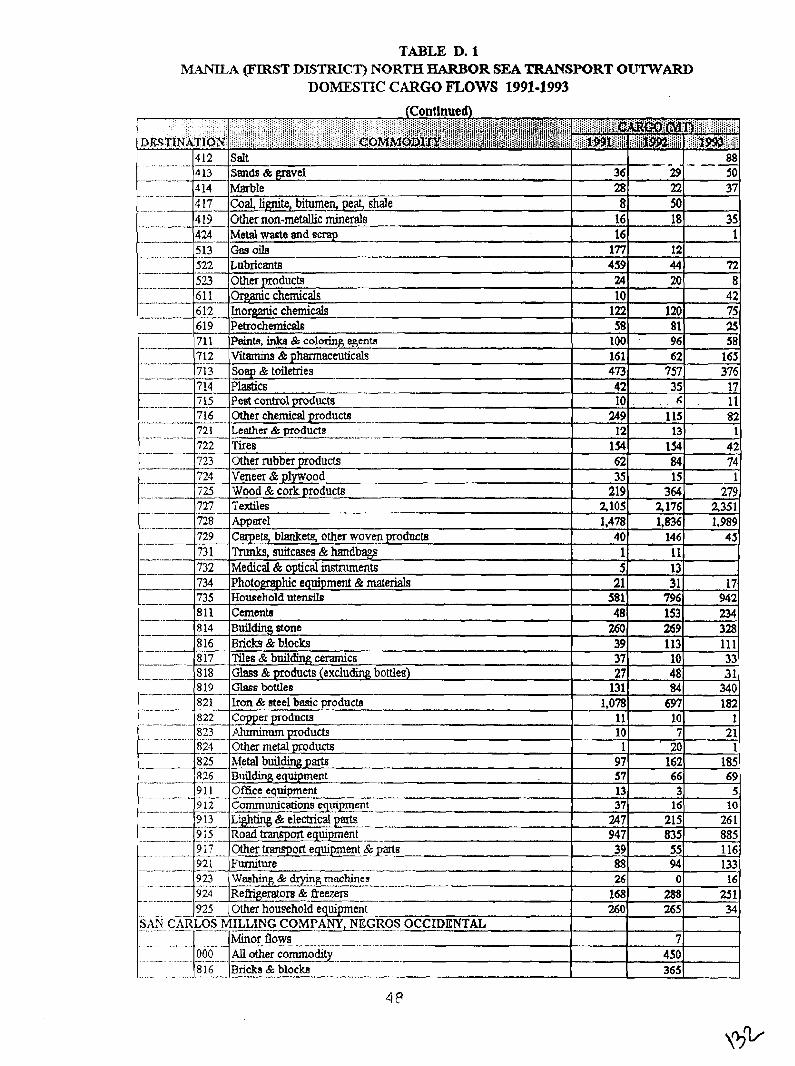
TABLE D. 1 MANILA (FIRST DL3TRIC.T) NORTH HARBOR SEA TRANSPORT OITTWARD
DOMESTIC CARGO FLOWS 1991-1993
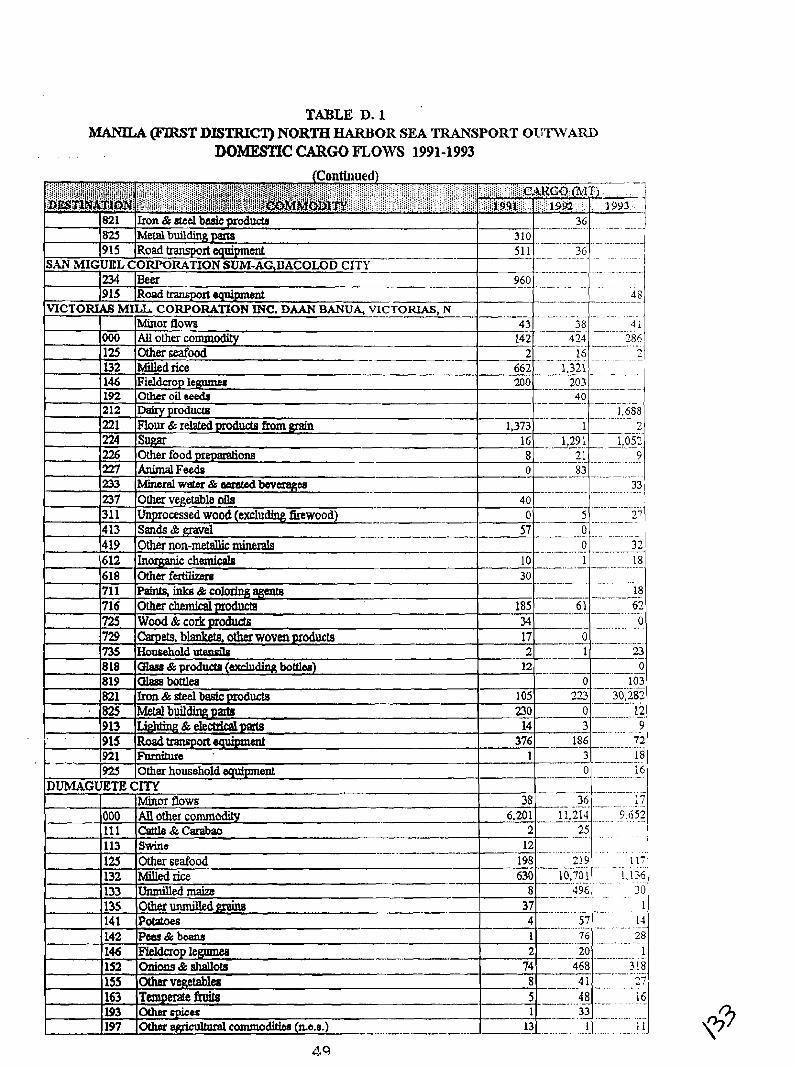
TABLE D. 1 MANILA (FDRST DISTRICT) NORTH HARBOR SEA TRANSPORT OUTWARD
D O ~ C CARGO mows 1991-1993
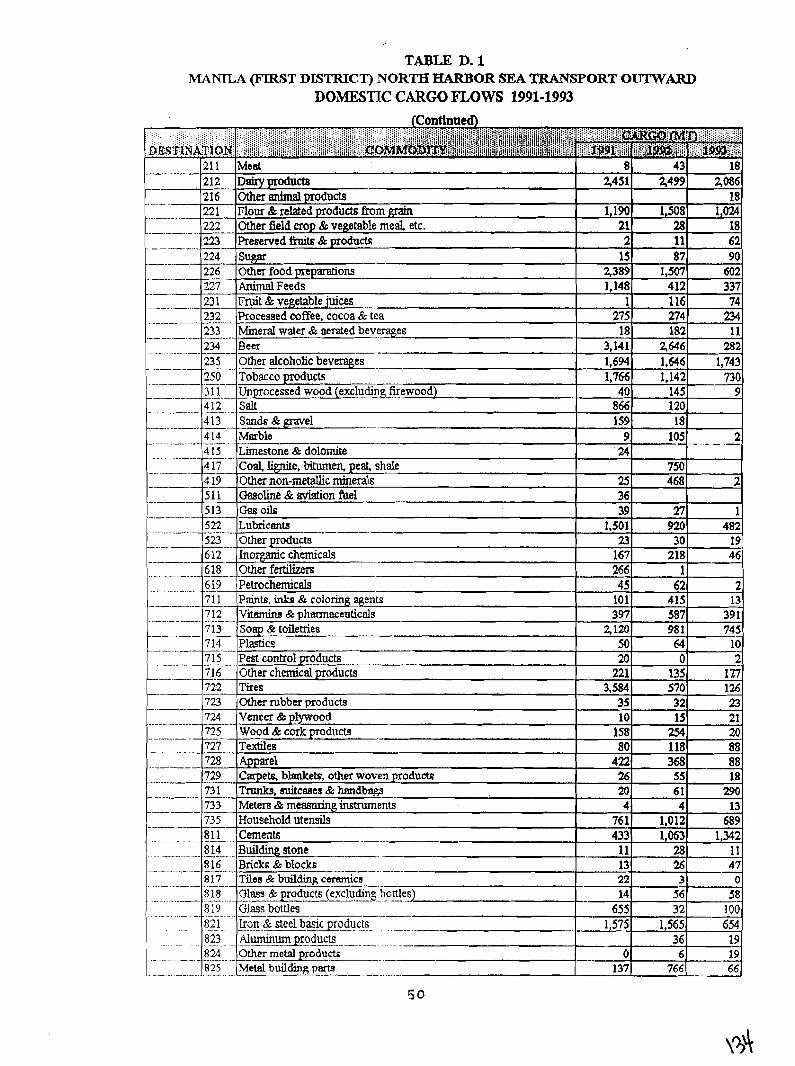
TABLE D. 1 MANlCtA (FIRST DL3TRICT) NORTH HARBOR SEA TRANSPORT OXlTWARD
DOMESTIC CARGO mows 1991-1993 (Conttnued)
. : . ;;;;:., :: .. , : : , i i : ; ::., i i i l i i i ; i : ; i~$, j! i ; i j , , j j i ; i f i lgi . ' i , , ,$$~ ... :.<_:.:::.:.:,:::.: ....... ; ~ o M ~ o D m j ~ ; ~ $ \ ; $ ~ $ ~ ~ ~ i , i $ $ g # $ l i
.. ........
.. .
. . -. -. . - - . . - -
. - -- -. . - -- .
211 2 12 2 16 221 222 223
Meat Dsiry products Other &a1 produds Flow & related products from & Other field crop & vegetable meat etc. Preserved finits & products
224 -- 226
Sugar Other food p r e p d o n s Animal Feeds Fmit & vegetable juices Processed coffee, cocoa & tea Mineral water & aerated beverages Beer . -------- Other alcoholic beverages Tobacco products Unprocessed wood (excluding, firewood) Sdt Sands&gravel Marble - -- Limestone & dolomite Coal, ]Ignite, bitumen, peat, shale Other non-metallic minerals Gasoline & aviation fuel aso oils Lubricant8 ---- Other products . Inorganic chemicals Otherfertilizers Petrochemicals Paints, inlrs & coloring agents Vitamins & pharmaceuticals Soap 2% toilemes
--A
Plastics pest control products Gther chemical products Tires Other rubber products Veneer & plywood Wood & cork product3 Textiles Apparel Carpets, blankets, other woven products Tmnk~, snitceaes & hsndbngs Metexa & measuring imbuments .- Household utensils Cements Building aone - -.
- - ,- - --
-. ...... ...
. - - . - -. .- -- - - .. .......
-. .- --
. . . . . . . .
.......... ...
......
50
8 2,451
1,190 21 2
227 23 1 232 233 - . -. - - 234 .. 235 . -
15 2,389 1,148
1 275 18
3,141 1,694 1,766 40 866 159 9 24
25 36 39
1,501 23 167 266 45 101 397
5 120 50 20 221
3,584 35 10 158 80 422 26 20 4
761 433 11 13 22 14 655 1,575
0 137
43 3499
1,508 28 11
-- - - --
18 2,086 18
1,024, 18 62
87 1,507 412 116 274 182
2,646 1,646 1,142 145 120 18 105 ---
750 468
n 920 30 218
1 62 415 587 98 1 64 0
135 570 32 15 254 118 368
55 6 1 4
1,012 1,063
28 -
26 3
250 . - -- - - 3g---
90 602 337 74 234 11 282
1,743 730
9
2 - ..- - -
2
1 482 19 46
2- 13 39 1 745 10
2. IT 126 23 21 20 88 88- 18
290 13 689
1,342 11
pp
47 0
56 32
1,565 36 6
766
58 100
- 654 19 19 66
- - .... . ..... 412 - .... 413 4 14
-. -. ... .. ....
- - -
-- ........ - .. -
... 4 15 - - - - -. 4 17 4 19 5 1 1 513 522
....- - 523 -- - .-
- -- -- - .....
- 612 618 -- 6 19 -- -. . - - -. .
- - - . - -. . -
- - 71 1 . -.
7 12 ............
- .- . - -. -
........
713 - 714 715'--'
.- --
-. ---.
- - - - - . . - -- - -- - .- - - - - -. - . -- - - . -. -
-. - -. - -- -
- 71L 722 723 724 .- -.
. 725 727 -- 728 729 73 1 733 . -.- 735 -
.................
..................
81 1 -- - 814 - -- ..
.............
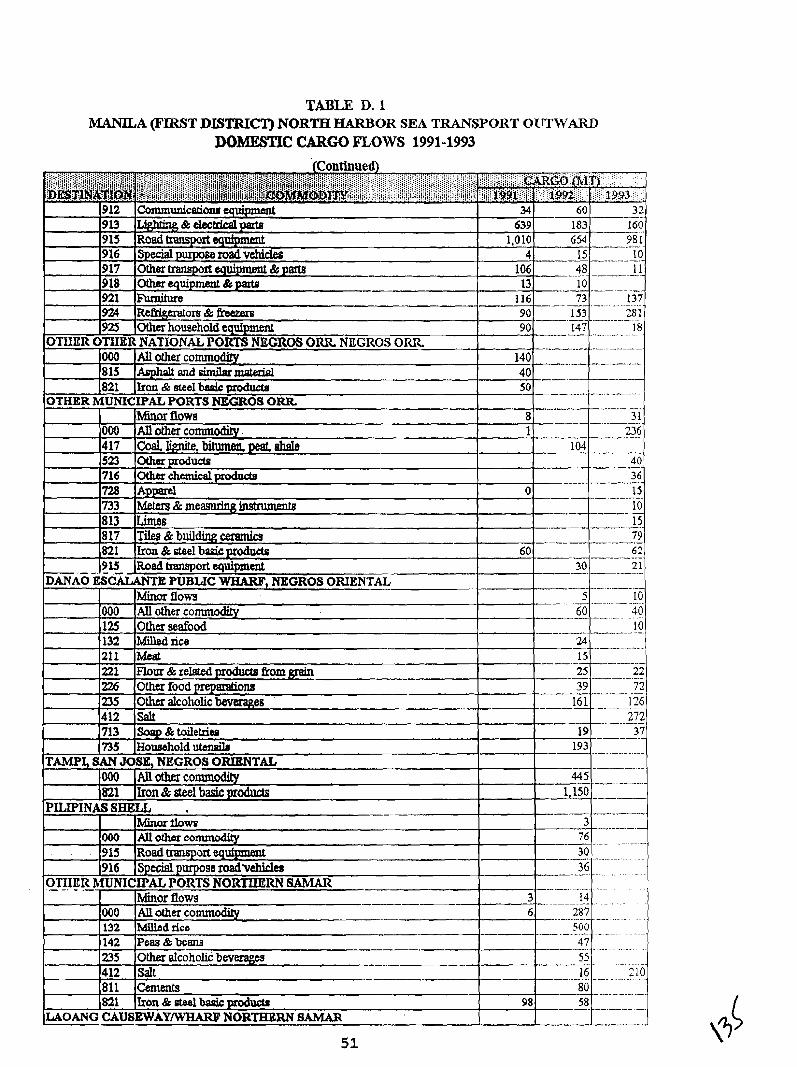
TABLE D. 1 MANILA (FIRST DISTRICT) NORTH HARBOR SEA TRANSPORT OXJTWARD
DOMESTIC CARGO FLOWS 1991-1993
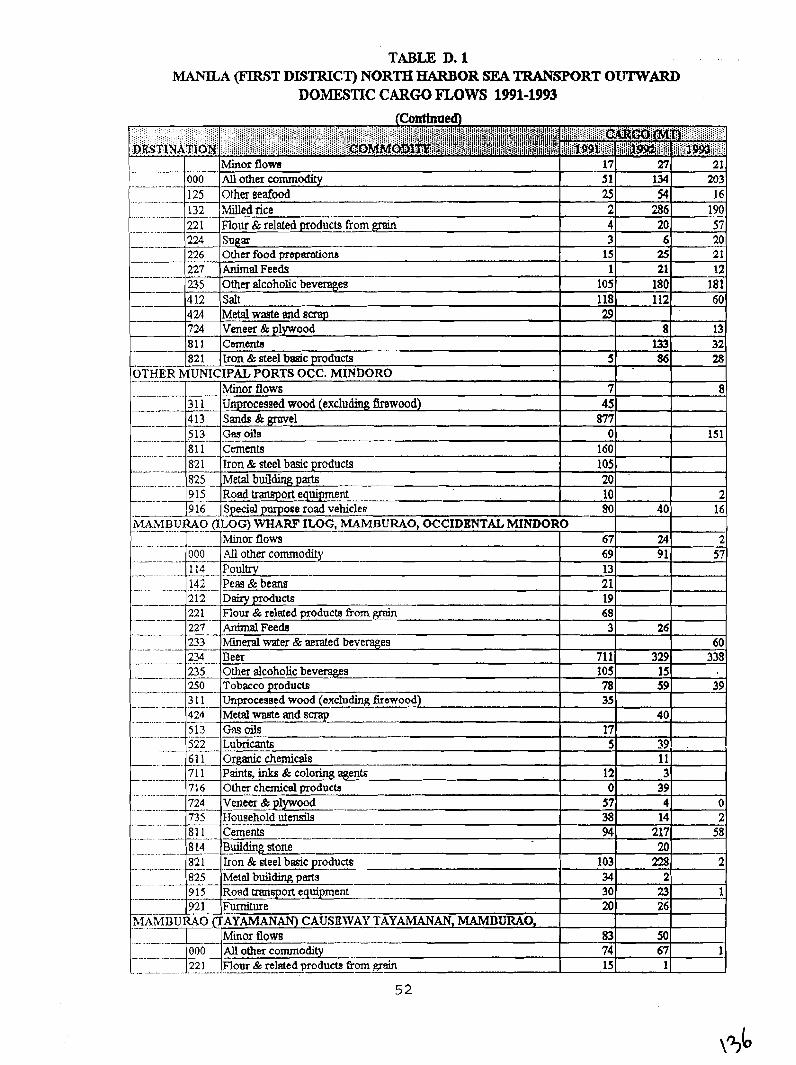
TABLE D. 1 MANlLA (FIRST DL5TRIC.T) NORTH HARBOR SEA TRANSPORT OT.JTWARD
DOMESTIC CARGO FLOWS 1991-1993 (Contlnueb)
- Minor flows AU otha commodity - Other seafood
. - -- - - - -- .---.-
000 I. 25 25
17 5 1
132 Milled rice . .. .. - . . . . - - -- -- 2 286 190 221 ,Flour & related products from grain
~ 4 20 57
52
54
27 134
16
21 203
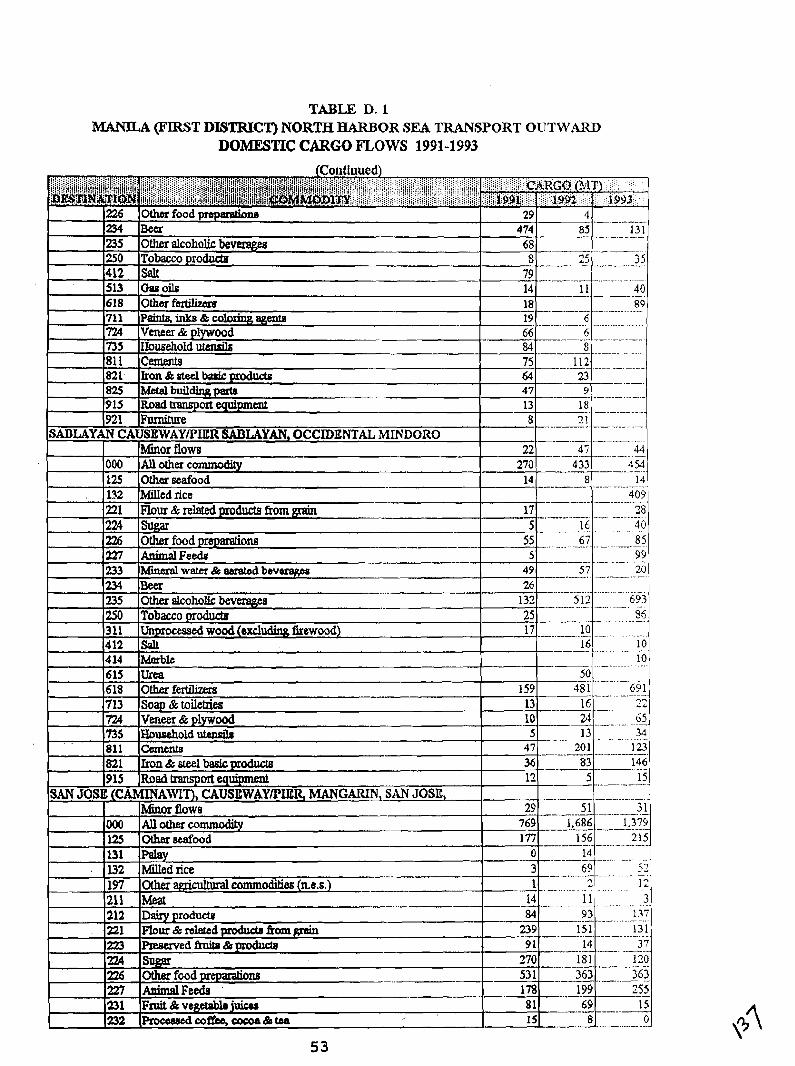
TABLE D. 1 MANILA @TRST DISTRICT) NORTH HARBOR SEA TRANSPORT OUTWARD
DOMESTIC CARGO mows 1991-1993
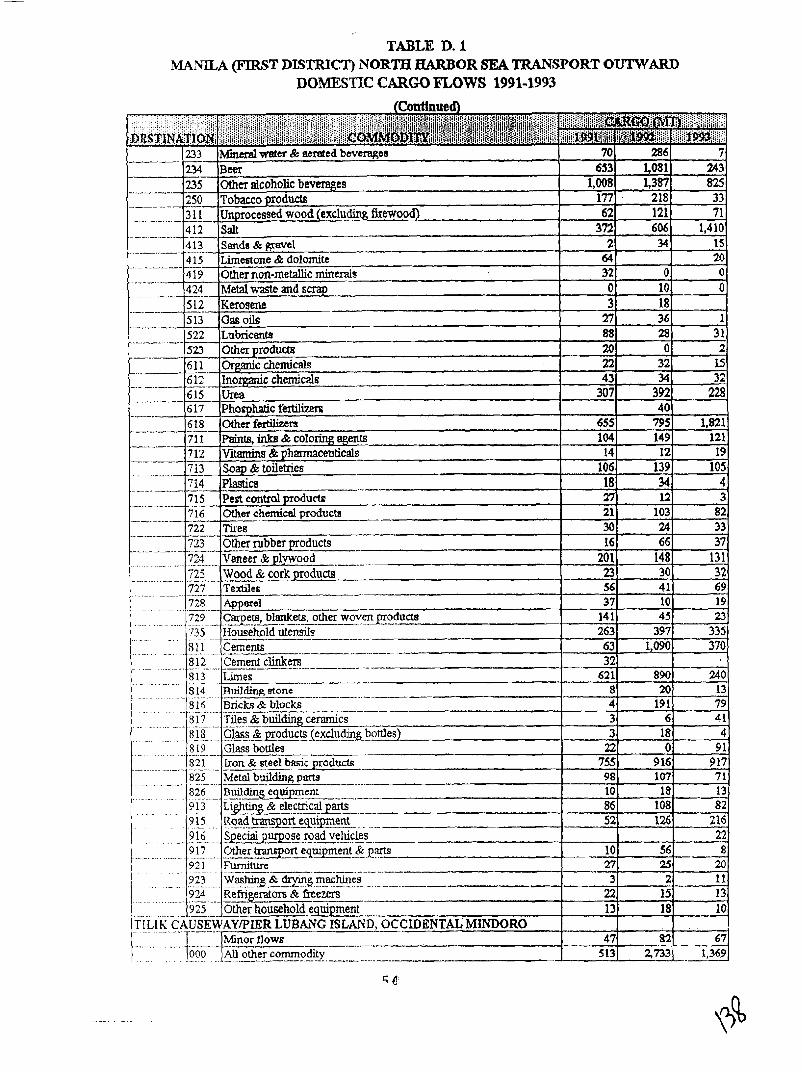
TABLE D. 1 IvLWILA (FIRST DLrTR1[CT) NORTH HARBOR SEA TRANSPORT 0'I.WWAR.D
DOMESTIC CARGO FLOWS 1991-1993
--
usehold utensils ..---.a
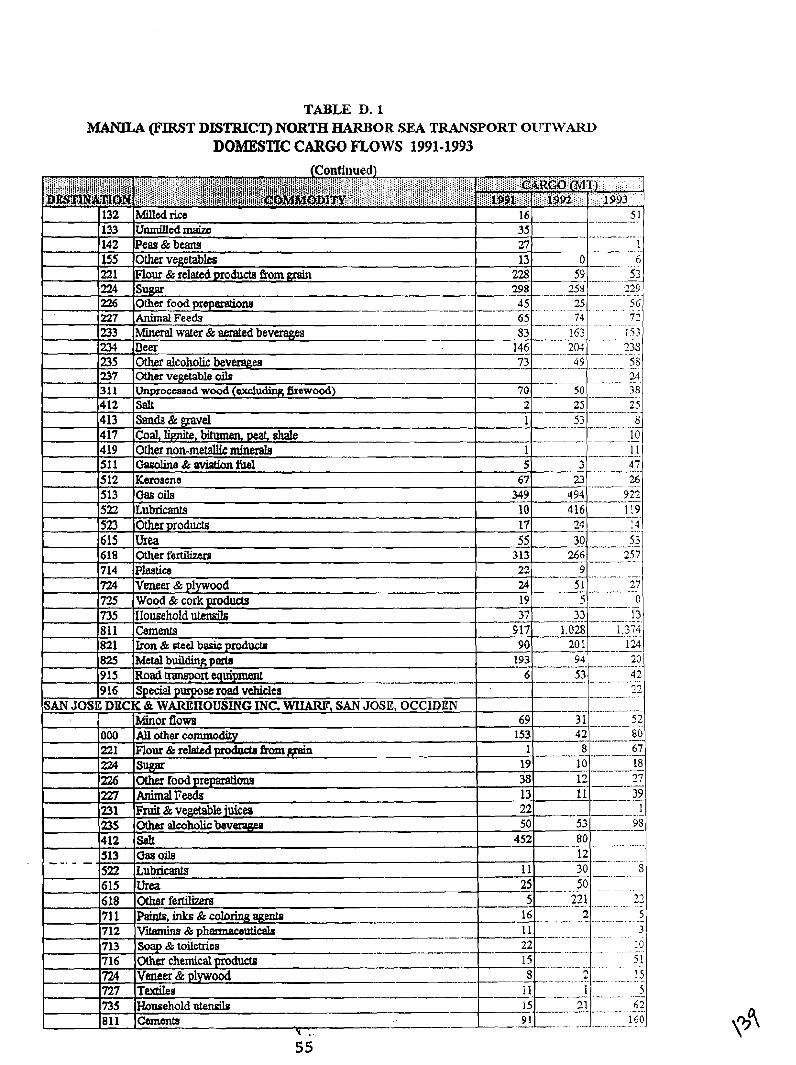
TABLE D. 1 MANILA (FIRST DISTRICT) NORTH HARBOR SEA TRANSPORT OUTWARD
DOMESTIC CARGO mows 1991-1993
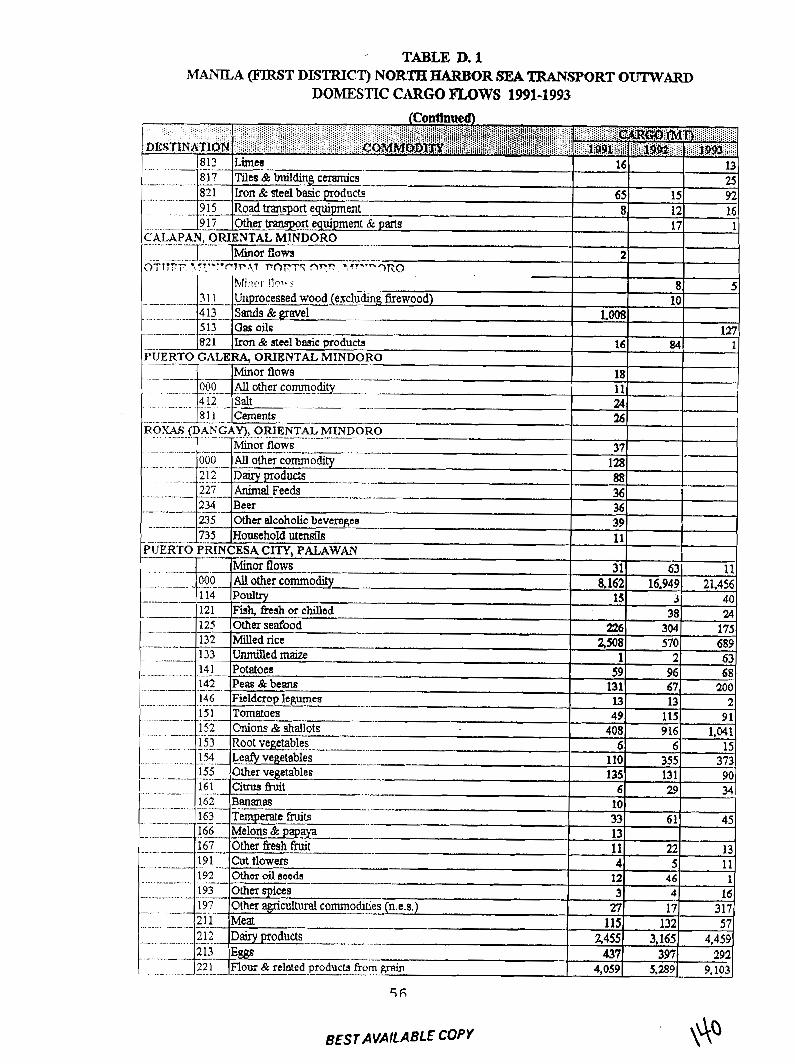
TABLE D. 1 MANILA (FIRST DL9TRICT) NORTH HARBOR SEA TRANSPORT 0TlT'WAR.D
DOMESTIC CARGO FLOWS 1991-1993
BEST AVAILABLE COPY
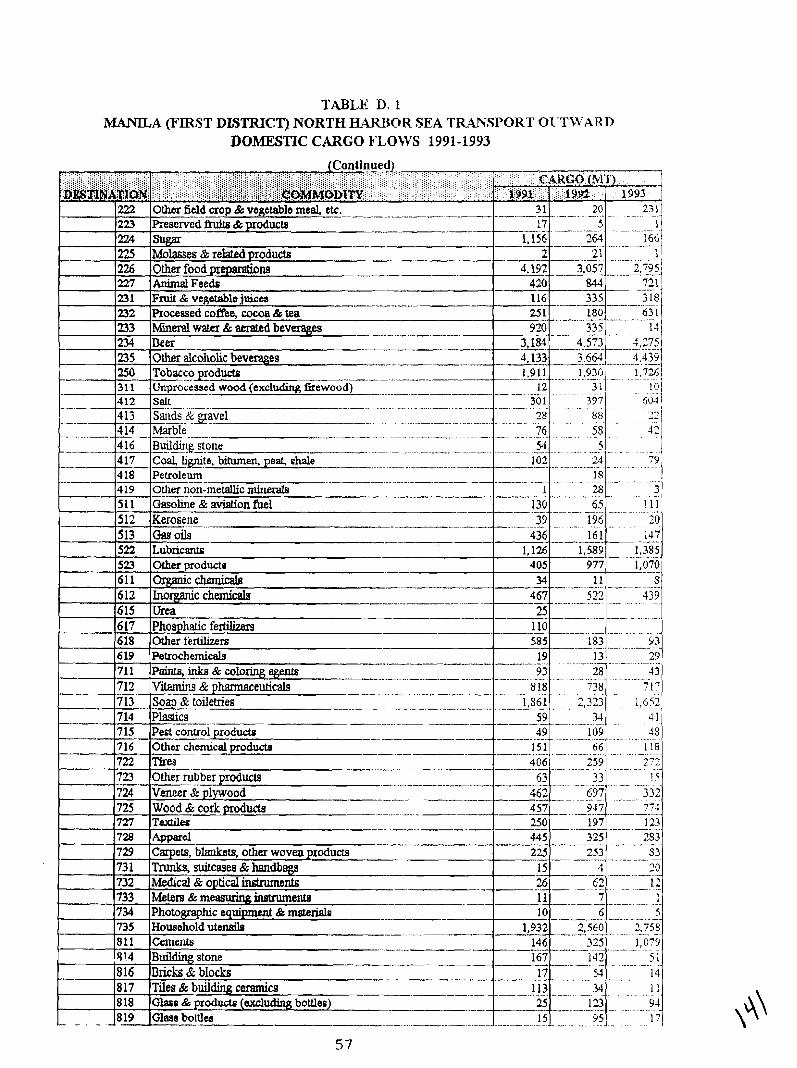
TABLE D. 1 MANILA (FIRST DL3TRIC.T) NORTH HAJUOR SEA TRANSPORT OI:TN'ARD
DOMESTIC CARGO FLOWS 1991-1993
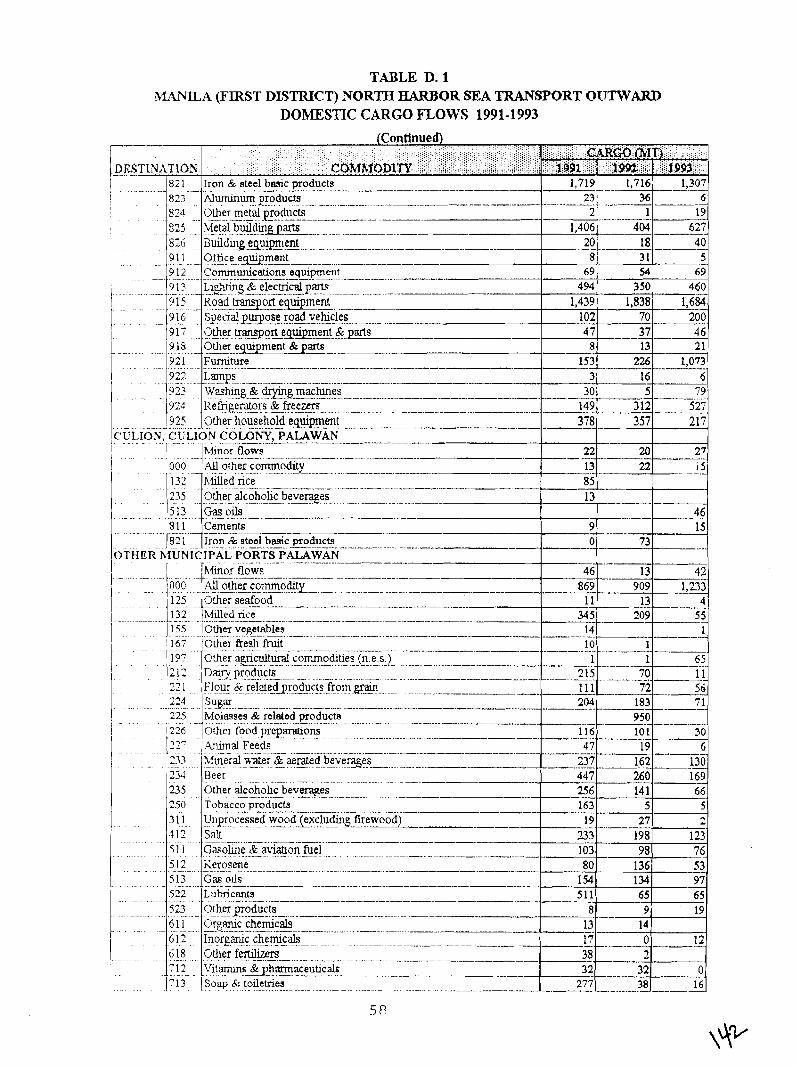
TABLE D. 1 ~~A (FIRST DLSl'RICT) NORTH HARBOR SEA TRANSPORT OUTWARD
DOMESTIC CARGO mows 1991-1993 (Continued)
, cmcofitn 0
DRSTlUATIDN COMMODITY 1991 1 1992 1 f 993 1 ~p
.....
....... 6
.....-. ........ 19
. . .............
.. 40
.... ........- - . . . - .. 5 31 - . 9 12 Communications equipmerit 69 54 69 ........................ .. . 9 13 Liarins 8; elecfrical parts 494 350 460
...)r--- .................. .-... -...-.......
9 1 5 Road transport equipment -- ................- . -. .- -- - 1,439 1,838 1,684 316 S .Pe c i a l ~ q o s e road vehicles .-.-A- 102 _ 70 200 ............ .......
, . . . . _ ...... _. ^
I 000 AU other commoditv . . . . . . . . . . . . . . . . . . . . . . .... ... ...... .- .- .....
132 h u e d rice I . . . . .... -- . . . I 235 .O.~e~~coholic_bevef~e_sss... -
I. . . . . . . . ! 3 . , . .-Gas?@
. . . . .......--.........- . .......... . .- . .--- , 233 hh!@ aakr 9; arrated beverages . . . . . . . . . . . . -. ..................................... ...-......-..-..-.-.A-
234 . . . . Beer .................................... .-
235 Other alcohohc beverages . . . . . . . . . . . . . . . . .
250 Tobacco products .................................... - 3 1 1 Urlprocessed wood @xcludine. fuewoodJ .................................................
312 S& 233 . . . . . . . . . ..... .
5.1 1 ~ a s o h e & atiation fuel . . . . . . . ............................................
Kerosene .... 80 136 ...............
1 54 134 97 .... ..................
.
...........................- - - -- ..- .---............--..-..A_---
. . . - - - - 32 32 Soap ............................................. & to~lemes 277 38 16 !713 I . ..
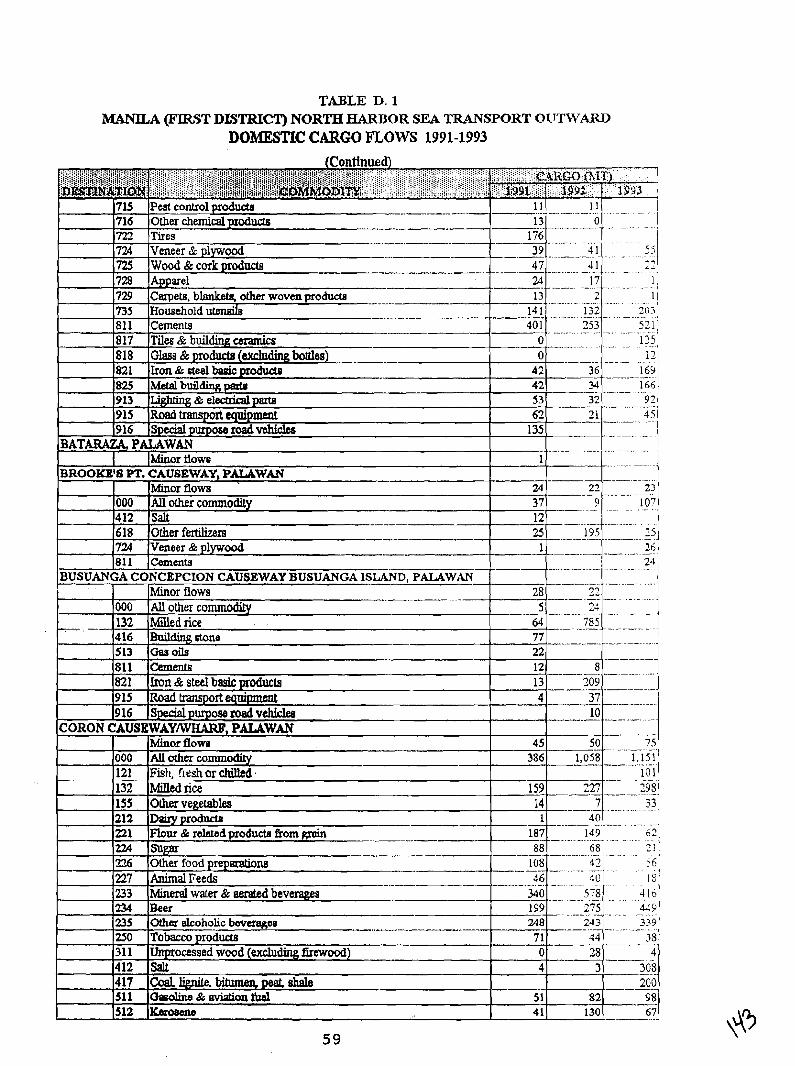
TABLE D. 1 M . . (J!'JRSI' DLSI'"I''C'I') NORTH HARBOR SEA TRANSPORT OUTWARD
DOMESTK CARGO mows i99i-i993
-.---
--. ..~A .. . . .
412 Salt 417 C o a L ~ b i t u m e n , p e a f ~ 511 CkEolins8saviati4nW 512 I(mwrsne
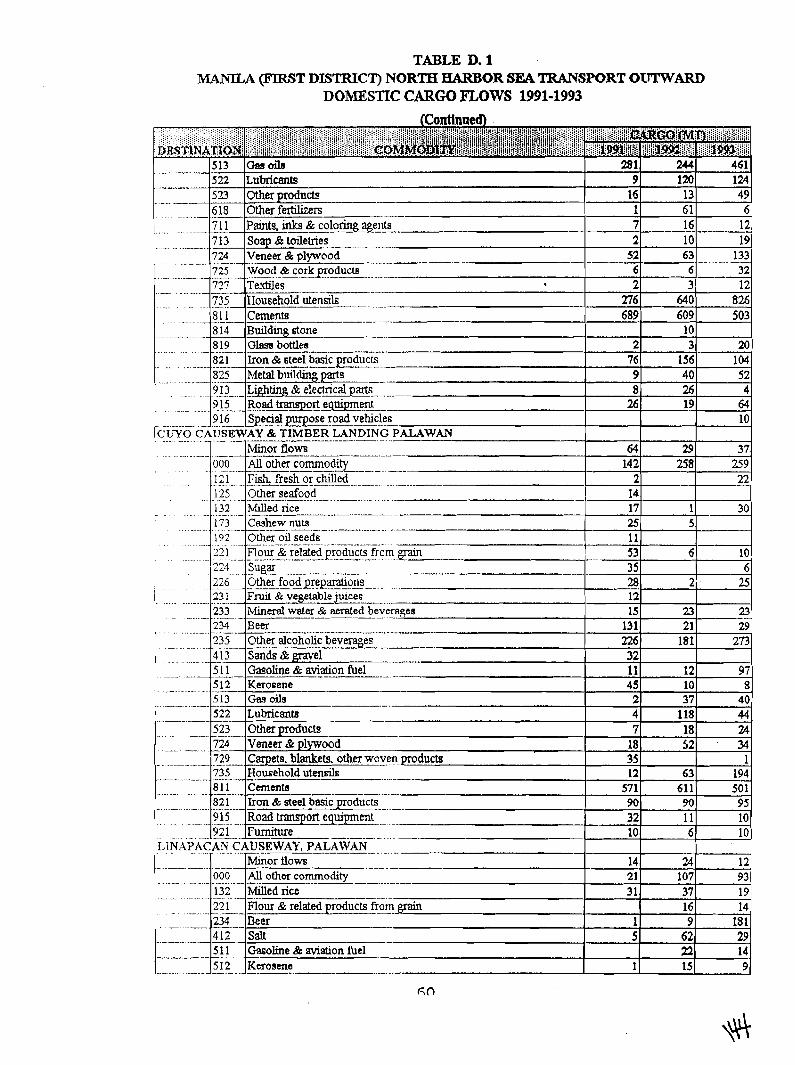
TABLE D. 1 MAMLA (FIRST DISTRICT) NORTH HARBOR SEA TRANSPORT OUTWARD
DOMESTIC CARGO mows 1991-1993
-. - - . . . . . - -
. .E.- Beer - 4 12 Salt ---- 5 11 Gasoline & aviation fie1
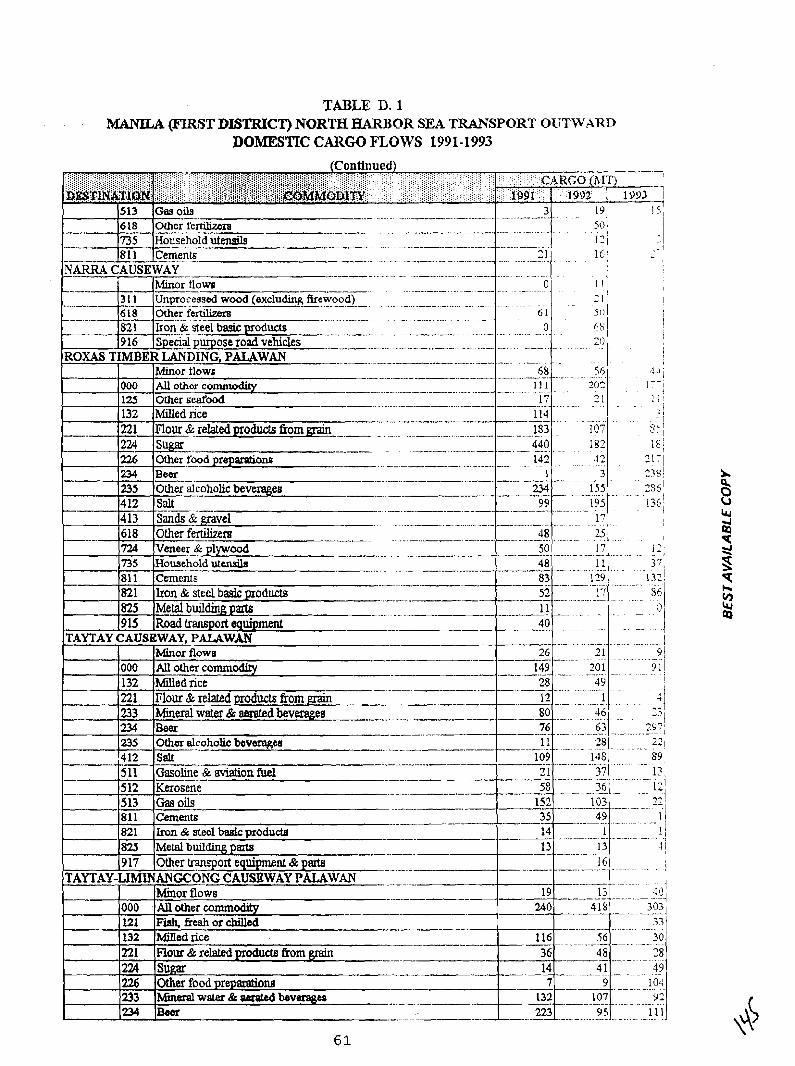
TABLE D. 1 MANILA (FIR3T DISTRICT) NORTH HARBOR SEA TRANSPORT OUTWARD
DOMESTIC CARGO F'LOWS 1991-1993
:..
513 Gasoils 3 ..-...... .... . . . . . .
.- 6 18 ~ther-%-&.lizem -.- - -- ............ .........................-.......-. 50
ns 'HoGei~idutensils . . . . . . . . 13 81 1 ceme.n&- --. ......... .---
7 -,
---- 2 1 ....................................... t NARR~~UXEWAY-~ I
.... ..... .................. I
ino or-flows ---- . . . . . . . 0 - I I !
-.--- 3 1 1 Unprocessed wood (excluding firewood) z-8- . -- - ....... .......................... I I I
Ocher fe~.tilizers 6 1 511 - . . . . .......................
.. . . . ............................
..... . . . . . . .... .........
. ..........
----, ................. ... --. -- ...-......-..........
..........................
---
....................
.... ............ - - - -.
1 3 -----.-. ...................... - . 116 56 3 0 .. -. -- - - -. .. - - ...-......... 36 48 -. - 7-8 .........
14 ........-.
7 104 . 9 . . --- . . . .
61
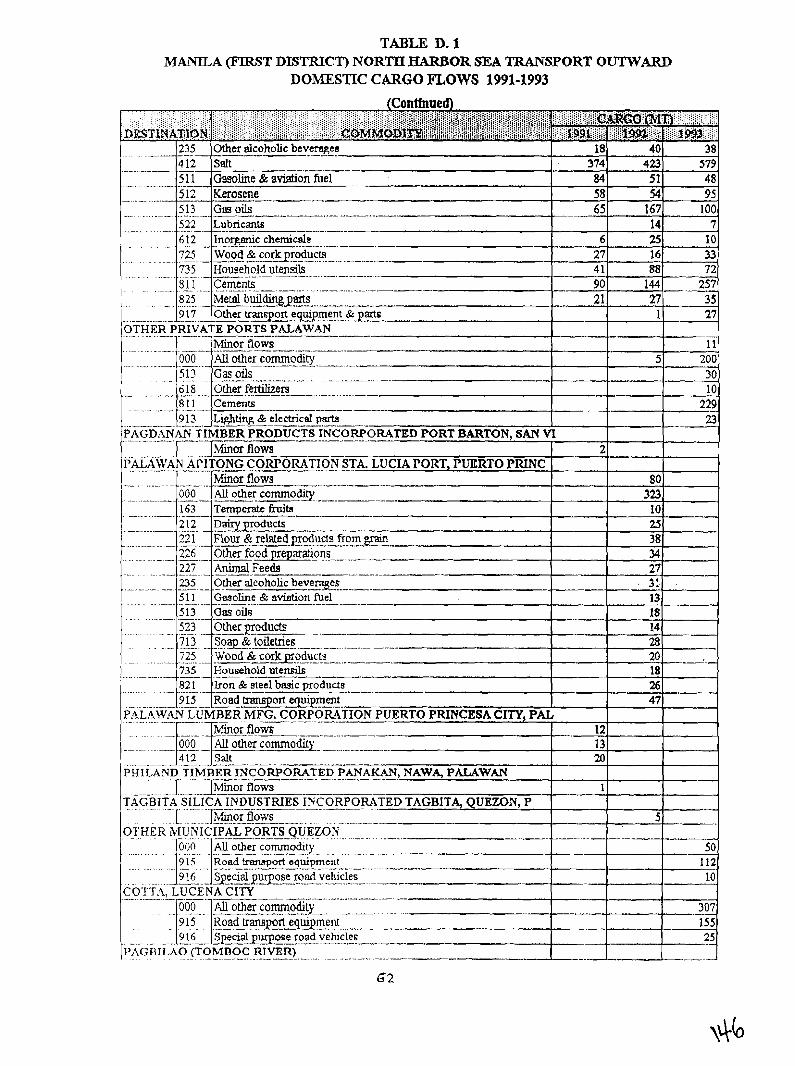
TABLE D. I MANlLA (J?lR!5T DISTRICT) NORTH HARBOR SEA TRANSPORT O I W A R D
DOMESTIC CARGO mows 1991-1993
235 Other alcoholic b e v q e s 412 Salt
. . - - . - . - - - - - ------ 5 1 1 Gasoline & aviation fuel -- . . . . - -- -- -. -. - - 84 51 48
. _ ..- -. 2E_Kennee ---- 58 54 95 513 Gasoils . *. . --- .- 65 167 100 522 Lubricants 14 7
.- . - ... -- .. . --
-------A-
.. -. . - - - - -
? - - -. . . . . - - -- . - . . . . -. . - .- -
. .. . ~ .
UEZON.. . -- -.--
'COTT.~, LLTCENA CITY
PAGAI1,AO (TOMBOC RIVER) . . . - - . . . . - -. . .- . . - , - . - .. .- - -. -- . . - . . . -. . . . - -. . .- . . . - - - . .
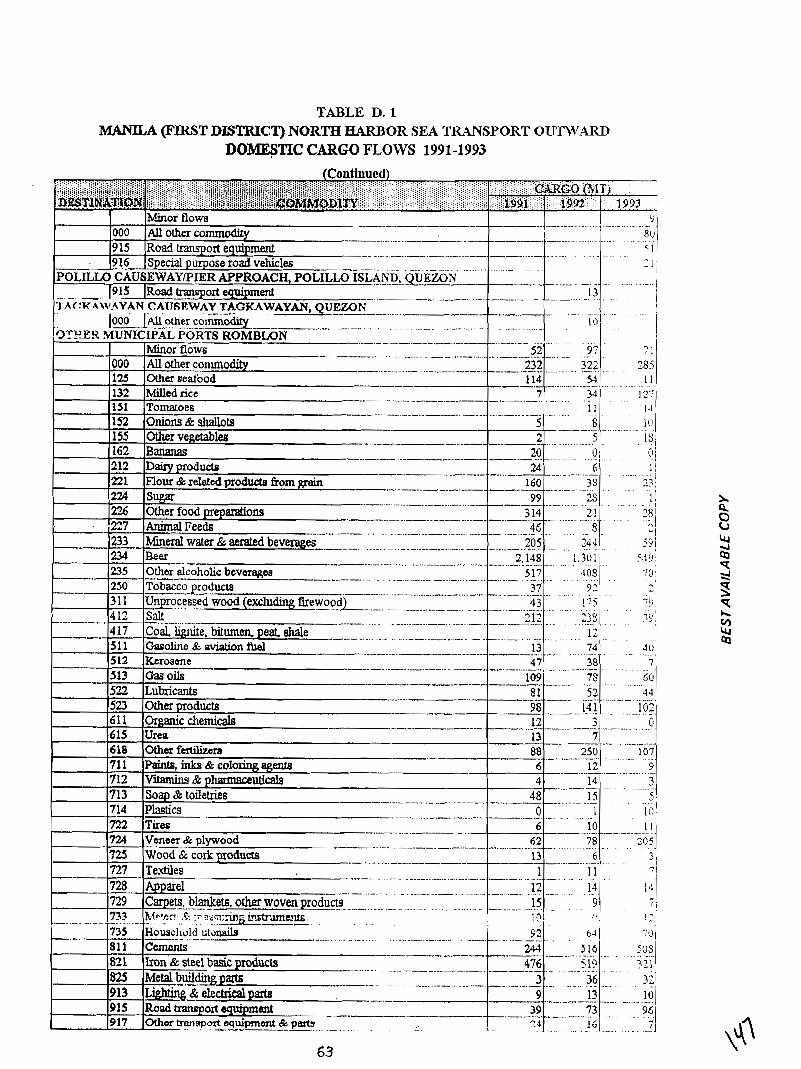
TABLE D. 1 -A (FIRST DISTRICT) NORTH HARBOR SEA T M S P O R T OUII.Ir-RD
DOMESTIC CARGO FLOWS 1991-1993
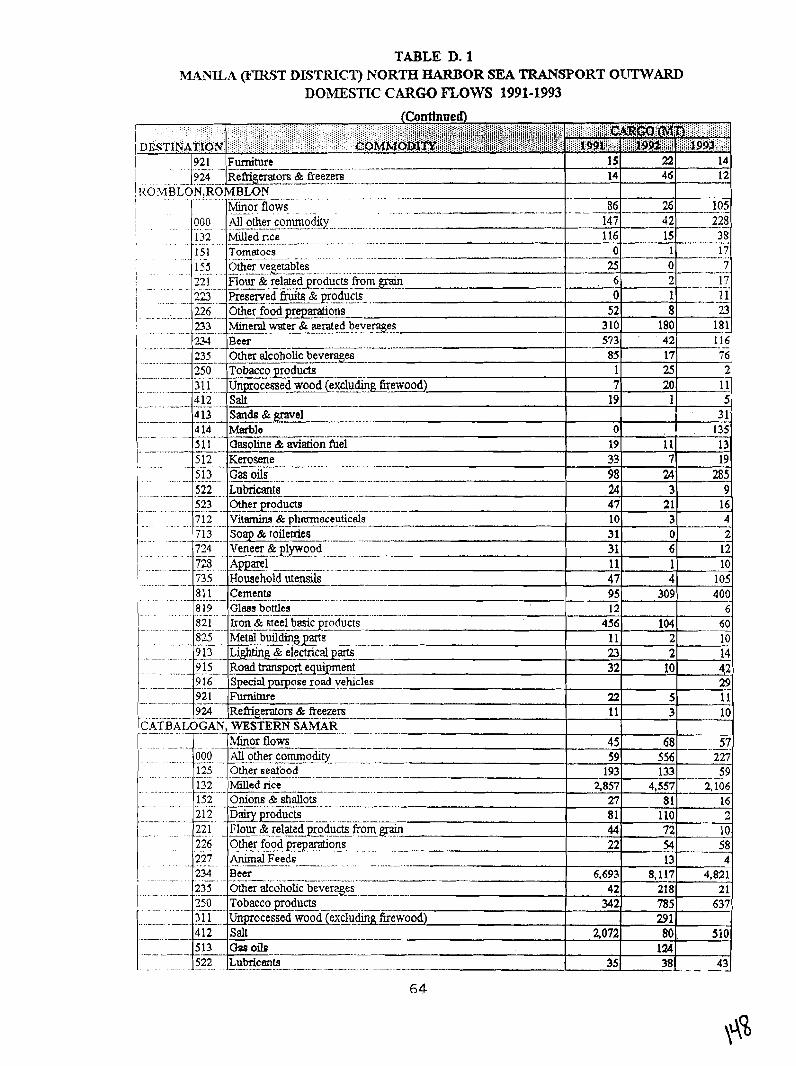
TABLE D. 1 W I L A @?K,3T DISTRICT) NORTH EARBOR SEA TRANSPORT OUTWARD
DOMESTIC CARGO nows 1991-1993
-- . . Gasoline & aviation fie1 19 11 13
33 7 19 - 98 24 285
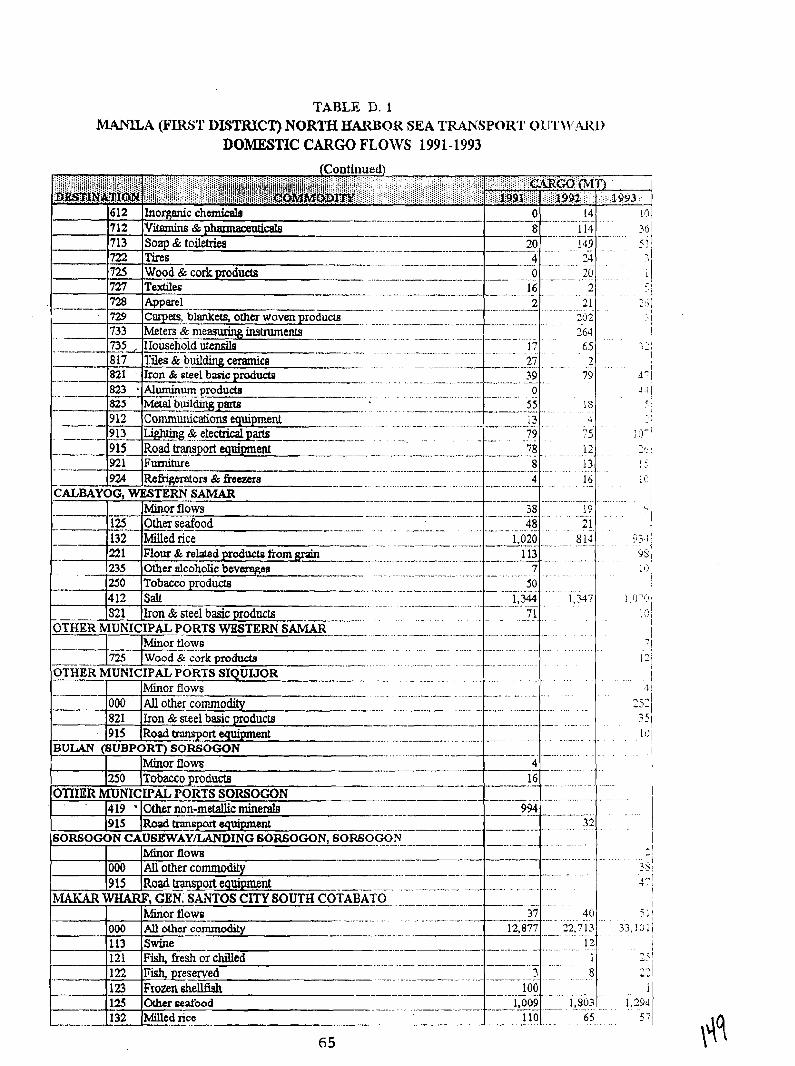
TABLE D. 1 MANILA (FLKST DISTRICT) NORTH HALU3OK SEA TRANSPORT OlJ'l'\l.41W
DOMESTIC CARW FLOWS 1991-1993
--. .... -- ............. - . -- ........................ -- 000 ' AU othei-xmodity ............................... 152 I 821 lron & steel basic products - ? I . .........
-- 915 Roadtmnsport q u i p & 1 1 ~ 1 . . . . . . . . . . . . . .
BULAN (SUBPORT) SORGO W N ...... 1 . . . . . . I I ~ o r flows - 4 . . . . . .
1250 l~obacco products - -- 16 .... , .............. .. .... .. OTIIIER MUNICIPAL PORTS SORSOGON ... ..............................
4 19 ' Other no%-metallic minerals - - - - - -- 934 .................. I . . . . . 1 -sport equipment 32
i -! - 8
1 . . . . . . . . . . . . . . . .
>s; . , 4: 1
I
511 33,101 /
I q i ~ -_ , -9- & -
i ...................
1129J ,
5;
.............
SOR~OWN CAUGEWAY/LANDING SORSOGON, SOWOGON -.. ..........
000 915
Minor flows AU other commodity ........
Road transport equipment .-. ........
h4- -9 (=EN- S~I'rrOS CITY MNJTH COTABK!?. . .....-.
.----
-
---.--
000 113 I21 122 123 125 132
Minor flowg ,. . ,.. 37 4 I) .....................
All other cost&odity ... -. ............. -- - ....... Swine . . -. .... - - ... - ... - Fish, fresh-61 chilled ..................................
Fish. preserved ............ ............. 3 8 .................. - - -.
Frozen shelliish 100 Other seafood 1,009 1.303 .........-. ........-..
MiUedrice - 110 65 , , ........................... .............. . . . . . . . . --.--
-- - 12,877
.. -
., ..... .. . . . . . . . .
.................... 12,713
12 ............................ 1
. . . . .
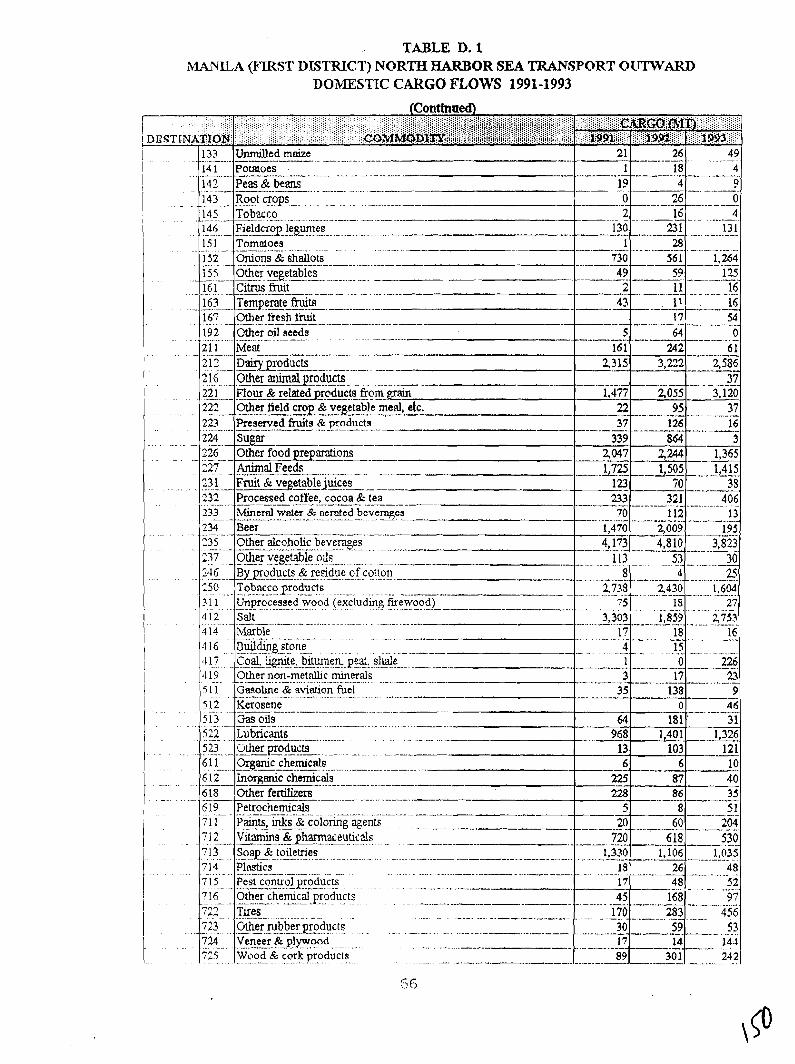
TABLE D. 1 MANILA (FIKST DLTTIUCT) NORTH HARBOR SEA TRANSPORT OUTWARD
DOMESTIC CARGO mows 1991-1993
i . . - 1 133 Unmilled maize -- I 141 ~ o m o e s .... - - ..... -. - -. .- .- - .- - . - ... - ........... - ........ -- - -. --
I . . . . .. 142 Peas & beans ..- -. -.-
I . . ..E- _.m~.z~P=.-.. . . . . . . . . , . .1!5-.- _Tobacco- . -..- ... -.....- - I .. 146 ...... Fieldcrop legumes ... ................ -. .- - - --. -. .----
151 Tomntoes - -. .- .- - - -. .- - - .. . . . . ...... . . . . . . - . . . . . . . . .. 152 Onions & shallots
. -. .,. . . -- 155 Other vegetables
-- .... .. .......... 161 -- Citrusffut . . . . -.-. . . . .- . .
.... . . . . - . -- 163 Tempe-e.f?ts 167 Other fiesh f i t - .
. . . .
-. . . I .. . .
. . .
. . . . . . . . . . . . . .
. . . . . . . . . .
-.- -- 192 .-.. ....- ..
211
. - . . - . .
.. - . . . . . . .
Other oil seeds - - . . . . . . . ..
Meot
2,047 226 Other food preparations
..................
. . . . . . . . . . . .
. . .
I I I I I I 1 . . . . . . . . . . . . . . . .
. . . .
. . . . . . I -. . . . . . . . .
. . . . . . . . . . I - . . . . .......
I . . . . . - I I I
5 ----------- - --
- 2,244 . . - - - 22: -. - .
23 1
. . . . . . .
161 --A-
2,315
- -. - - - - .- 1.477
22 -.--- --
. . . . . 2 12 .- - ?.!?..
-.!,365 - - Animal Feeds - -.-- -- - -. - . .-......... .-...... .... .. Fruit & vegetable_iuices -
233 - - . . . ....
234 -, - ..
64 -...--.---
..
- Dai r~~roduc t s . - ---- - -. - .- -- - ........ -. - 9!-!=eQr%ducE - . . . . . - . . -. . --
1.415 38
406 ....
1725 -L
-- - 233 232 -. -. ....
0 .. -- .-. 24 2
- 3,222
- -, .-. - 2055
95
1505 .-I--, 70 - - - - - 321 Processed coffee, cocoa & tea -- - - - - - .- -- -- --A - - - - - - .
M i n d water & aerated bevemgcs .- - -. - -. .- - .- - --. -. - --- 70 ... . ... . .. .... .. .- .- Beer -- -- - - - 1,470 . .
i ,7?2., - 'i ... 13 . . . . . .
61 ---.-
-------. 3,586 - - ... - - 37 - -
3.120 37 -- -- -. -
22 .-.. 1 - Flour --- & related~oducts - - -- from g&
37 . -- -- . - - -. 339
112 13 .- 2,009 193
..... . ....... . . . . -..
--
%E- - - .-
- -. cjther rubber product g. . . - .- . . - ...........- -. -.- . .- - - - Ve~e.er KP~.PO?~ ........... . . . -. .. . . .- ..... -- -- .--
.................... Wood CE cork -. ......... products - . . . . . . . . .
1 . . .
1
222 - ....... 223
.- . . . . . . . . 224
-.-P
4,810 3,823 -----
7%. . .
725
- -. - - . .
Other field crcy & v e ~ h b l e meal, efc. .-- - ."-- Preserved fruits & products .--- -- - - -. - - .- - - - -..- ....... . ... . ...- -- - K2.3 -.---.-----
126 .- - - .- - 864
4,173 2 3 5 - - -. - .
- . . -_ -11.9 30 - ". . 17
...--....----.--A
89
16 - .. - . . - -- 3
Other alcoholic bevemges -- - - - -- - - - -. - - .---A -, - .. ... . . .. . . 53 30 . . . . 3 - . . - . -.. -
g 4 25 - ---. -- ........ 2,733 ... . .. 1,604 ... .- '1.43 -.
?5 18 27 -- .- A - . . . . . . - ...... -
237 ..
..... -..-- 283 59 -. - 14 -.--
30 1
Other vegetable -- -- - ........ oils ...... -
156 53 - -. ...... 14;l . *-.
.-.~ ... 24 2
412 .......-
.- 14 3 li' . 11 17 ........ -
- 246 B y ~ o d u c t s & residue of cottori
Salt - -.--- 3,303 1,839 5753 -..-.....-... . . .. --- - - - . . . . . . . . . . .
- ~ a r b l e .... ....
17 18 16 - -- .-...... - . . . . . . . . . . .... .. . ~.@4??g.!f?r!e. . -. .- - - - - 1 15 - - - - -. - - - - - - .-
Coal. . lqute, .... . bitumerl'-peat. .. .. . . . sllale ... .. . -. - -. -- - - -. - - - -. - -. - - - - - - -- -- .- .. 1 . . . 0 226 -- - - .- -. - -- - -. -.
250 . . . . . . . . - ? 1 . . . . 1
.... --- Tobacco products
- . . ......... ............ - Unprocessed . wood (excludul~ firewood)
. . . . 4 19 -
. . . . . . . . . . . .- ....-.. -- - ----------
. .... ...... ..... ..................... ......... ........ . . . - Other non-metnlhc -. - minerals - - -. .- - - -. ---- 3 17 23 - - . . . . . .- - - - -. -. 35 - --- - 5 1 1 Gosohe & aviation -. fuel - ..-~ . .. ... . . ...... 138 9 .. .
0 46 --- 64
5 12 513 .- .
Kerosene -. - - -- - -- - - -. - - -. - - -- - . .... . . Gas oils
.- -. -- -- .- . .... -.............. 522 . . . ....
sg-_- 6 1 1 - .. --. 6 12
-- - - --
6 18 -. - -
- 6 19
181 '
3 1
Otha fermizers - -. -. . -- - . . - - .. - - - - -. - - . -. . - - -- - -- -- -. . -. . - ....... - - -...... - . -. - - -- -. - . -- Petrochemicals -
Lubricants ..... .- ... . . . . - . - ..... - .... .-
!2!~~od!L!! ... -. Orkanic chemicals -- - - - - -- ..... - .... -- - - - -. - -. -. - - Inorganic chemicals ----
35 5 1 -- . -
228
-- 5 7 l l . 712 ... -- .. -
. . . . . 71 3 -
714 - - ... . .
7 ....... 15 .-
716 --
86 8 .
Paints, .- ...... mks S( coloring ........ %en! ........ .. 20 60 204 ..----.----- vitamins &ph-maceuticals ---- - ---- - - . . . - . . . . . . . . . . . -- .. -- 530 --.il.E ----. .-..-
- ....-. ... Soap -. &. toiletries 1.330 1,106 1,035 .....-.-------- ---- Plastics -- - .- -. - - .- 18 26 48 .. ... . ... ...... ... . . . . . - , . .... .. Pest . control yroducrs - . . . . . . .... ... ... . . - - -- -. --- -- .- -- -. .A - -. - -- - .-----.-- -----. - 48 52 - - - -. - - - Other chemical - products . - ...... 45 168 97
. .
968 13 6
1.401 103
6
1,326 121 -- 10 40 .-- rn 87
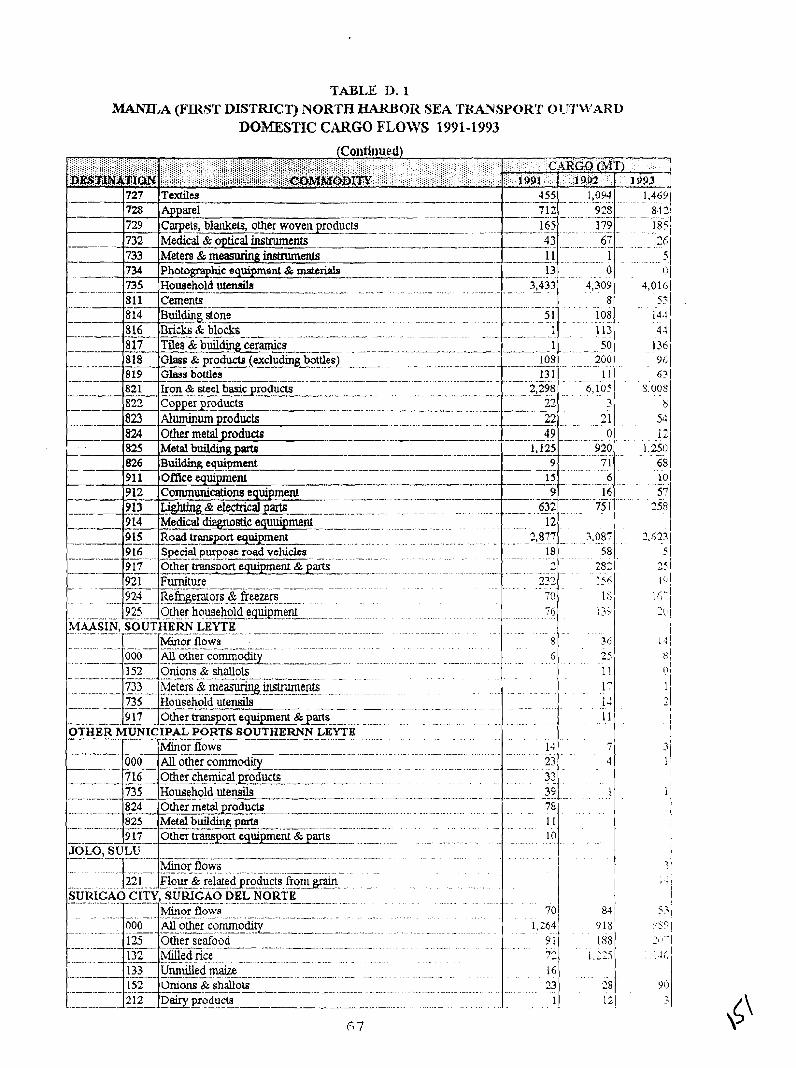
TABLE D. 1 I\/IANILA (FLKST DISTRICT) NORTH EIAKBOR SEA TUNSPORT O?rl'\\'AKZ,
DOIMESTIC CARGO FLOWS 1991-1993
(Contiuued) . . . . . . . I
.-----
-
--
-- ..
735 ~ ~ G i h ~ i d - i ~ - .... 3,433 . . . . 4,309 4,016)
13 1 1 1 63 /
22 3 ---- ~- .. --.
22 ._ .-21 . . .. . . .
- .. - . - .. -. .... -. . - . .. - - .. .- .- - - - .. - .................. ---------.Me--
...
..........-................... -. .-...-
. . . . . . . . . . . . . . . . . . . . . . . . . . . . . .
. . . . . . .
. . . . . . . . . . . . . . . .
. . . . . . . . . . - . . . . . . .
. . . . . . .
727 728 729 732 733 734
Textiles - 455 -. 1,0941 .......... 1,4691 Apparel . - 712 .... 91s .-~ 8421
Cqets, blankets, other woven products --- 165 ............. 1?9 ...... -
33 67 Medical a optical illmments .... . - . .- .-. .....
Meters & rneaaunngrnstruments . . 1 1 I . ..-. . . . . - .-
Photomhic equipment & materials 13 ... ... 0 (I I
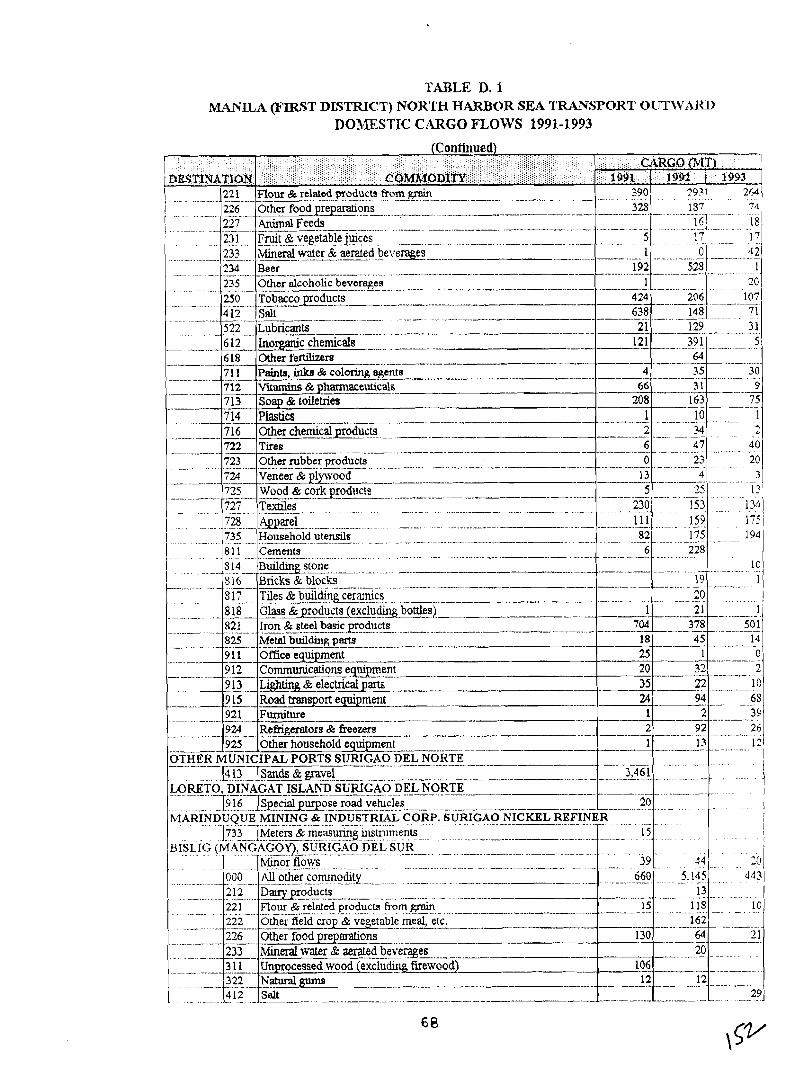
TABLE D. 1 MANILA (FIRST DLSIWCT) NORTH HARBOR SEA TRANSPORT 0 U T ~ V : i l u )
DO1,ESTIC CtIRGO FLOWS 1991- 1993
. . . . . . . . . . . . . . . : . . . . . . . . . . . . : : , . : . . . . . . . . . . . . . . . . . . . . (Continued)
. . . . . . . . . . . . . . . . . . . . . . . . . . . . . . . . . . . . . . : . . . . . . . . . . . . . . . . . :
. . . . . . . . : , : : : ::,. :li;i.iiiiiii;i'i:'.:i' . ) ;::; ij::il'l:iilil; .: :.:, ..> : ;::::.'i:": .. , ' i , .ii':l~;.,:;:;i;;~i.!:;l:~~;iii;j;;:;;jjiji:;;i$;;::..; . :.; .: : . . . . . .
: . i . : . , :::.: . : j . : , j . . : : . :::::::,:;.. . . . . . . ... . .
DEq~iNA~tofi ;~ j~. ' ;~<:~i j ;~~i i , i : : : ! I ;~.~~~i j~; j i ; j ; ; ' : ' i , i i : : . ~ i > N ~ ~ ~ t ~ i j ; j i : ; i i j i : ~ ~ ; i j . : ; i ~ ; ~ ; j ; ; ; ; ~ ; ; j j ~ ; j ; i j ~ i ; : j j j : ' ~ : ;" j : 390 193 . . . . . . . . . . . . . . . . .
328 157 74 1 . . .. .......... ..
I6 IS .... .-. . . .
1: 1: . . . . . . . .... 1 0 4 2 233 lfieral .--, water & aerated b e ~ ~ z w ......
Beer 192 523 _____C.____l_______l_____.. .......___.._._.___I___.. _ --- 1
. .
235 Other alcoholic beverages 1 20 ......
.... .
. . . __ . - . .. -- .. .- . -.
- - .- -- ...
.-- - - --
._____-_____.._____._.-_*l__ __ --.. __~.. -. _ ... ~- ... 4 24 206 107 .uo _ T _ ~ _ ~ _ B C C O P ~ O _ ~ U _ C L --- ----.
412 Salt 638 148 51 ..... . - 522 - - .... -- 6I2 618
4
21 129 31 L u b r m ! . ... .
35 30 71 1 & CO~-R~%M~B .. ...- .. - --- - - .- . -
.... 5 -- . ... ..
. . ........ Inorganic chemicals 121 39 1
._ .............
Other fertilizem . - - .---
712 Vurrmins & pharmaceuticals_ -. -. 7 13 Soap & toiletries
--4
714
64 - .- -- - - - - - -..
66 21 9 . 208 , 163 - - 75 -- - - --
............ 1
. . . . . . . . . 2 Plastics _-------.---.----.------e.- - .....
1
. -. .-
10
40 ......... .- ... - - .-
.
? 2 3 . 722 7 1 6
Other rubber products .- 0 23 --- ~.-.- 20 6 47 ? .-
.Oth!chemica~u~ts._. . -- - 2 34
.. ............... .. ..- .. .. .
724 Veneer & plywood ---, 13 4 - .- . --- -- ... - ..... 3
. . . . . . . . . . . -
. - . . .
725 Wood & cork products 5 25 ...-. . -.
. _ ..?? ...... 11 1 ...........
..............
Is3. . . . . . .
159 727 ....
. . . - . .
175 _ ..--... 228 - - . . . . . . . . . . .
T d e s -. . . . . . . . . . . . ..........
.728 ..--. 735
.._
. .
---. ..
5 14 Bullding stone 10 , . .. .. _ _ _ _ _ _ _ I - - _ _ _ . _ _ ----- -- ...
81 1 Cerneritrr . . . . . . . . . . . . . . . . . . . . . - ... -. . - .- - .... - ........... -, .............-..... -. ...-........... - - . - -- - ... -. -- .....-...
1 ... - ....... - . . . .
. .- ...... - . -
....
6 - - .- ... - ....
AaareL - .. . . . .
Household utensils .. . . . _ _ - ._..
5 16 . . .- .. .- 8 1: .-. ........ 8 18 - -.. - - 821 -~
82 . . . . - . . -
Bricks & blocks 19 ----- -- .---, .- - - ... .- - . . -- . -. .. - -. . -- .. - - - - .-.. -. .. - . . Tiles 8 buildm~cenmics 1 -.- ... _. -- . ...... .- . .- - -- .. .?O . . . . . . . . ,
825 Metal building, part8 ... _ ___________l__l________.__,. ___I__------_II..- 9 1 1 Office equipment - .. - ... - - - - - - -- .. - 1 0 - - A 9 12 Communications e~uip_mernt~.- -. ----- - - 20 ......... - 32 . -- .
2
9 13 Lighting 8 electrical parts .- .- - - -- - - - - - 22 1 0 -- .?Z - ... ............... .. ...
9 15 -- Road transport equipment 2$ - 94 - __- ... 68 921 Furniture - --- .- - - -.-- --- - -- - -. -- -- -- 1 2 . ... .- .
35 - - - - - - - - - .- .- - . . 924 Refrigeratore & freezers 2 92 24 . ........
......
.- ....... ..-............-.--............
... -. . . . 20
....... .....
..... ...
...............
_. ..... . . . . ...... ...... . . . .
-- - --- .... ..... ...... Flour &- related products frorn grain
. . . . . .
..... ....... ....
....... .......
106 - ...
. .
-. -- -- -. - .- - -. - - -. ... ...
45 18 14
.Glas~r~~ts -@clu_c l i r r~%es~ 1 2 1 1 ' - - - . --- . - . Iron & steel basic ~roducts 378 --
- - -- 704 .- - - . . . 50 1 .
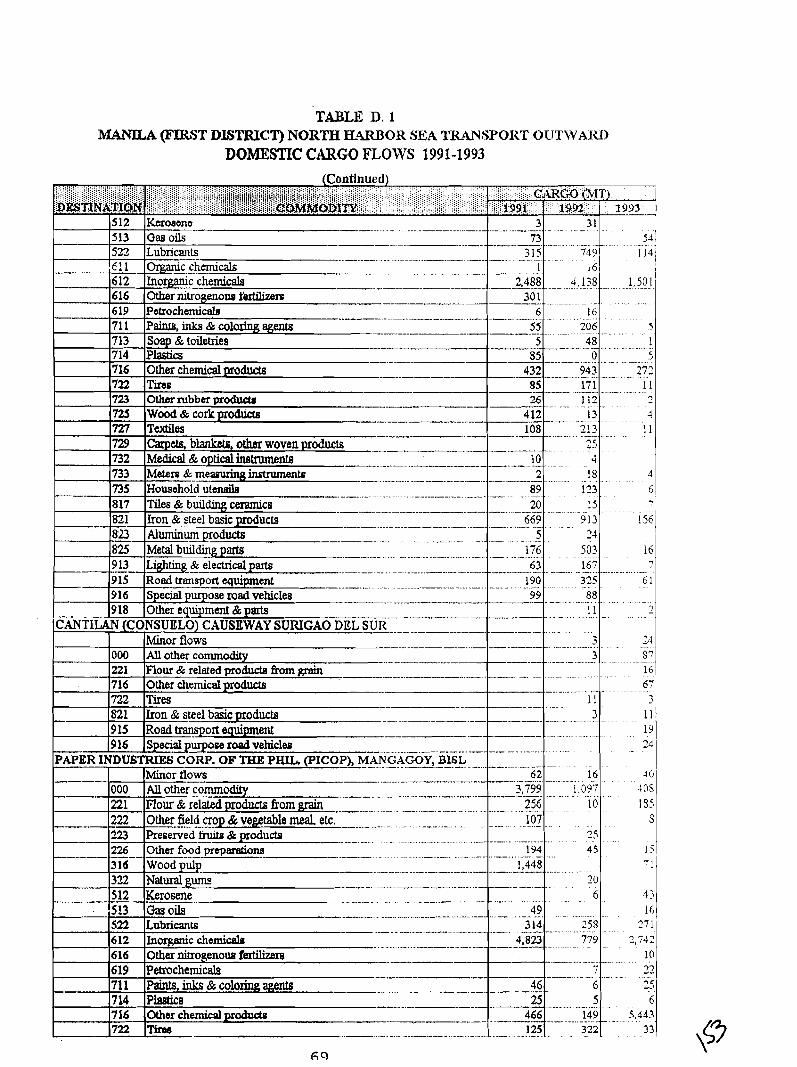
TABLE D. 1 MANILA QMST DL5TRICT) NORTH E4RI3OR SEA TRANSPORT OUTWAJU~
DOMESTIC CARGO FLOWS 1991-1993
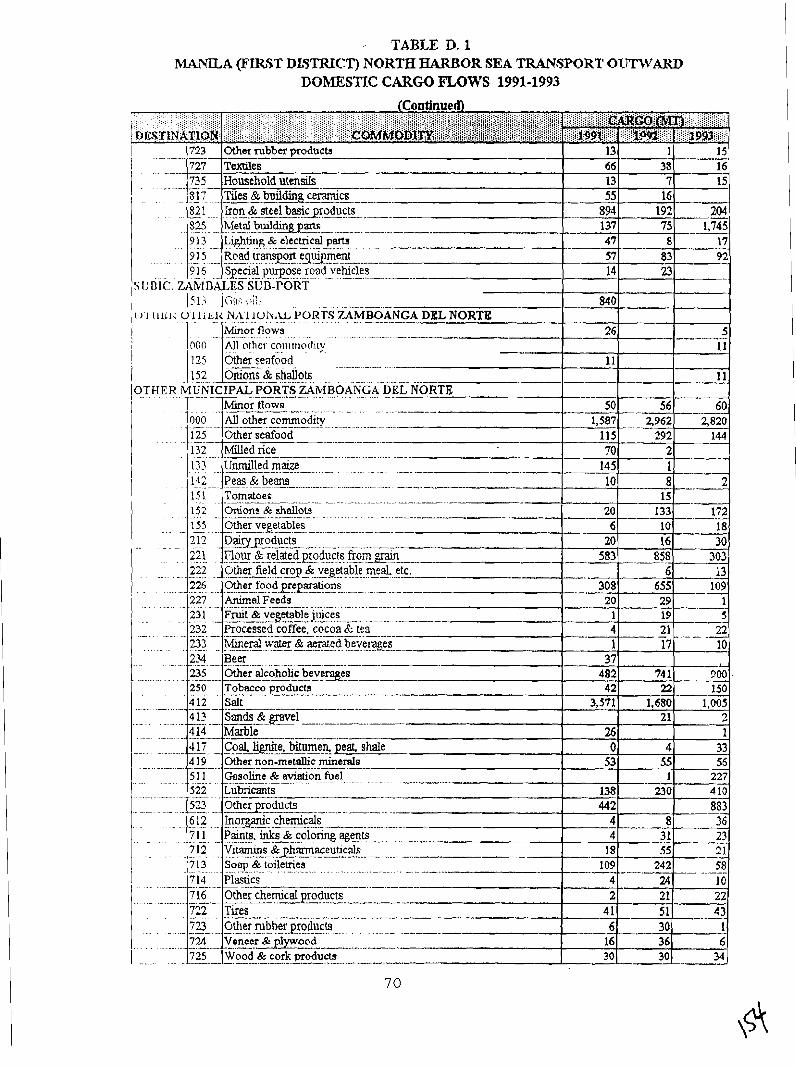
.. TABLE D. 1 ~ N L A (Fmyr DLTTRICT) NORTH HARBOR SEA TRANSPORT O x r r w m
DOMESTIC CARGO FLOWS 1991-1993
(Continuedl
. -. - -.... -. ......... - -
............. - -. ........................ - . - ........... -- . - - -. - ............................. Minor tlows
I . . . . . . . . . . . . Unmilled maize 123.
I . . . ..- . ... .. . -. .-.. ............- ......... . 142 -. -. -- Peas & berms -. -. - - -. -- - - 151 Tomatoes
. . . . . . . .... -...............
227 Animal Feeds . . . . . . .
231 Fruit 62 vegetablejuices . . . . .
237 Processed coffee, cocoa & tea ........................... - - ....-.. ... - ... - . Xheral >vater & aerated beverages . . . . . . . 73_? ..-.A_--
. . . . . . . . . . . ......... ...-.-..-..-.--.---.------.-.-p
235 -- Other alcoholic beverages -- -- -- - - - - -- - - ................. ..... .. . .
4 1-1 Sands & p e l 21 2 ...........
.................
-. - - - -- -. ........-....-..
. . . . . . . . .
.... - .............
.................
. ..
. . . . . . . . . . .
- . . . . . .
.
414 Marble 26 0
53
138 442
4 - 4
-. 18
j 1 7 4 19- - .-.. 5 1 1 .
- 109 ---
- -- -- - - .--- . Coal lignite. bitumen peat shale - Other non-metallic minerds -- -- - A -- - -- . ...... . Gosoline & aviation fuel
. ........
Soup & toiletries - - ,- --.--- -- ............................................... ................ .. Plastics --- - - -. .. . . Other chemical -- products
I -. ............
..............
4 55
1 230
7 13 ...........
714 - ..... ....
716
1 33 56
227 4 10 883
522 - ... 523 - - .....- $2 ...
71 1
242
.- . . . . .- . . . . . . .
. . . . . . . . .
................
I
-- .- 36 31 23 55 21
Lubricants -- -- - - - - -- Othegroducts - - - - . .. .- -... Inorganic chemicals -- Paints. inks B coloritlg -. agents - . ......
58 4 2
4 1
16 30
722 723 -. - - ..
- .. .- 724
712 -. ..
24 21 51
6 . 30 36
- 30
Tires ..... . -. -- - .......... -- ........ - - -- Glher rubber products--.- - ..... -. .... - ........................ -.- . - - -. . .. _Veneer P ? ? ? -..---...
Vitamins &~hmaceutic& --- -....-. ----- --
10 7-2 43
1 6
34 725 p o o d & cork products .............I.....____.........__...____---_.--
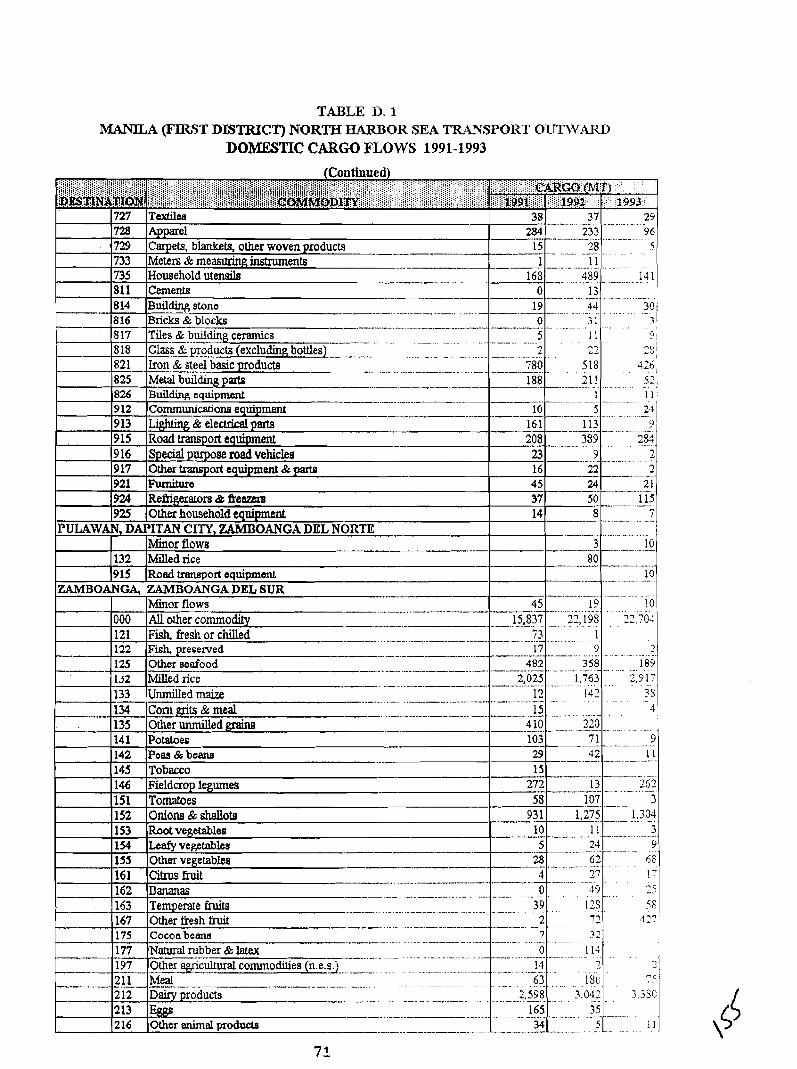
TABLE Ii. 1 MANlLA (FIRBT DL'TRICT) NORTH HARBOR SEA 'IRANSPORT OIJTWARD
DOMESTIC CARGO FLOWS 199 1-1 993
7
--
915 Road transport equipment -- 389 ............. 234 . --- 208 - 9 16 Special purpose road vehicles 23 9 ................ 2 917 Other transport equipment & partr! -- 16 --- 22 2 921 Fumiiure 45 24 2 1
.. .....................
....... -- ...........-
..............................
..... ..... ---.
~
1.275 1.304 ...............
727 728 7 3 733 735 811 814 8 16 8 17 818 .
821 8'25 826 9 12 9 13
Toxiilea 38 Apparel 284 ---- Carpets, blankets, other woven products 15
37 . 233 --- ... --
....... 28 11
.
--.- .!29 13 ........... -.
. 44
Meters Sc m e k g instruments ---p---.---p-.-.
Household utensil^ .-p -
Cements --.------ Building stone
29 ............... 96 ...-...........-..
5 ..........
......-...... 14 1 ...............
.................. . I 30 / . . . . . . . . . . . . . .
1 1% --
0 19
3 j 9 i
2s j . - . . ?2r; 1
. . . . . . . . . . . . . 5 3 1 I !
.............................
241 .................
9 8
................
Bricks &blocks 0
Tiles & building ceramics .- 5 .. . . . . . . . . . . - ................................. 2 C1ass~yl.o*ucts (excludin~ bo~eslRR.-R.R.RR ............ . .....
3 1 ........................
1 1 22 . . . . . . . . .
780 Lron & steel basic oducts - - ........... ......-....- 518 ......
~ e G E d i n ~ p2 188 21 1 Buildingequipment - ---. ............ .. ~ o m r n u n i c a ~ i o ~ equipment -- -. ----- -- ........ L&hg & elechical parts 161 113
---.. 10 -----
1 -.
5 . .- .....
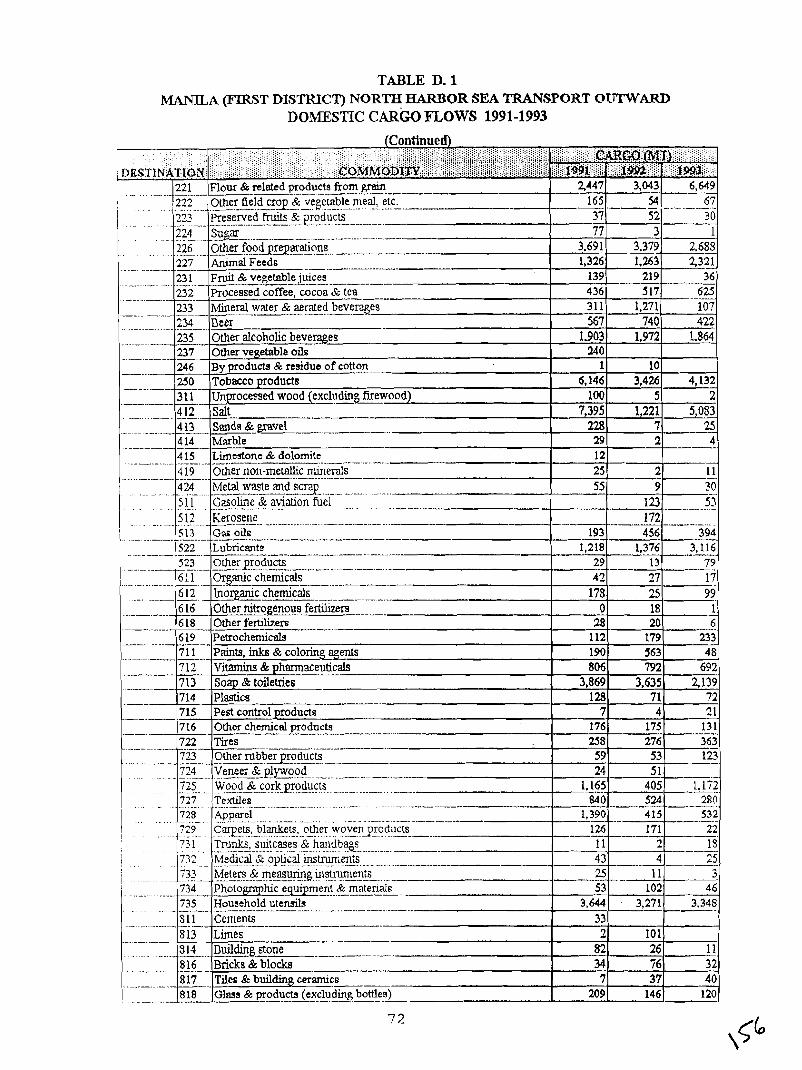
TABLE D. 1 MANILA (FlR9T DISTKICT) NORTH HARBOR SEA TRANSPORT 0U"IWARD
DOMESTIC CARGOFLOWS 1991-1993
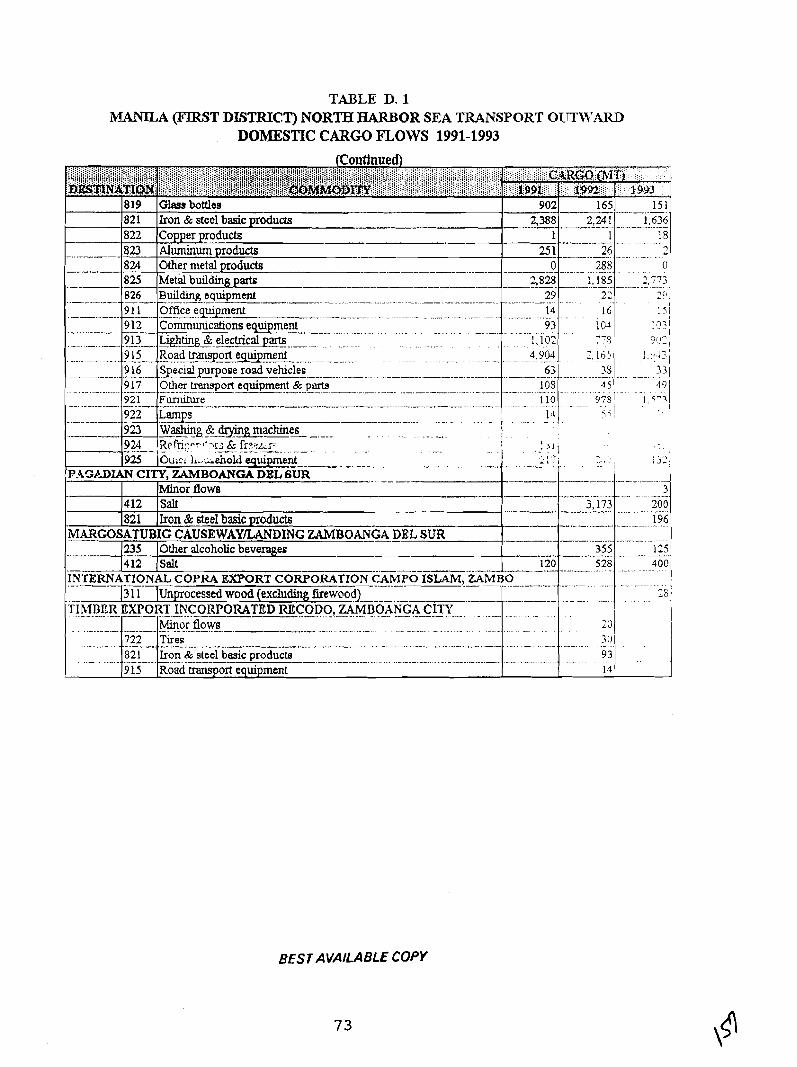
TABLE D. 1 M4NILA (FIRST DISTRICT) NORTH W O R SEA TRANSPORT OtrTW"i'
8 2 Gther metal products .. -. ...
825 Metal building parts .................... 22 -c> $ - - .. ,
...........
. . - - - . -. -- - Office equipment - .- --. - . - - 9 13 Commu~~ications equipment . - -. .- - - -. ---. . -- - --
......... --- 9 L . ~ i & @ g & - e l e c ~ ...................
(Co~lttnued)
9 15 Road tr.stgort e ~ m e n f .................. ..... .......... . . . . . . . . . . . . . . . . . . . . . . . . . . . . . ....................... t 4.904 :. 1651
.--..-. .. ..... . . . ..... -. ........ .. .. .... .. .............. ...
.,- - 9 16 9 e c i a l p u p e road vehcles - - ----- - - - - - -- - - - - -- - - .- - - -. 63 917 Other transport equipment & parta 109 .................. ......................... 921 Furniture 110 9;s
.......
922 Larnn_s-- 1.1 5 ; / - - -- ...... .- .... -. . - . . . . . . .~ - 9 2 3 w h g Q drymg machines -
' ' - .
. . . . . . . . . . . . . . . . . . . .
924 -- Rrfri;;ar.lt,~: 6: fr:?c,~r;. .. . . . . . . . . . . . i - . . . - . , 925 iOtiic: I L . C L ~ ~ O U equipment - . . - - - - . . , . . . . . . . . . . . . . .....
P.4'JPJ)XAN CITY, ZAMBOANGA DEL 6UR - -- . - -. - - l ~ i n o r flows --
1412 IS&
...................... ..: ::::j :...:.:. i :a@JZN&$fjH 8 .
819 821 822
1821 Ikon SZ steel basic product. CAUSEWAYLANDING
1235 lother alcoholic beverager -- 412 /salt
INTERNATIONAL . - - COPRA EXPORT CORPORATION CAMP0 ISLAM, ZAMBO .............
13 1 1 lUnprocessed wood (excluding lirewoodJ - -- -. . ... TIhlDER EXPORT INCORPORATED RECOD0 ZAMDOANGA CITY _ 9
823 Aluminumproducts 251 26 .. -. ..:, la ,
i $ ] i i i j i i i @ , $ , i # ; j ; , j ; ; i i 1 $ i ; ; , $ ; i ; i i i ' i ; ; $ j i i i j i j i ; i j ; i . ~ :.:. ;!iil!iifi;;i!!i!!:i:!:!!:!!!~i!~i!l ...................... i ~ j ~ ] i ~ ~ ~ i ~ I ; ~ ~ l i ~ ; ~ ~ ! ~ ~ ~ : j ~ : . ..IY1__..._._-..L_I___.. i $ 6 i i i i l i i . i i ~ i , ~ i ( i i j ~ ~ i . i f $ i / i ~ j ~ ~ ~ $ ~ , ~ ~ $ ~ ~ ~ ~ ~ O D ~ ~ ~ ~ ~ ~ ~ ~ i ~ i : j j ~ i j j ~ i ~ i ~ > i i i i i i i i i ~ i ~ j i i i j i i j ~ i ~ i ~ i ~ i ~ $ j ~ $ ~ ~ ~ ~ ~ ~ ~ ~ ~ ~ ~ ~ ~ ~ ~ . . . . . . . . . . . . . . _....II.......
Glaas bottles Iron & steel basic products -- Copper products
Minor flows ,- i ............... ........ .................................... . . . . . . . . . . - . . . . . . . . . . . . . . . . .
7.22 Tires . . . . . . .......... ....................... 821 Iron & steel besic products 93 . . . ......... . ... ........... ......... ...................................... . 9 15 Road transport equipment
- - - - -- -
BEST AVAILABLE COPY
.:.:.:.....
. . . . . . . . . . . . 3gyj 151 1 . -. - .
902 . 165 2,388 .
I 2.241 - -- --
1 1,636 - - - -. -. - .. - -
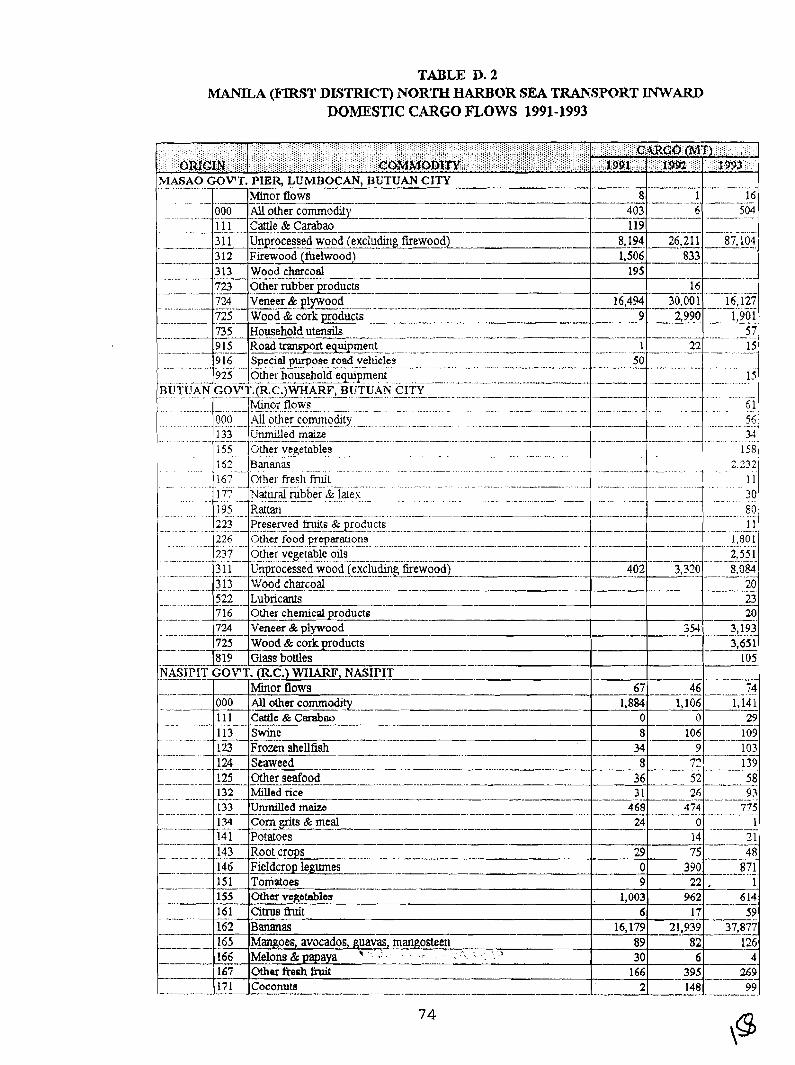
TABLE D. 2 MANlLA (FIRSl' DLTTRICT) NORTH HARBOR SEA TRANSPORT INWARD
DOMESTIC CARGO FLOWS 1991-1993
Minor flows 8 . . . . .
... - -- - -- - ............
8.194 - - .- - . -- --- 1,506
- 195
-- -................. ......... .... .
......... ......
1 ............... . .--- ............
..
L I d e d maize
..... . . ~
. .. . . . - . . . . . . . . . . - . . . ....
..... ............................ . .
. . . . . . . . . . . . . . .
...........................
~ ............... .... ....-.. .....
... ..........
Preserved fruits & paducts I ! .. ............. Other food preparations 1,801
2,55 1 .... ......-............ ..................
... - - - . - - .- 20
-
- 402 3,320 8.084 .- -- - -
-- 23 -- ---- - - -. -- .-- - - - . 20
55.1 - -1,193
-. .... --- . - -- 3,651
------ 105 -
.. -. . - 6 4 6
---- 1,884
- 0 ...... ... .. ... --- ..-A- 8 106 109 -... - . -
34 103
.................... - 134 .--
.. .....-. - -- - .... -. . - . ........ Corn gnts & meal - ---- Potatoes ------
ii3--%olCrPsS - - -- - -- E e w o p legumes Tom&% - Other vegetables -- -- - Cimfit - - -- - -
- .- -.. -- -- ---- - ...-.-.... .- ...
- .... - -
.
141
-- 146 - 15' 155 -. 161
- -
-----
- - - -- . . --.
.... -.................. 24 0 1 --.
29
.-- 0 9
, 1,003 -- 6
16.179 89 30
166
- 2
162 ' 165 166 167 171 - .
14 75
3 9 0
21.939
- 82 6
395 -. -- -- 148
Bananas Mangoes, avocados, guavas, mangosteen-
A ; . Melons & papaya 3 - > : . . ?
< .. -, . -3 . , '
Other fresh b i t Coconuta
- -
21 48
871 .- -.
37,87?
126 4 --.
269 - . - - -- - .................. 99
22 962
17
. 1 6 14 ---.-.--.-
59

_hlAluILA (l?IRST DISTRIC'Q NORTH JU.IU3OR SEA TRANSPORT JNW7ARD DOMESTIC CARGO FLOWS 1991-1993
3 15 W w a y - shppers - -.- -.
4 13 Sands &_gravel .. . ... - . . .. -- . . . . - ... - . - . .. - - -- - . - ..- - .. -. - - - -. - - - ! ........
4 16 Budding stone , ......-.. ---- ............... -. .... - .
4 19 Other non-metallic minerals ......................... - .......
474 b~etal w ~ ~ e mci scrap ........ . . . . . . . . ....- ...................
522 Lubricants .......... .............. ......... .- .................................. 6 14 Synthetic rubber ......... . . . .. 71 1 Paints, inks & coloring qen ts -............-.... - .... - - - ......... .- .... - - .. .- ....-... - - ......... -- . -.... - - 7 12 Vitmniria & uiiermaceuticah
. . . . . .-.....- - ...-...-.-......-. -- .........-.-... .- .... .--. ............................. - .- - ................ ... .... -tyy j Soap 6; toiletries - . . . . . . . . . . . . . . - - . . . ..... . .-
Other chernical products . . . PIE :. 722 Tires . . . . . . . -- .. -~ .............. ...- . -- -~ .-....
Other rubbery roducts -- ..
.......... Wood R: cork vroducts .V_~EE!*.!FO~??
. . . ................... 728 . are1 1 9 ~ ............................. ..9R ........... ..................... --- .. ........... -- .... 7 * o tical instruments ................... I.!.. ..... k!@?L&.-rn .......................................... - ...............
............... .............. ........ . ..........-...... .... .. 735 IIousehold utensils 4 155- 734 Pholomhi_c_e~~_~~ne_nt._&..maleG+-. -
191 266 743 18 I 1 l Cements I 21 161 .......................
8 14 Building stone .......................................
8 15 Glass & products (excludino bottles) ......................................... *. ... .........................
. .9!9 ..... C!asb.!z!ttles .... .....................................
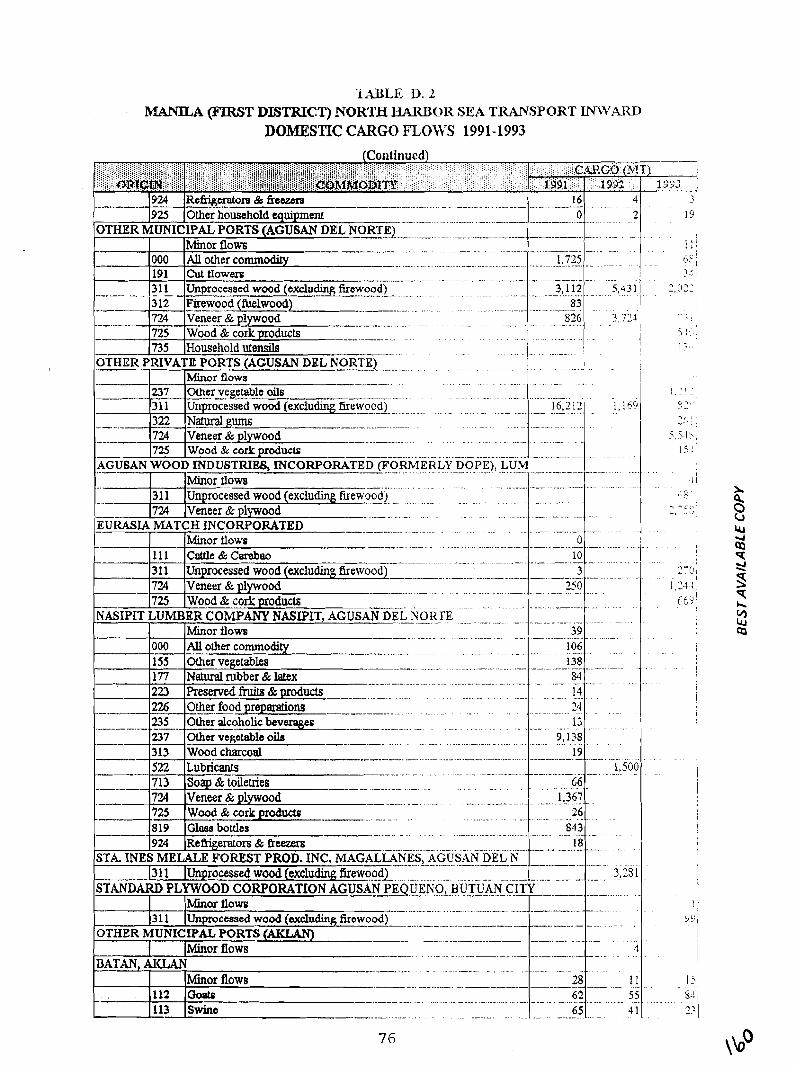
1 m L E D. 2 ~~A (FELST DLSTRICT) NOK'M HARBOR SEA TRANSPORT INYARI:)
DOMESTIC CARGO FLO'cVS 1991-1993
. . . . . . . . . . . . . . .
... . . . . . . . . .
. . . . . . . . . . . . . .
. . . . . . . .
---- ..........-...... -- .... .. - . . . . . . .
- .... . . . . . . . . . . . . . . . . . . . . . . . . . . i
. ..................... -- - ........ - ...................................
. . . . . . . . . . . . . . . . . . . . . . .
. . . . . . . ......................................... .-.-
. . . . . . . . . ...-............. - .............
. ..... . . . . . . . . . . . . . . . .- - - - ...............
....................... -. ........... ES, AGUSAN DEL . . . . . . . . . - -. - -- - - . ... .... ... .... ......... -- ............... UEKO, .... BUTUAN - .......- - - - . -
. . . . . . . . . . .
...................
- -- . . . . . . . . . . ........-..... .....
- . - ............. .- ... -- - - ... - ..... - .-............-......-........ . . . . . . . . . . . . . . . .
- --. ... -. .................... -- ..... . . . . . . . .
76
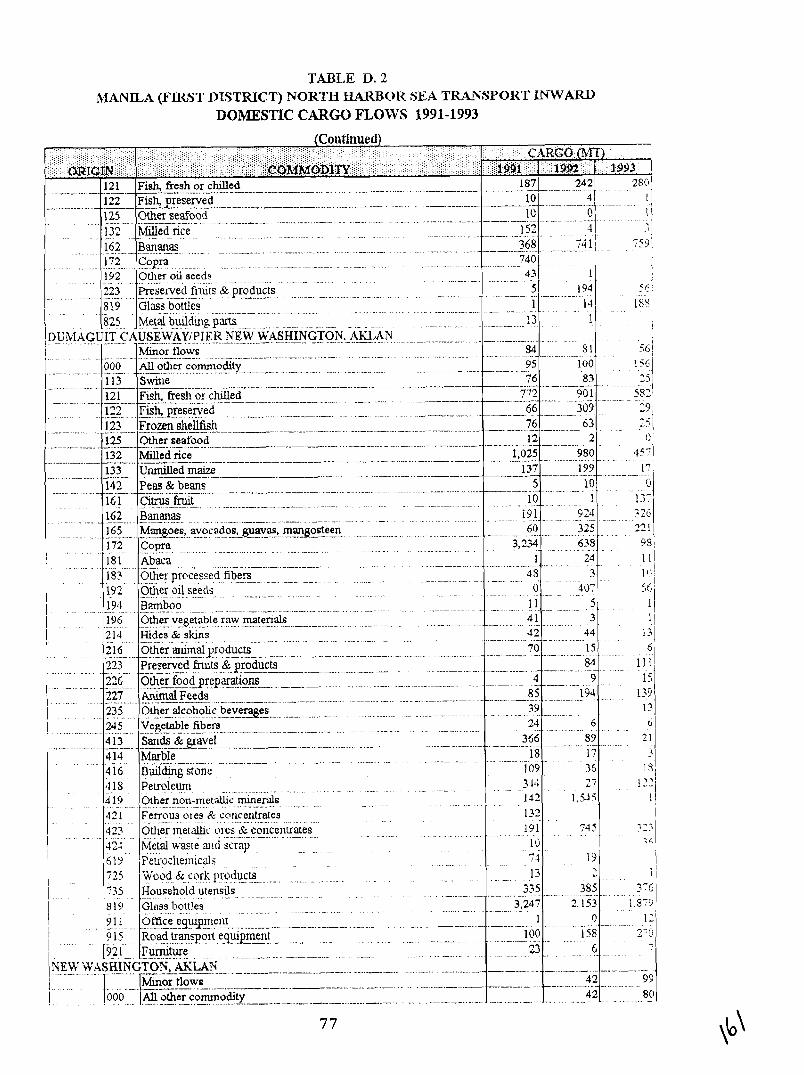
TABLE D. 2 11/IANILA (FIIiSl' DISTRICT) NOK1'H HARBOR SEA TRANSPORT LNWARL,
DOMESTIC CARGO FL07rVS 1991-1993
(CoiiMnue&)
. ........... .......... . . . . . . . . . . . . . .
122 -2 Fish _preserved 10 4 1 1 ... . .......... ......
125 Other seafood 10 0 ....._.._...I.... ...................... .... ........... ....... -.. . . . . .
13: h.fdled rice . . . . . 152 . . 3 - 1
. . . . . . . ......
162 anala as 368 741 ~-
.' i 7594 . . . . . . . . . ........ . ..... ..................... ......................... .....
740. !
. . . . . . . !.'I?.. C!?P~? . . . . . . . . . . . . . . . . . . . . . . . . . . . . . . . . . i . . . . . ........
192 Other oil seeds 43 1 ! . . . . . . . . . . . . . . . . . . . . . . . . . . . . . . . . . . . . . . . . . . . . . . . . . . . . . . . . . . . . . . . . . . . . . . . . . . . . . . . . . . . . . . . . . . . . . . . . . .
223 Preserved f nu rs &products 5 193 561 ........................ _ . .... ._ ........... . ........... . . . . ....... __ ........................
1 slr Olaso..b?tUer I SS ~ ....................................................... . . .. - . - . . . -
............... . _ ............ 1 ? I
. . . . . . . . . . . . 94 9 1 . . - - . . . . . . . . ..-......-.. .................. .....
100 .- ..-.. . . . . . . . . . . . . .
76 83
....... .... ....
. . . . . . . . . . . . . . .... ...........
._.- .........
...-.... ..... .. . . - . . . . . . ... . ... 1,025
.. .............. .......... 980 ___..
Unmilled maize __ 137 .. .....
5 10 .... . . . . . . . . . . . . . ................................. . . . . ...
. . . . . . . . . . . . . . . . . . . . .-........... . . . . . l e . . . . . . . . 1
i91 .................................... . . . - ........ . ~ ........... ?? .....
165 Mangoes, avocados, guavas, mvlgosteen . . 60 - . 325 121 1 ............ I i . . . . .
. . . . . . . . . . . . . .
I 1 ..............
I
I ................. .................
.......... ......................... . . . . . . . - . . .
172.. 191 183
192 194
1: . . . . . . . .
. . . . . . . . 139 13 6
226 Other food preparations __ - 3 9
Go?=!'. . . . . . . . . . . . . . . . . . . . . . . . . . . . . . . . . . . . . . .............................. . . . . . . . . . Abaca _ . _______.___C. .. . . . . . . . . . . . OLher precessed fibers . . . . . . . . . . . . . . . . . . . . . . . . . . -. -- .......-.... - . _ . . . . . . . . . . . . . . . -
. . . . . . . . . . . . . . . . . . . . . . . . , . . . Other oilseeck Bamboo ......................... .... .... . . .
4 13 Sands & gavel 366 89 .............. __ ...... . - - - - -.-... --- ........... ...
414 h h b l e 18 17 . . . . . . . . . . . . . . . . . . . . . . . . . . . . . . . . . . ..................
316 Duildjngstone 109 36 ?,I?. - ? 'i
. . . . . . . . . . . . . . . . . . . 4 18 beu?leunl . . . . . . . . . . . . . . . . . . . . . . . . . . . . . . . . 1221
.
4i9 Other non-melakc minerals . . . . . . . . . . . . ........................... . . . . . . . ! j . . - - .
471 Ferrous ores & ::c'oncenLrtes . . . . . . . . . . . . . . . . . . . . . . . . . . . . . . . . . . .... -. 423 OUier rnelahc ores k corlcerlLrates
I ' . -
. . . . . . . ( . . . . _ . . . . . . . . . . . . . . . . . . .
I . . . . . . . 431 Metal w ~ r e and scrap 619.' ~ e t r o s h e ~ u c ~ s -, . . . . . . . . 71 - I.. .
...... ? v!! k- !m& IT?!!!CK-. . . . 13 ................... I 7.15 Household utenslls . . . . . . . . . . . . . . . . . 385 ......................... ....... . . . . . . . . . . . . . . . . . . . . . . . . . . . . . . . . . . . . . . . _ 819 Glass bottles 3,247 7,153 1,s-9 . . . . . . . . . . . . . . . . . . . . . . . . . . . . . . . . . . . . . . . . .
1 '
91 1 OMce equlplne~u 12 .............. . . . . . . . . ..... -......... ......... i 1% . . . . . . . . . . . . ... . . . . . . . . . 9 1 - Road kanspolt ~~ui l '_m!1JJJ - . ...- . . . . . . . . . . . . . .... .....-.-
. . . . . . . . . . . . . . . . . . . . . . . . . ...... . . . . . . . . . . . - . ..
. . . .. . . ... .. ... 42 _ 55
. . . . . . . . . . . ...........
! 42 80 .... ... .... _ ...- ....... ...... - - - - ._.....
77
194
6'
.......... ........... .-... .... ..- . ...
227 M a l F e e d s 8s
3,241 1
> ....................
48 .......................................
0
1 96 214 2 16 " :I ..._ .....
1 . . . . . . . .
I . . . .
! ...................
. . . . . . . . . . . . . . . . . . . . . . . Other vegetable raw -ter'33s .......................... _ Hides & skins
_. . . ............ . . . . . . . . . ........... .
Other m a l p r o d u c t s 1: : : .
I ' I
. . . . . . . - . . 638
24 . . . . . . . . . - - . . . . . .
31 4 07
..
4 1 42
....
.. .... ...... _ . ._ ........
. . . . . .
9si 111
'] , ) I - I ?36,
j ................................................
44 ................
223
-
- . . . -. . . ! !. .......... 5 .
70 Prese~ved fruits &21oducts ... . . . . . .
.......
15 ..............................
84 _--.- .
" 5 ... O!!'talcr?!o!c be_~_%8es... .. ............ ........ 24 5 Vegetnble fibers
.................... 39 24 ................................................................
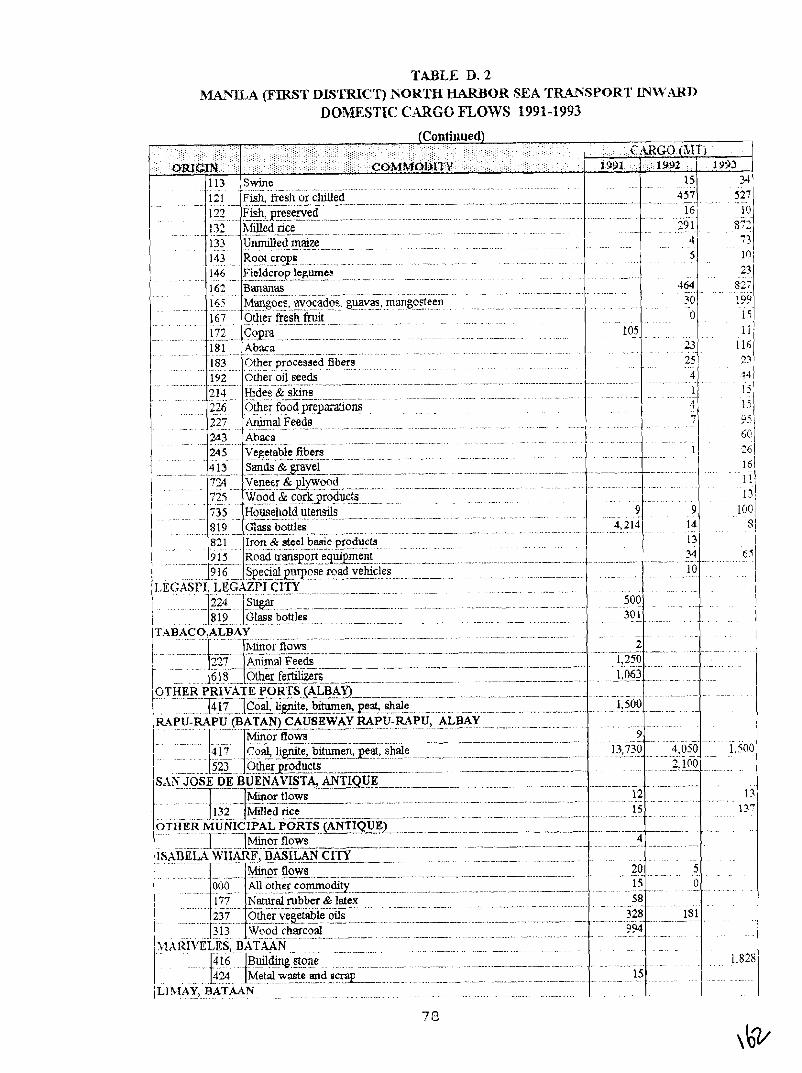
TABLE D. 2 W L L A (FIRST DISI'IUCT) NOKTH HARBOR SEA T M s P Q R I ' LIUW'.;UU)
DOMESTIC CARGO FLOWS 1991-1993
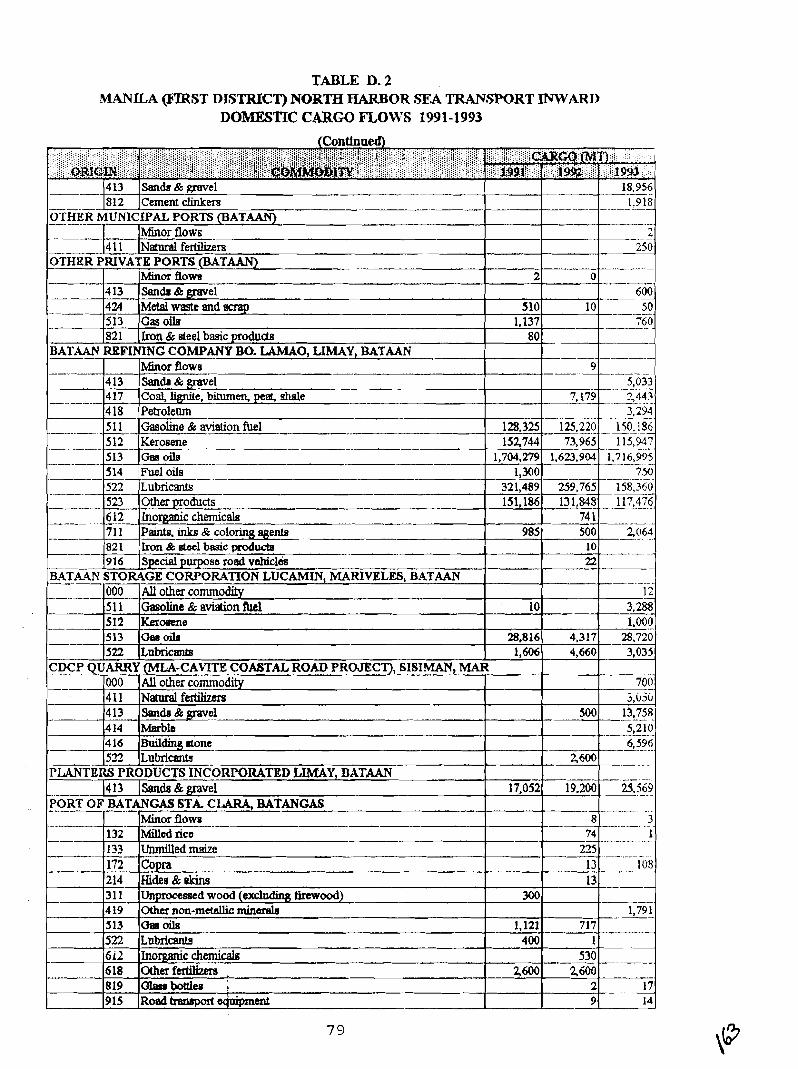
TABLE D. 2 MAMLA (FIRST DLSI"I'1C:T) NORTH HARBOR SEX TRANtmORT INWARD
DOMESTIC CARGO FLOWS 199 1-1993
- I - ---
510 10 1,137'
A_---
80 LIMAY, BATAAN - - - -- - - - -
Minor BOWS 9 5 hfmor flows k4-1 411 IN- f & r ~
OTHER PRIVATE PORTS (BATAAN) --.
413 S a n b & gravel -- 5,033 I - - - - - - - - 1417 Coal+&pite,bitumen,p4rh.Lc 7,179 .- ----I 2,447 -..
--
2 250
.---
-
6,596 - -. - - - - -. . -. .--- zfYJ0 . .
PLANTERS PRODUCTS INCORPORATED LIMAY, DATAAN --- -- . -.-
413 ISsnds&gravel 17,052 19.200 25.569 . -. -
PZRT ------.-- OO! BATANCAS STA CLARA, BATANGAS - - - -. . . .
71 1 821 916
-- -.---.
---
--
-
6 1 2 - : h o ~ c h e m i c a l s - -- ..--- Paints, inks & coloring agenp - Lron & steal basic producte --- --.- Special purpose rod vshiclds
B.4TA.4N STORAGE
522 Lubricwts 1,606 4,660 3,035 CDCP QUARRY (MLA-CAVITE -- COASTAL ROAD PROJECT), SISIMAN, - - MAR
I - -
1 - 1000 1 All other commodity
CORPORATION LUCAMIN, M A R I V E L ~ ~ T A A N All othm comrnm Gasoline & aviation f'uel K e r m e - Gasoils
.--
-- .- - . -
132' 133 172 214 3 1 1
985
000 5 1 1 512
Minor flows - ------ ~ i ~ e d rice Unmilled maize Copra - Hides & & Unprocessed wood (excludq tircwood)
10
28,816 513
3 -. . . - - . . - .
I - -. -. - - .
-~ - .- .- 108 . . .
- -
4 19 513 522 6iZ 618 819 915
- .
300
74 1 500
10 22
8 -- 74 ----.
225 13 13
-. 2,064
-- - - - .- -
4.317
Other non-maallic minerah 1,791 Osl oils 1,121 717 _
( L U M ~
12 3.288 1,000
28,720
Inorganic chemicals OCherfertilizera . Ola#botUea ; R~&trenapoacx$t$msnt
2600 -. 530 2600
2 9
- --- --
17 14

TABLE D. 2 MANILA (FIRST DLWRWl"JXI NORTH HARBOR SEA TRANSPORT INWARD
DOMESTIC CARGO mows 1991-1993 (Continued)
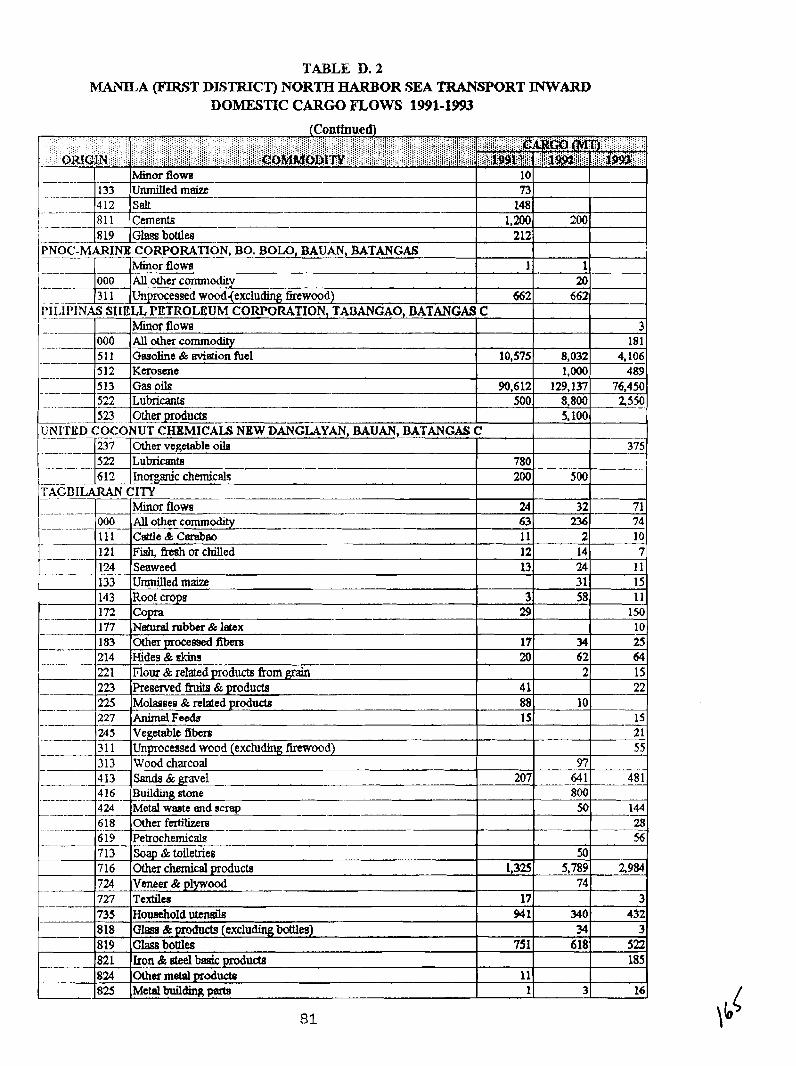
TABLE D. 2 MANILA (FIR9T DLSllUC'T) NORTH HARBOR SEA TRANSPORT JNWARD
DOMESTIC CARGO mows 1991-1993
(Continued)
ino or n o w 10 73
1.. . -
.- 1,200 200 212
PEMARINB - - -- - CORPORATION, BO. BOLO, BAUAN, BATANGAS 1
662
1 20
662
&or flows All other commodity
_Unprocessed wood(exc1udmg Bewood) . -. - - - -- . . - .- PILIPINAS SIIPLL PETROLEUM CORPORATION, TABANGAO, BATANGAS C
Minor flows 3 . 181
5 1 1 Gasoline & aviation fael 10,575 8,032 4,106
513 Gas oils
5,100
-- 200 500
Minm flows 24 32 - 71 / !??Lo All other comm* 63 236 74
111 C a t U e & C ~ e o 11 2 10
-- - - 121 Fish, fhh or chilled -- 12 14 7 124 Seaweed 13 24 11 133 Unmilledmaize 31 15 143 Root crops 3 58 11 - 172 Copra 29 150 -- 177 Netural rubber & latex 10 183 Ocherprocessedflbers 17 34 25 214 Hides & &im 20 62 64
000 - 31 1
t 221 223
-- . 225 -. - - - - -. . 227
245
nour & related products fiom grain Preserved h i t d & products Molaoses & related produds AnimalFe& - Vepetable 5bm Unprocessed wood (excluding finwood) Wood charcoal [Sand3 & gravel Buildmg stone - --
.. -- -
. -- - . -. - -- -
- 3 1 1 3 13 4 13 416 . - -
4 1 88 15
207
. .- - - -- - -. . -. --
. - -. -
1 3
17 941
75 1
11 1
2
10
97 64 1 800
424 618 - - . - 619 .- -.
15 22
15 2 1 55
481
50
---
50 5,789
74
340 34
618
3
Metal waste and scrap o t h e r f ~ ~ - . - - - - - -- Petrochemicah - --
144 28 56
2,984
3 432
3 522 185
16
Soap 8 toiletries Other chemical products Vmeer&plywood Textilea Household utlrnls Glass & prodncts (excluding bottles) Class bottles Iron & ateel b& prod- Other metal producto Metal building pmta
---- ---- --
--a
713 716 724 727 735 8 I 8 8 19 821 824 825
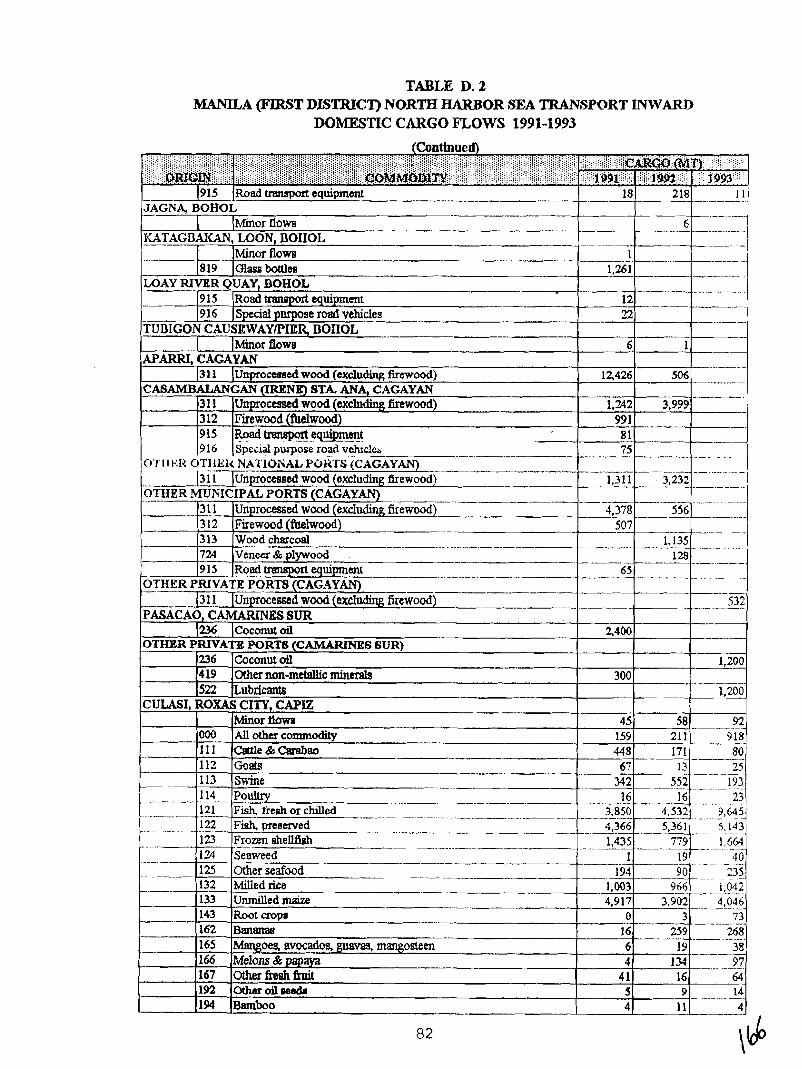
TABLE D. 2 M4NILA W 5 T DJSTRTCT) NORTH HARBOR *=A TRANSPORT INWARD
DOMESTIC CARGO mows 1991-1993 (Conttnued)
-- Road tFansport equipment - -- - - .- - -- - -. 18 - 218 111 -- - -- -
. - - -. -. . .-- .- - . -
I - - - - - . .
I
- -- ..- - -. - .
. -- - - .- -- . .
- - .-
JAGNA, BOHOL .- I (h4inor nom ----
KATAGDAKAN, LOON, DOIIOL - I -. ]Minor flows ---
6 -. --
1
-- 1916 I Special putpose road vehicles -.--- -- TUI3IGON CAUSEWAYPIER, DOIIOL
1 l ~ r flow8 6 APARRI, CAGAYAN
(3 1 1 (unprocessed wood (excluding firewood) 12,426 --- - ..
C A S A M B W G A N (IRENE) STA. AN& CAGAYAN - 131 1 1~nprocessed wood (excluding firewood) -- 1312 IFirewood (fuelwood) - -~ - 991
I R o a d - o i t - e ¶ m 8 1 - -- - - 75 -
. -.
- - - -- -- -- - - - - . - . 1,311 3,232
-- - . - - --. - - -- - .. - , .-- . . . - . -. . -. -. . . - 4,378 556
507 - .
1.135 . ---. -. . ...
- - -- -- - - 128 - . - 65
. - . - - - - - --- - .- - . - . --------- -.
firewood) ----- ---- 532 -
1236 (~oconut oil OTHER PRIVATE PORTS (CAMARINBIG 6UR)
-- - - . -
1819 lc~asrrbotllea --------- M A Y RIVER QUAY, BOHOL
(915 (~oad traneport equipant
114- Poultry 16 23 - - 16 121 Fish, ik.sh or ciulled .-.. --- 1 3,850 4,532 ~ -
C. -. . - - . 122 Fish, preserved -- ~ 4,366 5,361 . . lD 'G&n s h e W -- 1,435 779 -. - - -. . . - 1.6f9 - .. - . - - - . . - - - 124 Seaweed
- - --- --.- - 1 19 4 0 -- - - -- - . - - . - . - . Other seafood .-!% !!!! 3 5
132 Milled rice 966 p-
1.003 -- .-_1L04_22 133 Unmilled maize - - -- -- -- - - 4.917 3,902 4.046
--. 143 Root crop 0 3 73 - - - - .. - - - -. - - 162 Bananae 16 259 268
--.- 165 Mangoes, avocados, guavas, mangosteen 6 19 38 166 Melons & 4 97 134 167 Otherfieshhit 4 1 16 64 192 Otharoilpeeds 5 9
-- 14
194 Bamboo 4 11 --2~
2400
300
45 --- 159 --- 44 8
.---- 67 3;12 -.
236 4 19 522
1,261 -
12
Coconut oil Other non-metallic minerals Zubrlcam
1,200
58 211 171 . - - -- 13 -
552 --
.CULASI, ROXAS CITY, CAPE
-- --
1.200
92 9 18 80 - - - - - 25 - - - -. -- .
193 ~ .-
--
000 1 1 1 113 113
Minor ibis Auothacommodity Catle&Carabao '~oats -- - Swine ----- -
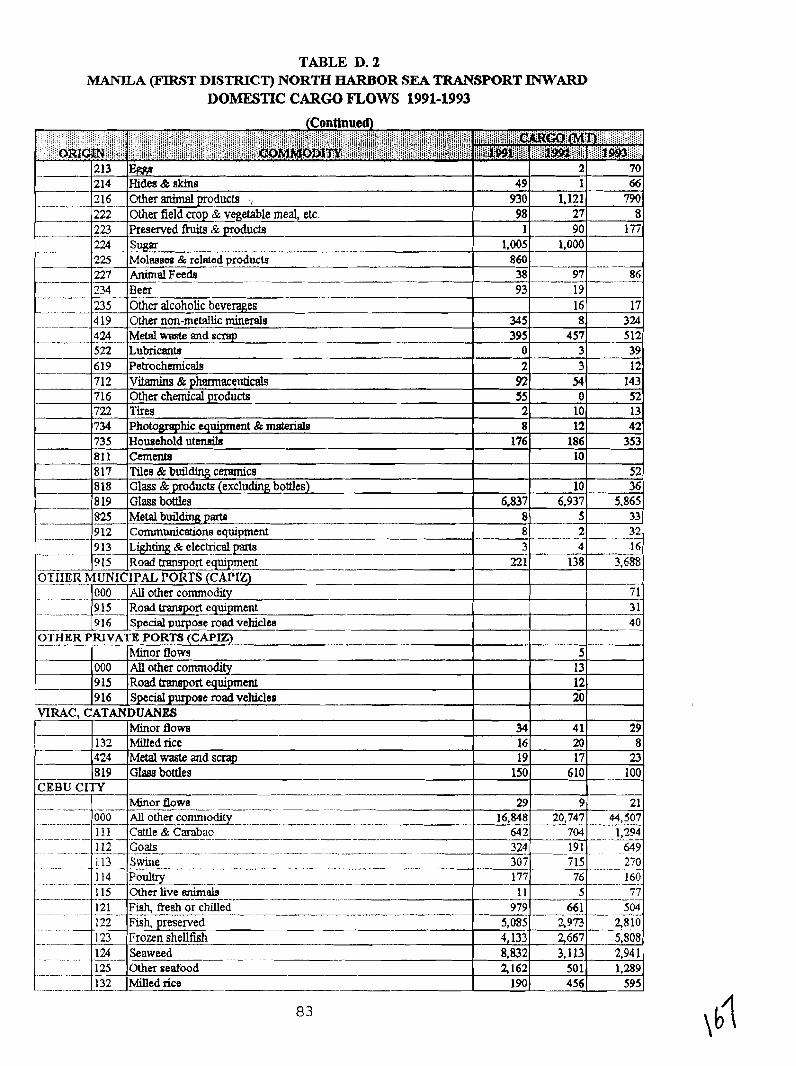
TABLE D. 2 MAMLA (FIRST DISTRICT) NORTH HARBOR SEA TRANSPORT INWARD
DOMESTIC CARGO mows 1991-1993
2 70 214 Hidm&akins 49 1 66 7-16 Othersnimalproducts .; 930 1,121 790 222 Other field crop &vegetable meal, etc. 98 27 8 223 Preserved fluils & produc& 1 90 177 224 . ! 1,005 1,000 225 Molasaas & relatad - -. ptoductrr -- 860 - 2 7 Animal Feed8 38 97 86

TABLE D. 2 MANILA -5T DL9TRICT) NORTH HARBOR SEA TRANVSPORT INWARD
DOMESTIC CARGO mows 1991-1993 (Continue&
133 Unmilled malzs 7,552 10,306 -- .- - - 6,567 - 134 Corn grits & meal -- 16,459 9.617 14,548 - 135 Other unmilled gmim 15 - 48 - . - -- 1 142 1.43 145
Peas & beans -- 118
- . - - . -. - -. -. . 146 F i e l d c r o ~ a e -. .
20!L-- ..E _ ..-.
1,145 . . . .. - 607 50 1
.. - - ~ . - . .
R_ootaopa -- &bzco - -- - - - - -- - - -. - -- - - - - -
36 9 1 - -.
--- -3- - - -. . - - - -
45 1 -- 1 1 145 609
9.106 2
10,090 385 739 202 270 168 400 53 645
4.200 66 272 250 - - - - -
6,801 48 11 1
- - 298 119
-- 1,169 3,601 1,954
87 1
--
70 1
- 118
7,463 1
3,347 2
217
749 38 49 119 200
2122
86 28 -- - - --
9,988
1
- -. . . 317 . 68 - -. - . -. -
158 ~_ .- 2
113
-41----_ 11 5,?32 -- 17 -- 3,552
- _ 320
2 457 83 16
52_ 3.171,
-. . - - - - 3 75
.-A_--
304 - - - - - 3.932
2
151 Toms~oea 153 155 161 162 163 165 166 167 171 in 174 175 176 177
20 277
77 512
1.097 1,965
466
- - -- Root vegetables Other vegetables --- Citrusfruit - Banana0 ---- Temperate lhb Msngoee. ftv- guavas, mangosteen Melons & papaya Otherhfihfirait Coconuta copra CofRo boanr (un&eatd) Cocoabeam Mmnuts&kemeIs Natural rubber & latex
---- .
Other oilseeds -- 1 ~ s
Bamboo -- s
Rattan &LRetable raw matetiale -- %fie~ agriculhxal commodities (n.e.8.)
Meat D;nryproducts Egge
197,
10 344 37
1,427 2,123 2928
57
-
-
,181 l~baca
194 195 196 197 211 212 213
182 183 191
Coconut tibera . .- ---. - - - Other processed fibera ----- Cutflowera
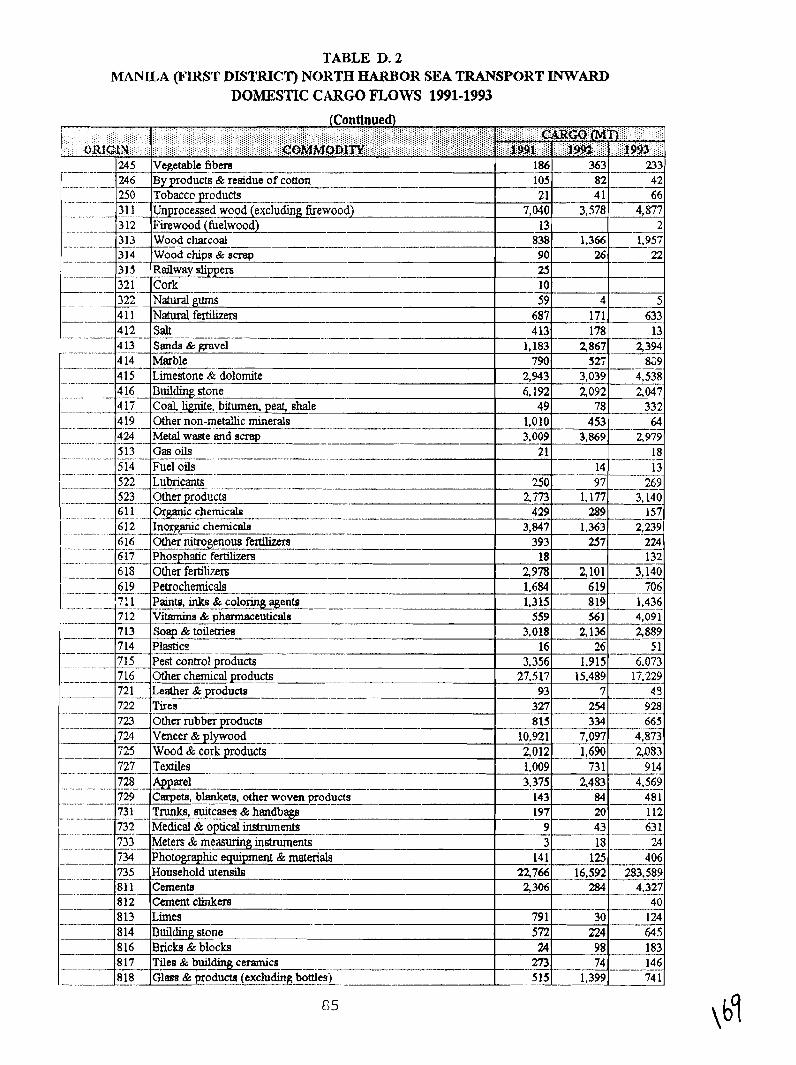
TABLE D. 2 MANILA m 9 T DISTRICT) NORTH HARBOR SEA TRANSPORT INWARD
DOMESTIC CARGO mows 1991-1993
(Continued) I . I . CAR60 Rnn
ORIGIN I - . . . *. C~MMODITY . , 991 . I , 198t j 1993 1 245 ! -- . -. .- - . . - . -. - - . . - . . -. . 3 1 1
3 12
Vegetable fibere . ------ - By products & residue of cotton - - - - - ---- - - - - -- Tobacccproducts Unprocessed wood (exc-d} Firewood (fuelwood) ___ Wood charcoal ---- -- -- -- - - -- - -. - - - -- Wood chips & scrsp -- Railway dippers - -- - - - -- - --
-'cork -- .- -- Nahualgums Naturalferhhm Salt - - - -- - -- -- - .- - - - - Sands & prove1 --- .- -- Marble - Limestone & dolomite Building stone
. - . . . . -. .- - . - - - . .- - . - . - -- - - . - - - - -- . - . . . . -
. - .- . - -
. . - - - - --- - - . - - ---
. -- - 313 - - - - - 314 . - - - - 3 15 - . . 321 - - .. 322 411 412 4 1 3
186 105 2 1
7,040 13
838 --
414 . -. - - - - - . - . . .-. - -. - -. 4 15
316 -. -. - -- - 4 17 Coal, m e , bitumen. shale --
4 19 Other non-metahc minerals -. . . ~
49 -- 1,010
3,009 21 --
- 363
- 82 4 1
3,578
1,366
Other n i g e n o u s fertilizers _..--I- ..-.--------.-_-----..^.._-_I__-
PhosphaSic fert ibm -- - - Other fe= - ~etro~h_&al~_ Paints, inks & color in^ agent0 ---- --- --- Vitamins & pharmeceuticals Soe to i l e t r i e s Plastics
. - - Z ! L E n - -- Other chemical products Leather &~roducts . - - -- - -- - - -- Tires . - - - .. .
6 16
.-. 233 42 66
4,877. 2 --
1,957
78 453
3,869
1 - . . . ..__
- - -. --. .- -
. - - - . - . . -. - . . .- - - -. . . - - - - - - -. - . . -
. . - - - - .. .. . _. . .
. - -. - . . -. . -- - - - - . . . - . - - - . - --
- - 22 --
5 633 13
90 26
332 64
2,979 18
. --- -. - . - - . - .- 250 2.773 429
617 -- - -- 618 - _619 - -. - 7: 1 712 713 714
716 721 . - -- -- - 722
- - -- -
. --
. - . . . -. - --- - - . . - - - - -. - - . . . - -...- - - --- . . - - . - -- . .- .- . - . . . . . - -. - -
25 lo 59 687 4 13
--
- 4
- 171 178
1,183 790
2,943 6,192
.- 14 - 13 97 269
723 724- 725--
- 727 . - 728
. . - . - - 729 . -- - .. . 73 1 . - .- A 732 - -- - ---
----- 1.177 289 -- -
Other rubbe~_poducts ~ ? & o o d Wood (pc cork products Temles . . -. . . - - AEparel . - .- - -- - -. - . - - - -.- - . -- - - - Cmpets,&@ets, other woven products - - - Trunkfi, Buitcases & handbag~ - - -- - - - - Medical & optical m - e n t s
--- -. - .- - - -. - - - . - - . . - - - -. - -. - . - -. -- --.
2,867 2,394
- -- 3.140.
157 . - .- . - - - 2,239 3,847
- 527 3,039 2,092
-- 1,363
733 734 735 . .-
G9 4.538 2,047
393 18
2,978 1.684
Meters (pc measuring instruments -- Photographtc equipment & mate&&-- Household utensils - .- - -. -.
257 224 132
81 1 -- - 8 12 813
2,101 619
Cementa - "~ementclinkm -- - -- -- Limes
3,140 706
1.436 4,091 5889
51 6.073 17.229
43 - --..-.- -. .
1.315 559
3,018 16
3,356 27.517
93
819 561
2,136 26
1,915 15.489
7 327 815
10,021 2,012 1.009 3,375
---. - -- 143 197 20 112 9 43 63 1
- 18 24 3 . . - 14 1 125 406
22,766 16.592 -.--- 283,589 2,306 284 4,327
40 79 1 30 1 24
254 334
7,097 1,690 731
928 665
4,873 2083 9 14
2,483 4,569 - -- - - -. - - --- . . -- - - - -- 84 48 1
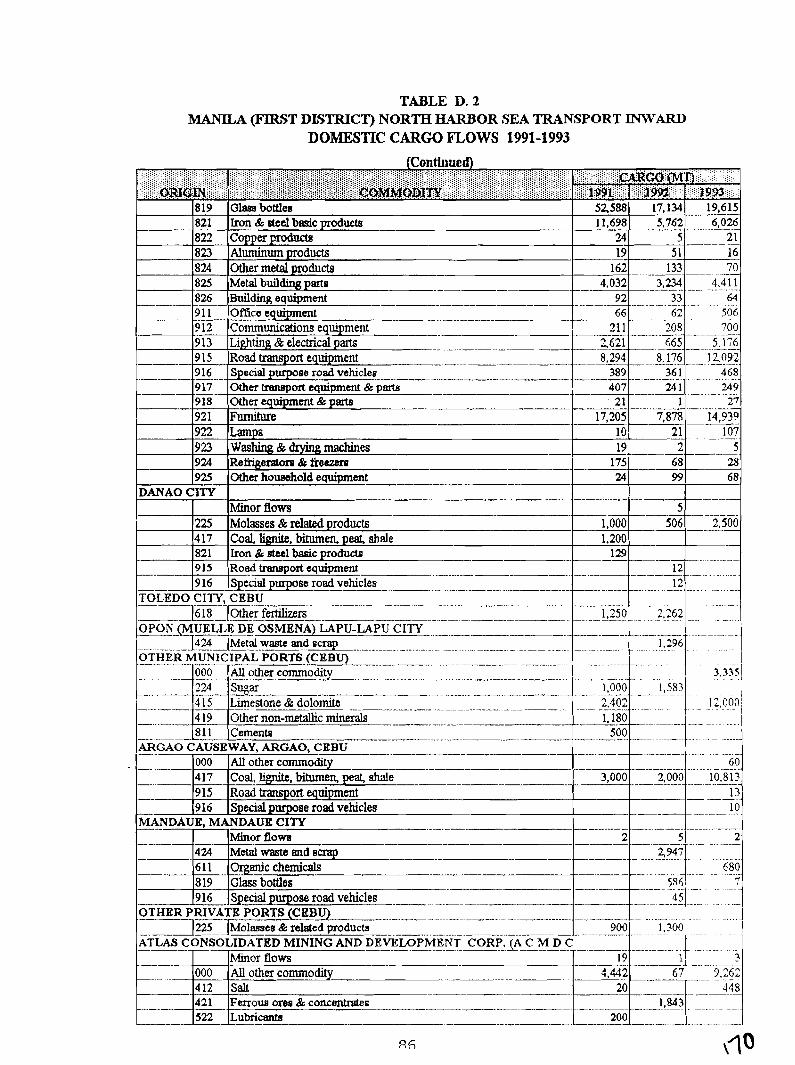
TABLE D. 2 MANILA (FDL3T DL3TRICT) NORTH JBWBOR SEA TRANSPORT INWARD
DOMESTIC CARGO nows 1991-1993
-
824 Other metal products 825 - Metal building parts --- - . 8 Building equipment --------- -- 33 9 1 1 OfEca equipment -- -- - - - - - . -- - -- -- -- - 9 12 Communications equipment --- -- 208 9 13 Lighting QE electrical parts --- - - -. - - - - - - 9 15 Road transport equipment --
.. - 389 36 1 9 16 Special PufPose road vehicles 917 Other t+anspott equipment
2 1
2 1
9 1 8 other equipment & prnts 921 Funuture 922 Lamps 923 Washing & dryingmachines
p---
19 924 Rehgeratora & iieezera 175 925 Other howohold equipment 24 99 --
DANA0 CITY -- - h4inor now9 .. --- 5
225 Molasses L related products A
417 Coal&&e.bitumenpeatshale 821 Iron & steel basic products 129
12 9 15 Road kawport equipment . ..-..--...-.--.-p---.. .. ~- - . .. .
-- 9 16 Special purpose road vehicles 12 ... . . . . -. . .
C I m , CEEJ ~
6 18 Tother f-IX 1,250 2,262 E-- .= . . . . - - . . ,. - . . - . . . . . . .- . . , - - . .. . . .. - - .. . ... . -. -. .-. ... - .- . - . -. . .- . . -- .. . - . .. . . . . . -- . .
OTHER MUNICIPAL PORTS (CEBU)
. 2.402
ARGAO CAUSEWAY, ARGAO, CEBU . - .- .- - - -- -- -- - - - - - - . - . - - - . . 000 K o t h e r commodity
4 17 Coa &I&, b i t m e n , peat, shale - - -
- 9 15 Road transport equipment 916 Special purpose road vehicles - - -.
MANDAUE, MANDAUE CITY _ .- - -- Minor flows -
424 ~ e i waste and s
~ ~.~
1,843
---..
- . . - - - ~ . - - .-. -
--- - -- - -- -- .- - - . --- ~
26
819 821 822 823
Gl8ea bottles Iron & &el baaic products -- Copper products Aluminumproducts
52,588 11,698
24 19
17,134
- - 5,762 19,615
-. . - 6,026 5 21
--.-/!! 16
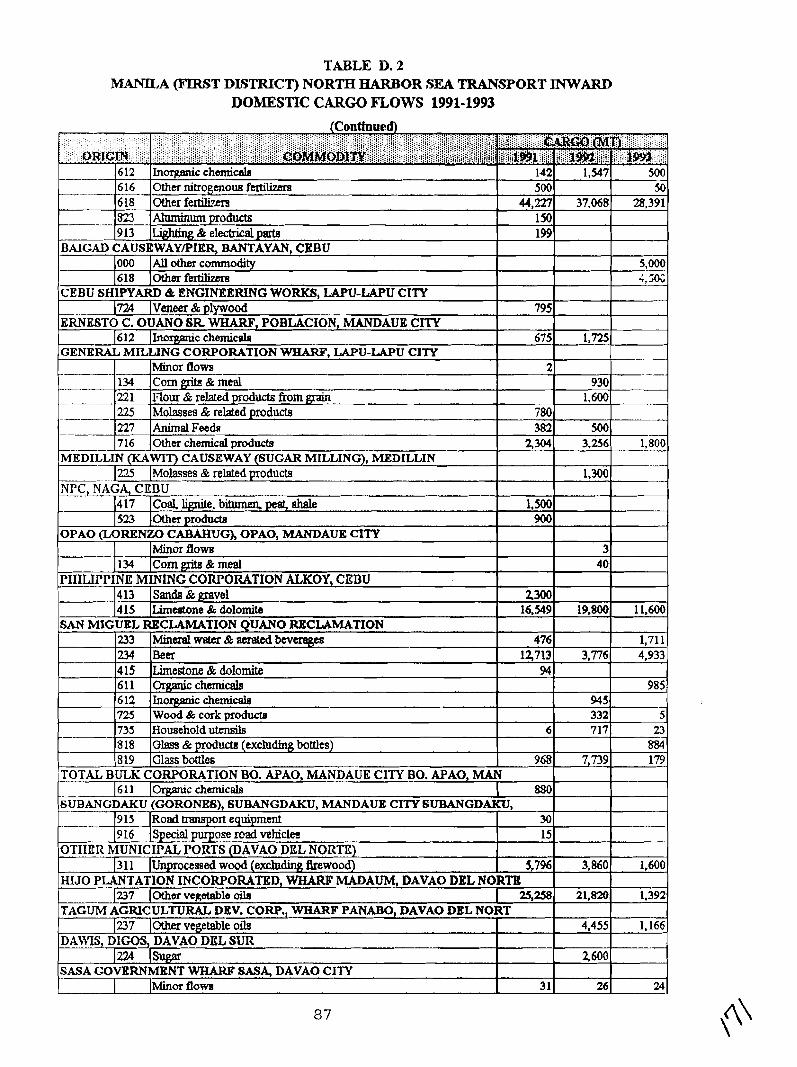
TABLE D. 2 MANILA m 3 T DL3TRICT) NORTH HARBOR SEA TRANSPORT INWARD
DOMESTIC CARGO mows 1991-1993
.-
6 12 725 735 8 18 819
-
rInor@c chemicale Wood & cork products Household ukmh Glass & pmducta (excludmg bottles) Glass bottles
TOTAL BULK CORPORATION BO. APAO, MANDAUE c m BO. APAO, MAN -- 1611 J ~ r ~ ~ c h r m i ~ a l s I 880 SUBANGDAKU (GORONES), BUBANGDAKU, MANDAUB cIn SUBANGDW,
87
3,860
21,820
4,455
2600
26
19 15 l ~ o a d twrurport equipment 10 16 [special purpose road vehicles
OTIIUR MUNICIPAL PORTS @AVAO DPL NORTR) 131 1 l~nprocessad wood (excludtng ffrewood)
6
968
1.600
1,392
1,166
241
30 15
5,796
p45 332 717
7,739
HIJO PLANTATION INCORPORATED, WHARF MADAUM, DAVAO DEL NORTE ) 237 1 other vegetable oile I 25,258
TAGUM AGRICULTURAL DEV. CORP., WHARF PANABO, DAVAO DEL NORT
5 23 884~ 179
1237 lother vegetable oils DALiqS, DIGOS, DAVAO DEL SUR
1224 (sugar SASA GOVERNMENT WHARF SASA, DAVAO c m
I ~ i n m flows 31
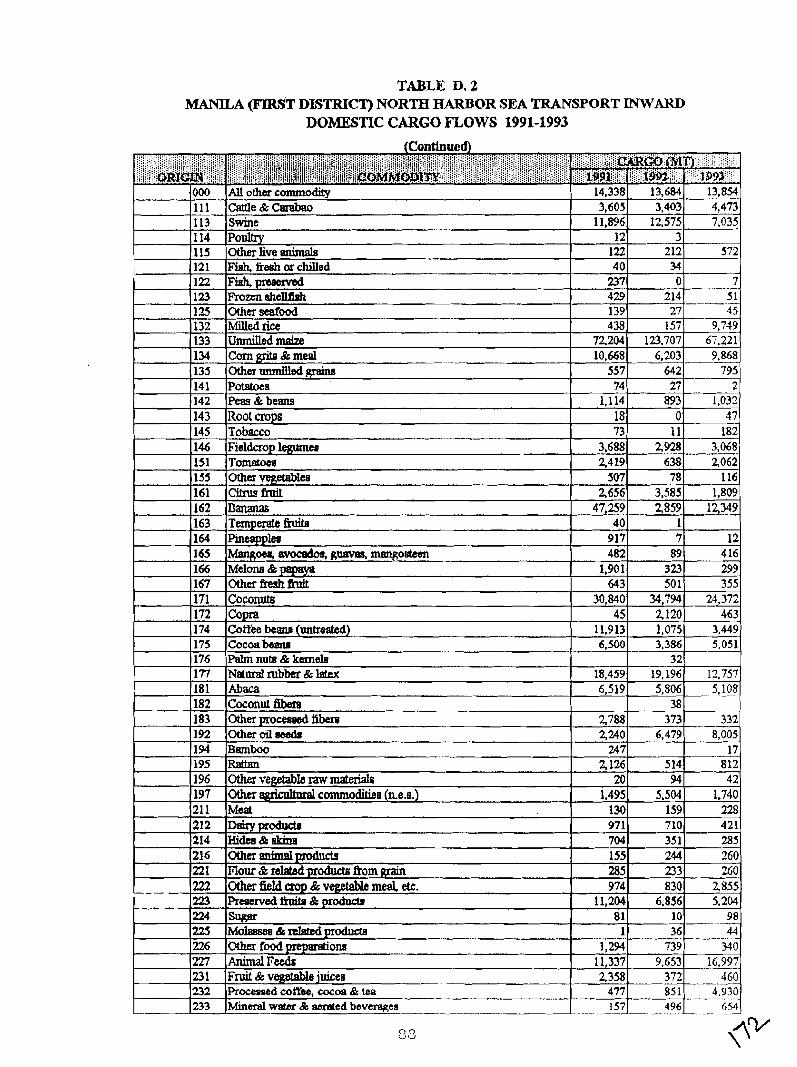
TABLE D. 2 MANILA -9T DLSi"i'ICT) NORTH HARBOR SEA TRANSPORT TNWARD
DOMESTIC CARGO mows 1991-1993
000 11 1 113 114
121 122
Allotheacommodity - Caltle & Carabao Swine Poulhy 2 7 - 1
Flsh,keshorchilled F k h , ~
14,338 3,605
11,896 12
40 237
132 1.33 134
w&f & aerated b e v q o a ---
83
429 139 438
72204 10,468
Milled rice UnmiIled maize Corn@ & meal
13,684 3,403
12.575 3
34 0
- 13,844 4,473 7,035
572
7 214 27
157 123.707 6,203
51
.- 45 9,749 67.221
-9,868 I
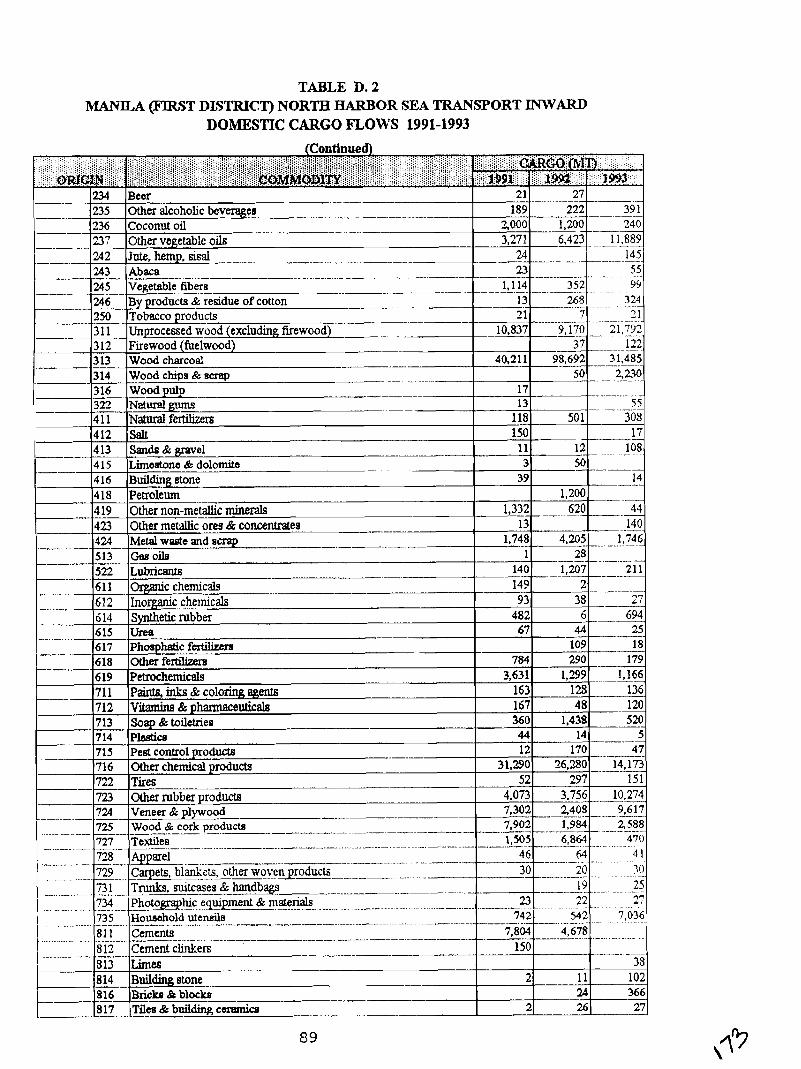
TABLE D. 2 M . (FIR9T DL~TRICT) NORTH HARBOR SEA TRANSPORT INWARD
DOMESTIC CARGO mows 1991-1993
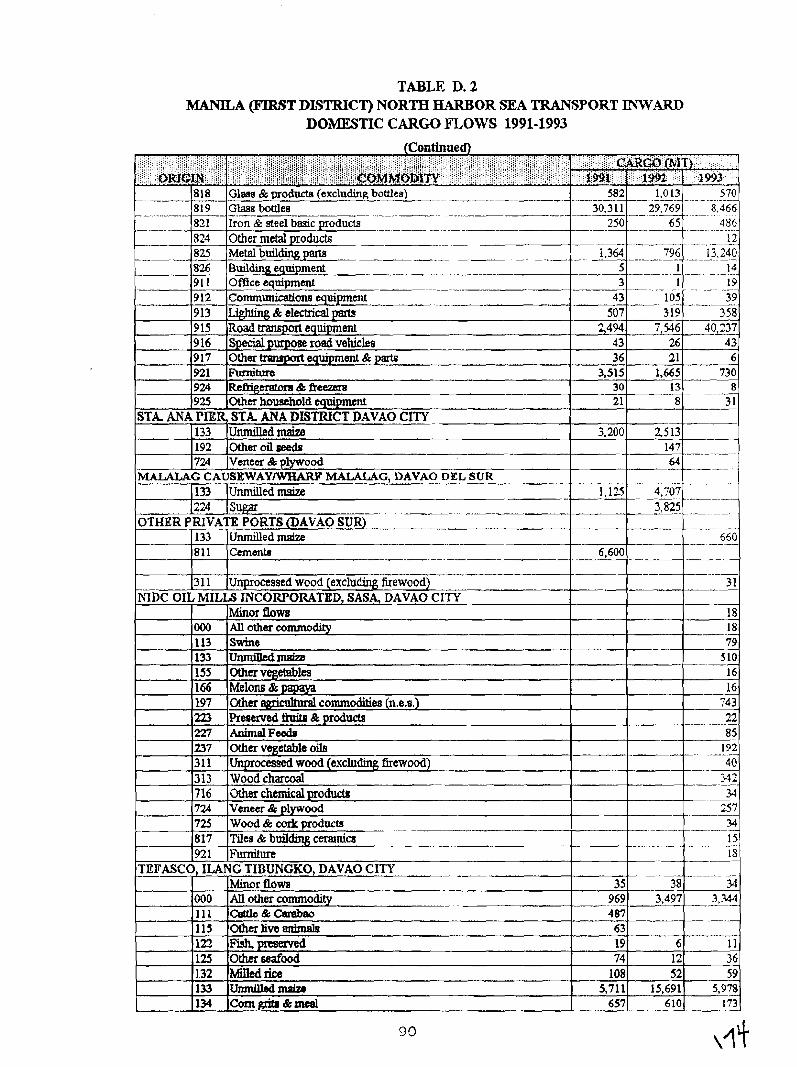
TABLE D. 2 MANILA (FIRST DL5TRICT) NORTH HARBOR SEA TRANSPORT INWARD
DOMESTIC CARGO nows 1991-1993
8 - 18 G l m & products (excluding bottles) - --- - - - - 582 1,013 5 70 -. - - -- - - - - - - . . -- - -- - - - - - 819 Glass boules 30,311 29,769 8,466
~ -- 821 Iron & steel basic producta 750 65 4 86 ----- - --- -
- 824 Other metal produds ~ -- . - .- 12 825 Metal buildmg pats A -- 796 13.240 !.364 -. _ - --

TABLE D. 2 MAMLA -9T DL9TRICT) NORTH HARBOR SEA TRANSPORT INWARD
DOMESTIC CARGO mows 1991-1993
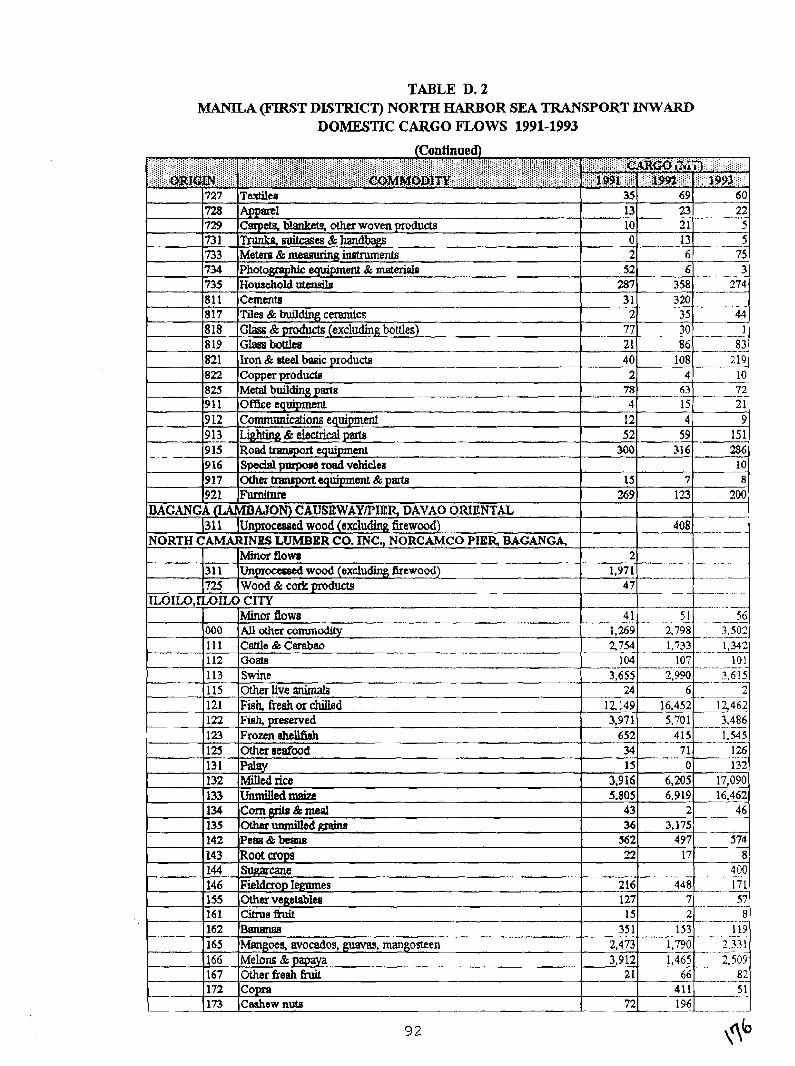
TABLE D. 2 MANlLA @"IR,9T DISTRICT) NORTH HARBOR SEA TRANSPORT INWARD
DOMESTIC CARGO FLOWS 1991-1993
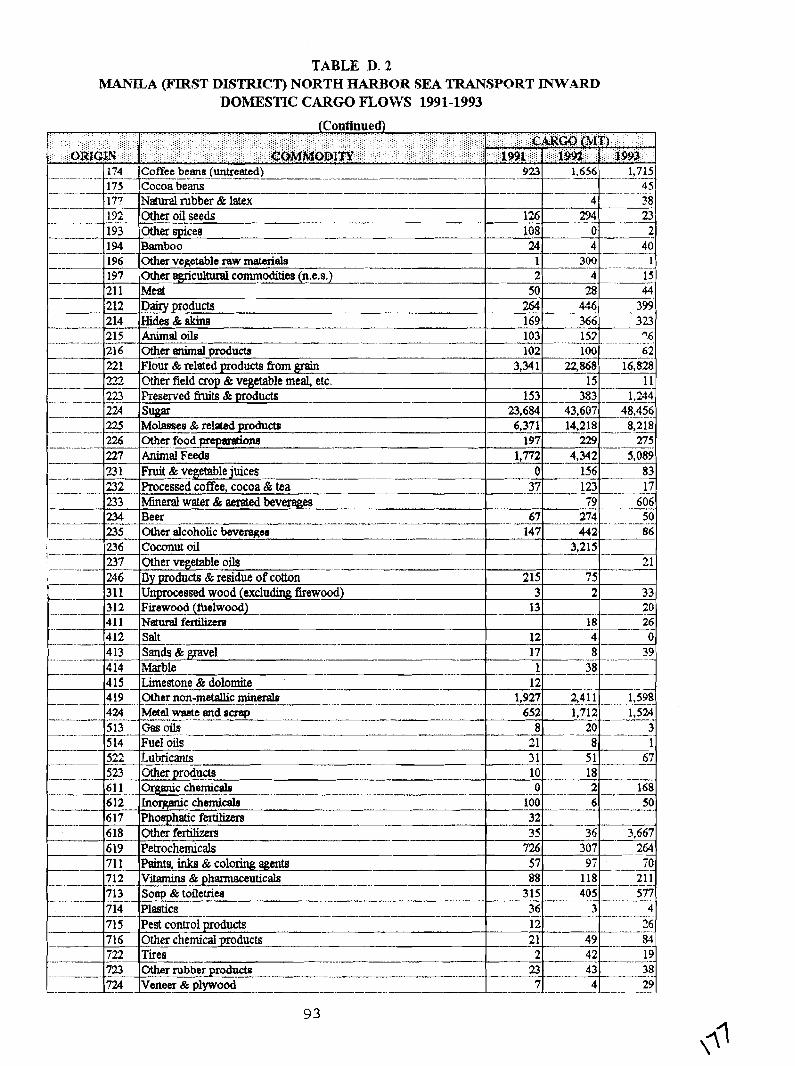
TABLE D. 2 MCANIliA (FIRST DL3TRICT) NORTH HARBOR SEA TRANSPORT INWARD
DOMESTIC CARGO FLOW'S 1991-1993
. . . . . . . . . . . . . . . . . . . . . . . . . ................... . . . . . . . . . . . . . . . . . . . . . . . . . . . . . . . . . . . . . . . . . . . . . . . . . . . . . . . . . . . . . . . . (Contfnued)
. . . . . . . . . : . . . . ; :. ::::::: :.: :.:. . . : :::::. :.
...:.:.. : : : : : : . ,.,:::.: . . . . . . . . . . . . . . . . . . ........... . . . . . . . . . . . . . . . . . . . . . . . . . . . . . . . . . . . . . . . . . . . . . . . . . . . . . . . . . . . . . . . . ........... . . . . . . . . . : : : : : :.: : :: :::.: ..:.:,:, ,.:: :.,.:.:;.;::: : , : . : . . . . , i i \ i . . . . . . i . I I I ;.,.;, , : . :I.;.,:. ..:i,ili:i..::: : :,;;;:;.;;:;; :;.;;; : .: ,i;:':...c:~GQ:i(E, : .,:.... :.: : .:.:.:.:.:.: j : :; :.:. :: : ...:. / . . / . ::::::::../:: :
1 : . . ~ ~ i c r ; ~ ; : : i ~ ; . ' :. -*-.- I~;;,;;~;,;:~;:iiiii ::':;ii;_i;:;;i;;;i ;:;i:':;:m~~~j~ft~~;i:;~~::; . . . . . . . . : : ; : : - i ; ; i : ; ; ; ; ; j i ; : : ; ; ; - - . - - . . . - - . - - i : : ; ; : $ ; ; ; / ~ ; i i , i s$$ ; i j ~ i i ~ j ~ , ; ' . - . . -.-.
174 Coffee beam (untreated) .- - -. - - - 923 1,656 1,715 ... -- - -- -. - - - -- - -. - - - - -. - --- ... -.. .. ...- -
175 Cocoa beans -- 4 5 -- .. - - .- .--. - - ... - .. 177 ~ d i i m b b e r & latex 4 38
126 2% 23 -- .-.-- 193 Other spices 108 0 2 ---
- 24 4 40 - - - - - - -- - 1 300 1
.--
----- 2 ---- 4 15
-- 50 23 44
- 264 446 3 5 169 366 323
- - - ---- 103 153 96 - - - -- -. . - - - . -. - - - 102 100 62
9 - -- -. - - . 221 Flour & related prod- &om grain 3,341 22,868 16,828
-. - 222 Other field crop & vegetable meal, etc. 15 11 ---- 223 Preserved firuits 22 products 153 383 1,244
- - - .. 224 sugat --_-----pp
225 Molasses & related product0 14.218 8,218 -- 6,371 -- 2 2 6 O L h e r f z d prepdona 197 ....... . 229 275
-. . -- 1 227 -.- - .---- - Animal Feeds 1,772 4,342 5,089 . - -. - - -
-. . --. . - . - 2.3 1 Fruit & vegetable juices -- 0 156 83
- 232 Processed coffee, cocoa & tea - 37 123 17 233 Mineral wster & aerated bevemgee '9 606 234 Beer -- - -- - t --
67 274 50 -. -- - -. - - - 235 Other alcoholic beverages 147 442 86 ,----------.-- - -- .- -- - 236 Coconutoil ,_-__-._.._.__.__-___I-___ 3,215 --- - 237 Other vegetable oils --- --- 21 246 Dy products & residue of cotton 215 75 3 1 1 Unprocessed wood (excludmg firewood) 3 2 33
.. - - - - - 3 12 Firewood (ibelwood) - - - - -- - -- 13 ..... -- 20
.A,--- 411 ~ e h l r a l f h 18 26
-. . -- - 412 Salt ----- -. .- - -- - ---. -- 12 -.-- 4 0
.- .. -. - -- K ~ ~ a n d s i ~ r a v e l - - 17 8 . - - 39 -- 414 a b l e 1 38
4 15 Limestone & dolomite '!? 419 Other non-metallic rnineralo - 1,927 2,411 1,598 424 Metal waste and scsap 652 1,712 1,524 ---- - 513 Gasoils 8 20 3 --
. - .- - 514 Fuel oils - 21 8 1 522 : tubrim- 31 51 _ 67 523 Other products 10 18 6 1 1 Orgmc chemicals 0 2 - 168 612 Inorganic chemicals 100 6 50 6 17 Pho~hatic fermizers - - 32 --. -
-- 618 Otherf&&xm -, ----- .- -- -- 35 36 3,667
619 Petrochemicals 726 307 244 71 1 P W . inks & coloring agents 57 97 70 '
7 12 Vitarmns & ~hannsceuticals - - - -- - - - - .- -. - .- - - - - -. ----- - - - - 88 118 21 1
- . - 713 Soap . & toiletries . 315 .. 405 - - -- 577 - . -- .. - -
?14--=cs -- .- -- - - - . .- -- - 36 3 4 ......---- .
- .-- 71 5 Pest control products - -- 12 26 .- - .- -- .-
-- 71 6 Other chemical products 49 83 21 . 722 Tires --- - 2 42 19 - 723 Other rubber prodducts ................. - - .-- - -- --- - . - -. -- - -. .......-...... 23 43 - 38 724 Veneer & plywood ....... ... . L^ ---.--I ~___LI_.._ - - 7 4 29
93
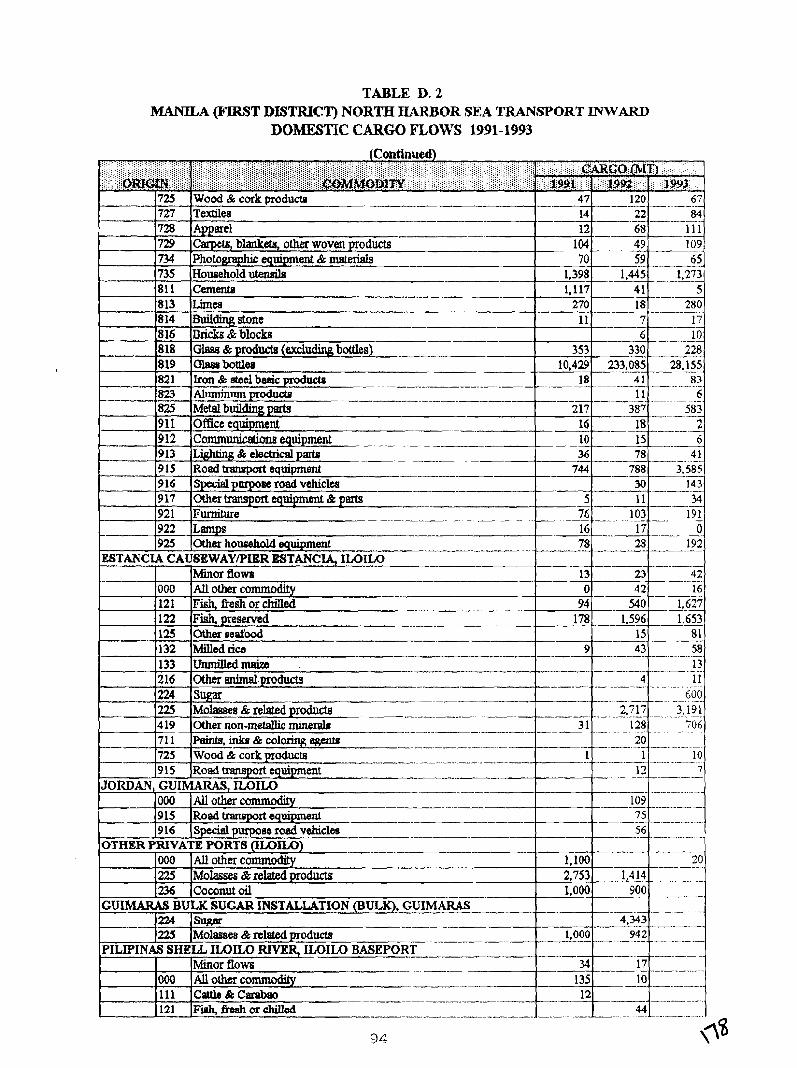
TABLE D. 2 MANILA W 3 T DISTRICT) NORTH HARBOR SEA TRANSPORT INWARD
DOMESTIC CARGO mows 1991-1993
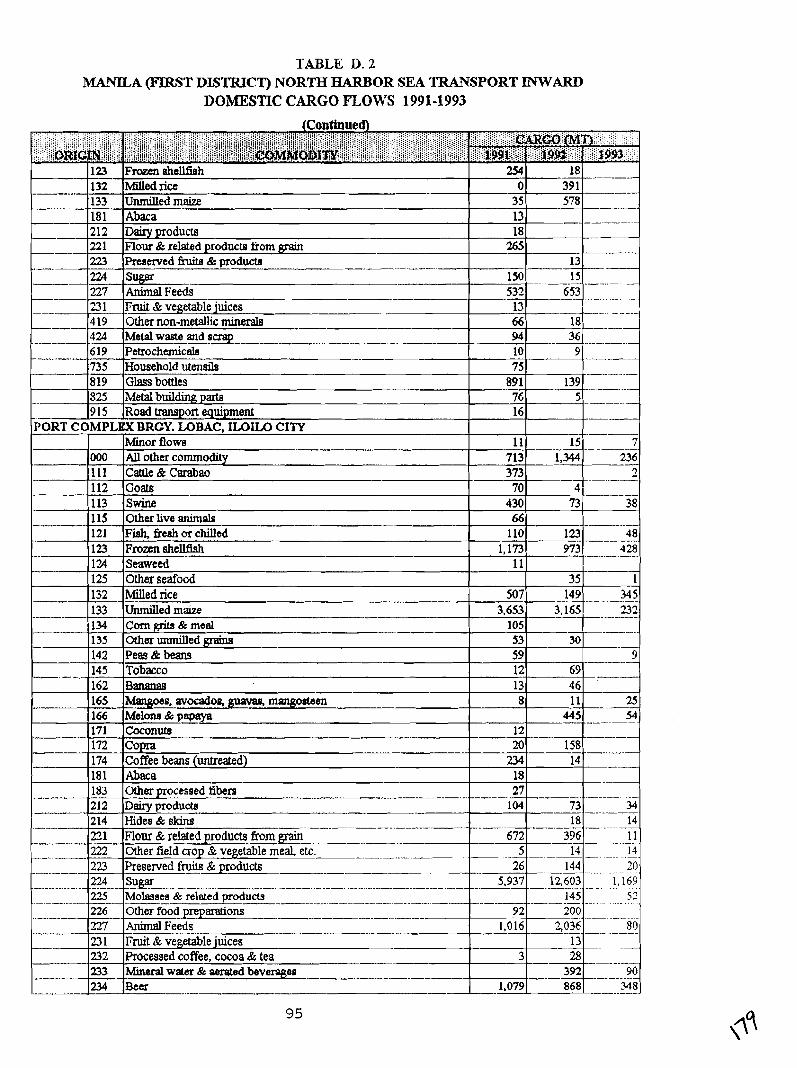
TABLE D. 2 MANILA (FIRqT DL5TKICT) NORTH HARBOR SEA TRANSPORT INWARD
DOMESTIC CARGO mows 1991-1993
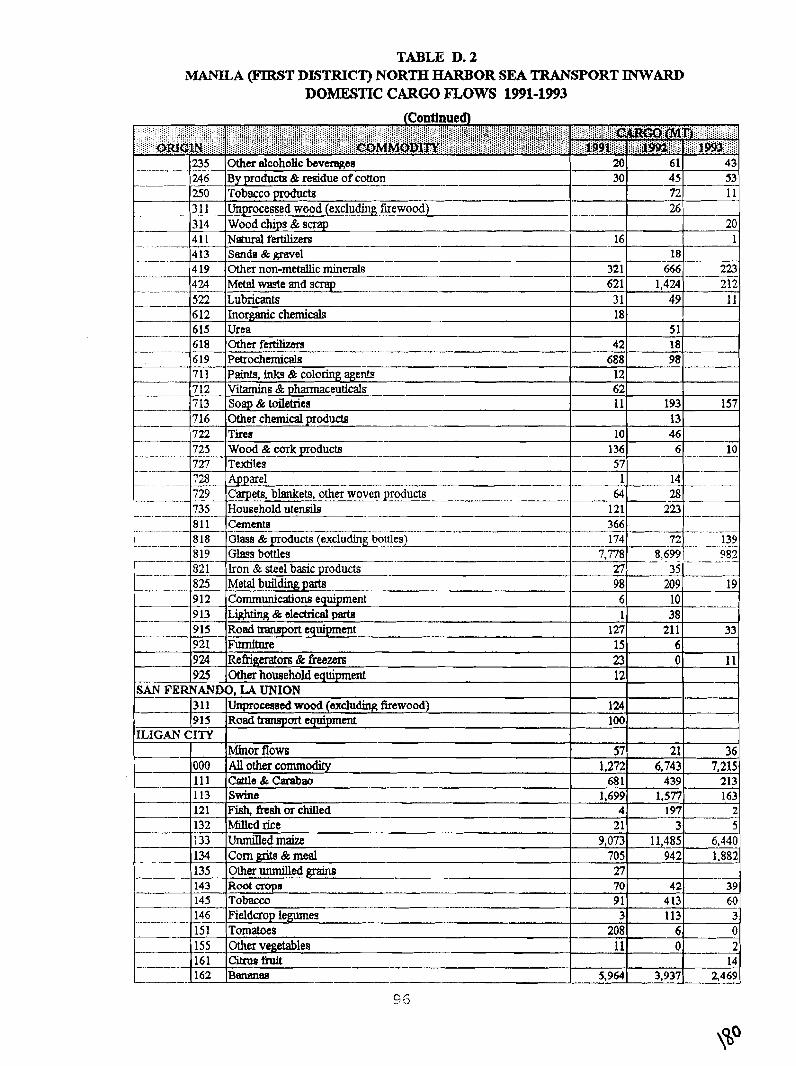
TABLE D. 2 MANILA (FIRST DL'STRICT) NORTH HARBOR SEA TRANSPORT INWARD
DOMESTIC CARGO FLOWS 1991-1993
--
U S 246 250 3 1 1 314 4 1 1 413
Other alcoholic b e v q e e By produrn & rexidue of cotton
------A
Tobacco products Unprocessed wood (excluding firewood) Wood chvps & scrap Natural feztihers -- Sands &gravel -----
4 19
- - --. . - - -- - -- --A
- . -. - - -
-----
- -- - -- - - --
- . .-
..Other non-metallic minerals h4et.d vraste and scrap .---- Lubricants Inorganic chemicals - Urea Otherfertilizars -- - - .- -. - . . - -. Petrochemicals --- Paints, fnks & coloring agents Vitamins L pharmaceuticals Soap & toiletries Other chemical produds -- Tirea Wood & cor&oducts ---- Textiles
.-
App are1 _ Carpets, blrmkets. other woven$oducts Household Wensils - - - - -. Cementa - -- -- -- . - -- Glass & products (excludingbottles) - -- - - - - - -- -. . G h s bottles -- - . - -- - - Iron & steel basic products Metal building parts Communications equipment Lighting & electrical pate Road tmmport equipment Furniture Refrigerators & & e e m Other household equipment LA UNION
20 30
-
16
-- 424 jn-' 612 615 618 . - 6 19 71 1 71 2 713 71 6 722 725 - - -- - 727 72a
32 1 666 223
13 1 1 - (9 15
I L I G . ~ cIn
000 1 1 1
6 1 43 45 53
121 Fkh, &ah or cNUed 4 197 2 132 Milled rice 21 3 5
-1.33 Unmilled maize 9,073 11,485 6,440 . - 134 Corn gds & meal 705 942 1.882
135 Other unmilled gtains 27 143 Root crops 70 42 39 145 Tobacco 9 1 413 60 ---.. -- 146 Fieldcrop legumes 3 113 3 I. 5 1 Tomatoes 208 6 0 155 Other vegetables 11 2 161 Citmofiuit -- 14 162 Bsnanae 5.964 3,937 2,469
9:;
621 31 18
-- 42 688 12 62 11
10 136
.- 57
- . - . -. -- - - . - -. -. . .- - . - -- - . - - - -. - -
---
. .-
124 100
57 1,272 681
1,699
Unproceaed wood (excluding firewood) Road trwspart equipment
Minor flows All other commodity Cattle & Carabao
72 26
18 --
729 735 81 1- -- - 8 18 . - - 819 - - 821 825 9 12 913 9 15 921 924 925
113 Swine
1 1
20
- 1
1,424 49
51 18
ANFE FERN AN DO, --
21 6.743 439
212 -- 1 1
1 64 121 366
. -- - 174
7,778 27 98 6 1
127 15 23 12
36 7,215 213
1,577 163
98
193 13 46 6
28 223 . - 72 .
_8,69? 35 209 lo
157
10 --
. - --- - - - - - - -. -
139 -- .-
982 .- .
- . 19
38 21 1 6 0
33
11
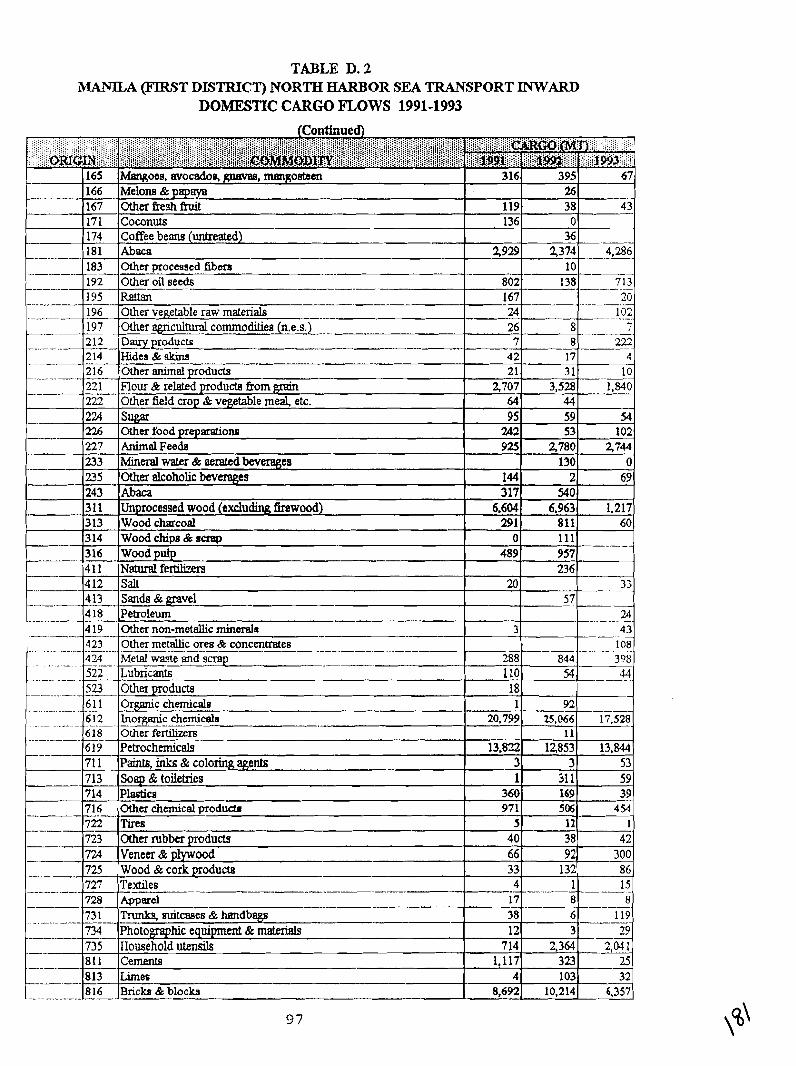
TABLE D. 2 MANlLA v 9 T DL9TRICT) NORTH HARBOR SEA TRANSPORT INWARD
DOMESTIC CARGO mows 1991-1993
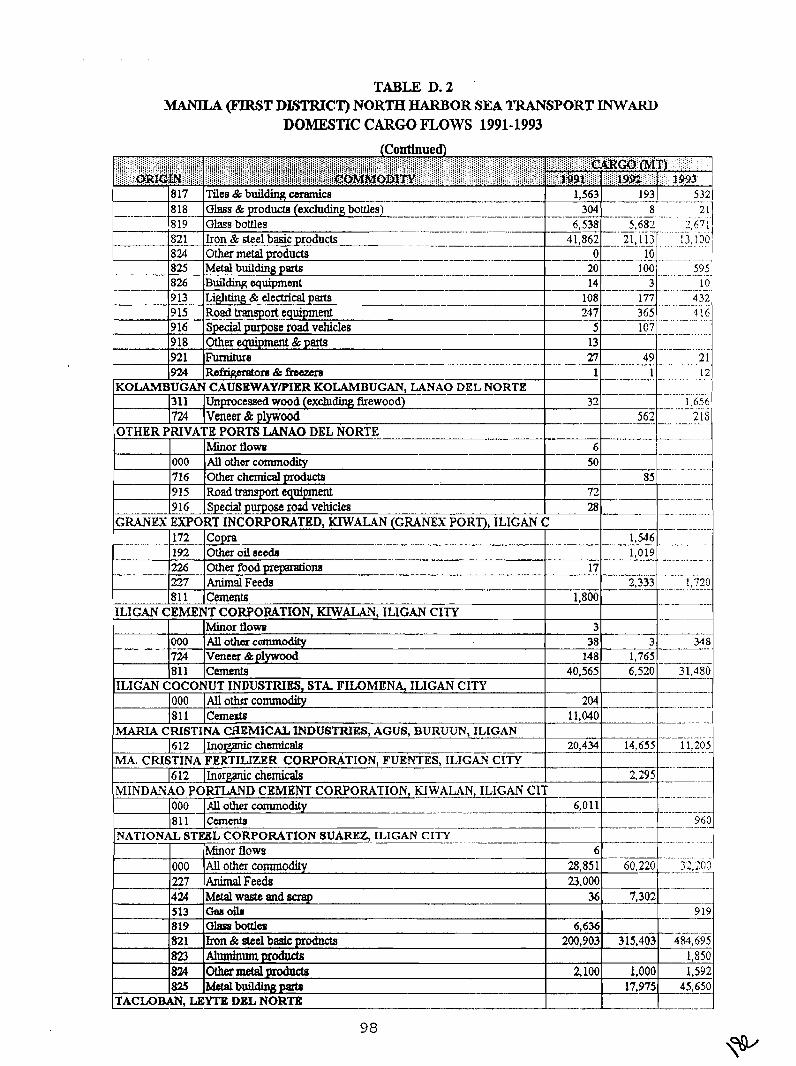
TABLE D. 2 MANILA (Fll&ST DISTRICT) NORTH HARBOR SEA TRANSPORT INWARD
DOMESTIC CARGO FLOWS 1991-1993
8 17 Tiles & buil* cararnica -
b*+Fodm (excludhs hulesL
- ---. -. - - 5321
211 ........ - ....... ..... ...... 819 Glass bottles ... -- -- i gl i j Iron ~ k c i basic prodmu 1824 1 other metal products - - - - -- - - - - . - .... .......-.
" ? OTHER PRIVATE PORTS -~
Minor flow
GRANEX
ILIGAN
- - -.--
000 716 915 9 16 EXPORT 172 192 226 227 81 1
All other c m o d i t y Other chemical products ----- Road transport equipment Special purpose road vehicles
- 204
11,040
20,434
ILIGAh' COCONUT 1000 1811
.
-- 3 348 ..
. -- - 6.520 - 31.480
so ---.
72 28
INDUSTRIES, STA. FILOMENA, ILlGAN CITY All 0 t h commodity Cemmtb - - - .
- - 14,655 .--.
3 38
148 40,565
MARIA CRIBTINA CHEMICAL INDUSTRIES, AGUB, BURUUN, ILIGAN 612 ~ ~ n o ~ c h e n d c a l e
MA, CRI~TINA FERTILIZER CORPORATION, FUENTE~LIGANTIET- 16 12 ( Inorganic chemicals
CEMENT CORPORATION, KMTALAN, ILIGAN CITY
.........
-- - - - - - ~-
. -- 11,205 - . . . ......... -. ....
................
- - -. 32.200 . . . - . -
919
MINDANAO PORTLAND CEMENT CORPORATION, MCIALAN, ILIGAN CIT
--
85 - -
. -- INCORPORATED, KIWALAN (GRANEXFORT), ILIGAN c - --
Copra - -- Other oil aeoda Other food prepdon8 17
000 - 724 811
000 227 424 513
. . - - - - - . . -. - - . .- - . _ - . _. _ _! .. - ... - ...... ................. - . -. ......
. - -- -- - 1.546
1,019
- - - - -- - -- . 2,333
, --.-- Animal Feeds Cemente
Minor flow Allothmcommodity Veneer &plywood Cements
2,295
6,011 - -- - -
NATIONAL 6
28,851 n.oo(?
36
Minor f low All other commodity Animal Feeds Metal waste and scrap Gas&
.- -. - . - . -. -. ....... - ....-.
.. - - - - -. - . - - - .- - . -. - - -.
1,720 - - . - -. . - - - . -- .
- 1 . E
- .- - -. - --- - - - - - -
- - . -. ... -.
000 1 AU other commodity - -- - --- 81 1 (~erncnt~
STEEL CORPORATION SUARRZ, ILIGAN c ~ n
60,220
- 7,302
819 821 823 824 825
- - . -. -- - - . . - - .- - - - - - - . - -
960 - - - - - - - . - .............
98
6,636 200,903
2100
-
O h bottlea Iron & steel basic prodnda Aluminumproducts oulermetalprodwta Metalbuildingp8xb
TACLOBAN, LEYTE DEL NORTE
-- 315,403
1.000 17.975
-
-. .- - - 484,695
1,850 1.592
45,650
. .- - -.
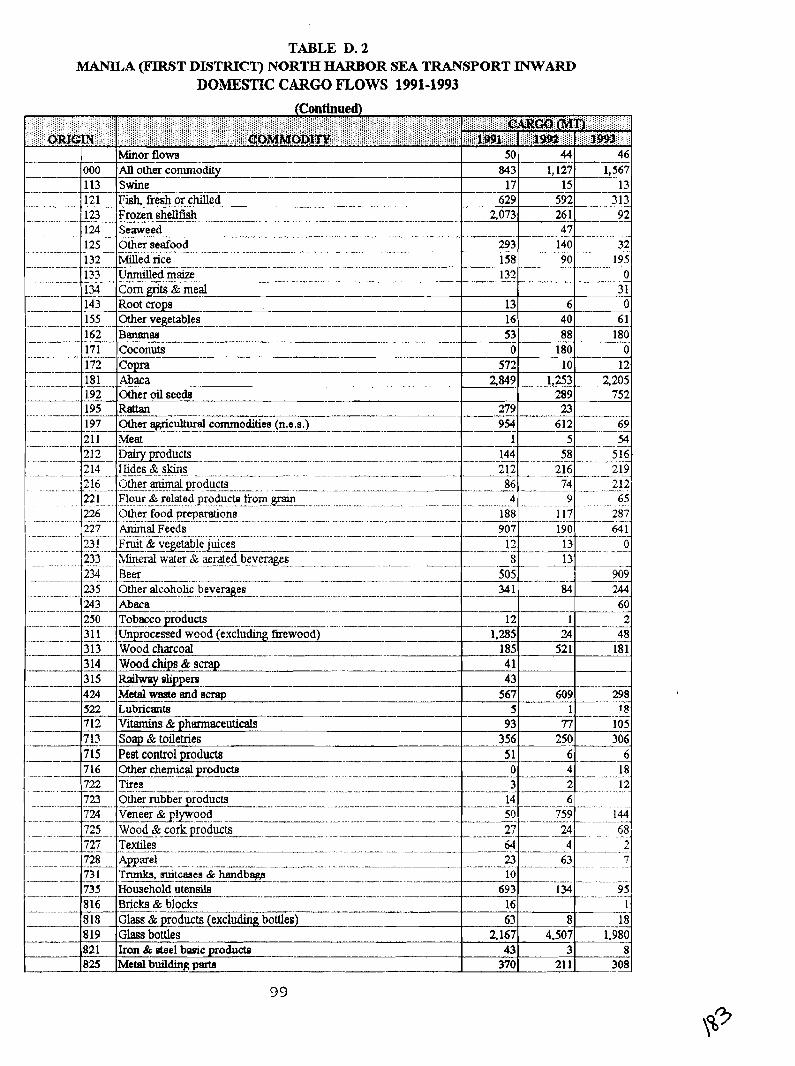
TABLE D. 2 MAMaA (FIRST DLSTRICT) NORTH HARBOR SEA TRANSPORT INWARD
DOMESTIC CARGO mows 1991-1993
. - -- - 000
4 9 65 ..........-........................-.- ........ .........................
. . . . . . ...... ................. 188 117 287 907 190 64 1 ............... -- .... ....................... - ............. ...... .... .... -- ... .- .....
12 13 0 .. -. -- -..... -- . .......... 8 b e v s s 13
- -- - . . -.
- Minor flows - -- 50 44 46 - AU other c o m m o d i t y -- - - - 843 1,127 1,567
- -.. - .-.. - --
..-...-.-.-..........
............... -
I. 13 -- 12 1 .. - -
- -- ........
-- ...... .
....................
Swine - - - - - - - -- -?-or chilled - -- -
234 -- ....
235 -.
243 . -
17 629
.Beer 505 909 . -. . -. . - .......- - - - - -- . - .- ...... .- . - -- - - - -- . -- . -- . - --- .. -- . - -. . - - Other alcoholic beve-es 34 1 84 244 .. -- .. .- ..--.. -- - - . -. .... -- .... .- ........ -- ......... -. .- -- - . - ..- .....-.-
Abaca ... 60 -
250 Tobaccopfoducts - - - - -- - - - - .- -- -. -. -- -. -- 12 1 2 ............. ..... ........ ... . . ... .
3 11 UJrocessed wood (exclu* fuewood) . -. - . . -- -. - -. . - - - 1.285 34 48
3 13 ,Wood charcoal 185 52 1 181 -. - . --- ---- - 314 Woodchig&scrap - ---- 41
. -. -.- - --. . 315 Railwayslippers - 43 - -- . - ----- - - -- - -- - -. --- 424 Metal waeta end scrap
..4 .- 567 609 298 522 Lubricants . .- .--- .. - - --- - - 5 1 18 - -. - - -- - - - 712 J4tmi.n~ & pharmaceuticals 93 ?7 105 713 Soap 8 toiletries 356 250 306 715 Pest control p d u c t s 5 1 6 . 6
.-- . - - -- 716 Other chernical~producta 0 ... .....
-- - - 722 Tires - .- ...... .... 723 Other rubberproducts .......-... .. -- -- - ... ---- . -- . -- .. - ......... .... -...- ... .......
I 724 Veneer & plywood . - - .- . --- - -. . --- -- - -- - -- .- . - - . -- - - - - 50 144 725 Wood 8 cork poducts
15 .--a
13 592 313
-1%- 124 ................... 125 ..
........... -.
........ - .. 727 Texhles 64 4 .-.....-. .... .....-.-. . .- -.. - .. ..... .- .. . .
728 Apgsrel 23 63 .--.....-...-.. .......... 731 TNnks, Buitcasea & handbqp
2,073
-- .
-F-m-eSe-!@ - Seaweed - - - ........ -. .............. .- .- ... - ......... .......-.. - .. - - - . Other eeafood - - -- - - -. -- - ..- . .. ... . ... .. . . .-
-!?I -C-&&g--- 31 143 R o o t c r o ~ 13 6 0 --
2 - - ..
7 ................................
261 92 47 -- -- .-.. - ..........
132 293 140 32
Milled rice 158 90 195 ....... . ....... .....-.-..-
I. ............ . . - -- -- - - -- -
. 7 . - - - - - - . . ' - - . . - . . - - - ' - " . - - - . . ' Household utensils - ---- - -- -- -. -- ..... .... ...... ..........
816 Bricks & blocks ...-.... .. - . --- - 818 Class 8 products (excludmg bottles) 819 G b s bottles
-- 821 Iron & &el=~ product~ - -- ----A
825 Metal building pmta -
133 Lhmdled maize - -. - 132 -- -- -- . -- - - 0
16 40 61 155 ....-. ~ _ ~ _ e @ b ! e s ~ ~ ~ ~ ~ ~
-- 10 -. .
162 B m e s - - - --.---.--------.---v--------p-p.-.--. 171 Coconuts - - -- -. -. .- - .- - ----
. - ---- -----A- -
......--
1.92 Other oil seeds - . . -. - -- -- 289 752 195 23 ..-... .. -23 197 Other agicultural commodities (n.e.s.) - --. - 954 612
. ....-. --- .
211 Meat -- -- - -- - -- 1 ..................... .. -... - - ....................... .. . .. . - 312 D q ~ o d u c t s 144 ..... ....
.?!5.--Jrides & skins .... 2 1 2 -_-216-- ... 2 16 ijther animalilroducts .I .-.....-... ....... .............. ... 86 --74- -- .
53
-- 0 572
2,849
693 1 34 9 5 16 63
2,167 43
370
88 180 10
1,253
180
-- 0 12
2,205
2
8 4.507
3 21 1
--
1
_-- 18 1.980
8 308

TABLE D. 2 MANILA (I?.IR,3T DL3TRICT) NORTH HARBOR SEA TRANSPORT INWARD
DOMESTIC CARGO mows 1991-1993
9 13 Lighhng & electrical . 32 3 . . .. -. 9 . 9 15 %ad rrwsport e q u i p g t 515 - .- 388 - - -- . .. .. - 500 - . .
9 16 Special purpose road vehicles - -- 13 . 917 ~thertranaporte~uipment&~arts 32 5 6 921 Furniture - - . . 7 1 5 24 - - -. - - 924 Reikigeratm & fream - -- -- -- --- - 47 1 3 - .- . -- -.
PALOMFON, LEYTE .-a -- . - . .. . --
h h o r flows -- -- 4 1 72 35 . - .- - . - -. - .
000 All other c o m m o ~ 183 1,545 657 132 Milled rice 1 1 145 Tobacco ----- -.- 50
-- 162 Banam - 35 172 Copra 1,251 1,048 -. -. -.
414 Marble 4 1 4 15 Limestone t dolomite 23
-- 4 19 Other non-metallic minerals 181 422 Copper ores & concentrates 8--- - 253
423 Other metallic ore0 & concenhtes 43 -- -- - 424 Metal waste and scrap 74 80
- 613 Inorgfinic chemicals 35 5 722 Tires - - - - - 727 Textlles 36 -- . - - - - -- - - - -- 813 Llmes 39 1 610 406
- --
.
.- ~
Other seafood
5
--
Salt - 20 S a n d & gravel
183 . 5!!l
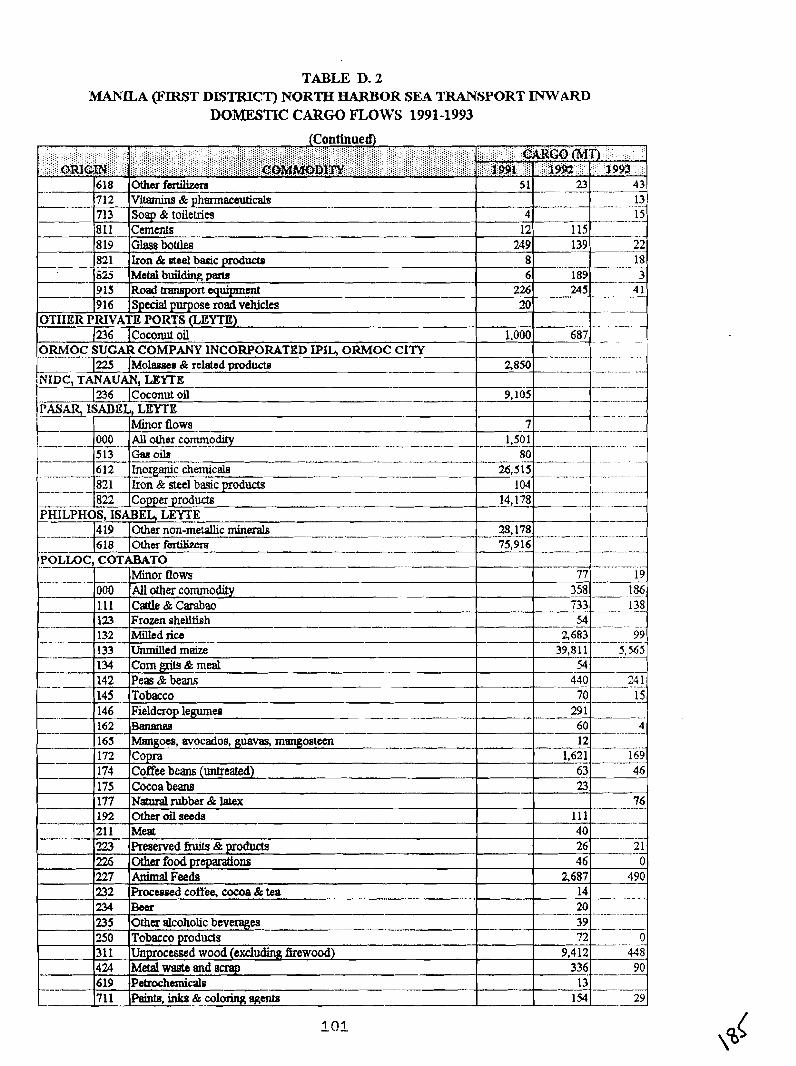
TABLE D. 2 MAMLA (FIRST DL5TRICT) NORTH HARBOR SEA TRANSPORT INWARD
DOMESTIC CARGO mows 1991-1993
(Continued)
-- 5 1 23 - 43
-- (712 Vitamins & pharmaceuticals - . - ,- - ---- --. . . . . 13
-
713 Soap & toiletries -. 4 .- - - 811 Cements 12
-.819 Glass botrles 249 821 Ison & ateel basic productn - - - -. ----- -- -- - -- 8 3.25 Metal building p a 6 189 --- 9 15 Road transport equipment 226 916 Special purpose road vehicles 20
OTIIER PRIVATE PORTS (LEYTIE) -- (236 lcoconut oil 1,000 687 -- .. . -.
ORMOC SUGAR COMPANY INCORPORATED IPIL, ORMOC c I n I~olawee & related producte ssso-
- -- - ... - . . - -- - - I236 1 Coconut oil -- 9,105 - - -. . - -. . - -- .-
PASAR, ISADEL, LEYTE -- -- Minor flows - 7
1.501 713- Gasoila 80
------- Iron & steel basic moducts
-- _ I
--A-
Minor flows 000 All other commodity I. 11 cattle & carabao 733 -- 123 Frozen shellfish -- -- 54 .- -- - - -. - -
guavas, mangosteen
I74 Coffee beans (untreated) 63 46 175 Cocoa beam .-- .-. . .. A * .
23 ".
--
--.-.
--
- - -
223 226 227 232 234 235 250 31 1 4%
. - . -.
~resefv- & products Other food preparations Animal Fee& Processed cofiee, cocoa & tea -- Bcar -- Other alcoholic beverages Tobacco produds Unprocessed wood (excluding !irewood) Metal waste and enap
26 46
Z687 14 20
-- 39 . 72
9,412 336
-. - -.-
1 4
... ---- - . - -. - - . -
4%
----
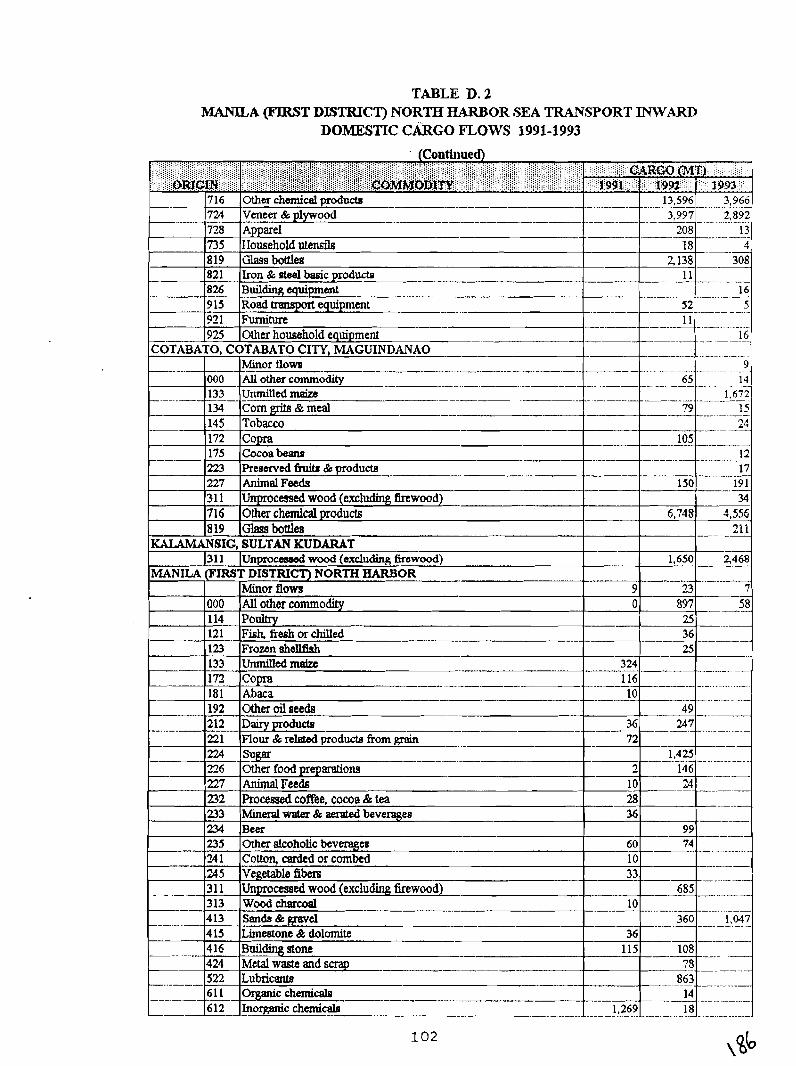
TABLE D. 2 MANlLA (FIEk3T DLiTRICV NORTH HARBOR SEA TRANSPORT INWARD
DOMESTIC CARGO mows 1991-1993
Minor flow t--+-t - ----. - - - - . -- - - - -- . . - -. . . -. . - - - -. . -. -. . . . ..
000 a other commoclitv i I A j%l
223 227
000 114 12 1
--- Pteactved 6uit~ & producta -- AnimalFeeda
123
150 3 191
Minor flows Ail other commodity Ponltry Fish, tie& or chilled ---------- From e h e m
31 1 716 819
--
-
9 23 0
A---
36 -- - - - -
133 Unmilledmab ----#&?---I --- -- . -- - -. -. . -
Unprocessed wood (excluding firewood) Other chemical products Glassbottles
-
1
KALAMANSIG, SULTAN KUDARAT 131 1 l~nprucessed wood (excluding firewood)
MANILA fFIRST DISTRICn NORTH HARBOR
--------a
-
C o p ----. .-----A- - -- -. -. - . . . -. -. . . -. -. .
1,650 2,468
6,748 34
3,556 21 1
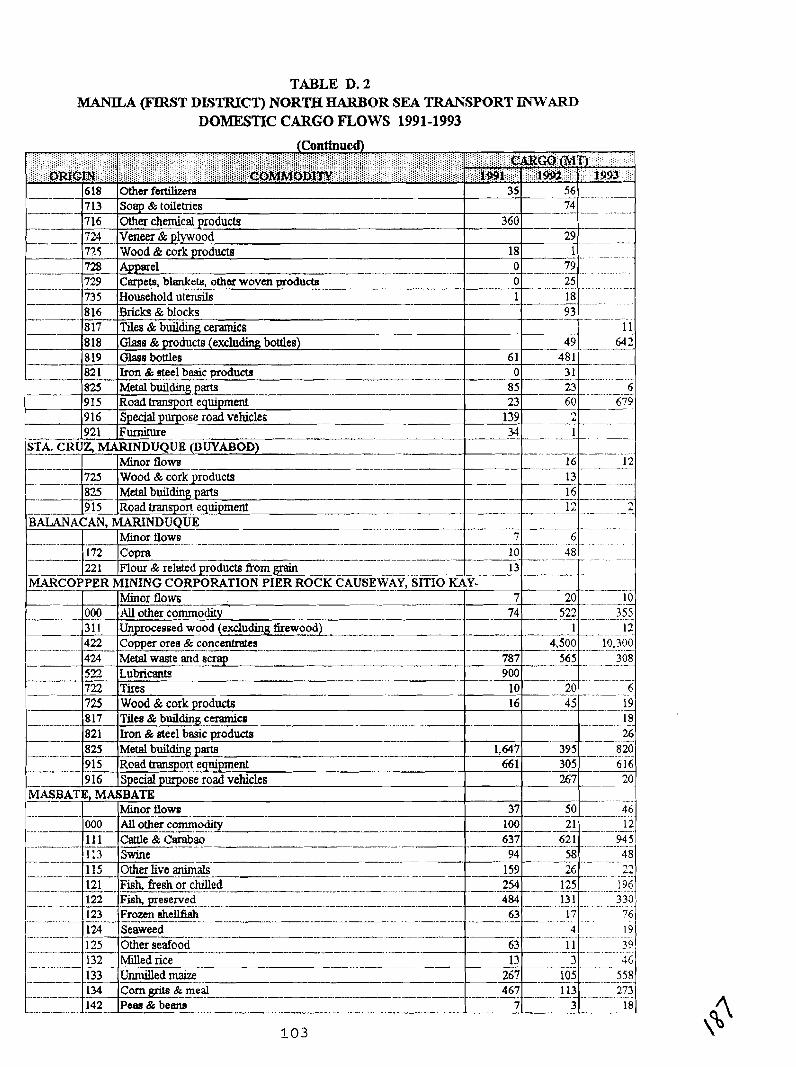
TABLE D. 2 lMANlLA (FIR5T DL5TRICT) NORTE HARBOR SEX TRANSPORT INWARD
DOMESTIC CARGO FLOWS 1991-1993
(Continued)
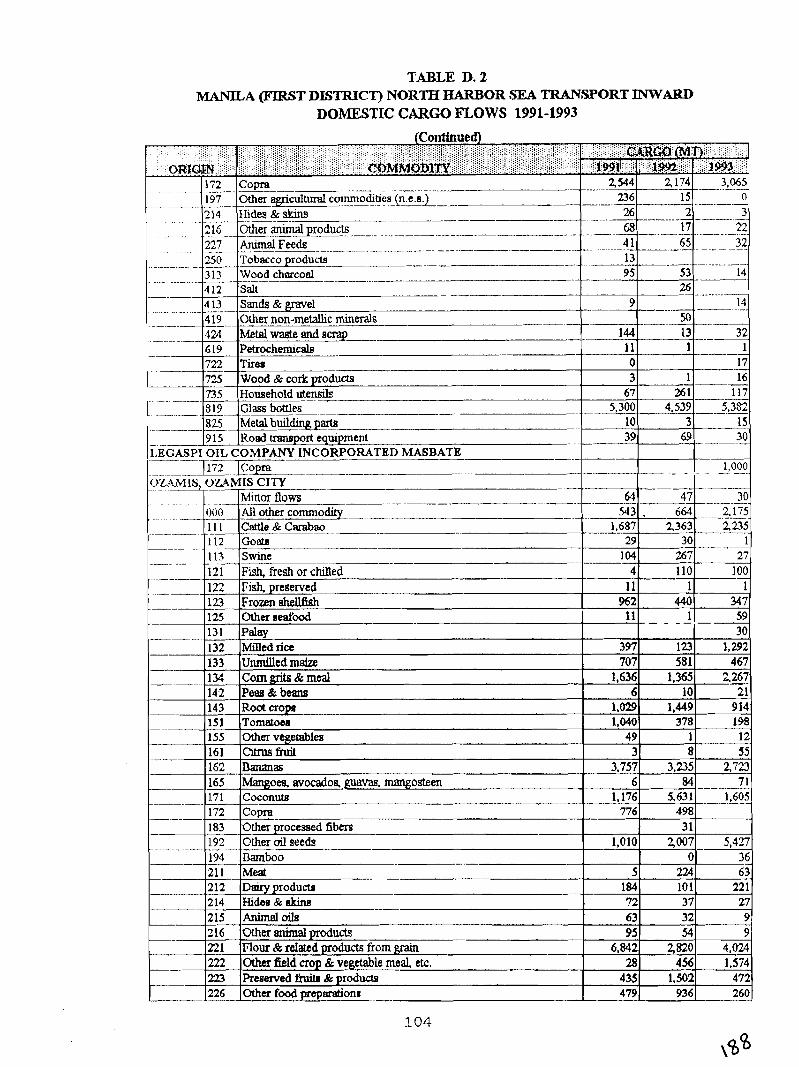
TABLE D. 2 MANlLA (FIRST DISTRICT) NORTH &ARBOR ,SEA TRANSPORT INWARD
DOMESTIC CARGO mows 1991-1993
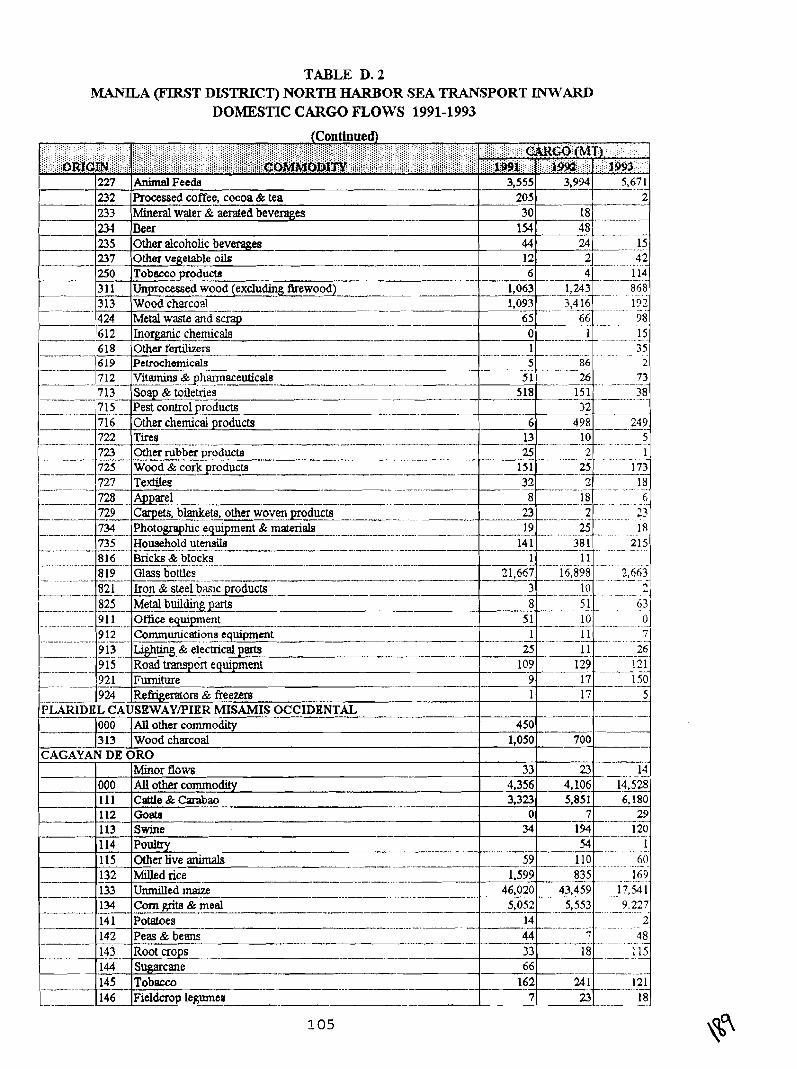
TABLE D. 2 MANILA m $ T DL~TRICT) NORTH HARBOR SEA TRANSPORT INWARD
D O M E S ~ C CARGO mows 1991-1993
227 AntnalFeeda 232 Rocessed coffee, cocoa & tea --- 205 233 Mineral water & aerated beverages 30 234 Deer 154 235 Other alcoholic beverages 44 24 15 237 Other vegetable oils 12 42
-- .-
-
250
- 31 1 313
. 424
.--.- - - 6 12- 618 k
---- - -- - - - - Tobacco $G<cta -- 6 - -. . - - 4 114 - - . - - ... . -. . - .
Unprocessed wood (excludq - fiewood) -- -. - 1,063 - 1,243 868 ~
-- -. -- y, 6 19 Petrochamicals . 5 86 2 ~
-- .- - -. . - . - - - 5 1 26 73 - -. - - - - - - - . . - - . - - - - -- - - .- 518 151 38 - -- - - .- - - . -
- 3 2 ,
-- 2.49 6 4 9 E -, - - . - - - - - 13 10 5 -~
--- 25 ~ 2 1 Wood & corkproducts ----.- 151 - 25 173 - - - - . -- .- - - -- - - - --
-- - . -. -- -- -- 32 2 18 .- .~.
- . . . - --. 8 18 6 . . - - ~ . 23 2. 23 .. -. .. ..- 19 25 18 ..--. . ~.
14 1 38 1 . - 816 Bricks & blocks 1 11
821'---<on Sc steel basic products C - - - . - . - -- - -. - - -- -. -. -. - - -- -- - -- - - - - 3 10 825 -!!@a1 build~ngparts --- -. - - . . - . - - .. - -- - - -
. - -. . . .. .. .. . . - - . - 9 1 1 Oftice equipsment - - .- - ---- - - . -- 5 1 ~ ~ ~ . - ~ m m u n i c a t i o n s equipment 1 11 71
.-.---.-...-....---.----.-----...--.----p------..-----.------..---..--. ~~ I 913 Llghhng - - -. - -. . . -- & electrical parts - - - - 25 11 26 - .. . -. - -. -- -.
9 1 5 Road -t equ ipma 1 -- - --. -- 109 129 . 121 - - -
I 921 Furniture - 9 17 150
-- -- -- - - . 924 Refriseratom & freezers 1 -. -- 17 -- PLARIDEL C+SBWAY/PIER MISAMIS OCCIDENTAL -. -- . . -
450- -
-- Wood charcoal 1,050 700 -.
CAGAYAN DE O R 0 .
Minor flows -- 33 3 000 All other commodity 1 1 1 Cattle & Carabao 112 Goam ----- -- --- 0 7 113 Swine -- 34 114 Poulhy 115 Otherlivemhals - -- 59 110 1.32 Milled rice - - .-- - - -. - -. . . - - 133 Unmilled maize 46,020 43.459 . 17.54 1 .
134 Corngfits&meal -- - ---. . 5,052 5,553 9,227 .---. -- -- -. . .- - .- - -- - . - . . . - - .. - . .. . .. .
. - - 141 Potatoes - --- - . - - . -- - - . . - 142 Peas & berms - 44 1.43 Root crops _ - - -- -. - -- - - - - - - I
Sugarcane -.- -.
66
Wood charcoal - - -----. -- - -- Metal waste and scrap .- -- .- -- -- -. . .- -.
1,093 3,416 192. - ~~
65 66 ~ 98 Inorganic chemicals -- .- - -. 0 1 -- . .--
Other fertilizers --
1 ~ . ..- .-
15 - -.- --- - . -. . - -
35 .- . . -- . . - . -
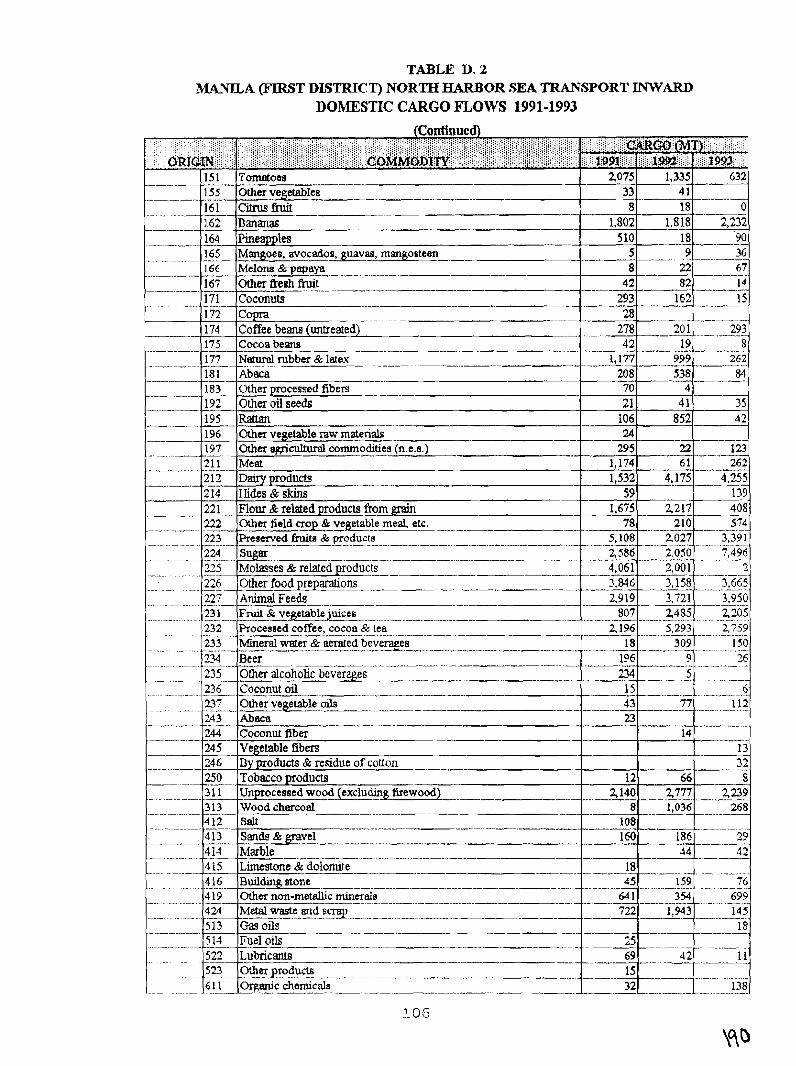
TABLE D. 2 MANILA (FIRST DLSTRICT) NORTH HARBOR SEA TRANSPORT INWARD
DOMESTIC CARGO FLOWS 1991-1993
LOG
\90
:..
,:: .. ;:; iii
...................................... ..:..:: .: .::.:.;::
.:j:/:::jji;j,j;:;;~i;j;.;;j:j:j:j:i:j::::.:::::::.:.:;:.:: : / . . . . . . . . . . . .,,,,: :::,:; .::.:. ;.:.;:::::,:;:::&;:;::,:: ,:. :.,::.:.:::; :,:iijiii;iii:j:!:$jj: ,:,: : j : j : ~ : : j ~ : j : : : ; : ; ; .:,:.:.. - .., . . , . . . . ...._.............. .I............. ....... ,, :. : : . . 1..
i;;~~:,~i;:;;;i;j:i;;;;j;iii~iiiiiii~iii;iji;iijj;iij~i;i;;~;:,~~M . . . . . . . . . .
- -- .- . -- -. - - . .--- - .
Tomatoes .- -
Other vegetable8 --------- mfiruit --
Pananas --- Pineapples -----
165 Mangoes, svocados, guavas, msmgosteen - - .--
- . ---- ----- Melona & pqaya 167 Other &eah fruit - - --- 171 Coconuts -- - ..
151
- I. 55 161 .
- - -. . - -- -. - 1.62
pi
2,075 33
------- 8 1,802
5 10 5 - -- 8
-- 42
1,335 632 4 1 -.-. P
- 18 0 1,818 -- 2,232
18 90
9 ~
172 Copra 174 Coffee beans (untreated) . - -. 175 Cocoa beans --- - -. - -.
- 19 .-
28 -. . -- . - 278
42
36
15 293 -
x!.--.-__- 29 3 8 - - .-
177 Natural rubber & latex .- 1,177 999 262 - 181 Abaca - -- - -. - - -- - - - -- -- 208 - 538 84
.- .- . 183 Other processed fibers 70 4 .--- 192 Other oil see& 21 41 35 195 R m 106 852 42 196 Other vegetable raw materials -- - -- . - 24
--A
295 - 22 1 23 21 1 Meat 1,174 61 262 - -- - -- -
1,532 4,175 4,255 59 139
products fiom l-. - 1.675 2217 408
.... 210 574
.... -- -- - .- - .- -. -- -. .. - -- -. - -- - .-......-... -.... ... ......
-. - ...
-. -. - - - -- - - - .- - -.
. 2,919 3,721 . 3.950 .... - - - - -. -- - - - -. - 807 2485 ...... 2205
.. . . ...
- --- 2,196 5.293 2,759
..... ....
235 Other alcoholic beverages _____ 236 Coconut oil ....... .- - -. - -- - -- -- -- - -- - - -- 237 Other vegetable *
,- -... -. ...
- - -- .-- 243 Abaca PA----
~ -- - - - -. 244 Coconut fiber 5 5 Vegetable fibers - 13
- -. - .. - - 246 I3y products & residue of coton 32 250 Tobacco products 12 66 -. 8
- --. -- -- - 31 1 U-cessed woodlexcluding --- tirewood) 2,140 2777 2239 . . .. . --- -- - - --
-
-- 22
- --. 82 162
~ - - ....
67 - - - - 14 -------
-- 1 1 3
- - - - - 413 -&able - --- - -- 34 32
- - - - -- 4 15 Limestone & dolonlite -- - - - pp - -- - -. . - - 18 . .. - - - - - - - -- - .... -. -- -
416 Bud- atone 45 159 76 -~~ .. .. -- .... .- ----- - - -. - ... .- -- - - .. -- - .- ... .- . -. - . -
4 19 Other non-metallic minerals 64 1 354 -. ........- --. - .- - - .- -- - - - - - --- -- - .- - -. -. -
-. - ...
- -. - - -. -- - - .- - . . - ... 513 Fuel oils
. . 25 ~~ 5 2 2 - L ~ f i c m 69 523 Other products
....- 15 . . .
. - - - . . -. - . . -. - -
Wood ch*cod - -- - - - - - 8 Salt - - - - -- - -- ----.-- 108 Sands & gravel 160 ------
- -. . - . --
..... -. . -. - -. - . - 412 .- 4 13 - - - -
1,036 268 - - - . - - -- ....
186 99
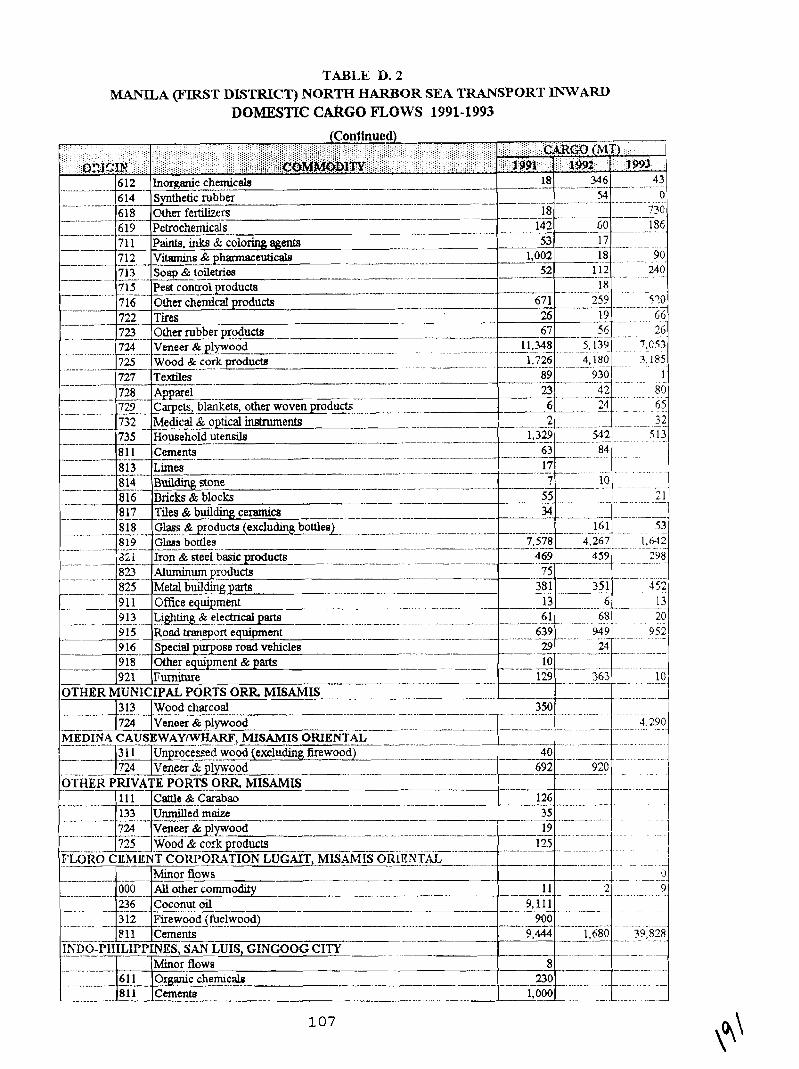
TABLE D. 2 MANILA (FIRST DLSTRICT) NORTH HARBOR SEA TRANSPORT INWARD
DOMESTIC CARGO mows 1991-1993
. . : . : : . . . . ::: . (Continued)
. . . . . . . . . . . . . . . . . . . ..:. . . . :, : , ; .: . : .
; ::::. ,,: . : . . . . .: . , . i,:i~n,~cr~ii:i,::ii -
-- 6 12 76 14 - . - ..... - - ...... --
618
. . . . . . . . : ,; :,,; ;i;;ii~i~iiiijiji;;j:;~~:j~;jjIi~~~~:;jjjj;~;j;:j;jj::~i;:;jj~;;~;jj~~j:::': . : ' . 1 : I . : . : : ' i ; i i ; ; i , i j : : : : j ; , ;;;::;. ..; j ; ; ; ; . : . w C ; O . . . ('&IT) :;:: ,,,:,:,:,,::1,: , , : ; I ; i , .. : :.::,. :: !::.:,:,>:,: ;;::::, .;:;.: : : i i i ; ' i i : i i i i i i l i i j i I i j i j ; ; ~ j ; j ~ ; ; ~ j ~ i j j : i : . , : : ; i ' ;i:l;;:;;.;::i;i.:iiij;;:;:::;i:;j.;:i;i;;:. .:.:.....
ii::j:ij:iji;i;i;i:::::.i.:::.ijijj;;;iiiii;jiiiijiii.j~qo~~~~f~,i;;;ijj;~j;ii .. . - . :;;;i:i;:;ij;ii;i:;ij;j;ii;;~iji~I:~ij;&::i:;!;i~~ - -. ,!!,.:::3993 Inorganic chemicale 18 346 4 3 Synthetic rubber 54 0 - - - - -
Other .- f e w s -. . -- 18 730 --
.. - - -- 6 19 Petrochemicals . ... . 142 60 186 .- - -- - -
71 1 P W . iriii-8~ coloring agents 53 17
- 712 Vitamins & phmmaceuticale 18 90 --. --- - --- --- - - -- - - - - - - - - -- 1.002 ~
7 1 3 - g ~ ~ & toiletriea - - - - - - - .- .- 52 ....
- -. - ..... 7 15 Pest c o n ~ o l products - . ..-
OUla c h Z c a ~ products .- . - --- 722 Tires
7U Other rubber ~ o d u c t s 724 Veneer & plywood ... .... _ ... . . ... - . . . . . . - - - . _ 725 Wood & cork producls .. ... - . -- .
727 T e d e s . . .. ...... .. ..... .. --- - - - -- 89
. ...... - -- - - - 23 -.
ven product& -- .. . - - .-- - . - -- - -- 6
2 732 Medical & optical inatrments . -~
735 Household u t e d 1,329 542 .---
81 1 Cements - 63 - 84 ..__.__ _ I . . . .. . . .
813 Limes . ____________ ... _ ..............
.- . - - - - -- 814 Buildmg stone 10 -. .......
. -- - - - --- ... ... i i 6 Dricks L blocks - . --. --
I - ~ ~ -
8 17 Tiles - A buildw ca-amics .. .- - - - -. -. -. 5-11
8 18 Glass & groducts (excludmg boulesl ........ 161 53 .. ___. ___ - _ .... ..- __ - . . - ... ---
8 19 G h a bottles 7,578 4,267 1,642 ... -- --
asi Iron & steel b a ~ ~ o d u c t s 4 69 459 298 -_ . .-.........
823 Aluminum~roducts .. - . -. - -. -- . -. - - . - - - - '5 ~~~. ----
825 :Metal bulldmgparts *- -- 38 1 3 52 .....
--- -- -- - 9_1& - - Office equipment 9 13 Li@ling& electrical parts - -. - -. -. .- - - - 61 -~ ----- 20
.. . ... .. ..... .-
639 ...... 952 -~
--- 29 ...
-- . 10 -- - - - - - - .- .....
- - - - - - 1'29
350
.
40
. . .
1 26 ...
35 19
~
....
. - . - . -- - - - - - - - - - - ---- -. ..-
.....
...
11 .-.... ..
.... 9,111
.--.-... - .- - -. ....... - -- -- - - - -. - - - -
- -- .......
..... .-. ... ... ... - --- - -
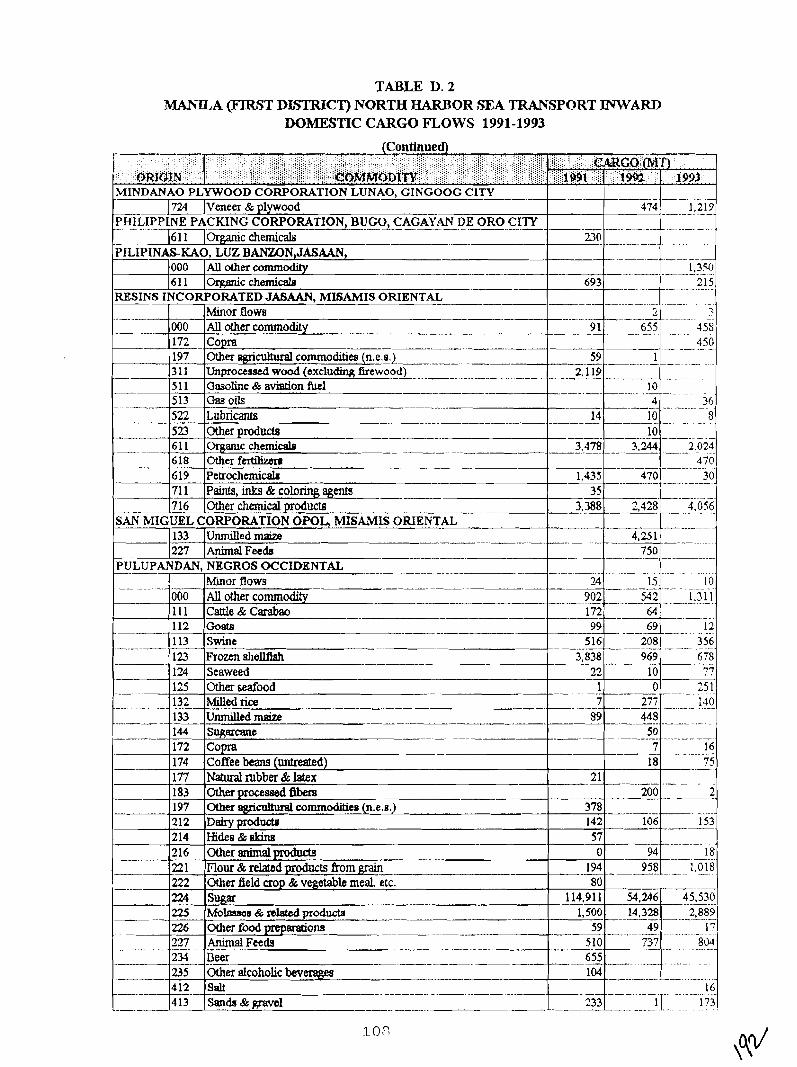
TABLE D. 2 MANILA w f 3 T DLS7TRICT) NORTH HARBOR SEA TRANSPORT INYARD
DOMESTIC C A R W FLOWS 1991-1993 (Continuern - . . -. -. - - - -
. . . . ; : . . : .. .. : . : j / j : i / : .: : , .: ' ' .
:::: .:.. , : ,:., .. i:; :.:.::::.:.::.:,i :!::::,. i.:,; ,.,, . .!::~,~!~.~~,~:;:;;:i\;~i~!~;;:~:~ . . .. .:.::i:::::.:;;.:;i2:~jjj.jj;!~i;i;i;i;iii~ ;;~:::i::;~~~!q:: :!!!.:: .'ti:':: i: ::: 1:: . : : ; : ' ~ ~ $ , f r ~ ,,.,
A;jr~~jm:i,~;.:;;:ijijiI;jj;j:j i;;<:';,ii;ii:;i :i;ii;;$i:;$;i -- ; i j i ; ~ i i @ g l l j i : ; j ; : ' i ~ +. . : i i ; : . . ,. .I&,) '
MINDANAO PLYWOOD CORPORATION - LUNAO, GINGOOG crn -- . - - . .- -- --
- - .- - . - -. ~ . ..
- -- - --
-- . .-
. . -. . - -- Minor flows 7
-- - - - - - 197 Other agnculhlral commodities (n.e.s.)
.--A-
3 1 1 Unprocessed wood (excluding firewood) - - -- - 5 1 1 Oasoline & aviation W - - -- 513 Qasoils
522 Lubricants -- - - - - - - 523 Ot&r products 6 1 1 Organic chemicale
227 (~nimal Feeds
-- -
. -. ---- * -- M o r Bows 000 Allothercommodlty 111 =e&Carabso -- 1 72 - - . -. - - .
I
112 Gosts
-.
-
- 69 12 99 . . .. -. - 516 208 356
222 224 225
. - - - . - - - -- .- -- -- I-
. -- -- Swine ~ ~ z e n a h e I L f i s h ~ ~ ~ - -- - .-
Seaweed Other seafood Milled rice --- Unmilledmaize
113 3,838
12 - 1
144 Sqacane --- 172 Co -- 174 Coffee b a n ~ untreated 177 Natural rubber Sc latex -2
Wm field crop & vegetable meal, etc. 80 Sugar - . . . - - - M o h s & dated moducts
226 227 . 2%
.--
--
~ - ~
~erfoodprepcwtions Animal Feeds -- -. - ~....
Fs 235 412 413-
123 124 125 132 133
7 277 - 140 . . - - -. . - - 89 448 -. - - - - - . - - - - . -. . . .
- ..-.
969 - .. -. 6 78 --
50 -
Other alcoholic beveragea Salt - -- - - - - - - . .. -- - - - -- - .- ~ a n h & p e l --
10
0 ~
- .- .
9-
? ? .---- 25 1
7 16
183 197 212 214 216 ,221
-- 18 -------~.
Otherprocesaedfibera -- 20% -.__-.- 2 ( X h e r ~ ~ c o m m ~ e s ( n . e . s . ) 378
DairyprodoRs 142 106 Hides&skins - 57 Otheranimalproducts 0 94
194 958 1.018 . n u r '% rd-d products &om grain_ . . . - * - - - - - - p - . - -. .
.- - 75
_ .
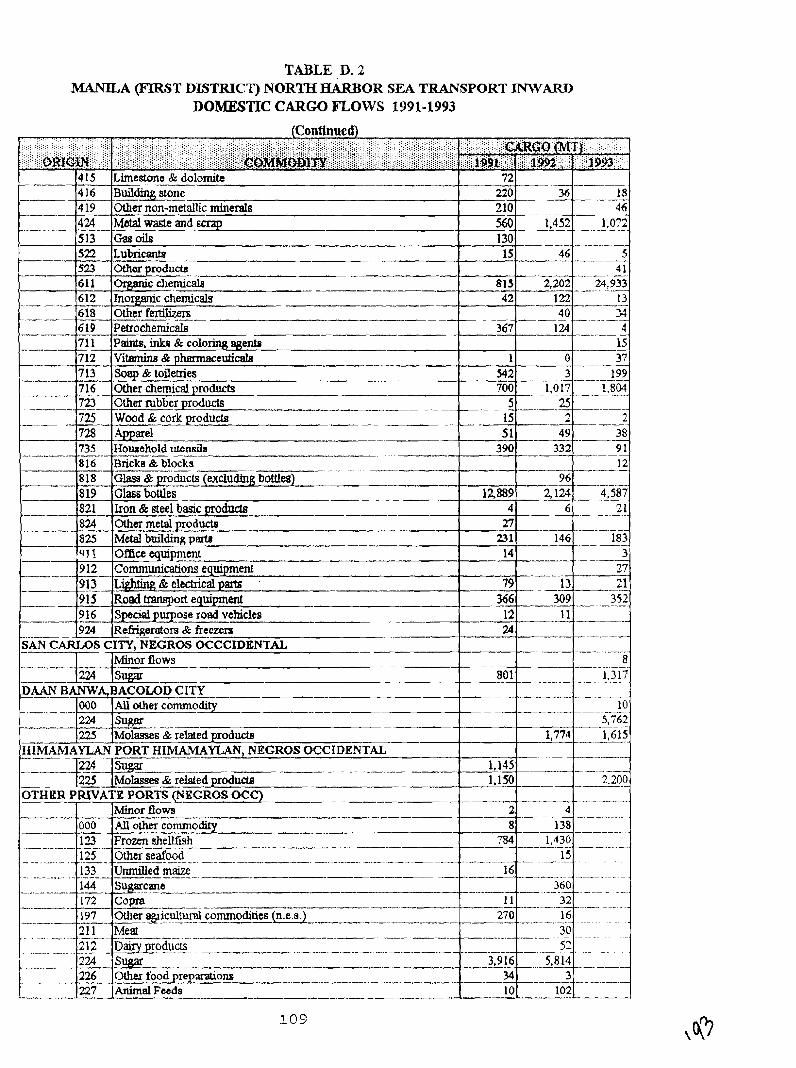
TABLE D. 2 MANILA (FIRST DISTRICT) NORTH HARBOR SEA TRANSPORT INWARD
DOMESTIC CARGO nows 1991-1993
(Continued) i:;: ::!:!;.:::;: ; i:.::i:i;:2;;:;;:;;;!;:;:;. .;.;.::::;; ;:;:: .............................. iji;j;;:;j:j/i::::::i:jii:;j;jIi;jj;jj;j;j::;; ;,;,!: :,.,.,.,,, ;:!:,::::::!;::: !,,,, :.:,:'.>.' -
-
-
513 Gasoils 130
--
C
109
72 *O 210 560
4 16 4 19
- 4%-
~- - -- 36
1,452
Building stone Other nan-metnllic m i n d Metal waste and scrap --
. - 18
46 - 1,072
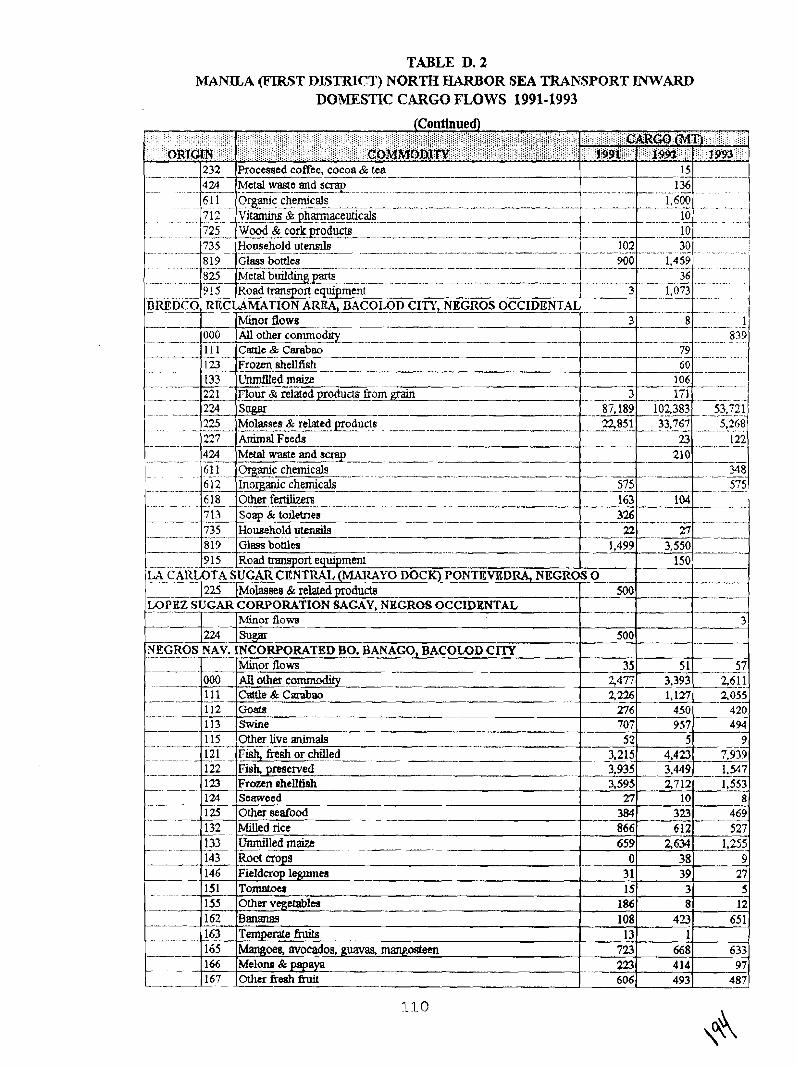
TABLE D. 2 MANILA (FtK'5T DL5TRICT) NORTH HARBOR SEA TRANSPORT INWARD
DOMESTIC CARGO mows 1991-1993
. . ...: (Coutinued)
; . , , ,, ,, , . . : : . : . : : . , : : : . : : : : : : : ; : . . . . . . : . . : . . . ::::.:.. ;. .:.: .... :...:.i ..;: .... . ....... :.:_:(:..._). . :.::...:. , , , , ,,,;,;:;.;;. !:::.::::::: ........................ ;!$:;;;!;;;; ;;;;;;!:t;;;;::;;;;i;;;ii $;:; i;;;;;;;j;i;~;;~;!j!~~;;;:;~~~;;~i;<i;ji;i;[;i;ii;;;;:$;;;i;~:{~ ,, :::: . . . : ...,... . . . . . . , . .
;;;;: ;;;:j;;; j i ~ ~ ; ~ i j i j ; ; j i ; ~ ; i i i i i i j j i j i i i j j j i i i j : I ; j i i ~ : : ; ; : ..................... :":.:':':':, ":'.;.. ......' :":.:.:::.....I. :.' . . .. ..
, . ... , - :.: ,.,:. : ,, , , : ; ...., :.:.:.:.:.:::,:.:.: ...,,,.,.,,,., ... .::::::~oMMDD~ry~~i~;~;~jij~'ii,~~j~~;;~j:~;;iji~~j;;~ijj : : . .......................... ::.::.::::::..::.: :.:::.: . - . . " P " -. ,
15 136
10
. -. - -. . . . .
900 1.459
3 1,073 - 1
- .- -- Minor f l o w ! . -- 3 -2 . .-
- - - . . - - - -- - -- - -- -
~ - - . -. -- .. - - -- - - . ... ~ -.- -- - - - - - - - ..- - -. - -- - . ._ . .
000 --- 111 -. -. - 123 133 22 1 224 -- - 225
5: 5 . - . - . - .- ~-
~
All other c o m m o q ----- 839 - . ~ . CactleBtCarabao - - - - -- 79 - .- . .
-- - -- -- . - - - - - - - . - Frozen shelLBsh 60 Unmilledmoiz lo6
104 . - - - - 326_----
.- I
53.721 5.268 -- - -. . . . . - - . -. . . .
-flour & relmd prodwts from @in --- - Sugar
122 ..-...---- -- - -- -
3 8
227 - - . 424 - -- - 61 1
575 - - - . - - . - - - - - - L . . -
163 . . . -. - - - - -. -
.~
735
Molasses & relatedpoducts ~- ~
22,851 33,767 -- - .- -- . . -- -. . - - - . -
-- 3 87.189 - -
Arrimal Feeds - - -- -- -- - -- ----- 23 Metal waste and ~ m y
27
,--- 3,550
---JZ_ 102383 -
- - .-- - --, - . -
7 13 Household ~ utetlgite - -
150
-
- . --- -- .
-.----.---.-----p--..---..-..---p-----.-.--- Soap & toiletries
22 819 G l m bottles - 9 15 Road %oft e ~ m e n t -~ .
LA c ARIX)TA SUGAR CENTRAL YO DOCK) PONTEVEDRA, NITGROS -F25pD~&~e8 & Aakd ~3 -
LOPEZ SUGAR CORPORATION SAGAY, NEGROS OCCIDENTAL
- - - - . .
--- 3
---- ---
57 261_1 2.055
420 -- 494
9
_7,939 1.547 - - -. -- - 1,553
8 469 - - - - - - 527
1,255 9
27 5
12 65 1
633 97
487 -
500
210 Oroanic chemicals P- - - - - - - - --
------- 1,499
0
--..- 500 -. - -- -
. - - -. - . 000 1 11 112 113
. - - - -. .. - 1 15
- 12 1 -
Minor flows An 0 t h c w Cattle & Carabeo Gaits Swine -- Other live animals -- FI&, fresh or chilled ----- .
Fish preserved - Frozen shelltish Seaweed Other seafood W e d rice
. . M e d maize ~ - - _ _ _ _ - -
Root crops Fieldcrop legme8 Tomatoe8 Other vegetables Bananas 'l'empmk fbib Mangoeg avocados. guavas, mangosteen Melom & papaya
Lotherfreshfruit
. - - - - -. -- -
- - - -.-A . .- -.
. -. - -. -,
I. 22 123 124 125 132 133 - - - 1.43 146
- 35 2477 2,226 276
- 707 52
~~~ ~- 3,215 3.935 3.595 n
384 866 659
0 31 15
186 108
13 723
- 223 606
-51 3,393
_ 1,127 450 957
5 4.423 3.449 - 2,712
10 323 -. 612
2,634 38 39 3 8
423 1
668 414 493
-
-- ---
151 155 162 163 165 166 167
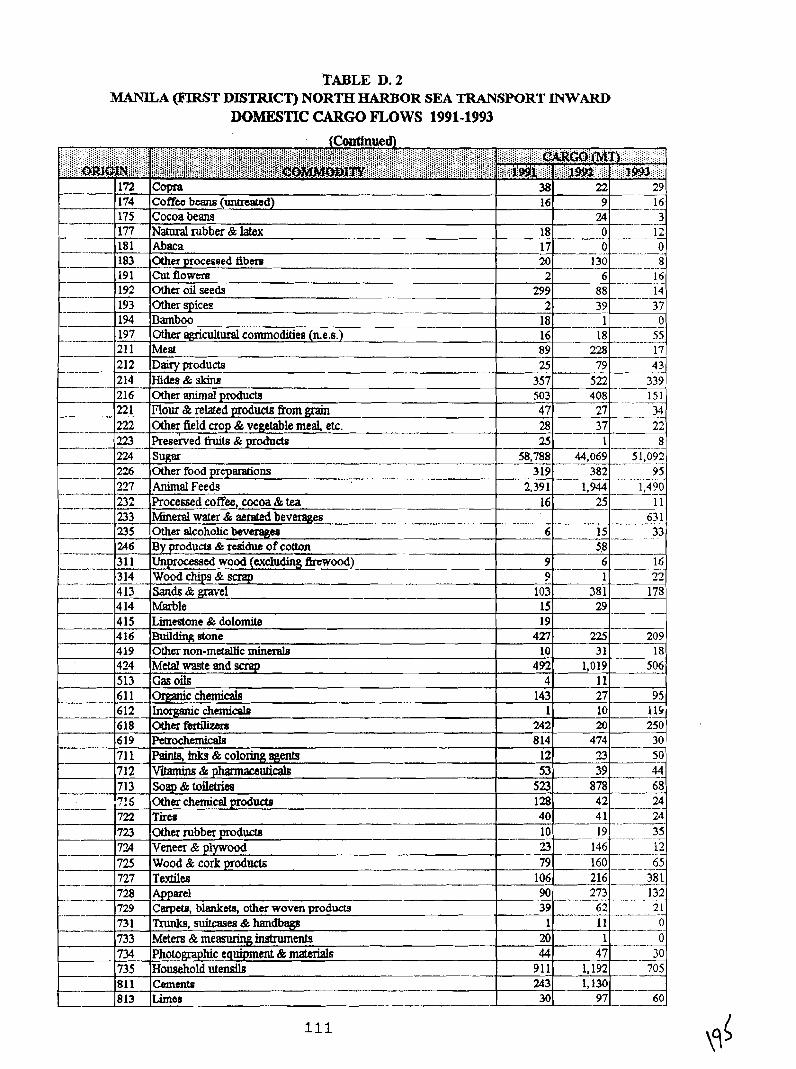
TABLE D. 2 MANILA @IR!ST DISTRICT) NORTH HARBOR SEA TRANSPORT KNWARD
DOMESTIC CARGO mows 1991-1993
--
.- - - -. -
-- - -. - -
172 174 175 177 181 183 191 192 193 194
Copra Coffee beans (untreated) Cocoa beans Natural rubber & latex -
Abaca --- Other processed fibers -- - Cutflowers -- Other oil seeds -- Other spices ----- Emboo
--
---
--
-- - - . .- - -- -. -- - --.- - . - --
-----
----- 3 1 1 Unprocessed wood (excluding firewood) .- 9 --- 6 16 314 Wood chips & scrap - - - - . .- - - ,9 1 - 22 413 SandsScgtavel- --.- 103 .. 381.-.- 178
-----. 414 -Marble - 15 29 4 15 Limestone & dolomite l9 -- 416 Building etone 427 225 209 -- 419 ,Other non-rnemlllc mind 10 31 18
Other egricult&l commodities (n.e.8.) Meat Dairy products Hides&skins OtheranimalpIoducta Flour & related products &om grain Other field crop & vegetable me& etc. --- Preserved hits & pr0duct~ S ~ M -- -. . Other -- food ~reparatiom - - ----..-A - - Animal ~ e e d s Processed coffee, cocoa Sc tea Mined wwx & aerated beverages Other alcoholic beverage0 -- By produda & residue of cotton
197 211 212 214 216 221 222 223
. 2.34 226 227 232 '2.33 235 2A6
38 22 29 -- 16 9 16
34 -- ---- 3 18 _ 12
17 TO 2
299L - 2
18 16 89 --- 25
357 503 47 28 2S
58,788 ---- 319 ----
2,391 16
6 -- --
0 0
1 3 0 8
18 55 228 17 79 43 --
522 339 d
4 08 151
2 7 34 37 22
1 8 44,069 51,092 . -- - - -. - - - - -
382 95
6 88 - - 39
_L
/--- - 1,944 -- . _ 25
.- -. . . 15
16 ~- .-
-- - - . - - 14 37 0
.
1,400 - - -- - - - -- 11
63 1 . . - -. - - .. .
33 58
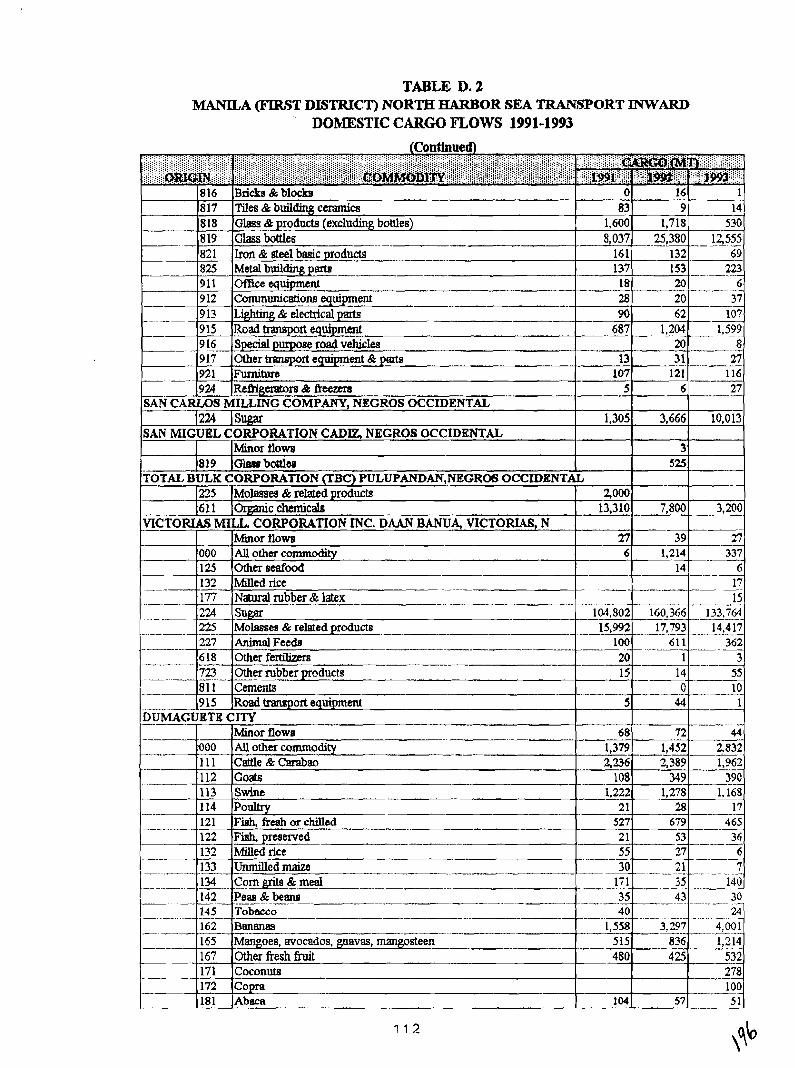
TABLE D, 2 MANlZA (FIRf3T DISTRICT) NORTH HARBOR SEA TRANtSPORT INWARD
DOMESTIC CARGO mows 1991-1993
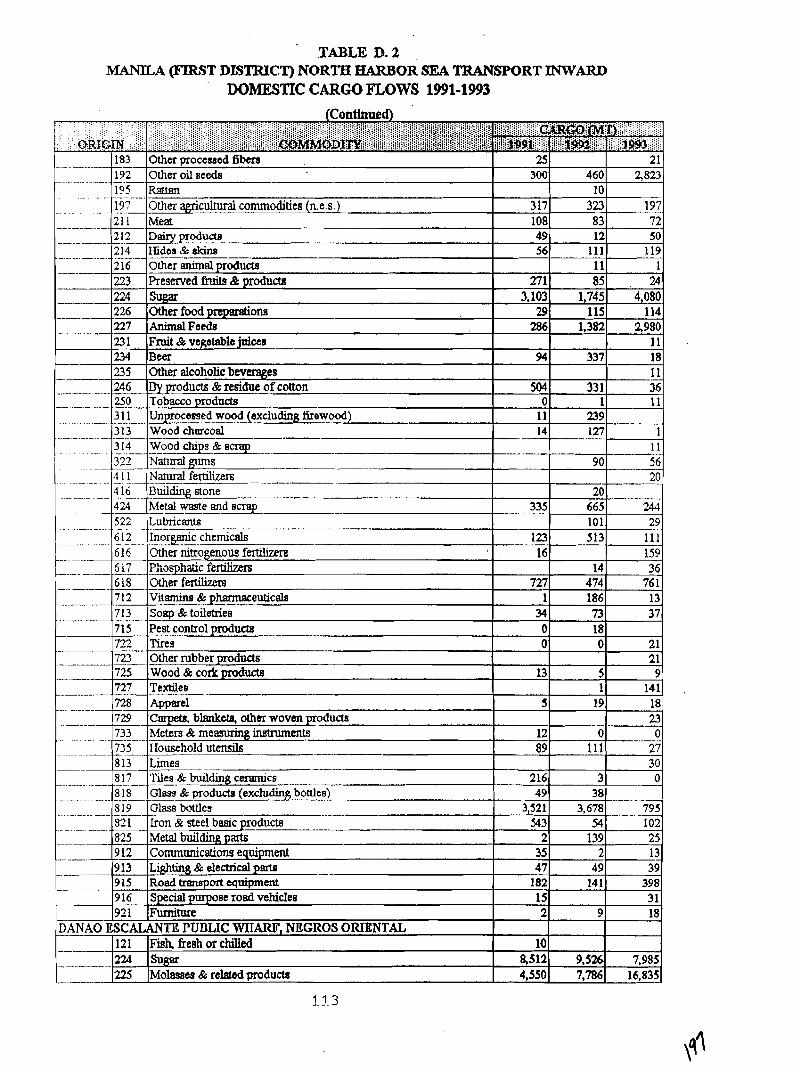
^ ,?ABLE 1b.2 MANlLA (FIRtBT DLSI'RICT) NORTH HARBOR SEA TRANSPORT INWARD
DOMESTIC CARGO mows 1991-1993 (Continued)
183 Jother processed fibers 2 1 I 3001 4601 2823
8 17 & building c&cs 216 -.................. -- 8 18 Glsss & products (excluding bottles j-
.- - - - - .. ..... ...... . ---. --. . -. - 49 38 8 19 Glass bottles 3,521 3,678 79 5
...........
................
-- -- -- DANA0
82 1 825 9 12 9 13 9 15 9 16 921
543 2 35 47
182 15 2
10 8512
---- Iron & steel basic products - Metal buildmg parts Comrnunicstionrr equipment Lighhng & electrical parto Road hnsport equipment Special purpose road vehicles Furniture
225 ....
4,550 Molasees & related products
54 139
2 49
14 1
9
9,526-
ESCALANTE PUDLIC WIIARF, NEGROS ORIENTAL
102 25 13 39
398 31 18
7,985 7,786
12 1 224
16,835
Fiah, ffeeh or chilled Sugar
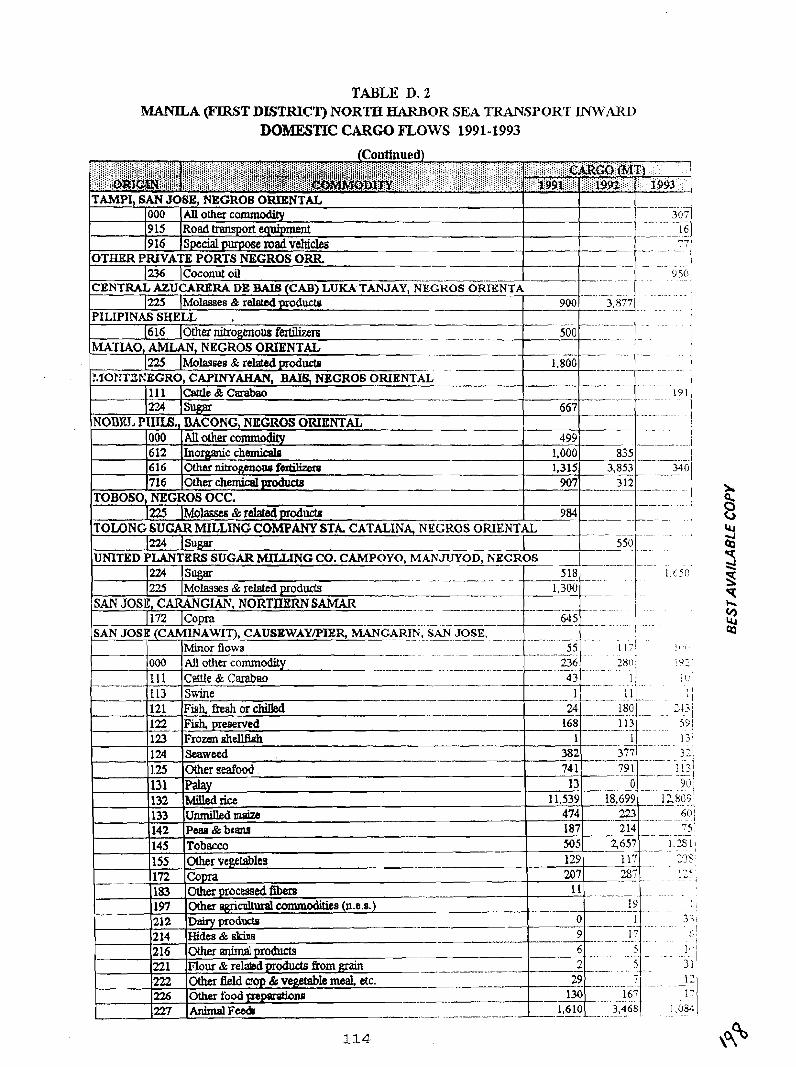
TABLE D. 2 MAMLA (F'IRST DISTRICT) NORTH HARBOR SEA TRANSPORT INWARD
DOMESTIC CARGO mows 1991-1993
. -. -A . . . .
- - - . - . .- -- .- IN, SAN JOSE, -. -. . -. - -- -. .
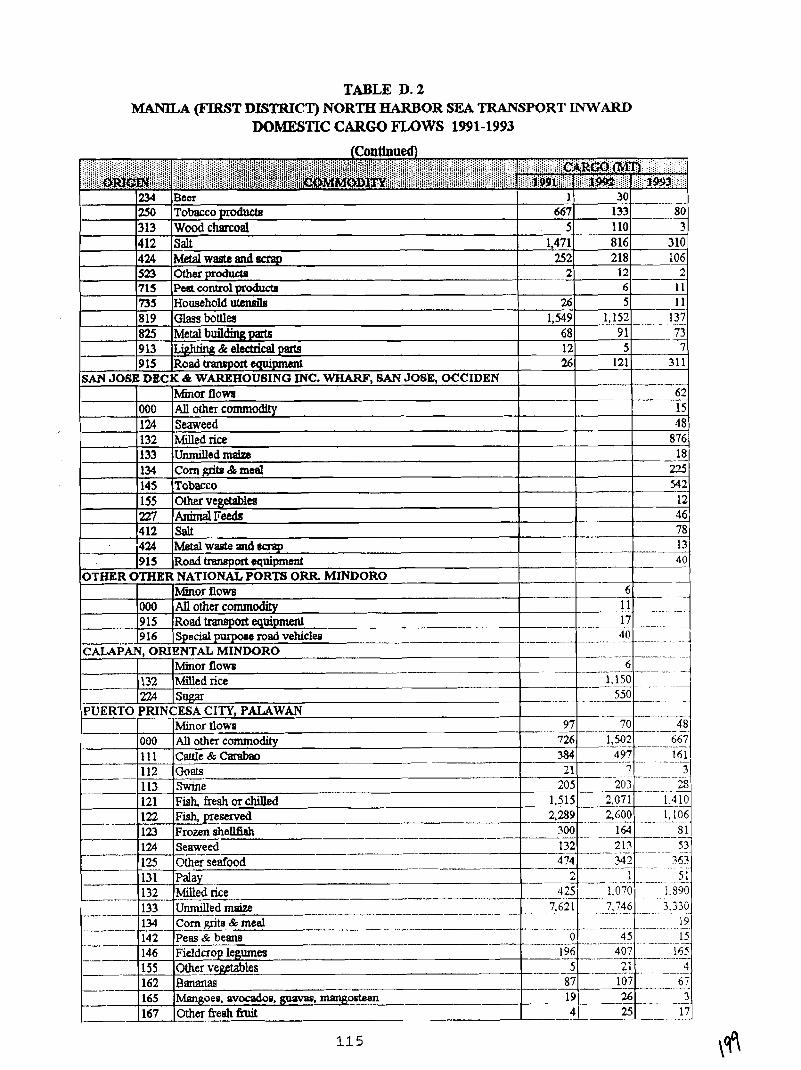
TABLE D. 2 MANLLA (FIRST DISTRICT) NORTH HARBOR SEA TRANSPORT INWARD
DOMESTIC CARGO F'LOWS 1991-1993
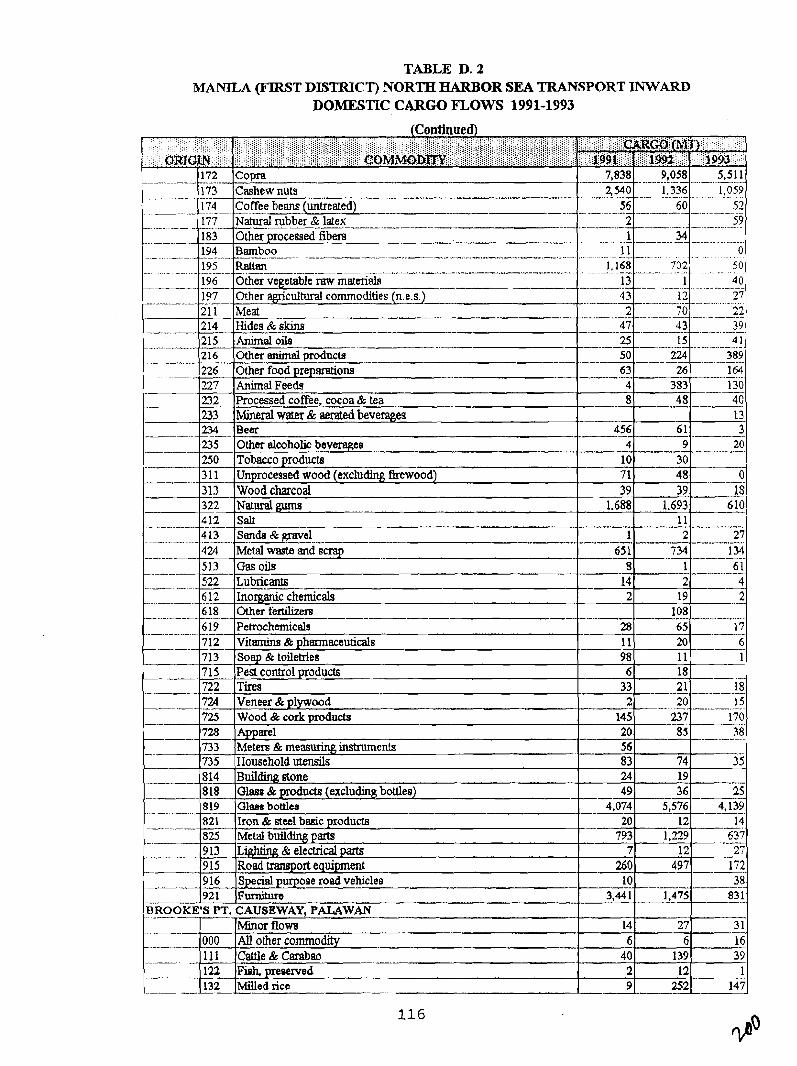
TABLE D. 2 MANILA (FIR9T DISTRICT) NORTH HARBOR SEA TRANSPORT INWARD
DOMESTIC CARGO FLOWS 1991-1993
.. (Continued)
, ,, , ,: :;:;;;:: :i$;ri;::;;ij;;i;i jii;i;i;i;i';;i;:jiijij;ii;;jjjjj;;i;jiijij;jjiiiI;jj;;;;j;:jii; : i ; j j i i * mc.m:~.I : : ; : 'i':iI";'i'i ::?: ; :!:!:,: i:j:i:i~!;(~!:iji!jji:j:i:::.::;,::::::::: . . . . . . . . . . . . . . ,: ;:;: ;.;;; :.: ............. :,,::;,:,;,;, :...::::::::: i:.:::::jjj:jjj;:;j::;::I;;;;i;j;i;j$~;;:~Q~ .... . I . . . .,I,,,,:,,,, . . . . . . ,: . . . . .:.: ,.,..: ...... , ' i , : ; . : : , .......... . . . . .
Copra ------- Cashew nuts - -- -. -- ,- - - -. .- - - - . - - ---. - -- ... . Coffee beans (untreated) ---.-- -
. . -. .-- - - 7,838 2,540 - ..... --. . .- ... --
56
- .- - -.- -- - . - .- - -- -. .... .. ... ..
.~.
172 - - - .- 173 - - 1.74
... -. ... - - -. - - - - 9,058 1.336 - - - . - - . -. . -.
60
......
-...-..-A -. -. 5.51 1 1,059 .......... - - ......
.... 52 --
177 ~d rubber SZ - latex - - - - .. - -- 2 --.--.---- -- . -- 53 .- . - - ... -. ...... -. - -. - 183 Other processed fibers ... ... .. 1 ... ... . - _ ._ .- -- .x
i94 Bamboo 1 1 .... . ............
... ............ .-. 0 . . . - . . . . . . . . . . . . . . .
195 RaUan 1.168 732 50 ..... . .....-
- -. -- - -. -. . .- - --
.----
- - . -. - . -- - - - -
.. - ...... -. ..-.- 13 1 40
-~ -
--
196 197 -. - 211 214 215 --
-- - . - .- -. . .. 12 43 - - -. --
47 4 3
--------- Other vegetable rsw materials -.------.--.-.-.--- Other agricultural commodities (nnees.)
pp
M&-- Hides & skins - Animaloils --- -
..
.............. 27 .- .- - 22 ;o__. 39
216 226 227 232 233 234 235
15 4 1 ---E -. -. - -. . - - - -- . Other animal product8 50 224 - 389
-- --
10 71 39
1.688
1 64 ..--- 130 ---
-- 40 13 3
Other food preparations 63 26
250 3 11 313 322
- - -. - -- . . ... ...
-- - . . --- -
-- --A. - - - - - - - - - -. - ... .
---
---.
Animal Feeds Processed coffee. cocoa rPc tea Mineral wrrter & m e d bevemges Beer
-- 30 48 39
1.693 1 1 -
[ T O ~ ~ C C O products Unprocessed wood (excludmg firewood) Wood charcoal Naturalgums --
412
0th alcoholic beverages .. -
-- 0
13 610
Salt --- - -
4 8
456
4 13 - -. - . . 424 513 522 6 12 -- 618 - -.
383
48.
61
.--. 4 -
Sande & gravel - .-p - - -- -- -. 1 - Metal waste and scrap 65 1 -- Gasoils . 8 Lubripts - 14 Inotganic chemicals -- 2 Other f ' m ---- --.- - -
2 27
728 733 735 8 14 818
6 19 -- - - 712 713 715 722 724
------ . . . 734
1 2 19
.----- 108
Wood & cork products Apptuel Meters & me- instruments IIousehold ufensils Building stone O~MP & products (excluding bdtles) G l m bottles - Iron & steelb8gic products Metal buildmg parts Lighting & electrical parts Road Vansport equipment Special purpose road vehicles Fumifwe - CAUSEWAY, PALAWAN
.- .
.- .----
.
9 --- --
. 1M ,- -
6 1
-- 4 2 .
819 821 825 9 13 9 15
20 -. - - -- -.
Petrochemicals 28 65 - -
145
-- 20 56 83 24
-- 49 4,074
-- 20 793 7
260 10
3,% 1
-
17
116
14 6
]Minor flows 000 I AU other commodity
.... -. - -- - - - . . - -- - :BROOKE'S
- 237 - ....
-..-
9 16 - 921 PT.
Vitrrmina & pharmaceuticals Soap & toiletries Pest control products Tires Veneer & plywood
40 2 9 252 -
170 ..
27 3 1
1 1 98 6 33 2
85
74 19
--- 36
6
38 . -- -- - -.....
35
25
20 11 18 2 1 20 --
6 1 --
18 IS .- -- + - - -
5,576 4,139 12 ----
1,223 12 497
---- ----- 1,475
14 ----. . 637 27
--.. 172 - -- 38
83 1 --..-
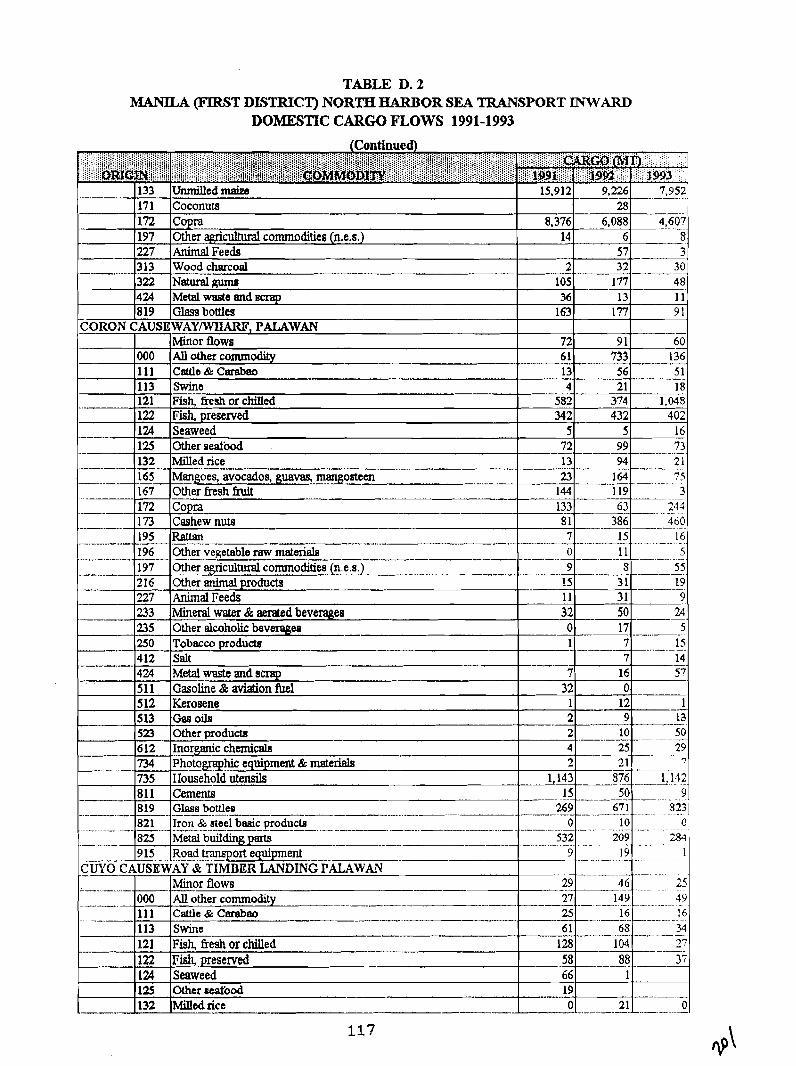
TABLE D. 2 MANILA (FIRST DL9TRICT) NORTH HARBOR SEA TRANSPORT INWARD
DOMESTIC CARGO FLOWS 1991-1993
-
.- - ..- -
CORON --
-- . .
133 171 1.72 197 227 313 322 424 819
Unmilled maim Coconuts Copra Other agricultml commodities (n.e.6.) Animal Feeds Wood charcoal Natural ppnm Metal wsste end scrap Glass bottles
....
165 167 172
Mangoes, avocados, guavas, mwgosteen Other fresh fruit Cop) Cashew nuts
.... - -. --- . Other --. vegetable raw materials
15.912
8,376 14
2 105 36
1 63
000 1 1 1 1.13 121 122 124 125 132
.
CUYO
72 6 1 13 4
582 342 5
- - - 72
CAUSEWAYMIIARV, PALAWAN Mar flows AUothercommodity Cattle & Carabm Swine Fish, fresh or cMed Fish preserved Seaweed Other seat'ood Milled rice
23 144
8 1 7
1.73
9.226 7,952
.--
,- .---- ........ ..
---- .-
- -- ..-a-
---
-
---
8U 915
28 6,088
6 57 32
9 1 - 733
.- --- 13 94 2 1 -- - . ....-
1 64 119 --
13!--.. - 6?
195 196 1.97 216 227 233 235 250 412 424 5 1 1 512 513 52) 6 12 734 735 811 819 821
Other~cul tural commodities (n.e.s.) - 9
Metal building parts - - - - --. . .. 532 209 % I
Road ort equipment 9 ... . 19 .............. -- - - 1
-. - - - - - .
4,607 8
'1 - 30 -
-- 60 136
.. - .......... 75 3
..........
....... 234
0 .... ,-
8 - - 3 1 31
17
Other animal products Animal Feeds Mineral water & aerated beverages Other alcoholic bevempi -
........ 49
............ 16
- - 386 - - - - - 460 . . - . - 15 16 . - . -- .- . . -. - -- - . . - . .
........... 1 1 ......... 5
55 - -- . .
19
-. 9 24 50----.
- . - -. 5 .
IS 1 1 32 0
"Tobacco produds Salt Metal waste and scrap Gasoline & aviation fuel Kerosene Oasoils Otherproducts lnorg&&c chemicals Photographic equipment & materials
.......................
CAUSEWAF&%~~LR LANDING PALAWAN ~-~
All other commodity ----- ......... 27 149 cGie&carabao 25 .. 16 .. --
-- ...... ..
177 . -- -. 13
177
56 51
---
%or flows - 29 -- - 4 6 000 111
48 - - . 1 1
- 9 1
21 374 432
5 - - - .- - - 99 -.
IIousehold utensils - lpk!? --.- !!?!i.---..~?. 1 14" Cements 15 ........ 9 -- _ - ----- o Glass boUles - 269 67 1 823 ......
Iron & eteel beaic producb 0 10 0 ................................ -- .. -.-----.----- ., ., ..... -, .. ........ ...... -
1 7 . -. ..... 15
................ 25
Swine -- 61 68 M , -- - - . - . .
Fish,fr&orchiUed 1 28 104 - 27 Fish, preserved 58 88 37 Seaweed 66 1 Other wafood - 19 ...- -. . .. .- -.
Milladrice 0 2 1 .- 0
--
.----
18 -- 1,048
402
16 - - -- -. -. -- 73 .
- 7
32 1
113 1.21 122 I 125 132
2 --
-- .. 4 2 - . . - 7
7 16 0
12
14 -. 57
--. 1
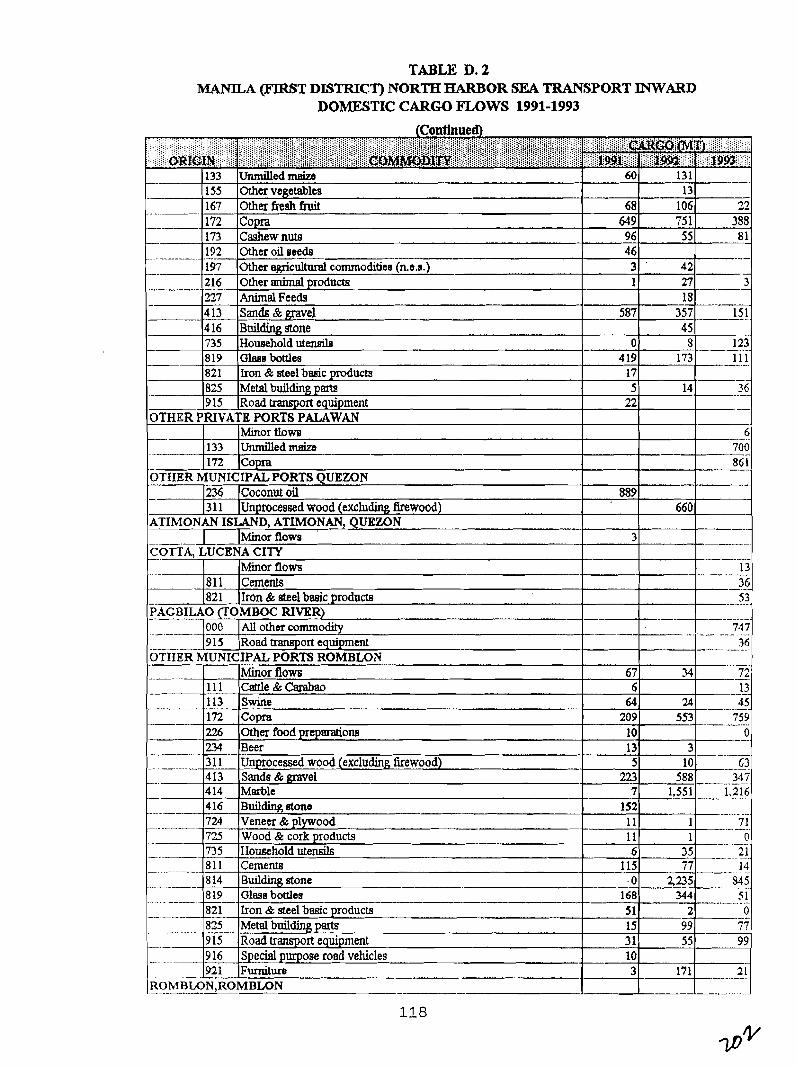
TABLE D. 2 MANILA (FIRST DLSI'RICT) NORTH HARBOR SEA TRANSPORT INWARD
DOMESTIC CARGO mows 1991-1993
819 G h r bottles 419 73. .. - - .- 821 Iron & steel baaic products 17 825 Metal building parts 5 14 9 15 Road transport equipment 22
OTHER PRIVATE PORTS PALAWAN -- Mmor tlom
133 Unmilled msize
(Continued)
: . . . . . . . ........... -
- 1.72 Copra 649 75 1 388 173 Cashew nuts 96 55 8 1 192 Other oil ~eeds . -- ----- 46 --- 197 Other agricultural commodities (n.e.8.) 3 42 -- .. . 216 Other animal products --.- a
1 27 3 227 AnimalFeeds 18 4 13 Sands & gravel 587 357 151 4 16 Building stone 45 735 Household utensils - 0 8 123 -- -
1.33 155 167
U d e d m a i z e Other vegetables Other fresh fruit
60
68
131
- 13 106 22
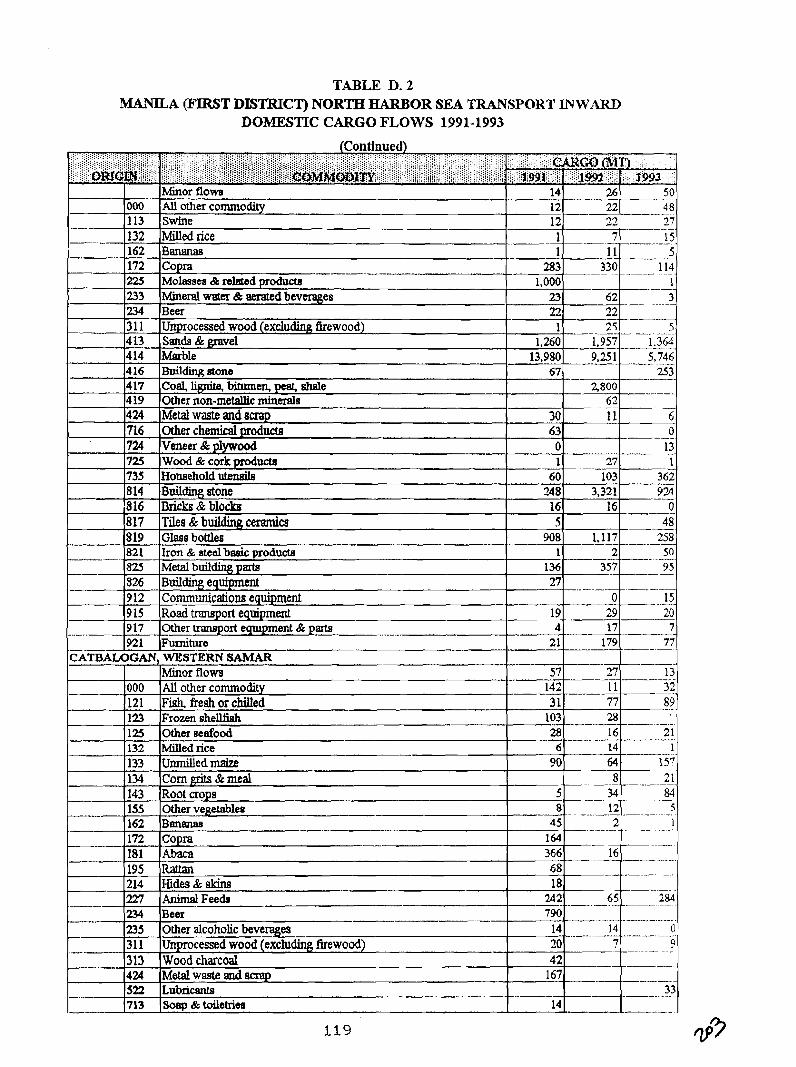
TABLE D. 2 MAMLA (FIRST DLSTRICT) NORTH HARBOR SEA TRANSPORT INWARD
DOMESTIC CARGO FLOWS 1991-1993
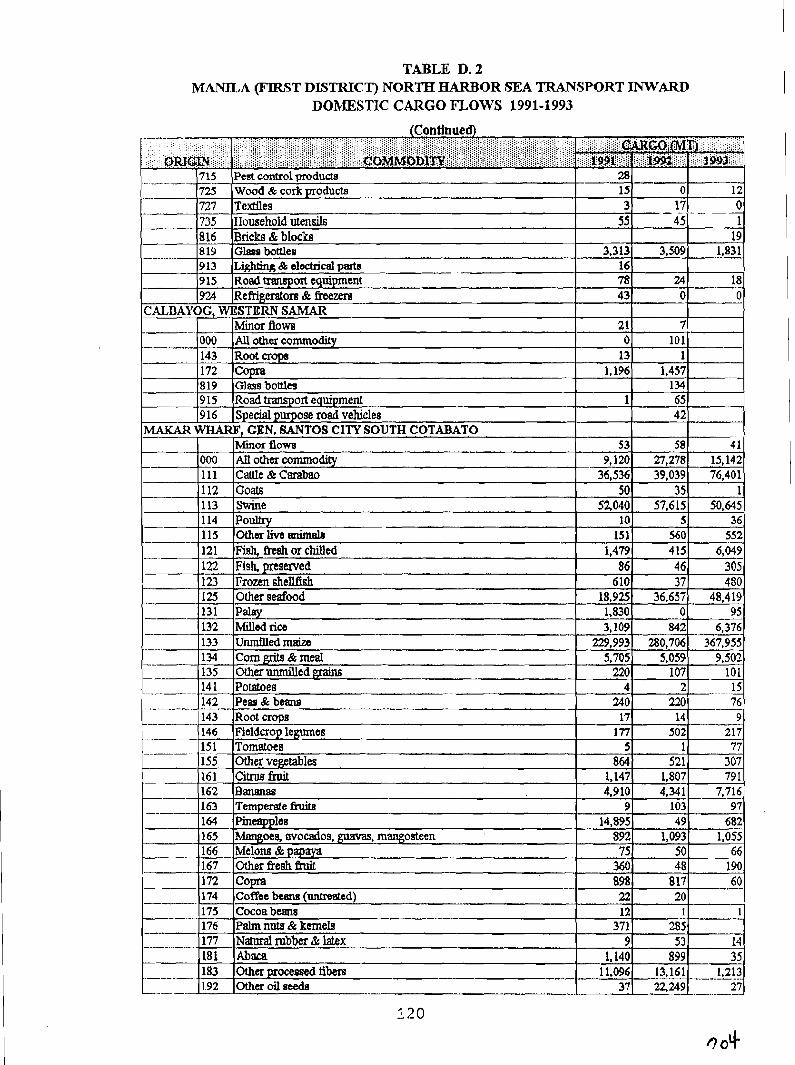
TABLE D. 2 MANILA (FIRST DISTRICT) NORTH HARBOR ,SEA TRANSPORT INWARD
DOMESTIC CARGO mows 1991-1993
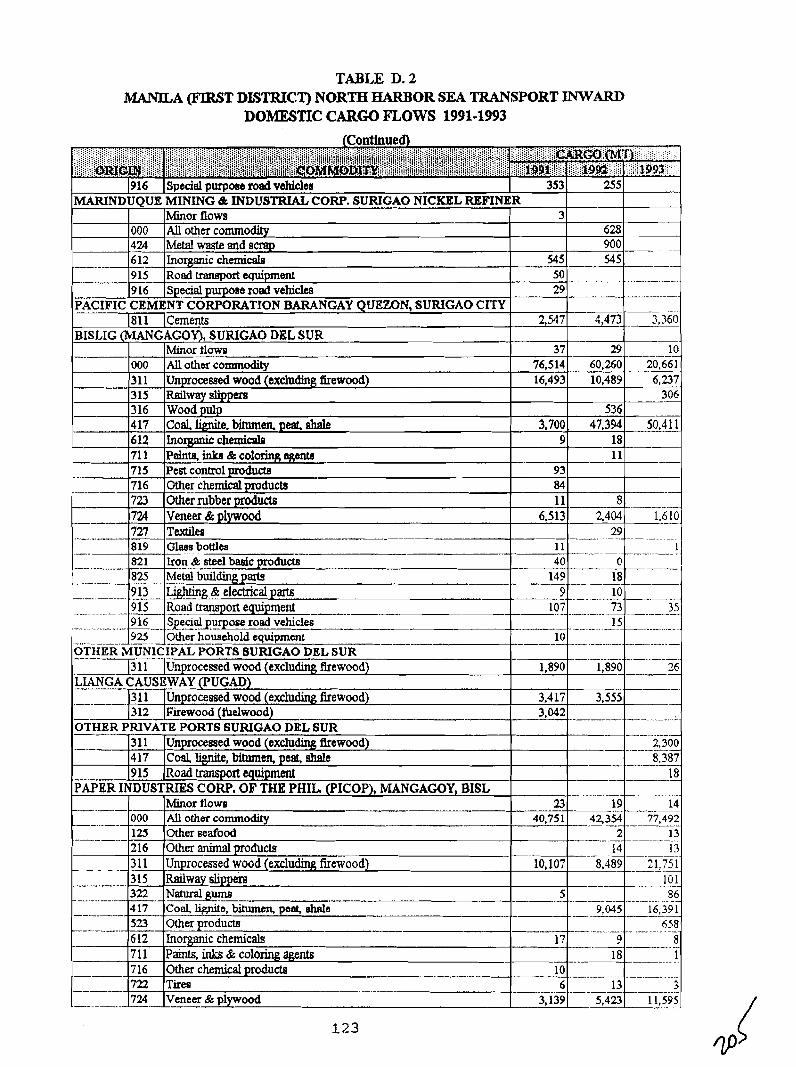
TABLE D. 2 MANILA (FIRST DLSTRICT) NORTH HARBOR SEA TRANSPORT INWARD
DOMESTIC CARGO mows 1991-1993 (Continued)
.................... ii,iie;i,i;,;: ~ i j i i i ; $ ; , , . , . ....
1916
:: :::::.:::.::.:.:.: .,.,:.:,:, jj:,j:i:j:~::::::j::::::::::;::::::'::::::::::::: i~iiix;ii;;.,,,ei;jii;i;j;i;jiiii~~!iiiir,i:;,iii~ii~<i~i i- i:iiiiii!i:iiiii:iIjI;;f;i:i'tfi:::$iiiii.C ;.;i'ji:j;~.,~m$$l Special purpoee rod vshiclea 353 255
MARINDUQUE MINING & INDUSTRIAL CORP. SURIGAO NICKEL =FINER
628 900
-- 545
- -
Pa----
- -- ~- PACIFIC CEMENT CORPORATION BARANGAY QUEZON, SURIGAO CITY
2,547 4,473 - 3,360
Minor flows All other commodity Metalwasteandscrap Inorganic chemicals Road lran6port equipment Special purpose road vehicle8
000 424 612 915 916
1811 Icemen& BISLIG (MANGAGOY), SURIGAO DEL SUR
3
545 . 50 29
000
.-
. --
.--
--
Minor flown Auothsrc~nrmodity
3 1 1 315 316 417 612 71 1 715 716 723 7% 727
Unprocessed wood (excluding h w o o d ) 16,493 10,489 6,237 Railwayslippers 306 Wood pulp 536 - Coal. lignite, bitumen. peat shale 3.700 47.394 50.41 1 Inorganic chemicrrlP 9 18 :Palnb, krka & colohg agents 11 Pest control products Other chemical produds -- Other rubber products 8 Veneer & plywood T d e o ----- 29
--- -- - - --. - - - - - -- Iron & steel basic products - -- - - 0
18 10
------ - - - - -
107 73 35 - - - - - - - -. .-. .. - - . - -. .- -
.- 15 - - -- -. . . ---. -. . . . . .- - -. 10 - --- -- - - - . - - ... . --- - - - - .- - -. . - -
-----33 1 1 l~nprocessed wood (excludmg firewood)
-I&4NGA CAUSEWAY (PUGAD) 3 1 1 l~nprocessed wood (excluding firewood)-
- - .- -. -. - . . - -. - - - 1,890 1,890 26
- OTHER -
3,417 --. 3,042'- -
23 40,751
10,107
5 .- --
312 l~irewood (Mwood) PRIVATE PORTS SURIGAO DEL SUR
4 17 Coal, lignite, bitwnem, peat, ahale - - - - - -- -- - 523 Otherproducts ---
- 3,555
31 1 4 17 915
PAPER INDUSTRIES CORP. OF THE PHIL. (PICOP), MANGAGOY, BISL
9,045 - .- .- . . -- -- -
- - - -
Unprocessed wood (excludmg firewood) Coal, bgute, bitumen, peat, shale Road transport equipment
--
. -
- . .- - - .
- -- . .. . . --- .. . 16,391
. - -. - .- 658
6 12 I n o ~ g c chemicals 7 1 1 P h , inks Jt coloring agents 716 Other chemical products 722 Tiren 724 Veneer & plywood
-. - -- 2,300 -,
-- 8,387 --
17
10 6 3
-- 000
. 125 2 16 31 1 - ,315 322 . -
-- - -
19 Minor tlows AU 0 t h commodity Other seafood Other animal products Unprocessed wood (excludmg firewood) Rialway slippek N W ~ u m 8 -
- .. 18
14 - - 42,354 77.492 ----
2 13 14
8,489 13
21,751 101 -- .--- .- --
-. . -- - - - -. - 86 . . . . .- . . . -. . . - -
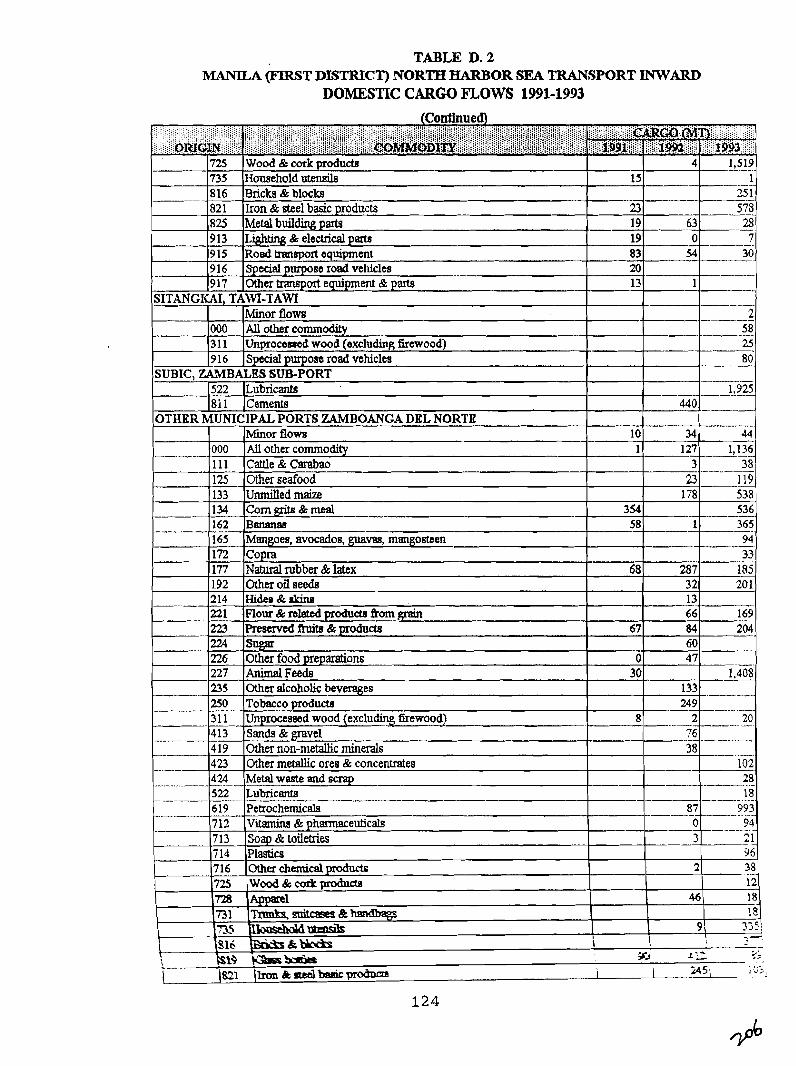
TABLE D. 2 MANILA (FIRST DISTRICT) NORTH HARBOR SEA TRANSPORT INWARD
DOMESTIC CARGO mows 1991-1993
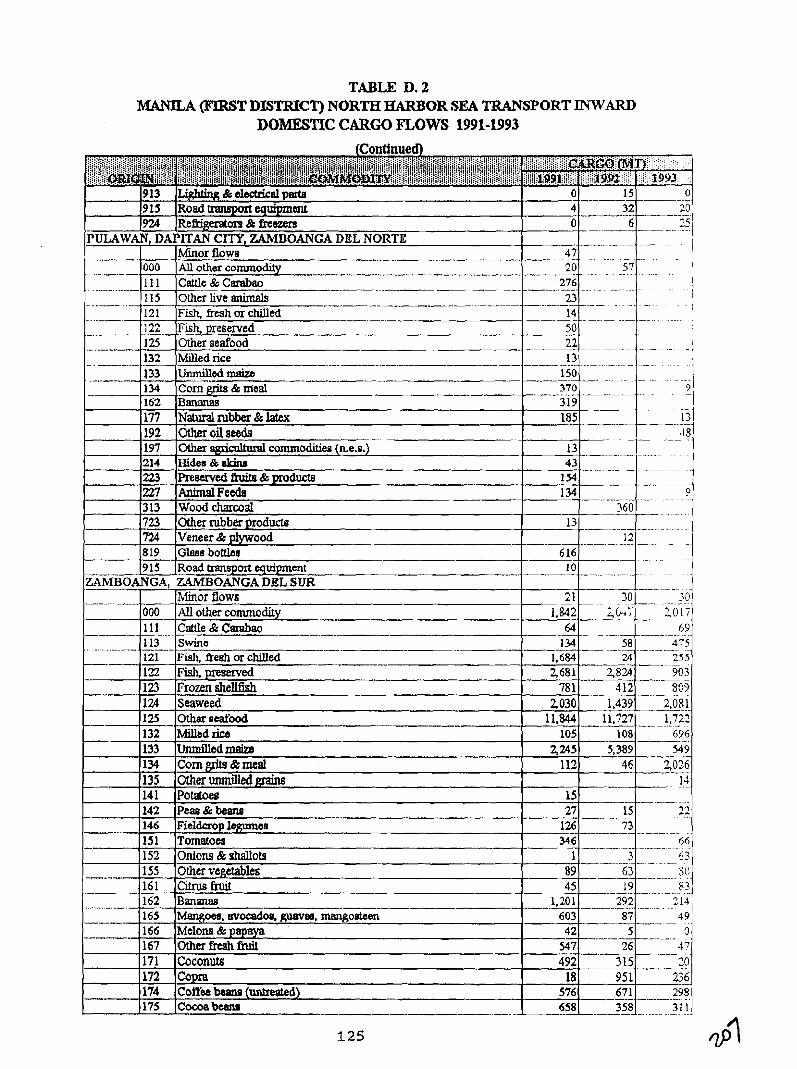
TABLE D. 2 MANlLA (FIRST DISTRICT) NORTH HARBOR S M TRANSPORT INWARD
DOMESTIC CARGO mows iwi-1993
915 Road tnmqmt quipmant - 4 32 - -- - - . 20 - . 924 Rcf3igeratm&fteeam 0 6 -. ..- . 7 . . <
IPULAWAN, DANTAN CITY, m D o A N c a Dm, N o R m ~ --I . . . . - . . -.
. . . . .- . -- - . 000 111 . - .. . . - . . - -- ii s --. 121 -
- 1.22
.. . --
- ~ 1 Minor flows - 47 ~ ~ -
AU other commodity 20 57 - .................................................... ~ ~
Cattle & Carabao ---p--..-pp-------..-..----..... ~ . . ~ ~~
276 7iL&live animals 23
~ - - i
14 Fish, fresh or chilled - .- .. .. . . - - ~ . i --F1;isish preserved ---- 50 . ~ . - . -
Other seafood .- 22 ~ --. ~
I . - 1
Milled rice .-- _ _ -..I 13 Unmilled maim --- 150 - -. . . . . - . - . . . . . . - -. -
I Corn grits & mal -- 370 9
125 132 .-- 133 134 162 1.77 192 197 214 2 3 227 313 723 724 8 19 91 5
ZAMBOANGA, -
. . -~ ...
. ~
13 48
Bananas Natural rubber & latex Other oilseeds
319 185
21 1,842
64 -- -- 134 --
Minor flows All other commodity W e & Cmabao
-7
Swine -- -- .. - - - . . .. .
.----
~... -. .
Other agrrcnlhrrPl cammoditiea (n.e.~.) Hidas & skim PreswedfhritrJ&producls Animal Feeds Wood charcoal Other rubber products Veneer & plywood - - Glaaa bottles Road transport equipment - ZAMBOANGA DEL SUR
000
1 11 __ 113
-- - 30 . ? 0 ~
---
----
-
l3 43
1 34
13
7 -- - .-
58 -- -. . - -. -
73 - ---- - - .. -. -. . -
3
LO17 ..
6 9 - - - .. . . . 475 -- . , .
23 5 - 121 122 1.23 124 125 132 133 1.34 135 141
1.684
- ..
- . . . --- - . -
---
-
--
146 151 152
. - - - - - - -. . . . 66 - . .- -- -. - . . . . -
6 3
616 ~~ ..
10
-. . . -
. - - - - - - -
- --
Fish, fie& or c u e d ---- Fish, preserved Prom shellfish Seaweed Other seefood --
-'-%lad rife Unmilled& corn grits ~t meal Other unmilledp7ains Potatoes
24 ---
142
~ ~ .~
- - - -- - - . -. . . . . - -
? -. - - -. - - -. . ..
360.- ~ . -. ~
~ - .
2,681 781
2030 11,844
105 2,245
i i a
2
125
Pea0 & beam --
155 161
. 162 165 166 167 171 172 174 175
Fieldcrop leffumas Tomatoes - Onions&shallota
-.- 12 . . .- -
126 - - 346 -
1
2 , 8 2 - 312
Other vegetables Citrus lhd -- Ban- -------- &p,ooa, avocadon, p a a , mangostaen Melons & papaya Otherfteshfiuit Coconuts Copra Coffee beann (untreated) Cocoabeans ------.-_..---
903 -- 809
-.-- 27 15 . . 22 -. ..
89 45
..--.- 1,201 603 ---
1,43_9 11,727
2.081- . 1,722 ..
63 So ~
8; 19
- - 29 2 - - . - -. . 87
42 547
18
. 108 5,389
46
. - - . . . - . . . 2 13 49 . ..
.- 696 . 549 .-
7,026 -
576 -- 67 -- 1 - -. -- -. 298 .. .
. _ _ ~ ? e - 3 ~ ? 8 1 - . . . . 3 1 i
5 -- -- - 26
.... 14 .-- .- . - . .
0 - .- . . . 47 - -- . ,n 4 9 2 . . - u ..
95 1 235
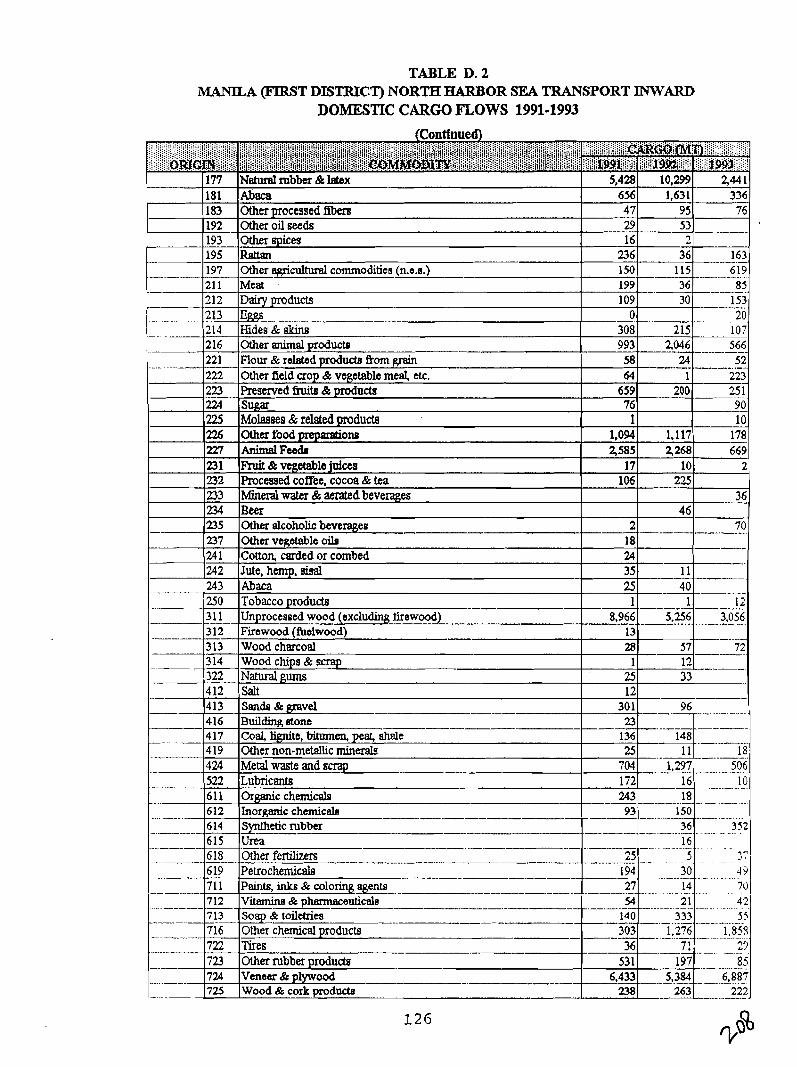
TABLE D. 2 MANILA w 3 T DISTRICT) NORTH HARBOR SEA TRANSPORT INWARD
DOMESTIC CARGO mows 1991-1993
. . . -- -- -- - .- - .- - - 713 Soap & toiletries -- - - -. . -- - - 716 Other chemical products
722 Tires - - --- 72.3 Other rubber producta 53 1
. . .... . - -. - 724 Veneer & plywood -.----- 725 Wood & cork modnete 238
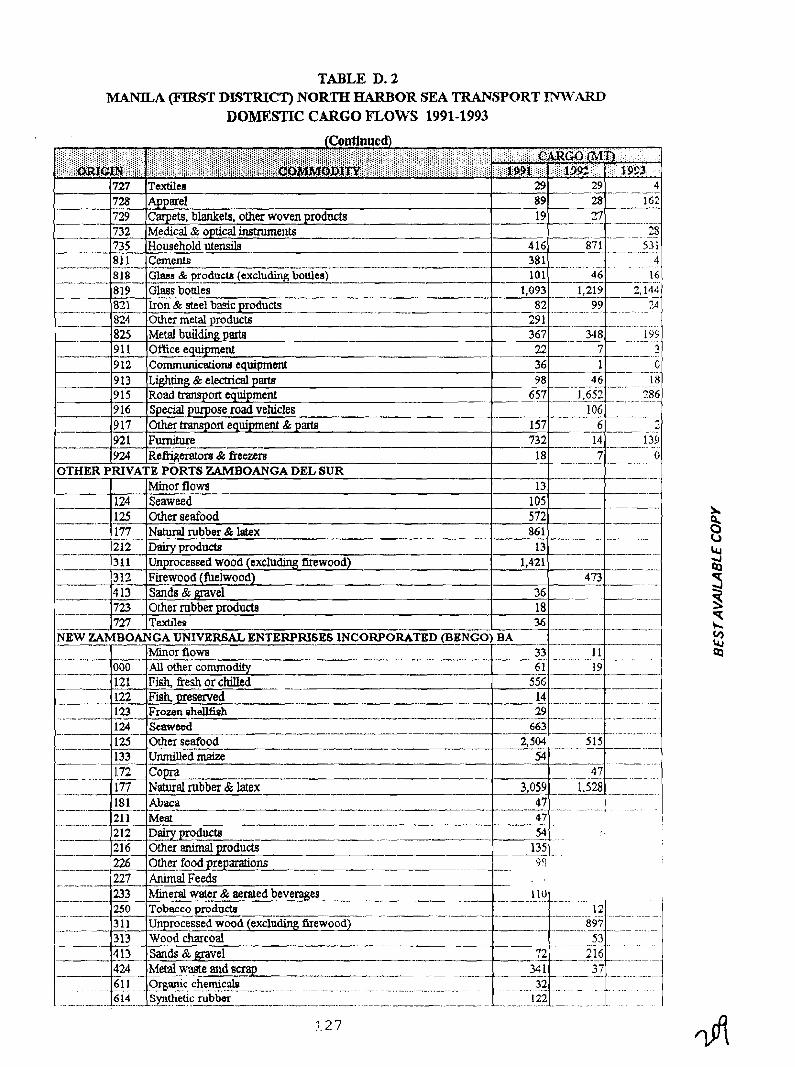
TABLE D. 2 MANKA (FTk9T DL9TRICT) NORTTI HARBOR SEA TRANSPORT W A R D
DOMESTIC CARGO mows 1991-1993
(Continued) "':;:":":"'.":j:;:;:;;I:~;;:j:;:j:i:?I:i:jj::i:;jji;ijjj:jj~;;j;ijj~iji~ii'i;ijij~~~~~~j;~;:;:;j~i;:~~~~~:;j;i;:;:;~~~j:>;:j:;:::;;~:j:j;;:;:::j:~:;;i:;.:::::;:j;j~~~:;;j~;~~;~~;:: j;:;;;;::;;;:::,
$;i@$gRt&ii@$ .,.. ...... ,.,.ai,.; ..-.. .j)!!!qj?;,$;i;i . . ;;i;:];;~~~:;,;:;:iiliiiiiiiiiiiiiiiiiiiiiiiiiiiiii,i~;i;ij:~~~~~p~:;;:;;:;;i:~:~:~::::::.:.::::::::. jijj;i;iitiiiii$ii;itji$izg,ii, j ' : . i i j I ; ~ ( i j i @ ~ j i $ i ~ , ~ i ; i $ ~ i i ~ ~ ~ ; ; i ~ ~ ~ ; ; ; ~ ~ i i ~ ~ ~ ; ~ ; ~ ~ ~ : ; ~ ~ ,::I.:.: ........ !/::::::::::.: .... .::::::ii:ji::l:ji.:.:i:::: .::::::::::
727 Taxtiles 29 29 4 -- -- --. -- -- .- .-
728 Apparel , 89 28 162 .-
729 Carpets, blankets, other woven products 19 27 -. - - .. . -
732 Medical & optical instruments - 23 ~- 735 Household ~tensile 4 16 8' 1 , 53 1
1.27
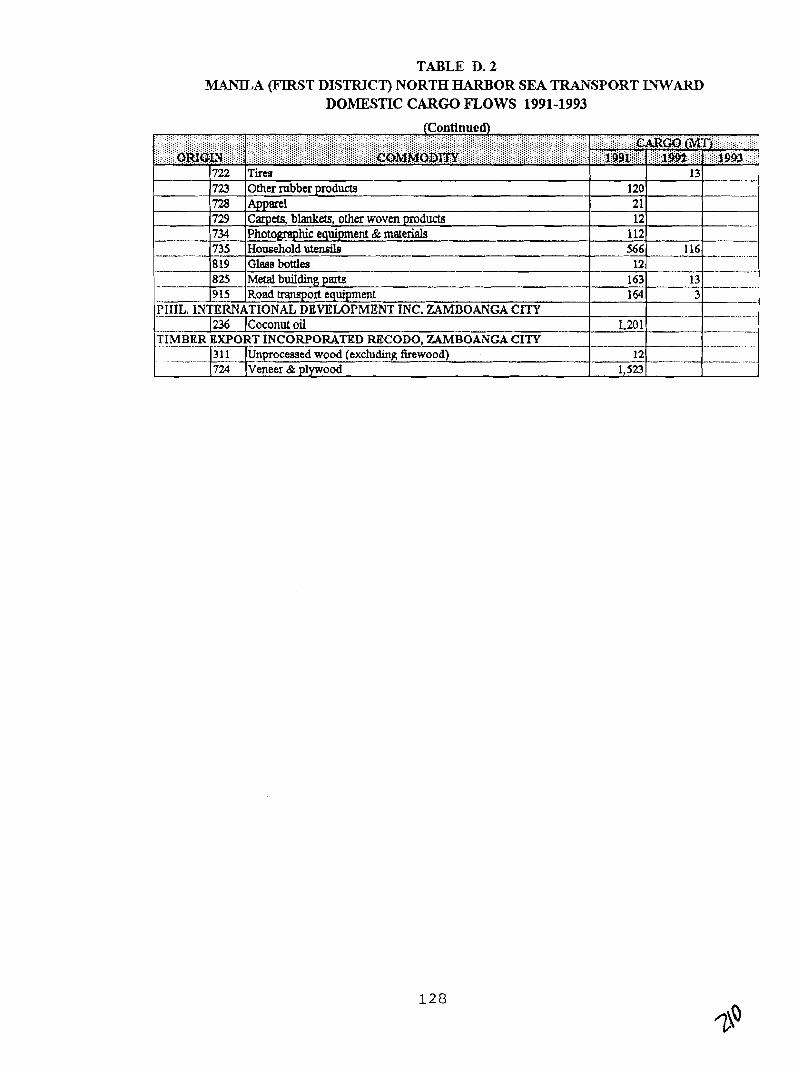
TABLE D. 2 MANILA m S T DL9TRICT) NORTH HARBOR SEA TRANSPORT INWARD
DOMESTIC CARGO mows 1991-1993
--
. . - - -
722 723 7 3 729 734 735 8 19 825 915
FIIIL. INTERNATION?DEMLOPMENT INC. ZAMIIOANGA CITY -- 1236 Jcoconut oil
TIMBER EXPORT INCORPORATED MCODO, ZQMBOANGA CITY __ ---- . - . . -- - . - - - 31~~nprocesrred wood (excluding firewood)
724 (veneer & plywood
Tirea Othm rubber products Apparel Carpets, blankets, other woven products Photographic equipment & mat& Household utensils --
---- G b s bottles ~ X d i n ~ ~ a r t . 8 -- Road or1 equipment
1.201 --------A
12 1,523
120 21 12
112 566 1
163 1 64
- - -. ..
13
116
. -- - 13
3
-. .
-- - .. - .........
-.
- - - .- -. .