precious shipping public company limited
TRANSCRIPT
Precious Shipping PCLPrecious Shipping PCL
PRECIOUS SHIPPING PUBLIC COMPANY LIMITED
Website http://www.preciousshipping.comE-Mail [email protected]
SET Opportunity Day
3rd March 20081
Precious Shipping PCLPrecious Shipping PCL
Industry OverviewIndustry Overview
2

Precious Shipping PCLPrecious Shipping PCL
INDUSTRY OVERVIEWINDUSTRY OVERVIEW
SHIPPING
COMMERCIAL CRAFTS
DRY TRADES
PASSENGER CARGO
CRUISE FERRIES DRY CARGO
SMALL HANDY 10-30,000 DWT
HANDYMAX30-50,000 DWT
SUPER HANDYMAX50-60,000 DWT
PANAMAX60-80,000 DWT
MULTI PURPOSE CAR CARRIERS TRAWLERS CONTAINERS REEFERS
TANKER TRADES
CHEMICAL
GAS
CLEAN
CRUDE
CAPESIZE80,000+ DWT
PSL
3
TYPE OF VESSELS
Precious Shipping PCLPrecious Shipping PCL
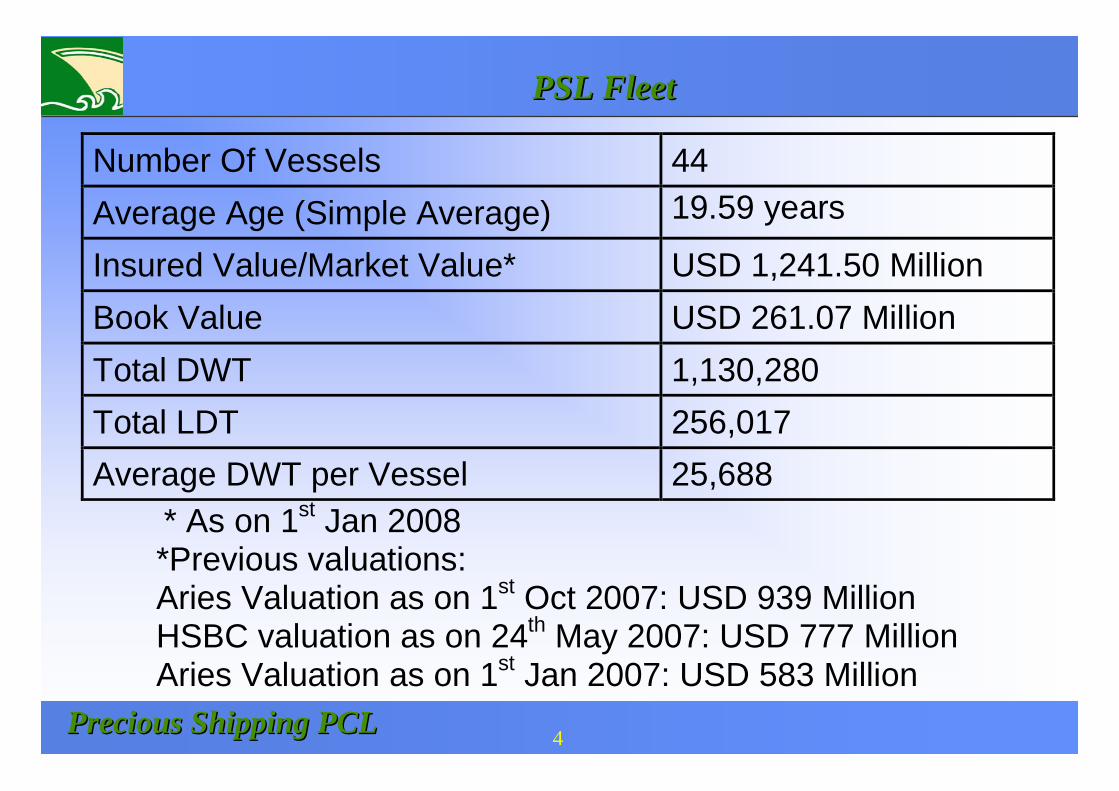
PSL FleetPSL Fleet
Number Of Vessels 44 Average Age (Simple Average) 19.59 years
Insured Value/Market Value* USD 1,241.50 Million Book Value USD 261.07 Million Total DWT 1,130,280 Total LDT 256,017 Average DWT per Vessel 25,688 * As on 1st Jan 2008
*Previous valuations: Aries Valuation as on 1st Oct 2007: USD 939 Million HSBC valuation as on 24th May 2007: USD 777 Million Aries Valuation as on 1st Jan 2007: USD 583 Million
4
Precious Shipping PCLPrecious Shipping PCL
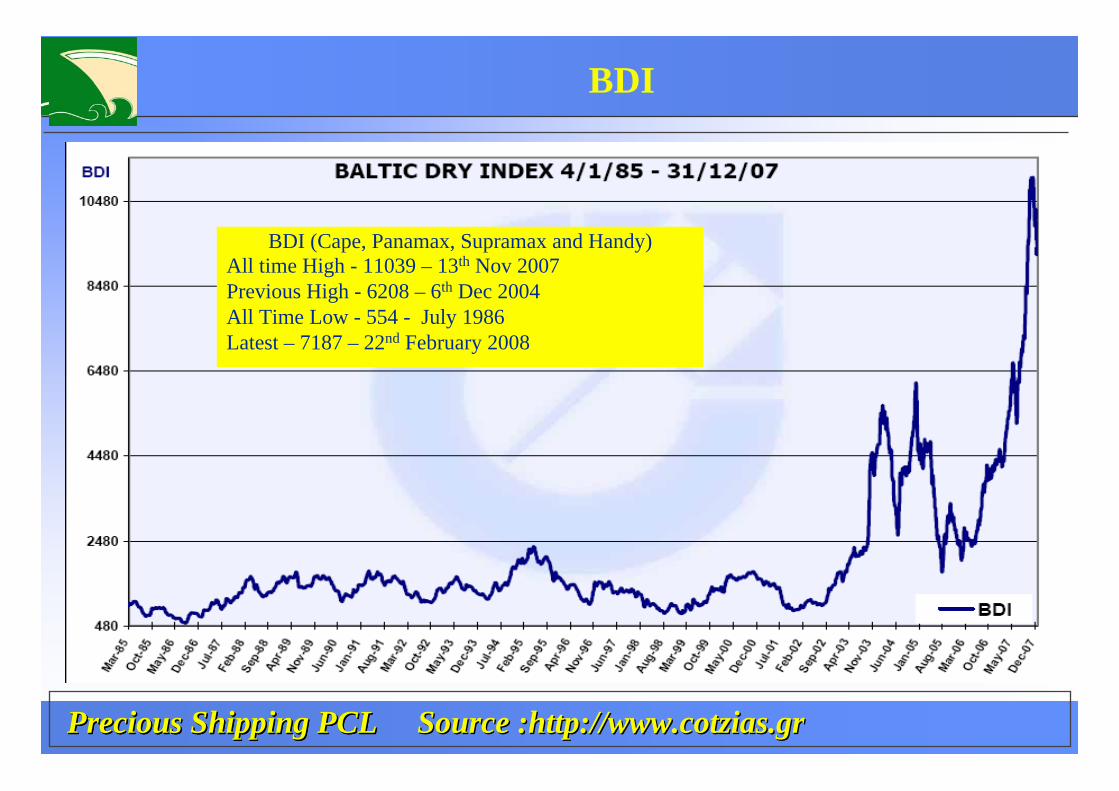
BDI
Precious Shipping PCL Source :Precious Shipping PCL Source :http://http://www.cotzias.grwww.cotzias.gr
BDI (Cape, Panamax, Supramax and Handy)All time High - 11039 – 13th Nov 2007Previous High - 6208 – 6th Dec 2004All Time Low - 554 - July 1986Latest – 7187 – 22nd February 2008
Precious Shipping PCLPrecious Shipping PCL Source : Howe Robinson ShipbrokersSource : Howe Robinson Shipbrokers
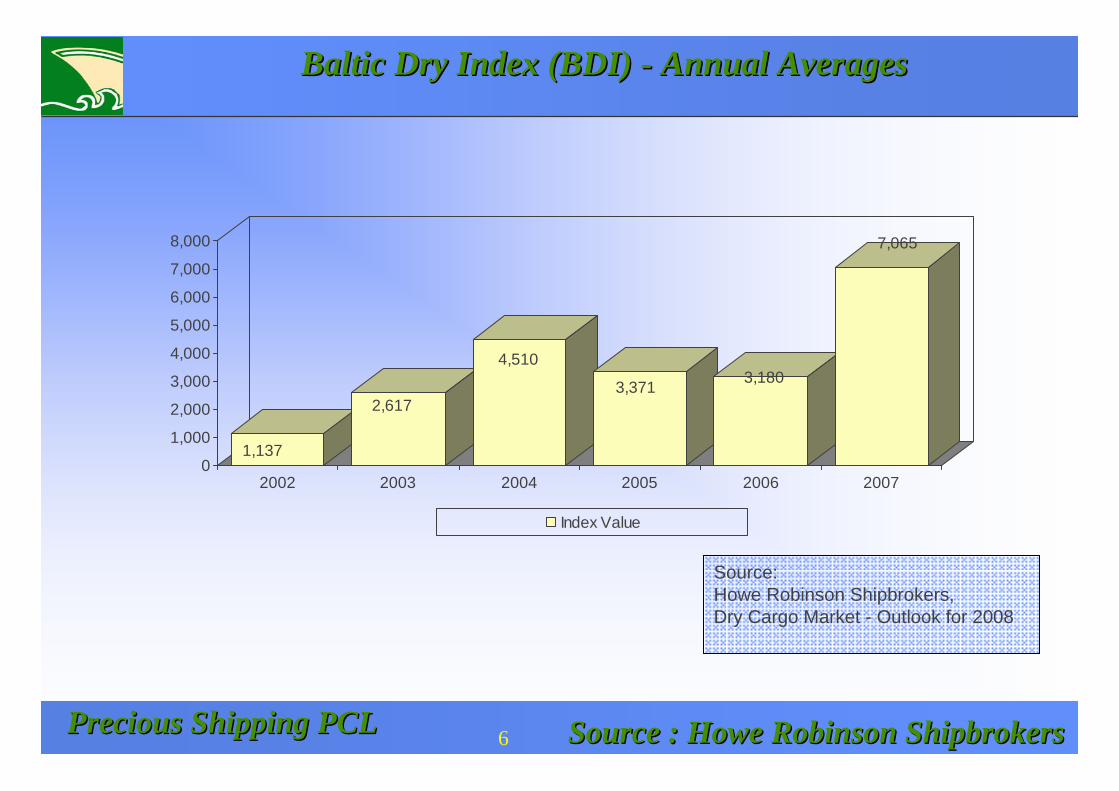
Baltic Dry Index (BDI) Baltic Dry Index (BDI) -- Annual AveragesAnnual Averages
6
Source:Howe Robinson Shipbrokers, Dry Cargo Market - Outlook for 2008
1,137
2,617
4,510
3,371 3,180
7,065
0
1,000
2,000
3,000
4,000
5,000
6,000
7,000
8,000
2002 2003 2004 2005 2006 2007
Index Value
Precious Shipping PCLPrecious Shipping PCL
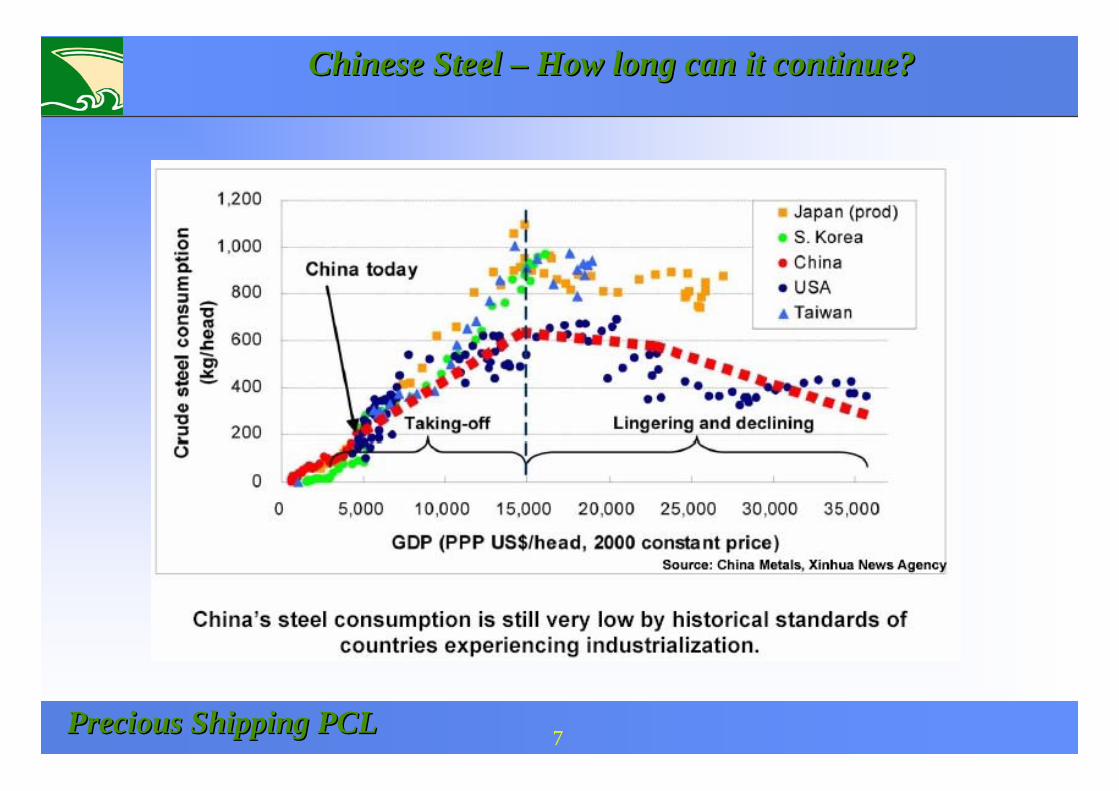
Chinese Steel Chinese Steel –– How long can it continue?How long can it continue?
7
Precious Shipping PCLPrecious Shipping PCL Source : Bloomberg/other newsSource : Bloomberg/other news
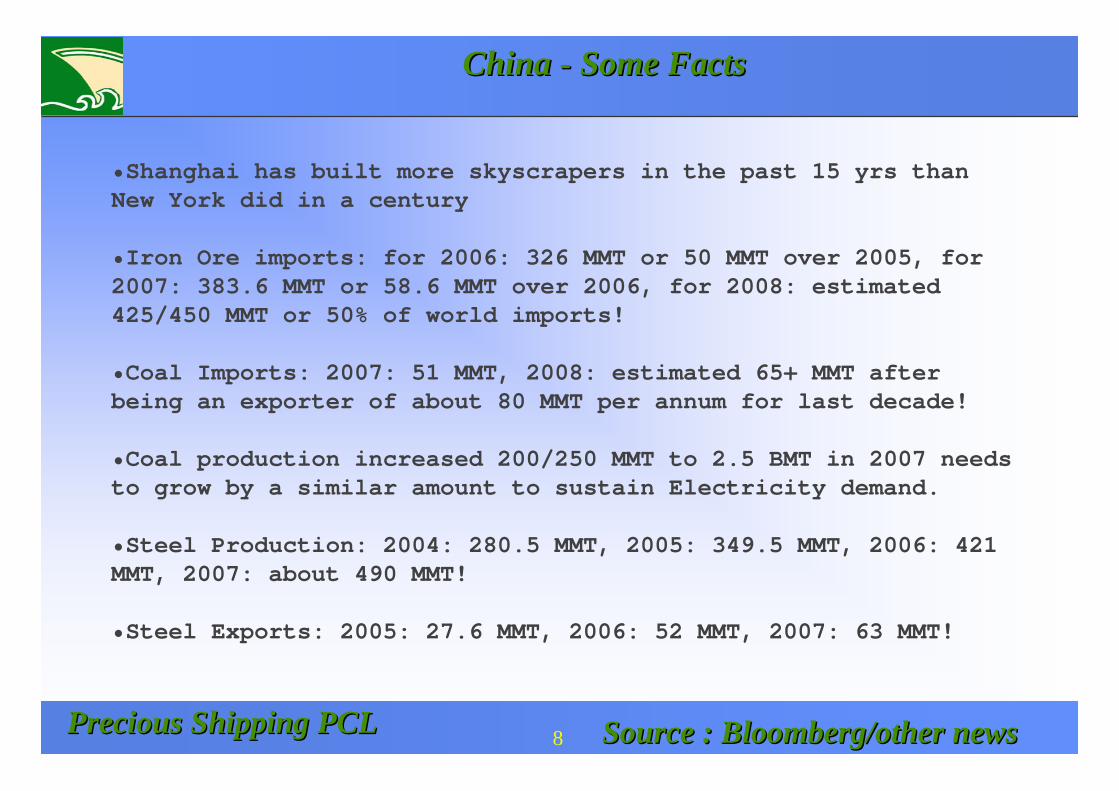
China China -- Some FactsSome Facts
8
•Shanghai has built more skyscrapers in the past 15 yrs than New York did in a century
•Iron Ore imports: for 2006: 326 MMT or 50 MMT over 2005, for 2007: 383.6 MMT or 58.6 MMT over 2006, for 2008: estimated 425/450 MMT or 50% of world imports!
•Coal Imports: 2007: 51 MMT, 2008: estimated 65+ MMT after being an exporter of about 80 MMT per annum for last decade!
•Coal production increased 200/250 MMT to 2.5 BMT in 2007 needs to grow by a similar amount to sustain Electricity demand.
•Steel Production: 2004: 280.5 MMT, 2005: 349.5 MMT, 2006: 421 MMT, 2007: about 490 MMT!
•Steel Exports: 2005: 27.6 MMT, 2006: 52 MMT, 2007: 63 MMT!
Precious Shipping PCLPrecious Shipping PCL Source : FT Source : FT
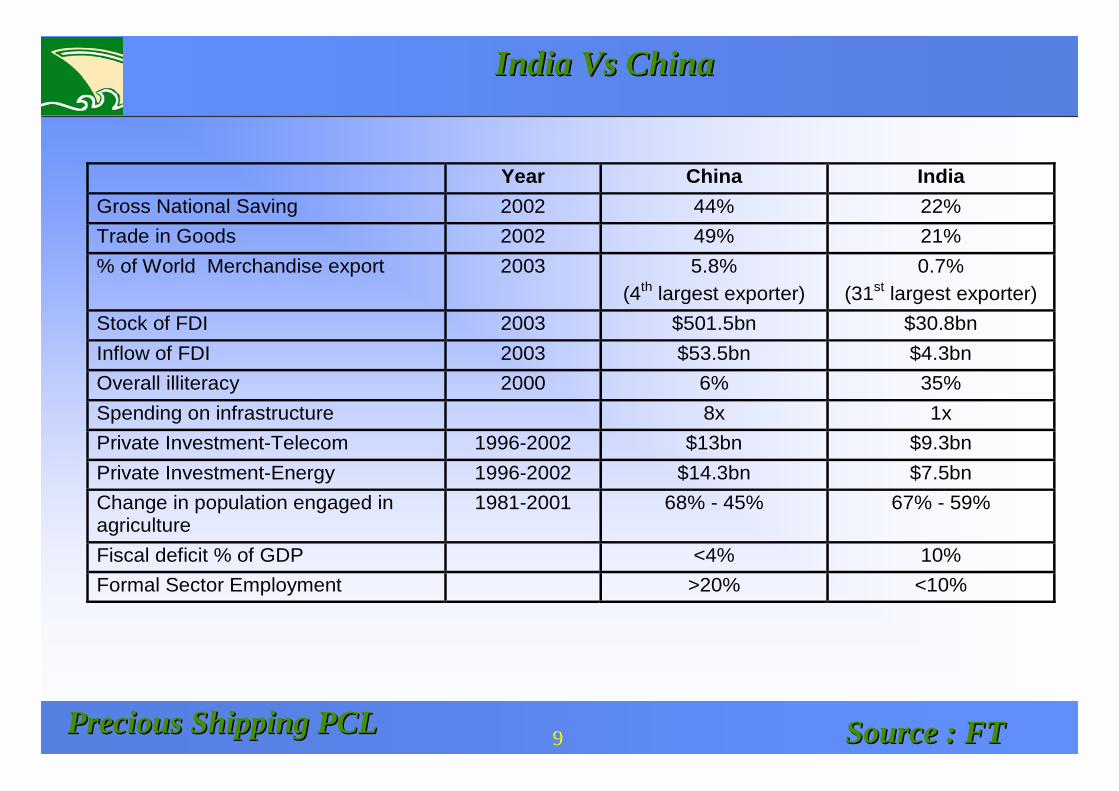
India Vs ChinaIndia Vs China
Year China India Gross National Saving 2002 44% 22% Trade in Goods 2002 49% 21% % of World Merchandise export 2003 5.8%
(4th largest exporter) 0.7%
(31st largest exporter) Stock of FDI 2003 $501.5bn $30.8bn Inflow of FDI 2003 $53.5bn $4.3bn Overall illiteracy 2000 6% 35% Spending on infrastructure 8x 1x Private Investment-Telecom 1996-2002 $13bn $9.3bn Private Investment-Energy 1996-2002 $14.3bn $7.5bn Change in population engaged in agriculture
1981-2001 68% - 45% 67% - 59%
Fiscal deficit % of GDP <4% 10% Formal Sector Employment >20% <10%
9
Precious Shipping PCLPrecious Shipping PCL 10
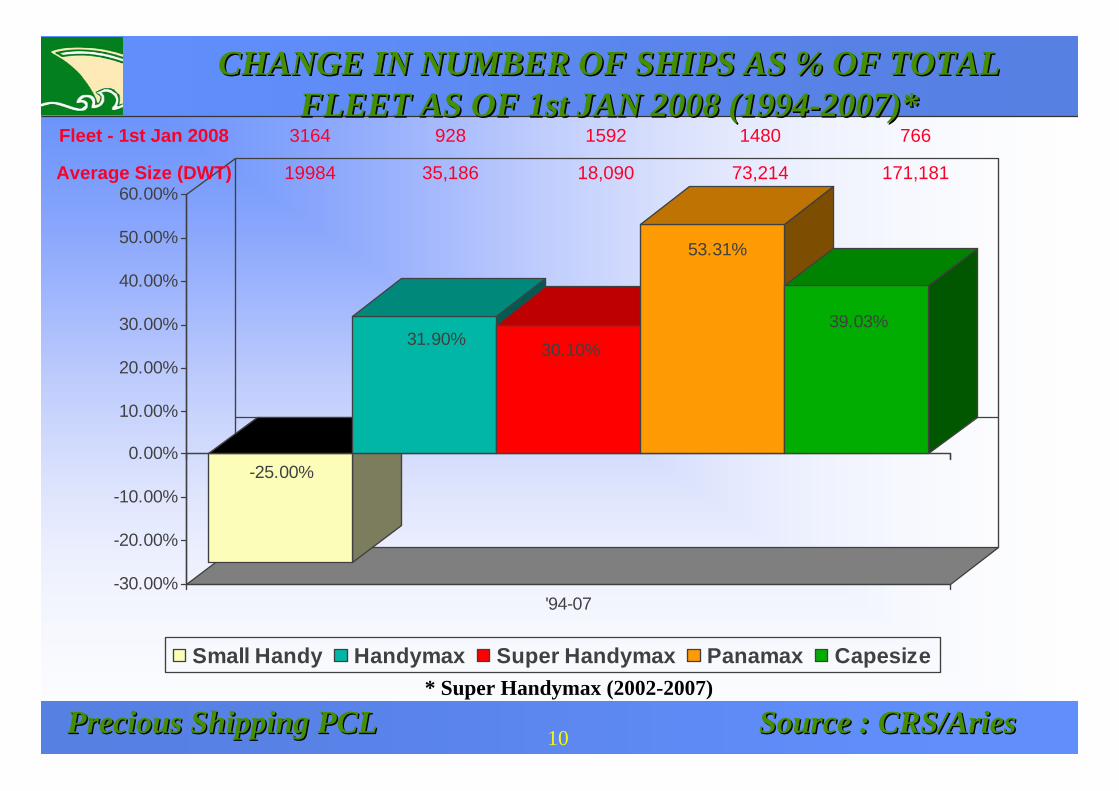
CHANGE IN NUMBER OF SHIPS AS % OF TOTAL CHANGE IN NUMBER OF SHIPS AS % OF TOTAL FLEET AS OF 1st JAN 2008 (1994FLEET AS OF 1st JAN 2008 (1994--2007)*2007)*
-25.00%
31.90% 30.10%
53.31%
39.03%
-30.00%
-20.00%
-10.00%
0.00%
10.00%
20.00%
30.00%
40.00%
50.00%
60.00%
'94-07
Small Handy Handymax Super Handymax Panamax Capesize
Source : CRS/Aries Source : CRS/Aries * Super Handymax (2002-2007)
171,18173,21418,09035,18619984Average Size (DWT)
766148015929283164Fleet - 1st Jan 2008
Precious Shipping PCLPrecious Shipping PCL 11 Source : CRS/Aries Source : CRS/Aries
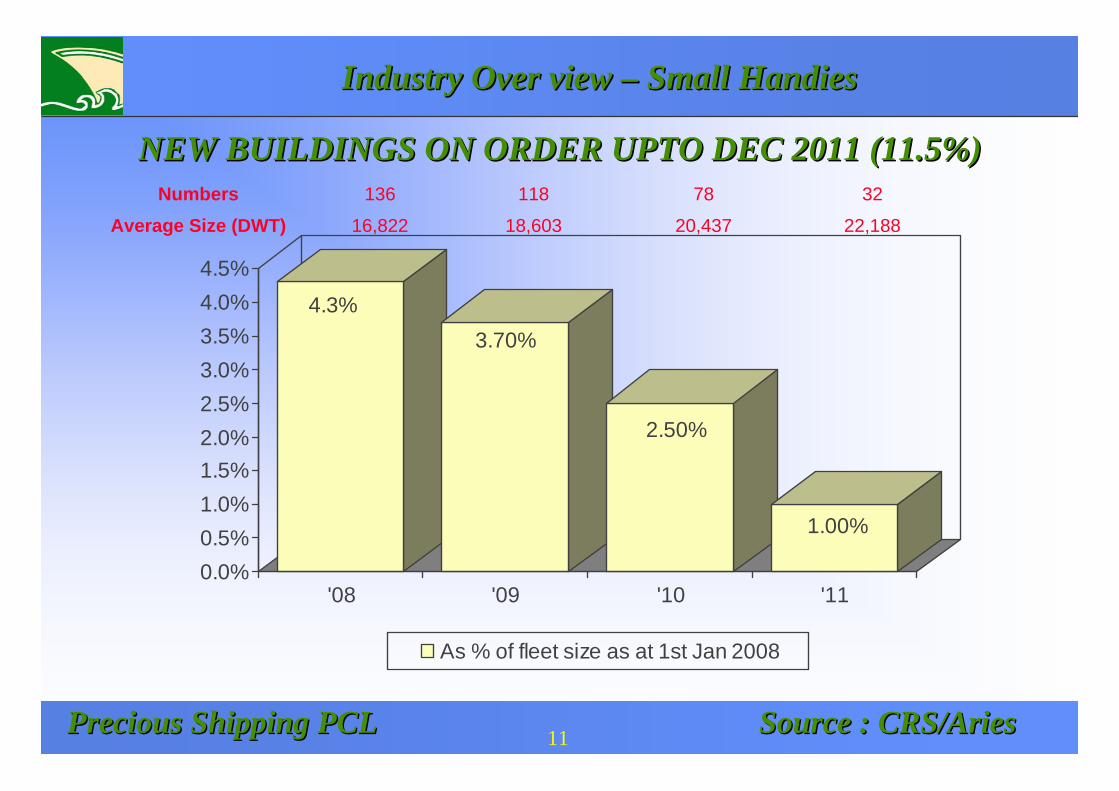
Industry Over view Industry Over view –– Small Small HandiesHandies
4.3%3.70%
2.50%
1.00%
0.0%0.5%1.0%1.5%2.0%2.5%3.0%3.5%4.0%4.5%
'08 '09 '10 '11
As % of fleet size as at 1st Jan 2008
NEW BUILDINGS ON ORDER UPTO DEC 2011 (11.5%)NEW BUILDINGS ON ORDER UPTO DEC 2011 (11.5%)
22,18820,43718,60316,822Average Size (DWT)3278118136Numbers
Precious Shipping PCLPrecious Shipping PCL 12 Source : CRS/Aries Source : CRS/Aries
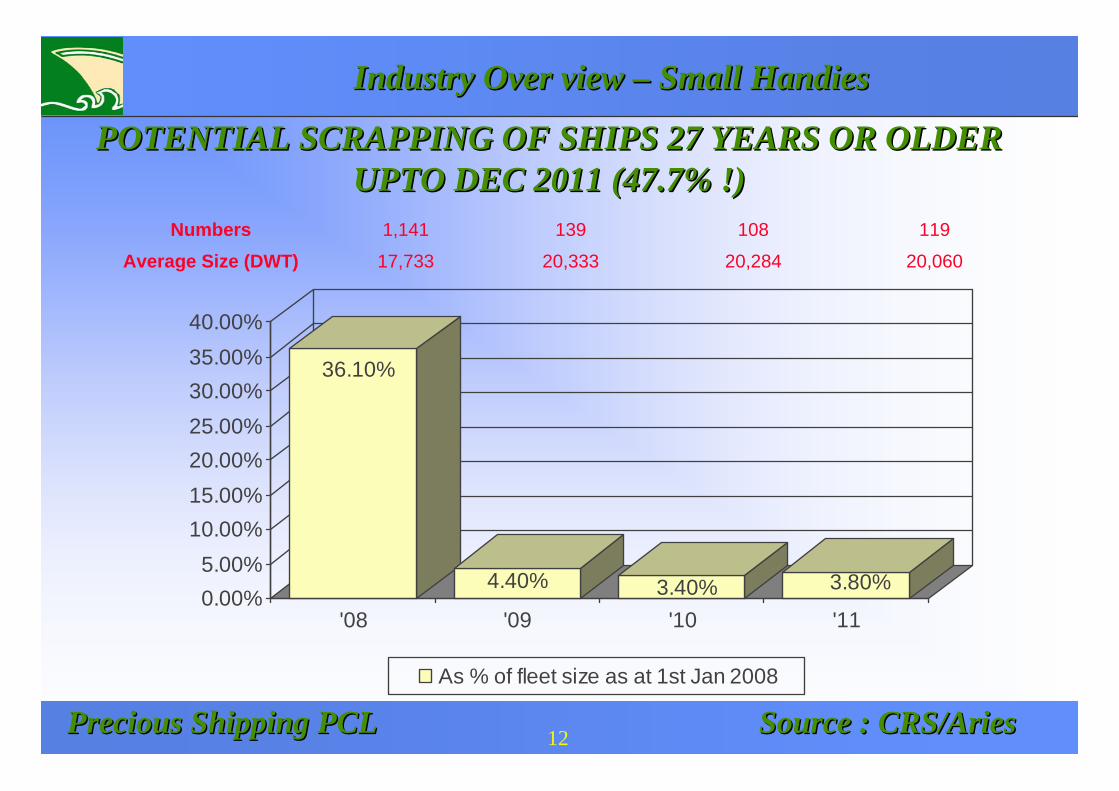
POTENTIAL SCRAPPING OF SHIPS 27 YEARS OR OLDER POTENTIAL SCRAPPING OF SHIPS 27 YEARS OR OLDER UPTO DEC 2011 (47.7% !)UPTO DEC 2011 (47.7% !)
Industry Over view Industry Over view –– Small Small HandiesHandies
36.10%
4.40% 3.40% 3.80%0.00%5.00%
10.00%15.00%20.00%25.00%30.00%35.00%40.00%
'08 '09 '10 '11
As % of fleet size as at 1st Jan 2008
20,06020,28420,33317,733Average Size (DWT)1191081391,141Numbers
Precious Shipping PCLPrecious Shipping PCL 13 Source : CRS/Aries Source : CRS/Aries
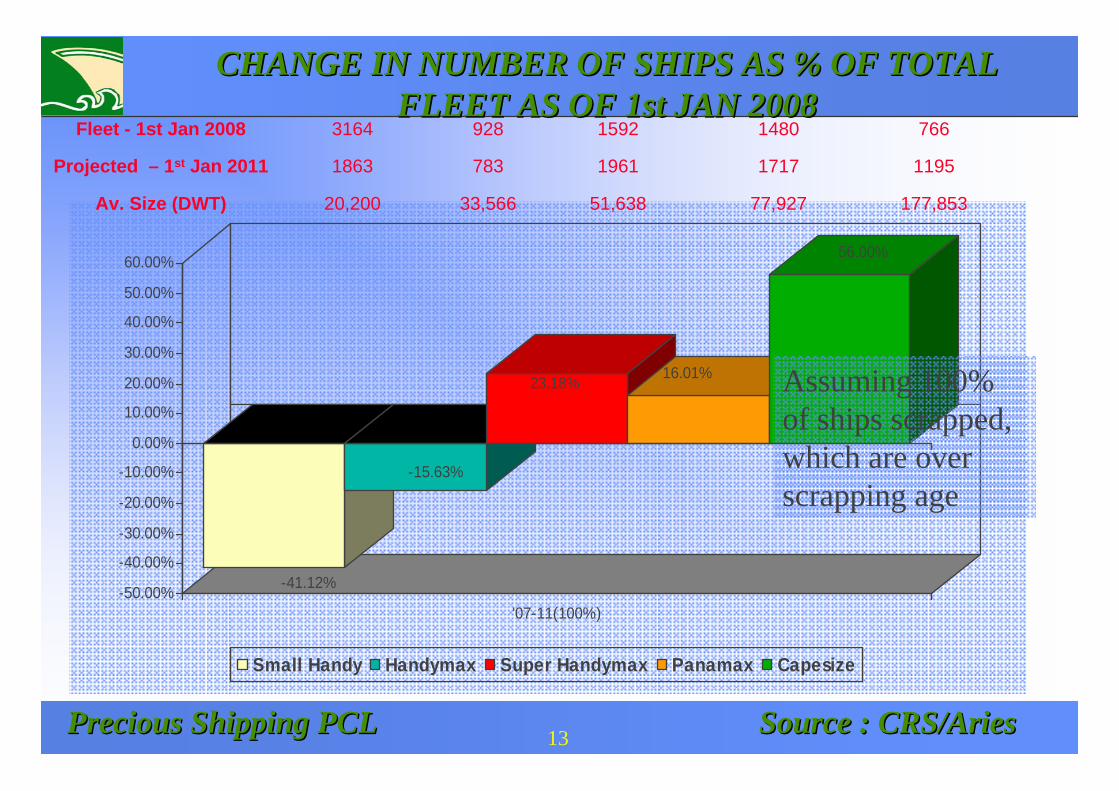
CHANGE IN NUMBER OF SHIPS AS % OF TOTAL CHANGE IN NUMBER OF SHIPS AS % OF TOTAL FLEET AS OF 1st JAN 2008FLEET AS OF 1st JAN 2008
-41.12%
-15.63%
23.18% 16.01%
56.00%
-50.00%
-40.00%
-30.00%
-20.00%
-10.00%
0.00%
10.00%
20.00%
30.00%
40.00%
50.00%
60.00%
'07-11(100%)
Small Handy Handymax Super Handymax Panamax Capesize
Assuming 100% of ships scrapped, which are over scrapping age
177,85377,92751,63833,56620,200Av. Size (DWT)
1195171719617831863Projected – 1st Jan 2011
766148015929283164Fleet - 1st Jan 2008
Precious Shipping PCLPrecious Shipping PCL 14 Source : CRS/Aries Source : CRS/Aries
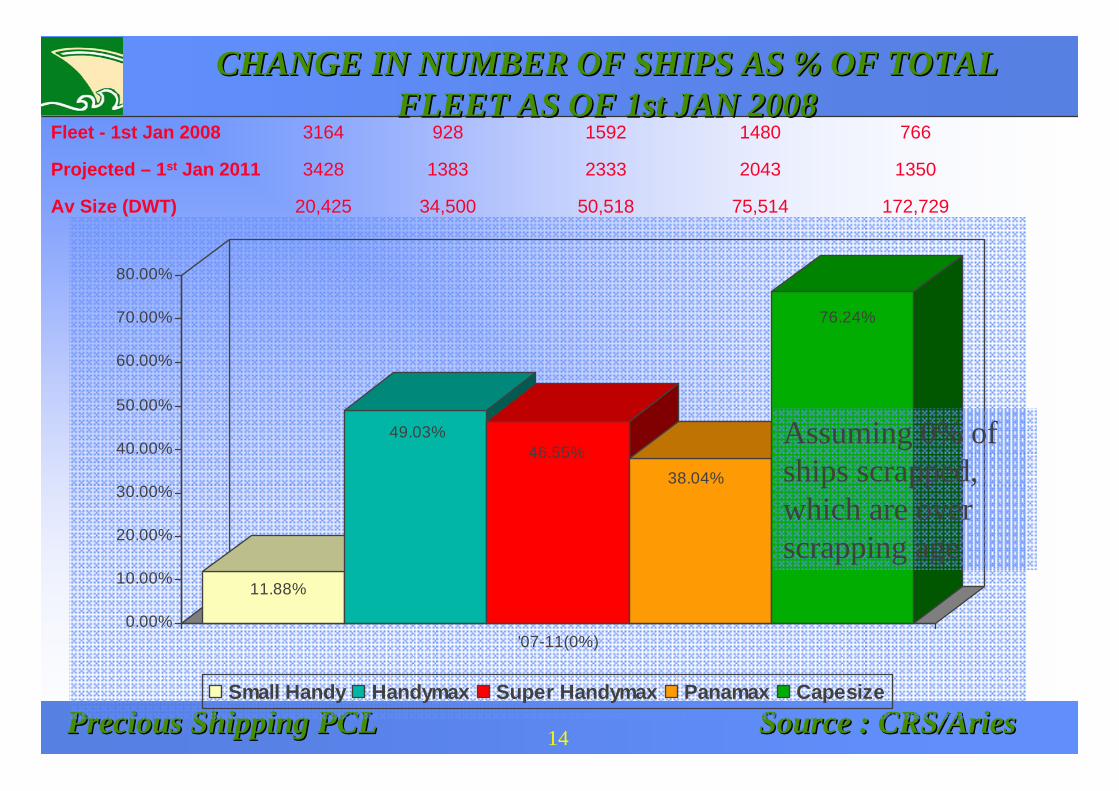
CHANGE IN NUMBER OF SHIPS AS % OF TOTAL CHANGE IN NUMBER OF SHIPS AS % OF TOTAL FLEET AS OF 1st JAN 2008FLEET AS OF 1st JAN 2008
11.88%
49.03%46.55%
38.04%
76.24%
0.00%
10.00%
20.00%
30.00%
40.00%
50.00%
60.00%
70.00%
80.00%
'07-11(0%)
Small Handy Handymax Super Handymax Panamax Capesize
Assuming 0% of ships scrapped, which are over scrapping age
172,72975,51450,51834,50020,425Av Size (DWT)
13502043233313833428Projected – 1st Jan 2011
766148015929283164Fleet - 1st Jan 2008
Precious Shipping PCLPrecious Shipping PCL 15 Source : CRS/Aries Source : CRS/Aries
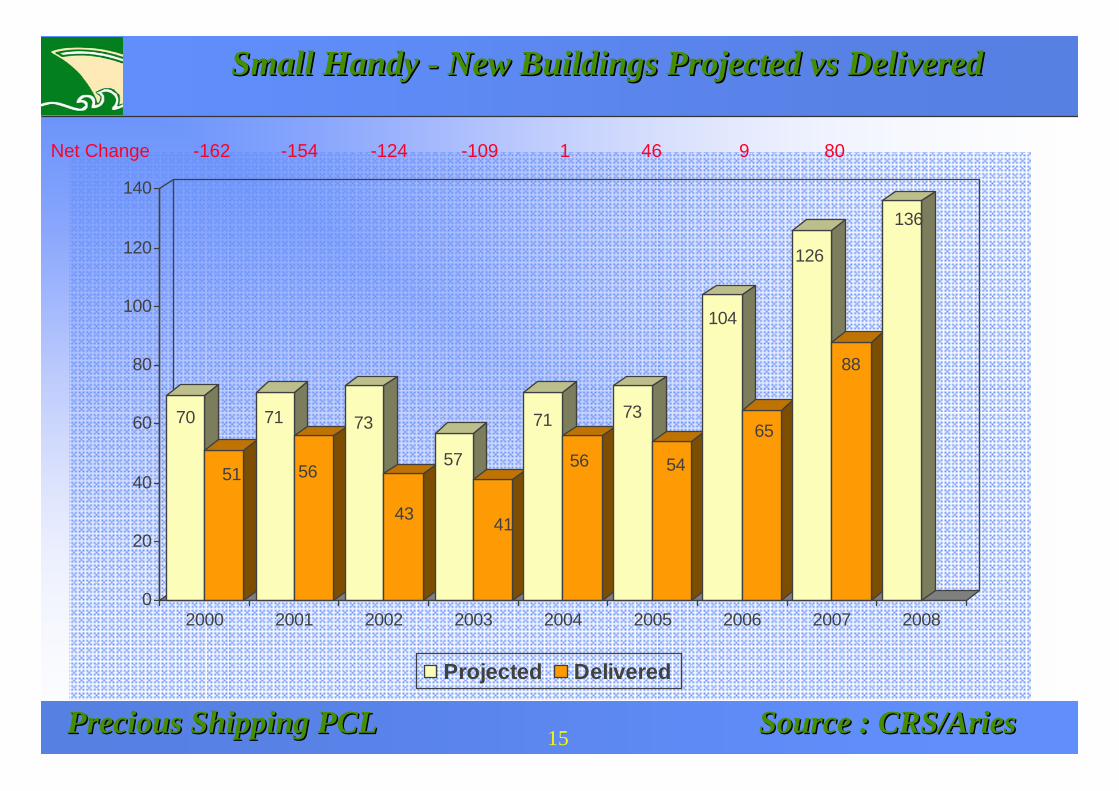
Small Handy Small Handy -- New Buildings Projected New Buildings Projected vsvs DeliveredDelivered
70
51
71
56
73
43
57
41
71
56
73
54
104
65
126
88
136
0
20
40
60
80
100
120
140
2000 2001 2002 2003 2004 2005 2006 2007 2008
Projected Delivered
809461-109-124-154-162Net Change
Precious Shipping PCLPrecious Shipping PCL 16
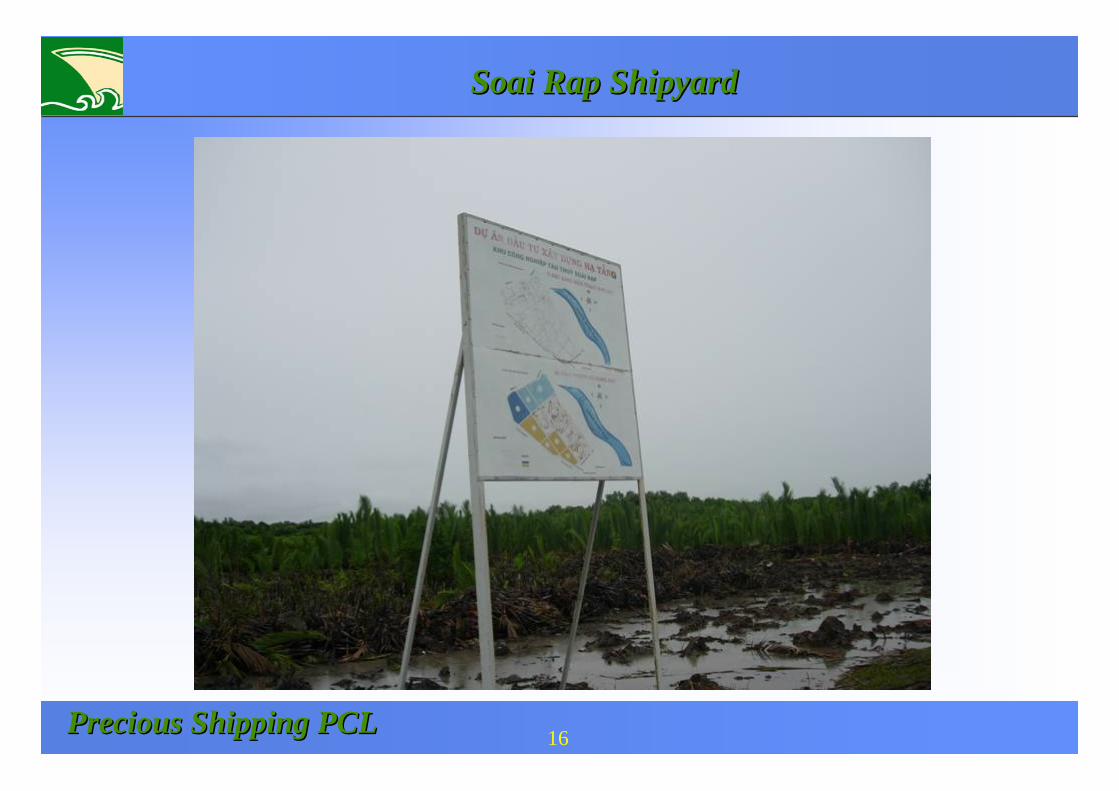
SoaiSoai Rap ShipyardRap Shipyard
Precious Shipping PCLPrecious Shipping PCL
Expert Opinions 2007 & 2008Expert Opinions 2007 & 2008
17
Precious Shipping PCLPrecious Shipping PCL Source : Howe Robinson ShipbrokersSource : Howe Robinson Shipbrokers
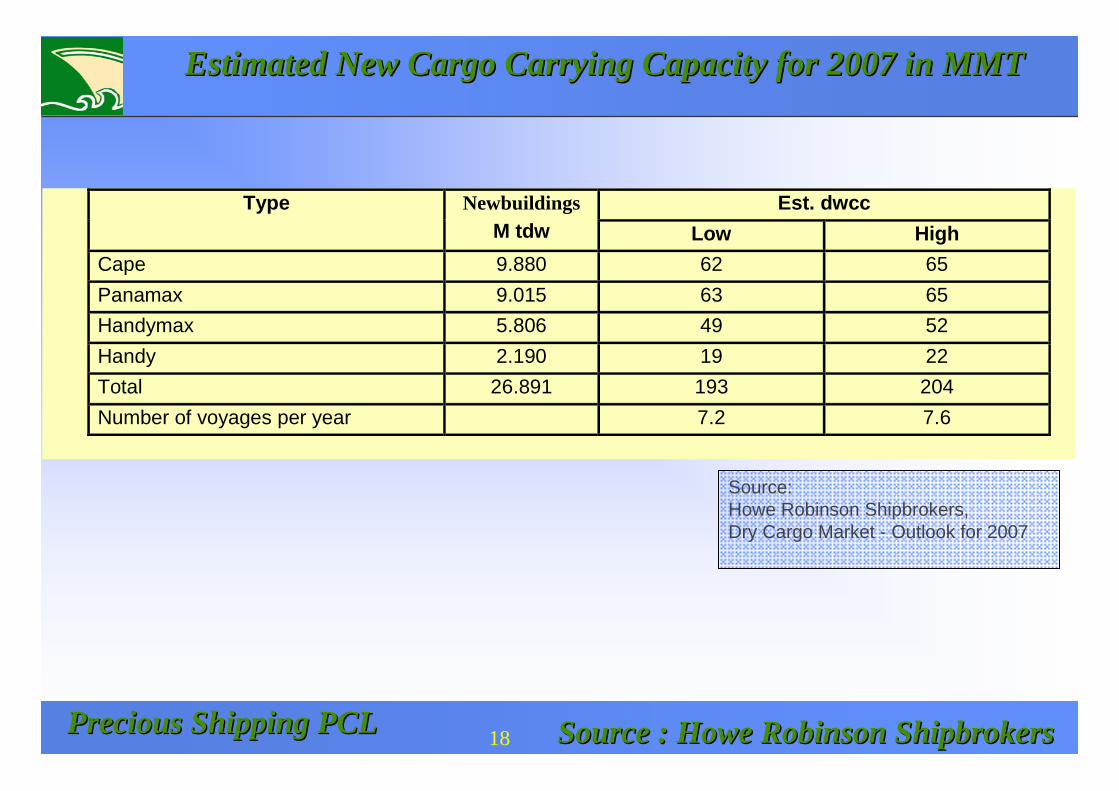
Estimated New Cargo Carrying Capacity for 2007 in MMTEstimated New Cargo Carrying Capacity for 2007 in MMT
Est. dwcc Type Newbuildings M tdw Low High
Cape 9.880 62 65 Panamax 9.015 63 65 Handymax 5.806 49 52 Handy 2.190 19 22 Total 26.891 193 204 Number of voyages per year 7.2 7.6
18
Source:Howe Robinson Shipbrokers, Dry Cargo Market - Outlook for 2007
Precious Shipping PCLPrecious Shipping PCL Source : Howe Robinson ShipbrokersSource : Howe Robinson Shipbrokers
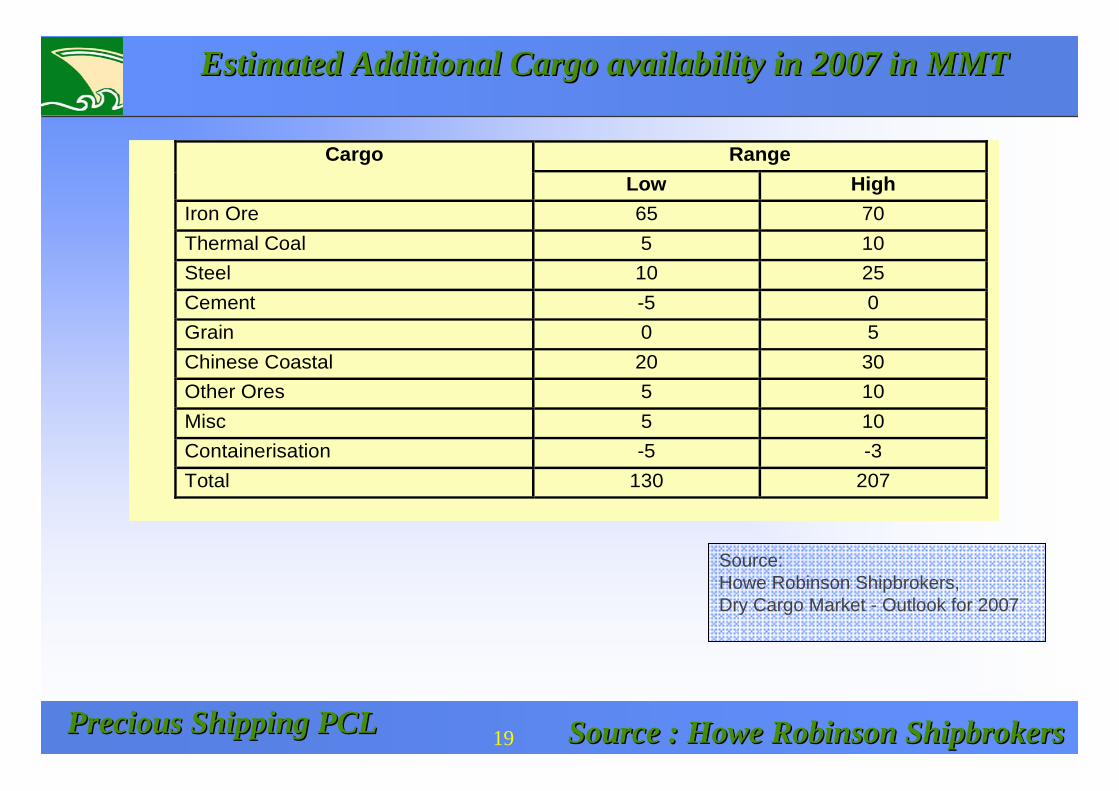
Estimated Additional Cargo availability in 2007 in MMTEstimated Additional Cargo availability in 2007 in MMT
Range Cargo Low High
Iron Ore 65 70 Thermal Coal 5 10 Steel 10 25 Cement -5 0 Grain 0 5 Chinese Coastal 20 30 Other Ores 5 10 Misc 5 10 Containerisation -5 -3 Total 130 207
19
Source:Howe Robinson Shipbrokers, Dry Cargo Market - Outlook for 2007
Precious Shipping PCLPrecious Shipping PCL Source : Howe Robinson ShipbrokersSource : Howe Robinson Shipbrokers
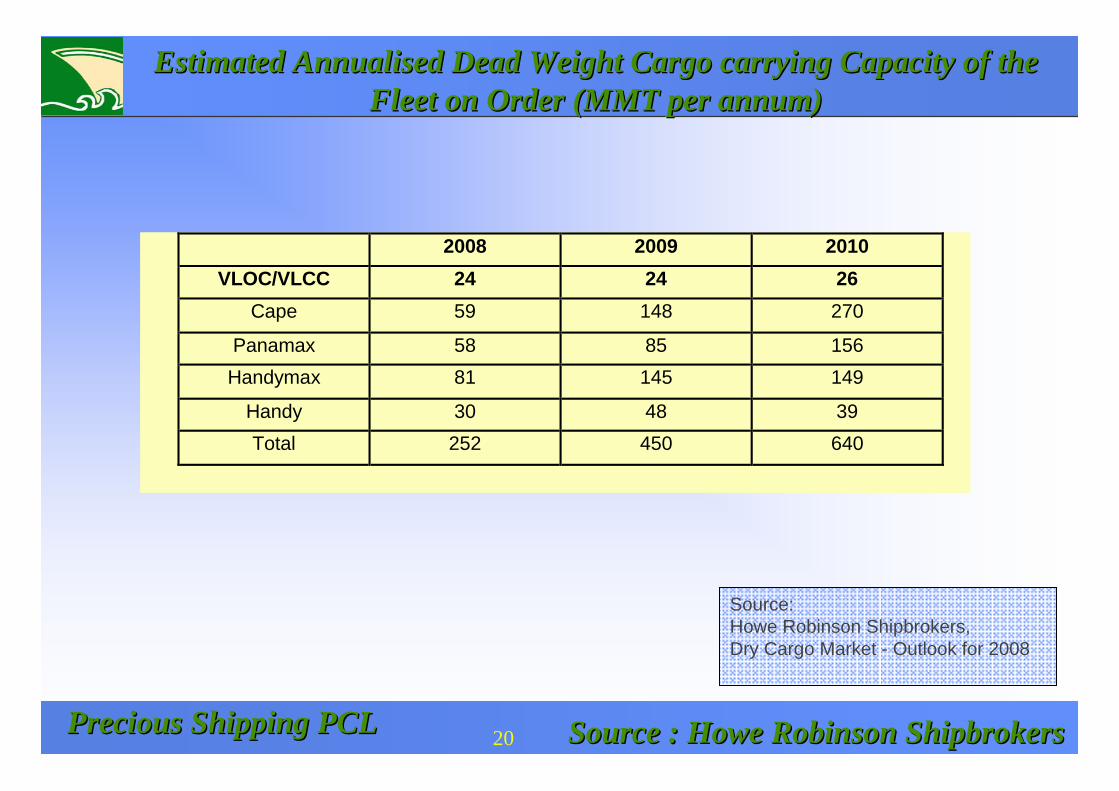
Estimated Estimated AnnualisedAnnualised Dead Weight Cargo carrying Capacity of the Dead Weight Cargo carrying Capacity of the Fleet on Order (MMT per annum)Fleet on Order (MMT per annum)
20
Source:Howe Robinson Shipbrokers, Dry Cargo Market - Outlook for 2008
2008 2009 2010 VLOC/VLCC 24 24 26
Cape 59 148 270
Panamax 58 85 156 Handymax 81 145 149
Handy 30 48 39 Total 252 450 640
Precious Shipping PCLPrecious Shipping PCL Source : Howe Robinson ShipbrokersSource : Howe Robinson Shipbrokers
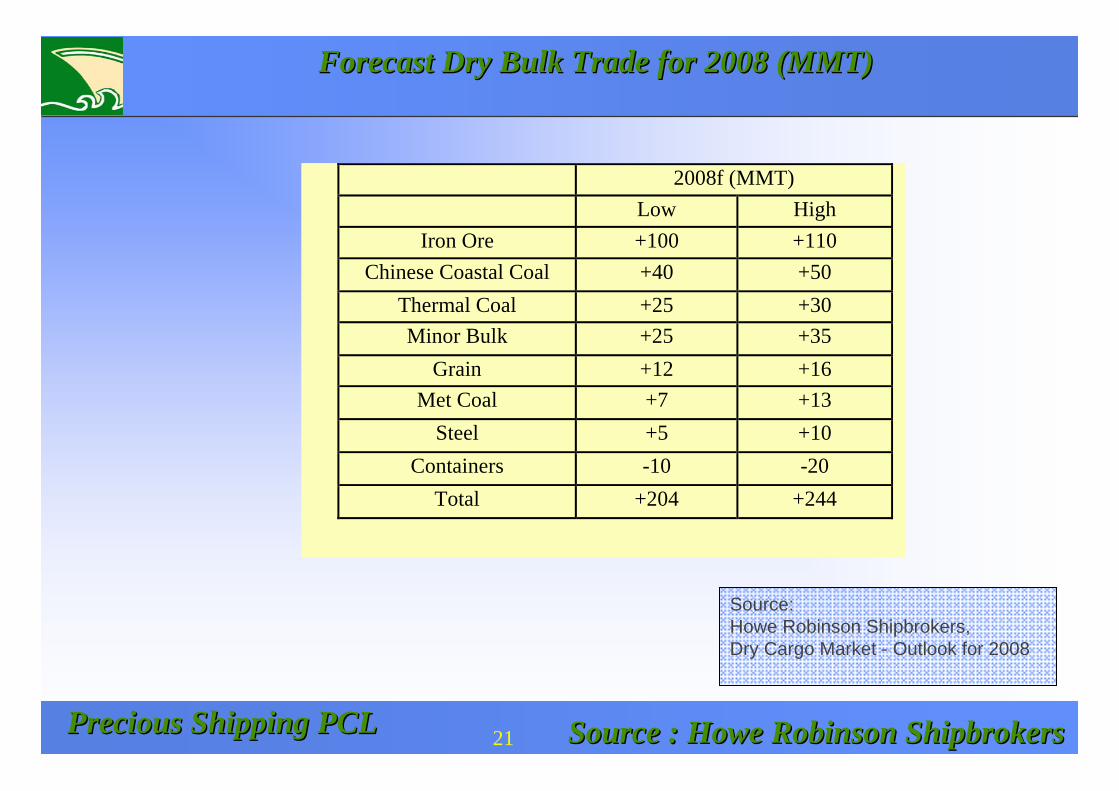
Forecast Dry Bulk Trade for 2008 (MMT)Forecast Dry Bulk Trade for 2008 (MMT)
21
Source:Howe Robinson Shipbrokers, Dry Cargo Market - Outlook for 2008
2008f (MMT) Low High
Iron Ore +100 +110 Chinese Coastal Coal +40 +50
Thermal Coal +25 +30 Minor Bulk +25 +35
Grain +12 +16 Met Coal +7 +13
Steel +5 +10 Containers -10 -20
Total +204 +244
Precious Shipping PCLPrecious Shipping PCL
PSL’sPSL’s StrategyStrategy
22
Precious Shipping PCLPrecious Shipping PCL
PSL’sPSL’s StrategyStrategy
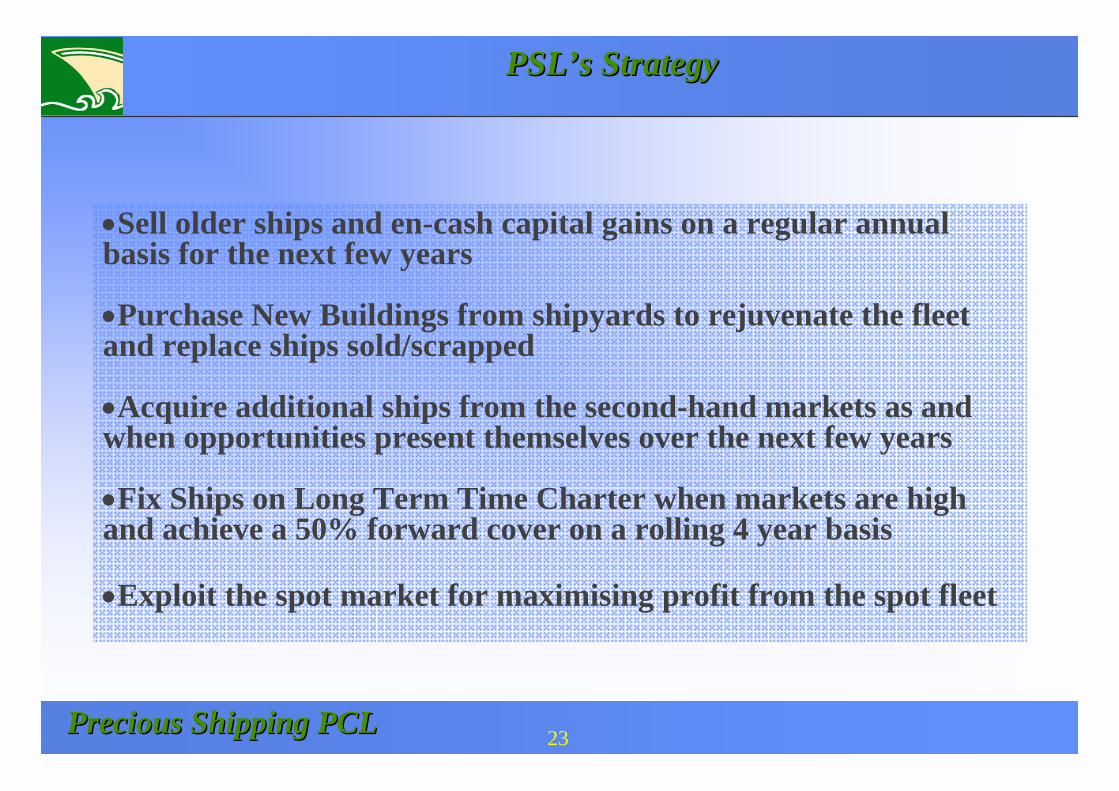
•Sell older ships and en-cash capital gains on a regular annual basis for the next few years
•Purchase New Buildings from shipyards to rejuvenate the fleet and replace ships sold/scrapped
•Acquire additional ships from the second-hand markets as and when opportunities present themselves over the next few years
•Fix Ships on Long Term Time Charter when markets are high and achieve a 50% forward cover on a rolling 4 year basis
•Exploit the spot market for maximising profit from the spot fleet
23
Precious Shipping PCLPrecious Shipping PCL
PSL New Building Strategy PSL New Building Strategy
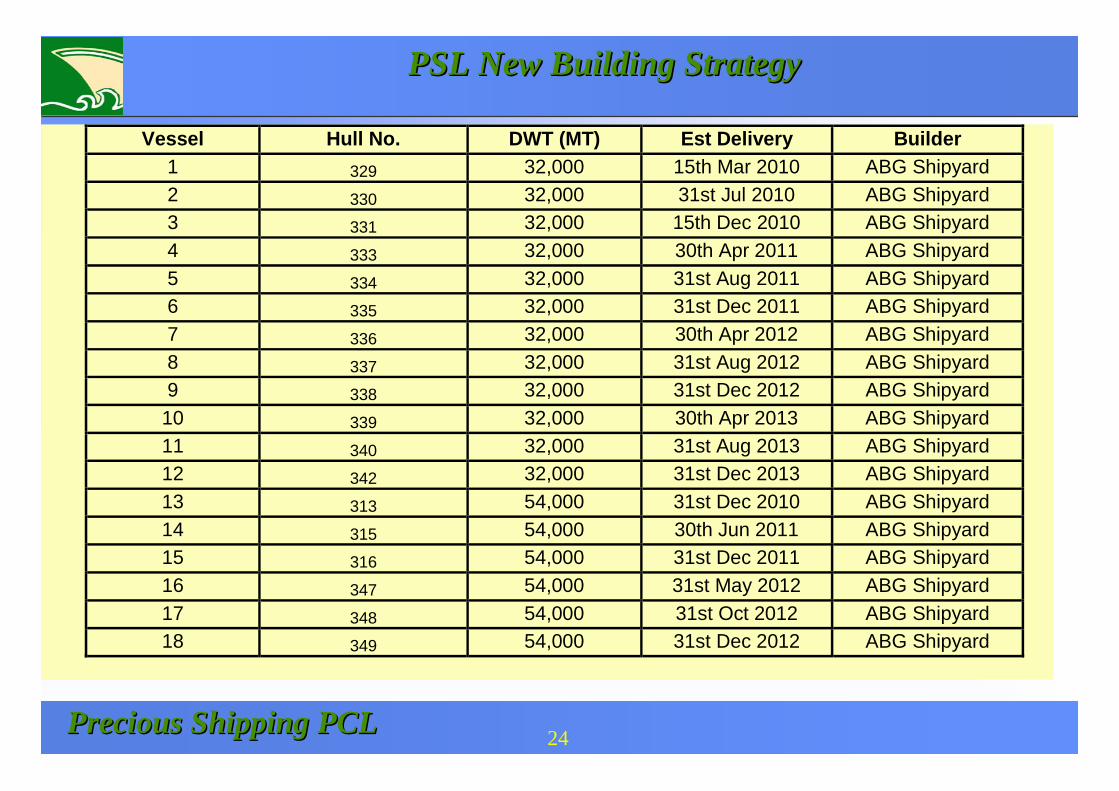
Vessel Hull No. DWT (MT) Est Delivery Builder1 329 32,000 15th Mar 2010 ABG Shipyard 2 330 32,000 31st Jul 2010 ABG Shipyard 3 331 32,000 15th Dec 2010 ABG Shipyard 4 333 32,000 30th Apr 2011 ABG Shipyard 5 334 32,000 31st Aug 2011 ABG Shipyard 6 335 32,000 31st Dec 2011 ABG Shipyard 7 336 32,000 30th Apr 2012 ABG Shipyard 8 337 32,000 31st Aug 2012 ABG Shipyard 9 338 32,000 31st Dec 2012 ABG Shipyard
10 339 32,000 30th Apr 2013 ABG Shipyard 11 340 32,000 31st Aug 2013 ABG Shipyard 12 342 32,000 31st Dec 2013 ABG Shipyard 13 313 54,000 31st Dec 2010 ABG Shipyard 14 315 54,000 30th Jun 2011 ABG Shipyard 15 316 54,000 31st Dec 2011 ABG Shipyard 16 347 54,000 31st May 2012 ABG Shipyard 17 348 54,000 31st Oct 2012 ABG Shipyard 18 349 54,000 31st Dec 2012 ABG Shipyard
24
Precious Shipping PCLPrecious Shipping PCL
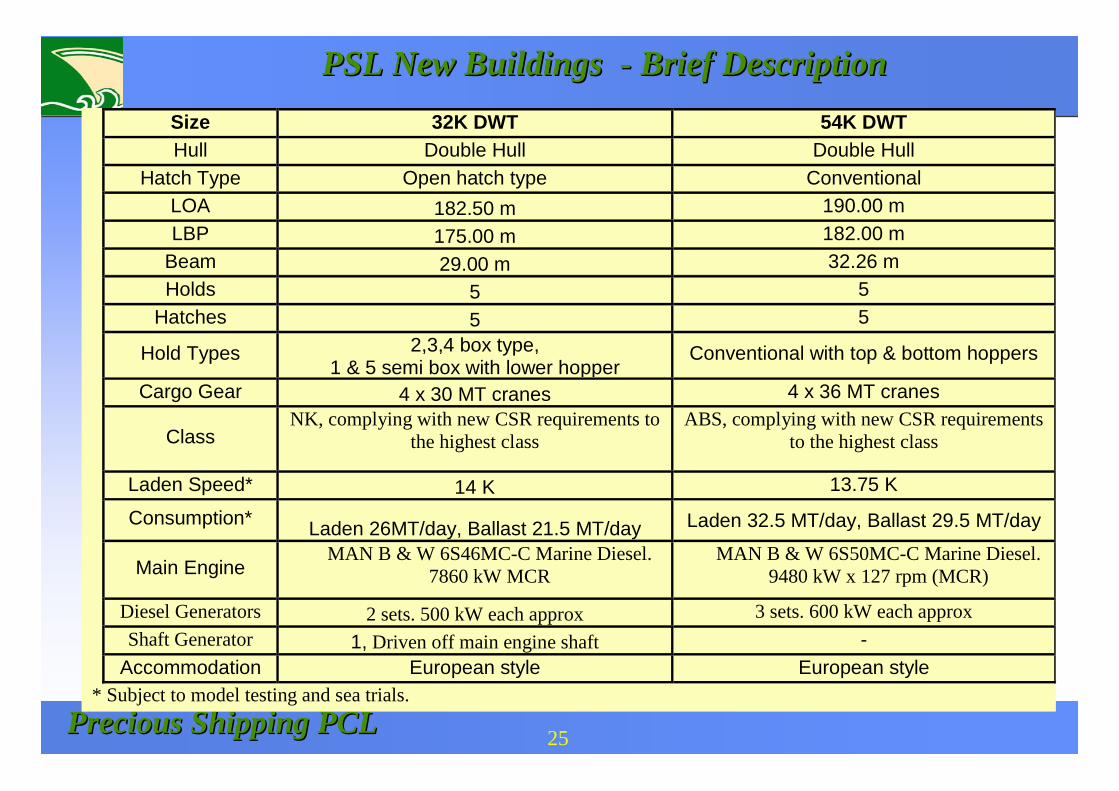
PSL New Buildings PSL New Buildings -- Brief DescriptionBrief DescriptionSize 32K DWT 54K DWTHull Double Hull Double Hull
Hatch Type Open hatch type Conventional LOA 182.50 m 190.00 m LBP 175.00 m 182.00 m
Beam 29.00 m 32.26 m Holds 5 5
Hatches 5 5
Hold Types 2,3,4 box type, 1 & 5 semi box with lower hopper
Conventional with top & bottom hoppers
Cargo Gear 4 x 30 MT cranes 4 x 36 MT cranes
Class NK, complying with new CSR requirements to
the highest class ABS, complying with new CSR requirements
to the highest class
Laden Speed* 14 K 13.75 K
Consumption* Laden 26MT/day, Ballast 21.5 MT/day Laden 32.5 MT/day, Ballast 29.5 MT/day
Main Engine MAN B & W 6S46MC-C Marine Diesel.
7860 kW MCR MAN B & W 6S50MC-C Marine Diesel.
9480 kW x 127 rpm (MCR)
Diesel Generators 2 sets. 500 kW each approx 3 sets. 600 kW each approx Shaft Generator 1, Driven off main engine shaft -
Accommodation European style European style * Subject to model testing and sea trials.
25
Precious Shipping PCLPrecious Shipping PCL
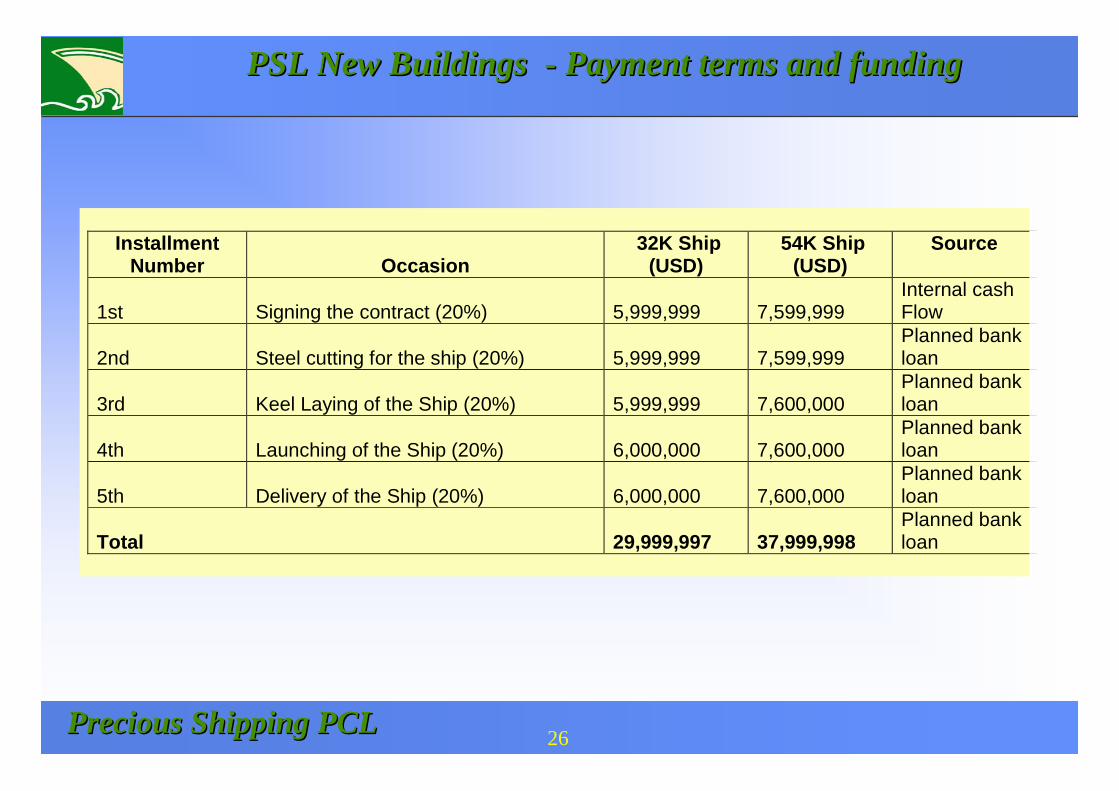
PSL New Buildings PSL New Buildings -- Payment terms and fundingPayment terms and funding
Installment
Number Occasion 32K Ship
(USD) 54K Ship
(USD) Source
1st Signing the contract (20%) 5,999,999
7,599,999
Internal cash Flow
2nd Steel cutting for the ship (20%) 5,999,999
7,599,999
Planned bank loan
3rd Keel Laying of the Ship (20%) 5,999,999
7,600,000
Planned bank loan
4th Launching of the Ship (20%) 6,000,000
7,600,000
Planned bank loan
5th Delivery of the Ship (20%) 6,000,000
7,600,000
Planned bank loan
Total 29,999,997
37,999,998
Planned bank loan
26
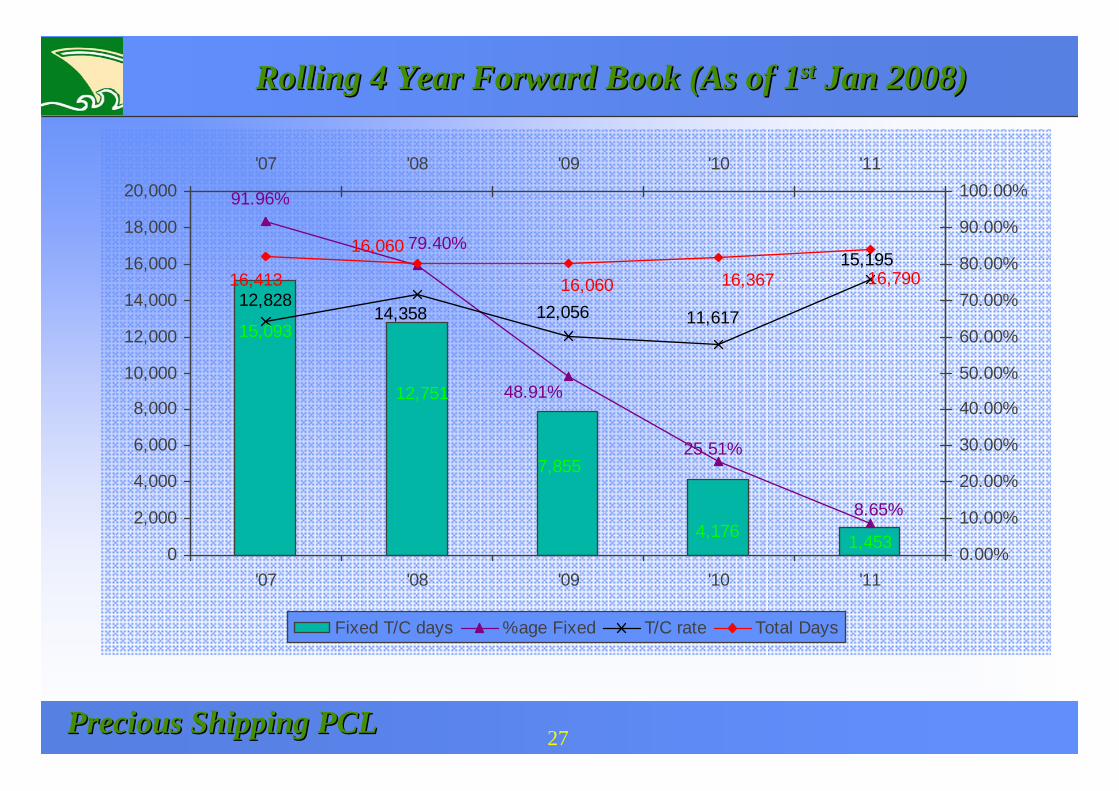
Precious Shipping PCLPrecious Shipping PCL
Rolling 4 Year Forward Book (As of 1Rolling 4 Year Forward Book (As of 1stst Jan 2008)Jan 2008)
4,176
15,093
1,453
7,855
12,751
8.65%
25.51%
79.40%
91.96%
48.91%
11,61712,828
15,195
14,358 12,056
16,79016,36716,060
16,060
16,413
0
2,000
4,000
6,000
8,000
10,000
12,000
14,000
16,000
18,000
20,000
'07 '08 '09 '10 '110.00%
10.00%
20.00%
30.00%
40.00%
50.00%
60.00%
70.00%
80.00%
90.00%
100.00%'07 '08 '09 '10 '11
Fixed T/C days %age Fixed T/C rate Total Days
27
Precious Shipping PCLPrecious Shipping PCL
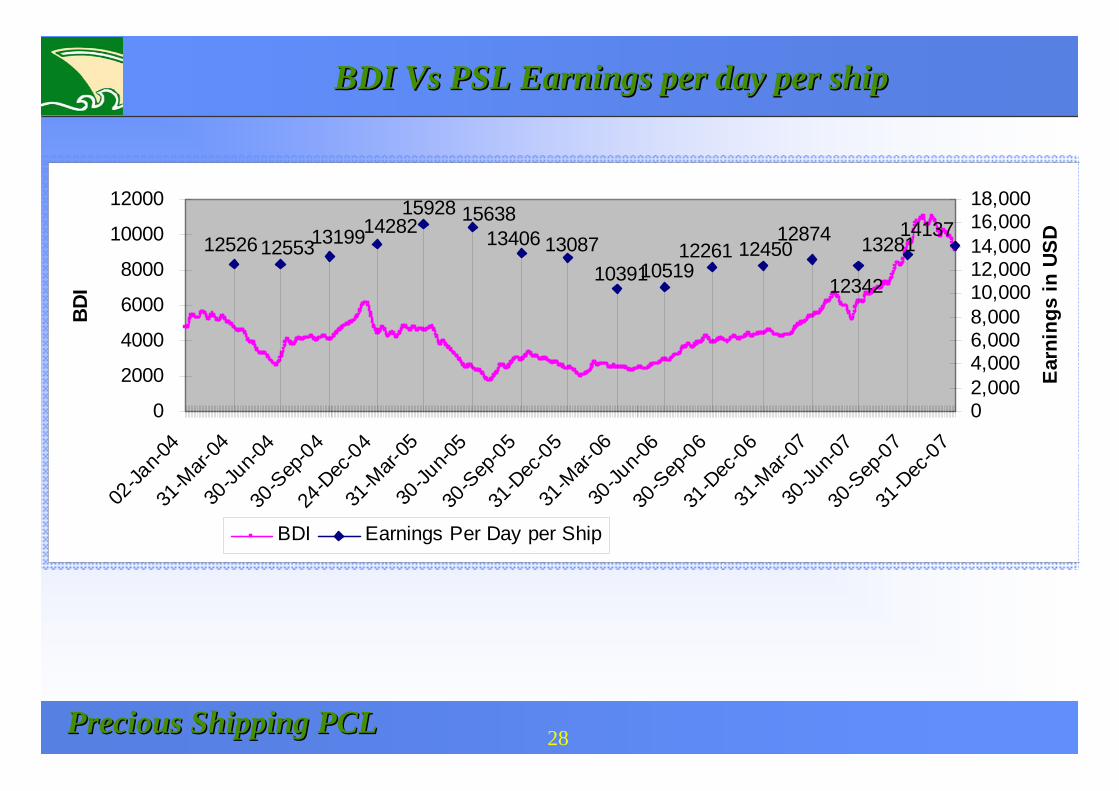
BDI Vs PSL Earnings per day per shipBDI Vs PSL Earnings per day per ship
1413713281
12342
128741245013087
1592814282131991255312526
1563813406
103911051912261
0
2000
4000
6000
8000
10000
12000
02-Ja
n-04
31-M
ar-04
30-Ju
n-04
30-S
ep-04
24-D
ec-04
31-M
ar-05
30-Ju
n-05
30-S
ep-05
31-D
ec-05
31-M
ar-06
30-Ju
n-06
30-S
ep-06
31-D
ec-06
31-M
ar-07
30-Ju
n-07
30-S
ep-07
31-D
ec-07
Date
BDI
02,0004,0006,0008,00010,00012,00014,00016,00018,000
Earn
ings
in U
SD
BDI Earnings Per Day per Ship
28
Precious Shipping PCLPrecious Shipping PCL
Earnings per day per ship Earnings per day per ship vsvs ExpensesExpenses
29
Precious Shipping PCLPrecious Shipping PCL
Operating Expenses Operating Expenses
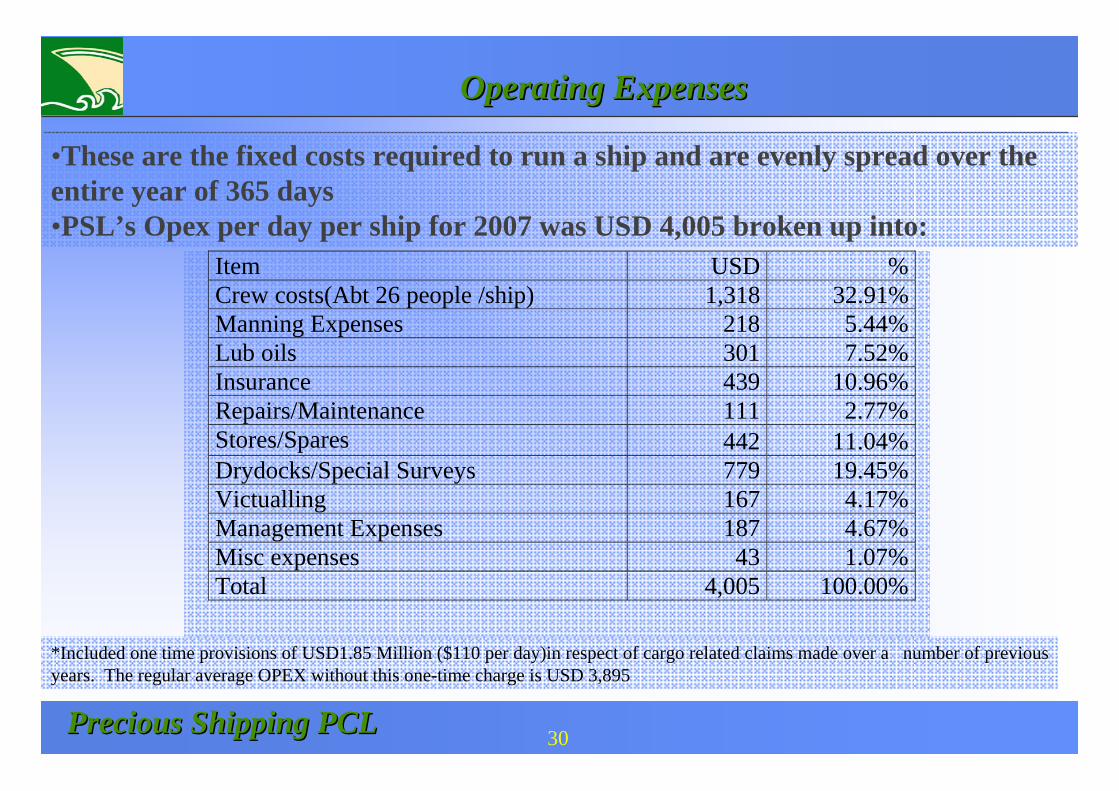
•These are the fixed costs required to run a ship and are evenly spread over the entire year of 365 days•PSL’s Opex per day per ship for 2007 was USD 4,005 broken up into:
Item USD %Crew costs(Abt 26 people /ship) 1,318 32.91%Manning Expenses 218 5.44%Lub oils 301 7.52%Insurance 439 10.96%Repairs/Maintenance 111 2.77%Stores/Spares 442 11.04%Drydocks/Special Surveys 779 19.45%Victualling 167 4.17%Management Expenses 187 4.67%Misc expenses 43 1.07%Total 4,005 100.00%
30
*Included one time provisions of USD1.85 Million ($110 per day)in respect of cargo related claims made over a number of previous years. The regular average OPEX without this one-time charge is USD 3,895
Precious Shipping PCLPrecious Shipping PCL
Operating Expenses Comparison Operating Expenses Comparison
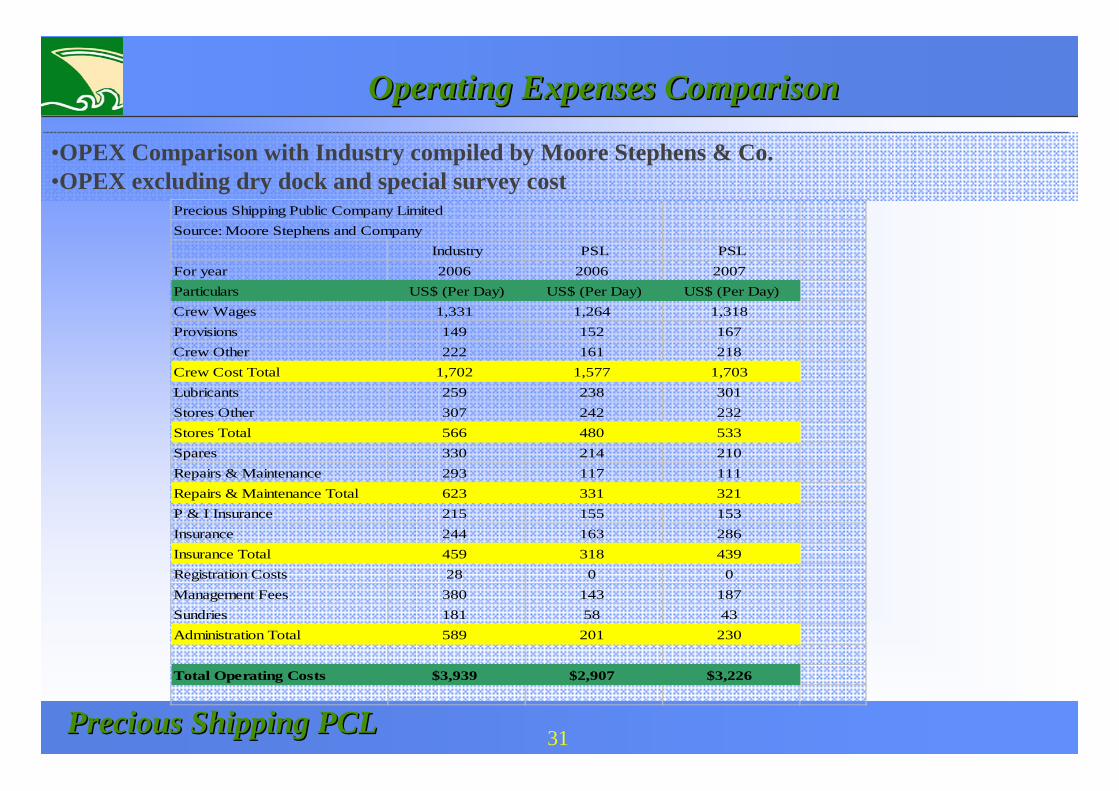
•OPEX Comparison with Industry compiled by Moore Stephens & Co.•OPEX excluding dry dock and special survey cost
Precious Shipping Public Company LimitedSource: Moore Stephens and Company
Industry PSL PSLFor year 2006 2006 2007Particulars US$ (Per Day) US$ (Per Day) US$ (Per Day)Crew Wages 1,331 1,264 1,318Provisions 149 152 167Crew Other 222 161 218Crew Cost Total 1,702 1,577 1,703Lubricants 259 238 301Stores Other 307 242 232Stores Total 566 480 533Spares 330 214 210Repairs & Maintenance 293 117 111Repairs & Maintenance Total 623 331 321P & I Insurance 215 155 153Insurance 244 163 286Insurance Total 459 318 439Registration Costs 28 0 0Management Fees 380 143 187Sundries 181 58 43Administration Total 589 201 230
Total Operating Costs $3,939 $2,907 $3,226
31
Precious Shipping PCLPrecious Shipping PCL
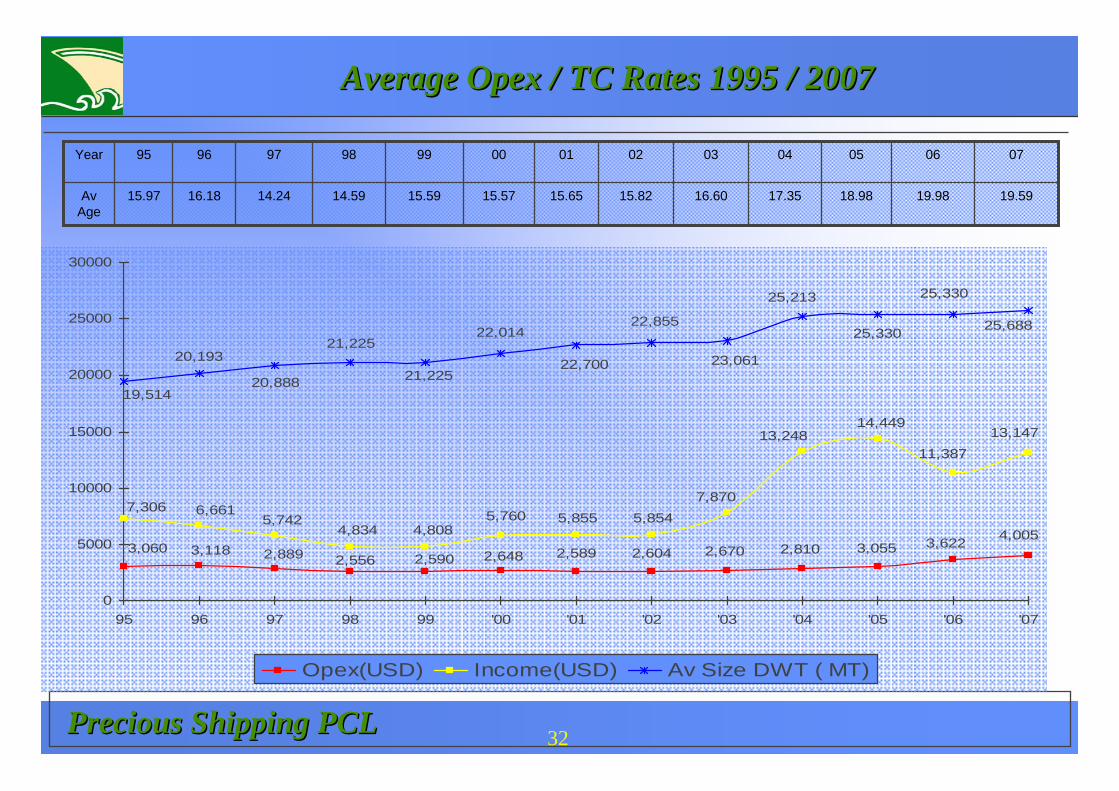
Average Average OpexOpex / TC Rates 1995 / 2007/ TC Rates 1995 / 2007
4,0053,6223,0552,8102,6702,6042,5892,6482,5902,5562,8893,1183,060
13,14711,387
14,44913,248
7,8705,8545,8555,760
4,8084,8345,742
6,6617,306
25,688
19,514
20,193
20,888
21,225
21,225
22,014
22,700
22,855
23,061
25,213
25,330
25,330
0
5000
10000
15000
20000
25000
30000
95 96 97 98 99 '00 '01 '02 '03 '04 '05 '06 '07
Opex(USD) Income(USD) Av Size DWT ( MT)
32
19.98
06
Av Age
Year
19.59
07
18.9817.3516.6015.8215.6515.5715.5914.5914.2416.1815.97
0504030201009998979695
Precious Shipping PCLPrecious Shipping PCL
FinancialsFinancials
33
Precious Shipping PCLPrecious Shipping PCL
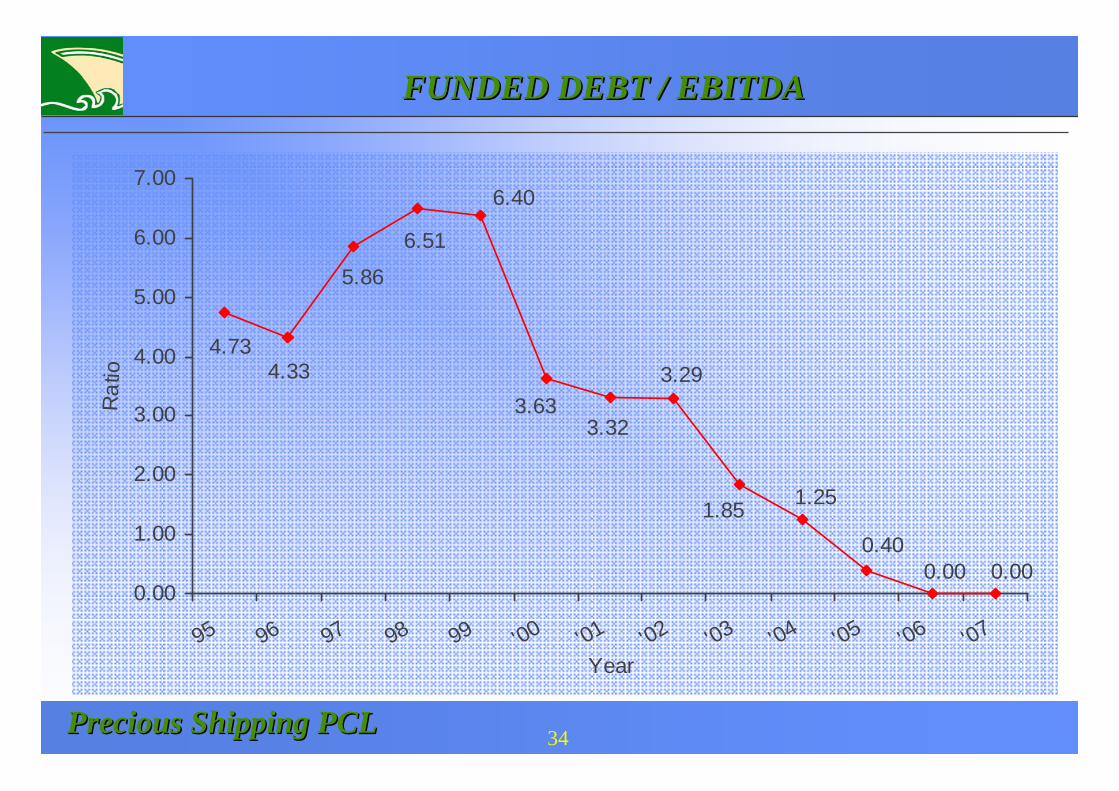
FUNDED DEBT / EBITDAFUNDED DEBT / EBITDA
0.000.000.40
1.25
6.40
6.51
5.86
4.334.73
3.633.32
3.29
1.85
0.00
1.00
2.00
3.00
4.00
5.00
6.00
7.00
95 96 97 98 99 '00 '01 '02 '03 '04 '05 '06 '07Year
Rat
io
34
Precious Shipping PCLPrecious Shipping PCL
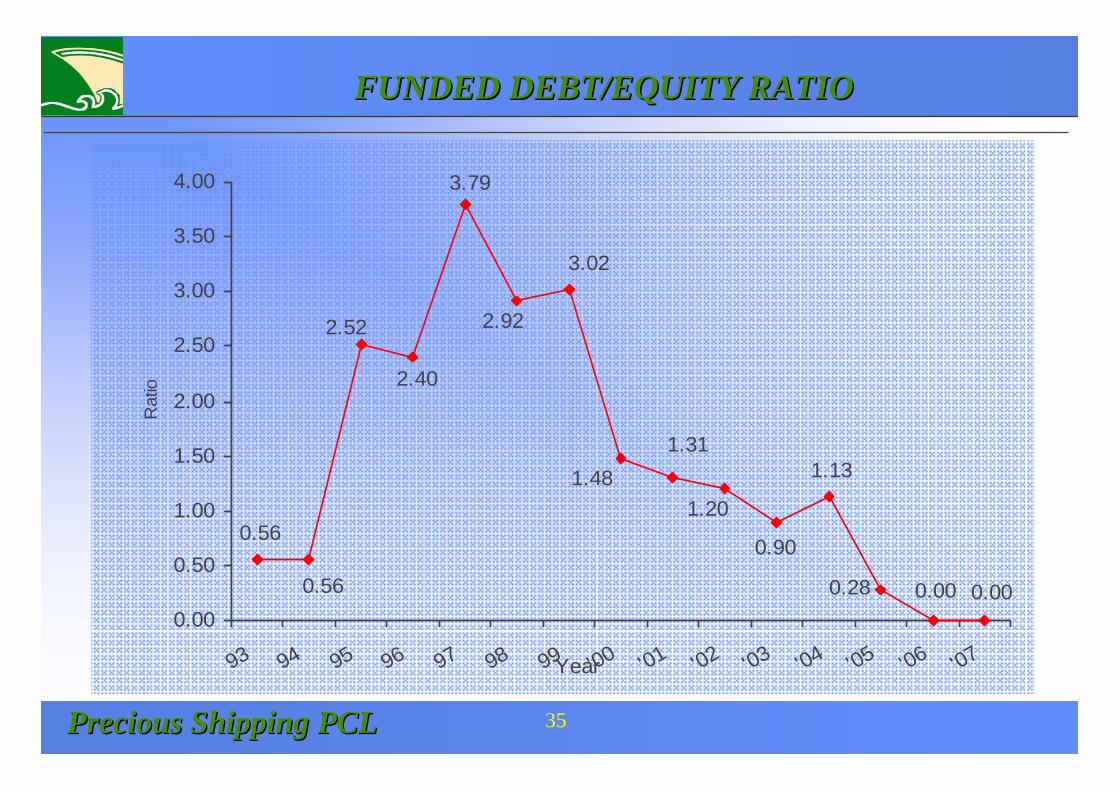
FUNDED DEBT/EQUITY RATIOFUNDED DEBT/EQUITY RATIO
0.000.000.28
1.13
0.90
1.20
3.79
2.40
2.52
0.56
0.56
2.92
3.02
1.481.31
0.00
0.50
1.00
1.50
2.00
2.50
3.00
3.50
4.00
93 94 95 96 97 98 99 '00 '01 '02 '03 '04 '05 '06 '07Year
Rat
io
35
Precious Shipping PCLPrecious Shipping PCL
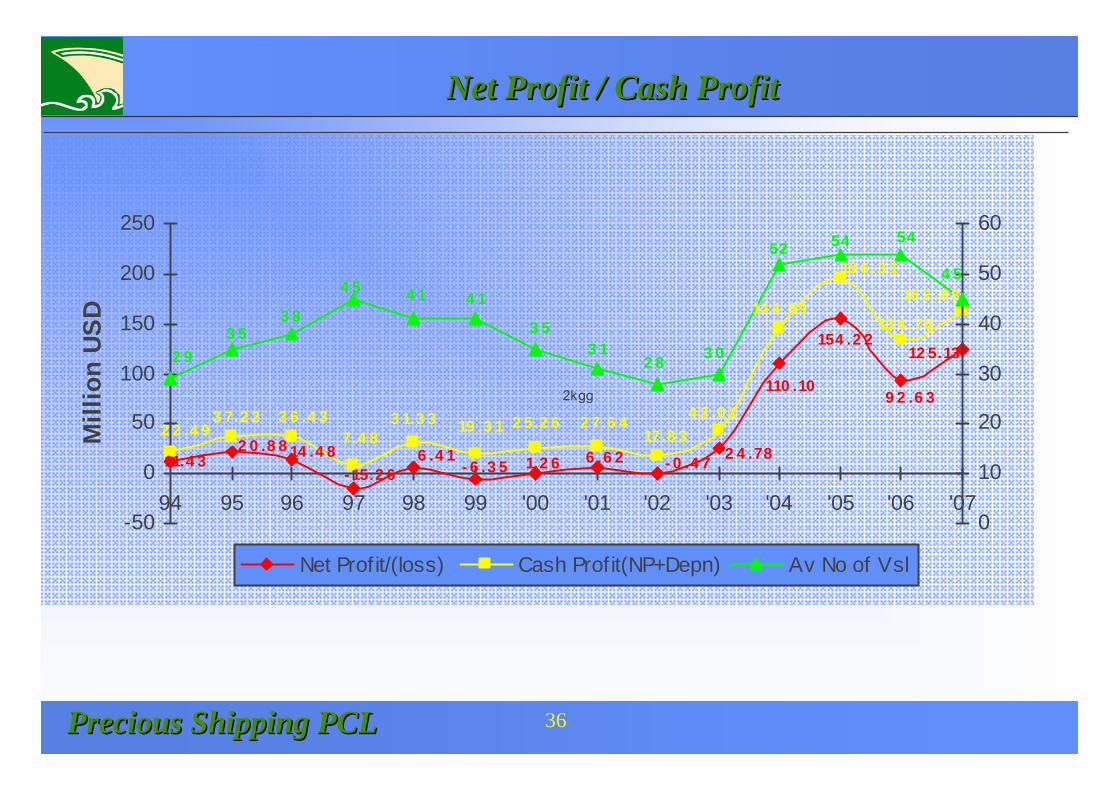
2 4 .78- 0 .4 76 .6 21.2 6- 6 .3 56 .4 1
- 15.2 614 .4 811.4 3
110 .10
12 5.13
9 2 .6 3
154 .2 2
2 0 .8 8
4 2 .0 12 2 .4 9
16 2 .8 8
17.8 32 7.6 42 5.2 619 .3 13 1.3 3
7.4 83 6 .4 33 7.2 2
13 4 .78
19 6 .3 1
14 4 .59
4 5
3 02 83 1
3 5
4 14 14 5
3 83 5
2 9
545452
-50
0
50
100
150
200
250
94 95 96 97 98 99 '00 '01 '02 '03 '04 '05 '06 '07
Mill
ion
USD
0
10
20
30
40
50
60
Net Profit/(loss) Cash Profit(NP+Depn) Av No of Vsl
2kgg
Net Profit / Cash Profit Net Profit / Cash Profit
36
Precious Shipping PCLPrecious Shipping PCL
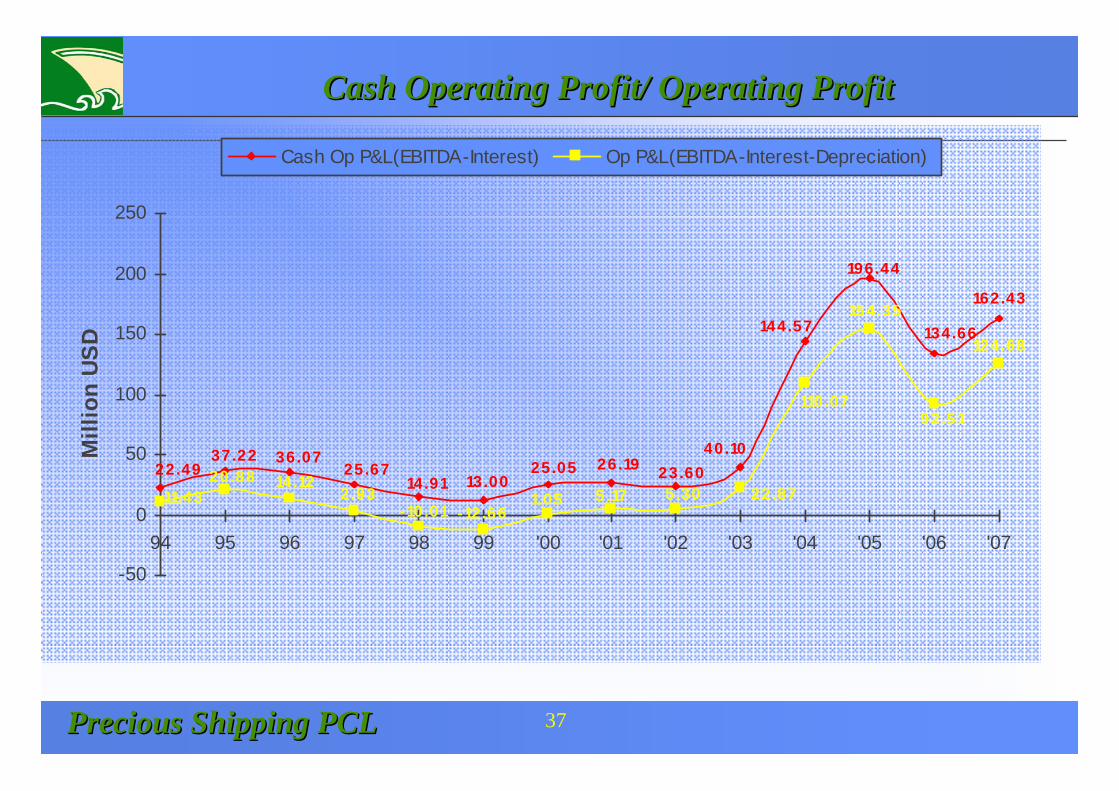
Cash Operating Profit/ Operating Profit Cash Operating Profit/ Operating Profit
134.66
196.44
40.1023.6026.1925.05
13.0014.9125.67
36.0722.49
37.22
144.57
162.43
110.07
22.875.305.171.05-12.66-10.01
2.9314.1220.88
11.43
154.35
124.68
92.51
-50
0
50
100
150
200
250
94 95 96 97 98 99 '00 '01 '02 '03 '04 '05 '06 '07
Mill
ion
USD
Cash Op P&L(EBITDA-Interest) Op P&L(EBITDA-Interest-Depreciation)
37
Precious Shipping PCLPrecious Shipping PCL
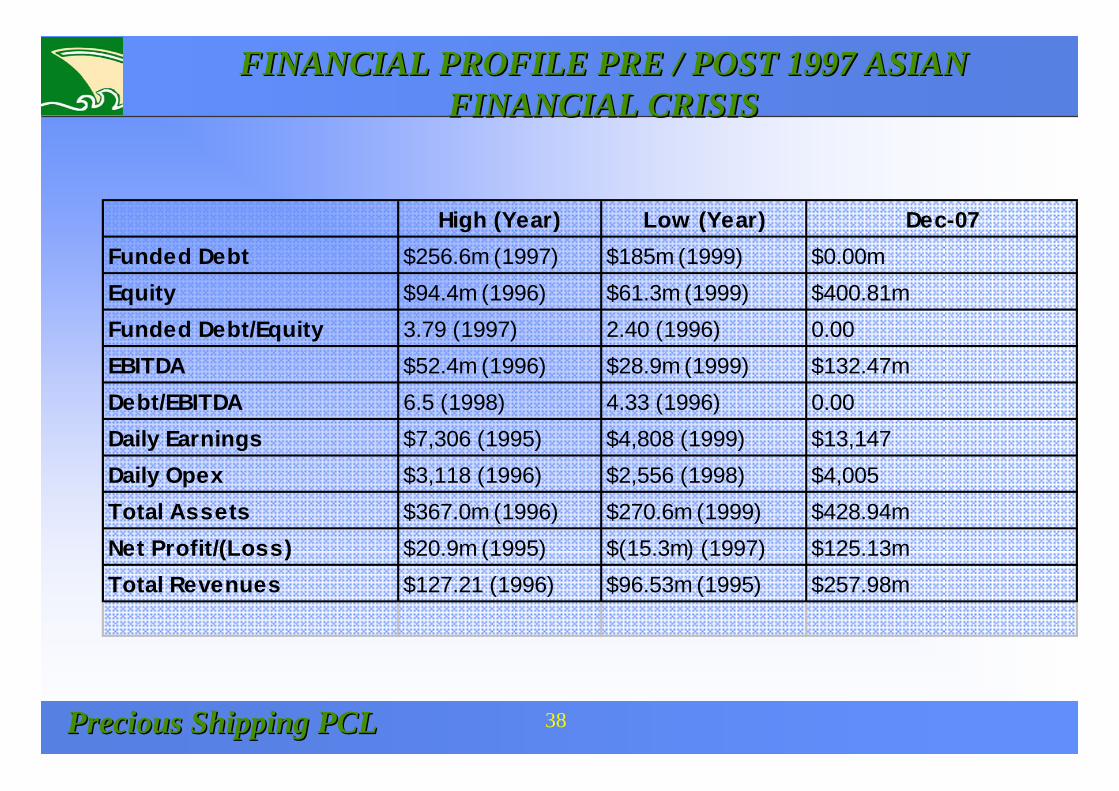
FINANCIAL PROFILE PRE / POST 1997 ASIAN FINANCIAL PROFILE PRE / POST 1997 ASIAN FINANCIAL CRISISFINANCIAL CRISIS
High (Year) Low (Year) Dec-07Funded Debt $256.6m (1997) $185m (1999) $0.00m Equity $94.4m (1996) $61.3m (1999) $400.81m Funded Debt/Equity 3.79 (1997) 2.40 (1996) 0.00EBITDA $52.4m (1996) $28.9m (1999) $132.47mDebt/EBITDA 6.5 (1998) 4.33 (1996) 0.00Daily Earnings $7,306 (1995) $4,808 (1999) $13,147Daily Opex $3,118 (1996) $2,556 (1998) $4,005Total Assets $367.0m (1996) $270.6m (1999) $428.94mNet Profit/(Loss) $20.9m (1995) $(15.3m) (1997) $125.13m Total Revenues $127.21 (1996) $96.53m (1995) $257.98m
38
Precious Shipping PCLPrecious Shipping PCL
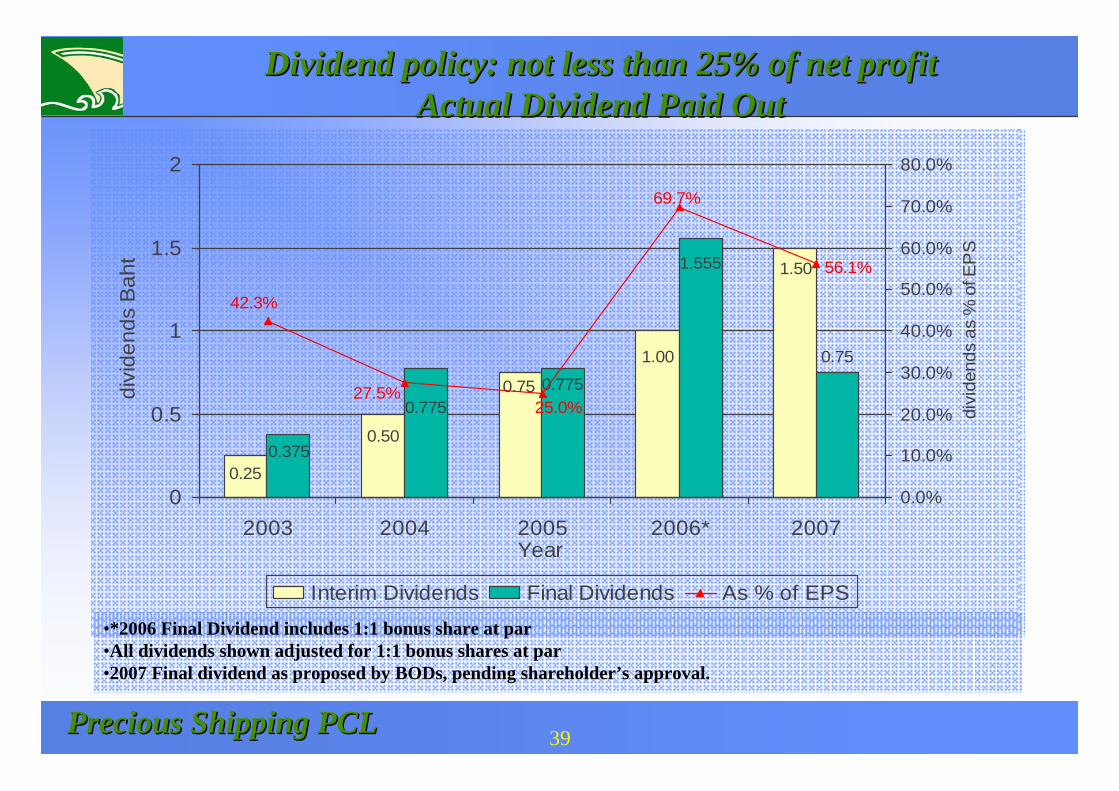
Dividend policy: not less than 25% of net profitDividend policy: not less than 25% of net profitActual Dividend Paid OutActual Dividend Paid Out
0.75
1.50
1.00
0.75
0.50
0.25
1.555
0.7750.775
0.375
56.1%
69.7%
25.0%27.5%
42.3%
0
0.5
1
1.5
2
2003 2004 2005 2006* 2007Year
divi
dend
s B
aht
0.0%
10.0%
20.0%
30.0%
40.0%
50.0%
60.0%
70.0%
80.0%
divi
dend
s as
% o
f EP
S
Interim Dividends Final Dividends As % of EPS
39
•*2006 Final Dividend includes 1:1 bonus share at par•All dividends shown adjusted for 1:1 bonus shares at par•2007 Final dividend as proposed by BODs, pending shareholder’s approval.

Precious Shipping PCLPrecious Shipping PCL
Awards and AchievementsAwards and Achievements
40

Precious Shipping PCLPrecious Shipping PCL
Industry Awards and Honors
41
Precious Shipping PCLPrecious Shipping PCL
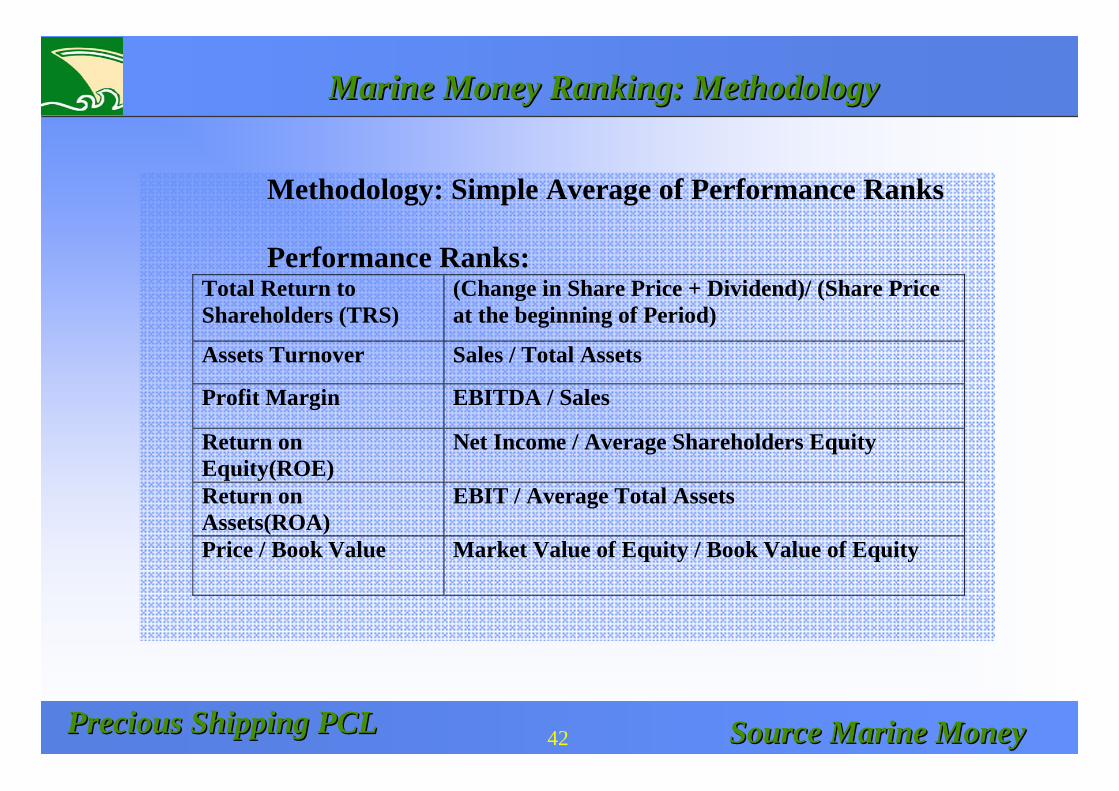
Marine Money Ranking: MethodologyMarine Money Ranking: Methodology
Source Marine MoneySource Marine Money
Methodology: Simple Average of Performance Ranks Performance Ranks:
Total Return to Shareholders (TRS)
(Change in Share Price + Dividend)/ (Share Price at the beginning of Period)
Assets Turnover Sales / Total Assets
Profit Margin EBITDA / Sales
Return on Equity(ROE)
Net Income / Average Shareholders Equity
Return on Assets(ROA)
EBIT / Average Total Assets
Price / Book Value Market Value of Equity / Book Value of Equity
42
Precious Shipping PCLPrecious Shipping PCL
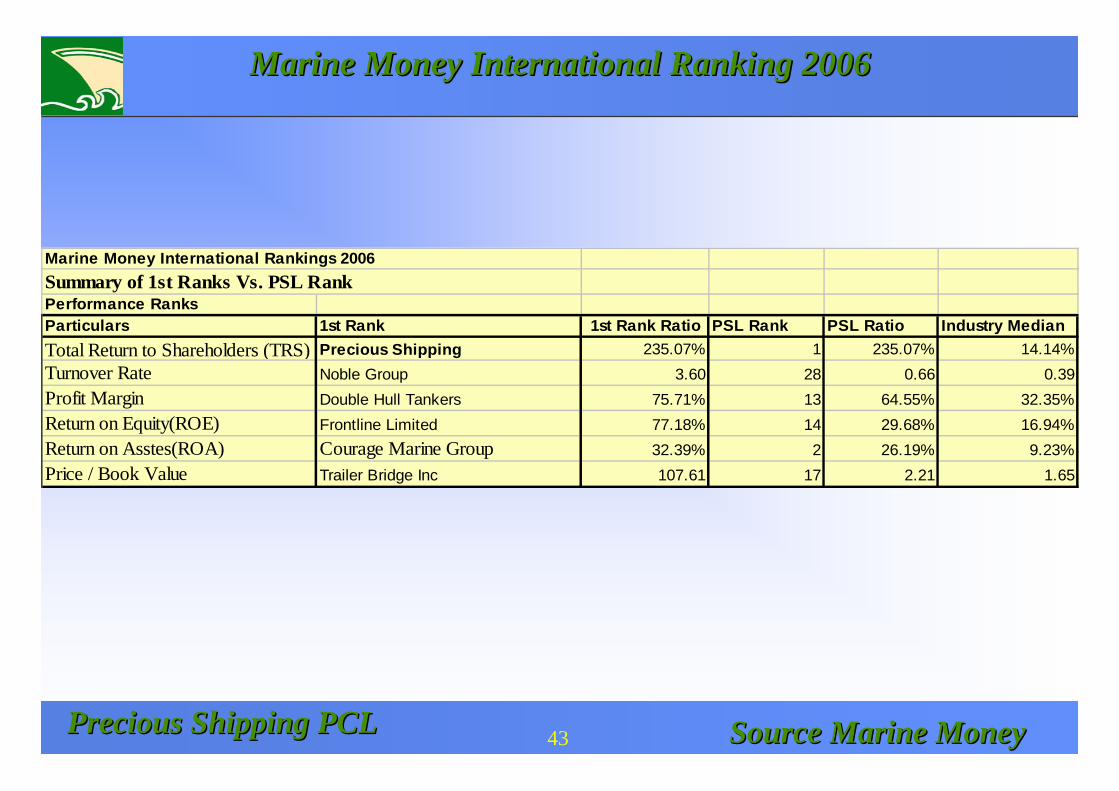
Marine Money International Ranking 2006Marine Money International Ranking 2006
Source Marine MoneySource Marine Money43
Marine Money International Rankings 2006Summary of 1st Ranks Vs. PSL Rank Performance RanksParticulars 1st Rank 1st Rank Ratio PSL Rank PSL Ratio Industry MedianTotal Return to Shareholders (TRS) Precious Shipping 235.07% 1 235.07% 14.14%Turnover Rate Noble Group 3.60 28 0.66 0.39Profit Margin Double Hull Tankers 75.71% 13 64.55% 32.35%Return on Equity(ROE) Frontline Limited 77.18% 14 29.68% 16.94%Return on Asstes(ROA) Courage Marine Group 32.39% 2 26.19% 9.23%Price / Book Value Trailer Bridge Inc 107.61 17 2.21 1.65
Precious Shipping PCLPrecious Shipping PCL
Shareholder’s returnsShareholder’s returns
44
Precious Shipping PCLPrecious Shipping PCL
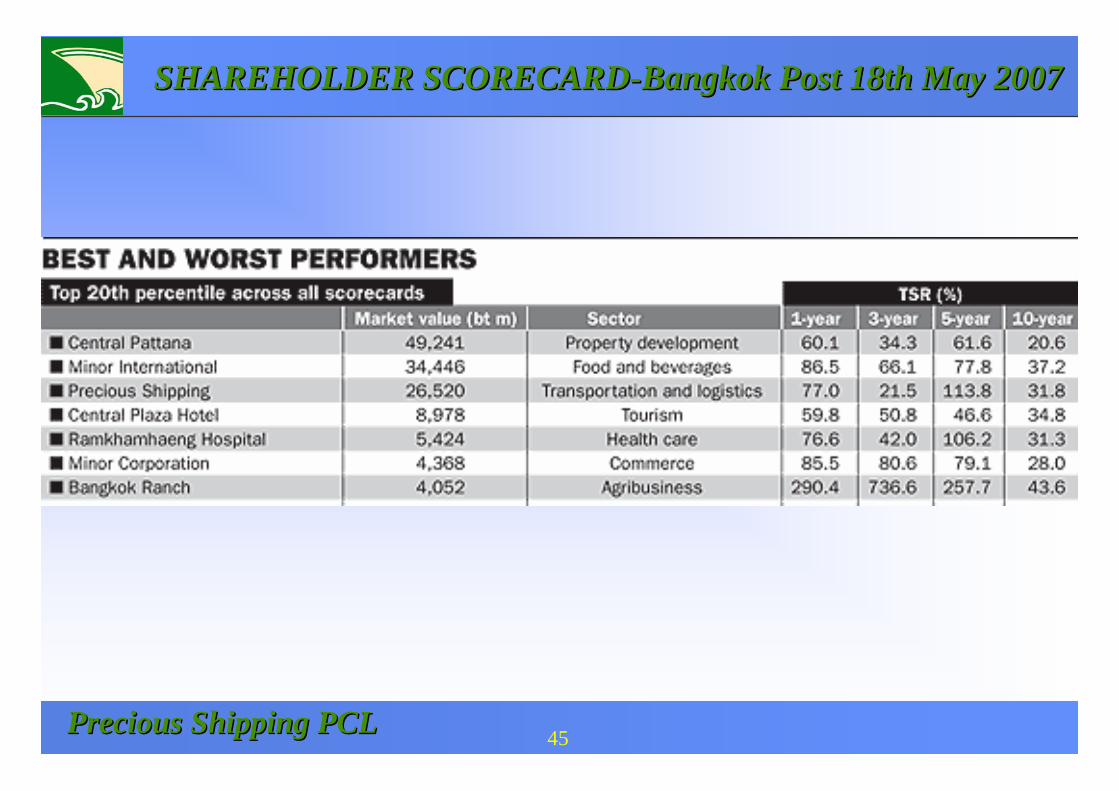
SHAREHOLDER SCORECARDSHAREHOLDER SCORECARD--Bangkok Post 18th May 2007Bangkok Post 18th May 2007
45
Precious Shipping PCLPrecious Shipping PCL
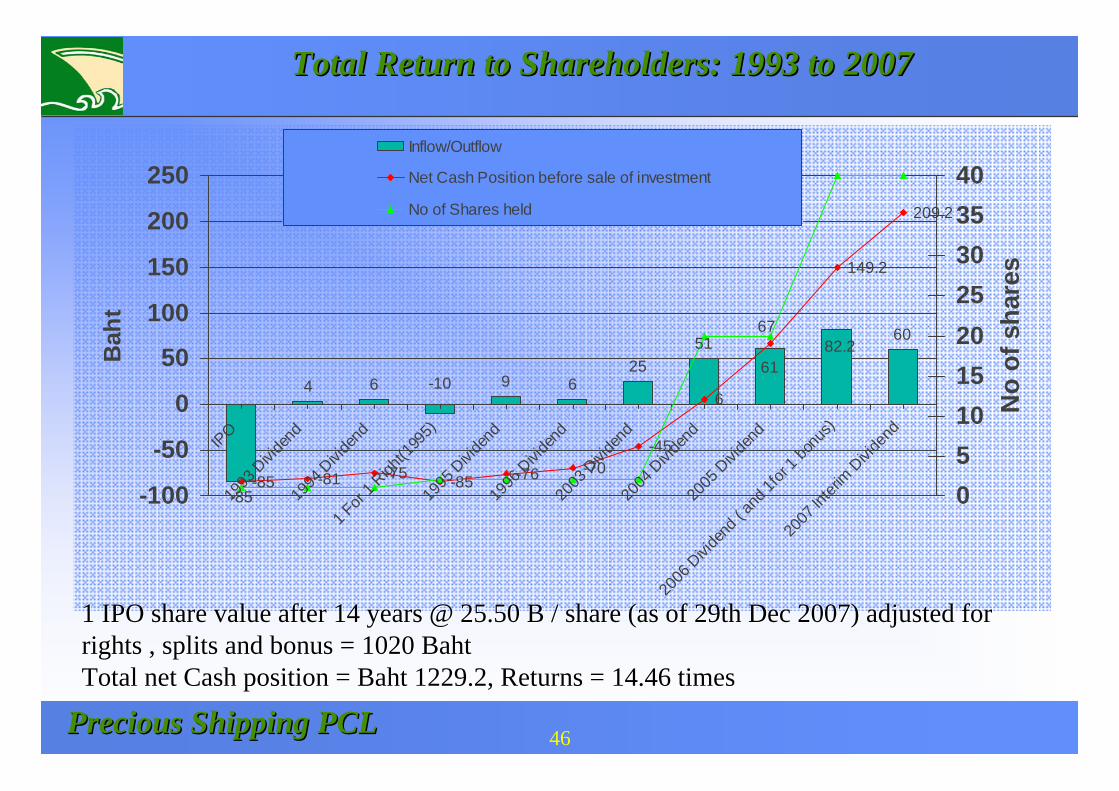
Total Return to Shareholders: 1993 to 2007Total Return to Shareholders: 1993 to 2007
46
-85
4 6 9 625
51 6082.2
61-10
-85 -81 -75 -85 -76 -70-45
6
149.2
209.2
67
-100
-50
0
50
100
150
200
250
IPO19
93 D
ividen
d19
94 D
ividen
d1 F
or 1 R
ight(1
995)
1995
Divid
end
1996
Divi
dend
2003
Divid
end
2004
Divid
end
2005
Divid
end
2006
Divid
end (
and 1
for 1
bonu
s)
2007
Inter
im D
ividen
d
Bah
t
0510152025303540
No
of s
hare
s
Inflow/Outflow
Net Cash Position before sale of investment
No of Shares held
1 IPO share value after 14 years @ 25.50 B / share (as of 29th D1 IPO share value after 14 years @ 25.50 B / share (as of 29th Dec 2007) adjusted for ec 2007) adjusted for rights , splits and bonus = 1020 Bahtrights , splits and bonus = 1020 BahtTotal net Cash position = Baht 1229.2, Returns = 14.46 timesTotal net Cash position = Baht 1229.2, Returns = 14.46 times
Precious Shipping PCLPrecious Shipping PCL
A A PRECIOUS SHIPPING PRECIOUS SHIPPING
PRESENTATIONPRESENTATION
47