basing care reforms on evidence: the kenya health sector costing model
TRANSCRIPT
RESEARCH ARTICLE Open Access
Basing care reforms on evidence: The Kenyahealth sector costing modelSteffen Flessa1*, Michael Moeller2, Tim Ensor3 and Klaus Hornetz2
Abstract
Background: The Government of the Republic of Kenya is in the process of implementing health care reforms.However, poor knowledge about costs of health care services is perceived as a major obstacle towards evidence-based, effective and efficient health care reforms. Against this background, the Ministry of Health of Kenya incooperation with its development partners conducted a comprehensive costing exercise and subsequentlydeveloped the Kenya Health Sector Costing Model in order to fill this data gap.
Methods: Based on standard methodology of costing of health care services in developing countries, standardquestionnaires and analyses were employed in 207 health care facilities representing different trustees (e.g.Government, Faith Based/Nongovernmental, private-for-profit organisations), levels of care and regions (urban,rural). In addition, a total of 1369 patients were randomly selected and asked about their demand-sided costs. Astandard step-down costing methodology was applied to calculate the costs per service unit and per diagnosis ofthe financial year 2006/2007.
Results: The total costs of essential health care services in Kenya were calculated as 690 million Euros or 18.65Euro per capita. 54% were incurred by public sector facilities, 17% by Faith Based and other Nongovernmentalfacilities and 23% in the private sector. Some 6% of the total cost is due to the overall administration provideddirectly by the Ministry and its decentralised organs. Around 37% of this cost is absorbed by salaries and 22% bydrugs and medical supplies. Generally, costs of lower levels of care are lower than of higher levels, but healthcentres are an exemption. They have higher costs per service unit than district hospitals.
Conclusions: The results of this study signify that the costs of health care services are quite high compared withthe Kenyan domestic product, but a major share are fixed costs so that an increasing coverage does notnecessarily increase the health care costs proportionally. Instead, productivity will rise in particular in under-utilizedprivate health care institutions. The results of this study also show that private-for-profit health care facilities are notonly the luxurious providers catering exclusively for the rich but also play an important role in the service provisionfor the poorer population. The study findings also demonstrated a high degree of cost variability across privateproviders, suggesting differences in quality and efficiencies.
BackgroundIn the first three decades after independence the peopleof the Republic of Kenya enjoyed an impressiveimprovement in all health indicators. For instance, from1960 to 1990 life expectancy rose from 43 to 62 years,infant mortality dropped during this period from 122 to63 and under-five-mortality declined from 204 to 93 per1000 live births [1]. However, most indicators showed a
deterioration during the 1990s, so that by the year 2000the life expectancy was back to 49 years, infant mortalitywas some 83 and under-five-mortality some 134 per1000 live births [2]. Main reasons for this deteriorationare the AIDS epidemic [3], the manifestation of resistantmalaria [4], the epidemiological transition with anincreasing burden of chronic-degenerative diseases [5].Strong inequity between the poor and the rich andrapid population growth are underlying factors drivingnegative health trends [6]. Whereas Kenyan health bud-gets had risen in absolute terms until 2005 [7], the
* Correspondence: [email protected] of Greifswald, Faculty of Law and Economics, Friedrich-Loeffler-Str. 70, D-17489 Greifswald, GermanyFull list of author information is available at the end of the article
Flessa et al. BMC Health Services Research 2011, 11:128http://www.biomedcentral.com/1472-6963/11/128
© 2011 Flessa et al; licensee BioMed Central Ltd. This is an Open Access article distributed under the terms of the Creative CommonsAttribution License (http://creativecommons.org/licenses/by/2.0), which permits unrestricted use, distribution, and reproduction inany medium, provided the original work is properly cited.
health care services for the majority of rural and urbanpoor has deteriorated.The Government of the Republic of Kenya realized this
negative development and responded with health carereform. Based on a comprehensive “Health Policy Frame-work” (1994) two “National Health Sector StrategicPlans” (HSSP I: 1999-2004; HSSP II: 2009-2010) wereapproved, the latter building the cornerstone of the Ken-yan health care reform. HSSP II provided the blueprintto innovations like the definition of a “Kenya EssentialPackage of Health” (KEPH), a “Community Strategy”, a“Joint Framework of Work and Financing” (JPWD) asexpression of the Sector-Wide Approach (SWAp) and a“Hospital Reform” aiming at more autonomy for provin-cial hospitals. The process of adapting the health caresystem is seen in perspectives of the so-called “Vision2030”, stating affordability, equity, quality and capacity asthe main objectives of the entire social sector. Imple-menting the new constitution which was promulgated inAugust 2010 will equally impact on the system design ofthe Kenyan Health Sector, especially in terms of decen-tralisation and realising the ‘Right to Health’ [8].Meanwhile the official health indicators have
improved, e.g., life expectancy is 52 years, infant mortal-ity rate is 52 and under-five-mortality rate is 77 per1000 live births [9]. A part of these improvements can,however, be attributed to widescale, well-financed, verti-cal, disease-specific programmes (e.g. to combatmalaria). Another part can is - at least partly - a conse-quence of the health care reform, such as the improve-ment of the supply chain management of essentialdrugs, the definition and application of an essentialhealth care package, the reduction of user fees, thetraining of hospital managers, the direct allocation anddistribution of funds etc. - a process that is under theleadership of the Ministries of Health and that isstrongly supported by international development part-ners. The Ministries and the related partners haveagreed on that all elements of health care reformsshould be evidence-based, i.e., there is a strong need forsound epidemiological and economic data.During the last few years the knowledge of demo-
graphic and disease-related statistics has improved dueto strong investments into the Health ManagementInformation System of Kenya [10]. However, the knowl-edge of the costs of health care services in this countryis very limited, and this „scarcity of information inhibitsgovernments from making informed choices about theallocation of public resources for better health, as wellas improvements in the management of publicly pro-vided and/or financed services” [11]. Consequently, thefollowing questions could not be answered until thehere presented costing model was developed:
- How high are the actual costs of health care ser-vices in total?- How high are the actual costs of health care ser-vices on each level of service?- Which role do the different trustees (Government,Private-for-Profit, Non-Profit) play?- What are the unit costs for treating specific dis-eases on each level, e.g. what resources do we haveto invest to treat one malaria case in a dispensary, ahealth centre and a district hospital?- How much would it cost to provide the KenyaEssential Package of Health to every Kenyan, i.e.,how would the costs react on an increasing demand?
It is obvious that decision-makers on health carereforms should know the answers to these questions inorder to provide sufficient funds and allocate them tothe most efficient levels of care. However, this informa-tion as not available in Kenya as the cost accounting ofhealth care institutions is rudimentary and no nationalstatistics exist on the micro-level distinguishing diseasesand levels of care. Consequently, the National HealthAccounts cannot provide an answer to these essentialquestions. It became necessary to develop a costing toolfor Kenya and inform the policy process and in particu-lar the health financing reforms with sufficiently precisecosting information.This paper presents the basic structure of the costing
model and some basic results. In the next section we pre-sent a literature review of costing studies for health careservices in developing countries. It is demonstrated thatour knowledge of costs is very limited and is usuallybased on extremely small samples. The third sectiondescribes the Kenyan Health Sector Costing Model. Thebasic costing methodology is discussed as well as the pro-cess of data collection and analysis. The fourth sectiongives an overview of the basic findings and providesanswers to the questions raised above. In the fifth sectionwe discuss these findings and give some ideas how theycan be utilized to inform the policy process. We concludewith some recommendations for the future developmentof costing health care services in Kenya.
State-of-the-ArtIn countries where accounting information is completeand reliable, costing of health care services is a standard.For instance, Mogyorosy & Smith [12] prepared adetailed literature review of methodological issues incosting health care services in EU states. They concludethat differences in costing methodologies are due to dif-ferent decision situations and research questions, notdue to disagreement on methodology and concepts.Consequently, in these countries costing of health care
Flessa et al. BMC Health Services Research 2011, 11:128http://www.biomedcentral.com/1472-6963/11/128
Page 2 of 15
services is a routine in the hands of professional costaccountants. The literature on general cost accounting[13-19], costing of health services [20-24] and of hospi-tal services [25-34] is enormous.Since the end of the 1980s, a substantial number of
papers have indicated the importance of costing healthcare services in developing countries [35-46], but ourknowledge of provider costs in developing countries andin particular in least developed countries is still limitedand the quality of studies is heterogeneous. Vaca, Krei-der & Kreider were among the first to cost health careservices in resource-poor countries. They conclude „thatup-to-date and accurate book-keeping was not followedin many cases”. Almost all lacked statistical informationon the results of their projects. Among justifications forthis were remarks like: ‚We’re not working to fill outforms and show statistics.’ [...] This would seem to be acommon attitude among project staff. [...] Health work-ers aren’t trained as economists and accountants andfew projects have the money or inclination to employsuch people themselves. It’s little surprise that questionsof financing sometimes never go beyond the short-termproblem of obtaining funding and supplying satisfactoryaccounts to donors” [47].This analysis was followed by a number of studies and
reviews. In 1990, Mills assessed 30 studies of hospitalcosts in developing countries and notes that all of themwere based on secondary data, i.e., existing accountsfrom the hospitals were used without considerationwhether they were correct or complete [36,37]. Thesame approach was followed by the Christian MedicalCommission (CMC, Geneva) which sent out question-naires in order to assess the costs of hospitals. They hadto realize that „there were wide variations in thorough-ness in use of raw data, analysis and reporting” [48].The quality of 27 studies on hospital costs analysed byShepard, Hodgkin & Anthony [41] was higher, but onlyfive of them were from least developed countries.Meanwhile a number of studies invested effort to
check and correct accounting data from health careinstitutions or programmes and search for missing fig-ures. Our knowledge of costs of hospitals [49-51], dis-tricts [52-54] and specific diseases has grown. Inparticular, the costs of HIV/Aids care and preventionare thoroughly analysed [55-57]. However, the meth-odologies of these studies strongly differ and they allfocus on small samples without being representative ofthe entire health care system of an entire nation.One attempt to develop an insight into the costs of
health care services in developing countries is the WHO-CHOICE project which has also contributed to ourunderstanding of health care costs [34,58]. However, the‘Costit Model’ of the WHO [59] is just a methodologicalframe where existing data from small-scale studies is
entered. Currently, there is not a single study summariz-ing the cost of the entire health care system of an entirecountry on all levels of health care, in all regions and ofall trustees. We know only very little about the costs of ahealth care system. In the case of Kenya we respond tothis deficiency by presenting a costing model that pro-vides reliable data for the entire health care system.
MethodsThe methodology section consists of four sub-sections.Firstly, we will describe the selection of the health careinstitutions that were part of this study. Secondly, wewill explain the process of data collection in these insti-tutions. Thirdly, the costing procedures will be pre-sented. Fourthly, we will give basic information on theKenyan Health Sector Costing Model Data Base con-taining the results of the first three steps.
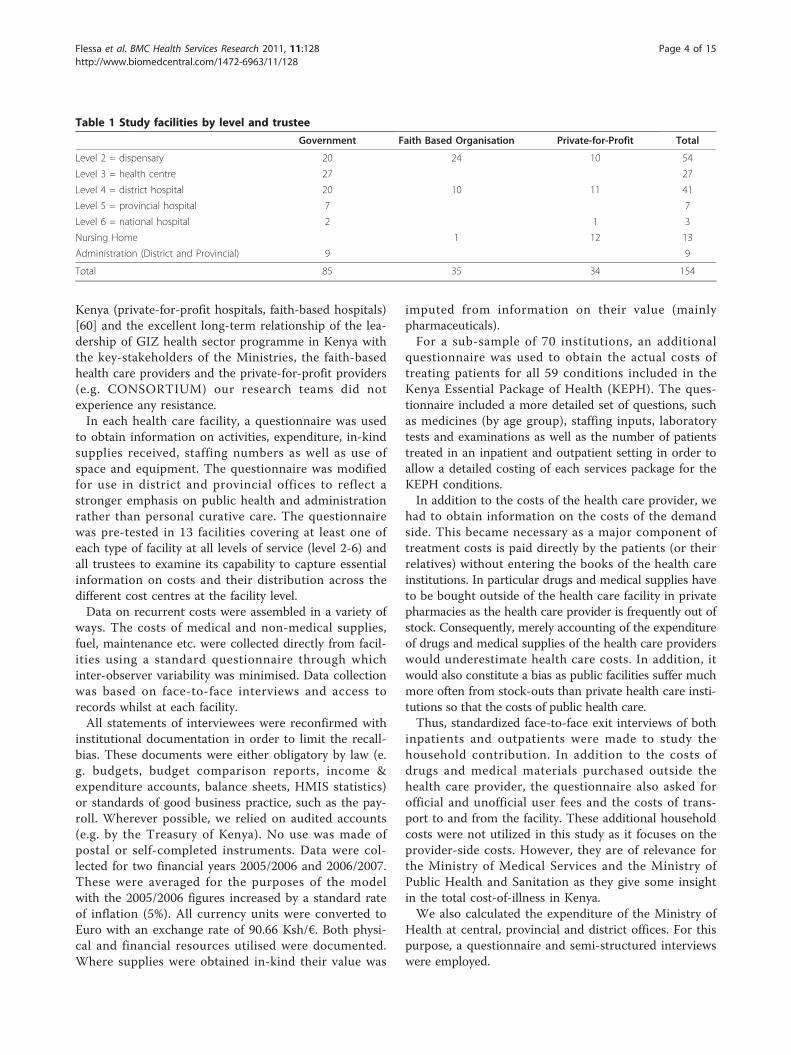
Selection of Health Care InstitutionsThe methods employed to obtain provider based costingdata comprised facility surveys, face to face interviewsand the review and analysis of secondary data sources.Based on the Kenya Health Care Facilities List of theMinistry of Health with 4002 facilities we stratified thehealth care institutions according to health care level (2:Dispensary; 3: Health Centre; 4: District Hospital; 5: Pro-vincial Hospital; 6: Tertiary Hospital), trustee (Govern-ment, Faith Based/Nongovernmental Organisations,Private-for-Profit), capacity (e.g. number of beds) andlocation (urban vs. rural and different provinces). Somefields were empty, e.g. there is no tertiary hospital inmany provinces, but 207 strata remained. If more thanone institution was in a stratum, we took a random sam-ple so that in total 207 health care facilities were includedin the original sample. To our knowledge this is one ofthe highest sample sizes of any costing study conductedin developing countries, and this coupled with the depthof data collection, renders the Kenyan costing study themost comprehensive of its kind. After the survey, 53health facilities had to be omitted from the analysis astheir data sets were incomplete or unreliable. Table 1exhibits the number of facilities in the analysis.At the targeted facilities, a total of 1369 patients were
randomly selected and asked about their demand-sidedcosts.To obtain information on super-overhead administra-
tive function at central, provincial and district healthlevel staff was purposefully selected using function (e.g.finance, head of administration or Human Resource) asthe principle criterion.
Data CollectionThe collection of data followed the standards describedin section 2. Based on two other studies of GIZ in
Flessa et al. BMC Health Services Research 2011, 11:128http://www.biomedcentral.com/1472-6963/11/128
Page 3 of 15
Kenya (private-for-profit hospitals, faith-based hospitals)[60] and the excellent long-term relationship of the lea-dership of GIZ health sector programme in Kenya withthe key-stakeholders of the Ministries, the faith-basedhealth care providers and the private-for-profit providers(e.g. CONSORTIUM) our research teams did notexperience any resistance.In each health care facility, a questionnaire was used
to obtain information on activities, expenditure, in-kindsupplies received, staffing numbers as well as use ofspace and equipment. The questionnaire was modifiedfor use in district and provincial offices to reflect astronger emphasis on public health and administrationrather than personal curative care. The questionnairewas pre-tested in 13 facilities covering at least one ofeach type of facility at all levels of service (level 2-6) andall trustees to examine its capability to capture essentialinformation on costs and their distribution across thedifferent cost centres at the facility level.Data on recurrent costs were assembled in a variety of
ways. The costs of medical and non-medical supplies,fuel, maintenance etc. were collected directly from facil-ities using a standard questionnaire through whichinter-observer variability was minimised. Data collectionwas based on face-to-face interviews and access torecords whilst at each facility.All statements of interviewees were reconfirmed with
institutional documentation in order to limit the recall-bias. These documents were either obligatory by law (e.g. budgets, budget comparison reports, income &expenditure accounts, balance sheets, HMIS statistics)or standards of good business practice, such as the pay-roll. Wherever possible, we relied on audited accounts(e.g. by the Treasury of Kenya). No use was made ofpostal or self-completed instruments. Data were col-lected for two financial years 2005/2006 and 2006/2007.These were averaged for the purposes of the modelwith the 2005/2006 figures increased by a standard rateof inflation (5%). All currency units were converted toEuro with an exchange rate of 90.66 Ksh/€. Both physi-cal and financial resources utilised were documented.Where supplies were obtained in-kind their value was
imputed from information on their value (mainlypharmaceuticals).For a sub-sample of 70 institutions, an additional
questionnaire was used to obtain the actual costs oftreating patients for all 59 conditions included in theKenya Essential Package of Health (KEPH). The ques-tionnaire included a more detailed set of questions, suchas medicines (by age group), staffing inputs, laboratorytests and examinations as well as the number of patientstreated in an inpatient and outpatient setting in order toallow a detailed costing of each services package for theKEPH conditions.In addition to the costs of the health care provider, we
had to obtain information on the costs of the demandside. This became necessary as a major component oftreatment costs is paid directly by the patients (or theirrelatives) without entering the books of the health careinstitutions. In particular drugs and medical supplies haveto be bought outside of the health care facility in privatepharmacies as the health care provider is frequently out ofstock. Consequently, merely accounting of the expenditureof drugs and medical supplies of the health care providerswould underestimate health care costs. In addition, itwould also constitute a bias as public facilities suffer muchmore often from stock-outs than private health care insti-tutions so that the costs of public health care.Thus, standardized face-to-face exit interviews of both
inpatients and outpatients were made to study thehousehold contribution. In addition to the costs ofdrugs and medical materials purchased outside thehealth care provider, the questionnaire also asked forofficial and unofficial user fees and the costs of trans-port to and from the facility. These additional householdcosts were not utilized in this study as it focuses on theprovider-side costs. However, they are of relevance forthe Ministry of Medical Services and the Ministry ofPublic Health and Sanitation as they give some insightin the total cost-of-illness in Kenya.We also calculated the expenditure of the Ministry of
Health at central, provincial and district offices. For thispurpose, a questionnaire and semi-structured interviewswere employed.
Table 1 Study facilities by level and trustee
Government Faith Based Organisation Private-for-Profit Total
Level 2 = dispensary 20 24 10 54
Level 3 = health centre 27 27
Level 4 = district hospital 20 10 11 41
Level 5 = provincial hospital 7 7
Level 6 = national hospital 2 1 3
Nursing Home 1 12 13
Administration (District and Provincial) 9 9
Total 85 35 34 154
Flessa et al. BMC Health Services Research 2011, 11:128http://www.biomedcentral.com/1472-6963/11/128
Page 4 of 15
Finally, an expert team of four (two clinicians, alaboratory expert and a pharmacist) was formed underthe leadership of the Ministry of Health to develop stan-dard treatment schemes for the KEPH conditions topermit calculation of normative as well as actual costs.
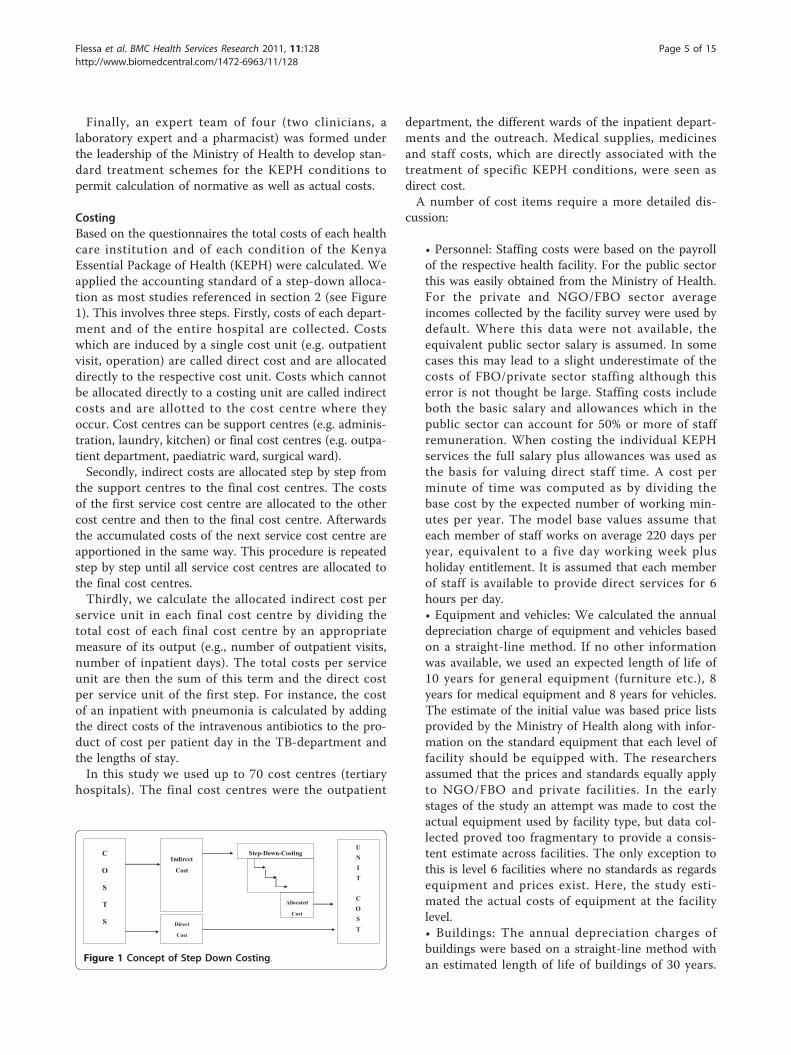
CostingBased on the questionnaires the total costs of each healthcare institution and of each condition of the KenyaEssential Package of Health (KEPH) were calculated. Weapplied the accounting standard of a step-down alloca-tion as most studies referenced in section 2 (see Figure1). This involves three steps. Firstly, costs of each depart-ment and of the entire hospital are collected. Costswhich are induced by a single cost unit (e.g. outpatientvisit, operation) are called direct cost and are allocateddirectly to the respective cost unit. Costs which cannotbe allocated directly to a costing unit are called indirectcosts and are allotted to the cost centre where theyoccur. Cost centres can be support centres (e.g. adminis-tration, laundry, kitchen) or final cost centres (e.g. outpa-tient department, paediatric ward, surgical ward).Secondly, indirect costs are allocated step by step from
the support centres to the final cost centres. The costsof the first service cost centre are allocated to the othercost centre and then to the final cost centre. Afterwardsthe accumulated costs of the next service cost centre areapportioned in the same way. This procedure is repeatedstep by step until all service cost centres are allocated tothe final cost centres.Thirdly, we calculate the allocated indirect cost per
service unit in each final cost centre by dividing thetotal cost of each final cost centre by an appropriatemeasure of its output (e.g., number of outpatient visits,number of inpatient days). The total costs per serviceunit are then the sum of this term and the direct costper service unit of the first step. For instance, the costof an inpatient with pneumonia is calculated by addingthe direct costs of the intravenous antibiotics to the pro-duct of cost per patient day in the TB-department andthe lengths of stay.In this study we used up to 70 cost centres (tertiary
hospitals). The final cost centres were the outpatient
department, the different wards of the inpatient depart-ments and the outreach. Medical supplies, medicinesand staff costs, which are directly associated with thetreatment of specific KEPH conditions, were seen asdirect cost.A number of cost items require a more detailed dis-
cussion:
• Personnel: Staffing costs were based on the payrollof the respective health facility. For the public sectorthis was easily obtained from the Ministry of Health.For the private and NGO/FBO sector averageincomes collected by the facility survey were used bydefault. Where this data were not available, theequivalent public sector salary is assumed. In somecases this may lead to a slight underestimate of thecosts of FBO/private sector staffing although thiserror is not thought be large. Staffing costs includeboth the basic salary and allowances which in thepublic sector can account for 50% or more of staffremuneration. When costing the individual KEPHservices the full salary plus allowances was used asthe basis for valuing direct staff time. A cost perminute of time was computed as by dividing thebase cost by the expected number of working min-utes per year. The model base values assume thateach member of staff works on average 220 days peryear, equivalent to a five day working week plusholiday entitlement. It is assumed that each memberof staff is available to provide direct services for 6hours per day.• Equipment and vehicles: We calculated the annualdepreciation charge of equipment and vehicles basedon a straight-line method. If no other informationwas available, we used an expected length of life of10 years for general equipment (furniture etc.), 8years for medical equipment and 8 years for vehicles.The estimate of the initial value was based price listsprovided by the Ministry of Health along with infor-mation on the standard equipment that each level offacility should be equipped with. The researchersassumed that the prices and standards equally applyto NGO/FBO and private facilities. In the earlystages of the study an attempt was made to cost theactual equipment used by facility type, but data col-lected proved too fragmentary to provide a consis-tent estimate across facilities. The only exception tothis is level 6 facilities where no standards as regardsequipment and prices exist. Here, the study esti-mated the actual costs of equipment at the facilitylevel.• Buildings: The annual depreciation charges ofbuildings were based on a straight-line method withan estimated length of life of buildings of 30 years.
C
O
S
T
S Direct
Cost
Indirect
Cost
Step-Down-Costing
Allocated
Cost
UNIT
COST
Figure 1 Concept of Step Down Costing.
Flessa et al. BMC Health Services Research 2011, 11:128http://www.biomedcentral.com/1472-6963/11/128
Page 5 of 15
Based on the questionnaire, this statistic could beadjusted if the quality of buildings required it. Theinitial costs were calculated as the product of thebuilding size [sqm] and the building cost per squaremetre. The latter was estimated by civil engineersand adjusted to the region.• Administration: The costs obtained from the Min-istry of Health and its decentralised functions wereanalysed and apportioned between its super-over-head administrative function and direct serviceprovision.• Demand-side costs: As described above, demand-sided costs were used to adjust the overall costs bylevel and function to take account of costs notrecorded in facilities. For instance, many patientsfrom government hospitals had to buy drugs fromprivate pharmacies because the government facilitywas out of stock. We added these costs to the costof the government hospital in order to determinethe real resource consumption of treating a patientand not only the expenditure of this institution.Because of the imprecise diagnostic informationobtained from the patient exit survey as well as thesample size it was not possible to break these datadown by KEPH condition or even department.Demand-sided cost arising outside the facility couldhence only be apportioned as an average to eachoutpatient and inpatient at each facility type.• Normative cost: The normative cost of standardtreatment guidelines for each KEPH activities wasderived from the optimal medical supplies needed totreat the condition and staff time required for diag-nosing, treating and nursing patients based on therecommendations of the expect committee underthe wings of the Ministry of Health. This costinginformation is added to the fixed costs derived fromthe generalised costing to provide an estimate of thecosts of each element of the KEPH.
The methodology applied in this study is a standardcosting method and has been widely utilized in theresearch referenced in section 2. However, this studycovers 207 institutions on five different levels of healthcare, about 70 cost centres and 59 costing units. Thisrequired a well-structured and professional approach todata collection, entry and presentation.
Kenyan Health Sector Costing Model Data BaseAll hand-written costing data was double-entered intoEpi-Info and then uploaded to the Excel model to com-plete the step-down allocation process. All data is avail-able in Software called “Kenyan Health Sector CostingModel”. The model is operated by GIZ, and the data isutilized by the Ministry of Medical Services and the
Ministry of Public Health and Sanitation (since the ori-ginal Ministry of Health was recently split into twoministries).The model produces the actual costs of the year of
survey, the normative cost of the same year and predic-tion for actual and normative costs for future years. Themodel distinguishes between all levels of health care ser-vices and all trustees. A limited number of scientistswith special training has access to the data base in orderto simulate scenarios, such as changes in the work load,share of conditions (e.g. rate of Caesarean section), staff-ing levels, salaries, and prices in other input factors (e.g.drugs). Based on this data base we will present somebasic results of actual costs of health care services inKenya of the financial year 2006/2007.
ResultsIn this section we present the total, unit costs and costsby diagnosis. We further analyse the cost-responsivenessbehaviour of health care costs in Kenya.
Total actual cost of health care servicesBased on the model we can calculate the total cost ofhealth care services in Kenya in the financial year 2006/2007 as 63 billion Ksh which is equivalent to 690 millionEuros or 18.65 Euro per capita1. As table 2 shows, some54% of this cost is incurred by public sector facilities,17% by Faith Based (FBO) and other Nongovernmental(NGO) facilities and 23% in the private sector. Some 6%of the total cost is due to the overall administration pro-vided directly by the Ministry and its decentralisedorgans. Table 2 also shows that around 37% of this costis absorbed by salaries (52% of recurrent funding) and22% by drugs and medical supplies (28% of recurrent).The percentage of staffing costs as a percentage of totalfacility cost varies across sectors and levels with morethan 70% of cost in public outpatient facilities and lessthan 20% in those private facilities which are highly spe-cialised on sophisticated equipment and well-off clients.The ratio of primary care (Level 1 to 3) versus second-
ary care (Level 4 to 6) costs is 1:2. The results alsoreveal that 53% of the costs at service level are con-sumed by outpatient services and 47% by inpatient ser-vice provision. Unfortunately it was not possible todistinguish between dispensaries and health centres ofFaith Based and other nongovernmental health institu-tions as their level of care was almost identical and thesample is not large enough to discriminate. The sameapplies for level 2 and level 3 facilities of private-for-profit organisations.
Cost per Service UnitFigure 2 compares the costs of outpatient visits at level2 (Dispensaries), level 3 (Health Centres) and level 4
Flessa et al. BMC Health Services Research 2011, 11:128http://www.biomedcentral.com/1472-6963/11/128
Page 6 of 15
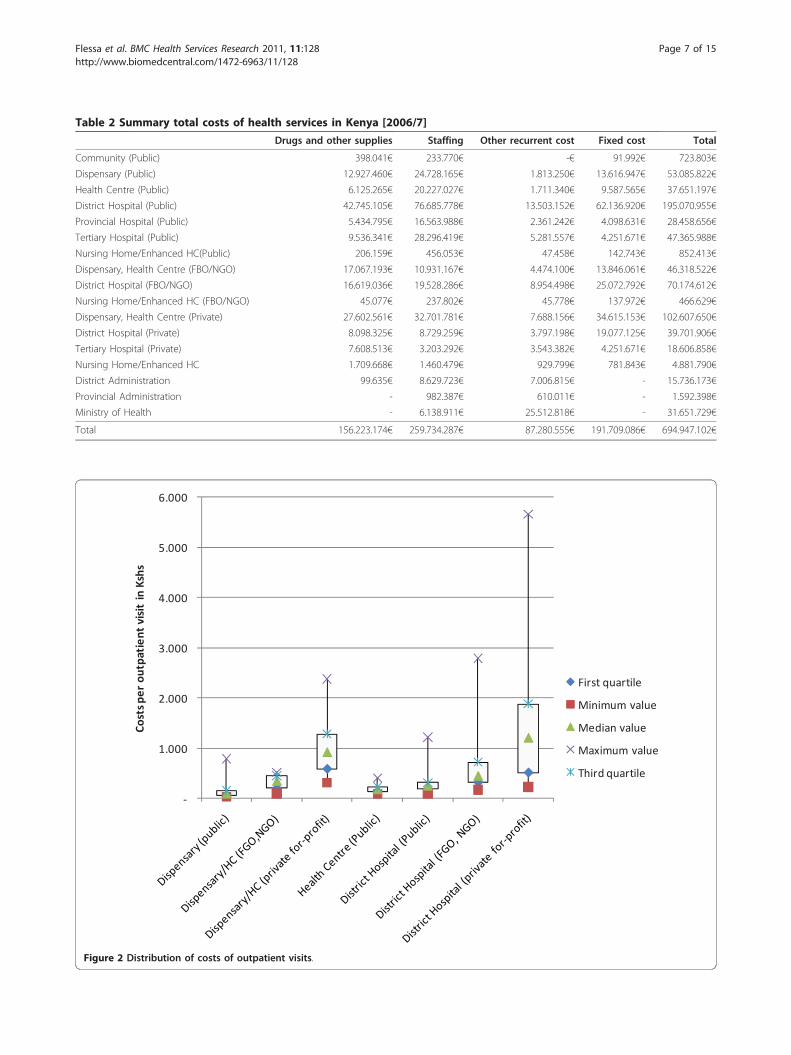
Table 2 Summary total costs of health services in Kenya [2006/7]
Drugs and other supplies Staffing Other recurrent cost Fixed cost Total
Community (Public) 398.041€ 233.770€ -€ 91.992€ 723.803€
Dispensary (Public) 12.927.460€ 24.728.165€ 1.813.250€ 13.616.947€ 53.085.822€
Health Centre (Public) 6.125.265€ 20.227.027€ 1.711.340€ 9.587.565€ 37.651.197€
District Hospital (Public) 42.745.105€ 76.685.778€ 13.503.152€ 62.136.920€ 195.070.955€
Provincial Hospital (Public) 5.434.795€ 16.563.988€ 2.361.242€ 4.098.631€ 28.458.656€
Tertiary Hospital (Public) 9.536.341€ 28.296.419€ 5.281.557€ 4.251.671€ 47.365.988€
Nursing Home/Enhanced HC(Public) 206.159€ 456.053€ 47.458€ 142.743€ 852.413€
Dispensary, Health Centre (FBO/NGO) 17.067.193€ 10.931.167€ 4.474.100€ 13.846.061€ 46.318.522€
District Hospital (FBO/NGO) 16.619.036€ 19.528.286€ 8.954.498€ 25.072.792€ 70.174.612€
Nursing Home/Enhanced HC (FBO/NGO) 45.077€ 237.802€ 45.778€ 137.972€ 466.629€
Dispensary, Health Centre (Private) 27.602.561€ 32.701.781€ 7.688.156€ 34.615.153€ 102.607.650€
District Hospital (Private) 8.098.325€ 8.729.259€ 3.797.198€ 19.077.125€ 39.701.906€
Tertiary Hospital (Private) 7.608.513€ 3.203.292€ 3.543.382€ 4.251.671€ 18.606.858€
Nursing Home/Enhanced HC 1.709.668€ 1.460.479€ 929.799€ 781.843€ 4.881.790€
District Administration 99.635€ 8.629.723€ 7.006.815€ - 15.736.173€
Provincial Administration - 982.387€ 610.011€ - 1.592.398€
Ministry of Health - 6.138.911€ 25.512.818€ - 31.651.729€
Total 156.223.174€ 259.734.287€ 87.280.555€ 191.709.086€ 694.947.102€
1.000
2.000
3.000
4.000
5.000
6.000
Costsp
erou
tpatient
visitinKshs
First quartile
Minimum value
Median value
Maximum value
Third quartile
Figure 2 Distribution of costs of outpatient visits.
Flessa et al. BMC Health Services Research 2011, 11:128http://www.biomedcentral.com/1472-6963/11/128
Page 7 of 15
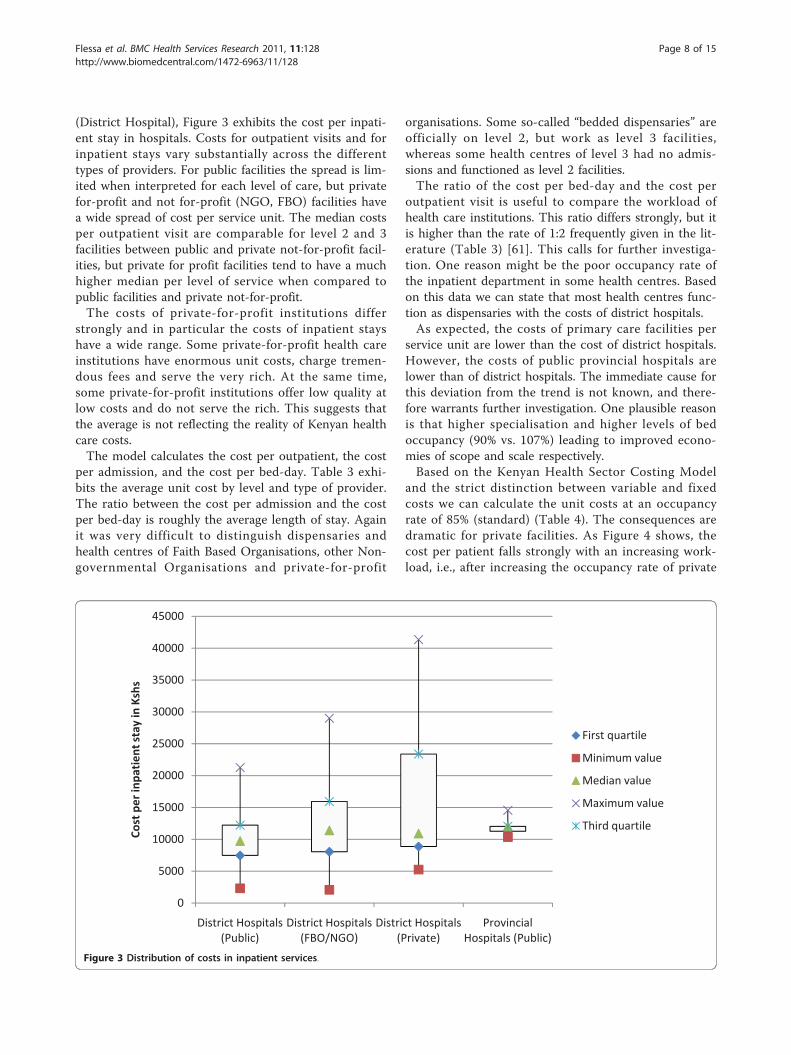
(District Hospital), Figure 3 exhibits the cost per inpati-ent stay in hospitals. Costs for outpatient visits and forinpatient stays vary substantially across the differenttypes of providers. For public facilities the spread is lim-ited when interpreted for each level of care, but privatefor-profit and not for-profit (NGO, FBO) facilities havea wide spread of cost per service unit. The median costsper outpatient visit are comparable for level 2 and 3facilities between public and private not-for-profit facil-ities, but private for profit facilities tend to have a muchhigher median per level of service when compared topublic facilities and private not-for-profit.The costs of private-for-profit institutions differ
strongly and in particular the costs of inpatient stayshave a wide range. Some private-for-profit health careinstitutions have enormous unit costs, charge tremen-dous fees and serve the very rich. At the same time,some private-for-profit institutions offer low quality atlow costs and do not serve the rich. This suggests thatthe average is not reflecting the reality of Kenyan healthcare costs.The model calculates the cost per outpatient, the cost
per admission, and the cost per bed-day. Table 3 exhi-bits the average unit cost by level and type of provider.The ratio between the cost per admission and the costper bed-day is roughly the average length of stay. Againit was very difficult to distinguish dispensaries andhealth centres of Faith Based Organisations, other Non-governmental Organisations and private-for-profit
organisations. Some so-called “bedded dispensaries” areofficially on level 2, but work as level 3 facilities,whereas some health centres of level 3 had no admis-sions and functioned as level 2 facilities.The ratio of the cost per bed-day and the cost per
outpatient visit is useful to compare the workload ofhealth care institutions. This ratio differs strongly, but itis higher than the rate of 1:2 frequently given in the lit-erature (Table 3) [61]. This calls for further investiga-tion. One reason might be the poor occupancy rate ofthe inpatient department in some health centres. Basedon this data we can state that most health centres func-tion as dispensaries with the costs of district hospitals.As expected, the costs of primary care facilities per
service unit are lower than the cost of district hospitals.However, the costs of public provincial hospitals arelower than of district hospitals. The immediate cause forthis deviation from the trend is not known, and there-fore warrants further investigation. One plausible reasonis that higher specialisation and higher levels of bedoccupancy (90% vs. 107%) leading to improved econo-mies of scope and scale respectively.Based on the Kenyan Health Sector Costing Model
and the strict distinction between variable and fixedcosts we can calculate the unit costs at an occupancyrate of 85% (standard) (Table 4). The consequences aredramatic for private facilities. As Figure 4 shows, thecost per patient falls strongly with an increasing work-load, i.e., after increasing the occupancy rate of private
0
5000
10000
15000
20000
25000
30000
35000
40000
45000
District Hospitals(Public)
District Hospitals(FBO/NGO)
District Hospitals(Private)
ProvincialHospitals (Public)
Costpe
rinpa
tien
tstayinKshs
First quartile
Minimum value
Median value
Maximum value
Third quartile
Figure 3 Distribution of costs in inpatient services.
Flessa et al. BMC Health Services Research 2011, 11:128http://www.biomedcentral.com/1472-6963/11/128
Page 8 of 15
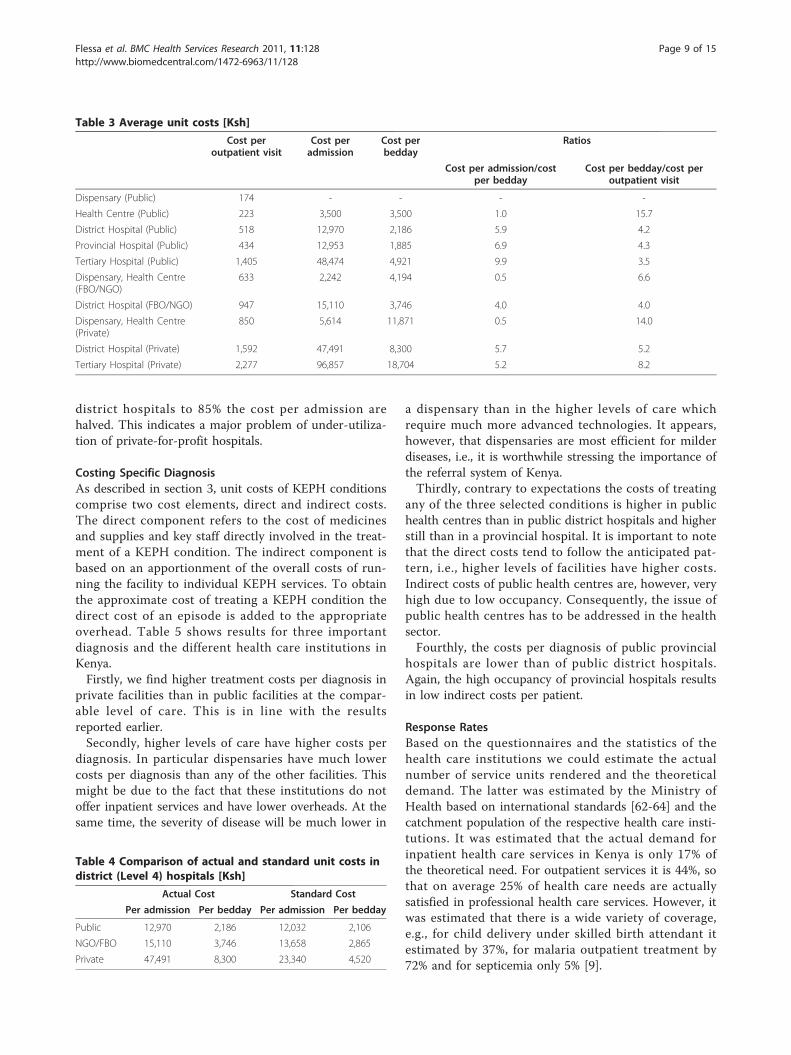
district hospitals to 85% the cost per admission arehalved. This indicates a major problem of under-utiliza-tion of private-for-profit hospitals.
Costing Specific DiagnosisAs described in section 3, unit costs of KEPH conditionscomprise two cost elements, direct and indirect costs.The direct component refers to the cost of medicinesand supplies and key staff directly involved in the treat-ment of a KEPH condition. The indirect component isbased on an apportionment of the overall costs of run-ning the facility to individual KEPH services. To obtainthe approximate cost of treating a KEPH condition thedirect cost of an episode is added to the appropriateoverhead. Table 5 shows results for three importantdiagnosis and the different health care institutions inKenya.Firstly, we find higher treatment costs per diagnosis in
private facilities than in public facilities at the compar-able level of care. This is in line with the resultsreported earlier.Secondly, higher levels of care have higher costs per
diagnosis. In particular dispensaries have much lowercosts per diagnosis than any of the other facilities. Thismight be due to the fact that these institutions do notoffer inpatient services and have lower overheads. At thesame time, the severity of disease will be much lower in
a dispensary than in the higher levels of care whichrequire much more advanced technologies. It appears,however, that dispensaries are most efficient for milderdiseases, i.e., it is worthwhile stressing the importance ofthe referral system of Kenya.Thirdly, contrary to expectations the costs of treating
any of the three selected conditions is higher in publichealth centres than in public district hospitals and higherstill than in a provincial hospital. It is important to notethat the direct costs tend to follow the anticipated pat-tern, i.e., higher levels of facilities have higher costs.Indirect costs of public health centres are, however, veryhigh due to low occupancy. Consequently, the issue ofpublic health centres has to be addressed in the healthsector.Fourthly, the costs per diagnosis of public provincial
hospitals are lower than of public district hospitals.Again, the high occupancy of provincial hospitals resultsin low indirect costs per patient.
Response RatesBased on the questionnaires and the statistics of thehealth care institutions we could estimate the actualnumber of service units rendered and the theoreticaldemand. The latter was estimated by the Ministry ofHealth based on international standards [62-64] and thecatchment population of the respective health care insti-tutions. It was estimated that the actual demand forinpatient health care services in Kenya is only 17% ofthe theoretical need. For outpatient services it is 44%, sothat on average 25% of health care needs are actuallysatisfied in professional health care services. However, itwas estimated that there is a wide variety of coverage,e.g., for child delivery under skilled birth attendant itestimated by 37%, for malaria outpatient treatment by72% and for septicemia only 5% [9].
Table 3 Average unit costs [Ksh]
Cost peroutpatient visit
Cost peradmission
Cost perbedday
Ratios
Cost per admission/costper bedday
Cost per bedday/cost peroutpatient visit
Dispensary (Public) 174 - - - -
Health Centre (Public) 223 3,500 3,500 1.0 15.7
District Hospital (Public) 518 12,970 2,186 5.9 4.2
Provincial Hospital (Public) 434 12,953 1,885 6.9 4.3
Tertiary Hospital (Public) 1,405 48,474 4,921 9.9 3.5
Dispensary, Health Centre(FBO/NGO)
633 2,242 4,194 0.5 6.6
District Hospital (FBO/NGO) 947 15,110 3,746 4.0 4.0
Dispensary, Health Centre(Private)
850 5,614 11,871 0.5 14.0
District Hospital (Private) 1,592 47,491 8,300 5.7 5.2
Tertiary Hospital (Private) 2,277 96,857 18,704 5.2 8.2
Table 4 Comparison of actual and standard unit costs indistrict (Level 4) hospitals [Ksh]
Actual Cost Standard Cost
Per admission Per bedday Per admission Per bedday
Public 12,970 2,186 12,032 2,106
NGO/FBO 15,110 3,746 13,658 2,865
Private 47,491 8,300 23,340 4,520
Flessa et al. BMC Health Services Research 2011, 11:128http://www.biomedcentral.com/1472-6963/11/128
Page 9 of 15
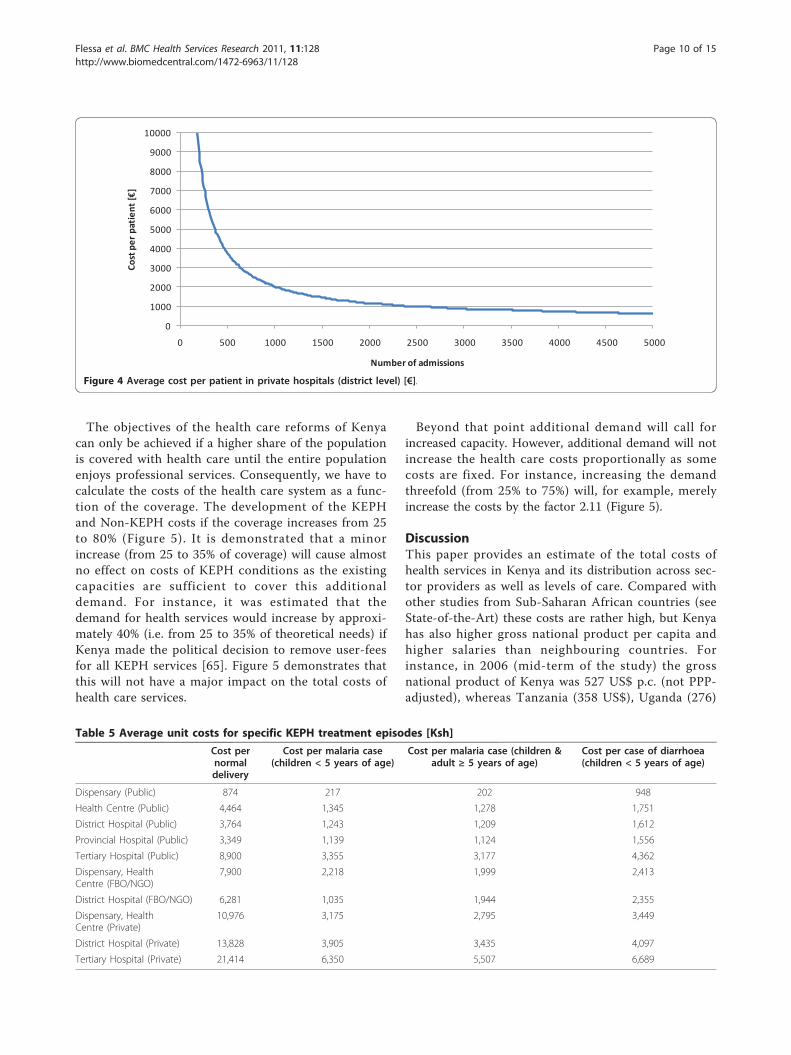
The objectives of the health care reforms of Kenyacan only be achieved if a higher share of the populationis covered with health care until the entire populationenjoys professional services. Consequently, we have tocalculate the costs of the health care system as a func-tion of the coverage. The development of the KEPHand Non-KEPH costs if the coverage increases from 25to 80% (Figure 5). It is demonstrated that a minorincrease (from 25 to 35% of coverage) will cause almostno effect on costs of KEPH conditions as the existingcapacities are sufficient to cover this additionaldemand. For instance, it was estimated that thedemand for health services would increase by approxi-mately 40% (i.e. from 25 to 35% of theoretical needs) ifKenya made the political decision to remove user-feesfor all KEPH services [65]. Figure 5 demonstrates thatthis will not have a major impact on the total costs ofhealth care services.
Beyond that point additional demand will call forincreased capacity. However, additional demand will notincrease the health care costs proportionally as somecosts are fixed. For instance, increasing the demandthreefold (from 25% to 75%) will, for example, merelyincrease the costs by the factor 2.11 (Figure 5).
DiscussionThis paper provides an estimate of the total costs ofhealth services in Kenya and its distribution across sec-tor providers as well as levels of care. Compared withother studies from Sub-Saharan African countries (seeState-of-the-Art) these costs are rather high, but Kenyahas also higher gross national product per capita andhigher salaries than neighbouring countries. Forinstance, in 2006 (mid-term of the study) the grossnational product of Kenya was 527 US$ p.c. (not PPP-adjusted), whereas Tanzania (358 US$), Uganda (276)
0
1000
2000
3000
4000
5000
6000
7000
8000
9000
10000
0 500 1000 1500 2000 2500 3000 3500 4000 4500 5000
Cost
per
pat
ient
[€]
Number of admissions
Figure 4 Average cost per patient in private hospitals (district level) [€].
Table 5 Average unit costs for specific KEPH treatment episodes [Ksh]
Cost pernormaldelivery
Cost per malaria case(children < 5 years of age)
Cost per malaria case (children &adult ≥ 5 years of age)
Cost per case of diarrhoea(children < 5 years of age)
Dispensary (Public) 874 217 202 948
Health Centre (Public) 4,464 1,345 1,278 1,751
District Hospital (Public) 3,764 1,243 1,209 1,612
Provincial Hospital (Public) 3,349 1,139 1,124 1,556
Tertiary Hospital (Public) 8,900 3,355 3,177 4,362
Dispensary, HealthCentre (FBO/NGO)
7,900 2,218 1,999 2,413
District Hospital (FBO/NGO) 6,281 1,035 1,944 2,355
Dispensary, HealthCentre (Private)
10,976 3,175 2,795 3,449
District Hospital (Private) 13,828 3,905 3,435 4,097
Tertiary Hospital (Private) 21,414 6,350 5,507 6,689
Flessa et al. BMC Health Services Research 2011, 11:128http://www.biomedcentral.com/1472-6963/11/128
Page 10 of 15
and Somalia (136 US$) had much lower GNPs p.c.Merely Sudan had a higher income per capita (643 U$),but this figure does not reflect Sudan’s reality. It isskewed due to military aid and oil income. Generally,Kenya is the richest country in Eastern Africa, even ifthe average does not reflect regional and social dispari-ties in this country (see Background).The costing study reported in this paper was designed
to inform policy makers about the total costs of healthcare services, where costs arise across the health sectorand what the differences are in costs between the differ-ent types of providers and levels of care. Consequently,policy makers, politicians and donor agencies can utilizethis data to base the Kenya health care reforms on cost-ing evidence instead of guesses. Before the KenyanHealth Sector Costing Model existed only a very limitedset of small-scale studies and budget reports existedwhich were neither representative nor reliable.We suggest that the data presented in this study can
be utilized in the Kenya Health Sector Reform processin the following areas:
• Budget impact: The actual costs of health care ser-vices in Kenya in 2006/07 were approximately 63billion Ksh or 690 million Euros. However, with thisamount we could cover merely some estimated 25%of the Kenya Essential Programme of Health for theentire population. Government decision-makers anddonor agencies have to be aware of the fact thathealth care is expensive and that covering the entire
population will be even more costly. However,investments in health care are usually regarded to behighly effective in a macro-economic perspective[66,67]. The Kenyan Government has stronglyexpressed its will to cover the entire population withhealth care services. Based on the assumption that80% healthcare coverage is realistic, additionalresources at the value of 431 million Euros would berequired annually for services covered under theKenyan Essential Package for Care (KEPH).• Productivity: The figures indicate that Governmentfacilities have generally lower costs per service unitthan Faith Based Organisations, other Nongovern-mental Organisations and private-for-profit organisa-tions, i.e., without consideration of quality,Government facilities have a higher productivitythan institutions of other trustees. This could haveat least two reasons. Firstly, a poverty level of 46%[68] indicates that comparably cheap or free-of-charge services have a higher demand and thereforeinduce a higher utilization of services with corre-spondingly low costs per service unit. Indeed, amajority of the population seeks low-cost care dueto financial constraints [69]. Secondly, the low unitcosts of Government facilities might indicate a lowquality of services. Indeed, literature and observa-tions by the researchers reported widely on the fre-quency of drug stock-outs in public facilities inKenya [68], an important indicator of quality. Higherutilization and lower quality of Government health
0
200,000,000
400,000,000
600,000,000
800,000,000
1,000,000,000
1,200,000,000
1,400,000,000
25% 30% 40% 50% 60% 70% 80%
Total costs in EUR
Coverage (effective demand) for KEPH and non KEPH services in 2006/07
Non KEPH
KEPH
Figure 5 Cost Responsiveness.
Flessa et al. BMC Health Services Research 2011, 11:128http://www.biomedcentral.com/1472-6963/11/128
Page 11 of 15
care services can explain at least partly the compar-ably low unit costs of Government facilities.The results of the Kenyan Health Sector CostingModel clearly indicate that the costs per service unitare generally lower at lower levels of the health carepyramid. Consequently, it is economically wise tostrengthen the referral system, i.e., patient who canbe treated in dispensaries should not be accepted byhospitals. There are many reasons why the referralsystem does not work, but based on this costingdata the Kenya health care reform has to re-addressthe issue of self-referral.• Spread of outpatient costs: The costs per serviceunit deviate strongly. For outpatient services thespread of costs is largest for private-for-profit facil-ities, signifying that either the productivity of pri-vately run outpatient services is not homogeneous,or that quality varies widely within the sub-sector.This underlines the need to consider a variation inquality within the private subsector until furthermore conclusive studies are undertaken [70]. InKenya it is definitely not true that the private-for-profit sector is only serving the rich with high-qual-ity health care. Instead, the private-for-profit is alsoaddressing the poorer strata of the society withaffordable care (and most likely with a lower qual-ity). This calls for a strengthening of all nationalefforts of quality assurance and regulation of the pri-vate sector to ensure consumer safety in the privatehealth care sector. Thus, the Kenya health carereform has to stress the nationwide implementationof the Kenya Quality Model (KQM) in all healthcare facilities and the Ministry of Public Health andSanitation as well as the Ministry of Medial Serviceshave to accept their role as regulators of the healthcare market.• Spread of inpatient costs: The average costs ofpublic inpatient services are similar to those of pri-vate facilities. However, the range is quite high indi-cating that there are no homogenous inpatientservices of private health care institutions in Kenya.Instead, the private health care sector is segmentedinto private hospitals for the richer strata of thesociety and private-for-profit hospitals for thepoorer. In the political discussion in Kenya it is stillassumed that private-for-profit hospitals are luxur-ious disease palaces for the super-rich. But this isnot the case. There is a strong need to study the pri-vate health sector in more details. It is the impres-sion of the researchers that we know by far too littleabout low-cost private health care services.• Utilization: The generalised unit costs were foundto be less in public facilities than in the private sub-sector, but the differences can be strongly reduced
by increasing the utilization of private facilities. If,for instance, Kenya would cover 80% of the popula-tion with the Kenya Essential Package of Health(KEPH), we would either require a strong increaseof the capacity of public facilities or utilize the pri-vate institutions to a much higher extent. As amajority of public facilities operates at full capacityand building new institutions is very expensive,efforts should be made to use the existing facilitiesand competences in the private sector. Not every-body in the Ministries of Health will readily acceptthe idea to utilize Faith Based and in particular pri-vate-for-profit organisations to a higher extent tocover the population with basic health care services.There is still an invisible rift between the public andthe private sector. Some argue that private facilitiesare too expensive so that they are not suitable forthe Kenya Essential Programme of Health. However,the health sector reform of Kenya focuses on Public-Private-Partnership and gives an explicit role to theprivate sector in providing health care services. Ourstudy demonstrates that the cost per service unit(e.g. outpatient visit, hospital admission) of private-for-profit facilities are rather high in comparison tothe institutions of other trustees. Our data alsoproves that the low utilization (e.g. number of outpa-tients, bed occupancy rate) of these private-for-profitinstitutions is a main reason for these high unitcosts. Assuming normal price elasticity we can con-clude, that the high unit costs in these institutionscould be reduced if the Government of Kenyadecided to pay for essential health care services irre-spective of the owner of the health care institution.• Staffing: The decreasing marginal unit cost withincreasing utilization is based on the assumptionthat health care institutions could either meet thedemand within their given labour capacity or acquiresufficient additional staff. However, hiring profes-sional staff in rural health care institutions and inparticular doctors for remote hospitals is quite diffi-cult in Kenya. Professionals tend to work in cities(in particular Nairobi) and in high-level health carefacilities. Our study results indicate that rural healthcare facilities are - on average - less staff intensivethan urban facilities, and private-for-profit institu-tions attract more professional staff per service unitthan government or faith-based/NGO institutions.The regulating bodies of Kenya must invest thoughtand effort to convince more professionals to work inrural places.• Health insurance: The Vision 2030 and the HealthFinancing Strategy of Kenya have the objective tocover the entire population with essential health careservices irrespective of an individual’s income and
Flessa et al. BMC Health Services Research 2011, 11:128http://www.biomedcentral.com/1472-6963/11/128
Page 12 of 15
wealth. The documents argue that this will in thelong run be achieved by the introduction of a healthinsurance system. Some pilot projects are on theway (e.g. HAKI: Health for All Kenyans ThroughInnovations) to determine the prospects and rules ofa possible health insurance system for Kenya. TheKenyan Health Sector Costing Model contributes tothis development in several aspects. Firstly, it give afirst insight into possible daily flat rate (e.g. for hos-pitals) and capitation (e.g. for dispensaries) as astarting point for the pilot districts of this new finan-cing scheme. Secondly, it demonstrates that thesame payments could be applied to health care insti-tutions of all trustees if we control for quality. Insur-ance will reduce the individual financial burden andwill allow patients to choose their provider so thatwe can anticipate that private health care institutionswill attract more clients so that their unit costs willdecrease. Consequently, this model calls for a rebatescheme where the same service (in quantity andquality) produces the same income for the providerirrespective of his ownership.• Future KEPH: It is obvious that Kenya is in theepidemiological transition where chronic-degenera-tive diseases become more and more dominant.However, the current KEPH concentrates mainly onmother and child health care as well as infectiousdiseases. Therefore, KEPH will have to be adjustedregularly to allow for the new disease panorama ofKenya. The economic consequences are broadlyunknown. The Kenyan Health Sector Costing Modelgives at least some insights on the expected costs byshowing reliable average cost per service unit (e.g.per patient day). This is a necessary - but not suffi-cient - condition of calculating the costs of newdiagnoses to be included into KEPH. Other costitems, such as diagnosis-specific drugs, will have tobe scrutinized additionally.• Coverage: A coverage of some 25% of theoreticalhealth care needs is quite dissatisfactory. Manypatients do not seek professional health care due tolong distances, high prices, poor quality and culturalreasons [64,71]. Our projections show that a mildincrease of coverage has hardly any cost conse-quences as the direct costs of KEPH conditions arevery low, and even strong increases in demand willnot result in proportional growth of health carecosts. Thus, health care reform must focus oninstruments to reduce the barriers. Consequently,the Kenya Quality Model (KQM), the Health for AllKenyans through Innovations (HAKI) and the Map-ping Study under the leadership of the Ministry ofMedical Services and the Ministry of Public Healthand Sanitation in cooperation with the German
Development Cooperation (GIZ) are of high impor-tance for an improved coverage. Their success willincrease the health care expenditure in Kenya - butit is obvious that this increase will be moderate.
The Kenyan Health Sector Costing Model is based ona much higher sample of health care institutions thanany of the studies references in section 3. It was scienti-fically supervised by international scholars and profes-sionally implemented by the German DevelopmentCooperation (GIZ) and the Ministry of Health of Kenya.Consequently, the quality of data is likely to be quitereliable in comparison with other studies on the costs ofhealth care services in developing countries. However,the authors are aware of a number of shortcomings thatlimit the validity and representativeness of the data pre-sented in this paper. Firstly, the model tried to coveralso the cost of level 1 (community services). However,the wide diversity of community services, such as Aids-Control-Programmes, health education, nutrition pro-grammes, gardening, road safety etc., made it very diffi-cult to come up with reliable results. Secondly, wecosted a large number of facilities in comparison toother studies. However, variability of costs, especially inthe private sector may have warranted a larger samplein order to draw national policy conclusions from thestudy. Thirdly, facilities and patients were subjected tothe costing exercise over a period of two months, whichmay under certain circumstances not be representativeof the national average of costs, given that disease andconsultation patterns are contingent on seasonal orother external variations. Finally, Nairobi based facilitieswere under-represented in the sample. Consequently,the results will correctly represent the situation in therest of the country, but might under-estimate the totalcosts for the entire country as - at comparable levels ofcare - healthcare costs generated in Nairobi tend to behigher than healthcare costs generated in rural facilities.
ConclusionsThis paper presents the first publication of results of theKenyan Health Sector Costing Model. The findings pro-vide knowledge that health care costs in Kenya, efficien-cies of health care provision and most likely quality areheterogeneous. This indicates that proposed health carereforms necessitate a flexible approach to account forthe inherent differences in the health system. The studyfurther demonstrated that significant room for improv-ing the efficiencies of the public and private sector facil-ities exist. The public sector facilities are suggested tolack the necessary means to provide treatment accordingto national standards and protocols, whereby the avail-ability of medicines appears to play a pivotal role in this.The private sector institutions are significantly more
Flessa et al. BMC Health Services Research 2011, 11:128http://www.biomedcentral.com/1472-6963/11/128
Page 13 of 15
heterogeneous than the public sector with costs for ser-vices varying widely. It can only be hypothesised thatthis is mirrored in the variability of quality, but furtherstudies need to be undertaken to validate this claim.What has been ascertained in this paper is that privatefacilities generate more costs for medicines and medicalsupply than public hospitals. Further we acknowledgethat private facilities are frequently not used to their fullcapacity which has some relevant policy implications inview of Kenya’s wish to meet Kenyan’s needs for healthservices. At the time of the study the met need was esti-mated to be some 25% on average for all conditions.Besides the policy implications that the findings alludeto, they also provoke economic considerations. Purcha-sers of health care services, i.e. the National HospitalInsurance Fund, private sector insurance companies orindeed the government can negotiate better prices if asteady and stable supply of patients to private healthfacilities can be assured. Measures to that end, such ascapitation payments, are currently being explored inKenya. Another measure, such as block contracting hasso far not received attention at policy or political level.Idle capacity in the private sector can equally, but notexclusively be used for delivering maternal health ser-vices as a priority area, as the output-based aid vouchersystem operated by the Government of Kenya with sup-port from the German Development Cooperationdemonstrates.The Kenyan Health Sector Costing Model is designed
to base health care reform decisions on evidence. Forthis target, the German Development Cooperation (GIZ)invested some 500,000 € (full cost) to develop themodel. It is agreed on that GIZ will also provide suffi-cient funds to update the database regularly so thatKenyan stakeholders are able to utilize these facts forevidence-based decision-making.Meanwhile, the Ministries of Health of Kenya have
started working with this tool, and key stakeholders inthe areas of health finance are in the process of develop-ing ways by which improved Hospital ManagementInformation System (HMIS) data, routinely collected byhealth institutions, can be integrated into the databaseof the model. In addition, sample data from some pilotdistricts (e.g. from the pilots of the above mentionedHAKI project) is currently collected to up-date the database. With this effort we can safeguard that fact-basedefforts are employed to reach the target of the Vision2030: a good health and reliable, equitable, affordableand sustainable health care services for the entire popu-lation of Kenya.
Note1 29.12.2006. Population: 37 million.
AcknowledgementsA special thank goes to the interviewers and to Burkard Koemm whosupervised the implementation.
Author details1University of Greifswald, Faculty of Law and Economics, Friedrich-Loeffler-Str. 70, D-17489 Greifswald, Germany. 2German International Cooperation(GIZ), Health Sector Programme, Nairobi, Kenya. 3Oxford Policy Management(OPM), Oxford, UK.
Authors’ contributionsSF and KH had the original idea of costing health care services in Kenya. TEwas in charge of data collection and modeling. MM and SF drafted thispaper. All authors read and approved the final manuscript.
Competing interestsThe authors declare that they have no competing interests.
Received: 30 November 2010 Accepted: 27 May 2011Published: 27 May 2011
References1. Ministry of Public Health and Sanitation and Ministry of Medial Services:
Accessible, affordable and quality health care in Kenya. Financing Options forUniversial Coverage Ministry of Public Health and Sanitation and M.o.M.Services, Editors. Republic of Kenya: Nairobi; 2010.
2. World Health Organisation: The World Health Report 2001 Geneva: TheWorld Health Organisation; 2001.
3. Rees PH: HIV/AIDS: the first 25 years–a view from Nairobi. East Afr Med J2008, 85(6):292-300.
4. Mwai L, et al: Chloroquine resistance before and after its withdrawal inKenya. Malar J 2009, 8:106.
5. Omran AR: The epidemiological transition: A theory of the epidemiologyof population change. Milbank Memorial Fund Quarterly 1971, 49:509-538.
6. Demery L, Gaddis I: Social Spending, Poverty and Gender Equality inKenya - A Benefit Incidence Analysis. Eschborn: German TechnicalCooperation; 2009.
7. World Bank: World Development Indicators 2007 Washington D.C.: The WorldBank; 2007.
8. Kenya Go: The Constitution of Kenya 2010 Nairobi: Attorney General; 2010.9. Central Bureau of Statistics: Kenya Demographic and Health Survey 2009
Ministry of Medical Services: Nairobi; 2009.10. Sankoh OA, Binka F: INDEPTH Network: Generating Empirical Population
and Health Data in Resource-constrained Countries in the DevelopingWorld. In Health Research in Developing Countries. Edited by: Becher H,Kouyate B. Springer Verlag: Berlin, Heidelberg; 2005:.
11. Ferranti Dd, Lovelace C, Pannenborg O: Preface. In Health expenditures,services, and outcomes in Africa. Basic data and cross-national comparisons,1990-1996. Edited by: Peters DHea. Human Development Network, Health,Nutrition, and Population Series: Washington DC; 1999:v-vi.
12. Mogyorosy Z, Smith P: The main methodological issues in costing health careservices Centre for Health Economics, University of York; 2005.
13. Halliday RG, Darba J: Cost data assessment in multinational economicevaluations: some theory and review of published studies. Appl HealthEcon Health Policy 2003, 2(3):149-55.
14. Dodge R: Foundations of cost and management accounting London:Chapman & Hall; 1994.
15. Drury C: Cost and management accounting: an introduction. London:Thomson;, 5 2003.
16. Drury C: Management and cost accounting. 6 edition. London: ThomsonLearning; 2004.
17. Horngren CT: Management and cost accounting. 3 edition. Harlow: PrenticeHall/Financial Times; 2005.
18. Horngren CT, Datar SM, Foster G: Cost accounting: a managerialemphasis. Charles T. Horngren series in accounting. 11 edition. Upper SaddleRiver, NJ: Prentice Hall; 2003.
19. Storey R: Introduction to cost and management accounting Basingstoke:Palgrave; 1995, xiii, 581.
Flessa et al. BMC Health Services Research 2011, 11:128http://www.biomedcentral.com/1472-6963/11/128
Page 14 of 15
20. Hankins RW, Baker JJ: Management accounting for health care organizations:tools and techniques for decision support Sudbury, Mass. London: Jones andBartlett; 2004, xvi, 467.
21. Jacobs P, Bachynsky J: Costing methods in the Canadian literature on theeconomic evaluation of health care. A survey and assessment. Int JTechnol Assess Health Care 1996, 12(4):721-34.
22. Koopmanschap MA, Touw KC, Rutten FF: Analysis of costs and cost-effectiveness in multinational trials. Health Policy 2001, 58(2):175-86.
23. Pines JM, Fager SS, Milzman DP: A review of costing methodologies incritical care studies. J Crit Care 2002, 17(3):181-6.
24. Smith MW, Barnett PG: Direct measurement of health care costs. MedCare Res Rev 2003, 60(3 Suppl):74S-91S.
25. King M: Activity based costing in hospitals: a case study investigation.London: Chartered Institute of Management Accountants; 1994.
26. Larsen J, Skjoldborg US: Comparing systems for costing hospital treatments.The case of stable angina pectoris. Health Policy 2004, 67(3):293-307.
27. Llewellyn S, Northcott D: The average hospital. Accounting Organisationsand Society 2005, 30:555-583.
28. Oostenbrink JB, et al: Unit costs of inpatient hospital days.Pharmacoeconomics 2003, 21(4):263-71.
29. Oostenbrink JB, Koopmanschap MA, Rutten FF: Standardisation of costs:the Dutch Manual for Costing in economic evaluations.Pharmacoeconomics 2002, 20(7):443-54.
30. Oostenbrink JB, Rutten FF: Cost assessment and price setting of inpatientcare in The Netherlands. The DBC case-mix system. Health Care ManagSci 2006, 9(3):287-94.
31. Reed SD, et al: Comparison of hospital costing methods in an economicevaluation of a multinational clinical trial. Int J Technol Assess Health Care2003, 19(2):396-406.
32. Shuman LJ, Wolfe H: The origins of hospital microcosting. J Soc HealthSyst 1992, 3(4):61-74.
33. Smet M: Cost characteristics of hospitals. Soc Sci Med 2002, 55(6):895-906.34. Adam T, Evans DB, Murray CJ: Econometric estimation of country-specific
hospital costs. Cost Eff Resour Alloc 2003, 1(1):3.35. Phillips MA: Why do costings? Health Policy Plan 1987, 2(3):255-7.36. Mills A: The economics of hospitals in developing countries. Part I:
Expenditure patterns. Health Policy and Planning 1990, 5(2):107-117.37. Mills A: The economics of hospitals in developing countries. Part II: Costs
and sources of incomes. Health Policy and Planning 1990, 5(3):203-218.38. Barnum H, Kutzin J: Public hospitals in developing countries Washington DC:
The World Bank; 1993.39. Creese A, Parker D: Cost analysis in primary health care: a training
manual for programme managers. Geneva: W. H. O; 1994.40. Hanson K, Gilson L: Cost, resource use and financing methodology for
basic health services: a pratical manual. In Bamako Initiative TechnicalReport Series. Volume 16. New York: UNICEF; 1993.
41. Shepard D, Hodgkin D, Antony Y: An analysis of hospital costs: a manual formanagers Geneva: World Health Organisation; 1998.
42. Kumaranayake L: The real and the nominal? Making inflationaryadjustments to cost and other economic data. Health Policy Plan 2000,15(2):230-4.
43. Witter S: Health economics for developing countries: a practical guide.London: Macmillan; 2000.
44. Walker D: Cost and cost-effectiveness guidelines: which ones to use?Health Policy Plan 2001, 16(1):113-21.
45. Walker D, Kumaranayake L: Allowing for differential timing in costanalyses: discounting and annualization. Health Policy Plan 2002,17(1):112-8.
46. Conteh L, Walker D: Cost and unit cost calculations using step-downaccounting. Health Policy Plan 2004, 19(2):127-35.
47. Vaca VH, K SD, Kreider MS: Financing church-related community-basedprimary health care Geneva: Christian Medical Commission; 1987.
48. Asante K: Sustainability of church hospitals in developing countries. Asearch for criteria for success. Geneva: Christian Medical Commission;1998.
49. Cao P, Toyabe S, Akazawa K: Development of a practical costing methodfor hospitals. Tohoku J Exp Med 2006, 208(3):213-24.
50. Murru M, et al: Costing health services in Lacor hospital. Health Policy andDevelopment 2003, 1:61-68.
51. Olukoga A: Unit costs of inpatient days in district hospitals in SouthAfrica. Singapore Med J 2007, 48(2):143-7.
52. Green A, et al: Using costing as a district planning and management toolin Balochistan, Pakistan. Health Policy and Planning 2001, 16(2):180-186.
53. Hutton G, Baltussen R: Cost valuation in resource-poor settings. HealthPolicy and Planning 2005, 20(4):252-259.
54. Manzi F, et al: Out-of-pocket payments for under-five health care in ruralsouthern Tanzania. Health Policy Plan 2005, 20(Suppl 1):i85-i93.
55. Guinness L, Levine R, Weaver M: 10 best resources in... cost analysis forHIV/AIDS programmes in low and middle income countries. Health PolicyPlan 2004, 19:242-245.
56. Hansen K, et al: The costs of HIV/AIDS care at government hospitals inZimbabwe. Health Policy Plan 2000, 15:432-440.
57. Wandwalo E, Robberstad B, Morkve O: Cost and cost-effectiveness ofcommunity based and health facility based directly observed treatmentof tuberculosis in Dar es Salaam, Tanzania. Cost Eff Resour Alloc 2005, 3:6.
58. Johns B, Baltussen R, Hutubessy R: Programme costs in the economicevaluation of health interventions. Cost Eff Resour Alloc 2003, 1:1.
59. Adam T, Aikins M, Evans DB: CostIt Software. Version 4.3. Short User’’sNotes. Geneva: World Health Organisation; 2002.
60. Mathauer I: Setting health insurance remuneration rates of privateproviders in Kenya: the role of costing, challenges and implications. TheInternational Journal of Health Planning and Management 2011, 26(1):e30-e47.
61. Fleßa S: Gesundheitsreformen in Entwicklungsländern: eine kritischeAnalyse aus Sicht der kirchlichen Entwicklungshilfe. Frankfurt am Main:Lembeck; 2002.
62. Amaghionyeodiwe LA: Determinants of the choice of healthcareproviders in Nigeria. Health Care Management Science 2008, 11:215-227.
63. Ministry of Public Health and Sanitation and Ministry of Medial Services:Household Health Expenditure and Utilization Survey Nairobi: Republic ofKenya; 2009.
64. Fleßa S: Costing Health Care Services in Developing Countries - APrerequisite for Affordability, Sustainability and Efficiency. In Challengesin Public Health. Band 57. Edited by: Razum O. Frankfurt am Main: PeterLang; 2009:.
65. Mwabu G, Mwanzia J, Liambila W: User charges in government facilitiesin Kenya: Effect on attendance and revenue. Health Policy and Planning1995, 10(2):164-170.
66. Sachs J: An economist’s view of health. Bull World Health Organ 2002,80:167-169.
67. Flessa S: Investing in health. Journal of Public Health 2007, 15(6):415-421.68. Kenya National Bureau of Statistics: Kenyan Integrated Household Budget
Survey. Nairobi: Government of Kenya; 2006.69. Ministry of Medical Services: Client Satisfaction Survey Nairobi: Government
of Kenya; 2009.70. Bitran R: Efficiency and Quality in the public and private sector in
Senegal. Health Policy and Planning 1995, 10(3):271-283.71. Amaghionyeodiwe LA: Determinants of hte choice of health care
provider in Nigeria. Health Care Management Science 2008, 11:215-227.
Pre-publication historyThe pre-publication history for this paper can be accessed here:http://www.biomedcentral.com/1472-6963/11/128/prepub
doi:10.1186/1472-6963-11-128Cite this article as: Flessa et al.: Basing care reforms on evidence: TheKenya health sector costing model. BMC Health Services Research 201111:128.
Flessa et al. BMC Health Services Research 2011, 11:128http://www.biomedcentral.com/1472-6963/11/128
Page 15 of 15