banks | sector report june'21 - pacra
TRANSCRIPT
Banks | Sector Report June’21
© The Pakistan Credit Rating Agency Limited
Contents Page No.
Overview 1
Five Years at a Glance 2
Foreword | Banking Prospects 3
Asset Analysis 7
Deposit Analysis 12
Banking Spreads 15
Profitability Analysis 16
Financial Ratios 17
Rating Curve 18
Islamic Banking Snapshot 19
Listed Banks | Stock Performance 20
Bibliography 21
TABLE OF CONTENTS
1
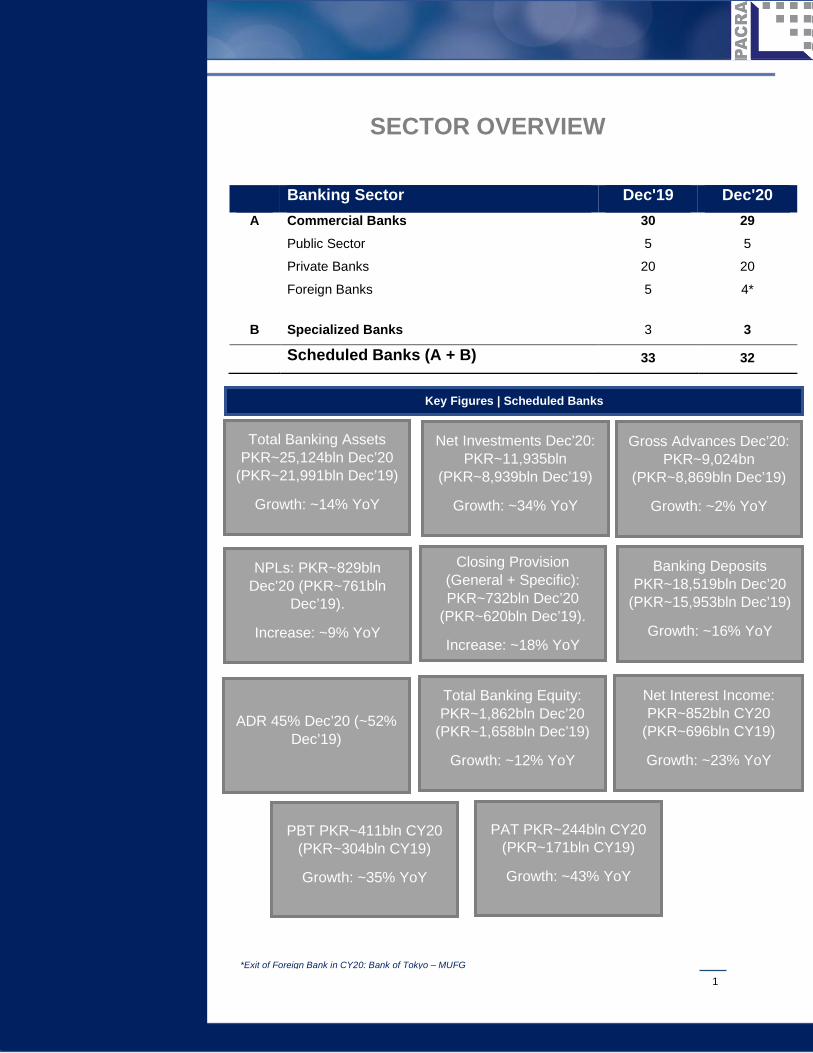
Banking Sector Dec'19 Dec'20 A Commercial Banks 30 29
Public Sector 5 5
Private Banks 20 20
Foreign Banks 5 4*
B Specialized Banks 3 3
Scheduled Banks (A + B) 33 32
SECTOR OVERVIEW
Gross Advances Dec’20: PKR~9,024bn
(PKR~8,869bln Dec’19)
Growth: ~2% YoY
Closing Provision (General + Specific): PKR~732bln Dec’20
(PKR~620bln Dec’19).
Increase: ~18% YoY
NPLs: PKR~829bln Dec’20 (PKR~761bln
Dec’19).
Increase: ~9% YoY
Net Investments Dec’20: PKR~11,935bln
(PKR~8,939bln Dec’19)
Growth: ~34% YoY
Total Banking Assets PKR~25,124bln Dec’20
(PKR~21,991bln Dec’19)
Growth: ~14% YoY
Total Banking Equity: PKR~1,862bln Dec’20
(PKR~1,658bln Dec’19)
Growth: ~12% YoY
Banking Deposits PKR~18,519bln Dec’20
(PKR~15,953bln Dec’19)
Growth: ~16% YoY
ADR 45% Dec’20 (~52% Dec’19)
Net Interest Income: PKR~852bln CY20
(PKR~696bln CY19)
Growth: ~23% YoY
PBT PKR~411bln CY20 (PKR~304bln CY19)
Growth: ~35% YoY
PAT PKR~244bln CY20 (PKR~171bln CY19)
Growth: ~43% YoY
Key Figures | Scheduled Banks
*Exit of Foreign Bank in CY20: Bank of Tokyo – MUFG
2
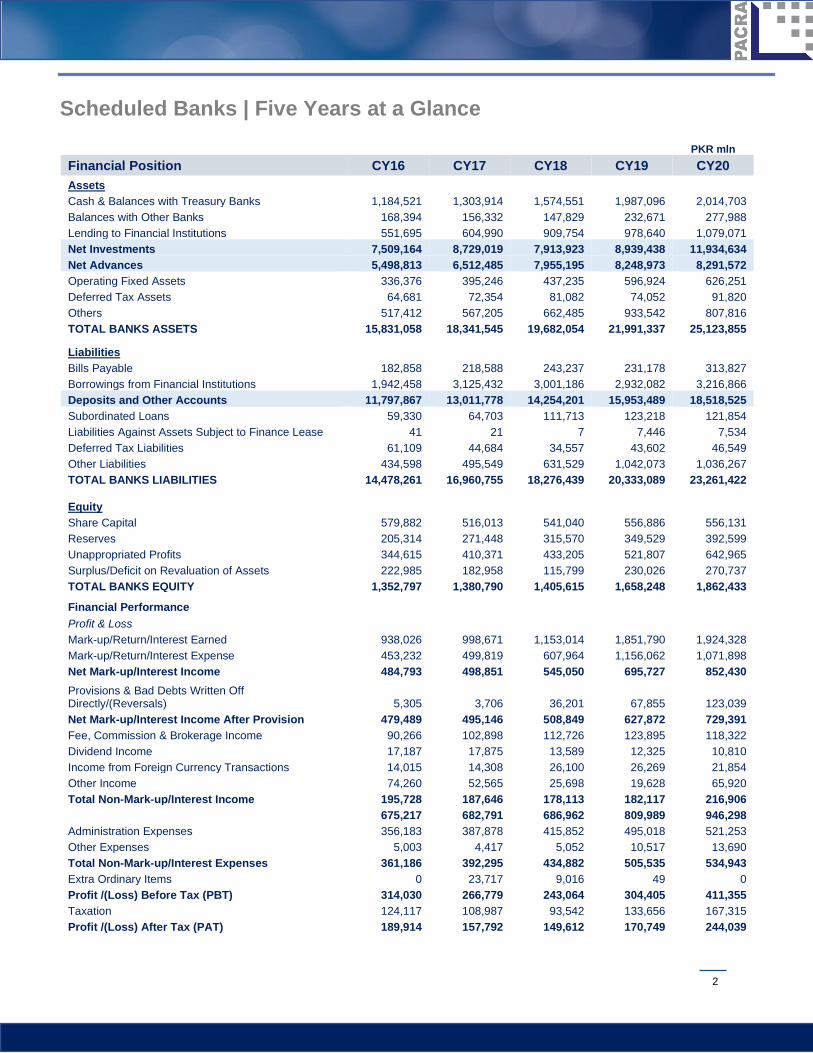
Scheduled Banks | Five Years at a Glance
PKR mln Financial Position CY16 CY17 CY18 CY19 CY20 Assets Cash & Balances with Treasury Banks 1,184,521 1,303,914 1,574,551 1,987,096 2,014,703 Balances with Other Banks 168,394 156,332 147,829 232,671 277,988 Lending to Financial Institutions 551,695 604,990 909,754 978,640 1,079,071 Net Investments 7,509,164 8,729,019 7,913,923 8,939,438 11,934,634 Net Advances 5,498,813 6,512,485 7,955,195 8,248,973 8,291,572 Operating Fixed Assets 336,376 395,246 437,235 596,924 626,251 Deferred Tax Assets 64,681 72,354 81,082 74,052 91,820 Others 517,412 567,205 662,485 933,542 807,816 TOTAL BANKS ASSETS 15,831,058 18,341,545 19,682,054 21,991,337 25,123,855
Liabilities Bills Payable 182,858 218,588 243,237 231,178 313,827 Borrowings from Financial Institutions 1,942,458 3,125,432 3,001,186 2,932,082 3,216,866 Deposits and Other Accounts 11,797,867 13,011,778 14,254,201 15,953,489 18,518,525 Subordinated Loans 59,330 64,703 111,713 123,218 121,854 Liabilities Against Assets Subject to Finance Lease 41 21 7 7,446 7,534 Deferred Tax Liabilities 61,109 44,684 34,557 43,602 46,549 Other Liabilities 434,598 495,549 631,529 1,042,073 1,036,267 TOTAL BANKS LIABILITIES 14,478,261 16,960,755 18,276,439 20,333,089 23,261,422
Equity Share Capital 579,882 516,013 541,040 556,886 556,131 Reserves 205,314 271,448 315,570 349,529 392,599 Unappropriated Profits 344,615 410,371 433,205 521,807 642,965 Surplus/Deficit on Revaluation of Assets 222,985 182,958 115,799 230,026 270,737 TOTAL BANKS EQUITY 1,352,797 1,380,790 1,405,615 1,658,248 1,862,433
Financial Performance Profit & Loss Mark-up/Return/Interest Earned 938,026 998,671 1,153,014 1,851,790 1,924,328 Mark-up/Return/Interest Expense 453,232 499,819 607,964 1,156,062 1,071,898 Net Mark-up/Interest Income 484,793 498,851 545,050 695,727 852,430 Provisions & Bad Debts Written Off Directly/(Reversals) 5,305 3,706 36,201 67,855 123,039 Net Mark-up/Interest Income After Provision 479,489 495,146 508,849 627,872 729,391 Fee, Commission & Brokerage Income 90,266 102,898 112,726 123,895 118,322 Dividend Income 17,187 17,875 13,589 12,325 10,810 Income from Foreign Currency Transactions 14,015 14,308 26,100 26,269 21,854 Other Income 74,260 52,565 25,698 19,628 65,920 Total Non-Mark-up/Interest Income 195,728 187,646 178,113 182,117 216,906
675,217 682,791 686,962 809,989 946,298 Administration Expenses 356,183 387,878 415,852 495,018 521,253 Other Expenses 5,003 4,417 5,052 10,517 13,690 Total Non-Mark-up/Interest Expenses 361,186 392,295 434,882 505,535 534,943 Extra Ordinary Items 0 23,717 9,016 49 0 Profit /(Loss) Before Tax (PBT) 314,030 266,779 243,064 304,405 411,355 Taxation 124,117 108,987 93,542 133,656 167,315 Profit /(Loss) After Tax (PAT) 189,914 157,792 149,612 170,749 244,039

3
Foreword | The Banking Prospects
The Economy | 2020 and beyond:
The year 2020 was a narrative of two halves for the Pakistan economy. Despite kicking off with nascent signs of
economic recovery, the emergence of the global COVID-19 pandemic and its induced lockdown measures took
a toll at the country’s economic performance as business activities almost came to a halt and many major
sectors were severely impacted. Consequently, the country’s GDP contracted by ~0.4% in FY20. However,
unlike many other nations struck by the catastrophe, the recovery path for domestic economy remained brisk
and structured supported by timely fiscal and monetary stimulus. Multiple initiatives by the Government and
apex regulators came handy to achieving economic stabilization. Major steps included Government’s relief
package of PKR~1.4trn, SBP’s decision to slash the policy rate by 625bps, loan restructuring and deferments
allowance by the SBP and introduction of Temporary Economic Refinance Facility (TERF). The country’s
current account balance flipped in surplus in the first two quarters of FY21 owing to restricted imports and debt
repayment relief from G-20 countries (USD~1.7bln). Although, the account turned negative again in 3QFY21
attributed to eased imports, majorly in the non-oil segment, the deficit is expected to remain below 1% of the
GDP. Additionally, improved remittances and export inflows (USD~21bln, up ~7% FY21(P) YoY) kept the
external account stable, with foreign exchange reserves averaging above USD~20bln in 9MFY21. This is
largely credited to the overwhelming response on Roshan Digital Account, an initiative by the SBP, to
encourage overseas Pakistan to remit money in Pakistan, the balance of which has now crossed USD1bln.
Cumulatively, these indicators contributed to the appreciation of PKR by ~3% against USD in 2QFY21. Pakistan
has also been able to secure the much-awaited IMF Extended Fund Facility (EFF) tranche of USD500mln in
Mar’21 based on its satisfactory progress under the fund-supported program.
The effect of economic indicators is gradually surfacing on the Industrial Sector as well. Large Scale
Manufacturing (LSM) registered a promising growth of ~9% in 9MFY21 stemming from some major sectors of
the economy. However, the
Industrial Sector is inevitably
exposed to supply shocks due to
inflationary pressure on the
economic output as international
commodity prices are on a
continual rising trajectory.
Meanwhile, uncertainty with regards
to the third wave of COVID-19 and
business slowdown persists while
vaccination drive remains relatively
slow. Considering the economic
0.002.004.006.008.0010.0012.0014.0016.00
0.002.004.006.008.00
10.0012.0014.0016.00
1Q 2Q 3Q 4Q 1Q 2Q 3Q 4Q 1Q 2Q 3Q 4Q 1Q
CY18 CY19 CY20 CY21
Interest Rates
6M KIBOR | Monthly Average (LHS)
6M T-Bills Cut-Off Yield | RHS
5 Year PIBs Yield | Cut-off Yield | RHS
4
conditions, the SBP has forecasted a GDP growth of ~3% for FY21, while the Government is projecting close to
4% GDP growth. While rising inflation is one of the key concerns, the SBP hints on keeping the policy rate
stable in the short-term and any change is expected to come in a gradual and measured manner.
Banks | A brief Insight:
In an economy of USD~250bln, the banking system holds a deposit base of USD~117bln (PKR~19trn) ~48% of
the GDP. The number, though seems significant, is low when compared to regional peers showing room for
growth. The country’s deposit base grew by ~16% YoY in CY20 almost in line with PKR depreciation of ~16% in
FY20 and aligned to the growth in M1 and M2 money supply. The growth seems impressive in PKR terms yet
remains slow in dollar terms. The deposit base is majorly fueled through CASA deposits contributing around
~70% with an average mix of ~30% CA and ~40% SA. Additionally, funding is also supported through interbank
borrowings (85% deposits and 15% borrowings). On the other hand, the sector added PKR~3trn to its total
asset base in CY20 clocking in at PKR~25trn. Almost ~80% of the banking assets are represented by Advances
and Investments. While Investments recorded a broad-based increase of ~33% in CY20, growth in advances
remained muted at ~1% on account of depressed demand and conservative lending resulting in the Sector ADR
to drop to ~45% in Dec’20 (~52% in Dec’19). The design of the Sector’s loan book represents concentration at
segment level. Almost ~71% of the banking loans are advanced to the corporate sector, while only ~5% are
extended to SMEs, though they make up over 30% of the GDP and only ~7% is utilized in consumer financing.
In a portfolio of PKR~9trn, almost PKR~2.7trn advances are in Energy and Textile Sectors alone (~30%).
Average non-performing loans (NPLs) range around ~10% of the loan book with Sugar and Electronics sectors
being the most significant contributors to the Infection ratio. Interestingly, textile sector, which was once the
highest contributor to Banking NPLs, has now improved its position and is lower than electronics and sugar in
credit infection. Total equity of the sector expanded by 12% in CY20 to PKR~1.9trn (CY19: PKR~1.7trn),
majorly on account of improved profit generation across the board.
Banks | Performance Analysis:
The year 2020 has been a period of turbulence, uncertainties and a bounce back for the domestic economy.
Despite the disruptions, the country’s banking system has demonstrated resilience to the economic shocks
through the support of regulatory measures and relief incentives. All these measures have played ad role in
steering the future direction of the banks in the short to medium term.
The sector’s performance has largely remained a function of two key drivers (i) changes in interest rate
environment and (ii) loan deferments and restructuring. The reduction in interest rates has impacted the sector’s
performance in a number of ways. As interest rates have declined, the yield on earning assets has fallen
resulting in banking spreads to shrink due to lower ADR. On the other hand, the reduction has come with a
timing difference on assets and deposits. The banking assets have gradually absorbed the change till 4QCY20
while the impact on deposits did not come off laggard. Consequently, the Net Interest Income (NII), has
benefitted to a great extent in CY20 and grew by a handsome ~23% recording around PKR~850bln. The
5
interest rate cut also enabled the banks to record promising one-off gains on government paper (PIBs and T-
bills), which fostered their profitability. Additionally, the mix of banking deposits of ~30% current accounts kept
the cost of funding in check. The demand for private sector credit remained muted for most of 2020, pushing the
banks to redirect their funding towards Government papers to earn better profits. Almost ~54% of the Mark-up
earned during CY20 pertained to investments. On the contrary, provision expense of the sector increased
drastically by ~105% in CY20, despite SBP’s allowance for deferment and restructuring of loans. This was
generally a strategic decision since most banks enjoyed higher profits and prudently recorded discretionary
provisions to reserve cushion against provisions that might arise in 2021 from pandemic-affected customers,
once SBP relaxations and waivers are rolled back. Up till April 16, 2021, a principal amount of PKR~911bln has
been approved by the banks, DFIs and MFBs for deferment and restructuring of loans of which Corporate
Sector share is around ~79%. This mix is aligned to the concentration of banking loans in the corporate sector.
Banks | Future Outlook | Stable:
Pakistan’s economy has rebounded well from COVID related shocks. SBP has hinted at a stable interest rate
environment. Hence no major upward revision in the interest rates is expected in the short-term barring very
high inflation. Any change in SBP’s stance regarding interest rate environment is expected to be gradual and
measured. This means that in the short term, yields and spreads are expected to remain largely in the same
range as they are now. The benefit of timing difference on spread adjustment and gains on interest cut have
already been factored into the sector profitability. While Industrial activity is gearing up and an uptick in private
sector lending is very likely, this may come with a need to expand the banking sector’s risk appetite too. Sectors
where infection ratio is alarmingly high (Sugar and Electronics) are prone to significant risks of defaults and
cautious approach is necessitated. Highest risk lies for the banks where reserves created to counter any
sudden deterioration in asset quality are insufficient. It is also pertinent to highlight that the application of IFRS-9
is around the corner, based on which, the provision expense is expected to elevate under the “Expected Credit
Loss” method. So, an increase in volume would come with a risk that would need cautious management
strategies. The banking credit reflects that almost ~41% of the sector loan book is dedicated to Short-Term
Working Capital Loans and Trade Finance – a concentrated exposure in short lived loans. Another key
challenge to the performance of the sector is its high operating costs. Almost ~55% of the core and non-core
income earned by the banks is consumed by the operating costs of the sector, leaving no major buffer to absorb
unanticipated losses. The Sector’s ADR has historically averaged around ~50%. While this is a sign that no
funding constraints exist for the sector, yet it also signifies room for credit growth even just to reach even split of
assets. The low ADR has been an approach that supported the banking sector’s profitability as banks go for
“safe lending” to the Government. It also implies that on an economic level, our banking sector still lacks behind
in energizing the banking penetration, providing impetus for growth of small industries and supporting financial
inclusion in the country. Pakistan continues to be among the top 7 unbanked economies of the world, SMEs,
holding over ~30% share in GDP have a meagre share of ~5% in banking credit. The Government intends to
stimulate the economy through SME and consumer banking inclusion and various initiatives are underway.
6
SBP’s Measures and Initiatives:
COVID-19 | Major Measures:
• The Monetary Policy Committee (MPC) reduced the policy rate by a cumulative 625 basis points from
13.25 percent to 7 percent in a short span of time from mid-March to June 2020.
• Temporary Economic Refinance Facility (TERF) is a concessionary refinance facility aimed at
promoting investment both new and expansion and/or Balancing, Modernization and Replacement
(BMR).
• Loan Extension and Restructuring Package of State Bank of Pakistan (Debt Relief Scheme) was
announced to facilitate the borrowers in restructuring and deferment of their loans.
• SBP Rozgar Scheme: The Scheme aims to prevent layoff by financing wages and salaries of
employees (permanent, contractual, daily wagers as well as outsourced) for six months for all kind of
businesses except for Government entities.
Other Initiatives:
• Issuance of SBP Amendment Act, 2021, giving more autonomy to the central bank, both in terms of
defined policy goals and appointments, minimize government and political interventions, and ensure
partial impunity for SBP officials from federal and provincial investigation agencies in case of any
alleged wrongdoing.
• Issuance of draft regulatory framework for digital banks. The proposed framework entails guidelines
for licensing, and supplementary regulations for digital banks. It sets out different types of digital bank
licenses, constitution models, minimum eligibility criteria and competencies for sponsors, directors, and
CEOs.
• Launch of Roshan Apni Car and Roshan Samaaji Khidmat after a promising response on Roshan
Digital Account (Sep’20).
• Launch of Raast: Raast is Pakistan’s first instant payment system that will enable end-to-end digital
payments among individuals, businesses and government entities instantaneously. The state-of-the-art
Pakistan’s Faster Payment System will be used to settle small-value retail payments in real time while
at the same time provide a cheap and universal access to all players in the financial industry including
banks and fintechs.
• SBP has issued regulatory framework to facilitate Business-to-Consumer (B2C) e-Commerce
exports from Pakistan. Under the new regulatory framework, the mandatory requirement of ‘Export’ (E)
form has been done away with and now an exporter can export goods up to USD 5,000/- per
consignment without the requirement of ‘E’ Form. This step facilitates exports in small quantities directly
to the consumers.
7
ASSET ANALYSIS: SCHEDULED BANKS
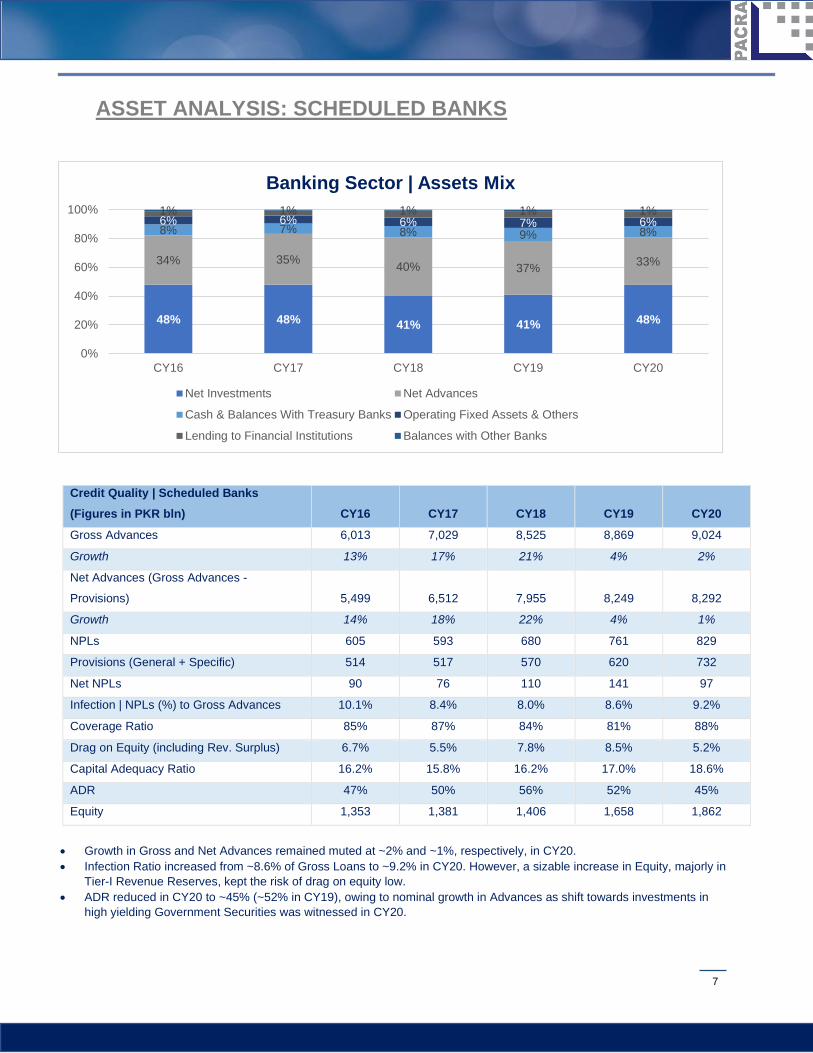
Credit Quality | Scheduled Banks (Figures in PKR bln) CY16 CY17 CY18 CY19 CY20 Gross Advances 6,013 7,029 8,525 8,869 9,024
Growth 13% 17% 21% 4% 2%
Net Advances (Gross Advances -
Provisions) 5,499 6,512 7,955 8,249 8,292
Growth 14% 18% 22% 4% 1%
NPLs 605 593 680 761 829
Provisions (General + Specific) 514 517 570 620 732
Net NPLs 90 76 110 141 97
Infection | NPLs (%) to Gross Advances 10.1% 8.4% 8.0% 8.6% 9.2%
Coverage Ratio 85% 87% 84% 81% 88%
Drag on Equity (including Rev. Surplus) 6.7% 5.5% 7.8% 8.5% 5.2%
Capital Adequacy Ratio 16.2% 15.8% 16.2% 17.0% 18.6%
ADR 47% 50% 56% 52% 45%
Equity 1,353 1,381 1,406 1,658 1,862
48% 48% 41% 41% 48%
34% 35% 40% 37% 33%
8% 7% 8% 9% 8%6% 6% 6% 7% 6%1% 1% 1% 1% 1%
0%
20%
40%
60%
80%
100%
CY16 CY17 CY18 CY19 CY20
Banking Sector | Assets Mix
Net Investments Net Advances
Cash & Balances With Treasury Banks Operating Fixed Assets & Others
Lending to Financial Institutions Balances with Other Banks
• Growth in Gross and Net Advances remained muted at ~2% and ~1%, respectively, in CY20. • Infection Ratio increased from ~8.6% of Gross Loans to ~9.2% in CY20. However, a sizable increase in Equity, majorly in
Tier-I Revenue Reserves, kept the risk of drag on equity low. • ADR reduced in CY20 to ~45% (~52% in CY19), owing to nominal growth in Advances as shift towards investments in
high yielding Government Securities was witnessed in CY20.
8
SEGMENT WISE LOAN PORTFOLIO
Figures in PKR bln CY19 CY20 Segment Wise Banking Credit
Exposure
Gross Advances
NPLs Infection
(%)
Share in total
advances
Gross Advances
NPLs Infection
(%)
Share in total
advances Corporate Sector 6,357 563 9% 72% 6,422 605 9% 71% Fixed Investments 2,802 269 10% 32% 3,097 283 9% 34%
Working Capital 2,307 201 9% 26% 2,087 226 11% 23%
Trade Finance 1,247 92 7% 14% 1,239 96 8% 14%
SMEs 480 77 16% 5% 461 79 17% 5% Fixed Investments 105 12 12% 1% 105 12 12% 1%
Working Capital 331 57 17% 4% 315 59 19% 3%
Trade Finance 44 8 18% 0% 41 8 19% 0%
Agriculture 345 61 18% 4% 338 77 23% 4% Consumer Financing 573 26 5% 6% 635 31 5% 7% (i) Credit Cards 49 3 5% 1% 51 3 6% 1%
(ii) Auto Loans 220 3 1% 2% 258 4 2% 3%
(iii) Consumer Durables 1 0 5% 0% 1 0 6% 0%
(iv) Mortgage Loans 93 11 12% 1% 94 12 12% 1%
(v) Other Personal
Loans 210 9 4% 2% 231 12 5% 3%
Commodity Financing 799 7 1% 9% 833 8 1% 9% Cotton 32 1 4% 0% 32 1 3% 0%
Rice 21 3 13% 0% 29 3 9% 0%
Sugar 72 3 4% 1% 72 2 3% 1%
Wheat 588 0 0% 7% 611 1 0% 7%
Others 87 1 1% 1% 89 1 1% 1%
Staff Loans 151 2 1% 2% 164 2 1% 2%
Others 165 25 15% 2% 171 26 16% 2%
TOTAL 8,869 761 100% 9,024 829 100%
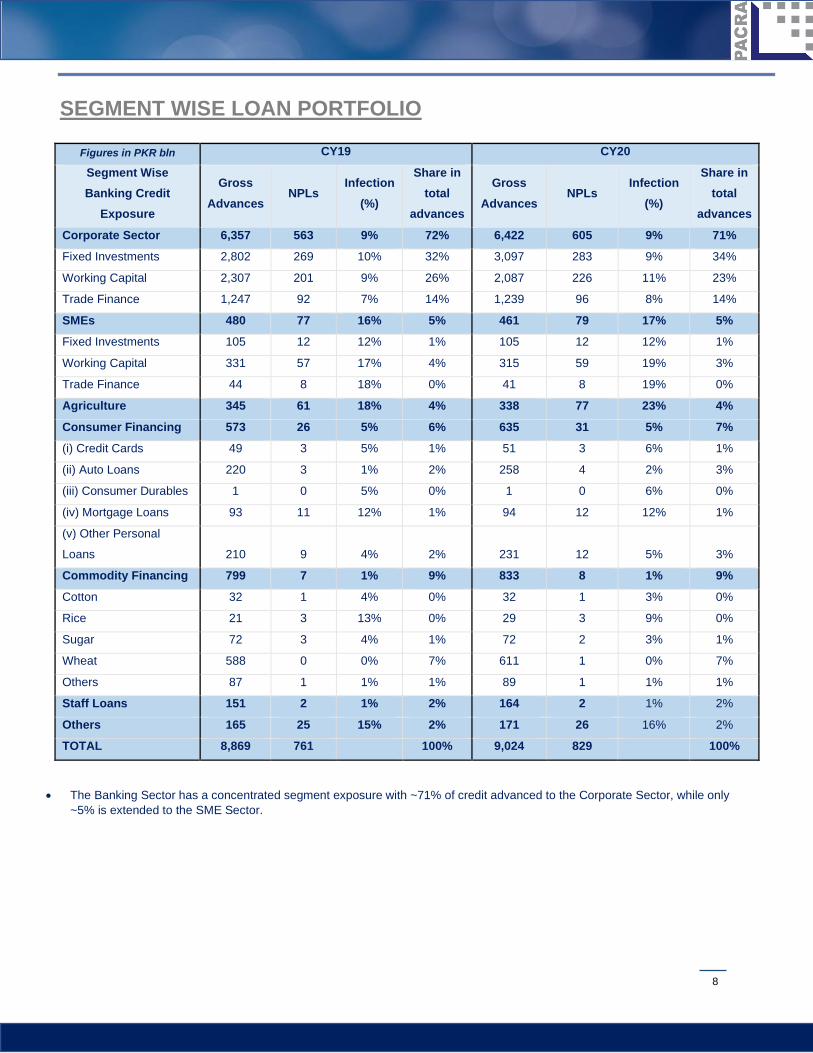
• The Banking Sector has a concentrated segment exposure with ~71% of credit advanced to the Corporate Sector, while only ~5% is extended to the SME Sector.
9
SECTOR WISE LOAN PORTFOLIO
ADVANCES (NET) BY BANKS:
Large Banks
Extra Large Banks
Advances Growth (%)
NPLs Infection Ratio ADR System Share
CY19 CY20 1QCY21 CY19 CY20 1QCY21 CY19 CY20 1QCY21 CY19 CY20 1QCY21 CY20 1QCY21
HBL 1,073 1,117 1,102 4% 82 82 75 8% 7% 7% 47% 42% 42% 14% 14%
NBP 1,073 983 948 -8% 149 171 183 14% 17% 19% 49% 41% 42% 12% 12%
Total/Average 2,146 2,101 2,050 231 253 257 11% 12% 13% 48% 41% 42% 26% 25%
Large Banks Advances
Growth NPLs Infection Ratio ADR System Share
CY19 CY20 1QCY21 CY19 CY20 1QCY21 CY19 CY20 1QCY21 CY19 CY20 1QCY21 CY20 1QCY21
UBL 636 530 541 -17% 77 84 80 12% 16% 15% 43% 32% 33% 7% 7%
MCB 497 463 429 -7% 49 51 52 10% 11% 12% 43% 36% 33% 6% 5%
Sector Wise Financing (figures in PKR bln)
CY19 CY20
Advances NPLs Infection
(%)
Share in total
Advances Advances NPLs
Infection (%)
Share in total
Advances
Energy 1,493 47 3% 17% 1,394 58 4% 15%
Textile 1,206 180 15% 14% 1,343 170 13% 15%
Individuals 764 61 8% 9% 815 65 8% 9%
Agribusiness 705 63 9% 8% 702 80 11% 8%
Pharma & Chemicals 311 15 5% 4% 327 17 5% 4%
Sugar 221 51 23% 2% 238 57 24% 3%
Financial Sector 252 11 4% 3% 230 11 5% 3%
Cement 191 4 2% 2% 204 6 3% 2%
Automobile 177 18 10% 2% 143 18 12% 2%
Electronics 120 20 17% 1% 111 22 20% 1%
Shoes & Leather garments 39 6 15% 0% 37 6 15% 0%
Insurance 4 0 0% 0% 6 0 2% 0%
Others 3,387 286 8% 38% 3,473 319 9% 38%
Total 8,869 761 100% 9,024 829 100%
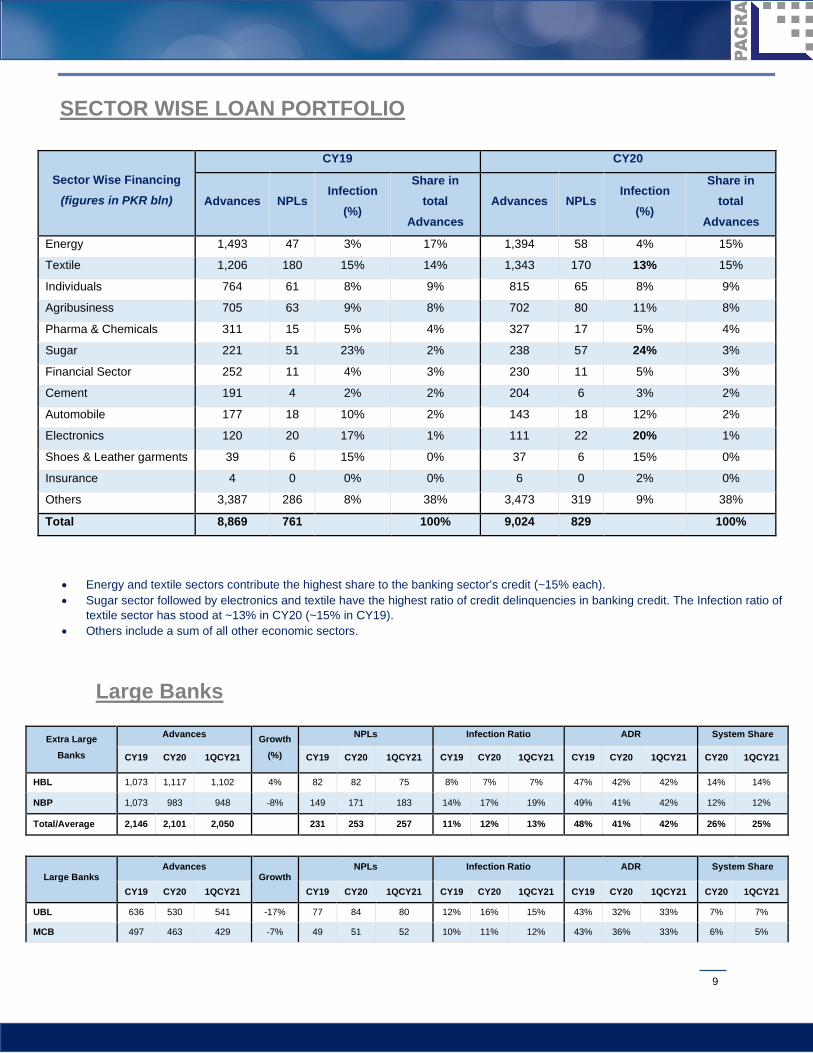
• Energy and textile sectors contribute the highest share to the banking sector’s credit (~15% each). • Sugar sector followed by electronics and textile have the highest ratio of credit delinquencies in banking credit. The Infection ratio of
textile sector has stood at ~13% in CY20 (~15% in CY19). • Others include a sum of all other economic sectors.
10
Meezan 494 513 522 4% 9 15 15 2% 3% 3% 46% 41% 42% 6% 6%
ABL 485 496 429 2% 16 14 14 3% 3% 3% 53% 41% 35% 6% 5%
AL Habib 489 510 533 4% 7 7 7 1% 1% 1% 54% 46% 46% 6% 7%
Alfalah 511 577 583 13% 22 26 25 4% 4% 4% 65% 65% 64% 7% 7%
Total/Average 3,112 3,090 3,038 181 197 192 5% 6% 6% 51% 44% 42% 38% 38%
Grand Total 5,258 5,190 5,088 -1% 411 451 450 8% 9% 10% 49% 42% 42% 64% 63%
Medium Banks
Medium Banks Advances
Growth NPLs Infection Ratio ADR System Share
CY19 CY20 1QCY21 CY19 CY20 1QCY21 CY19 CY20 1QCY21 CY19 CY20 1QCY21 CY20 1QCY21
BOP 383 391 415 2% 51 57 57 13% 15% 14% 55% 47% 50% 5% 5%
Askari 373 395 414 6% 28 28 28 8% 7% 7% 55% 50% 52% 5% 5%
Metro 264 312 346 18% 18 19 19 7% 6% 6% 43% 46% 48% 4% 4%
Standard Chartered 218 178 214 -18% 18 23 22 8% 13% 10% 47% 32% 38% 2% 3%
Faysal 310 318 322 3% 30 26 24 10% 8% 7% 68% 59% 59% 4% 4%
JS Bank 243 250 251 3% 10 12 13 4% 5% 5% 66% 58% 59% 3% 3%
Total/Average 1,791 1,845 1,962 3% 156 166 163 8% 9% 8% 56% 49% 51% 23% 24%
Small Banks
Small Banks Advances
Growth NPLs Infection Ratio ADR System Share
CY19 CY20 1QCY21 CY19 CY20 1QCY21 CY19 CY20 1QCY21 CY19 CY20 1QCY21 CY20 1QCY21
Soneri Bank 205 165 200 -20% 11 11 11 5% 7% 5% 68% 48% 59% 2% 2%
Bank Islami 132 130 153 -1% 8 18 19 6% 13% 12% 58% 46% 53% 2% 2%
DIB 178 199 205 12% 5 6 7 3% 3% 3% 85% 84% 83% 2% 3%
Bank of Khyber 110 129 137 18% 5 7 7 5% 6% 5% 60% 64% 64% 2% 2%
AlBaraka Bank 75 90 99 20% 9 10 10 12% 11% 10% 58% 57% 64% 1% 1%
Silk* 106 99 -7% 35 35 33% 35% 72% 64% 0% 1% 0%
MCB Islamic 51 85 85 65% 0 1 0 1% 1% 0% 63% 86% 84% 1% 1%
Samba 61 66 69 7% 3 3 4 4% 4% 5% 85% 84% 88% 1% 1%
Sindh 61 57 58 -7% 34 35 35 55% 62% 61% 46% 31% 30% 1% 1%
First Women Bank* 10 11 8% 2 2 18% 17% 58% 44% 0% 0% 0%
Summit Bank* 86 61 -28% 17 36 20% 59% 59% 72% 0% 1% 0%
Total/Average 1,076 1,093 1,005 2% 128 163 92 15% 20% 13% 65% 62% 48% 13% 12%
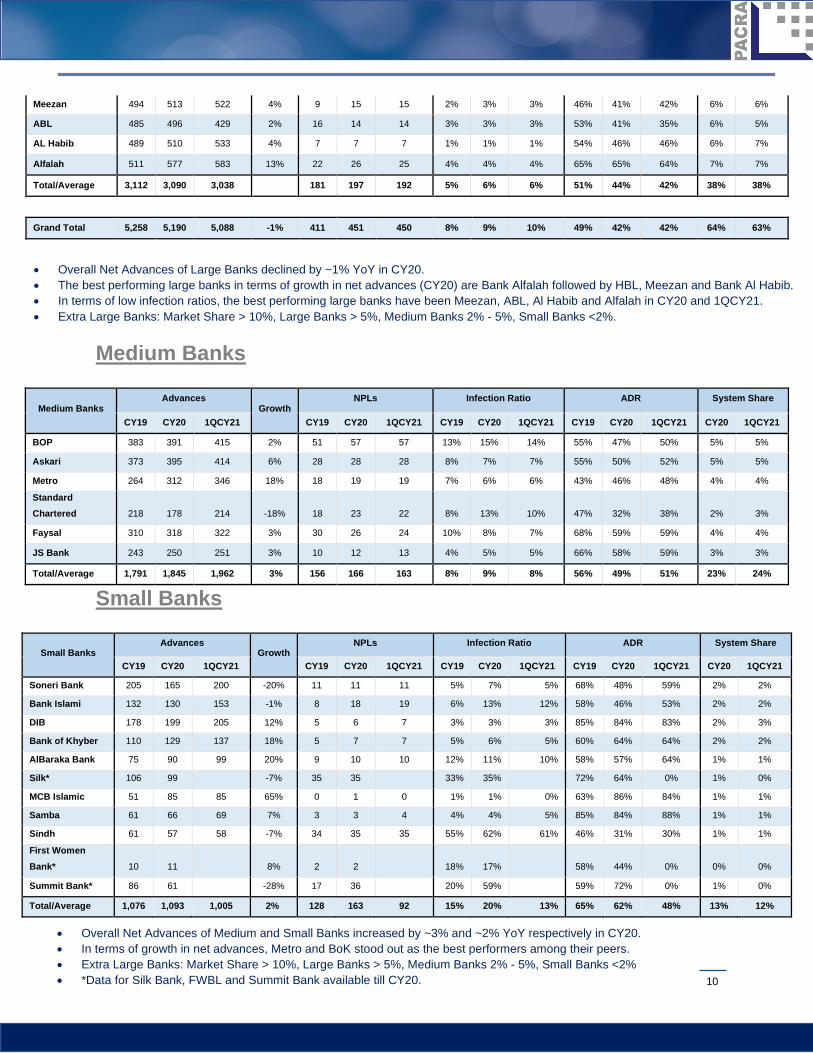
• Overall Net Advances of Large Banks declined by ~1% YoY in CY20. • The best performing large banks in terms of growth in net advances (CY20) are Bank Alfalah followed by HBL, Meezan and Bank Al Habib. • In terms of low infection ratios, the best performing large banks have been Meezan, ABL, Al Habib and Alfalah in CY20 and 1QCY21. • Extra Large Banks: Market Share > 10%, Large Banks > 5%, Medium Banks 2% - 5%, Small Banks <2%.
• Overall Net Advances of Medium and Small Banks increased by ~3% and ~2% YoY respectively in CY20. • In terms of growth in net advances, Metro and BoK stood out as the best performers among their peers. • Extra Large Banks: Market Share > 10%, Large Banks > 5%, Medium Banks 2% - 5%, Small Banks <2% • *Data for Silk Bank, FWBL and Summit Bank available till CY20.
11
CAPITAL ADEQUACY | BY BANKS
Extra Large Banks Capital Adequacy Ratio
CY19 CY20 1QCY21
HBL 17% 19% 20%
NBP 15% 20% 22%
Average 16% 19% 21%
Large Banks Capital Adequacy Ratio
CY19 CY20 1QCY21
UBL 19% 24% 24%
MCB 19% 21% 20%
Meezan 22% 25% 26%
ABL 17% 18% 18%
AL Habib 14% 15% 14%
Alfalah 17% 17% 16%
Average 18% 20% 20%
Medium Banks Capital Adequacy Ratio
CY19 CY20 1QCY21
BOP 15% 16% 14%
Askari 13% 15% 14%
Metro 15% 17% 15%
Standard Chartered 17% 19% 17%
Faysal 19% 19% 19%
JS Bank 13% 13% 13%
Average 15% 17% 15%
Small Banks Capital Adequacy Ratio
CY19 CY20 1QCY21
Soneri Bank 16% 17% 15%
Bank Islami 15% 16% 15%
DIB 17% 17% 16%
Bank of Khyber 15% 19% 17%
AlBaraka Bank 13% 13% 13%
Silk* 6% 4%
MCB Islamic 14% 12% 12%
Samba 18% 18% 20%
Sindh* 13% 15% 14%
First Women Bank 35% 36%
Summit Bank** 4% -8%
Average 15% 14% 15%
12
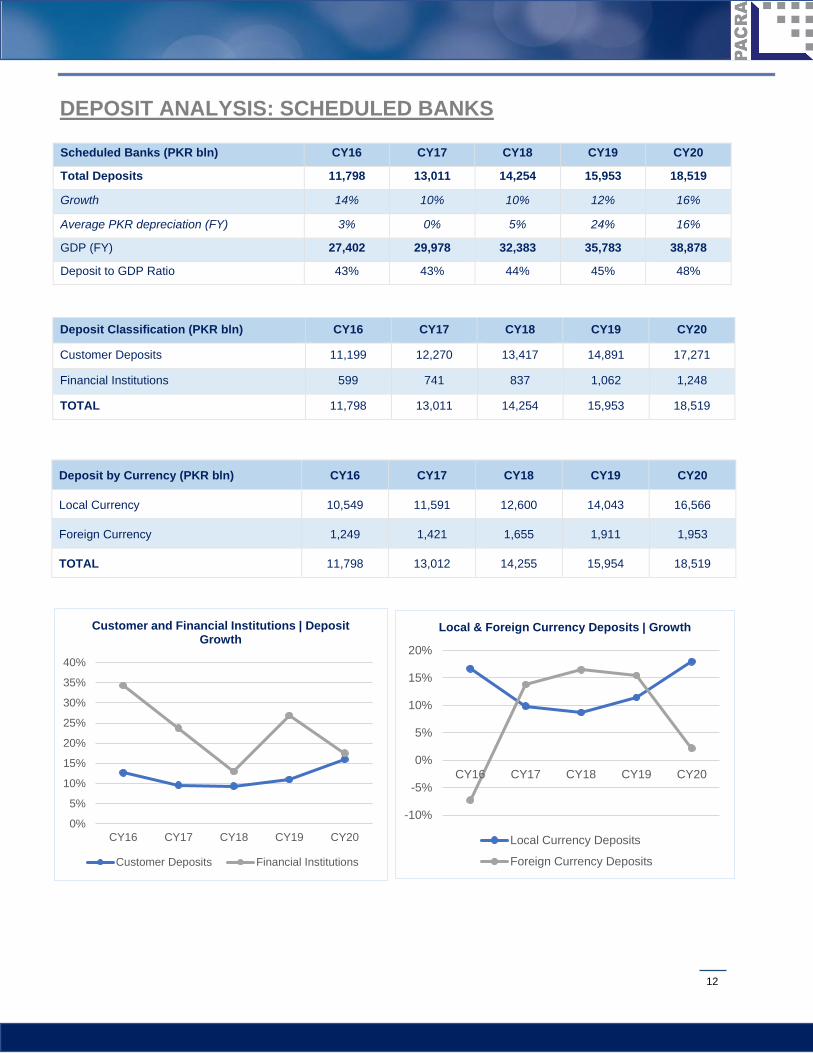
DEPOSIT ANALYSIS: SCHEDULED BANKS
Scheduled Banks (PKR bln) CY16 CY17 CY18 CY19 CY20
Total Deposits 11,798 13,011 14,254 15,953 18,519
Growth 14% 10% 10% 12% 16%
Average PKR depreciation (FY) 3% 0% 5% 24% 16%
GDP (FY) 27,402 29,978 32,383 35,783 38,878
Deposit to GDP Ratio 43% 43% 44% 45% 48%
Deposit Classification (PKR bln) CY16 CY17 CY18 CY19 CY20
Customer Deposits 11,199 12,270 13,417 14,891 17,271
Financial Institutions 599 741 837 1,062 1,248
TOTAL 11,798 13,011 14,254 15,953 18,519
Deposit by Currency (PKR bln) CY16 CY17 CY18 CY19 CY20
Local Currency 10,549 11,591 12,600 14,043 16,566
Foreign Currency 1,249 1,421 1,655 1,911 1,953
TOTAL 11,798 13,012 14,255 15,954 18,519
0%
5%
10%
15%
20%
25%
30%
35%
40%
CY16 CY17 CY18 CY19 CY20
Customer and Financial Institutions | Deposit Growth
Customer Deposits Financial Institutions
-10%
-5%
0%
5%
10%
15%
20%
CY16 CY17 CY18 CY19 CY20
Local & Foreign Currency Deposits | Growth
Local Currency Deposits
Foreign Currency Deposits
13
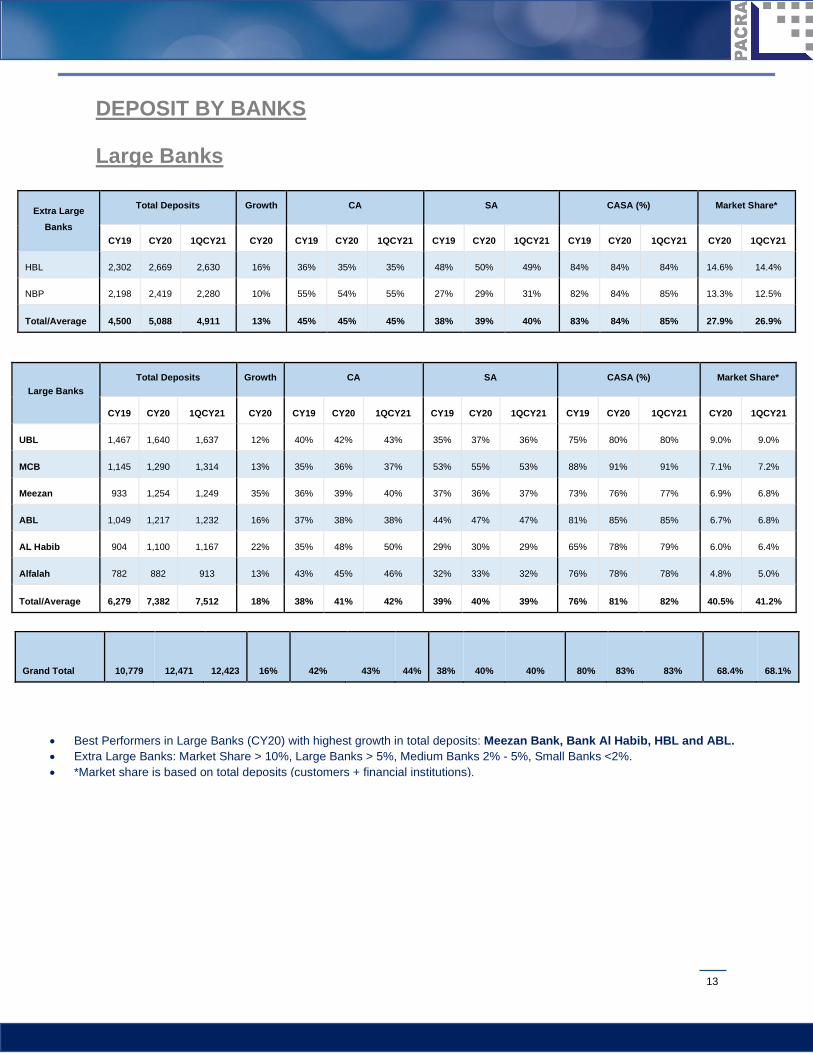
DEPOSIT BY BANKS
Large Banks
Extra Large Banks
Total Deposits Growth CA SA CASA (%) Market Share*
CY19 CY20 1QCY21 CY20 CY19 CY20 1QCY21 CY19 CY20 1QCY21 CY19 CY20 1QCY21 CY20 1QCY21
HBL 2,302 2,669 2,630 16% 36% 35% 35% 48% 50% 49% 84% 84% 84% 14.6% 14.4%
NBP 2,198 2,419 2,280 10% 55% 54% 55% 27% 29% 31% 82% 84% 85% 13.3% 12.5%
Total/Average 4,500 5,088 4,911 13% 45% 45% 45% 38% 39% 40% 83% 84% 85% 27.9% 26.9%
Large Banks Total Deposits Growth CA SA CASA (%) Market Share*
CY19 CY20 1QCY21 CY20 CY19 CY20 1QCY21 CY19 CY20 1QCY21 CY19 CY20 1QCY21 CY20 1QCY21
UBL 1,467 1,640 1,637 12% 40% 42% 43% 35% 37% 36% 75% 80% 80% 9.0% 9.0%
MCB 1,145 1,290 1,314 13% 35% 36% 37% 53% 55% 53% 88% 91% 91% 7.1% 7.2%
Meezan 933 1,254 1,249 35% 36% 39% 40% 37% 36% 37% 73% 76% 77% 6.9% 6.8%
ABL 1,049 1,217 1,232 16% 37% 38% 38% 44% 47% 47% 81% 85% 85% 6.7% 6.8%
AL Habib 904 1,100 1,167 22% 35% 48% 50% 29% 30% 29% 65% 78% 79% 6.0% 6.4%
Alfalah 782 882 913 13% 43% 45% 46% 32% 33% 32% 76% 78% 78% 4.8% 5.0%
Total/Average 6,279 7,382 7,512 18% 38% 41% 42% 39% 40% 39% 76% 81% 82% 40.5% 41.2%
Grand Total 10,779 12,471 12,423 16% 42% 43% 44% 38% 40% 40% 80% 83% 83% 68.4% 68.1%
• Best Performers in Large Banks (CY20) with highest growth in total deposits: Meezan Bank, Bank Al Habib, HBL and ABL. • Extra Large Banks: Market Share > 10%, Large Banks > 5%, Medium Banks 2% - 5%, Small Banks <2%. • *Market share is based on total deposits (customers + financial institutions).
14
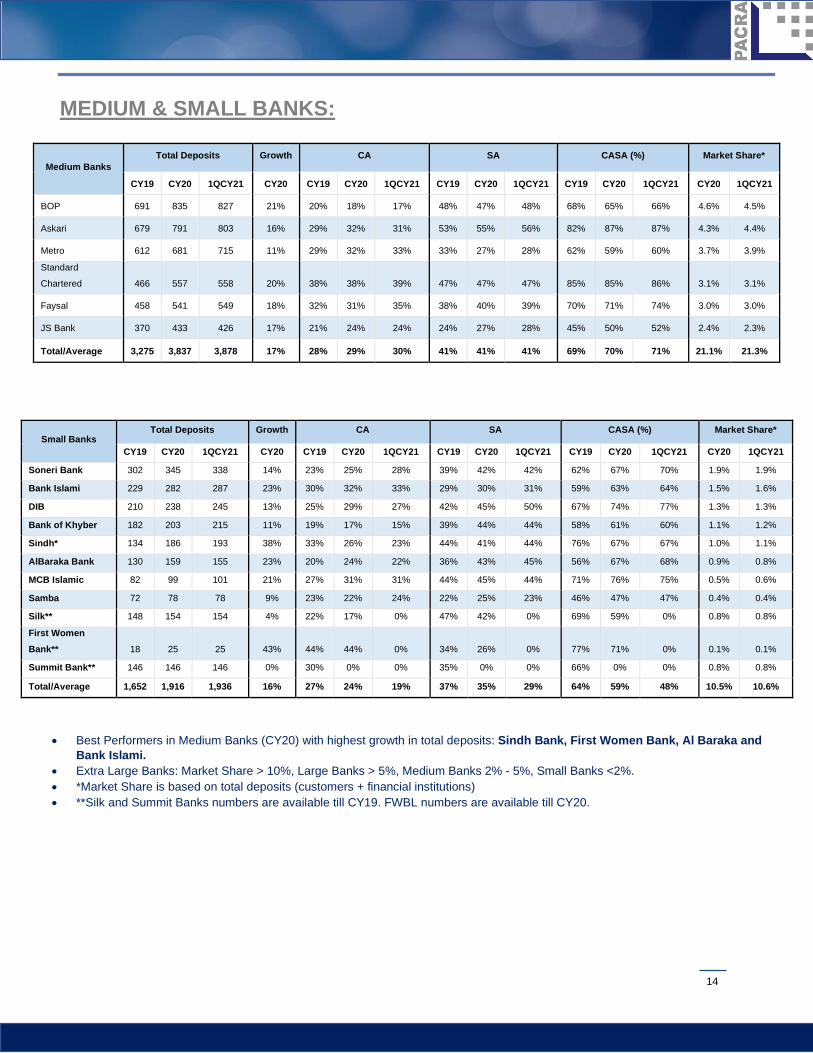
MEDIUM & SMALL BANKS:
Medium Banks Total Deposits Growth CA SA CASA (%) Market Share*
CY19 CY20 1QCY21 CY20 CY19 CY20 1QCY21 CY19 CY20 1QCY21 CY19 CY20 1QCY21 CY20 1QCY21
BOP 691 835 827 21% 20% 18% 17% 48% 47% 48% 68% 65% 66% 4.6% 4.5%
Askari 679 791 803 16% 29% 32% 31% 53% 55% 56% 82% 87% 87% 4.3% 4.4%
Metro 612 681 715 11% 29% 32% 33% 33% 27% 28% 62% 59% 60% 3.7% 3.9%
Standard
Chartered 466 557 558 20% 38% 38% 39% 47% 47% 47% 85% 85% 86% 3.1% 3.1%
Faysal 458 541 549 18% 32% 31% 35% 38% 40% 39% 70% 71% 74% 3.0% 3.0%
JS Bank 370 433 426 17% 21% 24% 24% 24% 27% 28% 45% 50% 52% 2.4% 2.3%
Total/Average 3,275 3,837 3,878 17% 28% 29% 30% 41% 41% 41% 69% 70% 71% 21.1% 21.3%
Small Banks Total Deposits Growth CA SA CASA (%) Market Share*
CY19 CY20 1QCY21 CY20 CY19 CY20 1QCY21 CY19 CY20 1QCY21 CY19 CY20 1QCY21 CY20 1QCY21
Soneri Bank 302 345 338 14% 23% 25% 28% 39% 42% 42% 62% 67% 70% 1.9% 1.9%
Bank Islami 229 282 287 23% 30% 32% 33% 29% 30% 31% 59% 63% 64% 1.5% 1.6%
DIB 210 238 245 13% 25% 29% 27% 42% 45% 50% 67% 74% 77% 1.3% 1.3%
Bank of Khyber 182 203 215 11% 19% 17% 15% 39% 44% 44% 58% 61% 60% 1.1% 1.2%
Sindh* 134 186 193 38% 33% 26% 23% 44% 41% 44% 76% 67% 67% 1.0% 1.1%
AlBaraka Bank 130 159 155 23% 20% 24% 22% 36% 43% 45% 56% 67% 68% 0.9% 0.8%
MCB Islamic 82 99 101 21% 27% 31% 31% 44% 45% 44% 71% 76% 75% 0.5% 0.6%
Samba 72 78 78 9% 23% 22% 24% 22% 25% 23% 46% 47% 47% 0.4% 0.4%
Silk** 148 154 154 4% 22% 17% 0% 47% 42% 0% 69% 59% 0% 0.8% 0.8%
First Women Bank** 18 25 25 43% 44% 44% 0% 34% 26% 0% 77% 71% 0% 0.1% 0.1%
Summit Bank** 146 146 146 0% 30% 0% 0% 35% 0% 0% 66% 0% 0% 0.8% 0.8%
Total/Average 1,652 1,916 1,936 16% 27% 24% 19% 37% 35% 29% 64% 59% 48% 10.5% 10.6%
• Best Performers in Medium Banks (CY20) with highest growth in total deposits: Sindh Bank, First Women Bank, Al Baraka and Bank Islami.
• Extra Large Banks: Market Share > 10%, Large Banks > 5%, Medium Banks 2% - 5%, Small Banks <2%. • *Market Share is based on total deposits (customers + financial institutions) • **Silk and Summit Banks numbers are available till CY19. FWBL numbers are available till CY20.
15
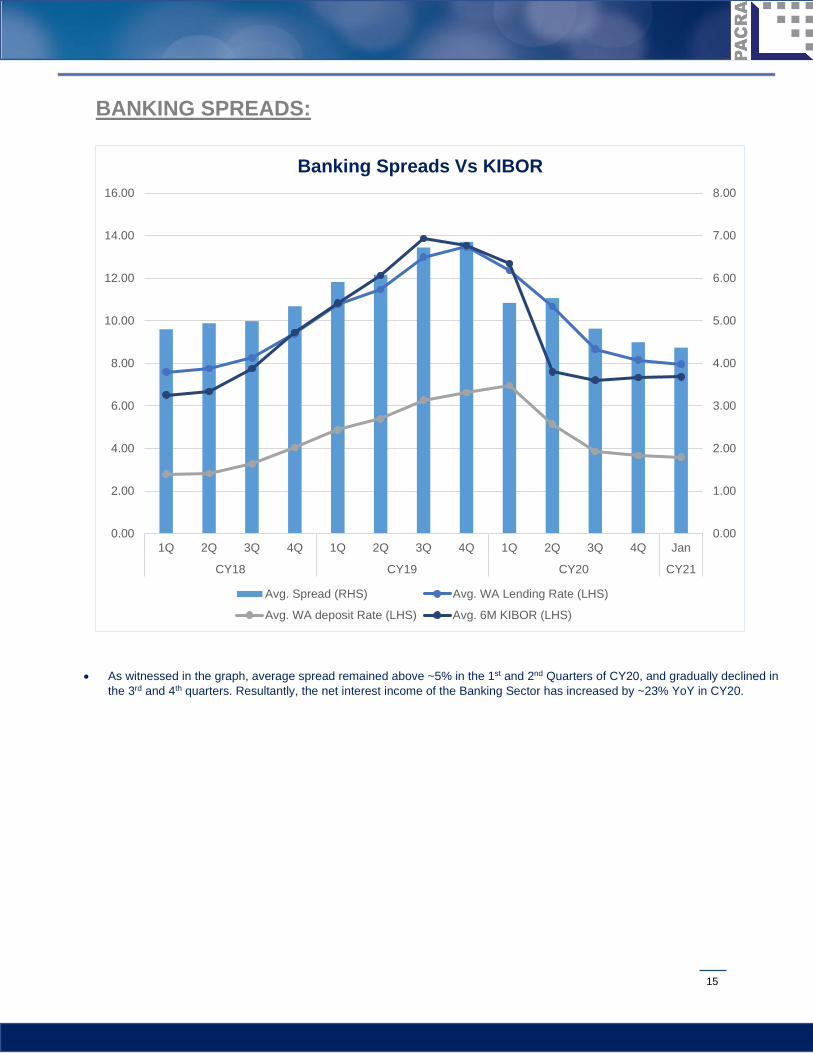
BANKING SPREADS:
0.00
1.00
2.00
3.00
4.00
5.00
6.00
7.00
8.00
0.00
2.00
4.00
6.00
8.00
10.00
12.00
14.00
16.00
1Q 2Q 3Q 4Q 1Q 2Q 3Q 4Q 1Q 2Q 3Q 4Q Jan
CY18 CY19 CY20 CY21
Banking Spreads Vs KIBOR
Avg. Spread (RHS) Avg. WA Lending Rate (LHS)
Avg. WA deposit Rate (LHS) Avg. 6M KIBOR (LHS)
• As witnessed in the graph, average spread remained above ~5% in the 1st and 2nd Quarters of CY20, and gradually declined in the 3rd and 4th quarters. Resultantly, the net interest income of the Banking Sector has increased by ~23% YoY in CY20.
16
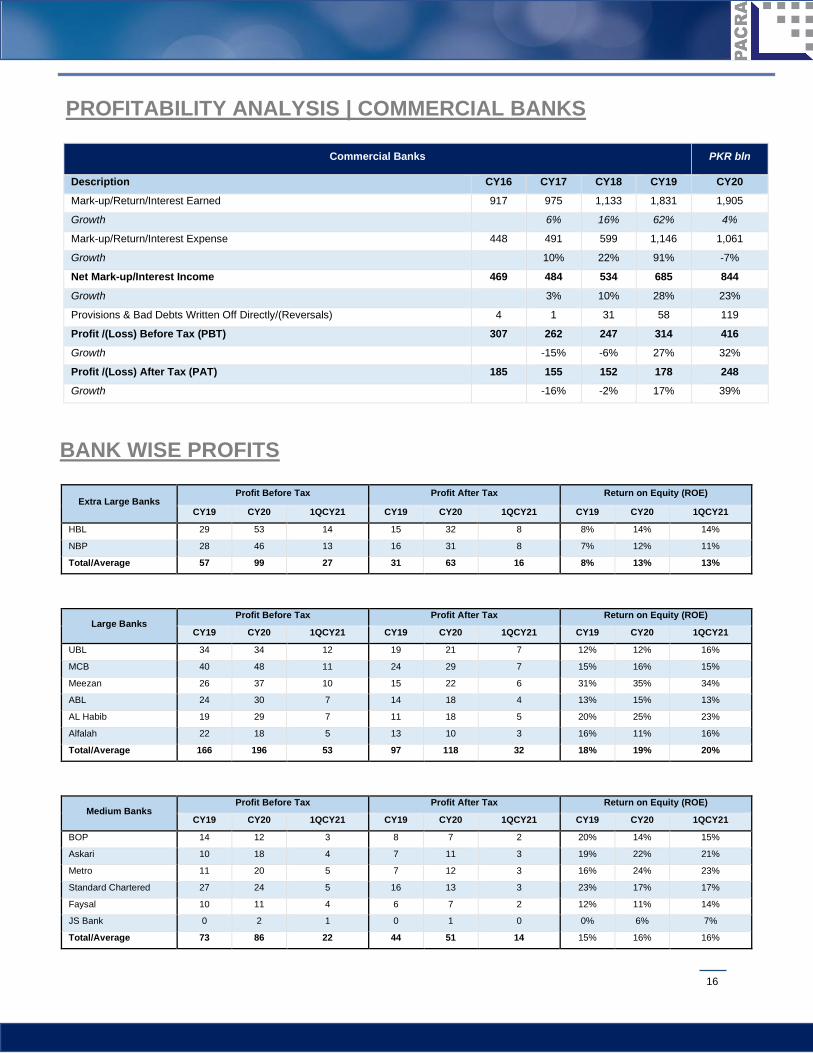
PROFITABILITY ANALYSIS | COMMERCIAL BANKS
Commercial Banks PKR bln
Description CY16 CY17 CY18 CY19 CY20 Mark-up/Return/Interest Earned 917 975 1,133 1,831 1,905
Growth 6% 16% 62% 4%
Mark-up/Return/Interest Expense 448 491 599 1,146 1,061
Growth 10% 22% 91% -7%
Net Mark-up/Interest Income 469 484 534 685 844
Growth 3% 10% 28% 23%
Provisions & Bad Debts Written Off Directly/(Reversals) 4 1 31 58 119
Profit /(Loss) Before Tax (PBT) 307 262 247 314 416 Growth -15% -6% 27% 32%
Profit /(Loss) After Tax (PAT) 185 155 152 178 248 Growth -16% -2% 17% 39%
BANK WISE PROFITS
Extra Large Banks Profit Before Tax Profit After Tax Return on Equity (ROE)
CY19 CY20 1QCY21 CY19 CY20 1QCY21 CY19 CY20 1QCY21
HBL 29 53 14 15 32 8 8% 14% 14%
NBP 28 46 13 16 31 8 7% 12% 11%
Total/Average 57 99 27 31 63 16 8% 13% 13%
Large Banks Profit Before Tax Profit After Tax Return on Equity (ROE)
CY19 CY20 1QCY21 CY19 CY20 1QCY21 CY19 CY20 1QCY21
UBL 34 34 12 19 21 7 12% 12% 16%
MCB 40 48 11 24 29 7 15% 16% 15%
Meezan 26 37 10 15 22 6 31% 35% 34%
ABL 24 30 7 14 18 4 13% 15% 13%
AL Habib 19 29 7 11 18 5 20% 25% 23%
Alfalah 22 18 5 13 10 3 16% 11% 16%
Total/Average 166 196 53 97 118 32 18% 19% 20%
Medium Banks Profit Before Tax Profit After Tax Return on Equity (ROE)
CY19 CY20 1QCY21 CY19 CY20 1QCY21 CY19 CY20 1QCY21
BOP 14 12 3 8 7 2 20% 14% 15%
Askari 10 18 4 7 11 3 19% 22% 21%
Metro 11 20 5 7 12 3 16% 24% 23%
Standard Chartered 27 24 5 16 13 3 23% 17% 17%
Faysal 10 11 4 6 7 2 12% 11% 14%
JS Bank 0 2 1 0 1 0 0% 6% 7%
Total/Average 73 86 22 44 51 14 15% 16% 16%
17
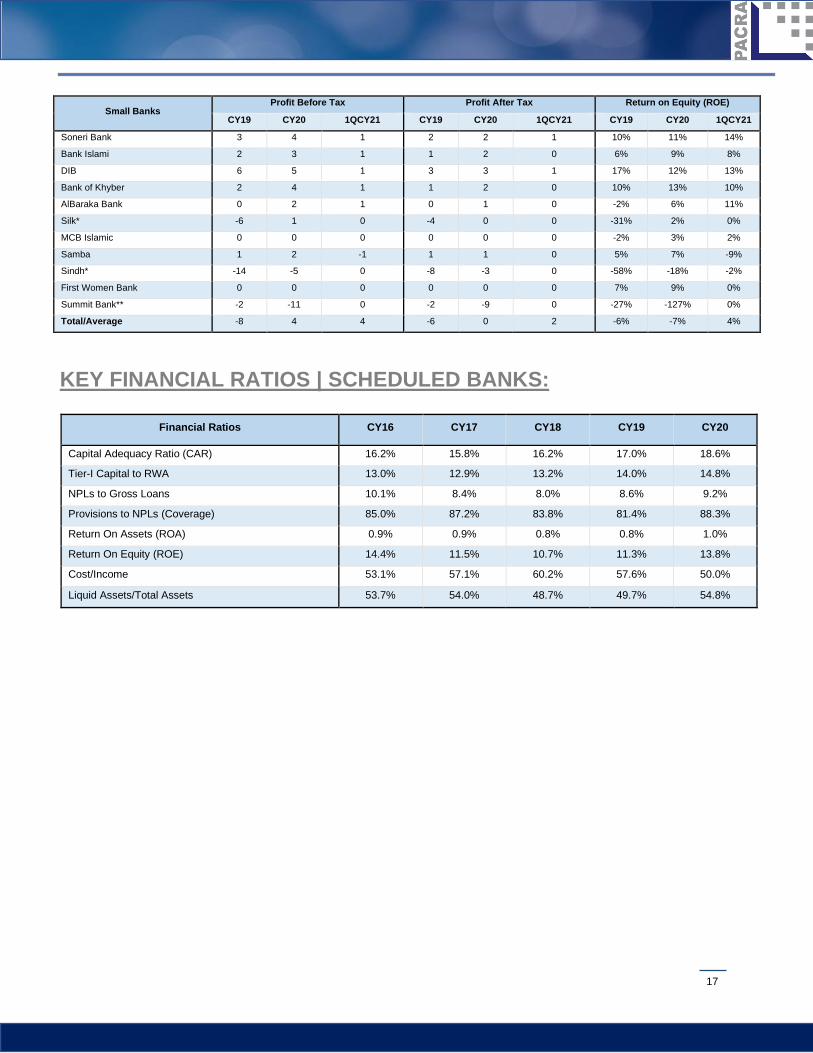
Small Banks Profit Before Tax Profit After Tax Return on Equity (ROE)
CY19 CY20 1QCY21 CY19 CY20 1QCY21 CY19 CY20 1QCY21
Soneri Bank 3 4 1 2 2 1 10% 11% 14%
Bank Islami 2 3 1 1 2 0 6% 9% 8%
DIB 6 5 1 3 3 1 17% 12% 13%
Bank of Khyber 2 4 1 1 2 0 10% 13% 10%
AlBaraka Bank 0 2 1 0 1 0 -2% 6% 11%
Silk* -6 1 0 -4 0 0 -31% 2% 0%
MCB Islamic 0 0 0 0 0 0 -2% 3% 2%
Samba 1 2 -1 1 1 0 5% 7% -9%
Sindh* -14 -5 0 -8 -3 0 -58% -18% -2%
First Women Bank 0 0 0 0 0 0 7% 9% 0%
Summit Bank** -2 -11 0 -2 -9 0 -27% -127% 0%
Total/Average -8 4 4 -6 0 2 -6% -7% 4%
KEY FINANCIAL RATIOS | SCHEDULED BANKS:
Financial Ratios CY16 CY17 CY18 CY19 CY20
Capital Adequacy Ratio (CAR) 16.2% 15.8% 16.2% 17.0% 18.6%
Tier-I Capital to RWA 13.0% 12.9% 13.2% 14.0% 14.8%
NPLs to Gross Loans 10.1% 8.4% 8.0% 8.6% 9.2%
Provisions to NPLs (Coverage) 85.0% 87.2% 83.8% 81.4% 88.3%
Return On Assets (ROA) 0.9% 0.9% 0.8% 0.8% 1.0%
Return On Equity (ROE) 14.4% 11.5% 10.7% 11.3% 13.8%
Cost/Income 53.1% 57.1% 60.2% 57.6% 50.0%
Liquid Assets/Total Assets 53.7% 54.0% 48.7% 49.7% 54.8%

18
RATING CURVE:
AAA AA+ AA AA- A+ A A-PACRA 4 4 2 2 1 3 1VIS 3 2 3 0 2 1 1
0
1
2
3
4
5
Banks - Entity Ratings
AAA AA+ AA AA- A+ A A- BBB+PACRA 1 0 3 5 3 2 2 0VIS 1 2 2 4 1 1 0 1
0
1
2
3
4
5
6
Banks - Debt Instrument Ratings
19
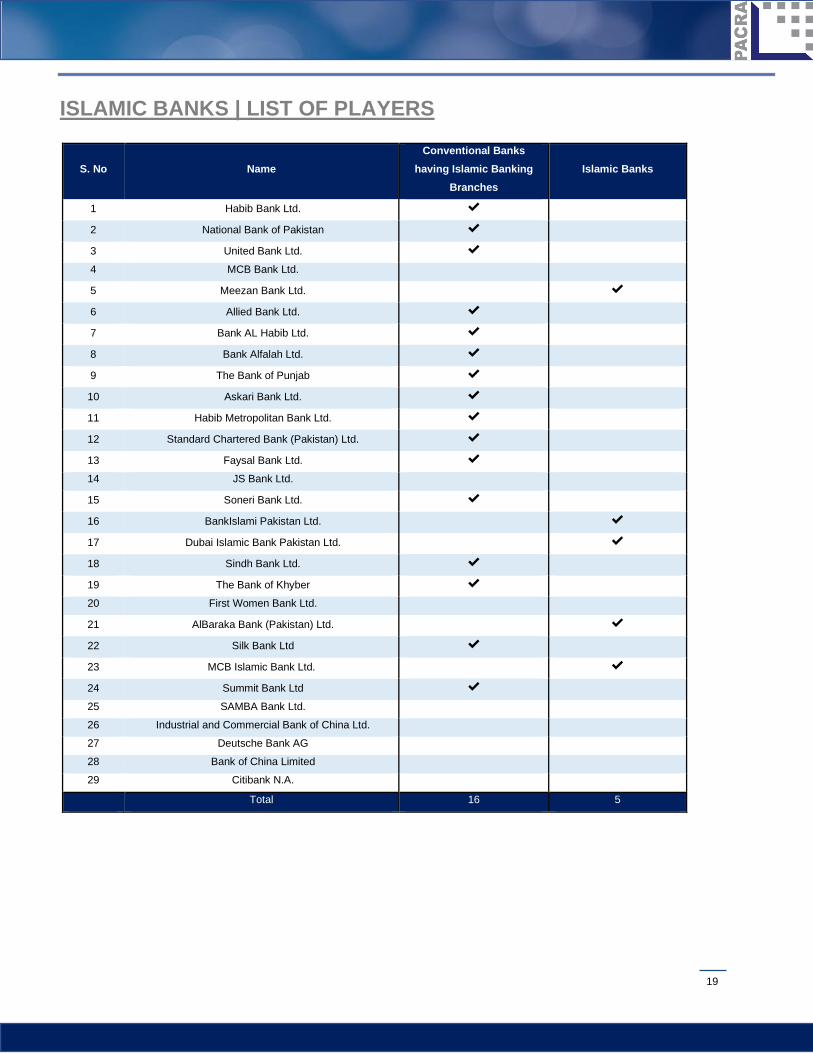
ISLAMIC BANKS | LIST OF PLAYERS
S. No Name Conventional Banks
having Islamic Banking Branches
Islamic Banks
1 Habib Bank Ltd. ✔
2 National Bank of Pakistan ✔
3 United Bank Ltd. ✔
4 MCB Bank Ltd.
5 Meezan Bank Ltd.
✔
6 Allied Bank Ltd. ✔
7 Bank AL Habib Ltd. ✔
8 Bank Alfalah Ltd. ✔
9 The Bank of Punjab ✔
10 Askari Bank Ltd. ✔
11 Habib Metropolitan Bank Ltd. ✔
12 Standard Chartered Bank (Pakistan) Ltd. ✔
13 Faysal Bank Ltd. ✔
14 JS Bank Ltd.
15 Soneri Bank Ltd. ✔
16 BankIslami Pakistan Ltd. ✔
17 Dubai Islamic Bank Pakistan Ltd.
✔
18 Sindh Bank Ltd. ✔
19 The Bank of Khyber ✔
20 First Women Bank Ltd.
21 AlBaraka Bank (Pakistan) Ltd.
✔
22 Silk Bank Ltd ✔
23 MCB Islamic Bank Ltd.
✔
24 Summit Bank Ltd ✔
25 SAMBA Bank Ltd.
26 Industrial and Commercial Bank of China Ltd.
27 Deutsche Bank AG
28 Bank of China Limited
29 Citibank N.A.
Total 16 5
20
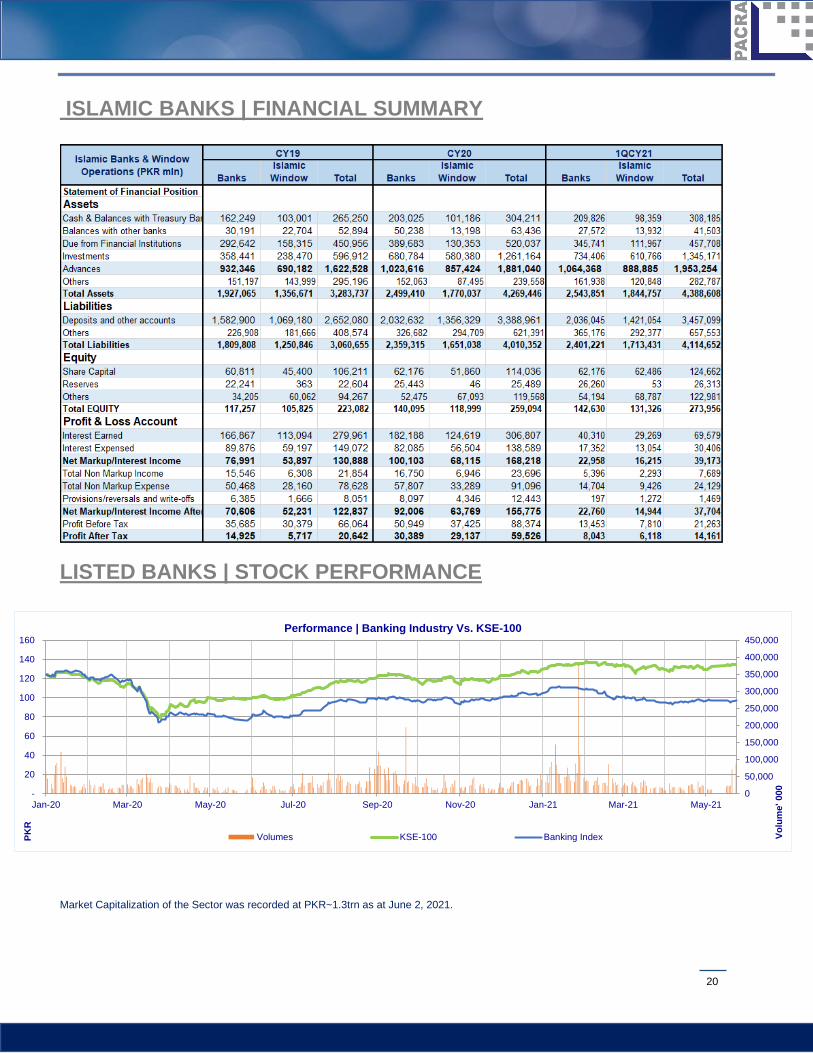
ISLAMIC BANKS | FINANCIAL SUMMARY
LISTED BANKS | STOCK PERFORMANCE
Market Capitalization of the Sector was recorded at PKR~1.3trn as at June 2, 2021.
0
50,000
100,000
150,000
200,000
250,000
300,000
350,000
400,000
450,000
-
20
40
60
80
100
120
140
160
Jan-20 Mar-20 May-20 Jul-20 Sep-20 Nov-20 Jan-21 Mar-21 May-21
Volu
me'
000
PKR
Performance | Banking Industry Vs. KSE-100
Volumes KSE-100 Banking Index
21
BIBLIOGRAPHY • State Bank of Pakistan • Pakistan Stock Exchange • Banks Financial Statements
DISCLAIMER PACRA has used due care in preparation of this document. Our information has been obtained from sources we consider to be reliable but its accuracy or completeness is not guaranteed. The information in this document may be copied or otherwise reproduced, in whole or in part, provided the source is duly acknowledged. The presentation should not be relied upon as professional advice.
PACRA Research & Publishing Unit (R&P) Contact:
Saniya Tauseef (R&P Lead), [email protected]
Insia Raza (Research Analyst), [email protected]
Contact Number: +92 42 3586 9504
pacra.com.pk linkedin.com/company/pacra facebook.com/pacra.pk