june 2014 - business.hsbc.uk
TRANSCRIPT
FarmingTAKING THE PULSE
INSIDE: overall outlook cap reform farming budget update economic landScape
June 2014
2 Taking the pulse >> Farming
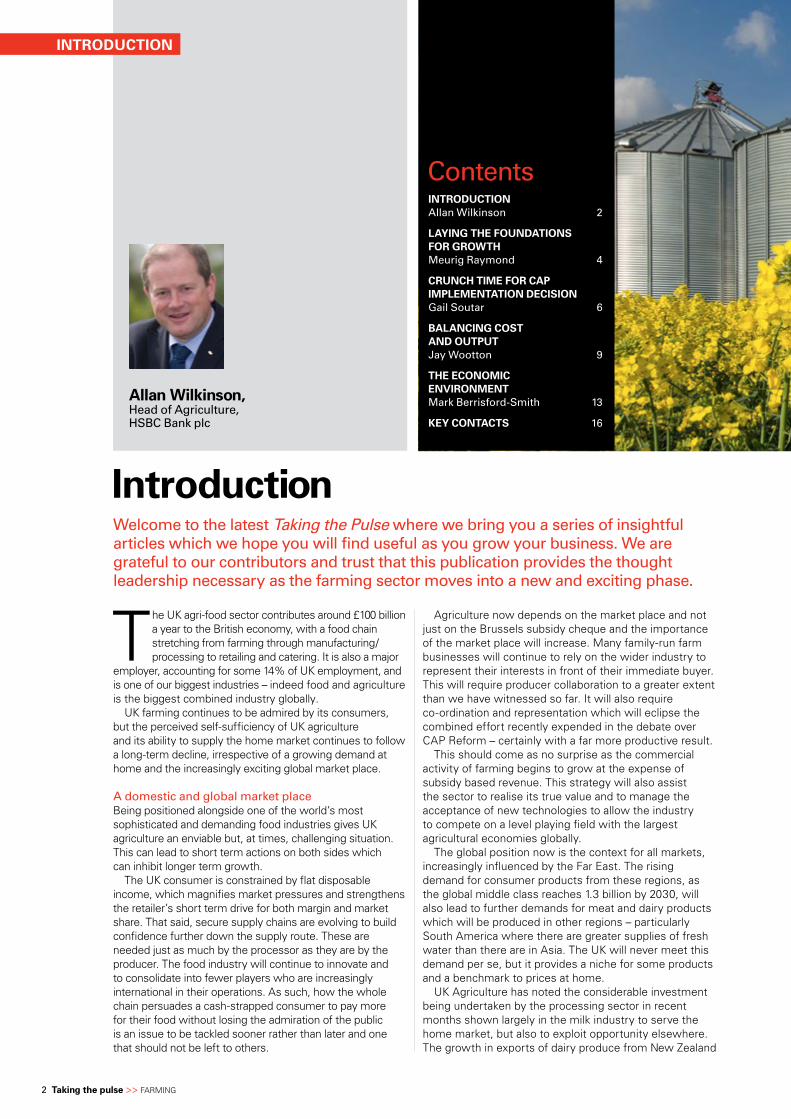
Allan Wilkinson,Head of agriculture, HSbc bank plc
The UK agri-food sector contributes around £100 billion a year to the British economy, with a food chain stretching from farming through manufacturing/processing to retailing and catering. it is also a major
employer, accounting for some 14% of UK employment, and is one of our biggest industries – indeed food and agriculture is the biggest combined industry globally.
UK farming continues to be admired by its consumers, but the perceived self-sufficiency of UK agriculture and its ability to supply the home market continues to follow a long-term decline, irrespective of a growing demand at home and the increasingly exciting global market place.
a domestic and global market placeBeing positioned alongside one of the world’s most sophisticated and demanding food industries gives UK agriculture an enviable but, at times, challenging situation. This can lead to short term actions on both sides which can inhibit longer term growth.
The UK consumer is constrained by flat disposable income, which magnifies market pressures and strengthens the retailer’s short term drive for both margin and market share. That said, secure supply chains are evolving to build confidence further down the supply route. These are needed just as much by the processor as they are by the producer. The food industry will continue to innovate and to consolidate into fewer players who are increasingly international in their operations. as such, how the whole chain persuades a cash-strapped consumer to pay more for their food without losing the admiration of the public is an issue to be tackled sooner rather than later and one that should not be left to others.
INTRODUCTION
IntroductionWelcome to the latest taking the pulse where we bring you a series of insightful articles which we hope you will find useful as you grow your business. We are grateful to our contributors and trust that this publication provides the thought leadership necessary as the farming sector moves into a new and exciting phase.
agriculture now depends on the market place and not just on the Brussels subsidy cheque and the importance of the market place will increase. many family-run farm businesses will continue to rely on the wider industry to represent their interests in front of their immediate buyer. This will require producer collaboration to a greater extent than we have witnessed so far. it will also require co-ordination and representation which will eclipse the combined effort recently expended in the debate over CaP reform – certainly with a far more productive result.
This should come as no surprise as the commercial activity of farming begins to grow at the expense of subsidy based revenue. This strategy will also assist the sector to realise its true value and to manage the acceptance of new technologies to allow the industry to compete on a level playing field with the largest agricultural economies globally.
The global position now is the context for all markets, increasingly influenced by the Far East. The rising demand for consumer products from these regions, as the global middle class reaches 1.3 billion by 2030, will also lead to further demands for meat and dairy products which will be produced in other regions – particularly South america where there are greater supplies of fresh water than there are in asia. The UK will never meet this demand per se, but it provides a niche for some products and a benchmark to prices at home.
UK agriculture has noted the considerable investment being undertaken by the processing sector in recent months shown largely in the milk industry to serve the home market, but also to exploit opportunity elsewhere. The growth in exports of dairy produce from new Zealand
contentsINTRODUCTION allan Wilkinson 2
LAYING THE FOUNDATIONS FOR GROWTH meurig raymond 4
CRUNCH TIME FOR CAP IMPLEMENTATION DECISION gail Soutar 6
BALANCING COST AND OUTPUT Jay Wootton 9
THE ECONOMIC ENvIRONMENT mark berrisford-Smith 13
KEY CONTACTS 16
2014 >> HSBC Agriculture 3
to China – a distance not much less than Britain to China – typifies the change in market dynamics leading to positive prospects.
cap reform The next incarnation of the EU’s Common agriculture Policy has been agreed by the various European institutions and the 28 member States who will be legally bound to deploy it between 2015-2020. This is a major milestone which will influence the whole of agriculture to a greater or lesser extent and, within the context of the EU’s multi annual Financial Framework, a reduction in allocated funds has been set for the first time in the EU’s history since inception in 1957. We believe that this change will be a signal for future reforms, making farming incomes proportionately more dependent on the commercial market place and we again re-iterate the rising importance of the customer.
time to revise the budgets We take the opportunity to revise three of our key budgets as shown in our sister publication Forward Planning 2014 published last autumn. in line with many good business habits the chance to revise the annual forecast is a prudent financial discipline. The re-assessment of our combinable crops, intensive dairy and lowland livestock sector farm budgets should allow readers to consider these findings for their own business, irrespective of whether these systems and enterprises directly replicate their own modus operandi.
the best There is no room for complacency, even in our top performing farm businesses. The very best operators continue to move forward at a pace, balancing cost management and deployment with excellence in technical output. These businesses have invested their own management skill base and will continue to do so, such that they remain alert to opportunity and resilient in the face of volatility. Cost volatility and income volatility bring genuine opportunity but also require a clear understanding of when to grasp the right margin based on cost management not just market price. This is evident in the contrasting
immediate fortunes of the dairy and cereals sectors discussed later. These farms, like their peers, nationally and globally crave the new technology that will in turn bring further efficiency. That may be public endorsement of existing bioscience technology (including the raft of poorly named but so called ‘gm’ technologies) or new avenues which will come through ongoing research.
HSbc agriculture We view UK agriculture as one of the Bank’s most preferred sectors, a position we have held for well over two decades. Our consistency and long-term approach will continue, providing each customer with bespoke funding to meet their needs. We have consistently grown our business, particularly in the last three years and this will continue as we look to take on more new customers. Our credit policy, focusing on viability and farm business performance, has been at the heart of everything that we have done. Our preference is for well-run farm businesses, irrespective of size or sector, which will adapt and be the most successful in coping with future volatility.
Last year we attracted year-on-year growth of over 22% in our lending book. We have additional funds to support viable businesses of today and tomorrow. We will help our customers to take advantage of the opportunities ahead, domestically first and foremost, but also increasingly globally.
We hope that Taking the Pulse 2014 will leave you in the same positive frame of mind as we are at HSBC agriculture. We have not known a better outlook for the sector and for the demand for food – it will remain challenging, however, the well run and structured family business will be at the heart of that success in the future. We look forward to working with you to seize this opportunity.
Allan Wilkinson Head of agriculture, HSBC Bank plc
4 Taking the pulse >> Farming
in the following article, gail Soutar details the latest CaP reform package from the European Commission and the seven year cycle of CaP reform can provide a useful milestone for assessing agriculture’s performance.
When the current CaP regime was introduced in 2007, the value of UK agricultural output totalled almost £16 billion. The latest Defra figures for 2013 value our farm output at £25.7 billion. Farming’s contribution to the UK economy has grown by a staggering 67% between 2007 and 2013. and perhaps most critically, 2013 represents the sixth successive year in which farming profitability (as measured by Total income from Farming – TiFF) has exceeded £4.5 billion. in 2007, TiFF totalled just £3.1 billion.
This theme is one consistently emphasised by the nFU in recent years. The step change in the value of UK farm output and the gains that farming has contributed to the economy are all worth shouting about (see infographic). When you set this against a backdrop of recession and slow economic recovery, it’s all the more impressive and ensures agriculture has stood out from the crowd.
as always, these headlines mask variances in performance across both sectors and regions, and we all know that input costs have increased significantly too. However, the headline figures are undoubtedly a positive. These are being reflected on the ground too, particularly following the wet conditions of autumn/winter 2012. Last year saw the smallest wheat harvest since 2001
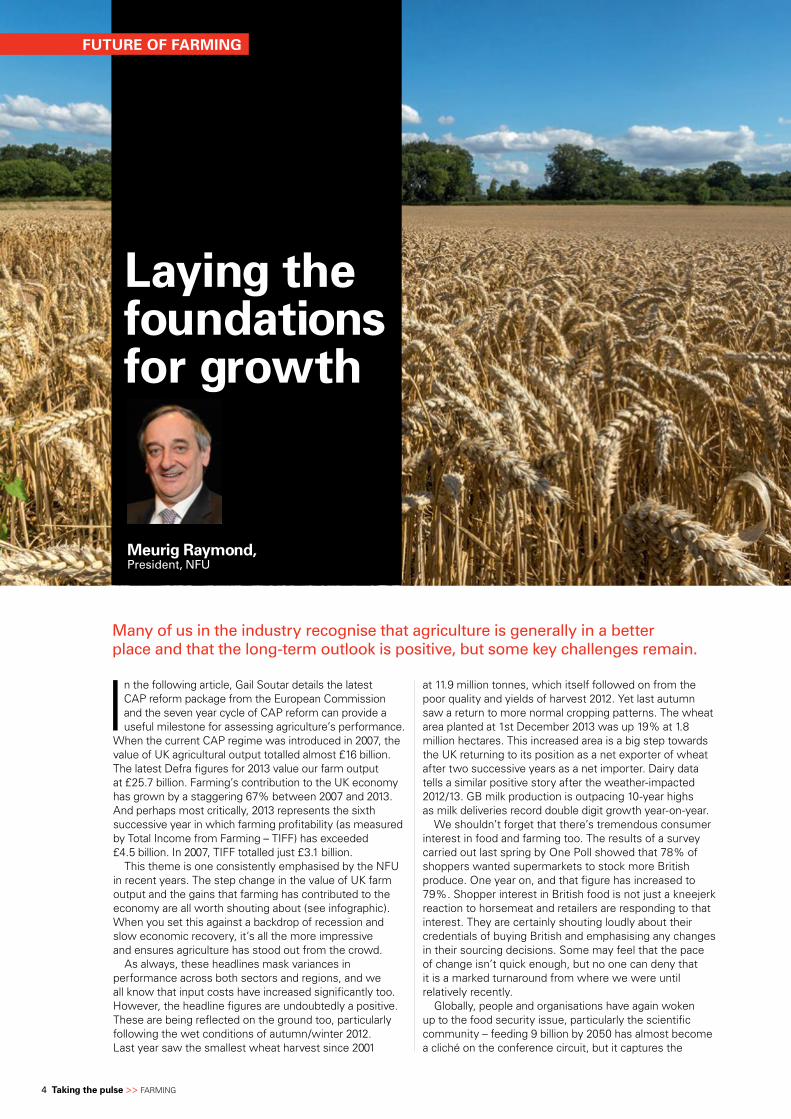
many of us in the industry recognise that agriculture is generally in a better place and that the long-term outlook is positive, but some key challenges remain.
Meurig Raymond,president, nfu
Laying the foundations for growth
at 11.9 million tonnes, which itself followed on from the poor quality and yields of harvest 2012. Yet last autumn saw a return to more normal cropping patterns. The wheat area planted at 1st December 2013 was up 19% at 1.8 million hectares. This increased area is a big step towards the UK returning to its position as a net exporter of wheat after two successive years as a net importer. Dairy data tells a similar positive story after the weather-impacted 2012/13. gB milk production is outpacing 10-year highs as milk deliveries record double digit growth year-on-year.
We shouldn’t forget that there’s tremendous consumer interest in food and farming too. The results of a survey carried out last spring by One Poll showed that 78% of shoppers wanted supermarkets to stock more British produce. One year on, and that figure has increased to 79%. Shopper interest in British food is not just a kneejerk reaction to horsemeat and retailers are responding to that interest. They are certainly shouting loudly about their credentials of buying British and emphasising any changes in their sourcing decisions. Some may feel that the pace of change isn’t quick enough, but no one can deny that it is a marked turnaround from where we were until relatively recently.
globally, people and organisations have again woken up to the food security issue, particularly the scientific community – feeding 9 billion by 2050 has almost become a cliché on the conference circuit, but it captures the
FUTURE OF FARMING

2014 >> HSBC Agriculture 5
potential demand for food. We’ve even heard Defra ministers flag up the issues of food security and production in recent months. The bottom line is that the global agricultural industry has to produce more and that feeds through to long-term confidence.
much is made of how we encourage the next generation into agriculture. Ultimately, it is the long-term prospects for farming that will do most to encourage new entrants. indeed, it’s heartening to look at student enrolment figures for land-based courses or apprenticeship numbers. Similarly, there are people such as Jim rogers – co founder of the Quantum investment fund – telling everyone the future is farming. Such is his confidence in farming as a growth industry and a business worth investing in, that he’s been telling people around the world that the future generation should learn to drive a tractor instead of looking at careers in other sectors; a message he reiterated at the nFU conference earlier this year.
Yet we’re not an industry without our challenges. We need a farm infrastructure equipped for the long term. Can we really have a 21st century agri-food sector if a significant proportion of our farm buildings date from the 1960s or 1970s? agriculture is not alone in calling for infrastructure incentives, but it is a point that the latest Budget has again failed to appreciate.
Few recognise the latest CaP reform package from the European Commission as a step forward and some aspects take us backwards. Policy will influence cropping decisions through greening’s crop diversification measure instead of encouraging farmers to respond to the market. Similarly, there is the potential to take land out of production through
ecological focus areas as policy influences supply. it is a timely reminder of the tensions and conflicts that can exist between policy and market signals.
Despite the positive steps from some in the food chain, our leading supermarket chains remain ultra-competitive when it comes to shopper footfall. What seems to be emerging is a renewed round of price cuts and promotions. my fear is that this materialises into downward pressure on margins across the UK supply chain. Such short term measures seem increasingly at odds with the global dynamics around food security. The demand for food isn’t going to abate any time soon. in the long run, it is only going to be a focus on improved productivity and growing global supply that will put downwards pressure on prices. an investment should generate income or appreciate over time and contribute to the economy; the so-called “investment in low prices” seems much more of a zero-sum game, with market share the battleground.
What is really needed is for key decision makers across both the public and private sectors to evaluate their decisions in the context of agriculture’s ability to produce food. What does sacrificing farm land to flooding mean for farm output? How would any plans to reduce the range of plant protection products available to farmers restrict our yields? Does the threat of cutting prices at the retail level reduce farmer confidence to invest? Looking at decisions from a long term food and farming perspective will help ensure that the impressive figures outlined at the start of this article are a foundation for continued growth rather than a high watermark for agricultural performance.
FUTURE OF FARMING
Source: NFU
6 Taking the pulse >> Farming
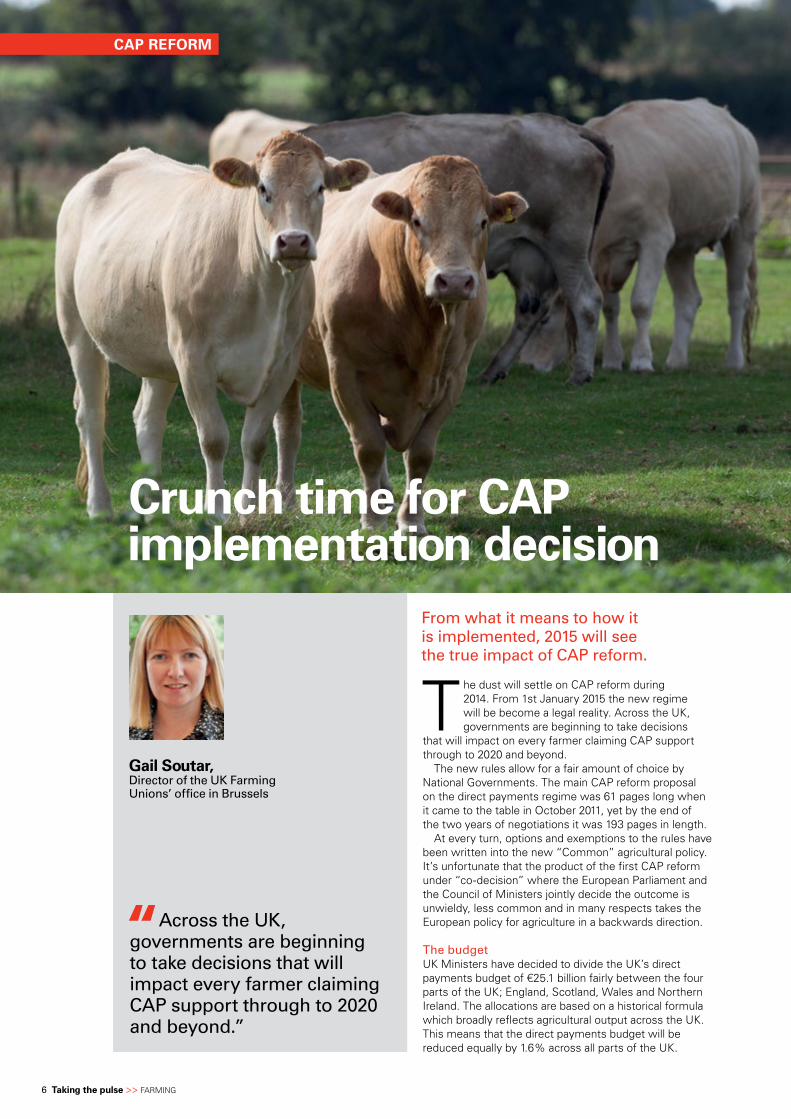
Gail Soutar,director of the uk farming unions’ office in brussels
CAP REFORM
The dust will settle on CaP reform during 2014. From 1st January 2015 the new regime will be become a legal reality. across the UK, governments are beginning to take decisions
that will impact on every farmer claiming CaP support through to 2020 and beyond.
The new rules allow for a fair amount of choice by national governments. The main CaP reform proposal on the direct payments regime was 61 pages long when it came to the table in October 2011, yet by the end of the two years of negotiations it was 193 pages in length.
at every turn, options and exemptions to the rules have been written into the new “Common” agricultural policy. it’s unfortunate that the product of the first CaP reform under “co-decision” where the European Parliament and the Council of ministers jointly decide the outcome is unwieldy, less common and in many respects takes the European policy for agriculture in a backwards direction.
the budgetUK ministers have decided to divide the UK’s direct payments budget of €25.1 billion fairly between the four parts of the UK; England, Scotland, Wales and northern ireland. The allocations are based on a historical formula which broadly reflects agricultural output across the UK. This means that the direct payments budget will be reduced equally by 1.6% across all parts of the UK.
Crunch time for CAP implementation decision
from what it means to how it is implemented, 2015 will see the true impact of cap reform.
across the uk, governments are beginning to take decisions that will impact every farmer claiming cap support through to 2020 and beyond.”
2014 >> HSBC Agriculture 7
CAP REFORM
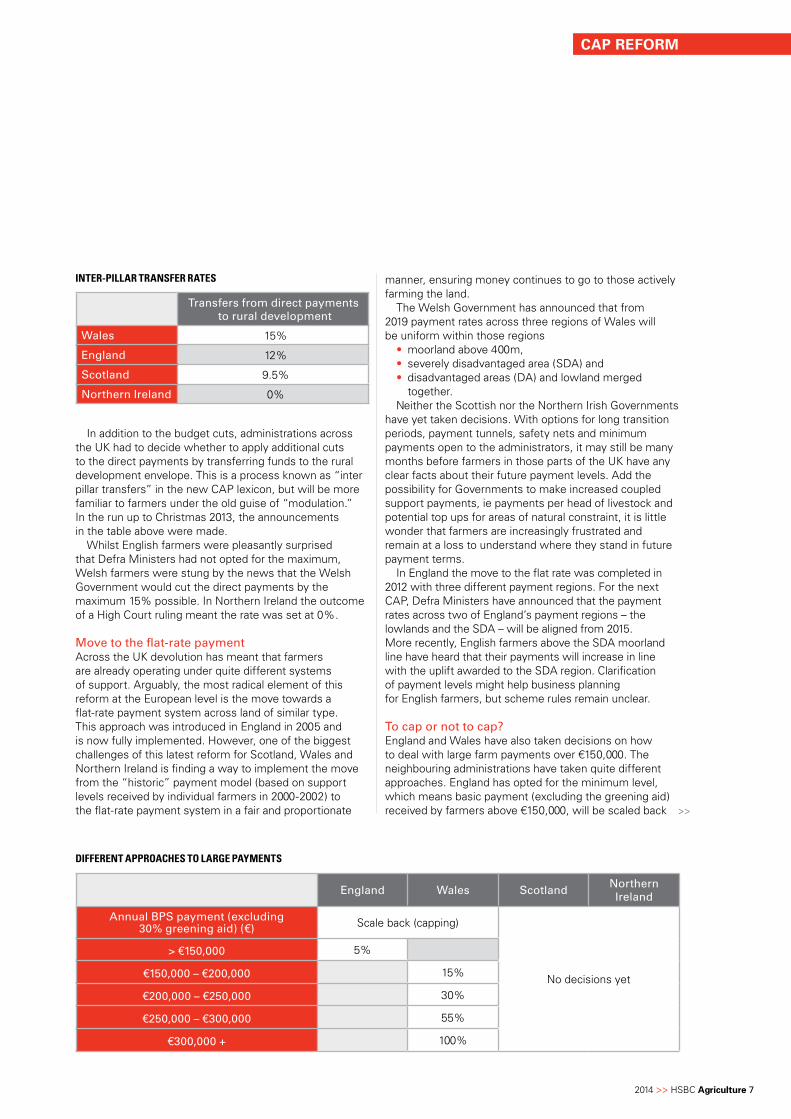
in addition to the budget cuts, administrations across the UK had to decide whether to apply additional cuts to the direct payments by transferring funds to the rural development envelope. This is a process known as “inter pillar transfers” in the new CaP lexicon, but will be more familiar to farmers under the old guise of “modulation.” in the run up to Christmas 2013, the announcements in the table above were made.
Whilst English farmers were pleasantly surprised that Defra ministers had not opted for the maximum, Welsh farmers were stung by the news that the Welsh government would cut the direct payments by the maximum 15% possible. in northern ireland the outcome of a High Court ruling meant the rate was set at 0%.
move to the flat-rate paymentacross the UK devolution has meant that farmers are already operating under quite different systems of support. arguably, the most radical element of this reform at the European level is the move towards a flat-rate payment system across land of similar type. This approach was introduced in England in 2005 and is now fully implemented. However, one of the biggest challenges of this latest reform for Scotland, Wales and northern ireland is finding a way to implement the move from the “historic” payment model (based on support levels received by individual farmers in 2000-2002) to the flat-rate payment system in a fair and proportionate
manner, ensuring money continues to go to those actively farming the land.
The Welsh government has announced that from 2019 payment rates across three regions of Wales will be uniform within those regions
• moorland above 400m, • severely disadvantaged area (SDa) and • disadvantaged areas (Da) and lowland merged
together. neither the Scottish nor the northern irish governments
have yet taken decisions. With options for long transition periods, payment tunnels, safety nets and minimum payments open to the administrators, it may still be many months before farmers in those parts of the UK have any clear facts about their future payment levels. add the possibility for governments to make increased coupled support payments, ie payments per head of livestock and potential top ups for areas of natural constraint, it is little wonder that farmers are increasingly frustrated and remain at a loss to understand where they stand in future payment terms.
in England the move to the flat rate was completed in 2012 with three different payment regions. For the next CaP, Defra ministers have announced that the payment rates across two of England’s payment regions – the lowlands and the SDa – will be aligned from 2015. more recently, English farmers above the SDa moorland line have heard that their payments will increase in line with the uplift awarded to the SDa region. Clarification of payment levels might help business planning for English farmers, but scheme rules remain unclear.
to cap or not to cap?England and Wales have also taken decisions on how to deal with large farm payments over €150,000. The neighbouring administrations have taken quite different approaches. England has opted for the minimum level, which means basic payment (excluding the greening aid) received by farmers above €150,000, will be scaled back
transfers from direct payments to rural development
Wales 15%
england 12%
Scotland 9.5%
northern ireland 0%
Inter-pIllar transfer rates
england Wales Scotland northern ireland
annual bpS payment (excluding 30% greening aid) (€) Scale back (capping)
no decisions yet
> €150,000 5%
€150,000 – €200,000 15%
€200,000 – €250,000 30%
€250,000 – €300,000 55%
€300,000 + 100%
DIfferent approaches to large payments
>>
8 Taking the pulse >> Farming
by 5%. in Wales they have decided to scale back amounts over €150,000 and no farmer will receive more than €300,000 in basic payment support, effectively capping the payments.
new environmental rules – greeningThe other headline grabber of this reform is the introduction of new mandatory environmental rules which farmers will have to follow in order to unlock 30% of their future payments. Those new rules, which apply across the whole of the EU, are
• retaining environmentally sensitive grasslands • ensuring 5% ecological focus areas on or adjacent
to arable land and• undertaking crop diversification.many UK farmers, ie those who are predominantly
grassland farmers with less than 30ha of arable land and those certified as organic, will be able to benefit from exemptions to the new requirements. However, in arable areas the fallout of the new requirements, especially the crop diversification requirement, is coming acutely into focus as farmers turn their attention to critical planting decisions this back end. Seed purchases and rotations are being planned out now.
crop diversification Farmers will have to consider their business models and make the necessary changes to comply with the new rules. This will impact on contract farmers, specialist growers, block croppers, livestock and dairy farmers with more than 30ha home grown cereals, as well as thousands of arable farmers who have sought to increase their individual business efficiencies. if they have more than 30ha of arable land they will have to grow at least three different crops on their arable land.
Crop diversification differs from crop rotation as the greening requirements are part of an annual scheme and, therefore, the requirements relate to what happens in the claim year, as opposed to over the duration of past or future years. government figures estimate that around 4,000 farmers in England and around 800 farmers in Scotland will have to change their current cropping regimes to comply. Based on the level of representation the nFU has received, we believe this underestimates the numbers affected.
The European definition of a crop is wide enough to ensure that wheat, barley, oats and oilseed rape will all be treated as different crops and that spring and winter crops will also be differentiated. Unfortunately it doesn’t go so far as to differentiate crops grown from the same species. This means that specialist brassica growers will find that their sprouts, cabbages, cauliflowers and broccoli will all be treated as the same crop! it’s no wonder that the nFU recently described this rule as utter madness and has called for it to be scrapped at the earliest opportunity.
ecological focus areas – threats to productive landFarmers with more than 15ha of arable, not exempted from the rule, will have to find 5% ecological focus area (EFa). at the time of writing, Defra and the devolved administrations are yet to take decisions on what will count towards EFa. The nFU is pushing Defra to include features such as hedges and ditches, as well as areas of nitrogen fixing crops, short rotation coppice and cover crops. The threat is that without the widest range of EFa measures, farmers will be forced to take productive land out of production and this will have a negative impact on food production.
given that many farmers have voluntarily entered into agri-environmental schemes that included taking land out of production, there remains concern and confusion amongst farmers about whether those areas could also count towards the EFa. in addition, will farmers continue to be paid environmental stewardship payments? We hope that Defra will provide clarity for farmers as soon as possible. Cropping plans and cash flow must be made based on facts rather than hearsay and speculation.
not just the “what”… but also the “how”as well as changes to the policy, Defra is designing a completely new system of “how” farmers will apply for the future CaP payments. From 2015 onwards the government in England will implement a “digital by default” approach. What this actually means for those who can’t get online is as yet unclear. a new, modern iT system and digital mapping system sounds good in theory, but mention new iT to a farmer and the very real memories of the rPa debacle last time around loom large in people’s minds.
Defra and the rPa are determined that they have learnt lessons from the past. Their number one objective is to minimise fines from the EU known as “infractions” by keeping things simple for farmers and the rPa alike. many will interpret a new iT system, new mapping requirements, new scheme rules, government targets to cut scheme guidance by 80% and fewer administrators on the ground to help farmers as the potential for a perfect storm come 2015.
The question on everyone’s lips is, with so much unclear, and so much still to fall into place, will the UK’s paying agencies manage to make accurate and timely payments to farmers in the back end of 2015? The nFU and its sister farming unions across the UK are certainly working closely with government to ensure that this happens.
With clear communications from government, effective timelines and plenty of notice, we believe that the industry and partners such as HSBC can work well together to ensure that farmers can focus on producing top quality produce for consumers. This will also help ensure that the CaP support payments continue to fulfil their vital role as a safety-net in the background to underpin business decisions and ensure everyone can take informed cash flow decisions.
CAP REFORM
We hope that defra will provide clarity for farmers as soon as possible. cropping plans and cash flow must be made based on facts rather than hearsay and speculation.”
>>
2014 >> HSBC Agriculture 9
With external pressures from weather to land price, all farm businesses face the challenge of maintaining profitability.
UK AGRICULTURE
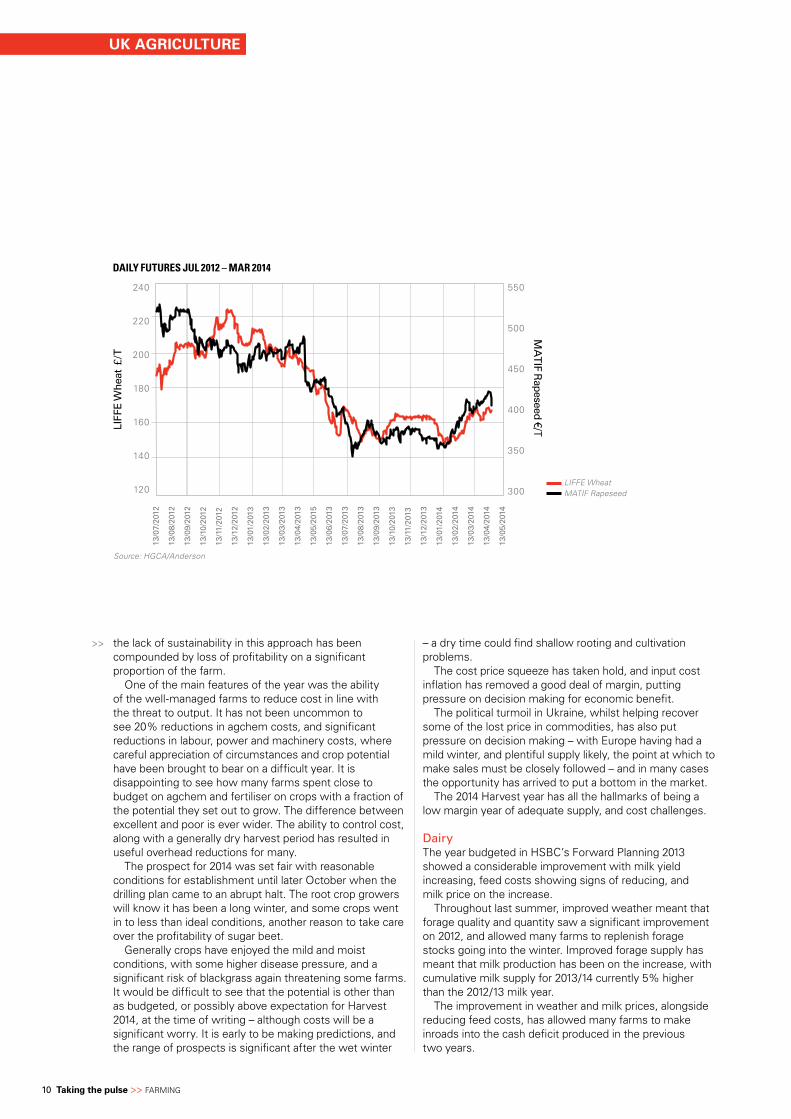
arableThe outcome of the 2013 Harvest is probably better than everyone’s worst fears, but still a considerable step back from the anticipated levels at the time of budgeting. The weather was a great leveller, with wet autumn followed by frozen winter and late spring conditions which left many pondering the potential for some crops to even survive. nature’s great potential to level up came into effect dramatically, with a sustained period of growth, giving surprisingly good results from some crops.
The movement of commodity markets came as the harvest was being realised, and too late for many to secure what had been profitable levels of price – a lesson to us all in recognising profit in grain pricing, to achieve stability in profit. Overall the 2013 harvest has seen many farms take a reduction of over 25% in profit. Crucially, active marketing has played a significant part in defending margin in this season.
The collapse in the profitability of oilseed rape has provided a significant challenge for those farms taking the short rotation option,
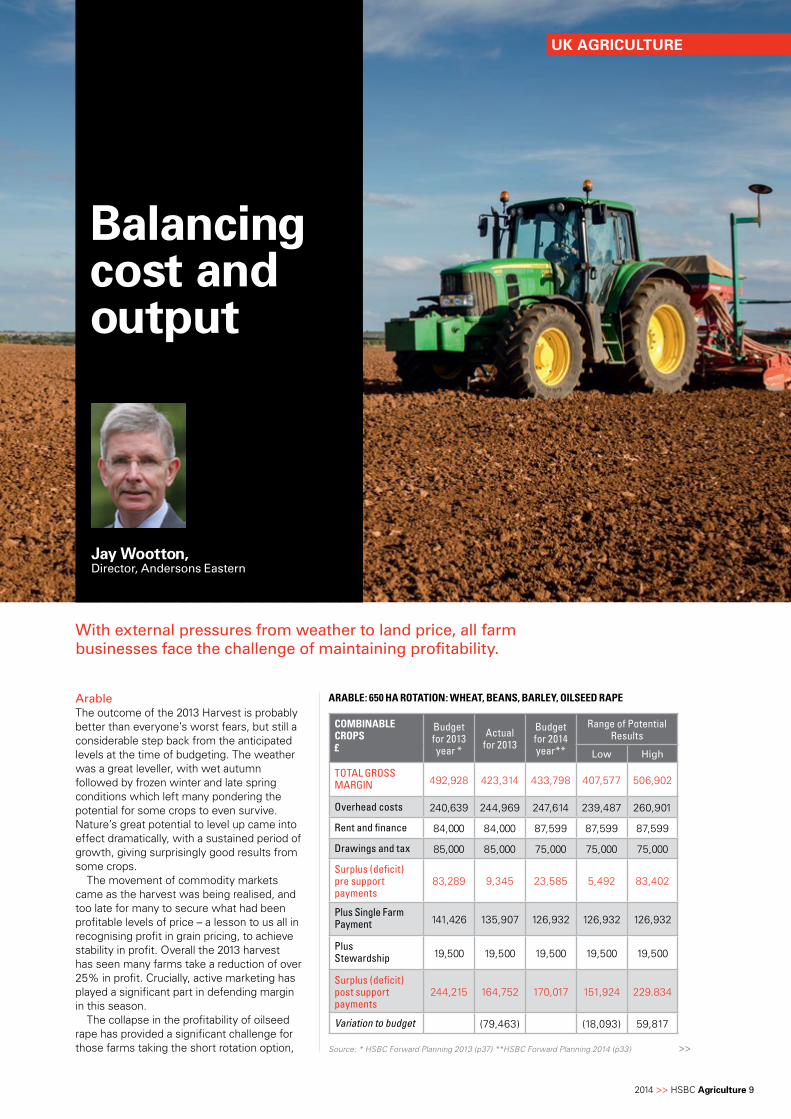
Balancing cost and output
>>
Jay Wootton,director, andersons eastern
arable: 650 ha rotatIon: Wheat, beans, barley, oIlseeD rape
combInable crops£
Budget for 2013 year *
Actual for 2013
Budget for 2014 year**
Range of Potential Results
low High
TOTAL GROSS MARGIN 492,928 423,314 433,798 407,577 506,902
Overhead costs 240,639 244,969 247,614 239,487 260,901
Rent and finance 84,000 84,000 87,599 87,599 87,599
Drawings and tax 85,000 85,000 75,000 75,000 75,000
Surplus (deficit) pre support payments
83,289 9,345 23,585 5,492 83,402
Plus Single Farm Payment 141,426 135,907 126,932 126,932 126,932
Plus Stewardship 19,500 19,500 19,500 19,500 19,500
Surplus (deficit) post support payments
244,215 164,752 170,017 151,924 229.834
Variation to budget (79,463) (18,093) 59,817
Source: * HSBC Forward Planning 2013 (p37) **HSBC Forward Planning 2014 (p33)
10 Taking the pulse >> Farming
the lack of sustainability in this approach has been compounded by loss of profitability on a significant proportion of the farm.
One of the main features of the year was the ability of the well-managed farms to reduce cost in line with the threat to output. it has not been uncommon to see 20% reductions in agchem costs, and significant reductions in labour, power and machinery costs, where careful appreciation of circumstances and crop potential have been brought to bear on a difficult year. it is disappointing to see how many farms spent close to budget on agchem and fertiliser on crops with a fraction of the potential they set out to grow. The difference between excellent and poor is ever wider. The ability to control cost, along with a generally dry harvest period has resulted in useful overhead reductions for many.
The prospect for 2014 was set fair with reasonable conditions for establishment until later October when the drilling plan came to an abrupt halt. The root crop growers will know it has been a long winter, and some crops went in to less than ideal conditions, another reason to take care over the profitability of sugar beet.
generally crops have enjoyed the mild and moist conditions, with some higher disease pressure, and a significant risk of blackgrass again threatening some farms. it would be difficult to see that the potential is other than as budgeted, or possibly above expectation for Harvest 2014, at the time of writing – although costs will be a significant worry. it is early to be making predictions, and the range of prospects is significant after the wet winter
UK AGRICULTURE
>> – a dry time could find shallow rooting and cultivation problems.
The cost price squeeze has taken hold, and input cost inflation has removed a good deal of margin, putting pressure on decision making for economic benefit.
The political turmoil in Ukraine, whilst helping recover some of the lost price in commodities, has also put pressure on decision making – with Europe having had a mild winter, and plentiful supply likely, the point at which to make sales must be closely followed – and in many cases the opportunity has arrived to put a bottom in the market.
The 2014 Harvest year has all the hallmarks of being a low margin year of adequate supply, and cost challenges.
dairyThe year budgeted in HSBC’s Forward Planning 2013 showed a considerable improvement with milk yield increasing, feed costs showing signs of reducing, and milk price on the increase.
Throughout last summer, improved weather meant that forage quality and quantity saw a significant improvement on 2012, and allowed many farms to replenish forage stocks going into the winter. improved forage supply has meant that milk production has been on the increase, with cumulative milk supply for 2013/14 currently 5% higher than the 2012/13 milk year.
The improvement in weather and milk prices, alongside reducing feed costs, has allowed many farms to make inroads into the cash deficit produced in the previous two years.
DAILY FUTURES JUL 2012 – MAR 2014
240
220
200
180
160
140
120
550
500
450
400
350
300
LIFF
E W
heat
£/T
MA
TIF R
apeseed /T
LIFFE WheatMATIF Rapeseed
Source: HGCA/Anderson
13/0
7/20
12
13/0
8/20
12
13/0
9/20
12
13/1
0/20
12
13/1
1/20
12
13/1
2/20
12
13/0
1/20
13
13/0
2/20
13
13/0
3/20
13
13/0
4/20
13
13/0
5/20
15
13/0
6/20
13
13/0
7/20
13
13/0
8/20
13
13/0
9/20
13
13/1
0/20
13
13/1
1/20
13
13/1
2/20
13
13/0
1/20
14
13/0
2/20
14
13/0
3/20
14
13/0
4/20
14
13/0
5/20
14
2014 >> HSBC Agriculture 11
The outlook for the 2014/15 grazing season looks to be positive with forage production running well ahead of last year and milk prices remaining solid. Uncertainty over Ukraine and russia could have an impact on feed prices going forward and a careful watch over feed costs may be required.
The proportion of milk marketed in retail outlets is causing uncertainty, with increasing polarity between milk contracts. The arla deal brokered back in november is starting to have a significant effect, with their market
UK AGRICULTURE
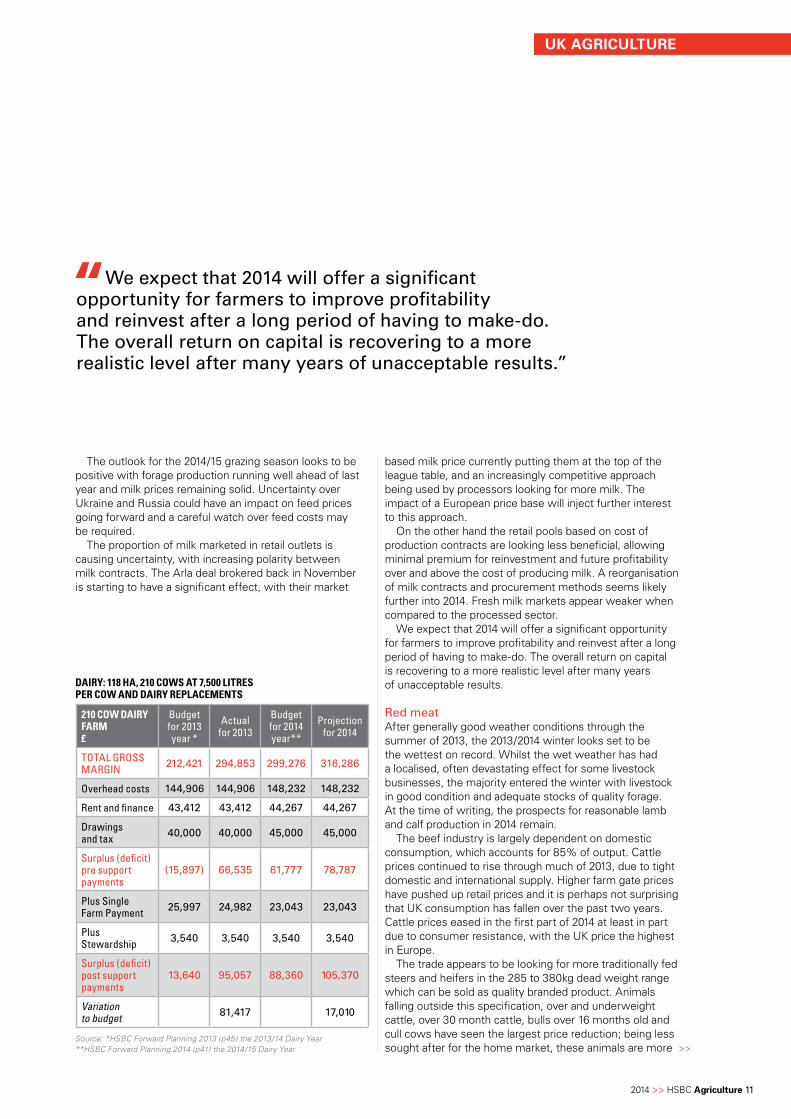
210 coW DaIry farm£
Budget for 2013 year *
Actual for 2013
Budget for 2014 year**
Projection for 2014
TOTAL GROSS MARGIN 212,421 294,853 299,276 316,286
Overhead costs 144,906 144,906 148,232 148,232
Rent and finance 43,412 43,412 44,267 44,267
Drawings and tax 40,000 40,000 45,000 45,000
Surplus (deficit) pre support payments
(15,897) 66,535 61,777 78,787
Plus Single Farm Payment 25,997 24,982 23,043 23,043
Plus Stewardship 3,540 3,540 3,540 3,540
Surplus (deficit) post support payments
13,640 95,057 88,360 105,370
Variation to budget 81,417 17,010
DaIry: 118 ha, 210 coWs at 7,500 lItres per coW anD DaIry replacements
Source: *HSBC Forward Planning 2013 (p45) the 2013/14 Dairy Year **HSBC Forward Planning 2014 (p41) the 2014/15 Dairy Year
based milk price currently putting them at the top of the league table, and an increasingly competitive approach being used by processors looking for more milk. The impact of a European price base will inject further interest to this approach.
On the other hand the retail pools based on cost of production contracts are looking less beneficial, allowing minimal premium for reinvestment and future profitability over and above the cost of producing milk. a reorganisation of milk contracts and procurement methods seems likely further into 2014. Fresh milk markets appear weaker when compared to the processed sector.
We expect that 2014 will offer a significant opportunity for farmers to improve profitability and reinvest after a long period of having to make-do. The overall return on capital is recovering to a more realistic level after many years of unacceptable results.
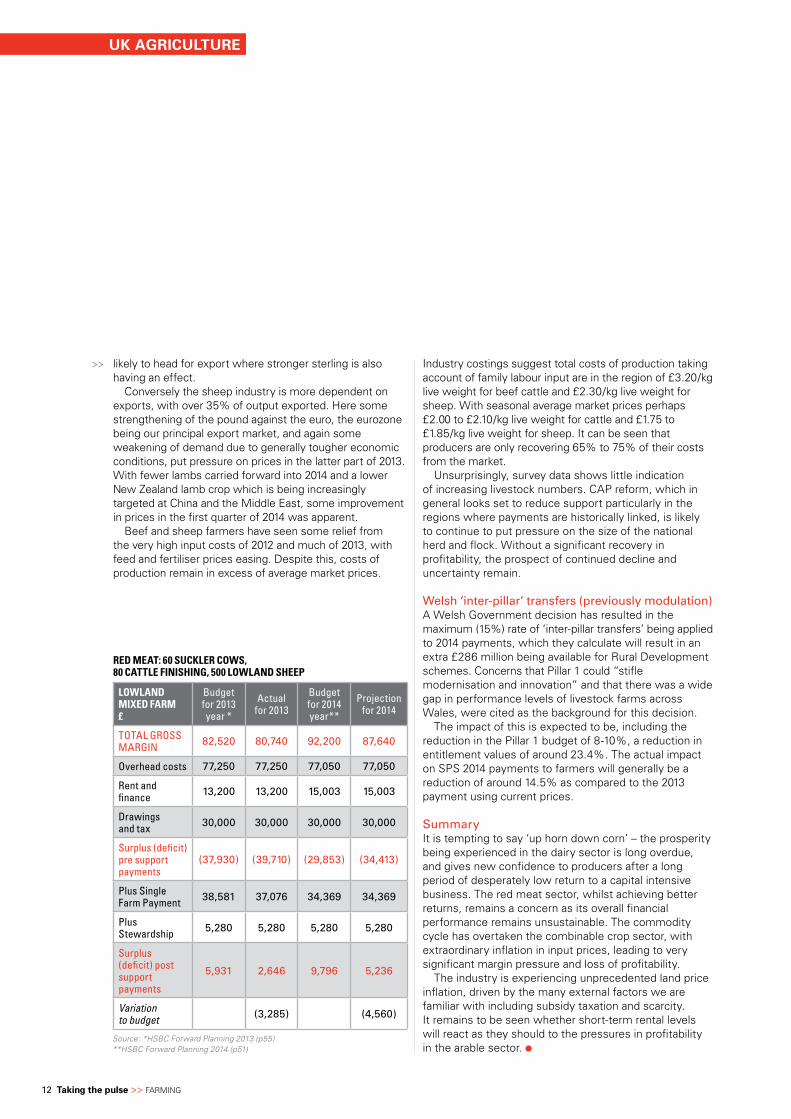
red meatafter generally good weather conditions through the summer of 2013, the 2013/2014 winter looks set to be the wettest on record. Whilst the wet weather has had a localised, often devastating effect for some livestock businesses, the majority entered the winter with livestock in good condition and adequate stocks of quality forage. at the time of writing, the prospects for reasonable lamb and calf production in 2014 remain.
The beef industry is largely dependent on domestic consumption, which accounts for 85% of output. Cattle prices continued to rise through much of 2013, due to tight domestic and international supply. Higher farm gate prices have pushed up retail prices and it is perhaps not surprising that UK consumption has fallen over the past two years. Cattle prices eased in the first part of 2014 at least in part due to consumer resistance, with the UK price the highest in Europe.
The trade appears to be looking for more traditionally fed steers and heifers in the 285 to 380kg dead weight range which can be sold as quality branded product. animals falling outside this specification, over and underweight cattle, over 30 month cattle, bulls over 16 months old and cull cows have seen the largest price reduction; being less sought after for the home market, these animals are more >>
We expect that 2014 will offer a significant opportunity for farmers to improve profitability and reinvest after a long period of having to make-do. the overall return on capital is recovering to a more realistic level after many years of unacceptable results.”
12 Taking the pulse >> Farming
likely to head for export where stronger sterling is also having an effect.
Conversely the sheep industry is more dependent on exports, with over 35% of output exported. Here some strengthening of the pound against the euro, the eurozone being our principal export market, and again some weakening of demand due to generally tougher economic conditions, put pressure on prices in the latter part of 2013. With fewer lambs carried forward into 2014 and a lower new Zealand lamb crop which is being increasingly targeted at China and the middle East, some improvement in prices in the first quarter of 2014 was apparent.
Beef and sheep farmers have seen some relief from the very high input costs of 2012 and much of 2013, with feed and fertiliser prices easing. Despite this, costs of production remain in excess of average market prices.
>> industry costings suggest total costs of production taking account of family labour input are in the region of £3.20/kg live weight for beef cattle and £2.30/kg live weight for sheep. With seasonal average market prices perhaps £2.00 to £2.10/kg live weight for cattle and £1.75 to £1.85/kg live weight for sheep. it can be seen that producers are only recovering 65% to 75% of their costs from the market.
Unsurprisingly, survey data shows little indication of increasing livestock numbers. CaP reform, which in general looks set to reduce support particularly in the regions where payments are historically linked, is likely to continue to put pressure on the size of the national herd and flock. Without a significant recovery in profitability, the prospect of continued decline and uncertainty remain.
Welsh ‘inter-pillar’ transfers (previously modulation)a Welsh government decision has resulted in the maximum (15%) rate of ‘inter-pillar transfers’ being applied to 2014 payments, which they calculate will result in an extra £286 million being available for rural Development schemes. Concerns that Pillar 1 could “stifle modernisation and innovation” and that there was a wide gap in performance levels of livestock farms across Wales, were cited as the background for this decision.
The impact of this is expected to be, including the reduction in the Pillar 1 budget of 8-10%, a reduction in entitlement values of around 23.4%. The actual impact on SPS 2014 payments to farmers will generally be a reduction of around 14.5% as compared to the 2013 payment using current prices.
Summaryit is tempting to say ‘up horn down corn’ – the prosperity being experienced in the dairy sector is long overdue, and gives new confidence to producers after a long period of desperately low return to a capital intensive business. The red meat sector, whilst achieving better returns, remains a concern as its overall financial performance remains unsustainable. The commodity cycle has overtaken the combinable crop sector, with extraordinary inflation in input prices, leading to very significant margin pressure and loss of profitability.
The industry is experiencing unprecedented land price inflation, driven by the many external factors we are familiar with including subsidy taxation and scarcity. it remains to be seen whether short-term rental levels will react as they should to the pressures in profitability in the arable sector.
loWlanD mIxeD farm£
Budget for 2013 year *
Actual for 2013
Budget for 2014 year**
Projection for 2014
TOTAL GROSS MARGIN 82,520 80,740 92,200 87,640
Overhead costs 77,250 77,250 77,050 77,050
Rent and finance 13,200 13,200 15,003 15,003
Drawings and tax 30,000 30,000 30,000 30,000
Surplus (deficit) pre support payments
(37,930) (39,710) (29,853) (34,413)
Plus Single Farm Payment 38,581 37,076 34,369 34,369
Plus Stewardship 5,280 5,280 5,280 5,280
Surplus (deficit) post support payments
5,931 2,646 9,796 5,236
Variation to budget (3,285) (4,560)
reD meat: 60 suckler coWs, 80 cattle fInIshIng, 500 loWlanD sheep
Source: *HSBC Forward Planning 2013 (p55) **HSBC Forward Planning 2014 (p51)
UK AGRICULTURE
2014 >> HSBC Agriculture 13
ECONOMIC LANDSCAPE
as the structure of global economic growth tilts back to the west, the UK is enjoying a solid recovery. The pace of global economic growth is expected to accelerate gradually this
year, although at just over 3% the rate of expansion will still be somewhat slower than was seen in 2010 and 2011 during the initial recovery from the ‘great recession’, and markedly slower than during the years prior to the financial crisis. But 2014 will be noteworthy for a significant tilt in the structure of global economic activity back to the western advanced economies. The gDP of these countries is expected to expand by close to 2% both this year and next, compared with growth of just over 1% in 2013. The biggest contribution to this acceleration is coming from the Eurozone. This isn’t to say that the single currency area is doing well, only that it’s doing somewhat less badly now that a fragile recovery is under way after a long double-dip recession.
meanwhile the large emerging economies that have been the key driver of the global economy in recent years are confronting a mix of structural issues. in particular, China’s rate of growth has slowed as the authorities implement wide-ranging reforms, while Brazil and russia are now growing at slower rates than Britain and america.
commodities – a structural supportThe shift in the pattern of growth has had a significant impact on demand for many commodities. in overall terms, prices are about a tenth down from the peak reached in the spring of 2011. Since the start of the year prices for food, beverages and agricultural raw materials have tended to rise, in contrast to the stability of fuel prices and the fall in prices for metals. But this has largely been the result of temporary factors affecting coffee and pork, while grain prices have been volatile in response to the ongoing tensions between russia and Ukraine. more generally, however, the commodities super cycle which began in 2003 appears to have run its course.
That said, with many emerging economies still at a commodity-intensive phase in their development, prices
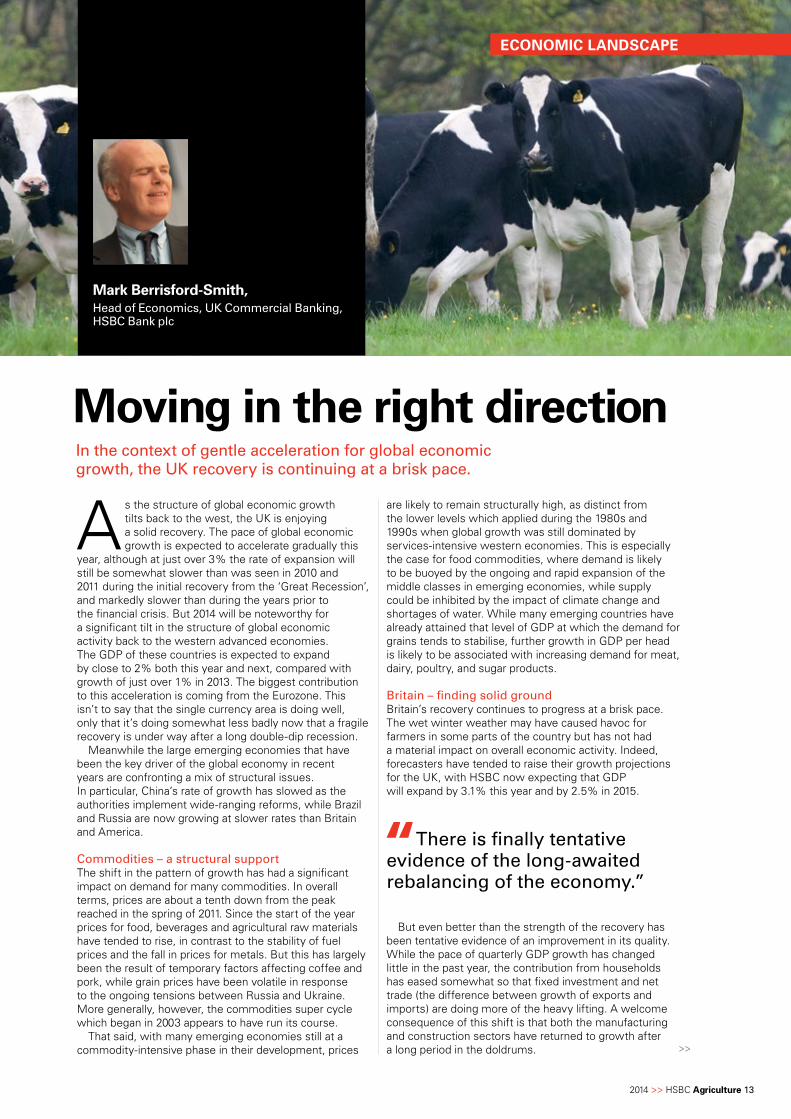
Moving in the right direction
>>
in the context of gentle acceleration for global economic growth, the uk recovery is continuing at a brisk pace.
Mark Berrisford-Smith,Head of economics, uk commercial banking, HSbc bank plc
are likely to remain structurally high, as distinct from the lower levels which applied during the 1980s and 1990s when global growth was still dominated by services-intensive western economies. This is especially the case for food commodities, where demand is likely to be buoyed by the ongoing and rapid expansion of the middle classes in emerging economies, while supply could be inhibited by the impact of climate change and shortages of water. While many emerging countries have already attained that level of gDP at which the demand for grains tends to stabilise, further growth in gDP per head is likely to be associated with increasing demand for meat, dairy, poultry, and sugar products.
britain – finding solid groundBritain’s recovery continues to progress at a brisk pace. The wet winter weather may have caused havoc for farmers in some parts of the country but has not had a material impact on overall economic activity. indeed, forecasters have tended to raise their growth projections for the UK, with HSBC now expecting that gDP will expand by 3.1% this year and by 2.5% in 2015.
there is finally tentative evidence of the long-awaited rebalancing of the economy.”
But even better than the strength of the recovery has been tentative evidence of an improvement in its quality. While the pace of quarterly gDP growth has changed little in the past year, the contribution from households has eased somewhat so that fixed investment and net trade (the difference between growth of exports and imports) are doing more of the heavy lifting. a welcome consequence of this shift is that both the manufacturing and construction sectors have returned to growth after a long period in the doldrums.

14 Taking the pulse >> Farming
ECONOMIC LANDSCAPE
>> But it is too soon to claim that the long-awaited rebalancing of the British economy has finally been achieved. With exporters still facing challenging conditions in many markets, much of the progress made towards rebalancing during the past year has come mostly from increased investment spending.
in this respect it is heartening that business investment seems at last to be set on a firm upward trajectory, with expenditure in the final quarter of 2013 being more than 8% higher than in the same months of the previous year.
meanwhile, the consumer landscape continues to brighten. Sentiment, as tracked by the monthly gFK/nOP survey is now back above its long term average, with recent readings at levels not seen since the spring of 2007. For most of last year, the strengthening of consumer spending was driven not by growth of incomes but by a willingness to run down the rate of saving. now, thanks to a combination of falling inflation and a gradual pick up in earnings growth, the prolonged squeeze on households’ real incomes is at last coming to an end, and people will be able to sustain spending growth without reducing the savings rate any further. This will put the recovery onto a more solid footing.
Inflation Average earnings Real pay growth(wages adjusted for inflation)
annu
al g
row
th, %
annual growth, %
Easing the pressure on household spending
Source: ONS
0
2
4
6
-4
-2
0
2
4
6
-4
-2
2003 2004 2005 2006 2007 2008 2009 2010 2011 2012 2013 2014
guidance 2.0The Bank of England’s initial experiment in forward guidance didn’t turn out as expected. Having announced with a great fanfare in august last year that interest rates wouldn’t be raised until the unemployment rate had fallen to 7%, mr Carney and his colleagues on the mPC were forced into a hasty rethink when the rate almost reached that threshold in just six months. in place of the original guidance, they’ve come up with a cocktail of 18 indicators that they will monitor. Yet this seemingly more confusing approach doesn’t alter the fact that the mPC is in no hurry to start hiking rates, as is made clear in all their speeches. it is still HSBC’s view that the first increases will take place in the second half of next year, with UK Bank rate ending 2015 at 1%.
Statements by mPC members also suggest that the subsequent pace of monetary tightening will be cautious, with Bank rate rising at a slow pace and peaking at a lower level than in previous economic cycles. it should
also be remembered that the dampening effect of rate rises will be augmented by the gradual disposal of the £375 billion of assets which the Bank of England purchased in its programme of quantitative easing. no firm decisions have yet been made on how QE is to be unwound, beyond a statement that no action is likely until after “a number” of interest rate increases. This suggests that the process will not start until 2016.
currencies – the pound holds firmJust as the UK economy has outperformed the expectations of analysts and pundits during the past 18 months, so too has the currency. The pound has trended gently higher, with its trade-weighted value increasing by 2% during the first five months of this year.
nonetheless, HSBC’s forecasts, published in may, anticipate that sterling is set to decline in value against the dollar, finishing this year at $1.62 and depreciating further during 2015 to an end-year rate of $1.50. meanwhile, the sterling rate against the euro is forecast to strengthen a little further in the short term to 79p, at which level it is projected to hold until the end of this year. But then in 2015, the general weakening of sterling is predicted to result in the pound/euro rate slipping to 83p by the end of 2015.
The key factor which is eventually expected to bear down on sterling is that old bugbear: the balance of payments. To begin with, the deficit on trade in goods remains at an elevated level, running at nearly £27 billion in the first quarter of 2014. But the real surprise has been the collapse in the flow of income from abroad. Put simply, the overseas investments of British businesses and others don’t seem to be performing very well. The upshot has been a shortfall on the overall current account position of more than 5% of gDP in both the third and fourth quarters of last year. Unless this situation turns round quickly, it is almost certain to put downward and potentially sudden pressure on the pound. Yet it is worth bearing in mind that the income flows in the current account are not only volatile but can also be subject to substantial revisions. Should the large deficit prove to be temporary, and if the dollar fails to stage the anticipated resurgence, then sterling could continue to hold at around its current level.
The euro too has proved remarkably resilient against the dollar, given that the economic recovery in the eurozone is a much more anaemic affair than that on the other side of the atlantic. moreover, the respective central banks are at very different points in the monetary policy cycle. The Federal reserve will be in a position to begin raising interest rates from early next year, assuming that it has completed the tapering of its asset purchases. meanwhile, it is looking increasingly likely that the ECB will loosen the stance of policy yet further in response to very low inflation rates and the strength of the euro, which has the potential to damage the recovery if unchecked. indeed, with little scope left for reductions in its key interest rates, the ECB could yet be forced down the road to full-blown quantitative easing, more than five years after its counterparts in Britain and america. if that turns out to be the case, then it could well be several years before the ECB is in a position to begin raising its interest rates, putting the euro at a distinct disadvantage to the currencies of other advanced economies, where the tightening cycle will be well under way. The eventual scale of policy loosening by the ECB will therefore be a key factor in driving the value of the euro, and is the biggest element of risk to any forecast. Based on information as at 1 June 2014
2014 >> HSBC Agriculture 15
ECONOMIC LANDSCAPE
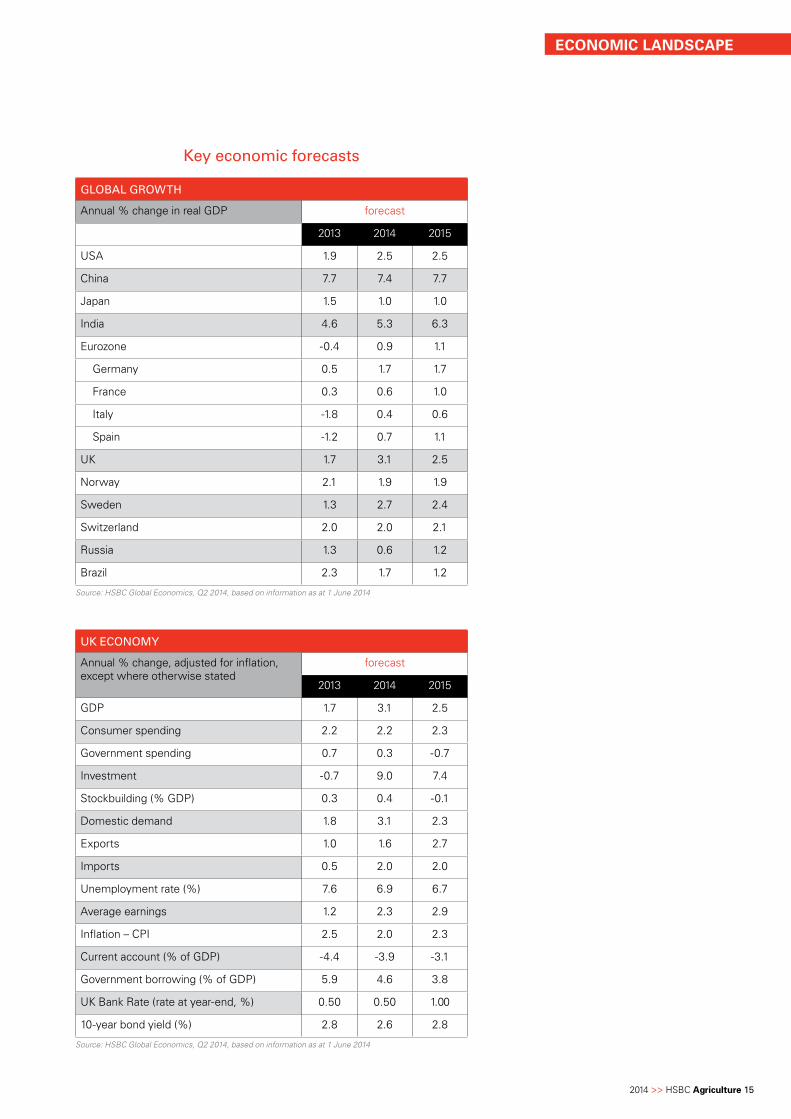
key economic forecasts
Source: HSBC Global Economics, Q2 2014, based on information as at 1 June 2014
Source: HSBC Global Economics, Q2 2014, based on information as at 1 June 2014
global groWtH
annual % change in real gDP forecast
2013 2014 2015
USa 1.9 2.5 2.5
China 7.7 7.4 7.7
Japan 1.5 1.0 1.0
india 4.6 5.3 6.3
Eurozone -0.4 0.9 1.1
germany 0.5 1.7 1.7
France 0.3 0.6 1.0
italy -1.8 0.4 0.6
Spain -1.2 0.7 1.1
UK 1.7 3.1 2.5
norway 2.1 1.9 1.9
Sweden 1.3 2.7 2.4
Switzerland 2.0 2.0 2.1
russia 1.3 0.6 1.2
Brazil 2.3 1.7 1.2
uk economy
annual % change, adjusted for inflation, except where otherwise stated
forecast
2013 2014 2015
gDP 1.7 3.1 2.5
Consumer spending 2.2 2.2 2.3
government spending 0.7 0.3 -0.7
investment -0.7 9.0 7.4
Stockbuilding (% gDP) 0.3 0.4 -0.1
Domestic demand 1.8 3.1 2.3
Exports 1.0 1.6 2.7
imports 0.5 2.0 2.0
Unemployment rate (%) 7.6 6.9 6.7
average earnings 1.2 2.3 2.9
inflation – CPi 2.5 2.0 2.3
Current account (% of gDP) -4.4 -3.9 -3.1
government borrowing (% of gDP) 5.9 4.6 3.8
UK Bank rate (rate at year-end, %) 0.50 0.50 1.00
10-year bond yield (%) 2.8 2.6 2.8
16 Taking the pulse >> Farming
CONTACTS
This document is published by HSBC Bank plc (“HSBC Bank”) as a piece of economic research for information purposes only. it is not intended to constitute investment advice, and no liability can be accepted by HSBC for recipients acting independently on this content. The information presented here is based on sources believed to be reliable, but HSBC Bank accepts no liability for any errors or omissions. Except where otherwise stated, any views, forecasts, or estimates are those of the Business Economics Department of HSBC Bank, which are subject to change without notice.
HSBC Bank Plc. registered Office: 8 Canada Square, London E14 5HQ. registered in England number 14259. HSBC Bank Plc, is authorised by the Prudential regulation authority and regulated by the Financial Conduct authority and the Prudential regulation authority. Our firm reference number is 114216.
aC29023
Allan Wilkinson Head of agriculture 07836 536150 [email protected]
Rt Hon Michael Jack agriculture & food adviser 07767 496857 [email protected]
Neil Wilson regional agriculture manager Scotland 07920 416109 [email protected]
Gordon Whitford regional agriculture manager northern England & northern ireland 07771 840799 [email protected]
HSBC Agriculture contacts
Andy Hipwell regional agriculture manager midlands 07767 005092 [email protected]
Ian Girdley regional agriculture manager Lincolnshire, East anglia & South East 07786 524543 [email protected]
Euryn Jones regional agriculture manager South West & Wales 07920 413221 [email protected]
Call: 08455 856915* visit: www.hsbc.co.uk/agriculture Email: [email protected] * lines are open 9am to 5pm monday to friday, excluding public holidays. HSbc agriculture offers farmers a specialist service that provides exceptional levels of support and strength and depth of industry understanding, as well as financial expertise. HSbc bank plc, agriculture Head office, penman Way, grove park, enderby, leicestershire, le19 1Sy