wrio june 2014
TRANSCRIPT
The World Rubber Industry Outlook
Review and Prospects to 2023
June 2014
International Rubber Study Group
Table of Contents
Foreword i
Assumptions and Scenarios ii
Executive Summary 1
1 The Economy 5
2 The Vehicle Sector 6
3 The Tyre Sector 8
4 Rubber Consumption 9
5 Normal Production of Natural Rubber 16
6 Supply-Demand Interaction and Price Formation 22
7 Production of Natural Rubber 25
8 Consumption of Natural Rubber and Synthetic Rubber 27
Appendix A Summary Description of the IRSG Modelling System 40
© Copyright : The International Rubber Study Group. All rights reserved. No part of this
publication may be reprinted or reproduced, stored in a retrieval system or transmitted in any
form or by any means, electronic, photocopy, recording or otherwise without the prior written
permission of the publisher.
i
Foreword
The International Rubber Study Group (IRSG) was established in 1944 as the only
intergovernmental organization that brought the world‟s rubber producing and consuming
stakeholders together. The IRSG is the forum for the discussion of matters affecting the
supply and demand for natural as well as synthetic rubber.
The IRSG is the authoritative source of statistical data and analysis for all aspects of the
rubber industry, including production, consumption and trade in rubber as well as rubber
products. The seminal purpose of the IRSG Secretariat is to prepare current estimates and
analyse future supply and demand trends, while undertaking statistical and economic studies
on specific aspects of the industry so as to continually improve its value-added service to
stakeholders.
As part of its work program, the Secretariat prepares long-term forecasts for the world
rubber industry using its Modelling System. It is an integrated, layered model that starts
with the economy, working its way up through the vehicle and tyre sectors before finally
arriving at the rubber demand and production.
The operation of the Modelling System is guided by two principles: keep it simple and
delegate to experts where possible. In regards to the second principle, the Modelling
System sources and uses the following data from third party:
Economic outlook
Vehicle data
Tyre data
Oil price outlook
The use of the third-party sourced data is not entirely wholesale. It is in some cases used
only as a guide. This is to ensure operational independence, especially in regards to carrying
out studies on alternative scenarios.
Details on the specific use of the third-party sourced are found in the respective chapters.
ii
Assumptions, Scenarios, Data Sources and Methodology
Assumptions
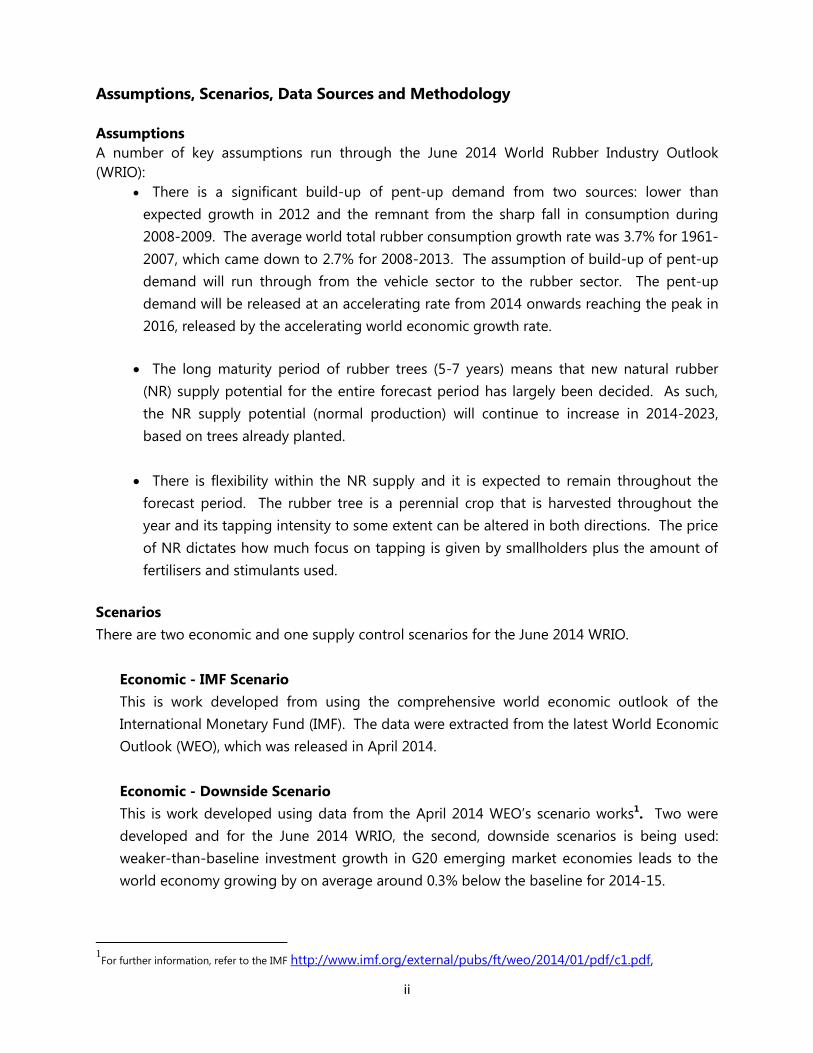
A number of key assumptions run through the June 2014 World Rubber Industry Outlook
(WRIO):
There is a significant build-up of pent-up demand from two sources: lower than
expected growth in 2012 and the remnant from the sharp fall in consumption during
2008-2009. The average world total rubber consumption growth rate was 3.7% for 1961-
2007, which came down to 2.7% for 2008-2013. The assumption of build-up of pent-up
demand will run through from the vehicle sector to the rubber sector. The pent-up
demand will be released at an accelerating rate from 2014 onwards reaching the peak in
2016, released by the accelerating world economic growth rate.
The long maturity period of rubber trees (5-7 years) means that new natural rubber
(NR) supply potential for the entire forecast period has largely been decided. As such,
the NR supply potential (normal production) will continue to increase in 2014-2023,
based on trees already planted.
There is flexibility within the NR supply and it is expected to remain throughout the
forecast period. The rubber tree is a perennial crop that is harvested throughout the
year and its tapping intensity to some extent can be altered in both directions. The price
of NR dictates how much focus on tapping is given by smallholders plus the amount of
fertilisers and stimulants used.
Scenarios
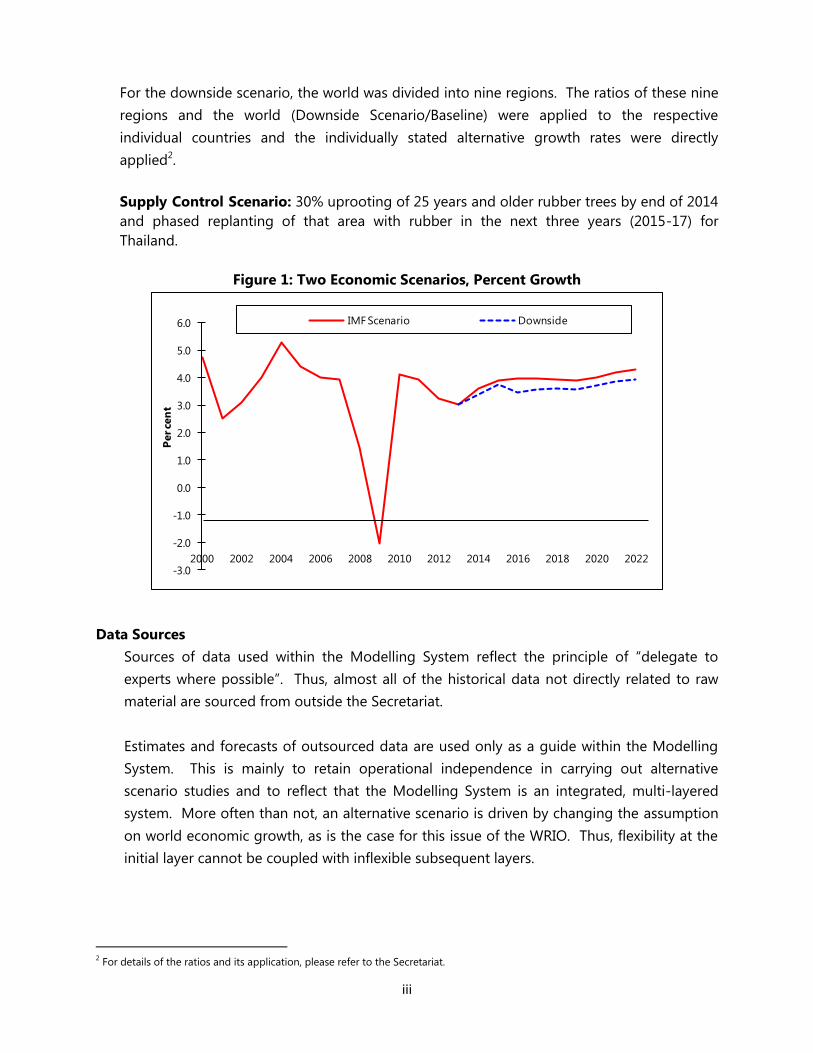
There are two economic and one supply control scenarios for the June 2014 WRIO.
Economic - IMF Scenario
This is work developed from using the comprehensive world economic outlook of the
International Monetary Fund (IMF). The data were extracted from the latest World Economic
Outlook (WEO), which was released in April 2014.
Economic - Downside Scenario
This is work developed using data from the April 2014 WEO‟s scenario works1. Two were
developed and for the June 2014 WRIO, the second, downside scenarios is being used:
weaker-than-baseline investment growth in G20 emerging market economies leads to the
world economy growing by on average around 0.3% below the baseline for 2014-15.
1For further information, refer to the IMF http://www.imf.org/external/pubs/ft/weo/2014/01/pdf/c1.pdf,
iii
For the downside scenario, the world was divided into nine regions. The ratios of these nine
regions and the world (Downside Scenario/Baseline) were applied to the respective
individual countries and the individually stated alternative growth rates were directly
applied2.
Supply Control Scenario: 30% uprooting of 25 years and older rubber trees by end of 2014
and phased replanting of that area with rubber in the next three years (2015-17) for
Thailand.
Figure 1: Two Economic Scenarios, Percent Growth
-3.0
-2.0
-1.0
0.0
1.0
2.0
3.0
4.0
5.0
6.0
2000 2002 2004 2006 2008 2010 2012 2014 2016 2018 2020 2022
Per ce
nt
IMF Scenario Downside
Data Sources
Sources of data used within the Modelling System reflect the principle of “delegate to
experts where possible”. Thus, almost all of the historical data not directly related to raw
material are sourced from outside the Secretariat.
Estimates and forecasts of outsourced data are used only as a guide within the Modelling
System. This is mainly to retain operational independence in carrying out alternative
scenario studies and to reflect that the Modelling System is an integrated, multi-layered
system. More often than not, an alternative scenario is driven by changing the assumption
on world economic growth, as is the case for this issue of the WRIO. Thus, flexibility at the
initial layer cannot be coupled with inflexible subsequent layers.
2 For details of the ratios and its application, please refer to the Secretariat.
iv
Economics
Historical and forecast economic growth rates of the world and individual countries/regions
up to and including 2019 were taken from the April 2014 World Economic Outlook (WEO)
of the IMF. Thereafter, the data are the output of the Secretariat‟s Modelling System.
Vehicles
Historical vehicle data (in use, sales and production) of the world and individual
countries/regions for 2000-2013 were taken from the May 2014 World Tyre Forecast Service
(WTFS) of LMC International. The historic data were wholly accepted and used in the
Modelling System exclusively, except for Canada, France and the USA.
Tyres
Historical tyre data (in use, sales and production) of the world and individual
countries/regions for 2000-2012 were taken from the May 2014 World Tyre Forecast Service
(WTFS) of LMC International. The historic data were wholly accepted and used in the
Modelling System.
Rubber
All rubber data (consumption, production, NR planted area, NR planting and NR replanting)
are sourced entirely within the Secretariat. Planting data and future planting assumptions
were updated and reviewed based on the annual survey as well as through discussions with
stakeholders.
Oil and rubber prices
Oil prices are sourced entirely from the Energy Information Agency (EIA). The short-term
outlook (2014-2015) was taken from the “Short-Term Energy Outlook” released on 10 June
2014, and the long-term outlook was taken from the “Annual Energy Outlook”, released on
7 May 2014.
Forecasts of natural and synthetic rubber prices are made by the Secretariat‟s Modelling
System.
Methodology – Tyre and Tyre Products Rubber Consumption
The calculation of total rubber consumption by the tyre sector is derived by multiplying the
number of tyres produced by the rubber weight of tyre. This calculation is carried for the three
main categories of automobile tyres:
Passenger car tyres (PCT) * Rubber weight = Total rubber consumption of PCT
Light commercial vehicle tyres (LCVT) * Rubber weight = Total rubber consumption of
LCVT
v
Medium/heavy vehicle tyres (MHCVT) * Rubber weight = Total rubber consumption of
MHCVT
Rubber weight of the three tyre types are estimated through surveys of the major tyre
manufacturers, which are intermittently reassessed by benchmarking against the following
parameters:
Average total weight of tyres – gathered via the national tyre manufacturers‟ associations
or trade data
Reverse engineered data
First-tier suppliers estimates
Publicly available and quoted data
There are, however, more than the three types of tyres produced in the world:
Aircraft tyres
Tow wheeled vehicle tyres: bicycle and motorcycle tyres
Off-the-road tyres: mining vehicle tyre, solid tyres (fork-lift trucks, supermarket trolleys,
buggies etc) and others
Others
These are aggregated into a category called Other Tyres, and its total rubber consumption
calculated as a remainder of the total rubber consumption of the total tyre sector and the
combined total rubber consumption of the three main categories of tyres. The total rubber
consumption of the Other Tyres category is calculated in this way due to:
Lack of production data of these tyre types
Lack of rubber weight data of these tyre types
To follow the first guiding principle in running the Modelling System – keep it simple
In practice, there are a number of challenges in correctly deriving the total rubber
consumption of the tyre sector, and the success of it depends upon the followings:
Assumption that the production data of the three main tyre types are correct
Availability of rubber weight of the three main tyre types for all producing countries
Assumption that rubber weights are correct
Availability of total rubber consumption of the total tyre sector
Only a limited number of countries report total rubber consumption data for the total tyre
sector and these countries include USA, Brazil, Japan, Germany, France, Italy, Spain, India,
Indonesia, Thailand, Malaysia, Korea and Taiwan, China. Already implied, the total rubber
consumption of the Other Tyres can only be derived in the presence of reported total rubber
consumption for the total tyre sector. In the absence of such data, the total rubber
consumption of the tyre sector is estimated using information from its most-like neighbour.
vi
The ranges of rubber weight used for the three main categories of automobile tyre are:
Rubber weight of PCT will range between 3.4-6.2kg
Rubber weight of LCVT will range between 5.3-13.1kg
Rubber weight of MHCVT will range between 20.7-40.4kg
Methodology – Natural and Synthetic Rubber Consumptions
Splitting the total rubber consumption by the Tyre sector into Natural rubber (NR)/Synthetic
Rubber (SR) is calculated by multiplying the total rubber consumption of the four tyre types by
its respective NR ratios.
The respective NR ratios of the four tyre types are estimated through surveys of the major tyre
manufacturers, which are intermittently reassessed through benchmarking against the
following parameters:
Reverse engineered data
First-tier suppliers estimates
Publicly available and quoted data
The NR ratios vary according to each country/regional location, and in most cases will
reflect:
Producer status, identifying the individual country as either a NR or SR producer. Thus,
country such as India (NR producer) has relatively higher NR ratios, while Russia (SR
producer) has relatively lower NR ratios.
Technology employed in the manufacture in tyres and local legislation.
Introduction of international company into a domestic company dominated country,
changing the NR/SR mix to that of the international norm.
Due to sensitivity surrounding the NR ratios, it will not explicitly be mentioned within this
report. Following the above statement, it is implicit that the SR consumption of the Tyre and
Tyre Products are calculated as a remainder of total rubber consumption of the Tyre and
Tyre Products following discovery of its NR consumption.
Methodology – Non-Tyre and Non-Tyre Products Rubber Consumption
Total rubber consumption of the Non-Tyre and Non-Tyre Products is calculated as a
remainder of total rubber consumption and total rubber consumption of the Tyre and Tyre
Products. This methodology is used because the Non-Tyre and Non-Tyre Products are too
fragmented for individual data collection and analysis. Thus, for historic data, the accuracy of
information pertaining to the Non-Tyre and Non-Tyre Products is contingent upon the
accuracy of the total rubber consumption and the total rubber consumption of the tyre
sector. For the outlook, it is directly linked to economic growth, with the individual country
vii
rubber consumption a function of its respective economic performance and consumption
trend.
Methodology – Normal Production
The combination of new planting, replanting, total area, yield and technical progress will
lead to projections of „normal production‟. The analysis incorporates the Vintage approach,
which is a model to analyse the effects of planting decisions in a positive or negative
direction on production potential. In this connection, the term vintage is defined as the area
planted in a certain year. Such a vintage is followed over time, when part of it will be
discarded because the land is used for other purposes or for replanting with the same crop.
Detailed modelling analyses using the Vintage approach have been done for eleven
countries: Thailand, Indonesia, Malaysia, India, Vietnam, China, Sri Lanka, Cambodia,
Philippines, Myanmar and Laos.
For further details on the Vintage approach, please contact the Secretariat.
1
Executive Summary
World total rubber consumption is forecast to increase at an accelerating rate of 4.1% and
4.4% over 2014 and 2015, respectively, growing above the long-term growth rate of 3.7%
under the IMF Scenario. The release of pent-up demand built-up over the last five years,
triggered by the accelerating world economic growth rate, lies behind this. As a result, the
world total rubber consumption is forecast to be 28.0 million tonnes in 2014 and 29.2 million
tonnes in 2015. Thereafter, the world total rubber consumption is forecast to increases at an
accelerating rate for another year, then increasing at decelerating rates to 2019. The growth
rate will subsequently recover, reflecting the dynamics of the world economy. Under the
Downside Scenario, world total rubber consumption is forecast to grow by 3.7% to 27.5
million tonnes in 2014, before increasing by 4.6% in 2015 to 29.1 million tonnes. The
sharper accelerated growth of the world economy in 2015, which follows a relatively shallow
slowdown (as compared to the IMF Scenario) in 2014, explains the minor difference in the
quantity of rubber consumed between the two economic scenarios in 2015.
World NR demand is forecast to increase by 4.5% in 2014 under the IMF Scenario, and by a
decelerated rate of 4.4% in 2015. The decelerated rate of growth in 2015, going against the
growth rate of the world total rubber consumption, is mainly a reflection of the relative
NR/SR price position. Thus, world total NR consumption is expected to be 11.90 million
tonnes and 12.43 million tonnes in 2014 and 2015, respectively. Throughout 2016-2023, the
relative price level is expected to remain a positive factor in the growth of world total NR
consumption, which will increase by an average 4.0% during 2016-2023.
Under the Downside Scenario, the world NR demand is forecast to grow by 4.1% to 11.86
million tonnes in 2014. The full impact of the slowdown in the world economic growth rate
seen on the world total rubber is cushioned for NR consumption in 2014 due to the relative
rubber price level. In 2015, the growth rate is forecast at 4.6%, increasing the world NR
consumption to 12.40 million tonnes. In 2023, the world NR consumption would be 16.8
million tonnes.
World SR demand is expected to increase to 16.05 million tonnes in 2014 and rise to 16.76
million tonnes in 2015 under the IMF Scenario. In 2023, the demand for SR will by 22.0
million tonnes. The average growth rate of SR consumption will be lower than that of total
rubber demand for 2014-2023. This is due to lower growth rate of rubber demand from
passenger car tyres and the Non-Tyre and Non-Tyre products as compared to their
respective counterparts and relative rubber price.
2
Demand for SR will increase by 3.5% to 16.00 million tonnes in 2014, under the Downside
Scenario, subsequently increasing to 16.72 million tonnes in 2015.
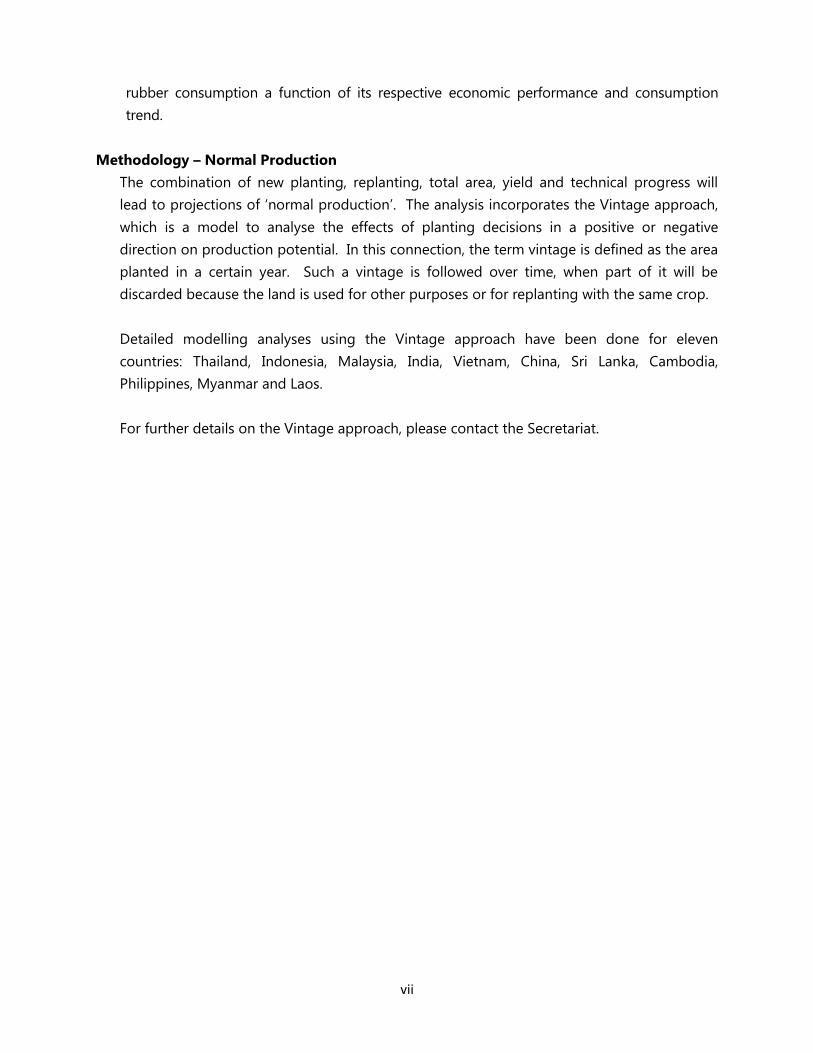
The outlook for NR supply is positive, sufficient to meet the demand of the industry for all
forecast years under all three scenarios. In the short-term (2014-2015), the annual surplus
production is expected to be the largest under the Downside Scenario. This is a mainly
reflection of the Normal Production, which remains unaffected either by the relative price
level or the quantity of rubber consumed.
Figure 2: Two Economic Scenarios, Total Rubber Demand, 2000-2023
6
11
16
21
26
31
36
41
2000 2002 2004 2006 2008 2010 2012 2014 2016 2018 2020 2022
Ru
bb
er co
nsu
mp
tio
n, m
n to
nn
es
IMF Scenario Downside Scenario
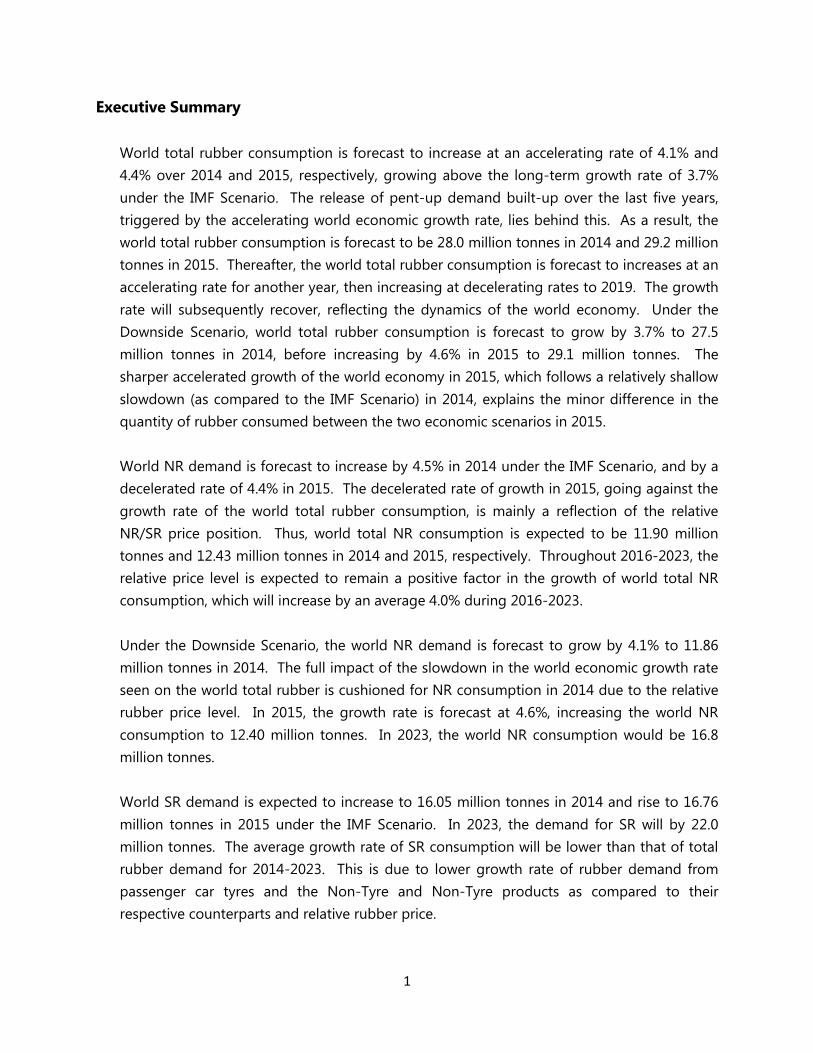
Figure 3: Three Scenarios, Natural Rubber Demand, 2000-2023
6
8
10
12
14
16
18
2000 2002 2004 2006 2008 2010 2012 2014 2016 2018 2020 2022
Ru
bb
er C
on
sum
pti
on
, m
n to
nnes
IMF-Base Planting Scenario Downside-Base Planting Scenario
IMF-Supply Control Scenario
3
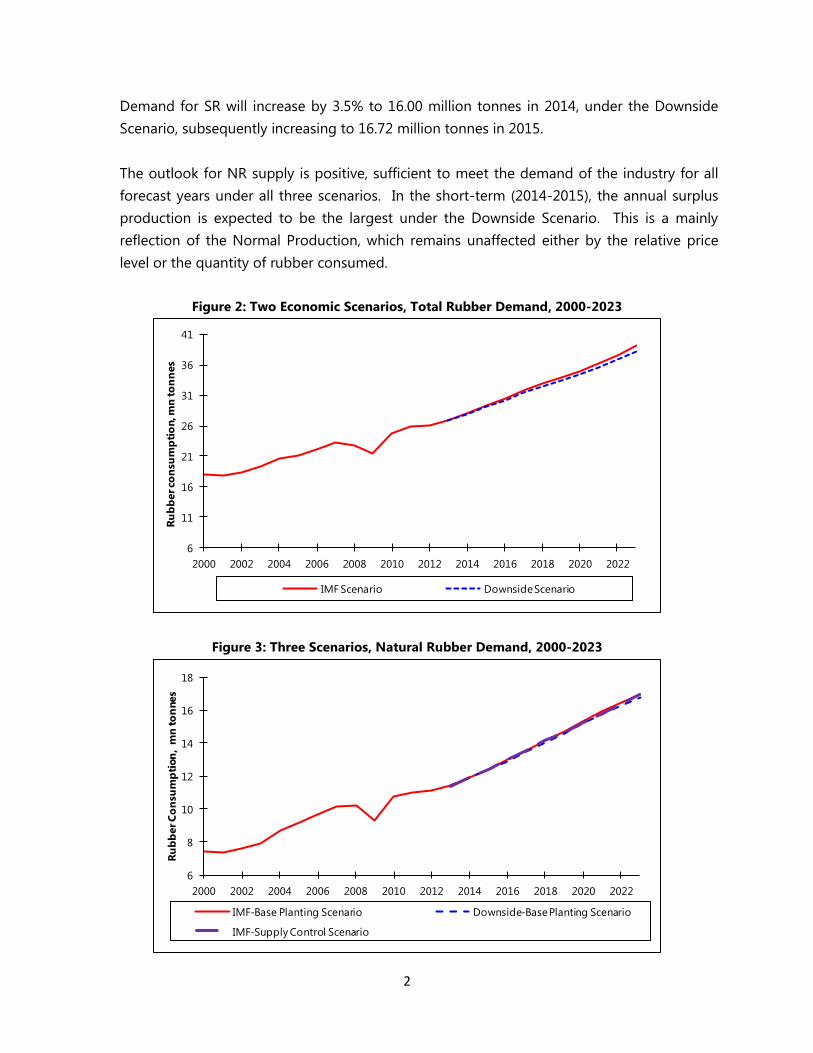
Figure 4: Three Scenarios, Synthetic Rubber Demand, 2000-2023
6
8
10
12
14
16
18
20
22
24
2000 2002 2004 2006 2008 2010 2012 2014 2016 2018 2020 2022
Ru
bb
er C
on
sum
pti
on
, m
n to
nnes
IMF-Base Planting Scenario Downside-Base Planting Scenario
IMF-Supply Control Scenario
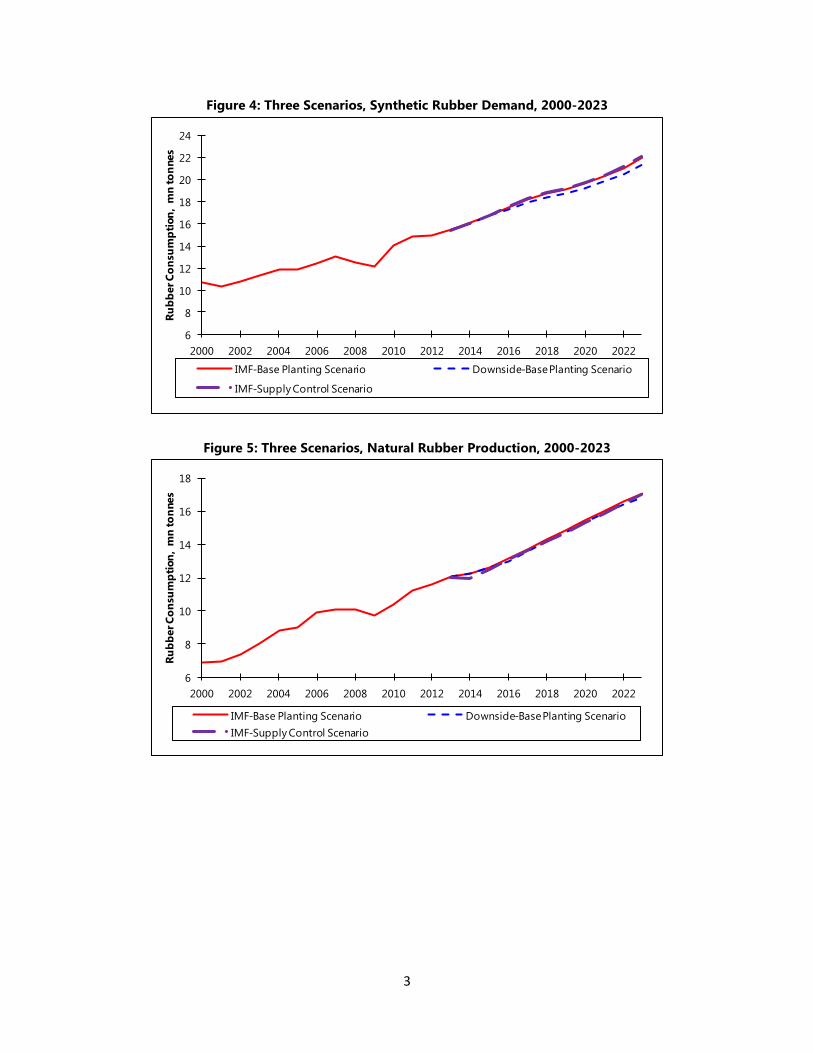
Figure 5: Three Scenarios, Natural Rubber Production, 2000-2023
6
8
10
12
14
16
18
2000 2002 2004 2006 2008 2010 2012 2014 2016 2018 2020 2022
Ru
bb
er C
on
sum
pti
on
, m
n to
nnes
IMF-Base Planting Scenario Downside-Base Planting Scenario
IMF-Supply Control Scenario
4
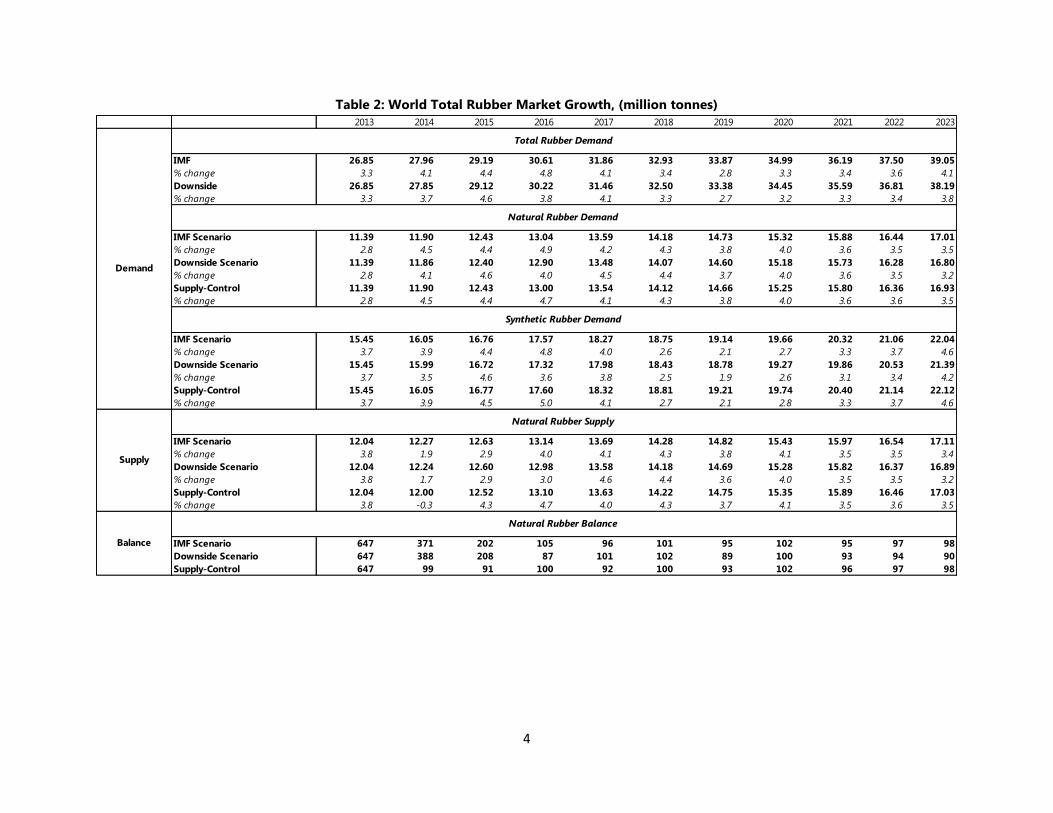
Table 2: World Total Rubber Market Growth, (million tonnes)
2013 2014 2015 2016 2017 2018 2019 2020 2021 2022 2023
IMF 26.85 27.96 29.19 30.61 31.86 32.93 33.87 34.99 36.19 37.50 39.05
% change 3.3 4.1 4.4 4.8 4.1 3.4 2.8 3.3 3.4 3.6 4.1
Downside 26.85 27.85 29.12 30.22 31.46 32.50 33.38 34.45 35.59 36.81 38.19
% change 3.3 3.7 4.6 3.8 4.1 3.3 2.7 3.2 3.3 3.4 3.8
IMF Scenario 11.39 11.90 12.43 13.04 13.59 14.18 14.73 15.32 15.88 16.44 17.01
% change 2.8 4.5 4.4 4.9 4.2 4.3 3.8 4.0 3.6 3.5 3.5
Downside Scenario 11.39 11.86 12.40 12.90 13.48 14.07 14.60 15.18 15.73 16.28 16.80
% change 2.8 4.1 4.6 4.0 4.5 4.4 3.7 4.0 3.6 3.5 3.2
Supply-Control 11.39 11.90 12.43 13.00 13.54 14.12 14.66 15.25 15.80 16.36 16.93
% change 2.8 4.5 4.4 4.7 4.1 4.3 3.8 4.0 3.6 3.6 3.5
IMF Scenario 15.45 16.05 16.76 17.57 18.27 18.75 19.14 19.66 20.32 21.06 22.04
% change 3.7 3.9 4.4 4.8 4.0 2.6 2.1 2.7 3.3 3.7 4.6
Downside Scenario 15.45 15.99 16.72 17.32 17.98 18.43 18.78 19.27 19.86 20.53 21.39
% change 3.7 3.5 4.6 3.6 3.8 2.5 1.9 2.6 3.1 3.4 4.2
Supply-Control 15.45 16.05 16.77 17.60 18.32 18.81 19.21 19.74 20.40 21.14 22.12
% change 3.7 3.9 4.5 5.0 4.1 2.7 2.1 2.8 3.3 3.7 4.6
IMF Scenario 12.04 12.27 12.63 13.14 13.69 14.28 14.82 15.43 15.97 16.54 17.11
% change 3.8 1.9 2.9 4.0 4.1 4.3 3.8 4.1 3.5 3.5 3.4
Downside Scenario 12.04 12.24 12.60 12.98 13.58 14.18 14.69 15.28 15.82 16.37 16.89
% change 3.8 1.7 2.9 3.0 4.6 4.4 3.6 4.0 3.5 3.5 3.2
Supply-Control 12.04 12.00 12.52 13.10 13.63 14.22 14.75 15.35 15.89 16.46 17.03
% change 3.8 -0.3 4.3 4.7 4.0 4.3 3.7 4.1 3.5 3.6 3.5
IMF Scenario 647 371 202 105 96 101 95 102 95 97 98
Downside Scenario 647 388 208 87 101 102 89 100 93 94 90
Supply-Control 647 99 91 100 92 100 93 102 96 97 98
Demand
Total Rubber Demand
Natural Rubber Demand
Synthetic Rubber Demand
Natural Rubber Supply
Natural Rubber Balance
Supply
Balance
5
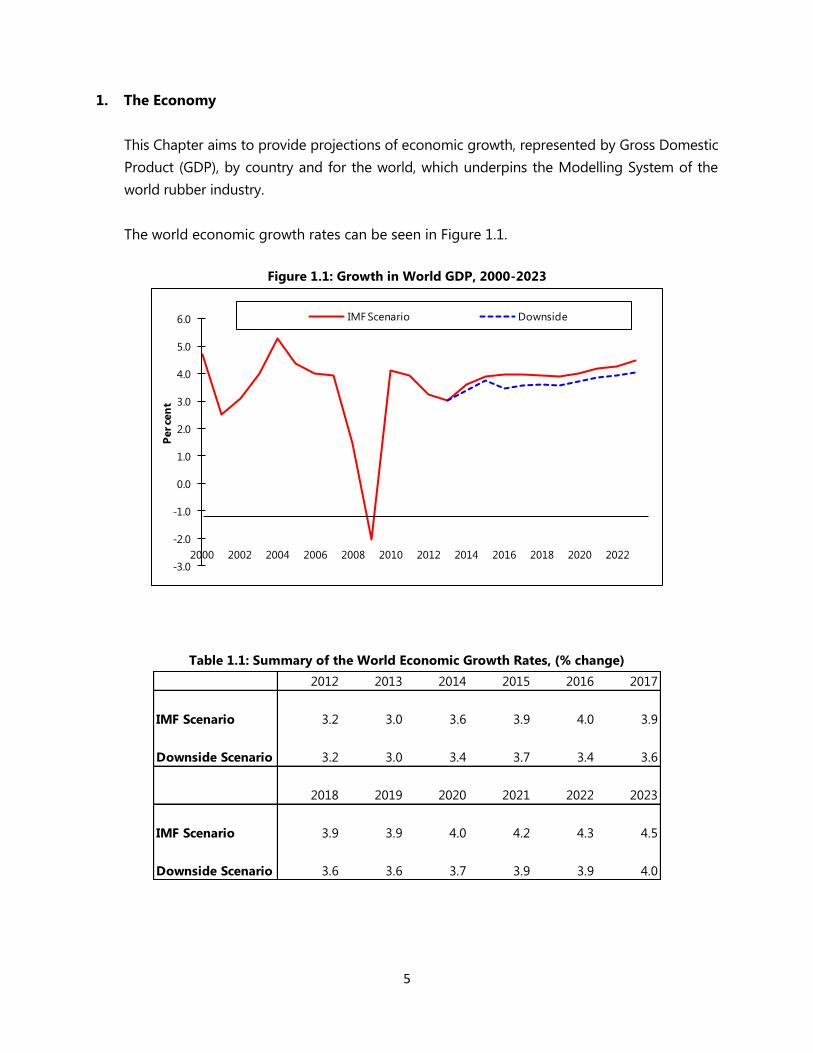
1. The Economy
This Chapter aims to provide projections of economic growth, represented by Gross Domestic
Product (GDP), by country and for the world, which underpins the Modelling System of the
world rubber industry.
The world economic growth rates can be seen in Figure 1.1.
Figure 1.1: Growth in World GDP, 2000-2023
-3.0
-2.0
-1.0
0.0
1.0
2.0
3.0
4.0
5.0
6.0
2000 2002 2004 2006 2008 2010 2012 2014 2016 2018 2020 2022
Per ce
nt
IMF Scenario Downside
Table 1.1: Summary of the World Economic Growth Rates, (% change)
2012 2013 2014 2015 2016 2017
IMF Scenario 3.2 3.0 3.6 3.9 4.0 3.9
Downside Scenario 3.2 3.0 3.4 3.7 3.4 3.6
2018 2019 2020 2021 2022 2023
IMF Scenario 3.9 3.9 4.0 4.2 4.3 4.5
Downside Scenario 3.6 3.6 3.7 3.9 3.9 4.0
6
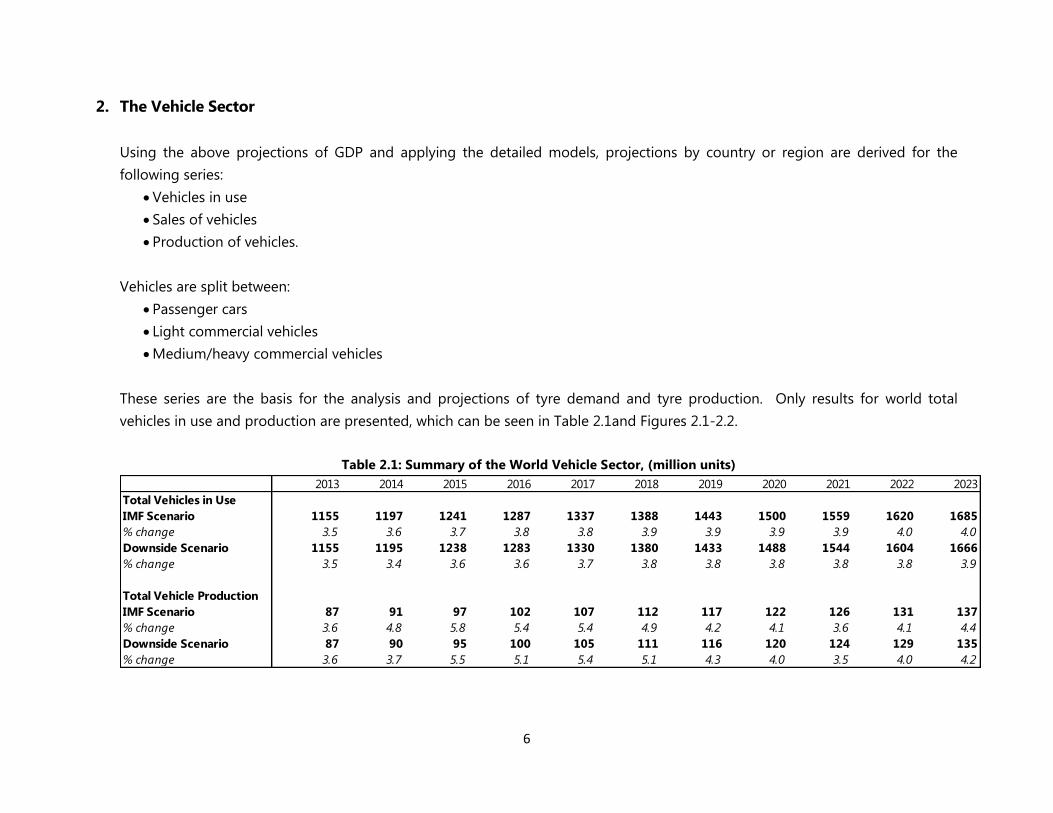
2. The Vehicle Sector
Using the above projections of GDP and applying the detailed models, projections by country or region are derived for the
following series:
Vehicles in use
Sales of vehicles
Production of vehicles.
Vehicles are split between:
Passenger cars
Light commercial vehicles
Medium/heavy commercial vehicles
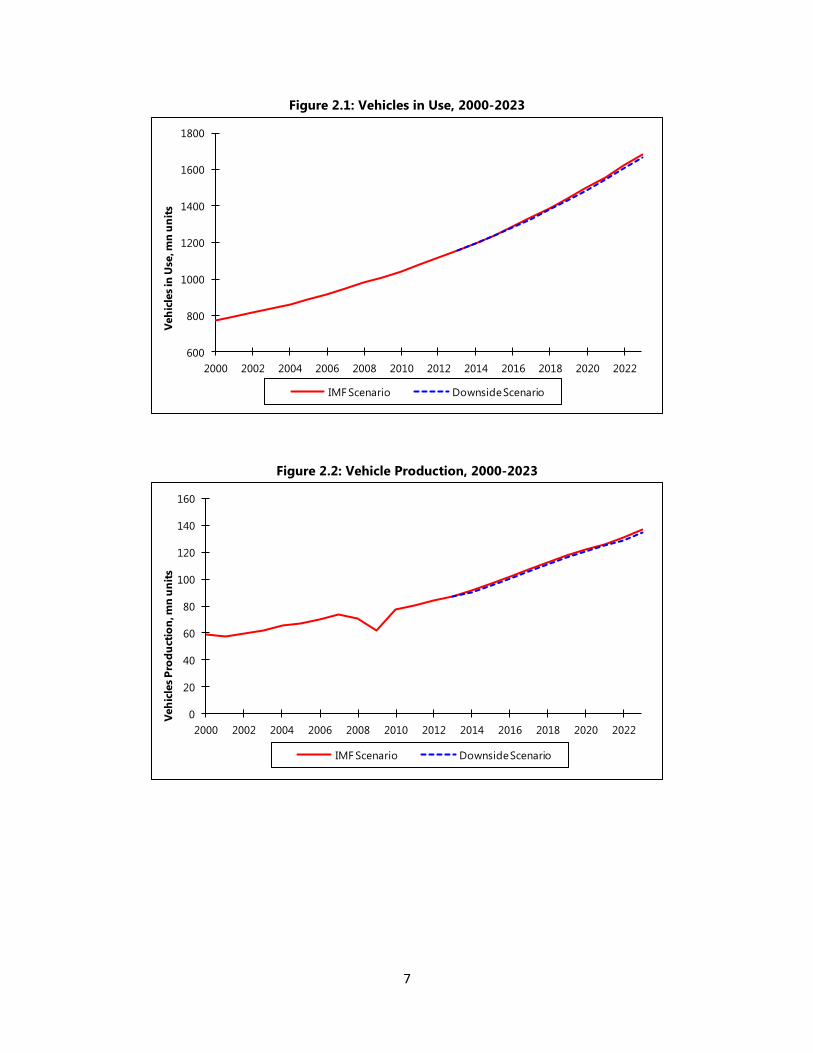
These series are the basis for the analysis and projections of tyre demand and tyre production. Only results for world total
vehicles in use and production are presented, which can be seen in Table 2.1and Figures 2.1-2.2.
Table 2.1: Summary of the World Vehicle Sector, (million units)
2013 2014 2015 2016 2017 2018 2019 2020 2021 2022 2023
Total Vehicles in Use
IMF Scenario 1155 1197 1241 1287 1337 1388 1443 1500 1559 1620 1685
% change 3.5 3.6 3.7 3.8 3.8 3.9 3.9 3.9 3.9 4.0 4.0
Downside Scenario 1155 1195 1238 1283 1330 1380 1433 1488 1544 1604 1666
% change 3.5 3.4 3.6 3.6 3.7 3.8 3.8 3.8 3.8 3.8 3.9
Total Vehicle Production
IMF Scenario 87 91 97 102 107 112 117 122 126 131 137
% change 3.6 4.8 5.8 5.4 5.4 4.9 4.2 4.1 3.6 4.1 4.4
Downside Scenario 87 90 95 100 105 111 116 120 124 129 135
% change 3.6 3.7 5.5 5.1 5.4 5.1 4.3 4.0 3.5 4.0 4.2
7
Figure 2.1: Vehicles in Use, 2000-2023
600
800
1000
1200
1400
1600
1800
2000 2002 2004 2006 2008 2010 2012 2014 2016 2018 2020 2022
Veh
icle
s in
Use
, mn
un
its
IMF Scenario Downside Scenario
Figure 2.2: Vehicle Production, 2000-2023
0
20
40
60
80
100
120
140
160
2000 2002 2004 2006 2008 2010 2012 2014 2016 2018 2020 2022
Veh
icle
s P
rod
uct
ion
, mn
un
its
IMF Scenario Downside Scenario
8
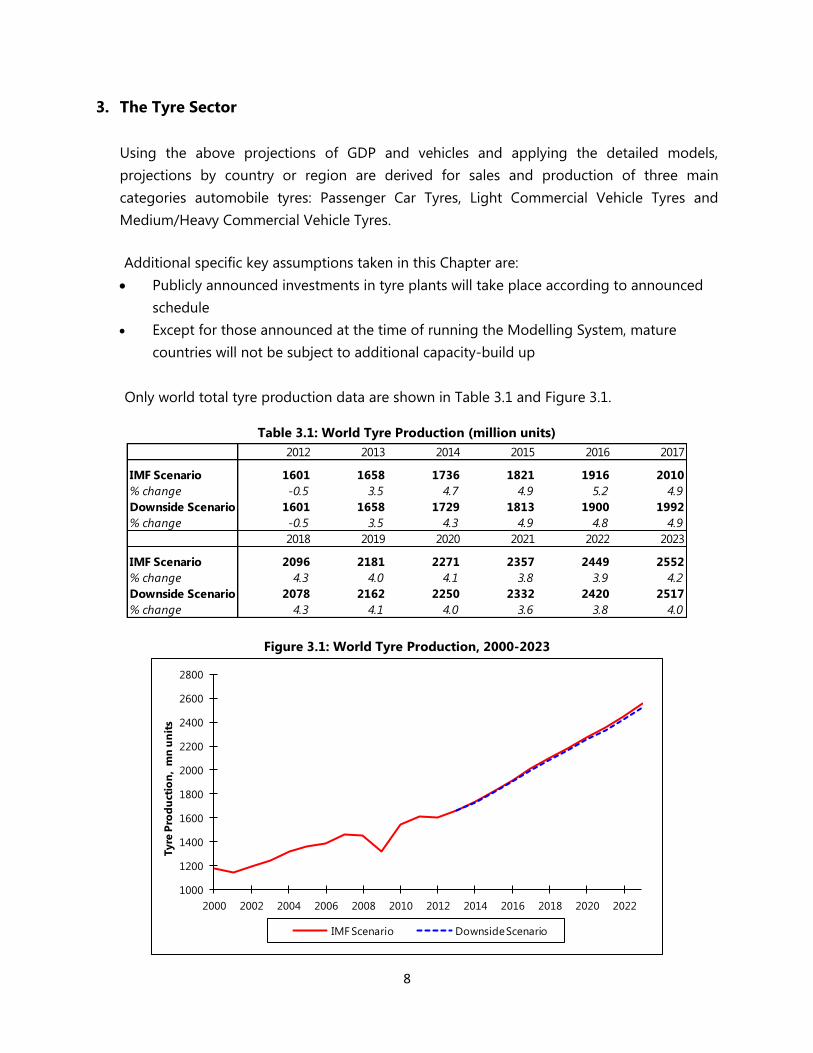
3. The Tyre Sector
Using the above projections of GDP and vehicles and applying the detailed models,
projections by country or region are derived for sales and production of three main
categories automobile tyres: Passenger Car Tyres, Light Commercial Vehicle Tyres and
Medium/Heavy Commercial Vehicle Tyres.
Additional specific key assumptions taken in this Chapter are:
Publicly announced investments in tyre plants will take place according to announced
schedule
Except for those announced at the time of running the Modelling System, mature
countries will not be subject to additional capacity-build up
Only world total tyre production data are shown in Table 3.1 and Figure 3.1.
Table 3.1: World Tyre Production (million units)
2012 2013 2014 2015 2016 2017
IMF Scenario 1601 1658 1736 1821 1916 2010
% change -0.5 3.5 4.7 4.9 5.2 4.9
Downside Scenario 1601 1658 1729 1813 1900 1992
% change -0.5 3.5 4.3 4.9 4.8 4.9
2018 2019 2020 2021 2022 2023
IMF Scenario 2096 2181 2271 2357 2449 2552
% change 4.3 4.0 4.1 3.8 3.9 4.2
Downside Scenario 2078 2162 2250 2332 2420 2517
% change 4.3 4.1 4.0 3.6 3.8 4.0
Figure 3.1: World Tyre Production, 2000-2023
1000
1200
1400
1600
1800
2000
2200
2400
2600
2800
2000 2002 2004 2006 2008 2010 2012 2014 2016 2018 2020 2022
Tyre
Pro
du
ctio
n,
mn
un
its
IMF Scenario Downside Scenario
9
4. Total Rubber Consumption
The focus of this Chapter is to arrive at projections of total rubber consumption. Using the
above projections of GDP, vehicles and tyre data and applying the detailed models,
projections by country or region are derived. Beginning with total rubber consumption, this
will be split into two parts: the Tyre and Tyre Products and Non-Tyre and Non-Tyre Products.
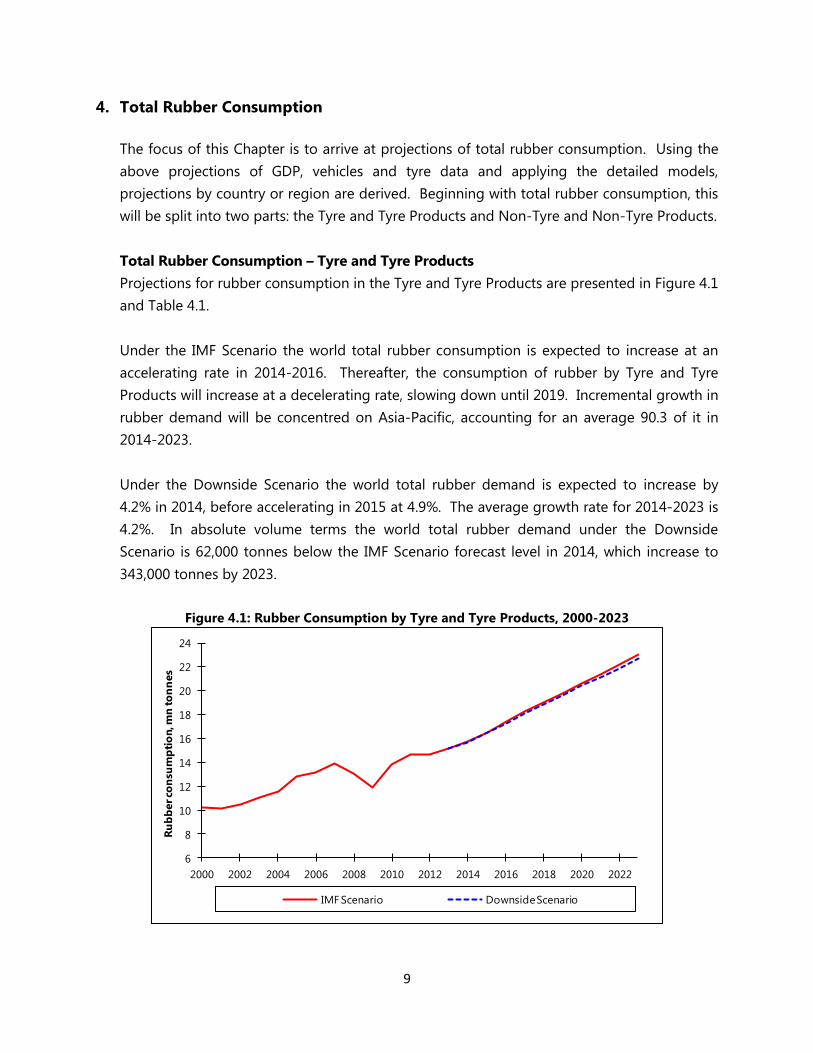
Total Rubber Consumption – Tyre and Tyre Products
Projections for rubber consumption in the Tyre and Tyre Products are presented in Figure 4.1
and Table 4.1.
Under the IMF Scenario the world total rubber consumption is expected to increase at an
accelerating rate in 2014-2016. Thereafter, the consumption of rubber by Tyre and Tyre
Products will increase at a decelerating rate, slowing down until 2019. Incremental growth in
rubber demand will be concentred on Asia-Pacific, accounting for an average 90.3 of it in
2014-2023.
Under the Downside Scenario the world total rubber demand is expected to increase by
4.2% in 2014, before accelerating in 2015 at 4.9%. The average growth rate for 2014-2023 is
4.2%. In absolute volume terms the world total rubber demand under the Downside
Scenario is 62,000 tonnes below the IMF Scenario forecast level in 2014, which increase to
343,000 tonnes by 2023.
Figure 4.1: Rubber Consumption by Tyre and Tyre Products, 2000-2023
6
8
10
12
14
16
18
20
22
24
2000 2002 2004 2006 2008 2010 2012 2014 2016 2018 2020 2022
Ru
bb
er co
nsu
mp
tio
n, m
n to
nn
es
IMF Scenario Downside Scenario
10
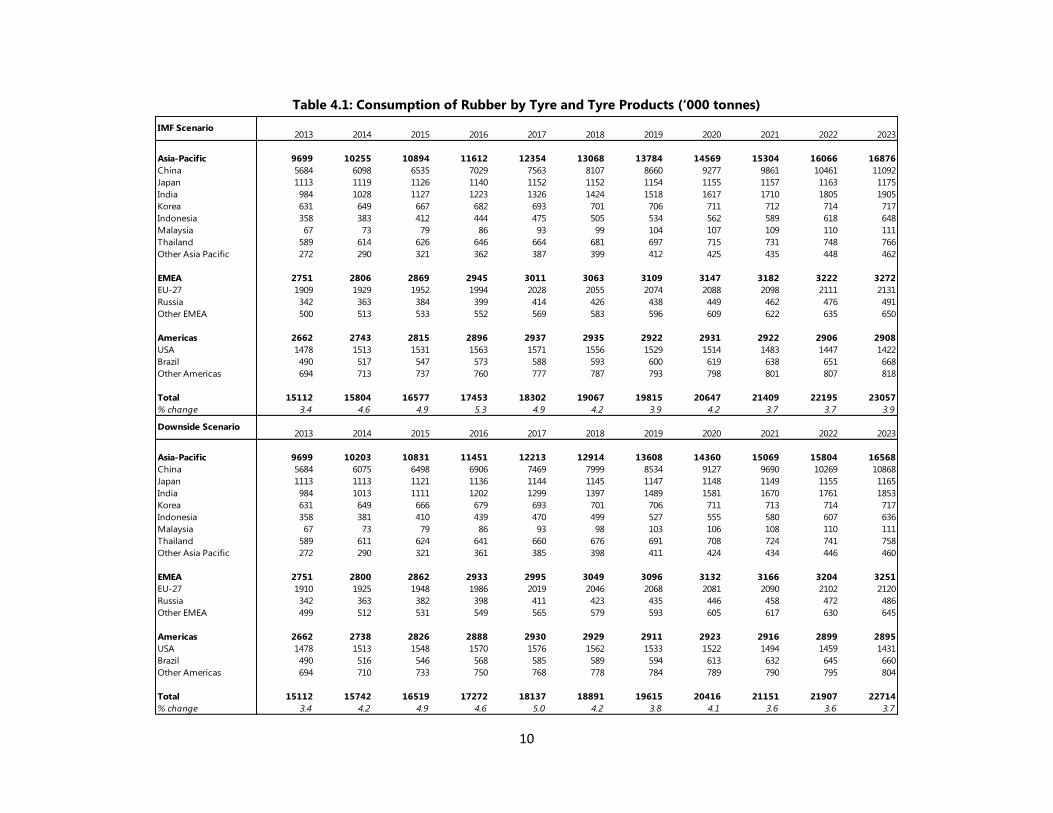
Table 4.1: Consumption of Rubber by Tyre and Tyre Products (‘000 tonnes)
2013 2014 2015 2016 2017 2018 2019 2020 2021 2022 2023
Asia-Pacific 9699 10255 10894 11612 12354 13068 13784 14569 15304 16066 16876
China 5684 6098 6535 7029 7563 8107 8660 9277 9861 10461 11092
Japan 1113 1119 1126 1140 1152 1152 1154 1155 1157 1163 1175
India 984 1028 1127 1223 1326 1424 1518 1617 1710 1805 1905
Korea 631 649 667 682 693 701 706 711 712 714 717
Indonesia 358 383 412 444 475 505 534 562 589 618 648
Malaysia 67 73 79 86 93 99 104 107 109 110 111
Thailand 589 614 626 646 664 681 697 715 731 748 766
Other Asia Pacific 272 290 321 362 387 399 412 425 435 448 462
EMEA 2751 2806 2869 2945 3011 3063 3109 3147 3182 3222 3272
EU-27 1909 1929 1952 1994 2028 2055 2074 2088 2098 2111 2131
Russia 342 363 384 399 414 426 438 449 462 476 491
Other EMEA 500 513 533 552 569 583 596 609 622 635 650
Americas 2662 2743 2815 2896 2937 2935 2922 2931 2922 2906 2908
USA 1478 1513 1531 1563 1571 1556 1529 1514 1483 1447 1422
Brazil 490 517 547 573 588 593 600 619 638 651 668
Other Americas 694 713 737 760 777 787 793 798 801 807 818
Total 15112 15804 16577 17453 18302 19067 19815 20647 21409 22195 23057
% change 3.4 4.6 4.9 5.3 4.9 4.2 3.9 4.2 3.7 3.7 3.9
2013 2014 2015 2016 2017 2018 2019 2020 2021 2022 2023
Asia-Pacific 9699 10203 10831 11451 12213 12914 13608 14360 15069 15804 16568
China 5684 6075 6498 6906 7469 7999 8534 9127 9690 10269 10868
Japan 1113 1113 1121 1136 1144 1145 1147 1148 1149 1155 1165
India 984 1013 1111 1202 1299 1397 1489 1581 1670 1761 1853
Korea 631 649 666 679 693 701 706 711 713 714 717
Indonesia 358 381 410 439 470 499 527 555 580 607 636
Malaysia 67 73 79 86 93 98 103 106 108 110 111
Thailand 589 611 624 641 660 676 691 708 724 741 758
Other Asia Pacific 272 290 321 361 385 398 411 424 434 446 460
EMEA 2751 2800 2862 2933 2995 3049 3096 3132 3166 3204 3251
EU-27 1910 1925 1948 1986 2019 2046 2068 2081 2090 2102 2120
Russia 342 363 382 398 411 423 435 446 458 472 486
Other EMEA 499 512 531 549 565 579 593 605 617 630 645
Americas 2662 2738 2826 2888 2930 2929 2911 2923 2916 2899 2895
USA 1478 1513 1548 1570 1576 1562 1533 1522 1494 1459 1431
Brazil 490 516 546 568 585 589 594 613 632 645 660
Other Americas 694 710 733 750 768 778 784 789 790 795 804
Total 15112 15742 16519 17272 18137 18891 19615 20416 21151 21907 22714
% change 3.4 4.2 4.9 4.6 5.0 4.2 3.8 4.1 3.6 3.6 3.7
IMF Scenario
Downside Scenario
11
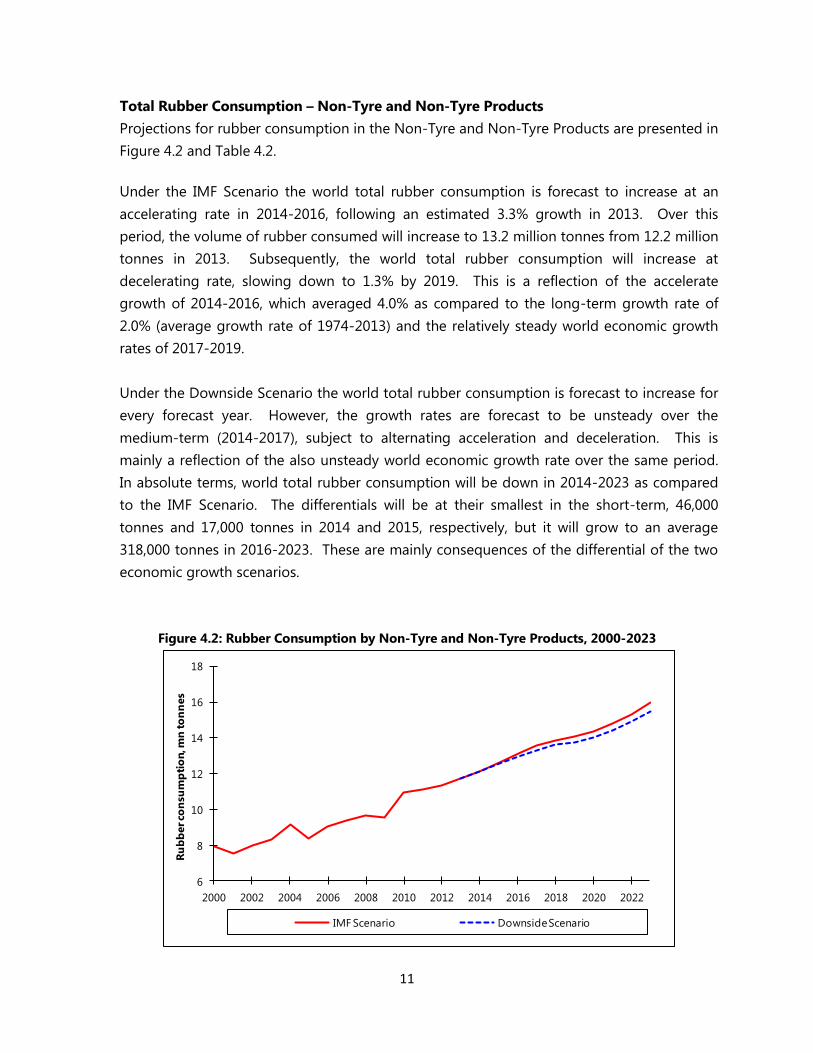
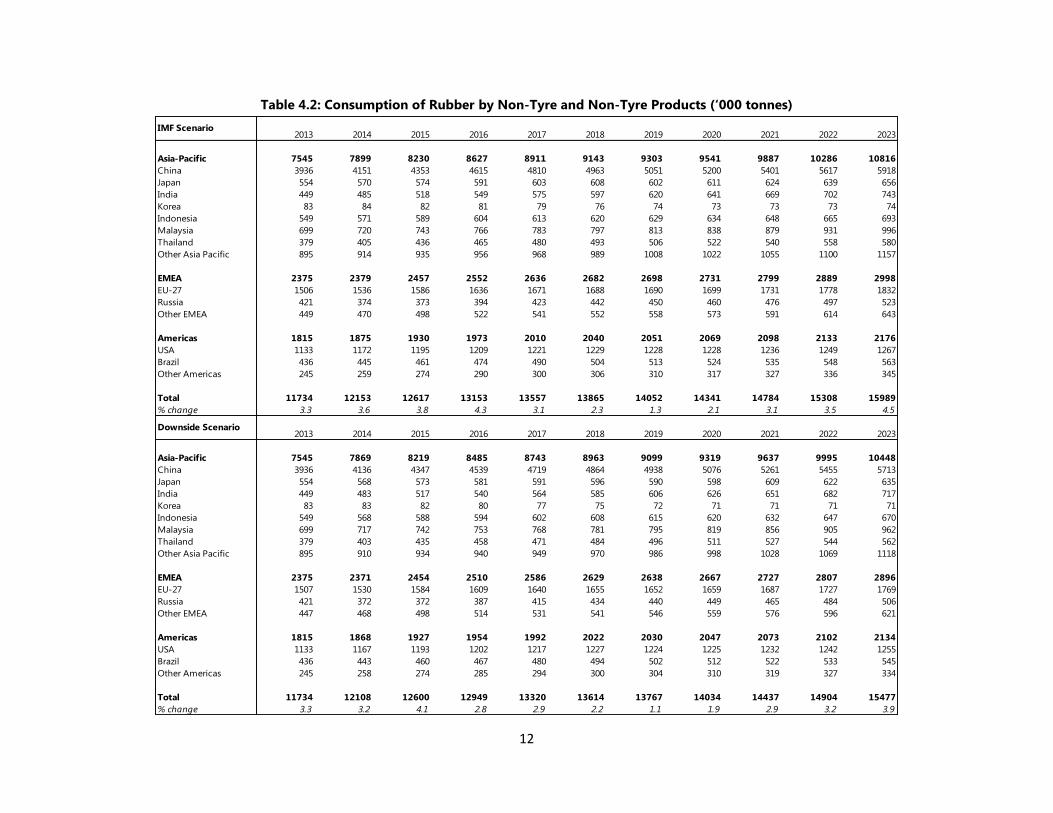
Total Rubber Consumption – Non-Tyre and Non-Tyre Products
Projections for rubber consumption in the Non-Tyre and Non-Tyre Products are presented in
Figure 4.2 and Table 4.2.
Under the IMF Scenario the world total rubber consumption is forecast to increase at an
accelerating rate in 2014-2016, following an estimated 3.3% growth in 2013. Over this
period, the volume of rubber consumed will increase to 13.2 million tonnes from 12.2 million
tonnes in 2013. Subsequently, the world total rubber consumption will increase at
decelerating rate, slowing down to 1.3% by 2019. This is a reflection of the accelerate
growth of 2014-2016, which averaged 4.0% as compared to the long-term growth rate of
2.0% (average growth rate of 1974-2013) and the relatively steady world economic growth
rates of 2017-2019.
Under the Downside Scenario the world total rubber consumption is forecast to increase for
every forecast year. However, the growth rates are forecast to be unsteady over the
medium-term (2014-2017), subject to alternating acceleration and deceleration. This is
mainly a reflection of the also unsteady world economic growth rate over the same period.
In absolute terms, world total rubber consumption will be down in 2014-2023 as compared
to the IMF Scenario. The differentials will be at their smallest in the short-term, 46,000
tonnes and 17,000 tonnes in 2014 and 2015, respectively, but it will grow to an average
318,000 tonnes in 2016-2023. These are mainly consequences of the differential of the two
economic growth scenarios.
Figure 4.2: Rubber Consumption by Non-Tyre and Non-Tyre Products, 2000-2023
6
8
10
12
14
16
18
2000 2002 2004 2006 2008 2010 2012 2014 2016 2018 2020 2022
Ru
bb
er co
nsu
mp
tio
n, m
n to
nn
es
IMF Scenario Downside Scenario
12
Table 4.2: Consumption of Rubber by Non-Tyre and Non-Tyre Products (‘000 tonnes)
2013 2014 2015 2016 2017 2018 2019 2020 2021 2022 2023
Asia-Pacific 7545 7899 8230 8627 8911 9143 9303 9541 9887 10286 10816
China 3936 4151 4353 4615 4810 4963 5051 5200 5401 5617 5918
Japan 554 570 574 591 603 608 602 611 624 639 656
India 449 485 518 549 575 597 620 641 669 702 743
Korea 83 84 82 81 79 76 74 73 73 73 74
Indonesia 549 571 589 604 613 620 629 634 648 665 693
Malaysia 699 720 743 766 783 797 813 838 879 931 996
Thailand 379 405 436 465 480 493 506 522 540 558 580
Other Asia Pacific 895 914 935 956 968 989 1008 1022 1055 1100 1157
EMEA 2375 2379 2457 2552 2636 2682 2698 2731 2799 2889 2998
EU-27 1506 1536 1586 1636 1671 1688 1690 1699 1731 1778 1832
Russia 421 374 373 394 423 442 450 460 476 497 523
Other EMEA 449 470 498 522 541 552 558 573 591 614 643
Americas 1815 1875 1930 1973 2010 2040 2051 2069 2098 2133 2176
USA 1133 1172 1195 1209 1221 1229 1228 1228 1236 1249 1267
Brazil 436 445 461 474 490 504 513 524 535 548 563
Other Americas 245 259 274 290 300 306 310 317 327 336 345
Total 11734 12153 12617 13153 13557 13865 14052 14341 14784 15308 15989
% change 3.3 3.6 3.8 4.3 3.1 2.3 1.3 2.1 3.1 3.5 4.5
2013 2014 2015 2016 2017 2018 2019 2020 2021 2022 2023
Asia-Pacific 7545 7869 8219 8485 8743 8963 9099 9319 9637 9995 10448
China 3936 4136 4347 4539 4719 4864 4938 5076 5261 5455 5713
Japan 554 568 573 581 591 596 590 598 609 622 635
India 449 483 517 540 564 585 606 626 651 682 717
Korea 83 83 82 80 77 75 72 71 71 71 71
Indonesia 549 568 588 594 602 608 615 620 632 647 670
Malaysia 699 717 742 753 768 781 795 819 856 905 962
Thailand 379 403 435 458 471 484 496 511 527 544 562
Other Asia Pacific 895 910 934 940 949 970 986 998 1028 1069 1118
EMEA 2375 2371 2454 2510 2586 2629 2638 2667 2727 2807 2896
EU-27 1507 1530 1584 1609 1640 1655 1652 1659 1687 1727 1769
Russia 421 372 372 387 415 434 440 449 465 484 506
Other EMEA 447 468 498 514 531 541 546 559 576 596 621
Americas 1815 1868 1927 1954 1992 2022 2030 2047 2073 2102 2134
USA 1133 1167 1193 1202 1217 1227 1224 1225 1232 1242 1255
Brazil 436 443 460 467 480 494 502 512 522 533 545
Other Americas 245 258 274 285 294 300 304 310 319 327 334
Total 11734 12108 12600 12949 13320 13614 13767 14034 14437 14904 15477
% change 3.3 3.2 4.1 2.8 2.9 2.2 1.1 1.9 2.9 3.2 3.9
IMF Scenario
Downside Scenario
13
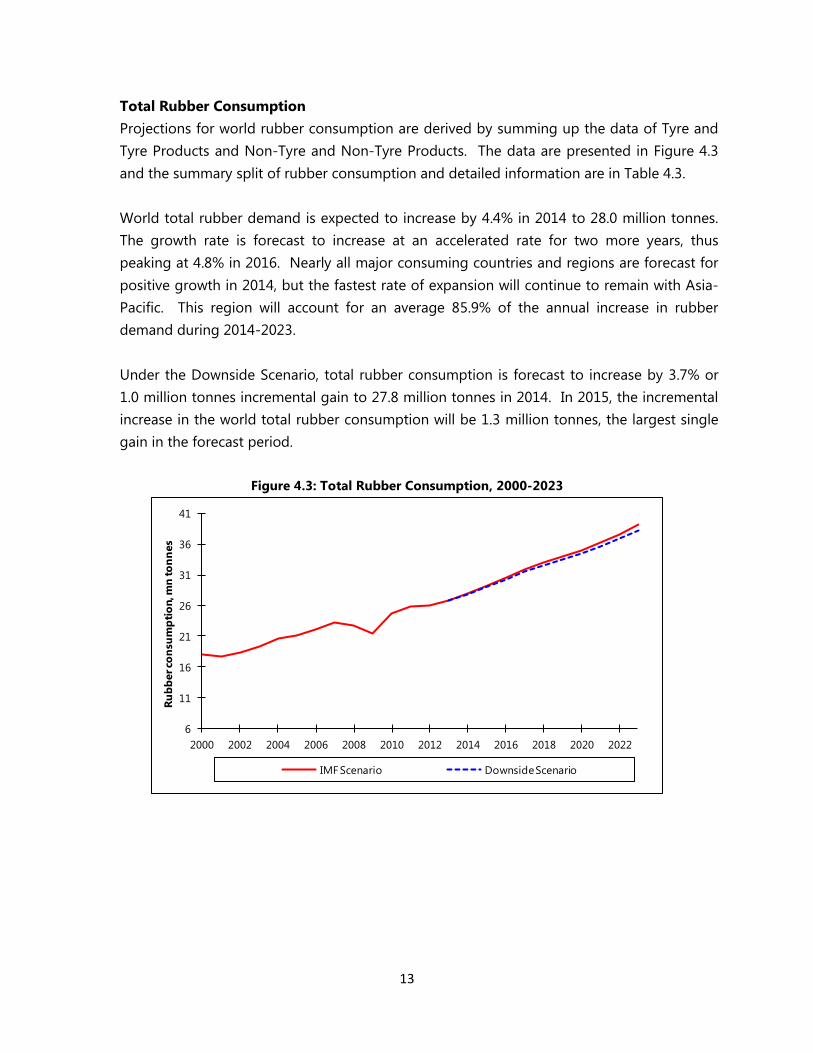
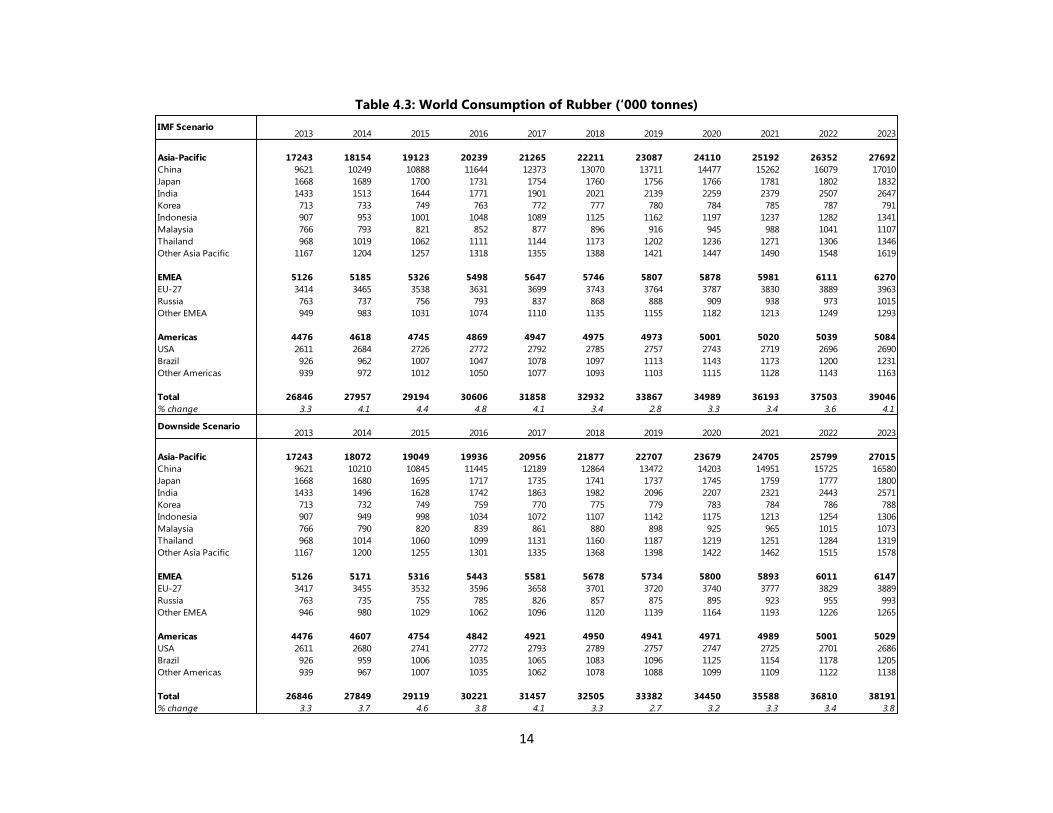
Total Rubber Consumption
Projections for world rubber consumption are derived by summing up the data of Tyre and
Tyre Products and Non-Tyre and Non-Tyre Products. The data are presented in Figure 4.3
and the summary split of rubber consumption and detailed information are in Table 4.3.
World total rubber demand is expected to increase by 4.4% in 2014 to 28.0 million tonnes.
The growth rate is forecast to increase at an accelerated rate for two more years, thus
peaking at 4.8% in 2016. Nearly all major consuming countries and regions are forecast for
positive growth in 2014, but the fastest rate of expansion will continue to remain with Asia-
Pacific. This region will account for an average 85.9% of the annual increase in rubber
demand during 2014-2023.
Under the Downside Scenario, total rubber consumption is forecast to increase by 3.7% or
1.0 million tonnes incremental gain to 27.8 million tonnes in 2014. In 2015, the incremental
increase in the world total rubber consumption will be 1.3 million tonnes, the largest single
gain in the forecast period.
Figure 4.3: Total Rubber Consumption, 2000-2023
6
11
16
21
26
31
36
41
2000 2002 2004 2006 2008 2010 2012 2014 2016 2018 2020 2022
Ru
bb
er co
nsu
mp
tio
n, m
n to
nn
es
IMF Scenario Downside Scenario
14
Table 4.3: World Consumption of Rubber (‘000 tonnes)
2013 2014 2015 2016 2017 2018 2019 2020 2021 2022 2023
Asia-Pacific 17243 18154 19123 20239 21265 22211 23087 24110 25192 26352 27692
China 9621 10249 10888 11644 12373 13070 13711 14477 15262 16079 17010
Japan 1668 1689 1700 1731 1754 1760 1756 1766 1781 1802 1832
India 1433 1513 1644 1771 1901 2021 2139 2259 2379 2507 2647
Korea 713 733 749 763 772 777 780 784 785 787 791
Indonesia 907 953 1001 1048 1089 1125 1162 1197 1237 1282 1341
Malaysia 766 793 821 852 877 896 916 945 988 1041 1107
Thailand 968 1019 1062 1111 1144 1173 1202 1236 1271 1306 1346
Other Asia Pacific 1167 1204 1257 1318 1355 1388 1421 1447 1490 1548 1619
EMEA 5126 5185 5326 5498 5647 5746 5807 5878 5981 6111 6270
EU-27 3414 3465 3538 3631 3699 3743 3764 3787 3830 3889 3963
Russia 763 737 756 793 837 868 888 909 938 973 1015
Other EMEA 949 983 1031 1074 1110 1135 1155 1182 1213 1249 1293
Americas 4476 4618 4745 4869 4947 4975 4973 5001 5020 5039 5084
USA 2611 2684 2726 2772 2792 2785 2757 2743 2719 2696 2690
Brazil 926 962 1007 1047 1078 1097 1113 1143 1173 1200 1231
Other Americas 939 972 1012 1050 1077 1093 1103 1115 1128 1143 1163
Total 26846 27957 29194 30606 31858 32932 33867 34989 36193 37503 39046
% change 3.3 4.1 4.4 4.8 4.1 3.4 2.8 3.3 3.4 3.6 4.1
2013 2014 2015 2016 2017 2018 2019 2020 2021 2022 2023
Asia-Pacific 17243 18072 19049 19936 20956 21877 22707 23679 24705 25799 27015
China 9621 10210 10845 11445 12189 12864 13472 14203 14951 15725 16580
Japan 1668 1680 1695 1717 1735 1741 1737 1745 1759 1777 1800
India 1433 1496 1628 1742 1863 1982 2096 2207 2321 2443 2571
Korea 713 732 749 759 770 775 779 783 784 786 788
Indonesia 907 949 998 1034 1072 1107 1142 1175 1213 1254 1306
Malaysia 766 790 820 839 861 880 898 925 965 1015 1073
Thailand 968 1014 1060 1099 1131 1160 1187 1219 1251 1284 1319
Other Asia Pacific 1167 1200 1255 1301 1335 1368 1398 1422 1462 1515 1578
EMEA 5126 5171 5316 5443 5581 5678 5734 5800 5893 6011 6147
EU-27 3417 3455 3532 3596 3658 3701 3720 3740 3777 3829 3889
Russia 763 735 755 785 826 857 875 895 923 955 993
Other EMEA 946 980 1029 1062 1096 1120 1139 1164 1193 1226 1265
Americas 4476 4607 4754 4842 4921 4950 4941 4971 4989 5001 5029
USA 2611 2680 2741 2772 2793 2789 2757 2747 2725 2701 2686
Brazil 926 959 1006 1035 1065 1083 1096 1125 1154 1178 1205
Other Americas 939 967 1007 1035 1062 1078 1088 1099 1109 1122 1138
Total 26846 27849 29119 30221 31457 32505 33382 34450 35588 36810 38191
% change 3.3 3.7 4.6 3.8 4.1 3.3 2.7 3.2 3.3 3.4 3.8
IMF Scenario
Downside Scenario
15
5 Normal Production of Natural Rubber
New planting and replanting data for natural rubber (NR) for the major countries is being
collected on a continuous basis and the impact on production has been analysed. Using
assumptions on planting policies for the future, the consequences for future NR
production potential have been derived. The analysis makes use of the Vintage approach,
which is a powerful model to analyse the effect of planting decisions on the production
potential for perennial crops. Detailed modelling analyses using the Vintage approach
have been done for eleven countries: Thailand, Indonesia, Malaysia, India, Vietnam, China,
Sri Lanka, Cambodia, Philippines, Myanmar and Laos.
The interaction of supply, demand and prices will be presented in Chapter 6. This will then
lead to projections of natural rubber production in Chapter 7. In this Chapter only
projections of Normal Production are given; these incorporate the latest revisions to
historic planting data and updates on future planting policy information.
Farmers respond to price levels in general and to price changes in particular. The general
assumption is that an increase in price leads to an increment in supply through intensive
tapping while a decrease in price may induce some farmers to tap more intensively to
maintain same level of income. However, a continued price drop can have an effect on
supply through investment decisions. For a crop like natural rubber, low prices may result in
uprooting of trees for the purpose of replanting with natural rubber or with another crop.
The boom and bust cycles of NR prices in the last four years have stimulated farmers to
react to the NR price behaviour in the above mentioned manner. The continued decline in
NR prices during the last two years and a slower than expected recovery in global
demand as well as increased supply has lead to an inventory build up which has created
concerns across the producer community around the world. This continuing bearish
market situation has dampened enthusiasm for some of the new planting projects and
has stimulated discussions on the need for accelerated replanting programmes to control
supply in short-term.
Planting Information: Data Collection and Forecast Assumptions
New planting and replanting data for the major countries are being collected on a
continuous basis and the impact on production has been analysed. Using assumptions on
planting policies for the future, the consequences for future NR production potential have
been derived. The Vintage model approach is used to analyse the effect of planting
decisions on the production potential. Detailed modelling analyses using the Vintage
model approach have been carried out for eleven countries: Thailand, Indonesia, Malaysia,
India, Vietnam, China, Sri Lanka, Cambodia, Philippines, Myanmar and Laos.
16
The interaction of supply, demand and prices will be presented in Chapter 6. This will then
lead to projections of NR production in Chapter 7. In this Chapter only projections of
Normal Production are given; these incorporate the latest revisions to historic planting
data and updates on future planting policy information.
The IRSG Secretariat has validated planting data and reviewed assumptions on the future
planting information across producers in Asia, Africa and Latin America based on the
annual survey conducted in 2014 as well as the latest feedback from stakeholders. The
latest update on planting information covers:
Revisions to the 2012-13 data on total area, new planting and replanting area
across producers.
Revision to Thailand‟s new planting information aligned to the previously
published high planting scenario
Updates to future planting information across other regions and countries.
The future production potential is analysed under a base planting scenario and an
alternative supply control scenario. The alternative supply control scenario premises
accelerated replanting for the largest producer, Thailand and the scenario logic is based
on the following observations:
Additional production capacity from the 2006-09 planted area.
Early opening of the new mature areas compared to the 7 years immaturity period
assumed for traditional rubber growing regions.
Intensive tapping during the high price period (2011-12)
Displacement of migrant tappers back to their counties of origin
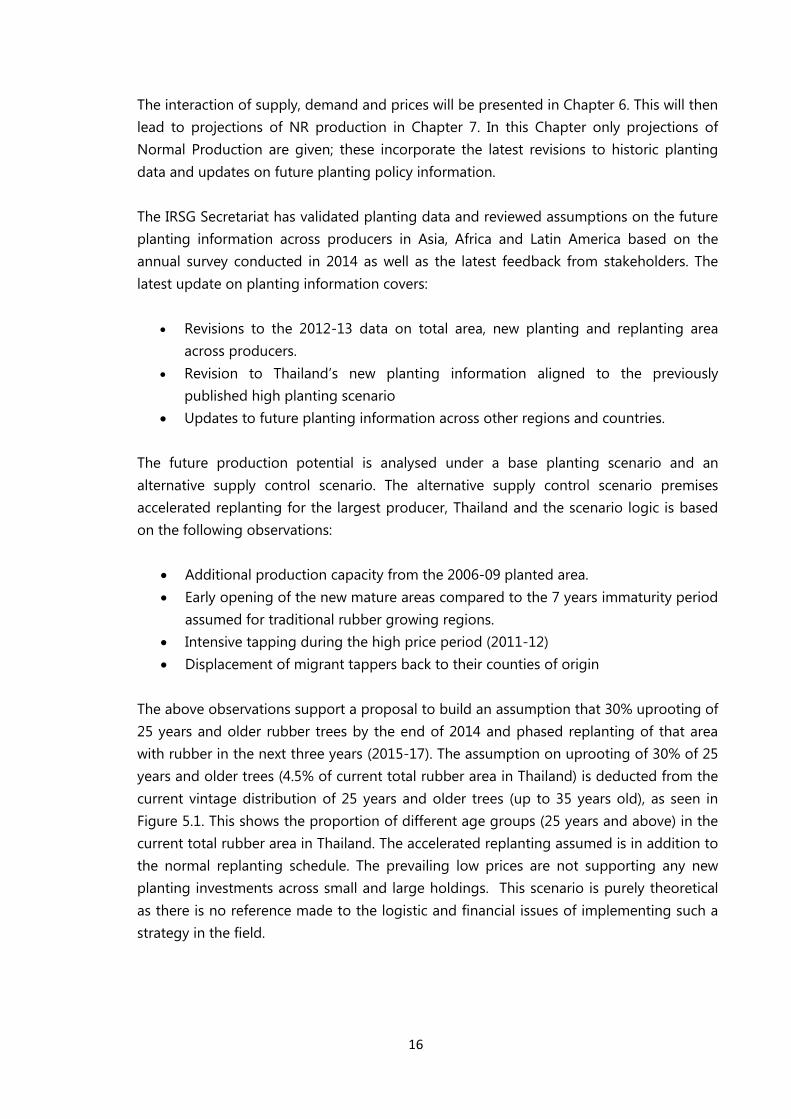
The above observations support a proposal to build an assumption that 30% uprooting of
25 years and older rubber trees by the end of 2014 and phased replanting of that area
with rubber in the next three years (2015-17). The assumption on uprooting of 30% of 25
years and older trees (4.5% of current total rubber area in Thailand) is deducted from the
current vintage distribution of 25 years and older trees (up to 35 years old), as seen in
Figure 5.1. This shows the proportion of different age groups (25 years and above) in the
current total rubber area in Thailand. The accelerated replanting assumed is in addition to
the normal replanting schedule. The prevailing low prices are not supporting any new
planting investments across small and large holdings. This scenario is purely theoretical
as there is no reference made to the logistic and financial issues of implementing such a
strategy in the field.
17
Figure 5.1 Replanted Area as % of Total Area with 30% Uprooting-Thailand (2014)
0.0%
0.5%
1.0%
1.5%
2.0%
2.5%
3.0%
3.5%
4.0%
4.5%
<25 + <26 + <27 + <28 + <29 + <30 + <31 + <32 + <33 + <34 + <35 +
Results
In the revised outlook, in addition to the mid-2000s new planting surge, an increased rate
of new planting was observed coinciding with the boom cycle in NR prices (Figure 5.2). A
combination of the following factors drives the current outlook:
The revision on planting information during the 2012-13 period.
Placing a moratorium on the granting of new economic land concessions for new
planting investments stimulated further delays in future new plantings in
emerging producing countries.
The latest outlook of new planting data, both the base planting and supply control
scenario can be seen in Table 5.1 The emerging producer countries Cambodia, Myanmar
and Laos (CAMAL), after a period of accelerated growth in new planting area have now
started delaying the process and further delays are expected in the future planned
investments. A deceleration in the new planting is seen in Asia-Pacific region as a whole.
18
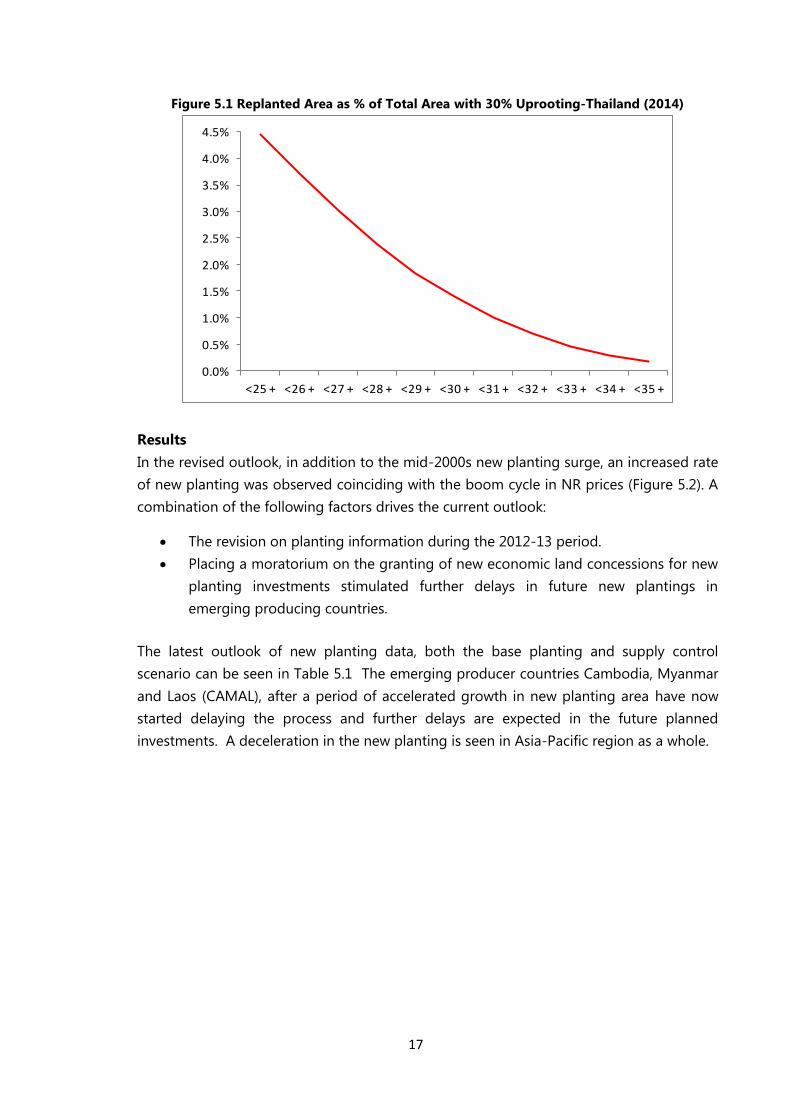
Table 5.1: New Planting of Natural Rubber Area, 11 countries (‘000 ha)
2005 2006 2007 2008 2009 2010 2011 2012 2013 2014 2015 2016 2017 2018 2019 2020 2021 2022 2023
Base Planting Scenario
Thailand 123 110 161 221 50 25 50 48 30 25 25 25 25 25 25 25 25 25 25
Indonesia 48 98 118 62 12 12 12 15 13 13 13 13 9 9 9 9 9 9 9
Malaysia 0 0 0 6 0 3 6 17 12 12 12 20 20 20 15 15 15 11 11
India 17 22 23 30 26 25 23 24 18 17 15 15 15 8 8 8 6 6 6
Vietnam 30 41 35 77 55 75 55 112 43 15 3 3 3 3 3 3 3 3 3
China 33 46 52 35 39 49 50 60 37 28 20 20 20 20 20 20 20 20 20
CAMAL 33 90 127 110 104 90 87 71 76 57 51 57 25 25 21 21 16 16 16
Sri Lanka 1 2 2 3 3 1 3 3 2 8 7 4 4 4 4 4 4 4 4
Philippines 2 16 22 16 8 13 26 17 11 21 21 5 5 5 5 5 5 5 5
Total 286 425 541 560 295 293 311 367 242 195 167 162 126 119 110 110 103 99 99
Supply Control Scenario
Thailand 123 110 161 221 50 25 50 48 30 0 0 0 0 25 25 25 25 25 25
Total 286 425 541 560 295 293 311 367 242 170 142 137 101 119 110 110 103 99 99 CAMAL countries include Cambodia, Myanmar and Lao PDR.
Figure 5.2: New Planting Natural Rubber Area, 11 countries, 2000-2023
0
100
200
300
400
500
600
1990 1995 2000 2005 2010 2015 2020
'000 h
a
19
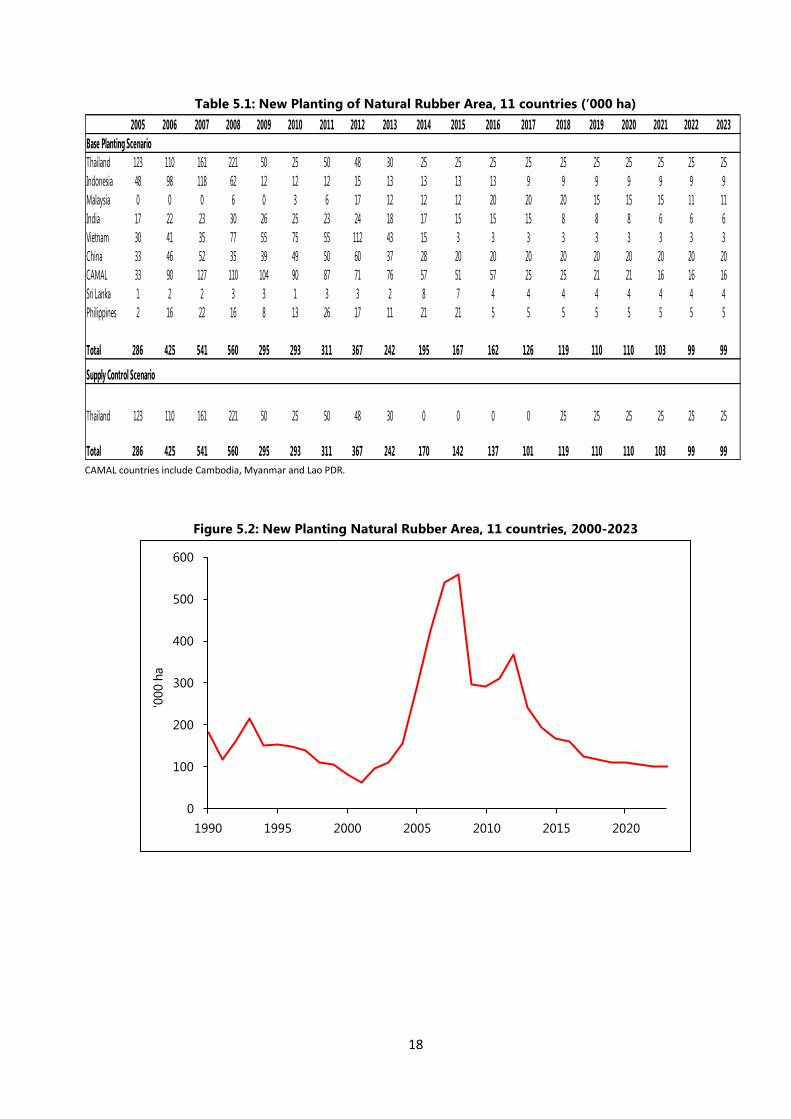
Table 5.2: Replanting of Natural Rubber Area, 11 countries (‘000 ha)
2005 2006 2007 2008 2009 2010 2011 2012 2013 2014 2015 2016 2017 2018 2019 2020 2021 2022 2023
Base Planting Scenario
Thailand 50 40 35 32 39 40 35 34 34 37 40 42 44 46 47 47 46 46 45
Indonesia 35 53 58 48 63 66 69 58 53 65 68 70 73 76 79 81 82 83 84
Malaysia 21 21 24 22 21 23 17 39 39 39 40 14 15 15 16 16 17 17 17
India 8 8 9 10 11 11 10 11 15 15 16 17 18 18 19 19 19 19 19
Vietnam 5 5 7 8 9 10 11 12 13 13 12 11 11 12 12 13 15 16 17
China 11 12 13 14 10 20 22 25 28 30 21 20 19 18 17 16 15 14 14
CAMAL 5 5 4 7 6 7 6 4 4 2 2 2 2 2 2 2 2 6 7
Sri Lanka 3 4 5 6 6 6 3 2 4 5 4 5 5 4 4 4 4 4 4
Philippines 0 0 0 0 1 1 1 1 1 1 1 1 1 1 1 1 1 1 2
Total 137 148 156 147 166 183 174 187 191 207 203 183 188 193 197 200 200 206 208
Supply Control Scenario
Thailand 50 40 35 32 39 40 35 34 34 37 76 77 79 37 39 40 40 41 41
Total 137 148 156 147 166 183 174 187 191 207 239 218 223 185 189 193 195 201 204 CAMAL countries include Cambodia, Myanmar and Lao PDR.
The current outlook on replanting (Table 5.2 and Figure 5.3) under the base planting
scenario is based on the following additional information:
Data revision to replanting information and assumption of accelerated replanting
to control the supply in the short-term by major producers.
The alternate scenario of supply control via accelerated replanting (30 % uprooting of 25
years and older rubber trees in Thailand and phased replanting of the area uprooted with
rubber in the subsequent three years resulted in two humps after 2014 (Figure 5.2).
Figure 5.3: Replanting Natural Rubber Area, 11 countries, 2000-2023
0
50
100
150
200
250
300
2000 2002 2004 2006 2008 2010 2012 2014 2016 2018 2020 2022
Rep
lan
tin
g, '
000 h
ect
are
s
Base Planting Scenario Supply Control Scenario
20
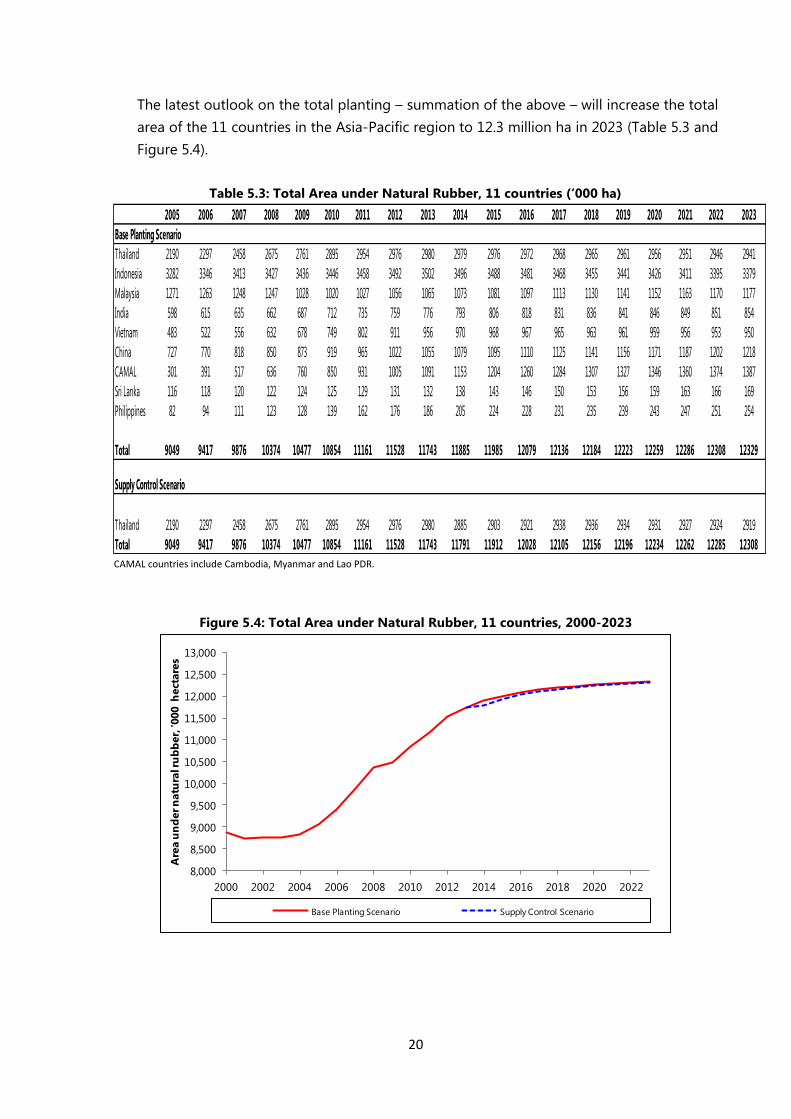
The latest outlook on the total planting – summation of the above – will increase the total
area of the 11 countries in the Asia-Pacific region to 12.3 million ha in 2023 (Table 5.3 and
Figure 5.4).
Table 5.3: Total Area under Natural Rubber, 11 countries (‘000 ha)
2005 2006 2007 2008 2009 2010 2011 2012 2013 2014 2015 2016 2017 2018 2019 2020 2021 2022 2023
Base Planting Scenario
Thailand 2190 2297 2458 2675 2761 2895 2954 2976 2980 2979 2976 2972 2968 2965 2961 2956 2951 2946 2941
Indonesia 3282 3346 3413 3427 3436 3446 3458 3492 3502 3496 3488 3481 3468 3455 3441 3426 3411 3395 3379
Malaysia 1271 1263 1248 1247 1028 1020 1027 1056 1065 1073 1081 1097 1113 1130 1141 1152 1163 1170 1177
India 598 615 635 662 687 712 735 759 776 793 806 818 831 836 841 846 849 851 854
Vietnam 483 522 556 632 678 749 802 911 956 970 968 967 965 963 961 959 956 953 950
China 727 770 818 850 873 919 965 1022 1055 1079 1095 1110 1125 1141 1156 1171 1187 1202 1218
CAMAL 301 391 517 636 760 850 931 1005 1091 1153 1204 1260 1284 1307 1327 1346 1360 1374 1387
Sri Lanka 116 118 120 122 124 125 129 131 132 138 143 146 150 153 156 159 163 166 169
Philippines 82 94 111 123 128 139 162 176 186 205 224 228 231 235 239 243 247 251 254
Total 9049 9417 9876 10374 10477 10854 11161 11528 11743 11885 11985 12079 12136 12184 12223 12259 12286 12308 12329
Supply Control Scenario
Thailand 2190 2297 2458 2675 2761 2895 2954 2976 2980 2885 2903 2921 2938 2936 2934 2931 2927 2924 2919
Total 9049 9417 9876 10374 10477 10854 11161 11528 11743 11791 11912 12028 12105 12156 12196 12234 12262 12285 12308 CAMAL countries include Cambodia, Myanmar and Lao PDR.
Figure 5.4: Total Area under Natural Rubber, 11 countries, 2000-2023
8,000
8,500
9,000
9,500
10,000
10,500
11,000
11,500
12,000
12,500
13,000
2000 2002 2004 2006 2008 2010 2012 2014 2016 2018 2020 2022
Are
a u
nd
er n
atu
ral r
ub
ber,
'000 h
ect
are
s
Base Planting Scenario Supply Control Scenario
21
Results – Normal Production
The outlook for the Normal Production has been driven by the following key assumptions
and additional information:
Acceptance of developments in total planting and total area under rubber as
discussed above
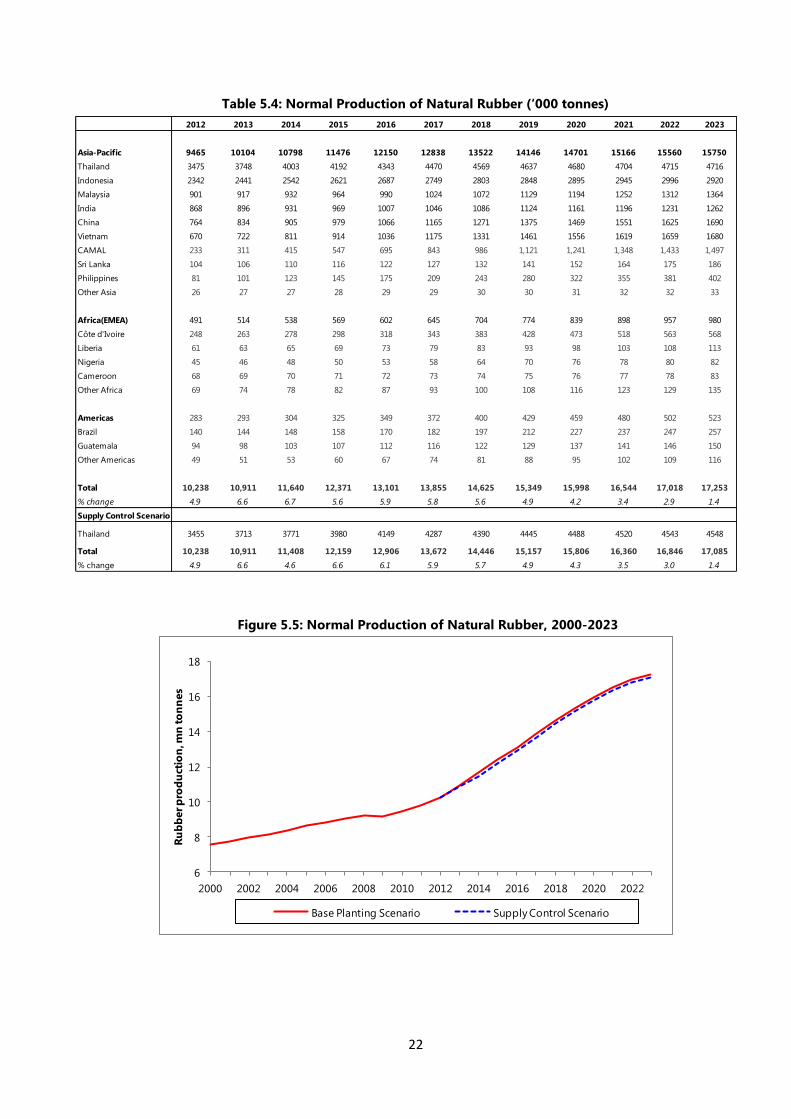
The Normal Production data are shown in Table 5.4 and Figure 5.5. Under the base planting
scenario, the Normal Production is expected to increase by 6.6% in 2014, 6.7% in 2015 and by
a further 5.6% in 2016 (Table 5.4). The Normal Production forecast is expected to reach 17.3
million tonnes of NR in 2023.
Under the supply control scenario, via uprooting 30% of 25 years and older trees in 2014 and
replanting that in the subsequent three years, the Normal production forecast is expected to
reach 17.1 million tonnes in 2023.
22
Table 5.4: Normal Production of Natural Rubber (‘000 tonnes)
2012 2013 2014 2015 2016 2017 2018 2019 2020 2021 2022 2023
Asia-Pacific 9465 10104 10798 11476 12150 12838 13522 14146 14701 15166 15560 15750
Thailand 3475 3748 4003 4192 4343 4470 4569 4637 4680 4704 4715 4716
Indonesia 2342 2441 2542 2621 2687 2749 2803 2848 2895 2945 2996 2920
Malaysia 901 917 932 964 990 1024 1072 1129 1194 1252 1312 1364
India 868 896 931 969 1007 1046 1086 1124 1161 1196 1231 1262
China 764 834 905 979 1066 1165 1271 1375 1469 1551 1625 1690
Vietnam 670 722 811 914 1036 1175 1331 1461 1556 1619 1659 1680
CAMAL 233 311 415 547 695 843 986 1,121 1,241 1,348 1,433 1,497
Sri Lanka 104 106 110 116 122 127 132 141 152 164 175 186
Philippines 81 101 123 145 175 209 243 280 322 355 381 402
Other Asia 26 27 27 28 29 29 30 30 31 32 32 33
Africa(EMEA) 491 514 538 569 602 645 704 774 839 898 957 980
Côte d'Ivoire 248 263 278 298 318 343 383 428 473 518 563 568
Liberia 61 63 65 69 73 79 83 93 98 103 108 113
Nigeria 45 46 48 50 53 58 64 70 76 78 80 82
Cameroon 68 69 70 71 72 73 74 75 76 77 78 83
Other Africa 69 74 78 82 87 93 100 108 116 123 129 135
Americas 283 293 304 325 349 372 400 429 459 480 502 523
Brazil 140 144 148 158 170 182 197 212 227 237 247 257
Guatemala 94 98 103 107 112 116 122 129 137 141 146 150
Other Americas 49 51 53 60 67 74 81 88 95 102 109 116
Total 10,238 10,911 11,640 12,371 13,101 13,855 14,625 15,349 15,998 16,544 17,018 17,253
% change 4.9 6.6 6.7 5.6 5.9 5.8 5.6 4.9 4.2 3.4 2.9 1.4
Supply Control Scenario
Thailand 3455 3713 3771 3980 4149 4287 4390 4445 4488 4520 4543 4548
Total 10,238 10,911 11,408 12,159 12,906 13,672 14,446 15,157 15,806 16,360 16,846 17,085
% change 4.9 6.6 4.6 6.6 6.1 5.9 5.7 4.9 4.3 3.5 3.0 1.4
Figure 5.5: Normal Production of Natural Rubber, 2000-2023
6
8
10
12
14
16
18
2000 2002 2004 2006 2008 2010 2012 2014 2016 2018 2020 2022
Ru
bb
er p
rod
uct
ion
, mn
to
nn
es
Base Planting Scenario Supply Control Scenario
23
6. Supply-Demand Interaction and Price Formation
The objective of this Chapter is to confront the projections of total rubber consumption, as
derived in Chapter 4, with the projections of NR Normal Production, given in Chapter 5. For
NR production, projections of „Normal Production‟, which excludes the price effect on
tapping intensity and the like, are the basis for production projections. Including the
influence of prices, projections of actual NR production are derived.
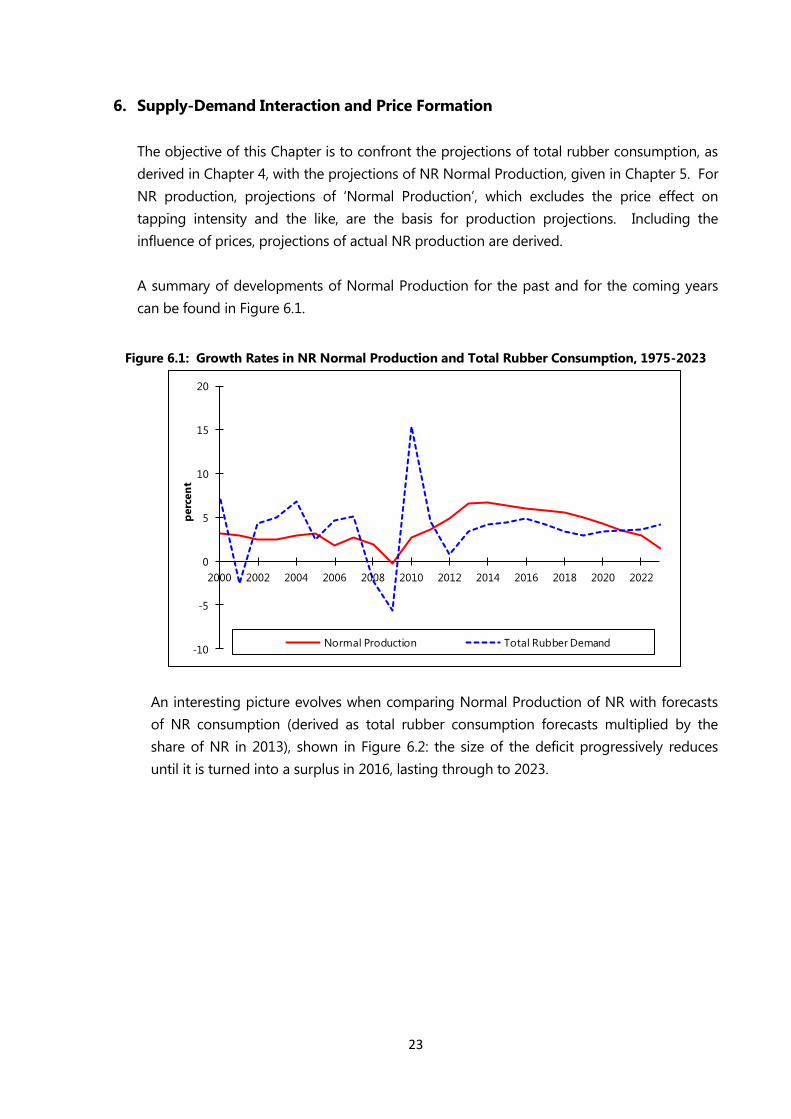
A summary of developments of Normal Production for the past and for the coming years
can be found in Figure 6.1.
Figure 6.1: Growth Rates in NR Normal Production and Total Rubber Consumption, 1975-2023
-10
-5
0
5
10
15
20
2000 2002 2004 2006 2008 2010 2012 2014 2016 2018 2020 2022
perc
en
t
Normal Production Total Rubber Demand
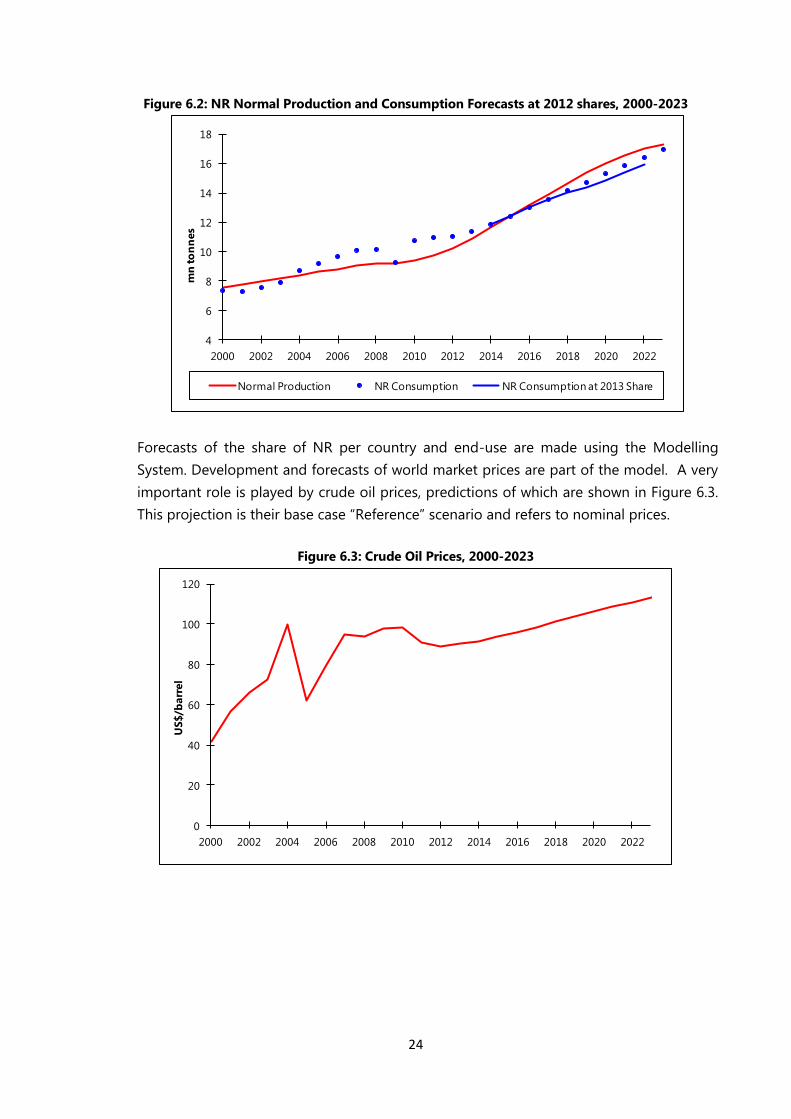
An interesting picture evolves when comparing Normal Production of NR with forecasts
of NR consumption (derived as total rubber consumption forecasts multiplied by the
share of NR in 2013), shown in Figure 6.2: the size of the deficit progressively reduces
until it is turned into a surplus in 2016, lasting through to 2023.
24
Figure 6.2: NR Normal Production and Consumption Forecasts at 2012 shares, 2000-2023
4
6
8
10
12
14
16
18
2000 2002 2004 2006 2008 2010 2012 2014 2016 2018 2020 2022
mn
to
nn
es
Normal Production NR Consumption NR Consumption at 2013 Share
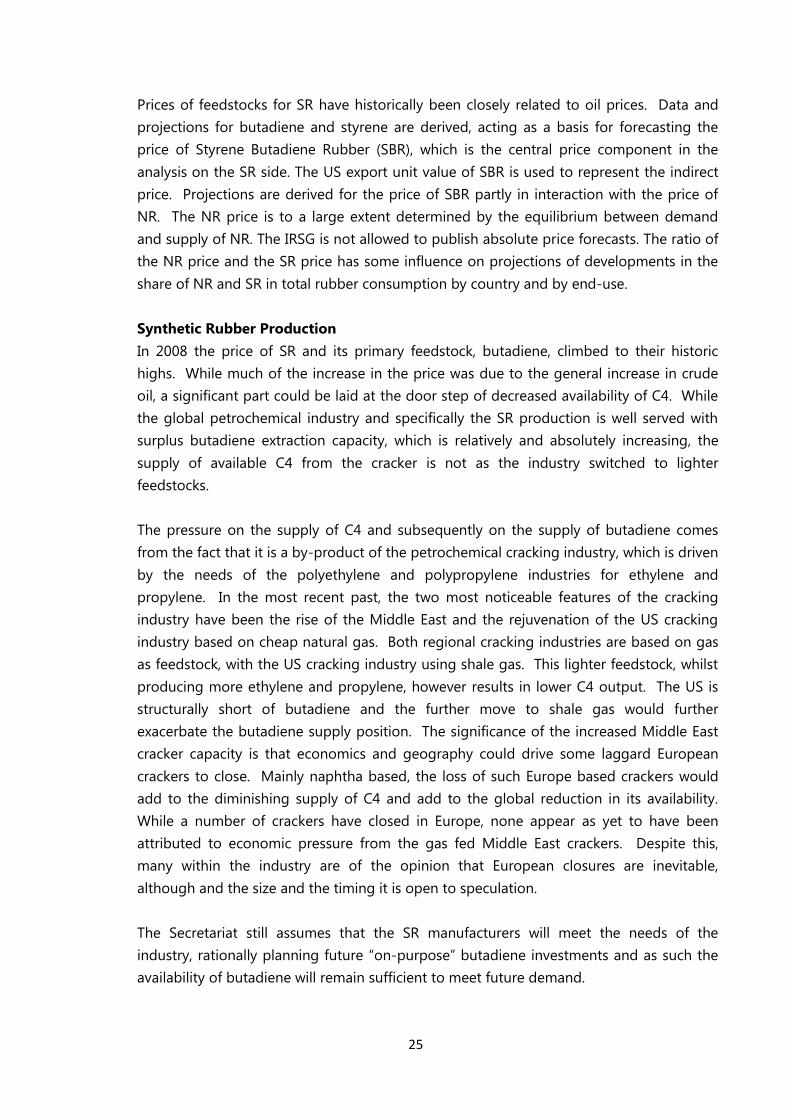
Forecasts of the share of NR per country and end-use are made using the Modelling
System. Development and forecasts of world market prices are part of the model. A very
important role is played by crude oil prices, predictions of which are shown in Figure 6.3.
This projection is their base case “Reference” scenario and refers to nominal prices.
Figure 6.3: Crude Oil Prices, 2000-2023
0
20
40
60
80
100
120
2000 2002 2004 2006 2008 2010 2012 2014 2016 2018 2020 2022
US$/b
arr
el
25
Prices of feedstocks for SR have historically been closely related to oil prices. Data and
projections for butadiene and styrene are derived, acting as a basis for forecasting the
price of Styrene Butadiene Rubber (SBR), which is the central price component in the
analysis on the SR side. The US export unit value of SBR is used to represent the indirect
price. Projections are derived for the price of SBR partly in interaction with the price of
NR. The NR price is to a large extent determined by the equilibrium between demand
and supply of NR. The IRSG is not allowed to publish absolute price forecasts. The ratio of
the NR price and the SR price has some influence on projections of developments in the
share of NR and SR in total rubber consumption by country and by end-use.
Synthetic Rubber Production
In 2008 the price of SR and its primary feedstock, butadiene, climbed to their historic
highs. While much of the increase in the price was due to the general increase in crude
oil, a significant part could be laid at the door step of decreased availability of C4. While
the global petrochemical industry and specifically the SR production is well served with
surplus butadiene extraction capacity, which is relatively and absolutely increasing, the
supply of available C4 from the cracker is not as the industry switched to lighter
feedstocks.
The pressure on the supply of C4 and subsequently on the supply of butadiene comes
from the fact that it is a by-product of the petrochemical cracking industry, which is driven
by the needs of the polyethylene and polypropylene industries for ethylene and
propylene. In the most recent past, the two most noticeable features of the cracking
industry have been the rise of the Middle East and the rejuvenation of the US cracking
industry based on cheap natural gas. Both regional cracking industries are based on gas
as feedstock, with the US cracking industry using shale gas. This lighter feedstock, whilst
producing more ethylene and propylene, however results in lower C4 output. The US is
structurally short of butadiene and the further move to shale gas would further
exacerbate the butadiene supply position. The significance of the increased Middle East
cracker capacity is that economics and geography could drive some laggard European
crackers to close. Mainly naphtha based, the loss of such Europe based crackers would
add to the diminishing supply of C4 and add to the global reduction in its availability.
While a number of crackers have closed in Europe, none appear as yet to have been
attributed to economic pressure from the gas fed Middle East crackers. Despite this,
many within the industry are of the opinion that European closures are inevitable,
although and the size and the timing it is open to speculation.
The Secretariat still assumes that the SR manufacturers will meet the needs of the
industry, rationally planning future “on-purpose” butadiene investments and as such the
availability of butadiene will remain sufficient to meet future demand.
26
7 Production of Natural Rubber
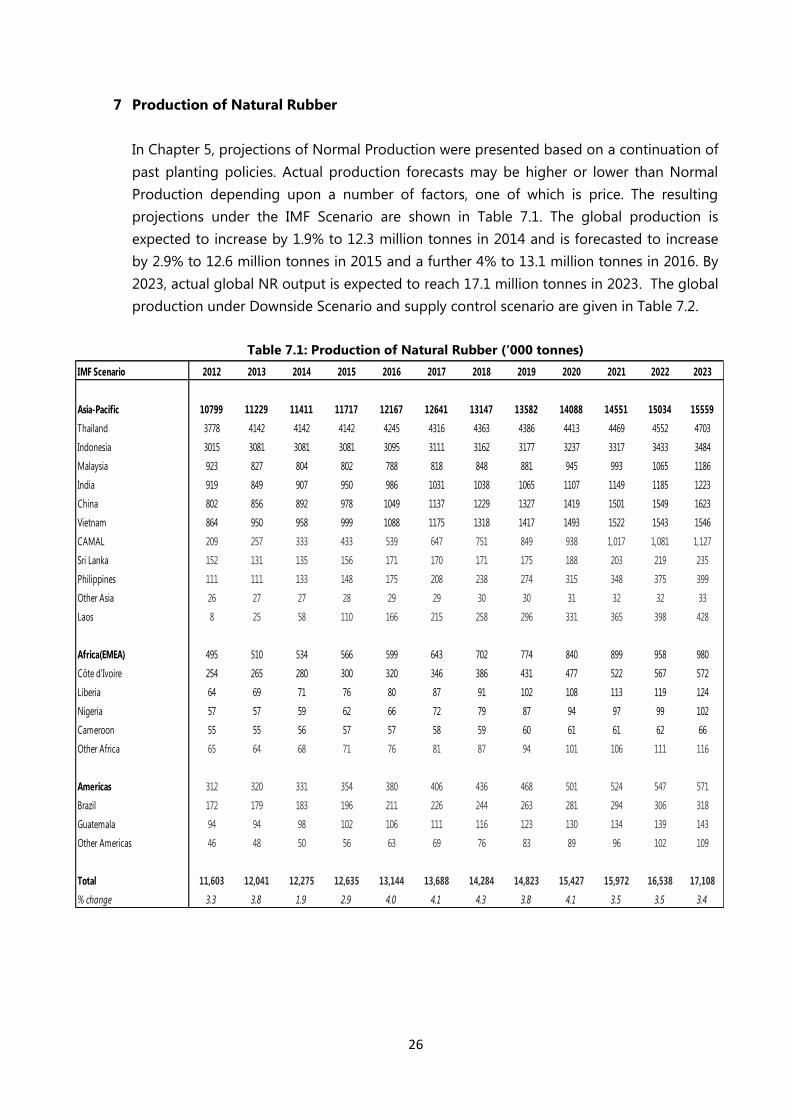
In Chapter 5, projections of Normal Production were presented based on a continuation of
past planting policies. Actual production forecasts may be higher or lower than Normal
Production depending upon a number of factors, one of which is price. The resulting
projections under the IMF Scenario are shown in Table 7.1. The global production is
expected to increase by 1.9% to 12.3 million tonnes in 2014 and is forecasted to increase
by 2.9% to 12.6 million tonnes in 2015 and a further 4% to 13.1 million tonnes in 2016. By
2023, actual global NR output is expected to reach 17.1 million tonnes in 2023. The global
production under Downside Scenario and supply control scenario are given in Table 7.2.
Table 7.1: Production of Natural Rubber (‘000 tonnes)
IMF Scenario 2012 2013 2014 2015 2016 2017 2018 2019 2020 2021 2022 2023
Asia-Pacific 10799 11229 11411 11717 12167 12641 13147 13582 14088 14551 15034 15559
Thailand 3778 4142 4142 4142 4245 4316 4363 4386 4413 4469 4552 4703
Indonesia 3015 3081 3081 3081 3095 3111 3162 3177 3237 3317 3433 3484
Malaysia 923 827 804 802 788 818 848 881 945 993 1065 1186
India 919 849 907 950 986 1031 1038 1065 1107 1149 1185 1223
China 802 856 892 978 1049 1137 1229 1327 1419 1501 1549 1623
Vietnam 864 950 958 999 1088 1175 1318 1417 1493 1522 1543 1546
CAMAL 209 257 333 433 539 647 751 849 938 1,017 1,081 1,127
Sri Lanka 152 131 135 156 171 170 171 175 188 203 219 235
Philippines 111 111 133 148 175 208 238 274 315 348 375 399
Other Asia 26 27 27 28 29 29 30 30 31 32 32 33
Laos 8 25 58 110 166 215 258 296 331 365 398 428
Africa(EMEA) 495 510 534 566 599 643 702 774 840 899 958 980
Côte d'Ivoire 254 265 280 300 320 346 386 431 477 522 567 572
Liberia 64 69 71 76 80 87 91 102 108 113 119 124
Nigeria 57 57 59 62 66 72 79 87 94 97 99 102
Cameroon 55 55 56 57 57 58 59 60 61 61 62 66
Other Africa 65 64 68 71 76 81 87 94 101 106 111 116
Americas 312 320 331 354 380 406 436 468 501 524 547 571
Brazil 172 179 183 196 211 226 244 263 281 294 306 318
Guatemala 94 94 98 102 106 111 116 123 130 134 139 143
Other Americas 46 48 50 56 63 69 76 83 89 96 102 109
Total 11,603 12,041 12,275 12,635 13,144 13,688 14,284 14,823 15,427 15,972 16,538 17,108
% change 3.3 3.8 1.9 2.9 4.0 4.1 4.3 3.8 4.1 3.5 3.5 3.4
27
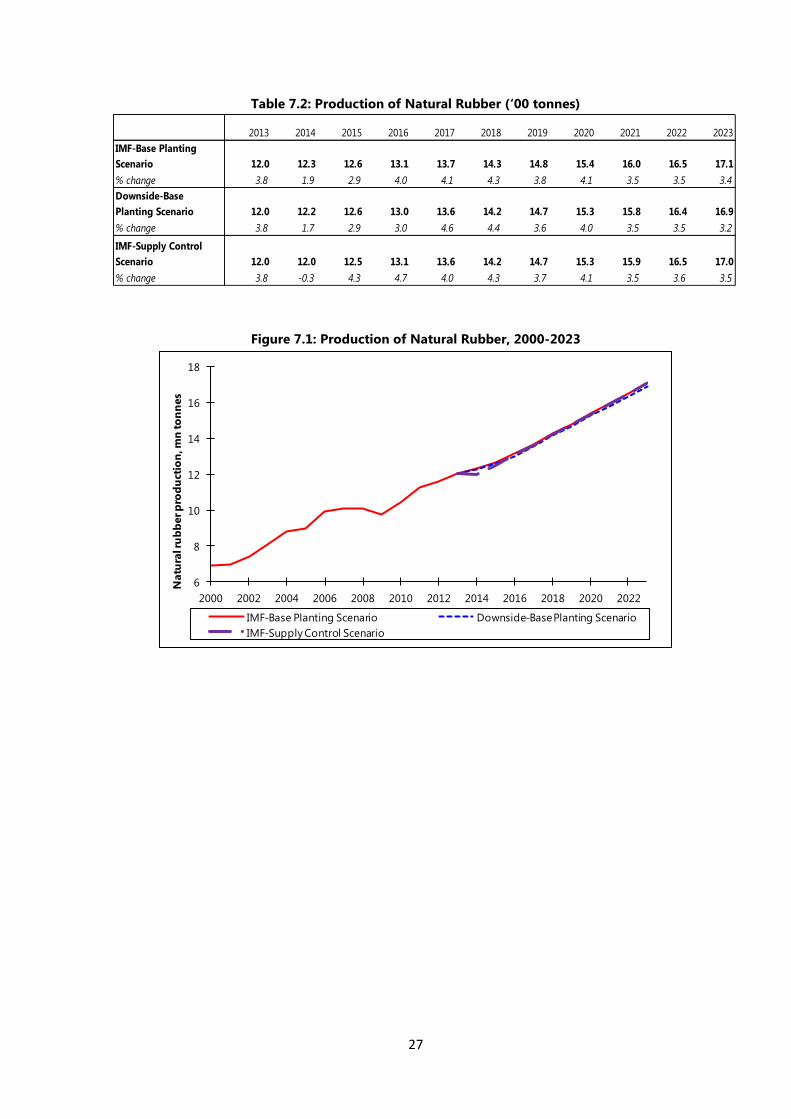
Table 7.2: Production of Natural Rubber (‘00 tonnes)
2013 2014 2015 2016 2017 2018 2019 2020 2021 2022 2023
IMF-Base Planting
Scenario 12.0 12.3 12.6 13.1 13.7 14.3 14.8 15.4 16.0 16.5 17.1
% change 3.8 1.9 2.9 4.0 4.1 4.3 3.8 4.1 3.5 3.5 3.4
Downside-Base
Planting Scenario 12.0 12.2 12.6 13.0 13.6 14.2 14.7 15.3 15.8 16.4 16.9
% change 3.8 1.7 2.9 3.0 4.6 4.4 3.6 4.0 3.5 3.5 3.2
IMF-Supply Control
Scenario 12.0 12.0 12.5 13.1 13.6 14.2 14.7 15.3 15.9 16.5 17.0
% change 3.8 -0.3 4.3 4.7 4.0 4.3 3.7 4.1 3.5 3.6 3.5
Figure 7.1: Production of Natural Rubber, 2000-2023
6
8
10
12
14
16
18
2000 2002 2004 2006 2008 2010 2012 2014 2016 2018 2020 2022
Natu
ral r
ub
ber p
rod
uct
ion
, mn
to
nn
es
IMF-Base Planting Scenario Downside-Base Planting Scenario
IMF-Supply Control Scenario
28
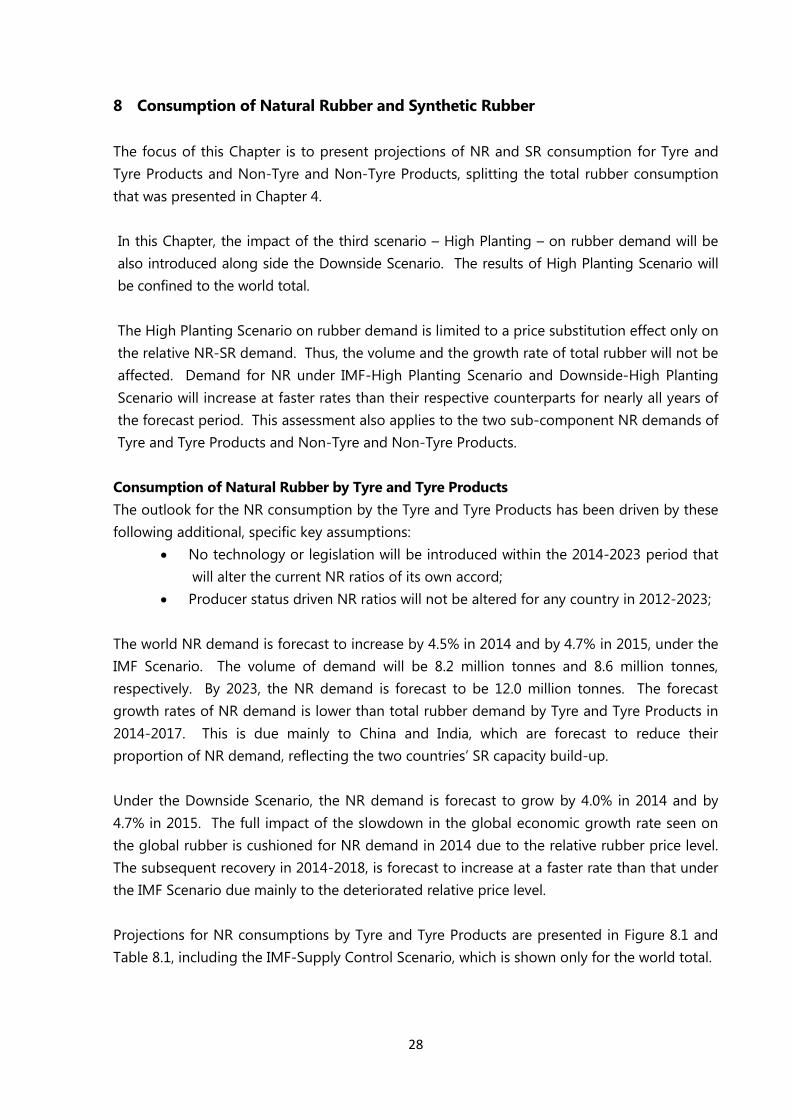
8 Consumption of Natural Rubber and Synthetic Rubber
The focus of this Chapter is to present projections of NR and SR consumption for Tyre and
Tyre Products and Non-Tyre and Non-Tyre Products, splitting the total rubber consumption
that was presented in Chapter 4.
In this Chapter, the impact of the third scenario – High Planting – on rubber demand will be
also introduced along side the Downside Scenario. The results of High Planting Scenario will
be confined to the world total.
The High Planting Scenario on rubber demand is limited to a price substitution effect only on
the relative NR-SR demand. Thus, the volume and the growth rate of total rubber will not be
affected. Demand for NR under IMF-High Planting Scenario and Downside-High Planting
Scenario will increase at faster rates than their respective counterparts for nearly all years of
the forecast period. This assessment also applies to the two sub-component NR demands of
Tyre and Tyre Products and Non-Tyre and Non-Tyre Products.
Consumption of Natural Rubber by Tyre and Tyre Products
The outlook for the NR consumption by the Tyre and Tyre Products has been driven by these
following additional, specific key assumptions:
No technology or legislation will be introduced within the 2014-2023 period that
will alter the current NR ratios of its own accord;
Producer status driven NR ratios will not be altered for any country in 2012-2023;
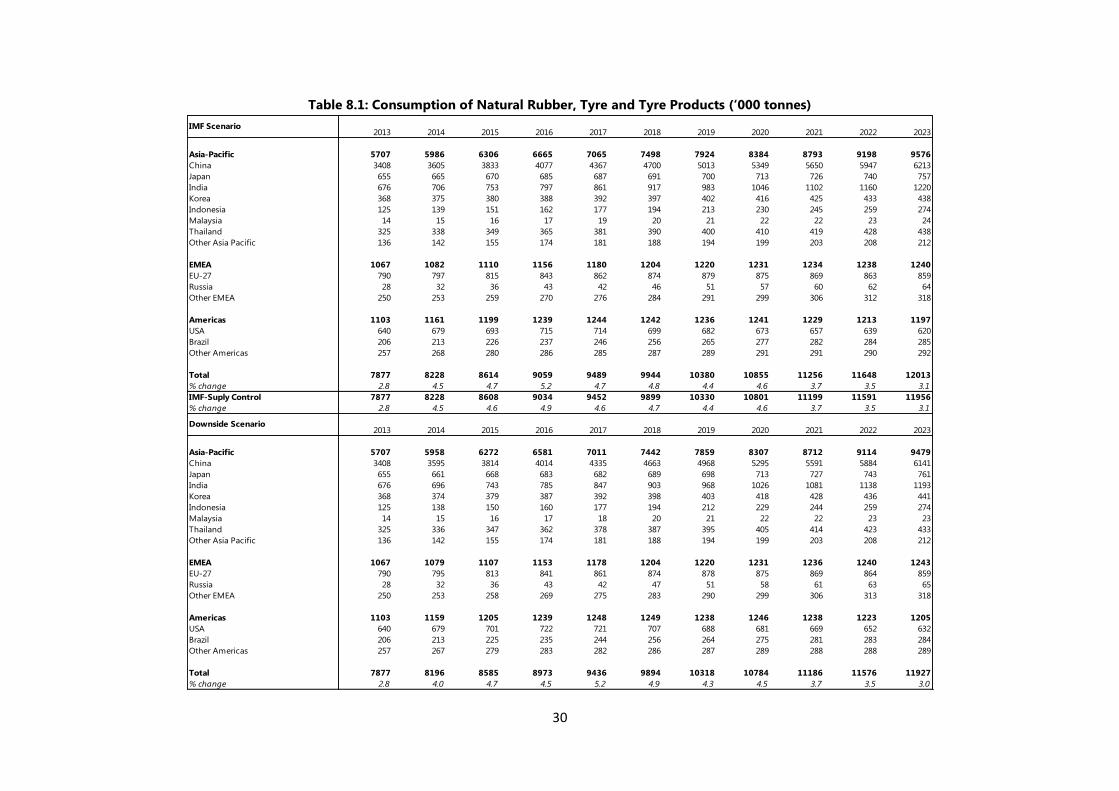
The world NR demand is forecast to increase by 4.5% in 2014 and by 4.7% in 2015, under the
IMF Scenario. The volume of demand will be 8.2 million tonnes and 8.6 million tonnes,
respectively. By 2023, the NR demand is forecast to be 12.0 million tonnes. The forecast
growth rates of NR demand is lower than total rubber demand by Tyre and Tyre Products in
2014-2017. This is due mainly to China and India, which are forecast to reduce their
proportion of NR demand, reflecting the two countries‟ SR capacity build-up.
Under the Downside Scenario, the NR demand is forecast to grow by 4.0% in 2014 and by
4.7% in 2015. The full impact of the slowdown in the global economic growth rate seen on
the global rubber is cushioned for NR demand in 2014 due to the relative rubber price level.
The subsequent recovery in 2014-2018, is forecast to increase at a faster rate than that under
the IMF Scenario due mainly to the deteriorated relative price level.
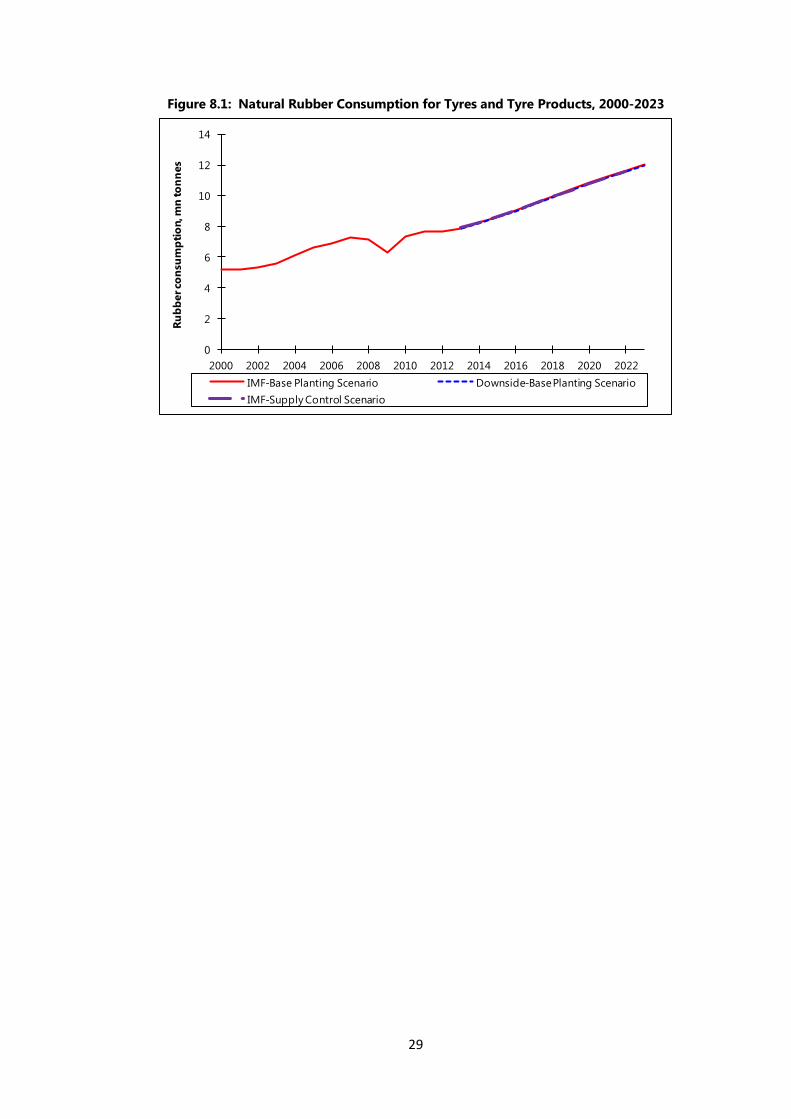
Projections for NR consumptions by Tyre and Tyre Products are presented in Figure 8.1 and
Table 8.1, including the IMF-Supply Control Scenario, which is shown only for the world total.
29
Figure 8.1: Natural Rubber Consumption for Tyres and Tyre Products, 2000-2023
0
2
4
6
8
10
12
14
2000 2002 2004 2006 2008 2010 2012 2014 2016 2018 2020 2022
Ru
bb
er co
nsu
mp
tio
n, m
n to
nn
es
IMF-Base Planting Scenario Downside-Base Planting Scenario
IMF-Supply Control Scenario
30
Table 8.1: Consumption of Natural Rubber, Tyre and Tyre Products (‘000 tonnes)
2013 2014 2015 2016 2017 2018 2019 2020 2021 2022 2023
Asia-Pacific 5707 5986 6306 6665 7065 7498 7924 8384 8793 9198 9576
China 3408 3605 3833 4077 4367 4700 5013 5349 5650 5947 6213
Japan 655 665 670 685 687 691 700 713 726 740 757
India 676 706 753 797 861 917 983 1046 1102 1160 1220
Korea 368 375 380 388 392 397 402 416 425 433 438
Indonesia 125 139 151 162 177 194 213 230 245 259 274
Malaysia 14 15 16 17 19 20 21 22 22 23 24
Thailand 325 338 349 365 381 390 400 410 419 428 438
Other Asia Pacific 136 142 155 174 181 188 194 199 203 208 212
EMEA 1067 1082 1110 1156 1180 1204 1220 1231 1234 1238 1240
EU-27 790 797 815 843 862 874 879 875 869 863 859
Russia 28 32 36 43 42 46 51 57 60 62 64
Other EMEA 250 253 259 270 276 284 291 299 306 312 318
Americas 1103 1161 1199 1239 1244 1242 1236 1241 1229 1213 1197
USA 640 679 693 715 714 699 682 673 657 639 620
Brazil 206 213 226 237 246 256 265 277 282 284 285
Other Americas 257 268 280 286 285 287 289 291 291 290 292
Total 7877 8228 8614 9059 9489 9944 10380 10855 11256 11648 12013
% change 2.8 4.5 4.7 5.2 4.7 4.8 4.4 4.6 3.7 3.5 3.1
IMF-Suply Control 7877 8228 8608 9034 9452 9899 10330 10801 11199 11591 11956
% change 2.8 4.5 4.6 4.9 4.6 4.7 4.4 4.6 3.7 3.5 3.1
2013 2014 2015 2016 2017 2018 2019 2020 2021 2022 2023
Asia-Pacific 5707 5958 6272 6581 7011 7442 7859 8307 8712 9114 9479
China 3408 3595 3814 4014 4335 4663 4968 5295 5591 5884 6141
Japan 655 661 668 683 682 689 698 713 727 743 761
India 676 696 743 785 847 903 968 1026 1081 1138 1193
Korea 368 374 379 387 392 398 403 418 428 436 441
Indonesia 125 138 150 160 177 194 212 229 244 259 274
Malaysia 14 15 16 17 18 20 21 22 22 23 23
Thailand 325 336 347 362 378 387 395 405 414 423 433
Other Asia Pacific 136 142 155 174 181 188 194 199 203 208 212
EMEA 1067 1079 1107 1153 1178 1204 1220 1231 1236 1240 1243
EU-27 790 795 813 841 861 874 878 875 869 864 859
Russia 28 32 36 43 42 47 51 58 61 63 65
Other EMEA 250 253 258 269 275 283 290 299 306 313 318
Americas 1103 1159 1205 1239 1248 1249 1238 1246 1238 1223 1205
USA 640 679 701 722 721 707 688 681 669 652 632
Brazil 206 213 225 235 244 256 264 275 281 283 284
Other Americas 257 267 279 283 282 286 287 289 288 288 289
Total 7877 8196 8585 8973 9436 9894 10318 10784 11186 11576 11927
% change 2.8 4.0 4.7 4.5 5.2 4.9 4.3 4.5 3.7 3.5 3.0
IMF Scenario
Downside Scenario
31
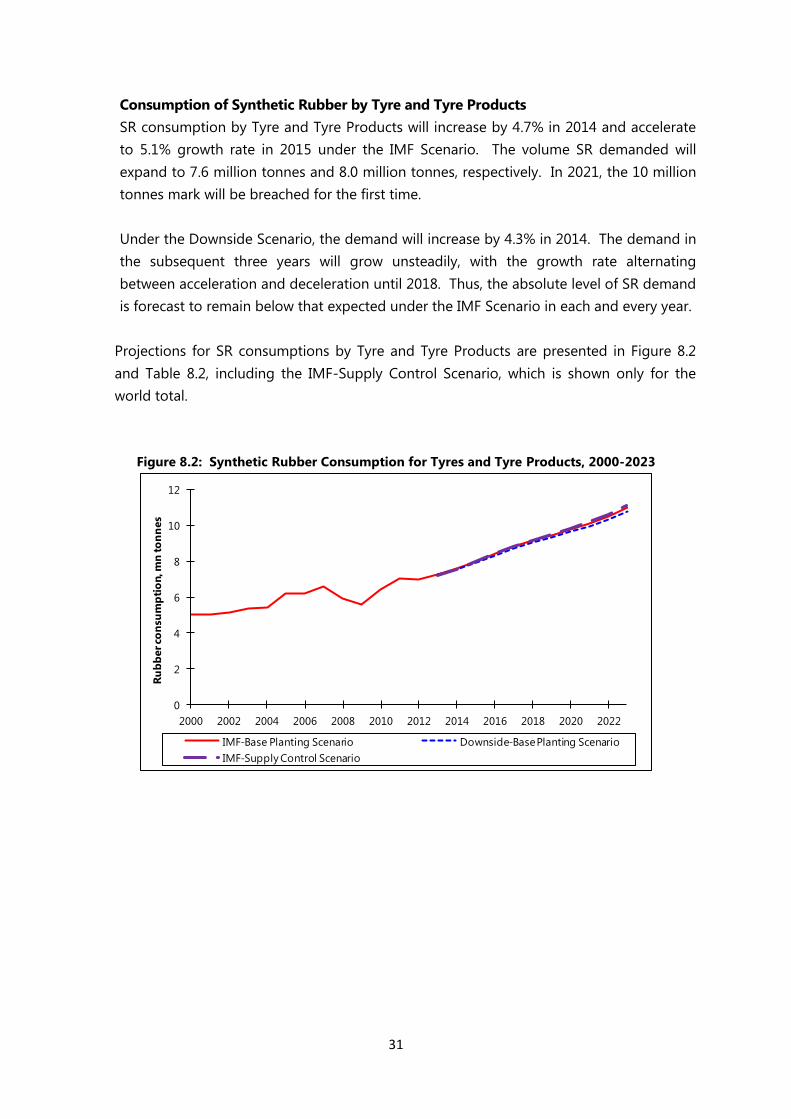
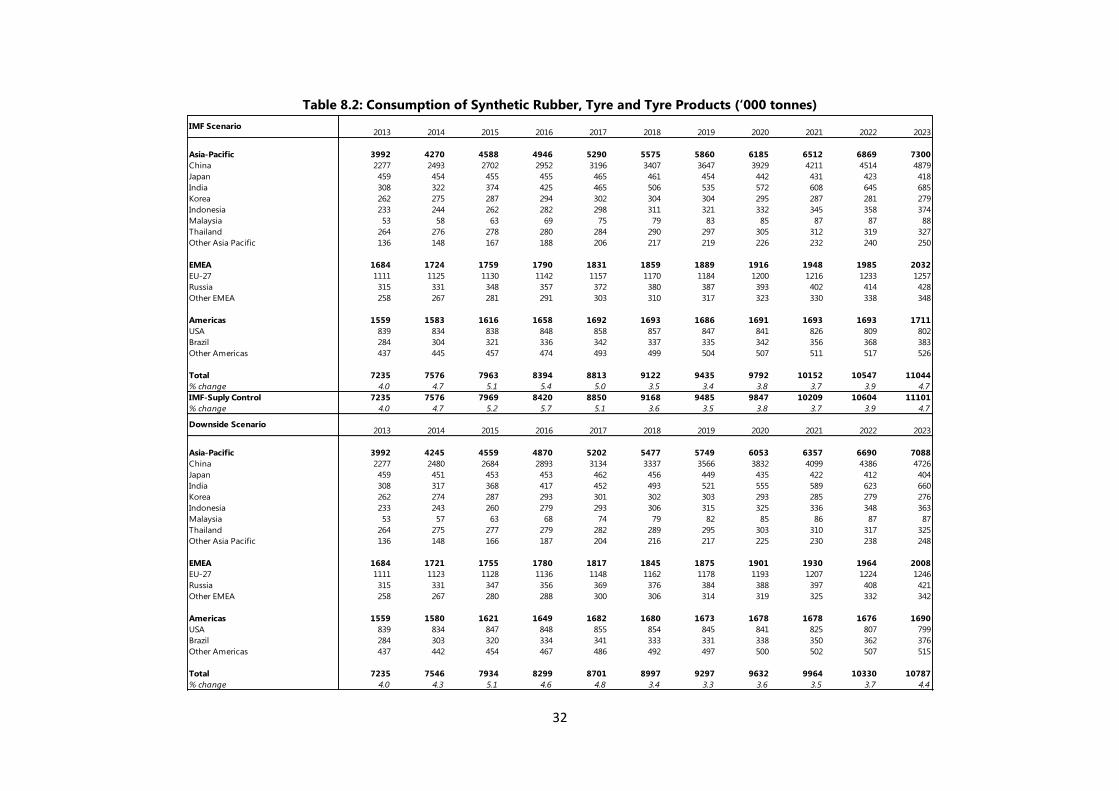
Consumption of Synthetic Rubber by Tyre and Tyre Products
SR consumption by Tyre and Tyre Products will increase by 4.7% in 2014 and accelerate
to 5.1% growth rate in 2015 under the IMF Scenario. The volume SR demanded will
expand to 7.6 million tonnes and 8.0 million tonnes, respectively. In 2021, the 10 million
tonnes mark will be breached for the first time.
Under the Downside Scenario, the demand will increase by 4.3% in 2014. The demand in
the subsequent three years will grow unsteadily, with the growth rate alternating
between acceleration and deceleration until 2018. Thus, the absolute level of SR demand
is forecast to remain below that expected under the IMF Scenario in each and every year.
Projections for SR consumptions by Tyre and Tyre Products are presented in Figure 8.2
and Table 8.2, including the IMF-Supply Control Scenario, which is shown only for the
world total.
Figure 8.2: Synthetic Rubber Consumption for Tyres and Tyre Products, 2000-2023
0
2
4
6
8
10
12
2000 2002 2004 2006 2008 2010 2012 2014 2016 2018 2020 2022
Ru
bb
er co
nsu
mp
tio
n, m
n to
nn
es
IMF-Base Planting Scenario Downside-Base Planting Scenario
IMF-Supply Control Scenario
32
Table 8.2: Consumption of Synthetic Rubber, Tyre and Tyre Products (‘000 tonnes)
2013 2014 2015 2016 2017 2018 2019 2020 2021 2022 2023
Asia-Pacific 3992 4270 4588 4946 5290 5575 5860 6185 6512 6869 7300
China 2277 2493 2702 2952 3196 3407 3647 3929 4211 4514 4879
Japan 459 454 455 455 465 461 454 442 431 423 418
India 308 322 374 425 465 506 535 572 608 645 685
Korea 262 275 287 294 302 304 304 295 287 281 279
Indonesia 233 244 262 282 298 311 321 332 345 358 374
Malaysia 53 58 63 69 75 79 83 85 87 87 88
Thailand 264 276 278 280 284 290 297 305 312 319 327
Other Asia Pacific 136 148 167 188 206 217 219 226 232 240 250
EMEA 1684 1724 1759 1790 1831 1859 1889 1916 1948 1985 2032
EU-27 1111 1125 1130 1142 1157 1170 1184 1200 1216 1233 1257
Russia 315 331 348 357 372 380 387 393 402 414 428
Other EMEA 258 267 281 291 303 310 317 323 330 338 348
Americas 1559 1583 1616 1658 1692 1693 1686 1691 1693 1693 1711
USA 839 834 838 848 858 857 847 841 826 809 802
Brazil 284 304 321 336 342 337 335 342 356 368 383
Other Americas 437 445 457 474 493 499 504 507 511 517 526
Total 7235 7576 7963 8394 8813 9122 9435 9792 10152 10547 11044
% change 4.0 4.7 5.1 5.4 5.0 3.5 3.4 3.8 3.7 3.9 4.7
IMF-Suply Control 7235 7576 7969 8420 8850 9168 9485 9847 10209 10604 11101
% change 4.0 4.7 5.2 5.7 5.1 3.6 3.5 3.8 3.7 3.9 4.7
2013 2014 2015 2016 2017 2018 2019 2020 2021 2022 2023
Asia-Pacific 3992 4245 4559 4870 5202 5477 5749 6053 6357 6690 7088
China 2277 2480 2684 2893 3134 3337 3566 3832 4099 4386 4726
Japan 459 451 453 453 462 456 449 435 422 412 404
India 308 317 368 417 452 493 521 555 589 623 660
Korea 262 274 287 293 301 302 303 293 285 279 276
Indonesia 233 243 260 279 293 306 315 325 336 348 363
Malaysia 53 57 63 68 74 79 82 85 86 87 87
Thailand 264 275 277 279 282 289 295 303 310 317 325
Other Asia Pacific 136 148 166 187 204 216 217 225 230 238 248
EMEA 1684 1721 1755 1780 1817 1845 1875 1901 1930 1964 2008
EU-27 1111 1123 1128 1136 1148 1162 1178 1193 1207 1224 1246
Russia 315 331 347 356 369 376 384 388 397 408 421
Other EMEA 258 267 280 288 300 306 314 319 325 332 342
Americas 1559 1580 1621 1649 1682 1680 1673 1678 1678 1676 1690
USA 839 834 847 848 855 854 845 841 825 807 799
Brazil 284 303 320 334 341 333 331 338 350 362 376
Other Americas 437 442 454 467 486 492 497 500 502 507 515
Total 7235 7546 7934 8299 8701 8997 9297 9632 9964 10330 10787
% change 4.0 4.3 5.1 4.6 4.8 3.4 3.3 3.6 3.5 3.7 4.4
IMF Scenario
Downside Scenario
33
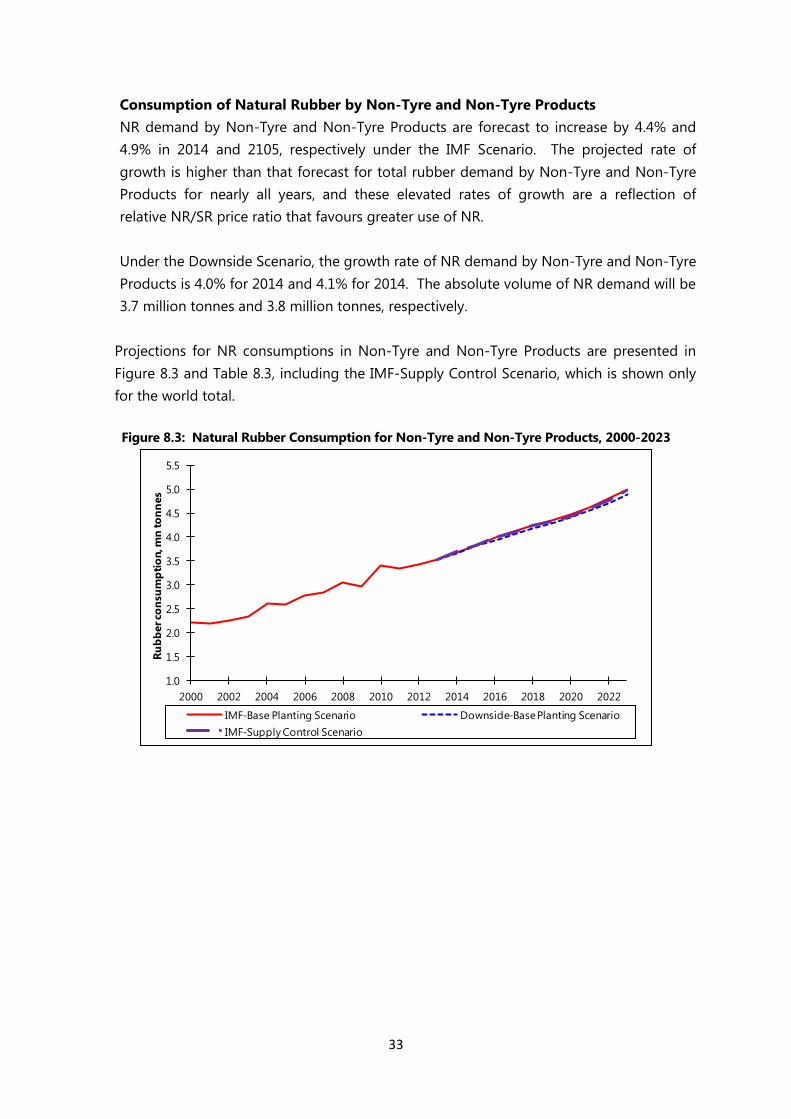
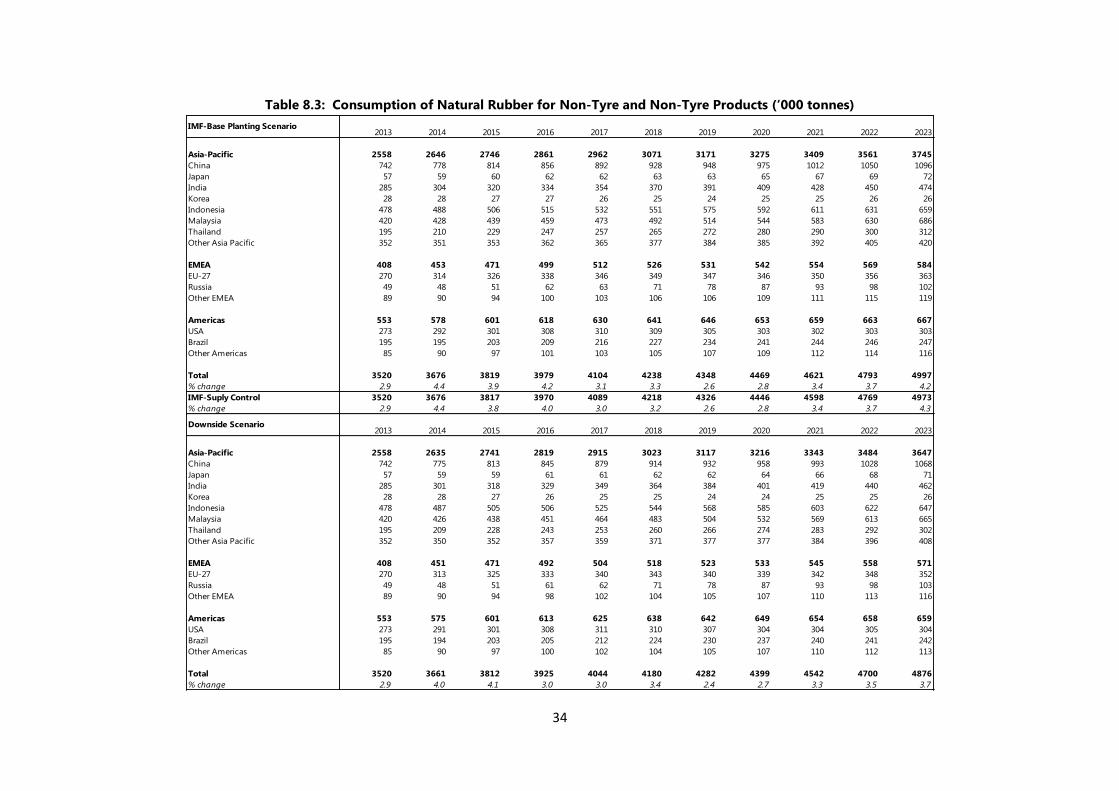
Consumption of Natural Rubber by Non-Tyre and Non-Tyre Products
NR demand by Non-Tyre and Non-Tyre Products are forecast to increase by 4.4% and
4.9% in 2014 and 2105, respectively under the IMF Scenario. The projected rate of
growth is higher than that forecast for total rubber demand by Non-Tyre and Non-Tyre
Products for nearly all years, and these elevated rates of growth are a reflection of
relative NR/SR price ratio that favours greater use of NR.
Under the Downside Scenario, the growth rate of NR demand by Non-Tyre and Non-Tyre
Products is 4.0% for 2014 and 4.1% for 2014. The absolute volume of NR demand will be
3.7 million tonnes and 3.8 million tonnes, respectively.
Projections for NR consumptions in Non-Tyre and Non-Tyre Products are presented in
Figure 8.3 and Table 8.3, including the IMF-Supply Control Scenario, which is shown only
for the world total.
Figure 8.3: Natural Rubber Consumption for Non-Tyre and Non-Tyre Products, 2000-2023
1.0
1.5
2.0
2.5
3.0
3.5
4.0
4.5
5.0
5.5
2000 2002 2004 2006 2008 2010 2012 2014 2016 2018 2020 2022
Ru
bb
er co
nsu
mp
tio
n, m
n to
nn
es
IMF-Base Planting Scenario Downside-Base Planting Scenario
IMF-Supply Control Scenario
34
Table 8.3: Consumption of Natural Rubber for Non-Tyre and Non-Tyre Products (‘000 tonnes)
2013 2014 2015 2016 2017 2018 2019 2020 2021 2022 2023
Asia-Pacific 2558 2646 2746 2861 2962 3071 3171 3275 3409 3561 3745
China 742 778 814 856 892 928 948 975 1012 1050 1096
Japan 57 59 60 62 62 63 63 65 67 69 72
India 285 304 320 334 354 370 391 409 428 450 474
Korea 28 28 27 27 26 25 24 25 25 26 26
Indonesia 478 488 506 515 532 551 575 592 611 631 659
Malaysia 420 428 439 459 473 492 514 544 583 630 686
Thailand 195 210 229 247 257 265 272 280 290 300 312
Other Asia Pacific 352 351 353 362 365 377 384 385 392 405 420
EMEA 408 453 471 499 512 526 531 542 554 569 584
EU-27 270 314 326 338 346 349 347 346 350 356 363
Russia 49 48 51 62 63 71 78 87 93 98 102
Other EMEA 89 90 94 100 103 106 106 109 111 115 119
Americas 553 578 601 618 630 641 646 653 659 663 667
USA 273 292 301 308 310 309 305 303 302 303 303
Brazil 195 195 203 209 216 227 234 241 244 246 247
Other Americas 85 90 97 101 103 105 107 109 112 114 116
Total 3520 3676 3819 3979 4104 4238 4348 4469 4621 4793 4997
% change 2.9 4.4 3.9 4.2 3.1 3.3 2.6 2.8 3.4 3.7 4.2
IMF-Suply Control 3520 3676 3817 3970 4089 4218 4326 4446 4598 4769 4973
% change 2.9 4.4 3.8 4.0 3.0 3.2 2.6 2.8 3.4 3.7 4.3
2013 2014 2015 2016 2017 2018 2019 2020 2021 2022 2023
Asia-Pacific 2558 2635 2741 2819 2915 3023 3117 3216 3343 3484 3647
China 742 775 813 845 879 914 932 958 993 1028 1068
Japan 57 59 59 61 61 62 62 64 66 68 71
India 285 301 318 329 349 364 384 401 419 440 462
Korea 28 28 27 26 25 25 24 24 25 25 26
Indonesia 478 487 505 506 525 544 568 585 603 622 647
Malaysia 420 426 438 451 464 483 504 532 569 613 665
Thailand 195 209 228 243 253 260 266 274 283 292 302
Other Asia Pacific 352 350 352 357 359 371 377 377 384 396 408
EMEA 408 451 471 492 504 518 523 533 545 558 571
EU-27 270 313 325 333 340 343 340 339 342 348 352
Russia 49 48 51 61 62 71 78 87 93 98 103
Other EMEA 89 90 94 98 102 104 105 107 110 113 116
Americas 553 575 601 613 625 638 642 649 654 658 659
USA 273 291 301 308 311 310 307 304 304 305 304
Brazil 195 194 203 205 212 224 230 237 240 241 242
Other Americas 85 90 97 100 102 104 105 107 110 112 113
Total 3520 3661 3812 3925 4044 4180 4282 4399 4542 4700 4876
% change 2.9 4.0 4.1 3.0 3.0 3.4 2.4 2.7 3.3 3.5 3.7
IMF-Base Planting Scenario
Downside Scenario
35
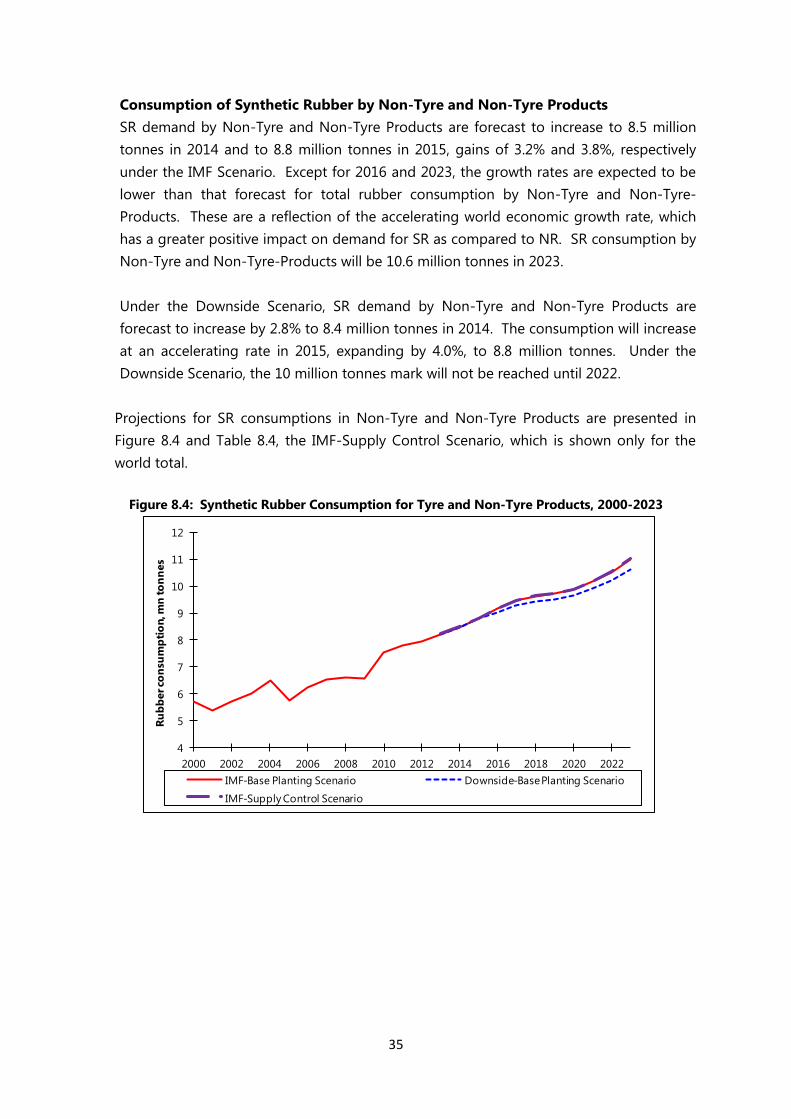
Consumption of Synthetic Rubber by Non-Tyre and Non-Tyre Products
SR demand by Non-Tyre and Non-Tyre Products are forecast to increase to 8.5 million
tonnes in 2014 and to 8.8 million tonnes in 2015, gains of 3.2% and 3.8%, respectively
under the IMF Scenario. Except for 2016 and 2023, the growth rates are expected to be
lower than that forecast for total rubber consumption by Non-Tyre and Non-Tyre-
Products. These are a reflection of the accelerating world economic growth rate, which
has a greater positive impact on demand for SR as compared to NR. SR consumption by
Non-Tyre and Non-Tyre-Products will be 10.6 million tonnes in 2023.
Under the Downside Scenario, SR demand by Non-Tyre and Non-Tyre Products are
forecast to increase by 2.8% to 8.4 million tonnes in 2014. The consumption will increase
at an accelerating rate in 2015, expanding by 4.0%, to 8.8 million tonnes. Under the
Downside Scenario, the 10 million tonnes mark will not be reached until 2022.
Projections for SR consumptions in Non-Tyre and Non-Tyre Products are presented in
Figure 8.4 and Table 8.4, the IMF-Supply Control Scenario, which is shown only for the
world total.
Figure 8.4: Synthetic Rubber Consumption for Tyre and Non-Tyre Products, 2000-2023
4
5
6
7
8
9
10
11
12
2000 2002 2004 2006 2008 2010 2012 2014 2016 2018 2020 2022
Ru
bb
er co
nsu
mp
tio
n, m
n to
nn
es
IMF-Base Planting Scenario Downside-Base Planting Scenario
IMF-Supply Control Scenario
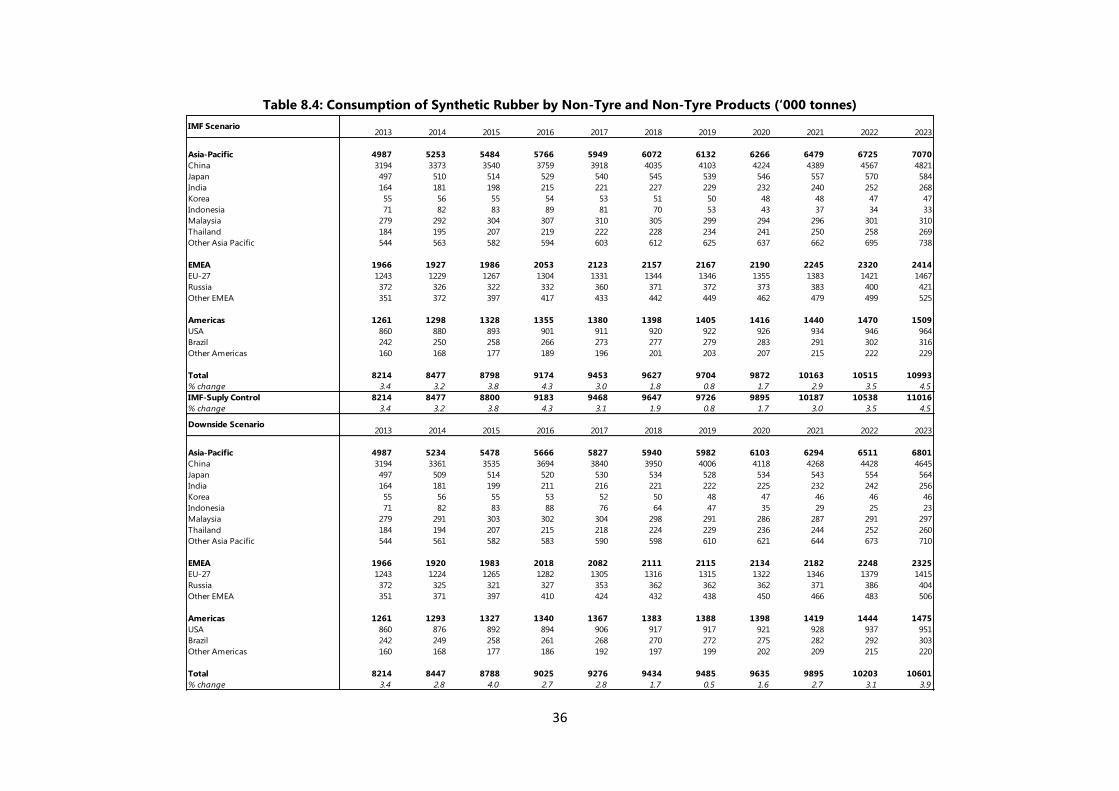
36
Table 8.4: Consumption of Synthetic Rubber by Non-Tyre and Non-Tyre Products (‘000 tonnes)
2013 2014 2015 2016 2017 2018 2019 2020 2021 2022 2023
Asia-Pacific 4987 5253 5484 5766 5949 6072 6132 6266 6479 6725 7070
China 3194 3373 3540 3759 3918 4035 4103 4224 4389 4567 4821
Japan 497 510 514 529 540 545 539 546 557 570 584
India 164 181 198 215 221 227 229 232 240 252 268
Korea 55 56 55 54 53 51 50 48 48 47 47
Indonesia 71 82 83 89 81 70 53 43 37 34 33
Malaysia 279 292 304 307 310 305 299 294 296 301 310
Thailand 184 195 207 219 222 228 234 241 250 258 269
Other Asia Pacific 544 563 582 594 603 612 625 637 662 695 738
EMEA 1966 1927 1986 2053 2123 2157 2167 2190 2245 2320 2414
EU-27 1243 1229 1267 1304 1331 1344 1346 1355 1383 1421 1467
Russia 372 326 322 332 360 371 372 373 383 400 421
Other EMEA 351 372 397 417 433 442 449 462 479 499 525
Americas 1261 1298 1328 1355 1380 1398 1405 1416 1440 1470 1509
USA 860 880 893 901 911 920 922 926 934 946 964
Brazil 242 250 258 266 273 277 279 283 291 302 316
Other Americas 160 168 177 189 196 201 203 207 215 222 229
Total 8214 8477 8798 9174 9453 9627 9704 9872 10163 10515 10993
% change 3.4 3.2 3.8 4.3 3.0 1.8 0.8 1.7 2.9 3.5 4.5
IMF-Suply Control 8214 8477 8800 9183 9468 9647 9726 9895 10187 10538 11016
% change 3.4 3.2 3.8 4.3 3.1 1.9 0.8 1.7 3.0 3.5 4.5
2013 2014 2015 2016 2017 2018 2019 2020 2021 2022 2023
Asia-Pacific 4987 5234 5478 5666 5827 5940 5982 6103 6294 6511 6801
China 3194 3361 3535 3694 3840 3950 4006 4118 4268 4428 4645
Japan 497 509 514 520 530 534 528 534 543 554 564
India 164 181 199 211 216 221 222 225 232 242 256
Korea 55 56 55 53 52 50 48 47 46 46 46
Indonesia 71 82 83 88 76 64 47 35 29 25 23
Malaysia 279 291 303 302 304 298 291 286 287 291 297
Thailand 184 194 207 215 218 224 229 236 244 252 260
Other Asia Pacific 544 561 582 583 590 598 610 621 644 673 710
EMEA 1966 1920 1983 2018 2082 2111 2115 2134 2182 2248 2325
EU-27 1243 1224 1265 1282 1305 1316 1315 1322 1346 1379 1415
Russia 372 325 321 327 353 362 362 362 371 386 404
Other EMEA 351 371 397 410 424 432 438 450 466 483 506
Americas 1261 1293 1327 1340 1367 1383 1388 1398 1419 1444 1475
USA 860 876 892 894 906 917 917 921 928 937 951
Brazil 242 249 258 261 268 270 272 275 282 292 303
Other Americas 160 168 177 186 192 197 199 202 209 215 220
Total 8214 8447 8788 9025 9276 9434 9485 9635 9895 10203 10601
% change 3.4 2.8 4.0 2.7 2.8 1.7 0.5 1.6 2.7 3.1 3.9
IMF Scenario
Downside Scenario
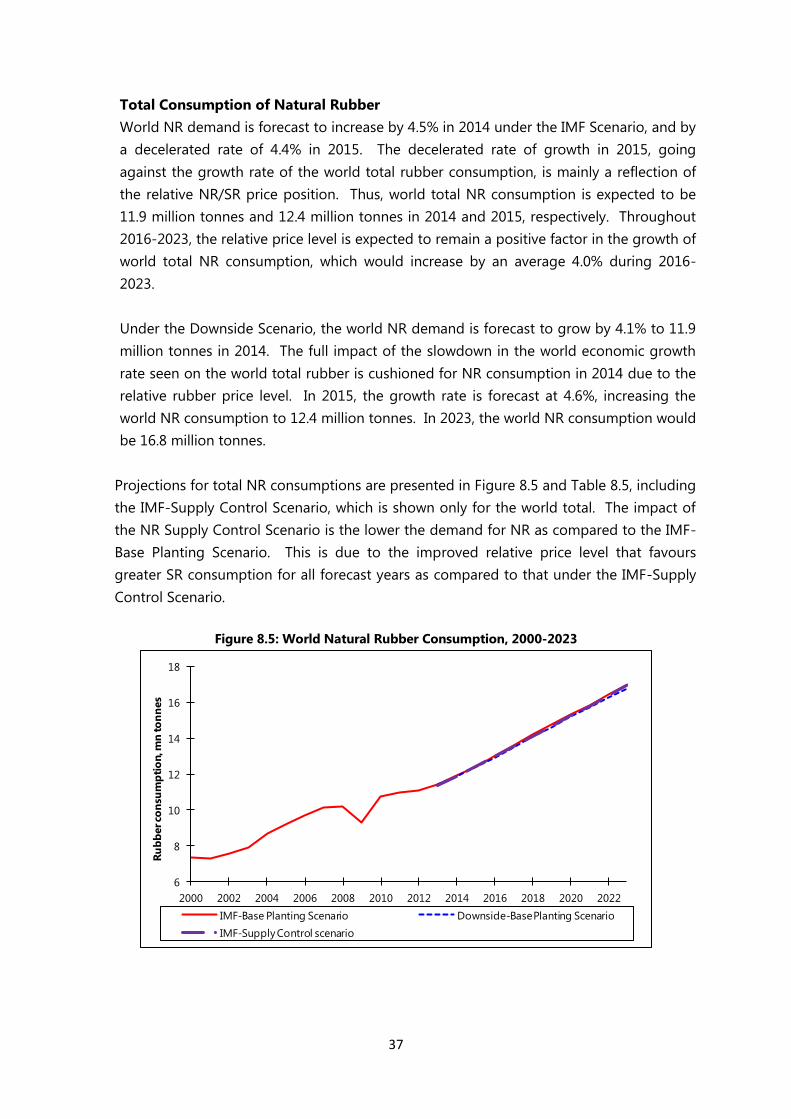
37
Total Consumption of Natural Rubber
World NR demand is forecast to increase by 4.5% in 2014 under the IMF Scenario, and by
a decelerated rate of 4.4% in 2015. The decelerated rate of growth in 2015, going
against the growth rate of the world total rubber consumption, is mainly a reflection of
the relative NR/SR price position. Thus, world total NR consumption is expected to be
11.9 million tonnes and 12.4 million tonnes in 2014 and 2015, respectively. Throughout
2016-2023, the relative price level is expected to remain a positive factor in the growth of
world total NR consumption, which would increase by an average 4.0% during 2016-
2023.
Under the Downside Scenario, the world NR demand is forecast to grow by 4.1% to 11.9
million tonnes in 2014. The full impact of the slowdown in the world economic growth
rate seen on the world total rubber is cushioned for NR consumption in 2014 due to the
relative rubber price level. In 2015, the growth rate is forecast at 4.6%, increasing the
world NR consumption to 12.4 million tonnes. In 2023, the world NR consumption would
be 16.8 million tonnes.
Projections for total NR consumptions are presented in Figure 8.5 and Table 8.5, including
the IMF-Supply Control Scenario, which is shown only for the world total. The impact of
the NR Supply Control Scenario is the lower the demand for NR as compared to the IMF-
Base Planting Scenario. This is due to the improved relative price level that favours
greater SR consumption for all forecast years as compared to that under the IMF-Supply
Control Scenario.
Figure 8.5: World Natural Rubber Consumption, 2000-2023
6
8
10
12
14
16
18
2000 2002 2004 2006 2008 2010 2012 2014 2016 2018 2020 2022
Ru
bb
er co
nsu
mp
tio
n, m
n to
nn
es
IMF-Base Planting Scenario Downside-Base Planting Scenario
IMF-Supply Control scenario
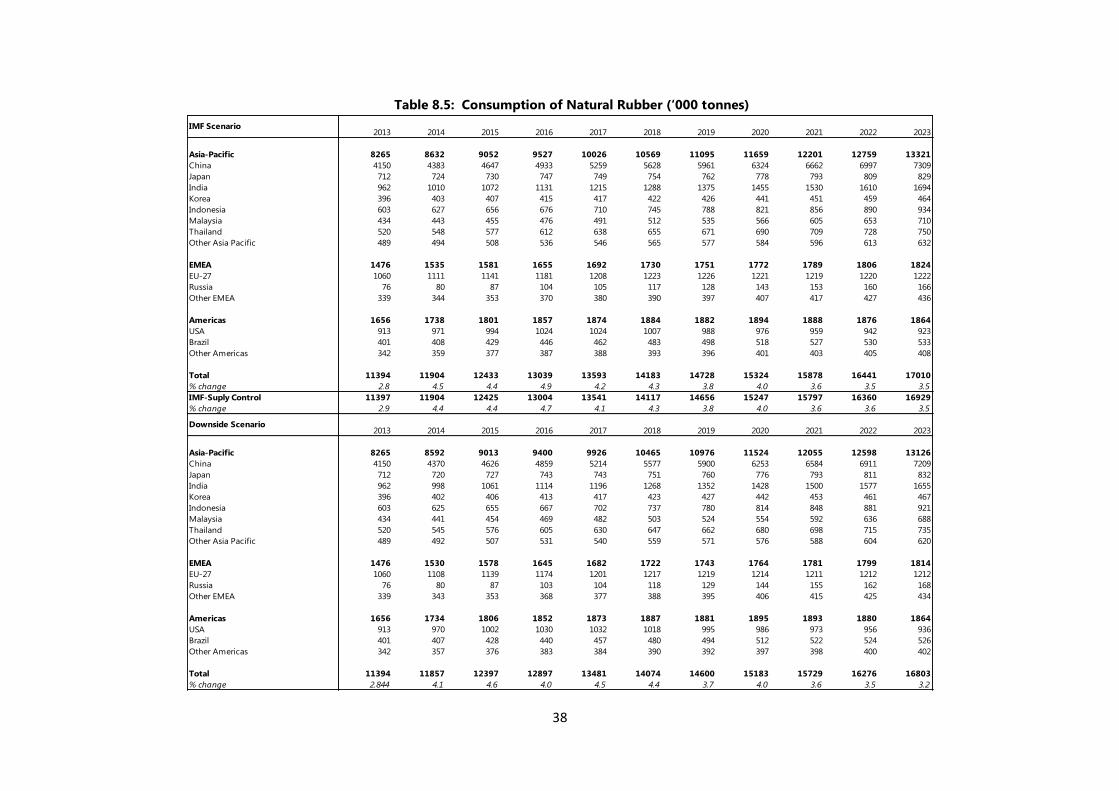
38
Table 8.5: Consumption of Natural Rubber (‘000 tonnes)
2013 2014 2015 2016 2017 2018 2019 2020 2021 2022 2023
Asia-Pacific 8265 8632 9052 9527 10026 10569 11095 11659 12201 12759 13321
China 4150 4383 4647 4933 5259 5628 5961 6324 6662 6997 7309
Japan 712 724 730 747 749 754 762 778 793 809 829
India 962 1010 1072 1131 1215 1288 1375 1455 1530 1610 1694
Korea 396 403 407 415 417 422 426 441 451 459 464
Indonesia 603 627 656 676 710 745 788 821 856 890 934
Malaysia 434 443 455 476 491 512 535 566 605 653 710
Thailand 520 548 577 612 638 655 671 690 709 728 750
Other Asia Pacific 489 494 508 536 546 565 577 584 596 613 632
EMEA 1476 1535 1581 1655 1692 1730 1751 1772 1789 1806 1824
EU-27 1060 1111 1141 1181 1208 1223 1226 1221 1219 1220 1222
Russia 76 80 87 104 105 117 128 143 153 160 166
Other EMEA 339 344 353 370 380 390 397 407 417 427 436
Americas 1656 1738 1801 1857 1874 1884 1882 1894 1888 1876 1864
USA 913 971 994 1024 1024 1007 988 976 959 942 923
Brazil 401 408 429 446 462 483 498 518 527 530 533
Other Americas 342 359 377 387 388 393 396 401 403 405 408
Total 11394 11904 12433 13039 13593 14183 14728 15324 15878 16441 17010
% change 2.8 4.5 4.4 4.9 4.2 4.3 3.8 4.0 3.6 3.5 3.5
IMF-Suply Control 11397 11904 12425 13004 13541 14117 14656 15247 15797 16360 16929
% change 2.9 4.4 4.4 4.7 4.1 4.3 3.8 4.0 3.6 3.6 3.5
2013 2014 2015 2016 2017 2018 2019 2020 2021 2022 2023
Asia-Pacific 8265 8592 9013 9400 9926 10465 10976 11524 12055 12598 13126
China 4150 4370 4626 4859 5214 5577 5900 6253 6584 6911 7209
Japan 712 720 727 743 743 751 760 776 793 811 832
India 962 998 1061 1114 1196 1268 1352 1428 1500 1577 1655
Korea 396 402 406 413 417 423 427 442 453 461 467
Indonesia 603 625 655 667 702 737 780 814 848 881 921
Malaysia 434 441 454 469 482 503 524 554 592 636 688
Thailand 520 545 576 605 630 647 662 680 698 715 735
Other Asia Pacific 489 492 507 531 540 559 571 576 588 604 620
EMEA 1476 1530 1578 1645 1682 1722 1743 1764 1781 1799 1814
EU-27 1060 1108 1139 1174 1201 1217 1219 1214 1211 1212 1212
Russia 76 80 87 103 104 118 129 144 155 162 168
Other EMEA 339 343 353 368 377 388 395 406 415 425 434
Americas 1656 1734 1806 1852 1873 1887 1881 1895 1893 1880 1864
USA 913 970 1002 1030 1032 1018 995 986 973 956 936
Brazil 401 407 428 440 457 480 494 512 522 524 526
Other Americas 342 357 376 383 384 390 392 397 398 400 402
Total 11394 11857 12397 12897 13481 14074 14600 15183 15729 16276 16803
% change 2.844 4.1 4.6 4.0 4.5 4.4 3.7 4.0 3.6 3.5 3.2
IMF Scenario
Downside Scenario
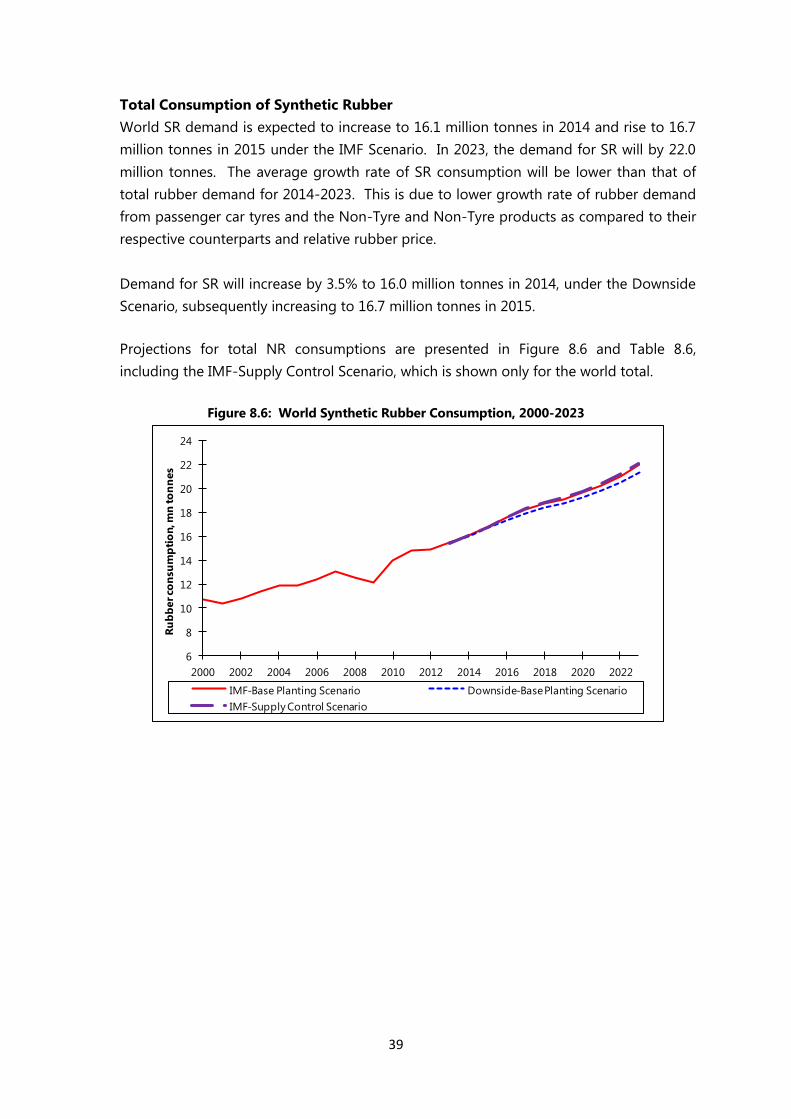
39
Total Consumption of Synthetic Rubber
World SR demand is expected to increase to 16.1 million tonnes in 2014 and rise to 16.7
million tonnes in 2015 under the IMF Scenario. In 2023, the demand for SR will by 22.0
million tonnes. The average growth rate of SR consumption will be lower than that of
total rubber demand for 2014-2023. This is due to lower growth rate of rubber demand
from passenger car tyres and the Non-Tyre and Non-Tyre products as compared to their
respective counterparts and relative rubber price.
Demand for SR will increase by 3.5% to 16.0 million tonnes in 2014, under the Downside
Scenario, subsequently increasing to 16.7 million tonnes in 2015.
Projections for total NR consumptions are presented in Figure 8.6 and Table 8.6,
including the IMF-Supply Control Scenario, which is shown only for the world total.
Figure 8.6: World Synthetic Rubber Consumption, 2000-2023
6
8
10
12
14
16
18
20
22
24
2000 2002 2004 2006 2008 2010 2012 2014 2016 2018 2020 2022
Ru
bb
er co
nsu
mp
tio
n, m
n to
nn
es
IMF-Base Planting Scenario Downside-Base Planting Scenario
IMF-Supply Control Scenario
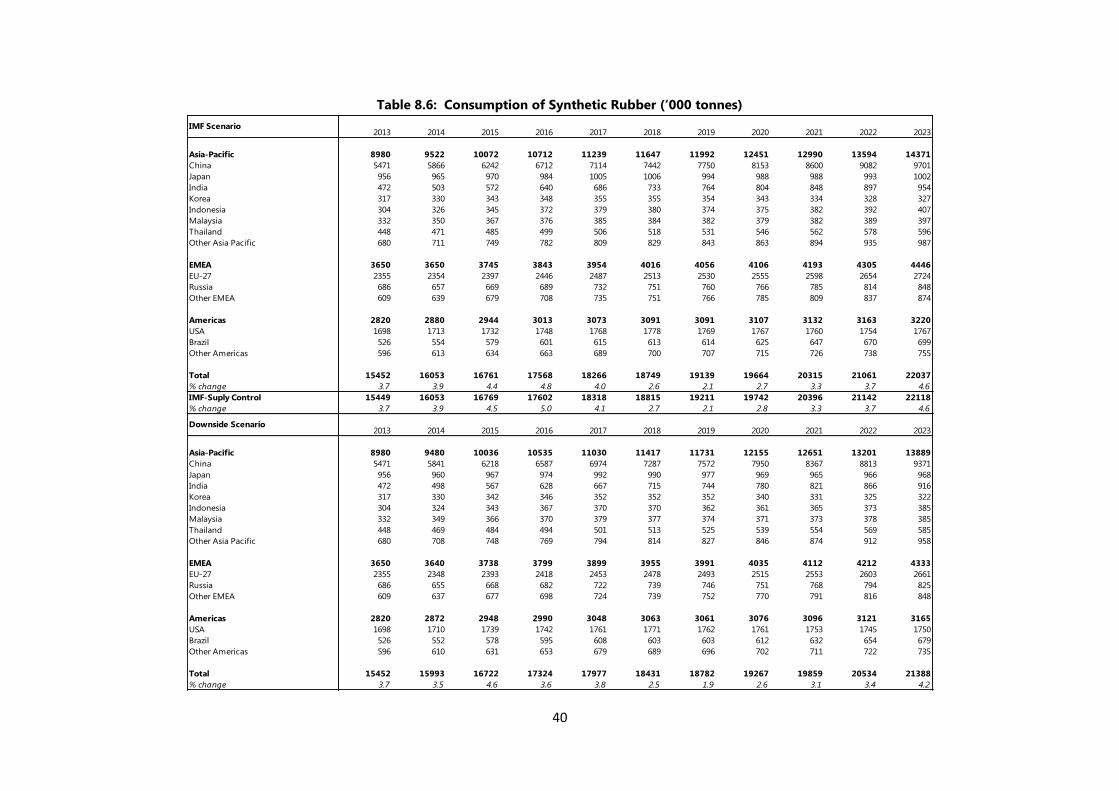
40
Table 8.6: Consumption of Synthetic Rubber (‘000 tonnes)
2013 2014 2015 2016 2017 2018 2019 2020 2021 2022 2023
Asia-Pacific 8980 9522 10072 10712 11239 11647 11992 12451 12990 13594 14371
China 5471 5866 6242 6712 7114 7442 7750 8153 8600 9082 9701
Japan 956 965 970 984 1005 1006 994 988 988 993 1002
India 472 503 572 640 686 733 764 804 848 897 954
Korea 317 330 343 348 355 355 354 343 334 328 327
Indonesia 304 326 345 372 379 380 374 375 382 392 407
Malaysia 332 350 367 376 385 384 382 379 382 389 397
Thailand 448 471 485 499 506 518 531 546 562 578 596
Other Asia Pacific 680 711 749 782 809 829 843 863 894 935 987
EMEA 3650 3650 3745 3843 3954 4016 4056 4106 4193 4305 4446
EU-27 2355 2354 2397 2446 2487 2513 2530 2555 2598 2654 2724
Russia 686 657 669 689 732 751 760 766 785 814 848
Other EMEA 609 639 679 708 735 751 766 785 809 837 874
Americas 2820 2880 2944 3013 3073 3091 3091 3107 3132 3163 3220
USA 1698 1713 1732 1748 1768 1778 1769 1767 1760 1754 1767
Brazil 526 554 579 601 615 613 614 625 647 670 699
Other Americas 596 613 634 663 689 700 707 715 726 738 755
Total 15452 16053 16761 17568 18266 18749 19139 19664 20315 21061 22037
% change 3.7 3.9 4.4 4.8 4.0 2.6 2.1 2.7 3.3 3.7 4.6
IMF-Suply Control 15449 16053 16769 17602 18318 18815 19211 19742 20396 21142 22118
% change 3.7 3.9 4.5 5.0 4.1 2.7 2.1 2.8 3.3 3.7 4.6
2013 2014 2015 2016 2017 2018 2019 2020 2021 2022 2023
Asia-Pacific 8980 9480 10036 10535 11030 11417 11731 12155 12651 13201 13889
China 5471 5841 6218 6587 6974 7287 7572 7950 8367 8813 9371
Japan 956 960 967 974 992 990 977 969 965 966 968
India 472 498 567 628 667 715 744 780 821 866 916
Korea 317 330 342 346 352 352 352 340 331 325 322
Indonesia 304 324 343 367 370 370 362 361 365 373 385
Malaysia 332 349 366 370 379 377 374 371 373 378 385
Thailand 448 469 484 494 501 513 525 539 554 569 585
Other Asia Pacific 680 708 748 769 794 814 827 846 874 912 958
EMEA 3650 3640 3738 3799 3899 3955 3991 4035 4112 4212 4333
EU-27 2355 2348 2393 2418 2453 2478 2493 2515 2553 2603 2661
Russia 686 655 668 682 722 739 746 751 768 794 825
Other EMEA 609 637 677 698 724 739 752 770 791 816 848
Americas 2820 2872 2948 2990 3048 3063 3061 3076 3096 3121 3165
USA 1698 1710 1739 1742 1761 1771 1762 1761 1753 1745 1750
Brazil 526 552 578 595 608 603 603 612 632 654 679
Other Americas 596 610 631 653 679 689 696 702 711 722 735
Total 15452 15993 16722 17324 17977 18431 18782 19267 19859 20534 21388
% change 3.7 3.5 4.6 3.6 3.8 2.5 1.9 2.6 3.1 3.4 4.2
IMF Scenario
Downside Scenario
41
Appendix A
The IRSG Annual Model
The IRSG annual model is a structural model per country or region, based on annual data,
forecasting developments in Gross Domestic Product (GDP), the Vehicle sector and the Tyre
sector, planting in NR and investments in SR, leading to the forecasts of consumption and
production of NR and SR. The model is used to prepare analyses and forecasts for
consumption and production of rubber as well as sales and production of rubber goods,
especially tyres. The main features of the structural model of the rubber economy to derive
projections of total rubber demand and supply are presented below.
1 The sub-model for forecasting total rubber consumption
Forecasts for the world economy
Economic activity is represented by Gross Domestic Product (GDP). The IRSG uses data from
the IMF. Normally the IMF makes forecasts for about 5 years ahead. The IRSG forecasts for
later years are based on the IRSG model, where growth rates for each country depend on the
following factors:
developments in growth in the world economy in the current and previous years
developments in growth in the country in the current and previous years
The Vehicle sector
In this section analyses and projections are derived for the following series:
vehicles in use
vehicle sales
vehicle production
Data are obtained from LMC/JDPower semi-annually, which is supplemented by additional
data collected by the IRSG during the year.
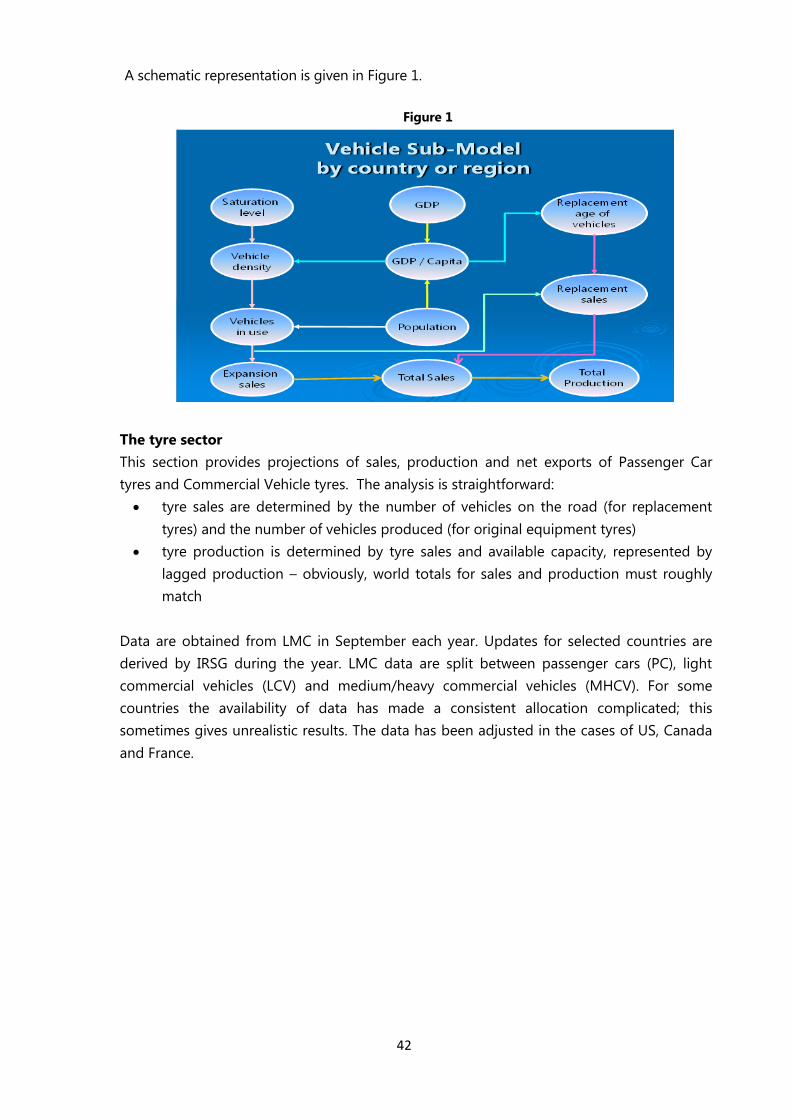
42
A schematic representation is given in Figure 1.
Figure 1
The tyre sector
This section provides projections of sales, production and net exports of Passenger Car
tyres and Commercial Vehicle tyres. The analysis is straightforward:
tyre sales are determined by the number of vehicles on the road (for replacement
tyres) and the number of vehicles produced (for original equipment tyres)
tyre production is determined by tyre sales and available capacity, represented by
lagged production – obviously, world totals for sales and production must roughly
match
Data are obtained from LMC in September each year. Updates for selected countries are
derived by IRSG during the year. LMC data are split between passenger cars (PC), light
commercial vehicles (LCV) and medium/heavy commercial vehicles (MHCV). For some
countries the availability of data has made a consistent allocation complicated; this
sometimes gives unrealistic results. The data has been adjusted in the cases of US, Canada
and France.
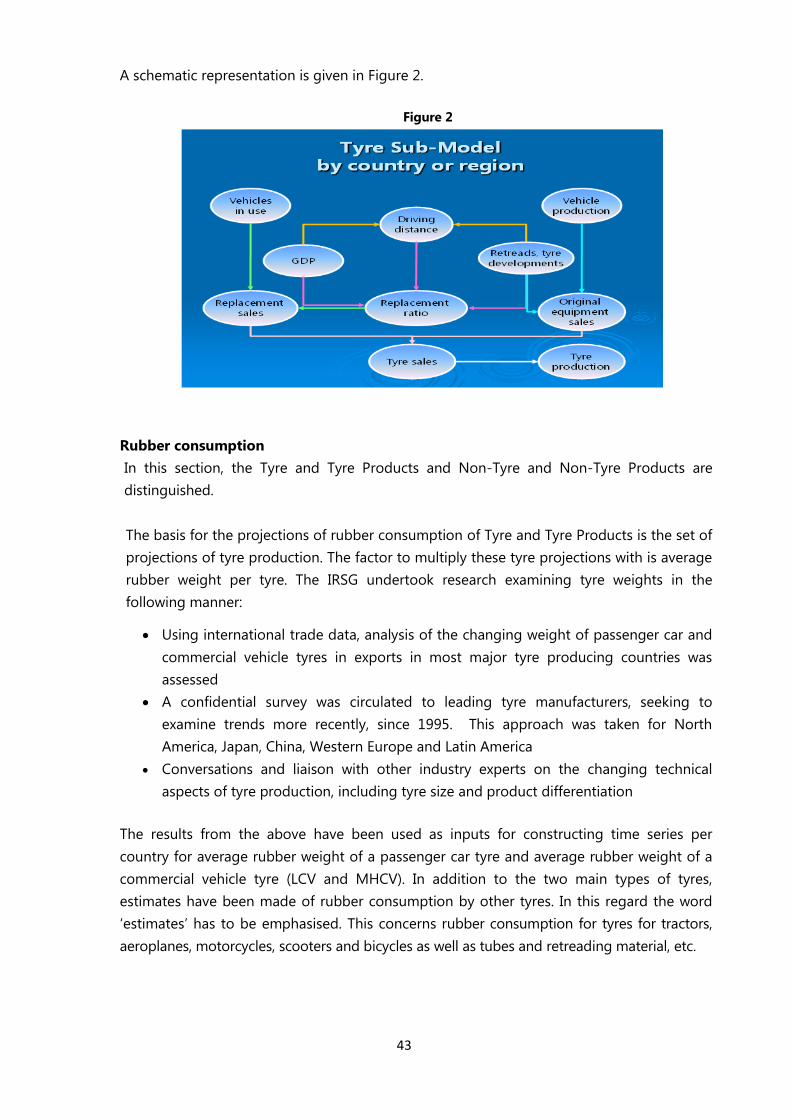
43
A schematic representation is given in Figure 2.
Figure 2
Rubber consumption
In this section, the Tyre and Tyre Products and Non-Tyre and Non-Tyre Products are
distinguished.
The basis for the projections of rubber consumption of Tyre and Tyre Products is the set of
projections of tyre production. The factor to multiply these tyre projections with is average
rubber weight per tyre. The IRSG undertook research examining tyre weights in the
following manner:
Using international trade data, analysis of the changing weight of passenger car and
commercial vehicle tyres in exports in most major tyre producing countries was
assessed
A confidential survey was circulated to leading tyre manufacturers, seeking to
examine trends more recently, since 1995. This approach was taken for North
America, Japan, China, Western Europe and Latin America
Conversations and liaison with other industry experts on the changing technical
aspects of tyre production, including tyre size and product differentiation
The results from the above have been used as inputs for constructing time series per
country for average rubber weight of a passenger car tyre and average rubber weight of a
commercial vehicle tyre (LCV and MHCV). In addition to the two main types of tyres,
estimates have been made of rubber consumption by other tyres. In this regard the word
„estimates‟ has to be emphasised. This concerns rubber consumption for tyres for tractors,
aeroplanes, motorcycles, scooters and bicycles as well as tubes and retreading material, etc.
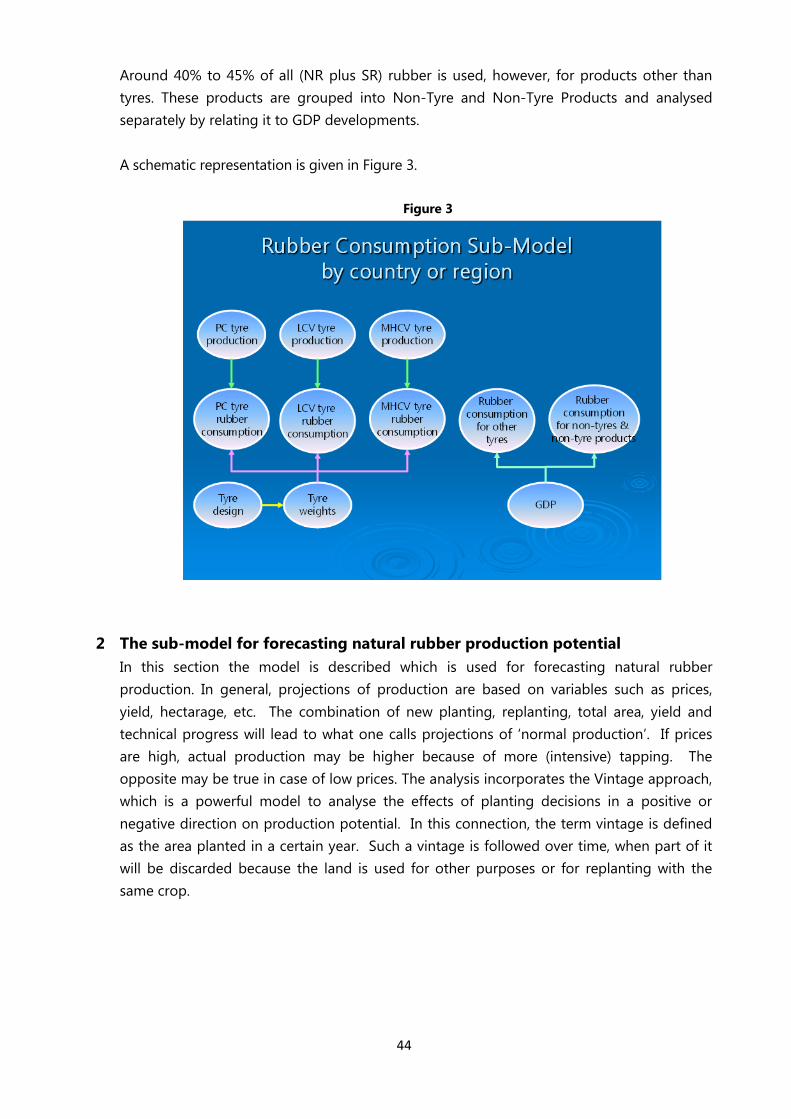
44
Around 40% to 45% of all (NR plus SR) rubber is used, however, for products other than
tyres. These products are grouped into Non-Tyre and Non-Tyre Products and analysed
separately by relating it to GDP developments.
A schematic representation is given in Figure 3.
Figure 3
2 The sub-model for forecasting natural rubber production potential
In this section the model is described which is used for forecasting natural rubber
production. In general, projections of production are based on variables such as prices,
yield, hectarage, etc. The combination of new planting, replanting, total area, yield and
technical progress will lead to what one calls projections of „normal production‟. If prices
are high, actual production may be higher because of more (intensive) tapping. The
opposite may be true in case of low prices. The analysis incorporates the Vintage approach,
which is a powerful model to analyse the effects of planting decisions in a positive or
negative direction on production potential. In this connection, the term vintage is defined
as the area planted in a certain year. Such a vintage is followed over time, when part of it
will be discarded because the land is used for other purposes or for replanting with the
same crop.
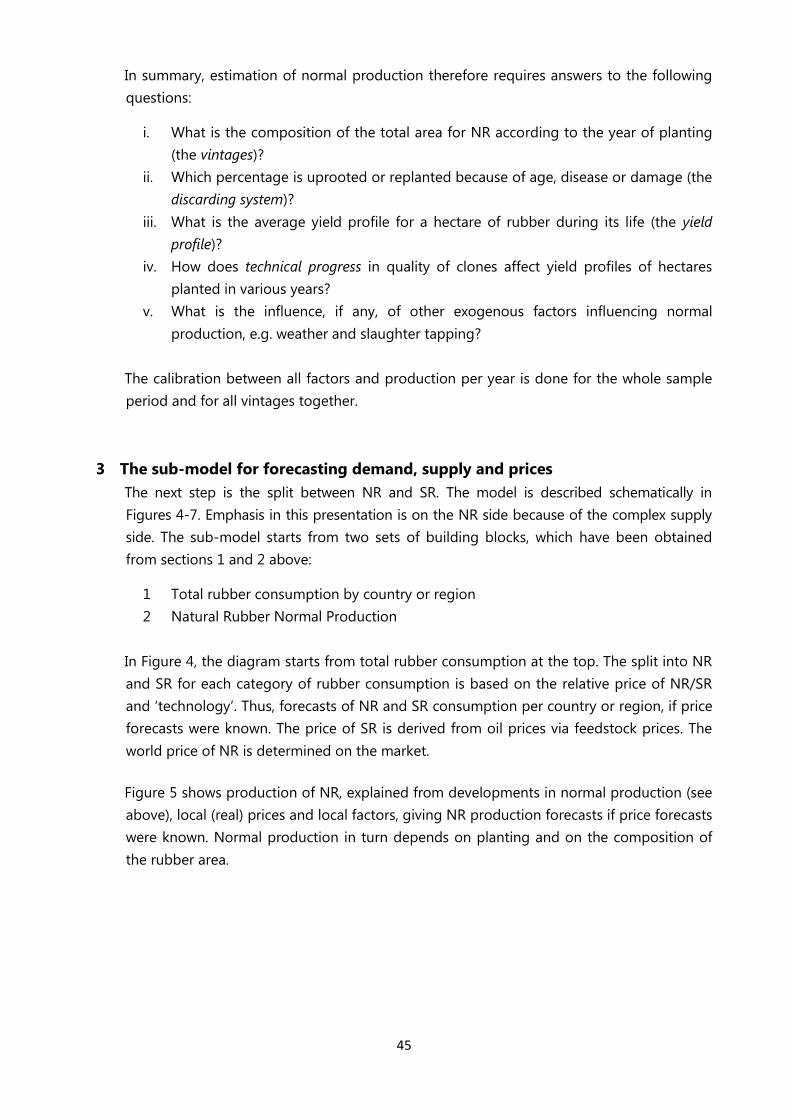
45
In summary, estimation of normal production therefore requires answers to the following
questions:
i. What is the composition of the total area for NR according to the year of planting
(the vintages)?
ii. Which percentage is uprooted or replanted because of age, disease or damage (the
discarding system)?
iii. What is the average yield profile for a hectare of rubber during its life (the yield
profile)?
iv. How does technical progress in quality of clones affect yield profiles of hectares
planted in various years?
v. What is the influence, if any, of other exogenous factors influencing normal
production, e.g. weather and slaughter tapping?
The calibration between all factors and production per year is done for the whole sample
period and for all vintages together.
3 The sub-model for forecasting demand, supply and prices
The next step is the split between NR and SR. The model is described schematically in
Figures 4-7. Emphasis in this presentation is on the NR side because of the complex supply
side. The sub-model starts from two sets of building blocks, which have been obtained
from sections 1 and 2 above:
1 Total rubber consumption by country or region
2 Natural Rubber Normal Production
In Figure 4, the diagram starts from total rubber consumption at the top. The split into NR
and SR for each category of rubber consumption is based on the relative price of NR/SR
and „technology‟. Thus, forecasts of NR and SR consumption per country or region, if price
forecasts were known. The price of SR is derived from oil prices via feedstock prices. The
world price of NR is determined on the market.
Figure 5 shows production of NR, explained from developments in normal production (see
above), local (real) prices and local factors, giving NR production forecasts if price forecasts
were known. Normal production in turn depends on planting and on the composition of
the rubber area.
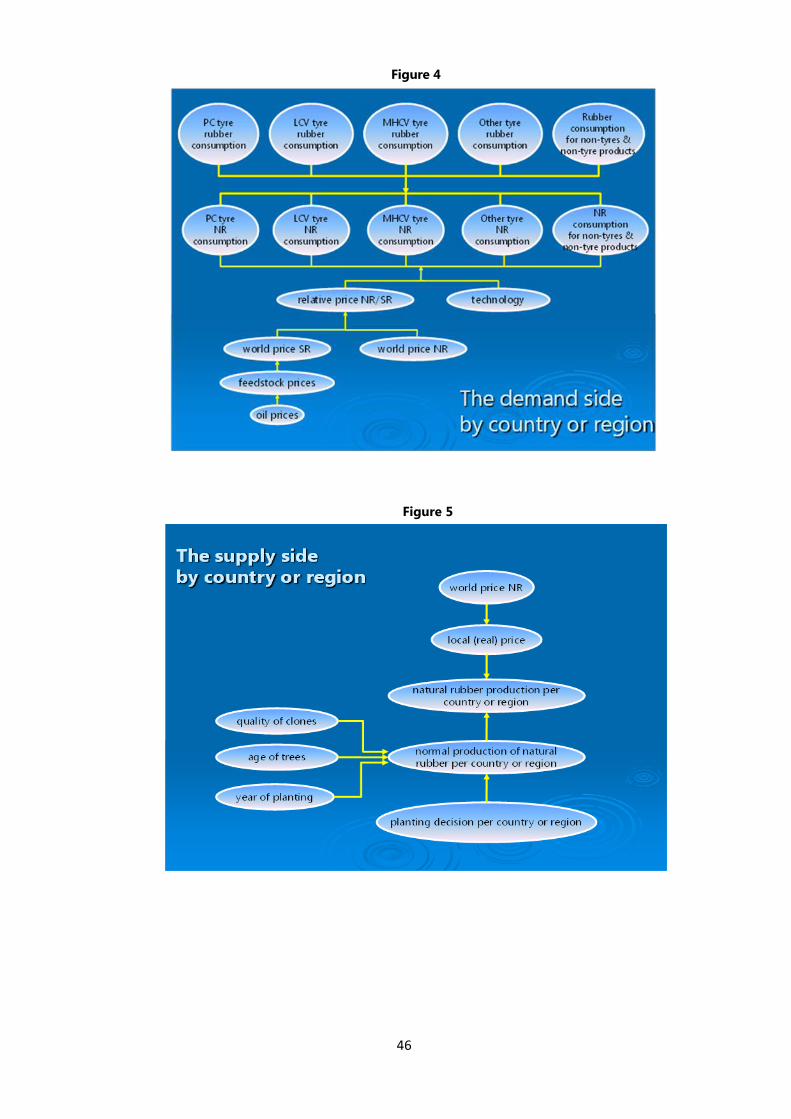
46
Figure 4
Figure 5
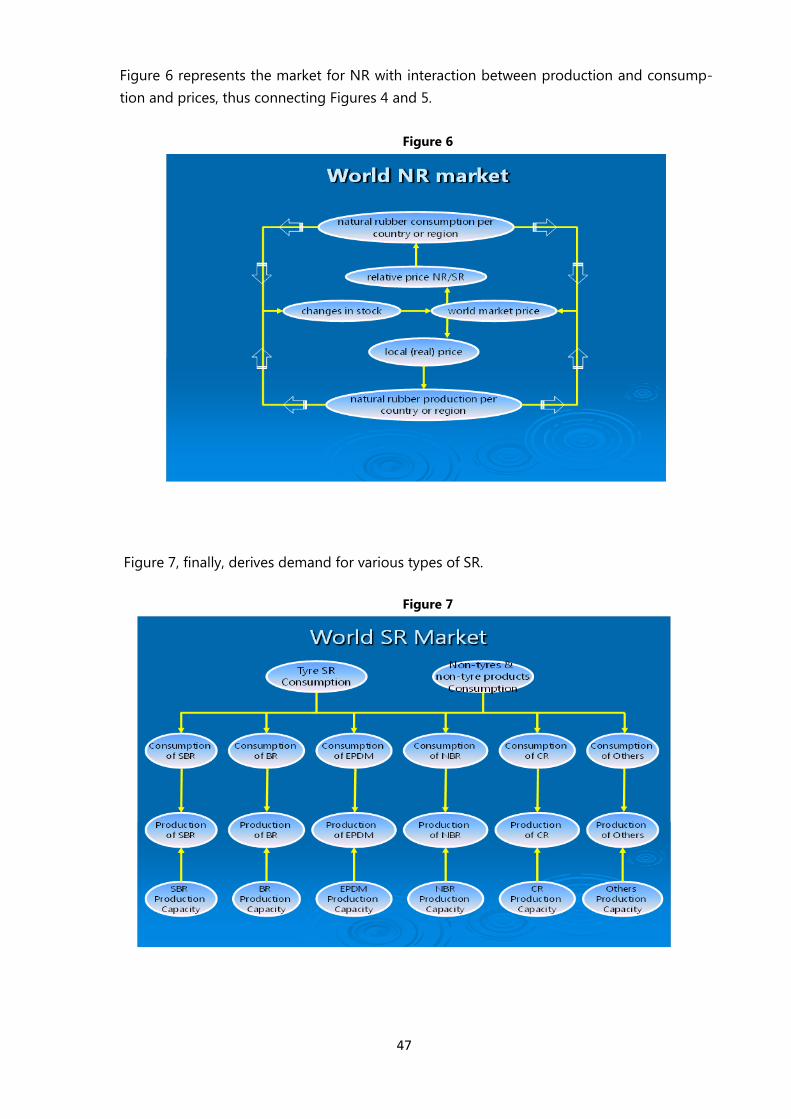
47
Figure 6 represents the market for NR with interaction between production and consump-
tion and prices, thus connecting Figures 4 and 5.
Figure 6
Figure 7, finally, derives demand for various types of SR.
Figure 7