bangladesh: coastal towns infrastructure improvement project
TRANSCRIPT
Technical Assistance Consultant’s Report
This consultant’s report does not necessarily reflect the views of ADB or the Government concerned, and ADB and the Government cannot be held liable for its contents.
Project Number: 44212 October 2013
Bangladesh: Coastal Towns Infrastructure Improvement Project (Financed by the Japan Fund for Poverty Reduction)
Prepared by:
GHK Consulting Limited
TA-8128 BAN (PPTA):
Preparing Coastal Towns Infrastructure Improvement Project
FINAL REPORT VOLUME 4: ANNEX – INFRASTRUCTURE, WATER
RESOURCES
October 2013
In association with:
TA-8128 BAN: Preparing Coastal Towns Infrastructure Improvement Project – FR Vol. 4: Infrastructure
This report consists of seven volumes:
Volume 1 Main Report
Volume 2 Appendices
Volume 3 Annex: Climate Change Assessment and Adaptation Strategy
Volume 4 Annex: Infrastructure, Water Resources
Volume 5 Annex: Finance and Economics
Volume 6 Annex: Environmental Safeguards
Volume 7 Annex: Resettlement Safeguards
i
TA-8128 BAN: Preparing Coastal Towns Infrastructure Improvement Project – FR Vol. 4: Infrastructure
PREPARING COASTAL TOWNS INFRASTRUCTURE IMPROVEMENT PROJECT PPTA - TA-8128 BAN
FINAL REPORT
VOLUME 4: INFRASTRUCTURE, WATER RESOURCES
List of Contents
Page
Glossary of Bangladeshi Terms ii
Acronyms ii
Location Map vii
Annex A: Municipal Infrastructure Data 1
Annex B: Drainage and Flood Control Data 41
Annex C: Water Supply Drawings 85
Annex D: Water Quality Laboratory Equipment 104
Annex E: Sanitation 106
Annex F: Water Resources 250
ii
TA-8128 BAN: Preparing Coastal Towns Infrastructure Improvement Project – FR Vol. 4: Infrastructure
GLOSSARY OF BANGLADESHI TERMS
crore 10 million (= 100 lakh) ghat boat landing station hartal nationwide strike/demonstration called by opposition parties khal drainage ditch/canal khas, khash belongs to government (e.g. land) katcha poor quality, poorly built lakh, lac 100,000 madrasha Islamic college mahalla community area mouza government-recogized land area parashad authority (pourashava) pourashava municipality pucca good quality, well built, solid thana police station upazila subdistrict
ACRONYMS
ABD Asian Development Bank ADP annual development plan ADSL Associates for Development Services AIFC average incremental financial cost AP affected person (resettlement)
BBS Bangladesh Bureau of Statistics BC bitumous carpeting BCCRF Bangladesh Climate Change Resilience Fund BDT Bangladesh Taka bgl below ground level BLS boat landing station BMD Bangladesh Meteorological DepartmentBMDF Bangladesh Municipal Development Fund BMGF Bill and Melinda Gates Foundation BPL below poverty line BRAC Bangladesh Rural Advancement Committee BRM Bangladesh Resident Mission (ADB) BT bitumen topped (road) BUET Bangladesh University of Engineering and Technology BWDB Bangladesh Water Development Board
CAG Comptroller and Auditor General CAGR compounded annual growth rate CARE An NGO CBO community-based organization CC city corporation; cement concrete; climate change CCA climate change adaptation CCF Climate Change Fund CCR climate change resilience CCRIP Climate Change Resilient Infrastructure Project CDIA Cities Development Initiative for Asia CDMP Comprehensive Disaster Management Programme CDTA capacity development technical assistance CEIP Coastal Embankment Improvement Program CEP Coastal Embankment Project CLTS Community-Led Total Sanitation CPS country partnership strategy (ADB) CQS consultants’ qualification selection
iii
TA-8128 BAN: Preparing Coastal Towns Infrastructure Improvement Project – FR Vol. 4: Infrastructure
CTIIP Coastal Towns Infrastructure Improvement Project
DANIDA Danish International Development Agency DED detailed engineering design DEM digital elevation models DEWATS decentralized wastewater treatment system DFID Department for International Development (UK) DFR draft final report DM disaster management DMC developing member country DMF design and monitoring framework DP development partner DPHE Department of Public Health Engineering DPP development project proforma DRM disaster risk management DRR disaster risk reduction DSCR debt service coverage ratio DSK Dushthya Shasthya Kendra (an NGO) DSP deep set pump (in tubewell) DTIDP District Towns Infrastructure Development Project DWASA Dhaka Water Supply and Sanitation Authority
EA executing agency EARF environmental assessment review framework EIA environmental impact analysis EIRR economic internal rate of return EMP environmental management plan EOCC economic opportunity cost of capital EU European Union
FAPAD Foreign Aided Project Audit Directorate FGD focus group discussion FMAQ financial management assessment questionnaire forex foreign exchange FS feasibility study FY fiscal year (1 July – 30 June)
GBM Ganges-Brahmaputra-Meghna river basin GCM General Circulation Model GHG greenhouse gas GHK GHK Consulting Limited (ICF GHK) GIS geographic information system GIZ German Society for International Cooperation GOB Government of Bangladesh
HBB herring bone bond (road) HH household
IA implementing agency ICB international competitive bidding ICCDC Institutional Capacity and Community Development Consultant IEC information-education-communication IEE initial environmental examination IIED International Institute of Economic Development IOL inventory of losses IPCC International Panel on Climate Change IPPF indigenous peoples planning framework IT information technology IUCN International Union for Conservation of Nature IWA International Water Association
iv
TA-8128 BAN: Preparing Coastal Towns Infrastructure Improvement Project – FR Vol. 4: Infrastructure
JFPR Japan Fund for Poverty Reduction JICA Japan International Cooperation Agency
KfW German development funding agency KPI key performance indicators
LARP land acquisition and resettlement plan LBDT lakh Bangladesh taka (BDT100,000) LDRRF local disaster risk reduction fund LGD Local Government Division LGED Local Government Engineering Department LGI local government institution LOI letter of intent LS lump sum l/s, lps liters per second
MAR managed aquifer recharge MBDT million Bangldesh taka MCA multi-criteria analysis MDG Millennium Development Goals M&E monitoring and evaluation MFF Multitranche Financing Facility (ADB) MHRW Ministry of Housing and Public Works MIDP municipal infrastructure development plan MIS management information system MLD million liters per day MLGRDC Ministry of Local Government, Rural Development, and Cooperatives MODMR Ministry of Disaster Management and Relief MOE Ministry of Education MOF Ministry of Finance MOU memorandum of understanding MSP Municipal Services Project MTBF Medium Term Budget Framework
NAPA National Adaptation Program of Action NCB national competitive bidding NGO non-government organization NIRAPAD Network for Information, Response and Preparedness Activities on
Disaster NPDM National Plan for Disaster Management NPV net present value NRW non-revenue water
OCR Ordinary Capital Resources (ADB) ODA official development assistance OHT overhead tank OJT on-the-job training O&M operation and maintenance
PAM project administration manual (ADB) PD project director PDA project design advance PDMC pourashava disaster management committee PDP pourashava development plan PIU project implementation unit PMO project management office PMSC Project Management and Supervision Consultant PMU project management unit PPCR Pilot Program for Climate Resilience
v
TA-8128 BAN: Preparing Coastal Towns Infrastructure Improvement Project – FR Vol. 4: Infrastructure
PPMS project performance management system PPP public-private partnership PPTA project preparatory technical assistance PRA participatory rural appraisal PSF pond sand filter PSU pourashava sanitation unit PWD Public Works Department (datum)
QC quality control QCBS Quality- and Cost-Based Selection QM quality management
RAJUK Rajdhani Unnayan Katripakkha RCC reinforced cement concrete RF resettlement framework RHD Roads and Highway Department ROW right of way R&R resettlement and rehabilitation RRP report and recommendation of the president (ADB) RSC rural sanitation center
SCF Strategic Climate Fund (ADB) SDP sector development plan SEWTPS socioeconomic and willingness-to-pay survey SFYP (Bangladesh) Sixth Five-Year Plan SIDA Swedish International Development Agency SLR sea level rise SPA social poverty assessment SPCR Strategic Program for Climate Resilience (GOB, 2010) SPEC Special Project Evaluation Committee SPS Safeguard Policy Statement (ADB) SST sea surface temperature STWSSSP Secondary Towns Water Supply and Sanitation Sector Project SWM solid waste management SWOT strength-weakness-opportunities-threat (analysis) SWTP surface water treatment plant
TA technical assistance
TNA training needs assessment TOR terms of reference TOT training-of-trainers TRM tidal river management
UDD Urban Development Directorate, Ministry of Housing and Public Works UFW unaccounted-for water UGIAP urban governance improvement action plan UGIIP Urban Governance Infrastructure Improvement Project ULB urban local body UNDP United Nations Development Programme UNFRA United Nations Food Relief Agency UN-HABITAT United Nations agency for human settlements UNICEF United Nations Children’s Fund UP union parashad UPPRP Urban Partnerships for Poverty Reduction Project USAID United States Agency for International Development UTIDP Upazila Towns Infrastructure Development Project
V variation (contract) VRC vulnerability reduction credit (climate change adaptation)
vi
TA-8128 BAN: Preparing Coastal Towns Infrastructure Improvement Project – FR Vol. 4: Infrastructure
WACC weighted average cost of capital WAPDA Water and Power Development Authority WARPO Water Resources Planning Organization WASH water, sanitation and hygiene watsan water and sanitation WB World Bank WFPF Water Financing Partnership Facility (Netherlands Trust Fund) WHO World Health Organization WQ water quality WRM water resources management WS water supply WSP water service provider WSP-EAP Water and Sanitation Program – East Asia Pacific WSS water supply and sanitation WSUP Water and Sanitation for Urban Poor WTP willingness-to-pay WWTP wastewater treatment plant
vii
TA-8128 BAN: Preparing Coastal Towns Infrastructure Improvement Project – FR Vol. 4: Infrastructure
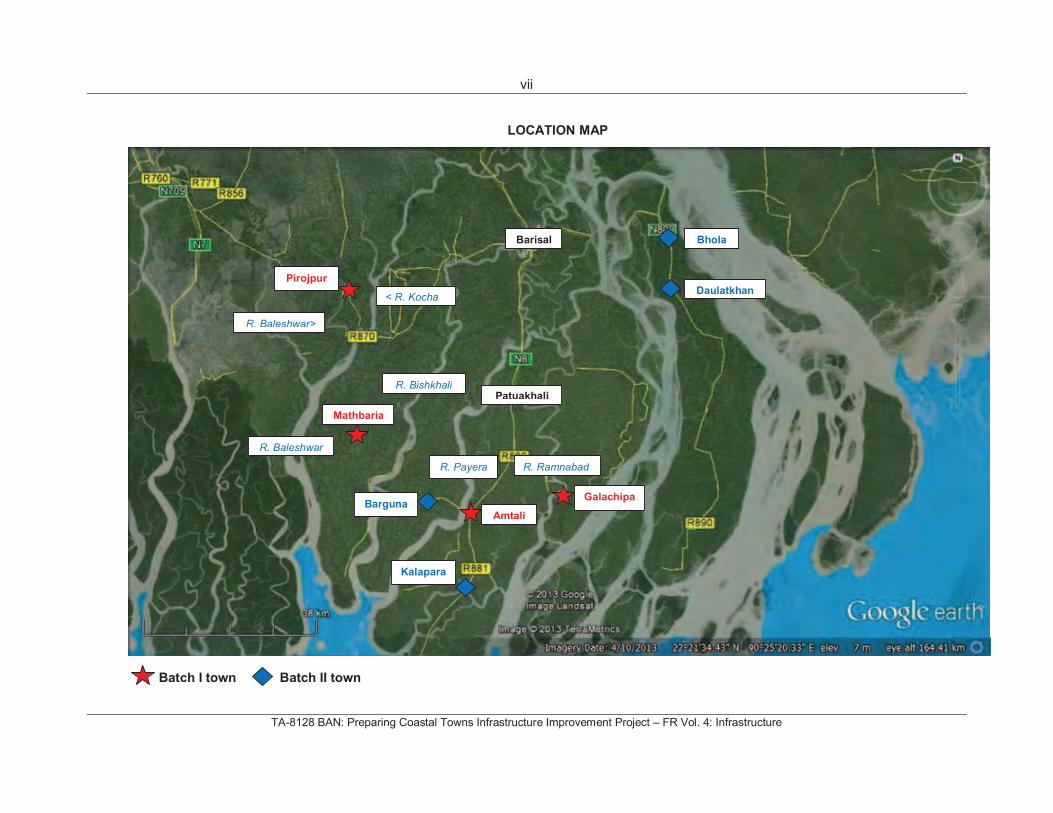
LOCATION MAP
Batch I town Batch II town
Amtali
Galachipa
Pirojpur
Mathbaria
R. Payera R. Ramnabad
R. Baleshwar>
< R. Kocha
R. Baleshwar
R. Bishkhali
Bhola
Daulatkhan
Barguna
Kalapara
Barisal
Patuakhali
1
TA-8128 BAN: Preparing Coastal Towns Infrastructure Improvement Project – FR Vol. 4: Infrastructure
ANNEX A: MUNICIPAL INFRASTRUCTURE DATA
Scoring Matices
Attachment 1: Subprojects with relevant information, Stage 1 (Batch I Pourashavas)
Attachment 2: Unit cost of items/ works for roads
Attachment 3: Maps showing location of subprojects, Stage 1 (Batch I Pourashavas)
Attachment 4: Typical drawings/cross-sections
Attachment 5: Subprojects (probable) for Stage 2 (Batch II Pourashavas)
2
TA-8128 BAN: Preparing Coastal Towns Infrastructure Improvement Project – FR Vol. 4: Infrastructure
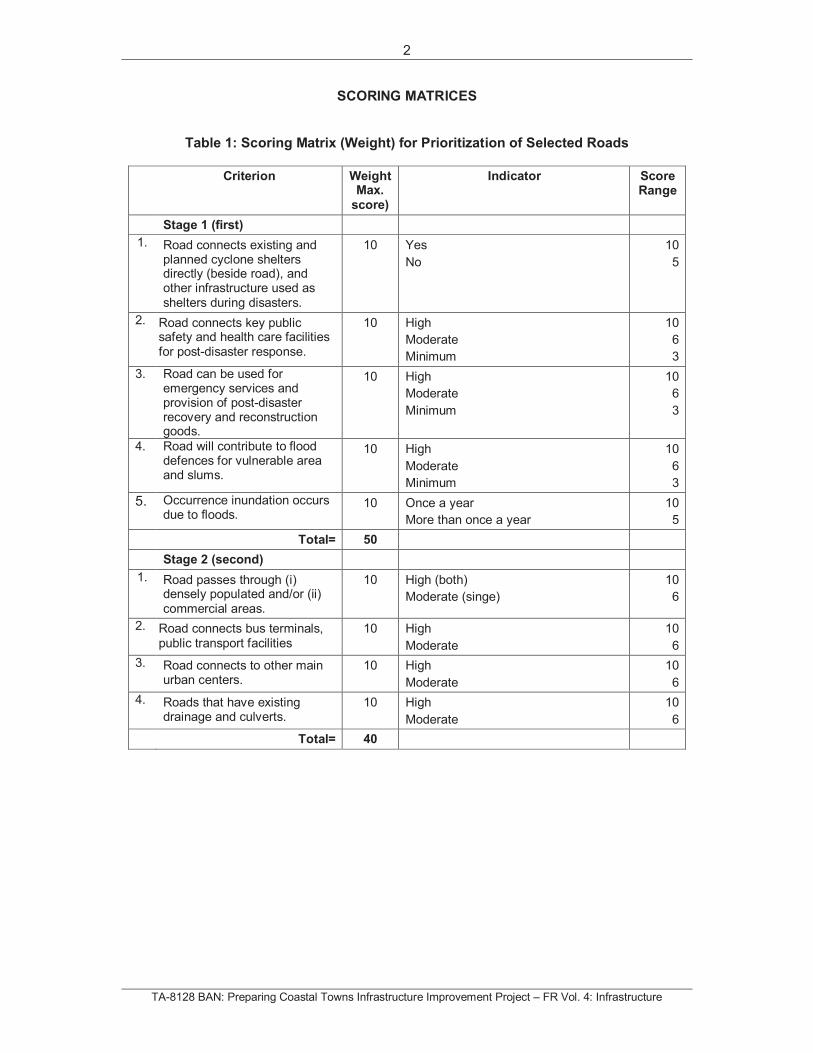
SCORING MATRICES
Table 1: Scoring Matrix (Weight) for Prioritization of Selected Roads
Criterion Weight Max.
score)
Indicator Score Range
Stage 1 (first)
1. Road connects existing and planned cyclone shelters directly (beside road), and other infrastructure used as shelters during disasters.
10 Yes
No
10
5
2. Road connects key public safety and health care facilities for post-disaster response.
10 High
Moderate
Minimum
10
6
3
3. Road can be used for emergency services and provision of post-disaster recovery and reconstruction goods.
10 High
Moderate
Minimum
10
6
3
4. Road will contribute to flood defences for vulnerable area and slums.
10 High
Moderate
Minimum
10
6
3
5. Occurrence inundation occurs due to floods.
10 Once a year
More than once a year
10
5
Total= 50
Stage 2 (second)
1. Road passes through (i) densely populated and/or (ii) commercial areas.
10 High (both)
Moderate (singe)
10
6
2. Road connects bus terminals, public transport facilities
10 High
Moderate
10
6
3. Road connects to other main urban centers.
10 High
Moderate
10
6
4. Roads that have existing drainage and culverts.
10 High
Moderate
10
6
Total= 40
3
TA-8128 BAN: Preparing Coastal Towns Infrastructure Improvement Project – FR Vol. 4: Infrastructure
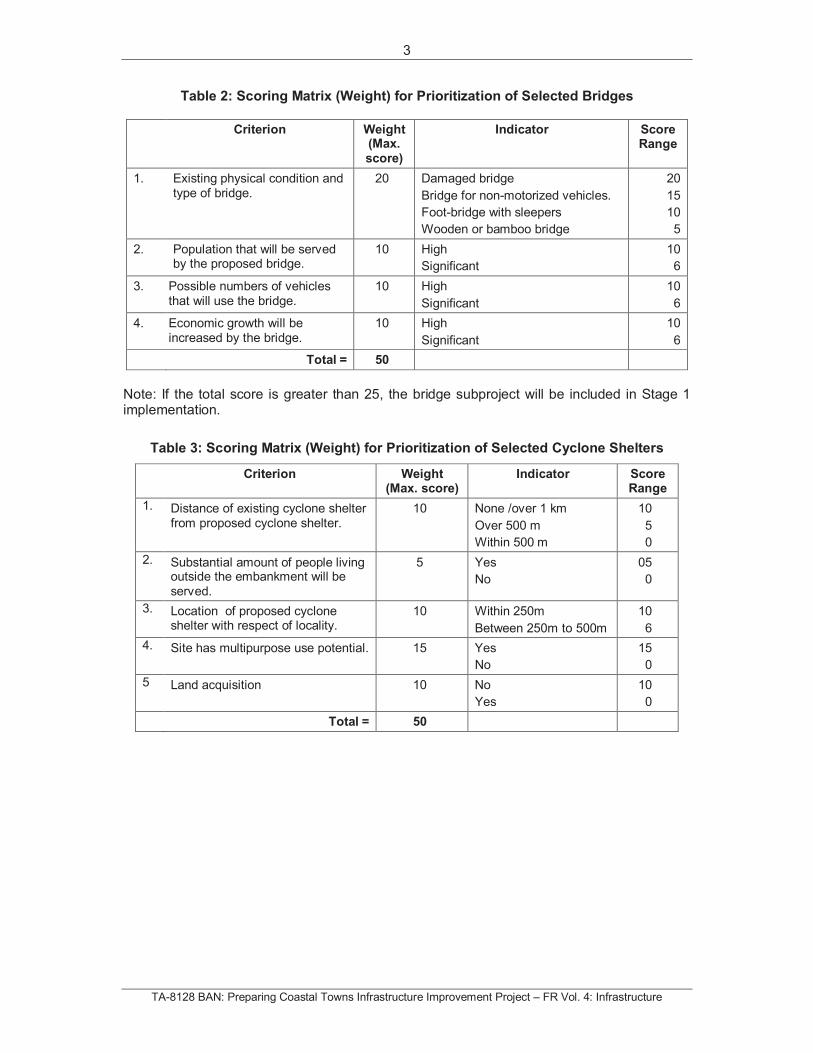
Table 2: Scoring Matrix (Weight) for Prioritization of Selected Bridges
Criterion Weight (Max. score)
Indicator Score Range
1. Existing physical condition and type of bridge.
20 Damaged bridge
Bridge for non-motorized vehicles.
Foot-bridge with sleepers
Wooden or bamboo bridge
20
15
10
5
2. Population that will be served by the proposed bridge.
10 High
Significant
10
6
3. Possible numbers of vehicles that will use the bridge.
10 High
Significant
10
6
4. Economic growth will be increased by the bridge.
10 High
Significant
10
6
Total = 50
Note: If the total score is greater than 25, the bridge subproject will be included in Stage 1 implementation.
Table 3: Scoring Matrix (Weight) for Prioritization of Selected Cyclone Shelters
Criterion Weight (Max. score)
Indicator Score Range
1. Distance of existing cyclone shelter from proposed cyclone shelter.
10 None /over 1 km
Over 500 m
Within 500 m
10
5
0
2. Substantial amount of people living outside the embankment will be served.
5 Yes
No
05
0
3. Location of proposed cyclone shelter with respect of locality.
10 Within 250m
Between 250m to 500m
10
6
4. Site has multipurpose use potential. 15 Yes
No
15
0
5 Land acquisition 10 No
Yes
10
0
Total = 50
4
TA-8128 BAN: Preparing Coastal Towns Infrastructure Improvement Project – FR Vol. 4: Infrastructure
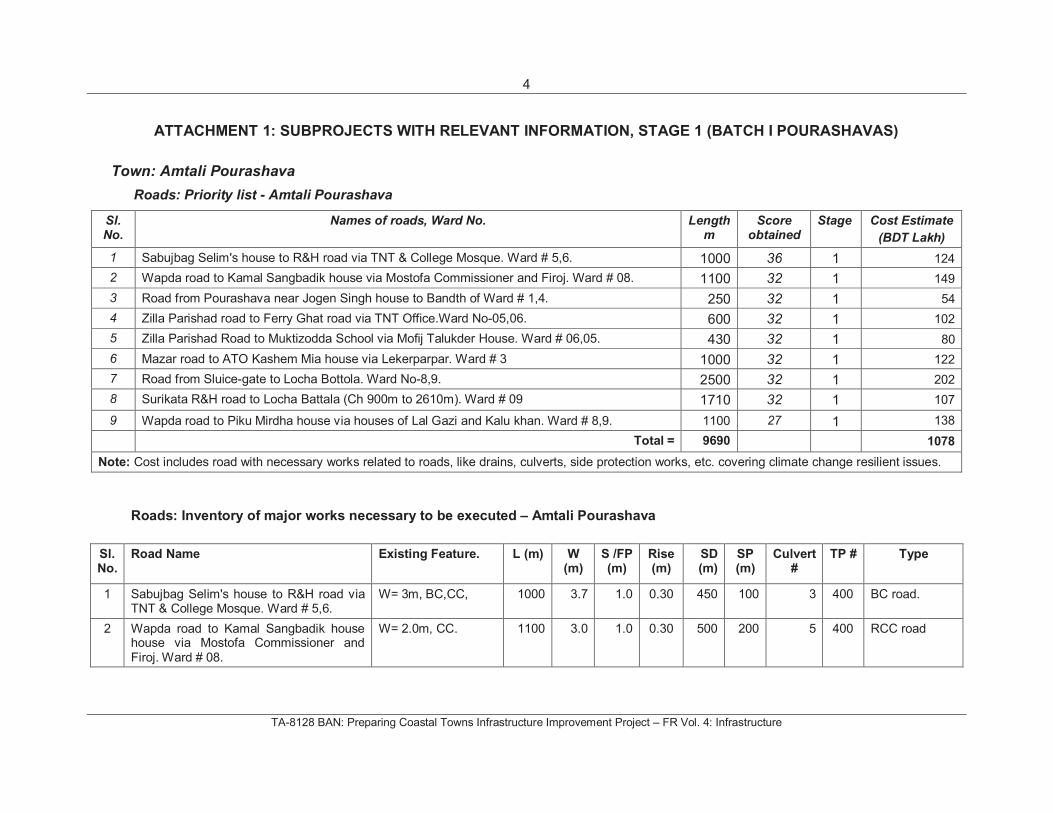
ATTACHMENT 1: SUBPROJECTS WITH RELEVANT INFORMATION, STAGE 1 (BATCH I POURASHAVAS)
Town: Amtali Pourashava
Roads: Priority list - Amtali Pourashava
Sl.No.
Names of roads, Ward No. Length m
Score obtained
Stage Cost Estimate
(BDT Lakh)
1 Sabujbag Selim's house to R&H road via TNT & College Mosque. Ward # 5,6. 1000 36 1 124
2 Wapda road to Kamal Sangbadik house via Mostofa Commissioner and Firoj. Ward # 08. 1100 32 1 149
3 Road from Pourashava near Jogen Singh house to Bandth of Ward # 1,4. 250 32 1 54
4 Zilla Parishad road to Ferry Ghat road via TNT Office.Ward No-05,06. 600 32 1 102
5 Zilla Parishad Road to Muktizodda School via Mofij Talukder House. Ward # 06,05. 430 32 1 80
6 Mazar road to ATO Kashem Mia house via Lekerparpar. Ward # 3 1000 32 1 122
7 Road from Sluice-gate to Locha Bottola. Ward No-8,9. 2500 32 1 202
8 Surikata R&H road to Locha Battala (Ch 900m to 2610m). Ward # 09 1710 32 1 107
9 Wapda road to Piku Mirdha house via houses of Lal Gazi and Kalu khan. Ward # 8,9. 1100 27 1 138
Total = 9690 1078
Note: Cost includes road with necessary works related to roads, like drains, culverts, side protection works, etc. covering climate change resilient issues.
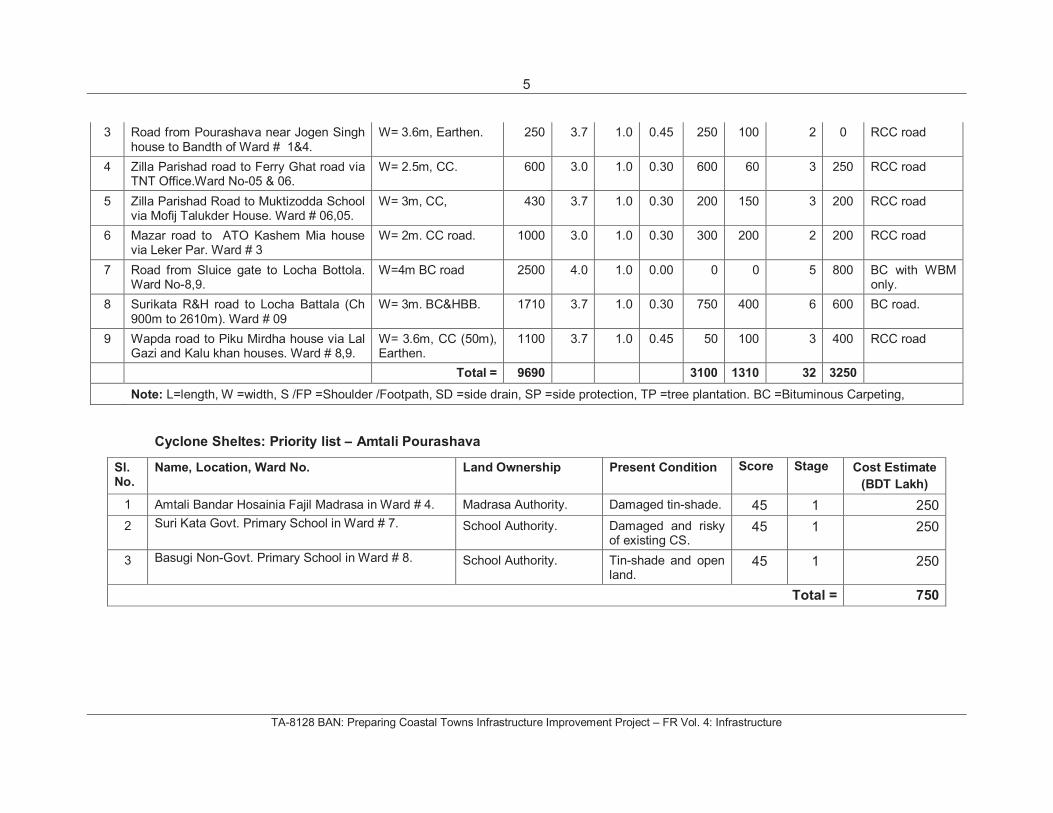
Roads: Inventory of major works necessary to be executed – Amtali Pourashava
Sl.No.
Road Name Existing Feature. L (m) W (m)
S /FP (m)
Rise (m)
SD(m)
SP(m)
Culvert #
TP # Type
1 Sabujbag Selim's house to R&H road via TNT & College Mosque. Ward # 5,6.
W= 3m, BC,CC, 1000 3.7 1.0 0.30 450 100 3 400 BC road.
2 Wapda road to Kamal Sangbadik house house via Mostofa Commissioner and Firoj. Ward # 08.
W= 2.0m, CC. 1100 3.0 1.0 0.30 500 200 5 400 RCC road
5
TA-8128 BAN: Preparing Coastal Towns Infrastructure Improvement Project – FR Vol. 4: Infrastructure
3 Road from Pourashava near Jogen Singh house to Bandth of Ward # 1&4.
W= 3.6m, Earthen. 250 3.7 1.0 0.45 250 100 2 0 RCC road
4 Zilla Parishad road to Ferry Ghat road via TNT Office.Ward No-05 & 06.
W= 2.5m, CC. 600 3.0 1.0 0.30 600 60 3 250 RCC road
5 Zilla Parishad Road to Muktizodda School via Mofij Talukder House. Ward # 06,05.
W= 3m, CC, 430 3.7 1.0 0.30 200 150 3 200 RCC road
6 Mazar road to ATO Kashem Mia house via Leker Par. Ward # 3
W= 2m. CC road. 1000 3.0 1.0 0.30 300 200 2 200 RCC road
7 Road from Sluice gate to Locha Bottola. Ward No-8,9.
W=4m BC road 2500 4.0 1.0 0.00 0 0 5 800 BC with WBM only.
8 Surikata R&H road to Locha Battala (Ch 900m to 2610m). Ward # 09
W= 3m. BC&HBB. 1710 3.7 1.0 0.30 750 400 6 600 BC road.
9 Wapda road to Piku Mirdha house via Lal Gazi and Kalu khan houses. Ward # 8,9.
W= 3.6m, CC (50m), Earthen.
1100 3.7 1.0 0.45 50 100 3 400 RCC road
Total = 9690 3100 1310 32 3250
Note: L=length, W =width, S /FP =Shoulder /Footpath, SD =side drain, SP =side protection, TP =tree plantation. BC =Bituminous Carpeting,
Cyclone Sheltes: Priority list – Amtali Pourashava
Sl.No.
Name, Location, Ward No. Land Ownership Present Condition Score Stage Cost Estimate
(BDT Lakh)
1 Amtali Bandar Hosainia Fajil Madrasa in Ward # 4. Madrasa Authority. Damaged tin-shade. 45 1 250
2 Suri Kata Govt. Primary School in Ward # 7. School Authority. Damaged and risky of existing CS.
45 1 250
3 Basugi Non-Govt. Primary School in Ward # 8. School Authority. Tin-shade and open land.
45 1 250
Total = 750
6
TA-8128 BAN: Preparing Coastal Towns Infrastructure Improvement Project – FR Vol. 4: Infrastructure
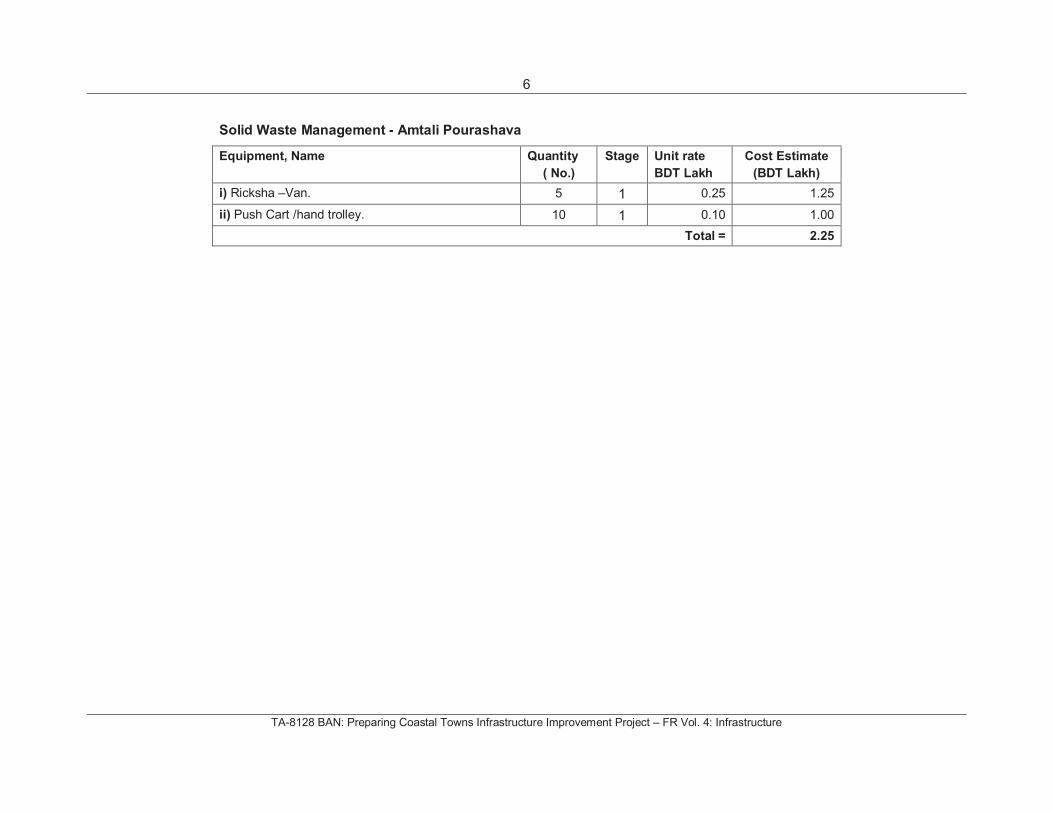
Solid Waste Management - Amtali Pourashava
Equipment, Name Quantity
( No.)
Stage Unit rate
BDT Lakh
Cost Estimate
(BDT Lakh)
i) Ricksha –Van. 5 1 0.25 1.25
ii) Push Cart /hand trolley. 10 1 0.10 1.00
Total = 2.25
7
TA-8128 BAN: Preparing Coastal Towns Infrastructure Improvement Project – FR Vol. 4: Infrastructure
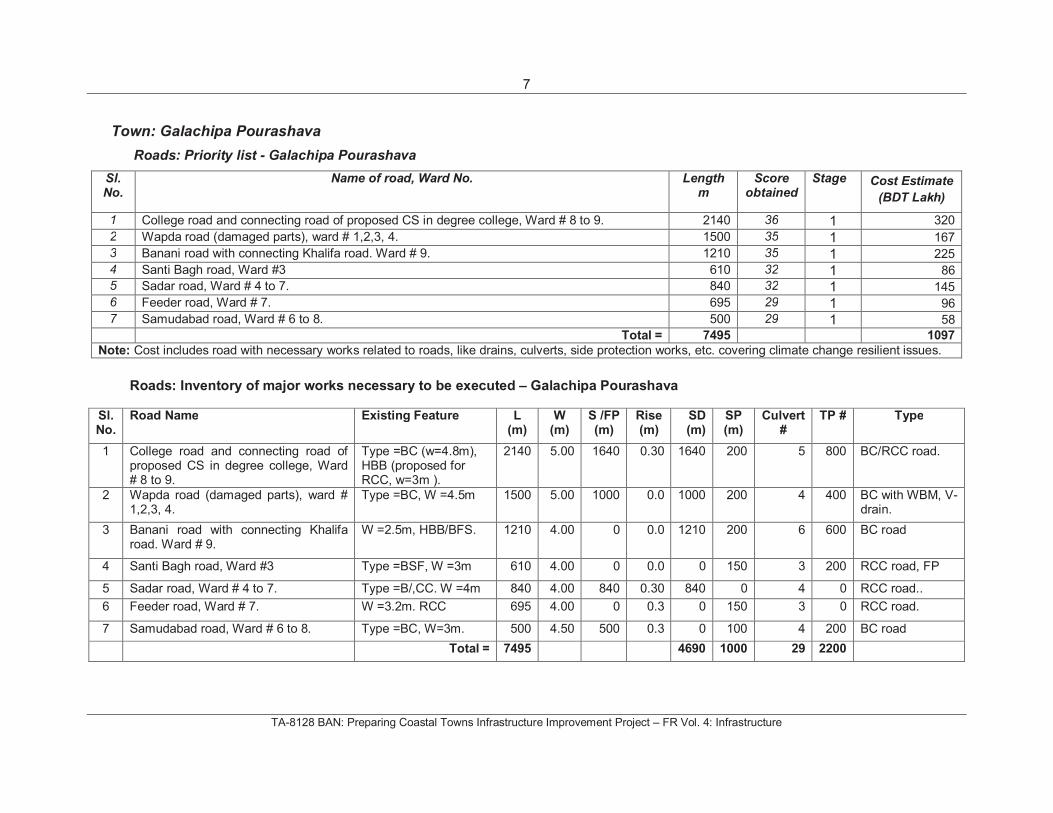
Town: Galachipa Pourashava
Roads: Priority list - Galachipa Pourashava
Sl.No.
Name of road, Ward No. Length m
Score obtained
Stage Cost Estimate
(BDT Lakh)
1 College road and connecting road of proposed CS in degree college, Ward # 8 to 9. 2140 36 1 320
2 Wapda road (damaged parts), ward # 1,2,3, 4. 1500 35 1 167
3 Banani road with connecting Khalifa road. Ward # 9. 1210 35 1 225
4 Santi Bagh road, Ward #3 610 32 1 86
5 Sadar road, Ward # 4 to 7. 840 32 1 145
6 Feeder road, Ward # 7. 695 29 1 96
7 Samudabad road, Ward # 6 to 8. 500 29 1 58
Total = 7495 1097
Note: Cost includes road with necessary works related to roads, like drains, culverts, side protection works, etc. covering climate change resilient issues.
Roads: Inventory of major works necessary to be executed – Galachipa Pourashava
Sl.No.
Road Name Existing Feature L(m)
W(m)
S /FP (m)
Rise (m)
SD(m)
SP(m)
Culvert #
TP # Type
1 College road and connecting road of proposed CS in degree college, Ward # 8 to 9.
Type =BC (w=4.8m), HBB (proposed for RCC, w=3m ).
2140 5.00 1640 0.30 1640 200 5 800 BC/RCC road.
2 Wapda road (damaged parts), ward # 1,2,3, 4.
Type =BC, W =4.5m 1500 5.00 1000 0.0 1000 200 4 400 BC with WBM, V-drain.
3 Banani road with connecting Khalifa road. Ward # 9.
W =2.5m, HBB/BFS. 1210 4.00 0 0.0 1210 200 6 600 BC road
4 Santi Bagh road, Ward #3 Type =BSF, W =3m 610 4.00 0 0.0 0 150 3 200 RCC road, FP
5 Sadar road, Ward # 4 to 7. Type =B/,CC. W =4m 840 4.00 840 0.30 840 0 4 0 RCC road..
6 Feeder road, Ward # 7. W =3.2m. RCC 695 4.00 0 0.3 0 150 3 0 RCC road.
7 Samudabad road, Ward # 6 to 8. Type =BC, W=3m. 500 4.50 500 0.3 0 100 4 200 BC road
Total = 7495 4690 1000 29 2200
8
TA-8128 BAN: Preparing Coastal Towns Infrastructure Improvement Project – FR Vol. 4: Infrastructure
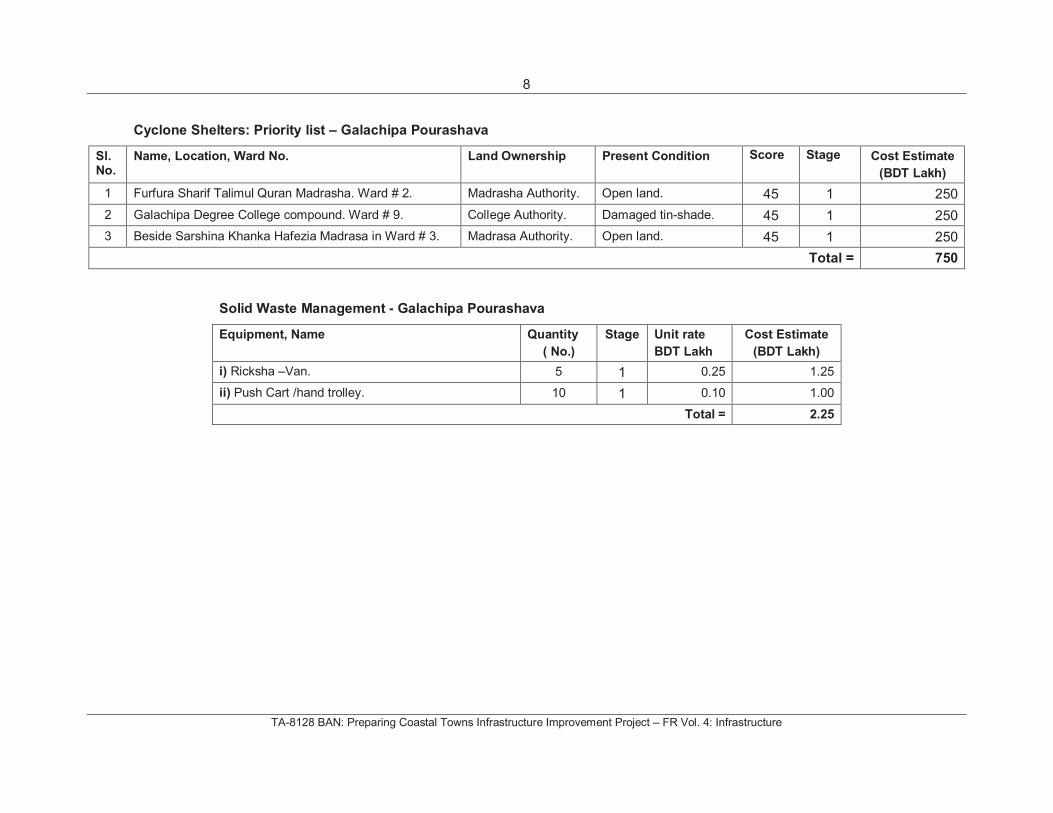
Cyclone Shelters: Priority list – Galachipa Pourashava
Sl.No.
Name, Location, Ward No. Land Ownership Present Condition Score Stage Cost Estimate
(BDT Lakh)
1 Furfura Sharif Talimul Quran Madrasha. Ward # 2. Madrasha Authority. Open land. 45 1 250
2 Galachipa Degree College compound. Ward # 9. College Authority. Damaged tin-shade. 45 1 250
3 Beside Sarshina Khanka Hafezia Madrasa in Ward # 3. Madrasa Authority. Open land. 45 1 250
Total = 750
Solid Waste Management - Galachipa Pourashava
Equipment, Name Quantity
( No.)
Stage Unit rate
BDT Lakh
Cost Estimate
(BDT Lakh)
i) Ricksha –Van. 5 1 0.25 1.25
ii) Push Cart /hand trolley. 10 1 0.10 1.00
Total = 2.25
9
TA-8128 BAN: Preparing Coastal Towns Infrastructure Improvement Project – FR Vol. 4: Infrastructure
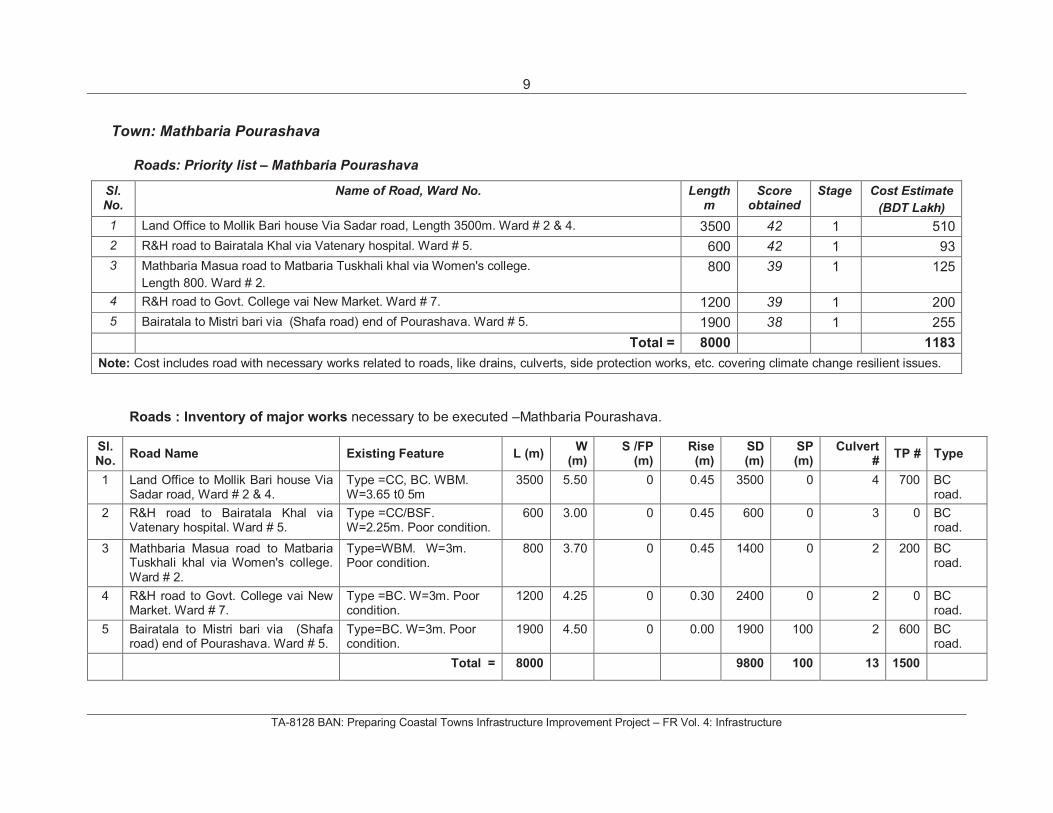
Town: Mathbaria Pourashava
Roads: Priority list – Mathbaria Pourashava
Sl.No.
Name of Road, Ward No. Length m
Score obtained
Stage Cost Estimate
(BDT Lakh)
1 Land Office to Mollik Bari house Via Sadar road, Length 3500m. Ward # 2 & 4. 3500 42 1 510
2 R&H road to Bairatala Khal via Vatenary hospital. Ward # 5. 600 42 1 93
3 Mathbaria Masua road to Matbaria Tuskhali khal via Women's college.
Length 800. Ward # 2.
800 39 1 125
4 R&H road to Govt. College vai New Market. Ward # 7. 1200 39 1 200
5 Bairatala to Mistri bari via (Shafa road) end of Pourashava. Ward # 5. 1900 38 1 255
Total = 8000 1183
Note: Cost includes road with necessary works related to roads, like drains, culverts, side protection works, etc. covering climate change resilient issues.
Roads : Inventory of major works necessary to be executed –Mathbaria Pourashava.
Sl.No.
Road Name Existing Feature L (m)W
(m)S /FP
(m)Rise (m)
SD(m)
SP(m)
Culvert #
TP # Type
1 Land Office to Mollik Bari house Via Sadar road, Ward # 2 & 4.
Type =CC, BC. WBM. W=3.65 t0 5m
3500 5.50 0 0.45 3500 0 4 700 BCroad.
2 R&H road to Bairatala Khal via Vatenary hospital. Ward # 5.
Type =CC/BSF. W=2.25m. Poor condition.
600 3.00 0 0.45 600 0 3 0 BCroad.
3 Mathbaria Masua road to Matbaria Tuskhali khal via Women's college. Ward # 2.
Type=WBM. W=3m. Poor condition.
800 3.70 0 0.45 1400 0 2 200 BCroad.
4 R&H road to Govt. College vai New Market. Ward # 7.
Type =BC. W=3m. Poor condition.
1200 4.25 0 0.30 2400 0 2 0 BCroad.
5 Bairatala to Mistri bari via (Shafa road) end of Pourashava. Ward # 5.
Type=BC. W=3m. Poor condition.
1900 4.50 0 0.00 1900 100 2 600 BCroad.
Total = 8000 9800 100 13 1500
10
TA-8128 BAN: Preparing Coastal Towns Infrastructure Improvement Project – FR Vol. 4: Infrastructure
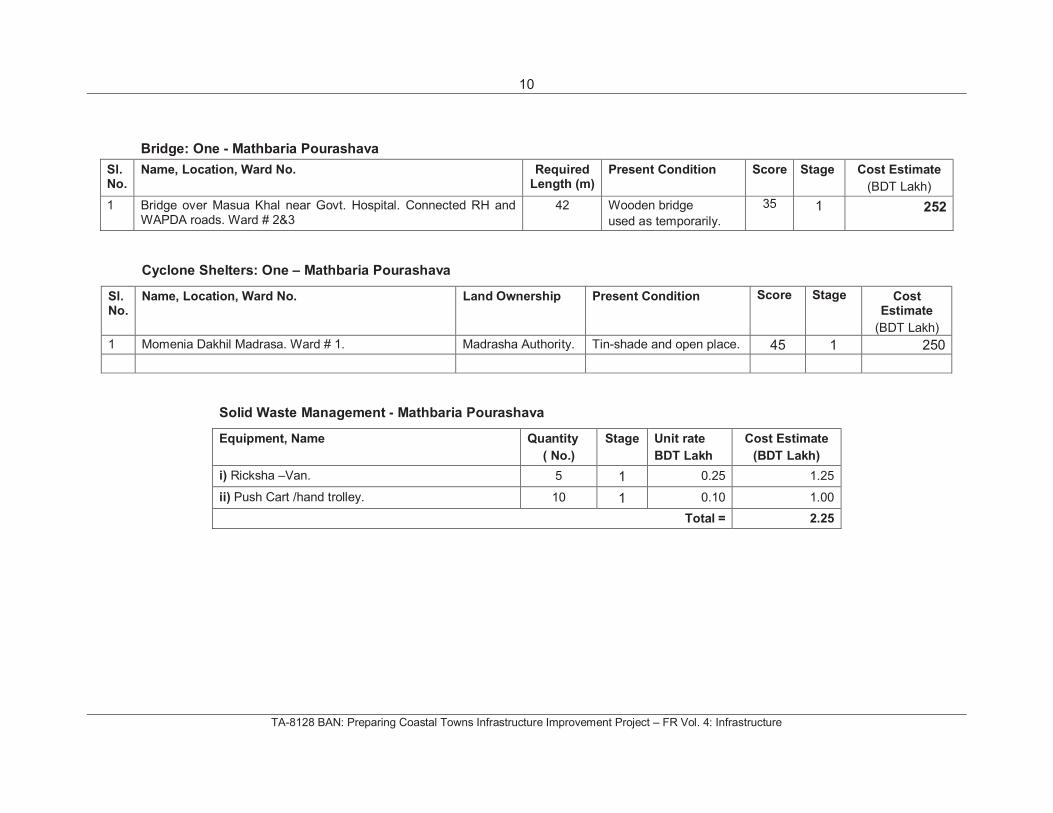
Bridge: One - Mathbaria Pourashava
Sl.No.
Name, Location, Ward No. Required Length (m)
Present Condition Score Stage Cost Estimate
(BDT Lakh)
1 Bridge over Masua Khal near Govt. Hospital. Connected RH and WAPDA roads. Ward # 2&3
42 Wooden bridge
used as temporarily.
35 1 252
Cyclone Shelters: One – Mathbaria Pourashava
Sl.No.
Name, Location, Ward No. Land Ownership Present Condition Score Stage CostEstimate
(BDT Lakh)
1 Momenia Dakhil Madrasa. Ward # 1. Madrasha Authority. Tin-shade and open place. 45 1 250
Solid Waste Management - Mathbaria Pourashava
Equipment, Name Quantity
( No.)
Stage Unit rate
BDT Lakh
Cost Estimate
(BDT Lakh)
i) Ricksha –Van. 5 1 0.25 1.25
ii) Push Cart /hand trolley. 10 1 0.10 1.00
Total = 2.25
11
TA-8128 BAN: Preparing Coastal Towns Infrastructure Improvement Project – FR Vol. 4: Infrastructure
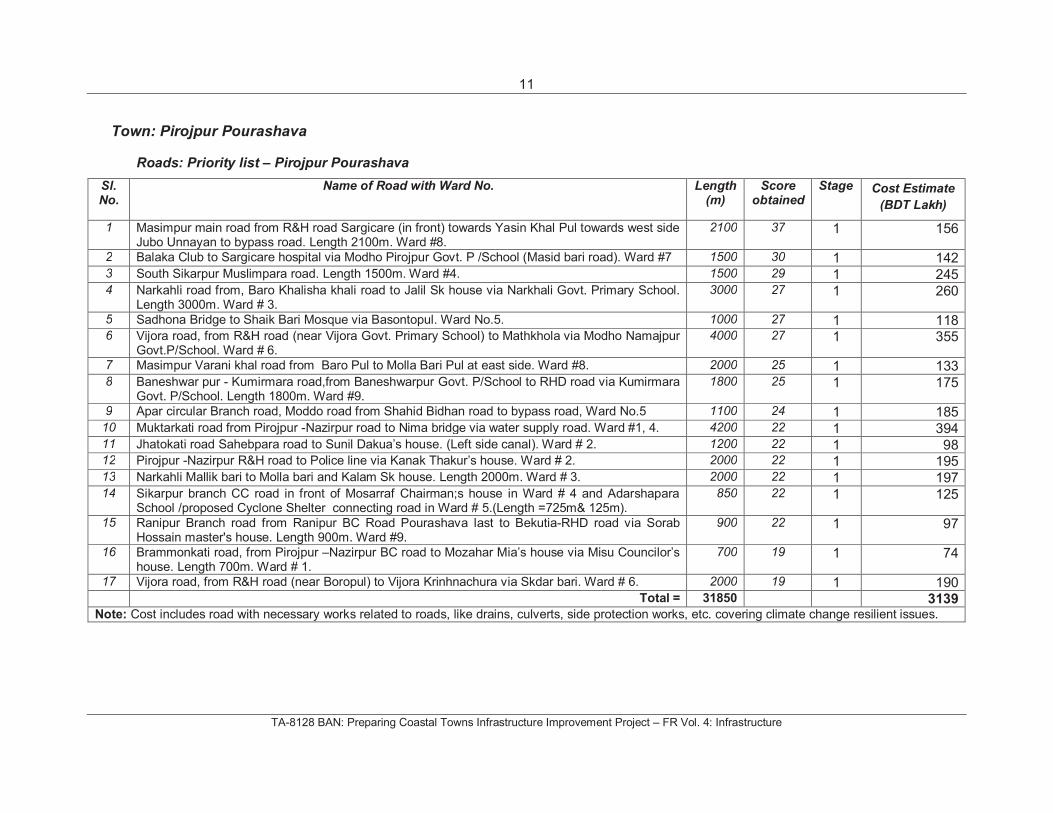
Town: Pirojpur Pourashava
Roads: Priority list – Pirojpur Pourashava
Sl.No.
Name of Road with Ward No. Length (m)
Score obtained
Stage Cost Estimate
(BDT Lakh)
1 Masimpur main road from R&H road Sargicare (in front) towards Yasin Khal Pul towards west side Jubo Unnayan to bypass road. Length 2100m. Ward #8.
2100 37 1 156
2 Balaka Club to Sargicare hospital via Modho Pirojpur Govt. P /School (Masid bari road). Ward #7 1500 30 1 1423 South Sikarpur Muslimpara road. Length 1500m. Ward #4. 1500 29 1 2454 Narkahli road from, Baro Khalisha khali road to Jalil Sk house via Narkhali Govt. Primary School.
Length 3000m. Ward # 3. 3000 27 1 260
5 Sadhona Bridge to Shaik Bari Mosque via Basontopul. Ward No.5. 1000 27 1 1186 Vijora road, from R&H road (near Vijora Govt. Primary School) to Mathkhola via Modho Namajpur
Govt.P/School. Ward # 6. 4000 27 1 355
7 Masimpur Varani khal road from Baro Pul to Molla Bari Pul at east side. Ward #8. 2000 25 1 1338 Baneshwar pur - Kumirmara road,from Baneshwarpur Govt. P/School to RHD road via Kumirmara
Govt. P/School. Length 1800m. Ward #9. 1800 25 1 175
9 Apar circular Branch road, Moddo road from Shahid Bidhan road to bypass road, Ward No.5 1100 24 1 18510 Muktarkati road from Pirojpur -Nazirpur road to Nima bridge via water supply road. Ward #1, 4. 4200 22 1 39411 Jhatokati road Sahebpara road to Sunil Dakua’s house. (Left side canal). Ward # 2. 1200 22 1 9812 Pirojpur -Nazirpur R&H road to Police line via Kanak Thakur’s house. Ward # 2. 2000 22 1 19513 Narkahli Mallik bari to Molla bari and Kalam Sk house. Length 2000m. Ward # 3. 2000 22 1 19714 Sikarpur branch CC road in front of Mosarraf Chairman;s house in Ward # 4 and Adarshapara
School /proposed Cyclone Shelter connecting road in Ward # 5.(Length =725m& 125m). 850 22 1 125
15 Ranipur Branch road from Ranipur BC Road Pourashava last to Bekutia-RHD road via Sorab Hossain master's house. Length 900m. Ward #9.
900 22 1 97
16 Brammonkati road, from Pirojpur –Nazirpur BC road to Mozahar Mia’s house via Misu Councilor’s house. Length 700m. Ward # 1.
700 19 1 74
17 Vijora road, from R&H road (near Boropul) to Vijora Krinhnachura via Skdar bari. Ward # 6. 2000 19 1 190Total = 31850 3139
Note: Cost includes road with necessary works related to roads, like drains, culverts, side protection works, etc. covering climate change resilient issues.
12
TA-8128 BAN: Preparing Coastal Towns Infrastructure Improvement Project – FR Vol. 4: Infrastructure
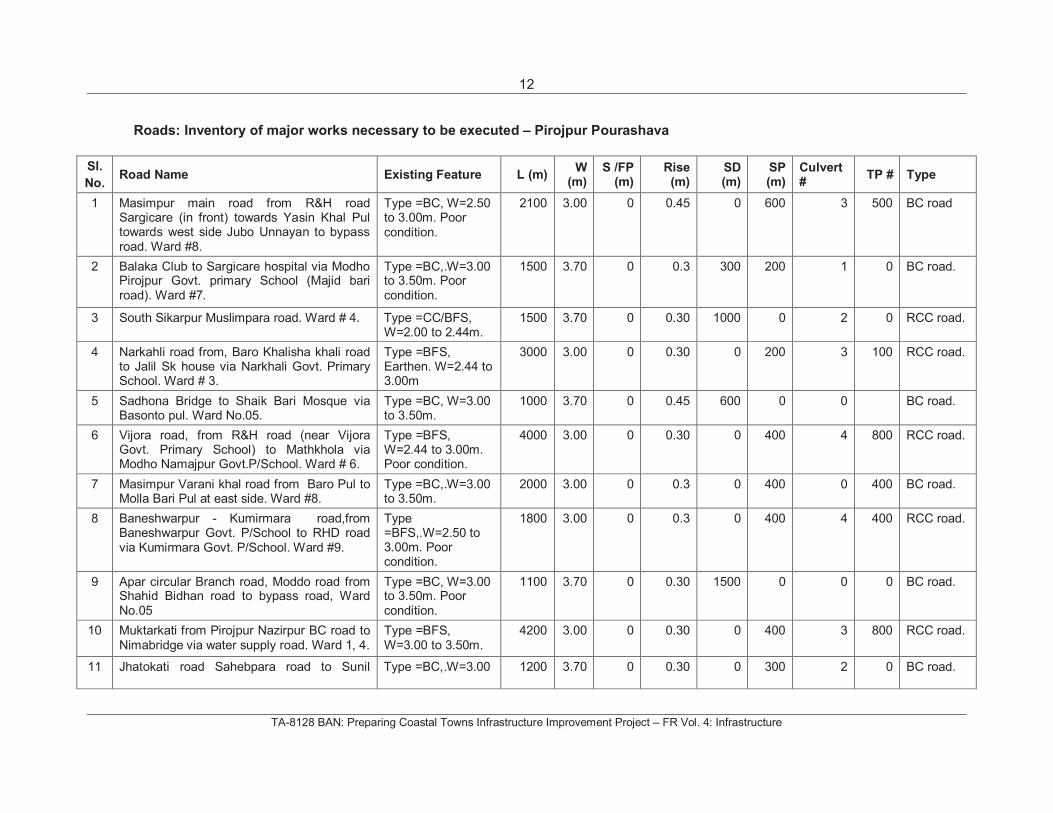
Roads: Inventory of major works necessary to be executed – Pirojpur Pourashava
Sl.
No. Road Name Existing Feature L (m)
W(m)
S /FP (m)
Rise (m)
SD(m)
SP(m)
Culvert #
TP # Type
1 Masimpur main road from R&H road Sargicare (in front) towards Yasin Khal Pul towards west side Jubo Unnayan to bypass road. Ward #8.
Type =BC, W=2.50 to 3.00m. Poor condition.
2100 3.00 0 0.45 0 600 3 500 BC road
2 Balaka Club to Sargicare hospital via Modho Pirojpur Govt. primary School (Majid bari road). Ward #7.
Type =BC,.W=3.00 to 3.50m. Poor condition.
1500 3.70 0 0.3 300 200 1 0 BC road.
3 South Sikarpur Muslimpara road. Ward # 4. Type =CC/BFS, W=2.00 to 2.44m.
1500 3.70 0 0.30 1000 0 2 0 RCC road.
4 Narkahli road from, Baro Khalisha khali road to Jalil Sk house via Narkhali Govt. Primary School. Ward # 3.
Type =BFS, Earthen. W=2.44 to 3.00m
3000 3.00 0 0.30 0 200 3 100 RCC road.
5 Sadhona Bridge to Shaik Bari Mosque via Basonto pul. Ward No.05.
Type =BC, W=3.00 to 3.50m.
1000 3.70 0 0.45 600 0 0 BC road.
6 Vijora road, from R&H road (near Vijora Govt. Primary School) to Mathkhola via Modho Namajpur Govt.P/School. Ward # 6.
Type =BFS, W=2.44 to 3.00m. Poor condition.
4000 3.00 0 0.30 0 400 4 800 RCC road.
7 Masimpur Varani khal road from Baro Pul to Molla Bari Pul at east side. Ward #8.
Type =BC,.W=3.00 to 3.50m.
2000 3.00 0 0.3 0 400 0 400 BC road.
8 Baneshwarpur - Kumirmara road,from Baneshwarpur Govt. P/School to RHD road via Kumirmara Govt. P/School. Ward #9.
Type =BFS,.W=2.50 to 3.00m. Poor condition.
1800 3.00 0 0.3 0 400 4 400 RCC road.
9 Apar circular Branch road, Moddo road from Shahid Bidhan road to bypass road, Ward No.05
Type =BC, W=3.00 to 3.50m. Poor condition.
1100 3.70 0 0.30 1500 0 0 0 BC road.
10 Muktarkati from Pirojpur Nazirpur BC road to Nimabridge via water supply road. Ward 1, 4.
Type =BFS, W=3.00 to 3.50m.
4200 3.00 0 0.30 0 400 3 800 RCC road.
11 Jhatokati road Sahebpara road to Sunil Type =BC,.W=3.00 1200 3.70 0 0.30 0 300 2 0 BC road.
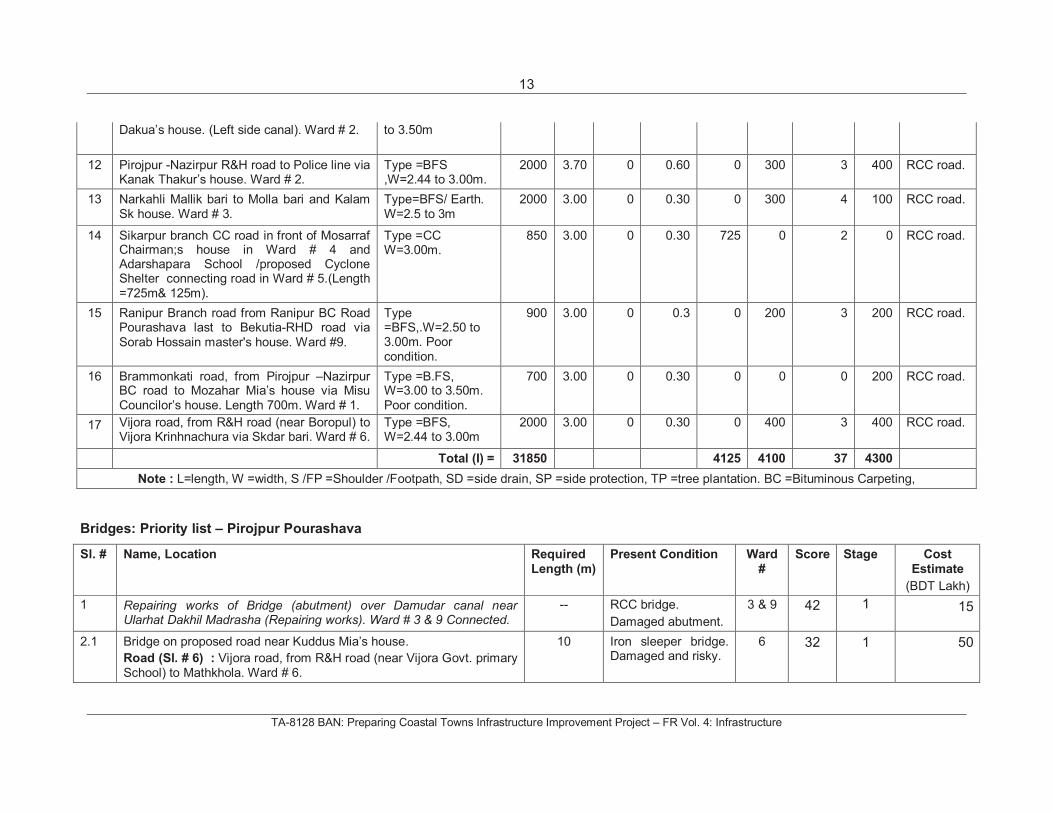
13
TA-8128 BAN: Preparing Coastal Towns Infrastructure Improvement Project – FR Vol. 4: Infrastructure
Dakua’s house. (Left side canal). Ward # 2. to 3.50m
12 Pirojpur -Nazirpur R&H road to Police line via Kanak Thakur’s house. Ward # 2.
Type =BFS ,W=2.44 to 3.00m.
2000 3.70 0 0.60 0 300 3 400 RCC road.
13 Narkahli Mallik bari to Molla bari and Kalam Sk house. Ward # 3.
Type=BFS/ Earth. W=2.5 to 3m
2000 3.00 0 0.30 0 300 4 100 RCC road.
14 Sikarpur branch CC road in front of Mosarraf Chairman;s house in Ward # 4 and Adarshapara School /proposed Cyclone Shelter connecting road in Ward # 5.(Length =725m& 125m).
Type =CC W=3.00m.
850 3.00 0 0.30 725 0 2 0 RCC road.
15 Ranipur Branch road from Ranipur BC Road Pourashava last to Bekutia-RHD road via Sorab Hossain master's house. Ward #9.
Type =BFS,.W=2.50 to 3.00m. Poor condition.
900 3.00 0 0.3 0 200 3 200 RCC road.
16 Brammonkati road, from Pirojpur –Nazirpur BC road to Mozahar Mia’s house via Misu Councilor’s house. Length 700m. Ward # 1.
Type =B.FS, W=3.00 to 3.50m. Poor condition.
700 3.00 0 0.30 0 0 0 200 RCC road.
17 Vijora road, from R&H road (near Boropul) to Vijora Krinhnachura via Skdar bari. Ward # 6.
Type =BFS, W=2.44 to 3.00m
2000 3.00 0 0.30 0 400 3 400 RCC road.
Total (I) = 31850 4125 4100 37 4300
Note : L=length, W =width, S /FP =Shoulder /Footpath, SD =side drain, SP =side protection, TP =tree plantation. BC =Bituminous Carpeting,
Bridges: Priority list – Pirojpur Pourashava
Sl. # Name, Location Required Length (m)
Present Condition Ward#
Score Stage CostEstimate
(BDT Lakh)
1 Repairing works of Bridge (abutment) over Damudar canal near Ularhat Dakhil Madrasha (Repairing works). Ward # 3 & 9 Connected.
-- RCC bridge.
Damaged abutment.
3 & 9 42 1 15
2.1 Bridge on proposed road near Kuddus Mia’s house.
Road (Sl. # 6) : Vijora road, from R&H road (near Vijora Govt. primary School) to Mathkhola. Ward # 6.
10 Iron sleeper bridge. Damaged and risky.
6 32 1 50
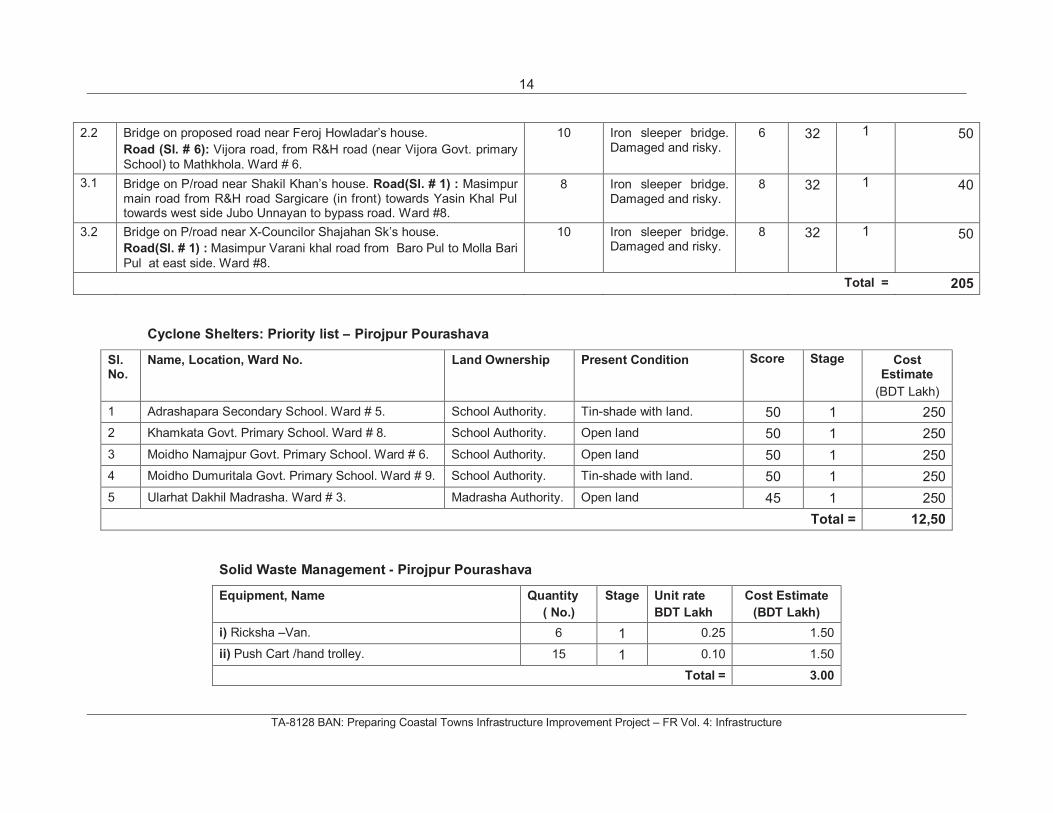
14
TA-8128 BAN: Preparing Coastal Towns Infrastructure Improvement Project – FR Vol. 4: Infrastructure
2.2 Bridge on proposed road near Feroj Howladar’s house.
Road (Sl. # 6): Vijora road, from R&H road (near Vijora Govt. primary
School) to Mathkhola. Ward # 6.
10 Iron sleeper bridge. Damaged and risky.
6 32 1 50
3.1 Bridge on P/road near Shakil Khan’s house. Road(Sl. # 1) : Masimpur main road from R&H road Sargicare (in front) towards Yasin Khal Pul towards west side Jubo Unnayan to bypass road. Ward #8.
8 Iron sleeper bridge. Damaged and risky.
8 32 1 40
3.2 Bridge on P/road near X-Councilor Shajahan Sk’s house.
Road(Sl. # 1) : Masimpur Varani khal road from Baro Pul to Molla Bari
Pul at east side. Ward #8.
10 Iron sleeper bridge. Damaged and risky.
8 32 1 50
Total = 205
Cyclone Shelters: Priority list – Pirojpur Pourashava
Sl.No.
Name, Location, Ward No. Land Ownership Present Condition Score Stage CostEstimate
(BDT Lakh)
1 Adrashapara Secondary School. Ward # 5. School Authority. Tin-shade with land. 50 1 250
2 Khamkata Govt. Primary School. Ward # 8. School Authority. Open land 50 1 250
3 Moidho Namajpur Govt. Primary School. Ward # 6. School Authority. Open land 50 1 250
4 Moidho Dumuritala Govt. Primary School. Ward # 9. School Authority. Tin-shade with land. 50 1 250
5 Ularhat Dakhil Madrasha. Ward # 3. Madrasha Authority. Open land 45 1 250
Total = 12,50
Solid Waste Management - Pirojpur Pourashava
Equipment, Name Quantity
( No.)
Stage Unit rate
BDT Lakh
Cost Estimate
(BDT Lakh)
i) Ricksha –Van. 6 1 0.25 1.50
ii) Push Cart /hand trolley. 15 1 0.10 1.50
Total = 3.00
15
TA-8128 BAN: Preparing Coastal Towns Infrastructure Improvement Project – FR Vol. 4: Infrastructure
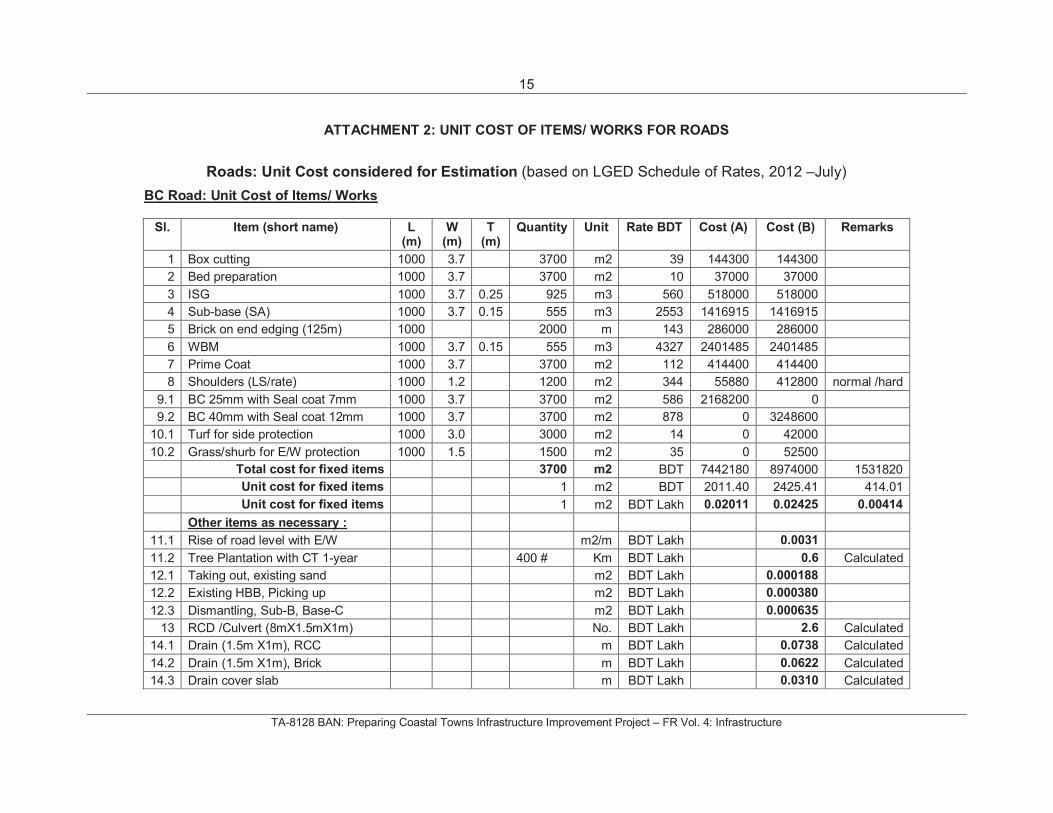
ATTACHMENT 2: UNIT COST OF ITEMS/ WORKS FOR ROADS
Roads: Unit Cost considered for Estimation (based on LGED Schedule of Rates, 2012 –July)
BC Road: Unit Cost of Items/ Works
Sl. Item (short name) L(m)
W(m)
T(m)
Quantity Unit Rate BDT Cost (A) Cost (B) Remarks
1 Box cutting 1000 3.7 3700 m2 39 144300 144300
2 Bed preparation 1000 3.7 3700 m2 10 37000 37000
3 ISG 1000 3.7 0.25 925 m3 560 518000 518000
4 Sub-base (SA) 1000 3.7 0.15 555 m3 2553 1416915 1416915
5 Brick on end edging (125m) 1000 2000 m 143 286000 286000
6 WBM 1000 3.7 0.15 555 m3 4327 2401485 2401485
7 Prime Coat 1000 3.7 3700 m2 112 414400 414400
8 Shoulders (LS/rate) 1000 1.2 1200 m2 344 55880 412800 normal /hard
9.1 BC 25mm with Seal coat 7mm 1000 3.7 3700 m2 586 2168200 0
9.2 BC 40mm with Seal coat 12mm 1000 3.7 3700 m2 878 0 3248600
10.1 Turf for side protection 1000 3.0 3000 m2 14 0 42000
10.2 Grass/shurb for E/W protection 1000 1.5 1500 m2 35 0 52500
Total cost for fixed items 3700 m2 BDT 7442180 8974000 1531820
Unit cost for fixed items 1 m2 BDT 2011.40 2425.41 414.01
Unit cost for fixed items 1 m2 BDT Lakh 0.02011 0.02425 0.00414
Other items as necessary :
11.1 Rise of road level with E/W m2/m BDT Lakh 0.0031
11.2 Tree Plantation with CT 1-year 400 # Km BDT Lakh 0.6 Calculated
12.1 Taking out, existing sand m2 BDT Lakh 0.000188
12.2 Existing HBB, Picking up m2 BDT Lakh 0.000380
12.3 Dismantling, Sub-B, Base-C m2 BDT Lakh 0.000635
13 RCD /Culvert (8mX1.5mX1m) No. BDT Lakh 2.6 Calculated
14.1 Drain (1.5m X1m), RCC m BDT Lakh 0.0738 Calculated
14.2 Drain (1.5m X1m), Brick m BDT Lakh 0.0622 Calculated
14.3 Drain cover slab m BDT Lakh 0.0310 Calculated
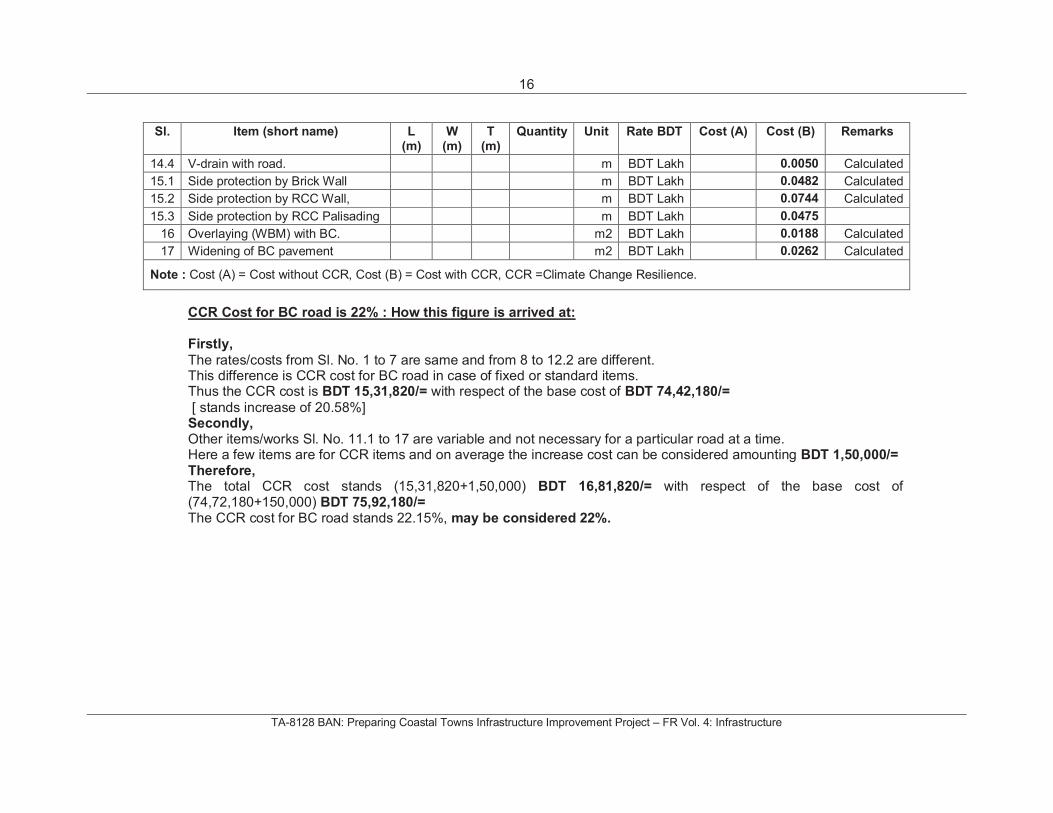
16
TA-8128 BAN: Preparing Coastal Towns Infrastructure Improvement Project – FR Vol. 4: Infrastructure
Sl. Item (short name) L(m)
W(m)
T(m)
Quantity Unit Rate BDT Cost (A) Cost (B) Remarks
14.4 V-drain with road. m BDT Lakh 0.0050 Calculated
15.1 Side protection by Brick Wall m BDT Lakh 0.0482 Calculated
15.2 Side protection by RCC Wall, m BDT Lakh 0.0744 Calculated
15.3 Side protection by RCC Palisading m BDT Lakh 0.0475
16 Overlaying (WBM) with BC. m2 BDT Lakh 0.0188 Calculated
17 Widening of BC pavement m2 BDT Lakh 0.0262 Calculated
Note : Cost (A) = Cost without CCR, Cost (B) = Cost with CCR, CCR =Climate Change Resilience.
CCR Cost for BC road is 22% : How this figure is arrived at:
Firstly,
The rates/costs from Sl. No. 1 to 7 are same and from 8 to 12.2 are different.This difference is CCR cost for BC road in case of fixed or standard items. Thus the CCR cost is BDT 15,31,820/= with respect of the base cost of BDT 74,42,180/=
[ stands increase of 20.58%] Secondly, Other items/works Sl. No. 11.1 to 17 are variable and not necessary for a particular road at a time. Here a few items are for CCR items and on average the increase cost can be considered amounting BDT 1,50,000/=Therefore, The total CCR cost stands (15,31,820+1,50,000) BDT 16,81,820/= with respect of the base cost of (74,72,180+150,000) BDT 75,92,180/= The CCR cost for BC road stands 22.15%, may be considered 22%.
17
TA-8128 BAN: Preparing Coastal Towns Infrastructure Improvement Project – FR Vol. 4: Infrastructure
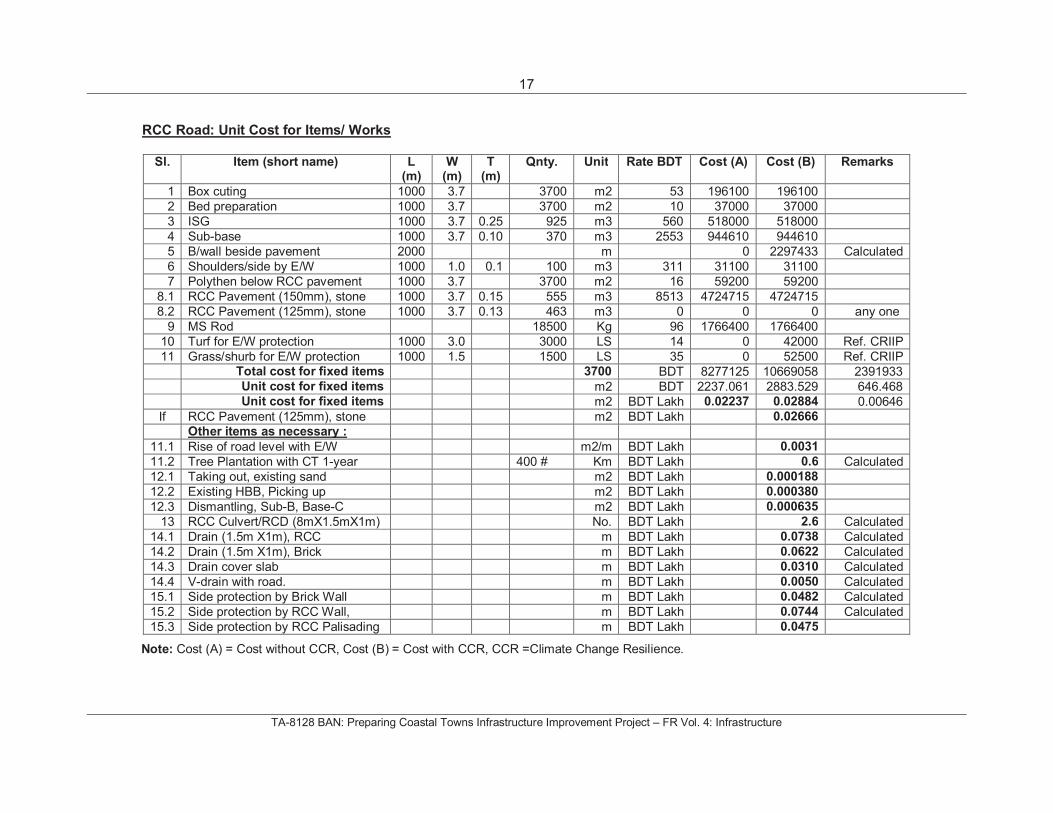
RCC Road: Unit Cost for Items/ Works
Sl. Item (short name) L(m)
W(m)
T(m)
Qnty. Unit Rate BDT Cost (A) Cost (B) Remarks
1 Box cuting 1000 3.7 3700 m2 53 196100 196100
2 Bed preparation 1000 3.7 3700 m2 10 37000 37000
3 ISG 1000 3.7 0.25 925 m3 560 518000 518000
4 Sub-base 1000 3.7 0.10 370 m3 2553 944610 944610
5 B/wall beside pavement 2000 m 0 2297433 Calculated
6 Shoulders/side by E/W 1000 1.0 0.1 100 m3 311 31100 31100
7 Polythen below RCC pavement 1000 3.7 3700 m2 16 59200 59200
8.1 RCC Pavement (150mm), stone 1000 3.7 0.15 555 m3 8513 4724715 4724715
8.2 RCC Pavement (125mm), stone 1000 3.7 0.13 463 m3 0 0 0 any one
9 MS Rod 18500 Kg 96 1766400 1766400
10 Turf for E/W protection 1000 3.0 3000 LS 14 0 42000 Ref. CRIIP
11 Grass/shurb for E/W protection 1000 1.5 1500 LS 35 0 52500 Ref. CRIIPTotal cost for fixed items 3700 BDT 8277125 10669058 2391933Unit cost for fixed items m2 BDT 2237.061 2883.529 646.468Unit cost for fixed items m2 BDT Lakh 0.02237 0.02884 0.00646
If RCC Pavement (125mm), stone m2 BDT Lakh 0.02666
Other items as necessary :
11.1 Rise of road level with E/W m2/m BDT Lakh 0.0031
11.2 Tree Plantation with CT 1-year 400 # Km BDT Lakh 0.6 Calculated
12.1 Taking out, existing sand m2 BDT Lakh 0.000188
12.2 Existing HBB, Picking up m2 BDT Lakh 0.000380
12.3 Dismantling, Sub-B, Base-C m2 BDT Lakh 0.000635
13 RCC Culvert/RCD (8mX1.5mX1m) No. BDT Lakh 2.6 Calculated
14.1 Drain (1.5m X1m), RCC m BDT Lakh 0.0738 Calculated
14.2 Drain (1.5m X1m), Brick m BDT Lakh 0.0622 Calculated
14.3 Drain cover slab m BDT Lakh 0.0310 Calculated
14.4 V-drain with road. m BDT Lakh 0.0050 Calculated
15.1 Side protection by Brick Wall m BDT Lakh 0.0482 Calculated
15.2 Side protection by RCC Wall, m BDT Lakh 0.0744 Calculated
15.3 Side protection by RCC Palisading m BDT Lakh 0.0475
Note: Cost (A) = Cost without CCR, Cost (B) = Cost with CCR, CCR =Climate Change Resilience.
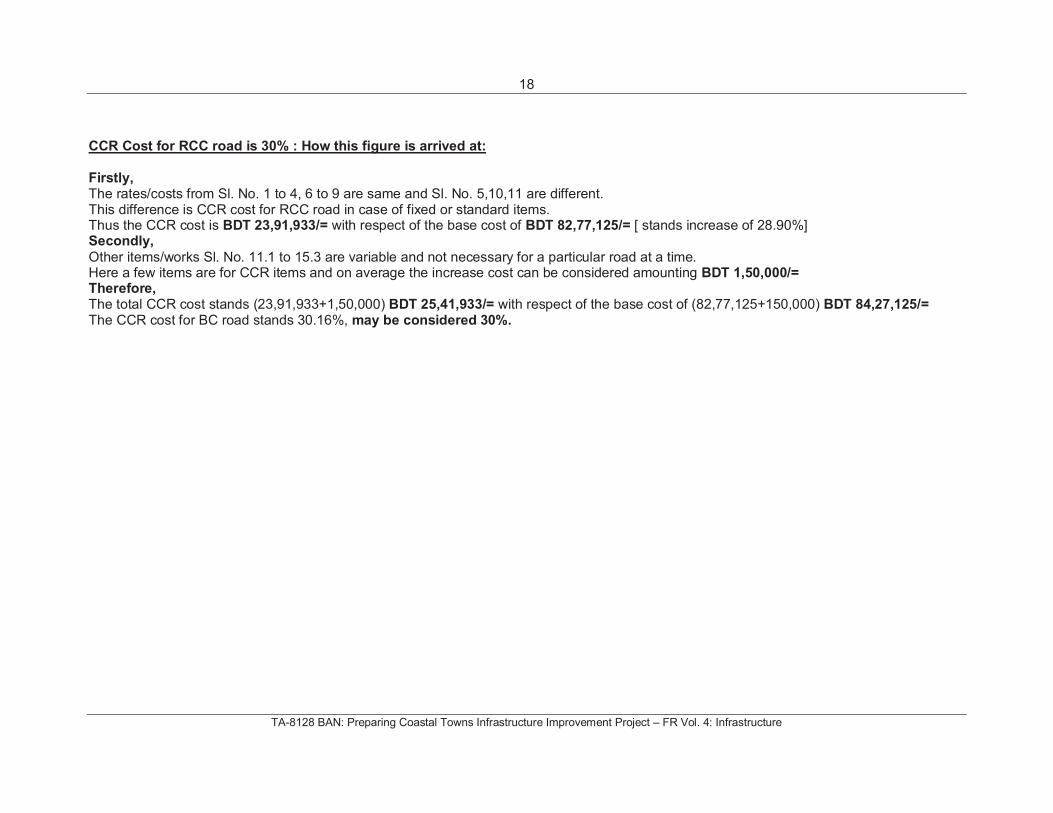
18
TA-8128 BAN: Preparing Coastal Towns Infrastructure Improvement Project – FR Vol. 4: Infrastructure
CCR Cost for RCC road is 30% : How this figure is arrived at:
Firstly, The rates/costs from Sl. No. 1 to 4, 6 to 9 are same and Sl. No. 5,10,11 are different.This difference is CCR cost for RCC road in case of fixed or standard items. Thus the CCR cost is BDT 23,91,933/= with respect of the base cost of BDT 82,77,125/= [ stands increase of 28.90%] Secondly,
Other items/works Sl. No. 11.1 to 15.3 are variable and not necessary for a particular road at a time. Here a few items are for CCR items and on average the increase cost can be considered amounting BDT 1,50,000/=Therefore, The total CCR cost stands (23,91,933+1,50,000) BDT 25,41,933/= with respect of the base cost of (82,77,125+150,000) BDT 84,27,125/= The CCR cost for BC road stands 30.16%, may be considered 30%.

19
TA-8128 BAN: Preparing Coastal Towns Infrastructure Improvement Project – FR Vol. 4: Infrastructure
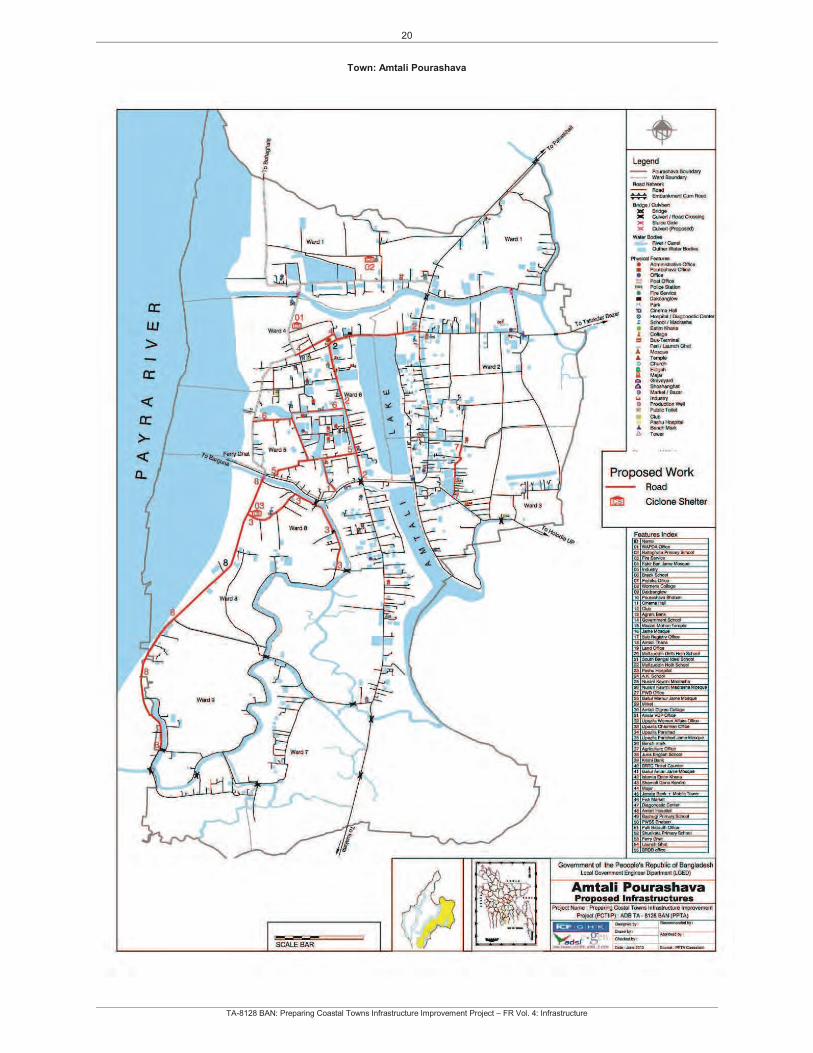
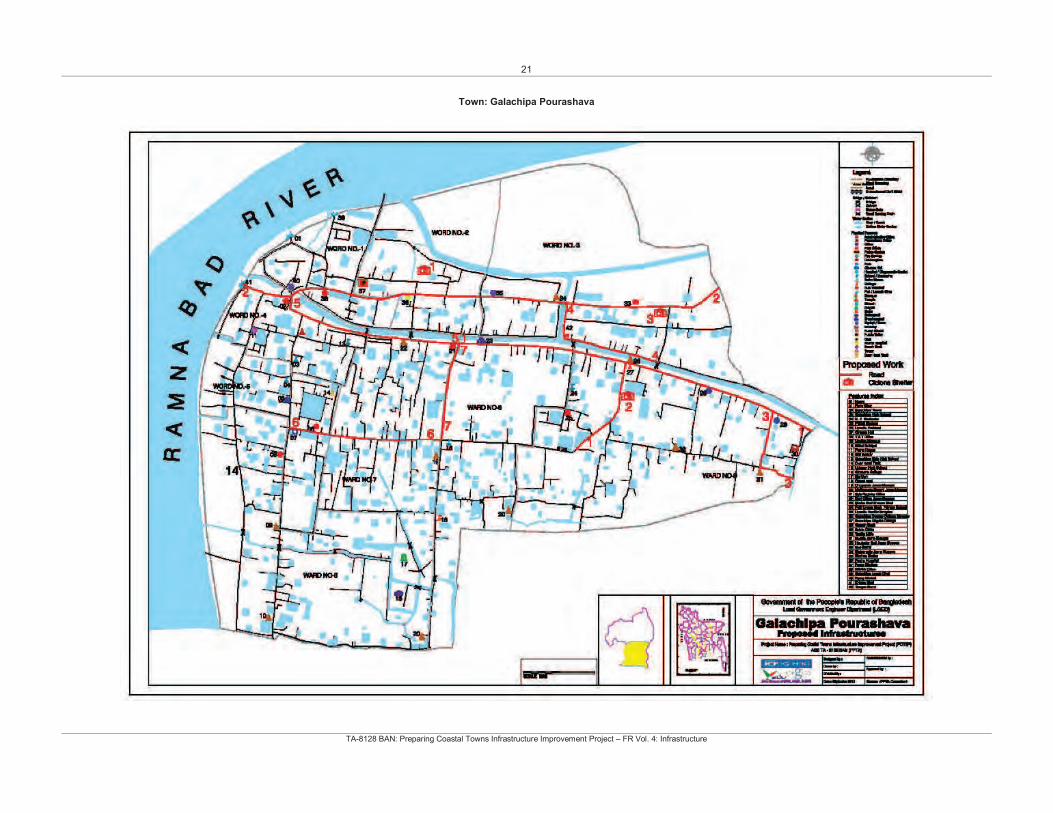
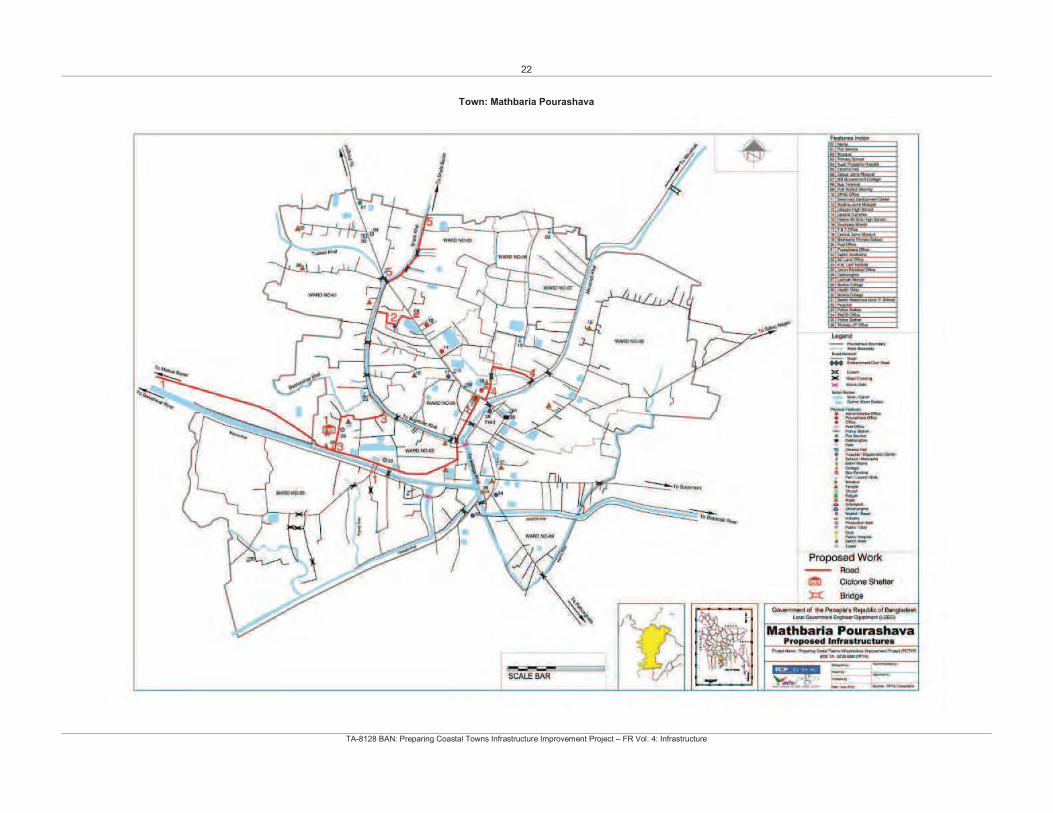
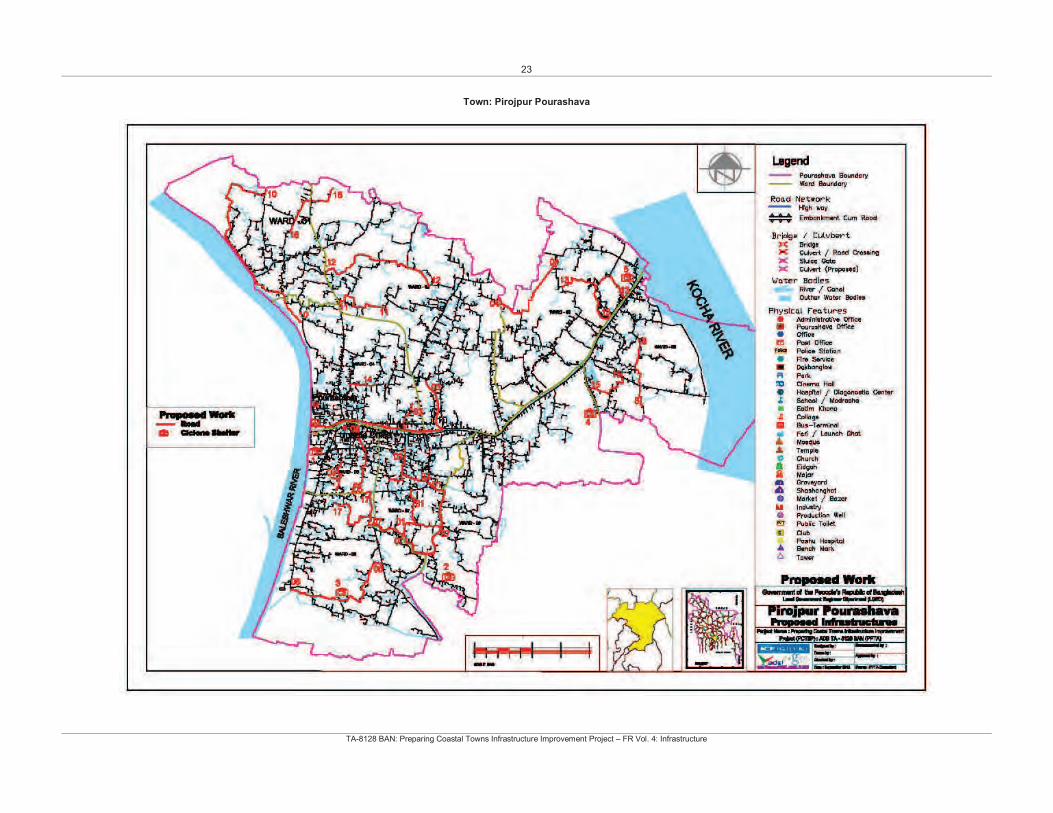
ATTACHMENT 3: MAPS SHOWING LOCATION OF SUBPROJECTS, STAGE 1 (BATCH I POURASHAVAS)
20
TA-8128 BAN: Preparing Coastal Towns Infrastructure Improvement Project – FR Vol. 4: Infrastructure
Town: Amtali Pourashava
21
TA-8128 BAN: Preparing Coastal Towns Infrastructure Improvement Project – FR Vol. 4: Infrastructure
Town: Galachipa Pourashava
22
TA-8128 BAN: Preparing Coastal Towns Infrastructure Improvement Project – FR Vol. 4: Infrastructure
Town: Mathbaria Pourashava
23
TA-8128 BAN: Preparing Coastal Towns Infrastructure Improvement Project – FR Vol. 4: Infrastructure
Town: Pirojpur Pourashava
24
TA-8128 BAN: Preparing Coastal Towns Infrastructure Improvement Project – FR Vol. 4: Infrastructure
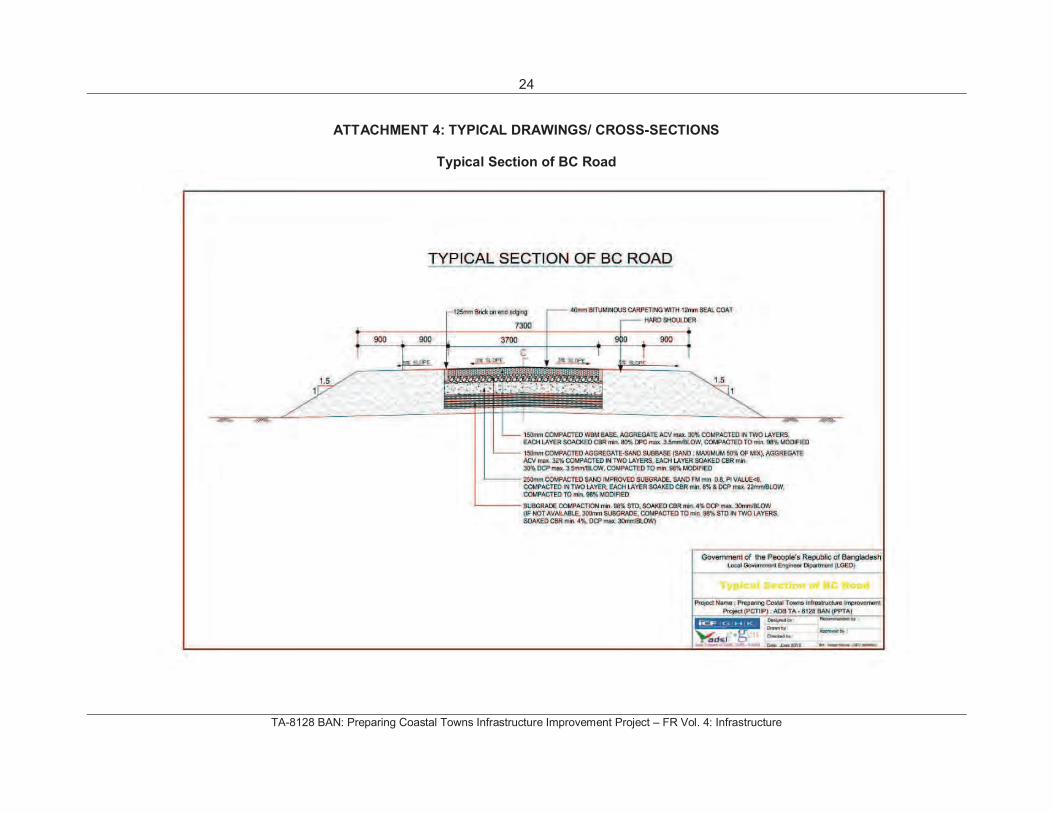
ATTACHMENT 4: TYPICAL DRAWINGS/ CROSS-SECTIONS
Typical Section of BC Road
25
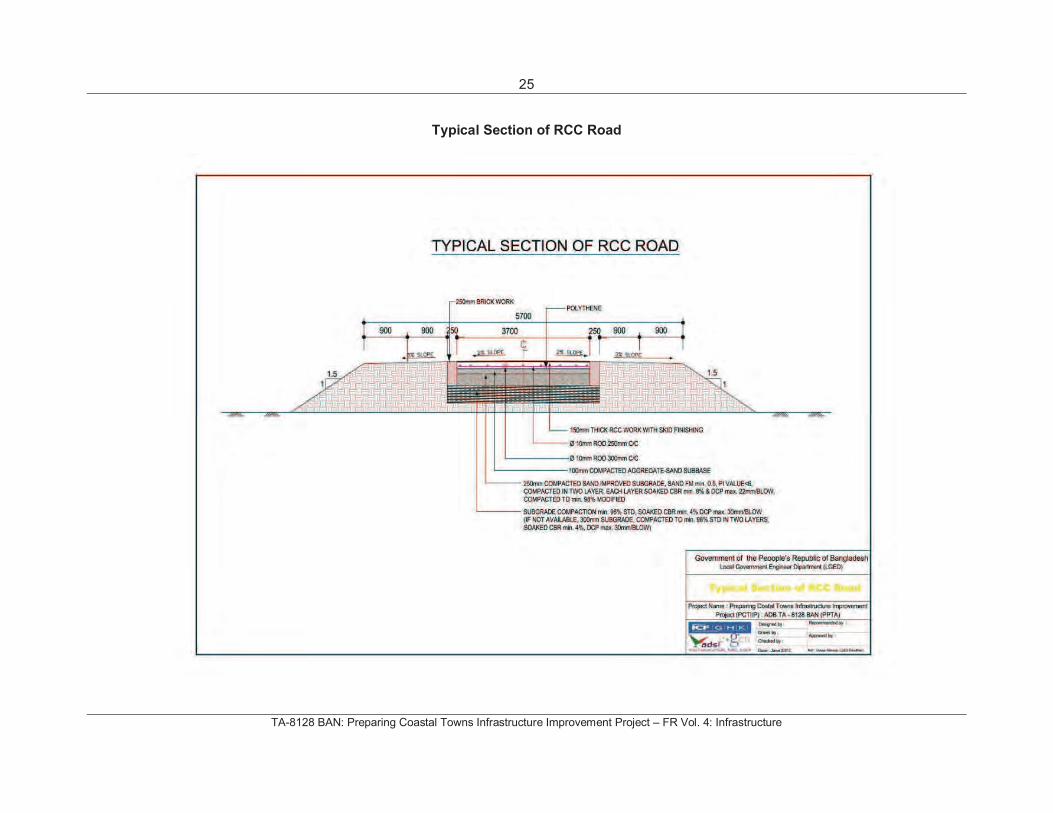
TA-8128 BAN: Preparing Coastal Towns Infrastructure Improvement Project – FR Vol. 4: Infrastructure
Typical Section of RCC Road
26
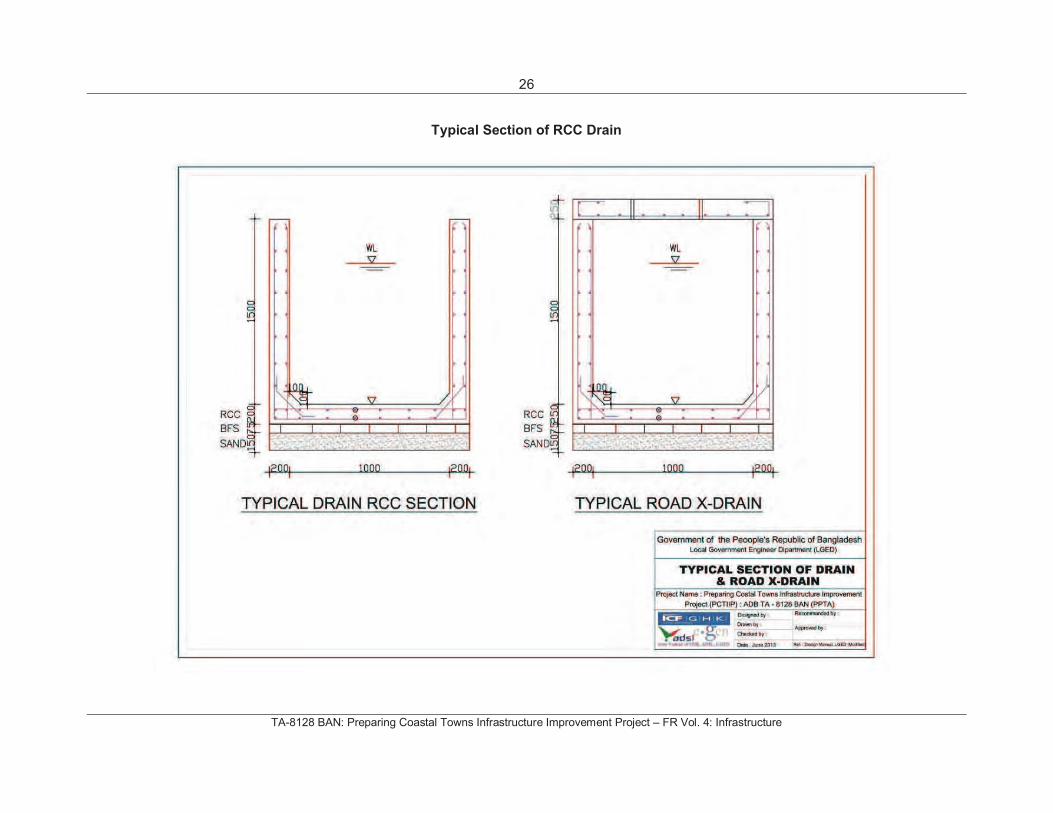
TA-8128 BAN: Preparing Coastal Towns Infrastructure Improvement Project – FR Vol. 4: Infrastructure
Typical Section of RCC Drain
27
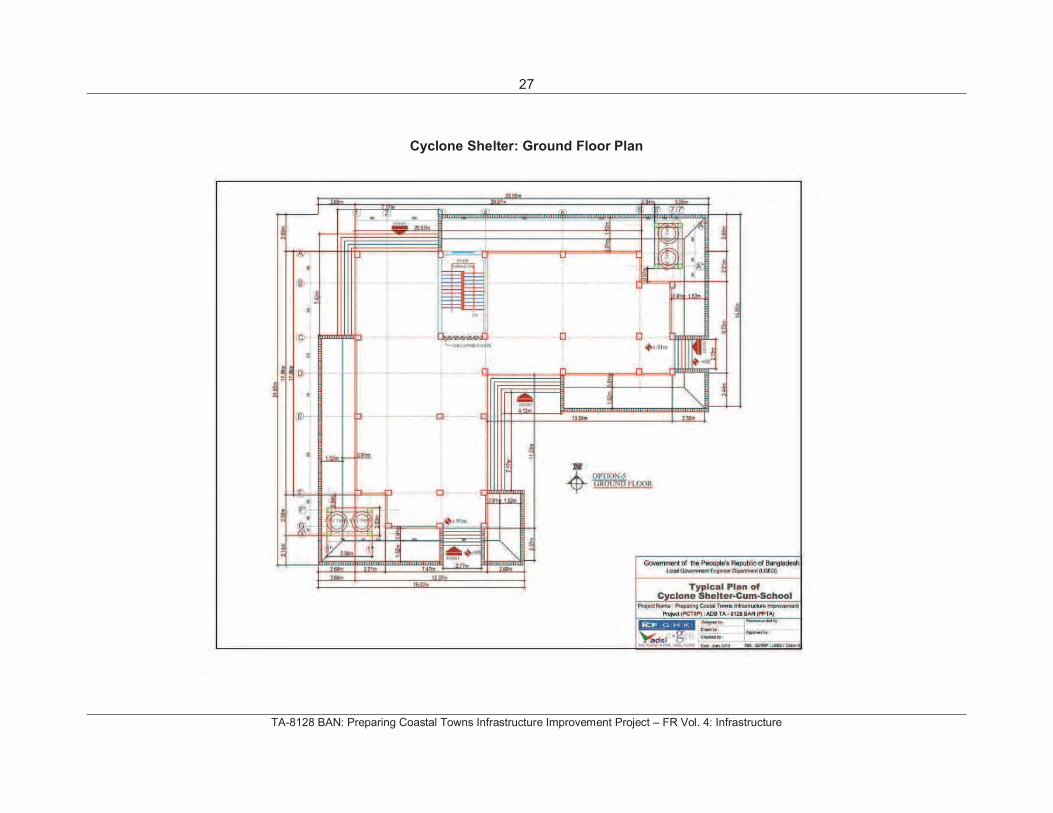
TA-8128 BAN: Preparing Coastal Towns Infrastructure Improvement Project – FR Vol. 4: Infrastructure
Cyclone Shelter: Ground Floor Plan
28
TA-8128 BAN: Preparing Coastal Towns Infrastructure Improvement Project – FR Vol. 4: Infrastructure
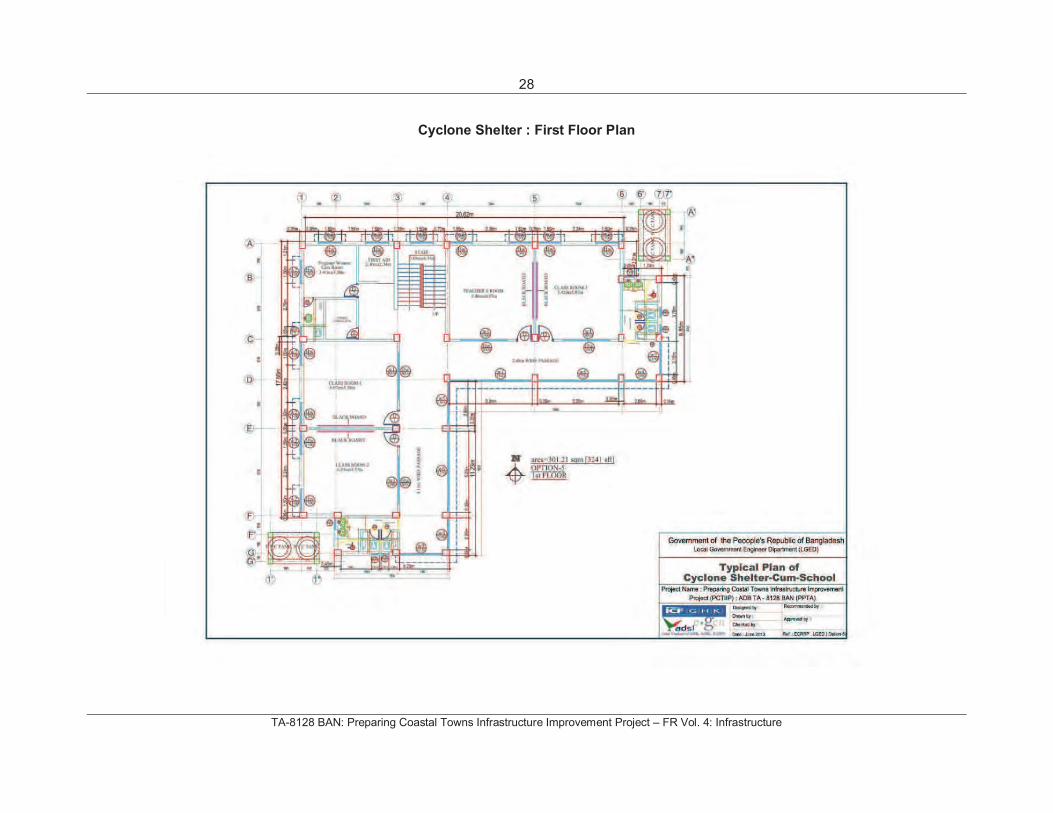
Cyclone Shelter : First Floor Plan
29
TA-8128 BAN: Preparing Coastal Towns Infrastructure Improvement Project – FR Vol. 4: Infrastructure
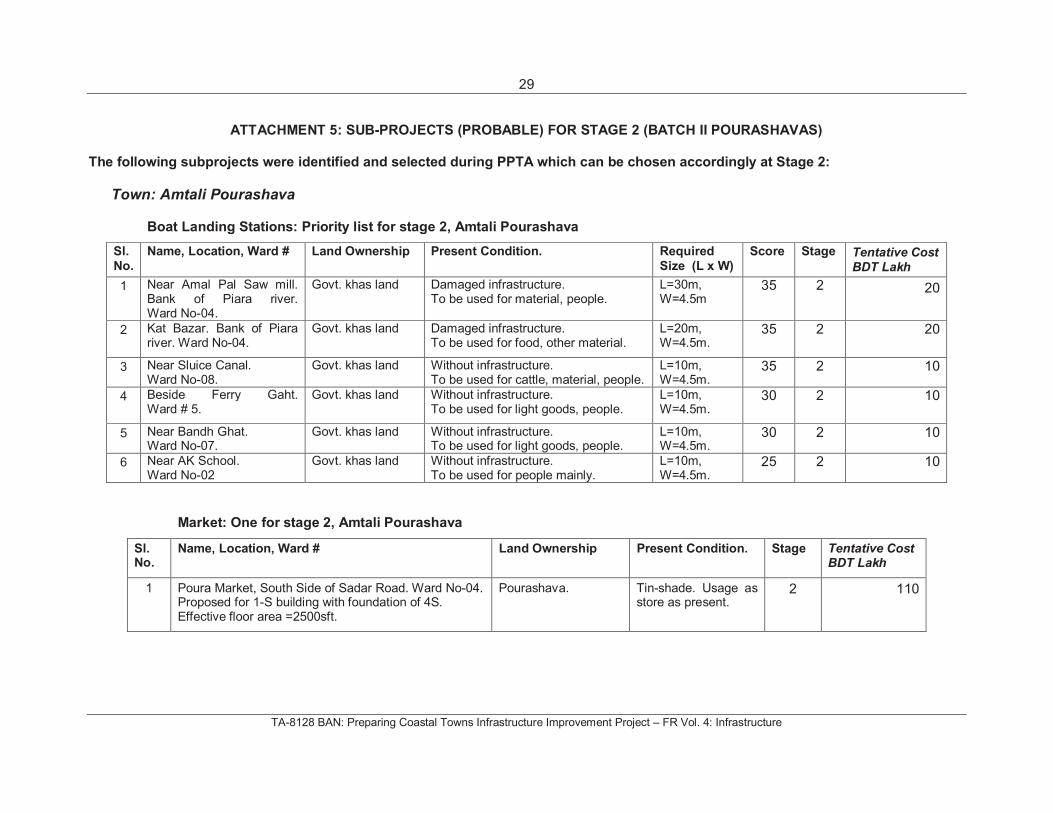
ATTACHMENT 5: SUB-PROJECTS (PROBABLE) FOR STAGE 2 (BATCH II POURASHAVAS)
The following subprojects were identified and selected during PPTA which can be chosen accordingly at Stage 2:
Town: Amtali Pourashava
Market: One for stage 2, Amtali Pourashava
Sl.No.
Name, Location, Ward # Land Ownership Present Condition. Stage Tentative Cost BDT Lakh
1 Poura Market, South Side of Sadar Road. Ward No-04. Proposed for 1-S building with foundation of 4S. Effective floor area =2500sft.
Pourashava. Tin-shade. Usage as store as present.
2 110
Boat Landing Stations: Priority list for stage 2, Amtali Pourashava
Sl.No.
Name, Location, Ward # Land Ownership Present Condition. Required Size (L x W)
Score Stage Tentative Cost BDT Lakh
1 Near Amal Pal Saw mill. Bank of Piara river. Ward No-04.
Govt. khas land Damaged infrastructure. To be used for material, people.
L=30m, W=4.5m
35 2 20
2 Kat Bazar. Bank of Piara river. Ward No-04.
Govt. khas land Damaged infrastructure. To be used for food, other material.
L=20m, W=4.5m.
35 2 20
3 Near Sluice Canal. Ward No-08.
Govt. khas land Without infrastructure. To be used for cattle, material, people.
L=10m, W=4.5m.
35 2 10
4 Beside Ferry Gaht. Ward # 5.
Govt. khas land Without infrastructure. To be used for light goods, people.
L=10m, W=4.5m.
30 2 10
5 Near Bandh Ghat. Ward No-07.
Govt. khas land Without infrastructure. To be used for light goods, people.
L=10m, W=4.5m.
30 2 10
6 Near AK School. Ward No-02
Govt. khas land Without infrastructure. To be used for people mainly.
L=10m, W=4.5m.
25 2 10
30
TA-8128 BAN: Preparing Coastal Towns Infrastructure Improvement Project – FR Vol. 4: Infrastructure
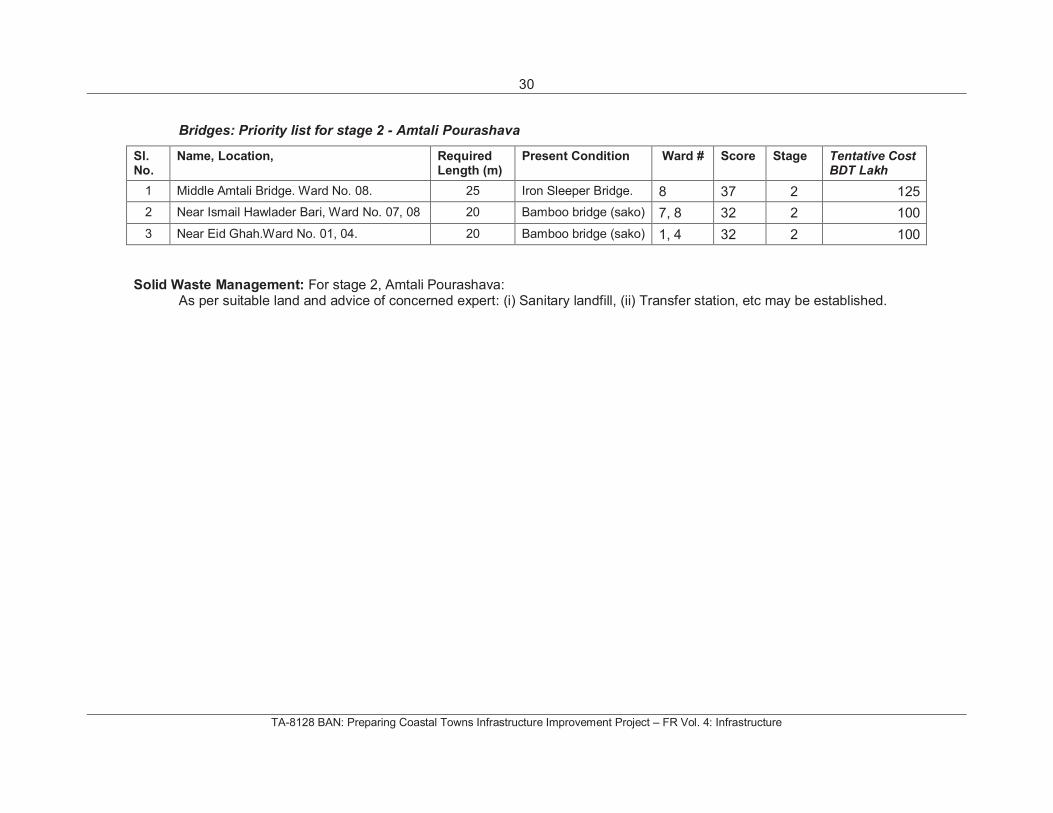
Bridges: Priority list for stage 2 - Amtali Pourashava
Sl.No.
Name, Location, Required Length (m)
Present Condition Ward # Score Stage Tentative Cost BDT Lakh
1 Middle Amtali Bridge. Ward No. 08. 25 Iron Sleeper Bridge. 8 37 2 125
2 Near Ismail Hawlader Bari, Ward No. 07, 08 20 Bamboo bridge (sako) 7, 8 32 2 100
3 Near Eid Ghah.Ward No. 01, 04. 20 Bamboo bridge (sako) 1, 4 32 2 100
Solid Waste Management: For stage 2, Amtali Pourashava: As per suitable land and advice of concerned expert: (i) Sanitary landfill, (ii) Transfer station, etc may be established.
31
TA-8128 BAN: Preparing Coastal Towns Infrastructure Improvement Project – FR Vol. 4: Infrastructure
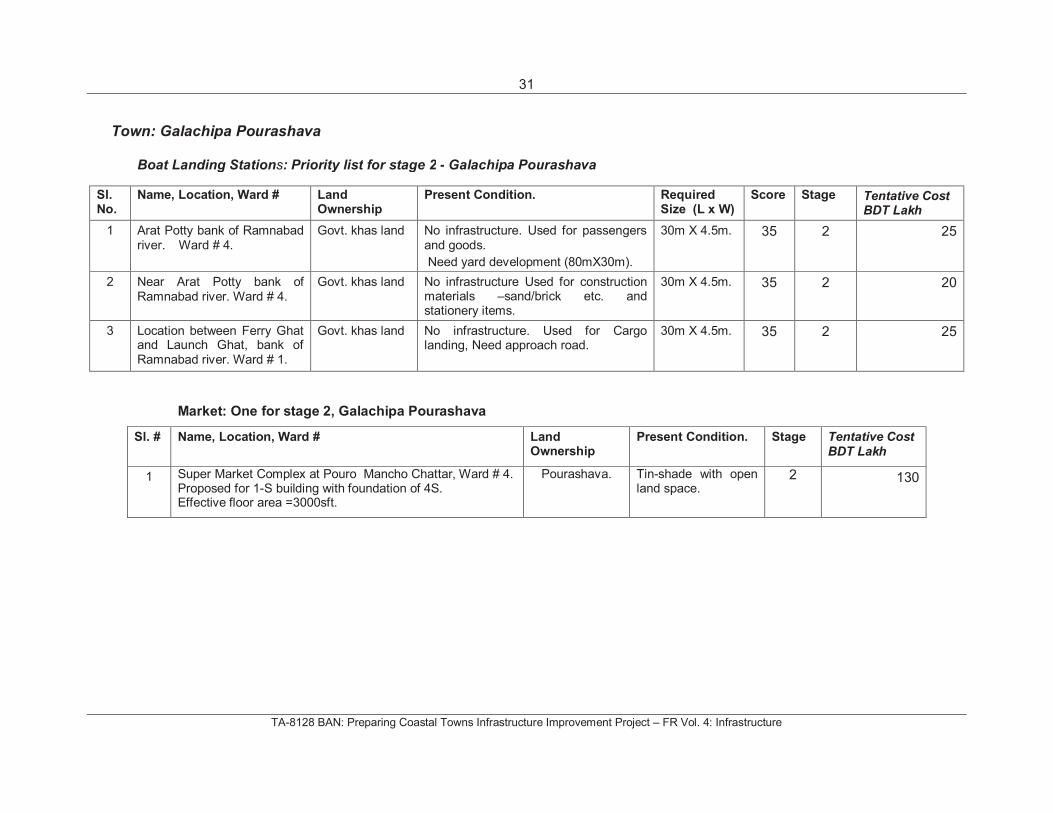
Town: Galachipa Pourashava
Market: One for stage 2, Galachipa Pourashava
Sl. # Name, Location, Ward # Land Ownership
Present Condition. Stage Tentative Cost BDT Lakh
1 Super Market Complex at Pouro Mancho Chattar, Ward # 4. Proposed for 1-S building with foundation of 4S. Effective floor area =3000sft.
Pourashava. Tin-shade with open land space.
2 130
Boat Landing Stations: Priority list for stage 2 - Galachipa Pourashava
Sl.No.
Name, Location, Ward # Land Ownership
Present Condition. Required Size (L x W)
Score Stage Tentative Cost BDT Lakh
1 Arat Potty bank of Ramnabad river. Ward # 4.
Govt. khas land No infrastructure. Used for passengers and goods.
Need yard development (80mX30m).
30m X 4.5m. 35 2 25
2 Near Arat Potty bank of Ramnabad river. Ward # 4.
Govt. khas land No infrastructure Used for construction materials –sand/brick etc. and stationery items.
30m X 4.5m. 35 2 20
3 Location between Ferry Ghat and Launch Ghat, bank of Ramnabad river. Ward # 1.
Govt. khas land No infrastructure. Used for Cargo landing, Need approach road.
30m X 4.5m. 35 2 25
32
TA-8128 BAN: Preparing Coastal Towns Infrastructure Improvement Project – FR Vol. 4: Infrastructure
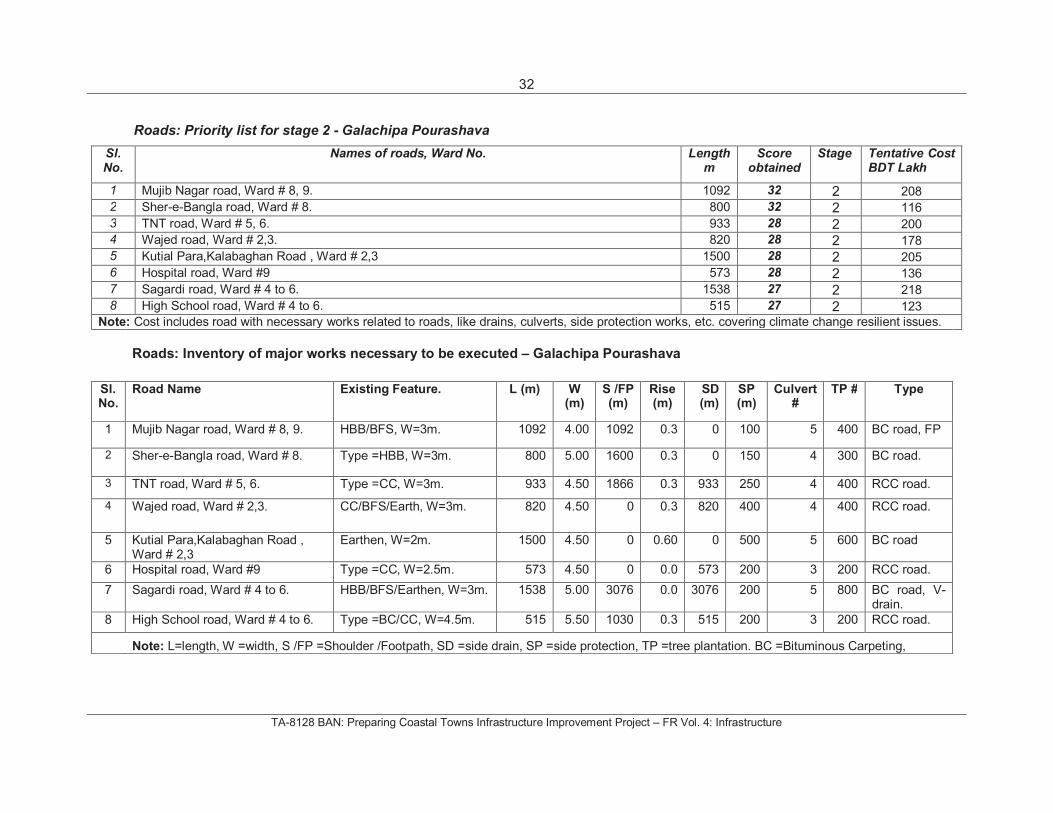
Roads: Priority list for stage 2 - Galachipa Pourashava
Sl.No.
Names of roads, Ward No. Length m
Score obtained
Stage Tentative Cost BDT Lakh
1 Mujib Nagar road, Ward # 8, 9. 1092 32 2 208
2 Sher-e-Bangla road, Ward # 8. 800 32 2 116
3 TNT road, Ward # 5, 6. 933 28 2 200
4 Wajed road, Ward # 2,3. 820 28 2 178
5 Kutial Para,Kalabaghan Road , Ward # 2,3 1500 28 2 205
6 Hospital road, Ward #9 573 28 2 136
7 Sagardi road, Ward # 4 to 6. 1538 27 2 218
8 High School road, Ward # 4 to 6. 515 27 2 123
Note: Cost includes road with necessary works related to roads, like drains, culverts, side protection works, etc. covering climate change resilient issues.
Roads: Inventory of major works necessary to be executed – Galachipa Pourashava
Sl.No.
Road Name Existing Feature. L (m) W(m)
S /FP (m)
Rise (m)
SD(m)
SP(m)
Culvert #
TP # Type
1 Mujib Nagar road, Ward # 8, 9. HBB/BFS, W=3m. 1092 4.00 1092 0.3 0 100 5 400 BC road, FP
2 Sher-e-Bangla road, Ward # 8. Type =HBB, W=3m. 800 5.00 1600 0.3 0 150 4 300 BC road.
3 TNT road, Ward # 5, 6. Type =CC, W=3m. 933 4.50 1866 0.3 933 250 4 400 RCC road.
4 Wajed road, Ward # 2,3. CC/BFS/Earth, W=3m. 820 4.50 0 0.3 820 400 4 400 RCC road.
5 Kutial Para,Kalabaghan Road , Ward # 2,3
Earthen, W=2m. 1500 4.50 0 0.60 0 500 5 600 BC road
6 Hospital road, Ward #9 Type =CC, W=2.5m. 573 4.50 0 0.0 573 200 3 200 RCC road.
7 Sagardi road, Ward # 4 to 6. HBB/BFS/Earthen, W=3m. 1538 5.00 3076 0.0 3076 200 5 800 BC road, V-drain.
8 High School road, Ward # 4 to 6. Type =BC/CC, W=4.5m. 515 5.50 1030 0.3 515 200 3 200 RCC road.
Note: L=length, W =width, S /FP =Shoulder /Footpath, SD =side drain, SP =side protection, TP =tree plantation. BC =Bituminous Carpeting,
33
TA-8128 BAN: Preparing Coastal Towns Infrastructure Improvement Project – FR Vol. 4: Infrastructure
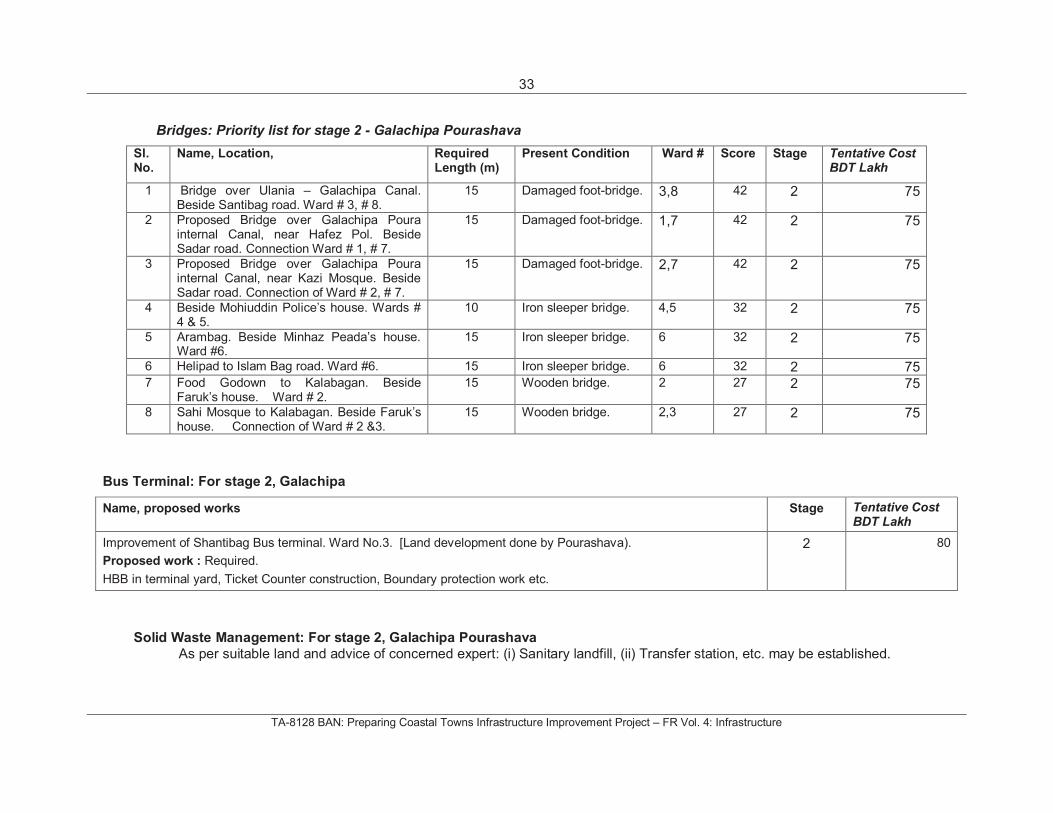
Bridges: Priority list for stage 2 - Galachipa Pourashava
Sl.No.
Name, Location, Required Length (m)
Present Condition Ward # Score Stage Tentative Cost BDT Lakh
1 Bridge over Ulania – Galachipa Canal. Beside Santibag road. Ward # 3, # 8.
15 Damaged foot-bridge. 3,8 42 2 75
2 Proposed Bridge over Galachipa Poura internal Canal, near Hafez Pol. Beside Sadar road. Connection Ward # 1, # 7.
15 Damaged foot-bridge. 1,7 42 2 75
3 Proposed Bridge over Galachipa Poura internal Canal, near Kazi Mosque. Beside Sadar road. Connection of Ward # 2, # 7.
15 Damaged foot-bridge. 2,7 42 2 75
4 Beside Mohiuddin Police’s house. Wards # 4 & 5.
10 Iron sleeper bridge. 4,5 32 2 75
5 Arambag. Beside Minhaz Peada’s house. Ward #6.
15 Iron sleeper bridge. 6 32 2 75
6 Helipad to Islam Bag road. Ward #6. 15 Iron sleeper bridge. 6 32 2 757 Food Godown to Kalabagan. Beside
Faruk’s house. Ward # 2. 15 Wooden bridge. 2 27 2 75
8 Sahi Mosque to Kalabagan. Beside Faruk’s house. Connection of Ward # 2 &3.
15 Wooden bridge. 2,3 27 2 75
Solid Waste Management: For stage 2, Galachipa Pourashava
As per suitable land and advice of concerned expert: (i) Sanitary landfill, (ii) Transfer station, etc. may be established.
Bus Terminal: For stage 2, Galachipa
Name, proposed works Stage Tentative Cost BDT Lakh
Improvement of Shantibag Bus terminal. Ward No.3. [Land development done by Pourashava).
Proposed work : Required.
HBB in terminal yard, Ticket Counter construction, Boundary protection work etc.
2 80
34
TA-8128 BAN: Preparing Coastal Towns Infrastructure Improvement Project – FR Vol. 4: Infrastructure
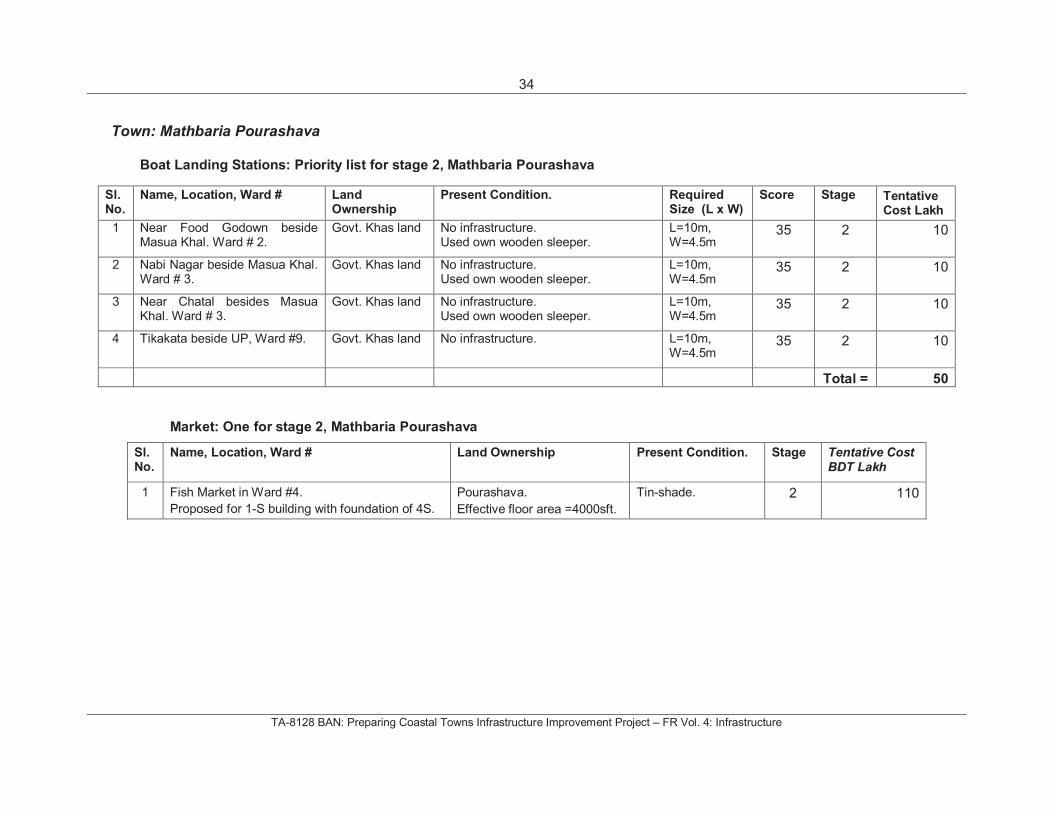
Town: Mathbaria Pourashava
Market: One for stage 2, Mathbaria Pourashava
Sl.No.
Name, Location, Ward # Land Ownership Present Condition. Stage Tentative Cost BDT Lakh
1 Fish Market in Ward #4.
Proposed for 1-S building with foundation of 4S.
Pourashava.
Effective floor area =4000sft.
Tin-shade. 2 110
Boat Landing Stations: Priority list for stage 2, Mathbaria Pourashava
Sl.No.
Name, Location, Ward # Land Ownership
Present Condition. Required Size (L x W)
Score Stage Tentative Cost Lakh
1 Near Food Godown beside Masua Khal. Ward # 2.
Govt. Khas land No infrastructure. Used own wooden sleeper.
L=10m, W=4.5m
35 2 10
2 Nabi Nagar beside Masua Khal. Ward # 3.
Govt. Khas land No infrastructure. Used own wooden sleeper.
L=10m, W=4.5m
35 2 10
3 Near Chatal besides Masua Khal. Ward # 3.
Govt. Khas land No infrastructure. Used own wooden sleeper.
L=10m, W=4.5m
35 2 10
4 Tikakata beside UP, Ward #9. Govt. Khas land No infrastructure. L=10m, W=4.5m
35 2 10
Total = 50
35
TA-8128 BAN: Preparing Coastal Towns Infrastructure Improvement Project – FR Vol. 4: Infrastructure
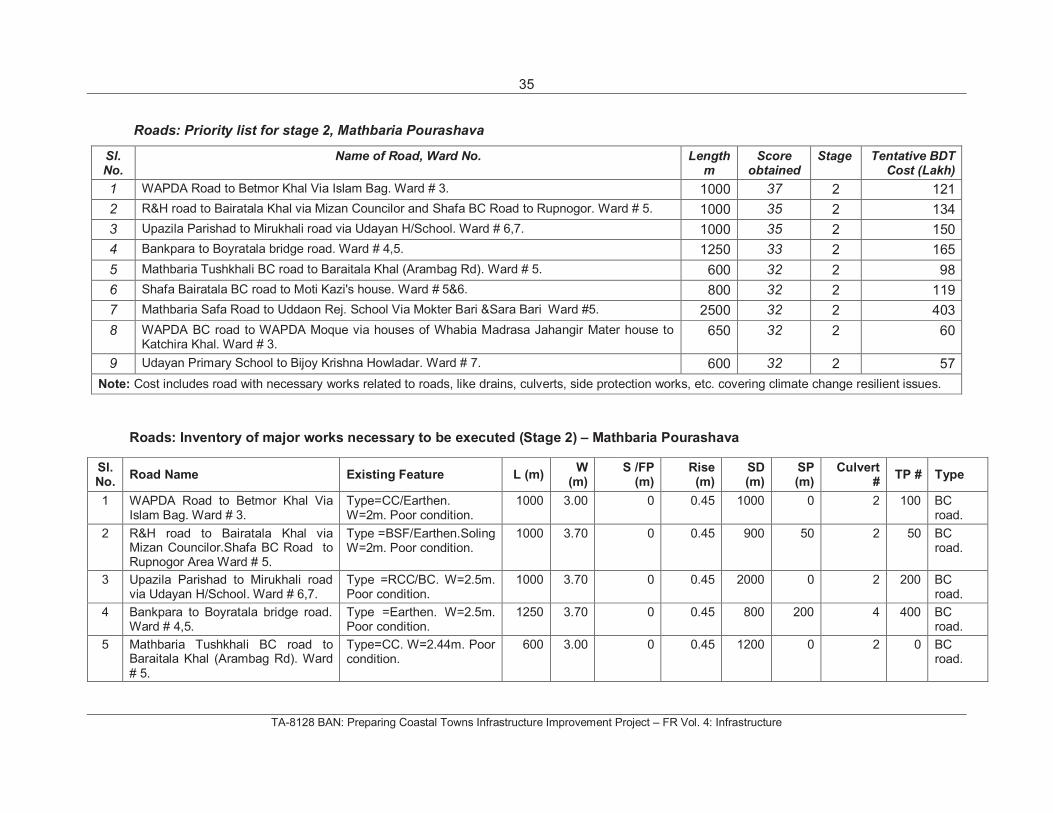
Roads: Priority list for stage 2, Mathbaria Pourashava
Sl.No.
Name of Road, Ward No. Length m
Score obtained
Stage Tentative BDT Cost (Lakh)
1 WAPDA Road to Betmor Khal Via Islam Bag. Ward # 3. 1000 37 2 121
2 R&H road to Bairatala Khal via Mizan Councilor and Shafa BC Road to Rupnogor. Ward # 5. 1000 35 2 134
3 Upazila Parishad to Mirukhali road via Udayan H/School. Ward # 6,7. 1000 35 2 150
4 Bankpara to Boyratala bridge road. Ward # 4,5. 1250 33 2 165
5 Mathbaria Tushkhali BC road to Baraitala Khal (Arambag Rd). Ward # 5. 600 32 2 98
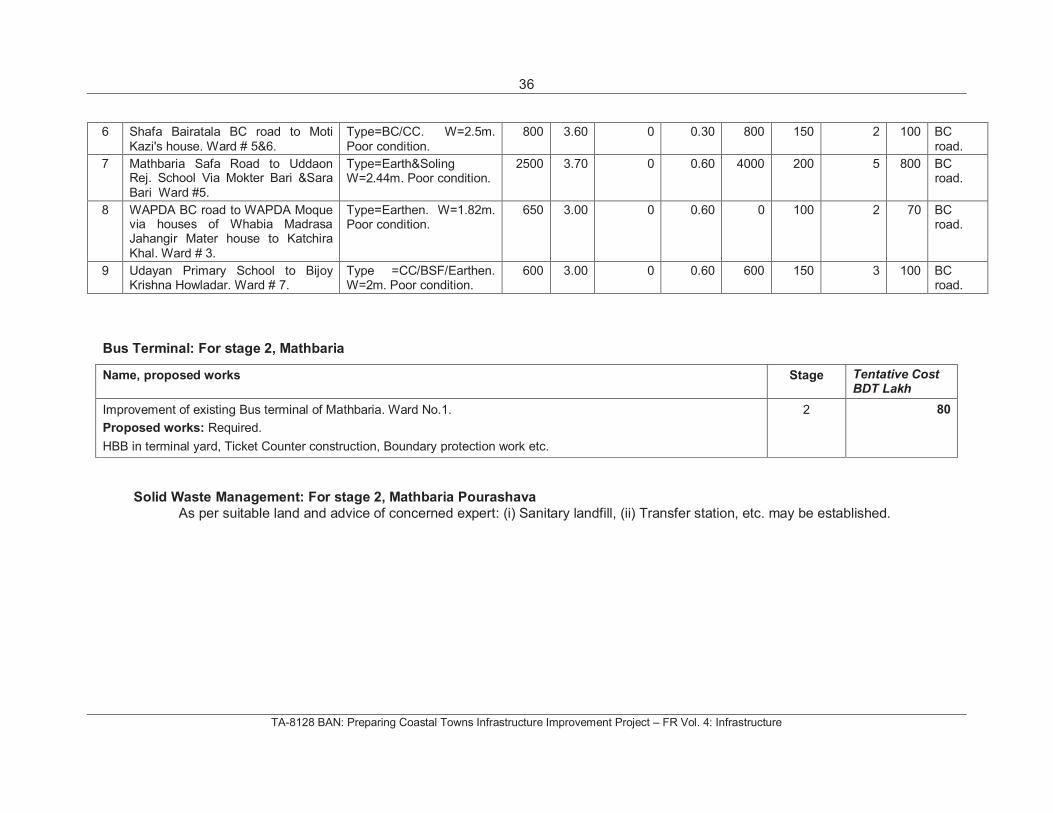
6 Shafa Bairatala BC road to Moti Kazi's house. Ward # 5&6. 800 32 2 119
7 Mathbaria Safa Road to Uddaon Rej. School Via Mokter Bari &Sara Bari Ward #5. 2500 32 2 403
8 WAPDA BC road to WAPDA Moque via houses of Whabia Madrasa Jahangir Mater house to Katchira Khal. Ward # 3.
650 32 2 60
9 Udayan Primary School to Bijoy Krishna Howladar. Ward # 7. 600 32 2 57
Note: Cost includes road with necessary works related to roads, like drains, culverts, side protection works, etc. covering climate change resilient issues.
Roads: Inventory of major works necessary to be executed (Stage 2) – Mathbaria Pourashava
Sl.No.
Road Name Existing Feature L (m)W
(m)S /FP
(m)Rise (m)
SD(m)
SP(m)
Culvert #
TP # Type
1 WAPDA Road to Betmor Khal Via Islam Bag. Ward # 3.
Type=CC/Earthen. W=2m. Poor condition.
1000 3.00 0 0.45 1000 0 2 100 BCroad.
2 R&H road to Bairatala Khal via Mizan Councilor.Shafa BC Road to Rupnogor Area Ward # 5.
Type =BSF/Earthen.Soling W=2m. Poor condition.
1000 3.70 0 0.45 900 50 2 50 BCroad.
3 Upazila Parishad to Mirukhali road via Udayan H/School. Ward # 6,7.
Type =RCC/BC. W=2.5m. Poor condition.
1000 3.70 0 0.45 2000 0 2 200 BCroad.
4 Bankpara to Boyratala bridge road. Ward # 4,5.
Type =Earthen. W=2.5m. Poor condition.
1250 3.70 0 0.45 800 200 4 400 BCroad.
5 Mathbaria Tushkhali BC road to Baraitala Khal (Arambag Rd). Ward # 5.
Type=CC. W=2.44m. Poor condition.
600 3.00 0 0.45 1200 0 2 0 BCroad.
36
TA-8128 BAN: Preparing Coastal Towns Infrastructure Improvement Project – FR Vol. 4: Infrastructure
6 Shafa Bairatala BC road to Moti Kazi's house. Ward # 5&6.
Type=BC/CC. W=2.5m. Poor condition.
800 3.60 0 0.30 800 150 2 100 BCroad.
7 Mathbaria Safa Road to Uddaon Rej. School Via Mokter Bari &Sara Bari Ward #5.
Type=Earth&Soling W=2.44m. Poor condition.
2500 3.70 0 0.60 4000 200 5 800 BCroad.
8 WAPDA BC road to WAPDA Moque via houses of Whabia Madrasa Jahangir Mater house to Katchira Khal. Ward # 3.
Type=Earthen. W=1.82m. Poor condition.
650 3.00 0 0.60 0 100 2 70 BCroad.
9 Udayan Primary School to Bijoy Krishna Howladar. Ward # 7.
Type =CC/BSF/Earthen. W=2m. Poor condition.
600 3.00 0 0.60 600 150 3 100 BCroad.
Solid Waste Management: For stage 2, Mathbaria Pourashava
As per suitable land and advice of concerned expert: (i) Sanitary landfill, (ii) Transfer station, etc. may be established.
Bus Terminal: For stage 2, Mathbaria
Name, proposed works Stage Tentative Cost BDT Lakh
Improvement of existing Bus terminal of Mathbaria. Ward No.1.
Proposed works: Required.
HBB in terminal yard, Ticket Counter construction, Boundary protection work etc.
2 80
37
TA-8128 BAN: Preparing Coastal Towns Infrastructure Improvement Project – FR Vol. 4: Infrastructure
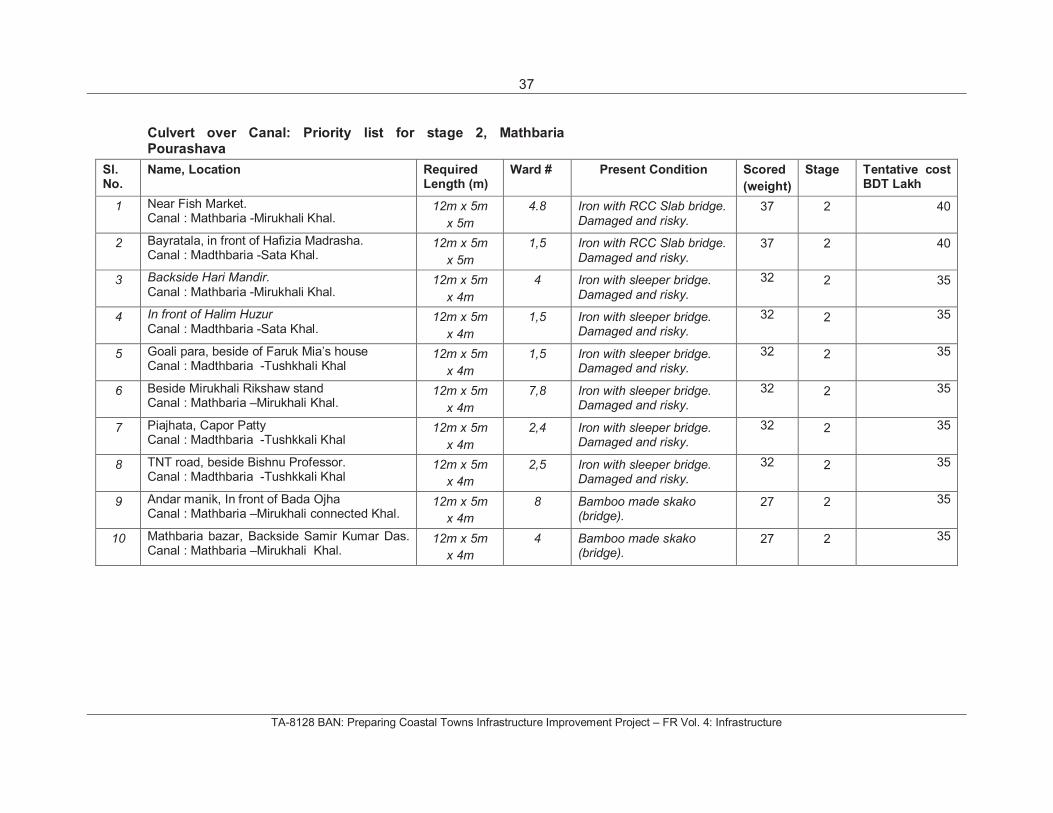
Culvert over Canal: Priority list for stage 2, Mathbaria Pourashava
Sl.No.
Name, Location Required Length (m)
Ward # Present Condition Scored
(weight)
Stage Tentative cost BDT Lakh
1 Near Fish Market. Canal : Mathbaria -Mirukhali Khal.
12m x 5m
x 5m
4.8 Iron with RCC Slab bridge. Damaged and risky.
37 2 40
2 Bayratala, in front of Hafizia Madrasha. Canal : Madthbaria -Sata Khal.
12m x 5m
x 5m
1,5 Iron with RCC Slab bridge. Damaged and risky.
37 2 40
3 Backside Hari Mandir.Canal : Mathbaria -Mirukhali Khal.
12m x 5m
x 4m
4 Iron with sleeper bridge. Damaged and risky.
32 2 35
4 In front of Halim HuzurCanal : Madthbaria -Sata Khal.
12m x 5m
x 4m
1,5 Iron with sleeper bridge. Damaged and risky.
32 2 35
5 Goali para, beside of Faruk Mia’s house Canal : Madthbaria -Tushkhali Khal
12m x 5m
x 4m
1,5 Iron with sleeper bridge. Damaged and risky.
32 2 35
6 Beside Mirukhali Rikshaw stand Canal : Mathbaria –Mirukhali Khal.
12m x 5m
x 4m
7,8 Iron with sleeper bridge. Damaged and risky.
32 2 35
7 Piajhata, Capor Patty Canal : Madthbaria -Tushkkali Khal
12m x 5m
x 4m
2,4 Iron with sleeper bridge. Damaged and risky.
32 2 35
8 TNT road, beside Bishnu Professor. Canal : Madthbaria -Tushkkali Khal
12m x 5m
x 4m
2,5 Iron with sleeper bridge. Damaged and risky.
32 2 35
9 Andar manik, In front of Bada Ojha Canal : Mathbaria –Mirukhali connected Khal.
12m x 5m
x 4m
8 Bamboo made skako (bridge).
27 2 35
10 Mathbaria bazar, Backside Samir Kumar Das. Canal : Mathbaria –Mirukhali Khal.
12m x 5m
x 4m
4 Bamboo made skako (bridge).
27 2 35
38
TA-8128 BAN: Preparing Coastal Towns Infrastructure Improvement Project – FR Vol. 4: Infrastructure
Town: Pirojpur Pourashava
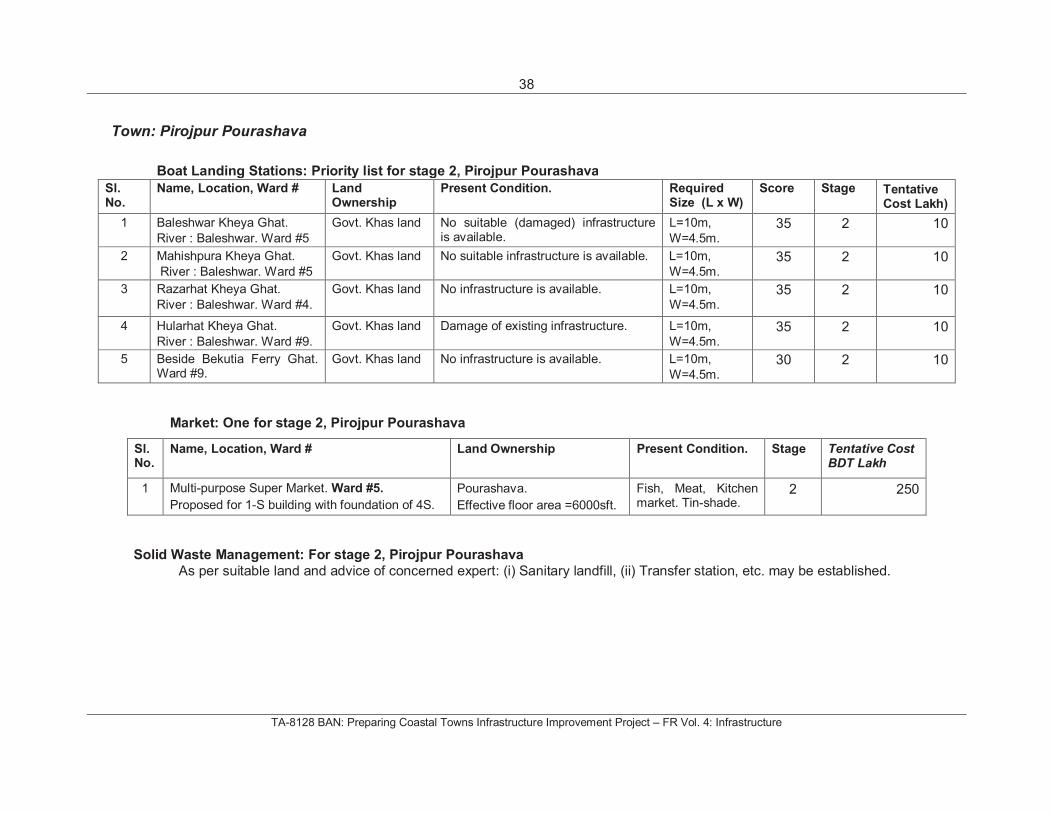
Market: One for stage 2, Pirojpur Pourashava
Sl.No.
Name, Location, Ward # Land Ownership Present Condition. Stage Tentative Cost BDT Lakh
1 Multi-purpose Super Market. Ward #5.
Proposed for 1-S building with foundation of 4S.
Pourashava.
Effective floor area =6000sft.
Fish, Meat, Kitchen market. Tin-shade.
2 250
Solid Waste Management: For stage 2, Pirojpur Pourashava
As per suitable land and advice of concerned expert: (i) Sanitary landfill, (ii) Transfer station, etc. may be established.
Boat Landing Stations: Priority list for stage 2, Pirojpur Pourashava
Sl.No.
Name, Location, Ward # Land Ownership
Present Condition. Required Size (L x W)
Score Stage Tentative Cost Lakh)
1 Baleshwar Kheya Ghat.
River : Baleshwar. Ward #5
Govt. Khas land No suitable (damaged) infrastructure is available.
L=10m,
W=4.5m. 35 2 10
2 Mahishpura Kheya Ghat.
River : Baleshwar. Ward #5
Govt. Khas land No suitable infrastructure is available. L=10m,
W=4.5m. 35 2 10
3 Razarhat Kheya Ghat.
River : Baleshwar. Ward #4.
Govt. Khas land No infrastructure is available. L=10m,
W=4.5m. 35 2 10
4 Hularhat Kheya Ghat.
River : Baleshwar. Ward #9.
Govt. Khas land Damage of existing infrastructure. L=10m,
W=4.5m. 35 2 10
5 Beside Bekutia Ferry Ghat. Ward #9.
Govt. Khas land No infrastructure is available. L=10m,
W=4.5m. 30 2 10
39
TA-8128 BAN: Preparing Coastal Towns Infrastructure Improvement Project – FR Vol. 4: Infrastructure
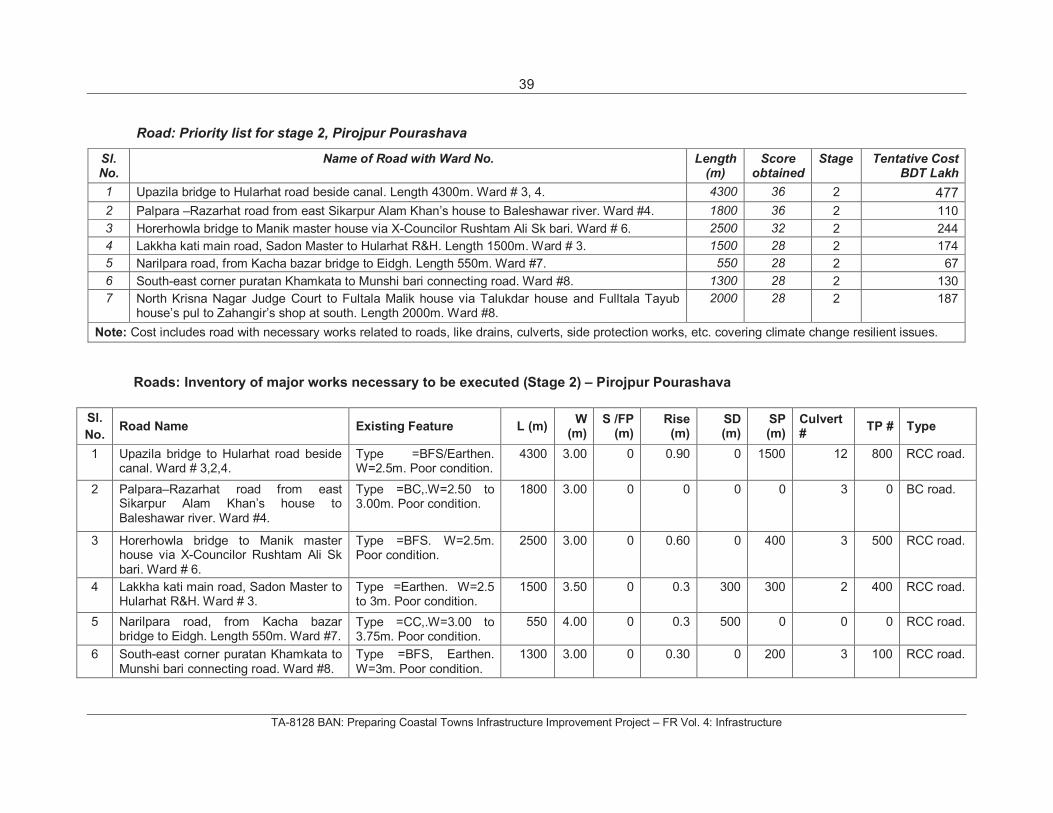
Road: Priority list for stage 2, Pirojpur Pourashava
Sl.No.
Name of Road with Ward No. Length (m)
Score obtained
Stage Tentative Cost BDT Lakh
1 Upazila bridge to Hularhat road beside canal. Length 4300m. Ward # 3, 4. 4300 36 2 477
2 Palpara –Razarhat road from east Sikarpur Alam Khan’s house to Baleshawar river. Ward #4. 1800 36 2 110
3 Horerhowla bridge to Manik master house via X-Councilor Rushtam Ali Sk bari. Ward # 6. 2500 32 2 244
4 Lakkha kati main road, Sadon Master to Hularhat R&H. Length 1500m. Ward # 3. 1500 28 2 174
5 Narilpara road, from Kacha bazar bridge to Eidgh. Length 550m. Ward #7. 550 28 2 67
6 South-east corner puratan Khamkata to Munshi bari connecting road. Ward #8. 1300 28 2 130
7 North Krisna Nagar Judge Court to Fultala Malik house via Talukdar house and Fulltala Tayub house’s pul to Zahangir’s shop at south. Length 2000m. Ward #8.
2000 28 2 187
Note: Cost includes road with necessary works related to roads, like drains, culverts, side protection works, etc. covering climate change resilient issues.
Roads: Inventory of major works necessary to be executed (Stage 2) – Pirojpur Pourashava
Sl.
No. Road Name Existing Feature L (m)
W(m)
S /FP (m)
Rise (m)
SD(m)
SP(m)
Culvert #
TP # Type
1 Upazila bridge to Hularhat road beside canal. Ward # 3,2,4.
Type =BFS/Earthen. W=2.5m. Poor condition.
4300 3.00 0 0.90 0 1500 12 800 RCC road.
2 Palpara–Razarhat road from east Sikarpur Alam Khan’s house to Baleshawar river. Ward #4.
Type =BC,.W=2.50 to 3.00m. Poor condition.
1800 3.00 0 0 0 0 3 0 BC road.
3 Horerhowla bridge to Manik master house via X-Councilor Rushtam Ali Sk bari. Ward # 6.
Type =BFS. W=2.5m. Poor condition.
2500 3.00 0 0.60 0 400 3 500 RCC road.
4 Lakkha kati main road, Sadon Master to Hularhat R&H. Ward # 3.
Type =Earthen. W=2.5 to 3m. Poor condition.
1500 3.50 0 0.3 300 300 2 400 RCC road.
5 Narilpara road, from Kacha bazar bridge to Eidgh. Length 550m. Ward #7.
Type =CC,.W=3.00 to 3.75m. Poor condition.
550 4.00 0 0.3 500 0 0 0 RCC road.
6 South-east corner puratan Khamkata to Munshi bari connecting road. Ward #8.
Type =BFS, Earthen. W=3m. Poor condition.
1300 3.00 0 0.30 0 200 3 100 RCC road.
40
TA-8128 BAN: Preparing Coastal Towns Infrastructure Improvement Project – FR Vol. 4: Infrastructure
7 North Krisna Nagar Judge Court to Fultala Malik house via Talukdar house and Fulltala Tayub house’s pul to Zahangir’s shop at south. Ward #8.
Type =BFS, W=3 to 3.5m. Poor condition.
2000 3.00 0 0.45 200 0 0 400 RCC road.
Note : L=length, W =width, S /FP =Shoulder /Footpath, SD =side drain, SP =side protection, TP =tree plantation. BC =Bituminous Carpeting,
Bridges: Priority list for stage 2, Pirojpur Pourashava
Sl.No.
Name, Location, Required Length (m)
Present Condition Ward #
Score Stage Tentative Cost Lakh)
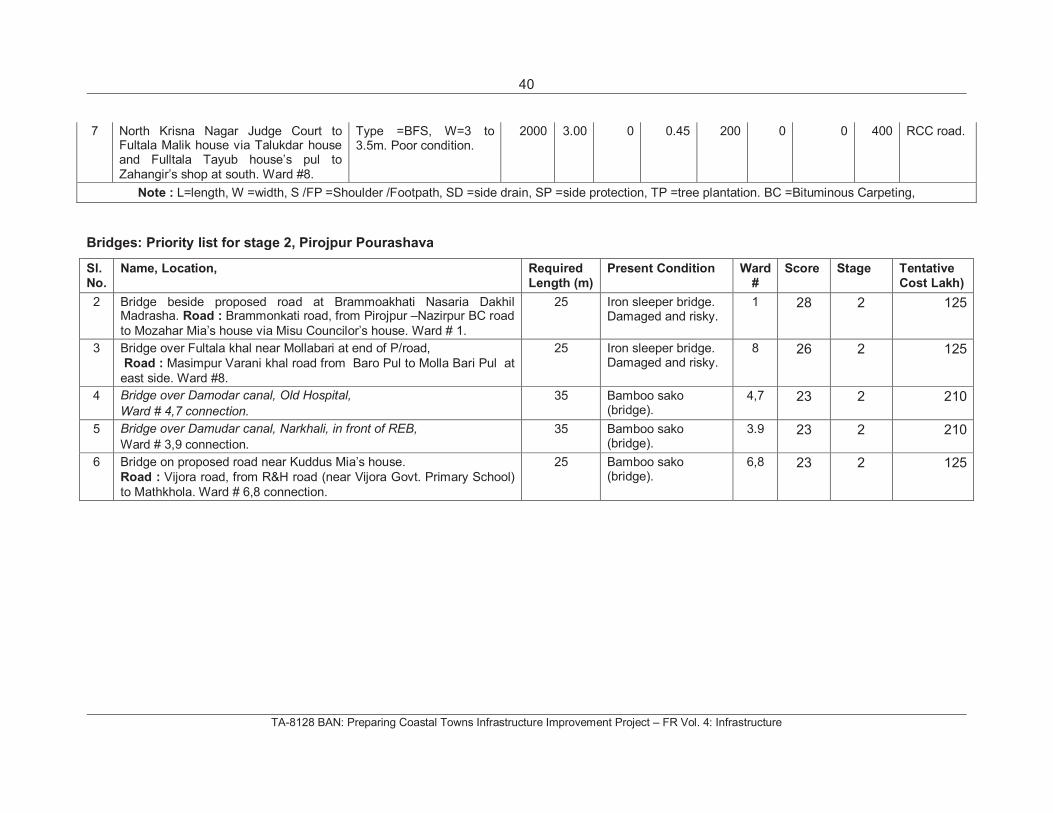
2 Bridge beside proposed road at Brammoakhati Nasaria Dakhil Madrasha. Road : Brammonkati road, from Pirojpur –Nazirpur BC road
to Mozahar Mia’s house via Misu Councilor’s house. Ward # 1.
25 Iron sleeper bridge. Damaged and risky.
1 28 2 125
3 Bridge over Fultala khal near Mollabari at end of P/road,
Road : Masimpur Varani khal road from Baro Pul to Molla Bari Pul at
east side. Ward #8.
25 Iron sleeper bridge. Damaged and risky.
8 26 2 125
4 Bridge over Damodar canal, Old Hospital,
Ward # 4,7 connection.
35 Bamboo sako (bridge).
4,7 23 2 210
5 Bridge over Damudar canal, Narkhali, in front of REB,
Ward # 3,9 connection.
35 Bamboo sako (bridge).
3.9 23 2 210
6 Bridge on proposed road near Kuddus Mia’s house.
Road : Vijora road, from R&H road (near Vijora Govt. Primary School)
to Mathkhola. Ward # 6,8 connection.
25 Bamboo sako (bridge).
6,8 23 2 125
41
TA-8128 BAN: Preparing Coastal Towns Infrastructure Improvement Project – FR Vol. 4: Infrastructure
ANNEX B: DRAINAGE AND FLOOD CONTROL DATA
1. Rainfall Hyetographs
2. Flooding and Drainage Congestion Analysis
3. Hydraulic Design Criteria
4. Proposed Interventions for Drainage Works
5. Maps showing Locations of Proposed Drainage Works
42
TA-8128 BAN: Preparing Coastal Towns Infrastructure Improvement Project – FR Vol. 4: Infrastructure
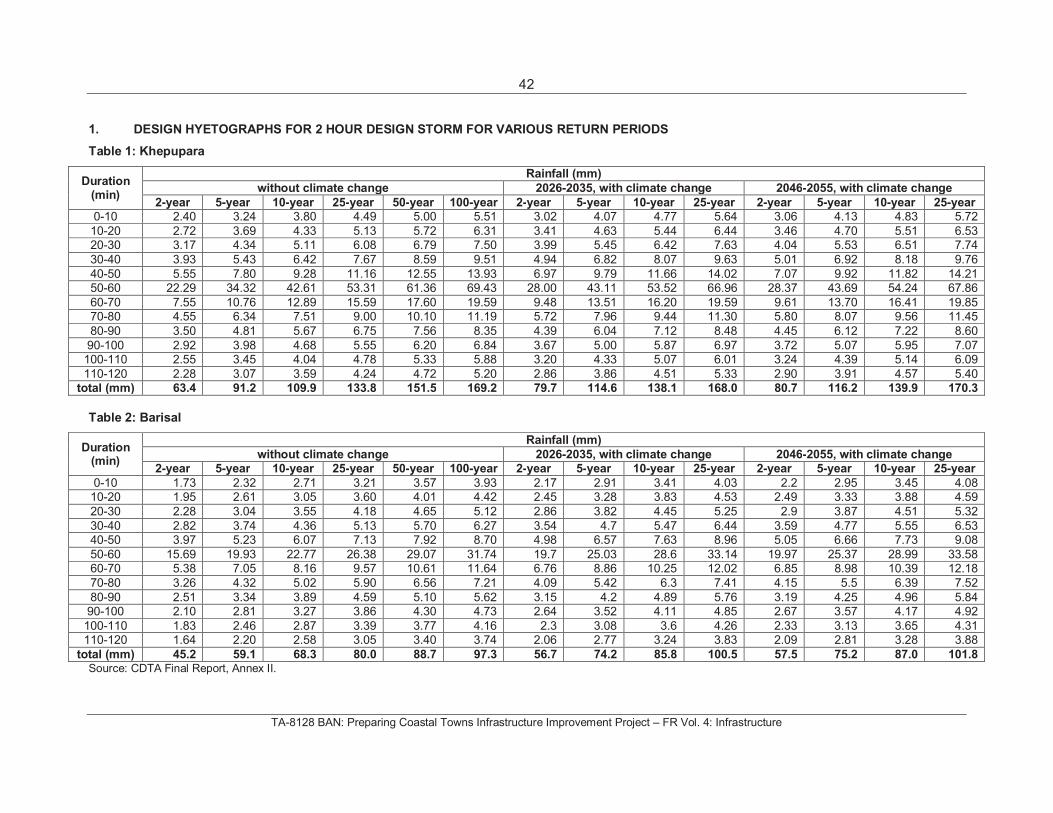
1. DESIGN HYETOGRAPHS FOR 2 HOUR DESIGN STORM FOR VARIOUS RETURN PERIODS
Table 1: Khepupara
Duration (min)
Rainfall (mm)
without climate change 2026-2035, with climate change 2046-2055, with climate change
2-year 5-year 10-year 25-year 50-year 100-year 2-year 5-year 10-year 25-year 2-year 5-year 10-year 25-year
0-10 2.40 3.24 3.80 4.49 5.00 5.51 3.02 4.07 4.77 5.64 3.06 4.13 4.83 5.72
10-20 2.72 3.69 4.33 5.13 5.72 6.31 3.41 4.63 5.44 6.44 3.46 4.70 5.51 6.53
20-30 3.17 4.34 5.11 6.08 6.79 7.50 3.99 5.45 6.42 7.63 4.04 5.53 6.51 7.74
30-40 3.93 5.43 6.42 7.67 8.59 9.51 4.94 6.82 8.07 9.63 5.01 6.92 8.18 9.76
40-50 5.55 7.80 9.28 11.16 12.55 13.93 6.97 9.79 11.66 14.02 7.07 9.92 11.82 14.21
50-60 22.29 34.32 42.61 53.31 61.36 69.43 28.00 43.11 53.52 66.96 28.37 43.69 54.24 67.86
60-70 7.55 10.76 12.89 15.59 17.60 19.59 9.48 13.51 16.20 19.59 9.61 13.70 16.41 19.85
70-80 4.55 6.34 7.51 9.00 10.10 11.19 5.72 7.96 9.44 11.30 5.80 8.07 9.56 11.45
80-90 3.50 4.81 5.67 6.75 7.56 8.35 4.39 6.04 7.12 8.48 4.45 6.12 7.22 8.60
90-100 2.92 3.98 4.68 5.55 6.20 6.84 3.67 5.00 5.87 6.97 3.72 5.07 5.95 7.07
100-110 2.55 3.45 4.04 4.78 5.33 5.88 3.20 4.33 5.07 6.01 3.24 4.39 5.14 6.09
110-120 2.28 3.07 3.59 4.24 4.72 5.20 2.86 3.86 4.51 5.33 2.90 3.91 4.57 5.40
total (mm) 63.4 91.2 109.9 133.8 151.5 169.2 79.7 114.6 138.1 168.0 80.7 116.2 139.9 170.3
Table 2: Barisal
Duration (min)
Rainfall (mm)
without climate change 2026-2035, with climate change 2046-2055, with climate change
2-year 5-year 10-year 25-year 50-year 100-year 2-year 5-year 10-year 25-year 2-year 5-year 10-year 25-year
0-10 1.73 2.32 2.71 3.21 3.57 3.93 2.17 2.91 3.41 4.03 2.2 2.95 3.45 4.08
10-20 1.95 2.61 3.05 3.60 4.01 4.42 2.45 3.28 3.83 4.53 2.49 3.33 3.88 4.59
20-30 2.28 3.04 3.55 4.18 4.65 5.12 2.86 3.82 4.45 5.25 2.9 3.87 4.51 5.32
30-40 2.82 3.74 4.36 5.13 5.70 6.27 3.54 4.7 5.47 6.44 3.59 4.77 5.55 6.53
40-50 3.97 5.23 6.07 7.13 7.92 8.70 4.98 6.57 7.63 8.96 5.05 6.66 7.73 9.08
50-60 15.69 19.93 22.77 26.38 29.07 31.74 19.7 25.03 28.6 33.14 19.97 25.37 28.99 33.58
60-70 5.38 7.05 8.16 9.57 10.61 11.64 6.76 8.86 10.25 12.02 6.85 8.98 10.39 12.18
70-80 3.26 4.32 5.02 5.90 6.56 7.21 4.09 5.42 6.3 7.41 4.15 5.5 6.39 7.52
80-90 2.51 3.34 3.89 4.59 5.10 5.62 3.15 4.2 4.89 5.76 3.19 4.25 4.96 5.84
90-100 2.10 2.81 3.27 3.86 4.30 4.73 2.64 3.52 4.11 4.85 2.67 3.57 4.17 4.92
100-110 1.83 2.46 2.87 3.39 3.77 4.16 2.3 3.08 3.6 4.26 2.33 3.13 3.65 4.31
110-120 1.64 2.20 2.58 3.05 3.40 3.74 2.06 2.77 3.24 3.83 2.09 2.81 3.28 3.88
total (mm) 45.2 59.1 68.3 80.0 88.7 97.3 56.7 74.2 85.8 100.5 57.5 75.2 87.0 101.8Source: CDTA Final Report, Annex II.
43
TA-8128 BAN: Preparing Coastal Towns Infrastructure Improvement Project – FR Vol. 4: Infrastructure
2. FLOODING AND DRAINAGE CONGESTION ANALYSIS
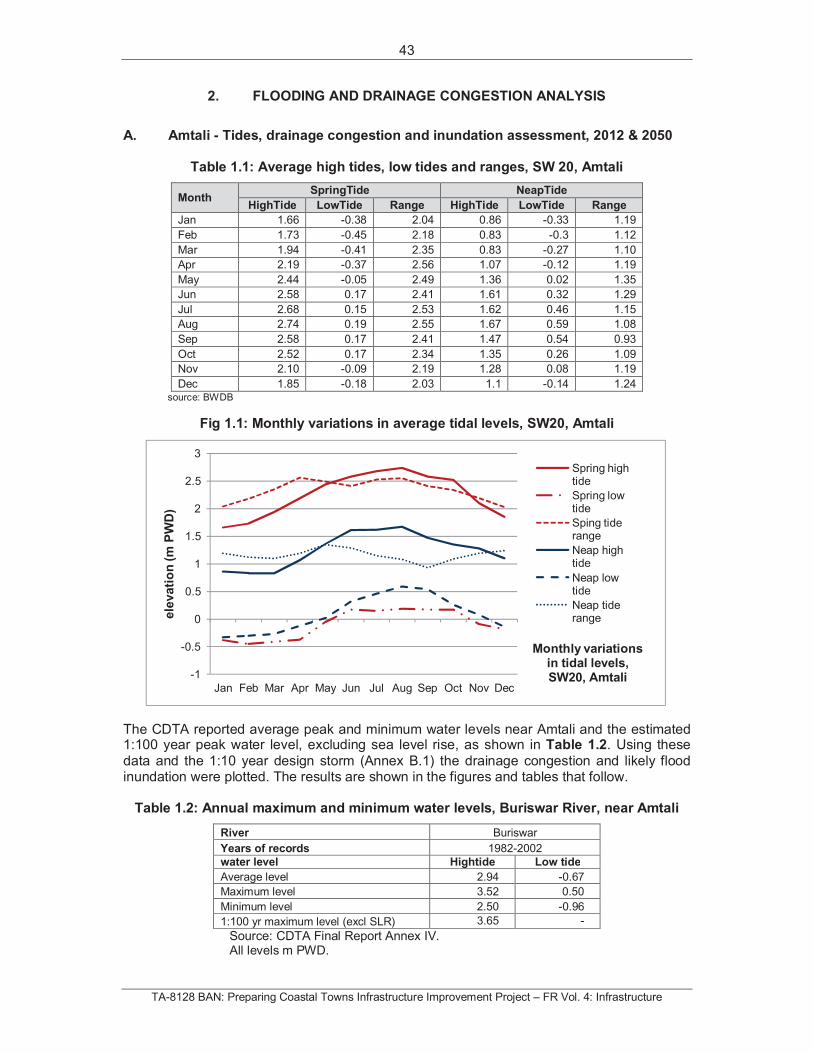
A. Amtali - Tides, drainage congestion and inundation assessment, 2012 & 2050
Table 1.1: Average high tides, low tides and ranges, SW 20, Amtali
MonthSpringTide NeapTide
HighTide LowTide Range HighTide LowTide Range
Jan 1.66 -0.38 2.04 0.86 -0.33 1.19
Feb 1.73 -0.45 2.18 0.83 -0.3 1.12
Mar 1.94 -0.41 2.35 0.83 -0.27 1.10
Apr 2.19 -0.37 2.56 1.07 -0.12 1.19
May 2.44 -0.05 2.49 1.36 0.02 1.35
Jun 2.58 0.17 2.41 1.61 0.32 1.29
Jul 2.68 0.15 2.53 1.62 0.46 1.15
Aug 2.74 0.19 2.55 1.67 0.59 1.08
Sep 2.58 0.17 2.41 1.47 0.54 0.93
Oct 2.52 0.17 2.34 1.35 0.26 1.09
Nov 2.10 -0.09 2.19 1.28 0.08 1.19
Dec 1.85 -0.18 2.03 1.1 -0.14 1.24source: BWDB
Fig 1.1: Monthly variations in average tidal levels, SW20, Amtali
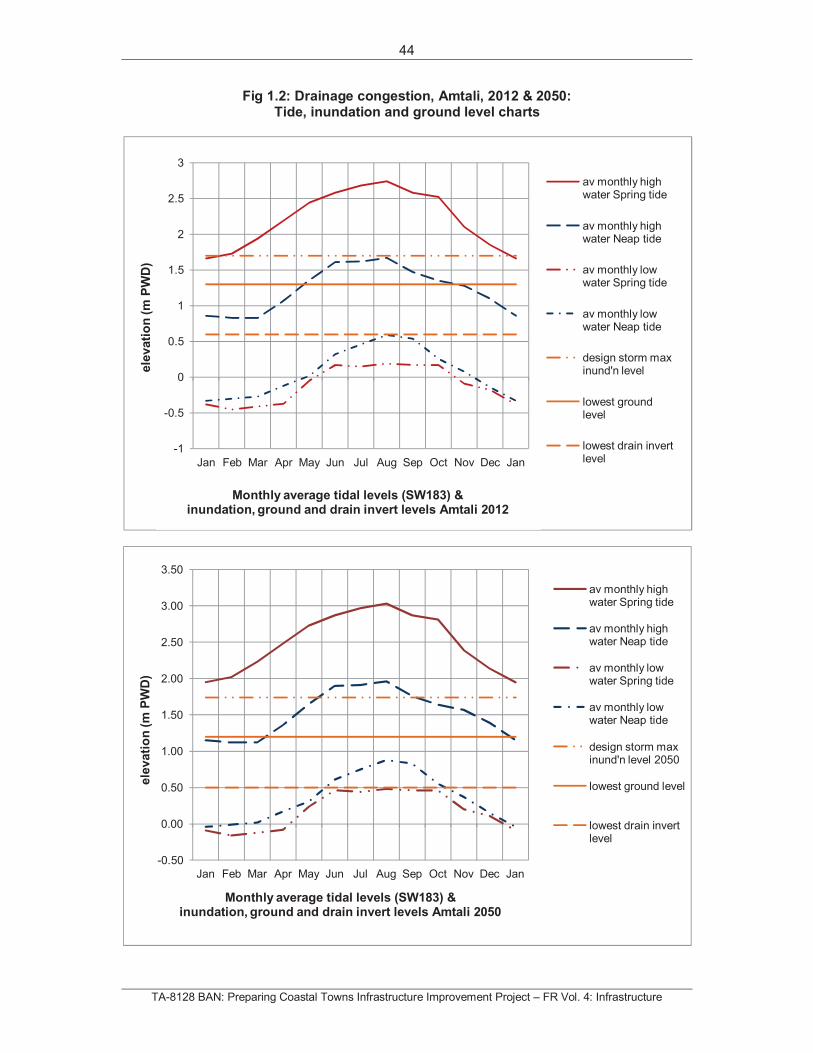
The CDTA reported average peak and minimum water levels near Amtali and the estimated 1:100 year peak water level, excluding sea level rise, as shown in Table 1.2. Using these
data and the 1:10 year design storm (Annex B.1) the drainage congestion and likely flood inundation were plotted. The results are shown in the figures and tables that follow.
Table 1.2: Annual maximum and minimum water levels, Buriswar River, near Amtali
River Buriswar
Years of records 1982-2002
water level Hightide Low tide
Average level 2.94 -0.67
Maximum level 3.52 0.50
Minimum level 2.50 -0.96
1:100 yr maximum level (excl SLR) 3.65 -
Source: CDTA Final Report Annex IV. All levels m PWD.
-1
-0.5
0
0.5
1
1.5
2
2.5
3
Jan Feb Mar Apr May Jun Jul Aug Sep Oct Nov Dec
Spring high tide
Spring low tide
Sping tide range
Neap high tide
Neap low tide
Neap tide range
Monthly variations in tidal levels, SW20, Amtali
ele
vati
on
(mP
WD
)
44
TA-8128 BAN: Preparing Coastal Towns Infrastructure Improvement Project – FR Vol. 4: Infrastructure
Fig 1.2: Drainage congestion, Amtali, 2012 & 2050: Tide, inundation and ground level charts
-0.50
0.00
0.50
1.00
1.50
2.00
2.50
3.00
3.50
Jan Feb Mar Apr May Jun Jul Aug Sep Oct Nov Dec Jan
av monthly high water Spring tide
av monthly high water Neap tide
av monthly low water Spring tide
av monthly low water Neap tide
design storm max inund'n level 2050
lowest ground level
lowest drain invert level
ele
vati
on
(mP
WD
)
Monthly average tidal levels (SW183) & inundation, ground and drain invert levels Amtali 2050
-1
-0.5
0
0.5
1
1.5
2
2.5
3
Jan Feb Mar Apr May Jun Jul Aug Sep Oct Nov Dec Jan
av monthly high water Spring tide
av monthly high water Neap tide
av monthly low water Spring tide
av monthly low water Neap tide
design storm max inund'n level
lowest ground level
lowest drain invert level
ele
vati
on
(mP
WD
)
Monthly average tidal levels (SW183) & inundation, ground and drain invert levels Amtali 2012
45
TA-8128 BAN: Preparing Coastal Towns Infrastructure Improvement Project – FR Vol. 4: Infrastructure
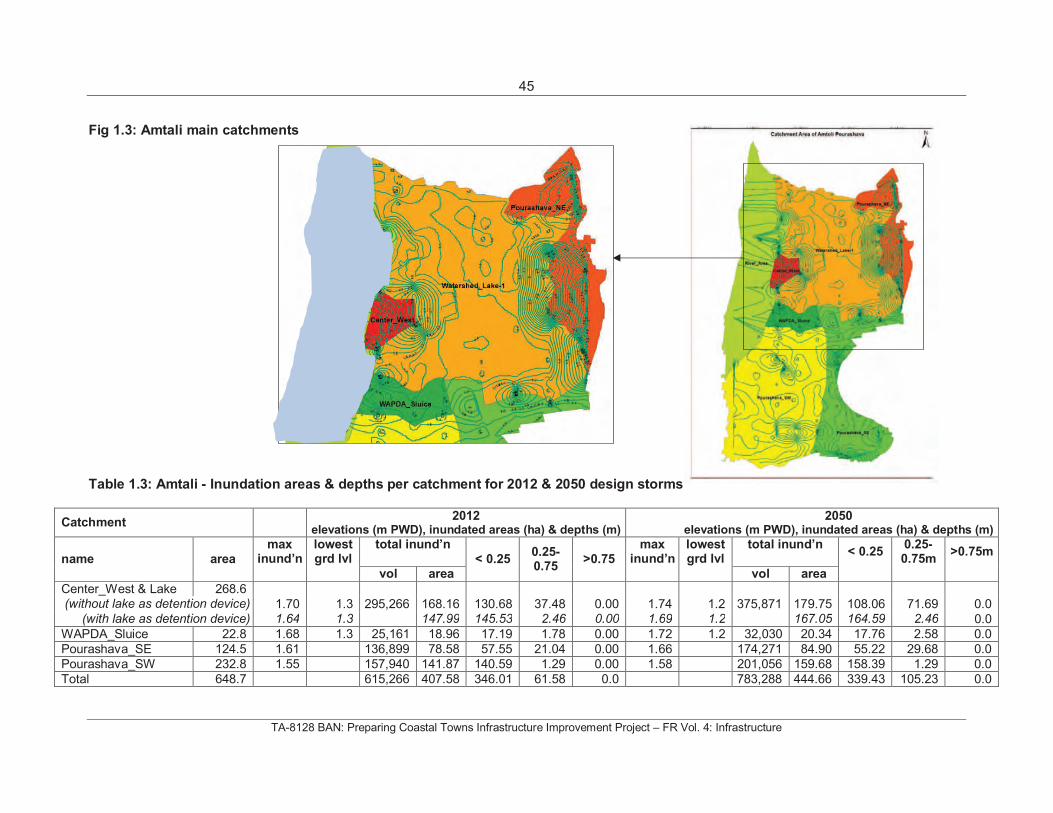
Fig 1.3: Amtali main catchments
Table 1.3: Amtali - Inundation areas & depths per catchment for 2012 & 2050 design storms
Catchment 2012
elevations (m PWD), inundated areas (ha) & depths (m)2050
elevations (m PWD), inundated areas (ha) & depths (m)
name areamax
inund’nlowest grd lvl
total inund’n< 0.25
0.25-0.75
>0.75 max
inund’nlowest grd lvl
total inund’n< 0.25
0.25-0.75m
>0.75m
vol area vol area
Center_West & Lake 268.6(without lake as detention device) 1.70 1.3 295,266 168.16 130.68 37.48 0.00 1.74 1.2 375,871 179.75 108.06 71.69 0.0
(with lake as detention device) 1.64 1.3 147.99 145.53 2.46 0.00 1.69 1.2 167.05 164.59 2.46 0.0
WAPDA_Sluice 22.8 1.68 1.3 25,161 18.96 17.19 1.78 0.00 1.72 1.2 32,030 20.34 17.76 2.58 0.0
Pourashava_SE 124.5 1.61 136,899 78.58 57.55 21.04 0.00 1.66 174,271 84.90 55.22 29.68 0.0
Pourashava_SW 232.8 1.55 157,940 141.87 140.59 1.29 0.00 1.58 201,056 159.68 158.39 1.29 0.0
Total 648.7 615,266 407.58 346.01 61.58 0.0 783,288 444.66 339.43 105.23 0.0
46
TA-8128 BAN: Preparing Coastal Towns Infrastructure Improvement Project – FR Vol. 4: Infrastructure
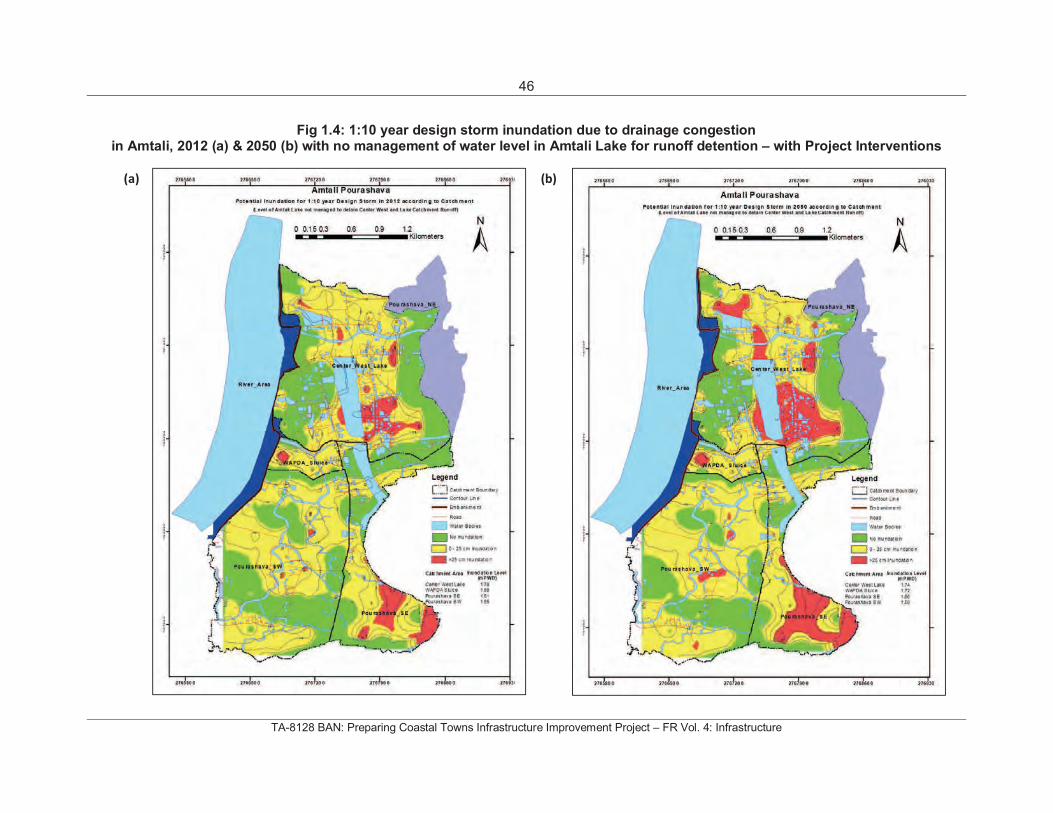
Fig 1.4: 1:10 year design storm inundation due to drainage congestion in Amtali, 2012 (a) & 2050 (b) with no management of water level in Amtali Lake for runoff detention – with Project Interventions
(a) (b)
47
TA-8128 BAN: Preparing Coastal Towns Infrastructure Improvement Project – FR Vol. 4: Infrastructure
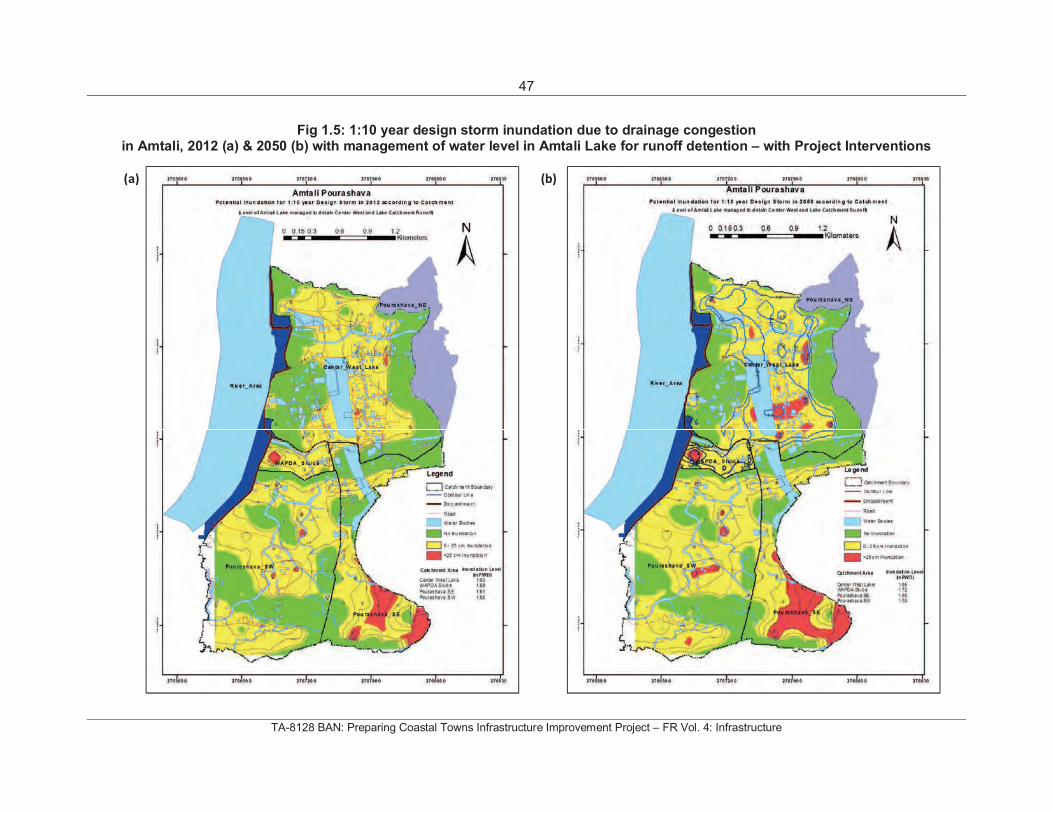
Fig 1.5: 1:10 year design storm inundation due to drainage congestion in Amtali, 2012 (a) & 2050 (b) with management of water level in Amtali Lake for runoff detention – with Project Interventions
(a) (b)
48
TA-8128 BAN: Preparing Coastal Towns Infrastructure Improvement Project – FR Vol. 4: Infrastructure
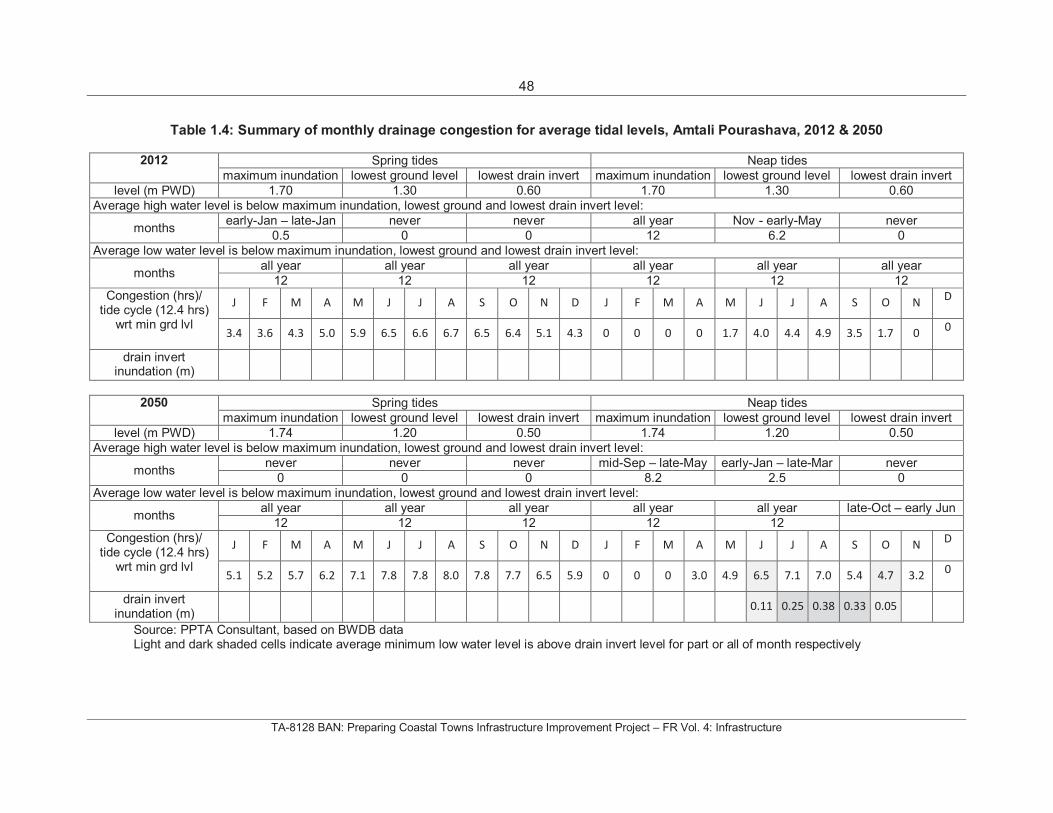
Table 1.4: Summary of monthly drainage congestion for average tidal levels, Amtali Pourashava, 2012 & 2050
2012 Spring tides Neap tides
maximum inundation lowest ground level lowest drain invert maximum inundation lowest ground level lowest drain invert
level (m PWD) 1.70 1.30 0.60 1.70 1.30 0.60
Average high water level is below maximum inundation, lowest ground and lowest drain invert level:
months early-Jan – late-Jan never never all year Nov - early-May never
0.5 0 0 12 6.2 0
Average low water level is below maximum inundation, lowest ground and lowest drain invert level:
months all year all year all year all year all year all year
12 12 12 12 12 12
Congestion (hrs)/ tide cycle (12.4 hrs)
wrt min grd lvl
J F M A M J J A S O N D J F M A M J J A S O N D
3.4 3.6 4.3 5.0 5.9 6.5 6.6 6.7 6.5 6.4 5.1 4.3 0 0 0 0 1.7 4.0 4.4 4.9 3.5 1.7 0 0
drain invert inundation (m)
2050 Spring tides Neap tides
maximum inundation lowest ground level lowest drain invert maximum inundation lowest ground level lowest drain invert
level (m PWD) 1.74 1.20 0.50 1.74 1.20 0.50
Average high water level is below maximum inundation, lowest ground and lowest drain invert level:
months never never never mid-Sep – late-May early-Jan – late-Mar never
0 0 0 8.2 2.5 0
Average low water level is below maximum inundation, lowest ground and lowest drain invert level:
months all year all year all year all year all year late-Oct – early Jun
12 12 12 12 12
Congestion (hrs)/ tide cycle (12.4 hrs)
wrt min grd lvl
J F M A M J J A S O N D J F M A M J J A S O N D
5.1 5.2 5.7 6.2 7.1 7.8 7.8 8.0 7.8 7.7 6.5 5.9 0 0 0 3.0 4.9 6.5 7.1 7.0 5.4 4.7 3.2 0
drain invert inundation (m)
0.11 0.25 0.38 0.33 0.05
Source: PPTA Consultant, based on BWDB data Light and dark shaded cells indicate average minimum low water level is above drain invert level for part or all of month respectively
49
TA-8128 BAN: Preparing Coastal Towns Infrastructure Improvement Project – FR Vol. 4: Infrastructure
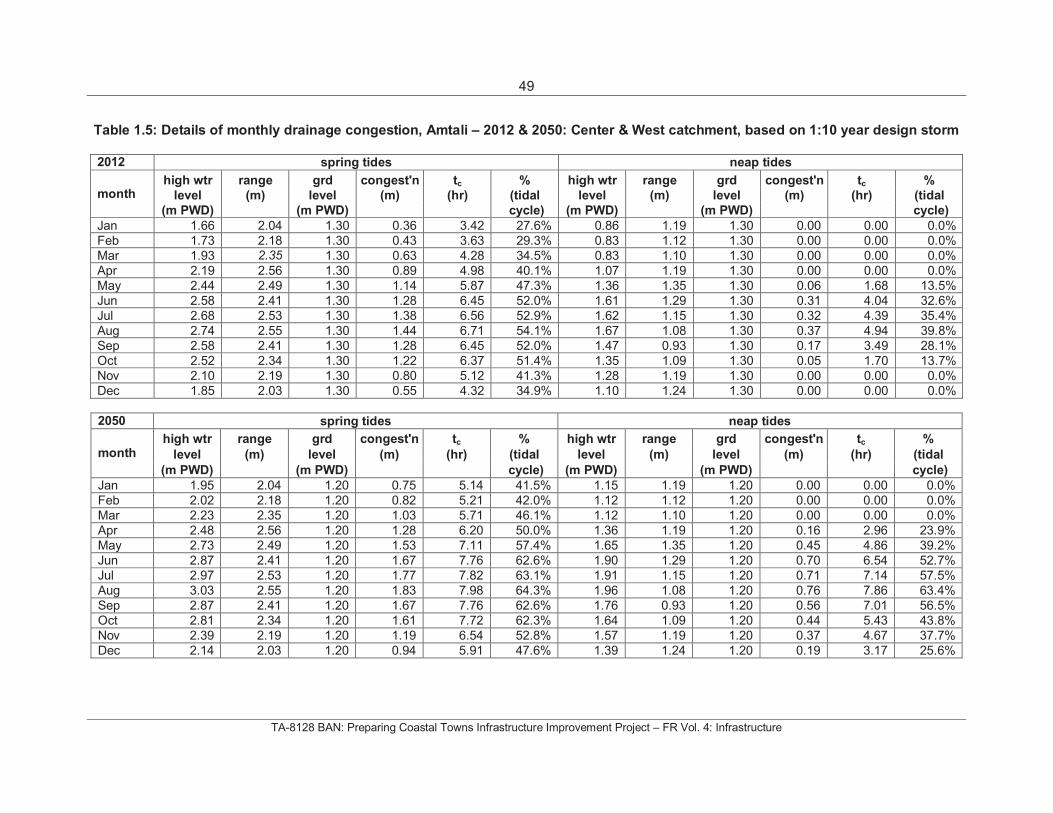
Table 1.5: Details of monthly drainage congestion, Amtali – 2012 & 2050: Center & West catchment, based on 1:10 year design storm
2012 spring tides neap tides
month high wtr range grd congest'n tc % high wtr range grd congest'n tc %
level (m) level (m) (hr) (tidal level (m) level (m) (hr) (tidal
(m PWD) (m PWD) cycle) (m PWD) (m PWD) cycle)
Jan 1.66 2.04 1.30 0.36 3.42 27.6% 0.86 1.19 1.30 0.00 0.00 0.0%
Feb 1.73 2.18 1.30 0.43 3.63 29.3% 0.83 1.12 1.30 0.00 0.00 0.0%
Mar 1.93 2.35 1.30 0.63 4.28 34.5% 0.83 1.10 1.30 0.00 0.00 0.0%
Apr 2.19 2.56 1.30 0.89 4.98 40.1% 1.07 1.19 1.30 0.00 0.00 0.0%
May 2.44 2.49 1.30 1.14 5.87 47.3% 1.36 1.35 1.30 0.06 1.68 13.5%
Jun 2.58 2.41 1.30 1.28 6.45 52.0% 1.61 1.29 1.30 0.31 4.04 32.6%
Jul 2.68 2.53 1.30 1.38 6.56 52.9% 1.62 1.15 1.30 0.32 4.39 35.4%
Aug 2.74 2.55 1.30 1.44 6.71 54.1% 1.67 1.08 1.30 0.37 4.94 39.8%
Sep 2.58 2.41 1.30 1.28 6.45 52.0% 1.47 0.93 1.30 0.17 3.49 28.1%
Oct 2.52 2.34 1.30 1.22 6.37 51.4% 1.35 1.09 1.30 0.05 1.70 13.7%
Nov 2.10 2.19 1.30 0.80 5.12 41.3% 1.28 1.19 1.30 0.00 0.00 0.0%
Dec 1.85 2.03 1.30 0.55 4.32 34.9% 1.10 1.24 1.30 0.00 0.00 0.0%
2050 spring tides neap tides
month high wtr range grd congest'n tc % high wtr range grd congest'n tc %
level (m) level (m) (hr) (tidal level (m) level (m) (hr) (tidal
(m PWD) (m PWD) cycle) (m PWD) (m PWD) cycle)
Jan 1.95 2.04 1.20 0.75 5.14 41.5% 1.15 1.19 1.20 0.00 0.00 0.0%
Feb 2.02 2.18 1.20 0.82 5.21 42.0% 1.12 1.12 1.20 0.00 0.00 0.0%
Mar 2.23 2.35 1.20 1.03 5.71 46.1% 1.12 1.10 1.20 0.00 0.00 0.0%
Apr 2.48 2.56 1.20 1.28 6.20 50.0% 1.36 1.19 1.20 0.16 2.96 23.9%
May 2.73 2.49 1.20 1.53 7.11 57.4% 1.65 1.35 1.20 0.45 4.86 39.2%
Jun 2.87 2.41 1.20 1.67 7.76 62.6% 1.90 1.29 1.20 0.70 6.54 52.7%
Jul 2.97 2.53 1.20 1.77 7.82 63.1% 1.91 1.15 1.20 0.71 7.14 57.5%
Aug 3.03 2.55 1.20 1.83 7.98 64.3% 1.96 1.08 1.20 0.76 7.86 63.4%
Sep 2.87 2.41 1.20 1.67 7.76 62.6% 1.76 0.93 1.20 0.56 7.01 56.5%
Oct 2.81 2.34 1.20 1.61 7.72 62.3% 1.64 1.09 1.20 0.44 5.43 43.8%
Nov 2.39 2.19 1.20 1.19 6.54 52.8% 1.57 1.19 1.20 0.37 4.67 37.7%
Dec 2.14 2.03 1.20 0.94 5.91 47.6% 1.39 1.24 1.20 0.19 3.17 25.6%
50
TA-8128 BAN: Preparing Coastal Towns Infrastructure Improvement Project – FR Vol. 4: Infrastructure
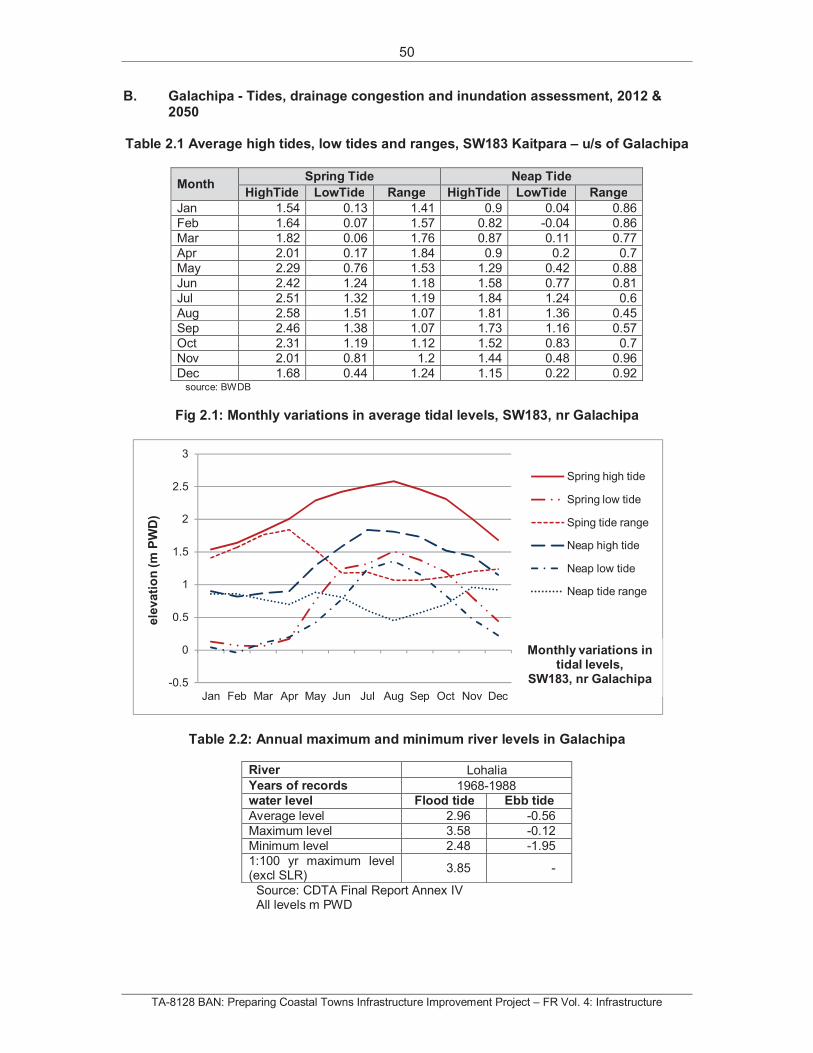
B. Galachipa - Tides, drainage congestion and inundation assessment, 2012 & 2050
Table 2.1 Average high tides, low tides and ranges, SW183 Kaitpara – u/s of Galachipa
Month Spring Tide Neap Tide
HighTide LowTide Range HighTide LowTide Range
Jan 1.54 0.13 1.41 0.9 0.04 0.86
Feb 1.64 0.07 1.57 0.82 -0.04 0.86
Mar 1.82 0.06 1.76 0.87 0.11 0.77
Apr 2.01 0.17 1.84 0.9 0.2 0.7
May 2.29 0.76 1.53 1.29 0.42 0.88
Jun 2.42 1.24 1.18 1.58 0.77 0.81
Jul 2.51 1.32 1.19 1.84 1.24 0.6
Aug 2.58 1.51 1.07 1.81 1.36 0.45
Sep 2.46 1.38 1.07 1.73 1.16 0.57
Oct 2.31 1.19 1.12 1.52 0.83 0.7
Nov 2.01 0.81 1.2 1.44 0.48 0.96
Dec 1.68 0.44 1.24 1.15 0.22 0.92source: BWDB
Fig 2.1: Monthly variations in average tidal levels, SW183, nr Galachipa
Table 2.2: Annual maximum and minimum river levels in Galachipa
River Lohalia
Years of records 1968-1988water level Flood tide Ebb tide
Average level 2.96 -0.56
Maximum level 3.58 -0.12
Minimum level 2.48 -1.95
1:100 yr maximum level (excl SLR)
3.85 -
Source: CDTA Final Report Annex IV All levels m PWD
-0.5
0
0.5
1
1.5
2
2.5
3
Jan Feb Mar Apr May Jun Jul Aug Sep Oct Nov Dec
Spring high tide
Spring low tide
Sping tide range
Neap high tide
Neap low tide
Neap tide range
ele
vati
on
(mP
WD
)
Monthly variations in tidal levels,
SW183, nr Galachipa
51
TA-8128 BAN: Preparing Coastal Towns Infrastructure Improvement Project – FR Vol. 4: Infrastructure
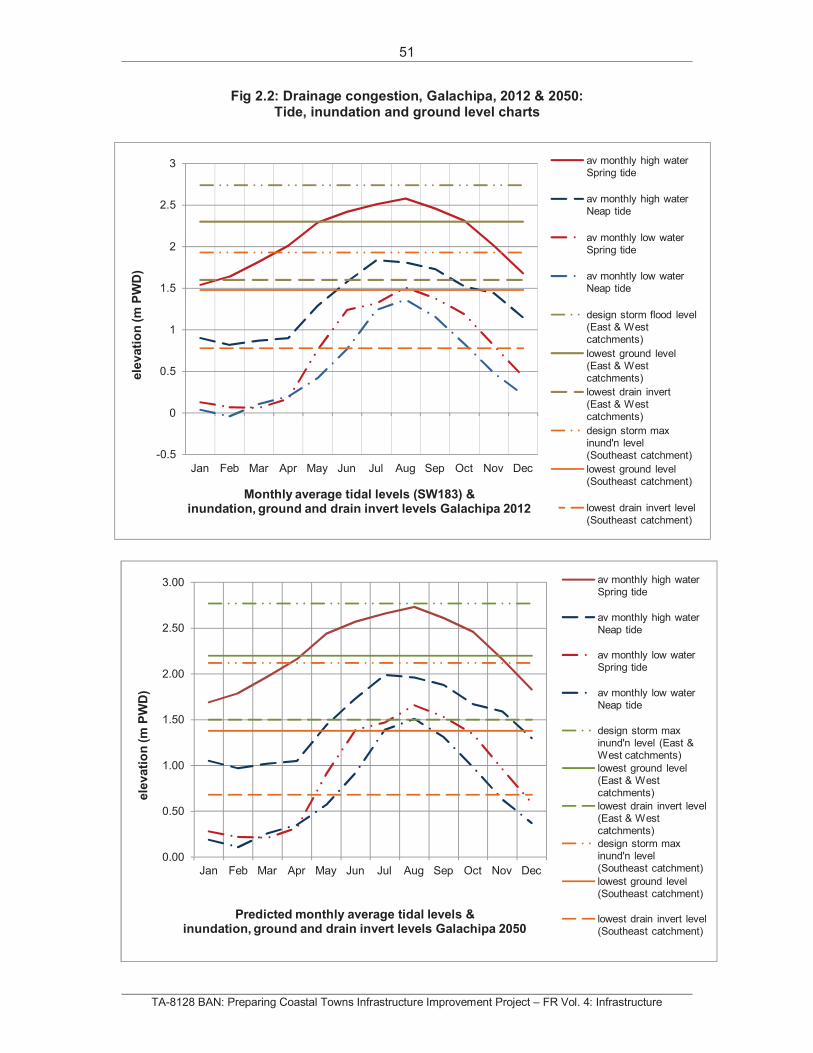
Fig 2.2: Drainage congestion, Galachipa, 2012 & 2050: Tide, inundation and ground level charts
-0.5
0
0.5
1
1.5
2
2.5
3
Jan Feb Mar Apr May Jun Jul Aug Sep Oct Nov Dec
av monthly high water Spring tide
av monthly high water Neap tide
av monthly low water Spring tide
av monhtly low water Neap tide
design storm flood level (East & West catchments)
lowest ground level (East & West catchments)
lowest drain invert (East & West catchments)
design storm max inund'n level (Southeast catchment)
lowest ground level (Southeast catchment)
lowest drain invert level (Southeast catchment)
ele
vati
on
(mP
WD
)
Monthly average tidal levels (SW183) & inundation, ground and drain invert levels Galachipa 2012
0.00
0.50
1.00
1.50
2.00
2.50
3.00
Jan Feb Mar Apr May Jun Jul Aug Sep Oct Nov Dec
av monthly high water Spring tide
av monthly high water Neap tide
av monthly low water Spring tide
av monthly low water Neap tide
design storm max inund'n level (East & West catchments)
lowest ground level (East & West catchments)
lowest drain invert level (East & West catchments)
design storm max inund'n level (Southeast catchment)
lowest ground level (Southeast catchment)
lowest drain invert level (Southeast catchment)
ele
vati
on
(mP
WD
)
Predicted monthly average tidal levels & inundation, ground and drain invert levels Galachipa 2050
52
TA-8128 BAN: Preparing Coastal Towns Infrastructure Improvement Project – FR Vol. 4: Infrastructure
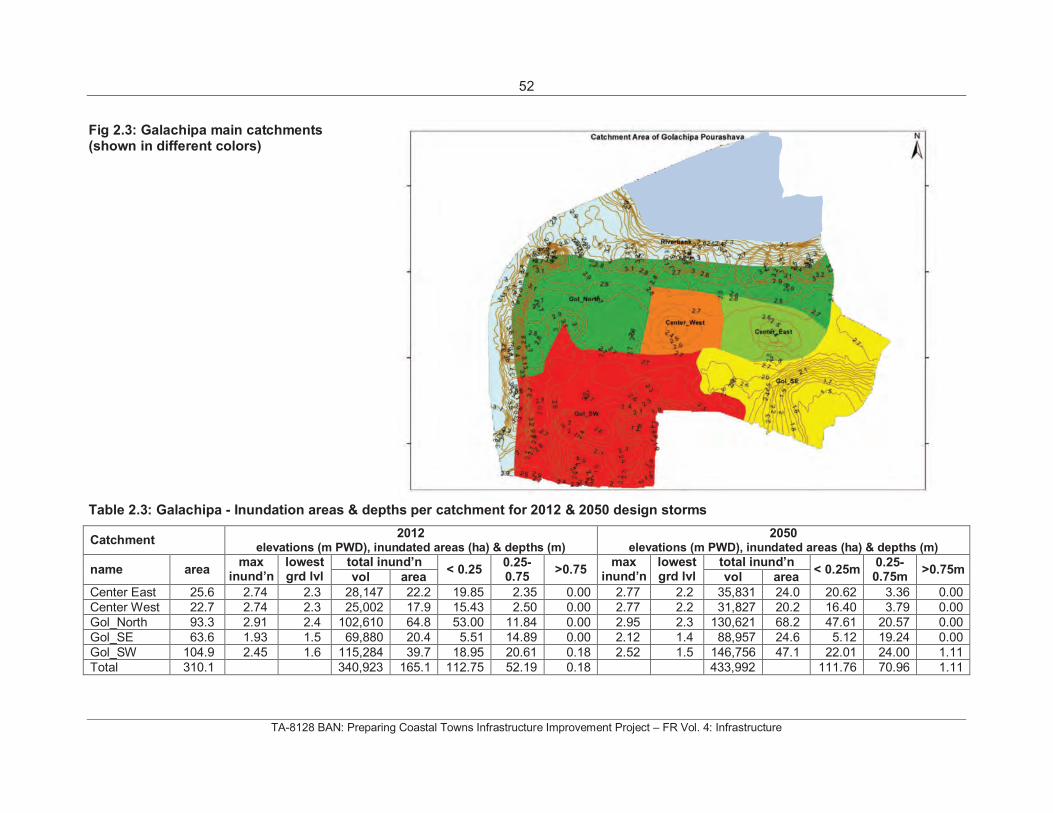
Fig 2.3: Galachipa main catchments (shown in different colors)
Table 2.3: Galachipa - Inundation areas & depths per catchment for 2012 & 2050 design storms
Catchment 2012
elevations (m PWD), inundated areas (ha) & depths (m)
2050elevations (m PWD), inundated areas (ha) & depths (m)
name areamax
inund’nlowest grd lvl
total inund’n< 0.25
0.25-0.75
>0.75 max
inund’nlowest grd lvl
total inund’n< 0.25m
0.25-0.75m
>0.75mvol area vol area
Center East 25.6 2.74 2.3 28,147 22.2 19.85 2.35 0.00 2.77 2.2 35,831 24.0 20.62 3.36 0.00
Center West 22.7 2.74 2.3 25,002 17.9 15.43 2.50 0.00 2.77 2.2 31,827 20.2 16.40 3.79 0.00
Gol_North 93.3 2.91 2.4 102,610 64.8 53.00 11.84 0.00 2.95 2.3 130,621 68.2 47.61 20.57 0.00
Gol_SE 63.6 1.93 1.5 69,880 20.4 5.51 14.89 0.00 2.12 1.4 88,957 24.6 5.12 19.24 0.00
Gol_SW 104.9 2.45 1.6 115,284 39.7 18.95 20.61 0.18 2.52 1.5 146,756 47.1 22.01 24.00 1.11
Total 310.1 340,923 165.1 112.75 52.19 0.18 433,992 111.76 70.96 1.11
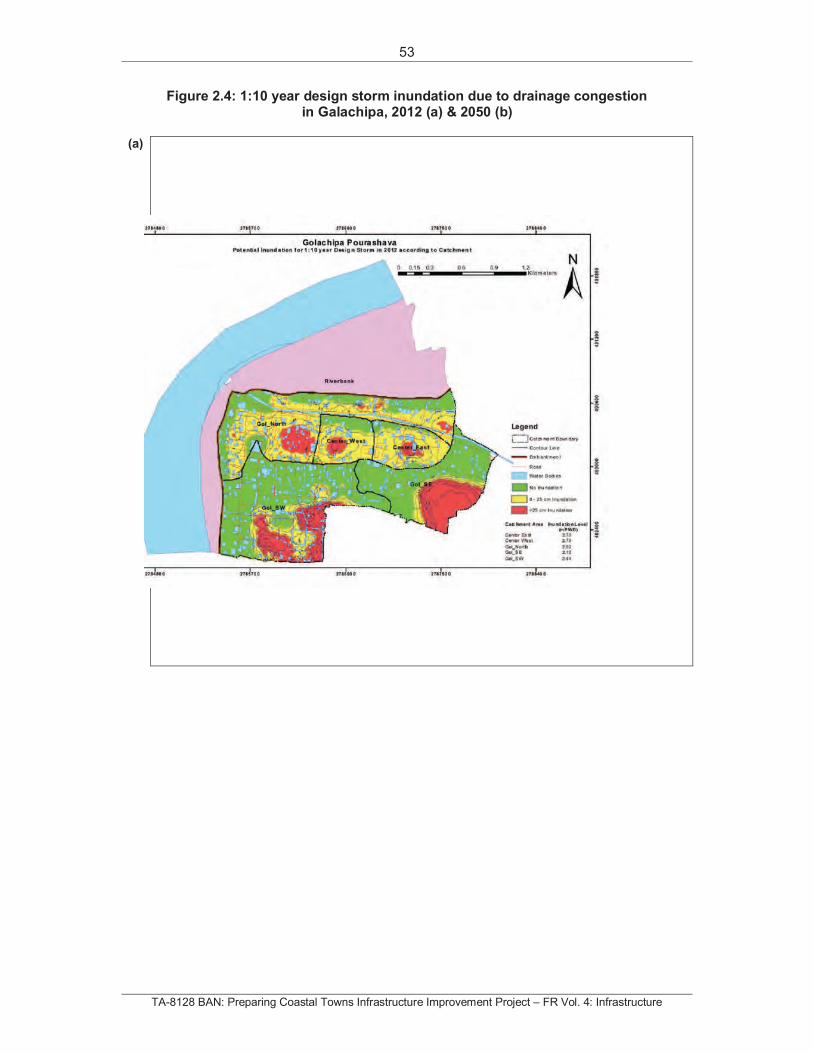
53
TA-8128 BAN: Preparing Coastal Towns Infrastructure Improvement Project – FR Vol. 4: Infrastructure
Figure 2.4: 1:10 year design storm inundation due to drainage congestion in Galachipa, 2012 (a) & 2050 (b)
(a)
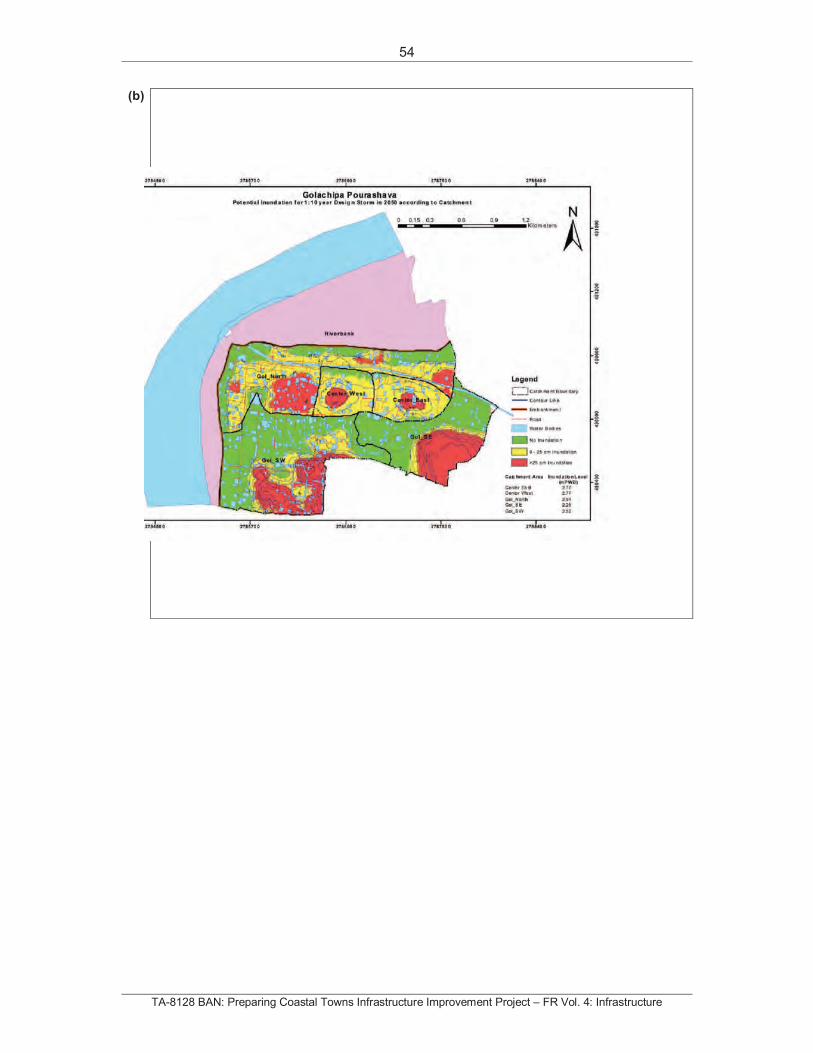
54
TA-8128 BAN: Preparing Coastal Towns Infrastructure Improvement Project – FR Vol. 4: Infrastructure
(b)
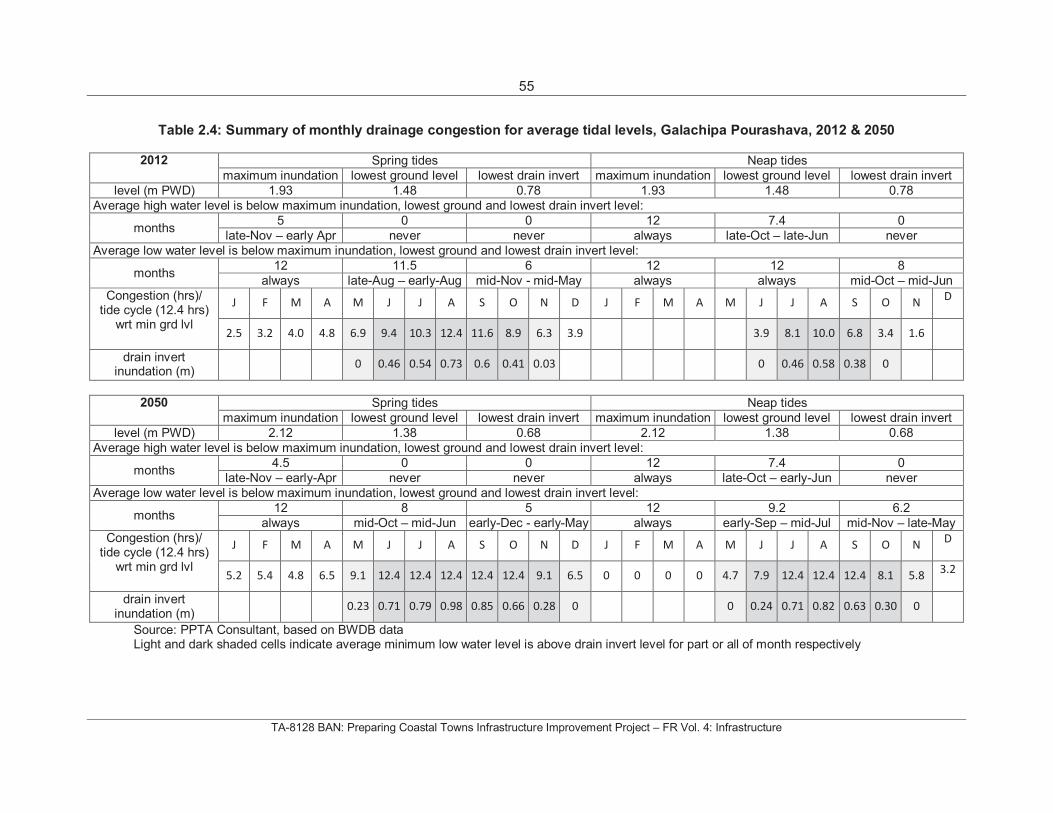
55
TA-8128 BAN: Preparing Coastal Towns Infrastructure Improvement Project – FR Vol. 4: Infrastructure
Table 2.4: Summary of monthly drainage congestion for average tidal levels, Galachipa Pourashava, 2012 & 2050
2012 Spring tides Neap tides
maximum inundation lowest ground level lowest drain invert maximum inundation lowest ground level lowest drain invert
level (m PWD) 1.93 1.48 0.78 1.93 1.48 0.78
Average high water level is below maximum inundation, lowest ground and lowest drain invert level:
months 5 0 0 12 7.4 0
late-Nov – early Apr never never always late-Oct – late-Jun never
Average low water level is below maximum inundation, lowest ground and lowest drain invert level:
months 12 11.5 6 12 12 8
always late-Aug – early-Aug mid-Nov - mid-May always always mid-Oct – mid-Jun
Congestion (hrs)/ tide cycle (12.4 hrs)
wrt min grd lvl
J F M A M J J A S O N D J F M A M J J A S O N D
2.5 3.2 4.0 4.8 6.9 9.4 10.3 12.4 11.6 8.9 6.3 3.9 3.9 8.1 10.0 6.8 3.4 1.6
drain invert inundation (m)
0 0.46 0.54 0.73 0.6 0.41 0.03 0 0.46 0.58 0.38 0
2050 Spring tides Neap tides
maximum inundation lowest ground level lowest drain invert maximum inundation lowest ground level lowest drain invert
level (m PWD) 2.12 1.38 0.68 2.12 1.38 0.68
Average high water level is below maximum inundation, lowest ground and lowest drain invert level:
months 4.5 0 0 12 7.4 0
late-Nov – early-Apr never never always late-Oct – early-Jun never
Average low water level is below maximum inundation, lowest ground and lowest drain invert level:
months 12 8 5 12 9.2 6.2
always mid-Oct – mid-Jun early-Dec - early-May always early-Sep – mid-Jul mid-Nov – late-May
Congestion (hrs)/ tide cycle (12.4 hrs)
wrt min grd lvl
J F M A M J J A S O N D J F M A M J J A S O N D
5.2 5.4 4.8 6.5 9.1 12.4 12.4 12.4 12.4 12.4 9.1 6.5 0 0 0 0 4.7 7.9 12.4 12.4 12.4 8.1 5.8 3.2
drain invert inundation (m)
0.23 0.71 0.79 0.98 0.85 0.66 0.28 0 0 0.24 0.71 0.82 0.63 0.30 0
Source: PPTA Consultant, based on BWDB data Light and dark shaded cells indicate average minimum low water level is above drain invert level for part or all of month respectively
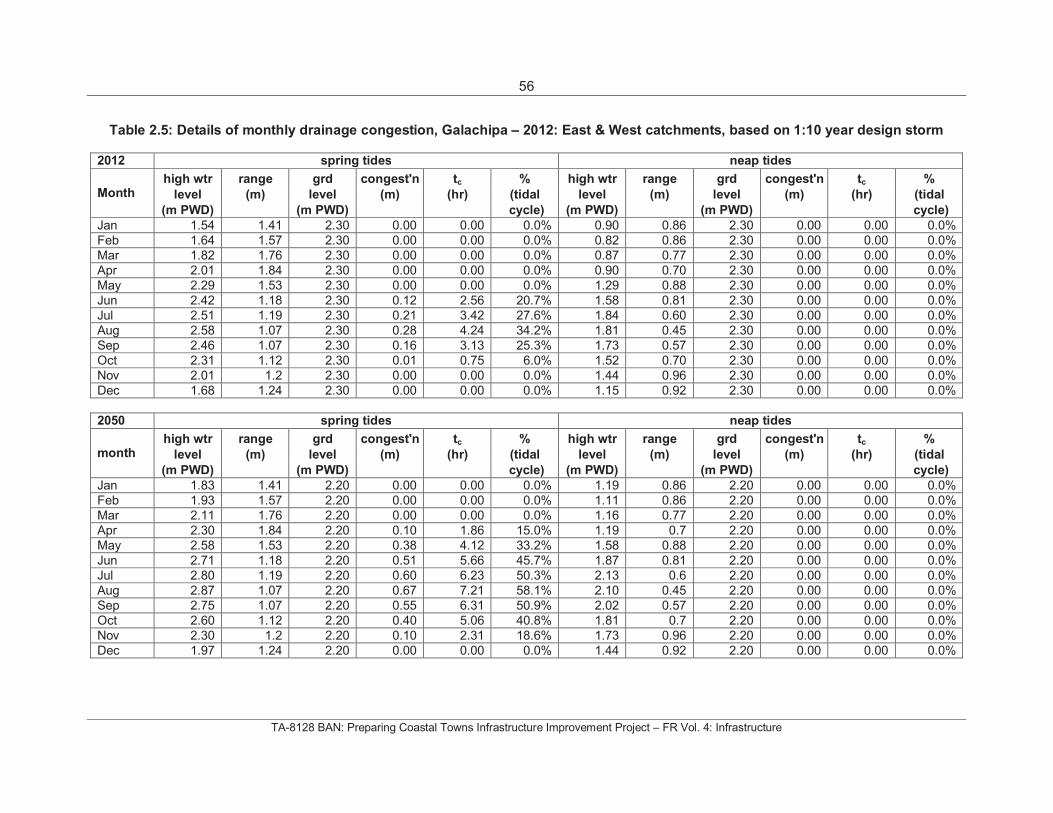
56
TA-8128 BAN: Preparing Coastal Towns Infrastructure Improvement Project – FR Vol. 4: Infrastructure
Table 2.5: Details of monthly drainage congestion, Galachipa – 2012: East & West catchments, based on 1:10 year design storm
2012 spring tides neap tides
Month high wtr range grd congest'n tc % high wtr range grd congest'n tc %
level (m) level (m) (hr) (tidal level (m) level (m) (hr) (tidal
(m PWD) (m PWD) cycle) (m PWD) (m PWD) cycle)
Jan 1.54 1.41 2.30 0.00 0.00 0.0% 0.90 0.86 2.30 0.00 0.00 0.0%
Feb 1.64 1.57 2.30 0.00 0.00 0.0% 0.82 0.86 2.30 0.00 0.00 0.0%
Mar 1.82 1.76 2.30 0.00 0.00 0.0% 0.87 0.77 2.30 0.00 0.00 0.0%
Apr 2.01 1.84 2.30 0.00 0.00 0.0% 0.90 0.70 2.30 0.00 0.00 0.0%
May 2.29 1.53 2.30 0.00 0.00 0.0% 1.29 0.88 2.30 0.00 0.00 0.0%
Jun 2.42 1.18 2.30 0.12 2.56 20.7% 1.58 0.81 2.30 0.00 0.00 0.0%
Jul 2.51 1.19 2.30 0.21 3.42 27.6% 1.84 0.60 2.30 0.00 0.00 0.0%
Aug 2.58 1.07 2.30 0.28 4.24 34.2% 1.81 0.45 2.30 0.00 0.00 0.0%
Sep 2.46 1.07 2.30 0.16 3.13 25.3% 1.73 0.57 2.30 0.00 0.00 0.0%
Oct 2.31 1.12 2.30 0.01 0.75 6.0% 1.52 0.70 2.30 0.00 0.00 0.0%
Nov 2.01 1.2 2.30 0.00 0.00 0.0% 1.44 0.96 2.30 0.00 0.00 0.0%
Dec 1.68 1.24 2.30 0.00 0.00 0.0% 1.15 0.92 2.30 0.00 0.00 0.0%
2050 spring tides neap tides
month high wtr range grd congest'n tc % high wtr range grd congest'n tc %
level (m) level (m) (hr) (tidal level (m) level (m) (hr) (tidal
(m PWD) (m PWD) cycle) (m PWD) (m PWD) cycle)
Jan 1.83 1.41 2.20 0.00 0.00 0.0% 1.19 0.86 2.20 0.00 0.00 0.0%
Feb 1.93 1.57 2.20 0.00 0.00 0.0% 1.11 0.86 2.20 0.00 0.00 0.0%
Mar 2.11 1.76 2.20 0.00 0.00 0.0% 1.16 0.77 2.20 0.00 0.00 0.0%
Apr 2.30 1.84 2.20 0.10 1.86 15.0% 1.19 0.7 2.20 0.00 0.00 0.0%
May 2.58 1.53 2.20 0.38 4.12 33.2% 1.58 0.88 2.20 0.00 0.00 0.0%
Jun 2.71 1.18 2.20 0.51 5.66 45.7% 1.87 0.81 2.20 0.00 0.00 0.0%
Jul 2.80 1.19 2.20 0.60 6.23 50.3% 2.13 0.6 2.20 0.00 0.00 0.0%
Aug 2.87 1.07 2.20 0.67 7.21 58.1% 2.10 0.45 2.20 0.00 0.00 0.0%
Sep 2.75 1.07 2.20 0.55 6.31 50.9% 2.02 0.57 2.20 0.00 0.00 0.0%
Oct 2.60 1.12 2.20 0.40 5.06 40.8% 1.81 0.7 2.20 0.00 0.00 0.0%
Nov 2.30 1.2 2.20 0.10 2.31 18.6% 1.73 0.96 2.20 0.00 0.00 0.0%
Dec 1.97 1.24 2.20 0.00 0.00 0.0% 1.44 0.92 2.20 0.00 0.00 0.0%
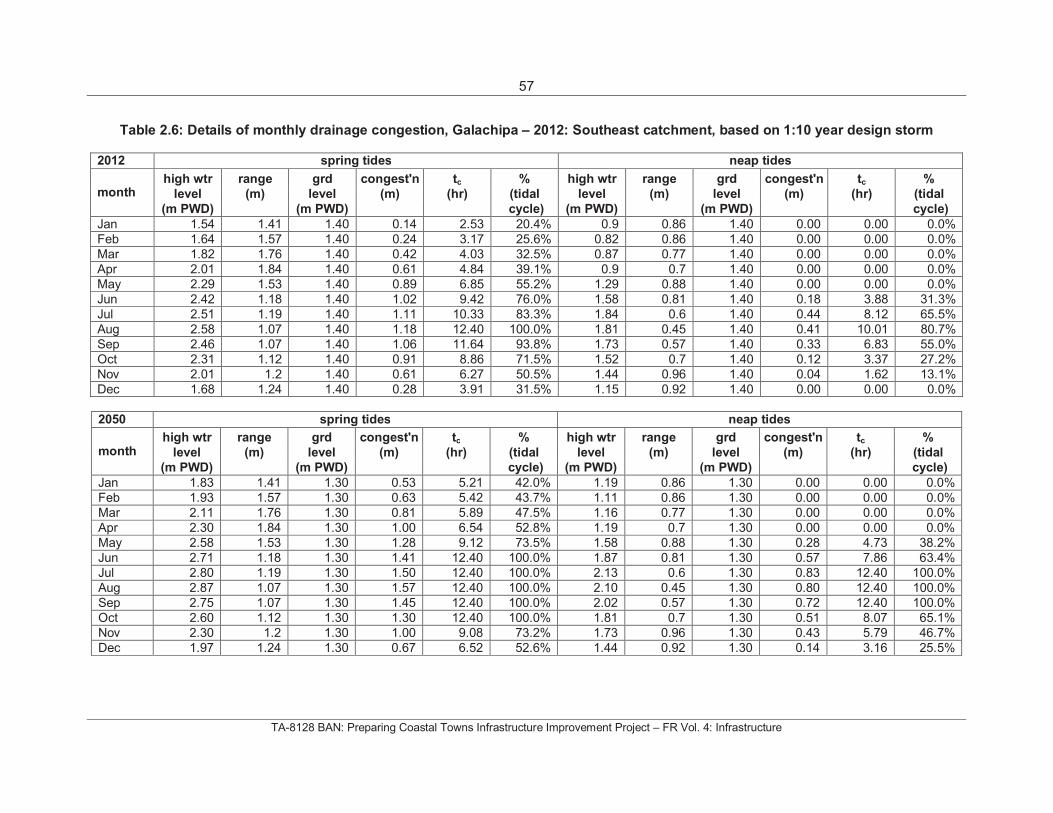
57
TA-8128 BAN: Preparing Coastal Towns Infrastructure Improvement Project – FR Vol. 4: Infrastructure
Table 2.6: Details of monthly drainage congestion, Galachipa – 2012: Southeast catchment, based on 1:10 year design storm
2012 spring tides neap tides
month high wtr range grd congest'n tc % high wtr range grd congest'n tc %
level (m) level (m) (hr) (tidal level (m) level (m) (hr) (tidal
(m PWD) (m PWD) cycle) (m PWD) (m PWD) cycle)
Jan 1.54 1.41 1.40 0.14 2.53 20.4% 0.9 0.86 1.40 0.00 0.00 0.0%
Feb 1.64 1.57 1.40 0.24 3.17 25.6% 0.82 0.86 1.40 0.00 0.00 0.0%
Mar 1.82 1.76 1.40 0.42 4.03 32.5% 0.87 0.77 1.40 0.00 0.00 0.0%
Apr 2.01 1.84 1.40 0.61 4.84 39.1% 0.9 0.7 1.40 0.00 0.00 0.0%
May 2.29 1.53 1.40 0.89 6.85 55.2% 1.29 0.88 1.40 0.00 0.00 0.0%
Jun 2.42 1.18 1.40 1.02 9.42 76.0% 1.58 0.81 1.40 0.18 3.88 31.3%
Jul 2.51 1.19 1.40 1.11 10.33 83.3% 1.84 0.6 1.40 0.44 8.12 65.5%
Aug 2.58 1.07 1.40 1.18 12.40 100.0% 1.81 0.45 1.40 0.41 10.01 80.7%
Sep 2.46 1.07 1.40 1.06 11.64 93.8% 1.73 0.57 1.40 0.33 6.83 55.0%
Oct 2.31 1.12 1.40 0.91 8.86 71.5% 1.52 0.7 1.40 0.12 3.37 27.2%
Nov 2.01 1.2 1.40 0.61 6.27 50.5% 1.44 0.96 1.40 0.04 1.62 13.1%
Dec 1.68 1.24 1.40 0.28 3.91 31.5% 1.15 0.92 1.40 0.00 0.00 0.0%
2050 spring tides neap tides
month high wtr range grd congest'n tc % high wtr range grd congest'n tc %
level (m) level (m) (hr) (tidal level (m) level (m) (hr) (tidal
(m PWD) (m PWD) cycle) (m PWD) (m PWD) cycle)
Jan 1.83 1.41 1.30 0.53 5.21 42.0% 1.19 0.86 1.30 0.00 0.00 0.0%
Feb 1.93 1.57 1.30 0.63 5.42 43.7% 1.11 0.86 1.30 0.00 0.00 0.0%
Mar 2.11 1.76 1.30 0.81 5.89 47.5% 1.16 0.77 1.30 0.00 0.00 0.0%
Apr 2.30 1.84 1.30 1.00 6.54 52.8% 1.19 0.7 1.30 0.00 0.00 0.0%
May 2.58 1.53 1.30 1.28 9.12 73.5% 1.58 0.88 1.30 0.28 4.73 38.2%
Jun 2.71 1.18 1.30 1.41 12.40 100.0% 1.87 0.81 1.30 0.57 7.86 63.4%
Jul 2.80 1.19 1.30 1.50 12.40 100.0% 2.13 0.6 1.30 0.83 12.40 100.0%
Aug 2.87 1.07 1.30 1.57 12.40 100.0% 2.10 0.45 1.30 0.80 12.40 100.0%
Sep 2.75 1.07 1.30 1.45 12.40 100.0% 2.02 0.57 1.30 0.72 12.40 100.0%
Oct 2.60 1.12 1.30 1.30 12.40 100.0% 1.81 0.7 1.30 0.51 8.07 65.1%
Nov 2.30 1.2 1.30 1.00 9.08 73.2% 1.73 0.96 1.30 0.43 5.79 46.7%
Dec 1.97 1.24 1.30 0.67 6.52 52.6% 1.44 0.92 1.30 0.14 3.16 25.5%
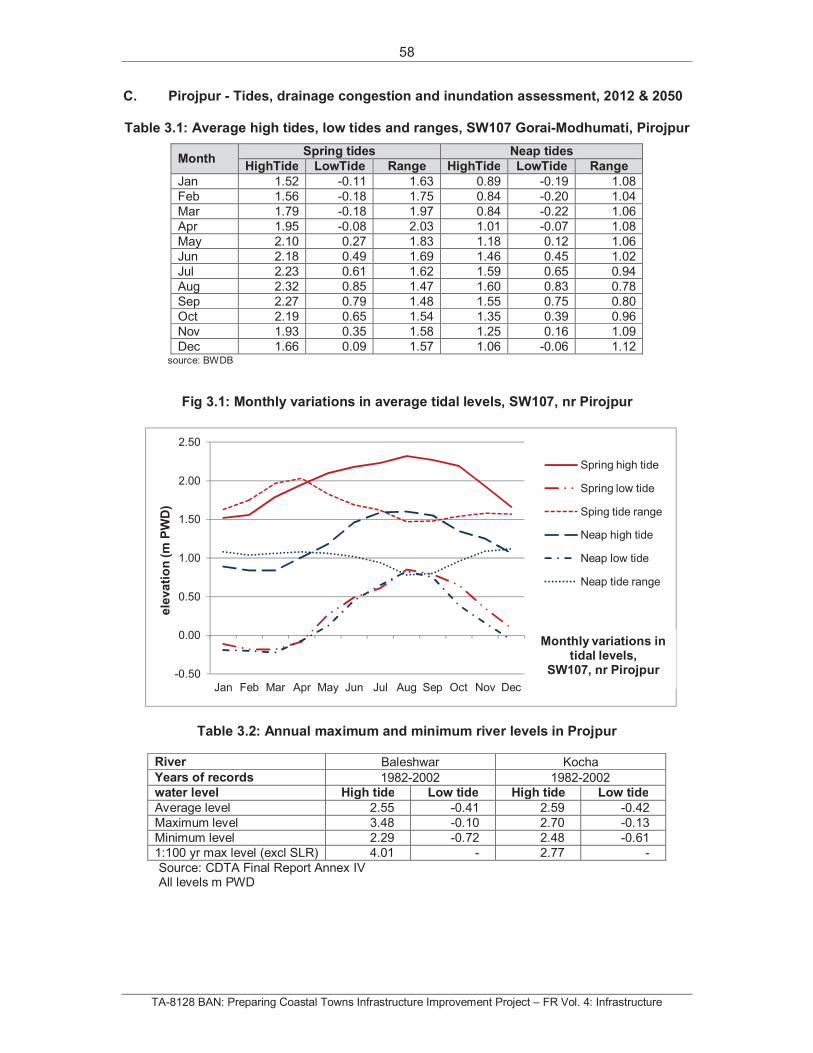
58
TA-8128 BAN: Preparing Coastal Towns Infrastructure Improvement Project – FR Vol. 4: Infrastructure
C. Pirojpur - Tides, drainage congestion and inundation assessment, 2012 & 2050
Table 3.1: Average high tides, low tides and ranges, SW107 Gorai-Modhumati, Pirojpur
Month Spring tides Neap tides
HighTide LowTide Range HighTide LowTide Range
Jan 1.52 -0.11 1.63 0.89 -0.19 1.08
Feb 1.56 -0.18 1.75 0.84 -0.20 1.04
Mar 1.79 -0.18 1.97 0.84 -0.22 1.06
Apr 1.95 -0.08 2.03 1.01 -0.07 1.08
May 2.10 0.27 1.83 1.18 0.12 1.06
Jun 2.18 0.49 1.69 1.46 0.45 1.02
Jul 2.23 0.61 1.62 1.59 0.65 0.94
Aug 2.32 0.85 1.47 1.60 0.83 0.78
Sep 2.27 0.79 1.48 1.55 0.75 0.80
Oct 2.19 0.65 1.54 1.35 0.39 0.96
Nov 1.93 0.35 1.58 1.25 0.16 1.09
Dec 1.66 0.09 1.57 1.06 -0.06 1.12source: BWDB
Fig 3.1: Monthly variations in average tidal levels, SW107, nr Pirojpur
Table 3.2: Annual maximum and minimum river levels in Projpur
River Baleshwar Kocha
Years of records 1982-2002 1982-2002water level High tide Low tide High tide Low tide
Average level 2.55 -0.41 2.59 -0.42
Maximum level 3.48 -0.10 2.70 -0.13
Minimum level 2.29 -0.72 2.48 -0.61
1:100 yr max level (excl SLR) 4.01 - 2.77 -
Source: CDTA Final Report Annex IV All levels m PWD
-0.50
0.00
0.50
1.00
1.50
2.00
2.50
Jan Feb Mar Apr May Jun Jul Aug Sep Oct Nov Dec
Spring high tide
Spring low tide
Sping tide range
Neap high tide
Neap low tide
Neap tide range
ele
vati
on
(mP
WD
)
Monthly variations in tidal levels,
SW107, nr Pirojpur
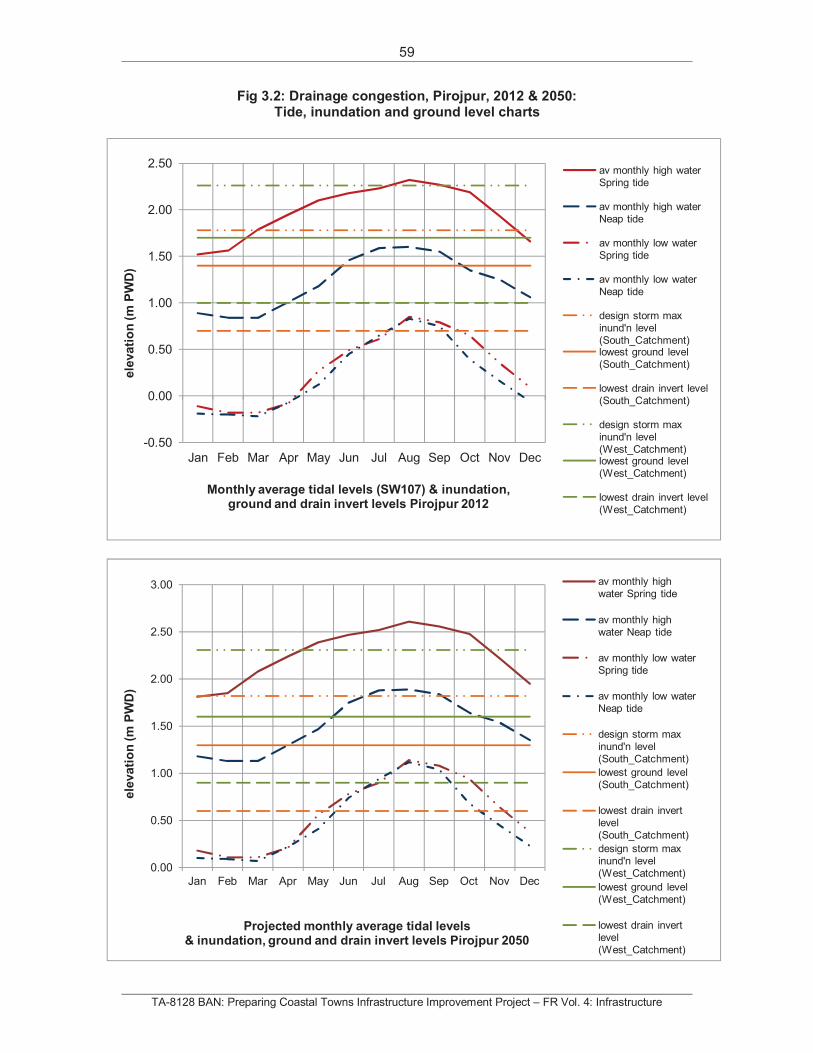
59
TA-8128 BAN: Preparing Coastal Towns Infrastructure Improvement Project – FR Vol. 4: Infrastructure
Fig 3.2: Drainage congestion, Pirojpur, 2012 & 2050: Tide, inundation and ground level charts
0.00
0.50
1.00
1.50
2.00
2.50
3.00
Jan Feb Mar Apr May Jun Jul Aug Sep Oct Nov Dec
av monthly high water Spring tide
av monthly high water Neap tide
av monthly low water Spring tide
av monthly low water Neap tide
design storm max inund'n level (South_Catchment)
lowest ground level (South_Catchment)
lowest drain invert level (South_Catchment)
design storm max inund'n level (West_Catchment)
lowest ground level (West_Catchment)
lowest drain invert level (West_Catchment)
ele
vati
on
(mP
WD
)
Projected monthly average tidal levels & inundation, ground and drain invert levels Pirojpur 2050
-0.50
0.00
0.50
1.00
1.50
2.00
2.50
Jan Feb Mar Apr May Jun Jul Aug Sep Oct Nov Dec
av monthly high water Spring tide
av monthly high water Neap tide
av monthly low water Spring tide
av monthly low water Neap tide
design storm max inund'n level (South_Catchment)lowest ground level (South_Catchment)
lowest drain invert level (South_Catchment)
design storm max inund'n level (West_Catchment)lowest ground level (West_Catchment)
lowest drain invert level (West_Catchment)
ele
vati
on
(mP
WD
)
Monthly average tidal levels (SW107) & inundation, ground and drain invert levels Pirojpur 2012
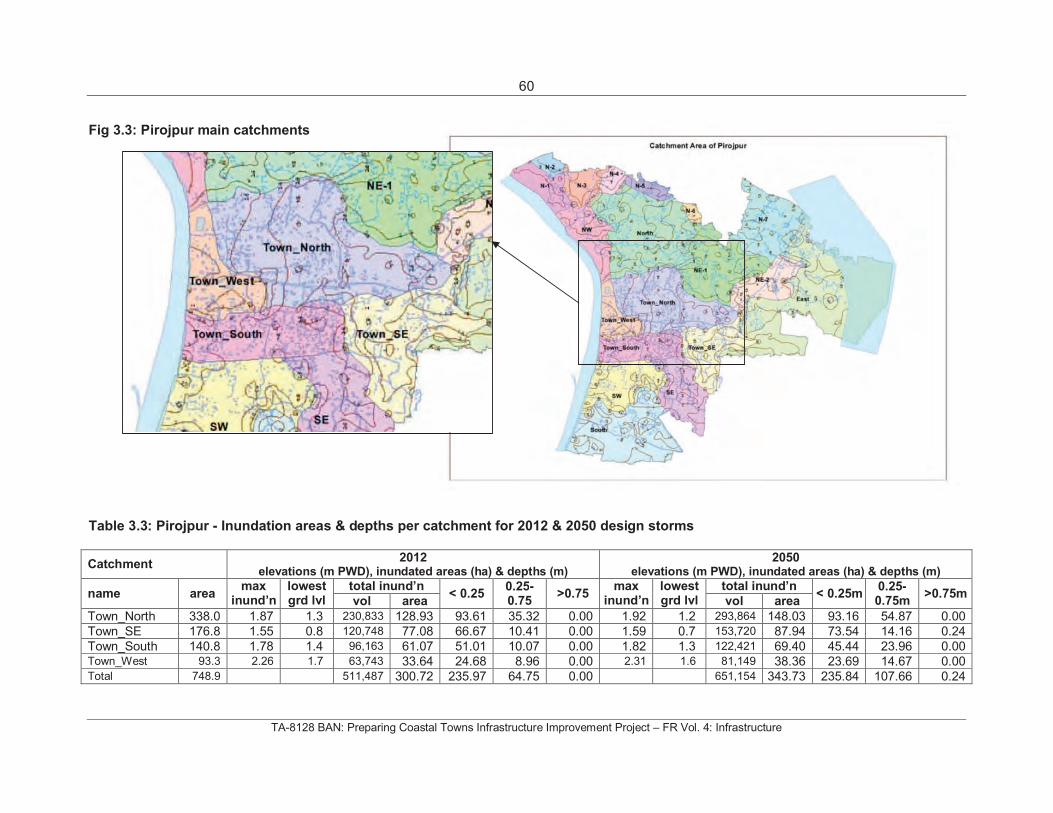
60
TA-8128 BAN: Preparing Coastal Towns Infrastructure Improvement Project – FR Vol. 4: Infrastructure
Fig 3.3: Pirojpur main catchments
Table 3.3: Pirojpur - Inundation areas & depths per catchment for 2012 & 2050 design storms
Catchment 2012
elevations (m PWD), inundated areas (ha) & depths (m) 2050
elevations (m PWD), inundated areas (ha) & depths (m)
name areamax
inund’nlowest grd lvl
total inund’n< 0.25
0.25-0.75
>0.75 max
inund’nlowest grd lvl
total inund’n< 0.25m
0.25-0.75m
>0.75mvol area vol area
Town_North 338.0 1.87 1.3 230,833 128.93 93.61 35.32 0.00 1.92 1.2 293,864 148.03 93.16 54.87 0.00
Town_SE 176.8 1.55 0.8 120,748 77.08 66.67 10.41 0.00 1.59 0.7 153,720 87.94 73.54 14.16 0.24
Town_South 140.8 1.78 1.4 96,163 61.07 51.01 10.07 0.00 1.82 1.3 122,421 69.40 45.44 23.96 0.00Town_West 93.3 2.26 1.7 63,743 33.64 24.68 8.96 0.00 2.31 1.6 81,149 38.36 23.69 14.67 0.00Total 748.9 511,487 300.72 235.97 64.75 0.00 651,154 343.73 235.84 107.66 0.24
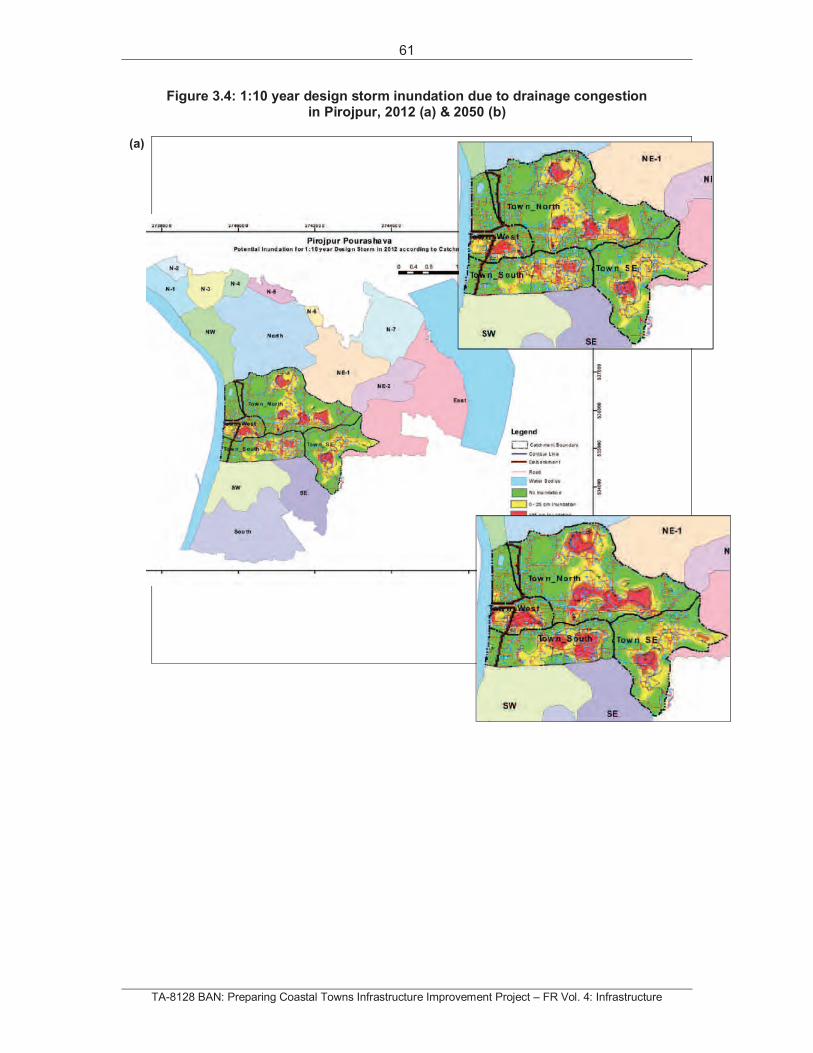
61
TA-8128 BAN: Preparing Coastal Towns Infrastructure Improvement Project – FR Vol. 4: Infrastructure
Figure 3.4: 1:10 year design storm inundation due to drainage congestion in Pirojpur, 2012 (a) & 2050 (b)
(a)
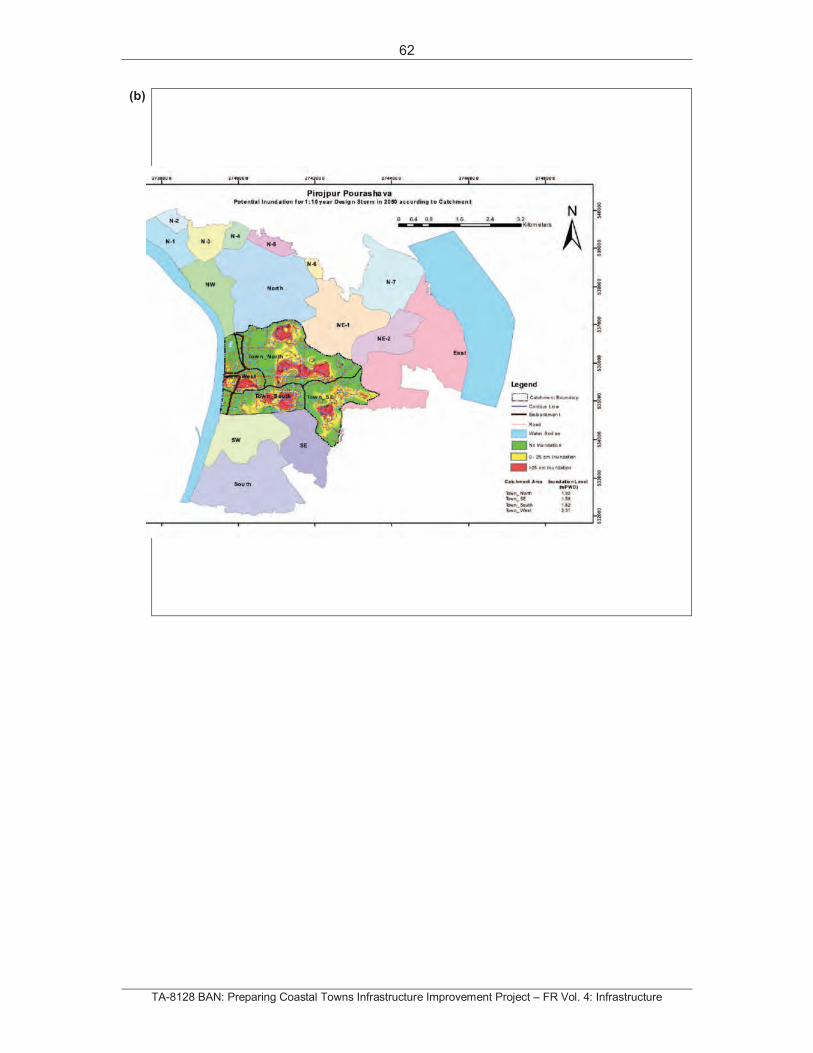
62
TA-8128 BAN: Preparing Coastal Towns Infrastructure Improvement Project – FR Vol. 4: Infrastructure
(b)
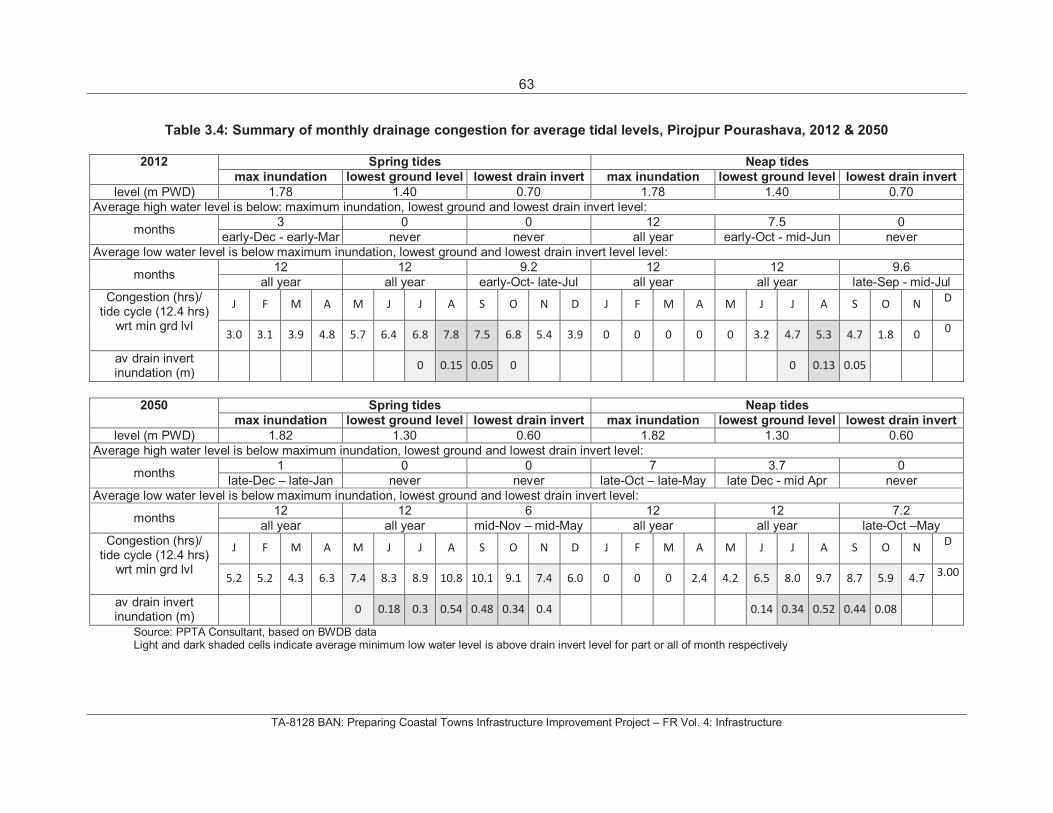
63
TA-8128 BAN: Preparing Coastal Towns Infrastructure Improvement Project – FR Vol. 4: Infrastructure
Table 3.4: Summary of monthly drainage congestion for average tidal levels, Pirojpur Pourashava, 2012 & 2050
2012 Spring tides Neap tides
max inundation lowest ground level lowest drain invert max inundation lowest ground level lowest drain invert
level (m PWD) 1.78 1.40 0.70 1.78 1.40 0.70
Average high water level is below: maximum inundation, lowest ground and lowest drain invert level:
months 3 0 0 12 7.5 0
early-Dec - early-Mar never never all year early-Oct - mid-Jun never
Average low water level is below maximum inundation, lowest ground and lowest drain invert level level:
months 12 12 9.2 12 12 9.6
all year all year early-Oct- late-Jul all year all year late-Sep - mid-Jul
Congestion (hrs)/ tide cycle (12.4 hrs)
wrt min grd lvl
J F M A M J J A S O N D J F M A M J J A S O N D
3.0 3.1 3.9 4.8 5.7 6.4 6.8 7.8 7.5 6.8 5.4 3.9 0 0 0 0 0 3.2 4.7 5.3 4.7 1.8 0 0
av drain invert inundation (m)
0 0.15 0.05 0 0 0.13 0.05
2050 Spring tides Neap tides
max inundation lowest ground level lowest drain invert max inundation lowest ground level lowest drain invert
level (m PWD) 1.82 1.30 0.60 1.82 1.30 0.60
Average high water level is below maximum inundation, lowest ground and lowest drain invert level:
months 1 0 0 7 3.7 0
late-Dec – late-Jan never never late-Oct – late-May late Dec - mid Apr never
Average low water level is below maximum inundation, lowest ground and lowest drain invert level:
months 12 12 6 12 12 7.2
all year all year mid-Nov – mid-May all year all year late-Oct –May
Congestion (hrs)/ tide cycle (12.4 hrs)
wrt min grd lvl
J F M A M J J A S O N D J F M A M J J A S O N D
5.2 5.2 4.3 6.3 7.4 8.3 8.9 10.8 10.1 9.1 7.4 6.0 0 0 0 2.4 4.2 6.5 8.0 9.7 8.7 5.9 4.7 3.00
av drain invert inundation (m)
0 0.18 0.3 0.54 0.48 0.34 0.4 0.14 0.34 0.52 0.44 0.08
Source: PPTA Consultant, based on BWDB data Light and dark shaded cells indicate average minimum low water level is above drain invert level for part or all of month respectively
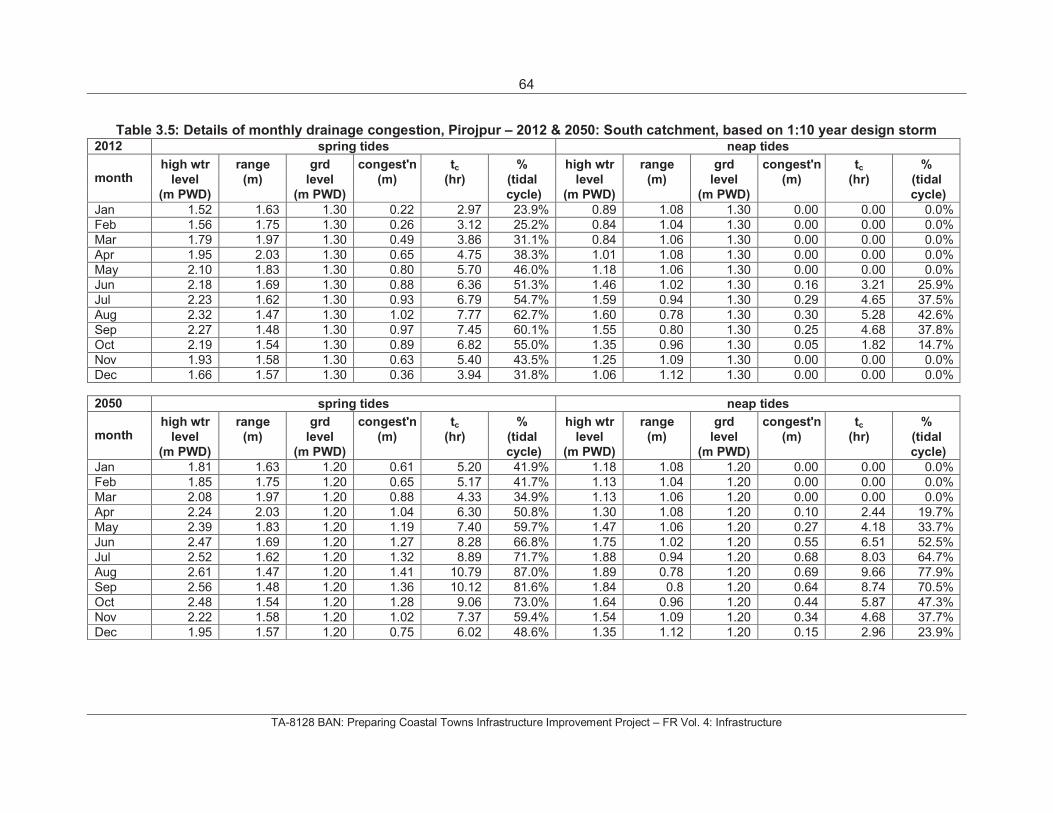
64
TA-8128 BAN: Preparing Coastal Towns Infrastructure Improvement Project – FR Vol. 4: Infrastructure
Table 3.5: Details of monthly drainage congestion, Pirojpur – 2012 & 2050: South catchment, based on 1:10 year design storm2012 spring tides neap tides
month high wtr range grd congest'n tc % high wtr range grd congest'n tc %
level (m) level (m) (hr) (tidal level (m) level (m) (hr) (tidal
(m PWD) (m PWD) cycle) (m PWD) (m PWD) cycle)
Jan 1.52 1.63 1.30 0.22 2.97 23.9% 0.89 1.08 1.30 0.00 0.00 0.0%
Feb 1.56 1.75 1.30 0.26 3.12 25.2% 0.84 1.04 1.30 0.00 0.00 0.0%
Mar 1.79 1.97 1.30 0.49 3.86 31.1% 0.84 1.06 1.30 0.00 0.00 0.0%
Apr 1.95 2.03 1.30 0.65 4.75 38.3% 1.01 1.08 1.30 0.00 0.00 0.0%
May 2.10 1.83 1.30 0.80 5.70 46.0% 1.18 1.06 1.30 0.00 0.00 0.0%
Jun 2.18 1.69 1.30 0.88 6.36 51.3% 1.46 1.02 1.30 0.16 3.21 25.9%
Jul 2.23 1.62 1.30 0.93 6.79 54.7% 1.59 0.94 1.30 0.29 4.65 37.5%
Aug 2.32 1.47 1.30 1.02 7.77 62.7% 1.60 0.78 1.30 0.30 5.28 42.6%
Sep 2.27 1.48 1.30 0.97 7.45 60.1% 1.55 0.80 1.30 0.25 4.68 37.8%
Oct 2.19 1.54 1.30 0.89 6.82 55.0% 1.35 0.96 1.30 0.05 1.82 14.7%
Nov 1.93 1.58 1.30 0.63 5.40 43.5% 1.25 1.09 1.30 0.00 0.00 0.0%
Dec 1.66 1.57 1.30 0.36 3.94 31.8% 1.06 1.12 1.30 0.00 0.00 0.0%
2050 spring tides neap tides
month high wtr range grd congest'n tc % high wtr range grd congest'n tc %
level (m) level (m) (hr) (tidal level (m) level (m) (hr) (tidal
(m PWD) (m PWD) cycle) (m PWD) (m PWD) cycle)
Jan 1.81 1.63 1.20 0.61 5.20 41.9% 1.18 1.08 1.20 0.00 0.00 0.0%
Feb 1.85 1.75 1.20 0.65 5.17 41.7% 1.13 1.04 1.20 0.00 0.00 0.0%
Mar 2.08 1.97 1.20 0.88 4.33 34.9% 1.13 1.06 1.20 0.00 0.00 0.0%
Apr 2.24 2.03 1.20 1.04 6.30 50.8% 1.30 1.08 1.20 0.10 2.44 19.7%
May 2.39 1.83 1.20 1.19 7.40 59.7% 1.47 1.06 1.20 0.27 4.18 33.7%
Jun 2.47 1.69 1.20 1.27 8.28 66.8% 1.75 1.02 1.20 0.55 6.51 52.5%
Jul 2.52 1.62 1.20 1.32 8.89 71.7% 1.88 0.94 1.20 0.68 8.03 64.7%
Aug 2.61 1.47 1.20 1.41 10.79 87.0% 1.89 0.78 1.20 0.69 9.66 77.9%
Sep 2.56 1.48 1.20 1.36 10.12 81.6% 1.84 0.8 1.20 0.64 8.74 70.5%
Oct 2.48 1.54 1.20 1.28 9.06 73.0% 1.64 0.96 1.20 0.44 5.87 47.3%
Nov 2.22 1.58 1.20 1.02 7.37 59.4% 1.54 1.09 1.20 0.34 4.68 37.7%
Dec 1.95 1.57 1.20 0.75 6.02 48.6% 1.35 1.12 1.20 0.15 2.96 23.9%
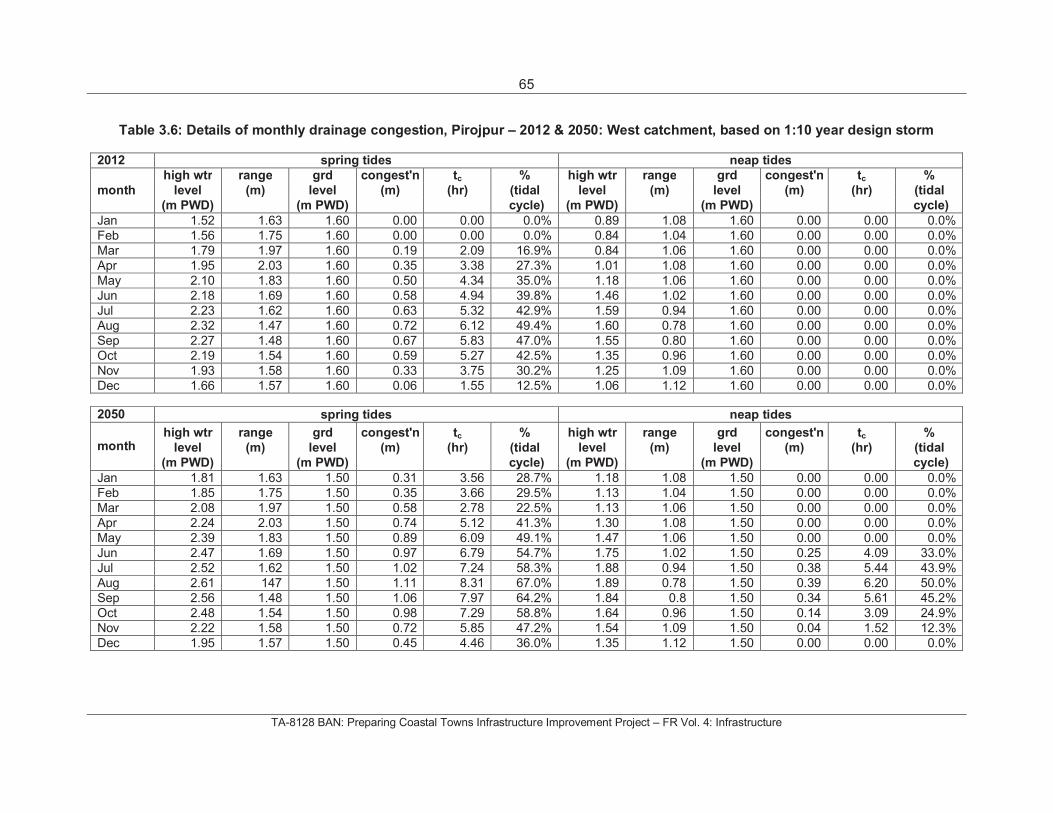
65
TA-8128 BAN: Preparing Coastal Towns Infrastructure Improvement Project – FR Vol. 4: Infrastructure
Table 3.6: Details of monthly drainage congestion, Pirojpur – 2012 & 2050: West catchment, based on 1:10 year design storm
2012 spring tides neap tides
month
high wtr range grd congest'n tc % high wtr range grd congest'n tc %
level (m) level (m) (hr) (tidal level (m) level (m) (hr) (tidal
(m PWD) (m PWD) cycle) (m PWD) (m PWD) cycle)
Jan 1.52 1.63 1.60 0.00 0.00 0.0% 0.89 1.08 1.60 0.00 0.00 0.0%
Feb 1.56 1.75 1.60 0.00 0.00 0.0% 0.84 1.04 1.60 0.00 0.00 0.0%
Mar 1.79 1.97 1.60 0.19 2.09 16.9% 0.84 1.06 1.60 0.00 0.00 0.0%
Apr 1.95 2.03 1.60 0.35 3.38 27.3% 1.01 1.08 1.60 0.00 0.00 0.0%
May 2.10 1.83 1.60 0.50 4.34 35.0% 1.18 1.06 1.60 0.00 0.00 0.0%
Jun 2.18 1.69 1.60 0.58 4.94 39.8% 1.46 1.02 1.60 0.00 0.00 0.0%
Jul 2.23 1.62 1.60 0.63 5.32 42.9% 1.59 0.94 1.60 0.00 0.00 0.0%
Aug 2.32 1.47 1.60 0.72 6.12 49.4% 1.60 0.78 1.60 0.00 0.00 0.0%
Sep 2.27 1.48 1.60 0.67 5.83 47.0% 1.55 0.80 1.60 0.00 0.00 0.0%
Oct 2.19 1.54 1.60 0.59 5.27 42.5% 1.35 0.96 1.60 0.00 0.00 0.0%
Nov 1.93 1.58 1.60 0.33 3.75 30.2% 1.25 1.09 1.60 0.00 0.00 0.0%
Dec 1.66 1.57 1.60 0.06 1.55 12.5% 1.06 1.12 1.60 0.00 0.00 0.0%
2050 spring tides neap tides
month high wtr range grd congest'n tc % high wtr range grd congest'n tc %
level (m) level (m) (hr) (tidal level (m) level (m) (hr) (tidal
(m PWD) (m PWD) cycle) (m PWD) (m PWD) cycle)
Jan 1.81 1.63 1.50 0.31 3.56 28.7% 1.18 1.08 1.50 0.00 0.00 0.0%
Feb 1.85 1.75 1.50 0.35 3.66 29.5% 1.13 1.04 1.50 0.00 0.00 0.0%
Mar 2.08 1.97 1.50 0.58 2.78 22.5% 1.13 1.06 1.50 0.00 0.00 0.0%
Apr 2.24 2.03 1.50 0.74 5.12 41.3% 1.30 1.08 1.50 0.00 0.00 0.0%
May 2.39 1.83 1.50 0.89 6.09 49.1% 1.47 1.06 1.50 0.00 0.00 0.0%
Jun 2.47 1.69 1.50 0.97 6.79 54.7% 1.75 1.02 1.50 0.25 4.09 33.0%
Jul 2.52 1.62 1.50 1.02 7.24 58.3% 1.88 0.94 1.50 0.38 5.44 43.9%
Aug 2.61 147 1.50 1.11 8.31 67.0% 1.89 0.78 1.50 0.39 6.20 50.0%
Sep 2.56 1.48 1.50 1.06 7.97 64.2% 1.84 0.8 1.50 0.34 5.61 45.2%
Oct 2.48 1.54 1.50 0.98 7.29 58.8% 1.64 0.96 1.50 0.14 3.09 24.9%
Nov 2.22 1.58 1.50 0.72 5.85 47.2% 1.54 1.09 1.50 0.04 1.52 12.3%
Dec 1.95 1.57 1.50 0.45 4.46 36.0% 1.35 1.12 1.50 0.00 0.00 0.0%
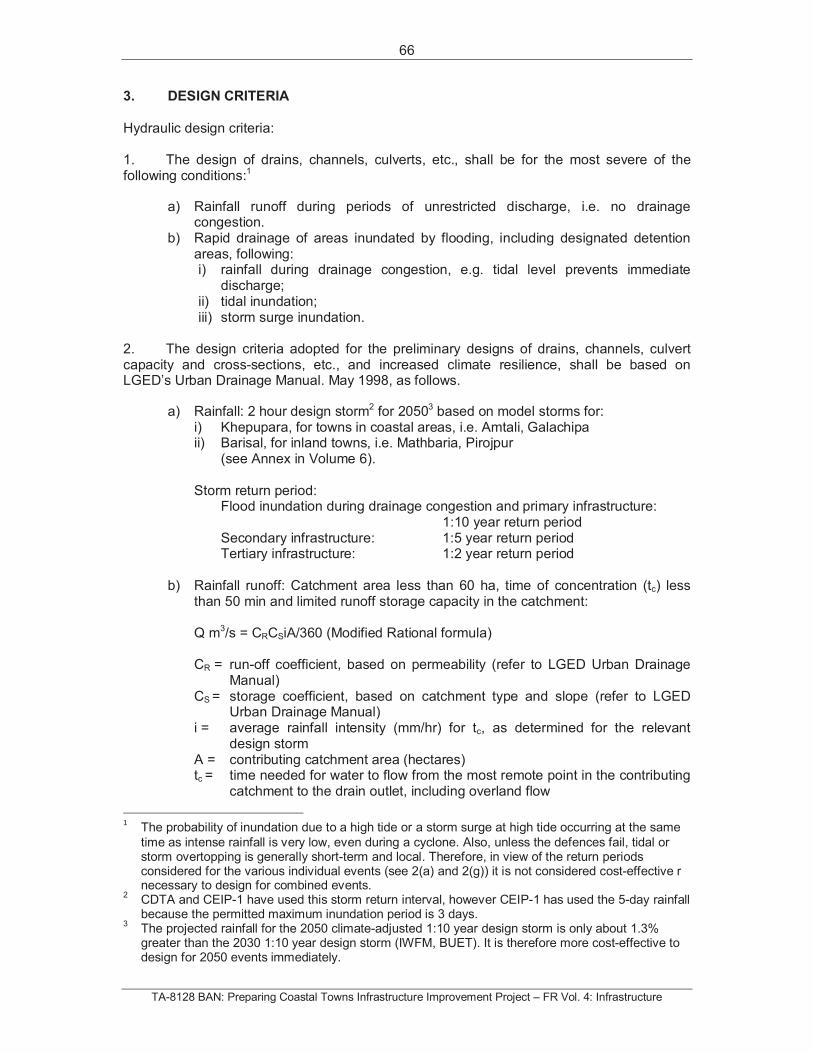
66
TA-8128 BAN: Preparing Coastal Towns Infrastructure Improvement Project – FR Vol. 4: Infrastructure
3. DESIGN CRITERIA
Hydraulic design criteria:
1. The design of drains, channels, culverts, etc., shall be for the most severe of the following conditions:1
a) Rainfall runoff during periods of unrestricted discharge, i.e. no drainage congestion.
b) Rapid drainage of areas inundated by flooding, including designated detention areas, following: i) rainfall during drainage congestion, e.g. tidal level prevents immediate
discharge; ii) tidal inundation; iii) storm surge inundation.
2. The design criteria adopted for the preliminary designs of drains, channels, culvert capacity and cross-sections, etc., and increased climate resilience, shall be based on LGED’s Urban Drainage Manual. May 1998, as follows.
a) Rainfall: 2 hour design storm2 for 20503 based on model storms for: i) Khepupara, for towns in coastal areas, i.e. Amtali, Galachipa ii) Barisal, for inland towns, i.e. Mathbaria, Pirojpur (see Annex in Volume 6).
Storm return period: Flood inundation during drainage congestion and primary infrastructure:
1:10 year return period Secondary infrastructure: 1:5 year return period Tertiary infrastructure: 1:2 year return period
b) Rainfall runoff: Catchment area less than 60 ha, time of concentration (tc) less than 50 min and limited runoff storage capacity in the catchment:
Q m3/s = CRCSiA/360 (Modified Rational formula)
CR = run-off coefficient, based on permeability (refer to LGED Urban Drainage Manual)
CS = storage coefficient, based on catchment type and slope (refer to LGED Urban Drainage Manual)
i = average rainfall intensity (mm/hr) for tc, as determined for the relevant design storm
A = contributing catchment area (hectares) tc = time needed for water to flow from the most remote point in the contributing
catchment to the drain outlet, including overland flow
1The probability of inundation due to a high tide or a storm surge at high tide occurring at the same
time as intense rainfall is very low, even during a cyclone. Also, unless the defences fail, tidal or storm overtopping is generally short-term and local. Therefore, in view of the return periods considered for the various individual events (see 2(a) and 2(g)) it is not considered cost-effective r necessary to design for combined events.
2 CDTA and CEIP-1 have used this storm return interval, however CEIP-1 has used the 5-day rainfall
because the permitted maximum inundation period is 3 days. 3 The projected rainfall for the 2050 climate-adjusted 1:10 year design storm is only about 1.3%
greater than the 2030 1:10 year design storm (IWFM, BUET). It is therefore more cost-effective to design for 2050 events immediately.
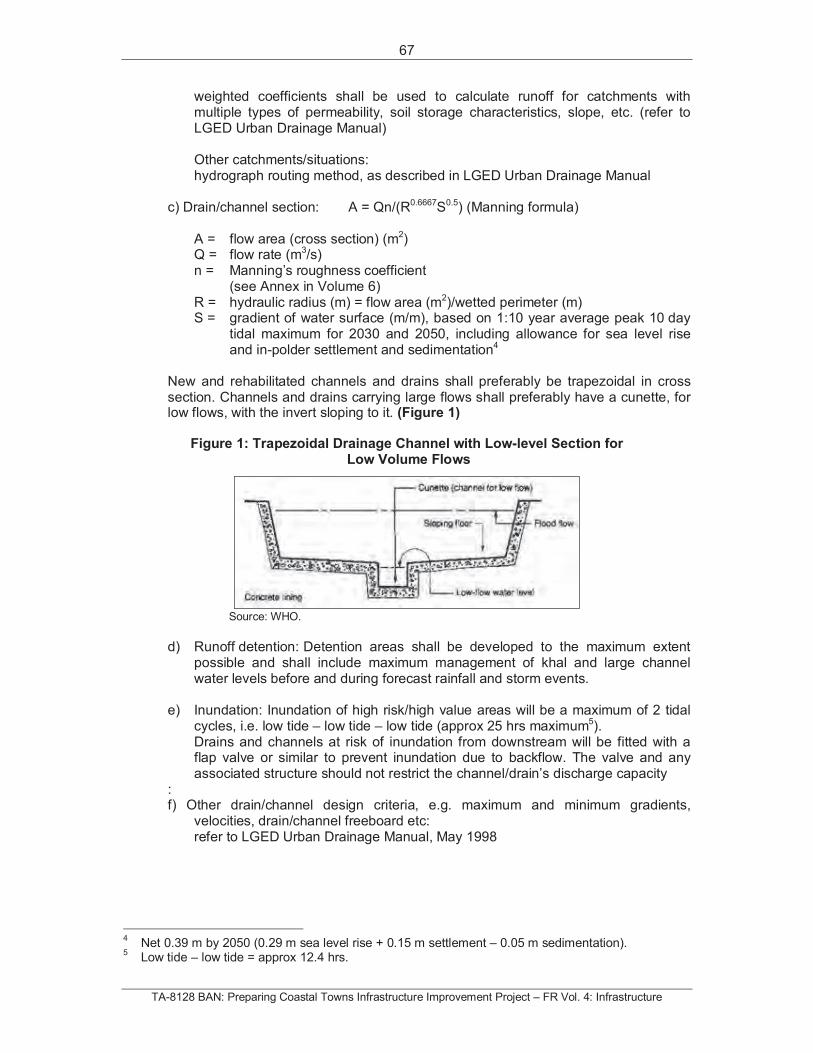
67
TA-8128 BAN: Preparing Coastal Towns Infrastructure Improvement Project – FR Vol. 4: Infrastructure
weighted coefficients shall be used to calculate runoff for catchments with multiple types of permeability, soil storage characteristics, slope, etc. (refer to LGED Urban Drainage Manual)
Other catchments/situations: hydrograph routing method, as described in LGED Urban Drainage Manual
c) Drain/channel section: A = Qn/(R0.6667S0.5) (Manning formula)
A = flow area (cross section) (m2)Q = flow rate (m3/s) n = Manning’s roughness coefficient
(see Annex in Volume 6) R = hydraulic radius (m) = flow area (m2)/wetted perimeter (m) S = gradient of water surface (m/m), based on 1:10 year average peak 10 day
tidal maximum for 2030 and 2050, including allowance for sea level rise and in-polder settlement and sedimentation4
New and rehabilitated channels and drains shall preferably be trapezoidal in cross section. Channels and drains carrying large flows shall preferably have a cunette, for low flows, with the invert sloping to it. (Figure 1)
Figure 1: Trapezoidal Drainage Channel with Low-level Section for Low Volume Flows
Source: WHO.
d) Runoff detention: Detention areas shall be developed to the maximum extent possible and shall include maximum management of khal and large channel water levels before and during forecast rainfall and storm events.
e) Inundation: Inundation of high risk/high value areas will be a maximum of 2 tidal cycles, i.e. low tide – low tide – low tide (approx 25 hrs maximum5).
Drains and channels at risk of inundation from downstream will be fitted with a flap valve or similar to prevent inundation due to backflow. The valve and any associated structure should not restrict the channel/drain’s discharge capacity
:f) Other drain/channel design criteria, e.g. maximum and minimum gradients,
velocities, drain/channel freeboard etc: refer to LGED Urban Drainage Manual, May 1998
4 Net 0.39 m by 2050 (0.29 m sea level rise + 0.15 m settlement – 0.05 m sedimentation).
5 Low tide – low tide = approx 12.4 hrs.
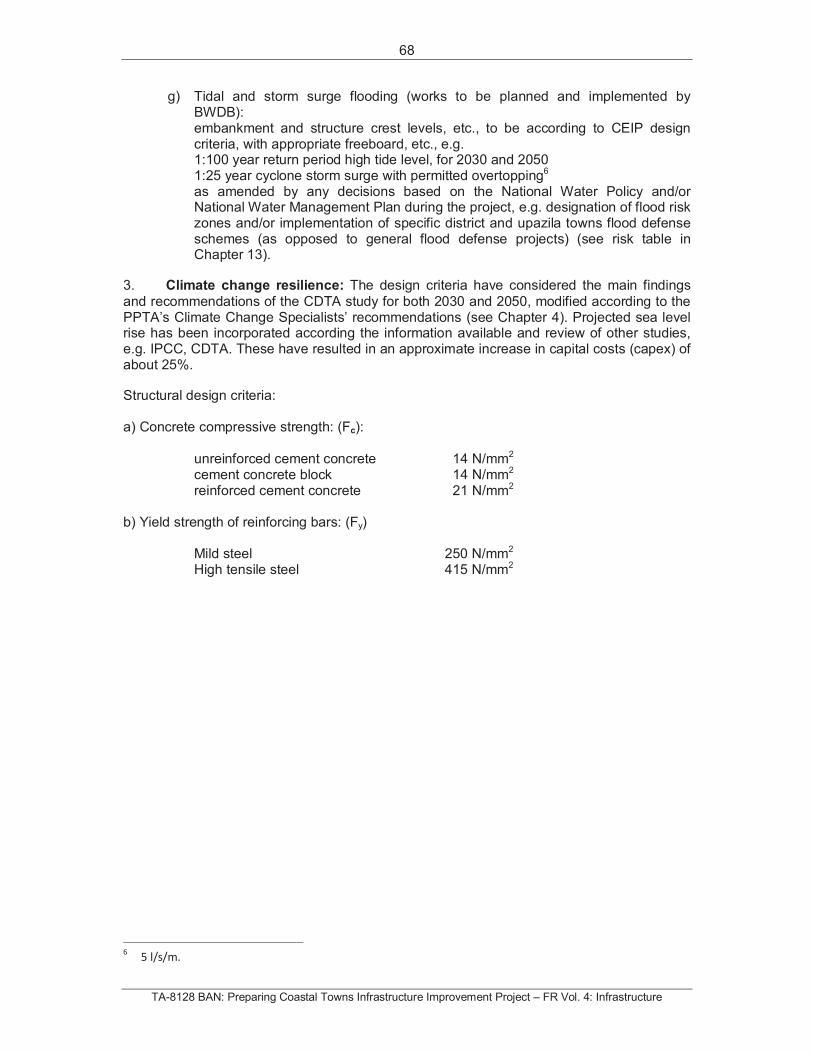
68
TA-8128 BAN: Preparing Coastal Towns Infrastructure Improvement Project – FR Vol. 4: Infrastructure
g) Tidal and storm surge flooding (works to be planned and implemented by BWDB):
embankment and structure crest levels, etc., to be according to CEIP design criteria, with appropriate freeboard, etc., e.g.
1:100 year return period high tide level, for 2030 and 2050 1:25 year cyclone storm surge with permitted overtopping6
as amended by any decisions based on the National Water Policy and/or National Water Management Plan during the project, e.g. designation of flood risk zones and/or implementation of specific district and upazila towns flood defense schemes (as opposed to general flood defense projects) (see risk table in Chapter 13).
3. Climate change resilience: The design criteria have considered the main findings
and recommendations of the CDTA study for both 2030 and 2050, modified according to the PPTA’s Climate Change Specialists’ recommendations (see Chapter 4). Projected sea level rise has been incorporated according the information available and review of other studies, e.g. IPCC, CDTA. These have resulted in an approximate increase in capital costs (capex) of about 25%.
Structural design criteria:
a) Concrete compressive strength: (Fc):
unreinforced cement concrete 14 N/mm2
cement concrete block 14 N/mm2
reinforced cement concrete 21 N/mm2
b) Yield strength of reinforcing bars: (Fy)
Mild steel 250 N/mm2
High tensile steel 415 N/mm2
6 5 l/s/m.
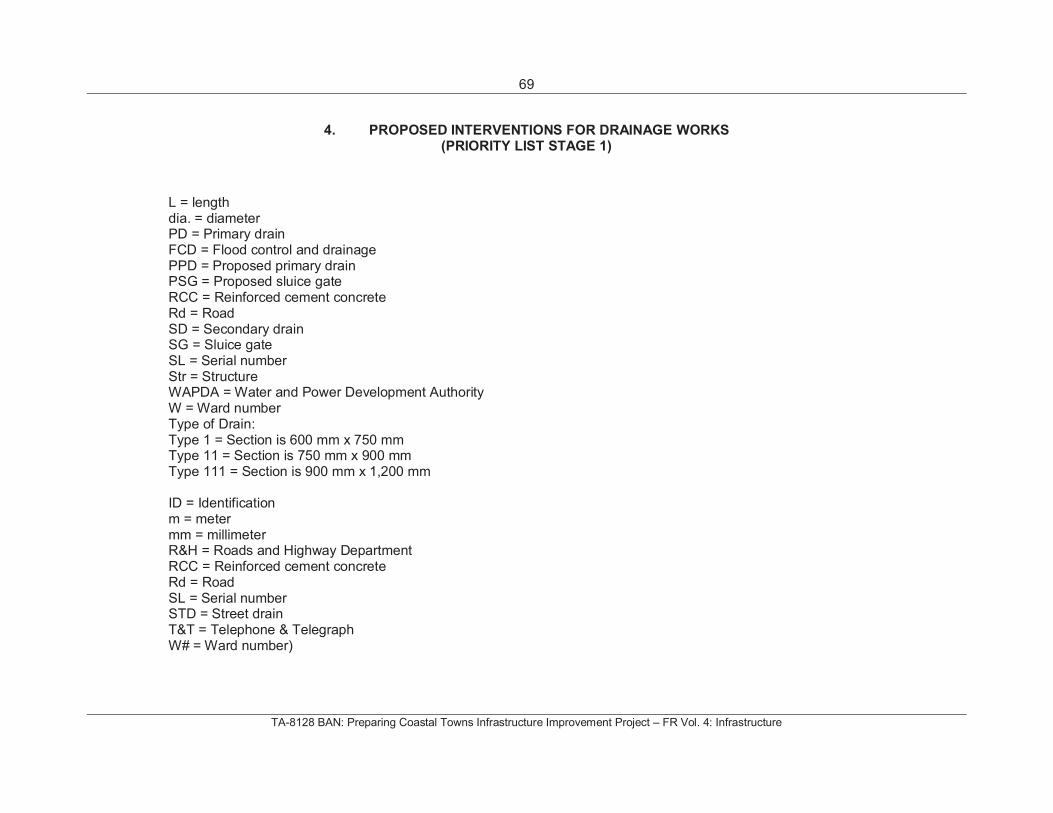
69
TA-8128 BAN: Preparing Coastal Towns Infrastructure Improvement Project – FR Vol. 4: Infrastructure
4. PROPOSED INTERVENTIONS FOR DRAINAGE WORKS (PRIORITY LIST STAGE 1)
L = length dia. = diameter PD = Primary drain FCD = Flood control and drainage PPD = Proposed primary drain PSG = Proposed sluice gate RCC = Reinforced cement concrete Rd = Road SD = Secondary drain SG = Sluice gate SL = Serial number Str = Structure WAPDA = Water and Power Development Authority W = Ward number Type of Drain: Type 1 = Section is 600 mm x 750 mm Type 11 = Section is 750 mm x 900 mm Type 111 = Section is 900 mm x 1,200 mm
ID = Identification m = meter mm = millimeter R&H = Roads and Highway Department RCC = Reinforced cement concrete Rd = Road SL = Serial number STD = Street drain T&T = Telephone & Telegraph W# = Ward number)
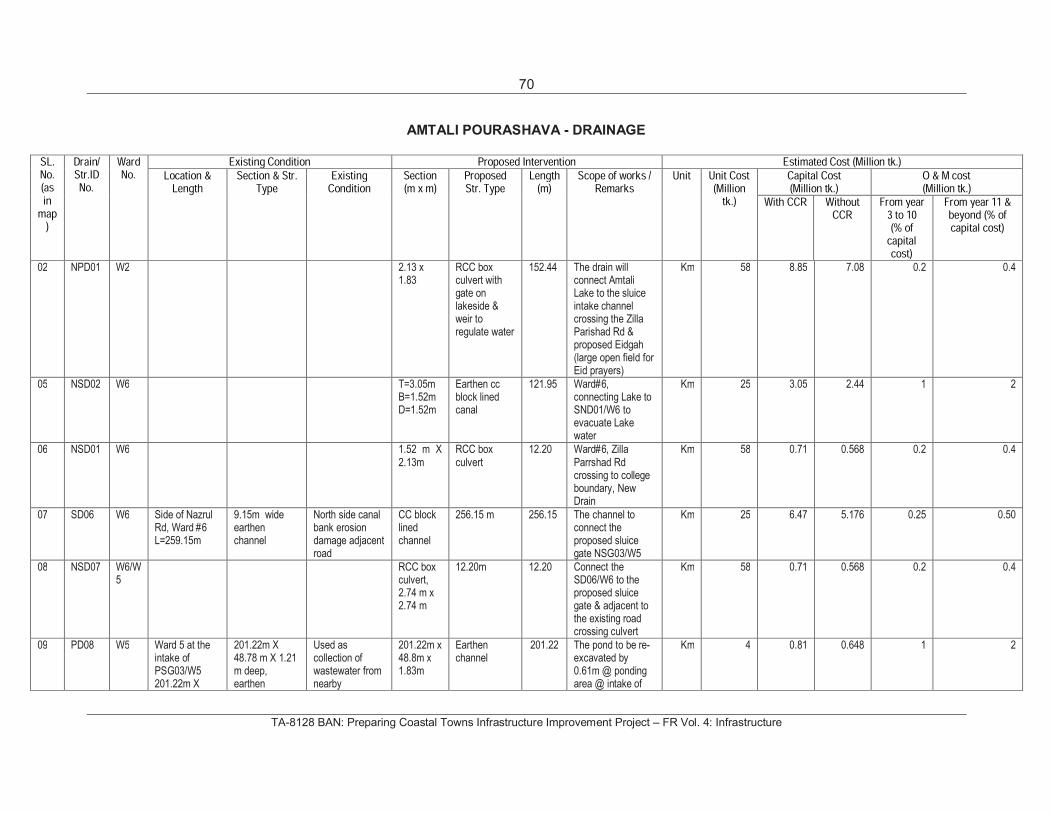
70
TA-8128 BAN: Preparing Coastal Towns Infrastructure Improvement Project – FR Vol. 4: Infrastructure
AMTALI POURASHAVA - DRAINAGE
SL.No. (asin
map)
Drain/Str.ID No.
Ward No.
Existing Condition Proposed Intervention Estimated Cost (Million tk.)Location &
Length Section & Str.
Type Existing
Condition Section(m x m)
Proposed Str. Type
Length(m)
Scope of works / Remarks
Unit Unit Cost(Million
tk.) Capital Cost(Million tk.)
O & M cost(Million tk.)
With CCR Without CCR
From year3 to 10 (% of
capital cost)
From year 11 &beyond (% of capital cost)
02 NPD01 W2 2.13 x 1.83
RCC box culvert with gate on lakeside & weir to regulate water
152.44 The drain will connect Amtali Lake to the sluice intake channel crossing the Zilla Parishad Rd & proposed Eidgah (large open field for Eid prayers)
Km 58 8.85 7.08 0.2 0.4
05 NSD02 W6 T=3.05m B=1.52m D=1.52m
Earthen cc block lined canal
121.95 Ward#6, connecting Lake to SND01/W6 to evacuate Lake water
Km 25 3.05 2.44 1 2
06 NSD01 W6 1.52 m X 2.13m
RCC box culvert
12.20 Ward#6, Zilla Parrshad Rd crossing to college boundary, New Drain
Km 58 0.71 0.568 0.2 0.4
07 SD06 W6 Side of Nazrul Rd, Ward #6 L=259.15m
9.15m wide earthen channel
North side canal bank erosion damage adjacent road
CC block lined channel
256.15 m 256.15 The channel to connect the proposed sluice gate NSG03/W5
Km 25 6.47 5.176 0.25 0.50
08 NSD07 W6/W5
RCC box culvert, 2.74 m x 2.74 m
12.20m 12.20 Connect the SD06/W6 to the proposed sluice gate & adjacent to the existing road crossing culvert
Km 58 0.71 0.568 0.2 0.4
09 PD08 W5 Ward 5 at the intake of PSG03/W5 201.22m X
201.22m X 48.78 m X 1.21 m deep, earthen
Used as collection of wastewater from nearby
201.22m x 48.8m x 1.83m
Earthen channel
201.22 The pond to be re-excavated by 0.61m @ ponding area @ intake of
Km 4 0.81 0.648 1 2
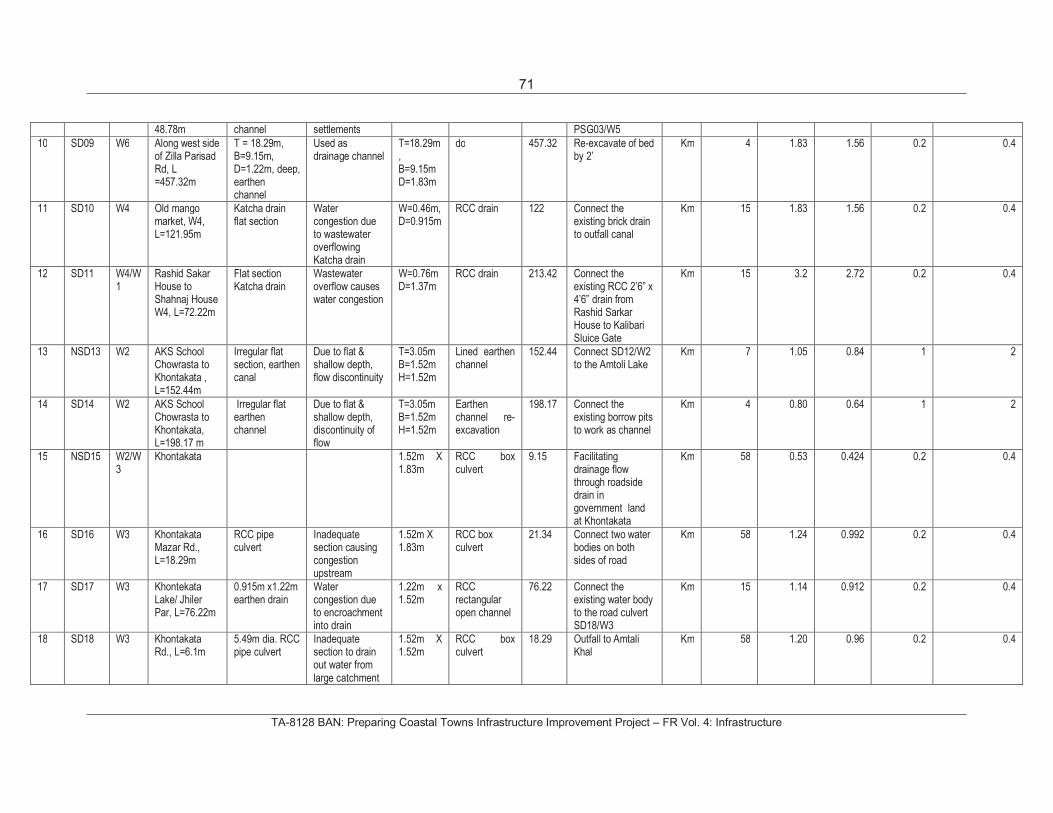
71
TA-8128 BAN: Preparing Coastal Towns Infrastructure Improvement Project – FR Vol. 4: Infrastructure
48.78m channel settlements PSG03/W510 SD09 W6 Along west side
of Zilla Parisad Rd, L =457.32m
T = 18.29m, B=9.15m, D=1.22m, deep, earthen channel
Used as drainage channel
T=18.29m,B=9.15m D=1.83m
do 457.32 Re-excavate of bed by 2’
Km 4 1.83 1.56 0.2 0.4
11 SD10 W4 Old mango market, W4, L=121.95m
Katcha drain flat section
Water congestion due to wastewater overflowing Katcha drain
W=0.46m, D=0.915m
RCC drain 122 Connect the existing brick drain to outfall canal
Km 15 1.83 1.56 0.2 0.4
12 SD11 W4/W1
Rashid Sakar House to Shahnaj House W4, L=72.22m
Flat section Katcha drain
Wastewater overflow causes water congestion
W=0.76mD=1.37m
RCC drain 213.42 Connect the existing RCC 2’6” x 4’6” drain from Rashid Sarkar House to Kalibari Sluice Gate
Km 15 3.2 2.72 0.2 0.4
13 NSD13 W2 AKS School Chowrasta to Khontakata , L=152.44m
Irregular flat section, earthen canal
Due to flat & shallow depth, flow discontinuity
T=3.05m B=1.52mH=1.52m
Lined earthen channel
152.44 Connect SD12/W2 to the Amtoli Lake
Km 7 1.05 0.84 1 2
14 SD14 W2 AKS School Chowrasta to Khontakata, L=198.17 m
Irregular flat earthen channel
Due to flat & shallow depth, discontinuity of flow
T=3.05m B=1.52mH=1.52m
Earthen channel re-excavation
198.17 Connect the existing borrow pits to work as channel
Km 4 0.80 0.64 1 2
15 NSD15 W2/W3
Khontakata 1.52m X 1.83m
RCC box culvert
9.15 Facilitating drainage flow through roadside drain in government land at Khontakata
Km 58 0.53 0.424 0.2 0.4
16 SD16 W3 Khontakata Mazar Rd., L=18.29m
RCC pipe culvert
Inadequate section causing congestion upstream
1.52m X 1.83m
RCC box culvert
21.34 Connect two water bodies on both sides of road
Km 58 1.24 0.992 0.2 0.4
17 SD17 W3 Khontekata Lake/ Jhiler Par, L=76.22m
0.915m x1.22m earthen drain
Water congestion due to encroachment into drain
1.22m x 1.52m
RCCrectangular open channel
76.22 Connect the existing water body to the road culvert SD18/W3
Km 15 1.14 0.912 0.2 0.4
18 SD18 W3 KhontakataRd., L=6.1m
5.49m dia. RCC pipe culvert
Inadequate section to drain out water from large catchment
1.52m X 1.52m
RCC box culvert
18.29 Outfall to Amtali Khal
Km 58 1.20 0.96 0.2 0.4
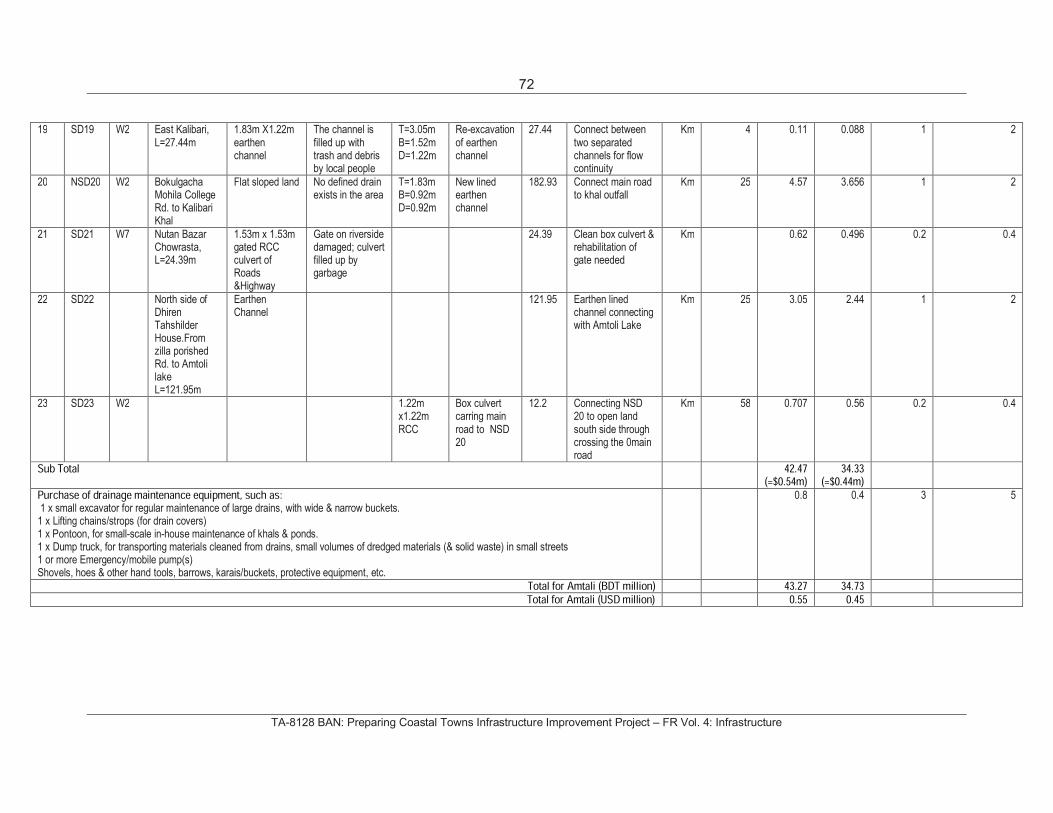
72
TA-8128 BAN: Preparing Coastal Towns Infrastructure Improvement Project – FR Vol. 4: Infrastructure
19 SD19 W2 East Kalibari, L=27.44m
1.83m X1.22m earthen channel
The channel is filled up with trash and debris by local people
T=3.05m B=1.52m D=1.22m
Re-excavation of earthen channel
27.44 Connect between two separated channels for flow continuity
Km 4 0.11 0.088 1 2
20 NSD20 W2 Bokulgacha Mohila College Rd. to Kalibari Khal
Flat sloped land No defined drain exists in the area
T=1.83m B=0.92m D=0.92m
New lined earthen channel
182.93 Connect main road to khal outfall
Km 25 4.57 3.656 1 2
21 SD21 W7 Nutan Bazar Chowrasta, L=24.39m
1.53m x 1.53m gated RCC culvert of Roads&Highway
Gate on riverside damaged; culvert filled up by garbage
24.39 Clean box culvert & rehabilitation of gate needed
Km 0.62 0.496 0.2 0.4
22 SD22 North side of DhirenTahshilder House.From zilla porished Rd. to Amtoli lake L=121.95m
Earthen Channel
121.95 Earthen lined channel connecting with Amtoli Lake
Km 25 3.05 2.44 1 2
23 SD23 W2 1.22m x1.22m RCC
Box culvert carring main road to NSD 20
12.2 Connecting NSD 20 to open land south side through crossing the 0main road
Km 58 0.707 0.56 0.2 0.4
Sub Total 42.47(=$0.54m)
34.33(=$0.44m)
Purchase of drainage maintenance equipment, such as:1 x small excavator for regular maintenance of large drains, with wide & narrow buckets.
1 x Lifting chains/strops (for drain covers) 1 x Pontoon, for small-scale in-house maintenance of khals & ponds. 1 x Dump truck, for transporting materials cleaned from drains, small volumes of dredged materials (& solid waste) in small streets 1 or more Emergency/mobile pump(s) Shovels, hoes & other hand tools, barrows, karais/buckets, protective equipment, etc.
0.8 0.4 3 5
Total for Amtali (BDT million) 43.27 34.73Total for Amtali (USD million) 0.55 0.45
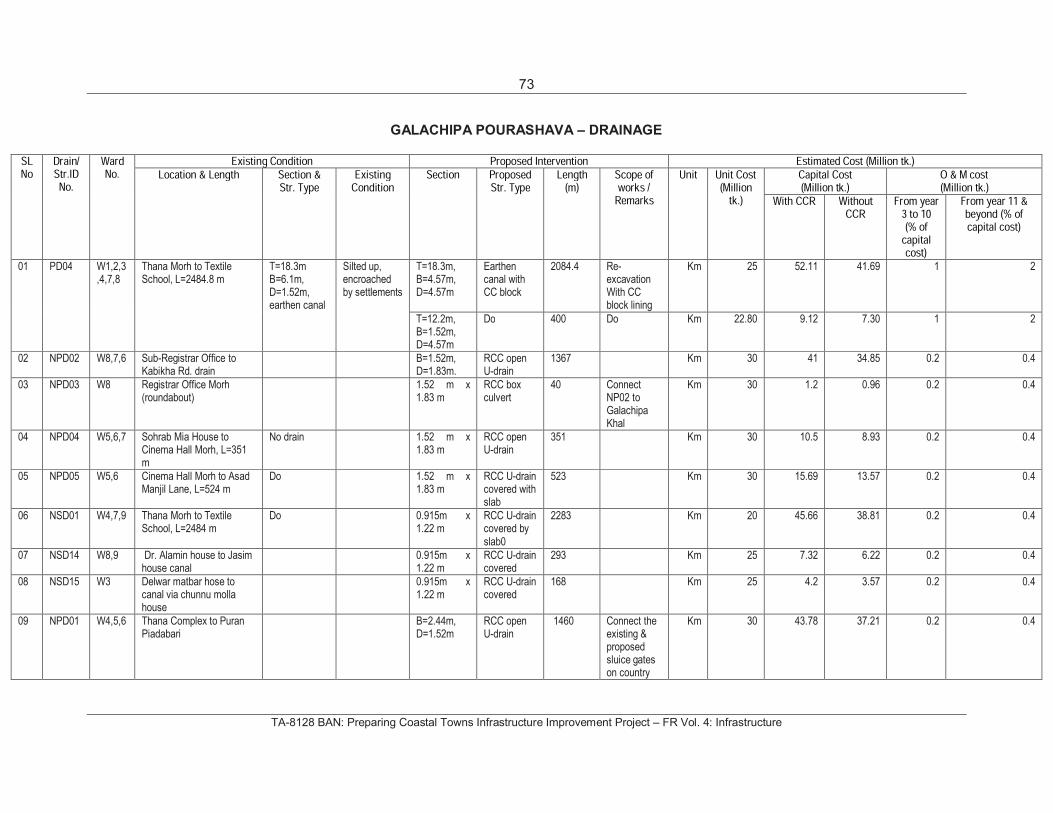
73
TA-8128 BAN: Preparing Coastal Towns Infrastructure Improvement Project – FR Vol. 4: Infrastructure
GALACHIPA POURASHAVA – DRAINAGE
SLNo
Drain/Str.ID No.
Ward No.
Existing Condition Proposed Intervention Estimated Cost (Million tk.)Location & Length Section &
Str. Type Existing
Condition Section Proposed
Str. Type Length
(m) Scope of works /
Remarks Unit Unit Cost
(Million tk.)
Capital Cost(Million tk.)
O & M cost(Million tk.)
With CCR Without CCR
From year3 to 10 (% of
capital cost)
From year 11 &beyond (% of capital cost)
01 PD04 W1,2,3,4,7,8
Thana Morh to Textile School, L=2484.8 m
T=18.3mB=6.1m, D=1.52m, earthen canal
Silted up, encroached by settlements
T=18.3m, B=4.57m, D=4.57m
Earthen canal with CC block
2084.4 Re-excavation With CC block lining
Km 25 52.11 41.69 1 2
T=12.2m, B=1.52m, D=4.57m
Do 400 Do Km 22.80 9.12 7.30 1 2
02 NPD02 W8,7,6 Sub-Registrar Office to Kabikha Rd. drain
B=1.52m,D=1.83m.
RCC open U-drain
1367 Km 30 41 34.85 0.2 0.4
03 NPD03 W8 Registrar Office Morh (roundabout)
1.52 m x 1.83 m
RCC box culvert
40 Connect NP02 to Galachipa Khal
Km 30 1.2 0.96 0.2 0.4
04 NPD04 W5,6,7 Sohrab Mia House to Cinema Hall Morh, L=351 m
No drain 1.52 m x 1.83 m
RCC open U-drain
351 Km 30 10.5 8.93 0.2 0.4
05 NPD05 W5,6 Cinema Hall Morh to Asad Manjil Lane, L=524 m
Do 1.52 m x 1.83 m
RCC U-draincovered with slab
523 Km 30 15.69 13.57 0.2 0.4
06 NSD01 W4,7,9 Thana Morh to Textile School, L=2484 m
Do 0.915m x 1.22 m
RCC U-draincovered by slab0
2283 Km 20 45.66 38.81 0.2 0.4
07 NSD14 W8,9 Dr. Alamin house to Jasim house canal
0.915m x 1.22 m
RCC U-draincovered
293 Km 25 7.32 6.22 0.2 0.4
08 NSD15 W3 Delwar matbar hose to canal via chunnu molla house
0.915m x 1.22 m
RCC U-draincovered
168 Km 25 4.2 3.57 0.2 0.4
09 NPD01 W4,5,6 Thana Complex to Puran Piadabari
B=2.44m,D=1.52m
RCC open U-drain
1460 Connect the existing & proposed sluice gates on country
Km 30 43.78 37.21 0.2 0.4
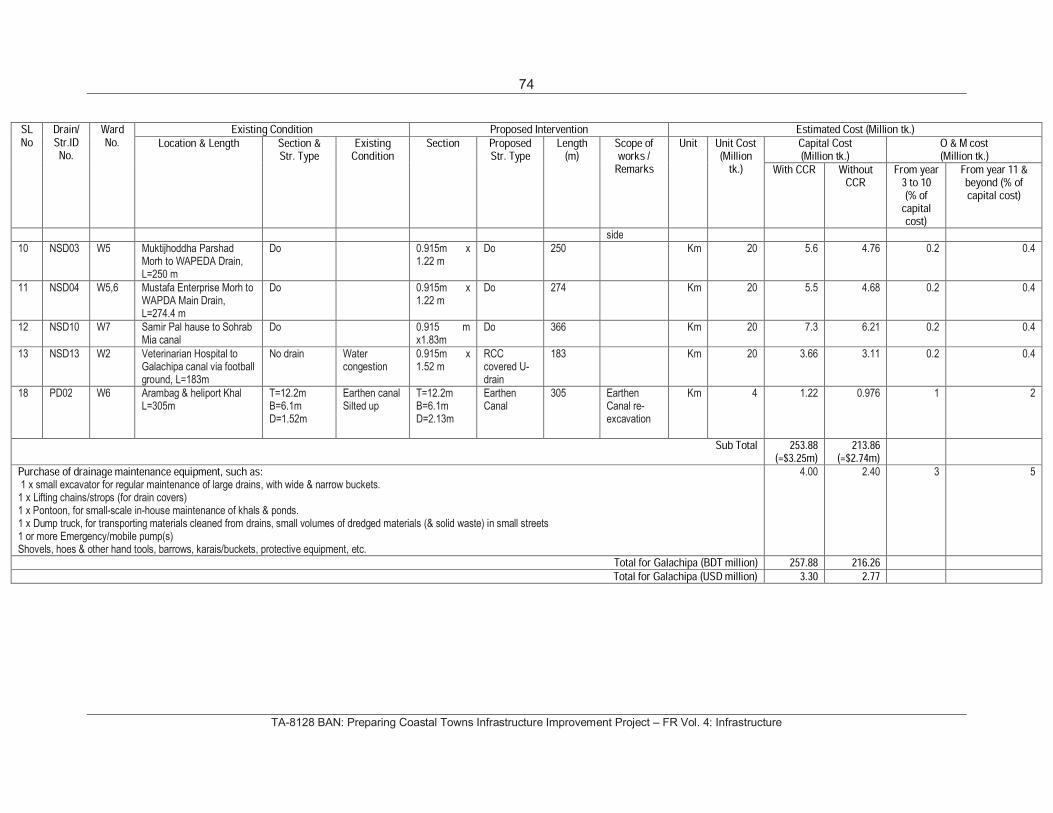
74
TA-8128 BAN: Preparing Coastal Towns Infrastructure Improvement Project – FR Vol. 4: Infrastructure
SLNo
Drain/Str.ID No.
Ward No.
Existing Condition Proposed Intervention Estimated Cost (Million tk.)Location & Length Section &
Str. Type Existing
Condition Section Proposed
Str. Type Length
(m) Scope of works /
Remarks Unit Unit Cost
(Million tk.)
Capital Cost(Million tk.)
O & M cost(Million tk.)
With CCR Without CCR
From year3 to 10 (% of
capital cost)
From year 11 &beyond (% of capital cost)
side10 NSD03 W5 Muktijhoddha Parshad
Morh to WAPEDA Drain, L=250 m
Do 0.915m x 1.22 m
Do 250 Km 20 5.6 4.76 0.2 0.4
11 NSD04 W5,6 Mustafa Enterprise Morh to WAPDA Main Drain, L=274.4 m
Do 0.915m x 1.22 m
Do 274 Km 20 5.5 4.68 0.2 0.4
12 NSD10 W7 Samir Pal hause to Sohrab Mia canal
Do 0.915 m x1.83m
Do 366 Km 20 7.3 6.21 0.2 0.4
13 NSD13 W2 Veterinarian Hospital to Galachipa canal via football ground, L=183m
No drain Water congestion
0.915m x 1.52 m
RCCcovered U-drain
183 Km 20 3.66 3.11 0.2 0.4
18 PD02 W6 Arambag & heliport KhalL=305m
T=12.2mB=6.1m D=1.52m
Earthen canal Silted up
T=12.2mB=6.1m D=2.13m
Earthen Canal
305 Earthen Canal re-excavation
Km 4 1.22 0.976 1 2
Sub Total 253.88(=$3.25m)
213.86(=$2.74m)
Purchase of drainage maintenance equipment, such as:1 x small excavator for regular maintenance of large drains, with wide & narrow buckets.
1 x Lifting chains/strops (for drain covers) 1 x Pontoon, for small-scale in-house maintenance of khals & ponds. 1 x Dump truck, for transporting materials cleaned from drains, small volumes of dredged materials (& solid waste) in small streets 1 or more Emergency/mobile pump(s) Shovels, hoes & other hand tools, barrows, karais/buckets, protective equipment, etc.
4.00 2.40 3 5
Total for Galachipa (BDT million) 257.88 216.26Total for Galachipa (USD million) 3.30 2.77
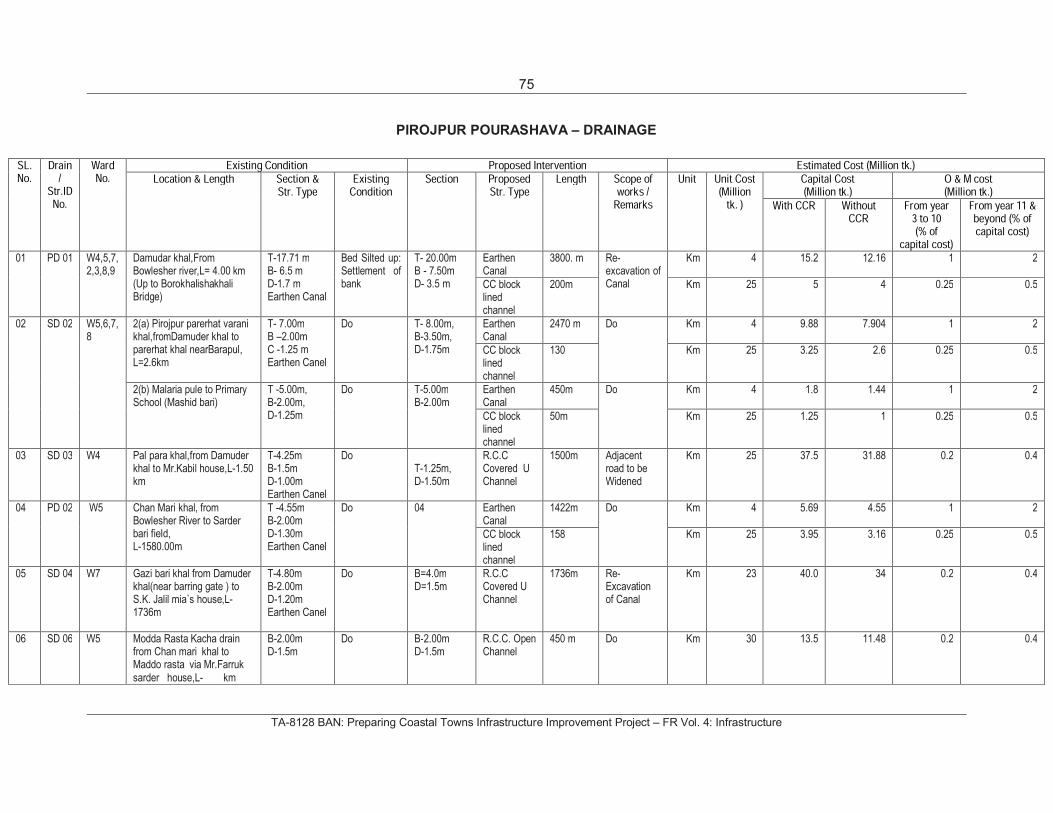
75
TA-8128 BAN: Preparing Coastal Towns Infrastructure Improvement Project – FR Vol. 4: Infrastructure
PIROJPUR POURASHAVA – DRAINAGE
SL.No.
Drain/
Str.ID No.
Ward No.
Existing Condition Proposed Intervention Estimated Cost (Million tk.)Location & Length Section &
Str. Type Existing
Condition Section Proposed
Str. Type Length Scope of
works / Remarks
Unit Unit Cost(Million
tk. ) Capital Cost(Million tk.)
O & M cost(Million tk.)
With CCR Without CCR
From year3 to 10 (% of
capital cost)
From year 11 &beyond (% of capital cost)
01 PD 01 W4,5,7,2,3,8,9
Damudar khal,From Bowlesher river,L= 4.00 km (Up to Borokhalishakhali Bridge)
T-17.71 mB- 6.5 m D-1.7 m Earthen Canal
Bed Silted up: Settlement of bank
T- 20.00mB - 7.50m D- 3.5 m
Earthen Canal
3800. m Re-excavation of Canal
Km 4 15.2 12.16 1 2
CC block lined channel
200m Km 25 5 4 0.25 0.5
02 SD 02 W5,6,7,8
2(a) Pirojpur parerhat varani khal,fromDamuder khal to parerhat khal nearBarapul, L=2.6km
T- 7.00mB –2.00m C -1.25 m Earthen Canel
Do T- 8.00m,B-3.50m, D-1.75m
Earthen Canal
2470 m Do Km 4 9.88 7.904 1 2
CC block lined channel
130 Km 25 3.25 2.6 0.25 0.5
2(b) Malaria pule to Primary School (Mashid bari)
T -5.00m,B-2.00m, D-1.25m
Do T-5.00mB-2.00m
Earthen Canal
450m Do Km 4 1.8 1.44 1 2
CC block lined channel
50m Km 25 1.25 1 0.25 0.5
03 SD 03 W4 Pal para khal,from Damuder khal to Mr.Kabil house,L-1.50 km
T-4.25mB-1.5m D-1.00mEarthen Canel
DoT-1.25m, D-1.50m
R.C.C Covered U Channel
1500m Adjacent road to be Widened
Km 25 37.5 31.88 0.2 0.4
04 PD 02 W5 Chan Mari khal, from Bowlesher River to Sarder bari field, L-1580.00m
T -4.55mB-2.00m D-1.30mEarthen Canel
Do 04 Earthen Canal
1422m Do Km 4 5.69 4.55 1 2
CC block lined channel
158 Km 25 3.95 3.16 0.25 0.5
05 SD 04 W7 Gazi bari khal from Damuder khal(near barring gate ) to S.K. Jalil mia`s house,L-1736m
T-4.80mB-2.00m D-1.20mEarthen Canel
Do B=4.0mD=1.5m
R.C.C Covered U Channel
1736m Re-Excavation of Canal
Km 23 40.0 34 0.2 0.4
06 SD 06 W5 Modda Rasta Kacha drain from Chan mari khal to Maddo rasta via Mr.Farruk sarder house,L- km
B-2.00mD-1.5m
Do B-2.00mD-1.5m
R.C.C. Open Channel
450 m Do Km 30 13.5 11.48 0.2 0.4
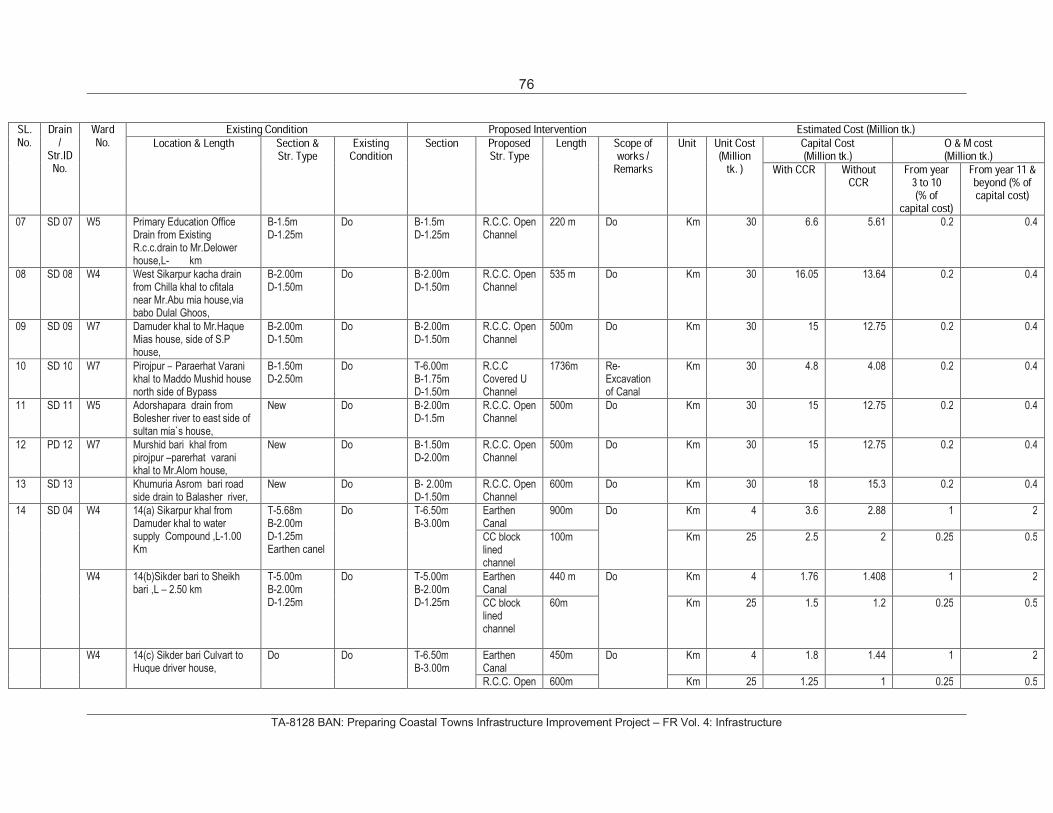
76
TA-8128 BAN: Preparing Coastal Towns Infrastructure Improvement Project – FR Vol. 4: Infrastructure
SL.No.
Drain/
Str.ID No.
Ward No.
Existing Condition Proposed Intervention Estimated Cost (Million tk.)Location & Length Section &
Str. Type Existing
Condition Section Proposed
Str. Type Length Scope of
works / Remarks
Unit Unit Cost(Million
tk. ) Capital Cost(Million tk.)
O & M cost(Million tk.)
With CCR Without CCR
From year3 to 10 (% of
capital cost)
From year 11 &beyond (% of capital cost)
07 SD 07 W5 Primary Education Office Drain from Existing R.c.c.drain to Mr.Delower house,L- km
B-1.5mD-1.25m
Do B-1.5mD-1.25m
R.C.C. Open Channel
220 m Do Km 30 6.6 5.61 0.2 0.4
08 SD 08 W4 West Sikarpur kacha drain from Chilla khal to cfitala near Mr.Abu mia house,via babo Dulal Ghoos,
B-2.00mD-1.50m
Do B-2.00mD-1.50m
R.C.C. Open Channel
535 m Do Km 30 16.05 13.64 0.2 0.4
09 SD 09 W7 Damuder khal to Mr.Haque Mias house, side of S.P house,
B-2.00mD-1.50m
Do B-2.00mD-1.50m
R.C.C. Open Channel
500m Do Km 30 15 12.75 0.2 0.4
10 SD 10 W7 Pirojpur – Paraerhat Varanikhal to Maddo Mushid house north side of Bypass
B-1.50mD-2.50m
Do T-6.00mB-1.75m D-1.50m
R.C.C Covered U Channel
1736m Re-Excavation of Canal
Km 30 4.8 4.08 0.2 0.4
11 SD 11 W5 Adorshapara drain from Bolesher river to east side of sultan mia`s house,
New Do B-2.00mD-1.5m
R.C.C. Open Channel
500m Do Km 30 15 12.75 0.2 0.4
12 PD 12 W7 Murshid bari khal from pirojpur –parerhat varani khal to Mr.Alom house,
New Do B-1.50mD-2.00m
R.C.C. Open Channel
500m Do Km 30 15 12.75 0.2 0.4
13 SD 13 Khumuria Asrom bari road side drain to Balasher river,
New Do B- 2.00mD-1.50m
R.C.C. Open Channel
600m Do Km 30 18 15.3 0.2 0.4
14 SD 04 W4 14(a) Sikarpur khal from Damuder khal to water supply Compound ,L-1.00 Km
T-5.68mB-2.00m D-1.25mEarthen canel
Do T-6.50mB-3.00m
Earthen Canal
900m Do Km 4 3.6 2.88 1 2
CC block lined channel
100m Km 25 2.5 2 0.25 0.5
W4 14(b)Sikder bari to Sheikh bari ,L – 2.50 km
T-5.00mB-2.00m D-1.25m
Do T-5.00mB-2.00m D-1.25m
Earthen Canal
440 m Do Km 4 1.76 1.408 1 2
CC block lined channel
60m Km 25 1.5 1.2 0.25 0.5
W4 14(c) Sikder bari Culvart to Huque driver house,
Do Do T-6.50mB-3.00m
Earthen Canal
450m Do Km 4 1.8 1.44 1 2
R.C.C. Open 600m Km 25 1.25 1 0.25 0.5
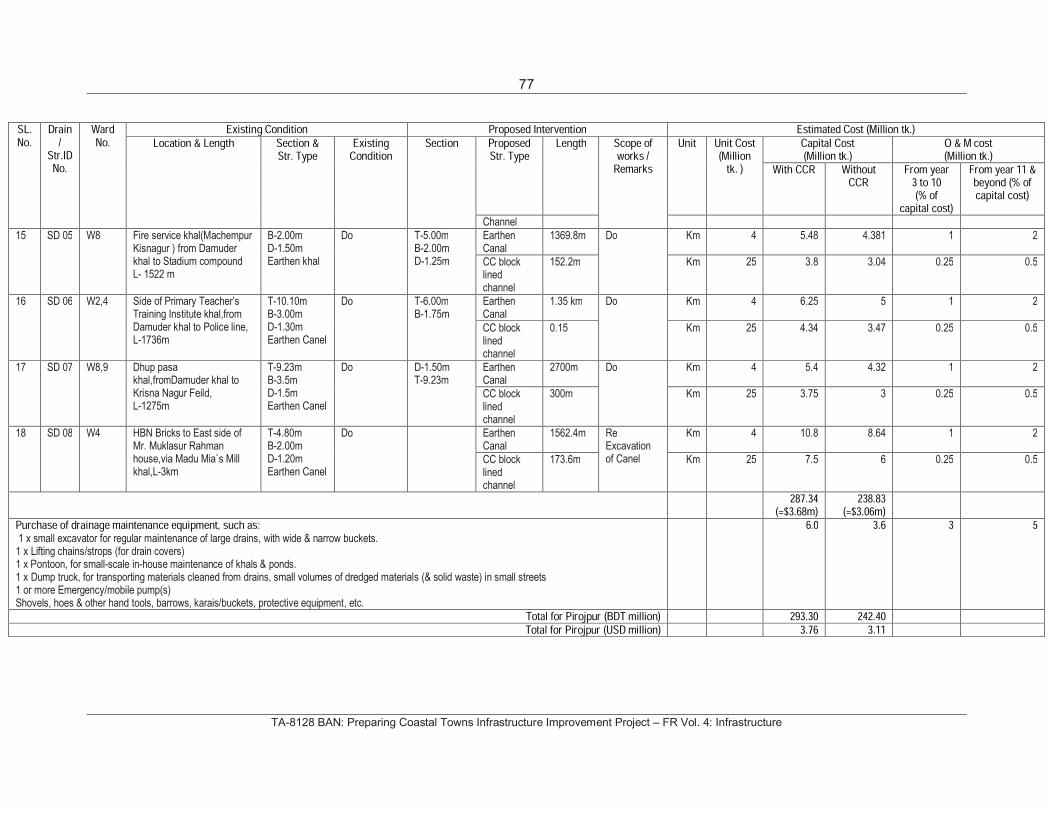
77
TA-8128 BAN: Preparing Coastal Towns Infrastructure Improvement Project – FR Vol. 4: Infrastructure
SL.No.
Drain/
Str.ID No.
Ward No.
Existing Condition Proposed Intervention Estimated Cost (Million tk.)Location & Length Section &
Str. Type Existing
Condition Section Proposed
Str. Type Length Scope of
works / Remarks
Unit Unit Cost(Million
tk. ) Capital Cost(Million tk.)
O & M cost(Million tk.)
With CCR Without CCR
From year3 to 10 (% of
capital cost)
From year 11 &beyond (% of capital cost)
Channel15 SD 05 W8 Fire service khal(Machempur
Kisnagur ) from Damuder khal to Stadium compound L- 1522 m
B-2.00mD-1.50mEarthen khal
Do T-5.00mB-2.00m D-1.25m
Earthen Canal
1369.8m Do Km 4 5.48 4.381 1 2
CC block lined channel
152.2m Km 25 3.8 3.04 0.25 0.5
16 SD 06 W2,4 Side of Primary Teacher’s Training Institute khal,from Damuder khal to Police line, L-1736m
T-10.10mB-3.00m D-1.30mEarthen Canel
Do T-6.00mB-1.75m
Earthen Canal
1.35 km Do Km 4 6.25 5 1 2
CC block lined channel
0.15 Km 25 4.34 3.47 0.25 0.5
17 SD 07 W8,9 Dhup pasa khal,fromDamuder khal to Krisna Nagur Feild, L-1275m
T-9.23mB-3.5m D-1.5mEarthen Canel
Do D-1.50mT-9.23m
Earthen Canal
2700m Do Km 4 5.4 4.32 1 2
CC block lined channel
300m Km 25 3.75 3 0.25 0.5
18 SD 08 W4 HBN Bricks to East side of Mr. Muklasur Rahman house,via Madu Mia`s Mill khal,L-3km
T-4.80mB-2.00m D-1.20mEarthen Canel
Do Earthen Canal
1562.4m ReExcavation of Canel
Km 4 10.8 8.64 1 2
CC block lined channel
173.6m Km 25 7.5 6 0.25 0.5
287.34(=$3.68m)
238.83(=$3.06m)
Purchase of drainage maintenance equipment, such as:1 x small excavator for regular maintenance of large drains, with wide & narrow buckets.
1 x Lifting chains/strops (for drain covers) 1 x Pontoon, for small-scale in-house maintenance of khals & ponds. 1 x Dump truck, for transporting materials cleaned from drains, small volumes of dredged materials (& solid waste) in small streets 1 or more Emergency/mobile pump(s) Shovels, hoes & other hand tools, barrows, karais/buckets, protective equipment, etc.
6.0 3.6 3 5
Total for Pirojpur (BDT million) 293.30 242.40Total for Pirojpur (USD million) 3.76 3.11
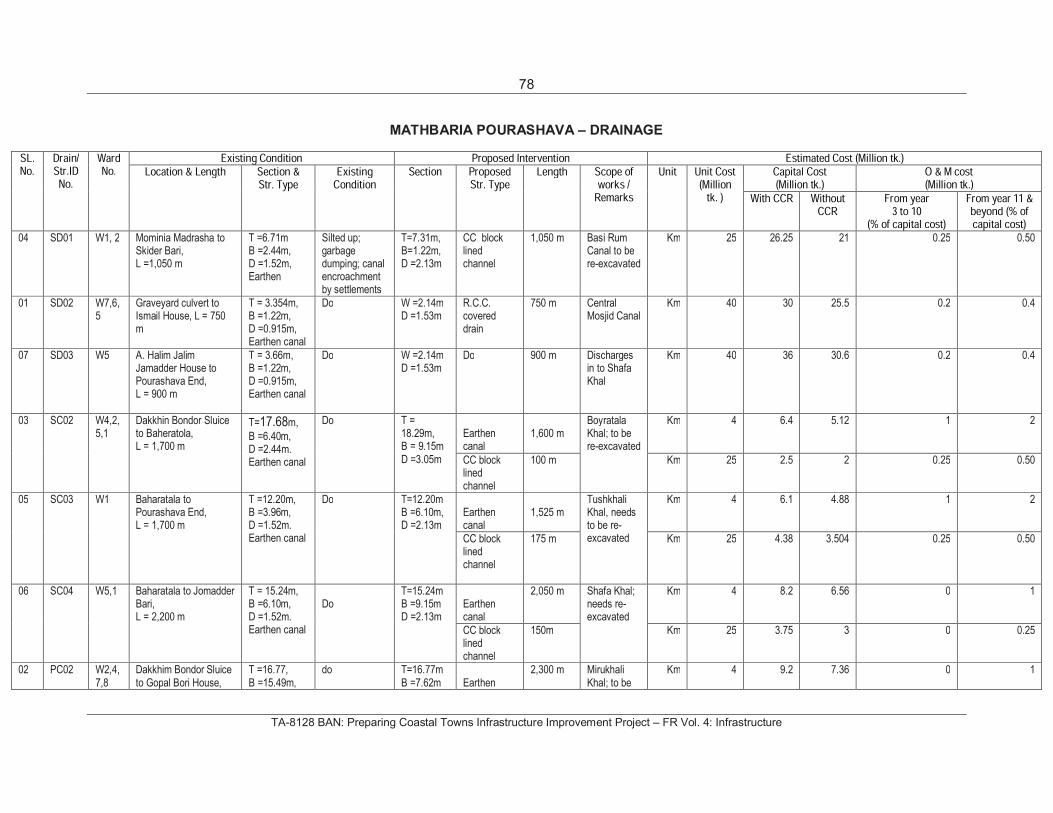
78
TA-8128 BAN: Preparing Coastal Towns Infrastructure Improvement Project – FR Vol. 4: Infrastructure
MATHBARIA POURASHAVA – DRAINAGE
SL.No.
Drain/Str.ID No.
Ward No.
Existing Condition Proposed Intervention Estimated Cost (Million tk.)Location & Length Section &
Str. Type Existing
Condition Section Proposed
Str. Type Length Scope of
works / Remarks
Unit Unit Cost(Million
tk. ) Capital Cost(Million tk.)
O & M cost(Million tk.)
With CCR Without CCR
From year3 to 10
(% of capital cost) From year 11 &beyond (% of capital cost)
04 SD01 W1, 2 Mominia Madrasha to Skider Bari, L =1,050 m
T =6.71mB =2.44m, D =1.52m, Earthen
Silted up; garbage dumping; canal encroachment by settlements
T=7.31m,B=1.22m, D =2.13m
CC block lined channel
1,050 m Basi Rum Canal to be re-excavated
Km 25 26.25 21 0.25 0.50
01 SD02 W7,6,5
Graveyard culvert to Ismail House, L = 750 m
T = 3.354m,B =1.22m, D =0.915m, Earthen canal
Do W =2.14mD =1.53m
R.C.C. covered drain
750 m CentralMosjid Canal
Km 40 30 25.5 0.2 0.4
07 SD03 W5 A. Halim Jalim Jamadder House to Pourashava End, L = 900 m
T = 3.66m,B =1.22m, D =0.915m, Earthen canal
Do W =2.14mD =1.53m
Do 900 m Discharges in to Shafa Khal
Km 40 36 30.6 0.2 0.4
03 SC02 W4,2,5,1
Dakkhin Bondor Sluice to Baheratola, L = 1,700 m
T=17.68m, B =6.40m, D =2.44m. Earthen canal
Do T = 18.29m, B = 9.15m D =3.05m
Earthen canal
1,600 m Boyratala Khal; to be re-excavated
Km 4 6.4 5.12 1 2
CC block lined channel
100 m Km 25 2.5 2 0.25 0.50
05 SC03 W1 Baharatala to Pourashava End, L = 1,700 m
T =12.20m,B =3.96m, D =1.52m. Earthen canal
Do T=12.20mB =6.10m, D =2.13m
Earthen canal
1,525 m Tushkhali Khal, needs to be re-excavated
Km 4 6.1 4.88 1 2
CC block lined channel
175 m Km 25 4.38 3.504 0.25 0.50
06 SC04 W5,1 Baharatala to Jomadder Bari, L = 2,200 m
T = 15.24m,B =6.10m, D =1.52m. Earthen canal
DoT=15.24mB =9.15m D =2.13m
Earthen canal
2,050 m Shafa Khal; needs re-excavated
Km 4 8.2 6.56 0 1
CC block lined channel
150m Km 25 3.75 3 0 0.25
02 PC02 W2,4,7,8
Dakkhim Bondor Sluice to Gopal Bori House,
T =16.77,B =15.49m,
do T=16.77mB =7.62m Earthen
2,300 m Mirukhali Khal; to be
Km 4 9.2 7.36 0 1
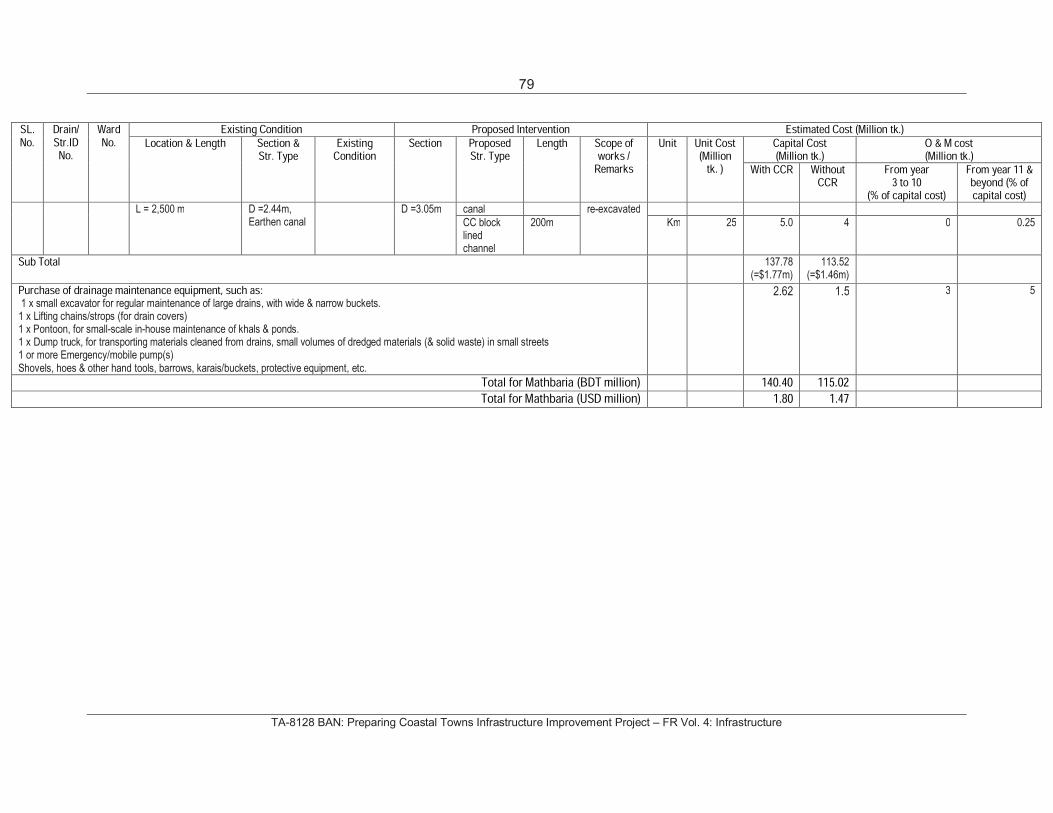
79
TA-8128 BAN: Preparing Coastal Towns Infrastructure Improvement Project – FR Vol. 4: Infrastructure
SL.No.
Drain/Str.ID No.
Ward No.
Existing Condition Proposed Intervention Estimated Cost (Million tk.)Location & Length Section &
Str. Type Existing
Condition Section Proposed
Str. Type Length Scope of
works / Remarks
Unit Unit Cost(Million
tk. ) Capital Cost(Million tk.)
O & M cost(Million tk.)
With CCR Without CCR
From year3 to 10
(% of capital cost) From year 11 &beyond (% of capital cost)
L = 2,500 m D =2.44m,Earthen canal
D =3.05m canal re-excavatedCC block lined channel
200m Km 25 5.0 4 0 0.25
Sub Total 137.78(=$1.77m)
113.52(=$1.46m)
Purchase of drainage maintenance equipment, such as:1 x small excavator for regular maintenance of large drains, with wide & narrow buckets.
1 x Lifting chains/strops (for drain covers) 1 x Pontoon, for small-scale in-house maintenance of khals & ponds. 1 x Dump truck, for transporting materials cleaned from drains, small volumes of dredged materials (& solid waste) in small streets 1 or more Emergency/mobile pump(s) Shovels, hoes & other hand tools, barrows, karais/buckets, protective equipment, etc.
2.62 1.5 3 5
Total for Mathbaria (BDT million) 140.40 115.02 Total for Mathbaria (USD million) 1.80 1.47

80
TA-8128 BAN: Preparing Coastal Towns Infrastructure Improvement Project – FR Vol. 4: Infrastructure
5. MAPS SHOWING LOCATIONS OF PROPOSED DRAINAGE WORKS
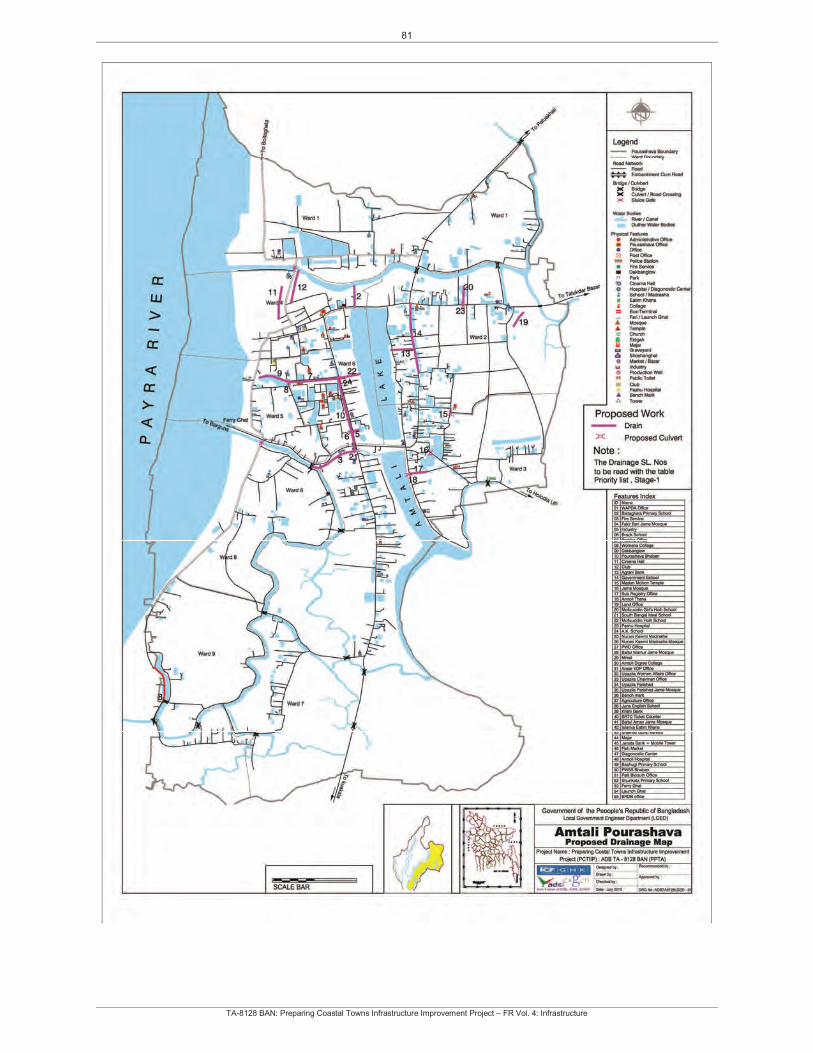
81
TA-8128 BAN: Preparing Coastal Towns Infrastructure Improvement Project – FR Vol. 4: Infrastructure
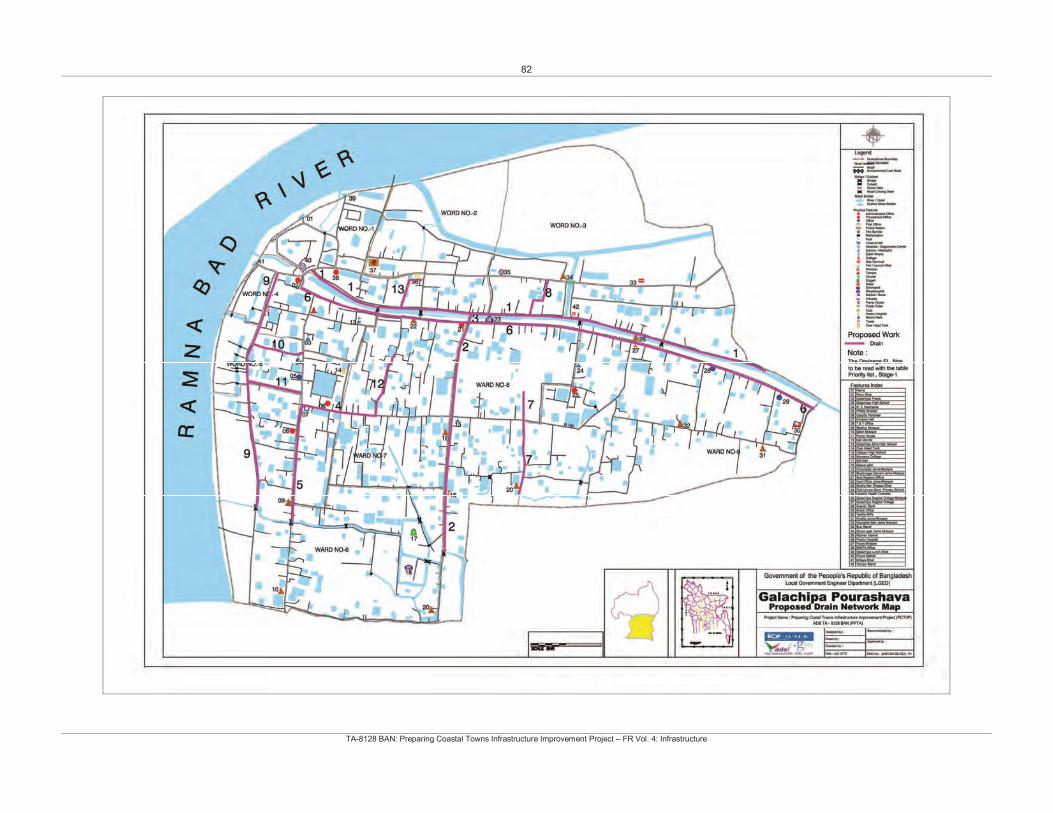
82
TA-8128 BAN: Preparing Coastal Towns Infrastructure Improvement Project – FR Vol. 4: Infrastructure
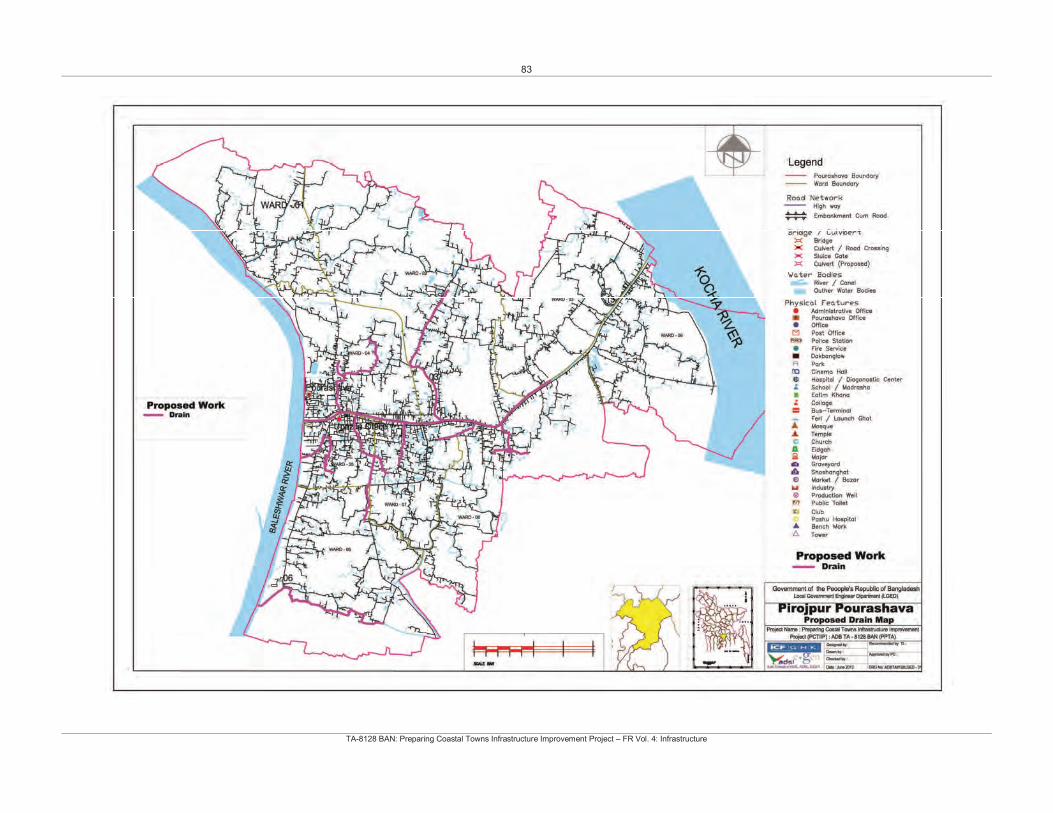
83
TA-8128 BAN: Preparing Coastal Towns Infrastructure Improvement Project – FR Vol. 4: Infrastructure
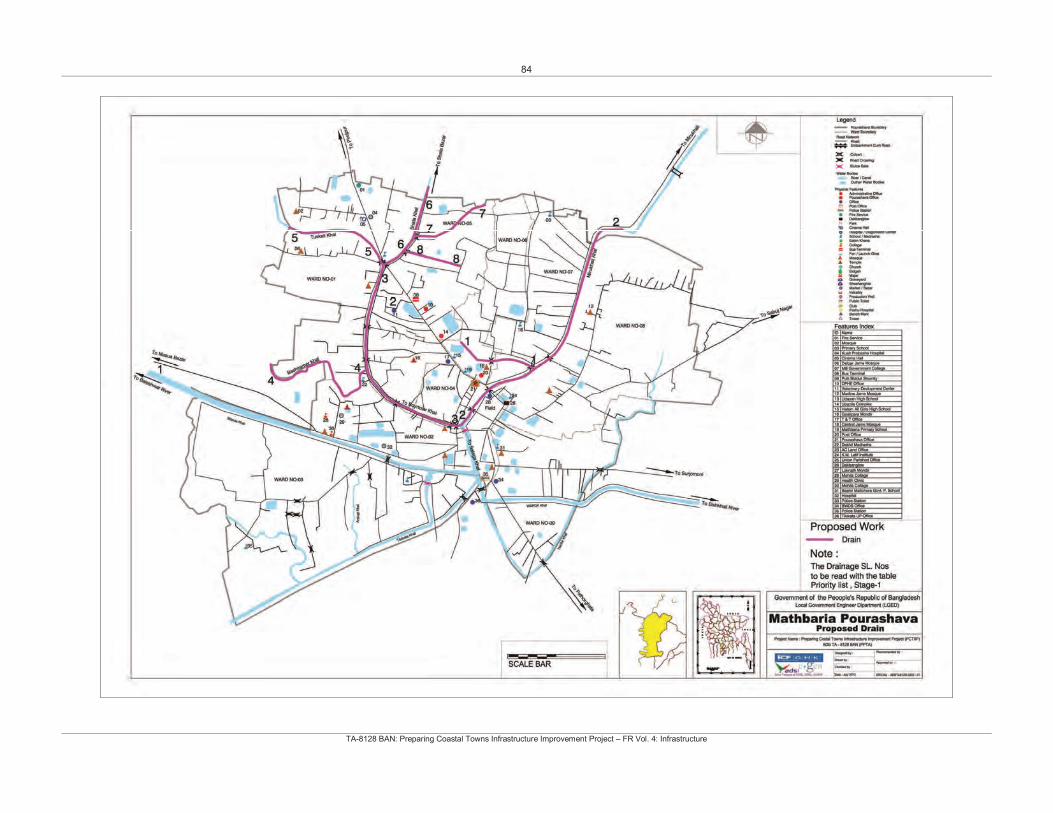
84
TA-8128 BAN: Preparing Coastal Towns Infrastructure Improvement Project – FR Vol. 4: Infrastructure
85
TA-8128 BAN: Preparing Coastal Towns Infrastructure Improvement Project – FR Vol. 4: Infrastructure
ANNEX C: WATER SUPPLY DRAWINGS
Amtali
01 Physical Features Map (A3) 02 Existing Water Supply System Map (A4) 03 Proposed Water Supply (Integrated) (A3) 04 Proposed Water Supply (Zone Wise) (A3) 05 Site Plan – Zone 2 (A4)
Galachipa
01 Physical Features Map (A3) 02 Existing Water Supply System Map (A4) 03 Proposed Water Supply (Integrated) (A3) 04 Proposed Water Supply (Zone Wise) (A3) 05 Tubewell Site Plan (A4)
Mathbaria
01 Physical Features Map (A3) 02 Proposed Water Supply (Integrated) (A3) 03 Surface Water Treatment Plant – Site Plan (A4) 04 Overhead Tank – Site Plan (A4)
Common Drawing
01 ProductionTubewell Design (A4)

86
TA-8128 BAN: Preparing Coastal Towns Infrastructure Improvement Project – FR Vol. 4: Infrastructure
Water Supply Drawings - Amtali
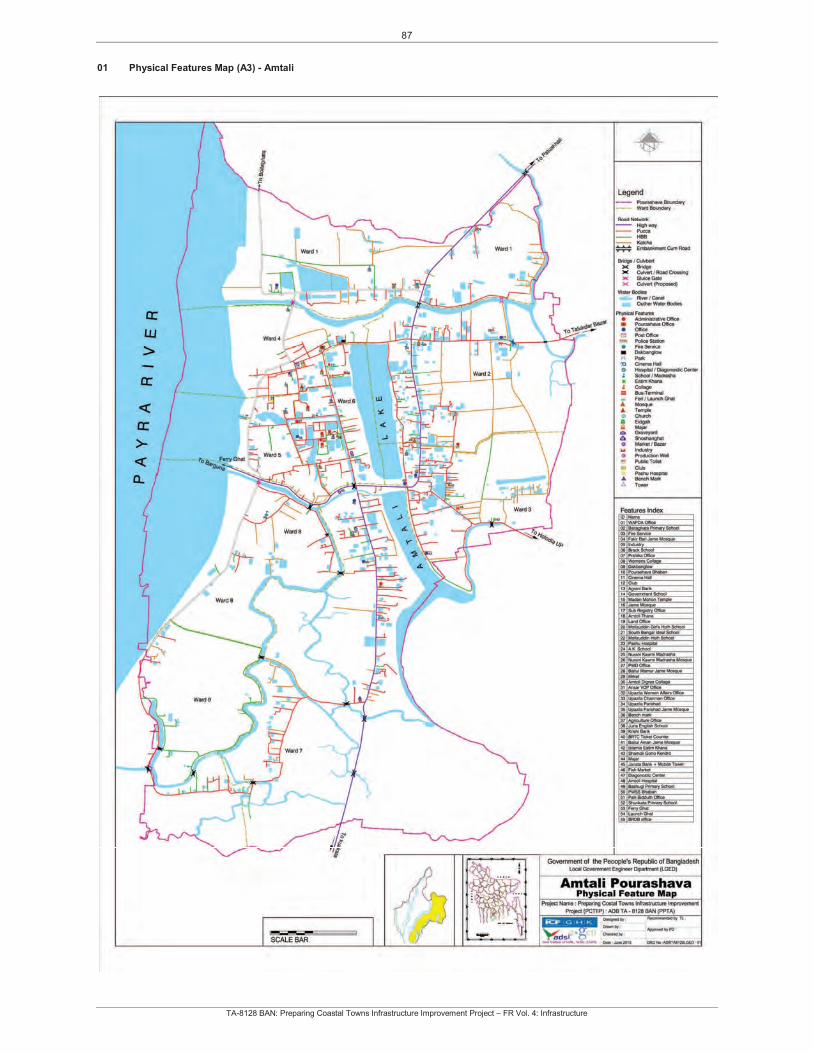
87
TA-8128 BAN: Preparing Coastal Towns Infrastructure Improvement Project – FR Vol. 4: Infrastructure
01 Physical Features Map (A3) - Amtali
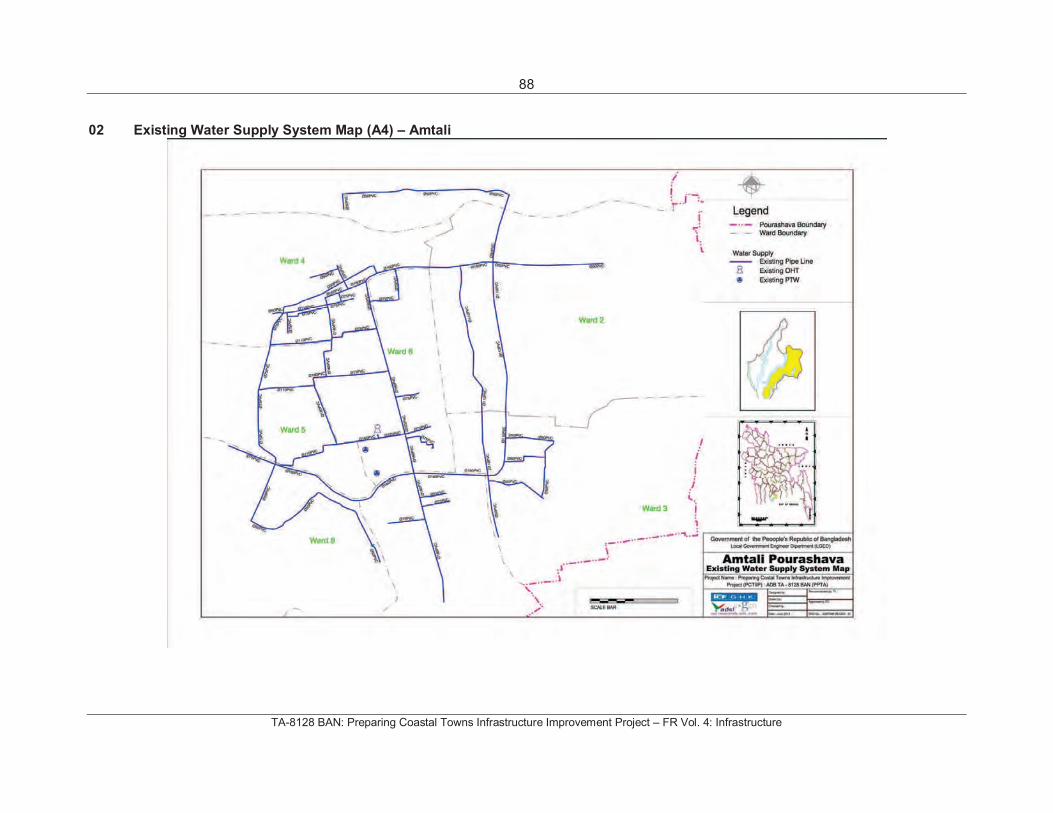
88
TA-8128 BAN: Preparing Coastal Towns Infrastructure Improvement Project – FR Vol. 4: Infrastructure
02 Existing Water Supply System Map (A4) – Amtali
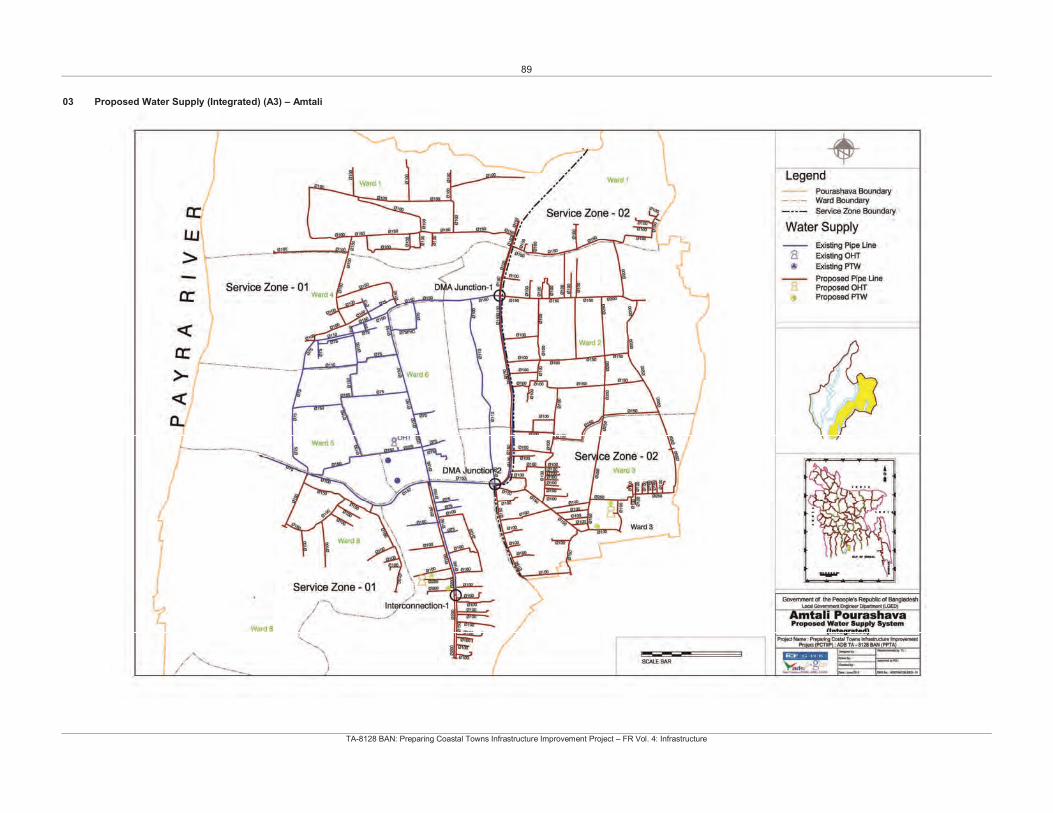
89
TA-8128 BAN: Preparing Coastal Towns Infrastructure Improvement Project – FR Vol. 4: Infrastructure
03 Proposed Water Supply (Integrated) (A3) – Amtali
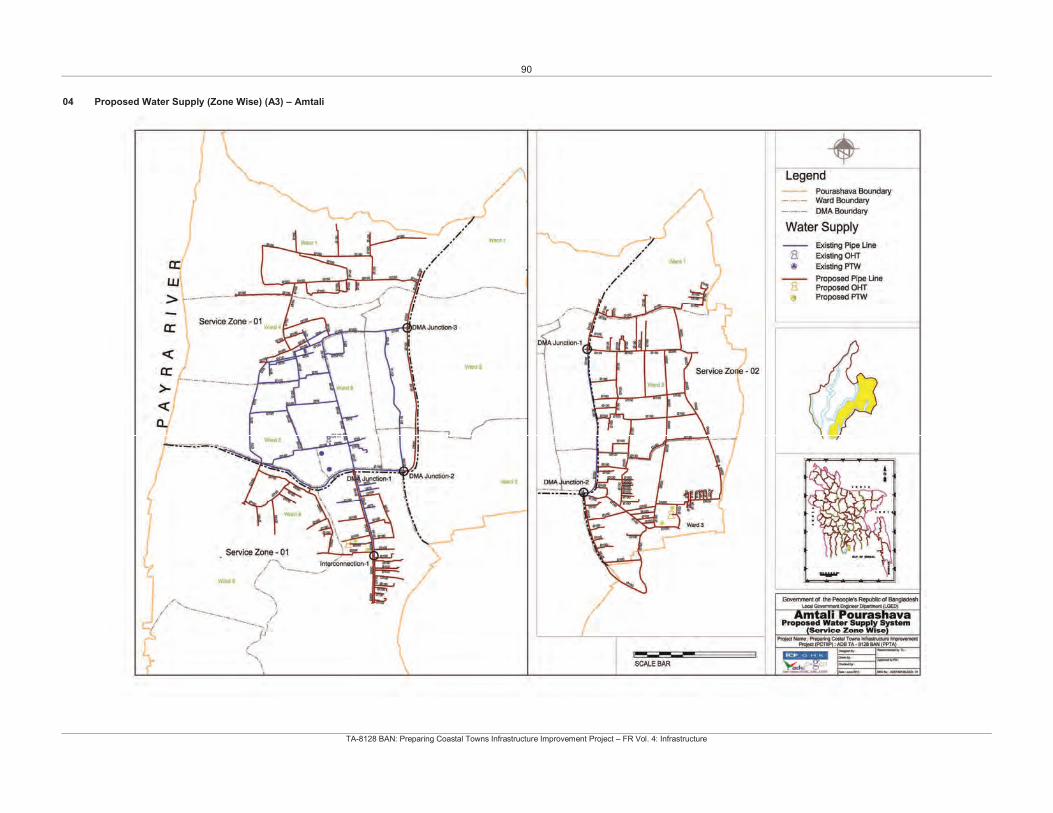
90
TA-8128 BAN: Preparing Coastal Towns Infrastructure Improvement Project – FR Vol. 4: Infrastructure
04 Proposed Water Supply (Zone Wise) (A3) – Amtali
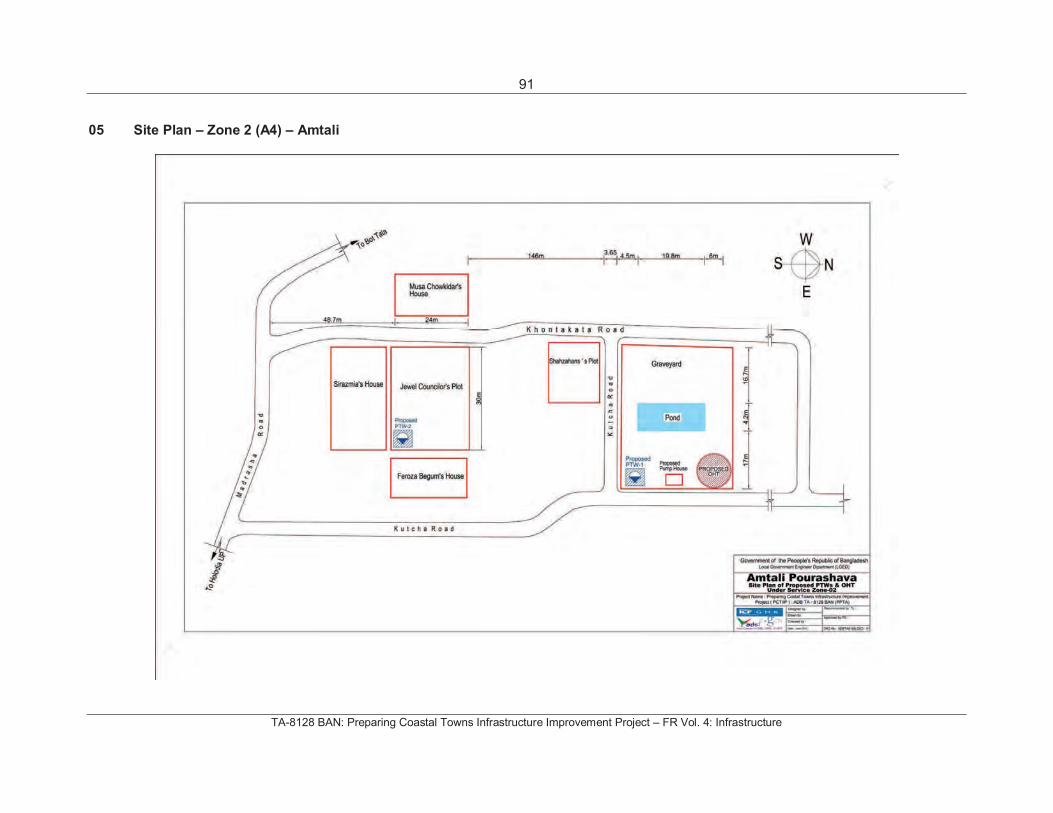
91
TA-8128 BAN: Preparing Coastal Towns Infrastructure Improvement Project – FR Vol. 4: Infrastructure
05 Site Plan – Zone 2 (A4) – Amtali

92
TA-8128 BAN: Preparing Coastal Towns Infrastructure Improvement Project – FR Vol. 4: Infrastructure
Water Supply Drawings - Galachipa
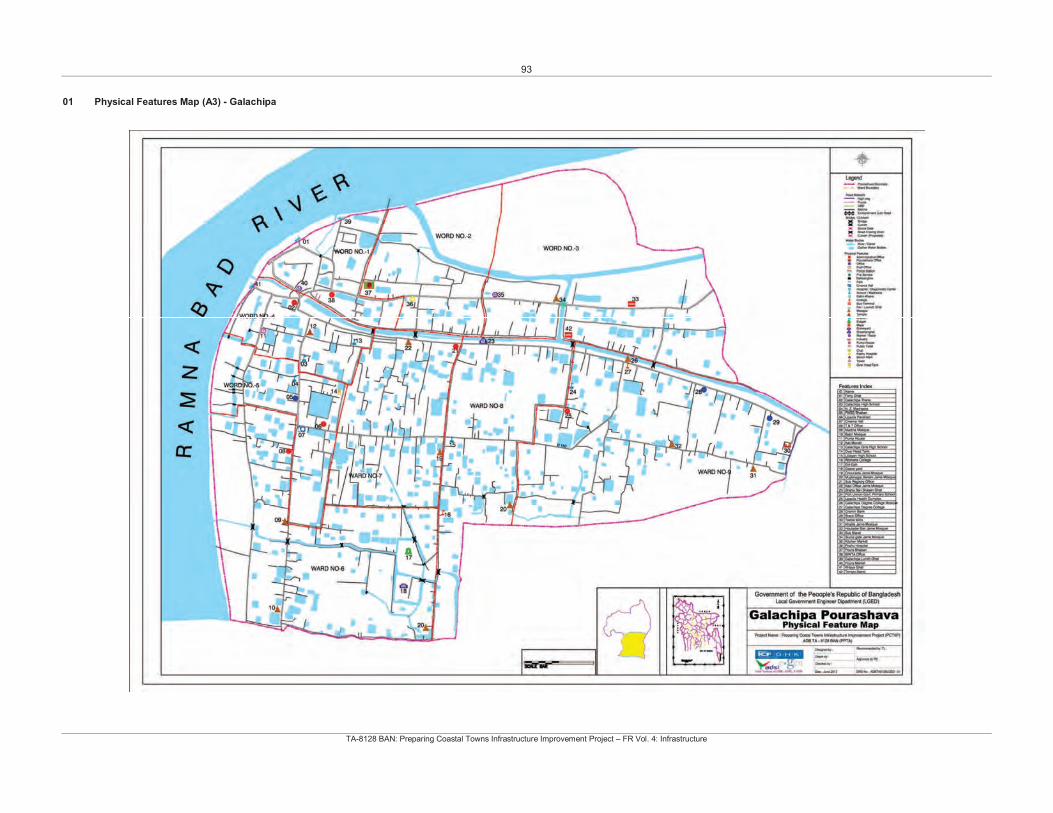
93
TA-8128 BAN: Preparing Coastal Towns Infrastructure Improvement Project – FR Vol. 4: Infrastructure
01 Physical Features Map (A3) - Galachipa
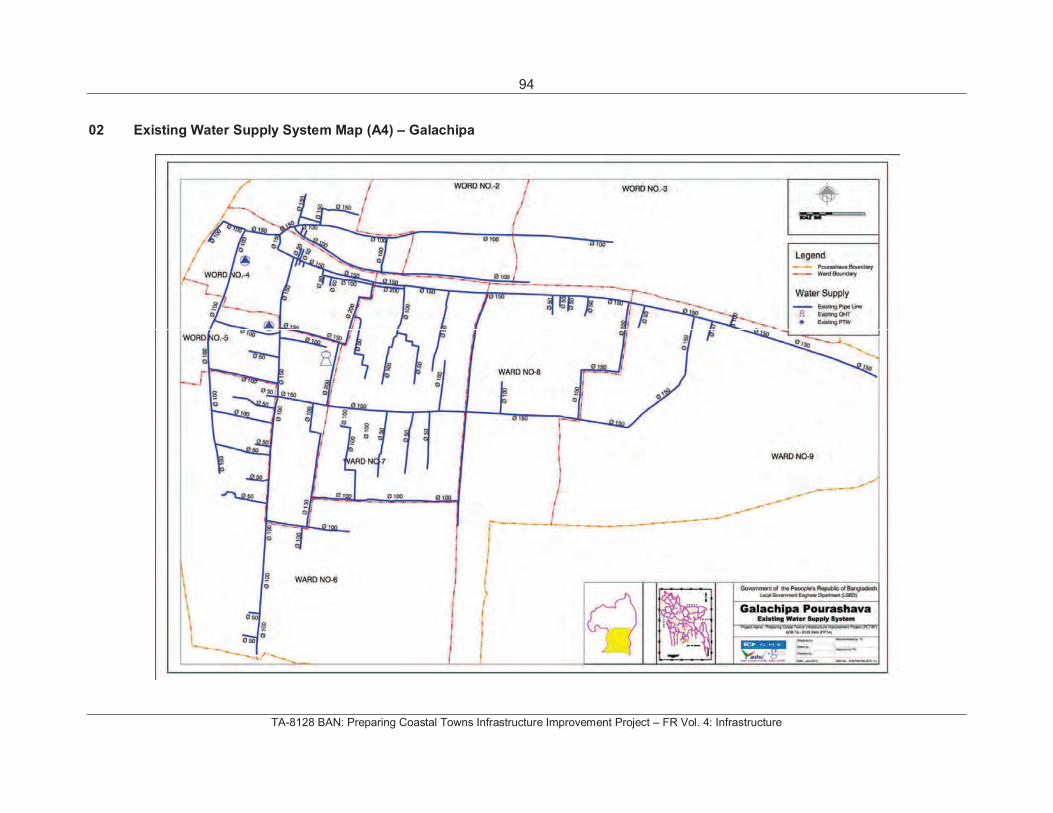
94
TA-8128 BAN: Preparing Coastal Towns Infrastructure Improvement Project – FR Vol. 4: Infrastructure
02 Existing Water Supply System Map (A4) – Galachipa
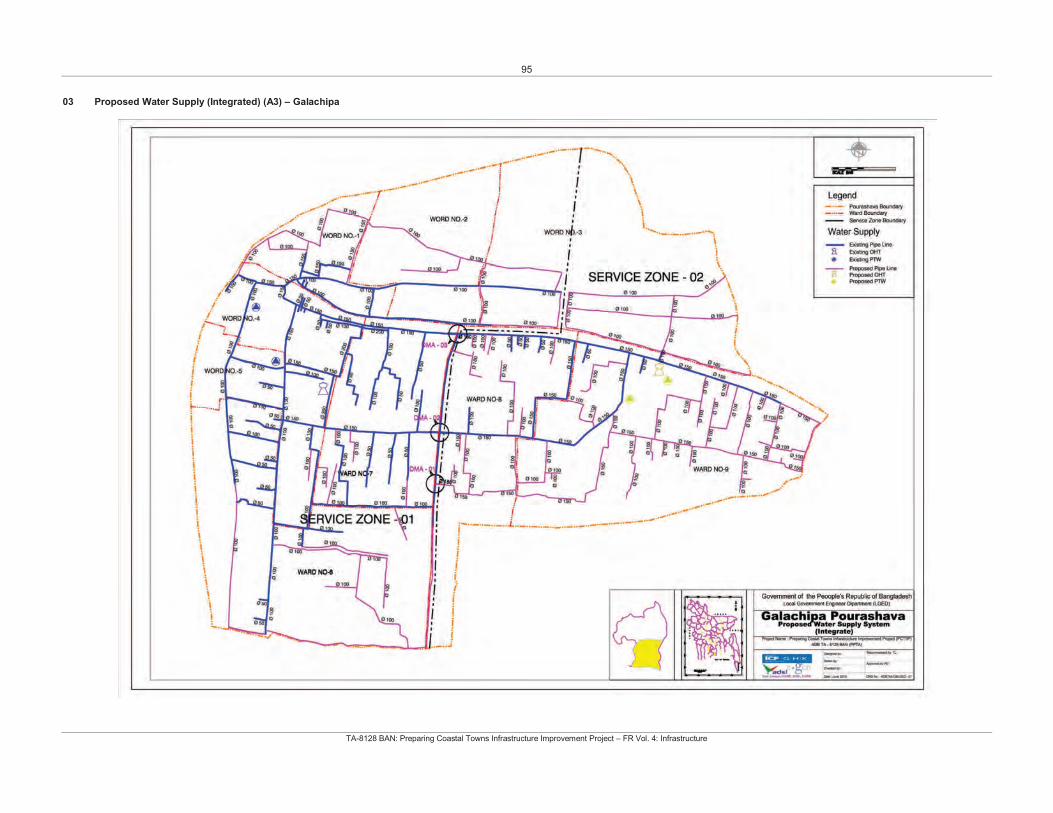
95
TA-8128 BAN: Preparing Coastal Towns Infrastructure Improvement Project – FR Vol. 4: Infrastructure
03 Proposed Water Supply (Integrated) (A3) – Galachipa
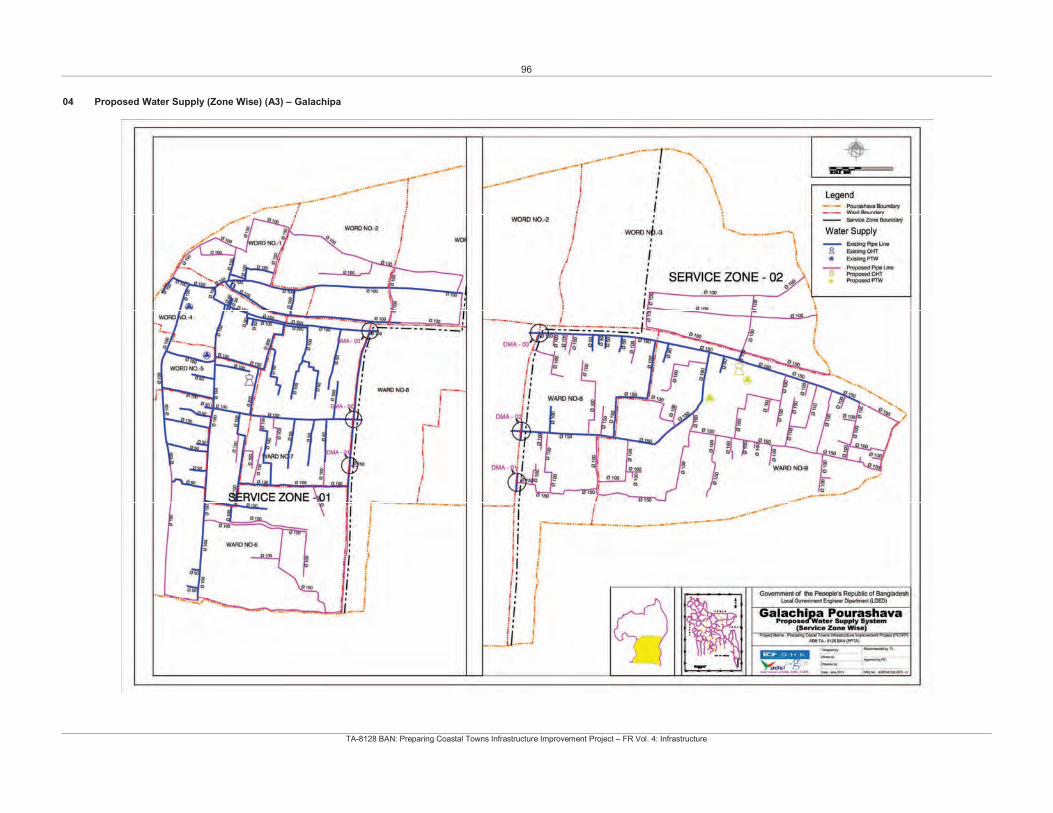
96
TA-8128 BAN: Preparing Coastal Towns Infrastructure Improvement Project – FR Vol. 4: Infrastructure
04 Proposed Water Supply (Zone Wise) (A3) – Galachipa
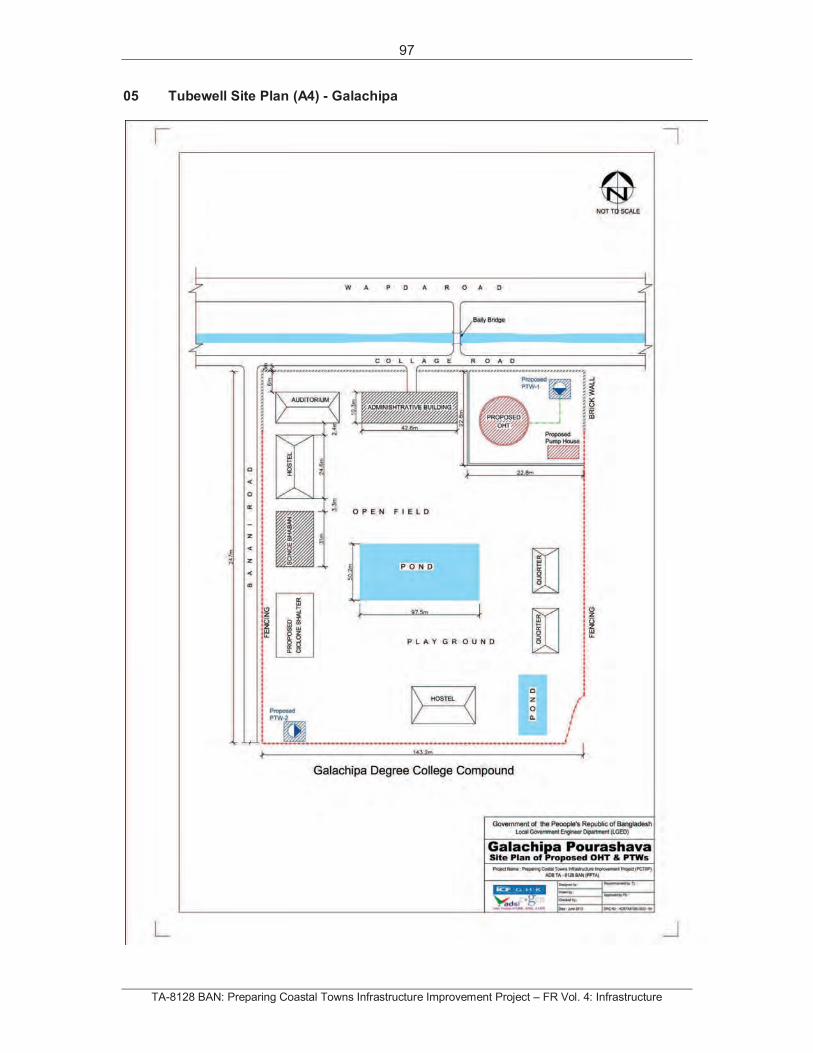
97
TA-8128 BAN: Preparing Coastal Towns Infrastructure Improvement Project – FR Vol. 4: Infrastructure
05 Tubewell Site Plan (A4) - Galachipa

98
TA-8128 BAN: Preparing Coastal Towns Infrastructure Improvement Project – FR Vol. 4: Infrastructure
Water Supply Drawings – Mathbaria
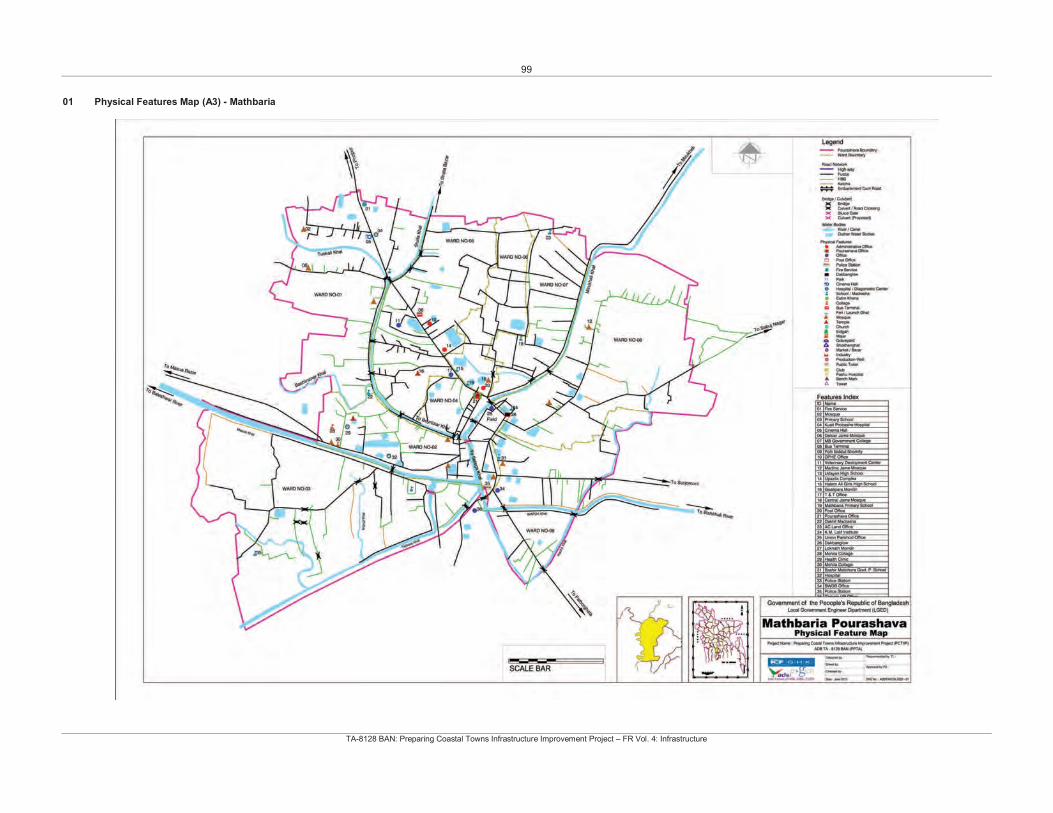
99
TA-8128 BAN: Preparing Coastal Towns Infrastructure Improvement Project – FR Vol. 4: Infrastructure
01 Physical Features Map (A3) - Mathbaria
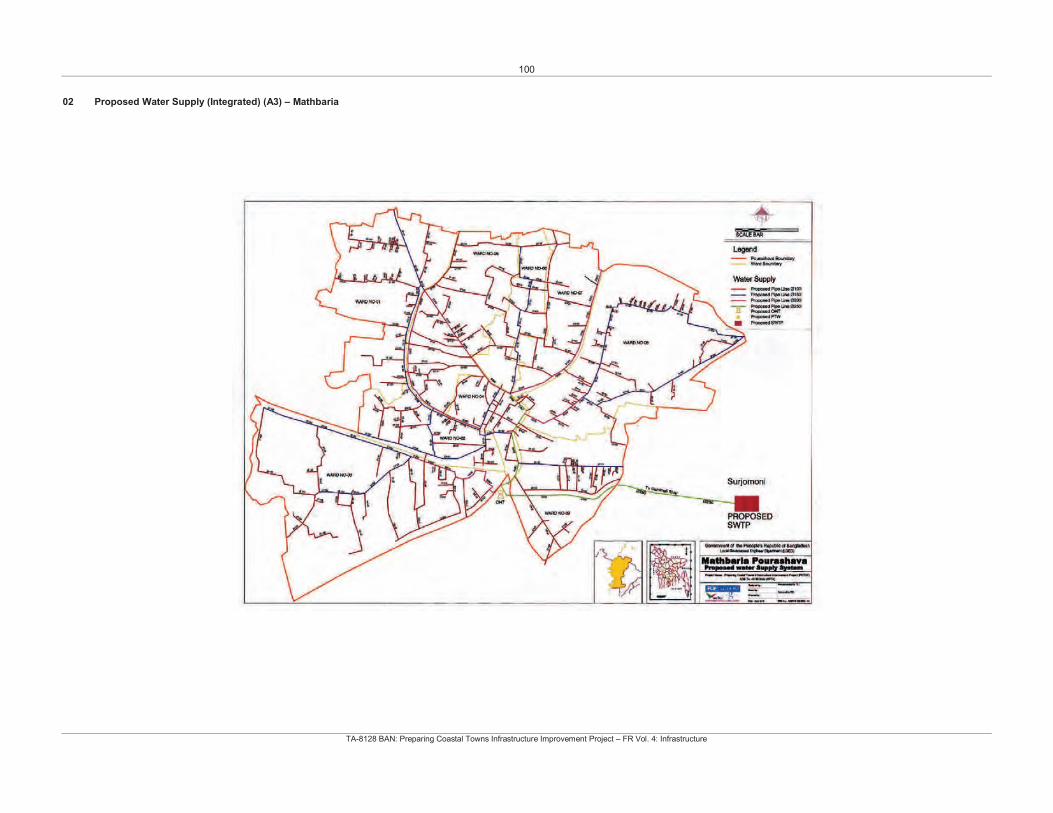
100
TA-8128 BAN: Preparing Coastal Towns Infrastructure Improvement Project – FR Vol. 4: Infrastructure
02 Proposed Water Supply (Integrated) (A3) – Mathbaria
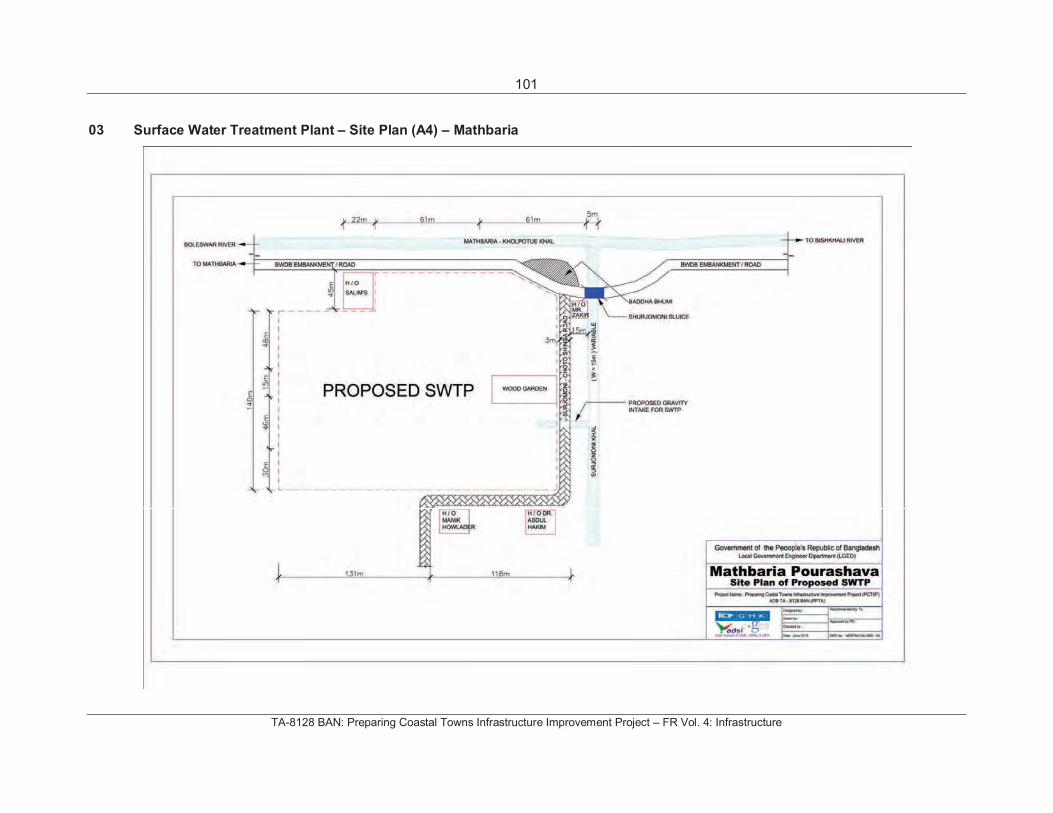
101
TA-8128 BAN: Preparing Coastal Towns Infrastructure Improvement Project – FR Vol. 4: Infrastructure
03 Surface Water Treatment Plant – Site Plan (A4) – Mathbaria
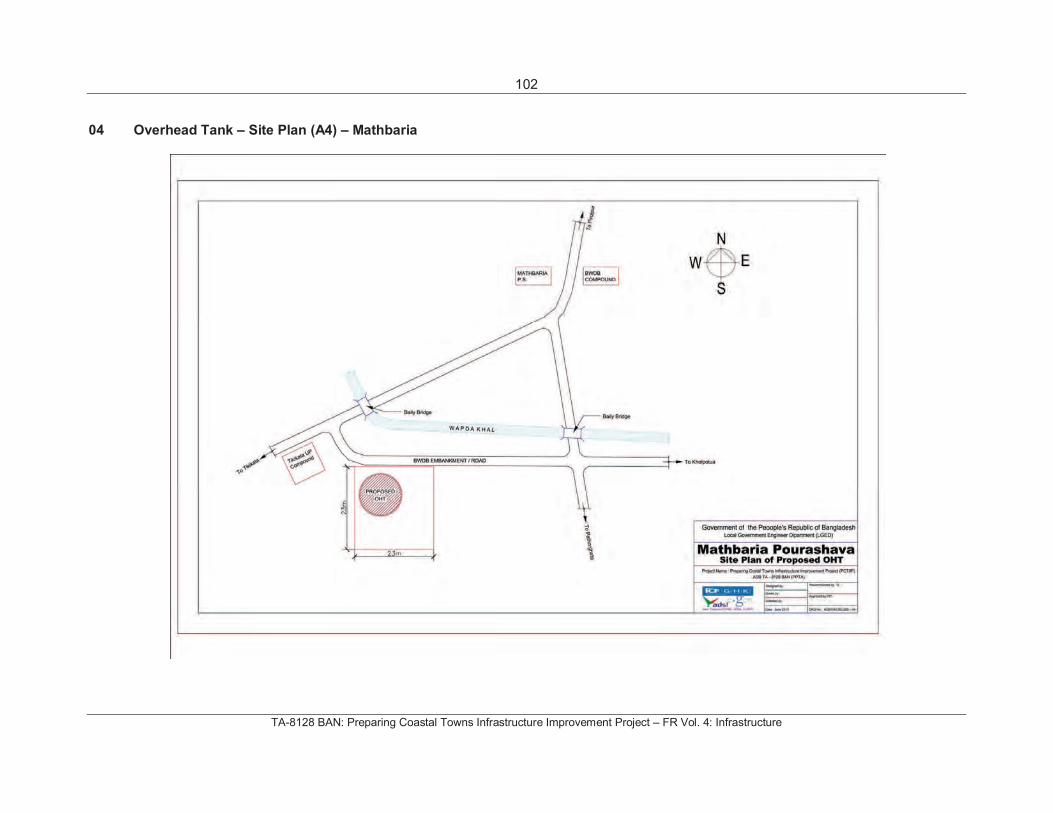
102
TA-8128 BAN: Preparing Coastal Towns Infrastructure Improvement Project – FR Vol. 4: Infrastructure
04 Overhead Tank – Site Plan (A4) – Mathbaria
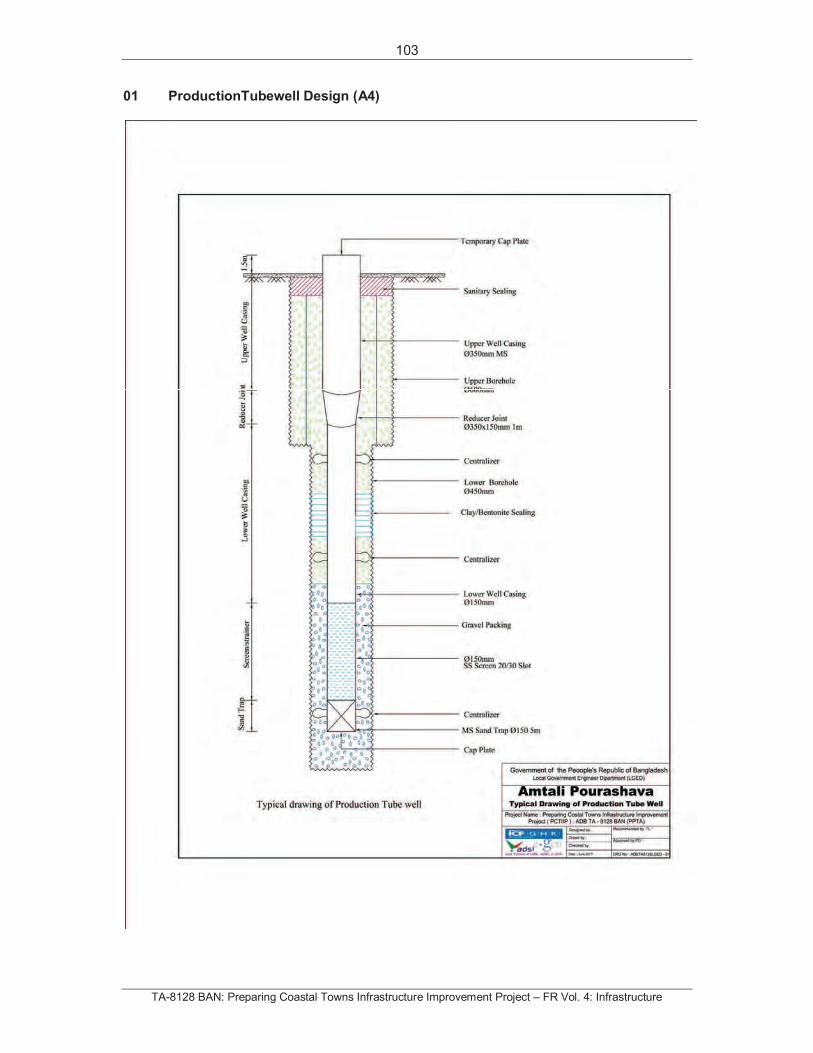
103
TA-8128 BAN: Preparing Coastal Towns Infrastructure Improvement Project – FR Vol. 4: Infrastructure
01 ProductionTubewell Design (A4)
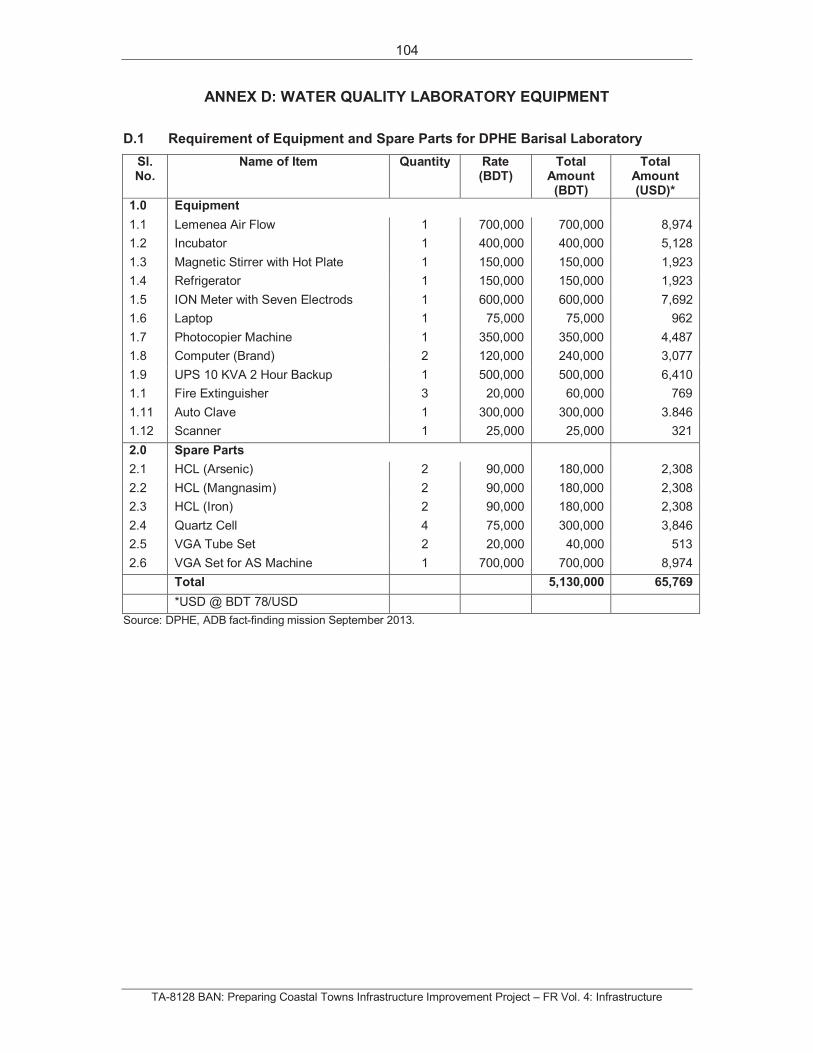
104
TA-8128 BAN: Preparing Coastal Towns Infrastructure Improvement Project – FR Vol. 4: Infrastructure
ANNEX D: WATER QUALITY LABORATORY EQUIPMENT
D.1 Requirement of Equipment and Spare Parts for DPHE Barisal Laboratory
Sl.No.
Name of Item Quantity Rate(BDT)
Total Amount (BDT)
Total Amount (USD)*
1.0 Equipment
1.1 Lemenea Air Flow 1 700,000 700,000 8,974
1.2 Incubator 1 400,000 400,000 5,128
1.3 Magnetic Stirrer with Hot Plate 1 150,000 150,000 1,923
1.4 Refrigerator 1 150,000 150,000 1,923
1.5 ION Meter with Seven Electrods 1 600,000 600,000 7,692
1.6 Laptop 1 75,000 75,000 962
1.7 Photocopier Machine 1 350,000 350,000 4,487
1.8 Computer (Brand) 2 120,000 240,000 3,077
1.9 UPS 10 KVA 2 Hour Backup 1 500,000 500,000 6,410
1.1 Fire Extinguisher 3 20,000 60,000 769
1.11 Auto Clave 1 300,000 300,000 3.846
1.12 Scanner 1 25,000 25,000 321
2.0 Spare Parts
2.1 HCL (Arsenic) 2 90,000 180,000 2,308
2.2 HCL (Mangnasim) 2 90,000 180,000 2,308
2.3 HCL (Iron) 2 90,000 180,000 2,308
2.4 Quartz Cell 4 75,000 300,000 3,846
2.5 VGA Tube Set 2 20,000 40,000 513
2.6 VGA Set for AS Machine 1 700,000 700,000 8,974
Total 5,130,000 65,769
*USD @ BDT 78/USD
Source: DPHE, ADB fact-finding mission September 2013.
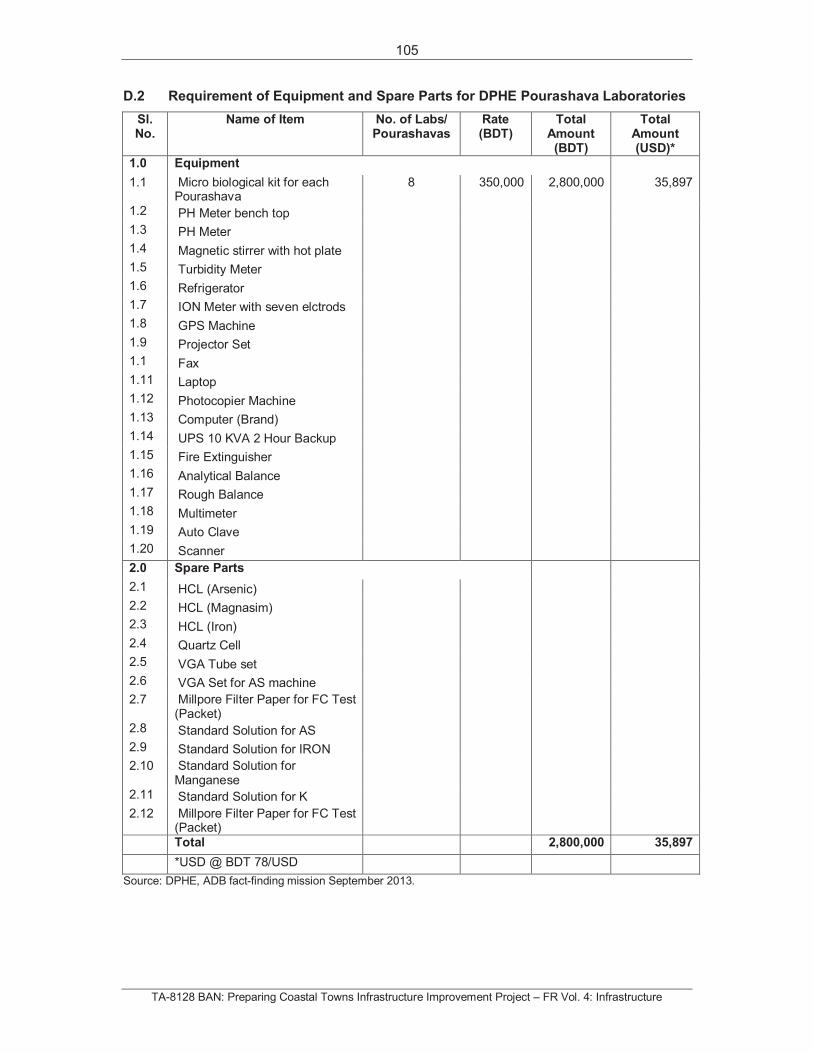
105
TA-8128 BAN: Preparing Coastal Towns Infrastructure Improvement Project – FR Vol. 4: Infrastructure
D.2 Requirement of Equipment and Spare Parts for DPHE Pourashava Laboratories
Sl.No.
Name of Item No. of Labs/Pourashavas
Rate(BDT)
Total Amount (BDT)
Total Amount (USD)*
1.0 Equipment
1.1 Micro biological kit for each Pourashava
8 350,000 2,800,000 35,897
1.2 PH Meter bench top
1.3 PH Meter
1.4 Magnetic stirrer with hot plate
1.5 Turbidity Meter
1.6 Refrigerator
1.7 ION Meter with seven elctrods
1.8 GPS Machine
1.9 Projector Set
1.1 Fax
1.11 Laptop
1.12 Photocopier Machine
1.13 Computer (Brand)
1.14 UPS 10 KVA 2 Hour Backup
1.15 Fire Extinguisher
1.16 Analytical Balance
1.17 Rough Balance
1.18 Multimeter
1.19 Auto Clave
1.20 Scanner
2.0 Spare Parts
2.1 HCL (Arsenic)
2.2 HCL (Magnasim)
2.3 HCL (Iron)
2.4 Quartz Cell
2.5 VGA Tube set
2.6 VGA Set for AS machine
2.7 Millpore Filter Paper for FC Test (Packet)
2.8 Standard Solution for AS
2.9 Standard Solution for IRON
2.10 Standard Solution for Manganese
2.11 Standard Solution for K
2.12 Millpore Filter Paper for FC Test (Packet) Total 2,800,000 35,897
*USD @ BDT 78/USD
Source: DPHE, ADB fact-finding mission September 2013.
106
TA-8128 BAN: Preparing Coastal Towns Infrastructure Improvement Project – FR Vol. 4: Infrastructure
ANNEX E: SANITATION
Annex E.1: Draft Final Report – Decentalised Sanitation Technologies
August 2013 Submitted to The Bill and Melinda Gates Foundation
Annex E.2: Cost Estimates of Proposed BMGF Sanitation Pilot Projects By BMGF Sanitation Specialist September 2013
Annex E.3: Sanitation Maps and Drawings

107
TA-8128 BAN: Preparing Coastal Towns Infrastructure Improvement Project – FR Vol. 4: Infrastructure
ANNEX E.1FINAL DRAFT REPORT – DECENTALISED SANITATION TECHNOLOGIES
August 2013
Submitted to The Bill and Melinda Gates Foundation
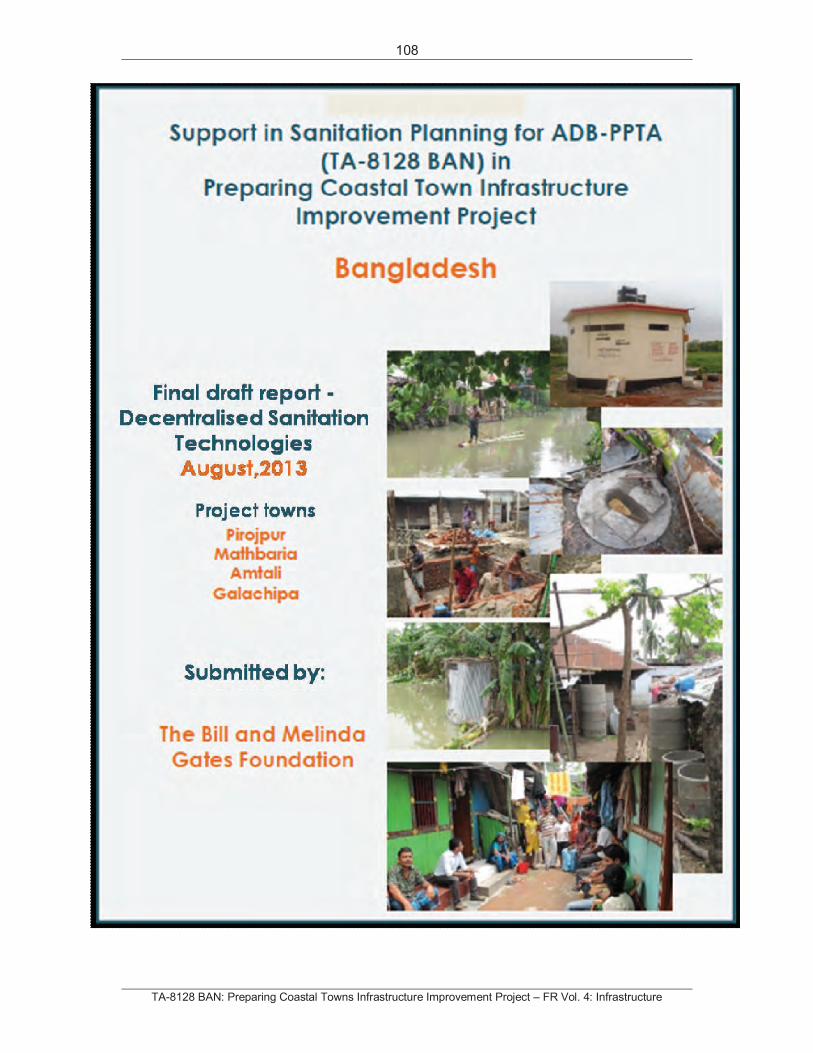
108
TA-8128 BAN: Preparing Coastal Towns Infrastructure Improvement Project – FR Vol. 4: Infrastructure
109
TA-8128 BAN: Preparing Coastal Towns Infrastructure Improvement Project – FR Vol. 4: Infrastructure
GLOSSARY OF TERMS
POURASHAVA – MUNICIPALITY
KHAL – CANAL
ACRONYMS
ABR - Anaerobic Baffled Reactor ADB - Asian Development Bank AF - Anaerobic Filter BDT - Bangladeshi Taka BGD - Biogas digester BOD - Biological Oxygen Demand CDTA - Capacity Development Technical Assistance COD - Chemical Oxygen Demand Cu.m Cubic metre DEWATS - Decentralized Wastewater Treatment System DPHE - Department of Public Health and Engineering GWL - Ground Water Level HH - Household HPGF - Horizontal Planted Gravel Filter HRT - Hydraulic Retention Time LGED - Local Government Engineering Department LPCD - Litres per capita per day PCTIIP - Preparation of Coastal Towns Infrastructure Improvement Project PD - Planted Drain PGF - Planted Gravel Filter PPTA - Project Preparatory Technical Assistance SoR - Schedule of Rates Sq.m square metre SSS - Simplified Sewer System ST - Settler TN - Total Nitrogen TOR - Terms of Reference TSS - Total Suspended Solids USD - United States Dollar WSP - Waste Stabilisation Pond
In this document 1USD = 70 BDT
110
TA-8128 BAN: Preparing Coastal Towns Infrastructure Improvement Project – FR Vol. 4: Infrastructure
Contents
1. INTRODUCTION ......................................................................................................... 113
1.1 Scope of Work ...................................................................................................... 114
1.2 Objectives ............................................................................................................ 114
1.3 Deliverables ......................................................................................................... 114
2. SANITATION TECHNOLOGY CHOICE .................................................................... 116
2.1 Understanding sanitation technologies ................................................................. 116
2.1.1 Off-site systems ........................................................................................... 116
2.1.2 On-site systems ............................................................................................ 116
2.1.3 Fecal sludge and septage management ........................................................ 116
2.2 Sanitation Technology Options ............................................................................. 117
2.2.1 Technologies for on-site collection, treatment and/or disposal: ...................... 117
2.2.2 Technologies for decentralised treatment system: ......................................... 117
2.2.3 Fecal sludge treatment technologies ............................................................. 118
The technologies identified for fecal sludge treatment are as follows: .......................... 118
2.3 Detailed review and description of identified technologies .................................... 119
2.3.1 Improved Twin pit system .............................................................................. 119
2.3.2 Improved Septic tank with soak pit ................................................................ 121
2.3.4 Shallow sewer system ................................................................................... 125
2.3.5 Small Bore Sewer System ............................................................................. 126
2.3.6 Dehydration vaults ........................................................................................ 127
2.3.7 Anaerobic Baffled Reactor (ABR) .................................................................. 129
2.3.8 Anaerobic Filter (AF) ..................................................................................... 130
2.3.9 Horizontal planted gravel filter ....................................................................... 132
2.3.10 DEWATS ................................................................................................... 134
2.3.12 Unplanted drying beds ............................................................................... 137
2.3.13 Planted drying beds ................................................................................... 138
2.3.14 Waste stabilization ponds (WSP) ................................................................ 139
2.3.15 Co-composting ............................................................................................ 141
2.4 Decision making matrix for technology selection .................................................. 142
2.4.1 Criteria for selection of appropriate technology .............................................. 142
2.4.2 Selection of on-site treatment technologies ................................................... 145
2.4.3 Fecal Sludge Treatment ................................................................................ 149
2.4.4 Decentralised Wastewater Treatment............................................................ 153
2.5 Application of sanitation technologies in PPTA towns ........................................... 157
111
TA-8128 BAN: Preparing Coastal Towns Infrastructure Improvement Project – FR Vol. 4: Infrastructure
2.5.1 Pilot projects in Galachipa town .................................................................... 158
2.5.2 Pilot projects in Amtali town ........................................................................... 177
2.5.3 Pilot projects in Mathbaria town ..................................................................... 195
2.5.4 Pilot projects in Pirojpur town ........................................................................ 205
2.7 Sanitation Planning in PPTA towns ...................................................................... 216
2.7.1 Approach and methodology ........................................................................... 216
2.7.2 The city sanitation task force (CTF) ............................................................... 217
2.7.3 The 100% sanitation campaign ..................................................................... 217
2.7.4 The city sanitation plan .................................................................................. 218
2.7.5 Capacity building ........................................................................................... 219
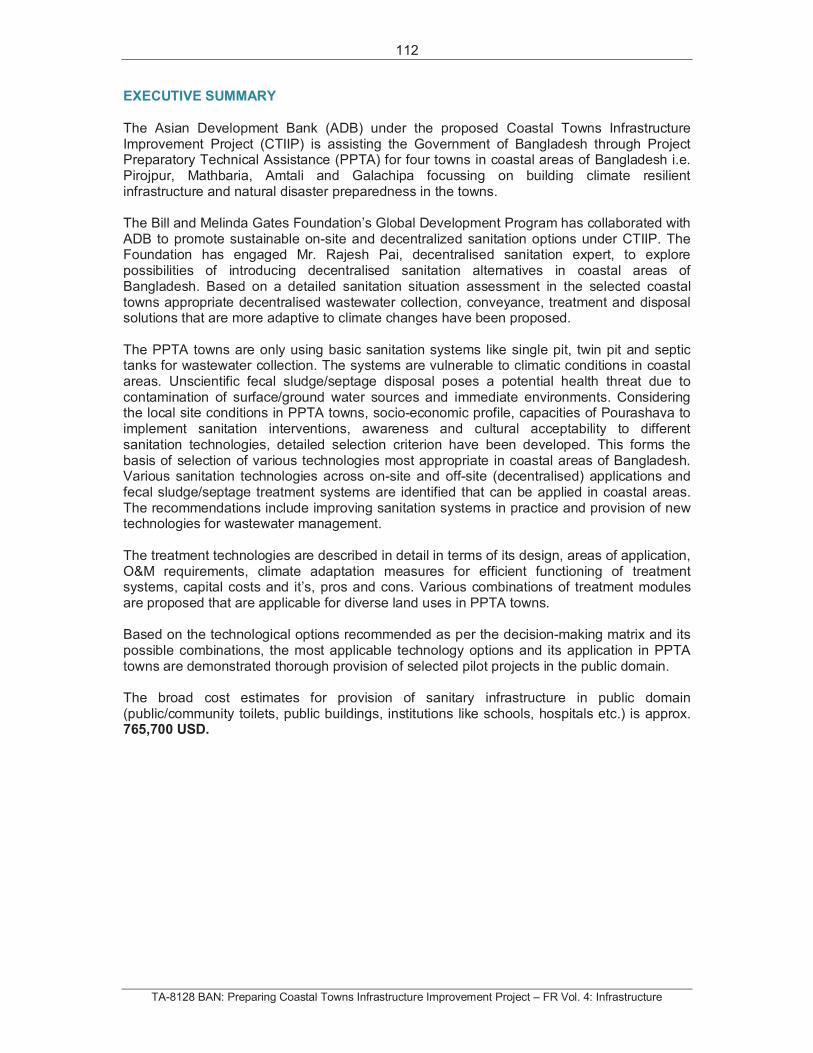
112
TA-8128 BAN: Preparing Coastal Towns Infrastructure Improvement Project – FR Vol. 4: Infrastructure
EXECUTIVE SUMMARY
The Asian Development Bank (ADB) under the proposed Coastal Towns Infrastructure Improvement Project (CTIIP) is assisting the Government of Bangladesh through Project Preparatory Technical Assistance (PPTA) for four towns in coastal areas of Bangladesh i.e. Pirojpur, Mathbaria, Amtali and Galachipa focussing on building climate resilient infrastructure and natural disaster preparedness in the towns.
The Bill and Melinda Gates Foundation’s Global Development Program has collaborated with ADB to promote sustainable on-site and decentralized sanitation options under CTIIP. The Foundation has engaged Mr. Rajesh Pai, decentralised sanitation expert, to explore possibilities of introducing decentralised sanitation alternatives in coastal areas of Bangladesh. Based on a detailed sanitation situation assessment in the selected coastal towns appropriate decentralised wastewater collection, conveyance, treatment and disposal solutions that are more adaptive to climate changes have been proposed.
The PPTA towns are only using basic sanitation systems like single pit, twin pit and septic tanks for wastewater collection. The systems are vulnerable to climatic conditions in coastal areas. Unscientific fecal sludge/septage disposal poses a potential health threat due to contamination of surface/ground water sources and immediate environments. Considering the local site conditions in PPTA towns, socio-economic profile, capacities of Pourashava to implement sanitation interventions, awareness and cultural acceptability to different sanitation technologies, detailed selection criterion have been developed. This forms the basis of selection of various technologies most appropriate in coastal areas of Bangladesh. Various sanitation technologies across on-site and off-site (decentralised) applications and fecal sludge/septage treatment systems are identified that can be applied in coastal areas. The recommendations include improving sanitation systems in practice and provision of new technologies for wastewater management.
The treatment technologies are described in detail in terms of its design, areas of application, O&M requirements, climate adaptation measures for efficient functioning of treatment systems, capital costs and it’s, pros and cons. Various combinations of treatment modules are proposed that are applicable for diverse land uses in PPTA towns.
Based on the technological options recommended as per the decision-making matrix and its possible combinations, the most applicable technology options and its application in PPTA towns are demonstrated thorough provision of selected pilot projects in the public domain.
The broad cost estimates for provision of sanitary infrastructure in public domain (public/community toilets, public buildings, institutions like schools, hospitals etc.) is approx. 765,700 USD.
113
TA-8128 BAN: Preparing Coastal Towns Infrastructure Improvement Project – FR Vol. 4: Infrastructure
1. INTRODUCTION
Bangladesh is home to 150 million people (BBS 2011), with 38 .1 million residing in the low-lying coastal delta of which 8.6 million reside in urban areas. These regions are highly vulnerable to severe weather events like flooding, tropical cyclones and storm/tidal surges. These calamities damage the building structures, infrastructure facilities like water supply systems, sanitation facilities, roads and boat-docking stations. Climate change impact is expected to result in an average sea level rise of about 0.45m by 2050—this could make 10-15% of the country extremely vulnerable to floods, and dislocate around 35 million people from coastal towns and rural areas (ADB 2013). Sea level rise will affect the surface and ground water resources adversely. Floods and water logging will affect the sanitation and health situation of the region.
The Asian Development Bank (ADB) is assisting the Government of Bangladesh in building climate resilient infrastructure in the coastal towns of the country and helping the local governments in development and operation of basic needs infrastructure services. The proposed ADB-assisted project is known as the Coastal Towns Infrastructure Improvement Project (CTIIP). The key themes of the project are: Climate change resilience and natural disaster preparedness, in poor and vulnerable coastal towns of Bangladesh (ADB 2013). The project scope includes implementation of improved infrastructure for delivering basic needs services in priority coastal towns of Bangladesh. The infrastructure design should be able to mitigate effects from natural disasters and climate change.
The project interventions envisage the following outcomes (ADB 2013):
i. Improved municipal infrastructure with climate-resilient designs, particularly for water supply, sanitation and drainage;
ii. Strengthened local governance and capacity for sustainable service delivery and urban planning;
iii. Awareness raising and behavioural change in climate change adaptation and disaster preparedness, water conservation and hygiene activities; and
iv. Project management and administrative support. The project design will incorporate the role of women in water supply and sanitation, and target the poor.
With limited resources and time frame of PPTA, the towns as selected under the CDTA-7890 (Pirojpur, Amtali and Galachipa) have been considered. The fourth town i.e. Mathbaria has been selected as it falls in the same region (Barisal division) for ease in implementation of the PPTA.
The Bill and Melinda Gates Foundation’s Global Development Program is working with partners in developing countries on improving people’s health and creating opportunities to alleviate themselves from poverty and hunger. The newest program area under Global Development Program is Water, Sanitation and Hygiene, which focuses on sanitation solutions that works for the poor. The Foundation and ADB has collaborated with each other to promote sustainable on-site and decentralized sanitation options particularly in the poor regions of Asia to improve and safeguard public health. The purpose of collaboration is to create platforms for implementation of innovative technologies developed as part of foundation’s R&D investments in improved emptying and treatment technologies and support from ADB for up scaling of successful approaches throughout the Asia region. In this context, the CTIIP has been selected as one of the project to team up for introducing innovative decentralized sanitation technologies in the selected towns.
114
TA-8128 BAN: Preparing Coastal Towns Infrastructure Improvement Project – FR Vol. 4: Infrastructure
The Foundation has engaged Mr. Rajesh Pai, Director (Planning and Infrastructure), CDD Society, Bangalore, India to explore possibilities of introducing decentralised sanitation alternatives in coastal areas of Bangladesh. Mr. Pai has more than 13 years of experience in designing and implementing decentralized sanitation projects (mainly with respect to toilet provision and decentralized wastewater treatment) in Asian, South East Asian and African Countries. Team involving Mr. Rahul Sachdeva (Environmental Planner) and Ms. Namrata Ginoya (Climate Change Professional) assists him. The key objective of the consultancy assignment is to support the PPTA in preparation of detailed investment plan for better sanitation facilities with focus on decentralized and on-site sanitation options in coastal areas of Bangladesh.
1.1 Scope of Work
Under the CTIIP, four towns (hereafter referred to as PPTA towns) have been selected for further studies and implementation. Each town has a sanitation component. The scope of work for the consultant is as follows: (i.) Plan for better sanitation facilities with focus on decentralized and on-site sanitation options for the selected towns, (ii.) Advise on the investment plan for the same.
1.2 Objectives
The objectives of the project are as follows:
i. Appraise the current sanitation status of the towns
ii. Advise on appropriate and affordable on-site sanitation facilities
iii. Check possibilities of introducing decentralized sanitation facilities
iv. Advise on costs of relevant components
v. Advise on best practices for financing
vi. Advise on developing public promotion campaigns for sanitation
vii. Advise on preparation of overall sanitation strategy for the coastal region.
1.3 Deliverables
Interim report with following information:
i. Information on design of existing sanitation facilities with success and failures
ii. Appraisal report on the current status of sanitation in coastal belt
iii. Recommendation of appropriate technical solution for appropriate and affordable on-site and decentralized sanitation facilities
iv. Estimated cost for relevant components
Final report with:
i. Finalized information submitted in the interim report
ii. Strategies on public promotion campaigns for sanitation
iii. Strategies on best practices for financing decentralized and on-site sanitation facilities
115
TA-8128 BAN: Preparing Coastal Towns Infrastructure Improvement Project – FR Vol. 4: Infrastructure
iv. Advise on preparation of overall sanitation strategy for the coastal region
Contents of this report:
The situation analysis of sanitation sector in each of the PPTA towns has been conducted and the findings are presented in interim report. However, this report specifically focuses on technical solutions recommended for PPTA towns, application of selected technologies in various landuse and related cost estimates
116
TA-8128 BAN: Preparing Coastal Towns Infrastructure Improvement Project – FR Vol. 4: Infrastructure
2. SANITATION TECHNOLOGY CHOICE
After detailed analysis of the sanitation issues from technical, institutional, financial and socio-economic perspectives, this section will focus on technical options for improvements in sanitation sector.
2.1 Understanding sanitation technologies
The sanitation systems have to be selected to address the complete chain of waste management including collection, conveyance, treatment and safe disposal/reuse of sewage (black water), sullage (grey water) and fecal sludge/septage. The systems can be either off-site or on-site.
2.1.1 Off-site systems
Off-site sanitation system includes collection and conveyance of sewage and sullage to another location away from point of generation for treatment, disposal or possible reuse. It can be classified into two main categories: decentralised and centralised. Decentralised system includes collection and treatment of wastewater from small clusters whereas; systems serving several clusters at city level are termed as centralized systems. Centralised systems require huge amount of water for smooth conveyance. Enormous investments are needed for laying of extensive sewer network, installation of treatment plant and its maintenance. The treatment systems are large in size, energy intensive, requires skilled labour for operations and maintenance.
2.1.2 On-site systems
On-site sanitation systems aim to contain human excreta at the point of generation. It can be classified into two main categories: wet systems, which require water for flushing and are connected to a leach pit or septic tank. On the other hand, dry systems do not require any water for flushing. The systems are designed to separate feces and urine and reuse of treated excreta.
The wet systems involve collection of waste in a pit or tank for further treatment and disposal in a pre-defined place. It is a preferred option where water availability or use is limited or in towns which do not have a sewer network or where a sewer network is not feasible. Waste from pits and tanks is collected and transported to a treatment facility for scientific treatment and disposal.
On site sanitation, systems are less capital intensive and do not require highly skilled labour. These systems are easy to maintain and do not require energy for operations.
2.1.3 Fecal sludge and septage management
Fecal sludge is the semi-solid settled contents of pit latrines while septage is the partially digested solid matter in the septic tank. The pits/tanks require regular desludging. The sludge and septage is either removed manually or pumped out mechanically. The sludge is then transported to a designated facility for further treatment and disposal.
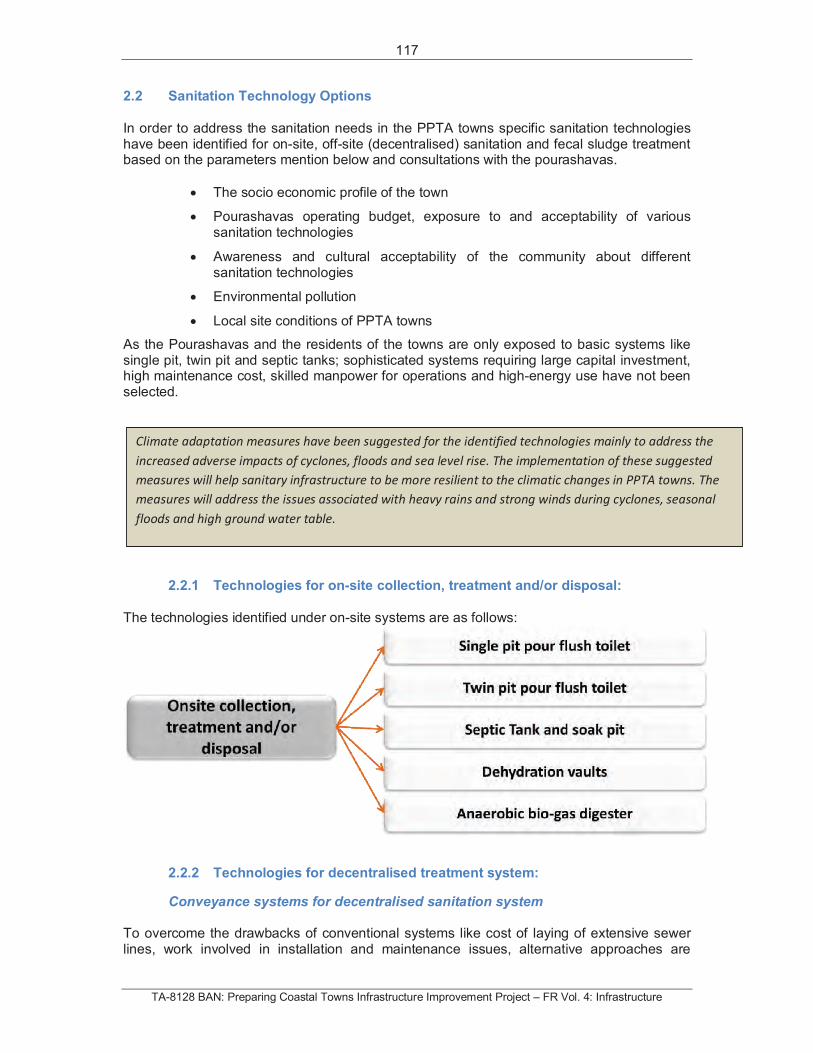
117
TA-8128 BAN: Preparing Coastal Towns Infrastructure Improvement Project – FR Vol. 4: Infrastructure
2.2 Sanitation Technology Options
In order to address the sanitation needs in the PPTA towns specific sanitation technologies have been identified for on-site, off-site (decentralised) sanitation and fecal sludge treatment based on the parameters mention below and consultations with the pourashavas.
The socio economic profile of the town
Pourashavas operating budget, exposure to and acceptability of various sanitation technologies
Awareness and cultural acceptability of the community about different sanitation technologies
Environmental pollution
Local site conditions of PPTA towns
As the Pourashavas and the residents of the towns are only exposed to basic systems like single pit, twin pit and septic tanks; sophisticated systems requiring large capital investment, high maintenance cost, skilled manpower for operations and high-energy use have not been selected.
2.2.1 Technologies for on-site collection, treatment and/or disposal:
The technologies identified under on-site systems are as follows:
2.2.2 Technologies for decentralised treatment system:
Conveyance systems for decentralised sanitation system
To overcome the drawbacks of conventional systems like cost of laying of extensive sewer lines, work involved in installation and maintenance issues, alternative approaches are
Climate adaptation measures have been suggested for the identified technologies mainly to address the
increased adverse impacts of cyclones, floods and sea level rise. The implementation of these suggested
measures will help sanitary infrastructure to be more resilient to the climatic changes in PPTA towns. The
measures will address the issues associated with heavy rains and strong winds during cyclones, seasonal
floods and high ground water table.
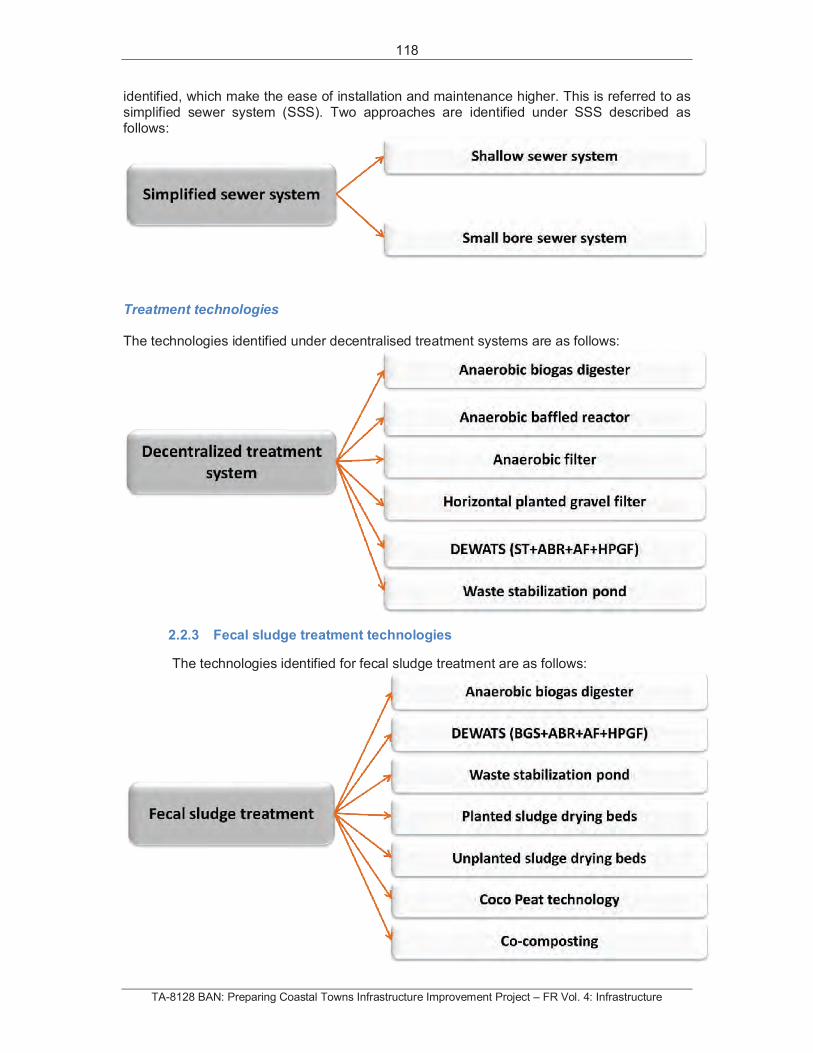
118
TA-8128 BAN: Preparing Coastal Towns Infrastructure Improvement Project – FR Vol. 4: Infrastructure
identified, which make the ease of installation and maintenance higher. This is referred to as simplified sewer system (SSS). Two approaches are identified under SSS described as follows:
Treatment technologies
The technologies identified under decentralised treatment systems are as follows:
2.2.3 Fecal sludge treatment technologies
The technologies identified for fecal sludge treatment are as follows:
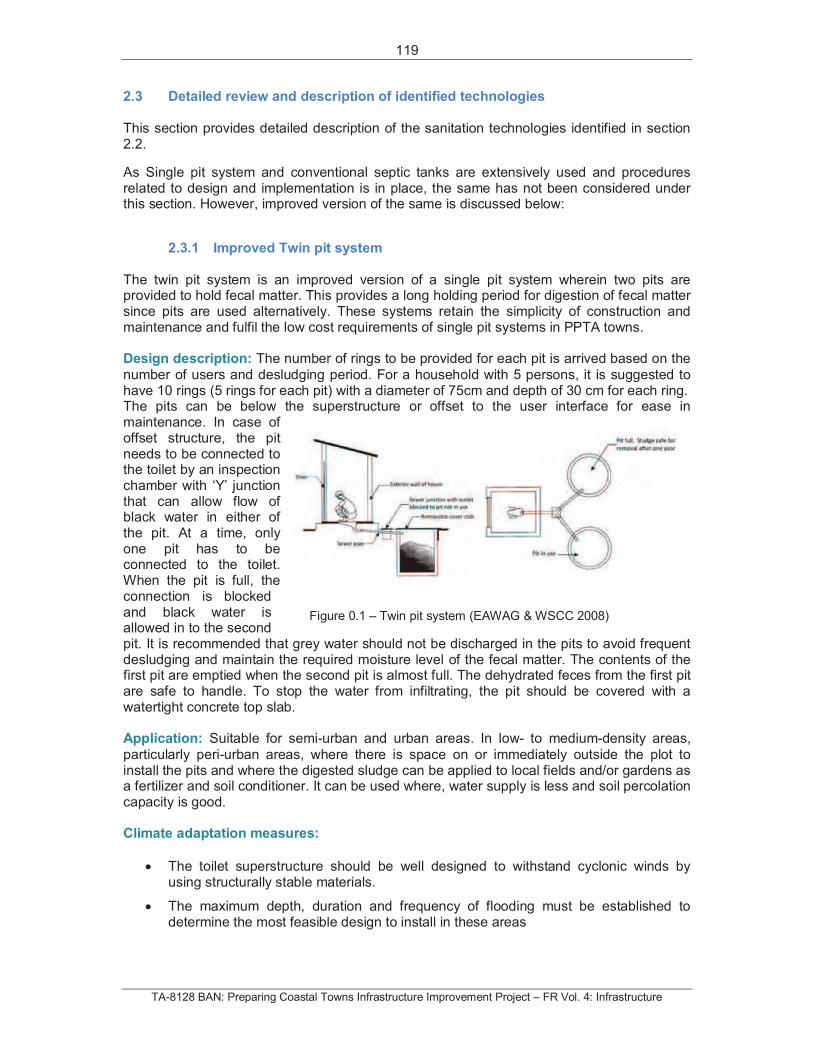
119
TA-8128 BAN: Preparing Coastal Towns Infrastructure Improvement Project – FR Vol. 4: Infrastructure
2.3 Detailed review and description of identified technologies
This section provides detailed description of the sanitation technologies identified in section 2.2.
As Single pit system and conventional septic tanks are extensively used and procedures related to design and implementation is in place, the same has not been considered under this section. However, improved version of the same is discussed below:
2.3.1 Improved Twin pit system
The twin pit system is an improved version of a single pit system wherein two pits are provided to hold fecal matter. This provides a long holding period for digestion of fecal matter since pits are used alternatively. These systems retain the simplicity of construction and maintenance and fulfil the low cost requirements of single pit systems in PPTA towns.
Design description: The number of rings to be provided for each pit is arrived based on the
number of users and desludging period. For a household with 5 persons, it is suggested to have 10 rings (5 rings for each pit) with a diameter of 75cm and depth of 30 cm for each ring. The pits can be below the superstructure or offset to the user interface for ease in maintenance. In case of offset structure, the pit needs to be connected to the toilet by an inspection chamber with ‘Y’ junction that can allow flow of black water in either of the pit. At a time, only one pit has to be connected to the toilet. When the pit is full, the connection is blocked and black water is allowed in to the second pit. It is recommended that grey water should not be discharged in the pits to avoid frequent desludging and maintain the required moisture level of the fecal matter. The contents of the first pit are emptied when the second pit is almost full. The dehydrated feces from the first pit are safe to handle. To stop the water from infiltrating, the pit should be covered with a watertight concrete top slab.
Application: Suitable for semi-urban and urban areas. In low- to medium-density areas,
particularly peri-urban areas, where there is space on or immediately outside the plot to install the pits and where the digested sludge can be applied to local fields and/or gardens as a fertilizer and soil conditioner. It can be used where, water supply is less and soil percolation capacity is good.
Climate adaptation measures:
The toilet superstructure should be well designed to withstand cyclonic winds by using structurally stable materials.
The maximum depth, duration and frequency of flooding must be established to determine the most feasible design to install in these areas
Figure 0.1 – Twin pit system (EAWAG & WSCC 2008)
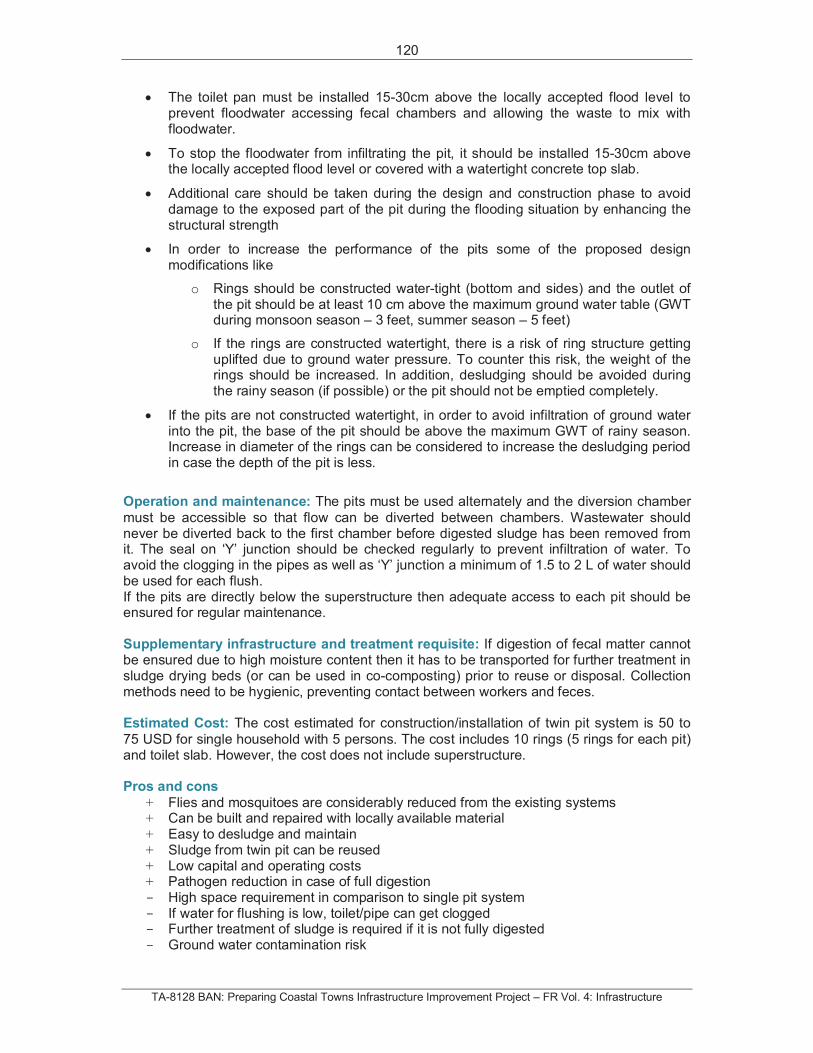
120
TA-8128 BAN: Preparing Coastal Towns Infrastructure Improvement Project – FR Vol. 4: Infrastructure
The toilet pan must be installed 15-30cm above the locally accepted flood level to prevent floodwater accessing fecal chambers and allowing the waste to mix with floodwater.
To stop the floodwater from infiltrating the pit, it should be installed 15-30cm above the locally accepted flood level or covered with a watertight concrete top slab.
Additional care should be taken during the design and construction phase to avoid damage to the exposed part of the pit during the flooding situation by enhancing the structural strength
In order to increase the performance of the pits some of the proposed design modifications like
o Rings should be constructed water-tight (bottom and sides) and the outlet of the pit should be at least 10 cm above the maximum ground water table (GWT during monsoon season – 3 feet, summer season – 5 feet)
o If the rings are constructed watertight, there is a risk of ring structure getting uplifted due to ground water pressure. To counter this risk, the weight of the rings should be increased. In addition, desludging should be avoided during the rainy season (if possible) or the pit should not be emptied completely.
If the pits are not constructed watertight, in order to avoid infiltration of ground water into the pit, the base of the pit should be above the maximum GWT of rainy season. Increase in diameter of the rings can be considered to increase the desludging period in case the depth of the pit is less.
Operation and maintenance: The pits must be used alternately and the diversion chamber
must be accessible so that flow can be diverted between chambers. Wastewater should never be diverted back to the first chamber before digested sludge has been removed from it. The seal on ‘Y’ junction should be checked regularly to prevent infiltration of water. To avoid the clogging in the pipes as well as ‘Y’ junction a minimum of 1.5 to 2 L of water should be used for each flush. If the pits are directly below the superstructure then adequate access to each pit should be ensured for regular maintenance.
Supplementary infrastructure and treatment requisite: If digestion of fecal matter cannot be ensured due to high moisture content then it has to be transported for further treatment in sludge drying beds (or can be used in co-composting) prior to reuse or disposal. Collection methods need to be hygienic, preventing contact between workers and feces.
Estimated Cost: The cost estimated for construction/installation of twin pit system is 50 to
75 USD for single household with 5 persons. The cost includes 10 rings (5 rings for each pit) and toilet slab. However, the cost does not include superstructure.
Pros and cons
+ Flies and mosquitoes are considerably reduced from the existing systems + Can be built and repaired with locally available material + Easy to desludge and maintain + Sludge from twin pit can be reused + Low capital and operating costs + Pathogen reduction in case of full digestion - High space requirement in comparison to single pit system - If water for flushing is low, toilet/pipe can get clogged - Further treatment of sludge is required if it is not fully digested - Ground water contamination risk
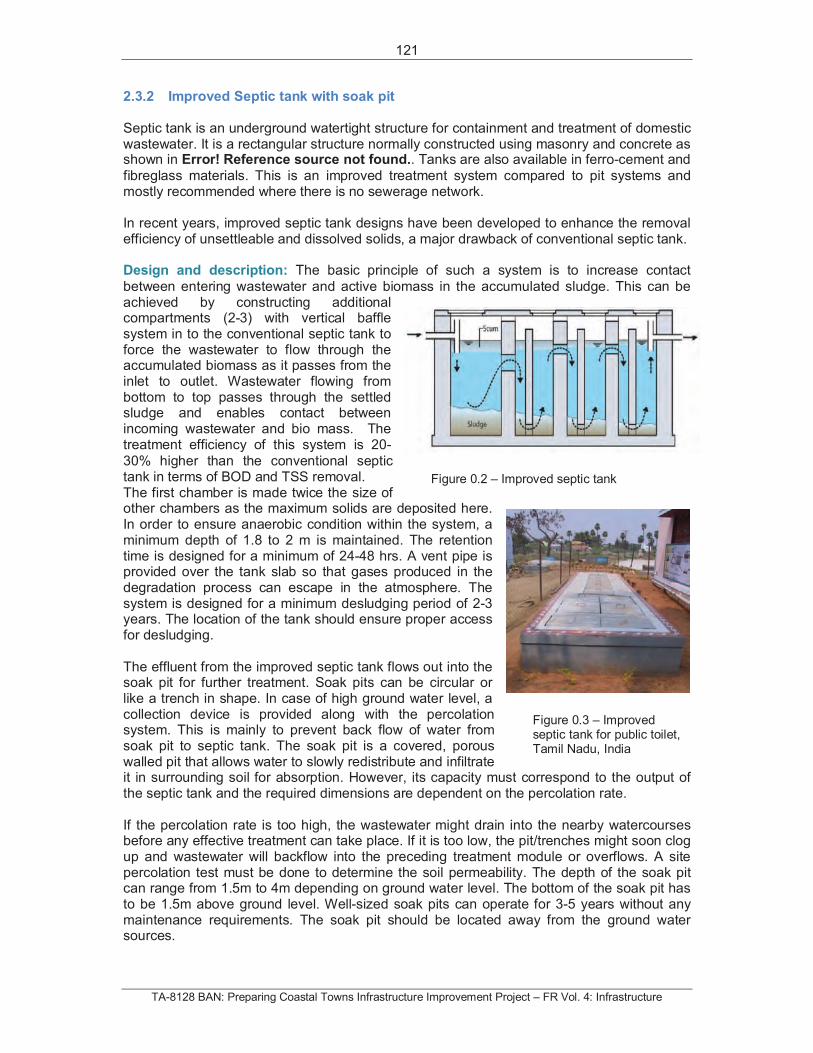
121
TA-8128 BAN: Preparing Coastal Towns Infrastructure Improvement Project – FR Vol. 4: Infrastructure
2.3.2 Improved Septic tank with soak pit
Septic tank is an underground watertight structure for containment and treatment of domestic wastewater. It is a rectangular structure normally constructed using masonry and concrete as shown in Error! Reference source not found.. Tanks are also available in ferro-cement and
fibreglass materials. This is an improved treatment system compared to pit systems and mostly recommended where there is no sewerage network.
In recent years, improved septic tank designs have been developed to enhance the removal efficiency of unsettleable and dissolved solids, a major drawback of conventional septic tank.
Design and description: The basic principle of such a system is to increase contact
between entering wastewater and active biomass in the accumulated sludge. This can be achieved by constructing additional compartments (2-3) with vertical baffle system in to the conventional septic tank to force the wastewater to flow through the accumulated biomass as it passes from the inlet to outlet. Wastewater flowing from bottom to top passes through the settled sludge and enables contact between incoming wastewater and bio mass. The treatment efficiency of this system is 20-
30% higher than the conventional septic tank in terms of BOD and TSS removal. The first chamber is made twice the size of other chambers as the maximum solids are deposited here. In order to ensure anaerobic condition within the system, a minimum depth of 1.8 to 2 m is maintained. The retention time is designed for a minimum of 24-48 hrs. A vent pipe is provided over the tank slab so that gases produced in the degradation process can escape in the atmosphere. The system is designed for a minimum desludging period of 2-3 years. The location of the tank should ensure proper access for desludging.
The effluent from the improved septic tank flows out into the soak pit for further treatment. Soak pits can be circular or like a trench in shape. In case of high ground water level, a collection device is provided along with the percolation system. This is mainly to prevent back flow of water from soak pit to septic tank. The soak pit is a covered, porous walled pit that allows water to slowly redistribute and infiltrate it in surrounding soil for absorption. However, its capacity must correspond to the output of the septic tank and the required dimensions are dependent on the percolation rate.
If the percolation rate is too high, the wastewater might drain into the nearby watercourses before any effective treatment can take place. If it is too low, the pit/trenches might soon clog up and wastewater will backflow into the preceding treatment module or overflows. A site percolation test must be done to determine the soil permeability. The depth of the soak pit can range from 1.5m to 4m depending on ground water level. The bottom of the soak pit has to be 1.5m above ground level. Well-sized soak pits can operate for 3-5 years without any maintenance requirements. The soak pit should be located away from the ground water sources.
Figure 0.2 – Improved septic tank
Figure 0.3 – Improved septic tank for public toilet, Tamil Nadu, India
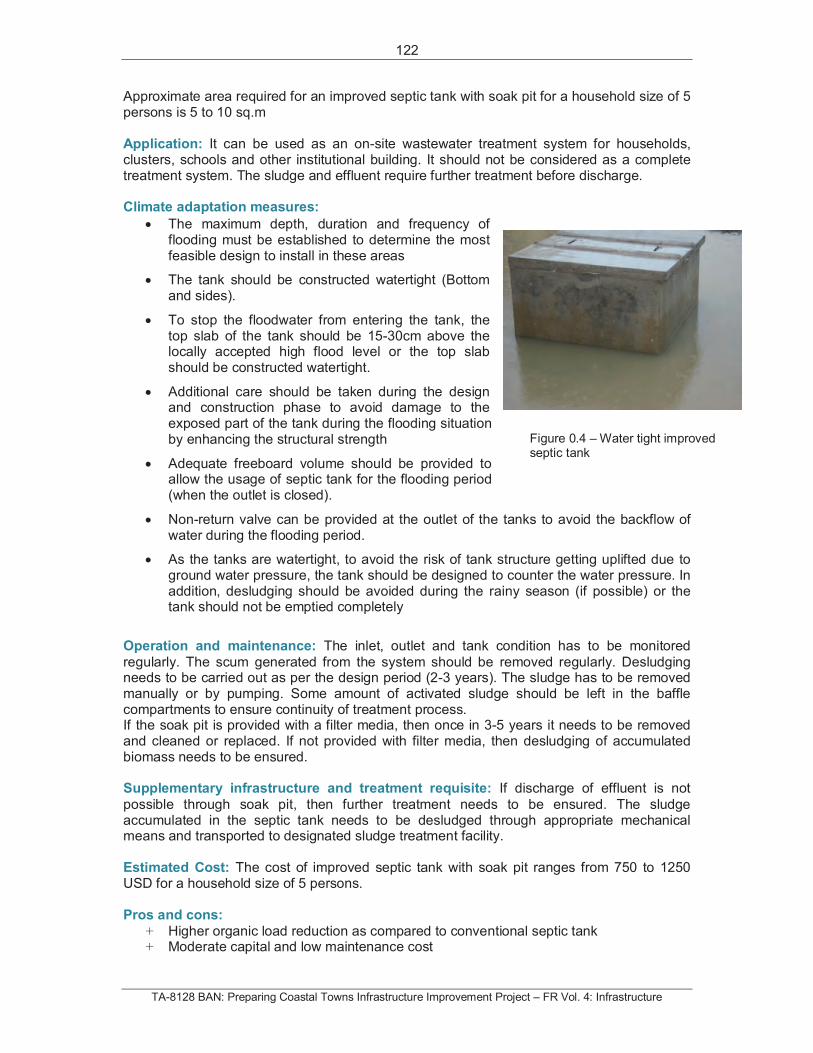
122
TA-8128 BAN: Preparing Coastal Towns Infrastructure Improvement Project – FR Vol. 4: Infrastructure
Approximate area required for an improved septic tank with soak pit for a household size of 5 persons is 5 to 10 sq.m
Application: It can be used as an on-site wastewater treatment system for households, clusters, schools and other institutional building. It should not be considered as a complete treatment system. The sludge and effluent require further treatment before discharge.
Climate adaptation measures:
The maximum depth, duration and frequency of flooding must be established to determine the most feasible design to install in these areas
The tank should be constructed watertight (Bottom and sides).
To stop the floodwater from entering the tank, the top slab of the tank should be 15-30cm above the locally accepted high flood level or the top slab should be constructed watertight.
Additional care should be taken during the design and construction phase to avoid damage to the exposed part of the tank during the flooding situation by enhancing the structural strength
Adequate freeboard volume should be provided to allow the usage of septic tank for the flooding period (when the outlet is closed).
Non-return valve can be provided at the outlet of the tanks to avoid the backflow of water during the flooding period.
As the tanks are watertight, to avoid the risk of tank structure getting uplifted due to ground water pressure, the tank should be designed to counter the water pressure. In addition, desludging should be avoided during the rainy season (if possible) or the tank should not be emptied completely
Operation and maintenance: The inlet, outlet and tank condition has to be monitored
regularly. The scum generated from the system should be removed regularly. Desludging needs to be carried out as per the design period (2-3 years). The sludge has to be removed manually or by pumping. Some amount of activated sludge should be left in the baffle compartments to ensure continuity of treatment process. If the soak pit is provided with a filter media, then once in 3-5 years it needs to be removed and cleaned or replaced. If not provided with filter media, then desludging of accumulated biomass needs to be ensured.
Supplementary infrastructure and treatment requisite: If discharge of effluent is not
possible through soak pit, then further treatment needs to be ensured. The sludge accumulated in the septic tank needs to be desludged through appropriate mechanical means and transported to designated sludge treatment facility.
Estimated Cost: The cost of improved septic tank with soak pit ranges from 750 to 1250 USD for a household size of 5 persons.
Pros and cons:
+ Higher organic load reduction as compared to conventional septic tank + Moderate capital and low maintenance cost
Figure 0.4 – Water tight improved septic tank
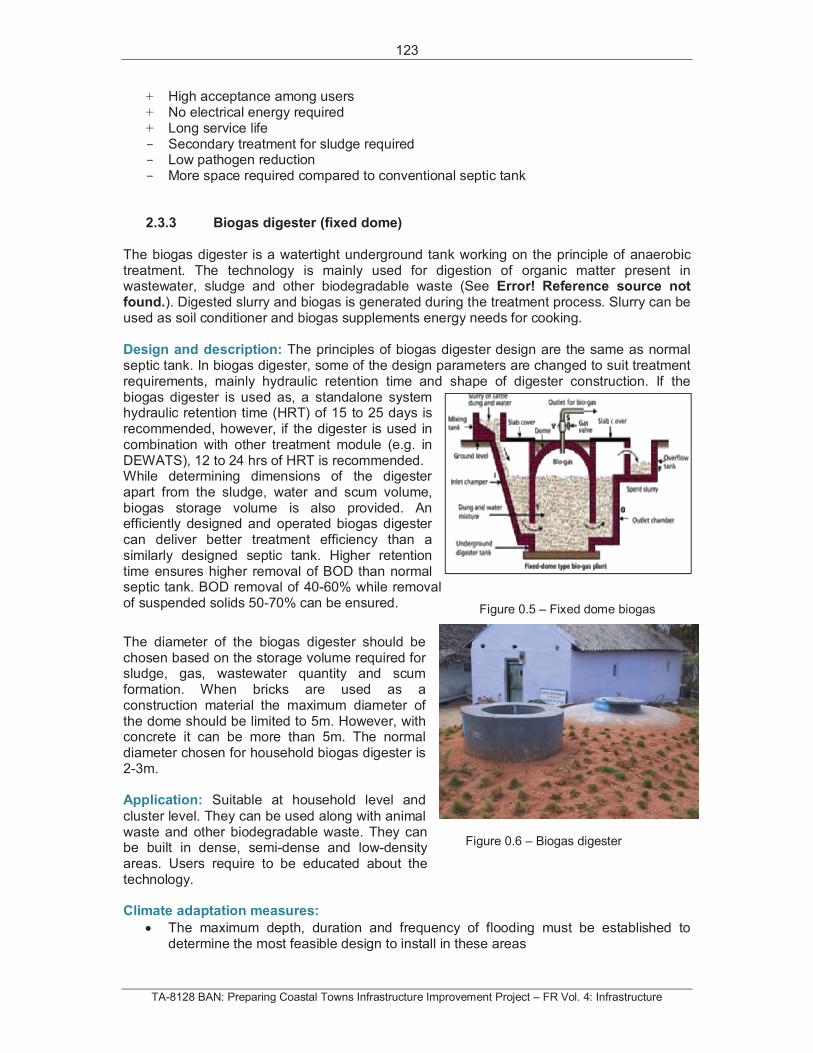
123
TA-8128 BAN: Preparing Coastal Towns Infrastructure Improvement Project – FR Vol. 4: Infrastructure
+ High acceptance among users + No electrical energy required + Long service life - Secondary treatment for sludge required - Low pathogen reduction - More space required compared to conventional septic tank
2.3.3 Biogas digester (fixed dome)
The biogas digester is a watertight underground tank working on the principle of anaerobic treatment. The technology is mainly used for digestion of organic matter present in wastewater, sludge and other biodegradable waste (See Error! Reference source not found.). Digested slurry and biogas is generated during the treatment process. Slurry can be used as soil conditioner and biogas supplements energy needs for cooking.
Design and description: The principles of biogas digester design are the same as normal septic tank. In biogas digester, some of the design parameters are changed to suit treatment requirements, mainly hydraulic retention time and shape of digester construction. If the biogas digester is used as, a standalone system hydraulic retention time (HRT) of 15 to 25 days is recommended, however, if the digester is used in combination with other treatment module (e.g. in DEWATS), 12 to 24 hrs of HRT is recommended. While determining dimensions of the digester apart from the sludge, water and scum volume, biogas storage volume is also provided. An efficiently designed and operated biogas digester can deliver better treatment efficiency than a similarly designed septic tank. Higher retention time ensures higher removal of BOD than normal septic tank. BOD removal of 40-60% while removal of suspended solids 50-70% can be ensured.
The diameter of the biogas digester should be chosen based on the storage volume required for sludge, gas, wastewater quantity and scum formation. When bricks are used as a construction material the maximum diameter of the dome should be limited to 5m. However, with concrete it can be more than 5m. The normal diameter chosen for household biogas digester is 2-3m.
Application: Suitable at household level and
cluster level. They can be used along with animal waste and other biodegradable waste. They can be built in dense, semi-dense and low-density areas. Users require to be educated about the technology.
Climate adaptation measures:
The maximum depth, duration and frequency of flooding must be established to determine the most feasible design to install in these areas
Figure 0.5 – Fixed dome biogas digester
Figure 0.6 – Biogas digester
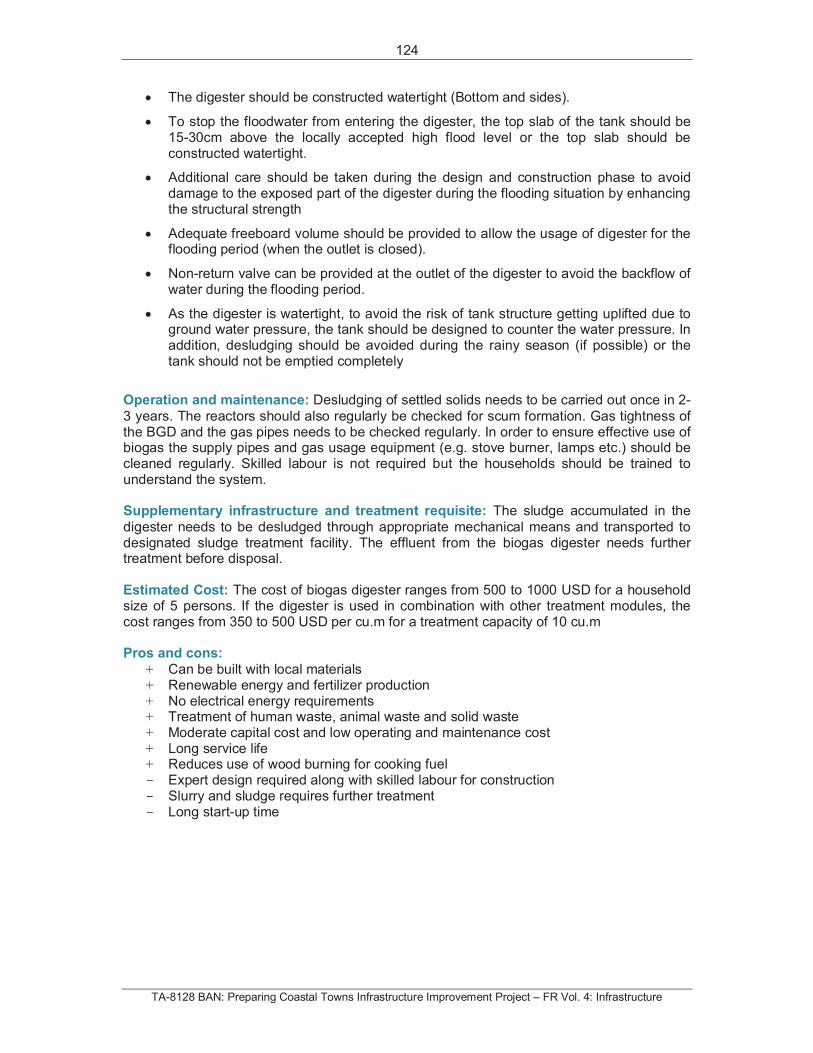
124
TA-8128 BAN: Preparing Coastal Towns Infrastructure Improvement Project – FR Vol. 4: Infrastructure
The digester should be constructed watertight (Bottom and sides).
To stop the floodwater from entering the digester, the top slab of the tank should be 15-30cm above the locally accepted high flood level or the top slab should be constructed watertight.
Additional care should be taken during the design and construction phase to avoid damage to the exposed part of the digester during the flooding situation by enhancing the structural strength
Adequate freeboard volume should be provided to allow the usage of digester for the flooding period (when the outlet is closed).
Non-return valve can be provided at the outlet of the digester to avoid the backflow of water during the flooding period.
As the digester is watertight, to avoid the risk of tank structure getting uplifted due to ground water pressure, the tank should be designed to counter the water pressure. In addition, desludging should be avoided during the rainy season (if possible) or the tank should not be emptied completely
Operation and maintenance: Desludging of settled solids needs to be carried out once in 2-
3 years. The reactors should also regularly be checked for scum formation. Gas tightness of the BGD and the gas pipes needs to be checked regularly. In order to ensure effective use of biogas the supply pipes and gas usage equipment (e.g. stove burner, lamps etc.) should be cleaned regularly. Skilled labour is not required but the households should be trained to understand the system.
Supplementary infrastructure and treatment requisite: The sludge accumulated in the
digester needs to be desludged through appropriate mechanical means and transported to designated sludge treatment facility. The effluent from the biogas digester needs further treatment before disposal.
Estimated Cost: The cost of biogas digester ranges from 500 to 1000 USD for a household size of 5 persons. If the digester is used in combination with other treatment modules, the cost ranges from 350 to 500 USD per cu.m for a treatment capacity of 10 cu.m
Pros and cons:
+ Can be built with local materials + Renewable energy and fertilizer production + No electrical energy requirements + Treatment of human waste, animal waste and solid waste + Moderate capital cost and low operating and maintenance cost + Long service life + Reduces use of wood burning for cooking fuel - Expert design required along with skilled labour for construction - Slurry and sludge requires further treatment - Long start-up time
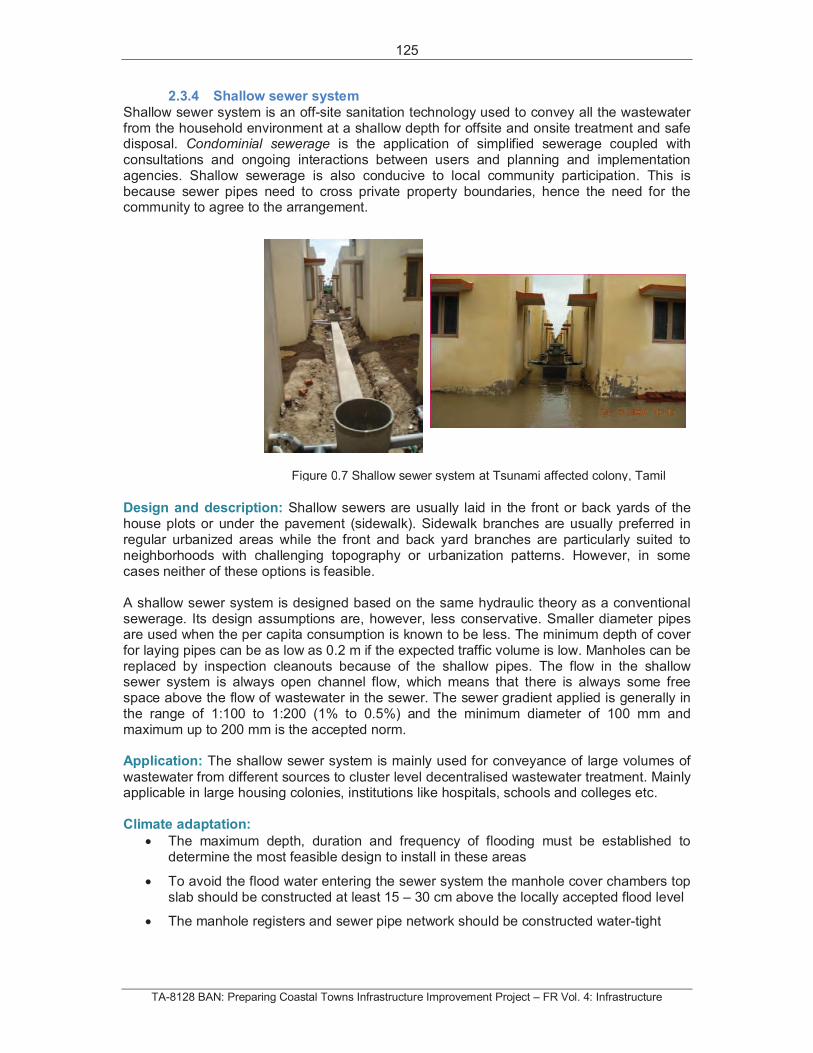
125
TA-8128 BAN: Preparing Coastal Towns Infrastructure Improvement Project – FR Vol. 4: Infrastructure
2.3.4 Shallow sewer system
Shallow sewer system is an off-site sanitation technology used to convey all the wastewater from the household environment at a shallow depth for offsite and onsite treatment and safe disposal. Condominial sewerage is the application of simplified sewerage coupled with consultations and ongoing interactions between users and planning and implementation agencies. Shallow sewerage is also conducive to local community participation. This is because sewer pipes need to cross private property boundaries, hence the need for the community to agree to the arrangement.
Design and description: Shallow sewers are usually laid in the front or back yards of the house plots or under the pavement (sidewalk). Sidewalk branches are usually preferred in regular urbanized areas while the front and back yard branches are particularly suited to neighborhoods with challenging topography or urbanization patterns. However, in some cases neither of these options is feasible.
A shallow sewer system is designed based on the same hydraulic theory as a conventional sewerage. Its design assumptions are, however, less conservative. Smaller diameter pipes are used when the per capita consumption is known to be less. The minimum depth of cover for laying pipes can be as low as 0.2 m if the expected traffic volume is low. Manholes can be replaced by inspection cleanouts because of the shallow pipes. The flow in the shallow sewer system is always open channel flow, which means that there is always some free space above the flow of wastewater in the sewer. The sewer gradient applied is generally in the range of 1:100 to 1:200 (1% to 0.5%) and the minimum diameter of 100 mm and maximum up to 200 mm is the accepted norm.
Application: The shallow sewer system is mainly used for conveyance of large volumes of
wastewater from different sources to cluster level decentralised wastewater treatment. Mainly applicable in large housing colonies, institutions like hospitals, schools and colleges etc.
Climate adaptation:
The maximum depth, duration and frequency of flooding must be established to determine the most feasible design to install in these areas
To avoid the flood water entering the sewer system the manhole cover chambers top slab should be constructed at least 15 – 30 cm above the locally accepted flood level
The manhole registers and sewer pipe network should be constructed water-tight
Figure 0.7 Shallow sewer system at Tsunami affected colony, Tamil
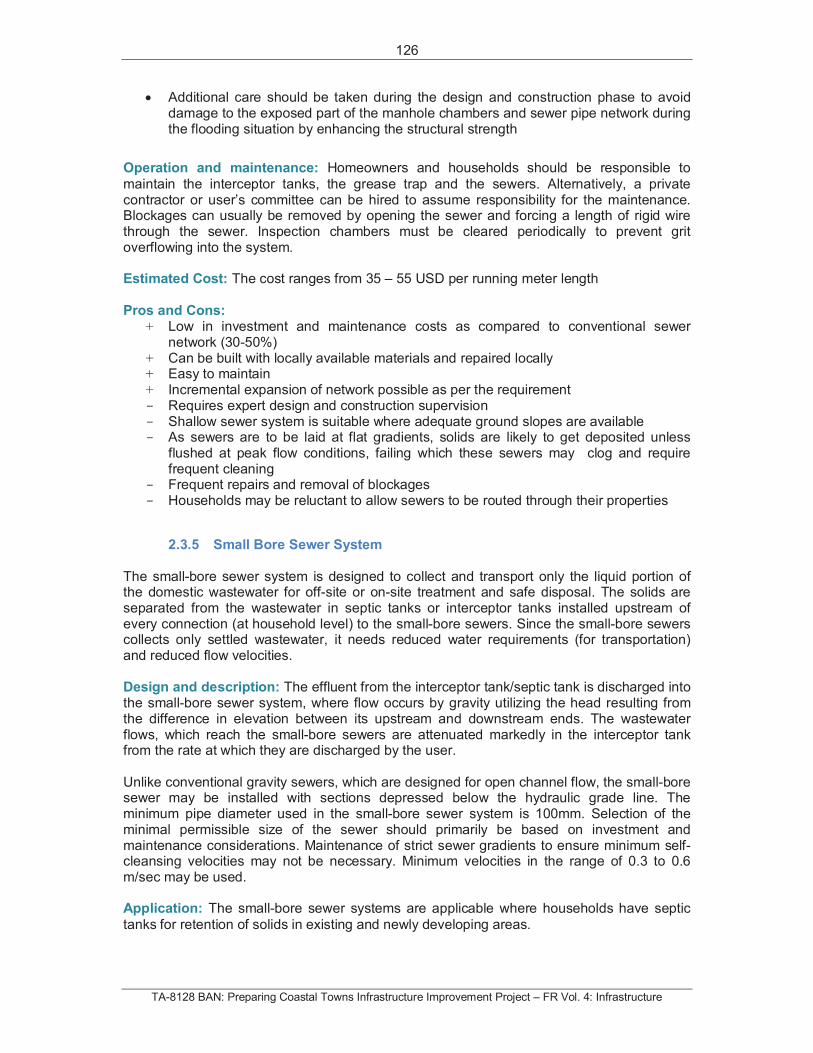
126
TA-8128 BAN: Preparing Coastal Towns Infrastructure Improvement Project – FR Vol. 4: Infrastructure
Additional care should be taken during the design and construction phase to avoid damage to the exposed part of the manhole chambers and sewer pipe network during the flooding situation by enhancing the structural strength
Operation and maintenance: Homeowners and households should be responsible to
maintain the interceptor tanks, the grease trap and the sewers. Alternatively, a private contractor or user’s committee can be hired to assume responsibility for the maintenance. Blockages can usually be removed by opening the sewer and forcing a length of rigid wire through the sewer. Inspection chambers must be cleared periodically to prevent grit overflowing into the system.
Estimated Cost: The cost ranges from 35 – 55 USD per running meter length
Pros and Cons: + Low in investment and maintenance costs as compared to conventional sewer
network (30-50%) + Can be built with locally available materials and repaired locally + Easy to maintain + Incremental expansion of network possible as per the requirement - Requires expert design and construction supervision - Shallow sewer system is suitable where adequate ground slopes are available - As sewers are to be laid at flat gradients, solids are likely to get deposited unless
flushed at peak flow conditions, failing which these sewers may clog and require frequent cleaning
- Frequent repairs and removal of blockages - Households may be reluctant to allow sewers to be routed through their properties
2.3.5 Small Bore Sewer System
The small-bore sewer system is designed to collect and transport only the liquid portion of the domestic wastewater for off-site or on-site treatment and safe disposal. The solids are separated from the wastewater in septic tanks or interceptor tanks installed upstream of every connection (at household level) to the small-bore sewers. Since the small-bore sewers collects only settled wastewater, it needs reduced water requirements (for transportation) and reduced flow velocities.
Design and description: The effluent from the interceptor tank/septic tank is discharged into the small-bore sewer system, where flow occurs by gravity utilizing the head resulting from the difference in elevation between its upstream and downstream ends. The wastewater flows, which reach the small-bore sewers are attenuated markedly in the interceptor tank from the rate at which they are discharged by the user.
Unlike conventional gravity sewers, which are designed for open channel flow, the small-bore sewer may be installed with sections depressed below the hydraulic grade line. The minimum pipe diameter used in the small-bore sewer system is 100mm. Selection of the minimal permissible size of the sewer should primarily be based on investment and maintenance considerations. Maintenance of strict sewer gradients to ensure minimum self-cleansing velocities may not be necessary. Minimum velocities in the range of 0.3 to 0.6 m/sec may be used.
Application: The small-bore sewer systems are applicable where households have septic
tanks for retention of solids in existing and newly developing areas.
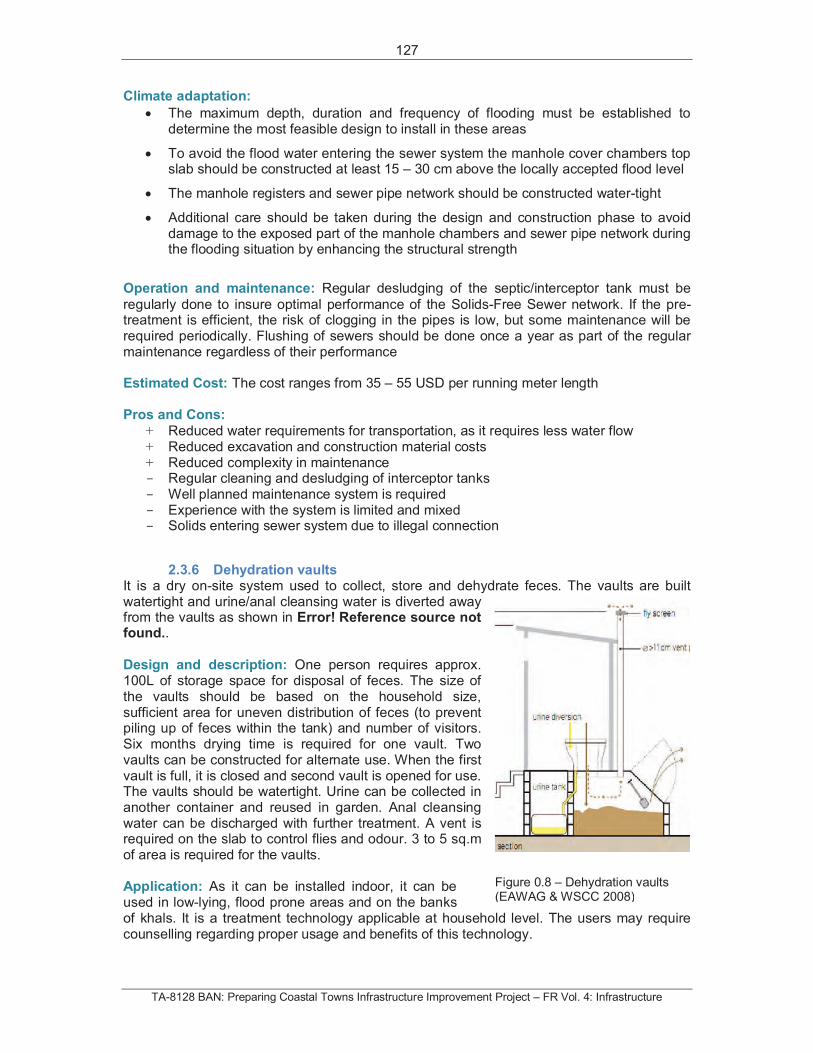
127
TA-8128 BAN: Preparing Coastal Towns Infrastructure Improvement Project – FR Vol. 4: Infrastructure
Climate adaptation:
The maximum depth, duration and frequency of flooding must be established to determine the most feasible design to install in these areas
To avoid the flood water entering the sewer system the manhole cover chambers top slab should be constructed at least 15 – 30 cm above the locally accepted flood level
The manhole registers and sewer pipe network should be constructed water-tight
Additional care should be taken during the design and construction phase to avoid damage to the exposed part of the manhole chambers and sewer pipe network during the flooding situation by enhancing the structural strength
Operation and maintenance: Regular desludging of the septic/interceptor tank must be
regularly done to insure optimal performance of the Solids-Free Sewer network. If the pre-treatment is efficient, the risk of clogging in the pipes is low, but some maintenance will be required periodically. Flushing of sewers should be done once a year as part of the regular maintenance regardless of their performance
Estimated Cost: The cost ranges from 35 – 55 USD per running meter length
Pros and Cons:
+ Reduced water requirements for transportation, as it requires less water flow + Reduced excavation and construction material costs + Reduced complexity in maintenance - Regular cleaning and desludging of interceptor tanks - Well planned maintenance system is required - Experience with the system is limited and mixed - Solids entering sewer system due to illegal connection
2.3.6 Dehydration vaults It is a dry on-site system used to collect, store and dehydrate feces. The vaults are built watertight and urine/anal cleansing water is diverted away from the vaults as shown in Error! Reference source not found..
Design and description: One person requires approx. 100L of storage space for disposal of feces. The size of the vaults should be based on the household size, sufficient area for uneven distribution of feces (to prevent piling up of feces within the tank) and number of visitors. Six months drying time is required for one vault. Two vaults can be constructed for alternate use. When the first vault is full, it is closed and second vault is opened for use. The vaults should be watertight. Urine can be collected in another container and reused in garden. Anal cleansing water can be discharged with further treatment. A vent is required on the slab to control flies and odour. 3 to 5 sq.m of area is required for the vaults.
Application: As it can be installed indoor, it can be used in low-lying, flood prone areas and on the banks of khals. It is a treatment technology applicable at household level. The users may require counselling regarding proper usage and benefits of this technology.
Figure 0.8 – Dehydration vaults (EAWAG & WSCC 2008)
128
TA-8128 BAN: Preparing Coastal Towns Infrastructure Improvement Project – FR Vol. 4: Infrastructure
Climate adaptation measures:
This technology is appropriate in areas with high ground water table and flood prone regions
Operation and maintenance: To dehydrate the feces, ash, soil or lime should be used to
cover the feces after every use. If urine or water gets inside the vault, then extra lime or ash should be spread for extra drying. The feces mound up after some time, thus it should be evenly spread out in the vault. If water is used for anal cleansing, it should be diverted appropriately. If dehydrated feces are used as fertilizer then, then it should be applied atleast one month prior to harvest.
Supplementary infrastructure and treatment requisite: Vault emptying equipments are
required. Space for application or disposal of dehydrated feces and urine needs to be identified. If the dehydration process is incomplete and vaults are filled then the partially digested fecal sludge needs to be desludged and transported for further treatment.
Estimated Cost: The cost of dehydration vault ranges from 75 to 110 USD for a household size of 5 persons excluding superstructure.
Pros and cons:
+ Can be constructed with local materials + Long service life + Suitable in flood prone areas + Easy emptying of vaults, easy to manage dried feces + No flies and mosquito problems if constructed properly + Low capital costs, no or low maintenance costs + Low space requirements + No energy requirement - Low acceptance - Users need education for its usage - High operating and maintenance requirements - Constant source of ash, lime or soil required - Appropriate discharge point for feces and urine is required - Manual emptying of vaults
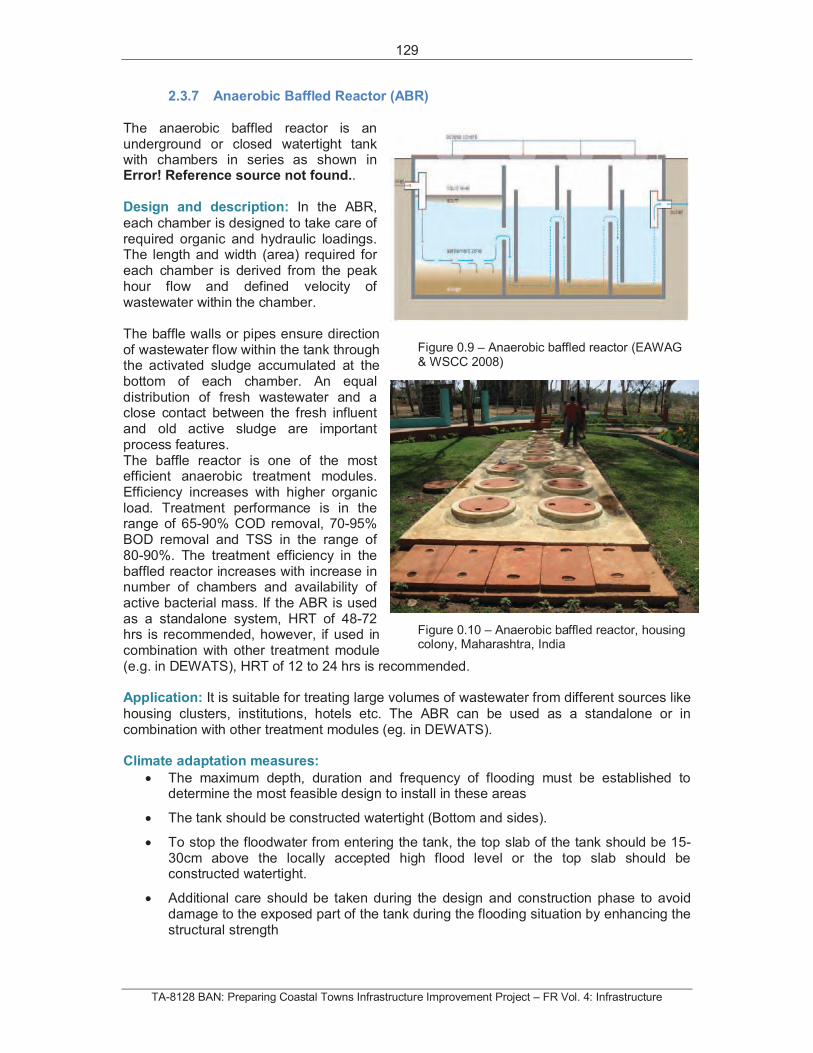
129
TA-8128 BAN: Preparing Coastal Towns Infrastructure Improvement Project – FR Vol. 4: Infrastructure
2.3.7 Anaerobic Baffled Reactor (ABR)
The anaerobic baffled reactor is an underground or closed watertight tank with chambers in series as shown in Error! Reference source not found..
Design and description: In the ABR,
each chamber is designed to take care of required organic and hydraulic loadings. The length and width (area) required for each chamber is derived from the peak hour flow and defined velocity of wastewater within the chamber.
The baffle walls or pipes ensure direction of wastewater flow within the tank through the activated sludge accumulated at the bottom of each chamber. An equal distribution of fresh wastewater and a close contact between the fresh influent and old active sludge are important process features. The baffle reactor is one of the most efficient anaerobic treatment modules. Efficiency increases with higher organic load. Treatment performance is in the range of 65-90% COD removal, 70-95% BOD removal and TSS in the range of 80-90%. The treatment efficiency in the baffled reactor increases with increase in number of chambers and availability of active bacterial mass. If the ABR is used as a standalone system, HRT of 48-72 hrs is recommended, however, if used in combination with other treatment module (e.g. in DEWATS), HRT of 12 to 24 hrs is recommended.
Application: It is suitable for treating large volumes of wastewater from different sources like
housing clusters, institutions, hotels etc. The ABR can be used as a standalone or in combination with other treatment modules (eg. in DEWATS).
Climate adaptation measures:
The maximum depth, duration and frequency of flooding must be established to determine the most feasible design to install in these areas
The tank should be constructed watertight (Bottom and sides).
To stop the floodwater from entering the tank, the top slab of the tank should be 15-30cm above the locally accepted high flood level or the top slab should be constructed watertight.
Additional care should be taken during the design and construction phase to avoid damage to the exposed part of the tank during the flooding situation by enhancing the structural strength
Figure 0.9 – Anaerobic baffled reactor (EAWAG & WSCC 2008)
Figure 0.10 – Anaerobic baffled reactor, housing colony, Maharashtra, India
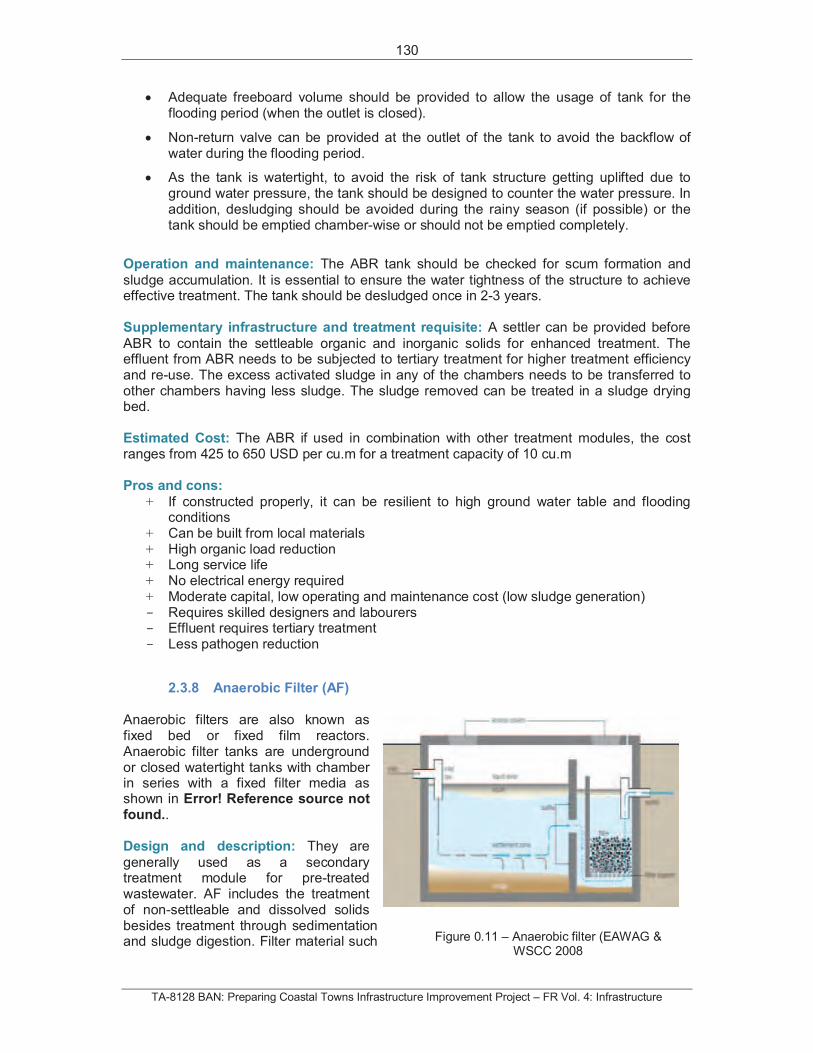
130
TA-8128 BAN: Preparing Coastal Towns Infrastructure Improvement Project – FR Vol. 4: Infrastructure
Adequate freeboard volume should be provided to allow the usage of tank for the flooding period (when the outlet is closed).
Non-return valve can be provided at the outlet of the tank to avoid the backflow of water during the flooding period.
As the tank is watertight, to avoid the risk of tank structure getting uplifted due to ground water pressure, the tank should be designed to counter the water pressure. In addition, desludging should be avoided during the rainy season (if possible) or the tank should be emptied chamber-wise or should not be emptied completely.
Operation and maintenance: The ABR tank should be checked for scum formation and
sludge accumulation. It is essential to ensure the water tightness of the structure to achieve effective treatment. The tank should be desludged once in 2-3 years.
Supplementary infrastructure and treatment requisite: A settler can be provided before
ABR to contain the settleable organic and inorganic solids for enhanced treatment. The effluent from ABR needs to be subjected to tertiary treatment for higher treatment efficiency and re-use. The excess activated sludge in any of the chambers needs to be transferred to other chambers having less sludge. The sludge removed can be treated in a sludge drying bed.
Estimated Cost: The ABR if used in combination with other treatment modules, the cost ranges from 425 to 650 USD per cu.m for a treatment capacity of 10 cu.m
Pros and cons:
+ If constructed properly, it can be resilient to high ground water table and flooding conditions
+ Can be built from local materials + High organic load reduction + Long service life + No electrical energy required + Moderate capital, low operating and maintenance cost (low sludge generation) - Requires skilled designers and labourers - Effluent requires tertiary treatment - Less pathogen reduction
2.3.8 Anaerobic Filter (AF)
Anaerobic filters are also known as fixed bed or fixed film reactors. Anaerobic filter tanks are underground or closed watertight tanks with chamber in series with a fixed filter media as shown in Error! Reference source not found..
Design and description: They are
generally used as a secondary treatment module for pre-treated wastewater. AF includes the treatment of non-settleable and dissolved solids besides treatment through sedimentation and sludge digestion. Filter material such
Figure 0.10 – Anaerobic Filter (EAWAG &
Figure 0.11 – Anaerobic filter (EAWAG & WSCC 2008
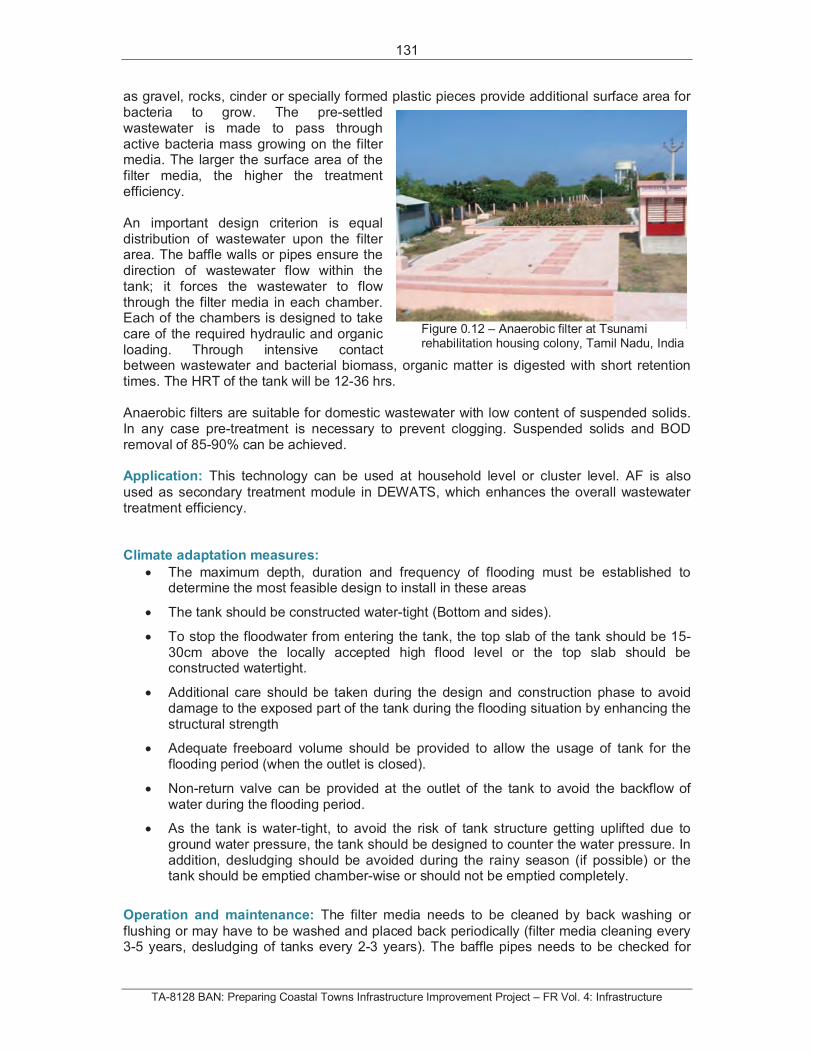
131
TA-8128 BAN: Preparing Coastal Towns Infrastructure Improvement Project – FR Vol. 4: Infrastructure
as gravel, rocks, cinder or specially formed plastic pieces provide additional surface area for bacteria to grow. The pre-settled wastewater is made to pass through active bacteria mass growing on the filter media. The larger the surface area of the filter media, the higher the treatment efficiency.
An important design criterion is equal distribution of wastewater upon the filter area. The baffle walls or pipes ensure the direction of wastewater flow within the tank; it forces the wastewater to flow through the filter media in each chamber. Each of the chambers is designed to take care of the required hydraulic and organic loading. Through intensive contact between wastewater and bacterial biomass, organic matter is digested with short retention times. The HRT of the tank will be 12-36 hrs.
Anaerobic filters are suitable for domestic wastewater with low content of suspended solids. In any case pre-treatment is necessary to prevent clogging. Suspended solids and BOD removal of 85-90% can be achieved.
Application: This technology can be used at household level or cluster level. AF is also
used as secondary treatment module in DEWATS, which enhances the overall wastewater treatment efficiency.
Climate adaptation measures:
The maximum depth, duration and frequency of flooding must be established to determine the most feasible design to install in these areas
The tank should be constructed water-tight (Bottom and sides).
To stop the floodwater from entering the tank, the top slab of the tank should be 15-30cm above the locally accepted high flood level or the top slab should be constructed watertight.
Additional care should be taken during the design and construction phase to avoid damage to the exposed part of the tank during the flooding situation by enhancing the structural strength
Adequate freeboard volume should be provided to allow the usage of tank for the flooding period (when the outlet is closed).
Non-return valve can be provided at the outlet of the tank to avoid the backflow of water during the flooding period.
As the tank is water-tight, to avoid the risk of tank structure getting uplifted due to ground water pressure, the tank should be designed to counter the water pressure. In addition, desludging should be avoided during the rainy season (if possible) or the tank should be emptied chamber-wise or should not be emptied completely.
Operation and maintenance: The filter media needs to be cleaned by back washing or
flushing or may have to be washed and placed back periodically (filter media cleaning every 3-5 years, desludging of tanks every 2-3 years). The baffle pipes needs to be checked for
Figure 0.12 – Anaerobic filter at Tsunami rehabilitation housing colony, Tamil Nadu, India
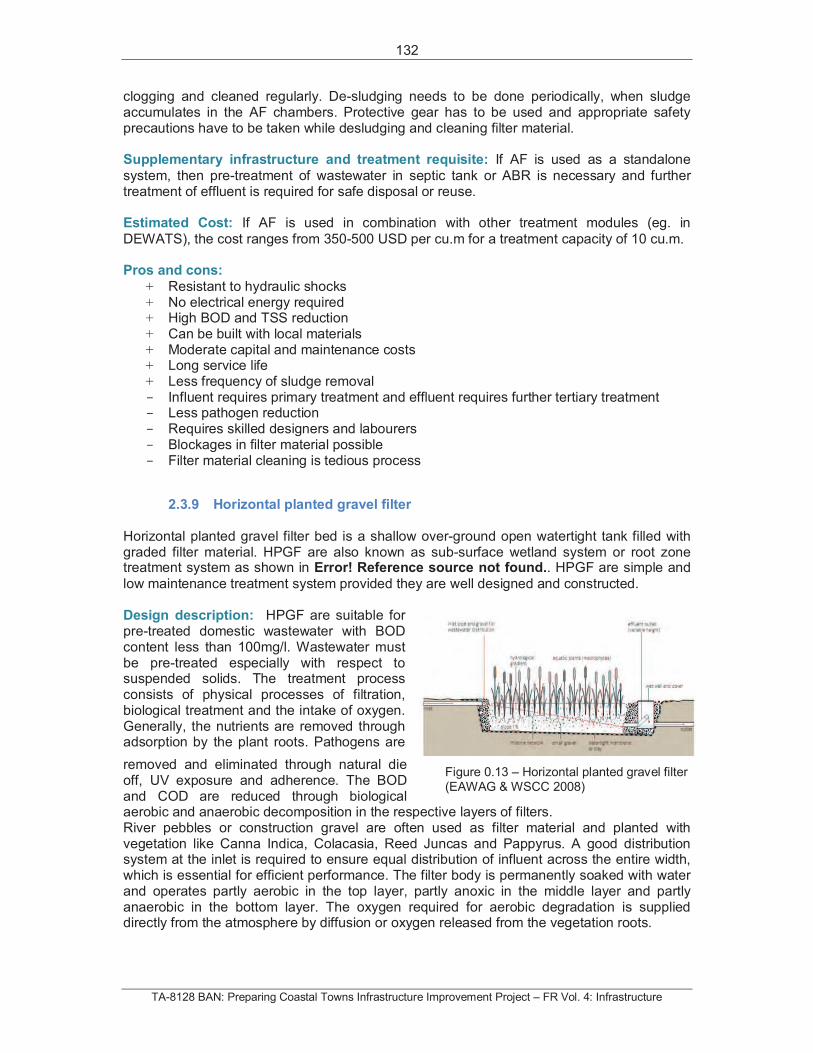
132
TA-8128 BAN: Preparing Coastal Towns Infrastructure Improvement Project – FR Vol. 4: Infrastructure
clogging and cleaned regularly. De-sludging needs to be done periodically, when sludge accumulates in the AF chambers. Protective gear has to be used and appropriate safety precautions have to be taken while desludging and cleaning filter material.
Supplementary infrastructure and treatment requisite: If AF is used as a standalone
system, then pre-treatment of wastewater in septic tank or ABR is necessary and further treatment of effluent is required for safe disposal or reuse.
Estimated Cost: If AF is used in combination with other treatment modules (eg. in
DEWATS), the cost ranges from 350-500 USD per cu.m for a treatment capacity of 10 cu.m.
Pros and cons:
+ Resistant to hydraulic shocks + No electrical energy required + High BOD and TSS reduction + Can be built with local materials + Moderate capital and maintenance costs + Long service life + Less frequency of sludge removal - Influent requires primary treatment and effluent requires further tertiary treatment - Less pathogen reduction - Requires skilled designers and labourers - Blockages in filter material possible - Filter material cleaning is tedious process
2.3.9 Horizontal planted gravel filter
Horizontal planted gravel filter bed is a shallow over-ground open watertight tank filled with graded filter material. HPGF are also known as sub-surface wetland system or root zone treatment system as shown in Error! Reference source not found.. HPGF are simple and
low maintenance treatment system provided they are well designed and constructed.
Design description: HPGF are suitable for pre-treated domestic wastewater with BOD content less than 100mg/l. Wastewater must be pre-treated especially with respect to suspended solids. The treatment process consists of physical processes of filtration, biological treatment and the intake of oxygen. Generally, the nutrients are removed through adsorption by the plant roots. Pathogens are
removed and eliminated through natural die off, UV exposure and adherence. The BOD and COD are reduced through biological aerobic and anaerobic decomposition in the respective layers of filters. River pebbles or construction gravel are often used as filter material and planted with vegetation like Canna Indica, Colacasia, Reed Juncas and Pappyrus. A good distribution system at the inlet is required to ensure equal distribution of influent across the entire width, which is essential for efficient performance. The filter body is permanently soaked with water and operates partly aerobic in the top layer, partly anoxic in the middle layer and partly anaerobic in the bottom layer. The oxygen required for aerobic degradation is supplied directly from the atmosphere by diffusion or oxygen released from the vegetation roots.
Figure 0.13 – Horizontal planted gravel filter (EAWAG & WSCC 2008)
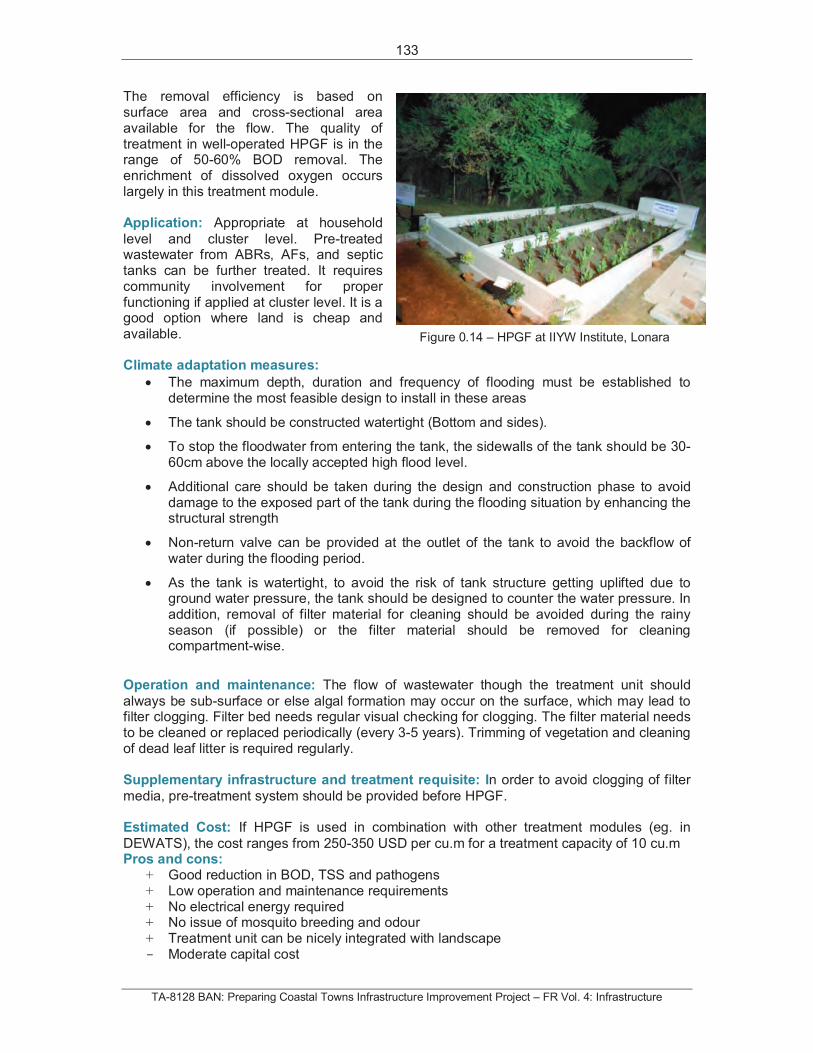
133
TA-8128 BAN: Preparing Coastal Towns Infrastructure Improvement Project – FR Vol. 4: Infrastructure
The removal efficiency is based on surface area and cross-sectional area available for the flow. The quality of treatment in well-operated HPGF is in the range of 50-60% BOD removal. The enrichment of dissolved oxygen occurs largely in this treatment module.
Application: Appropriate at household
level and cluster level. Pre-treated wastewater from ABRs, AFs, and septic tanks can be further treated. It requires community involvement for proper functioning if applied at cluster level. It is a good option where land is cheap and available.
Climate adaptation measures:
The maximum depth, duration and frequency of flooding must be established to determine the most feasible design to install in these areas
The tank should be constructed watertight (Bottom and sides).
To stop the floodwater from entering the tank, the sidewalls of the tank should be 30-60cm above the locally accepted high flood level.
Additional care should be taken during the design and construction phase to avoid damage to the exposed part of the tank during the flooding situation by enhancing the structural strength
Non-return valve can be provided at the outlet of the tank to avoid the backflow of water during the flooding period.
As the tank is watertight, to avoid the risk of tank structure getting uplifted due to ground water pressure, the tank should be designed to counter the water pressure. In addition, removal of filter material for cleaning should be avoided during the rainy season (if possible) or the filter material should be removed for cleaning compartment-wise.
Operation and maintenance: The flow of wastewater though the treatment unit should
always be sub-surface or else algal formation may occur on the surface, which may lead to filter clogging. Filter bed needs regular visual checking for clogging. The filter material needs to be cleaned or replaced periodically (every 3-5 years). Trimming of vegetation and cleaning of dead leaf litter is required regularly.
Supplementary infrastructure and treatment requisite: In order to avoid clogging of filter
media, pre-treatment system should be provided before HPGF.
Estimated Cost: If HPGF is used in combination with other treatment modules (eg. in
DEWATS), the cost ranges from 250-350 USD per cu.m for a treatment capacity of 10 cu.m Pros and cons:
+ Good reduction in BOD, TSS and pathogens + Low operation and maintenance requirements + No electrical energy required + No issue of mosquito breeding and odour + Treatment unit can be nicely integrated with landscape - Moderate capital cost
Figure 0.14 – HPGF at IIYW Institute, Lonara
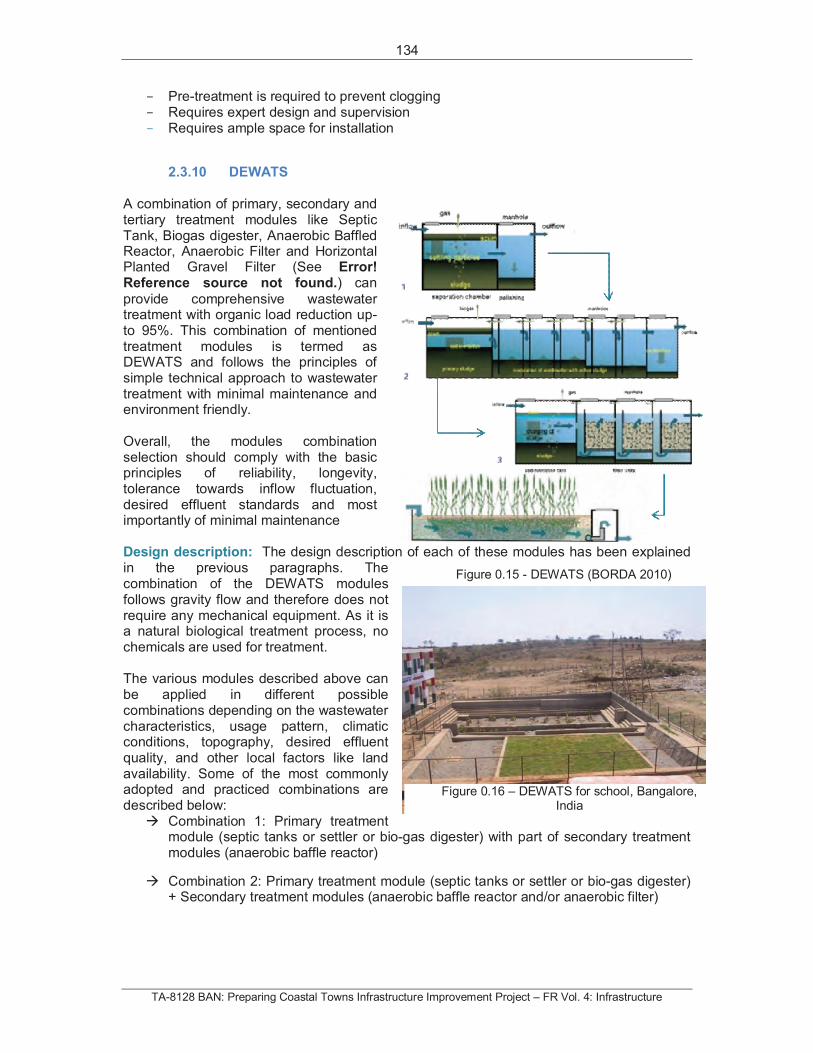
134
TA-8128 BAN: Preparing Coastal Towns Infrastructure Improvement Project – FR Vol. 4: Infrastructure
- Pre-treatment is required to prevent clogging - Requires expert design and supervision - Requires ample space for installation
2.3.10 DEWATS
A combination of primary, secondary and tertiary treatment modules like Septic Tank, Biogas digester, Anaerobic Baffled Reactor, Anaerobic Filter and Horizontal Planted Gravel Filter (See Error!Reference source not found.) can
provide comprehensive wastewater treatment with organic load reduction up-to 95%. This combination of mentioned treatment modules is termed as DEWATS and follows the principles of simple technical approach to wastewater treatment with minimal maintenance and environment friendly.
Overall, the modules combination selection should comply with the basic principles of reliability, longevity, tolerance towards inflow fluctuation, desired effluent standards and most importantly of minimal maintenance
Design description: The design description of each of these modules has been explained in the previous paragraphs. The combination of the DEWATS modules follows gravity flow and therefore does not require any mechanical equipment. As it is a natural biological treatment process, no chemicals are used for treatment.
The various modules described above can be applied in different possible combinations depending on the wastewater characteristics, usage pattern, climatic conditions, topography, desired effluent quality, and other local factors like land availability. Some of the most commonly adopted and practiced combinations are described below:
Combination 1: Primary treatment module (septic tanks or settler or bio-gas digester) with part of secondary treatment modules (anaerobic baffle reactor)
Combination 2: Primary treatment module (septic tanks or settler or bio-gas digester) + Secondary treatment modules (anaerobic baffle reactor and/or anaerobic filter)
Figure 0.15 - DEWATS (BORDA 2010)
Figure 0.16 – DEWATS for school, Bangalore, India
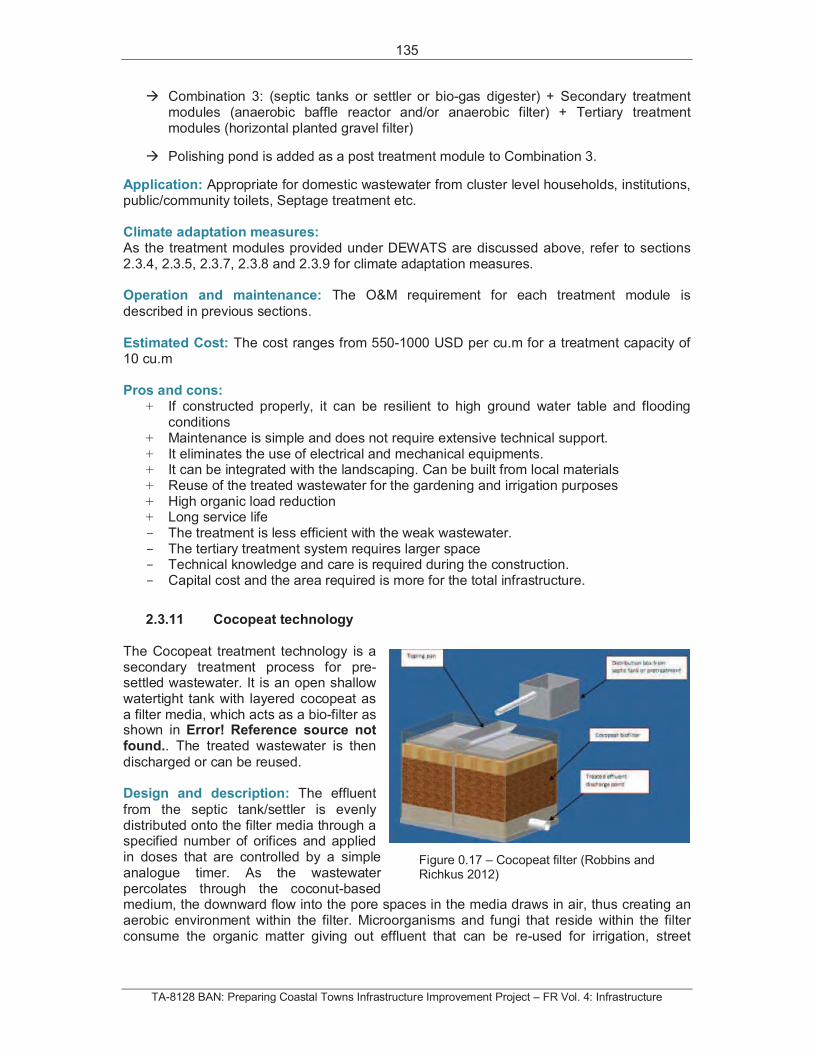
135
TA-8128 BAN: Preparing Coastal Towns Infrastructure Improvement Project – FR Vol. 4: Infrastructure
Combination 3: (septic tanks or settler or bio-gas digester) + Secondary treatment modules (anaerobic baffle reactor and/or anaerobic filter) + Tertiary treatment modules (horizontal planted gravel filter)
Polishing pond is added as a post treatment module to Combination 3.
Application: Appropriate for domestic wastewater from cluster level households, institutions, public/community toilets, Septage treatment etc.
Climate adaptation measures: As the treatment modules provided under DEWATS are discussed above, refer to sections 2.3.4, 2.3.5, 2.3.7, 2.3.8 and 2.3.9 for climate adaptation measures.
Operation and maintenance: The O&M requirement for each treatment module is
described in previous sections.
Estimated Cost: The cost ranges from 550-1000 USD per cu.m for a treatment capacity of 10 cu.m
Pros and cons: + If constructed properly, it can be resilient to high ground water table and flooding
conditions + Maintenance is simple and does not require extensive technical support. + It eliminates the use of electrical and mechanical equipments. + It can be integrated with the landscaping. Can be built from local materials + Reuse of the treated wastewater for the gardening and irrigation purposes + High organic load reduction + Long service life - The treatment is less efficient with the weak wastewater. - The tertiary treatment system requires larger space - Technical knowledge and care is required during the construction. - Capital cost and the area required is more for the total infrastructure.
2.3.11 Cocopeat technology
The Cocopeat treatment technology is a secondary treatment process for pre-settled wastewater. It is an open shallow watertight tank with layered cocopeat as a filter media, which acts as a bio-filter as shown in Error! Reference source not found.. The treated wastewater is then
discharged or can be reused.
Design and description: The effluent
from the septic tank/settler is evenly distributed onto the filter media through a specified number of orifices and applied in doses that are controlled by a simple analogue timer. As the wastewater percolates through the coconut-based medium, the downward flow into the pore spaces in the media draws in air, thus creating an aerobic environment within the filter. Microorganisms and fungi that reside within the filter consume the organic matter giving out effluent that can be re-used for irrigation, street
Figure 0.17 – Cocopeat filter (Robbins and Richkus 2012)
136
TA-8128 BAN: Preparing Coastal Towns Infrastructure Improvement Project – FR Vol. 4: Infrastructure
cleaning and toilet flushing. The system also reduces considerably the pathogen content in the treated effluent. Cocopeat bio-filter technology can be modular in design. Dimensions of one plastic bio-filter units can be 2.2 meters long by 1.1 meters wide and 1.2 meters in height. Hydraulic loading for one unit is from 350 to 500 litres of wastewater per day. To save on space, the modules can be stacked on top of each other (Watsan 2012). If sloping land is available, septic tank can be constructed on a higher level than coco-peat filter. If the septic tanks and coco-peat filter are on same level then regular pumping of effluent from septic tank to bio-filter is required.
Application: This technology can be installed in semi-dense and peri-urban areas, at
household level, commercial establishments, schools and other institutional buildings. For hotels and restaurants grease trap has to be provided as first treatment module. In case of high effluent volumes to be treated, more number of coco-peat modules can be added in series. For low-lying flood prone areas both, septic tank and coco-peat filter should be built above ground level. The outlet of the coco-peat module should be above the high flood level.
Climate adaptation measures:
The maximum depth, duration and frequency of flooding must be established to determine the most feasible design to install in these areas
The tank should be constructed watertight (Bottom and sides).
To stop the floodwater from entering the tank, the sidewalls of the tank should be atleast 15-60cm above the locally accepted high flood level.
Additional care should be taken during the design and construction phase to avoid damage to the exposed part of the tank during the flooding situation by enhancing the structural strength
If the tank is constructed underground and watertight, to avoid the risk of tank structure getting uplifted due to ground water pressure, the tank should be designed to counter the water pressure.
Operation and maintenance: If septic tank and coco-peat filter are on the same level then
daily pumping of effluent from septic tank to inlet of coco-peat is required to ensure uniform distribution of effluent over the filter media. The filter media has to be replaced every 2-3 years. The coco-peat is very cheap and readily available in Bangladesh. After the filter media’s lifespan of about 2-3 years, the spent filtering media can be composted and utilised to condition soil due to its high organic content.
Supplementary infrastructure and treatment requisite: To avoid clogging of coco-peat,
periodic desludging of the primary treatment module like septic tank/settler is required.
Estimated Cost: Information is not available
Pros and cons:
+ Suited for different wastewater streams like households, institutions and small clusters in different physical environments
+ Easy to construct, operate and maintain + Low or no electrical energy required + Effluent discharge can be reused or safely disposed in drains + Can be used where flow of wastewater is variable + Suitable in coconut producing regions - Implementation of treatment module is mainly dependent on coco-peat availability - The cost of filter material is the major factor affecting the cost of maintenance.
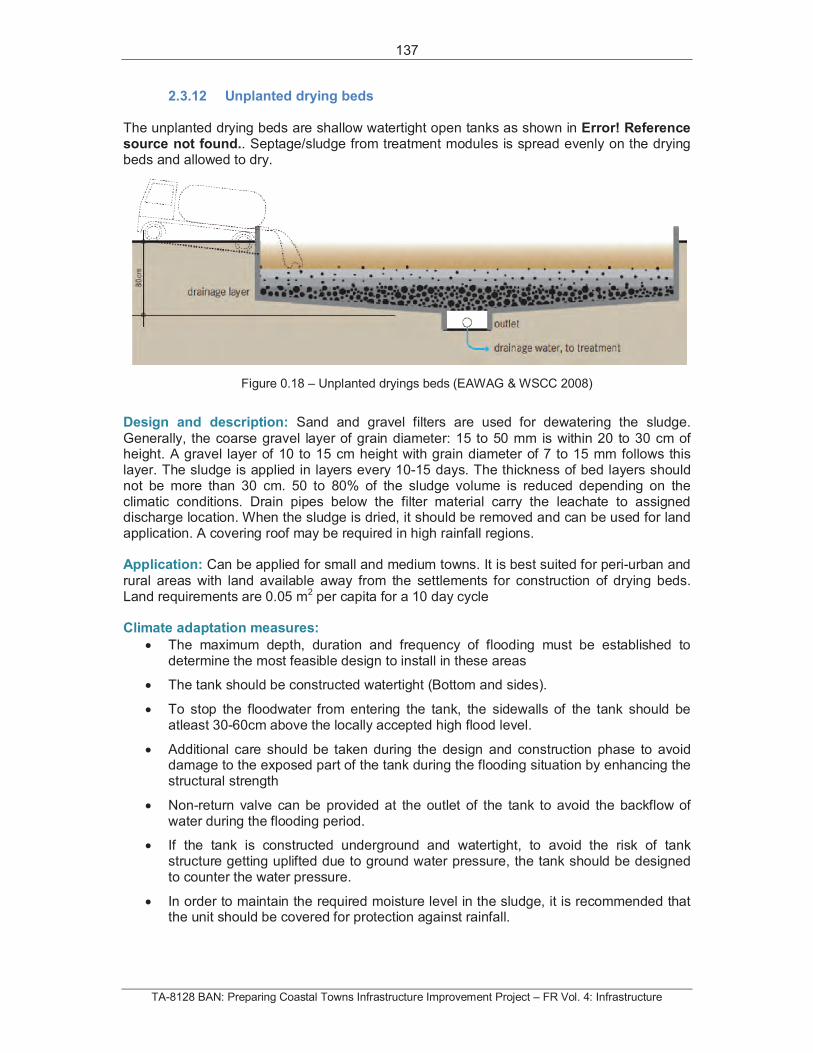
137
TA-8128 BAN: Preparing Coastal Towns Infrastructure Improvement Project – FR Vol. 4: Infrastructure
2.3.12 Unplanted drying beds
The unplanted drying beds are shallow watertight open tanks as shown in Error! Reference source not found.. Septage/sludge from treatment modules is spread evenly on the drying beds and allowed to dry.
Design and description: Sand and gravel filters are used for dewatering the sludge.
Generally, the coarse gravel layer of grain diameter: 15 to 50 mm is within 20 to 30 cm of height. A gravel layer of 10 to 15 cm height with grain diameter of 7 to 15 mm follows this layer. The sludge is applied in layers every 10-15 days. The thickness of bed layers should not be more than 30 cm. 50 to 80% of the sludge volume is reduced depending on the climatic conditions. Drain pipes below the filter material carry the leachate to assigned discharge location. When the sludge is dried, it should be removed and can be used for land application. A covering roof may be required in high rainfall regions.
Application: Can be applied for small and medium towns. It is best suited for peri-urban and
rural areas with land available away from the settlements for construction of drying beds. Land requirements are 0.05 m2 per capita for a 10 day cycle
Climate adaptation measures:
The maximum depth, duration and frequency of flooding must be established to determine the most feasible design to install in these areas
The tank should be constructed watertight (Bottom and sides).
To stop the floodwater from entering the tank, the sidewalls of the tank should be atleast 30-60cm above the locally accepted high flood level.
Additional care should be taken during the design and construction phase to avoid damage to the exposed part of the tank during the flooding situation by enhancing the structural strength
Non-return valve can be provided at the outlet of the tank to avoid the backflow of water during the flooding period.
If the tank is constructed underground and watertight, to avoid the risk of tank structure getting uplifted due to ground water pressure, the tank should be designed to counter the water pressure.
In order to maintain the required moisture level in the sludge, it is recommended that the unit should be covered for protection against rainfall.
Figure 0.18 – Unplanted dryings beds (EAWAG & WSCC 2008)
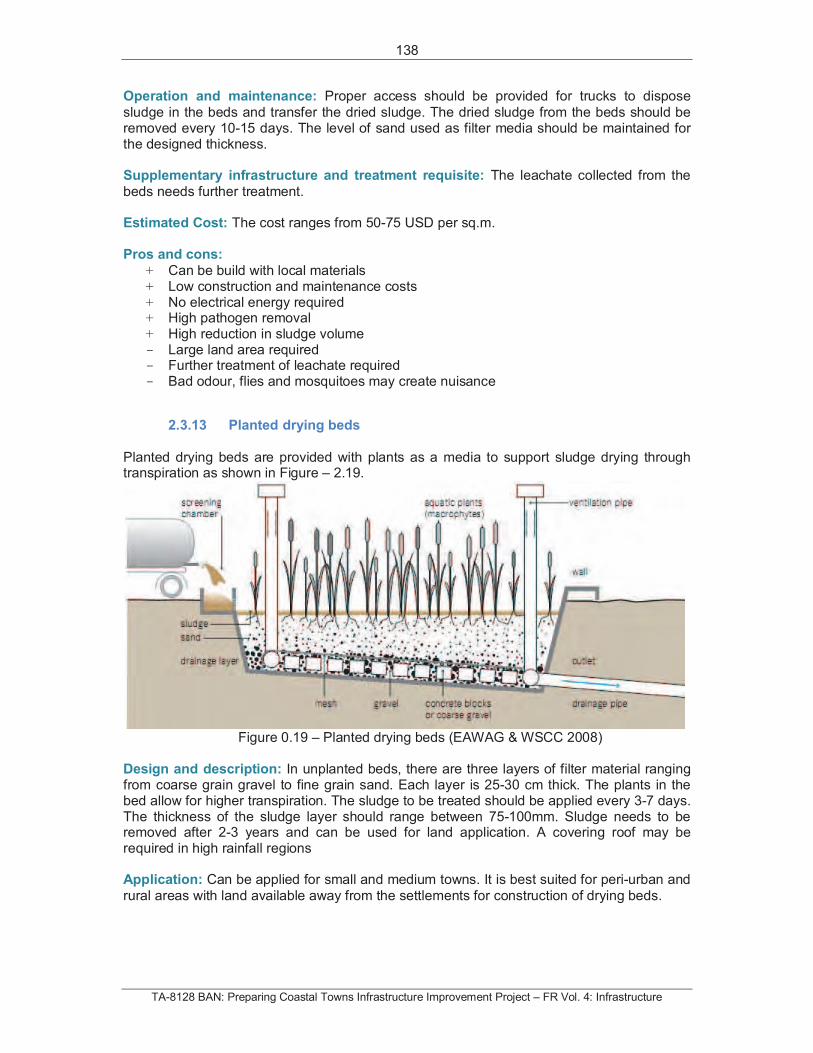
138
TA-8128 BAN: Preparing Coastal Towns Infrastructure Improvement Project – FR Vol. 4: Infrastructure
Operation and maintenance: Proper access should be provided for trucks to dispose
sludge in the beds and transfer the dried sludge. The dried sludge from the beds should be removed every 10-15 days. The level of sand used as filter media should be maintained for the designed thickness.
Supplementary infrastructure and treatment requisite: The leachate collected from the
beds needs further treatment.
Estimated Cost: The cost ranges from 50-75 USD per sq.m.
Pros and cons:
+ Can be build with local materials + Low construction and maintenance costs + No electrical energy required + High pathogen removal + High reduction in sludge volume - Large land area required - Further treatment of leachate required - Bad odour, flies and mosquitoes may create nuisance
2.3.13 Planted drying beds
Planted drying beds are provided with plants as a media to support sludge drying through transpiration as shown in Figure – 2.19.
Figure 0.19 – Planted drying beds (EAWAG & WSCC 2008)
Design and description: In unplanted beds, there are three layers of filter material ranging from coarse grain gravel to fine grain sand. Each layer is 25-30 cm thick. The plants in the bed allow for higher transpiration. The sludge to be treated should be applied every 3-7 days. The thickness of the sludge layer should range between 75-100mm. Sludge needs to be removed after 2-3 years and can be used for land application. A covering roof may be required in high rainfall regions
Application: Can be applied for small and medium towns. It is best suited for peri-urban and
rural areas with land available away from the settlements for construction of drying beds.
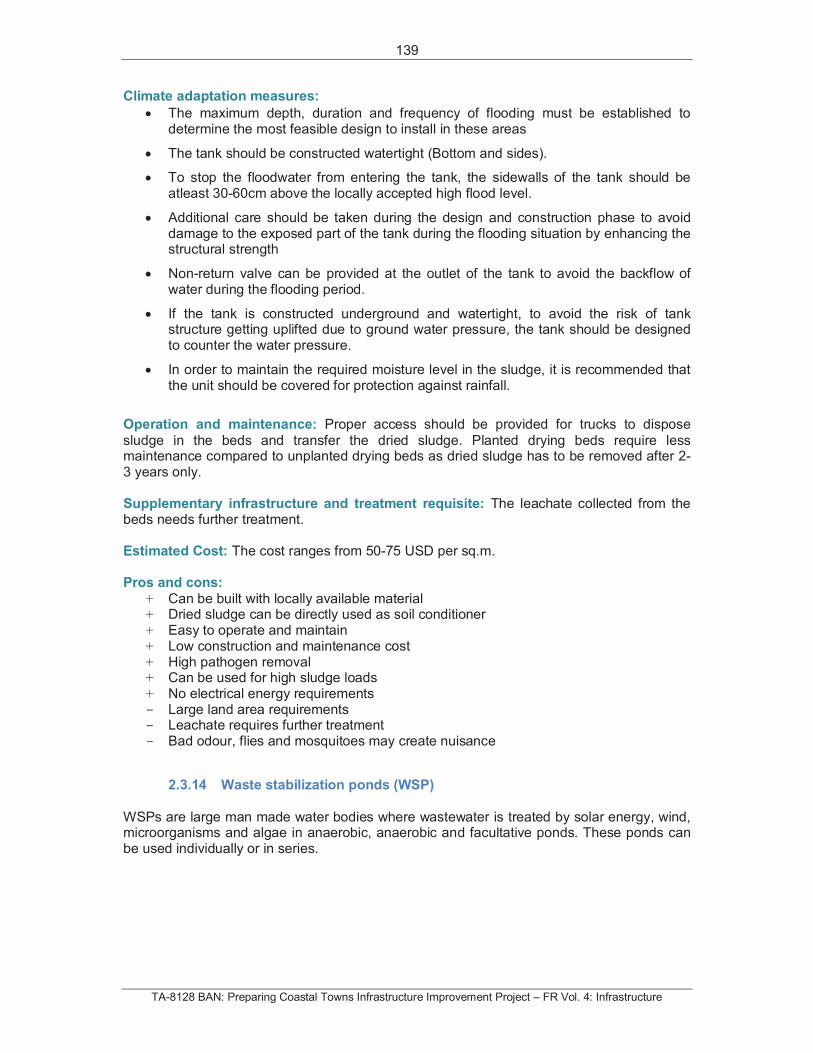
139
TA-8128 BAN: Preparing Coastal Towns Infrastructure Improvement Project – FR Vol. 4: Infrastructure
Climate adaptation measures:
The maximum depth, duration and frequency of flooding must be established to determine the most feasible design to install in these areas
The tank should be constructed watertight (Bottom and sides).
To stop the floodwater from entering the tank, the sidewalls of the tank should be atleast 30-60cm above the locally accepted high flood level.
Additional care should be taken during the design and construction phase to avoid damage to the exposed part of the tank during the flooding situation by enhancing the structural strength
Non-return valve can be provided at the outlet of the tank to avoid the backflow of water during the flooding period.
If the tank is constructed underground and watertight, to avoid the risk of tank structure getting uplifted due to ground water pressure, the tank should be designed to counter the water pressure.
In order to maintain the required moisture level in the sludge, it is recommended that the unit should be covered for protection against rainfall.
Operation and maintenance: Proper access should be provided for trucks to dispose
sludge in the beds and transfer the dried sludge. Planted drying beds require less maintenance compared to unplanted drying beds as dried sludge has to be removed after 2-3 years only.
Supplementary infrastructure and treatment requisite: The leachate collected from the beds needs further treatment.
Estimated Cost: The cost ranges from 50-75 USD per sq.m.
Pros and cons:
+ Can be built with locally available material + Dried sludge can be directly used as soil conditioner + Easy to operate and maintain + Low construction and maintenance cost + High pathogen removal + Can be used for high sludge loads + No electrical energy requirements - Large land area requirements - Leachate requires further treatment - Bad odour, flies and mosquitoes may create nuisance
2.3.14 Waste stabilization ponds (WSP)
WSPs are large man made water bodies where wastewater is treated by solar energy, wind, microorganisms and algae in anaerobic, anaerobic and facultative ponds. These ponds can be used individually or in series.
140
TA-8128 BAN: Preparing Coastal Towns Infrastructure Improvement Project – FR Vol. 4: Infrastructure
Figure 0.20 – Waste stabilization pond (EAWAG & WSCC 2008)
Design and description: The effluent is transferred from anaerobic pond to facultative to
aerobic pond. Solids and BOD (up to 60%) are reduced in anaerobic pond. These ponds are 2-5m in depth and require a retention time of 1-7 days. The facultative ponds are 1-2.5m in depth where solids accumulate at the bottom and are digested. BOD reductions of 75% are achieved with retention time of 5 to 30 days. A number of aerobic ponds can be added to achieve highly polished effluent. The depth of aerobic ponds is 0.5 to 1.5m to ensure sunlight penetration till the bottom. Pathogen removal up to 90% can be achieved. Wing mixing and algae provide oxygen in the pond. If aquaculture is practised in these ponds then high efficiency of nitrogen and phosphorus removal can be achieved. To prevent leaching, the ponds should have a liner. The liner can be clay, asphalt, compacted earth, or another impervious material. The ponds should protected by bunds in low-lying and flood prone regions.
Application: Suitable for semi-urban and rural areas where large land mass is available.
Can be applied in areas where there is a demand for treated water for reuse in agriculture and/or aquaculture. They offer a robust treatment process that can deal with a wide variety of wastewaters of varying types and concentrations. For higher organic load, high surface area is required.
Climate adaptation measures:
The maximum depth, duration and frequency of flooding must be established to determine the most feasible design to install in these areas
To avoid the floodwater from entering the ponds it is recommended to provide a structurally stable earthen bund around the pond atleast 30-60cm above high flood level.
Operation and maintenance: Scum formation has to be prevented, thus excess solids and garbage entering the ponds has to be removed. The fencing has to be well kept. The liner of the ponds has to be repaired time to time.
Supplementary infrastructure and treatment requisite: If septage and fecal sludge has to
be treated, the transportation infrastructure should be in place.
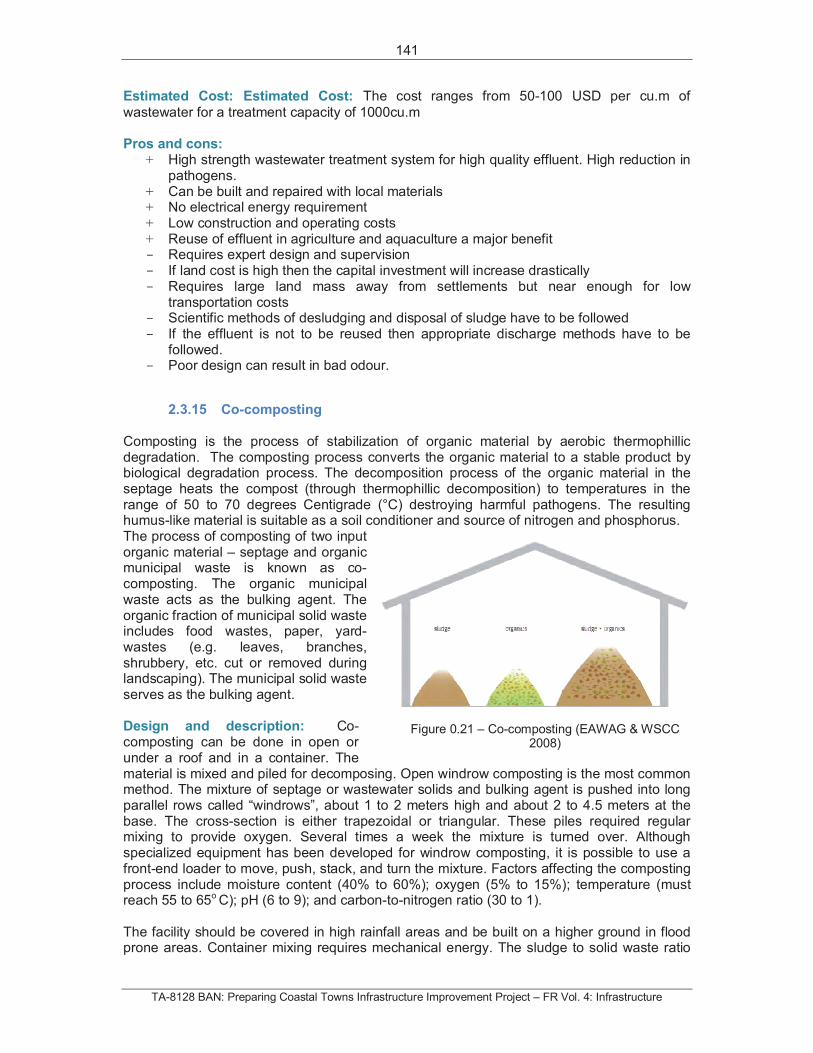
141
TA-8128 BAN: Preparing Coastal Towns Infrastructure Improvement Project – FR Vol. 4: Infrastructure
Estimated Cost: Estimated Cost: The cost ranges from 50-100 USD per cu.m of
wastewater for a treatment capacity of 1000cu.m
Pros and cons: + High strength wastewater treatment system for high quality effluent. High reduction in
pathogens. + Can be built and repaired with local materials + No electrical energy requirement + Low construction and operating costs + Reuse of effluent in agriculture and aquaculture a major benefit - Requires expert design and supervision - If land cost is high then the capital investment will increase drastically - Requires large land mass away from settlements but near enough for low
transportation costs - Scientific methods of desludging and disposal of sludge have to be followed - If the effluent is not to be reused then appropriate discharge methods have to be
followed. - Poor design can result in bad odour.
2.3.15 Co-composting
Composting is the process of stabilization of organic material by aerobic thermophillic degradation. The composting process converts the organic material to a stable product by biological degradation process. The decomposition process of the organic material in the septage heats the compost (through thermophillic decomposition) to temperatures in the range of 50 to 70 degrees Centigrade (°C) destroying harmful pathogens. The resulting humus-like material is suitable as a soil conditioner and source of nitrogen and phosphorus. The process of composting of two input organic material – septage and organic municipal waste is known as co-composting. The organic municipal waste acts as the bulking agent. The organic fraction of municipal solid waste includes food wastes, paper, yard-wastes (e.g. leaves, branches, shrubbery, etc. cut or removed during landscaping). The municipal solid waste serves as the bulking agent.
Design and description: Co-composting can be done in open or under a roof and in a container. The material is mixed and piled for decomposing. Open windrow composting is the most common method. The mixture of septage or wastewater solids and bulking agent is pushed into long parallel rows called “windrows”, about 1 to 2 meters high and about 2 to 4.5 meters at the base. The cross-section is either trapezoidal or triangular. These piles required regular mixing to provide oxygen. Several times a week the mixture is turned over. Although specialized equipment has been developed for windrow composting, it is possible to use a front-end loader to move, push, stack, and turn the mixture. Factors affecting the composting process include moisture content (40% to 60%); oxygen (5% to 15%); temperature (must reach 55 to 65o C); pH (6 to 9); and carbon-to-nitrogen ratio (30 to 1).
The facility should be covered in high rainfall areas and be built on a higher ground in flood prone areas. Container mixing requires mechanical energy. The sludge to solid waste ratio
Figure 0.21 – Co-composting (EAWAG & WSCC 2008)
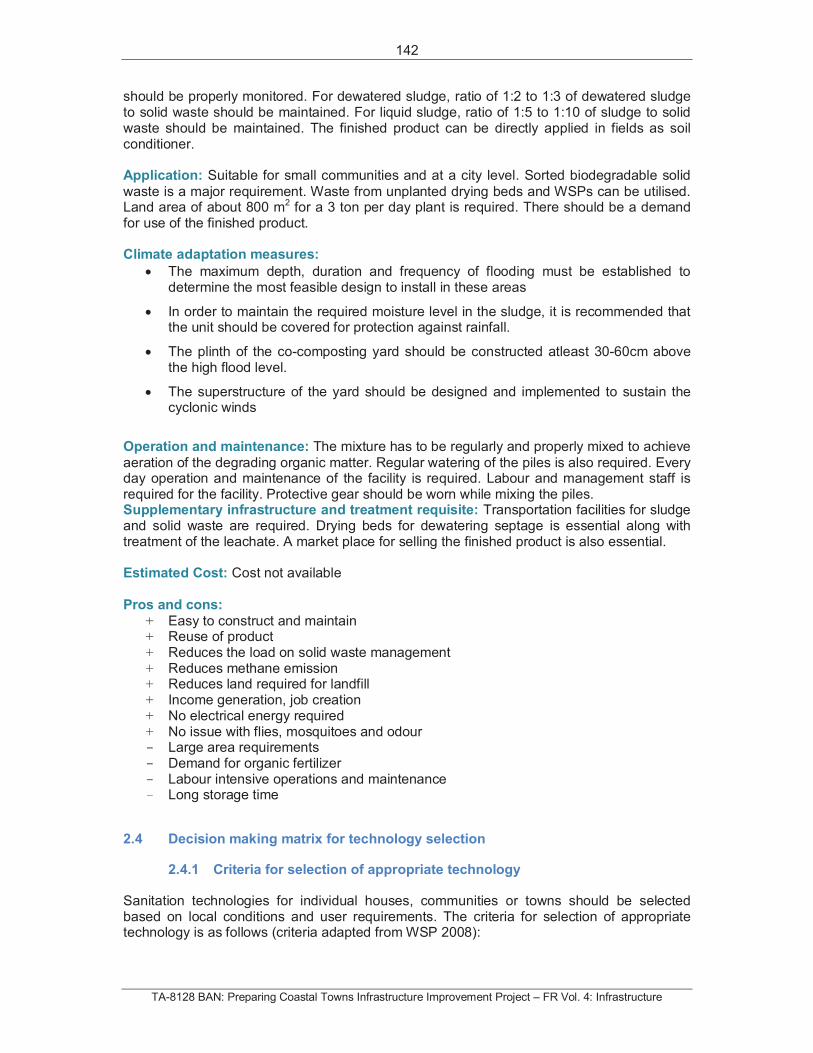
142
TA-8128 BAN: Preparing Coastal Towns Infrastructure Improvement Project – FR Vol. 4: Infrastructure
should be properly monitored. For dewatered sludge, ratio of 1:2 to 1:3 of dewatered sludge to solid waste should be maintained. For liquid sludge, ratio of 1:5 to 1:10 of sludge to solid waste should be maintained. The finished product can be directly applied in fields as soil conditioner.
Application: Suitable for small communities and at a city level. Sorted biodegradable solid
waste is a major requirement. Waste from unplanted drying beds and WSPs can be utilised. Land area of about 800 m2 for a 3 ton per day plant is required. There should be a demand for use of the finished product.
Climate adaptation measures:
The maximum depth, duration and frequency of flooding must be established to determine the most feasible design to install in these areas
In order to maintain the required moisture level in the sludge, it is recommended that the unit should be covered for protection against rainfall.
The plinth of the co-composting yard should be constructed atleast 30-60cm above the high flood level.
The superstructure of the yard should be designed and implemented to sustain the cyclonic winds
Operation and maintenance: The mixture has to be regularly and properly mixed to achieve
aeration of the degrading organic matter. Regular watering of the piles is also required. Every day operation and maintenance of the facility is required. Labour and management staff is required for the facility. Protective gear should be worn while mixing the piles. Supplementary infrastructure and treatment requisite: Transportation facilities for sludge and solid waste are required. Drying beds for dewatering septage is essential along with treatment of the leachate. A market place for selling the finished product is also essential.
Estimated Cost: Cost not available
Pros and cons:
+ Easy to construct and maintain + Reuse of product + Reduces the load on solid waste management + Reduces methane emission + Reduces land required for landfill + Income generation, job creation + No electrical energy required + No issue with flies, mosquitoes and odour - Large area requirements - Demand for organic fertilizer - Labour intensive operations and maintenance - Long storage time
2.4 Decision making matrix for technology selection
2.4.1 Criteria for selection of appropriate technology
Sanitation technologies for individual houses, communities or towns should be selected based on local conditions and user requirements. The criteria for selection of appropriate technology is as follows (criteria adapted from WSP 2008):
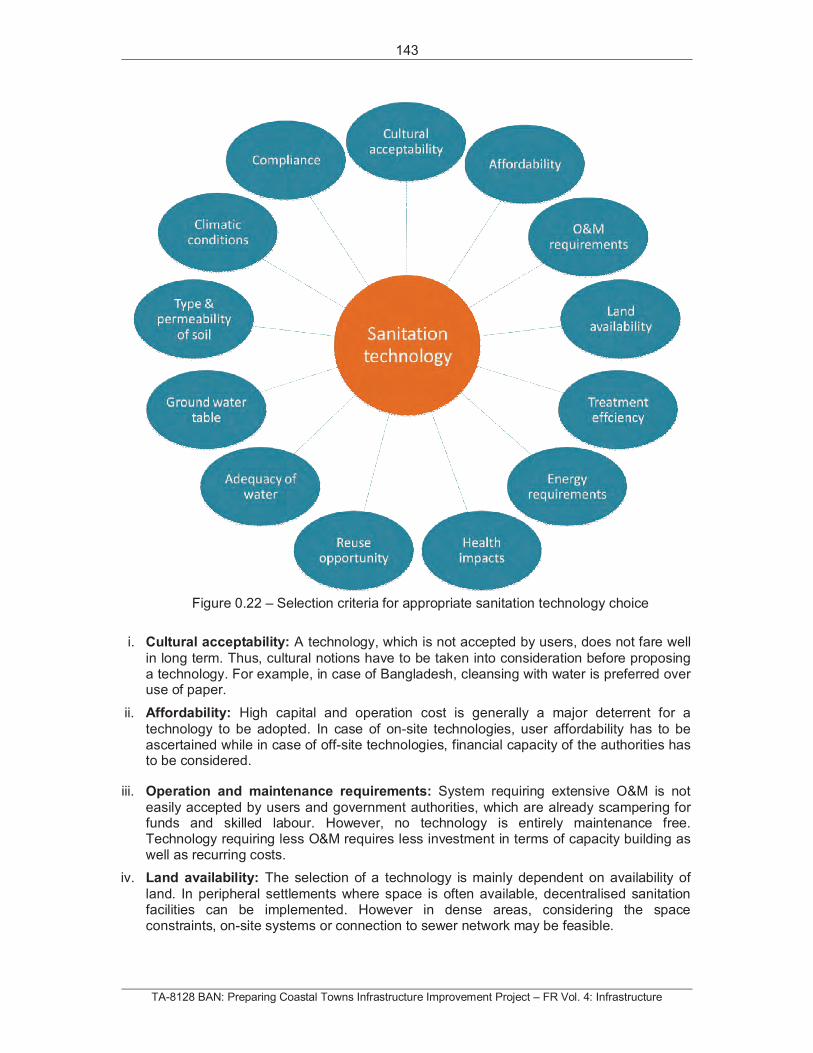
143
TA-8128 BAN: Preparing Coastal Towns Infrastructure Improvement Project – FR Vol. 4: Infrastructure
Figure 0.22 – Selection criteria for appropriate sanitation technology choice
i. Cultural acceptability: A technology, which is not accepted by users, does not fare well
in long term. Thus, cultural notions have to be taken into consideration before proposing a technology. For example, in case of Bangladesh, cleansing with water is preferred over use of paper.
ii. Affordability: High capital and operation cost is generally a major deterrent for a
technology to be adopted. In case of on-site technologies, user affordability has to be ascertained while in case of off-site technologies, financial capacity of the authorities has to be considered.
iii. Operation and maintenance requirements: System requiring extensive O&M is not
easily accepted by users and government authorities, which are already scampering for funds and skilled labour. However, no technology is entirely maintenance free. Technology requiring less O&M requires less investment in terms of capacity building as well as recurring costs.
iv. Land availability: The selection of a technology is mainly dependent on availability of
land. In peripheral settlements where space is often available, decentralised sanitation facilities can be implemented. However in dense areas, considering the space constraints, on-site systems or connection to sewer network may be feasible.
144
TA-8128 BAN: Preparing Coastal Towns Infrastructure Improvement Project – FR Vol. 4: Infrastructure
v. Treatment efficiency: The selected technology should have high treatment efficiency to
impact environment positively. For example, single pit latrines have negligible treatment efficiency, thus fecal sludge requires further treatment.
vi. Energy requirements: Most of the wastewater treatment projects fail due to unavailability of continuous electricity. In order to ensure sustenance it is necessary that technology should be selected which is less energy intensive or do not require energy for its operations.
vii. Health Impact: Current sanitation practices in the PPTA towns may adversely impact the
environment and health of the residents. The proposed technologies should improve the environmental condition and minimise the health risk.
viii. Reuse opportunity: Reuse of the treated waste should be considered to reduce
environmental pollution and sustain the technology. Reuse of treated waste and wastewater, as fertilizer has proven beneficial for the functioning of the system in many regions. Reuse generates revenue in certain cases, which helps in financially sustaining the system.
ix. Adequacy of water: Per capita water availability is one of the key criteria for selection of
technology. For example if, per capita availability of water is less than 40 lpcd then, off-site technologies are not feasible.
x. Ground water table: High ground water table affects the construction as well as day-to-
day working of the sanitation system. If the ground water table is high, the technologies should be selected which can work in such conditions or technologies have to be adapted to the situation.
xi. Type and permeability of soil: If systems require supernatant water, grey water or
sullage to be disposed in soak pit or to be leached in surrounding soil then the permeability of the soil should be high.
xii. Climatic conditions: While considering sanitation technologies, the climate of the region
should be taken into account. Temperature, rainfall pattern, frequency and intensity of floods and cyclonic storms should be taken into consideration.
xiii. Compliance: The technology has to comply with building bylaws, environmental laws
and social norms.
The decision-making matrix has been prepared by evaluating the identified technologies against the ‘selection criteria’ as discussed above. The matrix ascertains the favourability of a technology in comparison to other identified technologies. Red colour symbolizes low favourability, yellow moderate favourability and green high favourability.
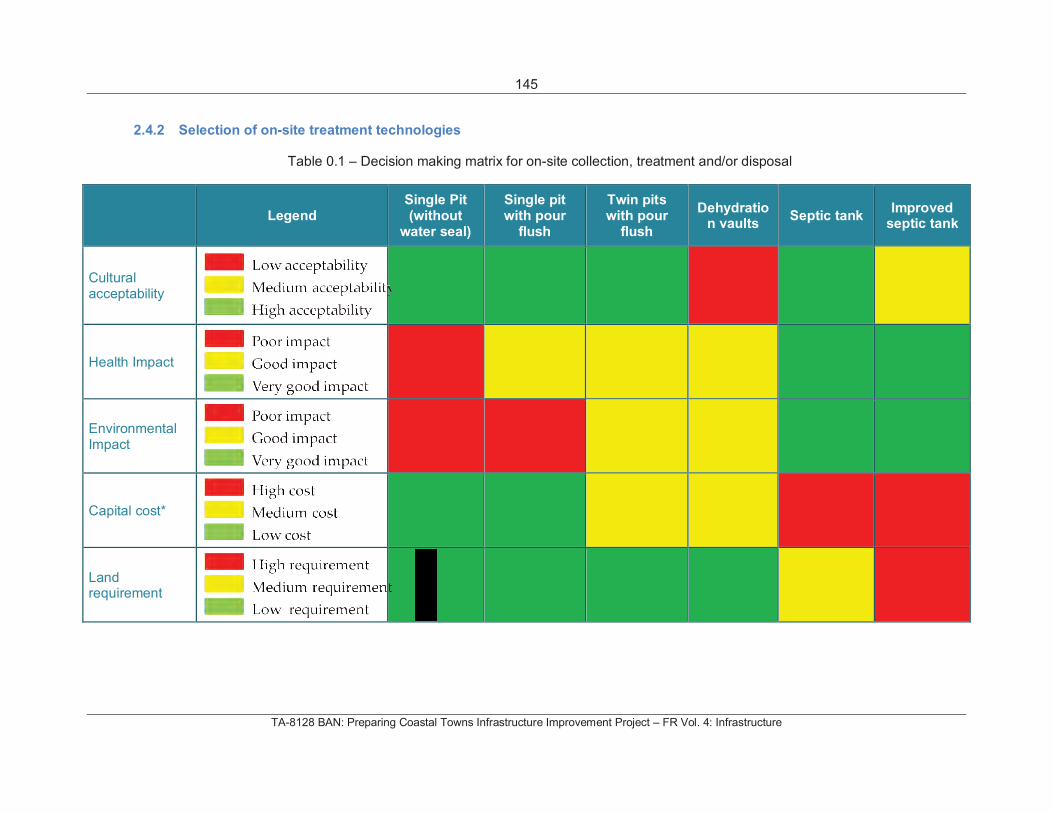
145
TA-8128 BAN: Preparing Coastal Towns Infrastructure Improvement Project – FR Vol. 4: Infrastructure
2.4.2 Selection of on-site treatment technologies
Table 0.1 – Decision making matrix for on-site collection, treatment and/or disposal
LegendSingle Pit (without
water seal)
Single pit with pour
flush
Twin pits with pour
flush
Dehydration vaults
Septic tankImproved
septic tank
Cultural acceptability
Health Impact
Environmental Impact
Capital cost*
Land requirement
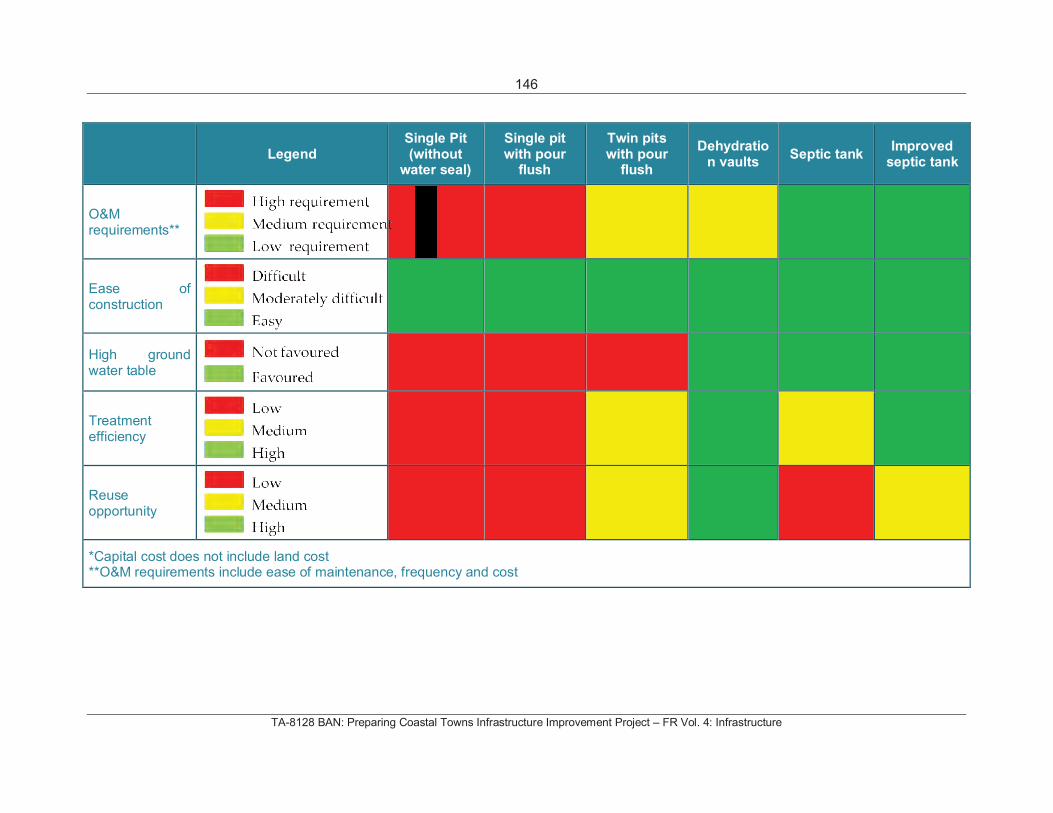
146
TA-8128 BAN: Preparing Coastal Towns Infrastructure Improvement Project – FR Vol. 4: Infrastructure
LegendSingle Pit (without
water seal)
Single pit with pour
flush
Twin pits with pour
flush
Dehydration vaults
Septic tankImproved
septic tank
O&M requirements**
Ease of construction
High ground water table
Treatment efficiency
Reuse opportunity
*Capital cost does not include land cost **O&M requirements include ease of maintenance, frequency and cost
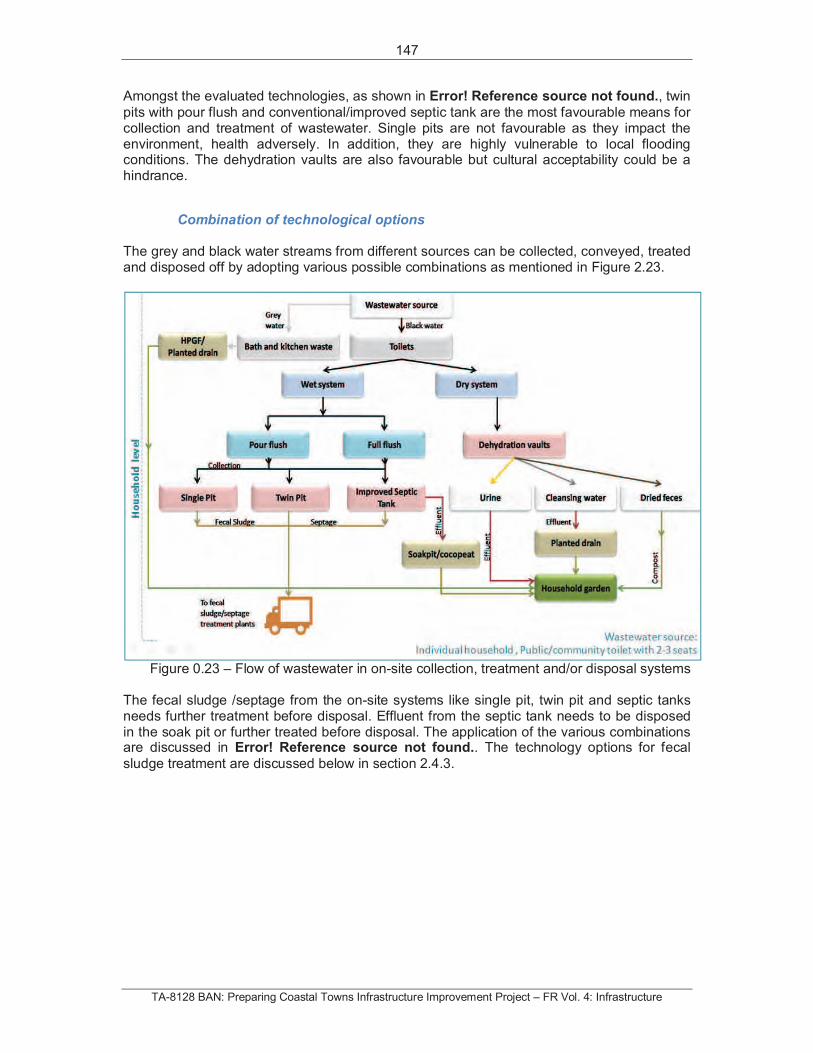
147
TA-8128 BAN: Preparing Coastal Towns Infrastructure Improvement Project – FR Vol. 4: Infrastructure
Amongst the evaluated technologies, as shown in Error! Reference source not found., twin
pits with pour flush and conventional/improved septic tank are the most favourable means for collection and treatment of wastewater. Single pits are not favourable as they impact the environment, health adversely. In addition, they are highly vulnerable to local flooding conditions. The dehydration vaults are also favourable but cultural acceptability could be a hindrance.
Combination of technological options
The grey and black water streams from different sources can be collected, conveyed, treated and disposed off by adopting various possible combinations as mentioned in Figure 2.23.
Figure 0.23 – Flow of wastewater in on-site collection, treatment and/or disposal systems
The fecal sludge /septage from the on-site systems like single pit, twin pit and septic tanks needs further treatment before disposal. Effluent from the septic tank needs to be disposed in the soak pit or further treated before disposal. The application of the various combinations are discussed in Error! Reference source not found.. The technology options for fecal
sludge treatment are discussed below in section 2.4.3.
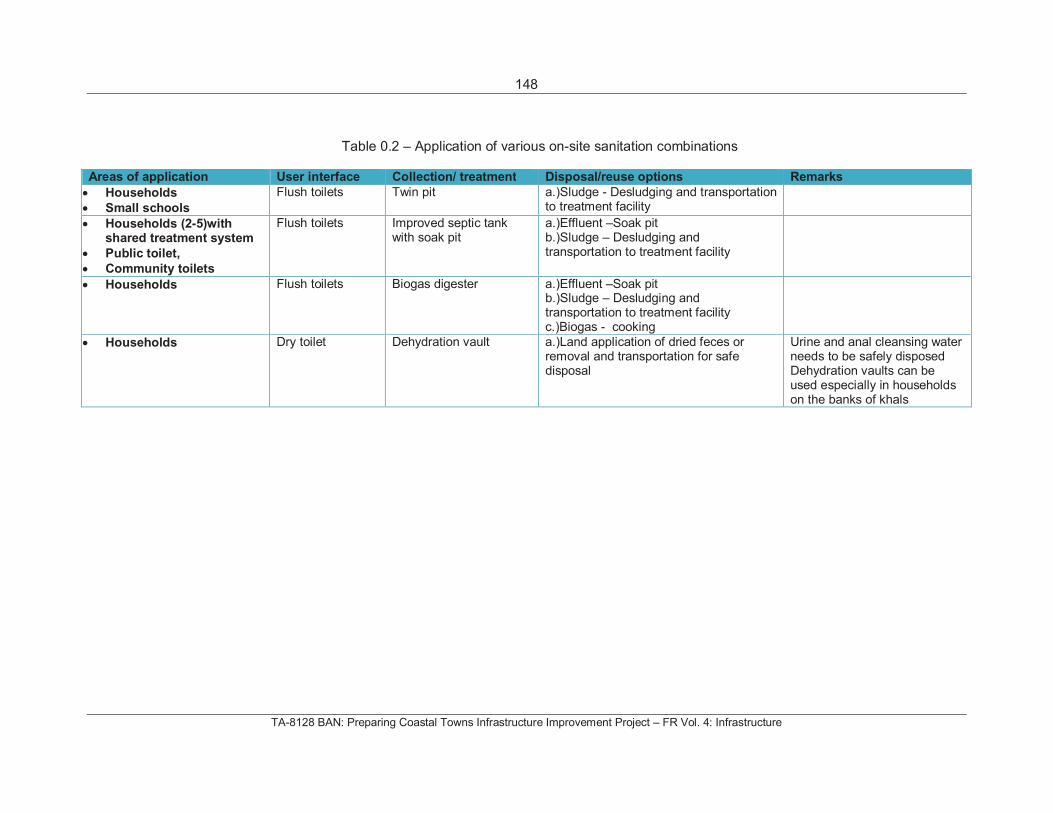
148
TA-8128 BAN: Preparing Coastal Towns Infrastructure Improvement Project – FR Vol. 4: Infrastructure
Table 0.2 – Application of various on-site sanitation combinations
Areas of application User interface Collection/ treatment Disposal/reuse options Remarks
Households
Small schools
Flush toilets Twin pit a.)Sludge - Desludging and transportation to treatment facility
Households (2-5)with shared treatment system
Public toilet,
Community toilets
Flush toilets Improved septic tank with soak pit
a.)Effluent –Soak pit b.)Sludge – Desludging and transportation to treatment facility
Households Flush toilets Biogas digester a.)Effluent –Soak pit b.)Sludge – Desludging and transportation to treatment facility c.)Biogas - cooking
Households Dry toilet Dehydration vault a.)Land application of dried feces or removal and transportation for safe disposal
Urine and anal cleansing water needs to be safely disposed Dehydration vaults can be used especially in households on the banks of khals
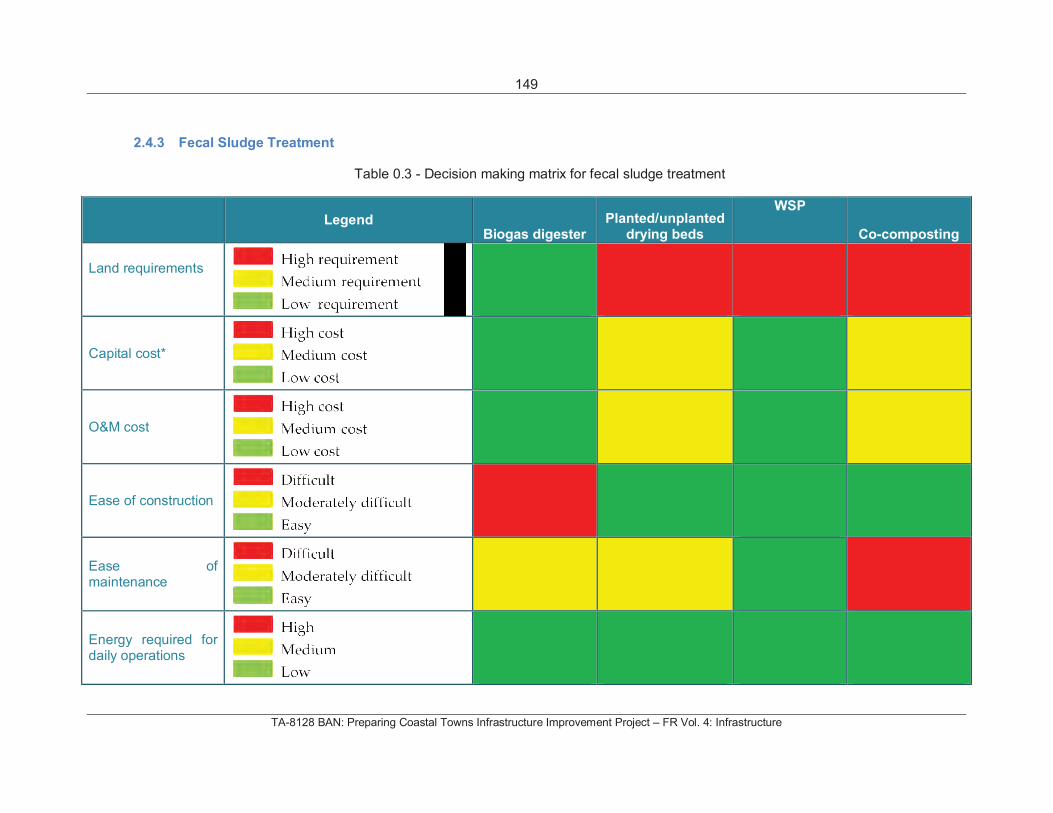
149
TA-8128 BAN: Preparing Coastal Towns Infrastructure Improvement Project – FR Vol. 4: Infrastructure
2.4.3 Fecal Sludge Treatment
Table 0.3 - Decision making matrix for fecal sludge treatment
Legend Biogas digester
Planted/unplanted drying beds
WSP
Co-composting
Land requirements
Capital cost*
O&M cost
Ease of construction
Ease of maintenance
Energy required for daily operations
Selection criteria
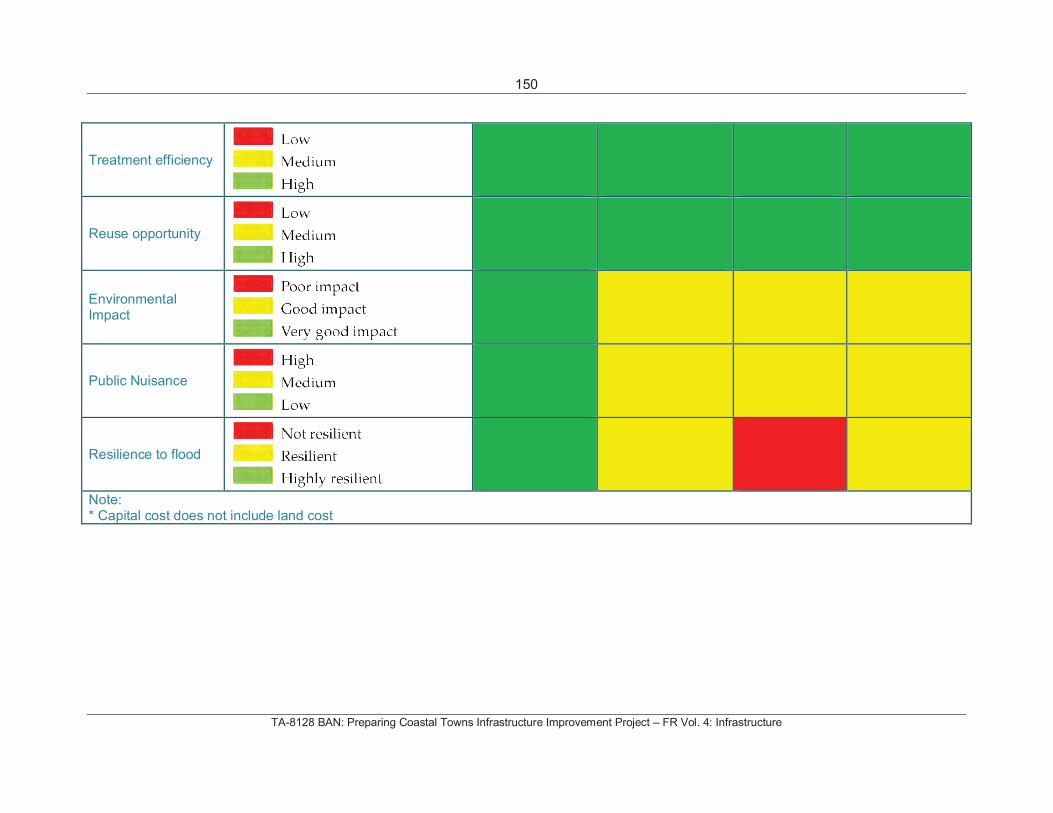
150
TA-8128 BAN: Preparing Coastal Towns Infrastructure Improvement Project – FR Vol. 4: Infrastructure
Treatment efficiency
Reuse opportunity
Environmental Impact
Public Nuisance
Resilience to flood
Note: * Capital cost does not include land cost
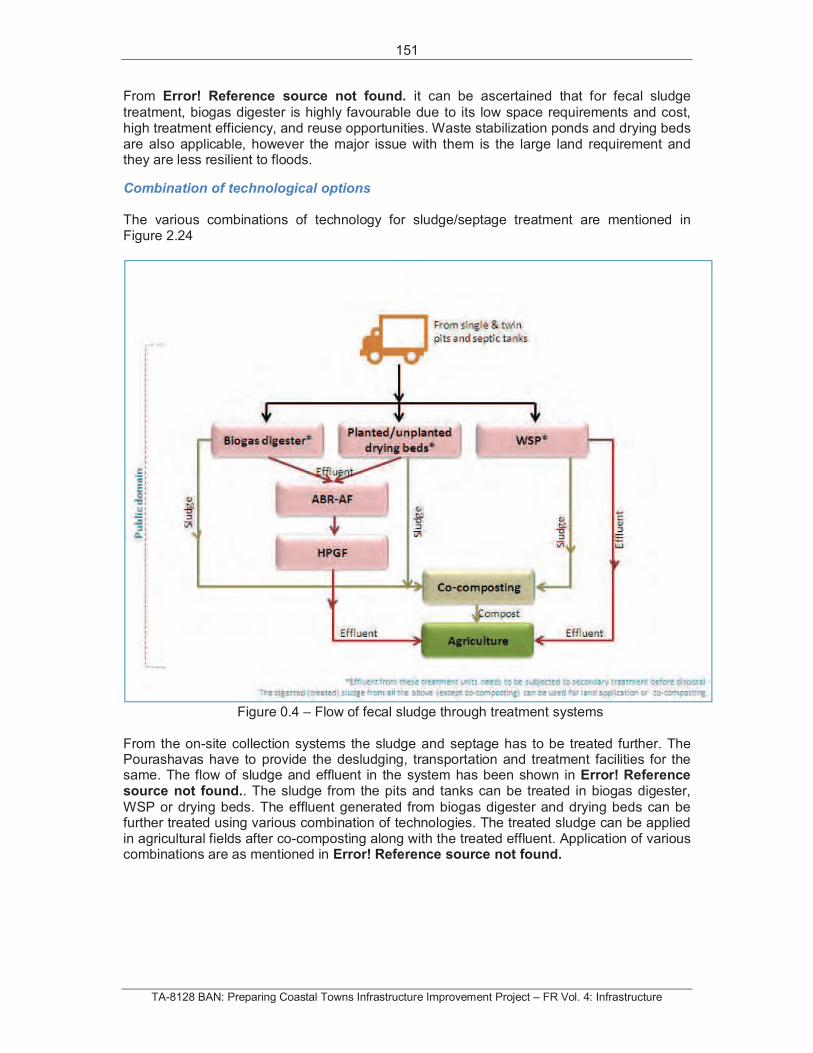
151
TA-8128 BAN: Preparing Coastal Towns Infrastructure Improvement Project – FR Vol. 4: Infrastructure
From Error! Reference source not found. it can be ascertained that for fecal sludge
treatment, biogas digester is highly favourable due to its low space requirements and cost, high treatment efficiency, and reuse opportunities. Waste stabilization ponds and drying beds are also applicable, however the major issue with them is the large land requirement and they are less resilient to floods.
Combination of technological options
The various combinations of technology for sludge/septage treatment are mentioned in Figure 2.24
Figure 0.4 – Flow of fecal sludge through treatment systems
From the on-site collection systems the sludge and septage has to be treated further. The Pourashavas have to provide the desludging, transportation and treatment facilities for the same. The flow of sludge and effluent in the system has been shown in Error! Reference source not found.. The sludge from the pits and tanks can be treated in biogas digester,
WSP or drying beds. The effluent generated from biogas digester and drying beds can be further treated using various combination of technologies. The treated sludge can be applied in agricultural fields after co-composting along with the treated effluent. Application of various combinations are as mentioned in Error! Reference source not found.
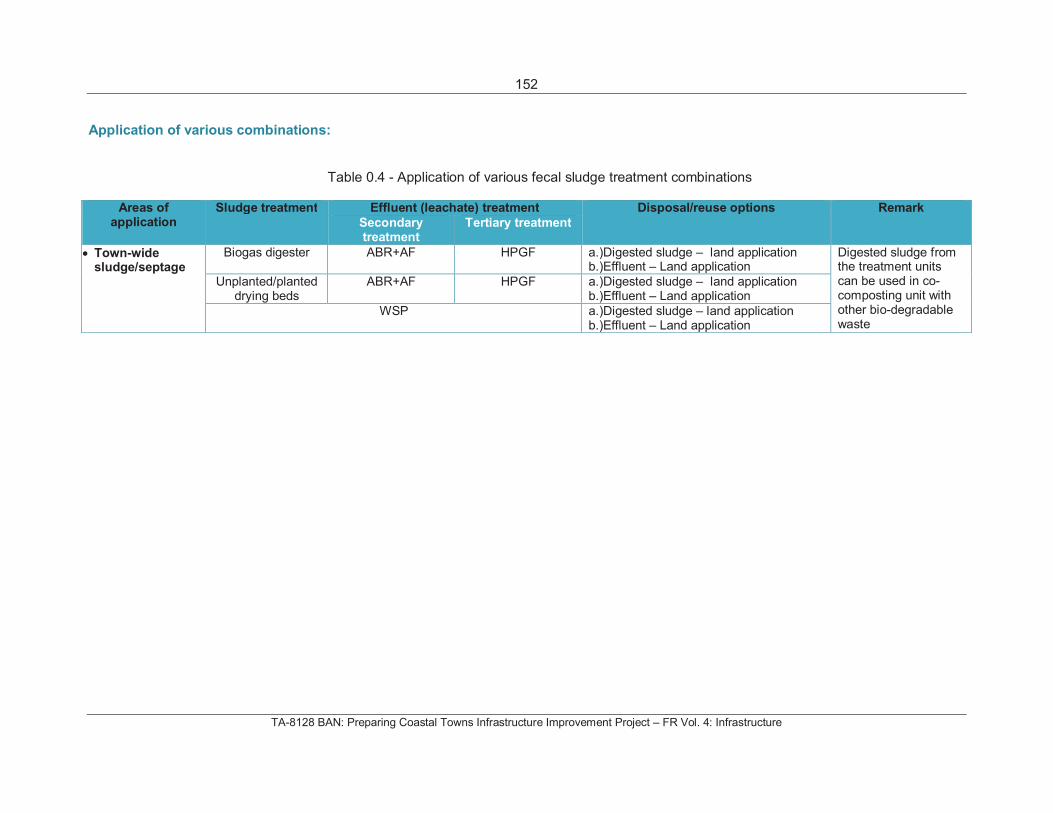
152
TA-8128 BAN: Preparing Coastal Towns Infrastructure Improvement Project – FR Vol. 4: Infrastructure
Application of various combinations:
Table 0.4 - Application of various fecal sludge treatment combinations
Areas of application
Sludge treatment Effluent (leachate) treatment Disposal/reuse options Remark
Secondary treatment
Tertiary treatment
Town-wide sludge/septage
Biogas digester ABR+AF HPGF a.)Digested sludge – land application b.)Effluent – Land application
Digested sludge from the treatment units can be used in co-composting unit with other bio-degradable waste
Unplanted/planted drying beds
ABR+AF HPGF a.)Digested sludge – land application b.)Effluent – Land application
WSP a.)Digested sludge – land application b.)Effluent – Land application
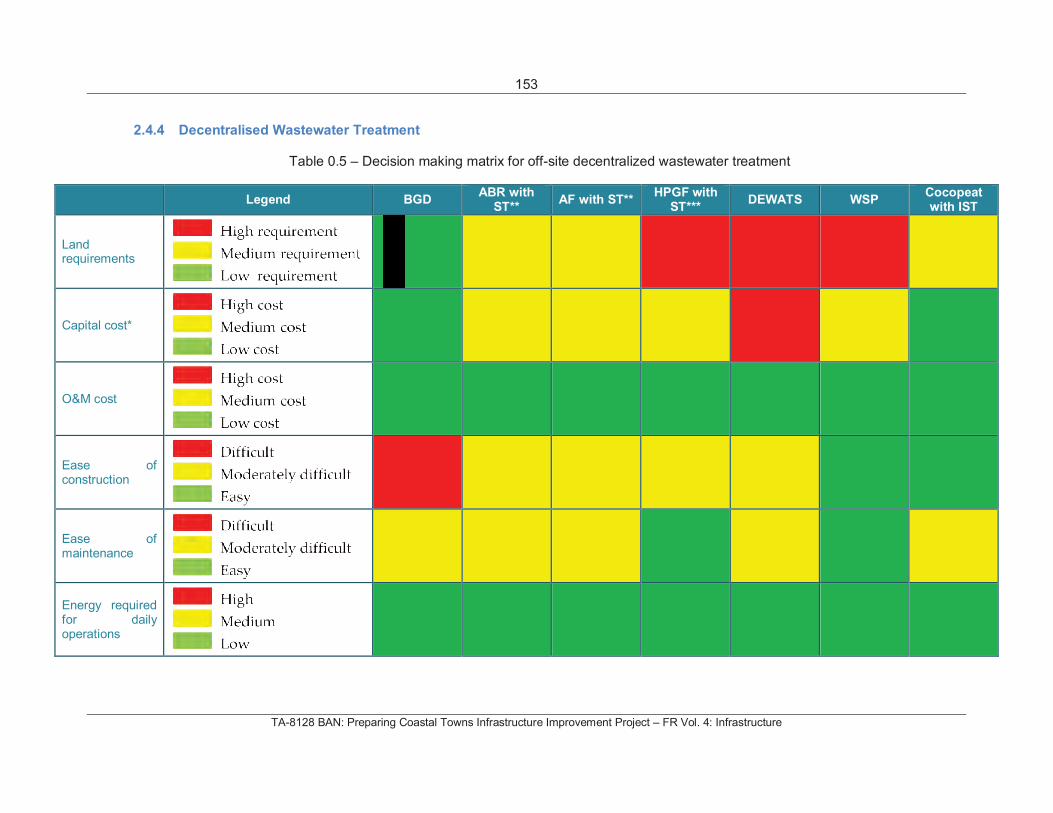
153
TA-8128 BAN: Preparing Coastal Towns Infrastructure Improvement Project – FR Vol. 4: Infrastructure
2.4.4 Decentralised Wastewater Treatment
Table 0.5 – Decision making matrix for off-site decentralized wastewater treatment
Legend BGD ABR with
ST** AF with ST**
HPGF with ST***
DEWATS WSP Cocopeat with IST
Landrequirements
Capital cost*
O&M cost
Ease of construction
Ease of maintenance
Energy required for daily operations
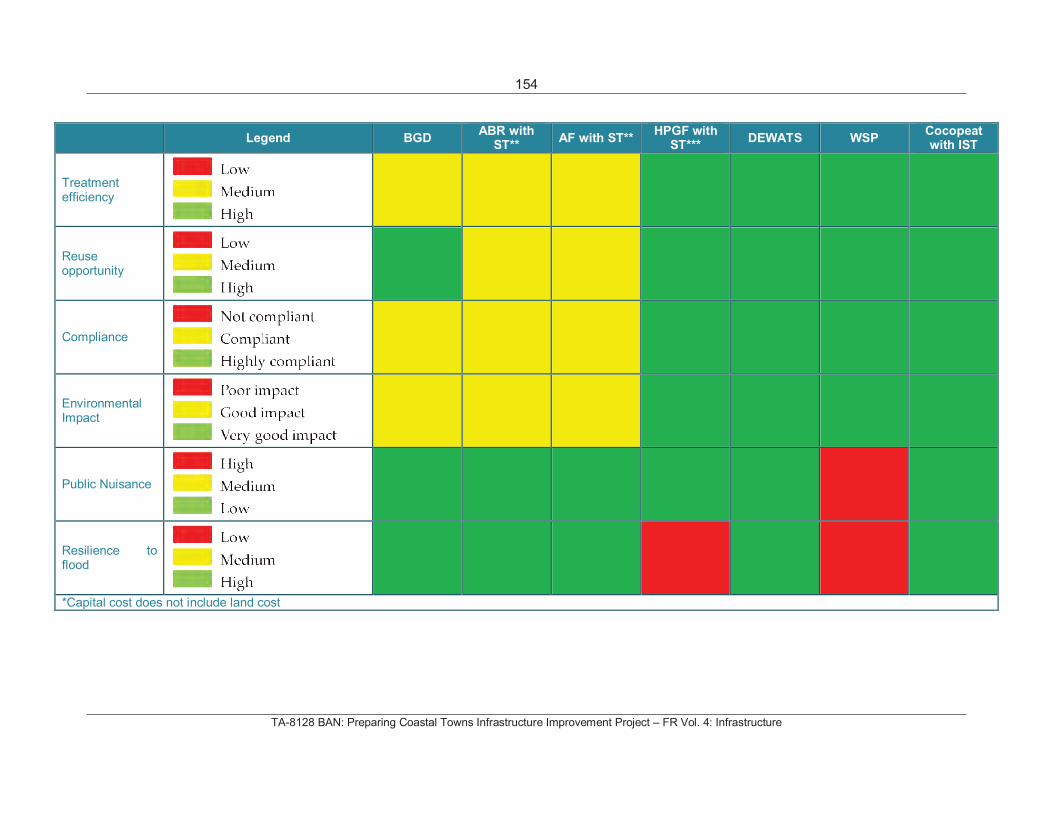
154
TA-8128 BAN: Preparing Coastal Towns Infrastructure Improvement Project – FR Vol. 4: Infrastructure
Legend BGD ABR with
ST** AF with ST**
HPGF with ST***
DEWATS WSP Cocopeat with IST
Treatment efficiency
Reuseopportunity
Compliance
Environmental Impact
Public Nuisance
Resilience to flood
*Capital cost does not include land cost
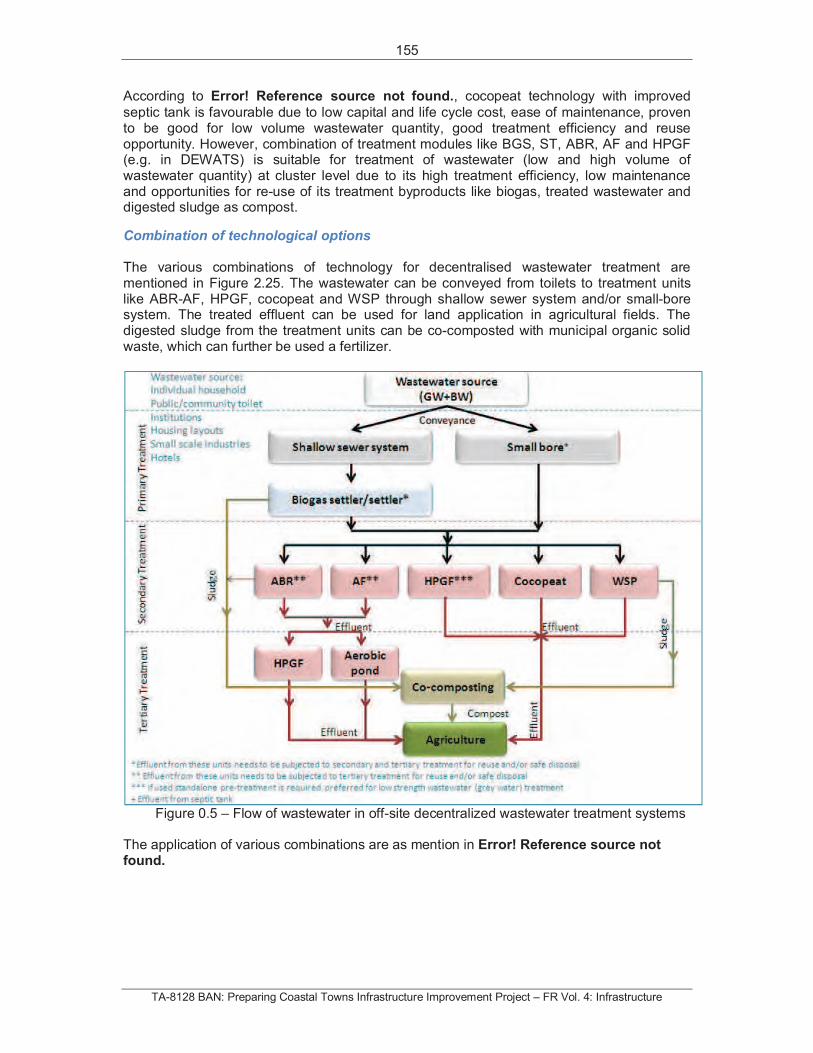
155
TA-8128 BAN: Preparing Coastal Towns Infrastructure Improvement Project – FR Vol. 4: Infrastructure
According to Error! Reference source not found., cocopeat technology with improved
septic tank is favourable due to low capital and life cycle cost, ease of maintenance, proven to be good for low volume wastewater quantity, good treatment efficiency and reuse opportunity. However, combination of treatment modules like BGS, ST, ABR, AF and HPGF (e.g. in DEWATS) is suitable for treatment of wastewater (low and high volume of wastewater quantity) at cluster level due to its high treatment efficiency, low maintenance and opportunities for re-use of its treatment byproducts like biogas, treated wastewater and digested sludge as compost.
Combination of technological options
The various combinations of technology for decentralised wastewater treatment are mentioned in Figure 2.25. The wastewater can be conveyed from toilets to treatment units like ABR-AF, HPGF, cocopeat and WSP through shallow sewer system and/or small-bore system. The treated effluent can be used for land application in agricultural fields. The digested sludge from the treatment units can be co-composted with municipal organic solid waste, which can further be used a fertilizer.
Figure 0.5 – Flow of wastewater in off-site decentralized wastewater treatment systems
The application of various combinations are as mention in Error! Reference source not found.
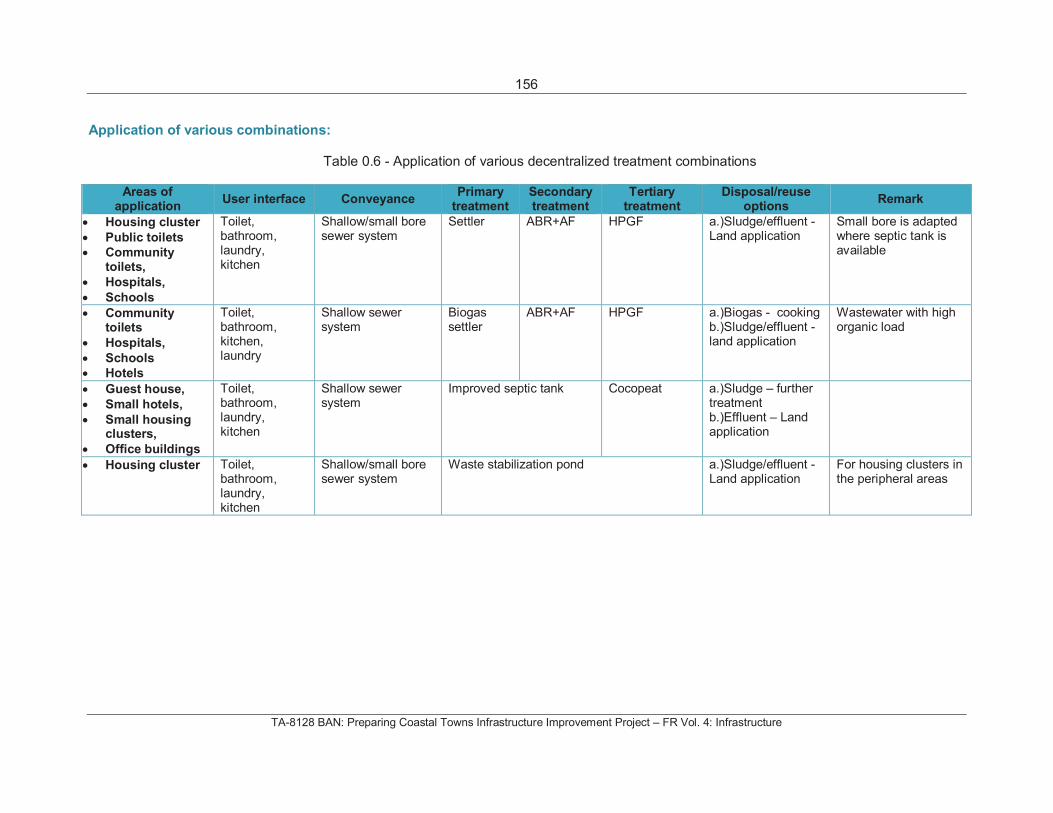
156
TA-8128 BAN: Preparing Coastal Towns Infrastructure Improvement Project – FR Vol. 4: Infrastructure
Application of various combinations:
Table 0.6 - Application of various decentralized treatment combinations
Areas of application
User interface ConveyancePrimary
treatmentSecondary treatment
Tertiary treatment
Disposal/reuse options
Remark
Housing cluster
Public toilets
Community toilets,
Hospitals,
Schools
Toilet, bathroom, laundry, kitchen
Shallow/small bore sewer system
Settler ABR+AF HPGF a.)Sludge/effluent - Land application
Small bore is adapted where septic tank is available
Community toilets
Hospitals,
Schools
Hotels
Toilet, bathroom, kitchen, laundry
Shallow sewer system
Biogas settler
ABR+AF HPGF a.)Biogas - cooking b.)Sludge/effluent - land application
Wastewater with high organic load
Guest house,
Small hotels,
Small housing clusters,
Office buildings
Toilet, bathroom, laundry, kitchen
Shallow sewer system
Improved septic tank Cocopeat a.)Sludge – further treatment b.)Effluent – Land application
Housing cluster Toilet, bathroom, laundry, kitchen
Shallow/small bore sewer system
Waste stabilization pond a.)Sludge/effluent - Land application
For housing clusters in the peripheral areas
157
TA-8128 BAN: Preparing Coastal Towns Infrastructure Improvement Project – FR Vol. 4: Infrastructure
2.5 Application of sanitation technologies in PPTA towns
Based on the technological options recommended as per the decision-making matrix and its possible combinations, the most applicable technology options and its application in PPTA towns is discussed in detail below.
In order to demonstrate the application of the suitable technologies it is proposed to classify the areas of application into two categories (a) public domain and (b) private domain. In context of this study, pilot projects are proposed to demonstrate the selected technology options in public domain. The pilots are selected based on the situation analysis, consultation with PPTA team, conducting pre-feasibility studies and willingness of respective Pourashava officials for project implementation. The team visited the prospective pilot locations with Pourashava officials. The respective pourashavas have ensured the required land area will be provided for implementation of the pilots.
Pilot projects in Galachipa town
It is proposed to implement the pilots in Galachipa Town for the following area/sector/land use:
Pilot Project- 1: Septage Management System for Galachipa Town
Pilot Project- 2: Public sanitation facility near Bailey Bridge
Pilot Project- 3: Wastewater management in Housing settlement, 40 barrack.
Pilot projects in Amtali town
It is proposed to implement the pilots in Amtali Town for the following area/sector/land use:
Pilot Project- 4: Septage Management System for Amtali Town
Pilot Project- 5: Community Based Sanitation facility at Mango Market
Pilot Project- 6: Wastewater management in Large Public (Hospital) Institution, Amtali.
Pilot projects in Mathbaria town
Pilot Project- 7: Wastewater management in Large Public (Education) Institution
Pilot Project- 8: Public sanitation facility in Market area.
Pilot projects in Pirojpur town
It is proposed to implement the pilots in Pirojpur Town for the following area/sector/land use:
Pilot Project- 9: Wastewater management in South Shikarpur Housing settlement
Pilot Project- 10: Improved sanitation system for sweepers housing colony, Krishnanagar
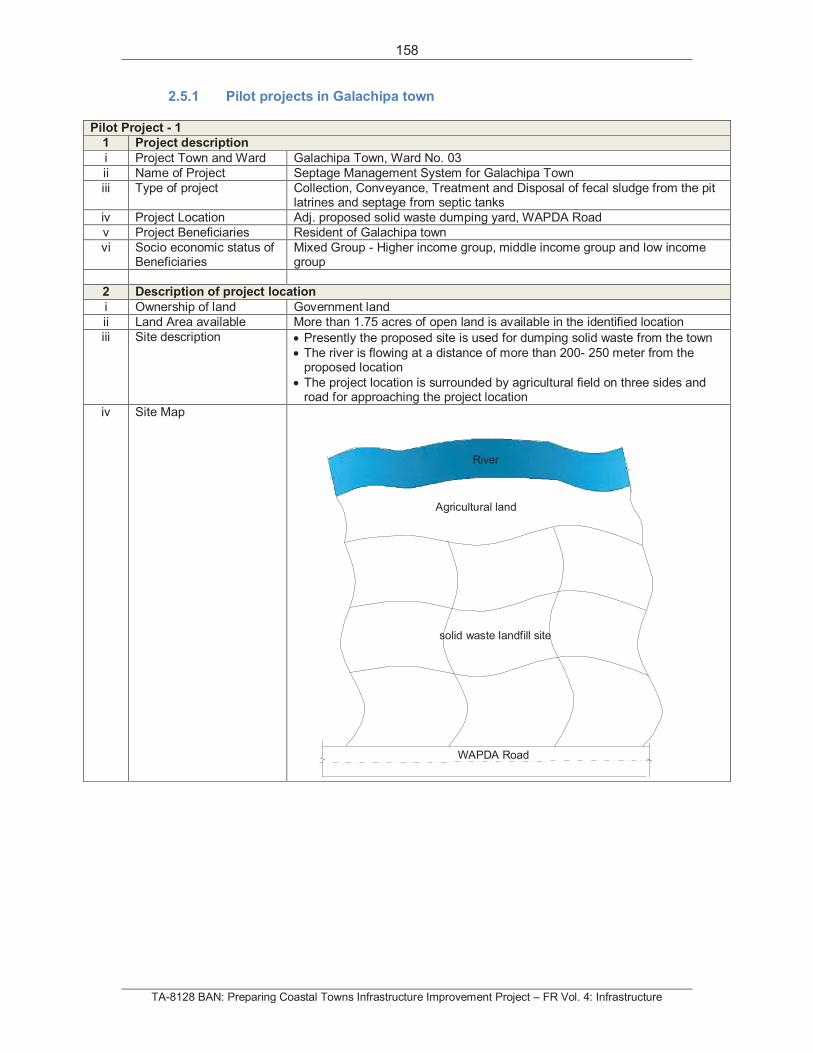
158
TA-8128 BAN: Preparing Coastal Towns Infrastructure Improvement Project – FR Vol. 4: Infrastructure
River
solid waste landfill site
Agricultural land
WAPDA Road
2.5.1 Pilot projects in Galachipa town
Pilot Project - 1
1 Project description
i Project Town and Ward Galachipa Town, Ward No. 03
ii Name of Project Septage Management System for Galachipa Town
iii Type of project Collection, Conveyance, Treatment and Disposal of fecal sludge from the pit latrines and septage from septic tanks
iv Project Location Adj. proposed solid waste dumping yard, WAPDA Road
v Project Beneficiaries Resident of Galachipa town
vi Socio economic status of Beneficiaries
Mixed Group - Higher income group, middle income group and low income group
2 Description of project location
i Ownership of land Government land
ii Land Area available More than 1.75 acres of open land is available in the identified location
iii Site description Presently the proposed site is used for dumping solid waste from the town
The river is flowing at a distance of more than 200- 250 meter from the proposed location
The project location is surrounded by agricultural field on three sides and road for approaching the project location
iv Site Map
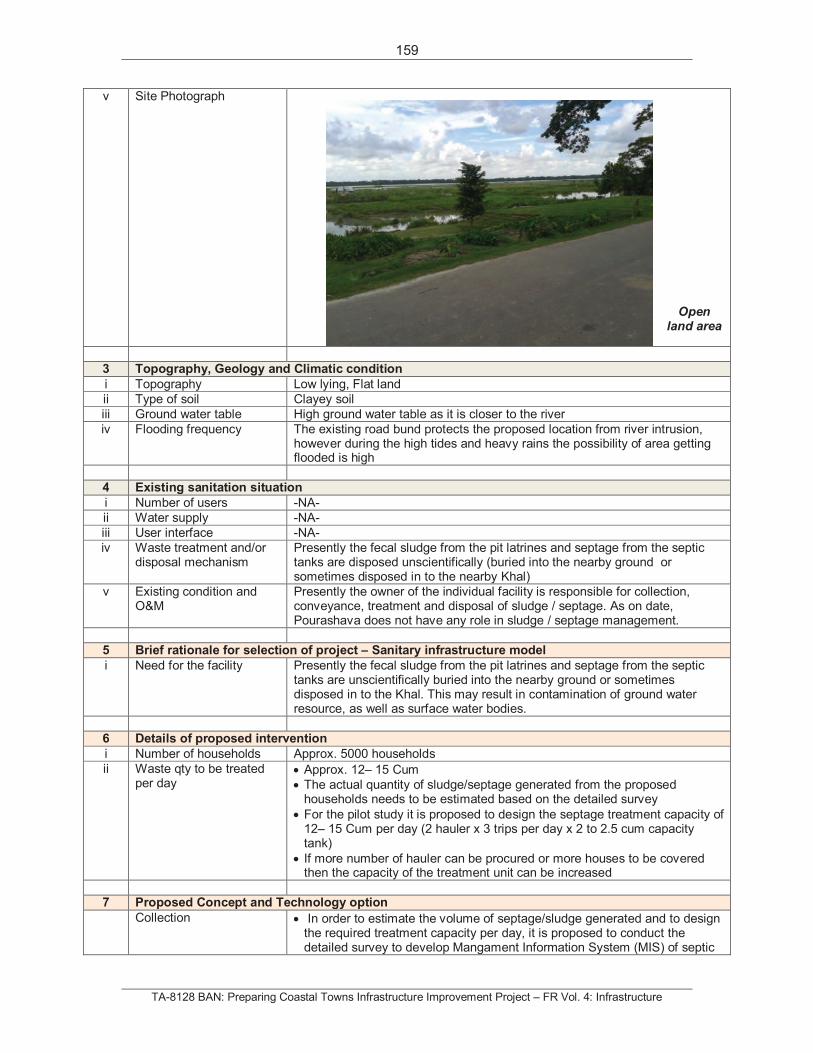
159
TA-8128 BAN: Preparing Coastal Towns Infrastructure Improvement Project – FR Vol. 4: Infrastructure
v Site Photograph
Open land area
3 Topography, Geology and Climatic condition
i Topography Low lying, Flat land
ii Type of soil Clayey soil
iii Ground water table High ground water table as it is closer to the river
iv Flooding frequency The existing road bund protects the proposed location from river intrusion, however during the high tides and heavy rains the possibility of area getting flooded is high
4 Existing sanitation situation
i Number of users -NA-
ii Water supply -NA-
iii User interface -NA-
iv Waste treatment and/or disposal mechanism
Presently the fecal sludge from the pit latrines and septage from the septic tanks are disposed unscientifically (buried into the nearby ground or sometimes disposed in to the nearby Khal)
v Existing condition and O&M
Presently the owner of the individual facility is responsible for collection, conveyance, treatment and disposal of sludge / septage. As on date, Pourashava does not have any role in sludge / septage management.
5 Brief rationale for selection of project – Sanitary infrastructure model
i Need for the facility Presently the fecal sludge from the pit latrines and septage from the septic tanks are unscientifically buried into the nearby ground or sometimes disposed in to the Khal. This may result in contamination of ground water resource, as well as surface water bodies.
6 Details of proposed intervention
i Number of households Approx. 5000 households
ii Waste qty to be treated per day
Approx. 12– 15 Cum
The actual quantity of sludge/septage generated from the proposed households needs to be estimated based on the detailed survey
For the pilot study it is proposed to design the septage treatment capacity of 12– 15 Cum per day (2 hauler x 3 trips per day x 2 to 2.5 cum capacity tank)
If more number of hauler can be procured or more houses to be covered then the capacity of the treatment unit can be increased
7 Proposed Concept and Technology option
Collection In order to estimate the volume of septage/sludge generated and to design the required treatment capacity per day, it is proposed to conduct the detailed survey to develop Mangament Information System (MIS) of septic
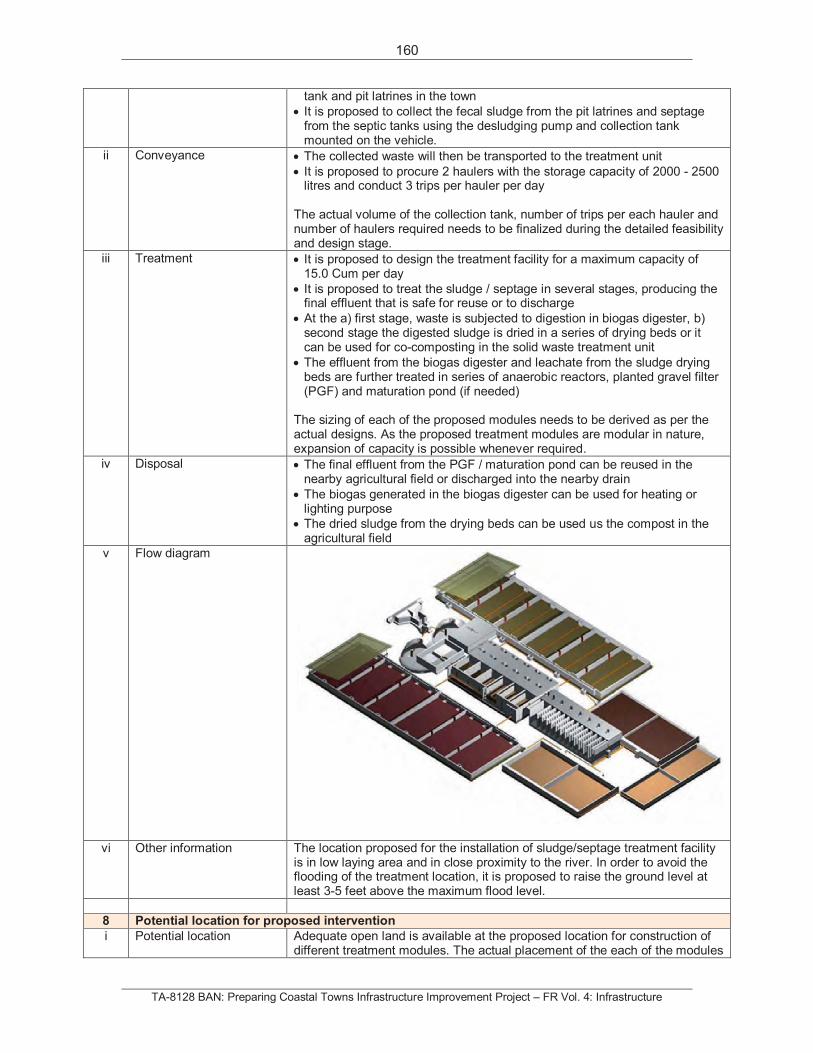
160
TA-8128 BAN: Preparing Coastal Towns Infrastructure Improvement Project – FR Vol. 4: Infrastructure
tank and pit latrines in the town
It is proposed to collect the fecal sludge from the pit latrines and septage from the septic tanks using the desludging pump and collection tank mounted on the vehicle.
ii Conveyance The collected waste will then be transported to the treatment unit
It is proposed to procure 2 haulers with the storage capacity of 2000 - 2500 litres and conduct 3 trips per hauler per day
The actual volume of the collection tank, number of trips per each hauler and number of haulers required needs to be finalized during the detailed feasibility and design stage.
iii Treatment It is proposed to design the treatment facility for a maximum capacity of 15.0 Cum per day
It is proposed to treat the sludge / septage in several stages, producing the final effluent that is safe for reuse or to discharge
At the a) first stage, waste is subjected to digestion in biogas digester, b) second stage the digested sludge is dried in a series of drying beds or it can be used for co-composting in the solid waste treatment unit
The effluent from the biogas digester and leachate from the sludge drying beds are further treated in series of anaerobic reactors, planted gravel filter (PGF) and maturation pond (if needed)
The sizing of each of the proposed modules needs to be derived as per the actual designs. As the proposed treatment modules are modular in nature, expansion of capacity is possible whenever required.
iv Disposal The final effluent from the PGF / maturation pond can be reused in the nearby agricultural field or discharged into the nearby drain
The biogas generated in the biogas digester can be used for heating or lighting purpose
The dried sludge from the drying beds can be used us the compost in the agricultural field
v Flow diagram
vi Other information The location proposed for the installation of sludge/septage treatment facility is in low laying area and in close proximity to the river. In order to avoid the flooding of the treatment location, it is proposed to raise the ground level at least 3-5 feet above the maximum flood level.
8 Potential location for proposed intervention
i Potential location Adequate open land is available at the proposed location for construction of different treatment modules. The actual placement of the each of the modules
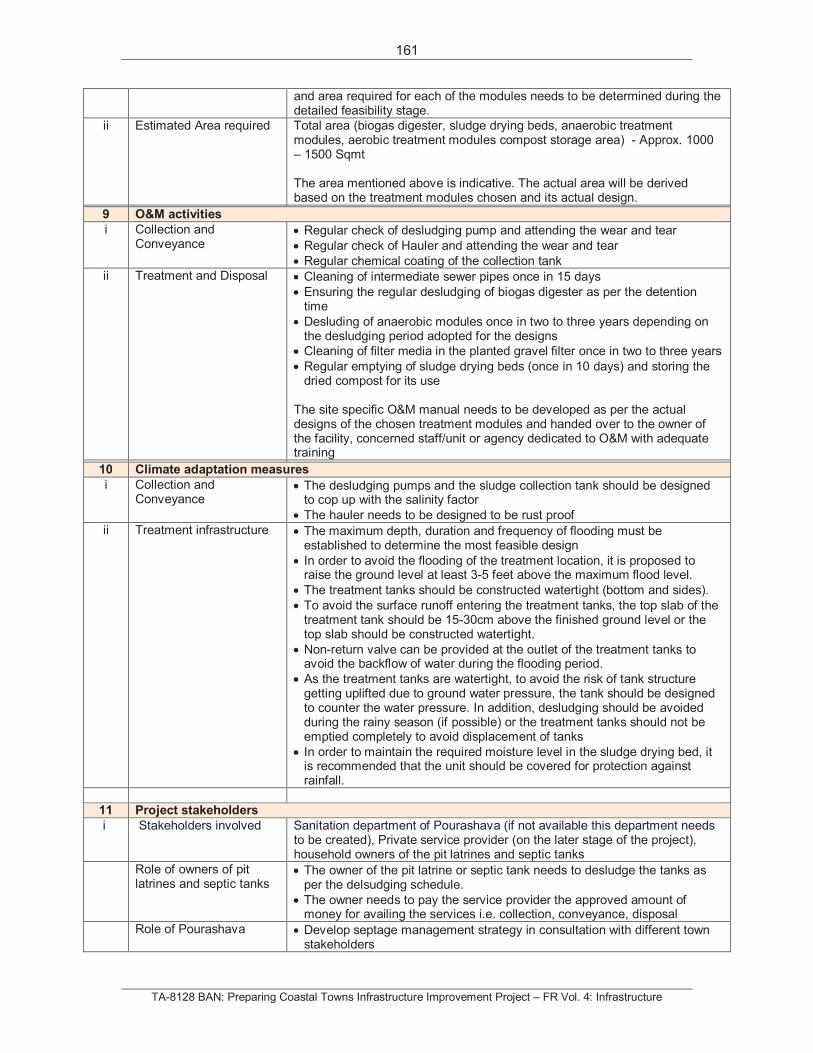
161
TA-8128 BAN: Preparing Coastal Towns Infrastructure Improvement Project – FR Vol. 4: Infrastructure
and area required for each of the modules needs to be determined during the detailed feasibility stage.
ii Estimated Area required Total area (biogas digester, sludge drying beds, anaerobic treatment modules, aerobic treatment modules compost storage area) - Approx. 1000 – 1500 Sqmt
The area mentioned above is indicative. The actual area will be derived based on the treatment modules chosen and its actual design.
9 O&M activities
i Collection and Conveyance
Regular check of desludging pump and attending the wear and tear
Regular check of Hauler and attending the wear and tear
Regular chemical coating of the collection tank ii Treatment and Disposal Cleaning of intermediate sewer pipes once in 15 days
Ensuring the regular desludging of biogas digester as per the detention time
Desluding of anaerobic modules once in two to three years depending on the desludging period adopted for the designs
Cleaning of filter media in the planted gravel filter once in two to three years
Regular emptying of sludge drying beds (once in 10 days) and storing the dried compost for its use
The site specific O&M manual needs to be developed as per the actual designs of the chosen treatment modules and handed over to the owner of the facility, concerned staff/unit or agency dedicated to O&M with adequate training
10 Climate adaptation measures
i Collection and Conveyance
The desludging pumps and the sludge collection tank should be designed to cop up with the salinity factor
The hauler needs to be designed to be rust proof
ii Treatment infrastructure The maximum depth, duration and frequency of flooding must be established to determine the most feasible design
In order to avoid the flooding of the treatment location, it is proposed to raise the ground level at least 3-5 feet above the maximum flood level.
The treatment tanks should be constructed watertight (bottom and sides).
To avoid the surface runoff entering the treatment tanks, the top slab of the treatment tank should be 15-30cm above the finished ground level or the top slab should be constructed watertight.
Non-return valve can be provided at the outlet of the treatment tanks to avoid the backflow of water during the flooding period.
As the treatment tanks are watertight, to avoid the risk of tank structure getting uplifted due to ground water pressure, the tank should be designed to counter the water pressure. In addition, desludging should be avoided during the rainy season (if possible) or the treatment tanks should not be emptied completely to avoid displacement of tanks
In order to maintain the required moisture level in the sludge drying bed, it is recommended that the unit should be covered for protection against rainfall.
11 Project stakeholders
i Stakeholders involved Sanitation department of Pourashava (if not available this department needs to be created), Private service provider (on the later stage of the project), household owners of the pit latrines and septic tanks
Role of owners of pit latrines and septic tanks
The owner of the pit latrine or septic tank needs to desludge the tanks as per the delsudging schedule.
The owner needs to pay the service provider the approved amount of money for availing the services i.e. collection, conveyance, disposal
Role of Pourashava Develop septage management strategy in consultation with different town stakeholders
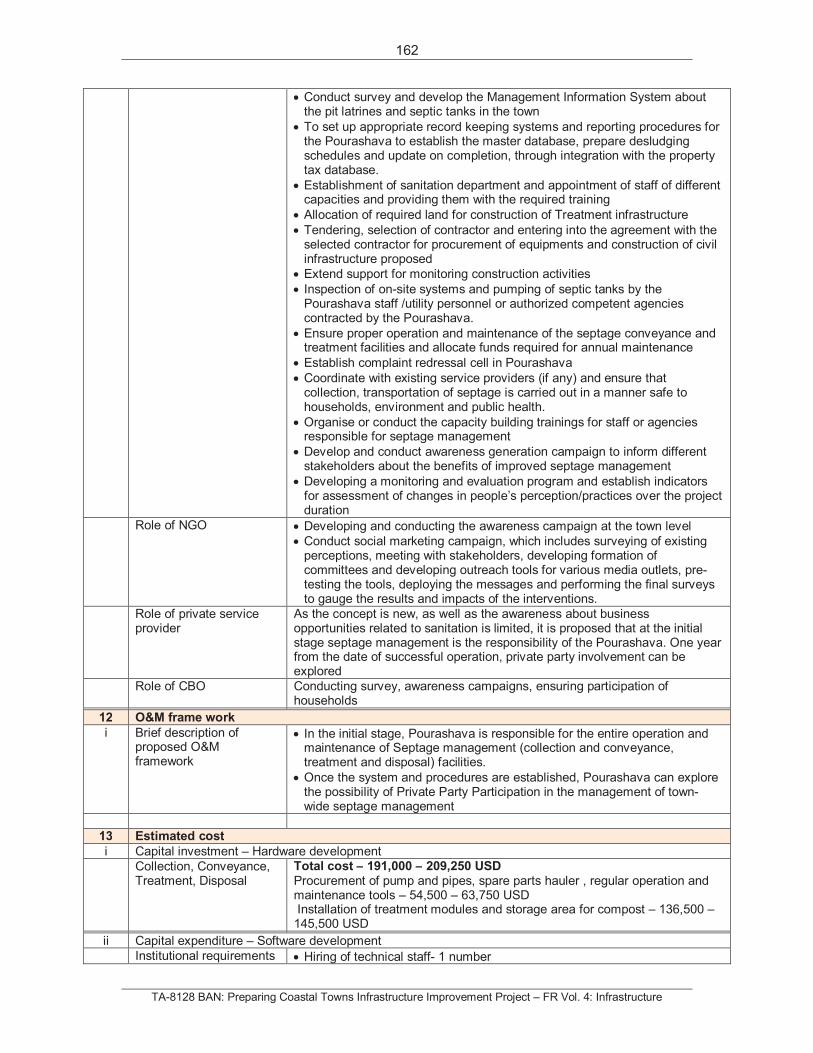
162
TA-8128 BAN: Preparing Coastal Towns Infrastructure Improvement Project – FR Vol. 4: Infrastructure
Conduct survey and develop the Management Information System about the pit latrines and septic tanks in the town
To set up appropriate record keeping systems and reporting procedures for the Pourashava to establish the master database, prepare desludging schedules and update on completion, through integration with the property tax database.
Establishment of sanitation department and appointment of staff of different capacities and providing them with the required training
Allocation of required land for construction of Treatment infrastructure
Tendering, selection of contractor and entering into the agreement with the selected contractor for procurement of equipments and construction of civil infrastructure proposed
Extend support for monitoring construction activities
Inspection of on-site systems and pumping of septic tanks by the Pourashava staff /utility personnel or authorized competent agencies contracted by the Pourashava.
Ensure proper operation and maintenance of the septage conveyance and treatment facilities and allocate funds required for annual maintenance
Establish complaint redressal cell in Pourashava
Coordinate with existing service providers (if any) and ensure that collection, transportation of septage is carried out in a manner safe to households, environment and public health.
Organise or conduct the capacity building trainings for staff or agencies responsible for septage management
Develop and conduct awareness generation campaign to inform different stakeholders about the benefits of improved septage management
Developing a monitoring and evaluation program and establish indicators for assessment of changes in people’s perception/practices over the project duration
Role of NGO Developing and conducting the awareness campaign at the town level
Conduct social marketing campaign, which includes surveying of existing perceptions, meeting with stakeholders, developing formation of committees and developing outreach tools for various media outlets, pre-testing the tools, deploying the messages and performing the final surveys to gauge the results and impacts of the interventions.
Role of private service provider
As the concept is new, as well as the awareness about business opportunities related to sanitation is limited, it is proposed that at the initial stage septage management is the responsibility of the Pourashava. One year from the date of successful operation, private party involvement can be explored
Role of CBO Conducting survey, awareness campaigns, ensuring participation of households
12 O&M frame work
i Brief description of proposed O&M framework
In the initial stage, Pourashava is responsible for the entire operation and maintenance of Septage management (collection and conveyance, treatment and disposal) facilities.
Once the system and procedures are established, Pourashava can explore the possibility of Private Party Participation in the management of town-wide septage management
13 Estimated cost
i Capital investment – Hardware development
Collection, Conveyance, Treatment, Disposal
Total cost – 191,000 – 209,250 USDProcurement of pump and pipes, spare parts hauler , regular operation and maintenance tools – 54,500 – 63,750 USD Installation of treatment modules and storage area for compost – 136,500 – 145,500 USD
ii Capital expenditure – Software development
Institutional requirements Hiring of technical staff- 1 number
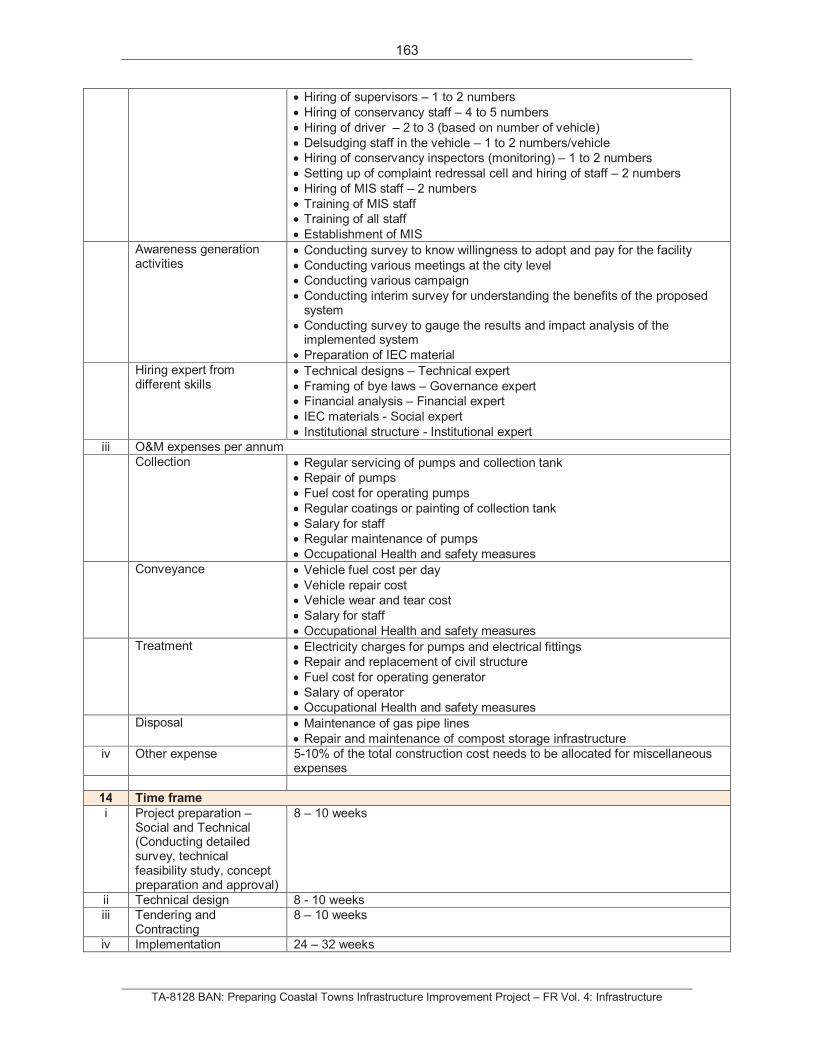
163
TA-8128 BAN: Preparing Coastal Towns Infrastructure Improvement Project – FR Vol. 4: Infrastructure
Hiring of supervisors – 1 to 2 numbers
Hiring of conservancy staff – 4 to 5 numbers
Hiring of driver – 2 to 3 (based on number of vehicle)
Delsudging staff in the vehicle – 1 to 2 numbers/vehicle
Hiring of conservancy inspectors (monitoring) – 1 to 2 numbers
Setting up of complaint redressal cell and hiring of staff – 2 numbers
Hiring of MIS staff – 2 numbers
Training of MIS staff
Training of all staff
Establishment of MIS
Awareness generation activities
Conducting survey to know willingness to adopt and pay for the facility
Conducting various meetings at the city level
Conducting various campaign
Conducting interim survey for understanding the benefits of the proposed system
Conducting survey to gauge the results and impact analysis of the implemented system
Preparation of IEC material
Hiring expert from different skills
Technical designs – Technical expert
Framing of bye laws – Governance expert
Financial analysis – Financial expert
IEC materials - Social expert
Institutional structure - Institutional expert
iii O&M expenses per annum
Collection Regular servicing of pumps and collection tank
Repair of pumps
Fuel cost for operating pumps
Regular coatings or painting of collection tank
Salary for staff
Regular maintenance of pumps
Occupational Health and safety measures
Conveyance Vehicle fuel cost per day
Vehicle repair cost
Vehicle wear and tear cost
Salary for staff
Occupational Health and safety measures
Treatment Electricity charges for pumps and electrical fittings
Repair and replacement of civil structure
Fuel cost for operating generator
Salary of operator
Occupational Health and safety measures
Disposal Maintenance of gas pipe lines
Repair and maintenance of compost storage infrastructure
iv Other expense 5-10% of the total construction cost needs to be allocated for miscellaneous expenses
14 Time frame
i Project preparation – Social and Technical (Conducting detailed survey, technical feasibility study, concept preparation and approval)
8 – 10 weeks
ii Technical design 8 - 10 weeks
iii Tendering and Contracting
8 – 10 weeks
iv Implementation 24 – 32 weeks
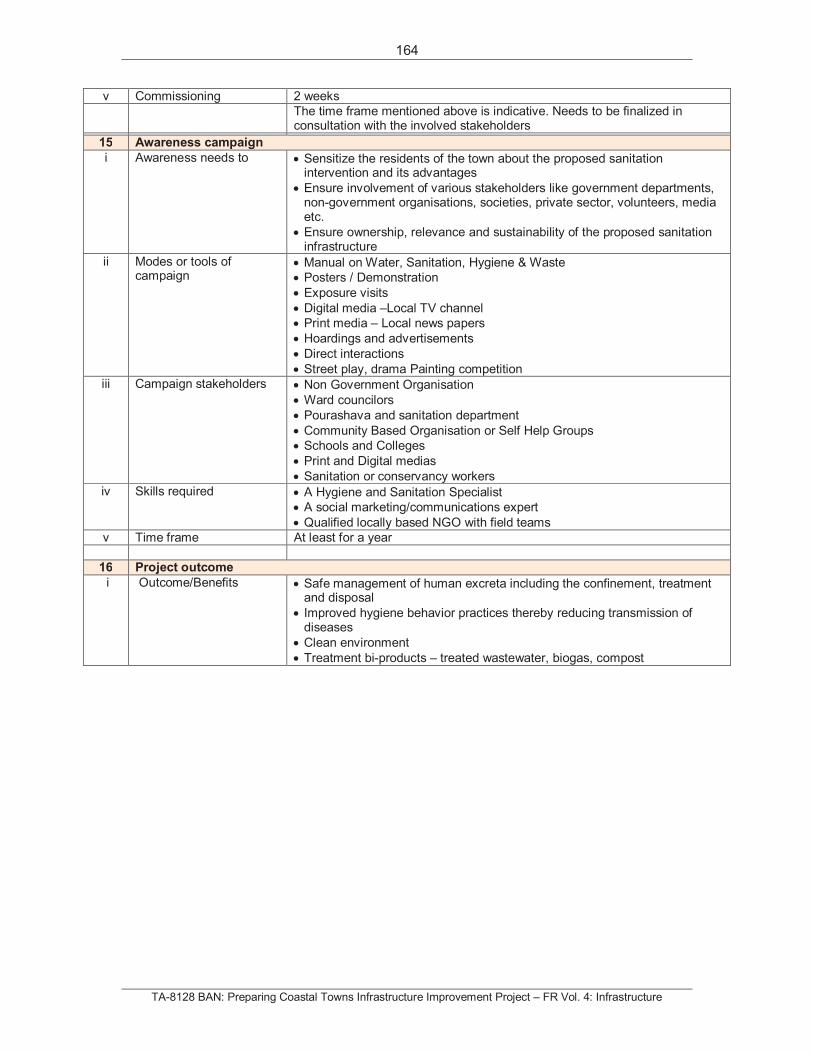
164
TA-8128 BAN: Preparing Coastal Towns Infrastructure Improvement Project – FR Vol. 4: Infrastructure
v Commissioning 2 weeks
The time frame mentioned above is indicative. Needs to be finalized in consultation with the involved stakeholders
15 Awareness campaign
i Awareness needs to Sensitize the residents of the town about the proposed sanitation intervention and its advantages
Ensure involvement of various stakeholders like government departments, non-government organisations, societies, private sector, volunteers, media etc.
Ensure ownership, relevance and sustainability of the proposed sanitation infrastructure
ii Modes or tools of campaign
Manual on Water, Sanitation, Hygiene & Waste
Posters / Demonstration
Exposure visits
Digital media –Local TV channel
Print media – Local news papers
Hoardings and advertisements
Direct interactions
Street play, drama Painting competition iii Campaign stakeholders Non Government Organisation
Ward councilors
Pourashava and sanitation department
Community Based Organisation or Self Help Groups
Schools and Colleges
Print and Digital medias
Sanitation or conservancy workers
iv Skills required A Hygiene and Sanitation Specialist
A social marketing/communications expert
Qualified locally based NGO with field teams
v Time frame At least for a year
16 Project outcome
i Outcome/Benefits Safe management of human excreta including the confinement, treatment and disposal
Improved hygiene behavior practices thereby reducing transmission of diseases
Clean environment
Treatment bi-products – treated wastewater, biogas, compost
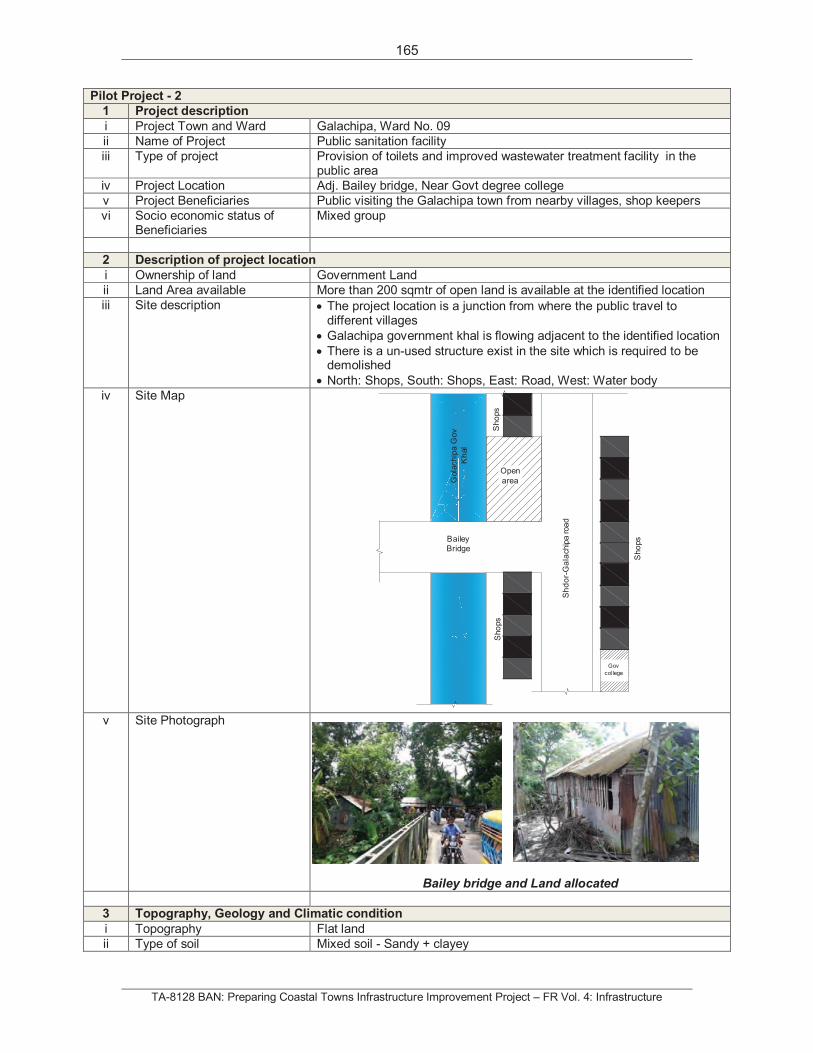
165
TA-8128 BAN: Preparing Coastal Towns Infrastructure Improvement Project – FR Vol. 4: Infrastructure
Sho
ps
Sho
ps
Open
areaGola
chip
aG
ov
Kh
al
Bailey
Bridge
Sho
ps
Sh
do
r-G
ala
chip
aro
ad
Gov
college
Pilot Project - 2
1 Project description
i Project Town and Ward Galachipa, Ward No. 09
ii Name of Project Public sanitation facility
iii Type of project Provision of toilets and improved wastewater treatment facility in the public area
iv Project Location Adj. Bailey bridge, Near Govt degree college
v Project Beneficiaries Public visiting the Galachipa town from nearby villages, shop keepers
vi Socio economic status of Beneficiaries
Mixed group
2 Description of project location
i Ownership of land Government Land
ii Land Area available More than 200 sqmtr of open land is available at the identified location
iii Site description The project location is a junction from where the public travel to different villages
Galachipa government khal is flowing adjacent to the identified location
There is a un-used structure exist in the site which is required to be demolished
North: Shops, South: Shops, East: Road, West: Water body
iv Site Map
v Site Photograph
Bailey bridge and Land allocated
3 Topography, Geology and Climatic condition
i Topography Flat land
ii Type of soil Mixed soil - Sandy + clayey
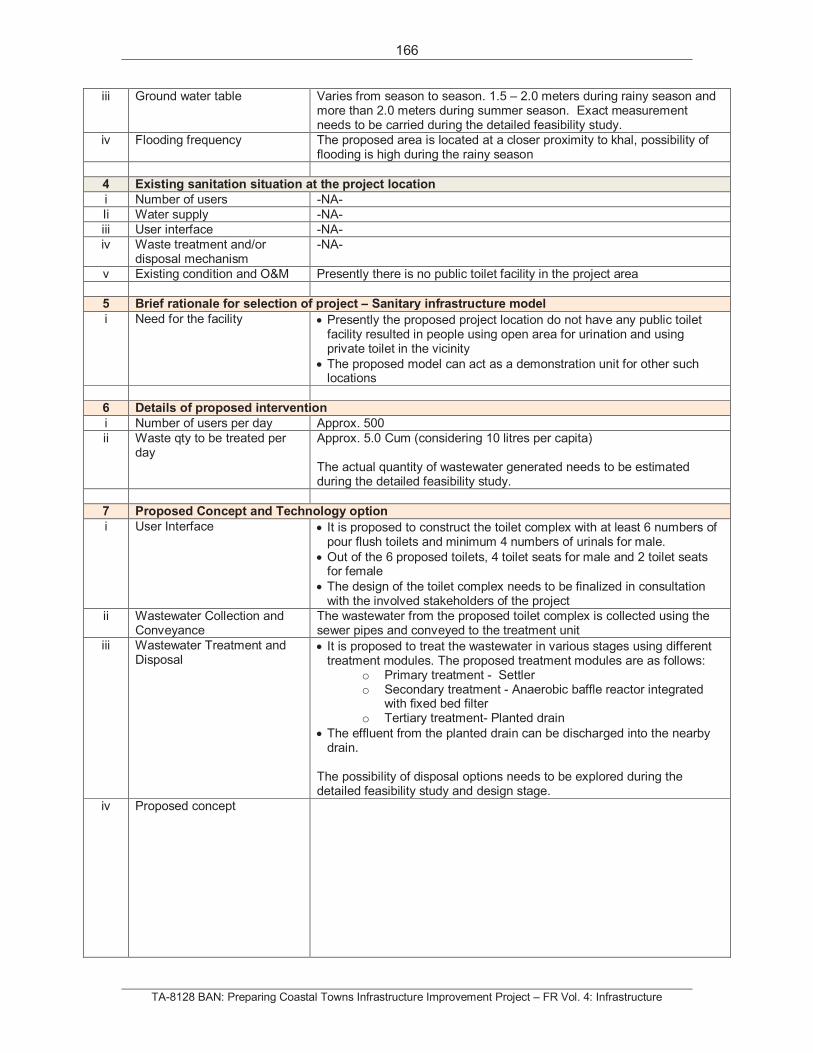
166
TA-8128 BAN: Preparing Coastal Towns Infrastructure Improvement Project – FR Vol. 4: Infrastructure
iii Ground water table Varies from season to season. 1.5 – 2.0 meters during rainy season and more than 2.0 meters during summer season. Exact measurement needs to be carried during the detailed feasibility study.
iv Flooding frequency The proposed area is located at a closer proximity to khal, possibility of flooding is high during the rainy season
4 Existing sanitation situation at the project location
i Number of users -NA-
Ii Water supply -NA-
iii User interface -NA-
iv Waste treatment and/or disposal mechanism
-NA-
v Existing condition and O&M Presently there is no public toilet facility in the project area
5 Brief rationale for selection of project – Sanitary infrastructure model
i Need for the facility Presently the proposed project location do not have any public toilet facility resulted in people using open area for urination and using private toilet in the vicinity
The proposed model can act as a demonstration unit for other such locations
6 Details of proposed intervention
i Number of users per day Approx. 500
ii Waste qty to be treated per day
Approx. 5.0 Cum (considering 10 litres per capita)
The actual quantity of wastewater generated needs to be estimated during the detailed feasibility study.
7 Proposed Concept and Technology option
i User Interface It is proposed to construct the toilet complex with at least 6 numbers of pour flush toilets and minimum 4 numbers of urinals for male.
Out of the 6 proposed toilets, 4 toilet seats for male and 2 toilet seats for female
The design of the toilet complex needs to be finalized in consultation with the involved stakeholders of the project
ii Wastewater Collection and Conveyance
The wastewater from the proposed toilet complex is collected using the sewer pipes and conveyed to the treatment unit
iii Wastewater Treatment and Disposal
It is proposed to treat the wastewater in various stages using different treatment modules. The proposed treatment modules are as follows:
o Primary treatment - Settler o Secondary treatment - Anaerobic baffle reactor integrated
with fixed bed filter o Tertiary treatment- Planted drain
The effluent from the planted drain can be discharged into the nearby drain.
The possibility of disposal options needs to be explored during the detailed feasibility study and design stage.
iv Proposed concept
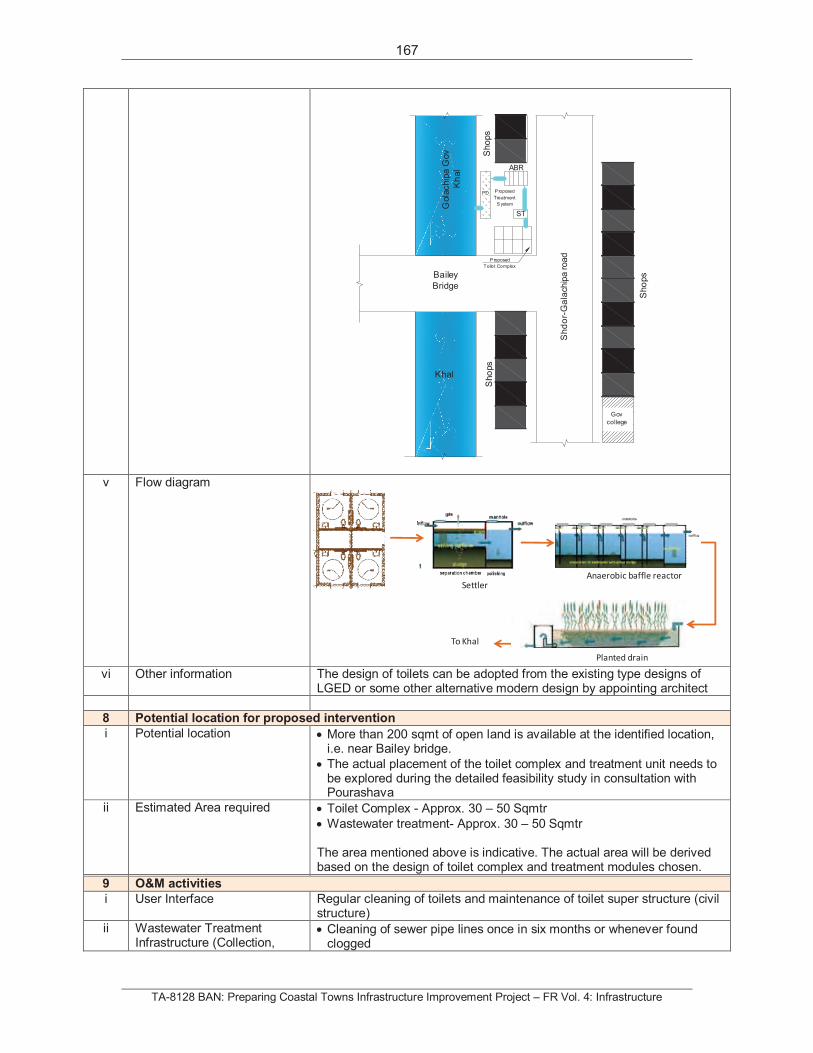
167
TA-8128 BAN: Preparing Coastal Towns Infrastructure Improvement Project – FR Vol. 4: Infrastructure
v Flow diagram
vi Other information The design of toilets can be adopted from the existing type designs of LGED or some other alternative modern design by appointing architect
8 Potential location for proposed intervention
i Potential location More than 200 sqmt of open land is available at the identified location, i.e. near Bailey bridge.
The actual placement of the toilet complex and treatment unit needs to be explored during the detailed feasibility study in consultation with Pourashava
ii Estimated Area required Toilet Complex - Approx. 30 – 50 Sqmtr
Wastewater treatment- Approx. 30 – 50 Sqmtr
The area mentioned above is indicative. The actual area will be derived based on the design of toilet complex and treatment modules chosen.
9 O&M activities
i User Interface Regular cleaning of toilets and maintenance of toilet super structure (civil structure)
ii Wastewater Treatment Infrastructure (Collection,
Cleaning of sewer pipe lines once in six months or whenever found clogged
Sho
ps
Sho
ps
Bailey
Bridge
Sho
ps
Sh
do
r-G
ala
chip
aro
ad
ABR
Khal
ST
PD P roposed
Treatment
S ystem
P roposed
Toilet Complex
Gola
chip
aG
ov
Kh
al
Gov
college
Settler
Planted drain
Anaerobic baffle reactor
To Khal
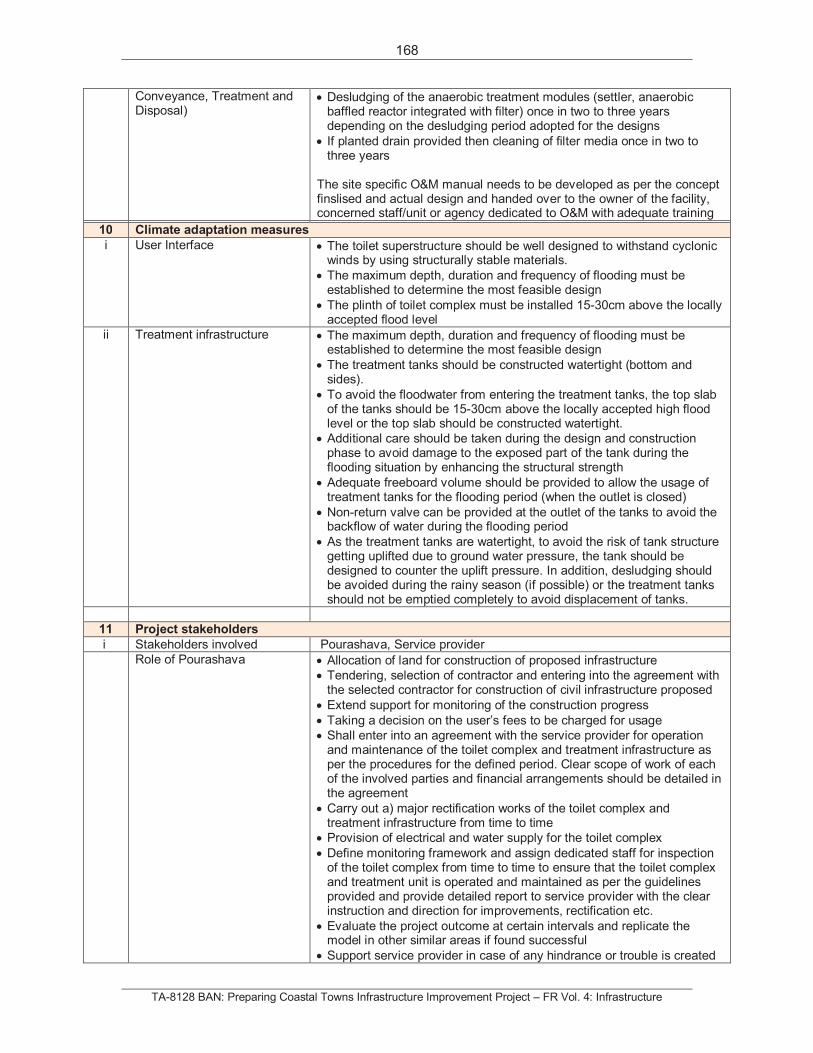
168
TA-8128 BAN: Preparing Coastal Towns Infrastructure Improvement Project – FR Vol. 4: Infrastructure
Conveyance, Treatment and Disposal)
Desludging of the anaerobic treatment modules (settler, anaerobic baffled reactor integrated with filter) once in two to three years depending on the desludging period adopted for the designs
If planted drain provided then cleaning of filter media once in two to three years
The site specific O&M manual needs to be developed as per the concept finslised and actual design and handed over to the owner of the facility, concerned staff/unit or agency dedicated to O&M with adequate training
10 Climate adaptation measures
i User Interface The toilet superstructure should be well designed to withstand cyclonic winds by using structurally stable materials.
The maximum depth, duration and frequency of flooding must be established to determine the most feasible design
The plinth of toilet complex must be installed 15-30cm above the locally accepted flood level
ii Treatment infrastructure The maximum depth, duration and frequency of flooding must be established to determine the most feasible design
The treatment tanks should be constructed watertight (bottom and sides).
To avoid the floodwater from entering the treatment tanks, the top slab of the tanks should be 15-30cm above the locally accepted high flood level or the top slab should be constructed watertight.
Additional care should be taken during the design and construction phase to avoid damage to the exposed part of the tank during the flooding situation by enhancing the structural strength
Adequate freeboard volume should be provided to allow the usage of treatment tanks for the flooding period (when the outlet is closed)
Non-return valve can be provided at the outlet of the tanks to avoid the backflow of water during the flooding period
As the treatment tanks are watertight, to avoid the risk of tank structure getting uplifted due to ground water pressure, the tank should be designed to counter the uplift pressure. In addition, desludging should be avoided during the rainy season (if possible) or the treatment tanks should not be emptied completely to avoid displacement of tanks.
11 Project stakeholders
i Stakeholders involved Pourashava, Service provider
Role of Pourashava Allocation of land for construction of proposed infrastructure
Tendering, selection of contractor and entering into the agreement with the selected contractor for construction of civil infrastructure proposed
Extend support for monitoring of the construction progress
Taking a decision on the user’s fees to be charged for usage
Shall enter into an agreement with the service provider for operation and maintenance of the toilet complex and treatment infrastructure as per the procedures for the defined period. Clear scope of work of each of the involved parties and financial arrangements should be detailed in the agreement
Carry out a) major rectification works of the toilet complex and treatment infrastructure from time to time
Provision of electrical and water supply for the toilet complex
Define monitoring framework and assign dedicated staff for inspection of the toilet complex from time to time to ensure that the toilet complex and treatment unit is operated and maintained as per the guidelines provided and provide detailed report to service provider with the clear instruction and direction for improvements, rectification etc.
Evaluate the project outcome at certain intervals and replicate the model in other similar areas if found successful
Support service provider in case of any hindrance or trouble is created
169
TA-8128 BAN: Preparing Coastal Towns Infrastructure Improvement Project – FR Vol. 4: Infrastructure
by the inhabitants or anti social elements in the operation and maintenance of toilet block
Necessitate action against service provider if the service provider do not meet the specified O&M requirements
Can also provide the advertisement rights on the walls of the toilets block as a revenue model
Role of Service provider Shall enter into an agreement with the Pourashava for operation and maintenance of the toilet complex and treatment infrastructure as per the guidelines provided
Shall operate and maintain the toilets complex (clean and hygienic) on ‘Pay and Use’ as per the user fee decided by the Pourashava
Regular maintenance and carry out the day to day repair works
Regular and periodical maintenance of treatment infrastructure as mentioned in Section -9
Ensure continuous serviceability of the toilet complex as per the time frame agreed with Pourashava during the agreement period
Allocation of funds for carrying out the regular and periodical O&M
Monthly bill payment for the usage of water and electricity
Shall maintain inventory of the fittings installed at the premises making them operative for public use at the time of taking over of complex and hand over the same in good condition after completion of agreement period
Organise to carry out minor repairs and improvement measures as pointed out by the authorized officials/officers during the inspection of the toilet premises
12 O&M frame work
i Brief description of proposed O&M framework
It is proposed that Pourashava appoint and enter into agreement with the service provider for management (operation and maintenance) of the toilet complex and the treatment infrastructure.
It is proposed that the O&M framework and roles and responsibilities of the involved stakeholders needs to be clearly defined and needs to enter into the formal agreements before commencement of the project
13 Estimated cost
i Capital investment Total Cost – 32,750 – 41,000 USDToilet Complex – 18,250 – 22,750 USD Wastewater Treatment Infrastructure – 14,500 – 18,250 USD
ii O&M expenses Needs to be derived after finalization of concept and design.
iii IEC related cost Posters, Education message board
iv Other expense 5-10% of the total construction cost needs to be allocated for miscellaneous expenses
14 Time frame
i Project preparation (Feasibility study, concept preparation and approval)
2-4 weeks
ii Technical design 6- 8 weeks
iii Tendering and 6- 8 weeks
iv Implementation 24 – 32 weeks
v Commissioning 1 week
The time frame mentioned above is indicative. Needs to be finalized in consultation with the involved stakeholders
15 Awareness campaign
i Awareness needs To train service provider for operation and maintenance of the toilet complex and treatment infrastructure
To persuade the user to do their part
170
TA-8128 BAN: Preparing Coastal Towns Infrastructure Improvement Project – FR Vol. 4: Infrastructure
ii Mode of campaign Training, Posters, Public education messages
iii Campaign stakeholders NGO, Pourashava
iv Skills required NGO and technical experts with sanitation background
v Time frame During the commissioning stage
16 Project outcome
i Outcome/Benefits Increased and improved access to clean sanitation facility
Safe management of human excreta including the confinement, treatment and disposal
Improved health and hygiene conditions
Clean environment
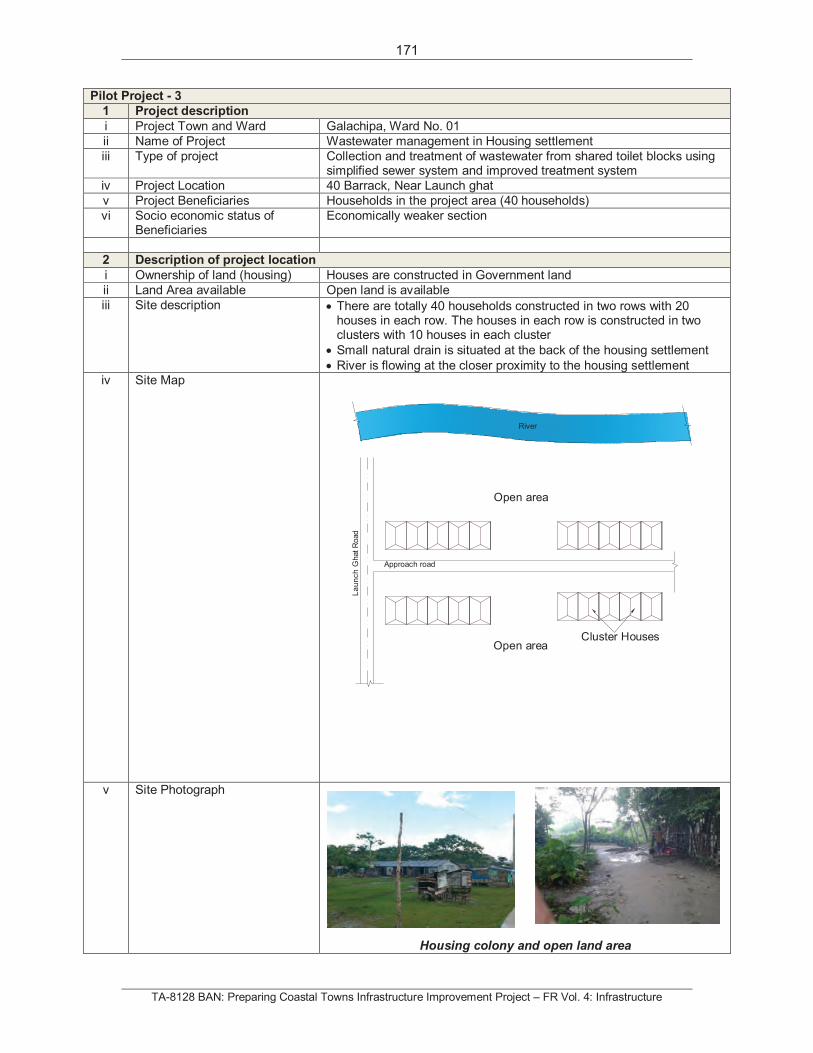
171
TA-8128 BAN: Preparing Coastal Towns Infrastructure Improvement Project – FR Vol. 4: Infrastructure
Pilot Project - 3
1 Project description
i Project Town and Ward Galachipa, Ward No. 01
ii Name of Project Wastewater management in Housing settlement
iii Type of project Collection and treatment of wastewater from shared toilet blocks using simplified sewer system and improved treatment system
iv Project Location 40 Barrack, Near Launch ghat
v Project Beneficiaries Households in the project area (40 households)
vi Socio economic status of Beneficiaries
Economically weaker section
2 Description of project location
i Ownership of land (housing) Houses are constructed in Government land
ii Land Area available Open land is available
iii Site description There are totally 40 households constructed in two rows with 20 houses in each row. The houses in each row is constructed in two clusters with 10 houses in each cluster
Small natural drain is situated at the back of the housing settlement
River is flowing at the closer proximity to the housing settlement iv Site Map
v Site Photograph
Housing colony and open land area
Open area
River
Approach road
La
un
ch
GhatR
oad
Open area
Cluster Houses
172
TA-8128 BAN: Preparing Coastal Towns Infrastructure Improvement Project – FR Vol. 4: Infrastructure
3 Topography, Geology and Climatic condition
i Topography Flat land
ii Type of soil Mixed soil - Sandy + clayey
iii Ground water table Varies from season to season. 1.5 – 2.0 meters during rainy season and more than 2.0 meters during summer season. Exact measurement needs to be carried during the detailed feasibility study.
iv Flooding frequency The housing colony is in close proximity to the river due to which there is a possibility flooding during the high tides or rainy season.
4 Existing sanitation situation at the project location
i Number of households/users 40 households, approx. 200 users
ii Water supply Hand tube well
iii User interface Temporary individual household pit latrine
iv Waste treatment and/or disposal mechanism
Pits
v Existing condition and O&M The toilets and pits are not maintained. Under one of the government scheme, pucca shared toilets were provided to the community. Presently these toilets are not in usable condition due to various reasons and the community has constructed temporary pit toilets for usage.
5 Brief rationale for selection of Project- Sanitary infrastructure model
i Need for the facility The economical status of the residents living in the community is very bad. The residents cannot afford to construct proper toilets with appropriate disposal system.
6 Details of proposed intervention
i Number of users/houses Approx. 200 users from 40 households
ii Wastewater source Toilets
iii Waste qty to be treated per day Approx. 2.0 Cum (only black water from the toilets- 10 litres per capita) The actual quantity of wastewater generated needs to be estimated during the detailed feasibility study.
7 Proposed Concept and Technology option
i User Interface It is proposed to provide totally 20 water flush toilets with 5 toilets for each cluster to serve 10 households. Each toilet is shared by two families.
ii Wastewater Collection and Conveyance
It is proposed to collect wastewater from each cluster and conveyed to respective treatment unit using the sewer pipes
iii Wastewater treatment and disposal
It is proposed to provide one common treatment unit (1.0 Cum capacity per day) for two clusters (covering 20 houses)
It is proposed to treat the wastewater in the improved septic tank.
The effluent from the treatment tank is further treated in the planted drain and discharged into the nearby drain
The possibility of disposal options needs to be explored during the detailed feasibility study and design stage.
vi Concept proposed
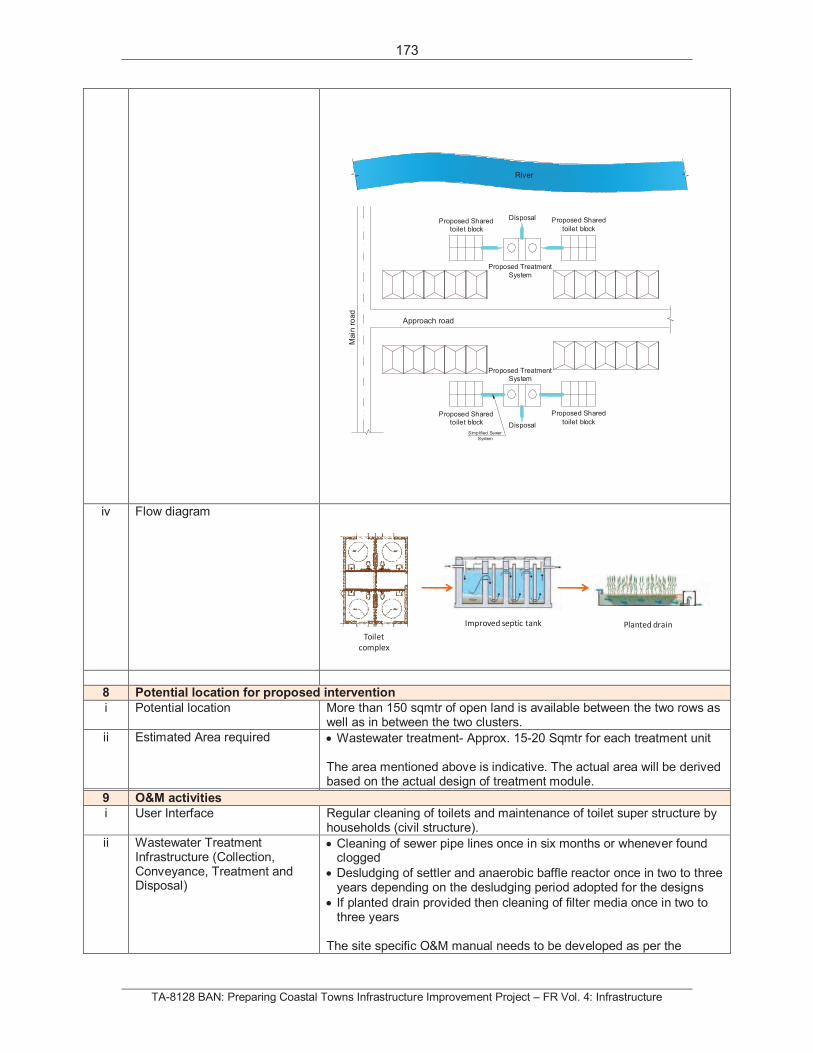
173
TA-8128 BAN: Preparing Coastal Towns Infrastructure Improvement Project – FR Vol. 4: Infrastructure
iv Flow diagram
8 Potential location for proposed intervention
i Potential location More than 150 sqmtr of open land is available between the two rows as well as in between the two clusters.
ii Estimated Area required Wastewater treatment- Approx. 15-20 Sqmtr for each treatment unit
The area mentioned above is indicative. The actual area will be derived based on the actual design of treatment module.
9 O&M activities
i User Interface Regular cleaning of toilets and maintenance of toilet super structure by households (civil structure).
ii Wastewater Treatment Infrastructure (Collection, Conveyance, Treatment and Disposal)
Cleaning of sewer pipe lines once in six months or whenever found clogged
Desludging of settler and anaerobic baffle reactor once in two to three years depending on the desludging period adopted for the designs
If planted drain provided then cleaning of filter media once in two to three years
The site specific O&M manual needs to be developed as per the
Proposed Sharedtoilet block
River
Approach road
Main
road
Proposed Shared
toilet block
Proposed Treatment
System
Proposed Sharedtoilet block
Proposed Shared
toilet block
Proposed TreatmentSystem
Simplified Sewer
System
Disposal
Disposal
Toilet
complex
Improved septic tank Planted drain
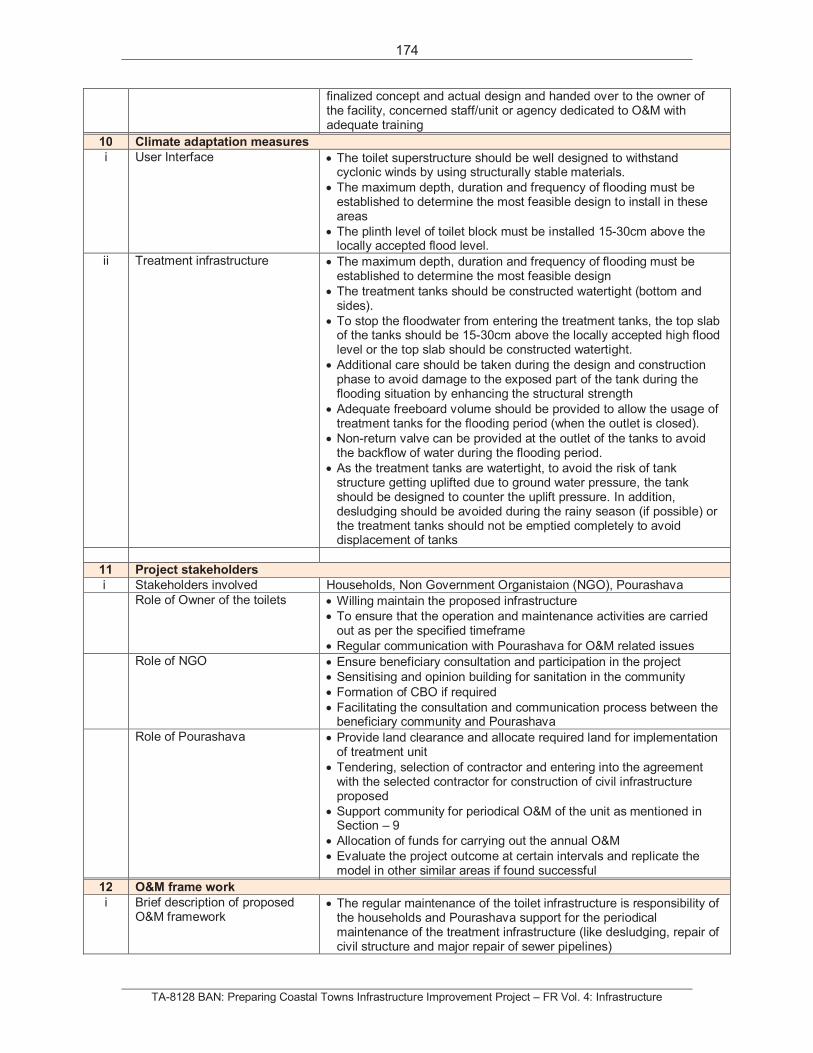
174
TA-8128 BAN: Preparing Coastal Towns Infrastructure Improvement Project – FR Vol. 4: Infrastructure
finalized concept and actual design and handed over to the owner of the facility, concerned staff/unit or agency dedicated to O&M with adequate training
10 Climate adaptation measures
i User Interface The toilet superstructure should be well designed to withstand cyclonic winds by using structurally stable materials.
The maximum depth, duration and frequency of flooding must be established to determine the most feasible design to install in these areas
The plinth level of toilet block must be installed 15-30cm above the locally accepted flood level.
ii Treatment infrastructure The maximum depth, duration and frequency of flooding must be established to determine the most feasible design
The treatment tanks should be constructed watertight (bottom and sides).
To stop the floodwater from entering the treatment tanks, the top slab of the tanks should be 15-30cm above the locally accepted high flood level or the top slab should be constructed watertight.
Additional care should be taken during the design and construction phase to avoid damage to the exposed part of the tank during the flooding situation by enhancing the structural strength
Adequate freeboard volume should be provided to allow the usage of treatment tanks for the flooding period (when the outlet is closed).
Non-return valve can be provided at the outlet of the tanks to avoid the backflow of water during the flooding period.
As the treatment tanks are watertight, to avoid the risk of tank structure getting uplifted due to ground water pressure, the tank should be designed to counter the uplift pressure. In addition, desludging should be avoided during the rainy season (if possible) or the treatment tanks should not be emptied completely to avoid displacement of tanks
11 Project stakeholders
i Stakeholders involved Households, Non Government Organistaion (NGO), Pourashava
Role of Owner of the toilets Willing maintain the proposed infrastructure
To ensure that the operation and maintenance activities are carried out as per the specified timeframe
Regular communication with Pourashava for O&M related issues
Role of NGO Ensure beneficiary consultation and participation in the project
Sensitising and opinion building for sanitation in the community
Formation of CBO if required
Facilitating the consultation and communication process between the beneficiary community and Pourashava
Role of Pourashava Provide land clearance and allocate required land for implementation of treatment unit
Tendering, selection of contractor and entering into the agreement with the selected contractor for construction of civil infrastructure proposed
Support community for periodical O&M of the unit as mentioned in Section – 9
Allocation of funds for carrying out the annual O&M
Evaluate the project outcome at certain intervals and replicate the model in other similar areas if found successful
12 O&M frame work
i Brief description of proposed O&M framework
The regular maintenance of the toilet infrastructure is responsibility of the households and Pourashava support for the periodical maintenance of the treatment infrastructure (like desludging, repair of civil structure and major repair of sewer pipelines)
175
TA-8128 BAN: Preparing Coastal Towns Infrastructure Improvement Project – FR Vol. 4: Infrastructure
The framework proposed above is indicative. The actual arrangements or framework needs to be finalized in consultation with the beneficiary community and Pourashava
It is proposed that the O&M framework and roles and responsibilities of the involved stakeholders needs to be clearly defined and needs to enter into the formal agreements before commencement of the project.
13 Estimated cost
i Capital investment - Hardware Total Cost – 33,750 – 41,250 USDShared Toilet Blocks – 11,000 – 13,750 USD Simplified Sewer System – 4,500 – 5,500 USD Wastewater Treatment Infrastructure – 18,250 – 22,000 USD
ii Capital expenditure – Software (IEC related cost)
Appointment of NGO
Community preparation
Conducting sensitization workshop
Organising meetings with involved stakeholders
Development of IEC material
O&M training to the CBO
iii O&M expenses Needs to be derived after finalization of concept and design
iv Other expense 5-10% of the total construction cost needs to be allocated for miscellaneous expenses
14 Time frame
i Project preparation - Social and technical ( like community preparation, detailed technical feasibility study, concept preparation and approval)
6-8 weeks
ii Technical design 6- 8 weeks
iii Tendering and Contracting 8 -12 weeks
iv Implementation 24 – 30 weeks
v Commissioning 1 week
The time frame mentioned above is indicative. Needs to be finalized in consultation with the involved stakeholders
15 Awareness campaign
i Awareness needs To sensitize the beneficiary community about the proposed sanitation project and its advantages
To inform the need of regular O&M of the sanitation infrastructure
To promote community based construction and maintenance of sanitation infrastructure
To Ensure ownership, relevance and sustainability of the Sanitation infrastructure
ii Mode of campaign Exposure visits
Posters and Brochures
Direct interactions
iii Campaign Stakeholders Non Government Organisation
Ward councilors
Pourashava and sanitation department
Community Based Organisation or Self Help Groups
iv Skills required A Hygiene and Sanitation Specialist
Qualified locally based NGO with field teams
v Time frame At least for six months during one year of implementation period
16 Project outcome
i Outcome/Benefits Safe management of human excreta including the confinement, treatment and disposal

176
TA-8128 BAN: Preparing Coastal Towns Infrastructure Improvement Project – FR Vol. 4: Infrastructure
Improved hygiene behaviour practices thereby reducing transmission of diseases
Clean environment
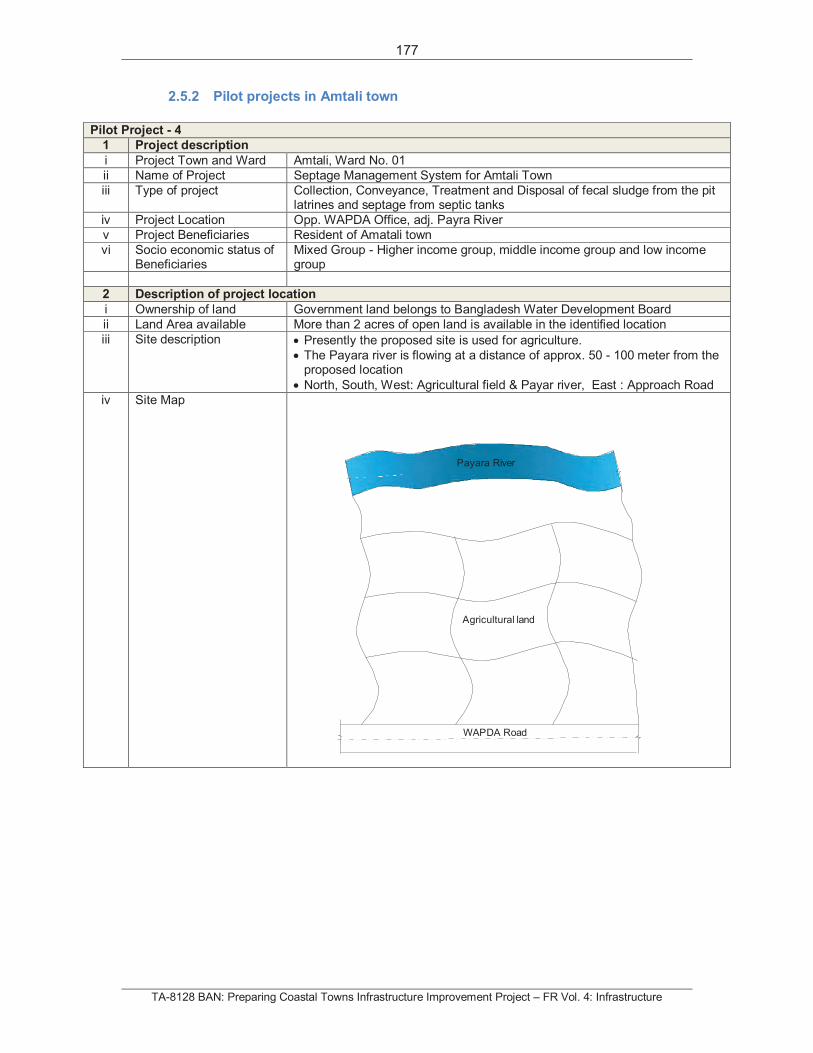
177
TA-8128 BAN: Preparing Coastal Towns Infrastructure Improvement Project – FR Vol. 4: Infrastructure
2.5.2 Pilot projects in Amtali town
Pilot Project - 4
1 Project description
i Project Town and Ward Amtali, Ward No. 01
ii Name of Project Septage Management System for Amtali Town
iii Type of project Collection, Conveyance, Treatment and Disposal of fecal sludge from the pit latrines and septage from septic tanks
iv Project Location Opp. WAPDA Office, adj. Payra River
v Project Beneficiaries Resident of Amatali town
vi Socio economic status of Beneficiaries
Mixed Group - Higher income group, middle income group and low income group
2 Description of project location
i Ownership of land Government land belongs to Bangladesh Water Development Board
ii Land Area available More than 2 acres of open land is available in the identified location
iii Site description Presently the proposed site is used for agriculture.
The Payara river is flowing at a distance of approx. 50 - 100 meter from the proposed location
North, South, West: Agricultural field & Payar river, East : Approach Road
iv Site Map
Payara River
Agricultural land
WAPDA Road
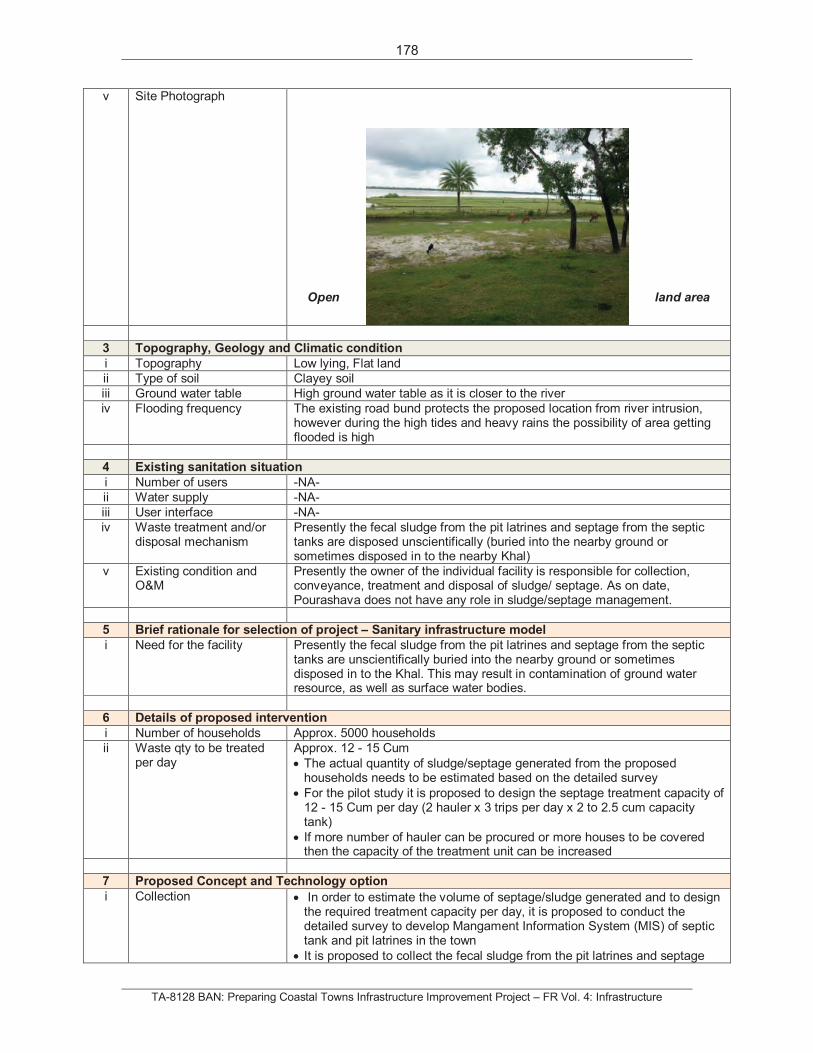
178
TA-8128 BAN: Preparing Coastal Towns Infrastructure Improvement Project – FR Vol. 4: Infrastructure
v Site Photograph
Open land area
3 Topography, Geology and Climatic condition
i Topography Low lying, Flat land
ii Type of soil Clayey soil
iii Ground water table High ground water table as it is closer to the river
iv Flooding frequency The existing road bund protects the proposed location from river intrusion, however during the high tides and heavy rains the possibility of area getting flooded is high
4 Existing sanitation situation
i Number of users -NA-
ii Water supply -NA-
iii User interface -NA-
iv Waste treatment and/or disposal mechanism
Presently the fecal sludge from the pit latrines and septage from the septic tanks are disposed unscientifically (buried into the nearby ground or sometimes disposed in to the nearby Khal)
v Existing condition and O&M
Presently the owner of the individual facility is responsible for collection, conveyance, treatment and disposal of sludge/ septage. As on date, Pourashava does not have any role in sludge/septage management.
5 Brief rationale for selection of project – Sanitary infrastructure model
i Need for the facility Presently the fecal sludge from the pit latrines and septage from the septic tanks are unscientifically buried into the nearby ground or sometimes disposed in to the Khal. This may result in contamination of ground water resource, as well as surface water bodies.
6 Details of proposed intervention
i Number of households Approx. 5000 households
ii Waste qty to be treated per day
Approx. 12 - 15 Cum
The actual quantity of sludge/septage generated from the proposed households needs to be estimated based on the detailed survey
For the pilot study it is proposed to design the septage treatment capacity of 12 - 15 Cum per day (2 hauler x 3 trips per day x 2 to 2.5 cum capacity tank)
If more number of hauler can be procured or more houses to be covered then the capacity of the treatment unit can be increased
7 Proposed Concept and Technology option
i Collection In order to estimate the volume of septage/sludge generated and to design the required treatment capacity per day, it is proposed to conduct the detailed survey to develop Mangament Information System (MIS) of septic tank and pit latrines in the town
It is proposed to collect the fecal sludge from the pit latrines and septage
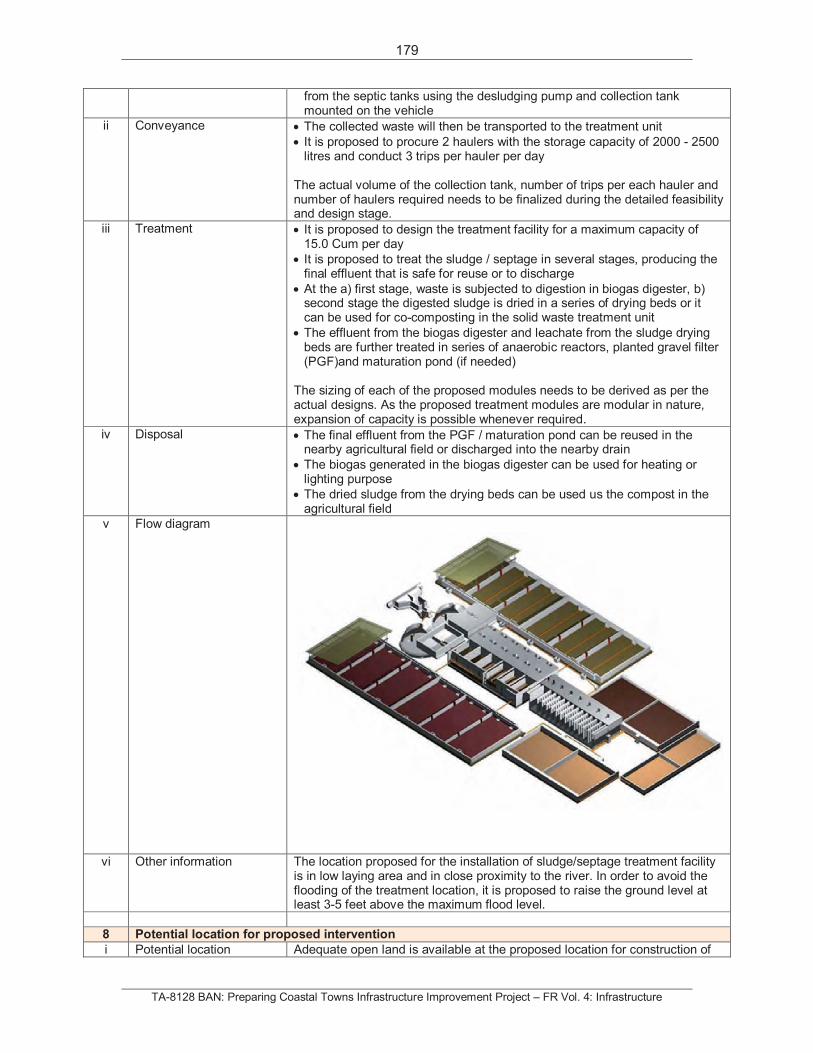
179
TA-8128 BAN: Preparing Coastal Towns Infrastructure Improvement Project – FR Vol. 4: Infrastructure
from the septic tanks using the desludging pump and collection tank mounted on the vehicle
ii Conveyance The collected waste will then be transported to the treatment unit
It is proposed to procure 2 haulers with the storage capacity of 2000 - 2500 litres and conduct 3 trips per hauler per day
The actual volume of the collection tank, number of trips per each hauler and number of haulers required needs to be finalized during the detailed feasibility and design stage.
iii Treatment It is proposed to design the treatment facility for a maximum capacity of 15.0 Cum per day
It is proposed to treat the sludge / septage in several stages, producing the final effluent that is safe for reuse or to discharge
At the a) first stage, waste is subjected to digestion in biogas digester, b) second stage the digested sludge is dried in a series of drying beds or it can be used for co-composting in the solid waste treatment unit
The effluent from the biogas digester and leachate from the sludge drying beds are further treated in series of anaerobic reactors, planted gravel filter (PGF)and maturation pond (if needed)
The sizing of each of the proposed modules needs to be derived as per the actual designs. As the proposed treatment modules are modular in nature, expansion of capacity is possible whenever required.
iv Disposal The final effluent from the PGF / maturation pond can be reused in the nearby agricultural field or discharged into the nearby drain
The biogas generated in the biogas digester can be used for heating or lighting purpose
The dried sludge from the drying beds can be used us the compost in the agricultural field
v Flow diagram
vi Other information The location proposed for the installation of sludge/septage treatment facility is in low laying area and in close proximity to the river. In order to avoid the flooding of the treatment location, it is proposed to raise the ground level at least 3-5 feet above the maximum flood level.
8 Potential location for proposed intervention
i Potential location Adequate open land is available at the proposed location for construction of
180
TA-8128 BAN: Preparing Coastal Towns Infrastructure Improvement Project – FR Vol. 4: Infrastructure
different treatment modules. The actual placement of the each of the modules and area required for each of the modules needs to be determined during the detailed feasibility study.
ii Estimated Area required Total area (biogas digester, sludge drying beds, anaerobic treatment modules, aerobic treatment modules compost storage area) - 1000 -1500 Sqmt
The area mentioned above is indicative. The actual area will be derived based on the treatment modules chosen and its actual design.
9 O&M activities
i Collection and Conveyance
Regular check of desludging pump and attending the wear and tear
Regular check of hauler and attending the wear and tear
Regular chemical coating of the collection tank ii Treatment and Disposal Cleaning of intermediate sewer pipes once in 15 days
Ensuring the regular desludging of biogas digester as per the detention time
Desludging of anaerobic modules once in two to three years depending on the desludging period adopted for the designs
Cleaning of filter media in the planted gravel filter once in two to three years
Regular emptying of sludge drying beds (once in 10 days) and storing the dried compost for its use
The site specific O&M manual needs to be developed as per the actual designs of the chosen treatment modules and handed over to the owner of the facility, concerned staff/unit or agency dedicated to O&M with adequate training.
10 Climate adaptation measures
i Collection and Conveyance
The desludging pumps and the sludge collection tank should be designed to cop up with the salinity factor
The hauler needs to be designed to be rust proof
ii Treatment infrastructure The maximum depth, duration and frequency of flooding must be established to determine the most feasible design
In order to avoid the flooding of the treatment location, it is proposed to raise the ground level at least 3-5 feet above the maximum flood level
The treatment tanks should be constructed water-tight (Bottom and sides)
To avoid the surface runoff entering the treatment tanks, the top slab of the treatment tank should be 15-30cm above the finished ground level or the top slab should be constructed water-tight
Non-return valve can be provided at the outlet of the treatment tanks to avoid the backflow of water during the flooding period
As the treatment tanks are watertight, to avoid the risk of tank structure getting uplifted due to ground water pressure, the tank should be designed to counter the water pressure. In addition, desludging should be avoided during the rainy season (if possible) or the treatment tanks should not be emptied completely to avoid displacement of tanks
In order to maintain the required moisture level in the sludge drying bed, it is recommended that the unit should be covered for protection against rainfall
11 Project stakeholders
i Stakeholders involved Sanitation department of Pourashava (if not available this department needs to be created), Private service provider (on the later stage of the project), Household owners of the pit latrines and septic tanks
Role of owners of pit latrines and septic tanks
The owner of the pit latrine or septic tank needs to desludge the tanks as per the delsudging schedule
The owner needs to pay the service provider approved amount of money for availing the services i.e. collection, conveyance, disposal of sludge/septage
181
TA-8128 BAN: Preparing Coastal Towns Infrastructure Improvement Project – FR Vol. 4: Infrastructure
Role of Pourashava Develop septage management strategy in consultation with different town stakeholders
Conduct survey and develop the Management Information System about the pit latrines and septic tanks in the town
To set up appropriate record keeping systems and reporting procedures for the Pourashava to establish the master database, prepare desludging schedules and update on completion, through integration with the property tax database.
Establishment of sanitation department and appointment of staff of different capacities and providing them with the required training
Allocation of required land for construction of Treatment infrastructure
Tendering, selection of contractor and entering into the agreement with the selected contractor for procurement of equipments and construction of civil infrastructure proposed
Extend support for monitoring construction activities
Inspection of on-site systems and pumping of septic tanks by the Pourashava staff /utility personnel or authorized competent agencies contracted by the Pourashava.
Ensure proper operation and maintenance of the septage conveyance and treatment facilities and allocate funds required for annual maintenance
Establish complaint redressal cell in Pourashava
Coordinate with existing service providers (if any) and ensure that collection, transportation of septage is carried out in a manner safe to households, environment and public health.
Organise or conduct the capacity building trainings for staff or agencies responsible for septage management
Develop and conduct awareness generation campaign to inform different stakeholders about the benefits of improved septage management
Developing a monitoring and evaluation program and establish indicators for assessment of changes in people’s perception/practices over the project duration
Role of NGO Developing and conducting the awareness campaign at the town level
Conduct social marketing campaign, which includes surveying of existing perceptions, meeting with stakeholders, developing formation of committees and developing outreach tools for various media outlets, pre-testing the tools, deploying the messages and performing the final surveys to gauge the results and impacts of the interventions.
Role of private service provider
As the concept is new, as well as the awareness about business opportunities related to sanitation is limited, it is proposed that at the initial stage septage management is the responsibility of the Pourashava. One year from the date of successful operation, private party involvement can be explored
Role of CBO Conducting survey, awareness campaigns, ensuring participation of households
12 O&M frame work
i Brief description of proposed O&M framework
In the initial stage, Pourashava is responsible for the entire operation and maintenance of Septage management (collection and conveyance, treatment and disposal) facilities.
Once the system and procedures are established, Pourashava can explore the possibility to Private Party Participation in the management of town-wide septage management
13 Estimated cost
i Capital investment – Hardware development
Collection, Conveyance, Treatment, Disposal
Total cost – 191,000 – 209,250 USDProcurement of pump and pipes, spare parts hauler , regular operation and maintenance tools – 54,500 – 63,750 USD Installation of treatment modules and storage area for compost – 136,500 – 145,500 USD
182
TA-8128 BAN: Preparing Coastal Towns Infrastructure Improvement Project – FR Vol. 4: Infrastructure
ii Capital expenditure – Software development
Institutional requirements Hiring of technical staff- 1 number
Hiring of supervisors – 1 to 2 numbers
Hiring of conservancy staff – 4 to 5 numbers
Hiring of driver – 2 to 3 (based on number of vehicle)
Delsudging staff in the vehicle – 1 to 2 numbers/vehicle
Hiring of conservancy inspectors (monitoring) – 1 to 2 numbers
Setting up of complaint redressal cell and hiring of staff – 2 numbers
Hiring of MIS staff – 2 numbers
Training of MIS staff
Training of all staff
Establishment of MIS
Awareness generation activities
Conducting survey to know willingness to adopt and pay for the facility
Conducting various meetings at the city level
Conducting various campaign
Conducting interim survey for understanding the benefits of the proposed system
Conducting survey to gauge the results and impact analysis of the implemented system
Preparation of IEC material
Hiring expert from different skills
Technical designs – Technical expert
Framing of bye laws – Governance expert
Financial analysis – Financial expert
IEC materials - Social expert
Institutional structure - Institutional expert iii O&M expenses per annum
Collection Regular servicing of pumps and collection tank
Repair of pumps
Fuel cost for operating pumps
Regular coatings or painting of collection tank
Salary for staff
Regular maintenance of pumps
Occupational Health and safety measures
Conveyance Vehicle fuel cost per day
Vehicle repair cost
Vehicle wear and tear cost
Salary for staff
Occupational Health and safety measures
Treatment Electricity charges for pumps and electrical fittings
Repair and replacement of civil structure
Fuel cost for operating generator
Salary of operator
Occupational Health and safety measures
Disposal Maintenance of gas pipe lines
Repair and maintenance of compost storage infrastructure iv Other expense 5-10% of the total construction cost needs to be allocated for miscellaneous
expenses
14 Time frame
i Project preparation – Social and Technical (conducting detailed survey, detailed technical feasibility study, concept preparation and approval)
8 – 10 weeks
ii Technical design 8 - 10 weeks
iii Tendering and 8 – 10 weeks
183
TA-8128 BAN: Preparing Coastal Towns Infrastructure Improvement Project – FR Vol. 4: Infrastructure
Contracting
iv Implementation 24 – 32 weeks
v Commissioning 2 weeks
The time frame mentioned above is indicative. Needs to be finalized in consultation with the involved stakeholders
15 Awareness campaign
i Awareness needs to Sensitize the residents of the town about the proposed sanitation intervention and its advantages
Ensure involvement of various stakeholders like government departments, non-government organisations, societies, private sector, volunteers, media etc.
Ensure ownership, relevance and sustainability of the proposed sanitation infrastructure
ii Modes or tools of campaign
Manual on Water, Sanitation, Hygiene & Waste
Posters / Demonstration
Exposure visits
Digital media –Local TV channel
Print media – Local news papers
Hoardings and advertisements
Direct interactions
Street play, drama Painting competition iii Campaign stakeholders Non Government Organisation
Ward councilors
Pourashava and sanitation department
Community Based Organisation or Self Help Groups
Schools and Colleges
Print and Digital medias
Sanitation or conservancy workers
iv Skills required A Hygiene and Sanitation Specialist
A social marketing/communications expert
Qualified locally based NGO with field teams
v Time frame At least for a year
16 Project outcome
i Outcome/Benefits Safe management of human excreta including the confinement, treatment and disposal
Improved hygiene behavior practices thereby reducing transmission of diseases
Clean environment
Treatment bi-products – treated wastewater, biogas, compost
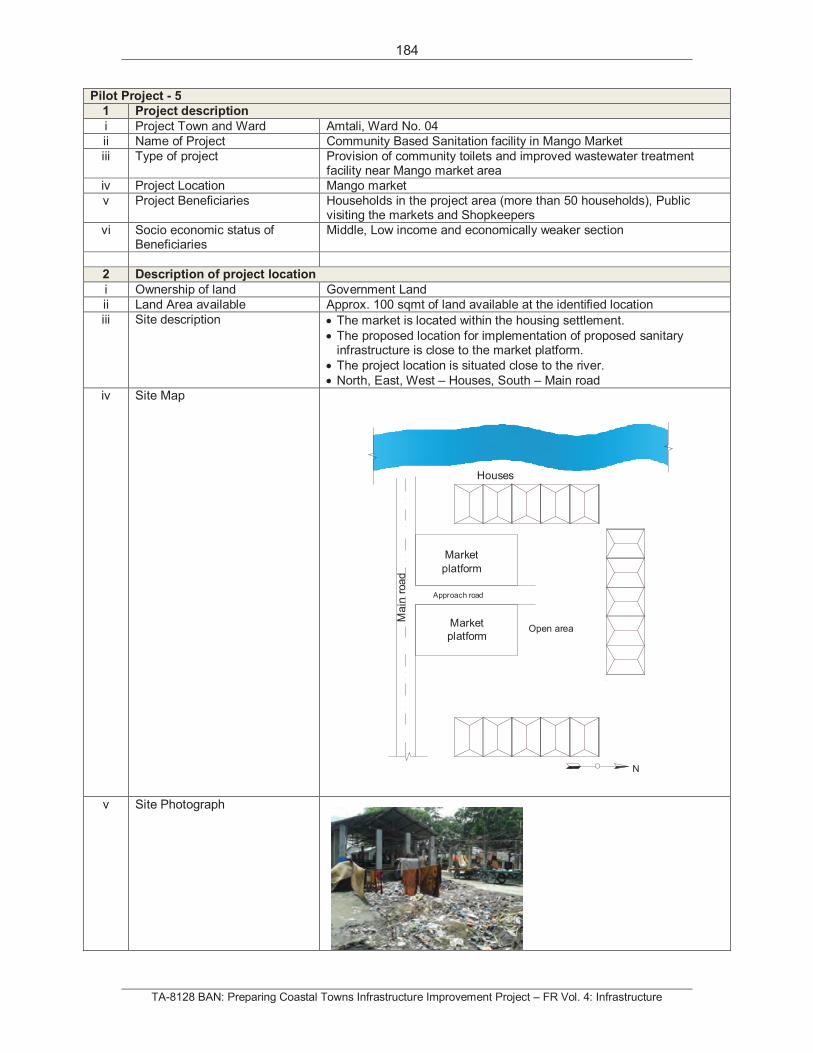
184
TA-8128 BAN: Preparing Coastal Towns Infrastructure Improvement Project – FR Vol. 4: Infrastructure
Pilot Project - 5
1 Project description
i Project Town and Ward Amtali, Ward No. 04
ii Name of Project Community Based Sanitation facility in Mango Market
iii Type of project Provision of community toilets and improved wastewater treatment facility near Mango market area
iv Project Location Mango market
v Project Beneficiaries Households in the project area (more than 50 households), Public visiting the markets and Shopkeepers
vi Socio economic status of Beneficiaries
Middle, Low income and economically weaker section
2 Description of project location
i Ownership of land Government Land
ii Land Area available Approx. 100 sqmt of land available at the identified location
iii Site description The market is located within the housing settlement.
The proposed location for implementation of proposed sanitary infrastructure is close to the market platform.
The project location is situated close to the river.
North, East, West – Houses, South – Main road
iv Site Map
v Site Photograph
Houses
Open area
N
Market
platform
Market
platform
Ma
inro
ad
Approach road
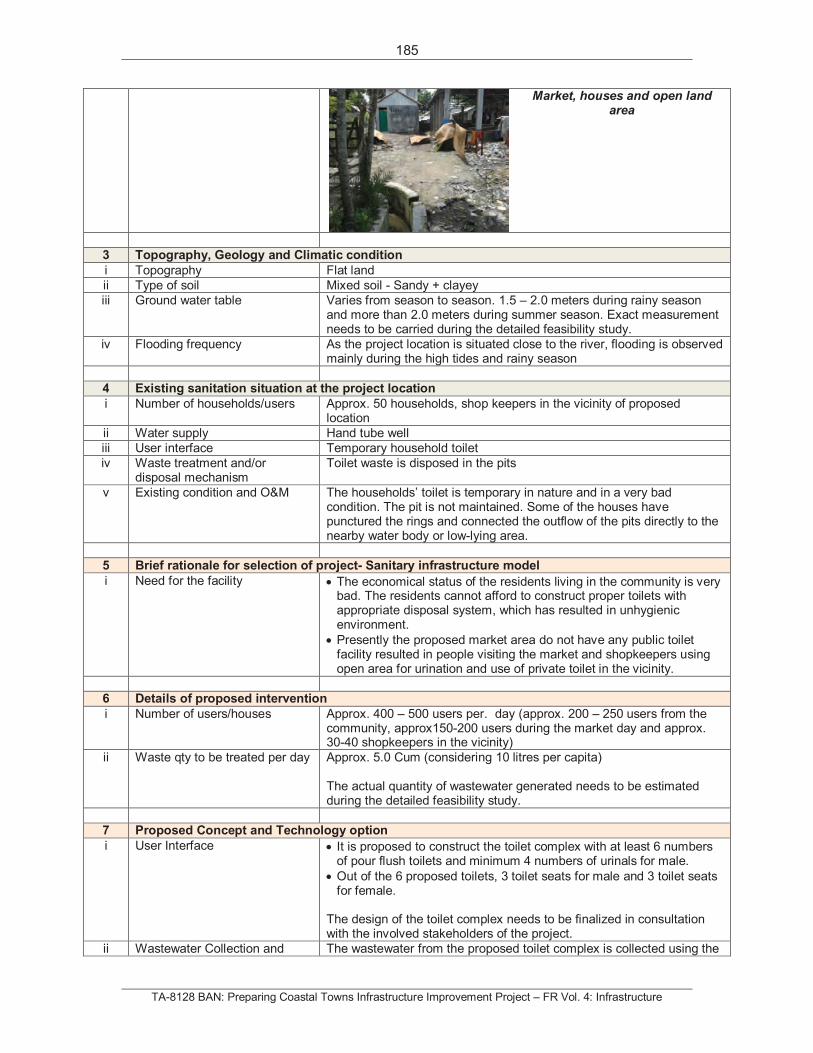
185
TA-8128 BAN: Preparing Coastal Towns Infrastructure Improvement Project – FR Vol. 4: Infrastructure
Market, houses and open land area
3 Topography, Geology and Climatic condition
i Topography Flat land
ii Type of soil Mixed soil - Sandy + clayey
iii Ground water table Varies from season to season. 1.5 – 2.0 meters during rainy season and more than 2.0 meters during summer season. Exact measurement needs to be carried during the detailed feasibility study.
iv Flooding frequency As the project location is situated close to the river, flooding is observed mainly during the high tides and rainy season
4 Existing sanitation situation at the project location
i Number of households/users Approx. 50 households, shop keepers in the vicinity of proposed location
ii Water supply Hand tube well
iii User interface Temporary household toilet
iv Waste treatment and/or disposal mechanism
Toilet waste is disposed in the pits
v Existing condition and O&M The households’ toilet is temporary in nature and in a very bad condition. The pit is not maintained. Some of the houses have punctured the rings and connected the outflow of the pits directly to the nearby water body or low-lying area.
5 Brief rationale for selection of project- Sanitary infrastructure model
i Need for the facility The economical status of the residents living in the community is very bad. The residents cannot afford to construct proper toilets with appropriate disposal system, which has resulted in unhygienic environment.
Presently the proposed market area do not have any public toilet facility resulted in people visiting the market and shopkeepers using open area for urination and use of private toilet in the vicinity.
6 Details of proposed intervention
i Number of users/houses Approx. 400 – 500 users per. day (approx. 200 – 250 users from the community, approx150-200 users during the market day and approx. 30-40 shopkeepers in the vicinity)
ii Waste qty to be treated per day Approx. 5.0 Cum (considering 10 litres per capita)
The actual quantity of wastewater generated needs to be estimated during the detailed feasibility study.
7 Proposed Concept and Technology option
i User Interface It is proposed to construct the toilet complex with at least 6 numbers of pour flush toilets and minimum 4 numbers of urinals for male.
Out of the 6 proposed toilets, 3 toilet seats for male and 3 toilet seats for female.
The design of the toilet complex needs to be finalized in consultation with the involved stakeholders of the project.
ii Wastewater Collection and The wastewater from the proposed toilet complex is collected using the
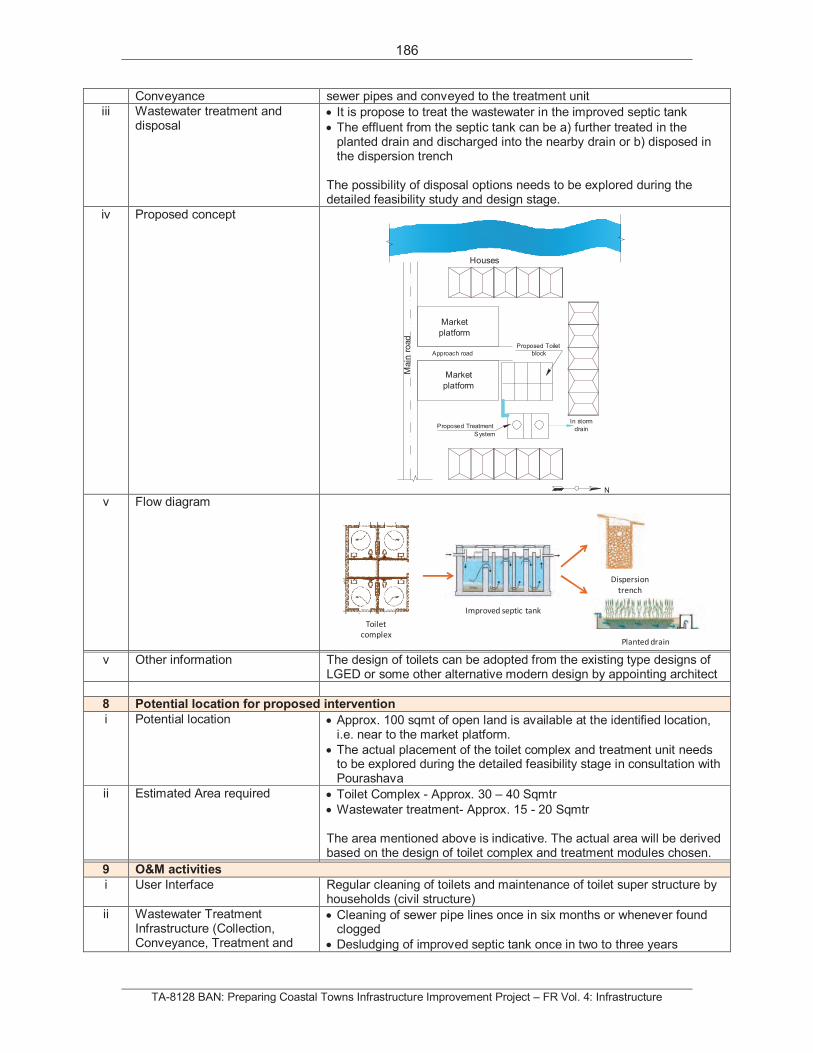
186
TA-8128 BAN: Preparing Coastal Towns Infrastructure Improvement Project – FR Vol. 4: Infrastructure
Conveyance sewer pipes and conveyed to the treatment unit
iii Wastewater treatment and disposal
It is propose to treat the wastewater in the improved septic tank
The effluent from the septic tank can be a) further treated in the planted drain and discharged into the nearby drain or b) disposed in the dispersion trench
The possibility of disposal options needs to be explored during the detailed feasibility study and design stage.
iv Proposed concept
v Flow diagram
v Other information The design of toilets can be adopted from the existing type designs of LGED or some other alternative modern design by appointing architect
8 Potential location for proposed intervention
i Potential location Approx. 100 sqmt of open land is available at the identified location, i.e. near to the market platform.
The actual placement of the toilet complex and treatment unit needs to be explored during the detailed feasibility stage in consultation with Pourashava
ii Estimated Area required Toilet Complex - Approx. 30 – 40 Sqmtr
Wastewater treatment- Approx. 15 - 20 Sqmtr
The area mentioned above is indicative. The actual area will be derived based on the design of toilet complex and treatment modules chosen.
9 O&M activities
i User Interface Regular cleaning of toilets and maintenance of toilet super structure by households (civil structure)
ii Wastewater Treatment Infrastructure (Collection, Conveyance, Treatment and
Cleaning of sewer pipe lines once in six months or whenever found clogged
Desludging of improved septic tank once in two to three years
Houses
Market
platform
Market
platform
Proposed Toilet
block
Proposed Treatment
System
In storm
drain
N
Main
road
Approach road
Toilet
complex
Improved septic tank
Dispersion
trench
Planted drain
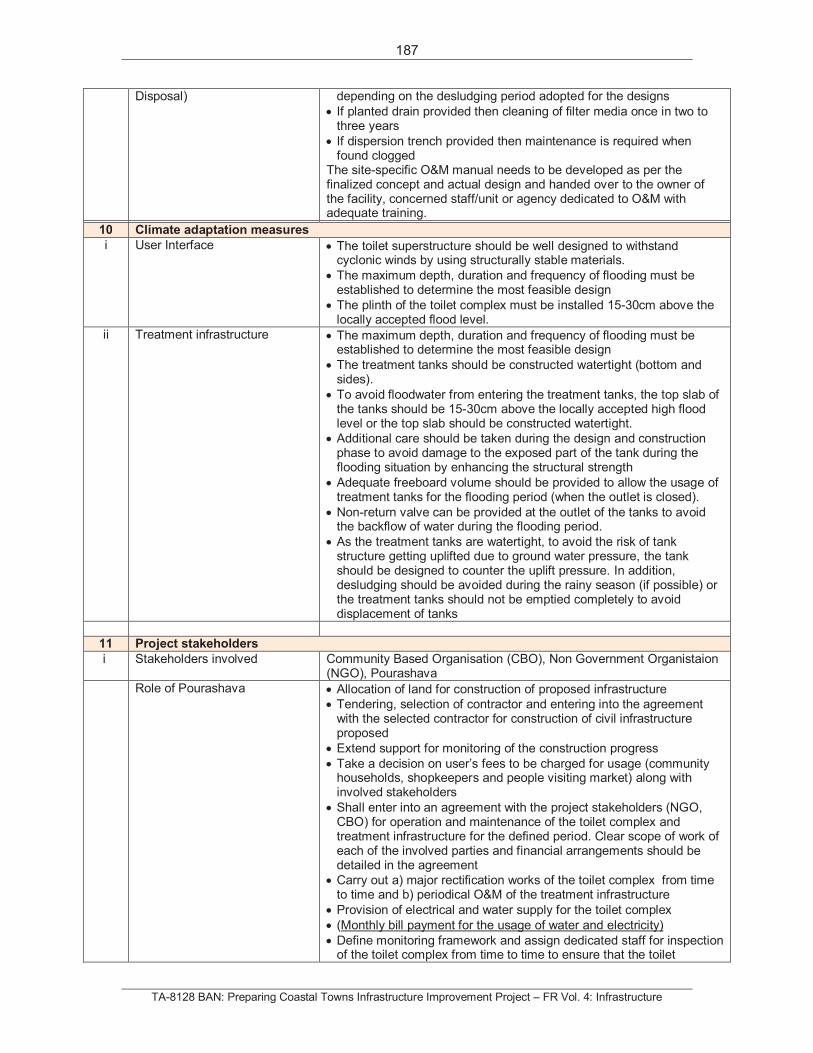
187
TA-8128 BAN: Preparing Coastal Towns Infrastructure Improvement Project – FR Vol. 4: Infrastructure
Disposal) depending on the desludging period adopted for the designs
If planted drain provided then cleaning of filter media once in two to three years
If dispersion trench provided then maintenance is required when found clogged
The site-specific O&M manual needs to be developed as per the finalized concept and actual design and handed over to the owner of the facility, concerned staff/unit or agency dedicated to O&M with adequate training.
10 Climate adaptation measures
i User Interface The toilet superstructure should be well designed to withstand cyclonic winds by using structurally stable materials.
The maximum depth, duration and frequency of flooding must be established to determine the most feasible design
The plinth of the toilet complex must be installed 15-30cm above the locally accepted flood level.
ii Treatment infrastructure The maximum depth, duration and frequency of flooding must be established to determine the most feasible design
The treatment tanks should be constructed watertight (bottom and sides).
To avoid floodwater from entering the treatment tanks, the top slab of the tanks should be 15-30cm above the locally accepted high flood level or the top slab should be constructed watertight.
Additional care should be taken during the design and construction phase to avoid damage to the exposed part of the tank during the flooding situation by enhancing the structural strength
Adequate freeboard volume should be provided to allow the usage of treatment tanks for the flooding period (when the outlet is closed).
Non-return valve can be provided at the outlet of the tanks to avoid the backflow of water during the flooding period.
As the treatment tanks are watertight, to avoid the risk of tank structure getting uplifted due to ground water pressure, the tank should be designed to counter the uplift pressure. In addition, desludging should be avoided during the rainy season (if possible) or the treatment tanks should not be emptied completely to avoid displacement of tanks
11 Project stakeholders
i Stakeholders involved Community Based Organisation (CBO), Non Government Organistaion (NGO), Pourashava
Role of Pourashava Allocation of land for construction of proposed infrastructure
Tendering, selection of contractor and entering into the agreement with the selected contractor for construction of civil infrastructure proposed
Extend support for monitoring of the construction progress
Take a decision on user’s fees to be charged for usage (community households, shopkeepers and people visiting market) along with involved stakeholders
Shall enter into an agreement with the project stakeholders (NGO, CBO) for operation and maintenance of the toilet complex and treatment infrastructure for the defined period. Clear scope of work of each of the involved parties and financial arrangements should be detailed in the agreement
Carry out a) major rectification works of the toilet complex from time to time and b) periodical O&M of the treatment infrastructure
Provision of electrical and water supply for the toilet complex
(Monthly bill payment for the usage of water and electricity)
Define monitoring framework and assign dedicated staff for inspection of the toilet complex from time to time to ensure that the toilet
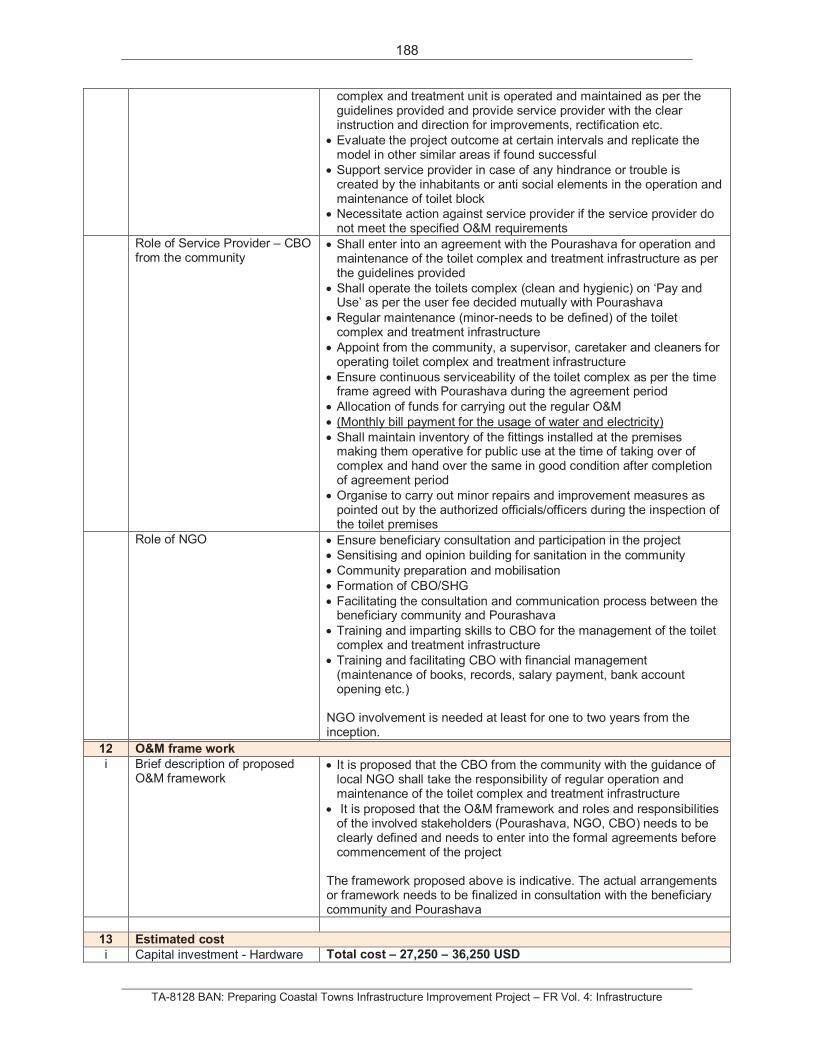
188
TA-8128 BAN: Preparing Coastal Towns Infrastructure Improvement Project – FR Vol. 4: Infrastructure
complex and treatment unit is operated and maintained as per the guidelines provided and provide service provider with the clear instruction and direction for improvements, rectification etc.
Evaluate the project outcome at certain intervals and replicate the model in other similar areas if found successful
Support service provider in case of any hindrance or trouble is created by the inhabitants or anti social elements in the operation and maintenance of toilet block
Necessitate action against service provider if the service provider do not meet the specified O&M requirements
Role of Service Provider – CBO from the community
Shall enter into an agreement with the Pourashava for operation and maintenance of the toilet complex and treatment infrastructure as per the guidelines provided
Shall operate the toilets complex (clean and hygienic) on ‘Pay and Use’ as per the user fee decided mutually with Pourashava
Regular maintenance (minor-needs to be defined) of the toilet complex and treatment infrastructure
Appoint from the community, a supervisor, caretaker and cleaners for operating toilet complex and treatment infrastructure
Ensure continuous serviceability of the toilet complex as per the time frame agreed with Pourashava during the agreement period
Allocation of funds for carrying out the regular O&M
(Monthly bill payment for the usage of water and electricity)
Shall maintain inventory of the fittings installed at the premises making them operative for public use at the time of taking over of complex and hand over the same in good condition after completion of agreement period
Organise to carry out minor repairs and improvement measures as pointed out by the authorized officials/officers during the inspection of the toilet premises
Role of NGO Ensure beneficiary consultation and participation in the project
Sensitising and opinion building for sanitation in the community
Community preparation and mobilisation
Formation of CBO/SHG
Facilitating the consultation and communication process between the beneficiary community and Pourashava
Training and imparting skills to CBO for the management of the toilet complex and treatment infrastructure
Training and facilitating CBO with financial management (maintenance of books, records, salary payment, bank account opening etc.)
NGO involvement is needed at least for one to two years from the inception.
12 O&M frame work
i Brief description of proposed O&M framework
It is proposed that the CBO from the community with the guidance of local NGO shall take the responsibility of regular operation and maintenance of the toilet complex and treatment infrastructure
It is proposed that the O&M framework and roles and responsibilities of the involved stakeholders (Pourashava, NGO, CBO) needs to be clearly defined and needs to enter into the formal agreements before commencement of the project
The framework proposed above is indicative. The actual arrangements or framework needs to be finalized in consultation with the beneficiary community and Pourashava
13 Estimated cost
i Capital investment - Hardware Total cost – 27,250 – 36,250 USD
189
TA-8128 BAN: Preparing Coastal Towns Infrastructure Improvement Project – FR Vol. 4: Infrastructure
Toilet complex – 18,250 – 22,750 USD Wastewater Treatment Infrastructure – 9,000 – 13,500 USD
ii Capital expenditure – Software (IEC related cost)
Appointment of NGO
Community preparation
Conducting sensitization workshop
Organising meetings with involved stakeholders
Development of IEC material
O&M training to the CBO
iii O&M expenses Needs to be derived after finalization of concept and design
iv Other expense 5-10% of the total construction cost needs to be allocated for miscellaneous expenses
14 Time frame
i Project preparation - Social and technical ( like community preparation, detailed technical feasibility study, concept preparation and approval)
8-12 weeks
ii Technical design 6- 8 weeks
iii Tendering and Contracting 8 -12 weeks
iv Implementation 24 – 30 weeks
v Commissioning 1 week
The time frame mentioned above is indicative. Needs to be finalized in consultation with the involved stakeholders
15 Awareness campaign
i Awareness needs To sensitize the beneficiary community about the proposed sanitation project and its advantages
To inform the needs of regular O&M of the sanitation infrastructure
To promote community based construction and maintenance of sanitation infrastructure
To ensure ownership, relevance and sustainability of the sanitation infrastructure
ii Mode of campaign Exposure visits
Posters and Broachers
Direct interactions
Street play, drama Painting competition
iii Campaign Stakeholders Non Government Organisation
Ward councilors
Pourashava and sanitation department
Community Based Organisation or Self Help Groups
iv Skills required A Hygiene and Sanitation Specialist
Qualified locally based NGO with field teams v Time frame At least for six months during one year of implementation period
16 Project outcome
i Outcome/Benefits Safe management of human excreta including the confinement, treatment and disposal
Improved hygiene behaviour practices thereby reducing transmission of diseases
Clean environment
Income generation for families of the community
Additional incomes for the CBO from the nearby shopkeepers and during the market day from the people using market
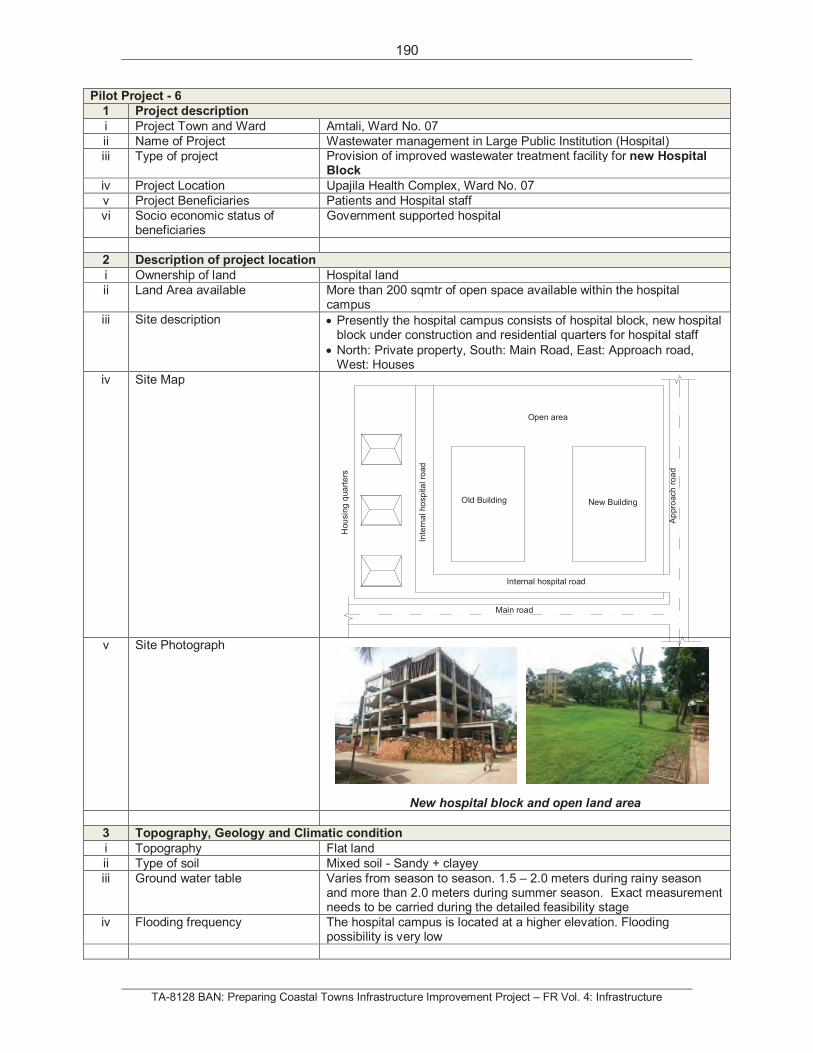
190
TA-8128 BAN: Preparing Coastal Towns Infrastructure Improvement Project – FR Vol. 4: Infrastructure
Pilot Project - 6
1 Project description
i Project Town and Ward Amtali, Ward No. 07
ii Name of Project Wastewater management in Large Public Institution (Hospital)
iii Type of project Provision of improved wastewater treatment facility for new Hospital Block
iv Project Location Upajila Health Complex, Ward No. 07
v Project Beneficiaries Patients and Hospital staff
vi Socio economic status of beneficiaries
Government supported hospital
2 Description of project location
i Ownership of land Hospital land
ii Land Area available More than 200 sqmtr of open space available within the hospital campus
iii Site description Presently the hospital campus consists of hospital block, new hospital block under construction and residential quarters for hospital staff
North: Private property, South: Main Road, East: Approach road, West: Houses
iv Site Map
v Site Photograph
New hospital block and open land area
3 Topography, Geology and Climatic condition
i Topography Flat land
ii Type of soil Mixed soil - Sandy + clayey
iii Ground water table Varies from season to season. 1.5 – 2.0 meters during rainy season and more than 2.0 meters during summer season. Exact measurement needs to be carried during the detailed feasibility stage
iv Flooding frequency The hospital campus is located at a higher elevation. Flooding possibility is very low
Old Building New Building
Open area
Internal hospital road
Inte
rnalho
sp
ita
lro
ad
Ap
pro
ach
roa
d
Main road
Hou
sin
gq
ua
rte
rs
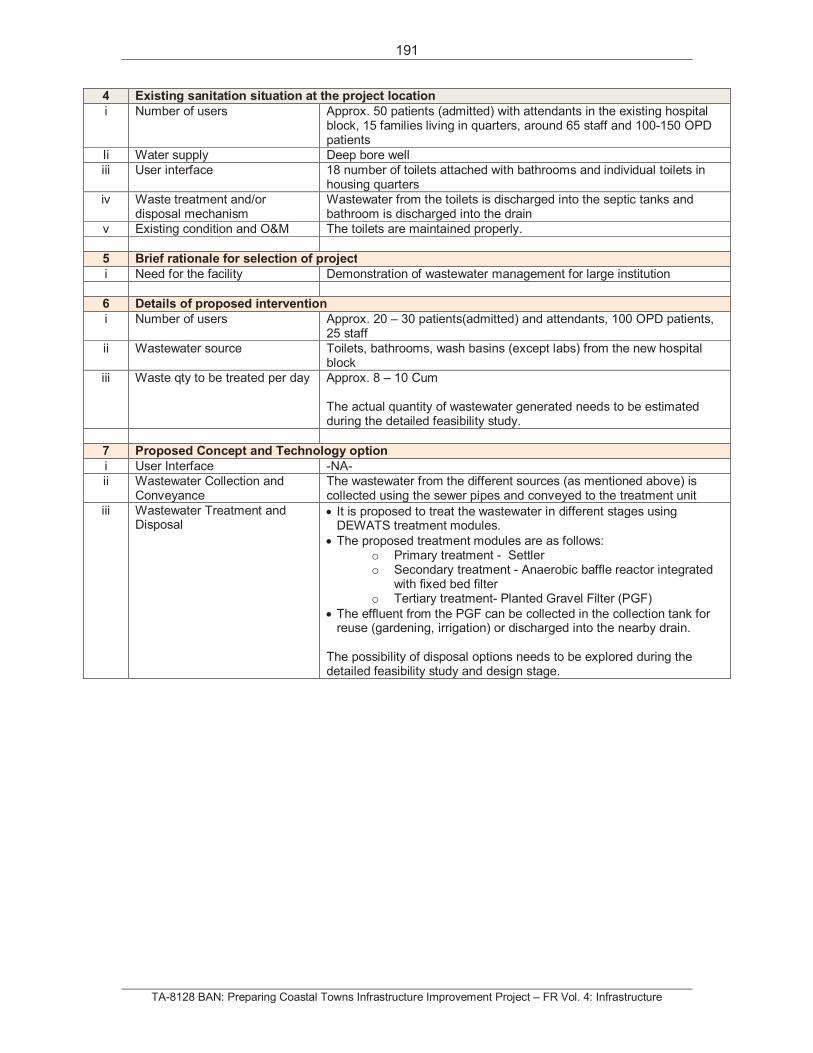
191
TA-8128 BAN: Preparing Coastal Towns Infrastructure Improvement Project – FR Vol. 4: Infrastructure
4 Existing sanitation situation at the project location
i Number of users Approx. 50 patients (admitted) with attendants in the existing hospital block, 15 families living in quarters, around 65 staff and 100-150 OPD patients
Ii Water supply Deep bore well
iii User interface 18 number of toilets attached with bathrooms and individual toilets in housing quarters
iv Waste treatment and/or disposal mechanism
Wastewater from the toilets is discharged into the septic tanks and bathroom is discharged into the drain
v Existing condition and O&M The toilets are maintained properly.
5 Brief rationale for selection of project
i Need for the facility Demonstration of wastewater management for large institution
6 Details of proposed intervention
i Number of users Approx. 20 – 30 patients(admitted) and attendants, 100 OPD patients, 25 staff
ii Wastewater source Toilets, bathrooms, wash basins (except labs) from the new hospital block
iii Waste qty to be treated per day Approx. 8 – 10 Cum
The actual quantity of wastewater generated needs to be estimated during the detailed feasibility study.
7 Proposed Concept and Technology option
i User Interface -NA-
ii Wastewater Collection and Conveyance
The wastewater from the different sources (as mentioned above) is collected using the sewer pipes and conveyed to the treatment unit
iii Wastewater Treatment and Disposal
It is proposed to treat the wastewater in different stages using DEWATS treatment modules.
The proposed treatment modules are as follows: o Primary treatment - Settler o Secondary treatment - Anaerobic baffle reactor integrated
with fixed bed filter o Tertiary treatment- Planted Gravel Filter (PGF)
The effluent from the PGF can be collected in the collection tank for reuse (gardening, irrigation) or discharged into the nearby drain.
The possibility of disposal options needs to be explored during the detailed feasibility study and design stage.
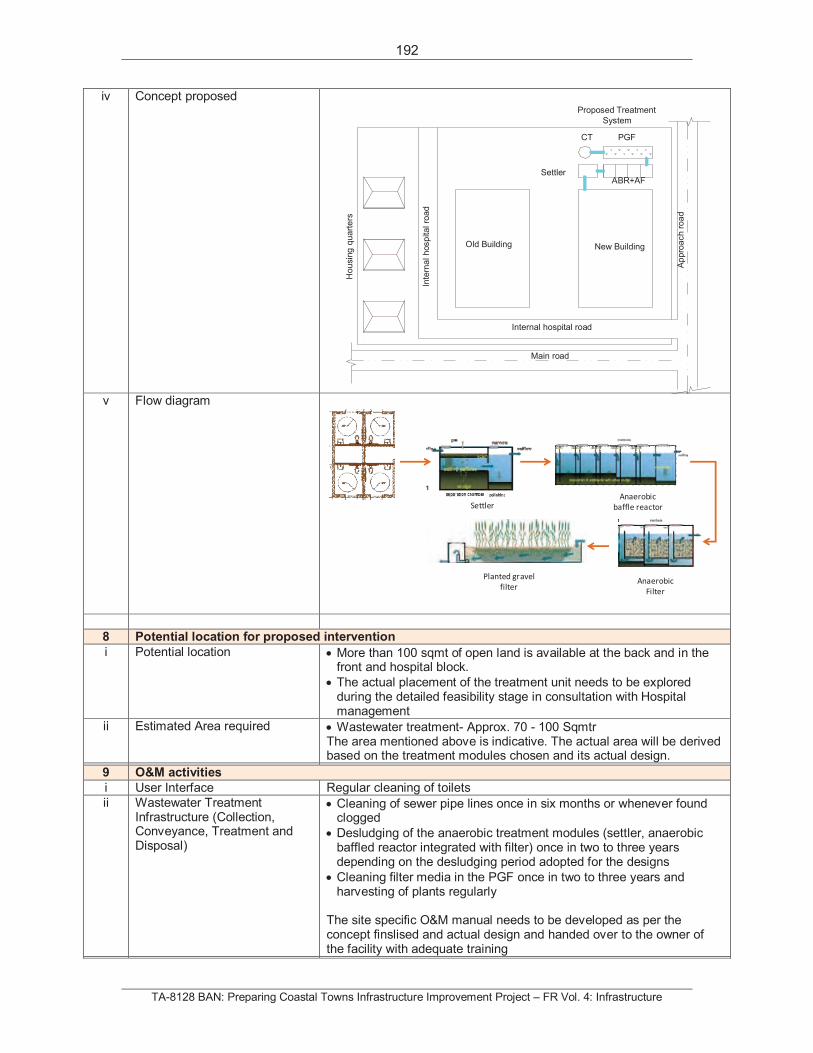
192
TA-8128 BAN: Preparing Coastal Towns Infrastructure Improvement Project – FR Vol. 4: Infrastructure
iv Concept proposed
v Flow diagram
8 Potential location for proposed intervention
i Potential location More than 100 sqmt of open land is available at the back and in the front and hospital block.
The actual placement of the treatment unit needs to be explored during the detailed feasibility stage in consultation with Hospital management
ii Estimated Area required Wastewater treatment- Approx. 70 - 100 Sqmtr The area mentioned above is indicative. The actual area will be derived based on the treatment modules chosen and its actual design.
9 O&M activities
i User Interface Regular cleaning of toilets
ii Wastewater Treatment Infrastructure (Collection, Conveyance, Treatment and Disposal)
Cleaning of sewer pipe lines once in six months or whenever found clogged
Desludging of the anaerobic treatment modules (settler, anaerobic baffled reactor integrated with filter) once in two to three years depending on the desludging period adopted for the designs
Cleaning filter media in the PGF once in two to three years and harvesting of plants regularly
The site specific O&M manual needs to be developed as per the concept finslised and actual design and handed over to the owner of the facility with adequate training
Anaerobic
baffle reactor
Anaerobic
Filter
Settler
Planted gravel
filter
Old Building New Building
SettlerABR+AF
PGFCT
Internal hospital road
Inte
rnalhosp
ita
lro
ad
Ap
pro
ach
roa
d
Ho
usin
gq
ua
rte
rs
Proposed Treatment
System
Main road
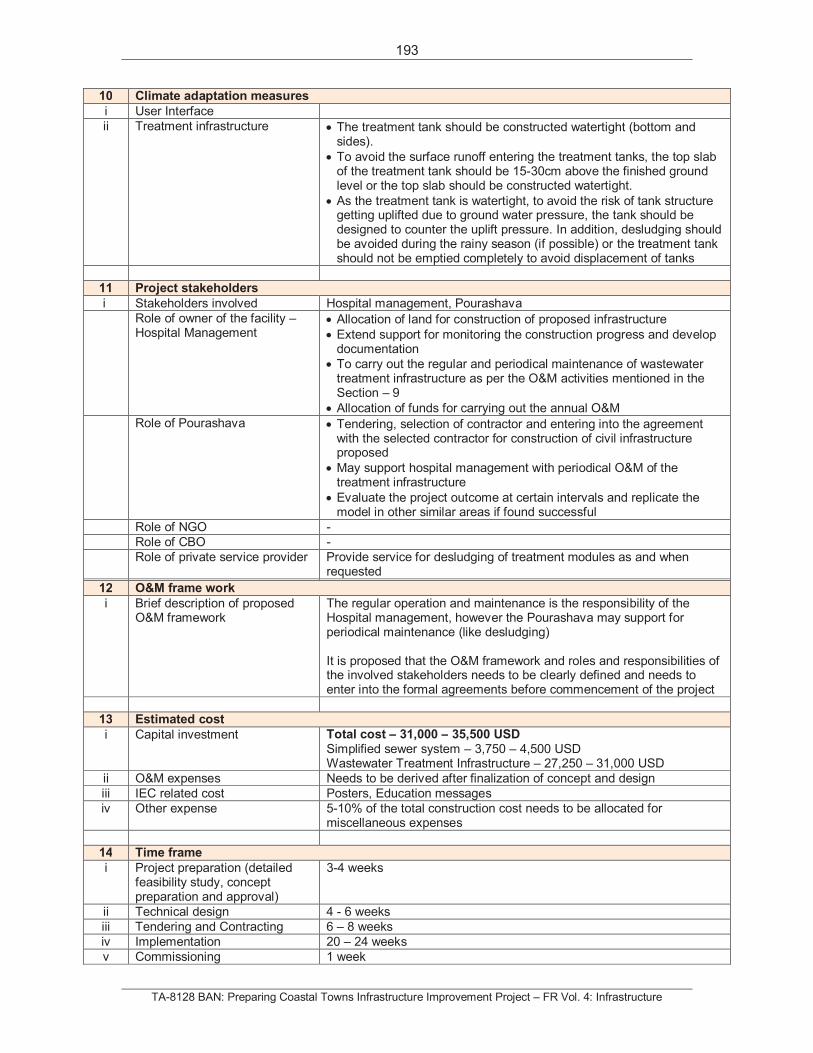
193
TA-8128 BAN: Preparing Coastal Towns Infrastructure Improvement Project – FR Vol. 4: Infrastructure
10 Climate adaptation measures
i User Interface
ii Treatment infrastructure The treatment tank should be constructed watertight (bottom and sides).
To avoid the surface runoff entering the treatment tanks, the top slab of the treatment tank should be 15-30cm above the finished ground level or the top slab should be constructed watertight.
As the treatment tank is watertight, to avoid the risk of tank structure getting uplifted due to ground water pressure, the tank should be designed to counter the uplift pressure. In addition, desludging should be avoided during the rainy season (if possible) or the treatment tank should not be emptied completely to avoid displacement of tanks
11 Project stakeholders
i Stakeholders involved Hospital management, Pourashava
Role of owner of the facility – Hospital Management
Allocation of land for construction of proposed infrastructure
Extend support for monitoring the construction progress and develop documentation
To carry out the regular and periodical maintenance of wastewater treatment infrastructure as per the O&M activities mentioned in the Section – 9
Allocation of funds for carrying out the annual O&M
Role of Pourashava Tendering, selection of contractor and entering into the agreement with the selected contractor for construction of civil infrastructure proposed
May support hospital management with periodical O&M of the treatment infrastructure
Evaluate the project outcome at certain intervals and replicate the model in other similar areas if found successful
Role of NGO -
Role of CBO -
Role of private service provider Provide service for desludging of treatment modules as and when requested
12 O&M frame work
i Brief description of proposed O&M framework
The regular operation and maintenance is the responsibility of the Hospital management, however the Pourashava may support for periodical maintenance (like desludging)
It is proposed that the O&M framework and roles and responsibilities of the involved stakeholders needs to be clearly defined and needs to enter into the formal agreements before commencement of the project
13 Estimated cost
i Capital investment Total cost – 31,000 – 35,500 USDSimplified sewer system – 3,750 – 4,500 USD Wastewater Treatment Infrastructure – 27,250 – 31,000 USD
ii O&M expenses Needs to be derived after finalization of concept and design
iii IEC related cost Posters, Education messages
iv Other expense 5-10% of the total construction cost needs to be allocated for miscellaneous expenses
14 Time frame
i Project preparation (detailed feasibility study, concept preparation and approval)
3-4 weeks
ii Technical design 4 - 6 weeks
iii Tendering and Contracting 6 – 8 weeks
iv Implementation 20 – 24 weeks
v Commissioning 1 week
194
TA-8128 BAN: Preparing Coastal Towns Infrastructure Improvement Project – FR Vol. 4: Infrastructure
The time frame mentioned above is indicative. Needs to be finalized in consultation with the involved stakeholders
15 Awareness campaign
i Awareness needs To inform the hospital staff about the proposed sanitation system and its advantages
To ensure timely O&M of the sanitation infrastructure
To ensure ownership, relevance and sustainability of the sanitation infrastructure
ii Mode of campaign Direct meetings, poster presentation
iii Campaign stakeholders NGO
iv Skills required NGO with sanitation background
v Time frame At the planning stage, during the commissioning stage
16 Project outcome
i Outcome/Benefits Safe management of human excreta including the confinement, treatment and disposal
Improved health and hygiene conditions
Clean environment
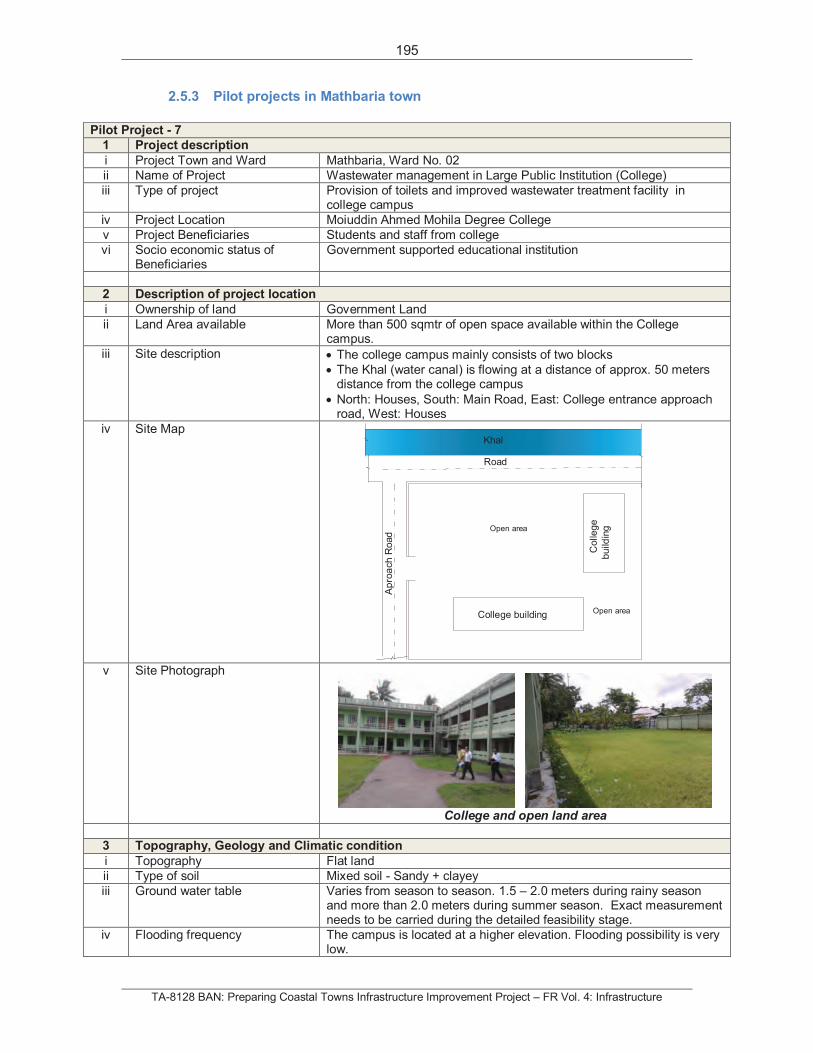
195
TA-8128 BAN: Preparing Coastal Towns Infrastructure Improvement Project – FR Vol. 4: Infrastructure
2.5.3 Pilot projects in Mathbaria town
Pilot Project - 7
1 Project description
i Project Town and Ward Mathbaria, Ward No. 02
ii Name of Project Wastewater management in Large Public Institution (College)
iii Type of project Provision of toilets and improved wastewater treatment facility in college campus
iv Project Location Moiuddin Ahmed Mohila Degree College
v Project Beneficiaries Students and staff from college
vi Socio economic status of Beneficiaries
Government supported educational institution
2 Description of project location
i Ownership of land Government Land
ii Land Area available More than 500 sqmtr of open space available within the College campus.
iii Site description The college campus mainly consists of two blocks
The Khal (water canal) is flowing at a distance of approx. 50 meters distance from the college campus
North: Houses, South: Main Road, East: College entrance approach road, West: Houses
iv Site Map
v Site Photograph
College and open land area
3 Topography, Geology and Climatic condition
i Topography Flat land
ii Type of soil Mixed soil - Sandy + clayey
iii Ground water table Varies from season to season. 1.5 – 2.0 meters during rainy season and more than 2.0 meters during summer season. Exact measurement needs to be carried during the detailed feasibility stage.
iv Flooding frequency The campus is located at a higher elevation. Flooding possibility is very low.
Road
Khal
Ap
roa
ch
Road
College building
Colle
ge
build
ingOpen area
Open area
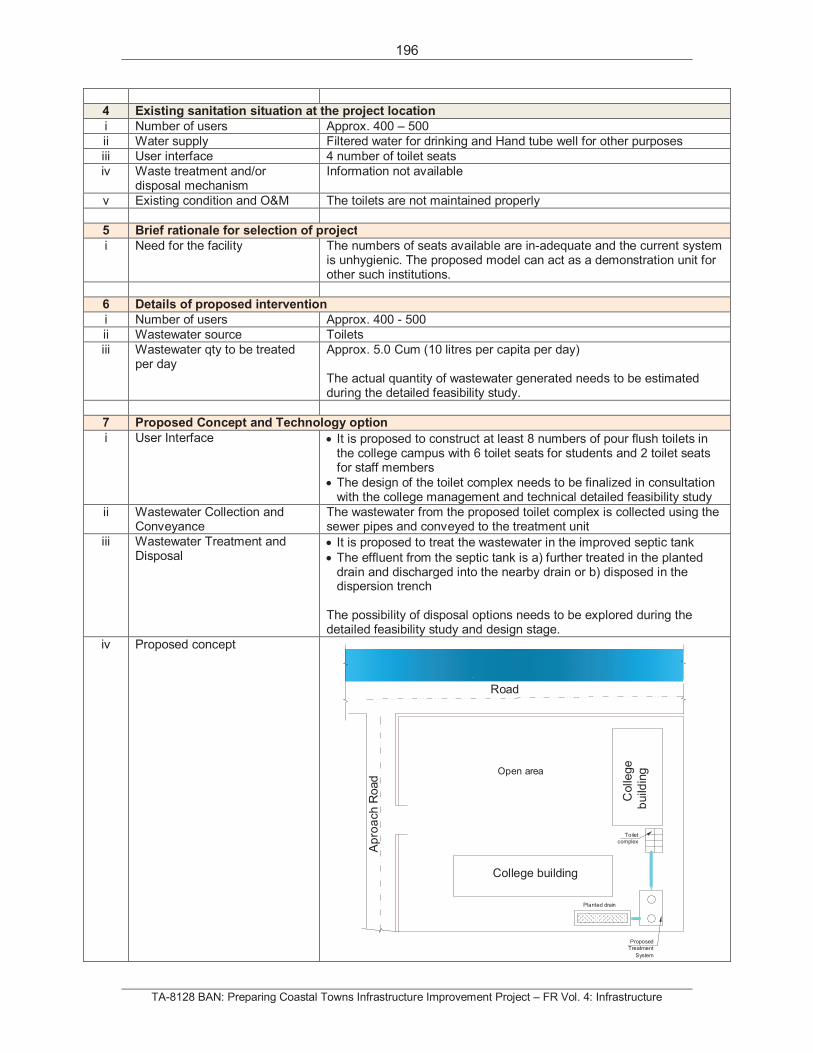
196
TA-8128 BAN: Preparing Coastal Towns Infrastructure Improvement Project – FR Vol. 4: Infrastructure
4 Existing sanitation situation at the project location
i Number of users Approx. 400 – 500
ii Water supply Filtered water for drinking and Hand tube well for other purposes
iii User interface 4 number of toilet seats
iv Waste treatment and/or disposal mechanism
Information not available
v Existing condition and O&M The toilets are not maintained properly
5 Brief rationale for selection of project
i Need for the facility The numbers of seats available are in-adequate and the current system is unhygienic. The proposed model can act as a demonstration unit for other such institutions.
6 Details of proposed intervention
i Number of users Approx. 400 - 500
ii Wastewater source Toilets
iii Wastewater qty to be treated per day
Approx. 5.0 Cum (10 litres per capita per day)
The actual quantity of wastewater generated needs to be estimated during the detailed feasibility study.
7 Proposed Concept and Technology option
i User Interface It is proposed to construct at least 8 numbers of pour flush toilets in the college campus with 6 toilet seats for students and 2 toilet seats for staff members
The design of the toilet complex needs to be finalized in consultation with the college management and technical detailed feasibility study
ii Wastewater Collection and Conveyance
The wastewater from the proposed toilet complex is collected using the sewer pipes and conveyed to the treatment unit
iii Wastewater Treatment and Disposal
It is proposed to treat the wastewater in the improved septic tank
The effluent from the septic tank is a) further treated in the planted drain and discharged into the nearby drain or b) disposed in the dispersion trench
The possibility of disposal options needs to be explored during the detailed feasibility study and design stage.
iv Proposed concept
Road
Khal
Ap
roa
ch
Road
College building
College
build
ing
Toilet
complex
Proposed
Treatment
System
Planted drain
Open area
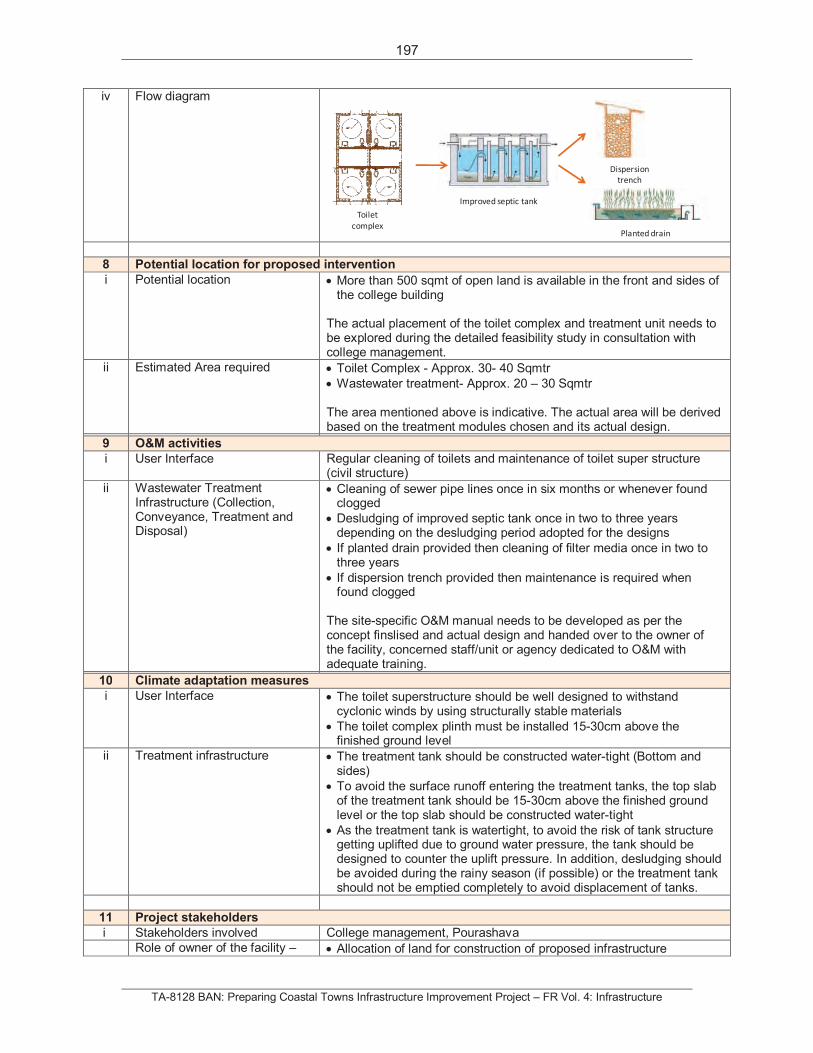
197
TA-8128 BAN: Preparing Coastal Towns Infrastructure Improvement Project – FR Vol. 4: Infrastructure
iv Flow diagram
8 Potential location for proposed intervention
i Potential location More than 500 sqmt of open land is available in the front and sides of the college building
The actual placement of the toilet complex and treatment unit needs to be explored during the detailed feasibility study in consultation with college management.
ii Estimated Area required Toilet Complex - Approx. 30- 40 Sqmtr
Wastewater treatment- Approx. 20 – 30 Sqmtr
The area mentioned above is indicative. The actual area will be derived based on the treatment modules chosen and its actual design.
9 O&M activities
i User Interface Regular cleaning of toilets and maintenance of toilet super structure (civil structure)
ii Wastewater Treatment Infrastructure (Collection, Conveyance, Treatment and Disposal)
Cleaning of sewer pipe lines once in six months or whenever found clogged
Desludging of improved septic tank once in two to three years depending on the desludging period adopted for the designs
If planted drain provided then cleaning of filter media once in two to three years
If dispersion trench provided then maintenance is required when found clogged
The site-specific O&M manual needs to be developed as per the concept finslised and actual design and handed over to the owner of the facility, concerned staff/unit or agency dedicated to O&M with adequate training.
10 Climate adaptation measures
i User Interface The toilet superstructure should be well designed to withstand cyclonic winds by using structurally stable materials
The toilet complex plinth must be installed 15-30cm above the finished ground level
ii Treatment infrastructure The treatment tank should be constructed water-tight (Bottom and sides)
To avoid the surface runoff entering the treatment tanks, the top slab of the treatment tank should be 15-30cm above the finished ground level or the top slab should be constructed water-tight
As the treatment tank is watertight, to avoid the risk of tank structure getting uplifted due to ground water pressure, the tank should be designed to counter the uplift pressure. In addition, desludging should be avoided during the rainy season (if possible) or the treatment tank should not be emptied completely to avoid displacement of tanks.
11 Project stakeholders
i Stakeholders involved College management, Pourashava
Role of owner of the facility – Allocation of land for construction of proposed infrastructure
Toilet
complex
Improved septic tank
Dispersion
trench
Planted drain
198
TA-8128 BAN: Preparing Coastal Towns Infrastructure Improvement Project – FR Vol. 4: Infrastructure
College Management Extend support for monitoring the construction progress and develop documentation
To carry out the regular and periodical maintenance of the toilet complex and wastewater treatment infrastructure as per the O&M activities mentioned in the Section – 9
Contribution of funds for construction of proposed sanitation infrastructure
Allocation of funds for carrying out the annual O&M
Role of Pourashava Tendering, selection of contractor and entering into the agreement with the selected contractor for construction of civil infrastructure proposed
May support college management with periodical O&M of the treatment infrastructure
Evaluate the project outcome at certain intervals and replicate the model in other similar areas if found successful
Role of NGO -
Role of CBO -
Role of private service provider Provide service for desludging of septic tank as and when requested
12 O&M frame work
i Brief description of proposed O&M framework
The regular operation and maintenance is the responsibility of the College management, however the Pourashava may support for periodical maintenance (like desludging)
It is proposed that the O&M framework, roles and responsibilities of the involved stakeholders needs to be clearly defined and needs to enter into the formal agreements before commencement of the project.
13 Estimated cost
i Capital investment Total cost- 22,750 – 31,500 USDToilet Complex – 13,750 – 18,000 USD Wastewater Treatment Infrastructure – 9,000 – 13,500 USD
ii O&M expenses Needs to be derived after finalization of concept and design
iii IEC related cost Posters, Education messages
iv Other expense 5-10% of the total construction cost needs to be allocated for miscellaneous expenses
14 Time frame
i Project preparation (detailed feasibility study, concept preparation and approval)
2-3 weeks
ii Technical design 4 - 6 weeks
iii Tendering and Contracting 6 – 8 weeks
iv Implementation 12 – 16 weeks
v Commissioning 1 week
The time frame mentioned above is indicative. Needs to be finalized in consultation with the involved stakeholders.
15 Awareness campaign
i Awareness needs To inform the students about the proposed sanitation system and its advantages
To inform the students about different hygiene practice and its relevance (hand washing, clean toilets)
To ensure timely O&M of the sanitation infrastructure
To ensure ownership, relevance and sustainability of the sanitation infrastructure
ii Mode of campaign Regularly conducting Health and Hygiene classes, poster presentation
iii Campaign stakeholders Teachers, NGO
iv Skills required NGO or Teachers trained with health and hygiene aspects

199
TA-8128 BAN: Preparing Coastal Towns Infrastructure Improvement Project – FR Vol. 4: Infrastructure
v Time frame At the planning stage, during the commissioning stage and thereafter at regular intervals
16 Project outcome
i Outcome/Benefits Safe management of human excreta including the confinement, treatment and disposal
Improved health and hygiene conditions
Clean environment
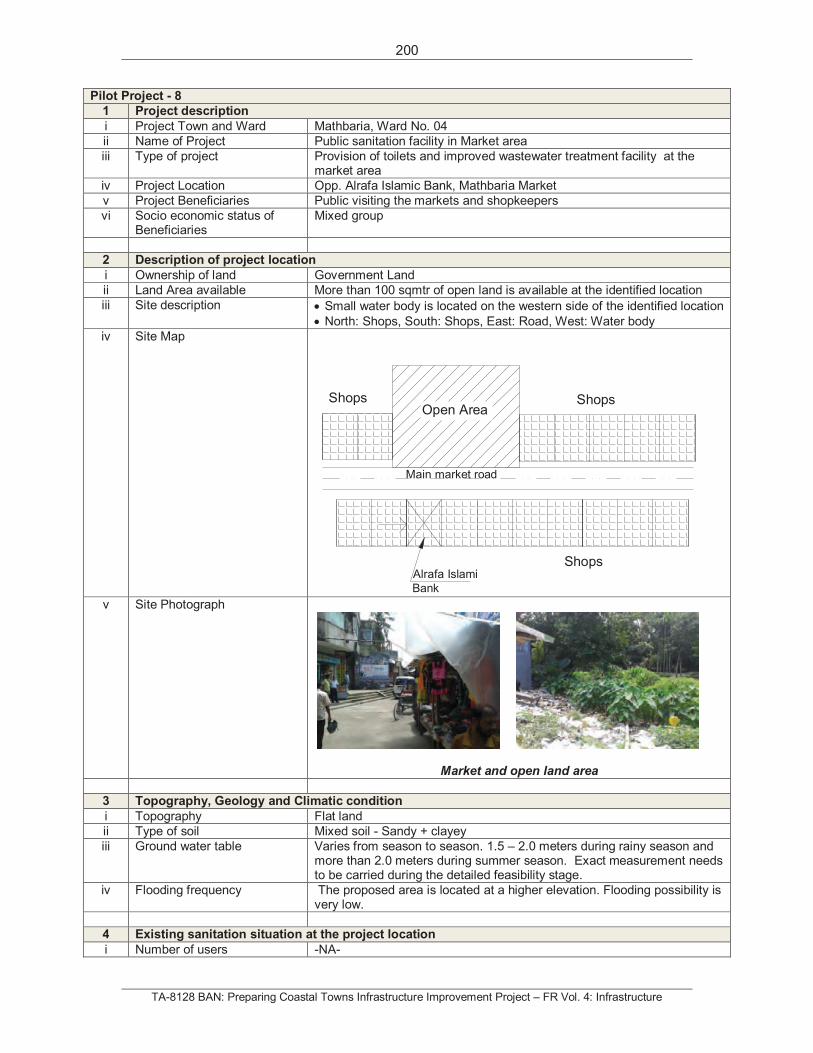
200
TA-8128 BAN: Preparing Coastal Towns Infrastructure Improvement Project – FR Vol. 4: Infrastructure
Pilot Project - 8
1 Project description
i Project Town and Ward Mathbaria, Ward No. 04
ii Name of Project Public sanitation facility in Market area
iii Type of project Provision of toilets and improved wastewater treatment facility at the market area
iv Project Location Opp. Alrafa Islamic Bank, Mathbaria Market
v Project Beneficiaries Public visiting the markets and shopkeepers
vi Socio economic status of Beneficiaries
Mixed group
2 Description of project location
i Ownership of land Government Land
ii Land Area available More than 100 sqmtr of open land is available at the identified location
iii Site description Small water body is located on the western side of the identified location
North: Shops, South: Shops, East: Road, West: Water body
iv Site Map
v Site Photograph
Market and open land area
3 Topography, Geology and Climatic condition
i Topography Flat land
ii Type of soil Mixed soil - Sandy + clayey
iii Ground water table Varies from season to season. 1.5 – 2.0 meters during rainy season and more than 2.0 meters during summer season. Exact measurement needs to be carried during the detailed feasibility stage.
iv Flooding frequency The proposed area is located at a higher elevation. Flooding possibility is very low.
4 Existing sanitation situation at the project location
i Number of users -NA-
Shops
Shops
ShopsOpen Area
Main market road
Alrafa Islami
Bank
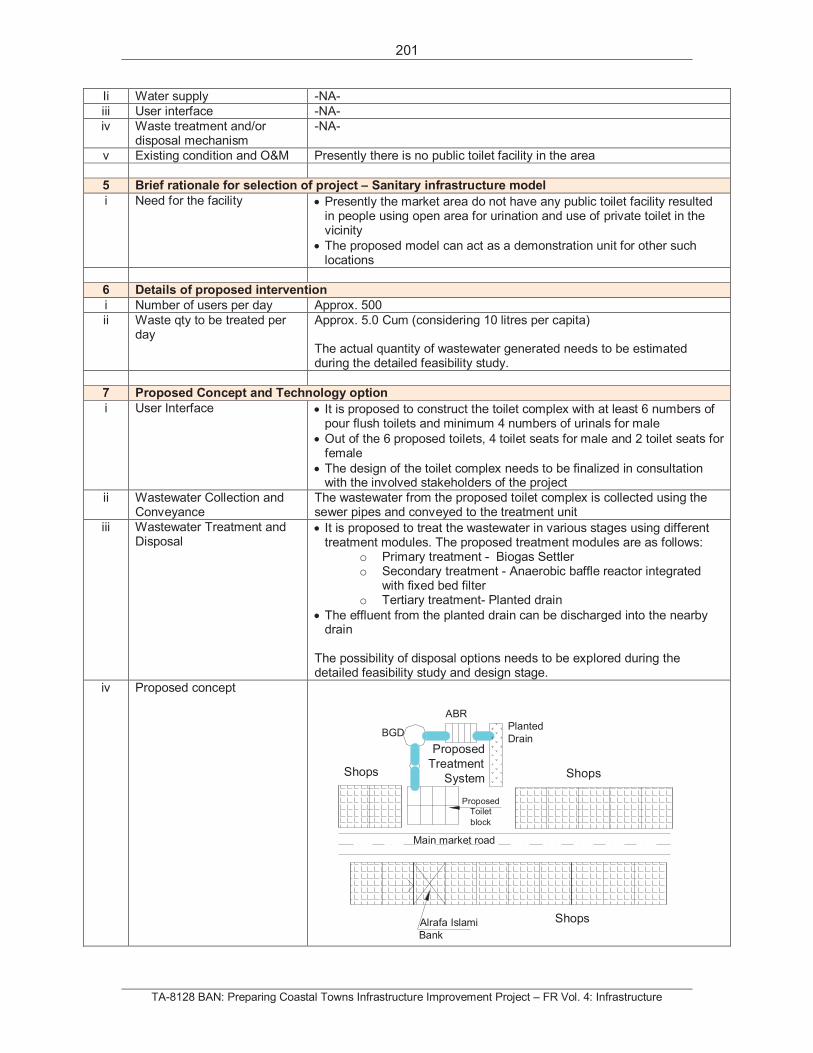
201
TA-8128 BAN: Preparing Coastal Towns Infrastructure Improvement Project – FR Vol. 4: Infrastructure
Ii Water supply -NA-
iii User interface -NA-
iv Waste treatment and/or disposal mechanism
-NA-
v Existing condition and O&M Presently there is no public toilet facility in the area
5 Brief rationale for selection of project – Sanitary infrastructure model
i Need for the facility Presently the market area do not have any public toilet facility resulted in people using open area for urination and use of private toilet in the vicinity
The proposed model can act as a demonstration unit for other such locations
6 Details of proposed intervention
i Number of users per day Approx. 500
ii Waste qty to be treated per day
Approx. 5.0 Cum (considering 10 litres per capita)
The actual quantity of wastewater generated needs to be estimated during the detailed feasibility study.
7 Proposed Concept and Technology option
i User Interface It is proposed to construct the toilet complex with at least 6 numbers of pour flush toilets and minimum 4 numbers of urinals for male
Out of the 6 proposed toilets, 4 toilet seats for male and 2 toilet seats for female
The design of the toilet complex needs to be finalized in consultation with the involved stakeholders of the project
ii Wastewater Collection and Conveyance
The wastewater from the proposed toilet complex is collected using the sewer pipes and conveyed to the treatment unit
iii Wastewater Treatment and Disposal
It is proposed to treat the wastewater in various stages using different treatment modules. The proposed treatment modules are as follows:
o Primary treatment - Biogas Settler o Secondary treatment - Anaerobic baffle reactor integrated
with fixed bed filter o Tertiary treatment- Planted drain
The effluent from the planted drain can be discharged into the nearby drain
The possibility of disposal options needs to be explored during the detailed feasibility study and design stage.
iv Proposed concept
ShopsShops
Main market road
ProposedToilet
block
BGD
ABRPlanted
Drain
ShopsAlrafa Islami
Bank
Proposed
Treatment
System
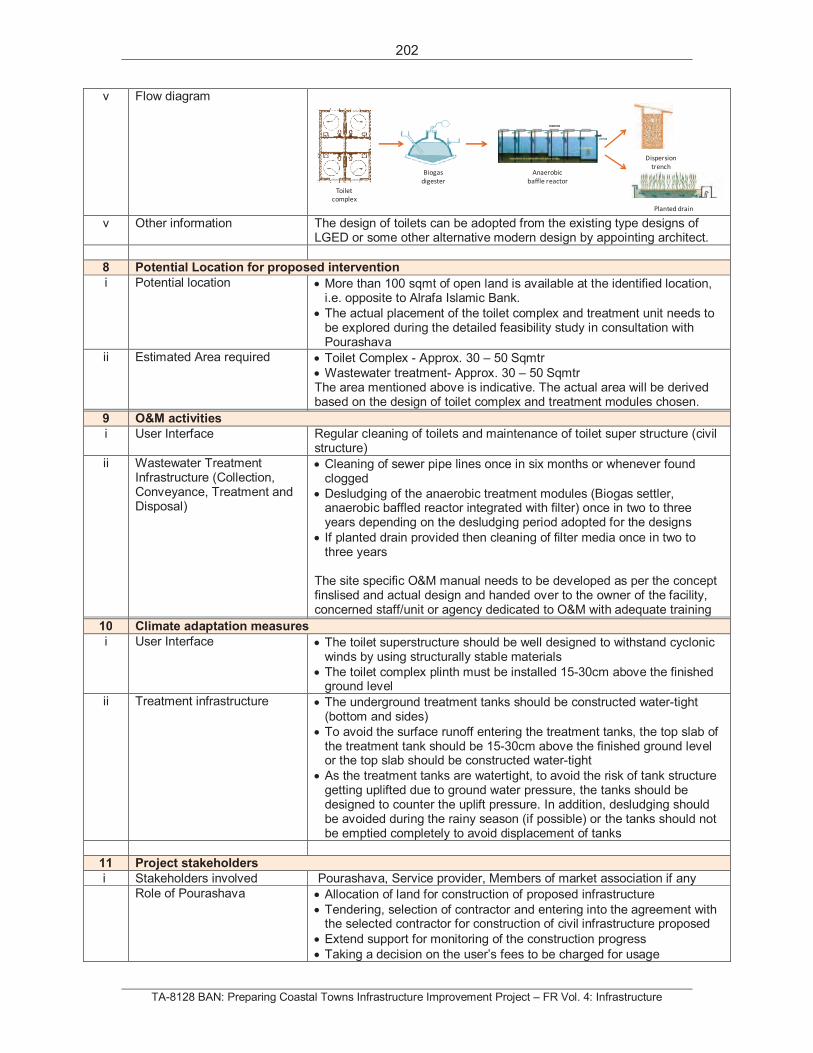
202
TA-8128 BAN: Preparing Coastal Towns Infrastructure Improvement Project – FR Vol. 4: Infrastructure
v Flow diagram
v Other information The design of toilets can be adopted from the existing type designs of LGED or some other alternative modern design by appointing architect.
8 Potential Location for proposed intervention
i Potential location More than 100 sqmt of open land is available at the identified location, i.e. opposite to Alrafa Islamic Bank.
The actual placement of the toilet complex and treatment unit needs to be explored during the detailed feasibility study in consultation with Pourashava
ii Estimated Area required Toilet Complex - Approx. 30 – 50 Sqmtr
Wastewater treatment- Approx. 30 – 50 Sqmtr The area mentioned above is indicative. The actual area will be derived based on the design of toilet complex and treatment modules chosen.
9 O&M activities
i User Interface Regular cleaning of toilets and maintenance of toilet super structure (civil structure)
ii Wastewater Treatment Infrastructure (Collection, Conveyance, Treatment and Disposal)
Cleaning of sewer pipe lines once in six months or whenever found clogged
Desludging of the anaerobic treatment modules (Biogas settler, anaerobic baffled reactor integrated with filter) once in two to three years depending on the desludging period adopted for the designs
If planted drain provided then cleaning of filter media once in two to three years
The site specific O&M manual needs to be developed as per the concept finslised and actual design and handed over to the owner of the facility, concerned staff/unit or agency dedicated to O&M with adequate training
10 Climate adaptation measures
i User Interface The toilet superstructure should be well designed to withstand cyclonic winds by using structurally stable materials
The toilet complex plinth must be installed 15-30cm above the finished ground level
ii Treatment infrastructure The underground treatment tanks should be constructed water-tight (bottom and sides)
To avoid the surface runoff entering the treatment tanks, the top slab of the treatment tank should be 15-30cm above the finished ground level or the top slab should be constructed water-tight
As the treatment tanks are watertight, to avoid the risk of tank structure getting uplifted due to ground water pressure, the tanks should be designed to counter the uplift pressure. In addition, desludging should be avoided during the rainy season (if possible) or the tanks should not be emptied completely to avoid displacement of tanks
11 Project stakeholders
i Stakeholders involved Pourashava, Service provider, Members of market association if any
Role of Pourashava Allocation of land for construction of proposed infrastructure
Tendering, selection of contractor and entering into the agreement with the selected contractor for construction of civil infrastructure proposed
Extend support for monitoring of the construction progress
Taking a decision on the user’s fees to be charged for usage
Toilet
complex
Biogas
digester
Anaerobic
baffle reactor
Dispersion
trench
Planted drain
203
TA-8128 BAN: Preparing Coastal Towns Infrastructure Improvement Project – FR Vol. 4: Infrastructure
Shall enter into an agreement with the service provider for operation and maintenance of the toilet complex and treatment infrastructure as per the procedures for the defined period. Clear scope of work of each of the involved parties and financial arrangements should be detailed in the agreement
Carry out a) major rectification works of the toilet complex and treatment infrastructure from time to time
Provision of electrical and water supply for the toilet complex
Define monitoring framework and assign dedicated staff for inspection of the toilet complex from time to time to ensure that the toilet complex and treatment unit is operated and maintained as per the guidelines provided and provide detailed report to service provider with the clear instruction and direction for improvements, rectification etc.
Evaluate the project outcome at certain intervals and replicate the model in other similar areas if found successful
Support service provider in case of any hindrance or trouble is created by the inhabitants or anti social elements in the operation and maintenance of toilet block
Necessitate action against service provider if the service provider do not meet the specified O&M requirements
Can also provide the advertisement rights on the walls of the toilets block as a revenue model
Role of Service provider Shall enter into an agreement with the Pourashava for operation and maintenance of the toilet complex and treatment infrastructure as per the guidelines provided
Shall operate and maintain the toilets complex (clean and hygienic) on ‘Pay and Use’ as per the user fee decided by the Pourashava
Regular maintenance and carry out the day to day repair works
Regular and periodical maintenance of treatment infrastructure as mentioned in Section -9
Ensure continuous serviceability of the toilet complex as per the time frame agreed with Pourashava during the agreement period
Allocation of funds for carrying out the regular and periodical O&M
Monthly bill payment for the usage of water and electricity
Shall maintain inventory of the fittings installed at the premises making them operative for public use at the time of taking over of complex and hand over the same in good condition after completion of agreement period
Organise to carry out minor repairs and improvement measures as pointed out by the authorized officials/officers during the inspection of the toilet premises
Role of Market Association Regular monitoring of the toilet complex for cleanliness and maintenance and report to Pourashava
To be part of the decision making process while fixing the user fee for usage of the facility
Support the service provider for better management of the toilet complex
Pay and use the toilet facilities
12 O&M frame work
i Brief description of proposed O&M framework
It is proposed that Pourashava appoint and enter into agreement with the service provider for management (operation and maintenance) of the toilet complex and the treatment infrastructure.
It is proposed that the O&M framework and roles and responsibilities of the involved stakeholders needs to be clearly defined and needs to enter into the formal agreements before commencement of the project.
13 Estimated cost
i Capital investment Total Cost – 32,000 – 41,000 USD
204
TA-8128 BAN: Preparing Coastal Towns Infrastructure Improvement Project – FR Vol. 4: Infrastructure
Toilet Complex – 18,250 – 22,750 USD Wastewater Treatment Infrastructure – 13750 – 18,250 USD
ii O&M expenses Needs to be derived after finalization of concept and design
iii IEC related cost Posters, Education message board
iv Other expense 5-10% of the total construction cost needs to be allocated for miscellaneous expenses
14 Time frame
i Project preparation (feasibility study, concept preparation and approval)
2-4 weeks
ii Technical design 6-8 weeks
iii Tendering and Contracting 6- 8 weeks
iv Implementation 24 – 32 weeks
v Commissioning 1 week
The time frame mentioned above is indicative. Needs to be finalized in consultation with the involved stakeholders
15 Awareness campaign
i Awareness needs To train service provider for operation and maintenance of the toilet complex and treatment infrastructure
To persuade the user to do their part ii Mode of campaign Training, Posters, Public education messages
iii Campaign stakeholders NGO, Pourashava, Market association
iv Skills required NGO and technical experts with sanitation background
v Time frame During the commissioning stage
16 Project outcome
i Outcome/Benefits Increased and improved access to clean sanitation facility
Safe management of human excreta including the confinement, treatment and disposal
Improved health and hygiene conditions
Clean environment
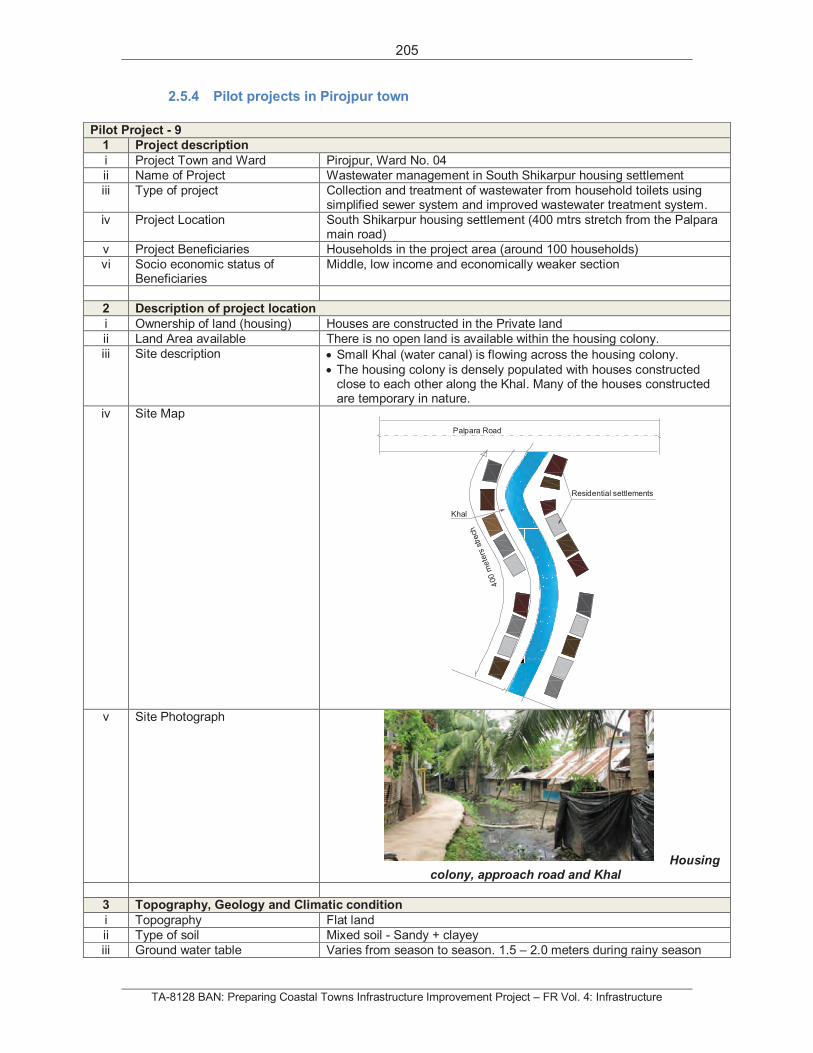
205
TA-8128 BAN: Preparing Coastal Towns Infrastructure Improvement Project – FR Vol. 4: Infrastructure
2.5.4 Pilot projects in Pirojpur town
Pilot Project - 9
1 Project description
i Project Town and Ward Pirojpur, Ward No. 04
ii Name of Project Wastewater management in South Shikarpur housing settlement
iii Type of project Collection and treatment of wastewater from household toilets using simplified sewer system and improved wastewater treatment system.
iv Project Location South Shikarpur housing settlement (400 mtrs stretch from the Palpara main road)
v Project Beneficiaries Households in the project area (around 100 households)
vi Socio economic status of Beneficiaries
Middle, low income and economically weaker section
2 Description of project location
i Ownership of land (housing) Houses are constructed in the Private land
ii Land Area available There is no open land is available within the housing colony.
iii Site description Small Khal (water canal) is flowing across the housing colony.
The housing colony is densely populated with houses constructed close to each other along the Khal. Many of the houses constructed are temporary in nature.
iv Site Map
v Site Photograph
Housing colony, approach road and Khal
3 Topography, Geology and Climatic condition
i Topography Flat land
ii Type of soil Mixed soil - Sandy + clayey
iii Ground water table Varies from season to season. 1.5 – 2.0 meters during rainy season
Palpara Road
Residential settlements
Khal
400
mete
rsst
rech
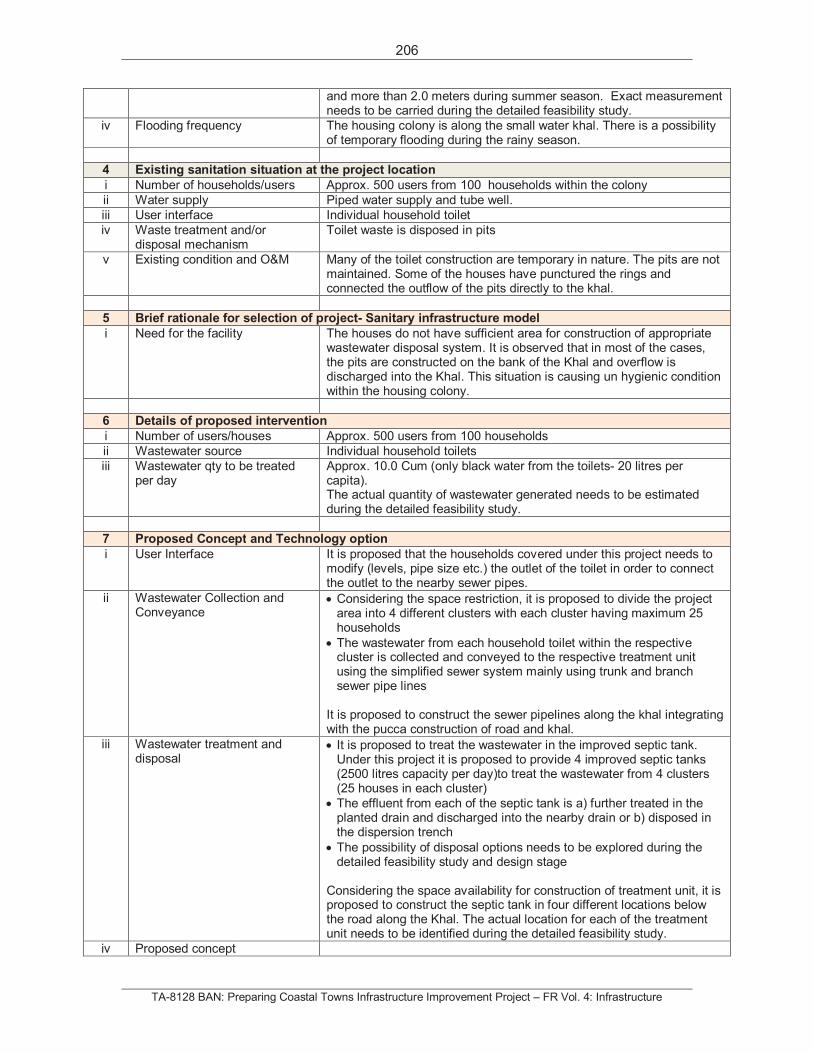
206
TA-8128 BAN: Preparing Coastal Towns Infrastructure Improvement Project – FR Vol. 4: Infrastructure
and more than 2.0 meters during summer season. Exact measurement needs to be carried during the detailed feasibility study.
iv Flooding frequency The housing colony is along the small water khal. There is a possibility of temporary flooding during the rainy season.
4 Existing sanitation situation at the project location
i Number of households/users Approx. 500 users from 100 households within the colony
ii Water supply Piped water supply and tube well.
iii User interface Individual household toilet
iv Waste treatment and/or disposal mechanism
Toilet waste is disposed in pits
v Existing condition and O&M Many of the toilet construction are temporary in nature. The pits are not maintained. Some of the houses have punctured the rings and connected the outflow of the pits directly to the khal.
5 Brief rationale for selection of project- Sanitary infrastructure model
i Need for the facility The houses do not have sufficient area for construction of appropriate wastewater disposal system. It is observed that in most of the cases, the pits are constructed on the bank of the Khal and overflow is discharged into the Khal. This situation is causing un hygienic condition within the housing colony.
6 Details of proposed intervention
i Number of users/houses Approx. 500 users from 100 households
ii Wastewater source Individual household toilets
iii Wastewater qty to be treated per day
Approx. 10.0 Cum (only black water from the toilets- 20 litres per capita). The actual quantity of wastewater generated needs to be estimated during the detailed feasibility study.
7 Proposed Concept and Technology option
i User Interface It is proposed that the households covered under this project needs to modify (levels, pipe size etc.) the outlet of the toilet in order to connect the outlet to the nearby sewer pipes.
ii Wastewater Collection and Conveyance
Considering the space restriction, it is proposed to divide the project area into 4 different clusters with each cluster having maximum 25 households
The wastewater from each household toilet within the respective cluster is collected and conveyed to the respective treatment unit using the simplified sewer system mainly using trunk and branch sewer pipe lines
It is proposed to construct the sewer pipelines along the khal integrating with the pucca construction of road and khal.
iii Wastewater treatment and disposal
It is proposed to treat the wastewater in the improved septic tank. Under this project it is proposed to provide 4 improved septic tanks (2500 litres capacity per day)to treat the wastewater from 4 clusters (25 houses in each cluster)
The effluent from each of the septic tank is a) further treated in the planted drain and discharged into the nearby drain or b) disposed in the dispersion trench
The possibility of disposal options needs to be explored during the detailed feasibility study and design stage
Considering the space availability for construction of treatment unit, it is proposed to construct the septic tank in four different locations below the road along the Khal. The actual location for each of the treatment unit needs to be identified during the detailed feasibility study.
iv Proposed concept
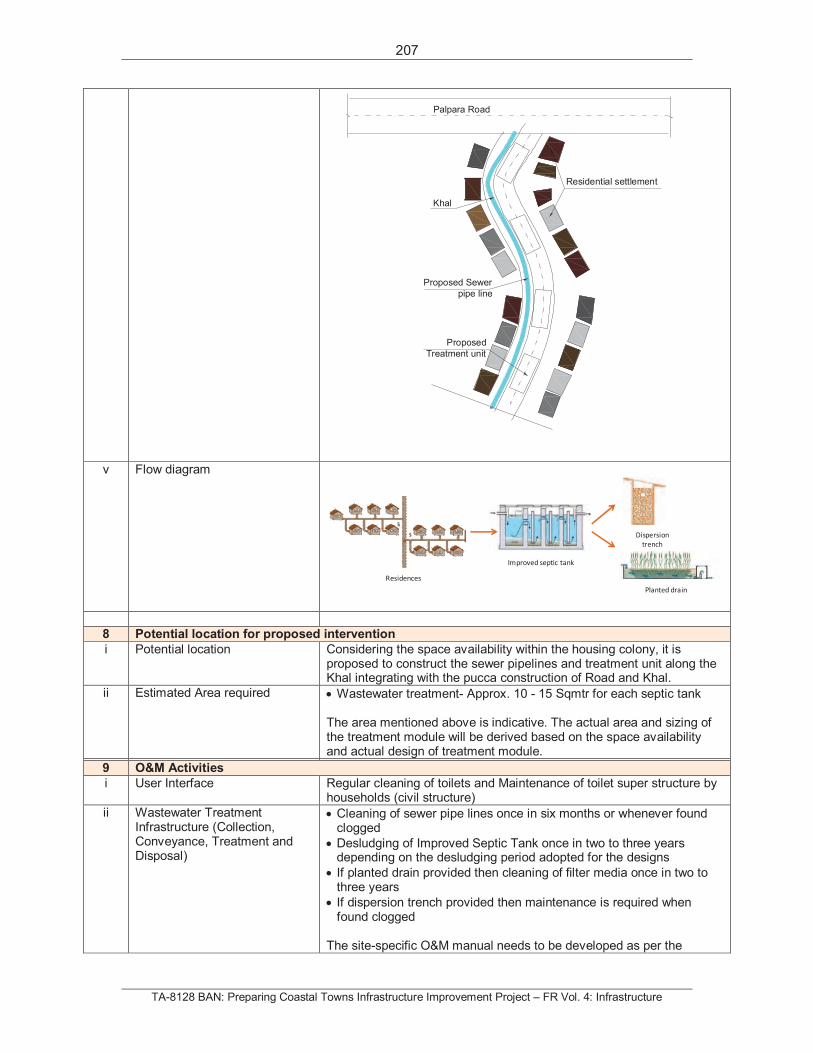
207
TA-8128 BAN: Preparing Coastal Towns Infrastructure Improvement Project – FR Vol. 4: Infrastructure
v Flow diagram
8 Potential location for proposed intervention
i Potential location Considering the space availability within the housing colony, it is proposed to construct the sewer pipelines and treatment unit along the Khal integrating with the pucca construction of Road and Khal.
ii Estimated Area required Wastewater treatment- Approx. 10 - 15 Sqmtr for each septic tank
The area mentioned above is indicative. The actual area and sizing of the treatment module will be derived based on the space availability and actual design of treatment module.
9 O&M Activities
i User Interface Regular cleaning of toilets and Maintenance of toilet super structure by households (civil structure)
ii Wastewater Treatment Infrastructure (Collection, Conveyance, Treatment and Disposal)
Cleaning of sewer pipe lines once in six months or whenever found clogged
Desludging of Improved Septic Tank once in two to three years depending on the desludging period adopted for the designs
If planted drain provided then cleaning of filter media once in two to three years
If dispersion trench provided then maintenance is required when found clogged
The site-specific O&M manual needs to be developed as per the
Palpara Road
Residential settlement
Khal
Proposed Sewer
pipe line
Proposed
Treatment unit
Residences
Improved septic tank
Dispersion
trench
Planted drain
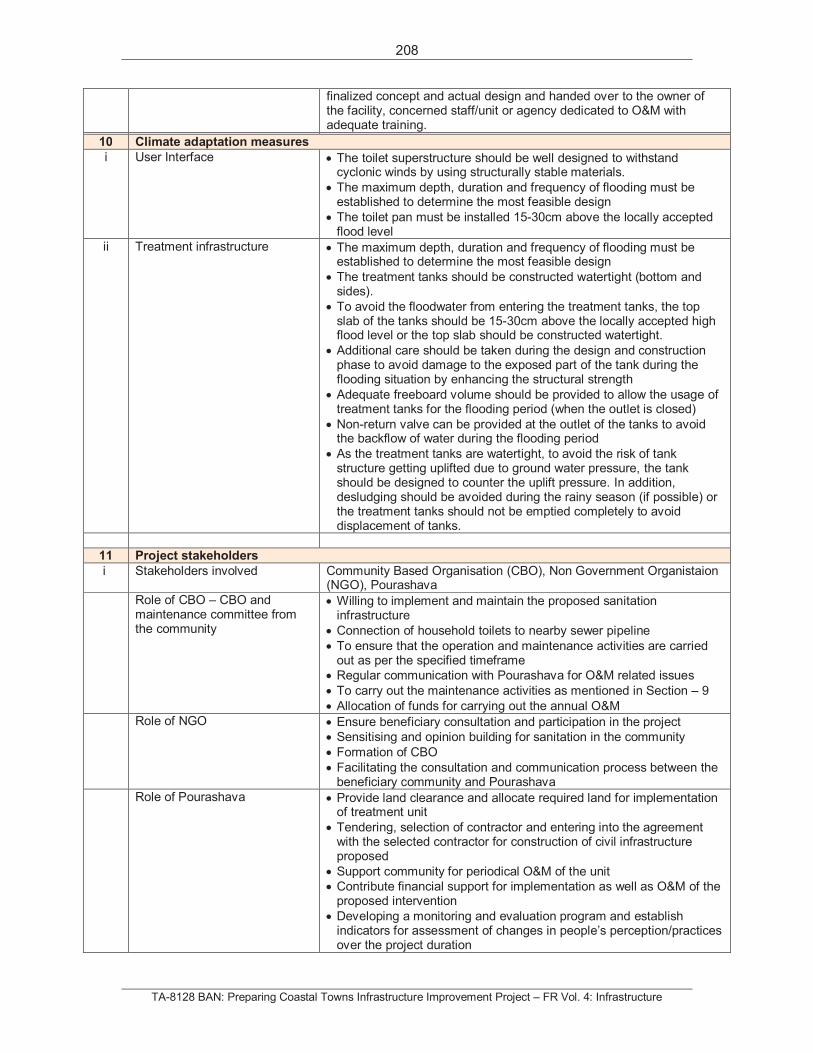
208
TA-8128 BAN: Preparing Coastal Towns Infrastructure Improvement Project – FR Vol. 4: Infrastructure
finalized concept and actual design and handed over to the owner of the facility, concerned staff/unit or agency dedicated to O&M with adequate training.
10 Climate adaptation measures
i User Interface The toilet superstructure should be well designed to withstand cyclonic winds by using structurally stable materials.
The maximum depth, duration and frequency of flooding must be established to determine the most feasible design
The toilet pan must be installed 15-30cm above the locally accepted flood level
ii Treatment infrastructure The maximum depth, duration and frequency of flooding must be established to determine the most feasible design
The treatment tanks should be constructed watertight (bottom and sides).
To avoid the floodwater from entering the treatment tanks, the top slab of the tanks should be 15-30cm above the locally accepted high flood level or the top slab should be constructed watertight.
Additional care should be taken during the design and construction phase to avoid damage to the exposed part of the tank during the flooding situation by enhancing the structural strength
Adequate freeboard volume should be provided to allow the usage of treatment tanks for the flooding period (when the outlet is closed)
Non-return valve can be provided at the outlet of the tanks to avoid the backflow of water during the flooding period
As the treatment tanks are watertight, to avoid the risk of tank structure getting uplifted due to ground water pressure, the tank should be designed to counter the uplift pressure. In addition, desludging should be avoided during the rainy season (if possible) or the treatment tanks should not be emptied completely to avoid displacement of tanks.
11 Project stakeholders
i Stakeholders involved Community Based Organisation (CBO), Non Government Organistaion (NGO), Pourashava
Role of CBO – CBO and maintenance committee from the community
Willing to implement and maintain the proposed sanitation infrastructure
Connection of household toilets to nearby sewer pipeline
To ensure that the operation and maintenance activities are carried out as per the specified timeframe
Regular communication with Pourashava for O&M related issues
To carry out the maintenance activities as mentioned in Section – 9
Allocation of funds for carrying out the annual O&M
Role of NGO Ensure beneficiary consultation and participation in the project
Sensitising and opinion building for sanitation in the community
Formation of CBO
Facilitating the consultation and communication process between the beneficiary community and Pourashava
Role of Pourashava Provide land clearance and allocate required land for implementation of treatment unit
Tendering, selection of contractor and entering into the agreement with the selected contractor for construction of civil infrastructure proposed
Support community for periodical O&M of the unit
Contribute financial support for implementation as well as O&M of the proposed intervention
Developing a monitoring and evaluation program and establish indicators for assessment of changes in people’s perception/practices over the project duration
209
TA-8128 BAN: Preparing Coastal Towns Infrastructure Improvement Project – FR Vol. 4: Infrastructure
Evaluate the project outcome at certain intervals and replicate the model in other similar areas if found successful
12 O&M frame work
i Brief description of proposed O&M framework
The regular operation and maintenance is the responsibility of the CBO or maintenance committee formed by the local community, however Pourashava may support for the periodical maintenance (like desludging, repair of civil structure and major repair of sewer pipelines)
The framework proposed above is indicative. The actual arrangements or framework needs to be finalized in consultation with the beneficiary community and Pourashava
It is proposed that the O&M framework and roles and responsibilities of the involved stakeholders needs to be clearly defined and needs to enter into the formal agreements before commencement of the project.
13 Estimated cost
i Capital investment - Hardware Total cost – 111,500 – 118,500 USDSimplified Sewer System – 78,500 – 82,000 USD Wastewater Treatment Infrastructure – 33,000 – 36,500 USD
ii Capital expenditure – Software (IEC related cost)
Appointment of NGO
Community preparation
Conducting sensitization workshop
Organising meetings with involved stakeholders
Development of IEC material
O&M training to the CBO iii O&M expenses Needs to be derived after finalization of concept and design
iv Other expense 5-10% of the total construction cost needs to be allocated for miscellaneous expenses
14 Time frame
i Project preparation - Social and technical ( like community preparation, detailed feasibility study, concept preparation and approval)
8-12 weeks
ii Technical design 6- 8 weeks
iii Tendering and Contracting 8 -12 weeks
iv Implementation 24 – 30 weeks
v Commissioning 1 week
The time frame mentioned above is indicative. Needs to be finalized in consultation with the involved stakeholders.
15 Awareness campaign
i Awareness needs To sensitize the beneficiary community about the proposed sanitation project and its advantages
To inform the needs of regular O&M of the sanitation infrastructure
To promote community based construction and maintenance of sanitation infrastructure
To ensure ownership, relevance and sustainability of the Sanitation infrastructure
ii Mode of campaign Exposure visits
Posters and Brochures
Direct interactions
Street play, drama, painting competition iii Campaign Stakeholders Non Government Organisation
Ward councilors
Pourashava and sanitation department
210
TA-8128 BAN: Preparing Coastal Towns Infrastructure Improvement Project – FR Vol. 4: Infrastructure
Community Based Organisation or Self Help Groups
iv Skills required A Hygiene and Sanitation Specialist
Qualified locally based NGO with field teams
v Time frame At least for six months during one year of implementation period
16 Project outcome
i Outcome/Benefits Safe management of human excreta including the confinement, treatment and disposal
Improved hygiene behaviour practices thereby reducing transmission of diseases
Clean environment
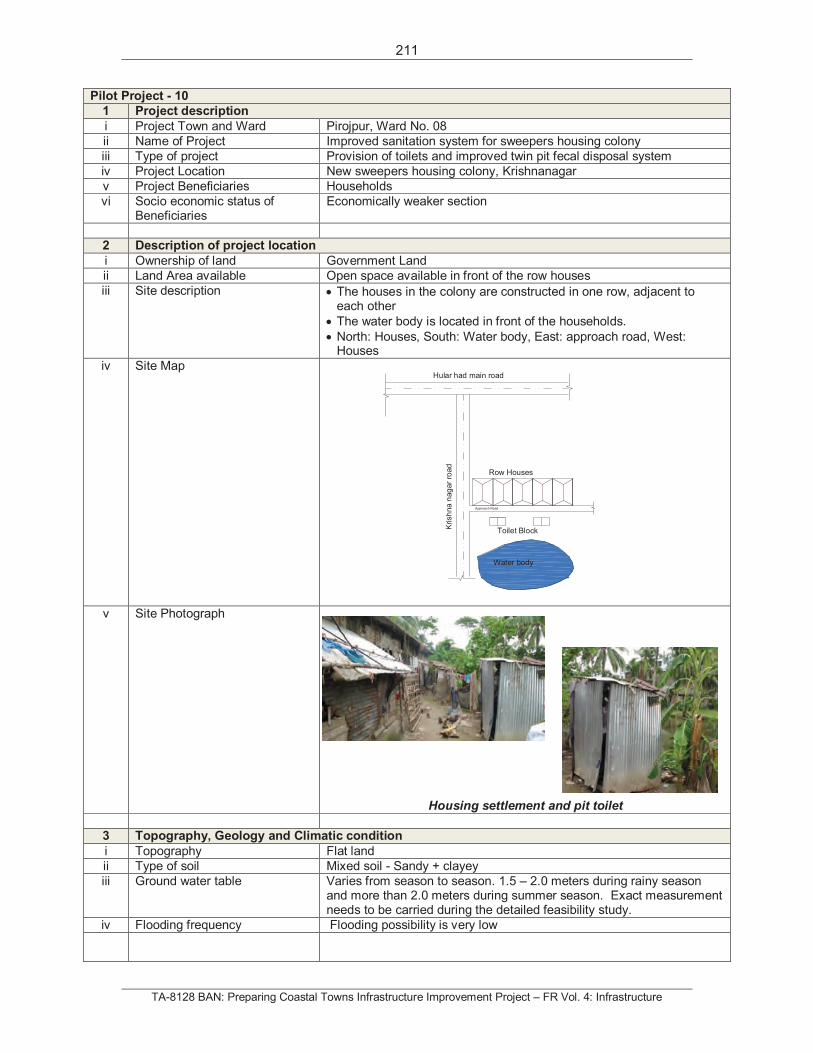
211
TA-8128 BAN: Preparing Coastal Towns Infrastructure Improvement Project – FR Vol. 4: Infrastructure
Pilot Project - 10
1 Project description
i Project Town and Ward Pirojpur, Ward No. 08
ii Name of Project Improved sanitation system for sweepers housing colony
iii Type of project Provision of toilets and improved twin pit fecal disposal system
iv Project Location New sweepers housing colony, Krishnanagar
v Project Beneficiaries Households
vi Socio economic status of Beneficiaries
Economically weaker section
2 Description of project location
i Ownership of land Government Land
ii Land Area available Open space available in front of the row houses
iii Site description The houses in the colony are constructed in one row, adjacent to each other
The water body is located in front of the households.
North: Houses, South: Water body, East: approach road, West: Houses
iv Site Map
v Site Photograph
Housing settlement and pit toilet
3 Topography, Geology and Climatic condition
i Topography Flat land
ii Type of soil Mixed soil - Sandy + clayey
iii Ground water table Varies from season to season. 1.5 – 2.0 meters during rainy season and more than 2.0 meters during summer season. Exact measurement needs to be carried during the detailed feasibility study.
iv Flooding frequency Flooding possibility is very low
Row Houses
Water body
Toilet BlockKrish
na
nag
ar
road
Hular had main road
Approach Road
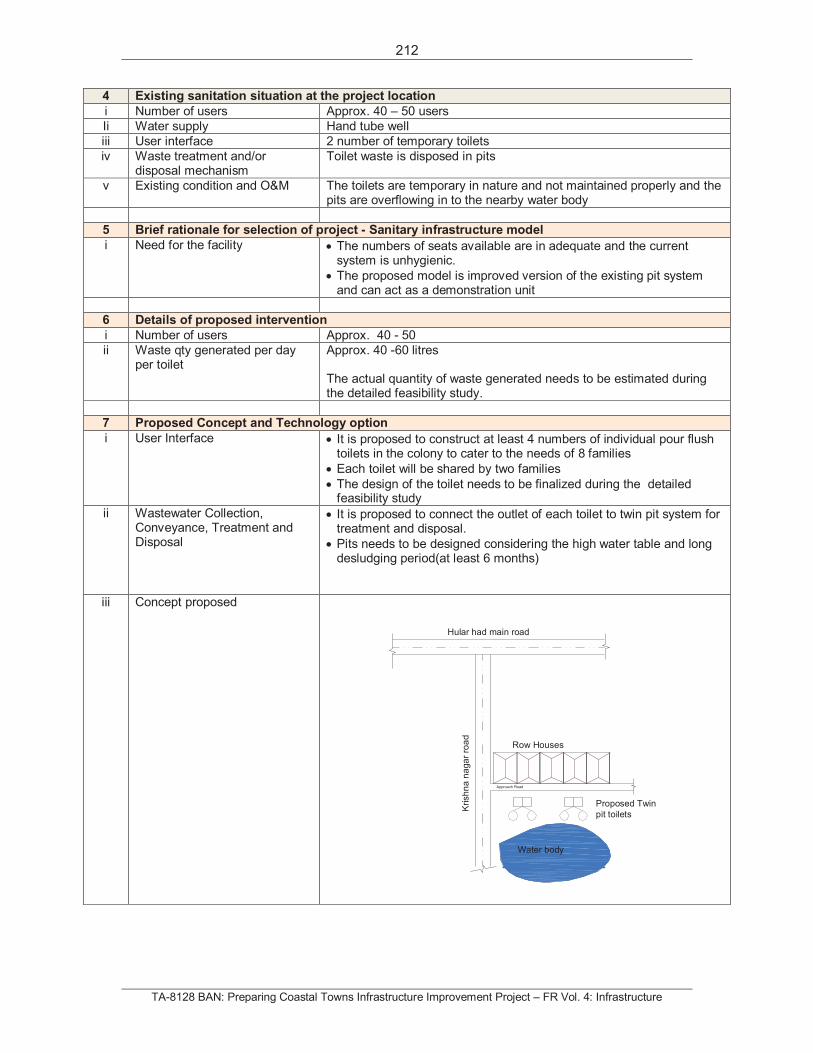
212
TA-8128 BAN: Preparing Coastal Towns Infrastructure Improvement Project – FR Vol. 4: Infrastructure
4 Existing sanitation situation at the project location
i Number of users Approx. 40 – 50 users
Ii Water supply Hand tube well
iii User interface 2 number of temporary toilets
iv Waste treatment and/or disposal mechanism
Toilet waste is disposed in pits
v Existing condition and O&M The toilets are temporary in nature and not maintained properly and the pits are overflowing in to the nearby water body
5 Brief rationale for selection of project - Sanitary infrastructure model
i Need for the facility The numbers of seats available are in adequate and the current system is unhygienic.
The proposed model is improved version of the existing pit system and can act as a demonstration unit
6 Details of proposed intervention
i Number of users Approx. 40 - 50
ii Waste qty generated per day per toilet
Approx. 40 -60 litres
The actual quantity of waste generated needs to be estimated during the detailed feasibility study.
7 Proposed Concept and Technology option
i User Interface It is proposed to construct at least 4 numbers of individual pour flush toilets in the colony to cater to the needs of 8 families
Each toilet will be shared by two families
The design of the toilet needs to be finalized during the detailed feasibility study
ii Wastewater Collection, Conveyance, Treatment and Disposal
It is proposed to connect the outlet of each toilet to twin pit system for treatment and disposal.
Pits needs to be designed considering the high water table and long desludging period(at least 6 months)
iii Concept proposed
Row Houses
Water body
Proposed Twin
pit toilets
Krish
na
na
ga
rro
ad
Hular had main road
Approach Road
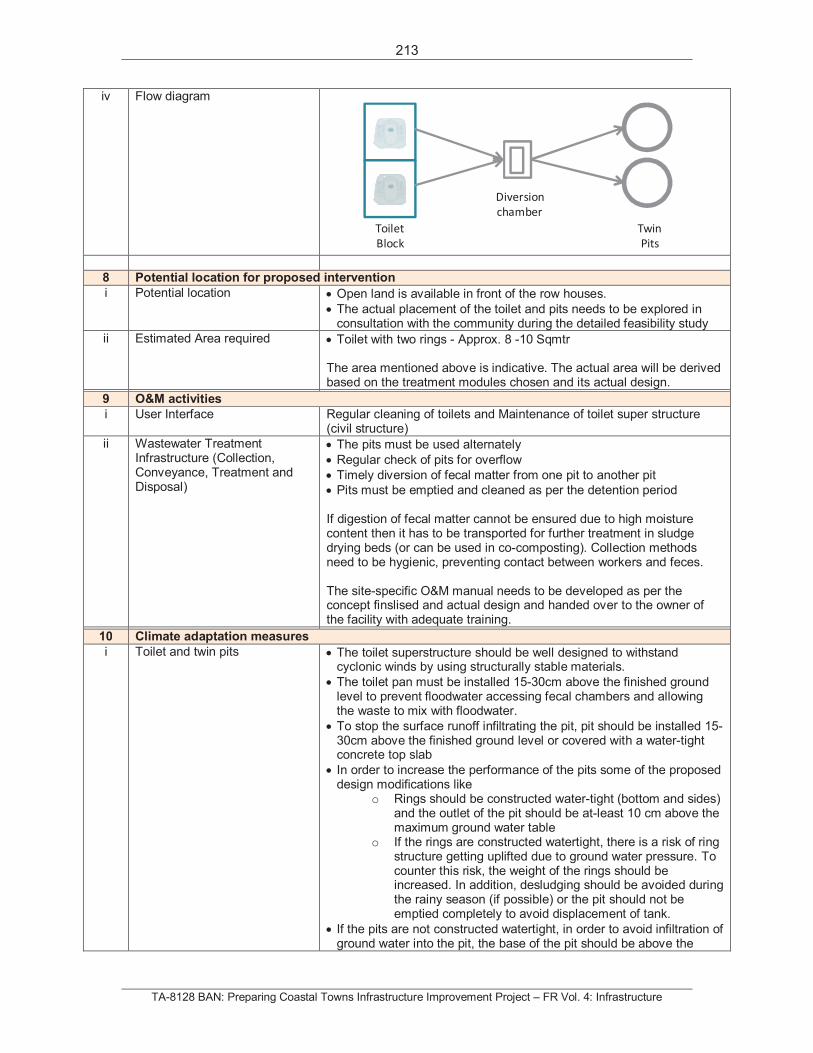
213
TA-8128 BAN: Preparing Coastal Towns Infrastructure Improvement Project – FR Vol. 4: Infrastructure
iv Flow diagram
8 Potential location for proposed intervention
i Potential location Open land is available in front of the row houses.
The actual placement of the toilet and pits needs to be explored in consultation with the community during the detailed feasibility study
ii Estimated Area required Toilet with two rings - Approx. 8 -10 Sqmtr
The area mentioned above is indicative. The actual area will be derived based on the treatment modules chosen and its actual design.
9 O&M activities
i User Interface Regular cleaning of toilets and Maintenance of toilet super structure (civil structure)
ii Wastewater Treatment Infrastructure (Collection, Conveyance, Treatment and Disposal)
The pits must be used alternately
Regular check of pits for overflow
Timely diversion of fecal matter from one pit to another pit
Pits must be emptied and cleaned as per the detention period
If digestion of fecal matter cannot be ensured due to high moisture content then it has to be transported for further treatment in sludge drying beds (or can be used in co-composting). Collection methods need to be hygienic, preventing contact between workers and feces.
The site-specific O&M manual needs to be developed as per the concept finslised and actual design and handed over to the owner of the facility with adequate training.
10 Climate adaptation measures
i Toilet and twin pits The toilet superstructure should be well designed to withstand cyclonic winds by using structurally stable materials.
The toilet pan must be installed 15-30cm above the finished ground level to prevent floodwater accessing fecal chambers and allowing the waste to mix with floodwater.
To stop the surface runoff infiltrating the pit, pit should be installed 15-30cm above the finished ground level or covered with a water-tight concrete top slab
In order to increase the performance of the pits some of the proposed design modifications like
o Rings should be constructed water-tight (bottom and sides) and the outlet of the pit should be at-least 10 cm above the maximum ground water table
o If the rings are constructed watertight, there is a risk of ring structure getting uplifted due to ground water pressure. To counter this risk, the weight of the rings should be increased. In addition, desludging should be avoided during the rainy season (if possible) or the pit should not be emptied completely to avoid displacement of tank.
If the pits are not constructed watertight, in order to avoid infiltration of ground water into the pit, the base of the pit should be above the
Toilet
Block
Diversion
chamber
Twin
Pits
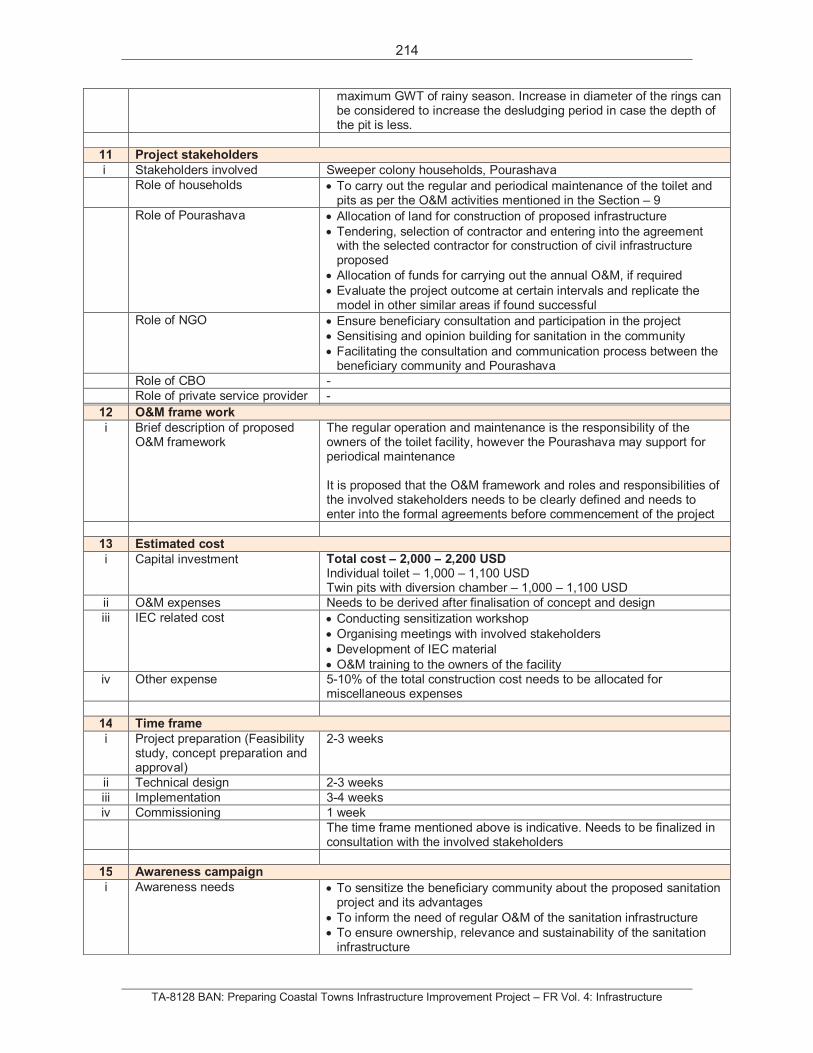
214
TA-8128 BAN: Preparing Coastal Towns Infrastructure Improvement Project – FR Vol. 4: Infrastructure
maximum GWT of rainy season. Increase in diameter of the rings can be considered to increase the desludging period in case the depth of the pit is less.
11 Project stakeholders
i Stakeholders involved Sweeper colony households, Pourashava
Role of households To carry out the regular and periodical maintenance of the toilet and pits as per the O&M activities mentioned in the Section – 9
Role of Pourashava Allocation of land for construction of proposed infrastructure
Tendering, selection of contractor and entering into the agreement with the selected contractor for construction of civil infrastructure proposed
Allocation of funds for carrying out the annual O&M, if required
Evaluate the project outcome at certain intervals and replicate the model in other similar areas if found successful
Role of NGO Ensure beneficiary consultation and participation in the project
Sensitising and opinion building for sanitation in the community
Facilitating the consultation and communication process between the beneficiary community and Pourashava
Role of CBO -
Role of private service provider -
12 O&M frame work
i Brief description of proposed O&M framework
The regular operation and maintenance is the responsibility of the owners of the toilet facility, however the Pourashava may support for periodical maintenance
It is proposed that the O&M framework and roles and responsibilities of the involved stakeholders needs to be clearly defined and needs to enter into the formal agreements before commencement of the project
13 Estimated cost
i Capital investment Total cost – 2,000 – 2,200 USDIndividual toilet – 1,000 – 1,100 USD Twin pits with diversion chamber – 1,000 – 1,100 USD
ii O&M expenses Needs to be derived after finalisation of concept and design
iii IEC related cost Conducting sensitization workshop
Organising meetings with involved stakeholders
Development of IEC material
O&M training to the owners of the facility iv Other expense 5-10% of the total construction cost needs to be allocated for
miscellaneous expenses
14 Time frame
i Project preparation (Feasibility study, concept preparation and approval)
2-3 weeks
ii Technical design 2-3 weeks
iii Implementation 3-4 weeks
iv Commissioning 1 week
The time frame mentioned above is indicative. Needs to be finalized in consultation with the involved stakeholders
15 Awareness campaign
i Awareness needs To sensitize the beneficiary community about the proposed sanitation project and its advantages
To inform the need of regular O&M of the sanitation infrastructure
To ensure ownership, relevance and sustainability of the sanitation infrastructure
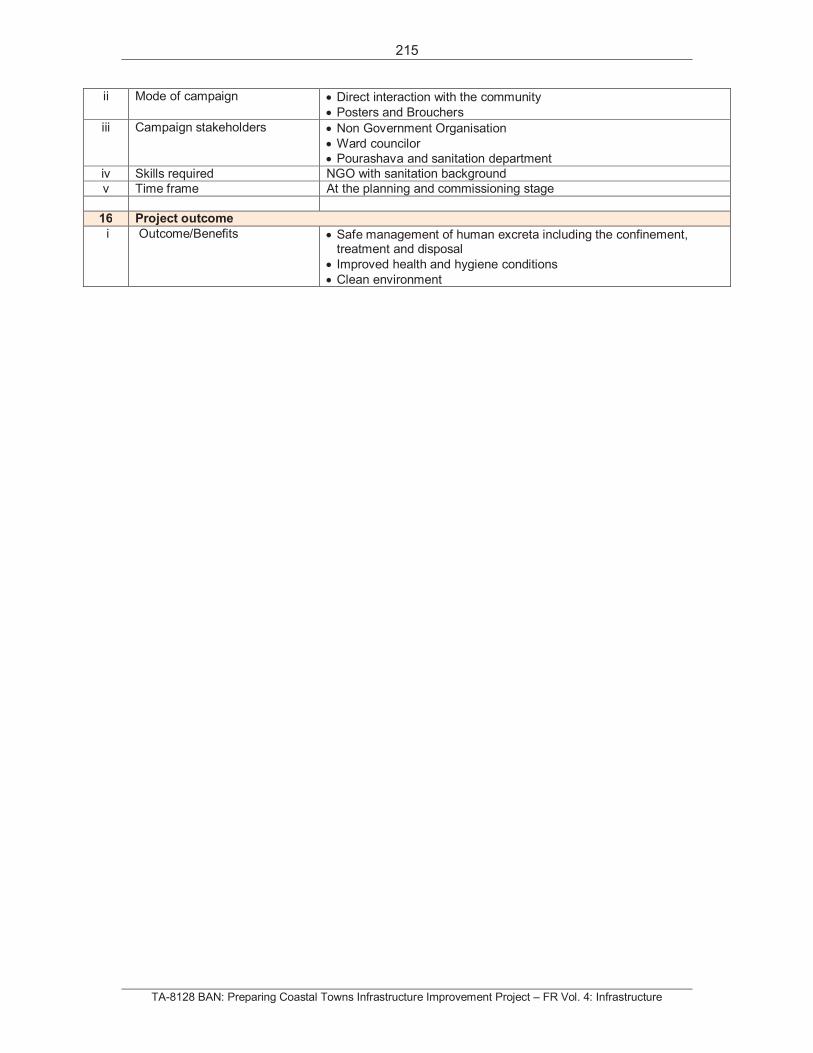
215
TA-8128 BAN: Preparing Coastal Towns Infrastructure Improvement Project – FR Vol. 4: Infrastructure
ii Mode of campaign Direct interaction with the community
Posters and Brouchers
iii Campaign stakeholders Non Government Organisation
Ward councilor
Pourashava and sanitation department
iv Skills required NGO with sanitation background
v Time frame At the planning and commissioning stage
16 Project outcome
i Outcome/Benefits Safe management of human excreta including the confinement, treatment and disposal
Improved health and hygiene conditions
Clean environment
216
TA-8128 BAN: Preparing Coastal Towns Infrastructure Improvement Project – FR Vol. 4: Infrastructure
2.6 Town-wise cost estimation for provision of selected pilots in the Public Domain
This section was superseded by revised cost estimates submitted by the BMGF Sanitation Specialist on 13 September 2013. Please refer to Annex E.2.
2.7 Sanitation Planning in PPTA towns
A lot of efforts are being channelized in the sanitation sector in Bangladesh through various programs. However, the sanitation interventions to be implemented are not derived based on systematic assessment of sanitation situation in the towns. The recommendations made by the local bodies relies to a great extent on their day to day working experiences in delivery of sanitation services, however the absence of a town wide sanitation strategy/plan often results in critical areas being neglected where measures are needed on priority basis.
Based on the field visits conducted to the PPTA towns, some observations regarding the status of sanitation services and its access to communities and, working knowledge and framework of Pourashava are mentioned as follows:
Absence of country level sanitation strategy for coastal towns
Pourashavas limited exposure to on-site and off-site sanitation systems which can be
applied to coastal areas in Bangladesh
The provision of sanitation services follows more of a piece meal approach
In absence of a systematic sanitation data compilation and analysis system at town
level, the Pourashava does not have in-depth understanding of the sanitation issues
in their jurisdiction areas
The sanitation staff in Pourashavas are not exposed to sanitation planning practices.
2.7.1 Approach and methodology
The approach for addressing the gap in sanitation infrastructure and services is taking coastal towns towards ‘Total Sanitation’ through a ‘Systems’ driven approach. This can be achieved through City Sanitation Planning (CSP) process, which systematically looks into service delivery levels in the towns, identify critical/stress areas for sanitation provision, community engagement in grass root sanitation planning and awareness generation as well as framework for monitoring and evaluation of sanitation services in the urban area.
The overall goal is to achieve 100% sanitation in the PPTA towns wherein every citizen has access to a toilet facility and all the fecal sludge/Septage/solid waste is collected, treated and disposed off safely. Every aspect of the process and infrastructure provision must integrate community participation and must be inclusive. In addition, water and wastewater management must be carried out in an environmentally sustainable manner, recycling and reusing the byproducts as far as possible.
The Sanitation Plan preparation process for a PPTA town would consist of following main activities:
1. Formation of sanitation task force
2. Sanitation Awareness Campaign
3. Sanitation Plan
4. Capacity building of urban local bodies in sanitation service delivery
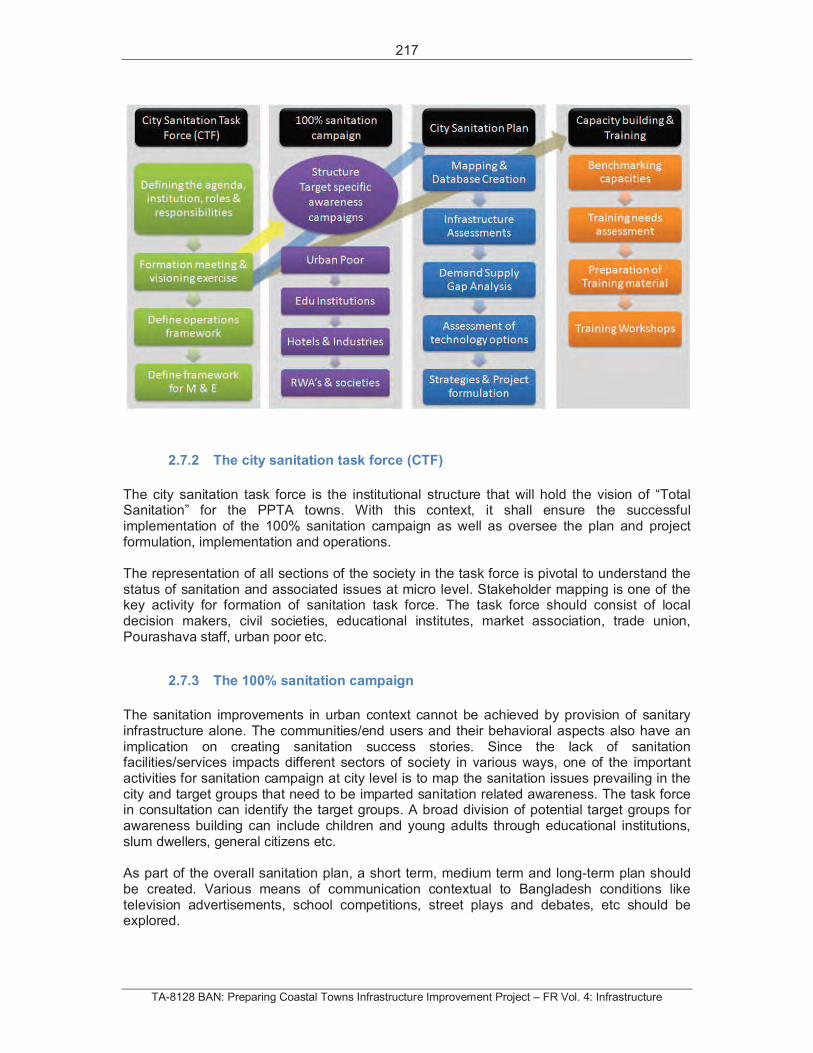
217
TA-8128 BAN: Preparing Coastal Towns Infrastructure Improvement Project – FR Vol. 4: Infrastructure
2.7.2 The city sanitation task force (CTF)
The city sanitation task force is the institutional structure that will hold the vision of “Total Sanitation” for the PPTA towns. With this context, it shall ensure the successful implementation of the 100% sanitation campaign as well as oversee the plan and project formulation, implementation and operations.
The representation of all sections of the society in the task force is pivotal to understand the status of sanitation and associated issues at micro level. Stakeholder mapping is one of the key activity for formation of sanitation task force. The task force should consist of local decision makers, civil societies, educational institutes, market association, trade union, Pourashava staff, urban poor etc.
2.7.3 The 100% sanitation campaign
The sanitation improvements in urban context cannot be achieved by provision of sanitary infrastructure alone. The communities/end users and their behavioral aspects also have an implication on creating sanitation success stories. Since the lack of sanitation facilities/services impacts different sectors of society in various ways, one of the important activities for sanitation campaign at city level is to map the sanitation issues prevailing in the city and target groups that need to be imparted sanitation related awareness. The task force in consultation can identify the target groups. A broad division of potential target groups for awareness building can include children and young adults through educational institutions, slum dwellers, general citizens etc.
As part of the overall sanitation plan, a short term, medium term and long-term plan should be created. Various means of communication contextual to Bangladesh conditions like television advertisements, school competitions, street plays and debates, etc should be explored.
218
TA-8128 BAN: Preparing Coastal Towns Infrastructure Improvement Project – FR Vol. 4: Infrastructure
2.7.4 The city sanitation plan
The City Sanitation Plan is the strategy document, which includes technical aspects to address the sanitation gaps in the towns, project proposals and block cost estimates. The plan preparation includes following key activities:
Sanitation Mapping
This includes preparation of base map of a town on GIS platform. The existing maps are used and up-dated using various sources of information like satellite images, field surveys and consultations with the local bodies.
Assessing Demand Supply Gap in sanitation provision
The data on various sectors like water supply, sewerage system, solid waste management, public sanitation and storm water management is collected and mounted as layers of information on GIS platform. Available secondary data shall be collected mentioned as follows:
Demographics – current and projected population
Water supply – source, quantity and quality of water supplied, areas facing scarcity of
water
Sanitation – public toilets/community toilets (location, number of toilet seats, user
charges etc.)
Wastewater management – fecal sludge/Septage management
Solid waste management – waste generation, collection, treatment and disposal
Assessment of Pourashava budget
Pourashava - institutional and legal framework
Based on the information mentioned above, detailed demand supply gap in provision of sanitary services with a Pourashava will be determined. The extent of gap in service delivery is indication of a particular area under sanitation stress. This helps in prioritizing the sanitation interventions during implementation phase.
Assessing technology options
The section of correct technology choice is one of the key challenges for reaching 100 % sanitation access. The technology options are broadly classified into on-site sanitation and off-site sanitation systems. The characteristics of each type of system and their application in Bangladesh context shall be captured. The application of appropriate technologies to address stress areas under sanitation shall be explored. The technologies as presented above shall be used as reference for decision-making.
It is important that a holistic technical approach, which incorporates centralized and decentralized systems are chosen. A mix of options (including conventional and non-conventional solutions) needs to be chosen to address the sanitation issues as a whole at a citywide level. The planning approach has to define the project-specific social, cultural,
219
TA-8128 BAN: Preparing Coastal Towns Infrastructure Improvement Project – FR Vol. 4: Infrastructure
economic, health and environmental priorities, which will influence technology selection and the system design. Technologies that promote recycle and reuse of treated wastewater should be preferred.
Strategies and Project Formulation
Strategies and solutions for addressing sanitation needs in all the un-served areas in the city shall be provided. In addition, a strategy to address the sanitation needs of future population growth shall also be formulated through project solutions as well as recommendations to policy initiatives.
The strategies shall focus on strengthening existing systems and proposing new systems relevant to the local conditions in Bangladesh. Special emphasis shall be given to address issues pertaining to livelihood linkages of the urban poor with sanitation sector, user charges etc to develop strategies that are financially self-sustaining.
Costing and Implementation Strategy
Block cost estimates will be developed along with a phasing plan. This shall be consistent with the goals to achieve 100% sanitation. Cost estimation shall also include O & M costs as well as replacement costs.
Community participation in operations and maintenance as well as vendor development requirements shall be explored.
Recommendations to the Legislative Framework
Recommendations shall be given to the development control regulations, building byelaws and other legislation to facilitate achievement of 100% sanitation.
2.7.5 Capacity building
The capacity of the local body needs to be enhanced for implementing the sanitation improvement interventions. The extent of capacity building requirements can be assessed by benchmarking of existing human resource, infrastructure, hardware and software to achieve 100% sanitation. Based on the benchmarking the training needs shall be identified where in house capacities required to be built. A plan for training requirements needs to be formulated based on the needs assessment.
220
TA-8128 BAN: Preparing Coastal Towns Infrastructure Improvement Project – FR Vol. 4: Infrastructure
3. BIBLIOGRAPHY
ADB. Interim report of TA-8128 BAN (PPTA): Preparing Coastal Towns Infrastructure
Improvement Project. Dhaka: ADB, 2013.
ADB:b. TA-8128 BAN (PPTA): Preparing Coastal Towns Infrastructure Improvement Project,
Interim report Vol.2: Appendices. Dhaka: Asian Development Bank, 2013.
ADB:c. TA 7890-BAN: Strengthening the Resilience of the Urban Water Supply, Drainage,
and Sanitation to Climate Change in Coastal Towns. Draft Final report, Vol. 1, Asian
Development Bank, 2013.
BBS. Population and Housing Census 2011, Bangladesh at a glance. Dhaka, 2011.
BBS:a. BBS Community Report, Zilla: Pirojpur. Dhaka: Bangladesh Bureau of statistics,
Ministry of Planning, 2012.
BBS:b. BBS Community Report, Zilla: Barguna. Dhaka: Bangladesh Bureau of statistics,
Ministry of Planning, 2012.
BBS:c. BBS Community report, Zilla: Patuakhali. Dhaka: Bangladesh Bureau of statistics,
Ministry of Planning, 2012.
BORDA. DEWATS. 2010. http://www.borda-sea.org/basic-needs-services/dewats-
decentralized-wastewater-treatment.html (accessed July 11, 2013).
EAWAG & WSCC. “Compendium of Sanitation Systems and technologies.” 2008.
GoB. National Adaptation Program of Action. Dhaka: Government of Bangladesh, 2009.
Khan, S M Munjurul Hannan, Saleemul Huq, and Md Shamsuddoha. “The Bangladesh
National Climate Funds.” LDC paper series,International Institute for Environment and
Development and European Capacity Building Initiative, 2011: 2-12.
MoEF-B'desh. Bangladesh initiatives towards 3R approaches: Country analysis pape.
Vietnam: Fourth regional 3R forum in Asia, 2013.
Robbins, D., and J Richkus. “Utilizing Cocopeat as a Medium for Wastewater Treatment
Biofiltration for Residential and Institutional Applications.” 2012.
SJK. “Pirojpur - Community survey report.” STWSSP. GOB-ADB, 2010.
WASH. WASH help desk. 2012. washhelpdesk.wordpress.com/2010/11/25/differences-
between-on-site-sanitation-and-off-site-snitation-zimbabwe/ (accessed June 19, 2013).
Watsan. Wastewater solutions fordevelopment. 2012.
http://watsanexp.ning.com/page/cocopeat-gen (accessed June 27, 2013).
221
TA-8128 BAN: Preparing Coastal Towns Infrastructure Improvement Project – FR Vol. 4: Infrastructure
WATSAN. Water supply information. April 2011.
http://www.ngof.org/wdb/watercoveragedetail.php?did=006#Water%20Supply%20Coverage
(accessed July 4, 2013).
WHO. Bangladesh Demographic and Health Survey. 2010. http://www.wssinfo.org/
(accessed June 30, 2013).
WHO-UNICEF. Progress on sanitation and drinking water-Joint monitoring program.
Monitoring report, WHO-UNICEF, 2013.
WSP. A guide to decisionmaking: Technology options for Urban sanitation in India. Guidance
documment, New Delhi: Water Sanitation Program and Government of India, 2008.
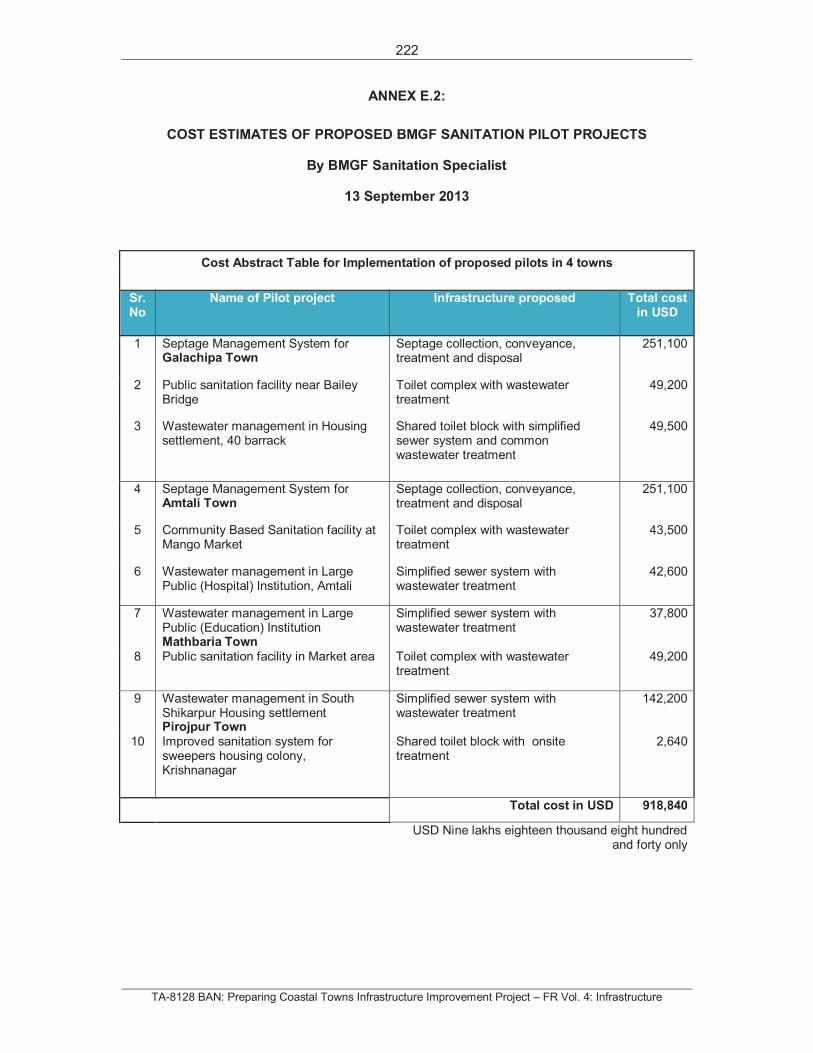
222
TA-8128 BAN: Preparing Coastal Towns Infrastructure Improvement Project – FR Vol. 4: Infrastructure
ANNEX E.2:
COST ESTIMATES OF PROPOSED BMGF SANITATION PILOT PROJECTS
By BMGF Sanitation Specialist
13 September 2013
Cost Abstract Table for Implementation of proposed pilots in 4 towns
Sr. No
Name of Pilot project Infrastructure proposed Total cost in USD
1 Septage Management System for Galachipa Town
Septage collection, conveyance, treatment and disposal
251,100
2 Public sanitation facility near Bailey Bridge
Toilet complex with wastewater treatment
49,200
3 Wastewater management in Housing settlement, 40 barrack
Shared toilet block with simplified sewer system and common wastewater treatment
49,500
4 Septage Management System for Amtali Town
Septage collection, conveyance, treatment and disposal
251,100
5 Community Based Sanitation facility at Mango Market
Toilet complex with wastewater treatment
43,500
6 Wastewater management in Large Public (Hospital) Institution, Amtali
Simplified sewer system with wastewater treatment
42,600
7 Wastewater management in Large Public (Education) Institution Mathbaria Town
Simplified sewer system with wastewater treatment
37,800
8 Public sanitation facility in Market area Toilet complex with wastewater treatment
49,200
9 Wastewater management in South Shikarpur Housing settlement Pirojpur Town
Simplified sewer system with wastewater treatment
142,200
10 Improved sanitation system for sweepers housing colony, Krishnanagar
Shared toilet block with onsite treatment
2,640
Total cost in USD 918,840
USD Nine lakhs eighteen thousand eight hundred and forty only
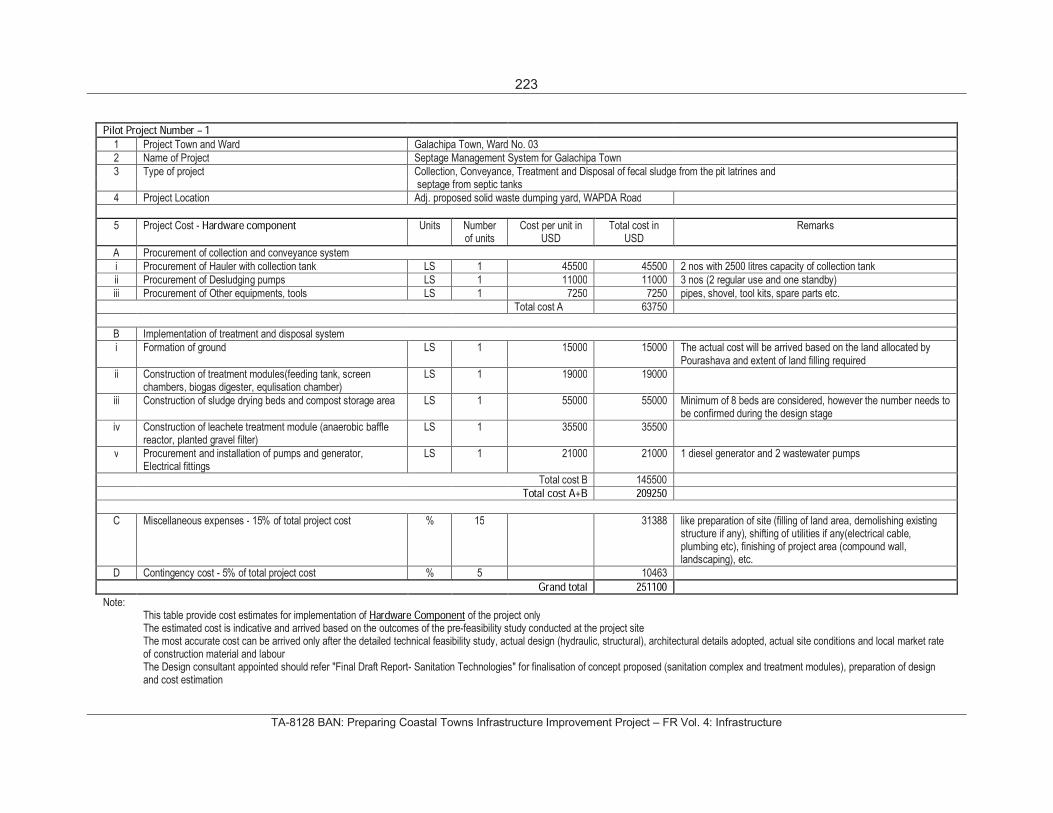
223
TA-8128 BAN: Preparing Coastal Towns Infrastructure Improvement Project – FR Vol. 4: Infrastructure
Pilot Project Number – 11 Project Town and Ward Galachipa Town, Ward No. 032 Name of Project Septage Management System for Galachipa Town3 Type of project Collection, Conveyance, Treatment and Disposal of fecal sludge from the pit latrines and
septage from septic tanks4 Project Location Adj. proposed solid waste dumping yard, WAPDA Road
5 Project Cost - Hardware component Units Numberof units
Cost per unit in USD
Total cost in USD
Remarks
A Procurement of collection and conveyance systemi Procurement of Hauler with collection tank LS 1 45500 45500 2 nos with 2500 litres capacity of collection tankii Procurement of Desludging pumps LS 1 11000 11000 3 nos (2 regular use and one standby)iii Procurement of Other equipments, tools LS 1 7250 7250 pipes, shovel, tool kits, spare parts etc.
Total cost A 63750
B Implementation of treatment and disposal system i Formation of ground LS 1 15000 15000 The actual cost will be arrived based on the land allocated by
Pourashava and extent of land filling required ii Construction of treatment modules(feeding tank, screen
chambers, biogas digester, equlisation chamber) LS 1 19000 19000
iii Construction of sludge drying beds and compost storage area LS 1 55000 55000 Minimum of 8 beds are considered, however the number needs to be confirmed during the design stage
iv Construction of leachete treatment module (anaerobic baffle reactor, planted gravel filter)
LS 1 35500 35500
v Procurement and installation of pumps and generator, Electrical fittings
LS 1 21000 21000 1 diesel generator and 2 wastewater pumps
Total cost B 145500Total cost A+B 209250
C Miscellaneous expenses - 15% of total project cost % 15 31388 like preparation of site (filling of land area, demolishing existing structure if any), shifting of utilities if any(electrical cable, plumbing etc), finishing of project area (compound wall, landscaping), etc.
D Contingency cost - 5% of total project cost % 5 10463Grand total 251100
Note: This table provide cost estimates for implementation of Hardware Component of the project onlyThe estimated cost is indicative and arrived based on the outcomes of the pre-feasibility study conducted at the project siteThe most accurate cost can be arrived only after the detailed technical feasibility study, actual design (hydraulic, structural), architectural details adopted, actual site conditions and local market rate of construction material and labour The Design consultant appointed should refer "Final Draft Report- Sanitation Technologies" for finalisation of concept proposed (sanitation complex and treatment modules), preparation of design and cost estimation
224
TA-8128 BAN: Preparing Coastal Towns Infrastructure Improvement Project – FR Vol. 4: Infrastructure
The cost related to Software Components needs to be arrived based on the suggestion proposed in the "Final Draft Report- Sanitation Technologies" for each of the projectThe cost related to Operation &Maintenance needs to be arrived based on the O&M activities and O&M framework proposed in the "Final Draft Report- Sanitation Technologies" for each of the project The cost related to Land is not considered as Pourashava agreed to provide the Government Land for implementation of the proposed project
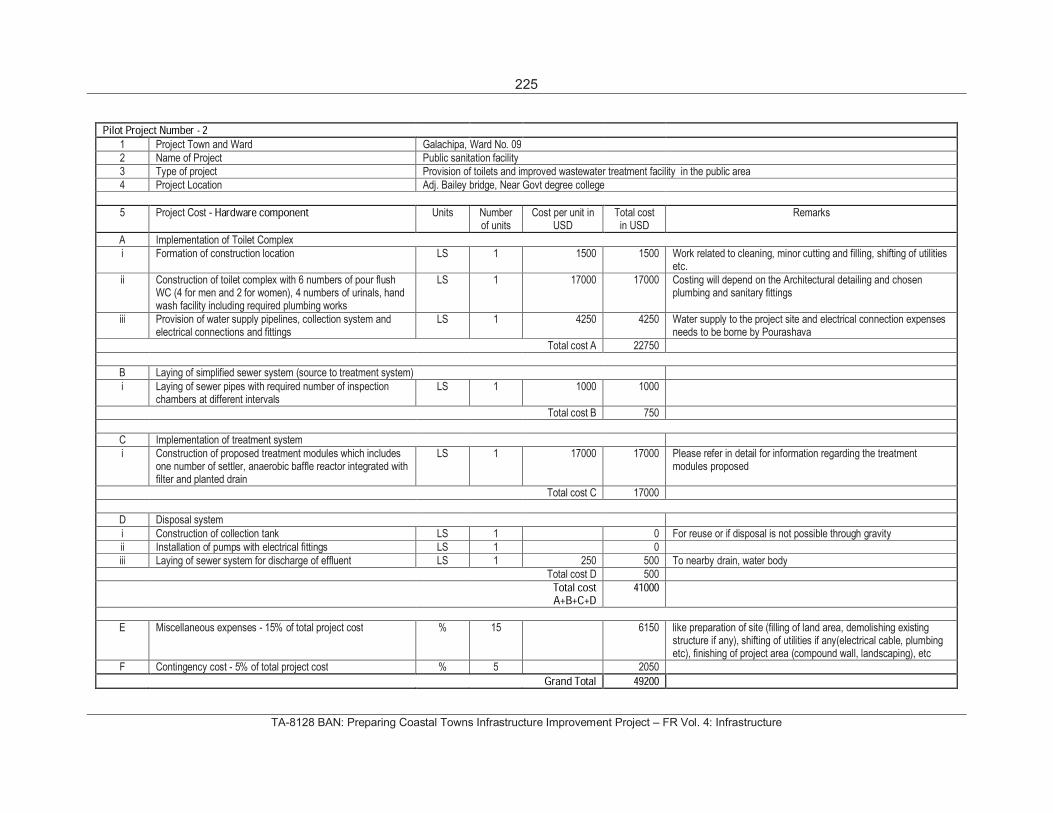
225
TA-8128 BAN: Preparing Coastal Towns Infrastructure Improvement Project – FR Vol. 4: Infrastructure
Pilot Project Number - 21 Project Town and Ward Galachipa, Ward No. 092 Name of Project Public sanitation facility3 Type of project Provision of toilets and improved wastewater treatment facility in the public area4 Project Location Adj. Bailey bridge, Near Govt degree college
5 Project Cost - Hardware component Units Numberof units
Cost per unit in USD
Total cost in USD
Remarks
A Implementation of Toilet Complexi Formation of construction location LS 1 1500 1500 Work related to cleaning, minor cutting and filling, shifting of utilities
etc. ii Construction of toilet complex with 6 numbers of pour flush
WC (4 for men and 2 for women), 4 numbers of urinals, hand wash facility including required plumbing works
LS 1 17000 17000 Costing will depend on the Architectural detailing and chosen plumbing and sanitary fittings
iii Provision of water supply pipelines, collection system and electrical connections and fittings
LS 1 4250 4250 Water supply to the project site and electrical connection expenses needs to be borne by Pourashava
Total cost A 22750
B Laying of simplified sewer system (source to treatment system)i Laying of sewer pipes with required number of inspection
chambers at different intervals LS 1 1000 1000
Total cost B 750
C Implementation of treatment systemi Construction of proposed treatment modules which includes
one number of settler, anaerobic baffle reactor integrated with filter and planted drain
LS 1 17000 17000 Please refer in detail for information regarding the treatment modules proposed
Total cost C 17000
D Disposal systemi Construction of collection tank LS 1 0 For reuse or if disposal is not possible through gravityii Installation of pumps with electrical fittings LS 1 0iii Laying of sewer system for discharge of effluent LS 1 250 500 To nearby drain, water body
Total cost D 500Total cost A+B+C+D
41000
E Miscellaneous expenses - 15% of total project cost % 15 6150 like preparation of site (filling of land area, demolishing existing structure if any), shifting of utilities if any(electrical cable, plumbing etc), finishing of project area (compound wall, landscaping), etc
F Contingency cost - 5% of total project cost % 5 2050
Grand Total 49200
226
TA-8128 BAN: Preparing Coastal Towns Infrastructure Improvement Project – FR Vol. 4: Infrastructure
Note: This table provide cost estimates for implementation of Hardware Component of the project onlyThe estimated cost is indicative and arrived based on the outcomes of the pre-feasibility study conducted at the project siteThe most accurate cost can be arrived only after the detailed technical feasibility study, actual design (hydraulic, structural), architectural details adopted, actual site conditions and local market rate of construction material and labour The Design consultant appointed should refer "Final Draft Report- Sanitation Technologies" for finalisation of concept proposed (sanitation complex and treatment modules), preparation of design and cost estimation The cost related to Software Components needs to be arrived based on the suggestion proposed in the "Final Draft Report- Sanitation Technologies" for each of the projectThe cost related to Operation &Maintenance needs to be arrived based on the O&M activities and O&M framework proposed in the "Final Draft Report- Sanitation Technologies" for each of the project The cost related to Land is not considered as Pourashava agreed to provide the Government Land for implementation of the proposed project
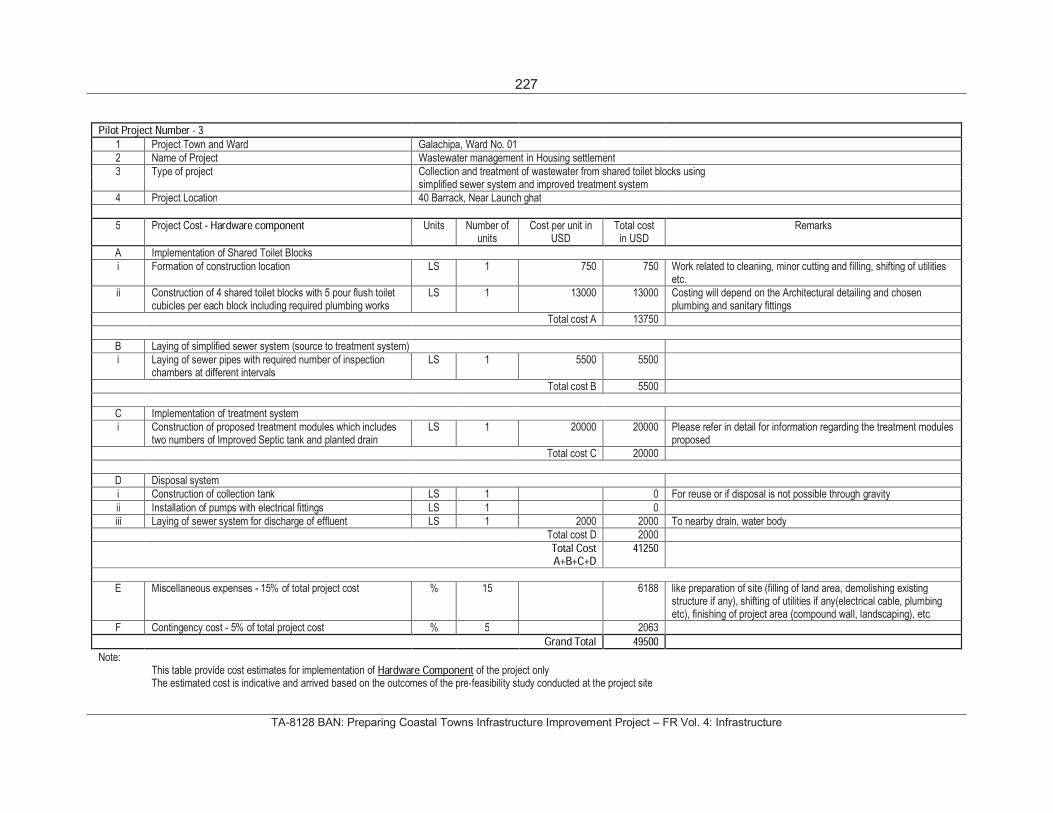
227
TA-8128 BAN: Preparing Coastal Towns Infrastructure Improvement Project – FR Vol. 4: Infrastructure
Pilot Project Number - 31 Project Town and Ward Galachipa, Ward No. 012 Name of Project Wastewater management in Housing settlement3 Type of project Collection and treatment of wastewater from shared toilet blocks using
simplified sewer system and improved treatment system4 Project Location 40 Barrack, Near Launch ghat
5 Project Cost - Hardware component Units Number of units
Cost per unit in USD
Total cost in USD
Remarks
A Implementation of Shared Toilet Blocksi Formation of construction location LS 1 750 750 Work related to cleaning, minor cutting and filling, shifting of utilities
etc. ii Construction of 4 shared toilet blocks with 5 pour flush toilet
cubicles per each block including required plumbing works LS 1 13000 13000 Costing will depend on the Architectural detailing and chosen
plumbing and sanitary fittings Total cost A 13750
B Laying of simplified sewer system (source to treatment system)i Laying of sewer pipes with required number of inspection
chambers at different intervals LS 1 5500 5500
Total cost B 5500
C Implementation of treatment systemi Construction of proposed treatment modules which includes
two numbers of Improved Septic tank and planted drain LS 1 20000 20000 Please refer in detail for information regarding the treatment modules
proposed Total cost C 20000
D Disposal systemi Construction of collection tank LS 1 0 For reuse or if disposal is not possible through gravityii Installation of pumps with electrical fittings LS 1 0iii Laying of sewer system for discharge of effluent LS 1 2000 2000 To nearby drain, water body
Total cost D 2000Total Cost A+B+C+D
41250
E Miscellaneous expenses - 15% of total project cost % 15 6188 like preparation of site (filling of land area, demolishing existing structure if any), shifting of utilities if any(electrical cable, plumbing etc), finishing of project area (compound wall, landscaping), etc
F Contingency cost - 5% of total project cost % 5 2063Grand Total 49500
Note: This table provide cost estimates for implementation of Hardware Component of the project onlyThe estimated cost is indicative and arrived based on the outcomes of the pre-feasibility study conducted at the project site
228
TA-8128 BAN: Preparing Coastal Towns Infrastructure Improvement Project – FR Vol. 4: Infrastructure
The most accurate cost can be arrived only after the detailed technical feasibility study, actual design (hydraulic, structural), architectural details adopted, actual site conditions and local market rate of construction material and labour The Design consultant appointed should refer "Final Draft Report- Sanitation Technologies" for finalisation of concept proposed (sanitation complex and treatment modules), preparation of design and cost estimation The cost related to Software Components needs to be arrived based on the suggestion proposed in the "Final Draft Report- Sanitation Technologies" for each of the projectThe cost related to Operation &Maintenance needs to be arrived based on the O&M activities and O&M framework proposed in the "Final Draft Report- Sanitation Technologies" for each of the project The cost related to Land is not considered as Pourashava agreed to provide the Government Land for implementation of the proposed project
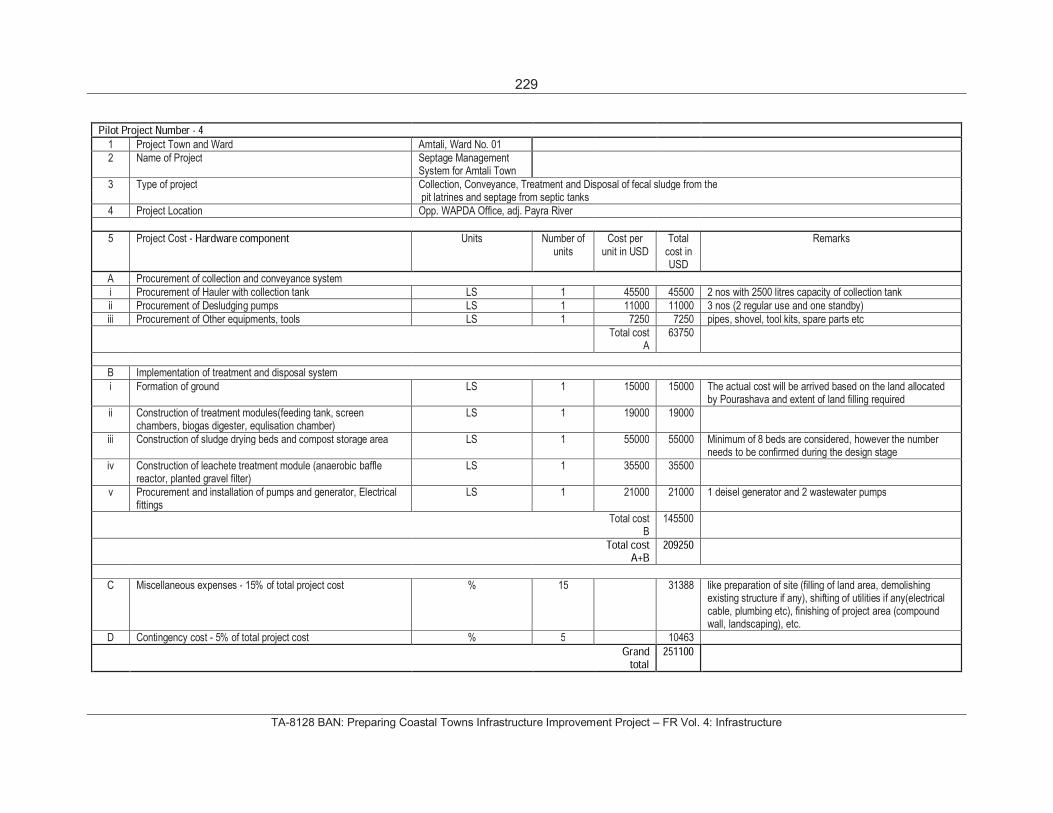
229
TA-8128 BAN: Preparing Coastal Towns Infrastructure Improvement Project – FR Vol. 4: Infrastructure
Pilot Project Number - 41 Project Town and Ward Amtali, Ward No. 012 Name of Project Septage Management
System for Amtali Town 3 Type of project Collection, Conveyance, Treatment and Disposal of fecal sludge from the
pit latrines and septage from septic tanks4 Project Location Opp. WAPDA Office, adj. Payra River
5 Project Cost - Hardware component Units Number of units
Cost per unit in USD
Total cost in USD
Remarks
A Procurement of collection and conveyance systemi Procurement of Hauler with collection tank LS 1 45500 45500 2 nos with 2500 litres capacity of collection tankii Procurement of Desludging pumps LS 1 11000 11000 3 nos (2 regular use and one standby)iii Procurement of Other equipments, tools LS 1 7250 7250 pipes, shovel, tool kits, spare parts etc
Total cost A
63750
B Implementation of treatment and disposal system i Formation of ground LS 1 15000 15000 The actual cost will be arrived based on the land allocated
by Pourashava and extent of land filling required ii Construction of treatment modules(feeding tank, screen
chambers, biogas digester, equlisation chamber) LS 1 19000 19000
iii Construction of sludge drying beds and compost storage area LS 1 55000 55000 Minimum of 8 beds are considered, however the number needs to be confirmed during the design stage
iv Construction of leachete treatment module (anaerobic baffle reactor, planted gravel filter)
LS 1 35500 35500
v Procurement and installation of pumps and generator, Electrical fittings
LS 1 21000 21000 1 deisel generator and 2 wastewater pumps
Total cost B
145500
Total cost A+B
209250
C Miscellaneous expenses - 15% of total project cost % 15 31388 like preparation of site (filling of land area, demolishing existing structure if any), shifting of utilities if any(electrical cable, plumbing etc), finishing of project area (compound wall, landscaping), etc.
D Contingency cost - 5% of total project cost % 5 10463Grand
total 251100
230
TA-8128 BAN: Preparing Coastal Towns Infrastructure Improvement Project – FR Vol. 4: Infrastructure
Note: This table provide cost estimates for implementation of Hardware Component of the project onlyThe estimated cost is indicative and arrived based on the outcomes of the pre-feasibility study conducted at the project siteThe most accurate cost can be arrived only after the detailed technical feasibility study, actual design (hydraulic, structural), architectural details adopted, actual site conditions and local market rate of construction material and labour The Design consultant appointed should refer "Final Draft Report- Sanitation Technologies" for finalisation of concept proposed (sanitation complex and treatment modules), preparation of design and cost estimation The cost related to Software Components needs to be arrived based on the suggestion proposed in the "Final Draft Report- Sanitation Technologies" for each of the projectThe cost related to Operation &Maintenance needs to be arrived based on the O&M activities and O&M framework proposed in the "Final Draft Report- Sanitation Technologies" for each of the project The cost related to Land is not considered as Pourashava agreed to provide the Government Land for implementation of the proposed project
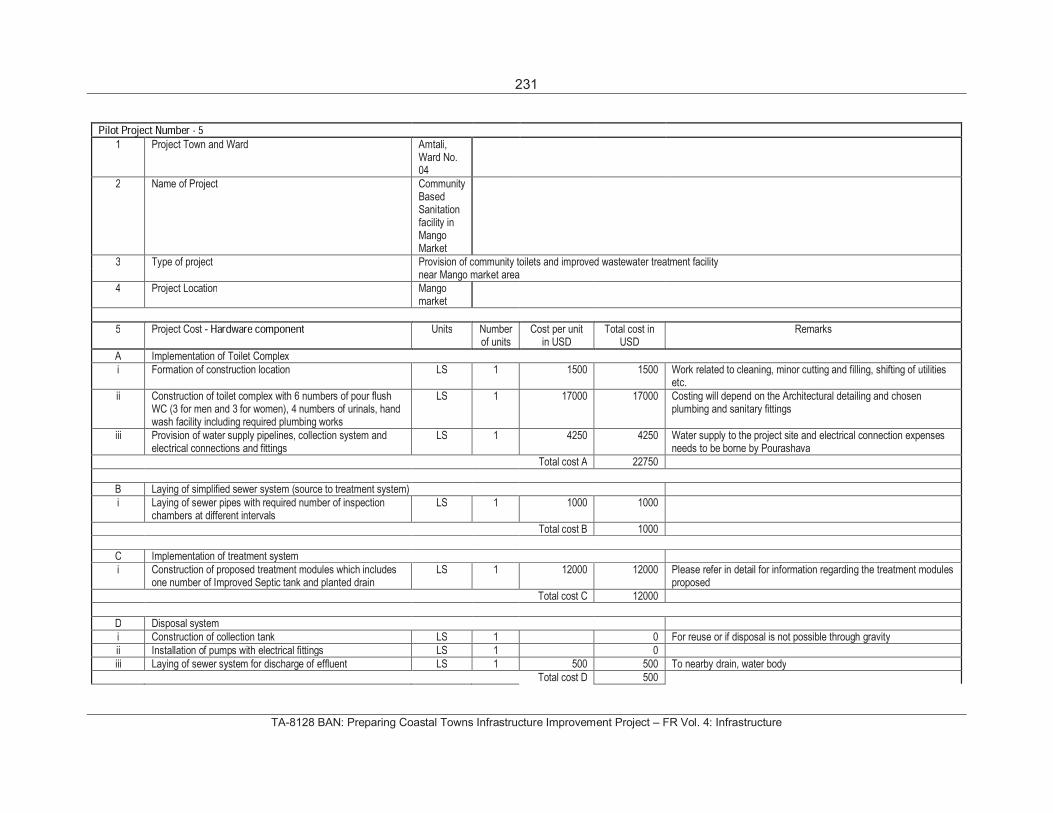
231
TA-8128 BAN: Preparing Coastal Towns Infrastructure Improvement Project – FR Vol. 4: Infrastructure
Pilot Project Number - 51 Project Town and Ward Amtali,
Ward No. 04
2 Name of Project Community Based Sanitation facility in Mango Market
3 Type of project Provision of community toilets and improved wastewater treatment facility near Mango market area
4 Project Location Mango market
5 Project Cost - Hardware component Units Numberof units
Cost per unit in USD
Total cost in USD
Remarks
A Implementation of Toilet Complexi Formation of construction location LS 1 1500 1500 Work related to cleaning, minor cutting and filling, shifting of utilities
etc. ii Construction of toilet complex with 6 numbers of pour flush
WC (3 for men and 3 for women), 4 numbers of urinals, hand wash facility including required plumbing works
LS 1 17000 17000 Costing will depend on the Architectural detailing and chosen plumbing and sanitary fittings
iii Provision of water supply pipelines, collection system and electrical connections and fittings
LS 1 4250 4250 Water supply to the project site and electrical connection expenses needs to be borne by Pourashava
Total cost A 22750
B Laying of simplified sewer system (source to treatment system)i Laying of sewer pipes with required number of inspection
chambers at different intervals LS 1 1000 1000
Total cost B 1000
C Implementation of treatment systemi Construction of proposed treatment modules which includes
one number of Improved Septic tank and planted drain LS 1 12000 12000 Please refer in detail for information regarding the treatment modules
proposed Total cost C 12000
D Disposal systemi Construction of collection tank LS 1 0 For reuse or if disposal is not possible through gravityii Installation of pumps with electrical fittings LS 1 0iii Laying of sewer system for discharge of effluent LS 1 500 500 To nearby drain, water body
Total cost D 500
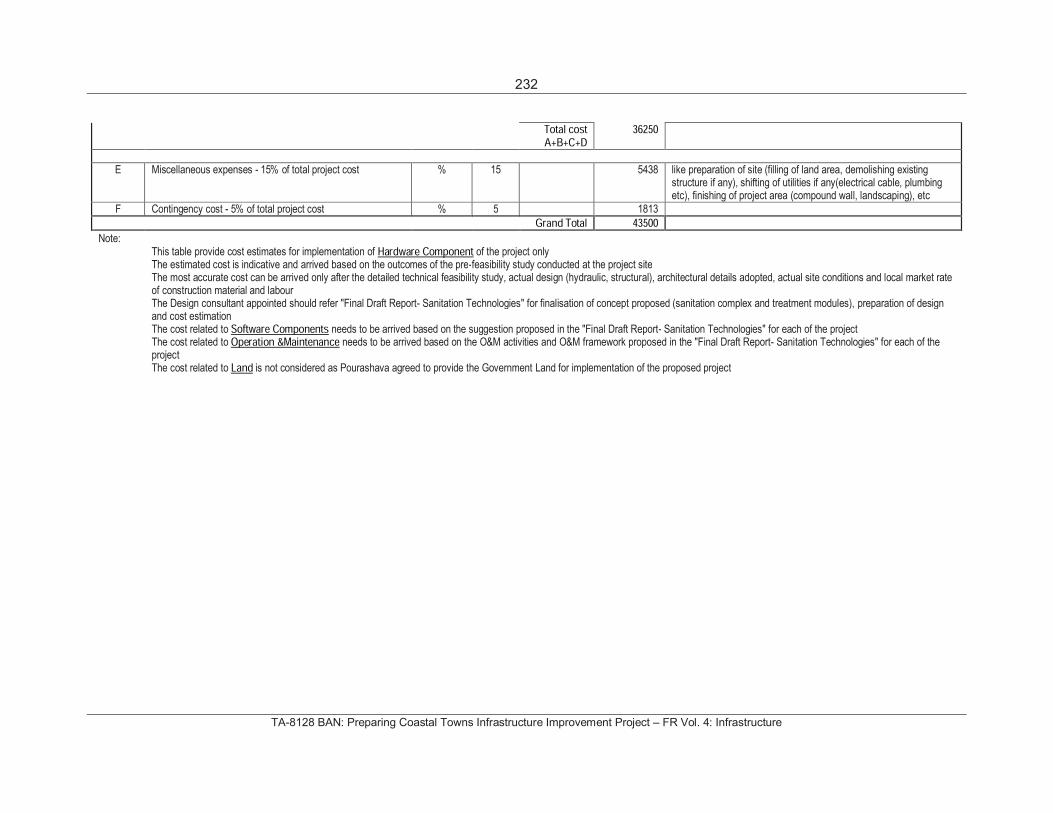
232
TA-8128 BAN: Preparing Coastal Towns Infrastructure Improvement Project – FR Vol. 4: Infrastructure
Total cost A+B+C+D
36250
E Miscellaneous expenses - 15% of total project cost % 15 5438 like preparation of site (filling of land area, demolishing existing structure if any), shifting of utilities if any(electrical cable, plumbing etc), finishing of project area (compound wall, landscaping), etc
F Contingency cost - 5% of total project cost % 5 1813Grand Total 43500
Note: This table provide cost estimates for implementation of Hardware Component of the project onlyThe estimated cost is indicative and arrived based on the outcomes of the pre-feasibility study conducted at the project siteThe most accurate cost can be arrived only after the detailed technical feasibility study, actual design (hydraulic, structural), architectural details adopted, actual site conditions and local market rate of construction material and labour The Design consultant appointed should refer "Final Draft Report- Sanitation Technologies" for finalisation of concept proposed (sanitation complex and treatment modules), preparation of design and cost estimation The cost related to Software Components needs to be arrived based on the suggestion proposed in the "Final Draft Report- Sanitation Technologies" for each of the projectThe cost related to Operation &Maintenance needs to be arrived based on the O&M activities and O&M framework proposed in the "Final Draft Report- Sanitation Technologies" for each of the project The cost related to Land is not considered as Pourashava agreed to provide the Government Land for implementation of the proposed project
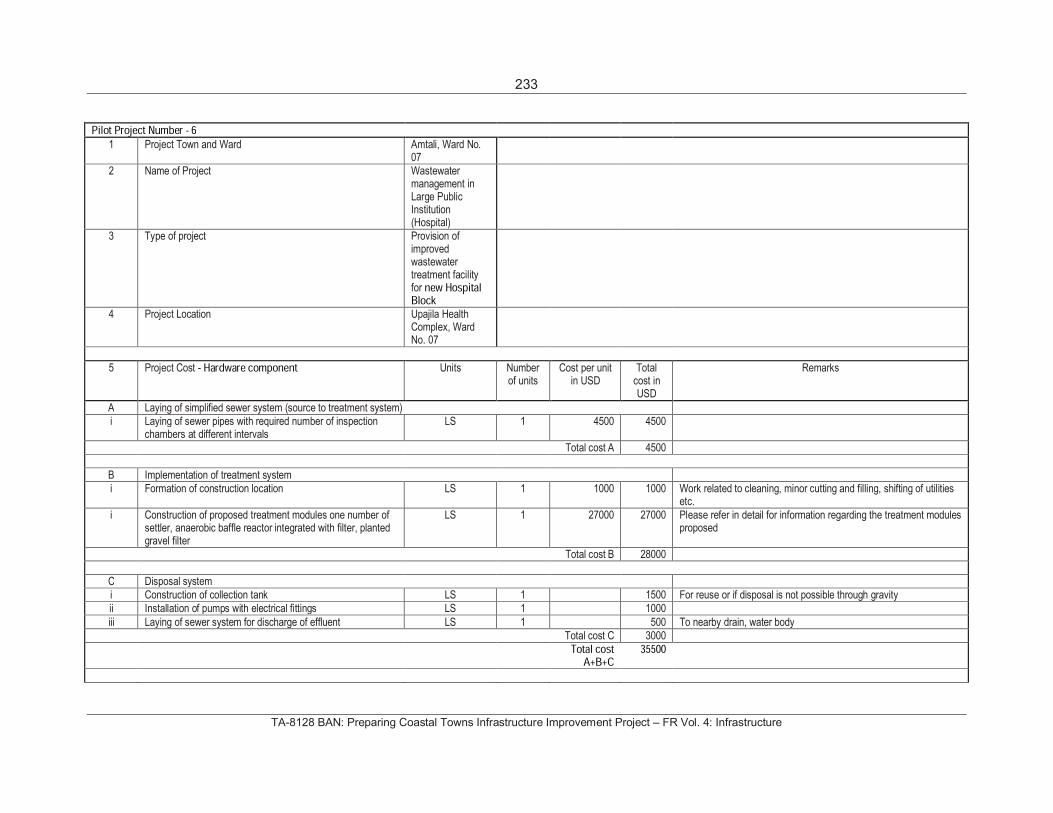
233
TA-8128 BAN: Preparing Coastal Towns Infrastructure Improvement Project – FR Vol. 4: Infrastructure
Pilot Project Number - 61 Project Town and Ward Amtali, Ward No.
072 Name of Project Wastewater
management in Large Public Institution (Hospital)
3 Type of project Provision of improved wastewater treatment facility for new Hospital Block
4 Project Location Upajila Health Complex, Ward No. 07
5 Project Cost - Hardware component Units Numberof units
Cost per unit in USD
Total cost in USD
Remarks
A Laying of simplified sewer system (source to treatment system)i Laying of sewer pipes with required number of inspection
chambers at different intervals LS 1 4500 4500
Total cost A 4500
B Implementation of treatment systemi Formation of construction location LS 1 1000 1000 Work related to cleaning, minor cutting and filling, shifting of utilities
etc. i Construction of proposed treatment modules one number of
settler, anaerobic baffle reactor integrated with filter, planted gravel filter
LS 1 27000 27000 Please refer in detail for information regarding the treatment modules proposed
Total cost B 28000
C Disposal systemi Construction of collection tank LS 1 1500 For reuse or if disposal is not possible through gravityii Installation of pumps with electrical fittings LS 1 1000iii Laying of sewer system for discharge of effluent LS 1 500 To nearby drain, water body
Total cost C 3000Total cost
A+B+C 35500
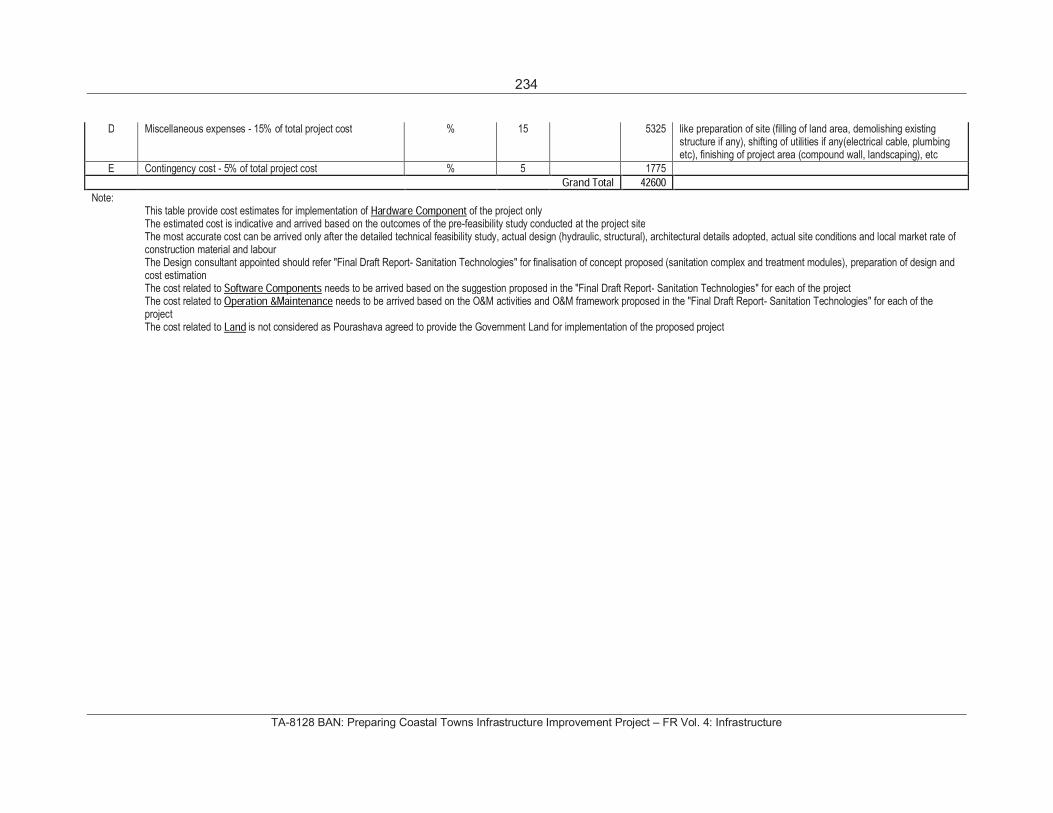
234
TA-8128 BAN: Preparing Coastal Towns Infrastructure Improvement Project – FR Vol. 4: Infrastructure
D Miscellaneous expenses - 15% of total project cost % 15 5325 like preparation of site (filling of land area, demolishing existing structure if any), shifting of utilities if any(electrical cable, plumbing etc), finishing of project area (compound wall, landscaping), etc
E Contingency cost - 5% of total project cost % 5 1775Grand Total 42600
Note: This table provide cost estimates for implementation of Hardware Component of the project onlyThe estimated cost is indicative and arrived based on the outcomes of the pre-feasibility study conducted at the project siteThe most accurate cost can be arrived only after the detailed technical feasibility study, actual design (hydraulic, structural), architectural details adopted, actual site conditions and local market rate of construction material and labour The Design consultant appointed should refer "Final Draft Report- Sanitation Technologies" for finalisation of concept proposed (sanitation complex and treatment modules), preparation of design and cost estimation The cost related to Software Components needs to be arrived based on the suggestion proposed in the "Final Draft Report- Sanitation Technologies" for each of the projectThe cost related to Operation &Maintenance needs to be arrived based on the O&M activities and O&M framework proposed in the "Final Draft Report- Sanitation Technologies" for each of the project The cost related to Land is not considered as Pourashava agreed to provide the Government Land for implementation of the proposed project
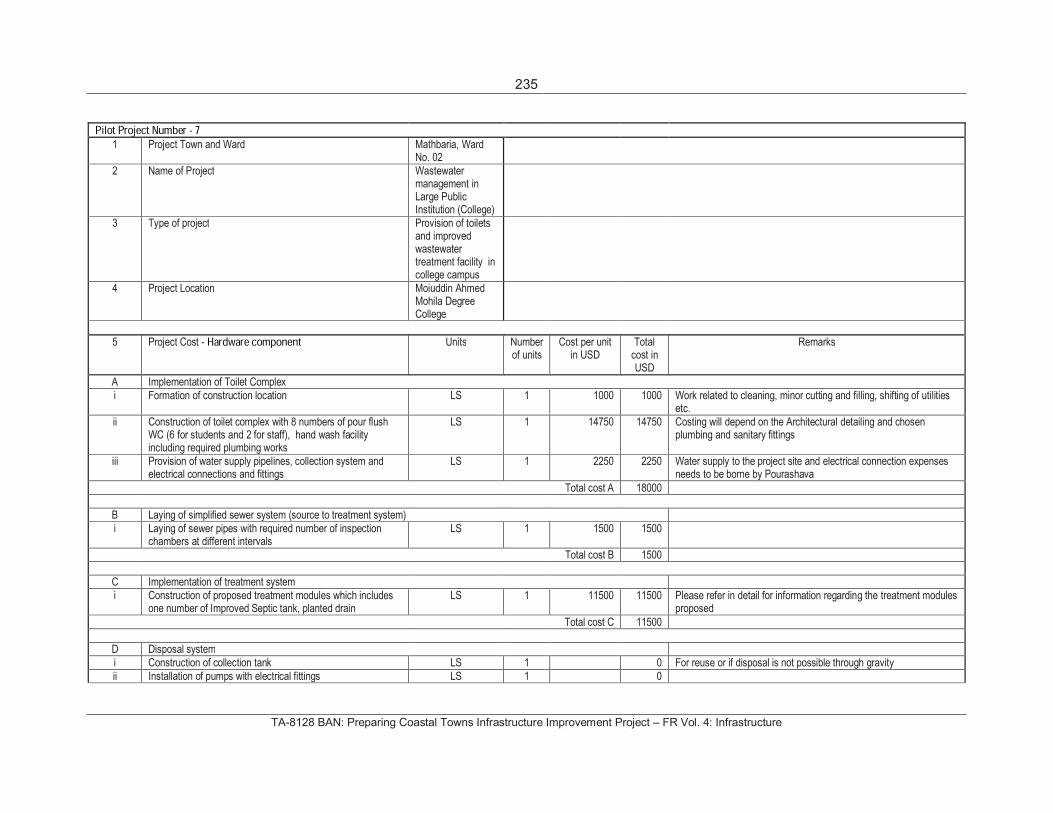
235
TA-8128 BAN: Preparing Coastal Towns Infrastructure Improvement Project – FR Vol. 4: Infrastructure
Pilot Project Number - 71 Project Town and Ward Mathbaria, Ward
No. 02 2 Name of Project Wastewater
management in Large Public Institution (College)
3 Type of project Provision of toilets and improved wastewater treatment facility in college campus
4 Project Location Moiuddin Ahmed Mohila Degree College
5 Project Cost - Hardware component Units Numberof units
Cost per unit in USD
Total cost in USD
Remarks
A Implementation of Toilet Complexi Formation of construction location LS 1 1000 1000 Work related to cleaning, minor cutting and filling, shifting of utilities
etc. ii Construction of toilet complex with 8 numbers of pour flush
WC (6 for students and 2 for staff), hand wash facility including required plumbing works
LS 1 14750 14750 Costing will depend on the Architectural detailing and chosen plumbing and sanitary fittings
iii Provision of water supply pipelines, collection system and electrical connections and fittings
LS 1 2250 2250 Water supply to the project site and electrical connection expenses needs to be borne by Pourashava
Total cost A 18000
B Laying of simplified sewer system (source to treatment system)i Laying of sewer pipes with required number of inspection
chambers at different intervals LS 1 1500 1500
Total cost B 1500
C Implementation of treatment systemi Construction of proposed treatment modules which includes
one number of Improved Septic tank, planted drain LS 1 11500 11500 Please refer in detail for information regarding the treatment modules
proposed Total cost C 11500
D Disposal systemi Construction of collection tank LS 1 0 For reuse or if disposal is not possible through gravityii Installation of pumps with electrical fittings LS 1 0
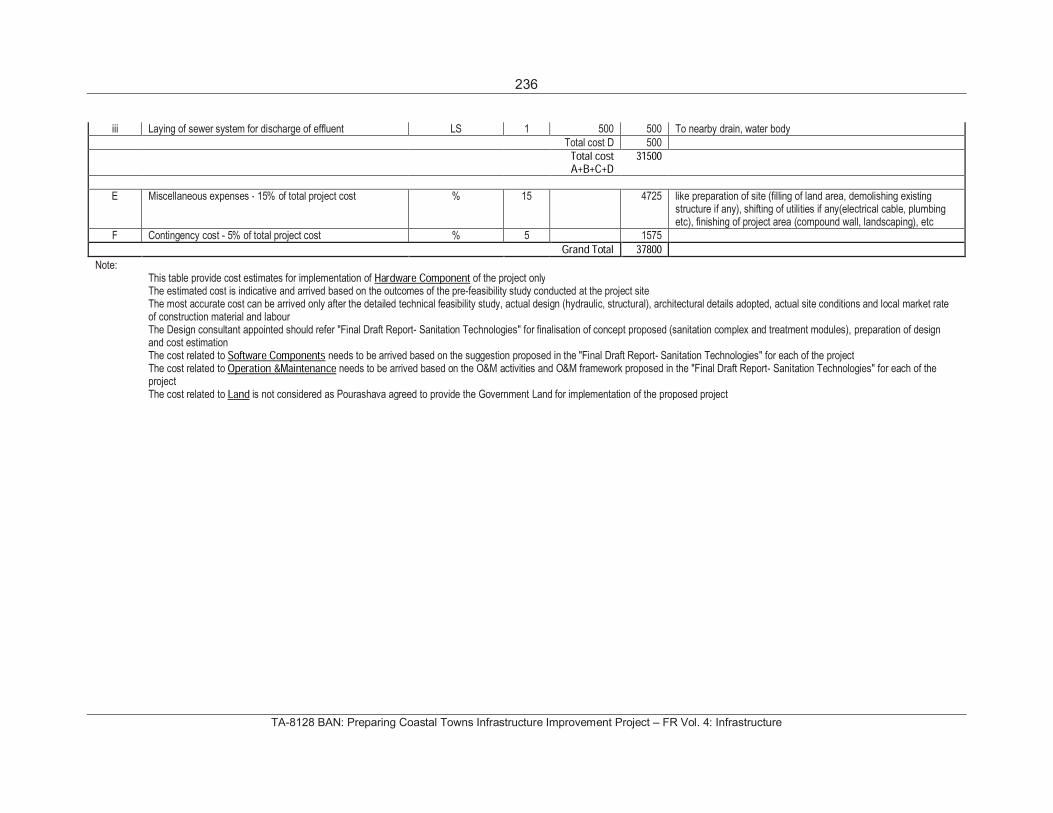
236
TA-8128 BAN: Preparing Coastal Towns Infrastructure Improvement Project – FR Vol. 4: Infrastructure
iii Laying of sewer system for discharge of effluent LS 1 500 500 To nearby drain, water bodyTotal cost D 500
Total cost A+B+C+D
31500
E Miscellaneous expenses - 15% of total project cost % 15 4725 like preparation of site (filling of land area, demolishing existing structure if any), shifting of utilities if any(electrical cable, plumbing etc), finishing of project area (compound wall, landscaping), etc
F Contingency cost - 5% of total project cost % 5 1575Grand Total 37800
Note: This table provide cost estimates for implementation of Hardware Component of the project onlyThe estimated cost is indicative and arrived based on the outcomes of the pre-feasibility study conducted at the project siteThe most accurate cost can be arrived only after the detailed technical feasibility study, actual design (hydraulic, structural), architectural details adopted, actual site conditions and local market rate of construction material and labour The Design consultant appointed should refer "Final Draft Report- Sanitation Technologies" for finalisation of concept proposed (sanitation complex and treatment modules), preparation of design and cost estimation The cost related to Software Components needs to be arrived based on the suggestion proposed in the "Final Draft Report- Sanitation Technologies" for each of the projectThe cost related to Operation &Maintenance needs to be arrived based on the O&M activities and O&M framework proposed in the "Final Draft Report- Sanitation Technologies" for each of the project The cost related to Land is not considered as Pourashava agreed to provide the Government Land for implementation of the proposed project
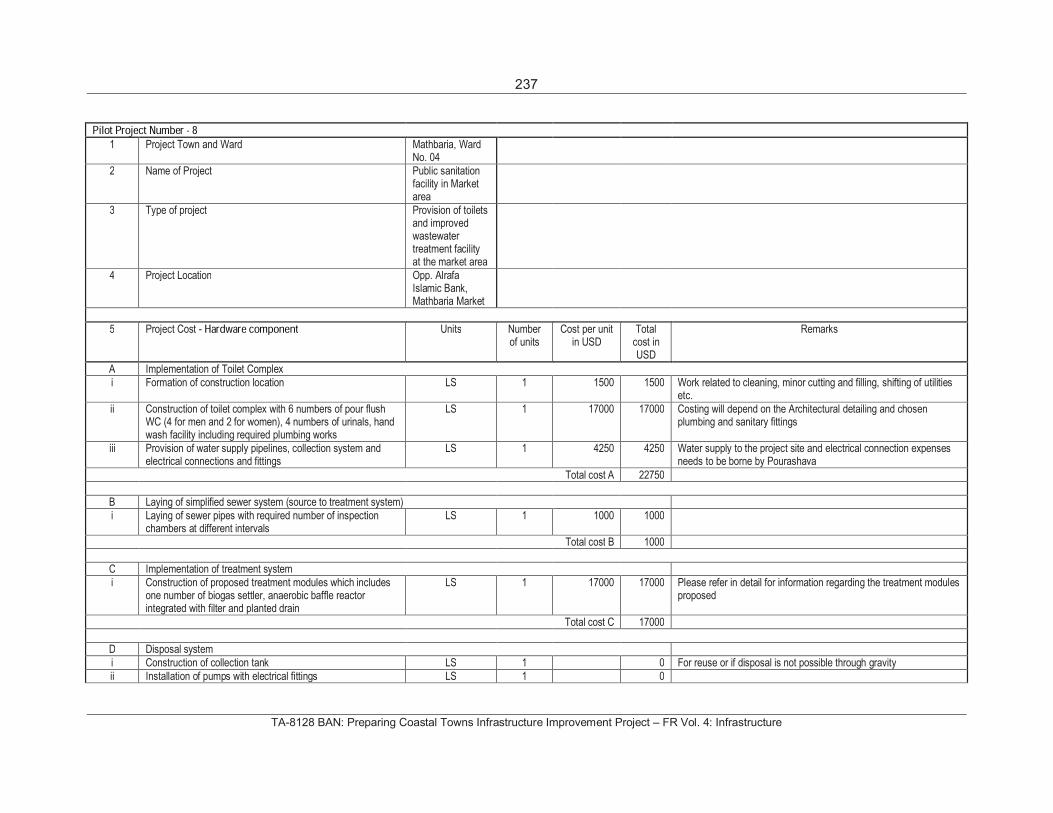
237
TA-8128 BAN: Preparing Coastal Towns Infrastructure Improvement Project – FR Vol. 4: Infrastructure
Pilot Project Number - 81 Project Town and Ward Mathbaria, Ward
No. 04 2 Name of Project Public sanitation
facility in Market area
3 Type of project Provision of toilets and improved wastewater treatment facility at the market area
4 Project Location Opp. Alrafa Islamic Bank, Mathbaria Market
5 Project Cost - Hardware component Units Numberof units
Cost per unit in USD
Total cost in USD
Remarks
A Implementation of Toilet Complexi Formation of construction location LS 1 1500 1500 Work related to cleaning, minor cutting and filling, shifting of utilities
etc. ii Construction of toilet complex with 6 numbers of pour flush
WC (4 for men and 2 for women), 4 numbers of urinals, hand wash facility including required plumbing works
LS 1 17000 17000 Costing will depend on the Architectural detailing and chosen plumbing and sanitary fittings
iii Provision of water supply pipelines, collection system and electrical connections and fittings
LS 1 4250 4250 Water supply to the project site and electrical connection expenses needs to be borne by Pourashava
Total cost A 22750
B Laying of simplified sewer system (source to treatment system)i Laying of sewer pipes with required number of inspection
chambers at different intervals LS 1 1000 1000
Total cost B 1000
C Implementation of treatment systemi Construction of proposed treatment modules which includes
one number of biogas settler, anaerobic baffle reactor integrated with filter and planted drain
LS 1 17000 17000 Please refer in detail for information regarding the treatment modules proposed
Total cost C 17000
D Disposal systemi Construction of collection tank LS 1 0 For reuse or if disposal is not possible through gravityii Installation of pumps with electrical fittings LS 1 0

238
TA-8128 BAN: Preparing Coastal Towns Infrastructure Improvement Project – FR Vol. 4: Infrastructure
iii Laying of sewer system for discharge of effluent LS 1 250 250 To nearby drain, water bodyTotal cost D 250
Total cost A+B+C+D
41000
E Miscellaneous expenses - 15% of total project cost % 15 6150 like preparation of site (filling of land area, demolishing existing structure if any), shifting of utilities if any(electrical cable, plumbing etc), finishing of project area (compound wall, landscaping), etc
F Contingency cost - 5% of total project cost % 5 2050Grand Total 49200
Note: This table provide cost estimates for implementation of Hardware Component of the project onlyThe estimated cost is indicative and arrived based on the outcomes of the pre-feasibility study conducted at the project siteThe most accurate cost can be arrived only after the detailed technical feasibility study, actual design (hydraulic, structural), architectural details adopted, actual site conditions and local market rate of construction material and labour The Design consultant appointed should refer "Final Draft Report- Sanitation Technologies" for finalisation of concept proposed (sanitation complex and treatment modules), preparation of design and cost estimation The cost related to Software Components needs to be arrived based on the suggestion proposed in the "Final Draft Report- Sanitation Technologies" for each of the projectThe cost related to Operation &Maintenance needs to be arrived based on the O&M activities and O&M framework proposed in the "Final Draft Report- Sanitation Technologies" for each of the project The cost related to Land is not considered as Pourashava agreed to provide the Government Land for implementation of the proposed project
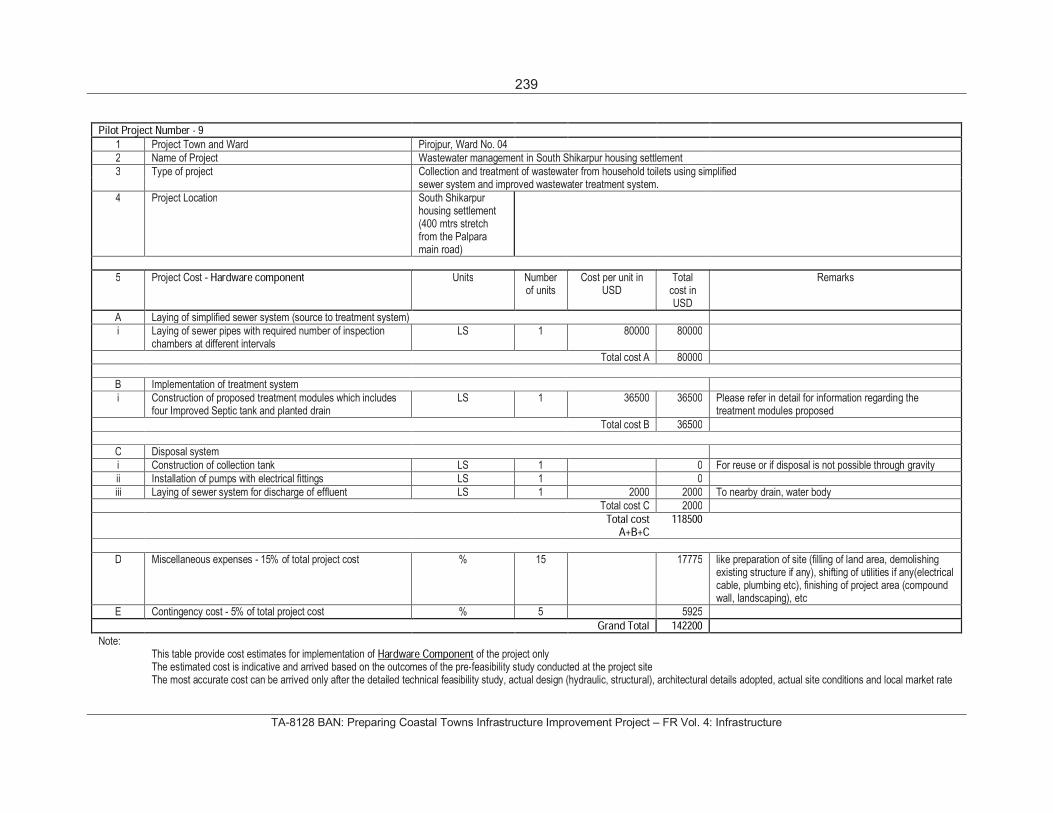
239
TA-8128 BAN: Preparing Coastal Towns Infrastructure Improvement Project – FR Vol. 4: Infrastructure
Pilot Project Number - 91 Project Town and Ward Pirojpur, Ward No. 042 Name of Project Wastewater management in South Shikarpur housing settlement3 Type of project Collection and treatment of wastewater from household toilets using simplified
sewer system and improved wastewater treatment system.4 Project Location South Shikarpur
housing settlement (400 mtrs stretch from the Palpara main road)
5 Project Cost - Hardware component Units Numberof units
Cost per unit in USD
Total cost in USD
Remarks
A Laying of simplified sewer system (source to treatment system)i Laying of sewer pipes with required number of inspection
chambers at different intervals LS 1 80000 80000
Total cost A 80000
B Implementation of treatment systemi Construction of proposed treatment modules which includes
four Improved Septic tank and planted drain LS 1 36500 36500 Please refer in detail for information regarding the
treatment modules proposed Total cost B 36500
C Disposal systemi Construction of collection tank LS 1 0 For reuse or if disposal is not possible through gravityii Installation of pumps with electrical fittings LS 1 0iii Laying of sewer system for discharge of effluent LS 1 2000 2000 To nearby drain, water body
Total cost C 2000Total cost
A+B+C 118500
D Miscellaneous expenses - 15% of total project cost % 15 17775 like preparation of site (filling of land area, demolishing existing structure if any), shifting of utilities if any(electrical cable, plumbing etc), finishing of project area (compound wall, landscaping), etc
E Contingency cost - 5% of total project cost % 5 5925Grand Total 142200
Note: This table provide cost estimates for implementation of Hardware Component of the project onlyThe estimated cost is indicative and arrived based on the outcomes of the pre-feasibility study conducted at the project siteThe most accurate cost can be arrived only after the detailed technical feasibility study, actual design (hydraulic, structural), architectural details adopted, actual site conditions and local market rate
240
TA-8128 BAN: Preparing Coastal Towns Infrastructure Improvement Project – FR Vol. 4: Infrastructure
of construction material and labourThe Design consultant appointed should refer "Final Draft Report- Sanitation Technologies" for finalisation of concept proposed (sanitation complex and treatment modules), preparation of design and cost estimation The cost related to Software Components needs to be arrived based on the suggestion proposed in the "Final Draft Report- Sanitation Technologies" for each of the projectThe cost related to Operation &Maintenance needs to be arrived based on the O&M activities and O&M framework proposed in the "Final Draft Report- Sanitation Technologies" for each of the project The cost related to Land is not considered as Pourashava agreed to provide the Government Land for implementation of the proposed project
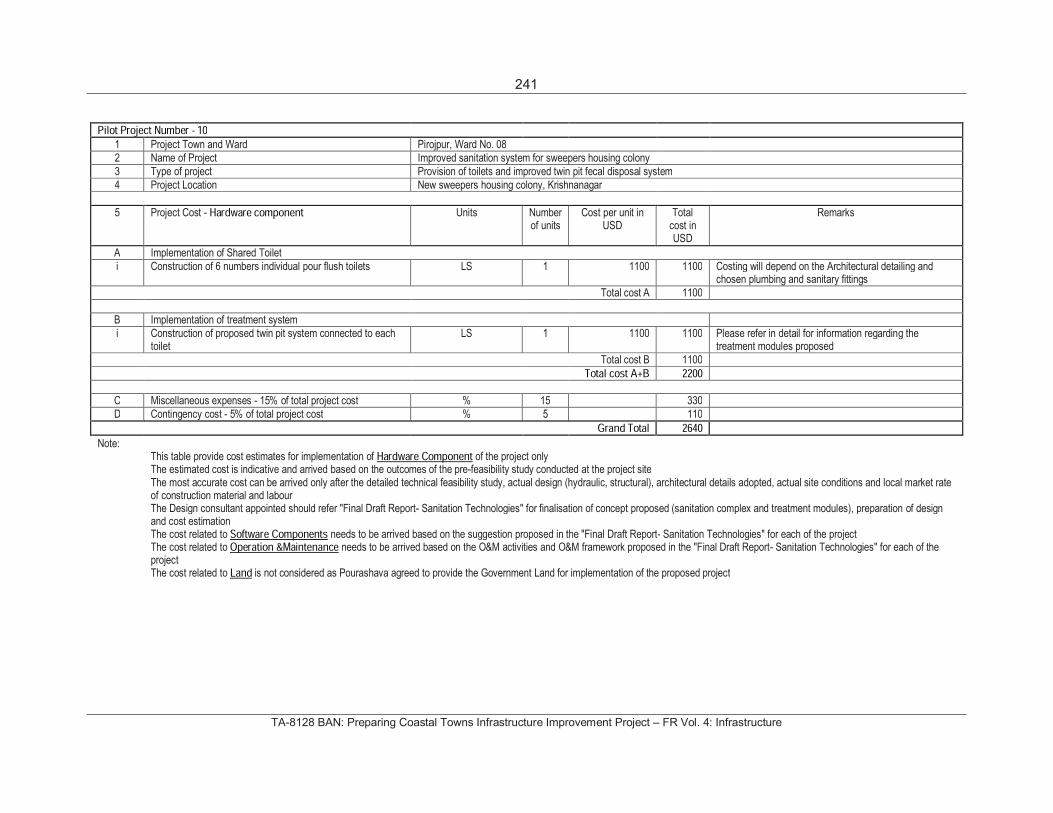
241
TA-8128 BAN: Preparing Coastal Towns Infrastructure Improvement Project – FR Vol. 4: Infrastructure
Pilot Project Number - 101 Project Town and Ward Pirojpur, Ward No. 082 Name of Project Improved sanitation system for sweepers housing colony3 Type of project Provision of toilets and improved twin pit fecal disposal system4 Project Location New sweepers housing colony, Krishnanagar
5 Project Cost - Hardware component Units Numberof units
Cost per unit in USD
Total cost in USD
Remarks
A Implementation of Shared Toilet i Construction of 6 numbers individual pour flush toilets LS 1 1100 1100 Costing will depend on the Architectural detailing and
chosen plumbing and sanitary fittings Total cost A 1100
B Implementation of treatment systemi Construction of proposed twin pit system connected to each
toilet LS 1 1100 1100 Please refer in detail for information regarding the
treatment modules proposed Total cost B 1100
Total cost A+B 2200C Miscellaneous expenses - 15% of total project cost % 15 330D Contingency cost - 5% of total project cost % 5 110
Grand Total 2640Note:
This table provide cost estimates for implementation of Hardware Component of the project onlyThe estimated cost is indicative and arrived based on the outcomes of the pre-feasibility study conducted at the project siteThe most accurate cost can be arrived only after the detailed technical feasibility study, actual design (hydraulic, structural), architectural details adopted, actual site conditions and local market rate of construction material and labour The Design consultant appointed should refer "Final Draft Report- Sanitation Technologies" for finalisation of concept proposed (sanitation complex and treatment modules), preparation of design and cost estimation The cost related to Software Components needs to be arrived based on the suggestion proposed in the "Final Draft Report- Sanitation Technologies" for each of the projectThe cost related to Operation &Maintenance needs to be arrived based on the O&M activities and O&M framework proposed in the "Final Draft Report- Sanitation Technologies" for each of the project The cost related to Land is not considered as Pourashava agreed to provide the Government Land for implementation of the proposed project
242
TA-8128 BAN: Preparing Coastal Towns Infrastructure Improvement Project – FR Vol. 4: Infrastructure
ANNEX E.3
SANITATION MAPS AND DRAWINGS
Location of Proposed Sanitation Infrastructure: Amtali Pourashava
Location of Proposed Sanitation Infrastructure: Galachipa Pourashava
Location of Proposed Sanitation Infrastructure: Pirojpur Pourashava
Location of Proposed Sanitation Infrastructure: Mathbaria Pourashava
Preliminary Layout of Public Toilet
Preliminary Layout of School Toilet
Preliminary Layout of Community Toilet

243
TA-8128 BAN: Preparing Coastal Towns Infrastructure Improvement Project – FR Vol. 4: Infrastructure
Location of Proposed Sanitation Infrastructure: Amtali Pourashava
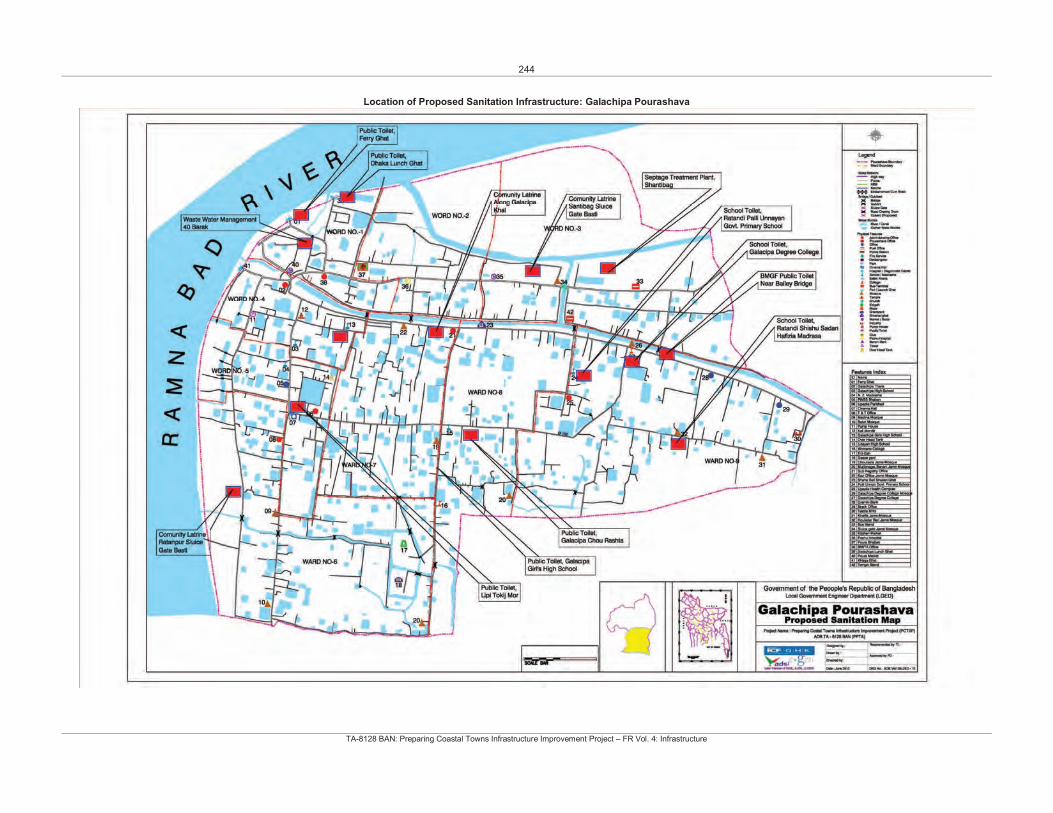
244
TA-8128 BAN: Preparing Coastal Towns Infrastructure Improvement Project – FR Vol. 4: Infrastructure
Location of Proposed Sanitation Infrastructure: Galachipa Pourashava
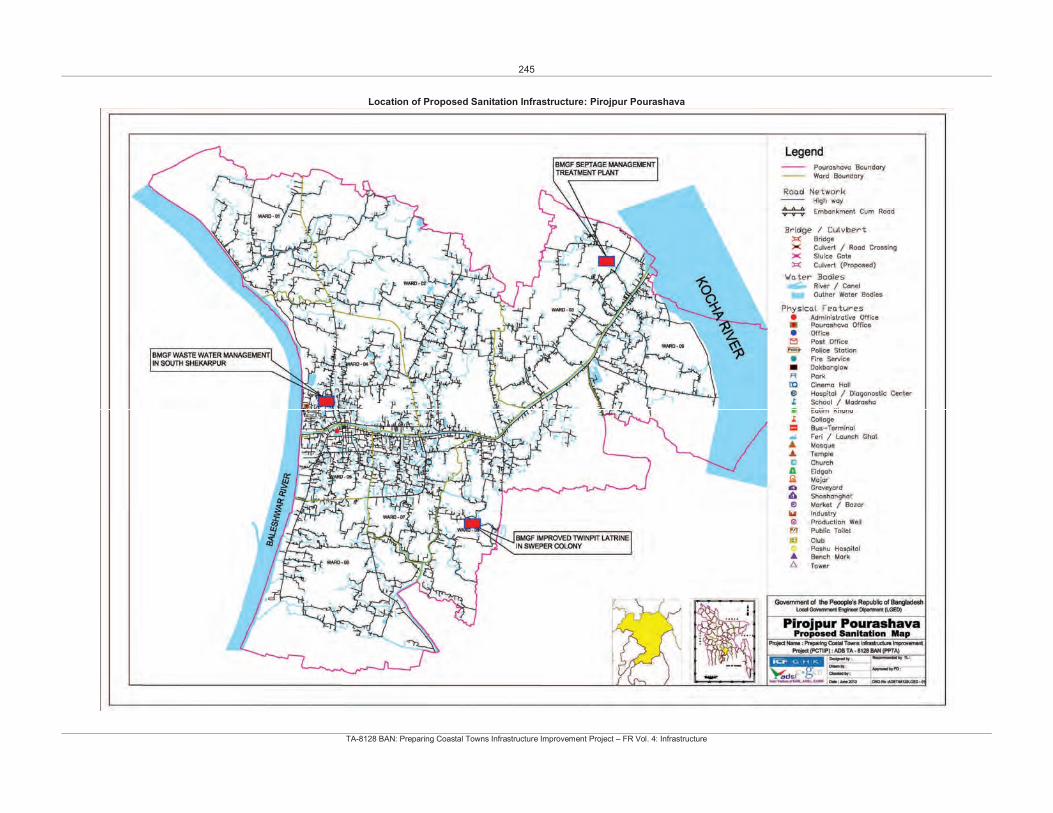
245
TA-8128 BAN: Preparing Coastal Towns Infrastructure Improvement Project – FR Vol. 4: Infrastructure
Location of Proposed Sanitation Infrastructure: Pirojpur Pourashava
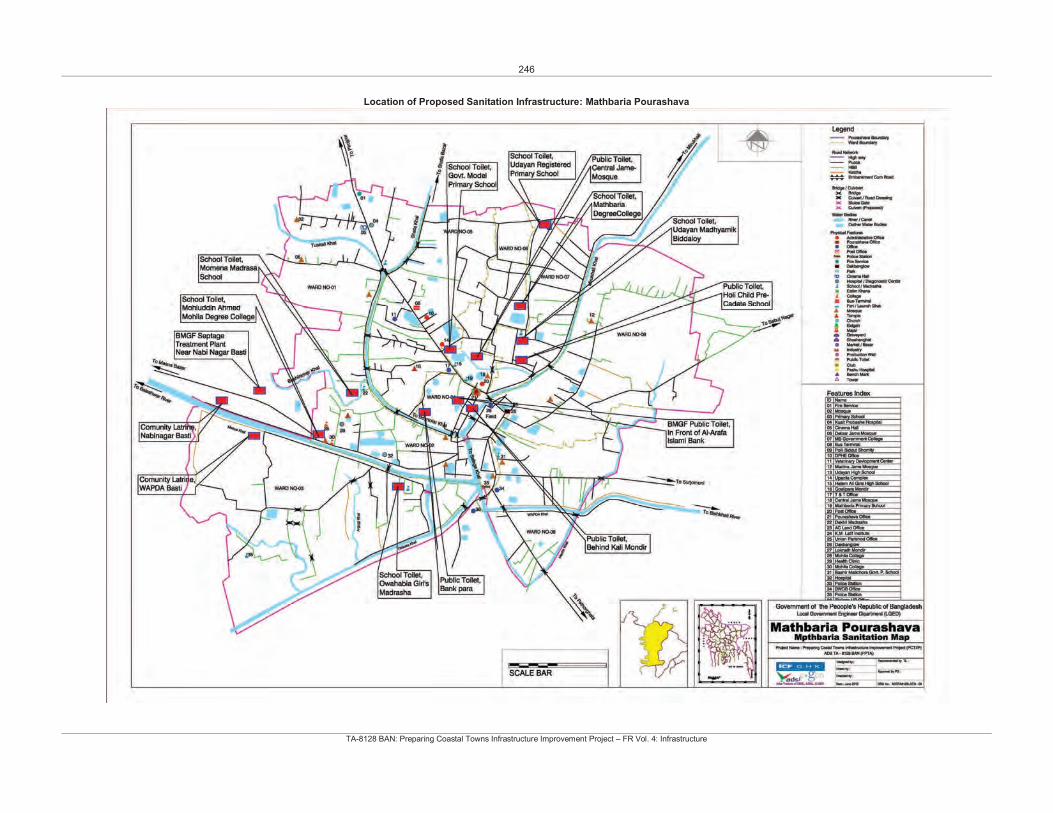
246
TA-8128 BAN: Preparing Coastal Towns Infrastructure Improvement Project – FR Vol. 4: Infrastructure
Location of Proposed Sanitation Infrastructure: Mathbaria Pourashava
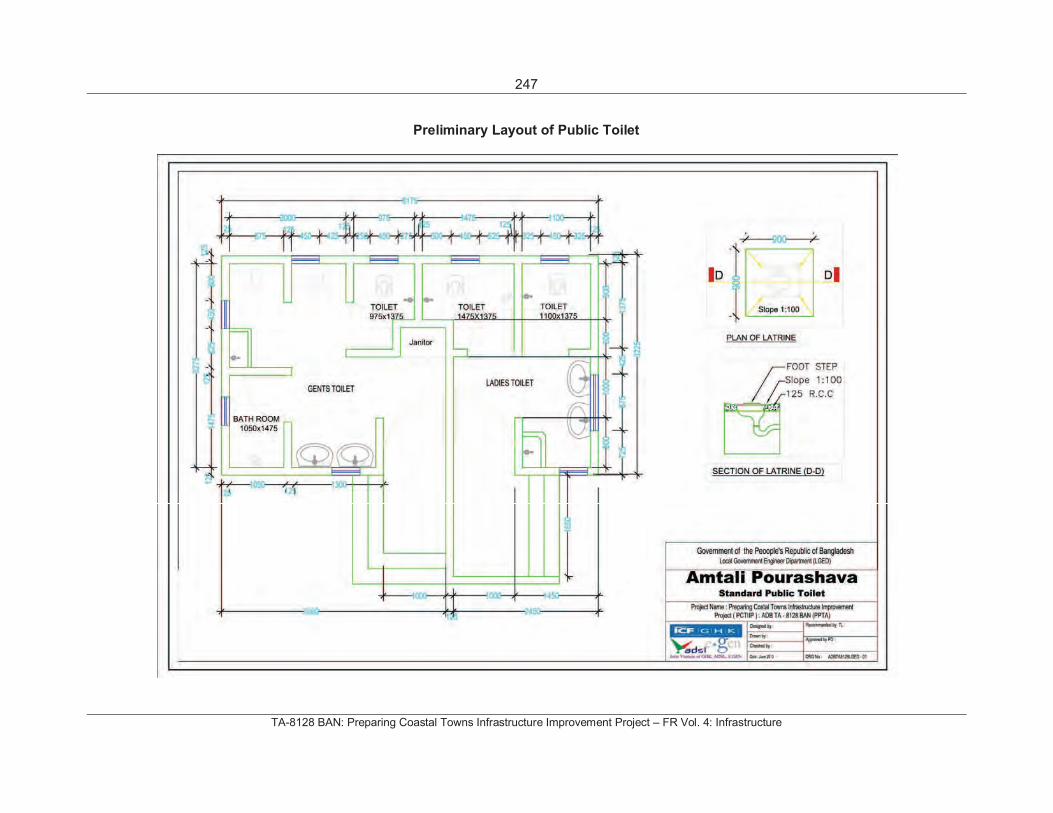
247
TA-8128 BAN: Preparing Coastal Towns Infrastructure Improvement Project – FR Vol. 4: Infrastructure
Preliminary Layout of Public Toilet
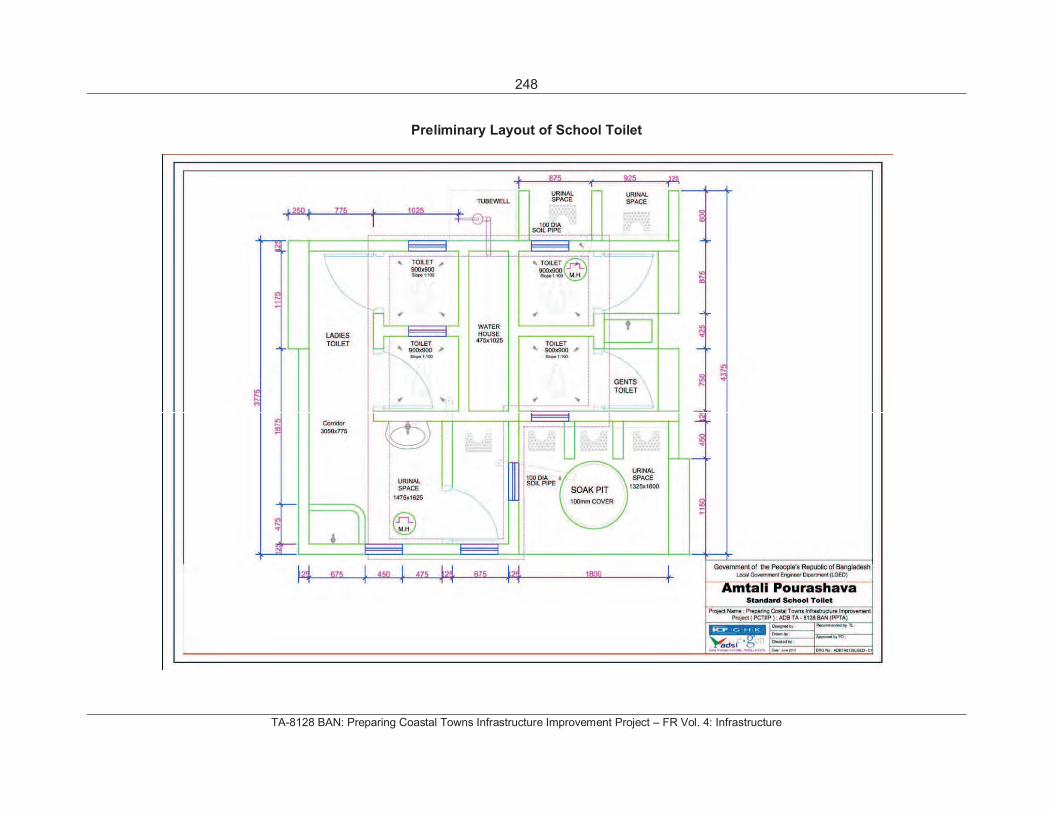
248
TA-8128 BAN: Preparing Coastal Towns Infrastructure Improvement Project – FR Vol. 4: Infrastructure
Preliminary Layout of School Toilet
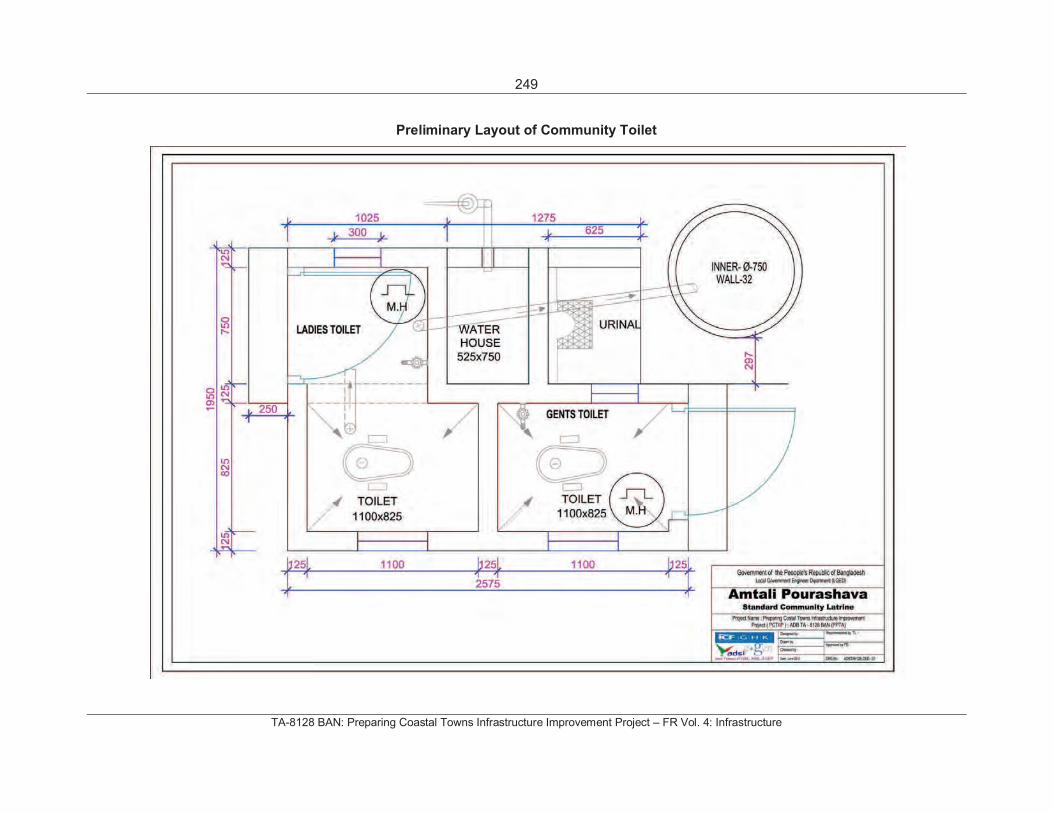
249
TA-8128 BAN: Preparing Coastal Towns Infrastructure Improvement Project – FR Vol. 4: Infrastructure
Preliminary Layout of Community Toilet

250
TA-8128 BAN: Preparing Coastal Towns Infrastructure Improvement Project – FR Vol. 4: Infrastructure
ANNEX F: WATER RESOURCES
1. Water Quality Standards
2. Hydrological and Hydrogeological Study: Coastal Town Amtali
3. Hydrological and Hydrogeological Study: Coastal Town Galachipa
4. Hydrological and Hydrogeological Study: Coastal Town Pirojpur
5. Hydrological and Hydrogeological Study: Coastal Town Mathbaria
6. Groundwater Resource Assessment for Coastal Areas of Bangladesh
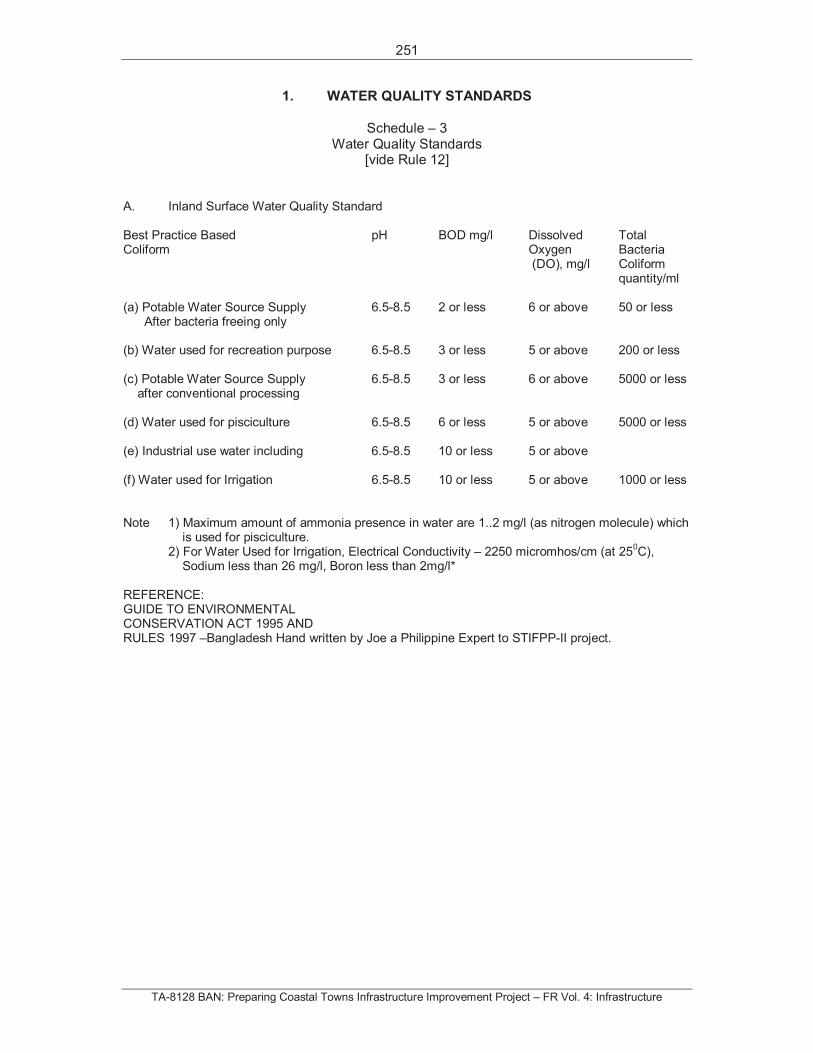
251
TA-8128 BAN: Preparing Coastal Towns Infrastructure Improvement Project – FR Vol. 4: Infrastructure
1. WATER QUALITY STANDARDS
Schedule – 3 Water Quality Standards
[vide Rule 12]
A. Inland Surface Water Quality Standard
Best Practice Based pH BOD mg/l Dissolved Total Coliform Oxygen Bacteria
(DO), mg/l Coliformquantity/ml
(a) Potable Water Source Supply 6.5-8.5 2 or less 6 or above 50 or less After bacteria freeing only
(b) Water used for recreation purpose 6.5-8.5 3 or less 5 or above 200 or less
(c) Potable Water Source Supply 6.5-8.5 3 or less 6 or above 5000 or less after conventional processing
(d) Water used for pisciculture 6.5-8.5 6 or less 5 or above 5000 or less
(e) Industrial use water including 6.5-8.5 10 or less 5 or above
(f) Water used for Irrigation 6.5-8.5 10 or less 5 or above 1000 or less
Note 1) Maximum amount of ammonia presence in water are 1..2 mg/l (as nitrogen molecule) which is used for pisciculture. 2) For Water Used for Irrigation, Electrical Conductivity – 2250 micromhos/cm (at 25
0C),
Sodium less than 26 mg/l, Boron less than 2mg/l*
REFERENCE: GUIDE TO ENVIRONMENTAL CONSERVATION ACT 1995 AND RULES 1997 –Bangladesh Hand written by Joe a Philippine Expert to STIFPP-II project.
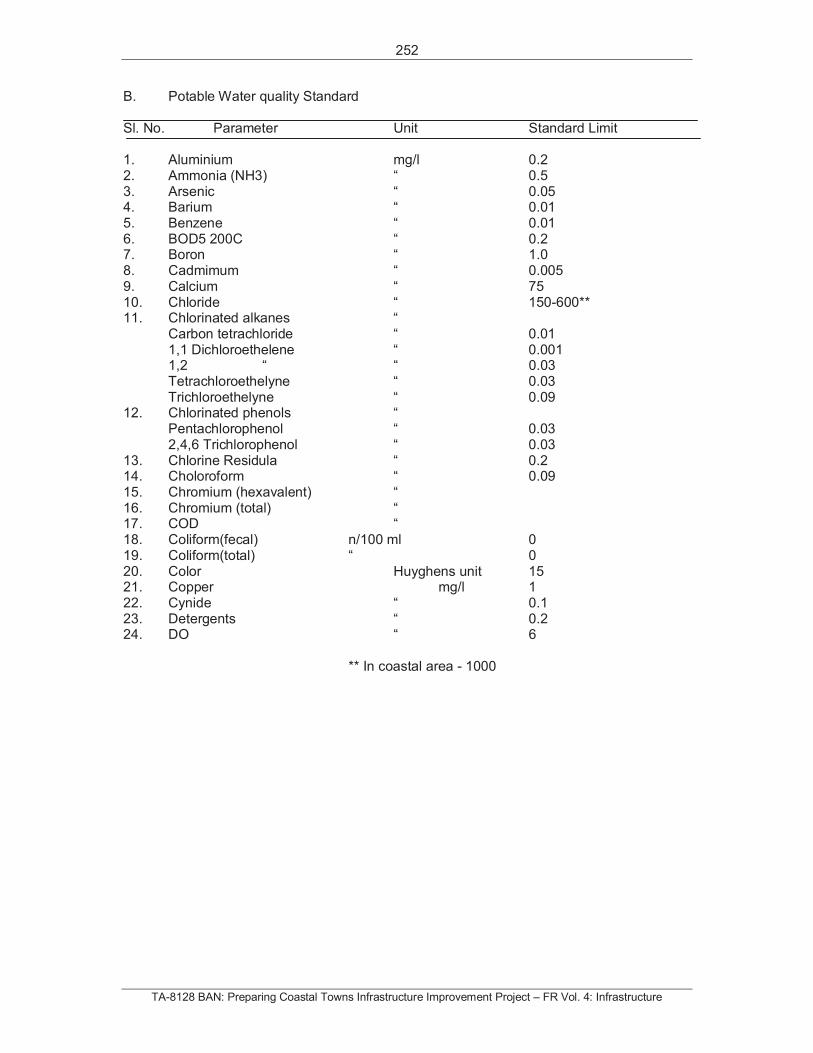
252
TA-8128 BAN: Preparing Coastal Towns Infrastructure Improvement Project – FR Vol. 4: Infrastructure
B. Potable Water quality Standard
Sl. No. Parameter Unit Standard Limit
1. Aluminium mg/l 0.2 2. Ammonia (NH3) “ 0.5 3. Arsenic “ 0.05 4. Barium “ 0.01 5. Benzene “ 0.01 6. BOD5 200C “ 0.2 7. Boron “ 1.0 8. Cadmimum “ 0.005 9. Calcium “ 75 10. Chloride “ 150-600** 11. Chlorinated alkanes “
Carbon tetrachloride “ 0.01 1,1 Dichloroethelene “ 0.001 1,2 “ “ 0.03 Tetrachloroethelyne “ 0.03 Trichloroethelyne “ 0.09
12. Chlorinated phenols “Pentachlorophenol “ 0.03 2,4,6 Trichlorophenol “ 0.03
13. Chlorine Residula “ 0.2 14. Choloroform “ 0.09 15. Chromium (hexavalent) “16. Chromium (total) “17. COD “18. Coliform(fecal) n/100 ml 019. Coliform(total) “ 020. Color Huyghens unit 15 21. Copper mg/l 122. Cynide “ 0.1 23. Detergents “ 0.2 24. DO “ 6
** In coastal area - 1000
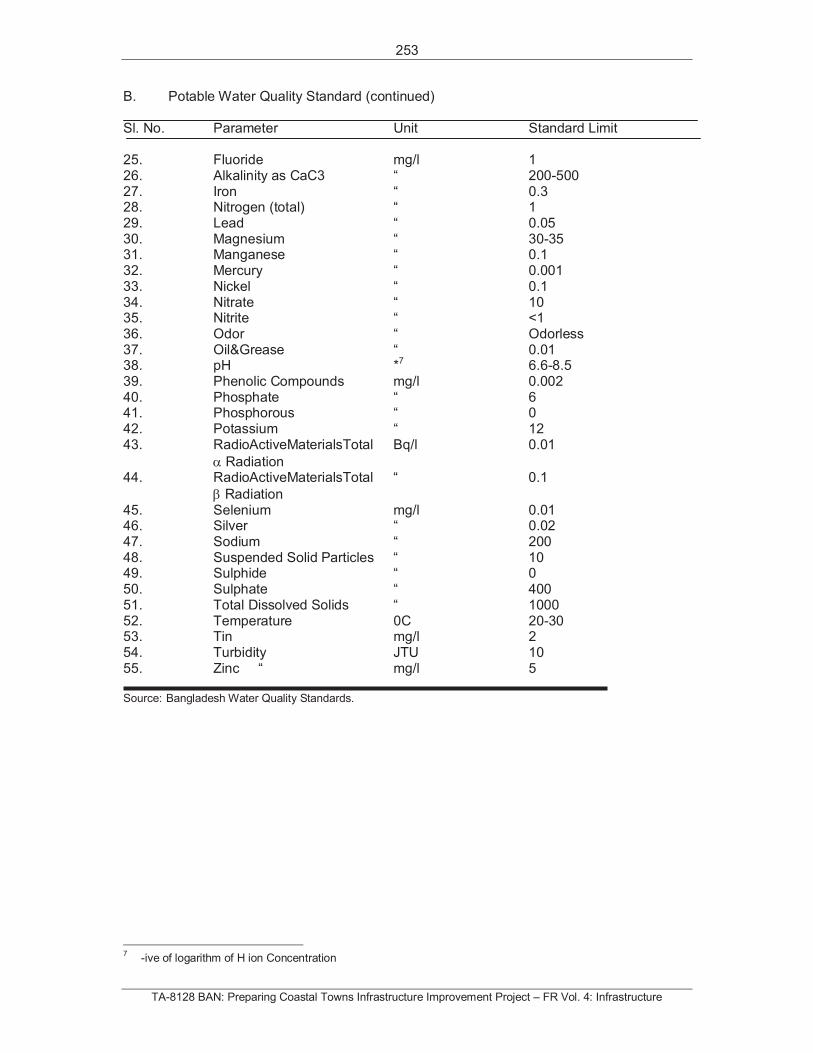
253
TA-8128 BAN: Preparing Coastal Towns Infrastructure Improvement Project – FR Vol. 4: Infrastructure
B. Potable Water Quality Standard (continued)
Sl. No. Parameter Unit Standard Limit
25. Fluoride mg/l 126. Alkalinity as CaC3 “ 200-500 27. Iron “ 0.3 28. Nitrogen (total) “ 129. Lead “ 0.05 30. Magnesium “ 30-35 31. Manganese “ 0.1 32. Mercury “ 0.001 33. Nickel “ 0.1 34. Nitrate “ 10 35. Nitrite “ <1 36. Odor “ Odorless 37. Oil&Grease “ 0.01 38. pH *7 6.6-8.5 39. Phenolic Compounds mg/l 0.002 40. Phosphate “ 641. Phosphorous “ 042. Potassium “ 12 43. RadioActiveMaterialsTotal Bq/l 0.01
Radiation 44. RadioActiveMaterialsTotal “ 0.1
Radiation 45. Selenium mg/l 0.01 46. Silver “ 0.02 47. Sodium “ 200 48. Suspended Solid Particles “ 10 49. Sulphide “ 050. Sulphate “ 400 51. Total Dissolved Solids “ 1000 52. Temperature 0C 20-30 53. Tin mg/l 254. Turbidity JTU 10 55. Zinc “ mg/l 5
Source: Bangladesh Water Quality Standards.
7 -ive of logarithm of H ion Concentration
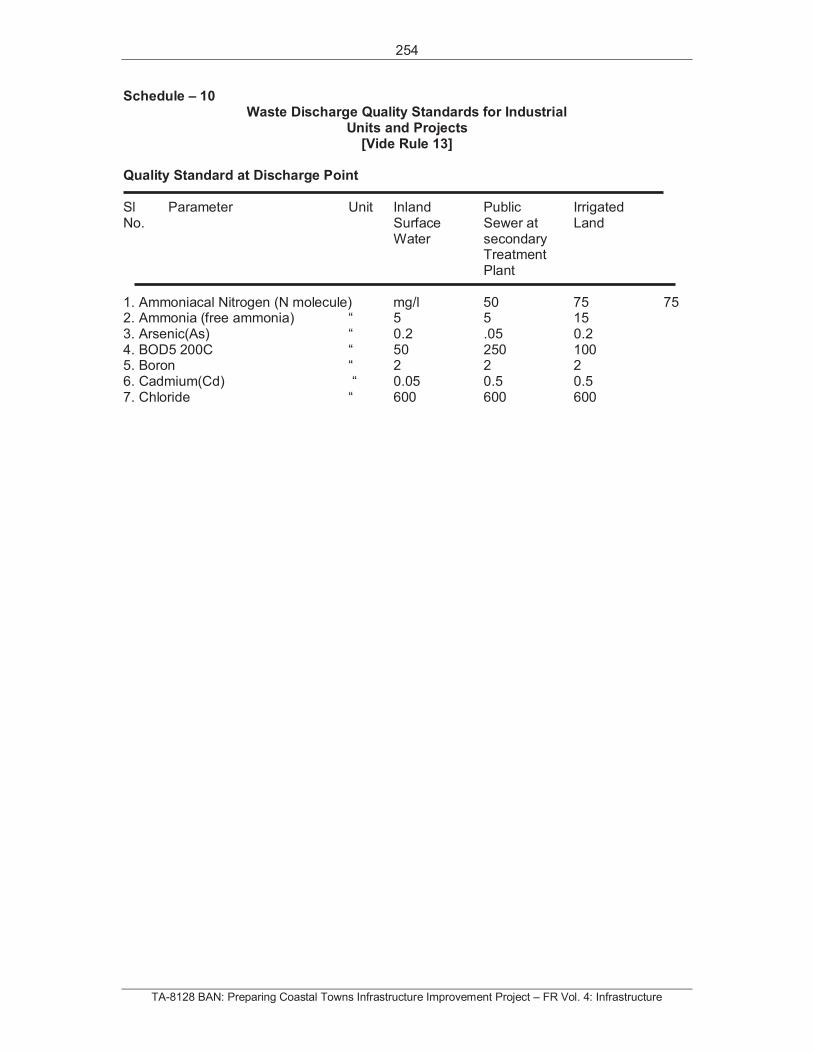
254
TA-8128 BAN: Preparing Coastal Towns Infrastructure Improvement Project – FR Vol. 4: Infrastructure
Schedule – 10 Waste Discharge Quality Standards for Industrial
Units and Projects [Vide Rule 13]
Quality Standard at Discharge Point
Sl Parameter Unit Inland Public Irrigated No. Surface Sewer at Land
Water secondary Treatment Plant
1. Ammoniacal Nitrogen (N molecule) mg/l 50 75 75 2. Ammonia (free ammonia) “ 5 5 15 3. Arsenic(As) “ 0.2 .05 0.2 4. BOD5 200C “ 50 250 100 5. Boron “ 2 2 26. Cadmium(Cd) “ 0.05 0.5 0.5 7. Chloride “ 600 600 600

255
TA-8128 BAN: Preparing Coastal Towns Infrastructure Improvement Project – FR Vol. 4: Infrastructure
2. HYDROLOGICAL AND HYDROGEOLOGICAL STUDY COASTAL TOWN AMTALI
04 July, 2013
Table of Contents
1. Background Information
1.1 Location of Coastal Town Amtali
1.2 Availability of Hydrological stations in the area
1.3 Availability of Groundwater stations
2. Tide at Amtali
3. Sea Salinity
4. Rainfall
5. Groundwater
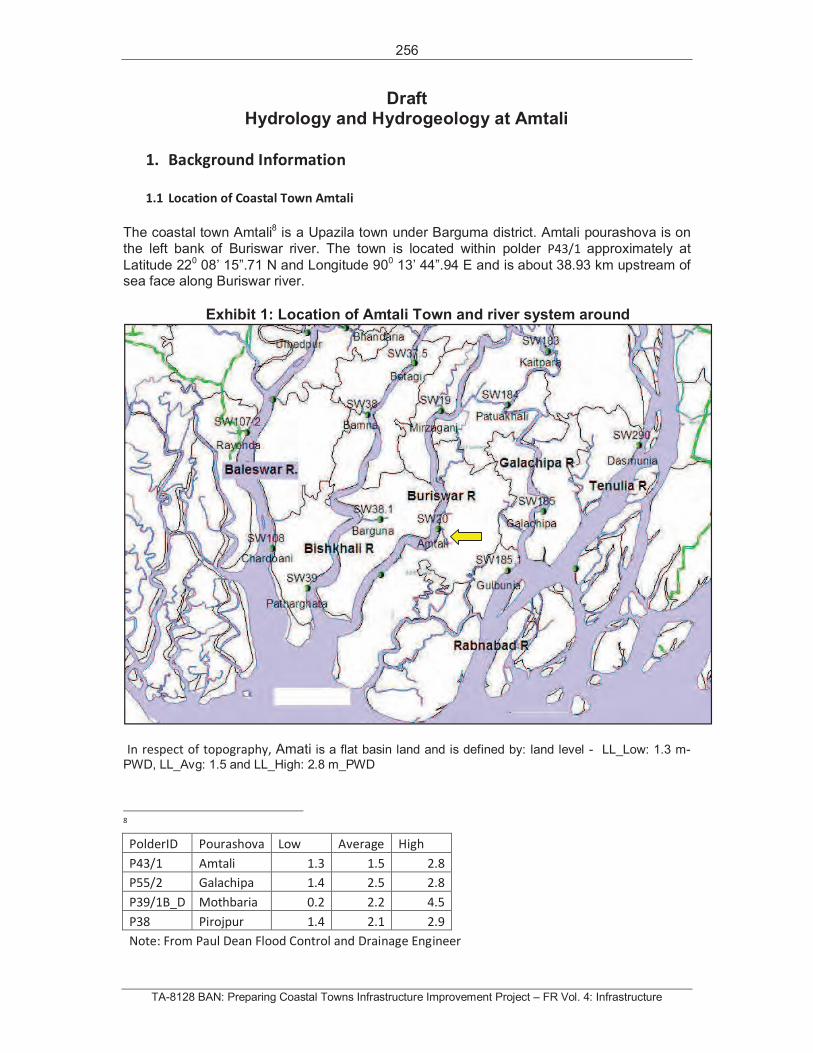
256
TA-8128 BAN: Preparing Coastal Towns Infrastructure Improvement Project – FR Vol. 4: Infrastructure
Draft Hydrology and Hydrogeology at Amtali
1. Background Information
1.1 Location of Coastal Town Amtali
The coastal town Amtali8 is a Upazila town under Barguma district. Amtali pourashova is on
the left bank of Buriswar river. The town is located within polder P43/1 approximately at
Latitude 220 08’ 15”.71 N and Longitude 900 13’ 44”.94 E and is about 38.93 km upstream of sea face along Buriswar river.
Exhibit 1: Location of Amtali Town and river system around
In respect of topography, Amati is a flat basin land and is defined by: land level - LL_Low: 1.3 m-
PWD, LL_Avg: 1.5 and LL_High: 2.8 m_PWD
8
PolderID Pourashova Low Average High
P43/1 Amtali 1.3 1.5 2.8
P55/2 Galachipa 1.4 2.5 2.8
P39/1B_D Mothbaria 0.2 2.2 4.5
P38 Pirojpur 1.4 2.1 2.9
Note: From Paul Dean Flood Control and Drainage Engineer
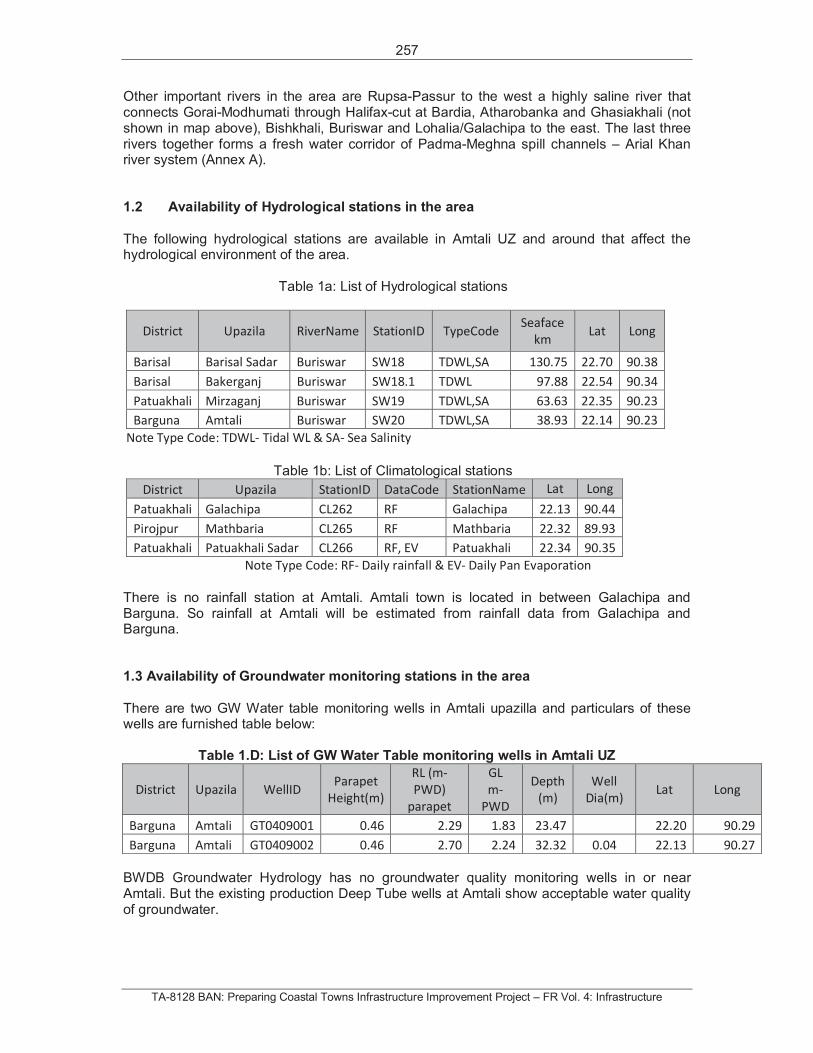
257
TA-8128 BAN: Preparing Coastal Towns Infrastructure Improvement Project – FR Vol. 4: Infrastructure
Other important rivers in the area are Rupsa-Passur to the west a highly saline river that connects Gorai-Modhumati through Halifax-cut at Bardia, Atharobanka and Ghasiakhali (not shown in map above), Bishkhali, Buriswar and Lohalia/Galachipa to the east. The last three rivers together forms a fresh water corridor of Padma-Meghna spill channels – Arial Khan river system (Annex A).
1.2 Availability of Hydrological stations in the area
The following hydrological stations are available in Amtali UZ and around that affect the hydrological environment of the area.
Table 1a: List of Hydrological stations
District Upazila RiverName StationID TypeCode Seaface
km Lat Long
Barisal Barisal Sadar Buriswar SW18 TDWL,SA 130.75 22.70 90.38
Barisal Bakerganj Buriswar SW18.1 TDWL 97.88 22.54 90.34
Patuakhali Mirzaganj Buriswar SW19 TDWL,SA 63.63 22.35 90.23
Barguna Amtali Buriswar SW20 TDWL,SA 38.93 22.14 90.23
Note Type Code: TDWL- Tidal WL & SA- Sea Salinity
Table 1b: List of Climatological stations
District Upazila StationID DataCode StationName Lat Long
Patuakhali Galachipa CL262 RF Galachipa 22.13 90.44
Pirojpur Mathbaria CL265 RF Mathbaria 22.32 89.93
Patuakhali Patuakhali Sadar CL266 RF, EV Patuakhali 22.34 90.35
Note Type Code: RF- Daily rainfall & EV- Daily Pan Evaporation
There is no rainfall station at Amtali. Amtali town is located in between Galachipa and Barguna. So rainfall at Amtali will be estimated from rainfall data from Galachipa and Barguna.
1.3 Availability of Groundwater monitoring stations in the area
There are two GW Water table monitoring wells in Amtali upazilla and particulars of these wells are furnished table below:
Table 1.D: List of GW Water Table monitoring wells in Amtali UZ
District Upazila WellIDParapet
Height(m)
RL (m-
PWD)
parapet
GL
m-
PWD
Depth
(m)
Well
Dia(m) Lat Long
Barguna Amtali GT0409001 0.46 2.29 1.83 23.47 22.20 90.29
Barguna Amtali GT0409002 0.46 2.70 2.24 32.32 0.04 22.13 90.27
BWDB Groundwater Hydrology has no groundwater quality monitoring wells in or near Amtali. But the existing production Deep Tube wells at Amtali show acceptable water quality of groundwater.
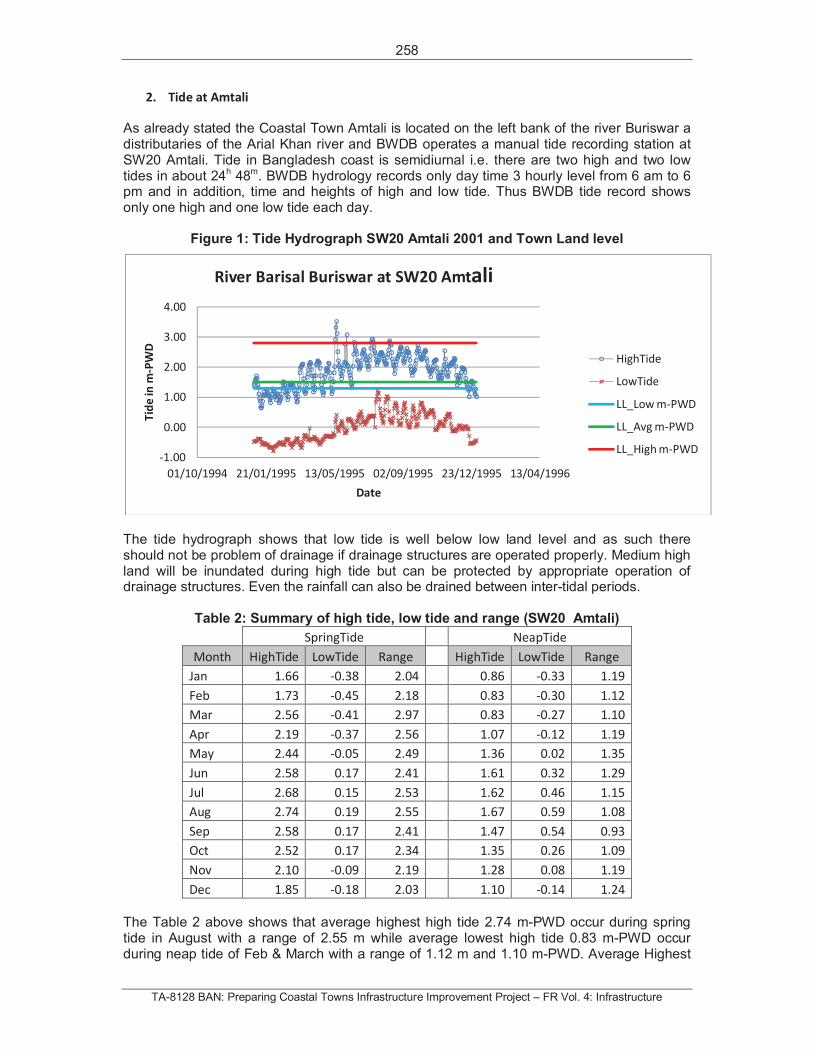
258
TA-8128 BAN: Preparing Coastal Towns Infrastructure Improvement Project – FR Vol. 4: Infrastructure
2. Tide at Amtali
As already stated the Coastal Town Amtali is located on the left bank of the river Buriswar a distributaries of the Arial Khan river and BWDB operates a manual tide recording station at SW20 Amtali. Tide in Bangladesh coast is semidiurnal i.e. there are two high and two low tides in about 24h 48m. BWDB hydrology records only day time 3 hourly level from 6 am to 6 pm and in addition, time and heights of high and low tide. Thus BWDB tide record shows only one high and one low tide each day.
Figure 1: Tide Hydrograph SW20 Amtali 2001 and Town Land level
The tide hydrograph shows that low tide is well below low land level and as such there should not be problem of drainage if drainage structures are operated properly. Medium high land will be inundated during high tide but can be protected by appropriate operation of drainage structures. Even the rainfall can also be drained between inter-tidal periods.
Table 2: Summary of high tide, low tide and range (SW20 Amtali)
SpringTide NeapTide
Month HighTide LowTide Range HighTide LowTide Range
Jan 1.66 -0.38 2.04 0.86 -0.33 1.19
Feb 1.73 -0.45 2.18 0.83 -0.30 1.12
Mar 2.56 -0.41 2.97 0.83 -0.27 1.10
Apr 2.19 -0.37 2.56 1.07 -0.12 1.19
May 2.44 -0.05 2.49 1.36 0.02 1.35
Jun 2.58 0.17 2.41 1.61 0.32 1.29
Jul 2.68 0.15 2.53 1.62 0.46 1.15
Aug 2.74 0.19 2.55 1.67 0.59 1.08
Sep 2.58 0.17 2.41 1.47 0.54 0.93
Oct 2.52 0.17 2.34 1.35 0.26 1.09
Nov 2.10 -0.09 2.19 1.28 0.08 1.19
Dec 1.85 -0.18 2.03 1.10 -0.14 1.24
The Table 2 above shows that average highest high tide 2.74 m-PWD occur during spring tide in August with a range of 2.55 m while average lowest high tide 0.83 m-PWD occur during neap tide of Feb & March with a range of 1.12 m and 1.10 m-PWD. Average Highest
-1.00
0.00
1.00
2.00
3.00
4.00
01/10/1994 21/01/1995 13/05/1995 02/09/1995 23/12/1995 13/04/1996
Tid
ein
m-P
WD
Date
River Barisal Buriswar at SW20 Amtali
HighTide
LowTide
LL_Low m-PWD
LL_Avg m-PWD
LL_High m-PWD
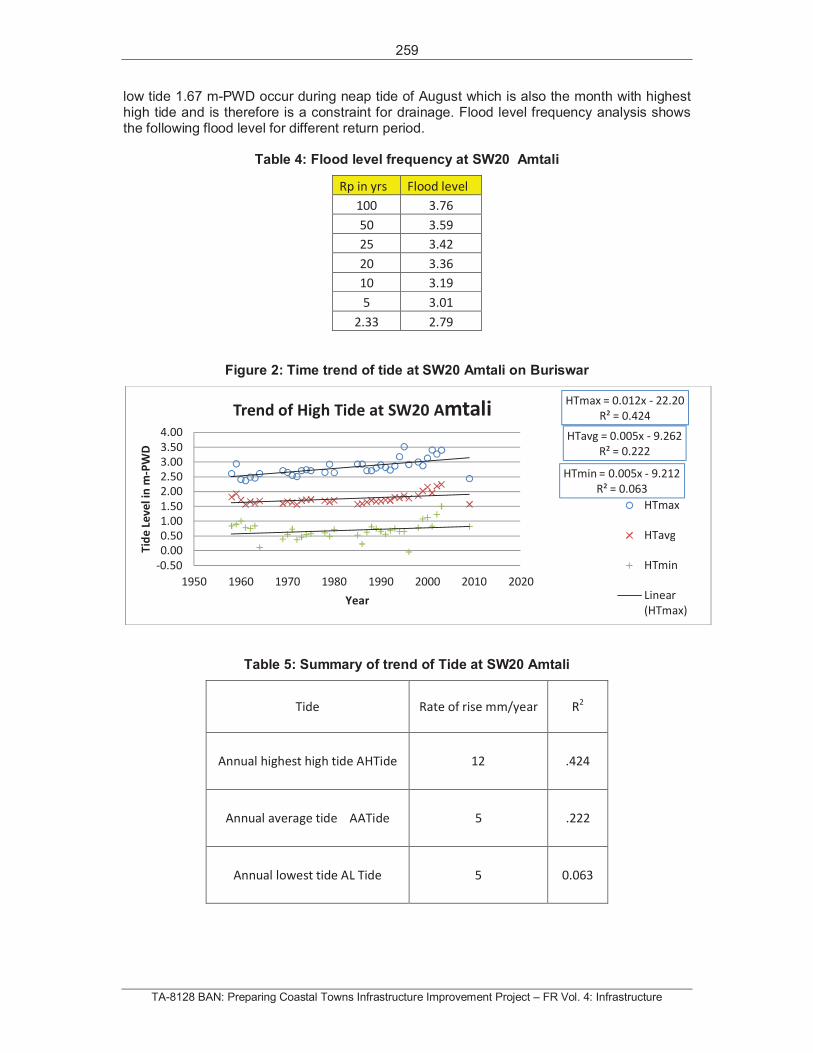
259
TA-8128 BAN: Preparing Coastal Towns Infrastructure Improvement Project – FR Vol. 4: Infrastructure
low tide 1.67 m-PWD occur during neap tide of August which is also the month with highest high tide and is therefore is a constraint for drainage. Flood level frequency analysis shows the following flood level for different return period.
Table 4: Flood level frequency at SW20 Amtali
Rp in yrs Flood level
100 3.76
50 3.59
25 3.42
20 3.36
10 3.19
5 3.01
2.33 2.79
Figure 2: Time trend of tide at SW20 Amtali on Buriswar
Table 5: Summary of trend of Tide at SW20 Amtali
Tide Rate of rise mm/year R2
Annual highest high tide AHTide 12 .424
Annual average tide AATide 5 .222
Annual lowest tide AL Tide 5 0.063
HTmax = 0.012x - 22.20
R² = 0.424
HTavg = 0.005x - 9.262
R² = 0.222
HTmin = 0.005x - 9.212
R² = 0.063
-0.50
0.00
0.50
1.00
1.50
2.00
2.50
3.00
3.50
4.00
1950 1960 1970 1980 1990 2000 2010 2020
Tid
eLe
ve
lin
m-P
WD
Year
Trend of High Tide at SW20 Amtali
HTmax
HTavg
HTmin
Linear
(HTmax)
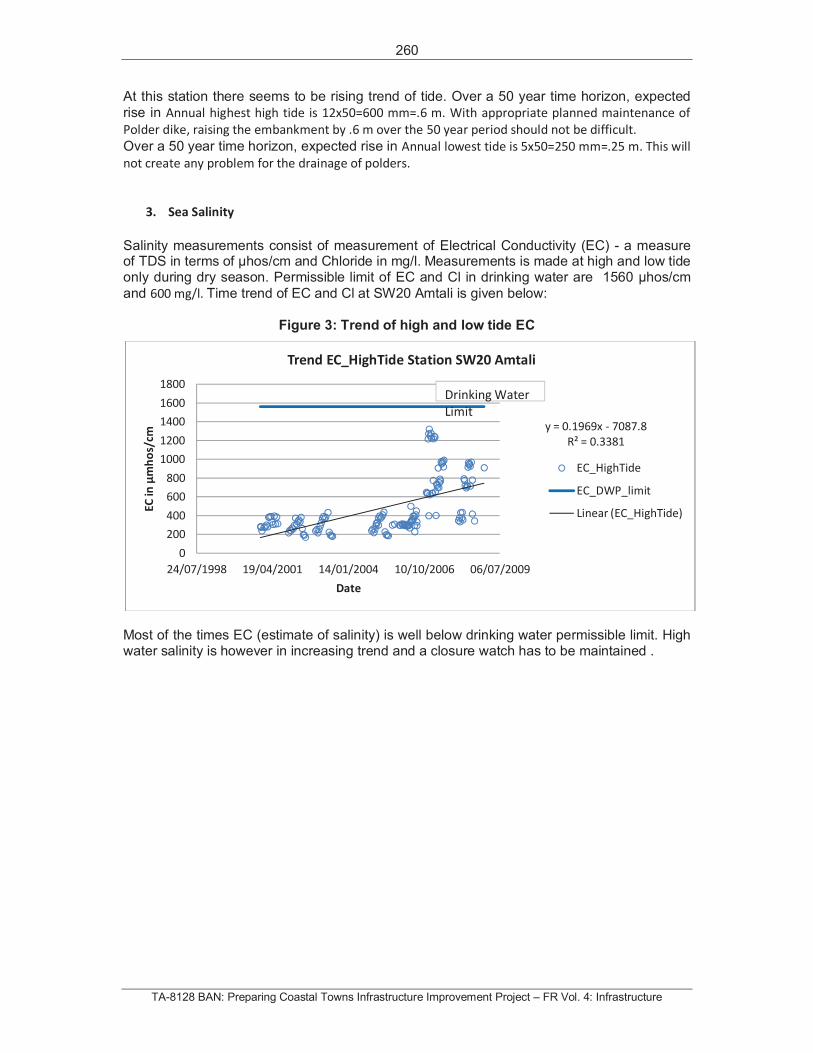
260
TA-8128 BAN: Preparing Coastal Towns Infrastructure Improvement Project – FR Vol. 4: Infrastructure
At this station there seems to be rising trend of tide. Over a 50 year time horizon, expected
rise in Annual highest high tide is 12x50=600 mm=.6 m. With appropriate planned maintenance of
Polder dike, raising the embankment by .6 m over the 50 year period should not be difficult.
Over a 50 year time horizon, expected rise in Annual lowest tide is 5x50=250 mm=.25 m. This will
not create any problem for the drainage of polders.
3. Sea Salinity
Salinity measurements consist of measurement of Electrical Conductivity (EC) - a measure of TDS in terms of hos/cm and Chloride in mg/l. Measurements is made at high and low tide only during dry season. Permissible limit of EC and Cl in drinking water are 1560 hos/cm
and 600 mg/l. Time trend of EC and Cl at SW20 Amtali is given below:
Figure 3: Trend of high and low tide EC
Most of the times EC (estimate of salinity) is well below drinking water permissible limit. High water salinity is however in increasing trend and a closure watch has to be maintained .
y = 0.1969x - 7087.8
R² = 0.3381
0
200
400
600
800
1000
1200
1400
1600
1800
24/07/1998 19/04/2001 14/01/2004 10/10/2006 06/07/2009
EC
inm
ho
s/cm
Date
Trend EC_HighTide Station SW20 Amtali
EC_HighTide
EC_DWP_limit
Linear (EC_HighTide)
Drinking Water
Limit
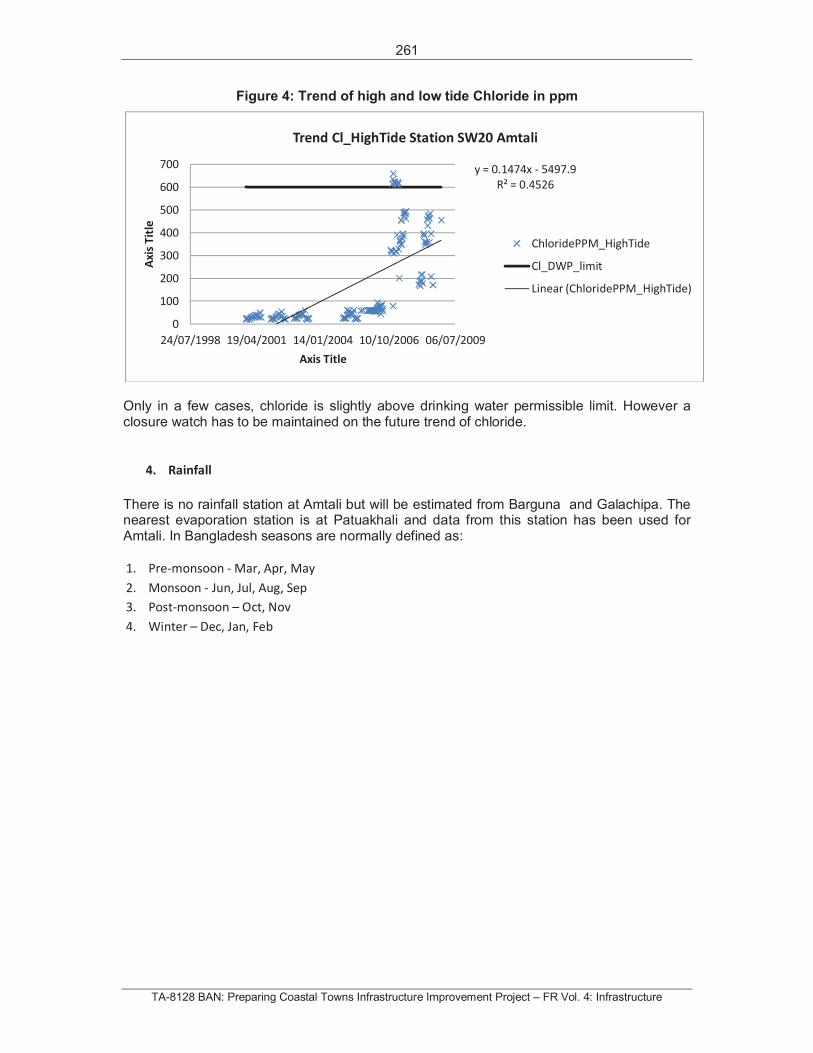
261
TA-8128 BAN: Preparing Coastal Towns Infrastructure Improvement Project – FR Vol. 4: Infrastructure
Figure 4: Trend of high and low tide Chloride in ppm
Only in a few cases, chloride is slightly above drinking water permissible limit. However a closure watch has to be maintained on the future trend of chloride.
4. Rainfall
There is no rainfall station at Amtali but will be estimated from Barguna and Galachipa. The nearest evaporation station is at Patuakhali and data from this station has been used for Amtali. In Bangladesh seasons are normally defined as:
1. Pre-monsoon - Mar, Apr, May
2. Monsoon - Jun, Jul, Aug, Sep
3. Post-monsoon – Oct, Nov
4. Winter – Dec, Jan, Feb
y = 0.1474x - 5497.9
R² = 0.4526
0
100
200
300
400
500
600
700
24/07/1998 19/04/2001 14/01/2004 10/10/2006 06/07/2009
Axi
sT
itle
Axis Title
Trend Cl_HighTide Station SW20 Amtali
ChloridePPM_HighTide
Cl_DWP_limit
Linear (ChloridePPM_HighTide)
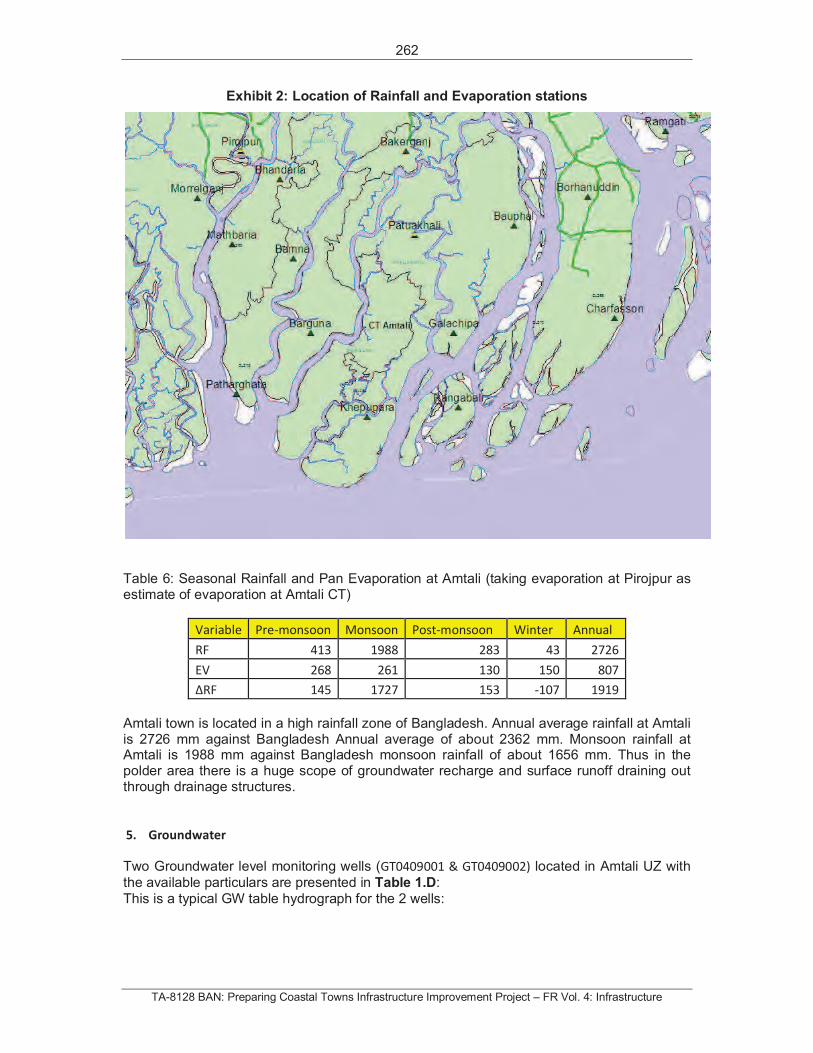
262
TA-8128 BAN: Preparing Coastal Towns Infrastructure Improvement Project – FR Vol. 4: Infrastructure
Exhibit 2: Location of Rainfall and Evaporation stations
Table 6: Seasonal Rainfall and Pan Evaporation at Amtali (taking evaporation at Pirojpur as estimate of evaporation at Amtali CT)
Variable Pre-monsoon Monsoon Post-monsoon Winter Annual
RF 413 1988 283 43 2726
EV 268 261 130 150 807
RF 145 1727 153 -107 1919
Amtali town is located in a high rainfall zone of Bangladesh. Annual average rainfall at Amtali is 2726 mm against Bangladesh Annual average of about 2362 mm. Monsoon rainfall at Amtali is 1988 mm against Bangladesh monsoon rainfall of about 1656 mm. Thus in the polder area there is a huge scope of groundwater recharge and surface runoff draining out through drainage structures.
5. Groundwater
Two Groundwater level monitoring wells (GT0409001 & GT0409002) located in Amtali UZ with
the available particulars are presented in Table 1.D:
This is a typical GW table hydrograph for the 2 wells:
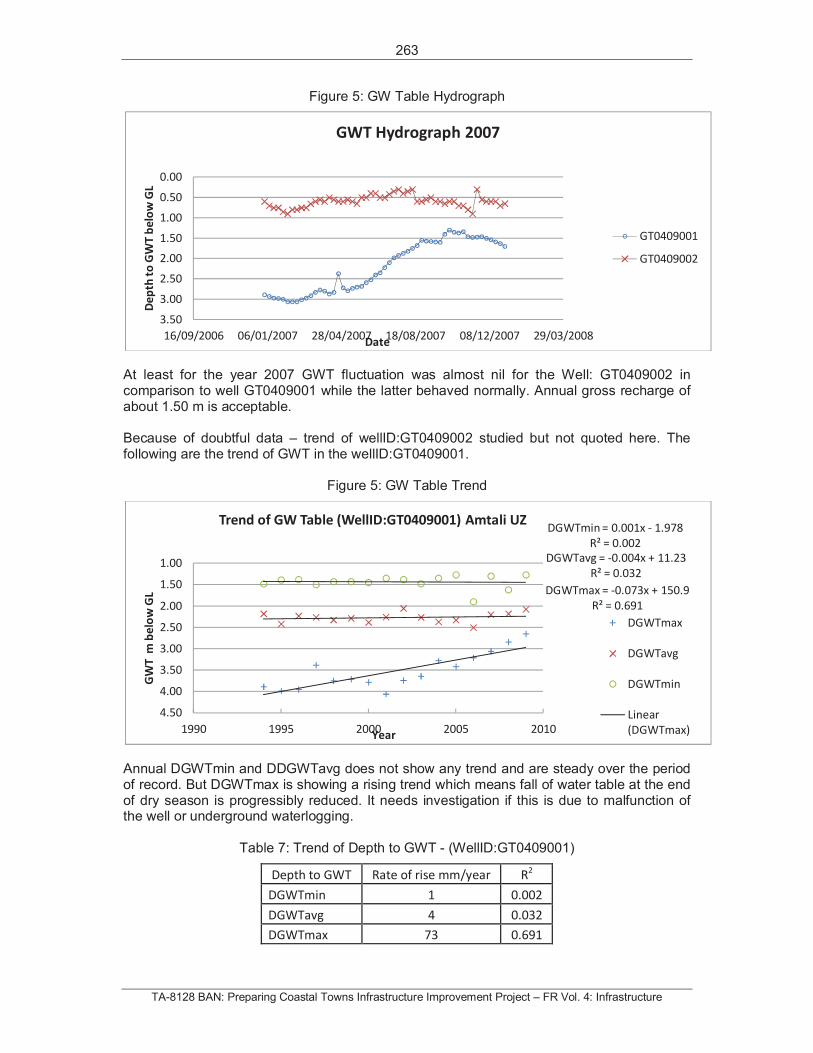
263
TA-8128 BAN: Preparing Coastal Towns Infrastructure Improvement Project – FR Vol. 4: Infrastructure
Figure 5: GW Table Hydrograph
At least for the year 2007 GWT fluctuation was almost nil for the Well: GT0409002 in comparison to well GT0409001 while the latter behaved normally. Annual gross recharge of about 1.50 m is acceptable.
Because of doubtful data – trend of wellID:GT0409002 studied but not quoted here. The following are the trend of GWT in the wellID:GT0409001.
Figure 5: GW Table Trend
Annual DGWTmin and DDGWTavg does not show any trend and are steady over the period of record. But DGWTmax is showing a rising trend which means fall of water table at the end of dry season is progressibly reduced. It needs investigation if this is due to malfunction of the well or underground waterlogging.
Table 7: Trend of Depth to GWT - (WellID:GT0409001)
Depth to GWT Rate of rise mm/year R2
DGWTmin 1 0.002
DGWTavg 4 0.032
DGWTmax 73 0.691
0.00
0.50
1.00
1.50
2.00
2.50
3.00
3.50
16/09/2006 06/01/2007 28/04/2007 18/08/2007 08/12/2007 29/03/2008
De
pth
toG
WT
be
low
GL
Date
GWT Hydrograph 2007
GT0409001
GT0409002
DGWTmax = -0.073x + 150.9
R² = 0.691
DGWTavg = -0.004x + 11.23
R² = 0.032
DGWTmin = 0.001x - 1.978
R² = 0.002
1.00
1.50
2.00
2.50
3.00
3.50
4.00
4.50
1990 1995 2000 2005 2010
GW
Tm
be
low
GL
Year
Trend of GW Table (WellID:GT0409001) Amtali UZ
DGWTmax
DGWTavg
DGWTmin
Linear
(DGWTmax)
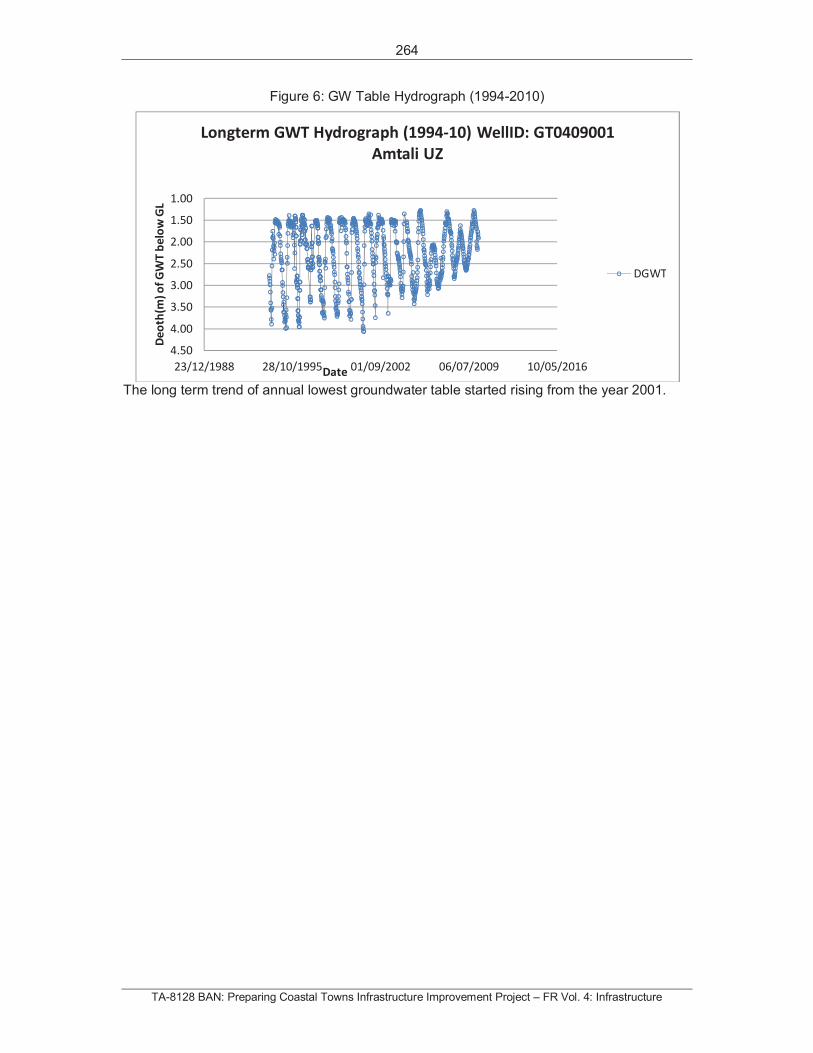
264
TA-8128 BAN: Preparing Coastal Towns Infrastructure Improvement Project – FR Vol. 4: Infrastructure
Figure 6: GW Table Hydrograph (1994-2010)
The long term trend of annual lowest groundwater table started rising from the year 2001.
1.00
1.50
2.00
2.50
3.00
3.50
4.00
4.50
23/12/1988 28/10/1995 01/09/2002 06/07/2009 10/05/2016
De
oth
(m)
of
GW
Tb
elo
wG
L
Date
Longterm GWT Hydrograph (1994-10) WellID: GT0409001
Amtali UZ
DGWT

265
TA-8128 BAN: Preparing Coastal Towns Infrastructure Improvement Project – FR Vol. 4: Infrastructure
Annex A: Fresh water corridor of Padm-Meghna spill channels – Arial Khan river system
266
TA-8128 BAN: Preparing Coastal Towns Infrastructure Improvement Project – FR Vol. 4: Infrastructure
3. HYDROLOGICAL AND HYDROGEOLOGICAL STUDY COASTAL TOWN GALACHIPA
04 July, 2013
Table of Contents
1. Background Information
1.1 Location of Coastal Town Galachipa
1.2 Availability of Hydrological stations in the area
1.3 Availability of Groundwater stations
2. Tide at Galachipa
3. Sea Salinity
4. Rainfall
5. Groundwater
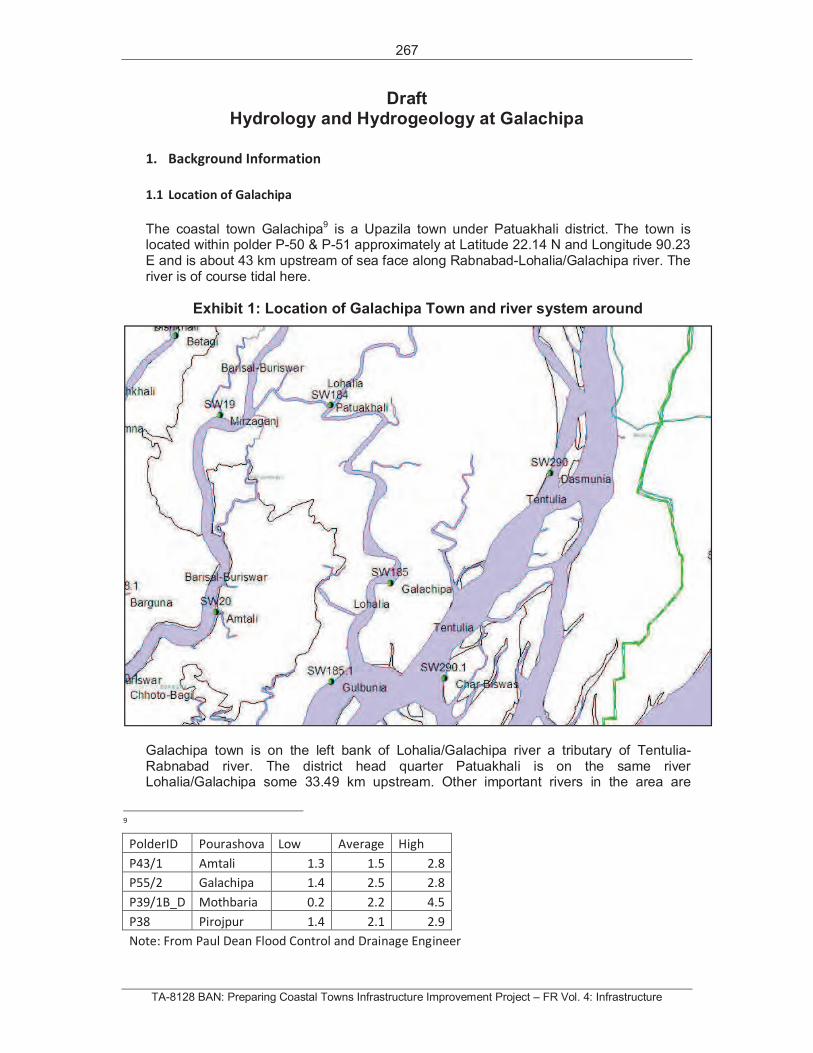
267
TA-8128 BAN: Preparing Coastal Towns Infrastructure Improvement Project – FR Vol. 4: Infrastructure
Draft Hydrology and Hydrogeology at Galachipa
1. Background Information
1.1 Location of Galachipa
The coastal town Galachipa9 is a Upazila town under Patuakhali district. The town is located within polder P-50 & P-51 approximately at Latitude 22.14 N and Longitude 90.23 E and is about 43 km upstream of sea face along Rabnabad-Lohalia/Galachipa river. The river is of course tidal here.
Exhibit 1: Location of Galachipa Town and river system around
Galachipa town is on the left bank of Lohalia/Galachipa river a tributary of Tentulia-Rabnabad river. The district head quarter Patuakhali is on the same river Lohalia/Galachipa some 33.49 km upstream. Other important rivers in the area are
9
PolderID Pourashova Low Average High
P43/1 Amtali 1.3 1.5 2.8
P55/2 Galachipa 1.4 2.5 2.8
P39/1B_D Mothbaria 0.2 2.2 4.5
P38 Pirojpur 1.4 2.1 2.9
Note: From Paul Dean Flood Control and Drainage Engineer
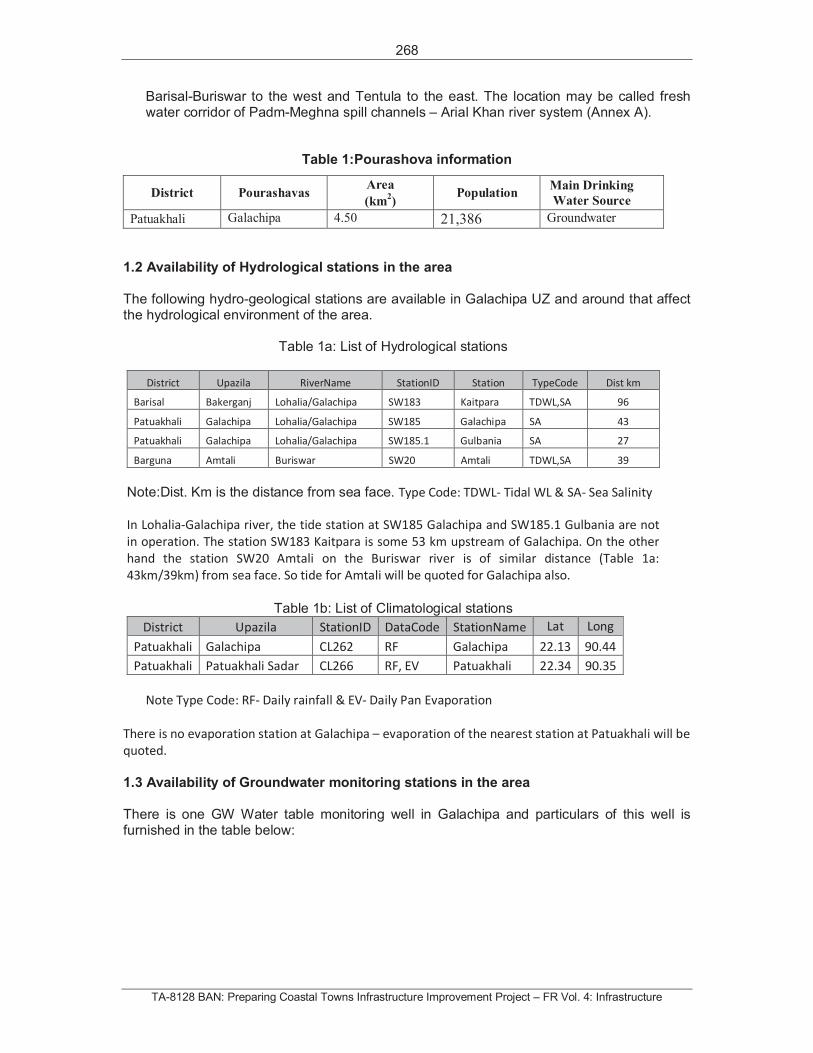
268
TA-8128 BAN: Preparing Coastal Towns Infrastructure Improvement Project – FR Vol. 4: Infrastructure
Barisal-Buriswar to the west and Tentula to the east. The location may be called fresh water corridor of Padm-Meghna spill channels – Arial Khan river system (Annex A).
Table 1:Pourashova information
District Pourashavas Area
(km2)
Population Main Drinking
Water Source
Patuakhali Galachipa 4.50 21,386 Groundwater
1.2 Availability of Hydrological stations in the area
The following hydro-geological stations are available in Galachipa UZ and around that affect the hydrological environment of the area.
Table 1a: List of Hydrological stations
District Upazila RiverName StationID Station TypeCode Dist km
Barisal Bakerganj Lohalia/Galachipa SW183 Kaitpara TDWL,SA 96
Patuakhali Galachipa Lohalia/Galachipa SW185 Galachipa SA 43
Patuakhali Galachipa Lohalia/Galachipa SW185.1 Gulbania SA 27
Barguna Amtali Buriswar SW20 Amtali TDWL,SA 39
Note:Dist. Km is the distance from sea face. Type Code: TDWL- Tidal WL & SA- Sea Salinity
In Lohalia-Galachipa river, the tide station at SW185 Galachipa and SW185.1 Gulbania are not
in operation. The station SW183 Kaitpara is some 53 km upstream of Galachipa. On the other
hand the station SW20 Amtali on the Buriswar river is of similar distance (Table 1a:
43km/39km) from sea face. So tide for Amtali will be quoted for Galachipa also.
Table 1b: List of Climatological stations
District Upazila StationID DataCode StationName Lat Long
Patuakhali Galachipa CL262 RF Galachipa 22.13 90.44
Patuakhali Patuakhali Sadar CL266 RF, EV Patuakhali 22.34 90.35
Note Type Code: RF- Daily rainfall & EV- Daily Pan Evaporation
There is no evaporation station at Galachipa – evaporation of the nearest station at Patuakhali will be
quoted.
1.3 Availability of Groundwater monitoring stations in the area
There is one GW Water table monitoring well in Galachipa and particulars of this well is furnished in the table below:
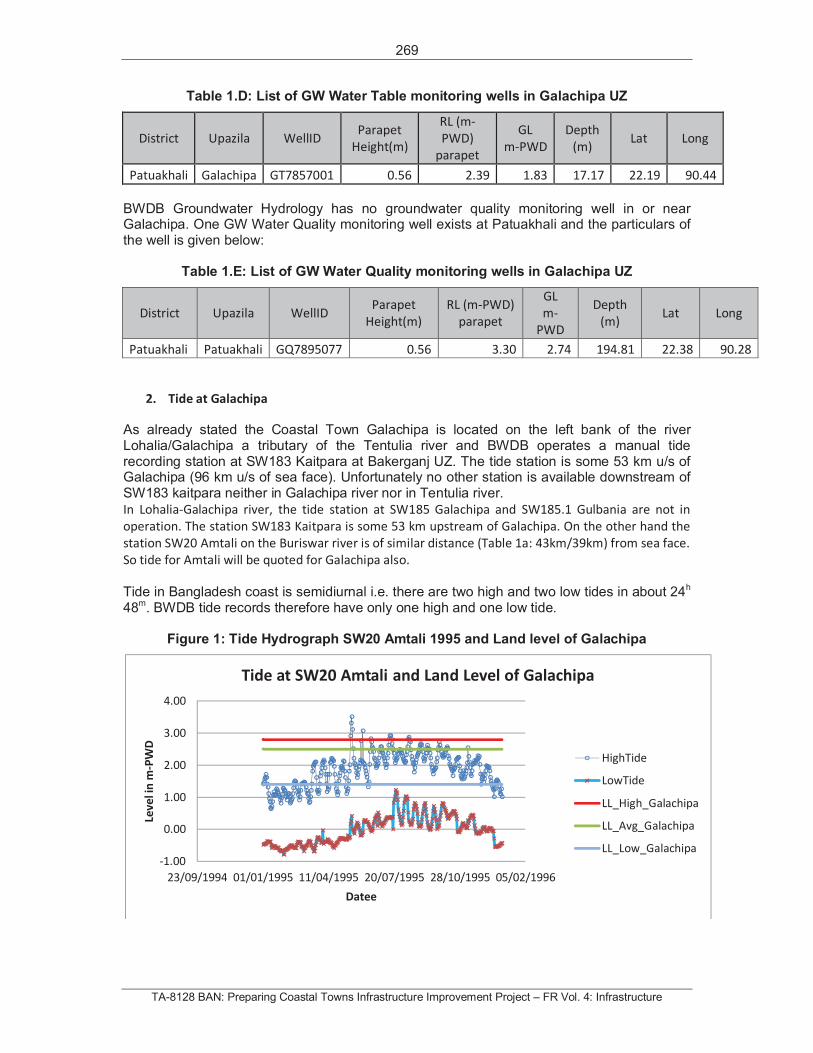
269
TA-8128 BAN: Preparing Coastal Towns Infrastructure Improvement Project – FR Vol. 4: Infrastructure
Table 1.D: List of GW Water Table monitoring wells in Galachipa UZ
District Upazila WellID Parapet
Height(m)
RL (m-
PWD)
parapet
GL
m-PWD
Depth
(m) Lat Long
Patuakhali Galachipa GT7857001 0.56 2.39 1.83 17.17 22.19 90.44
BWDB Groundwater Hydrology has no groundwater quality monitoring well in or near Galachipa. One GW Water Quality monitoring well exists at Patuakhali and the particulars of the well is given below:
Table 1.E: List of GW Water Quality monitoring wells in Galachipa UZ
District Upazila WellIDParapet
Height(m)
RL (m-PWD)
parapet
GL
m-
PWD
Depth
(m) Lat Long
Patuakhali Patuakhali GQ7895077 0.56 3.30 2.74 194.81 22.38 90.28
2. Tide at Galachipa
As already stated the Coastal Town Galachipa is located on the left bank of the river Lohalia/Galachipa a tributary of the Tentulia river and BWDB operates a manual tide recording station at SW183 Kaitpara at Bakerganj UZ. The tide station is some 53 km u/s of Galachipa (96 km u/s of sea face). Unfortunately no other station is available downstream of SW183 kaitpara neither in Galachipa river nor in Tentulia river.
In Lohalia-Galachipa river, the tide station at SW185 Galachipa and SW185.1 Gulbania are not in
operation. The station SW183 Kaitpara is some 53 km upstream of Galachipa. On the other hand the
station SW20 Amtali on the Buriswar river is of similar distance (Table 1a: 43km/39km) from sea face.
So tide for Amtali will be quoted for Galachipa also.
Tide in Bangladesh coast is semidiurnal i.e. there are two high and two low tides in about 24h
48m. BWDB tide records therefore have only one high and one low tide.
Figure 1: Tide Hydrograph SW20 Amtali 1995 and Land level of Galachipa
-1.00
0.00
1.00
2.00
3.00
4.00
23/09/1994 01/01/1995 11/04/1995 20/07/1995 28/10/1995 05/02/1996
Lev
eli
nm
-PW
D
Datee
Tide at SW20 Amtali and Land Level of Galachipa
HighTide
LowTide
LL_High_Galachipa
LL_Avg_Galachipa
LL_Low_Galachipa
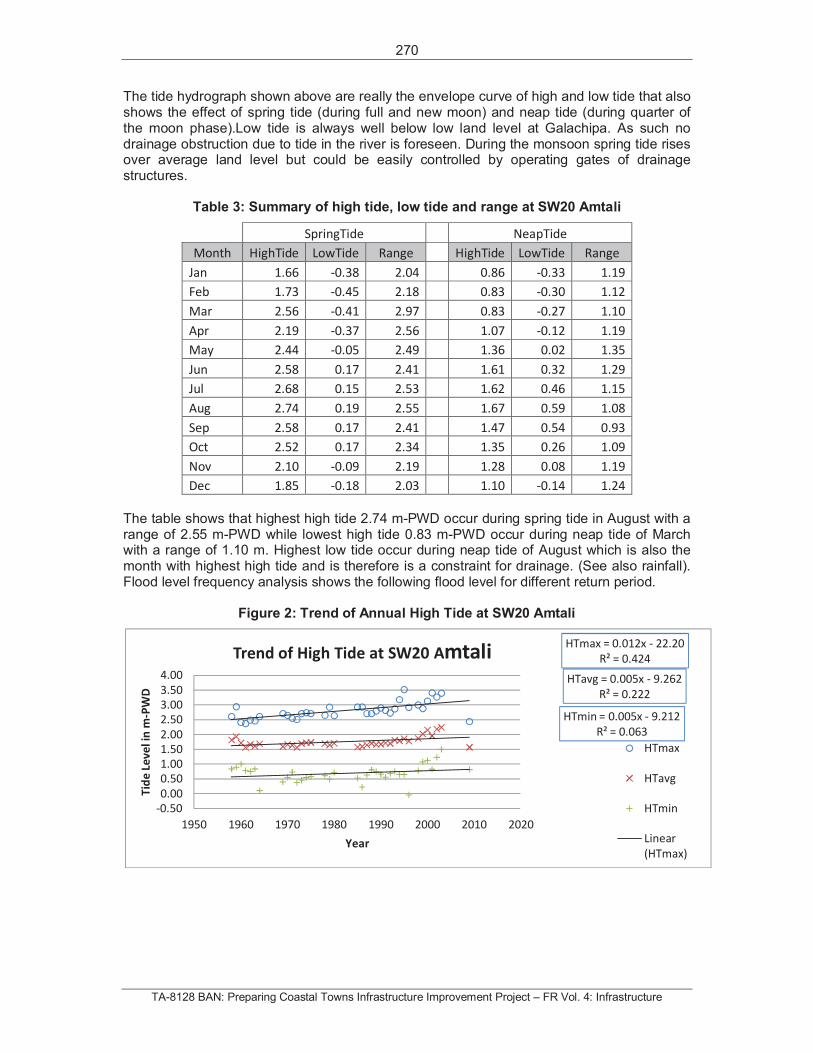
270
TA-8128 BAN: Preparing Coastal Towns Infrastructure Improvement Project – FR Vol. 4: Infrastructure
The tide hydrograph shown above are really the envelope curve of high and low tide that also shows the effect of spring tide (during full and new moon) and neap tide (during quarter of the moon phase).Low tide is always well below low land level at Galachipa. As such no drainage obstruction due to tide in the river is foreseen. During the monsoon spring tide rises over average land level but could be easily controlled by operating gates of drainage structures.
Table 3: Summary of high tide, low tide and range at SW20 Amtali
SpringTide NeapTide
Month HighTide LowTide Range HighTide LowTide Range
Jan 1.66 -0.38 2.04 0.86 -0.33 1.19
Feb 1.73 -0.45 2.18 0.83 -0.30 1.12
Mar 2.56 -0.41 2.97 0.83 -0.27 1.10
Apr 2.19 -0.37 2.56 1.07 -0.12 1.19
May 2.44 -0.05 2.49 1.36 0.02 1.35
Jun 2.58 0.17 2.41 1.61 0.32 1.29
Jul 2.68 0.15 2.53 1.62 0.46 1.15
Aug 2.74 0.19 2.55 1.67 0.59 1.08
Sep 2.58 0.17 2.41 1.47 0.54 0.93
Oct 2.52 0.17 2.34 1.35 0.26 1.09
Nov 2.10 -0.09 2.19 1.28 0.08 1.19
Dec 1.85 -0.18 2.03 1.10 -0.14 1.24
The table shows that highest high tide 2.74 m-PWD occur during spring tide in August with a range of 2.55 m-PWD while lowest high tide 0.83 m-PWD occur during neap tide of March with a range of 1.10 m. Highest low tide occur during neap tide of August which is also the month with highest high tide and is therefore is a constraint for drainage. (See also rainfall). Flood level frequency analysis shows the following flood level for different return period.
Figure 2: Trend of Annual High Tide at SW20 Amtali
HTmax = 0.012x - 22.20
R² = 0.424
HTavg = 0.005x - 9.262
R² = 0.222
HTmin = 0.005x - 9.212
R² = 0.063
-0.50
0.00
0.50
1.00
1.50
2.00
2.50
3.00
3.50
4.00
1950 1960 1970 1980 1990 2000 2010 2020
Tid
eLe
ve
lin
m-P
WD
Year
Trend of High Tide at SW20 Amtali
HTmax
HTavg
HTmin
Linear
(HTmax)
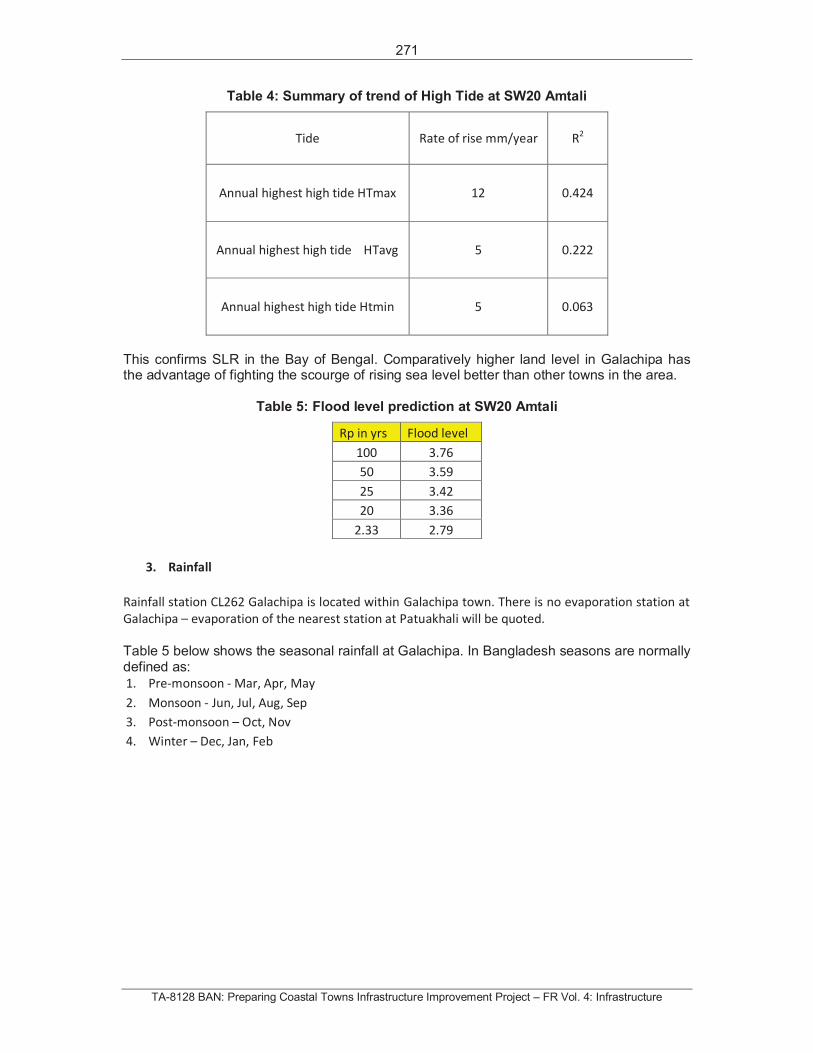
271
TA-8128 BAN: Preparing Coastal Towns Infrastructure Improvement Project – FR Vol. 4: Infrastructure
Table 4: Summary of trend of High Tide at SW20 Amtali
Tide Rate of rise mm/year R2
Annual highest high tide HTmax 12 0.424
Annual highest high tide HTavg 5 0.222
Annual highest high tide Htmin 5 0.063
This confirms SLR in the Bay of Bengal. Comparatively higher land level in Galachipa has the advantage of fighting the scourge of rising sea level better than other towns in the area.
Table 5: Flood level prediction at SW20 Amtali
Rp in yrs Flood level
100 3.76
50 3.59
25 3.42
20 3.36
2.33 2.79
3. Rainfall
Rainfall station CL262 Galachipa is located within Galachipa town. There is no evaporation station at
Galachipa – evaporation of the nearest station at Patuakhali will be quoted.
Table 5 below shows the seasonal rainfall at Galachipa. In Bangladesh seasons are normally defined as:
1. Pre-monsoon - Mar, Apr, May
2. Monsoon - Jun, Jul, Aug, Sep
3. Post-monsoon – Oct, Nov
4. Winter – Dec, Jan, Feb
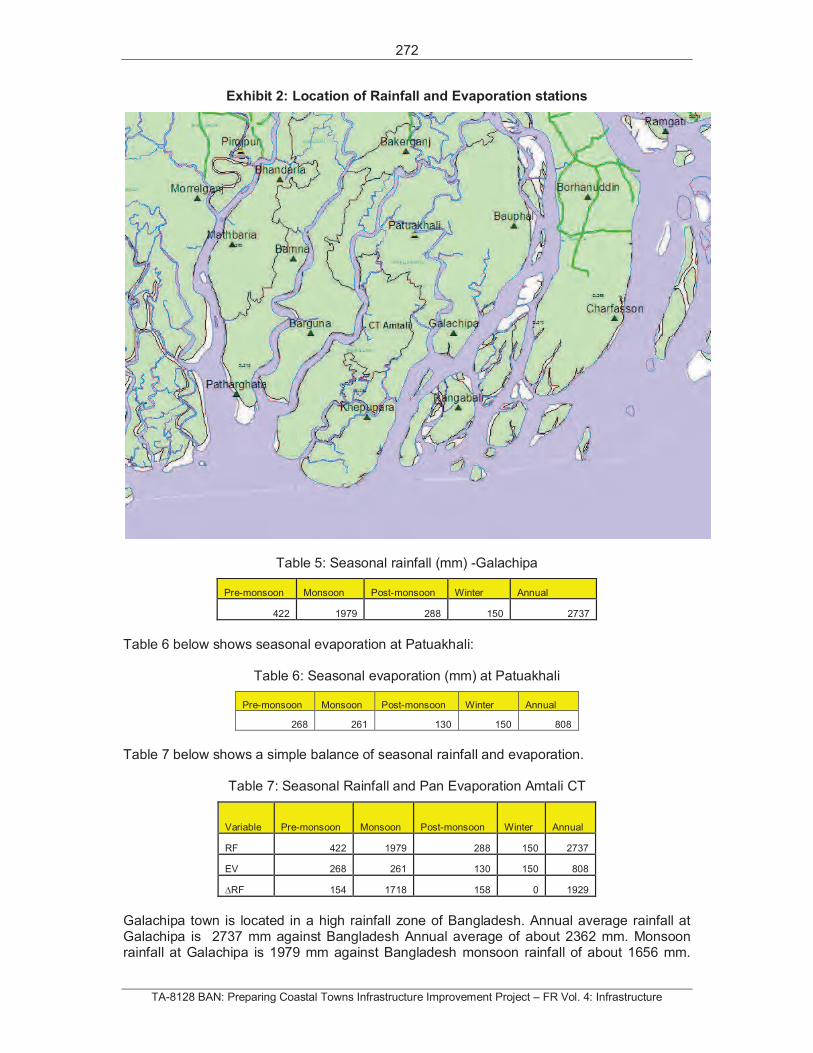
272
TA-8128 BAN: Preparing Coastal Towns Infrastructure Improvement Project – FR Vol. 4: Infrastructure
Exhibit 2: Location of Rainfall and Evaporation stations
Table 5: Seasonal rainfall (mm) -Galachipa
Pre-monsoon Monsoon Post-monsoon Winter Annual
422 1979 288 150 2737
Table 6 below shows seasonal evaporation at Patuakhali:
Table 6: Seasonal evaporation (mm) at Patuakhali
Pre-monsoon Monsoon Post-monsoon Winter Annual
268 261 130 150 808
Table 7 below shows a simple balance of seasonal rainfall and evaporation.
Table 7: Seasonal Rainfall and Pan Evaporation Amtali CT
Variable Pre-monsoon Monsoon Post-monsoon Winter Annual
RF 422 1979 288 150 2737
EV 268 261 130 150 808
RF 154 1718 158 0 1929
Galachipa town is located in a high rainfall zone of Bangladesh. Annual average rainfall at Galachipa is 2737 mm against Bangladesh Annual average of about 2362 mm. Monsoon rainfall at Galachipa is 1979 mm against Bangladesh monsoon rainfall of about 1656 mm.
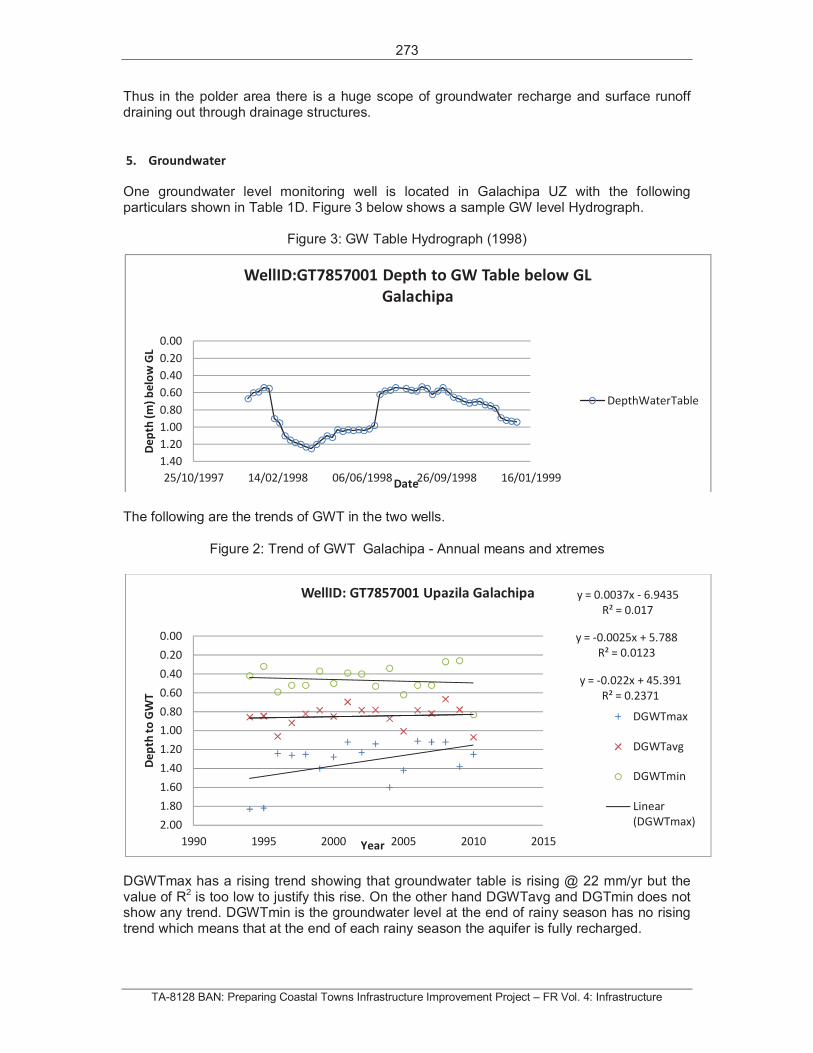
273
TA-8128 BAN: Preparing Coastal Towns Infrastructure Improvement Project – FR Vol. 4: Infrastructure
Thus in the polder area there is a huge scope of groundwater recharge and surface runoff draining out through drainage structures.
5. Groundwater
One groundwater level monitoring well is located in Galachipa UZ with the following particulars shown in Table 1D. Figure 3 below shows a sample GW level Hydrograph.
Figure 3: GW Table Hydrograph (1998)
The following are the trends of GWT in the two wells.
Figure 2: Trend of GWT Galachipa - Annual means and xtremes
DGWTmax has a rising trend showing that groundwater table is rising @ 22 mm/yr but the value of R2 is too low to justify this rise. On the other hand DGWTavg and DGTmin does not show any trend. DGWTmin is the groundwater level at the end of rainy season has no rising trend which means that at the end of each rainy season the aquifer is fully recharged.
0.00
0.20
0.40
0.60
0.80
1.00
1.20
1.40
25/10/1997 14/02/1998 06/06/1998 26/09/1998 16/01/1999
De
pth
(m)
be
low
GL
Date
WellID:GT7857001 Depth to GW Table below GL
Galachipa
DepthWaterTable
y = -0.022x + 45.391
R² = 0.2371
y = -0.0025x + 5.788
R² = 0.0123
y = 0.0037x - 6.9435
R² = 0.017
0.00
0.20
0.40
0.60
0.80
1.00
1.20
1.40
1.60
1.80
2.00
1990 1995 2000 2005 2010 2015
De
pth
toG
WT
Year
WellID: GT7857001 Upazila Galachipa
DGWTmax
DGWTavg
DGWTmin
Linear
(DGWTmax)
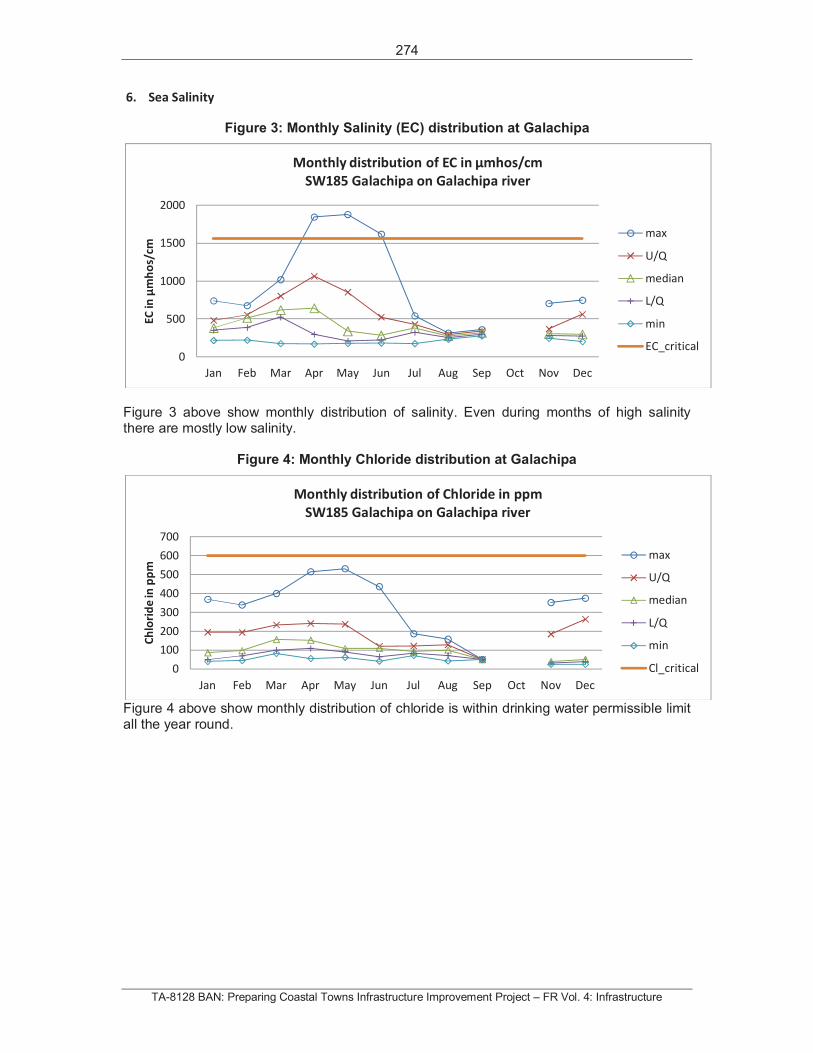
274
TA-8128 BAN: Preparing Coastal Towns Infrastructure Improvement Project – FR Vol. 4: Infrastructure
6. Sea Salinity
Figure 3: Monthly Salinity (EC) distribution at Galachipa
Figure 3 above show monthly distribution of salinity. Even during months of high salinity there are mostly low salinity.
Figure 4: Monthly Chloride distribution at Galachipa
Figure 4 above show monthly distribution of chloride is within drinking water permissible limit all the year round.
0
500
1000
1500
2000
Jan Feb Mar Apr May Jun Jul Aug Sep Oct Nov Dec
EC
inm
ho
s/cm
Monthly distribution of EC in mhos/cm
SW185 Galachipa on Galachipa river
max
U/Q
median
L/Q
min
EC_critical
0
100
200
300
400
500
600
700
Jan Feb Mar Apr May Jun Jul Aug Sep Oct Nov Dec
Ch
lori
de
inp
pm
Monthly distribution of Chloride in ppm
SW185 Galachipa on Galachipa river
max
U/Q
median
L/Q
min
Cl_critical
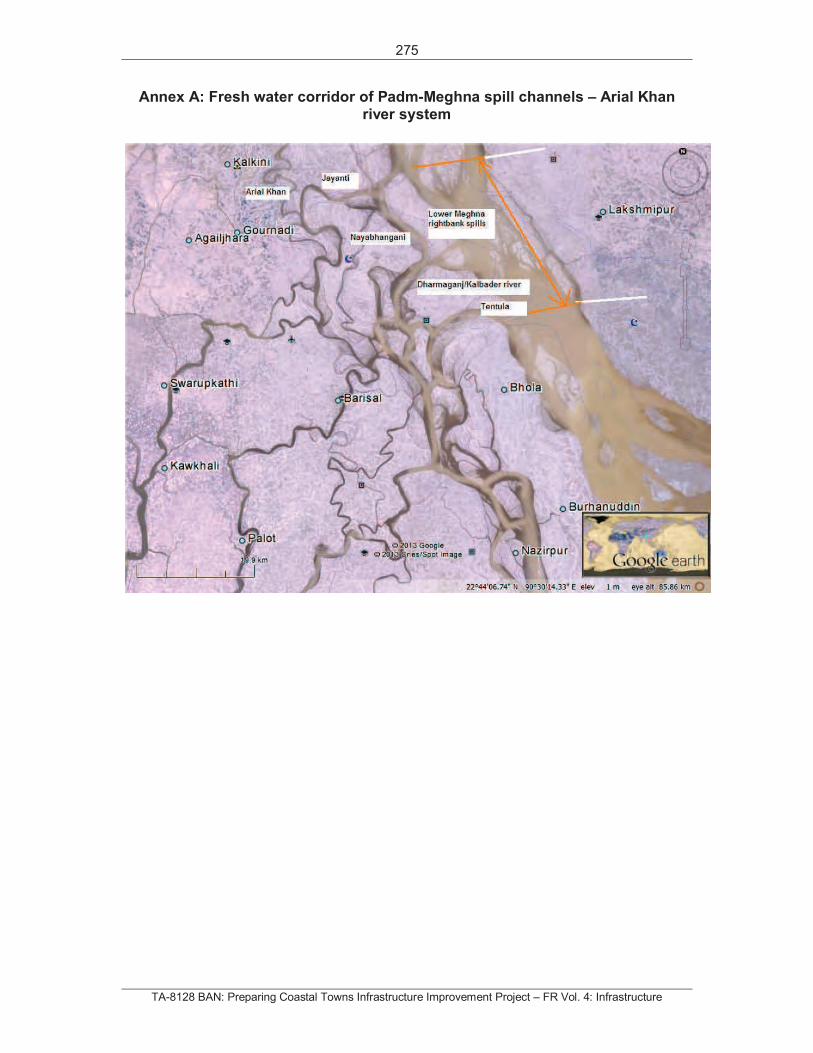
275
TA-8128 BAN: Preparing Coastal Towns Infrastructure Improvement Project – FR Vol. 4: Infrastructure
Annex A: Fresh water corridor of Padm-Meghna spill channels – Arial Khan river system
276
TA-8128 BAN: Preparing Coastal Towns Infrastructure Improvement Project – FR Vol. 4: Infrastructure
4. HYDROLOGICAL AND HYDROGEOLOGICAL STUDY COASTAL TOWN PIROJPUR
04 July, 2013
Table of Contents
1. Background Information
1.1 Location of Coastal Town Pirojpur
1.2 Availability of Hydrological stations in the area
1.3 Availability of Groundwater stations
2. Tide at Pirojpur
3. Sea Salinity
4. Rainfall
5. Groundwater
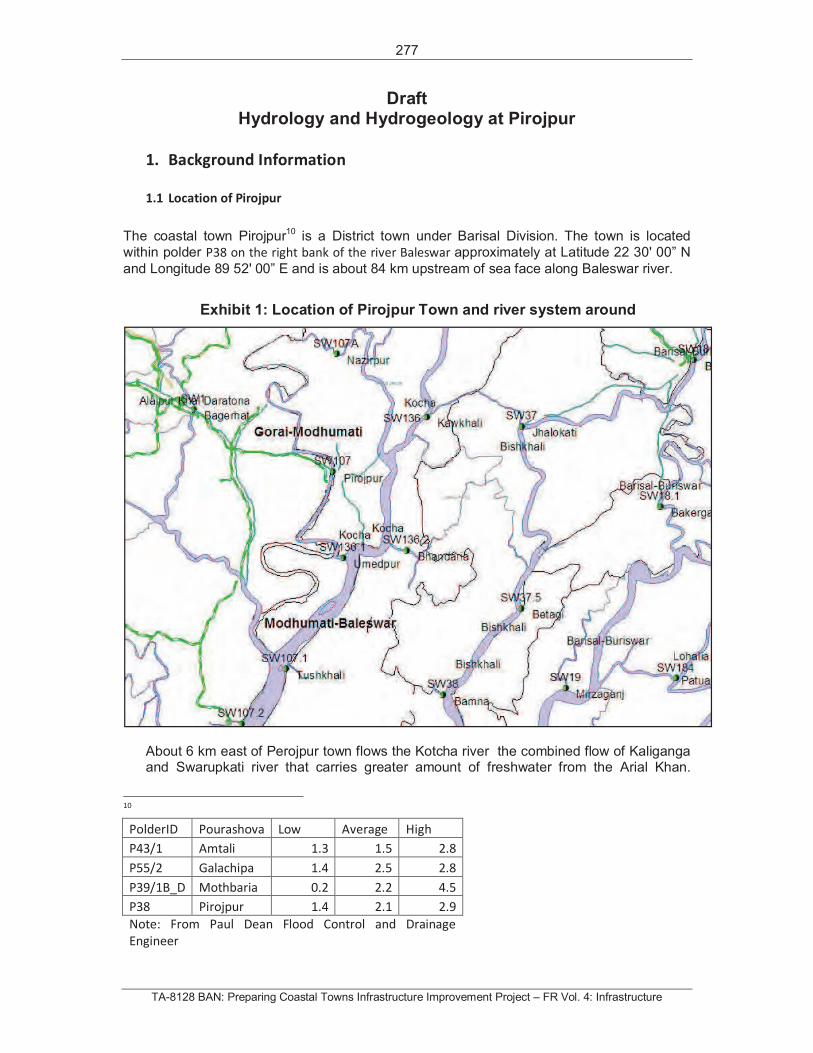
277
TA-8128 BAN: Preparing Coastal Towns Infrastructure Improvement Project – FR Vol. 4: Infrastructure
Draft Hydrology and Hydrogeology at Pirojpur
1. Background Information
1.1 Location of Pirojpur
The coastal town Pirojpur10 is a District town under Barisal Division. The town is located
within polder P38 on the right bank of the river Baleswar approximately at Latitude 22 30' 00” N
and Longitude 89 52' 00” E and is about 84 km upstream of sea face along Baleswar river.
Exhibit 1: Location of Pirojpur Town and river system around
About 6 km east of Perojpur town flows the Kotcha river the combined flow of Kaliganga and Swarupkati river that carries greater amount of freshwater from the Arial Khan.
10
PolderID Pourashova Low Average High
P43/1 Amtali 1.3 1.5 2.8
P55/2 Galachipa 1.4 2.5 2.8
P39/1B_D Mothbaria 0.2 2.2 4.5
P38 Pirojpur 1.4 2.1 2.9
Note: From Paul Dean Flood Control and Drainage
Engineer
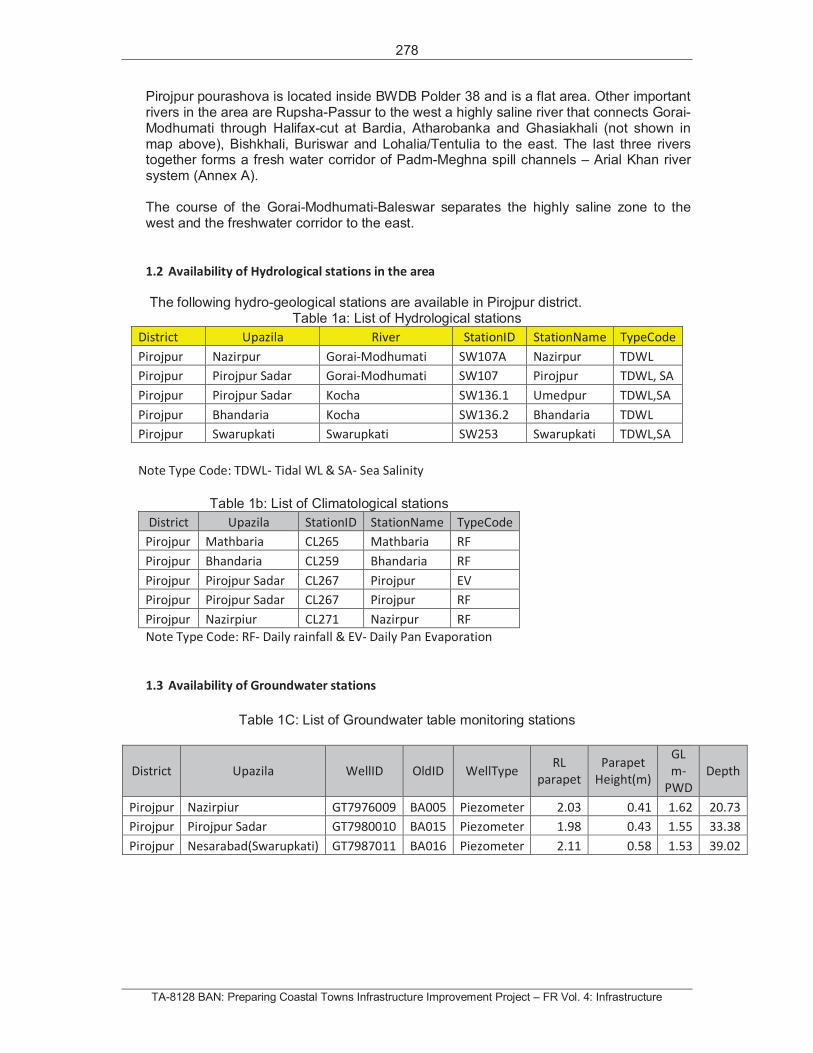
278
TA-8128 BAN: Preparing Coastal Towns Infrastructure Improvement Project – FR Vol. 4: Infrastructure
Pirojpur pourashova is located inside BWDB Polder 38 and is a flat area. Other important rivers in the area are Rupsha-Passur to the west a highly saline river that connects Gorai-Modhumati through Halifax-cut at Bardia, Atharobanka and Ghasiakhali (not shown in map above), Bishkhali, Buriswar and Lohalia/Tentulia to the east. The last three rivers together forms a fresh water corridor of Padm-Meghna spill channels – Arial Khan river system (Annex A).
The course of the Gorai-Modhumati-Baleswar separates the highly saline zone to the west and the freshwater corridor to the east.
1.2 Availability of Hydrological stations in the area
The following hydro-geological stations are available in Pirojpur district. Table 1a: List of Hydrological stations
District Upazila River StationID StationName TypeCode
Pirojpur Nazirpur Gorai-Modhumati SW107A Nazirpur TDWL
Pirojpur Pirojpur Sadar Gorai-Modhumati SW107 Pirojpur TDWL, SA
Pirojpur Pirojpur Sadar Kocha SW136.1 Umedpur TDWL,SA
Pirojpur Bhandaria Kocha SW136.2 Bhandaria TDWL
Pirojpur Swarupkati Swarupkati SW253 Swarupkati TDWL,SA
Note Type Code: TDWL- Tidal WL & SA- Sea Salinity
Table 1b: List of Climatological stations
District Upazila StationID StationName TypeCode
Pirojpur Mathbaria CL265 Mathbaria RF
Pirojpur Bhandaria CL259 Bhandaria RF
Pirojpur Pirojpur Sadar CL267 Pirojpur EV
Pirojpur Pirojpur Sadar CL267 Pirojpur RF
Pirojpur Nazirpiur CL271 Nazirpur RF
Note Type Code: RF- Daily rainfall & EV- Daily Pan Evaporation
1.3 Availability of Groundwater stations
Table 1C: List of Groundwater table monitoring stations
District Upazila WellID OldID WellType RL
parapet
Parapet
Height(m)
GL
m-
PWD
Depth
Pirojpur Nazirpiur GT7976009 BA005 Piezometer 2.03 0.41 1.62 20.73
Pirojpur Pirojpur Sadar GT7980010 BA015 Piezometer 1.98 0.43 1.55 33.38
Pirojpur Nesarabad(Swarupkati) GT7987011 BA016 Piezometer 2.11 0.58 1.53 39.02
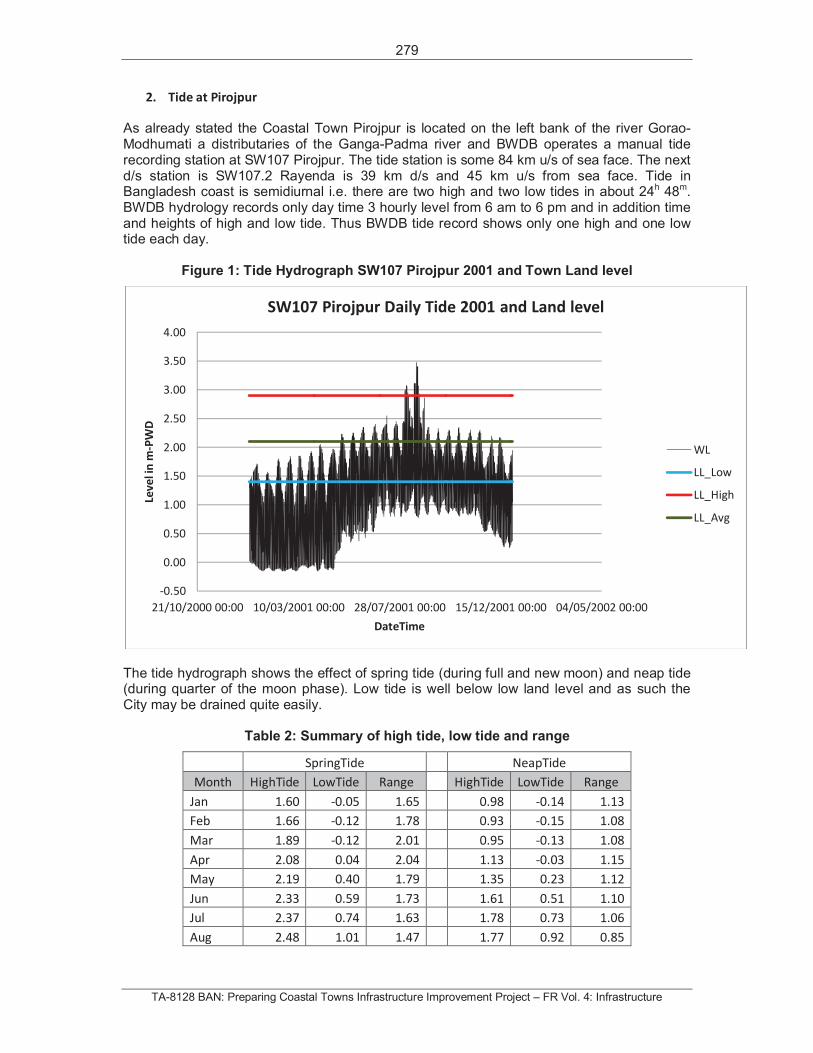
279
TA-8128 BAN: Preparing Coastal Towns Infrastructure Improvement Project – FR Vol. 4: Infrastructure
2. Tide at Pirojpur
As already stated the Coastal Town Pirojpur is located on the left bank of the river Gorao-Modhumati a distributaries of the Ganga-Padma river and BWDB operates a manual tide recording station at SW107 Pirojpur. The tide station is some 84 km u/s of sea face. The next d/s station is SW107.2 Rayenda is 39 km d/s and 45 km u/s from sea face. Tide in Bangladesh coast is semidiurnal i.e. there are two high and two low tides in about 24h 48m.BWDB hydrology records only day time 3 hourly level from 6 am to 6 pm and in addition time and heights of high and low tide. Thus BWDB tide record shows only one high and one low tide each day.
Figure 1: Tide Hydrograph SW107 Pirojpur 2001 and Town Land level
The tide hydrograph shows the effect of spring tide (during full and new moon) and neap tide (during quarter of the moon phase). Low tide is well below low land level and as such the City may be drained quite easily.
Table 2: Summary of high tide, low tide and range
SpringTide NeapTide
Month HighTide LowTide Range HighTide LowTide Range
Jan 1.60 -0.05 1.65 0.98 -0.14 1.13
Feb 1.66 -0.12 1.78 0.93 -0.15 1.08
Mar 1.89 -0.12 2.01 0.95 -0.13 1.08
Apr 2.08 0.04 2.04 1.13 -0.03 1.15
May 2.19 0.40 1.79 1.35 0.23 1.12
Jun 2.33 0.59 1.73 1.61 0.51 1.10
Jul 2.37 0.74 1.63 1.78 0.73 1.06
Aug 2.48 1.01 1.47 1.77 0.92 0.85
-0.50
0.00
0.50
1.00
1.50
2.00
2.50
3.00
3.50
4.00
21/10/2000 00:00 10/03/2001 00:00 28/07/2001 00:00 15/12/2001 00:00 04/05/2002 00:00
Lev
eli
nm
-PW
D
DateTime
SW107 Pirojpur Daily Tide 2001 and Land level
WL
LL_Low
LL_High
LL_Avg
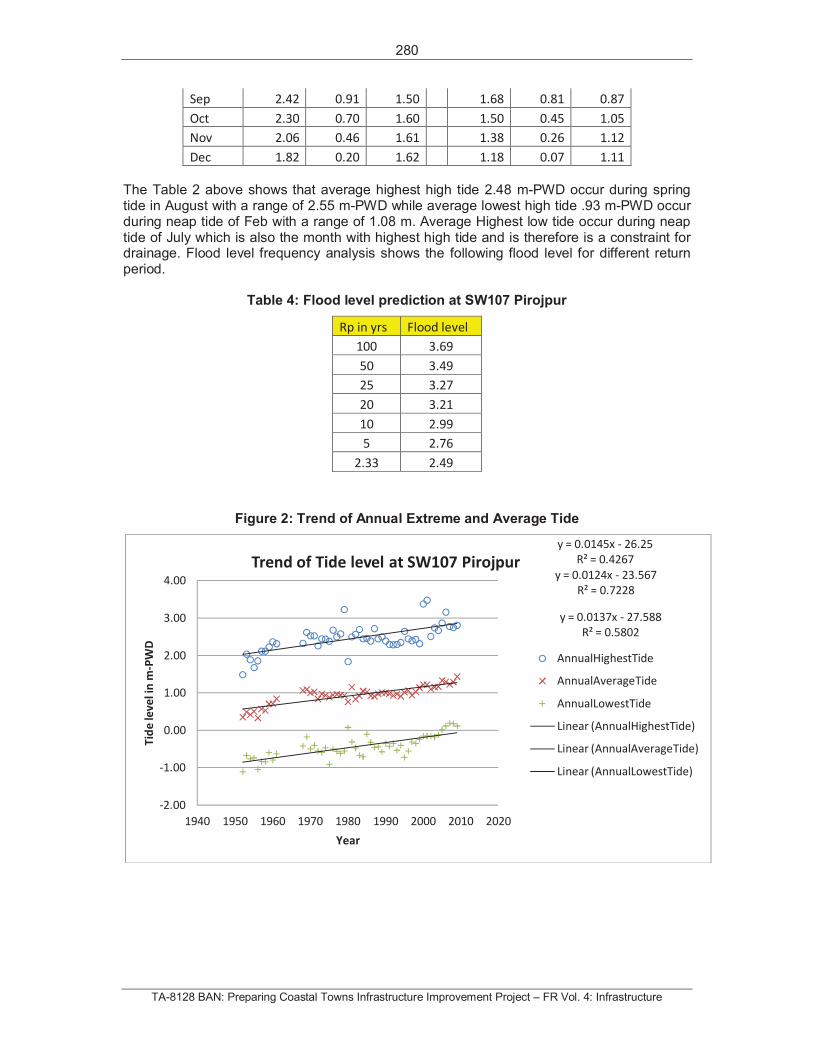
280
TA-8128 BAN: Preparing Coastal Towns Infrastructure Improvement Project – FR Vol. 4: Infrastructure
Sep 2.42 0.91 1.50 1.68 0.81 0.87
Oct 2.30 0.70 1.60 1.50 0.45 1.05
Nov 2.06 0.46 1.61 1.38 0.26 1.12
Dec 1.82 0.20 1.62 1.18 0.07 1.11
The Table 2 above shows that average highest high tide 2.48 m-PWD occur during spring tide in August with a range of 2.55 m-PWD while average lowest high tide .93 m-PWD occur during neap tide of Feb with a range of 1.08 m. Average Highest low tide occur during neap tide of July which is also the month with highest high tide and is therefore is a constraint for drainage. Flood level frequency analysis shows the following flood level for different return period.
Table 4: Flood level prediction at SW107 Pirojpur
Rp in yrs Flood level
100 3.69
50 3.49
25 3.27
20 3.21
10 2.99
5 2.76
2.33 2.49
Figure 2: Trend of Annual Extreme and Average Tide
y = 0.0145x - 26.25
R² = 0.4267
y = 0.0124x - 23.567
R² = 0.7228
y = 0.0137x - 27.588
R² = 0.5802
-2.00
-1.00
0.00
1.00
2.00
3.00
4.00
1940 1950 1960 1970 1980 1990 2000 2010 2020
Tid
ele
ve
lin
m-P
WD
Year
Trend of Tide level at SW107 Pirojpur
AnnualHighestTide
AnnualAverageTide
AnnualLowestTide
Linear (AnnualHighestTide)
Linear (AnnualAverageTide)
Linear (AnnualLowestTide)
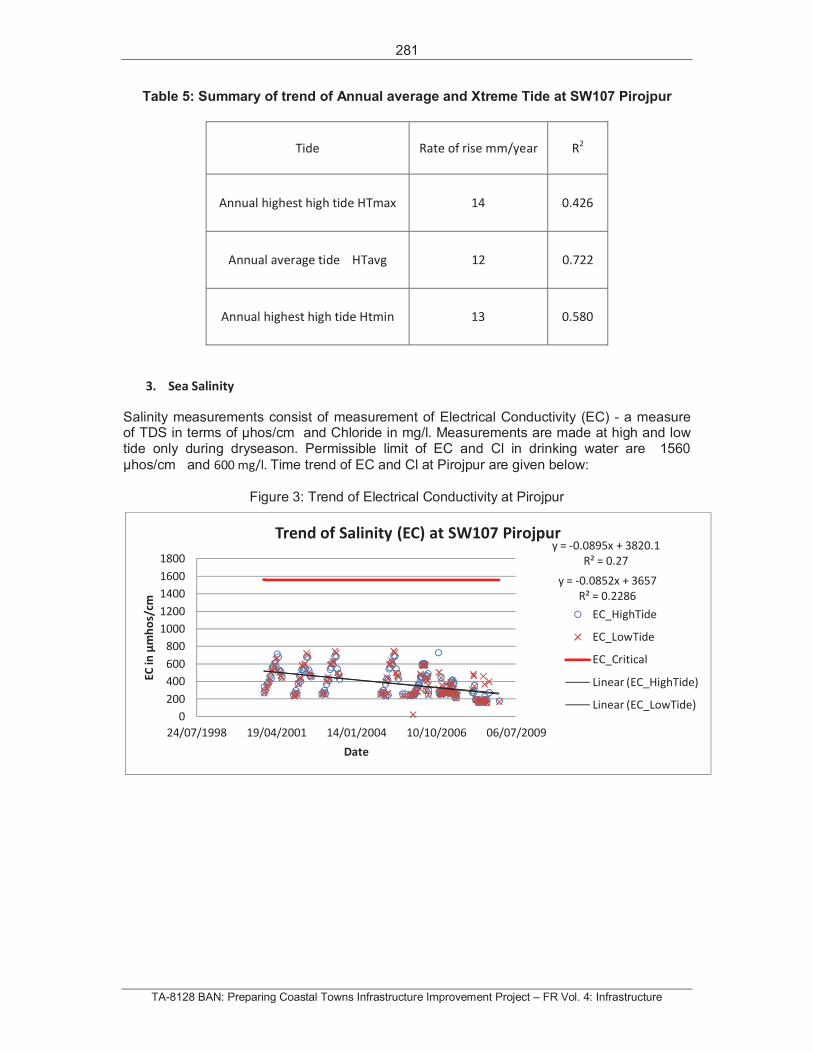
281
TA-8128 BAN: Preparing Coastal Towns Infrastructure Improvement Project – FR Vol. 4: Infrastructure
Table 5: Summary of trend of Annual average and Xtreme Tide at SW107 Pirojpur
Tide Rate of rise mm/year R2
Annual highest high tide HTmax 14 0.426
Annual average tide HTavg 12 0.722
Annual highest high tide Htmin 13 0.580
3. Sea Salinity
Salinity measurements consist of measurement of Electrical Conductivity (EC) - a measure of TDS in terms of hos/cm and Chloride in mg/l. Measurements are made at high and low tide only during dryseason. Permissible limit of EC and Cl in drinking water are 1560
hos/cm and 600 mg/l. Time trend of EC and Cl at Pirojpur are given below:
Figure 3: Trend of Electrical Conductivity at Pirojpur
y = -0.0895x + 3820.1
R² = 0.27
y = -0.0852x + 3657
R² = 0.2286
0
200
400
600
800
1000
1200
1400
1600
1800
24/07/1998 19/04/2001 14/01/2004 10/10/2006 06/07/2009
EC
inm
ho
s/cm
Date
Trend of Salinity (EC) at SW107 Pirojpur
EC_HighTide
EC_LowTide
EC_Critical
Linear (EC_HighTide)
Linear (EC_LowTide)
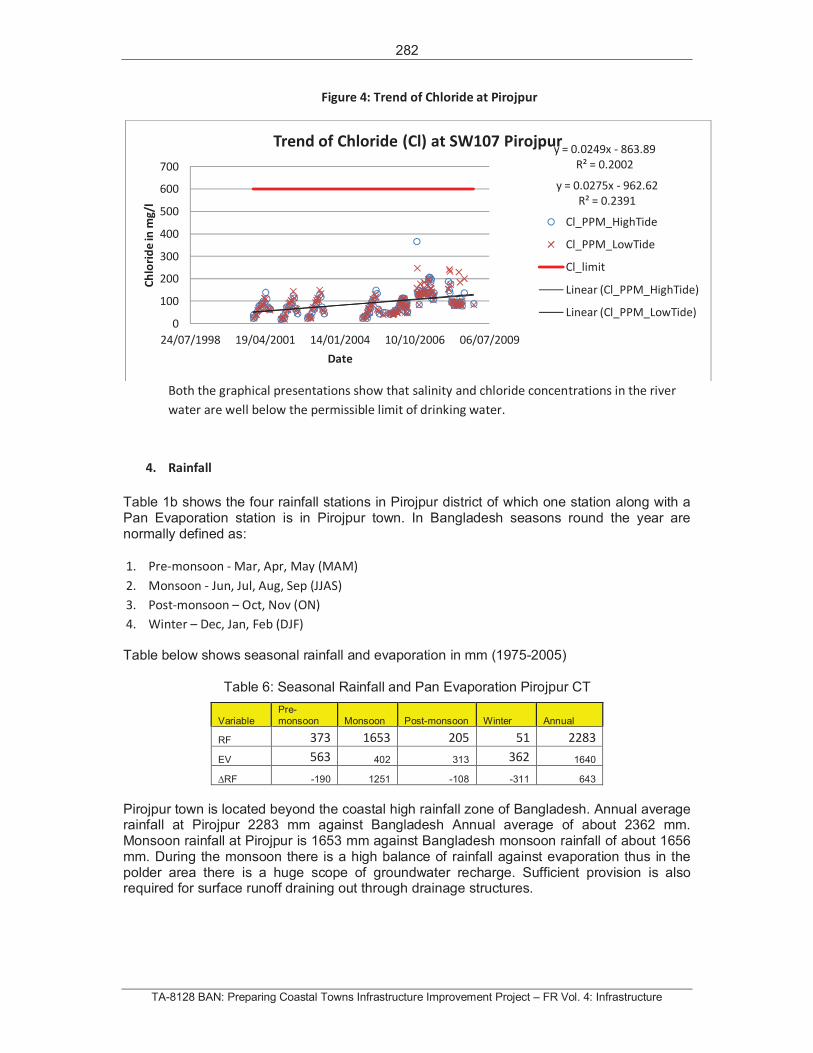
282
TA-8128 BAN: Preparing Coastal Towns Infrastructure Improvement Project – FR Vol. 4: Infrastructure
Figure 4: Trend of Chloride at Pirojpur
Both the graphical presentations show that salinity and chloride concentrations in the river
water are well below the permissible limit of drinking water.
4. Rainfall
Table 1b shows the four rainfall stations in Pirojpur district of which one station along with a Pan Evaporation station is in Pirojpur town. In Bangladesh seasons round the year are normally defined as:
1. Pre-monsoon - Mar, Apr, May (MAM)
2. Monsoon - Jun, Jul, Aug, Sep (JJAS)
3. Post-monsoon – Oct, Nov (ON)
4. Winter – Dec, Jan, Feb (DJF)
Table below shows seasonal rainfall and evaporation in mm (1975-2005)
Table 6: Seasonal Rainfall and Pan Evaporation Pirojpur CT
Variable Pre-monsoon Monsoon Post-monsoon Winter Annual
RF 373 1653 205 51 2283
EV 563 402 313 362 1640
RF -190 1251 -108 -311 643
Pirojpur town is located beyond the coastal high rainfall zone of Bangladesh. Annual average rainfall at Pirojpur 2283 mm against Bangladesh Annual average of about 2362 mm. Monsoon rainfall at Pirojpur is 1653 mm against Bangladesh monsoon rainfall of about 1656 mm. During the monsoon there is a high balance of rainfall against evaporation thus in the polder area there is a huge scope of groundwater recharge. Sufficient provision is also required for surface runoff draining out through drainage structures.
y = 0.0249x - 863.89
R² = 0.2002
y = 0.0275x - 962.62
R² = 0.2391
0
100
200
300
400
500
600
700
24/07/1998 19/04/2001 14/01/2004 10/10/2006 06/07/2009
Ch
lori
de
inm
g/l
Date
Trend of Chloride (Cl) at SW107 Pirojpur
Cl_PPM_HighTide
Cl_PPM_LowTide
Cl_limit
Linear (Cl_PPM_HighTide)
Linear (Cl_PPM_LowTide)
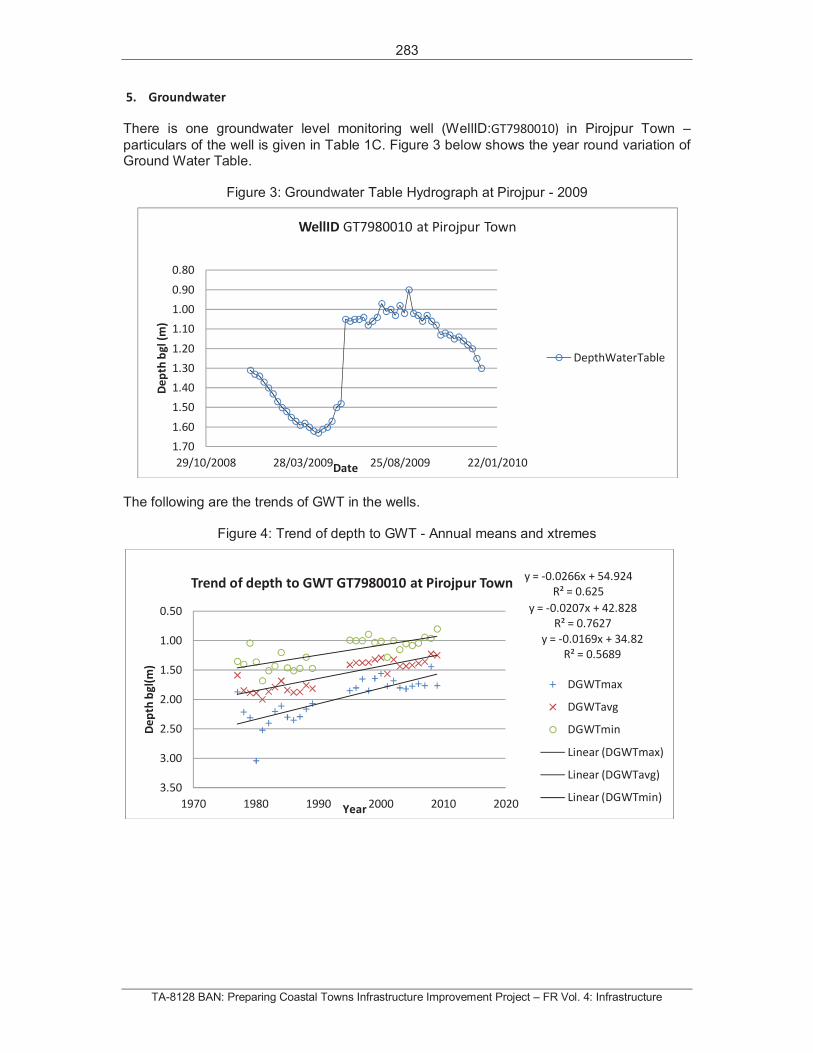
283
TA-8128 BAN: Preparing Coastal Towns Infrastructure Improvement Project – FR Vol. 4: Infrastructure
5. Groundwater
There is one groundwater level monitoring well (WellID:GT7980010) in Pirojpur Town –
particulars of the well is given in Table 1C. Figure 3 below shows the year round variation of Ground Water Table.
Figure 3: Groundwater Table Hydrograph at Pirojpur - 2009
The following are the trends of GWT in the wells.
Figure 4: Trend of depth to GWT - Annual means and xtremes
0.80
0.90
1.00
1.10
1.20
1.30
1.40
1.50
1.60
1.70
29/10/2008 28/03/2009 25/08/2009 22/01/2010
De
pth
bg
l(m
)
Date
WellID GT7980010 at Pirojpur Town
DepthWaterTable
y = -0.0266x + 54.924
R² = 0.625
y = -0.0207x + 42.828
R² = 0.7627
y = -0.0169x + 34.82
R² = 0.5689
0.50
1.00
1.50
2.00
2.50
3.00
3.50
1970 1980 1990 2000 2010 2020
De
pth
bg
l(m
)
Year
Trend of depth to GWT GT7980010 at Pirojpur Town
DGWTmax
DGWTavg
DGWTmin
Linear (DGWTmax)
Linear (DGWTavg)
Linear (DGWTmin)
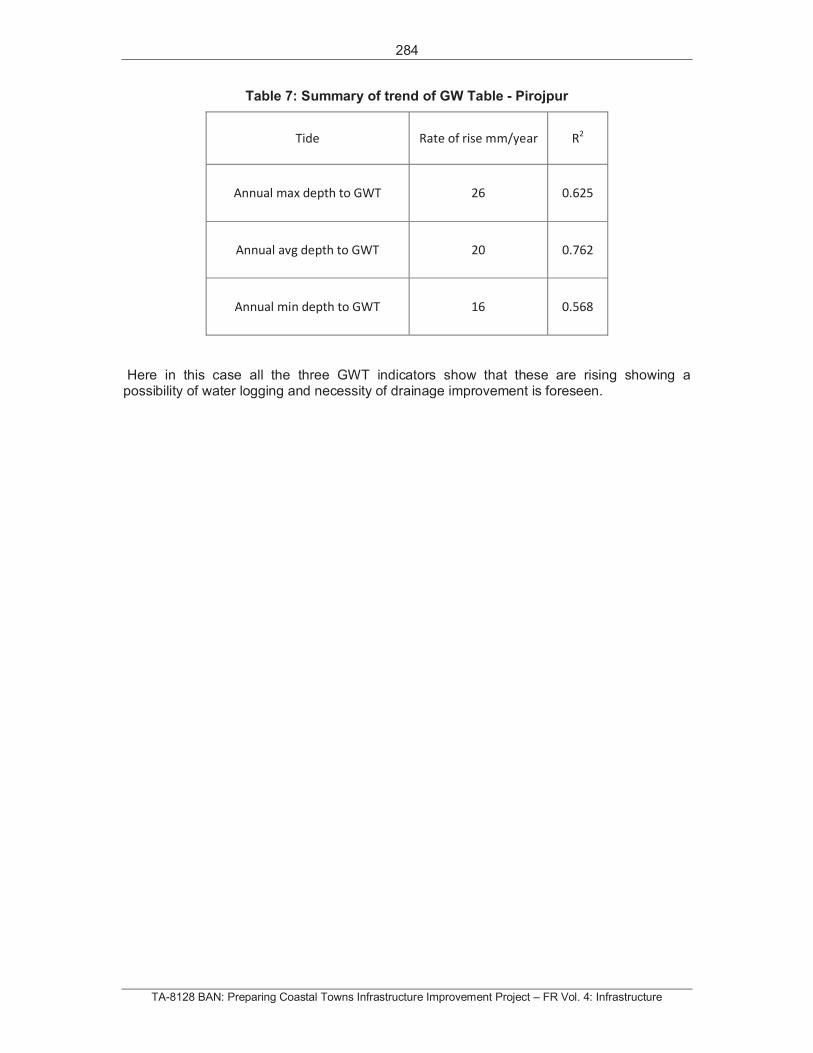
284
TA-8128 BAN: Preparing Coastal Towns Infrastructure Improvement Project – FR Vol. 4: Infrastructure
Table 7: Summary of trend of GW Table - Pirojpur
Tide Rate of rise mm/year R2
Annual max depth to GWT 26 0.625
Annual avg depth to GWT 20 0.762
Annual min depth to GWT 16 0.568
Here in this case all the three GWT indicators show that these are rising showing a possibility of water logging and necessity of drainage improvement is foreseen.

285
TA-8128 BAN: Preparing Coastal Towns Infrastructure Improvement Project – FR Vol. 4: Infrastructure
Annex A: Fresh water corridor of Padm-Meghna spill channels – Arial Khan river system
286
TA-8128 BAN: Preparing Coastal Towns Infrastructure Improvement Project – FR Vol. 4: Infrastructure
5. HYDROLOGICAL AND HYDROGEOLOGICAL STUDY COASTAL TOWN MATHBARIA
04 July, 2013
Table of Contents
1. Background Information
1.1 Location of Coastal Town Mathbaria
1.2 Availability of Hydrological stations in the area
1.3 Availability of Groundwater stations
2. Tide at Mathbaria
3. Sea Salinity
4. Rainfall
5. Groundwater
Water Supply in Mathbaria Paurashova area 1. Groundwater Quality
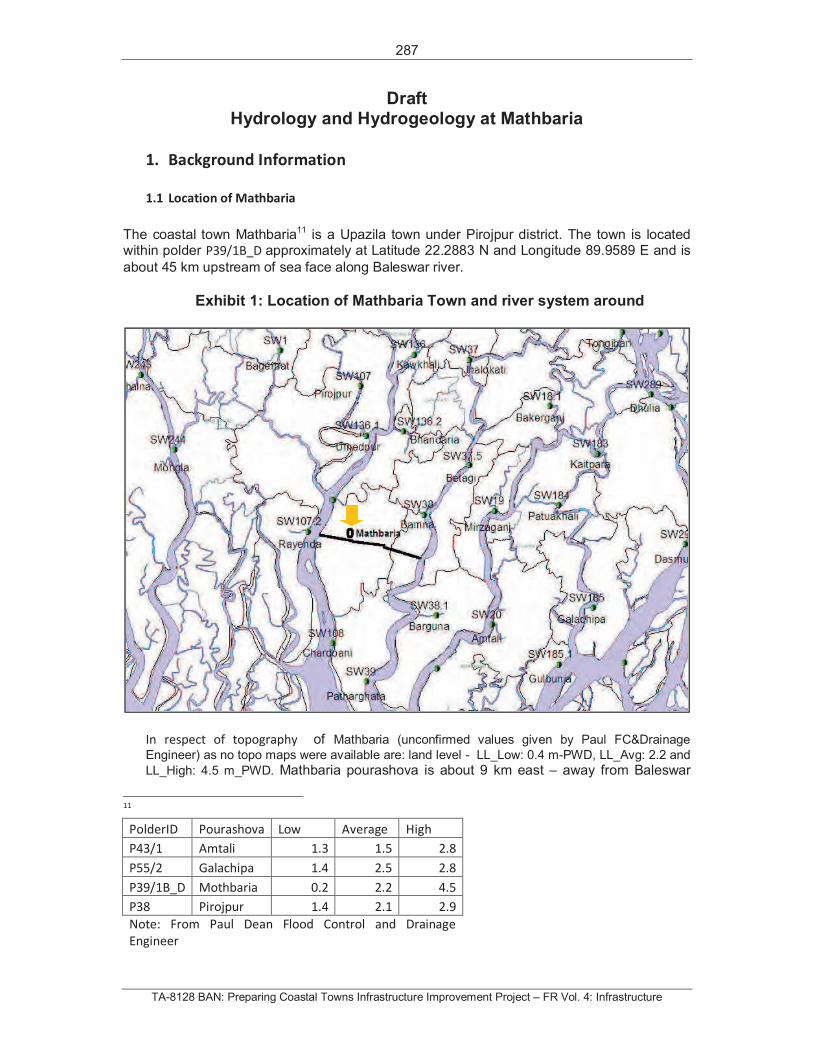
287
TA-8128 BAN: Preparing Coastal Towns Infrastructure Improvement Project – FR Vol. 4: Infrastructure
Draft Hydrology and Hydrogeology at Mathbaria
1. Background Information
1.1 Location of Mathbaria
The coastal town Mathbaria11 is a Upazila town under Pirojpur district. The town is located within polder P39/1B_D approximately at Latitude 22.2883 N and Longitude 89.9589 E and is
about 45 km upstream of sea face along Baleswar river.
Exhibit 1: Location of Mathbaria Town and river system around
In respect of topography of Mathbaria (unconfirmed values given by Paul FC&Drainage
Engineer) as no topo maps were available are: land level - LL_Low: 0.4 m-PWD, LL_Avg: 2.2 and
LL_High: 4.5 m_PWD. Mathbaria pourashova is about 9 km east – away from Baleswar
11
PolderID Pourashova Low Average High
P43/1 Amtali 1.3 1.5 2.8
P55/2 Galachipa 1.4 2.5 2.8
P39/1B_D Mothbaria 0.2 2.2 4.5
P38 Pirojpur 1.4 2.1 2.9
Note: From Paul Dean Flood Control and Drainage
Engineer
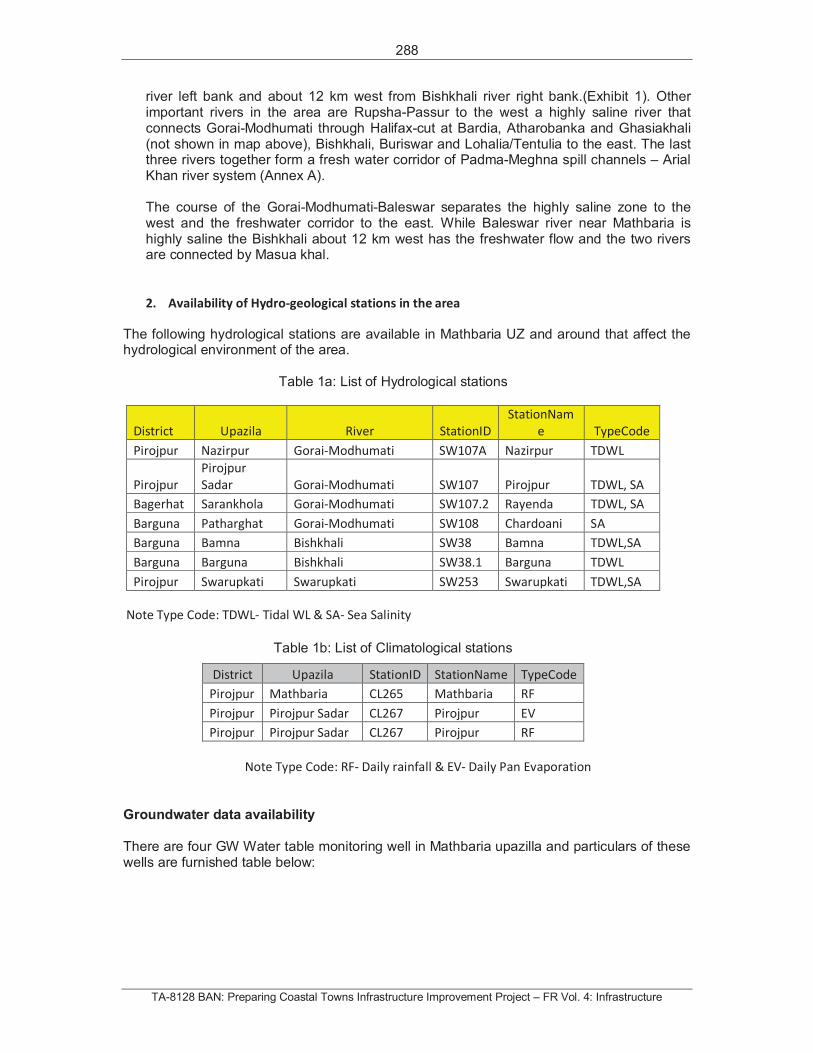
288
TA-8128 BAN: Preparing Coastal Towns Infrastructure Improvement Project – FR Vol. 4: Infrastructure
river left bank and about 12 km west from Bishkhali river right bank.(Exhibit 1). Other important rivers in the area are Rupsha-Passur to the west a highly saline river that connects Gorai-Modhumati through Halifax-cut at Bardia, Atharobanka and Ghasiakhali (not shown in map above), Bishkhali, Buriswar and Lohalia/Tentulia to the east. The last three rivers together form a fresh water corridor of Padma-Meghna spill channels – Arial Khan river system (Annex A).
The course of the Gorai-Modhumati-Baleswar separates the highly saline zone to the west and the freshwater corridor to the east. While Baleswar river near Mathbaria is highly saline the Bishkhali about 12 km west has the freshwater flow and the two rivers are connected by Masua khal.
2. Availability of Hydro-geological stations in the area
The following hydrological stations are available in Mathbaria UZ and around that affect the hydrological environment of the area.
Table 1a: List of Hydrological stations
District Upazila River StationID
StationNam
e TypeCode
Pirojpur Nazirpur Gorai-Modhumati SW107A Nazirpur TDWL
Pirojpur
Pirojpur
Sadar Gorai-Modhumati SW107 Pirojpur TDWL, SA
Bagerhat Sarankhola Gorai-Modhumati SW107.2 Rayenda TDWL, SA
Barguna Patharghat Gorai-Modhumati SW108 Chardoani SA
Barguna Bamna Bishkhali SW38 Bamna TDWL,SA
Barguna Barguna Bishkhali SW38.1 Barguna TDWL
Pirojpur Swarupkati Swarupkati SW253 Swarupkati TDWL,SA
Note Type Code: TDWL- Tidal WL & SA- Sea Salinity
Table 1b: List of Climatological stations
District Upazila StationID StationName TypeCode
Pirojpur Mathbaria CL265 Mathbaria RF
Pirojpur Pirojpur Sadar CL267 Pirojpur EV
Pirojpur Pirojpur Sadar CL267 Pirojpur RF
Note Type Code: RF- Daily rainfall & EV- Daily Pan Evaporation
Groundwater data availability
There are four GW Water table monitoring well in Mathbaria upazilla and particulars of these wells are furnished table below:
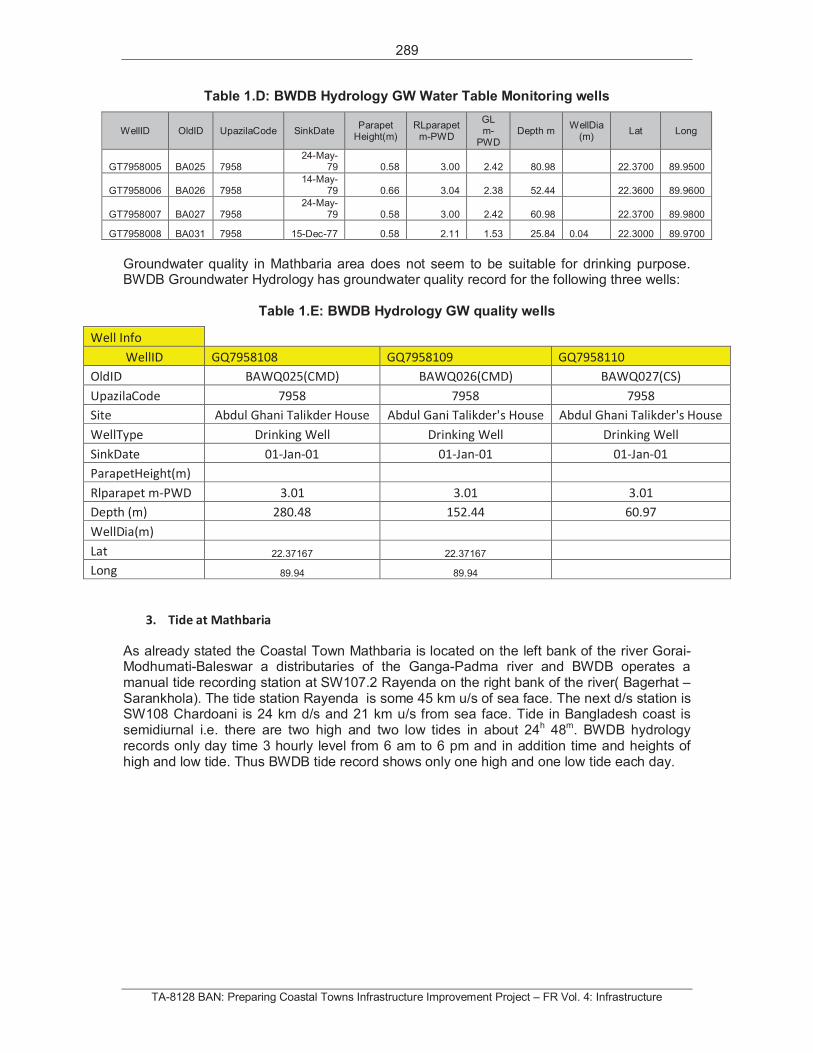
289
TA-8128 BAN: Preparing Coastal Towns Infrastructure Improvement Project – FR Vol. 4: Infrastructure
Table 1.D: BWDB Hydrology GW Water Table Monitoring wells
WellID OldID UpazilaCode SinkDate Parapet
Height(m) RLparapet
m-PWD
GL m-
PWD Depth m
WellDia (m)
Lat Long
GT7958005 BA025 7958 24-May-
79 0.58 3.00 2.42 80.98 22.3700 89.9500
GT7958006 BA026 7958 14-May-
79 0.66 3.04 2.38 52.44 22.3600 89.9600
GT7958007 BA027 7958 24-May-
79 0.58 3.00 2.42 60.98 22.3700 89.9800
GT7958008 BA031 7958 15-Dec-77 0.58 2.11 1.53 25.84 0.04 22.3000 89.9700
Groundwater quality in Mathbaria area does not seem to be suitable for drinking purpose. BWDB Groundwater Hydrology has groundwater quality record for the following three wells:
Table 1.E: BWDB Hydrology GW quality wells
Well Info
WellID GQ7958108 GQ7958109 GQ7958110
OldID BAWQ025(CMD) BAWQ026(CMD) BAWQ027(CS)
UpazilaCode 7958 7958 7958
Site Abdul Ghani Talikder House Abdul Gani Talikder's House Abdul Ghani Talikder's House
WellType Drinking Well Drinking Well Drinking Well
SinkDate 01-Jan-01 01-Jan-01 01-Jan-01
ParapetHeight(m)
Rlparapet m-PWD 3.01 3.01 3.01
Depth (m) 280.48 152.44 60.97
WellDia(m)
Lat 22.37167 22.37167
Long 89.94 89.94
3. Tide at Mathbaria
As already stated the Coastal Town Mathbaria is located on the left bank of the river Gorai-Modhumati-Baleswar a distributaries of the Ganga-Padma river and BWDB operates a manual tide recording station at SW107.2 Rayenda on the right bank of the river( Bagerhat – Sarankhola). The tide station Rayenda is some 45 km u/s of sea face. The next d/s station is SW108 Chardoani is 24 km d/s and 21 km u/s from sea face. Tide in Bangladesh coast is semidiurnal i.e. there are two high and two low tides in about 24h 48m. BWDB hydrology records only day time 3 hourly level from 6 am to 6 pm and in addition time and heights of high and low tide. Thus BWDB tide record shows only one high and one low tide each day.
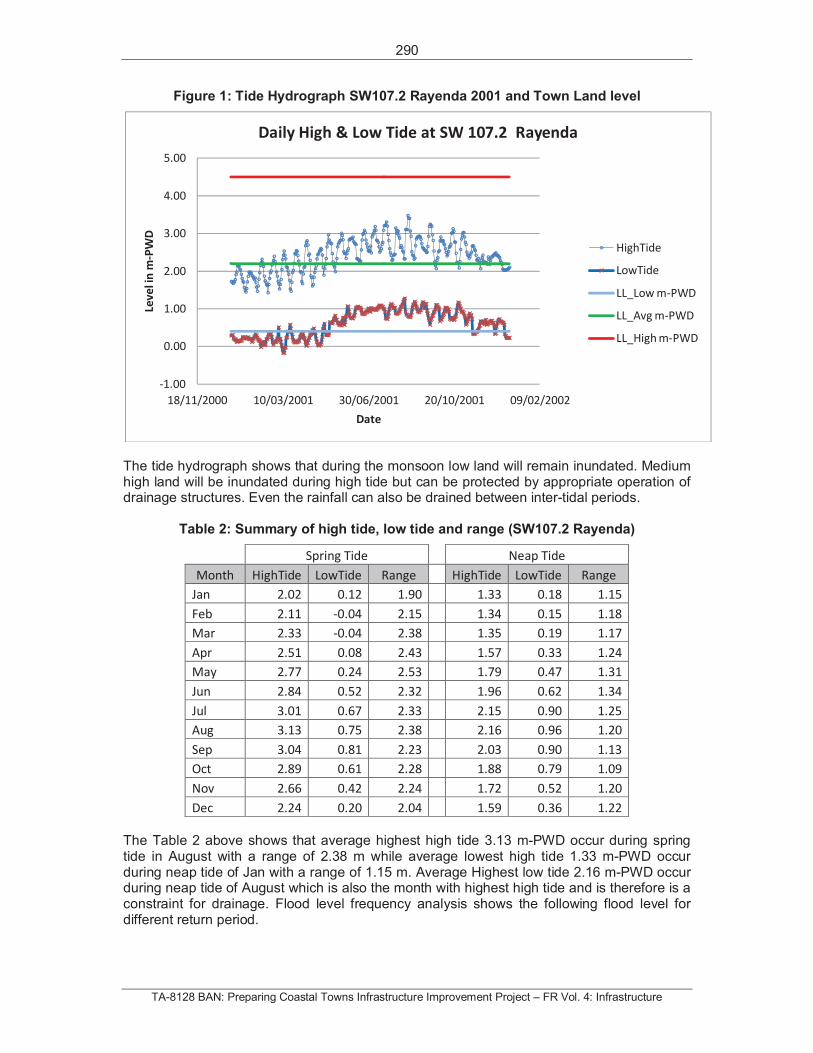
290
TA-8128 BAN: Preparing Coastal Towns Infrastructure Improvement Project – FR Vol. 4: Infrastructure
Figure 1: Tide Hydrograph SW107.2 Rayenda 2001 and Town Land level
The tide hydrograph shows that during the monsoon low land will remain inundated. Medium high land will be inundated during high tide but can be protected by appropriate operation of drainage structures. Even the rainfall can also be drained between inter-tidal periods.
Table 2: Summary of high tide, low tide and range (SW107.2 Rayenda)
Spring Tide Neap Tide
Month HighTide LowTide Range HighTide LowTide Range
Jan 2.02 0.12 1.90 1.33 0.18 1.15
Feb 2.11 -0.04 2.15 1.34 0.15 1.18
Mar 2.33 -0.04 2.38 1.35 0.19 1.17
Apr 2.51 0.08 2.43 1.57 0.33 1.24
May 2.77 0.24 2.53 1.79 0.47 1.31
Jun 2.84 0.52 2.32 1.96 0.62 1.34
Jul 3.01 0.67 2.33 2.15 0.90 1.25
Aug 3.13 0.75 2.38 2.16 0.96 1.20
Sep 3.04 0.81 2.23 2.03 0.90 1.13
Oct 2.89 0.61 2.28 1.88 0.79 1.09
Nov 2.66 0.42 2.24 1.72 0.52 1.20
Dec 2.24 0.20 2.04 1.59 0.36 1.22
The Table 2 above shows that average highest high tide 3.13 m-PWD occur during spring tide in August with a range of 2.38 m while average lowest high tide 1.33 m-PWD occur during neap tide of Jan with a range of 1.15 m. Average Highest low tide 2.16 m-PWD occur during neap tide of August which is also the month with highest high tide and is therefore is a constraint for drainage. Flood level frequency analysis shows the following flood level for different return period.
-1.00
0.00
1.00
2.00
3.00
4.00
5.00
18/11/2000 10/03/2001 30/06/2001 20/10/2001 09/02/2002
Lev
eli
nm
-PW
D
Date
Daily High & Low Tide at SW 107.2 Rayenda
HighTide
LowTide
LL_Low m-PWD
LL_Avg m-PWD
LL_High m-PWD
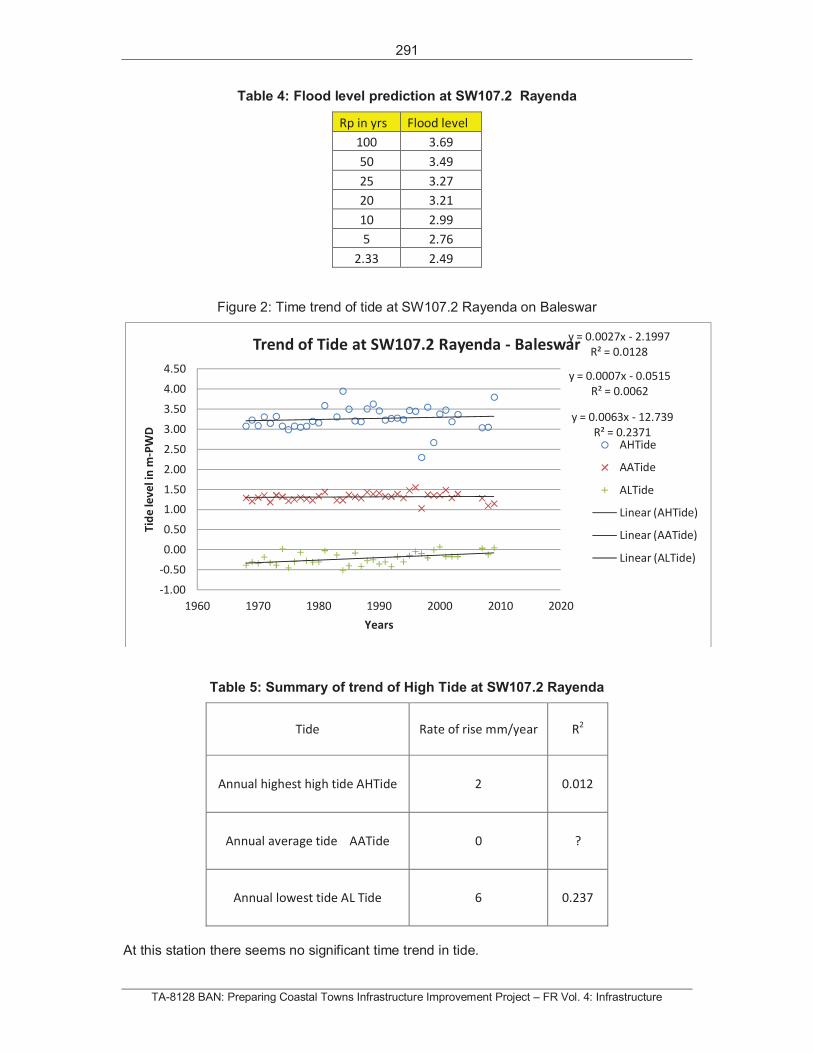
291
TA-8128 BAN: Preparing Coastal Towns Infrastructure Improvement Project – FR Vol. 4: Infrastructure
Table 4: Flood level prediction at SW107.2 Rayenda
Rp in yrs Flood level
100 3.69
50 3.49
25 3.27
20 3.21
10 2.99
5 2.76
2.33 2.49
Figure 2: Time trend of tide at SW107.2 Rayenda on Baleswar
Table 5: Summary of trend of High Tide at SW107.2 Rayenda
Tide Rate of rise mm/year R2
Annual highest high tide AHTide 2 0.012
Annual average tide AATide 0 ?
Annual lowest tide AL Tide 6 0.237
At this station there seems no significant time trend in tide.
y = 0.0027x - 2.1997
R² = 0.0128
y = 0.0007x - 0.0515
R² = 0.0062
y = 0.0063x - 12.739
R² = 0.2371
-1.00
-0.50
0.00
0.50
1.00
1.50
2.00
2.50
3.00
3.50
4.00
4.50
1960 1970 1980 1990 2000 2010 2020
Tid
ele
ve
lin
m-P
WD
Years
Trend of Tide at SW107.2 Rayenda - Baleswar
AHTide
AATide
ALTide
Linear (AHTide)
Linear (AATide)
Linear (ALTide)
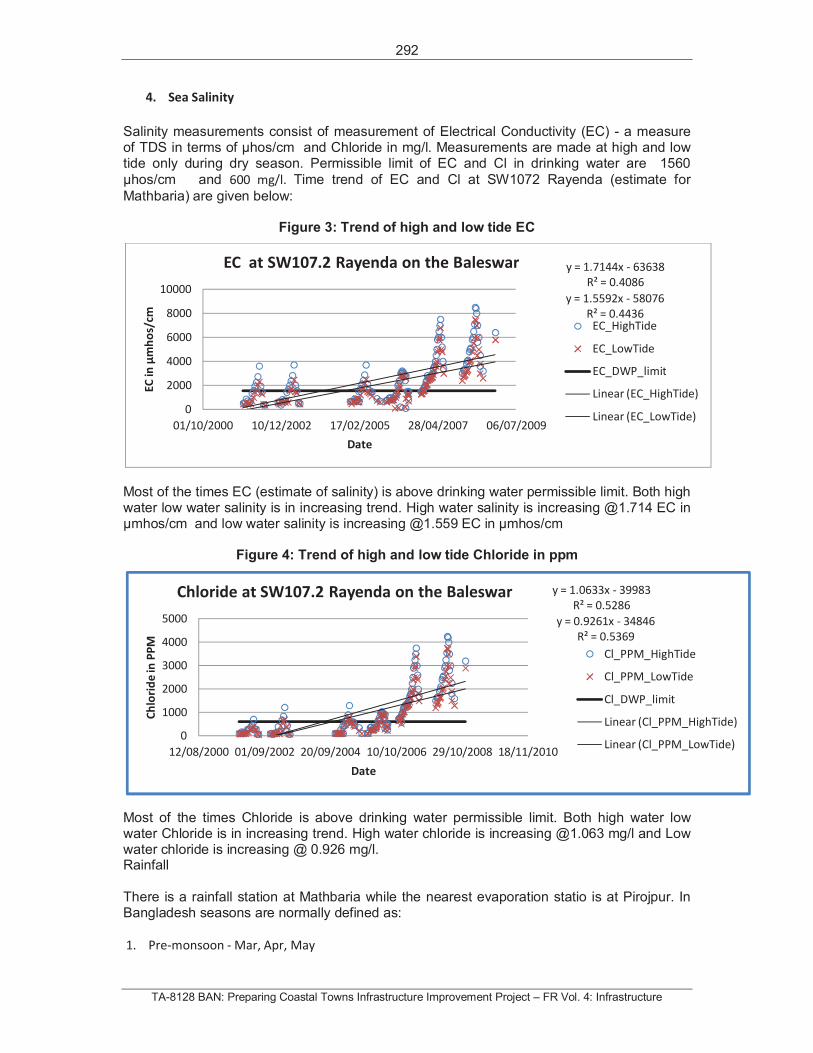
292
TA-8128 BAN: Preparing Coastal Towns Infrastructure Improvement Project – FR Vol. 4: Infrastructure
4. Sea Salinity
Salinity measurements consist of measurement of Electrical Conductivity (EC) - a measure of TDS in terms of hos/cm and Chloride in mg/l. Measurements are made at high and low tide only during dry season. Permissible limit of EC and Cl in drinking water are 1560
hos/cm and 600 mg/l. Time trend of EC and Cl at SW1072 Rayenda (estimate for
Mathbaria) are given below:
Figure 3: Trend of high and low tide EC
Most of the times EC (estimate of salinity) is above drinking water permissible limit. Both high water low water salinity is in increasing trend. High water salinity is increasing @1.714 EC in
mhos/cm and low water salinity is increasing @1.559 EC in mhos/cm
Figure 4: Trend of high and low tide Chloride in ppm
Most of the times Chloride is above drinking water permissible limit. Both high water low water Chloride is in increasing trend. High water chloride is increasing @1.063 mg/l and Low water chloride is increasing @ 0.926 mg/l. Rainfall
There is a rainfall station at Mathbaria while the nearest evaporation statio is at Pirojpur. In Bangladesh seasons are normally defined as:
1. Pre-monsoon - Mar, Apr, May
y = 1.7144x - 63638
R² = 0.4086
y = 1.5592x - 58076
R² = 0.4436
0
2000
4000
6000
8000
10000
01/10/2000 10/12/2002 17/02/2005 28/04/2007 06/07/2009
EC
inm
ho
s/cm
Date
EC at SW107.2 Rayenda on the Baleswar
EC_HighTide
EC_LowTide
EC_DWP_limit
Linear (EC_HighTide)
Linear (EC_LowTide)
y = 1.0633x - 39983
R² = 0.5286
y = 0.9261x - 34846
R² = 0.5369
0
1000
2000
3000
4000
5000
12/08/2000 01/09/2002 20/09/2004 10/10/2006 29/10/2008 18/11/2010
Ch
lori
de
inP
PM
Date
Chloride at SW107.2 Rayenda on the Baleswar
Cl_PPM_HighTide
Cl_PPM_LowTide
Cl_DWP_limit
Linear (Cl_PPM_HighTide)
Linear (Cl_PPM_LowTide)
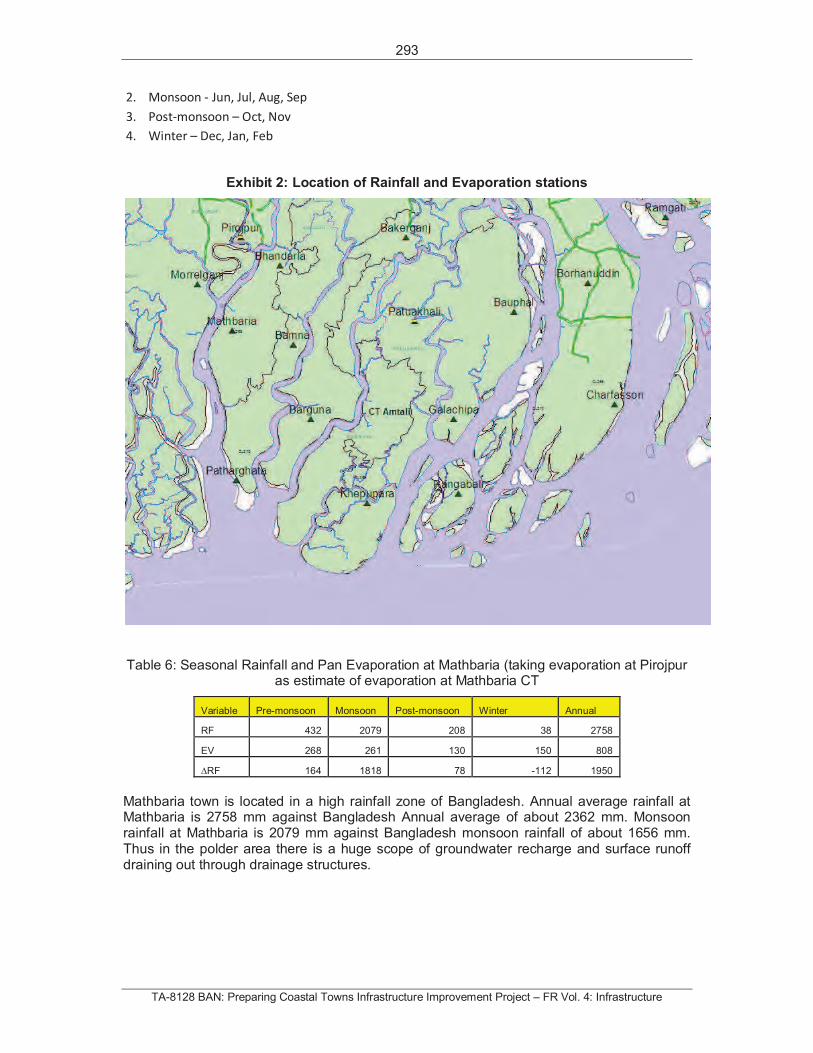
293
TA-8128 BAN: Preparing Coastal Towns Infrastructure Improvement Project – FR Vol. 4: Infrastructure
2. Monsoon - Jun, Jul, Aug, Sep
3. Post-monsoon – Oct, Nov
4. Winter – Dec, Jan, Feb
Exhibit 2: Location of Rainfall and Evaporation stations
Table 6: Seasonal Rainfall and Pan Evaporation at Mathbaria (taking evaporation at Pirojpur as estimate of evaporation at Mathbaria CT
Variable Pre-monsoon Monsoon Post-monsoon Winter Annual
RF 432 2079 208 38 2758
EV 268 261 130 150 808
RF 164 1818 78 -112 1950
Mathbaria town is located in a high rainfall zone of Bangladesh. Annual average rainfall at Mathbaria is 2758 mm against Bangladesh Annual average of about 2362 mm. Monsoon rainfall at Mathbaria is 2079 mm against Bangladesh monsoon rainfall of about 1656 mm. Thus in the polder area there is a huge scope of groundwater recharge and surface runoff draining out through drainage structures.
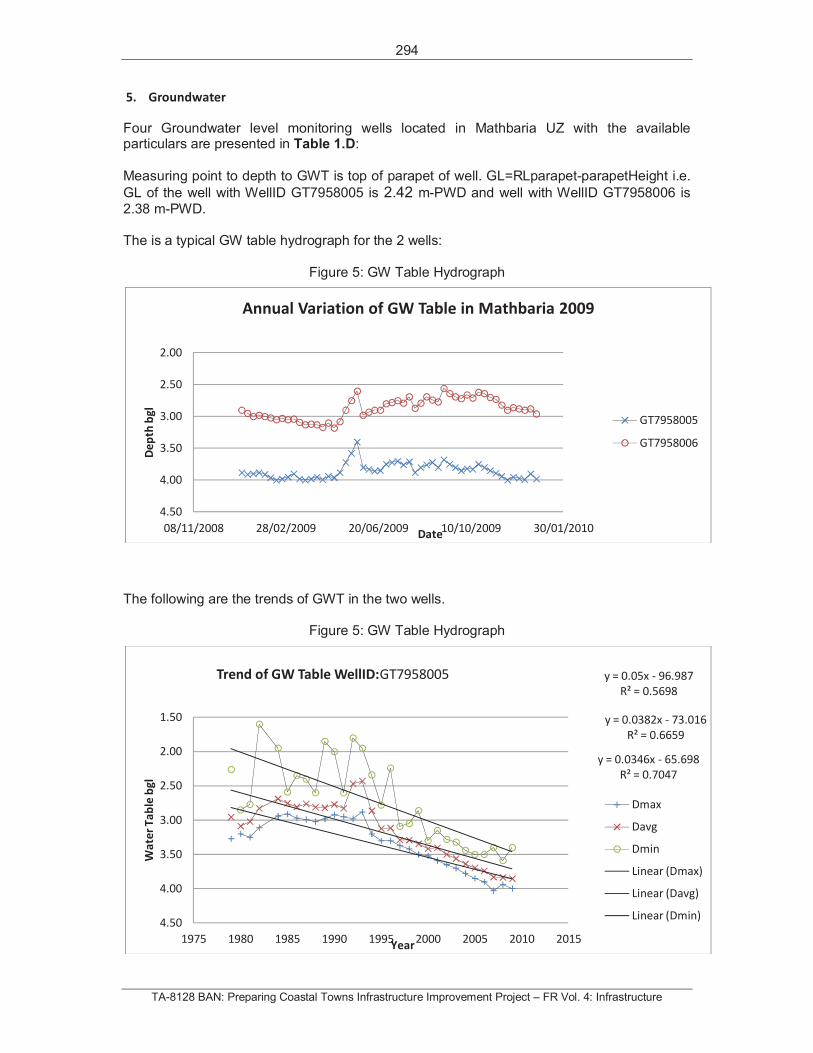
294
TA-8128 BAN: Preparing Coastal Towns Infrastructure Improvement Project – FR Vol. 4: Infrastructure
5. Groundwater
Four Groundwater level monitoring wells located in Mathbaria UZ with the available particulars are presented in Table 1.D:
Measuring point to depth to GWT is top of parapet of well. GL=RLparapet-parapetHeight i.e.
GL of the well with WellID GT7958005 is 2.42 m-PWD and well with WellID GT7958006 is
2.38 m-PWD.
The is a typical GW table hydrograph for the 2 wells:
Figure 5: GW Table Hydrograph
The following are the trends of GWT in the two wells.
Figure 5: GW Table Hydrograph
2.00
2.50
3.00
3.50
4.00
4.50
08/11/2008 28/02/2009 20/06/2009 10/10/2009 30/01/2010
De
pth
bg
l
Date
Annual Variation of GW Table in Mathbaria 2009
GT7958005
GT7958006
y = 0.0346x - 65.698
R² = 0.7047
y = 0.0382x - 73.016
R² = 0.6659
y = 0.05x - 96.987
R² = 0.5698
1.50
2.00
2.50
3.00
3.50
4.00
4.50
1975 1980 1985 1990 1995 2000 2005 2010 2015
Wa
ter
Ta
ble
bg
l
Year
Trend of GW Table WellID:GT7958005
Dmax
Davg
Dmin
Linear (Dmax)
Linear (Davg)
Linear (Dmin)
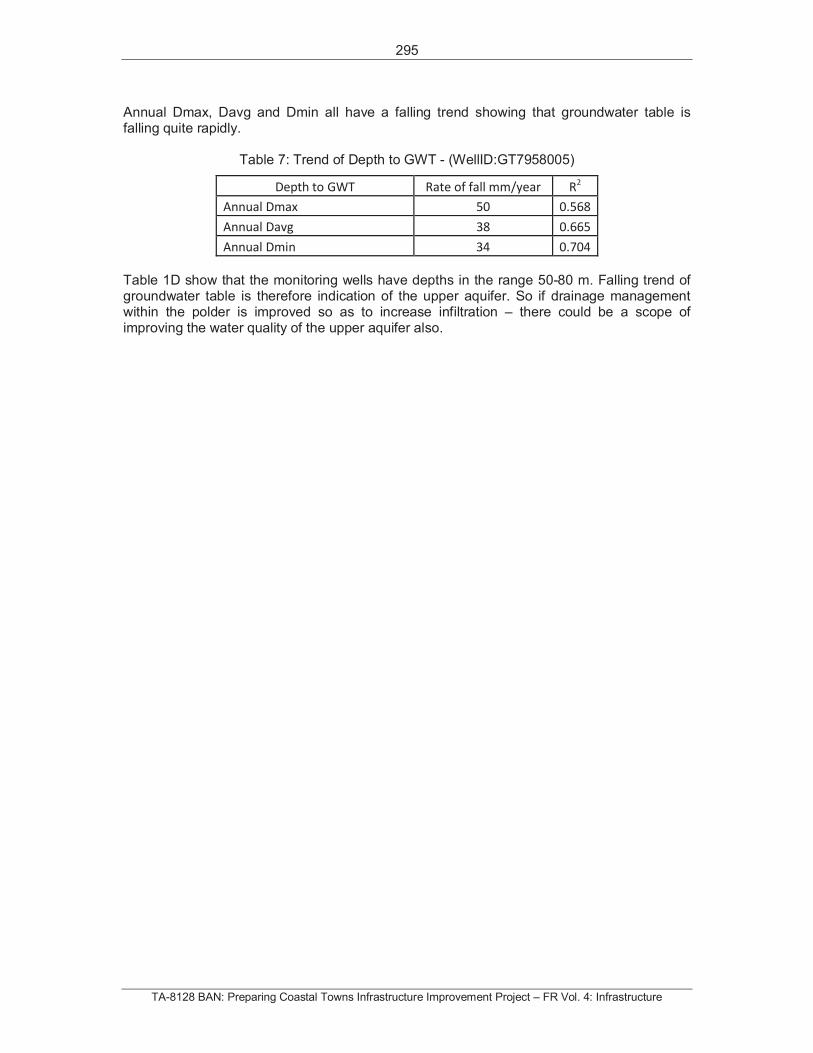
295
TA-8128 BAN: Preparing Coastal Towns Infrastructure Improvement Project – FR Vol. 4: Infrastructure
Annual Dmax, Davg and Dmin all have a falling trend showing that groundwater table is falling quite rapidly.
Table 7: Trend of Depth to GWT - (WellID:GT7958005)
Depth to GWT Rate of fall mm/year R2
Annual Dmax 50 0.568
Annual Davg 38 0.665
Annual Dmin 34 0.704
Table 1D show that the monitoring wells have depths in the range 50-80 m. Falling trend of groundwater table is therefore indication of the upper aquifer. So if drainage management within the polder is improved so as to increase infiltration – there could be a scope of improving the water quality of the upper aquifer also.
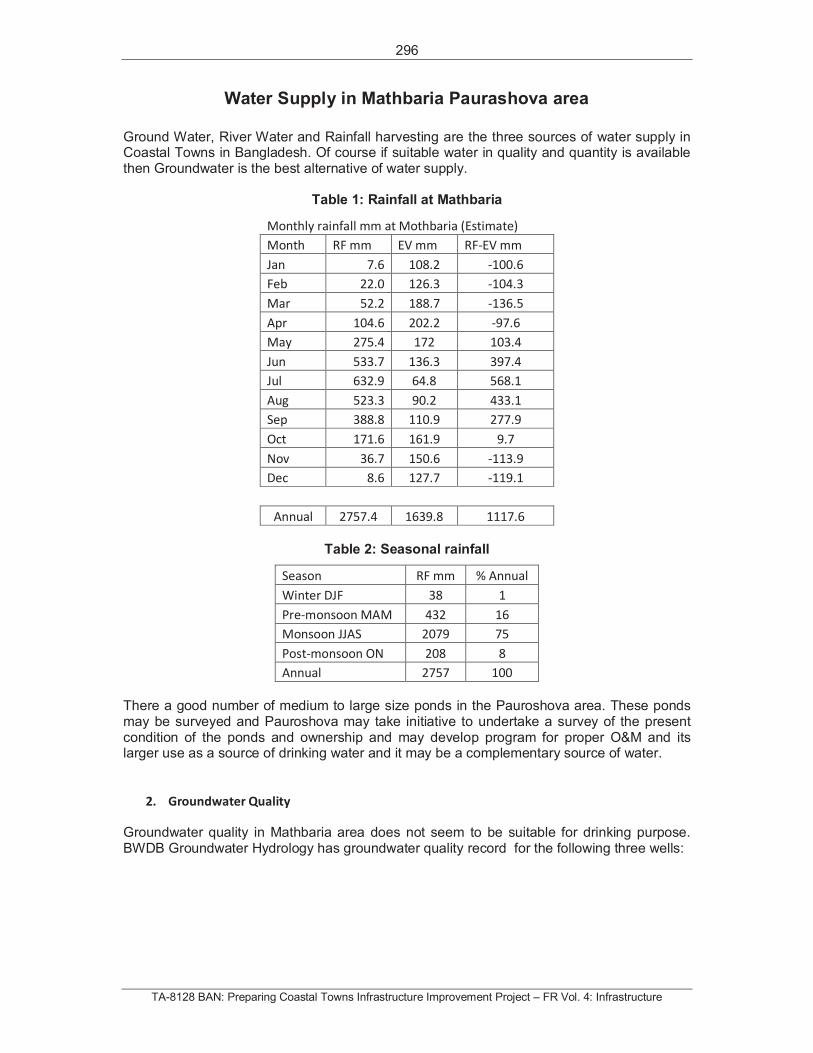
296
TA-8128 BAN: Preparing Coastal Towns Infrastructure Improvement Project – FR Vol. 4: Infrastructure
Water Supply in Mathbaria Paurashova area
Ground Water, River Water and Rainfall harvesting are the three sources of water supply in Coastal Towns in Bangladesh. Of course if suitable water in quality and quantity is available then Groundwater is the best alternative of water supply.
Table 1: Rainfall at Mathbaria
Monthly rainfall mm at Mothbaria (Estimate)
Month RF mm EV mm RF-EV mm
Jan 7.6 108.2 -100.6
Feb 22.0 126.3 -104.3
Mar 52.2 188.7 -136.5
Apr 104.6 202.2 -97.6
May 275.4 172 103.4
Jun 533.7 136.3 397.4
Jul 632.9 64.8 568.1
Aug 523.3 90.2 433.1
Sep 388.8 110.9 277.9
Oct 171.6 161.9 9.7
Nov 36.7 150.6 -113.9
Dec 8.6 127.7 -119.1
Annual 2757.4 1639.8 1117.6
Table 2: Seasonal rainfall
Season RF mm % Annual
Winter DJF 38 1
Pre-monsoon MAM 432 16
Monsoon JJAS 2079 75
Post-monsoon ON 208 8
Annual 2757 100
There a good number of medium to large size ponds in the Pauroshova area. These ponds may be surveyed and Pauroshova may take initiative to undertake a survey of the present condition of the ponds and ownership and may develop program for proper O&M and its larger use as a source of drinking water and it may be a complementary source of water.
2. Groundwater Quality
Groundwater quality in Mathbaria area does not seem to be suitable for drinking purpose. BWDB Groundwater Hydrology has groundwater quality record for the following three wells:
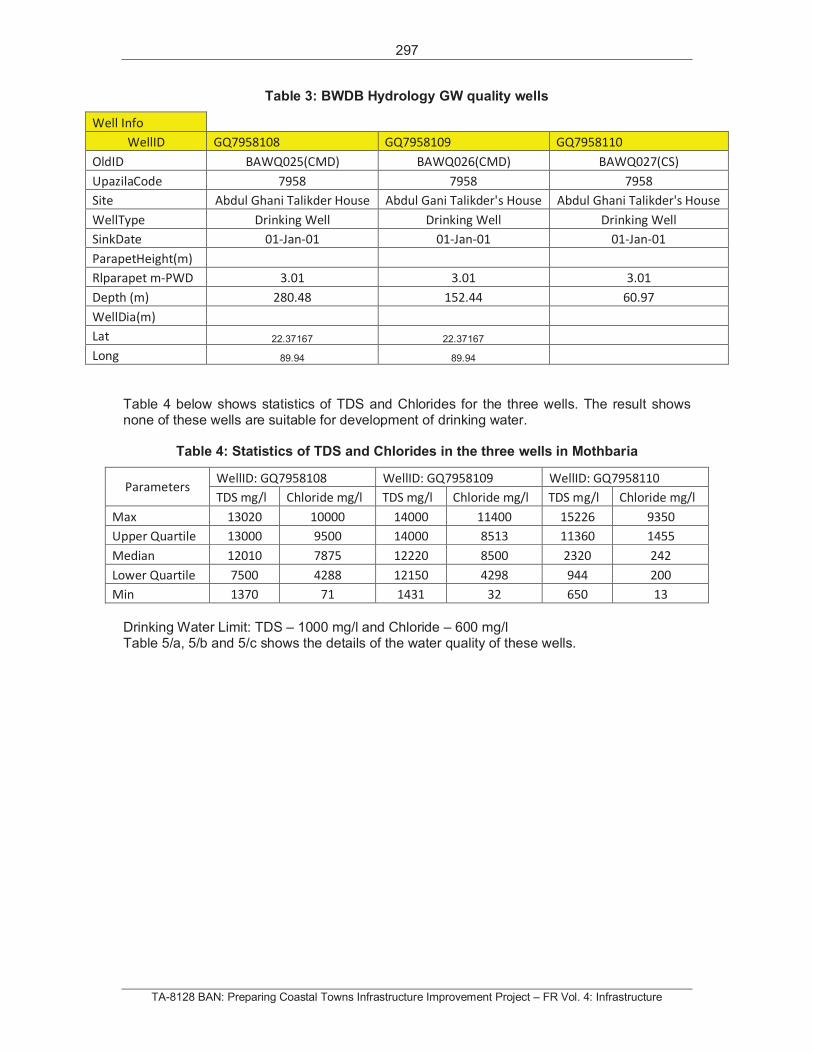
297
TA-8128 BAN: Preparing Coastal Towns Infrastructure Improvement Project – FR Vol. 4: Infrastructure
Table 3: BWDB Hydrology GW quality wells
Well Info
WellID GQ7958108 GQ7958109 GQ7958110
OldID BAWQ025(CMD) BAWQ026(CMD) BAWQ027(CS)
UpazilaCode 7958 7958 7958
Site Abdul Ghani Talikder House Abdul Gani Talikder's House Abdul Ghani Talikder's House
WellType Drinking Well Drinking Well Drinking Well
SinkDate 01-Jan-01 01-Jan-01 01-Jan-01
ParapetHeight(m)
Rlparapet m-PWD 3.01 3.01 3.01
Depth (m) 280.48 152.44 60.97
WellDia(m)
Lat 22.37167 22.37167
Long 89.94 89.94
Table 4 below shows statistics of TDS and Chlorides for the three wells. The result shows none of these wells are suitable for development of drinking water.
Table 4: Statistics of TDS and Chlorides in the three wells in Mothbaria
Parameters WellID: GQ7958108 WellID: GQ7958109 WellID: GQ7958110
TDS mg/l Chloride mg/l TDS mg/l Chloride mg/l TDS mg/l Chloride mg/l
Max 13020 10000 14000 11400 15226 9350
Upper Quartile 13000 9500 14000 8513 11360 1455
Median 12010 7875 12220 8500 2320 242
Lower Quartile 7500 4288 12150 4298 944 200
Min 1370 71 1431 32 650 13
Drinking Water Limit: TDS – 1000 mg/l and Chloride – 600 mg/l Table 5/a, 5/b and 5/c shows the details of the water quality of these wells.
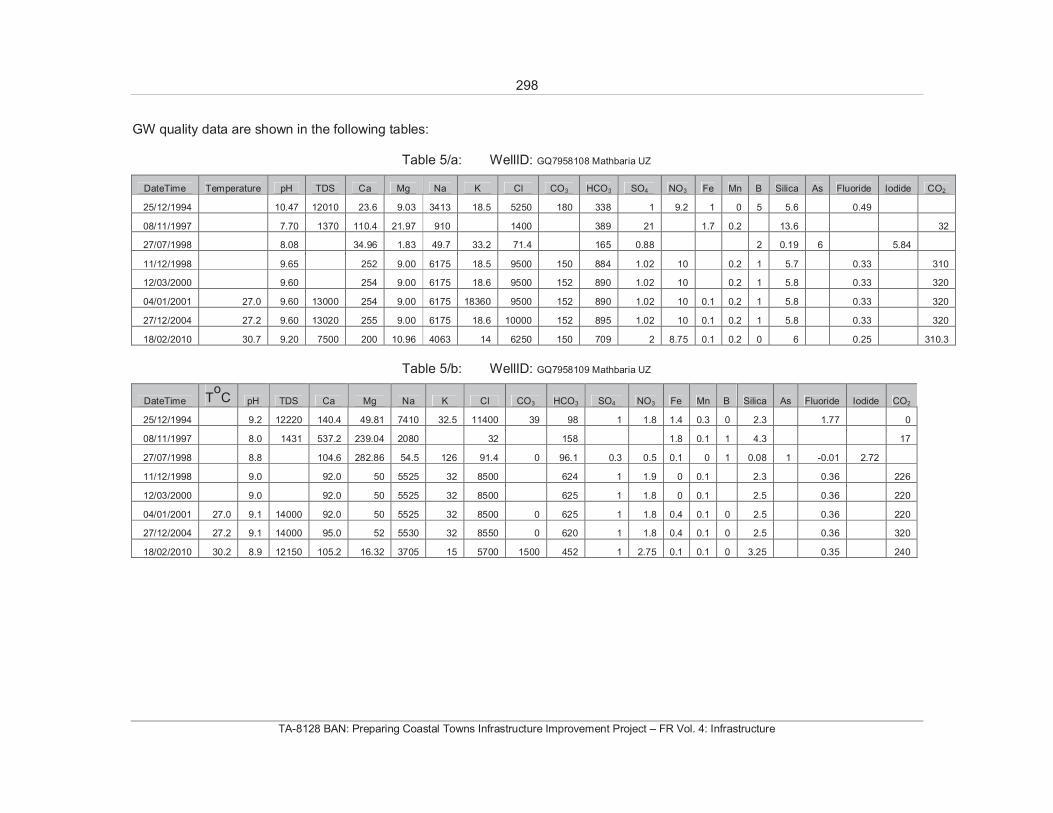
298
TA-8128 BAN: Preparing Coastal Towns Infrastructure Improvement Project – FR Vol. 4: Infrastructure
GW quality data are shown in the following tables:
Table 5/a: WellID: GQ7958108 Mathbaria UZ
DateTime Temperature pH TDS Ca Mg Na K Cl CO3 HCO3 SO4 NO3 Fe Mn B Silica As Fluoride Iodide CO2
25/12/1994 10.47 12010 23.6 9.03 3413 18.5 5250 180 338 1 9.2 1 0 5 5.6 0.49
08/11/1997 7.70 1370 110.4 21.97 910 1400 389 21 1.7 0.2 13.6 32
27/07/1998 8.08 34.96 1.83 49.7 33.2 71.4 165 0.88 2 0.19 6 5.84
11/12/1998 9.65 252 9.00 6175 18.5 9500 150 884 1.02 10 0.2 1 5.7 0.33 310
12/03/2000 9.60 254 9.00 6175 18.6 9500 152 890 1.02 10 0.2 1 5.8 0.33 320
04/01/2001 27.0 9.60 13000 254 9.00 6175 18360 9500 152 890 1.02 10 0.1 0.2 1 5.8 0.33 320
27/12/2004 27.2 9.60 13020 255 9.00 6175 18.6 10000 152 895 1.02 10 0.1 0.2 1 5.8 0.33 320
18/02/2010 30.7 9.20 7500 200 10.96 4063 14 6250 150 709 2 8.75 0.1 0.2 0 6 0.25 310.3
Table 5/b: WellID: GQ7958109 Mathbaria UZ
DateTime ToC pH TDS Ca Mg Na K Cl CO3 HCO3 SO4 NO3 Fe Mn B Silica As Fluoride Iodide CO2
25/12/1994 9.2 12220 140.4 49.81 7410 32.5 11400 39 98 1 1.8 1.4 0.3 0 2.3 1.77 0
08/11/1997 8.0 1431 537.2 239.04 2080 32 158 1.8 0.1 1 4.3 17
27/07/1998 8.8 104.6 282.86 54.5 126 91.4 0 96.1 0.3 0.5 0.1 0 1 0.08 1 -0.01 2.72
11/12/1998 9.0 92.0 50 5525 32 8500 624 1 1.9 0 0.1 2.3 0.36 226
12/03/2000 9.0 92.0 50 5525 32 8500 625 1 1.8 0 0.1 2.5 0.36 220
04/01/2001 27.0 9.1 14000 92.0 50 5525 32 8500 0 625 1 1.8 0.4 0.1 0 2.5 0.36 220
27/12/2004 27.2 9.1 14000 95.0 52 5530 32 8550 0 620 1 1.8 0.4 0.1 0 2.5 0.36 320
18/02/2010 30.2 8.9 12150 105.2 16.32 3705 15 5700 1500 452 1 2.75 0.1 0.1 0 3.25 0.35 240
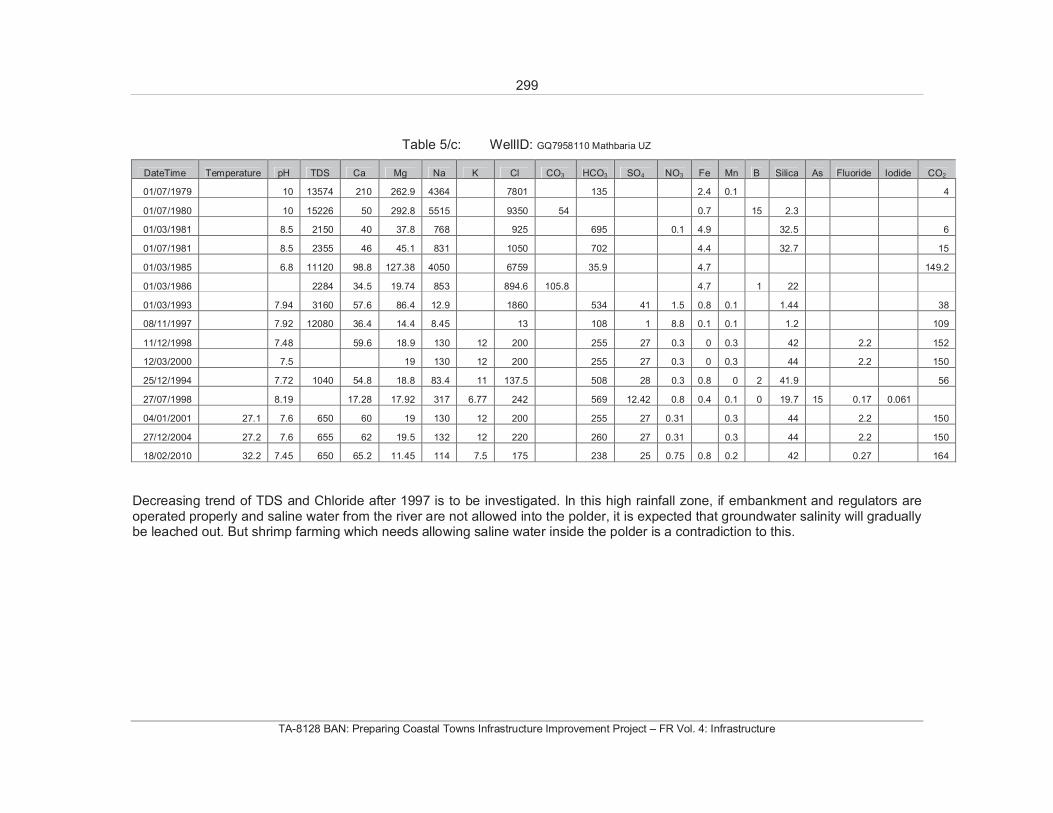
299
TA-8128 BAN: Preparing Coastal Towns Infrastructure Improvement Project – FR Vol. 4: Infrastructure
Table 5/c: WellID: GQ7958110 Mathbaria UZ
DateTime Temperature pH TDS Ca Mg Na K Cl CO3 HCO3 SO4 NO3 Fe Mn B Silica As Fluoride Iodide CO2
01/07/1979 10 13574 210 262.9 4364 7801 135 2.4 0.1 4
01/07/1980 10 15226 50 292.8 5515 9350 54 0.7 15 2.3
01/03/1981 8.5 2150 40 37.8 768 925 695 0.1 4.9 32.5 6
01/07/1981 8.5 2355 46 45.1 831 1050 702 4.4 32.7 15
01/03/1985 6.8 11120 98.8 127.38 4050 6759 35.9 4.7 149.2
01/03/1986 2284 34.5 19.74 853 894.6 105.8 4.7 1 22
01/03/1993 7.94 3160 57.6 86.4 12.9 1860 534 41 1.5 0.8 0.1 1.44 38
08/11/1997 7.92 12080 36.4 14.4 8.45 13 108 1 8.8 0.1 0.1 1.2 109
11/12/1998 7.48 59.6 18.9 130 12 200 255 27 0.3 0 0.3 42 2.2 152
12/03/2000 7.5 19 130 12 200 255 27 0.3 0 0.3 44 2.2 150
25/12/1994 7.72 1040 54.8 18.8 83.4 11 137.5 508 28 0.3 0.8 0 2 41.9 56
27/07/1998 8.19 17.28 17.92 317 6.77 242 569 12.42 0.8 0.4 0.1 0 19.7 15 0.17 0.061
04/01/2001 27.1 7.6 650 60 19 130 12 200 255 27 0.31 0.3 44 2.2 150
27/12/2004 27.2 7.6 655 62 19.5 132 12 220 260 27 0.31 0.3 44 2.2 150
18/02/2010 32.2 7.45 650 65.2 11.45 114 7.5 175 238 25 0.75 0.8 0.2 42 0.27 164
Decreasing trend of TDS and Chloride after 1997 is to be investigated. In this high rainfall zone, if embankment and regulators are operated properly and saline water from the river are not allowed into the polder, it is expected that groundwater salinity will gradually be leached out. But shrimp farming which needs allowing saline water inside the polder is a contradiction to this.
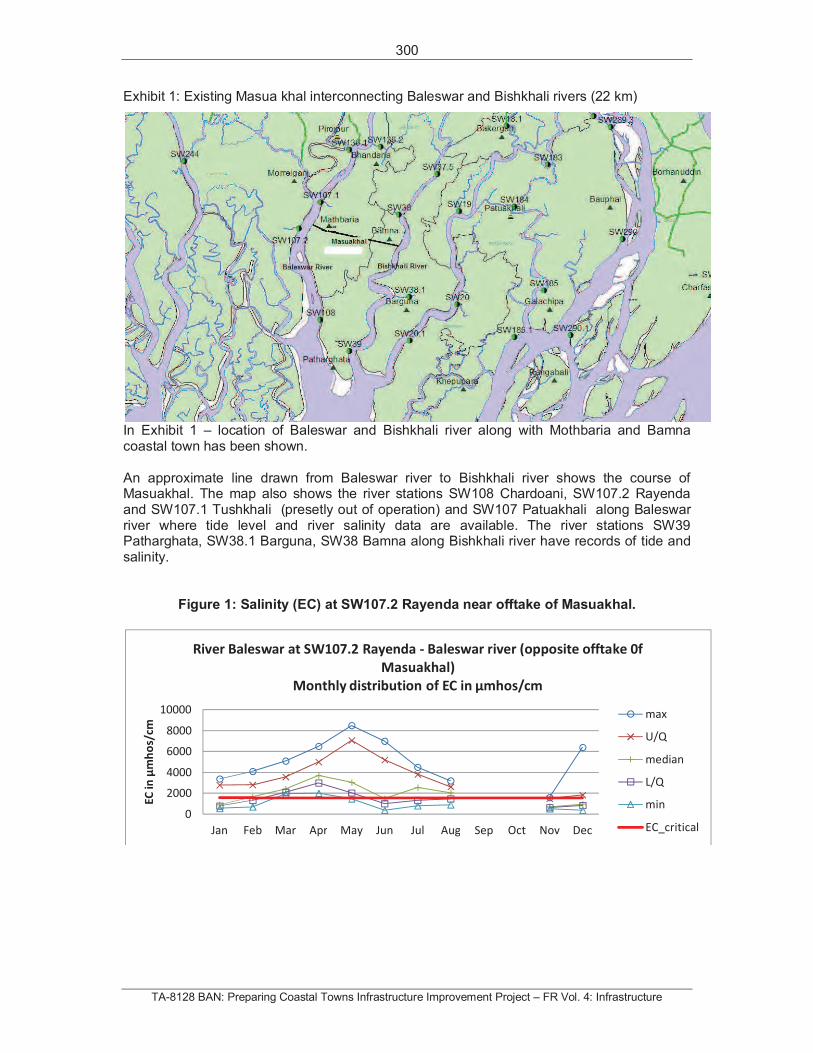
300
TA-8128 BAN: Preparing Coastal Towns Infrastructure Improvement Project – FR Vol. 4: Infrastructure
Exhibit 1: Existing Masua khal interconnecting Baleswar and Bishkhali rivers (22 km)
In Exhibit 1 – location of Baleswar and Bishkhali river along with Mothbaria and Bamna coastal town has been shown.
An approximate line drawn from Baleswar river to Bishkhali river shows the course of Masuakhal. The map also shows the river stations SW108 Chardoani, SW107.2 Rayenda and SW107.1 Tushkhali (presetly out of operation) and SW107 Patuakhali along Baleswar river where tide level and river salinity data are available. The river stations SW39 Patharghata, SW38.1 Barguna, SW38 Bamna along Bishkhali river have records of tide and salinity.
Figure 1: Salinity (EC) at SW107.2 Rayenda near offtake of Masuakhal.
0
2000
4000
6000
8000
10000
Jan Feb Mar Apr May Jun Jul Aug Sep Oct Nov Dec
EC
inm
ho
s/cm
River Baleswar at SW107.2 Rayenda - Baleswar river (opposite offtake 0f
Masuakhal)
Monthly distribution of EC in mhos/cm
max
U/Q
median
L/Q
min
EC_critical
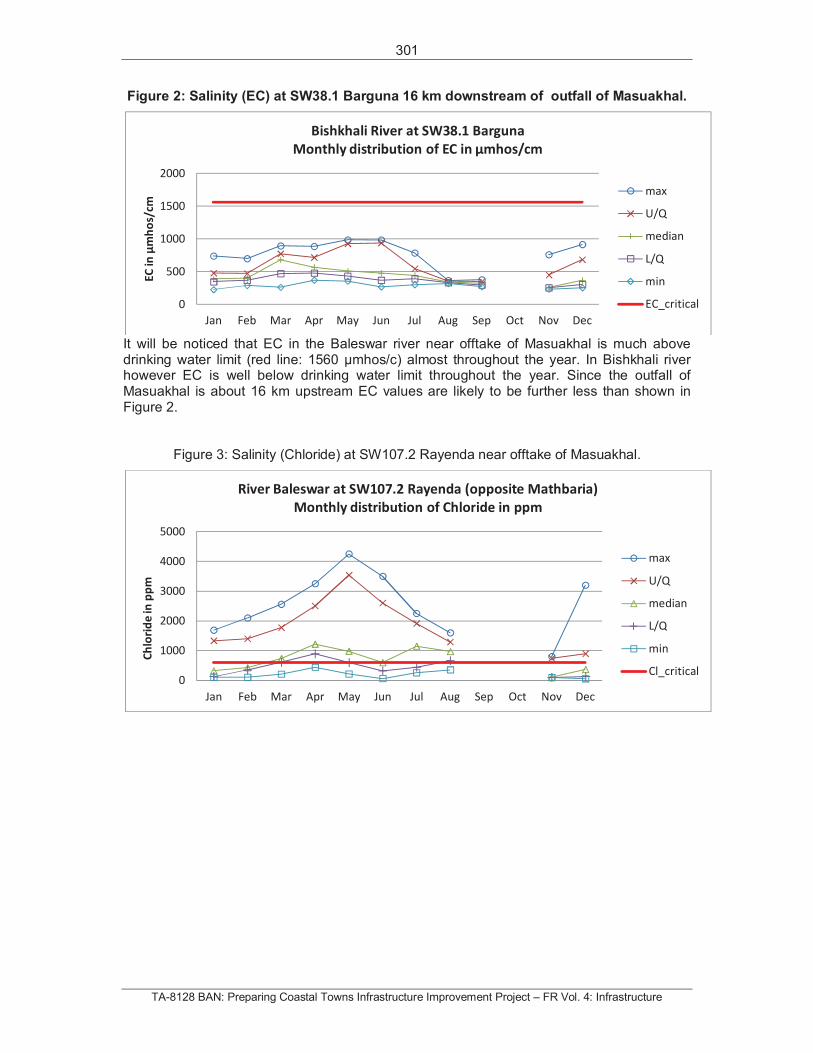
301
TA-8128 BAN: Preparing Coastal Towns Infrastructure Improvement Project – FR Vol. 4: Infrastructure
Figure 2: Salinity (EC) at SW38.1 Barguna 16 km downstream of outfall of Masuakhal.
It will be noticed that EC in the Baleswar river near offtake of Masuakhal is much above drinking water limit (red line: 1560 mhos/c) almost throughout the year. In Bishkhali river however EC is well below drinking water limit throughout the year. Since the outfall of Masuakhal is about 16 km upstream EC values are likely to be further less than shown in Figure 2.
Figure 3: Salinity (Chloride) at SW107.2 Rayenda near offtake of Masuakhal.
0
500
1000
1500
2000
Jan Feb Mar Apr May Jun Jul Aug Sep Oct Nov Dec
EC
inm
ho
s/cm
Bishkhali River at SW38.1 Barguna
Monthly distribution of EC in mhos/cm
max
U/Q
median
L/Q
min
EC_critical
0
1000
2000
3000
4000
5000
Jan Feb Mar Apr May Jun Jul Aug Sep Oct Nov Dec
Ch
lori
de
inp
pm
River Baleswar at SW107.2 Rayenda (opposite Mathbaria)
Monthly distribution of Chloride in ppm
max
U/Q
median
L/Q
min
Cl_critical
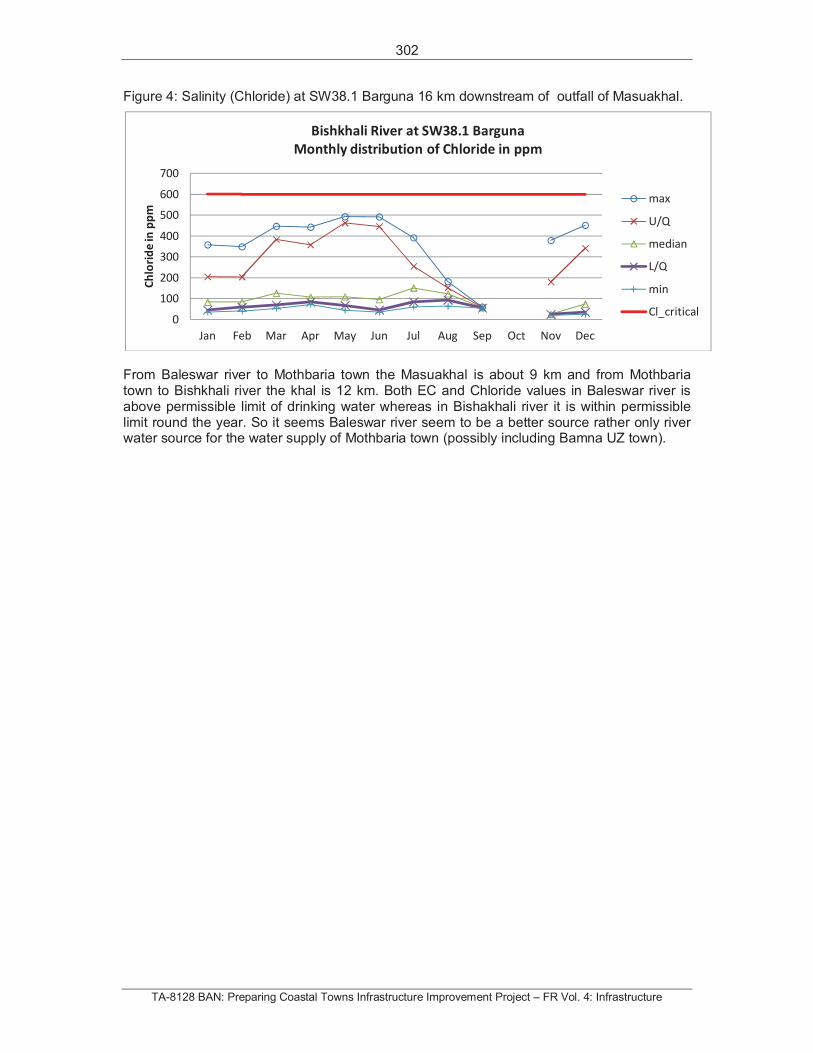
302
TA-8128 BAN: Preparing Coastal Towns Infrastructure Improvement Project – FR Vol. 4: Infrastructure
Figure 4: Salinity (Chloride) at SW38.1 Barguna 16 km downstream of outfall of Masuakhal.
From Baleswar river to Mothbaria town the Masuakhal is about 9 km and from Mothbaria town to Bishkhali river the khal is 12 km. Both EC and Chloride values in Baleswar river is above permissible limit of drinking water whereas in Bishakhali river it is within permissible limit round the year. So it seems Baleswar river seem to be a better source rather only river water source for the water supply of Mothbaria town (possibly including Bamna UZ town).
0
100
200
300
400
500
600
700
Jan Feb Mar Apr May Jun Jul Aug Sep Oct Nov Dec
Ch
lori
de
inp
pm
Bishkhali River at SW38.1 Barguna
Monthly distribution of Chloride in ppm
max
U/Q
median
L/Q
min
Cl_critical
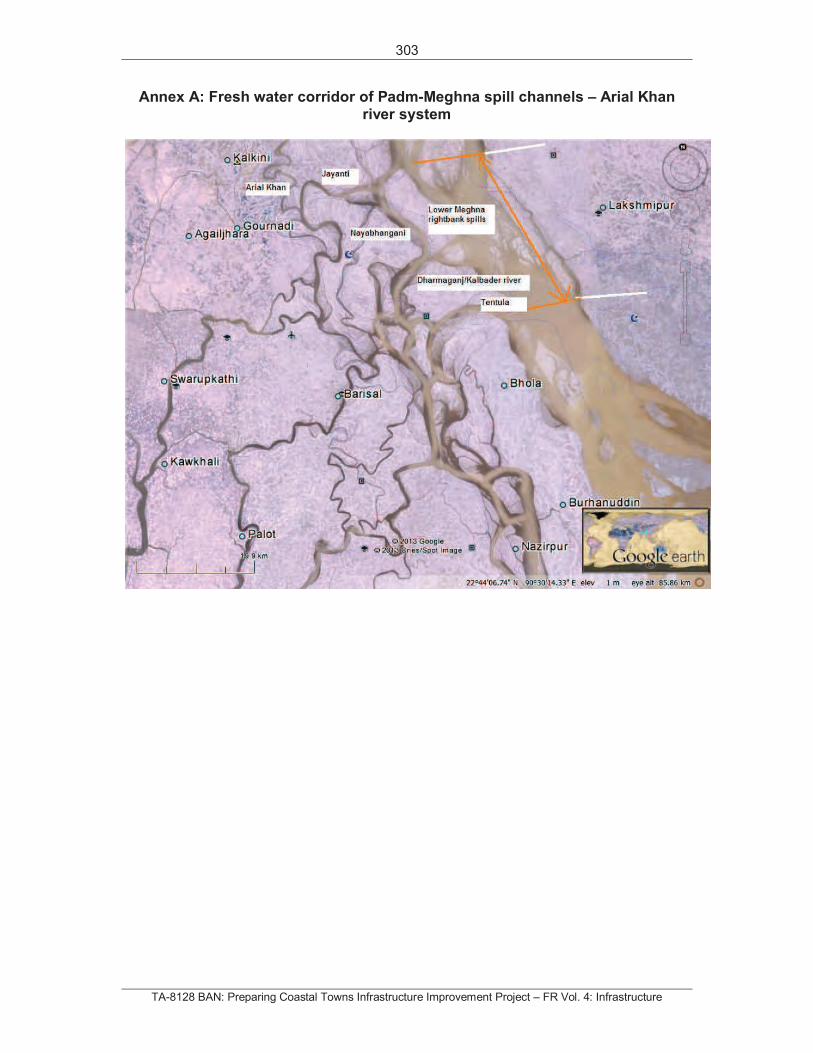
303
TA-8128 BAN: Preparing Coastal Towns Infrastructure Improvement Project – FR Vol. 4: Infrastructure
Annex A: Fresh water corridor of Padm-Meghna spill channels – Arial Khan river system

304
TA-8128 BAN: Preparing Coastal Towns Infrastructure Improvement Project – FR Vol. 4: Infrastructure
6. GROUNDWATER RESOURCE ASSESSMENT FOR COASTAL AREAS OF BANGLADESH
September 2013
Note: The format from the original document has been slightly adjusted to fit with the main style of this volume.
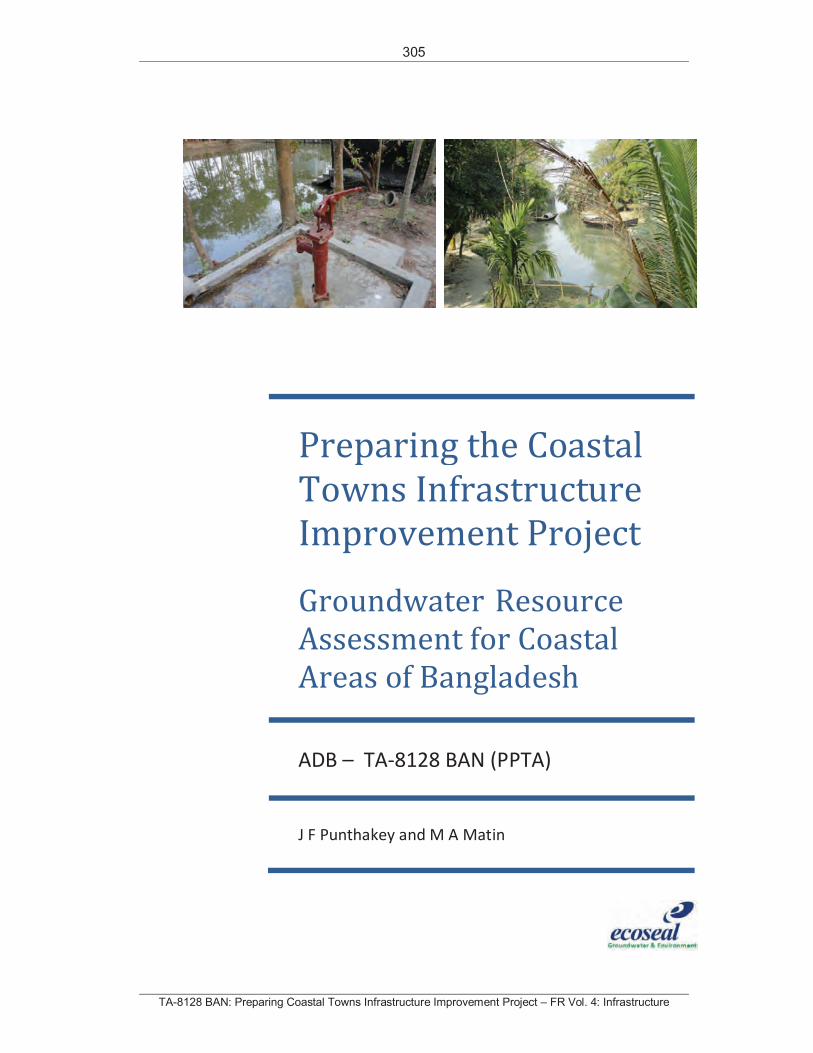
305
TA-8128 BAN: Preparing Coastal Towns Infrastructure Improvement Project – FR Vol. 4: Infrastructure
Preparing the Coastal
Towns Infrastructure
Improvement Project
Groundwater Resource
Assessment for Coastal
Areas of Bangladesh
ADB – TA-8128 BAN (PPTA)
J F Punthakey and M A Matin
306
TA-8128 BAN: Preparing Coastal Towns Infrastructure Improvement Project – FR Vol. 4: Infrastructure
Photo Reference
Deep hand tube well LGED Patuakhali (top left cover page)
Amtali town, ponds (top right cover page)
Project Contact
Contact Person Dr. Jay F. Punthakey
Position Director Groundwater & Environment
Firm Ecoseal Developments Pty Ltd
Address PO Box 496
Roseville
NSW 2069, Australia
Phone +612 9880 8900
Mobile +614 1017 2300
Fax +612 9924 3580
Email [email protected]
Doc No. Ecoseal CR: 2013-126 Date: 11 Jul 2013
ADB Contact
Submitted to: Asian Development Bank
Project: Preparing the Coastal Towns Infrastructure
Improvement Project - Groundwater Resource
Assessment for Coastal Areas of Bangladesh
Project Contact Ron Slangen
Position Urban Economist
Address PO Box 789
Manila 0980, Philippines
Phone +632 632 6270
Mobile
Fax +632 632
Email [email protected]
Project Ref. TA-8128 BAN (PPTA)
307
TA-8128 BAN: Preparing Coastal Towns Infrastructure Improvement Project – FR Vol. 4: Infrastructure
Acknowledgements
This Report is based on (a) site visit to Dhaka and coastal towns from 4 to 14 February 2013, and from 9 to 23 June and 28-30 June and (b) information provided by staff from the Asian Development Bank (ADB) and several Government of Bangladesh agencies, NGO’s and development agencies.
The report draws extensively from studies of the groundwater resources of selected coastal towns in Bangladesh, and discussions with Ron Slangen, Project Director PPTA-8128, Abul Bashar PD for PPTA-8128 and the PPTA consultant team led by Roger Jackson and Zahangir Alam. We are grateful for the background briefing, extensive discussions and guidance provided by Ron Slangen of the ADB.
We acknowledge the assistance of S Tapu for GIS assistance and Toma Saha for assistance with data entry and analysis.
We are particularly grateful to the DPHE engineers that have shared groundwater data for the Barisal Division, and convey are thanks to the focal point of contact for DPHE Mr Bhuiyan, and A.K Ibrahim and Saifur Rahman for sharing knowledge and information with us.
Our sincere thanks for the assistance with obtaining data provided by Peter Ravenscroft (UNICEF), Zia u Haq (NGOF), Alok Majumder (Dutch Wash Allaiance), Abdus Salam (SLOPB, and (JICA). NGO’s such as NGOF, SLOPB and others are playing a key role in providing communities with access to groundwater from deep tube wells.
308
TA-8128 BAN: Preparing Coastal Towns Infrastructure Improvement Project – FR Vol. 4: Infrastructure
Abbreviations
ADB APSUbglBUETBWDB CDTADPHEECGBM GOBIUCNIWM MAR MASL MSL NGOFPPTAPTW SLOPB
Asian Development Bank Arsenic Policy Support Unit below ground level Bangladesh University of Engineering and Technology Bangladesh Water Development Board Capacity Development Technical Assistance Department of Public Health and Engineering Electrical conductivity (µS/cm) Ganges, Brahmaputra and Meghna Government of Bangladesh International Union for Conservation of Nature Institute of Water Modelling Managed Aquifer Recharge Metres Above Sea Level Mean Sea Level ngo Forum for Public Health Project/Program Preparatory Technical Assistance Public Tube Wells
309
TA-8128 BAN: Preparing Coastal Towns Infrastructure Improvement Project – FR Vol. 4: Infrastructure
Table of Contents
Acknowledgements................................... ................................................... ............................. 307
Abbreviations ..................................... ................................................... ................................... 308
Table of Contents ................................. ................................................... .................................. 309
TA-8128 BAN (PPTA): .................................................. ................................................... ...... 311
Preparing the Coastal Towns Infrastructure Improvement Project .................................... 311
Groundwater Resource Assessment for Coastal Areas of Bangladesh ............................ 311
1. Introduction ................................... ................................................... ............................ 311
2. Objectives of the Groundwater Study for Coastal Towns ............................................. .. 313
3. Groundwater Resources for Coastal Towns ........................................................... ........ 314
3.1 Benefits of the Groundwater Study for Coastal Towns ........................................... 316
4. Seawater Intrusion and Upconing ................................................................... ............... 317
4.1 Causes and control of seawater intrusion.......................................................... ..... 317
4.2 Modelling seawater intrusion ..................................................................... ........... 319
4.3 Seawater intrusion impacts on coastal aquifers ................................................... .. 320
5. Groundwater Resource Potential of Deep Aquifers for Barisal Division .......................... 322
5.1 Groundwater resource potential ................................................................... ......... 322
5.2 Depth to groundwater for Barisal Division......................................................... ..... 325
5.3 Groundwater quality for Barisal Division ......................................................... ....... 329
6. Coupled flow and salinity model through Amtali..................................................... ....... 334
6.1 Model Location ................................ ................................................... ................... 334
6.2 Modelling software ............................ ................................................... ................. 335
6.3 Conceptual model .............................. ................................................... ................. 335
6.4 Model design and construction .................................................................... .......... 336
6.5 Boundary conditions ........................... ................................................... ................ 336
6.6 Hydraulic properties ............................................................................. ................. 338
6.7 Groundwater Pumping............................................................................... ............ 339
6.8 Model Scenarios ............................... ................................................... .................. 341
7. Key Findings and Recommendations................................................................... ........... 349
7.1 Groundwater resource potential ................................................................... ......... 349
7.2 Amtali cross-section model ....................................................................... ............. 349
8. Strengthening groundwater governance in the coastal zone .......................................... 352
310
TA-8128 BAN: Preparing Coastal Towns Infrastructure Improvement Project – FR Vol. 4: Infrastructure
8.1 Operational management and monitoring of groundwater .................................... 353
8.2 Future risks associated with groundwater abstraction from deep aquifers ............. 353
8.3 Sustainability of deep groundwater abstraction ................................................... .. 354
8.4 Water Conservation and Managed Aquifer Recharge Schemes .............................. 355
8.5 Ecosystem Services ............................................................................... ................. 356
8.6 Groundwater supply for Barisal Division - Problem Tree......................................... 356
9. APPENDIX A ..................................... ................................................... ........................... 358
9.1 Model simulation from 2009 to 2065 with increased pumping, sea level rise and
increased transmissivity ............................................................................. ....................... 358
311
TA-8128 BAN: Preparing Coastal Towns Infrastructure Improvement Project – FR Vol. 4: Infrastructure
TA-8128 BAN (PPTA):
Preparing the Coastal Towns Infrastructure Improvement Project
Groundwater Resource Assessment for Coastal Areas of Bangladesh
1. Introduction
1. The low-lying coastal region of Bangladesh supports the livelihoods of over 38.5 million people. Communities in coastal towns are particularly vulnerable to climate related events and increased salinity of rivers as sea levels rise. Much of the area is subjected to annual cyclones that result in flooding. Moreover storm surges, erosion, waterlogging, salinity and an increasing population make the coastal zone and its inhabitants particularly vulnerable.
2. The coastal areas also offer opportunities for reducing poverty and contributing towards the development goals of the Government of Bangladesh (GOB). The coastal zone has significant agricultural production (rice and other crops) and natural resources including fisheries, shrimp farms and related infrastructure to support these industries. In the western part of the coastal zone lies the Sunderbans – an extensive area of mangrove forests and wildlife that provide essential ecosystem support services.
3. The projected impacts of climate change will increase the vulnerability of the coastal zone, causing people to migrate inland due to the loss of coastal land to sea level rise. Fig 1.1 shows the extent of salinity intrusion for the baseline and for sea level rise of 0.32 m and 0.88 m. For instance a 0.88 m sea level rise is projected to impact coastal areas as far as Patuakhali and Bhola.
4. Sea-level rise may also alter the salinity of groundwater and surface water resources, increasing soil salinity in farm land. Saline intrusion along the main river channels is at its maximum in the dry season when flows are low and at a minimum during the monsoon season.
5. Cyclones and associated storm surges are also predicted to increase in severity and frequency in the coastal zone of Bangladesh which would have a significant impact on water supplies, coastal lands and its inhabitants with increased severity of impacts on the poor.
6. The Coastal Towns Infrastructure Improvement Project will provide climate-resilient municipal infrastructure in coastal towns of Bangladesh with key investments in water supply, sanitation, drainage, urban roads and bridges, solid waste management, slum improvements, and transport facilities.
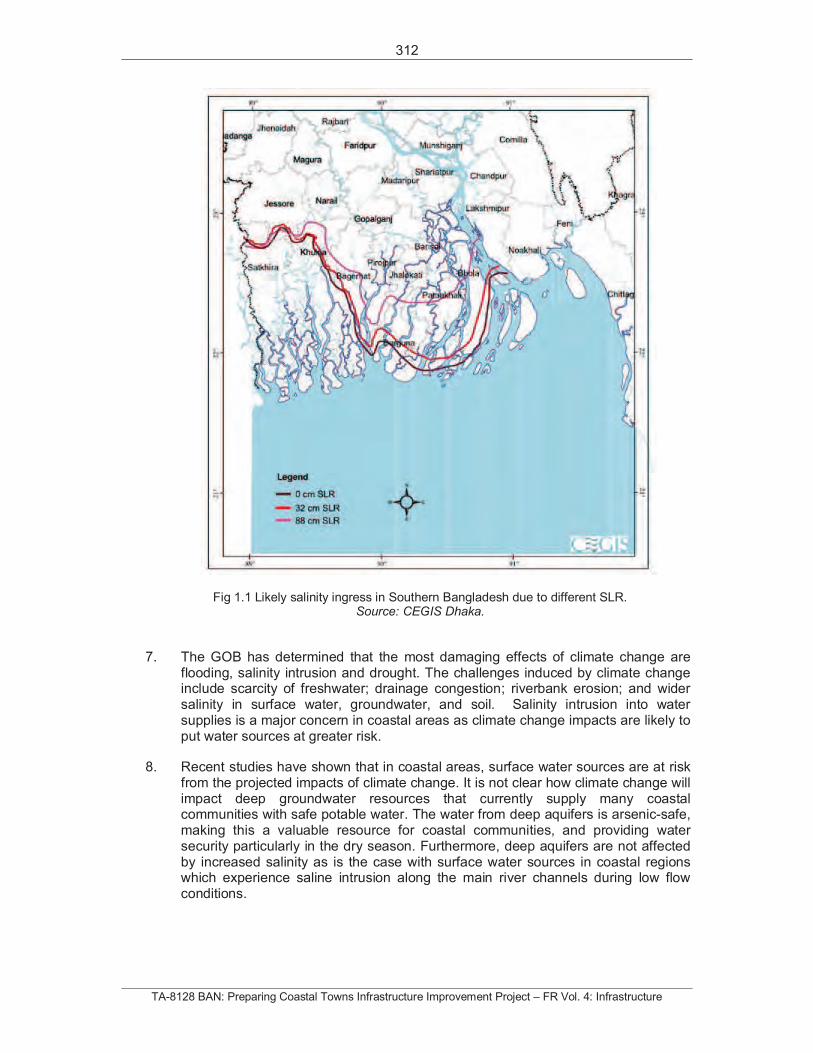
312
TA-8128 BAN: Preparing Coastal Towns Infrastructure Improvement Project – FR Vol. 4: Infrastructure
Fig 1.1 Likely salinity ingress in Southern Bangladesh due to different SLR. Source: CEGIS Dhaka.
7. The GOB has determined that the most damaging effects of climate change are flooding, salinity intrusion and drought. The challenges induced by climate change include scarcity of freshwater; drainage congestion; riverbank erosion; and wider salinity in surface water, groundwater, and soil. Salinity intrusion into water supplies is a major concern in coastal areas as climate change impacts are likely to put water sources at greater risk.
8. Recent studies have shown that in coastal areas, surface water sources are at risk from the projected impacts of climate change. It is not clear how climate change will impact deep groundwater resources that currently supply many coastal communities with safe potable water. The water from deep aquifers is arsenic-safe, making this a valuable resource for coastal communities, and providing water security particularly in the dry season. Furthermore, deep aquifers are not affected by increased salinity as is the case with surface water sources in coastal regions which experience saline intrusion along the main river channels during low flow conditions.
313
TA-8128 BAN: Preparing Coastal Towns Infrastructure Improvement Project – FR Vol. 4: Infrastructure
2. Objectives of the Groundwater Study for Coastal Towns
9. The overall objective of the Groundwater Study is to advise ADB and GOB on sustainable sources of groundwater to be developed under the planned project considering water quality (salinity) under various climate scenarios and projected increases in population. The specific objectives include:
i. To assess the groundwater resource potential of future abstraction of groundwater in the vicinity of project towns with attention to salinity by mapping the groundwater potential and salinity for Barisal Division.
ii. To undertake the development of a coupled flow and transport cross-section model of the deep groundwater system through Amtali to estimate the relative impact of increased groundwater demand, salinity intrusion, and impact of sea level rise on fresh groundwater in deep aquifers. To assess the overall sustainability of the system to meet the projected demand till 2040.
iii. To prepare a framework to monitor and manage groundwater resources in coastal areas so that the future risks of groundwater extraction from deep aquifers can be assessed.
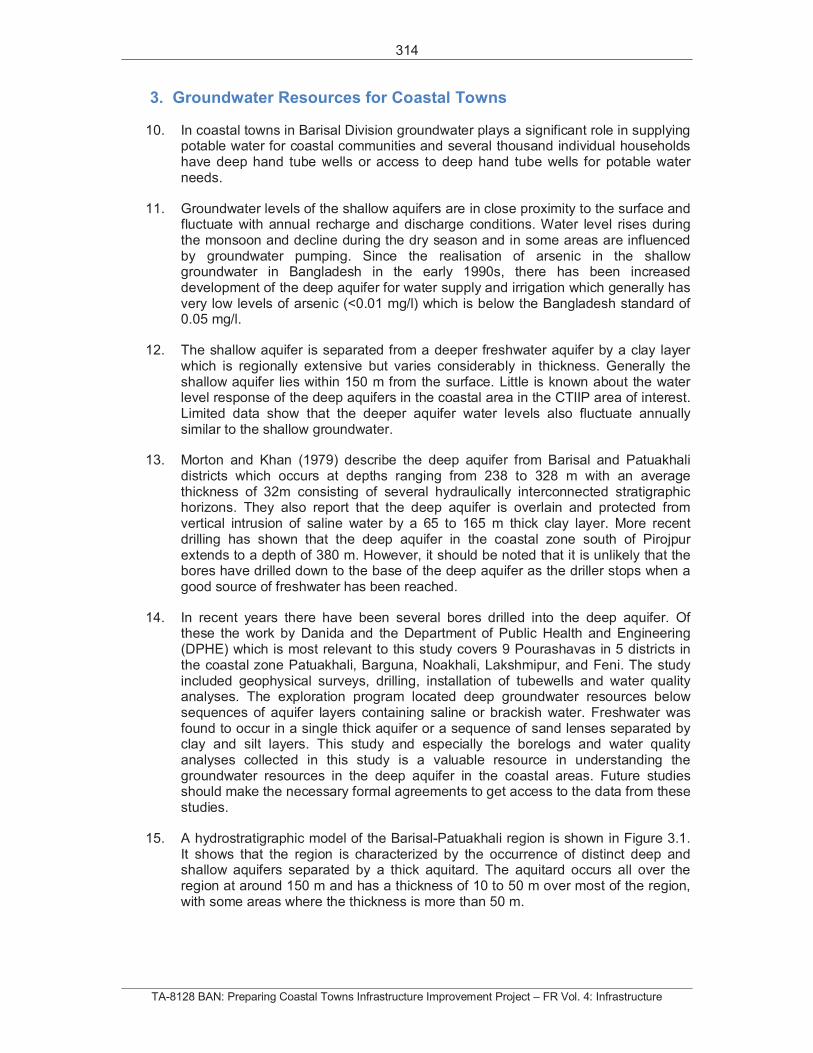
314
TA-8128 BAN: Preparing Coastal Towns Infrastructure Improvement Project – FR Vol. 4: Infrastructure
3. Groundwater Resources for Coastal Towns
10. In coastal towns in Barisal Division groundwater plays a significant role in supplying potable water for coastal communities and several thousand individual households have deep hand tube wells or access to deep hand tube wells for potable water needs.
11. Groundwater levels of the shallow aquifers are in close proximity to the surface and fluctuate with annual recharge and discharge conditions. Water level rises during the monsoon and decline during the dry season and in some areas are influenced by groundwater pumping. Since the realisation of arsenic in the shallow groundwater in Bangladesh in the early 1990s, there has been increased development of the deep aquifer for water supply and irrigation which generally has very low levels of arsenic (<0.01 mg/l) which is below the Bangladesh standard of 0.05 mg/l.
12. The shallow aquifer is separated from a deeper freshwater aquifer by a clay layer which is regionally extensive but varies considerably in thickness. Generally the shallow aquifer lies within 150 m from the surface. Little is known about the water level response of the deep aquifers in the coastal area in the CTIIP area of interest. Limited data show that the deeper aquifer water levels also fluctuate annually similar to the shallow groundwater.
13. Morton and Khan (1979) describe the deep aquifer from Barisal and Patuakhali districts which occurs at depths ranging from 238 to 328 m with an average thickness of 32m consisting of several hydraulically interconnected stratigraphic horizons. They also report that the deep aquifer is overlain and protected from vertical intrusion of saline water by a 65 to 165 m thick clay layer. More recent drilling has shown that the deep aquifer in the coastal zone south of Pirojpur extends to a depth of 380 m. However, it should be noted that it is unlikely that the bores have drilled down to the base of the deep aquifer as the driller stops when a good source of freshwater has been reached.
14. In recent years there have been several bores drilled into the deep aquifer. Of these the work by Danida and the Department of Public Health and Engineering (DPHE) which is most relevant to this study covers 9 Pourashavas in 5 districts in the coastal zone Patuakhali, Barguna, Noakhali, Lakshmipur, and Feni. The study included geophysical surveys, drilling, installation of tubewells and water quality analyses. The exploration program located deep groundwater resources below sequences of aquifer layers containing saline or brackish water. Freshwater was found to occur in a single thick aquifer or a sequence of sand lenses separated by clay and silt layers. This study and especially the borelogs and water quality analyses collected in this study is a valuable resource in understanding the groundwater resources in the deep aquifer in the coastal areas. Future studies should make the necessary formal agreements to get access to the data from these studies.
15. A hydrostratigraphic model of the Barisal-Patuakhali region is shown in Figure 3.1. It shows that the region is characterized by the occurrence of distinct deep and shallow aquifers separated by a thick aquitard. The aquitard occurs all over the region at around 150 m and has a thickness of 10 to 50 m over most of the region, with some areas where the thickness is more than 50 m.
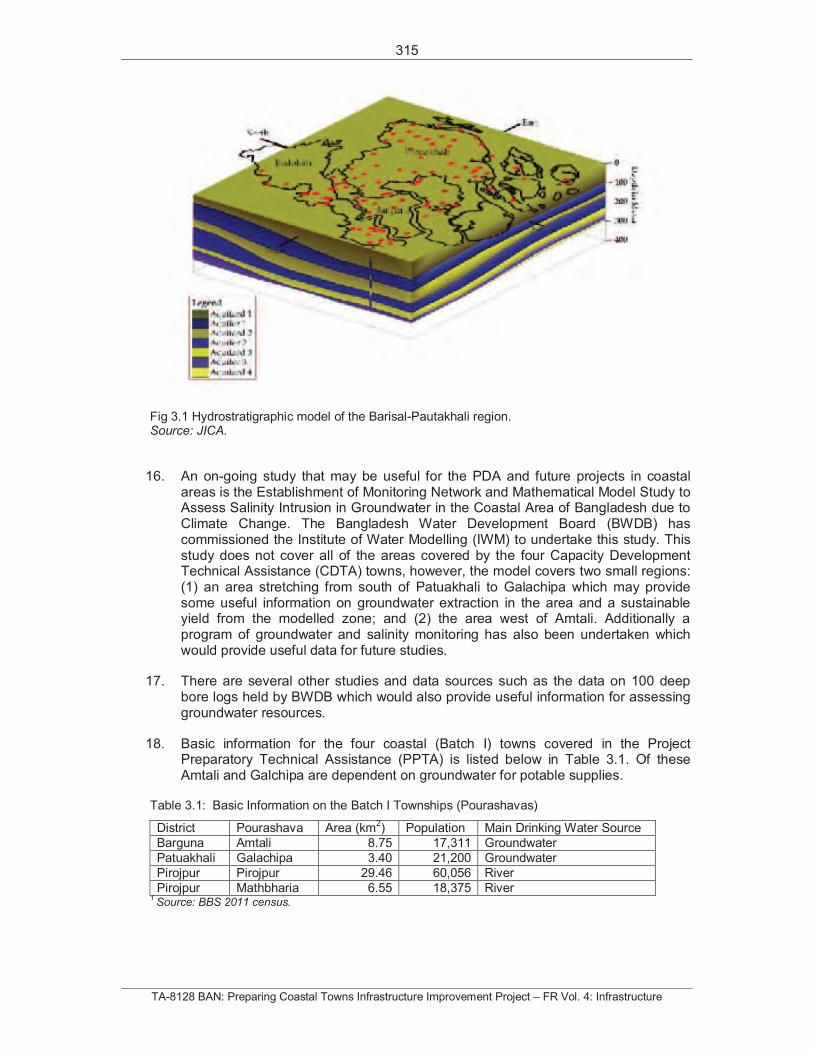
315
TA-8128 BAN: Preparing Coastal Towns Infrastructure Improvement Project – FR Vol. 4: Infrastructure
Fig 3.1 Hydrostratigraphic model of the Barisal-Pautakhali region. Source: JICA.
16. An on-going study that may be useful for the PDA and future projects in coastal areas is the Establishment of Monitoring Network and Mathematical Model Study to Assess Salinity Intrusion in Groundwater in the Coastal Area of Bangladesh due to Climate Change. The Bangladesh Water Development Board (BWDB) has commissioned the Institute of Water Modelling (IWM) to undertake this study. This study does not cover all of the areas covered by the four Capacity Development Technical Assistance (CDTA) towns, however, the model covers two small regions: (1) an area stretching from south of Patuakhali to Galachipa which may provide some useful information on groundwater extraction in the area and a sustainable yield from the modelled zone; and (2) the area west of Amtali. Additionally a program of groundwater and salinity monitoring has also been undertaken which would provide useful data for future studies.
17. There are several other studies and data sources such as the data on 100 deep bore logs held by BWDB which would also provide useful information for assessing groundwater resources.
18. Basic information for the four coastal (Batch I) towns covered in the Project Preparatory Technical Assistance (PPTA) is listed below in Table 3.1. Of these Amtali and Galchipa are dependent on groundwater for potable supplies.
Table 3.1: Basic Information on the Batch I Townships (Pourashavas)
District Pourashava Area (km2) Population Main Drinking Water Source
Barguna Amtali 8.75 17,311 Groundwater
Patuakhali Galachipa 3.40 21,200 Groundwater
Pirojpur Pirojpur 29.46 60,056 River
Pirojpur Mathbharia 6.55 18,375 River 1Source: BBS 2011 census.
316
TA-8128 BAN: Preparing Coastal Towns Infrastructure Improvement Project – FR Vol. 4: Infrastructure
3.1 Benefits of the Groundwater Study for Coastal Towns
19. Understanding the impact of increased groundwater withdrawals as the population increases and the impact of sea level rise will allow for improved understanding of the sustainability of the system. The key outcome indicator for incorporating climate-resilient designs is compliance with government and/or WHO salinity standards for drinking water.
20. Water level and water quality monitoring of a consistent set of deep tubewells is recommended. The framework to monitor and manage groundwater resources will provide the basis for improving groundwater management and for assessing future risks of increased abstraction. A second key outcome will be improved capacity to monitor groundwater resources, and will build capacity for improved groundwater governance at the Pourashava level. Monitoring will also provide information on a key indicator that drinking water standards are complied with.
21. Observation and monitoring and careful use of this information to guide management of deep fresh groundwater aquifers in the coastal zone is essential and recommended to be undertaken at the Pourashava level. This in turn will require capacity building and training in groundwater monitoring and assessment at the Pourashava level.
22. Water supply to coastal towns is mainly from groundwater sources drawn from deep and shallow tube wells. To meet increasing demand, local government bodies plan to build or expand water supply facilities. Thus, water supply facilities should include strengthened resilience to climate change. New water supply wells should be located where there is the likelihood of obtaining safe potable supplies and the design should give consideration to flooding so that the well head is above the expected flood levels to ensure that access to potable water during flooding is maintained.
317
TA-8128 BAN: Preparing Coastal Towns Infrastructure Improvement Project – FR Vol. 4: Infrastructure
4. Seawater Intrusion and Upconing
23. During recent decades there has been worldwide increase in urbanisation. Many major population centres are situated on or near a coast, and increasingly rely on coastal aquifers for water supply. Saline water has been reported to be the most common pollutant in fresh groundwater. Todd (1980) indicated that as little as 2 percent seawater in freshwater can render the water unpotable. The problem of saline intrusion and upconing requires the careful and specific management of coastal aquifers to ensure their long term viability and sustainability.
24. Saline intrusion occurs when modern seawater displaces, or mixes with, freshwater within an aquifer in response to a change in the hydrogeological environment. Saline water may be derived from many sources:
seawater intrusion into an aquifer; upconing of ancient seawater (connate water); water concentrated by evaporation; or in situ mineralisation.
25. In coastal aquifers excess pumping may reduce groundwater seaward gradients, which reduces outflow of freshwater towards the sea and which may result in denser saline water displacing the fresh water within the aquifer. The increased use of groundwater from coastal aquifers along the eastern seaboard of Australia has increased the potential for saline intrusion by modern sea water encroaching into the aquifer along the coast and by localised upconing due to over-abstraction. Improved monitoring and management of coastal aquifers in Australia is being undertaken in order to minimise adverse impacts.
4.1 Causes and control of seawater intrusion
26. In coastal aquifer there is an interface between freshwater which has a relative density of 1 and seawater which has a relative density of 1.025. This difference in density results in the seawater lying beneath the freshwater on the landward side of the coastline. In practice the fresh and saline waters are miscible which results in a mixing zone, however, the thickness of this zone depends on hydrodynamics of the aquifer. The shape of the interface will generally be similar to that shown in Figure 4.1 with a steep slope in the shallowest part of the aquifer grading to a gentler slope at depth. This change of slope may create a "toe" of salt water extending into the aquifer beneath the salt water. As discussed below, the interface is likely to be more or less diffuse depending on prevailing conditions. The position, shape and sharpness of the interface depend on the degree of balance between the head conditions in the aquifer and the sea level and the flow conditions that prevail. The extent of the toe into the aquifer beneath the fresh water will depend in part on the depth to the base of the aquifer. In a very shallow aquifer there may be essentially no toe, and the steep part of the interface will extend to the base of the aquifer.
27. Groundwater discharge to the sea from the aquifer occurs adjacent to the salt water interface, on the landward side, as the groundwater head in the aquifer overcomes the salt water head of the sea and moves fresh water up to the surface along the interface. This phenomenon is clearly visible along the beaches of the study area, at low tide, when drainage of water from the aquifer discharges in a linear zone along the higher side of the beach.
318
TA-8128 BAN: Preparing Coastal Towns Infrastructure Improvement Project – FR Vol. 4: Infrastructure
28. The balance that sustains the position and shape of the salt water interface can be upset by a change of conditions in the aquifer, such as by pumping. If pumping lowers the head in the aquifer, the seaward gradient will be lowered, there will be a reduction in fresh water flow towards the sea, and there will be a tendency for the interface to move in a landward direction. In other words, there will be seawater intrusion into the aquifer.
29. If the aquifer is sufficiently deep to allow a toe of salt water to extend into it, reduced heads in the aquifer consequent upon pumping may induce a landward shift of the toe, and continued pumping may induce upconing of salt water from it into the productive part of the aquifer.
30. Seawater intrusion is caused primarily by the reduction of head in the dunal aquifer, and the subsequent reduction of fresh water discharge to the sea as a result of groundwater abstraction. This discharge of freshwater is derived from one of three sources: drainage from the water table; release from elastic storage; and drainage at the seawater/freshwater interface (Essaid, 1986). Reduction in freshwater discharge to the coastal boundary will result in the salt water wedge moving inland as flushing with fresh water decreases, and the thickness of the wedge increases. If a reasonable quantity of fresh water flow is maintained at the coast, a new equilibrium eventually develops.
31. Groundwater abstraction above a freshwater/saltwater interface causes upconing. Depending on aquifer characteristics, well penetration, and pumping rate, a stable situation may be attained, where salt water does not reach the well. However, when this critical state is exceeded, salt water enters the well, mixes with the fresh water, and the quality of the discharge decreases.
32. Abstraction is not the only control on the position of the saline water/fresh water interface. A number of other factors can affect its position including:
seasonal changes in natural groundwater flow; tidal effects; barometric pressure; dispersion; and climate change – global warming and associated sea level rise.
33. Some of these have short term implications (tidal effects and barometric pressure) some are periodic (seasonal changes in groundwater flow) and others are long term (climate change and artificial influences).
34. Climate change resulting in a rise in global mean sea levels is likely to threaten vulnerable coastal aquifers. The impacts of sea level rise will be felt first in low lying coastal areas and deltaic zones where land elevations are within a few metres above or below sea level. The impacts will include increased saltwater intrusion into coastal aquifers, and a further shift inland of the mixing zone between freshwater and seawater. This could also threaten many groundwater wells in coastal regions resulting in higher risk of upconing of saline groundwater resulting in decreased water quality from these wells.
35. Control of saline intrusion requires understanding of the hydraulic conditions within the aquifer; it also requires knowledge of the source of the saline water. It is therefore necessary to identify the extent of the problem, and to assess the behaviour of the saline water body under various conditions of recharge and discharge, so that efficient water resources management can be implemented.
319
TA-8128 BAN: Preparing Coastal Towns Infrastructure Improvement Project – FR Vol. 4: Infrastructure
36. The optimum solution to the problem of saline intrusion is prevention, with aquifer management being such that the encroachment of sea water is prevented or controlled to an acceptable degree.
37. The problems of saline intrusion cannot be ignored. The implications in terms of public water supply include the possible reduction of groundwater abstraction, abandonment of fresh water sources and possible need for desalination in order to provide potable water.
38. The location of the sea water/freshwater interface is important to groundwater management in coastal regions. The exact locations of the freshwater/saline water interface and the transitional zone are difficult to determine, either theoretically or by field-testing. There are many approaches to delineating the depth to, and extent of, a saline water body. Water salinity has been defined by Hem (1970) in terms of the Total Dissolved Solids (TDS) content. His classification is shown in Table 4.1.
39. When water bodies with differing salinities are in contact, molecular diffusion causes mixing across the line of contact. The effects of diffusion are exacerbated when groundwater and seawater are in motion, and the intergranular structure of the formation causes dispersion and the development of a transition zone due to groundwater and saline water movement. External influences such as tides, recharge events and pumping will cause movement of the interface and encourage mixing, thus increasing the interface thickness. Thus the processes of diffusion and dispersion result in a transition zone where the salinity gradually changes from completely fresh to fully saline, the thickness of the zone depending on these two components.
Table 4.1 Degree of salinity after Hem (1970)
Description TDS (mg/l)
Fresh < 1000
Slightly saline 1000 - 3000
Moderately saline 3000 - 10000
Very saline 10000 - 35000
Brine > 35000
4.2 Modelling seawater intrusion
40. Modelling can provide a useful tool to predict the likely extent of saline intrusion. A wide spectrum of models has been developed over recent years. Saline intrusion problems are intrinsically complex due to the number of interacting phenomena. It is therefore difficult to acquire the detailed understanding needed to effectively manage such situations. Several quite common real-world occurrences do not lend themselves to conventional analytical techniques. Numerical models are therefore valuable tools for quantifying the hydraulic parameters and testing conceptual models of the aquifer system.
41. As with most modelling exercises, saline intrusion models incorporate some simplifying assumptions and approximations. These may affect the accuracy of the results but such simplifications are often necessary because of limitations in the available field data for the system. To be useful, the numerical model must be based on an adequate conceptual model that incorporates all the mechanisms relevant to the situation under study.
320
TA-8128 BAN: Preparing Coastal Towns Infrastructure Improvement Project – FR Vol. 4: Infrastructure
42. The dominant mechanism of saline intrusion is mass transport: the salt in solution is carried with the water by advection. In addition to the normal flow equations, saline intrusion models usually take account of the effects of density variations within the groundwater due to the mass of salt in solution. These introduce vertical flow to the system and lead to stratification in the eventual salinity distribution. This is important because a number of common conceptual models assume groundwater flow is entirely horizontal. The transport is often regarded as conservative though at a higher level of sophistication solute production or decay and chemical evolution can be included. The principle distinction between classes of saline intrusion model lies in their treatment of the interface between the separate bodies of water within the aquifer. As described earlier, saline and fresh water are miscible, and mixing occurs at the interface due to molecular diffusion and mechanical dispersion. The parameters that control diffusion and dispersion are difficult to quantify directly and in any case the width of the transition zone is often small compared to the dimensions of the saline water body. Consequently many models have included a sharp interface approximation, with the advance of one water body completely displacing the other body by piston flow.
43. The vertical flow components mentioned above mean that saline intrusion problems are fully three-dimensional. However, some line of symmetry can often be deduced (eg. perpendicular to a straight coastline) so that vertical strip, 2D models can provide a useful insight to the situation while minimising the computational complexity. Horizontal 2D models imply a vertical interface which can be misleading: wells that appear safely on the fresh side of the interface might be at risk of degradation by upconing at the toe of the intruding wedge.
4.3 Seawater intrusion impacts on coastal aquifers
44. The general pattern of fresh ground-water flow in coastal aquifers is from areas where ground-water levels (hydraulic heads) are high towards coastal discharge areas where ground-water levels are, by definition, at the lowest elevation in the groundwater system. Fresh ground water comes in contact with saline ground water at the seaward margins of coastal aquifers. The seaward limit of freshwater in a particular aquifer is controlled by groundwater head in the aquifer (which controls the amount of freshwater flowing through the aquifer), the thickness and hydraulic properties of the aquifer and adjacent confining units, the relative densities of saltwater and freshwater, and by other less obvious variables. Because of its lower density, freshwater tends to remain above the saline (saltwater) zones of the aquifer, although in multilayered aquifer systems, seaward-flowing freshwater can discharge upward through confining units into overlying saltwater. Seawater has a total dissolved-solids concentration of about 35,000 mg/L, of which dissolved chloride is the largest component (about 19,000 mg/L) and its density is about 1,025 kg/m3.
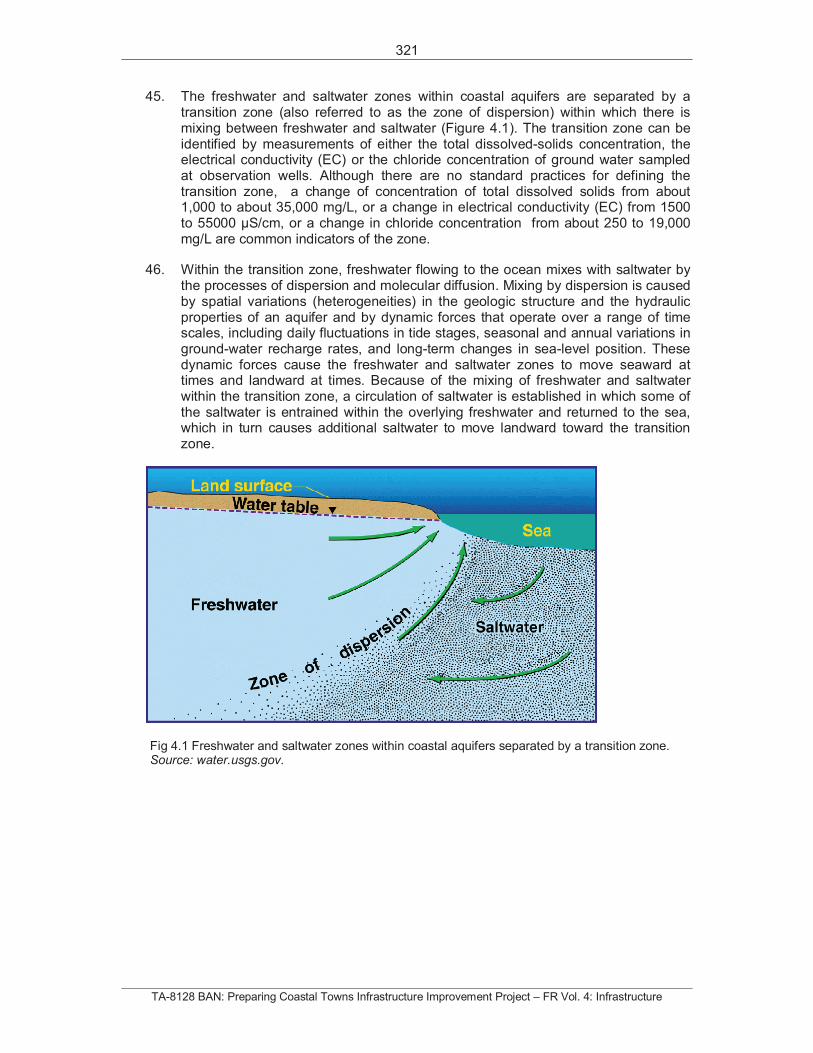
321
TA-8128 BAN: Preparing Coastal Towns Infrastructure Improvement Project – FR Vol. 4: Infrastructure
45. The freshwater and saltwater zones within coastal aquifers are separated by a transition zone (also referred to as the zone of dispersion) within which there is mixing between freshwater and saltwater (Figure 4.1). The transition zone can be identified by measurements of either the total dissolved-solids concentration, the electrical conductivity (EC) or the chloride concentration of ground water sampled at observation wells. Although there are no standard practices for defining the transition zone, a change of concentration of total dissolved solids from about 1,000 to about 35,000 mg/L, or a change in electrical conductivity (EC) from 1500 to 55000 µS/cm, or a change in chloride concentration from about 250 to 19,000 mg/L are common indicators of the zone.
46. Within the transition zone, freshwater flowing to the ocean mixes with saltwater by the processes of dispersion and molecular diffusion. Mixing by dispersion is caused by spatial variations (heterogeneities) in the geologic structure and the hydraulic properties of an aquifer and by dynamic forces that operate over a range of time scales, including daily fluctuations in tide stages, seasonal and annual variations in ground-water recharge rates, and long-term changes in sea-level position. These dynamic forces cause the freshwater and saltwater zones to move seaward at times and landward at times. Because of the mixing of freshwater and saltwater within the transition zone, a circulation of saltwater is established in which some of the saltwater is entrained within the overlying freshwater and returned to the sea, which in turn causes additional saltwater to move landward toward the transition zone.
Fig 4.1 Freshwater and saltwater zones within coastal aquifers separated by a transition zone. Source: water.usgs.gov.
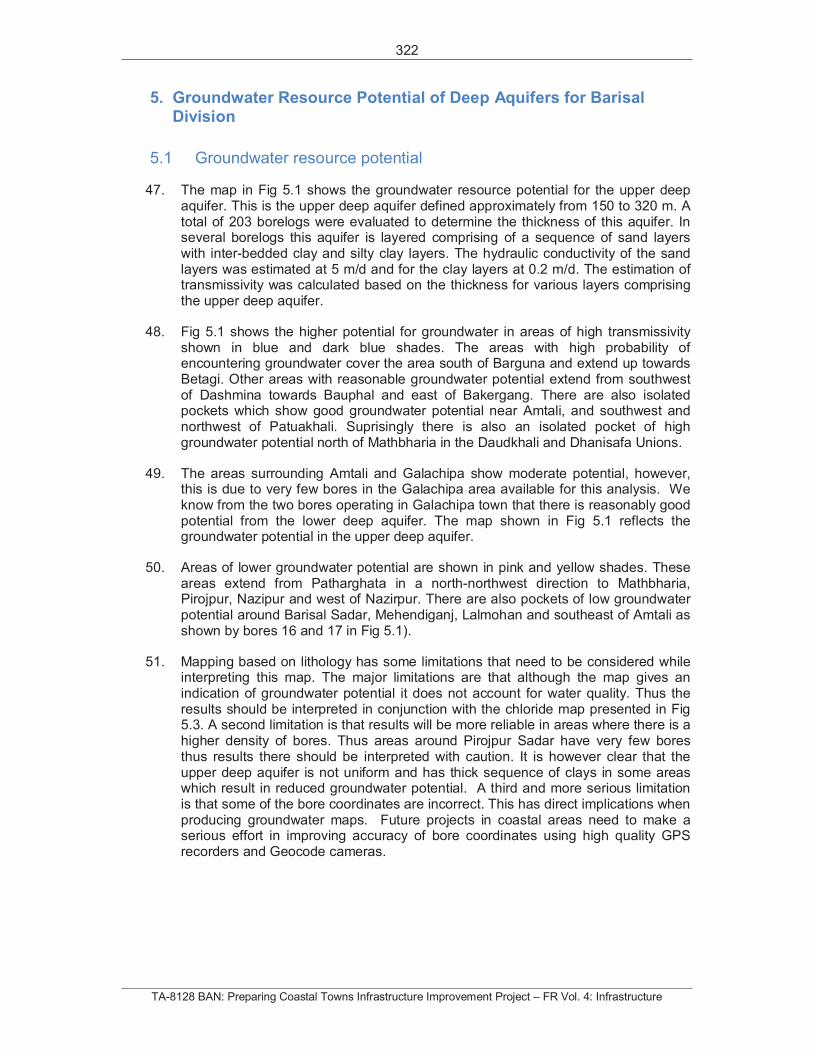
322
TA-8128 BAN: Preparing Coastal Towns Infrastructure Improvement Project – FR Vol. 4: Infrastructure
5. Groundwater Resource Potential of Deep Aquifers for Barisal Division
5.1 Groundwater resource potential
47. The map in Fig 5.1 shows the groundwater resource potential for the upper deep aquifer. This is the upper deep aquifer defined approximately from 150 to 320 m. A total of 203 borelogs were evaluated to determine the thickness of this aquifer. In several borelogs this aquifer is layered comprising of a sequence of sand layers with inter-bedded clay and silty clay layers. The hydraulic conductivity of the sand layers was estimated at 5 m/d and for the clay layers at 0.2 m/d. The estimation of transmissivity was calculated based on the thickness for various layers comprising the upper deep aquifer.
48. Fig 5.1 shows the higher potential for groundwater in areas of high transmissivity shown in blue and dark blue shades. The areas with high probability of encountering groundwater cover the area south of Barguna and extend up towards Betagi. Other areas with reasonable groundwater potential extend from southwest of Dashmina towards Bauphal and east of Bakergang. There are also isolated pockets which show good groundwater potential near Amtali, and southwest and northwest of Patuakhali. Suprisingly there is also an isolated pocket of high groundwater potential north of Mathbharia in the Daudkhali and Dhanisafa Unions.
49. The areas surrounding Amtali and Galachipa show moderate potential, however, this is due to very few bores in the Galachipa area available for this analysis. We know from the two bores operating in Galachipa town that there is reasonably good potential from the lower deep aquifer. The map shown in Fig 5.1 reflects the groundwater potential in the upper deep aquifer.
50. Areas of lower groundwater potential are shown in pink and yellow shades. These areas extend from Patharghata in a north-northwest direction to Mathbharia, Pirojpur, Nazipur and west of Nazirpur. There are also pockets of low groundwater potential around Barisal Sadar, Mehendiganj, Lalmohan and southeast of Amtali as shown by bores 16 and 17 in Fig 5.1).
51. Mapping based on lithology has some limitations that need to be considered while interpreting this map. The major limitations are that although the map gives an indication of groundwater potential it does not account for water quality. Thus the results should be interpreted in conjunction with the chloride map presented in Fig 5.3. A second limitation is that results will be more reliable in areas where there is a higher density of bores. Thus areas around Pirojpur Sadar have very few bores thus results there should be interpreted with caution. It is however clear that the upper deep aquifer is not uniform and has thick sequence of clays in some areas which result in reduced groundwater potential. A third and more serious limitation is that some of the bore coordinates are incorrect. This has direct implications when producing groundwater maps. Future projects in coastal areas need to make a serious effort in improving accuracy of bore coordinates using high quality GPS recorders and Geocode cameras.
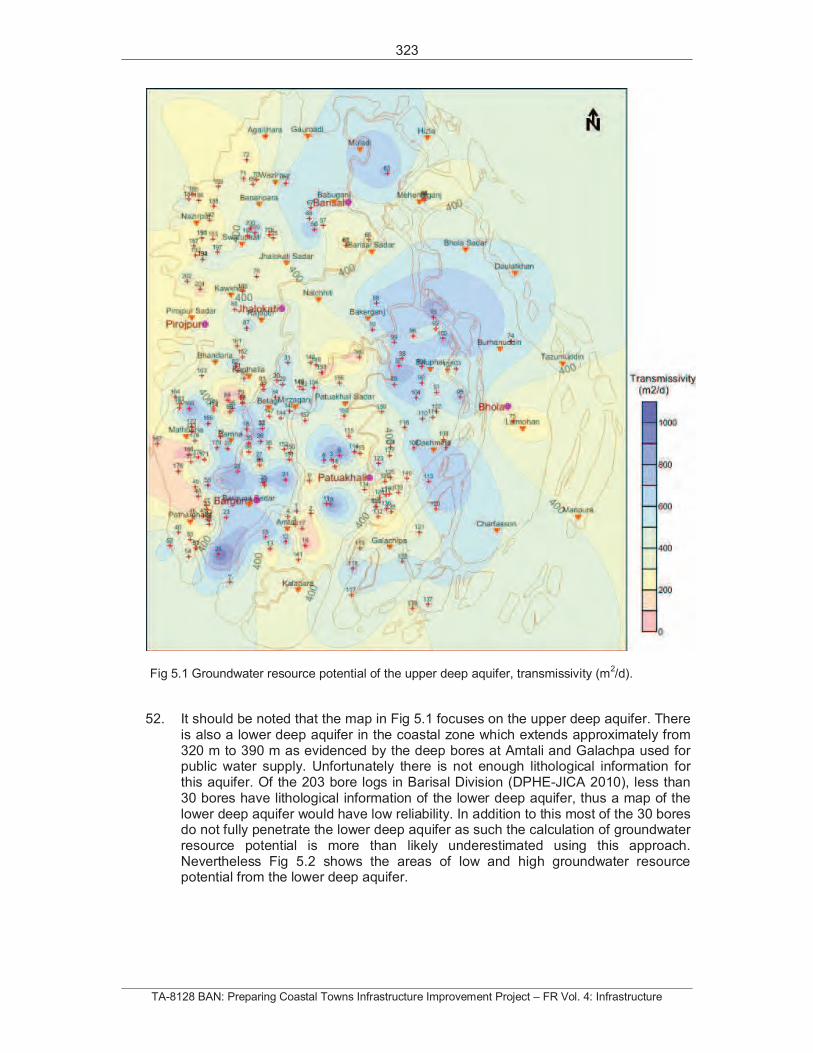
323
TA-8128 BAN: Preparing Coastal Towns Infrastructure Improvement Project – FR Vol. 4: Infrastructure
Fig 5.1 Groundwater resource potential of the upper deep aquifer, transmissivity (m2/d).
52. It should be noted that the map in Fig 5.1 focuses on the upper deep aquifer. There is also a lower deep aquifer in the coastal zone which extends approximately from 320 m to 390 m as evidenced by the deep bores at Amtali and Galachpa used for public water supply. Unfortunately there is not enough lithological information for this aquifer. Of the 203 bore logs in Barisal Division (DPHE-JICA 2010), less than 30 bores have lithological information of the lower deep aquifer, thus a map of the lower deep aquifer would have low reliability. In addition to this most of the 30 bores do not fully penetrate the lower deep aquifer as such the calculation of groundwater resource potential is more than likely underestimated using this approach. Nevertheless Fig 5.2 shows the areas of low and high groundwater resource potential from the lower deep aquifer.
324
TA-8128 BAN: Preparing Coastal Towns Infrastructure Improvement Project – FR Vol. 4: Infrastructure
53. Fig 5.2 shows specific locations where deep bores have penetrated the lower deep aquifer. Despite the fact that most of these bores have only partially penetrated the deep aquifer the areas of known high resource potential are shown by blue circles. These are typically aquifers with transmissivities greater than 300 m2/d. some of these may well have higher transmissivities as the aquifer may be much deeper than penetrated by the bore.
54. The areas with good groundwater resource potential for the lower deep aquifer are around Amtali, Galachipa, Bakerganj, northwest of Barisal Sadar, south west of Banma which is just southeast of Mathbharia.
Fig 5.2 Groundwater resource potential of the lower deep aquifer, transmissivity (m2/d).
Barguna
Barisal
Bhola
Jhalokati
Patuakhali
Pirojpur
Agailjhara
Amtali
Babuganj
Bakerganj
Bamna
Banaripara
Barguna Sadar
Barisal Sadar
Bauphal
Betagi
Bhandaria
Bhola Sadar
Burhanuddin
Charfasson
Dashmina
Daulatkhan
Galachipa
Gaurnadi Hizla
Jhalokati Sadar
Kalapara
Kanthalia
Kawkhali
Lalmohan
Manpura
Mathbaria
Mehendiganj
Mirzaganj
Muladi
Nalchhiti
Nazirpur
Patharghata
Patuakhali Sadar
Pirojpur Sadar Rajapur
Swarupkati
Tazumuddin
Wazirpur
PatharghataPatharghaPatharghataPatharghPatharghataPatharghataPatharghata
KanthaKanthKantha
handaria
KanthKanthaKanthaKantha
athbariaathbariaMathbariaathbariaathbaria
AmtaliAmtaliAmtaliAmtaliAmtaliAmtaliAmtaliAmtaliAmtaliAmtaliAmtaliAmtaliAmtaliAmtaliAmtali
BamBamBamBamBamBamBamBamBamBamBamBamBamBamBamBamBamBamBamBamBamBamBamBamBamBamBamBamBamBamBamBam
BetagiBetagiBetagi
MehendiganMehendigaMehendiganMehendiganMehendiganMehendigaMehendiganMehendiga
BaupBauphBaupBaupBaup
DashminaDashminaDashminaDashminaDashminaDashminaDashmina
325
TA-8128 BAN: Preparing Coastal Towns Infrastructure Improvement Project – FR Vol. 4: Infrastructure
55. The areas where the deep aquifer shows lower groundwater potential are areas north and south of Mathbharia, between Bhandaria and Mirzaganj and other isolated pockets. We emphasise that the lower resource potential of the deep aquifer is limited by the depth of penetration which results in a reduced aquifer thickness and consequently a lower transmissivity. We would recommend a deep drilling program to at least 390 m bgl similar to the Amtali bores in order to determine the resource potential of the lower deep aquifer, particularly in the vicinity of Mathbharia where there is an acute need for water supply.
56. Fig 5.2 also shows a qualitative assessment of relative high and low probability of encountering high yielding wells. The qualitative assessment is made by identifying those bores where sand layers have been encountered in the bottom of the hole typically at depths greater than 280 m. The relative low probability locations have been identified where deep bores have encountered thick clay sequences at depths greater than 300 m. Although a subjective assessment it is nevertheless useful in identifying possible locations where the aquifer yield is high, and conversely where the aquifer yield is likely to be low, and interestingly are similar to the upper deep aquifer.
57. It would also be noteworthy to check the salinity levels in the existing nearby wells before commencing drilling. Simply put the aquifer yields may be good but if the salinity is over 1000 mg/l it is not useable for potable supplies.
58. Although these maps cannot definitively point to a location of good groundwater potential it nevertheless gives a good visual representation where there would be increased probability of finding high yielding aquifers. Another good use of these maps may be to guide drilling programs in so far as to identify areas to avoid drilling. These are typically characterised by low transmissivity and low probability of finding suitable high yielding aquifers.
5.2 Depth to groundwater for Barisal Division
59. Depth to groundwater maps were constructed from data supplied by DPHE for 196 deep tube wells and are shown in Figs 5.3, 5.4 and 5.5 for 1990, 2000 and 2012 respectively. The main limitations of this data set is that bore coordinates have not been recorded. The approximate locations of the wells were identified from the Union and Mouza in which the wells are listed. A second limitation is the lack of any data on surveyed levels. It would be useful for each bore to be surveyed so that an accurate groundwater level can be determined.
60. The map in Fig 5.3 shows depth to groundwater was close to the surface in 1990 in the southern coastal districts south of Mirzagang, Dashmina and Burhanuddin. The map also shows distinct zones with depth to groundwater increasing in a northerly direction with the greatest depths in Barisal District.
61. The depth to groundwater map for 2000 in Fig 5.4 shows an increase in depth to groundwater and reflects increased groundwater usage over the 10-year period from 1990 to 2000. There is a 1 m increase in depths to groundwater for the areas around Bhola and Lalmohan and similarly for Barisal District. The depth to groundwater is greatest around Barisal in a northerly direction.
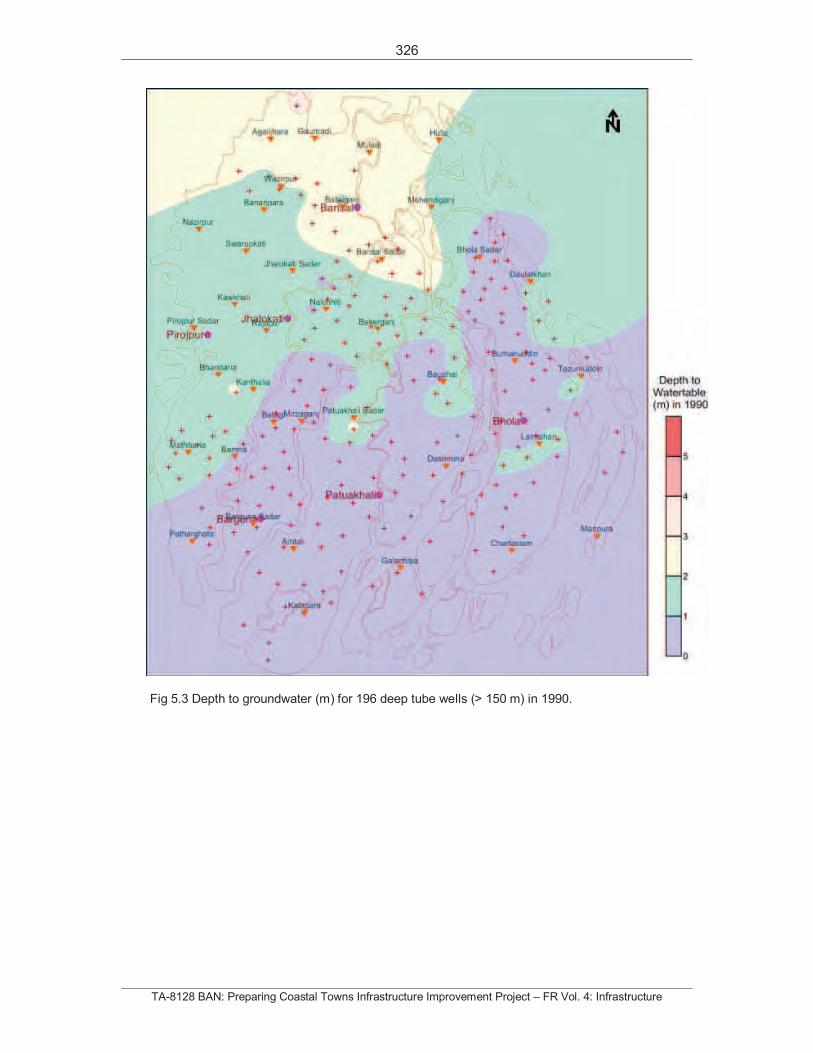
326
TA-8128 BAN: Preparing Coastal Towns Infrastructure Improvement Project – FR Vol. 4: Infrastructure
Fig 5.3 Depth to groundwater (m) for 196 deep tube wells (> 150 m) in 1990.
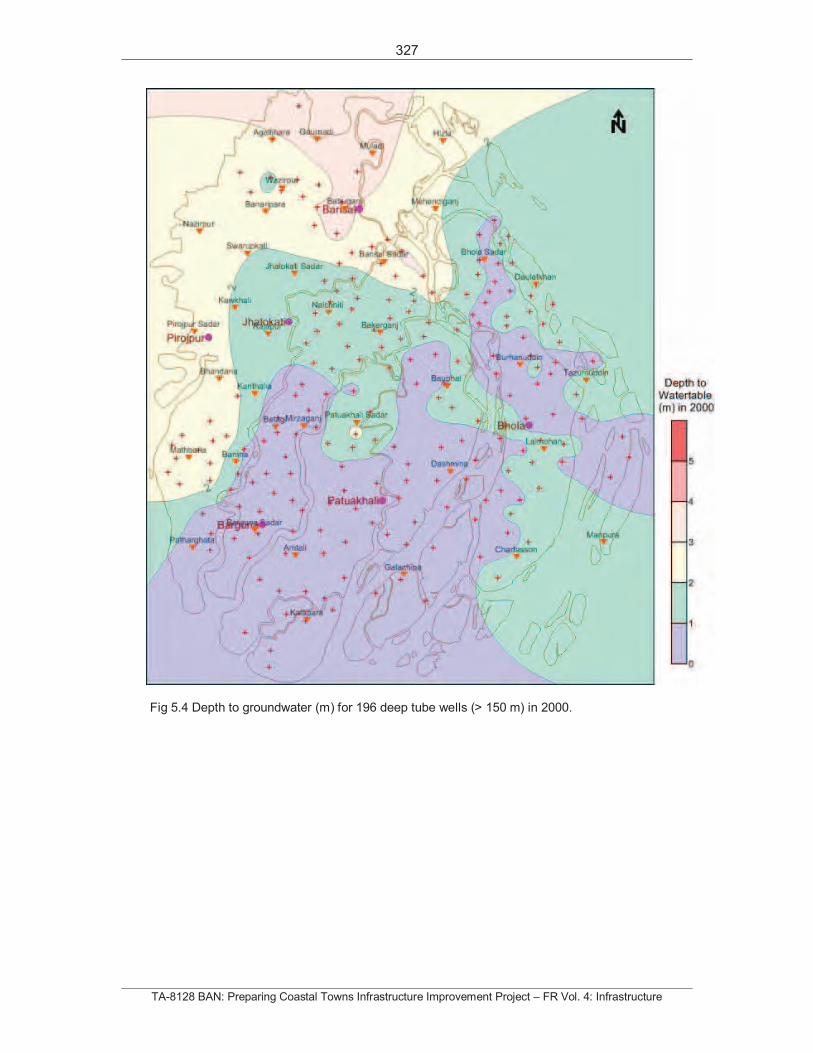
327
TA-8128 BAN: Preparing Coastal Towns Infrastructure Improvement Project – FR Vol. 4: Infrastructure
Fig 5.4 Depth to groundwater (m) for 196 deep tube wells (> 150 m) in 2000.
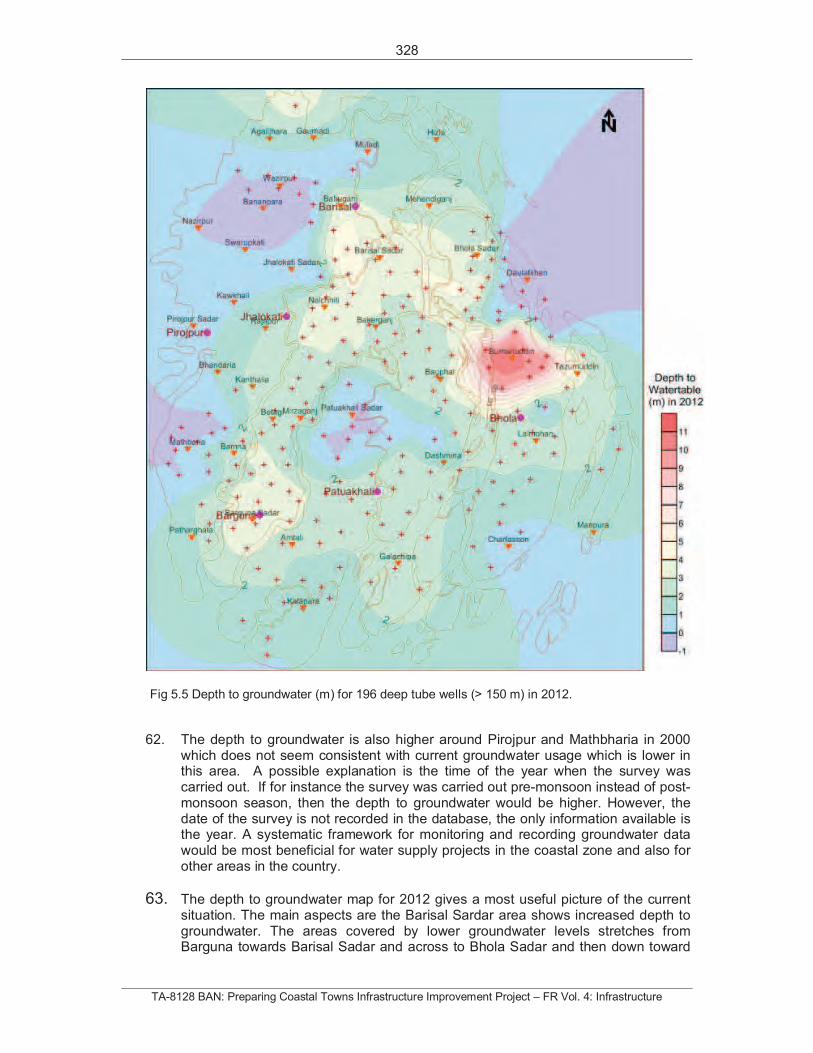
328
TA-8128 BAN: Preparing Coastal Towns Infrastructure Improvement Project – FR Vol. 4: Infrastructure
Fig 5.5 Depth to groundwater (m) for 196 deep tube wells (> 150 m) in 2012.
62. The depth to groundwater is also higher around Pirojpur and Mathbharia in 2000 which does not seem consistent with current groundwater usage which is lower in this area. A possible explanation is the time of the year when the survey was carried out. If for instance the survey was carried out pre-monsoon instead of post-monsoon season, then the depth to groundwater would be higher. However, the date of the survey is not recorded in the database, the only information available is the year. A systematic framework for monitoring and recording groundwater data would be most beneficial for water supply projects in the coastal zone and also for other areas in the country.
63. The depth to groundwater map for 2012 gives a most useful picture of the current situation. The main aspects are the Barisal Sardar area shows increased depth to groundwater. The areas covered by lower groundwater levels stretches from Barguna towards Barisal Sadar and across to Bhola Sadar and then down toward
329
TA-8128 BAN: Preparing Coastal Towns Infrastructure Improvement Project – FR Vol. 4: Infrastructure
Burhanuddin. The depth to groundwater is deepest at Burhanuddin as shown by the red zone there. The depth of over 12 m in this area needs to be rechecked as previous readings for this bore from 1986 to 2009 is in the 1.5 to 2.5 m range. Thus it seems unusual for the bore to record a reading of 12.5 m. Notwithstanding this reading the increased depth to groundwater from Barguna to Barisal and then to Bhola is a reflection of increased number of wells tapping the groundwater from the upper deep aquifer. If, as the data suggests, these trends are pointing to increased groundwater usage from the upper deep aquifer, then it would be reasonable to make the case for a monitoring framework for water levels and water quality in the Barisal Division. Building knowledge and capacity to monitor groundwater resources and to improve the management of resources at the local level is required. This does not mean that groundwater use needs to be restricted. Rather, we advocate building awareness for water conservation and managed aquifer recharge schemes in the coastal areas which would benefit coastal communities.
5.3 Groundwater quality for Barisal Division
64. The distribution of chloride measured in 40 deep tube wells in 2011 (Ravenscroft et al. 2012) is shown in Fig 5.6. The recommended chloride limit for Bangladesh is between 200 and 600 mg/l. The areas of very high chloride levels (>1000 mg/l) in Fig 5.6 are located at Kanthalia, Bhandaria and Mathbharia. These areas also correspond to moderate to low groundwater potential areas due to the presence of inter-bedded clay and silty clay layers. Elevated chloride levels (700-800 mg/l) also occur at Pirojpur and Agailjhara which also coincide with areas of low groundwater potential. The chloride level in the deep aquifer south of Barguna has a measured value of 892 mg/l. The bore here is very close to the coast and it is possible that this bore may be experiencing seawater intrusion impacts. The lithological log for this well needs to be located and examined and regular monitoring at this location is needed to ascertain if the deep aquifer is being impacted by salinity intrusion.
65. In the remaining coastal areas, groundwater in the deep aquifers has a lower chloride range (<500 mg/l). The districts with low chloride levels in the deep aquifer are Bhola, Patuakhali, Barisal and parts of Barguna. This covers a large area however, due to the variability of the aquifers it is probable that there are pockets of high salinity groundwater that are not shown in Fig 5.6.
66. The map of chloride distribution shown in Fig 5.6 is based on 40 sampled points consequently the results need to be interpreted with caution. It should be noted that the number of sampling points are on the low side considering the variability encountered in these aquifers. There is a clear need to undertake a survey of deep aquifers in the Barisal Division to locate and identify wells which can be used for water quality monitoring. This type of data would guide the selection of suitable locations for deep tubewells for community water supply.
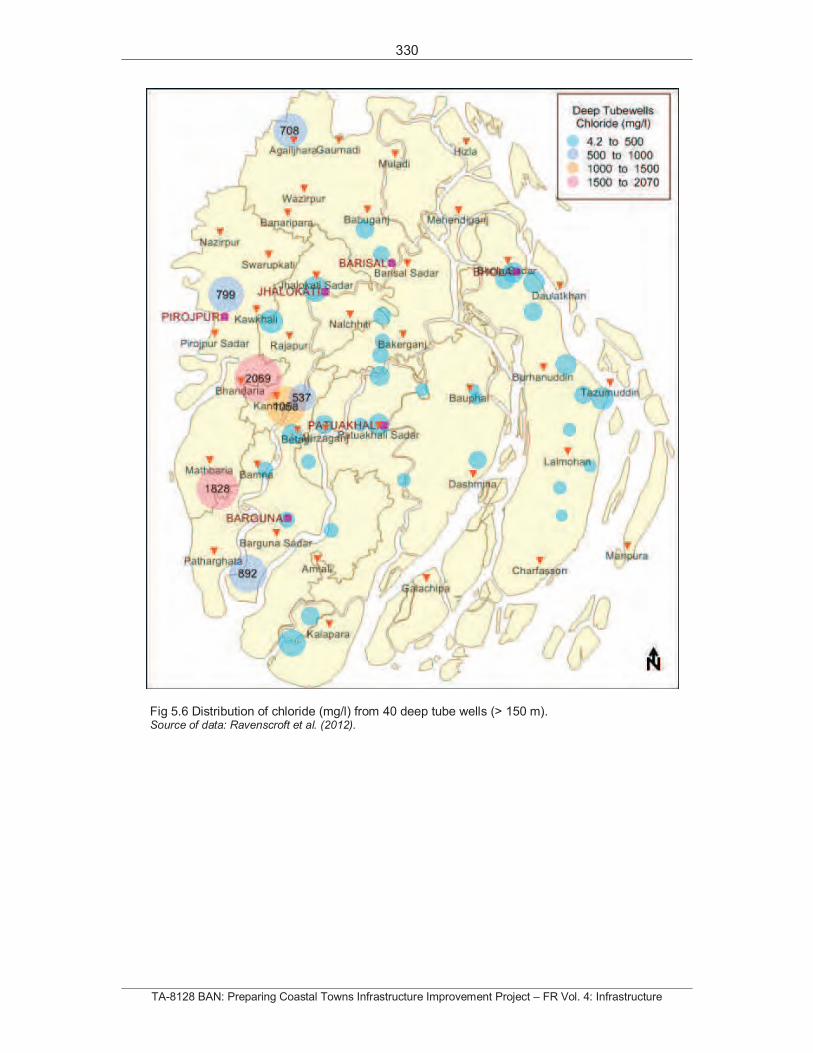
330
TA-8128 BAN: Preparing Coastal Towns Infrastructure Improvement Project – FR Vol. 4: Infrastructure
Fig 5.6 Distribution of chloride (mg/l) from 40 deep tube wells (> 150 m). Source of data: Ravenscroft et al. (2012).
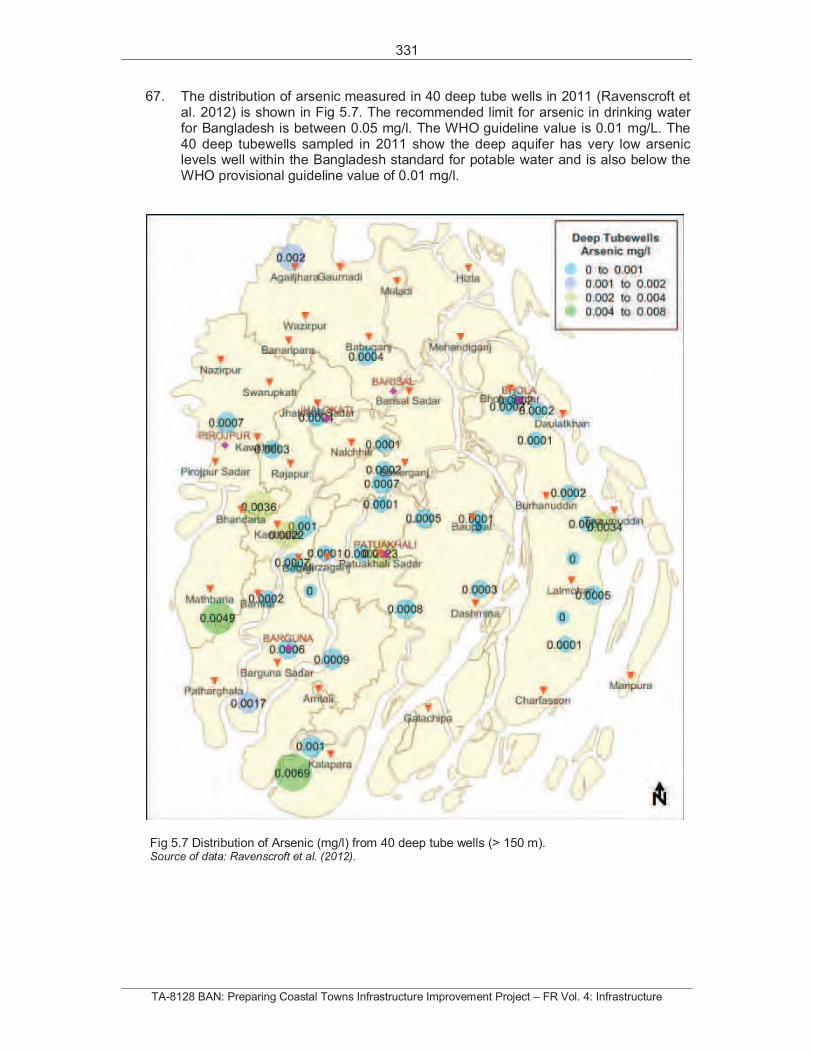
331
TA-8128 BAN: Preparing Coastal Towns Infrastructure Improvement Project – FR Vol. 4: Infrastructure
67. The distribution of arsenic measured in 40 deep tube wells in 2011 (Ravenscroft et al. 2012) is shown in Fig 5.7. The recommended limit for arsenic in drinking water for Bangladesh is between 0.05 mg/l. The WHO guideline value is 0.01 mg/L. The 40 deep tubewells sampled in 2011 show the deep aquifer has very low arsenic levels well within the Bangladesh standard for potable water and is also below the WHO provisional guideline value of 0.01 mg/l.
Fig 5.7 Distribution of Arsenic (mg/l) from 40 deep tube wells (> 150 m). Source of data: Ravenscroft et al. (2012).
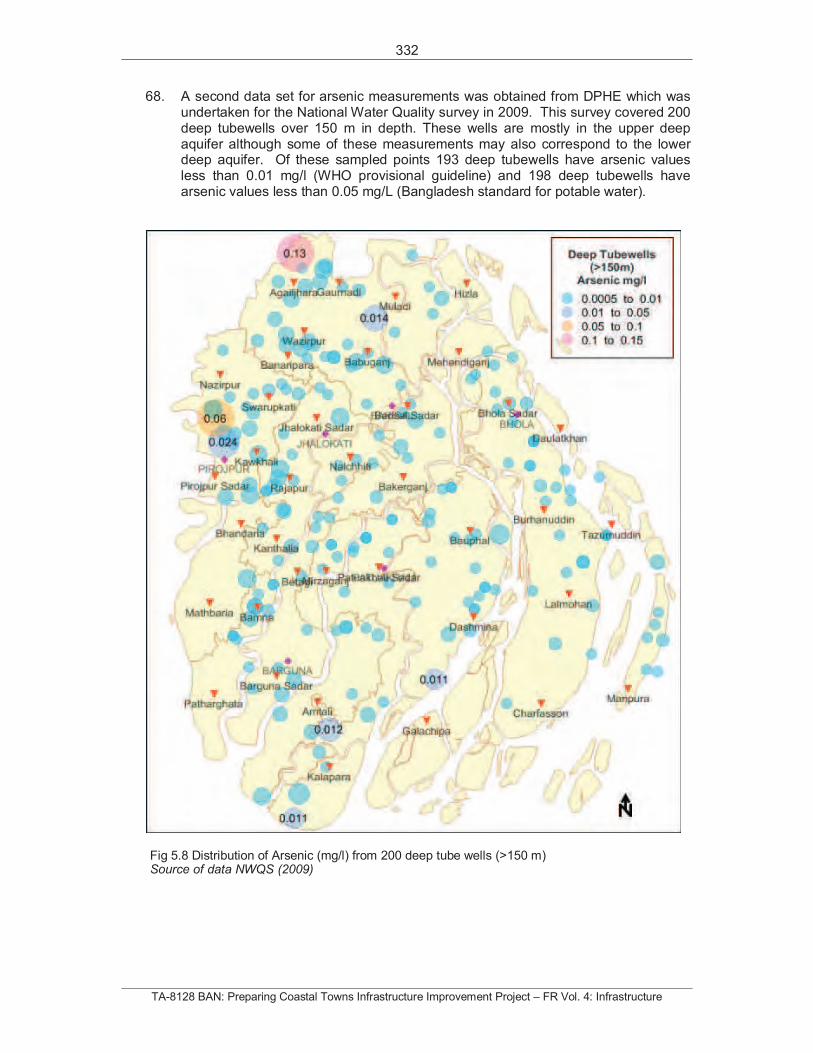
332
TA-8128 BAN: Preparing Coastal Towns Infrastructure Improvement Project – FR Vol. 4: Infrastructure
68. A second data set for arsenic measurements was obtained from DPHE which was undertaken for the National Water Quality survey in 2009. This survey covered 200 deep tubewells over 150 m in depth. These wells are mostly in the upper deep aquifer although some of these measurements may also correspond to the lower deep aquifer. Of these sampled points 193 deep tubewells have arsenic values less than 0.01 mg/l (WHO provisional guideline) and 198 deep tubewells have arsenic values less than 0.05 mg/L (Bangladesh standard for potable water).
Fig 5.8 Distribution of Arsenic (mg/l) from 200 deep tube wells (>150 m) Source of data NWQS (2009)
333
TA-8128 BAN: Preparing Coastal Towns Infrastructure Improvement Project – FR Vol. 4: Infrastructure
69. There are two deep tubewells which exceed the Bangladesh standard. The deep tubewell south of Nazirpur has a measured arsenic concentration of 0.06 mg/l, and the tubewell north of Agailjhara has an arsenic concentration of 0.13 mg/l. Both these wells need to be examined with a borehole camera to ascertain the possibility of casing leaks or splits. Details of when the bore was constructed and the lithological information for these bores also need to be examined with continued monitoring. Both these wells are in excess of the 0.05 mg/l limit for arsenic and consequently are not safe for potable water use. Considering that a number of deep tubewells around Agaijhara and to the south of Nazirpur are arsenic-safe, it is more than likely that the well casing has been compromised.
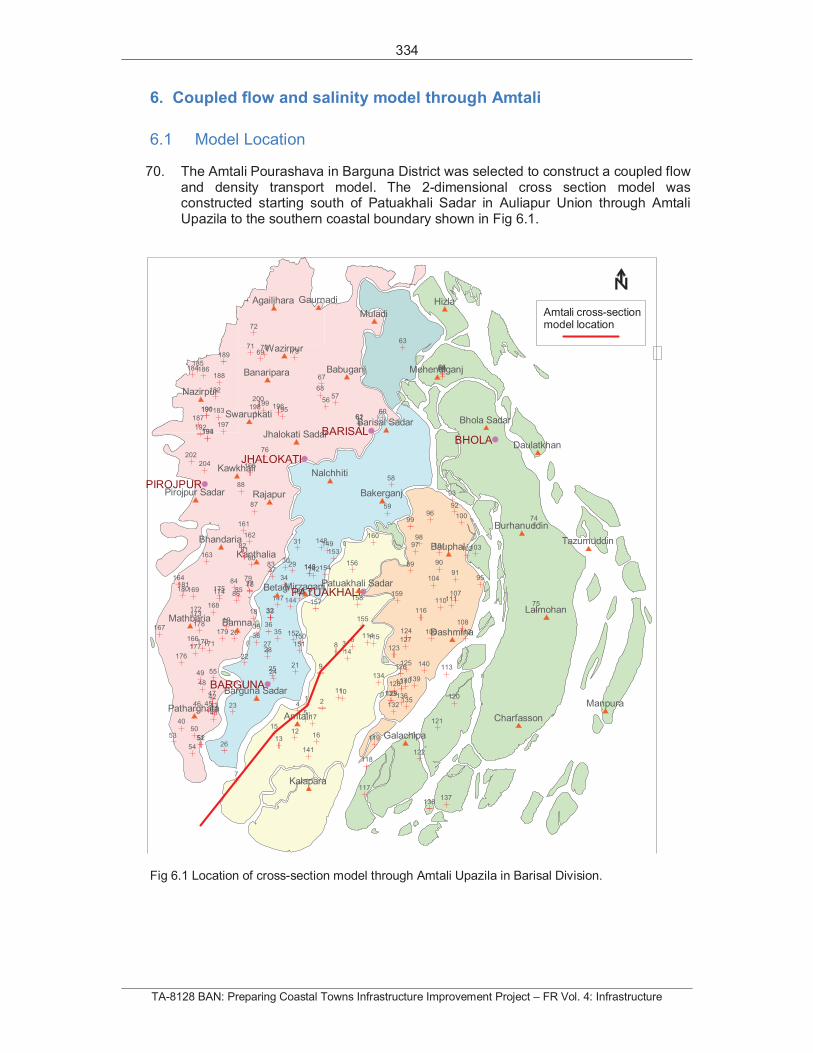
334
TA-8128 BAN: Preparing Coastal Towns Infrastructure Improvement Project – FR Vol. 4: Infrastructure
6. Coupled flow and salinity model through Amtali
6.1 Model Location
70. The Amtali Pourashava in Barguna District was selected to construct a coupled flow and density transport model. The 2-dimensional cross section model was constructed starting south of Patuakhali Sadar in Auliapur Union through Amtali Upazila to the southern coastal boundary shown in Fig 6.1.
Fig 6.1 Location of cross-section model through Amtali Upazila in Barisal Division.
1 2
3
4
5
6
7
8
9
1011
1213
14
15
16
17
18
19
20
21
22
23
2425
26
2728
2930
31
3233
34
3536
37
38
39
40
41
42
43444546
47
48
49
50
515253
54
55
5657
58
59
606162
63
64656667
68
697071
72
73
74
75
76
777879
80
8182
83
84
8586
87
88
89 90
91
92
93
95
96
9798
99100
101 102103
104
106
107
108
110111
112
113
114115
116
117
118
119
120
121
122
123
124
125126
127
128
129
130131
132
133
134
135136
137138
139
140
141
142143
144145
146
147
148149
150151
152
153
154
155
156
157158
159
160
161
162
163
164
165
166
167
168
169
170171
172173
174175
176
177
178179
180181
182
183
184185
186
187
188
189
190191
192193194
195196
197
198199
200
202
204
PIROJPUR
BARISALBHOLA
JHALOKATI
PATUAKHALI
BARGUNA
Agailjhara
Amtali
Babuganj
Bakerganj
Bamna
Banaripara
Barguna Sadar
Barisal Sadar
Bauphal
Betagi
Bhandaria
Bhola Sadar
Burhanuddin
Charfasson
Dashmina
Daulatkhan
Galachipa
Gaurnadi Hizla
Jhalokati Sadar
Kalapara
Kanthalia
Kawkhali
Lalmohan
Manpura
Mathbaria
Mehendiganj
Mirzaganj
Muladi
Nalchhiti
Nazirpur
Patharghata
Patuakhali Sadar
Pirojpur Sadar Rajapur
Swarupkati
Tazumuddin
Wazirpur
Amtali cross-sectionmodel location
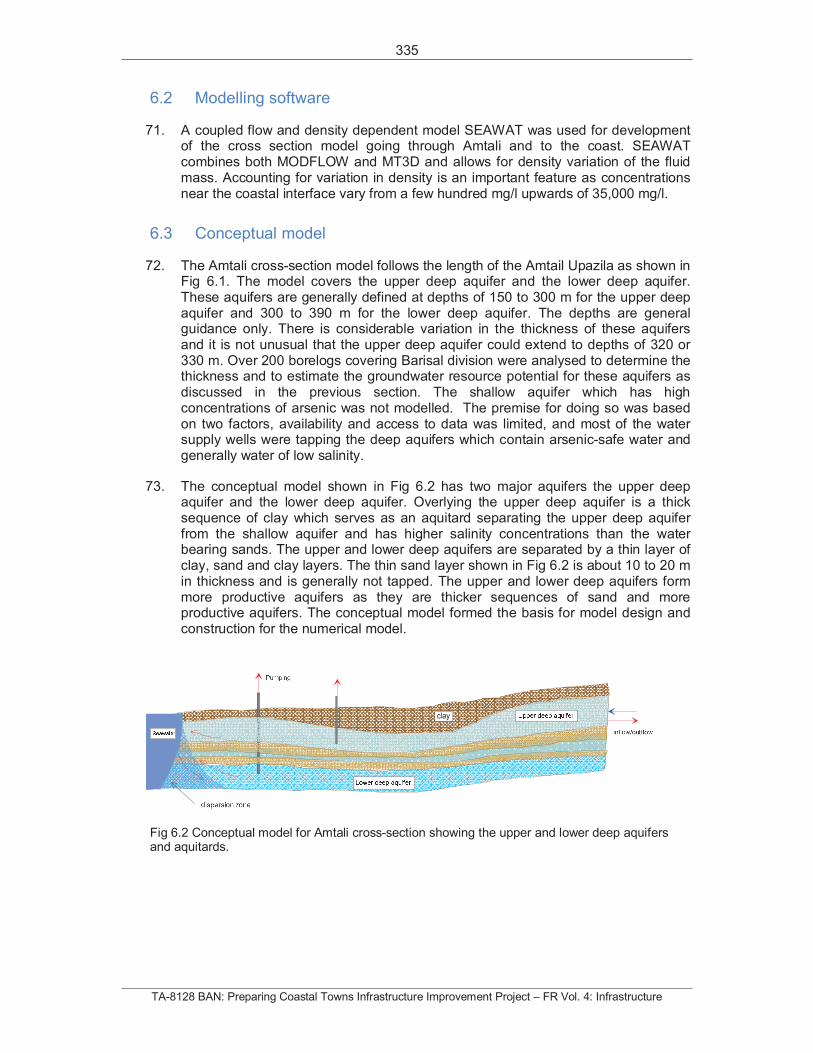
335
TA-8128 BAN: Preparing Coastal Towns Infrastructure Improvement Project – FR Vol. 4: Infrastructure
6.2 Modelling software
71. A coupled flow and density dependent model SEAWAT was used for development of the cross section model going through Amtali and to the coast. SEAWAT combines both MODFLOW and MT3D and allows for density variation of the fluid mass. Accounting for variation in density is an important feature as concentrations near the coastal interface vary from a few hundred mg/l upwards of 35,000 mg/l.
6.3 Conceptual model
72. The Amtali cross-section model follows the length of the Amtail Upazila as shown in Fig 6.1. The model covers the upper deep aquifer and the lower deep aquifer. These aquifers are generally defined at depths of 150 to 300 m for the upper deep aquifer and 300 to 390 m for the lower deep aquifer. The depths are general guidance only. There is considerable variation in the thickness of these aquifers and it is not unusual that the upper deep aquifer could extend to depths of 320 or 330 m. Over 200 borelogs covering Barisal division were analysed to determine the thickness and to estimate the groundwater resource potential for these aquifers as discussed in the previous section. The shallow aquifer which has high concentrations of arsenic was not modelled. The premise for doing so was based on two factors, availability and access to data was limited, and most of the water supply wells were tapping the deep aquifers which contain arsenic-safe water and generally water of low salinity.
73. The conceptual model shown in Fig 6.2 has two major aquifers the upper deep aquifer and the lower deep aquifer. Overlying the upper deep aquifer is a thick sequence of clay which serves as an aquitard separating the upper deep aquifer from the shallow aquifer and has higher salinity concentrations than the water bearing sands. The upper and lower deep aquifers are separated by a thin layer of clay, sand and clay layers. The thin sand layer shown in Fig 6.2 is about 10 to 20 m in thickness and is generally not tapped. The upper and lower deep aquifers form more productive aquifers as they are thicker sequences of sand and more productive aquifers. The conceptual model formed the basis for model design and construction for the numerical model.
Fig 6.2 Conceptual model for Amtali cross-section showing the upper and lower deep aquifers and aquitards.
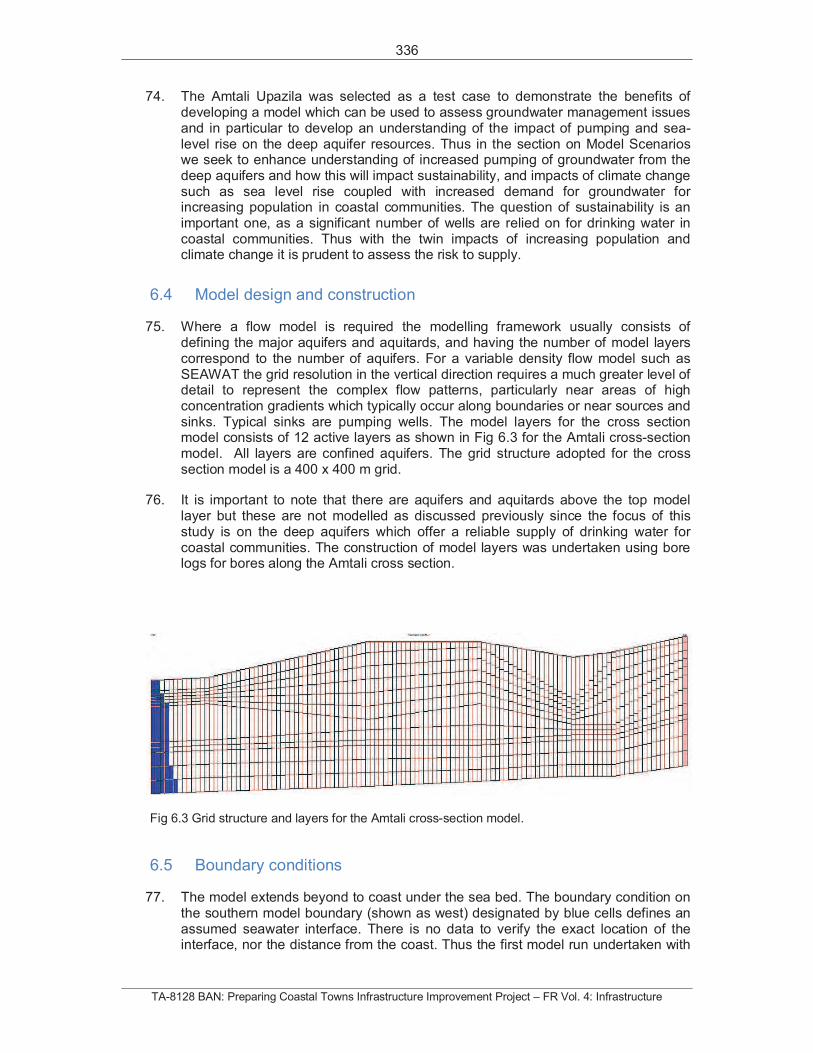
336
TA-8128 BAN: Preparing Coastal Towns Infrastructure Improvement Project – FR Vol. 4: Infrastructure
74. The Amtali Upazila was selected as a test case to demonstrate the benefits of developing a model which can be used to assess groundwater management issues and in particular to develop an understanding of the impact of pumping and sea-level rise on the deep aquifer resources. Thus in the section on Model Scenarios we seek to enhance understanding of increased pumping of groundwater from the deep aquifers and how this will impact sustainability, and impacts of climate change such as sea level rise coupled with increased demand for groundwater for increasing population in coastal communities. The question of sustainability is an important one, as a significant number of wells are relied on for drinking water in coastal communities. Thus with the twin impacts of increasing population and climate change it is prudent to assess the risk to supply.
6.4 Model design and construction
75. Where a flow model is required the modelling framework usually consists of defining the major aquifers and aquitards, and having the number of model layers correspond to the number of aquifers. For a variable density flow model such as SEAWAT the grid resolution in the vertical direction requires a much greater level of detail to represent the complex flow patterns, particularly near areas of high concentration gradients which typically occur along boundaries or near sources and sinks. Typical sinks are pumping wells. The model layers for the cross section model consists of 12 active layers as shown in Fig 6.3 for the Amtali cross-section model. All layers are confined aquifers. The grid structure adopted for the cross section model is a 400 x 400 m grid.
76. It is important to note that there are aquifers and aquitards above the top model layer but these are not modelled as discussed previously since the focus of this study is on the deep aquifers which offer a reliable supply of drinking water for coastal communities. The construction of model layers was undertaken using bore logs for bores along the Amtali cross section.
Fig 6.3 Grid structure and layers for the Amtali cross-section model.
6.5 Boundary conditions
77. The model extends beyond to coast under the sea bed. The boundary condition on the southern model boundary (shown as west) designated by blue cells defines an assumed seawater interface. There is no data to verify the exact location of the interface, nor the distance from the coast. Thus the first model run undertaken with
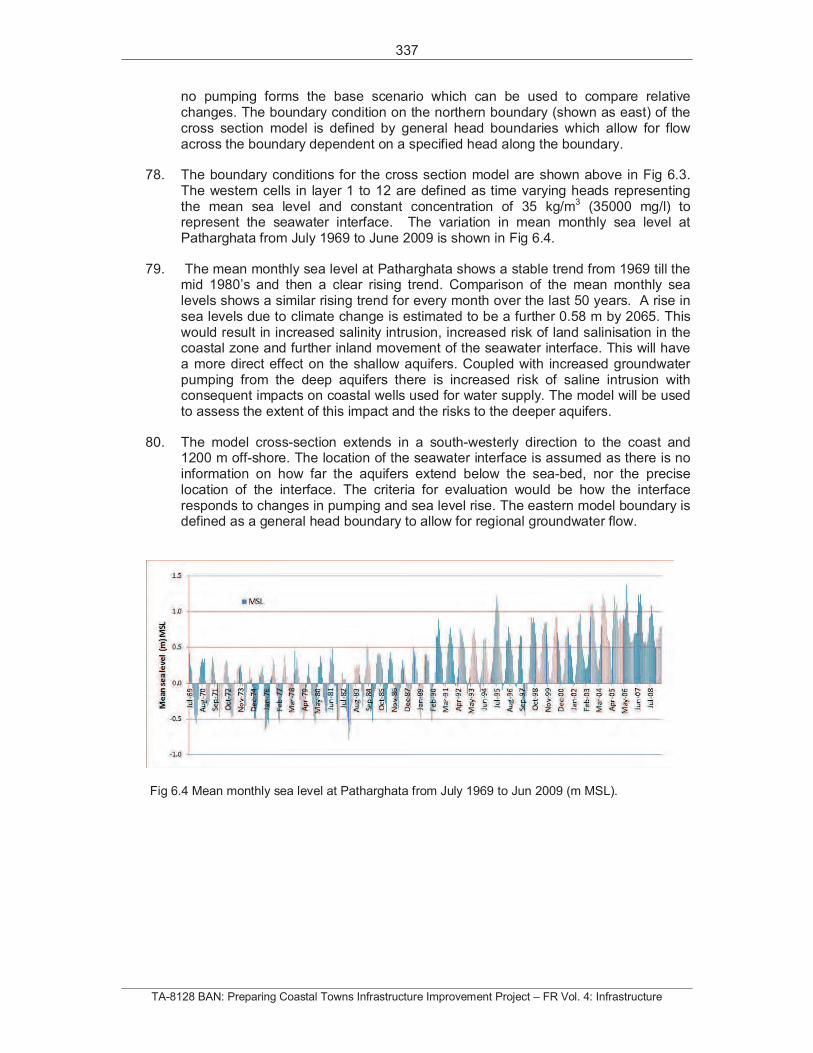
337
TA-8128 BAN: Preparing Coastal Towns Infrastructure Improvement Project – FR Vol. 4: Infrastructure
no pumping forms the base scenario which can be used to compare relative changes. The boundary condition on the northern boundary (shown as east) of the cross section model is defined by general head boundaries which allow for flow across the boundary dependent on a specified head along the boundary.
78. The boundary conditions for the cross section model are shown above in Fig 6.3. The western cells in layer 1 to 12 are defined as time varying heads representing the mean sea level and constant concentration of 35 kg/m3 (35000 mg/l) to represent the seawater interface. The variation in mean monthly sea level at Patharghata from July 1969 to June 2009 is shown in Fig 6.4.
79. The mean monthly sea level at Patharghata shows a stable trend from 1969 till the mid 1980’s and then a clear rising trend. Comparison of the mean monthly sea levels shows a similar rising trend for every month over the last 50 years. A rise in sea levels due to climate change is estimated to be a further 0.58 m by 2065. This would result in increased salinity intrusion, increased risk of land salinisation in the coastal zone and further inland movement of the seawater interface. This will have a more direct effect on the shallow aquifers. Coupled with increased groundwater pumping from the deep aquifers there is increased risk of saline intrusion with consequent impacts on coastal wells used for water supply. The model will be used to assess the extent of this impact and the risks to the deeper aquifers.
80. The model cross-section extends in a south-westerly direction to the coast and 1200 m off-shore. The location of the seawater interface is assumed as there is no information on how far the aquifers extend below the sea-bed, nor the precise location of the interface. The criteria for evaluation would be how the interface responds to changes in pumping and sea level rise. The eastern model boundary is defined as a general head boundary to allow for regional groundwater flow.
Fig 6.4 Mean monthly sea level at Patharghata from July 1969 to Jun 2009 (m MSL).
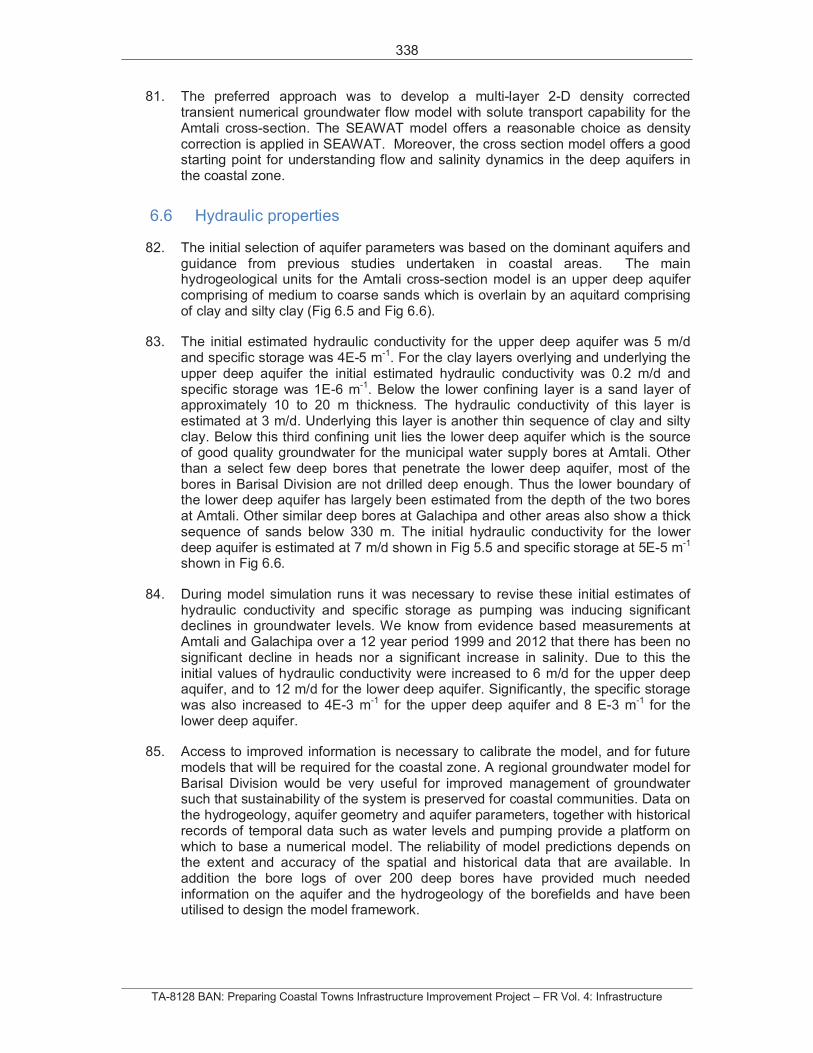
338
TA-8128 BAN: Preparing Coastal Towns Infrastructure Improvement Project – FR Vol. 4: Infrastructure
81. The preferred approach was to develop a multi-layer 2-D density corrected transient numerical groundwater flow model with solute transport capability for the Amtali cross-section. The SEAWAT model offers a reasonable choice as density correction is applied in SEAWAT. Moreover, the cross section model offers a good starting point for understanding flow and salinity dynamics in the deep aquifers in the coastal zone.
6.6 Hydraulic properties
82. The initial selection of aquifer parameters was based on the dominant aquifers and guidance from previous studies undertaken in coastal areas. The main hydrogeological units for the Amtali cross-section model is an upper deep aquifer comprising of medium to coarse sands which is overlain by an aquitard comprising of clay and silty clay (Fig 6.5 and Fig 6.6).
83. The initial estimated hydraulic conductivity for the upper deep aquifer was 5 m/d and specific storage was 4E-5 m-1. For the clay layers overlying and underlying the upper deep aquifer the initial estimated hydraulic conductivity was 0.2 m/d and specific storage was 1E-6 m-1. Below the lower confining layer is a sand layer of approximately 10 to 20 m thickness. The hydraulic conductivity of this layer is estimated at 3 m/d. Underlying this layer is another thin sequence of clay and silty clay. Below this third confining unit lies the lower deep aquifer which is the source of good quality groundwater for the municipal water supply bores at Amtali. Other than a select few deep bores that penetrate the lower deep aquifer, most of the bores in Barisal Division are not drilled deep enough. Thus the lower boundary of the lower deep aquifer has largely been estimated from the depth of the two bores at Amtali. Other similar deep bores at Galachipa and other areas also show a thick sequence of sands below 330 m. The initial hydraulic conductivity for the lower deep aquifer is estimated at 7 m/d shown in Fig 5.5 and specific storage at 5E-5 m-1
shown in Fig 6.6.
84. During model simulation runs it was necessary to revise these initial estimates of hydraulic conductivity and specific storage as pumping was inducing significant declines in groundwater levels. We know from evidence based measurements at Amtali and Galachipa over a 12 year period 1999 and 2012 that there has been no significant decline in heads nor a significant increase in salinity. Due to this the initial values of hydraulic conductivity were increased to 6 m/d for the upper deep aquifer, and to 12 m/d for the lower deep aquifer. Significantly, the specific storage was also increased to 4E-3 m-1 for the upper deep aquifer and 8 E-3 m-1 for the lower deep aquifer.
85. Access to improved information is necessary to calibrate the model, and for future models that will be required for the coastal zone. A regional groundwater model for Barisal Division would be very useful for improved management of groundwater such that sustainability of the system is preserved for coastal communities. Data on the hydrogeology, aquifer geometry and aquifer parameters, together with historical records of temporal data such as water levels and pumping provide a platform on which to base a numerical model. The reliability of model predictions depends on the extent and accuracy of the spatial and historical data that are available. In addition the bore logs of over 200 deep bores have provided much needed information on the aquifer and the hydrogeology of the borefields and have been utilised to design the model framework.
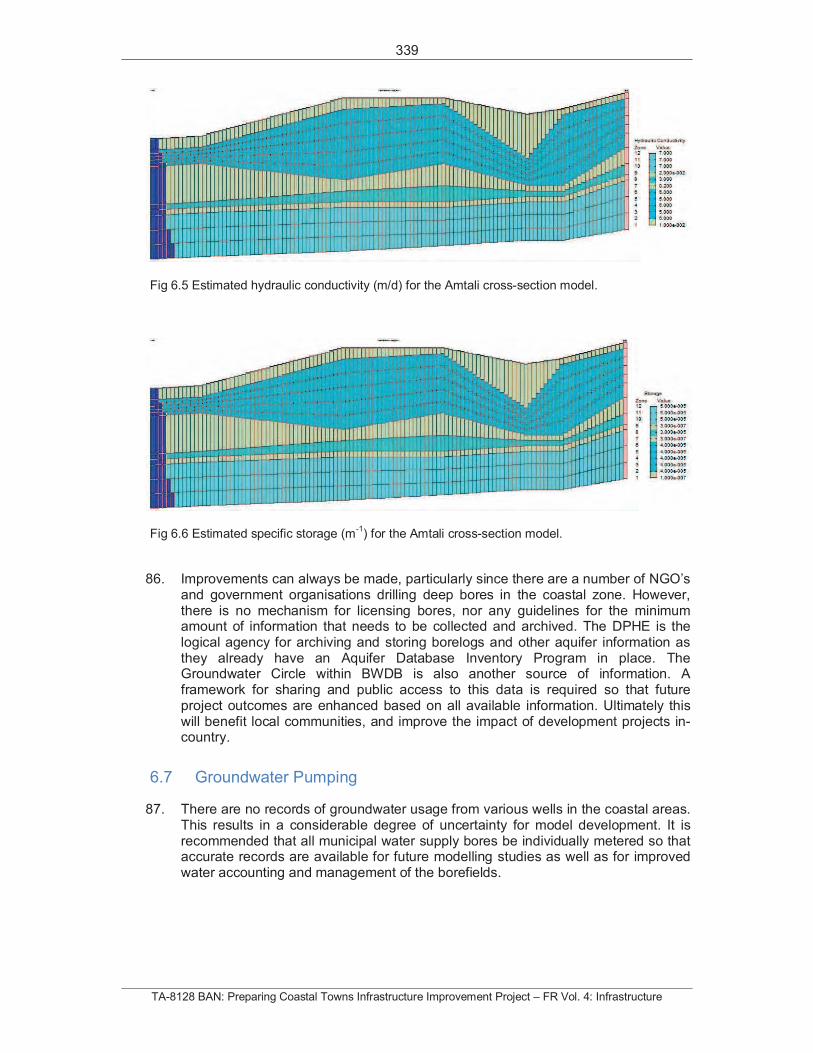
339
TA-8128 BAN: Preparing Coastal Towns Infrastructure Improvement Project – FR Vol. 4: Infrastructure
Fig 6.5 Estimated hydraulic conductivity (m/d) for the Amtali cross-section model.
Fig 6.6 Estimated specific storage (m-1
) for the Amtali cross-section model.
86. Improvements can always be made, particularly since there are a number of NGO’s and government organisations drilling deep bores in the coastal zone. However, there is no mechanism for licensing bores, nor any guidelines for the minimum amount of information that needs to be collected and archived. The DPHE is the logical agency for archiving and storing borelogs and other aquifer information as they already have an Aquifer Database Inventory Program in place. The Groundwater Circle within BWDB is also another source of information. A framework for sharing and public access to this data is required so that future project outcomes are enhanced based on all available information. Ultimately this will benefit local communities, and improve the impact of development projects in-country.
6.7 Groundwater Pumping
87. There are no records of groundwater usage from various wells in the coastal areas. This results in a considerable degree of uncertainty for model development. It is recommended that all municipal water supply bores be individually metered so that accurate records are available for future modelling studies as well as for improved water accounting and management of the borefields.
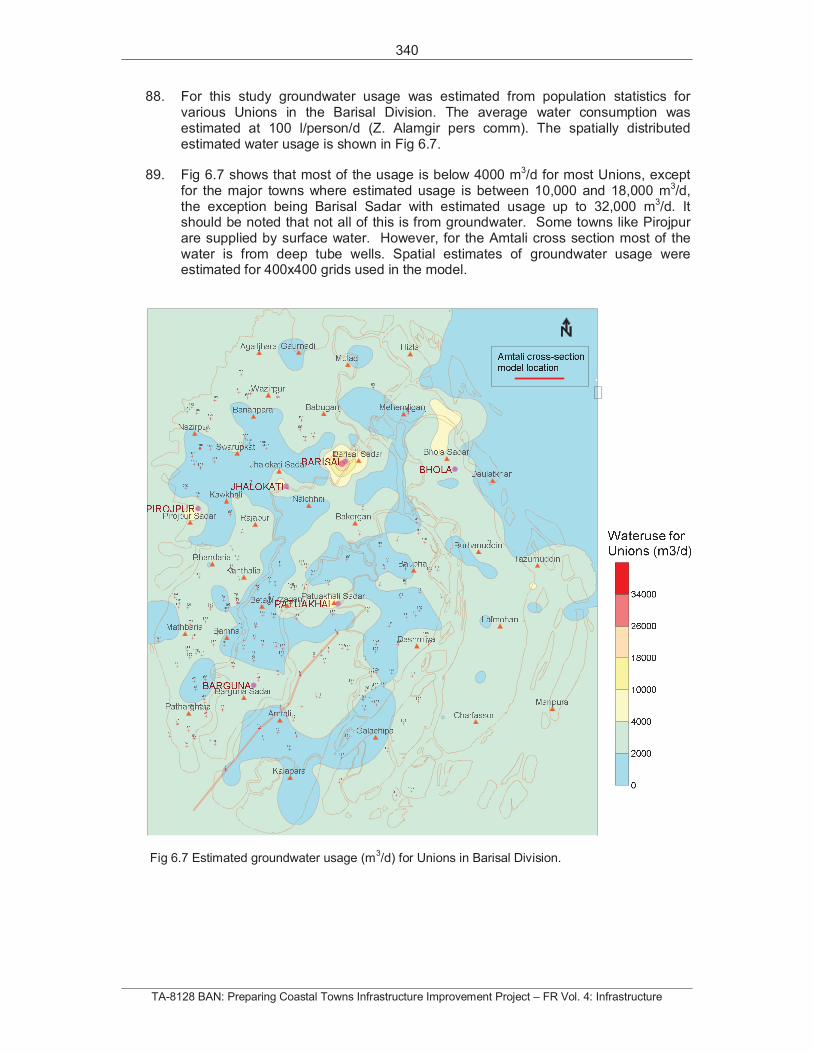
340
TA-8128 BAN: Preparing Coastal Towns Infrastructure Improvement Project – FR Vol. 4: Infrastructure
88. For this study groundwater usage was estimated from population statistics for various Unions in the Barisal Division. The average water consumption was estimated at 100 l/person/d (Z. Alamgir pers comm). The spatially distributed estimated water usage is shown in Fig 6.7.
89. Fig 6.7 shows that most of the usage is below 4000 m3/d for most Unions, except for the major towns where estimated usage is between 10,000 and 18,000 m3/d, the exception being Barisal Sadar with estimated usage up to 32,000 m3/d. It should be noted that not all of this is from groundwater. Some towns like Pirojpur are supplied by surface water. However, for the Amtali cross section most of the water is from deep tube wells. Spatial estimates of groundwater usage were estimated for 400x400 grids used in the model.
Fig 6.7 Estimated groundwater usage (m3/d) for Unions in Barisal Division.
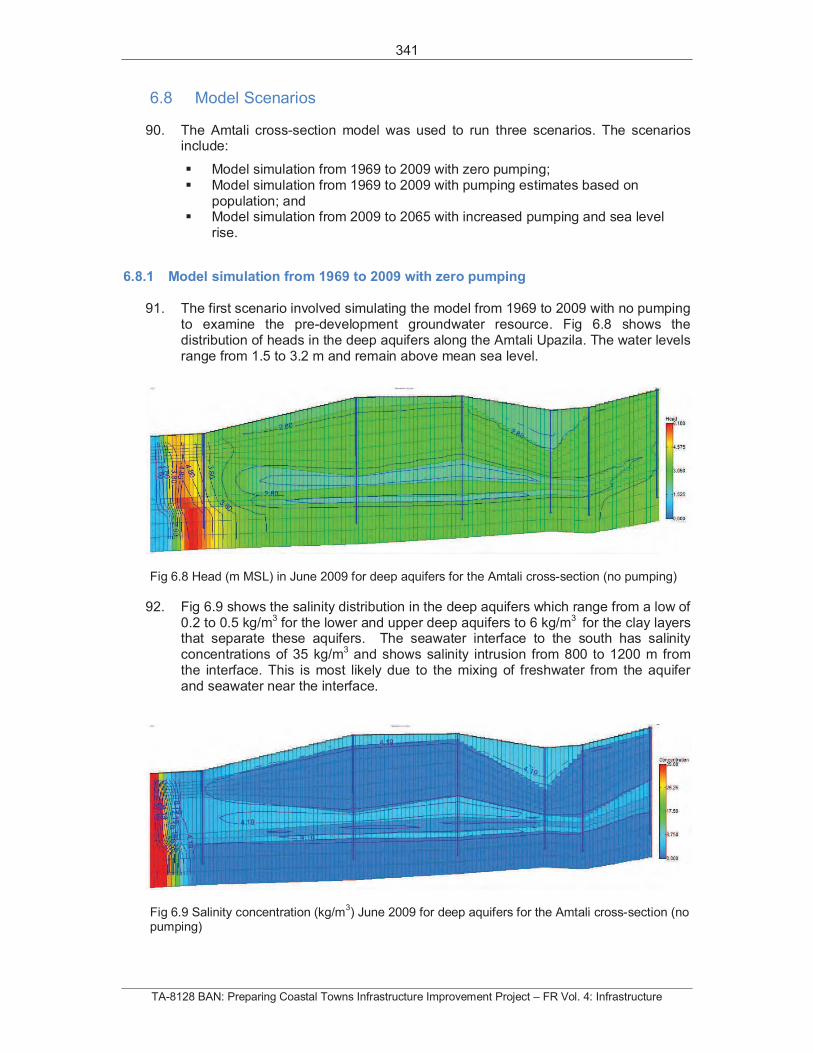
341
TA-8128 BAN: Preparing Coastal Towns Infrastructure Improvement Project – FR Vol. 4: Infrastructure
6.8 Model Scenarios
90. The Amtali cross-section model was used to run three scenarios. The scenarios include:
Model simulation from 1969 to 2009 with zero pumping; Model simulation from 1969 to 2009 with pumping estimates based on
population; and Model simulation from 2009 to 2065 with increased pumping and sea level
rise.
6.8.1 Model simulation from 1969 to 2009 with zero pumping
91. The first scenario involved simulating the model from 1969 to 2009 with no pumping to examine the pre-development groundwater resource. Fig 6.8 shows the distribution of heads in the deep aquifers along the Amtali Upazila. The water levels range from 1.5 to 3.2 m and remain above mean sea level.
Fig 6.8 Head (m MSL) in June 2009 for deep aquifers for the Amtali cross-section (no pumping)
92. Fig 6.9 shows the salinity distribution in the deep aquifers which range from a low of 0.2 to 0.5 kg/m3 for the lower and upper deep aquifers to 6 kg/m3 for the clay layers that separate these aquifers. The seawater interface to the south has salinity concentrations of 35 kg/m3 and shows salinity intrusion from 800 to 1200 m from the interface. This is most likely due to the mixing of freshwater from the aquifer and seawater near the interface.
Fig 6.9 Salinity concentration (kg/m3) June 2009 for deep aquifers for the Amtali cross-section (no
pumping)
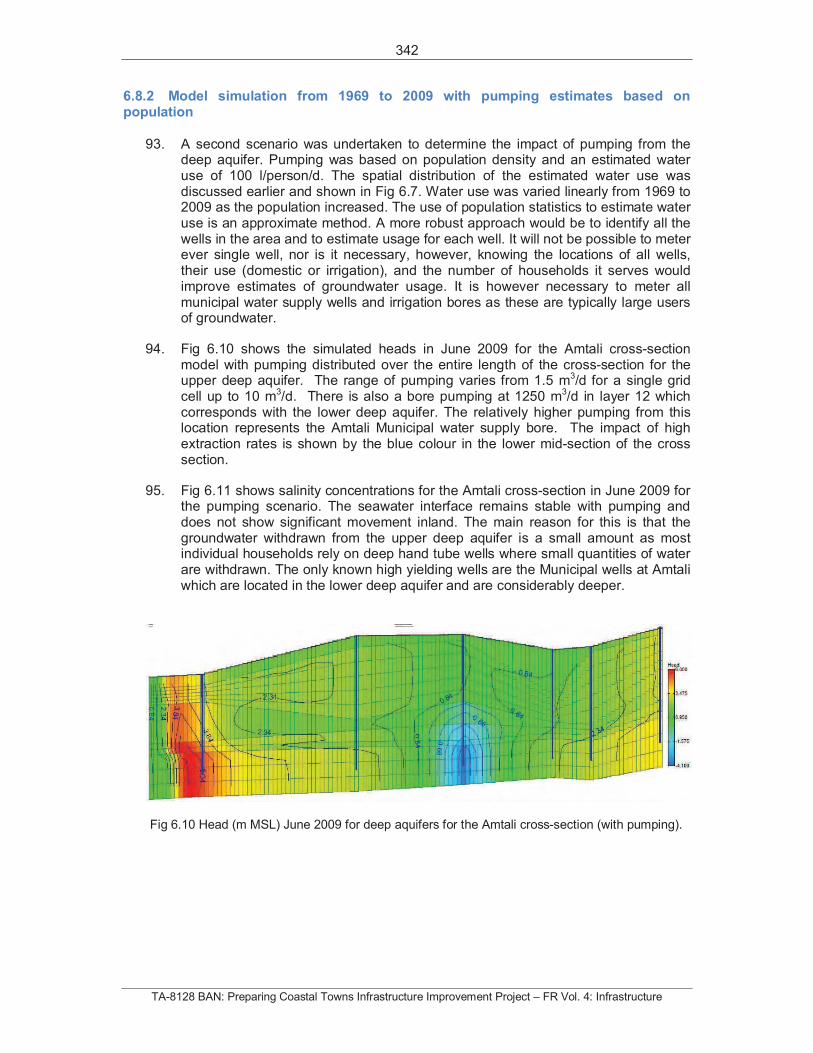
342
TA-8128 BAN: Preparing Coastal Towns Infrastructure Improvement Project – FR Vol. 4: Infrastructure
6.8.2 Model simulation from 1969 to 2009 with pumping estimates based on population
93. A second scenario was undertaken to determine the impact of pumping from the deep aquifer. Pumping was based on population density and an estimated water use of 100 l/person/d. The spatial distribution of the estimated water use was discussed earlier and shown in Fig 6.7. Water use was varied linearly from 1969 to 2009 as the population increased. The use of population statistics to estimate water use is an approximate method. A more robust approach would be to identify all the wells in the area and to estimate usage for each well. It will not be possible to meter ever single well, nor is it necessary, however, knowing the locations of all wells, their use (domestic or irrigation), and the number of households it serves would improve estimates of groundwater usage. It is however necessary to meter all municipal water supply wells and irrigation bores as these are typically large users of groundwater.
94. Fig 6.10 shows the simulated heads in June 2009 for the Amtali cross-section model with pumping distributed over the entire length of the cross-section for the upper deep aquifer. The range of pumping varies from 1.5 m3/d for a single grid cell up to 10 m3/d. There is also a bore pumping at 1250 m3/d in layer 12 which corresponds with the lower deep aquifer. The relatively higher pumping from this location represents the Amtali Municipal water supply bore. The impact of high extraction rates is shown by the blue colour in the lower mid-section of the cross section.
95. Fig 6.11 shows salinity concentrations for the Amtali cross-section in June 2009 for the pumping scenario. The seawater interface remains stable with pumping and does not show significant movement inland. The main reason for this is that the groundwater withdrawn from the upper deep aquifer is a small amount as most individual households rely on deep hand tube wells where small quantities of water are withdrawn. The only known high yielding wells are the Municipal wells at Amtali which are located in the lower deep aquifer and are considerably deeper.
Fig 6.10 Head (m MSL) June 2009 for deep aquifers for the Amtali cross-section (with pumping).
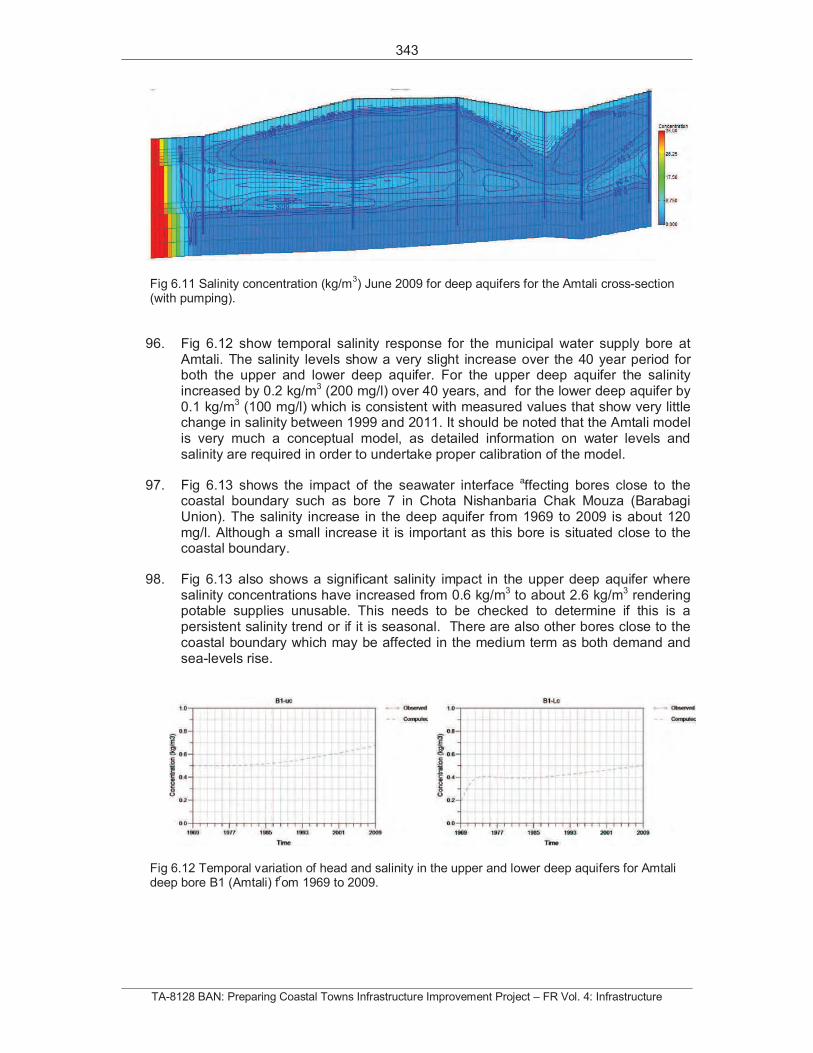
343
TA-8128 BAN: Preparing Coastal Towns Infrastructure Improvement Project – FR Vol. 4: Infrastructure
Fig 6.11 Salinity concentration (kg/m3) June 2009 for deep aquifers for the Amtali cross-section
(with pumping).
96. Fig 6.12 show temporal salinity response for the municipal water supply bore at Amtali. The salinity levels show a very slight increase over the 40 year period for both the upper and lower deep aquifer. For the upper deep aquifer the salinity increased by 0.2 kg/m3 (200 mg/l) over 40 years, and for the lower deep aquifer by 0.1 kg/m3 (100 mg/l) which is consistent with measured values that show very little change in salinity between 1999 and 2011. It should be noted that the Amtali model is very much a conceptual model, as detailed information on water levels and salinity are required in order to undertake proper calibration of the model.
97. Fig 6.13 shows the impact of the seawater interface affecting bores close to the coastal boundary such as bore 7 in Chota Nishanbaria Chak Mouza (Barabagi Union). The salinity increase in the deep aquifer from 1969 to 2009 is about 120 mg/l. Although a small increase it is important as this bore is situated close to the coastal boundary.
98. Fig 6.13 also shows a significant salinity impact in the upper deep aquifer where salinity concentrations have increased from 0.6 kg/m3 to about 2.6 kg/m3 rendering potable supplies unusable. This needs to be checked to determine if this is a persistent salinity trend or if it is seasonal. There are also other bores close to the coastal boundary which may be affected in the medium term as both demand and sea-levels rise.
Fig 6.12 Temporal variation of head and salinity in the upper and lower deep aquifers for Amtali deep bore B1 (Amtali) f
rom 1969 to 2009.
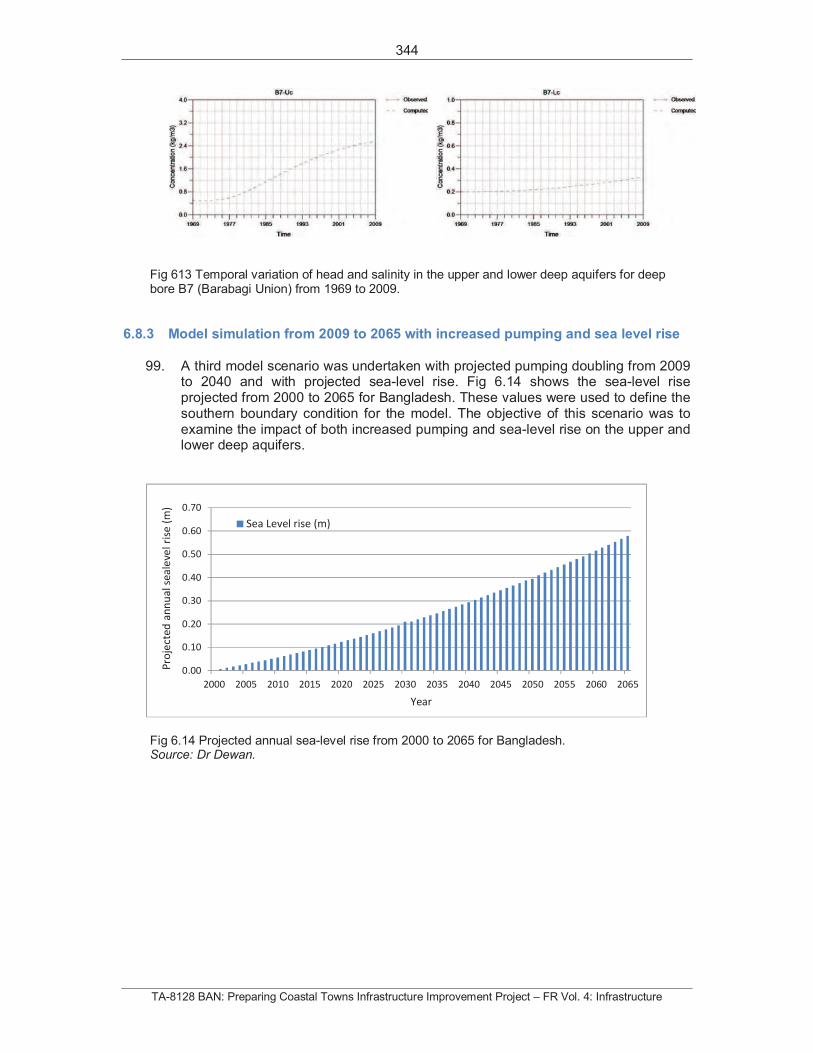
344
TA-8128 BAN: Preparing Coastal Towns Infrastructure Improvement Project – FR Vol. 4: Infrastructure
Fig 613 Temporal variation of head and salinity in the upper and lower deep aquifers for deep bore B7 (Barabagi Union) from 1969 to 2009.
6.8.3 Model simulation from 2009 to 2065 with increased pumping and sea level rise
99. A third model scenario was undertaken with projected pumping doubling from 2009 to 2040 and with projected sea-level rise. Fig 6.14 shows the sea-level rise projected from 2000 to 2065 for Bangladesh. These values were used to define the southern boundary condition for the model. The objective of this scenario was to examine the impact of both increased pumping and sea-level rise on the upper and lower deep aquifers.
Fig 6.14 Projected annual sea-level rise from 2000 to 2065 for Bangladesh. Source: Dr Dewan.
0.00
0.10
0.20
0.30
0.40
0.50
0.60
0.70
2000 2005 2010 2015 2020 2025 2030 2035 2040 2045 2050 2055 2060 2065
Pro
ject
ed
an
nu
als
ea
leve
lri
se(m
)
Year
Sea Level rise (m)
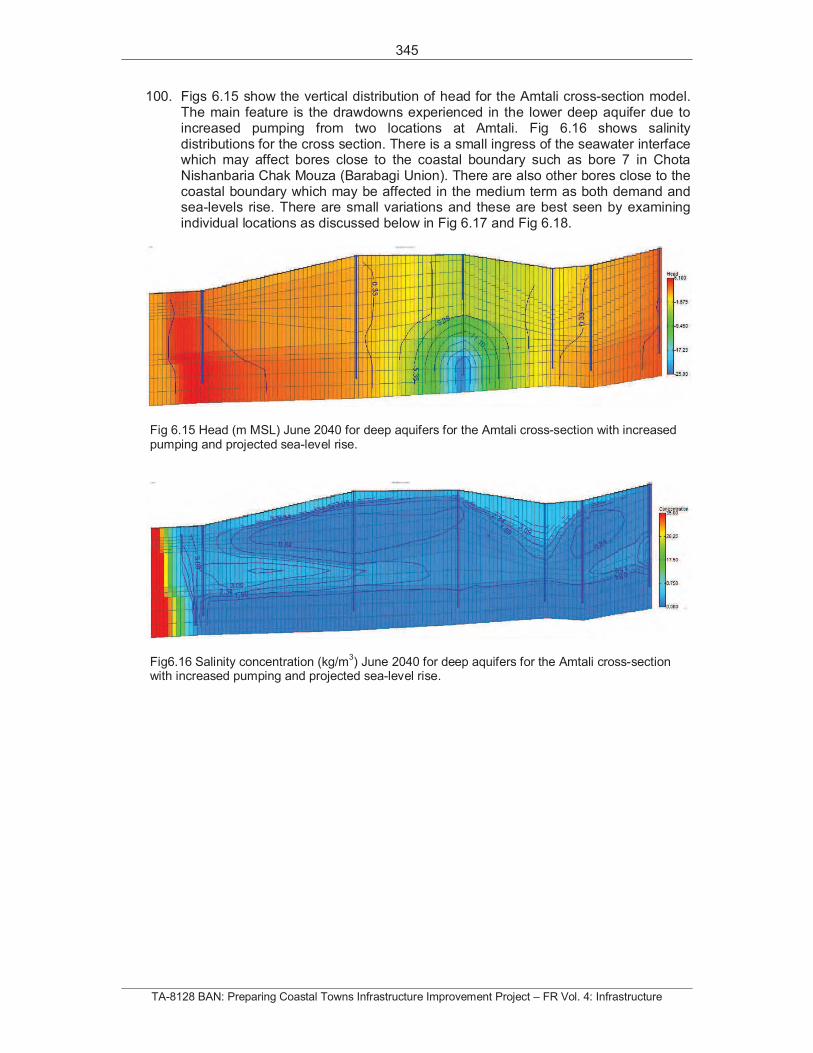
345
TA-8128 BAN: Preparing Coastal Towns Infrastructure Improvement Project – FR Vol. 4: Infrastructure
100. Figs 6.15 show the vertical distribution of head for the Amtali cross-section model. The main feature is the drawdowns experienced in the lower deep aquifer due to increased pumping from two locations at Amtali. Fig 6.16 shows salinity distributions for the cross section. There is a small ingress of the seawater interface which may affect bores close to the coastal boundary such as bore 7 in Chota Nishanbaria Chak Mouza (Barabagi Union). There are also other bores close to the coastal boundary which may be affected in the medium term as both demand and sea-levels rise. There are small variations and these are best seen by examining individual locations as discussed below in Fig 6.17 and Fig 6.18.
Fig 6.15 Head (m MSL) June 2040 for deep aquifers for the Amtali cross-section with increased pumping and projected sea-level rise.
Fig6.16 Salinity concentration (kg/m3) June 2040 for deep aquifers for the Amtali cross-section
with increased pumping and projected sea-level rise.
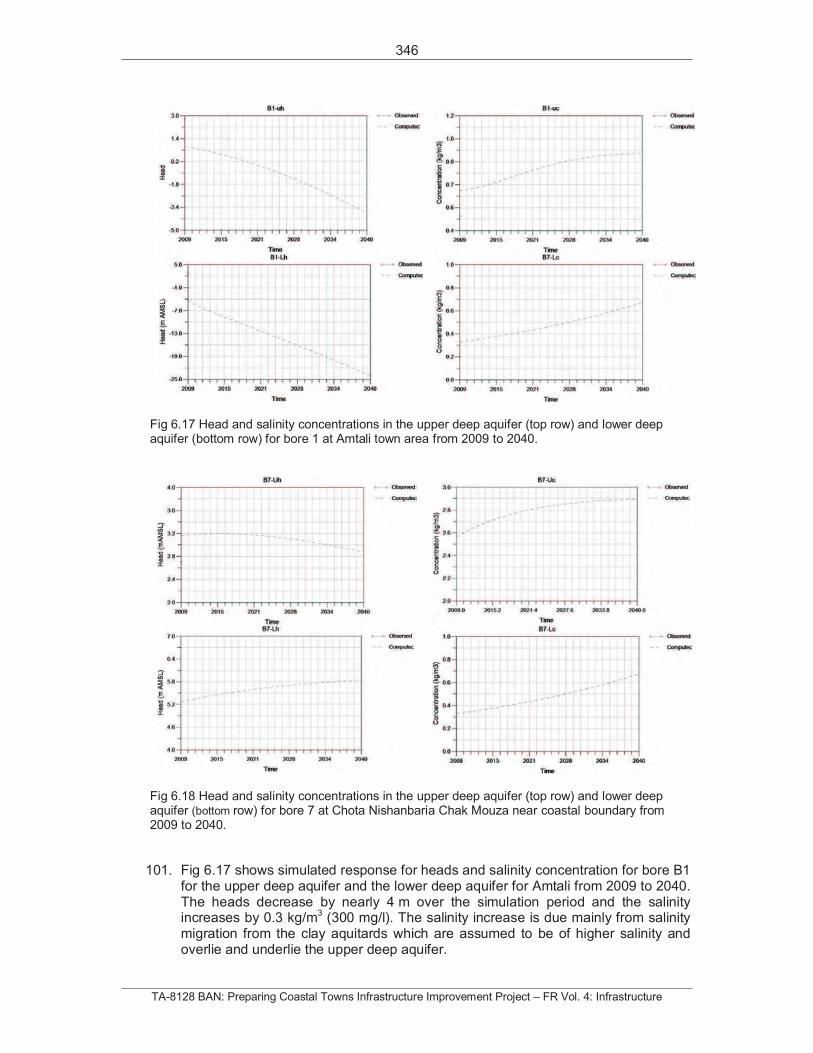
346
TA-8128 BAN: Preparing Coastal Towns Infrastructure Improvement Project – FR Vol. 4: Infrastructure
Fig 6.17 Head and salinity concentrations in the upper deep aquifer (top row) and lower deep aquifer (bottom row) for bore 1 at Amtali town area from 2009 to 2040.
Fig 6.18 Head and salinity concentrations in the upper deep aquifer (top row) and lower deep aquifer (bottom row) for bore 7 at Chota Nishanbaria Chak Mouza near coastal boundary from 2009 to 2040.
101. Fig 6.17 shows simulated response for heads and salinity concentration for bore B1 for the upper deep aquifer and the lower deep aquifer for Amtali from 2009 to 2040. The heads decrease by nearly 4 m over the simulation period and the salinity increases by 0.3 kg/m3 (300 mg/l). The salinity increase is due mainly from salinity migration from the clay aquitards which are assumed to be of higher salinity and overlie and underlie the upper deep aquifer.
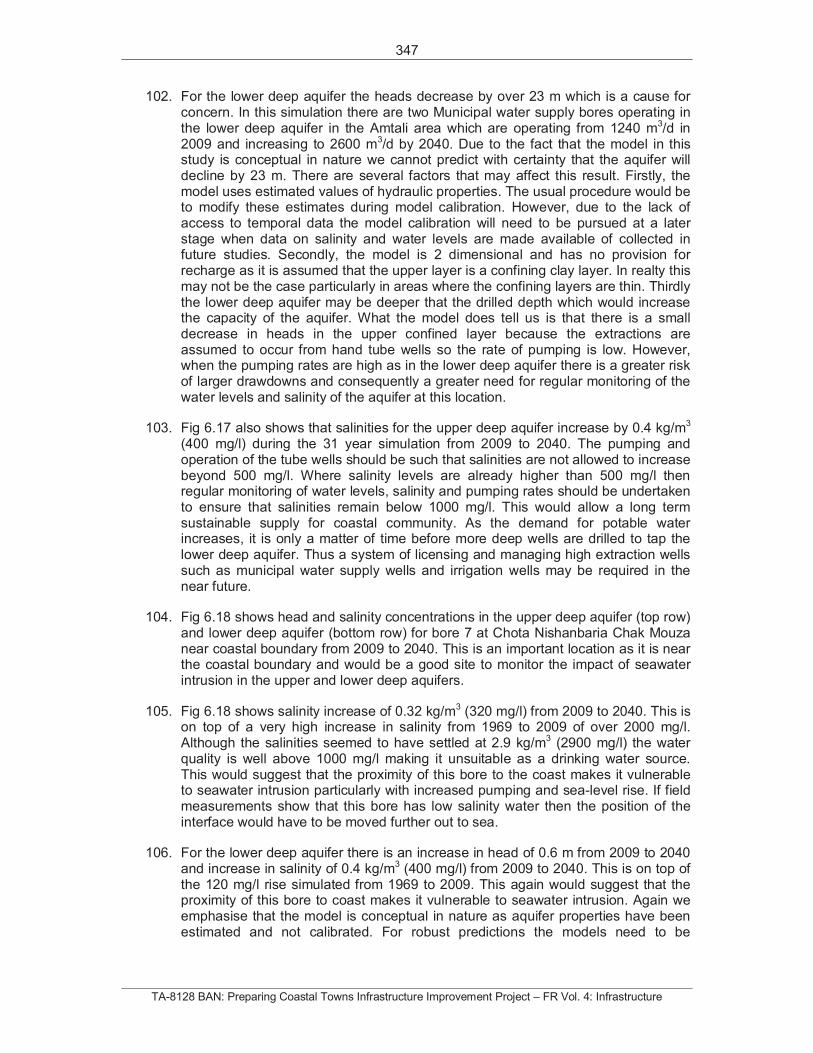
347
TA-8128 BAN: Preparing Coastal Towns Infrastructure Improvement Project – FR Vol. 4: Infrastructure
102. For the lower deep aquifer the heads decrease by over 23 m which is a cause for concern. In this simulation there are two Municipal water supply bores operating in the lower deep aquifer in the Amtali area which are operating from 1240 m3/d in 2009 and increasing to 2600 m3/d by 2040. Due to the fact that the model in this study is conceptual in nature we cannot predict with certainty that the aquifer will decline by 23 m. There are several factors that may affect this result. Firstly, the model uses estimated values of hydraulic properties. The usual procedure would be to modify these estimates during model calibration. However, due to the lack of access to temporal data the model calibration will need to be pursued at a later stage when data on salinity and water levels are made available of collected in future studies. Secondly, the model is 2 dimensional and has no provision for recharge as it is assumed that the upper layer is a confining clay layer. In realty this may not be the case particularly in areas where the confining layers are thin. Thirdly the lower deep aquifer may be deeper that the drilled depth which would increase the capacity of the aquifer. What the model does tell us is that there is a small decrease in heads in the upper confined layer because the extractions are assumed to occur from hand tube wells so the rate of pumping is low. However, when the pumping rates are high as in the lower deep aquifer there is a greater risk of larger drawdowns and consequently a greater need for regular monitoring of the water levels and salinity of the aquifer at this location.
103. Fig 6.17 also shows that salinities for the upper deep aquifer increase by 0.4 kg/m3
(400 mg/l) during the 31 year simulation from 2009 to 2040. The pumping and operation of the tube wells should be such that salinities are not allowed to increase beyond 500 mg/l. Where salinity levels are already higher than 500 mg/l then regular monitoring of water levels, salinity and pumping rates should be undertaken to ensure that salinities remain below 1000 mg/l. This would allow a long term sustainable supply for coastal community. As the demand for potable water increases, it is only a matter of time before more deep wells are drilled to tap the lower deep aquifer. Thus a system of licensing and managing high extraction wells such as municipal water supply wells and irrigation wells may be required in the near future.
104. Fig 6.18 shows head and salinity concentrations in the upper deep aquifer (top row) and lower deep aquifer (bottom row) for bore 7 at Chota Nishanbaria Chak Mouza near coastal boundary from 2009 to 2040. This is an important location as it is near the coastal boundary and would be a good site to monitor the impact of seawater intrusion in the upper and lower deep aquifers.
105. Fig 6.18 shows salinity increase of 0.32 kg/m3 (320 mg/l) from 2009 to 2040. This is on top of a very high increase in salinity from 1969 to 2009 of over 2000 mg/l. Although the salinities seemed to have settled at 2.9 kg/m3 (2900 mg/l) the water quality is well above 1000 mg/l making it unsuitable as a drinking water source. This would suggest that the proximity of this bore to the coast makes it vulnerable to seawater intrusion particularly with increased pumping and sea-level rise. If field measurements show that this bore has low salinity water then the position of the interface would have to be moved further out to sea.
106. For the lower deep aquifer there is an increase in head of 0.6 m from 2009 to 2040 and increase in salinity of 0.4 kg/m3 (400 mg/l) from 2009 to 2040. This is on top of the 120 mg/l rise simulated from 1969 to 2009. This again would suggest that the proximity of this bore to coast makes it vulnerable to seawater intrusion. Again we emphasise that the model is conceptual in nature as aquifer properties have been estimated and not calibrated. For robust predictions the models need to be

348
TA-8128 BAN: Preparing Coastal Towns Infrastructure Improvement Project – FR Vol. 4: Infrastructure
calibrated for both heads and salinity in order to improve understanding of likely impacts.
107. We recommend a set of sentinel bores be used to provide communities with early warning of increasing seawater intrusion risk which could have an impact on their drinking water source.
349
TA-8128 BAN: Preparing Coastal Towns Infrastructure Improvement Project – FR Vol. 4: Infrastructure
7. Key Findings and Recommendations
7.1 Groundwater resource potential
108. The areas where the deep aquifer shows lower groundwater potential are areas north and south of Mathbharia, between Bhandaria and Mirzaganj. We emphasise that the lower resource potential of the deep aquifer is limited by the depth of penetration which results in a reduced aquifer thickness and consequently a lower transmissivity. We would recommend a deep drilling program to at least 390 m BGL similar to the Amtali bores in order to determine the resource potential of the lower deep aquifer, particularly in the vicinity of Mathbharia where there is an acute need for water supply.
109. It would also be noteworthy to undertake a survey of salinity levels in the existing wells before commencing drilling. Simply put the aquifer yields may be good but if the salinity is over 1000 mg/l it is not useable for potable supplies.
110. The groundwater maps provide guidance on areas of good groundwater potential and where there is increased probability of finding high yielding aquifers. Another good use of these maps would be to guide drilling programs in so far as to identify areas to avoid drilling. These areas are typically characterised by low transmissivity and low probability of finding suitable high yielding aquifers.
111. The map of chloride distribution is based on 40 sampled points consequently the results need to be interpreted with caution. It should be noted that the number of sampling points are on the low side considering the variability encountered in these aquifers. There is a clear need to undertake a survey of deep aquifers in the Barisal Division to locate and identify wells which can be used for water quality monitoring. This would guide the selection of suitable locations for deep tubewells for community water supply.
112. There are two deep tubewells which exceed the Bangladesh standard. The deep tubewell south of Nazirpur has a measured arsenic concentration of 0.06 mg/l, and the tubewell north of Agailjhara has an arsenic concetration of 0.13 mg/l. Both these wells need to be examined with a borehole camera to ascertain the possibility of casing leaks or splits. Details of when the bore was constructed and the lithological information for these bores also need to be examined with continued monitoring. Both these wells are in excess of the 0.05 mg/l limit for arsenic and consequently are not safe for potable water use. Considering that a number of deep tubewells around Agaijhara and to the south of Nazirpur are arsenic-safe, it is more than likely that the well casing has been compromised.
7.2 Amtali cross-section model
113. The Amtali cross-section model has been used to assess the long-term impact of increased groundwater usage from 1969 to 2009. This has shown there is negligible impact on sustainability of the system during this period for most locations along the transect. However, close to the coast the seawater interface may affect bores close to the coastal boundary such as bore 7 in (Barabagi Union). There are also other bores close to the coastal boundary which may be affected in the medium term as both demand and sea-levels rise.
114. Additional scenarios with sea level rise and increased groundwater pumping from 2009 to 2040 showed increase in salinity for bores closest to the interface. Salinity
350
TA-8128 BAN: Preparing Coastal Towns Infrastructure Improvement Project – FR Vol. 4: Infrastructure
for bore 7 increased from 0.6 kg/m3 in 1969 to 2.9 kg/m3 (2900 mg/l), which is well above 1000 mg/l making it unsuitable as a drinking water source. This would suggest that the proximity of this bore to the coast makes it vulnerable to seawater intrusion particularly with increased pumping and sea-level rise.
115. The water levels for the lower deep aquifer at Amtali decreased by 23 m and salinities increased by 400 mg/l due to increased extractions to meet demand till 2040 which increases the risk of salinity migration from overlying clay layers. mg/l. When pumping rates are high as in the lower deep aquifer there is a greater risk of larger drawdowns and consequently a greater need for regular monitoring of the water levels and salinity of the aquifer at this location.
116. The pumping and operation of the tube wells should be such that salinities are not allowed to increase beyond 500 mg/l. Where salinity levels are already higher than 500 mg/l then regular monitoring of water levels, salinity and pumping rates should be undertaken to ensure that salinities remain below 1000 mg/l. This would allow a long term sustainable supply for coastal community. As the demand for potable water increases, it is only a matter of time before more deep wells are drilled to tap the lower deep aquifer. Thus a system of licensing and managing high extraction wells such as municipal water supply wells and irrigation wells may be required in the near future.
117. The Amtali model is a conceptual model as access to groundwater levels and salinity information is required for model calibration and for future modelling efforts. Improved mapping and modelling requires spatial and temporal data on water levels, salinity and groundwater usage data over a sufficient number of years for model calibration. A considerable body of data is available within various GOB agencies and with NGO’s. Improved access to this data would result in improved outcomes for important national projects that contribute to poverty alleviation and improved resilience for coastal communities. Simply put there is increased economic costs to the country when access to data is limited as projects get done in a piecemeal fashion and where lack of data access hinders progress.
118. Access to improved information is necessary to calibrate the model and for future models that are required for the coastal zone. A regional groundwater model for Barisal Division would be very useful for improved management of groundwater such that sustainability of the system is preserved for coastal communities. Data on the hydrogeology, aquifer geometry and aquifer parameters, together with historical records of temporal data such as water levels and pumping provide a platform on which to base a numerical model. The reliability of model predictions depends on the extent and accuracy of the spatial and historical data that are available.
119. Improvements can always be made, particularly since there are a number of NGO’s and government organisations drilling deep bores in the coastal zone. However, there is no mechanism for licensing bores, nor any guidelines of the minimum amount of information that needs to be collected and archived. The DPHE is the logical agency for archiving and storing borelogs and other aquifer information as they already have an Aquifer Database Inventory Program in place. The Groundwater Circle within BWDB is also another source of information. A framework for sharing and having access to this data is required so that future project outcomes are enhanced based on all available information. Ultimately this will benefit local communities, and improve the impact of development projects in-country.
351
TA-8128 BAN: Preparing Coastal Towns Infrastructure Improvement Project – FR Vol. 4: Infrastructure
120. It is not economically viable to meter ever single well, nor is it necessary, however, knowing the locations of all wells, their use (domestic or irrigation), and the number of households it serves would improve estimates of groundwater usage. It is however necessary to meter all Municipal water supply wells and irrigation bores as these are typically large users of groundwater. A survey needs to be designed to capture basic information (location, coordinates, lithology, water levels and water quality and surveyed levels).
121. There is a small ingress of the seawater interface which may affect bores close to the coastal boundary such as bore 7 in Barabagi Union. There are also other bores close to the coastal boundary which may be affected in the medium term as both demand and sea-levels rise. We recommend a set of sentinel bores be used to provide communities with early warning of increasing seawater intrusion risk which could have an impact on their drinking water source.
352
TA-8128 BAN: Preparing Coastal Towns Infrastructure Improvement Project – FR Vol. 4: Infrastructure
8. Strengthening groundwater governance in the coastal zone
122. Groundwater is a major natural resource in Bangladesh and plays a much more important role in the coastal areas where many coastal towns are dependent on freshwater supplies from the underlying deep aquifer system. In the long term as demand increases, there will be increased reliance on the groundwater from the deep system and for towns that are currently dependent on surface water supplies, conjunctive use of groundwater and surface water will be required, given that surface water may suffer from significant salinity intrusion in dry season. Thus town like Pirojpur that currently rely on surface water may be forced to look for other alternatives if salinity at the intake source increases during the dry season.
123. As the coastal zone develops over the next several decades, competition for land and water resources will intensify. Thus institutional arrangements and good governance in the water sector will be critical to managing development of groundwater resources in a sustainable manner. Improving water governance by capacity development at the pourashava level is recommended.
124. The implications of climate change on saltwater intrusion on the groundwater system of the coastal region in the Districts of Barguna, Patuakhali and Pirojpur will need detailed assessment. Given the importance of groundwater to the people in these coastal districts and for long-term development and sustainability, it will be vital to develop a regional model covering these districts to assess and manage risks associated with climate change.
125. Improved land and water management planning is required along with and a regulatory framework for licensing high yielding water supply wells and to determine allocations.
126. Projected population in the coastal zone is likely to double by 2050. This will increase demand on the groundwater system and with the impacts of climate change better management will be required to ensure water supplies during long duration droughts or longer than usual dry periods. There will also be additional demand for irrigation during the dry season to meet food security needs for the coastal zone.
127. The increased vulnerability of the coastal zone will increase the risks to livelihoods and the loss of coastal land to sea level rise will force people to migrate inland. The 0.88 m sea level rise scenario shows extensive coastal areas up to Patuakhali and Bhola will be impacted by salinity intrusion resulting in a significant loss of productive coastal land. This in turn may lead to higher population density in the new coastal areas due to migration and significantly increase water demand where it has not been anticipated.
128. Storm surges of 1 or more meters depth would affect additional coastal land and water resources, thus efforts to mitigate the impacts of storm surges and sea-level rise area priority for coastal towns.
129. The sustainability of groundwater resources in the coastal zone will become an increasingly important consideration as more wells are drilled to meet demand. There are many deep hand tube wells that need to be accounted for so an improved estimate of total groundwater extraction can be made. Similarly, there may be other deep wells being used for commercial use that need to be accounted for.
353
TA-8128 BAN: Preparing Coastal Towns Infrastructure Improvement Project – FR Vol. 4: Infrastructure
8.1 Operational management and monitoring of groundwater
130. At present no agencies have a programme in place to support or monitor deep tubewells. There are many reasons for this, not the least of which is the sheer number of tubewells in coastal areas. Other issues include problems with locating and identifying wells, as many of the wells do not have coordinates and some have inconsistent co-ordinate systems. Some records have approximate locations based on district and upazilla names, making the process of locating wells from approximate location descriptions problematic. There is no system for recording new deep tubewells, abandoned wells, or wells that have been relocated. Systematic purging of wells for salinity or water quality sampling is practically impossible because wells are used throughout the day. We are not suggesting here that every single well be monitored however, a systematic monitoring programme needs to be established using a network of dedicated observation wells that are easy to access and where routine observations are undertaken to improve the understanding of deep groundwater resources.
131. Building groundwater monitoring and management capabilities at the local government level is needed. The key recommendations are bi-annual monitoring of water levels and salinity, and monitoring groundwater usage for water supply wells owned by the Pourashavas. This can be supplemented by community surveys of groundwater usage for private deep tubewells.
132. We recommend metering of all municipal water supply wells and irrigation bores as these are typically large users of groundwater. A survey needs to be designed to capture basic information (location, coordinates, lithology, water levels and water quality and surveyed levels).
133. Several thousand deep tubewells have been drilled by NGOs in Bangladesh. Many of the databases do not have coordinates for these wells. It is recommended that in future projects a survey team is engaged to obtain GPS coordinates, location photos, and groundwater usage for improved groundwater mapping. Information of these wells needs to be brought under an integrated database so as to enable assessment of the resource and allow knowledge based future planning.
134. Bores close to the coastal boundary may be affected in the medium term as both demand and sea-levels rise. We recommend a set of sentinel bores be used to provide communities with early warning of increasing seawater intrusion risk which could have an impact on their drinking water source.
8.2 Future risks associated with groundwater abstraction from deep aquifers
135. In recent studies on water quality analysis for the deep tubewells in Barisal Division has found no evidence of deteriorating water quality for iron, arsenic, salinity and other water quality parameters. The risk of lateral salinity intrusion in the deep aquifer at Amtali and Galachipa seems to be very low, at least for the current level of extraction. Based on these observations it can be concluded that current pumping rates can be maintained. In the event that salinity levels increase or water levels drop significantly, water abstraction from production wells could be reduced to avoid the risk of saline water intrusion into the aquifer.
136. These findings confirm previous inferences that deep tubewells provide good quality potable water, and are also the most economic and socially acceptable
354
TA-8128 BAN: Preparing Coastal Towns Infrastructure Improvement Project – FR Vol. 4: Infrastructure
intervention for arsenic mitigation in Bangladesh. Although the GOB policy is to favour the use of surface water, most of the coastal communities seem to prefer direct use of deep groundwater.
137. With increasing depth, the deeper aquifers are increasingly separated from surface water bodies by clay and silt layers (aquitards). The long-term risks of pumping from the deep aquifers are (i) downward leakage of arsenic rich waters from shallow aquifers if downward gradients are created by excessive drawdowns in the deep aquifers; (ii) the downward leakage or lateral intrusion of residual salinity left from pockets of trapped high salinity groundwater.
138. Since access to safe drinking water is considered to be a fundamental and universal human right, restricting the use of deep groundwater is not an option. At the same time, there are no regulations to control excessive abstraction. Deep groundwater is important not only for potable water but also for irrigation which is essential for food production and food security for Bangladesh. We do not propose regulation, rather the introduction of principles and awareness for improved governance of groundwater as a shared community resource.
139. In the future there may be a need to find alternatives to deep groundwater in some areas due to deteriorating water quality. These may include (i) new surface water supply schemes; (ii) treatment of shallow or deep groundwater; and (iii) managed aquifer recharge schemes such as possible injection of treated surface water during the monsoon when surface water sources are plentiful.
140. For town like Mathbharia where the salinity of groundwater is beyond permissible level, other options can be explored. Managed aquifer recharge for the shallow saline groundwater are possible options along with surface water supplies and rainwater harvesting.
8.3 Sustainability of deep groundwater abstraction
141. Deep tubewells in the coastal regions have provided safe and reliable community water supplies for the past 13 years for Amtali and Galachipa and several other locations. The composition of the groundwater quality has remained stable and continues to provide safe potable water for these coastal communities, suggesting that the aquifers can continue to supply water for many decades.
142. Whilst sustainability of deep groundwater resources needs to be understood and implemented, this should be undertaken over a long time horizon as demand and risks to groundwater quality increase. This also gives enough time for alternative strategies (such as Managed Aquifer Recharge Schemes) to be developed and implemented. Additionally the use of brackish groundwater will need to be considered in future years.
143. Utilisation of groundwater storage for specified planning periods and other adaptive management strategies are being explored and advocated in Australia (Lawson et al. 2012) and in Bangladesh (Ravenscroft et al. 2013). With increasing demand for groundwater the modelling tools must be put in place to better understand the implications of increased groundwater abstraction and aquifer stress.
144. The formation of a Groundwater Users’ Association that can progressively increase their capacity to monitor and manage groundwater and improve groundwater governance at the local level would assist in promoting the understanding of key resource sustainability issues. This would also provide for community support for
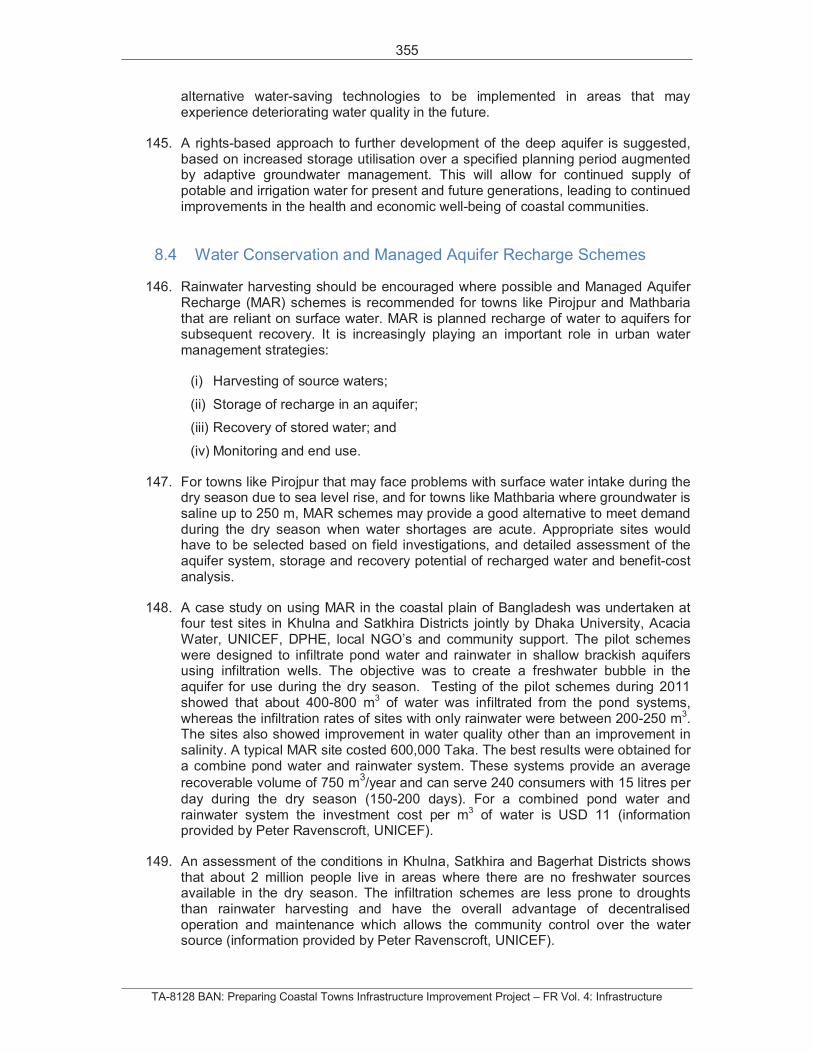
355
TA-8128 BAN: Preparing Coastal Towns Infrastructure Improvement Project – FR Vol. 4: Infrastructure
alternative water-saving technologies to be implemented in areas that may experience deteriorating water quality in the future.
145. A rights-based approach to further development of the deep aquifer is suggested, based on increased storage utilisation over a specified planning period augmented by adaptive groundwater management. This will allow for continued supply of potable and irrigation water for present and future generations, leading to continued improvements in the health and economic well-being of coastal communities.
8.4 Water Conservation and Managed Aquifer Recharge Schemes
146. Rainwater harvesting should be encouraged where possible and Managed Aquifer Recharge (MAR) schemes is recommended for towns like Pirojpur and Mathbaria that are reliant on surface water. MAR is planned recharge of water to aquifers for subsequent recovery. It is increasingly playing an important role in urban water management strategies:
(i) Harvesting of source waters;
(ii) Storage of recharge in an aquifer;
(iii) Recovery of stored water; and
(iv) Monitoring and end use.
147. For towns like Pirojpur that may face problems with surface water intake during the dry season due to sea level rise, and for towns like Mathbaria where groundwater is saline up to 250 m, MAR schemes may provide a good alternative to meet demand during the dry season when water shortages are acute. Appropriate sites would have to be selected based on field investigations, and detailed assessment of the aquifer system, storage and recovery potential of recharged water and benefit-cost analysis.
148. A case study on using MAR in the coastal plain of Bangladesh was undertaken at four test sites in Khulna and Satkhira Districts jointly by Dhaka University, Acacia Water, UNICEF, DPHE, local NGO’s and community support. The pilot schemes were designed to infiltrate pond water and rainwater in shallow brackish aquifers using infiltration wells. The objective was to create a freshwater bubble in the aquifer for use during the dry season. Testing of the pilot schemes during 2011 showed that about 400-800 m3 of water was infiltrated from the pond systems, whereas the infiltration rates of sites with only rainwater were between 200-250 m3.The sites also showed improvement in water quality other than an improvement in salinity. A typical MAR site costed 600,000 Taka. The best results were obtained for a combine pond water and rainwater system. These systems provide an average
recoverable volume of 750 m3/year and can serve 240 consumers with 15 litres per
day during the dry season (150-200 days). For a combined pond water and rainwater system the investment cost per m3 of water is USD 11 (information provided by Peter Ravenscroft, UNICEF).
149. An assessment of the conditions in Khulna, Satkhira and Bagerhat Districts shows that about 2 million people live in areas where there are no freshwater sources available in the dry season. The infiltration schemes are less prone to droughts than rainwater harvesting and have the overall advantage of decentralised operation and maintenance which allows the community control over the water source (information provided by Peter Ravenscroft, UNICEF).
356
TA-8128 BAN: Preparing Coastal Towns Infrastructure Improvement Project – FR Vol. 4: Infrastructure
150. A MAR scheme with combined pond water and rainwater harvesting would best be designed using locally available materials. Communities and Unions would require assistance in site selection and training in construction, operation and maintenance. A minimum level monitoring of water quality parameters would also be required to ensure continued supply of safe potable supplies. MAR schemes may also be beneficial for towns like Mathbaria which have limited choices for potable water supplies. MAR scheme would need to be much larger and would require a detailed feasibility study to ensure that sites are available and the aquifer conditions suitable for large scale MAR schemes.
8.5 Ecosystem Services
151. Future studies may also wish to draw on the knowledge banks within IUCN who have successfully used mangroves to act as buffers for coastal areas and for providing essential ecosystem services.
152. Mangroves provide numerous and vital ecosystem services, such as providing coastal and lagoon protection and water purification services, and they act as a natural sanctuary for endangered species. They also provide income opportunities for small communities dependent on wild honey.
8.6 Groundwater supply for Barisal Division - Problem Tree
153. A problem tree for addressing inadequate supplies of safe potable water for coastal communities in Barisal Division is shown in Fig 8.1. The figure summarises the main groundwater resource management and supply issues that need to be addressed for improving safe potable supplies for coastal towns. The three main causes of inadequate supplies of safe potable water for coastal communities are: lack of good quality groundwater in some coastal areas; climate change impacts particularly sealevel rise and damage to tubewells from flooding; and weak governance and institutional capacity to manage groundwater at the local level.
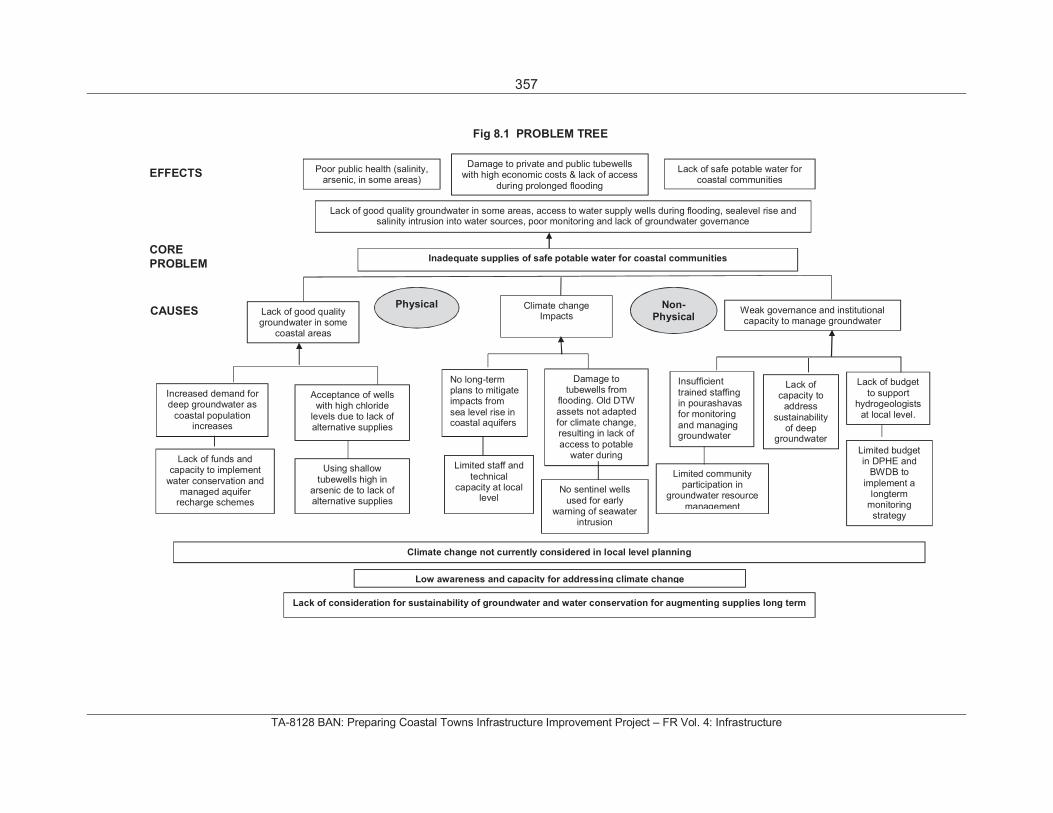
357
TA-8128 BAN: Preparing Coastal Towns Infrastructure Improvement Project – FR Vol. 4: Infrastructure
CORE
PROBLEM
Fig 8.1 PROBLEM TREE
Poor public health (salinity, arsenic, in some areas)
Lack of safe potable water for coastal communities
Inadequate supplies of safe potable water for coastal communities
Lack of good quality groundwater in some
coastal areas
Climate change Impacts
Weak governance and institutional capacity to manage groundwater
Insufficient trained staffing in pourashavas for monitoring and managing groundwater
Lack of budget to support
hydrogeologists at local level.
Limited staff and technical
capacity at local level
EFFECTS
CAUSES
Damage to private and public tubewells with high economic costs & lack of access
during prolonged flooding
Climate change not currently considered in local level planning
Low awareness and capacity for addressing climate change
Lack of good quality groundwater in some areas, access to water supply wells during flooding, sealevel rise and salinity intrusion into water sources, poor monitoring and lack of groundwater governance
Physical Non- Physical
Increased demand for deep groundwater as
coastal population increases
Lack of funds and capacity to implement
water conservation and managed aquifer
recharge schemes
Acceptance of wells with high chloride
levels due to lack of alternative supplies
Limited community participation in
groundwater resource management
No long-term plans to mitigate impacts from sea level rise in coastal aquifers
Lack of consideration for sustainability of groundwater and water conservation for augmenting supplies long term
Limited budget in DPHE and
BWDB to implement a
longterm monitoring
strategy
Damage to tubewells from
flooding. Old DTW assets not adapted for climate change, resulting in lack of access to potable
water during extreme events
No sentinel wells used for early
warning of seawater intrusion
Lack of capacity to
address sustainability
of deep groundwater
Using shallow tubewells high in
arsenic de to lack of alternative supplies
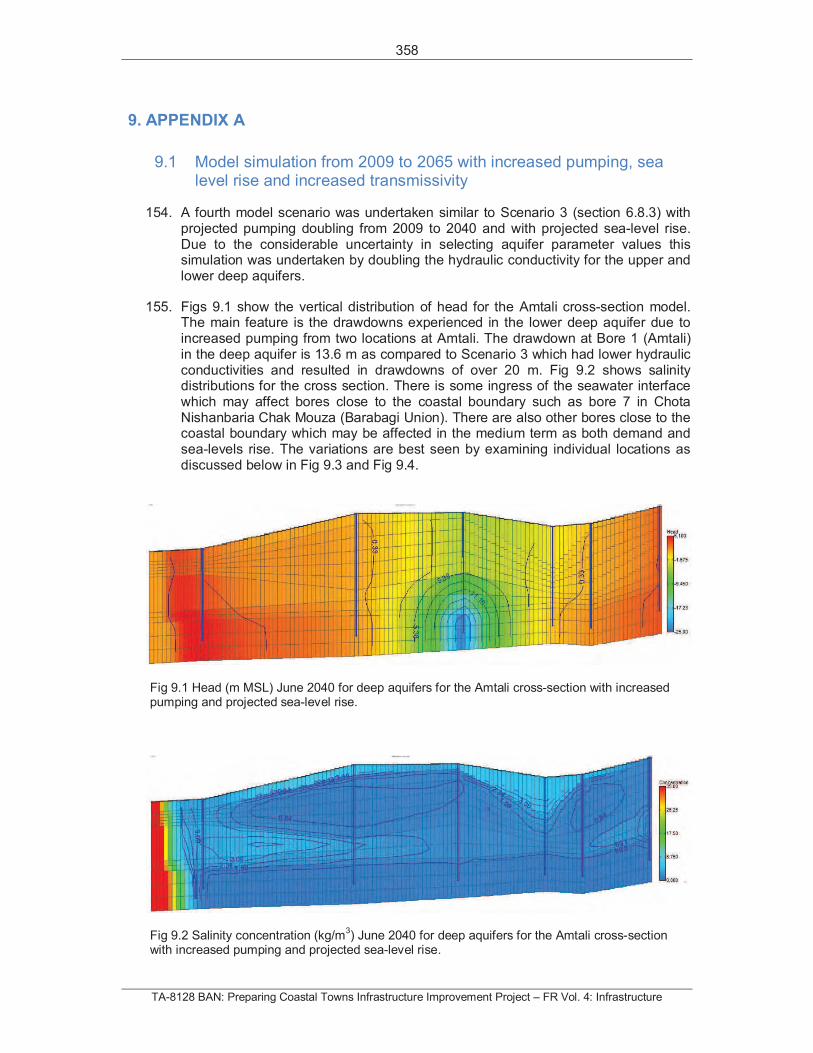
358
TA-8128 BAN: Preparing Coastal Towns Infrastructure Improvement Project – FR Vol. 4: Infrastructure
9. APPENDIX A
9.1 Model simulation from 2009 to 2065 with increased pumping, sea level rise and increased transmissivity
154. A fourth model scenario was undertaken similar to Scenario 3 (section 6.8.3) with projected pumping doubling from 2009 to 2040 and with projected sea-level rise. Due to the considerable uncertainty in selecting aquifer parameter values this simulation was undertaken by doubling the hydraulic conductivity for the upper and lower deep aquifers.
155. Figs 9.1 show the vertical distribution of head for the Amtali cross-section model. The main feature is the drawdowns experienced in the lower deep aquifer due to increased pumping from two locations at Amtali. The drawdown at Bore 1 (Amtali) in the deep aquifer is 13.6 m as compared to Scenario 3 which had lower hydraulic conductivities and resulted in drawdowns of over 20 m. Fig 9.2 shows salinity distributions for the cross section. There is some ingress of the seawater interface which may affect bores close to the coastal boundary such as bore 7 in Chota Nishanbaria Chak Mouza (Barabagi Union). There are also other bores close to the coastal boundary which may be affected in the medium term as both demand and sea-levels rise. The variations are best seen by examining individual locations as discussed below in Fig 9.3 and Fig 9.4.
Fig 9.1 Head (m MSL) June 2040 for deep aquifers for the Amtali cross-section with increased pumping and projected sea-level rise.
Fig 9.2 Salinity concentration (kg/m3) June 2040 for deep aquifers for the Amtali cross-section
with increased pumping and projected sea-level rise.
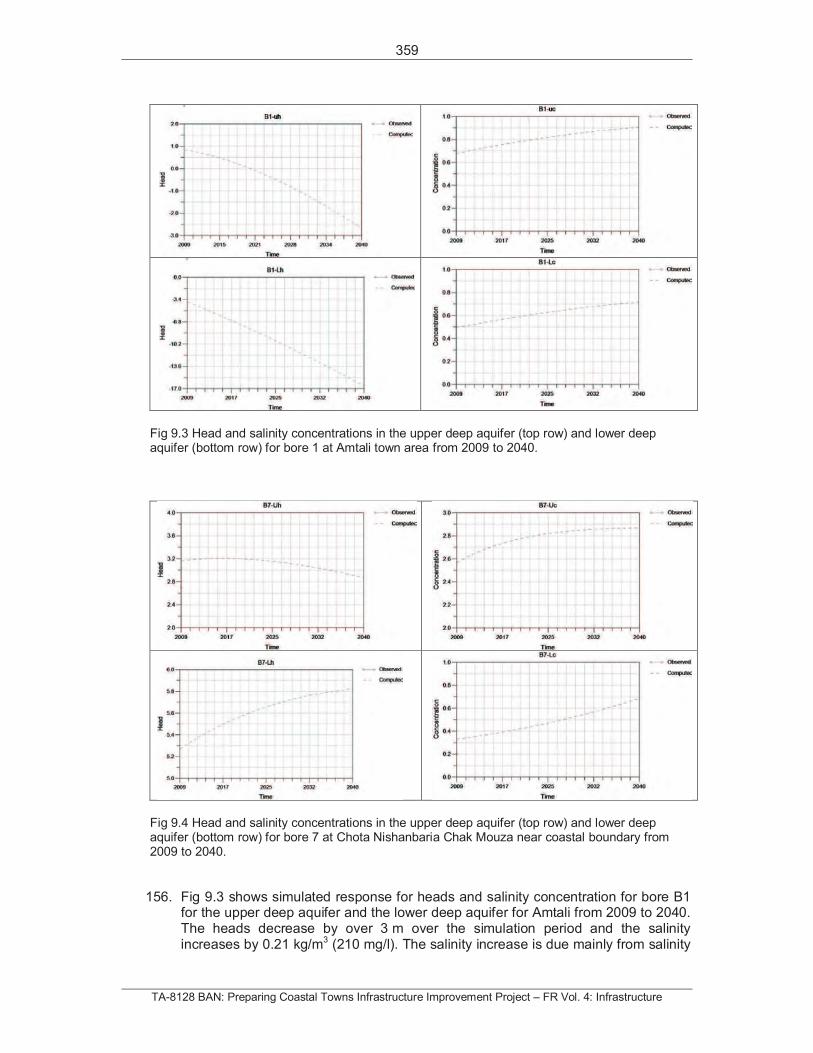
359
TA-8128 BAN: Preparing Coastal Towns Infrastructure Improvement Project – FR Vol. 4: Infrastructure
Fig 9.3 Head and salinity concentrations in the upper deep aquifer (top row) and lower deep aquifer (bottom row) for bore 1 at Amtali town area from 2009 to 2040.
Fig 9.4 Head and salinity concentrations in the upper deep aquifer (top row) and lower deep aquifer (bottom row) for bore 7 at Chota Nishanbaria Chak Mouza near coastal boundary from 2009 to 2040.
156. Fig 9.3 shows simulated response for heads and salinity concentration for bore B1 for the upper deep aquifer and the lower deep aquifer for Amtali from 2009 to 2040. The heads decrease by over 3 m over the simulation period and the salinity increases by 0.21 kg/m3 (210 mg/l). The salinity increase is due mainly from salinity
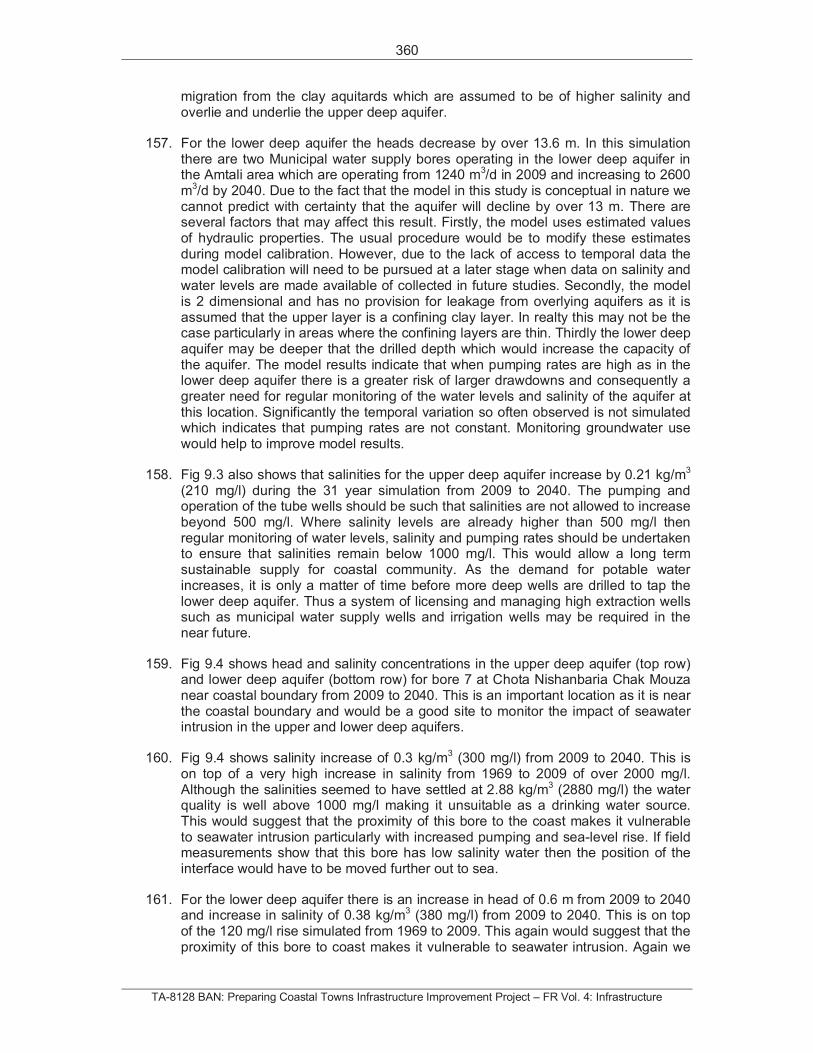
360
TA-8128 BAN: Preparing Coastal Towns Infrastructure Improvement Project – FR Vol. 4: Infrastructure
migration from the clay aquitards which are assumed to be of higher salinity and overlie and underlie the upper deep aquifer.
157. For the lower deep aquifer the heads decrease by over 13.6 m. In this simulation there are two Municipal water supply bores operating in the lower deep aquifer in the Amtali area which are operating from 1240 m3/d in 2009 and increasing to 2600 m3/d by 2040. Due to the fact that the model in this study is conceptual in nature we cannot predict with certainty that the aquifer will decline by over 13 m. There are several factors that may affect this result. Firstly, the model uses estimated values of hydraulic properties. The usual procedure would be to modify these estimates during model calibration. However, due to the lack of access to temporal data the model calibration will need to be pursued at a later stage when data on salinity and water levels are made available of collected in future studies. Secondly, the model is 2 dimensional and has no provision for leakage from overlying aquifers as it is assumed that the upper layer is a confining clay layer. In realty this may not be the case particularly in areas where the confining layers are thin. Thirdly the lower deep aquifer may be deeper that the drilled depth which would increase the capacity of the aquifer. The model results indicate that when pumping rates are high as in the lower deep aquifer there is a greater risk of larger drawdowns and consequently a greater need for regular monitoring of the water levels and salinity of the aquifer at this location. Significantly the temporal variation so often observed is not simulated which indicates that pumping rates are not constant. Monitoring groundwater use would help to improve model results.
158. Fig 9.3 also shows that salinities for the upper deep aquifer increase by 0.21 kg/m3
(210 mg/l) during the 31 year simulation from 2009 to 2040. The pumping and operation of the tube wells should be such that salinities are not allowed to increase beyond 500 mg/l. Where salinity levels are already higher than 500 mg/l then regular monitoring of water levels, salinity and pumping rates should be undertaken to ensure that salinities remain below 1000 mg/l. This would allow a long term sustainable supply for coastal community. As the demand for potable water increases, it is only a matter of time before more deep wells are drilled to tap the lower deep aquifer. Thus a system of licensing and managing high extraction wells such as municipal water supply wells and irrigation wells may be required in the near future.
159. Fig 9.4 shows head and salinity concentrations in the upper deep aquifer (top row) and lower deep aquifer (bottom row) for bore 7 at Chota Nishanbaria Chak Mouza near coastal boundary from 2009 to 2040. This is an important location as it is near the coastal boundary and would be a good site to monitor the impact of seawater intrusion in the upper and lower deep aquifers.
160. Fig 9.4 shows salinity increase of 0.3 kg/m3 (300 mg/l) from 2009 to 2040. This is on top of a very high increase in salinity from 1969 to 2009 of over 2000 mg/l. Although the salinities seemed to have settled at 2.88 kg/m3 (2880 mg/l) the water quality is well above 1000 mg/l making it unsuitable as a drinking water source. This would suggest that the proximity of this bore to the coast makes it vulnerable to seawater intrusion particularly with increased pumping and sea-level rise. If field measurements show that this bore has low salinity water then the position of the interface would have to be moved further out to sea.
161. For the lower deep aquifer there is an increase in head of 0.6 m from 2009 to 2040 and increase in salinity of 0.38 kg/m3 (380 mg/l) from 2009 to 2040. This is on top of the 120 mg/l rise simulated from 1969 to 2009. This again would suggest that the proximity of this bore to coast makes it vulnerable to seawater intrusion. Again we

361
TA-8128 BAN: Preparing Coastal Towns Infrastructure Improvement Project – FR Vol. 4: Infrastructure
emphasise that the model is conceptual in nature as aquifer properties have been estimated and not calibrated. For robust predictions the models need to be calibrated for both heads and salinity in order to improve understanding of likely impacts.
162. We recommend a set of sentinel bores be used to provide communities with early warning of increasing seawater intrusion risk which could have an impact on their drinking water source.