azide derivatized anticancer agents of vitamin k 3: x-ray structural, dsc, resonance spectral and...
TRANSCRIPT
This article appeared in a journal published by Elsevier. The attachedcopy is furnished to the author for internal non-commercial researchand education use, including for instruction at the authors institution
and sharing with colleagues.
Other uses, including reproduction and distribution, or selling orlicensing copies, or posting to personal, institutional or third party
websites are prohibited.
In most cases authors are permitted to post their version of thearticle (e.g. in Word or Tex form) to their personal website orinstitutional repository. Authors requiring further information
regarding Elsevier’s archiving and manuscript policies areencouraged to visit:
http://www.elsevier.com/copyright
Author's personal copy
Azide derivatized anticancer agents of Vitamin K3: X-ray structural, DSC,resonance spectral and API studies
Kirti Badave a, Yogesh Patil a, Rajesh Gonnade b, Darbha Srinivas c, Rajan Dasgupta d, Ayesha Khan d,Sandhya Rane a,⇑a Department of Chemistry, University of Pune, Pune 411 007, Indiab Center for Material Characterization, National Chemical Laboratory, Pune 411 008, Indiac Catalysis Division, National Chemical Laboratory, Pune 411 008, Indiad Institute of Bioinformatics & Biotechnology, University of Pune, Pune 411 007, India
a r t i c l e i n f o
Article history:Received 15 July 2011Received in revised form 6 September 2011Accepted 8 September 2011Available online 14 September 2011
Keywords:Electronic isomersRAHB (resonance assisted H-bonding)API (Active Pharmaceutical Ingredients)Vitamin K3
Anticancer agents
a b s t r a c t
Compound 1 [1-imino (acetyl hydrazino)–Vitamin K3], displays valence tautomerically related electronicisomers as Form I and Form II. Form I exhibits 2D packing fragment with 1D ribbon chains of N–H� � �Ohydrogen bonds and shows EPR silent features. While Form II is EPR active and exhibits biradical naturewith double quantum transitions at g = 2.0040. 1H NMR of compound 2, [1-imino (hydrazino carboxyl-ate)–Vitamin K3] and Form II exhibit p delocalization via resonance assisted H-bonding [RAHB] effectcompared to Form I. Molecular interactions in Form I and II are visualized by DSC. The electronic struc-tures of compounds 1 and 2 have been correlated to their API values by measuring anticancer activities,mitochondrial potentials and DNA shearing patterns. Form II and compound 2 indicate mitochondriamediated apoptosis (�75% cell death) while Form I causes 35% cell death.
� 2011 Elsevier B.V. All rights reserved.
1. Introduction
Menadione (Vitamin K3) is a synthetic derivative of the natu-rally occurring Vitamins K1 and K2. In vitro, menadione is effectiveagainst a wide variety of tumor cells at concentrations that areclinically achievable IC50 values usually ranging from 10 to50 lM [1,2]. Like other quinonoid compounds menadione, iscytotoxic via electrophilic arylation or redox cycling [3]. In caseof menadione, the oxidative stress generated appears to be dose-dependent and capable to induce both apoptosis and necrosis,depending on the doses used [4]. Verrax et al. have shown thatmenadione redox-cycling is greatly increased by the addition ofascorbate; a fact that explains the synergistic antitumor activityof the ascorbate/menadione combination. While neither menadi-one nor ascorbate alone exhibit cytotoxicity at the doses whichthey were used in their in vitro and in vivo studies [5]. The modeof cell death by ascorbate/menadione was necrotic-like as con-firmed by annexin-V/propidium iodide labeled cells and lightmicroscopy examination [6]. Necrosis is a form of traumatic celldeath that results from acute cellular injury, in which the cellulardebris can cause damage to the normal cell. Thus apoptosis, the
process of programmed cell death (PCD) is a preferred mode of celldeath.
We have recently evaluated menadione derivatives for theiracid phosphatase (APase) enzyme inhibitory activity to suggestits probable antioncogenic candidature [5], wherein the imino-functionalized C-1 position of menadione oxime exhibited slightlyhigher activity than the parent menadione. Instead of simple iminefunctions such as oximes or Schiff’s bases, hydrazides exhibit car-cinostatic activity against several types of tumors, which may bedue to their ability of peptide like hydrogen bonding with greaterstability as suggested by Cabezas and Satterthwait [6]. Azide deriv-atives of therapeutically relevant compounds are useful as pro-drugs. In addition they are often better able to penetrate theblood–brain barrier than the corresponding drugs [7]. Hence to en-hance and exploit antioncogenic potency of Vitamin K3 [8], wehave coupled C-1 position of menadione with methyl and meth-oxy-derivative of acetyl hydrazine to perform iminofunctionalizedazide derivatives as compounds 1 and 2 respectively, as hybriddrugs [9,10]. Compound 1 exhibits characteristic redox isomersas Form I and Form II. In pharmaceutical solids as drug com-pounds, rigid molecules are rather rare and most of the activepharmaceutical ingredients (API) formed by molecules with eitherone or number of rotatable bonds and molecular units with confor-mational flexibility [11] are preferred. Such API value deals withexceptional valence tautomers expressed by resonance assisted
0022-2860/$ - see front matter � 2011 Elsevier B.V. All rights reserved.doi:10.1016/j.molstruc.2011.09.022
⇑ Corresponding author. Tel./fax: +91 20 25691728.E-mail address: [email protected] (S. Rane).
Journal of Molecular Structure 1006 (2011) 288–296
Contents lists available at SciVerse ScienceDirect
Journal of Molecular Structure
journal homepage: www.elsevier .com/locate /molstruc
Author's personal copy
H-bonding (RAHB) effect in 1 and it is compared with compound 2for substituent effect on hydrazides in the present investigations.The importance of RAHB in Vitamin K3 family members was estab-lished in our laboratory [5]. To gain insight of such RAHB in azidederivatized menadione towards stability, the anticancer activityagainst HeLa, HL-60 and CAPAN-1 cell lines via hybrid drug uptakeis reported in the current paper. The DNA laddering studies andmitochondrial membrane potential studies were performed toconfirm apoptotic mode of cell death.
2. Experimental
2.1. Measurements
2.1.1. C, H, N, S analytical dataC, H, N, S analytical data were done on FLASH EA 1112 series
(Thermo Electron Corporation).
2.1.2. 1H NMR spectra1H NMR spectra were recorded on Varian Mercury YH 300 NMR
instrument at 298 K. Chemical shift reported as ppm relative toTMS as internal standard.
2.1.3. Single crystal X-ray crystallographySingle crystal X-ray diffraction studies were conducted on se-
lected good quality single crystals of Form I of 1 using Leica polar-izing microscope and mounted on glass fibers with epoxy cement.The X-ray data were collected on a Brüker-AXS Smart Apex CCDdiffractometer at 297(2) K with graphite-monochromatized (MoKa = 0.71073 Å) radiation. The X-ray generator was operated at50 kV and 30 mA. The intensity measurements were monitoredby the SMART program (version 5.63, Brüker AXS Inc., Madison,Wisconsin, USA, 1997). Data reduction was performed with theSAINT software (version 6.45, Brüker AXS Inc., Madison, Wisconsin,USA, 2003). All the data were corrected for Lorentz and polariza-tion effects. A semi-empirical absorption correction based on sym-metry equivalent reflections was applied by using the SADABSprogram, G.M. Sheldrick, SADABS (version 2.10, Brüker AXS Inc.,Madison, Wisconsin, USA, 2003). Lattice parameters were deter-mined from the least squares analysis of all reflections. The struc-ture was solved by direct method and refined by full matrix leastsquares, based on F2, using the SHELXTL software package (G.M.Sheldrick, SHELXTL 6.14, Program for the structure solution andrefinement, Brüker AXS Inc., Madison, Wisconsin, USA, 2000). Allnon-hydrogen atoms were refined with anisotropic displacementparameters. The hydrogen atoms in all structures were includedin the refinement as per the riding model option in SHELXL (Bru-ker, 2003). Hydrogen atoms in all the structures were located froma difference Fourier map, their positional coordinates and isotropicthermal parameters were refined. Molecular and packing diagramswere generated using ORTEP-32 and Mercury-2.3. Geometrical cal-culations were performed using SHELXTL (Brüker, 2003) andPLATON.
2.1.4. DSC analysisThe thermal behavior of tautomers of 1 (Form I, Form II) and 2
were investigated by measuring enthalpy change on DSC-60, Shi-madzu Scientific Instrument at Department of Chemistry, Univer-sity of Pune, Pune 411 007. Indium (99.99%) DHfusion = 97 cal/g,M.P. 156.4� were used to prepare calibration curve and to calibratetemperature axis. Crystals (wt. 1 mg) were placed on an aluminumpan (5 mm diameter) and were analyzed from low temperature(�120 �C) using an empty pan as the reference. The heating ratewas 5 �C/min and nitrogen gas was used for purging.
2.1.5. EPR measurementsThe X band EPR spectra of Form II of 1 were recorded on a Brü-
ker EMX EPR spectrometer at National Chemical Laboratory, Pune411 008, operating at X-band 9.42 GHz frequency and 100 kHzfield modulation.
2.2. Materials
Synthetic starting material, reagents and solvents were of ana-lytical grade. Menadione (3-methyl-1,4-naphthoquinone), acetylhydrazide, methyl hydrazino carboxylate were obtained from Sig-ma–Aldrich. Solvents used in synthesis and crystallization are ofextra pure HPLC grade purchased from RANCHEM (India). The pro-gress of the reaction was monitored by thin layer chromatographywith F254 silica-gel precoated sheets (Merck) using hexane/acetone60/40 as eluent; UV light was used for detection.
2.3. Synthesis
2.3.1. Synthesis of 1 (Form I and Form II)A mixture of acetyl hydrazine (0.74 g, 0.01 mol) and menadione
(1.72 g, 0.01 mol) was dissolved in mixture of methanol (30 ml)and acetic acid (5.12 ml, 2 mol). The solution was refluxed for24 h and then mixture was allowed to cool, yielded yellow crystal-line compound (Form I). It was collected by filtration, rinsed thor-oughly with methanol, dried.
The clear filtrate yielded deep red brown micro crystals of FormII after 15 days, which were collected by filtration, washed withmethanol and dried under vacuum.
Form I: Yellow crystals, Yield: (1.16 g) 50.86%, Anal. Calc.: C,68.41; H, 5.30; N, 12.27. Found: C, 68.38; H, 5.10; N, 12.73. 1HNMR (300 MHz, CDCl3) [C2–H2 at �7.5 d(s), C5–H5 at �8.3 d(d);C8–H8 at �8.2 d(d); C6–H6 at �7.65 d(t); C7–H7 at �7.6 d(t)].
Form II: Red brown crystals, Yield: (0.320 g) 14.03%, Anal. Calc.:C, 68.41; H, 5.30; N, 12.27. Found: C, 67.75; H, 4.98; N, 12.44. 1HNMR (300 MHz, CDCl3) [C2–H2 at �7.5 d(s), C5–H5 at �8.3 d(d);C8–H8 at �8.2 d(d); C6–H6 at �7.65 d(t); C7–H7 at �7.6 d(t)].
Retention factor (Rf) of menadione, Form I of 1 and Form II of 1are 0.825, 0.675, 0.600 respectively using solvent hexane:acetone:3:2 ratio.
2.3.2. Synthesis of 2A mixture of menadione (1.72 g, 0.01 mol) and methyl hydra-
zino carboxylate (0.90 g, 0.01 mol) was dissolved in mixture ofmethanol (30 ml) and acetic acid (5.12 ml, 2 mol). The solutionwas refluxed for 5 h and then mixture was allowed to cool, yieldedyellow crystalline compound. It was collected by filtration, rinsedthoroughly with methanol, dried.
Yellow crystalline powder of 2: Yield: (1.85 g) 75.81%, Anal.Calc.: C, 63.99; H, 4.95; N, 11.45. Found: C, 63.55; H, 4.80; N,11.65. 1H NMR data in d6-DMSO: aromatic protons: C5–H5 at8.237 d(d); C8–H8 at 8.06 d(d); C6–H6 at 7.7 d(t); C7–H7 at 7.59d(t); quinonoidal ring protons C2–H2 at 8.1 d(s); methyl proton2.082 d(s); hydrazino fragment protons-methoxy at 3.8 d(s); amideN2–H2 at 11.59 d(s).
Retention factor (Rf) of menadione and compound 2 are 0.825,0.725 respectively using solvent hexane:acetone: 3:2 ratio.
2.4. Biological activity
2.4.1. Anticancer activityThe cells were trypsinized using TPVG solution. 1 ml of 1 � 105
cells/ml of medium and dilutions of concentration 5, 10, 15, 20 and25 lM was added in 96 well plates and kept in the CO2 incubatorfor 24, 28, 72 and 96 h. The compounds were dissolved in 20%DMSO to obtain a solution of 1 mM concentration each. These
K. Badave et al. / Journal of Molecular Structure 1006 (2011) 288–296 289
Author's personal copy
samples were then filter sterilized using a 0.22 lm filter using syr-inge filter. All experiments were carried out in Laminar flow hoods,Laminar Flow Ultraclean Air Unit, Microfilt, India. The cells werevisualized using an Inverted Microscope, Olympus.
The number of viable cells remaining after appropriate treat-ment was determined by 3-(4,5-dimethylthiazol-2-yl)-2,5-diphe-nyltetrazolium bromide (MTT; Sigma Chemical Co.) assay [12].After 24, 48, 72 h, and 96 h MTT was added to each well at a finalvolume of 0.5 mg/ml and the microplates were incubated at 37 �Cfor 3 h. After the supernatant was removed, the formazan saltresulting from the reduction of MTT was solubilized in dimethylsulfoxide (DMSO, Sigma Chemical Co.) and the absorbance wasread at 570 nm using an automatic plate reader (Thermo Corpora-tion). The cell viability was extrapolated from the absorbance val-ues and expressed as percent survival. Fluorescence Microscopicstudies were carried out on a Carl Zeiss Fluorescence Microscopes.
2.4.2. DNA Ladder assay1.0 ml of 1 � 105 cells/ml of the cell culture was taken and cen-
trifuged at 10,000 rpm for 15 min. To the supernatant 100 ll lysisbuffer (without SDS) was added and kept at room temperature for5 min and mixed on a cyclomixer (vortex). Lysis buffer (300 ll withSDS) was added and gently mixed by inversion. This was followedby the addition of 66 ll of 5 M NaCl. The mixture was centrifugedat 10,000 rpm for 30 min at room temperature and the supernatanttransferred to a new micro-centrifuge tube. Equal volumes of chlo-roform was added and mixed gently till it turned milky. The mix-ture was treated with RNase for 5 min. Equal volume of chloroformwas added and mixed gently till it turned milky. Ice-cold isopropa-nol was added and incubated for 1 h on ice. The mixture was cen-trifuged at 10,000 rpm for 15 min and the supernatant wasdecanted. The DNA pellet was air dried to remove traces of isopro-panol and re-suspended in about 50 ll of Tris EDTA buffer. TheDNA isolated was run on a gel and absorbance at 260/280 nmwas noted to assess the purity of extracted DNA. The DNA obtainedwas 69 ng/ml.
2.4.3. Mitochondrial membrane potential measurementsMitochondria from rat heart were isolated as described previ-
ously [13]. Incubations were conducted at either 28 �C or 37 �C ina medium composed of 135 mM KCl, 20 mM MOPS, 5 mMK2HPO4 and 5 mM MgCl2 at pH 7.00. Substrates were added asindicated in the figure legends. Incubations also contained R123at concentrations indicated in the figure legends. Isolated mito-chondria were kept at 4 �C and used within 4 h after isolation.
Rhodamine 123 dissolved in methanol was used directly. Themethanol concentrations in all incubations of mitochondria werekept at 0.5% (v/v). Fluorescent measurements of mitochondriaand extracts were made using a Spectra Max5 (Molecular Probes)Multiscanner using a 90� excitation and emission optical pathand a thermostat cuvette holder. The excitation and emission slitswere 0.5 mm, to yield a bandpass of 2.1 nm.
3. Results and discussion
3.1. Synthesis and characterization
Iminofunctionalized azide derivatives 1 and 2 were synthesizedby coupling at C-1 position of Vitamin K3 in good yields. The redoxisomeric electronic structures of 1 as Form I and Form II are char-acterized in solid state and in solution with the help of thermo-chemical DSC and resonance spectral (ESR and 1H NMR) studies.The active pharmaceutical ingredients (API) are identified fromtheir anticancer activity.
3.2. Electronic isomer in Form I of 1 with X-ray crystal structure suchas ketohydrazone
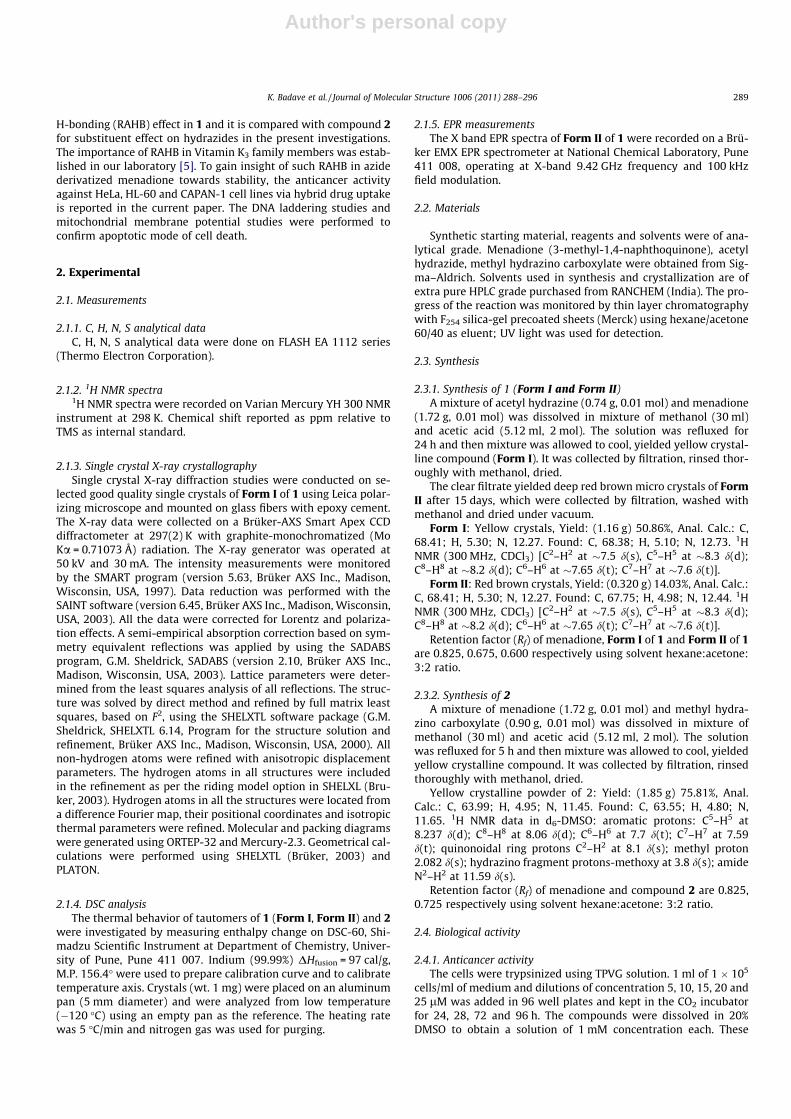
Recently, we have established valence tautomers or electronicisomers in derivatized naphthoquinones [5,14,15] with respect totheir polymorphic behavior and chemical nature. A single crystalX-ray structure is solved to identify such redox form of 1 as ther-modynamic yellow crystalline stable Form I at high temperatureand metastable kinetic brick red fine crystalline Form II obtainedon cooling the filtrate of Form I. Fig. 1 shows a typical ORTEP viewof Form I of 1.
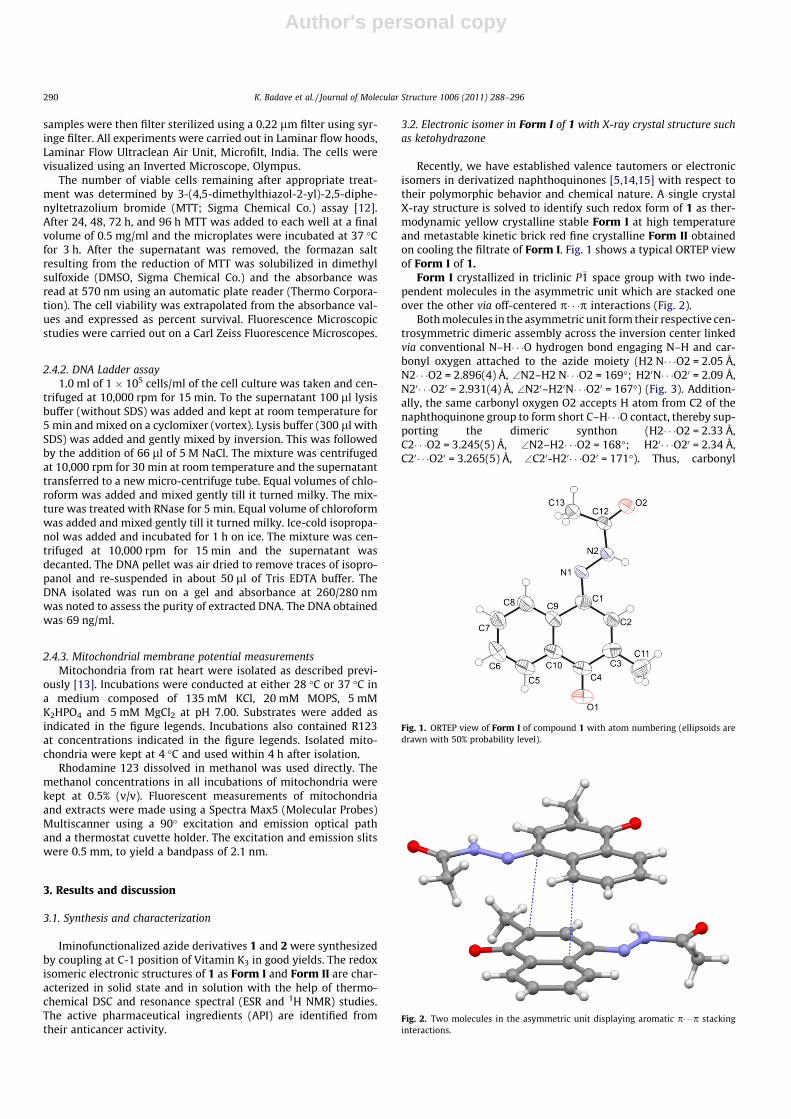
Form I crystallized in triclinic P�1 space group with two inde-pendent molecules in the asymmetric unit which are stacked oneover the other via off-centered p� � �p interactions (Fig. 2).
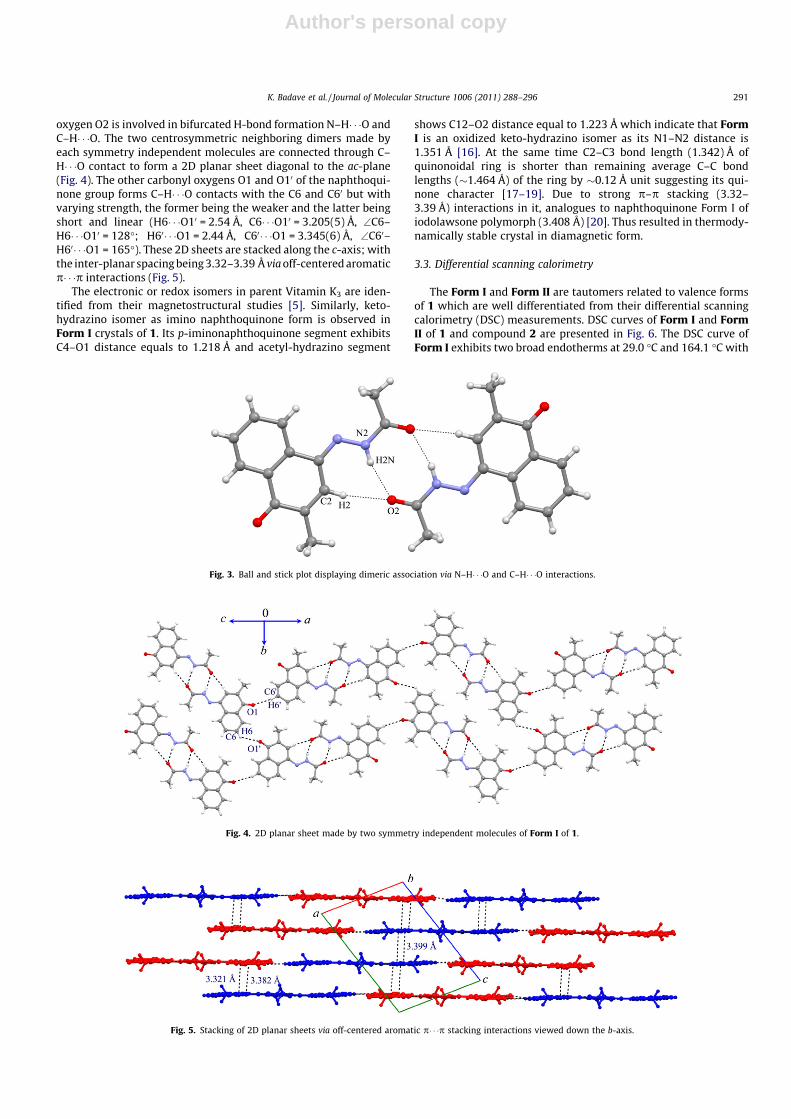
Both molecules in the asymmetric unit form their respective cen-trosymmetric dimeric assembly across the inversion center linkedvia conventional N–H� � �O hydrogen bond engaging N–H and car-bonyl oxygen attached to the azide moiety (H2 N� � �O2 = 2.05 Å,N2� � �O2 = 2.896(4) Å, \N2–H2 N� � �O2 = 169�; H20N� � �O20 = 2.09 Å,N20� � �O20 = 2.931(4) Å, \N20–H20N� � �O20 = 167�) (Fig. 3). Addition-ally, the same carbonyl oxygen O2 accepts H atom from C2 of thenaphthoquinone group to form short C–H� � �O contact, thereby sup-porting the dimeric synthon (H2� � �O2 = 2.33 Å,C2� � �O2 = 3.245(5) Å, \N2–H2� � �O2 = 168�; H20� � �O20 = 2.34 Å,C20� � �O20 = 3.265(5) Å, \C20-H20� � �O20 = 171�). Thus, carbonyl
Fig. 1. ORTEP view of Form I of compound 1 with atom numbering (ellipsoids aredrawn with 50% probability level).
Fig. 2. Two molecules in the asymmetric unit displaying aromatic p� � �p stackinginteractions.
290 K. Badave et al. / Journal of Molecular Structure 1006 (2011) 288–296
Author's personal copy
oxygen O2 is involved in bifurcated H-bond formation N–H� � �O andC–H� � �O. The two centrosymmetric neighboring dimers made byeach symmetry independent molecules are connected through C–H� � �O contact to form a 2D planar sheet diagonal to the ac-plane(Fig. 4). The other carbonyl oxygens O1 and O10 of the naphthoqui-none group forms C–H� � �O contacts with the C6 and C60 but withvarying strength, the former being the weaker and the latter beingshort and linear (H6� � �O10 = 2.54 Å, C6� � �O10 = 3.205(5) Å, \C6–H6� � �O10 = 128�; H60� � �O1 = 2.44 Å, C60� � �O1 = 3.345(6) Å, \C60–H60� � �O1 = 165�). These 2D sheets are stacked along the c-axis; withthe inter-planar spacing being 3.32–3.39 Å via off-centered aromaticp� � �p interactions (Fig. 5).
The electronic or redox isomers in parent Vitamin K3 are iden-tified from their magnetostructural studies [5]. Similarly, keto-hydrazino isomer as imino naphthoquinone form is observed inForm I crystals of 1. Its p-iminonaphthoquinone segment exhibitsC4–O1 distance equals to 1.218 Å and acetyl-hydrazino segment
shows C12–O2 distance equal to 1.223 Å which indicate that FormI is an oxidized keto-hydrazino isomer as its N1–N2 distance is1.351 Å [16]. At the same time C2–C3 bond length (1.342) Å ofquinonoidal ring is shorter than remaining average C–C bondlengths (�1.464 Å) of the ring by �0.12 Å unit suggesting its qui-none character [17–19]. Due to strong p–p stacking (3.32–3.39 Å) interactions in it, analogues to naphthoquinone Form I ofiodolawsone polymorph (3.408 Å) [20]. Thus resulted in thermody-namically stable crystal in diamagnetic form.
3.3. Differential scanning calorimetry
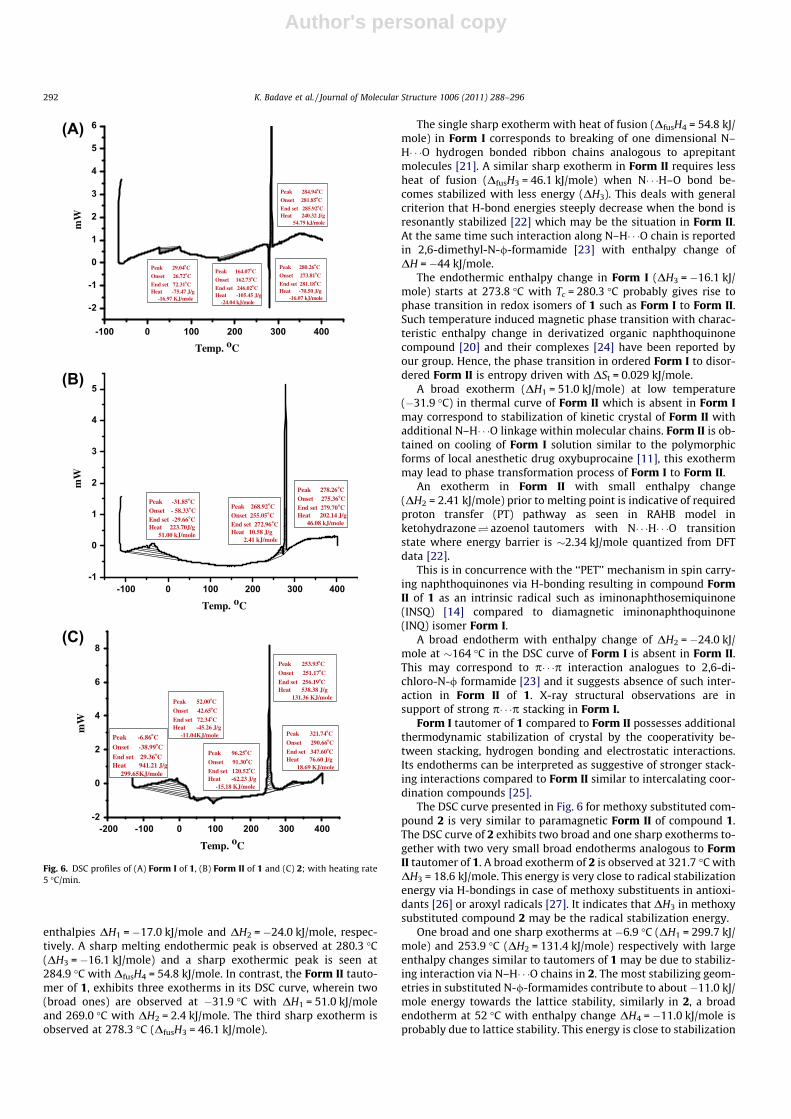
The Form I and Form II are tautomers related to valence formsof 1 which are well differentiated from their differential scanningcalorimetry (DSC) measurements. DSC curves of Form I and FormII of 1 and compound 2 are presented in Fig. 6. The DSC curve ofForm I exhibits two broad endotherms at 29.0 �C and 164.1 �C with
Fig. 3. Ball and stick plot displaying dimeric association via N–H� � �O and C–H� � �O interactions.
Fig. 4. 2D planar sheet made by two symmetry independent molecules of Form I of 1.
Fig. 5. Stacking of 2D planar sheets via off-centered aromatic p� � �p stacking interactions viewed down the b-axis.
K. Badave et al. / Journal of Molecular Structure 1006 (2011) 288–296 291
Author's personal copy
enthalpies DH1 = �17.0 kJ/mole and DH2 = �24.0 kJ/mole, respec-tively. A sharp melting endothermic peak is observed at 280.3 �C(DH3 = �16.1 kJ/mole) and a sharp exothermic peak is seen at284.9 �C with DfusH4 = 54.8 kJ/mole. In contrast, the Form II tauto-mer of 1, exhibits three exotherms in its DSC curve, wherein two(broad ones) are observed at �31.9 �C with DH1 = 51.0 kJ/moleand 269.0 �C with DH2 = 2.4 kJ/mole. The third sharp exotherm isobserved at 278.3 �C (DfusH3 = 46.1 kJ/mole).
The single sharp exotherm with heat of fusion (DfusH4 = 54.8 kJ/mole) in Form I corresponds to breaking of one dimensional N–H� � �O hydrogen bonded ribbon chains analogous to aprepitantmolecules [21]. A similar sharp exotherm in Form II requires lessheat of fusion (DfusH3 = 46.1 kJ/mole) when N� � �H–O bond be-comes stabilized with less energy (DH3). This deals with generalcriterion that H-bond energies steeply decrease when the bond isresonantly stabilized [22] which may be the situation in Form II.At the same time such interaction along N–H� � �O chain is reportedin 2,6-dimethyl-N-/-formamide [23] with enthalpy change ofDH = �44 kJ/mole.
The endothermic enthalpy change in Form I (DH3 = �16.1 kJ/mole) starts at 273.8 �C with Tc = 280.3 �C probably gives rise tophase transition in redox isomers of 1 such as Form I to Form II.Such temperature induced magnetic phase transition with charac-teristic enthalpy change in derivatized organic naphthoquinonecompound [20] and their complexes [24] have been reported byour group. Hence, the phase transition in ordered Form I to disor-dered Form II is entropy driven with DSt = 0.029 kJ/mole.
A broad exotherm (DH1 = 51.0 kJ/mole) at low temperature(�31.9 �C) in thermal curve of Form II which is absent in Form Imay correspond to stabilization of kinetic crystal of Form II withadditional N–H� � �O linkage within molecular chains. Form II is ob-tained on cooling of Form I solution similar to the polymorphicforms of local anesthetic drug oxybuprocaine [11], this exothermmay lead to phase transformation process of Form I to Form II.
An exotherm in Form II with small enthalpy change(DH2 = 2.41 kJ/mole) prior to melting point is indicative of requiredproton transfer (PT) pathway as seen in RAHB model inketohydrazone� azoenol tautomers with N� � �H� � �O transitionstate where energy barrier is �2.34 kJ/mole quantized from DFTdata [22].
This is in concurrence with the ‘‘PET’’ mechanism in spin carry-ing naphthoquinones via H-bonding resulting in compound FormII of 1 as an intrinsic radical such as iminonaphthosemiquinone(INSQ) [14] compared to diamagnetic iminonaphthoquinone(INQ) isomer Form I.
A broad endotherm with enthalpy change of DH2 = �24.0 kJ/mole at �164 �C in the DSC curve of Form I is absent in Form II.This may correspond to p� � �p interaction analogues to 2,6-di-chloro-N-/ formamide [23] and it suggests absence of such inter-action in Form II of 1. X-ray structural observations are insupport of strong p� � �p stacking in Form I.
Form I tautomer of 1 compared to Form II possesses additionalthermodynamic stabilization of crystal by the cooperativity be-tween stacking, hydrogen bonding and electrostatic interactions.Its endotherms can be interpreted as suggestive of stronger stack-ing interactions compared to Form II similar to intercalating coor-dination compounds [25].
The DSC curve presented in Fig. 6 for methoxy substituted com-pound 2 is very similar to paramagnetic Form II of compound 1.The DSC curve of 2 exhibits two broad and one sharp exotherms to-gether with two very small broad endotherms analogous to FormII tautomer of 1. A broad exotherm of 2 is observed at 321.7 �C withDH3 = 18.6 kJ/mole. This energy is very close to radical stabilizationenergy via H-bondings in case of methoxy substituents in antioxi-dants [26] or aroxyl radicals [27]. It indicates that DH3 in methoxysubstituted compound 2 may be the radical stabilization energy.
One broad and one sharp exotherms at �6.9 �C (DH1 = 299.7 kJ/mole) and 253.9 �C (DH2 = 131.4 kJ/mole) respectively with largeenthalpy changes similar to tautomers of 1 may be due to stabiliz-ing interaction via N–H� � �O chains in 2. The most stabilizing geom-etries in substituted N-/-formamides contribute to about�11.0 kJ/mole energy towards the lattice stability, similarly in 2, a broadendotherm at 52 �C with enthalpy change DH4 = �11.0 kJ/mole isprobably due to lattice stability. This energy is close to stabilization
-100 0 100 200 300 400
-2
-1
0
1
2
3
4
5
6
Peak 29.04οC
Onset 26.72οC
End set 72.31οCHeat -75.47 J/g -16.97 KJ/mole
Peak 164.07οC
Onset 162.73οC
End set 246.02οCHeat -105.45 J/g -24.04 kJ/mole
Peak 280.26οC
Onset 273.81οC
End set 281.18οCHeat -70.50 J/g -16.07 kJ/mole
Peak 284.94οC
Onset 281.85οC
End set 285.92οCHeat 240.32 J/g 54.79 kJ/mole
Temp. oC
mW
(A)
-100 0 100 200 300 400-1
0
1
2
3
4
5
Peak -31.85οCOnset - 58.33οCEnd set -29.66οCHeat 223.70J/g 51.00 kJ/mole
Peak 278.26οCOnset 275.36οCEnd set 279.70οCHeat 202.14 J/g 46.08 kJ/mole
Peak 268.92οCOnset 255.05οCEnd set 272.96οCHeat 10.58 J/g 2.41 kJ/mole
mW
Temp. oC
(B)
-200 -100 0 100 200 300 400-2
0
2
4
6
8
Peak 96.25οC
Onset 91.30οC
End set 120.52οCHeat -62.23 J/g -15.18 KJ/mole
Peak 321.74οC
Onset 290.66οC
End set 347.60οCHeat 76.60 J/g 18.69 KJ/mole
Peak 253.93οC
Onset 251.17οC
End set 256.19οCHeat 538.38 J/g 131.36 KJ/mole
Peak 52.00οC
Onset 42.65οC
End set 72.34οCHeat -45.26 J/g -11.04KJ/mole Peak -6.86οC
Onset -38.99οC
End set 29.36οCHeat 941.21 J/g 299.65KJ/mole
mW
Temp. oC
(C)
Fig. 6. DSC profiles of (A) Form I of 1, (B) Form II of 1 and (C) 2; with heating rate5 �C/min.
292 K. Badave et al. / Journal of Molecular Structure 1006 (2011) 288–296
Author's personal copy
by edge to face C–H� � �p interaction as seen in methyl substitutedformamides [23].
In DSC curve of 2 a small endotherm prior to melting exotherm,with DH5 = �15.2 kJ/mole at 96.3 �C, may govern the phase changeanalogous to spin carrying 3-iodo-2-hydroxy-1,4-naphthoquinone[20].
Lastly, if we compare the energy changes in terms of total en-thalpy change for exothermic N–H� � �O interactions in Form I andForm II of 1 and 2 compounds, it exhibits increasing order. Com-parison between non-resonant static and stable Form I (DEHB =54.8 kJ/mole) with resonant Form II (DEHB = 51.0 + 46.1 = 97.1 kJ/mole) of compound 1, there is �1.8 times increase in energy dueto contribution of resonance analogues to tautomeric b-aminoneand b-enaminone [28] forms. In the case of compound 2(DEHB = 299.7 + 131.4 = 431.1 kJ/mole) which is �7.8 times greaterthan non-resonant Form I and �4.4 times higher than resonantForm II of compound 1. This indicates that in compound 2, e�
donating methoxy substituents shift the RAHB more towards imi-noenol form compared to ketohydrazino Form I similar as azo-naphthol tautomers [22,28] which is shown in Scheme-I [seeSupplementary material].
3.4. Resonance spectral studies
The degree of p-delocalization of ketohydrazino fragment in 1and 2 depends on chemical substitution enhancing RAHB mecha-nism which is supported by infra resonance spectral studies.
3.4.1. 1H NMR spectraForm I and Form II tautomers of 1 exhibit in aprotic CDCl3 sim-
ilar spectra for aromatic protons in the region 7.5–8.3 ppm. [C5–H5
at �8.3 d(d); C8–H8 at �8.2 d(d); C6–H6 at �7.65 d(t); C7–H7 at�7.6 ppm d(t)] [29]. The methyl protons of menadione fragmentsand acetyl hydrazine fragments are observed at �2.3 d(s) and�2.5 d(s), respectively. The quinonoidal ring proton (C2–H2) ofForm II, shows upfield shift (7.3 d) compared to Form I (7.5 d).Similarly, the D2O exchangeable amide –NH proton in Form II
exhibits upfield shift (9.46 d) [30] compared to Form I (10 d). Likeb-enaminonic system [26] remarkable r delocalizations via
2000 2500 3000 3500 4000 4500
-20000
-10000
0
10000
20000
g = 2.0038
Inte
nsit
y
Field (G)
3000 3200 3400 3600 3800 4000-2000
-1000
0
1000
2000
3000
Inte
nsit
y
Field (G)
g = 2.0043
(a) (b)
Fig. 7. Solid state X-band EPR spectra of Form-II of 1 at 298 K: (a) fine brown colored powder and (b) crystalline form.
Table 1Theoretically generated molecular parameters.
S. no. Compound miLogP(calculated)
LogP(observed)
TPSA nrotb
1 Menadione 2.044 1.928 34.142 02 Form I (1) 1.876 2.054 58.533 13 Form II (1) 1.972 2.025 41.674 14 2 2.376 2.613 67.767 2
HeLa
0
20
40
60
80
100
5 20 50 100 200
Conc. (μμM)
% C
ell V
iabl
ility
(A) HeLa cell lines
CAPAN-1
0
20
40
60
80
100
5 20 50 100 200
Conc. (μM)
% C
ell V
iabi
lity
HL-60
0
20
40
60
80
100
5 20 50 100 200
Conc. (μM)
% C
ell V
iabi
lity
(B) CAPAN-1 cell lines
(C) HL-60 cell lines
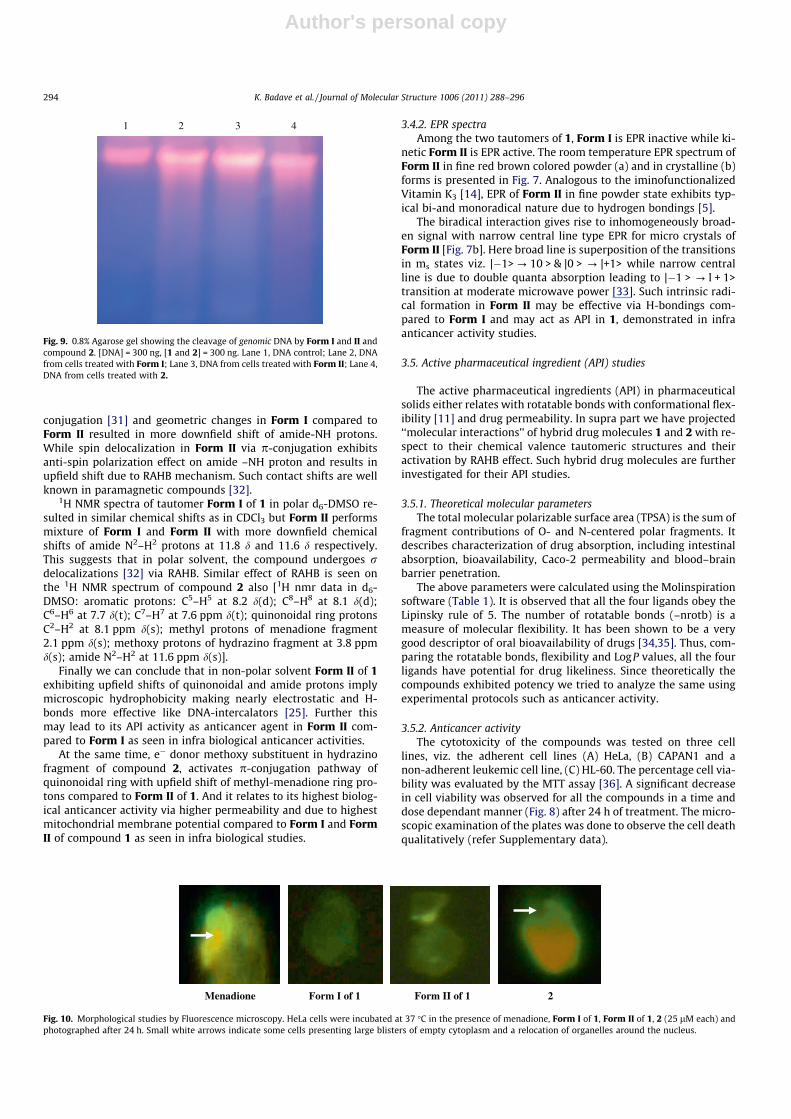
Fig. 8. Effect of the menadione , Form I of 1 , Form II of 1 and 2 on cellsurvival. Cells were incubated for 24 h at different concentrations of ranging from 5to 200 lM. Results represent the mean values from at least three experiments.�p < 0.05 as compared with control values (untreated conditions).
K. Badave et al. / Journal of Molecular Structure 1006 (2011) 288–296 293
Author's personal copy
conjugation [31] and geometric changes in Form I compared toForm II resulted in more downfield shift of amide-NH protons.While spin delocalization in Form II via p-conjugation exhibitsanti-spin polarization effect on amide –NH proton and results inupfield shift due to RAHB mechanism. Such contact shifts are wellknown in paramagnetic compounds [32].
1H NMR spectra of tautomer Form I of 1 in polar d6-DMSO re-sulted in similar chemical shifts as in CDCl3 but Form II performsmixture of Form I and Form II with more downfield chemicalshifts of amide N2–H2 protons at 11.8 d and 11.6 d respectively.This suggests that in polar solvent, the compound undergoes rdelocalizations [32] via RAHB. Similar effect of RAHB is seen onthe 1H NMR spectrum of compound 2 also [1H nmr data in d6-DMSO: aromatic protons: C5–H5 at 8.2 d(d); C8–H8 at 8.1 d(d);C6–H6 at 7.7 d(t); C7–H7 at 7.6 ppm d(t); quinonoidal ring protonsC2–H2 at 8.1 ppm d(s); methyl protons of menadione fragment2.1 ppm d(s); methoxy protons of hydrazino fragment at 3.8 ppmd(s); amide N2–H2 at 11.6 ppm d(s)].
Finally we can conclude that in non-polar solvent Form II of 1exhibiting upfield shifts of quinonoidal and amide protons implymicroscopic hydrophobicity making nearly electrostatic and H-bonds more effective like DNA-intercalators [25]. Further thismay lead to its API activity as anticancer agent in Form II com-pared to Form I as seen in infra biological anticancer activities.
At the same time, e� donor methoxy substituent in hydrazinofragment of compound 2, activates p-conjugation pathway ofquinonoidal ring with upfield shift of methyl-menadione ring pro-tons compared to Form II of 1. And it relates to its highest biolog-ical anticancer activity via higher permeability and due to highestmitochondrial membrane potential compared to Form I and FormII of compound 1 as seen in infra biological studies.
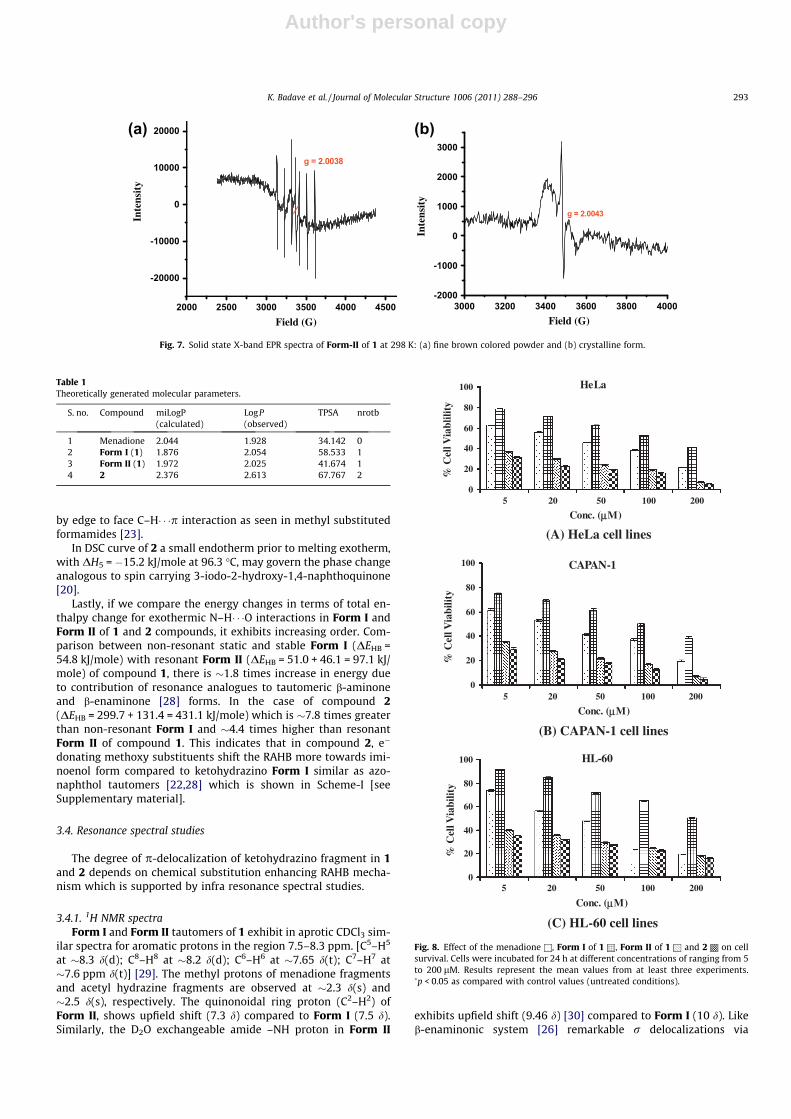
3.4.2. EPR spectraAmong the two tautomers of 1, Form I is EPR inactive while ki-
netic Form II is EPR active. The room temperature EPR spectrum ofForm II in fine red brown colored powder (a) and in crystalline (b)forms is presented in Fig. 7. Analogous to the iminofunctionalizedVitamin K3 [14], EPR of Form II in fine powder state exhibits typ-ical bi-and monoradical nature due to hydrogen bondings [5].
The biradical interaction gives rise to inhomogeneously broad-en signal with narrow central line type EPR for micro crystals ofForm II [Fig. 7b]. Here broad line is superposition of the transitionsin ms states viz. |�1> ? 10 > & |0 > ? |+1> while narrow centralline is due to double quanta absorption leading to |�1 > ? l + 1>transition at moderate microwave power [33]. Such intrinsic radi-cal formation in Form II may be effective via H-bondings com-pared to Form I and may act as API in 1, demonstrated in infraanticancer activity studies.
3.5. Active pharmaceutical ingredient (API) studies
The active pharmaceutical ingredients (API) in pharmaceuticalsolids either relates with rotatable bonds with conformational flex-ibility [11] and drug permeability. In supra part we have projected‘‘molecular interactions’’ of hybrid drug molecules 1 and 2 with re-spect to their chemical valence tautomeric structures and theiractivation by RAHB effect. Such hybrid drug molecules are furtherinvestigated for their API studies.
3.5.1. Theoretical molecular parametersThe total molecular polarizable surface area (TPSA) is the sum of
fragment contributions of O- and N-centered polar fragments. Itdescribes characterization of drug absorption, including intestinalabsorption, bioavailability, Caco-2 permeability and blood–brainbarrier penetration.
The above parameters were calculated using the Molinspirationsoftware (Table 1). It is observed that all the four ligands obey theLipinsky rule of 5. The number of rotatable bonds (–nrotb) is ameasure of molecular flexibility. It has been shown to be a verygood descriptor of oral bioavailability of drugs [34,35]. Thus, com-paring the rotatable bonds, flexibility and LogP values, all the fourligands have potential for drug likeliness. Since theoretically thecompounds exhibited potency we tried to analyze the same usingexperimental protocols such as anticancer activity.
3.5.2. Anticancer activityThe cytotoxicity of the compounds was tested on three cell
lines, viz. the adherent cell lines (A) HeLa, (B) CAPAN1 and anon-adherent leukemic cell line, (C) HL-60. The percentage cell via-bility was evaluated by the MTT assay [36]. A significant decreasein cell viability was observed for all the compounds in a time anddose dependant manner (Fig. 8) after 24 h of treatment. The micro-scopic examination of the plates was done to observe the cell deathqualitatively (refer Supplementary data).
1 2 3 4
Fig. 9. 0.8% Agarose gel showing the cleavage of genomic DNA by Form I and II andcompound 2. [DNA] = 300 ng, [1 and 2] = 300 ng. Lane 1, DNA control; Lane 2, DNAfrom cells treated with Form I; Lane 3, DNA from cells treated with Form II; Lane 4,DNA from cells treated with 2.
Menadione Form I of 1 Form II of 1 2
Fig. 10. Morphological studies by Fluorescence microscopy. HeLa cells were incubated at 37 �C in the presence of menadione, Form I of 1, Form II of 1, 2 (25 lM each) andphotographed after 24 h. Small white arrows indicate some cells presenting large blisters of empty cytoplasm and a relocation of organelles around the nucleus.
294 K. Badave et al. / Journal of Molecular Structure 1006 (2011) 288–296
Author's personal copy
Preliminary microscopic studies of the cell suggested apoptoticmode of cell death. Compound 2 exhibited the highest toxicitywhile among the two forms of 1 viz. Form II showed activity sim-ilar to Compound 2. The activity of menadione was comparablewith an earlier report [37].
3.5.3. Effect of compounds on DNAGel electrophoresis was carried out for detecting DNA fragmen-
tation to confirm the mode of cell death either necrosis or apopto-sis. The genomic DNA was extracted after treating the HeLa celllines with the ligands Form I and Form II of compound 1 and com-pound 2. Fig. 9 describes the cleaving pattern observed by Agarosegel electrophoresis (0.8–1%) to visualize the DNA. A shearing pat-tern was observed instead of ladder formation, which is usually ob-tained for planar compounds [38]. Similar DNA patterns were alsoobserved by us for HL-60 as well as CAPAN1 cell lines.
3.5.4. Fluorescence microscopic imagesSince the compounds exhibited intrinsic fluorescence the drug
uptake was monitored using fluorescence microscopy. The druguptake could be most likely due to the adherence of the com-pounds to the plasma membrane by electrostatic attraction beforeits transport across the membrane facilitated by difference in con-centration gradient or some other unknown mechanism. The emis-sion spectra of the compounds show that there is greater excitationat 430 nm, which is a typical minimum excitation wavelength forsingle-photon confocal microscopy experiments [39].
After 24 h of treatment the cells were washed with PBS andfixed onto a glass slide. Menadione, Form II of 1 and 2 showed thatthe compounds (25 lM) were easily taken up by the HeLa cells.The mode of cell death for menadione is found to be ‘‘autochizis’’[40]. In case of Form I, Form II of 1 and compound 2, apoptotic celldeaths were observed by the inverted microscopic images. Theseresults were confirmed with DNA laddering studies [41]. Howeverfor Form I it is probable that the compound just adhered to the cellsurface and brought about some morphological changes leading tocell death. However, no drug uptake was observed in this case ascompared to menadione, Form II of 1 and 2. Thus the activitymechanism for Form I of 1 is different and needs to be explored.
Although the chem-informatics data indicated drug likelinessfor all the four ligands, while the MTT data observed was different.This difference in cell death may be due to the differential drug up-take as observed by the fluorescence microscopic images (seeFig. 10).
3.5.5. Mitochondrial membrane potential measurementsSince the DNA data indicate apoptotic mode of cell death, it was
essential to confirm whether the cell death was mediated throughthe mitochondrial membrane. As Form I of 1 did not show druguptake, this effect needed to be confirmed using mitochondrialmembrane potential measurements [42].
In coupled mitochondria, the excitation and emission wave-lengths of peak intensities of Rhodamine 123 were 510 and534 nm, respectively. Upon deenergizing with dinitrophenol, thesewavelengths shifted to 500 and 526 nm. The maximum differencein the excitation spectra between the coupled and uncoupled statewith Rhodamine 123 occurred at 497 and 520 nm.
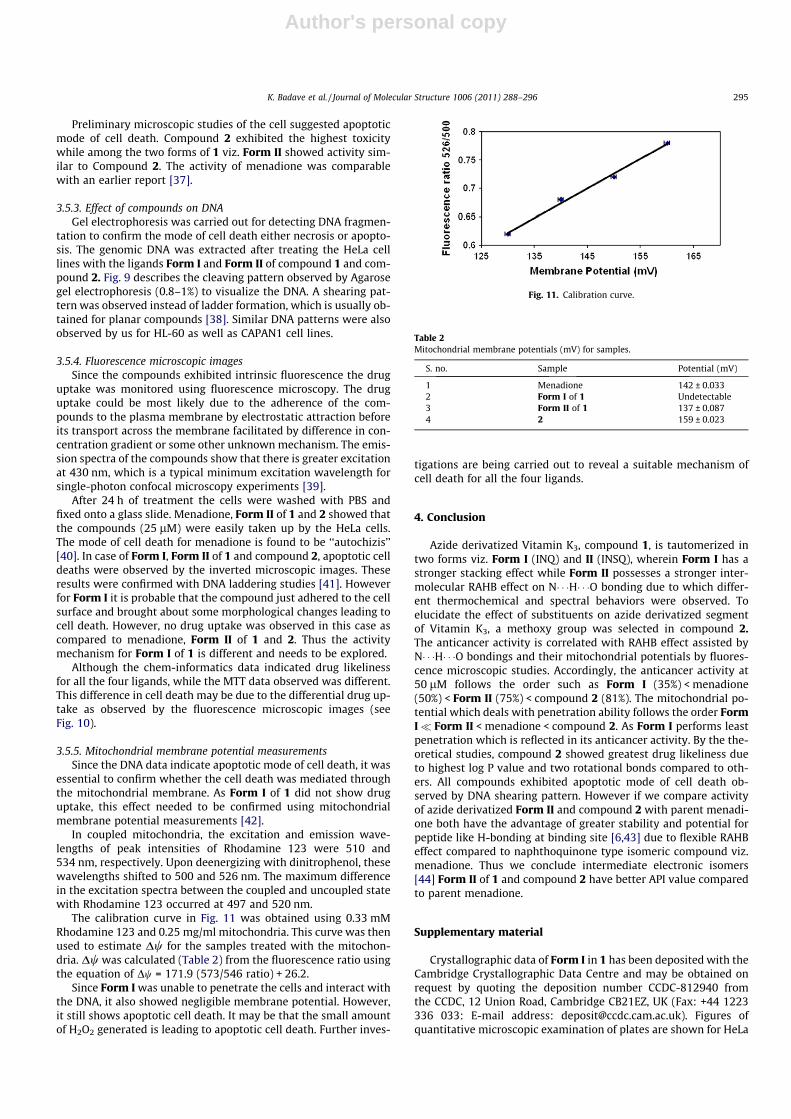
The calibration curve in Fig. 11 was obtained using 0.33 mMRhodamine 123 and 0.25 mg/ml mitochondria. This curve was thenused to estimate Dw for the samples treated with the mitochon-dria. Dw was calculated (Table 2) from the fluorescence ratio usingthe equation of Dw = 171.9 (573/546 ratio) + 26.2.
Since Form I was unable to penetrate the cells and interact withthe DNA, it also showed negligible membrane potential. However,it still shows apoptotic cell death. It may be that the small amountof H2O2 generated is leading to apoptotic cell death. Further inves-
tigations are being carried out to reveal a suitable mechanism ofcell death for all the four ligands.
4. Conclusion
Azide derivatized Vitamin K3, compound 1, is tautomerized intwo forms viz. Form I (INQ) and II (INSQ), wherein Form I has astronger stacking effect while Form II possesses a stronger inter-molecular RAHB effect on N� � �H� � �O bonding due to which differ-ent thermochemical and spectral behaviors were observed. Toelucidate the effect of substituents on azide derivatized segmentof Vitamin K3, a methoxy group was selected in compound 2.The anticancer activity is correlated with RAHB effect assisted byN� � �H� � �O bondings and their mitochondrial potentials by fluores-cence microscopic studies. Accordingly, the anticancer activity at50 lM follows the order such as Form I (35%) < menadione(50%) < Form II (75%) < compound 2 (81%). The mitochondrial po-tential which deals with penetration ability follows the order FormI� Form II < menadione < compound 2. As Form I performs leastpenetration which is reflected in its anticancer activity. By the the-oretical studies, compound 2 showed greatest drug likeliness dueto highest log P value and two rotational bonds compared to oth-ers. All compounds exhibited apoptotic mode of cell death ob-served by DNA shearing pattern. However if we compare activityof azide derivatized Form II and compound 2 with parent menadi-one both have the advantage of greater stability and potential forpeptide like H-bonding at binding site [6,43] due to flexible RAHBeffect compared to naphthoquinone type isomeric compound viz.menadione. Thus we conclude intermediate electronic isomers[44] Form II of 1 and compound 2 have better API value comparedto parent menadione.
Supplementary material
Crystallographic data of Form I in 1 has been deposited with theCambridge Crystallographic Data Centre and may be obtained onrequest by quoting the deposition number CCDC-812940 fromthe CCDC, 12 Union Road, Cambridge CB21EZ, UK (Fax: +44 1223336 033: E-mail address: [email protected]). Figures ofquantitative microscopic examination of plates are shown for HeLa
Fig. 11. Calibration curve.
Table 2Mitochondrial membrane potentials (mV) for samples.
S. no. Sample Potential (mV)
1 Menadione 142 ± 0.0332 Form I of 1 Undetectable3 Form II of 1 137 ± 0.0874 2 159 ± 0.023
K. Badave et al. / Journal of Molecular Structure 1006 (2011) 288–296 295
Author's personal copy
and CAPAN-1 cell lines. Scheme-I for probable tautomeric forms isdeposited.
Acknowledgements
Professor A.N. Latey, Academic Co-ordinator, National Instituteof Virology, Pune is thanked for the technical assistance. K.B. isthankful to UGC for financial assistance as JRF under Meritoriousfellowship [F.4-1/2006(BSR)/5-82/2007(BSR)]. A.K. acknowledgesDepartment of Science and Technology (DST), New Delhi, India,for providing a DST fast track fellowship under the scheme [SR/FTP/CS-96/2007].
References
[1] E.C. Cranenburg, L.J. Schurgers, C. Vermer, Thronb. Haemost. 98 (2007) 120.[2] D.W. Lanrson, S.M. Plaza, Altern. Med. Rev. 8 (2003) 303.[3] T. Akiyoshi, S. Matzno, M. Sakai, N. Okamura, K. Matsuyama, Cancer
Chemother. Pharmacol. 65 (2009) 143.[4] (a) J. Verrax, M. Delvaux, N. Beghein, H. Taper, B. Gallez, P. Buc Calderon, Free
Radical Res. 39 (2005) 649;(b) J. Verrax, J. Cadrobbi, C. Marques, H. Taper, Y. Habraken, J. Piette, P. BucCalderon, Apoptosis 9 (2004) 223;(c) N. Sata, H. Klonowski-Stumpe, B. Han, D. Haussinger, C. Niederau, FreeRadical Biol. Med. 23 (1997) 844.
[5] S. Rane, K. Ahmed, S. Gawali, S. Zaware, D. Shriniwas, R. Gonnande, M.Bhadbhade, J. Mol. Struct. 892 (2008) 74.
[6] E. Cabezas, A.C. Satterthwait, J. Am. Chem. Soc. 121 (1999) 3862.[7] A.A. Farooqui, W-Y. Ong, L.A. Horrocks, Pharmacol. Rev. 58 (2006) 591.[8] S. Matzno, Y. Yamaguchi, T. Akiyoshi, T. Nakabayashi, K. Matsuyama, Biol.
Pharm. Bull. 31 (2008) 1270.[9] N. Hulsman, J.P. Medema, C. Bos, A. Jongejan, R. Leurs, M.J. Smit, I.J.P. de Esch,
D. Richel, M. Wijtmans, J. Med. Chem. 50 (2007) 2424.[10] R. Morphy, C. Kay, Z. Rankovic, Drug Discov. Today 9 (2004) 641.[11] U.J. Griesser, R.K.R. Jetti, M.F. Haddow, T. Brehmer, D.C. Apperley, A. King, R.K.
Harris, Cryst. Growth Des. 8 (2008) 44.[12] K. Subbaramaiah, N. Telang, J.Y. Ramonetti, R. Araki, B. Devito, B.B. Weksler, A.J.
Dannenberg, Cancer Res. 56 (1996) 4424.[13] R.C. Scaduto, Eur. J. Biochem. 223 (1994) 751.[14] A.V. Todkary, R. Dalvi, S. Salunke-Gawali, J. Linares, F. Varret, J. Marrot, J.V.
Yakhmi, M. Bhadbhade, D. Srinivas, S.P. Gejji, S.Y. Rane, Spectrochim. Acta A 63(2006) 130.
[15] N.R. Dhumal, A.V. Todkari, S.Y. Rane, S.P. Gejji, Theor. Chem. Acc. 113 (2005)161.
[16] P. Gilli, V. Bertolasi, L. Pretto, A. Lycka, G. Gilli, J. Am. Chem. Soc. 124 (2002)13554.
[17] O. Carugo, K. Djinovic, M. Rizzi, C.B. Castellani, J. Chem. Soc., Dalton Trans. 472(1991) 1255.
[18] C.G. Pierpont, C.W. Lange, Prog. Inorg. Chem. 41 (1994) 331.[19] H. Amouri, Y. Besace, J.L. Bras, J. Am. Chem. Soc. 120 (1998) 6171.[20] S.B. Zaware, S. Dagade-Waghmode, R.G. Gonnade, D. Srinivas, S.Y. Rane, J. Mol.
Struct. 938 (2009) 328.[21] D.E. Brown, T. Gelbrich, V. Kahlenberg, G. Laus, J. Wieser, U.J. Griesser, New J.
Chem. 32 (2008) 1677.[22] P. Gilli, V. Bertolasi, L. Pretto, L. Antonov, G. Gilli, J. Am. Chem. Soc. 127 (2005)
4943.[23] B. Omondi, M.A. Fernandes, M. Layh, D.C. Levendis, J.L. Look, T.S.P. Mkwizu,
Cryst. Eng. Comm. 7 (2005) 690.[24] S. Salunke-Gawali, S.Y. Rane, K. Boukheddaden, E. Codjori, J. Linares, F. Varret,
P.P. Bakare, J. Therm. Anal. Calorim. 79 (2005) 669.[25] A. Odani, R. Shimata, H. Masuda, O. Yamauchi, Inorg. Chem. 30 (1991) 2133.[26] M. Lucarini, G.F. Pedulli, M. Cipollone, J. Org. Chem. 59 (1994) 5063.[27] M. Lucarini, V. Mugnaini, G.F. Pedulli, J. Org. Chem. 67 (2002) 928.[28] P. Gilli, V. Bertolasi, V. Ferretti, G. Gilli, J. Am. Chem. Soc. 122 (2000) 10405.[29] S.Y. Rane, D.D. Dhavale, M.P. Mulay, E.M. Khan, Spectrochim. Acta 46A (1990)
113.[30] K.B. Gudasi, M.S. Patil, R.S. Vadavi, R.V. Shenoy, S.A. Patil, M. Netaji,
Spectrochim. Acta A 67 (2007) 172.[31] R.S. Drago, Physical Methods for Chemists, 2nd ed., Saunders College Publisher,
1992.[32] A.E. Martell (Ed.), Coordination Chemistry, vol. 1, ACS Monograph, Van
Nostand Reinhold Pbl. Co., 1971.[33] J.E. Wertz, J.R. Bolton, Electron Spin Resonance–Elementary Theory and
Practical Applications, Chapman Hall, New York, 1986.[34] U. Schtzschneider, N. Metzler-Nolte, Angew. Chem. Int. Ed. 45 (2006) 1504.[35] K.H. Thompson, C. Orvig, Dalton Trans. (2006) 761.[36] C.A. Lipinski, F. Lombardo, B.W. Dominy, P.J. Feeney, Adv. Drug Deliv. Rev. 46
(2001) 3.[37] F.Y. Wu, W.C. Liao, H.M. Chang, Life Sci. 52 (1993) 1797.[38] H. Niedner, R. Christen, X. Lin, A. Kondo, S.B. Howell, Mol. Pharmacol. 60 (2001)
1153.[39] A.R. Hibbs, Confocal Microscopy for Biologists, Plenum Publishers, New York,
2004.[40] J. Verrax, H. Taper, P.B. Calderon, Curr. Mol. Pharmacol. 1 (2008) 80.[41] M. Fritsche, C. Haessler, G. Brandner, Oncogene 8 (1993) 307.[42] C.S. Russell, W.G. Lee, Biophys. J. 76 (1999) 469.[43] J. Dimmock, S. Vashishtha, J. Stables, Eur. J. Med. Chem. 35 (2000) 241.[44] S.B. Zaware, R.G. Gonnade, D. Srinivas, A. Khan, S.Y. Rane, New J. Chem. 35
(2011) 1615.
296 K. Badave et al. / Journal of Molecular Structure 1006 (2011) 288–296