automatic registration of ers and spot multisensor images in a data fusion context
TRANSCRIPT
Automatic registration of ERS and SPOT multisensor
images in a data fusion context
Olivier TheÂpaut*, Kidiyo Kpalma, Joseph Ronsin
INSA, Laboratoire ARTIST, 20, avenue des Buttes de CoeÈsmes, CS 14315, 35043 Rennes Cedex, France
Accepted 24 September 1999
Abstract
This paper deals with an automatic registration method of multidate and multisensor remote sensing images as
preprocessing in a multichannel consensual segmentation scheme. This two step method consists in a geometrical correction
followed by residual translation compensation, performed by detecting the crosscorrelation maximum between multidate
images. This second step is preceded by an edge detection for pre®ltered European remote sensing satellite (ERS) and satellite
pour l'observation de la terre (SPOT) multisensor images. The registration of these two kinds of images constitutes, indeed,
the unavoidable ®rst part of a multichannel data fusion scheme that requires point to point matching. # 2000 Elsevier Science
B.V. All rights reserved.
Keywords: Environment management; Data fusion; Multisensor image registration
1. Introduction
Faced with the diversity of remote sensing systems
and of the data they produce, there is a need to
synthesize this information abundance. ERS SAR
(synthetic aperture radar) instruments actively gener-
ate images in the ®eld of microwaves. As for SPOT
HRV (high-resolution visible) instruments, they pas-
sively generate images in the visible and near infrared
®eld. To those two remote sensing systems correspond
two kinds of images containing redundant and com-
plementary data. Since wavelengths differ, acquired
information differs too. While SPOT images give high
precision information about agricultural and forest
patchwork, road and ¯uvial network locations, ERS
images give information about soil and vegetation
nature and moisture and, moreover, their acquisition
is much less dependent on weather conditions or
sunlight.
Unfortunately, these images do not match directly.
The acquisition geometry features infer a particular
processing for each kind of image to achieve multi-
channel registration. The drawback of registration
methods based on the detection followed by the
matching of points or structures of control is that,
they require a more or less automatic matching of the
control entities (Rignot et al., 1991; Brown, 1992).
And those developed for images acquired by the same
kind of sensor cannot be utilized for heterogeneous
ones (Djamdji et al., 1993).
Forest Ecology and Management 128 (2000) 93±100
* Corresponding author. Tel.: �33-299-286-650; fax: �33-299-
286-495.
E-mail address: [email protected] (O. TheÂpaut).
0378-1127/00/$ ± see front matter # 2000 Elsevier Science B.V. All rights reserved.
PII: S 0 3 7 8 - 1 1 2 7 ( 9 9 ) 0 0 2 7 6 - 5
The purpose of this paper is to present our multidate
and multisensor registration method consisting in a
geometrical correction followed by a spatial cross-
correlation (TheÂpaut et al., 1998). Its principal advan-
tage is its reliability and its full automation. After their
registration, superposable scenes can be used to extract
consensual segmentation, performed by a cooperative
segmentation step followed by a decision one.
We also present here the qualitative and quantitative
results of our automatic registration method and an
immediate application of speckle cooperative multi-
channel ®ltering that necessitates coregistered images.
2. Geometrical correction
Geometrical correction aims at replacing the
images in a common reference system. This will
constitute the ®rst step of our multidate and multi-
sensor registration method. We assume in this section
that the acquired scenes correspond to a plate area at
sea level and, then, do not require the use of a digital
elevation map (DEM) to get rid of foreshortening,
layover and shadowing.
2.1. Acquisition model
Depending on the sensor, SAR for ERS and HRV
for SPOT, the acquisition geometry is not the same
(Curlander and McDonough, 1991; Bonn and Rochon,
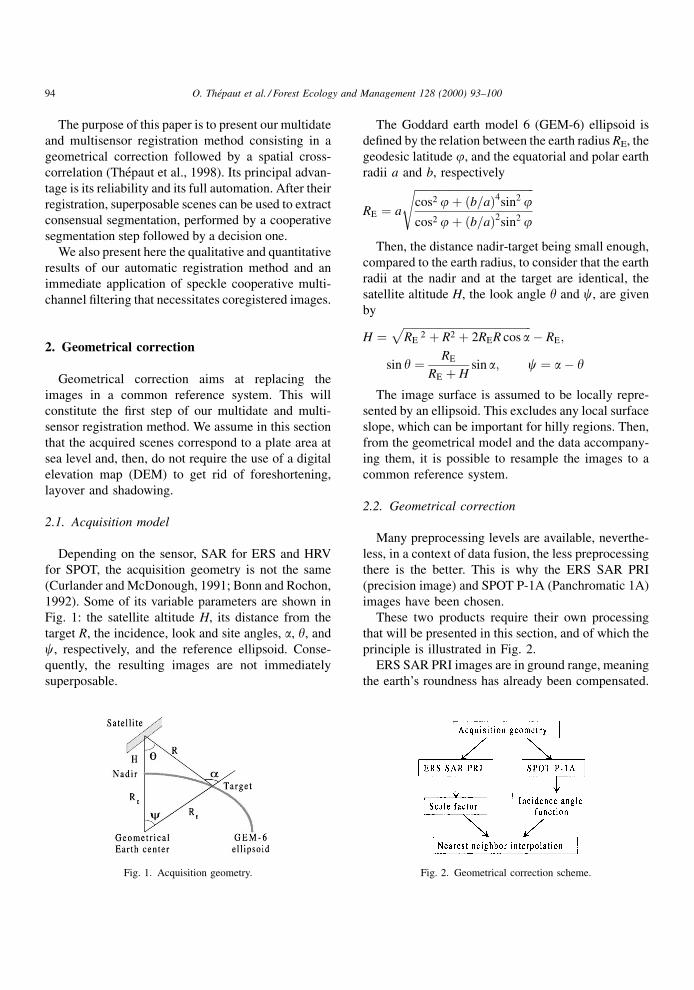
1992). Some of its variable parameters are shown in
Fig. 1: the satellite altitude H, its distance from the
target R, the incidence, look and site angles, a, y, and
c, respectively, and the reference ellipsoid. Conse-
quently, the resulting images are not immediately
superposable.
The Goddard earth model 6 (GEM-6) ellipsoid is
de®ned by the relation between the earth radius RE, the
geodesic latitude j, and the equatorial and polar earth
radii a and b, respectively
RE � a
�������������������������������������������cos2 j� �b=a�4sin2 j
cos2 j� �b=a�2sin2 j
sThen, the distance nadir-target being small enough,
compared to the earth radius, to consider that the earth
radii at the nadir and at the target are identical, the
satellite altitude H, the look angle y and c, are given
by
H �����������������������������������������������RE
2 � R2 � 2RER cos ap
ÿ RE;
sin y � RE
RE � Hsin a; c � aÿ y
The image surface is assumed to be locally repre-
sented by an ellipsoid. This excludes any local surface
slope, which can be important for hilly regions. Then,
from the geometrical model and the data accompany-
ing them, it is possible to resample the images to a
common reference system.
2.2. Geometrical correction
Many preprocessing levels are available, neverthe-
less, in a context of data fusion, the less preprocessing
there is the better. This is why the ERS SAR PRI
(precision image) and SPOT P-1A (Panchromatic 1A)
images have been chosen.
These two products require their own processing
that will be presented in this section, and of which the
principle is illustrated in Fig. 2.
ERS SAR PRI images are in ground range, meaning
the earth's roundness has already been compensated.
Fig. 1. Acquisition geometry. Fig. 2. Geometrical correction scheme.
94 O. TheÂpaut et al. / Forest Ecology and Management 128 (2000) 93±100
A simple scale factor and a nearest-neighbor inter-
polation are suf®cient to ensure the registration to a
common geodesic grid in latitude and longitude.
As for SPOT P-1A images, they require a proces-
sing, according to satellite-target distance, able to
compensate the distortion resulting of the earth geo-
metry. Modelling the acquisition reference system,
simple trigonometric relations ensure the commuta-
tion to the chosen reference system. After this proces-
sing, a simple nearest-neighbor interpolation is
suf®cient to perform the resampling to ®t the ERS
image resolution (12.5 m).
3. Registration
Nevertheless, some residual translations between
the images resulting from geometrical correction pro-
cessing usually remain and need to be compensated.
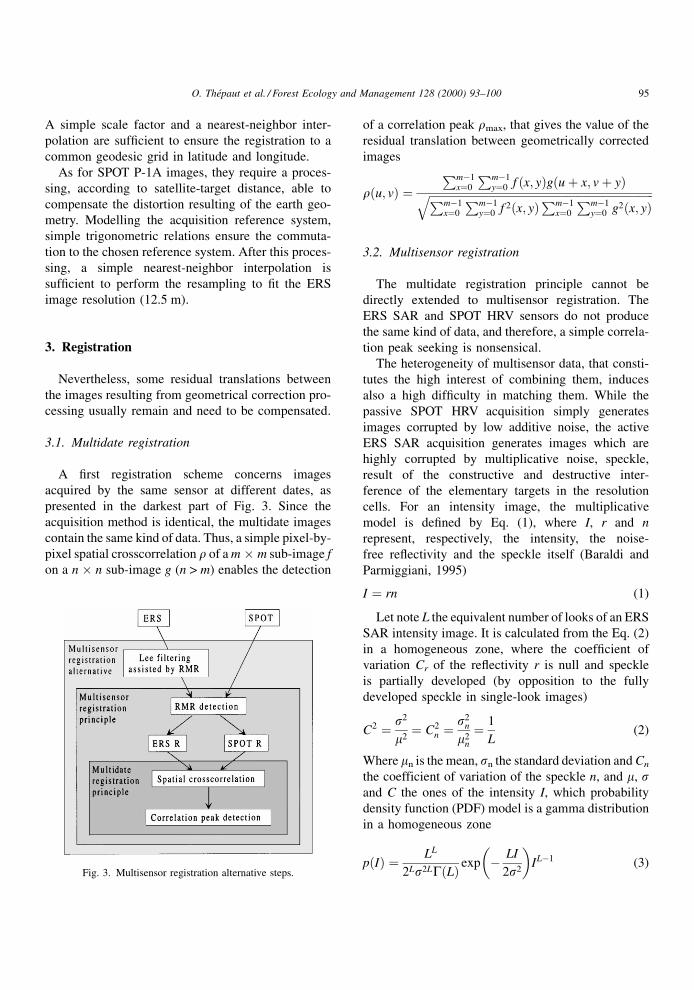
3.1. Multidate registration
A ®rst registration scheme concerns images
acquired by the same sensor at different dates, as
presented in the darkest part of Fig. 3. Since the
acquisition method is identical, the multidate images
contain the same kind of data. Thus, a simple pixel-by-
pixel spatial crosscorrelation r of a m � m sub-image f
on a n � n sub-image g (n > m) enables the detection
of a correlation peak rmax, that gives the value of the
residual translation between geometrically corrected
images
r�u; v� �Pmÿ1
x�0
Pmÿ1y�0 f �x; y�g�u� x; v� y����������������������������������������������������������������������������������Pmÿ1
x�0
Pmÿ1y�0 f 2�x; y�Pmÿ1
x�0
Pmÿ1y�0 g2�x; y�
q3.2. Multisensor registration
The multidate registration principle cannot be
directly extended to multisensor registration. The
ERS SAR and SPOT HRV sensors do not produce
the same kind of data, and therefore, a simple correla-
tion peak seeking is nonsensical.
The heterogeneity of multisensor data, that consti-
tutes the high interest of combining them, induces
also a high dif®culty in matching them. While the
passive SPOT HRV acquisition simply generates
images corrupted by low additive noise, the active
ERS SAR acquisition generates images which are
highly corrupted by multiplicative noise, speckle,
result of the constructive and destructive inter-
ference of the elementary targets in the resolution
cells. For an intensity image, the multiplicative
model is de®ned by Eq. (1), where I, r and n
represent, respectively, the intensity, the noise-
free re¯ectivity and the speckle itself (Baraldi and
Parmiggiani, 1995)
I � rn (1)
Let note L the equivalent number of looks of an ERS
SAR intensity image. It is calculated from the Eq. (2)
in a homogeneous zone, where the coef®cient of
variation Cr of the re¯ectivity r is null and speckle
is partially developed (by opposition to the fully
developed speckle in single-look images)
C2 � s2
m2� C2
n �s2
n
m2n
� 1
L(2)
Where mn is the mean, sn the standard deviation and Cn
the coefficient of variation of the speckle n, and m, sand C the ones of the intensity I, which probability
density function (PDF) model is a gamma distribution
in a homogeneous zone
p�I� � LL
2Ls2LG�L� exp ÿ LI
2s2
� �ILÿ1 (3)
Fig. 3. Multisensor registration alternative steps.
O. TheÂpaut et al. / Forest Ecology and Management 128 (2000) 93±100 95
3.2.1. Principle
A solution consists in seeking the correlation peak
using edge information rather than radiometry data.
Though some of the edges detected in ERS images
stem from a strong variation of soil moisture or
vegetation growth, we assume that a scene contains
a higher number of stable than evanescent structures.
The mid-gray part of Fig. 3 illustrates this principle
whose ®rst advantage resides in its simplicity.
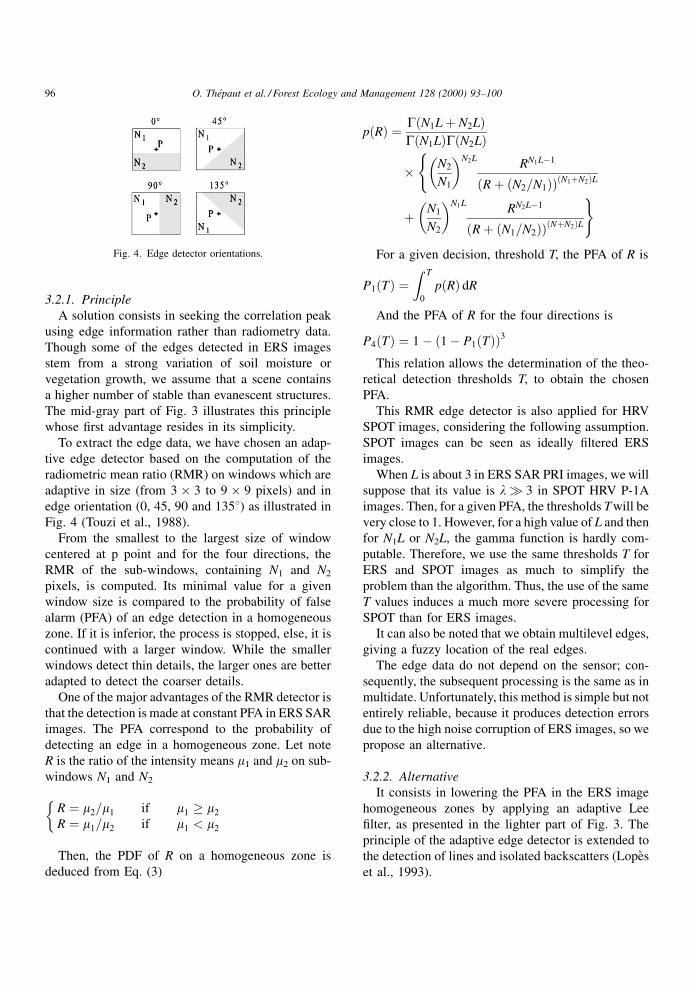
To extract the edge data, we have chosen an adap-
tive edge detector based on the computation of the
radiometric mean ratio (RMR) on windows which are
adaptive in size (from 3 � 3 to 9 � 9 pixels) and in
edge orientation (0, 45, 90 and 1358) as illustrated in
Fig. 4 (Touzi et al., 1988).
From the smallest to the largest size of window
centered at p point and for the four directions, the
RMR of the sub-windows, containing N1 and N2
pixels, is computed. Its minimal value for a given
window size is compared to the probability of false
alarm (PFA) of an edge detection in a homogeneous
zone. If it is inferior, the process is stopped, else, it is
continued with a larger window. While the smaller
windows detect thin details, the larger ones are better
adapted to detect the coarser details.
One of the major advantages of the RMR detector is
that the detection is made at constant PFA in ERS SAR
images. The PFA correspond to the probability of
detecting an edge in a homogeneous zone. Let note
R is the ratio of the intensity means m1 and m2 on sub-
windows N1 and N2
R � m2=m1 if m1 � m2
R � m1=m2 if m1 < m2
�Then, the PDF of R on a homogeneous zone is
deduced from Eq. (3)
p�R� � G�N1L� N2L�G�N1L�G�N2L�
� N2
N1
� �N2LRN1Lÿ1
R� �N2=N1�� ��N1�N2�L
(
� N1
N2
� �N1LRN2Lÿ1
R� �N1=N2�� ��N�N2�L
)For a given decision, threshold T, the PFA of R is
P1�T� �Z T
0
p�R� dR
And the PFA of R for the four directions is
P4�T� � 1ÿ 1ÿ P1�T�� �3This relation allows the determination of the theo-
retical detection thresholds T, to obtain the chosen
PFA.
This RMR edge detector is also applied for HRV
SPOT images, considering the following assumption.
SPOT images can be seen as ideally ®ltered ERS
images.
When L is about 3 in ERS SAR PRI images, we will
suppose that its value is l� 3 in SPOT HRV P-1A
images. Then, for a given PFA, the thresholds T will be
very close to 1. However, for a high value of L and then
for N1L or N2L, the gamma function is hardly com-
putable. Therefore, we use the same thresholds T for
ERS and SPOT images as much to simplify the
problem than the algorithm. Thus, the use of the same
T values induces a much more severe processing for
SPOT than for ERS images.
It can also be noted that we obtain multilevel edges,
giving a fuzzy location of the real edges.
The edge data do not depend on the sensor; con-
sequently, the subsequent processing is the same as in
multidate. Unfortunately, this method is simple but not
entirely reliable, because it produces detection errors
due to the high noise corruption of ERS images, so we
propose an alternative.
3.2.2. Alternative
It consists in lowering the PFA in the ERS image
homogeneous zones by applying an adaptive Lee
®lter, as presented in the lighter part of Fig. 3. The
principle of the adaptive edge detector is extended to
the detection of lines and isolated backscatters (LopeÁs
et al., 1993).
Fig. 4. Edge detector orientations.
96 O. TheÂpaut et al. / Forest Ecology and Management 128 (2000) 93±100
Instead of ®ltering with a gamma gamma maximum
a posteriori (GGMAP) ®lter, the homogeneous areas
detected at a constant PFA, a Lee ®lter is used which is
less time costly, and for which the estimated
unspeckled radiometry is given by Eq. (4) (Lee,
1980; Baraldi and Parmiggiani, 1995)
r̂ � I
mn
C2 ÿ C2n
C2 � C2n
� mmn
C2n � C4
n
C2 � C4n
(4)
Since in the case of a 3-look intensity image in a
homogeneous zone, m � 1 and s � 1/L, Eq. (4) can be
written
r̂ � I 1ÿ C2n
C2
� �� m
C2n
C2
While the homogeneous zones are ®ltered, the
edges, lines and isolated backscatters are preserved.
It thus, follows that the RMR detector, applied to the
adaptive Lee ®ltered images, provides more reliable
information on edge location, because the homoge-
neous zones are less noisy than in the original images.
Multisensor processing is then carried out in the same
way as the multidate one.
The registration step is unavoidable, therefore, our
simple and reliable multidate and multisensor regis-
tration method constitutes a robust automatic preli-
minary step of our data fusion scheme. The pixel to
pixel matching of the resulting images allows us to
consider data fusion schemes such as consensual
segmentation, classi®cation, temporal agriculture
and forest supervision or soil hygrometry fusion.
4. Results
To illustrate our purpose, we present some results of
our two step registration method and an application
example.
4.1. Geometrical correction
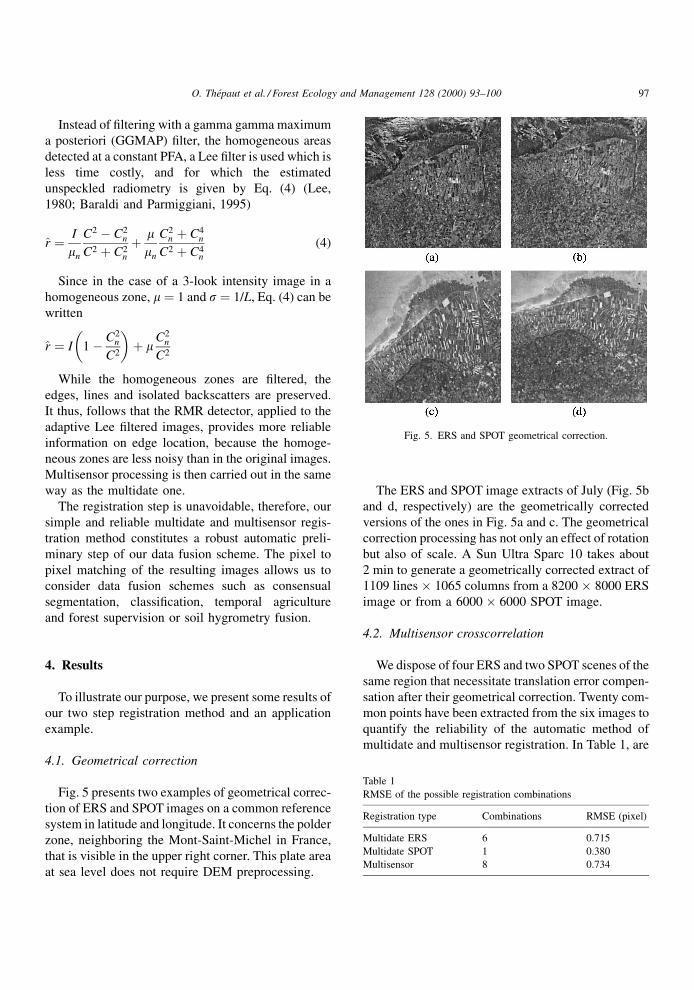
Fig. 5 presents two examples of geometrical correc-
tion of ERS and SPOT images on a common reference
system in latitude and longitude. It concerns the polder
zone, neighboring the Mont-Saint-Michel in France,
that is visible in the upper right corner. This plate area
at sea level does not require DEM preprocessing.
The ERS and SPOT image extracts of July (Fig. 5b
and d, respectively) are the geometrically corrected
versions of the ones in Fig. 5a and c. The geometrical
correction processing has not only an effect of rotation
but also of scale. A Sun Ultra Sparc 10 takes about
2 min to generate a geometrically corrected extract of
1109 lines � 1065 columns from a 8200 � 8000 ERS
image or from a 6000 � 6000 SPOT image.
4.2. Multisensor crosscorrelation
We dispose of four ERS and two SPOT scenes of the
same region that necessitate translation error compen-
sation after their geometrical correction. Twenty com-
mon points have been extracted from the six images to
quantify the reliability of the automatic method of
multidate and multisensor registration. In Table 1, are
Fig. 5. ERS and SPOT geometrical correction.
Table 1
RMSE of the possible registration combinations
Registration type Combinations RMSE (pixel)
Multidate ERS 6 0.715
Multidate SPOT 1 0.380
Multisensor 8 0.734
O. TheÂpaut et al. / Forest Ecology and Management 128 (2000) 93±100 97
presented the results in term of root mean square error
(RMSE) of every possible registration combinations
of these six images.
The registration quality depends highly of the
extract size. The larger they are, the more reliable
is the peak location. Nevertheless, we have to make a
compromise between this size and the computation
time that is about 1 min for the crosscorrelation of a
300 � 300 extract on a 400 � 400 one.
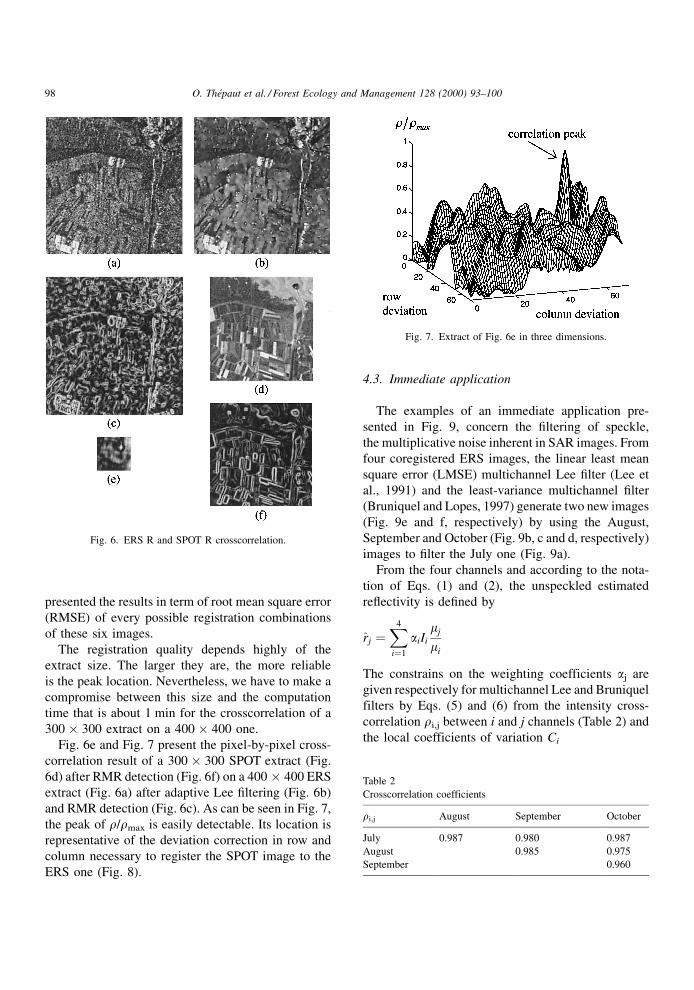
Fig. 6e and Fig. 7 present the pixel-by-pixel cross-
correlation result of a 300 � 300 SPOT extract (Fig.
6d) after RMR detection (Fig. 6f) on a 400 � 400 ERS
extract (Fig. 6a) after adaptive Lee ®ltering (Fig. 6b)
and RMR detection (Fig. 6c). As can be seen in Fig. 7,
the peak of r/rmax is easily detectable. Its location is
representative of the deviation correction in row and
column necessary to register the SPOT image to the
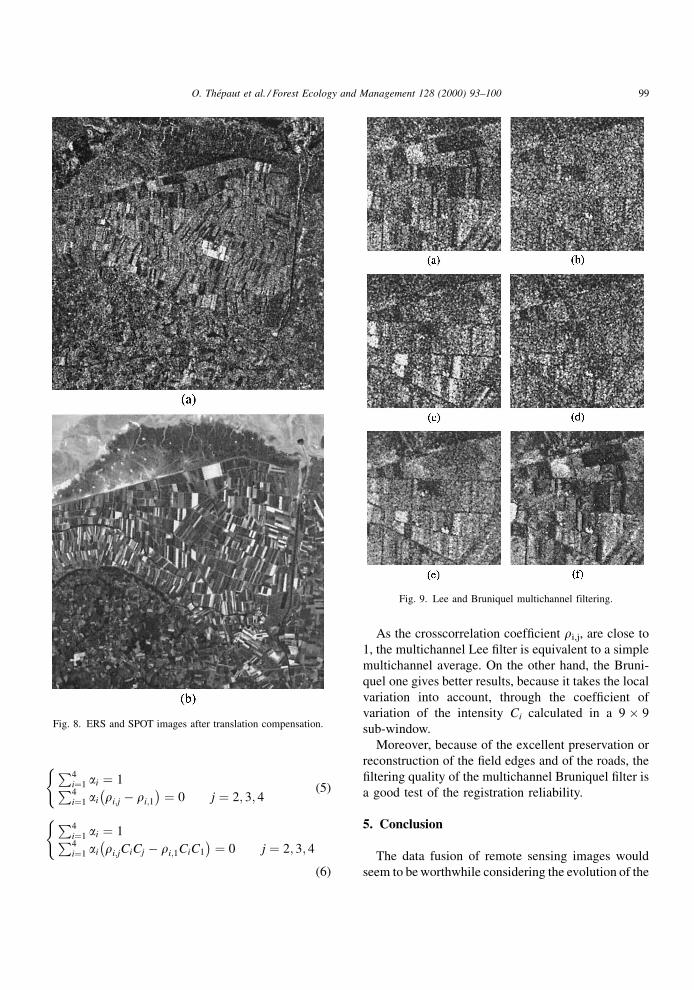
ERS one (Fig. 8).
4.3. Immediate application
The examples of an immediate application pre-
sented in Fig. 9, concern the ®ltering of speckle,
the multiplicative noise inherent in SAR images. From
four coregistered ERS images, the linear least mean
square error (LMSE) multichannel Lee ®lter (Lee et
al., 1991) and the least-variance multichannel ®lter
(Bruniquel and Lopes, 1997) generate two new images
(Fig. 9e and f, respectively) by using the August,
September and October (Fig. 9b, c and d, respectively)
images to ®lter the July one (Fig. 9a).
From the four channels and according to the nota-
tion of Eqs. (1) and (2), the unspeckled estimated
re¯ectivity is de®ned by
r̂j �X4
i�1
aiIi
mj
mi
The constrains on the weighting coefficients aj are
given respectively for multichannel Lee and Bruniquel
filters by Eqs. (5) and (6) from the intensity cross-
correlation ri,j between i and j channels (Table 2) and
the local coefficients of variation Ci
Fig. 6. ERS R and SPOT R crosscorrelation.
Fig. 7. Extract of Fig. 6e in three dimensions.
Table 2
Crosscorrelation coefficients
ri,j August September October
July 0.987 0.980 0.987
August 0.985 0.975
September 0.960
98 O. TheÂpaut et al. / Forest Ecology and Management 128 (2000) 93±100
P4i�1 ai � 1P4i�1 ai ri;j ÿ ri;1
ÿ � � 0 j � 2; 3; 4
((5)
P4i�1 ai � 1P4i�1 ai ri;jCiCj ÿ ri;1CiC1
ÿ � � 0 j � 2; 3; 4
((6)
As the crosscorrelation coef®cient ri,j, are close to
1, the multichannel Lee ®lter is equivalent to a simple
multichannel average. On the other hand, the Bruni-
quel one gives better results, because it takes the local
variation into account, through the coef®cient of
variation of the intensity Ci calculated in a 9 � 9
sub-window.
Moreover, because of the excellent preservation or
reconstruction of the ®eld edges and of the roads, the
®ltering quality of the multichannel Bruniquel ®lter is
a good test of the registration reliability.
5. Conclusion
The data fusion of remote sensing images would
seem to be worthwhile considering the evolution of the
Fig. 8. ERS and SPOT images after translation compensation.
Fig. 9. Lee and Bruniquel multichannel filtering.
O. TheÂpaut et al. / Forest Ecology and Management 128 (2000) 93±100 99
natural and agricultural resource management. Unfor-
tunately, the multidate and multisensor images are not
directly superposable, so they have to be coregistered.
Here we propose a fully automatic registration
method divided into two steps. Geometric correction
is followed by residual translation compensation
through spatial crosscorrelation processing. This
method is ef®cient for multidate images, but has to
be completed for multisensor ones. Edge images,
extracted from pre®ltered ERS and SPOT images,
undergo the same processing as the multidate ones.
This reliable method constitutes the unavoidable pre-
liminary step of a multichannel consensual segmenta-
tion or classi®cation.
References
Baraldi, A., Parmiggiani, F., 1995. An alternative form of the Lee
filter for speckle suppression in SAR images. Graph. Models
Image Proc. 57(1), 75±78.
Bonn, F., Rochon, G., PreÂcis de teÂleÂdeÂtection: principes et
meÂthodes. In: Presses de l'Universite du QueÂbec, vol. 1,
Canada, 1992.
Brown, L.G., 1992. A survey of image registration techniques.
ACM Comput. Surveys 24(4), 325±376.
Bruniquel, J., Lopes, A., 1997. Multivariate optimal speckle
reduction in SAR imagery. Int. J. Remote Sens. 18(3), 603±
627.
Curlander, J.C., McDonough, R.N., Geometric calibration of SAR
data. In: Synthetic Aperture Radar: Systems and Signal
Processing, Wiley, New York, 1991.
Djamdji, J.P., Bijaoui, A., Maniere, R., 1993. Geometrical
registration of images: the multiresolution approach. Photo-
grammetric Eng. Remote Sens. 59(5), 645±653.
Lee, J.S., 1980. Digital image enhancement and noise filtering by
use of local statistics. IEEE Trans. Pattern Anal. Machine Intell.
2(2), 165±168.
Lee, J.S., Grunes, M.R., Mango, S.A., 1991. Speckle reduction in
multipolarization, multifrequency SAR imagery. IEEE Trans.
Geosci. Remote Sens. 29(4), 535±544.
LopeÁs, A., Nezri, E., Touzi, R., Laur, H., 1993. Structure detection
and statistical adaptive speckle filtering in SAR images. Int. J.
Remote Sens. 14(9), 1735±1758.
Rignot, E.J.M., Kowk, R., Curlander, J.C., Pang, S.S., 1991.
Automated multisensor registration: requirements and techni-
ques. Photogrammetric Eng. Remote Sens. 57(8), 1029±
1038.
TheÂpaut, O., Kpalma, K., Ronsin, J., ERS SAR and SPOT image
automatic registration in a multichannel consensual segmenta-
tion scheme. Proceedings of IEEE International Geoscience
and Remote Sensing Symposium, vol. 2, pp. 1040±1042, July
1998.
Touzi, R., LopeÁs, A., Bousquet, P., 1988. A statistical and
geometrical edge detector for SAR image. IEEE Trans. Geosci.
Remote Sens. 26(6), 764±773.
100 O. TheÂpaut et al. / Forest Ecology and Management 128 (2000) 93±100