atlas copco annual report 2021
TRANSCRIPT

Atlas CopcoAnnual report 2021
GRI Standards and external reviewAtlas Copco reports on its sustainability work for 2021 according to GRI Standards, Global Reporting Initiative’s reporting guidelines, level Core, which in combination with EU taxonomy – classification of sustainable activities on page 132 also constitutes Atlas Copco’s statutory sustainability report. Ernst & Young has expressed an opinion that a statutory sustainability report has been prepared according to the Swedish Annual Accounts Act, and has performed a limited review of the sustainability report according to GRI Standards, core option, see page 143. More information can be found at: www.atlascopcogroup.com
Notice The amounts are presented in MSEK unless otherwise indicated and numbers in parentheses represent comparative figures for the preceding year. The figures presented in this report refer to continuing operations unless otherwise stated.
Atlas Copco is the home of industrial ideas. We develop smart, sustainable and highly efficient solutions that empower our customers to grow and drive society forward. We do it with people, profit and planet in mind, and with the highest business integrity.
Our innovative products, solutions, and services are demanded by every type of industry. They enable everything from industrial automation to reliable medical air solutions.
This annual report reflects Atlas Copco’s mission of creating sustainable, profitable growth. It integrates financial, sustainability, and governance information to describe the Group in a comprehensive and cohesive manner.
INTRODUCTION 1 Summary of 2021
2 A decentralized group with four business areas
3 President and CEO
THIS IS ATLAS COPCO
5 This is Atlas Copco – Home of Industrial ideas
6 Our targets
8 This is how we do business
12 Creating lasting value for all stakeholders
THE YEAR IN REVIEW
14 The year in review (Administration report)
22 Business area: Compressor Technique
25 Business area: Vacuum Technique
28 Business area: Industrial Technique
31 Business area: Power Technique
34 Sustainable approach to delivering value
35 Raising our climate ambition
36 Products and service
39 People
41 Safety and well-being
42 Ethics
44 Environment
47 Risks, risk management and opportunities
52 The Atlas Copco share
GOVERNANCE 54 Corporate governance
FINANCIALS 64 Financial statements (Group)
69 Notes (Group)
110 Financial statements (Parent)
112 Notes (Parent)
OTHER INFORMATION
123 Signatures of the Board of Directors
124 Audit report
127 Financial definitions
128 Sustainability notes (Group)
136 GRI index
143Auditor’s Limited Assurance Report on Atlas Copco AB’s sustainability report
144 Three years in summary
145 Contacts
Forward-looking statements Some statements in this report are forward-looking, and the actual outcomes could be materially different. In addition to the factors explicitly discussed, others could have a material effect on the actual outcomes. Such factors include, but are not limited to, general busi-ness conditions, fluctuations in exchange rates and interest rates, political developments, the impact and pricing of competing prod-ucts, product development, commercialization and technological difficulties, supply-chain interruptions, and major customer credit losses.
Atlas Copco AB is a public company. Atlas Copco AB and its subsidiaries are sometimes referred to as the Atlas Copco Group, the Group, the company, or Atlas Copco. Atlas Copco AB is also sometimes referred to as Atlas Copco or the company. Any mentioning of the Board of Directors or the Board refers to the Board of Directors of Atlas Copco AB.
The audited annual accounts and consolidated accounts can be found on pages 14–41, 47–51 and 64–123, excluding the quarterly data on page 82. The corporate governance report examined by the auditors can be found on pages 54–63.
Sustainability information that has been reviewed by the auditors can be found on pages 5–13, 34–46 and 128–142.
INTRO
DU
CTION
THIS IS A
TLAS CO
PCOTH
E YEA
R IN REV
IEWFIN
AN
CIALS
OTH
ER INFO
RMA
TION

INTRO
DU
CTION
THIS IS A
TLAS CO
PCOTH
E YEA
R IN REV
IEWFIN
AN
CIALS
OTH
ER INFO
RMA
TION
Atlas Copco 2021Record orders, revenues and operating profit
Orders received, revenues and operating margin
0
20 000
40 000
60 000
80 000
100 000
120 000
140 000
2021202020192018
MSEK
0
20000
40000
60000
80000
100000
120000
2020201920182017*
MSEK
0
5
10
15
20
25
30
35
%
Operating cash flow and return on capital employed
0
7
14
21
28
35
2020201920182017*
%
0
7
14
21
28
35
0
5 000
10 000
15 000
20 000
2021202020192018
MSEK
0
10
20
30
40
%
Orders received, MSEK Revenues, MSEK Operating margin, %
Operating cash flow, MSEK Return on capital employed, %
Key financial dataMSEK 2021 2020 2019 2018Orders received 129 545 100 554 106 104 97 132Revenues 110 912 99 787 103 756 95 363EBITDA 29 025 24 335 26 597 24 510– in % of revenues 26.2 24.4 25.6 25.7EBITA* 25 015 20 474 22 900 22 101– in % of revenues 22.6 20.5 22.1 23.2Operating profit 23 559 19 146 21 897 21 187– in % of revenues 21.2 19.2 21.1 22.2Adjusted operating profit 24 246 19 998 22 677 21 135– in % of revenues 21.9 20.0 21.9 22.2Profit before tax 23 410 18 825 21 572 20 844– in % of revenues 21.1 18.9 20.8 21.9Profit for the year 18 134 14 783 16 543 16 336Basic earnings per share, SEK 14.89 12.16 13.60 13.45Diluted earnings per share, SEK 14.85 12.14 13.59 13.43
* Operating profit excluding amortization of intangibles related to acquisitions.
Operating margin: 21.2%
(19.2)
Operating cash flow: MSEK 19 378
(18 910)
Revenues: MSEK 110 912
(11%)
Return on capital employed:
27% (23)
Dividend/earnings per share, average 1)
including discontinued operations
0
10
20
30
40
50
60
3 years5 years10 years
Goal
%
Dividend policy history–2003 30–40% of earnings 2003–2011 40–50% of earnings 2011– about 50% of earnings
1) Dividend for the fiscal year 2021 is based on the proposal from the Board of Directors.
Atlas Copco 2021 1
SUMMARY OF 2021
INTRODUCTION• Summary of 2021
A decentralized group with four business areas
President and CEO
INTRO
DU
CTION
THIS IS A
TLAS CO
PCOTH
E YEA
R IN REV
IEWFIN
AN
CIALS
OTH
ER INFO
RMA
TION
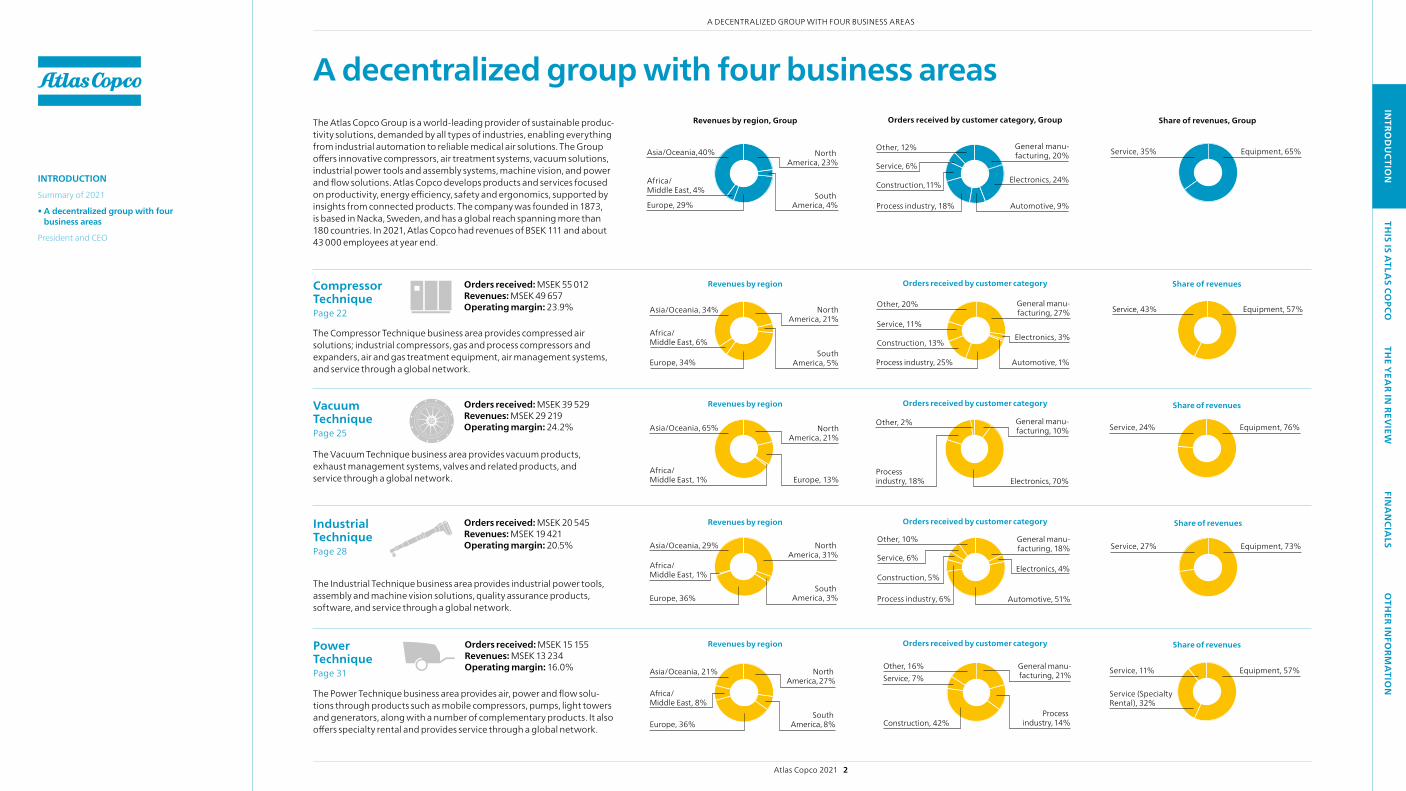
A decentralized group with four business areasThe Atlas Copco Group is a world- leading provider of sustainable produc-tivity solutions, demanded by all types of industries, enabling everything from industrial automation to reliable medical air solutions. The Group offers innovative compressors, air treatment systems, vacuum solutions, industrial power tools and assembly systems, machine vision, and power and flow solutions. Atlas Copco develops products and services focused on productivity, energy efficiency, safety and ergonomics, supported by insights from connected products. The company was founded in 1873, is based in Nacka, Sweden, and has a global reach spanning more than 180 countries. In 2021, Atlas Copco had revenues of BSEK 111 and about 43 000 employees at year end.
Compressor TechniquePage 22
Vacuum TechniquePage 25
Industrial TechniquePage 28
Power TechniquePage 31
Revenues by region
Revenues by region
Orders received by customer category
Orders received by customer category
Asia/Oceania, 34% NorthAmerica, 21%
Africa/Middle East, 6%
Europe, 34%South
America, 5%
Asia/Oceania, 29% North America, 31%
Africa/Middle East, 1%
Europe, 36%South
America, 3%
Asia/Oceania, 65% NorthAmerica, 21%
Africa/Middle East, 1% Europe, 13%
Asia/Oceania, 21% North America, 27%
Africa/Middle East, 8%
Europe, 36%South
America, 8%
Other, 20% General manu-facturing, 27%
Construction, 13%
Service, 11%
Process industry, 25% Automotive, 1%
Electronics, 3%
Other, 10% General manu-facturing, 18%
Construction, 5%
Service, 6%Electronics, 4%
Automotive, 51%Process industry, 6%
Other, 2% General manu-facturing, 10%
Process industry, 18% Electronics, 70%
General manu-facturing, 21%
Other, 16%
Construction, 42%
Service, 7%
Process industry, 14%
The Compressor Technique business area provides compressed air solutions; industrial compressors, gas and process compressors and expanders, air and gas treatment equipment, air management systems, and service through a global network.
Orders received: MSEK 55 012Revenues: MSEK 49 657Operating margin: 23.9%
The Vacuum Technique business area provides vacuum products, exhaust management systems, valves and related products, and service through a global network.
Orders received: MSEK 39 529Revenues: MSEK 29 219Operating margin: 24.2%
Revenues by region
Revenues by region
Orders received by customer category
Orders received by customer category
The Industrial Technique business area provides industrial power tools, assembly and machine vision solutions, quality assurance products, software, and service through a global network.
Orders received: MSEK 20 545Revenues: MSEK 19 421Operating margin: 20.5%
The Power Technique business area provides air, power and flow solu-tions through products such as mobile compressors, pumps, light towers and generators, along with a number of complementary products. It also offers specialty rental and provides service through a global network.
Orders received: MSEK 15 155Revenues: MSEK 13 234Operating margin: 16.0%
Revenues by region, Group
Asia/Oceania, 40% North America, 23%
Africa/Middle East, 4%
Europe, 29%South
America, 4%
Share of revenues, Group
Equipment, 65%Service, 35%
Orders received by customer category, Group
Other, 12% General manu-facturing, 20%
Construction, 11%
Service, 6%
Process industry, 18%
Electronics, 24%
Automotive, 9%
Share of revenues
Service, 43% Equipment, 57%
Share of revenues
Equipment, 76%Service, 24%
Share of revenues
Equipment, 73%Service, 27%
Share of revenues
Equipment, 57%Service, 11%
Service (Specialty Rental), 32%
Atlas Copco 2021 2
A DECENTRALIzED GROUP wITH FOUR BUSINESS AREAS
INTRODUCTIONSummary of 2021
• A decentralized group with four business areas
President and CEO

INTRO
DU
CTION
THIS IS A
TLAS CO
PCOTH
E YEA
R IN REV
IEWFIN
AN
CIALS
OTH
ER INFO
RMA
TION
The transformation into a better tomorrow is driven by technology
Atlas Copco delivered a record result in 2021, with new record levels for both orders received and revenues. Our increased investments in R&D over the past couple of years also resulted in several new product launches. Through our sustainable innovations we support our customers’ efforts to lower their energy consumption as well as strengthen their productivity and offering.
Mats Rahmström, CEO and President of the Atlas Copco Group, what were the main achievements during 2021? I am very pleased to see that our long-term efforts and strong focus, as well as our strive to be agile and always find better ways, have paid off. we have continued to increase our R&D-investments in areas where we believe we can make a difference, as well as our pres-ence in segments and markets where we see potential for sustain-able profitable growth. These are fundamental parts of our strategy and how we improve our customers’ technologies and processes and drive development forward, which is what Atlas Copco is all about. we also significantly raised our climate ambitions by setting science- based targets for reducing our greenhouse gas emissions in line with the goals of the Paris Agreement.
Why has Atlas Copco set science-based targets? The science is clear, we need to act to limit the effects of climate change and companies as well as individuals and governments need to do their part. we have set goals to reduce the emissions from our own operations in line with keeping the global temperature rise below 1.5 degrees, and to reduce emissions from the value chain in line with well below a 2-degree temperature rise. I’m also happy with the process behind setting the targets, where each business area has developed its own plans for how to achieve this.
The main benefit of these targets is that they inspire new ways of thinking, new initiatives and the actions needed for positive change. The absolute majority of our emissions comes from the use of our products and this is where we can make the most impact. we will continue to focus on increasing the energy efficiency of products and support our customers in reaching their sustainability ambi-tions, while reducing the emissions from our own operations.
PAGE 35
How do you comment on the financial results for the year? we saw a very high demand from our customers in 2021 and our orders received reached a new record level. Despite constrains in the supply chain we also delivered record revenues. Our operating profit also reached record levels. Our strong financial position enables us to continue investing in our competitiveness.
What trends and change-drivers do you consider most important for the Group going forward? The climate challenge is an important change-driver. we see clear business opportunities in being part of driving the transformation into a low-carbon society, by enabling new technologies and con-tinuing to develop products used in the manufacturing of solar panels, wind turbines, electrical vehicles and sustainably produced hydrogen, to name a few examples.
For us digitalization is very much part of everything we do. It is a very important change-driver for our customers and how we inter-act with them, as well as for how we run our factories. Digital solu-tions enable reskilling and upskilling on a massive scale. As an exam-ple, we have recently completed several virtual product launches and use augmented reality to provide technical insights to both our field technicians and customers.
In service, connectivity is a game changer. Previously, we relied on information from our customers, but we now fully control the health status and performance of our machines. All business areas com-bined have hundreds of thousands of connected machines in the field, and the amount of data they generate is impressive and grow-ing. It enables us to offer performance-based service solutions. we also avoid over or under servicing, and instead we move into pre-scriptive service. As a bonus, the data is fed back to our development engineers. we want to be the best at analyzing and acting on all this data, and data analytics is already a core competency.
We will continue to focus on increasing the energy efficiency of products and supporting our customers to reach their sustainability ambitions, while reducing the emissions from our own operations.
Atlas Copco 2021 3
PRESIDENT AND CEO
INTRODUCTIONSummary of 2021
A decentralized group with four business areas
• President and CEO
INTRO
DU
CTION
THIS IS A
TLAS CO
PCOTH
E YEA
R IN REV
IEWFIN
AN
CIALS
OTH
ER INFO
RMA
TION
The transformation into a better tomorrow is driven by technology, continued
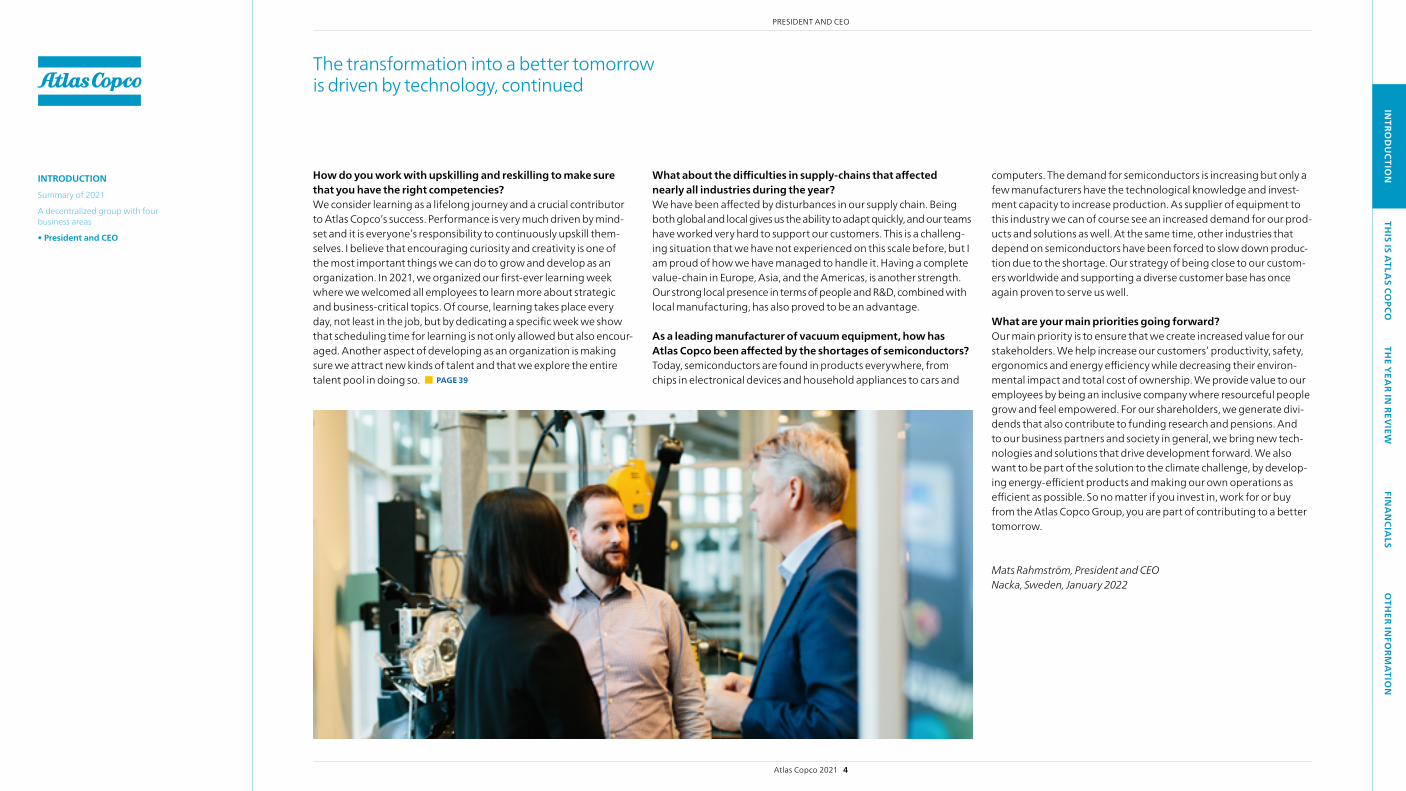
How do you work with upskilling and reskilling to make sure that you have the right competencies? we consider learning as a lifelong journey and a crucial contributor to Atlas Copco’s success. Performance is very much driven by mind-set and it is everyone’s responsibility to continuously upskill them-selves. I believe that encouraging curiosity and creativity is one of the most important things we can do to grow and develop as an organization. In 2021, we organized our first-ever learning week where we welcomed all employees to learn more about strategic and business-critical topics. Of course, learning takes place every day, not least in the job, but by dedicating a specific week we show that scheduling time for learning is not only allowed but also encour-aged. Another aspect of developing as an organization is making sure we attract new kinds of talent and that we explore the entire talent pool in doing so. PAGE 39
What about the difficulties in supply-chains that affected nearly all industries during the year?we have been affected by disturbances in our supply chain. Being both global and local gives us the ability to adapt quickly, and our teams have worked very hard to support our customers. This is a challeng-ing situation that we have not experienced on this scale before, but I am proud of how we have managed to handle it. Having a complete value-chain in Europe, Asia, and the Americas, is another strength. Our strong local presence in terms of people and R&D, combined with local manufacturing, has also proved to be an advantage.
As a leading manufacturer of vacuum equipment, how has Atlas Copco been affected by the shortages of semiconductors? Today, semiconductors are found in products everywhere, from chips in electronical devices and household appliances to cars and
computers. The demand for semiconductors is increasing but only a few manufacturers have the technological knowledge and invest-ment capacity to increase production. As supplier of equipment to this industry we can of course see an increased demand for our prod-ucts and solutions as well. At the same time, other industries that depend on semiconductors have been forced to slow down produc-tion due to the shortage. Our strategy of being close to our custom-ers worldwide and supporting a diverse customer base has once again proven to serve us well.
What are your main priorities going forward?Our main priority is to ensure that we create increased value for our stakeholders. we help increase our customers’ productivity, safety, ergonomics and energy efficiency while decreasing their environ-mental impact and total cost of ownership. we provide value to our employees by being an inclusive company where resourceful people grow and feel empowered. For our shareholders, we generate divi-dends that also contribute to funding research and pensions. And to our business partners and society in general, we bring new tech-nologies and solutions that drive development forward. we also want to be part of the solution to the climate challenge, by develop-ing energy-efficient products and making our own operations as efficient as possible. So no matter if you invest in, work for or buy from the Atlas Copco Group, you are part of contributing to a better tomorrow.
Mats Rahmström, President and CEONacka, Sweden, January 2022
Atlas Copco 2021 4
PRESIDENT AND CEO
INTRODUCTIONSummary of 2021
A decentralized group with four business areas
• President and CEO

INTRO
DU
CTION
THIS IS A
TLAS CO
PCOTH
E YEA
R IN REV
IEWFIN
AN
CIALS
OTH
ER INFO
RMA
TION
This is Atlas Copco – Home of Industrial Ideas
DIVERSIFIED – Diverse customer base– Sales in Asia/Oceania,
Americas, and EMEA – Production in Europe, Asia
and America
AGILE– Outsourced production model, 75% of production
cost of equipment is purchased components– Flexible workforce– Continuous scenario planning – Leadership model with clear accountability – Transparent organization with strong follow up
RESILIENT– 35% of sales is service business– Asset-light operations
To succeed in our mission, Atlas Copco strives for a leading position in selected markets and segments. This is achieved through innovations and by delivering leading differentiated technology. With products and services critical to the customers’ operations, Atlas Copco strives to support customers in their success. To support profitable growth over a business cycles, the Group aims to have an agile balance sheet and focuses on marketplaces with high service potential.
SERVICEIncrease the service offer by giving our customers new insights and peace of mind, more and more based on customer data and real-time insights.
INNOVATIONInvest in research and development to develop new solutions that improve our cus-tomers’ performance. Connectivity and data-driven insights are key drivers in this.
PRESENCEIncrease market presence by expanding into selected markets, segments, and technol-ogies. whether we sell directly or indirectly, and under which brand, depends on the custom-er and market.
OPERATIONAL EXCELLENCEContinuously strive for improved operational efficiency with respon-sible use of resources, including developing top-quality and highly efficient products and services.
PEOPLERely on competent people who are passionate about their jobs, performance, and committed to deliver customer value. Attract resourceful people and empower them to grow.
Our industrial ideas empower our customers to grow and drive society forward. This is how we create a better tomorrow.
We are convinced that leading products, together with a decentralized organization with full accountability for individuals and teams make our customers, and our company, future-proof.
Our vision is to become and remain First in Mind—First in Choice of our customers and other stakeholders. Our mission is to achieve sustainable, profitable growth. This means that we must create lasting results with responsible use of resources and with the highest business integrity.
Strategy and fundamentals for growth
Leading position in
selected end markets
Products critical to the customers’ operations
Leading differentiated
technology
Leading service offer
Atlas Copco 2021 5
THIS IS ATLAS COPCO
THIS IS ATLAS COPCO• This is Atlas Copco – Home of
Industrial ideas
Our targets
This is how we do business
Creating lasting value for all stakeholders
Contributing to the UN Sustainable Development Goals

INTRO
DU
CTION
THIS IS A
TLAS CO
PCOTH
E YEA
R IN REV
IEWFIN
AN
CIALS
OTH
ER INFO
RMA
TION
Atlas Copco sets ambitious targets to deliver sustainable, profitable growth. The targets have different time horizons: annual, three-year, over a business cycle, and by 2030 for the longer-term ambitions. Sustainability plays an important role in Atlas Copco’s vision and is an integral part of the Group’s mission. An integrated sustainable strategy, backed by ambitious targets, helps the company deliver greater value to all stakeholders in a way that is economically, environmentally and socially responsible. Below you find our targets and progress until 2021. Updated sustainable targets valid from 2022 can be found on the next page.
FINANCIALRevenue growth measured over a business cycle Target: 8% per annum
Sustained high return on capital employed by constantly striving for operational excellence and generating growth
Earnings as dividends to shareholders Target: about 50%
0
2
4
6
8
10
3 years5 years10 years0
20 000
40 000
60 000
80 000
100 000
20212020201920180
10
20
30
40
50
60
3 years5 years10 years
Goal Goal
% MSEK % %
0
10
20
30
40
50
0
2
4
6
8
10
3 years5 years10 years0
20 000
40 000
60 000
80 000
100 000
20212020201920180
10
20
30
40
50
60
3 years5 years10 years
Goal Goal
% MSEK % %
0
10
20
30
40
50
Annual revenue growth rate, average 1) Capital employed and return 1)
Capital employed, MSEK Return on capital employed, %
1) Figures for the years between 2012 and 2017 are best estimated numbers, as the effects of the distribution of Epiroc and restatements for IFRS 15 are not fully reconciled.
Our targets
PEOPLE 2021 2020 2019 Target*
The degree to which employees agree there is opportunity to learn and grow should be above the global benchmark and continuously increase 73 Survey every two years 71 >71
The degree to which employees agree we have a work culture of respect, fairness and openness should be above the global benchmark and continuously increase 76 Survey every two years 74 >75
Share of female employees (year end). Goal by 2030 20.9% 20.0% 19.8% 30%
ETHICS 2021 2020 2019 Target*
Employees sign the Business Code of Practice 98% 99% 98% 100%
Employees are trained in the Business Code of Practice 97% 99% 94% 100%
Managers in risk countries lead trainings in the Business Code of Practice 96% 99% 91% 100%
Significant suppliers sign the Business Code of Practice 93% 93% 90% 100%
Significant distributors sign the Business Code of Practice 87% 84% 59% 100%
PRODUCTS & SERVICE 2021 2020 2019 Target*
Projects for new or redesigned products with goals for reduced environmental impact by 2021 98% Reported in 2021 100%
Projects for new or redesigned products that will achieve a significantly reduced environ mental impact, i.e. 5% or lower carbon footprint over the product’s life cycle 43% The divisions set their own goals
SAFETY & WELL-BEING 2021 2020 2019 Target*
The degree to which employees agree that the company takes a genuine interest in their well-being should continuously increase 73
Survey every two years 69 Increase
Balanced safety pyramid, meaning that more near misses than minor injuries, and more minor injuries than recordable injuries are reported Yes Yes Yes Yes
ENVIRON MENT 2021 2020 2019 Target*
CO2 emissions from energy in operations and transport (tonnes) in relation to cost of sales. Goal by 2030. Base year: 2018 ** 3.3 3.8 4.3 –50%
waste (kg) in relation to cost of sales 590 581 597 Decrease
water consumption (m3) in relation to cost of sales 6.6 7.2 7.2 Decrease
Significant direct suppliers with an approved environmental management system 31% 30% 28% Increase
* For more information about the sustainability focus areas, targets, and processes, see pages 34–46 and the sustainability notes on pages 128–142.
** In 2018 (the base year), CO2 emissions from energy in operations and transport (tonnes) in relation to cost of sales was 5.3.
Dividend/earnings per share, average 2)
including discontinued operations
0
2
4
6
8
10
3 years5 years10 years0
20 000
40 000
60 000
80 000
100 000
20212020201920180
10
20
30
40
50
60
3 years5 years10 years
Goal Goal
% MSEK % %
0
10
20
30
40
50
Dividend policy history
–2003 30–40% of earnings 2003–2011 40–50% of earnings 2011– about 50% of earnings
2) Dividend for the fiscal year 2021 is based on the proposal from the Board of Directors.
Atlas Copco 2021 6
THIS IS ATLAS COPCO
THIS IS ATLAS COPCO This is Atlas Copco – Home of Industrial ideas
• Our targets
This is how we do business
Creating lasting value for all stakeholders
Contributing to the UN Sustainable Development Goals

INTRO
DU
CTION
THIS IS A
TLAS CO
PCOTH
E YEA
R IN REV
IEWFIN
AN
CIALS
OTH
ER INFO
RMA
TION
Fully committed to being part of the solution for a better tomorrow, Atlas Copco has reviewed its sustainability targets. The targets have different time horizons: annual, three-year and by 2030, for the longer-term ambitions. Atlas Copco has set science-based targets for greenhouse gas emission reductions in line with the Paris Agreement.
Sustainability targets valid from 2022
The sustainability targets cover the areas: people, ethics, products and service, climate and the environment, and safety and wellbeing. Some of the previous targets have been revised to reflect changing stakeholder expectations and to support the organi-zation’s implementation of prioritized strategies and behaviors. For instance, a key performance indicator (KPI) measuring employees’ sense of belonging at the com-pany has been added. The ethics-related targets from 2022 extend the requirement for a leader-led training to all employees, with an additional training requirement for new employees. To increase circularity in product design, a Group methodology for assessing the circularity of new or redesigned products will also be developed.
Science-based targets for greenhouse gas emission reductionsIn 2021, Atlas Copco set science-based targets to reduce greenhouse gas emissions in line with the goals of the Paris Agreement. Atlas Copco aims to reduce emissions from our own operations in line with keeping the global temperature rise below 1.5 degrees, and to reduce emissions from the value chain in line with keeping well below a 2-degree temperature rise. The science-based targets significantly raise Atlas Copco’s ambition for carbon emissions reduction, as they involve the entire value chain, most notably the use of sold products, and since the targets are set for absolute emission reductions. The targets have been validated by the Science Based Targets initiative and replace our previous greenhouse gas emission targets from 2022.
For more information about how Atlas Copco works to achieve its sustainability targets, see pages 34–46.
PEOPLE TARGET
Female employees by 2030 30%
Employees agree that they feel a sense of belonging at the companyAbove the global benchmark and a
continuous increase
Employees agree we have a work culture of respect, fairness and openness
Employees agree there is opportunity to learn and grow in the company
ETHICS TARGET
Employees sign the Group’s Code of Conduct 1) compliance statement annually 100%
New employees participate in the Group’s ethics training within 12 months of joining the company 100%
Employees participate in the Group’s biennial ethics training, starting 2022 100%
Significant suppliers confirm compliance with the Group’s Code of Conduct 1) 100%
Significant distributors confirm compliance with the Group’s Code of Conduct 1) 100%
SAFETY & WELL-BEING TARGETEmployees agree that the company takes a genuine interest in their well-being Continuous increase
Balanced safety pyramid = more reports of risk observations than near misses, more reports of near misses than minor injuries, and more or equal reports of minor injuries relative to recordable injuries A balanced safety pyramid
CLIMATE & ENVIRON MENT TARGETReduction in line with the 1.5 degree warming trajectory in CO2e 2) emissions (tonnes) from scopes 1 & 2 by 2030. Base year: 2019 –46%
Reduction in line with the well-below 2 degrees warming trajectory in CO2e 2) emissions (tonnes) from scope 3 by 2030. Base year: 2019 –28%
Significant direct suppliers with an approved environmental management system Continuous increase
water consumption (m3) in relation to cost of sales Continuous decrease
Reused, recycled or recovered waste from internal operations by 2030 100%
PRODUCTS & SERVICE TARGETProjects for new and redesigned products with targets for reduced carbon impact 100%
By 2024, Atlas Copco has a Group-common methodology for assessing the circularity of new or redesigned products Common methodology
1) Previously referred to as the Business Code of Practice.2) CO2e means carbon dioxide equivalent emissions.
Atlas Copco aims to reduce emissions from its own operations in line with keeping the global temperature rise below 1.5 degrees, and to reduce emissions from the value chain in line with keeping the temperature rise well below 2-degrees.
Atlas Copco 2021 7
THIS IS ATLAS COPCO
THIS IS ATLAS COPCO This is Atlas Copco – Home of Industrial ideas
• Our targets
This is how we do business
Creating lasting value for all stakeholders
Contributing to the UN Sustainable Development Goals
INTRO
DU
CTION
THIS IS A
TLAS CO
PCOTH
E YEA
R IN REV
IEWFIN
AN
CIALS
OTH
ER INFO
RMA
TION
This is how we do business
Atlas Copco is characterized by focused businesses in selected market segments, high customer focus through a decentralized organization, global presence, a stable service business, professional people, and an asset-light and flexible manu facturing setup. By providing professional service, technical competence, application knowledge and digital capabilities the Group builds close customer relationships through direct and indirect channels.
Power Technique, 12%
Compressor Technique, 45%
Vacuum Technique, 26%
Industrial Technique, 17%
Share of revenues by business area
Other, 12% General manufacturing, 20%
Construction, 11%
Service, 6%
Process industry, 18%Electronics, 24%
Automotive, 9%
Orders received by customer category
Share of revenues
Equipment, 65%Service, 35%
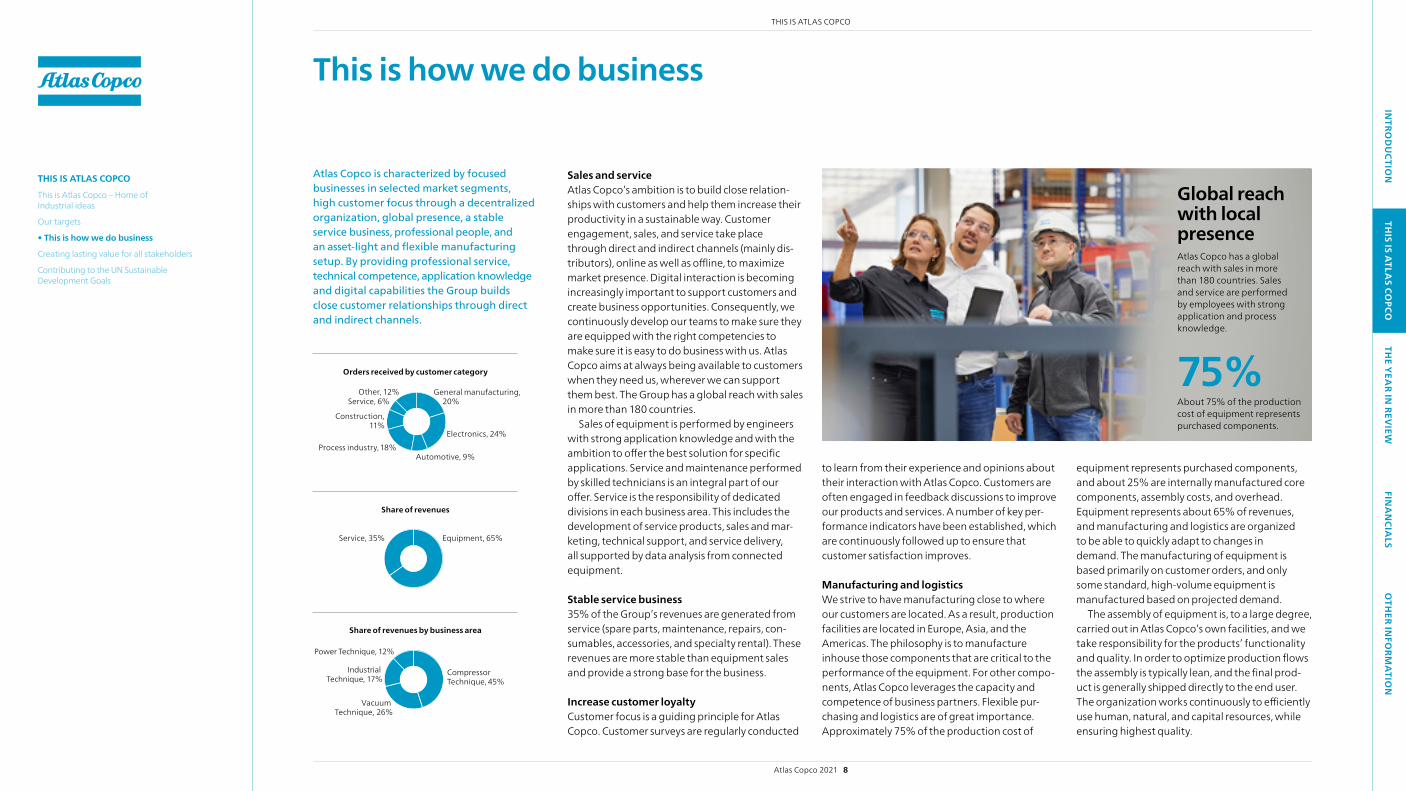
Sales and serviceAtlas Copco’s ambition is to build close relation-ships with customers and help them increase their productivity in a sustainable way. Customer engagement, sales, and service take place through direct and indirect channels (mainly dis-tributors), online as well as offline, to maximize market presence. Digital interaction is becoming increasingly important to support customers and create business opportunities. Consequently, we continuously develop our teams to make sure they are equipped with the right competencies to make sure it is easy to do business with us. Atlas Copco aims at always being available to customers when they need us, wherever we can support them best. The Group has a global reach with sales in more than 180 countries.
Sales of equipment is performed by engineers with strong application knowledge and with the ambition to offer the best solution for specific applications. Service and maintenance performed by skilled technicians is an integral part of our offer. Service is the responsibility of dedicated divisions in each business area. This includes the development of service products, sales and mar-keting, technical support, and service delivery, all supported by data analysis from connected equipment.
Stable service business35% of the Group’s revenues are generated from service (spare parts, maintenance, repairs, con-sumables, accessories, and specialty rental). These revenues are more stable than equipment sales and provide a strong base for the business.
Increase customer loyaltyCustomer focus is a guiding principle for Atlas Copco. Customer surveys are regularly conducted
75%
Global reach with local presence Atlas Copco has a global reach with sales in more than 180 countries. Sales and service are performed by employees with strong application and process knowledge.
About 75% of the production cost of equipment represents purchased components.
to learn from their experience and opinions about their interaction with Atlas Copco. Customers are often engaged in feedback discussions to improve our products and services. A number of key per-formance indicators have been established, which are continuously followed up to ensure that customer satis faction improves.
Manufacturing and logisticswe strive to have manufacturing close to where our customers are located. As a result, production facilities are located in Europe, Asia, and the Americas. The philosophy is to manu facture inhouse those components that are critical to the performance of the equipment. For other compo-nents, Atlas Copco leverages the capacity and competence of business partners. Flexible pur-chasing and logistics are of great importance.Approximately 75% of the production cost of
equipment represents purchased components, and about 25% are internally manufactured core components, assembly costs, and overhead. Equipment represents about 65% of revenues, and manufacturing and logistics are organized to be able to quickly adapt to changes in demand. The manufacturing of equipment is based primarily on customer orders, and only some standard, high-volume equipment is manufactured based on projected demand.
The assembly of equipment is, to a large degree, carried out in Atlas Copco’s own facilities, and we take responsibility for the products’ functionality and quality. In order to optimize production flows the assembly is typically lean, and the final prod-uct is generally shipped directly to the end user. The organization works continuously to efficiently use human, natural, and capital resources, while ensuring highest quality.
Atlas Copco 2021 8
THIS IS ATLAS COPCO
THIS IS ATLAS COPCO This is Atlas Copco – Home of Industrial ideas
Our targets
• This is how we do business
Creating lasting value for all stakeholders
Contributing to the UN Sustainable Development Goals
INTRO
DU
CTION
THIS IS A
TLAS CO
PCOTH
E YEA
R IN REV
IEWFIN
AN
CIALS
OTH
ER INFO
RMA
TION
This is how we do business, continued
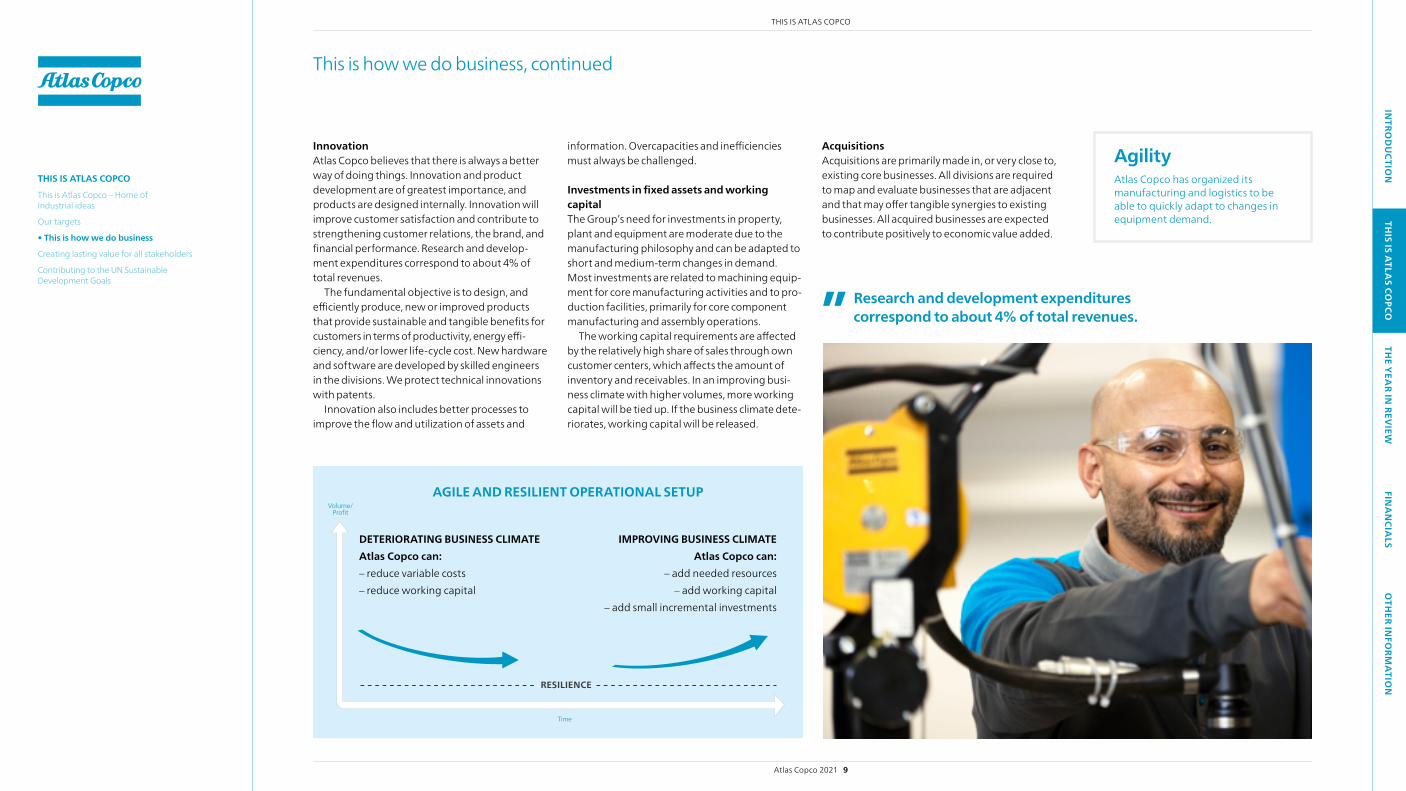
InnovationAtlas Copco believes that there is always a better way of doing things. Innovation and product development are of greatest importance, and products are designed internally. Innovation will improve customer satisfaction and contribute to strengthening customer relations, the brand, and financial performance. Research and develop-ment expenditures correspond to about 4% of total revenues.
The fundamental objective is to design, and efficiently produce, new or improved products that provide sustainable and tangible benefits for customers in terms of productivity, energy effi-ciency, and/or lower life-cycle cost. New hardware and software are developed by skilled engineers in the divisions. we protect technical innovations with patents.
Innovation also includes better processes to improve the flow and utilization of assets and
AGILE AND RESILIENT OPERATIONAL SETUP
RESILIENCE
DETERIORATING BUSINESS CLIMATEAtlas Copco can:– reduce variable costs– reduce working capital
IMPROVING BUSINESS CLIMATEAtlas Copco can:
– add needed resources– add working capital
– add small incremental investments
Time
Volume/ Profit
information. Overcapacities and inefficiencies must always be challenged.
Investments in fixed assets and working capitalThe Group’s need for investments in property, plant and equipment are moderate due to the manufacturing philosophy and can be adapted to short and medium-term changes in demand. Most investments are related to machining equip-ment for core manufacturing activities and to pro-duction facilities, primarily for core component manufacturing and assembly operations.
The working capital requirements are affected by the relatively high share of sales through own customer centers, which affects the amount of inventory and receivables. In an improving busi-ness climate with higher volumes, more working capital will be tied up. If the business climate dete-riorates, working capital will be released.
AcquisitionsAcquisitions are primarily made in, or very close to, existing core businesses. All divisions are required to map and evaluate businesses that are adjacent and that may offer tangible synergies to existing businesses. All acquired businesses are expected to contribute positively to economic value added.
AgilityAtlas Copco has organized its manufacturing and logistics to be able to quickly adapt to changes in equipment demand.
Research and development expenditures correspond to about 4% of total revenues.
Atlas Copco 2021 9
THIS IS ATLAS COPCO
THIS IS ATLAS COPCO This is Atlas Copco – Home of Industrial ideas
Our targets
• This is how we do business
Creating lasting value for all stakeholders
Contributing to the UN Sustainable Development Goals
INTRO
DU
CTION
THIS IS A
TLAS CO
PCOTH
E YEA
R IN REV
IEWFIN
AN
CIALS
OTH
ER INFO
RMA
TION
Atlas Copco’s organization is based on the principle of decentralized responsibilities and authorities
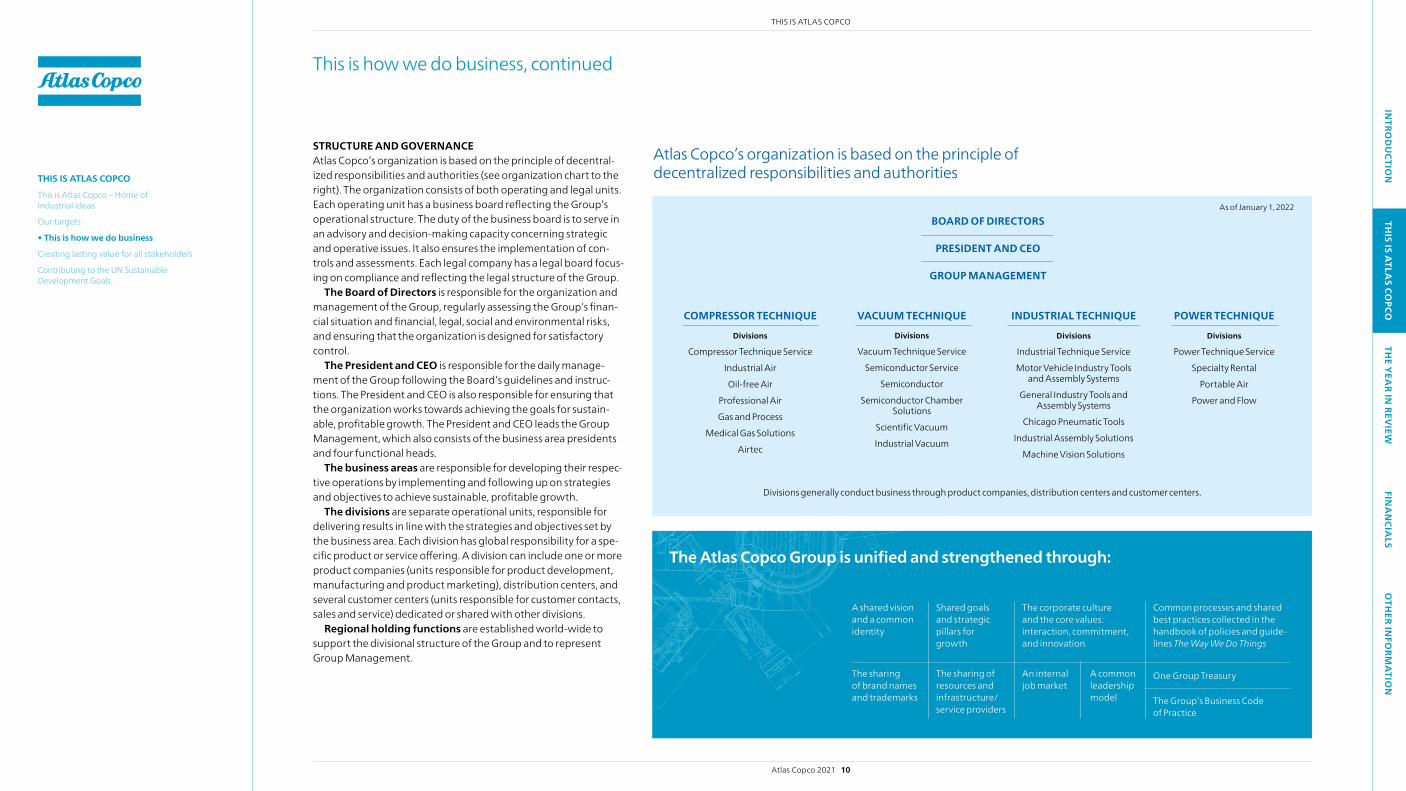
STRUCTURE AND GOVERNANCEAtlas Copco’s organization is based on the principle of decentral-ized responsibilities and authorities (see organization chart to the right). The organization consists of both operating and legal units. Each opera ting unit has a business board reflecting the Group’s operational structure. The duty of the business board is to serve in an advisory and decision-making capacity concerning strategic and operative issues. It also ensures the implementation of con-trols and assessments. Each legal company has a legal board focus-ing on compliance and reflecting the legal structure of the Group.
The Board of Directors is responsible for the organization and management of the Group, regularly assessing the Group’s finan-cial situation and financial, legal, social and environmental risks, and ensuring that the organization is designed for satisfactory control.
The President and CEO is responsible for the daily manage-ment of the Group following the Board’s guidelines and instruc-tions. The President and CEO is also responsible for ensuring that the organization works towards achieving the goals for sustain-able, profitable growth. The President and CEO leads the Group Management, which also consists of the business area presidents and four functional heads.
The business areas are responsible for developing their respec-tive operations by implementing and following up on strategies and objectives to achieve sustainable, profitable growth.
The divisions are separate operational units, responsible for delivering results in line with the strategies and objectives set by the business area. Each division has global responsibility for a spe-cific product or service offering. A division can include one or more product companies (units responsible for product development, manufac turing and product marketing), distribution centers, and several customer centers (units responsible for customer contacts, sales and service) dedicated or shared with other divisions.
Regional holding functions are established world-wide to support the divisional structure of the Group and to represent Group Management.
As of January 1, 2022
The sharing of resources and infrastructure/ service providers
Common processes and shared best practices collected in the handbook of policies and guide- lines The Way We Do Things
A common leadership model
An internal job market
One Group Treasury
A shared vision and a common identity
Shared goals and strategic pillars for growth
The corporate culture and the core values: interaction, commitment, and innovation
The sharing of brand names and trademarks
The Atlas Copco Group is unified and strengthened through:
GROUP MANAGEMENT
BOARD OF DIRECTORS
PRESIDENT AND CEO
Divisions generally conduct business through product companies, distribution centers and customer centers.
COMPRESSOR TECHNIQUE
Divisions
Compressor Technique Service
Industrial Air
Oil-free Air
Professional Air
Gas and Process
Medical Gas Solutions
Airtec
Divisions
Vacuum Technique Service
Semiconductor Service
Semiconductor
Semiconductor Chamber Solutions
Scientific Vacuum
Industrial Vacuum
VACUUM TECHNIQUE
Divisions
Industrial Technique Service
Motor Vehicle Industry Tools and Assembly Systems
General Industry Tools and Assembly Systems
Chicago Pneumatic Tools
Industrial Assembly Solutions
Machine Vision Solutions
INDUSTRIAL TECHNIQUE
Divisions
Power Technique Service
Specialty Rental
Portable Air
Power and Flow
POWER TECHNIQUE
This is how we do business, continued
The Group’s Business Code of Practice
Atlas Copco 2021 10
THIS IS ATLAS COPCO
THIS IS ATLAS COPCO This is Atlas Copco – Home of Industrial ideas
Our targets
• This is how we do business
Creating lasting value for all stakeholders
Contributing to the UN Sustainable Development Goals

INTRO
DU
CTION
THIS IS A
TLAS CO
PCOTH
E YEA
R IN REV
IEWFIN
AN
CIALS
OTH
ER INFO
RMA
TION
INTERACTIONwe interact and develop close relations with customers, internally and externally, as well as with other stakeholders. This takes place in many ways: physically, online or in directly through business partners. we always look for what is best for a specific target group.
INNOVATIONOur innovative spirit is reflected in every-thing we do. Our customers expect the best from Atlas Copco and our objective is to consistently deliver high-quality prod-ucts and service that increase customers’ productivity and competitiveness.
COMMITMENTwe operate worldwide with a long-term commitment to our customers in each country and market served. we keep our promises and always strive to exceed high expectations.
LEADERSHIP AND PEOPLEIn Atlas Copco, leadership is defined as the ability to create lasting results through people. Atlas Copco believes that competent and committed leaders are crucial to achieving sustainable, profit-able growth. Freedom to act and accountability are guiding principles.
All leaders are given a mission statement from their leader, outlining long-term expectations and goals in both quantitative and qualitative terms. The timeframe of a mission is typically three to five years. Based on the mission statement, the man-ager is expected to develop a vision, and clarify how the mission will be achieved, including the strategies, organization and people needed to make it happen.
Atlas Copco’s performance is closely related to how the Group succeeds in being a good employer, attracting and developing resourceful and motivated people. with a global business
Our core values reflect how we behave internally and in relation to external stakeholders.
THE BUSINESS CODE OF PRACTICE Internal policy documents related to business ethics and social and environ-mental performance are summarized in Atlas Copco’s Business Code of Practice. All employees in Group companies, as well as our business partners, are expected to adhere to these policies. All employees are required to annually take ethics trainings and to sign a compliance statement.
In Atlas Copco, leadership is defined as the ability to create lasting results.
conducted through numerous companies, we work with continuous competence development, knowledge sharing, while embedding the core values: interaction, commitment, and innovation across all people processes.
Atlas Copco has a strong culture of growing talent by encouraging employees to take account-ability for their own career and learning journey. The Group enables internal mobility and growth by offering continuous competence development activities and the internal job market. with the ambition to develop individuals and teams to reach their full potential, Atlas Copco offers acces-sible tools and targeted learning content, both digital and classroom courses and programs, for all employees.
If Atlas Copco needs to adapt its capacity in a deteriorating business climate, the first action is to stop recruitment. Layoffs are the last resort.
PROCESSESGroup-wide strategies, processes, principles, guidelines, and shared best practices are gathered in the handbook of policies and guidelines The Way We Do Things. The handbook is available to all employees. Although most of the processes are self-explanatory, managers are provided regular training in how to implement them. wherever Atlas Copco’s employees are located, they are expected to work in accordance with the provided processes, principles and guidelines.
The content of the handbook covers gover-nance, safety, health, environment and quality, accounting and business control, treasury, tax, audit and internal control, information technol-ogy, people management, legal, communications and branding, risk, crisis management, administra-tive services, insurance, standardization, and acquisitions.
This is how we do business, continued
Atlas Copco 2021 11
THIS IS ATLAS COPCO
THIS IS ATLAS COPCO This is Atlas Copco – Home of Industrial ideas
Our targets
• This is how we do business
Creating lasting value for all stakeholders
Contributing to the UN Sustainable Development Goals

INTRO
DU
CTION
THIS IS A
TLAS CO
PCOTH
E YEA
R IN REV
IEWFIN
AN
CIALS
OTH
ER INFO
RMA
TION
Creating lasting value for all stakeholders
Atlas Copco’s vision is to become and remain First in Mind—First in Choice of its customers and other principal stakeholders. The Group aims to continuously deliver sustainable, profitable growth with an increased positive impact on society and the environment. Below, we illustrate how we with a responsible use of resources – human, natural and capital – create value for customers, employees, business partners, shareholders, as well as for society and the environment.
NATURAL RESOURCES
– 385 Gwh total energy use – 58% renewable energy
of total Mwh energy used in operations
– 75% of production cost of equipment is purchased components
FINANCIAL RESOURCES
– Average capital employed MSEK 87 537
– MSEK 4 163 investments in innovation*
HUMAN RESOURCES
– 41 300 employees, on average
– Employees in 70 countries– 4 000 R&D engineers
generating industrial ideas and innovations
The resources we put in
Atlas CopcoDecentralized
leadership model
Agile setup and asset-light
operations
Core values
Common vision, mission and
strategy
Innovations for customers’
success
Close customer relationship with
application knowledge and
professional service
Sustainability priorities
The value we create
CUSTOMERS
– Increased productivity– Increased safety and
ergonomics in working environment
– Energy savings– Decreased total cost
of ownership
SOCIETY/ENVIRONMENT
– 98% of employees have signed the Business Code of Practice
– 97% of employees were trained in the Business Code of Practice
– 3% reduced CO2 emissions from energy in operations and transport of goods
– Employment for 43 000 employees in 70 countries at year end
SHAREHOLDERS
– 27% return on capital employed
– MSEK 19 378 operating cash flow
– 22% annual total return A-share, 10 year
EMPLOYEES
– Employees agree there is opportunity to learn and grow in the company
– Employees agree Atlas Copco has a work culture of respect, fairness and openness
BUSINESS PARTNERS
– More than 5 000 significant suppliers
– Leverage competence– Market access– Long-term reliable partner – Over 600 suppliers audited
on safety, health, environ-ment and ethics
* Investments in product development, including capitalized expenditures.
Atlas Copco 2021 12
THIS IS ATLAS COPCO
THIS IS ATLAS COPCO This is Atlas Copco – Home of Industrial ideas
Our targets
This is how we do business
• Creating lasting value for all stakeholders
Contributing to the UN Sustainable Development Goals
INTRO
DU
CTION
THIS IS A
TLAS CO
PCOTH
E YEA
R IN REV
IEWFIN
AN
CIALS
OTH
ER INFO
RMA
TION
Contributing to the UN Sustainable Development Goals
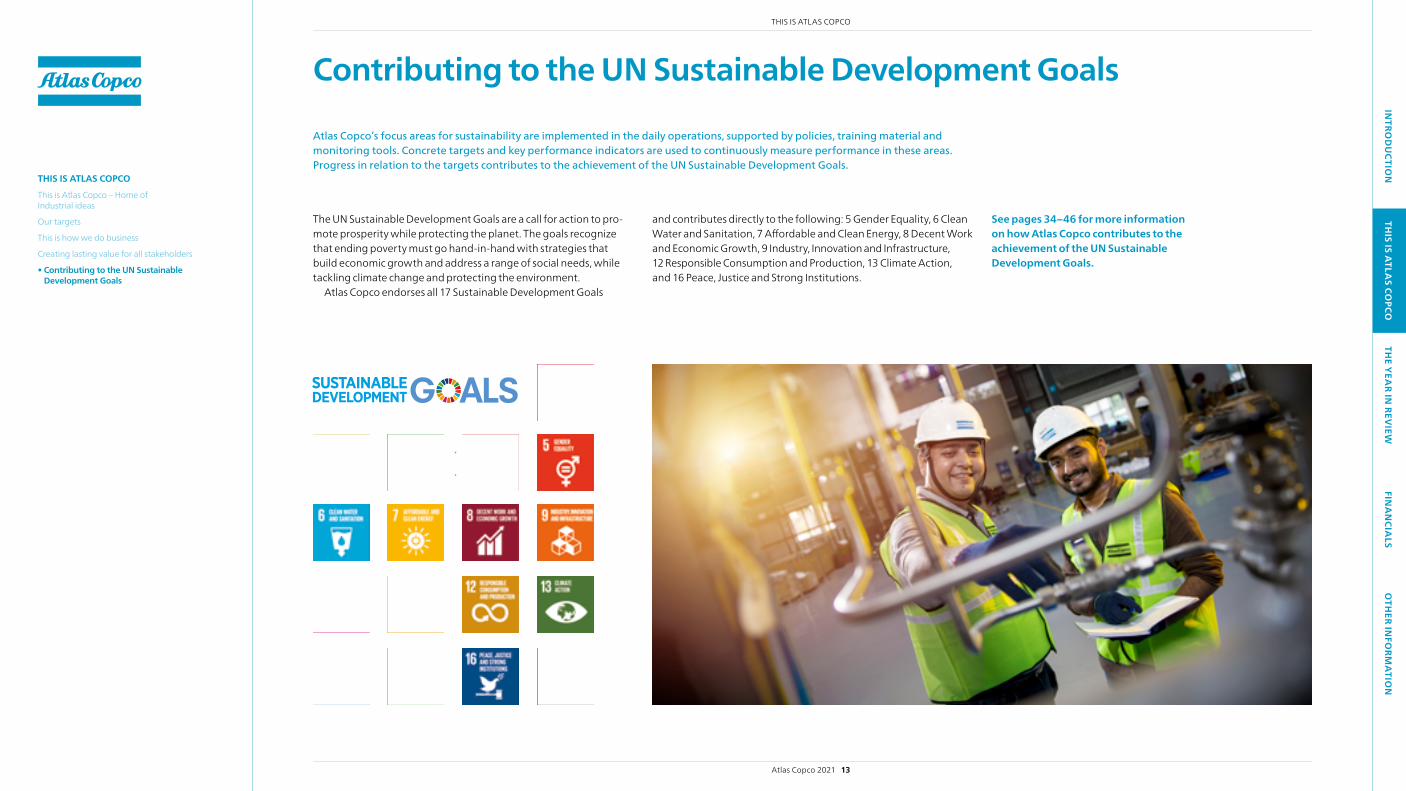
Atlas Copco’s focus areas for sustainability are implemented in the daily operations, supported by policies, training material and monitoring tools. Concrete targets and key performance indicators are used to continuously measure performance in these areas. Progress in relation to the targets contributes to the achievement of the UN Sustainable Development Goals.
The UN Sustainable Development Goals are a call for action to pro-mote prosperity while protecting the planet. The goals recognize that ending poverty must go hand-in-hand with strategies that build economic growth and address a range of social needs, while tackling climate change and protecting the environment.
Atlas Copco endorses all 17 Sustainable Development Goals
and contributes directly to the following: 5 Gender Equality, 6 Clean water and Sanitation, 7 Affordable and Clean Energy, 8 Decent work and Economic Growth, 9 Industry, Innovation and Infrastructure, 12 Responsible Consumption and Production, 13 Climate Action, and 16 Peace, Justice and Strong Institutions.
See pages 34–46 for more information on how Atlas Copco contributes to the achievement of the UN Sustainable Development Goals.
Atlas Copco 2021 13
THIS IS ATLAS COPCO
THIS IS ATLAS COPCO This is Atlas Copco – Home of Industrial ideas
Our targets
This is how we do business
Creating lasting value for all stakeholders
• Contributing to the UN Sustainable Development Goals

INTRO
DU
CTION
THIS IS A
TLAS CO
PCOTH
E YEA
R IN REV
IEWFIN
AN
CIALS
OTH
ER INFO
RMA
TION
The year in review
Market review and demandThe overall demand for Atlas Copco’s equipment and services improved considerably compared to the previous year, which was heavily impacted by the Covid-19 pandemic. The order intake increased significantly already in the first quarter and this continued throughout the year. In com-parable currency, the Group’s order intake for equipment increased by 46%, while the service business, including specialty rental, grew by 15%, with positive development in all business areas and most regions.
The demand for compressors increased, which led to significantly increased order volumes in all regions, primarily driven by industrial compres-sors, although gas and process compressors also achieved solid order growth.
The order intake for vacuum equipment increased strongly in most regions mainly as a result of substantially higher demand from the semiconductor industry. Order volumes for indus-trial vacuum applications also grew significantly.
Order volumes for industrial power tools, assembly and machine vision solutions increased noticeably, supported by growing demand from the automotive and general industry. Solid order growth was achieved in all regions.
The order intake for portable air and power and flow products, such as portable compressors, con-struction tools, generators and pumps, increased significantly. Strong order growth was achieved in all regions, particularly in North America.
In total, the Group’s order intake increased by 29% to a record MSEK 129 545 (100 554), corre-sponding to an organic growth of 33%. Currency had a negative effect of 6% while acquisitions contributed with 2%.
Further information can be found in the business area sections on pages 21–33.
North AmericaOrders received in North America increased 43% in local currencies. Order volumes increased for all types of equipment. In particular, strong order growth was achieved for vacuum equipment to the semiconductor industry, and for power equip-ment, such as portable compressors, generators and pumps. The last was primarily supported by increased demand from equipment rental compa-nies in the second half of the year. The order intake for industrial power tools, assembly and vision solutions, increased significantly, supported by increased demand from the automotive and gen-eral industry. Order volumes for service increased in all business areas. In total, North America accounted for 24% (23) of orders received.
South AmericaOrder intake in South America increased 31% in local currencies. The growth was primarily driven by increased demand for power equipment, and industrial and portable compressors, in the big-gest market Brazil. Solid order growth was also achieved for industrial power tools and assembly solutions, and order intake for service increased in all business areas. In total, South America accounted for 4% (4) of orders received.
EuropeOrders received in Europe increased 27% in local currencies. In particular, strong order growth was achieved for industrial and portable compres-sors, vacuum equipment for semiconductor appli-cations and industrial customers, industrial power tools and assembly solutions to the general indus-try and vision solutions. However, order volumes for gas and process compressors, and industrial power tools and assembly solutions to the auto-motive industry, did not reach previous year’s
level. The order intake for service increased in all business areas. In total, Europe accounted for 28% (30) of orders received.
Africa/Middle EastOrders received increased 5% in Africa/Middle East in local currencies. The order intake for indus-trial and portable compressors increased signifi-cantly, while order volumes for gas and process compressors and vacuum equipment did not reach the previous year’s level. Order volumes for the service business increased in all business areas except Vacuum Technique, where order intake decreased. In total, Africa/Middle East accounted for 4% (5) of orders received.
Asia/OceaniaOrder intake in local currencies in Asia/Oceania increased by 40%. Order volumes for equipment increased considerably, and solid order growth was achieved for service.
The order intake for small/medium and large- sized industrial compressors increased signifi-cantly. Solid order growth was achieved for gas and process compressors, and portable compres-sors. Order volumes for vacuum equipment also increased significantly, primarily driven by higher demand from the semiconductor and flat panel industry. The order intake for industrial power tools, assembly and vision solutions also increased, supported by higher demand from the automotive and general industry. Asia/Oceania accounted for 40% (38) of orders received.
Market presenceAtlas Copco had own customer centers in 70 (71) countries and production facilities in 21 (21) countries. Revenues were reported in 183 (184) countries.
Important eventsAcquisitions and divestmentsThe Group completed 17 acquisitions during the year. In total, the acquisitions added net revenues of approximately MSEK 2 200.
In December, the CMM (Coordinate Measuring Machine) part of the Perceptron business in the Industrial Technique business area (acquired in December 2020) was divested. The divestment was a result of further focus on in-line metrology in contrast to off-line applications. The CMM business has revenues of about 100 MSEK.
Changes in Group ManagementPeter Kinnart was appointed Senior Vice President, Chief Financial Officer effective July 17, 2021, replacing Hans Ola Meyer who retired. Peter Kinnart was previously Vice President Business Con-trol at the business area Compressor Technique.
Eva Klasén was appointed Senior Vice President, Chief Legal Officer effective May 1, 2022, replacing Håkan Osvald who will retire. Eva Klasén was previ-ously Deputy Chief Legal Officer at Atlas Copco AB.
Sara Hägg Liljedal was appointed Senior Vice President, Chief Communications Officer effective February 1, 2022. Sara Hägg Liljedal was previ-ously Media Relations Manager for the Group, and replaced Gisela Lindstrand, who left the Group in September 2021.
ESG recognitionsIn 2021 Atlas Copco received, among others, rating of AA in the MSCI ESG Ratings assessment, was given Prime status by the ISS ESG rating, and remains a constituent of the FTSE4Good Index Series. Atlas Copco scored a B by CDP in 2021 for the carbon-related disclosure and a B for the water-related disclosure.
Atlas Copco 2021 14
THE YEAR IN REVIEw
THE YEAR IN REVIEW• Administration report
Business areas
Compressor Technique
Vacuum Technique
Industrial Technique
Power Technique
Sustainable approach to delivering value
Raising our climate ambition
Products and service
People
Safety and well-being
Ethics
Environment
Risks, risk management and opportunities
The Atlas Copco share
Corporate Governance
Board of Directors
Group Management
Internal control over financial reporting
INTRO
DU
CTION
THIS IS A
TLAS CO
PCOTH
E YEA
R IN REV
IEWFIN
AN
CIALS
OTH
ER INFO
RMA
TION
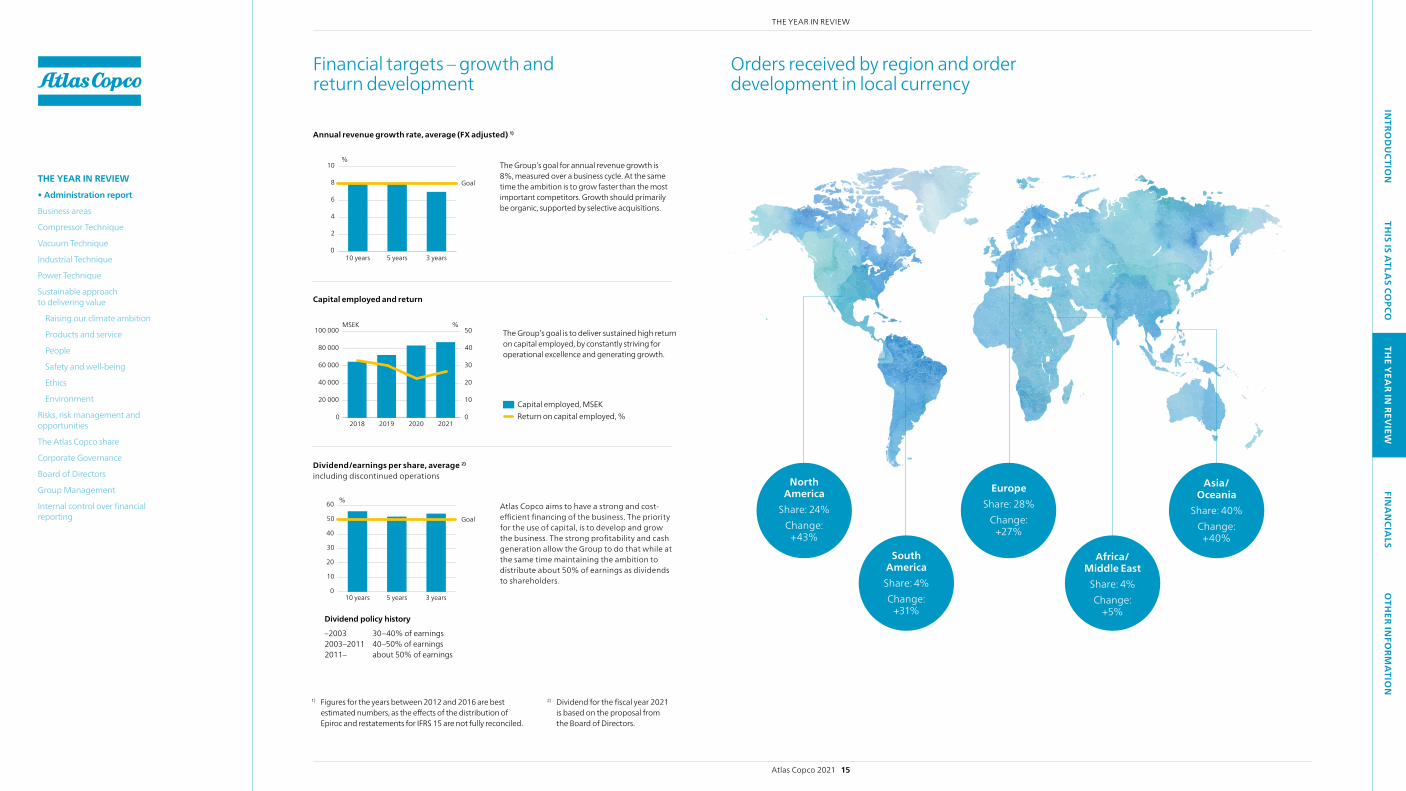
Financial targets – growth and return development
Annual revenue growth rate, average (FX adjusted) 1)
The Group’s goal for annual revenue growth is 8%, measured over a business cycle. At the same time the ambition is to grow faster than the most important competitors. Growth should primarily be organic, supported by selective acquisitions.
Atlas Copco aims to have a strong and cost-efficient financing of the business. The priority for the use of capital, is to develop and grow the business. The strong profitability and cash generation allow the Group to do that while at the same time maintaining the ambition to distribute about 50% of earnings as dividends to shareholders.
Dividend/earnings per share, average 2)
including discontinued operations
Capital employed and return
The Group’s goal is to deliver sustained high return on capital employed, by constantly striving for operational excellence and generating growth.
1) Figures for the years between 2012 and 2016 are best estimated numbers, as the effects of the distribution of Epiroc and restatements for IFRS 15 are not fully reconciled.
0
2
4
6
8
10
3 years5 years10 years0
20 000
40 000
60 000
80 000
100 000
20212020201920180
10
20
30
40
50
60
3 years5 years10 years
Goal Goal
% MSEK % %
0
10
20
30
40
50
0
2
4
6
8
10
3 years5 years10 years0
20 000
40 000
60 000
80 000
100 000
20212020201920180
10
20
30
40
50
60
3 years5 years10 years
Goal Goal
% MSEK % %
0
10
20
30
40
50
0
2
4
6
8
10
3 years5 years10 years0
20 000
40 000
60 000
80 000
100 000
20212020201920180
10
20
30
40
50
60
3 years5 years10 years
Goal Goal
% MSEK % %
0
10
20
30
40
50
Dividend policy history
–2003 30–40% of earnings 2003–2011 40–50% of earnings 2011– about 50% of earnings
2) Dividend for the fiscal year 2021 is based on the proposal from the Board of Directors.
Orders received by region and order development in local currency
North America
Share: 24%Change:
+43%
South AmericaShare: 4%Change:
+31%
EuropeShare: 28%
Change: +27%
Africa/ Middle East
Share: 4%Change:
+5%
Asia/ Oceania
Share: 40%Change:
+40%
Capital employed, MSEK Return on capital employed, %
Atlas Copco 2021 15
THE YEAR IN REVIEw
THE YEAR IN REVIEW• Administration report
Business areas
Compressor Technique
Vacuum Technique
Industrial Technique
Power Technique
Sustainable approach to delivering value
Raising our climate ambition
Products and service
People
Safety and well-being
Ethics
Environment
Risks, risk management and opportunities
The Atlas Copco share
Corporate Governance
Board of Directors
Group Management
Internal control over financial reporting
INTRO
DU
CTION
THIS IS A
TLAS CO
PCOTH
E YEA
R IN REV
IEWFIN
AN
CIALS
OTH
ER INFO
RMA
TION
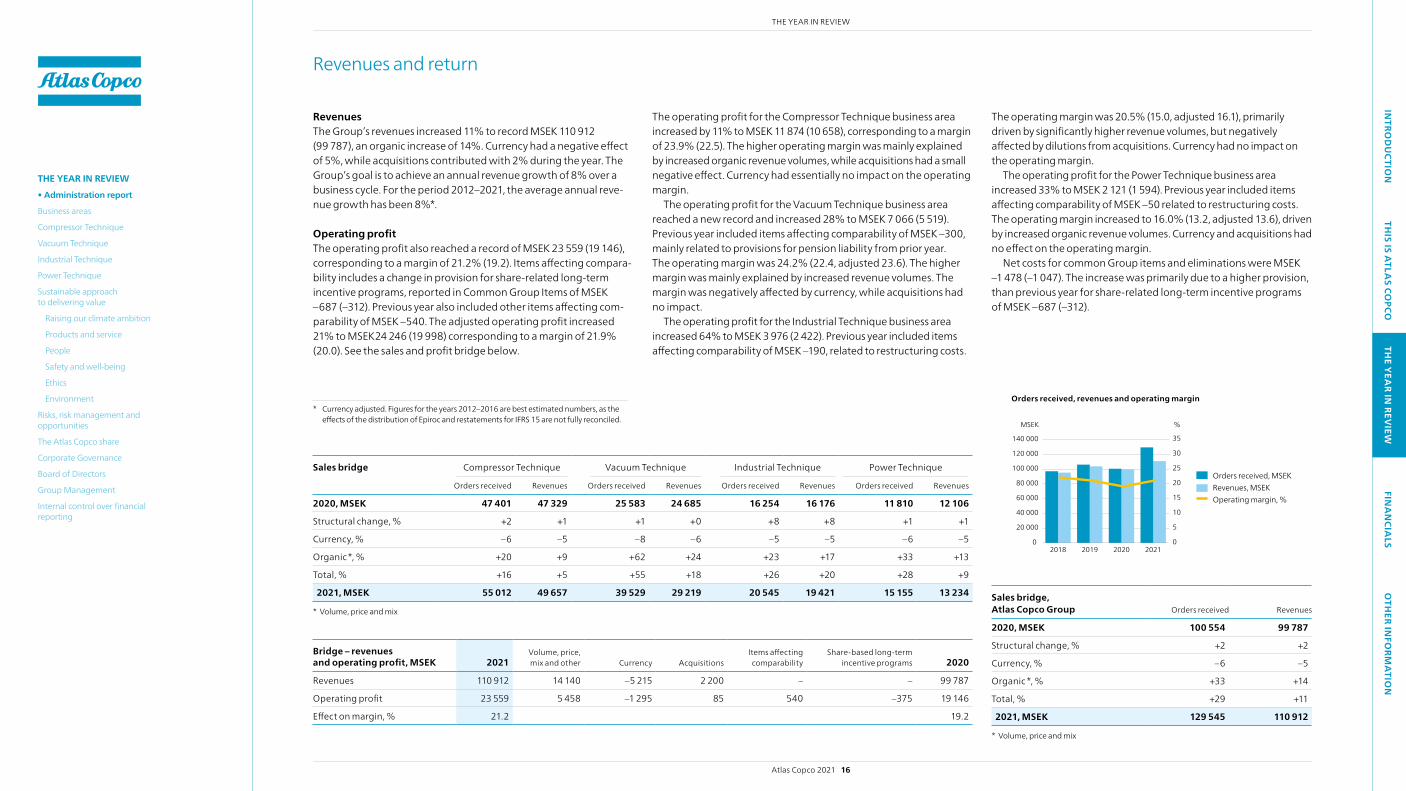
RevenuesThe Group’s revenues increased 11% to record MSEK 110 912 (99 787), an organic increase of 14%. Currency had a negative effect of 5%, while acquisitions contributed with 2% during the year. The Group’s goal is to achieve an annual revenue growth of 8% over a business cycle. For the period 2012–2021, the average annual reve-nue growth has been 8%*.
Operating profitThe operating profit also reached a record of MSEK 23 559 (19 146), corresponding to a margin of 21.2% (19.2). Items affecting compara-bility includes a change in provision for share-related long-term incentive programs, reported in Common Group Items of MSEK –687 (–312). Previous year also included other items affecting com-parability of MSEK –540. The adjusted operating profit increased 21% to MSEK24 246 (19 998) corresponding to a margin of 21.9% (20.0). See the sales and profit bridge below.
The operating profit for the Compressor Technique business area increased by 11% to MSEK 11 874 (10 658), corresponding to a margin of 23.9% (22.5). The higher operating margin was mainly explained by increased organic revenue volumes, while acquisitions had a small negative effect. Currency had essentially no impact on the operating margin.
The operating profit for the Vacuum Technique business area reached a new record and increased 28% to MSEK 7 066 (5 519). Previous year included items affecting comparability of MSEK –300, mainly related to provisions for pension liability from prior year. The operating margin was 24.2% (22.4, adjusted 23.6). The higher margin was mainly explained by increased revenue volumes. The margin was negatively affected by currency, while acquisitions had no impact.
The operating profit for the Industrial Technique business area increased 64% to MSEK 3 976 (2 422). Previous year included items affecting comparability of MSEK –190, related to restructuring costs.
Revenues and return
* Currency adjusted. Figures for the years 2012–2016 are best estimated numbers, as the effects of the distribution of Epiroc and restatements for IFRS 15 are not fully reconciled.
Bridge – revenues and operating profit, MSEK 2021
Volume, price, mix and other Currency Acquisitions
Items affecting comparability
Share-based long-term incentive programs 2020
Revenues 110 912 14 140 –5 215 2 200 – – 99 787
Operating profit 23 559 5 458 –1 295 85 540 –375 19 146
Effect on margin, % 21.2 19.2
Sales bridge, Atlas Copco Group Orders received Revenues
2020, MSEK 100 554 99 787
Structural change, % +2 +2
Currency, % –6 –5
Organic *, % +33 +14
Total, % +29 +11
2021, MSEK 129 545 110 912
* Volume, price and mix
Sales bridge Compressor Technique Vacuum Technique Industrial Technique Power Technique
Orders received Revenues Orders received Revenues Orders received Revenues Orders received Revenues
2020, MSEK 47 401 47 329 25 583 24 685 16 254 16 176 11 810 12 106
Structural change, % +2 +1 +1 +0 +8 +8 +1 +1
Currency, % –6 –5 –8 –6 –5 –5 –6 –5
Organic*, % +20 +9 +62 +24 +23 +17 +33 +13
Total, % +16 +5 +55 +18 +26 +20 +28 +9
2021, MSEK 55 012 49 657 39 529 29 219 20 545 19 421 15 155 13 234
* Volume, price and mix
0
20 000
40 000
60 000
80 000
100 000
120 000
140 000
2021202020192018
MSEK
0
20000
40000
60000
80000
100000
120000
2020201920182017*
MSEK
0
5
10
15
20
25
30
35
%
Orders received, revenues and operating margin
Orders received, MSEKRevenues, MSEKOperating margin, %
The operating margin was 20.5% (15.0, adjusted 16.1), primarily driven by significantly higher revenue volumes, but negatively affected by dilutions from acquisitions. Currency had no impact on the operating margin.
The operating profit for the Power Technique business area increased 33% to MSEK 2 121 (1 594). Previous year included items affecting comparability of MSEK –50 related to restructuring costs. The operating margin increased to 16.0% (13.2, adjusted 13.6), driven by increased organic revenue volumes. Currency and acquisitions had no effect on the operating margin.
Net costs for common Group items and eliminations were MSEK –1 478 (–1 047). The increase was primarily due to a higher provision, than previous year for share-related long-term incentive programs of MSEK –687 (–312).
Atlas Copco 2021 16
THE YEAR IN REVIEw
THE YEAR IN REVIEW• Administration report
Business areas
Compressor Technique
Vacuum Technique
Industrial Technique
Power Technique
Sustainable approach to delivering value
Raising our climate ambition
Products and service
People
Safety and well-being
Ethics
Environment
Risks, risk management and opportunities
The Atlas Copco share
Corporate Governance
Board of Directors
Group Management
Internal control over financial reporting
INTRO
DU
CTION
THIS IS A
TLAS CO
PCOTH
E YEA
R IN REV
IEWFIN
AN
CIALS
OTH
ER INFO
RMA
TION
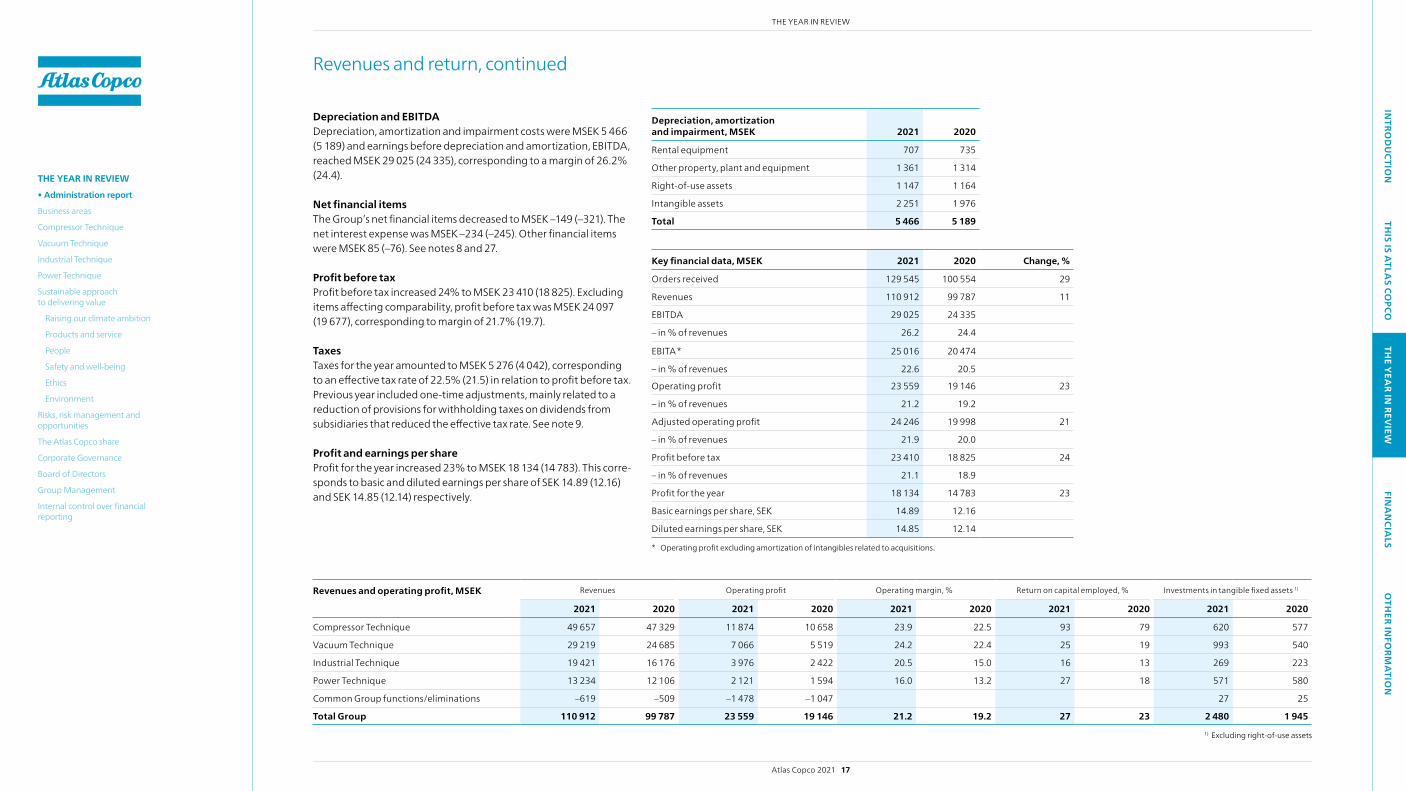
Revenues and operating profit, MSEK Revenues Operating profit Operating margin, % Return on capital employed, % Investments in tangible fixed assets 1)
2021 2020 2021 2020 2021 2020 2021 2020 2021 2020
Compressor Technique 49 657 47 329 11 874 10 658 23.9 22.5 93 79 620 577
Vacuum Technique 29 219 24 685 7 066 5 519 24.2 22.4 25 19 993 540
Industrial Technique 19 421 16 176 3 976 2 422 20.5 15.0 16 13 269 223
Power Technique 13 234 12 106 2 121 1 594 16.0 13.2 27 18 571 580
Common Group functions/eliminations –619 –509 –1 478 –1 047 27 25
Total Group 110 912 99 787 23 559 19 146 21.2 19.2 27 23 2 480 1 9451) Excluding right-of-use assets
Depreciation and EBITDADepreciation, amortization and impairment costs were MSEK 5 466 (5 189) and earnings before depreciation and amortization, EBITDA,reached MSEK 29 025 (24 335), corresponding to a margin of 26.2% (24.4).
Net financial itemsThe Group’s net financial items decreased to MSEK –149 (–321). The net interest expense was MSEK –234 (–245). Other financial items were MSEK 85 (–76). See notes 8 and 27.
Profit before taxProfit before tax increased 24% to MSEK 23 410 (18 825). Excluding items affecting comparability, profit before tax was MSEK 24 097 (19 677), corresponding to margin of 21.7% (19.7).
TaxesTaxes for the year amounted to MSEK 5 276 (4 042), corresponding to an effective tax rate of 22.5% (21.5) in relation to profit before tax. Previous year included one-time adjustments, mainly related to a reduction of provisions for withholding taxes on dividends from subsidiaries that reduced the effective tax rate. See note 9.
Profit and earnings per shareProfit for the year increased 23% to MSEK 18 134 (14 783). This corre-sponds to basic and diluted earnings per share of SEK 14.89 (12.16) and SEK 14.85 (12.14) respectively.
Depreciation, amortization and impairment, MSEK 2021 2020
Rental equipment 707 735
Other property, plant and equipment 1 361 1 314
Right-of-use assets 1 147 1 164
Intangible assets 2 251 1 976
Total 5 466 5 189
Key financial data, MSEK 2021 2020 Change, %
Orders received 129 545 100 554 29
Revenues 110 912 99 787 11
EBITDA 29 025 24 335
– in % of revenues 26.2 24.4
EBITA * 25 016 20 474
– in % of revenues 22.6 20.5
Operating profit 23 559 19 146 23
– in % of revenues 21.2 19.2
Adjusted operating profit 24 246 19 998 21
– in % of revenues 21.9 20.0
Profit before tax 23 410 18 825 24
– in % of revenues 21.1 18.9
Profit for the year 18 134 14 783 23
Basic earnings per share, SEK 14.89 12.16
Diluted earnings per share, SEK 14.85 12.14
* Operating profit excluding amortization of intangibles related to acquisitions.
Revenues and return, continued
Atlas Copco 2021 17
THE YEAR IN REVIEw
THE YEAR IN REVIEW• Administration report
Business areas
Compressor Technique
Vacuum Technique
Industrial Technique
Power Technique
Sustainable approach to delivering value
Raising our climate ambition
Products and service
People
Safety and well-being
Ethics
Environment
Risks, risk management and opportunities
The Atlas Copco share
Corporate Governance
Board of Directors
Group Management
Internal control over financial reporting
INTRO
DU
CTION
THIS IS A
TLAS CO
PCOTH
E YEA
R IN REV
IEWFIN
AN
CIALS
OTH
ER INFO
RMA
TION
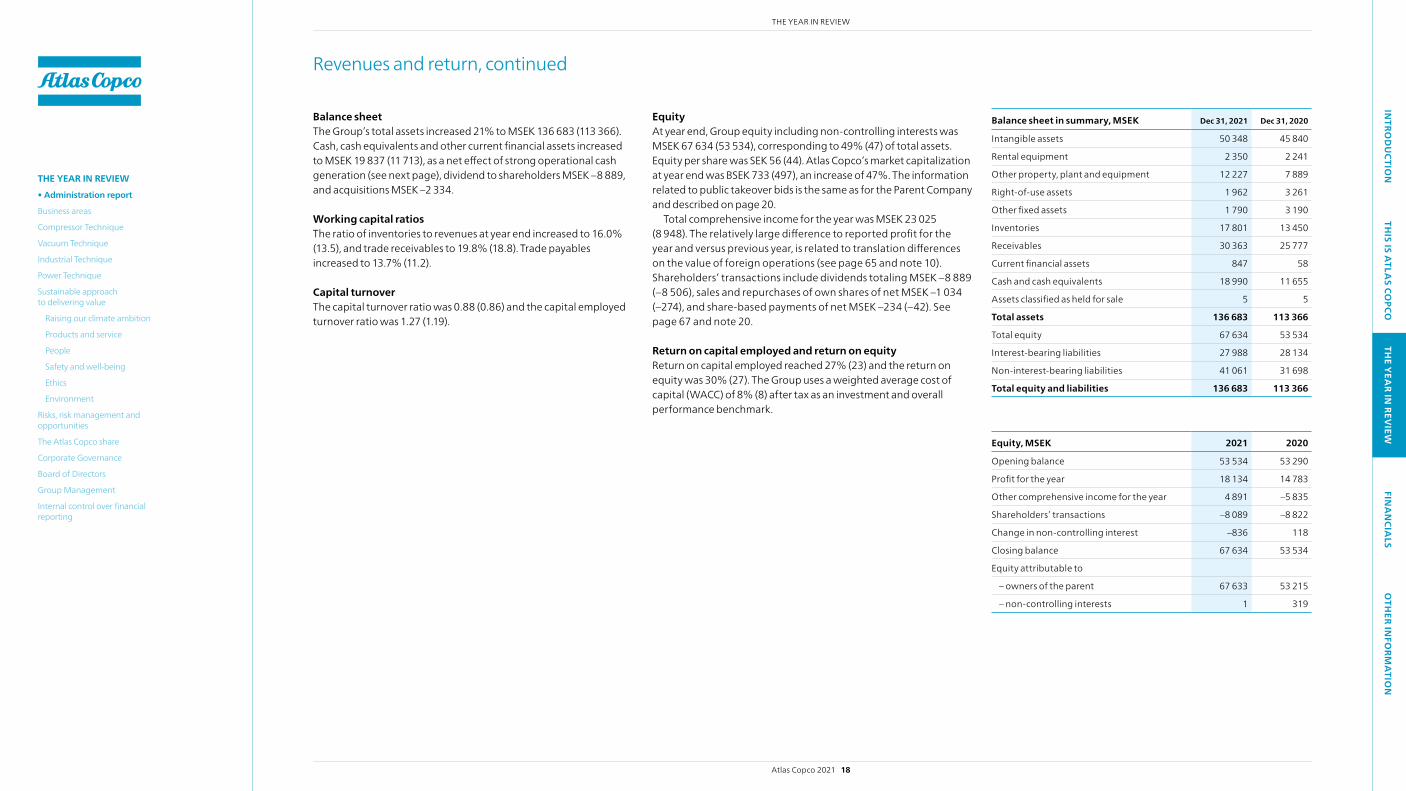
Balance sheetThe Group’s total assets increased 21% to MSEK 136 683 (113 366). Cash, cash equivalents and other current financial assets increased to MSEK 19 837 (11 713), as a net effect of strong operational cash generation (see next page), dividend to shareholders MSEK –8 889, and acquisitions MSEK –2 334.
Working capital ratiosThe ratio of inventories to revenues at year end increased to 16.0% (13.5), and trade receivables to 19.8% (18.8). Trade payables increased to 13.7% (11.2).
Capital turnoverThe capital turnover ratio was 0.88 (0.86) and the capital employed turnover ratio was 1.27 (1.19).
EquityAt year end, Group equity including non-controlling interests was MSEK 67 634 (53 534), corresponding to 49% (47) of total assets. Equity per share was SEK 56 (44). Atlas Copco’s market capitalization at year end was BSEK 733 (497), an increase of 47%. The information related to public takeover bids is the same as for the Parent Company and described on page 20.
Total comprehensive income for the year was MSEK 23 025 (8 948). The relatively large difference to reported profit for the year and versus previous year, is related to translation differences on the value of foreign operations (see page 65 and note 10). Shareholders’ transactions include dividends totaling MSEK –8 889 (–8 506), sales and repurchases of own shares of net MSEK –1 034 (–274), and share-based payments of net MSEK –234 (–42). See page 67 and note 20.
Return on capital employed and return on equityReturn on capital employed reached 27% (23) and the return on equity was 30% (27). The Group uses a weighted average cost of capital (wACC) of 8% (8) after tax as an investment and overall performance benchmark.
Revenues and return, continued
Balance sheet in summary, MSEK Dec 31, 2021 Dec 31, 2020
Intangible assets 50 348 45 840
Rental equipment 2 350 2 241
Other property, plant and equipment 12 227 7 889
Right-of-use assets 1 962 3 261
Other fixed assets 1 790 3 190
Inventories 17 801 13 450
Receivables 30 363 25 777
Current financial assets 847 58
Cash and cash equivalents 18 990 11 655
Assets classified as held for sale 5 5
Total assets 136 683 113 366
Total equity 67 634 53 534
Interest-bearing liabilities 27 988 28 134
Non-interest-bearing liabilities 41 061 31 698
Total equity and liabilities 136 683 113 366
Equity, MSEK 2021 2020
Opening balance 53 534 53 290
Profit for the year 18 134 14 783
Other comprehensive income for the year 4 891 –5 835
Shareholders’ transactions –8 089 –8 822
Change in non-controlling interest –836 118
Closing balance 67 634 53 534
Equity attributable to
– owners of the parent 67 633 53 215
– non-controlling interests 1 319
Atlas Copco 2021 18
THE YEAR IN REVIEw
THE YEAR IN REVIEW• Administration report
Business areas
Compressor Technique
Vacuum Technique
Industrial Technique
Power Technique
Sustainable approach to delivering value
Raising our climate ambition
Products and service
People
Safety and well-being
Ethics
Environment
Risks, risk management and opportunities
The Atlas Copco share
Corporate Governance
Board of Directors
Group Management
Internal control over financial reporting

INTRO
DU
CTION
THIS IS A
TLAS CO
PCOTH
E YEA
R IN REV
IEWFIN
AN
CIALS
OTH
ER INFO
RMA
TION
Interest-bearing debt and net indebtednessTotal interest-bearing debt was MSEK 27 988 (28 134), whereof MSEK 3 114 (3 488) in post-employment benefits. The Group has an average maturity of 4.1 years on interest-bearing liabilities. See notes 21 and 23 for additional information. The Group’s net indebt-edness, amounted to MSEK 8 151 (16 421) at year end. The net debt/EBITDA ratio was 0.3 (0.7) and the debt/equity ratio was 12% (31).
Credit ratingAtlas Copco’s long-term and short-term debt is rated by Standard & Poor’s and Fitch with the long-/short-term rating A+/A-1 and A+/F1+, respectively.
Operating cash flow and investmentsOperating cash surplus was MSEK 28 952 (25 081). Cash flows from financial items were MSEK 459 (244). Net pension funding and pay-ments were MSEK –330 (–340). The working capital increased by MSEK 244 (decrease of 2 166), primarily due to higher inventories and trade receivables. Net investments in rental equipment were MSEK 474 (416).
Gross investments in property, plant and equipment increased to MSEK 1 970 (1 459). Notable investments in 2021 were made by Compressor Technique in further automation of its main production facility in Belgium and in a new production unit in Italy.
Vacuum Technique invested in increased production capacity in China, new production units in the USA and South Korea, expansion of an existing production unit in the United Kingdom, and two new service technology centers, one in Ireland, and one in China. Indus-trial Technique invested in a new factory for machine vision systems in
Revenues and return, continued
Germany and new machining equipment in a production facility in Sweden. Power Technique invested in a new rental depot in Canada. Cash received from sale of property, plant and equipment were MSEK 93 (39).
Net investments in intangible assets, mainly related to capitaliza-tion of product development expenditures, were MSEK 1 389 (1 337). Net investments in other assets were MSEK –514 (+54). In total, the operating cash flow reached MSEK 19 378 (18 910).
Cash flow from structural changesThe net cash flow from structural changes, i.e. acquisitions and divestments, amounted to MSEK –2 341 (–13 583). Previous year included approximately MSEK 10 300 related to the acquisition of ISRA VISION. See also note 2.
Cash flow from financing Dividends paid amounted to MSEK –8 889 (–8 506). Sales and repur-chases of own shares resulted in a net of MSEK 1 034 (–274), all related to hedging or deliveries of shares for the long-term incentive plans described on page 94. Change in interest-bearing liabilities was MSEK –1 645 (444).
EmployeesIn 2021, the average number of employees in the Group increased by 1 666 to 41 272. At year end, the number of employees was 42 862 (40 160), and the number of consultants/external work-force was 3 762 (2 907). For comparable units, the total workforce increased by 3 249. See also note 5.
Calculation of operating cash flow, MSEK 2021 2020
Operating cash surplus 28 952 25 081
Net financial items 459 244
Taxes paid –5 211 –4 531
Pension funding –330 –340
Change in working capital –244 2 166
Increase in rental equipment, net –474 –416
Cash flows from operating activities 23 152 22 204
Investments of property, plant and equipment, net –1 877 –1 420
Other investments, net –1 356 –1 283
Cash flow from investments –3 233 –2 703
Adjustment for currency hedges of loans –541 –591
Operating cash flow 19 378 18 910
Average number of employees 2021 2020
Atlas Copco Group 41 272 39 606
– Sweden 1 402 1 447
– Outside Sweden 39 870 38 160
Business areas
– Compressor Technique 18 785 18 212
– Vacuum Technique 8 961 8 226
– Industrial Technique 8 745 8 308
– Power Technique 3 973 4 059
– Common Group functions 808 801
Atlas Copco 2021 19
THE YEAR IN REVIEw
THE YEAR IN REVIEW• Administration report
Business areas
Compressor Technique
Vacuum Technique
Industrial Technique
Power Technique
Sustainable approach to delivering value
Raising our climate ambition
Products and service
People
Safety and well-being
Ethics
Environment
Risks, risk management and opportunities
The Atlas Copco share
Corporate Governance
Board of Directors
Group Management
Internal control over financial reporting

INTRO
DU
CTION
THIS IS A
TLAS CO
PCOTH
E YEA
R IN REV
IEWFIN
AN
CIALS
OTH
ER INFO
RMA
TION
Atlas Copco AB is the ultimate Parent Company of the Atlas Copco Group and is headquartered in Nacka, Sweden.
EarningsProfit before tax amounted to MSEK 5 515 (11 040) and profit for the year amounted to MSEK 5 176 (11 111).
FinancingThe total assets of the Parent Company were MSEK 173 859 (178 591). At year end 2021, cash and cash equivalents amounted to MSEK 0 (8) and interest-bearing liabilities amounted to MSEK 23 121 (25 351), whereof the main part is Group-internal loans. Equity represented 86% (85) of total assets and non-restricted equity totaled MSEK 143 591 (146 504).
EmployeesThe average number of employees in the Parent Company was 107 (107).
RemunerationPrinciples for remuneration, fees and other remuneration paid to the Board of Directors, the President and CEO, and other members of Group Management, other statistics and the guidelines regarding remuneration and benefits to Group Management as approved by the Annual General Meeting are specified in note 5.
Financial risks, risks and factors of uncertaintyAtlas Copco is subject to currency risks, interest rate risks and other financial risks. Atlas Copco has adopted a policy to control the finan-cial risks to which Atlas Copco AB and other Group companies are exposed. A financial risk management committee meets regularly to make decisions about how to manage these risks. See also Risks, risk management and opportunities on pages 47–51.
Appropriation of profit and proposed share splitThe Board of Directors proposes to the Annual General Meeting an ordinary dividend of SEK 7.60 (7.30) per share for the 2021 fiscal year. In order to facilitate a more efficient cash management, the ordi-nary annual dividend is proposed to be paid in two installments, the first with record date April 28, 2022, and the second with record date October 21, 2022. The first installment amount will be SEK 3.80 per share. The second installment amount will be SEK 3.80 per share (or SEK 0.95 per share if the proposed share split is decided by the Annual General Meeting).
The Board also proposes to the Annual General Meeting a share split and redemption share procedure, whereby every share is split into four (4) ordinary shares and one (1) redemption share. The redemption share is automatically redeemed at SEK 8.00 per share. Combined with the proposed ordinary dividend, shareholders will receive SEK 15.60 per share which corresponds to a total capital dis-tribution of MSEK 19 004 to shareholders. This excludes shares cur-rently held by the company. If the Annual General Meeting 2022 decides in accordance with the Board’s proposal, the payment of the redemption share will be made around June 13, 2022.
SEK
Retained earnings including reserve for fair value 138 414 537 596
Profit for the year 5 176 207 640
The Board of Directors proposes that these earnings be appropriated as follows:
To the shareholders, a dividend of SEK 7.60 per share 9 258 246 797
To be retained in the business 134 332 498 439
Total 143 590 745 236
Parent Company
Shares and share capitalAt year end, Atlas Copco’s share capital totaled MSEK 786 (786) and a total number of 1 229 613 104 shares divided into 839 394 096 class A shares and 390 219 008 class B shares were issued. Net of 11 422 736 class A shares and 0 class B shares held by Atlas Copco, 1 218 190 368 shares were outstanding. Class A shares entitle the owner to one vote while class B shares entitle the owner to one tenth of a vote. Class A shares and class B shares carry equal rights to a part of the Company’s assets and profit.
Investor AB is the single largest shareholder in Atlas Copco AB. At year end 2021, Investor AB held a total of 207 754 141 shares, representing 22.3% of the votes and 16.9% of the capital.
There are no restrictions prohibiting the right to transfer shares of the Company, nor is the Company aware of any such agreements. In addition, the Company is not party to any material agreement that enters into force or is changed or ceases to be valid if the control of the Company is changed as a result of a public takeover bid. There is no limitation to the number of votes that can be cast at a General Meeting of shareholders.
As prescribed by the Articles of Association, the General Meeting has sole authority for the election of Board members and there are no other rules relating to the election or dismissal of Board members or changes in the Articles of Association. Correspondingly, there are no agreements with Board members or employees regarding com-pensation in case of changes of current position reflecting a public takeover bid.
Statutory sustainability reportAtlas Copco has prepared a sustainability report in accordance with the Global Reporting Initiative’s guidelines (GRI Standards) which, in combination with EU taxonomy – classification of sustainable activi-ties on page 132, also constitutes Atlas Copco’s statutory sustainabil-ity report. The sustainability report has been prepared in accordance with disclosure requirements set out in the Swedish Annual Accounts Act chapter 6 paragraph 11. The scope and content of the sustainability report is defined on page 136.
Atlas Copco 2021 20
THE YEAR IN REVIEw
THE YEAR IN REVIEW• Administration report
Business areas
Compressor Technique
Vacuum Technique
Industrial Technique
Power Technique
Sustainable approach to delivering value
Raising our climate ambition
Products and service
People
Safety and well-being
Ethics
Environment
Risks, risk management and opportunities
The Atlas Copco share
Corporate Governance
Board of Directors
Group Management
Internal control over financial reporting

INTRO
DU
CTION
THIS IS A
TLAS CO
PCOTH
E YEA
R IN REV
IEWFIN
AN
CIALS
OTH
ER INFO
RMA
TION
Business areasThe Atlas Copco Group is a world-leading provider of sustainable productivity solutions. The Group offers customers innovative compressors, air treatment systems, vacuum solutions, industrial power tools and assembly systems, machine vision, and power and flow solutions. Atlas Copco’s four business areas are responsible for developing their respective operations by implementing and following up on strategies and objectives to achieve sustainable, profitable growth.
Key figures, MSEK 2021 2020 Change, %
Orders received 55 012 47 401 16%
Revenues 49 657 47 329 5%
EBITA* 12 205 10 952
– as a percentage of revenue 24.6 23.1
Operating profit 11 874 10 658 11%
Operating margin, % 23.9 22.5
Return on capital employed, % 93 79
Investments 620 577
Average number of employees 18 785 18 212
* Operating profit excluding amortization of intangibles related to acquisitions.
Key figures, MSEK 2021 2020 Change, %
Orders received 39 529 25 583 55%
Revenues 29 219 24 685 18%
EBITA* 7 569 6 036
– as a percentage of revenue 25.9 24.5
Operating profit 7 066 5 519 28%
Operating margin, % 24.2 22.4
Return on capital employed, % 25 19
Investments 993 540
Average number of employees 8 961 8 226
* Operating profit excluding amortization of intangibles related to acquisitions.
Key figures, MSEK 2021 2020 Change, %
Orders received 20 545 16 254 26%
Revenues 19 421 16 176 20%
EBITA* 4 538 2 868
– as a percentage of revenue 23.4 17.7
Operating profit 3 976 2 422 64%
Operating margin, % 20.5 15.0
Return on capital employed, % 16 13
Investments 269 223
Average number of employees 8 745 8 308
* Operating profit excluding amortization of intangibles related to acquisitions.
Key figures, MSEK 2021 2020 Change, %
Orders received 15 155 11 810 28%
Revenues 13 234 12 106 9%
EBITA* 2 182 1 666
– as a percentage of revenue 16.5 13.8
Operating profit 2 121 1 594 33%
Operating margin, % 16 13.2
Return on capital employed, % 27 18
Investments 571 580
Average number of employees 3 973 4 059
* Operating profit excluding amortization of intangibles related to acquisitions.
The Compressor Technique business area provides compressed air solutions: industrial compressors, gas and process compressors and expanders, air and gas treatment equipment, and air management systems. The business area has a global service network and innovates for sustainable productivity mainly for the manufacturing and process industries.
Compressor Technique, page 22
Vacuum Technique, page 25
The Vacuum Technique business area provides vacuum products, exhaust management systems, valves and related products. The main markets served are semi conductor and scientific, as well as a wide range of industrial segments including chemical process industries, food packaging and paper handling. The business area has a global service network and innovates for sustainable productivity in order to further improve its customers’ performance.
Industrial Technique, page 28
Power Technique, page 31
The Industrial Technique business area provides industrial power tools, assembly and machine vision solutions, quality assurance products, software and service through a global network. The business area innovates for sustainable productivity for customers in the automotive and general industries.
The Power Technique business area provides air, power and flow solutions through products such as mobile compressors, pumps, light towers and generators, along with a number of complementary products. It also offers specialty rental and provides services through a global network. Guided by a forward-thinking approach to innovation, Power Technique provides sustainable productivity solu-tions across multiple industries, including construction, manufacturing, oil and gas, and exploration drilling.
Atlas Copco 2021 21
THE YEAR IN REVIEw
THE YEAR IN REVIEWAdministration report
• Business areas
Compressor Technique
Vacuum Technique
Industrial Technique
Power Technique
Sustainable approach to delivering value
Raising our climate ambition
Products and service
People
Safety and well-being
Ethics
Environment
Risks, risk management and opportunities
The Atlas Copco share
Corporate Governance
Board of Directors
Group Management
Internal control over financial reporting

INTRO
DU
CTION
THIS IS A
TLAS CO
PCOTH
E YEA
R IN REV
IEWFIN
AN
CIALS
OTH
ER INFO
RMA
TION
Compressor TechniqueThe demand for equipment and service was strong, and the order intake increased significantly with strong growth in all regions. The business area continued to invest in product development, market presence, and service with an intensified focus on sustainability. In addition, ten acquisitions were completed during the year.
Market developmentThe demand for the business area’s equipment and services was strong, and order volumes increased noticeably, primarily due to increased demand for equipment in the first half of 2021. In total, the order intake increased 20% organically.
The service business achieved solid order growth, mainly driven by increased demand in Asia, although the order intake also grew notice-ably in other regions.
Order volumes for equipment increased signifi-cantly supported by strong demand in all regions. The order intake for large industrial, and small and medium-sized compressors, grew at about the same pace supported by solid demand in all regions, particularly in North America and Asia. The order intake for gas and process compressors increased markedly driven by increased demand in North America and Asia, while order volumes decreased in South America, Europe, and Africa/Middle East.
Market presence and organizational developmentThe business area continued to invest in innova-tion and market presence by adding resources and digital capabilities in research and develop-ment, marketing and sales, and service. Several new innovative products were launched, and the service offer was strengthened with an increased focus on connectivity and data analytics to sup-port customer needs.
Activities were carried out during the year to increase the focus on market segments contribut-ing to the ongoing shift in society towards green
Sales bridgeOrders
received Revenues
2020, MSEK 47 401 47 329
Structural change, % +2 +1
Currency, % –6 –5
Organic*, % +20 +9
Total, % +16 +5
2021, MSEK 55 012 49 657
* Volume, price and mix
Revenues, MSEK 49 6572020: 47 329
Operating profit margin 23.9%2020: 22.5%
Return on capital employed 93%2020: 79%
0
12 000
24 000
36 000
48 000
60 000
20212020201920180
5
10
15
20
25MSEK %
Orders received, revenuesand operating margin
Orders received, MSEKRevenues, MSEKOperating margin, %
energy, both through organizational structure, product development, and market presence. The business area also developed a plan for how to contribute to the Group’s commitment to science-based targets.
The work to reduce the environmental footprint from the business area’s own operations contin-ued with, for example, the transition to renewable energy in the production facility in wuxi, China.
The business area invested in further automa-tion in its main factory in Antwerp, Belgium, and in a new production unit in Brendola, Italy.
Through several acquisitions, the business area also increased its presence in targeted markets and customer segments.
AcquisitionsThe business area completed ten acquisitions in 2021: • Kawalek Kompressoren, a German compressed
air distributor and service provider with 10 employees.
• DGM SRL, an Italian distributor of compressed air equipment and related services with 21 employees.
• Cooper Freer Ltd, a UK-based compressed air distributor and service provider with 18 employees.
• The operating assets of MidState Air Compres-sor, a US-based compressor distributor with 15 employees.
• The operating assets of Medigas Service & Testing Co. Inc., a US-based supplier of medical gas systems with 6 employees and revenues of about MSEK 23.
• The operating assets of Compressed Air Systems, Inc. (CAS), a US-based compressor distributor with 30 employees.
• Airflow Compressors & Pneumatics Ltd (Airflow), a UK-based compressor distributor with 16 employees.
• CPC Pumps International Inc., a Canadian com-pany specialized in the design, manufacturing, and servicing of custom-engineered, mission- critical centrifugal pumps. The company has 110 employees and revenues of about MSEK 385 in 2020.
• AEP, a French compressor distributor and service provider with 8 employees.
• S.T.E.R.I. srl, an Italian compressor distributor and service provider with 19 employees.
Revenues, profits and returnsRevenues reached MSEK 49 657 (47 329), an organic increase of 9%. The operating profit increased by 11% to MSEK 11 874 (10 658), corresponding to a margin of 23.9% (22.5). The higher operating margin was mainly explained by increased organic revenue volumes, while acqui-sitions had a small negative effect. Currency had essentially no impact on the operating margin. Return on capital employed was 93% (79).
Atlas Copco 2021 22
THE YEAR IN REVIEw – COMPRESSOR TECHNIqUE
THE YEAR IN REVIEWAdministration report
Business areas
• Compressor Technique
Vacuum Technique
Industrial Technique
Power Technique
Sustainable approach to delivering value
Raising our climate ambition
Products and service
People
Safety and well-being
Ethics
Environment
Risks, risk management and opportunities
The Atlas Copco share
Corporate Governance
Board of Directors
Group Management
Internal control over financial reporting
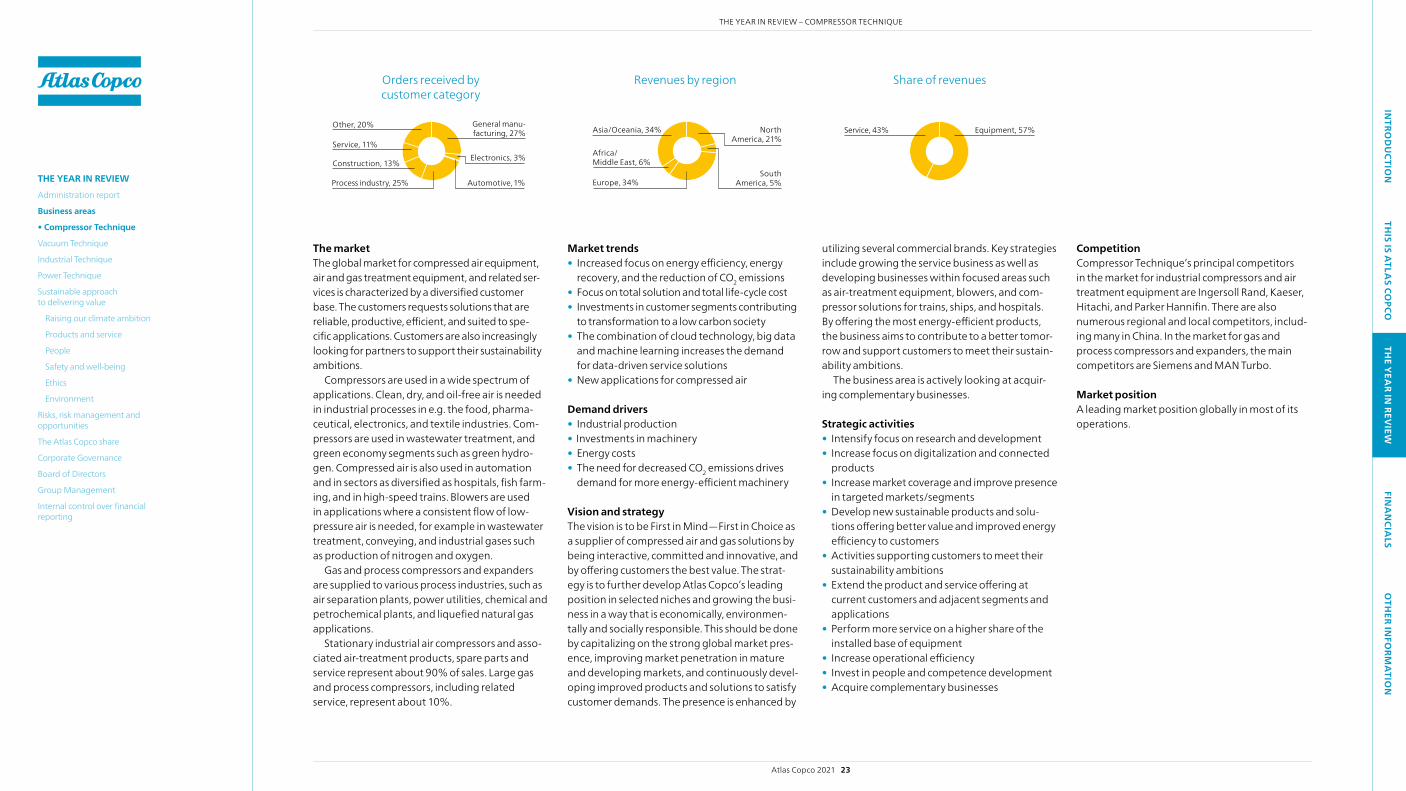
INTRO
DU
CTION
THIS IS A
TLAS CO
PCOTH
E YEA
R IN REV
IEWFIN
AN
CIALS
OTH
ER INFO
RMA
TION
The marketThe global market for compressed air equipment, air and gas treatment equipment, and related ser-vices is characterized by a diversified customer base. The customers requests solutions that are reliable, productive, efficient, and suited to spe-cific applications. Customers are also increasingly looking for partners to support their sustainability ambitions.
Compressors are used in a wide spectrum of applications. Clean, dry, and oil-free air is needed in industrial processes in e.g. the food, pharma-ceutical, electronics, and textile industries. Com-pressors are used in wastewater treatment, and green economy segments such as green hydro-gen. Compressed air is also used in automation and in sectors as diversified as hospitals, fish farm-ing, and in high-speed trains. Blowers are used in applications where a consistent flow of low- pressure air is needed, for example in waste water treatment, conveying, and industrial gases such as production of nitrogen and oxygen.
Gas and process compressors and expanders are supplied to various process industries, such as air separation plants, power utilities, chemical and petro chemical plants, and liquefied natural gas applications.
Stationary industrial air compressors and asso-ciated air-treatment products, spare parts and service represent about 90% of sales. Large gas and process compressors, including related service, represent about 10%.
Other, 20% General manu-facturing, 27%
Construction, 13%
Service, 11%
Process industry, 25% Automotive, 1%
Electronics, 3%
Orders received by customer category
Asia/Oceania, 34% NorthAmerica, 21%
Africa/Middle East, 6%
Europe, 34%South
America, 5%
Revenues by region
Service, 43% Equipment, 57%
Share of revenues
Market trends• Increased focus on energy efficiency, energy
recovery, and the reduction of CO2 emissions• Focus on total solution and total life- cycle cost• Investments in customer segments contributing
to transformation to a low carbon society • The combination of cloud technology, big data
and machine learning increases the demand for data-driven service solutions
• New applications for compressed air
Demand drivers• Industrial production• Investments in machinery• Energy costs• The need for decreased CO2 emissions drives
demand for more energy-efficient machinery
Vision and strategyThe vision is to be First in Mind—First in Choice as a supplier of compressed air and gas solutions by being interactive, committed and innovative, and by offering customers the best value. The strat-egy is to further develop Atlas Copco’s leading position in selected niches and growing the busi-ness in a way that is economically, environmen-tally and socially responsible. This should be done by capitalizing on the strong global market pres-ence, improving market penetration in mature and developing markets, and continuously devel-oping improved products and solutions to satisfy customer demands. The presence is enhanced by
utilizing several commercial brands. Key strategies include growing the service business as well as developing businesses within focused areas such as air-treatment equipment, blowers, and com-pressor solutions for trains, ships, and hospitals. By offering the most energy-efficient products, the business aims to contribute to a better tomor-row and support customers to meet their sustain-ability ambitions.
The business area is actively looking at acquir-ing complementary businesses.
Strategic activities• Intensify focus on research and development• Increase focus on digitalization and connected
products• Increase market coverage and improve presence
in targeted markets/segments• Develop new sustainable products and solu-
tions offering better value and improved energy efficiency to customers
• Activities supporting customers to meet their sustainability ambitions
• Extend the product and service offering at current customers and adjacent segments and applications
• Perform more service on a higher share of the installed base of equipment
• Increase operational efficiency• Invest in people and competence development• Acquire complementary businesses
CompetitionCompressor Technique’s principal competitors in the market for industrial compressors and air treatment equipment are Ingersoll Rand, Kaeser, Hitachi, and Parker Hannifin. There are also numerous regional and local competitors, includ-ing many in China. In the market for gas and process compressors and expanders, the main competitors are Siemens and MAN Turbo.
Market position A leading market position globally in most of its operations.
Atlas Copco 2021 23
THE YEAR IN REVIEw – COMPRESSOR TECHNIqUE
THE YEAR IN REVIEWAdministration report
Business areas
• Compressor Technique
Vacuum Technique
Industrial Technique
Power Technique
Sustainable approach to delivering value
Raising our climate ambition
Products and service
People
Safety and well-being
Ethics
Environment
Risks, risk management and opportunities
The Atlas Copco share
Corporate Governance
Board of Directors
Group Management
Internal control over financial reporting
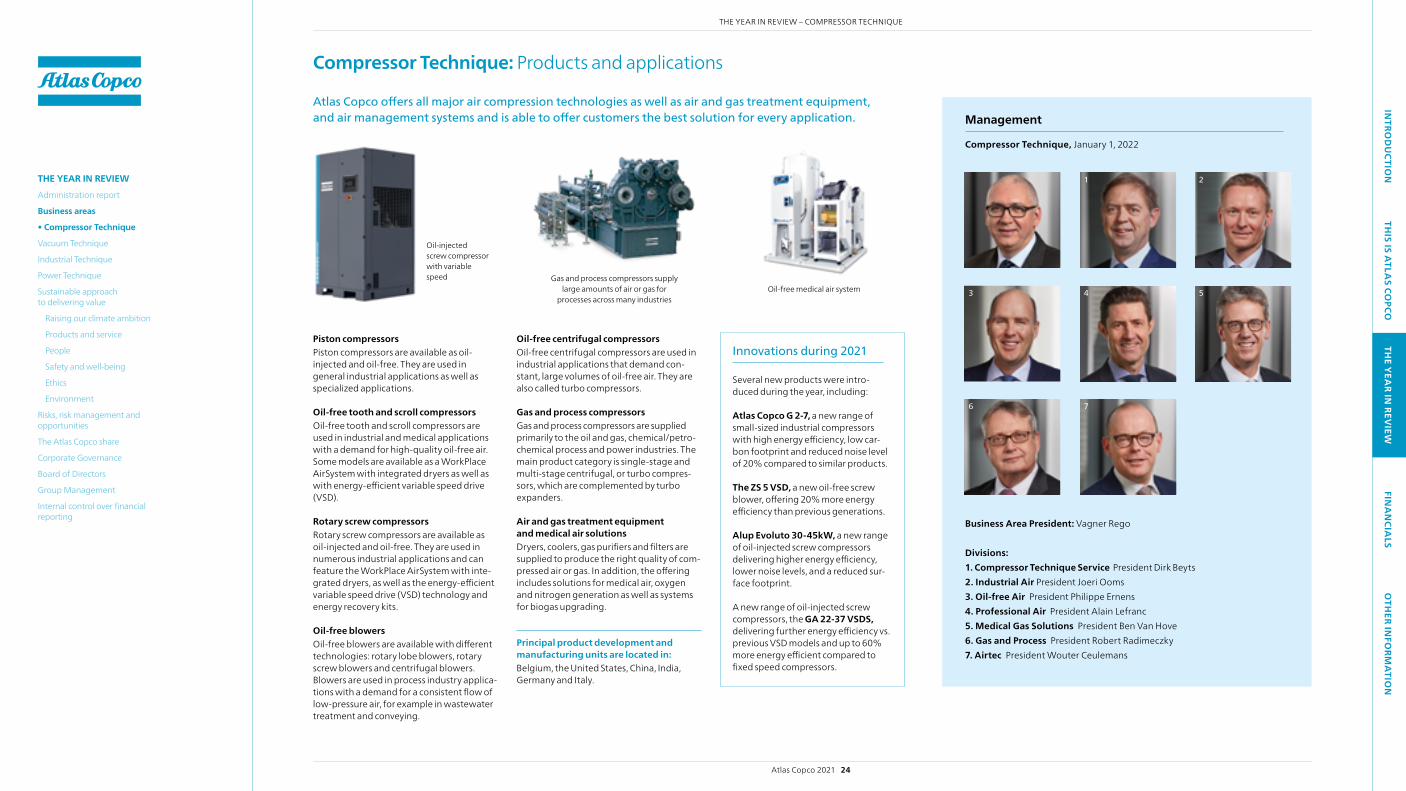
INTRO
DU
CTION
THIS IS A
TLAS CO
PCOTH
E YEA
R IN REV
IEWFIN
AN
CIALS
OTH
ER INFO
RMA
TION
Compressor Technique: Products and applications
Piston compressors Piston compressors are available as oil- injected and oil-free. They are used in general industrial applications as well as specialized applications.
Oil-free tooth and scroll compressors Oil-free tooth and scroll compressors are used in industrial and medical applications with a demand for high-quality oil-free air. Some models are available as a workPlace AirSystem with integrated dryers as well as with energy-efficient variable speed drive (VSD).
Rotary screw compressors Rotary screw compressors are available as oil-injected and oil-free. They are used in numerous industrial applications and can feature the workPlace AirSystem with inte-grated dryers, as well as the energy-efficient variable speed drive (VSD) technology and energy recovery kits.
Oil-free blowers Oil-free blowers are available with different technologies: rotary lobe blowers, rotary screw blowers and centrifugal blowers. Blowers are used in process industry applica-tions with a demand for a consistent flow of low-pressure air, for example in wastewater treatment and conveying.
Oil-free centrifugal compressorsOil-free centrifugal compressors are used in industrial applications that demand con-stant, large volumes of oil-free air. They are also called turbo compressors.
Gas and process compressors Gas and process compressors are supplied primarily to the oil and gas, chemical/petro-chemical process and power industries. The main product category is single-stage and multi-stage centrifugal, or turbo compres-sors, which are complemented by turbo expanders.
Air and gas treatment equipment and medical air solutionsDryers, coolers, gas purifiers and filters are supplied to produce the right quality of com-pressed air or gas. In addition, the offering includes solutions for medical air, oxygen and nitrogen generation as well as systems for biogas upgrading.
Principal product development and manufacturing units are located in:Belgium, the United States, China, India, Germany and Italy.
Oil-injected screw compressor with variable speed
Oil-free medical air system Gas and process compressors supply
large amounts of air or gas for processes across many industries
Atlas Copco offers all major air compression technologies as well as air and gas treatment equipment, and air management systems and is able to offer customers the best solution for every application.
Innovations during 2021
Several new products were intro-duced during the year, including:
Atlas Copco G 2-7, a new range of small-sized industrial compressors with high energy efficiency, low car-bon footprint and reduced noise level of 20% compared to similar products.
The ZS 5 VSD, a new oil-free screw blower, offering 20% more energy efficiency than previous generations.
Alup Evoluto 30-45kW, a new range of oil-injected screw compressors delivering higher energy efficiency, lower noise levels, and a reduced sur-face footprint.
A new range of oil-injected screw compressors, the GA 22-37 VSDS, delivering further energy efficiency vs. previous VSD models and up to 60% more energy efficient compared to fixed speed compressors.
Business Area President: Vagner Rego
Divisions:1. Compressor Technique Service President Dirk Beyts2. Industrial Air President Joeri Ooms3. Oil-free Air President Philippe Ernens4. Professional Air President Alain Lefranc5. Medical Gas Solutions President Ben Van Hove6. Gas and Process President Robert Radimeczky7. Airtec President wouter Ceulemans
Management
Compressor Technique, January 1, 2022
2
4 5
6
3
7
1
Atlas Copco 2021 24
THE YEAR IN REVIEw – COMPRESSOR TECHNIqUE
THE YEAR IN REVIEWAdministration report
Business areas
• Compressor Technique
Vacuum Technique
Industrial Technique
Power Technique
Sustainable approach to delivering value
Raising our climate ambition
Products and service
People
Safety and well-being
Ethics
Environment
Risks, risk management and opportunities
The Atlas Copco share
Corporate Governance
Board of Directors
Group Management
Internal control over financial reporting
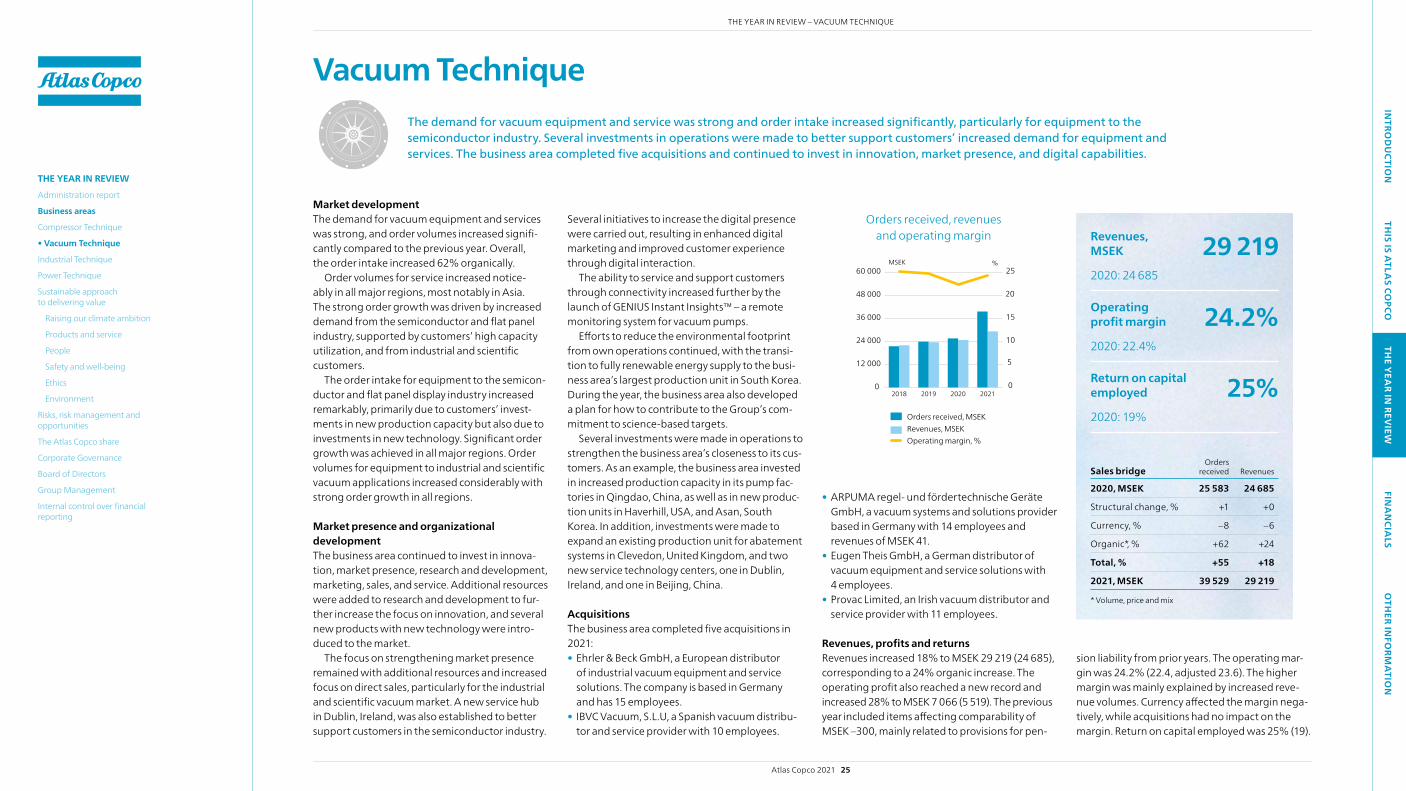
INTRO
DU
CTION
THIS IS A
TLAS CO
PCOTH
E YEA
R IN REV
IEWFIN
AN
CIALS
OTH
ER INFO
RMA
TION
Vacuum TechniqueThe demand for vacuum equipment and service was strong and order intake increased significantly, particularly for equipment to the semiconductor industry. Several investments in operations were made to better support customers’ increased demand for equipment and services. The business area completed five acquisitions and continued to invest in innovation, market presence, and digital capabilities.
Market developmentThe demand for vacuum equipment and services was strong, and order volumes increased signifi-cantly compared to the previous year. Overall, the order intake increased 62% organically.
Order volumes for service increased notice-ably in all major regions, most notably in Asia. The strong order growth was driven by increased demand from the semiconductor and flat panel industry, supported by customers’ high capacity utilization, and from industrial and scientific customers.
The order intake for equipment to the semicon-ductor and flat panel display industry increased remarkably, primarily due to customers’ invest-ments in new production capacity but also due to investments in new technology. Significant order growth was achieved in all major regions. Order volumes for equipment to industrial and scientific vacuum applications increased considerably with strong order growth in all regions.
Market presence and organizational developmentThe business area continued to invest in innova-tion, market presence, research and development, marketing, sales, and service. Additional resources were added to research and development to fur-ther increase the focus on innovation, and several new products with new technology were intro-duced to the market.
The focus on strengthening market presence remained with additional resources and increased focus on direct sales, particularly for the industrial and scientific vacuum market. A new service hub in Dublin, Ireland, was also established to better support customers in the semiconductor industry.
Sales bridgeOrders
received Revenues
2020, MSEK 25 583 24 685
Structural change, % +1 +0
Currency, % –8 –6
Organic*, % +62 +24
Total, % +55 +18
2021, MSEK 39 529 29 219
* Volume, price and mix
Revenues, MSEK 29 2192020: 24 685
Operating profit margin 24.2%2020: 22.4%
Return on capital employed 25%2020: 19%
0
12 000
24 000
36 000
48 000
60 000
20212020201920180
5
10
15
20
25MSEK %
Orders received, revenuesand operating margin
Orders received, MSEKRevenues, MSEKOperating margin, %
Several initiatives to increase the digital presence were carried out, resulting in enhanced digital marketing and improved customer experience through digital interaction.
The ability to service and support customers through connectivity increased further by the launch of GENIUS Instant Insights™ – a remote monitoring system for vacuum pumps.
Efforts to reduce the environmental footprint from own operations continued, with the transi-tion to fully renewable energy supply to the busi-ness area’s largest production unit in South Korea. During the year, the business area also developed a plan for how to contribute to the Group’s com-mitment to science-based targets.
Several investments were made in operations to strengthen the business area’s closeness to its cus-tomers. As an example, the business area invested in increased production capacity in its pump fac-tories in qingdao, China, as well as in new produc-tion units in Haverhill, USA, and Asan, South Korea. In addition, investments were made to expand an existing production unit for abatement systems in Clevedon, United Kingdom, and two new service technology centers, one in Dublin, Ireland, and one in Beijing, China.
AcquisitionsThe business area completed five acquisitions in 2021: • Ehrler & Beck GmbH, a European distributor
of industrial vacuum equipment and service solutions. The company is based in Germany and has 15 employees.
• IBVC Vacuum, S.L.U, a Spanish vacuum distribu-tor and service provider with 10 employees.
• ARPUMA regel- und fördertechnische Geräte GmbH, a vacuum systems and solutions provider based in Germany with 14 employees and revenues of MSEK 41.
• Eugen Theis GmbH, a German distributor of vacuum equipment and service solutions with 4 employees.
• Provac Limited, an Irish vacuum distributor and service provider with 11 employees.
Revenues, profits and returnsRevenues increased 18% to MSEK 29 219 (24 685), corresponding to a 24% organic increase. The operating profit also reached a new record and increased 28% to MSEK 7 066 (5 519). The previous year included items affecting comparability of MSEK –300, mainly related to provisions for pen-
sion liability from prior years. The operating mar-gin was 24.2% (22.4, adjusted 23.6). The higher margin was mainly explained by increased reve-nue volumes. Currency affected the margin nega-tively, while acquisitions had no impact on the margin. Return on capital employed was 25% (19).
Atlas Copco 2021 25
THE YEAR IN REVIEw – VACUUM TECHNIqUE
THE YEAR IN REVIEWAdministration report
Business areas
Compressor Technique
• Vacuum Technique
Industrial Technique
Power Technique
Sustainable approach to delivering value
Raising our climate ambition
Products and service
People
Safety and well-being
Ethics
Environment
Risks, risk management and opportunities
The Atlas Copco share
Corporate Governance
Board of Directors
Group Management
Internal control over financial reporting

INTRO
DU
CTION
THIS IS A
TLAS CO
PCOTH
E YEA
R IN REV
IEWFIN
AN
CIALS
OTH
ER INFO
RMA
TION
The marketVacuum and abatement solutions are required in a number of applications where the pressure needs to be below atmospheric pressure and/or the environment needs to be clean.
The Vacuum Technique business area sells prod-ucts, systems and services across several targeted market sectors.
The market can be categorized into semicon-ductor, industrial vacuum and scientific vacuum. However, each of these sectors contains several sub-sectors and specific applications.
Vacuum products include a broad range of dry pumps, turbomolecular pumps and other vacuum pumps. They are used to create highly con-trolled, low-pressure, particle-free environments in a diverse set of manufacturing processes. Such pro-cesses include semiconductor, flat panel display, LED and solar, glass and optical coating, scientific instruments used in life sciences, research institutes focused on renewable energy, high-energy lasers and nanotechnology, pharmaceuticals, heat treat-ment, lithium-ion batteries, and food processing and packaging.
Abatement systems include stand-alone and customized solutions which integrate vacuum and exhaust management technologies. Abatement is required both to prevent adverse chemical reac-tions within production processes and to com-ply with strict regulatory emission controls. The business area also provides value-added services including equipment monitoring, field and on-site servicing, remanufacturing, service upgrades and provision of spare parts and oils.
Other, 2% General manu-facturing, 10%
Process industry, 18% Electronics, 70%
Orders received by customer category
Asia/Oceania, 65% NorthAmerica, 21%
Africa/Middle East, 1% Europe, 13%
Revenues by region
Equipment, 76%Service, 24%
Share of revenues
Market trends• Increased use of demanding materials and
extreme working temperatures in processes for semiconductor and industrial production
• Focus on energy-efficiency • Continued trend towards stricter regulatory
emission standards • Increased demand for digitally supported
service offers• Focus on total solutions and total life-cycle cost• Focus on circularity as a sustainability solution
Demand drivers• Industrial production• Manufacturing of semiconductors, research and
development equipment, lithium-ion batteries, flat panel display and solar energy products
• Demand for energy-efficient vacuum pumps • Increase in vacuum requirements to support
new production processes
Vision and strategyThe vision is to be First in Mind—First in Choice for vacuum and abatement solutions. The strategy focuses on technology leadership, market leadership and agility, to support growth. This is done by focusing on product research and development programs together with deployment of highly innovative products and services. Continued execution of market leadership will be done by an organization focused on agility, growing market share in our traditional heartlands and further expansion of the geographical footprint.
Additionally, the business area has a strong focus on developing the service business and an effi-cient and flexible global operations footprint.
Strategic activities• Increase market coverage and improve presence
in targeted markets and segments• Fast introduction of highly innovative products
and services offering better value and improved energy efficiency
• Increased market penetration and coverage through brand portfolio management
• Perform more service on a higher share of the installed base of equipment
• Invest in service presence close to customers• Increase organizations’ agility and operational
efficiency• Invest in people and competence development• Grow through strategically attractive
acquisitions
CompetitionVacuum Technique’s principal competitors are: Semiconductor market: DAS Environmental Expert, Ebara, Kashiyama, Pfeiffer Vacuum, Shimadzu Corporation.
Industrial and scientific market: Ingersoll Rand, Pfeiffer Vacuum, and Busch.
Market position A global market leader for vacuum and abatement solutions.
Atlas Copco 2021 26
THE YEAR IN REVIEw – VACUUM TECHNIqUE
THE YEAR IN REVIEWAdministration report
Business areas
Compressor Technique
• Vacuum Technique
Industrial Technique
Power Technique
Sustainable approach to delivering value
Raising our climate ambition
Products and service
People
Safety and well-being
Ethics
Environment
Risks, risk management and opportunities
The Atlas Copco share
Corporate Governance
Board of Directors
Group Management
Internal control over financial reporting
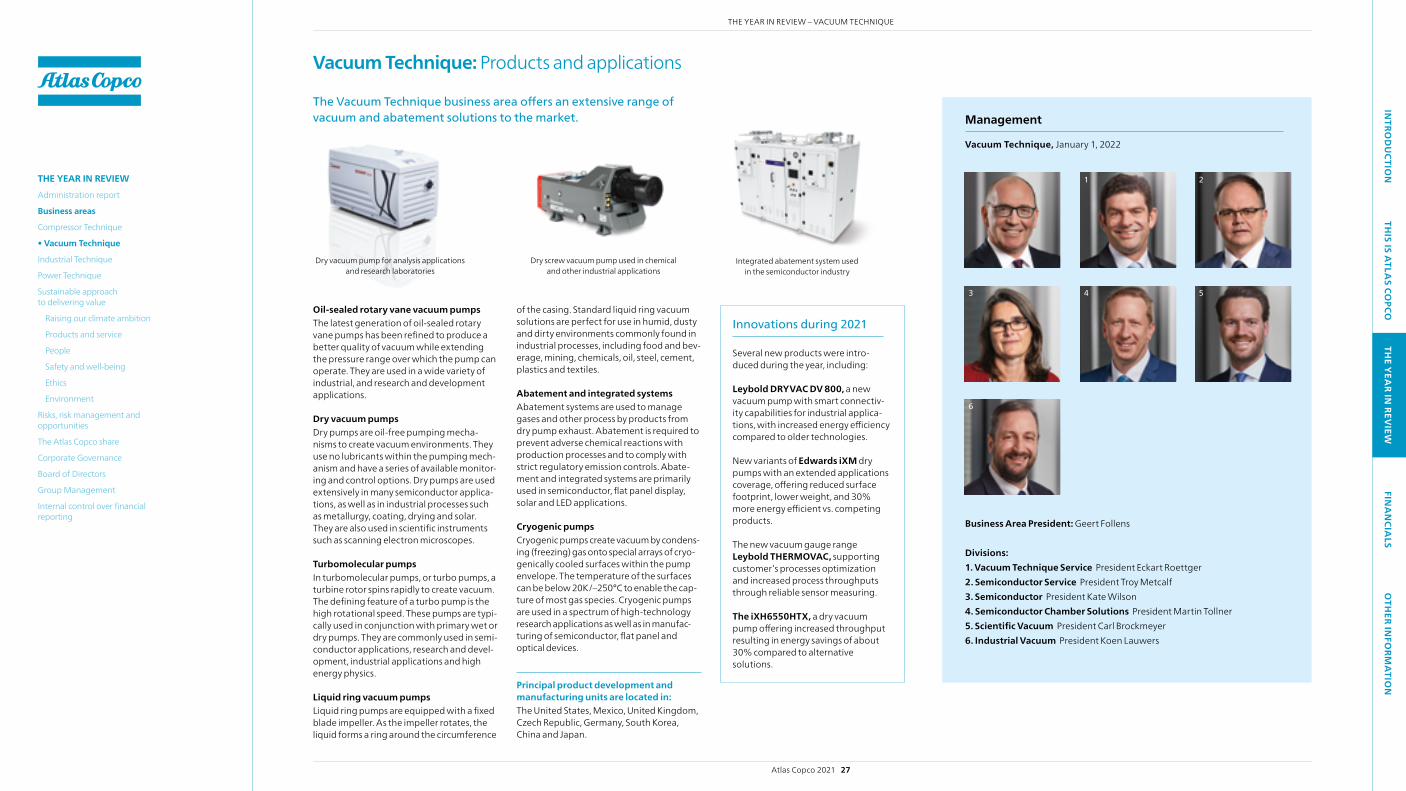
INTRO
DU
CTION
THIS IS A
TLAS CO
PCOTH
E YEA
R IN REV
IEWFIN
AN
CIALS
OTH
ER INFO
RMA
TION
Vacuum Technique: Products and applications
Oil-sealed rotary vane vacuum pumpsThe latest generation of oil-sealed rotary vane pumps has been refined to produce a better quality of vacuum while extending the pressure range over which the pump can operate. They are used in a wide variety of industrial, and research and development applications.
Dry vacuum pumps Dry pumps are oil-free pumping mecha-nisms to create vacuum environments. They use no lubricants within the pumping mech-anism and have a series of available monitor-ing and control options. Dry pumps are used extensively in many semiconductor applica-tions, as well as in industrial processes such as metallurgy, coating, drying and solar. They are also used in scientific instruments such as scanning electron microscopes.
Turbomolecular pumpsIn turbomolecular pumps, or turbo pumps, a turbine rotor spins rapidly to create vacuum. The defining feature of a turbo pump is the high rotational speed. These pumps are typi-cally used in conjunction with primary wet or dry pumps. They are commonly used in semi-conductor applications, research and devel-opment, industrial applications and high energy physics.
Liquid ring vacuum pumpsLiquid ring pumps are equipped with a fixed blade impeller. As the impeller rotates, the liquid forms a ring around the circumference
Dry vacuum pump for analysis applications and research laboratories
Integrated abatement system used in the semiconductor industry
Dry screw vacuum pump used in chemical and other industrial applications
The Vacuum Technique business area offers an extensive range of vacuum and abatement solutions to the market.
Innovations during 2021
Several new products were intro-duced during the year, including:
Leybold DRYVAC DV 800, a new vacuum pump with smart connectiv-ity capabilities for industrial applica-tions, with increased energy efficiency compared to older technologies.
New variants of Edwards iXM dry pumps with an extended applications coverage, offering reduced surface footprint, lower weight, and 30% more energy efficient vs. competing products.
The new vacuum gauge range Leybold THERMOVAC, supporting customer’s processes optimization and increased process throughputs through reliable sensor measuring.
The iXH6550HTX, a dry vacuum pump offering increased throughput resulting in energy savings of about 30% compared to alternative solutions.
Business Area President: Geert Follens
Divisions:1. Vacuum Technique Service President Eckart Roettger2. Semiconductor Service President Troy Metcalf3. Semiconductor President Kate wilson4. Semiconductor Chamber Solutions President Martin Tollner5. Scientific Vacuum President Carl Brockmeyer 6. Industrial Vacuum President Koen Lauwers
Management
Vacuum Technique, January 1, 2022
2
4 5
6
3
1
of the casing. Standard liquid ring vacuum solutions are perfect for use in humid, dusty and dirty environments commonly found in industrial processes, including food and bev-erage, mining, chemicals, oil, steel, cement, plastics and textiles.
Abatement and integrated systemsAbatement systems are used to manage gases and other process by products from dry pump exhaust. Abatement is required to prevent adverse chemical reactions with production processes and to comply with strict regulatory emission controls. Abate-ment and integrated systems are primarily used in semiconductor, flat panel display, solar and LED applications.
Cryogenic pumps Cryogenic pumps create vacuum by condens-ing (freezing) gas onto special arrays of cryo-genically cooled surfaces within the pump envelope. The temperature of the surfaces can be below 20K/–250°C to enable the cap-ture of most gas species. Cryogenic pumps are used in a spectrum of high-technology research applications as well as in manufac-turing of semiconductor, flat panel and optical devices.
Principal product development and manufacturing units are located in:The United States, Mexico, United Kingdom, Czech Republic, Germany, South Korea, China and Japan.
Atlas Copco 2021 27
THE YEAR IN REVIEw – VACUUM TECHNIqUE
THE YEAR IN REVIEWAdministration report
Business areas
Compressor Technique
• Vacuum Technique
Industrial Technique
Power Technique
Sustainable approach to delivering value
Raising our climate ambition
Products and service
People
Safety and well-being
Ethics
Environment
Risks, risk management and opportunities
The Atlas Copco share
Corporate Governance
Board of Directors
Group Management
Internal control over financial reporting

INTRO
DU
CTION
THIS IS A
TLAS CO
PCOTH
E YEA
R IN REV
IEWFIN
AN
CIALS
OTH
ER INFO
RMA
TION
Industrial Technique
The demand for equipment and service increased, and solid order growth was achieved in all regions, supported by increased demand from automotive and general industry customers. The business area continued to invest in research and development and further intensified its focus on machine vision solutions.
Market developmentThe overall demand for equipment and services increased significantly, supported by increased levels of customer activity in both the automo-tive and general industry. In total, the order intake increased 23% organically.
The service business achieved solid order growth with increased order volumes in all regions.
Order volumes for advanced industrial tools, assembly- and vision solutions to the automotive industry increased markedly, supported by cus-tomers’ increased investments in the production of electric vehicles, particularly in Asia and North America. The order intake also increased in South America but decreased somewhat in Europe.
The order intake for industrial power tools and vision solutions to the general industry increased noticeably, supported by increased demand from most customer segments. Order growth was achieved in all regions.
Market presence and organizational developmentThe business area continued to invest in inno-vation with an added number of employees in research and development.
Several new and innovative products were introduced to the market during the year. The business area intensified its efforts on data-driven service to even better support the custom-ers in improving quality and uptime. The focus on increasing digital market presence continued
Sales bridgeOrders
received Revenues
2020, MSEK 16 254 16 176
Structural change, % +8 +8
Currency, % –5 –5
Organic*, % +23 +17
Total, % +26 +20
2021, MSEK 20 545 19 421
* Volume, price and mix
Revenues, MSEK 19 4212020: 16 176
Operating profit margin 20.5%2020: 15.0%
Return on capital employed 16%2020: 13%
0
5 000
10 000
15 000
20 000
25 000
20212020201920180
5
10
15
20
25MSEK %
Orders received, revenuesand operating margin
Orders received, MSEKRevenues, MSEKOperating margin, %
through digital marketing activities and further roll out of an e-commerce platform in new markets.
The focus on reducing the environmental foot-print continued with, for example, the invest-ments in renewable electricity in three manufac-turing sites, one in Germany, one in Japan, and one in the United States.
The business area also developed a plan for how to contribute to the Group’s commitment to science-based targets.
Investments were made in new machining equipment in the production facility in Tierp, Sweden, and a new innovation center and factory for vision systems in Darmstadt, Germany.
Acquisitions and divestmentsThe business area made one acquisition and one divestment in 2021: • The operating assets of the German-based
NATEV GmbH was acquired. The company is specialized in positioning solutions for assem-bly tools used in industrial production and has 10 employees and revenues of approximately MSEK 5.
• In December, the CMM (Coordinate Measuring Machine) business part of Perceptron (acquired in December 2020) was divested. The divest-ment was a result of further focus on in-line metrology in contrast to off-line applications. The CMM business has annual revenues of about MSEK 100.
Revenues, profits and returnsRevenues increased 20% to MSEK 19 421 (16 176), corresponding to a 17% organic increase. The operating profit increased 64% to MSEK 3 976 (2 422). Previous year included items affecting comparability of MSEK –190, related to restructur-ing costs. The operating margin was 20.5% (15.0, adjusted 16.1), primarily driven by significantly higher revenue volumes but negatively affected by dilutions from acquisitions. Currency had no impact on the operating margin. Return on capital employed was 16% (13).
Atlas Copco 2021 28
THE YEAR IN REVIEw – INDUSTRIAL TECHNIqUE
THE YEAR IN REVIEWAdministration report
Business areas
Compressor Technique
Vacuum Technique
• Industrial Technique
Power Technique
Sustainable approach to delivering value
Raising our climate ambition
Products and service
People
Safety and well-being
Ethics
Environment
Risks, risk management and opportunities
The Atlas Copco share
Corporate Governance
Board of Directors
Group Management
Internal control over financial reporting
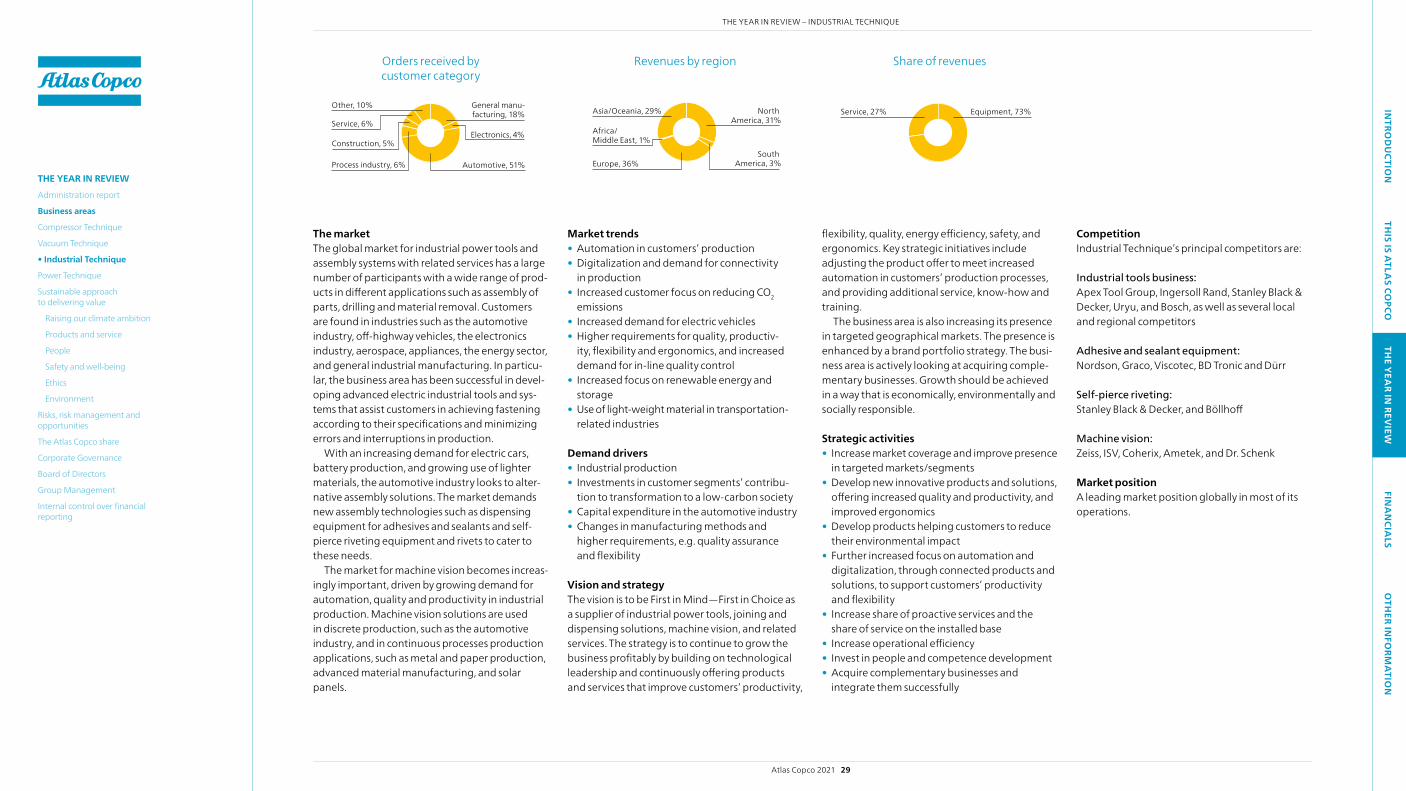
INTRO
DU
CTION
THIS IS A
TLAS CO
PCOTH
E YEA
R IN REV
IEWFIN
AN
CIALS
OTH
ER INFO
RMA
TION
The marketThe global market for industrial power tools and assembly systems with related services has a large number of participants with a wide range of prod-ucts in different applications such as assembly of parts, drilling and material removal. Customers are found in industries such as the automotive industry, off-highway vehicles, the electronics industry, aerospace, appliances, the energy sector, and general industrial manufacturing. In particu-lar, the business area has been successful in devel-oping advanced electric industrial tools and sys-tems that assist customers in achieving fastening according to their specifications and minimizing errors and interruptions in production.
with an increasing demand for electric cars, battery production, and growing use of lighter materials, the automotive industry looks to alter-native assembly solutions. The market demands new assembly technologies such as dispensing equipment for adhesives and sealants and self-pierce riveting equipment and rivets to cater to these needs.
The market for machine vision becomes increas-ingly important, driven by growing demand for automation, quality and productivity in industrial production. Machine vision solutions are used in discrete production, such as the automotive industry, and in continuous processes production applications, such as metal and paper production, advanced material manufacturing, and solar panels.
Other, 10% General manu-facturing, 18%
Construction, 5%
Service, 6%Electronics, 4%
Automotive, 51%Process industry, 6%
Orders received by customer category
Asia/Oceania, 29% North America, 31%
Africa/Middle East, 1%
Europe, 36%South
America, 3%
Revenues by region
Equipment, 73%Service, 27%
Share of revenues
Market trends• Automation in customers’ production • Digitalization and demand for connectivity
in production• Increased customer focus on reducing CO2
emissions • Increased demand for electric vehicles• Higher requirements for quality, productiv-
ity, flexibility and ergonomics, and increased demand for in-line quality control
• Increased focus on renewable energy and storage
• Use of light-weight material in transportation- related industries
Demand drivers• Industrial production• Investments in customer segments’ contribu-
tion to transformation to a low-carbon society • Capital expenditure in the automotive industry • Changes in manufacturing methods and
higher requirements, e.g. quality assurance and flexibility
Vision and strategyThe vision is to be First in Mind—First in Choice as a supplier of industrial power tools, joining and dispensing solutions, machine vision, and related services. The strategy is to continue to grow the business profitably by building on technological leadership and continuously offering products and services that improve customers’ productivity,
flexibility, quality, energy efficiency, safety, and ergonomics. Key strategic initiatives include adjusting the product offer to meet increased automation in customers’ production processes, and providing additional service, know-how and training.
The business area is also increasing its presence in targeted geographical markets. The presence is enhanced by a brand portfolio strategy. The busi-ness area is actively looking at acquiring comple-mentary businesses. Growth should be achieved in a way that is economically, environmentally and socially responsible.
Strategic activities• Increase market coverage and improve presence
in targeted markets/segments• Develop new innovative products and solutions,
offering increased quality and productivity, and improved ergonomics
• Develop products helping customers to reduce their environmental impact
• Further increased focus on automation and digitalization, through connected products and solutions, to support customers’ productivity and flexibility
• Increase share of proactive services and the share of service on the installed base
• Increase operational efficiency• Invest in people and competence development• Acquire complementary businesses and
integrate them successfully
CompetitionIndustrial Technique’s principal competitors are:
Industrial tools business: Apex Tool Group, Ingersoll Rand, Stanley Black & Decker, Uryu, and Bosch, as well as several local and regional competitors
Adhesive and sealant equipment: Nordson, Graco, Viscotec, BD Tronic and Dürr
Self-pierce riveting: Stanley Black & Decker, and Böllhoff
Machine vision: zeiss, ISV, Coherix, Ametek, and Dr. Schenk
Market position A leading market position globally in most of its operations.
Atlas Copco 2021 29
THE YEAR IN REVIEw – INDUSTRIAL TECHNIqUE
THE YEAR IN REVIEWAdministration report
Business areas
Compressor Technique
Vacuum Technique
• Industrial Technique
Power Technique
Sustainable approach to delivering value
Raising our climate ambition
Products and service
People
Safety and well-being
Ethics
Environment
Risks, risk management and opportunities
The Atlas Copco share
Corporate Governance
Board of Directors
Group Management
Internal control over financial reporting

INTRO
DU
CTION
THIS IS A
TLAS CO
PCOTH
E YEA
R IN REV
IEWFIN
AN
CIALS
OTH
ER INFO
RMA
TION
Industrial Technique: Products and applications
Industrial assembly tools and solutions Advanced assembly tools and systems are used in the automotive industry and general industrial production such as aerospace, off-highway, and electronics. The business area provides a broad range of pneumatic, hydraulic and electric assembly tools, control systems, and associated software for safety- critical tightening. These systems generally make it possible for customers to collect, record, and process assembly data in their production.
Self-pierce riveting solutions, adhesive dispensing and flow drill fastening equipment Self-pierce rivets, adhesive, and flow-drill fasteners are primarily used in the automo-tive industry driven by increased use of light materials in car manufacturing. The business area offers self-pierce riveting tools and riv-ets, dispensing equipment for adhesives and sealants, as well as flow-drill fastening equipment.
Material removal tools, drills and other pneumatic productsPneumatic and electric industrial grinders, drills and percussive tools are used in several industrial applications, for example in metal fabrication and aerospace production. The business area also offers airline infrastruc-ture for optimization of pneumatic tools, and air motors that are used as drive units in various industries and applications.
Machine vision solutionsMachine vision is a key technology for indus-trial automation and digital manufacturing. The core competence involves the develop-ment of surface inspection systems and 3D machine vision products. The combination of high-performance cameras and illumina-tion units, specialized software and business intelligence architecture allows for detailed analysis of production flows and quality assurance in a wide range of industries.
Principal product development and manufacturing units are located in:Sweden, Germany, Hungary, United Kingdom, France, China, Japan, and the United States.
Self-pierce riveting system
Machine vision solutions
The Industrial Technique business area offers the most extensive range of industrial power tools, assembly systems, and machine vision solutions on the market.
Innovations during 2021
Several new products were intro-duced during the year, including:
The new Henrob 4mm self-pierce riveting system, offering car manu-facturers retained structural joint strength and consistency in safety- critical areas despite thinner frames in the car body.
A multi-stereo 3D scanner, the ISRA X-GAGE3D, providing peerless measurement accuracy and fast image processing for robot guidance and in-line metrology application in vehicle production.
A dispensing system, Scheugen pflug DosPL DPL2001/DosP DP2001, offering high productivity, process reliability and accuracy in production of battery systems.
A controller, Power Focus 8, meets customers’ need for more flexible production and digitalization at production lines.
Business Area President: Henrik Elmin
Divisions:1. Industrial Technique Service President Håkan Andersson2. Motor Vehicle Industry Tools and Assembly Systems President Lars Eklöf3. General Industry Tools and Assembly Systems President Carl von Schantz 4. Chicago Pneumatic Tools President Ivo Maltir 5. Industrial Assembly Solutions President Berthold Peters 6. Machine Vision Solutions President Tomas Lundin
Management
Industrial Technique, January 1, 2022
2
4 5
6
3
1Handheld battery tool for assembly applications
Atlas Copco 2021 30
THE YEAR IN REVIEw – INDUSTRIAL TECHNIqUE
THE YEAR IN REVIEWAdministration report
Business areas
Compressor Technique
Vacuum Technique
• Industrial Technique
Power Technique
Sustainable approach to delivering value
Raising our climate ambition
Products and service
People
Safety and well-being
Ethics
Environment
Risks, risk management and opportunities
The Atlas Copco share
Corporate Governance
Board of Directors
Group Management
Internal control over financial reporting

INTRO
DU
CTION
THIS IS A
TLAS CO
PCOTH
E YEA
R IN REV
IEWFIN
AN
CIALS
OTH
ER INFO
RMA
TION
Power TechniqueThe demand for equipment, service and specialty rental solutions increased, and significant order growth was achieved in most regions. The business area continued to invest in research and development, digital presence, and the offer for temporary steam solutions was further strengthened through an acquisition.
Market developmentThe overall demand for equipment, service and specialty rental solutions increased considerably, supporting strong order growth in most regions, particularly North America and Europe. In total, the order intake increased 33% organically.
Order volumes to the specialty rental busi-ness increased noticeably, particularly in the sec-ond half of the year. The order intake grew in all regions except Africa/Middle East, where order volumes remained unchanged. The demand for service also increased and strong order growth was achieved in all regions.
The demand for equipment increased signifi-cantly, particularly in the second half of the year, supported by increased investments by equip-ment rental companies. Order volumes increased for portable compressors and power and flow equipment, such as generators and pumps.
Market presence and organizational developmentThe business area continued to invest in innova-tion and market presence in targeted markets and segments. Numerous new innovative prod-ucts were introduced during the year, and the offer for temporary steam solutions was strength-ened through the acquisition of Eco Steam and Heating Solutions.
The digital presence was improved through several market activities and the launch of a new e-commerce platform. The ability to support and provide service to customers also increased by more connected products through FleetLink – a remote monitoring system for power equipment.
Sales bridgeOrders
received Revenues
2020, MSEK 11 810 12 106
Structural change, % +1 +1
Currency, % –6 –5
Organic*, % +33 +13
Total, % +28 +9
2021, MSEK 15 155 13 234
* Volume, price and mix
Revenues, MSEK 13 2342020: 12 106
Operating profit margin 16.0%2020: 13.2%
Return on capital employed 27%2020: 18%
0
5 000
10 000
15 000
20 000
25 000
20212020201920180
5
10
15
20
25MSEK %
Orders received, revenuesand operating margin
Orders received, MSEKRevenues, MSEKOperating margin, %
The focus on reducing the environmental foot-print of the business area’s own operations con-tinued, with an increased number of production units having solar panels installed for their power supply as one result. The offer of electrical-driven equipment was also extended, as an example of how customers are supported in meeting their sustainability ambitions.
During the year, the business area also devel-oped a plan for how to contribute to the Group’s commitment to science-based targets.
To better support customers in need of tempo-rary power equipment and service, investments were made in a new rental depot in Varennes, Canada.
AcquisitionsThe business area completed one acquisition in 2021: • Eco Steam and Heating Solutions, a specialty
steam rental company based in the Netherlands, with 23 employees and revenues of MSEK 198.
Revenues, profits and returnsRevenues increased 9% to MSEK 13 234 (12 106), corresponding to a 13% organic increase. The operating profit increased 33% to MSEK 2 121 (1 594). Previous year included items affecting comparability of MSEK –50 related to restruc-turing costs. The operating margin increased to 16.0% (13.2, adjusted 13.6), driven by increased organic revenue volumes. Currency and acqui-sitions had no effect on the operating margin. Return on capital employed was 27% (18).
Atlas Copco 2021 31
THE YEAR IN REVIEw – POwER TECHNIqUE
THE YEAR IN REVIEWAdministration report
Business areas
Compressor Technique
Vacuum Technique
Industrial Technique
• Power Technique
Sustainable approach to delivering value
Raising our climate ambition
Products and service
People
Safety and well-being
Ethics
Environment
Risks, risk management and opportunities
The Atlas Copco share
Corporate Governance
Board of Directors
Group Management
Internal control over financial reporting
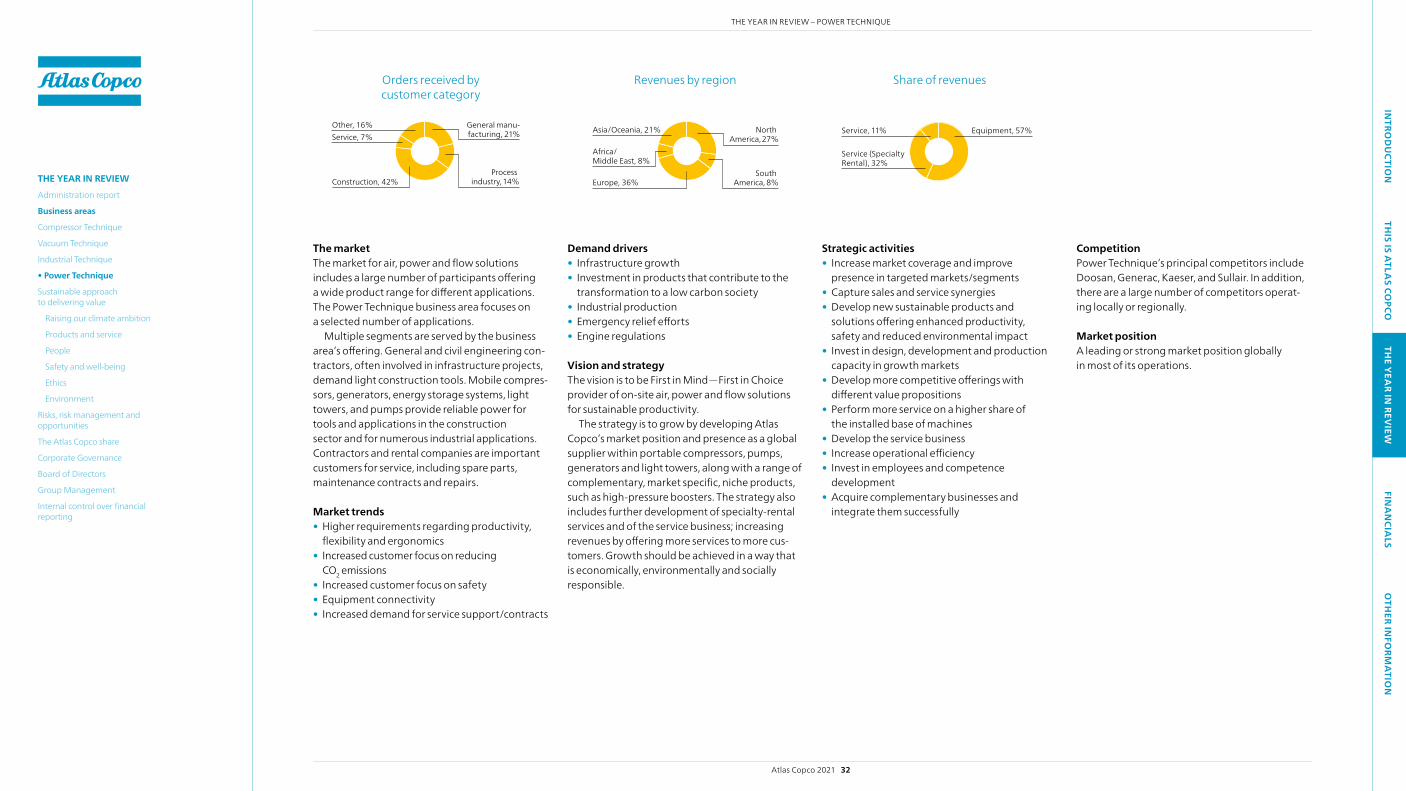
INTRO
DU
CTION
THIS IS A
TLAS CO
PCOTH
E YEA
R IN REV
IEWFIN
AN
CIALS
OTH
ER INFO
RMA
TION
The marketThe market for air, power and flow solutions includes a large number of participants offering a wide product range for different applications. The Power Technique business area focuses on a selected number of applications.
Multiple segments are served by the business area’s offering. General and civil engineering con-tractors, often involved in infrastructure projects, demand light construction tools. Mobile compres-sors, generators, energy storage systems, light towers, and pumps provide reliable power for tools and applications in the construction sector and for numerous industrial applications. Contractors and rental companies are important customers for service, including spare parts, maintenance contracts and repairs.
Market trends• Higher requirements regarding productivity,
flexibility and ergonomics • Increased customer focus on reducing
CO2 emissions• Increased customer focus on safety • Equipment connectivity• Increased demand for service support/contracts
General manu-facturing, 21%
Other, 16%
Construction, 42%
Service, 7%
Process industry, 14%
Orders received by customer category
Asia/Oceania, 21% North America, 27%
Africa/Middle East, 8%
Europe, 36%South
America, 8%
Revenues by region
Equipment, 57%Service, 11%
Service (Specialty Rental), 32%
Share of revenues
Demand drivers• Infrastructure growth • Investment in products that contribute to the
transformation to a low carbon society• Industrial production • Emergency relief efforts• Engine regulations
Vision and strategyThe vision is to be First in Mind—First in Choice provider of on-site air, power and flow solutions for sustainable productivity.
The strategy is to grow by developing Atlas Copco’s market position and presence as a global supplier within portable compressors, pumps, generators and light towers, along with a range of complementary, market specific, niche products, such as high-pressure boosters. The strategy also includes further development of specialty-rental services and of the service business; increasing revenues by offering more services to more cus-tomers. Growth should be achieved in a way that is economically, environmentally and socially responsible.
Strategic activities• Increase market coverage and improve
presence in targeted markets/segments• Capture sales and service synergies• Develop new sustainable products and
solutions offering enhanced productivity, safety and reduced environmental impact
• Invest in design, development and production capacity in growth markets
• Develop more competitive offerings with different value propositions
• Perform more service on a higher share of the installed base of machines
• Develop the service business• Increase operational efficiency• Invest in employees and competence
development• Acquire complementary businesses and
integrate them successfully
CompetitionPower Technique’s principal competitors include Doosan, Generac, Kaeser, and Sullair. In addition, there are a large number of competitors operat-ing locally or regionally.
Market position A leading or strong market position globally in most of its operations.
Atlas Copco 2021 32
THE YEAR IN REVIEw – POwER TECHNIqUE
THE YEAR IN REVIEWAdministration report
Business areas
Compressor Technique
Vacuum Technique
Industrial Technique
• Power Technique
Sustainable approach to delivering value
Raising our climate ambition
Products and service
People
Safety and well-being
Ethics
Environment
Risks, risk management and opportunities
The Atlas Copco share
Corporate Governance
Board of Directors
Group Management
Internal control over financial reporting
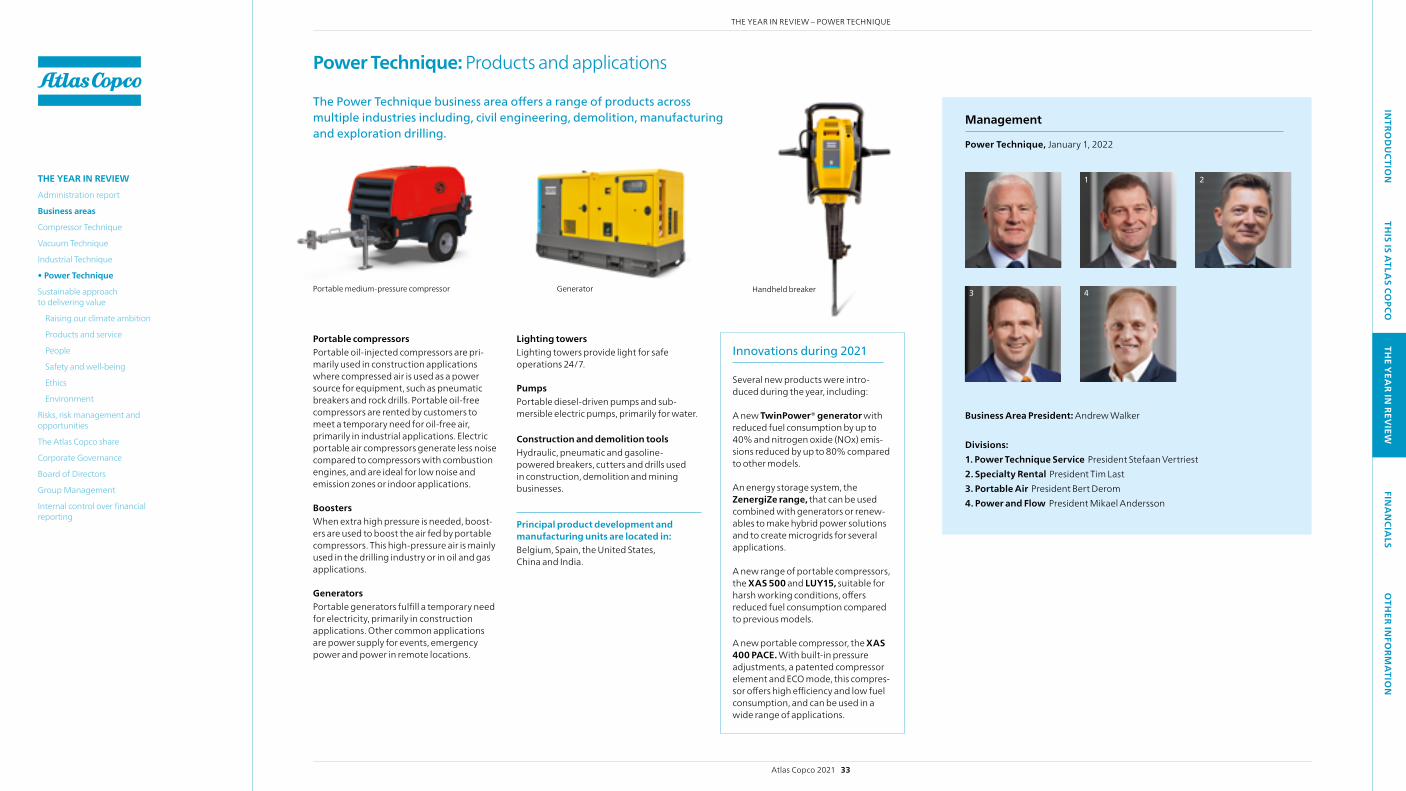
INTRO
DU
CTION
THIS IS A
TLAS CO
PCOTH
E YEA
R IN REV
IEWFIN
AN
CIALS
OTH
ER INFO
RMA
TION
Power Technique: Products and applications
Portable compressorsPortable oil-injected compressors are pri-marily used in construction applications where compressed air is used as a power source for equipment, such as pneumatic breakers and rock drills. Portable oil-freecompressors are rented by customers to meet a temporary need for oil-free air, primarily in industrial applications. Electric portable air compressors generate less noise compared to compressors with combustion engines, and are ideal for low noise and emission zones or indoor applications.
Boosters when extra high pressure is needed, boost-ers are used to boost the air fed by portable compressors. This high-pressure air is mainly used in the drilling industry or in oil and gas applications.
GeneratorsPortable generators fulfill a temporary need for electricity, primarily in construction applications. Other common applications are power supply for events, emergency power and power in remote locations.
Lighting towersLighting towers provide light for safe operations 24/7.
PumpsPortable diesel-driven pumps and sub-mersible electric pumps, primarily for water.
Construction and demolition toolsHydraulic, pneumatic and gasoline- powered breakers, cutters and drills used in construction, demolition and mining businesses.
Principal product development and manufacturing units are located in:Belgium, Spain, the United States,China and India.
Portable medium-pressure compressor Handheld breaker Generator
The Power Technique business area offers a range of products across multiple industries including, civil engineering, demolition, manufacturing and exploration drilling.
Innovations during 2021
Several new products were intro-duced during the year, including:
A new TwinPower® generator with reduced fuel consumption by up to 40% and nitrogen oxide (NOx) emis-sions reduced by up to 80% compared to other models.
An energy storage system, the ZenergiZe range, that can be used combined with generators or renew-ables to make hybrid power solutions and to create microgrids for several applications.
A new range of portable compressors, the XAS 500 and LUY15, suitable for harsh working conditions, offers reduced fuel consumption compared to previous models.
A new portable compressor, the XAS 400 PACE. with built-in pressure adjustments, a patented compressor element and ECO mode, this compres-sor offers high efficiency and low fuel consumption, and can be used in a wide range of applications.
Business Area President: Andrew walker
Divisions:1. Power Technique Service President Stefaan Vertriest 2. Specialty Rental President Tim Last3. Portable Air President Bert Derom4. Power and Flow President Mikael Andersson
Management
Power Technique, January 1, 2022
2
43
1
Atlas Copco 2021 33
THE YEAR IN REVIEw – POwER TECHNIqUE
THE YEAR IN REVIEWAdministration report
Business areas
Compressor Technique
Vacuum Technique
Industrial Technique
• Power Technique
Sustainable approach to delivering value
Raising our climate ambition
Products and service
People
Safety and well-being
Ethics
Environment
Risks, risk management and opportunities
The Atlas Copco share
Corporate Governance
Board of Directors
Group Management
Internal control over financial reporting
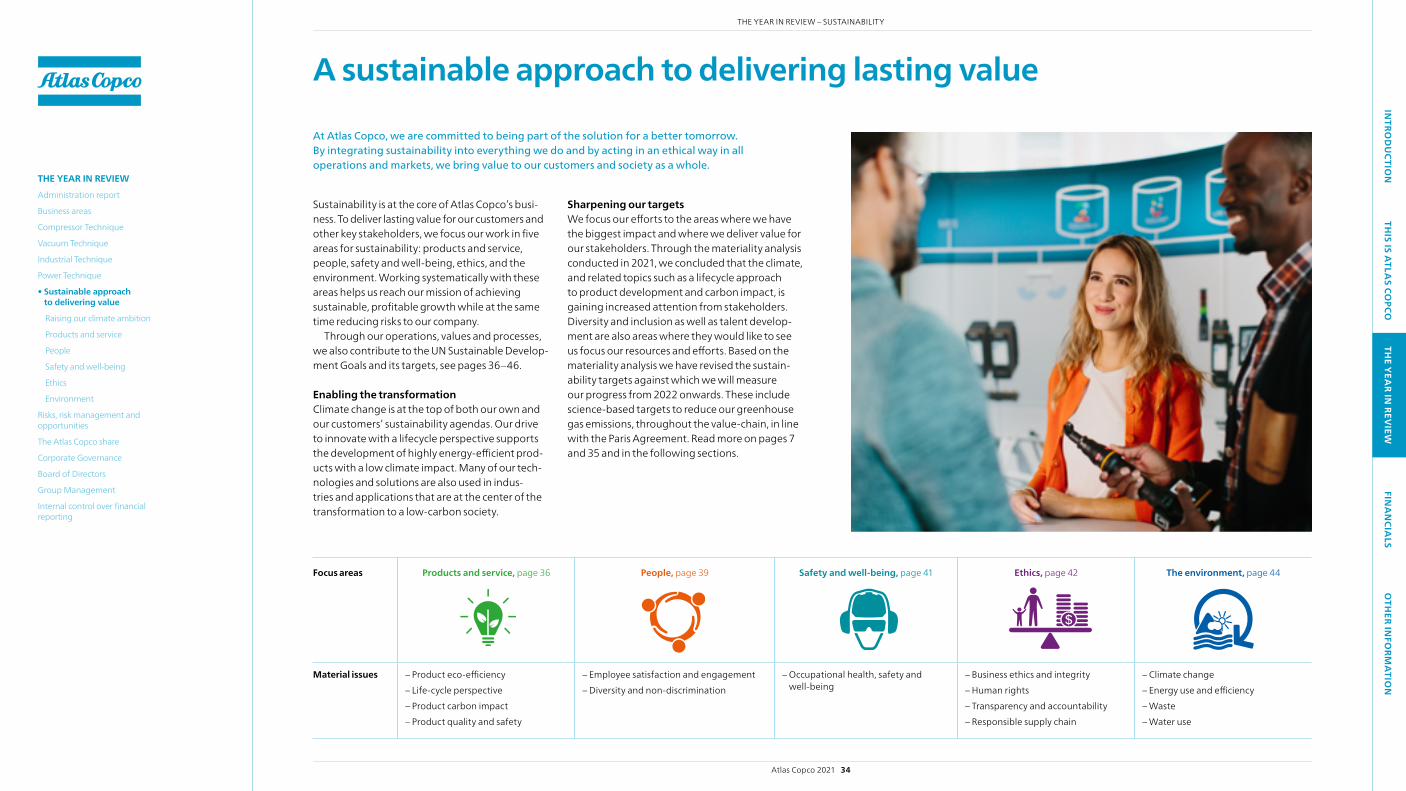
INTRO
DU
CTION
THIS IS A
TLAS CO
PCOTH
E YEA
R IN REV
IEWFIN
AN
CIALS
OTH
ER INFO
RMA
TION
A sustainable approach to delivering lasting value
At Atlas Copco, we are committed to being part of the solution for a better tomorrow. By integrating sustainability into everything we do and by acting in an ethical way in all operations and markets, we bring value to our customers and society as a whole.
Sustainability is at the core of Atlas Copco’s busi-ness. To deliver lasting value for our customers and other key stakeholders, we focus our work in five areas for sustainability: products and service, people, safety and well-being, ethics, and the environment. working systematically with these areas helps us reach our mission of achieving sustainable, profitable growth while at the same time reducing risks to our company.
Through our operations, values and processes, we also contribute to the UN Sustainable Develop-ment Goals and its targets, see pages 36–46.
Enabling the transformation Climate change is at the top of both our own and our customers’ sustainability agendas. Our drive to innovate with a lifecycle perspective supports the development of highly energy-efficient prod-ucts with a low climate impact. Many of our tech-nologies and solutions are also used in indus-tries and applications that are at the center of the transformation to a low-carbon society.
Sharpening our targetswe focus our efforts to the areas where we have the biggest impact and where we deliver value for our stakeholders. Through the materiality analysis conducted in 2021, we concluded that the climate, and related topics such as a lifecycle approach to product development and carbon impact, is gaining increased attention from stakeholders. Diversity and inclusion as well as talent develop-ment are also areas where they would like to see us focus our resources and efforts. Based on the materiality analysis we have revised the sustain-ability targets against which we will measure our progress from 2022 onwards. These include science-based targets to reduce our greenhouse gas emissions, throughout the value- chain, in line with the Paris Agreement. Read more on pages 7 and 35 and in the following sections.
Focus areas Products and service, page 36 People, page 39 Safety and well-being, page 41 Ethics, page 42 The environment, page 44
Material issues – Product eco-efficiency – Life-cycle perspective – Product carbon impact – Product quality and safety
– Employee satisfaction and engagement– Diversity and non-discrimination
– Occupational health, safety and well-being
– Business ethics and integrity– Human rights– Transparency and accountability– Responsible supply chain
– Climate change– Energy use and efficiency– waste– water use
Atlas Copco 2021 34
THE YEAR IN REVIEw – SUSTAINABILITY
THE YEAR IN REVIEWAdministration report
Business areas
Compressor Technique
Vacuum Technique
Industrial Technique
Power Technique
• Sustainable approach to delivering value
Raising our climate ambition
Products and service
People
Safety and well-being
Ethics
Environment
Risks, risk management and opportunities
The Atlas Copco share
Corporate Governance
Board of Directors
Group Management
Internal control over financial reporting

INTRO
DU
CTION
THIS IS A
TLAS CO
PCOTH
E YEA
R IN REV
IEWFIN
AN
CIALS
OTH
ER INFO
RMA
TION
Purchased goodsand services
Fuel and energyrelated activities
Transportationand distribution Waste from
operations
Employeecommuniting
Companyfacilities
Companyvehicles
Transportationand
distribution
Processing ofsold products
Businesstravel Use of sold
productsEnd-of-Life treatment
of sold products
Leasedassets
Investments
Capitalgoods
Franchises
Purchased electricity, steam,
heating and cooling for own use
Leasedassets
Upstream activities including suppliers Downstream activities including products in use
Value chain CO₂
Atlas Copco Group
Scope 2Indirect
Scope 3Indirect
Scope 3Indirect
Scope 1Direct
CO2 impact in the value chainMore than 90% of the greenhouse gas emissions in our value chain are generated when the products are used. Less than 1% of emissions come from Atlas Copco’s own operations, and less than 5% originate from components, transport etc.
The world urgently needs low-carbon solutions, and Atlas Copco’s innovations are part of enabling the transformation. Our technolo-gies are critical in existing low-carbon technologies like electric vehi-cles and solar power, and they are also part of emerging technolo-gies for energy production, energy storage, smart manufacturing processes, transportation, and more.
As a leading and global supplier, Atlas Copco can also make a pos-itive impact through our operations, transportation, and product design. In fact, more than 90% of all the greenhouse gas emissions that we generate come from when the products are in use.
Committing to science-based targetsTo ensure that we fulfill our climate ambitions, in 2021 Atlas Copco set two science-based targets to reduce our greenhouse gas emis-sions in line with the Paris Agreement. This means that Atlas Copco
has committed to take action in line with the Paris Agreement goal of keeping the global temperature rise to well below 2°C, and pref-erably not higher than 1.5°C. The science-based targets are set for the entire value chain, including the use of products. They are set for absolute reductions, and not in relation to cost of sales.
Target 1: Emissions from purchased energy and our own operationsThe first target concerns emissions from Atlas Copco’s own opera-tions and the energy we purchase (scope 1 and 2). Here our target is to reduce our greenhouse emissions in line with the Paris Agreement to limit the global temperature rise to maximum 1.5 °C. To do this, we have a target of reducing emissions generated in these parts of the value chain by 46% by 2030. Read more about how we work with lowering the emissions from our own operations on pages 44–45.
Target 2: Upstream and downstream activitiesOur second target concerns emissions generated outside of Atlas Copco’s own operations, in up- and downstream activities (scope 3). Here we will reduce greenhouse gas emissions in line with the Paris Agreement to keep global temperature rise at well below 2 °C. To achieve this, we have set a target to reduce our indirect upstream and downstream emissions by 28% by 2030. Read more about how we work with lowering the emissions from our products on pages 36–38.
Atlas Copco’s science-based targets are valid from 2022, and are set for 2030 with 2019 as the base year. The targets have been validated by the Science Based Targets initiative.
Raising our climate ambitionTo contribute to a more sustainable future, Atlas Copco has committed to science-based targets for the reduction of greenhouse gas emissions in the entire value chain.
The Science Based Targets initiative (SBTi) provides companies with a clear path and methods for setting targets for reducing their greenhouse gas emissions in line with the Paris Agreement. They also define and pro-mote best practices in emissions reductions and net-zero targets in line with the latest climate science. The SBTi is a partnership between CDP, the United Nations Global Compact, world Resources Insti-tute (wRI) and the world wide Fund for Nature (wwF).
Source: GHG-protocol
Atlas Copco 2021 35
THE YEAR IN REVIEw – SUSTAINABILITY
THE YEAR IN REVIEWAdministration report
Business areas
Compressor Technique
Vacuum Technique
Industrial Technique
Power Technique
• Sustainable approach to delivering value
Raising our climate ambition
Products and service
People
Safety and well-being
Ethics
Environment
Risks, risk management and opportunities
The Atlas Copco share
Corporate Governance
Board of Directors
Group Management
Internal control over financial reporting
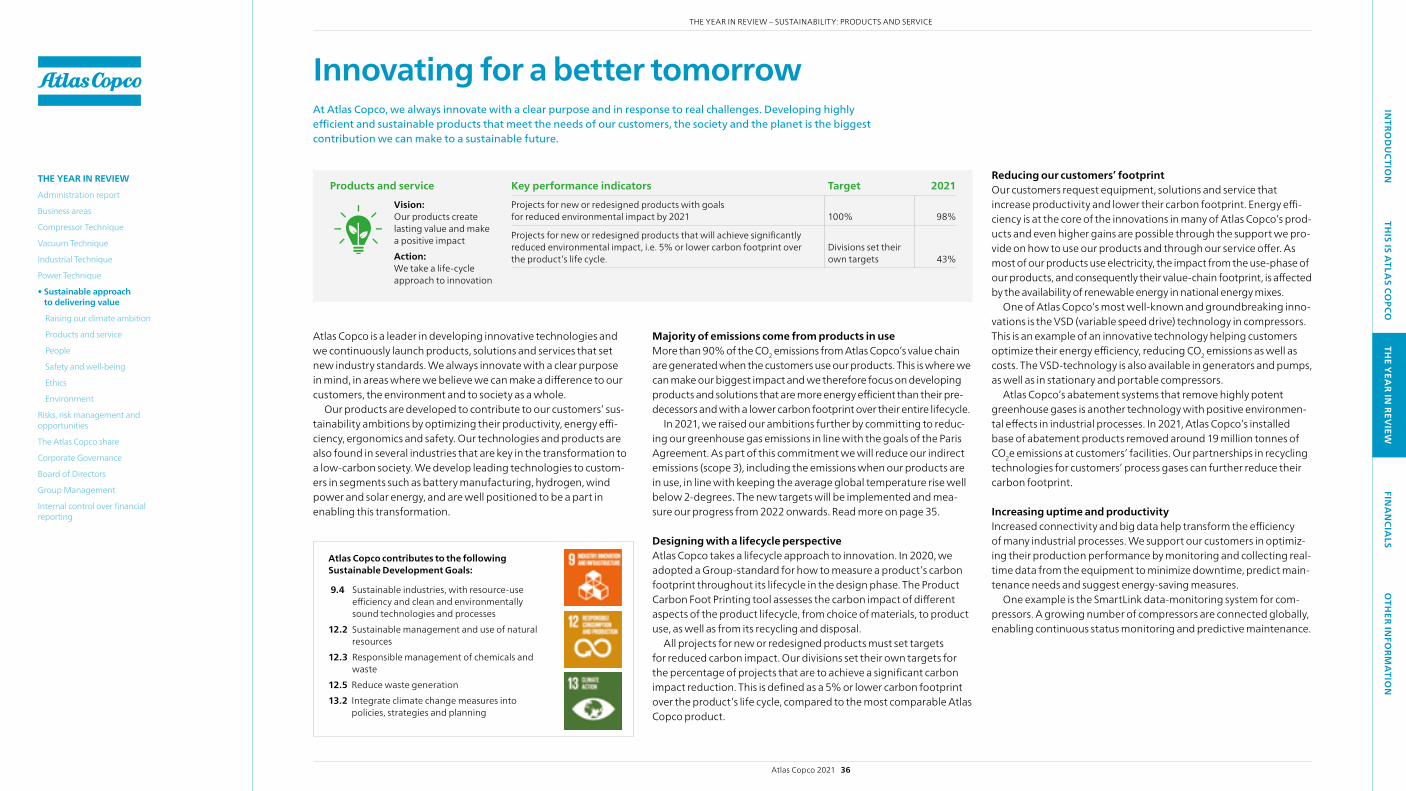
INTRO
DU
CTION
THIS IS A
TLAS CO
PCOTH
E YEA
R IN REV
IEWFIN
AN
CIALS
OTH
ER INFO
RMA
TION
Atlas Copco is a leader in developing innovative technologies and we continuously launch products, solutions and services that set new industry standards. we always innovate with a clear purpose in mind, in areas where we believe we can make a difference to our customers, the environment and to society as a whole.
Our products are developed to contribute to our customers’ sus-tainability ambitions by optimizing their productivity, energy effi-ciency, ergonomics and safety. Our technologies and products are also found in several industries that are key in the transformation to a low-carbon society. we develop leading technologies to custom-ers in segments such as battery manufacturing, hydrogen, wind power and solar energy, and are well positioned to be a part in enabling this transformation.
Innovating for a better tomorrowAt Atlas Copco, we always innovate with a clear purpose and in response to real challenges. Developing highly efficient and sustainable products that meet the needs of our customers, the society and the planet is the biggest contribution we can make to a sustainable future.
Products and serviceVision: Our products create lasting value and make a positive impactAction: we take a life-cycle approach to innovation
Reducing our customers’ footprint Our customers request equipment, solutions and service that increase productivity and lower their carbon footprint. Energy effi-ciency is at the core of the innovations in many of Atlas Copco’s prod-ucts and even higher gains are possible through the support we pro-vide on how to use our products and through our service offer. As most of our products use electricity, the impact from the use-phase of our products, and consequently their value-chain footprint, is affected by the availability of renewable energy in national energy mixes.
One of Atlas Copco’s most well-known and groundbreaking inno-vations is the VSD (variable speed drive) technology in compressors. This is an example of an innovative technology helping customers optimize their energy efficiency, reducing CO2 emissions as well as costs. The VSD-technology is also available in generators and pumps, as well as in stationary and portable compressors.
Atlas Copco’s abatement systems that remove highly potent greenhouse gases is another technology with positive environmen-tal effects in industrial processes. In 2021, Atlas Copco’s installed base of abatement products removed around 19 million tonnes of CO2e emissions at customers’ facilities. Our partnerships in recycling technologies for customers’ process gases can further reduce their carbon footprint.
Increasing uptime and productivityIncreased connectivity and big data help transform the efficiency of many industrial processes. we support our customers in optimiz-ing their production performance by monitoring and collecting real-time data from the equipment to minimize downtime, predict main-tenance needs and suggest energy-saving measures.
One example is the Smart Link data-monitoring system for com-pressors. A growing number of compressors are connected globally, enabling continuous status monitoring and predictive maintenance.
Majority of emissions come from products in useMore than 90% of the CO2 emissions from Atlas Copco’s value chain are generated when the customers use our products. This is where we can make our biggest impact and we therefore focus on developing products and solutions that are more energy efficient than their pre-decessors and with a lower carbon footprint over their entire lifecycle.
In 2021, we raised our ambitions further by committing to reduc-ing our greenhouse gas emissions in line with the goals of the Paris Agreement. As part of this commitment we will reduce our indirect emissions (scope 3), including the emissions when our products are in use, in line with keeping the average global temperature rise well below 2-degrees. The new targets will be implemented and mea-sure our progress from 2022 onwards. Read more on page 35.
Designing with a lifecycle perspectiveAtlas Copco takes a lifecycle approach to innovation. In 2020, we adopted a Group- standard for how to measure a product’s carbon footprint throughout its lifecycle in the design phase. The Product Carbon Foot Printing tool assesses the carbon impact of different aspects of the product lifecycle, from choice of materials, to product use, as well as from its recycling and disposal.
All projects for new or redesigned products must set targets for reduced carbon impact. Our divisions set their own targets for the percentage of projects that are to achieve a significant carbon impact reduction. This is defined as a 5% or lower carbon footprint over the product’s life cycle, compared to the most comparable Atlas Copco product.
Atlas Copco contributes to the following Sustainable Development Goals:
9.4 Sustainable industries, with resource-use efficiency and clean and environmentally sound technologies and processes
12.2 Sustainable management and use of natural resources
12.3 Responsible management of chemicals and waste
12.5 Reduce waste generation13.2 Integrate climate change measures into
policies, strategies and planning
Key performance indicators Target 2021Projects for new or redesigned products with goals for reduced environmental impact by 2021 100% 98%
Projects for new or redesigned products that will achieve significantly reduced environmental impact, i.e. 5% or lower carbon footprint over the product’s life cycle.
Divisions set their own targets 43%
Atlas Copco 2021 36
THE YEAR IN REVIEw – SUSTAINABILITY: PRODUCTS AND SERVICE
THE YEAR IN REVIEWAdministration report
Business areas
Compressor Technique
Vacuum Technique
Industrial Technique
Power Technique
• Sustainable approach to delivering value
Raising our climate ambition
Products and service
People
Safety and well-being
Ethics
Environment
Risks, risk management and opportunities
The Atlas Copco share
Corporate Governance
Board of Directors
Group Management
Internal control over financial reporting

INTRO
DU
CTION
THIS IS A
TLAS CO
PCOTH
E YEA
R IN REV
IEWFIN
AN
CIALS
OTH
ER INFO
RMA
TION
Enabling the transition to renewable energyUpscaling the access to renewable energy will be key in reaching a low-carbon future and the demand is increasing. Many of the tech-nologies in this sector are closely related to Atlas Copco’s products and solutions in vacuum technology, compressor technology, power storage and supply, and industrial production and inspection.
Vacuum and abatement solutions, for example, are essential parts in the manufacturing of solar panels. Vacuum pumps are needed in the production of the silicon wafers and photovoltaic cells that cap-ture the sunlight and convert it into energy. The surface of the panels must also be flawless in order to efficiently capture the energy. Atlas Copco develops optical inspection systems for complete control of the panels, which helps improve their efficiency and throughput.
In wind energy, Atlas Copco’s industrial tools, such as grinders, wrenches and tensioners, are used in building the turbines, and our generators are used to start them up.
Recovering and storing energy generated by renewable sources is one of the main challenges, and Atlas Copco has the technology and expertise to take a leading position in this area. Read more about how Atlas Copco has developed a solution addressing this challenge in the case below. Another example is the zenergize battery-powered energy storage system that can be combined with renewable sources of energy for immediate or later use. It captures
the energy and stores it for delivery at any given time. Its intelligent control system then manages the energy offer and demand to increase the efficiency of hybrid power solutions.
Our service supports circularity and optimizes customers’ investmentsThrough a strong service offering we ensure that our customers get the most out of each investment. Our service divisions ensure the repair and reuse of used products, which extends their useful life and minimizes waste. They also provide support on how to optimally use the products, which enables energy-efficiency gains. The iXM Hybrid upgrade service product is an example of an offering where cus-tomers can return their current pump to their local Atlas Copco ser-vice technology center, where the pumps are converted to use a low power mechanism, thus reducing its CO2 emissions, read more in the case to the right.
Many of Atlas Copco’s products are also designed so they can be returned, refurbished and resold. This contributes to increased circu-larity and such used equipment meet the same high standards as when they were new in terms of quality, performance and energy efficiency. Furthermore, some Atlas Copco units accept contami-nated products, which otherwise would be disposed of as hazard-ous waste, and return them to full operation.
Innovating for a better tomorrow, continued
Storing electric energy is a challenge in the green transi-tion. Non-dispatchable renewables such as wind and solar PV are a poor fit to the load on the grid. It works for low-to-medium penetration with renewables, but not in a full-blown green transition.
Collaborations between industries is critical in the effort to find new and innovative solutions to curb climate change. Together with a company specialized in storage technologies with a high impact on climate change, Atlas Copco has developed a solution to collecting and storing excess renewable energy. The solution combines our customer’s expertise in storing technologies with Atlas Copco’s technologies in turbomachinery compressing and expanding the working gas.
The energy is stored as heat and cold in crushed rock,
encapsulated in insulated tanks. Charging and discharg-ing is carried out by circulating pure compressed air through the crushed rock reservoirs, transferring heat between rocks and air. The Atlas Copco turbomachinery represents the centerpiece of this system, as it is efficient-ly converting the excess electricity into thermally stored energy and finally back into electricity, thus being the most important part of the thermal battery.
This thermal energy storage solution has an assumed 55% of roundtrip efficiency. Calculating with a com-plete charge/discharge cycle every three days of the first demonstration plant, the developed solution could save up to 7 500 metric tons of CO2 over its lifetime, which equals greenhouse gas emissions from around 1 600 passenger cars driven for one year in the US.
The iXH semiconductor dry pump range is the lead-ing pumping technology used in the semiconductor industry over the last 8 years. The iXM range is the latest dry pump technology offering lower power products with improved capability to handle a wider portfolio of applications than any previous low power design from Atlas Copco.
Combining applications knowledge of semicon-ductor processes, with technical product knowl-edge has enabled the development of the iXM Hybrid service upgrade product. The solution offers pumps currently in the market to be returned to Atlas Copco’s local service technology center. Through a fully engineered upgrade the iXH1210 dry pump is converted to utilize the iXM low power mechanism, whilst retaining all other elements of the iXH system.
The iXM Hybrid product provides a 25% power saving over the original iXH product. Utilizing the existing pump system allows for upgraded products to be re-installed directly with no change to custom-er connections or settings.
The iXM Hybrid product is currently deployed at a world leading semiconductor customer. This project delivered around 700 metric tons reduction in CO2 emissions over first 20 months, correspond-ing to the greenhouse gas emissions from 160 pas-senger cars being driven in the US for one year. The above project could deliver a total annual sav-ings of around 13 000 metric tons of CO2 emis-sions following the completion of the full five-year program.
Supporting the energy transition
Power-efficient pumping technology used in semiconductor application
Atlas Copco 2021 37
THE YEAR IN REVIEw – SUSTAINABILITY: PRODUCTS AND SERVICE
THE YEAR IN REVIEWAdministration report
Business areas
Compressor Technique
Vacuum Technique
Industrial Technique
Power Technique
• Sustainable approach to delivering value
Raising our climate ambition
Products and service
People
Safety and well-being
Ethics
Environment
Risks, risk management and opportunities
The Atlas Copco share
Corporate Governance
Board of Directors
Group Management
Internal control over financial reporting

INTRO
DU
CTION
THIS IS A
TLAS CO
PCOTH
E YEA
R IN REV
IEWFIN
AN
CIALS
OTH
ER INFO
RMA
TION
Innovating for a better tomorrow, continued
Building on Atlas Copco in-house developed technology, the new E-AIR V1100VSD portable compressor uses electricity instead of diesel to deliver compressed air for our customers. The efficient drivetrain has more power density than a comparable power diesel engine enabling similar airflow in a smaller and lighter com-pressor. Noise levels are lower, and varying air demand can be met by the minimally required energy over a wider range of airflows. Moreover, the required pressure can be exactly matched without any sacrifices in efficiency.
The E-AIR V1100VSD is versatile since the amperage and sock-ets available on the customer’s site can be easily implemented. In addition to substantially reduced operating costs, the highly efficient electricity usage also reduces emissions compared to the diesel-driven unit.
Equivalent energy saved from swapping a diesel-driven com-pressor to the E-AIR V1100 VSD is calculated at up to 22 percent. By replacing diesel-driven units in the same airflow category, based on the E-AIR V1100VSD orders between October 2020 and October 2021, customers could reduce CO2 emissions by approx-imately 300 metric tons per year, corresponding to greenhouse gas emissions of 65 passenger cars driven for one year in the US.
New battery tool drives smarter assembly
Portable electric compressor used in tough customer applications like miningThe global assembly industry is transforming, becoming digi-
tal and more flexible, while achieving better ergonomics and reducing carbon footprint. The Tensor ITB-A has been devel-oped to meet the shifting market demands and drive smart-er assembly.
The Tensor ITB-A is a range of handheld, cordless tools, which share an integrated controller platform which manages the tool and real time integration to a production system. with the Tensor ITB-A, Atlas Copco is developing the assembly process by increasing the production flexibility and reducing the need for hardware and equipment in the factories, as well as reducing power consumption. By substitut-ing the traditional setup of one battery tool and one physical controller box with the Tensor ITB-A, the lifecycle carbon impact can be re-duced by 75 percent per year. Firstly, the setup with an integrated controller eliminates the environmental impact in the supply chain from producing and transporting physical controllers. Secondly, Tensor ITB-A consumes less power while in use, reducing both carbon footprint and cost for customers.
By replacing traditional systems, a tool and a separate controller, with the new Tensor ITB-A, savings can amount to around 650 metric tons of CO2 emissions per year. This is based on an esti-mation of replacement of traditional systems the coming two years and the equivalent of 140 passenger cars driven for one year in the US.
HEX@ – a new evolution in vacuum pump controlA vacuum service technician explaining the functionalities of the HEX@ Controller to a customer. This is the next generation in vacuum control, with possibilities of remote controlling the system via PC, mobile phone or tablet.
In 2021 the Atlas Copco Group had 6 600 patents, linked to around 2 400 inventions.
Atlas Copco 2021 38
THE YEAR IN REVIEw – SUSTAINABILITY: PRODUCTS AND SERVICE
THE YEAR IN REVIEWAdministration report
Business areas
Compressor Technique
Vacuum Technique
Industrial Technique
Power Technique
• Sustainable approach to delivering value
Raising our climate ambition
Products and service
People
Safety and well-being
Ethics
Environment
Risks, risk management and opportunities
The Atlas Copco share
Corporate Governance
Board of Directors
Group Management
Internal control over financial reporting

INTRO
DU
CTION
THIS IS A
TLAS CO
PCOTH
E YEA
R IN REV
IEWFIN
AN
CIALS
OTH
ER INFO
RMA
TION
Enabling development and lifelong learningAtlas Copco’s ambition is to be the most attractive employer in our industry. To reach this position, we nurture and grow our culture and enable the full potential of our people so they can deliver world-class solutions to our customers every day.
People
As a world-leading provider of innovative productivity solutions, Atlas Copco depends on all our talented and committed employees. One of our focus areas is to attract, develop and retain passionate people, to be First in Mind—First in Choice as an employer and to achieve long-term business success.
Aligning people success with business successAtlas Copco has developed a talent framework based on a common set of competencies that have been identified as the most critical to our business success and are relevant to all employees.
The framework breaks down the five key competencies into behaviors that strengthen Atlas Copco’s ability to drive real change in employee performance. It emphasizes our belief that every employee has a critical role in driving the Group’s success.
Developing passionate peopleAtlas Copco has a strong culture of growing talent by encouraging employees to take accountability for their own development. we encourage curiosity and enable learning through continuous feed-back and coaching. we also have the ambition to learn from each other each day at work, and create personalized and interactive learning opportunities to drive upskilling for business and personal success.
In 2021, Atlas Copco implemented a new process for performance and development dialogues. The purpose is to increase the number and quality of dialogues and hold leaders accountable for growing people through ongoing feedback and coaching. The talent frame-work competencies are fully integrated in the process.
Atlas Copco’s learning management system is another key ingre-dient of our learning culture. Through the system, they gain easy access to an extensive library of digital and classroom courses and programs, relevant across the business, or targeted to a specific subject, function or role.
Developing future-proof leadersDeveloping future-proof leaders is another pillar of Atlas Copco’s people philosophy. we strive to develop leaders who coach and develop teams and individuals to reach their full potential through inclusion, collaboration, and trust.
In Atlas Copco, leadership is defined as the ability to create lasting results. Our leadership portfolio offers personalized learning through
a modular set-up. Each module focuses on a specific skill mapped against the talent framework competencies. In 2021, new modules were added to the portfolio and, in response to the pandemic, trans-formed into virtual trainings.
Attracting talentwe believe that inclusion is a critical driver for long-term success. To ensure a strong and diverse pipeline, Atlas Copco seeks to pro-actively attract talent from the entire talent pool. Targeted employer branding activities and competence-based recruitment safeguard cultural fit and diversity. This includes structured interview guides with a focus on behaviors.
The biggest gap in the area of diversity is within gender balance, and we address this through our goal of 30% women in the Group by 2030. In 2021, progress was made towards better gender balance with 20.9% (20.0) women in the workforce by year end.
Atlas Copco contributes to the following Sustainable Development Goals:
5.1 End discrimination against women and girls5.5 Ensure women’s full participation and equal
opportunities for leadership and decision making
8.8 Protect labour rights and promote safe and secure working environments
Key performance indicators Target 2021 2020 2019 CommentDegree to which employees agree there is opportunity to learn and grow in the company *
Above bench mark (71) 73 – 71
The employee survey is conducted every two years.
Degree to which employees agree there is a work culture of respect, fairness and openness *
Above benchmark (75) 76 – 74
Share of female employees at year end 2030, % 30% 20.9 20.0 19.8
* Scores based on scale 0–100 where 0 is “strongly disagree” and 100 is “strongly agree”.
Vision: Our culture of collaboration and inclusion drives our successAction: we help each other grow and thrive
Atlas Copco 2021 39
THE YEAR IN REVIEw – SUSTAINABILITY: PEOPLE
THE YEAR IN REVIEWAdministration report
Business areas
Compressor Technique
Vacuum Technique
Industrial Technique
Power Technique
• Sustainable approach to delivering value
Raising our climate ambition
Products and service
People
Safety and well-being
Ethics
Environment
Risks, risk management and opportunities
The Atlas Copco share
Corporate Governance
Board of Directors
Group Management
Internal control over financial reporting
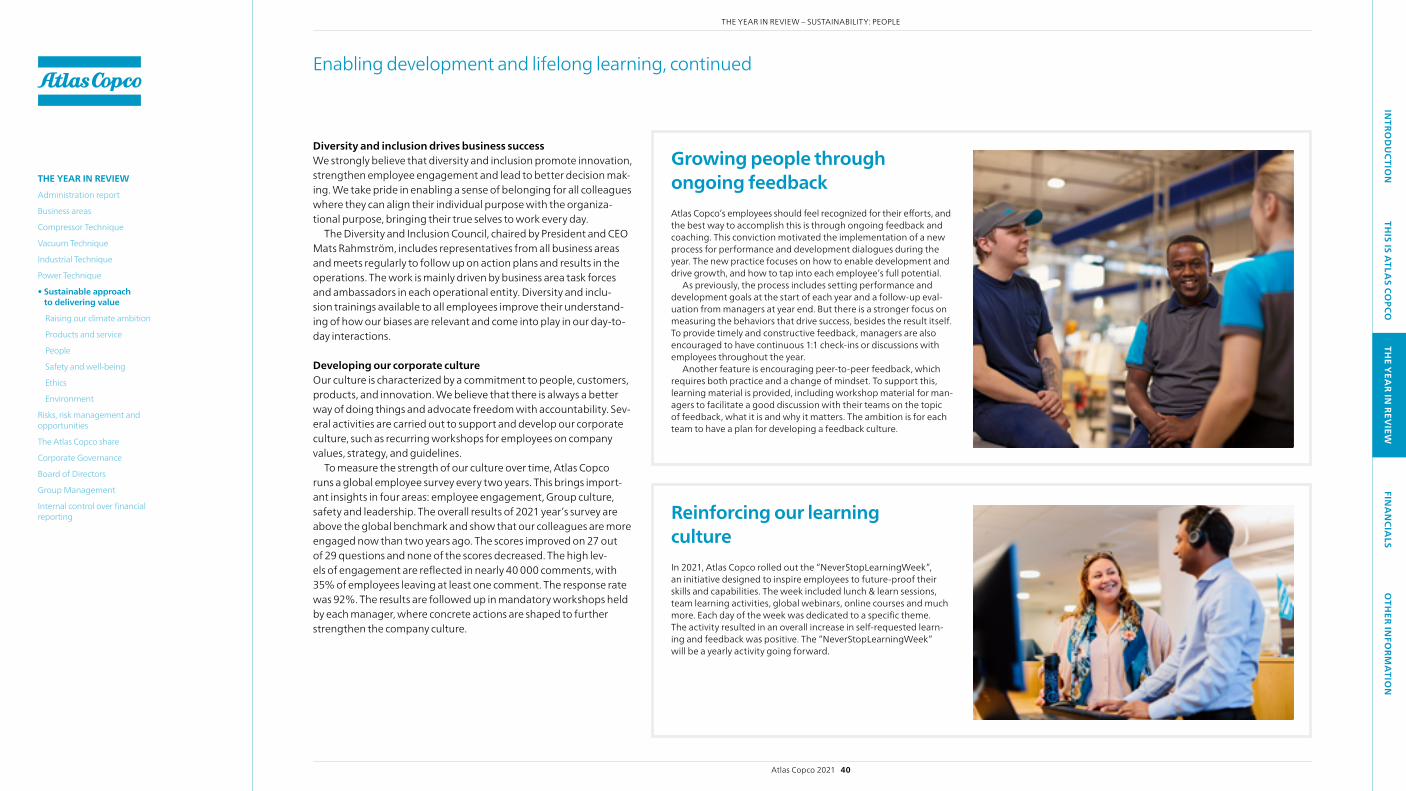
INTRO
DU
CTION
THIS IS A
TLAS CO
PCOTH
E YEA
R IN REV
IEWFIN
AN
CIALS
OTH
ER INFO
RMA
TION
Diversity and inclusion drives business successwe strongly believe that diversity and inclusion promote innovation, strengthen employee engagement and lead to better decision mak-ing. we take pride in enabling a sense of belonging for all colleagues where they can align their individual purpose with the organiza-tional purpose, bringing their true selves to work every day.
The Diversity and Inclusion Council, chaired by President and CEO Mats Rahmström, includes representatives from all business areas and meets regularly to follow up on action plans and results in the operations. The work is mainly driven by business area task forces and ambassadors in each operational entity. Diversity and inclu-sion trainings available to all employees improve their understand-ing of how our biases are relevant and come into play in our day-to-day interactions.
Developing our corporate cultureOur culture is characterized by a commitment to people, customers, products, and innovation. we believe that there is always a better way of doing things and advocate freedom with accountability. Sev-eral activities are carried out to support and develop our corporate culture, such as recurring workshops for employees on company values, strategy, and guidelines.
To measure the strength of our culture over time, Atlas Copco runs a global employee survey every two years. This brings import-ant insights in four areas: employee engagement, Group culture, safety and leadership. The overall results of 2021 year’s survey are above the global benchmark and show that our colleagues are more engaged now than two years ago. The scores improved on 27 out of 29 questions and none of the scores decreased. The high lev-els of engagement are reflected in nearly 40 000 comments, with 35% of employees leaving at least one comment. The response rate was 92%. The results are followed up in mandatory workshops held by each manager, where concrete actions are shaped to further strengthen the company culture.
Growing people through ongoing feedbackAtlas Copco’s employees should feel recognized for their efforts, and the best way to accomplish this is through ongoing feedback and coaching. This conviction motivated the implementation of a new process for performance and development dialogues during the year. The new practice focuses on how to enable development and drive growth, and how to tap into each employee’s full potential.
As previously, the process includes setting performance and development goals at the start of each year and a follow-up eval-uation from managers at year end. But there is a stronger focus on measuring the behaviors that drive success, besides the result itself. To provide timely and constructive feedback, managers are also encouraged to have continuous 1:1 check-ins or discussions with employees throughout the year.
Another feature is encouraging peer-to-peer feedback, which requires both practice and a change of mindset. To support this, learning material is provided, including workshop material for man-agers to facilitate a good discussion with their teams on the topic of feedback, what it is and why it matters. The ambition is for each team to have a plan for developing a feedback culture.
Reinforcing our learning cultureIn 2021, Atlas Copco rolled out the “NeverStopLearningweek”, an initiative designed to inspire employees to future-proof their skills and capabilities. The week included lunch & learn sessions, team learning activities, global webinars, online courses and much more. Each day of the week was dedicated to a specific theme. The activity resulted in an overall increase in self-requested learn-ing and feedback was positive. The “NeverStopLearningweek” will be a yearly activity going forward.
Enabling development and lifelong learning, continued
Atlas Copco 2021 40
THE YEAR IN REVIEw – SUSTAINABILITY: PEOPLE
THE YEAR IN REVIEWAdministration report
Business areas
Compressor Technique
Vacuum Technique
Industrial Technique
Power Technique
• Sustainable approach to delivering value
Raising our climate ambition
Products and service
People
Safety and well-being
Ethics
Environment
Risks, risk management and opportunities
The Atlas Copco share
Corporate Governance
Board of Directors
Group Management
Internal control over financial reporting
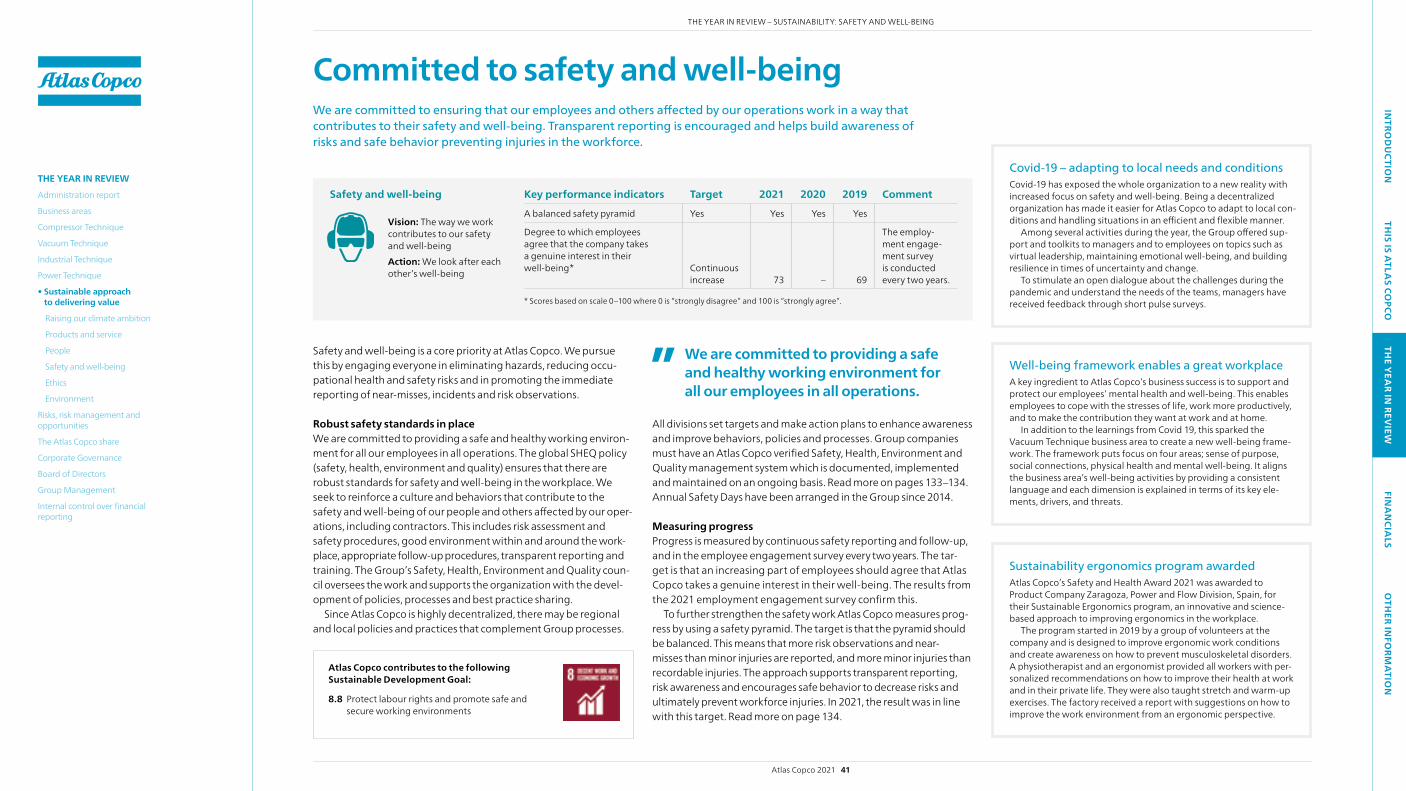
INTRO
DU
CTION
THIS IS A
TLAS CO
PCOTH
E YEA
R IN REV
IEWFIN
AN
CIALS
OTH
ER INFO
RMA
TION
Committed to safety and well-beingWe are committed to ensuring that our employees and others affected by our operations work in a way that contributes to their safety and well-being. Transparent reporting is encouraged and helps build awareness of risks and safe behavior preventing injuries in the workforce.
Key performance indicators Target 2021 2020 2019 Comment
A balanced safety pyramid Yes Yes Yes Yes
Degree to which employees agree that the company takes a genuine interest in their well-being * Continuous
increase 73 – 69
The employ-ment engage-ment survey is conducted every two years.
* Scores based on scale 0–100 where 0 is “strongly disagree” and 100 is “strongly agree”.
Atlas Copco contributes to the following Sustainable Development Goal:
8.8 Protect labour rights and promote safe and secure working environments
Covid-19 – adapting to local needs and conditionsCovid-19 has exposed the whole organization to a new reality with increased focus on safety and well-being. Being a decentralized organization has made it easier for Atlas Copco to adapt to local con-ditions and handling situations in an efficient and flexible manner.
Among several activities during the year, the Group offered sup-port and toolkits to managers and to employees on topics such as virtual leadership, maintaining emotional well-being, and building resilience in times of uncertainty and change.
To stimulate an open dialogue about the challenges during the pandemic and understand the needs of the teams, managers have received feedback through short pulse surveys.
Safety and well-being is a core priority at Atlas Copco. we pursue this by engaging everyone in eliminating hazards, reducing occu-pational health and safety risks and in promoting the immediate reporting of near-misses, incidents and risk observations.
Robust safety standards in place we are committed to providing a safe and healthy working environ-ment for all our employees in all operations. The global SHEq policy (safety, health, environment and quality) ensures that there are robust standards for safety and well-being in the workplace. we seek to reinforce a culture and behaviors that contribute to the safety and well-being of our people and others affected by our oper-ations, including contractors. This includes risk assessment and safety procedures, good environment within and around the work-place, appropriate follow-up procedures, transparent reporting and training. The Group’s Safety, Health, Environment and quality coun-cil oversees the work and supports the organization with the devel-opment of policies, processes and best practice sharing.
Since Atlas Copco is highly decentralized, there may be regional and local policies and practices that complement Group processes.
All divisions set targets and make action plans to enhance awareness and improve behaviors, policies and processes. Group companies must have an Atlas Copco verified Safety, Health, Environment and quality management system which is documented, implemented and maintained on an ongoing basis. Read more on pages 133–134. Annual Safety Days have been arranged in the Group since 2014.
Measuring progressProgress is measured by continuous safety reporting and follow-up, and in the employee engagement survey every two years. The tar-get is that an increasing part of employees should agree that Atlas Copco takes a genuine interest in their well-being. The results from the 2021 employment engagement survey confirm this.
To further strengthen the safety work Atlas Copco measures prog-ress by using a safety pyramid. The target is that the pyramid should be balanced. This means that more risk observations and near-misses than minor injuries are reported, and more minor injuries than recordable injuries. The approach supports transparent reporting, risk awareness and encourages safe behavior to decrease risks and ultimately prevent workforce injuries. In 2021, the result was in line with this target. Read more on page 134.
Well-being framework enables a great workplaceA key ingredient to Atlas Copco’s business success is to support and protect our employees’ mental health and well-being. This enables employees to cope with the stresses of life, work more productively, and to make the contribution they want at work and at home.
In addition to the learnings from Covid 19, this sparked the Vacuum Technique business area to create a new well-being frame-work. The framework puts focus on four areas; sense of purpose, social connections, physical health and mental well-being. It aligns the business area’s well-being activities by providing a consistent language and each dimension is explained in terms of its key ele-ments, drivers, and threats.
Sustainability ergonomics program awardedAtlas Copco’s Safety and Health Award 2021 was awarded to Product Company zaragoza, Power and Flow Division, Spain, for their Sustainable Ergonomics program, an innovative and science- based approach to improving ergonomics in the workplace.
The program started in 2019 by a group of volunteers at the company and is designed to improve ergonomic work conditions and create awareness on how to prevent musculoskeletal disorders. A physiotherapist and an ergonomist provided all workers with per-sonalized recommendations on how to improve their health at work and in their private life. They were also taught stretch and warm-up exercises. The factory received a report with suggestions on how to improve the work environment from an ergonomic perspective.
We are committed to providing a safe and healthy working environment for all our employees in all operations.
Safety and well-being
Vision: The way we work contributes to our safety and well-beingAction: we look after each other’s well-being
Atlas Copco 2021 41
THE YEAR IN REVIEw – SUSTAINABILITY: SAFETY AND wELL-BEING
THE YEAR IN REVIEWAdministration report
Business areas
Compressor Technique
Vacuum Technique
Industrial Technique
Power Technique
• Sustainable approach to delivering value
Raising our climate ambition
Products and service
People
Safety and well-being
Ethics
Environment
Risks, risk management and opportunities
The Atlas Copco share
Corporate Governance
Board of Directors
Group Management
Internal control over financial reporting
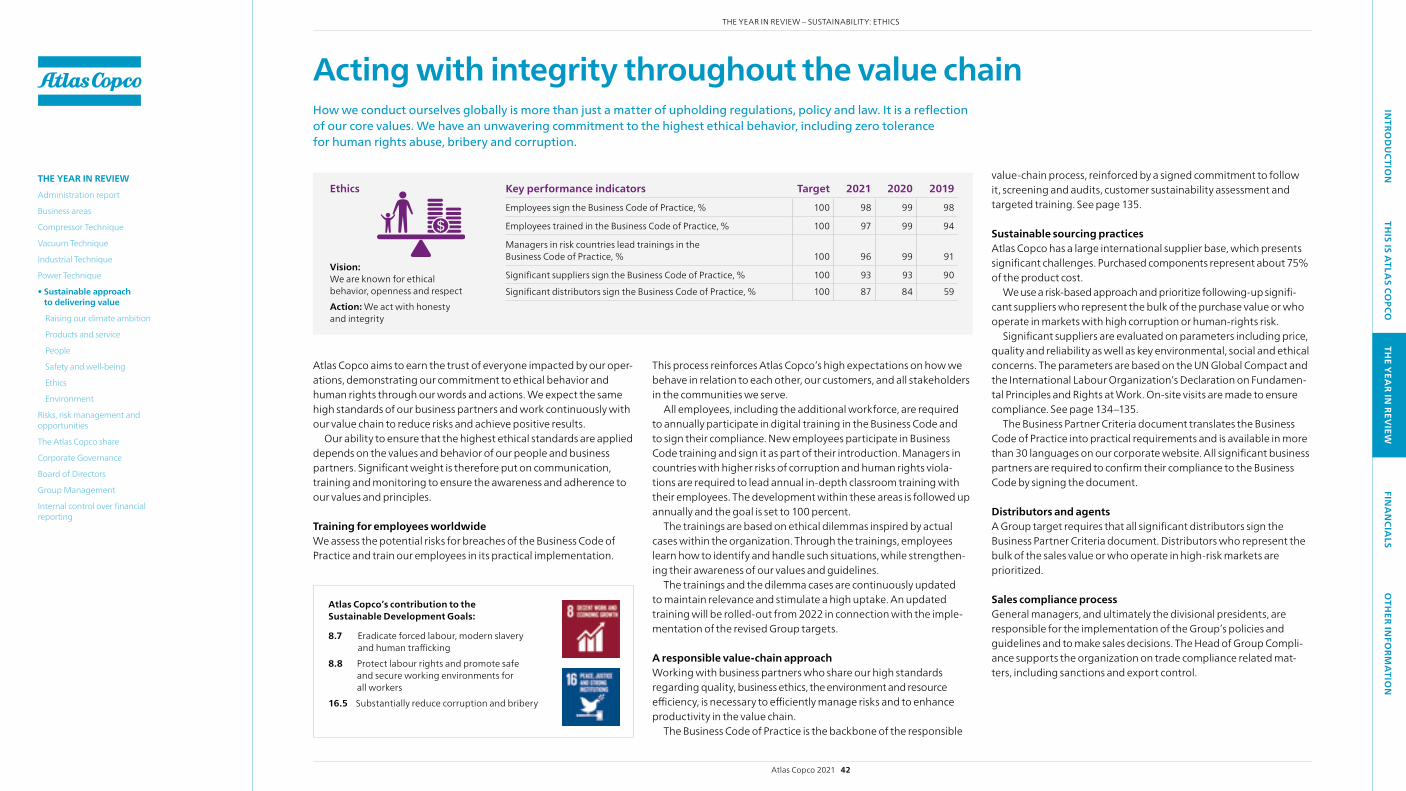
INTRO
DU
CTION
THIS IS A
TLAS CO
PCOTH
E YEA
R IN REV
IEWFIN
AN
CIALS
OTH
ER INFO
RMA
TION
Acting with integrity throughout the value chainHow we conduct ourselves globally is more than just a matter of upholding regulations, policy and law. It is a reflection of our core values. We have an unwavering commitment to the highest ethical behavior, including zero tolerance for human rights abuse, bribery and corruption.
Atlas Copco’s contribution to the Sustainable Development Goals:
8.7 Eradicate forced labour, modern slavery and human trafficking
8.8 Protect labour rights and promote safe and secure working environments for all workers
16.5 Substantially reduce corruption and bribery
Ethics
Atlas Copco aims to earn the trust of everyone impacted by our oper-ations, demonstrating our commitment to ethical behavior and human rights through our words and actions. we expect the same high standards of our business partners and work continuously with our value chain to reduce risks and achieve positive results.
Our ability to ensure that the highest ethical standards are applied depends on the values and behavior of our people and business partners. Significant weight is therefore put on communication, training and monitoring to ensure the awareness and adherence to our values and principles.
Training for employees worldwidewe assess the potential risks for breaches of the Business Code of Practice and train our employees in its practical implementation.
This process reinforces Atlas Copco’s high expectations on how we behave in relation to each other, our customers, and all stakeholders in the communities we serve.
All employees, including the additional workforce, are required to annually participate in digital training in the Business Code and to sign their compliance. New employees participate in Business Code training and sign it as part of their introduction. Managers in countries with higher risks of corruption and human rights viola-tions are required to lead annual in-depth classroom training with their employees. The development within these areas is followed up annually and the goal is set to 100 percent.
The trainings are based on ethical dilemmas inspired by actual cases within the organization. Through the trainings, employees learn how to identify and handle such situations, while strengthen-ing their awareness of our values and guidelines.
The trainings and the dilemma cases are continuously updated to maintain relevance and stimulate a high uptake. An updated training will be rolled-out from 2022 in connection with the imple-mentation of the revised Group targets.
A responsible value-chain approachworking with business partners who share our high standards regarding quality, business ethics, the environment and resource efficiency, is necessary to efficiently manage risks and to enhance productivity in the value chain.
The Business Code of Practice is the backbone of the responsible
value-chain process, reinforced by a signed commitment to follow it, screening and audits, customer sustainability assessment and targeted training. See page 135.
Sustainable sourcing practicesAtlas Copco has a large international supplier base, which presents significant challenges. Purchased components represent about 75% of the product cost.
we use a risk-based approach and prioritize following-up signifi-cant suppliers who represent the bulk of the purchase value or who operate in markets with high corruption or human-rights risk.
Significant suppliers are evaluated on parameters including price, quality and reliability as well as key environmental, social and ethical concerns. The parameters are based on the UN Global Compact and the International Labour Organization’s Declaration on Fundamen-tal Principles and Rights at work. On-site visits are made to ensure compliance. See page 134–135.
The Business Partner Criteria document translates the Business Code of Practice into practical requirements and is available in more than 30 languages on our corporate website. All significant business partners are required to confirm their compliance to the Business Code by signing the document.
Distributors and agents A Group target requires that all significant distributors sign the Business Partner Criteria document. Distributors who represent the bulk of the sales value or who operate in high-risk markets are prioritized.
Sales compliance processGeneral managers, and ultimately the divisional presidents, are responsible for the implementation of the Group’s policies and guidelines and to make sales decisions. The Head of Group Compli-ance supports the organization on trade compliance related mat-ters, including sanctions and export control.
Key performance indicators Target 2021 2020 2019Employees sign the Business Code of Practice, % 100 98 99 98
Employees trained in the Business Code of Practice, % 100 97 99 94
Managers in risk countries lead trainings in the Business Code of Practice, % 100 96 99 91
Significant suppliers sign the Business Code of Practice, % 100 93 93 90
Significant distributors sign the Business Code of Practice, % 100 87 84 59
Vision: we are known for ethical behavior, openness and respectAction: we act with honesty and integrity
Atlas Copco 2021 42
THE YEAR IN REVIEw – SUSTAINABILITY: ETHICS
THE YEAR IN REVIEWAdministration report
Business areas
Compressor Technique
Vacuum Technique
Industrial Technique
Power Technique
• Sustainable approach to delivering value
Raising our climate ambition
Products and service
People
Safety and well-being
Ethics
Environment
Risks, risk management and opportunities
The Atlas Copco share
Corporate Governance
Board of Directors
Group Management
Internal control over financial reporting
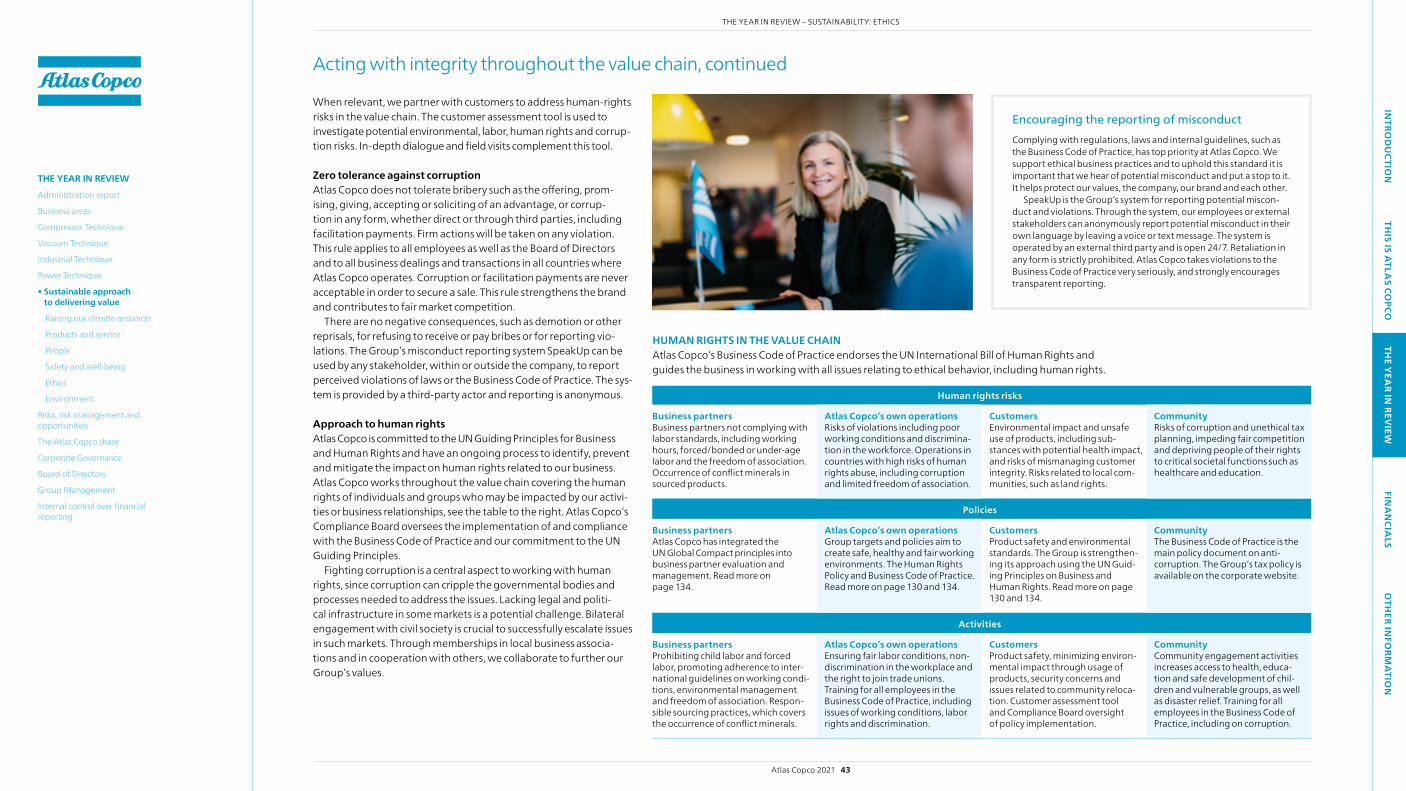
INTRO
DU
CTION
THIS IS A
TLAS CO
PCOTH
E YEA
R IN REV
IEWFIN
AN
CIALS
OTH
ER INFO
RMA
TION
Encouraging the reporting of misconductComplying with regulations, laws and internal guidelines, such as the Business Code of Practice, has top priority at Atlas Copco. we support ethical business practices and to uphold this standard it is important that we hear of potential misconduct and put a stop to it. It helps protect our values, the company, our brand and each other.
SpeakUp is the Group’s system for reporting potential miscon-duct and violations. Through the system, our employees or external stakeholders can anonymously report potential misconduct in their own language by leaving a voice or text message. The system is operated by an external third party and is open 24/7. Retaliation in any form is strictly prohibited. Atlas Copco takes violations to the Business Code of Practice very seriously, and strongly encourages transparent reporting.
HUMAN RIGHTS IN THE VALUE CHAINAtlas Copco’s Business Code of Practice endorses the UN International Bill of Human Rights and guides the business in working with all issues relating to ethical behavior, including human rights.
Human rights risks
Business partners Business partners not complying with labor standards, including working hours, forced/bonded or under-age labor and the freedom of association. Occurrence of conflict minerals in sourced products.
Atlas Copco’s own operations Risks of violations including poor working conditions and discrimina-tion in the workforce. Operations in countries with high risks of human rights abuse, including corruption and limited freedom of association.
Customers Environmental impact and unsafe use of products, including sub-stances with potential health impact, and risks of mismanaging customer integrity. Risks related to local com-munities, such as land rights.
Community Risks of corruption and unethical tax planning, impeding fair competition and depriving people of their rights to critical societal functions such as healthcare and education.
Policies
Business partners Atlas Copco has integrated the UN Global Compact principles into business partner evaluation and management. Read more on page 134.
Atlas Copco’s own operations Group targets and policies aim to create safe, healthy and fair working environments. The Human Rights Policy and Business Code of Practice. Read more on page 130 and 134.
Customers Product safety and environmental standards. The Group is strengthen-ing its approach using the UN Guid-ing Principles on Business and Human Rights. Read more on page 130 and 134.
Community The Business Code of Practice is the main policy document on anti-corruption. The Group’s tax policy is available on the corporate website.
Activities
Business partners Prohibiting child labor and forced labor, promoting adherence to inter-national guidelines on working condi-tions, environmental management and freedom of association. Respon-sible sourcing practices, which covers the occurrence of conflict minerals.
Atlas Copco’s own operations Ensuring fair labor conditions, non-discrimination in the workplace and the right to join trade unions. Training for all employees in the Business Code of Practice, including issues of working conditions, labor rights and discrimination.
Customers Product safety, minimizing environ-mental impact through usage of products, security concerns and issues related to community reloca-tion. Customer assessment tool and Compliance Board oversight of policy implementation.
Community Community engagement activities increases access to health, educa-tion and safe develop ment of chil-dren and vulnerable groups, as well as disaster relief. Training for all employees in the Business Code of Practice, including on corruption.
when relevant, we partner with customers to address human-rights risks in the value chain. The customer assessment tool is used to investigate potential environmental, labor, human rights and corrup-tion risks. In-depth dialogue and field visits complement this tool.
Zero tolerance against corruptionAtlas Copco does not tolerate bribery such as the offering, prom-ising, giving, accepting or soliciting of an advantage, or corrup-tion in any form, whether direct or through third parties, including facilitation payments. Firm actions will be taken on any violation. This rule applies to all employees as well as the Board of Directors and to all business dealings and transactions in all countries where Atlas Copco operates. Corruption or facilitation payments are never acceptable in order to secure a sale. This rule strengthens the brand and contributes to fair market competition.
There are no negative consequences, such as demotion or other reprisals, for refusing to receive or pay bribes or for reporting vio-lations. The Group’s misconduct reporting system SpeakUp can be used by any stakeholder, within or outside the company, to report perceived violations of laws or the Business Code of Practice. The sys-tem is provided by a third-party actor and reporting is anonymous.
Approach to human rightsAtlas Copco is committed to the UN Guiding Principles for Business and Human Rights and have an ongoing process to identify, prevent and mitigate the impact on human rights related to our business. Atlas Copco works throughout the value chain covering the human rights of individuals and groups who may be impacted by our activi-ties or business relationships, see the table to the right. Atlas Copco’s Compliance Board oversees the implementation of and compliance with the Business Code of Practice and our commitment to the UN Guiding Principles.
Fighting corruption is a central aspect to working with human rights, since corruption can cripple the governmental bodies and processes needed to address the issues. Lacking legal and politi-cal infra structure in some markets is a potential challenge. Bilateral engagement with civil society is crucial to successfully escalate issues in such markets. Through memberships in local business associa-tions and in cooperation with others, we collaborate to further our Group’s values.
Acting with integrity throughout the value chain, continued
Atlas Copco 2021 43
THE YEAR IN REVIEw – SUSTAINABILITY: ETHICS
THE YEAR IN REVIEWAdministration report
Business areas
Compressor Technique
Vacuum Technique
Industrial Technique
Power Technique
• Sustainable approach to delivering value
Raising our climate ambition
Products and service
People
Safety and well-being
Ethics
Environment
Risks, risk management and opportunities
The Atlas Copco share
Corporate Governance
Board of Directors
Group Management
Internal control over financial reporting
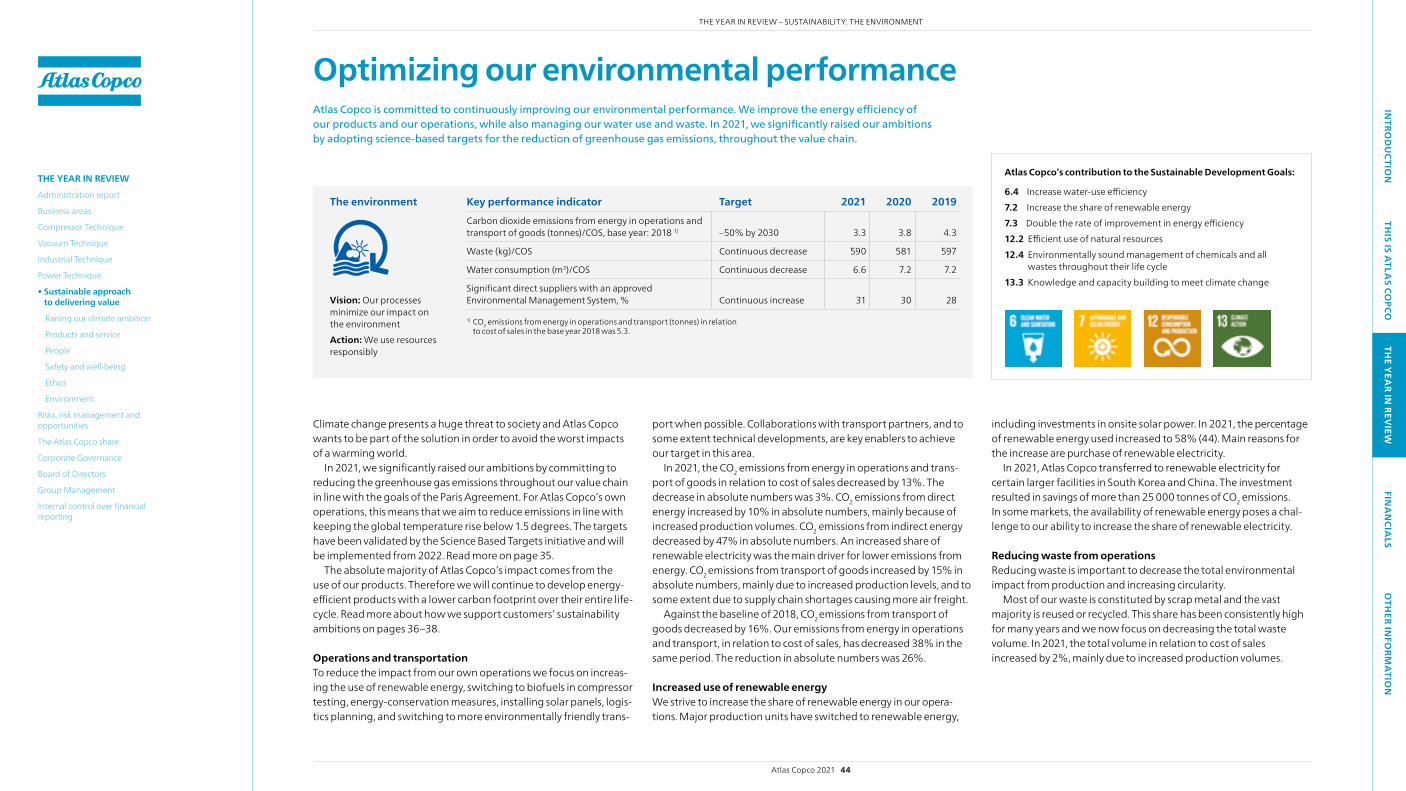
INTRO
DU
CTION
THIS IS A
TLAS CO
PCOTH
E YEA
R IN REV
IEWFIN
AN
CIALS
OTH
ER INFO
RMA
TION
Optimizing our environmental performanceAtlas Copco is committed to continuously improving our environmental performance. We improve the energy efficiency of our products and our operations, while also managing our water use and waste. In 2021, we significantly raised our ambitions by adopting science-based targets for the reduction of greenhouse gas emissions, throughout the value chain.
Climate change presents a huge threat to society and Atlas Copco wants to be part of the solution in order to avoid the worst impacts of a warming world.
In 2021, we significantly raised our ambitions by committing to reducing the greenhouse gas emissions throughout our value chain in line with the goals of the Paris Agreement. For Atlas Copco’s own operations, this means that we aim to reduce emissions in line with keeping the global temperature rise below 1.5 degrees. The targets have been validated by the Science Based Targets initiative and will be implemented from 2022. Read more on page 35.
The absolute majority of Atlas Copco’s impact comes from the use of our products. Therefore we will continue to develop energy- efficient products with a lower carbon footprint over their entire life-cycle. Read more about how we support customers’ sustainability ambitions on pages 36–38.
Operations and transportationTo reduce the impact from our own operations we focus on increas-ing the use of renewable energy, switching to biofuels in compressor testing, energy-conservation measures, installing solar panels, logis-tics planning, and switching to more environmentally friendly trans-
port when possible. Collaborations with transport partners, and to some extent technical developments, are key enablers to achieve our target in this area.
In 2021, the CO2 emissions from energy in operations and trans-port of goods in relation to cost of sales decreased by 13%. The decrease in absolute numbers was 3%. CO2 emissions from direct energy increased by 10% in absolute numbers, mainly because of increased production volumes. CO2 emissions from indirect energy decreased by 47% in absolute numbers. An increased share of renewable electricity was the main driver for lower emissions from energy. CO2 emissions from transport of goods increased by 15% in absolute numbers, mainly due to increased production levels, and to some extent due to supply chain shortages causing more air freight.
Against the baseline of 2018, CO2 emissions from transport of goods decreased by 16%. Our emissions from energy in operations and transport, in relation to cost of sales, has decreased 38% in the same period. The reduction in absolute numbers was 26%.
Increased use of renewable energywe strive to increase the share of renewable energy in our opera-tions. Major production units have switched to renewable energy,
including investments in onsite solar power. In 2021, the percentage of renewable energy used increased to 58% (44). Main reasons for the increase are purchase of renewable electricity.
In 2021, Atlas Copco transferred to renewable electricity for certain larger facilities in South Korea and China. The investment resulted in savings of more than 25 000 tonnes of CO2 emissions. In some markets, the availability of renewable energy poses a chal-lenge to our ability to increase the share of renewable electricity.
Reducing waste from operationsReducing waste is important to decrease the total environmental impact from production and increasing circularity.
Most of our waste is constituted by scrap metal and the vast majority is reused or recycled. This share has been consistently high for many years and we now focus on decreasing the total waste volume. In 2021, the total volume in relation to cost of sales increased by 2%, mainly due to increased production volumes.
Atlas Copco’s contribution to the Sustainable Development Goals:
6.4 Increase water-use efficiency7.2 Increase the share of renewable energy7.3 Double the rate of improvement in energy efficiency12.2 Efficient use of natural resources12.4 Environmentally sound management of chemicals and all
wastes throughout their life cycle13.3 Knowledge and capacity building to meet climate change
The environment
Vision: Our processes minimize our impact on the environmentAction: we use resources responsibly
Key performance indicator Target 2021 2020 2019Carbon dioxide emissions from energy in operations and transport of goods (tonnes)/COS, base year: 2018 1) –50% by 2030 3.3 3.8 4.3
waste (kg)/COS Continuous decrease 590 581 597
water consumption (m3)/COS Continuous decrease 6.6 7.2 7.2
Significant direct suppliers with an approved Environmental Management System, % Continuous increase 31 30 28
1) CO2 emissions from energy in operations and transport (tonnes) in relation to cost of sales in the base year 2018 was 5.3.
Atlas Copco 2021 44
THE YEAR IN REVIEw – SUSTAINABILITY: THE ENVIRONMENT
THE YEAR IN REVIEWAdministration report
Business areas
Compressor Technique
Vacuum Technique
Industrial Technique
Power Technique
• Sustainable approach to delivering value
Raising our climate ambition
Products and service
People
Safety and well-being
Ethics
Environment
Risks, risk management and opportunities
The Atlas Copco share
Corporate Governance
Board of Directors
Group Management
Internal control over financial reporting
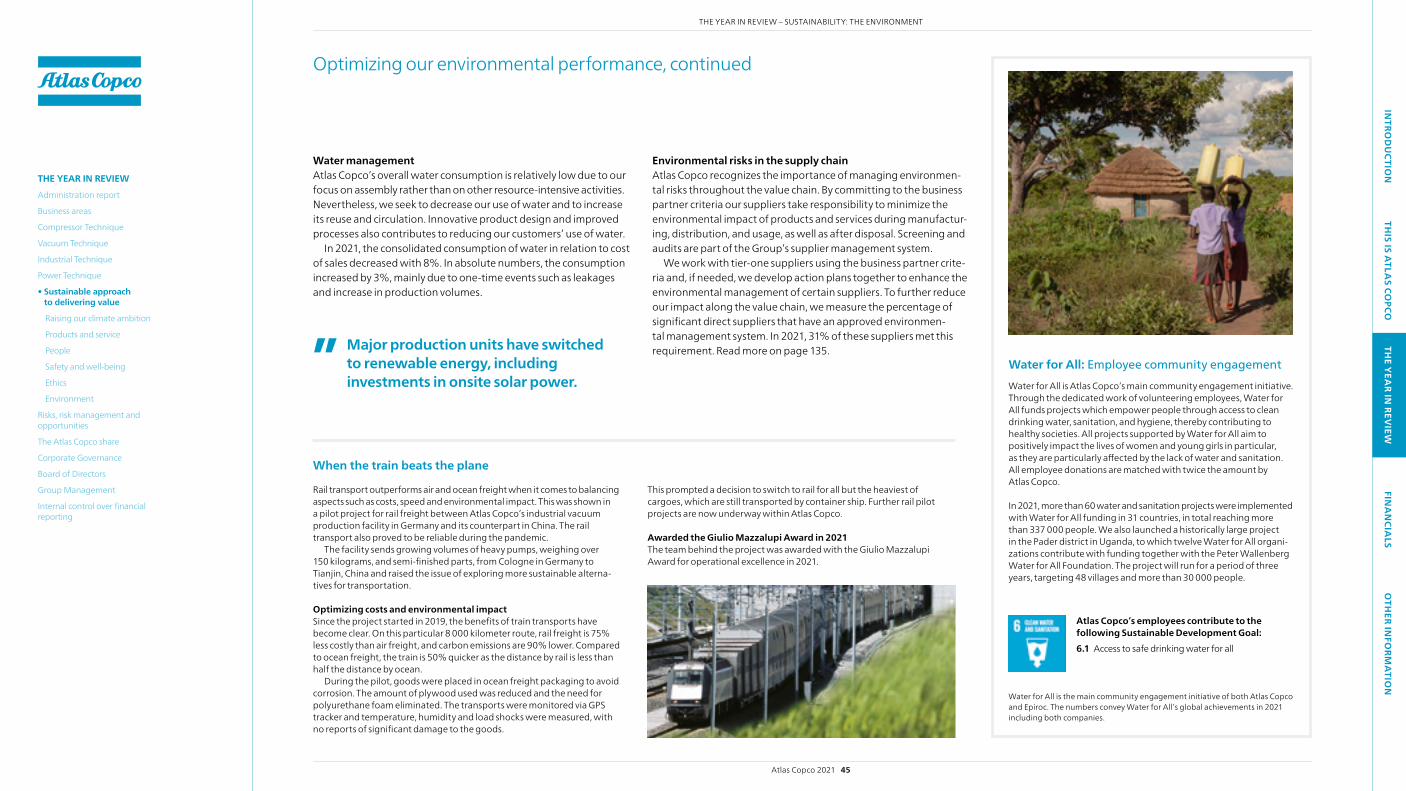
INTRO
DU
CTION
THIS IS A
TLAS CO
PCOTH
E YEA
R IN REV
IEWFIN
AN
CIALS
OTH
ER INFO
RMA
TION
Water management Atlas Copco’s overall water consumption is relatively low due to our focus on assembly rather than on other resource-intensive activities. Nevertheless, we seek to decrease our use of water and to increase its reuse and circulation. Innovative product design and improved processes also contributes to reducing our customers’ use of water.
In 2021, the consolidated consumption of water in relation to cost of sales decreased with 8%. In absolute numbers, the consumption increased by 3%, mainly due to one-time events such as leakages and increase in production volumes.
Rail transport outperforms air and ocean freight when it comes to balancing aspects such as costs, speed and environmental impact. This was shown in a pilot project for rail freight between Atlas Copco’s industrial vacuum production facility in Germany and its counterpart in China. The rail transport also proved to be reliable during the pandemic.
The facility sends growing volumes of heavy pumps, weighing over 150 kilograms, and semi-finished parts, from Cologne in Germany to Tianjin, China and raised the issue of exploring more sustainable alterna-tives for transportation.
Optimizing costs and environmental impact Since the project started in 2019, the benefits of train transports have become clear. On this particular 8 000 kilometer route, rail freight is 75% less costly than air freight, and carbon emissions are 90% lower. Compared to ocean freight, the train is 50% quicker as the distance by rail is less than half the distance by ocean.
During the pilot, goods were placed in ocean freight packaging to avoid corrosion. The amount of plywood used was reduced and the need for polyurethane foam eliminated. The transports were monitored via GPS tracker and temperature, humidity and load shocks were measured, with no reports of significant damage to the goods.
This prompted a decision to switch to rail for all but the heaviest of cargoes, which are still transported by container ship. Further rail pilot projects are now underway within Atlas Copco.
Awarded the Giulio Mazzalupi Award in 2021The team behind the project was awarded with the Giulio Mazzalupi Award for operational excellence in 2021.
Atlas Copco’s employees contribute to the following Sustainable Development Goal: 6.1 Access to safe drinking water for all
Water for All: Employee community engagement
water for All is the main community engagement initiative of both Atlas Copco and Epiroc. The numbers convey water for All’s global achievements in 2021 including both companies.
water for All is Atlas Copco’s main community engagement initiative. Through the dedicated work of volunteering employees, water for All funds projects which empower people through access to clean drinking water, sanitation, and hygiene, thereby contributing to healthy societies. All projects supported by water for All aim to positively impact the lives of women and young girls in particular, as they are particularly affected by the lack of water and sanitation. All employee donations are matched with twice the amount by Atlas Copco.
In 2021, more than 60 water and sanitation projects were implemented with water for All funding in 31 countries, in total reaching more than 337 000 people. we also launched a historically large project in the Pader district in Uganda, to which twelve water for All organi-zations contribute with funding together with the Peter wallenberg water for All Foundation. The project will run for a period of three years, targeting 48 villages and more than 30 000 people.
Optimizing our environmental performance, continued
When the train beats the plane
Environmental risks in the supply chainAtlas Copco recognizes the importance of managing environmen-tal risks throughout the value chain. By committing to the business partner criteria our suppliers take responsibility to minimize the environmental impact of products and services during manufactur-ing, distribution, and usage, as well as after disposal. Screening and audits are part of the Group’s supplier management system.
we work with tier-one suppliers using the business partner crite-ria and, if needed, we develop action plans together to enhance the environmental management of certain suppliers. To further reduce our impact along the value chain, we measure the percentage of significant direct suppliers that have an approved environmen-tal management system. In 2021, 31% of these suppliers met this requirement. Read more on page 135.Major production units have switched
to renewable energy, including investments in onsite solar power.
Atlas Copco 2021 45
THE YEAR IN REVIEw – SUSTAINABILITY: THE ENVIRONMENT
THE YEAR IN REVIEWAdministration report
Business areas
Compressor Technique
Vacuum Technique
Industrial Technique
Power Technique
• Sustainable approach to delivering value
Raising our climate ambition
Products and service
People
Safety and well-being
Ethics
Environment
Risks, risk management and opportunities
The Atlas Copco share
Corporate Governance
Board of Directors
Group Management
Internal control over financial reporting

INTRO
DU
CTION
THIS IS A
TLAS CO
PCOTH
E YEA
R IN REV
IEWFIN
AN
CIALS
OTH
ER INFO
RMA
TION
The European Union (EU) taxonomy aims to provide guidance and over time a comprehensive classification system for when an economic activity can be deemed sustainable. It consists of six environmental objectives of which two are relevant for the financial year 2021: climate change mitigation and climate change adaptation.
Atlas Copco develops and offers a wide range of products for different end markets and applications. we strive to provide the most energy-efficient products for each specific applica-tion to support our customers in minimizing their energy consumption and reducing the climate impact of a product’s use phase.
Based on the now available EU taxonomy delegated act for climate mitigation and climate adaptation, Atlas Copco is eligible for climate mitigation under the definition “manufac-ture of low-carbon technologies aimed at substantial green-house gas emission reductions in other sectors of the econ-omy” (section 3.6).
Due to the lack of specific definitions for “substantial green-house gas emission reductions” in section 3.6 provided in the delegated act, Atlas Copco applies a conservative approach regarding which technologies are included as eligible in the taxonomy reporting. The most efficient products in terms of energy savings or other means to avoid, reduce, remove, or store greenhouse gas emissions, compared to alterna-tive technologies commonly used on the market, have been included as taxonomy eligible.
Eligible products have been identified as products that:
1) prevent the venting of environmentally hazardous gases directly into the atmosphere, or
2) enable substantial energy savings compared to available tech-nologies commonly used on the market by either use optimiza-tion, in and of themselves, by enabling the shift to electric/battery power, or by introducing new solutions on the market.
Eligible products include e.g. Atlas Copco’s VSD (variable speed drive) compressors, abatement systems, electrical portable com-pressors, and our latest electric range of industrial power tools.
Furthermore, Atlas Copco’s products and solutions are critical to several manufacturing processes for customer segments defined as eligible in the taxonomy sections 3.1–3.4 including customers within renewable energy technologies (e.g. solar energy, wind energy, hydropower or tide energy), production of electrical cars, battery manufacturing, and hydrogen manufacturing equipment. Hence, revenues related to the above segments are included as taxonomy eligible.
For further details, see page 132.
EU taxonomy – classification of sustainable activities
22%
6%
19%
17% from productsegments
5% from customer segments
Taxonomy eligible revenues
Taxonomy eligible capital expenditure
Taxonomy eligible operating expenses
Atlas Copco 2021 46
THE YEAR IN REVIEw – SUSTAINABILITY: THE ENVIRONMENT
THE YEAR IN REVIEWAdministration report
Business areas
Compressor Technique
Vacuum Technique
Industrial Technique
Power Technique
• Sustainable approach to delivering value
Raising our climate ambition
Products and service
People
Safety and well-being
Ethics
Environment
Risks, risk management and opportunities
The Atlas Copco share
Corporate Governance
Board of Directors
Group Management
Internal control over financial reporting
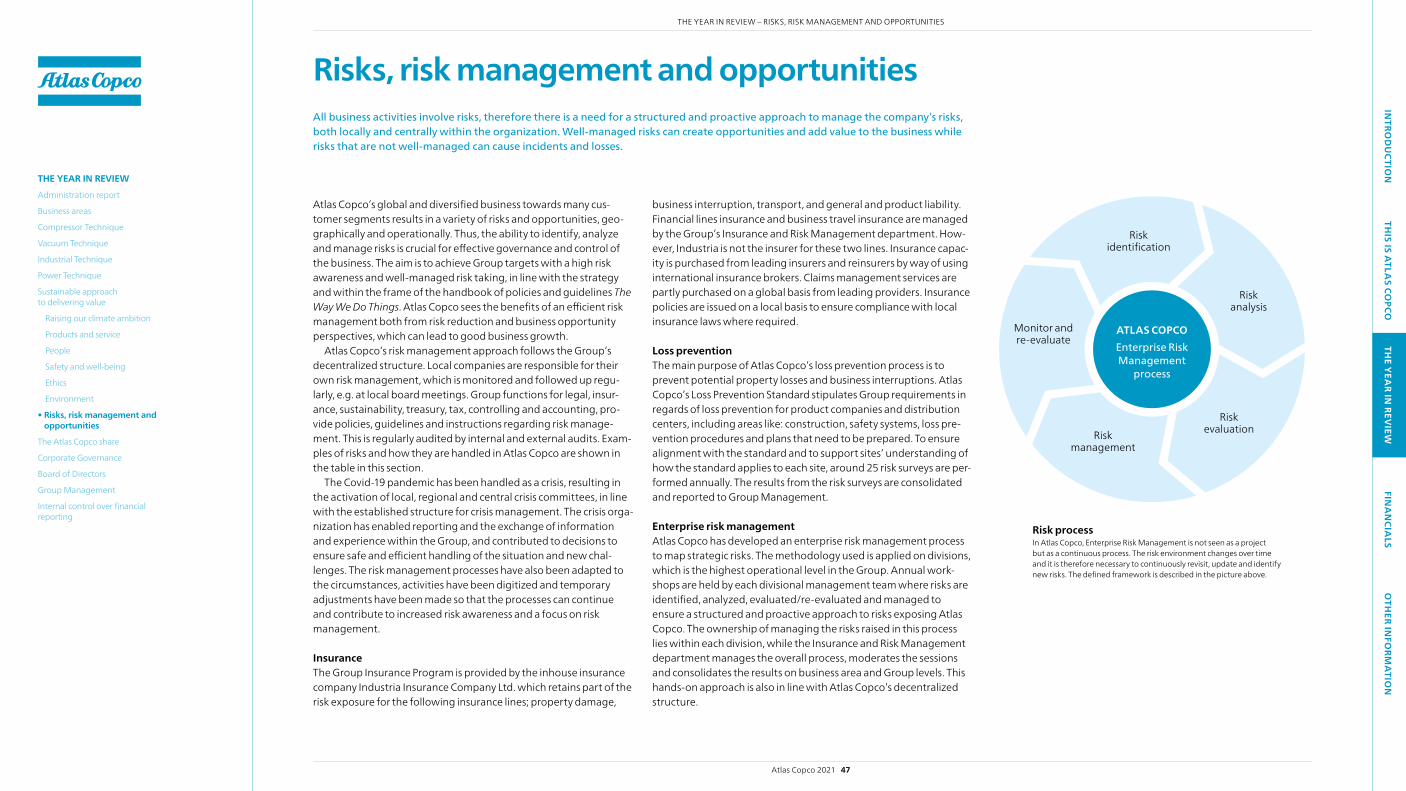
INTRO
DU
CTION
THIS IS A
TLAS CO
PCOTH
E YEA
R IN REV
IEWFIN
AN
CIALS
OTH
ER INFO
RMA
TION
Risks, risk management and opportunitiesAll business activities involve risks, therefore there is a need for a structured and proactive approach to manage the company’s risks, both locally and centrally within the organization. Well-managed risks can create opportunities and add value to the business while risks that are not well-managed can cause incidents and losses.
Atlas Copco’s global and diversified business towards many cus-tomer segments results in a variety of risks and opportunities, geo-graphically and operationally. Thus, the ability to identify, analyze and manage risks is crucial for effective governance and control of the business. The aim is to achieve Group targets with a high risk awareness and well-managed risk taking, in line with the strategy and within the frame of the handbook of policies and guidelines The Way We Do Things. Atlas Copco sees the benefits of an efficient risk management both from risk reduction and business opportunity perspectives, which can lead to good business growth.
Atlas Copco’s risk management approach follows the Group’s decentralized structure. Local companies are responsible for their own risk management, which is monitored and followed up regu-larly, e.g. at local board meetings. Group functions for legal, insur-ance, sustainability, treasury, tax, controlling and accounting, pro-vide policies, guidelines and instructions regarding risk manage-ment. This is regularly audited by internal and external audits. Exam-ples of risks and how they are handled in Atlas Copco are shown in the table in this section.
The Covid-19 pandemic has been handled as a crisis, resulting in the activation of local, regional and central crisis committees, in line with the established structure for crisis management. The crisis orga-nization has enabled reporting and the exchange of information and experience within the Group, and contributed to decisions to ensure safe and efficient handling of the situation and new chal-lenges. The risk management processes have also been adapted to the circumstances, activities have been digitized and temporary adjustments have been made so that the processes can continue and contribute to increased risk awareness and a focus on risk management.
InsuranceThe Group Insurance Program is provided by the inhouse insurance company Industria Insurance Company Ltd. which retains part of the risk exposure for the following insurance lines; property damage,
business interruption, transport, and general and product liability. Financial lines insurance and business travel insurance are managed by the Group’s Insurance and Risk Management department. How-ever, Industria is not the insurer for these two lines. Insurance capac-ity is purchased from leading insurers and reinsurers by way of using international insurance brokers. Claims management services are partly purchased on a global basis from leading providers. Insurance policies are issued on a local basis to ensure compliance with local insurance laws where required.
Loss preventionThe main purpose of Atlas Copco’s loss prevention process is to prevent potential property losses and business interruptions. Atlas Copco’s Loss Prevention Standard stipulates Group requirements in regards of loss prevention for product companies and distribution centers, including areas like: construction, safety systems, loss pre-vention procedures and plans that need to be prepared. To ensure alignment with the standard and to support sites’ understanding of how the standard applies to each site, around 25 risk surveys are per-formed annually. The results from the risk surveys are consolidated and reported to Group Management.
Enterprise risk managementAtlas Copco has developed an enterprise risk management process to map strategic risks. The methodology used is applied on divisions, which is the highest operational level in the Group. Annual work-shops are held by each divisional management team where risks are identified, analyzed, evaluated/re-evaluated and managed to ensure a structured and proactive approach to risks exposing Atlas Copco. The ownership of managing the risks raised in this process lies within each division, while the Insurance and Risk Management department manages the overall process, moderates the sessions and consolidates the results on business area and Group levels. This hands-on approach is also in line with Atlas Copco’s decentralized structure.
ATLAS COPCOEnterprise Risk Management
process
Monitor and re-evaluate
Risk identification
Risk management
Risk evaluation
Risk analysis
Risk processIn Atlas Copco, Enterprise Risk Management is not seen as a project but as a continuous process. The risk environment changes over time and it is therefore necessary to continuously revisit, update and identify new risks. The defined framework is described in the picture above.
Atlas Copco 2021 47
THE YEAR IN REVIEw – RISKS, RISK MANAGEMENT AND OPPORTUNITIES
THE YEAR IN REVIEWAdministration report
Business areas
Compressor Technique
Vacuum Technique
Industrial Technique
Power Technique
Sustainable approach to delivering value
Raising our climate ambition
Products and service
People
Safety and well-being
Ethics
Environment
• Risks, risk management and opportunities
The Atlas Copco share
Corporate Governance
Board of Directors
Group Management
Internal control over financial reporting

INTRO
DU
CTION
THIS IS A
TLAS CO
PCOTH
E YEA
R IN REV
IEWFIN
AN
CIALS
OTH
ER INFO
RMA
TION
RISK CONTEXT MITIGATING ACTIVITIES OPPORTUNITIES
LEGAL Atlas Copco’s business operations are affected by numerous laws, regulations and trade sanctions as well as commercial and finan-cial agreements with customers, suppliers and other counterpar-ties, and also by licenses, patents and other intangible property rights.
• Inhouse lawyers on five continents support Group companies with advice on laws and regulations, including compliance, as well as support with contract reviews. Proactive training is also done.
• A yearly legal risk survey of all companies in the Group is performed in addition to conti-nuous follow-up of the legal risk exposure. The result of the survey is compiled, analyzed and reported to the Board and the auditors.
• A separate central function, Group Compliance, is in place. It is responsible for aligning and coordinating the compliance organization which, in line with Atlas Copco’s decen-tralized structure, is hosted in the business areas and divisions.
Complying with legal norms and laws minimizes costs and increases opportunities to strengthen Atlas Copco’s reputation. It also develops reliable partnerships and improves business stability.
The ability to trade on all markets, in compliance with applicable trade sanctions, increases revenue and lowers risk.
FINANCIAL Changes in exchange rates can adversely affect Group earnings when revenues from sales and costs for production and sourcing are denominated in different currencies (transaction risks). An adverse effect on Group earnings can also occur when earnings of foreign subsidiaries are translated into SEK and on the value of the Group equity when the net assets of foreign subsidiaries are translated into SEK (translation risks). Atlas Copco’s net interest cost is affected by changes in market interest rates.Funding risk refers to the risk that the Group and its subsidiaries do not have access to financing on acceptable terms. As in any business, there can be a credit risk linked to our customers’ abilities to pay.
• A Financial Risk Management Committee meets regularly to manage financial risks. • Atlas Copco Financial Solutions is responsible for these risks and supports Group
companies to implement financial policies and guidelines.• The Group’s operations continuously monitor relevant exchange rates and try to offset
negative changes by adjusting sales prices and costs.• Translation risks are partially hedged by borrowings in foreign currency and financial
derivatives.• The Group’s Financial Risk Policy stipulates that a minimum amount of standby credit
facilities should exist and that a minimum average time to maturity for the external debt is set.
• Stringent credit policies are applied and there is no major concentration of credit risk. The provision for bad debt is based on historical loss levels and up-to-date information and is deemed sufficient.
working proactively with financial risks improves the profit margin and creates possibilities for more stable cash flow. Overall, financial risk mitigation has the ability to improve business resilience for Atlas Copco.
REPORTING (INCLUDING TAX)
The risk related to the communication of financial information to the capital market is that the reports do not give a fair view of the Group’s true financial position and results of operations. Reporting errors could result in management drawing the wrong conclusions. However, with many small entities, the material impact is low.Taxes is an area with increased focus, especially transfer pricing risks but also new tax rules and regulations.Estimations sometimes form a portion of the sustainability data which is reported, and thus by its nature the numbers presented may not be representative of the Group’s impact.
• Atlas Copco subsidiaries report their financial statements regularly in accordance with International Financial Reporting Standards (IFRS). The Group’s consolidated financial statements, based on those reports, are prepared in accordance with IFRS and applica-ble parts of the Annual Accounts Act as stated in RFR 1 “Supplementary Rules for Groups”.
• The Group’s operational and legal consolidated results are based on the same num-bers and system. These are analyzed by divisional, business area, Group Management and corporate functions before being published externally.
• The Group has procedures in place to ensure compliance with Group instructions, standards, laws and regulations, for example internal and external audits.
• Group Tax monitors and ensures compliance with local tax rules. Transfer pricing poli-cies and agreements are implemented in operations and regularly updated. quarterly updates on tax are presented to the Board and Group Management.
• Atlas Copco reports sustainability information according to GRI Standards and works with training to improve reporting practices.
Integrated reporting provides a better understanding of business risks and opportunities which in turn allows for improved decision making. It also allows the company to identify opportunities for business synergies.
Addressing reporting risks increases trans parency and improves the potential to represent the business fairly and accurately.
Improved reporting results in improved business insights and risk management, especially when the data has been integrated to highlight interdependencies.
Efficient and consistent reporting based on clear standards and principles creates transparency, supports decision making and drawing the right conclusions.
Increased reporting requirements on taxes improves transparency.
CORRUPTION AND FRAUD
Corruption and bribery exist in many markets where Atlas Copco conducts business.Fraud or criminal deception intended to result in financial or personal gain, is always present in global operations.
• zero-tolerance policy on bribery and corruption, including facilitation payments. • Internal control routines aimed at preventing and detecting deviations. The Internal
Audit function is established to ensure compliance with the Group’s corporate gover-nance, internal control and risk management policies.
• Control self-assessment tool to analyze internal control processes. • Training in the Business Code of Practice and signing compliance to the Code for all
employees and significant business partners.• The global Group misconduct reporting system to report violations anonymously.• The Group supports fair competition and forbids discussions or agreements with
competitors concerning pricing or market sharing.
By fighting against corruption and fraud, Atlas Copco has the opportunity to work with industry peers to influence international market practices. Refusing to pay bribes may cause temporary delays and setbacks; however it reduces costs in both the long and short run, builds opportunities to improve operational efficiencies and creates more stability in society and in markets where the Group operates.
working against corruption and fraud improves Atlas Copco’s credibility and transparency and creates more ways to improve stakeholder relations.
Examples of risks and how they are handled by Atlas Copco
Atlas Copco 2021 48
THE YEAR IN REVIEw – RISKS, RISK MANAGEMENT AND OPPORTUNITIES
THE YEAR IN REVIEWAdministration report
Business areas
Compressor Technique
Vacuum Technique
Industrial Technique
Power Technique
Sustainable approach to delivering value
Raising our climate ambition
Products and service
People
Safety and well-being
Ethics
Environment
• Risks, risk management and opportunities
The Atlas Copco share
Corporate Governance
Board of Directors
Group Management
Internal control over financial reporting

INTRO
DU
CTION
THIS IS A
TLAS CO
PCOTH
E YEA
R IN REV
IEWFIN
AN
CIALS
OTH
ER INFO
RMA
TION
RISK CONTEXT MITIGATING ACTIVITIES OPPORTUNITIES
HUMAN RIGHTS Atlas Copco operates in countries/areas with high risk of human rights abuse, including child labor, forced or compulsory labor, poor working conditions, limitations of the freedom of associa-tion and discrimination. Atlas Copco encounters customers who are exposed to human rights issues.Risks to the Group’s reputation may arise from relationships with business suppliers who do not comply with internationally accepted ethical, social and environmental standards.
• Guidance by interaction with well-established non-governmental organizations to identify and mitigate risks.
• Policies and procedures corresponding to the UN Guiding Principles on Business and Human Rights, which Atlas Copco has committed to since 2011.
• Due diligence process and integration of internal controls for human rights violations in relevant processes.
• The Group customer sustainability assessment tool.• Regular supplier evaluations in accordance with the UN Global Compact.
Following the UN Guiding Principles on Business and Human Rights to respect human rights reduces risks and costs.
Strong business ethics help promote societal prosperity and a more stable market place.
working with human rights positively impacts both the Atlas Copco brand and stakeholder relations.
SAFETY AND HEALTH Poor physical and mental health and too much stress among employees affect the individual and can cause sick leave and disturbances in the production.Accidents or incidents in the workplace, due to the lack of proper safety measures, harm employees and can negatively affect Atlas Copco’s productivity and brand.Atlas Copco recognizes the risk that serious diseases and pandem-ics can interrupt business operations and harm employees.
• The Group regularly assesses and manages safety and health risks in operations.• Training is held regularly.• The ambition is to certify all major units in accordance with the ISO 45001 standard.• workplace wellness programs. • Atlas Copco’s business partners are trained in Group policies including the approach
to health and safety.
Improved safety and well-being among employees increases employee satisfaction and engagement, productivity and strengthens the brand.
Improving working conditions for customers and business partners benefits their employees and local societies and can enhance long-lasting relationships that result in repeat orders.
ENVIRON MENTAL AND CLIMATE
The primary drivers for external environmental risk are physical changes in climate and natural resources, changes in regulations, taxes and resource prices.Natural disasters as a consequence of climate change can disrupt own operations or impact the supply chain.Increased fuel/energy taxes increase operational costs. Regulations and requirements related to carbon-dioxide emissions from products and industrial processes are gradually increasing.Climate-related and environmental events can affect all of Atlas Copco’s operations and negatively affect operations either directly or by disrupting the supply chain. Market shifts toward a low-carbon economy may impact the viability of certain sectors.
• Atlas Copco continuously develops products with improved energy efficiency, reduced emissions and lower environmental footprint.
• Atlas Copco has several key performance indicators (KPIs) that address resource and energy usage in order to reduce carbon-dioxide emissions.
• Strict handling processes for hazardous waste and chemicals are implemented in all operational units. Compliance is audited regularly and awareness is reinforced by training.
• All cooling agents in Atlas Copco products have a zero-ozone depleting impact during the product’s lifecycle, and the aim is to continue to introduce cooling agents with lower Global warming Potential (GwP).
working proactively with environmental risks can provide signifi-cant opportunities to drive innovation at Atlas Copco.
Given that many customers are operating in areas of extreme water stress/scarcity, water-efficient or water-recycling products can have a strong customer appeal. This presents a strong business opportunity to extend Atlas Copco’s innovations to the focused area of water consumption.
Climate change impacts and predictions can induce changes in consumers’ habits and behavior. As a result of climate events, Atlas Copco’s customers can become more risk averse and demand sus-tainable products from the Group. New businesses and business models that are being served by Atlas Copco arise. For instance, increased renewable energy generation and the surge in produc-tion of electrical vehicles present opportunities to provide prod-ucts to the industries.
MARKET A widespread financial crisis and economic downturn would not only affect the Group negatively but could also impact customers’ ability to finance their investments. Changes in customers’ pro-duction levels also have an effect on the Group’s sales of spare parts, service and consumables. In developing markets, new smaller competitors continuously appear which may affect Atlas Copco negatively.
• well-diversified sales to customers in multiple countries and industries. Sales of spare parts and service are relatively stable in comparison to sales of equipment.
• Monthly follow-up of market and sales development enables quick actions. • Agile manufacturing set-up makes it possible to quickly adapt to changes in the
demand for equipment.• Leading position in most market segments provides economies of scale.
A significant competitive advantage as a result of a strong global presence, including growth markets.
Opportunities to positively impact both society and environment, through the Group’s high-quality sustainable products and high ethical standards.
Continue to develop close, long-term and strategic relationships with customers and suppliers.
Examples of risks and how they are handled by Atlas Copco, continued
Atlas Copco 2021 49
THE YEAR IN REVIEw – RISKS, RISK MANAGEMENT AND OPPORTUNITIES
THE YEAR IN REVIEWAdministration report
Business areas
Compressor Technique
Vacuum Technique
Industrial Technique
Power Technique
Sustainable approach to delivering value
Raising our climate ambition
Products and service
People
Safety and well-being
Ethics
Environment
• Risks, risk management and opportunities
The Atlas Copco share
Corporate Governance
Board of Directors
Group Management
Internal control over financial reporting

INTRO
DU
CTION
THIS IS A
TLAS CO
PCOTH
E YEA
R IN REV
IEWFIN
AN
CIALS
OTH
ER INFO
RMA
TION
RISK CONTEXT MITIGATING ACTIVITIES OPPORTUNITIES
REPUTATION The Group’s reputation is a valuable asset which may be affected in part through the Group’s operations or actions and in part through the actions of external stakeholders. Products must deliver on the brand promise and be of high quality, safe and have a low negative impact on the environment when used by the customer. There is potential for reputational risk from non-compliance to product labeling standards or if there are cases of false advertising. Unsatisfied employees may potentially detract the Atlas Copco brand.
• All Atlas Copco products are tested and quality assured. Product labeling is monitored and there are regular communications trainings.
• The Group actively engages in stakeholder dialogue. • Compulsory training in the Business Code of Practice includes the yearly signing of a
compliance statement. • A clear and well known corporate identity and brand management.• An employee survey is carried out every two years and followed up actively.
Brand positioning. Stakeholder engagement not only mitigates reputational risks in certain cases but it also presents opportunities to increase aware-ness and credibility of Atlas Copco’s brand through improvements and innovations.
Delivering tested and quality-assured products improves customer satisfaction and promotes repeat business.
Attract and develop employees who adhere to the Business Code of Practice.
PRODUCTION Core component manufacturing is concentrated to a few locations and if there are interruptions or lack of capacity in these locations, this may have an effect on deliveries or on the quality of products.Production facilities could also have a risk of damaging the environ-ment through their operations, e.g. through hazardous waste and emissions. Atlas Copco is directly and indirectly exposed to raw material prices.Atlas Copco primarily distributes products and services directly to the end customer. If the distribution is not efficient, it may impact customer satisfaction, sales and profits. Damages and losses during the course of distribution can be costly.Some sales are made indirectly through distributors and rental companies and their performance may have a negative effect on sales. The distribution of products results in CO2 emissions from transport.
• Manufacturing units continuously monitor the production process, test the safety and quality of products, make risk assessments, and train employees.
• Atlas Copco has an internal Loss Prevention Standard to ensure high level of protection.
• Production units have developed business continuity plans.• Ambition to certify all manufacturing units in accordance with the ISO 14001
standard.• Physical distribution of products is concentrated to a number of distribution centers
and their delivery efficiency is continuously monitored.• Resources are allocated to training and development of the service organization. • As indirect sales are local/regional, the negative impact of poor performance is
limited.• Increased focus on safer and more effective transports to reduce losses, costs and
total emissions per transport.
Continued opportunities to extensively promote operational excellence to streamline production, minimize inefficiencies and maintain a high flexibility in the production process.
Continue to strengthen the relationship with customers through timely deliveries of products and services.
Transport efficiencies and safe transports can save the customers time and cost while reducing the environ mental impact of their own operations.
Reduce fuel costs and resource requirements which improves business agility for the Group.
SUPPLY CHAIN Atlas Copco and its business partners, such as suppliers, subcon-tractors and joint venture partners, must share the same values as expressed in the Group’s Business Code of Practice regarding issues such as human rights standards and principles of ethical conduct. The availability of many components is dependent on suppliers and if they have interruptions or lack capacity, this may affect deliveries. Using a large number of suppliers gives rise to the risk that prod-ucts contain components which are not sustainably produced, e.g. hazardous substances or electronic components containing conflict minerals, or components with a large carbon footprint.
• Business partners are selected and evaluated based on objective factors including quality, delivery, price, and reliability, as well as on social/environmental responsibility.
• Significant direct suppliers are required to have an approved environmental manage-ment system.
• The presence of conflict minerals in Atlas Copco’s value chain is investigated and eradicated. • Establishment of a global network of sub-suppliers, to prevent supplier dependency.• E-learning for business partners (suppliers and distributors) to raise awareness of the
Business Code of Practice, including the requirement for significant business partner to sign and follow the Business Code of Practice. Action plans developed together with suppliers to deal with shortcomings and deviations.
• Atlas Copco maintains lists of substances that are prohibited or restricted due to their potential negative impact on health or the environment. Compliance with these lists is part of the business partner criteria.
Further increase business agility and reduce costs by improving supplier inventory management in response to changes in demand.
Continue to be a preferred business partner and promote effi-ciency, sustainability and safety. Good supplier relations help to improve Atlas Copco’s competitive position.
Strengthen customer relationships by supporting customers impacted by the Dodd Frank legislation on conflict minerals.
Promote human rights and work towards improving labor condi-tions, reducing corruption and conflicts.
EMPLOYEE Atlas Copco must have access to and attract skilled and motivated employees and safeguard the availability of competent managers to achieve established strategic and operational objectives.
• The competence mapping and plan secure access to people with the right expertise at the right time. Recruitment can be both external and internal. Internal recruitment and job rotation are facilitated by the Internal job market.
• Salaries and other conditions are adapted to the market and linked to business priorities. Atlas Copco strives to maintain good relationships with unions.
Motivated and skilled employees and managers are crucial to achieve or exceed business goals and objectives.
Examples of risks and how they are handled by Atlas Copco, continued
Atlas Copco 2021 50
THE YEAR IN REVIEw – RISKS, RISK MANAGEMENT AND OPPORTUNITIES
THE YEAR IN REVIEWAdministration report
Business areas
Compressor Technique
Vacuum Technique
Industrial Technique
Power Technique
Sustainable approach to delivering value
Raising our climate ambition
Products and service
People
Safety and well-being
Ethics
Environment
• Risks, risk management and opportunities
The Atlas Copco share
Corporate Governance
Board of Directors
Group Management
Internal control over financial reporting
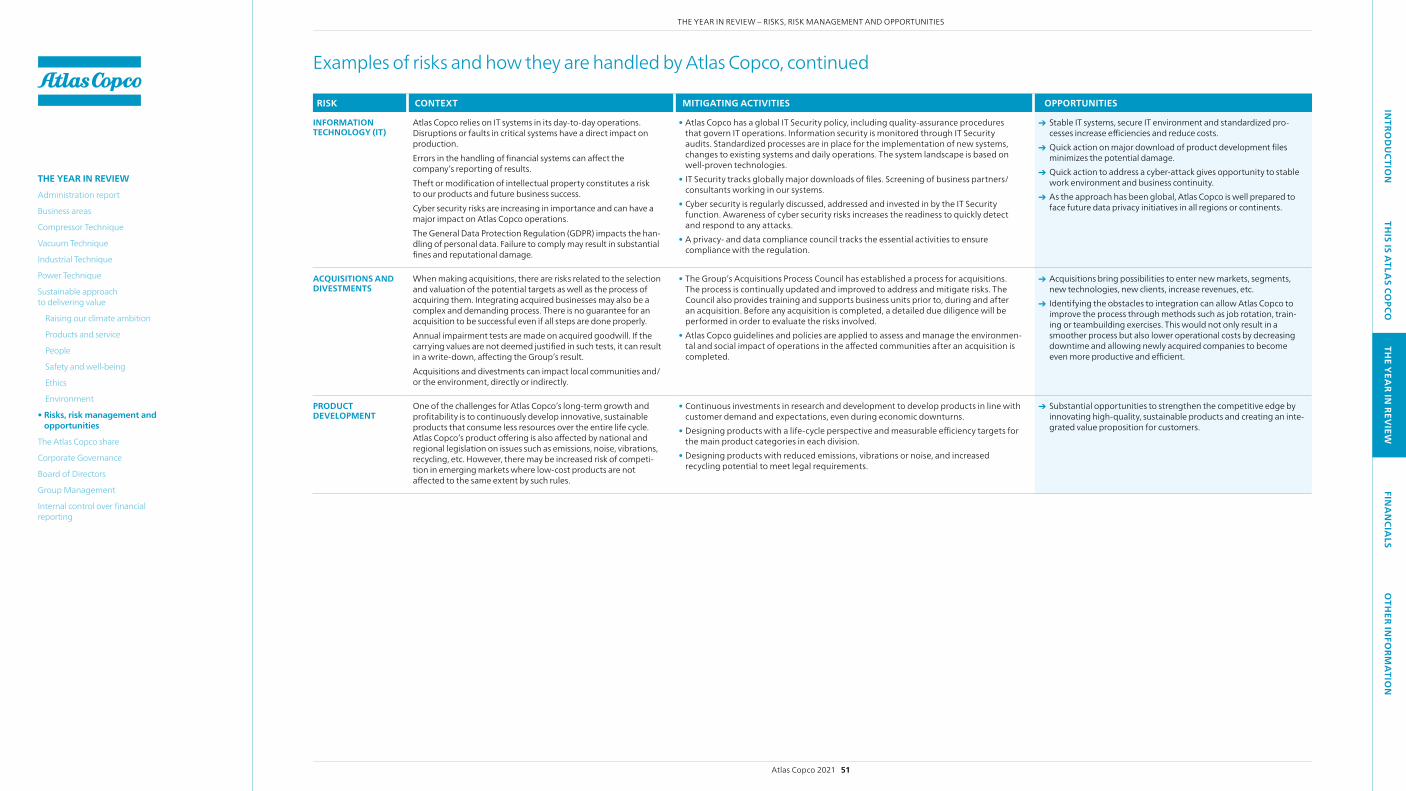
INTRO
DU
CTION
THIS IS A
TLAS CO
PCOTH
E YEA
R IN REV
IEWFIN
AN
CIALS
OTH
ER INFO
RMA
TION
RISK CONTEXT MITIGATING ACTIVITIES OPPORTUNITIES
INFORMATION TECHNOLOGY (IT)
Atlas Copco relies on IT systems in its day-to-day operations. Disruptions or faults in critical systems have a direct impact on production. Errors in the handling of financial systems can affect the company’s reporting of results.Theft or modification of intellectual property constitutes a risk to our products and future business success.Cyber security risks are increasing in importance and can have a major impact on Atlas Copco operations.The General Data Protection Regulation (GDPR) impacts the han-dling of personal data. Failure to comply may result in substantial fines and reputational damage.
• Atlas Copco has a global IT Security policy, including quality-assurance procedures that govern IT operations. Information security is monitored through IT Security audits. Standardized processes are in place for the implementation of new systems, changes to existing systems and daily operations. The system landscape is based on well-proven technologies.
• IT Security tracks globally major downloads of files. Screening of business partners/consultants working in our systems.
• Cyber security is regularly discussed, addressed and invested in by the IT Security function. Awareness of cyber security risks increases the readiness to quickly detect and respond to any attacks.
• A privacy- and data compliance council tracks the essential activities to ensure compliance with the regulation.
Stable IT systems, secure IT environment and standardized pro-cesses increase efficiencies and reduce costs.
quick action on major download of product development files minimizes the potential damage.
quick action to address a cyber-attack gives opportunity to stable work environment and business continuity.
As the approach has been global, Atlas Copco is well prepared to face future data privacy initiatives in all regions or continents.
ACQUISITIONS AND DIVESTMENTS
when making acquisitions, there are risks related to the selection and valuation of the potential targets as well as the process of acquiring them. Integrating acquired businesses may also be a complex and demanding process. There is no guarantee for an acquisition to be successful even if all steps are done properly. Annual impairment tests are made on acquired goodwill. If the carrying values are not deemed justified in such tests, it can result in a write-down, affecting the Group’s result.Acquisitions and divestments can impact local communities and/or the environment, directly or indirectly.
• The Group’s Acquisitions Process Council has established a process for acquisitions. The process is continually updated and improved to address and mitigate risks. The Council also provides training and supports business units prior to, during and after an acquisition. Before any acquisition is completed, a detailed due diligence will be performed in order to evaluate the risks involved.
• Atlas Copco guidelines and policies are applied to assess and manage the environmen-tal and social impact of operations in the affected communities after an acquisition is completed.
Acquisitions bring possibilities to enter new markets, segments, new technologies, new clients, increase revenues, etc.
Identifying the obstacles to integration can allow Atlas Copco to improve the process through methods such as job rotation, train-ing or teambuilding exercises. This would not only result in a smoother process but also lower operational costs by decreasing downtime and allowing newly acquired companies to become even more productive and efficient.
PRODUCT DEVELOPMENT
One of the challenges for Atlas Copco’s long-term growth and profitability is to continuously develop innovative, sustainable products that consume less resources over the entire life cycle. Atlas Copco’s product offering is also affected by national and regional legislation on issues such as emissions, noise, vibrations, recycling, etc. However, there may be increased risk of competi-tion in emerging markets where low-cost products are not affected to the same extent by such rules.
• Continuous investments in research and development to develop products in line with customer demand and expectations, even during economic downturns.
• Designing products with a life-cycle perspective and measurable efficiency targets for the main product categories in each division.
• Designing products with reduced emissions, vibrations or noise, and increased recycling potential to meet legal requirements.
Substantial opportunities to strengthen the competitive edge by innovating high-quality, sustainable products and creating an inte-grated value proposition for customers.
Examples of risks and how they are handled by Atlas Copco, continued
Atlas Copco 2021 51
THE YEAR IN REVIEw – RISKS, RISK MANAGEMENT AND OPPORTUNITIES
THE YEAR IN REVIEWAdministration report
Business areas
Compressor Technique
Vacuum Technique
Industrial Technique
Power Technique
Sustainable approach to delivering value
Raising our climate ambition
Products and service
People
Safety and well-being
Ethics
Environment
• Risks, risk management and opportunities
The Atlas Copco share
Corporate Governance
Board of Directors
Group Management
Internal control over financial reporting

INTRO
DU
CTION
THIS IS A
TLAS CO
PCOTH
E YEA
R IN REV
IEWFIN
AN
CIALS
OTH
ER INFO
RMA
TION
Share price development and returns In 2021, the price of the A share increased 48.6% to SEK 625.8 (421.1) and the B share increased 44.5% to SEK 532.2 (368.3). The annual total return on the Atlas Copco A share, equal to dividend, redemption and the change in the share price, including the distribution of Epiroc AB, was on average 22% for the past ten years and 27% for the past five years. The corresponding total return for Nasdaq Stockholm was 17% and 18%, respectively.
Trading and market capitalization The Atlas Copco shares are listed on Nasdaq Stockholm, which represented 28.6% of the total trading of the A share (34.3% of the B share) in 2021. Other markets, so called Multilateral Trad-ing Facilities (MTF), e.g. CBOE and Turquoise, accounted for 40.0% (35.3% of the B share), and the remaining 31.4% (30.4% of the B share) were traded outside public markets, for example through over-the-counter trading.
The market capitalization at year end 2021 was MSEK 732 967 (497 187) and the company represented 5.9% (5.7) of the total market value of Nasdaq Stockholm. Atlas Copco was the fifth (second) most traded share in 2021 by total turnover.
The Atlas Copco share
A program for American Depositary Receipts (ADRs) was established in the United States in 1990. One ADR corresponds to one share. The depositary bank is Citibank N.A. At year end 2021, there were 32 781 544 ADRs outstanding, of which 31 509 088 represented A shares and 1 272 456 represented B shares.
Personnel stock option program and repurchase of own sharesThe Board of Directors will propose to the Annual General Meeting 2022 a similar performance-based long-term incentive program as in previous years, increasing the number of possible candidates in the program from 335 to 500. For Group Management, participa-tion in the plan will require own investment in Atlas Copco shares. The intention is to cover the plan through the repurchase of the company’s own shares. The company’s holding of own shares on December 31, 2021, appears in the table to the right.
Dividend, mandatory redemption of shares, and share splitThe Board of Directors proposes to the Annual General Meeting 2022 an ordinary dividend of SEK 7.60 (7.30) per share to be paid for the 2021 fiscal year. In order to facilitate a more efficient cash man-agement, the dividend is proposed to be paid in two installments.
SHARE INFORMATION 2021-12-31 A share B share
Nasdaq Stockholm ATCO A ATCO BISIN code SE0011166610 SE0011166628ADR ATLKY.OTC ATLCY.OTCTotal number of shares 839 394 096 390 219 008
% of votes 95.6 4.4% of capital 68.3 31.7
whereof shares held by Atlas Copco 11 422 736 0% of votes 1.3 0.0% of capital 0.9 0.0
Ordinary dividend per share, SEKEarnings per share, SEK
* Proposed by the Board of Directors
SEK
0
5
10
15
20
25
20212020*201920182017201620152014201320122011
12.00
15.00
Dividend and redemption per share, SEKExtraordinary items, SEK
SEK
0
5
10
15
20
25
2021*20202019201820172016201520142013201220112010
9.00
12.00
15.00 15.60
EARNINGS AND DISTRIBUTION PER SHARE
Dividend and redemption per share, SEK
Extraordinary items, SEK
Earnings per share, SEK
Ordinary dividend per share, SEK
Distribution of Epiroc AB on June 18, 2018
* Proposed by the Board of Directors
Distribution of Epiroc AB on June 18, 2018
0
50
100
150
200
250
300
350
400
450
20192018201720162015
SEK
Highest–lowest share price, A share
General index (OMXS)
Industrials index (OMXSI)
0100000
200000 300000
400000500000 600000700000800000900000100000011000001200000130000014000001500000
16000001700000180000019000002000000
Total average daily volume traded A shares, thousands
02 500
5 000
7 500
10 000
0
100
200
300
400
500
600
700
202120202019201820170
100
200
300
400
500
600
700SEK
Distribution of Epiroc AB on June 18, 2018
Highest–lowest share price, A share
General index (OMXS)
Industrials index (OMXSI)
Total average daily volume traded A shares, thousands
Distribution of Epiroc AB on June 18, 2018
02 0004 0006 0008 000
10 000
SHARE PRICE
If approved, the dividend has averaged 52% of basic earnings per share during the last five years. The ambition is to distribute about 50% of earnings as dividends to shareholders. See more information on page 20.
In order to adjust the Group’s balance sheet to a more efficient structure, while preserving adequate financial flexibility for future growth, the Board of Directors proposes to the Annual General Meeting 2022 a share split and redemption share procedure, whereby every share is split into four (4) ordinary shares and one (1) redemption share. The redemption share is then automatically redeemed at SEK 8.00 per share. Combined with the proposed ordi-nary dividend, shareholders will receive MSEK 19 004.
Atlas Copco 2021 52
THE YEAR IN REVIEW – THE ATLAS COPCO SHARE
THE YEAR IN REVIEWAdministration report
Business areas
Compressor Technique
Vacuum Technique
Industrial Technique
Power Technique
Sustainable approach to delivering value
Raising our climate ambition
Products and service
People
Safety and well-being
Ethics
Environment
Risks, risk management and opportunities
• The Atlas Copco share
Corporate Governance
Board of Directors
Group Management
Internal control over financial reporting

INTRO
DU
CTION
THIS IS A
TLAS CO
PCOTH
E YEA
R IN REV
IEWFIN
AN
CIALS
OTH
ER INFO
RMA
TION
Ownership structureAt the end of 2021, Atlas Copco had 87 923 (82 079) shareholders. The ten largest shareholders registered directly or as a group with Euroclear Sweden, the Swedish Central Securities Depository, by voting rights, accounted for 34% (35) of the voting rights and 31% (32) of the capital. Swedish investors held 47% (48) of the capital and represented 44% (45) of the voting rights.
TEN LARGEST SHAREHOLDERS* December 31, 2021 % of votes % of capital
Investor AB 22.3 16.9Swedbank Robur fonder 2.3 3.5Alecta Pensionsförsäkring 2.1 3.9Handelsbanken fonder 1.8 1.8SEB Investment Management 1.6 1.2Folksam 1.0 1.0SPP Fonder AB 0.8 0.8Avanza Fonder 0.7 0.7Länsförsäkringar fondförvaltning AB 0.6 0.5Nordea Investment Funds 0.4 0.4Others 66.4 69.3Total 100.0 100.0– of which shares held by Atlas Copco 1.3 0.9
* Shareholders registered directly or as a group with Euroclear Sweden, the Swedish Central Securities Depository.
OWNERSHIP STRUCTURENumber of shares, December 31, 2021 % of shareholders % of capital
1–500 75.2 0.6501–2 000 16.8 1.32 001–10 000 6.3 1.910 001–50 000 1.1 1.650 001–100 000 0.2 0.8>100 000 0.4 93.8Total 100.0 100.0
SHAREHOLDERS BY COUNTRYDecember 31, 2021, percent of capital
Other, 14% Sweden, 47%
The United Kingdom, 8%
The UnitedStates, 32%
Other, 14% Sweden, 47%
The United Kingdom, 8% The United States, 31%
SHARE ISSUES 1) Change of share capital, MSEK Amount distributed, MSEK
2011 Split 2:1Share redemption 2) 1 229 613 104 shares at SEK 5 –393.0 –6 067.0Bonus issue No new shares issued 393.0
2015 Split 2:1 Share redemption 3) 1 229 613 104 shares at SEK 6 –393.0 –7 304.7
Bonus issue No new shares issued 393.02018 Split 2:1
Share redemption 4) 1 229 613 104 shares at SEK 8 –393.0 –9 704.6Bonus issue No new shares issued 393.0
1) For more information please visit www.atlascopcogroup.com/investor-relations. 3) 1 217 444 513 shares net of shares held by Atlas Copco.2) 1 213 493 751 shares net of shares held by Atlas Copco. 4) 1 213 080 695 shares net of shares held by Atlas Copco.
IMPORTANT DATES2022 April 26 First quarter results
April 26 Annual General MeetingApril 27* Shares trade excluding right to dividend of SEK 3.80May 3* Dividend payment date (preliminary)May 12* Shares trade excl. right to redemption share of SEK 8.00June 13* Redemption payment date (preliminary)July 19 Second quarter resultsOctober 19 Third quarter resultsOctober 20* Shares trade excluding right to dividend of SEK 3.80October 26* Dividend payment date (preliminary)November 17 Capital Markets Day
2023 January 26 Fourth quarter results 2022
* Board of Directors proposal to the Annual General Meeting. The record date is the first trading day after shares trade excluding the right to dividend.
More information
– More data per share can be found on page 144 in the three-year summary.
– For more information on distribution of shares, option programs and repurchase of own shares, see notes 5, 20 and 23.
– Detailed information on the share and debt can be found on www.atlascopcogroup.com/investor-relations
OWNERSHIP CATEGORYDecember 31, 2021 % of capital
Shareholders domiciled abroad (legal entities and individuals) 53.1Swedish financial companies 37.0Swedish individuals 4.3Other Swedish legal entities 1.8Swedish social insurance funds 2.6Swedish trade organizations 0.9Swedish government and municipals 0.3Total 100.0
The Atlas Copco share, continued
Atlas Copco 2021 53
THE YEAR IN REVIEW – THE ATLAS COPCO SHARE
THE YEAR IN REVIEWAdministration report
Business areas
Compressor Technique
Vacuum Technique
Industrial Technique
Power Technique
Sustainable approach to delivering value
Raising our climate ambition
Products and service
People
Safety and well-being
Ethics
Environment
Risks, risk management and opportunities
• The Atlas Copco share
Corporate Governance
Board of Directors
Group Management
Internal control over financial reporting

INTRO
DU
CTION
THIS IS A
TLAS CO
PCOTH
E YEA
R IN REV
IEWFIN
AN
CIALS
OTH
ER INFO
RMA
TION
Atlas Copco AB is incorporated under the laws of Sweden with a public listing at Nasdaq Stockholm AB (Nasdaq Stockholm). Atlas Copco is governed by Swedish legislation and regulations, primarily the Swedish Companies Act, but also the rules of Nasdaq Stockholm, the Swedish Corporate Governance Code (the Code), the Articles of Association and other relevant rules.
Atlas Copco does not report any deviations from the Code for the financial year 2021. The corporate governance report has been examined by the auditors, see page 124.
Corporate governance
In the corporate governance report, Atlas Copco presents how applicable rules are implemented in efficient control systems to achieve long-term growth. Good corporate governance is not only about following applicable rules, it is also about doing what is right. The objective is to find the right balance between risk and control in a decentralized management model. The goal is sustainability in pro ductivity and profitability, as well as in governance.
Atlas Copco is a truly global industrial company, which creates lasting value and empowers customers to drive society for-ward in over 180 countries. Through energy-efficient products that save carbon emissions, and by implementing values and processes with respect for people and the planet, Atlas Copco can contribute to a better tomorrow.
In 2021, Atlas Copco set science-based targets to reduce greenhouse gas emissions in line with the goals of the Paris Agreement. As a leading industrial innovator and global sup-plier, Atlas Copco can play a role in combating climate change. By making this commitment Atlas Copco shows its ambition to be part of the transformation to a low-carbon society.
The Atlas Copco Business Code of Practice is the most important instrument to make sure the company always acts with the highest ethical standards and integrity. The main international ethical standards supported by Atlas Copco are the International Bill of Human Rights, the International Labour Organization’s Declaration on Fundamental Principles and Rights at work, the OECD Guidelines for Multinational Companies and the UN Global Compact. Atlas Copco is a member of the UN Global Compact since 2008.
Meetings of the Board and the Nomination Committee during 2021
Preliminary full-year 2020 results, the annual audit and review of
Vacuum Technique
Meeting per capsulam
Half-year report meeting
Various investments’ approvals
BOARD OF DIRECTORS’ MEETINGS AND ACTIVITIES
NOMINATION COMMITTEE MEETINGS
First-quarter results meeting and review of
Industrial Technique
Q1
Q2
Q3
Q4
January
February
March
April
May
June
July
August
September
October
November
December
Nomination Committee meeting
Nomination Committee meeting
Nomination Committee meeting
Statutory meeting
Review of management, succession planning and
strategy discussion
Third-quarter results meeting and review of Compressor
Technique and Group Treasury Report
The following information is available at www.atlascopcogroup.com
➔ Atlas Copco’s Articles of Association ➔ The Business Code of Practice ➔ Corporate governance reports since 2004
(as a part of the annual report)➔ Information on Atlas Copco’s Annual General Meeting
The annual signing of the Business Code of Practice, together with training, supports Atlas Copco’s employees to identify and handle ethical dilemmas and strengthens the awareness of Atlas Copco’s values and guidelines. Atlas Copco also requests that significant busi-ness partners commit to comply with the Business Code of Practice. This is further supported by a third-party operated system providing anonymous reporting of suspected ethical misconduct.
To safeguard the Group’s reputation, Atlas Copco relies on solid governance and the leaders’ ability to defend values, including of course, internal and external control and audits.
Hans Stråberg Chair since 2014
Comment from the Chair
Atlas Copco 2021 54
THE YEAR IN REVIEw – CORPORATE GOVERNANCE
THE YEAR IN REVIEWAdministration report
Business areas
Compressor Technique
Vacuum Technique
Industrial Technique
Power Technique
Sustainable approach to delivering value
Raising our climate ambition
Products and service
People
Safety and well-being
Ethics
Environment
Risks, risk management and opportunities
The Atlas Copco share
• Corporate Governance
Board of Directors
Group Management
Internal control over financial reporting
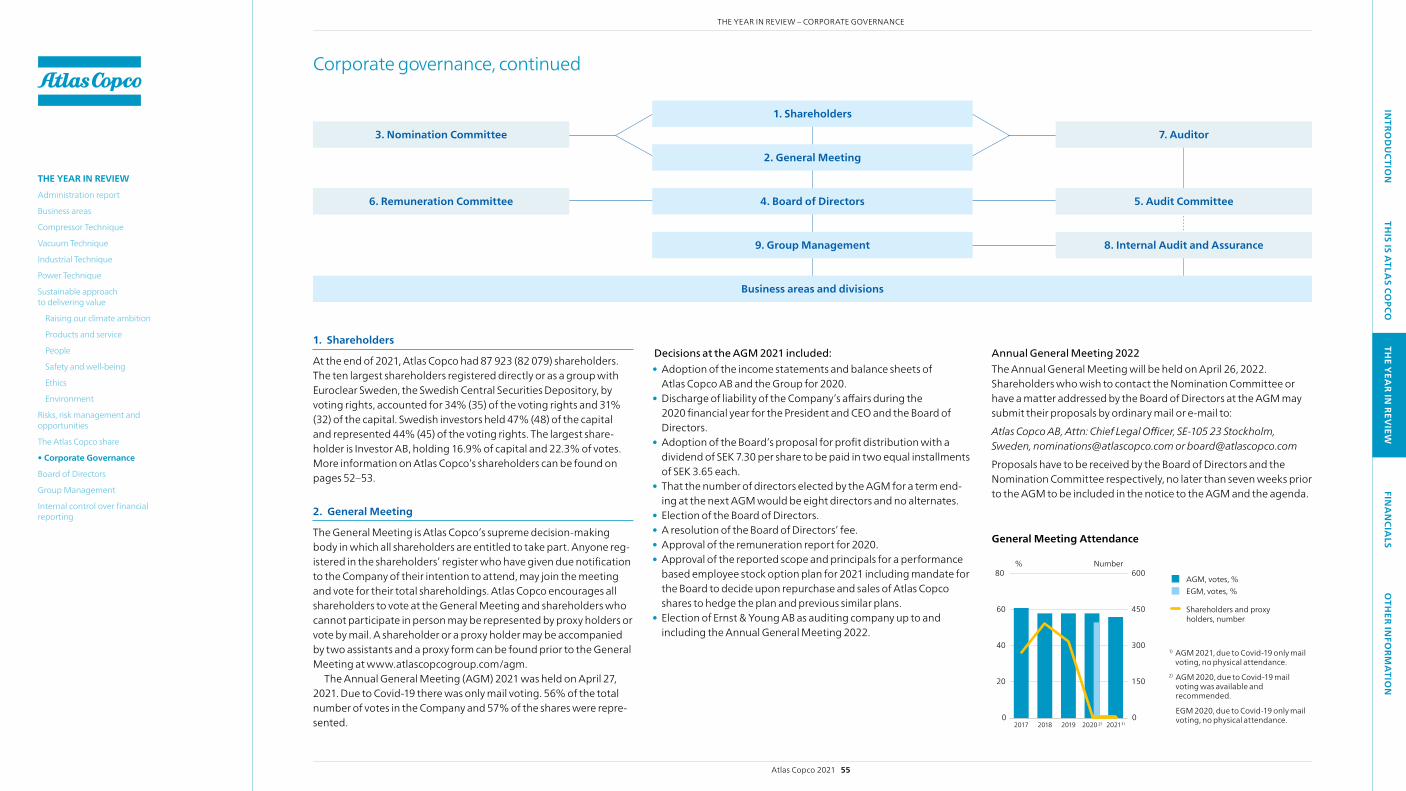
INTRO
DU
CTION
THIS IS A
TLAS CO
PCOTH
E YEA
R IN REV
IEWFIN
AN
CIALS
OTH
ER INFO
RMA
TION
1. Shareholders
At the end of 2021, Atlas Copco had 87 923 (82 079) shareholders. The ten largest shareholders registered directly or as a group with Euroclear Sweden, the Swedish Central Securities Depository, by voting rights, accounted for 34% (35) of the voting rights and 31% (32) of the capital. Swedish investors held 47% (48) of the capital and represented 44% (45) of the voting rights. The largest share-holder is Investor AB, holding 16.9% of capital and 22.3% of votes. More information on Atlas Copco’s shareholders can be found on pages 52–53.
2. General Meeting
The General Meeting is Atlas Copco’s supreme decision-making body in which all shareholders are entitled to take part. Anyone reg-istered in the shareholders’ register who have given due notification to the Company of their intention to attend, may join the meeting and vote for their total shareholdings. Atlas Copco encourages all shareholders to vote at the General Meeting and share holders who cannot participate in person may be represented by proxy holders or vote by mail. A shareholder or a proxy holder may be accompanied by two assistants and a proxy form can be found prior to the General Meeting at www.atlascopcogroup.com/agm.
The Annual General Meeting (AGM) 2021 was held on April 27, 2021. Due to Covid-19 there was only mail voting. 56% of the total number of votes in the Company and 57% of the shares were repre-sented.
Decisions at the AGM 2021 included: • Adoption of the income statements and balance sheets of
Atlas Copco AB and the Group for 2020.• Discharge of liability of the Company’s affairs during the
2020 financial year for the President and CEO and the Board of Directors.
• Adoption of the Board’s proposal for profit distribution with a dividend of SEK 7.30 per share to be paid in two equal installments of SEK 3.65 each.
• That the number of directors elected by the AGM for a term end-ing at the next AGM would be eight directors and no alternates.
• Election of the Board of Directors.• A resolution of the Board of Directors’ fee.• Approval of the remuneration report for 2020.• Approval of the reported scope and principals for a performance
based employee stock option plan for 2021 including mandate for the Board to decide upon repurchase and sales of Atlas Copco shares to hedge the plan and previous similar plans.
• Election of Ernst & Young AB as auditing company up to and including the Annual General Meeting 2022.
Annual General Meeting 2022The Annual General Meeting will be held on April 26, 2022.Shareholders who wish to contact the Nomination Committee or have a matter addressed by the Board of Directors at the AGM may submit their proposals by ordinary mail or e-mail to: Atlas Copco AB, Attn: Chief Legal Officer, SE-105 23 Stockholm, Sweden, [email protected] or [email protected] have to be received by the Board of Directors and the Nomination Committee respectively, no later than seven weeks prior to the AGM to be included in the notice to the AGM and the agenda.
Business areas and divisions
2. General Meeting
4. Board of Directors
1. Shareholders
9. Group Management
3. Nomination Committee
6. Remuneration Committee 5. Audit Committee
8. Internal Audit and Assurance
7. Auditor
0
20
40
60
80
20211)2020 2)2019201820170
150
300
450
600%
AGM, votes, %EGM, votes, %
Number
Shareholders and proxy holders, number
General Meeting Attendance 0
20
40
60
80
2020*20192018201720160
150
300
450
600%
AGM, votes, %EGM, votes, %
Number
Shareholders and proxy holders, number
1) AGM 2021, due to Covid-19 only mail voting, no physical attendance.
2) AGM 2020, due to Covid-19 mail voting was available and recommended.
EGM 2020, due to Covid-19 only mail voting, no physical attendance.
Corporate governance, continued
Atlas Copco 2021 55
THE YEAR IN REVIEw – CORPORATE GOVERNANCE
THE YEAR IN REVIEWAdministration report
Business areas
Compressor Technique
Vacuum Technique
Industrial Technique
Power Technique
Sustainable approach to delivering value
Raising our climate ambition
Products and service
People
Safety and well-being
Ethics
Environment
Risks, risk management and opportunities
The Atlas Copco share
• Corporate Governance
Board of Directors
Group Management
Internal control over financial reporting

INTRO
DU
CTION
THIS IS A
TLAS CO
PCOTH
E YEA
R IN REV
IEWFIN
AN
CIALS
OTH
ER INFO
RMA
TION
3. Nomination Committee
The goal of the Nomination Committee is to propose a Board with a broad and complementary experience from a number of important industries and markets, as well as a composition that is characterized by diversity, broadness and gender balance. Experience from manufac-turing industry with international coverage is important, as it is Atlas Copco’s main focus. The Nomination Committee’s diversity policy is based on section 4.1 in the Corporate Governance Code. The eight Board members elected by the shareholders have backgrounds from various industries. As proposed to the AGM 2021, two of the seven non-executive members are women. One member is born in the 1940’s, four in the 1950’s, one in the 1960’s, and one is born in the 1970’s. The Board members are of three different nationalities, from Germany and the United States, and a majority of the Board members coming from Sweden. Increasing the diversity of the Board of Directors with regard to gender is a priority for the Nomination Committee.
Based on the findings of the Chair of the Board, the Nomination Committee annually evaluates the work of the Board. Further to that, the Nomination Committee proposes the Chair to the Annual General Meeting, prepares a proposal regarding number and names of Board members, including Chair and a proposal for remuneration to the Chair and other Board members not employed by the Com-pany, as well as a proposal for remuneration for Board committee work. Finally, the Nomination Committee proposes an audit com-pany including remuneration for the audit.
The proposals and the Nomination Committee’s statement will be published at the latest with the notice to the AGM 2022. In view of the Nomination Committee’s strive to reach gender balance, for example in case of equal competence, the candidate that will lead to improved gender balance should be proposed.
In compliance with the Swedish Corporate Governance Code and the procedures adopted by the AGM 2016, the representatives of the four largest shareholders, listed in the shareholders’ register as of August 31, 2021, together with the Chair of the Board shall form the Nomination Committee. The members of the Nomination Com-mittee for the AGM 2022 were announced on September 8, 2021, and represented approximately 29% of all votes in the Company. The members of the Nomination Committee receive no compensa-tion for their work in the committee.
Nomination Committee members for the AGM 2022: Petra Hedengran, Investor AB, Chair of the Nomination Committee; Jan Andersson, Swedbank Robur funds; Mikael wiberg, Alecta; Helen Fasth Gillstedt, Handelsbanken Fonder AB; and Hans Stråberg, Atlas Copco AB, Chair of the Board.
4. Board of Directors
The Board of Directors is responsible for the overall organization, administration and management of Atlas Copco in the best interest of the Company and its shareholders. The Board is responsible for following applicable rules and implementing efficient control sys-tems in the decentralized organization. An efficient control system offers the correct balance between risk and control. The long-term goals are regularly evaluated by the Board based on the Group’s financial situation and financial, legal, social and environmental risks. The mission is to achieve a sustainable and profitable develop-ment of the Group.
Board of Directors’ membersAt the end of 2021 the Board of Directors consisted of eight elected members, including the President and CEO. The Board also had two employee representatives, each with one personal deputy. Atlas Copco fulfilled the 2021 requirements of Nasdaq Stockholm and the rules of the Swedish Corporate Governance Code regarding inde-pendency of board members.
The Board of Directors’ workThe Board continuously addresses the strategic direction, the finan-cial performance, and the methods to maintain sustainable profit-ability of the Group. Further, the Board regularly ensures that effi-cient control systems are in place. The Board also follows up on the compliance of the Business Code of Practice as well as on the whis-tleblowing system. Besides the general distribution of responsibili-ties that apply, in accordance with the Swedish Companies Act and the Code, the Board and its committees (Audit Committee, Remu-neration Committee and others) annually review and adopt “The Rules of Procedure” and “The written Instructions”, which are documents that govern the Board’s work and distribution of tasks between the Board, the committees and the President, as well as the Company’s reporting processes.
The Board held eight meetings in 2021. Seven meetings were held at Atlas Copco AB in Nacka and virtually and one per capsulam. The attendance at Board meetings is presented on page 58–59.
The Board continuously evaluates the performance of the Presi-dent and CEO, Mats Rahmström. For the Annual Audit, the Compa-ny’s principal auditor, Erik Sandström, Ernst & Young AB, reported his observations to the Board and the Board also had a separate session with the auditor where members of Group Management were not present.
Evaluation of the Board of Directors’ work The annual evaluation of the Board of Directors’ work, including the Board’s committees (Audit Committee, Remuneration Committee and others) was conducted by the Chair of the Board, Hans Stråberg. He evaluated the Board’s working procedures, competence and composition, including the background, experience and diversity of Board members. His findings were presented to the Nomination Committee.
Remuneration to the Board of Directors Remuneration and fees are based on the work performed by the Board. The AGM 2021 decided to adopt the Nomination Commit-tee’s proposal for remuneration to the Chair and other Board mem-bers not employed by the Company, and the proposed remunera-tion for committee work. See also note 5.
• The Chair was granted an amount of SEK 2 600 000.• Each of the other Board members not employed by the Company
was granted SEK 825 000.• An amount of SEK 335 000 was granted to the Chair of the Audit
Committee and SEK 210 000 to each of the other members of this committee.
• An amount of SEK 130 000 was granted to the Chair of the Remu-neration Committee and SEK 95 000 to each of the other members of this committee.
• An amount of SEK 100 000 was granted to each non-executive director who, in addition, participates in committee work decided upon by the Board.
• The meeting further resolved that 50% of the director’s Board fee could be received in the form of synthetic shares.
5. Audit Committee
The Audit Committee is elected by the Board at the statutory Board meeting after the Annual General Meeting and until the statutory Board meeting the following year. The work of the Audit Committee is directed by the Audit Committee Charter, which is reviewed and approved annually by the Board. The Chair of the committee has the accounting competence required by the Swedish Companies Act and two of the members are independent from the Company and its main shareholder. The Audit Committee’s primary task is to support the Board of Directors in fulfilling its responsibilities in the areas of audit and internal control, accounting, financial reporting and risk management as well as to supervise the financial structure and oper-ations of the Group and approve financial guarantees and new legal
Corporate governance, continued
Atlas Copco 2021 56
THE YEAR IN REVIEw – CORPORATE GOVERNANCE
THE YEAR IN REVIEWAdministration report
Business areas
Compressor Technique
Vacuum Technique
Industrial Technique
Power Technique
Sustainable approach to delivering value
Raising our climate ambition
Products and service
People
Safety and well-being
Ethics
Environment
Risks, risk management and opportunities
The Atlas Copco share
• Corporate Governance
Board of Directors
Group Management
Internal control over financial reporting

INTRO
DU
CTION
THIS IS A
TLAS CO
PCOTH
E YEA
R IN REV
IEWFIN
AN
CIALS
OTH
ER INFO
RMA
TION
entities, delegated by the Board. The Audit Committee work further includes reviewing internal audit procedures, monitoring the exter-nal auditor, considering any inspection findings, review and monitor the independence of the external auditor, and assist the Nomination Committee in the selection of the auditor.
During the year, the committee convened five times. All members were present at these meetings. All meetings of the Audit Commit-tee have been reported to the Board of Directors and the corre-sponding Minutes have been distributed to the Board.
The Audit Committee members during 2021 were Staffan Bohman, Anna Ohlsson-Leijon, Johan Forssell and Hans Stråberg. Staffan Bohman was Chair of the committee until November 2021, when Anna Ohlsson-Leijon took over as Chair.
6. Remuneration Committee
The Remuneration Committee is elected by the Board at the statu-tory Board meeting after the Annual General Meeting and until the statutory Board meeting the following year. The work of the Remu-neration Committee is directed by the Remuneration Committee Charter, which is reviewed and approved annually by the Board. The Remuneration Committee’s primary task is to propose to the Board the remuneration to the President and CEO and a long-term incen-tive plan for key employees. The purpose of a long-term incentive plan is to align the interests of key personnel with those of the share-holders. The guidelines for executive remuneration in Atlas Copco aim to establish principles for fair and consistent remuneration with respect to compensation, benefits, and termination. The base salary is based on competence, area of responsibility, experience and per-formance, while the variable compensation is linked to predeter-mined and measurable criteria which can be both financial or non- financial. The guidelines for executive remuneration are reviewed annually and the Annual General Meeting 2021 approved the guide-lines for remuneration. See also note 5.
The Remuneration Committee had three meetings in 2021. All members were present. During the year, the Remuneration Commit-tee also supported the President and CEO in determining remunera-tion to the other members of Group Management. All meetings of the Remuneration Committee have been reported to the Board and the corresponding Minutes have been distributed to the Board.
The Remuneration Committee members during 2021 were Hans Stråberg, Chair, Peter wallenberg Jr, and Staffan Bohman.
7. Auditor
The task of the external auditor is to examine Atlas Copco’s consoli-dated accounts and annual report, as well as to review the Board and the CEO’s management of the Company. At the AGM 2021 the audit firm Ernst & Young AB, Sweden, was elected external auditor until the AGM 2022 in compliance with a proposal from the Nomination Committee. The principal auditor is Erik Sandström, Authorized Pub-lic Accountant at Ernst & Young AB. At the AGM 2021, Erik Sand-ström referred to the auditor’s report for the Company and the Group in the annual report and explained the process applied when performing the audit. He also recommended adoption of the pre-sented income statements and balance sheets, discharge of liability for the President and CEO and the Board of Directors, and adoption of the proposed distribution of profits.
8. Internal Audit and Assurance
Internal Audit and Assurance aims to provide independent and objective assurance on internal control by conducting internal audits. It reports five times per year to the Audit Committee. Read more on pages 62–63.
9. Group Management
Besides the President and CEO, the Group Management consists of four business area presidents and four senior vice presidents respon-sible for the main Group functions; Corporate Communications, Human Resources, Controlling and Finance, and Legal. The President and CEO is responsible for the ongoing management of the Group following the Board’s guidelines and instructions.
Remuneration to Group Management The guidelines for executive remuneration in Atlas Copco are reviewed annually by the Board of Directors and presented to the AGM for approval at least every four years. In 2021, the AGM decided to adopt the Board’s proposal. The remuneration shall consist of base salary, variable compensation, possible long-term incentives (personnel options), pension benefits and other benefits. The vari-able compensation is limited to a maximum percentage of the base salary and is linked to predetermined and measurable criteria which can be financial or non-financial. Non-financial criteria for 2021 has been to reduce the Group’s CO2 emissions. No fees are paid for board memberships in Group companies.
Atlas Copco is registered in Sweden and is legally governed by the Swedish Companies Act (2005:551). This act requires that the Board of Directors governs the Company to be profitable and create value for its shareholders. However, Atlas Copco recognizes going beyond this, extending it to integrating sustainability into its business creating long-term value for all stakeholders, which is ultimately in the best interest of the Company, the shareholders and society. The significant stakeholder audience, as outlined in Atlas Copco’s Business Code of Practice, in-cludes representatives of society, em ployees, customers, business partners and shareholders.
The Business Code of Practice is the central guiding policy for Atlas Copco, and is owned by the Board of Directors. Its commitment goes beyond the requirements of legal compliance, to supporting voluntary international ethical guidelines. These include the United Nations International Bill of Human Rights, International Labour Orga-nization’s Declaration on Fundamental Principles and Rights at work, the ten principles of the United Nations Global Compact, and OECD’s
Guidelines for Multinational Enterprises. Atlas Copco has employed a stakeholder-driven approach in order to identify the most material environmental, human rights, labor and ethical aspects of its business. These priorities guide how the Group develops and drives its business strategy, as well as its roadmap to support the UN Sustainable Develop-ment Goals.
The strategy and fundamentals for growth together with the Group targets presen ted on pages 5–7 aim at continuously delivering sustain-able, profitable growth for the Group. This means an increased eco-nomic value creation and, simultaneously, a positive impact on society and the environment, thus creating shared value.
Atlas Copco monitors and voluntarily discloses the progress on these material financial and non-financial aspects, through an exter-nally assured, integrated annual report. In addition to the Annual General Meeting, Atlas Copco also creates engagement opportunities so that non-shareholders can address the Group in various stake-holder dialogues.
Corporate governance, continued
Statement of materiality and significant audiences
Atlas Copco 2021 57
THE YEAR IN REVIEw – CORPORATE GOVERNANCE
THE YEAR IN REVIEWAdministration report
Business areas
Compressor Technique
Vacuum Technique
Industrial Technique
Power Technique
Sustainable approach to delivering value
Raising our climate ambition
Products and service
People
Safety and well-being
Ethics
Environment
Risks, risk management and opportunities
The Atlas Copco share
• Corporate Governance
Board of Directors
Group Management
Internal control over financial reporting
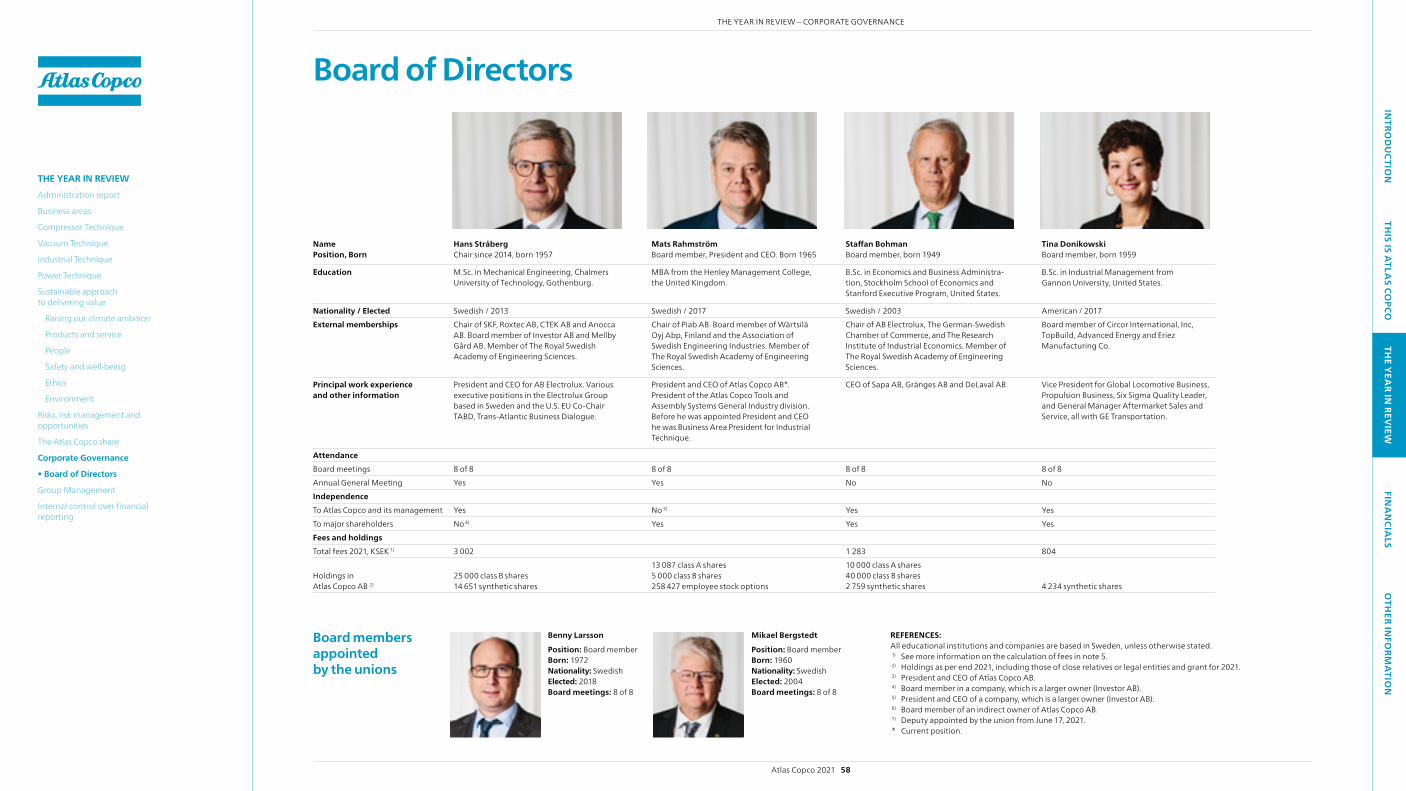
INTRO
DU
CTION
THIS IS A
TLAS CO
PCOTH
E YEA
R IN REV
IEWFIN
AN
CIALS
OTH
ER INFO
RMA
TION
NamePosition, Born
Hans StråbergChair since 2014, born 1957
Mats RahmströmBoard member, President and CEO. Born 1965
Staffan BohmanBoard member, born 1949
Tina DonikowskiBoard member, born 1959
Education M.Sc. in Mechanical Engineering, Chalmers University of Technology, Gothenburg.
MBA from the Henley Management College, the United Kingdom.
B.Sc. in Economics and Business Administra-tion, Stockholm School of Economics and Stanford Executive Program, United States.
B.Sc. in Industrial Management from Gannon University, United States.
Nationality / Elected Swedish / 2013 Swedish / 2017 Swedish / 2003 American / 2017External memberships Chair of SKF, Roxtec AB, CTEK AB and Anocca
AB. Board member of Investor AB and Mellby Gård AB. Member of The Royal Swedish Academy of Engineering Sciences.
Chair of Piab AB. Board member of wärtsilä Oyj Abp, Finland and the Association of Swedish Engineering Industries. Member of The Royal Swedish Academy of Engineering Sciences.
Chair of AB Electrolux, The German-Swedish Chamber of Commerce, and The Research Institute of Industrial Economics. Member of The Royal Swedish Academy of Engineering Sciences.
Board member of Circor International, Inc, TopBuild, Advanced Energy and Eriez Manufacturing Co.
Principal work experience and other information
President and CEO for AB Electrolux. Various executive positions in the Electrolux Group based in Sweden and the U.S. EU Co-Chair TABD, Trans-Atlantic Business Dialogue.
President and CEO of Atlas Copco AB*. President of the Atlas Copco Tools and Assembly Systems General Industry division. Before he was appointed President and CEO he was Business Area President for Industrial Technique.
CEO of Sapa AB, Gränges AB and DeLaval AB. Vice President for Global Locomotive Business, Propulsion Business, Six Sigma quality Leader, and General Manager Aftermarket Sales and Service, all with GE Transportation.
AttendanceBoard meetings 8 of 8 8 of 8 8 of 8 8 of 8Annual General Meeting Yes Yes No NoIndependenceTo Atlas Copco and its management Yes No 3) Yes YesTo major shareholders No 4) Yes Yes YesFees and holdingsTotal fees 2021, KSEK 1) 3 002 1 283 804
Holdings in Atlas Copco AB 2)
25 000 class B shares14 651 synthetic shares
13 087 class A shares5 000 class B shares258 427 employee stock options
10 000 class A shares40 000 class B shares2 759 synthetic shares 4 234 synthetic shares
Board of Directors
Board members appointed by the unions
Benny Larsson
Position: Board member Born: 1972 Nationality: Swedish Elected: 2018 Board meetings: 8 of 8
Mikael Bergstedt
Position: Board member Born: 1960 Nationality: Swedish Elected: 2004 Board meetings: 8 of 8
REFERENCES:All educational institutions and companies are based in Sweden, unless otherwise stated.1) See more information on the calculation of fees in note 5. 2) Holdings as per end 2021, including those of close relatives or legal entities and grant for 2021. 3) President and CEO of Atlas Copco AB. 4) Board member in a company, which is a larger owner (Investor AB). 5) President and CEO of a company, which is a larger owner (Investor AB).6) Board member of an indirect owner of Atlas Copco AB.7) Deputy appointed by the union from June 17, 2021.* Current position.
Atlas Copco 2021 58
THE YEAR IN REVIEw – CORPORATE GOVERNANCE
THE YEAR IN REVIEWAdministration report
Business areas
Compressor Technique
Vacuum Technique
Industrial Technique
Power Technique
Sustainable approach to delivering value
Raising our climate ambition
Products and service
People
Safety and well-being
Ethics
Environment
Risks, risk management and opportunities
The Atlas Copco share
Corporate Governance
• Board of Directors
Group Management
Internal control over financial reporting
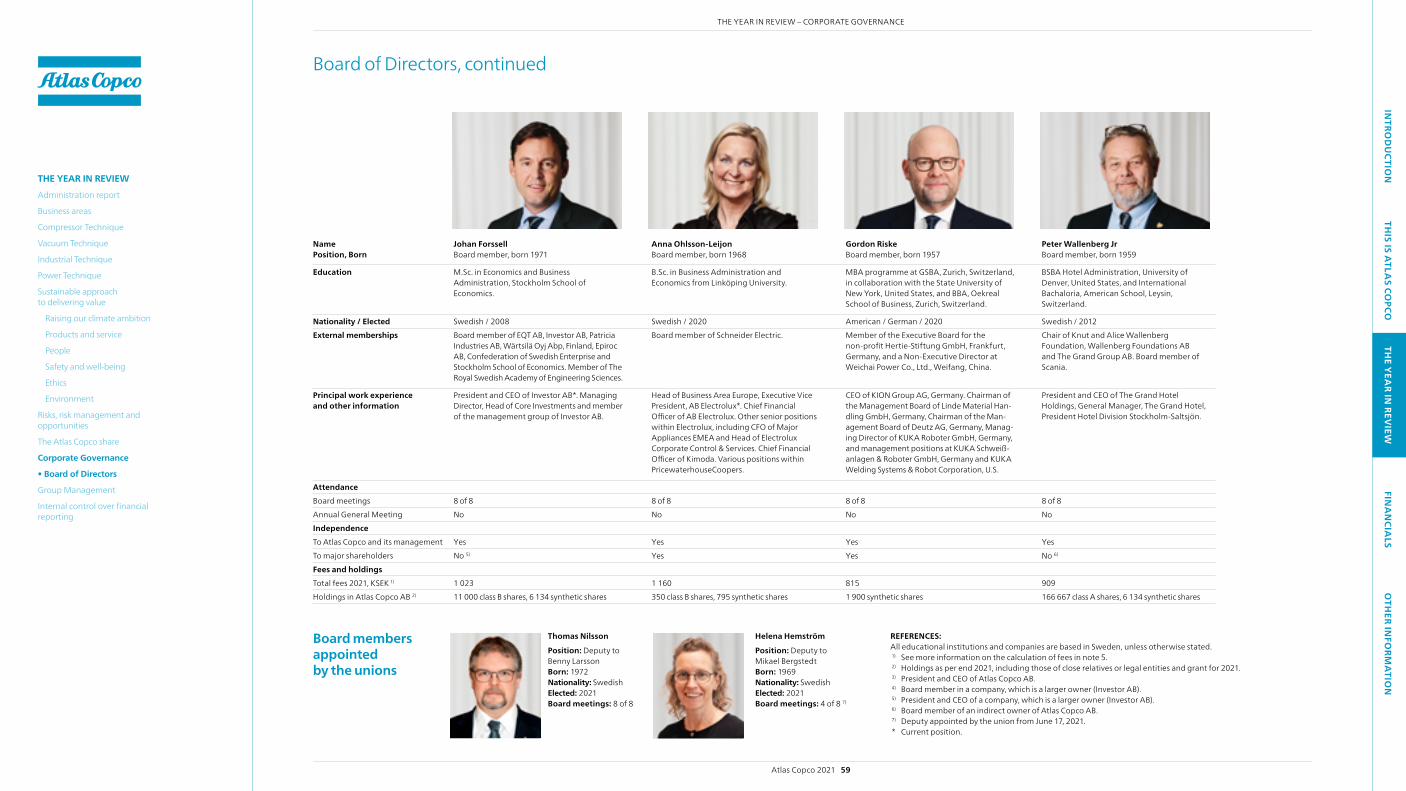
INTRO
DU
CTION
THIS IS A
TLAS CO
PCOTH
E YEA
R IN REV
IEWFIN
AN
CIALS
OTH
ER INFO
RMA
TION
NamePosition, Born
Johan ForssellBoard member, born 1971
Anna Ohlsson-LeijonBoard member, born 1968
Gordon RiskeBoard member, born 1957
Peter Wallenberg JrBoard member, born 1959
Education M.Sc. in Economics and Business Administration, Stockholm School of Economics.
B.Sc. in Business Administration and Economics from Linköping University.
MBA programme at GSBA, zurich, Switzerland, in collaboration with the State University of New York, United States, and BBA, Oekreal School of Business, zurich, Switzerland.
BSBA Hotel Administration, University of Denver, United States, and International Bachaloria, American School, Leysin, Switzerland.
Nationality / Elected Swedish / 2008 Swedish / 2020 American / German / 2020 Swedish / 2012External memberships Board member of EqT AB, Investor AB, Patricia
Industries AB, wärtsilä Oyj Abp, Finland, Epiroc AB, Confederation of Swedish Enterprise and Stockholm School of Economics. Member of The Royal Swedish Academy of Engineering Sciences.
Board member of Schneider Electric. Member of the Executive Board for the non-profit Hertie-Stiftung GmbH, Frankfurt, Germany, and a Non-Executive Director at weichai Power Co., Ltd., weifang, China.
Chair of Knut and Alice wallenberg Foundation, wallenberg Foundations AB and The Grand Group AB. Board member of Scania.
Principal work experience and other information
President and CEO of Investor AB*. Managing Director, Head of Core Investments and member of the management group of Investor AB.
Head of Business Area Europe, Executive Vice President, AB Electrolux*. Chief FinancialOfficer of AB Electrolux. Other senior positions within Electrolux, including CFO of Major Appliances EMEA and Head of Electrolux Corporate Control & Services. Chief Financial Officer of Kimoda. Various positions withinPrice waterhouseCoopers.
CEO of KION Group AG, Germany. Chairman of the Management Board of Linde Material Han-dling GmbH, Germany, Chairman of the Man-agement Board of Deutz AG, Germany, Manag-ing Director of KUKA Roboter GmbH, Germany, and management positions at KUKA Schweiß-anlagen & Roboter GmbH, Germany and KUKA welding Systems & Robot Corporation, U.S.
President and CEO of The Grand Hotel Holdings, General Manager, The Grand Hotel, President Hotel Division Stockholm-Saltsjön.
AttendanceBoard meetings 8 of 8 8 of 8 8 of 8 8 of 8Annual General Meeting No No No No IndependenceTo Atlas Copco and its management Yes Yes Yes YesTo major shareholders No 5) Yes Yes No 6)
Fees and holdingsTotal fees 2021, KSEK 1) 1 023 1 160 815 909Holdings in Atlas Copco AB 2) 11 000 class B shares, 6 134 synthetic shares 350 class B shares, 795 synthetic shares 1 900 synthetic shares 166 667 class A shares, 6 134 synthetic shares
Board of Directors, continued
REFERENCES:All educational institutions and companies are based in Sweden, unless otherwise stated.1) See more information on the calculation of fees in note 5. 2) Holdings as per end 2021, including those of close relatives or legal entities and grant for 2021. 3) President and CEO of Atlas Copco AB. 4) Board member in a company, which is a larger owner (Investor AB). 5) President and CEO of a company, which is a larger owner (Investor AB).6) Board member of an indirect owner of Atlas Copco AB.7) Deputy appointed by the union from June 17, 2021.* Current position.
Board members appointed by the unions
Thomas Nilsson
Position: Deputy to Benny Larsson Born: 1972 Nationality: Swedish Elected: 2021 Board meetings: 8 of 8
Helena Hemström
Position: Deputy to Mikael Bergstedt Born: 1969 Nationality: Swedish Elected: 2021 Board meetings: 4 of 8 7)
Atlas Copco 2021 59
THE YEAR IN REVIEw – CORPORATE GOVERNANCE
THE YEAR IN REVIEWAdministration report
Business areas
Compressor Technique
Vacuum Technique
Industrial Technique
Power Technique
Sustainable approach to delivering value
Raising our climate ambition
Products and service
People
Safety and well-being
Ethics
Environment
Risks, risk management and opportunities
The Atlas Copco share
Corporate Governance
• Board of Directors
Group Management
Internal control over financial reporting
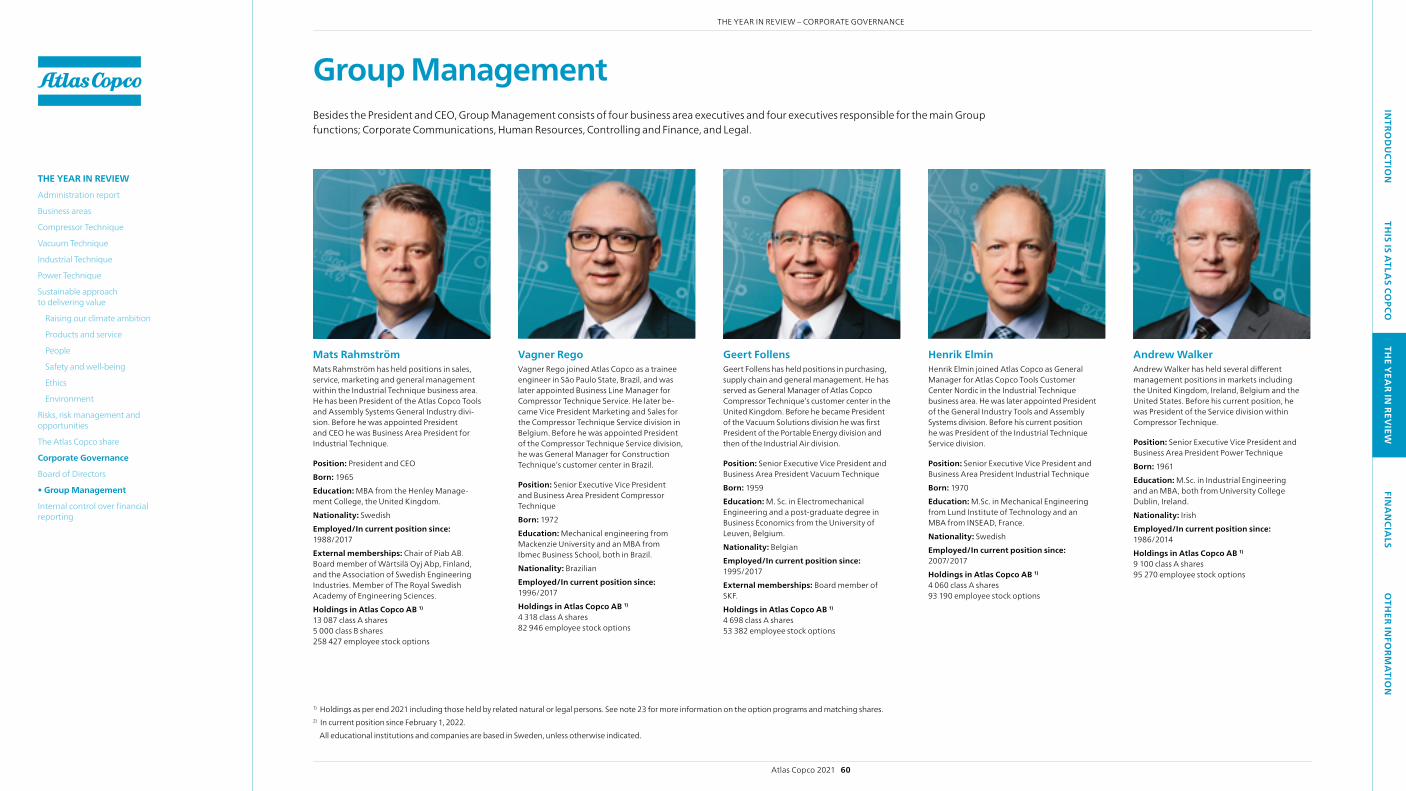
INTRO
DU
CTION
THIS IS A
TLAS CO
PCOTH
E YEA
R IN REV
IEWFIN
AN
CIALS
OTH
ER INFO
RMA
TION
Besides the President and CEO, Group Management consists of four business area executives and four executives responsible for the main Group functions; Corporate Communications, Human Resources, Controlling and Finance, and Legal.
Group Management
Mats RahmströmMats Rahmström has held positions in sales, service, marketing and general management within the Industrial Technique business area. He has been President of the Atlas Copco Tools and Assembly Systems General Industry divi-sion. Before he was appointed President and CEO he was Business Area President for Industrial Technique.
Position: President and CEO Born: 1965Education: MBA from the Henley Manage-ment College, the United Kingdom.Nationality: SwedishEmployed/In current position since: 1988/2017External memberships: Chair of Piab AB. Board member of wärtsilä Oyj Abp, Finland, and the Association of Swedish Engineering Industries. Member of The Royal Swedish Academy of Engineering Sciences.Holdings in Atlas Copco AB 1)
13 087 class A shares 5 000 class B shares 258 427 employee stock options
Vagner RegoVagner Rego joined Atlas Copco as a trainee engineer in São Paulo State, Brazil, and was later appointed Business Line Manager for Compressor Technique Service. He later be-came Vice President Marketing and Sales for the Compressor Technique Service division in Belgium. Before he was appointed President of the Compressor Technique Service division, he was General Manager for Construction Technique’s customer center in Brazil.
Position: Senior Executive Vice President and Business Area President Compressor Technique Born: 1972Education: Mechanical engineering from Mackenzie University and an MBA from Ibmec Business School, both in Brazil.Nationality: BrazilianEmployed/In current position since: 1996/2017Holdings in Atlas Copco AB 1)
4 318 class A shares82 946 employee stock options
Geert FollensGeert Follens has held positions in purchasing, supply chain and general management. He has served as General Manager of Atlas Copco Compressor Technique’s customer center in the United Kingdom. Before he became President of the Vacuum Solutions division he was first President of the Portable Energy division and then of the Industrial Air division.
Position: Senior Executive Vice President and Business Area President Vacuum Technique Born: 1959Education: M. Sc. in Electromechanical Engineering and a post-graduate degree in Business Economics from the University of Leuven, Belgium.Nationality: BelgianEmployed/In current position since: 1995/2017External memberships: Board member of SKF.Holdings in Atlas Copco AB 1)
4 698 class A shares53 382 employee stock options
Henrik ElminHenrik Elmin joined Atlas Copco as General Manager for Atlas Copco Tools Customer Center Nordic in the Industrial Technique business area. He was later appointed President of the General Industry Tools and Assembly Systems division. Before his current position he was President of the Industrial Technique Service division.
Position: Senior Executive Vice President and Business Area President Industrial TechniqueBorn: 1970Education: M.Sc. in Mechanical Engineering from Lund Institute of Technology and an MBA from INSEAD, France.Nationality: SwedishEmployed/In current position since: 2007/2017Holdings in Atlas Copco AB 1)
4 060 class A shares93 190 employee stock options
1) Holdings as per end 2021 including those held by related natural or legal persons. See note 23 for more information on the option programs and matching shares.2) In current position since February 1, 2022. All educational institutions and companies are based in Sweden, unless otherwise indicated.
Andrew WalkerAndrew walker has held several different management positions in markets including the United Kingdom, Ireland, Belgium and the United States. Before his current position, he was President of the Service division within Compressor Technique.
Position: Senior Executive Vice President and Business Area President Power TechniqueBorn: 1961Education: M.Sc. in Industrial Engineering and an MBA, both from University College Dublin, Ireland.Nationality: IrishEmployed/In current position since: 1986/2014Holdings in Atlas Copco AB 1)
9 100 class A shares95 270 employee stock options
Atlas Copco 2021 60
THE YEAR IN REVIEw – CORPORATE GOVERNANCE
THE YEAR IN REVIEWAdministration report
Business areas
Compressor Technique
Vacuum Technique
Industrial Technique
Power Technique
Sustainable approach to delivering value
Raising our climate ambition
Products and service
People
Safety and well-being
Ethics
Environment
Risks, risk management and opportunities
The Atlas Copco share
Corporate Governance
Board of Directors
• Group Management
Internal control over financial reporting

INTRO
DU
CTION
THIS IS A
TLAS CO
PCOTH
E YEA
R IN REV
IEWFIN
AN
CIALS
OTH
ER INFO
RMA
TION
Håkan OsvaldHåkan Osvald has been General Counsel for Atlas Copco North America Inc. and Chicago Pneumatic Tool Company in the United States. He was subsequently appointed Vice President Deputy General Counsel Atlas Copco Group, with a special responsibility for acquisitions. Prior to his current position, he was General Counsel Operations. Since 2012 he is Senior Vice Presi-dent General Counsel and Secretary of the Board of Directors for Atlas Copco AB.
Position: Senior Vice President, Chief Legal OfficerBorn: 1954Education: Master of Law from Uppsala University.Nationality: SwedishEmployed/In current position since: 1985/2012External memberships: Member of the Board of Sweden-China Trade Council and the Board of Djurgården Hockey.Holdings in Atlas Copco AB 1)
6 989 class A shares2 600 class B shares23 203 employee stock options
Peter KinnartPeter Kinnart started his career at Atlas Copco as business controller at Airpower in Antwerp. He has held several management positions within different areas at Atlas Copco in Belgium, Germany, Spain and Switzerland. Prior to his current position, he was Vice President Business Control at Atlas Copco’s Business Area Compres-sor Technique.
Position: Senior Vice President, Chief Financial OfficerBorn: 1969Education: Master in Applied Economic Science and a Master in Commercial Engineering from the University of Antwerp (UFSIA), Belgium.Nationality: BelgianEmployed/In current position since: 1993/2021
Holdings in Atlas Copco AB 1)
700 class A shares44 931 employee stock options
Sara Hägg Liljedal 2)
Sara Hägg Liljedal began her career as a journalist working for different Swedish media. Between 2007 and 2013 she worked as Press Secretary for the Speaker of the Swedish Parlia-ment. She has also held roles as a Press and PR Manager for Swedish investment services com-panies Swedbank Robur and Skandia. Before she was appointed Senior Vice President, Chief Communications Officer, she was Media Relations Manager for the Atlas Copco Group.
Position: Senior Vice President, Chief Communications Officer Born: 1980Education: BA in Journalism from Stockholm University.Nationality: SwedishEmployed/In current position since: 2018/2022
Holdings in Atlas Copco AB 1)
54 class A shares55 class B shares10 525 employee stock options
Cecilia SandbergCecilia Sandberg began her career as Human Resources consultant for a travel agency. 1999–2007 she held different Human Resources roles at Scandinavian Airlines and Astrazeneca. Between 2007 and 2015 Cecilia Sandberg was Vice President Human Resources for Atlas Copco’s Industrial Technique business area. Before she started her current position she was Senior Vice President Human Resources at Permobil.
Position: Senior Vice President, Chief Human Resources OfficerBorn: 1968Education: B.Sc. in Human Resources and a M.Sc. in Sociology from Stockholm University.Nationality: SwedishEmployed/In current position since: 2017/2017Holdings in Atlas Copco AB 1)
2 105 class A shares30 122 employee stock options
Group Management, continued
1) Holdings as per end 2021, including those held by related natural or legal persons. See note 23 for more information on the option programs and matching shares.2) In current position since February 1, 2022. All educational institutions and companies are based in Sweden, unless otherwise indicated.
Atlas Copco 2021 61
THE YEAR IN REVIEw – CORPORATE GOVERNANCE
THE YEAR IN REVIEWAdministration report
Business areas
Compressor Technique
Vacuum Technique
Industrial Technique
Power Technique
Sustainable approach to delivering value
Raising our climate ambition
Products and service
People
Safety and well-being
Ethics
Environment
Risks, risk management and opportunities
The Atlas Copco share
Corporate Governance
Board of Directors
• Group Management
Internal control over financial reporting

INTRO
DU
CTION
THIS IS A
TLAS CO
PCOTH
E YEA
R IN REV
IEWFIN
AN
CIALS
OTH
ER INFO
RMA
TION
Internal control over financial reporting
This section includes a description of Atlas Copco’s system of internal controls over financial reporting in accordance with the requirements set forth in the Swedish Code of Corporate Governance and as stipulated by the Swedish Companies Act.
1 Risk assessment
The company applies different processes to assess and identify the main risks relating to financial reporting misstatements. The risk assessments are regularly performed to identify new risks and follow up that internal control is adequate to address the identified risks. The key risk areas for the financial reporting and control activi-ties that are in place to manage the risks are presented in the table on the next page.
The purpose of well-developed internal controls over financial reporting is to ensure correct and reliable financial statements and disclosures.
The basis for the internal control is defined by the overall control environment. The Board of Directors is responsible for establishing an efficient system for internal control and governs the work through the Audit Committee and CEO. Group Management sets the tone for the organization, influencing the control consciousness of employees. One key success factor for a strong control environ-ment lies in ensuring that the organizational structure, decision hier-archy, corporate values in terms of ethics and integrity as well as authority to act, are clearly defined and communicated through guiding documents such as internal policies, guidelines, manuals, and codes.
The financial reporting accounting policies and guidelines are issued by Group Management to all subsidiaries, which are followed up with newsletters and conference calls. Trainings are also held for complex accounting areas and new accounting policies. The policies and guide lines detail the appropriate accounting for key risk areas such as revenues, trade receivables, including bad debt provisions, inventory costing and obsolescence, accounting for income taxes (current and deferred), financial instruments and business acquisitions.
The internal control process is based on a control framework that creates structure for the other four components of the process – risk assessment, control activities, information and communication as well as monitoring. The starting point of the process is the frame-work for internal control issued by the Committee of Sponsoring Organizations of the Treadway Commission (COSO), www.coso.org.
ATLAS COPCO’S INTERNAL CONTROL SYSTEM
Control environment
Risk assessment
Control activities(see next page)
1 2
4 3
Monitoring(see next page)
Information and commu ni cation(see next page)
Atlas Copco 2021 62
THE YEAR IN REVIEw – CORPORATE GOVERNANCE
THE YEAR IN REVIEWAdministration report
Business areas
Compressor Technique
Vacuum Technique
Industrial Technique
Power Technique
Sustainable approach to delivering value
Raising our climate ambition
Products and service
People
Safety and well-being
Ethics
Environment
Risks, risk management and opportunities
The Atlas Copco share
Corporate Governance
Board of Directors
Group Management
• Internal control over financial reporting

INTRO
DU
CTION
THIS IS A
TLAS CO
PCOTH
E YEA
R IN REV
IEWFIN
AN
CIALS
OTH
ER INFO
RMA
TION
KEY FINANCIAL REPORTING RISKS Revenues are not recognized in the appropriate accounting period
Trade receivables are not appropriately valued
Inventory is not appropriately valued at the lower of cost or net realizable value
Income taxes are not accounted for in accordance with applicable tax legislation
Business acquisitions and associated goodwill as well as intangible assets are not appropriately accounted for
2 Control activities to manage key financial reporting risks
Customer contracts are signed at appropriate level within the Group.
Trade receivables and provisions for bad debt are appropriately reconciled at each reporting date.
Inventory counts are performed on a regular basis.
Tax calculations are prepared and reviewed at each reporting date.
All business acquisitions are approved by the Board, CEO or Divisional President.
Revenues are disaggregated and analyzed by type (e.g. goods, services and rental) and by period at local, divi-sional, business area and Group level.
Credit assessments are performed, and credit limits are reviewed on a regular basis.
Inventories are appropriately recon-ciled at each reporting date.
The effective tax rate for each country is analyzed at each reporting date by Group Tax.
Purchase price allocations are prepared at divisional level and reviewed at Group level.
Revenues for goods shipped are scruti-nized at period end against shipping terms and the percentage of comple-tion for services and projects are assessed at each reporting date.
Provisions for bad debts are made according to Group policy.
Inventory costs are reviewed and approved by the divisions.
Compliance with transfer pricing policies is monitored regularly.
Goodwill impairment tests are prepared at business area level and reviewed at Group level.
Days of sales are analyzed at local, divi-sional, business area and Group level.
Inventory levels and the saleability of inventory are assessed at each report-ing date together with obsolescence.
Ongoing tax audits and disputes are monitored by Group tax specialists.
3 Information and communication
The company has information and communication channels designed to ensure that information is identified, captured and communicated in a form and timeframe that enable managers and other employees to carry out their responsibilities. Reporting instructions and accounting guidelines are communicated to per-sonnel concerned through the financial reporting accounting poli-cies and guidelines, which are included in the handbook of policies and guidelines The Way We Do Things, and supported by, for exam-ple, training programs for different categories of employees. A com-mon Group reporting system is used to report and consolidate all financial information.
4 Monitoring
Examples of monitoring activities for the financial reporting include:
• Management at divisional, business area and Group level regularly reviews the financial information and assess compliance to Group policies.
• The Audit Committee and the Board of Directors regularly review reports on financial performance of the Group, by business area and geography.
• The internal audit process aims to provide independent and objec-tive assurance on internal control. Furthermore, the process aims to serve as a tool for employee professional development and to identify and recommend leading practices within the Group. Inter-nal audits are annually planned or initiated by the Group internal audit function with a risk-based approach. Internal audits are con-ducted under leadership of Group internal audit staff with audit team members having diverse functional competencies but always with expertise in accounting and controlling. The results of the internal audits undertaken are regularly reported to the Audit Committee and to Group Management.
• A control self-assessment (CSA) is performed primarily to support local unit managers to evaluate the status of their control routines and to address areas for improvement. One of the areas in the CSA is internal control, which includes internal control over financial reporting. Other areas include legal matters, communication and branding, and the Business Code of Practice.
• The Group has an independent misconduct reporting system where employees and other stakeholders can anonymously report on behavior or actions that are possible violations of laws or of Group policies, including violations of accounting and financial reporting guidelines and policies. The reporting system also includes perceived cases of human rights violation, discrimination or corruption. The reports are treated confidentially and the per-son reporting is guaranteed anonymity via an independent third-party service provider. More information about the grievance mechanism can be found on page 131.
• In the compliance process, all managers and all employees are requested to sign a statement confirming understanding and compliance to financial policies, the Business Code of Practice and applicable laws and regulations.
Internal control over financial reporting, continued
Atlas Copco 2021 63
THE YEAR IN REVIEw – CORPORATE GOVERNANCE
THE YEAR IN REVIEWAdministration report
Business areas
Compressor Technique
Vacuum Technique
Industrial Technique
Power Technique
Sustainable approach to delivering value
Raising our climate ambition
Products and service
People
Safety and well-being
Ethics
Environment
Risks, risk management and opportunities
The Atlas Copco share
Corporate Governance
Board of Directors
Group Management
• Internal control over financial reporting

Financial statements and notesMSEK unless otherwise stated
ATLAS COPCO GROUP Page
Consolidated income statement 65Consolidated statement of comprehensive income 65Consolidated balance sheet 66Consolidated statement of changes in equity 67Consolidated statement of cash flows 68
Note
1 Significant accounting principles, critical accounting estimates and judgements 692 Acquisitions 763 Assets held for sale and divestments 784 Segment information 795 Employees and personnel expenses 826 Remuneration to auditors 867 Other operating income and expenses 868 Financial income and expenses 869 Taxes 8610 Other comprehensive income 8811 Earnings per share 8812 Intangible assets 8913 Property, plant and equipment 9114 Investments in associated companies and joint ventures 9215 Other financial assets 9216 Inventories 9317 Trade receivables 9318 Other receivables 9319 Cash and cash equivalents 9320 Equity 9421 Borrowings 9522 Leases 9723 Employee benefits 9924 Other liabilities 10425 Provisions 10426 Assets pledged and contingent liabilities 10427 Financial exposure and principles for control of financial risks 10528 Related parties 109
PARENT COMPANY Page
Income statement 110Statement of comprehensive income 110Balance sheet 110Statement of changes in equity 111Statement of cash flows 111
Note
A1 Significant accounting principles 112A2 Employees and personnel expenses and remuneration to auditors 113A3 Other operating income and expenses 113A4 Financial income and expenses 113A5 Appropriations 114A6 Income tax 114A7 Intangible assets 114A8 Property, plant and equipment 114A9 Deferred tax assets and liabilities 115A10 Shares in Group companies 115A11 Other financial assets 115A12 Other receivables 115A13 Cash and cash equivalents 115A14 Equity 115A15 Post-employment benefits 116A16 Other provisions 117A17 Borrowings 117A18 Other liabilities 118A19 Financial exposure and principles for control of financial risks 118A20 Assets pledged and contingent liabilities 118A21 Directly owned subsidiaries 119A22 Related parties 120
Atlas Copco 2021 64
INTRO
DU
CTION
THIS IS A
TLAS CO
PCOTH
E YEA
R IN REV
IEWFIN
AN
CIALS
OTH
ER INFO
RMA
TION
FINANCIALS
Group
Consolidated income statement
Consolidated statement of comprehensive income
Consolidated balance sheet
Consolidated statement of changes in equity
Consolidated statement of cash flows
Notes
Parent company

For the year ended December 31 Amounts in MSEK Note 2021 2020
Revenues 4 110 912 99 787 Cost of sales –64 383 –58 607 Gross profit 46 529 41 180
Marketing expenses –12 178 –11 334Administrative expenses –7 283 –6 493 Research and development expenses –4 125 –3 762Other operating income 7 781 270Other operating expenses 7 –201 –748 Share of profit in associated companies and joint ventures 14 36 33Operating profit 4, 5, 6, 16 23 559 19 146
Financial income 8 243 161 Financial expenses 8 –392 –482 Net financial items –149 –321
Profit before tax 23 410 18 825
Income tax expense 9 –5 276 –4 042Profit for the year 18 134 14 783
Profit attributable to: – owners of the parent 18 130 14 779– non-controlling interests 4 4
Basic earnings per share, SEK 11 14.89 12.16 Diluted earnings per share, SEK 11 14.85 12.14
For the year ended December 31 Amounts in MSEK Note 2021 2020
Profit for the year 18 134 14 783 Other comprehensive income Items that will not be reclassified to profit or loss Remeasurements of defined benefit plans 808 93 Income tax relating to items that will not be reclassified –160 –19 648 74
Items that may be reclassified subsequently to profit or loss Translation differences: – on foreign operations 4 571 –6 398 Hedge of net investments in foreign operations –342 673 Cash flow hedges –102 27 Income tax relating to items that may be reclassified 116 –211 4 243 –5 909 Other comprehensive income for the year, net of tax 10 4 891 –5 835 Total comprehensive income for the year 23 025 8 948 Total comprehensive income attributable to: – owners of the parent 23 018 8 963 – non-controlling interests 7 –15
Consolidated statement of comprehensive incomeConsolidated income statement
Atlas Copco 2021 65
FINANCIAL STATEMENTSIN
TROD
UCTIO
NTH
IS IS ATLA
S COPCO
THE Y
EAR IN
REVIEW
FINA
NCIA
LSO
THER IN
FORM
ATIO
N
FINANCIALS
Group
Consolidated income statement
Consolidated statement of comprehensive income
Consolidated balance sheet
Consolidated statement of changes in equity
Consolidated statement of cash flows
Notes
Parent company

Consolidated balance sheet
Amounts in MSEK Note Dec. 31, 2021 Dec. 31, 2020
ASSETS Non-current assets Intangible assets 12 50 348 45 840 Rental equipment 13 2 342 2 241 Other property, plant and equipment 13 8 991 7 889 Right-of-use assets 22 3 244 3 261 Investments in associated companies and joint ventures 14 931 931 Other financial assets 15 965 673 Other receivables 66 102 Deferred tax assets 9 1 790 1 484 Total non-current assets 68 677 62 421
Current assets Inventories 16 17 801 13 450 Trade receivables 17 21 954 18 801 Income tax receivables 990 969Other receivables 18 7 419 6 007Other financial assets 15 847 58Cash and cash equivalents 19 18 990 11 655 Assets classified as held for sale 3 5 5 Total current assets 68 006 50 945 TOTAL ASSETS 136 683 113 366
Amounts in MSEK Note Dec. 31, 2021 Dec. 31, 2020
EQUITY Page 64 Share capital 786 786 Other paid-in capital 8 557 7 855 Reserves 7 208 2 913 Retained earnings 51 082 41 661 Total equity attributable to owners of the parent 67 633 53 215
Non-controlling interests 1 319 TOTAL EQUITY 67 634 53 534
LIABILITIES Non-current liabilities Borrowings 21 20 893 21 669 Post-employment benefits 23 3 114 3 488 Other liabilities 328 278 Provisions 25 1 686 1 195 Deferred tax liabilities 9 2 225 1 736 Total non-current liabilities 28 246 28 366
Current liabilities Borrowings 21 3 981 2 977 Trade payables 15 159 11 202 Income tax liabilities 1 893 1 367 Other liabilities 24 18 144 13 987 Provisions 25 1 626 1 933 Total current liabilities 40 803 31 466 TOTAL EQUITY AND LIABILITIES 136 683 113 366
Information concerning assets pledged and contingent liabilities is disclosed in note 26.
Atlas Copco 2021 66
FINANCIAL STATEMENTSIN
TROD
UCTIO
NTH
IS IS ATLA
S COPCO
THE Y
EAR IN
REVIEW
FINA
NCIA
LSO
THER IN
FORM
ATIO
N
FINANCIALS
Group
Consolidated income statement
Consolidated statement of comprehensive income
Consolidated balance sheet
Consolidated statement of changes in equity
Consolidated statement of cash flows
Notes
Parent company

2021 Equity attributable to owners of the parent
Amounts in MSEK Share capital Other paid-in capital Hedging reserve Trans lation reserve Retained earnings Total Non-controlling interests Total equity
Opening balance, Jan. 1 786 7 855 59 2 854 41 661 53 215 319 53 534 Profit for the year 18 130 18 130 4 18 134 Other comprehensive income for the year –83 4 323 648 4 888 3 4 891 Transfer of reserves 55 –55 – –Total comprehensive income for the year –83 4 378 18 723 23 018 7 23 025
Dividend –8 889 –8 889 –8 889 Acquisition of series A shares –416 –416 –416 Divestment of series A shares 702 748 1 450 1 450 Change of non-controlling interests –511 –511 –325 –836 Share-based payment, equity settled: – expense during the year 212 212 212 – exercise option –446 –446 –446 Closing balance, Dec. 31 786 8 557 –24 7 232 51 082 67 633 1 67 634
2020 Equity attributable to owners of the parent
Amounts in MSEK Share capital Other paid-in capital Hedging reserve Trans lation reserve Retained earnings Total Non-controlling interests Total equity
Opening balance, Jan. 1 786 7 622 40 8 764 36 019 53 231 59 53 290 Profit for the year 14 779 14 779 4 14 783 Other comprehensive income for the year 19 –5 910 75 –5 816 –19 –5 835 Total comprehensive income for the year 19 –5 910 14 854 8 963 –15 8 948
Dividend –8 506 –8 506 –8 506 Acquisition of series A shares –1 097 –1 097 –1 097 Divestment of series A shares 230 590 820 820 Divestment of series B shares 3 – 3 3 Change of non-controlling interests –157 –157 275 118 Share-based payment, equity settled: – expense during the year 158 158 158 – exercise option –200 –200 –200 Closing balance, Dec. 31 786 7 855 59 2 854 41 661 53 215 319 53 534
Consolidated statement of changes in equity
Atlas Copco 2021 67
FINANCIAL STATEMENTSIN
TROD
UCTIO
NTH
IS IS ATLA
S COPCO
THE Y
EAR IN
REVIEW
FINA
NCIA
LSO
THER IN
FORM
ATIO
N
FINANCIALS
Group
Consolidated income statement
Consolidated statement of comprehensive income
Consolidated balance sheet
Consolidated statement of changes in equity
Consolidated statement of cash flows
Notes
Parent company
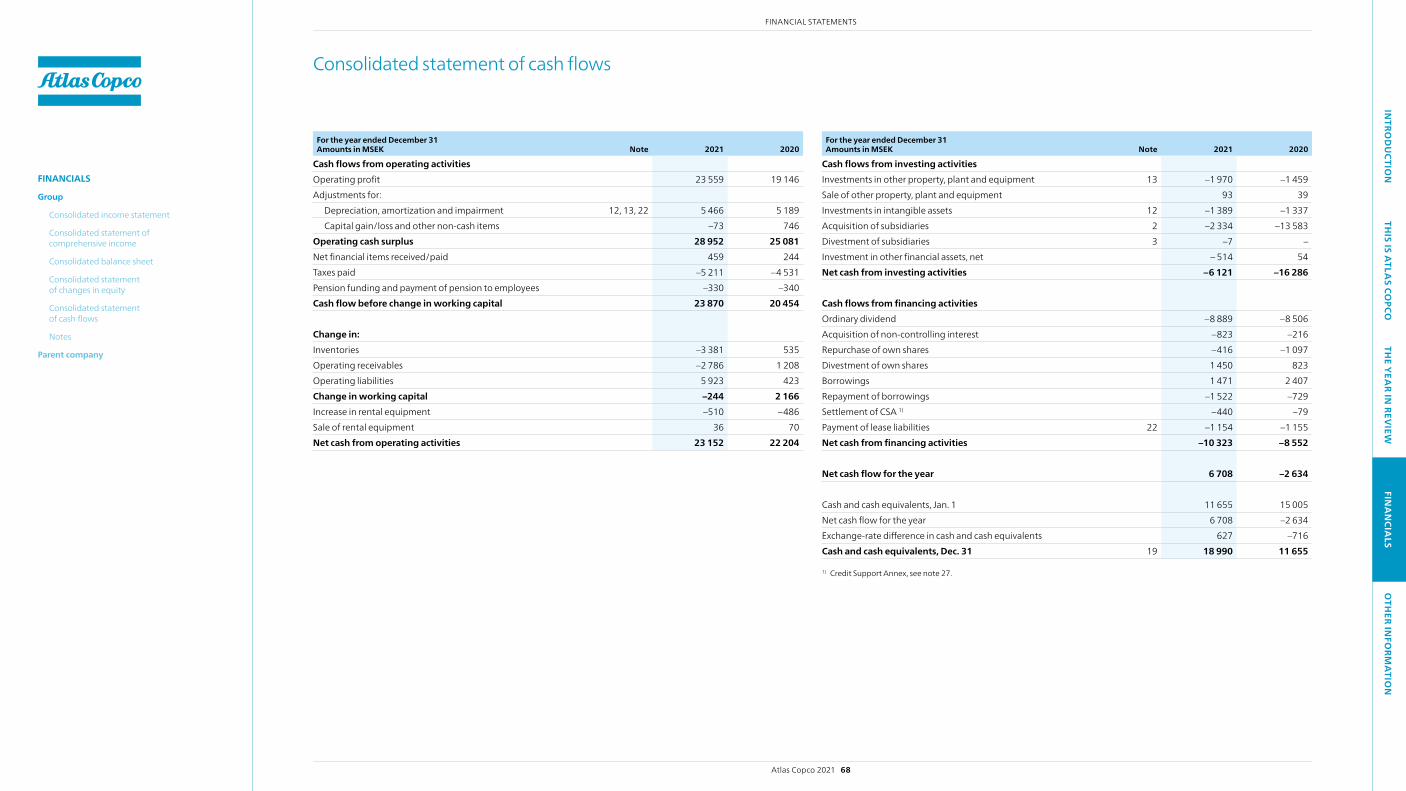
Consolidated statement of cash flows
For the year ended December 31 Amounts in MSEK Note 2021 2020
Cash flows from operating activities Operating profit 23 559 19 146 Adjustments for:
Depreciation, amortization and impairment 12, 13, 22 5 466 5 189 Capital gain/loss and other non-cash items –73 746
Operating cash surplus 28 952 25 081 Net financial items received/paid 459 244Taxes paid –5 211 –4 531 Pension funding and payment of pension to employees –330 –340 Cash flow before change in working capital 23 870 20 454
Change in: Inventories –3 381 535 Operating receivables –2 786 1 208 Operating liabilities 5 923 423 Change in working capital –244 2 166 Increase in rental equipment –510 –486 Sale of rental equipment 36 70 Net cash from operating activities 23 152 22 204
For the year ended December 31 Amounts in MSEK Note 2021 2020
Cash flows from investing activities Investments in other property, plant and equipment 13 –1 970 –1 459 Sale of other property, plant and equipment 93 39 Investments in intangible assets 12 –1 389 –1 337 Acquisition of subsidiaries 2 –2 334 –13 583 Divestment of subsidiaries 3 –7 – Investment in other financial assets, net – 514 54 Net cash from investing activities –6 121 –16 286
Cash flows from financing activities Ordinary dividend –8 889 –8 506Acquisition of non-controlling interest –823 –216Repurchase of own shares –416 –1 097Divestment of own shares 1 450 823 Borrowings 1 471 2 407 Repayment of borrowings –1 522 –729 Settlement of CSA 1) –440 –79 Payment of lease liabilities 22 –1 154 –1 155 Net cash from financing activities –10 323 –8 552
Net cash flow for the year 6 708 –2 634
Cash and cash equivalents, Jan. 1 11 655 15 005Net cash flow for the year 6 708 –2 634Exchange-rate difference in cash and cash equivalents 627 –716 Cash and cash equivalents, Dec. 31 19 18 990 11 655
1) Credit Support Annex, see note 27.
Atlas Copco 2021 68
FINANCIAL STATEMENTSIN
TROD
UCTIO
NTH
IS IS ATLA
S COPCO
THE Y
EAR IN
REVIEW
FINA
NCIA
LSO
THER IN
FORM
ATIO
N
FINANCIALS
Group
Consolidated income statement
Consolidated statement of comprehensive income
Consolidated balance sheet
Consolidated statement of changes in equity
Consolidated statement of cash flows
Notes
Parent company
1. Significant accounting principles, critical accounting estimates and judgements
SIGNIFICANT ACCOUNTING PRINCIPLESThe consolidated financial statements comprise Atlas Copco AB, the Parent Company (“the Company”), and its subsidiaries (together “the Group” or Atlas Copco) and the Group’s interest in associated companies and joint ventures. Atlas Copco AB is headquartered in Nacka, Sweden.
Basis of preparationThe consolidated financial statements have been prepared in accordance with International Financial Reporting Standards (IFRS) as endorsed by the EU. The statements are also prepared in accordance with the Swedish recommenda-tion RFR 1 “Supplementary Accounting Rules for Groups” and applicable state-ments issued by the Swedish Financial Reporting Board. These require certain addi tional disclosures for Swedish consolidated financial statements prepared in accordance with IFRS.
The accounting principles set out below have been consistently applied to all periods presented, unless otherwise stated, and for all entities included in the consolidated financial statements. The annual report for the Group and for Atlas Copco AB, including financial statements, was approved for issuance on March 2, 2022. The balance sheets and income statements are subject to approval by the Annual General Meeting of the shareholders on April 26, 2022.
Basis of consolidationThe consolidated financial statements have been prepared in accordance with the acquisition method. Accordingly, business combinations are seen as if the Group directly acquires the assets and assumes the liabilities of the entity acquired. The consolidated income statements and balance sheets of the Group include all entities in which the Company, directly or indirectly, has control.
Control exists when the Company has power over the entity, is exposed, or has rights, to variable returns from its involvement with the entity and has the ability to use its power to affect its returns. Generally, control and hence con-solidation is based on ownership. In a few exceptions, consolidation is based on agreements that give the Group control over an entity. See note A22 for information on the Group’s subsidiaries.
Intra-group balances and internal income and expense arising from intra-group transactions are fully eliminated in preparing the consolidated financial statements. Gains and losses arising from intra-group transactions that are recognized in assets, such as inventory and fixed assets, are eliminated in full, but losses only to the extent that there is no evidence of impairment.
Business combinationsAt the acquisition date, i.e. the date on which control is obtained, each identifi-able asset acquired and liability assumed is recognized at its acquisition-date fair value. The consideration transferred, measured at fair value, includes assets transferred by the Group, liabilities to the former owners of the acquiree and the equity interests issued by the Group in exchange for control of the acquiree. Any subsequent change in such fair value is recognized in profit or loss, unless the contingent consideration is classified as equity. Transactions costs that the Group incur in connection with a business combination are expensed as incurred.
Goodwill is measured as the excess of the sum of the consideration trans-ferred, the amount of any non-controlling interests in the acquiree, and the fair value of the Group’s previously held equity interest in the acquiree (if any) over the net of acquisition-date fair value amounts of the identifiable assets acquired and liabilities assumed.
Non-controlling interest is initially measured either • at fair value, or • at the non-controlling interest’s proportionate share of the fair value of
identifiable net assets. Subsequent profit or loss attributable to the non-controlling interest is allo-cated to the non-controlling interest, even if it puts the non-controlling inter-est in a deficit position. Acquisitions of non-controlling interests are recog-nized as a transaction between equity attributable to owners of the parent and non-controlling interests. The difference between consideration paid and the proportionate share of net assets acquired is recognized in equity. For details on the acquisitions made during the year, see note 2.
Associated companies and joint venturesAn associate is an entity in which the Group has significant influence, but not control, over financial and operating policies. when the Group holds 20–50% of the voting power, it is presumed that significant influence exists, unless oth-erwise demonstrated. A joint venture is an entity over which the Group has joint control, through contractual agreements with one or more parties. Investments in associated companies and joint ventures are reported accord-ing to the equity method. This means that the carrying value of interests in an associate or joint venture corresponds to the Group’s share of reported equity of the associate or joint venture, plus any goodwill, and any other remaining fair value adjustments recognized at acquisition date.
“Share of profit in associated companies and joint ventures”, included in the income statement, comprises the Group’s share of the associate’s and joint ven-ture’s income after tax adjusted for any amortization and depreciation, impair-ment losses, and other adjustments arising from any remaining fair value adjustments recognized at acquisition date. Dividends received from an associ-ated company or joint venture reduce the carrying value of the investment.
Unrealized gains and losses arising from transactions with an associate or a joint venture are eliminated to the extent of the Group’s interest, but losses only to the extent that there is no evidence of impairment of the asset. when the Group’s share of losses in an associate or a joint venture equals or exceeds its interest in the associate or joint venture, the Group does not recognize fur-ther losses unless the Group has incurred obligations or made payments on behalf of the associate.
Functional currency and foreign currency translation The consolidated financial statements are presented in Swedish krona (SEK), which is the functional currency for Atlas Copco AB and also the presentation currency for the Group’s financial reporting. Unless otherwise stated, the amounts presented are in millions Swedish krona (MSEK).
Transactions in foreign currencies are translated at the foreign exchange rate ruling at the date of the transaction. Non-monetary items carried at his-torical cost are reported using the exchange rate at the date of the transaction and non-monetary items carried at fair value are reported at the rate that existed when the fair values were determined. Tangible and intangible assets, inventory and advanced payments are examples of non-monetary items.
Receivables and liabilities and other monetary items denominated in foreign currencies are translated using the foreign exchange rate at the balance sheet date. The exchange rate gains and losses related to receivables and payables and other operating receivables and liabilities are included in “Other operating income and expenses” and foreign exchange rate gains and losses attributable to other financial assets and liabilities are included in “Financial income and
expenses”. Exchange rate differences on translation to functional currency are reported in “Other comprehensive income” in the following cases: • translation of a financial liability designated as a hedge of the net invest-
ment in a foreign operation,• translation of intra-group receivables from, or liabilities to, a foreign opera-
tion that in substance is part of the net investment in the foreign operation,• cash flow hedges of foreign currency to the extent that the hedge is
effective. In the consolidation, the balance sheets of foreign subsidiaries are translated to SEK using exchange rates at the end of the reporting period and the income statements are translated at the average rates for the reporting period. For-eign exchange differences arising on such translation are recognized in “Other comprehensive income” and are accumulated in the currency translation reserve in equity. Exchange rates for major currencies that have been used for the consolidated financial statements are shown in note 27.
Segment reportingAn operating segment is a component of the Group that engages in business activities from which it may earn revenue and incur expenses, and for which discrete financial information is available. The operating results of all operating segments are reviewed regularly by the Group’s President and CEO, the chief operating decision maker, to make decisions about allocation of resources to the segments and also to assess their performance. See note 4 for additional information.
Revenue recognitionRevenue is recognized at an amount that reflects the expected and entitled consideration for transferring goods and/or services to customers when control has passed to the customer.
Goods soldRevenue from goods sold are recognized at one point in time when control of the good has been transferred to the customer. This occurs for example when the Group has a present right to payment for the good, the customer has legal title of the good, the good has been delivered to the customer and/or the cus-tomer has the significant risks and rewards of the ownership of the good.
when the goods sold are highly customized and an enforceable right to payment is present, revenue is recognized over time using the proportion of cost incurred to date compared to estimated total cost to measure the prog-ress towards complete satisfaction of that performance obligation and thereby transferring the control of the good to the customer.
Installation services are sold together with the good or separately. The Group assesses the contract at inception, and the installation service is either consid ered as part of the performance obligation of the sale of the good or as a sepa rate performance obligation. The installation service is a separate per-formance obligation when the customer can benefit from the service either on its own or together with other resources readily available and the promise to transfer the service to the customer is separately identifiable from other prom-ises in the contract.
For buy-back commitments where the buy-back price is lower than the orig-inal selling price but there is an economic incentive for the customer to use the buy-back commitment option, the transaction is accounted for as a lease.
Atlas Copco 2021 69
FINANCIAL STATEMENTS – NOTESIN
TROD
UCTIO
NTH
IS IS ATLA
S COPCO
THE Y
EAR IN
REVIEW
FINA
NCIA
LSO
THER IN
FORM
ATIO
N
FINANCIALS
Group
Consolidated income statement
Consolidated statement of comprehensive income
Consolidated balance sheet
Consolidated statement of changes in equity
Consolidated statement of cash flows
• Notes
Parent company

Variable considerationSome contracts with customers provide a right of return, trade discounts or volume rebates. If revenue cannot be reliably measured, the Group defers rev-enue until the uncertainty is resolved. Such liabilities are estimated at contract inception and updated thereafter.
Rights of returnwhen a contract with a customer provides a right to return the good within a specified period, the Group accounts for the right of return using the expected value method. The amount of revenue related to the expected returns is deferred and recognized in the statement of financial position within “Other liabilities”. A corresponding adjustment is made to the cost of sales and recog-nized in the statement of financial position within “Inventories”.
Rendering of serviceRevenue from service is recognized over time by reference to the progress towards satisfaction of each performance obligation. The progress towards satisfaction of each performance obligation is measured by the proportion of cost incurred to date compared to estimated total cost of each performance obligation.
where the outcome of a service contract cannot be estimated reliably, reve-nue is recognized to the extent of cost incurred that are expected to be recov-erable. when it is probable that total contract costs will exceed total revenue, the expected loss is recognized as an expense immediately. when the value of the service performed to the customer corresponds directly to the right to invoice for that service, revenue is recognized to the amount invoiced.
Specialty rentalIncome from specialty rental is recognized on a straight-line basis over the rental period. The specialty rental business is considered to be a service as this includes a complete solution to the customers to fulfill the customer needs. Sale of equipment from the specialty rental business is recognized as revenue when the control of the asset has been transferred to the buyer. Indicators of transfer of control is explained under “Goods sold” see page 66. The carrying value of the specialty rental equipment sold is recognized as cost of sales. Investments in and sales of specialty rental equipment are included in cash flows from operating activities.
Contract assets and contract liabilitiesThe timing of revenue recognition, billings and cash collections results in billed account receivables, unbilled receivables (contract assets), and customer advances and deposits (contract liabilities) in the consolidated balance sheet. Billing occurs either as work progresses in accordance with agreed-upon con-tractual terms, upon achievement of contractual milestones or when the con-trol of the goods has been transferred to the customer. The Group sometimes receives advances or deposits from customers, before revenue is recognized, resulting in contract liabilities. These contract assets and contract liabilities are reported in the consolidated balance sheet, in “Other receivables” or “Other liabilities”, on a contract-by-contract basis at the end of each reporting period. Payment terms range from contract to contract and are dependent upon the agreement with the customer.
Practical expedientsThe Group has elected to apply the following practical expedients:For the disclosure of the aggregate amount of the transaction price allocated
to the performance obligations that are unsatisfied (or partially unsatisfied) at the end of the reporting period, the Group does not disclose the value related to the following expedients:• the performance obligation that is part of the contract that has an original
expected duration of one year or less, and• the entity has a right to consideration from a customer in an amount that
corresponds directly with the value to the customer of the entity’s perfor-mance completed to date.
For incremental cost of obtaining the contract, the Group uses the practical expe-dient of recognizing the incremental cost as an expense if the amortization period of the asset, that otherwise would have been recognized, is one year or less.
Other operating income and expensesGains and losses on disposals of an item of non-current tangible and intangi-ble assets are determined by comparing the proceeds from disposal with the carrying amount. See note 7 for additional information.
Government grantsGovernment grants are recognized when there is reasonable assurance that the Group will comply with the conditions attached to the grants and that the grants will be received. Government grants related to expenses are recog-nized in the income statement as a deduction of the associated expenses. If the grants cannot be allocated to an associated expense, government grants are recognized in “Other operating income”. Government grants related to assets are recognized as a deduction in arriving at the carrying amount of the asset and rec-ognized as revenue over the useful life of the asset through a reduction of the depreciation expense. See note 7 for additional information.
Financial income and expensesInterest income and interest expenses are recognized in profit or loss using the effective interest rate method. Dividend income is recognized in profit or loss on the date that the Group’s right to receive payment is established. See note 8 for additional information.
Income taxes Income taxes include both current and deferred taxes. Income taxes are reported in profit or loss unless the underlying transaction is reported in “Other comprehensive income” or in “Equity”, in which case the corresponding tax is reported according to the same principle.
A current tax liability or asset is recognized for the estimated taxes payable or refundable for the current year or prior years.
Deferred tax is recognized using the balance sheet liability method. The cal-culation of deferred taxes is based on differences between the values reported in the balance sheet and their valuation for taxation, which are referred to as temporary differences, and the carry forward of unused tax losses and tax credits. Temporary differences attributable to the following assets and liabili-ties are not provided for: • the initial recognition of goodwill,• the initial recognition (other than in business combinations) of assets or lia-
bilities that affect neither accounting nor taxable profit,• differences related to investments in subsidiaries, associated companies
and joint ventures to the extent that they will probably not reverse in the foreseeable future, and for which the Company is able to control the timing of the reversal of the temporary differences.
A deferred tax asset is recognized only to the extent that it is probable that future taxable profits will be available against which the asset can be utilized. In the calculation of deferred taxes, enacted or substantively enacted tax rates are used for the individual tax jurisdictions.
Current and deferred tax assets and liabilities are offset when there is a legally enforceable right to set off current tax assets against current tax liabili-ties and when they relate to income taxes levied by the same taxation author-ity and the Group intends to settle its current tax assets and liabilities on a net basis. For details regarding taxes, see note 9.
Earnings per shareBasic earnings per share are calculated based on the profit for the year attribut-able to owners of the parent and the basic weighted average number of shares outstanding. Diluted earnings per share are calculated based on the profit for the year attributable to owners of the parent and the diluted weighted aver-age number of shares outstanding. Dilutive effects arise from stock options that are settled in shares, or that at the employees’ choice can be settled in shares or cash in the share-based incentive programs.
Stock options have a dilutive effect when the average share price during the period exceeds the exercise price of the options. when calculating the dilutive effect, the exercise price is adjusted by the value of future services related to the options. If options for which employees can choose settlement in shares or cash are dilutive, the profit for the year is adjusted for the difference between cash-settled and equity-settled treatment of options and the more dilutive of cash settlement and share settlement is used in calculating earnings per share. See note 11 for more details.
Intangible assetsGoodwill Goodwill is recognized at cost, as established at the date of acquisition of a business (see “Business combinations”), less accumulated impairment losses, if any. Goodwill is allocated to the cash-generating units (CGU) that are expected to benefit from the synergies of the business combination. Impairment testing is made at least annually and whenever the need is indicated. The impairment test is performed at the level on which goodwill is monitored for internal man-agement purposes. The four business areas of Atlas Copco’s operations have been identified as CGUs. Goodwill is reported as an intangible asset with indef-inite useful life.
Technology-based intangible assetsExpenditure on research activities is expensed as incurred. Research projects acquired as part of business combinations are initially recognized at their fair value at the acquisition date. Subsequent to initial recognition, these research projects are carried at cost less amortization and impairment losses. Expendi-ture on development activities are expensed as incurred unless the activities meet the criteria for being capitalized i.e.:• the product or process being developed is estimated to be technically
and commercially feasible, and • the Group has the intent and ability to complete and sell or use the
product or process. The expenditure capitalized includes the cost of materials, direct labor, and other costs directly attributable to the project. Capitalized development expenditure is carried at cost less accumulated amortization and impairment losses. Amortization related to research and development expenditure for
1. Significant accounting principles, critical accounting estimates and judgements, continued
Atlas Copco 2021 70
FINANCIAL STATEMENTS – NOTESIN
TROD
UCTIO
NTH
IS IS ATLA
S COPCO
THE Y
EAR IN
REVIEW
FINA
NCIA
LSO
THER IN
FORM
ATIO
N
FINANCIALS
Group
Consolidated income statement
Consolidated statement of comprehensive income
Consolidated balance sheet
Consolidated statement of changes in equity
Consolidated statement of cash flows
• Notes
Parent company

2021 amounted to 1 028 (975). This has been reported as part of research and development costs in the income statement since the Group follows up on the research and development function as a whole.
TrademarksTrademarks acquired by the Group are capitalized based on their fair value at the time of acquisition. Certain trademarks are estimated to have an indefi-nite useful life and are carried at cost less accumulated impairment losses. They are tested at least annually for impairment. Other trademarks, which have finite useful lives, are carried at cost less accumulated amortization and impairment losses.
Marketing and customer related intangible assetsAcquired marketing and customer related intangibles are capitalized based on their fair value at the time of acquisition and are carried at cost less accu-mulated amortization and impairment losses.
Other intangible assetsAcquired intangible assets relating to contract-based rights, such as licenses or franchise agreements, are capitalized based on their fair value at the time of acquisition and carried at cost less accumulated amortization and impair-ment losses. Expenditure on internally generated goodwill, trademarks and similar items is expensed as incurred. Changes in the Group’s intangible assets during the year are described in note 12.
Property, plant and equipment Items of property, plant and equipment are carried at cost less accumulated depreciation and impairment losses. Cost of an item of property, plant and equipment comprises purchase price, import duties, and any cost directly attributable to bringing the asset to the location and condition for use. The cost also includes dismantlement and removal of the asset in the future if applicable. Borrowing cost for assets that need a substantial period of time to get ready for their intended use are included in the cost value until the assets are substantially ready for their use or sale and are thereafter depreciated over the useful life of the asset. The Group capitalizes costs on initial recogni-tion and on replacement of significant parts of property, plant and equip-ment if it is probable that the future economic benefits embodied will flow to the Group and the cost can be measured reliably. All other costs are recog-nized as an expense in profit or loss when incurred. Changes in the Group’s property, plant and equipment during the year are described in note 13.
Rental equipmentThe rental fleet is comprised of diesel and electric powered air compressors, generators, air dryers, and to a lesser extent general construction equipment. Rental equipment is initially recognized at cost and is depreciated over the estimated useful lives of the equipment. Rental equipment is depreciated to a residual value estimated at 0–10% of cost.
Depreciation and amortization Depreciation and amortization are calculated based on cost using the straight-line method over the estimated useful life of the asset. Parts of prop-erty, plant and equipment with a cost that is significant in relation to the total cost of the item are depreciated separately when the useful lives of the parts do not coincide with the useful lives of other parts of the item. The following useful lives are used for depreciation and amortization:
Technology-based intangible assets 3–15 yearsTrademarks with finite lives 5–15 years Marketing and customer related intangible assets 5–15 yearsBuildings 25–50 yearsMachinery and equipment 3–10 yearsVehicles 4–5 yearsComputer hardware and software 3–10 yearsRental equipment 3–8 years
The useful lives and residual values are reassessed annually. Land, assets under construction, goodwill, and trademarks with indefinite lives are not depreci-ated or amortized.
LeasesGroup as lesseeRecognition of a leaseUpon initiation, contracts are assessed by the Group, to determine whether a contract is, or contains a lease. If the contract conveys the right to control the use of an identified asset for a certain period of time in exchange for consideration, then it is or contains a lease. The right to control the use of an identifiable asset is assessed by the Group based upon if there is an identifiable asset, if the Group has the right to obtain substantially all economic benefits from the use of the asset and if the Group has the right to steer the use of the asset. The Group has elected to separate the non-lease components and apply a number of practical expedi-ents with regard to short-term leases and leases for which the underlying asset is of low value. In cases where the Group acts as an intermediate lessor, it accounts for its interests in the head-lease and the sub-lease separately.
Measurement of a right-of-use asset and lease liabilityRight-of-use assetOn commencement date, the Group measures the right-of-use asset at cost, which includes the following: the initial amount of the lease liability adjusted for any lease payments made at or before the commencement date, less any lease incentives received and any initial direct costs incurred by the Group as well as an estimate of costs to be incurred by the Group in dismantling and removing the underlying asset, restoring the site on which it is located or restoring the under-lying asset to the condition required by the lease contract. Cost for dis mantling, removing or restoring the site on which it is located and/or the unde rlying asset is only recognized when the Group incurs an obligation to do so.
The right-of-use asset is depreciated over the lease term, using the straight-line method. Changes in the Group’s right-of-use asset during the year is described in note 22.
Lease liabilityOn commencement date, the lease liability is measured at the present value of the unpaid lease payments, discounted using the interest rate implicit in the lease, or if the rate cannot be readily determined, the Group’s incremental bor-rowing rate. Lease payments included in the lease liability comprise of fixed payments, variable lease payments that depend on an index or a rate, amounts to be paid under a residual value guarantee and lease payments in an optional renewal period if the Group is reasonably certain to exercise an extension option as well as penalties for early termination of a lease, if the Group is rea-sonably certain to terminate early. If there is a purchase option present, this will be included if the Group is reasonably certain to exercise the option.
The lease liability is measured at amortized cost by using the effective interest rate method. For additional information see note 21.
Short-term leases and leases for which the underlying asset is of low valueThe Group has elected to apply recognition exemptions for short-term leases and leases for which the underlying asset is of low value, for example office equipment such as printers and computers. Lease payments associated with those leases are recognized as an expense on a straight-line basis over the lease term.
Group as a lessorAt inception of a lease contract, the Group assess whether the lease is a finance lease or an operating lease. If the lease transfers substantially all of the risks and rewards incidental to ownership of the asset, it is considered to be a finance lease; if not, it is an operating lease. Under finance leases where the Group acts as lessor, the transaction is recognized as a sale and a lease receiv-able, comprising the future minimum lease payments and any residual value guaranteed to the Group. Lease payments are recognized as repayment of the lease receivable and interest income. In cases where the Group acts as a lessor under an operating lease, the lease payments are included in profit or loss on a straight-line basis over the term of the lease.
In cases where the Group acts as an intermediate lessor, it accounts for its interests in the head-lease and the sub-lease separately. The Group assesses the lease classification of a sub-lease with reference to the right-of-use asset arising from the head-lease.
Impairment of non-financial assetsThe carrying values of the Group’s non-financial assets are reviewed at least at each reporting date to determine whether there is any indication of impair-ment. If any such indication exists, the Group estimates the recoverable amount of the asset. An impairment loss is recognized if the carrying amount of an asset or its cash-generating unit (CGU) exceeds its recoverable amount (i.e. the greater of fair value less costs to sell and value in use). In assessing the value in use, the estimated future cash flows are discounted to their present value using a discount rate that reflects current market assessments of the time value of money and the risks specific to the asset or CGU. For the purpose of assessing impairment, assets are grouped in CGUs, which are the smallest identifiable groups of assets that generate cash inflows that are largely inde-pendent of the cash inflows from other assets or group of assets. Impairment losses are recognized in profit or loss. An impairment loss related to goodwill is not reversed. In respect of other assets, impairment losses in prior periods are reviewed for possible reversal of the impairment at each reporting date.
InventoriesInventories are valued at the lower of cost and net realizable value. Net realiz-able value is the estimated selling price for inventories less all estimated costs of completion and costs necessary to make the sale. Inventories are recognized according to the first-in, first-out principle and includes the cost of acquiring inventories and bringing them to their existing location and condition. Inven-tories manufactured by the Group and work in progress include an appropri-ate share of production overheads based on normal operating capacity. Inven-tories are reported net of deductions for obsolescence and internal profits aris-ing in connection with deliveries from the production companies to the cus-tomer centers. See note 16 for more details.
1. Significant accounting principles, critical accounting estimates and judgements, continued
Atlas Copco 2021 71
FINANCIAL STATEMENTS – NOTESIN
TROD
UCTIO
NTH
IS IS ATLA
S COPCO
THE Y
EAR IN
REVIEW
FINA
NCIA
LSO
THER IN
FORM
ATIO
N
FINANCIALS
Group
Consolidated income statement
Consolidated statement of comprehensive income
Consolidated balance sheet
Consolidated statement of changes in equity
Consolidated statement of cash flows
• Notes
Parent company
Equity Shares issued by the company are classified as equity. Incremental costs directly attributable to the issue of ordinary shares and share options are recognized as a deduction from equity, net of any tax effect.
when Atlas Copco shares are repurchased, the amount of the consideration paid is recognized as a deduction from equity net of any tax effect. Repur-chased shares are classified as treasury shares and are presented as a deduc-tion from total equity. when treasury shares are sold or subsequently reissued, the amount received is recognized as an increase in equity and the resulting surplus or deficit on the transaction is transferred to or from Other paid-in capital.
Supply chain financingThe Group and Banks, with close relations to Atlas Copco, offer suppliers the opportunity to use a supply chain financing scheme (SCF) which allows them to be paid earlier than the invoice due date. The Group evaluates supplier arrangements against a number of indicators to assess if the payable contin-ues to hold characteristics of a trade payable or should be classified as borrow-ings; these indicators include whether the payment terms exceed customary payment terms in the industry. These transactions have been recognized as either “Account payables” or “Borrowings” in the Group’s balance sheet and as “Change in operating liabilities” or change in “Borrowings” or “Repayment of borrowings” in the statement of cash flows.
ProvisionsProvisions are recognized:• when the Group has a legal or constructive obligation as a result of a
past event, • it is probable that the Group will have to settle the obligation, and • the amount of the obligation can be estimated reliably. The amount recognized as a provision is the best estimate of the consideration required to settle the present obligation at the balance sheet date.
If the effect of the time value of money is material, the provision is determined by discounting the expected future cash flows of estimated expenditures.
Provisions for product warranties are recognized as cost of sales at the time the products are sold based on the estimated cost using historical data for level of repairs and replacements.
A restructuring provision is recognized when the Group has approved a detailed and formal restructuring plan and the restructuring has either com-menced or been announced publicly.
Present obligations arising under onerous contracts are recognized as pro-visions. An onerous contract is considered to exist where the Group has a con-tract under which the unavoidable costs of meeting the obligations under the contract exceed the economic benefits expected to be received from the con-tract. Before a provision is established, the Group recognizes any impairment loss on the asset associated with the contract. For details on provisions see note 25.
Post-employment benefitsPost-employment benefit plans are classified either as defined contribution or defined benefit plans. Under a defined contribution plan, the Group pays fixed contributions into a separate entity and will have no legal or constructive obli-gation to pay further amounts if the fund does not hold sufficient assets to pay all employee benefits. Contributions to defined contributions plans are
expensed when employees provide services entitling them to the contribution. Other post-employment benefit plans are defined benefit plans and it is the
Group’s obligation to provide agreed benefits to current and former employ-ees. The net obligation of defined benefit plans is calculated by estimating the amount of future benefits that employees have earned in return for their ser-vices in current and prior periods. The amount is discounted to determine its present value and the fair values of any plan assets are deducted. Funded plans with net assets, i.e. plans with assets exceeding the commitments, are reported as financial non-current assets.
The cost for defined benefit plans is calculated using the Projected Unit Credit Method, which distributes the cost over the employee’s service period. The calculation is performed annually by independent actuaries using actuarial assumptions such as employee turnover, mortality, future increase in salaries and medical cost. Changes in actuarial assumptions, experience adjustments of obligations and changes in fair value of plan assets result in remeasurements and are recognized in “Other comprehensive income”. Each quarter a remea-surement is performed to adjust the present value of pension liabilities and the fair value of pension assets against “Other comprehensive income”. Net interest on defined benefit obligations and plan assets is reported as “Interest income” or “Interest expense”. See note 23 for additional information.
Share-based compensation The Group has share-based incentive programs, consisting of share options and share appreciation rights, which have been offered to certain employees based on position and performance. Additionally, the Board is offered synthetic shares.
The fair value of share options that can only be settled in shares (equity- settled) is recognized as an employee expense with a corresponding increase in equity. The fair value, measured at grant date using the Black-Scholes formula, is recognized as an expense over the vesting period. The amount recognized as an expense is adjusted to reflect the actual number of share options that vest.
The fair value of the share appreciation rights, synthetic shares, and options with a choice for employees to settle in shares or cash is recognized in accordance with principles for cash-settled share-based payments. The value is recognized as an employee expense with a corresponding increase in liabili-ties. The fair value, measured at grant date and remeasured at each reporting date using the Black-Scholes formula, is accrued and recognized as an expense over the vesting period. Changes in fair value are, during the vesting period and after the vesting period until settlement, recognized in profit or loss as an employee expense. The accumulated expense recognized equals the cash amount paid at settlement.
Social security charges are paid in cash and are accounted for in consistence with the principles for cash-settled share-based payments, regardless of whether they are related to equity- or cash-settled share-based payments. See note 23 for details.
Financial assets and liabilities – financial instruments Recognition and derecognitionFinancial assets and liabilities are recognized when the Group becomes a party to the contractual provision of the instrument. Transactions of financial assets are accounted for at trade date, which is the day when the Group contractually commits to acquire or dispose of the assets. Trade receivables are recognized on issuance of invoices. Liabilities are recognized when the other party has performed and there is a contractual obligation to pay. Derecognition, fully or
partially, of a financial asset occurs when the rights in the contract have been realized or matured, or when the Group no longer has control over it. A finan-cial liability is derecognized, fully or partially, when the obligation specified in the contract is discharged or otherwise expires. A financial asset and a financial liability are offset and the net amount presented in the balance sheet when there is a legal right to offset the recognized amounts and there is an intention to either settle on a net basis or to realize the asset and settle the liability simul-taneously.
Gains and losses from derecognition and modifications are recognized in profit or loss.
Measurement of financial instrumentsFinancial instruments are classified at initial recognition. The classification decides the measurement of the instruments.
Classification and measurement of financial assetsEquity instruments: are classified at fair value through profit or loss (FVTPL).
Derivative instruments: are classified at FVTPL, unless they are classified as a hedging instrument and the effective part of the hedge is recognized in “Other comprehensive income”.
Debt instruments: the classification of financial assets that are debt instru-ments, including hybrid contracts, is based on the Group’s business model for managing the assets and the asset’s contractual cash flow characteristics. The instruments are classified at:• amortized cost,• fair value through “Other comprehensive income” (FVOCI), or• fair value through profit or loss (FVTPL). Financial assets at amortized cost are at initial recognition measured at fair value including transaction costs. After initial recognition, they are measured at amortized cost using the effective interest rate method. Assets classified at amortized cost are held under the business model of collecting the contractual cash flows that are solely payments of principal and interest on the principal amount outstanding. The assets are subject to a loss allowance for expected credit losses.
Fair value through “Other comprehensive income” (FVOCI) are assets held under the business model of both selling and collecting the contractual cash flows that are solely payments of principal and interest on the principal amount outstanding. Financial instruments in this category are recognized at fair value at initial recognition and changes in fair value are recognized in “Other compre-hensive income” (OCI) until derecognition, when the amounts in OCI are reclas-sified to profit or loss. The assets are subject to a loss allowance for expected credit losses.
Fair value through profit or loss (FVTPL) are all other debt instruments that are not measured at amortized cost or FVOCI. Financial instruments in this cat-egory are recognized at fair value at initial recognition and changes in fair value are recognized in profit or loss.
Classification and measurement of financial liabilitiesFinancial liabilities are classified at amortized cost, except derivatives. Financial liabilities at amortized cost are at initial recognition measured at fair value including transaction costs. After initial recognition, they are measured at the effective interest rate method.
1. Significant accounting principles, critical accounting estimates and judgements, continued
Atlas Copco 2021 72
FINANCIAL STATEMENTS – NOTESIN
TROD
UCTIO
NTH
IS IS ATLA
S COPCO
THE Y
EAR IN
REVIEW
FINA
NCIA
LSO
THER IN
FORM
ATIO
N
FINANCIALS
Group
Consolidated income statement
Consolidated statement of comprehensive income
Consolidated balance sheet
Consolidated statement of changes in equity
Consolidated statement of cash flows
• Notes
Parent company
Derivatives are classified at FVTPL, unless they are classified as a hedging instrument and the effective part of the hedge is recognized in “Other comprehensive income”.
Fair value for financial assets and financial liabilities is determined in the manner described in note 27.
Impairment of financial assetsFinancial assets, except those classified at fair value through profit and loss (FVTPL), are subject to impairment for expected credit losses. In addition, the impairment model applies to contract assets, loan commitments and financial guarantees that are not measured at FVTPL. The IFRS 9 expected credit loss (ECL) model is forward looking and a loss allowance is recognized when there is an exposure to credit risk, usually at first recognition of an asset or receivable. The ECL reflects the present value of all cash shortfalls related to default events either over the following 12 months or over the expected life of a financial instrument, depending on the type of asset and on the credit deterioration from inception. The ECL reflects an unbiased, probability-weighted outcome that considers mul-tiple scenarios based on reasonable and supportable forecasts.
The simplified model is applied on trade receivables, lease receivables, con-tract assets and certain other financial receivables. A loss allowance is recog-nized over the expected lifetime of the receivable or asset. For other items sub-ject to ECL, the impairment model with a three-stage approach is applied. Ini-tially, and at each reporting date, a loss allowance will be recognized for the following 12 months, or a shorter time period depending on the time to matu-rity (stage 1). If it has been a significant increase in credit risk since origination, a loss allowance will be recognized for the remaining lifetime of the asset (stage 2). For assets that are considered as credit impaired, allowance for credit losses will continue to capture the lifetime expected credit losses (stage 3). For credit impaired receivables and assets, the interest revenue is calculated based on the carrying amount of the asset, net of the loss allowance, rather than its gross carrying amount as in previous stages.
In the respective model applied, the measurement of ECL is based on differ-ent methods for different credit risk exposures. For trade receivables, contract assets and certain other financial receivables, the method is based on historical loss rates in combination with forward looking considerations. Lease receiv-ables, certain other financial receivables and cash and cash equivalent are impaired by a rating method, where ECL is measured by the product of the probability of default, loss given default, and exposure at default. Both external credit agencies rating and internally developed rating methods are applied.
The measurement of ECL considers potential collaterals and other credit enhancements in the form of guarantees.
The financial assets are presented in the financial statements at amortized cost, i.e. net of gross carrying amount and the loss allowance. Changes in the loss allowance is recognized in profit or loss, as impairment losses within the line cost of sales.
Derivatives and hedge accountingDerivatives are initially recognized at fair value on the date a derivative con-tract is entered into and are subsequently measured at fair value. The method of recognizing the resulting gain or loss depends on whether the derivative is designated as a hedging instrument, and if so, the nature of the item hedged. Changes in fair value for derivatives that do not fulfill the criteria for hedge accounting are recognized as operating or financial transactions based on the purpose of the use of the derivative. Interest payments for interest rate swaps
are recognized as interest income or expense, whereas changes in fair value of future payments are presented as gains or losses from financial instruments. IFRS 9 Hedge accounting is applied. In order to qualify for hedge accounting the hedging relationship must be:• formally identified and designated,• expected to fulfil the effectiveness requirements, and• documented.The Group assesses, evaluates, and documents effectiveness both at hedge inception and on an ongoing basis. Hedge effectiveness is assessed by an anal-ysis of the economic relationship between the hedged item and the hedging instrument, and the effect of credit risk must not dominate the value changes’ that result from that economic relationship. Further, the hedge ratio, as defined in the Group s risk management strategy, must be the same in the hedging relationship as in the actually hedge performed.
Cash flow hedges: Changes in the fair value of the hedging instrument are rec-ognized in “Other comprehensive income” to the extent that the hedge is effective and the accumulated changes in fair value are recognized as a sepa-rate component in equity. Gains or losses relating to the ineffective part of hedges are recognized immediately in profit or loss.
The amount recognized in equity through “Other comprehensive income” is reversed to profit or loss in the same period in which the hedged item affects profit or loss. when the hedged forecast transaction results in the recognition of a non-financial asset or a non-financial liability, the amount previously rec-ognized in other comprehensive income and accumulated in equity is trans-ferred from equity and included in the initial measurement of the cost of the non-financial asset or liability. The Group uses foreign currency forwards to hedge part of the future cash flows from forecasted transactions in foreign currencies. Interest rate swaps can also be used as cash flow hedges for hedg-ing interest on borrowings with variable interest.
Hedge of net investments in foreign operations: The Group hedges a substan-tial part of net investments in foreign operations. Changes in the value of the hedge instrument relating to the effective portion of the hedge are recog-nized in “Other comprehensive income” and accumulated in equity. Gains or losses relating to the ineffective portion are recognized immediately in profit or loss. On divestment of foreign operations, the gain or loss accumulated in equity is recycled through profit or loss, increasing or decreasing the profit or loss on the divestment. The Group uses loans and forward contracts as hedg-ing instruments.
Accounting for discontinuation of hedges: Hedge accounting may not be voluntarily discontinued. Hedge accounting is discontinued: • when the hedging instrument expires or is sold, terminated, or exercised, • when there is no longer an economic relationship between the hedged
item and the hedging instrument or the effect of credit risk dominates the value changes that result from the economic relationship, or
• when the hedge accounting no longer meets the risk management objectives.
For cash flow hedges, any gain or loss recognized in “Other comprehensive income” and accumulated in equity at the time of hedge discontinuation remains in equity and is recognized when the forecast transaction is ultimately recognized in profit or loss. when a forecast transaction is no longer expected to occur, the gain or loss accumulated in equity is recognized immediately in
profit or loss. For net investment hedges, any gain and loss recognized in “Other comprehensive income” and accumulated in equity at the time of hedge dis-continuation remains in equity until divestment of foreign operations, when the gain or loss accumulated in equity is recycled through profit or loss.
Assets held for sale Assets are classified as held for sale if their value, within one year, will be recovered through a sale and not through continued use in the operations. On the reclassification date, assets and liabilities are measured at the lower of fair value less selling expenses and the carrying amount. Gains and losses recognized on remeasurement and disposal are reported in profit or loss. In the balance sheet assets held for sale and associated liabilities are reported separately, the comparative period is not affected.
Contingent liabilities A contingent liability is a possible obligation or a present obligation that arises from past events that is not reported as a liability or provision, due either to that it is not probable that an outflow of resources will be required to settle the obli-gation or that a sufficiently reliable calculation of the amount cannot be made.
New or amended accounting standards in 2021 The following new or amended IFRS standards have been applied by the Group from 2021, with none, or no material impact on the Group.
Leases Covid-19 Related Rent Concessions beyond 30 June 2021 (Amendment to IFRS 16)The amendment provided relief to lessees from applying IFRS 16 guidance on lease modification accounting for rent concessions arising as a direct conse-quence of the Covid-19 pandemic. As a practical expedient, a lessee may elect not to assess whether a Covid-19 related rent concession from a lessor is a lease modification. A lessee that made this election accounted for any change in lease payments resulting from Covid-19 related rent concession in the same way as it would account for the change under IFRS 16 if the change was not a lease modification. The IASB extended the period of application of the practi-cal expedient to June 30, 2022.
Interest Rate Benchmark Reform – Phase 2 (Amendments to IFRS 9, IAS 39, IFRS 7, IFRS 4 and IFRS 16)The amendments to IFRS 9 introduce a practical expedient if a modification of contractual cash flows of a financial asset or a financial liability is necessary as a direct consequence of the IBOR reform and occurs on an “economically equiv-alent” basis. In those cases, changes will be accounted for by updating the effective interest rate. The amendments to IFRS 16 introduce a similar practical expedient when accounting for lease modifications required by the IBOR reform. The practical expedient allows a remeasurement of the lease liability by using the revised discount rate. The amount of the remeasurement is recog-nized as an adjustment to the right-of-use asset.
Configuration or Customization Costs in a Cloud Computing Arrangement (IAS 38)In April 2021, International Financial Reporting Interpretations Committee (IFRS IC) published an agenda decision on accounting for cloud computing costs. The new guidance addresses configuration and customization costs on a supplier’s application in a cloud arrangement. The agenda decision should be
1. Significant accounting principles, critical accounting estimates and judgements, continued
Atlas Copco 2021 73
FINANCIAL STATEMENTS – NOTESIN
TROD
UCTIO
NTH
IS IS ATLA
S COPCO
THE Y
EAR IN
REVIEW
FINA
NCIA
LSO
THER IN
FORM
ATIO
N
FINANCIALS
Group
Consolidated income statement
Consolidated statement of comprehensive income
Consolidated balance sheet
Consolidated statement of changes in equity
Consolidated statement of cash flows
• Notes
Parent company

applied retrospectively and implies that depending on facts and circum-stances, some costs should be recognized as operating expenses when the work is performed. The new guidance is not expected to have any significant effect on the Group.
New or amended accounting standards effective after 2021The following standards, interpretations, and amendments have been issued but were not effective as of December 31, 2021 and in some cases had not been adopted by the EU. The Group has not applied the new standards, inter-pretations or amendments. The current assessment is that these amendments will have none or no material effect on the Group.
Reference to the Conceptual Framework (Amendment to IFRS 3)The amendments mainly relate to updated references in IFRS 3 as a conse-quence of previous amendments in the Conceptual Framework. Further, a new exception is introduced for obligations and contingent liabilities within the scope of IAS 37 and IFRIC 21. Finally, the amendment adds an explicit state-ment that an acquirer should not recognize any contingent assets acquired in a business combination. The amendments are effective for business combina-tions for which the date of acquisition is on or after January 1, 2022.
Proceeds before Intended Use (Amendment to IAS 16)The amendments clarify that any proceeds from selling items produced before the property, plant and equipment is available for use, shall not be deducted from the cost of that property, plant and equipment. Consequently, an entity recognizes such sales proceeds and related costs in profit or loss. The amend-ments also clarify the meaning of ‘testing whether an asset is functioning properly’ and that IAS 2 Inventories is applicable for measuring those costs to proceed. The amendments are effective for annual periods beginning on or after January 1, 2022.
Onerous Contracts—Cost of Fulfilling a Contract (Amendment to IAS 37)The amendments specify that the ‘cost of fulfilling’ a contract comprises both incremental costs of fulfilling that contract and an allocation of other costs that relate directly to fulfilling that contract. The amendments apply to contracts for which the entity has not yet fulfilled all its obligations at the beginning of the annual reporting period in which the entity first applies the amendments. Comparatives are not restated. The amendments are effective for annual periods beginning on or after January 1, 2022.
Annual Improvements to IFRS Standards 2018-2020 (Amendments to IFRS 1, IFRS 9, IFRS 16 and IAS 41)The amendments to IFRS 9 clarify which liabilities that shall be included in apply-ing the ‘10 per cent test’ to assess whether to derecognize a financial liability.
The amendments to illustrative example 13 accompanying IFRS 16 remove the text related to reimbursement of leasehold improvements. The other Annual Improvements related to IFRS 1 and IAS 41 are not impacting the Group. The amendments are effective for annual periods beginning on or after January 1, 2022.
IFRS 17 Insurance ContractsIFRS 17 establishes the principles for the recognition, measurement, presenta-tion, and disclosure of insurance contracts and supersedes IFRS 4 Insurance Contracts. Some contracts that have not been within the scope of IFRS 4, may
1. Significant accounting principles, critical accounting estimates and judgements, continued
be applicable within the scope of IFRS 17 and therefore the Group is investigat-ing the possible effects of IFRS 17. The Group has a wholly owned captive. Intra-group transactions are eliminated upon consolidation. The reinsurance contracts that the captive holds with the third-party reinsurer are not reinsur-ance contracts according to the definition within IFRS 17, instead the Group is the policyholder in that relationship. Hence, the contracts are not in scope of IFRS 17. IFRS 17 also outlines that some fixed fee service contracts can meet the definition of insurance contracts. If specified conditions are met, the Group however can choose to apply IFRS 15 instead of IFRS 17 to such contracts that it issues. IFRS 17 is effective for annual reporting periods beginning on or after January 1, 2023. The Group’s current estimate is that IFRS 17 will have no mate-rial effect. The Group is still assessing the effect of IFRS 17 and will continue to assess the effect during 2022.
Classification of Liabilities as Current or Noncurrent (Amendment to IAS 1)The amendments to IAS 1 affect the presentation of liabilities as current or non-current in the statement of financial position. The classification of liabili-ties as current or non-current should be based on rights that are in existence at the end of the reporting period. The classification is unaffected by expecta-tions about whether an entity will or will not exercise its right to defer settle-ment of a liability. The amendments are applied retrospectively for annual periods beginning on or after January 1, 2023.
Disclosure of Accounting Policies (Amendments to IAS 1 and IFRS Practice Statement 2)The amendments change the requirements in IAS 1 regarding disclosure of accounting policies. The amendments replace the term ‘significant accounting policies’ with ‘material accounting policy information’. Accounting policy information is material if, when considered together with other information included in an entity’s financial statements, it can reasonably be expected to influence decisions that the primary users of general purpose financial state-ments make on the basis of those financial statements. Amendments to IAS 1 also clarify that accounting policy information that relates to immaterial trans-actions, other events or conditions is immaterial and need not be disclosed. Accounting policy information may be material because of the nature of the related transactions, other events or conditions, even if the amounts are imma-terial. Further, the guidance and examples have been developed to explain and demonstrate the application of the materiality criteria on disclosures of accounting policy information described in IFRS Practice Statement 2. The amendments to IAS 1 are effective for annual periods beginning on or after January 1, 2023. The amendments to IFRS Practice Statement 2 do not contain an effective date or transition requirements.
Definition of Accounting Estimates (Amendment to IAS 8)The amendments to IAS 8 include a change to the definition of accounting estimates. Under the new definition, accounting estimates are “monetary amounts in financial statements that are subject to measurement uncer-tainty”. The definition of a change in accounting estimates was deleted and the concept of changes in accounting estimates in the Standard has been clari-fied. The amendments are effective for annual periods beginning on or after January 1, 2023.
Deferred Tax related to Assets and Liabilities arising from a Single Transaction (Amendment to IAS 12)The amendments introduce an exception from the initial recognition of deferred tax for a transaction that gives rise to an asset or liability, if certain cri-teria are met. The amendments clarify that the exception is not applicable for transactions that give rise to equal taxable and deductible temporary differ-ences. This may for example arise upon recognition of a lease liability and the corresponding right-of-use asset applying IFRS 16 at the commencement date of a lease. Another example may be provisions for estimated future costs of dismantling, removal and restoration, recognized as part of Property, plant and equipment. The amendments are applied retrospectively for annual periods beginning on or after January 1, 2023.
CRITICAL ACCOUNTING ESTIMATES AND JUDGEMENTS The preparation of financial reports requires management’s judgement and the use of estimates and assumptions that affects the amounts reported in the consolidated financial statements. These estimates and associated assumptions are based on historical experience and various other factors that are believed to be reasonable under the prevailing circumstances. Actual result may differ from those estimates. The estimates and assumptions are reviewed on an on-going basis. Changes in accounting estimates are recog-nized in the period which they are revised in and in any future periods affected.
The estimates and the judgements which, in the opinion of management, are significant to the underlying amounts included in the financial reports and for which there is a significant risk that future events or new information could entail a change in those estimates or judgements are as follows:
Revenue recognitionKey sources of estimation uncertaintyRevenue for services and for highly customized goods where an enforceable right of payment is present is recognized over time in profit or loss by refer-ence to the progress towards satisfaction of the performance obligation at the balance sheet date. The progress towards satisfaction is determined by the proportion of cost incurred to date compared to the estimated total cost of each performance obligation. There is always an uncertainty if the total estimated expenditure is correctly calculated, and if the expenditure incurred reflects accurately the actual costs incurred, which means that there is uncer-tainty in the estimates of the degree of completion of the work performed. Management has assessed this method of determining the progress towards satisfaction of the performance obligation as most suitable as it reflects the progression of work performed, and the enforceable right of payment from the customer as the costs are incurred on the performance obligations.
Revenue for goods sold is recognized in profit or loss at one point in time when control of the good has been transferred to the customer.
Accounting judgementManagement’s judgement is used, for instance, when assessing:• the degree of progress towards satisfaction of the performance obligations
and the estimated total costs for such contracts when revenue is recog-nized over time, to determine the revenue and cost to be recognized in the current period, and whether any losses need to be recognized,
Atlas Copco 2021 74
FINANCIAL STATEMENTS – NOTESIN
TROD
UCTIO
NTH
IS IS ATLA
S COPCO
THE Y
EAR IN
REVIEW
FINA
NCIA
LSO
THER IN
FORM
ATIO
N
FINANCIALS
Group
Consolidated income statement
Consolidated statement of comprehensive income
Consolidated balance sheet
Consolidated statement of changes in equity
Consolidated statement of cash flows
• Notes
Parent company

• if the control has been transferred to the customer (for example the Group has a present right to payment for the good, the customer has legal title of the good, the good has been delivered to the customer and/or the customer has the significant risks and rewards of the ownership of the good), to deter-mine if revenue and cost should be recognized in the current period,
• the transaction price of each performance obligation when a contract includes more than one performance obligation, to determine the revenue and cost to be recognized in the current period,
• certain contracts which include a right of return and/or volume rebates that give rise to variable consideration, variable consideration is assessed to identify possible constrains, and
• the customer credit risk (i.e. the risk that the customer will not meet the payment obligation), to determine and justify the revenue recognized in the current period.
Impairment of goodwill, other intangible assets and other long-lived assetsKey sources of estimation uncertaintyGoodwill and certain trademarks are not amortized but are subject to annual tests for impairment. Other intangible assets and other long-lived assets are amortized or depreciated based on management’s estimates of the period that the assets will generate revenue but are also reviewed regularly for indica-tions of impairment.
The impairment tests are based on a review of the recoverable amount, which is estimated based on management’s projections of future cash flows using internal business plans and forecasts.
Accounting judgementAsset impairment requires management’s judgement, particularly in assessing: • whether an event has occurred that may affect asset values, • whether the carrying value of an asset can be supported by the net present
value of future cash flows, which are estimated based upon the continued use of the asset in the business,
• the appropriate assumptions to be applied in preparing cash flow projections, and
• the discounting of these cash flows.Changing the assumptions selected by management to determine the level, if any, of impairment could affect the financial position and results of operation. See note 12.
Deferred taxesKey sources of estimation uncertaintyDeferred tax assets are recognized for temporary differences between the car-rying amounts for financial reporting purposes of assets and liabilities and the amounts used for taxation purposes and for tax loss carry-forwards. The Group recognizes deferred tax assets based upon management’s estimates of future taxable profit in different tax jurisdictions. The actual results may differ from these estimates, due to change in the business climate and change in tax legislation. See note 9.
InventoryAccounting judgementThe Group values inventory at the lower of historical cost, based on the first-in, first-out basis, and net realizable value. The calculation of net realizable value
1. Significant accounting principles, critical accounting estimates and judgements, continued
involves management’s judgement on the estimated sales prices, over-stock articles, outdated articles, damaged goods, and selling costs. If the estimated net realizable value is lower than cost, a valuation allowance is established for inventory obsolescence. See note 16 for additional information.
Leases Key sources of estimation uncertainty when the Group cannot readily determine the interest rate implicit in the lease, it uses incremental borrowing rate (IBR) to measure lease liabilities. The IBR is the rate of interest that the Group would have to pay to borrow over simi-lar terms which requires estimations when no observable rates are available. The Group estimates the IBR by using market interest rates and adjusting with entity specific estimates such as currency and country risk.
Accounting judgement The Group has several lease contracts that include extension options. The Group applies judgement in evaluating the lease term, it considers all facts and circumstances that create an economic incentive to exercise an extension option. Extension options are only included in the lease term if the lease is rea-sonably certain to be extended. For leases of premises, the following factors are normally the most relevant:• if any leasehold improvements are expected to have a significant remaining
value, the Group is typically reasonably certain to extend.• otherwise, the Group considers other factors including historical lease
durations and the costs and business disruption required to replace the leased asset.
The renewal periods for leases of offices and warehouse premises with exten-sion options exceeding 10 to 15 years are not included as part of the lease term as these are not reasonably certain to be exercised. In addition, renewal options for leases of motor vehicles are not part of the lease term because the Group typically leases motor vehicles for not more than three to five years and, hence, is not exercising any renewal options.
After the commencement date, the Group reassesses the lease term if there is a significant event or change in circumstances that is within its control and affects its ability to exercise the option to renew. Refer to note 22 for informa-tion on potential future rental payments relating to extension options that are not included in the lease term.
Trade and financial receivable Key sources of estimation uncertainty: The Group measure the expected credit losses on financial assets classified at amortized cost including trade and financial receivables, lease receivables and contract assets. The expected credit losses for trade receivables and contract assets are an assessment of specific loss provisions corresponding to individu-ally significant exposures as well as historical loss rates in combination with for-ward looking considerations. The expected credit losses for lease receivables and financial receivables are an assessment that reflects an unbiased, proba-bility-weighted outcome based on reasonable and supportable forecasts.
Accounting judgement: Management’s judgement considers rapidly changing market conditions. An overlay control is performed to ensure that an adequate loss allowance is rec-ognized. Additional information is included in section “Credit risk” in note 27.
Pension and other post-employment benefit valuation assumptionsKey sources of estimation uncertaintyPensions and other post-employment obligations are dependent on the assumptions established by management and used by actuaries in calculating such amounts. The key assumptions include discount rates, inflation, future salary increases, mortality rates, and healthcare-cost trend rates. The actuarial assumptions are reviewed on an annual basis and are changed when it is deemed appropriate.
See note 23 for additional information regarding assumptions used in the calculation of pension and post-employment obligations.
Legal proceedings and tax claimsAccounting judgement Atlas Copco recognizes a liability when the Group has an obligation from a past event involving the transfer of economic benefits and when a reasonable estimate can be made of what the transfer might be. The Group reviews out-standing legal cases regularly in order to assess the need for provisions in the financial statements. These reviews consider the factors of the specific case by internal legal counsel and through the use of outside legal counsel and advi-sors when necessary. The financial statements may be affected to the extent that management’s assessments of the factors considered are not consistent with the actual outcome.
Additionally, the legal entities of the Group are frequently subject to audits by tax authorities in accordance with standard practice in the countries where the Group operates. In instances where the tax authorities have a different view on how to interpret the tax legislation, the Group makes estimates as to the likelihood of the outcome of the dispute, as well as estimates of potential claims. The actual results may differ from these estimates.
Warranty provisionsKey sources of estimation uncertaintyProvisions for product warranties should cover future commitments for the sales volumes already realized. warranty provisions are complex accounting estimates due to the variety of variables which are included in the calculations. The calculation methods are based on the type of products sold and historical data for level of repairs and replacements. The underlying estimates for calculating the provision are reviewed at least quarterly as well as when new products are introduced or when other changes occur which may affect the calculation. See note 25.
AcquisitionsKey sources of estimation uncertaintyThe Group performs purchase price allocations related to business combina-tions. Purchase prices are allocated to the underlying acquired assets and liabili-ties based on their estimated fair value at the time of the acquisition. Fair value is commonly based on valuation models. The valuation methods rely on various assumptions, such as estimated future cash flows, remaining economic useful life etc. The determination of the fair value requires the Group to apply assump-tions and estimates. These can vary from the actual outcomes. See note 2.
Atlas Copco 2021 75
FINANCIAL STATEMENTS – NOTESIN
TROD
UCTIO
NTH
IS IS ATLA
S COPCO
THE Y
EAR IN
REVIEW
FINA
NCIA
LSO
THER IN
FORM
ATIO
N
FINANCIALS
Group
Consolidated income statement
Consolidated statement of comprehensive income
Consolidated balance sheet
Consolidated statement of changes in equity
Consolidated statement of cash flows
• Notes
Parent company
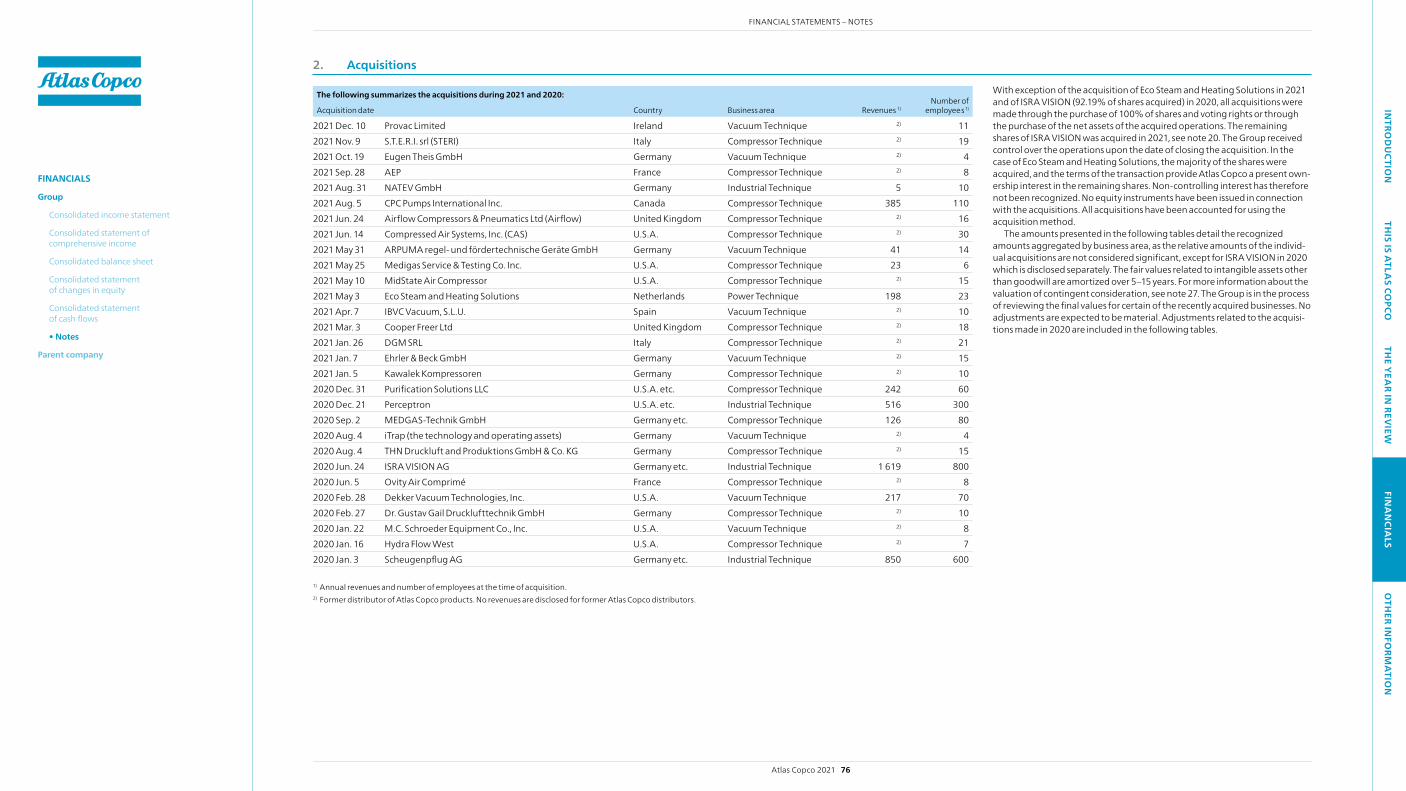
2. Acquisitions
The following summarizes the acquisitions during 2021 and 2020:
Acquisition date Country Business area Revenues 1) Number of
employees1)
2021 Dec. 10 Provac Limited Ireland Vacuum Technique 2) 11 2021 Nov. 9 S.T.E.R.I. srl (STERI) Italy Compressor Technique 2) 19 2021 Oct. 19 Eugen Theis GmbH Germany Vacuum Technique 2) 42021 Sep. 28 AEP France Compressor Technique 2) 8 2021 Aug. 31 NATEV GmbH Germany Industrial Technique 5 10 2021 Aug. 5 CPC Pumps International Inc. Canada Compressor Technique 385 110 2021 Jun. 24 Airflow Compressors & Pneumatics Ltd (Airflow) United Kingdom Compressor Technique 2) 16 2021 Jun. 14 Compressed Air Systems, Inc. (CAS) U.S.A. Compressor Technique 2) 30 2021 May 31 ARPUMA regel- und fördertechnische Geräte GmbH Germany Vacuum Technique 41 14 2021 May 25 Medigas Service & Testing Co. Inc. U.S.A. Compressor Technique 23 6 2021 May 10 MidState Air Compressor U.S.A. Compressor Technique 2) 15 2021 May 3 Eco Steam and Heating Solutions Netherlands Power Technique 198 232021 Apr. 7 IBVC Vacuum, S.L.U. Spain Vacuum Technique 2) 10 2021 Mar. 3 Cooper Freer Ltd United Kingdom Compressor Technique 2) 18 2021 Jan. 26 DGM SRL Italy Compressor Technique 2) 212021 Jan. 7 Ehrler & Beck GmbH Germany Vacuum Technique 2) 152021 Jan. 5 Kawalek Kompressoren Germany Compressor Technique 2) 102020 Dec. 31 Purification Solutions LLC U.S.A. etc. Compressor Technique 242 602020 Dec. 21 Perceptron U.S.A. etc. Industrial Technique 516 3002020 Sep. 2 MEDGAS-Technik GmbH Germany etc. Compressor Technique 126 802020 Aug. 4 iTrap (the technology and operating assets) Germany Vacuum Technique 2) 42020 Aug. 4 THN Druckluft and Produktions GmbH & Co. KG Germany Compressor Technique 2) 152020 Jun. 24 ISRA VISION AG Germany etc. Industrial Technique 1 619 8002020 Jun. 5 Ovity Air Comprimé France Compressor Technique 2) 82020 Feb. 28 Dekker Vacuum Technologies, Inc. U.S.A. Vacuum Technique 217 702020 Feb. 27 Dr. Gustav Gail Drucklufttechnik GmbH Germany Compressor Technique 2) 102020 Jan. 22 M.C. Schroeder Equipment Co., Inc. U.S.A. Vacuum Technique 2) 82020 Jan. 16 Hydra Flow west U.S.A. Compressor Technique 2) 72020 Jan. 3 Scheugenpflug AG Germany etc. Industrial Technique 850 600
1) Annual revenues and number of employees at the time of acquisition.2) Former distributor of Atlas Copco products. No revenues are disclosed for former Atlas Copco distributors.
with exception of the acquisition of Eco Steam and Heating Solutions in 2021 and of ISRA VISION (92.19% of shares acquired) in 2020, all acquisitions were made through the purchase of 100% of shares and voting rights or through the purchase of the net assets of the acquired operations. The remaining shares of ISRA VISION was acquired in 2021, see note 20. The Group received control over the operations upon the date of closing the acquisition. In the case of Eco Steam and Heating Solutions, the majority of the shares were acquired, and the terms of the transaction provide Atlas Copco a present own-ership interest in the remaining shares. Non-controlling interest has therefore not been recognized. No equity instruments have been issued in connection with the acquisitions. All acquisitions have been accounted for using the acquisition method.
The amounts presented in the following tables detail the recognized amounts aggregated by business area, as the relative amounts of the individ-ual acquisitions are not considered significant, except for ISRA VISION in 2020 which is disclosed separately. The fair values related to intangible assets other than goodwill are amortized over 5–15 years. For more information about the valuation of contingent consideration, see note 27. The Group is in the process of reviewing the final values for certain of the recently acquired businesses. No adjustments are expected to be material. Adjustments related to the acquisi-tions made in 2020 are included in the following tables.
Atlas Copco 2021 76
FINANCIAL STATEMENTS – NOTESIN
TROD
UCTIO
NTH
IS IS ATLA
S COPCO
THE Y
EAR IN
REVIEW
FINA
NCIA
LSO
THER IN
FORM
ATIO
N
FINANCIALS
Group
Consolidated income statement
Consolidated statement of comprehensive income
Consolidated balance sheet
Consolidated statement of changes in equity
Consolidated statement of cash flows
• Notes
Parent company
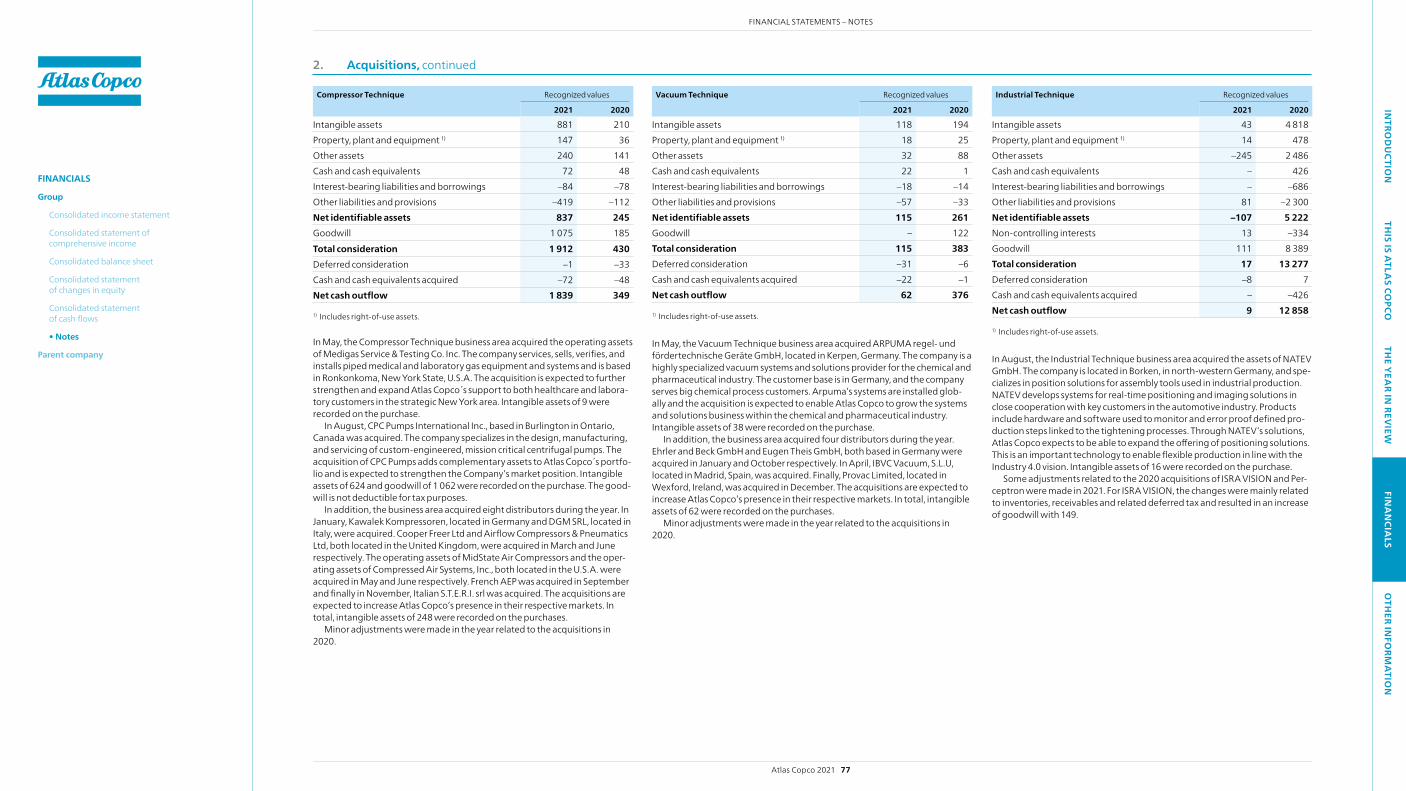
2. Acquisitions, continued
Compressor Technique Recognized values
2021 2020
Intangible assets 881 210 Property, plant and equipment 1) 147 36Other assets 240 141 Cash and cash equivalents 72 48 Interest-bearing liabilities and borrowings –84 –78 Other liabilities and provisions –419 –112 Net identifiable assets 837 245 Goodwill 1 075 185Total consideration 1 912 430 Deferred consideration –1 –33 Cash and cash equivalents acquired –72 –48 Net cash outflow 1 839 349
1) Includes right-of-use assets.
In May, the Compressor Technique business area acquired the operating assets of Medigas Service & Testing Co. Inc. The company services, sells, verifies, and installs piped medical and laboratory gas equipment and systems and is based in Ronkonkoma, New York State, U.S.A. The acquisition is expected to further strengthen and expand Atlas Copco s support to both healthcare and labora-tory customers in the strategic New York area. Intangible assets of 9 were recorded on the purchase.
In August, CPC Pumps International Inc., based in Burlington in Ontario, Canada was acquired. The company specializes in the design, manufacturing, and servicing of custom-engineered, mission critical centrifugal pumps. The acquisition of CPC Pumps adds complementary assets to Atlas Copco s portfo-lio and is expected to strengthen the Company’s market position. Intangible assets of 624 and goodwill of 1 062 were recorded on the purchase. The good-will is not deductible for tax purposes.
In addition, the business area acquired eight distributors during the year. In January, Kawalek Kompressoren, located in Germany and DGM SRL, located in Italy, were acquired. Cooper Freer Ltd and Airflow Compressors & Pneumatics Ltd, both located in the United Kingdom, were acquired in March and June respectively. The operating assets of MidState Air Compressors and the oper-ating assets of Compressed Air Systems, Inc., both located in the U.S.A. were acquired in May and June respectively. French AEP was acquired in September and finally in November, Italian S.T.E.R.I. srl was acquired. The acquisitions are expected to increase Atlas Copco’s presence in their respective markets. In total, intangible assets of 248 were recorded on the purchases.
Minor adjustments were made in the year related to the acquisitions in 2020.
Vacuum Technique Recognized values
2021 2020
Intangible assets 118 194 Property, plant and equipment 1) 18 25 Other assets 32 88 Cash and cash equivalents 22 1Interest-bearing liabilities and borrowings –18 –14Other liabilities and provisions –57 –33Net identifiable assets 115 261 Goodwill – 122 Total consideration 115 383 Deferred consideration –31 –6 Cash and cash equivalents acquired –22 –1 Net cash outflow 62 376
1) Includes right-of-use assets.
In May, the Vacuum Technique business area acquired ARPUMA regel- und fördertechnische Geräte GmbH, located in Kerpen, Germany. The company is a highly specialized vacuum systems and solutions provider for the chemical and pharmaceutical industry. The customer base is in Germany, and the company serves big chemical process customers. Arpuma’s systems are installed glob-ally and the acquisition is expected to enable Atlas Copco to grow the systems and solutions business within the chemical and pharmaceutical industry. Intangible assets of 38 were recorded on the purchase.
In addition, the business area acquired four distributors during the year. Ehrler and Beck GmbH and Eugen Theis GmbH, both based in Germany were acquired in January and October respectively. In April, IBVC Vacuum, S.L.U, located in Madrid, Spain, was acquired. Finally, Provac Limited, located in wexford, Ireland, was acquired in December. The acquisitions are expected to increase Atlas Copco’s presence in their respective markets. In total, intangible assets of 62 were recorded on the purchases.
Minor adjustments were made in the year related to the acquisitions in 2020.
Industrial Technique Recognized values
2021 2020
Intangible assets 43 4 818 Property, plant and equipment 1) 14 478 Other assets –245 2 486 Cash and cash equivalents – 426 Interest-bearing liabilities and borrowings – –686Other liabilities and provisions 81 –2 300 Net identifiable assets –107 5 222 Non-controlling interests 13 –334Goodwill 111 8 389 Total consideration 17 13 277 Deferred consideration –8 7 Cash and cash equivalents acquired – –426 Net cash outflow 9 12 858
1) Includes right-of-use assets.
In August, the Industrial Technique business area acquired the assets of NATEV GmbH. The company is located in Borken, in north-western Germany, and spe-cializes in position solutions for assembly tools used in industrial production. NATEV develops systems for real-time positioning and imaging solutions in close cooperation with key customers in the automotive industry. Products include hardware and software used to monitor and error proof defined pro-duction steps linked to the tightening processes. Through NATEV’s solutions, Atlas Copco expects to be able to expand the offering of positioning solutions. This is an important technology to enable flexible production in line with the Industry 4.0 vision. Intangible assets of 16 were recorded on the purchase.
Some adjustments related to the 2020 acquisitions of ISRA VISION and Per-ceptron were made in 2021. For ISRA VISION, the changes were mainly related to inventories, receivables and related deferred tax and resulted in an increase of goodwill with 149.
Atlas Copco 2021 77
FINANCIAL STATEMENTS – NOTESIN
TROD
UCTIO
NTH
IS IS ATLA
S COPCO
THE Y
EAR IN
REVIEW
FINA
NCIA
LSO
THER IN
FORM
ATIO
N
FINANCIALS
Group
Consolidated income statement
Consolidated statement of comprehensive income
Consolidated balance sheet
Consolidated statement of changes in equity
Consolidated statement of cash flows
• Notes
Parent company
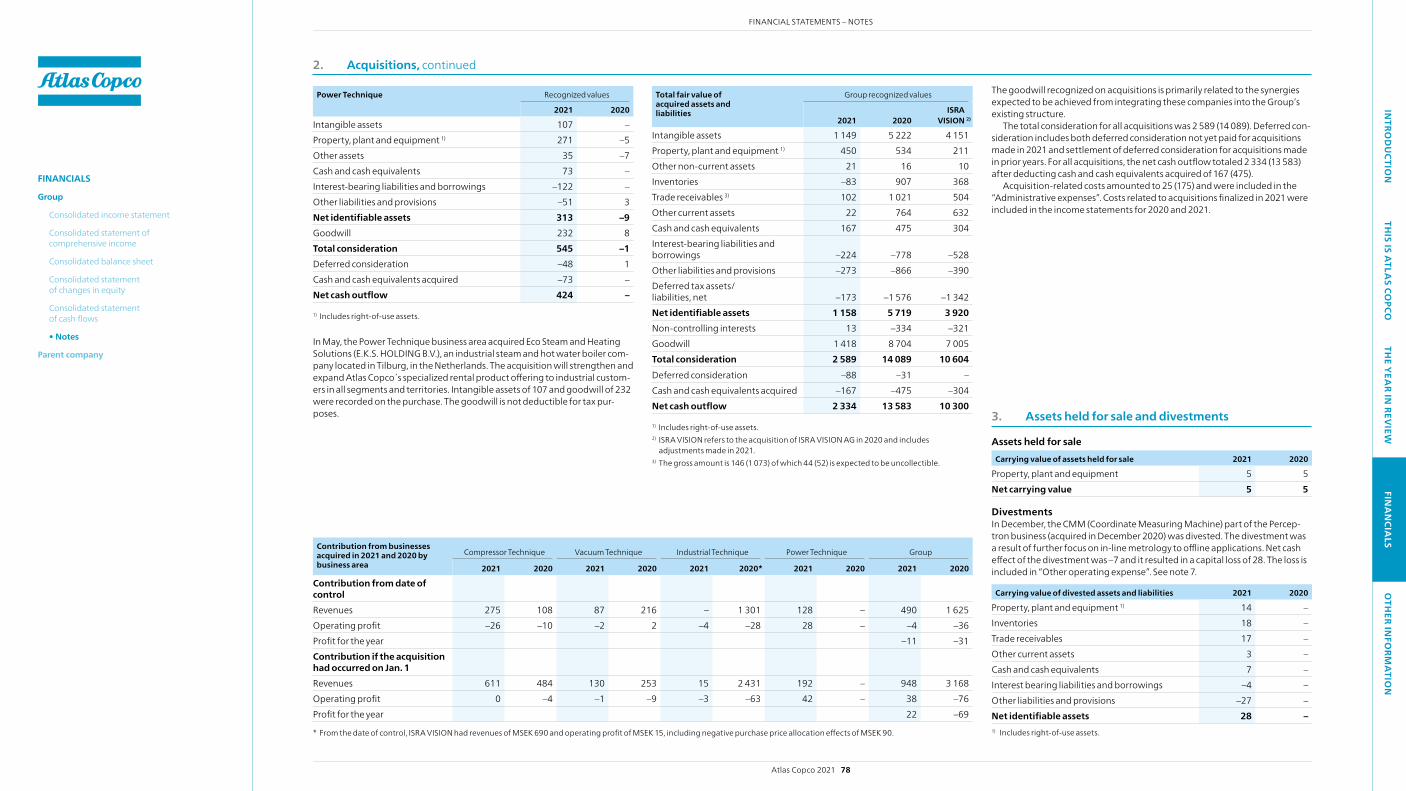
2. Acquisitions, continued
The goodwill recognized on acquisitions is primarily related to the synergies expected to be achieved from integrating these companies into the Group’s existing structure.
The total consideration for all acquisitions was 2 589 (14 089). Deferred con-sideration includes both deferred consideration not yet paid for acquisitions made in 2021 and settlement of deferred consideration for acquisitions made in prior years. For all acquisitions, the net cash outflow totaled 2 334 (13 583) after deducting cash and cash equivalents acquired of 167 (475).
Acquisition-related costs amounted to 25 (175) and were included in the “Administrative expenses”. Costs related to acquisitions finalized in 2021 were included in the income statements for 2020 and 2021.
Contribution from businesses acquired in 2021 and 2020 by business area
Compressor Technique Vacuum Technique Industrial Technique Power Technique Group
2021 2020 2021 2020 2021 2020* 2021 2020 2021 2020
Contribution from date of control Revenues 275 108 87 216 – 1 301 128 – 490 1 625 Operating profit –26 –10 –2 2 –4 –28 28 – –4 –36 Profit for the year –11 –31 Contribution if the acquisition had occurred on Jan. 1 Revenues 611 484 130 253 15 2 431 192 – 948 3 168Operating profit 0 –4 –1 –9 –3 –63 42 – 38 –76 Profit for the year 22 –69
* From the date of control, ISRA VISION had revenues of MSEK 690 and operating profit of MSEK 15, including negative purchase price allocation effects of MSEK 90.
Power Technique Recognized values
2021 2020
Intangible assets 107 – Property, plant and equipment 1) 271 –5 Other assets 35 –7 Cash and cash equivalents 73 – Interest-bearing liabilities and borrowings –122 – Other liabilities and provisions –51 3 Net identifiable assets 313 –9 Goodwill 232 8 Total consideration 545 –1 Deferred consideration –48 1 Cash and cash equivalents acquired –73 – Net cash outflow 424 –
1) Includes right-of-use assets.
In May, the Power Technique business area acquired Eco Steam and Heating Solutions (E.K.S. HOLDING B.V.), an industrial steam and hot water boiler com-pany located in Tilburg, in the Netherlands. The acquisition will strengthen and expand Atlas Copco s specialized rental product offering to industrial custom-ers in all segments and territories. Intangible assets of 107 and goodwill of 232 were recorded on the purchase. The goodwill is not deductible for tax pur-poses. 3. Assets held for sale and divestments
Assets held for saleCarrying value of assets held for sale 2021 2020
Property, plant and equipment 5 5 Net carrying value 5 5
DivestmentsIn December, the CMM (Coordinate Measuring Machine) part of the Percep-tron business (acquired in December 2020) was divested. The divestment was a result of further focus on in-line metrology to offline applications. Net cash effect of the divestment was –7 and it resulted in a capital loss of 28. The loss is included in “Other operating expense”. See note 7.
Carrying value of divested assets and liabilities 2021 2020
Property, plant and equipment 1) 14 – Inventories 18 –Trade receivables 17 –Other current assets 3 –Cash and cash equivalents 7 –Interest bearing liabilities and borrowings –4 –Other liabilities and provisions –27 –Net identifiable assets 28 – 1) Includes right-of-use assets.
Total fair value of acquired assets and liabilities
Group recognized values
2021 2020 ISRA
VISION 2)
Intangible assets 1 149 5 222 4 151Property, plant and equipment 1) 450 534 211Other non-current assets 21 16 10Inventories –83 907 368Trade receivables 3) 102 1 021 504Other current assets 22 764 632 Cash and cash equivalents 167 475 304Interest-bearing liabilities and borrowings –224 –778 –528Other liabilities and provisions –273 –866 –390Deferred tax assets/ liabilities, net –173 –1 576 –1 342Net identifiable assets 1 158 5 719 3 920Non-controlling interests 13 –334 –321Goodwill 1 418 8 704 7 005Total consideration 2 589 14 089 10 604Deferred consideration –88 –31 – Cash and cash equivalents acquired –167 –475 –304Net cash outflow 2 334 13 583 10 300
1) Includes right-of-use assets.2) ISRA VISION refers to the acquisition of ISRA VISION AG in 2020 and includes
adjustments made in 2021.3) The gross amount is 146 (1 073) of which 44 (52) is expected to be uncollectible.
Atlas Copco 2021 78
FINANCIAL STATEMENTS – NOTESIN
TROD
UCTIO
NTH
IS IS ATLA
S COPCO
THE Y
EAR IN
REVIEW
FINA
NCIA
LSO
THER IN
FORM
ATIO
N
FINANCIALS
Group
Consolidated income statement
Consolidated statement of comprehensive income
Consolidated balance sheet
Consolidated statement of changes in equity
Consolidated statement of cash flows
• Notes
Parent company

2021 Compressor Technique Vacuum Technique Industrial Technique Power Technique Common Group functions Eliminations Group
Revenues from external customers 49 216 29 200 19 390 13 106 – – 110 912Inter-segment revenues 441 19 31 128 – –619 –Total revenues 49 657 29 219 19 421 13 234 – –619 110 912 Operating profit 11 874 7 066 3 976 2 121 –1 486 8 23 559– of which share of profit in associated companies and joint ventures 0 30 6 – – – 36
Net financial items –149 Income tax expense –5 276 Profit for the year 18 134 Non-cash expenses Depreciation/amortization 1 434 1 283 1 315 1 101 237 –32 5 338Impairment 15 36 71 8 –2 – 128Other non-cash expenses –119 32 –228 34 281 – – Segment assets 33 164 36 463 29 423 11 230 9 044 –6 956 112 368– of which goodwill 5 580 12 047 13 124 1 362 – – 32 113Investments in associated companies and joint ventures 1 801 128 – 1 – 931Unallocated assets 23 384 Total assets 33 165 37 264 29 551 11 230 9 045 –6 956 136 683 Segment liabilities 19 172 7 326 5 287 3 353 8 334 –6 854 36 618Unallocated liabilities 32 431 Total liabilities 19 172 7 326 5 287 3 353 8 334 –6 854 69 049 Capital expenditures Property, plant and equipment 1 082 1 181 427 703 130 –26 3 497– of which right-of-use assets 462 188 158 132 77 – 1 017Intangible assets 191 473 527 141 57 – 1 389Total capital expenditures 1 273 1 654 954 844 187 –26 4 886Goodwill acquired 1 075 – 111 232 – – 1 418
2021 Compressor Technique Vacuum Technique Industrial Technique Power Technique Common Group functions Eliminations Group
Items affecting comparability in Operating profit – – – – –687 1) – –687
1) Refers to a change in provision for share-related long-term incentive programs.
4. Segment information
Atlas Copco 2021 79
FINANCIAL STATEMENTS – NOTESIN
TROD
UCTIO
NTH
IS IS ATLA
S COPCO
THE Y
EAR IN
REVIEW
FINA
NCIA
LSO
THER IN
FORM
ATIO
N
FINANCIALS
Group
Consolidated income statement
Consolidated statement of comprehensive income
Consolidated balance sheet
Consolidated statement of changes in equity
Consolidated statement of cash flows
• Notes
Parent company
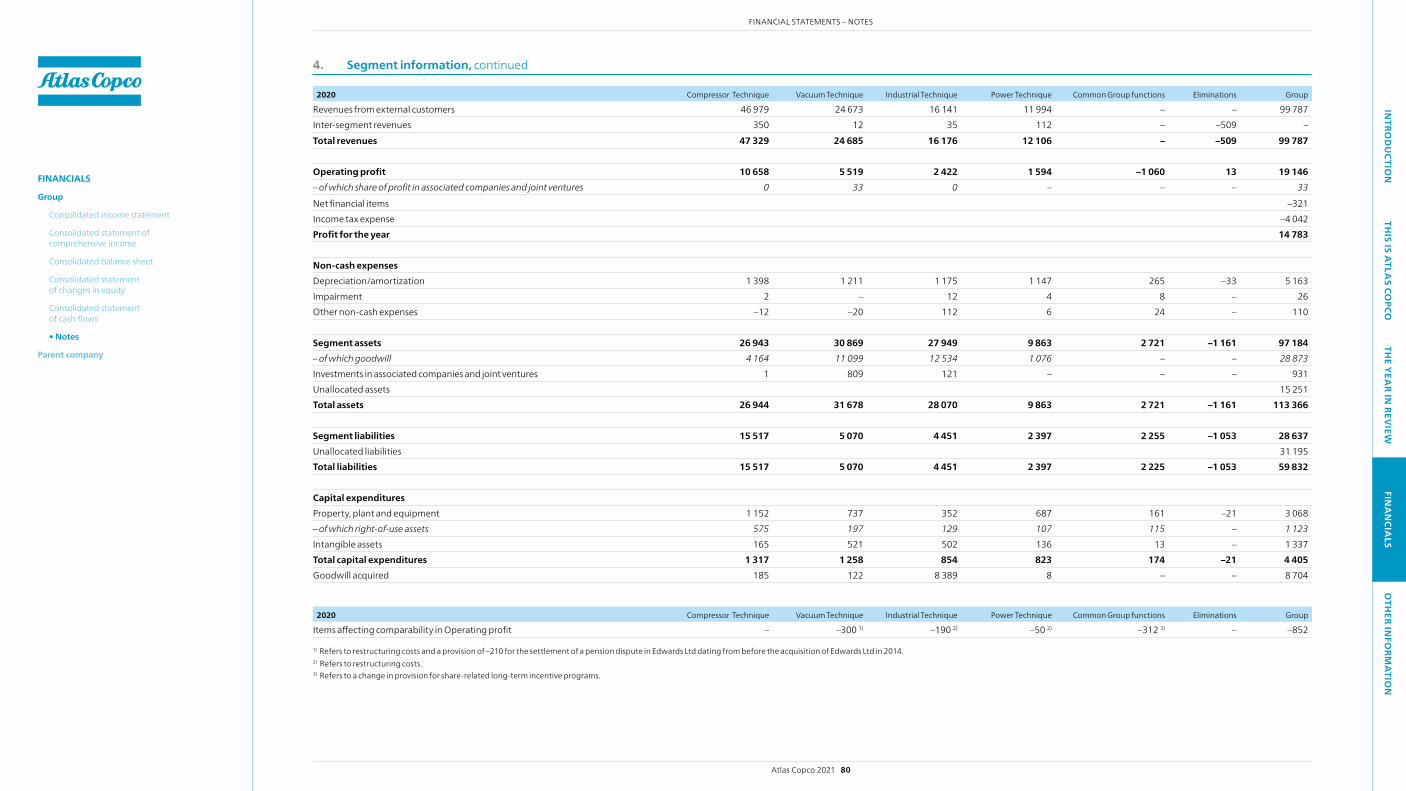
2020 Compressor Technique Vacuum Technique Industrial Technique Power Technique Common Group functions Eliminations Group
Revenues from external customers 46 979 24 673 16 141 11 994 – – 99 787 Inter-segment revenues 350 12 35 112 – –509 – Total revenues 47 329 24 685 16 176 12 106 – –509 99 787 Operating profit 10 658 5 519 2 422 1 594 –1 060 13 19 146– of which share of profit in associated companies and joint ventures 0 33 0 – – – 33
Net financial items –321 Income tax expense –4 042 Profit for the year 14 783 Non-cash expenses Depreciation/amortization 1 398 1 211 1 175 1 147 265 –33 5 163 Impairment 2 – 12 4 8 – 26 Other non-cash expenses –12 –20 112 6 24 – 110 Segment assets 26 943 30 869 27 949 9 863 2 721 –1 161 97 184 – of which goodwill 4 164 11 099 12 534 1 076 – – 28 873 Investments in associated companies and joint ventures 1 809 121 – – – 931 Unallocated assets 15 251 Total assets 26 944 31 678 28 070 9 863 2 721 –1 161 113 366 Segment liabilities 15 517 5 070 4 451 2 397 2 255 –1 053 28 637 Unallocated liabilities 31 195 Total liabilities 15 517 5 070 4 451 2 397 2 225 –1 053 59 832 Capital expenditures Property, plant and equipment 1 152 737 352 687 161 –21 3 068 – of which right-of-use assets 575 197 129 107 115 – 1 123 Intangible assets 165 521 502 136 13 – 1 337 Total capital expenditures 1 317 1 258 854 823 174 –21 4 405 Goodwill acquired 185 122 8 389 8 – – 8 704
2020 Compressor Technique Vacuum Technique Industrial Technique Power Technique Common Group functions Eliminations Group
Items affecting comparability in Operating profit – –300 1) –190 2) –50 2) –312 3) – –852
1) Refers to restructuring costs and a provision of –210 for the settlement of a pension dispute in Edwards Ltd dating from before the acquisition of Edwards Ltd in 2014.2) Refers to restructuring costs.3) Refers to a change in provision for share-related long-term incentive programs.
4. Segment information, continued
Atlas Copco 2021 80
FINANCIAL STATEMENTS – NOTESIN
TROD
UCTIO
NTH
IS IS ATLA
S COPCO
THE Y
EAR IN
REVIEW
FINA
NCIA
LSO
THER IN
FORM
ATIO
N
FINANCIALS
Group
Consolidated income statement
Consolidated statement of comprehensive income
Consolidated balance sheet
Consolidated statement of changes in equity
Consolidated statement of cash flows
• Notes
Parent company

The Group is organized in separate and focused but still integrated business areas, each operating through divisions. The business areas offer different products and services to different customer groups. They are also the basis for management and internal reporting and are regularly reviewed by the Group’s President and CEO, the chief operating decision maker. The chief operating decision maker uses more than one measure of the operating seg-ments’ profit or loss to assess performance and allocate resources. The operat-ing profit of the business areas is the primary profit measure used by the chief operating decision maker, and is reconciled to the consolidated operating profit in the tables on the previous pages. Items affecting comparability are included in a separate table since the chief operating decision maker reviews also these as part of allocating resources to the different business areas. All business areas are managed on a worldwide basis and their role is to develop, implement and follow up the objectives and strategies within their respective business.
See pages 21–33 for a description of the business areas. Common group functions, i.e. functions which serve all business areas or
the Group as a whole, are not considered a segment.The accounting principles for the segments are the same as those described
in note 1. Atlas Copco’s inter-segment pricing is determined on a commercial basis.
Segment assets are comprised of property, plant and equipment, right- of-use assets, intangible assets, other non-current receivables, inventories, and current receivables.
Segment liabilities include the sum of non-interest-bearing liabilities such as operating liabilities, other provisions, and other non-current liabilities. Capital expenditure includes property, plant and equipment, and intangible assets, but excludes the effect of goodwill, intangible assets and property, plant and equipment through acquisitions.
Revenues from external customers
0
10 000
20 000
30 000
40 000
50 000
60 000
70 000
80 000
20202021
MSEK
EquipmentService (incl. spare parts, consumables, accessories and rental)
4. Segment information, continued
0
10 000
20 000
30 000
40 000
50 000
60 000
70 000
80 000
20202021
MSEK
EquipmentService (incl. spare parts, consumables, accessories and rental)
Geographic distribution
2021
Compressor Technique, % Vacuum Technique, % Industrial Technique, % Power Technique, %
Group, %Orders
received RevenuesOrders
received RevenuesOrders
received RevenuesOrders
received RevenuesOrders
received Revenues
North America 21 21 21 21 31 31 29 27 24 23South America 5 5 – – 2 3 7 8 4 4Europe 34 34 14 13 36 36 36 36 28 29Africa/Middle East 7 6 1 1 2 1 8 8 4 4Asia/Oceania 33 34 64 65 29 29 20 21 40 40 100 100 100 100 100 100 100 100 100 100
By geographic area/country
Revenues Non-current assets
2021 2020 2021 2020
North America U.S.A. 22 317 20 513 12 481 11 668 Other countries 3 678 3 135 2 115 268 25 995 23 648 14 596 11 936 South America Brazil 2 449 2 076 435 447 Other countries 1 793 1 488 128 146 4 242 3 564 563 593 Europe Belgium 1 087 1 102 2 501 2 224 France 3 272 3 385 565 731 Germany 6 468 6 116 20 964 20 604 Italy 2 955 2 631 2 103 2 025 Sweden 1 558 1 425 1 235 1 330 United Kingdom 2 835 2 646 13 743 12 639 Other countries 13 646 13 016 2 343 1 650 31 821 30 321 43 454 41 203 Africa/Middle East South Africa 710 522 79 85 Other countries 4 178 4 635 319 366 4 888 5 157 398 451 Asia/Oceania Greater China 25 544 20 519 2 667 2 200 India 3 930 3 197 289 286 Japan 2 485 2 918 568 489 South Korea 6 024 5 008 1 818 1 491 Other countries 5 983 5 455 572 582 43 966 37 097 5 914 5 048 Total 110 912 99 787 64 925 59 231
Geographical informationThe revenues presented are based on the location of the customers while non-current assets are based on the geographical location of the assets. These assets include non-current assets other than financial instruments, investments in associated companies and joint ventures, deferred tax assets, and post-employment benefit assets.
Atlas Copco 2021 81
FINANCIAL STATEMENTS – NOTESIN
TROD
UCTIO
NTH
IS IS ATLA
S COPCO
THE Y
EAR IN
REVIEW
FINA
NCIA
LSO
THER IN
FORM
ATIO
N
FINANCIALS
Group
Consolidated income statement
Consolidated statement of comprehensive income
Consolidated balance sheet
Consolidated statement of changes in equity
Consolidated statement of cash flows
• Notes
Parent company
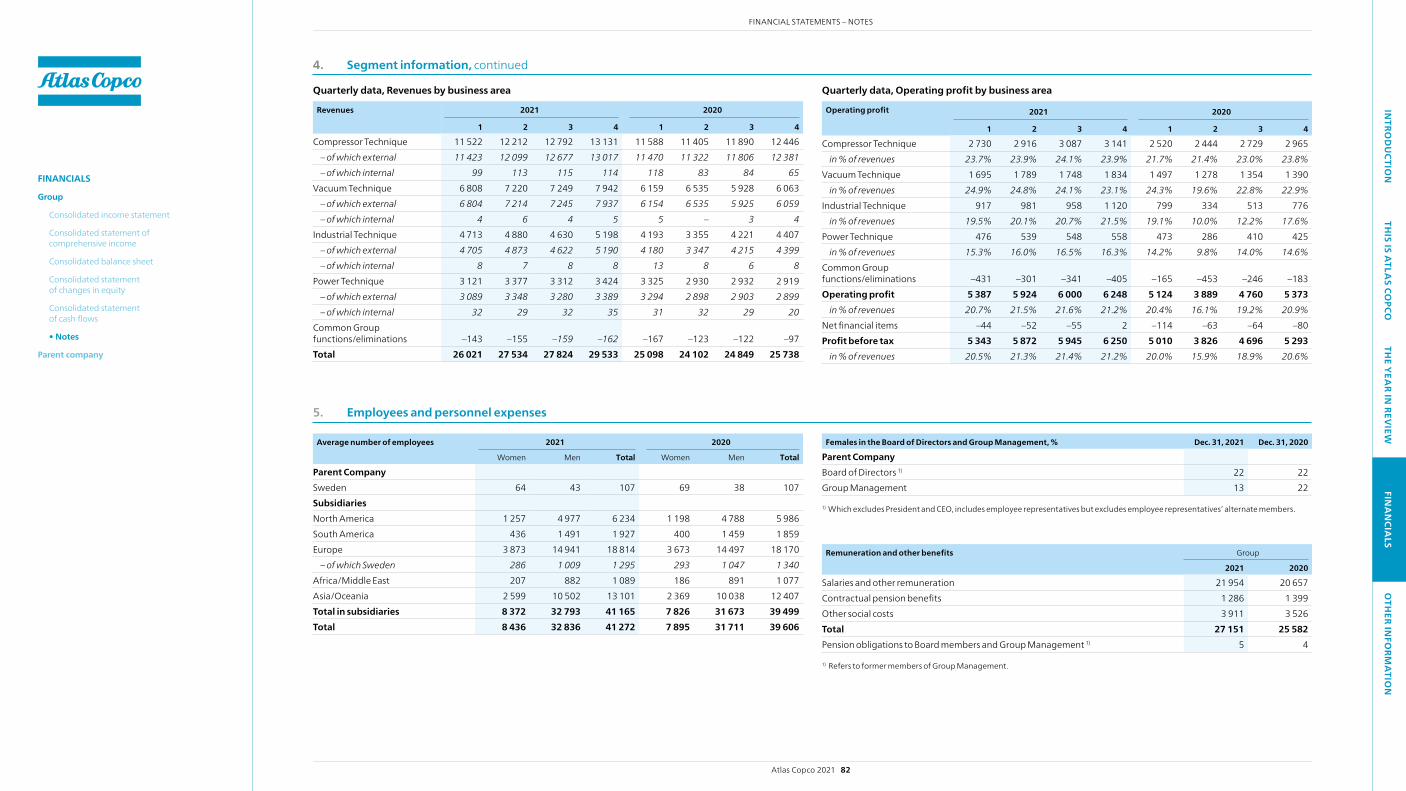
4. Segment information, continued
Quarterly data, Revenues by business area
Revenues 2021 2020
1 2 3 4 1 2 3 4
Compressor Technique 11 522 12 212 12 792 13 131 11 588 11 405 11 890 12 446 – of which external 11 423 12 099 12 677 13 017 11 470 11 322 11 806 12 381 – of which internal 99 113 115 114 118 83 84 65
Vacuum Technique 6 808 7 220 7 249 7 942 6 159 6 535 5 928 6 063 – of which external 6 804 7 214 7 245 7 937 6 154 6 535 5 925 6 059 – of which internal 4 6 4 5 5 – 3 4
Industrial Technique 4 713 4 880 4 630 5 198 4 193 3 355 4 221 4 407 – of which external 4 705 4 873 4 622 5 190 4 180 3 347 4 215 4 399 – of which internal 8 7 8 8 13 8 6 8
Power Technique 3 121 3 377 3 312 3 424 3 325 2 930 2 932 2 919 – of which external 3 089 3 348 3 280 3 389 3 294 2 898 2 903 2 899 – of which internal 32 29 32 35 31 32 29 20
Common Group functions/eliminations
–143
–155
–159
–162
–167
–123
–122
–97
Total 26 021 27 534 27 824 29 533 25 098 24 102 24 849 25 738
Quarterly data, Operating profit by business area
Operating profit 2021 2020
1 2 3 4 1 2 3 4
Compressor Technique 2 730 2 916 3 087 3 141 2 520 2 444 2 729 2 965 in % of revenues 23.7% 23.9% 24.1% 23.9% 21.7% 21.4% 23.0% 23.8%
Vacuum Technique 1 695 1 789 1 748 1 834 1 497 1 278 1 354 1 390 in % of revenues 24.9% 24.8% 24.1% 23.1% 24.3% 19.6% 22.8% 22.9%
Industrial Technique 917 981 958 1 120 799 334 513 776 in % of revenues 19.5% 20.1% 20.7% 21.5% 19.1% 10.0% 12.2% 17.6%
Power Technique 476 539 548 558 473 286 410 425 in % of revenues 15.3% 16.0% 16.5% 16.3% 14.2% 9.8% 14.0% 14.6%
Common Group functions/eliminations
–431
–301
–341
–405
–165
–453
–246
–183
Operating profit 5 387 5 924 6 000 6 248 5 124 3 889 4 760 5 373 in % of revenues 20.7% 21.5% 21.6% 21.2% 20.4% 16.1% 19.2% 20.9%
Net financial items –44 –52 –55 2 –114 –63 –64 –80 Profit before tax 5 343 5 872 5 945 6 250 5 010 3 826 4 696 5 293
in % of revenues 20.5% 21.3% 21.4% 21.2% 20.0% 15.9% 18.9% 20.6%
Average number of employees 2021 2020
women Men Total women Men Total
Parent Company Sweden 64 43 107 69 38 107 Subsidiaries North America 1 257 4 977 6 234 1 198 4 788 5 986 South America 436 1 491 1 927 400 1 459 1 859 Europe 3 873 14 941 18 814 3 673 14 497 18 170
– of which Sweden 286 1 009 1 295 293 1 047 1 340 Africa/Middle East 207 882 1 089 186 891 1 077 Asia/Oceania 2 599 10 502 13 101 2 369 10 038 12 407 Total in subsidiaries 8 372 32 793 41 165 7 826 31 673 39 499 Total 8 436 32 836 41 272 7 895 31 711 39 606
5. Employees and personnel expenses
Females in the Board of Directors and Group Management, % Dec. 31, 2021 Dec. 31, 2020
Parent Company Board of Directors 1) 22 22Group Management 13 22
1) which excludes President and CEO, includes employee representatives but excludes employee representatives’ alternate members.
Remuneration and other benefits Group
2021 2020
Salaries and other remuneration 21 954 20 657 Contractual pension benefits 1 286 1 399 Other social costs 3 911 3 526 Total 27 151 25 582 Pension obligations to Board members and Group Management 1) 5 4
1) Refers to former members of Group Management.
Atlas Copco 2021 82
FINANCIAL STATEMENTS – NOTESIN
TROD
UCTIO
NTH
IS IS ATLA
S COPCO
THE Y
EAR IN
REVIEW
FINA
NCIA
LSO
THER IN
FORM
ATIO
N
FINANCIALS
Group
Consolidated income statement
Consolidated statement of comprehensive income
Consolidated balance sheet
Consolidated statement of changes in equity
Consolidated statement of cash flows
• Notes
Parent company
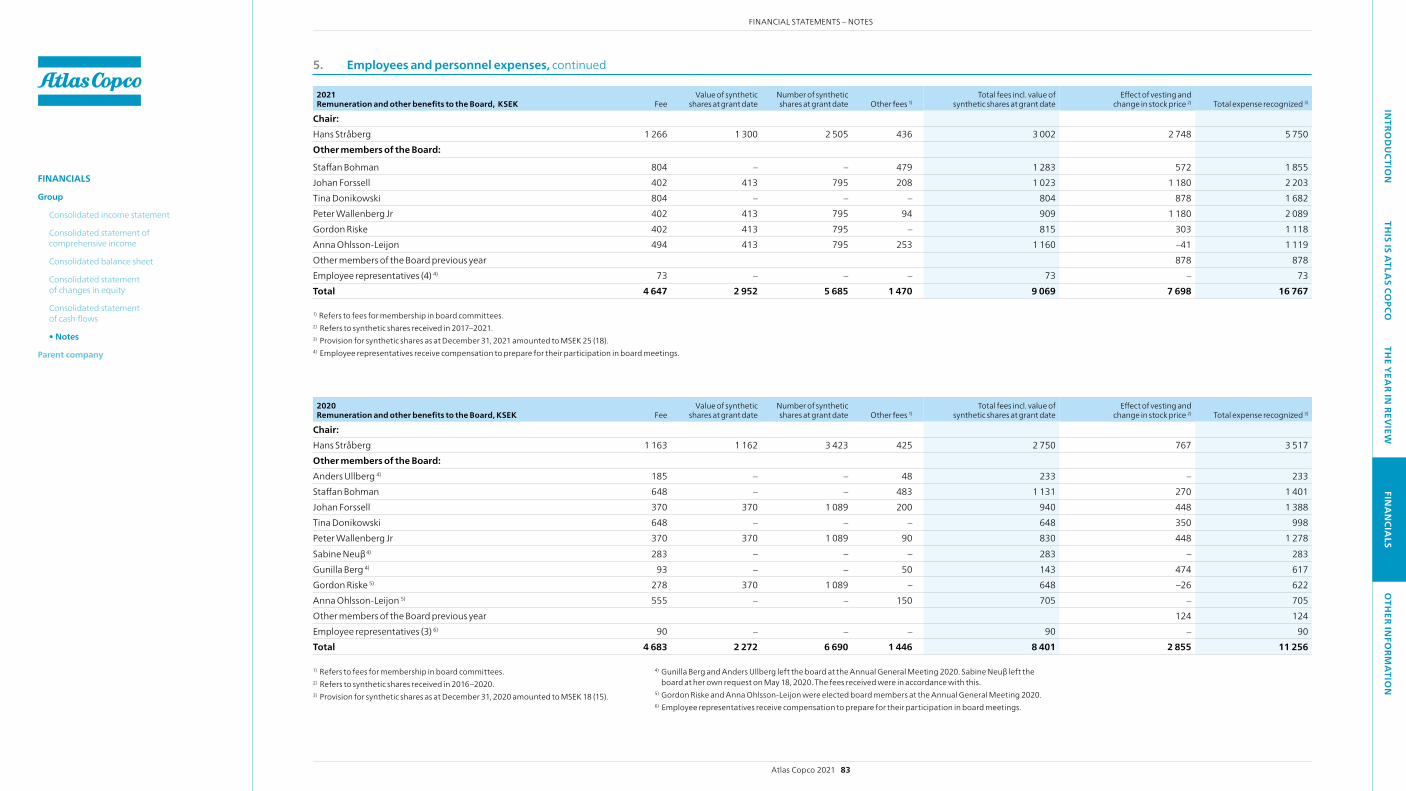
5. Employees and personnel expenses, continued
2020 Remuneration and other benefits to the Board, KSEK Fee
Value of synthetic shares at grant date
Number of synthetic shares at grant date Other fees 1)
Total fees incl. value of synthetic shares at grant date
Effect of vesting and change in stock price 2) Total expense recognized 3)
Chair: Hans Stråberg 1 163 1 162 3 423 425 2 750 767 3 517 Other members of the Board: Anders Ullberg 4) 185 – – 48 233 – 233Staffan Bohman 648 – – 483 1 131 270 1 401 Johan Forssell 370 370 1 089 200 940 448 1 388 Tina Donikowski 648 – – – 648 350 998 Peter wallenberg Jr 370 370 1 089 90 830 448 1 278 Sabine Neuβ 4) 283 – – – 283 – 283 Gunilla Berg 4) 93 – – 50 143 474 617 Gordon Riske 5) 278 370 1 089 – 648 –26 622Anna Ohlsson-Leijon 5) 555 – – 150 705 – 705Other members of the Board previous year 124 124 Employee representatives (3) 6) 90 – – – 90 – 90 Total 4 683 2 272 6 690 1 446 8 401 2 855 11 256
2021 Remuneration and other benefits to the Board, KSEK Fee
Value of synthetic shares at grant date
Number of synthetic shares at grant date Other fees 1)
Total fees incl. value of synthetic shares at grant date
Effect of vesting and change in stock price 2) Total expense recognized 3)
Chair: Hans Stråberg 1 266 1 300 2 505 436 3 002 2 748 5 750 Other members of the Board:
Staffan Bohman 804 – – 479 1 283 572 1 855 Johan Forssell 402 413 795 208 1 023 1 180 2 203 Tina Donikowski 804 – – – 804 878 1 682 Peter wallenberg Jr 402 413 795 94 909 1 180 2 089 Gordon Riske 402 413 795 – 815 303 1 118 Anna Ohlsson-Leijon 494 413 795 253 1 160 –41 1 119 Other members of the Board previous year 878 878 Employee representatives (4) 4) 73 – – – 73 – 73 Total 4 647 2 952 5 685 1 470 9 069 7 698 16 767
1) Refers to fees for membership in board committees.2) Refers to synthetic shares received in 2017–2021. 3) Provision for synthetic shares as at December 31, 2021 amounted to MSEK 25 (18).4) Employee representatives receive compensation to prepare for their participation in board meetings.
1) Refers to fees for membership in board committees.2) Refers to synthetic shares received in 2016–2020. 3) Provision for synthetic shares as at December 31, 2020 amounted to MSEK 18 (15).
4) Gunilla Berg and Anders Ullberg left the board at the Annual General Meeting 2020. Sabine Neuβ left the board at her own request on May 18, 2020. The fees received were in accordance with this.
5) Gordon Riske and Anna Ohlsson-Leijon were elected board members at the Annual General Meeting 2020. 6) Employee representatives receive compensation to prepare for their participation in board meetings.
Atlas Copco 2021 83
FINANCIAL STATEMENTS – NOTESIN
TROD
UCTIO
NTH
IS IS ATLA
S COPCO
THE Y
EAR IN
REVIEW
FINA
NCIA
LSO
THER IN
FORM
ATIO
N
FINANCIALS
Group
Consolidated income statement
Consolidated statement of comprehensive income
Consolidated balance sheet
Consolidated statement of changes in equity
Consolidated statement of cash flows
• Notes
Parent company

5. Employees and personnel expenses, continued
2021Remuneration and other benefits to Group Management, KSEK Base salary Variable compensation 2) Other benefits 3) Pension fees
Total, excl. recognized costs for share based payments
Recognized costs for share based payments 4)
Total expense recognized
President and CEO Mats Rahmström 1) 16 500 13 200 445 5 795 35 940 7 758 43 698 Other members of Group Management (8 positions) 30 843 14 931 11 105 11 095 67 974 15 383 83 357 Total 47 343 28 131 11 550 16 890 103 914 23 141 127 055 Total remuneration and other benefits to the Board and Group Management 143 822
1) Further details on the President and CEO remuneration is part of the Remuneration Report that will be published in connection with the notice to the Annual General Meeting. 2) Refers to variable compensation earned in 2021 to be paid in 2022, based on actual base salary entitlement.3) Refers to vacation pay, company car, medical insurance, and other benefits.4) Refers to stock options and SARs received in 2016–2021 and includes recognized costs due to change in stock price and vesting period, see also note 23.
2020Remuneration and other benefits to Group Management, KSEK Base salary 2) Variable compensation 3) Other benefits 4) Pension fees
Total, excl. recognized costs for share based payments
Recognized costs for share based payments 5)
Total expense recognized
President and CEO Mats Rahmström 1) 15 600 5 824 347 5 625 27 396 12 594 39 990 Other members of Group Management (8 positions) 31 670 9 054 5 168 8 567 54 459 13 794 68 253 Total 47 270 14 878 5 515 14 192 81 855 26 388 108 243 Total remuneration and other benefits to the Board and Group Management 119 499
1 ) Further details on the President and CEO remuneration is part of the Remuneration Report that will be published in connection with the notice to the Annual General Meeting. 2) President and CEO as well as members in Group Management based in Sweden decided to abstain 10% of their base salary for the months April, May and June to a good cause project related to Covid-19 research.3) Refers to variable compensation earned in 2020 to be paid in 2021, based on actual base salary entitlement.4) Refers to vacation pay, company car, medical insurance, and other benefits.5) Refers to stock options and SARs received in 2016–2020 and includes recognized costs due to change in stock price and vesting period, see also note 23.
The guidelines for remuneration to the Board and Group Management are approved at the Annual General Meeting of the shareholders. The guidelines approved by the 2021 meeting are described in the following paragraphs.
Board membersRemuneration and fees are based on the work performed by the Board. The remuneration and fees approved for 2021 are detailed in the table on the pre-vious page. The remuneration to the President and CEO, who is a member of Group Management, is described in the following sections and in the Remu-neration Report.
The Annual General Meeting decided that each board member can elect to receive 50% of the 2021 gross fee before tax, excluding other committee fees, in the form of synthetic shares and the remaining part in cash. The number of synthetic shares is based upon an average end price of series A shares during ten trading days following the release of the first quarterly interim report for
2021. The share rights are earned 25% per quarter as long as the member remains on the Board. After five years, the synthetic shares give the right to receive a cash payment per synthetic share based upon an average price for series A shares during ten trading days following the release of the first quar-terly interim report of the year of payment. The board members will receive divi-dends on series A shares until payment date in the form of new synthetic shares. If a board member resigns from his or her position before the stipulated pay-ment date as stated above, the board member has the right to request a pre-payment. The prepayment will be made twelve months after the date when the board member resigned or otherwise the original payment date is valid.
Status end of year Five board members accepted the right to receive synthetic shares. The number and costs at grant date and at the end of the financial year are disclosed by board member in the table on the previous page.
Remuneration and other committees 2021 The board has three committees:• Remuneration committee consisting of Hans Stråberg (Chair), Peter
wallenberg Jr and Staffan Bohman. The committee proposed compensa-tion to the President and CEO for approval by the Board. The committee also supported the President and CEO in determining the compensation to the other members of Group Management.
• Audit committee consisting of Staffan Bohman (Chair until October 21, 2021), Anna Ohlsson-Leijon (Chair from October 22, 2021), Johan Forssell and Hans Stråberg.
• Repurchase committee consisting of Staffan Bohman (Chair) and Hans Stråberg.
Guidelines for remuneration and other fees for members of the Board, the President and CEO, and other members of Group Management
Atlas Copco 2021 84
FINANCIAL STATEMENTS – NOTESIN
TROD
UCTIO
NTH
IS IS ATLA
S COPCO
THE Y
EAR IN
REVIEW
FINA
NCIA
LSO
THER IN
FORM
ATIO
N
FINANCIALS
Group
Consolidated income statement
Consolidated statement of comprehensive income
Consolidated balance sheet
Consolidated statement of changes in equity
Consolidated statement of cash flows
• Notes
Parent company
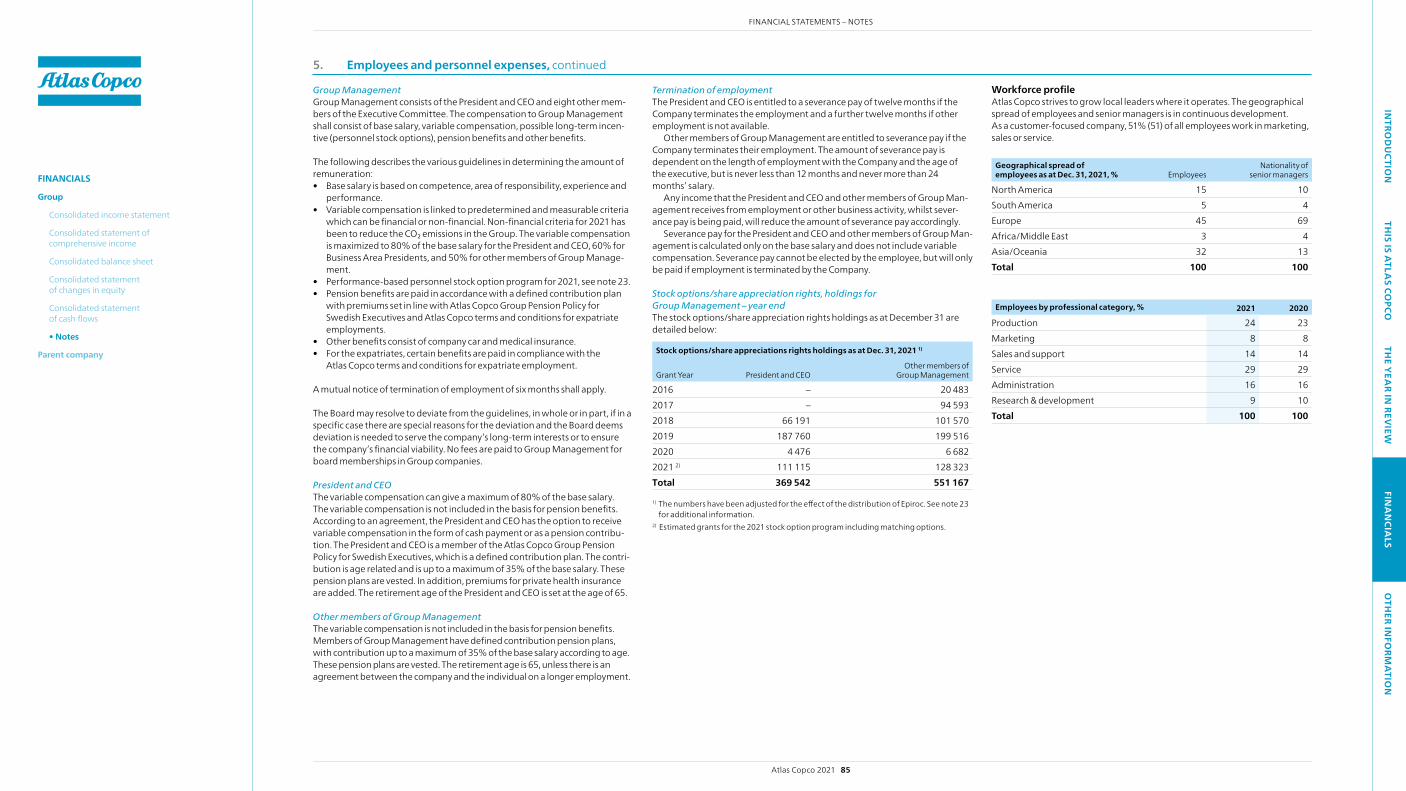
5. Employees and personnel expenses, continued
Group ManagementGroup Management consists of the President and CEO and eight other mem-bers of the Executive Committee. The compensation to Group Management shall consist of base salary, variable compensation, possible long-term incen-tive (personnel stock options), pension benefits and other benefits.
The following describes the various guidelines in determining the amount of remuneration:• Base salary is based on competence, area of responsibility, experience and
performance. • Variable compensation is linked to predetermined and measurable criteria
which can be financial or non-financial. Non-financial criteria for 2021 has been to reduce the CO₂ emissions in the Group. The variable compensation is maximized to 80% of the base salary for the President and CEO, 60% for Business Area Presidents, and 50% for other members of Group Manage-ment.
• Performance-based personnel stock option program for 2021, see note 23.• Pension benefits are paid in accordance with a defined contribution plan
with premiums set in line with Atlas Copco Group Pension Policy for Swedish Executives and Atlas Copco terms and conditions for expatriate employments.
• Other benefits consist of company car and medical insurance.• For the expatriates, certain benefits are paid in compliance with the
Atlas Copco terms and conditions for expatriate employment.
A mutual notice of termination of employment of six months shall apply.
The Board may resolve to deviate from the guidelines, in whole or in part, if in a specific case there are special reasons for the deviation and the Board deems deviation is needed to serve the company’s long-term interests or to ensure the company’s financial viability. No fees are paid to Group Management for board memberships in Group companies.
President and CEOThe variable compensation can give a maximum of 80% of the base salary. The variable compensation is not included in the basis for pension benefits. According to an agreement, the President and CEO has the option to receive variable compensation in the form of cash payment or as a pension contribu-tion. The President and CEO is a member of the Atlas Copco Group Pension Policy for Swedish Executives, which is a defined contribution plan. The contri-bution is age related and is up to a maximum of 35% of the base salary. These pension plans are vested. In addition, premiums for private health insurance are added. The retirement age of the President and CEO is set at the age of 65.
Other members of Group ManagementThe variable compensation is not included in the basis for pension benefits. Members of Group Management have defined contribution pension plans, with contribution up to a maximum of 35% of the base salary according to age. These pension plans are vested. The retirement age is 65, unless there is an agreement between the company and the individual on a longer employment.
Workforce profileAtlas Copco strives to grow local leaders where it operates. The geo graphical spread of employees and senior managers is in continuous development. As a customer-focused company, 51% (51) of all employees work in marketing, sales or service.
Geographical spread of employees as at Dec. 31, 2021, % Employees
Nationality of senior managers
North America 15 10 South America 5 4 Europe 45 69 Africa/Middle East 3 4 Asia/Oceania 32 13 Total 100 100
Employees by professional category, % 2021 2020
Production 24 23 Marketing 8 8 Sales and support 14 14 Service 29 29 Administration 16 16 Research & development 9 10 Total 100 100
Termination of employmentThe President and CEO is entitled to a severance pay of twelve months if the Company terminates the employment and a further twelve months if other employment is not available.
Other members of Group Management are entitled to severance pay if the Company terminates their employment. The amount of severance pay is dependent on the length of employment with the Company and the age of the executive, but is never less than 12 months and never more than 24 months’ salary.
Any income that the President and CEO and other members of Group Man-agement receives from employment or other business activity, whilst sever-ance pay is being paid, will reduce the amount of severance pay accordingly.
Severance pay for the President and CEO and other members of Group Man-agement is calculated only on the base salary and does not include variable compensation. Severance pay cannot be elected by the employee, but will only be paid if employment is terminated by the Company.
Stock options/share appreciation rights, holdings for Group Management – year end The stock options/share appreciation rights holdings as at December 31 are detailed below:
Stock options/share appreciations rights holdings as at Dec. 31, 2021 1)
Grant Year President and CEOOther members of
Group Management
2016 – 20 4832017 – 94 5932018 66 191 101 5702019 187 760 199 516 2020 4 476 6 682 2021 2) 111 115 128 323 Total 369 542 551 167
1) The numbers have been adjusted for the effect of the distribution of Epiroc. See note 23 for additional information.
2) Estimated grants for the 2021 stock option program including matching options.
Atlas Copco 2021 85
FINANCIAL STATEMENTS – NOTESIN
TROD
UCTIO
NTH
IS IS ATLA
S COPCO
THE Y
EAR IN
REVIEW
FINA
NCIA
LSO
THER IN
FORM
ATIO
N
FINANCIALS
Group
Consolidated income statement
Consolidated statement of comprehensive income
Consolidated balance sheet
Consolidated statement of changes in equity
Consolidated statement of cash flows
• Notes
Parent company

6. Remuneration to auditors
Audit fees and other services 2021 2020
Ernst & Young Audit fee 67 62 Other services, tax 3 2 Other services, other 1 0 Deloitte Audit fee 5 8 Other services, tax 4 4 Other services, other 1 3 Other audit firms Audit fee 10 11 Total 91 90
Audit fee refers to audit of the financial statements and the accounting records. For the Parent Company, this also includes the administration of the business by the Board of Directors and the President and CEO.
Tax services include mostly tax consultancy services. Other services essentially comprise consultancy services, such as due diligence
services in connection with acquisitions, investigations and similar.At the Annual General Meeting 2021, Ernst & Young was re-elected as audi-
tor for the Group up to and including the Annual General Meeting 2022.
Additional information on costs by natureCost of goods sold includes expenses for inventories, see note 16, warranty costs and transportation costs.
Salaries, remunerations and employer contributions amounted to 27 151 (25 582) whereof expenses for post-employment benefits amounted to 1 286 (1 399). See note 5 for further details.
Government grants of 210 (444) have been deducted in the related expenses or included in other operating income. The decrease in government grants is mainly related to additional government grants received in 2020 due to temporary measures related to the Covid-19 pandemic. Government grants related to assets have been recognized as a deduction when establishing the carrying amount of the asset. Therefore, the government grants are reported as income over the useful life of the asset through a reduction in depreciation expense. The remaining value of these grants, at the end of 2021, amounted to 34 (32).
Included in the operating profit are exchange rate changes on payables and receivables, and the effects from currency hedging. The operating profit also includes –109 (–29) of realized foreign exchange hedging result, which were previously recognized in equity. Amortization, depreciation and impairment charge for the year amounted to 5 466 (5 189). See note 12, 13 and 22 for fur-ther details. Costs for research and development amounted to 4 125 (3 762).
8. Financial income and expenses
Financial income and expenses 2021 2020
Interest income: – cash and cash equivalents 22 42– derivatives 136 94 – other – 9 Capital gain: – other assets 51 16 Change in fair value – other assets 29 –Foreign exchange gain, net 5 – Financial income 243 161 Interest expenses: – borrowings –348 –350 – pension provisions, net –34 –37 – deferred considerations –10 –4 Change in fair value – other liabilities and borrowings – –1 Foreign exchange loss, net – –87Impairment loss – –3 Financial expenses –392 –482Financial expenses, net –149 –321
“Foreign exchange gain/loss, net” includes foreign exchange gains of 545 (353) on financial assets at fair value through profit or loss and foreign exchange losses of –540 (–440) on other liabilities.
7. Other operating income and expenses
Other operating income 2021 2020
Commissions received 12 11 Income from insurance operations 135 101 Capital gain on sale of property, plant and equipment 51 23 Exchange-rate differences, net 392 –Other operating income 191 135 Total 781 270
Other operating expenses 2021 2020
Capital loss on sale of property, plant and equipment
–22 –42
Capital loss on divestment of business –28 –Exchange-rate differences, net – –397Other operating expenses 1) –151 –309Total –201 –748
1) Other operating expenses for 2020 include –210 related to a provision for settlement of a pension dispute in Edwards Ltd (Vacuum Technique) dating from before the acquisition of Edwards Ltd in 2014.
7. Other operating income and expenses, continued 9. Taxes
Income tax expense 2021 2020
Current taxes –5 372 –4 801Deferred taxes 96 759 Total –5 276 –4 042
The following is a reconciliation of the companies’ weighted average tax based on the nominal tax for the country as compared to the actual tax charge:
2021 2020
Profit before tax 23 410 18 825 weighted average tax based on national rates –5 481 –4 320 in % 23.4 22.9 Tax effect of: – non-deductible expenses –268 –534 – withholding and other taxes on dividends –322 –29 – tax-exempt income 686 617 Adjustments from prior years: – current taxes 216 85 – deferred taxes –60 229 Effects of tax losses/credits utilized 22 1 Change in tax rate, deferred tax –151 –65 Tax losses not recognized 163 –57 Other items –81 31
Income tax expense –5 276 –4 042Effective tax in % 22.5 21.5
The effective tax rate was 22.5% (21.5). withholding and other taxes on divi-dends of –322 (–29) relate to provisions on retained earnings in countries where Atlas Copco incur withholding and other taxes on dividends. Tax-exempt income of 686 (617) refers to income that is not subject to taxation or subject to reduced taxation under local law in various countries. Adjustments from prior years – current tax includes the net from tax issues, tax disputes and also one-time positive tax effects in different countries and amounted to 216 (85).
In 2021, effects of income tax rate changes have affected the result with –151 (–65).
Atlas Copco 2021 86
FINANCIAL STATEMENTS – NOTESIN
TROD
UCTIO
NTH
IS IS ATLA
S COPCO
THE Y
EAR IN
REVIEW
FINA
NCIA
LSO
THER IN
FORM
ATIO
N
FINANCIALS
Group
Consolidated income statement
Consolidated statement of comprehensive income
Consolidated balance sheet
Consolidated statement of changes in equity
Consolidated statement of cash flows
• Notes
Parent company

European Commission’s decision on Belgium’s tax rulingsOn January 11, 2016, the European Commission announced its decision that Belgian tax rulings granted to companies regarding “Excess Profit” shall be considered as illegal state aid and that unpaid taxes shall be reclaimed by the Belgian state. Atlas Copco had such tax ruling since 2010.
Following the European Commission decision, Atlas Copco has paid, in total MEUR 313 (MSEK 2 952). During 2015, Atlas Copco made a provision of MEUR 300 (MSEK 2 802) and paid MEUR 239 (MSEK 2 250) in 2016. In the second quarter of 2017, Atlas Copco paid the remaining amount of MEUR 68 (MSEK 655). During 2017, MEUR 13 (MSEK 125) was expensed as an interest cost.
The Belgian government, as well as Atlas Copco, appealed the decision to the General Court of the European Union (EGC) in Luxembourg and on Febru-ary 14, 2019, the EGC annulled the decision taken by the European Commission on January 11, 2016. On May 3, 2019, the European Commission appealed the EGC’s annulment. Following a decision by the European Court of Justice in 2021, the annulment was incorrect, and the case has again been referred to the General Court for judgement.
In September 2020, the European Commission also published individual opening decision stating that the specific decisions granted by Belgium between 2005 and 2014 regarding tax rulings granted to multinationals regarding “Excess Profit” violated the EU rules for state aid. One of these individual decisions concerns Atlas Copco.
It is likely several years before final decisions are made.
The following table reconciles the net asset balance of deferred taxes at the beginning of the year to the net asset at the end of the year:
Change in deferred taxes 2021 2020
Opening balance net, Jan. 1 –252 747 Business acquisitions –173 –1 576Charges to profit for the year 96 759 Tax on amounts recorded to other comprehensive income –90 –179 Translation differences –16 –3 Closing balance net, Dec. 31 –435 –252
The deferred tax assets and liabilities recognized in the balance sheet are attributable to the following:
Deferred tax assets and liabilities 2021 2020
Assets Liabilities Net balance Assets Liabilities Net balance
Intangible assets 460 4 088 –3 628 391 3 533 –3 142
Property, plant and equipment 1) 222 850 –628 222 893 –671 Other financial assets 33 131 –98 21 55 –34 Inventories 1 705 25 1 680 1 378 33 1 345 Current receivables 169 274 –105 165 260 –95 Operating liabilities 821 11 810 705 9 696 Provisions 344 8 336 327 5 322 Post-employment benefits 788 14 774 860 15 845 Borrowings 1) 598 15 583 500 5 495 Loss/credit carry-forwards 233 – 233 293 – 293 Other items 2) 3 395 –392 8 314 –306 Deferred tax assets/liabilities 5 376 5 811 –435 4 870 5 122 –252 Netting of assets/liabilities –3 586 –3 586 – –3 386 –3 386 – Net deferred tax balances 1 790 2 225 –435 1 484 1 736 –252
1) The gross amount of deferred tax assets and liabilities relating to right-of-use assets and lease liabilities are included in Property, plant and equipment and Borrowings. The net amount of these items is not material.
2) Other items primarily include tax deductions which are not related to specific balance sheet items.
9. Taxes, continued
Deferred tax assets regarding tax loss carry-forwards are reported to the extent that realization of the related tax benefit through future taxable results is probable. At December 31, the Group had total tax loss carry-forwards of 2 345 (3 254), of which deferred tax assets were recognized for 881 (1 387). The tax value of reported tax loss carry-forwards totals 231 (293). There is no expiration date for utilization of the major part of the tax losses carry-forwards for which deferred tax assets have been recognized.
Tax loss carry-forwards for which no deferred tax have been recognized expire in accordance with below table:
2021 2020
Expires after 1–2 years 111 109 Expires after 3–4 years 69 69 Expires after 5–6 years 29 49 No expiry date 1 255 1 640 Total 1 464 1 867
Changes in temporary differences during the year that are recognized in the income statement are attributable to the following:
2021 2020
Intangible assets –75 297 Property, plant and equipment 1) 73 17 Other financial assets –11 –14 Inventories 178 121 Current receivables 31 –11 Operating liabilities 63 38 Provisions –6 48 Post-employment benefits –7 21 Borrowings 1) –4 –28 Other items –84 231 Changes due to temporary differences 158 720 Loss/credit carry-forwards –62 39 Charges to profit for the year 96 759
1) Changes in Property, plant and equipment and Borrowings mainly relate to right-of-use asset and lease liabilities. The net amount of these items is not material.
Atlas Copco 2021 87
FINANCIAL STATEMENTS – NOTESIN
TROD
UCTIO
NTH
IS IS ATLA
S COPCO
THE Y
EAR IN
REVIEW
FINA
NCIA
LSO
THER IN
FORM
ATIO
N
FINANCIALS
Group
Consolidated income statement
Consolidated statement of comprehensive income
Consolidated balance sheet
Consolidated statement of changes in equity
Consolidated statement of cash flows
• Notes
Parent company
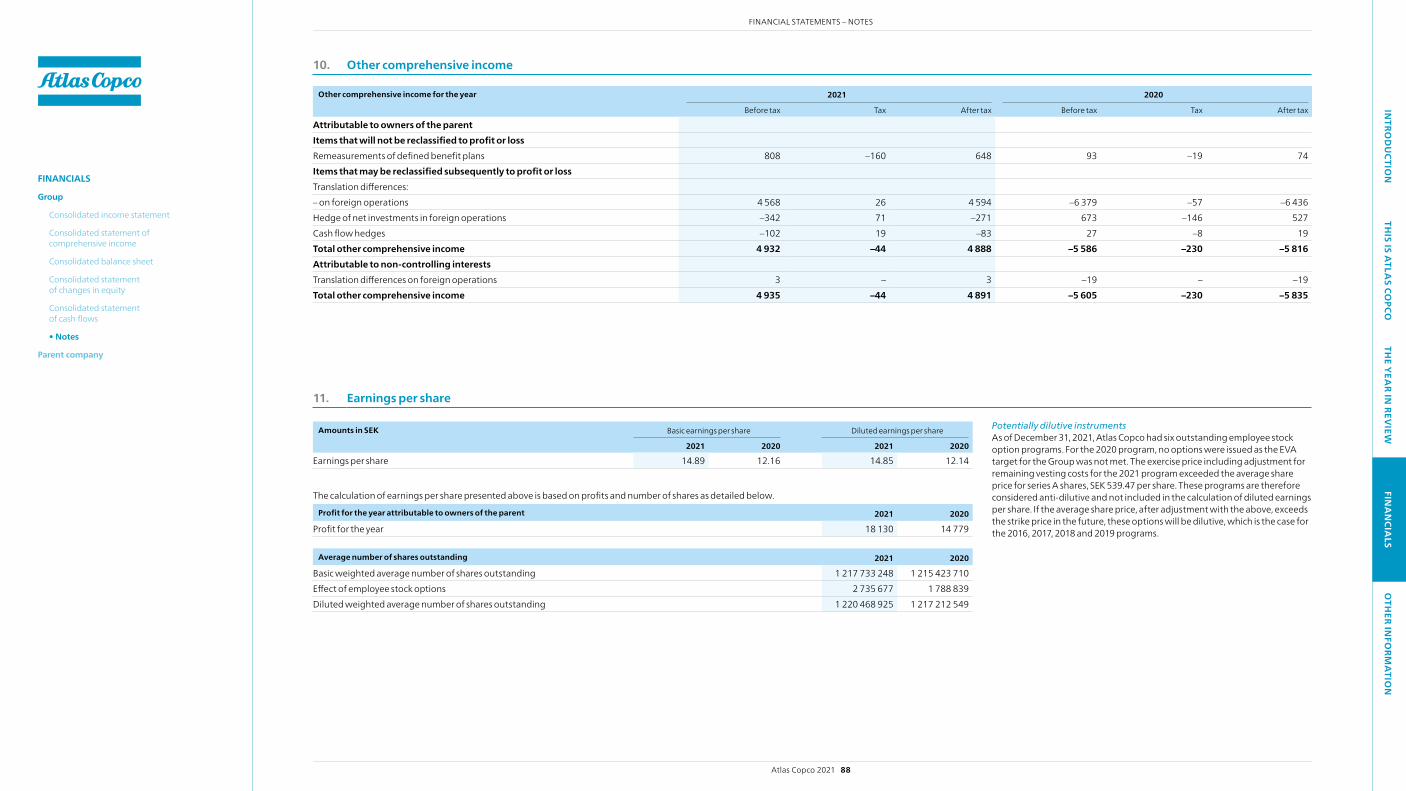
10. Other comprehensive income
Other comprehensive income for the year 2021 2020
Before tax Tax After tax Before tax Tax After tax
Attributable to owners of the parent Items that will not be reclassified to profit or loss Remeasurements of defined benefit plans 808 –160 648 93 –19 74 Items that may be reclassified subsequently to profit or loss Translation differences: – on foreign operations 4 568 26 4 594 –6 379 –57 –6 436 Hedge of net investments in foreign operations –342 71 –271 673 –146 527 Cash flow hedges –102 19 –83 27 –8 19 Total other comprehensive income 4 932 –44 4 888 –5 586 –230 –5 816 Attributable to non-controlling interests Translation differences on foreign operations 3 – 3 –19 – –19 Total other comprehensive income 4 935 –44 4 891 –5 605 –230 –5 835
11. Earnings per share
Amounts in SEK Basic earnings per share Diluted earnings per share
2021 2020 2021 2020
Earnings per share 14.89 12.16 14.85 12.14
The calculation of earnings per share presented above is based on profits and number of shares as detailed below.
Profit for the year attributable to owners of the parent 2021 2020
Profit for the year 18 130 14 779
Average number of shares outstanding 2021 2020
Basic weighted average number of shares outstanding 1 217 733 248 1 215 423 710 Effect of employee stock options 2 735 677 1 788 839 Diluted weighted average number of shares outstanding 1 220 468 925 1 217 212 549
Potentially dilutive instruments As of December 31, 2021, Atlas Copco had six outstanding employee stock option programs. For the 2020 program, no options were issued as the EVA target for the Group was not met. The exercise price including adjustment for remaining vesting costs for the 2021 program exceeded the average share price for series A shares, SEK 539.47 per share. These programs are therefore considered anti-dilutive and not included in the calculation of diluted earnings per share. If the average share price, after adjustment with the above, exceeds the strike price in the future, these options will be dilutive, which is the case for the 2016, 2017, 2018 and 2019 programs.
Atlas Copco 2021 88
FINANCIAL STATEMENTS – NOTESIN
TROD
UCTIO
NTH
IS IS ATLA
S COPCO
THE Y
EAR IN
REVIEW
FINA
NCIA
LSO
THER IN
FORM
ATIO
N
FINANCIALS
Group
Consolidated income statement
Consolidated statement of comprehensive income
Consolidated balance sheet
Consolidated statement of changes in equity
Consolidated statement of cash flows
• Notes
Parent company
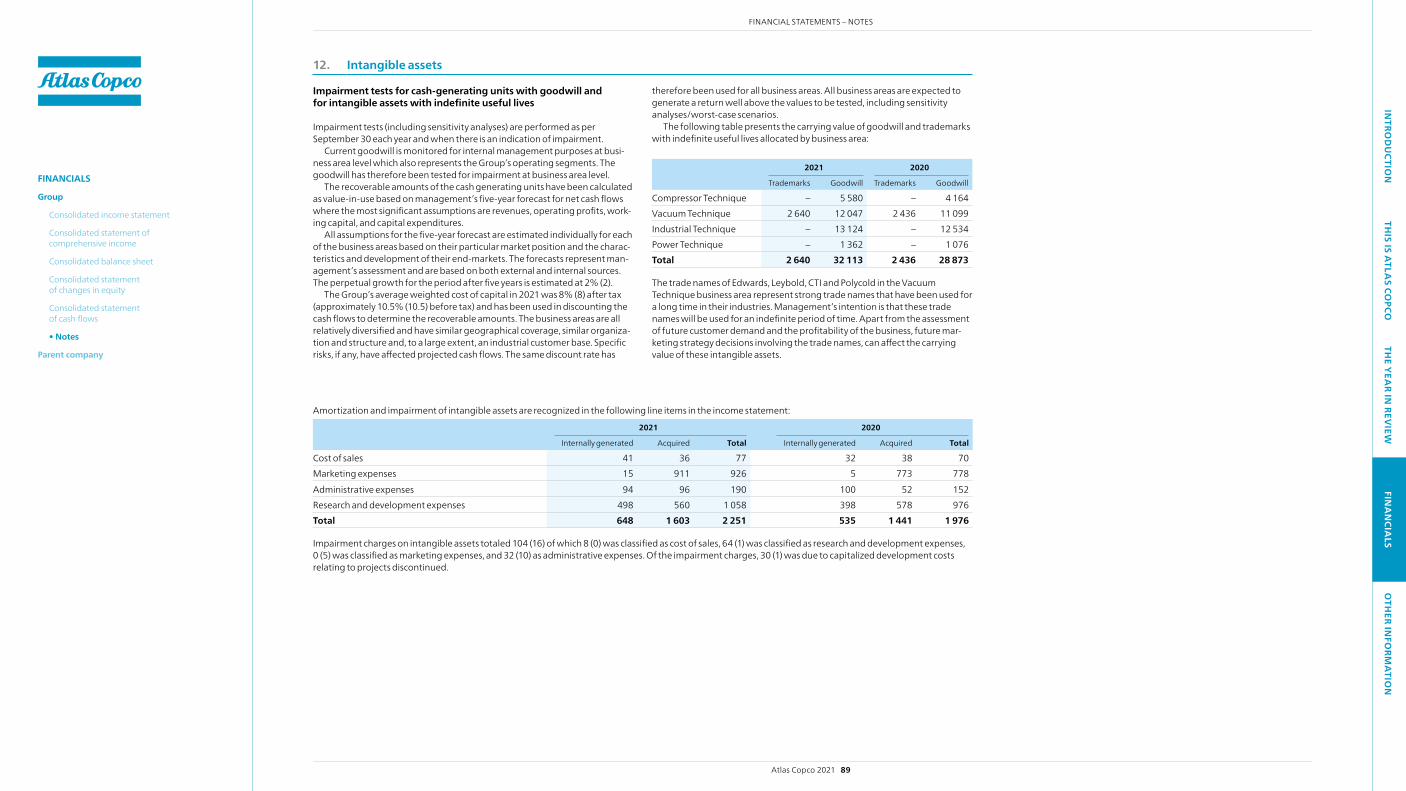
12. Intangible assets
Impairment tests for cash-generating units with goodwill and for intangible assets with indefinite useful lives
Impairment tests (including sensitivity analyses) are performed as per September 30 each year and when there is an indication of impairment.
Current goodwill is monitored for internal management purposes at busi-ness area level which also represents the Group’s operating segments. The goodwill has therefore been tested for impairment at business area level.
The recoverable amounts of the cash generating units have been calculated as value-in-use based on management’s five-year forecast for net cash flows where the most significant assumptions are revenues, operating profits, work-ing capital, and capital expenditures.
All assumptions for the five-year forecast are estimated individually for each of the business areas based on their particular market position and the charac-teristics and development of their end-markets. The forecasts represent man-agement’s assessment and are based on both external and internal sources. The perpetual growth for the period after five years is estimated at 2% (2).
The Group’s average weighted cost of capital in 2021 was 8% (8) after tax (approximately 10.5% (10.5) before tax) and has been used in discounting the cash flows to determine the recoverable amounts. The business areas are all relatively diversified and have similar geographical coverage, similar organiza-tion and structure and, to a large extent, an industrial customer base. Specific risks, if any, have affected projected cash flows. The same discount rate has
therefore been used for all business areas. All business areas are expected to generate a return well above the values to be tested, including sensitivity analyses/worst-case scenarios.
The following table presents the carrying value of goodwill and trademarks with indefinite useful lives allocated by business area:
2021 2020
Trademarks Goodwill Trademarks Goodwill
Compressor Technique – 5 580 – 4 164 Vacuum Technique 2 640 12 047 2 436 11 099 Industrial Technique – 13 124 – 12 534 Power Technique – 1 362 – 1 076 Total 2 640 32 113 2 436 28 873
The trade names of Edwards, Leybold, CTI and Polycold in the Vacuum Technique business area represent strong trade names that have been used for a long time in their industries. Management’s intention is that these trade names will be used for an indefinite period of time. Apart from the assessment of future customer demand and the profitability of the business, future mar-keting strategy decisions involving the trade names, can affect the carrying value of these intangible assets.
Amortization and impairment of intangible assets are recognized in the following line items in the income statement:
2021 2020
Internally generated Acquired Total Internally generated Acquired Total
Cost of sales 41 36 77 32 38 70 Marketing expenses 15 911 926 5 773 778 Administrative expenses 94 96 190 100 52 152 Research and development expenses 498 560 1 058 398 578 976 Total 648 1 603 2 251 535 1 441 1 976
Impairment charges on intangible assets totaled 104 (16) of which 8 (0) was classified as cost of sales, 64 (1) was classified as research and development expenses, 0 (5) was classified as marketing expenses, and 32 (10) as administrative expenses. Of the impairment charges, 30 (1) was due to capitalized development costs relating to projects discontinued.
Atlas Copco 2021 89
FINANCIAL STATEMENTS – NOTESIN
TROD
UCTIO
NTH
IS IS ATLA
S COPCO
THE Y
EAR IN
REVIEW
FINA
NCIA
LSO
THER IN
FORM
ATIO
N
FINANCIALS
Group
Consolidated income statement
Consolidated statement of comprehensive income
Consolidated balance sheet
Consolidated statement of changes in equity
Consolidated statement of cash flows
• Notes
Parent company

Internally generated intangible assets Acquired intangible assets
2021Product
developmentOther technology
and contract basedProduct
development TrademarksMarketing and
customer relatedOther technology
and contract based Goodwill Total
Cost Opening balance, Jan. 1 5 414 1 565 469 4 501 9 768 7 858 28 904 58 479 Investments 1 106 192 1 – – 90 – 1 389 Business acquisitions – – – 66 855 228 1 418 2 567 Disposals –12 –25 –14 –3 –19 –51 – –124 Reclassifications 50 –5 110 – – –150 – 5 Translation differences 162 47 44 302 622 531 1 822 3 530 Closing balance, Dec. 31 6 720 1 774 610 4 866 11 226 8 506 32 144 65 846Amortization and impairment losses Opening balance, Jan. 1 3 041 975 43 1 219 4 207 3 123 31 12 639 Amortization for the period 447 137 3 141 783 636 – 2 147 Impairment charge for the period 51 13 – – – 40 – 104 Disposals –12 –25 –14 –3 –19 –51 – –124 Reclassifications 24 –5 60 – – –78 – 1 Translation differences 69 33 9 61 334 225 – 731 Closing balance, Dec. 31 3 620 1 128 101 1 418 5 305 3 895 31 15 498 Carrying amounts at Jan. 1 2 373 590 426 3 282 5 561 4 735 28 873 45 840
Carrying amounts at Dec. 31 3 100 646 509 3 448 5 921 4 611 32 113 50 348
12. Intangible assets, continued
Internally generated intangible assets Acquired intangible assets
2020Product
developmentOther technology
and contract basedProduct
development TrademarksMarketing and
customer relatedOther technology
and contract based Goodwill Total
Cost Opening balance, Jan. 1 4 611 1 321 538 4 433 7 549 7 030 22 789 48 271Investments 1 034 161 3 – – 139 – 1 337Business acquisitions – – – 494 3 117 1 611 8 704 13 926Disposals –5 –13 –13 – –20 –50 – –101Reclassifications 9 170 –5 – – –170 – 4Translation differences –235 –74 –54 –426 –878 –702 –2 589 –4 958Closing balance, Dec. 31 5 414 1 565 469 4 501 9 768 7 858 28 904 58 479Amortization and impairment losses Opening balance, Jan. 1 2 788 727 28 1 166 3 975 3 006 32 11 722Amortization for the period 393 131 5 145 678 608 – 1 960Impairment charge for the period 1 10 – 1 4 – – 16Disposals –5 –13 –10 – –20 –50 – –98Reclassifications –22 170 22 – – –170 – –Translation differences –114 –50 –2 –93 –430 –271 –1 –961Closing balance, Dec. 31 3 041 975 43 1 219 4 207 3 123 31 12 639Carrying amounts at Jan. 1 1 823 594 510 3 267 3 574 4 024 22 757 36 549Carrying amounts at Dec. 31 2 373 590 426 3 282 5 561 4 735 28 873 45 840
Other technology and contract based intangible assets include computer software, patents, and contract based rights such as licenses and fran-chise agreements. Marketing and customer related intangible assets include Internet domain names, customer lists, customer contracts and relationships with customers. All intangible assets other than goodwill and trademarks with indefinite useful lives are amortized.
For information regarding principles for amortization and impairment, see note 1.
See note 2 for information on business acquisitions.
Atlas Copco 2021 90
FINANCIAL STATEMENTS – NOTESIN
TROD
UCTIO
NTH
IS IS ATLA
S COPCO
THE Y
EAR IN
REVIEW
FINA
NCIA
LSO
THER IN
FORM
ATIO
N
FINANCIALS
Group
Consolidated income statement
Consolidated statement of comprehensive income
Consolidated balance sheet
Consolidated statement of changes in equity
Consolidated statement of cash flows
• Notes
Parent company

2021 Buildings and land Machinery and equipment Construction in progress and advances Total Rental equipment
Cost Opening balance, Jan. 1 6 355 11 710 670 18 735 5 223Investments 51 607 1 312 1 970 510Business acquisitions 82 29 – 111 228Divestment of business –13 –1 – –14 –Disposals –215 –444 –8 –667 –324Reclassifications 145 671 –825 –9 –25Translation differences 352 612 55 1 019 349Closing balance, Dec. 31 6 757 13 184 1 204 21 145 5 961Depreciation and impairment losses Opening balance, Jan. 1 2 636 8 210 – 10 846 2 982Depreciation for the period 247 1 087 – 1 334 707Impairment charge for the period 3 19 5 27 –Disposals –181 –422 – –603 –278Reclassifications –4 – – –4 –12Translation differences 141 413 – 554 220Closing balance, Dec. 31 2 842 9 307 5 12 154 3 619Carrying amounts at Jan. 1 3 719 3 500 670 7 889 2 241Carrying amounts at Dec. 31 3 915 3 877 1 199 8 991 2 342
2020 Buildings and land Machinery and equipment Construction in progress and advances Total Rental equipment
Cost Opening balance, Jan. 1 6 353 12 000 565 18 918 5 980 Investments 96 534 829 1 459 486 Business acquisitions 243 103 23 369 –5 Disposals –39 –651 – –690 –433 Reclassifications 153 591 –704 40 –117 Translation differences –451 –867 –43 –1 361 –688 Closing balance, Dec. 31 6 355 11 710 670 18 735 5 223 Depreciation and impairment losses Opening balance, Jan. 1 2 593 8 304 – 10 897 3 122 Depreciation for the period 246 1 066 – 1 312 735 Impairment charge for the period – 2 – 2 – Disposals –37 –597 – –634 –410 Reclassifications 18 16 – 34 –92 Translation differences –184 –581 – –765 –373 Closing balance, Dec. 31 2 636 8 210 – 10 846 2 982 Carrying amounts at Jan. 1 3 760 3 696 565 8 021 2 858 Carrying amounts at Dec. 31 3 719 3 500 670 7 889 2 241
13. Property, plant and equipment
For information regarding principles for depreciation and impairment, see note 1.
See note 2 for information on business acquisitions.
Atlas Copco 2021 91
FINANCIAL STATEMENTS – NOTESIN
TROD
UCTIO
NTH
IS IS ATLA
S COPCO
THE Y
EAR IN
REVIEW
FINA
NCIA
LSO
THER IN
FORM
ATIO
N
FINANCIALS
Group
Consolidated income statement
Consolidated statement of comprehensive income
Consolidated balance sheet
Consolidated statement of changes in equity
Consolidated statement of cash flows
• Notes
Parent company

14. Investments in associated companies and joint ventures
Accumulated capital participation 2021 2020
Opening balance, Jan. 1 931 1 037Acquisitions of joint ventures – 0Dividends –36 –49 Profit for the year after income tax 36 33 Translation differences 0 –90 Closing balance, Dec. 31 931 931
The tables below are based on the most recent financial reporting available from associated companies and joint ventures.
2021 Summary of financial information for associated companies and joint ventures Country Assets 1) Liabilities 1) Equity 1) Revenues 1)
Profit for the year 1)
Group’s share, % 2)
Carrying value Dec. 31
Associated companies qingdao qianshao Pneumatic Tool Manufacturing Tech Ltd. China 59 18 41 31 –7 25 10
Reintube S.L. Spain 9 5 4 14 0 47 1ISRA Immobilie Berlin GmbH Germany 74 80 –6 6 1 49.99 0Joint ventures Toku-Hanbai Group Japan 419 183 236 883 16 50 118 Ulvac Cryogenics Inc. Japan 1 260 430 830 716 59 50 802
Total 931 1) Presented amounts for associated companies and joint ventures are for 100% of the company.2) The Atlas Copco percentage share of each holding represents both ownership interest and voting power.
2020 Summary of financial information for associated companies and joint ventures Country Assets 1) Liabilities 1) Equity 1) Revenues 1)
Profit for the year 1)
Group’s share, % 2)
Carrying value Dec. 31
Associated companies qingdao qianshao Pneumatic Tool Manufacturing Tech Ltd. China 59 16 43 28 –7 25 11 Reintube S.L. Spain 7 3 4 9 0 47 1 ISRA Immobilie Berlin GmbH Germany 75 81 –6 2 3) 0 3) 49.99 0Joint ventures Toku-Hanbai Group Japan 399 180 219 819 4 50 110
Ulvac Cryogenics Inc. Japan 1 257 416 841 752 69 50 809
Total 931 1) Presented amounts for associated companies and joint ventures are for 100% of the company.2) The Atlas Copco percentage share of each holding represents both ownership interest and voting power.3) Included from the date of acquisition.
The fair value of financial instruments under other financial assets corresponds to their carrying value.
2021 2020
Non-current Pension and other similar benefit assets (note 23) 781 496 Financial assets at fair value through OCI 16 15Financial assets at fair value through profit or loss 37 26Financial assets measured at amortized cost: – lease receivables 72 82 – other financial receivables 59 54 Closing balance, Dec. 31 965 673 Current Financial assets at fair value through profit or loss 587 – Financial assets measured at amortized cost: – lease receivables 29 20 – other financial receivables 231 38 Closing balance, Dec. 31 847 58
See note 22 for information on leases and note 27 for information on credit risk.
15. Other financial assets
Atlas Copco 2021 92
FINANCIAL STATEMENTS – NOTESIN
TROD
UCTIO
NTH
IS IS ATLA
S COPCO
THE Y
EAR IN
REVIEW
FINA
NCIA
LSO
THER IN
FORM
ATIO
N
FINANCIALS
Group
Consolidated income statement
Consolidated statement of comprehensive income
Consolidated balance sheet
Consolidated statement of changes in equity
Consolidated statement of cash flows
• Notes
Parent company

The fair value for trade receivables corresponds to their carrying value. Trade receivables are measured at amortized cost.
Expected credit losses, trade 2021 2020
Opening balance, Jan. 1 780 711 Business acquisitions and divestments 42 52 Provisions recognized for potential losses 268 401 Amounts used for established losses –172 –144Release of unnecessary provisions –222 –163 Translation differences 49 –77 Closing balance, Dec. 31 745 780
Trade receivables of 21 954 (18 801) are reported net of expected credit losses and other impairments amounting to 745 (780).
Expected credit losses and impairment losses recognized in the income statement totaled –10 (193).
For credit risk information, see note 27.
17. Trade receivables
2021 2020
Raw materials 3 052 2 075 work in progress 3 553 2 806Semi-finished goods 4 963 3 626Finished goods 6 233 4 943 Closing balance, Dec. 31 17 801 13 450
Provisions for obsolescence and other write-downs of inventories recorded as cost of sales amounted to 553 (547). Reversals of write-downs which were recognized in earnings totaled 71 (30). Previous write-downs have been reversed as a result of improved market conditions in certain markets.
Inventories recognized as expense amounted to 46 717 (41 989).
16. Inventories
The fair value of financial instruments included in other receivables corre-sponds to their carrying value.
2021 2020
Derivatives: – at fair value through profit or loss 9 307 – at fair value through OCI – 89 Financial assets measured at amortized cost: – other receivables 2 922 2 178 – contract assets 3 545 2 826 Prepaid expenses 943 607 Closing balance, Dec. 31 7 419 6 007
Other receivables consist primarily of VAT claims and advances to suppliers. Contract assets relate mainly to service and construction projects. Impairment losses recognized on contract assets were insignificant. Prepaid expenses include items such as insurance, IT and employee costs.
See note 27 for information on the Group’s derivatives.
18. Other receivables
The fair value of cash and cash equivalents corresponds to their carrying value. Cash and cash equivalents are measured at amortized cost.
2021 2020
Cash 17 863 10 778 Cash equivalents 1 127 877 Closing balance, Dec. 31 18 990 11 655
During 2021, cash and cash equivalents had an estimated average effective interest rate of 0.15% (0.38). The committed, but unutilized, credit lines were MEUR 1 640 (1 640), which equaled to MSEK 16 788 (16 467).
See note 27 for additional information.
19. Cash and cash equivalents
Atlas Copco 2021 93
FINANCIAL STATEMENTS – NOTESIN
TROD
UCTIO
NTH
IS IS ATLA
S COPCO
THE Y
EAR IN
REVIEW
FINA
NCIA
LSO
THER IN
FORM
ATIO
N
FINANCIALS
Group
Consolidated income statement
Consolidated statement of comprehensive income
Consolidated balance sheet
Consolidated statement of changes in equity
Consolidated statement of cash flows
• Notes
Parent company
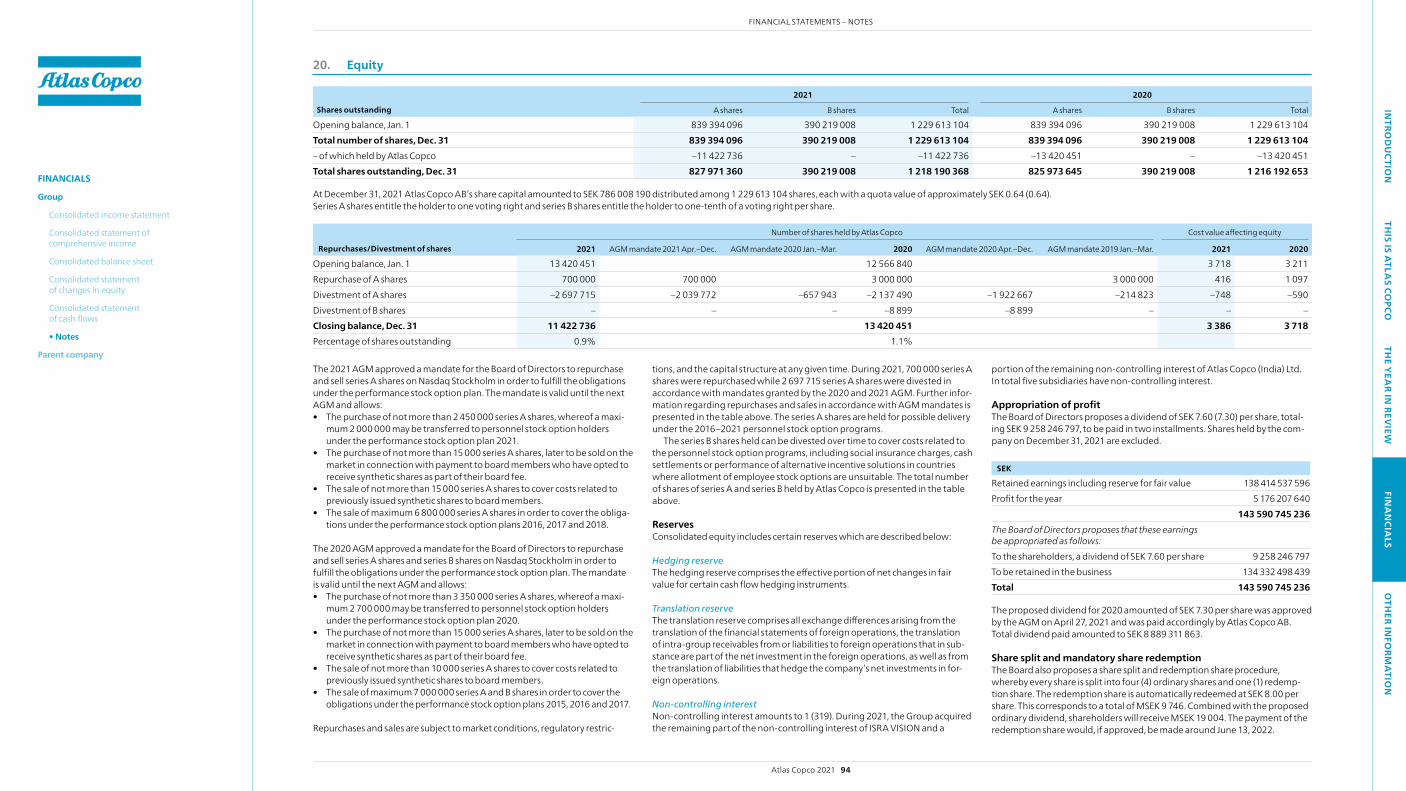
20. Equity
2021 2020
Shares outstanding A shares B shares Total A shares B shares Total
Opening balance, Jan. 1 839 394 096 390 219 008 1 229 613 104 839 394 096 390 219 008 1 229 613 104 Total number of shares, Dec. 31 839 394 096 390 219 008 1 229 613 104 839 394 096 390 219 008 1 229 613 104 – of which held by Atlas Copco –11 422 736 – –11 422 736 –13 420 451 – –13 420 451 Total shares outstanding, Dec. 31 827 971 360 390 219 008 1 218 190 368 825 973 645 390 219 008 1 216 192 653
At December 31, 2021 Atlas Copco AB’s share capital amounted to SEK 786 008 190 distributed among 1 229 613 104 shares, each with a quota value of approximately SEK 0.64 (0.64). Series A shares entitle the holder to one voting right and series B shares entitle the holder to one-tenth of a voting right per share.
Number of shares held by Atlas Copco Cost value affecting equity
Repurchases/Divestment of shares 2021 AGM mandate 2021 Apr.–Dec. AGM mandate 2020 Jan.–Mar. 2020 AGM mandate 2020 Apr.–Dec. AGM mandate 2019 Jan.–Mar. 2021 2020
Opening balance, Jan. 1 13 420 451 12 566 840 3 718 3 211 Repurchase of A shares 700 000 700 000 3 000 000 3 000 000 416 1 097 Divestment of A shares –2 697 715 –2 039 772 –657 943 –2 137 490 –1 922 667 –214 823 –748 –590 Divestment of B shares – – – –8 899 –8 899 – – – Closing balance, Dec. 31 11 422 736 13 420 451 3 386 3 718 Percentage of shares outstanding 0.9% 1.1%
The 2021 AGM approved a mandate for the Board of Directors to repurchaseand sell series A shares on Nasdaq Stockholm in order to fulfill the obligations under the performance stock option plan. The mandate is valid until the next AGM and allows:• The purchase of not more than 2 450 000 series A shares, whereof a maxi-
mum 2 000 000 may be transferred to personnel stock option holders under the performance stock option plan 2021.
• The purchase of not more than 15 000 series A shares, later to be sold on the market in connection with payment to board members who have opted to receive synthetic shares as part of their board fee.
• The sale of not more than 15 000 series A shares to cover costs related to previously issued synthetic shares to board members.
• The sale of maximum 6 800 000 series A shares in order to cover the obliga-tions under the performance stock option plans 2016, 2017 and 2018.
The 2020 AGM approved a mandate for the Board of Directors to repurchaseand sell series A shares and series B shares on Nasdaq Stockholm in order to fulfill the obligations under the performance stock option plan. The mandate is valid until the next AGM and allows:• The purchase of not more than 3 350 000 series A shares, whereof a maxi-
mum 2 700 000 may be transferred to personnel stock option holders under the performance stock option plan 2020.
• The purchase of not more than 15 000 series A shares, later to be sold on the market in connection with payment to board members who have opted to receive synthetic shares as part of their board fee.
• The sale of not more than 10 000 series A shares to cover costs related to previously issued synthetic shares to board members.
• The sale of maximum 7 000 000 series A and B shares in order to cover the obligations under the performance stock option plans 2015, 2016 and 2017.
Repurchases and sales are subject to market conditions, regulatory restric-
tions, and the capital structure at any given time. During 2021, 700 000 series A shares were repurchased while 2 697 715 series A shares were divested in accordance with mandates granted by the 2020 and 2021 AGM. Further infor-mation regarding repurchases and sales in accordance with AGM mandates is presented in the table above. The series A shares are held for possible delivery under the 2016–2021 personnel stock option programs.
The series B shares held can be divested over time to cover costs related to the personnel stock option programs, including social insurance charges, cash settlements or performance of alternative incentive solutions in countries where allotment of employee stock options are unsuitable. The total number of shares of series A and series B held by Atlas Copco is presented in the table above.
ReservesConsolidated equity includes certain reserves which are described below:
Hedging reserveThe hedging reserve comprises the effective portion of net changes in fair value for certain cash flow hedging instruments.
Translation reserveThe translation reserve comprises all exchange differences arising from thetranslation of the financial statements of foreign operations, the translation of intra-group receivables from or liabilities to foreign operations that in sub-stance are part of the net investment in the foreign operations, as well as from the translation of liabilities that hedge the company’s net investments in for-eign operations.
Non-controlling interestNon-controlling interest amounts to 1 (319). During 2021, the Group acquired the remaining part of the non-controlling interest of ISRA VISION and a
portion of the remaining non-controlling interest of Atlas Copco (India) Ltd. In total five subsidiaries have non-controlling interest.
Appropriation of profitThe Board of Directors proposes a dividend of SEK 7.60 (7.30) per share, total-ing SEK 9 258 246 797, to be paid in two installments. Shares held by the com-pany on December 31, 2021 are excluded.
SEK
Retained earnings including reserve for fair value 138 414 537 596 Profit for the year 5 176 207 640 143 590 745 236 The Board of Directors proposes that these earnings be appropriated as follows:
To the shareholders, a dividend of SEK 7.60 per share 9 258 246 797 To be retained in the business 134 332 498 439 Total 143 590 745 236
The proposed dividend for 2020 amounted of SEK 7.30 per share was approved by the AGM on April 27, 2021 and was paid accordingly by Atlas Copco AB. Total dividend paid amounted to SEK 8 889 311 863.
Share split and mandatory share redemptionThe Board also proposes a share split and redemption share procedure, whereby every share is split into four (4) ordinary shares and one (1) redemp-tion share. The redemption share is automatically redeemed at SEK 8.00 per share. This corresponds to a total of MSEK 9 746. Combined with the proposed ordinary dividend, shareholders will receive MSEK 19 004. The payment of the redemption share would, if approved, be made around June 13, 2022.
Atlas Copco 2021 94
FINANCIAL STATEMENTS – NOTESIN
TROD
UCTIO
NTH
IS IS ATLA
S COPCO
THE Y
EAR IN
REVIEW
FINA
NCIA
LSO
THER IN
FORM
ATIO
N
FINANCIALS
Group
Consolidated income statement
Consolidated statement of comprehensive income
Consolidated balance sheet
Consolidated statement of changes in equity
Consolidated statement of cash flows
• Notes
Parent company
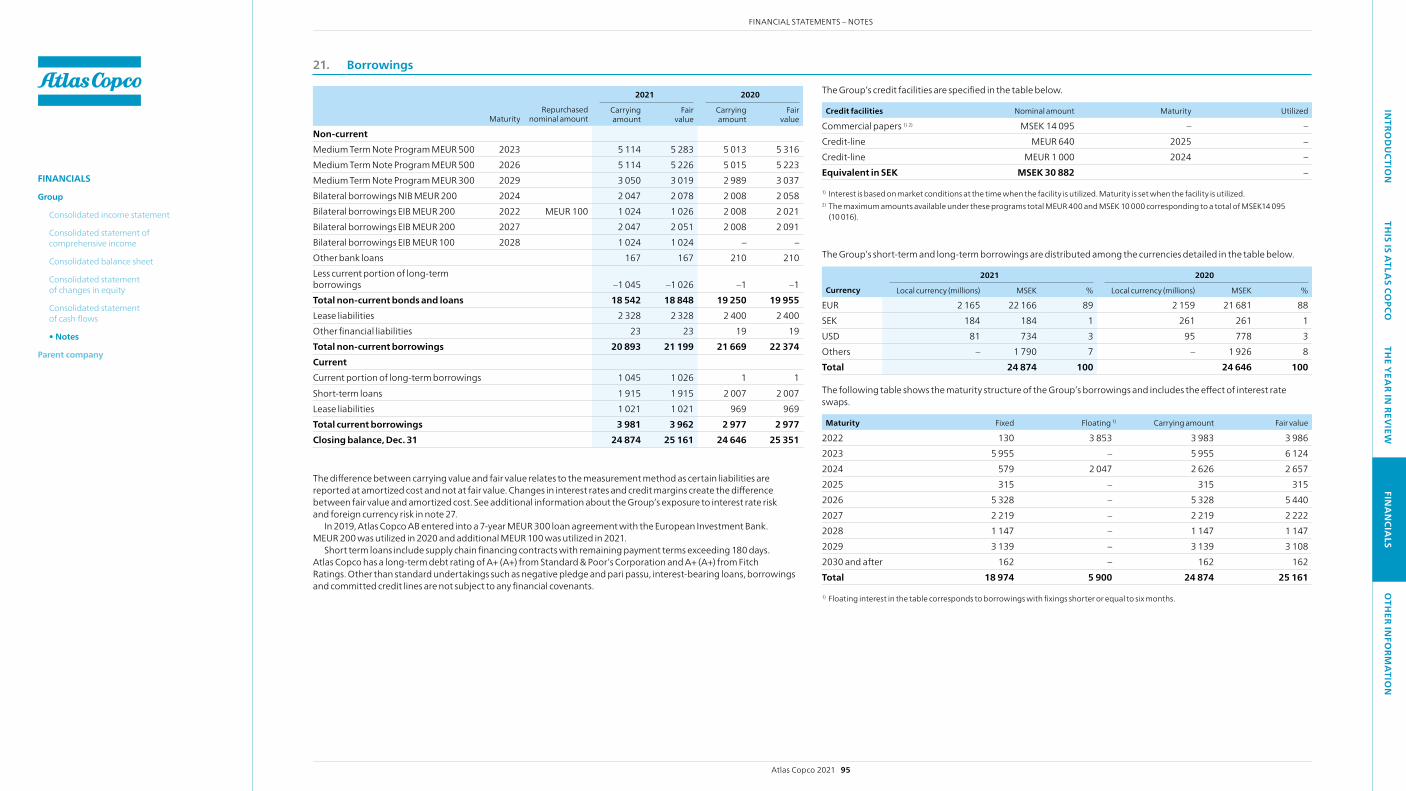
21. Borrowings
2021 2020
MaturityRepurchased
nominal amountCarrying amount
Fair value
Carrying amount
Fair value
Non-current Medium Term Note Program MEUR 500 2023 5 114 5 283 5 013 5 316 Medium Term Note Program MEUR 500 2026 5 114 5 226 5 015 5 223 Medium Term Note Program MEUR 300 2029 3 050 3 019 2 989 3 037 Bilateral borrowings NIB MEUR 200 2024 2 047 2 078 2 008 2 058 Bilateral borrowings EIB MEUR 200 2022 MEUR 100 1 024 1 026 2 008 2 021 Bilateral borrowings EIB MEUR 200 2027 2 047 2 051 2 008 2 091 Bilateral borrowings EIB MEUR 100 2028 1 024 1 024 – – Other bank loans 167 167 210 210 Less current portion of long-term borrowings –1 045 –1 026 –1 –1 Total non-current bonds and loans 18 542 18 848 19 250 19 955 Lease liabilities 2 328 2 328 2 400 2 400 Other financial liabilities 23 23 19 19 Total non-current borrowings 20 893 21 199 21 669 22 374 Current Current portion of long-term borrowings 1 045 1 026 1 1 Short-term loans 1 915 1 915 2 007 2 007 Lease liabilities 1 021 1 021 969 969 Total current borrowings 3 981 3 962 2 977 2 977 Closing balance, Dec. 31 24 874 25 161 24 646 25 351
The difference between carrying value and fair value relates to the measurement method as certain liabilities are reported at amortized cost and not at fair value. Changes in interest rates and credit margins create the difference between fair value and amortized cost. See additional information about the Group’s exposure to interest rate risk and foreign currency risk in note 27.
In 2019, Atlas Copco AB entered into a 7-year MEUR 300 loan agreement with the European Investment Bank. MEUR 200 was utilized in 2020 and additional MEUR 100 was utilized in 2021.
Short term loans include supply chain financing contracts with remaining payment terms exceeding 180 days. Atlas Copco has a long-term debt rating of A+ (A+) from Standard & Poor’s Corporation and A+ (A+) from Fitch Ratings. Other than standard undertakings such as negative pledge and pari passu, interest-bearing loans, borrowings and committed credit lines are not subject to any financial covenants.
The Group’s credit facilities are specified in the table below.
Credit facilities Nominal amount Maturity Utilized
Commercial papers 1) 2) MSEK 14 095 – – Credit-line MEUR 640 2025 – Credit-line MEUR 1 000 2024 – Equivalent in SEK MSEK 30 882 –
1) Interest is based on market conditions at the time when the facility is utilized. Maturity is set when the facility is utilized. 2) The maximum amounts available under these programs total MEUR 400 and MSEK 10 000 corresponding to a total of MSEK14 095
(10 016).
The Group’s short-term and long-term borrowings are distributed among the currencies detailed in the table below.
2021 2020
Currency Local currency (millions) MSEK % Local currency (millions) MSEK %
EUR 2 165 22 166 89 2 159 21 681 88 SEK 184 184 1 261 261 1 USD 81 734 3 95 778 3 Others – 1 790 7 – 1 926 8 Total 24 874 100 24 646 100
The following table shows the maturity structure of the Group’s borrowings and includes the effect of interest rate swaps.
Maturity Fixed Floating 1) Carrying amount Fair value
2022 130 3 853 3 983 3 9862023 5 955 – 5 955 6 1242024 579 2 047 2 626 2 6572025 315 – 315 3152026 5 328 – 5 328 5 4402027 2 219 – 2 219 2 2222028 1 147 – 1 147 1 1472029 3 139 – 3 139 3 108 2030 and after 162 – 162 162 Total 18 974 5 900 24 874 25 161
1) Floating interest in the table corresponds to borrowings with fixings shorter or equal to six months.
Atlas Copco 2021 95
FINANCIAL STATEMENTS – NOTESIN
TROD
UCTIO
NTH
IS IS ATLA
S COPCO
THE Y
EAR IN
REVIEW
FINA
NCIA
LSO
THER IN
FORM
ATIO
N
FINANCIALS
Group
Consolidated income statement
Consolidated statement of comprehensive income
Consolidated balance sheet
Consolidated statement of changes in equity
Consolidated statement of cash flows
• Notes
Parent company
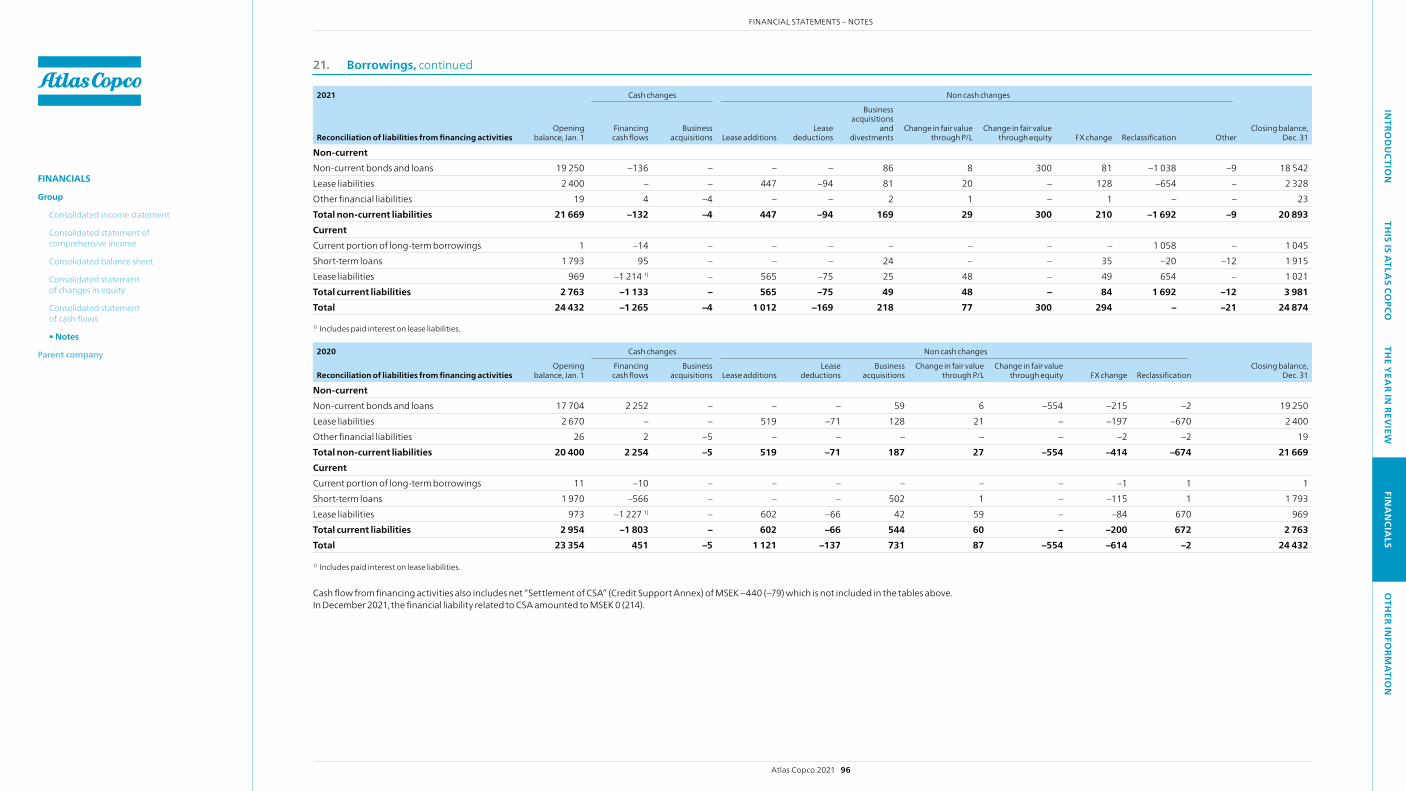
21. Borrowings, continued
2021 Cash changes Non cash changes
Reconciliation of liabilities from financing activitiesOpening
balance, Jan. 1Financing cash flows
Businessacquisitions Lease additions
Lease deductions
Businessacquisitions
and divestments
Change in fair value through P/L
Change in fair value through equity FX change Reclassi fica tion Other
Closing balance, Dec. 31
Non-current Non-current bonds and loans 19 250 –136 – – – 86 8 300 81 –1 038 –9 18 542 Lease liabilities 2 400 – – 447 –94 81 20 – 128 –654 – 2 328 Other financial liabilities 19 4 –4 – – 2 1 – 1 – – 23 Total non-current liabilities 21 669 –132 –4 447 –94 169 29 300 210 –1 692 –9 20 893 Current Current portion of long-term borrowings 1 –14 – – – – – – – 1 058 – 1 045 Short-term loans 1 793 95 – – – 24 – – 35 –20 –12 1 915 Lease liabilities 969 –1 214 1) – 565 –75 25 48 – 49 654 – 1 021 Total current liabilities 2 763 –1 133 – 565 –75 49 48 – 84 1 692 –12 3 981 Total 24 432 –1 265 –4 1 012 –169 218 77 300 294 – –21 24 874
1) Includes paid interest on lease liabilities.
2020 Cash changes Non cash changes
Reconciliation of liabilities from financing activitiesOpening
balance, Jan. 1Financing cash flows
Businessacquisitions Lease additions
Lease deductions
Businessacquisitions
Change in fair value through P/L
Change in fair value through equity FX change Reclassi fica tion
Closing balance, Dec. 31
Non-current Non-current bonds and loans 17 704 2 252 – – – 59 6 –554 –215 –2 19 250Lease liabilities 2 670 – – 519 –71 128 21 – –197 –670 2 400Other financial liabilities 26 2 –5 – – – – – –2 –2 19Total non-current liabilities 20 400 2 254 –5 519 –71 187 27 –554 –414 –674 21 669 Current Current portion of long-term borrowings 11 –10 – – – – – – –1 1 1Short-term loans 1 970 –566 – – – 502 1 – –115 1 1 793Lease liabilities 973 –1 227 1) – 602 –66 42 59 – –84 670 969Total current liabilities 2 954 –1 803 – 602 –66 544 60 – –200 672 2 763 Total 23 354 451 –5 1 121 –137 731 87 –554 –614 –2 24 432
1) Includes paid interest on lease liabilities.
Cash flow from financing activities also includes net “Settlement of CSA” (Credit Support Annex) of MSEK –440 (–79) which is not included in the tables above.In December 2021, the financial liability related to CSA amounted to MSEK 0 (214).
Atlas Copco 2021 96
FINANCIAL STATEMENTS – NOTESIN
TROD
UCTIO
NTH
IS IS ATLA
S COPCO
THE Y
EAR IN
REVIEW
FINA
NCIA
LSO
THER IN
FORM
ATIO
N
FINANCIALS
Group
Consolidated income statement
Consolidated statement of comprehensive income
Consolidated balance sheet
Consolidated statement of changes in equity
Consolidated statement of cash flows
• Notes
Parent company

Right-of-use assets, 2021 Buildings and land Machinery and equipment Rental equipment Total
Cost Opening balance, Jan. 1 3 491 1 510 38 5 039 Additions 583 434 – 1 017 Business acquisitions and divestments 84 19 7 110 Deductions –246 –245 –12 –503 Reclassifications –11 –13 – –24 Translation differences 216 71 1 288 Closing balance, Dec. 31 4 117 1 776 34 5 927 Depreciation and impairment losses Opening balance, Jan. 1 1 080 674 24 1 778 Depreciation and impairment for the period 701 438 8 1 147 Divestments – –1 – –1Deductions –109 –218 –7 –334 Reclassifications –15 –8 – –23 Translation differences 81 35 – 116 Closing balance, Dec. 31 1 738 920 25 2 683 Carrying amounts, Jan. 1 2 411 836 14 3 261 Carrying amounts, Dec. 31 2 379 856 9 3 244
Right-of-use assets, 2020 Buildings and land Machinery and equipment Rental equipment Total
Cost Opening balance, Jan. 1 3 176 1 408 47 4 631 Additions 677 446 – 1 123 Business acquisitions 157 13 – 170 Deductions –208 –192 –3 –403 Reclassifications –25 –37 –4 –66 Translation differences –286 –128 –2 –416 Closing balance, Dec. 31 3 491 1 510 38 5 039 Depreciation and impairment losses Opening balance, Jan. 1 610 442 22 1 074 Depreciation and impairment for the period 702 454 8 1 164 Deductions –121 –143 –3 –267 Reclassifications –25 –25 –2 –52 Translation differences –86 –54 –1 –141 Closing balance, Dec. 31 1 080 674 24 1 778 Carrying amounts, Jan. 1 2 566 966 25 3 557 Carrying amounts, Dec. 31 2 411 836 14 3 261
22. Leases
Group as a lesseeAtlas Copco s lease portfolio consists mainly of leased buildings such as offices and warehouses, vehicles and production equipment. There are several lease contracts with extension options and variable lease payments. Carrying amounts and movements of the right-of-use asset are presented in the tables below:
The following amounts have been recognized in profit or loss:
Leasing in income statement 2021 2020
Depreciation and impairment expense on right-of-use assets –1 147 –1 164 Interest expense on lease liabilities –68 –80 Expense relating to leases of low value assets –53 –44 Expense relating to short-term leases –105 –105 Expense relating to variable lease payments –27 –29 Income from subleasing right-of-use assets 8 6 Total amount recognized in profit or loss –1 392 –1 416
For cash outflows related to leases, the principal payment amounts to 1 154 (1 155) and the interest portion of lease payments to 60 (72). The principal pay-ment is recognized as cash flow from financing activities and the interest por-tion of the lease payment as cash flow from operating activities, net financial items paid. For further information, see consolidated statements of cash flow and note 21.
Lease contracts that include extension options are mainly related to prem-ises, machinery and equipment. Management uses significant judgement in determining whether these extension options are reasonably certain to be exercised. Extension options reasonably certain to be exercised are included in the lease term. Future cash outflow relating to extension options expected not to be exercised amounts to 175 (157). For leases that have not yet commenced, the future cash outflow amounts to 48 (13).
For carrying amounts and movements of lease liabilities related to the right-of-use assets, see note 21.
The maturity analysis of lease liabilities is disclosed in note 27.
Atlas Copco 2021 97
FINANCIAL STATEMENTS – NOTESIN
TROD
UCTIO
NTH
IS IS ATLA
S COPCO
THE Y
EAR IN
REVIEW
FINA
NCIA
LSO
THER IN
FORM
ATIO
N
FINANCIALS
Group
Consolidated income statement
Consolidated statement of comprehensive income
Consolidated balance sheet
Consolidated statement of changes in equity
Consolidated statement of cash flows
• Notes
Parent company
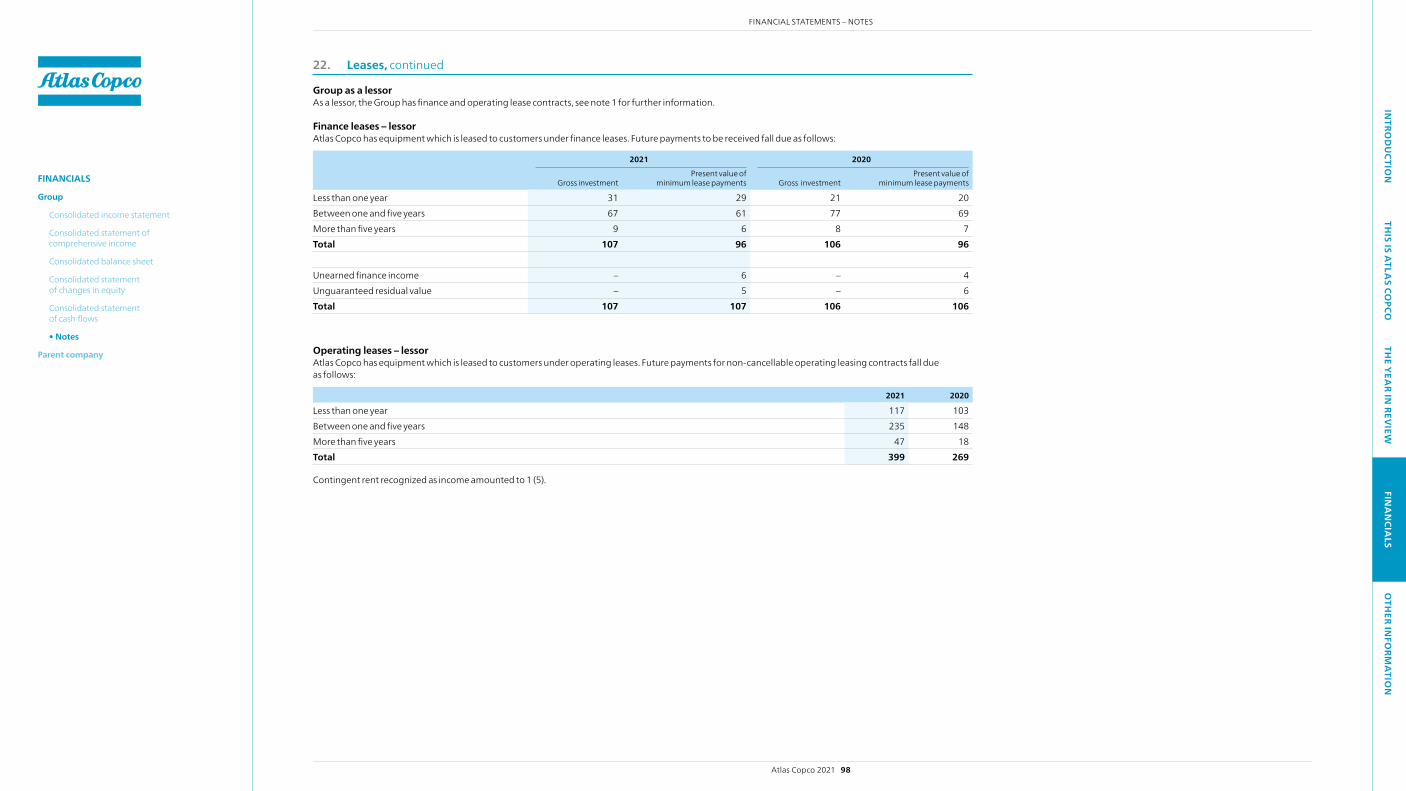
22. Leases, continued
Group as a lessorAs a lessor, the Group has finance and operating lease contracts, see note 1 for further information.
Finance leases – lessorAtlas Copco has equipment which is leased to customers under finance leases. Future payments to be received fall due as follows:
2021 2020
Gross investmentPresent value of
minimum lease payments Gross investmentPresent value of
minimum lease payments
Less than one year 31 29 21 20 Between one and five years 67 61 77 69 More than five years 9 6 8 7 Total 107 96 106 96 Unearned finance income – 6 – 4 Unguaranteed residual value – 5 – 6 Total 107 107 106 106
Operating leases – lessorAtlas Copco has equipment which is leased to customers under operating leases. Future payments for non-cancellable operating leasing contracts fall due as follows:
2021 2020
Less than one year 117 103 Between one and five years 235 148 More than five years 47 18 Total 399 269
Contingent rent recognized as income amounted to 1 (5).
Atlas Copco 2021 98
FINANCIAL STATEMENTS – NOTESIN
TROD
UCTIO
NTH
IS IS ATLA
S COPCO
THE Y
EAR IN
REVIEW
FINA
NCIA
LSO
THER IN
FORM
ATIO
N
FINANCIALS
Group
Consolidated income statement
Consolidated statement of comprehensive income
Consolidated balance sheet
Consolidated statement of changes in equity
Consolidated statement of cash flows
• Notes
Parent company
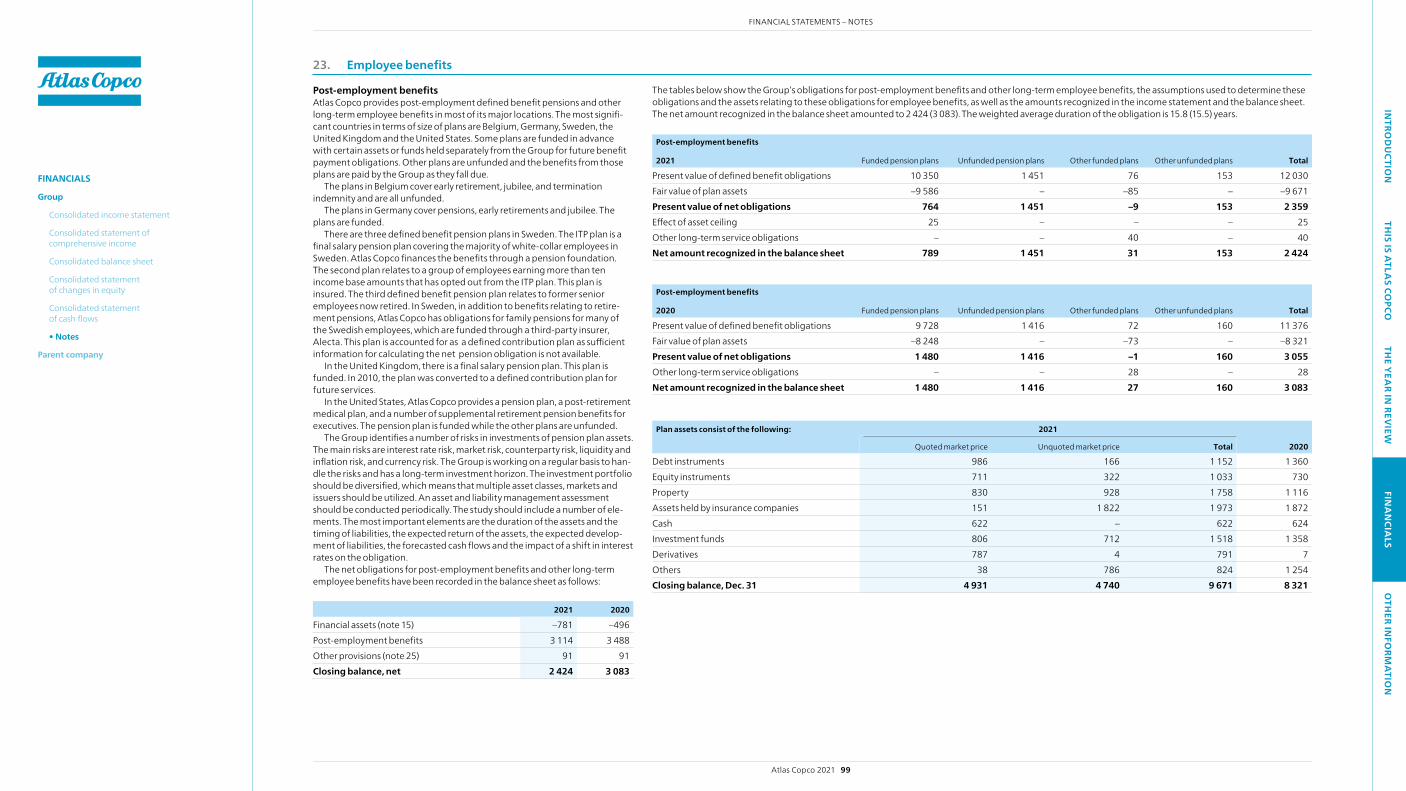
23. Employee benefits
Post-employment benefitsAtlas Copco provides post-employment defined benefit pensions and other long-term employee benefits in most of its major locations. The most signifi-cant countries in terms of size of plans are Belgium, Germany, Sweden, the United Kingdom and the United States. Some plans are funded in advance with certain assets or funds held separately from the Group for future benefit payment obligations. Other plans are unfunded and the benefits from those plans are paid by the Group as they fall due.
The plans in Belgium cover early retirement, jubilee, and termination indemnity and are all unfunded.
The plans in Germany cover pensions, early retirements and jubilee. The plans are funded.
There are three defined benefit pension plans in Sweden. The ITP plan is a final salary pension plan covering the majority of white-collar employees in Sweden. Atlas Copco finances the benefits through a pension foundation. The second plan relates to a group of employees earning more than ten income base amounts that has opted out from the ITP plan. This plan is insured. The third defined benefit pension plan relates to former senior employees now retired. In Sweden, in addition to benefits relating to retire-ment pensions, Atlas Copco has obligations for family pensions for many of the Swedish employees, which are funded through a third-party insurer, Alecta. This plan is accounted for as a defined contribution plan as sufficient information for calculating the net pension obligation is not available.
In the United Kingdom, there is a final salary pension plan. This plan is funded. In 2010, the plan was converted to a defined contribution plan for future services.
In the United States, Atlas Copco provides a pension plan, a post-retirement medical plan, and a number of supplemental retirement pension benefits for executives. The pension plan is funded while the other plans are unfunded.
The Group identifies a number of risks in investments of pension plan assets. The main risks are interest rate risk, market risk, counterparty risk, liquidity and inflation risk, and currency risk. The Group is working on a regular basis to han-dle the risks and has a long-term investment horizon. The investment portfolio should be diversified, which means that multiple asset classes, markets and issuers should be utilized. An asset and liability management assessment should be conducted periodically. The study should include a number of ele-ments. The most important elements are the duration of the assets and the timing of liabilities, the expected return of the assets, the expected develop-ment of liabilities, the forecasted cash flows and the impact of a shift in interest rates on the obligation.
The net obligations for post-employment benefits and other long-term employee benefits have been recorded in the balance sheet as follows:
2021 2020
Financial assets (note 15) –781 –496Post-employment benefits 3 114 3 488Other provisions (note 25) 91 91Closing balance, net 2 424 3 083
The tables below show the Group’s obligations for post-employment benefits and other long-term employee benefits, the assumptions used to determine these obligations and the assets relating to these obligations for employee benefits, as well as the amounts recognized in the income statement and the balance sheet. The net amount recognized in the balance sheet amounted to 2 424 (3 083). The weighted average duration of the obligation is 15.8 (15.5) years.
Post-employment benefits
2021 Funded pension plans Unfunded pension plans Other funded plans Other unfunded plans Total
Present value of defined benefit obligations 10 350 1 451 76 153 12 030Fair value of plan assets –9 586 – –85 – –9 671Present value of net obligations 764 1 451 –9 153 2 359Effect of asset ceiling 25 – – – 25Other long-term service obligations – – 40 – 40 Net amount recognized in the balance sheet 789 1 451 31 153 2 424
Post-employment benefits
2020 Funded pension plans Unfunded pension plans Other funded plans Other unfunded plans Total
Present value of defined benefit obligations 9 728 1 416 72 160 11 376 Fair value of plan assets –8 248 – –73 – –8 321 Present value of net obligations 1 480 1 416 –1 160 3 055Other long-term service obligations – – 28 – 28 Net amount recognized in the balance sheet 1 480 1 416 27 160 3 083
Plan assets consist of the following: 2021
2020quoted market price Unquoted market price Total
Debt instruments 986 166 1 152 1 360 Equity instruments 711 322 1 033 730 Property 830 928 1 758 1 116 Assets held by insurance companies 151 1 822 1 973 1 872 Cash 622 – 622 624 Investment funds 806 712 1 518 1 358 Derivatives 787 4 791 7 Others 38 786 824 1 254 Closing balance, Dec. 31 4 931 4 740 9 671 8 321
Atlas Copco 2021 99
FINANCIAL STATEMENTS – NOTESIN
TROD
UCTIO
NTH
IS IS ATLA
S COPCO
THE Y
EAR IN
REVIEW
FINA
NCIA
LSO
THER IN
FORM
ATIO
N
FINANCIALS
Group
Consolidated income statement
Consolidated statement of comprehensive income
Consolidated balance sheet
Consolidated statement of changes in equity
Consolidated statement of cash flows
• Notes
Parent company
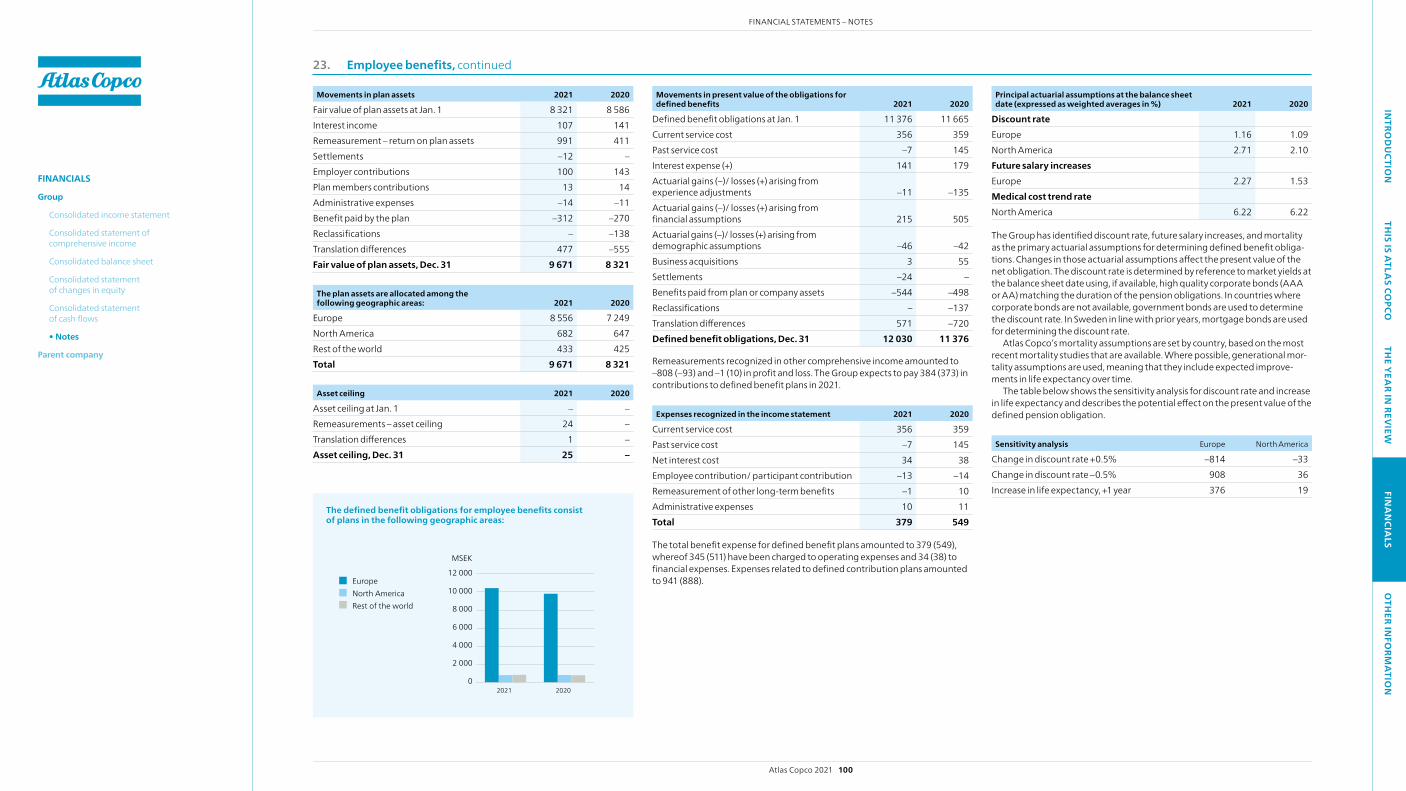
23. Employee benefits, continued
Movements in present value of the obligations for defined benefits 2021 2020
Defined benefit obligations at Jan. 1 11 376 11 665 Current service cost 356 359 Past service cost –7 145 Interest expense (+) 141 179 Actuarial gains (–)/ losses (+) arising from experience adjustments –11 –135 Actuarial gains (–)/ losses (+) arising from financial assumptions 215 505 Actuarial gains (–)/ losses (+) arising from demographic assumptions –46 –42 Business acquisitions 3 55 Settlements –24 – Benefits paid from plan or company assets –544 –498 Reclassifications – –137 Translation differences 571 –720 Defined benefit obligations, Dec. 31 12 030 11 376
Remeasurements recognized in other comprehensive income amounted to –808 (–93) and –1 (10) in profit and loss. The Group expects to pay 384 (373) in contributions to defined benefit plans in 2021.
Expenses recognized in the income statement 2021 2020
Current service cost 356 359 Past service cost –7 145 Net interest cost 34 38 Employee contribution/ participant contribution –13 –14 Remeasurement of other long-term benefits –1 10 Administrative expenses 10 11 Total 379 549
The total benefit expense for defined benefit plans amounted to 379 (549), whereof 345 (511) have been charged to operating expenses and 34 (38) to financial expenses. Expenses related to defined contribution plans amounted to 941 (888).
0
2 000
4 000
6 000
8 000
10 000
12 000
20202021
MSEK
EuropeNorth AmericaRest of the world
0
2 000
4 000
6 000
8 000
10 000
20202021
MSEK
EuropeNorth AmericaRest of the world
The defined benefit obligations for employee benefits consist of plans in the following geographic areas:
Movements in plan assets 2021 2020
Fair value of plan assets at Jan. 1 8 321 8 586 Interest income 107 141 Remeasurement – return on plan assets 991 411 Settlements –12 – Employer contributions 100 143 Plan members contributions 13 14 Administrative expenses –14 –11 Benefit paid by the plan –312 –270 Reclassifications – –138 Translation differences 477 –555 Fair value of plan assets, Dec. 31 9 671 8 321
The plan assets are allocated among the following geographic areas: 2021 2020
Europe 8 556 7 249North America 682 647Rest of the world 433 425Total 9 671 8 321
Asset ceiling 2021 2020
Asset ceiling at Jan. 1 – – Remeasurements – asset ceiling 24 – Translation differences 1 – Asset ceiling, Dec. 31 25 –
Principal actuarial assumptions at the balance sheet date (expressed as weighted averages in %) 2021 2020
Discount rate Europe 1.16 1.09 North America 2.71 2.10 Future salary increases Europe 2.27 1.53 Medical cost trend rate North America 6.22 6.22
The Group has identified discount rate, future salary increases, and mortality as the primary actuarial assumptions for determining defined benefit obliga-tions. Changes in those actuarial assumptions affect the present value of the net obligation. The discount rate is determined by reference to market yields at the balance sheet date using, if available, high quality corporate bonds (AAA or AA) matching the duration of the pension obligations. In countries where corporate bonds are not available, government bonds are used to determine the discount rate. In Sweden in line with prior years, mortgage bonds are used for determining the discount rate.
Atlas Copco’s mortality assumptions are set by country, based on the most recent mortality studies that are available. where possible, generational mor-tality assumptions are used, meaning that they include expected improve-ments in life expectancy over time.
The table below shows the sensitivity analysis for discount rate and increase in life expectancy and describes the potential effect on the present value of the defined pension obligation.
Sensitivity analysis Europe North America
Change in discount rate +0.5% –814 –33Change in discount rate –0.5% 908 36 Increase in life expectancy, +1 year 376 19
Atlas Copco 2021 100
FINANCIAL STATEMENTS – NOTESIN
TROD
UCTIO
NTH
IS IS ATLA
S COPCO
THE Y
EAR IN
REVIEW
FINA
NCIA
LSO
THER IN
FORM
ATIO
N
FINANCIALS
Group
Consolidated income statement
Consolidated statement of comprehensive income
Consolidated balance sheet
Consolidated statement of changes in equity
Consolidated statement of cash flows
• Notes
Parent company
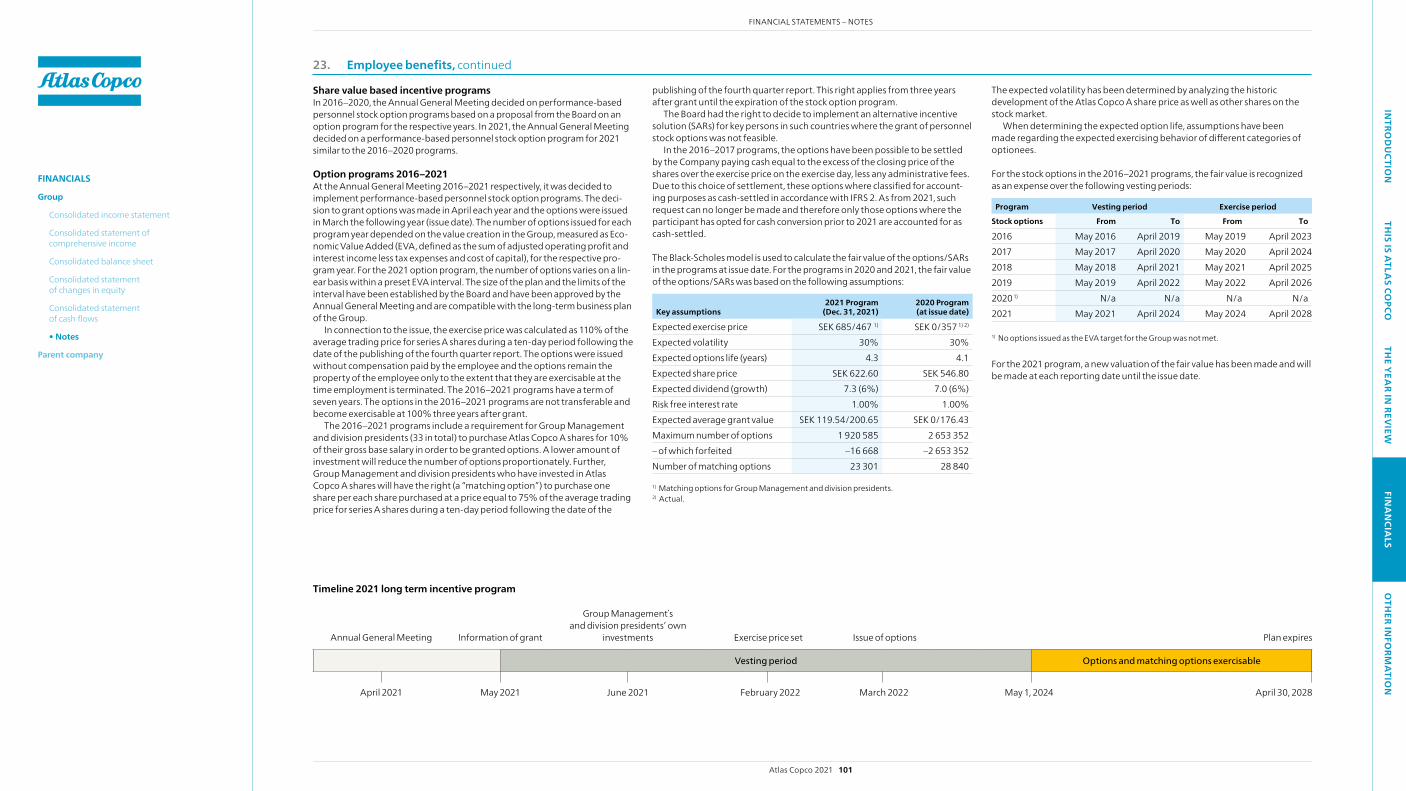
23. Employee benefits, continued
Share value based incentive programsIn 2016–2020, the Annual General Meeting decided on performance-based personnel stock option programs based on a proposal from the Board on an option program for the respective years. In 2021, the Annual General Meeting decided on a performance-based personnel stock option program for 2021 similar to the 2016–2020 programs.
Option programs 2016–2021At the Annual General Meeting 2016–2021 respectively, it was decided to implement performance-based personnel stock option programs. The deci-sion to grant options was made in April each year and the options were issued in March the following year (issue date). The number of options issued for each program year depended on the value creation in the Group, measured as Eco-nomic Value Added (EVA, defined as the sum of adjusted operating profit and interest income less tax expenses and cost of capital), for the respective pro-gram year. For the 2021 option program, the number of options varies on a lin-ear basis within a preset EVA interval. The size of the plan and the limits of the interval have been established by the Board and have been approved by the Annual General Meeting and are compatible with the long-term business plan of the Group.
In connection to the issue, the exercise price was calculated as 110% of the average trading price for series A shares during a ten-day period following the date of the publishing of the fourth quarter report. The options were issued without compensation paid by the employee and the options remain the property of the employee only to the extent that they are exercisable at the time employment is terminated. The 2016–2021 programs have a term of seven years. The options in the 2016–2021 programs are not transferable and become exercisable at 100% three years after grant.
The 2016–2021 programs include a requirement for Group Management and division presidents (33 in total) to purchase Atlas Copco A shares for 10% of their gross base salary in order to be granted options. A lower amount of investment will reduce the number of options proportionately. Further, Group Management and division presidents who have invested in Atlas Copco A shares will have the right (a “matching option”) to purchase one share per each share purchased at a price equal to 75% of the average trading price for series A shares during a ten-day period following the date of the
publishing of the fourth quarter report. This right applies from three years after grant until the expiration of the stock option program.
The Board had the right to decide to implement an alternative incentive solution (SARs) for key persons in such countries where the grant of personnel stock options was not feasible.
In the 2016–2017 programs, the options have been possible to be settled by the Company paying cash equal to the excess of the closing price of the shares over the exercise price on the exercise day, less any administrative fees. Due to this choice of settlement, these options where classified for account-ing purposes as cash-settled in accordance with IFRS 2. As from 2021, such request can no longer be made and therefore only those options where the participant has opted for cash conversion prior to 2021 are accounted for as cash-settled.
The Black-Scholes model is used to calculate the fair value of the options/SARs in the programs at issue date. For the programs in 2020 and 2021, the fair value of the options/SARs was based on the following assumptions:
Key assumptions2021 Program
(Dec. 31, 2021)2020 Program(at issue date)
Expected exercise price SEK 685/467 1) SEK 0/357 1) 2)
Expected volatility 30% 30%Expected options life (years) 4.3 4.1Expected share price SEK 622.60 SEK 546.80Expected dividend (growth) 7.3 (6%) 7.0 (6%) Risk free interest rate 1.00% 1.00%Expected average grant value SEK 119.54/200.65 SEK 0/176.43Maximum number of options 1 920 585 2 653 352– of which forfeited –16 668 –2 653 352Number of matching options 23 301 28 840
1) Matching options for Group Management and division presidents. 2) Actual.
The expected volatility has been determined by analyzing the historic development of the Atlas Copco A share price as well as other shares on the stock market.
when determining the expected option life, assumptions have been made regarding the expected exercising behavior of different categories of optionees.
For the stock options in the 2016–2021 programs, the fair value is recognized as an expense over the following vesting periods:
Program Vesting period Exercise period
Stock options From To From To
2016 May 2016 April 2019 May 2019 April 20232017 May 2017 April 2020 May 2020 April 20242018 May 2018 April 2021 May 2021 April 20252019 May 2019 April 2022 May 2022 April 20262020 1) N/a N/a N/a N/a2021 May 2021 April 2024 May 2024 April 2028
1) No options issued as the EVA target for the Group was not met.
For the 2021 program, a new valuation of the fair value has been made and will be made at each reporting date until the issue date.
Timeline 2021 long term incentive program
Annual General Meeting Information of grant
Group Management s and division presidents’ own
investments Exercise price set Issue of options Plan expires
Vesting period Options and matching options exercisable
April 2021 May 2021 June 2021 February 2022 March 2022 May 1, 2024 April 30, 2028
Atlas Copco 2021 101
FINANCIAL STATEMENTS – NOTESIN
TROD
UCTIO
NTH
IS IS ATLA
S COPCO
THE Y
EAR IN
REVIEW
FINA
NCIA
LSO
THER IN
FORM
ATIO
N
FINANCIALS
Group
Consolidated income statement
Consolidated statement of comprehensive income
Consolidated balance sheet
Consolidated statement of changes in equity
Consolidated statement of cash flows
• Notes
Parent company
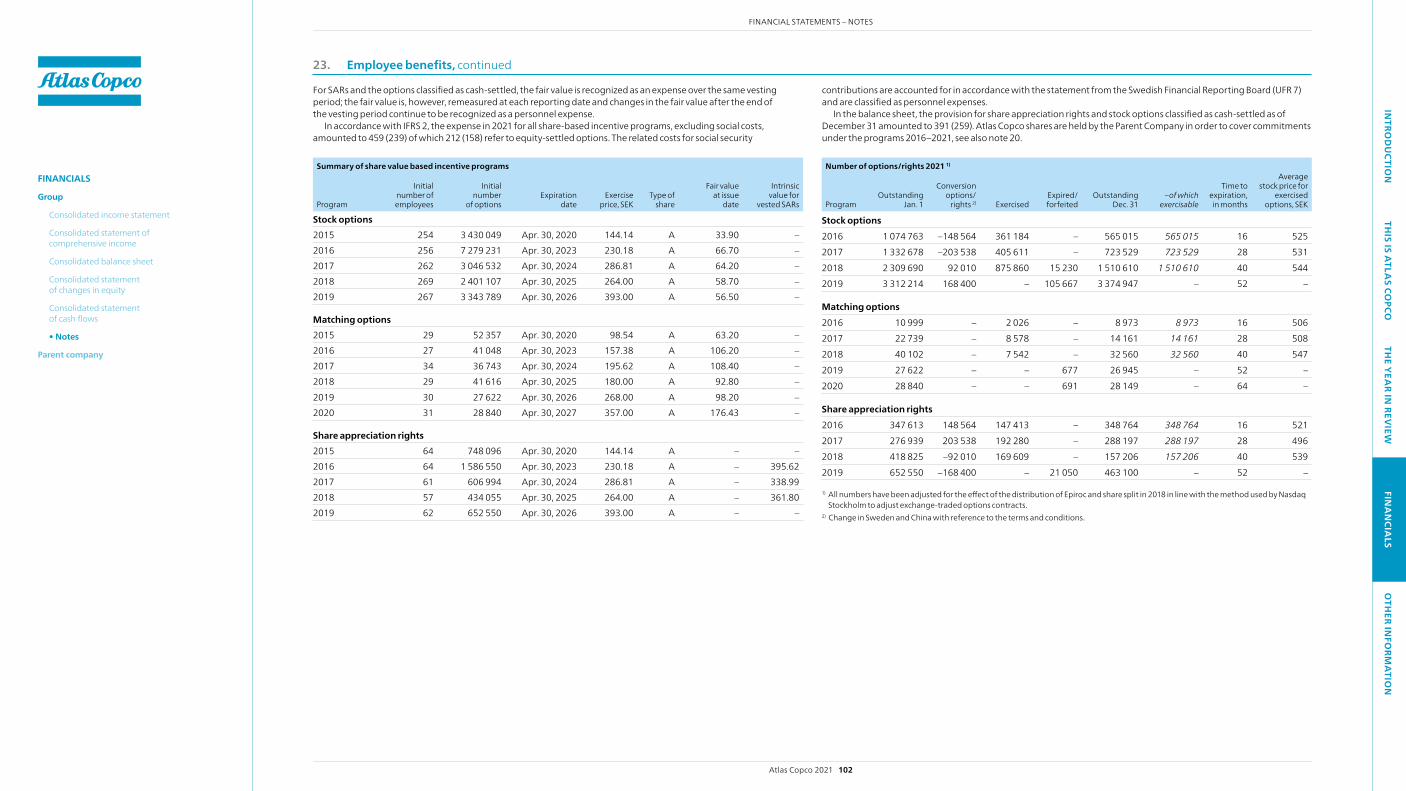
23. Employee benefits, continued
For SARs and the options classified as cash-settled, the fair value is recognized as an expense over the same vesting period; the fair value is, however, remeasured at each reporting date and changes in the fair value after the end of the vesting period continue to be recognized as a personnel expense.
In accordance with IFRS 2, the expense in 2021 for all share-based incentive programs, excluding social costs, amounted to 459 (239) of which 212 (158) refer to equity-settled options. The related costs for social security
contributions are accounted for in accordance with the statement from the Swedish Financial Reporting Board (UFR 7) and are classified as personnel expenses.
In the balance sheet, the provision for share appreciation rights and stock options classified as cash-settled as of December 31 amounted to 391 (259). Atlas Copco shares are held by the Parent Company in order to cover commitments under the programs 2016–2021, see also note 20.
Summary of share value based incentive programs
Program
Initial number of
employees
Initial number
of optionsExpiration
dateExercise
price, SEKType of
share
Fair value at issue
date
Intrinsic value for
vested SARs
Stock options 2015 254 3 430 049 Apr. 30, 2020 144.14 A 33.90 – 2016 256 7 279 231 Apr. 30, 2023 230.18 A 66.70 – 2017 262 3 046 532 Apr. 30, 2024 286.81 A 64.20 – 2018 269 2 401 107 Apr. 30, 2025 264.00 A 58.70 – 2019 267 3 343 789 Apr. 30, 2026 393.00 A 56.50 –
Matching options 2015 29 52 357 Apr. 30, 2020 98.54 A 63.20 – 2016 27 41 048 Apr. 30, 2023 157.38 A 106.20 – 2017 34 36 743 Apr. 30, 2024 195.62 A 108.40 – 2018 29 41 616 Apr. 30, 2025 180.00 A 92.80 – 2019 30 27 622 Apr. 30, 2026 268.00 A 98.20 – 2020 31 28 840 Apr. 30, 2027 357.00 A 176.43 –
Share appreciation rights 2015 64 748 096 Apr. 30, 2020 144.14 A – – 2016 64 1 586 550 Apr. 30, 2023 230.18 A – 395.62 2017 61 606 994 Apr. 30, 2024 286.81 A – 338.99 2018 57 434 055 Apr. 30, 2025 264.00 A – 361.80 2019 62 652 550 Apr. 30, 2026 393.00 A – –
Number of options/rights 2021 1)
ProgramOutstanding
Jan. 1
Conversion options/
rights 2) ExercisedExpired/ forfeited
Outstanding Dec. 31
–of which exercisable
Time to expiration, in months
Average stock price for
exercised options, SEK
Stock options 2016 1 074 763 –148 564 361 184 – 565 015 565 015 16 525 2017 1 332 678 –203 538 405 611 – 723 529 723 529 28 531 2018 2 309 690 92 010 875 860 15 230 1 510 610 1 510 610 40 544 2019 3 312 214 168 400 – 105 667 3 374 947 – 52 –
Matching options 2016 10 999 – 2 026 – 8 973 8 973 16 506 2017 22 739 – 8 578 – 14 161 14 161 28 508 2018 40 102 – 7 542 – 32 560 32 560 40 547 2019 27 622 – – 677 26 945 – 52 – 2020 28 840 – – 691 28 149 – 64 –
Share appreciation rights 2016 347 613 148 564 147 413 – 348 764 348 764 16 521 2017 276 939 203 538 192 280 – 288 197 288 197 28 496 2018 418 825 –92 010 169 609 – 157 206 157 206 40 539 2019 652 550 –168 400 – 21 050 463 100 – 52 –
1) All numbers have been adjusted for the effect of the distribution of Epiroc and share split in 2018 in line with the method used by Nasdaq Stockholm to adjust exchange-traded options contracts.
2) Change in Sweden and China with reference to the terms and conditions.
Atlas Copco 2021 102
FINANCIAL STATEMENTS – NOTESIN
TROD
UCTIO
NTH
IS IS ATLA
S COPCO
THE Y
EAR IN
REVIEW
FINA
NCIA
LSO
THER IN
FORM
ATIO
N
FINANCIALS
Group
Consolidated income statement
Consolidated statement of comprehensive income
Consolidated balance sheet
Consolidated statement of changes in equity
Consolidated statement of cash flows
• Notes
Parent company
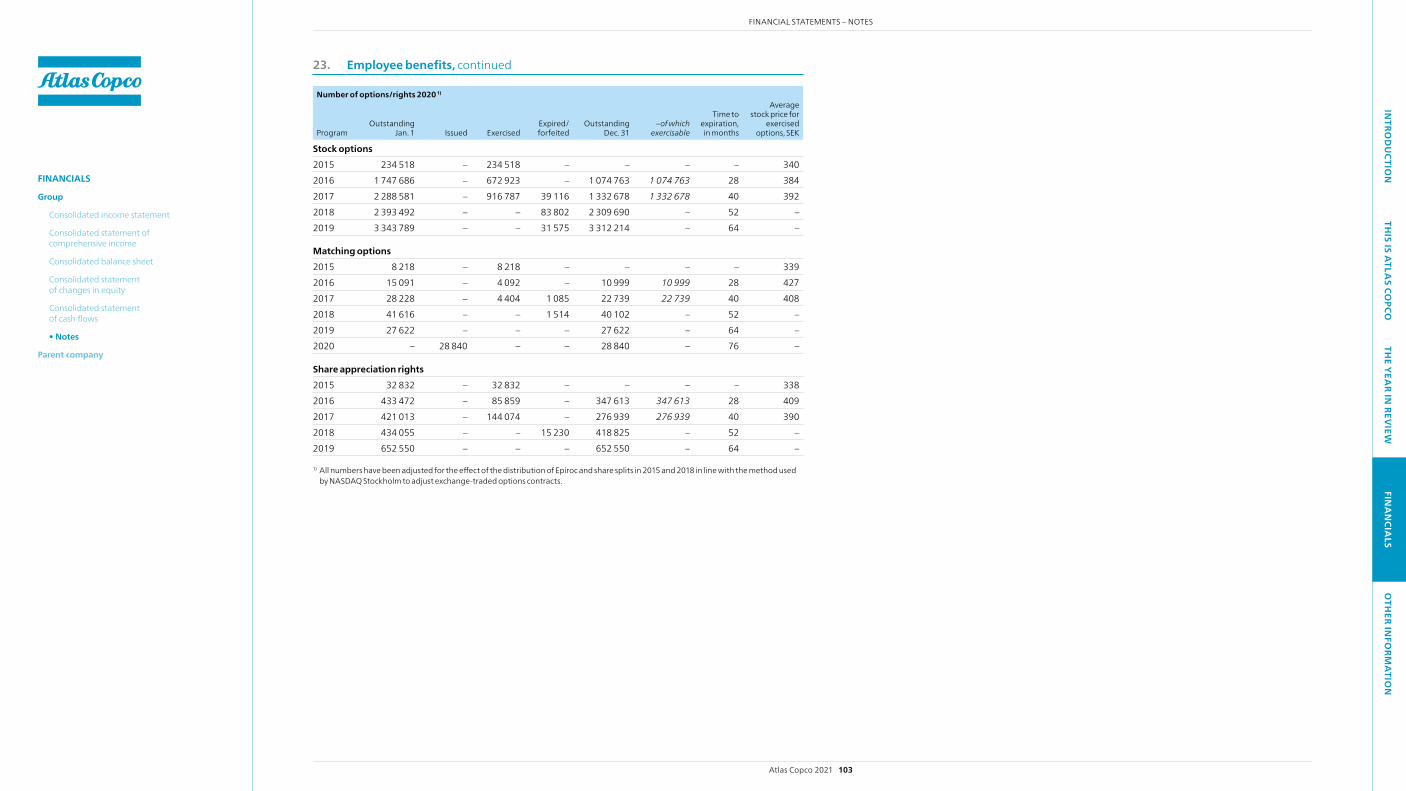
23. Employee benefits, continued
Number of options/rights 2020 1)
ProgramOutstanding
Jan. 1 Issued ExercisedExpired/ forfeited
Outstanding Dec. 31
–of which exercisable
Time to expiration, in months
Average stock price for
exercised options, SEK
Stock options 2015 234 518 – 234 518 – – – – 3402016 1 747 686 – 672 923 – 1 074 763 1 074 763 28 3842017 2 288 581 – 916 787 39 116 1 332 678 1 332 678 40 3922018 2 393 492 – – 83 802 2 309 690 – 52 – 2019 3 343 789 – – 31 575 3 312 214 – 64 –
Matching options 2015 8 218 – 8 218 – – – – 339 2016 15 091 – 4 092 – 10 999 10 999 28 427 2017 28 228 – 4 404 1 085 22 739 22 739 40 408 2018 41 616 – – 1 514 40 102 – 52 – 2019 27 622 – – – 27 622 – 64 – 2020 – 28 840 – – 28 840 – 76 –
Share appreciation rights 2015 32 832 – 32 832 – – – – 3382016 433 472 – 85 859 – 347 613 347 613 28 4092017 421 013 – 144 074 – 276 939 276 939 40 3902018 434 055 – – 15 230 418 825 – 52 – 2019 652 550 – – – 652 550 – 64 –
1) All numbers have been adjusted for the effect of the distribution of Epiroc and share splits in 2015 and 2018 in line with the method used by NASDAq Stockholm to adjust exchange-traded options contracts.
Atlas Copco 2021 103
FINANCIAL STATEMENTS – NOTESIN
TROD
UCTIO
NTH
IS IS ATLA
S COPCO
THE Y
EAR IN
REVIEW
FINA
NCIA
LSO
THER IN
FORM
ATIO
N
FINANCIALS
Group
Consolidated income statement
Consolidated statement of comprehensive income
Consolidated balance sheet
Consolidated statement of changes in equity
Consolidated statement of cash flows
• Notes
Parent company

24. Other liabilities
Fair value of other liabilities corresponds to carrying value.
Other current liabilities 2021 2020
Derivatives: – at fair value through profit and loss 163 69 – at fair value through OCI 59 – Other financial liabilities: – other liabilities 2 206 2 099 – accrued expenses 8 182 6 617 Prepaid income other 40 28 Contract liabilities: – advances from customers 5 114 3 027 – deferred revenues construction contracts 429 516 – deferred revenues service contracts 1 951 1 631 Closing balance, Dec. 31 18 144 13 987
Accrued expenses include items such as social costs, vacation pay liability, accrued interest, and accrued operational expenses. See note 27 for informa-tion on the Group’s derivatives.
The amounts included in contract liabilities at the beginning of the year have been recognized as revenue during the year except for 447 (376). The main reason for revenues not recognized during the year is that they are related to performance obligations that will be performed in future periods.
As of the end of 2021, transaction price allocated to remaining performance obligations was 14 296 (12 772) and the majority will be recognized as revenue over the next three years. The transaction price does not include consideration that is constrained.
25. Provisions 26. Assets pledged and contingent liabilities
2021Product
warranty Restruc turing Other Total
Opening balance, Jan. 1 1 217 411 1 500 3 128During the year: – provisions made 1 219 100 926 2 245 – provisions used –918 –242 –407 –1 567 – provisions reversed –330 –12 –268 –610 Reclassification – 10 2 12Translation differences 73 4 27 104Closing balance, Dec. 31 1 261 271 1 780 3 312 Non-current 224 100 1 362 1 686 Current 1 037 171 418 1 626 Total 1 261 271 1 780 3 312
Assets pledged for debts to credit institutions and other commitments 2021 2020
Inventory and property, plant and equipment 57 61 Endowment insurances 201 183 Total 258 244
Contingent liabilities 2021 2020
Notes discounted 7 8Sureties and other contingent liabilities 252 244Total 259 252
Sureties and other contingent liabilities relate primarily to pension commit-ments and commitments related to customer claims and various legal matters.
2020Product
warranty Restruc turing Other Total
Opening balance, Jan. 1 1 193 225 1 344 2 762During the year: – provisions made 1 216 290 638 2 144 – provisions used –945 –79 –269 –1 293 – provisions reversed –169 –7 –179 –355 Business acquisitions 23 – 16 39 Translation differences –101 –18 –50 –169 Closing balance, Dec. 31 1 217 411 1 500 3 128 Non-current 193 28 974 1 195 Current 1 024 383 526 1 933 Total 1 217 411 1 500 3 128
Maturity 2021
Product warranty Restruc turing Other Total
Less than one year 1 037 171 418 1 626Between one and five years 214 81 857 1 152More than five years 10 19 505 534 Total 1 261 271 1 780 3 312
Other provisions consist primarily of amounts related to share-based pay-ments including social fees, other long-term employee benefits (see note 23), and asset restoration obligations.
25. Provisions, continued
Atlas Copco 2021 104
FINANCIAL STATEMENTS – NOTESIN
TROD
UCTIO
NTH
IS IS ATLA
S COPCO
THE Y
EAR IN
REVIEW
FINA
NCIA
LSO
THER IN
FORM
ATIO
N
FINANCIALS
Group
Consolidated income statement
Consolidated statement of comprehensive income
Consolidated balance sheet
Consolidated statement of changes in equity
Consolidated statement of cash flows
• Notes
Parent company
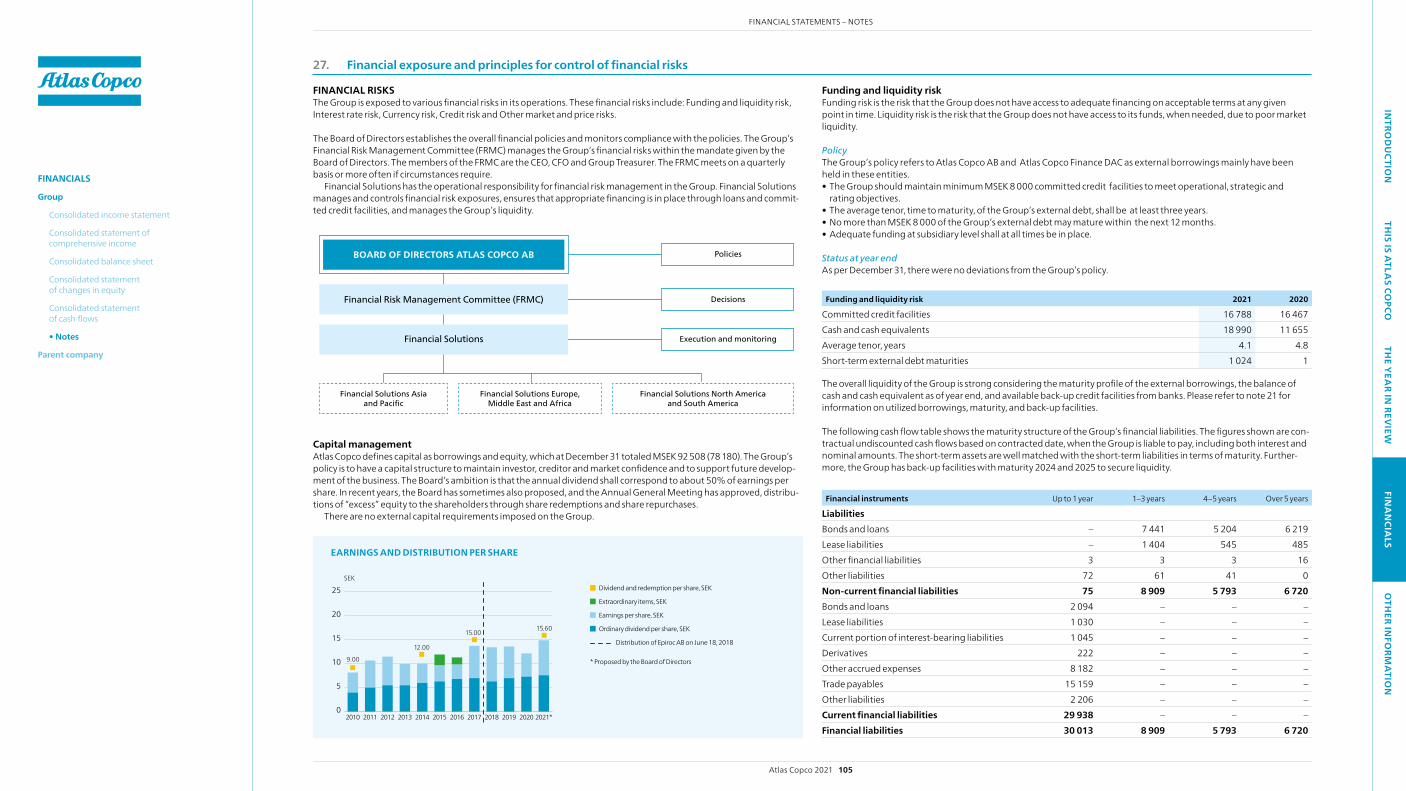
27. Financial exposure and principles for control of financial risks
FINANCIAL RISKSThe Group is exposed to various financial risks in its operations. These financial risks include: Funding and liquidity risk, Interest rate risk, Currency risk, Credit risk and Other market and price risks.
The Board of Directors establishes the overall financial policies and monitors compliance with the policies. The Group’s Financial Risk Management Committee (FRMC) manages the Group’s financial risks within the mandate given by the Board of Directors. The members of the FRMC are the CEO, CFO and Group Treasurer. The FRMC meets on a quarterly basis or more often if circumstances require.
Financial Solutions has the operational responsibility for financial risk management in the Group. Financial Solutions manages and controls financial risk exposures, ensures that appropriate financing is in place through loans and commit-ted credit facilities, and manages the Group’s liquidity.
Financial Solutions
Financial Risk Management Committee (FRMC)
BOARD OF DIRECTORS ATLAS COPCO AB Policies
Decisions
Financial Solutions Asia and Paci�c
Financial Solutions Europe, Middle East and Africa
Financial Solutions North America and South America
Execution and monitoring
Capital managementAtlas Copco defines capital as borrowings and equity, which at December 31 totaled MSEK 92 508 (78 180). The Group’s policy is to have a capital structure to maintain investor, creditor and market confidence and to support future develop-ment of the business. The Board’s ambition is that the annual dividend shall correspond to about 50% of earnings per share. In recent years, the Board has sometimes also proposed, and the Annual General Meeting has approved, distribu-tions of “excess” equity to the shareholders through share redemptions and share repurchases.
There are no external capital requirements imposed on the Group.
Funding and liquidity riskFunding risk is the risk that the Group does not have access to adequate financing on acceptable terms at any given point in time. Liquidity risk is the risk that the Group does not have access to its funds, when needed, due to poor market liquidity.
Policy The Group’s policy refers to Atlas Copco AB and Atlas Copco Finance DAC as external borrowings mainly have been held in these entities.• The Group should maintain minimum MSEK 8 000 committed credit facilities to meet operational, strategic and
rating objectives.• The average tenor, time to maturity, of the Group’s external debt, shall be at least three years.• No more than MSEK 8 000 of the Group’s external debt may mature within the next 12 months. • Adequate funding at subsidiary level shall at all times be in place.
Status at year endAs per December 31, there were no deviations from the Group’s policy.
Funding and liquidity risk 2021 2020
Committed credit facilities 16 788 16 467 Cash and cash equivalents 18 990 11 655 Average tenor, years 4.1 4.8 Short-term external debt maturities 1 024 1
The overall liquidity of the Group is strong considering the maturity profile of the external borrowings, the balance of cash and cash equivalent as of year end, and available back-up credit facilities from banks. Please refer to note 21 for information on utilized borrowings, maturity, and back-up facilities.
The following cash flow table shows the maturity structure of the Group’s financial liabilities. The figures shown are con-tractual undiscounted cash flows based on contracted date, when the Group is liable to pay, including both interest and nominal amounts. The short-term assets are well matched with the short-term liabilities in terms of maturity. Further-more, the Group has back-up facilities with maturity 2024 and 2025 to secure liquidity.
Financial instruments Up to 1 year 1–3 years 4–5 years Over 5 years
Liabilities Bonds and loans – 7 441 5 204 6 219 Lease liabilities – 1 404 545 485 Other financial liabilities 3 3 3 16 Other liabilities 72 61 41 0 Non-current financial liabilities 75 8 909 5 793 6 720 Bonds and loans 2 094 – – – Lease liabilities 1 030 – – – Current portion of interest-bearing liabilities 1 045 – – – Derivatives 222 – – –Other accrued expenses 8 182 – – –Trade payables 15 159 – – –Other liabilities 2 206 – – –Current financial liabilities 29 938 – – –Financial liabilities 30 013 8 909 5 793 6 720
Ordinary dividend per share, SEKEarnings per share, SEK
* Proposed by the Board of Directors
SEK
0
5
10
15
20
25
20212020*201920182017201620152014201320122011
12.00
15.00
Dividend and redemption per share, SEKExtraordinary items, SEK
SEK
0
5
10
15
20
25
2021*20202019201820172016201520142013201220112010
9.00
12.00
15.00 15.60
EARNINGS AND DISTRIBUTION PER SHARE
Dividend and redemption per share, SEK
Extraordinary items, SEK
Earnings per share, SEK
Ordinary dividend per share, SEK
Distribution of Epiroc AB on June 18, 2018
Distribution of Epiroc AB on June 18, 2018
* Proposed by the Board of Directors
Atlas Copco 2021 105
FINANCIAL STATEMENTS – NOTESIN
TROD
UCTIO
NTH
IS IS ATLA
S COPCO
THE Y
EAR IN
REVIEW
FINA
NCIA
LSO
THER IN
FORM
ATIO
N
FINANCIALS
Group
Consolidated income statement
Consolidated statement of comprehensive income
Consolidated balance sheet
Consolidated statement of changes in equity
Consolidated statement of cash flows
• Notes
Parent company
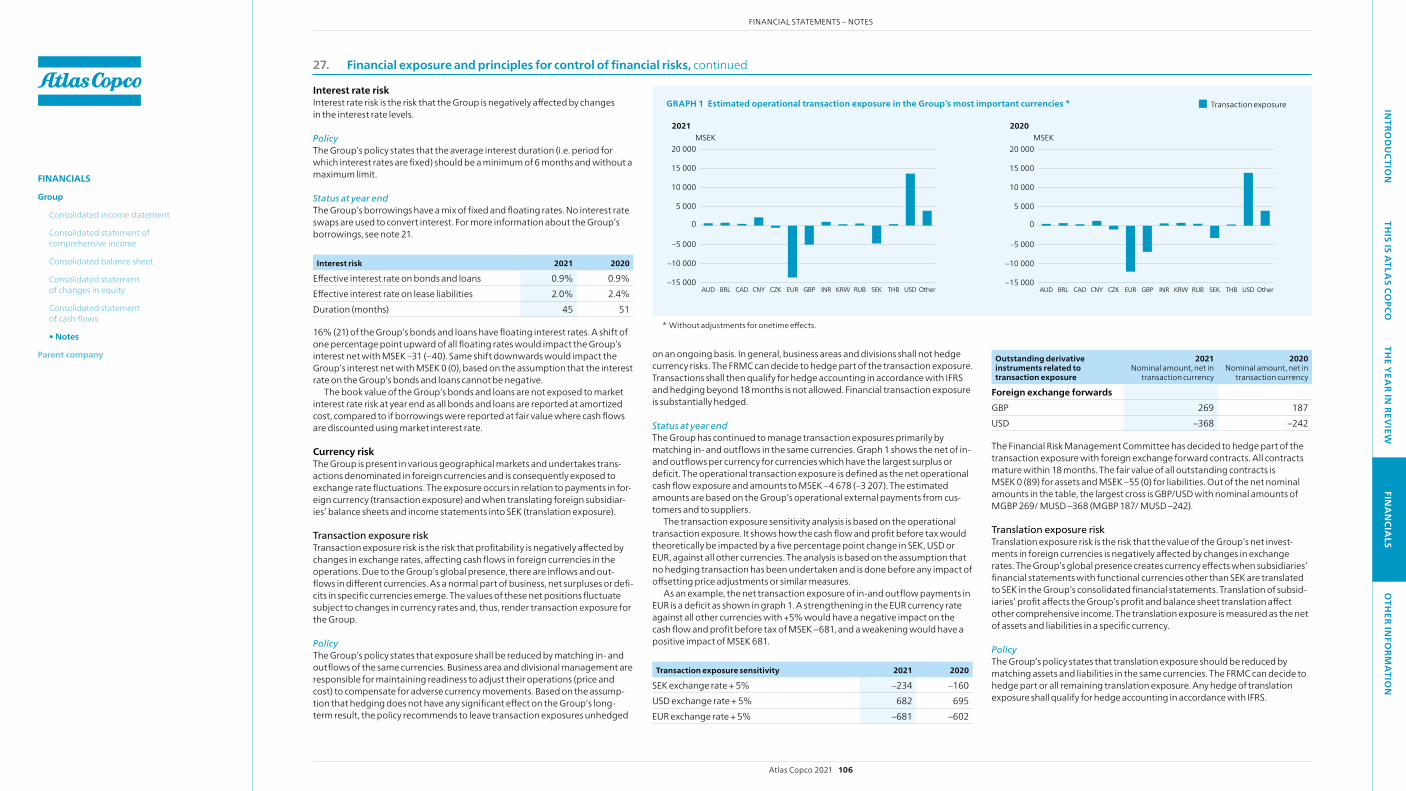
27. Financial exposure and principles for control of financial risks, continued
Interest rate riskInterest rate risk is the risk that the Group is negatively affected by changes in the interest rate levels.
PolicyThe Group’s policy states that the average interest duration (i.e. period for which interest rates are fixed) should be a minimum of 6 months and without a maximum limit.
Status at year end The Group’s borrowings have a mix of fixed and floating rates. No interest rate swaps are used to convert interest. For more information about the Group’s borrowings, see note 21.
Interest risk 2021 2020
Effective interest rate on bonds and loans 0.9% 0.9% Effective interest rate on lease liabilities 2.0% 2.4% Duration (months) 45 51
16% (21) of the Group’s bonds and loans have floating interest rates. A shift of one percentage point upward of all floating rates would impact the Group’s interest net with MSEK –31 (–40). Same shift downwards would impact the Group’s interest net with MSEK 0 (0), based on the assumption that the interest rate on the Group’s bonds and loans cannot be negative.
The book value of the Group’s bonds and loans are not exposed to market interest rate risk at year end as all bonds and loans are reported at amortized cost, compared to if borrowings were reported at fair value where cash flows are discounted using market interest rate.
Currency riskThe Group is present in various geographical markets and undertakes trans-actions denominated in foreign currencies and is consequently exposed to exchange rate fluctuations. The exposure occurs in relation to payments in for-eign currency (transaction exposure) and when translating foreign subsidiar-ies’ balance sheets and income statements into SEK (translation exposure).
Transaction exposure riskTransaction exposure risk is the risk that profitability is negatively affected by changes in exchange rates, affecting cash flows in foreign currencies in the operations. Due to the Group’s global presence, there are inflows and out-flows in different currencies. As a normal part of business, net surpluses or defi-cits in specific currencies emerge. The values of these net positions fluctuate subject to changes in currency rates and, thus, render transaction exposure for the Group.
PolicyThe Group’s policy states that exposure shall be reduced by matching in- and outflows of the same currencies. Business area and divisional management are responsible for maintaining readiness to adjust their operations (price and cost) to compensate for adverse currency movements. Based on the assump-tion that hedging does not have any significant effect on the Group’s long-term result, the policy recommends to leave transaction exposures unhedged
GRAPH 1 Estimated operational transaction exposure in the Group’s most important currencies *
–15 000
–10 000
–5 000
0
5 000
10 000
15 000
20 000
OtherUSDTHBSEKRUBKRWINRGBPEURCZKCNYCADBRLAUD
MSEK2021
–15 000
–10 000
–5 000
0
5 000
10 000
15 000
20 000
OtherUSDTHBSEKRUBKRWINRGBPEURCZKCNYCADBRLAUD
MSEK2020
–15 000
–10 000
–5 000
0
5 000
10 000
15 000
20 000
OtherUSDTHBSEKRUBKRWINRGBPEURCZKCNYCADBRLAUD
MSEK2021
–15 000
–10 000
–5 000
0
5 000
10 000
15 000
20 000
OtherUSDTHBSEKRUBKRWINRGBPEURCZKCNYCADBRLAUD
MSEK2020
* without adjustments for onetime effects.
Outstanding derivative instruments related to transaction exposure
2021 Nominal amount, net in
transaction currency
2020 Nominal amount, net in
transaction currency
Foreign exchange forwards GBP 269 187 USD –368 –242
The Financial Risk Management Committee has decided to hedge part of the transaction exposure with foreign exchange forward contracts. All contracts mature within 18 months. The fair value of all outstanding contracts is MSEK 0 (89) for assets and MSEK –55 (0) for liabilities. Out of the net nominal amounts in the table, the largest cross is GBP/USD with nominal amounts of MGBP 269/ MUSD –368 (MGBP 187/ MUSD –242).
Translation exposure riskTranslation exposure risk is the risk that the value of the Group’s net invest-ments in foreign currencies is negatively affected by changes in exchange rates. The Group’s global presence creates currency effects when subsidiaries’ financial statements with functional currencies other than SEK are translated to SEK in the Group’s consolidated financial statements. Translation of subsid-iaries’ profit affects the Group’s profit and balance sheet translation affect other comprehensive income. The translation exposure is measured as the net of assets and liabilities in a specific currency.
PolicyThe Group’s policy states that translation exposure should be reduced by matching assets and liabilities in the same currencies. The FRMC can decide to hedge part or all remaining translation exposure. Any hedge of translation exposure shall qualify for hedge accounting in accordance with IFRS.
on an ongoing basis. In general, business areas and divisions shall not hedge currency risks. The FRMC can decide to hedge part of the transaction exposure. Transactions shall then qualify for hedge accounting in accordance with IFRS and hedging beyond 18 months is not allowed. Financial transaction exposure is substantially hedged.
Status at year endThe Group has continued to manage transaction exposures primarily by matching in- and outflows in the same currencies. Graph 1 shows the net of in- and outflows per currency for currencies which have the largest surplus or deficit. The operational transaction exposure is defined as the net operational cash flow exposure and amounts to MSEK –4 678 (–3 207). The estimated amounts are based on the Group’s operational external payments from cus-tomers and to suppliers.
The transaction exposure sensitivity analysis is based on the operational transaction exposure. It shows how the cash flow and profit before tax would theoretically be impacted by a five percentage point change in SEK, USD or EUR, against all other currencies. The analysis is based on the assumption that no hedging transaction has been undertaken and is done before any impact of offsetting price adjustments or similar measures.
As an example, the net transaction exposure of in-and outflow payments in EUR is a deficit as shown in graph 1. A strengthening in the EUR currency rate against all other currencies with +5% would have a negative impact on the cash flow and profit before tax of MSEK –681, and a weakening would have a positive impact of MSEK 681.
Transaction exposure sensitivity 2021 2020
SEK exchange rate + 5% –234 –160 USD exchange rate + 5% 682 695 EUR exchange rate + 5% –681 –602
Transaction exposure
Atlas Copco 2021 106
FINANCIAL STATEMENTS – NOTESIN
TROD
UCTIO
NTH
IS IS ATLA
S COPCO
THE Y
EAR IN
REVIEW
FINA
NCIA
LSO
THER IN
FORM
ATIO
N
FINANCIALS
Group
Consolidated income statement
Consolidated statement of comprehensive income
Consolidated balance sheet
Consolidated statement of changes in equity
Consolidated statement of cash flows
• Notes
Parent company
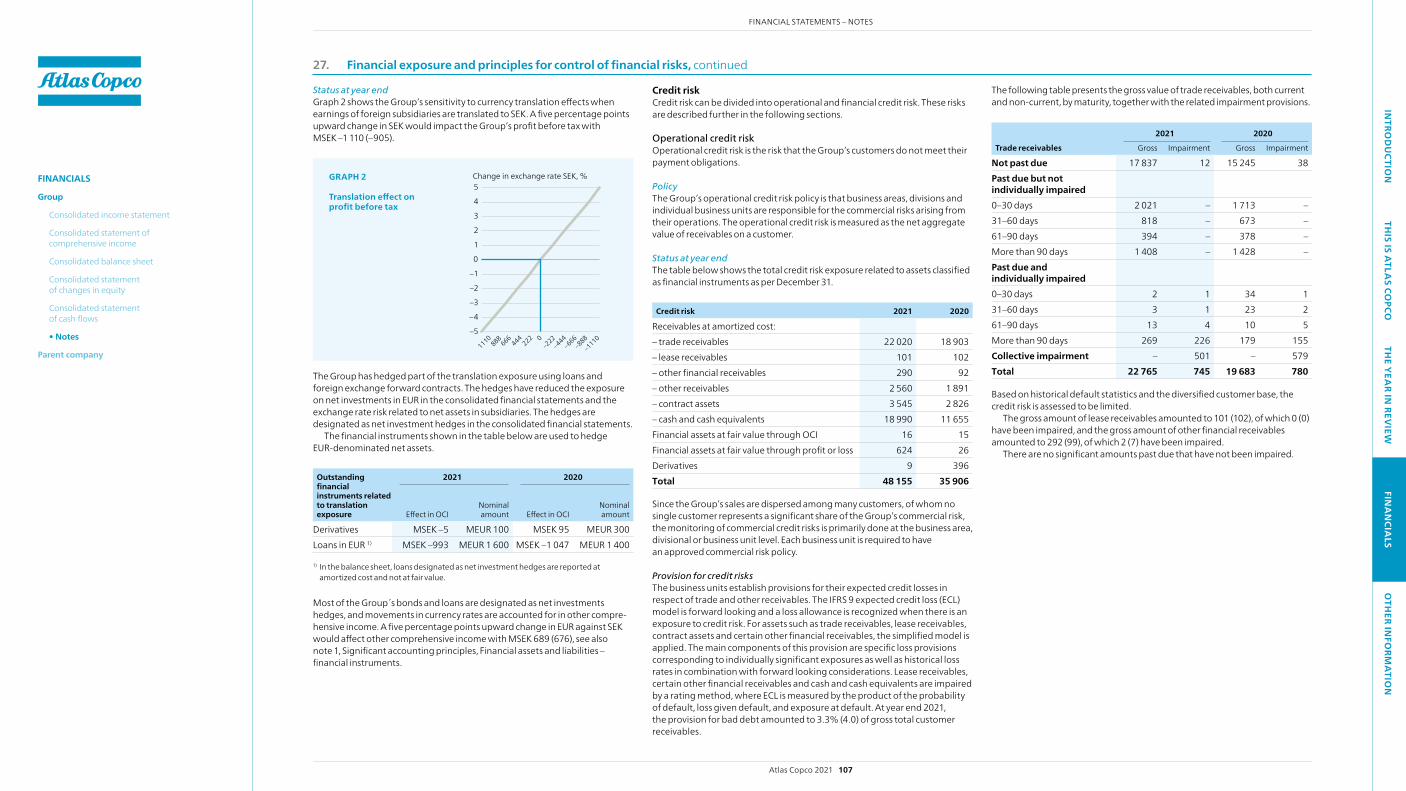
Status at year endGraph 2 shows the Group’s sensitivity to currency translation effects when earnings of foreign subsidiaries are translated to SEK. A five percentage points upward change in SEK would impact the Group’s profit before tax with MSEK –1 110 (–905).
–5
–4
–3
–2
–1
0
1
2
3
4
5
–1110–888
–666–444
–2220222
444666
8881110
Change in exchange rate SEK, %
Change in pro�t, MSEK
555444333
2221110
–111–222
–333–444
–555
Change in exchange rate SEK, %
Change in pro�t, MSEK
–5
–4
–3
–2
–1
0
1
2
3
4
5
550
440
330
220
1100
–110
–220
–330
–440
–550
GRAPH 2
Translation effect on profit before tax
The Group has hedged part of the translation exposure using loans and foreign exchange forward contracts. The hedges have reduced the exposure on net investments in EUR in the consolidated financial statements and the exchange rate risk related to net assets in subsidiaries. The hedges are designated as net investment hedges in the consolidated financial statements.
The financial instruments shown in the table below are used to hedge EUR-denominated net assets.
Outstanding financial instru ments related to trans lation exposure
2021 2020
Effect in OCINominal amount Effect in OCI
Nominal amount
Derivatives MSEK –5 MEUR 100 MSEK 95 MEUR 300 Loans in EUR 1) MSEK –993 MEUR 1 600 MSEK –1 047 MEUR 1 400
1) In the balance sheet, loans designated as net investment hedges are reported at amortized cost and not at fair value.
Most of the Group s bonds and loans are designated as net investments hedges, and movements in currency rates are accounted for in other compre-hensive income. A five percentage points upward change in EUR against SEK would affect other comprehensive income with MSEK 689 (676), see also note 1, Significant accounting principles, Financial assets and liabilities – financial instruments.
27. Financial exposure and principles for control of financial risks, continued
Credit riskCredit risk can be divided into operational and financial credit risk. These risks are described further in the following sections.
Operational credit riskOperational credit risk is the risk that the Group’s customers do not meet their payment obligations.
PolicyThe Group’s operational credit risk policy is that business areas, divisions and individual business units are responsible for the commercial risks arising from their operations. The operational credit risk is measured as the net aggregate value of receivables on a customer.
Status at year end The table below shows the total credit risk exposure related to assets classified as financial instruments as per December 31.
Credit risk 2021 2020
Receivables at amortized cost: – trade receivables 22 020 18 903 – lease receivables 101 102 – other financial receivables 290 92 – other receivables 2 560 1 891 – contract assets 3 545 2 826 – cash and cash equivalents 18 990 11 655 Financial assets at fair value through OCI 16 15 Financial assets at fair value through profit or loss 624 26 Derivatives 9 396 Total 48 155 35 906
Since the Group’s sales are dispersed among many customers, of whom no single customer represents a significant share of the Group’s commercial risk, the monitoring of commercial credit risks is primarily done at the business area, divisional or business unit level. Each business unit is required to have an approved commercial risk policy.
Provision for credit risksThe business units establish provisions for their expected credit losses in respect of trade and other receivables. The IFRS 9 expected credit loss (ECL) model is forward looking and a loss allowance is recognized when there is an exposure to credit risk. For assets such as trade receivables, lease receivables, contract assets and certain other financial receivables, the simplified model is applied. The main components of this provision are specific loss provisions corresponding to individually significant exposures as well as historical loss rates in combination with forward looking considerations. Lease receivables, certain other financial receivables and cash and cash equivalents are impaired by a rating method, where ECL is measured by the product of the probability of default, loss given default, and exposure at default. At year end 2021, the provision for bad debt amounted to 3.3% (4.0) of gross total customer receivables.
The following table presents the gross value of trade receivables, both current and non-current, by maturity, together with the related impairment provisions.
Trade receivables
2021 2020
Gross Impairment Gross Impairment
Not past due 17 837 12 15 245 38 Past due but not individually impaired 0–30 days 2 021 – 1 713 – 31–60 days 818 – 673 – 61–90 days 394 – 378 – More than 90 days 1 408 – 1 428 – Past due and individually impaired 0–30 days 2 1 34 1 31–60 days 3 1 23 2 61–90 days 13 4 10 5 More than 90 days 269 226 179 155 Collective impairment – 501 – 579 Total 22 765 745 19 683 780
Based on historical default statistics and the diversified customer base, the credit risk is assessed to be limited.
The gross amount of lease receivables amounted to 101 (102), of which 0 (0) have been impaired, and the gross amount of other financial receivables amounted to 292 (99), of which 2 (7) have been impaired.
There are no significant amounts past due that have not been impaired.
Atlas Copco 2021 107
FINANCIAL STATEMENTS – NOTESIN
TROD
UCTIO
NTH
IS IS ATLA
S COPCO
THE Y
EAR IN
REVIEW
FINA
NCIA
LSO
THER IN
FORM
ATIO
N
FINANCIALS
Group
Consolidated income statement
Consolidated statement of comprehensive income
Consolidated balance sheet
Consolidated statement of changes in equity
Consolidated statement of cash flows
• Notes
Parent company
Financial credit riskCredit risk on financial transactions is the risk that the Group incurs losses as a result of non-payment by counterparts related to the Group’s investments, bank deposits or derivative transactions.
PolicyThe Group’s financial credit risk is measured differently depending on trans-action type; investment transactions or derivative transactions.
Investment transactionsCash and cash equivalent may only be invested with a counterparty if the counter party rating is above a rating threshold. The threshold for cash and cash equivalent is set at A-/A3 (as rated by Standard & Poor’s, Fitch Ratings and Moody’s). Investments in structured financial products are not allowed, unless approved by the FRMC. Furthermore, counterparty exposure, tenor and liquid-ity of the investment are considered before any investment is made. A list of each approved counterparty and its maximum exposure limit is maintained and monitored.
Derivative transactionsDerivative transactions may only be undertaken with approved counterparts for which credit limits are established and with which ISDA (International Swaps and Derivatives Association) master agreements and CSA (Credit Support Annex) agreements are in force. Derivative transactions may only be entered into by Atlas Copco Financial Solutions or in rare cases by another sub-sidiary, but only with approval from the Group Treasurer. Atlas Copco primarily uses derivatives as hedging instruments and the policy allows only standard-ized (as opposed to structured) derivatives.
Status at year endInvestment transactions in form of cash and cash equivalents amounted to MSEK 18 990 (11 655) at year end. These consist of cash, short term bank deposits and investments in liquidity funds. At year end, the measured credit risk on derivatives, taking into account the market value and collaterals, amounted to MSEK 29 (115).
The table below presents the reported value of the Group’s derivatives.
Outstanding derivative instruments 2021 2020
Assets 9 396 Liabilities 222 69
No financial assets or liabilities are offset in the balance sheet. The table below shows derivatives covered by master netting agreements.
Outstanding net position for derivative instruments
Gross
Offset in balance
sheet
Net inbalance
sheet
Master netting
agreementCash
collateralNet
position
Assets Derivatives 9 – 9 –222 225 12 Liabilities Derivatives 222 – 222 –222 – –
The positive net position in assets is due to the fact that the exchange of security is done on a weekly basis.
Other market and price risksCommodity-price risk is the risk that the cost of direct and indirect materials could increase as underlying commodity prices rise in global markets. The Group is directly and indirectly exposed to raw material price fluctuations. Cost increases for raw materials and components often coincide with strong end-customer demand and are compensated for by increased market prices. Therefore, the Group does not hedge commodity-price risks.
Fair value of financial instrumentsIn Atlas Copco’s balance sheet, financial instruments are carried at fair value or at amortized cost. The fair value is established according to a fair value hier-archy. The hierarchy levels should reflect the extent to which fair value is based on observable market data or own assumptions. Below is a description of each level and valuation methods used for each financial instrument.
Level 1In the Level 1 method, fair value is based on quoted (unadjusted) prices in active markets for identical assets or liabilities. A market is considered as active if quoted prices from an exchange, broker, industry group, pricing service, or supervisory body are readily and regularly available and those prices represent actual and regularly occurring market transactions at arm’s length.
Level 2In the Level 2 method, fair value is based on models that utilize observable data for the asset or liability other than the quoted prices included within Level 1 that are observable for the asset or liability, either directly (i.e. as prices) or indi-rectly (i.e. derived from prices). Such observable data may be market interest rates and yield curves.
Level 3In the Level 3 method, fair value is based on a valuation model, whereby signifi-cant input is based on unobservable market data.
Valuation methodsDerivativesFair values of forward exchange contracts are calculated based on pre vailing markets. Interest rate swaps are valued based on market rates and present value of future cash flows. Discounted cash flow models are used for the valuation.
Interest-bearing liabilitiesFair values are calculated based on market rates and present value of future cash flows.
Finance leases and other financial receivablesFair values are calculated based on market rates for similar contracts and present value of future cash flows.
27. Financial exposure and principles for control of financial risks, continued
Atlas Copco 2021 108
FINANCIAL STATEMENTS – NOTESIN
TROD
UCTIO
NTH
IS IS ATLA
S COPCO
THE Y
EAR IN
REVIEW
FINA
NCIA
LSO
THER IN
FORM
ATIO
N
FINANCIALS
Group
Consolidated income statement
Consolidated statement of comprehensive income
Consolidated balance sheet
Consolidated statement of changes in equity
Consolidated statement of cash flows
• Notes
Parent company
27. Financial exposure and principles for control of financial risks, continued
In other liabilities, MSEK 125 (97) relate to contingent considerations for acquisitions. The fair value of these liabilities has been calculated based on the expected outcome of the targets set out in the contracts, given a discount rate of 10.5%. For information about changes due to acquisitions, see note 2.
Reconciliation of financial liabilities in Level 3
Opening balance
Business acquisitions Settlement Discounting effect Remeasurement
Translation differences
Closing balance
Profit/loss related to liabilities included in closing balance
Contingent considerations 2021 97 31 –10 10 –13 10 125 3
Currency rates used in the financial statements Value Code
Year-end rate Average rate
2021 2020 2021 2020
Canada 1 CAD 7.07 6.39 6.82 6.84 China 1 CNY 1.42 1.25 1.33 1.33 EU 1 EUR 10.24 10.04 10.15 10.49 India 1 INR 0.12 0.11 0.12 0.12South Korea 1 000 KRw 7.61 7.53 7.50 7.79United Kingdom 1 GBP 12.19 11.07 11.77 11.82 U.S.A. 1 USD 9.05 8.18 8.57 9.18
The Group’s financial instruments by levelThe carrying value for the Group’s financial instruments corresponds to fair value in all categories except for borrowings. See note 21 for additional information about the Group’s borrowings. The following table includes financial instruments at their fair value and by category.
28. Related parties
Relationships The Group has related party relationships with the Company’s largest share-holder, its associates, joint ventures and with its Board members and Group Management. The Company’s largest shareholder, Investor AB, controls approximately 22% (22) of the voting rights in Atlas Copco.
The subsidiaries that are directly owned by the Parent Company are pre-sented in note A21 to the financial statements of the Parent Company. Holding companies and operating subsidiaries are listed in note A22. Information about associated companies and joint ventures is found in note 14. Informa-tion about Board members and Group Management is presented on pages 58–61.
Transactions and outstanding balancesThe Group has not had any transactions with Investor AB during the year, other than dividends declared and has no outstanding balances with Investor AB.
Investor AB has controlling or significant influence in companies with which Atlas Copco may have transactions within the normal course of business. Any such transactions are made on commercial terms.
The Group has leasing agreements related to buildings owned by the Group’s German pension trust. These agreements are on market terms. “Lease liabilities” in the table below represents the outstanding balances over the lease term with the Group’s German pension trust.
In addition, the Group sold various products and purchased goods through certain associated companies and joint ventures on terms generally similar to those prevailing with unrelated parties.
The following table summarizes the Group’s related party transactions with its associates, joint ventures and other related parties:
2021 2020
Revenues 20 41 Goods purchased 23 18 Service purchased 90 107 At Dec. 31: Trade receivables 25 18 Trade payables 14 21 Lease liabilities 227 249
Compensation to key management personnelCompensation to the Board and to Group Management is disclosed in note 5.
Financial instruments by fair value hierarchy
2021 2020
Fair value Level 1 Level 2 Level 3 Fair value Level 1 Level 2 Level 3
Financial assets 184 30 154 – 177 26 151 – Other receivables 66 – 66 – 102 – 102 – Non-current financial assets 250 30 220 – 279 26 253 –Trade receivables 21 954 – 21 954 – 18 801 – 18 801 – Financial assets 847 20 827 – 58 – 58 – Other receivables 2 560 – 2 560 – 1 891 – 1 891 – Derivatives 9 – 9 – 396 – 396 – Contract assets 3 545 – 3 545 – 2 826 – 2 826 – Current financial assets 28 915 20 28 895 – 23 972 – 23 972 – Financial assets 29 165 50 29 115 – 24 251 26 24 225 – Bonds and loans 18 848 13 528 5 320 – 20 133 13 731 6 402 – Other financial liabilities 23 – 23 – 19 – 19 – Other liabilities 174 – 100 74 161 – 94 67 Non-current financial liabilities 19 045 13 528 5 443 74 20 313 13 731 6 515 67 Current portion of long-term loans 1 026 – 1 026 – 1 – 1 – Short-term loans 1 915 – 1 915 – 2 007 – 2 007 – Derivatives 222 – 222 – 69 – 69 – Other accrued expenses 8 182 – 8 182 – 6 617 – 6 617 – Trade payables 15 159 – 15 159 – 11 202 – 11 202 – Other liabilities 2 206 – 2 155 51 2 099 – 2 069 30 Current financial liabilities 28 710 – 28 659 51 21 995 – 21 965 30 Financial liabilities 47 755 13 528 34 102 125 42 308 13 731 28 480 97
Atlas Copco 2021 109
FINANCIAL STATEMENTS – NOTESIN
TROD
UCTIO
NTH
IS IS ATLA
S COPCO
THE Y
EAR IN
REVIEW
FINA
NCIA
LSO
THER IN
FORM
ATIO
N
FINANCIALS
Group
Consolidated income statement
Consolidated statement of comprehensive income
Consolidated balance sheet
Consolidated statement of changes in equity
Consolidated statement of cash flows
• Notes
Parent company

Financial statements, Parent Company
Income statement
For the year ended December 31 Amounts in MSEK Note 2021 2020
Administrative expenses A2 –764 –615 Other operating income A3 121 105 Other operating expenses A3 –1 –19 Operating loss –644 –529 Financial income A4 3 858 12 125 Financial expenses A4 –394 –644 Profit after financial items 2 820 10 952 Appropriations A5 2 695 88 Profit before tax 5 515 11 040 Income tax A6 –339 71 Profit for the year 5 176 11 111
Statement of comprehensive income
For the year ended December 31 Amounts in MSEK Note 2021 2020
Profit for the year 5 176 11 111 Other comprehensive income for the year – – Total comprehensive income for the year 5 176 11 111
Balance sheet
As at December 31 Amounts in MSEK Note 2021 2020
ASSETS Non-current assets Intangible assets A7 13 12 Tangible assets A8 34 38 Financial assets:
Deferred tax assets A9 63 183 Shares in Group companies A10, A21 163 569 161 228 Other financial assets A11 223 204
Total non-current assets 163 902 161 665 Current assets Income tax receivables 610 810 Other receivables A12 9 347 16 108 Cash and cash equivalents A13 0 8 Total current assets 9 957 16 926 TOTAL ASSETS 173 859 178 591
As at December 31 Amounts in MSEK Note 2021 2020
EQUITY Restricted equity Share capital 786 786 Legal reserve 4 999 4 999 Total restricted equity 5 785 5 785 Non-restricted equity Reserve for fair value –1 180 –1 180 Retained earnings 139 595 136 573 Profit for the year 5 176 11 111 Total non-restricted equity 143 591 146 504 TOTAL EQUITY 149 376 152 289
PROVISIONS Post-employment benefits A15 205 188 Other provisions A16 813 478 Total provisions 1 018 666
LIABILITIES Non-current liabilities Borrowings A17 22 195 23 007 Total non-current liabilities 22 195 23 007
Current liabilities Borrowings A17 926 2 344Other liabilities A18 344 285 Total current liabilities 1 270 2 629 TOTAL EQUITY AND LIABILITIES 173 859 178 591
Atlas Copco 2021 110
FINANCIAL STATEMENTSIN
TROD
UCTIO
NTH
IS IS ATLA
S COPCO
THE Y
EAR IN
REVIEW
FINA
NCIA
LSO
THER IN
FORM
ATIO
N
FINANCIALS
Group
Consolidated income statement
Consolidated statement of comprehensive income
Consolidated balance sheet
Consolidated statement of changes in equity
Consolidated statement of cash flows
Notes
• Parent company

Statement of changes in equity
MSEK unless otherwise stated Number of shares outstanding Share capital Legal reserve Reserve for fair value – translation reserve Retained earnings Total
Opening balance, Jan. 1, 2021 1 216 192 653 786 4 999 –1 180 147 684 152 289Total comprehensive income for the year 5 176 5 176 Ordinary dividend –8 889 –8 889 Acquisition series A shares –700 000 –416 –416Divestment series A shares 2 697 715 1 451 1 451 Share-based payment, equity settled: – expense during the year 212 212 – exercise of options –447 –447 Closing balance, Dec. 31, 2021 1 218 190 368 786 4 999 –1 180 144 771 149 376
Opening balance, Jan. 1, 2020 1 217 046 264 786 4 999 –1 180 145 395 150 000 Total comprehensive income for the year 11 111 11 111 Ordinary dividend –8 506 –8 506 Acquisition series A shares –3 000 000 –1 097 –1 097 Divestment series A shares 2 137 490 820 820 Divestment series B shares 8 899 3 3 Share-based payment, equity settled: – expense during the year 158 158 – exercise of options –200 –200 Closing balance, Dec. 31, 2020 1 216 192 653 786 4 999 –1 180 147 684 152 289
See note A14 for additional information.
Statement of cash flows
For the year ended December 31, MSEK 2021 2020
Cash flows from operating activities Operating loss –644 –529 Adjustments for:
Depreciation 11 10 Capital gain/loss and other non-cash items –596 –283
Operating cash deficit –1 229 –802 Net financial items received 3 639 11 902 Group contributions received 88 1 930 Taxes paid –210 –124 Cash flow before change in working capital 2 288 12 906 Change in
Operating receivables 9 573 –2 408 Operating liabilities 60 –35
Change in working capital 9 633 –2 443 Net cash from operating activities 11 921 10 463
For the year ended December 31, MSEK 2021 2020
Cash flow from investing activities Investments in tangible assets –3 –7 Investments in intangible assets –5 – Investments in subsidiaries –1 833 –3 105 Repayments/investments in financial assets –2 –2 Net cash from investing activities –1 843 –3 114 Cash flow from financing activities Dividends paid –8 889 –8 506 Repurchase and divestment of own shares 1 034 –274 Change in interest-bearing liabilities –2 231 1 402 Net cash from financing activities –10 086 –7 378 Net cash flow for the year –8 –29 Cash and cash equivalents, Jan. 1 8 36 Net cash flow for the year –8 –29 Cash and cash equivalents, Dec. 31 0 8
Atlas Copco 2021 111
FINANCIAL STATEMENTSIN
TROD
UCTIO
NTH
IS IS ATLA
S COPCO
THE Y
EAR IN
REVIEW
FINA
NCIA
LSO
THER IN
FORM
ATIO
N
FINANCIALS
Group
Consolidated income statement
Consolidated statement of comprehensive income
Consolidated balance sheet
Consolidated statement of changes in equity
Consolidated statement of cash flows
Notes
• Parent company

Notes to the Parent Company financial statementsMSEK unless otherwise stated
A1. Significant accounting principles
Atlas Copco AB is the ultimate Parent Company of the Atlas Copco Group and is headquartered in Nacka, Sweden. Its operations include administrative functions, holding company functions as well as parts of Atlas Copco Financial Solutions (Treasury).
The financial statements of Atlas Copco AB have been prepared in accordance with the Swedish Annual Accounts Act and the recommendation RFR 2, “Accounting for Legal Entities”, hereafter referred to as “RFR 2”, issued by the Swedish Financial Reporting Board. In accordance with RFR 2, parent compa-nies that issue consolidated financial statements according to International Financial Reporting Standards (IFRS), as endorsed by the European Union, shall present their financial statements in accordance with IFRS, to the extent these accounting principles comply with the Swedish Annual Accounts Act and may use exemptions from IFRS provided by RFR 2 due to Swedish accounting or tax legislation.
The financial statements are presented in Swedish krona (SEK), rounded to the nearest million. The parent company’s accounting principles have been consistently applied to all periods presented unless otherwise stated. The financial statements are prepared using the same accounting principles as described in note 1 in the Group’s consolidated financial statements, except for those disclosed in the following sections.
For discussion regarding accounting estimates and judgments, see 74.
SubsidiariesParticipations in subsidiaries are accounted for by the Parent Company at his-torical cost. The carrying amounts of participations in subsidiaries are reviewed for impairment in accordance with IAS 36, Impairment of Assets. See the Group’s accounting policies, Impairment of financial assets, for further details.
Transaction costs incurred in connection with a business combination are accounted for by the Parent Company as part of the acquisition costs and are not expensed.
Lease contractsAll lease contracts entered into by the Parent Company are expensed continuously on a straight-line basis over the lease term. Leases are not carried as assets, since the risk and rewards associated with ownership of the assets have not been transferred to the Parent Company.
Employee benefits Defined benefit plansDefined benefit plans are not accounted for in accordance with IAS 19. In the Parent Company defined benefit plans are accounted for according to the Swedish law regarding pensions, ”Tryggandelagen” and regulations issued by the Swedish Financial Supervisory Board. The primary differences as compared to IAS 19 are the way discount rates are fixed, that the calculation of defined benefit obligations is based on current salary levels, without consideration of future salary increases and that all actuarial gains and losses are included in profit or loss as they occur.
Share-based paymentsThe share-based payments that the Parent Company has granted to employ-ees in the Parent Company are accounted for using the same principle as described in note 1 in the Group’s consolidated financial statements.
The share-based payments that the Parent Company has granted to employees in subsidiaries are not accounted for as an employee expense in the Parent Company, but are recognized against Shares in Group companies. This vesting cost is accrued over the same period as in the Group and with a corre-sponding increase in equity for equity-settled programs and as a change in lia-bilities for cash-settled programs.
Financial guaranteesFinancial guarantees issued by the Parent Company for the benefit of subsid-iaries are not valued according to IFRS 9. They are reported as contingent liabil-ities, unless it becomes probable that the guarantees will lead to payments. In such case, provisions will be recorded.
Hedge accountingInterest-bearing liabilities denominated in other currencies than SEK, used to hedge currency exposure from investments in shares of foreign subsidiaries are not translated using the foreign exchange rates on the reporting date, but measured based on the exchange rate the day that the hedging relation was established.
Derivatives used to hedge investments in shares in foreign subsidiaries are recognized at fair value and changes therein are recognized in profit or loss. The corresponding fair value change on shares in subsidiaries is recognized in profit or loss, as fair value hedge accounting is applied.
Group and shareholders’ contributions In Sweden, Group contributions are deductible for tax purposes but share-holders’ contributions are not. Group contributions are recognized as appro-priations in the income statement. Shareholders’ contributions are recognized as an increase of Shares in Group companies and tested for impairment.
Atlas Copco 2021 112
FINANCIAL STATEMENTS – NOTESIN
TROD
UCTIO
NTH
IS IS ATLA
S COPCO
THE Y
EAR IN
REVIEW
FINA
NCIA
LSO
THER IN
FORM
ATIO
N
FINANCIALS
Group
Consolidated income statement
Consolidated statement of comprehensive income
Consolidated balance sheet
Consolidated statement of changes in equity
Consolidated statement of cash flows
Notes
• Parent company
A2. Employees and personnel expenses and remuneration to auditors
Average number of employees 2021 2020
women Men Total women Men Total
Sweden 64 43 107 69 38 107
Women in Atlas Copco Board and Management, % Dec. 31, 2021 Dec. 31, 2020
Board of Directors excl. employee representatives 22 25 1)
Group Management 13 22
1) One female board member left the board after the Annual General Meeting at her own request, and no replacement has been made.
Salaries and other remunerations 2021 2020
Board members and Group Management 1) Other employees Board members and Group Management 1) Other employees
Sweden 107 107 77 100 of which variable compensation 20 10
1) Includes 7 (7) board members who receive fees from Atlas Copco AB as well as the President and CEO and 5 (5) positions of the Group Management who are employed by and receive salary and other fees from the Company.
For information regarding remuneration and other fees for members of the Board, the President and CEO, and other members of Group Management, see note 5 of the consolidated financial statements.
Audit fee refers to audit of the financial state-ments and the accounting records. For the Parent Company the audit also includes the administra-tion of the business by the Board of Directors, the President and CEO.
Tax services include tax compliance services.Other services essentially comprise consultancy
services.At the Annual General Meeting Ernst & Young
AB was re-elected as the company’s auditor until the end of the annual general meeting 2022.
Pension benefits and other social costs 2021 2020
Contractual pension benefits for Board members and Group Management 12 11 Contractual pension benefits for other employees 23 23 Other social costs 79 67 Total 114 101 Pension obligations to former members of Group Management 5 4
A3. Other operating income and expense
2021 2020
Commissions received 121 105 Other operating income 0 0 Total other operating income 121 105 Exchange-rate differences, net –1 –2 Other operating expense 0 –17 Total other operating expense –1 –19
Other operating expense, 0 (17) MSEK, essentially comprise costs associated with the split of the Group.
A4. Financial income and expenses
Financial income and expenses 2021 2020
Interest income: – cash and cash equivalents 0 0 – receivables from Group companies 9 26 – derivatives 0 3 Dividend income from Group companies 3 849 11 381 Capital gain 0 713 Foreign exchange gain, net 0 2 Financial income 3 858 12 125 Interest expense: – borrowings –189 –186 – liabilities to Group companies –29 –37 Change in fair value: – other liabilities 0 0 Foreign exchange loss, net –1 0 Impairment loss: – write-down of shares in Group companies –175 –421 Financial expenses –394 –644 Financial income, net 3 464 11 481
Following table presents the net gain or loss by category of financial instruments.
Net gain/loss on 2021 2020
– loans and receivables, incl. bank deposits 8 28 – other liabilities 0 –223 – derivatives –218 3 Profit from shares in Group companies 3 674 11 673 Total 3 464 11 481
Profit from shares in Group companies mainly refers to dividend income from sub-sidiaries and capital gains from transfer of shares in subsidiaries. These transactions are eliminated in the Group accounts since they are internal. For further informa-tion about the hedges, see note 27 of the consolidated financial statements.
Remuneration to auditorsAudit fees and consultancy fees for advice or assistance other than audit, were as follows:
2021 2020
Ernst & Young –audit fee 5 5 – other services, tax 0 0 – other services, other 1 – Deloitte – other services, other – 2 Total 6 7
Atlas Copco 2021 113
FINANCIAL STATEMENTS – NOTESIN
TROD
UCTIO
NTH
IS IS ATLA
S COPCO
THE Y
EAR IN
REVIEW
FINA
NCIA
LSO
THER IN
FORM
ATIO
N
FINANCIALS
Group
Consolidated income statement
Consolidated statement of comprehensive income
Consolidated balance sheet
Consolidated statement of changes in equity
Consolidated statement of cash flows
Notes
• Parent company

A5. Appropriations
2021 2020
Group contributions paid –9 –2
Group contributions received 2 704 90 Total 2 695 88
2021 2020
Buildings and land Machinery and equipment Total Buildings and land Machinery and equipment Total
Accumulated cost Opening balance, Jan. 1 46 67 113 46 60 106 Investments 2 1 3 – 7 7 Closing balance, Dec. 31 48 68 116 46 67 113 Accumulated depreciation Opening balance, Jan. 1 16 59 75 14 55 69 Depreciation for the year 3 4 7 2 4 6 Closing balance, Dec. 31 19 63 82 16 59 75 Carrying amount Opening balance, Jan. 1 30 8 38 32 5 37 Closing balance, Dec. 31 29 5 34 30 8 38
Buildings and land relates to improvements in leased properties. Depreciation is accounted for under administrative expenses in the Income Statement.
The leasing costs for assets, such as rented premises, cars and office equip-ment are reported among administrative expenses and amounted to 58 (58). Future payments for non-cancelable leasing contracts amounted to 175 (177) and fall due as follows in the table beside.
2021 2020
Less than one year 59 59Between one and five years 116 117More than five years – 1Total 175 177
A8. Property, plant and equipmentA6. Income tax
2021 2020
Current tax –219 –44 Deferred tax –120 115 Total –339 71
Profit before taxes 5 515 11 040
The Swedish corporate tax rate, % 20.6 21.4 National tax based on profit before taxes –1 137 –2 364 Tax effects of: – non-deductible expenses –39 –94 – tax exempt income 793 2 588– deductible expenses, not recognized in
Income statement 26 57– tax financial net 48 –41– change in tax rate, deferred tax – –7– controlled foreign company taxation –24 –24 – adjustments from prior years –6 –44 Total –339 71 Effective tax in % 6.1 –0.6
The Parent Company’s effective tax rate of 6.1% (–0.6) is primarily affected by non-taxable income such as dividends from Group companies.
A7. Intangible assets
Capitalized expenditures for computer programs
2021 2020
Accumulated cost Opening balance, Jan. 1 67 67 Investments 5 – Closing balance, Dec. 31 72 67 Accumulated depreciation Opening balance, Jan. 1 55 51 Depreciation for the year 4 4 Closing balance, Dec. 31 59 55 Carrying amount Opening balance, Jan. 1 12 16 Closing balance, Dec. 31 13 12
Atlas Copco 2021 114
FINANCIAL STATEMENTS – NOTESIN
TROD
UCTIO
NTH
IS IS ATLA
S COPCO
THE Y
EAR IN
REVIEW
FINA
NCIA
LSO
THER IN
FORM
ATIO
N
FINANCIALS
Group
Consolidated income statement
Consolidated statement of comprehensive income
Consolidated balance sheet
Consolidated statement of changes in equity
Consolidated statement of cash flows
Notes
• Parent company
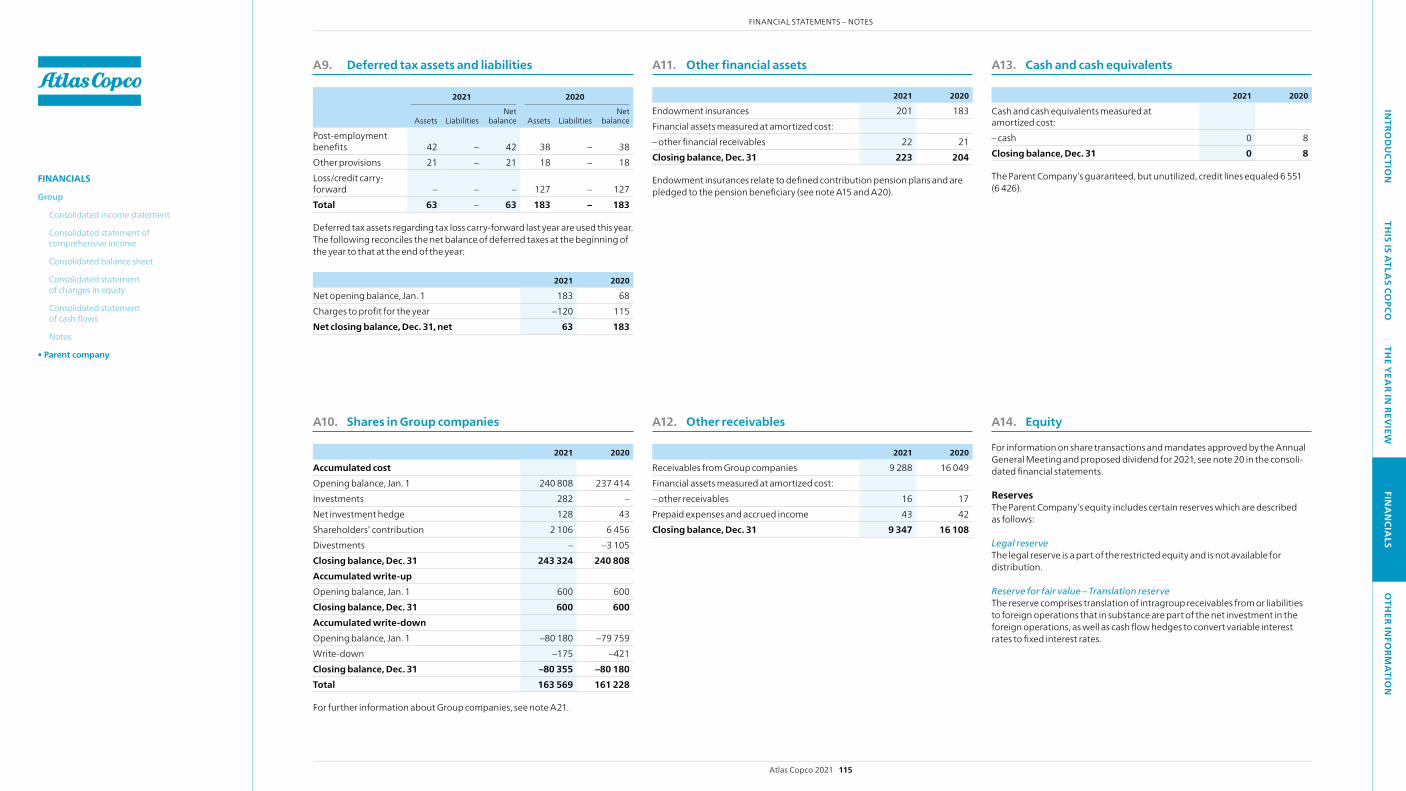
A9. Deferred tax assets and liabilities
2021 2020
Assets Liabi litiesNet
balance Assets Liabi litiesNet
balance
Post-employment benefits 42 – 42 38 – 38 Other provisions 21 – 21 18 – 18 Loss/credit carry- forward – – – 127 – 127Total 63 – 63 183 – 183
Deferred tax assets regarding tax loss carry-forward last year are used this year. The following reconciles the net balance of deferred taxes at the beginning of the year to that at the end of the year:
2021 2020
Net opening balance, Jan. 1 183 68 Charges to profit for the year –120 115 Net closing balance, Dec. 31, net 63 183
A10. Shares in Group companies
2021 2020
Accumulated cost Opening balance, Jan. 1 240 808 237 414 Investments 282 – Net investment hedge 128 43 Shareholders’ contribution 2 106 6 456 Divestments – –3 105 Closing balance, Dec. 31 243 324 240 808 Accumulated write-up Opening balance, Jan. 1 600 600 Closing balance, Dec. 31 600 600 Accumulated write-down Opening balance, Jan. 1 –80 180 –79 759 write-down –175 –421 Closing balance, Dec. 31 –80 355 –80 180 Total 163 569 161 228
For further information about Group companies, see note A21.
A11. Other financial assets
2021 2020
Endowment insurances 201 183 Financial assets measured at amortized cost: – other financial receivables 22 21 Closing balance, Dec. 31 223 204
Endowment insurances relate to defined contribution pension plans and are pledged to the pension beneficiary (see note A15 and A20).
A12. Other receivables
2021 2020
Receivables from Group companies 9 288 16 049 Financial assets measured at amortized cost: – other receivables 16 17 Prepaid expenses and accrued income 43 42 Closing balance, Dec. 31 9 347 16 108
A14. Equity
For information on share transactions and mandates approved by the Annual General Meeting and proposed dividend for 2021, see note 20 in the consoli-dated financial statements.
ReservesThe Parent Company’s equity includes certain reserves which are described as follows:
Legal reserveThe legal reserve is a part of the restricted equity and is not available for distribution.
Reserve for fair value – Translation reserveThe reserve comprises translation of intragroup receivables from or liabilities to foreign operations that in substance are part of the net investment in the foreign operations, as well as cash flow hedges to convert variable interest rates to fixed interest rates.
A13. Cash and cash equivalents
2021 2020
Cash and cash equivalents measured at amortized cost: – cash 0 8 Closing balance, Dec. 31 0 8
The Parent Company’s guaranteed, but unutilized, credit lines equaled 6 551 (6 426).
Atlas Copco 2021 115
FINANCIAL STATEMENTS – NOTESIN
TROD
UCTIO
NTH
IS IS ATLA
S COPCO
THE Y
EAR IN
REVIEW
FINA
NCIA
LSO
THER IN
FORM
ATIO
N
FINANCIALS
Group
Consolidated income statement
Consolidated statement of comprehensive income
Consolidated balance sheet
Consolidated statement of changes in equity
Consolidated statement of cash flows
Notes
• Parent company

A15. Post-employment benefits
2021 2020
Defined contribution pension plans
Defined benefit pension plans Total
Defined contribution pension plans
Defined benefit pension plans Total
Opening balance, Jan. 1 183 5 188 190 5 195 Provision made 42 – 42 16 1 17 Provision used –24 –1 –25 –23 –1 –24 Closing balance, Dec. 31 201 4 205 183 5 188
The Parent Company has endowment insurances of 201 (183) relating to defined contribution pension plans. The insurances are recognized as other financial assets, and pledged to the pension beneficiary.
Description of defined benefit pension plansThe Parent Company has two defined benefit pension plans. The ITP plan is a final salary pension plan covering the majority of salaried employees in Atlas Copco AB which benefits are secured through the Atlas Copco pension trust. The second plan relates to retired former senior employees. These pension arrangements are provided for.
2021 2020
Funded pension Unfunded pension Total Funded pension Unfunded pension Total
Defined benefit obligations 150 5 155 147 5 152 Fair value of plan assets –672 – –672 –460 – –460 Present value of net obligations –522 5 –517 –313 5 –308 Not recognized surplus 522 – 522 313 – 313 Net amount recognized in balance sheet – 5 5 – 5 5
2021 2020
Reconciliation of defined benefit obligations Funded pension Unfunded pension Total Funded pension Unfunded pension Total
Defined benefit obligations at Jan. 1 147 5 152 148 5 153 Service cost 4 – 4 4 – 4 Interest expense 5 – 5 5 – 5 Benefits paid from plan –8 –1 –9 –8 –1 –9 Other changes in obligations 2 1 3 –2 1 –1 Defined benefit obligations at Dec. 31 150 5 155 147 5 152
2021 2020
Reconciliation of plan assets Funded pension Unfunded pension Total Funded pension Unfunded pension Total
Fair value of plan assets at Jan. 1 460 – 460 391 – 391Return on plan assets 220 – 220 77 – 77Payments/Renumeration of plan assets –8 – –8 –8 – –8Fair value of plan assets at Dec. 31 672 – 672 460 – 460
2021 2020
Pension commitments provided for in the balance sheet Costs excluding interest 15 15 Total 15 15 Pension commitments provided for through insurance contracts Service cost 23 23 Total 23 23
Net cost for pensions, excluding taxes 38 38 Special employer’s contribution 6 6 Total 44 44
Pension expenses excluding taxes for the year, included within administrative expenses amounted to 38 (38) of which the Board members and Group Management 12 (11) and others 26 (27).
The Parent Company’s share in plan assets fair value in the Atlas Copco pension trust amounts to 672 (460) and is allocated as follows:
2021 2020
Equity securities 54 37 Bonds 50 191 Real estate 308 172 Alternative investments 212 144Cash and cash equivalents 48 60 Total 672 460
The plan assets of the Atlas Copco pension trust are not included in the financial assets of the Parent Company.
The return on plan assets in the Atlas Copco pension trust amounted to 47.7% (14.4) inclusive of MSEK 7.7 (7.7) paid remuneration.
The Parent Company adheres to the actuarial assumptions used by The Swedish Pension Registration Institute (PRI) i.e. discount rate 2.9% (3.8). The Parent Company estimates MSEK 12 will be paid to defined benefit pension plans during 2022.
Atlas Copco 2021 116
FINANCIAL STATEMENTS – NOTESIN
TROD
UCTIO
NTH
IS IS ATLA
S COPCO
THE Y
EAR IN
REVIEW
FINA
NCIA
LSO
THER IN
FORM
ATIO
N
FINANCIALS
Group
Consolidated income statement
Consolidated statement of comprehensive income
Consolidated balance sheet
Consolidated statement of changes in equity
Consolidated statement of cash flows
Notes
• Parent company
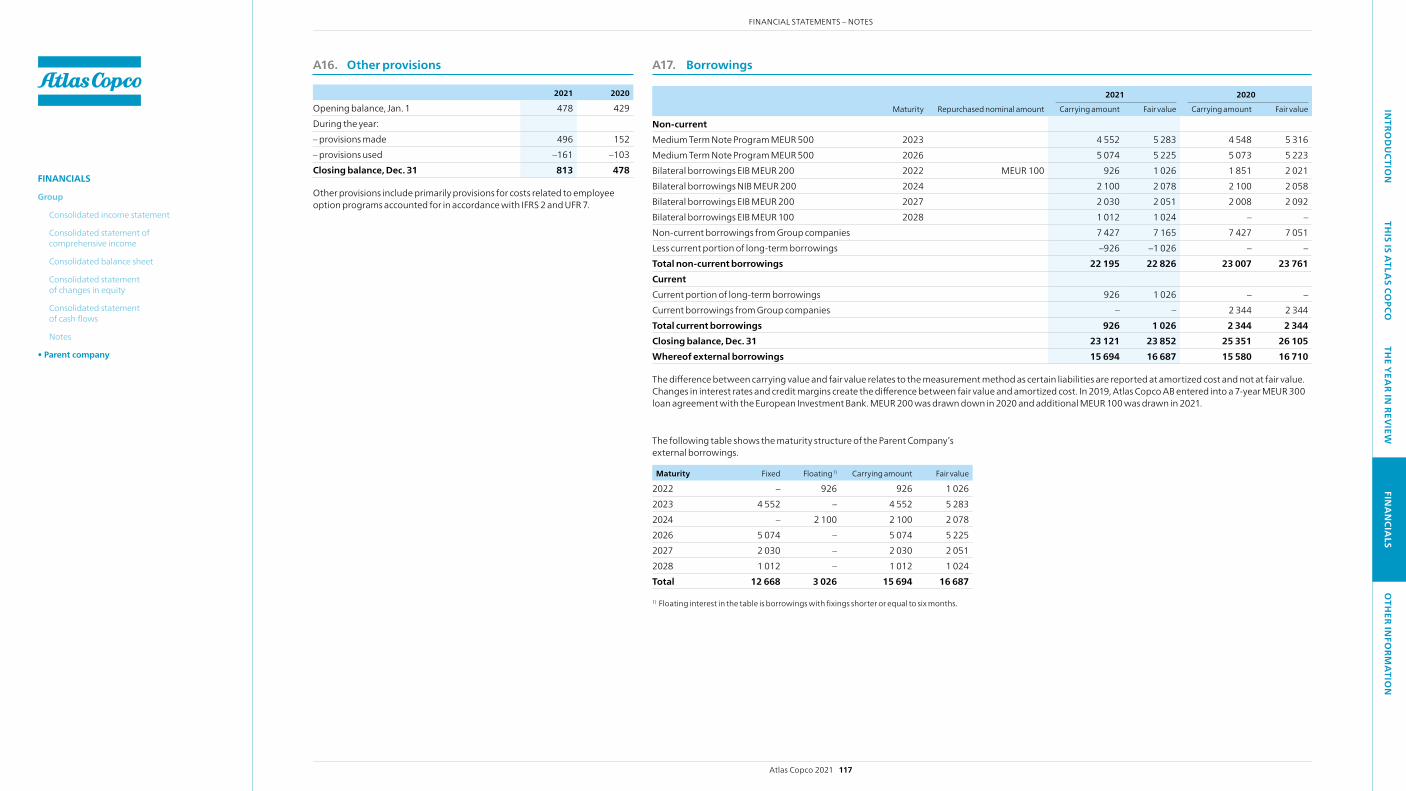
A16. Other provisions
2021 2020
Opening balance, Jan. 1 478 429 During the year: – provisions made 496 152 – provisions used –161 –103 Closing balance, Dec. 31 813 478
Other provisions include primarily provisions for costs related to employee option programs accounted for in accordance with IFRS 2 and UFR 7.
A17. Borrowings
2021 2020
Maturity Repurchased nominal amount Carrying amount Fair value Carrying amount Fair value
Non-current Medium Term Note Program MEUR 500 2023 4 552 5 283 4 548 5 316 Medium Term Note Program MEUR 500 2026 5 074 5 225 5 073 5 223 Bilateral borrowings EIB MEUR 200 2022 MEUR 100 926 1 026 1 851 2 021 Bilateral borrowings NIB MEUR 200 2024 2 100 2 078 2 100 2 058 Bilateral borrowings EIB MEUR 200 2027 2 030 2 051 2 008 2 092Bilateral borrowings EIB MEUR 100 2028 1 012 1 024 – – Non-current borrowings from Group companies 7 427 7 165 7 427 7 051Less current portion of long-term borrowings –926 –1 026 – – Total non-current borrowings 22 195 22 826 23 007 23 761 Current Current portion of long-term borrowings 926 1 026 – –Current borrowings from Group companies – – 2 344 2 344 Total current borrowings 926 1 026 2 344 2 344 Closing balance, Dec. 31 23 121 23 852 25 351 26 105 Whereof external borrowings 15 694 16 687 15 580 16 710
The difference between carrying value and fair value relates to the measurement method as certain liabilities are reported at amortized cost and not at fair value. Changes in interest rates and credit margins create the difference between fair value and amortized cost. In 2019, Atlas Copco AB entered into a 7-year MEUR 300 loan agreement with the European Investment Bank. MEUR 200 was drawn down in 2020 and additional MEUR 100 was drawn in 2021.
The following table shows the maturity structure of the Parent Company’s external borrowings.
Maturity Fixed Floating 1) Carrying amount Fair value
2022 – 926 926 1 0262023 4 552 – 4 552 5 2832024 – 2 100 2 100 2 078 2026 5 074 – 5 074 5 2252027 2 030 – 2 030 2 0512028 1 012 – 1 012 1 024 Total 12 668 3 026 15 694 16 687
1) Floating interest in the table is borrowings with fixings shorter or equal to six months.
Atlas Copco 2021 117
FINANCIAL STATEMENTS – NOTESIN
TROD
UCTIO
NTH
IS IS ATLA
S COPCO
THE Y
EAR IN
REVIEW
FINA
NCIA
LSO
THER IN
FORM
ATIO
N
FINANCIALS
Group
Consolidated income statement
Consolidated statement of comprehensive income
Consolidated balance sheet
Consolidated statement of changes in equity
Consolidated statement of cash flows
Notes
• Parent company
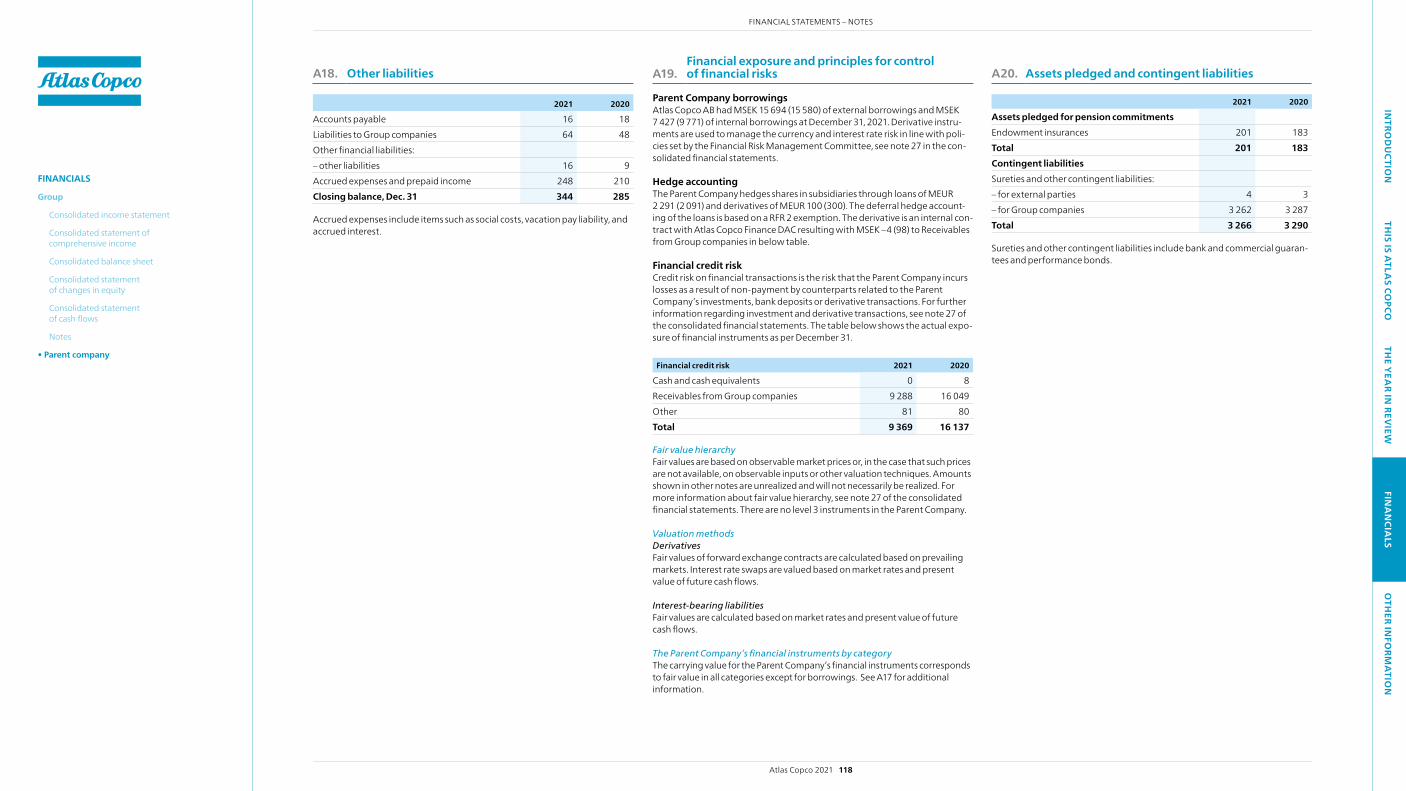
A18. Other liabilities
2021 2020
Accounts payable 16 18 Liabilities to Group companies 64 48 Other financial liabilities: – other liabilities 16 9 Accrued expenses and prepaid income 248 210 Closing balance, Dec. 31 344 285
Accrued expenses include items such as social costs, vacation pay liability, and accrued interest.
A19.Financial exposure and principles for control of financial risks A20. Assets pledged and contingent liabilities
2021 2020
Assets pledged for pension commitments Endowment insurances 201 183 Total 201 183 Contingent liabilities Sureties and other contingent liabilities: – for external parties 4 3 – for Group companies 3 262 3 287 Total 3 266 3 290
Sureties and other contingent liabilities include bank and commercial guaran-tees and performance bonds.
Parent Company borrowingsAtlas Copco AB had MSEK 15 694 (15 580) of external borrowings and MSEK 7 427 (9 771) of internal borrowings at December 31, 2021. Derivative instru-ments are used to manage the currency and interest rate risk in line with poli-cies set by the Financial Risk Management Committee, see note 27 in the con-solidated financial statements.
Hedge accountingThe Parent Company hedges shares in subsidiaries through loans of MEUR 2 291 (2 091) and derivatives of MEUR 100 (300). The deferral hedge account-ing of the loans is based on a RFR 2 exemption. The derivative is an internal con-tract with Atlas Copco Finance DAC resulting with MSEK –4 (98) to Receivables from Group companies in below table.
Financial credit riskCredit risk on financial transactions is the risk that the Parent Company incurs losses as a result of non-payment by counterparts related to the Parent Company’s investments, bank deposits or derivative transactions. For further information regarding investment and derivative transactions, see note 27 of the consolidated financial statements. The table below shows the actual expo-sure of financial instruments as per December 31.
Financial credit risk 2021 2020
Cash and cash equivalents 0 8 Receivables from Group companies 9 288 16 049 Other 81 80 Total 9 369 16 137
Fair value hierarchyFair values are based on observable market prices or, in the case that such prices are not available, on observable inputs or other valuation techniques. Amounts shown in other notes are unrealized and will not necessarily be realized. For more information about fair value hierarchy, see note 27 of the consolidated financial statements. There are no level 3 instruments in the Parent Company.
Valuation methodsDerivativesFair values of forward exchange contracts are calculated based on prevailing markets. Interest rate swaps are valued based on market rates and present value of future cash flows.
Interest-bearing liabilitiesFair values are calculated based on market rates and present value of future cash flows.
The Parent Company’s financial instruments by categoryThe carrying value for the Parent Company’s financial instruments corresponds to fair value in all categories except for borrowings. See A17 for additional information.
Atlas Copco 2021 118
FINANCIAL STATEMENTS – NOTESIN
TROD
UCTIO
NTH
IS IS ATLA
S COPCO
THE Y
EAR IN
REVIEW
FINA
NCIA
LSO
THER IN
FORM
ATIO
N
FINANCIALS
Group
Consolidated income statement
Consolidated statement of comprehensive income
Consolidated balance sheet
Consolidated statement of changes in equity
Consolidated statement of cash flows
Notes
• Parent company

A21. Directly owned subsidiaries
2021 2020
Number of shares
Percent held
Carrying value
Number of shares
Percent held
Carrying value
Directly owned product companies Atlas Copco Airpower n.v., wilrijk 76 415 100 46 806 76 415 100 46 521
Directly owned customer centers AGRE Kompressoren GmbH, Steyr 200 000 100 7 200 000 100 7ALUP Kompressoren Polska sp. z.o.o., Janki 9 000 100 14 – – –Atlas Copco (Cyprus) Ltd., Nicosia 99 998 100 0 99 998 100 0Atlas Copco (India) Ltd., Pune 21 731 917 100 874 21 731 917 100 827Atlas Copco (Ireland) Ltd., Dublin 250 000 100 28 250 000 100 28Atlas Copco (Malaysia), Sdn. Bhd., Shah Alam 1 000 000 100 14 1 000 000 100 11Atlas Copco (Philippines) Inc., Binan 677 980 100 69 677 980 100 34Atlas Copco (Schweiz) AG., Studen 8 000 100 63 8 000 100 63 Atlas Copco (South East Asia) Pte.Ltd., Singapore 4 500 000 100 35 4 500 000 100 34Atlas Copco Argentina S.A.C.I., Buenos Aires 5 120 025 93/100 1) 84 5 120 025 93/100 1) 84Atlas Copco Brasil Ltda., Barueri 70 358 841 100 257 70 358 841 100 253Atlas Copco Canada Inc., Toronto 6 946 100 2 185 6 946 100 665Atlas Copco Chile SpA, Santiago 24 998 100 6 24 998 100 6Atlas Copco Compressor AB, 556155-2794, Nacka 60 000 100 36 60 000 100 34Atlas Copco Eastern Africa Limited., Nairobi 482 999 100 40 482 999 100 40Atlas Copco Equipment Egypt S.A.E., Cairo 5 0/100 1) 4 5 0/100 1) 4Atlas Copco GmbH, Vienna 1 100 43 1 100 43Atlas Copco Indoeuropeiska AB, 556155-2760, Nacka 3 500 100 20 3 500 100 20Atlas Copco KK, Tokyo 100 000 100 39 100 000 100 38Atlas Copco Kompressorteknik A/S, Albertslund 4 000 100 5 4 000 100 5 Atlas Copco Maroc SA., Casablanca 3 960 99 6 3 960 99 6Atlas Copco Polska Sp. z o. o., warsaw 4 000 100 80 – – – Atlas Copco Services Middle East OMC, Manama 500 100 27 500 100 18Atlas Copco Ukraine LLC, Kiev 10 000 000 100 3 – – – Atlas Copco Venezuela SA, Valencia (Caracas) 25 812 000 100 0 25 812 000 100 0 Servatechnik AG, Oftringen 3 500 100 25 3 500 100 28Soc. Atlas Copco de Portugal Lda., Porto Salvo 1 100 15 1 100 14
2021 2020
Number of shares
Percent held
Carrying value
Number of shares
Percent held
Carrying value
Directly owned holding companies and others AB Atlas Diesel, 556019-1610, Nacka 1 000 100 0 1 000 100 0Atlas Copco A/S, Langhus 2 500 100 44 2 500 100 44Atlas Copco Beheer B.V., zwijndrecht 15 712 100 84 15 712 100 247Atlas Copco Finance Belgium BVBA, wilrijk 1 0/100 1) 0 1 0/100 1) 0Atlas Copco Finance DAC, Dublin 5 162 000 001 100 54 428 5 162 000 001 100 54 300Atlas Copco France Holding S.A., Cergy Pontoise 278 255 100 341 278 255 100 314Atlas Copco Holding GmbH, Essen 2 100 4 351 2 100 4 341Atlas Copco Internationaal B.V., zwijndrecht 10 002 100 27 455 10 002 100 27 376Atlas Copco Järla Holding AB, 556062-0212, Nacka 95 000 100 716 95 000 100 717Atlas Copco Nacka Holding AB, 556397-7452, Nacka 100 000 100 12 100 000 100 12Atlas Copco Sickla Holding AB, 556309-5255, Nacka 1 000 100 25 084 1 000 100 25 004Econus S A, Montevideo 21 582 605 100 17 21 582 605 100 17Industria Försäkrings AB, 516401-7930, Nacka 300 000 100 30 300 000 100 30JSC Atlas Copco, Moscow 2 644 100 185 – – –Oy Atlas Copco AB, Vantaa 150 100 33 150 100 33Power Tools Distribution n.v., Hoeselt 1 0/100 1) 4 1 0/100 1) 1Saltus Industrial Technique AB, 559053-5455, Nacka 500 100 0 500 100 9Carrying amount, Dec. 31 163 569 161 228
1) First figure: percentage held by Parent Company, second figure: percentage held by Atlas Copco Group.
Atlas Copco 2021 119
FINANCIAL STATEMENTS – NOTESIN
TROD
UCTIO
NTH
IS IS ATLA
S COPCO
THE Y
EAR IN
REVIEW
FINA
NCIA
LSO
THER IN
FORM
ATIO
N
FINANCIALS
Group
Consolidated income statement
Consolidated statement of comprehensive income
Consolidated balance sheet
Consolidated statement of changes in equity
Consolidated statement of cash flows
Notes
• Parent company
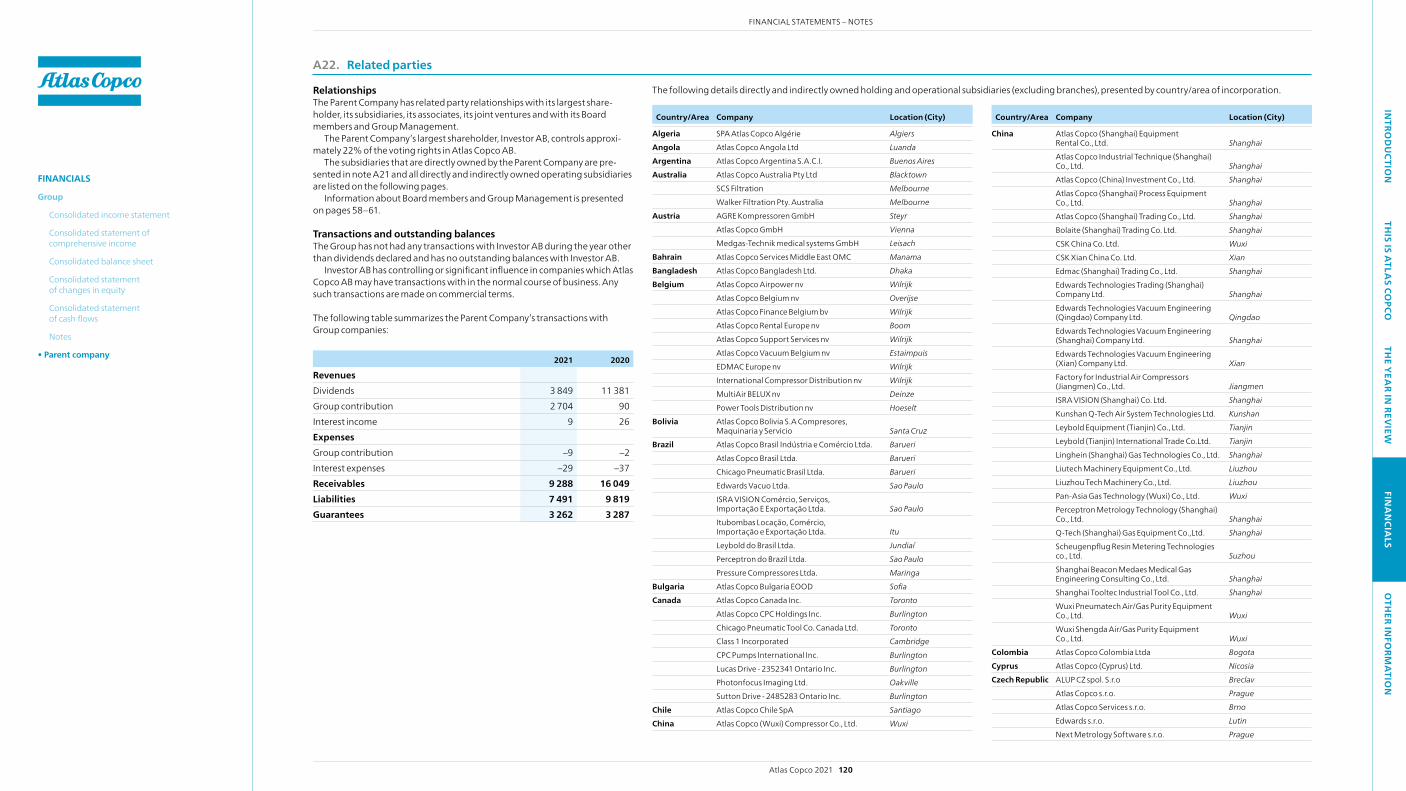
A22. Related parties
RelationshipsThe Parent Company has related party relationships with its largest share-holder, its subsidiaries, its associates, its joint ventures and with its Board members and Group Management.
The Parent Company’s largest shareholder, Investor AB, controls approxi-mately 22% of the voting rights in Atlas Copco AB.
The subsidiaries that are directly owned by the Parent Company are pre-sented in note A21 and all directly and indirectly owned operating subsidiaries are listed on the following pages.
Information about Board members and Group Management is presented on pages 58–61.
Transactions and outstanding balancesThe Group has not had any transactions with Investor AB during the year other than dividends declared and has no outstanding balances with Investor AB.
Investor AB has controlling or significant influence in companies which Atlas Copco AB may have transactions with in the normal course of business. Any such transactions are made on com mercial terms.
The following table summarizes the Parent Company’s transactions with Group companies:
2021 2020
Revenues Dividends 3 849 11 381Group contribution 2 704 90Interest income 9 26Expenses Group contribution –9 –2 Interest expenses –29 –37 Receivables 9 288 16 049 Liabilities 7 491 9 819 Guarantees 3 262 3 287
Country/Area Company Location (City) Country/Area Company Location (City)
The following details directly and indirectly owned holding and operational subsidiaries (excluding branches), presented by country/area of incorporation.
Algeria SPA Atlas Copco Algérie AlgiersAngola Atlas Copco Angola Ltd LuandaArgentina Atlas Copco Argentina S.A.C.I. Buenos AiresAustralia Atlas Copco Australia Pty Ltd Blacktown
SCS Filtration Melbournewalker Filtration Pty. Australia Melbourne
Austria AGRE Kompressoren GmbH SteyrAtlas Copco GmbH ViennaMedgas-Technik medical systems GmbH Leisach
Bahrain Atlas Copco Services Middle East OMC ManamaBangladesh Atlas Copco Bangladesh Ltd. DhakaBelgium Atlas Copco Airpower nv Wilrijk
Atlas Copco Belgium nv OverijseAtlas Copco Finance Belgium bv WilrijkAtlas Copco Rental Europe nv BoomAtlas Copco Support Services nv WilrijkAtlas Copco Vacuum Belgium nv EstaimpuisEDMAC Europe nv WilrijkInternational Compressor Distribution nv WilrijkMultiAir BELUX nv DeinzePower Tools Distribution nv Hoeselt
Bolivia Atlas Copco Bolivia S.A Compresores, Maquinaria y Servicio Santa Cruz
Brazil Atlas Copco Brasil Indústria e Comércio Ltda. Barueri Atlas Copco Brasil Ltda. Barueri Chicago Pneumatic Brasil Ltda. Barueri Edwards Vacuo Ltda. Sao PauloISRA VISION Comércio, Serviços, Importação E Exportação Ltda. Sao PauloItubombas Locação, Comércio, Importação e Exportação Ltda. ItuLeybold do Brasil Ltda. JundiaíPerceptron do Brazil Ltda. Sao PauloPressure Compressores Ltda. Maringa
Bulgaria Atlas Copco Bulgaria EOOD SofiaCanada Atlas Copco Canada Inc. Toronto
Atlas Copco CPC Holdings Inc. BurlingtonChicago Pneumatic Tool Co. Canada Ltd. TorontoClass 1 Incorporated CambridgeCPC Pumps International Inc. BurlingtonLucas Drive - 2352341 Ontario Inc. BurlingtonPhotonfocus Imaging Ltd. OakvilleSutton Drive - 2485283 Ontario Inc. Burlington
Chile Atlas Copco Chile SpA SantiagoChina Atlas Copco (wuxi) Compressor Co., Ltd. Wuxi
China Atlas Copco (Shanghai) Equipment Rental Co., Ltd. ShanghaiAtlas Copco Industrial Technique (Shanghai) Co., Ltd. ShanghaiAtlas Copco (China) Investment Co., Ltd. ShanghaiAtlas Copco (Shanghai) Process Equipment Co., Ltd. ShanghaiAtlas Copco (Shanghai) Trading Co., Ltd. ShanghaiBolaite (Shanghai) Trading Co. Ltd. ShanghaiCSK China Co. Ltd. Wuxi CSK Xian China Co. Ltd. Xian Edmac (Shanghai) Trading Co., Ltd. ShanghaiEdwards Technologies Trading (Shanghai) Company Ltd. ShanghaiEdwards Technologies Vacuum Engineering (qingdao) Company Ltd. QingdaoEdwards Technologies Vacuum Engineering (Shanghai) Company Ltd. ShanghaiEdwards Technologies Vacuum Engineering (Xian) Company Ltd. XianFactory for Industrial Air Compressors (Jiangmen) Co., Ltd. JiangmenISRA VISION (Shanghai) Co. Ltd. ShanghaiKunshan q-Tech Air System Technologies Ltd. KunshanLeybold Equipment (Tianjin) Co., Ltd. Tianjin Leybold (Tianjin) International Trade Co.Ltd. Tianjin Linghein (Shanghai) Gas Technologies Co., Ltd. ShanghaiLiutech Machinery Equipment Co., Ltd. LiuzhouLiuzhou Tech Machinery Co., Ltd. LiuzhouPan-Asia Gas Technology (wuxi) Co., Ltd. WuxiPerceptron Metrology Technology (Shanghai) Co., Ltd. Shanghaiq-Tech (Shanghai) Gas Equipment Co.,Ltd. ShanghaiScheugenpflug Resin Metering Technologies co., Ltd. SuzhouShanghai Beacon Medaes Medical Gas Engineering Consulting Co., Ltd. ShanghaiShanghai Tooltec Industrial Tool Co., Ltd. Shanghaiwuxi Pneumatech Air/Gas Purity Equipment Co., Ltd. Wuxiwuxi Shengda Air/Gas Purity Equipment Co., Ltd. Wuxi
Colombia Atlas Copco Colombia Ltda BogotaCyprus Atlas Copco (Cyprus) Ltd. NicosiaCzech Republic ALUP Cz spol. S.r.o Breclav
Atlas Copco s.r.o. PragueAtlas Copco Services s.r.o. BrnoEdwards s.r.o. LutinNext Metrology Software s.r.o. Prague
Atlas Copco 2021 120
FINANCIAL STATEMENTS – NOTESIN
TROD
UCTIO
NTH
IS IS ATLA
S COPCO
THE Y
EAR IN
REVIEW
FINA
NCIA
LSO
THER IN
FORM
ATIO
N
FINANCIALS
Group
Consolidated income statement
Consolidated statement of comprehensive income
Consolidated balance sheet
Consolidated statement of changes in equity
Consolidated statement of cash flows
Notes
• Parent company
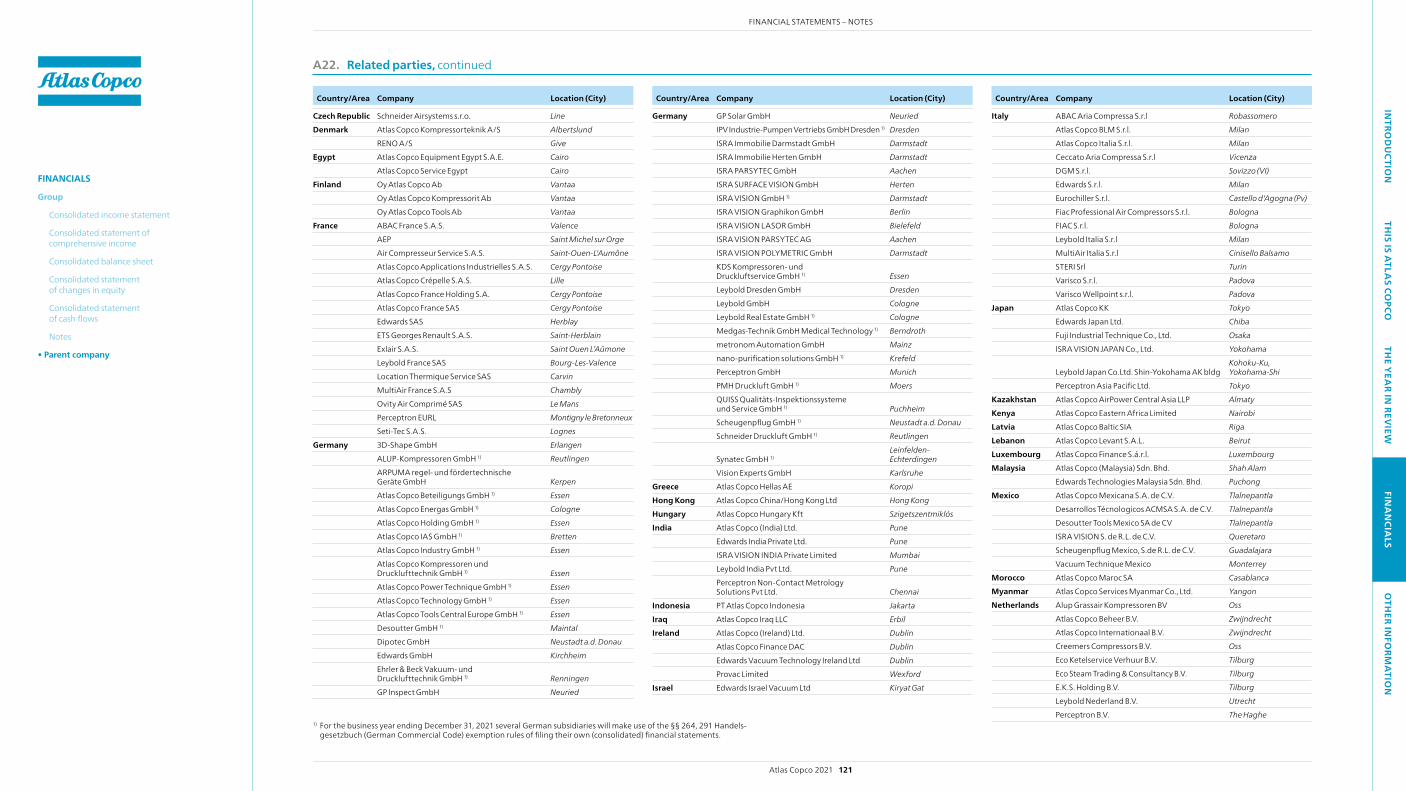
A22. Related parties, continued
Country/Area Company Location (City) Country/Area Company Location (City) Country/Area Company Location (City)
Czech Republic Schneider Airsystems s.r.o. LineDenmark Atlas Copco Kompressorteknik A/S Albertslund
RENO A/S GiveEgypt Atlas Copco Equipment Egypt S.A.E. Cairo
Atlas Copco Service Egypt CairoFinland Oy Atlas Copco Ab Vantaa
Oy Atlas Copco Kompressorit Ab Vantaa Oy Atlas Copco Tools Ab Vantaa
France ABAC France S.A.S. ValenceAEP Saint Michel sur OrgeAir Compresseur Service S.A.S. Saint-Ouen-L'AumôneAtlas Copco Applications Industrielles S.A.S. Cergy PontoiseAtlas Copco Crépelle S.A.S. LilleAtlas Copco France Holding S.A. Cergy PontoiseAtlas Copco France SAS Cergy PontoiseEdwards SAS HerblayETS Georges Renault S.A.S. Saint-HerblainExlair S.A.S. Saint Ouen L’AûmoneLeybold France SAS Bourg-Les-ValenceLocation Thermique Service SAS CarvinMultiAir France S.A.S ChamblyOvity Air Comprimé SAS Le MansPerceptron EURL Montigny le BretonneuxSeti-Tec S.A.S. Lognes
Germany 3D-Shape GmbH ErlangenALUP-Kompressoren GmbH 1) ReutlingenARPUMA regel- und fördertechnische Geräte GmbH KerpenAtlas Copco Beteiligungs GmbH 1) EssenAtlas Copco Energas GmbH 1) CologneAtlas Copco Holding GmbH 1) EssenAtlas Copco IAS GmbH 1) BrettenAtlas Copco Industry GmbH 1) EssenAtlas Copco Kompressoren und Drucklufttechnik GmbH 1) EssenAtlas Copco Power Technique GmbH 1) EssenAtlas Copco Technology GmbH 1) EssenAtlas Copco Tools Central Europe GmbH 1) EssenDesoutter GmbH 1) MaintalDipotec GmbH Neustadt a.d. DonauEdwards GmbH KirchheimEhrler & Beck Vakuum- und Drucklufttechnik GmbH 1) RenningenGP Inspect GmbH Neuried
Germany GP Solar GmbH NeuriedIPV Industrie-Pumpen Vertriebs GmbH Dresden 1) Dresden ISRA Immobilie Darmstadt GmbH DarmstadtISRA Immobilie Herten GmbH DarmstadtISRA PARSYTEC GmbH AachenISRA SURFACE VISION GmbH HertenISRA VISION GmbH 1) DarmstadtISRA VISION Graphikon GmbH BerlinISRA VISION LASOR GmbH BielefeldISRA VISION PARSYTEC AG AachenISRA VISION POLYMETRIC GmbH DarmstadtKDS Kompressoren- und Druckluftservice GmbH 1) EssenLeybold Dresden GmbH Dresden Leybold GmbH Cologne Leybold Real Estate GmbH 1) Cologne Medgas-Technik GmbH Medical Technology 1) Berndrothmetronom Automation GmbH Mainznano-purification solutions GmbH 1) KrefeldPerceptron GmbH MunichPMH Druckluft GmbH 1) MoersqUISS qualitäts-Inspektionssysteme und Service GmbH 1) PuchheimScheugenpflug GmbH 1) Neustadt a.d. DonauSchneider Druckluft GmbH 1) Reutlingen
Synatec GmbH 1)Leinfelden- Echterdingen
Vision Experts GmbH KarlsruheGreece Atlas Copco Hellas AE Koropi Hong Kong Atlas Copco China/Hong Kong Ltd Hong KongHungary Atlas Copco Hungary Kft SzigetszentmiklósIndia Atlas Copco (India) Ltd. Pune
Edwards India Private Ltd. PuneISRA VISION INDIA Private Limited MumbaiLeybold India Pvt Ltd. PunePerceptron Non-Contact Metrology Solutions Pvt Ltd. Chennai
Indonesia PT Atlas Copco Indonesia JakartaIraq Atlas Copco Iraq LLC ErbilIreland Atlas Copco (Ireland) Ltd. Dublin
Atlas Copco Finance DAC DublinEdwards Vacuum Technology Ireland Ltd DublinProvac Limited Wexford
Israel Edwards Israel Vacuum Ltd Kiryat Gat
Italy ABAC Aria Compressa S.r.l RobassomeroAtlas Copco BLM S.r.l. MilanAtlas Copco Italia S.r.l. MilanCeccato Aria Compressa S.r.l VicenzaDGM S.r.l. Sovizzo (VI)Edwards S.r.l. MilanEurochiller S.r.l. Castello d'Agogna (Pv)Fiac Professional Air Compressors S.r.l. BolognaFIAC S.r.l. BolognaLeybold Italia S.r.l Milan MultiAir Italia S.r.l Cinisello Balsamo STERI Srl TurinVarisco S.r.l. PadovaVarisco wellpoint s.r.l. Padova
Japan Atlas Copco KK TokyoEdwards Japan Ltd. ChibaFuji Industrial Technique Co., Ltd. OsakaISRA VISION JAPAN Co., Ltd. Yokohama
Leybold Japan Co.Ltd. Shin-Yokohama AK bldgKohoku-Ku, Yokohama-Shi
Perceptron Asia Pacific Ltd. TokyoKazakhstan Atlas Copco AirPower Central Asia LLP AlmatyKenya Atlas Copco Eastern Africa Limited NairobiLatvia Atlas Copco Baltic SIA RigaLebanon Atlas Copco Levant S.A.L. BeirutLuxembourg Atlas Copco Finance S.á.r.l. LuxembourgMalaysia Atlas Copco (Malaysia) Sdn. Bhd. Shah Alam
Edwards Technologies Malaysia Sdn. Bhd. PuchongMexico Atlas Copco Mexicana S.A. de C.V. Tlalnepantla
Desarrollos Técnologicos ACMSA S.A. de C.V. TlalnepantlaDesoutter Tools Mexico SA de CV TlalnepantlaISRA VISION S. de R.L. de C.V. QueretaroScheugenpflug Mexico, S.de R.L. de C.V. GuadalajaraVacuum Technique Mexico Monterrey
Morocco Atlas Copco Maroc SA CasablancaMyanmar Atlas Copco Services Myanmar Co., Ltd. YangonNetherlands Alup Grassair Kompressoren BV Oss
Atlas Copco Beheer B.V. ZwijndrechtAtlas Copco Internationaal B.V. ZwijndrechtCreemers Compressors B.V. OssEco Ketelservice Verhuur B.V. TilburgEco Steam Trading & Consultancy B.V. TilburgE.K.S. Holding B.V. TilburgLeybold Nederland B.V. Utrecht Perceptron B.V. The Haghe
1) For the business year ending December 31, 2021 several German subsidiaries will make use of the §§ 264, 291 Handels-gesetzbuch (German Commercial Code) exemption rules of filing their own (consolidated) financial statements.
Atlas Copco 2021 121
FINANCIAL STATEMENTS – NOTESIN
TROD
UCTIO
NTH
IS IS ATLA
S COPCO
THE Y
EAR IN
REVIEW
FINA
NCIA
LSO
THER IN
FORM
ATIO
N
FINANCIALS
Group
Consolidated income statement
Consolidated statement of comprehensive income
Consolidated balance sheet
Consolidated statement of changes in equity
Consolidated statement of cash flows
Notes
• Parent company

New Zealand Atlas Copco (N.z.) Ltd. AucklandExlair (Nz) Limited Auckland
Nigeria Atlas Copco Nigeria Ltd. Lagos Norway Atlas Copco A/S Langhus
Atlas Copco Kompressorteknikk A/S LanghusAtlas Copco Tools A/S LanghusBerema A/S Langhus
Pakistan Atlas Copco Pakistan (Private) Limited LahorePeru Atlas Copco Perú S.A.C. LimaPhilippines Atlas Copco (Philippines) Inc. BinanPoland ALUP Kompressoren Polska sp. z.o.o. Janki
Atlas Copco Polska Sp. z o.o. WarsawPortugal Sociedade Atlas Copco de Portugal
Unipessoal Lda Porto SalvoRomania Atlas Copco Romania S.R.L. Bucharest
Scheugenpflug S.R.L. SibiuRussia Airgrupp LLC Moscow
ISRA VISION LLC MoscowJSC Atlas Copco Moscow
Serbia Atlas Copco Srbija doo BelgradeSingapore Atlas Copco (South East Asia) Pte. Ltd Singapore
Leybold Singapore Pte Ltd SingaporeVacuum Technique Singapore Pte Ltd Singapore
Slovakia Atlas Copco s.r.o BratislavaISRA VISION s.r.o. BratislavaPerceptron Slovensko s.r.o. BratislavaSchneider Airsystems s.r.o. Nitra
Slovenia Atlas Copco d.o.o. TrzinSouth Africa Atlas Copco Industrial South Africa (Pty) Ltd Boksburg
Rand Air South Africa (Pty) Ltd BoksburgSouth Korea Atlas Copco Korea Co., Ltd. Seongnam
CP Tools Korea Co., Ltd. AnyangCSK Inc. Yongin Edwards Korea Ltd CheonanISRA VISION Korea Co. Ltd SeoulLeybold Korea Ltd Bundang
Spain Aire Comprimido Industrial Iberia, S.L. MadridAtlas Copco S.A.E. MadridGrupos Electrógenos Europa, S.A. ZaragozaIBVC Vacuum, S.L.U. Madrid
Leybold Hispanica S.A. Cornellá de LlobregatPerceptron Iberica, S.L. BarcelonaPhotonfocus Spain, S.L. Barcelona
Sweden Atlas Copco Compressor AB NackaAtlas Copco Industrial Technique AB Nacka
Sweden Atlas Copco Järla Holding AB NackaAtlas Copco Nacka Holding AB NackaAtlas Copco Sickla Holding AB NackaIndustria Insurance Company Ltd Industria Försäkringsaktiebolag Nacka
Switzerland ALUP Kompressoren AG OftringenAtlas Copco (Schweiz) AG StudenLeybold Schweiz AG Steinhausen Medgas-Technik Schweiz AG Sankt-GallenPhotonfocus AG Lachen
Taiwan Atlas Copco Taiwan Ltd. TaoyuanCSKT Inc. Jubei Edwards Technologies Ltd JhunanLeybold Taiwan Ltd Hsin-Chu
Thailand Atlas Copco (Thailand) Limited BangkokTurkey Atlas Copco Makinalari Imalat AS Istanbul
Chicago Pneumatic Endüstriyel Ürünler Ticaret A.Ş IstanbulDost Kompresör Endüstri Makinaları İmal Bakım ve Ticaret A.Ş IstanbulEkomak Endüstriyel Kompresör Makine Sanayi ve Ticaret A.Ş IstanbulISRA VISION Yapay Görme Ve Otomasyon San. Ve Tıc. A.ş Istanbul
Ukraine Atlas Copco Ukraine LLC KievUnited Arab Emirates Atlas Copco Middle East FzE DubaiUnited Kingdom Air Compressors and Tools Limited Hemel Hempstead
Airflow Compressors and Pneumatics Limited WaringtonAtlas Copco IAS UK Limited FlintshireAtlas Copco Ltd. Hemel HempsteadAtlas Copco UK Holdings Ltd. Hemel HempsteadBeaconMedaes Ltd StaveleyCooper Freer Ltd LeicesterCooper Freer Holdings Ltd LeicesterEdwards High Vacuum International Ltd. Burgess HillEdwards Ltd. Burgess HillIsocool Limited BraintreeISRA VISION Ltd. LondonISRA VISION PARSYTEC Ltd. EastleighLeybold UK Ltd. Chessington Nano Purification Solutions Ltd NewcastlePurification Solutions UK Limited GatesheadPerceptron Metrology UK Ltd. Birmingham Tentec Ltd. Birminghamwalker Filtration Ltd. UK Washington
U.S.A. Air & Gas Solutions LLC CharlotteAtlas Copco Compressors LLC Rock HillAtlas Copco Comptec LLC VoorheesvilleAtlas Copco IAS LLC Auburn HillsAtlas Copco Mafi-Trench Company LLC Santa MariaAtlas Copco North America LLC ParsippanyAtlas Copco Rental LLC LaporteAtlas Copco Tools & Assembly Systems LLC Auburn HillsAtlas Copco USA Holdings Inc. ParsippanyBeaconMedaes LLC Rock HillC H Spencer LLC Salt Lake CityChicago Pneumatic International Inc. Rock HillChicago Pneumatic Tool Company LLC Rock HillDekker Vacuum Technologies Inc Michigan CityEdwards Vacuum, LLC WilmingtonHenrob Corporation New HudsonISRA SURFACE VISION Inc. Berkeley LakeISRA VISION PARSYTEC Inc. Berkeley LakeLeybold USA Inc. WilmingtonMid-South Engine & Power Systems LLC White OakNowvac Inc. ParsippanyPerceptron Inc. PlymouthPerceptron Global Inc. PlymouthPerceptron Software Technology, Inc. PlymouthPowerhouse Equipment & Engineering Co. Inc. DelancoPower Technique North America LLC Rock Hillquincy Compressor LLC Bay MinetteScheugenpflug Inc. KennesawVacuum Technique LLC Michigan Citywalker Filtration Inc. US Erie
Venezuela Atlas Copco Venezuela SA ValenciaVietnam Atlas Copco Vietnam Company Ltd. HanoiZambia Atlas Copco Industrial zambia Limited Kitwe
A22. Related parties, continued
Country/Area Company Location (City) Country/Area Company Location (City) Country/Area Company Location (City)
Atlas Copco 2021 122
FINANCIAL STATEMENTS – NOTESIN
TROD
UCTIO
NTH
IS IS ATLA
S COPCO
THE Y
EAR IN
REVIEW
FINA
NCIA
LSO
THER IN
FORM
ATIO
N
FINANCIALS
Group
Consolidated income statement
Consolidated statement of comprehensive income
Consolidated balance sheet
Consolidated statement of changes in equity
Consolidated statement of cash flows
Notes
• Parent company
INTRO
DU
CTION
THIS IS A
TLAS CO
PCOTH
E YEA
R IN REV
IEWFIN
AN
CIALS
OTH
ER INFO
RMA
TION
Signatures of the Board of Directors
The Parent Company financial statements have been prepared in accordance with generally accepted accounting principles in Sweden and the consolidated financial statements have been prepared in accordance with International Accounting Standards as prescribed by the European Parliament and the Regulation (EC) No 1606/2002 dated July 19, 2002 on the application of Inter-national Accounting Standards. The Parent Company financial statements and the consolidated financial statements give a true and fair view of the Parent Company’s and the Group’s financial position and results of operations.
Our audit report was submitted on March 18, 2022, Ernst & Young AB
Erik SandströmAuthorized Public Accountant
Atlas Copco AB is required to publish information included in this annual report in accordance with the Swedish Securities Market Act. The information was made public on March 21, 2022.
Mats Rahmström Gordon Riske Peter wallenberg Jr Mikael Bergstedt Benny LarssonBoard member
President and CEOBoard member Board member Board member
Employee representativeBoard member
Employee representative
Nacka, March 2, 2022, Atlas Copco AB
Hans Stråberg Staffan Bohman Tina Donikowski Johan Forssell Anna Ohlsson-LeijonChair Board member Board member Board member Board member
The administration report for the Group and Parent Company provides a true and fair overview of the development of the Group’s and Parent Company’s business activities, financial position and results of operations as well as the significant risks and uncertainties which the Parent Company and its subsidiaries are exposed to.
The Annual Report also contains the Group’s and Parent Company’s statutory sustainability report in accordance with the Swedish Annual Accounts Act, Chapter 6, Section 11, see page 20.
Atlas Copco 2021 123
SIGNATURES OF THE BOARD OF DIRECTORS
OTHER INFORMATION• Signatures of the Board of Directors
Audit Report
Financial definitions
Sustainability notes
Three years in summary
Contacts
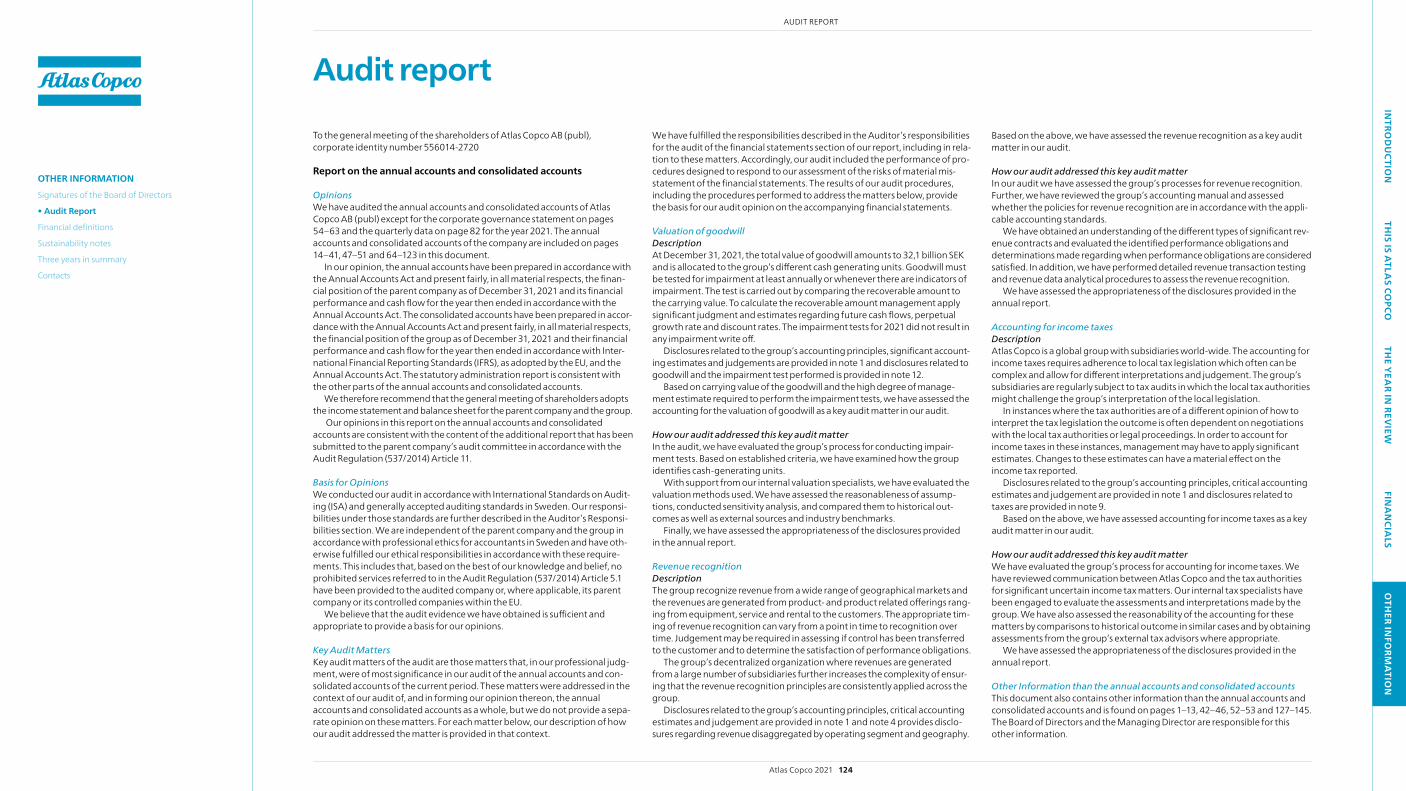
INTRO
DU
CTION
THIS IS A
TLAS CO
PCOTH
E YEA
R IN REV
IEWFIN
AN
CIALS
OTH
ER INFO
RMA
TION
Audit report
To the general meeting of the shareholders of Atlas Copco AB (publ), corporate identity number 556014-2720
Report on the annual accounts and consolidated accounts
Opinionswe have audited the annual accounts and consolidated accounts of Atlas Copco AB (publ) except for the corporate governance statement on pages 54–63 and the quarterly data on page 82 for the year 2021. The annual accounts and consolidated accounts of the company are included on pages 14–41, 47–51 and 64–123 in this document.
In our opinion, the annual accounts have been prepared in accordance with the Annual Accounts Act and present fairly, in all material respects, the finan-cial position of the parent company as of December 31, 2021 and its financial performance and cash flow for the year then ended in accordance with the Annual Accounts Act. The consolidated accounts have been prepared in accor-dance with the Annual Accounts Act and present fairly, in all material respects, the financial position of the group as of December 31, 2021 and their financial performance and cash flow for the year then ended in accordance with Inter-national Financial Reporting Standards (IFRS), as adopted by the EU, and the Annual Accounts Act. The statutory administration report is consistent with the other parts of the annual accounts and consolidated accounts.
we therefore recommend that the general meeting of shareholders adopts the income statement and balance sheet for the parent company and the group.
Our opinions in this report on the annual accounts and consolidated accounts are consistent with the content of the additional report that has been submitted to the parent company’s audit committee in accordance with the Audit Regulation (537/2014) Article 11.
Basis for Opinionswe conducted our audit in accordance with International Standards on Audit-ing (ISA) and generally accepted auditing standards in Sweden. Our responsi-bilities under those standards are further described in the Auditor’s Responsi-bilities section. we are independent of the parent company and the group in accordance with professional ethics for accountants in Sweden and have oth-erwise fulfilled our ethical responsibilities in accordance with these require-ments. This includes that, based on the best of our knowledge and belief, no prohibited services referred to in the Audit Regulation (537/2014) Article 5.1 have been provided to the audited company or, where applicable, its parent company or its controlled companies within the EU.
we believe that the audit evidence we have obtained is sufficient and appropriate to provide a basis for our opinions.
Key Audit MattersKey audit matters of the audit are those matters that, in our professional judg-ment, were of most significance in our audit of the annual accounts and con-solidated accounts of the current period. These matters were addressed in the context of our audit of, and in forming our opinion thereon, the annual accounts and consolidated accounts as a whole, but we do not provide a sepa-rate opinion on these matters. For each matter below, our description of how our audit addressed the matter is provided in that context.
we have fulfilled the responsibilities described in the Auditor’s responsibilities for the audit of the financial statements section of our report, including in rela-tion to these matters. Accordingly, our audit included the performance of pro-cedures designed to respond to our assessment of the risks of material mis-statement of the financial statements. The results of our audit procedures, including the procedures performed to address the matters below, provide the basis for our audit opinion on the accompanying financial statements.
Valuation of goodwill DescriptionAt December 31, 2021, the total value of goodwill amounts to 32,1 billion SEK and is allocated to the group’s different cash generating units. Goodwill must be tested for impairment at least annually or whenever there are indicators of impairment. The test is carried out by comparing the recoverable amount to the carrying value. To calculate the recoverable amount management apply significant judgment and estimates regarding future cash flows, perpetual growth rate and discount rates. The impairment tests for 2021 did not result in any impairment write off.
Disclosures related to the group’s accounting principles, significant account-ing estimates and judgements are provided in note 1 and disclosures related to goodwill and the impairment test performed is provided in note 12.
Based on carrying value of the goodwill and the high degree of manage-ment estimate required to perform the impairment tests, we have assessed the accounting for the valuation of goodwill as a key audit matter in our audit.
How our audit addressed this key audit matterIn the audit, we have evaluated the group’s process for conducting impair-ment tests. Based on established criteria, we have examined how the group identifies cash-generating units.
with support from our internal valuation specialists, we have evaluated the valuation methods used. we have assessed the reasonableness of assump-tions, conducted sensitivity analysis, and compared them to historical out-comes as well as external sources and industry benchmarks.
Finally, we have assessed the appropriateness of the disclosures provided in the annual report.
Revenue recognitionDescriptionThe group recognize revenue from a wide range of geographical markets and the revenues are generated from product- and product related offerings rang-ing from equipment, service and rental to the customers. The appropriate tim-ing of revenue recognition can vary from a point in time to recognition over time. Judgement may be required in assessing if control has been transferred to the customer and to determine the satisfaction of performance obligations.
The group’s decentralized organization where revenues are generated from a large number of subsidiaries further increases the complexity of ensur-ing that the revenue recognition principles are consistently applied across the group.
Disclosures related to the group’s accounting principles, critical accounting estimates and judgement are provided in note 1 and note 4 provides disclo-sures regarding revenue disaggregated by operating segment and geography.
Based on the above, we have assessed the revenue recognition as a key audit matter in our audit.
How our audit addressed this key audit matterIn our audit we have assessed the group’s processes for revenue recognition. Further, we have reviewed the group’s accounting manual and assessed whether the policies for revenue recognition are in accordance with the appli-cable accounting standards.
we have obtained an understanding of the different types of significant rev-enue contracts and evaluated the identified performance obligations and determinations made regarding when performance obligations are considered satisfied. In addition, we have performed detailed revenue transaction testing and revenue data analytical procedures to assess the revenue recognition.
we have assessed the appropriateness of the disclosures provided in the annual report.
Accounting for income taxesDescriptionAtlas Copco is a global group with subsidiaries world-wide. The accounting for income taxes requires adherence to local tax legislation which often can be complex and allow for different interpretations and judgement. The group’s subsidiaries are regularly subject to tax audits in which the local tax authorities might challenge the group’s interpretation of the local legislation.
In instances where the tax authorities are of a different opinion of how to interpret the tax legislation the outcome is often dependent on negotiations with the local tax authorities or legal proceedings. In order to account for income taxes in these instances, management may have to apply significant estimates. Changes to these estimates can have a material effect on the income tax reported.
Disclosures related to the group’s accounting principles, critical accounting estimates and judgement are provided in note 1 and disclosures related to taxes are provided in note 9.
Based on the above, we have assessed accounting for income taxes as a key audit matter in our audit.
How our audit addressed this key audit matterwe have evaluated the group’s process for accounting for income taxes. we have reviewed communication between Atlas Copco and the tax authorities for significant uncertain income tax matters. Our internal tax specialists have been engaged to evaluate the assessments and interpretations made by the group. we have also assessed the reasonability of the accounting for these matters by comparisons to historical outcome in similar cases and by obtaining assessments from the group’s external tax advisors where appropriate.
we have assessed the appropriateness of the disclosures provided in the annual report.
Other Information than the annual accounts and consolidated accountsThis document also contains other information than the annual accounts and consolidated accounts and is found on pages 1–13, 42–46, 52–53 and 127–145. The Board of Directors and the Managing Director are responsible for this other information.
Atlas Copco 2021 124
AUDIT REPORT
OTHER INFORMATIONSignatures of the Board of Directors
• Audit Report
Financial definitions
Sustainability notes
Three years in summary
Contacts

INTRO
DU
CTION
THIS IS A
TLAS CO
PCOTH
E YEA
R IN REV
IEWFIN
AN
CIALS
OTH
ER INFO
RMA
TION
Our opinion on the annual accounts and consolidated accounts does not cover this other information and we do not express any form of assurance conclusion regarding this other information.
In connection with our audit of the annual accounts and consolidated accounts, our responsibility is to read the information identified above and consider whether the information is materially inconsistent with the annual accounts and consolidated accounts. In this procedure we also take into account our knowledge otherwise obtained in the audit and assess whether the information otherwise appears to be materially misstated.
If we, based on the work performed concerning this information, conclude that there is a material misstatement of this other information, we are required to report that fact. we have nothing to report in this regard.
Responsibilities of the Board of Directors and the Managing Director The Board of Directors and the Managing Director are responsible for the preparation of the annual accounts and consolidated accounts and that they give a fair presentation in accordance with the Annual Accounts Act and, con-cerning the consolidated accounts, in accordance with IFRS as adopted by the EU. The Board of Directors and the Managing Director are also responsible for such internal control as they determine is necessary to enable the preparation of annual accounts and consolidated accounts that are free from material mis-statement, whether due to fraud or error.
In preparing the annual accounts and consolidated accounts, The Board of Directors and the Managing Director are responsible for the assessment of the company’s and the group’s ability to continue as a going concern. They disclose, as applicable, matters related to going concern and using the going concern basis of accounting. The going concern basis of accounting is however not applied if the Board of Directors and the Managing Director intends to liquidate the company, to cease operations, or has no realistic alternative but to do so.
The Audit Committee shall, without prejudice to the Board of Director’s responsibilities and tasks in general, among other things oversee the company’s financial reporting process.
Auditor’s responsibilityOur objectives are to obtain reasonable assurance about whether the annual accounts and consolidated accounts as a whole are free from material mis-statement, whether due to fraud or error, and to issue an auditor’s report that includes our opinions. Reasonable assurance is a high level of assurance, but is not a guarantee that an audit conducted in accordance with ISAs and gener-ally accepted auditing standards in Sweden will always detect a material mis-statement when it exists. Misstatements can arise from fraud or error and are considered material if, individually or in the aggregate, they could reasonably be expected to influence the economic decisions of users taken on the basis of these annual accounts and consolidated accounts.
As part of an audit in accordance with ISAs, we exercise professional judg-ment and maintain professional skepticism throughout the audit. we also:
• Identify and assess the risks of material misstatement of the annual accounts and consolidated accounts, whether due to fraud or error, design and perform audit procedures responsive to those risks, and obtain audit evidence that is sufficient and appropriate to provide a basis for our opinions.
Audit report, continued
The risk of not detecting a material misstatement resulting from fraud is higher than for one resulting from error, as fraud may involve collusion, forgery, intentional omissions, misrepresentations, or the override of internal control.
• Obtain an understanding of the company’s internal control relevant to our audit in order to design audit procedures that are appropriate in the circumstances, but not for the purpose of expressing an opinion on the effectiveness of the company’s internal control.
• Evaluate the appropriateness of accounting policies used and the reason-ableness of accounting estimates and related disclosures made by the Board of Directors and the Managing Director.
• Conclude on the appropriateness of the Board of Directors’ and the Man-aging Director’s use of the going concern basis of accounting in preparing the annual accounts and consolidated accounts. we also draw a conclu-sion, based on the audit evidence obtained, as to whether any material uncertainty exists related to events or conditions that may cast significant doubt on the company’s and the group’s ability to continue as a going con-cern. If we conclude that a material uncertainty exists, we are required to draw attention in our auditor’s report to the related disclosures in the annual accounts and consolidated accounts or, if such disclosures are inad-equate, to modify our opinion about the annual accounts and consolidated accounts. Our conclusions are based on the audit evidence obtained up to the date of our auditor’s report. However, future events or conditions may cause a company and a group to cease to continue as a going concern.
• Evaluate the overall presentation, structure and content of the annual accounts and consolidated accounts, including the disclosures, and whether the annual accounts and consolidated accounts represent the underlying transactions and events in a manner that achieves fair presenta-tion.
• Obtain sufficient and appropriate audit evidence regarding the financial information of the entities or business activities within the group to express an opinion on the consolidated accounts. we are responsible for the direc-tion, supervision and performance of the group audit. we remain solely responsible for our opinions.
we must inform the Board of Directors of, among other matters, the planned scope and timing of the audit. we must also inform of significant audit findings during our audit, including any significant deficiencies in internal control that we identified.
we must also provide the Board of Directors with a statement that we have complied with relevant ethical requirements regarding independence, and to communicate with them all relationships and other matters that may reason-ably be thought to bear on our independence, and where applicable, related safeguards.
From the matters communicated with the Board of Directors, we determine those matters that were of most significance in the audit of the annual accounts and consolidated accounts, including the most important assessed risks for material misstatement, and are therefore the key audit matters. we describe these matters in the auditor’s report unless law or regulation precludes disclosure about the matter.
Report on other legal and regulatory requirements
OpinionsIn addition to our audit of the annual accounts and consolidated accounts, we have also audited the administration of the Board of Directors and the Manag-ing Director of Atlas Copco AB (publ) for the year 2021 and the proposed appropriations of the company’s profit or loss.
we recommend to the general meeting of shareholders that the profit be appropriated (loss be dealt with) in accordance with the proposal in the statu-tory administration report and that the members of the Board of Directors and the Managing Director be discharged from liability for the financial year.
Basis for opinionswe conducted the audit in accordance with generally accepted auditing stan-dards in Sweden. Our responsibilities under those standards are further described in the Auditor’s Responsibilities section. we are independent of the parent company and the group in accordance with professional ethics for accountants in Sweden and have otherwise fulfilled our ethical responsibilities in accordance with these requirements.
we believe that the audit evidence we have obtained is sufficient and appropriate to provide a basis for our opinions.
Responsibilities of the Board of Directors and the Managing DirectorThe Board of Directors is responsible for the proposal for appropriations of the company’s profit or loss. At the proposal of a dividend, this includes an assess-ment of whether the dividend is justifiable considering the requirements which the company’s and the group’s type of operations, size and risks place on the size of the parent company’s and the group’s equity, consolidation requirements, liquidity and position in general.
The Board of Directors is responsible for the company’s organization and the administration of the company’s affairs. This includes among other things continuous assessment of the company’s and the group’s financial situation and ensuring that the company’s organization is designed so that the account-ing, management of assets and the company’s financial affairs otherwise are controlled in a reassuring manner. The Managing Director shall manage the ongoing administration according to the Board of Directors’ guidelines and instructions and among other matters take measures that are necessary to ful-fill the company’s accounting in accordance with law and handle the manage-ment of assets in a reassuring manner.
Auditor’s responsibilityOur objective concerning the audit of the administration, and thereby our opinion about discharge from liability, is to obtain audit evidence to assess with a reasonable degree of assurance whether any member of the Board of Directors or the Managing Director in any material respect:
• has undertaken any action or been guilty of any omission which can give rise to liability to the company, or
• in any other way has acted in contravention of the Companies Act, the Annual Accounts Act or the Articles of Association.
Atlas Copco 2021 125
AUDIT REPORT
OTHER INFORMATIONSignatures of the Board of Directors
• Audit Report
Financial definitions
Sustainability notes
Three years in summary
Contacts
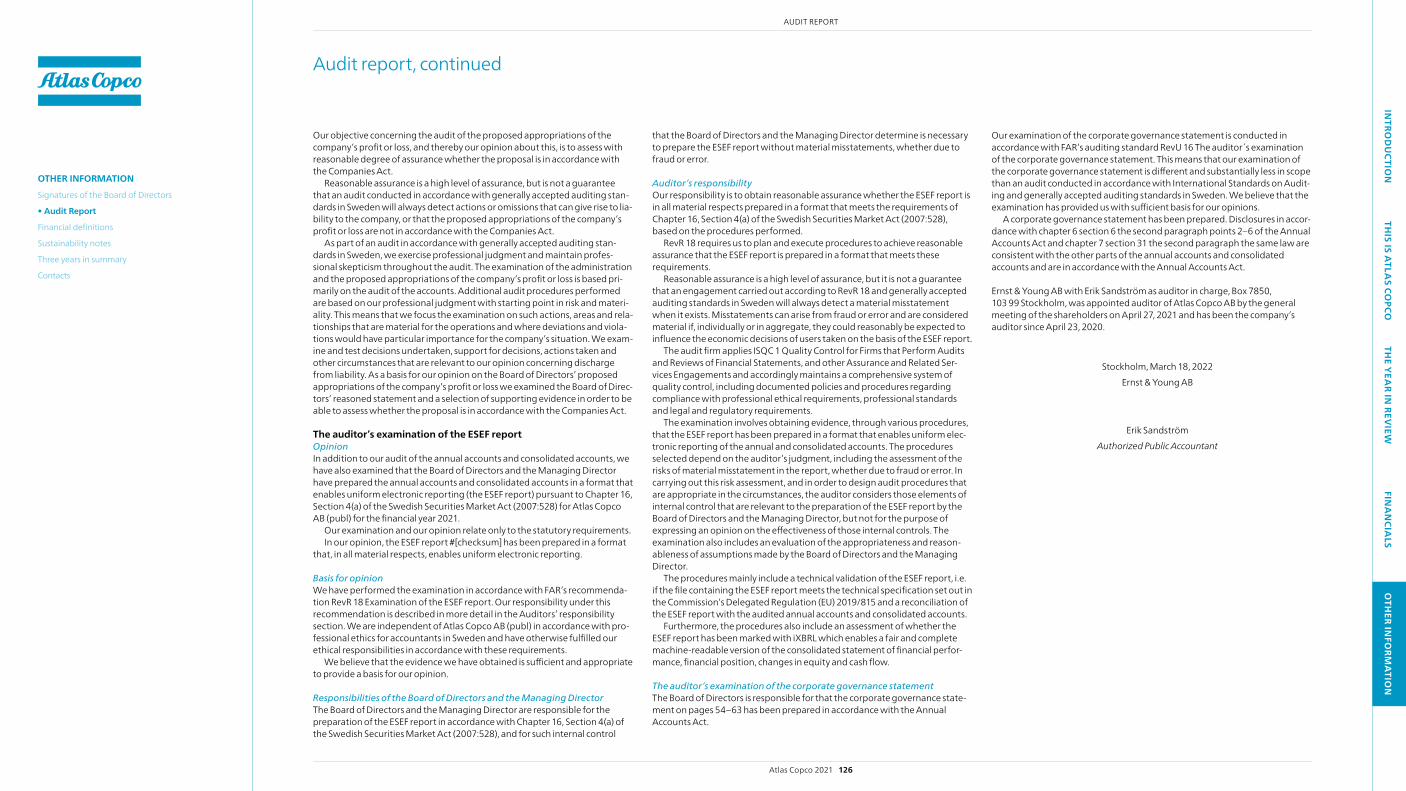
INTRO
DU
CTION
THIS IS A
TLAS CO
PCOTH
E YEA
R IN REV
IEWFIN
AN
CIALS
OTH
ER INFO
RMA
TION
Our objective concerning the audit of the proposed appropriations of the company’s profit or loss, and thereby our opinion about this, is to assess with reasonable degree of assurance whether the proposal is in accordance with the Companies Act.
Reasonable assurance is a high level of assurance, but is not a guarantee that an audit conducted in accordance with generally accepted auditing stan-dards in Sweden will always detect actions or omissions that can give rise to lia-bility to the company, or that the proposed appropriations of the company’s profit or loss are not in accordance with the Companies Act.
As part of an audit in accordance with generally accepted auditing stan-dards in Sweden, we exercise professional judgment and maintain profes-sional skepticism throughout the audit. The examination of the administration and the proposed appropriations of the company’s profit or loss is based pri-marily on the audit of the accounts. Additional audit procedures performed are based on our professional judgment with starting point in risk and materi-ality. This means that we focus the examination on such actions, areas and rela-tionships that are material for the operations and where deviations and viola-tions would have particular importance for the company’s situation. we exam-ine and test decisions undertaken, support for decisions, actions taken and other circumstances that are relevant to our opinion concerning discharge from liability. As a basis for our opinion on the Board of Directors’ proposed appropriations of the company’s profit or loss we examined the Board of Direc-tors’ reasoned statement and a selection of supporting evidence in order to be able to assess whether the proposal is in accordance with the Companies Act.
The auditor’s examination of the ESEF reportOpinionIn addition to our audit of the annual accounts and consolidated accounts, we have also examined that the Board of Directors and the Managing Director have prepared the annual accounts and consolidated accounts in a format that enables uniform electronic reporting (the ESEF report) pursuant to Chapter 16, Section 4(a) of the Swedish Securities Market Act (2007:528) for Atlas Copco AB (publ) for the financial year 2021.
Our examination and our opinion relate only to the statutory requirements.In our opinion, the ESEF report #[checksum] has been prepared in a format
that, in all material respects, enables uniform electronic reporting.
Basis for opinionwe have performed the examination in accordance with FAR’s recommenda-tion RevR 18 Examination of the ESEF report. Our responsibility under this recommendation is described in more detail in the Auditors’ responsibility section. we are independent of Atlas Copco AB (publ) in accordance with pro-fessional ethics for accountants in Sweden and have otherwise fulfilled our ethical responsibilities in accordance with these requirements.
we believe that the evidence we have obtained is sufficient and appropriate to provide a basis for our opinion.
Responsibilities of the Board of Directors and the Managing DirectorThe Board of Directors and the Managing Director are responsible for the preparation of the ESEF report in accordance with Chapter 16, Section 4(a) of the Swedish Securities Market Act (2007:528), and for such internal control
Audit report, continued
that the Board of Directors and the Managing Director determine is necessary to prepare the ESEF report without material misstatements, whether due to fraud or error.
Auditor’s responsibilityOur responsibility is to obtain reasonable assurance whether the ESEF report is in all material respects prepared in a format that meets the requirements of Chapter 16, Section 4(a) of the Swedish Securities Market Act (2007:528), based on the procedures performed.
RevR 18 requires us to plan and execute procedures to achieve reasonable assurance that the ESEF report is prepared in a format that meets these requirements.
Reasonable assurance is a high level of assurance, but it is not a guarantee that an engagement carried out according to RevR 18 and generally accepted auditing standards in Sweden will always detect a material misstatement when it exists. Misstatements can arise from fraud or error and are considered material if, individually or in aggregate, they could reasonably be expected to influence the economic decisions of users taken on the basis of the ESEF report.
The audit firm applies ISqC 1 quality Control for Firms that Perform Audits and Reviews of Financial Statements, and other Assurance and Related Ser-vices Engagements and accordingly maintains a comprehensive system of quality control, including documented policies and procedures regarding compliance with professional ethical requirements, professional standards and legal and regulatory requirements.
The examination involves obtaining evidence, through various procedures, that the ESEF report has been prepared in a format that enables uniform elec-tronic reporting of the annual and consolidated accounts. The procedures selected depend on the auditor’s judgment, including the assessment of the risks of material misstatement in the report, whether due to fraud or error. In carrying out this risk assessment, and in order to design audit procedures that are appropriate in the circumstances, the auditor considers those elements of internal control that are relevant to the preparation of the ESEF report by the Board of Directors and the Managing Director, but not for the purpose of expressing an opinion on the effectiveness of those internal controls. The examination also includes an evaluation of the appropriateness and reason-ableness of assumptions made by the Board of Directors and the Managing Director.
The procedures mainly include a technical validation of the ESEF report, i.e. if the file containing the ESEF report meets the technical specification set out in the Commission’s Delegated Regulation (EU) 2019/815 and a reconciliation of the ESEF report with the audited annual accounts and consolidated accounts.
Furthermore, the procedures also include an assessment of whether the ESEF report has been marked with iXBRL which enables a fair and complete machine-readable version of the consolidated statement of financial perfor-mance, financial position, changes in equity and cash flow.
The auditor’s examination of the corporate governance statementThe Board of Directors is responsible for that the corporate governance state-ment on pages 54–63 has been prepared in accordance with the Annual Accounts Act.
Our examination of the corporate governance statement is conducted in accordance with FAR’s auditing standard RevU 16 The auditor s examination of the corporate governance statement. This means that our examination of the corporate governance statement is different and substantially less in scope than an audit conducted in accordance with International Standards on Audit-ing and generally accepted auditing standards in Sweden. we believe that the examination has provided us with sufficient basis for our opinions.
A corporate governance statement has been prepared. Disclosures in accor-dance with chapter 6 section 6 the second paragraph points 2–6 of the Annual Accounts Act and chapter 7 section 31 the second paragraph the same law are consistent with the other parts of the annual accounts and consolidated accounts and are in accordance with the Annual Accounts Act.
Ernst & Young AB with Erik Sandström as auditor in charge, Box 7850, 103 99 Stockholm, was appointed auditor of Atlas Copco AB by the general meeting of the shareholders on April 27, 2021 and has been the company’s auditor since April 23, 2020.
Stockholm, March 18, 2022Ernst & Young AB
Erik SandströmAuthorized Public Accountant
Atlas Copco 2021 126
AUDIT REPORT
OTHER INFORMATIONSignatures of the Board of Directors
• Audit Report
Financial definitions
Sustainability notes
Three years in summary
Contacts
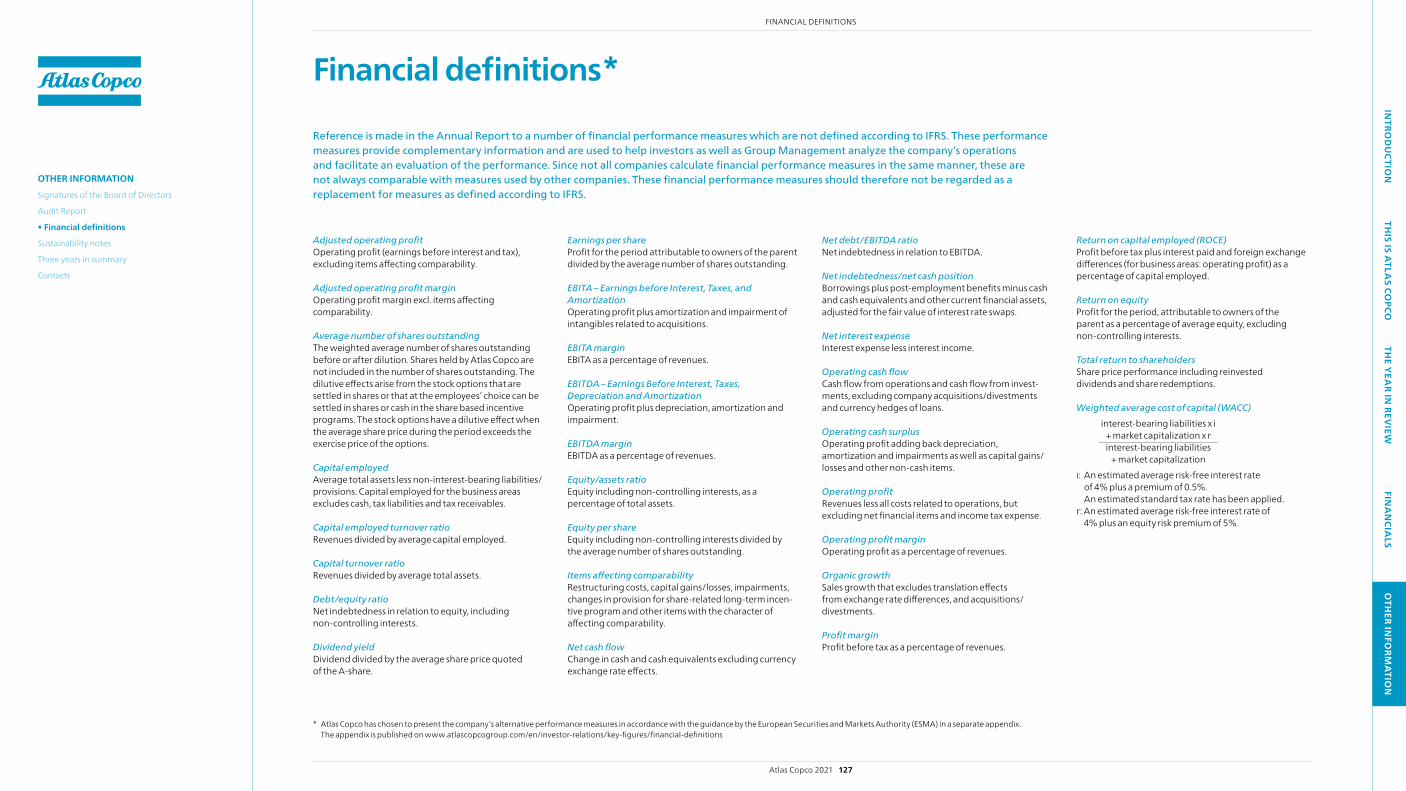
INTRO
DU
CTION
THIS IS A
TLAS CO
PCOTH
E YEA
R IN REV
IEWFIN
AN
CIALS
OTH
ER INFO
RMA
TION
Financial definitions *
Reference is made in the Annual Report to a number of financial performance measures which are not defined according to IFRS. These performance measures provide complementary information and are used to help investors as well as Group Management analyze the company’s operations and facilitate an evaluation of the performance. Since not all companies calculate financial performance measures in the same manner, these are not always comparable with measures used by other companies. These financial performance measures should therefore not be regarded as a replacement for measures as defined according to IFRS.
Adjusted operating profitOperating profit (earnings before interest and tax), excluding items affecting comparability.
Adjusted operating profit marginOperating profit margin excl. items affecting comparability.
Average number of shares outstandingThe weighted average number of shares outstanding before or after dilution. Shares held by Atlas Copco are not included in the number of shares outstanding. The dilutive effects arise from the stock options that are settled in shares or that at the employees’ choice can be settled in shares or cash in the share based incentive programs. The stock options have a dilutive effect when the average share price during the period exceeds the exercise price of the options.
Capital employed Average total assets less non-interest-bearing liabilities/provisions. Capital employed for the business areas excludes cash, tax liabilities and tax receivables.
Capital employed turnover ratio Revenues divided by average capital employed.
Capital turnover ratio Revenues divided by average total assets.
Debt/equity ratioNet indebtedness in relation to equity, including non-controlling interests.
Dividend yieldDividend divided by the average share price quoted of the A-share.
Earnings per share Profit for the period attributable to owners of the parent divided by the average number of shares outstanding.
EBITA – Earnings before Interest, Taxes, and AmortizationOperating profit plus amortization and impairment of intangibles related to acquisitions.
EBITA marginEBITA as a percentage of revenues.
EBITDA – Earnings Before Interest, Taxes, Depreciation and AmortizationOperating profit plus depreciation, amortization and impairment.
EBITDA marginEBITDA as a percentage of revenues.
Equity/assets ratioEquity including non-controlling interests, as a percentage of total assets.
Equity per shareEquity including non-controlling interests divided by the average number of shares outstanding.
Items affecting comparabilityRestructuring costs, capital gains/losses, impairments, changes in provision for share-related long-term incen-tive program and other items with the character of affecting comparability.
Net cash flowChange in cash and cash equivalents excluding currency exchange rate effects.
Net debt/EBITDA ratioNet indebtedness in relation to EBITDA.
Net indebtedness/net cash positionBorrowings plus post-employment benefits minus cash and cash equivalents and other current financial assets, adjusted for the fair value of interest rate swaps.
Net interest expenseInterest expense less interest income.
Operating cash flowCash flow from operations and cash flow from invest-ments, excluding company acquisitions/divestments and currency hedges of loans.
Operating cash surplusOperating profit adding back depreciation, amortization and impairments as well as capital gains/losses and other non-cash items.
Operating profitRevenues less all costs related to operations, but excluding net financial items and income tax expense.
Operating profit marginOperating profit as a percentage of revenues.
Organic growthSales growth that excludes translation effects from exchange rate differences, and acquisitions/ divestments.
Profit marginProfit before tax as a percentage of revenues.
Return on capital employed (ROCE)Profit before tax plus interest paid and foreign exchange differences (for business areas: operating profit) as a percentage of capital employed.
Return on equityProfit for the period, attributable to owners of the parent as a percentage of average equity, excluding non-controlling interests.
Total return to shareholdersShare price performance including reinvested dividends and share redemptions.
Weighted average cost of capital (WACC)interest-bearing liabilities x i
+ market capitalization x rinterest-bearing liabilities
+ market capitalizationi: An estimated average risk-free interest rate
of 4% plus a premium of 0.5%. An estimated standard tax rate has been applied.
r: An estimated average risk-free interest rate of 4% plus an equity risk premium of 5%.
* Atlas Copco has chosen to present the company’s alternative performance measures in accordance with the guidance by the European Securities and Markets Authority (ESMA) in a separate appendix. The appendix is published on www.atlascopcogroup.com/en/investor-relations/key-figures/financial-definitions
Atlas Copco 2021 127
FINANCIAL DEFINITIONS
OTHER INFORMATIONSignatures of the Board of Directors
Audit Report
• Financial definitions
Sustainability notes
Three years in summary
Contacts

VERY HIGH
Importance to Atlas Copco s
stakeholders
MEDIUM
MEDIUM Atlas Copco’s economic, social and environmental impact VERY HIGH
1
23
4
5
6
716
1415
17
18
19
20
8
13
11 22
12
10 9
21
INTRO
DU
CTION
THIS IS A
TLAS CO
PCOTH
E YEA
R IN REV
IEWFIN
AN
CIALS
OTH
ER INFO
RMA
TION
Sustainability notesAtlas Copco’s mission is to achieve sustainable, profitable growth. The sustainability report is an integrated part of the Group’s annual report. The sustainability notes on the following pages include complementary information about the materiality analysis, stakeholder dialogue, governance, results and reporting principles.
Stakeholder engagementAtlas Copco’s sustainability report aims to provide stakeholders with relevant information about the Group’s economic, environmental and social impact. In defining the report content, Atlas Copco applies Global Reporting Initiative’s (GRI) reporting principles on stakeholder inclusiveness, sustainability context, materiality and completeness.
Atlas Copco’s Business Code of Practice defines the Group’s five key stakeholders – those who can be significantly affected by Atlas Copco’s operations and who similarly affect Atlas Copco. Internal stakeholders include functions such as research and development, logis-tics, human resources and purchasing. For external stakeholders’ input, Atlas Copco directly and indirectly engages with international NGOs, unions, key investors, civil society and business advocacy groups, customers and business partners. This stakeholder-driven approach takes inspiration from GRI’s guidance for materiality.
Materiality analysisA materiality analysis is conducted regularly, involving internal and external stakeholders through surveys and interviews. A survey asking stakeholders to prioritize a set of pre- defined issues is posted on the intranet and spread externally in order to capture a broad array of stakeholder views. In-depth interviews with stakeholder groups such as custom-ers, employees, investors, NGOs, peers and board members complement the survey. The result is discussed in internal workshops with employees representing functions such as marketing, purchasing, engineering, HR and logistics and the specialist safety, health, environment and quality function and is reviewed by Group Management.
Atlas Copco uses the stakeholder input together with UN Global Compact’s ten princi-ples, mapping of the business’ impact on the UN Sustainable Development Goals, and risk and opportunity assessments to define the Group’s significant environmental, economic and social impact. The analysis is used in the review of the Group’s focus areas for sustain-ability. It also serves as input to the formulation of the sustainability KPIs and targets, as presented on page 6, that measure Atlas Copco’s progress.
Materiality analysis 2021 In 2021, Atlas Copco conducted a renewed materiality analysis with the objective to gain the perspectives of external and internal stakeholders and to identify risks and opportuni-ties relating to sustainability.
Among the conclusions from the analysis, compared to the one in 2018, are that stake-holders place increased focus on issues such as diversity and inclusion, and talent develop-ment and retention. Gender balance in leadership positions within the Group also gained attention. Issues relating to climate change, such as circular business models, life-cycle approach to product development, and carbon impact, were also prioritized higher by stakeholders compared with the previous years’ analyses. Among the topics identified as less material were water use, community engagement and tax policy.
The findings are presented in the materiality matrix to the right and has formed the basis for defining the Group’s focus areas for sustainability as well as the corresponding updated KPIs and targets which apply from 2022 onwards. Read more on page 7.
1 Business integrity 2 Human rights 3 Labor rights 4 Responsible value chain 5 Responsible tax policy 6 Diversity and inclusion 7 Occupational health, safety
and well-being 8 Community engagement 9 Talent development and
retention 10 Gender balance in leadership
positions 11 Gender pay equality 12 Data protection and privacy 13 Multi-stakeholder collaboration 14 Product quality and service 15 Life-cycle approach to product
development 16 Product carbon impact 17 Climate impact along the
value chain 18 water use 19 Circular business models 20 Material traceability and
sourcing 21 Energy use and efficiency 22 Natural environments and
ecosystems
Value creatorsThese are topics that are central to long-term value creation and working with them should help position Atlas Copco as a leader within sustainability. Our ambition level is expressed through our targets and KPIs.
Trust buildersworking with these topics help build trust in Atlas Copco’s business. Our ambition is to deliver transparency and to keep pace with stakeholder expectations.
Strategic enablersThese are topics that play a central role to delivering on Atlas Copco’s business strategy. working with them should build and ensure business resilience.
Topics– Business ethics and integrity– Occupational health, safety & well-being– Product quality and service– Life-cycle approach to product
development– Product carbon impact
Topics– Energy use and efficiency– Human rights– Responsible value chain– Data protection and privacy– Climate impact along the value chain
Topics– Diversity and inclusion– Talent development and retention– Gender balance in leadership positions– Circular business models
Materiality analysis 2021
Atlas Copco 2021 128
SUSTAINABILITY NOTES
OTHER INFORMATIONSignatures of the Board of Directors
Audit Report
Financial definitions
• Sustainability notes
Three years in summary
Contacts

INTRO
DU
CTION
THIS IS A
TLAS CO
PCOTH
E YEA
R IN REV
IEWFIN
AN
CIALS
OTH
ER INFO
RMA
TION
Business partners Our own operations Customers
IMPACT
Atlas Copco has a large supplier base and purchased compo-nents account for about 75% of the product cost. The choice of suppliers is therefore of great importance for the Group’s impact from a social and environmental perspective. The col-laboration with business partners and the supplier require-ments aim to protect Atlas Copco from risks and promote better standards in society.
Atlas Copco’s operations is global with employees and manufac-turing in a large number of countries. In some of these, there is a high risk of human rights violations, corruption, and non-compli-ance with laws and Atlas Copco’s policies. The impact of our own operations relates mainly to the manufacturing and transport of products, and employees’ working conditions, including their health and safety.
Atlas Copco’s customers demand innovative, high-quality products that are resource and energy efficient, safe and ergonomic. The main part of the products’ climate impact occurs when they are being used.
RISKS
– Business partners who do not live up to human rights standards, such as decent working conditions and the freedom of association
– Business partners who do not live up to the principles of ethical business, for example regarding corruption
– Purchased components that are not produced in a sustainable way, e.g. the presence of conflict minerals, or components with a large carbon footprint
– Climate- or environmental-related events causing disruptions in the supply or distribution chain
– Insufficient standards regarding safety and health– Lack of access to skilled and competent employees – Violations of human rights, such as discrimination and
restrictions on freedom of association– Unethical behavior or corruption– Environmental impact from waste and emissions– Manufacturing and transport of products lead to greenhouse
gas emissions– Climate- or environmental-related events causing disruptions
in operations or manufacturing
– Customers impact on the environment, the climate, human rights or other social aspects
– Risks of sanctions– Risks of corruption
ACTIVITIES
– Risk-based assessment of business partners, including quality and social/environmental responsibility aspects
– Requirement that significant direct suppliers must have an approved environmental management system
– Requirement that significant business partners must sign and follow the Business Code of Practice
– Action plans developed together with the supplier to deal with any shortcomings and deviations
– Employee training in the Business Code of Practice, and a system for reporting violations
– Safety, health and environmental training for business partners
– Global network of sub-suppliers reducing the dependence on individual suppliers
– Promoting international standards, such as UN Global Compact
– Technology development in collaboration with business partners
– Adopting Science-Based Targets for the reduction of greenhouse-gas emissions (scope 3), including plans by each business area for how to contribute to the targets.
– Regular assessment of sustainability risks, including climate- related risks
– Targeted recruiting and competence development– Certification of major operating units according to ISO 9001,
ISO 14001 and ISO 45001– Training for all employees in the Business Code of Practice,
and a system for reporting violations– Follow-up and control through internal audits– Safety and health training– Increased use of renewal energy and efforts to decrease
energy consumption– Efforts to decrease waste volumes and to increase the share
of reused and recycled waste– Efforts to reduce water consumption– Reduced use of air freight in favor of more environmentally
friendly transport– Applying international standards and guidelines, such as
the UN Global Compact – Adopting Science-Based Targets for the reduction of green-
house-gas emissions (scope 1 and 2), including plans by each business area for how to contribute to the targets.
– Continuous development of products with improved ergonomics, safety, energy effi-ciency and reduced emissions
– Employee training in the Business Code of Practice, and a system for reporting violations
– Evaluation of customers’ sustainability work and dialogue with customers in complex markets
– Collaborations with customers to develop efficient, safe and environmentally friendly solutions
– Adopting Science-Based Targets for the reduction of greenhouse-gas emissions (scope 3), including plans by each business area for how to contribute to the targets.
Sustainability impact and risks in the value chain
Understanding our sustainability impact and risks throughout the value chain helps us choose the right actions to handle them. The table below shows where our impact takes place, the corresponding risks and examples of how we work to minimize them. Read more about our climate-related risks and how we handle them on page 133.
Atlas Copco 2021 129
SUSTAINABILITY NOTES
OTHER INFORMATIONSignatures of the Board of Directors
Audit Report
Financial definitions
• Sustainability notes
Three years in summary
Contacts
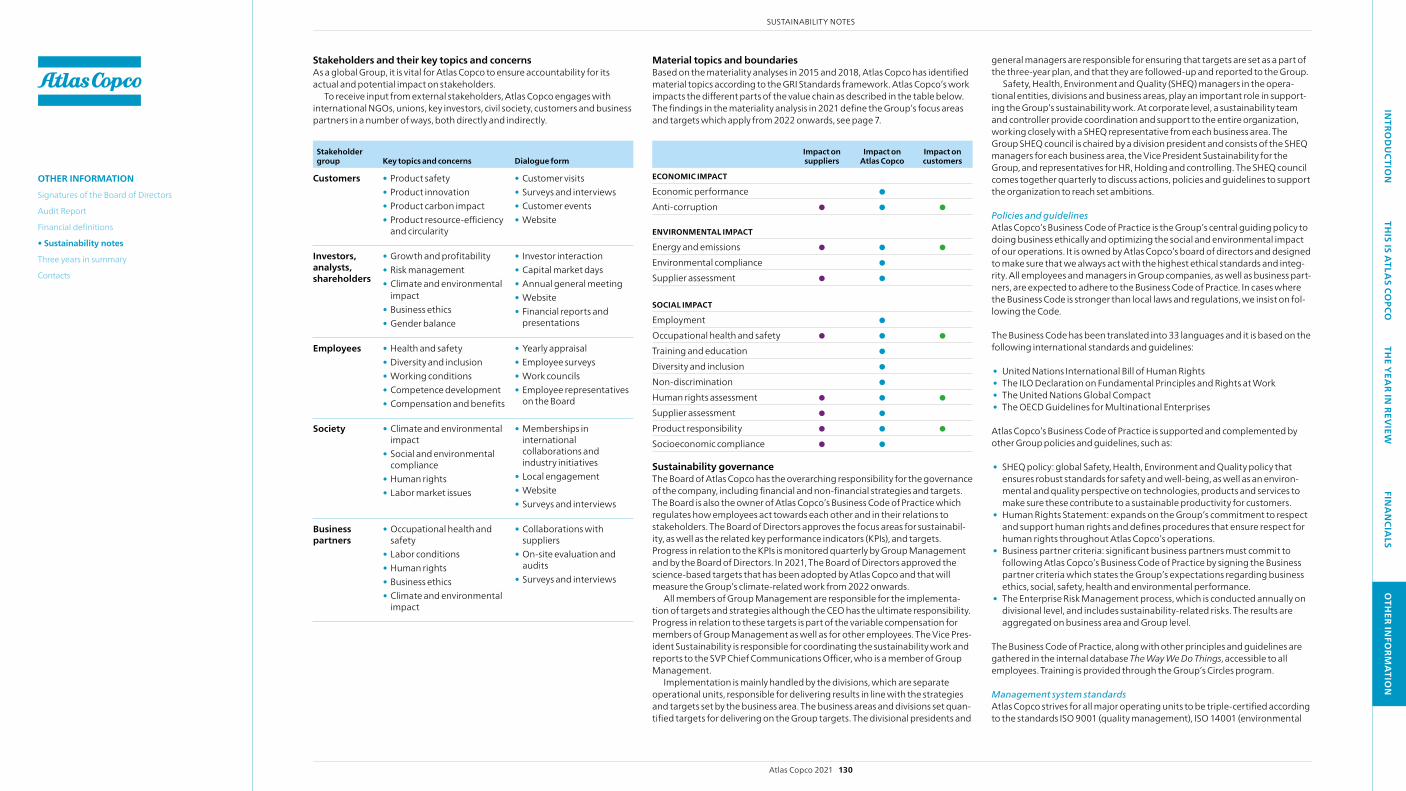
INTRO
DU
CTION
THIS IS A
TLAS CO
PCOTH
E YEA
R IN REV
IEWFIN
AN
CIALS
OTH
ER INFO
RMA
TION
Stakeholders and their key topics and concerns As a global Group, it is vital for Atlas Copco to ensure accountability for its actual and potential impact on stakeholders.
To receive input from external stakeholders, Atlas Copco engages with international NGOs, unions, key investors, civil society, customers and business partners in a number of ways, both directly and indirectly.
Stakeholder group Key topics and concerns Dialogue form
Customers • Product safety• Product innovation• Product carbon impact• Product resource-efficiency
and circularity
• Customer visits • Surveys and interviews• Customer events• website
Investors, analysts, shareholders
• Growth and profitability• Risk management• Climate and environmental
impact • Business ethics• Gender balance
• Investor interaction• Capital market days• Annual general meeting• website• Financial reports and
presentations
Employees • Health and safety• Diversity and inclusion• working conditions• Competence development• Compensation and benefits
• Yearly appraisal • Employee surveys • work councils• Employee representatives
on the Board
Society • Climate and environmental impact
• Social and environmental compliance
• Human rights• Labor market issues
• Memberships in international collaborations and industry initiatives
• Local engagement• website• Surveys and interviews
Business partners
• Occupational health and safety
• Labor conditions• Human rights• Business ethics• Climate and environmental
impact
• Collaborations with suppliers
• On-site evaluation and audits
• Surveys and interviews
Material topics and boundariesBased on the materiality analyses in 2015 and 2018, Atlas Copco has identified material topics according to the GRI Standards framework. Atlas Copco’s work impacts the different parts of the value chain as described in the table below. The findings in the materiality analysis in 2021 define the Group’s focus areas and targets which apply from 2022 onwards, see page 7.
Impact on suppliers
Impact on Atlas Copco
Impact on customers
ECONOMIC IMPACT Economic performance Anti-corruption
ENVIRONMENTAL IMPACT
Energy and emissionsEnvironmental complianceSupplier assessment
SOCIAL IMPACT
EmploymentOccupational health and safetyTraining and educationDiversity and inclusionNon-discriminationHuman rights assessmentSupplier assessmentProduct responsibilitySocioeconomic compliance
Sustainability governanceThe Board of Atlas Copco has the overarching responsibility for the governance of the company, including financial and non-financial strategies and targets. The Board is also the owner of Atlas Copco’s Business Code of Practice which regulates how employees act towards each other and in their relations to stakeholders. The Board of Directors approves the focus areas for sustainabil-ity, as well as the related key performance indicators (KPIs), and targets. Progress in relation to the KPIs is monitored quarterly by Group Management and by the Board of Directors. In 2021, The Board of Directors approved the science-based targets that has been adopted by Atlas Copco and that will measure the Group’s climate-related work from 2022 onwards.
All members of Group Management are responsible for the implementa-tion of targets and strategies although the CEO has the ultimate responsibility. Progress in relation to these targets is part of the variable compensation for members of Group Management as well as for other employees. The Vice Pres-ident Sustainability is responsible for coordinating the sustainability work and reports to the SVP Chief Communications Officer, who is a member of Group Management.
Implementation is mainly handled by the divisions, which are separate operational units, responsible for delivering results in line with the strategies and targets set by the business area. The business areas and divisions set quan-tified targets for delivering on the Group targets. The divisional presidents and
general managers are responsible for ensuring that targets are set as a part of the three-year plan, and that they are followed-up and reported to the Group.
Safety, Health, Environment and quality (SHEq) managers in the opera-tional entities, divisions and business areas, play an important role in support-ing the Group’s sustainability work. At corporate level, a sustainability team and controller provide coordination and support to the entire organization, working closely with a SHEq representative from each business area. The Group SHEq council is chaired by a division president and consists of the SHEq managers for each business area, the Vice President Sustainability for the Group, and representatives for HR, Holding and controlling. The SHEq council comes together quarterly to discuss actions, policies and guidelines to support the organization to reach set ambitions.
Policies and guidelinesAtlas Copco’s Business Code of Practice is the Group’s central guiding policy to doing business ethically and optimizing the social and environmental impact of our operations. It is owned by Atlas Copco’s board of directors and designed to make sure that we always act with the highest ethical standards and integ-rity. All employees and managers in Group companies, as well as business part-ners, are expected to adhere to the Business Code of Practice. In cases where the Business Code is stronger than local laws and regulations, we insist on fol-lowing the Code.
The Business Code has been translated into 33 languages and it is based on the following international standards and guidelines:
• United Nations International Bill of Human Rights• The ILO Declaration on Fundamental Principles and Rights at work• The United Nations Global Compact• The OECD Guidelines for Multinational Enterprises
Atlas Copco’s Business Code of Practice is supported and complemented by other Group policies and guidelines, such as:
• SHEq policy: global Safety, Health, Environment and quality policy that ensures robust standards for safety and well-being, as well as an environ-mental and quality perspective on technologies, products and services to make sure these contribute to a sustainable productivity for customers.
• Human Rights Statement: expands on the Group’s commitment to respect and support human rights and defines procedures that ensure respect for human rights throughout Atlas Copco’s operations.
• Business partner criteria: significant business partners must commit to following Atlas Copco’s Business Code of Practice by signing the Business partner criteria which states the Group’s expectations regarding business ethics, social, safety, health and environmental performance.
• The Enterprise Risk Management process, which is conducted annually on divisional level, and includes sustainability-related risks. The results are aggregated on business area and Group level.
The Business Code of Practice, along with other principles and guidelines are gathered in the internal database The Way We Do Things, accessible to all employees. Training is provided through the Group’s Circles program.
Management system standardsAtlas Copco strives for all major operating units to be triple-certified according to the standards ISO 9001 (quality management), ISO 14001 (environmental
Atlas Copco 2021 130
SUSTAINABILITY NOTES
OTHER INFORMATIONSignatures of the Board of Directors
Audit Report
Financial definitions
• Sustainability notes
Three years in summary
Contacts
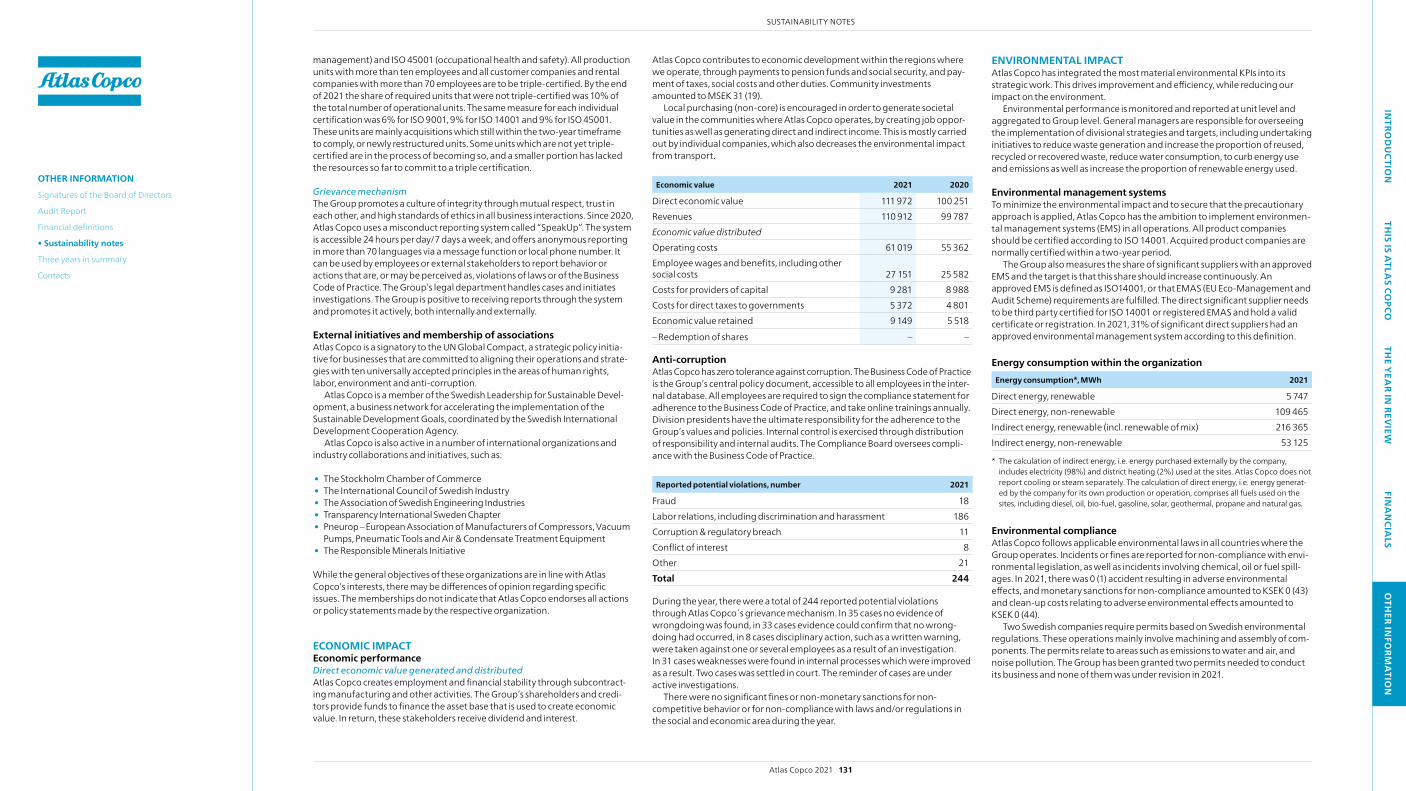
INTRO
DU
CTION
THIS IS A
TLAS CO
PCOTH
E YEA
R IN REV
IEWFIN
AN
CIALS
OTH
ER INFO
RMA
TION
management) and ISO 45001 (occupational health and safety). All production units with more than ten employees and all customer companies and rental companies with more than 70 employees are to be triple-certified. By the end of 2021 the share of required units that were not triple-certified was 10% of the total number of operational units. The same measure for each individual certification was 6% for ISO 9001, 9% for ISO 14001 and 9% for ISO 45001. These units are mainly acquisitions which still within the two-year timeframe to comply, or newly restructured units. Some units which are not yet triple- certified are in the process of becoming so, and a smaller portion has lacked the resources so far to commit to a triple certification.
Grievance mechanismThe Group promotes a culture of integrity through mutual respect, trust in each other, and high standards of ethics in all business interactions. Since 2020, Atlas Copco uses a misconduct reporting system called “SpeakUp”. The system is accessible 24 hours per day/7 days a week, and offers anonymous reporting in more than 70 languages via a message function or local phone number. It can be used by employees or external stakeholders to report behavior or actions that are, or may be perceived as, violations of laws or of the Business Code of Practice. The Group’s legal department handles cases and initiates investigations. The Group is positive to receiving reports through the system and promotes it actively, both internally and externally.
External initiatives and membership of associationsAtlas Copco is a signatory to the UN Global Compact, a strategic policy initia-tive for businesses that are committed to aligning their operations and strate-gies with ten universally accepted principles in the areas of human rights, labor, environment and anti-corruption.
Atlas Copco is a member of the Swedish Leadership for Sustainable Devel-opment, a business network for accelerating the implementation of the Sustainable Development Goals, coordinated by the Swedish International Development Cooperation Agency.
Atlas Copco is also active in a number of international organizations and industry collaborations and initiatives, such as:
• The Stockholm Chamber of Commerce• The International Council of Swedish Industry • The Association of Swedish Engineering Industries• Transparency International Sweden Chapter• Pneurop – European Association of Manufacturers of Compressors, Vacuum
Pumps, Pneumatic Tools and Air & Condensate Treatment Equipment• The Responsible Minerals Initiative
while the general objectives of these organizations are in line with Atlas Copco’s interests, there may be differences of opinion regarding specific issues. The memberships do not indicate that Atlas Copco endorses all actions or policy statements made by the respective organization.
ECONOMIC IMPACT Economic performanceDirect economic value generated and distributed Atlas Copco creates employment and financial stability through subcontract-ing manufacturing and other activities. The Group’s shareholders and credi-tors provide funds to finance the asset base that is used to create economic value. In return, these stakeholders receive dividend and interest.
Atlas Copco contributes to economic development within the regions where we operate, through payments to pension funds and social security, and pay-ment of taxes, social costs and other duties. Community investments amounted to MSEK 31 (19).
Local purchasing (non-core) is encouraged in order to generate societal value in the communities where Atlas Copco operates, by creating job oppor-tunities as well as generating direct and indirect income. This is mostly carried out by individual companies, which also decreases the environmental impact from transport.
Economic value 2021 2020
Direct economic value 111 972 100 251 Revenues 110 912 99 787 Economic value distributed Operating costs 61 019 55 362 Employee wages and benefits, including other social costs 27 151 25 582 Costs for providers of capital 9 281 8 988 Costs for direct taxes to governments 5 372 4 801 Economic value retained 9 149 5 518 – Redemption of shares – –
Anti-corruptionAtlas Copco has zero tolerance against corruption. The Business Code of Practice is the Group’s central policy document, accessible to all employees in the inter-nal database. All employees are required to sign the compliance statement for adherence to the Business Code of Practice, and take online trainings annually. Division presidents have the ultimate responsibility for the adherence to the Group’s values and policies. Internal control is exercised through distribution of responsibility and internal audits. The Compliance Board oversees compli-ance with the Business Code of Practice.
Reported potential violations, number 2021
Fraud 18Labor relations, including discrimination and harassment 186Corruption & regulatory breach 11Conflict of interest 8Other 21Total 244
During the year, there were a total of 244 reported potential violations through Atlas Copco s grievance mechanism. In 35 cases no evidence of wrongdoing was found, in 33 cases evidence could confirm that no wrong-doing had occurred, in 8 cases disciplinary action, such as a written warning, were taken against one or several employees as a result of an investigation. In 31 cases weaknesses were found in internal processes which were improved as a result. Two cases was settled in court. The reminder of cases are under active investigations.
There were no significant fines or non-monetary sanctions for non- competitive behavior or for non-compliance with laws and/or regulations in the social and economic area during the year.
ENVIRONMENTAL IMPACT Atlas Copco has integrated the most material environmental KPIs into its strategic work. This drives improvement and efficiency, while reducing our impact on the environment.
Environmental performance is monitored and reported at unit level and aggregated to Group level. General managers are responsible for overseeing the implementation of divisional strategies and targets, including undertaking initiatives to reduce waste generation and increase the proportion of reused, recycled or recovered waste, reduce water consumption, to curb energy use and emissions as well as increase the proportion of renewable energy used.
Environmental management systemsTo minimize the environmental impact and to secure that the precautionary approach is applied, Atlas Copco has the ambition to implement environmen-tal management systems (EMS) in all operations. All product companies should be certified according to ISO 14001. Acquired product companies are normally certified within a two-year period.
The Group also measures the share of significant suppliers with an approved EMS and the target is that this share should increase continuously. An approved EMS is defined as ISO14001, or that EMAS (EU Eco-Management and Audit Scheme) requirements are fulfilled. The direct significant supplier needs to be third party certified for ISO 14001 or registered EMAS and hold a valid certificate or registration. In 2021, 31% of significant direct suppliers had an approved environmental management system according to this definition.
Energy consumption within the organization Energy consumption*, MWh 2021
Direct energy, renewable 5 747Direct energy, non-renewable 109 465Indirect energy, renewable (incl. renewable of mix) 216 365Indirect energy, non-renewable 53 125
* The calculation of indirect energy, i.e. energy purchased externally by the company, includes electricity (98%) and district heating (2%) used at the sites. Atlas Copco does not report cooling or steam separately. The calculation of direct energy, i.e. energy generat-ed by the company for its own production or operation, comprises all fuels used on the sites, including diesel, oil, bio-fuel, gasoline, solar, geothermal, propane and natural gas.
Environmental complianceAtlas Copco follows applicable environmental laws in all countries where the Group operates. Incidents or fines are reported for non-compliance with envi-ronmental legislation, as well as incidents involving chemical, oil or fuel spill-ages. In 2021, there was 0 (1) accident resulting in adverse environmental effects, and monetary sanctions for non-compliance amounted to KSEK 0 (43) and clean-up costs relating to adverse environmental effects amounted to KSEK 0 (44).
Two Swedish companies require permits based on Swedish environmental regulations. These operations mainly involve machining and assembly of com-ponents. The permits relate to areas such as emissions to water and air, and noise pollution. The Group has been granted two permits needed to conduct its business and none of them was under revision in 2021.
Atlas Copco 2021 131
SUSTAINABILITY NOTES
OTHER INFORMATIONSignatures of the Board of Directors
Audit Report
Financial definitions
• Sustainability notes
Three years in summary
Contacts

INTRO
DU
CTION
THIS IS A
TLAS CO
PCOTH
E YEA
R IN REV
IEWFIN
AN
CIALS
OTH
ER INFO
RMA
TION
EU TAXONOMY – classification of sustainable activities
Total (MSEK)Taxonomy
eligible (%)Taxonomy
non-eligible (%)
Revenues 110 912 22 78Capital expenditures 6 486 6 94Operating expenses 4 135 19 81
Background Based on the now available EU taxonomy delegated act for climate change mitigation and climate change adaptation, the Atlas Copco is eligible for climate change mitigation under the ‘3.6 Manufacture of other low-car-bon technologies’ section. Atlas Copco is an enabler and also considers sales to the following customer segments as eligible: ‘3.1 Manufacture of renewable energies’, ‘3.2 Manufacture of equipment for production and use of hydrogen’, ‘3.3 Manufacture of low carbon technologies for trans-port’, and ‘3.4 Manufacture of batteries’. In total, 22% of Atlas Copco’s reve-nues are eligible (17% from product segments and 5% from customer seg-ments). At this stage, Atlas Copco has not identified any activities relevant for climate change adaptation.
3.6 Manufacture of other low-carbon technologies“Manufacture of technologies aimed at substantial greenhouse gas emission reductions in other sectors of the economy.”
Product segment revenuesAtlas Copco uses the following definition for identification of 3.6 taxonomy eligible technologies for climate change mitigation: “Technologies which enable substantial energy savings and/or other means to avoid, reduce, remove, or store greenhouse-gas emissions compared to alternative tech-nologies commonly used on the market.”
The term “substantial” lacks a measurable and quantifiable definition in the taxonomy. Atlas Copco has therefore evaluated a technology’s capa-bilities in relation to its market context. This means that the quantified threshold for “substantial emissions reductions” varies between different product portfolios and/or different parts of the organization.
Atlas Copco considers technologies taxonomy eligible for climate change mitigation if they: • Prevent the venting of environmentally hazardous gases directly into
the atmosphere, (avoid principle), or• Enable substantial energy savings compared to available technologies
commonly used on the market by either (reduce principle): – Use optimization – The nature of the product / In and of itself (e.g. variable instead of
fixed speed) – Introduce completely new solutions on the market – Enable the shift to electric/battery power
The taxonomy eligible revenues include both product and service reve-nues. It excludes sales to oil and gas extraction industries. Sales relevant for both product and customer segment revenues have only been included under the former to avoid double reporting.
Eligible technologies From the Compressor Technique business area, all variable speed drive (VSD) compressors are included as taxonomy eligible for climate change mitigation due to their significant energy saving capabilities compared to fixed speed compressors. Additional technologies included are the latest gas generation technology which enables on-site nitrogen and oxygen generation (normally delivered by truck in liquid form), as well as the latest ranges of blowers, boosters, and rotary drum dryers all of which offer sig-nificant energy savings compared to market standards.
From the Vacuum Technique business area, two main product groups are included as taxonomy eligible for climate change mitigation: abate-ment systems and the latest generation of dry pumps. The latest genera-tion of dry pumps offers significant energy savings compared to previous designs and abatement systems are an exhaust management solution that destroys toxic and global warming gases which negatively impact the environment.
From the Industrial Technique business area the following products are included as taxonomy eligible for climate change mitigation: the latest range of electric power tools, which aid the shift from air to electric power while offering significant energy savings. Also included are technologies which through node optimization reduce the number of controller units needed in a production line, thereby reducing the energy consumed. Lastly, the latest versions of the Industrial Technique business area’s bat-tery driven products are included, as they offer significant energy savings.
From the Power Technique business area, three main product groups are included as taxonomy eligible for climate change mitigation: all elec-tric portable compressors, the business area’s battery solution products, and the Stage V range of portable compressors (Stage T4F in the U.S.A.). The latter is a diesel-driven portable compressor range meeting the latest EU market standard while offering additional energy savings compared to the standard’s requirements. Stage V portable compressors are often used at construction sites where it is not possible to rely on electric machinery until the necessary infrastructure is in place. On such occa-sions, the Stage V range is a very good option from an energy consump-tion perspective, making it relevant for taxonomy eligibility as a transi-tional economic activity.
Customer segment revenuesAtlas Copco considers customer segment revenues taxonomy eligible for climate change mitigation if the products and solutions aid manufacturing processes of taxonomy eligible customers’ end-product. Atlas Copco is an enabler of manufacturing processes rather than a supplier of components. As such, our products and services enable others to make substantial con-tributions to the climate change mitigation objective. The relevant taxon-omy sections for the customer segment reporting are 3.1, 3.2, 3.3 and 3.4. The taxonomy eligible revenues include both product and service reve-nues.
Atlas Copco bases its reporting on the North American code standard NAICS which means that Atlas Copco have translated the taxonomy men-tioned NACE codes into their closest NAICS equivalent.
All external revenues to eligible customer segments in scope have been included. This includes customers within renewable energy technologies (e.g. solar energy, hydropower, or wind and tide energy), production of electrical cars, battery manufacturing, and lastly, hydrogen manufacturing
equipment. Sales to distributors or to companies that rent out equipment has been excluded.
Capital expenditure and operating expenditureThe taxonomy eligible capital expenditure (CapEx) and operating expen-diture (OpEx) that have been identified include capitalized expenditures for; relevant R&D projects of eligible technologies, solar panels and other energy-efficiency measures in buildings, vehicle fleet electrification and energy efficient hire fleet technologies.
The CapEx denominator used for the taxonomy KPI calculation consists of additions to tangible and intangible assets (including right of use assets) during the financial year, considered before depreciation, amortization, and any re-measurements, including those resulting from revaluations and impairments, and excluding fair value changes. The denominator also includes additions to tangible and intangible assets resulting from busi-ness combinations.
The OpEx denominator used for the taxonomy KPI calculation consists only of taxonomy related OpEx defined as; non-capitalized costs that relate to research and development, building renovation measures, main-tenance and repair, and any other direct expenditures relating to the day-to-day servicing of assets of property, plant, and equipment by the under-taking or third party to whom activities are outsourced that are necessary to ensure the continued and effective functioning of such assets.
Concluding commentAtlas Copco has chosen a conservative approach as to which products and technologies to include as eligible under taxonomy section 3.6. Atlas Copco considers revenues that originate from enabling key manufacturing processes of customers in sections 3.1, 3.2, 3.3, and 3.4 as eligible. As reporting practice and guidelines develop, and as the taxonomy scope evolves, Atlas Copco may reevaluate the current approach.
Atlas Copco 2021 132
SUSTAINABILITY NOTES
OTHER INFORMATIONSignatures of the Board of Directors
Audit Report
Financial definitions
• Sustainability notes
Three years in summary
Contacts

INTRO
DU
CTION
THIS IS A
TLAS CO
PCOTH
E YEA
R IN REV
IEWFIN
AN
CIALS
OTH
ER INFO
RMA
TION
SOCIAL IMPACT EmploymentInformation on employees and other workers Atlas Copco is a significant employer on the global market. The Group reports the number of employees as full time equivalents (FTE) per geographical spread and per professional category, as well as divided between white-collar and blue-collar employees.
New employee hires and employee turnoverThe total number and rate of external new employee hires in 2021 was 6 524 (3 352) which constitutes 15.8% (8.5) of the total average number of employ-ees during the year. The percentage of externally recruited females was 27% (26). The total number of resignations was 2 833 (1 727), which constitutes 6.9% (4.4) of the total average number of employees during the year. The mobility in 2021 was largely in line with the level during 2019, before the pan-demic.
The Group’s KPIs for employee satisfaction and engagement measure how employees perceive the opportunities to grow in the company and how they perceive the company culture. The targets for both KPIs are to be above the employee engagement survey provider’s proprietary benchmark for global companies. The benchmark is based on anonymized data from the survey provider’s customer base with tens of millions of respondents in more than 150 countries, as well as input from industry panel studies to produce robust and unbiased normative data.
Freedom of association and collective bargainingAtlas Copco views trade unions and employee representatives as a valuable support for its employees, and fosters relationships based on mutual respect and constructive dialogue. Labor practices and employee rights, such as col-lective bargaining, are included in the Business Code of Practice. In 2021, 32% (32) of all employees were covered by collective bargaining agreements.
As a decentralized organization, the engagement and dialogue with labor unions takes place at a local level. In countries where no independent labor unions exist, Atlas Copco has taken measures to establish forums for employer/employee relations, through environment and safety committees.
Labor relations are followed-up regularly on the operational level and reviewed by internal audit. The compliance of significant suppliers to Atlas Copco’s Business Code of Practice, which is based on international guidelines and frameworks such as the UN Global Compact and the International Labour Organization Declaration on Fundamental Principles and Rights at work, is audited regularly.
Occupational health and safetySafety and well-being are key priorities for Atlas Copco due to the importance of a sound working environment to employees’ health and motivation, as well as to the Group’s productivity and competitiveness. The global Safety, Health and Environmental policy ensures that there are robust standards for safety and well-being in the workplace.
All divisions set targets and make action plans to enhance awareness and improve behavior, policies and processes with the purpose of offering a safe and healthy work environment and to identify and address risks. Group com-panies must have an Atlas Copco verified Safety Health Environment and quality management system, which is documented, implemented and main-tained on an ongoing basis. Customer companies and rental companies with more than 70 employees and all product companies shall be certified accord-ing to ISO 45001. This involves regular risk assessments and follow-up on con-ditions and safety-related processes of both our own workplaces and those
CLIMATE-RELATED INFORMATION There are a growing number of voluntary reporting standards, initiatives and regulations concerning climate, such as the Taskforce for Climate-related Financial Disclosures (TCFD). Atlas Copco follows the development closely, takes inspiration from the guidelines and seeks to address major areas of infor-mation sought.
Our reporting on climate-related risks and opportunities is a continuous improvement project and the efforts to under-stand, report and act upon climate topics is developing at a good pace.
GovernanceThe Board of Directors is responsible for Atlas Copco’s overall strategy, organization, administration and management. This includes climate-related risks and opportunities. The Board of Directors have approved the science-based targets that were adopted by Atlas Copco in 2021 and that will measure the Group’s climate-related work from 2022 onwards. Climate- related issues concern several functions and areas of expertise in the organization. At an operational level, risks and opportu-nities are governed by Group Management and the divisional presidents. Read more about corporate governance on pages 54–57.
StrategyAtlas Copco assesses climate-related risks and opportunities that have an actual and potential impact on our business and strategy. The process for identification of risks and opportuni-ties is centered at the divisions. The Group has identified and assessed the following market, regulatory and physical risks related to climate change:
• Market risks: Market shifts toward a low-carbon economy may impact the viability of certain sectors and products. Atlas Copco’s continuous work to increase the energy effi-ciency of our products helps mitigate these risks. This shift also represents an opportunity to continue developing highly energy-efficient products and may give rise to new businesses and business models. For instance, increased generation of renewable energy, such as solar panels and wind mills, and the surge in production of electrical vehicles, present both existing and future opportunities to provide products and services to these industries.
• Regulatory risks: Climate and energy policy will gradually be sharpened and favor companies that deliver energy- efficient products and comply with sustainable practices. Among the risks are increased energy prices and taxes, and regulations related to CO2 or other greenhouse-gas emis-sions. As the Group invests in innovative products via research and development, more strict regulations will likely offer opportunities for Atlas Copco.
• Physical risks: Changing weather patterns may pose a physical risk to operational units or suppliers in areas in risk of rising sea levels, water scarcity or violent storms that could result in disruptions in the production or logistics chain. The physical risk is assessed at site level and safety measures are taken if needed, as part of the loss prevention program. Atlas Copco has a global network of suppliers, which provides resilience to local or regional disruptions.
Risk managementClimate-related risks, such as physical risks for operational entities or market risks connected to products, are assessed at the divisional level and are, if deemed relevant, included in the annual Enterprise Risk Management process. An aggregated analysis of the identified risks is presented annually to Group Management. Read more about the risk management process on page 47.
Metrics and targetsFor the period 2019–2021, Atlas Copco set targets for reduc-ing the carbon emissions from our new and re-designed prod-ucts, own operations, as well as from inbound and outbound transport of goods. From 2022, Atlas Copco will implement science-based targets covering the entire value-chain. Atlas Copco’s greenhouse gas emission reduction targets are approved by the Science-based Target initiative as being aligned with the Paris Agreement.
Read more about the targets and the progress made on pages 35–36, 44, 131 and 141.
Atlas Copco 2021 133
SUSTAINABILITY NOTES
OTHER INFORMATIONSignatures of the Board of Directors
Audit Report
Financial definitions
• Sustainability notes
Three years in summary
Contacts
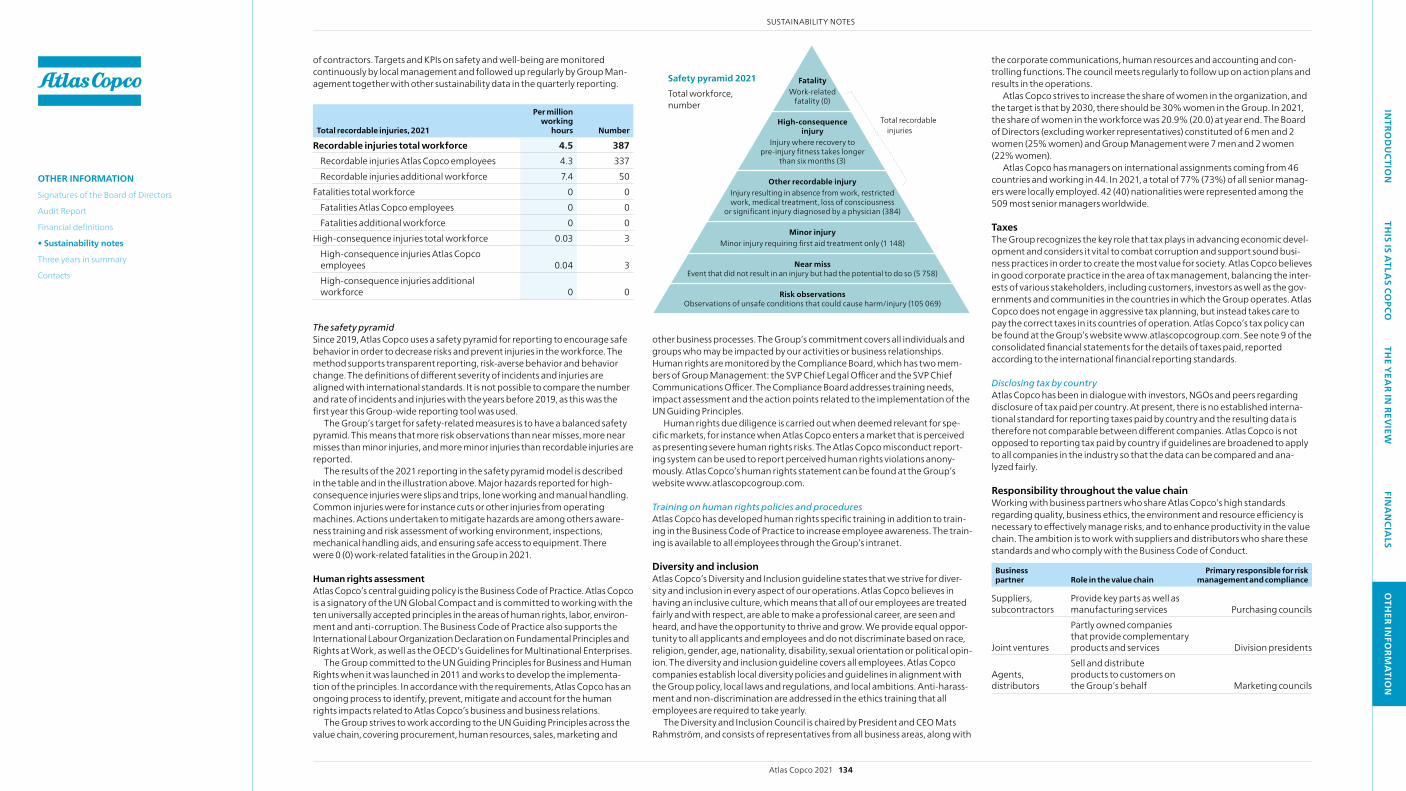
INTRO
DU
CTION
THIS IS A
TLAS CO
PCOTH
E YEA
R IN REV
IEWFIN
AN
CIALS
OTH
ER INFO
RMA
TION
of contractors. Targets and KPIs on safety and well-being are monitored continuously by local management and followed up regularly by Group Man-agement together with other sustainability data in the quarterly reporting.
Total recordable injuries, 2021
Per million working
hours Number
Recordable injuries total workforce 4.5 387Recordable injuries Atlas Copco employees 4.3 337Recordable injuries additional workforce 7.4 50
Fatalities total workforce 0 0Fatalities Atlas Copco employees 0 0Fatalities additional workforce 0 0
High-consequence injuries total workforce 0.03 3High-consequence injuries Atlas Copco employees 0.04 3High-consequence injuries additional workforce 0 0
The safety pyramidSince 2019, Atlas Copco uses a safety pyramid for reporting to encourage safe behavior in order to decrease risks and prevent injuries in the workforce. The method supports transparent reporting, risk-averse behavior and behavior change. The definitions of different severity of incidents and injuries are aligned with international standards. It is not possible to compare the number and rate of incidents and injuries with the years before 2019, as this was the first year this Group-wide reporting tool was used.
The Group’s target for safety-related measures is to have a balanced safety pyramid. This means that more risk observations than near misses, more near misses than minor injuries, and more minor injuries than recordable injuries are reported.
The results of the 2021 reporting in the safety pyramid model is described in the table and in the illustration above. Major hazards reported for high- consequence injuries were slips and trips, lone working and manual handling. Common injuries were for instance cuts or other injuries from operating machines. Actions undertaken to mitigate hazards are among others aware-ness training and risk assessment of working environment, inspections, mechanical handling aids, and ensuring safe access to equipment. There were 0 (0) work-related fatalities in the Group in 2021.
Human rights assessmentAtlas Copco’s central guiding policy is the Business Code of Practice. Atlas Copco is a signatory of the UN Global Compact and is committed to working with the ten universally accepted principles in the areas of human rights, labor, environ-ment and anti-corruption. The Business Code of Practice also supports the International Labour Organization Declaration on Fundamental Principles and Rights at work, as well as the OECD’s Guidelines for Multinational Enterprises.
The Group committed to the UN Guiding Principles for Business and Human Rights when it was launched in 2011 and works to develop the implementa-tion of the principles. In accordance with the requirements, Atlas Copco has an ongoing process to identify, prevent, mitigate and account for the human rights impacts related to Atlas Copco’s business and business relations.
The Group strives to work according to the UN Guiding Principles across the value chain, covering procurement, human resources, sales, marketing and
other business processes. The Group’s commitment covers all individuals and groups who may be impacted by our activities or business relationships. Human rights are monitored by the Compliance Board, which has two mem-bers of Group Management: the SVP Chief Legal Officer and the SVP Chief Communications Officer. The Compliance Board addresses training needs, impact assessment and the action points related to the implementation of the UN Guiding Principles.
Human rights due diligence is carried out when deemed relevant for spe-cific markets, for instance when Atlas Copco enters a market that is perceived as presenting severe human rights risks. The Atlas Copco misconduct report-ing system can be used to report perceived human rights violations anony-mously. Atlas Copco’s human rights statement can be found at the Group’s website www.atlascopcogroup.com.
Training on human rights policies and proceduresAtlas Copco has developed human rights specific training in addition to train-ing in the Business Code of Practice to increase employee awareness. The train-ing is available to all employees through the Group’s intranet.
Diversity and inclusionAtlas Copco’s Diversity and Inclusion guideline states that we strive for diver-sity and inclusion in every aspect of our operations. Atlas Copco believes in having an inclusive culture, which means that all of our employees are treated fairly and with respect, are able to make a professional career, are seen and heard, and have the opportunity to thrive and grow. we provide equal oppor-tunity to all applicants and employees and do not discriminate based on race, religion, gender, age, nationality, disability, sexual orientation or political opin-ion. The diversity and inclusion guideline covers all employees. Atlas Copco companies establish local diversity policies and guidelines in alignment with the Group policy, local laws and regulations, and local ambitions. Anti-harass-ment and non-discrimination are addressed in the ethics training that all employees are required to take yearly.
The Diversity and Inclusion Council is chaired by President and CEO Mats Rahmström, and consists of representatives from all business areas, along with
the corporate communications, human resources and accounting and con-trolling functions. The council meets regularly to follow up on action plans and results in the operations.
Atlas Copco strives to increase the share of women in the organization, and the target is that by 2030, there should be 30% women in the Group. In 2021, the share of women in the workforce was 20.9% (20.0) at year end. The Board of Directors (excluding worker representatives) constituted of 6 men and 2 women (25% women) and Group Management were 7 men and 2 women (22% women).
Atlas Copco has managers on international assignments coming from 46 countries and working in 44. In 2021, a total of 77% (73%) of all senior manag-ers were locally employed. 42 (40) nationalities were represented among the 509 most senior managers worldwide.
TaxesThe Group recognizes the key role that tax plays in advancing economic devel-opment and considers it vital to combat corruption and support sound busi-ness practices in order to create the most value for society. Atlas Copco believes in good corporate practice in the area of tax management, balancing the inter-ests of various stakeholders, including customers, investors as well as the gov-ernments and communities in the countries in which the Group operates. Atlas Copco does not engage in aggressive tax planning, but instead takes care to pay the correct taxes in its countries of operation. Atlas Copco’s tax policy can be found at the Group’s website www.atlascopcogroup.com. See note 9 of the consolidated financial statements for the details of taxes paid, reported according to the international financial reporting standards.
Disclosing tax by countryAtlas Copco has been in dialogue with investors, NGOs and peers regarding disclosure of tax paid per country. At present, there is no established interna-tional standard for reporting taxes paid by country and the resulting data is therefore not comparable between different companies. Atlas Copco is not opposed to reporting tax paid by country if guidelines are broadened to apply to all companies in the industry so that the data can be compared and ana-lyzed fairly.
Responsibility throughout the value chainworking with business partners who share Atlas Copco’s high standards regarding quality, business ethics, the environment and resource efficiency is necessary to effectively manage risks, and to enhance productivity in the value chain. The ambition is to work with suppliers and distributors who share these standards and who comply with the Business Code of Conduct.
Business partner Role in the value chain
Primary responsible for risk management and compliance
Suppliers, subcontractors
Provide key parts as well as manufacturing services Purchasing councils
Joint ventures
Partly owned companies that provide complementary products and services Division presidents
Agents, distributors
Sell and distribute products to customers on the Group’s behalf Marketing councils
Total recordable injuries
Safety pyramid 2021Total workforce, number
Fatality work-related
fatality (0)
High-consequence injury
Injury where recovery to pre-injury fitness takes longer
than six months (3)
Other recordable injury Injury resulting in absence from work, restricted work, medical treatment, loss of consciousness
or significant injury diagnosed by a physician (384)
Minor injury Minor injury requiring first aid treatment only (1 148)
Near miss Event that did not result in an injury but had the potential to do so (5 758)
Risk observationsObservations of unsafe conditions that could cause harm/injury (105 069)
Atlas Copco 2021 134
SUSTAINABILITY NOTES
OTHER INFORMATIONSignatures of the Board of Directors
Audit Report
Financial definitions
• Sustainability notes
Three years in summary
Contacts
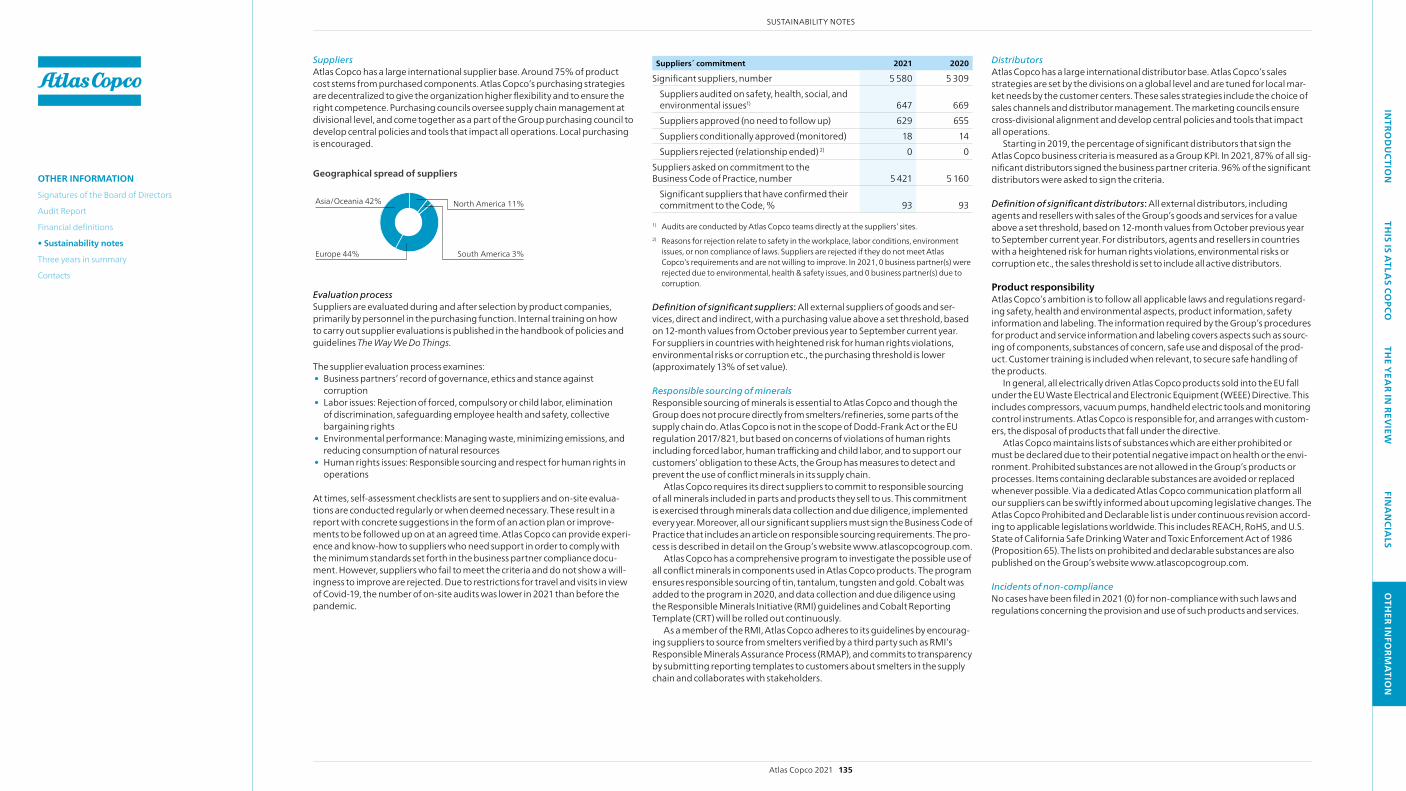
INTRO
DU
CTION
THIS IS A
TLAS CO
PCOTH
E YEA
R IN REV
IEWFIN
AN
CIALS
OTH
ER INFO
RMA
TION
SuppliersAtlas Copco has a large international supplier base. Around 75% of product cost stems from purchased components. Atlas Copco’s purchasing strategies are decentralized to give the organization higher flexibility and to ensure the right competence. Purchasing councils oversee supply chain management at divisional level, and come together as a part of the Group purchasing council to develop central policies and tools that impact all operations. Local purchasing is encouraged.
Geographical spread of suppliers
Asia/Oceania 42% North America 11%
Europe 44% South America 3%
Evaluation process Suppliers are evaluated during and after selection by product companies, primarily by personnel in the purchasing function. Internal training on how to carry out supplier evaluations is published in the handbook of policies and guidelines The Way We Do Things.
The supplier evaluation process examines:• Business partners’ record of governance, ethics and stance against
corruption• Labor issues: Rejection of forced, compulsory or child labor, elimination
of discrimination, safeguarding employee health and safety, collective bargaining rights
• Environmental performance: Managing waste, minimizing emissions, and reducing consumption of natural resources
• Human rights issues: Responsible sourcing and respect for human rights in operations
At times, self-assessment checklists are sent to suppliers and on-site evalua-tions are conducted regularly or when deemed necessary. These result in a report with concrete suggestions in the form of an action plan or improve-ments to be followed up on at an agreed time. Atlas Copco can provide experi-ence and know-how to suppliers who need support in order to comply with the minimum standards set forth in the business partner compliance docu-ment. However, suppliers who fail to meet the criteria and do not show a will-ingness to improve are rejected. Due to restrictions for travel and visits in view of Covid-19, the number of on-site audits was lower in 2021 than before the pandemic.
Suppliers´ commitment 2021 2020
Significant suppliers, number 5 580 5 309 Suppliers audited on safety, health, social, and environmental issues1) 647 669 Suppliers approved (no need to follow up) 629 655 Suppliers conditionally approved (monitored) 18 14 Suppliers rejected (relationship ended) 2) 0 0
Suppliers asked on commitment to the Business Code of Practice, number 5 421 5 160
Significant suppliers that have confirmed their commitment to the Code, % 93 93
1) Audits are conducted by Atlas Copco teams directly at the suppliers’ sites. 2) Reasons for rejection relate to safety in the workplace, labor conditions, environment
issues, or non compliance of laws. Suppliers are rejected if they do not meet Atlas Copco’s requirements and are not willing to improve. In 2021, 0 business partner(s) were rejected due to environ mental, health & safety issues, and 0 business partner(s) due to corruption.
Definition of significant suppliers: All external suppliers of goods and ser-vices, direct and indirect, with a purchasing value above a set threshold, based on 12-month values from October previous year to September current year. For suppliers in countries with heightened risk for human rights violations, environmental risks or corruption etc., the purchasing threshold is lower (approximately 13% of set value).
Responsible sourcing of mineralsResponsible sourcing of minerals is essential to Atlas Copco and though the Group does not procure directly from smelters/refineries, some parts of the supply chain do. Atlas Copco is not in the scope of Dodd-Frank Act or the EU regulation 2017/821, but based on concerns of violations of human rights including forced labor, human trafficking and child labor, and to support our customers’ obligation to these Acts, the Group has measures to detect and prevent the use of conflict minerals in its supply chain.
Atlas Copco requires its direct suppliers to commit to responsible sourcing of all minerals included in parts and products they sell to us. This commitment is exercised through minerals data collection and due diligence, implemented every year. Moreover, all our significant suppliers must sign the Business Code of Practice that includes an article on responsible sourcing requirements. The pro-cess is described in detail on the Group’s website www.atlascopcogroup.com.
Atlas Copco has a comprehensive program to investigate the possible use of all conflict minerals in components used in Atlas Copco products. The program ensures responsible sourcing of tin, tantalum, tungsten and gold. Cobalt was added to the program in 2020, and data collection and due diligence using the Responsible Minerals Initiative (RMI) guidelines and Cobalt Reporting Template (CRT) will be rolled out continuously.
As a member of the RMI, Atlas Copco adheres to its guidelines by encourag-ing suppliers to source from smelters verified by a third party such as RMI’s Responsible Minerals Assurance Process (RMAP), and commits to transparency by submitting reporting templates to customers about smelters in the supply chain and collaborates with stakeholders.
DistributorsAtlas Copco has a large international distributor base. Atlas Copco’s sales strategies are set by the divisions on a global level and are tuned for local mar-ket needs by the customer centers. These sales strategies include the choice of sales channels and distributor management. The marketing councils ensure cross- divisional alignment and develop central policies and tools that impact all operations.
Starting in 2019, the percentage of significant distributors that sign the Atlas Copco business criteria is measured as a Group KPI. In 2021, 87% of all sig-nificant distributors signed the business partner criteria. 96% of the significant distributors were asked to sign the criteria.
Definition of significant distributors: All external distributors, including agents and resellers with sales of the Group’s goods and services for a value above a set threshold, based on 12-month values from October previous year to September current year. For distributors, agents and resellers in countries with a heightened risk for human rights violations, environmental risks or corruption etc., the sales threshold is set to include all active distributors.
Product responsibility Atlas Copco’s ambition is to follow all applicable laws and regulations regard-ing safety, health and environmental aspects, product information, safety information and labeling. The information required by the Group’s procedures for product and service information and labeling covers aspects such as sourc-ing of components, substances of concern, safe use and disposal of the prod-uct. Customer training is included when relevant, to secure safe handling of the products.
In general, all electrically driven Atlas Copco products sold into the EU fall under the EU waste Electrical and Electronic Equipment (wEEE) Directive. This includes compressors, vacuum pumps, handheld electric tools and monitoring control instruments. Atlas Copco is responsible for, and arranges with custom-ers, the disposal of products that fall under the directive.
Atlas Copco maintains lists of substances which are either prohibited or must be declared due to their potential negative impact on health or the envi-ronment. Prohibited substances are not allowed in the Group’s products or processes. Items containing declarable substances are avoided or replaced whenever possible. Via a dedicated Atlas Copco communication platform all our suppliers can be swiftly informed about upcoming legislative changes. The Atlas Copco Prohibited and Declarable list is under continuous revision accord-ing to applicable legislations worldwide. This includes REACH, RoHS, and U.S. State of California Safe Drinking water and Toxic Enforcement Act of 1986 (Proposition 65). The lists on prohibited and declarable substances are also published on the Group’s website www.atlascopcogroup.com.
Incidents of non-compliance No cases have been filed in 2021 (0) for non-compliance with such laws and regulations concerning the provision and use of such products and services.
Atlas Copco 2021 135
SUSTAINABILITY NOTES
OTHER INFORMATIONSignatures of the Board of Directors
Audit Report
Financial definitions
• Sustainability notes
Three years in summary
Contacts
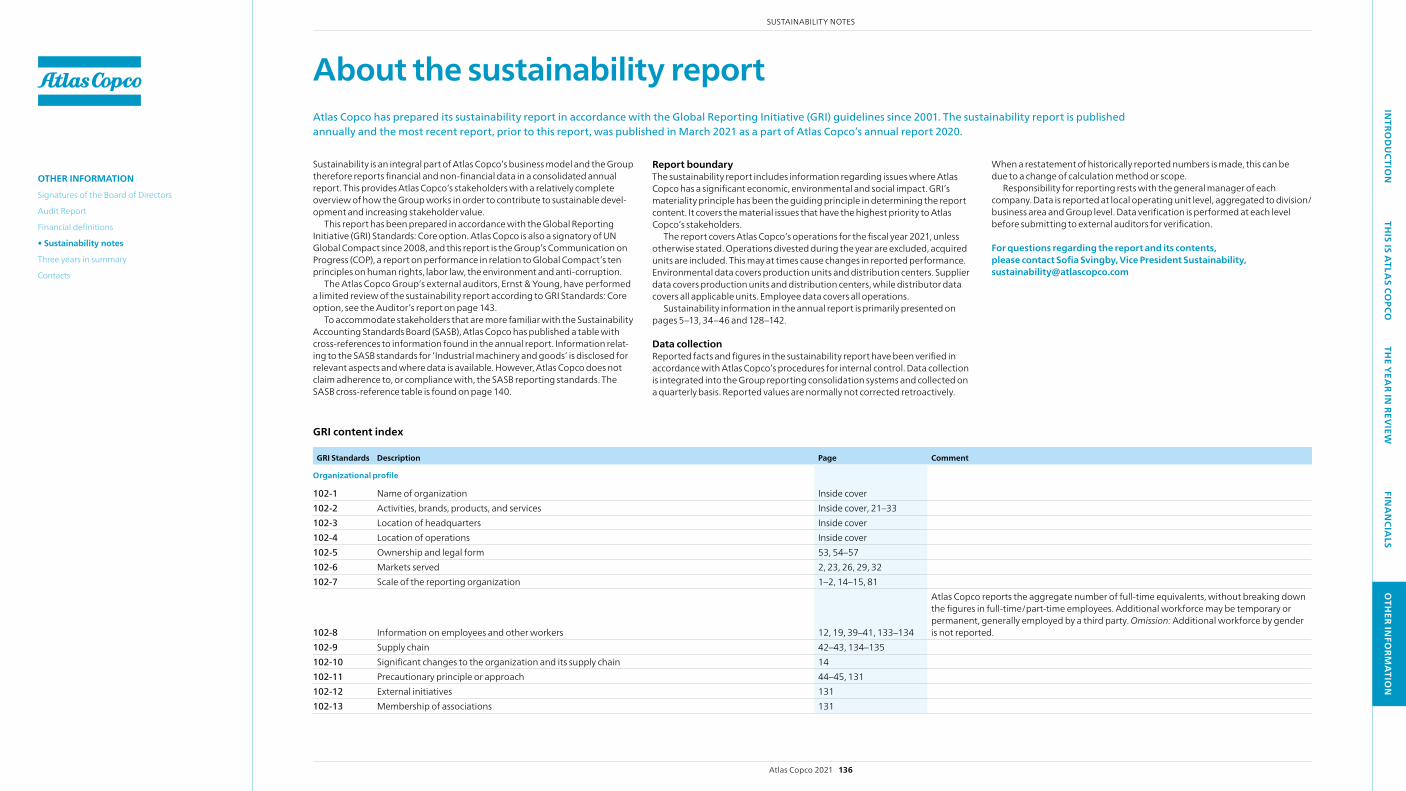
INTRO
DU
CTION
THIS IS A
TLAS CO
PCOTH
E YEA
R IN REV
IEWFIN
AN
CIALS
OTH
ER INFO
RMA
TION
About the sustainability report Atlas Copco has prepared its sustainability report in accordance with the Global Reporting Initiative (GRI) guidelines since 2001. The sustainability report is published annually and the most recent report, prior to this report, was published in March 2021 as a part of Atlas Copco’s annual report 2020.
Sustainability is an integral part of Atlas Copco’s business model and the Group therefore reports financial and non-financial data in a consolidated annual report. This provides Atlas Copco’s stakeholders with a relatively complete overview of how the Group works in order to contribute to sustainable devel-opment and increasing stakeholder value.
This report has been prepared in accordance with the Global Reporting Initiative (GRI) Standards: Core option. Atlas Copco is also a signatory of UN Global Compact since 2008, and this report is the Group’s Communication on Progress (COP), a report on performance in relation to Global Compact’s ten principles on human rights, labor law, the environment and anti-corruption.
The Atlas Copco Group’s external auditors, Ernst & Young, have performed a limited review of the sustainability report according to GRI Standards: Core option, see the Auditor’s report on page 143.
To accommodate stakeholders that are more familiar with the Sustainability Accounting Standards Board (SASB), Atlas Copco has published a table with cross-references to information found in the annual report. Information relat-ing to the SASB standards for ‘Industrial machinery and goods’ is disclosed for relevant aspects and where data is available. However, Atlas Copco does not claim adherence to, or compliance with, the SASB reporting standards. The SASB cross-reference table is found on page 140.
GRI content index
GRI Standards Description Page Comment
Organizational profile
102-1 Name of organization Inside cover102-2 Activities, brands, products, and services Inside cover, 21–33102-3 Location of headquarters Inside cover102-4 Location of operations Inside cover102-5 Ownership and legal form 53, 54–57102-6 Markets served 2, 23, 26, 29, 32102-7 Scale of the reporting organization 1–2, 14–15, 81
102-8 Information on employees and other workers 12, 19, 39–41, 133–134
Atlas Copco reports the aggregate number of full-time equivalents, without breaking down the figures in full-time/part-time employees. Additional workforce may be temporary or permanent, generally employed by a third party. Omission: Additional workforce by gender is not reported.
102-9 Supply chain 42–43, 134–135102-10 Significant changes to the organization and its supply chain 14102-11 Precautionary principle or approach 44–45, 131102-12 External initiatives 131102-13 Membership of associations 131
Report boundaryThe sustainability report includes information regarding issues where Atlas Copco has a significant economic, environmental and social impact. GRI’s materiality principle has been the guiding principle in determining the report content. It covers the material issues that have the highest priority to Atlas Copco’s stakeholders.
The report covers Atlas Copco’s operations for the fiscal year 2021, unless otherwise stated. Operations divested during the year are excluded, acquired units are included. This may at times cause changes in reported performance. Environmental data covers production units and distribution centers. Supplier data covers production units and distribution centers, while distributor data covers all applicable units. Employee data covers all operations.
Sustainability information in the annual report is primarily presented on pages 5–13, 34–46 and 128–142.
Data collectionReported facts and figures in the sustainability report have been verified in accordance with Atlas Copco’s procedures for internal control. Data collection is integrated into the Group reporting consolidation systems and collected on a quarterly basis. Reported values are normally not corrected retroactively.
when a restatement of historically reported numbers is made, this can be due to a change of calculation method or scope.
Responsibility for reporting rests with the general manager of each company. Data is reported at local operating unit level, aggregated to division/business area and Group level. Data verification is performed at each level before submitting to external auditors for verification.
For questions regarding the report and its contents, please contact Sofia Svingby, Vice President Sustainability, [email protected]
Atlas Copco 2021 136
SUSTAINABILITY NOTES
OTHER INFORMATIONSignatures of the Board of Directors
Audit Report
Financial definitions
• Sustainability notes
Three years in summary
Contacts
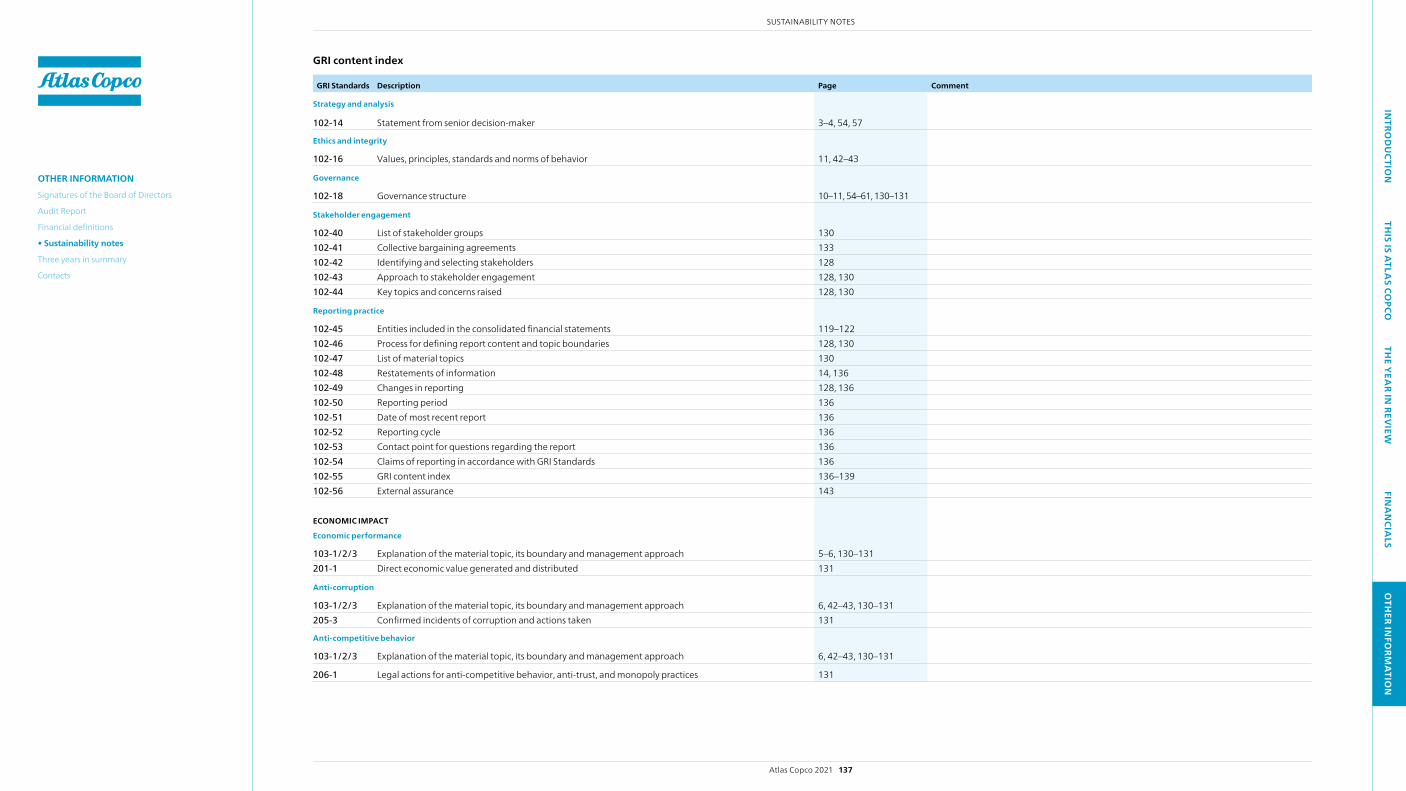
INTRO
DU
CTION
THIS IS A
TLAS CO
PCOTH
E YEA
R IN REV
IEWFIN
AN
CIALS
OTH
ER INFO
RMA
TION
GRI Standards Description Page Comment
Strategy and analysis
102-14 Statement from senior decision-maker 3–4, 54, 57
Ethics and integrity
102-16 Values, principles, standards and norms of behavior 11, 42–43
Governance
102-18 Governance structure 10–11, 54–61, 130–131
Stakeholder engagement
102-40 List of stakeholder groups 130102-41 Collective bargaining agreements 133102-42 Identifying and selecting stakeholders 128102-43 Approach to stakeholder engagement 128, 130102-44 Key topics and concerns raised 128, 130
Reporting practice
102-45 Entities included in the consolidated financial statements 119–122102-46 Process for defining report content and topic boundaries 128, 130102-47 List of material topics 130102-48 Restatements of information 14, 136102-49 Changes in reporting 128, 136 102-50 Reporting period 136102-51 Date of most recent report 136102-52 Reporting cycle 136102-53 Contact point for questions regarding the report 136102-54 Claims of reporting in accordance with GRI Standards 136102-55 GRI content index 136–139102-56 External assurance 143
ECONOMIC IMPACT
Economic performance
103-1/2/3 Explanation of the material topic, its boundary and management approach 5–6, 130–131201-1 Direct economic value generated and distributed 131
Anti-corruption
103-1/2/3 Explanation of the material topic, its boundary and management approach 6, 42–43, 130–131205-3 Confirmed incidents of corruption and actions taken 131
Anti-competitive behavior
103-1/2/3 Explanation of the material topic, its boundary and management approach 6, 42–43, 130–131
206-1 Legal actions for anti-competitive behavior, anti-trust, and monopoly practices 131
GRI content index
Atlas Copco 2021 137
SUSTAINABILITY NOTES
OTHER INFORMATIONSignatures of the Board of Directors
Audit Report
Financial definitions
• Sustainability notes
Three years in summary
Contacts
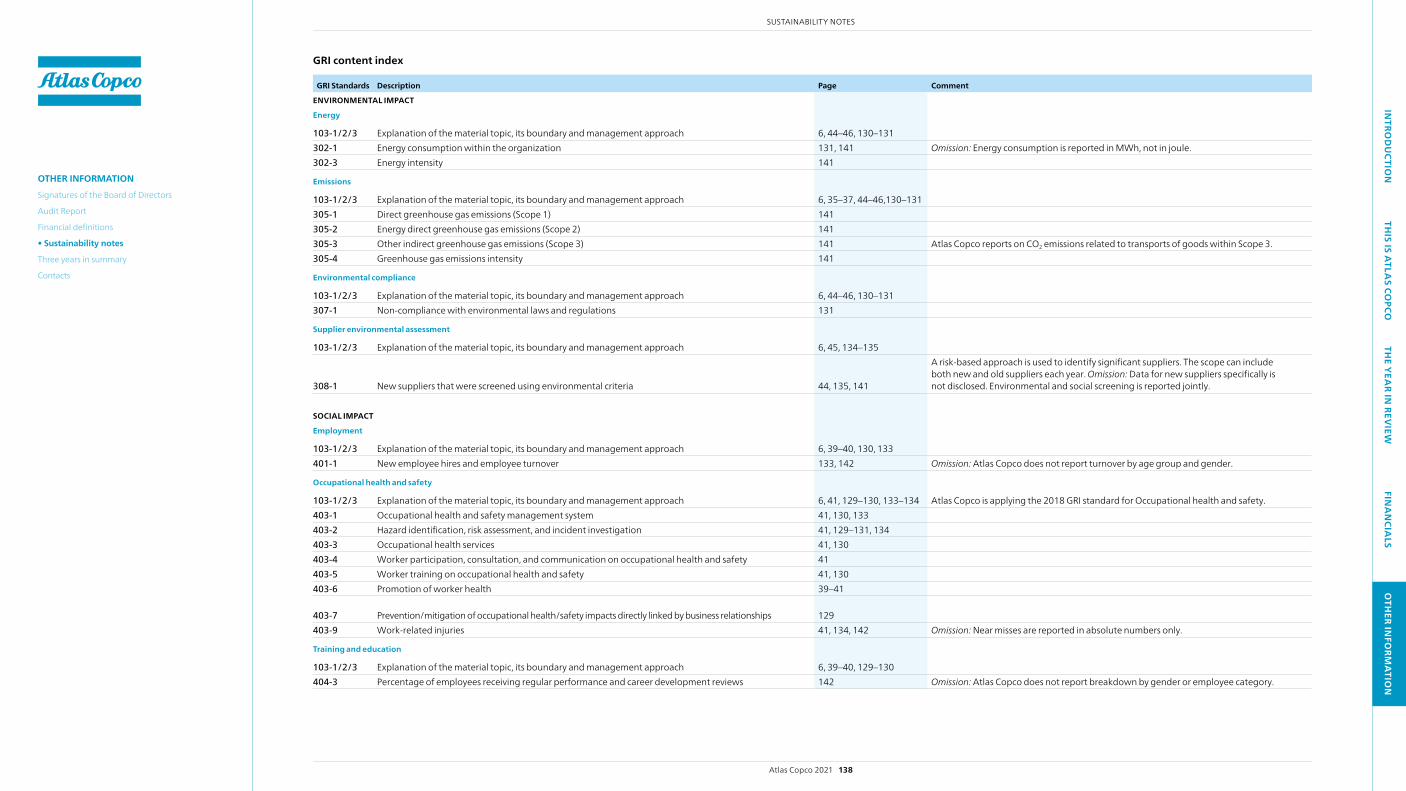
INTRO
DU
CTION
THIS IS A
TLAS CO
PCOTH
E YEA
R IN REV
IEWFIN
AN
CIALS
OTH
ER INFO
RMA
TION
GRI Standards Description Page Comment
ENVIRONMENTAL IMPACT
Energy
103-1/2/3 Explanation of the material topic, its boundary and management approach 6, 44–46, 130–131302-1 Energy consumption within the organization 131, 141 Omission: Energy consumption is reported in Mwh, not in joule. 302-3 Energy intensity 141
Emissions
103-1/2/3 Explanation of the material topic, its boundary and management approach 6, 35–37, 44–46,130–131305-1 Direct greenhouse gas emissions (Scope 1) 141305-2 Energy direct greenhouse gas emissions (Scope 2) 141305-3 Other indirect greenhouse gas emissions (Scope 3) 141 Atlas Copco reports on CO2 emissions related to transports of goods within Scope 3.305-4 Greenhouse gas emissions intensity 141
Environmental compliance
103-1/2/3 Explanation of the material topic, its boundary and management approach 6, 44–46, 130–131307-1 Non-compliance with environmental laws and regulations 131
Supplier environmental assessment
103-1/2/3 Explanation of the material topic, its boundary and management approach 6, 45, 134–135
308-1 New suppliers that were screened using environmental criteria 44, 135, 141
A risk-based approach is used to identify significant suppliers. The scope can include both new and old suppliers each year. Omission: Data for new suppliers specifically is not disclosed. Environmental and social screening is reported jointly.
SOCIAL IMPACT
Employment
103-1/2/3 Explanation of the material topic, its boundary and management approach 6, 39–40, 130, 133401-1 New employee hires and employee turnover 133, 142 Omission: Atlas Copco does not report turnover by age group and gender.
Occupational health and safety
103-1/2/3 Explanation of the material topic, its boundary and management approach 6, 41, 129–130, 133–134 Atlas Copco is applying the 2018 GRI standard for Occupational health and safety.403-1 Occupational health and safety management system 41, 130, 133403-2 Hazard identification, risk assessment, and incident investigation 41, 129–131, 134403-3 Occupational health services 41, 130403-4 worker participation, consultation, and communication on occupational health and safety 41403-5 worker training on occupational health and safety 41, 130403-6 Promotion of worker health 39–41
403-7 Prevention/mitigation of occupational health/safety impacts directly linked by business relationships 129403-9 work-related injuries 41, 134, 142 Omission: Near misses are reported in absolute numbers only.
Training and education
103-1/2/3 Explanation of the material topic, its boundary and management approach 6, 39–40, 129–130404-3 Percentage of employees receiving regular performance and career development reviews 142 Omission: Atlas Copco does not report breakdown by gender or employee category.
GRI content index
Atlas Copco 2021 138
SUSTAINABILITY NOTES
OTHER INFORMATIONSignatures of the Board of Directors
Audit Report
Financial definitions
• Sustainability notes
Three years in summary
Contacts

INTRO
DU
CTION
THIS IS A
TLAS CO
PCOTH
E YEA
R IN REV
IEWFIN
AN
CIALS
OTH
ER INFO
RMA
TION
GRI Standards Description Page Comment
Diversity and inclusion
103-1/2/3 Explanation of the material topic, its boundary and management approach 6, 39–40, 130, 134
405-1 Diversity of governance bodies and employees 39–40, 58–61, 134, 142Omission: Age group is not disclosed at Group level. Minority group membership is not reported on in the Group.
Non-discrimination
103-1/2/3 Explanation of the material topic, its boundary and management approach 6, 39–40, 130, 134406-1 Incidents of discrimination and corrective actions taken 131
Human rights assessment
103-1/2/3 Explanation of the material topic, its boundary and management approach 6, 42–43, 129–130, 134
412-2 Employee training on human rights policies or procedures 42–43, 134, 139All employees are trained in the Business Code of Practice, which includes respect for human rights. Omission: Employee training is not reported by category of training at Group level.
Supplier social assessment
103-1/2/3 Explanation of the material topic, its boundary and management approach 6, 42, 134–135
414-1 New suppliers that were screened using social criteria 42, 135, 142
A risk-based approach is used to identify significant suppliers. The scope can include both new and old suppliers each year. Omission: Data for new suppliers specifically is not disclosed. Environmental and social screening is reported jointly.
Customer health and safety
103-1/2/3 Explanation of the material topic, its boundary and management approach 43, 130, 135416-2 Incidents of non-compliance concerning the health and safety impacts of products and services 135
Marketing and labeling
103-1/2/3 Explanation of the material topic, its boundary and management approach 129, 133
417-2 Incidents of non-compliance concerning product and service information and labeling 133
Socioeconomic compliance
103-1/2/3 Explanation of the material topic, its boundary and management approach 6, 129, 130419-1 Non-compliance with laws and regulations in the social and economic area 130
GRI content index
Atlas Copco 2021 139
SUSTAINABILITY NOTES
OTHER INFORMATIONSignatures of the Board of Directors
Audit Report
Financial definitions
• Sustainability notes
Three years in summary
Contacts
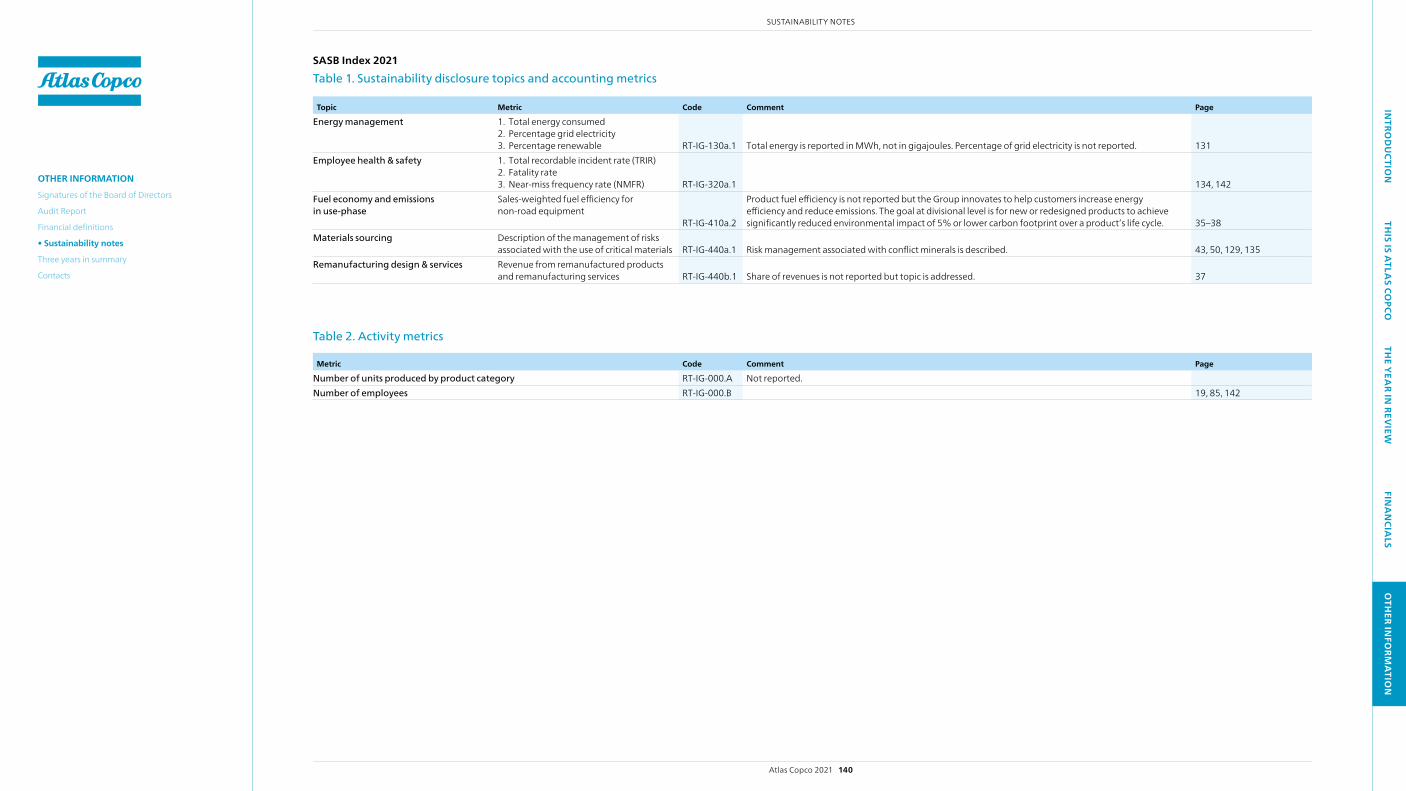
INTRO
DU
CTION
THIS IS A
TLAS CO
PCOTH
E YEA
R IN REV
IEWFIN
AN
CIALS
OTH
ER INFO
RMA
TION
Energy management 1. Total energy consumed 2. Percentage grid electricity 3. Percentage renewable RT-IG-130a.1 Total energy is reported in Mwh, not in gigajoules. Percentage of grid electricity is not reported. 131
Employee health & safety 1. Total recordable incident rate (TRIR) 2. Fatality rate 3. Near-miss frequency rate (NMFR) RT-IG-320a.1 134, 142
Fuel economy and emissions in use-phase
Sales-weighted fuel efficiency for non-road equipment
RT-IG-410a.2
Product fuel efficiency is not reported but the Group innovates to help customers increase energy efficiency and reduce emissions. The goal at divisional level is for new or redesigned products to achieve significantly reduced environmental impact of 5% or lower carbon footprint over a product’s life cycle. 35–38
Materials sourcing Description of the management of risks associated with the use of critical materials RT-IG-440a.1 Risk management associated with conflict minerals is described. 43, 50, 129, 135
Remanufacturing design & services Revenue from remanufactured products and remanufacturing services RT-IG-440b.1 Share of revenues is not reported but topic is addressed. 37
Topic Metric Code Comment Page
SASB Index 2021Table 1. Sustainability disclosure topics and accounting metrics
Number of units produced by product category RT-IG-000.A Not reported. Number of employees RT-IG-000.B 19, 85, 142
Table 2. Activity metrics
Metric Code Comment Page
Atlas Copco 2021 140
SUSTAINABILITY NOTES
OTHER INFORMATIONSignatures of the Board of Directors
Audit Report
Financial definitions
• Sustainability notes
Three years in summary
Contacts
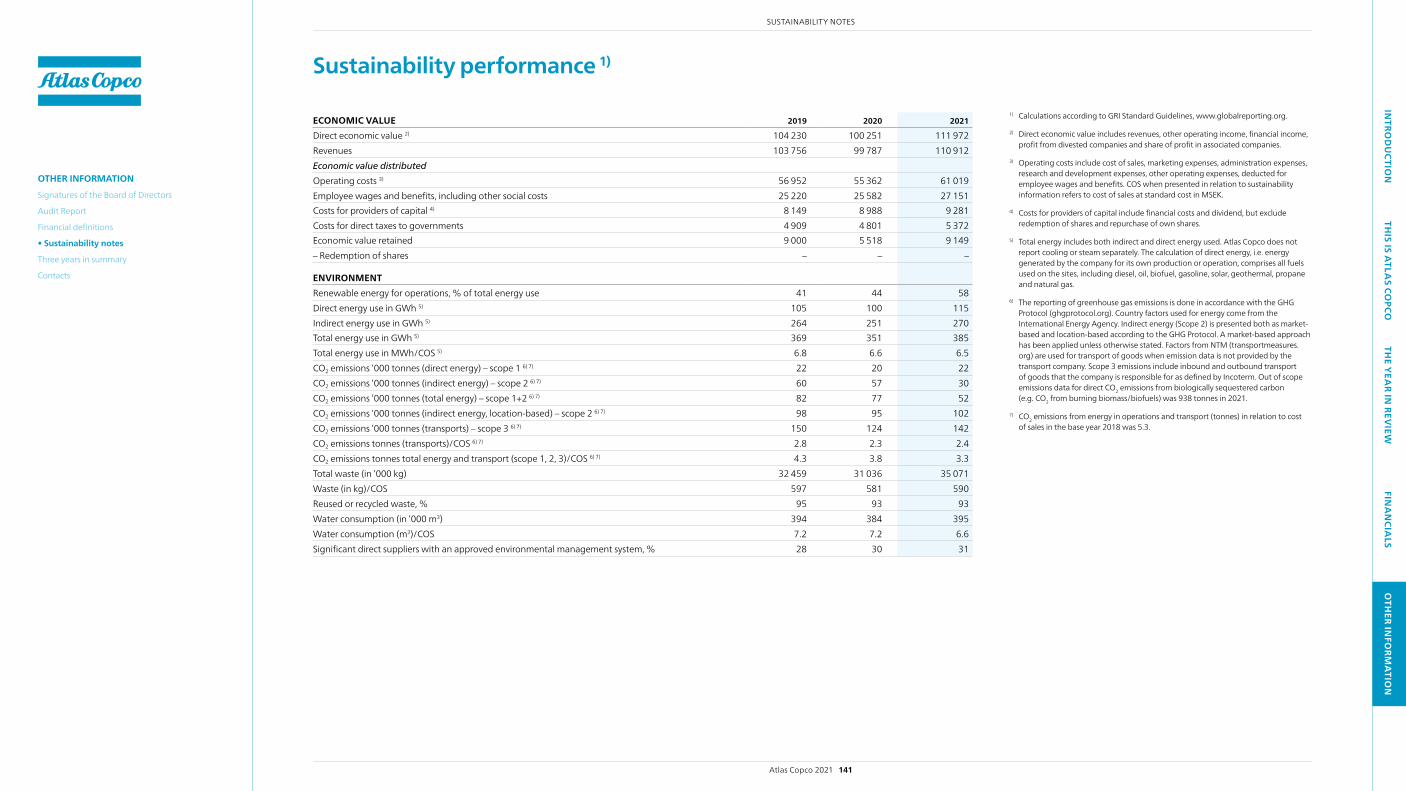
INTRO
DU
CTION
THIS IS A
TLAS CO
PCOTH
E YEA
R IN REV
IEWFIN
AN
CIALS
OTH
ER INFO
RMA
TION
Sustainability performance 1)
ECONOMIC VALUE 2019 2020 2021
Direct economic value 2) 104 230 100 251 111 972Revenues 103 756 99 787 110 912Economic value distributedOperating costs 3) 56 952 55 362 61 019Employee wages and benefits, including other social costs 25 220 25 582 27 151Costs for providers of capital 4) 8 149 8 988 9 281Costs for direct taxes to governments 4 909 4 801 5 372Economic value retained 9 000 5 518 9 149– Redemption of shares – – –
ENVIRONMENTRenewable energy for operations, % of total energy use 41 44 58Direct energy use in Gwh 5) 105 100 115Indirect energy use in Gwh 5) 264 251 270Total energy use in Gwh 5) 369 351 385Total energy use in Mwh/COS 5) 6.8 6.6 6.5CO2 emissions ’000 tonnes (direct energy) – scope 1 6) 7) 22 20 22CO2 emissions ’000 tonnes (indirect energy) – scope 2 6) 7) 60 57 30CO2 emissions ’000 tonnes (total energy) – scope 1+2 6) 7) 82 77 52CO2 emissions ’000 tonnes (indirect energy, location-based) – scope 2 6) 7) 98 95 102CO2 emissions ’000 tonnes (transports) – scope 3 6) 7) 150 124 142CO2 emissions tonnes (transports)/COS 6) 7) 2.8 2.3 2.4CO2 emissions tonnes total energy and transport (scope 1, 2, 3)/COS 6) 7) 4.3 3.8 3.3Total waste (in ’000 kg) 32 459 31 036 35 071waste (in kg)/COS 597 581 590Reused or recycled waste, % 95 93 93water consumption (in ’000 m3) 394 384 395water consumption (m3)/COS 7.2 7.2 6.6Significant direct suppliers with an approved environmental management system, % 28 30 31
1) Calculations according to GRI Standard Guidelines, www.globalreporting.org.
2) Direct economic value includes revenues, other operating income, financial income, profit from divested companies and share of profit in associated companies.
3) Operating costs include cost of sales, marketing expenses, administration expenses, research and development expenses, other operating expenses, deducted for employee wages and benefits. COS when presented in relation to sustainability information refers to cost of sales at standard cost in MSEK.
4) Costs for providers of capital include financial costs and dividend, but exclude redemption of shares and repurchase of own shares.
5) Total energy includes both indirect and direct energy used. Atlas Copco does not report cooling or steam separately. The calculation of direct energy, i.e. energy generated by the company for its own production or operation, comprises all fuels used on the sites, including diesel, oil, biofuel, gasoline, solar, geothermal, propane and natural gas.
6) The reporting of greenhouse gas emissions is done in accordance with the GHG Protocol (ghgprotocol.org). Country factors used for energy come from the International Energy Agency. Indirect energy (Scope 2) is presented both as market-based and location-based according to the GHG Protocol. A market-based approach has been applied unless otherwise stated. Factors from NTM (transportmeasures.org) are used for transport of goods when emission data is not provided by the transport company. Scope 3 emissions include inbound and outbound transport of goods that the company is responsible for as defined by Incoterm. Out of scope emissions data for direct CO2 emissions from biologically sequestered carbon (e.g. CO2 from burning biomass/biofuels) was 938 tonnes in 2021.
7) CO2 emissions from energy in operations and transport (tonnes) in relation to cost of sales in the base year 2018 was 5.3.
Atlas Copco 2021 141
SUSTAINABILITY NOTES
OTHER INFORMATIONSignatures of the Board of Directors
Audit Report
Financial definitions
• Sustainability notes
Three years in summary
Contacts

INTRO
DU
CTION
THIS IS A
TLAS CO
PCOTH
E YEA
R IN REV
IEWFIN
AN
CIALS
OTH
ER INFO
RMA
TION
PEOPLE 2019 2020 2021
white-collar employees, % 69 70 69Blue-collar employees, % 31 30 31Employee turnover white-collar employees, % 6.0 4.2 6.4Employee turnover blue-collar employees, % 5.6 4.8 7.8Total turnover, voluntary leave, % 5.9 4.4 6.9Yearly performance and development discussion, % 84 85 82Proportion of female employees, % year end 19.8 20.0 20.9Proportion of female managers, % year end 19.5 19.7 20.5Degree to which employees agree that there are opportunities to learn and grow in the company (score) 8) 71 – 73Degree to which employees agree that we have a work culture of respect, fairness and openness (score) 8) 74 – 76
SAFETY AND WELL-BEINGRecordable injuries total workforce, number 406 385 387Recordable injuries per million working hours total workforce 5.2 4.8 4.5Minor injuries total workforce, number 997 922 1 148Minor injuries per million working hours total workforce 12.7 11.6 13.4Fatalities, number 1 0 0Fatalities per million working hours total workforce 0.01 0 0Sick leave due to diseases and recordable injuries, % 2.0 2.1 2.2Degree to which employees agree that Atlas Copco takes a genuine interest in their well-being (score) 8) 69 – 73A balanced safety pyramid (yes/no) yes yes yes
ETHICS Employees signed compliance to the Business Code of Practice, % 98 99 98Employees trained in the Business Code of Practice, % 94 99 97Managers in risk countries held trainings in the Business Code of Practice, % 91 99 96Significant distributors committed to the Business Code of Practice, % 59 84 87Significant suppliers committed to the Business Code of Practice, % 90 93 93
Sustainability performance, continued
8) Results are, as a rule, collected every two years through the Group’s employee survey.
Atlas Copco 2021 142
SUSTAINABILITY NOTES
OTHER INFORMATIONSignatures of the Board of Directors
Audit Report
Financial definitions
• Sustainability notes
Three years in summary
Contacts

INTRO
DU
CTION
THIS IS A
TLAS CO
PCOTH
E YEA
R IN REV
IEWFIN
AN
CIALS
OTH
ER INFO
RMA
TION
This is the translation of the auditor’s report in Swedish.
To Atlas Copco AB, corporate identity number 556014-2720
Stockholm, March 18, 2022Ernst & Young AB
Introductionwe have been engaged by the Board of Directors of Atlas Copco AB to undertake a limited assurance engagement of Atlas Copco AB’s Sustainability Report for the year 2021. The scope of the Sustainability Report has been defined on page 136–139. Furthermore, we have per-formed an examination of the Statutory Sustainability Report. The scope of the Statutory Sustainability Report has been defined on page 20.
Responsibilities of the Board and Executive Management The Board of Directors and Executive Management are responsible for the preparation of the Sustainability Report including the Statutory Sustainability Report in accordance with applicable criteria and the Annual Accounts Act respectively. The criteria are defined on pages 136–139 in the Sustainability Report and consist of the GRI Sustainability Reporting Standards, as well as the accounting and calculation principles that the company has developed. This responsibility includes the internal control relevant to the preparation of a Sustainability Report that is free from material misstatements, whether due to fraud or error.
Responsibilities of the auditor Our responsibility is to express a conclusion on the Sustainability Report based on our limited assurance
procedures and to express an opinion regarding the Statutory Sustainability Report. Our engagement is limited to historical information presented in this document and does therefore not cover future oriented information.
we have conducted our engagement in accordance with ISAE 3000 Assurance engagements other than audits or reviews of historical financial information. A limited assurance engagement consists of making inquiries, pri-marily of persons responsible for the preparation of the Sustainability Report, and applying analytical and other limited assurance procedures. Our examination regard-ing the Statutory Sustainability Report has been con-ducted in accordance with FAR’s accounting standard RevR 12 The auditor’s opinion regarding the statutory sustainability report. A limited assurance engagement and an examination according to RevR 12 are different from and substantially less in scope than reasonable assurance conducted in accordance with IAASB’s Stan-dards on Auditing and other generally accepted auditing standards in Sweden.
The firm applies ISqC 1 (International Standard on quality Control) and accordingly maintains a comprehen-sive system of quality control including documented poli-cies and procedures regarding compliance with ethical requirements, professional standards and applicable legal and regulatory requirements. we are independent of Atlas Copco AB in accordance with professional ethics for accountants in Sweden and have otherwise fulfilled
our ethical responsibilities in accordance with these requirements.
The procedures performed in a limited review and an examination according to RevR 12 do not enable us to obtain assurance that we would become aware of all sig-nificant matters that might be identified in a reasonable assurance engagement. The conclusion based on limited assurance procedures and an examination according to RevR 12 does not provide the same level of assurance as a conclusion based on reasonable assurance.
Our procedures are based on the criteria defined by the Board of Directors and the Executive Management as described above. we consider these criteria suitable for the preparation of the Sustainability Report.
we believe that the evidence we have obtained is sufficient and appropriate to provide a basis for our conclusions below.
Conclusions Based on the limited assurance procedures we have per-formed, nothing has come to our attention that causes us to believe that the Sustainability Report is not prepared, in all material respects, in accordance with the criteria defined by the Board of Directors and Executive Management.
A Statutory Sustainability Report has been prepared.
Outi AlestaloExpert Member of FAR
Erik SandströmAuthorized Public Accountant
Auditor’s Limited Assurance Report on Atlas Copco AB’s Sustainability Report and statement regarding the Statutory Sustainability Report
Atlas Copco 2021 143
SUSTAINABILITY NOTES
OTHER INFORMATIONSignatures of the Board of Directors
Audit Report
Financial definitions
• Sustainability notes
Three years in summary
Contacts
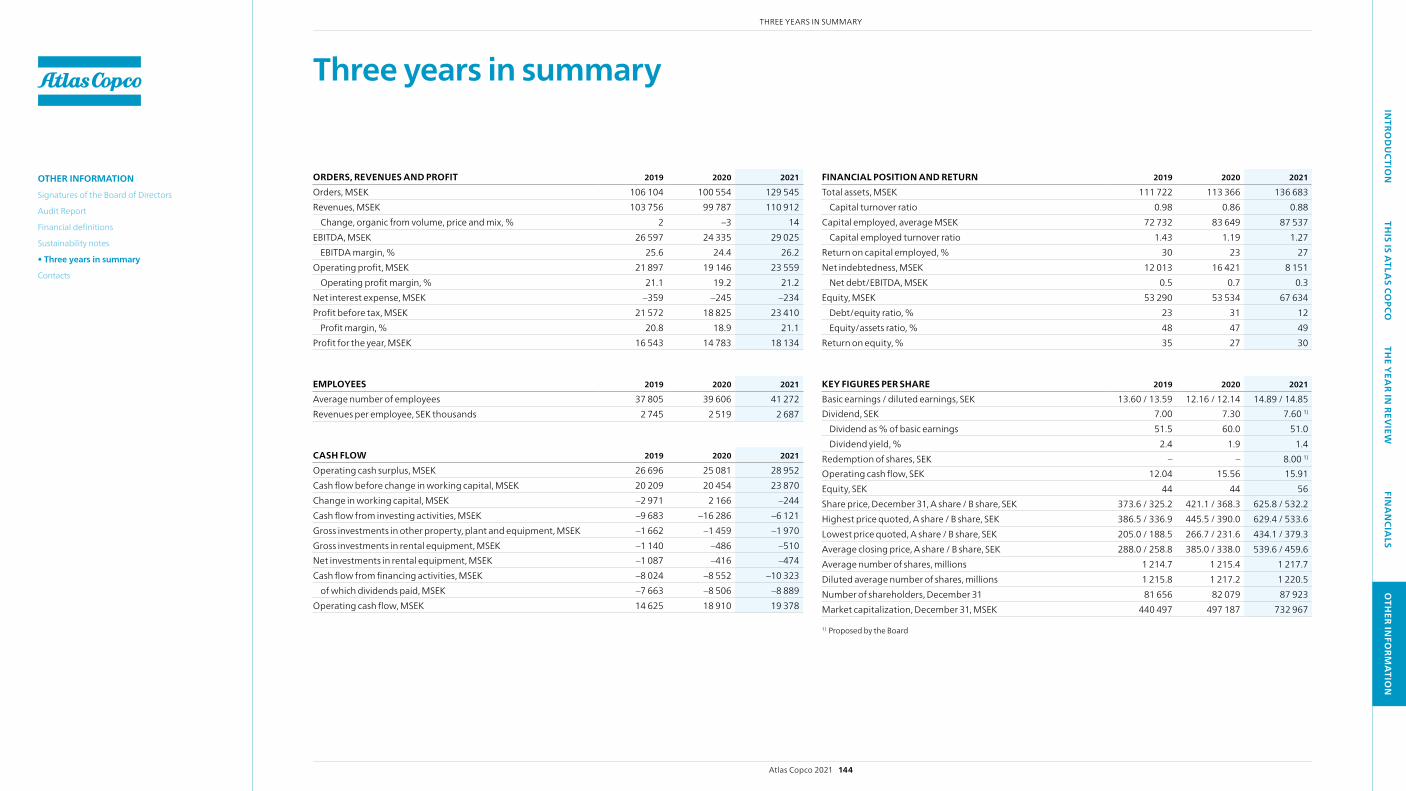
INTRO
DU
CTION
THIS IS A
TLAS CO
PCOTH
E YEA
R IN REV
IEWFIN
AN
CIALS
OTH
ER INFO
RMA
TION
ORDERS, REVENUES AND PROFIT 2019 2020 2021
Orders, MSEK 106 104 100 554 129 545Revenues, MSEK 103 756 99 787 110 912
Change, organic from volume, price and mix, % 2 –3 14EBITDA, MSEK 26 597 24 335 29 025
EBITDA margin, % 25.6 24.4 26.2Operating profit, MSEK 21 897 19 146 23 559
Operating profit margin, % 21.1 19.2 21.2Net interest expense, MSEK –359 –245 –234Profit before tax, MSEK 21 572 18 825 23 410
Profit margin, % 20.8 18.9 21.1Profit for the year, MSEK 16 543 14 783 18 134
EMPLOYEES 2019 2020 2021
Average number of employees 37 805 39 606 41 272Revenues per employee, SEK thousands 2 745 2 519 2 687
CASH FLOW 2019 2020 2021
Operating cash surplus, MSEK 26 696 25 081 28 952Cash flow before change in working capital, MSEK 20 209 20 454 23 870Change in working capital, MSEK –2 971 2 166 –244Cash flow from investing activities, MSEK –9 683 –16 286 –6 121Gross investments in other property, plant and equipment, MSEK –1 662 –1 459 –1 970Gross investments in rental equipment, MSEK –1 140 –486 –510Net investments in rental equipment, MSEK –1 087 –416 –474Cash flow from financing activities, MSEK –8 024 –8 552 –10 323
of which dividends paid, MSEK –7 663 –8 506 –8 889Operating cash flow, MSEK 14 625 18 910 19 378
Three years in summary
FINANCIAL POSITION AND RETURN 2019 2020 2021
Total assets, MSEK 111 722 113 366 136 683Capital turnover ratio 0.98 0.86 0.88
Capital employed, average MSEK 72 732 83 649 87 537Capital employed turnover ratio 1.43 1.19 1.27
Return on capital employed, % 30 23 27Net indebtedness, MSEK 12 013 16 421 8 151
Net debt/EBITDA, MSEK 0.5 0.7 0.3Equity, MSEK 53 290 53 534 67 634
Debt/equity ratio, % 23 31 12Equity/assets ratio, % 48 47 49
Return on equity, % 35 27 30
KEY FIGURES PER SHARE 2019 2020 2021
Basic earnings / diluted earnings, SEK 13.60 / 13.59 12.16 / 12.14 14.89 / 14.85Dividend, SEK 7.00 7.30 7.60 1)
Dividend as % of basic earnings 51.5 60.0 51.0Dividend yield, % 2.4 1.9 1.4
Redemption of shares, SEK – – 8.00 1)
Operating cash flow, SEK 12.04 15.56 15.91Equity, SEK 44 44 56Share price, December 31, A share / B share, SEK 373.6 / 325.2 421.1 / 368.3 625.8 / 532.2Highest price quoted, A share / B share, SEK 386.5 / 336.9 445.5 / 390.0 629.4 / 533.6 Lowest price quoted, A share / B share, SEK 205.0 / 188.5 266.7 / 231.6 434.1 / 379.3Average closing price, A share / B share, SEK 288.0 / 258.8 385.0 / 338.0 539.6 / 459.6Average number of shares, millions 1 214.7 1 215.4 1 217.7Diluted average number of shares, millions 1 215.8 1 217.2 1 220.5Number of shareholders, December 31 81 656 82 079 87 923Market capitalization, December 31, MSEK 440 497 497 187 732 967
1) Proposed by the Board
Atlas Copco 2021 144
THREE YEARS IN SUMMARY
OTHER INFORMATIONSignatures of the Board of Directors
Audit Report
Financial definitions
Sustainability notes
• Three years in summary
Contacts

INTRO
DU
CTION
THIS IS A
TLAS CO
PCOTH
E YEA
R IN REV
IEWFIN
AN
CIALS
OTH
ER INFO
RMA
TION
CONTACTS
Investor relations
Daniel Althoff, Vice President Investor Relations [email protected]
Sustainability
Sofia Svingby, Vice President Sustainability [email protected]
Media
Sara Hägg Liljedal, Chief Communications Officer [email protected]
Production: Atlas Copco in cooperation with Griller grafisk form AB and Text Helene AB
Copyright 2022, Atlas Copco AB, Stockholm, Sweden
Prepress: Bildrepro Print: Hylte Tryck
8993 0001 76
CONTACTS
Atlas Copco 2021 145
OTHER INFORMATIONSignatures of the Board of Directors
Audit Report
Financial definitions
Sustainability notes
Three years in summary
• Contacts

Atlas Copco AB (publ)SE-105 23 Stockholm, SwedenPhone: +46 8 743 80 00Reg. no: 556014-2720
atlascopcogroup.com