assessment of the availability of agricultural and forest residues for bioenergy production in...
TRANSCRIPT

b i om a s s a n d b i o e n e r g y 3 5 ( 2 0 1 1 ) 1 9 9 5e2 0 0 5
Avai lab le a t www.sc iencedi rec t .com
ht tp : / /www.e lsev ier . com/ loca te /b iombioe
Assessment of the availability of agricultural and forestresidues for bioenergy production in Romania
Nicolae Scarlat a,*, Viorel Blujdea b, Jean-Francois Dallemand a
a Institute for Energy, Joint Research Centre, European Commission, Via E. Fermi 2749, TP 450, 21027 Ispra (Va), Italyb Institute for Environment and Sustainability, Joint Research Centre, European Commission, Italy
a r t i c l e i n f o
Article history:
Received 24 July 2009
Received in revised form
24 January 2011
Accepted 28 January 2011
Available online 22 February 2011
Keywords:
Assessment
Agricultural residues
Forest and wood processing
residues
Biomass availability
Bioenergy
Romania
* Corresponding author. Tel.: þ39 (0) 3327865E-mail address: [email protected]
0961-9534/$ e see front matter ª 2011 Elsevdoi:10.1016/j.biombioe.2011.01.057
a b s t r a c t
This paper provides a resource-based assessment of availability of biomass resources for
energy production in Romania, at NUTS-3 level. The estimation of available biomass
includes the residues generated from crop production, pruning of vineyards and orchards,
forestry operations and wood processing. The estimation of crop residue availability
considers several site-specific factors such as crop yields, multi-annual yield variation,
environmental constraints and competitive uses. The evaluation of agricultural residues
was based on specific residue to product ratios, depending on crop type and crop yield. An
estimate of pruning residues is proposed, based on current orchard and vineyard areas and
specific ratios of residues. Woody biomass considers forest and forestry residues (including
firewood) and wood processing by-products, taking into account the type and share of the
unused part of the tree biomass and technical and economic aspects, including availability
and competitive use. The amount of agricultural and forest residues available for bioenergy
in Romania was estimated at 228.1 PJ on average, of which 137.1 PJ was from annual crop
residues, 17.3 PJ residues from permanent crops and 73.7 PJ/year from forestry residues,
firewood and wood processing by-products. The biomass availability shows large annual
and spatial variations, between 135.6 and 320.0 PJ, due to the variation in crop production
and forestry operations. This variation, which is even larger at the NUTS-3 level, if not
properly considered may result in shortages in biomass supply in some years, when
biomass is available in a lower amount than the average.
ª 2011 Elsevier Ltd. All rights reserved.
1. Introduction is a 24.0% share of energy from renewable sources in gross final
The energy from renewable sources in Romania contributed
187.5 PJ in 2005 and 195.0 PJ in 2007 [1]. Themost important part
came from biomass (64% of the renewable energy), of which
biomass used for heating represented 99.5% of renewable
energy used for heating, while biomass contribution to renew-
able electricity generation was insignificant in 2005. For
Romania, the target set by the Directive 2009/28/EC on the
promotionof theuseof energy fromrenewable sources for 2020
51; fax: þ39 (0) 332789992a.eu (N. Scarlat).ier Ltd. All rights reserved
consumption, which is an increase of 6.2% from 17.8% in the
2005 reference year. The National Renewable Action Plan [2],
developed according to the Renewable Energy Directive, esti-
mates that the gross final energy consumptionwill be 1268 PJ in
2020 in the additional energy efficiency scenario. Achieving the
overall national target for 2020 impliesa consumptionof energy
from renewable sources of 304 PJ. Biomasswill continue to play
a major role in achieving this target, although the contribution
of other renewables, such as wind, is expected to increase.
.
.

b i om a s s an d b i o e n e r g y 3 5 ( 2 0 1 1 ) 1 9 9 5e2 0 0 51996
From the point of view of existing potential, biomass repre-
sents a promising renewable energy source for Romania. Bio-
energy production represents one of the opportunities for
agriculture and rural development, providing alternative
options for using agriculture, forestry and wood processing
residues.The increasing roleofbiomass in futureenergysupply
requires the use of all available resources in a sustainable way,
without causing directly or indirectly negative impacts. The
Romanian Strategy for the valorisationof the renewable energy
sources, adopted by the Government Decision 1535/2003, esti-
mated the biomass potential at 318 PJ, of which: forest residues
and firewood (49.8 PJ/year), wood waste, such as sawdust and
other wood remains (20.4 PJ/year), agricultural wastes cereal
straw, maize stalks, trimming residues (200.9 PJ/year), biogas
(24.6 PJ/year) and municipal solid wastes (22.8 PJ/year).
The biomass from agriculture and forestry may constitute
a significant resource for bioenergy that could significantly
contribute to the total energy supply. However, the main
technical aspects of biomass residues utilisation for bioenergy
production relate to the resource availability at local level. A
better assessment of the biomass availability is therefore
needed at regional and local level, which can assist in the
identification of themost adequate locations and capacities of
biomass-based plants. Therefore, this paper provides a res-
ource-based assessment of the available agricultural and
forestry residues which can actually be used for energy
production in Romania at NUTS-3 (Nomenclature of Territo-
rial Units for Statistics) level, which corresponds to counties.
The annual variation in biomass production/availability for
bioenergy is a key factor to consider, since this can cause
shortages in supply in certain years, if not adequately taken
into account. This variability impacts on the location and
operation of bioenergy plants, transport and other logistics,
because the location of a bioenergy plant must consider the
minimum available resources in the area. Also, lower res-
ources available in the bioenergy plant area can lead to
logistical problems and decreased economics of the plant, due
to the increased collection area, longer transport routes and
increased biomass collection costs. Therefore, this paper
provides an estimate of the inter-annual variability of biomass
availability, to provide actual data on the biomass which is
available each year for energy generation.
2. Methods, data and assumptions
This paper aims to produce a resource based assessment of
biomass availability for bioenergy production, providing
conservative estimates, in compliance with agro-environ-
mental constraints and current competitive uses. The esti-
mation ismade both at national and county (i.e. NUTS-3) level,
for which sound statistics are currently available. Biomass
availability depends on the supply costs, and therefore,
increased public supportmechanisms improve the economics
of bioenergy production and increase resource availability.
This analysis concentrated on the estimation of the natural
capital without integrating full mobilisation costs and public
support mechanisms.
The paper considers the residues generated from agricul-
tural crop production, pruning of vineyards and orchards,
forestry operations and wood processing. The residues (straw,
stalks, stems and cobs) generated from the main agricultural
crops, which could be used for energy production, are
included in the estimation: wheat, barley, oats, rye, rice, and
maize, sunflower and oilseed rape. The assessment of the
agricultural crop residues availability considers several site-
specific factors such as crops yields, multi-annual yield vari-
ation, environmental constraints and competitive uses. The
estimation of agricultural residues is based on specific total
residue to product ratios, depending on the crop type and crop
yield. The estimates of pruning residues from fruit tree plan-
tations and vineyards are based on current orchard and
vineyard areas and specific ratios of residues. Forest residues
included in the estimates consider forestry residues, firewood
andwood processing by-products. Estimations of their annual
availability are based on the time series harvested quota,
types of operations (final cut, forest thinning and cleaning
operations) and on species/group of species (coniferous,
beech, oak.), at NUTS-3 level. The estimates took into
account their availability, forest accessibility, type and share
of the commercially unused part of the tree biomass and
technical and economic aspects of their collection. Wood
processing residues (sawdust, shavings, bark, wood remains,
etc.) estimations are based on the by-products fraction, taking
into consideration the technological process.
The estimates of the total biomass potentially available for
bioenergy production are given as the average, maximum and
minimum amounts at NUTS-3 level, thus considering their
annual variations. Key data is provided by national statistics
[1], providing complete, detailed and spatially disaggregated
time series. The period from 2000 to 2006 is selected as
a reference for the study. The availability of biomass at local
level and the distribution of the biomass resources over the
land area are essential for bioenergy production. Therefore,
the density of biomass resources per land area was estimated
as an adequate criterion for comparing available resources
between regions and counties and as a key factor in the
economics of a bioenergy plant. This provides an indication of
on the areas which are the most adequate and cost-effective
for bioenergy production and where the collection cost of
biomass is the lowest.
2.1. Agricultural land and forest land in Romania
From the total area of Romania (23.8 Mha), the utilised agri-
cultural area covers, on average, 10.3 Mha, (43.4% of the total
area) out of which arable land is 6.6 Mha (Fig. 1). Cereals have
the highest share of agricultural production, with a produc-
tion of 10.5Mt in 2000 and 15.8Mt in 2006, peaking at 24.4Mt in
2004. The rapeseed production increased steadily in the last
years, from 76,100 t in 2000 to 361,500 t in 2007, due to the
increased use of rapeseed oil for biofuels production [1].
Romania is also an important producer of sunflower, with
a production ranging from0.7Mt in 2000 to 1.5Mt in 2006. Fruit
production covers an area of 207,000 ha and reaches almost
1.5 Mt/year. Vineyards cover about 185,000 ha, with a grape
production of about 1.2 Mt/year [1].
Romania has an area of about 6.4 million ha covered by
forests, with 29.9% coniferous, 49.5% non-coniferous (31.5%
beech and 18.0% oak), 15.7% various hardwood species and
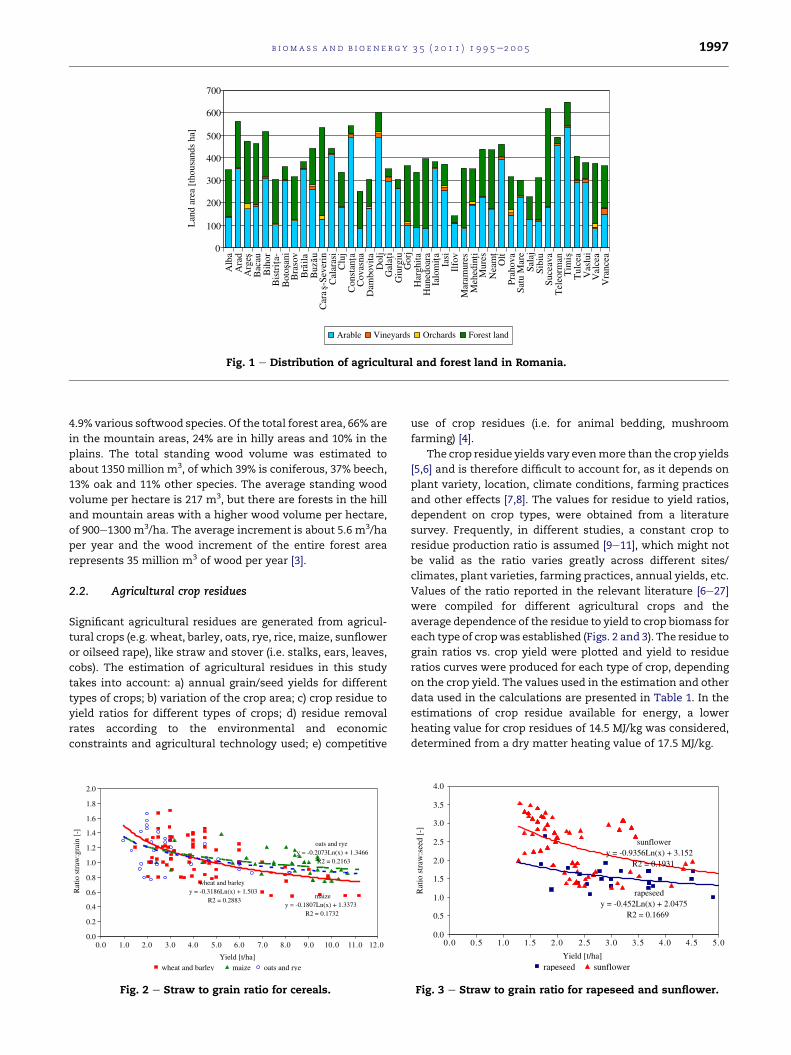
Fig. 1 e Distribution of agricultural and forest land in Romania.
b i om a s s a n d b i o e n e r g y 3 5 ( 2 0 1 1 ) 1 9 9 5e2 0 0 5 1997
4.9% various softwood species. Of the total forest area, 66% are
in the mountain areas, 24% are in hilly areas and 10% in the
plains. The total standing wood volume was estimated to
about 1350 million m3, of which 39% is coniferous, 37% beech,
13% oak and 11% other species. The average standing wood
volume per hectare is 217 m3, but there are forests in the hill
and mountain areas with a higher wood volume per hectare,
of 900e1300 m3/ha. The average increment is about 5.6 m3/ha
per year and the wood increment of the entire forest area
represents 35 million m3 of wood per year [3].
2.2. Agricultural crop residues
Significant agricultural residues are generated from agricul-
tural crops (e.g. wheat, barley, oats, rye, rice, maize, sunflower
or oilseed rape), like straw and stover (i.e. stalks, ears, leaves,
cobs). The estimation of agricultural residues in this study
takes into account: a) annual grain/seed yields for different
types of crops; b) variation of the crop area; c) crop residue to
yield ratios for different types of crops; d) residue removal
rates according to the environmental and economic
constraints and agricultural technology used; e) competitive
wheat and barleyy = -0.3186Ln(x) + 1.503
R2 = 0.2883maize
y = -0.1807Ln(x) + 1.3373R2 = 0.1732
oats and ryey = -0.2073Ln(x) + 1.3466
R2 = 0.2163
0.0
0.2
0.4
0.6
0.8
1.0
1.2
1.4
1.6
1.8
2.0
0.0 1.0 2.0 3.0 4.0 5.0 6.0 7.0 8.0 9.0 10.0 11.0 12.0
Yield [t/ha]
Rat
io s
traw
:gra
in [
-]
wheat and barley maize oats and rye
Fig. 2 e Straw to grain ratio for cereals.
use of crop residues (i.e. for animal bedding, mushroom
farming) [4].
The crop residue yields vary evenmore than the crop yields
[5,6] and is therefore difficult to account for, as it depends on
plant variety, location, climate conditions, farming practices
and other effects [7,8]. The values for residue to yield ratios,
dependent on crop types, were obtained from a literature
survey. Frequently, in different studies, a constant crop to
residue production ratio is assumed [9e11], which might not
be valid as the ratio varies greatly across different sites/
climates, plant varieties, farming practices, annual yields, etc.
Values of the ratio reported in the relevant literature [6e27]
were compiled for different agricultural crops and the
average dependence of the residue to yield to crop biomass for
each type of cropwas established (Figs. 2 and 3). The residue to
grain ratios vs. crop yield were plotted and yield to residue
ratios curves were produced for each type of crop, depending
on the crop yield. The values used in the estimation and other
data used in the calculations are presented in Table 1. In the
estimations of crop residue available for energy, a lower
heating value for crop residues of 14.5 MJ/kg was considered,
determined from a dry matter heating value of 17.5 MJ/kg.
rapeseedy = -0.452Ln(x) + 2.0475
R2 = 0.1669
sunflowery = -0.9356Ln(x) + 3.152
R2 = 0.1931
0.0
0.5
1.0
1.5
2.0
2.5
3.0
3.5
4.0
0.0 0.5 1.0 1.5 2.0 2.5 3.0 3.5 4.0 4.5 5.0
Yield [t/ha]
Rat
io s
traw
:see
d [-
]
rapeseed sunflower
Fig. 3 e Straw to grain ratio for rapeseed and sunflower.

Table 1 e Main characteristics of agricultural residues used in this study.
Crop type Residue toyield ratio
Availability[%]
Seed moisturecontent [%]
Straw moisturecontent [%]
Wheat and barley 1.05e1.78 40 15 15
Rye and oat 1.08e1.42 40 15 15
Maize 1.04e1.52 50 15 30
Rapeseed 1.20e1.98 50 15 50
Sunflower 2.20e3.50 50 15 40
Source: [33e35].
Table 2 e Residue to fruit yields obtained for pruning.
Crop Residue tofruit yields
Moisture[%]
Availability[%]
Apple trees 0.2e0.5 40 80
Pear trees 0.2e0.5 40 80
Peach trees 0.4e0.6 40 80
Apricots 0.4e0.6 40 80
Cherry trees 0.4e0.6 40 80
Plum trees 0.8e1.2 40 80
Nut trees 0.6e1.8 40 80
Vineyards 0.3e1.0 40 80
Source: [37].
b i om a s s an d b i o e n e r g y 3 5 ( 2 0 1 1 ) 1 9 9 5e2 0 0 51998
As a result of varying local conditions, the estimates of the
amount of residues that may be removed vary widely and
have a high degree of uncertainty. Several studies proposed
different values for sustainable removal rates of crop residues.
Walsh et al. [9] and Van der Sluis et al. [28] suggested biomass
removal rates of between 30 and 40% of the residue without
reducing soil productivity. Some authors proposed a sustain-
able removal rate of 40e50% for wheat straw andmaize stover
[7,8,15], while Glassner [29] estimated that 20e60% of maize
stover can be sustainably harvested. Low tillage farming with
high crop yields could lead to a higher removal rate, increasing
the availability of straw for other uses [14], up to 68e75% of the
maize residue [15], or even 76e82% [15,29]. In this study,
removal rates of 40% for wheat, barley and oats and 50% for
maize, sunflower and rapeseed were considered.
The estimates of the available crop residues must include
the consideration of competing uses. Animal breeding is the
most important competitive use of straw and stover, which
are used mostly for feeding and bedding [30]. Straw is also
used in agriculture and gardening, for crop protection, mainly
in cold climates [7]. Straw is used as substrate for mushroom
production, together with horse manure or poultry litter. The
spent compost can be used for other activities or used as soil
conditioner, fertiliser and in bioremediation.
The amount of crop residues used for different purposes
was calculated based on animal population (cattle, horses and
sheep) and mushroom production in each county. For esti-
mating the use for animals, it is important to determine the
amount of livestock in a specific region and how many use
some form of a bedding system. The amount of straw used
depends on the straw availability, on the type of farms and
farming systems [31]; therefore, the exact amount of residues
used is difficult to establish. In this study, a consumption of
1.5 kg of straw/day per head was considered for the use of
straw for cattle bedding (for a quarter of the cattle population),
as well as for equines (horses, mules). For sheep, an average
consumption on 0.1 kg straw/day per head was used. For the
use of straw for pigs, a consumption of 0.5 kg of straw/day per
head of pig, (one eight of the pigs population using straw) was
considered [31,32].
2.3. Pruning residues
Orchards and vineyards require annual pruning operations,
which produce large amounts of biomass, which might
potentially be available as a bioenergy source. The residues
generated from the pruning of orchards (apples, pears, plums,
peaches, apricots and cherry trees) and vineyards, consist of
small branches and biomass resulted from regular and clea-
ning operations.
Little data is available on pruning residues. However,
several studies proposed some figures for the ratios of residue
to product yields for pruning [33e36]. These data show certain
scattering and must be used with caution. The available data
was compiled and conservative data were used in the com-
putation of the available biomass from pruning. Based on our
own survey and on the data reported in different studies
[33e36] we proposed data to be used to establish the average,
the minimum and maximum amount of annual trimming
residues (Table 2). Not all of the residues are available for use
and losses from the collection must be considered; an avail-
ability factor of 80% was considered.
2.4. Wood residues
The wood residues included in the assessment are: forest
residues, firewood and wood processing residues. The avail-
able forest biomass is determined by the types of operations
(final felling, forest thinning and cleaning operations) and on
species/group of species (coniferous, beech, oaks, softwood
and hardwood) at NUTS III (county) level. The estimates are
based on the percentage of branches, crown tops and bark for
coniferous and deciduous trees depending on the forest
operation (final felling, forest thinning or cleaning). The esti-
mates of the forest residues and wood industry by-products
are based on current annual felling rates for the selected
reference period in this study. Wood harvesting rates are
considered sustainable and reflect the accessibility and the
current potential of forests. However, total annual felling
represents only around 45% of the annual increment in forest

Table 3 e Forest residues from harvesting operations.
Operation/biomass included Share of forestry residues (% of stand volume)
Coniferous Beech Oak Hardwood Softwood
Final cuts/tree biomass (<5 cm diametera) 4 4 5 6 6
Secondary cuts/tree biomass(<5 cm diameter) 1 13 11 19 12
Secondary cuts/firewoodb (>5 cm diameter) 20 52 55 50 63
a Trees tops, branches, usually left in the forest, never harvested.
b Firewood is part of the tree which is not usable from technological point of view (i.e. small branches, defects). It does not include trees tops
and branches under 5 cm diameter.
Source: [37]
b i om a s s a n d b i o e n e r g y 3 5 ( 2 0 1 1 ) 1 9 9 5e2 0 0 5 1999
biomass, which is amongst the lowest in Europe. Therefore,
this study provides data only on the presently available forest
residues and not the whole potential.
Under economical, social and environmental constraints,
it is considered that only a part of forest residues can be
removed from the land to be used for energy production (up to
80% in the plains and 50e70% in the mountain areas),
depending on the availability, general/local topography, forest
accessibility and technical and economic difficulties of
biomass collection. The major part of the logging residues
resulting from the main felling is currently left in the forest.
However in mountain areas, only a part of the residues can be
collected from the technical and economic point of view
(30e50%), depending on the terrain type, slope and accessi-
bility of the area. In the plain and hilly area, at least 80% of the
residues can be made available for bioenergy production.
About 50e60% of the residues are already removed from
forests and used for energy production in the plain and hilly
areas, while in mountain areas the whole amount is unused
for the moment [37,38] Table 3.
Biomass available for bioenergy is that which has no tech-
nological purposes, like: tops, branches, bark, or damaged and
imperfect wood. In the final cuts, branches, which account for
amaximumof4%inconiferousand19%innon-coniferousstand
volumes, are currently left in the forest, thus they are practically
available. In the final cuts, firewood amounts to about 20% in
0.0
0.2
0.4
0.6
0.8
1.0
1.2
1.4
1.6
1.8
Alb
aA
rad
Arg
esB
acau
Bih
orB
istr
ita-
Bot
osan
iB
raso
vB
raila
Buz
auC
aras
-Sev
erin
Cal
aras
iC
luj
Con
stan
taC
ovas
naD
ambo
vita
Dol
jG
alat
iG
iurg
iu
Agr
icul
tura
l res
idue
s [M
t dry
/yea
r]
Min Ave
Fig. 4 e Production of agricultura
coniferous forests and 10% in non-coniferous forests, while in
secondary cuts, it ranges from 20% in coniferous to 52e63% in
oak, beech, softwood and hardwood harvest. Firewood is
entirelyharvested,andcurrentlyusedforheating inhouseholds.
Wood residues are generated from roundwood processing:
sawdust, shavings, bark, wood remains, etc. The fraction of
available by-products varies depending on the processing
technology: a part of by-products (sawdust, wood remains,
etc.) are used to produce other wood based products: particle-
board, plywood, fibreboard, etc. The processing efficiency of
wood varies between 52 and 65% for timber, to 80% for veneer
production, plywood, etc., depending on the species/group of
species. On average, around three quarters of the felled
roundwood is transformed into final products [38]. The
remaining by-products (bark, sawdust, wood chips, shavings,
etc.) might be available for energy generation. A survey [38]
undertaken at companies involved in the wood processing
residues revealed that almost all the wood residues generated
in the wood processing industry are presently used for the
production of energy needed in their own technological
process. These residues are however included in the estimates
of forest biomass available for energy production. The esti-
mations of wood residues available for energy production are
basedona lowerheatingvalue (LHV)of 10.4GJ/m3andadensity
of 570 kg/m3 for deciduous trees and a lower heating value of
7.6 GJ/m3 and a density of 400 kg/m3 for coniferous trees.
Gor
jH
argh
itaH
uned
oara
Ialo
mita Iasi
Ilfo
vM
aram
ures
Meh
edin
tiM
ures
Nea
mt
Olt
Prah
ova
Satu
Mar
eSa
laj
Sibi
uSu
ceav
aT
eleo
rman
Tim
isT
ulce
aV
aslu
iV
alce
aV
ranc
ea
rage Max
l crop residues per counties.

0.000
0.050
0.100
0.150
0.200
0.250
0.300
0.350
0.400
0.450
0.500
Alb
aA
rad
Arg
esB
acau
Bih
orB
istr
ita-
Bot
osan
iB
raso
vB
raila
Buz
auC
aras
-Sev
erin
Cal
aras
iC
luj
Con
stan
taC
ovas
naD
ambo
vita
Dol
jG
alat
iG
iurg
iuG
orj
Har
ghita
Hun
edoa
raIa
lom
ita Iasi
Ilfo
vM
aram
ures
Meh
edin
tiM
ures
Nea
mt
Olt
Prah
ova
Satu
Mar
eSa
laj
Sibi
uSu
ceav
aT
eleo
rman
Tim
isT
ulce
aV
aslu
iV
alce
aV
ranc
ea
Woo
d re
sidu
es [
Mt d
ry/y
ear]
Min Average Max
Fig. 5 e Available woody biomass residues from forestry and wood processing industry per counties.
0
20
40
60
80
100
120
140
160
180
200
trimmingresidues
crop residues forestryresidues
firewood woodprocessing
Res
idue
s [P
J/ye
ar]
Min Average Max
Fig. 6 e Available biomass residues in Romania.
b i om a s s an d b i o e n e r g y 3 5 ( 2 0 1 1 ) 1 9 9 5e2 0 0 52000
3. Biomass resource availability forbioenergy
3.1. Availability of agricultural crop residues
The total amount of agricultural annual and permanent crop
residues is estimated at NUTS-3 level, as average amount,
over the reference period selected for the study. Annual crop
residues production amounts on average 19.2 Mt dry/year,
ranging from 10.2 to 27.0 Mt dry/year. Only a part of these
annual residues can be collected, if considering the various
agro-environmental constraints. The collectable annual crop
residues are, on average 8.9 Mt dry/year (ranging from 4.7 to
12.6 Mt dry/year). Comparatively, the annual production of
trimming residues is much lower, on average 1.1 Mt dry/year
(ranging from 0.6 to 1.4 Mt dry/year), of which only 80% can be
collected: 0.9 Mt dry/year (varying from 0.5 Mt to 1.2 Mt dry/
year). Thus, the collectable agricultural residues from annual
and permanent crops, are 9.8 Mt dry/year on average,
(between 2.2 and 13.8 Mt dry/year), with large variations from
one region to another (Fig. 4). The main uses of crop residues
amount to around 1.3 Mt/year, of which: cattle 0.4 Mt/year,
horses 0.5 Mt/year, sheep 0.3 Mt/year, pigs 0.1 Mt/year, while
mushroom production uses a very low amount (6000 t/year),
due to the very low production of mushrooms.
The available annual crop residues for energy generation
amount on average 137.1 PJ (ranging from 63.6 to 202.0 PJ),
while trimming residues amount on average 17.3 PJ (ranging
from 9.6 to 22.3 PJ). The total agricultural residues available for
bioenergy production amount on average 154.4 PJ, but vary
from 73.2 to 224.2 PJ. This variation is due to the crop pro-
duction and especially due to the yield variation in different
years, while the crop area is rather constant. Better farming
practices and the use of new plant varieties, resistant to
adverse climate conditions and drought might reduce this
variability. A significant non-uniform regional distribution of
the available agricultural biomass was revealed. The large
variation of agricultural crop residues between counties is
mainly due to the differences in crop area, but also due to yield
variation between different regions. Thus, most of the annual
crop residues are available in the counties from the Southern
Plain (Calarasi, Constanta, Teleorman, Dolj, Ialomita, Olt,
Braila) and from the West plain (Timis), while residues from
permanent crops are only available in a few counties from
hilly areas (Vrancea, Arges, Dambovita, Iasi). The distribution
of agricultural residues in the country is shown in Fig. 4.
3.2. Availability of woody biomass resources
The estimation of annual woody biomass available is 3.8 Mt
dry/year on average, varying within a range of 3.2e5.0 Mt dry/
year. The bioenergy related potential of available woody
biomass was estimated at 73.7 PJ/year, from 62.4 to
95.8 PJ/year. This data represents the amount that can actually
be used at the present for bioenergy and not the theoretical
potential related to the biomass increment in forests. In
comparison, the theoretical potential according to the total
biomass increment in Romanian forests is around 332 PJ. If
forest harvesting will increase from the current share of 45%
of annual increment (thus “under harvested”), to a higher rate
(70e80% in Nordic countries), the availability of wood residues
0
2
4
6
8
10
12
Alb
aA
rad
Arg
esB
acau
Bih
orB
istr
ita-
Bot
osan
iB
raso
vB
raila
Buz
auC
aras
-Sev
erin
Cal
aras
iC
luj
Con
stan
taC
ovas
naD
ambo
vita
Dol
jG
alat
iG
iurg
iuG
orj
Har
ghita
Hun
edoa
raIa
lom
ita Iasi
Ilfo
vM
aram
ures
Meh
edin
tiM
ures
Nea
mt
Olt
Prah
ova
Satu
Mar
eSa
laj
Sibi
uSu
ceav
aT
eleo
rman
Tim
isT
ulce
aV
aslu
iV
alce
aV
ranc
ea
Ave
rage
res
ourc
es [
PJ/y
ear]
Permanent crop residues Annual crop residues Forestry residues Firewood Wood processing residues
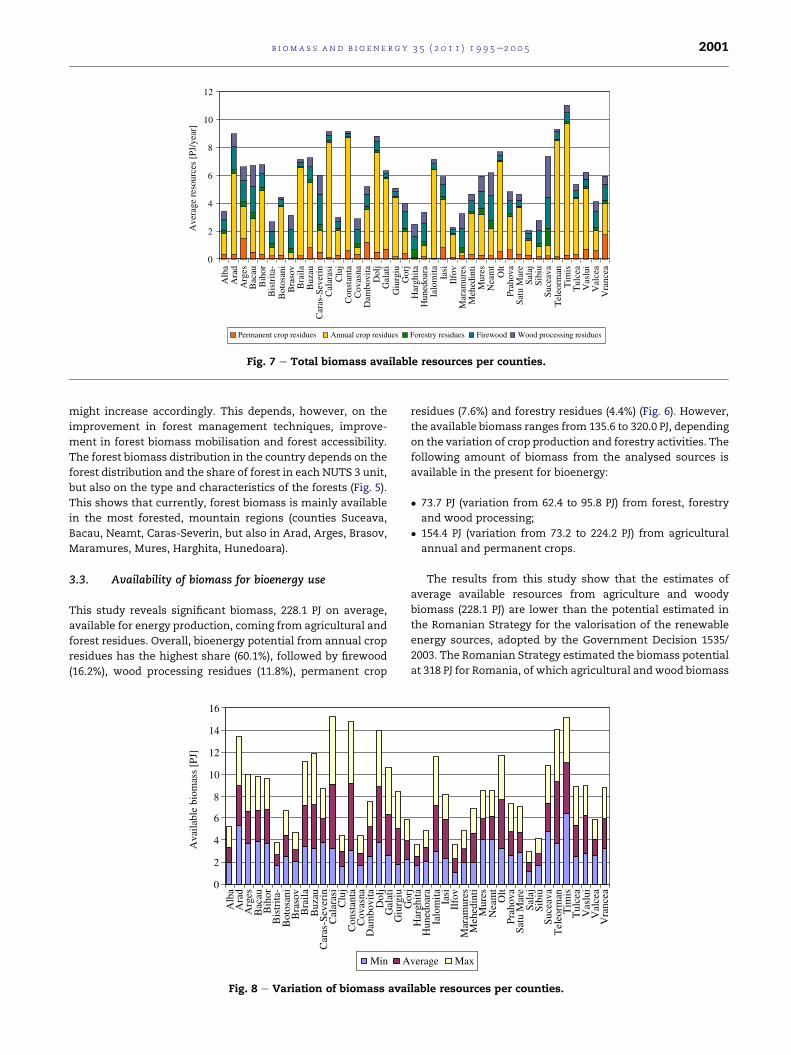
Fig. 7 e Total biomass available resources per counties.
b i om a s s a n d b i o e n e r g y 3 5 ( 2 0 1 1 ) 1 9 9 5e2 0 0 5 2001
might increase accordingly. This depends, however, on the
improvement in forest management techniques, improve-
ment in forest biomass mobilisation and forest accessibility.
The forest biomass distribution in the country depends on the
forest distribution and the share of forest in each NUTS 3 unit,
but also on the type and characteristics of the forests (Fig. 5).
This shows that currently, forest biomass is mainly available
in the most forested, mountain regions (counties Suceava,
Bacau, Neamt, Caras-Severin, but also in Arad, Arges, Brasov,
Maramures, Mures, Harghita, Hunedoara).
3.3. Availability of biomass for bioenergy use
This study reveals significant biomass, 228.1 PJ on average,
available for energy production, coming from agricultural and
forest residues. Overall, bioenergy potential from annual crop
residues has the highest share (60.1%), followed by firewood
(16.2%), wood processing residues (11.8%), permanent crop
0
2
4
6
8
10
12
14
16
Alb
aA
rad
Arg
esB
acau
Bih
orB
istr
ita-
Bot
osan
iB
raso
vB
raila
Buz
auC
aras
-Sev
erin
Cal
aras
iC
luj
Con
stan
taC
ovas
naD
ambo
vita
Dol
jG
alat
iG
iurg
iu
Ava
ilabl
e bi
omas
s [P
J]
Min A
Fig. 8 e Variation of biomass ava
residues (7.6%) and forestry residues (4.4%) (Fig. 6). However,
the available biomass ranges from 135.6 to 320.0 PJ, depending
on the variation of crop production and forestry activities. The
following amount of biomass from the analysed sources is
available in the present for bioenergy:
� 73.7 PJ (variation from 62.4 to 95.8 PJ) from forest, forestry
and wood processing;
� 154.4 PJ (variation from 73.2 to 224.2 PJ) from agricultural
annual and permanent crops.
The results from this study show that the estimates of
average available resources from agriculture and woody
biomass (228.1 PJ) are lower than the potential estimated in
the Romanian Strategy for the valorisation of the renewable
energy sources, adopted by the Government Decision 1535/
2003. The Romanian Strategy estimated the biomass potential
at 318 PJ for Romania, of which agricultural andwood biomass
Gor
jH
argh
itaH
uned
oara
Ialo
mita Iasi
Ilfo
vM
aram
ures
Meh
edin
tiM
ures
Nea
mt
Olt
Prah
ova
Satu
Mar
eSa
laj
Sibi
uSu
ceav
aT
eleo
rman
Tim
isT
ulce
aV
aslu
iV
alce
aV
ranc
ea
verage Max
ilable resources per counties.
0.0
0.5
1.0
1.5
2.0
2.5
3.0
Alb
aA
rad
Arg
esB
acau
Bih
orB
istr
ita-
Bot
osan
iB
raso
vB
raila
Buz
auC
aras
-Sev
erin
Cal
aras
iC
luj
Con
stan
taC
ovas
naD
ambo
vita
Dol
jG
alat
iG
iurg
iuG
orj
Har
ghita
Hun
edoa
raIa
lom
ita Iasi
Ilfo
vM
aram
ures
Meh
edin
tiM
ures
Nea
mt
Olt
Prah
ova
Satu
Mar
eSa
laj
Sibi
uSu
ceav
aT
eleo
rman
Tim
isT
ulce
aV
aslu
iV
alce
aV
ranc
ea
Bio
mas
s de
nsity
[T
J/km
2]
Min Average Max
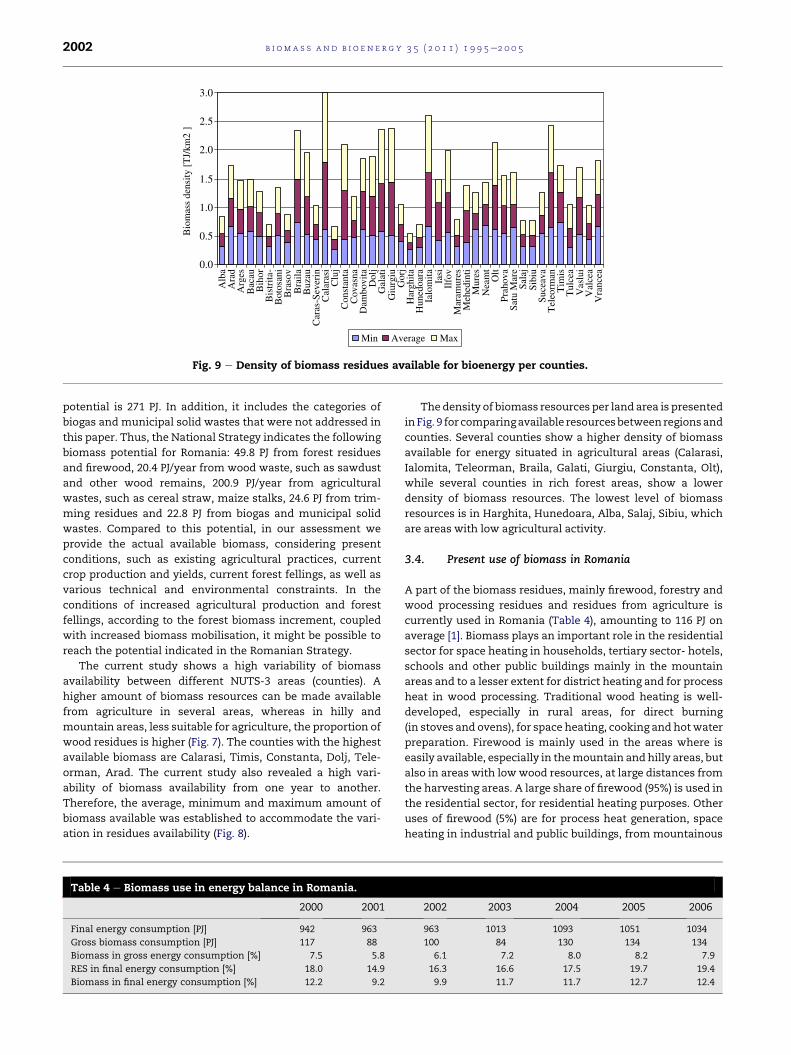
Fig. 9 e Density of biomass residues available for bioenergy per counties.
b i om a s s an d b i o e n e r g y 3 5 ( 2 0 1 1 ) 1 9 9 5e2 0 0 52002
potential is 271 PJ. In addition, it includes the categories of
biogas and municipal solid wastes that were not addressed in
this paper. Thus, the National Strategy indicates the following
biomass potential for Romania: 49.8 PJ from forest residues
and firewood, 20.4 PJ/year from wood waste, such as sawdust
and other wood remains, 200.9 PJ/year from agricultural
wastes, such as cereal straw, maize stalks, 24.6 PJ from trim-
ming residues and 22.8 PJ from biogas and municipal solid
wastes. Compared to this potential, in our assessment we
provide the actual available biomass, considering present
conditions, such as existing agricultural practices, current
crop production and yields, current forest fellings, as well as
various technical and environmental constraints. In the
conditions of increased agricultural production and forest
fellings, according to the forest biomass increment, coupled
with increased biomass mobilisation, it might be possible to
reach the potential indicated in the Romanian Strategy.
The current study shows a high variability of biomass
availability between different NUTS-3 areas (counties). A
higher amount of biomass resources can be made available
from agriculture in several areas, whereas in hilly and
mountain areas, less suitable for agriculture, the proportion of
wood residues is higher (Fig. 7). The counties with the highest
available biomass are Calarasi, Timis, Constanta, Dolj, Tele-
orman, Arad. The current study also revealed a high vari-
ability of biomass availability from one year to another.
Therefore, the average, minimum and maximum amount of
biomass available was established to accommodate the vari-
ation in residues availability (Fig. 8).
Table 4 e Biomass use in energy balance in Romania.
2000 2001
Final energy consumption [PJ] 942 963
Gross biomass consumption [PJ] 117 88
Biomass in gross energy consumption [%] 7.5 5.8
RES in final energy consumption [%] 18.0 14.9
Biomass in final energy consumption [%] 12.2 9.2
The density of biomass resources per land area is presented
inFig. 9 for comparingavailable resourcesbetweenregionsand
counties. Several counties show a higher density of biomass
available for energy situated in agricultural areas (Calarasi,
Ialomita, Teleorman, Braila, Galati, Giurgiu, Constanta, Olt),
while several counties in rich forest areas, show a lower
density of biomass resources. The lowest level of biomass
resources is in Harghita, Hunedoara, Alba, Salaj, Sibiu, which
are areas with low agricultural activity.
3.4. Present use of biomass in Romania
A part of the biomass residues, mainly firewood, forestry and
wood processing residues and residues from agriculture is
currently used in Romania (Table 4), amounting to 116 PJ on
average [1]. Biomass plays an important role in the residential
sector for space heating in households, tertiary sector- hotels,
schools and other public buildings mainly in the mountain
areas and to a lesser extent for district heating and for process
heat in wood processing. Traditional wood heating is well-
developed, especially in rural areas, for direct burning
(in stoves and ovens), for space heating, cooking and hotwater
preparation. Firewood is mainly used in the areas where is
easily available, especially in themountain and hilly areas, but
also in areas with lowwood resources, at large distances from
the harvesting areas. A large share of firewood (95%) is used in
the residential sector, for residential heating purposes. Other
uses of firewood (5%) are for process heat generation, space
heating in industrial and public buildings, from mountainous
2002 2003 2004 2005 2006
963 1013 1093 1051 1034
100 84 130 134 134
6.1 7.2 8.0 8.2 7.9
16.3 16.6 17.5 19.7 19.4
9.9 11.7 11.7 12.7 12.4
-4
-2
0
2
4
6
8
10
12
Alb
aA
rad
Arg
esB
acau
Bih
orB
istr
ita-
Bot
osan
iB
raso
vB
raila
Buz
auC
aras
-Sev
erin
Cal
aras
iC
luj
Con
stan
taC
ovas
naD
ambo
vita
Dol
jG
alat
iG
iurg
iuG
orj
Har
ghita
Hun
edoa
raIa
lom
ita Iasi
Ilfo
vM
aram
ures
Meh
edin
tiM
ures
Nea
mt
Olt
Prah
ova
Satu
Mar
eSa
laj
Sibi
uSu
ceav
aT
eleo
rman
Tim
isT
ulce
aV
aslu
iV
alce
aV
ranc
ea
Unu
sed
biom
ass
[PJ]
Min Average Max
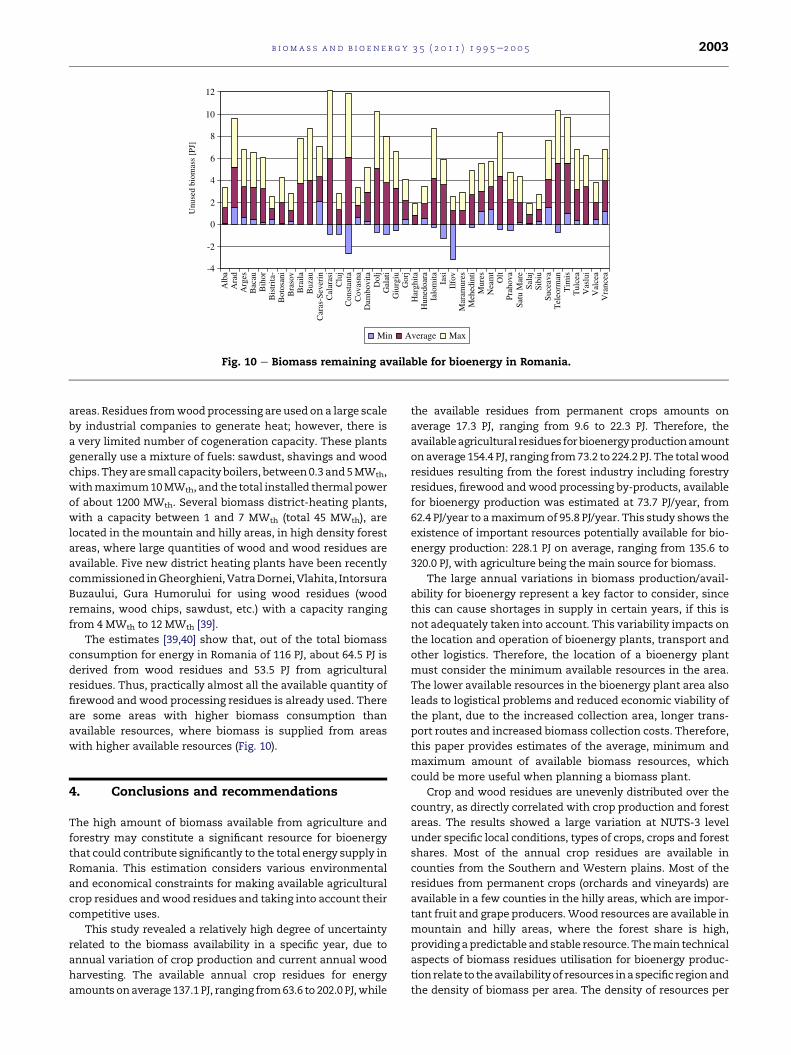
Fig. 10 e Biomass remaining available for bioenergy in Romania.
b i om a s s a n d b i o e n e r g y 3 5 ( 2 0 1 1 ) 1 9 9 5e2 0 0 5 2003
areas. Residues fromwoodprocessing are used on a large scale
by industrial companies to generate heat; however, there is
a very limited number of cogeneration capacity. These plants
generally use a mixture of fuels: sawdust, shavings and wood
chips. They are small capacity boilers, between0.3 and5MWth,
withmaximum10MWth, and the total installed thermal power
of about 1200 MWth. Several biomass district-heating plants,
with a capacity between 1 and 7 MWth (total 45 MWth), are
located in the mountain and hilly areas, in high density forest
areas, where large quantities of wood and wood residues are
available. Five new district heating plants have been recently
commissioned inGheorghieni, VatraDornei,Vlahita, Intorsura
Buzaului, Gura Humorului for using wood residues (wood
remains, wood chips, sawdust, etc.) with a capacity ranging
from 4 MWth to 12 MWth [39].
The estimates [39,40] show that, out of the total biomass
consumption for energy in Romania of 116 PJ, about 64.5 PJ is
derived from wood residues and 53.5 PJ from agricultural
residues. Thus, practically almost all the available quantity of
firewood and wood processing residues is already used. There
are some areas with higher biomass consumption than
available resources, where biomass is supplied from areas
with higher available resources (Fig. 10).
4. Conclusions and recommendations
The high amount of biomass available from agriculture and
forestry may constitute a significant resource for bioenergy
that could contribute significantly to the total energy supply in
Romania. This estimation considers various environmental
and economical constraints for making available agricultural
crop residues andwood residues and taking into account their
competitive uses.
This study revealed a relatively high degree of uncertainty
related to the biomass availability in a specific year, due to
annual variation of crop production and current annual wood
harvesting. The available annual crop residues for energy
amounts onaverage 137.1 PJ, ranging from63.6 to 202.0 PJ,while
the available residues from permanent crops amounts on
average 17.3 PJ, ranging from 9.6 to 22.3 PJ. Therefore, the
availableagricultural residues forbioenergyproductionamount
onaverage 154.4 PJ, ranging from73.2 to 224.2 PJ. The totalwood
residues resulting from the forest industry including forestry
residues, firewood and wood processing by-products, available
for bioenergy production was estimated at 73.7 PJ/year, from
62.4 PJ/year to amaximumof 95.8 PJ/year. This study shows the
existence of important resources potentially available for bio-
energy production: 228.1 PJ on average, ranging from 135.6 to
320.0 PJ, with agriculture being the main source for biomass.
The large annual variations in biomass production/avail-
ability for bioenergy represent a key factor to consider, since
this can cause shortages in supply in certain years, if this is
not adequately taken into account. This variability impacts on
the location and operation of bioenergy plants, transport and
other logistics. Therefore, the location of a bioenergy plant
must consider the minimum available resources in the area.
The lower available resources in the bioenergy plant area also
leads to logistical problems and reduced economic viability of
the plant, due to the increased collection area, longer trans-
port routes and increased biomass collection costs. Therefore,
this paper provides estimates of the average, minimum and
maximum amount of available biomass resources, which
could be more useful when planning a biomass plant.
Crop and wood residues are unevenly distributed over the
country, as directly correlated with crop production and forest
areas. The results showed a large variation at NUTS-3 level
under specific local conditions, types of crops, crops and forest
shares. Most of the annual crop residues are available in
counties from the Southern and Western plains. Most of the
residues from permanent crops (orchards and vineyards) are
available in a few counties in the hilly areas, which are impor-
tant fruit and grape producers.Wood resources are available in
mountain and hilly areas, where the forest share is high,
providing apredictable and stable resource. Themain technical
aspects of biomass residues utilisation for bioenergy produc-
tionrelate to theavailabilityof resources ina specific regionand
the density of biomass per area. The density of resources per

b i om a s s an d b i o e n e r g y 3 5 ( 2 0 1 1 ) 1 9 9 5e2 0 0 52004
area is a key factor, determining the collection radius of the
biomass and the cost of collection, which is an important
limiting factor. A combination of a high plant capacity and low
density of biomass increases the transport capacity and road
traffic, which can be limited in some areas by the local road
infrastructure. A solution to solve this problem is the diversifi-
cation of biomass feedstock to reduce the collection distance
and compensate for yield variability. The setting up of a bio-
energyplantdependsultimatelyontheresourceavailabilitybut
it should meanwhile match the energy (heat) demand in that
area. Thus, the plant location is amatter of optimisation, as the
energy demand and biomass supply issue influence the logis-
tics of the plant, the biomass collection distance and transport
costs.
A part of the biomass residues available, mainly firewood,
forestry and wood processing residues and residues from agri-
culture is currently used in Romania. Thus, it is estimated that
54% of energy production from biomass is presently derived
fromwoodresiduesand46% isderived fromagriculturalwastes
and residues [38,39,41]. Almost all of the available firewood and
wood residue is already used in Romania. A large part of the
biomass isused inhouseholds, instovesandkilns,with lowfuel
efficiency. There is large amount of biomass available still
unused. Biomass could be better used in cogeneration, district
heating plants, in advanced systems, which are already avail-
able on the market, operating with high efficiency. Small
capacity plantswill make better, more effective use of the local
resources and thus would limit the total biomass required and
better match supply with demand. A more detailed analysis at
the local level will decide on the exact location of the plant
based on the resources available in that area.
This study was performed as a technical input to the
preparation of the National Renewable Action Plan of
Romania within the framework of the Directive 2009/28/EC on
the promotion of the use of energy from renewable sources.
r e f e r e n c e s
[1] National Institute of Statistics http://www.insse.ro/cms/rw/pages/index.ro.do.
[2] Romania. National renewable energy action plan inaccordance with Directive 2009/28/EC on the promotion ofthe use of energy from renewable sources; 2010.
[3] National Forest Administration http://www.rosilva.ro/categorie.php?id¼4
[4] Edwards R, �Suri M, Huld T, Dallemand JF. GIS-basedassessment of cereal straw energy resource in the EU. 14thEuropean biomass for energy industry & climate protectionconference, Paris; 2005.
[5] Summers MD, Jenkins BM. Biomass production andallocation in rice with implications for straw harvesting andutilization. Biomass Bioenergy 2003;24:163e73.
[6] Hamelinck C, van den Broek R, Rice B, Gilbert A, Ragwitz M,Toro F. Liquid biofuels strategy study for ireland, reportprepared for sustainable energy Ireland; 2004.
[7] Panoutsou C, Labalette F. Cereals straw for bioenergy andcompetitive uses, Proceedings of the cereals straw resourcesfor bioenergy in the European Union, Pamplona, 18e19October 2006.
[8] Patterson PE, Makus L, Momont P, Robertson L. Theavailability, alternative uses and value of straw in Idaho,
final report of the Project BD-K251. Idaho WheatCommission; 1995.
[9] Walsh ME, Perlack RL, Turhollow A, de la Torre Ugarte D,Becker DA, Graham RL, et al. Biomass feedstock availabilityin the US; 1999. State Level Analysis.
[10] Nelson RG. Resource assessment and removal analysis forcorn stover and wheat straw in the Eastern and MidwesternUnited States. Biomass Bioenergy 2002;22:349e63.
[11] Ericsson K. and Nilsson L.J. Assessment of the potentialbiomass supply in Europe using a resource focussedapproach, Lund University Gerdagatan 13, S-223 62 Lund,Sweden.
[12] Wilhelm W, Johnson JMF, Hatfield JL, Voorhees WB,Linden DR. Crop and soil productivity response to cornresidue removal: a literature review. Agron J 2004;96:1e17.
[13] USDA-NRCS. White paper crop residue removal for biomassenergy production: effects on soils and recommendations;2006.
[14] Johnson JMF, Allmaras RR, Reicosky DC. Estimating sourcecarbon from crop residues, roots and rhizodeposits using thegrain-yield database. Agron J 2006;98:622e36.
[15] Kadam KL, McMillan JD. Availability of corn stover asa sustainable feedstock for bioethanol production. BioresourTechnol 2003;88:17e25.
[16] Graham RL, Nelson R, Sheehan J, Perlack RD, Wright LL.Current and potential U.S. corn stover supplies. Agron J 2007;99:1e11.
[17] Lee C. and Grove J. Straw yields from six small grain varieties2003e2004 and 2004e2005 growing seasons, University ofKentucky.
[18] Diamantidis ND, Koukios G. Agricultural crops and residuesas feedstocks for non-food products in Western Europe. IndCrops Prod; 2000:97e106.
[19] Koukios EG. Agriculture as a source of biomass in WesternEurope, report for biomass for greenhouse gas emissionreduction (BRED) project; 1998.
[20] Katterer T, Andren O, Persson J. The impact of alteredmanagement on long-term agricultural soil carbon stocks-a Swedish case study. Nutrient Cycling in Agroecosystems2004;70:179e87.
[21] Gallagher P., Dikeman M., Fritz J., Wailes E., Gauther W.,Shapouri H. Biomass from crop residues: cost and supplyestimates, AER-819.
[22] Sokhansanj S, Turhollow A, Cushman J, Cundiff J.Engineering aspects of collecting corn stover for bioenergy.Biomass Bioenergy 2002;23:347e55.
[23] Aboudrare A, Debaeke P, Bouaziz A, Chekli H. Effects of soiltillage and fallow management on soil water storage andsun-flower production in a semi-arid Mediterranean climate.Agr Water Manag 2006;83:183e96.
[24] Petersen CT, Jørgensen U, Svendsen H, Hansen S, Jensen HE,Nielsen NE. Parameter assessment for simulation of biomassproduction and nitrogen uptake in winter rape. Eur. J. Agron1995;4:77e89.
[25] Rathke GW, Christen O, Diepenbrock W. Effects of nitrogensource and rate on productivity and quality of winter oilseedrape grown in different crop rotations. Field Crop Res 2005;94:103e13.
[26] Rinaldi M, Losavio N, Flagella Z. Evaluation and applicationof the oilcropesun model for sunflower in southern Italy.Agric Syst 2003;78:17e30.
[27] Soriano MA, Orgaz F, Villalobos FJ, Fereres E. Efficiency ofwater use of early plantings of sunflower. Eur. J. Agron 2004;21:465e76.
[28] Van der Sluis E, Shane R, Stearns L. Local biomass feedstocksavailability for fuelling ethanol production. Biofuels, foodand feed tradeoffs conference, April 12e13, 2007, St. Louis,Missouri; 2007.
b i om a s s a n d b i o e n e r g y 3 5 ( 2 0 1 1 ) 1 9 9 5e2 0 0 5 2005
[29] Glassner DA, Hettenhaus JR, Schechinger TM. Corn stovercollection project, BioEnergy’98: expanding BioEnergypartnerships; 1998.
[30] Powlson D., Using straw for energy-implications for soils &agriculture, Workshop Proceedings cereals straw andagricultural residues for bioenergy in New Member Statesand Candidate countries, Novi Sad, 2e3 Oct. 2007.
[31] Rps-Mcos. An assessment of the renewable energy resourcepotential of dry agricultural residues in and, Report forSustainable Energy Ireland; 2004.
[32] Tuyttens FAM. The importance of straw for pig and cattlewelfare: a review. Appl Anim Behav Sci 2005;92:261e82.
[33] Esteban LS, Ciria P, Carrasco JE. An assessment of relevantmethodological elements and criteria for surveyingsustainable agricultural and forestry biomass byproducts forenergy purposes. Bioresources 2008;3:910e28.
[34] Nikolaou A, Lychanaras V, Panoutsou C. Characteristics andgeographical distribution of agricultural residues for energyproduction in Greece, 12th European conference of biomassfor energy, industry and climate protection, Amsterdam;17e21 June 2002.
[35] Di Blasi C, Tanzi V, Lanzetta M. A study on the production ofagricultural residues in Italy. Biomass Bioenergy 1997;12:321e31.
[36] Jolli D, Giljum S. Unused biomass extraction in agriculture,forestry and fishery, Seri Report Nr. 3; 2005.
[37] Blujdea V. Contribution of wood to the national energysecurity e structure and evolution of wood consumption inRomania, Forest Research and Management Institute Report;2008.
[38] Scarlat N, Mihai M. Research and experiments for woodresidues and biomass use for energy production, ReportS4-12-97; 1997.
[39] Ionescu L. Renewable energy sources: a continuouschallenge for Romania. Timisoara: Modern Wood EnergySystems and Markets; 16e17 September 2008.
[40] Tantareanu C. Country survey-Romania, ERA bioenergystrategy e short term measures to develop the Europeanresearch area for bioenergy RTD, AG Meeting; 7 October 2002.
[41] Scarlat N. Romanian energy situation and biofuel market,international workshop wood fuel e an energy source fortomorrow’s Europe,May, 18e19th; 2004. Pamporovo, Bulgaria.