assessment of human influenza pandemic scenarios in europe
TRANSCRIPT
1www.eurosurveillance.org
Review articles
Assessment of human influenza pandemic scenarios in Europe
C Napoli1, M Fabiani1, C Rizzo ([email protected])1, M Barral2, J Oxford3, J M Cohen4, L Niddam5, P Goryński6, A Pistol7, C Lionis8, S Briand9, A Nicoll10, P Penttinen10, C Gauci11, A Bounekkar12, S Bonnevay12, A Beresniak13
1. Istituto Superiore di Sanità (ISS), Rome, Italy2. Basque Institute for Agricultural Research and Development, Biscay, Spain3. Retroscreen Virology, London, United Kingdom4. Open Rome, Paris, France5. Niddam European Community Lawyer, Budapest, Hungary6. Polish National Institute of Public Health, Warsaw, Poland7. Romanian National Institute of Public Health, Bucharest, Romania8. University of Crete, Crete, Greece9. World Health Organization (WHO), Geneva, Switzerland10. European Centre for Disease Prevention and Control (ECDC), Stockholm, Sweden11. Ministry of Health, Elderly and Community Care, Valletta, Malta12. Université Claude Bernard Lyon 1, Lyon, France13. Université Paris Descartes, Paris, France
Citation style for this article: Napoli C, Fabiani M, Rizzo C, Barral M, Oxford J, Cohen JM, Niddam L, Goryński P, Pistol A, Lionis C, Briand S, Nicoll A, Penttinen P, Gauci C, Bounekkar A, Bonnevay S, Beresniak A. Assessment of human influenza pandemic scenarios in Europe. Euro Surveill. 2015;20(7):pii=21038. Available online: http://www.eurosurveillance.org/ViewArticle.aspx?ArticleId=21038
Article submitted on 08 January 2014 / published on 19 February 2015
The response to the emergence of the 2009 influenza A(H1N1) pandemic was the result of a decade of pan-demic planning, largely centred on the threat of an avian influenza A(H5N1) pandemic. Based on a litera-ture review, this study aims to define a set of new pan-demic scenarios that could be used in case of a future influenza pandemic. A total of 338 documents were identified using a searching strategy based on seven combinations of keywords. Eighty-three of these docu-ments provided useful information on the 13 virus-related and health-system-related parameters initially considered for describing scenarios. Among these, four parameters were finally selected (clinical attack rate, case fatality rate, hospital admission rate, and intensive care admission rate) and four different levels of severity for each of them were set. The definition of six most likely scenarios results from the combina-tion of four different levels of severity of the four final parameters (256 possible scenarios). Although it has some limitations, this approach allows for more flex-ible scenarios and hence it is far from the classic sce-narios structure used for pandemic plans until 2009.
IntroductionBefore the 2009 influenza A(H1N1) pandemic, most European Union (EU) Member States had developed preparedness plans in order to timely respond to an eventual pandemic. Many of these plans involve explicit or implicit planning assumptions on what can be expected during a pandemic and on how a pan-demic virus might behave [1].
The response to the emergence of the 2009 influ-enza A(H1N1) pandemic was the result of a decade of
pandemic planning, largely centred on the threat of an avian influenza A(H5N1) pandemic. However, the influenza A(H5N1) and the 2009 pandemic influenza A(H1N1) viruses have markedly different characteris-tics in terms of mortality among confirmed cases and human-to-human transmission [2,3]. Moreover, the 2009 pandemic influenza A(H1N1) virus caused illness that did not require hospitalisation in the vast majority of cases, and was a highly transmissible virus among humans spreading to several countries within days [3,4].
In this situation, the severity assessment applied dur-ing the 2009 influenza A(H1N1) pandemic using a vari-ety of indicators leading to a qualitative assessment in three levels (i.e. mild, moderate and severe) was not specific enough to guide interventions [5,6].
After the pandemic, the International Health Regulations (IHR) Pandemic Review Committee encour-aged the World Health Organization (WHO) to develop and utilise measures to assess the severity of every influenza epidemic by applying, evaluating and refin-ing tools to measure severity every year [7]. WHO has recently developed a new document for Pandemic Influenza Risk Management [8].
The 2009 influenza pandemic highlighted the impor-tance of quantitatively defining different scenarios; severity should be assessed as early as possible dur-ing a pandemic and continually re-assessed as the pan-demic evolves and new information becomes available.

2 www.eurosurveillance.org
This work has been conducted in the frame of the European Commission project FLURESP (Cost-effectiveness assessment of European influenza human pandemic alert and response strategies) with the aim to define a set of scenarios to be used for a future pandemic planning (www.fluresp.eu).
Methods
Literature review and selection of parametersThe literature search was conducted by consult-ing Medline, restricting it to articles published until December 2011. Seven different sets of keywords were considered (Table 1).
A systematic selection procedure was conducted in two steps by two researchers independently. In the first step, the major topics of the articles were assessed by title and abstract. In this phase of the selection pro-cedure, all articles reporting epidemiological data on influenza pandemics were included. In case of doubt on the article’s relevant information, the article was included in the second selection step.
In the second step, the full text articles, previously selected , were assessed. These articles were included in the review if they reported at least one of the fol-lowing 13 parameters: basic reproductive number (R0); clinical attack rate (CAR); age-specific CAR; case fatal-ity rate (CFR); communicability/generation interval; modes of transmission; incubation period; timing and duration of pandemic; clinical consultation rate (CCR); hospital admission rate (HAR); intensive care admis-sion rate (ICAR); work absenteeism; bed occupancy rate (BOR). If the articles included did not contain
information on at least one of the parameters listed above or if the study design was of low quality (e.g. small sample size, unclear definition of outcomes), they were excluded. Moreover, pertinent related cita-tions were considered.
Of each article included in the review, the following data were recorded: year of the study, year of pan-demic referring to, country, and described parameters.
International technical reports were obtained by con-sulting the websites of the European Centre for Disease Prevention and Control (ECDC) and WHO. Influenza pandemic preparedness plans for the European Union/European Economic Area (EU/EEA) countries were obtained from the ECDC website [9]. We also consid-ered relevant studies based on mathematical mod-elling published in the literature but not retrieved through the search strategy.
Parameters collected through the literature review were subsequently discussed within the FURESP Project by a panel of experts composed of collaborators from inter-national (WHO and ECDC) and national public health organisations (from France, Italy, Spain and the United Kingdom) who selected the parameters to be used for defining scenarios.
Definition of severity profiles and scenariosFor each of the selected parameters, four severity pro-files were defined. In order to set the profiles, ranges of variability for each of the parameters were catego-rised into a four-group scale, according to a quartile distribution. We then adjusted the ranges for each of the four groups, according to the suggestions made by the panel of experts. Based on the possible combi-nation of the four severity profiles of each of the four parameters, a set of scenarios were defined.
Results
Parameters selectedFrom the literature review we collected information on 13 parameters as potential candidates for defining the pandemic scenario. These parameters were divided into eight virus-related (R0; CAR; age-specific CAR; CFR; communicability/generation interval; modes of transmission; incubation period; timing and duration of pandemic) and five health-system-related (CCR; HAR; ICAR; work absenteeism; BOR).
The panel of experts was of the opinion that some of the parameters collected through the literature review were more relevant for mathematical modelling than for public health purposes, and others were considered less relevant for defining scenarios; consequently, all these were excluded: R0; age-specific CAR; communica-bility/generation interval; modes of transmission; incu-bation period; timing and duration of pandemic. For example, R0 (the average number of secondary infec-tions produced by a single infected individual while
Table 1Sets of keywords used in searching scientific articles and number of articles retrieved for the study on pandemic influenza scenarios in Europe
Sets of keywords Original articles Reviews Total
‘Human influenza pandemic description’ 20 6 26
‘Influenza outbreak parameters estimation’ 7 0 7
‘Influenza scenario description’ 2 0 2
‘Influenza pandemic scenario’ 88 15 103
‘Influenza pandemic scenario description’ 2 0 2
‘Influenza pandemic parameter estimation’ 3 0 3
‘Influenza pandemic investigation’ 148 22 170
Total 270 43 313
The search was restricted to articles published until December 2011.

3www.eurosurveillance.org
they are infectious, in an entirely susceptible popula-tion), incubation period, and the generation interval (defined as the mean duration between time of infec-tion of a secondary infected individual and the time of infection of their primary infector), are measures of the degree of transmissibility of an infection and in combi-nation might affect CAR. Age-specific CAR in most of the considered influenza pandemics were derived from studies conducted in small and selected communi-ties not representative of the entire population, while the timing and duration of pandemic is expected to be from several weeks to a few months but will likely vary from country to country or within a single coun-try. Therefore, these parameters were not considered in this study. Additionally, the contribution and clinical importance of potentially different modes of transmis-sion of influenza are unknown and therefore were con-sidered not relevant.
Thus, according to the opinion of the panel of experts, four parameters were selected to be used for defining scenarios for pandemic planning. The two virus-related parameters are listed below with their limitations:
• CAR, the proportion of the population with clinical symptoms over a specified period of time. Some individuals may not develop symptoms severe enough to be readily identified as acute respira-tory infection (ARI) or influenza-like-illness (ILI). The measured CAR is thus not always the number of individuals who actually develop symptoms, and
may also include the number of individuals seek-ing healthcare.
• CFR, represented by the proportion of individuals who develop influenza symptoms, and die because of complications. The measured CFR could be affected by the laboratory confirmation that may be unavailable to validate the total number of cases. Moreover, the confirmation is likely biased to more severe cases. This results in an overesti-mation of the clinical severity of the disease, espe-cially in case of people with underlying conditions that are at higher risk of death.
The health-system-related parameters deal with viru-lence (i.e. the ability of the virus to invade the tissues of the host and produce pathologic effects and com-plications) and impact (i.e. the effect on the health-care sector) of the virus on the population. The most relevant health-system-resource utilisation parameters used to define pandemic scenarios are listed below with their limitations:
• HAR, represented by the proportion of population hospitalised for confirmed influenza independently from the presence of complications. This measure is strongly affected by how the healthcare systems in different countries are structured.
• ICAR, the proportion of hospitalisations for con-firmed influenza that are treated in an intensive care unit (ICU) for influenza complications.
The ICAR could also be related to the level of virulence of the virus, since it is a proxy for the level of severity.
Literature reviewA total of 338 documents (including technical reports and scientific articles and reviews) were identified using our search strategy with the seven sets of key-words. Of these, 17 were duplicated articles and 238 showed no relevant information on the selected parameters (Figure 1). In conclusion, 83 articles and documents reporting information on the parameters listed above were considered for this study.
The year of publication of these documents ranges from 2003 to 2011 with more than half of the documents pub-lished between 2009 and 2010. When evaluating the performance of keywords’ combinations selected, 26% (83/321) of the detected documents provided useful information on the parameters for defining scenarios. The largest number of documents was detected using three sets of keywords (293/321, 91%) (Table 1).
The keywords combination ‘human influenza pandemic description’ provided the highest proportion of useful documents (10/28, 36%).
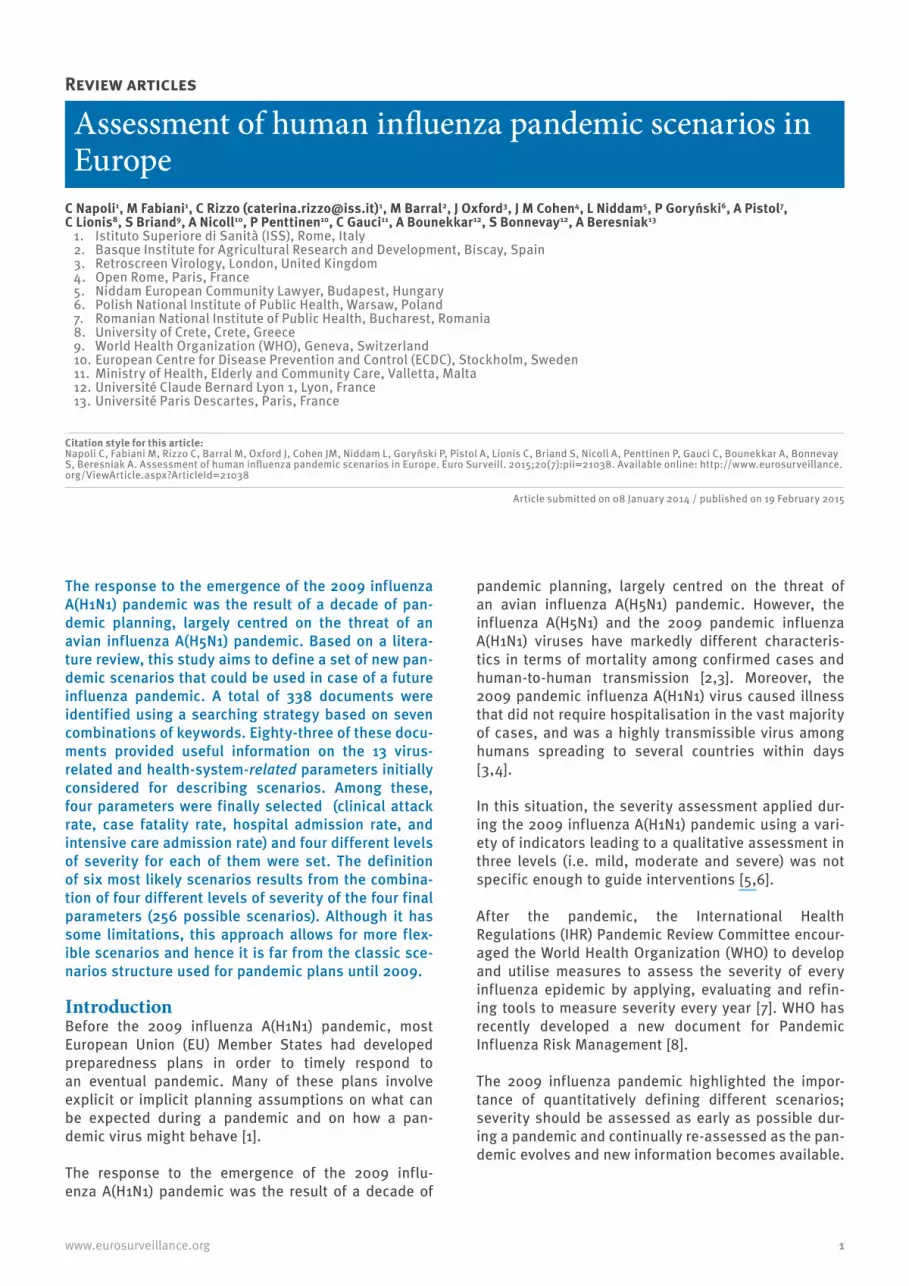
The range estimates for the parameters derived from the 83 selected documents and their specific refer-ences are listed in Table 2.
Figure 1Flowchart outlining the selection of documents for the study on pandemic influenza scenarios in Europe
The search was restricted to articles published until December 2011.
Documents detected using seven combinations of keywords (n=338)
•Most relevant official reports (n=327)•References detected indirectly (n=4)•Related articles in PubMed (n=7)
Documents with no relevant information
(n=238)
Duplications (n=17)
Individual documents (n=321)
Documents available with some information on the parameters of
interest (n=83)
4 www.eurosurveillance.org
Of the 83 relevant articles, 23 articles reported infor-mation on R0, with values ranging from 0.99 to 3.75. Thirty-four reported data on CAR, whose values ranged widely between 0 and 50%, while eight documents pro-vided some information on age-specific CAR. For the CFR, 30 articles showed a range between 0 and 25%. Only three articles dealt with the generation interval, whose range was 1.6–4.1 days. The duration of infec-tiousness, reported in five articles, ranged between one and 21 days. Only seven articles provided generic descriptions of possible modes of transmission: all of them reported the respiratory route by droplets of infected secretions and/or hand-face contact after touching a contaminated person or surface. The incu-bation period, described in 12 articles, ranged from 0.5 to seven days, while the pandemic duration varied from 0 to 180 days according to seven articles. Moving to health system resource utilisation parameters, CCR ranged from 14% to 73% (seven articles); HAR ranged from 0% to 27.5% (26 articles); ICAR ranged from 0% to 34% (13 articles); work absenteeism ranged from 0 to 40% (seven articles); and BOR was between 0% and 37% of total critical care bed capacity according to one article.
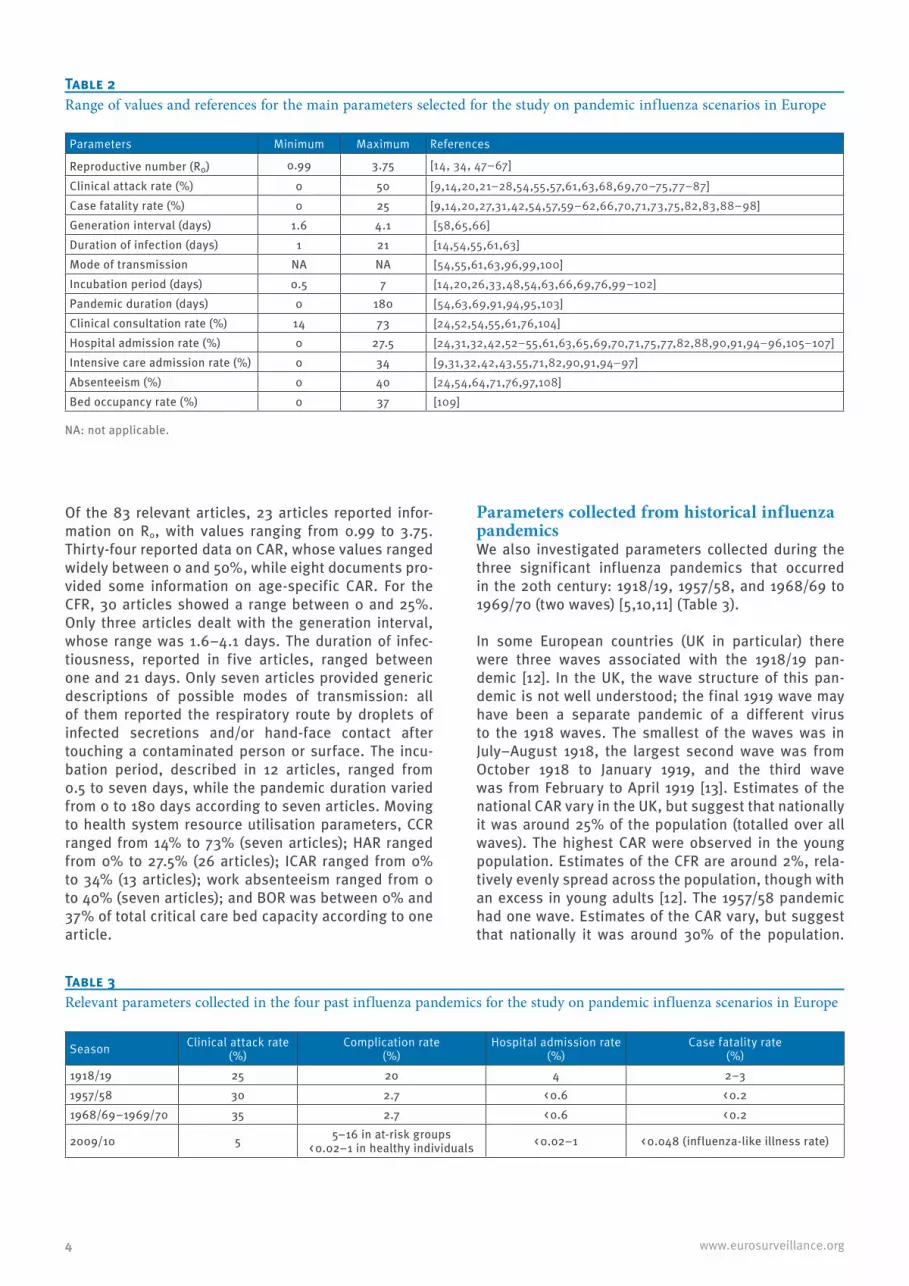
Parameters collected from historical influenza pandemicsWe also investigated parameters collected during the three significant influenza pandemics that occurred in the 20th century: 1918/19, 1957/58, and 1968/69 to 1969/70 (two waves) [5,10,11] (Table 3).
In some European countries (UK in particular) there were three waves associated with the 1918/19 pan-demic [12]. In the UK, the wave structure of this pan-demic is not well understood; the final 1919 wave may have been a separate pandemic of a different virus to the 1918 waves. The smallest of the waves was in July–August 1918, the largest second wave was from October 1918 to January 1919, and the third wave was from February to April 1919 [13]. Estimates of the national CAR vary in the UK, but suggest that nationally it was around 25% of the population (totalled over all waves). The highest CAR were observed in the young population. Estimates of the CFR are around 2%, rela-tively evenly spread across the population, though with an excess in young adults [12]. The 1957/58 pandemic had one wave. Estimates of the CAR vary, but suggest that nationally it was around 30% of the population.
Table 2Range of values and references for the main parameters selected for the study on pandemic influenza scenarios in Europe
Parameters Minimum Maximum References
Reproductive number (R0) 0.99 3.75 [14, 34, 47–67]
Clinical attack rate (%) 0 50 [9,14,20,21–28,54,55,57,61,63,68,69,70–75,77–87]Case fatality rate (%) 0 25 [9,14,20,27,31,42,54,57,59–62,66,70,71,73,75,82,83,88–98]Generation interval (days) 1.6 4.1 [58,65,66]Duration of infection (days) 1 21 [14,54,55,61,63]Mode of transmission NA NA [54,55,61,63,96,99,100]Incubation period (days) 0.5 7 [14,20,26,33,48,54,63,66,69,76,99–102]Pandemic duration (days) 0 180 [54,63,69,91,94,95,103]Clinical consultation rate (%) 14 73 [24,52,54,55,61,76,104]Hospital admission rate (%) 0 27.5 [24,31,32,42,52–55,61,63,65,69,70,71,75,77,82,88,90,91,94–96,105–107]Intensive care admission rate (%) 0 34 [9,31,32,42,43,55,71,82,90,91,94–97]Absenteeism (%) 0 40 [24,54,64,71,76,97,108]Bed occupancy rate (%) 0 37 [109]
NA: not applicable.
Season Clinical attack rate (%)
Complication rate(%)
Hospital admission rate(%)
Case fatality rate(%)
1918/19 25 20 4 2–31957/58 30 2.7 < 0.6 < 0.21968/69–1969/70 35 2.7 < 0.6 < 0.2
2009/10 5 5–16 in at-risk groups< 0.02–1 in healthy individuals < 0.02–1 < 0.048 (influenza-like illness rate)
Table 3Relevant parameters collected in the four past influenza pandemics for the study on pandemic influenza scenarios in Europe

5www.eurosurveillance.org
Estimates of the CFR are around 0.1–0.2%. These average figures mask the considerable variation by age, most deaths being in the older adult population. However, the highest number of cases was registered in the young individuals [14]. The 1968/69 pandemic came in two waves in Europe [15]. Estimates of the national CAR vary, but based on comparisons with the epidemic in the United States (US), it may have been around 35% of the population [12]. Estimates of the CFR are less than 0.2%. These average figures for mortal-ity mask the considerable variation by age, again, with most deaths recorded in the older adult population.
Parameters collected from the 2009 influenza pandemicThe recent influenza A(H1N1) pandemic in 2009/10 pro-duced no major signal of excess deaths in the overall population [16], and most of the EU countries have reported data on those that have died from confirmed 2009 pandemic influenza A(H1N1) as a result of influ-enza A(H1N1) virus infection, but case ascertainment is unlikely to have been complete, and the true number is almost certainly higher [17-19].
Rates from the ILI surveillance systems across Europe showed that consultations were highest in the young. There was only one wave, except for the UK where two ‘waves’, one immediately following the other, were observed. There were high levels of background immu-nity among elderly.
In general, estimates of the CAR for the 2009 pandemic influenza A(H1N1) vary among countries: 0.01% in the central region of Portugal [20], 0.072% in Mexico [21], 18.3% in New Zealand [22], 30% in the Netherlands [23]. Across Europe the estimated CAR was 30% [24]. This variation reflects the different methods used to get the data: e.g. seroprevalence studies, epidemio-logical studies in different populations, mathematical models, etc. Other experiences in smaller groups of population provide additional results: 3.15% in a train in China [25], 4% in a primary school in China [26], 22% on a Peruvian Navy ship [27], 28.5% during an outbreak investigation in Nepal [28].
In the UK, figures used to track the epidemic sug-gest a CAR of 1–2% and modelling studies suggest that these estimates reflect only around 10% of those infected [29], which is consistent with the results of the
serological analysis of the first wave [30]. If only half of those infected were symptomatic, although possibly with very mild symptoms (as this is typical for influ-enza), the CAR would be around 5–10%. If so, estimates of the CFR are around 0.01% [31,32], but higher levels have been reported in the literature: up to 0.05% in the US [31], 0.1% in Spain [33], and 0.35% in Europe [24], 0.6% in Mexico [34]. In terms of age groups, mortal-ity was spread evenly across the age groups although most cases were reported in the younger age groups.
Definition of severity profiles and scenariosTable 4, shows the severity profile for each of the four selected parameters derived from the literature review and selected by the suggestions of the panel of experts. With regard to CAR, the literature review reported data ranging from 0 to 50%. Nevertheless, since the maxi-mum value of 50% refers to the extreme value reported during the 1889 ‘Russian’ pandemic [13,35-39], this value was excluded and, therefore, CAR maximum value was set at 35%.
Also for CFR, from the literature review the observed values ranged from 0% to 25% (Table 2). However, some of the data collected from the literature review were estimates of CFR derived from different popula-tions (often representing high-risk groups) and source of information (mortality associated with the 2009 pandemic influenza A(H1N1) was estimated 15 times higher than reported laboratory-confirmed deaths) [40]. Moreover, when considering the influenza A(H5N1) avian influenza virus: CFR estimates reported by WHO for the ongoing outbreak is around 60% [41], even if, findings from a study based on surveillance and sero-prevalence data published in 2008, reports estimates ranging from 14 to 33% [42]. For this reason we set the maximum level of the CFR at 2.5%, as most of val-ues from recent pandemics ranged from 0.01 to 2.5% [13,14,32] (Table 3).
HAR depends on the level of virulence of the pan-demic virus. However, its estimation may be affected by access to healthcare, proportion of chronic medical conditions in the population, pregnancy, and the virus characteristics (e.g. the level of pre-existing immunity, and pathogenicity of the virus itself). In our literature
Table 4Severity profile for the selected parameters, study on pandemic influenza scenarios in Europe
Parameters Type of parameters Severity profile (%)Clinical attack rate Transmission 0–5 5–10 10–25 25–35Case fatality rate Virulence 0–0.01 0.01–0.05 0.05–0.8 0.8–2.5Hospital admission rate Use of medical
resources0–0.02 0.02–0.2 0.2–2 2–4
Intensive care admission rate 0–0.01 0.01–2.5 2.5–5 5–35
These severity profiles do not take into account any mitigation or control measures.

6 www.eurosurveillance.org
review we obtained values ranging from 0 to 27.5%. As the extreme value refer to pandemic 1918/19 in the US Army Camps¸ according to the opinions of the panel of experts set the maximum value to 4% as this value was collected in the general population [5].
For ICAR, it ranged from 0 to 35% in the literature review, and we considered the maximum of 35% as ‘reasonable worst case’ given that it was derived from an accurate evaluation of laboratory-confirmed influ-enza hospitalised cases conducted in the US [43].
Based on the above described ranges of values, it is possible to define 256 different scenarios. Among these, we selected six reasonable scenarios, accord-ing to the opinion of the panel of experts (Figure 2).
In detail, scenario A represents a ‘seasonal-like’ influ-enza outbreak; scenario B describes a situation in which the virus is quite diffusive, with an important HAR and a low virulence and ICAR, similar to the 2009 pandemic. The high HAR in scenario B could also rep-resent high-risk groups (e.g. elderly, individuals with underlying conditions). Scenario C and D represent a situation in which the CAR is high with a low and a high virulence, respectively. Moreover, since the scenarios described above do not take into account the age pro-file of the population and the proportion of individuals
with chronic conditions, we consider a reasonable solution to retain scenario E and F that represent the worst case scenarios for at-risk groups.
DiscussionIn our study we defined a set of scenarios that may be useful for pandemic planning. We used the combi-nation of four severity profiles of four epidemiologi-cal parameters to identify 256 possible scenarios that can be adapted over time and are far from the classic scenarios structure used for pandemic plans up to the 2009 influenza pandemic [1]. Among the scenarios identified, on the basis of a literature review and of the opinion of the panel of experts, we selected the six most likely scenarios that synthesise the possible effect of an influenza outbreak with different charac-teristics (from a seasonal-like to a major event).
Historically, influenza pandemic planning has been based on an assessment of the ‘reasonable worst case’, derived from previous influenza seasons and pandemics in the 20th century, and thus has shown not to be appropriate during a moderate event, such as the 2009 pandemic [44]. Other experiences reported a modelling approach using a combination of indica-tors leading to a qualitative assessment in three lev-els (i.e. mild, moderate and severe) [5]; that approach was considered not to be specific enough to guide
Figure 2Six possible scenarios identified by a combination of the selected parameters, study on pandemic influenza scenarios in Europe
CAR: clinical attack rate; CFR: case fatality rate; HAR: hospital admission rate; ICAR: intensive care admission rate.The values of the parameters defining scenarios are highlighted in grey.
AType of parameters Parameters Scenario ‘seasonal-like’
Transmission CAR (%) 0–5 5–10 10–25 25–35Virulence CFR (%) 0–0.01 0.01–0.05 0.05–0.8 0.8–2.5
Use of medical resources
HAR (%) 0–0.02 0.02–0.2 0.2–2 2–4ICAR (%) 0–0.01 0.01–2.5 2.5–5 5–35
CType of parameters Parameters Scenario ‘community risk, low
virulence’Transmission CAR (%) 0–5 5–10 10–25 25–35Virulence CFR (%) 0–0.01 0.01–0.05 0.05–0.8 0.8–2.5
Use of medical resources
HAR (%) 0–0.02 0.02–0.2 0.2–2 2–4ICAR (%) 0–0.01 0.01–2.5 2.5–5 5–35
EType of parameters Parameters Scenario ‘high-risk groups/age
groups’Transmission CAR (%) 0–5 5–10 10–25 25–35Virulence CFR (%) 0–0.01 0.01–0.05 0.05–0.8 0.8–2.5
Use of medical resources
HAR (%) 0–0.02 0.02–0.2 0.2–2 2–4ICAR (%) 0–0.01 0.01–2.5 2.5–5 5–35
BType of parameters Parameters Scenario ‘2009 pandemic-like’
Transmission CAR (%) 0–5 5–10 10–25 25–35Virulence CFR (%) 0–0.01 0.01–0.05 0.05–0.8 0.8–2.5
Use of medical resources
HAR (%) 0–0.02 0.02–0.2 0.2–2 2–4ICAR (%) 0–0.01 0.01–2.5 2.5–5 5–35
DType of parameters Parameters Scenario ‘community risk, high
virulence’Transmission CAR (%) 0–5 5–10 10–25 25–35Virulence CFR (%) 0–0.01 0.01–0.05 0.05–0.8 0.8–2.5
Use of medical resources
HAR (%) 0–0.02 0.02–0.2 0.2–2 2–4ICAR (%) 0–0.01 0.01–2.5 2.5–5 5–35
FType of parameters Parameters Scenario ‘major event’
Transmission CAR (%) 0–5 5–10 10–25 25–35Virulence CFR (%) 0–0.01 0.01–0.05 0.05–0.8 0.8–2.5
Use of medical resources
HAR (%) 0–0.02 0.02–0.2 0.2–2 2–4ICAR (%) 0–0.01 0.01–2.5 2.5–5 5–35

7www.eurosurveillance.org
interventions [6]. Moreover, mathematical modelling based on preliminary epidemiological data is useful in defining the impact and the mitigation measures to be implemented during a pandemic. However, these mod-els are strongly affected by the epidemiological param-eters used and, even if they are able to explore a wide range of values, they need a specific set of scenarios to produce reliable results. For this reason, the use of scenarios in pandemic planning is crucial.
In our literature review, most of the selected articles and documents were observational studies, mathe-matical simulations, or reviews. Information referring to different world regions, different population sub-groups and different influenza pandemics (mostly the 2009 influenza pandemic) over 100 years-period made comparison of results difficult. In fact, our results showed that most of the parameters values vary a lot between different countries and in different pandem-ics. For example, mortality rates often vary by age: age-specific mortality rates for 1957/58 and 1968/69 show a U-shaped pattern with a slightly increased CFR in the very young and an increasing one with older age [45]. On the other hand, during the 1918 pandemic, a higher mortality rate was observed in young adults followed by lower rates in other age groups [35]. Moreover, vari-ation in epidemiological parameters could also reflect differences in the surveillance systems (e.g. in case of different case definitions, time lag between influenza confirmation and death, etc.) and diagnostic methods. This heterogeneous information presented in the docu-ments did not allow us to use parts of the data (e.g. the absolute number of deaths was neglected where the corresponding denominator to calculate CFR was missing). It should also be noted that we did not con-sider age groups and the proportion of people with other underlying conditions that are strictly related to the vulnerability of the population to a pandemic virus [6]. Finally, estimates for the 2009/10 pandemic are likely to change as further data and studies become available after the literature review was conducted (December 2011).
The experience of the 2009 influenza pandemic showed that the EU countries had prepared for a pan-demic of high severity but appeared unable to adapt their national and subnational responses adequately to a more moderate event. Knowledge of past pandem-ics is of substantial help when planning for a future one [46] and indeed the epidemiological aspects of the three 20th century influenza pandemics (1918/20, 1957/58, 1968/69) are of outstanding importance. However, modelling studies based on epidemiological parameters collected during the 20th century pandem-ics overestimated the impact of the 2009/10 pandemic [8]. Furthermore, society has undergone major changes since 1918 (the scenario on which most pandemic plans and models before and during the 2009 pandemic have been based) and even since 1968, with an increased availability of ICUs and clinical countermeasures (such as vaccines, antivirals, etc.).
Thus, in June 2013, the WHO published the ‘Pandemic Influenza Risk Management’ [8]. The approach taken in this document introduces a risk-based approach to pandemic influenza risk management and encourages countries to develop flexible plans, and to conduct risk assessments in order to prioritise the develop-ment of risk management programmes tailored to the hazards present. Our results are in line with the ‘WHO Pandemic Influenza Risk Management’ [8] and provide a description of possible scenarios of pandemic influ-enza considering key epidemiological parameters. The described scenarios allow severity assessments and provide the basis for developing flexible risk manage-ment plans over the course of a pandemic.
In the context of the FLURESP Project, the proposed scenarios have been used to select potential response strategies (clustered and ranked according to perfor-mance and efficiency using a multi-criteria analysis) in order to conduct cost-effectiveness evaluations to compare cost and performance of response strategies for each proposed scenario.
Our study, although not based on a standardised pro-cedure, is supported by an extensive literature review and suggestions derived from a panel of experts.
In conclusion, our study provides an original template to categorise human influenza pandemic scenarios, useful for pandemic planning. Before using its out-comes, limitations should be taken into account by public health authorities dealing with pandemic plan-ning. This study is the first step of the FLURESP project, whose objective is to define adequate public health responses and measures according to each scenario presented in this paper and to compare performance and cost-effectiveness of such measures.
AcknowledgementsThis work was possible thanks to research funding provided by the EU DG-Sanco for the FLURESP Project (Grant agree-ment no. 2010-11-01). We thank Dr Peter G Grove and Dr Guy Walker for their useful insights.
Conflicts of interestNone declared.
Authors’ contributionsThe work presented here was carried out in collaboration be-tween all authors. C.N. M.F. and C.R. contributed to the data collection, performed the analysis and drafted the manu-script. . C.N., M.F., C.R., A.Bo., S.Bo., M.B., J.O., J.M.C., L.N., P.G., A.P., C.L. and C.G. interpreted the results. S.Br., A.N. and P.P contributed to the methodological approach. A.Be. conceived the overall study aims and design. All authors have contributed to, seen and approved the manuscript.

8 www.eurosurveillance.org
References1. World Health Organization (WHO). WHO global influenza
preparedness plan. Geneva: WHO. 2005. [Accessed April 2013]. Available from: http://www.who.int/csr/resources/publications/influenza/WHO_CDS_CSR_GIP_2005_5.pdf
2. World Health Organization. Epidemiology of WHO-confirmed human cases of avian influenza A(H5N1) infection. Wkly Epidemiol Rec. 2006;81(26):249-57. PMID:16812929
3. World Health Organization (WHO). Pandemic Influenza A (H1N1). Geneva: WHO. 2011. [Accessed April 2013]. Available from: http://www.who.int/csr/resources/publications/swineflu/h1n1_donor_032011.pdf
4. United Kingdom Department of Health. UK Influenza Pandemic Preparedness Strategy 2011. London: Department of Health. 10 Nov 2011. [Accessed April 2013]. Available from: https://www.gov.uk/government/uploads/system/uploads/attachment_data/file/213717/dh_131040.pdf
5. Ajelli M, Gonçalves B, Balcan D, Colizza V, Hu H, Ramasco JJ, et al. Comparing large-scale computational approaches to epidemic modeling: agent-based versus structured metapopulation models. BMC Infect Dis. 2010;10(1):190. http://dx.doi.org/10.1186/1471-2334-10-190 PMID:20587041
6. World Health Organization. Considerations for assessing the severity of an influenza pandemic. Wkly Epidemiol Rec. 2009;84(22):197-202. Last accessedApril2013. Available from: http://www.who.int/wer/2009/wer8422/en/index.html PMID:19480086
7. World Health Organization (WHO). Strengthening response to pandemics and other public-health emergencies. Geneva: WHO. 2011. [Accessed April 2013]. Available from: http://www.who.int/ihr/publications/RC_report/en/index.html
8. World Health Organization (WHO). Pandemic Influenza Risk Management. WHO Interim Guidance. Geneva: WHO. 2013. [Accessed July 2014]. Available from: http://www.who.int/influenza/preparedness/pandemic/GIP_PandemicInfluenzaRiskManagementInterimGuidance_Jun2013.pdf?ua=1
9. European Centre for Disease Control and Prevention (ECDC). ECDC health information. Pandemic (H1N1) 2009 planning assumptions to end of May 2010 for EU/EEA countries. Stockholm: ECDC. 11 Nov 2009. [Accessed April 2013]. Available from: http://www.ecdc.europa.eu/en/healthtopics/Documents/091111_Pandemic_(H1N1)_2009_Planning_Assumptions_for_EU_EEA_countries.pdf
10. Yu H, Feng L, Peng Z, Feng Z, Shay DK, Yang W. Estimates of the impact of a future influenza pandemic in China. Influenza Other Respi Viruses. 2009;3(5):223-31. http://dx.doi.org/10.1111/j.1750-2659.2009.00093.x PMID:21462394
11. Miller MA, Viboud C, Olson DR, Grais RF, Rabaa MA, Simonsen L. Prioritization of influenza pandemic vaccination to minimize years of life lost. J Infect Dis. 2008;198(3):305-11. http://dx.doi.org/10.1086/589716 PMID:18558871
12. Department of Health. Scientific Pandemic Influenza Advisory Committee (SPI): Subgroup on Modelling. Modelling Summary. 13 Jun 2013. London: Department of Health. Available from: https://www.gov.uk/government/uploads/system/uploads/attachment_data/file/208264/SPI-M_Modelling_Summary_13_06_13.pdf
13. Nguyen-Van-Tam JS, Hampson AW. The epidemiology and clinical impact of pandemic influenza. Vaccine. 2003;21(16):1762-8. http://dx.doi.org/10.1016/S0264-410X(03)00069-0 PMID:12686091
14. World Health Organization (WHO). Pandemic influenza preparedness and response. Geneva: WHO. 2009. [Accessed April 2013]. Available from: http://whqlibdoc.who.int/publications/2009/9789241547680_eng.pdf
15. Rizzo C, Bella A, Viboud C, Simonsen L, Miller MA, Rota MC, et al. Trends for influenza-related deaths during pandemic and epidemic seasons, Italy, 1969-2001. Emerg Infect Dis. 2007;13(5):694-9. http://dx.doi.org/10.3201/eid1305.061309 PMID:17553246
16. Yang L, Chan KP, Cowling BJ, Chiu SS, Chan KH, Peiris JS, et al. Excess mortality associated with the 2009 pandemic of influenza A(H1N1) in Hong Kong. Epidemiol Infect. 2012;140(09):1542-50. http://dx.doi.org/10.1017/S0950268811002238 PMID:22074735
17. O’Dowd A. Swine flu claims first European death, as cases worldwide rise to 36,000. BMJ. 2009;338(jun16 3):b2470. http://dx.doi.org/10.1136/bmj.b2470 PMID:19531555
18. Nishiura H. Case fatality ratio of pandemic influenza. Lancet Infect Dis. 2010;10(7):443-4. http://dx.doi.org/10.1016/S1473-3099(10)70120-1 PMID:20610325
19. Nishiura H. The virulence of pandemic influenza A (H1N1) 2009: an epidemiological perspective on the case-fatality
ratio. Expert Rev Respir Med. 2010;4(3):329-38. http://dx.doi.org/10.1586/ers.10.24 PMID:20524916
20. Duque V, Cordeiro E, Mota V, Vaz J, Morais C, Rodrigues F, et al. The early days of pandemic (H1N1) 2009 virus infection in the central region of Portugal. Rev Port Pneumol. 2010;16(6):870-9. PMID:21067692
21. Chowell G, Echevarría-Zuno S, Viboud C, Simonsen L, Tamerius J, Miller MA, et al. Characterizing the epidemiology of the 2009 influenza A/H1N1 pandemic in Mexico. PLoS Med. 2011;8(5):e1000436. http://dx.doi.org/10.1371/journal.pmed.1000436 PMID:21629683
22. Bandaranayake D, Huang QS, Bissielo A, Wood T, Mackereth G, Baker MG, et al. Risk factors and immunity in a nationally representative population following the 2009 influenza A(H1N1) pandemic. PLoS ONE. 2010;5(10):e13211. http://dx.doi.org/10.1371/journal.pone.0013211 PMID:20976224
23. Hak E, Meijboom MJ, Buskens E. Modelling the health-economic impact of the next influenza pandemic in The Netherlands. Vaccine. 2006;24(44-46):6756-60. http://dx.doi.org/10.1016/j.vaccine.2006.05.065 PMID:16797797
24. European Centre for Disease Control and Prevention (ECDC). Planning assumption for first wave of pandemic H1N1 2009 in Europe. Stockholm: ECDC. 29 Jul 2009. [Accessed April 2013]. Available from: http://www.ecdc.europa.eu/en/activities/sciadvice/_layouts/forms/Review_DispForm.aspx?ID=88&List=a3216f4c-f040-4f51-9f77-a96046dbfd72
25. Cui F, Luo H, Zhou L, Yin D, Zheng C, Wang D, et al. Transmission of pandemic influenza A (H1N1) virus in a train in China. J Epidemiol. 2011;21(4):271-7. http://dx.doi.org/10.2188/jea.JE20100119 PMID:21646746
26. Huai Y, Lin J, Varma JK, Peng Z, He J, Cheng C, et al. A primary school outbreak of pandemic 2009 influenza A (H1N1) in China. Influenza Other Respi Viruses. 2010;4(5):259-66. http://dx.doi.org/10.1111/j.1750-2659.2010.00150.x PMID:20795308
27. Centers for Disease Control and Prevention (CDC). Outbreak of 2009 pandemic influenza A (H1N1) on a Peruvian Navy ship - June-July 2009. MMWR Morb Mortal Wkly Rep. 2010;59(6):162-5. PMID:20168295
28. Mahato RK, Bhandari GP, Shrestha JM, Basnet P. Pandemic influenza A (H1N1) 2009 outbreak investigation in Nepal. J Nepal Health Res Counc. 2010;8(2):75-7. PMID:21876566
29. Baguelin M, Hoschler K, Stanford E, Waight P, Hardelid P, Andrews N, et al. Age-specific incidence of A/H1N1 2009 influenza infection in England from sequential antibody prevalence data using likelihood-based estimation. PLoS ONE. 2011;6(2):e17074. http://dx.doi.org/10.1371/journal.pone.0017074 PMID:21373639
30. Miller E, Hoschler K, Hardelid P, Stanford E, Andrews N, Zambon M. Incidence of 2009 pandemic influenza A H1N1 infection in England: a cross-sectional serological study. Lancet. 2010;375(9720):1100-8. http://dx.doi.org/10.1016/S0140-6736(09)62126-7 PMID:20096450
31. Presanis AM, De Angelis D, Hagy A, Reed C, Riley S, Cooper BS, et al. The severity of pandemic H1N1 influenza in the United States, from April to July 2009: a Bayesian analysis. PLoS Med. 2009;6(12):e1000207. http://dx.doi.org/10.1371/journal.pmed.1000207 PMID:19997612
32. Presanis AM, Lipsitch M, De Angelis, Swine Flu Investigation Team, New York City Department of Health and Mental Hygiene, Hagy A, et al. The severity of pandemic H1N1 influenza in the United States, April - July 2009. PLoS Curr. 2009;1:RRN1042. PMID:20029614
33. Santa-Olalla Peralta P, Cortes García M, Martínez Sánchez EV, Nogareda Moreno F, Limia Sánchez A, Pachón Del Amo I, et al. [Enhanced surveillance of initial cases of pandemic influenza (H1N1) 2009 infection in Spain, April-June 2009]. Rev Esp Salud Publica. 2010;84(5):529-46. [Spanish]. http://dx.doi.org/10.1590/S1135-57272010000500007 PMID:21203718
34. World Health Organization (WHO). Public health measures during the influenza A(H1N1) 2009 pandemic 2011. Geneva: WHO. 2011. [Accessed April 2013]. Available from: http://whqlibdoc.who.int/hq/2011/WHO_HSE_GIP_ITP_2011.3_eng.pdf
35. Monto AS. Influenza: quantifying morbidity and mortality. Am J Med. 1987;82(6) 6A;20-5. http://dx.doi.org/10.1016/0002-9343(87)90556-0 PMID:3591814
36. Mann PG, Pereira MS, Smith JW, Hart RJ, Williams WO, Dunhill B. A five-year study of influenza in families. Joint Public Health Laboratory Service/Royal College of General Practitioners working group. J Hyg (Lond). 1981;87(02):191-200. http://dx.doi.org/10.1017/S0022172400069400 PMID:7288174
37. Longini IM Jr, Halloran ME, Nizam A, Yang Y. Containing pandemic influenza with antiviral agents. Am J Epidemiol. 2004;159(7):623-33. http://dx.doi.org/10.1093/aje/kwh092 PMID:15033640

9www.eurosurveillance.org
38. Fleming DM. The contribution of influenza to combined acute respiratory infections, hospital admissions, and deaths in winter. Commun Dis Public Health. 2000;3(1):32-8. PMID:10743316
39. Carrat F, Vergu E, Ferguson NM, Lemaitre M, Cauchemez S, Leach S, et al. Time lines of infection and disease in human influenza: a review of volunteer challenge studies. Am J Epidemiol. 2008;167(7):775-85. http://dx.doi.org/10.1093/aje/kwm375 PMID:18230677
40. Dawood FS, Iuliano AD, Reed C, Meltzer MI, Shay DK, Cheng PY, et al. Estimated global mortality associated with the first 12 months of 2009 pandemic influenza A H1N1 virus circulation: a modelling study. Lancet Infect Dis. 2012;12(9):687-95. http://dx.doi.org/10.1016/S1473-3099(12)70121-4 PMID:22738893
41. World Health Organization (WHO). Influenza at the Human-Animal Interface. Geneva: WHO. [Accessed April 2013]. Available from: www.who.int/csr/disease/avian_influenza/
42. Li FC, Choi BC, Sly T, Pak AW. Finding the real case-fatality rate of H5N1 avian influenza. J Epidemiol Community Health. 2008;62(6):555-9. http://dx.doi.org/10.1136/jech.2007.064030 PMID:18477756
43. Skarbinski J, Jain S, Bramley A, Lee EJ, Huang J, Kirschke D, et al. Hospitalized patients with 2009 pandemic influenza A (H1N1) virus infection in the United States--September-October 2009. Clin Infect Dis. 2011;52(1) Suppl 1;S50-9. http://dx.doi.org/10.1093/cid/ciq021 PMID:21342900
44. Reed C, Biggerstaff M, Finelli L, Koonin LM, Beauvais D, Uzicanin A, et al. Novel framework for assessing epidemiologic effects of influenza epidemics and pandemics. Emerg Infect Dis. 2013;19(1):85-91. http://dx.doi.org/10.3201/eid1901.120124 PMID:23260039
45. Simonsen L, Clarke MJ, Schonberger LB, Arden NH, Cox NJ, Fukuda K. Pandemic versus epidemic influenza mortality: a pattern of changing age distribution. J Infect Dis. 1998;178(1):53-60. http://dx.doi.org/10.1086/515616 PMID:9652423
46. Miller MA, Viboud C, Balinska M, Simonsen L. The signature features of influenza pandemics--implications for policy. N Engl J Med. 2009;360(25):2595-8. http://dx.doi.org/10.1056/NEJMp0903906 PMID:19423872
47. Balcan D, Hu H, Goncalves B, Bajardi P, Poletto C, Ramasco JJ, et al. Seasonal transmission potential and activity peaks of the new influenza A(H1N1). A Monte Carlo likelihood analysis based on human mobility. BMC Med. 2009;10:7:45. doi: 10.1186/1741-7015-7-45.
48. Chowell G, Ammon CE, Hengartner NW, Hyman JM. Estimation of the reproductive number of the Spanish flu epidemic in Geneva, Switzerland. Vaccine. 2006;24(44-46):6747-50. http://dx.doi.org/10.1016/j.vaccine.2006.05.055 PMID:16782243
49. Chowell G, Nishiura H, Bettencourt LM. Comparative estimation of the reproduction number for pandemic influenza from daily case notification data. J R Soc Interface. 2007;4(12):155-66. http://dx.doi.org/10.1098/rsif.2006.0161 PMID:17254982
50. Chowell G, Viboud C, Munayco CV, Gómez J, Simonsen L, Miller MA, et al. Spatial and temporal characteristics of the 2009 A/H1N1 influenza pandemic in Peru. PLoS ONE. 2011;6(6):e21287. http://dx.doi.org/10.1371/journal.pone.0021287 PMID:21712984
51. Colizza V, Barrat A, Barthelemy M, Valleron AJ, Vespignani A. Modeling the worldwide spread of pandemic influenza: baseline case and containment interventions. PLoS Med. 2007;4(1):e13. http://dx.doi.org/10.1371/journal.pmed.0040013 PMID:17253899
52. Marchbanks TL, Bhattarai A, Fagan RP, Ostroff S, Sodha SV, Moll ME, et al.; Pennsylvania Working Group. An outbreak of 2009 pandemic influenza A (H1N1) virus infection in an elementary school in Pennsylvania. Clin Infect Dis. 2011;52(1) Suppl 1;S154-60. http://dx.doi.org/10.1093/cid/ciq058 PMID:21342888
53. Novel influenza A(H1N1) investigation team. Description of the early stage of pandemic (H1N1) 2009 in Germany, 27 April-16 June 2009. Euro Surveill. 2009;14(31):19295. PMID:19660249
54. Pandemic Flu Response Review Team. Cabinet Office (UK). The 2009 Influenza Pandemic: an independent official review of the UK response to the 2009 influenza pandemic. London: Cabinet Office. July 2010. [Accessed April 2013]. Available from: https://www.gov.uk/government/uploads/system/uploads/attachment_data/file/61252/the2009influenzapandemic-review.pdf
55. Polish Ministry of Health. Krajowy plan działań dla polski na wypadek wystąpienia kolejnej pandemii grypy [Polish National Action Plan in the event of the next influenza pandemic]. 10 Aug 2005. [Accessed April 2013]. Available from: http://www2.mz.gov.pl/wwwfiles/ma_struktura/docs/zalacznik_r_26.pdf,
56. Simón Méndez L, de Mateo Ontañón S, Larrauri Cámara A, Jiménez-Jorge S, Vaqué Rafart J, Pérez Hoyos S; en
representación del Sistema de Vigilancia de Gripe en España (SVGE). [Transmissibility and severity of the pandemic influenza A (H1N1) 2009 virus in Spain]. Gac Sanit. 2011;25(4):296-302. [Spanish] PMID:21543138
57. Valleron AJ, Cori A, Valtat S, Meurisse S, Carrat F, Boëlle PY. Transmissibility and geographic spread of the 1889 influenza pandemic. Proc Natl Acad Sci USA. 2010;107(19):8778-81. http://dx.doi.org/10.1073/pnas.1000886107 PMID:20421481
58. Viboud C, Tam T, Fleming D, Handel A, Miller MA, Simonsen L. Transmissibility and mortality impact of epidemic and pandemic influenza, with emphasis on the unusually deadly 1951 epidemic. Vaccine. 2006;24(44-46):6701-7. http://dx.doi.org/10.1016/j.vaccine.2006.05.067 PMID:16806596
59. World Health Organization (WHO). WHO checklist for influenza pandemic preparedness planning. Geneva: WHO. 2005. [Accessed April 2013]. Available from: http://whqlibdoc.who.int/hq/2005/WHO_CDS_CSR_GIP_2005.4.pdf
60. World Health Organization (WHO). Pandemic influenza preparedness Framework 2011. Geneva: WHO. 2011. [Accessed April 2013]. Available from: http://whqlibdoc.who.int/publications/2011/9789241503082_eng.pdf
61. Turkish Ministry of Health. Directorate General of Primary Health Care. Pandemic Influenza National Action Plan. Ankara: Ministry of Health. 2005.
62. Franco-Paredes C, Hernandez-Ramos I, Del Rio C, Alexander KT, Tapia-Conyer R, Santos-Preciado JI. H1N1 influenza pandemics: comparing the events of 2009 in Mexico with those of 1976 and 1918-1919. Arch Med Res. 2009;40(8):669-72. http://dx.doi.org/10.1016/j.arcmed.2009.10.004 PMID:20304254
63. Malta Health Division. Influenza Pandemic Contingency Plan for the Maltese Islands. Malta. 2007.
64. Lee VJ, Chen MI. Effectiveness of neuraminidase inhibitors for preventing staff absenteeism during pandemic influenza. Emerg Infect Dis. 2007;13(3):449-57. http://dx.doi.org/10.3201/eid1303.060309 PMID:17552099
65. Lessler J, Cummings DA, Fishman S, Vora A, Burke DS. Transmissibility of swine flu at Fort Dix, 1976. J R Soc Interface. 2007;4(15):755-62. http://dx.doi.org/10.1098/rsif.2007.0228 PMID:17412677
66. Lessler J, Reich NG, Cummings DA, New York City Department of Health and Mental Hygiene Swine Influenza Investigation Team. Outbreak of 2009 pandemic influenza A (H1N1) at a New York City school. N Engl J Med. 2009;361(27):2628-36. http://dx.doi.org/10.1056/NEJMoa0906089 PMID:20042754
67. Mills CE, Robins JM, Lipsitch M. Transmissibility of 1918 pandemic influenza. Nature. 2004;432(7019):904-6. http://dx.doi.org/10.1038/nature03063 PMID:15602562
68. Jackson C, Vynnycky E, Mangtani P. Estimates of the transmissibility of the 1968 (Hong Kong) influenza pandemic: evidence of increased transmissibility between successive waves. Am J Epidemiol. 2010;171(4):465-78. http://dx.doi.org/10.1093/aje/kwp394 PMID:20007674
69. Carrat F, Luong J, Lao H, Sallé AV, Lajaunie C, Wackernagel H. A ‘small-world-like’ model for comparing interventions aimed at preventing and controlling influenza pandemics. BMC Med. 2006;23:4:26.
70. Correia AM, Queirós L, Dias J. Pandemic influenza A (H1N1) in the North of Portugal: how did the autumn-winter wave behave? Rev Port Pneumol. 2010;16(6):880-6. PMID:21067693
71. United Kingdom Department of Health. Cabinet Office. Swine Flu. UK Planning Assumptions. London: Department of Health. 3 Sep 2009. [Accessed April 2013]. Avalaible from: http://webarchive.nationalarchives.gov.uk/20130107105354/http://www.dh.gov.uk/prod_consum_dh/groups/dh_digitalassets/documents/digitalasset/dh_104843.pdf
72. Doyle TJ, Hopkins RS; Transmission Investigation Team. Low secondary transmission of 2009 pandemic influenza A (H1N1) in households following an outbreak at a summer camp: relationship to timing of exposure. Epidemiol Infect. 2011;139(01):45-51. http://dx.doi.org/10.1017/S095026881000141X PMID:20561391
73. Gomez J, Munayco C, Arrasco J, Suarez L, Laguna-Torres V, Aguilar P, et al. Pandemic influenza in a southern hemisphere setting: the experience in Peru from May to September, 2009. Euro Surveill. 2009;14(42):19371. PMID:19883547
74. Gordon A, Saborío S, Videa E, López R, Kuan G, Balmaseda A, et al. Clinical attack rate and presentation of pandemic H1N1 influenza versus seasonal influenza A and B in a pediatric cohort in Nicaragua. Clin Infect Dis. 2010;50(11):1462-7. http://dx.doi.org/10.1086/652647 PMID:20420502
75. Iuliano AD, Reed C, Guh A, Desai M, Dee DL, Kutty P, et al. Notes from the field: outbreak of 2009 pandemic influenza A (H1N1) virus at a large public university in Delaware, April-May 2009. Clin Infect Dis. 2009;49(12):1811-20. http://dx.doi.org/10.1086/649555 PMID:19911964

10 www.eurosurveillance.org
76. Jhung MA, Swerdlow D, Olsen SJ, Jernigan D, Biggerstaff M, Kamimoto L, et al. Epidemiology of 2009 pandemic influenza A (H1N1) in the United States. Clin Infect Dis. 2011;52(1) Suppl 1;S13-26. http://dx.doi.org/10.1093/cid/ciq008 PMID:21342884
77. Lee BY, Bailey RR, Wiringa AE, Assi TM, Beigi RH. Antiviral medications for pregnant women for pandemic and seasonal influenza: an economic computer model. Obstet Gynecol. 2009;114(5):971-80. http://dx.doi.org/10.1097/AOG.0b013e3181bdbfed PMID:20168096
78. Leung YH, Li MP, Chuang SK. A school outbreak of pandemic (H1N1) 2009 infection: assessment of secondary household transmission and the protective role of oseltamivir. Epidemiol Infect. 2011;139(01):41-4. http://dx.doi.org/10.1017/S0950268810001445 PMID:20561390
79. Li T, Liu Y, Di B, Wang M, Shen J, Zhang Y, et al. Epidemiological investigation of an outbreak of pandemic influenza A (H1N1) 2009 in a boarding school: serological analysis of 1570 cases. J Clin Virol. 2011;50(3):235-9. http://dx.doi.org/10.1016/j.jcv.2010.11.012 PMID:21195022
80. Mayoral Cortés JM, Ruiz Fernández J, Pachón Díaz J, Navarro Marí JM, Puell Gómez L, Pérez Morilla E, et al. [Infection by the pandemic virus (H1N1) 2009 in Andalusia]. Rev Esp Salud Publica. 2010;84(5):517-28. http://dx.doi.org/10.1590/S1135-57272010000500006 PMID:21203717
81. Nougairède A, Ninove L, Zandotti C, Salez N, Mantey K, Resseguier N, et al. Novel virus influenza A (H1N1sw) in South-Eastern France, April-August 2009. PLoS ONE. 2010;5(2):e9214. http://dx.doi.org/10.1371/journal.pone.0009214 PMID:20174643
82. Office General delà santé Publique, Confederation Suisse: Plan suisse de pandémie Influenza. available at: http://www.bag.admin.ch/influenza/01120/01134/03058/index.html?lang=fr, Last accessed April 2013.
83. Smith RD, Keogh-Brown MR, Barnett T. Estimating the economic impact of pandemic influenza: An application of the computable general equilibrium model to the U.K. Soc Sci Med. 2011;73(2):235-44. http://dx.doi.org/10.1016/j.socscimed.2011.05.025 PMID:21708419
84. van Genugten ML, Heijnen ML, Jager JC. Pandemic influenza and healthcare demand in the Netherlands: scenario analysis. Emerg Infect Dis. 2003;9(5):531-8. http://dx.doi.org/10.3201/eid0905.020321 PMID:12737735
85. Wielders CC, van Lier EA, van ’t Klooster TM, van Gageldonk-Lafeber AB, van den Wijngaard CC, Haagsma JA, et al. The burden of 2009 pandemic influenza A(H1N1) in the Netherlands. Eur J Public Health. 2012;22(1):150-7. http://dx.doi.org/10.1093/eurpub/ckq187 PMID:21183472
86. Wilson N, Mansoor O, Baker M. Estimating the impact of the next influenza pandemic on population health and health sector capacity in New Zealand. N Z Med J. 2004;118(1211):U1346.
87. Yates L, Pierce M, Stephens S, Mill AC, Spark P, Kurinczuk JJ, et al. Influenza A/H1N1v in pregnancy: an investigation of the characteristics and management of affected women and the relationship to pregnancy outcomes for mother and infant. Health Technol Assess. 2010;14(34):109-82. http://dx.doi.org/10.3310/hta14340-02 PMID:20630123
88. Barry JM, Viboud C, Simonsen L. Cross-protection between successive waves of the 1918-1919 influenza pandemic: epidemiological evidence from US Army camps and from Britain. J Infect Dis. 2008;198(10):1427-34. http://dx.doi.org/10.1086/592454 PMID:18808337
89. Centers for Disease Control and Prevention (CDC). Outbreak of 2009 pandemic influenza A (H1N1) at a school - Hawaii, May 2009. MMWR Morb Mortal Wkly Rep. 2010;58(51):1440-4. PMID:20057351
90. Cherifi S, Reynders M, Theunissen C. Hospital preparedness and clinical description of the 2009 influenza A (H1N1) pandemic in a Belgian tertiary hospital. J Hosp Infect. 2011;77(2):118-22. http://dx.doi.org/10.1016/j.jhin.2010.09.032 PMID:21216036
91. Di Giambenedetto S, Zileri Dal Verme L, Sali M, Farina S, Di Cristo V, Manzara S, et al. Clinical presentation, microbiological features and correlates of disease severity of 2009 pandemic influenza A (H1N1) infection. Eur J Clin Microbiol Infect Dis. 2011;30(4):541-9. http://dx.doi.org/10.1007/s10096-010-1116-7 PMID:21104285
92. Donaldson LJ, Rutter PD, Ellis BM, Greaves FE, Mytton OT, Pebody RG, et al. Mortality from pandemic A/H1N1 2009 influenza in England: public health surveillance study. BMJ. 2009;339(dec10 1):b5213. http://dx.doi.org/10.1136/bmj.b5213 PMID:20007665
93. Fujikura Y, Kawana A, Kato Y, Mizuno Y, Kudo K. [Clinical features in fatal Spanish influenza: Japanese Army Hospital medical records investigation]. Kansenshogaku Zasshi. 2010;84(2):165-70. [Japanese]. PMID:20420160
94. Jain S, Kamimoto L, Bramley AM Schmitz AM, Benoit SR, Louie J, et al. Hospitalized Patients with 2009 H1N1 Influenza in the United States, April–June 2009. N Engl J Med. 2009; 361(20):1935-44. doi: 10.1056/NEJMoa0906695.
95. Louie JK, Acosta M, Winter K, Jean C, Gavali S, Schechter R, et al.California Pandemic (H1N1) Working Group. Factors associated with death or hospitalization due to pandemic 2009 influenza A(H1N1) infection in California. JAMA. 2009;302(17):1896-902. http://dx.doi.org/10.1001/jama.2009.1583 PMID:19887665
96. Al Hajjar S, McIntosh K; Sami Al Hajjara and Kenneth McIntoshb. The first influenza pandemic of the 21st century. Ann Saudi Med. 2010;30(1):1-10. PMID:20103951
97. Santa-Olalla Peralta P, Cortes-García M, Vicente-Herrero M, Castrillo-Villamandos C, Arias-Bohigas P, Pachon-del Amo I, et al. Risk factors for disease severity among hospitalised patients with 2009 pandemic influenza A (H1N1) in Spain, April - December 2009. Euro Surveill. 2010;15(38):19667. PMID:20929651
98. Shieh WJ, Blau DM, Denison AM, Deleon-Carnes M, Adem P, Bhatnagar J, et al. 2009 pandemic influenza A (H1N1): pathology and pathogenesis of 100 fatal cases in the United States. Am J Pathol. 2010;177(1):166-75. http://dx.doi.org/10.2353/ajpath.2010.100115 PMID:20508031
99. Han K, Zhu XP, He F, Liu LG, Zhang LJ, Ma HL, et al. [Non-airborne transmission during outbreak of pandemic (H1N1) 2009 among tour group members, China, June 2009]. Zhonghua Liu Xing Bing Xue Za Zhi. 2010;31(9):1046-9. [Chinese]. PMID:21162874
100. Koopmans M, Wilbrink B, Conyn M, Natrop G, van der Nat H, Vennema H, et al. Transmission of H7N7 avian influenza A virus to human beings during a large outbreak in commercial poultry farms in the Netherlands. Lancet. 2004;363(9409):587-93. http://dx.doi.org/10.1016/S0140-6736(04)15589-X PMID:14987882
101. Cao B, Li XW, Mao Y, Wang J, Lu HZ, Chen YS, et al. Clinical features of the initial cases of 2009 pandemic influenza A (H1N1) virus infection in China. N Engl J Med. 2009;361(26):2507-17. http://dx.doi.org/10.1056/NEJMoa0906612 PMID:20007555
102. Lessler J, Reich NG, Brookmeyer R, Perl TM, Nelson KE, Cummings DA. Incubation periods of acute respiratory viral infections: a systematic review. Lancet Infect Dis. 2009;9(5):291-300. http://dx.doi.org/10.1016/S1473-3099(09)70069-6 PMID:19393959
103. Yang TH, Chu D, Hu BS, Hung YT, Chou P. Early experience of the pandemic influenza H1N1 2009 epidemic in Taiwan. J Chin Med Assoc. 2011;74(7):298-304. http://dx.doi.org/10.1016/j.jcma.2011.05.005 PMID:21783094
104. Yuan J, Zhang L, Xu W, Shen J, Zhang P, Ma H. Reported changes in health-related behaviours in Chinese urban residents in response to an influenza pandemic. Epidemiol Infect. 2009;137(07):988-93. http://dx.doi.org/10.1017/S0950268809002726 PMID:19426571
105. AlMazroa MA, Memish ZA, AlWadey AM. Pandemic influenza A (H1N1) in Saudi Arabia: description of the first one hundred cases. Ann Saudi Med. 2010;30(1):11-4. PMID:20103952
106. Balter S, Gupta LS, Lim S, Fu J, Perlman SE. Pandemic (H1N1) 2009 surveillance for severe illness and response, New York, USA, April-July 2009. Emerg Infect Dis. 2010;16(8):1259-64. http://dx.doi.org/10.3201/eid1608.091847 PMID:20678320
107. van Genugten ML, Heijnen ML. The expected number of hospitalisations and beds needed due to pandemic influenza on a regional level in the Netherlands. Virus Res. 2004;103(1-2):17-23. http://dx.doi.org/10.1016/j.virusres.2004.02.007 PMID:15163483
108. Martinese F, Keijzers G, Grant S, Lind J. How would Australian hospital staff react to an avian influenza admission, or an influenza pandemic? Emerg Med Australas. 2009;21(1):12-24. http://dx.doi.org/10.1111/j.1742-6723.2008.01143.x PMID:19254308
109. Ercole A, Taylor BL, Rhodes A, Menon DK. Modelling the impact of an influenza A/H1N1 pandemic on critical care demand from early pathogenicity data: the case for sentinel reporting. Anaesthesia. 2009;64(9):937-41. http://dx.doi.org/10.1111/j.1365-2044.2009.06070.x PMID:19645759