ascertainment corrected rates: applications of capture-recapture methods
TRANSCRIPT
International Journal of Epktemtology© International Efridemiologlcal Association 1993
Vol. 22, No. 3Printed in Great Britain
Ascertainment Corrected Rates:Applications of Capture-RecaptureMethodsDANIEL J MCCARTY/ EUGENE S TULL,* CLAUDIA S MOY," C KENT KWOH*AND RONALD E LAPORTE*
McCarty D J (Department of Epidemiology, University of Pittsburgh, Pittsburgh, PA 15261, USA), Tull E S, Moy C S,Kwoh C K and LaPorte R E. Ascertainment corrected rates: Applications of capture-recapture methods. InternationalJournal of Epidemiology 1993; 22: 559-565.Accurate rates, though fundamental to epidemiology, are often very difficult to obtain. Incidence, prevalence, andmortality rates have traditionally been established through either passive reporting surveillance systems, through activesurveillance systems, or by a combination of the two methods. Typically, when researchers employ these approachesthey do not formally evaluate or correct for the degree of underascertainment. Undercount of cases is a potent deter-minant of rates which we cannot continue to ignore. We believe all rates should be adjusted for underascertainment inorder to achieve a truer picture of the risk and risk factors of disease. Here, we present a procedure to ascertainmentcorrect rates based upon well established capture-recapture methods.
Rose and Barker1 noted that 'Rates are the hallmark ofepidemiology, for they form the bases of comparisonsbetween population groups.'
Sir Richard Doll recently stated: 'The monitoring ofincidence unfortunately is more complicated than themonitoring of mortality, because incidence data arehard to come by, registration of cases is now seldomcomplete, and increases in the recorded rate may bedue to an increase in the efficiency of registration'.2
As described by these distinguished epidemiologists,precise incidence rates are central to epidemiology, butthey are also very difficult to achieve. A critical,though often overlooked component of disease moni-toring is the degree of undercount. We believe one wayto begin to improve rates is by correcting them for thelevel of ascertainment.
Ascertainment level can be considered a primarydeterminant in the calculation of a rate. Given its in-fluence on incidence and prevalence, it is surprisinghow little attention has been focused on adjusting forundercount. For instance, we would never considercomparing mortality rates across populations without
• Department of Epidemiology, University of Pittsburgh, Pittsburgh,PA 15261 USA.•• The Wilmer Ophthalmological Institute, Johns Hopkins University,Johns Hopkins Medical Institution, Baltimore, MD 21205 USA.t School of Medicine, University of Pittsburgh, Pittsburgh,PA 15261 USA.
first adjusting for age, since age is a primary deter-minant of mortality. However with incidence andprevalence, we continue to report and compare rateswith little regard to one of their primary determinants,ascertainment level.
TRADITIONAL DISEASE MONITORINGSYSTEMSFor most diseases, ascertainment rates in traditionalpassive surveillance systems are acknowledged to below and variable, and therefore rates from thesesystems are used with extreme caution. Population-based registries (i.e. active surveillance systems), incontrast, typically have much higher degrees of ascer-tainment. However, despite the primary assumption ofcomplete enumeration inherent in the formal defini-tion of a population-based registry, less than 65% ofcancer registries evaluate the degree of undercount,and mechanisms by which completeness of ascertain-ment are assessed are quite variable.3 This brings usback to the undetermined role of undercount in cancerrates and efficiency of registration presented earlier bySir Richard Doll. Myocardial infarction registries arealso seldom formally evaluated for level of ascertain-ment,4 and where they are there is evidence of sub-stantial undercount.5 Therefore, it appears that fortraditional forms of disease monitoring, ascertain-ment, though one of the most important determinantsof rates, has largely been ignored.
559
560 INTERNATIONAL JOURNAL OF EPIDEMIOLOGY
If methods to estimate the degree of undercountwere available, it would be possible to compare moreaccurately reported rates between populations, and theprecision of epidemiology itself would improve. Forinstance, we would be more comfortable in reportingincidence estimates from passive surveillance systemsif rates could be adjusted to reflect degree of under-ascertainment. Active surveillance systems, such aspopulation-based registries, would also benefit greatlyfrom ascertainment correction as 100% enumeration istypically too expensive, very labour intensive, andalmost impossible to achieve for broad monitoring ofdisease frequency. Recently, we discussed the potentialbenefits of ascertainment adjustment in establishingaccurate incidence rates for connective tissue diseases,and their capacity to help explain discrepancies inreported rates across populations.6 Furthermore, aswill be demonstrated, near 100% ascertainment maynot be necessary to accurately calculate incidence.
In this paper, we describe how well-establishedcapture-recapture methods and log-linear models canbe applied to evaluate the degree of undercount andhow this estimate can be used to provide an ascertain-ment corrected rate. This approach not only may leadto a more precise means of monitoring diseases, but itcan also be applied quite easily to most traditionalpassive and active disease monitoring systems.
CAPTURE-RECAPTURE METHODSAn interesting parallel to the status of epidemiologicaldisease monitoring, which focuses attention on identi-fying new events for the numerator of incidence rates,is that of the US Bureau of the Census which providesinformation to estimate the denominator of rates.Recognizing the difficulty in achieving a 100% countof the US population, census researchers havedeveloped approaches to adjust for undercount.7 Wepropose that similar methods used to adjustdenominators in incidence and prevalence rates also beapplied to adjust the numerators.
Approaches for adjusting estimates to reflect ascer-tainment level (or census undercount) are collectivelyreferred to as capture-recapture methods. These well-established methods have a long history of use indemography, from estimating the population ofFrance in the 18th century,8 determining birth anddeath rates in India,9 to current uses in the 1990 USCensus.7 Their greatest application, however, has beenin the monitoring of the births, deaths and theabundance of wildlife,8-10*12 where they have becomethe standard for estimating the changing frequency ofcertain birds, fish, and insects. We have recentlysuggested that these methods are underutilized in
epidemiology and have considerable potential formonitoring diseases.3t6t13 Hook and Regal have alsostressed the value of these methods even for apparentlyexhaustive surveys.14
The following wildlife example briefly illustrates thesimplest form of a two-sample capture-recapturemodel.12 A sample of animals (M) is captured, thenmarked and released. Subsequently, a second sampleof animals (n) is captured. An estimate of the popula-tion size (N) can then be calculated based on thenumber of marked animals captured in the secondsample (m) such that N = [(M +l)(n+l)/(m+1)]-1.The variance of N can be estimated by Var (N) =((M + 1 )(n + 1 )(M-m)(n-m))/((m + 1 ̂ (m + 2)) and con-fidence intervals constructed by N + (-) 1.96(\/var).We will discuss assumptions for this model, confidenceintervals (CI), and an extension of this method, themultiple recapture census (log-linear modelling).15
In epidemiology, capture-recapture techniques allowthe number of cases of disease in a defined populationto be estimated using two or more sources of cases.Potential sources often include hospital records,private practice physicians, death certificates, or otherpatient lists. Taken alone, each of these sources mayconsiderably undercount the actual number of cases.However, by using information provided by duplicatecases (cases found in more than once source), anestimate of the number of individuals not identifiedcan be calculated. From the estimate of the number of'uncounted' cases, an 'ascertainment corrected' ratecan be derived.
These methods are slowly making inroads intoepidemiology, with the evaluation of the frequencyand changing patterns of adverse drug reactions,16
spina bifida,17 cleft palate,18 congenital rubella syn-drome," cancer,20 and intravenous drug use.21 Webelieve these techniques can be applied to complementexisting disease monitoring systems, and have madecapture-recapture methods the cornerstone formonitoring incidence in our WHO Multinational Pro-ject for Childhood Diabetes.22
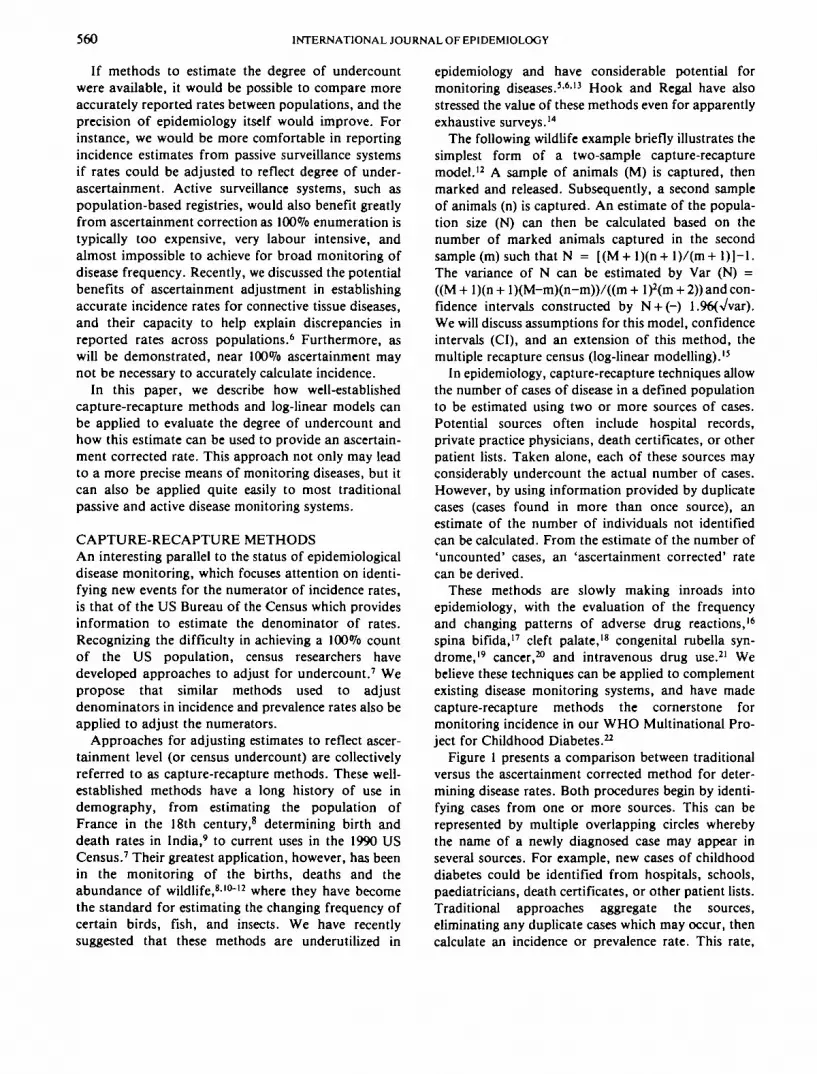
Figure 1 presents a comparison between traditionalversus the ascertainment corrected method for deter-mining disease rates. Both procedures begin by identi-fying cases from one or more sources. This can berepresented by multiple overlapping circles wherebythe name of a newly diagnosed case may appear inseveral sources. For example, new cases of childhooddiabetes could be identified from hospitals, schools,paediatricians, death certificates, or other patient lists.Traditional approaches aggregate the sources,eliminating any duplicate cases which may occur, thencalculate an incidence or prevalence rate. This rate,
ASCERTAINMENT—USE OF CAPTURE-RECAPTURE METHODS
Employ multiple sources to identify cases
561
True number of casesin the population
(unknown)
Traditional Methods Ascertainment Correction Methods
'- Sources
True number of casesin the population(unknown) I I True number of cases in the
population estimated usingCapture-recapture methods
Unadjusted "crude" rate Ascertainment corrected ratewith 95% confidence intervals
FIGURE 1 Traditional vtrsus ascertainment correction methods for determining disease frequency
however, should be regarded as the 'crude rate' since itassumes that the aggregate of the sources represent all(or nearly all) of the cases in the population.
In contrast, the ascertainment corrected methodtakes advantage of the duplicate information ignoredby most traditional techniques. Keeping the sourcesdisaggregated, this approach applies capture-recapturemethods to evaluate the degree of overlap between thesources and obtains an estimate of the number of in-dividuals who were missed in the population. This
estimate of the undercount is then used to correct therate and construct 95% CI, resulting in an 'ascertain-ment corrected' rate.
Because this method always evaluates and correctsincidence and prevalence estimates for the efficiency ofregistration (ascertainment), epidemiologists can bemore confident that reported geographical differencesin the frequency and rising rates of disease over timeare not the result of as Sir Richard Doll stated 'an in-crease in the efficiency of registration'. Furthermore,
562 INTERNATIONAL JOURNAL OF EPIDEMIOLOGY
the CI constructed around these estimates indicate thelevel of enumeration and permit rational and mean-ingful comparisons of rates across populations.
The utility of the ascertainment correction approachcan be further demonstrated through the followingseries of examples. We begin by presenting a simpletwo-source example and discuss its potential to provideaccurate rates. We then review possible limitationswhich can arise in two-source comparisons. Next, weoffer a three-source example which uses the multiplerecapture census (log-linear modelling)23 to adjust anincidence rate for ascertainment. The later approachcan be employed to address the potential biases whichmay arise from two-sample analysis.
Childhood DiabetesThe ascertainment correction method was recentlyused to estimate the incidence of childhood diabetes inMadrid, Spain.24 Assessment of diabetes incidencebegan with the development of a traditional popula-tion-based registry which identified 432 cases throughhospital inpatient records. Since it was expected thatthe majority of onset diabetes cases would be admittedto hospitals at diagnosis, initial case ascertainment wasaccomplished by reviewing discharge records at allhospitals in Madrid with a paediatric or paediatric en-docrinology service. All cases who were diagnosedfrom 1985 to 1988, resided in Madrid at the time ofdiagnosis, and were under the age of 15 were eligiblefor registration.
Although enumeration was expected to be high, itwas recognized that cases diagnosed outside ofMadrid, as well as those never admitted to a hospital,would be missed. To evaluate the level of ascertain-ment in the hospital registry, 138 cases were lateridentified through the Spanish Diabetes Association.It was found that 119 cases were common to the twosources. Using the principle source and duplicateinformation, simple two-sample capture-recapturemethods were applied to estimate the number ofmissed cases.
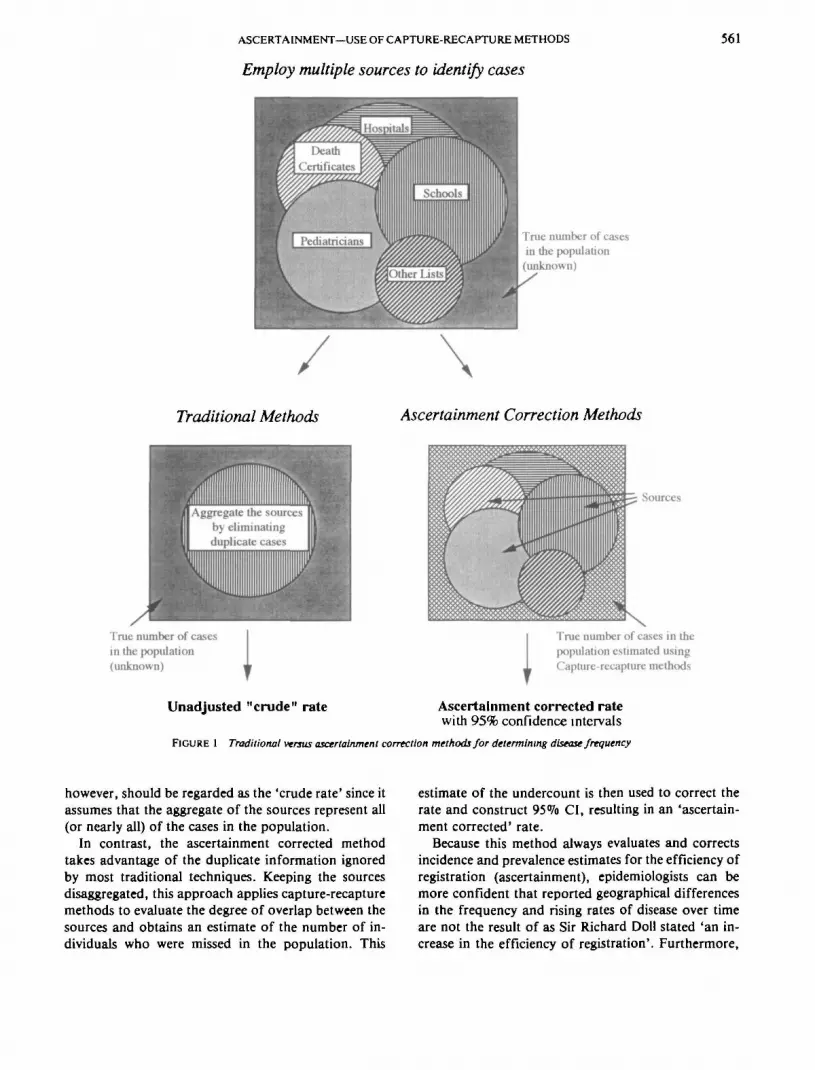
The duplicate information, the aggregated in-cidence, and the ascertainment corrected incidencerate are presented in Table 1. Simply aggregating the432 hospital cases to the 138 found through thediabetes association and eliminating any duplicatecases revealed 451 new cases. This translates to an'unadjusted' incidence rate of 10.2 per 100000. Whenwe applied capture-recapture methods to this duplicateinformation however, we found that 50 cases may nothave been identified. This estimate of 50 unascertainedcases was then used to ascertainment correct thenumber of cases we had identified, and construct 95%confidence intervals (CI). Adjusting for undercount,the total number of cases in Madrid was estimated tobe 501. The ascertainment corrected incidence, there-fore was found to be 11.3 per 100000 (95% CI : 10.6-11.9). Overall ascertainment rates for the hospitalregistry, the diabetes association list, and the com-bined data were estimated to be 86%, 28% and 90%respectively.
The crude incidence not corrected for ascertainmentwas not much lower than the corrected incidence inthis example. However, for most diseases, it is unlikelythat such a high level of ascertainment can be easilyachieved from a single source.
Assumptions of Two-Sample Capture-RecaptureMethodsAlthough they are simple to use, there are instances inwhich the two-sample capture-recapture methods maylead to biased estimates. Traditional capture-recapturemodels require that the population be closed to addi-tions or deletions, that individual identifiers are notlost or overlooked, and that for a given source eachcase is equally likely to be listed by that source (in-dependence).15 The first two assumptions are notusually problematic as these populations are relativelystable and unique identifiers, such as names and socialsecurity numbers, are rarely lost. The most difficultassumption, however, is that of independence, as trulyindependent sources rarely occur. For instance, physi-
TABLE I Childhood diabetes in Madrid, Spain
Hospitals Diabetesassociation
Aggregatedregistry
Ascertainment correctedestimate (95<S% CI)»
Cases
Incidenceper 100000 per year)Estimated degreeof ascertainment (%)
4329.8
86
1383.1
28
45110.2
90
501 (472-530)11.3 (10.6-11.9)
100
* Based on two-sample capture-recapture methods.
ASCERTAINMENT—USE OF CAPTURE-RECAPTURE METHODS 563
cians tend to refer patients to specific hospitals,laboratories, certain specialists, etc.
In the animal literature, dependencies may result inpositive interactions (trap fascination) or negative in-teractions (trap avoidance). In epidemiology, 'trapfascination' could be renamed 'health care visibility' inthat it suggests certain individuals are more likely to beidentified by a particular source. Negative interaction,or 'trap avoidance', could be referred to 'health careinvisibility ' as it reflects a situation where individualsmay be systematically excluded from a selected source.The direction of the dependencies directly effect theprecision of the calculated rates. For instance, positiveinteractions deflate estimates while negative inter-actions inflate estimates. For these reasons, two-sample capture-recapture estimates must be used withcaution. Hook and Regal25 however, suggest thatbiased estimates may be useful as indicators of upperor lower boundary limits if the directions of thedependencies between the sources are known or highlysuspected.
Fortunately, there exist methods, such as theBernoulli census and log-linear modelling, that canassess source dependencies. It is important to note,that in order to investigate source dependencies andtheir influence on estimates, both of these techniquesrequire at least three sources for estimating populationsize. Therefore, if dependencies between the twosources are suspected, it is recommended that three ormore sources be employed to control for potentialdependencies prior to ascertainment correcting in-cidence or prevalence rates.
Wittes, Colton and Sidel13 proposed a 'Bernoullicensus' approach, which plots all the pairwise com-parison of the two-sample estimates to investigate bias.If dependence is suspected, the related sources may bemerged and treated as a single source. This process isrepeated until no source dependency is suggested.
Another technique which addresses dependency be-tween sources has been proposed by Fienberg.23 Thismethod employs log-linear models for incompletemultiway contingency tables. Using this technique,data can be placed in an incomplete 2k contingencytable, where k represents the number of sources selectedfor case ascertainment. This table displays the re-capture history of all cases in the community, with theexception of one missing cell which corresponds to thenumber of unascertained cases in the population. Log-linear models are then fitted to this contingency tablewhich use the observed cells to predict the missing cell.By predicting the value of the missing cell, estimates ofthe size of the population of interest may be obtained.Source dependencies may be modelled using inter-
action terms which are added to the simplest model (in-dependent sources) until no significant improvementof fit occurs. This approach was recently used byFrischer et al. to estimate the prevalence of injectingdrug use in Glasgow, Scotland.21
Hook et al.11 compared estimates of the prevalenceof spina bifida in New York using both the BernoulliCensus and log-linear modelling and concluded bothmethods provided very similar estimates. The follow-ing example demonstrates the utility of log-linearmodels to provide ascertainment corrected rates usingmore than two sources. Furthermore, it displays howeasily this approach can be applied to complementtraditional disease monitoring systems.
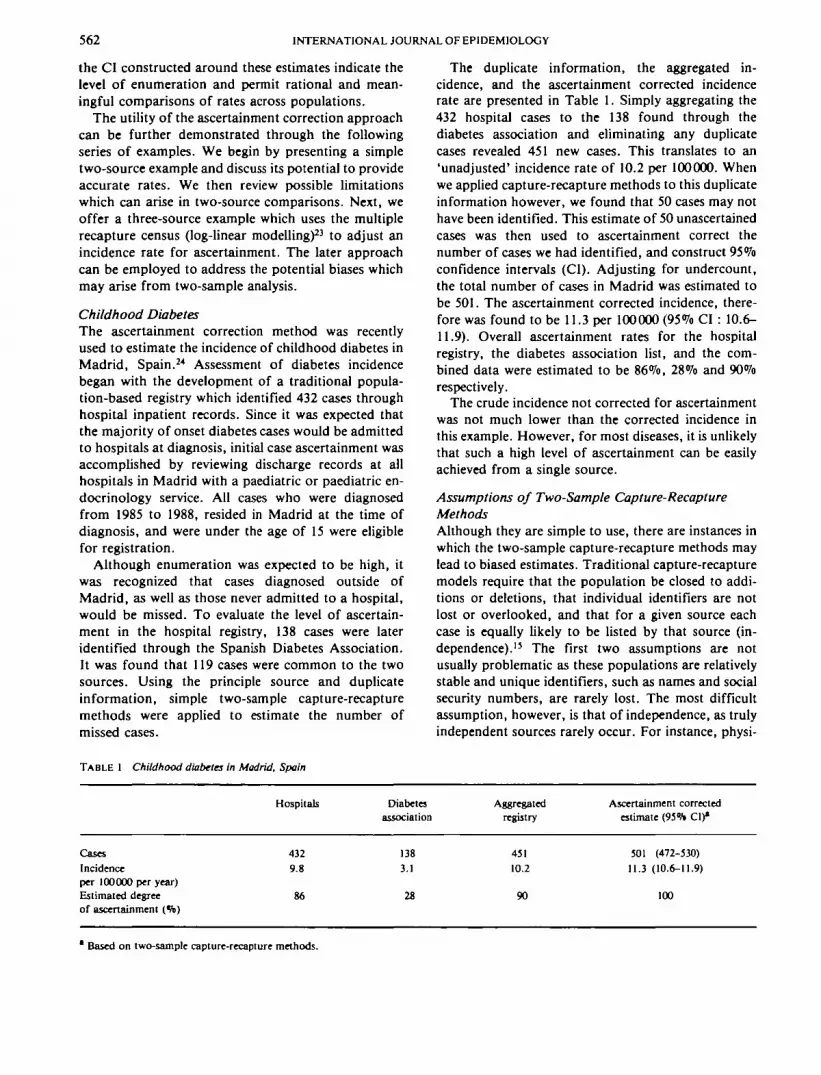
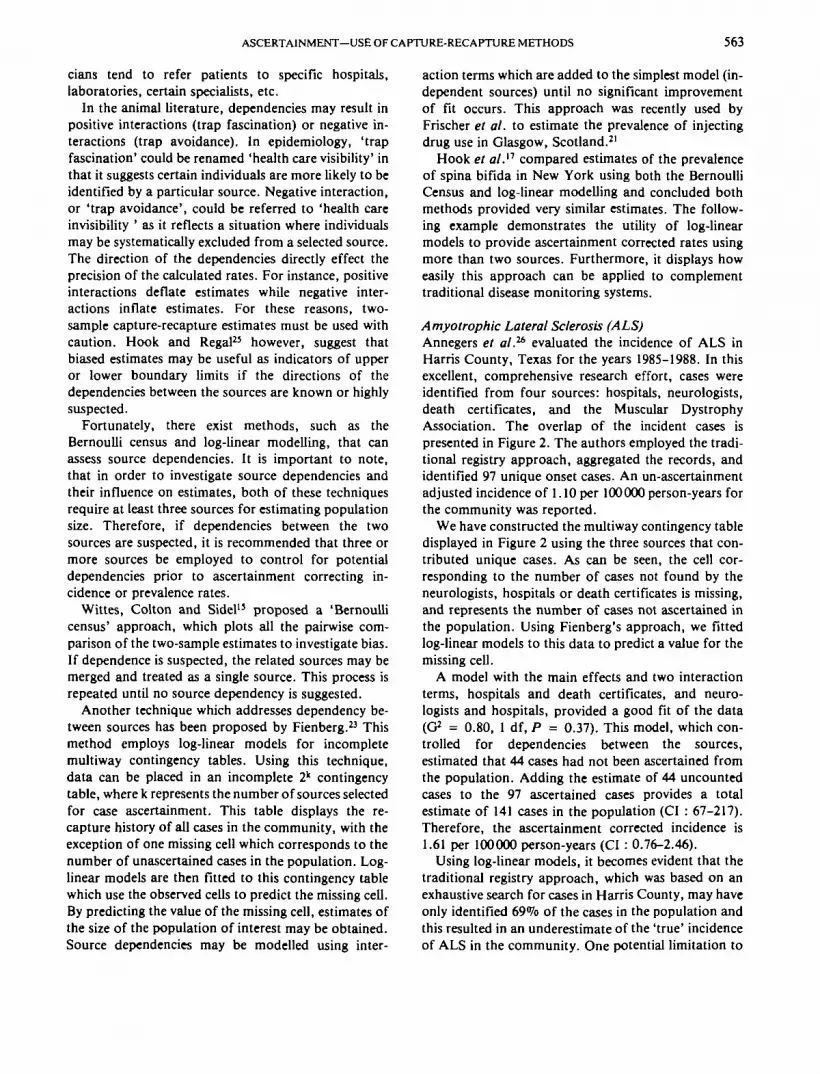
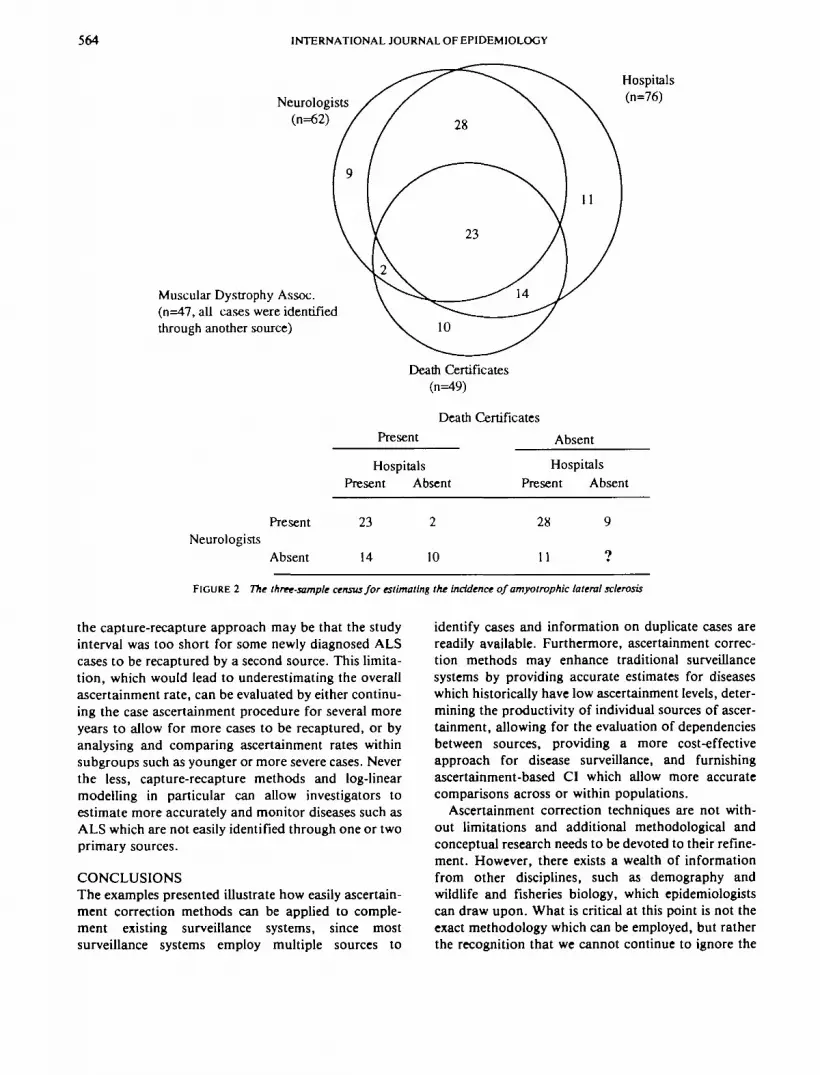
Amyotrophic Lateral Sclerosis (ALS)Annegers et al.26 evaluated the incidence of ALS inHarris County, Texas for the years 1985-1988. In thisexcellent, comprehensive research effort, cases wereidentified from four sources: hospitals, neurologists,death certificates, and the Muscular DystrophyAssociation. The overlap of the incident cases ispresented in Figure 2. The authors employed the tradi-tional registry approach, aggregated the records, andidentified 97 unique onset cases. An un-ascertainmentadjusted incidence of 1.10 per 100000 person-years forthe community was reported.
We have constructed the multiway contingency tabledisplayed in Figure 2 using the three sources that con-tributed unique cases. As can be seen, the cell cor-responding to the number of cases not found by theneurologists, hospitals or death certificates is missing,and represents the number of cases not ascertained inthe population. Using Fienberg's approach, we fittedlog-linear models to this data to predict a value for themissing cell.
A model with the main effects and two interactionterms, hospitals and death certificates, and neuro-logists and hospitals, provided a good fit of the data(G2 = 0.80, 1 df, P = 0.37). This model, which con-trolled for dependencies between the sources,estimated that 44 cases had not been ascertained fromthe population. Adding the estimate of 44 uncountedcases to the 97 ascertained cases provides a totalestimate of 141 cases in the population (CI : 67-217).Therefore, the ascertainment corrected incidence is1.61 per 100000 person-years (CI : 0.76-2.46).
Using log-linear models, it becomes evident that thetraditional registry approach, which was based on anexhaustive search for cases in Harris County, may haveonly identified 69% of the cases in the population andthis resulted in an underestimate of the 'true' incidenceof ALS in the community. One potential limitation to
564 INTERNATIONAL JOURNAL OF EPIDEMIOLOGY
Neurologists(n=62)
Muscular Dystrophy Assoc.(n=47, all cases were identifiedthrough another source)
Hospitals(n=76)
PresentNeurologists
Absent
Death Certificates(n=49)
Death Certificates
Present Absent
Hospitals HospitalsPresent Absent Present Absent
23
14
2 28
10 11
9
9
FIGURE 2 The three-sample census for estimating the incidence of amyotrophic lateral sclerosis
the capture-recapture approach may be that the studyinterval was too short for some newly diagnosed ALScases to be recaptured by a second source. This limita-tion, which would lead to underestimating the overallascertainment rate, can be evaluated by either continu-ing the case ascertainment procedure for several moreyears to allow for more cases to be recaptured, or byanalysing and comparing ascertainment rates withinsubgroups such as younger or more severe cases. Neverthe less, capture-recapture methods and log-linearmodelling in particular can allow investigators toestimate more accurately and monitor diseases such asALS which are not easily identified through one or twoprimary sources.
CONCLUSIONSThe examples presented illustrate how easily ascertain-ment correction methods can be applied to comple-ment existing surveillance systems, since mostsurveillance systems employ multiple sources to
identify cases and information on duplicate cases arereadily available. Furthermore, ascertainment correc-tion methods may enhance traditional surveillancesystems by providing accurate estimates for diseaseswhich historically have low ascertainment levels, deter-mining the productivity of individual sources of ascer-tainment, allowing for the evaluation of dependenciesbetween sources, providing a more cost-effectiveapproach for disease surveillance, and furnishingascertainment-based CI which allow more accuratecomparisons across or within populations.
Ascertainment correction techniques are not with-out limitations and additional methodological andconceptual research needs to be devoted to their refine-ment. However, there exists a wealth of informationfrom other disciplines, such as demography andwildlife and fisheries biology, which epidemiologistscan draw upon. What is critical at this point is not theexact methodology which can be employed, but ratherthe recognition that we cannot continue to ignore the

ASCERTAINMENT—USE OF CAPTURE-RECAPTURE METHODS 565
distortion within our incidence and prevalence ratescreated by a failure to adjust for undercount.
It is important that we break away from the com-monly held belief that 100% enumeration is requiredfor accurate incidence and prevalence rates. Instead,there needs to be a recognition that underascertain-ment will always exist, can be estimated, and can becorrected to provide a more accurate picture of diseasefrequency. We strongly urge that all rates be reportedonly after formal evaluation and adjustments forunderascertainment have been completed.
ACKNOWLEDGEMENTResearch support by NIH grant R01-DK 24021,T32-DK 07410.
REFERENCES' Rose G, Barker D J P. Epidemiology for the Uninitiated. London;
British Medical Journal Publication, 1986; pp 9.2 Doll R. Progress against cancer. An epidemiologic assessment.
The 1991 John C Cassd Memorial Lecture. Am J Epidemiol1991; 134: 675-88.
3 Coleman M P, Demaret E. Cancer Registration in the EuropeanEconomic Community. Lyon, France: 1ARC TechnicalReport No. 3, 1988.
* Hammar N, Nerbrand C, Ahlmark G et al. Identification of casesof myocardial infarction: Hospital discharge data and mortalitydata compared to myocardial infarction community registers.Int J Epidemiol 1991; 20: 114-20.
5 LaPorte R E, Tull E, McCarty D. Monitoring the incidence ofmyocardial infarctions: applications of capture-mark-recapture technology. Int J Epidemiol 1992; 21: 258-62.
6 McCarty D J, Kwoh C K, LaPorte R E. The importance ofincidence registries for connective tissue diseases. JRheumatol1992; 19: 1-7.
7 Wolter K M. Accounting for America's uncounted and miscounted.Science 1991; 253: 12-15.
8 Pollock K H. Modeling capture, recapture, and removal statisticsfor estimation of demographic parameters for fish and wildlifepopulations: past, present, and future. J Am Stat Assoc 1991;86: 225-38.
9 Sekar C C, Deming W E. On a method for estimating birth anddeath rates and the extent of registration. Am Slat Assoc J1949; 100-15.
10 Eberhardt L L. Appraising variability in population studies. J WlldlManage 1978; 42: 207-38.
" Chapman D G. The estimation of biological populations. AnnMath Stat 1954; 25: 1-15.
12 Seber G F. The Estimation of Animal Abundance and RelatedParameters, 2nd edn. London: Griffin & Co, 1982.
13 LaPorte R E. McCarty D J, Tull E S, Tajima N. Counting birdsbees and NCDs. Lancet 1992; 339: 494.
'* Hook E B, Regal R R. The value of capture-recapture methods evenfor apparent exhaustive surveys. The need for adjustment forsource of ascertainment intersection in attempted completeprevalence studies. Am J Epidemiol 1992; 135: 1060-67.
15 Bishop Y M M, Renberg S E, Holland P W. Discrete MulttvariateAnalysis: Theory and Practice. Cambridge, Mass: MIT Press,1975; pp 229-56.
16 Wittes J T, Colton T, Sidel V W. Capture-recapture methods forassessing the completeness of case ascertainment when usingmultiple information sources. J Chron Dis 1974; 27: 25-36.
17 Hook E B, Albright S G, Cross P K. Use of Bernoulli Census andlog-linear methods for estimating the prevalence of spinabifida in live births and the completeness of vital recordreports in New York State. Am J Epidemiol 1980; 112:750-58.
18 Chapman C J. Ethnic differences in the incidence of cleft Up and/orcleft palate in Auckland, 1960-1976. NZ Med J 1983; 96:327-29.
19 Cochi S L, Edmonds L E, Dyer K et al. Congenital rubella syn-drome in the United States, 1970-1985. Am J Epidemiol 1989;129: 349-61.
2 0 Robels S C, Marrett L D, Clarke E A, Risch H A. An application ofcapture-recapture methods to the estimation of completenessof cancer registration. J Clin Epidemiol 1988; 41: 495-501.
21 Frischer M, Bloor M, Finlay A et al. A new method of estimatingprevalence of injecting drug use in an urban population:results from a Scottish City. Int J Epidemiol 1991; 20:997-1000.
2 2 WHO DIAMOND Project Group. WHO multinational project forchildhood diabetes. Diabetes Care 1990; 13: 1062-68.
23 Renberg S E. The multiple recapture census for closed populationsand incomplete 2k contingency tables. Biometrics 1972; 59:591-603.
2 4 Serrano-Rios M, Moy C S, Serrano RMel al. Incidence of Type 1(insulin-dependent) diabetes mellitus in subjects 0-14 years ofage in the comunidad of Madrid, Spain. Diabetologia 1990;33: 422-24.
23 Hook E B, Regal R R. Capture-recapture methods (Letter). Lancet1992; 339: 742.
26 Annegers J F. Appel S, Lee J R, Perkins P. Incidence andprevalence of amyotrophic lateral sclerosis in Harris County,Texas, 1985-1988. Arch Neurol 1991; 48: 589-93.
{Revised version received October 1992)