an experimental evaluation of capture‐recapture in software inspections
TRANSCRIPT
C. Wohlin, P. Runeson and J. Brantestam, "An Experimental Evaluation of Capture-Recapture in Software Inspections", Journal of Software Testing, Verification and
Reliability, Vol. 5, No. 4, pp. 213-232, 1995.
An Experimental Evaluation of Capture-Recapture in Software Inspections 3 August 1995 1
An Experimental Evaluation ofCapture-Recapture in Software Inspections
Claes Wohlin*, Per Runeson** and Johan Brantestam**
* Dept. of Communication Systems ** Q-LabsLund Institute of Technology IDEON Research ParkLund University S - 223 70 LUNDBox 118 SwedenS - 221 00 LUNDSweden
Abstract
The use of capture-recapture to estimate the residual faults in a software artifact hasevolved as a promising method. However, the assumptions needed to make the esti-mates are not completely fulfilled in software development, leading to an underestima-tion of the residual fault content. Therefore, a method employing a filtering techniquewith an experience factor to improve the estimates of the residual faults is proposed inthis paper.
An experimental study of the capture-recapture method with this correction methodhas been conducted. It is concluded that the correction method improves the capture-recapture estimate of the number of residual defects in the inspected document.
Keywords:
Experimental software engineering, software inspections, capture-recapture, softwaremetrics, fault content estimation
1.0 Introduction
Software inspections are described as one of several cost-effective techniques toimprove software quality. Inspections have been discussed extensively since theirintroduction by Fagan (Fagan, 1976). A comprehensive description of softwareinspections can be found in (Gilb et al., 1993).
A method of estimating the residual faults after an inspection using capture-recapturehas been proposed by (Eick et al., 1992). This method has been further studied by(Vander Wiel et al., 1993), who concluded that the method often underestimated theactual number of faults. The capture-recapture method can be applied to any type ofdocument being inspected, and is thus applicable not only during code inspections,but, for example, also during inspection of requirements specifications. The capture-
An Experimental Evaluation of Capture-Recapture in Software Inspections 3 August 1995 2
recapture method can be combined with any other suitable measures for softwareinspection. A number of measures are proposed by (Gilb et. al., 1993), for example, ameasure for estimated effectiveness of the inspection. This type of measure is, how-ever, not discussed here.
The objective of this study was to find solutions to some problems identified in apply-ing the capture-recapture method in software inspections. The proposals were testedusing an experiment in which the number of faults in the document is known.
2.0 Brief introduction to capture-recapture
2.1 Inspections and capture-recapture
The capture-recapture method was originally used to estimate animal populationsthrough multiple independent counters. Statistical inference is used to draw conclusionsabout the total population size. In software engineering the method is applied to count-ing the number of faults based on data from several independent sources. It is assumedthat one reviewer capture a certain fault, and as other reviewers identify the same faultthey are said to recapture the fault. This means that the reviewers can be treated as in-dependent counters in a similar way to when estimating wildlife populations. The meth-od has been proposed by (Eick et al., 1992) for fault content estimations in inspectionsin the software development process. The method is hence quite new but it is extremelysimple to apply and the result is intuitively appealing.
Inspections employing the capture-recapture method consist of four different steps:
1. Inspection preparationInspection preparation means reading the documents to be inspected carefully andnoting all faults found. Each reviewer is responsible for being well-prepared beforegoing to the inspection meeting. “Well-prepared” means that a minimum of prepa-ration time should be required to be able to include a reviewer in the estimationprocess.
2. Inspection meeting and data collectionThe inspection is led by a moderator (or chairman) who is responsible for collectingthe fault information from the individual reviewers. The moderator should also notethe preparation time for each reviewer and if it is judged that one or several review-ers have not prepared themselves as required, they should be excluded from theestimation process as their poor preparation will influence the estimate in an unpre-dictable way. It is recommended that the moderator determines a minimum prepa-ration time in advance for the data to be useful.
3. Data analysisThe fault data collected during the inspection form the basis for analysis. The anal-ysis is performed by applying an estimation method to the data collected. Differentmethods can be used and they are based on different assumptions. Two methods arediscussed in Section 2.2.
An Experimental Evaluation of Capture-Recapture in Software Inspections 3 August 1995 3
4. Result evaluation and decision makingAs a result of the data analysis, the number of faults prior to the inspection, andhence the residual faults after the inspection, can be estimated. The method pro-vides some important estimates which can be used to estimate trends and formulatethresholds. It is hence possible to define thresholds for approval of a particular doc-ument, but specific values must be determined explicitly for each organisationapplying the capture-recapture method.The estimates may also form the basis for process improvement, since if thenumber and type of faults can be determined, it will then be possible to improveboth the document creation process (which may be the software development proc-ess) and the inspection process itself by improving the inspection guidelines.
The capture-recapture method is closely related to fault seeding, where a knownnumber of faults are entered into the documents to be used in the estimation process.The major advantage with the capture-recapture method is that faults do not have to beintroduced into the documents; the faults already present are used in the estimationprocedure. The capture-recapture method does not assume that any faults are knownprior to inspection preparation. The estimate is based only on faults found by individ-ual reviewers preparing for the inspection.
2.2 Estimation methods in capture-recapture
2.2.1 Maximum-Likelihood estimation method
The capture-recapture method as presented by (Eick et al., 1992) is based on the Max-imum-Likelihood estimation method. The estimation method is based on the followingassumptions.
• All faults are found by a specific reviewer with equal probability. Differencesbetween reviewers are allowed, but each reviewer is assumed to have the sameprobability of finding all the faults.
• The reviewers work independently.
It is, of course, also assumed that the number of reviewers is at least two, but themethod does not assume an upper limit.
It is possible to derive a formula which has a maximum for the most likely value of theinitial number of faults prior to the inspection, i.e. N. Upon maximisation, the formulagives the Maximum-Likelihood estimate of N. n is defined as the number of uniquefaults found, excluding those found at the review meeting. The definition of n meansthat faults found by more than one reviewer are only counted once. nj is the number offaults found by reviewer j and m is the number of reviewers. The Maximum-Likeli-hood function which is maximised is (Vander-Wiel et. al., 1993):
An Experimental Evaluation of Capture-Recapture in Software Inspections 3 August 1995 4
(Eq. 1)
This function can be maximised numerically, but the simplest solution is to plot orsimply calculate the function for N Š n or (n+r) until the maximum is reached, where ris the number of faults found at the review meeting.
2.2.2 Jackknife estimation method
The Jackknife estimation method is based on the following assumptions.
• All reviewers have the same probability of detecting a specific fault, but the differ-ent faults may have different detection probabilities. This assumption is the oppo-site to that made above for the Maximum-Likelihood method.
• The reviewers work independently.
The Jackknife estimation method has been evaluated by (Vander Wiel et al., 1993), butit was not shown to be superior to the Maximum-Likelihood method. Therefore, theMaximum-Likelihood method was used throughout this investigation.
The first assumption above, made for the Jackknife estimation method is, however,used as a basis below when discussing how the faults found during inspection can bedivided into different classes through a filtering technique. The assumption is not usedas stated, but the main idea behind the assumption is used, see below.
3.0 Capture-recapture problems
There are some problems associated with the capture-recapture method using Maxi-mum-Likelihood estimates.
• A consequence of the assumptions used in the model is that if many reviewers areinvolved in the inspection, then it is very unlikely that any faults are estimated toremain at all. However, practical experience contradicts this. Some faults are verydifficult to find and some may not be found by any reviewer, hence this causes aproblem when applying the method.
• Faults found at the inspection meeting are not included in the estimation procedure.The faults found at the meeting are subtracted from the estimate, hence loweringthe estimate and if many faults are found at the meeting then the estimate of thenumber of faults prior to the inspection will be equal to the number of faults found.A large number of faults found at the meeting indicates that a large number of faultsremain, but the method implies the opposite, as the estimation method is based onfaults found prior to the meeting.
L N( ) Nn⎝ ⎠⎛ ⎞log nj njlog
j 1=
m
∑ Nm Nlog– N nj–( ) N nj–( )logj 1=
m
∑+ +=
An Experimental Evaluation of Capture-Recapture in Software Inspections 3 August 1995 5
• The estimation method does not work if there is no overlap between the reviewers.The method gives an infinite estimate of the faults prior to the inspection. No over-lap should indicate that a large number of faults remain, but the method is unable tocope with this situation accurately.
The two first items are closely related to the assumption of the equal probabilities of aspecific reviewer finding the different faults present in the inspected document. Thefirst item is related to this assumption since it is well known that some faults are verydifficult to find and may also be found through a combination of reviewers, hence con-tradicting the assumption, see Section 4.0. The second item reduces the estimate of theresidual fault content incorrectly, because it is assumed that all faults found at theinspection meeting are part of the estimate and in many situations this means that thenumber of residual faults after the meeting is estimated to be equal to zero. This isincorrect since some faults may be impossible to find for a single reviewer, but it ispossible to locate the fault at the meeting due to the combinations of competence andexperience of the individual reviewers. Therefore, it is essential to propose an estima-tion method, which tries to compensate for the unrealistic assumption about equalprobabilities for all faults in the document for a single reviewer. The solution is, how-ever, not the Jackknife estimation method as shown by (Vander Wiel et. al., 1993).
4.0 Reviewer profile
4.1 Reviewer profile model
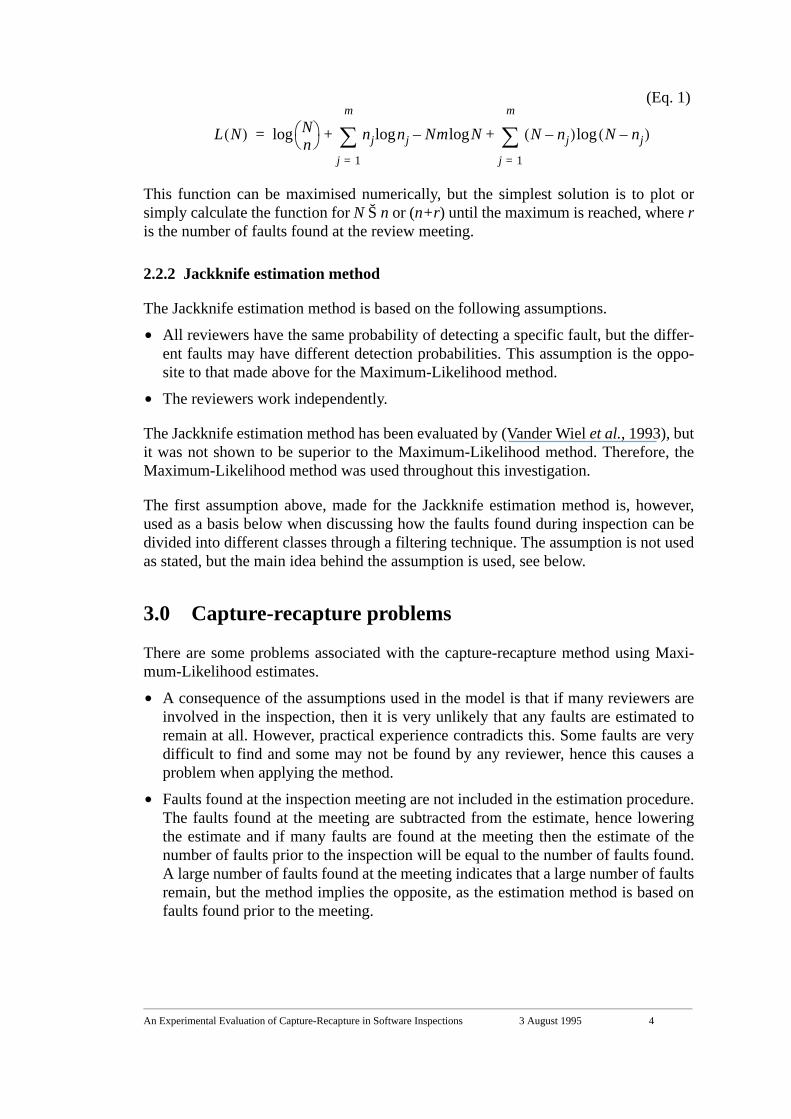
As mentioned before, the Maximum-Likelihood method is based on the assumptionthat for a specific reviewer, the probability of finding each different fault is the same.This is obviously not true, since it is known that different faults are more or less easyto find. In order to explain the behaviour of a reviewer, a simple reviewer model isintroduced. It is based on dividing the faults into k classes, denoted Fi where 1ð i ð k,each representing a fault type with a certain probability, pi, of being found by the spe-cific reviewer. This means that the probability of a reviewer finding a fault from faultclass Fi is pi. By presenting all the fault classes with their probabilities in a diagram, areviewer profile is obtained, see Figure 1.
FIGURE 1. Reviewer profile for a reviewer and mean probability of finding a fault.
Probability
Fault classF1 F2 F3 Fk-1 Fk
mean probabilityof finding a fault
An Experimental Evaluation of Capture-Recapture in Software Inspections 3 August 1995 6
4.2 Example of applying the model
Different reviewers have different skills in finding different faults. However, it is verylikely that different reviewers have fairly similar reviewer profiles, i.e. the reviewerswill find certain faults difficult to locate, while others are relatively easy to find. Thisis due to the fact that the reviewers have similar backgrounds, i.e. they speak the samelanguage, they have roughly the same education, and so on. This makes it likely thatthere will be a number of faults belonging to certain fault classes which almost all thereviewers will find, and faults belonging to other fault classes which only a fewreviewers will find. It can hence be argued that different reviewers have a higher prob-ability of finding some faults than others. This, however, does not mean that they havethe same probability of finding these faults as, for example, is assumed in the Jack-knife estimation method.
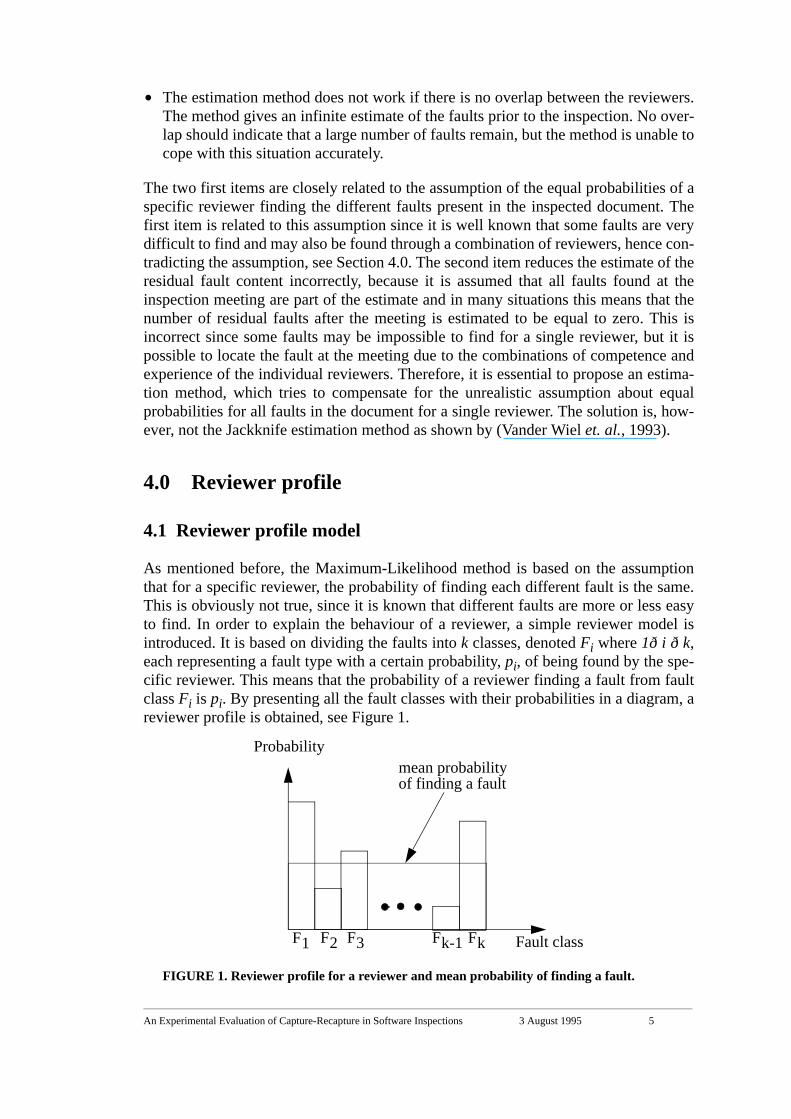
In this discussion, a very simple example is used with only two fault classes and tworeviewers. The reviewer profiles, which are quite similar, are presented in Figure 2.The model is applicable to any reviewer profile and any distribution between faultclasses, see below.
FIGURE 2. Example reviewer profiles.
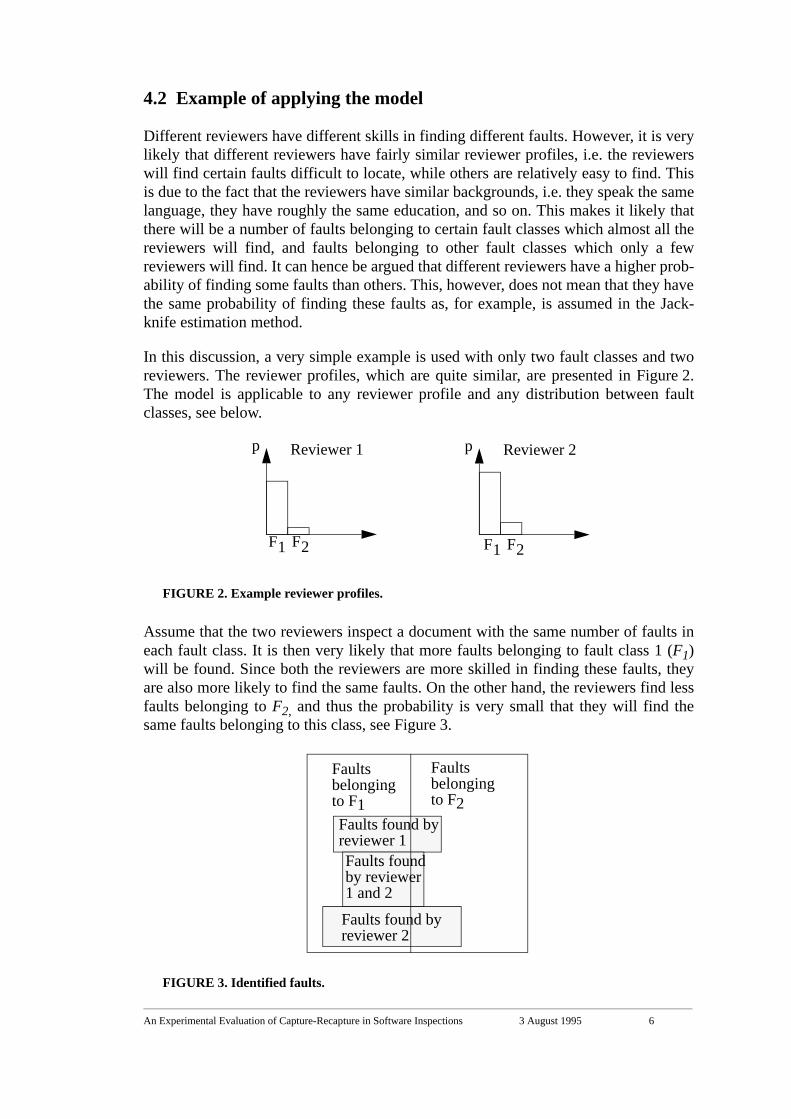
Assume that the two reviewers inspect a document with the same number of faults ineach fault class. It is then very likely that more faults belonging to fault class 1 (F1)will be found. Since both the reviewers are more skilled in finding these faults, theyare also more likely to find the same faults. On the other hand, the reviewers find lessfaults belonging to F2, and thus the probability is very small that they will find thesame faults belonging to this class, see Figure 3.
FIGURE 3. Identified faults.
Reviewer 1p Reviewer 2p
F2F1 F2F1
Faults
to F2belonging
Faults
to F1belonging
Faults found byreviewer 1Faults foundby reviewer1 and 2
Faults found byreviewer 2
An Experimental Evaluation of Capture-Recapture in Software Inspections 3 August 1995 7
If the Maximum-Likelihood method was to be applied to the data from this inspectionit would probably indicate that most faults had been found. However, it is known thata large number of faults remain in fault class F2. The reason for this is that the majorityof the identified faults are from fault class F1 and among these faults there is a largeoverlap since these faults are very likely to be found by both the reviewers.
Based on this simple example, which was presented to highlight the problems associ-ated with equal probabilities of finding all faults for each reviewer, it is concluded thatthe assumption is wrong and the method of estimation must be adapted to take accountof this fact.
5.0 Solution procedure
The three problems described in Section 3.0 are critical when the estimation techniqueis put into practice. The capture-recapture method including Maximum-Likelihood isstill tractable as it allows for the estimation of the residual fault content, but it requiressome improvements. Therefore, a procedure which takes into account the effects of theabove problems is proposed. The method is, to some extent pragmatic, but it is betterto be pragmatic than stubborn and continue to use a mathematically correct methodwhich notoriously produces underestimates.
The procedure can be summarized as follows.
1. The faults must be divided into groups such that it is more likely that the assump-tion regarding the same probability of detection holds. This can be achieved byintroducing a filter which divides the fault data into different classes. The filtermust be based on the number of reviewers who find a specific fault, since if manyreviewers find a specific fault then it can be assumed that it is more likely that areviewer will find this fault, than a fault which has only been found by onereviewer. The first step is therefore to identify a suitable filter.The construction of a filter is based on the same assumption as the Jackknife esti-mation method, see Section 2.2.2, i.e. the faults are not detected with the sameprobability, as assumed when using the Maximum-Likelihood estimation methodfor all faults in one class. However, the filtering technique does not require that thedetection probabilities to be the same for all reviewers, which is assumed in theJackknife estimation method.An extreme filter is to divide the fault data into classes based on the exact numberof reviewers who have found a specific fault, i.e. class 1: faults found by all review-ers, class 2: faults found by all reviewers but one and so forth. This is the most fine-grained filter that could be constructed. This type of filter would not work in prac-tice as a certain overlap between the reviewers is needed to perform the estimationof the residual fault content.Another example of a filter is to divide the fault data based on percentages: forexample, class 1: faults found by at least 50% of the reviewers and class 2: faultsfound by less than 50% of the reviewers. Two classes are used when discussing fil-tering techniques below. An analysis of the estimates based on changes in the per-
An Experimental Evaluation of Capture-Recapture in Software Inspections 3 August 1995 8
centage value is presented in Section 7.0, based on data from the experimentalstudy. The choice of a filter must be based on experience so that the best possiblefilter for a specific organisation is identified.
2. The Maximum-Likelihood function must be used for each fault class and the esti-mates are summed to obtain the total number of faults in the inspection document,and hence the estimate of the residual faults. If the number of faults found at themeeting is larger than the estimate of the residual faults at the start of the meeting,then the estimate must be considered as unreliable.
3. If the reviewers have no fault in common in any of the fault classes, then the esti-mation method fails, and a method of overcoming this problem must be formulated.The estimation must be based on experience, i.e. the faults found by single review-ers must be multiplied by an experience constant. Initially, the constant is assigneda value of 2, which is equivalent to assuming that as many faults as have beenfound by single reviewers are remaining. This rule must be applied when the esti-mation method fails. In the long run, experience must be the basis for determiningthe multiplicative factor. (See also Section 7.0.)
4. The estimate of the number of faults prior to the inspection meeting is made bysumming the estimates, hence the residual faults are easily derived. This can becomplemented with a confidence analysis, as discussed by (Vander Wiel et al.,1993).
To summarize, the division into classes by applying a filtering technique makes use ofone of the advantages of the Jackknife estimation method, but it does not suffer fromits drawbacks. The Maximum-Likelihood estimation method is then applied to eachfault class, which makes the assumptions of the Maximum-Likelihood method morerealistic. The proposed procedure was then evaluated through an experiment.
6.0 The experiment
6.1 Introduction
An experiment was designed and conducted to evaluate the capture-recapture methodwhen applied to fault data obtained from inspections. The data were divided into faultclasses and the residual fault content after the inspection was estimated using the Max-imum-Likelihood method for each fault class. The objective was to assess the classifi-cation technique, which is based on filtering the collected fault data.
The hypothesis is that it is possible to identify a classification scheme or filtering tech-nique which improves the fault content estimation from fault data collected frominspections.
An Experimental Evaluation of Capture-Recapture in Software Inspections 3 August 1995 9
6.2 Experimental design and instrumentation
6.2.1 Inspection team
The experiment was conducted with an inspection team of 22 reviewers randomlydivided into three groups. This resulted in two inspection groups each with sevenreviewers and one group with eight reviewers. The 22 reviewers were a mixture offourth-year undergraduate students and personnel employed as software engineeringconsultants at Q-Labs.
All reviewers were familiar with inspection techniques in general and no specialinstruction or training was given prior to the experiment. Prior to inspection, the teamwas informed about the document to be inspected and also about the objective of thestudy, including information on the capture-recapture method.
6.2.2 Inspected document
As strict control of the experiment was desired, it was deemed infeasible to use a realsoftware document. The experiment required that the number of faults in the inspecteddocument be known in advance. Therefore, it was decided to use a textual documentsince many documents in software production are written in natural language. Thecapture-recapture method can be applied to any type of document, hence the choice ofdocument should not influence the outcome of the experiment to any great extent.
The inspected document was a technical paper which had first been run through a spellchecker and had then been edited by an English-speaking professional prior to publi-cation, see (Wohlin et al., 1994). The document consisted of 18 double-spaced pages,of which 2 pages were figures. In total, the document contained 5645 words.
As the objective was to evaluate the estimation procedure, it was necessary to intro-duce a known number of faults into the document. Therefore, it was decided to seed aknown number of faults into the document and then use the edited document as thecorrect answer after the inspection. The faults were randomly distributed in the docu-ment.
6.2.3 Faults in the document
The objective was to seed faults which were similar to the faults that had beenremoved based on the spell-checker and the editing of the document. The types offaults to be introduced were discussed carefully and it was agreed that faults whichcould clearly be identified as faults should be seeded; implying that only faults whichit was deemed that the reviewers could find and identify as faults should be seeded.This was viewed as a prerequisite for the experiment and it was not believed to influ-ence the results. Thus, it was decided not to seed dubious formulations, which couldalways be debated as being correct, or not.
In total, 37 faults were seeded into the document and one unknown fault was alsofound. No other faults had been found since, by the authors or communicated by the

An Experimental Evaluation of Capture-Recapture in Software Inspections 3 August 1995 10
readers of the paper, see (Wohlin et. al., 1994). The number of faults of each type,including the unseeded fault, were as follows:
• 6 spelling errors considered simple to find (e.g. detialed instead of detailed)
• 9 spelling errors considered difficult to find (e.g. hypotesis instead of hypothesis)
• 4 logical errors (e.g. two definitions changed place)
• 3 incorrect references (e.g. figure 7 instead of figure 6)
• 5 wrong or missing words (e.g. pacific instead of specific)
• 11 grammatical errors (e.g. is instead of are)
All faults could objectively be considered as faults, as an edited version of the docu-ment existed and the faults had been seeded very carefully. No judgement regardinggood or bad wording was to take place concerning the faults.
6.2.4 Threats to the validity of the experiment
The following potential threats were identified.
• The inspected document is not a software document.The capture-recapture method can be applied to any type of document, and manydocuments produced during software development are textual documents. There-fore, the threat is regarded as non-critical.
• The faults are seeded.It was unfortunately necessary to seed faults to enable assessment of the estimationprocedure. Fault seeding is always a potential problem, but the objective was toseed faults which were representative of the types of faults that were removed in thefirst place. Thus, the influence of the seeding is minimised.
• The experimental design is not representative of real inspections.A laboratory experiment is often a necessary step in assessing new technical pro-posals prior to transferring the technique to practical use. The objective was, how-ever, to imitate the real inspection with capture-recapture as closely as possible.
• The inspection team is not representative of software developers.This threat is not regarded as being critical as many of the fourth-year students willgo into software development quite soon. The students were also mixed with moreexperienced personnel by including a number of consultants from Q-Labs in theexperiment.
6.3 Conducting the experiment
The inspection preparation was conducted by distributing the document to the review-ers, who were supervised to ensure that no cooperation took place. The reviewersmarked items which they considered as being faults directly in the document. Theinspection preparation lasted for 1-1.5 hour and the reviewers were asked to leave theroom when they were finished and had handed in the inspected document. After the
An Experimental Evaluation of Capture-Recapture in Software Inspections 3 August 1995 11
inspection preparation, the documents were scrutinized and the fault data were col-lected. This was done to imitate the inspection meeting and data collection. The faultdata were collected in tables, which are shown in Appendix A.
The inspection team reassembled the next day and the results of the inspection prepa-ration and the imitation of the inspection meeting and data collection were discussed.The reviewers were given back their documents containing faults found which wereregarded as faults, markings indicating items which were judged not to be faults andseeded faults which were not found by any reviewer. This meeting was essential forthe experiment to ensure that the markings had been correctly interpreted and also toreach a consensus within the inspection team regarding what constituted a fault.
6.4 Data analysis
6.4.1 Inspection data
Some significant characteristics of the data are presented below as a summary of thedata presented in Appendix A:
• Between 4 and 21 faults were reported by the individual reviewers.
• In total, 36 unique faults were found by the inspection team, i.e. 2 faults remainedundetected in the document. The first group found 30 unique faults, the secondgroup found only 25 unique faults while the third and final group found 34 uniquefaults.
• No fault was found by all 22 reviewers. One fault was found by as many as 20 ofthe reviewers, while 5 faults were found by single reviewers.
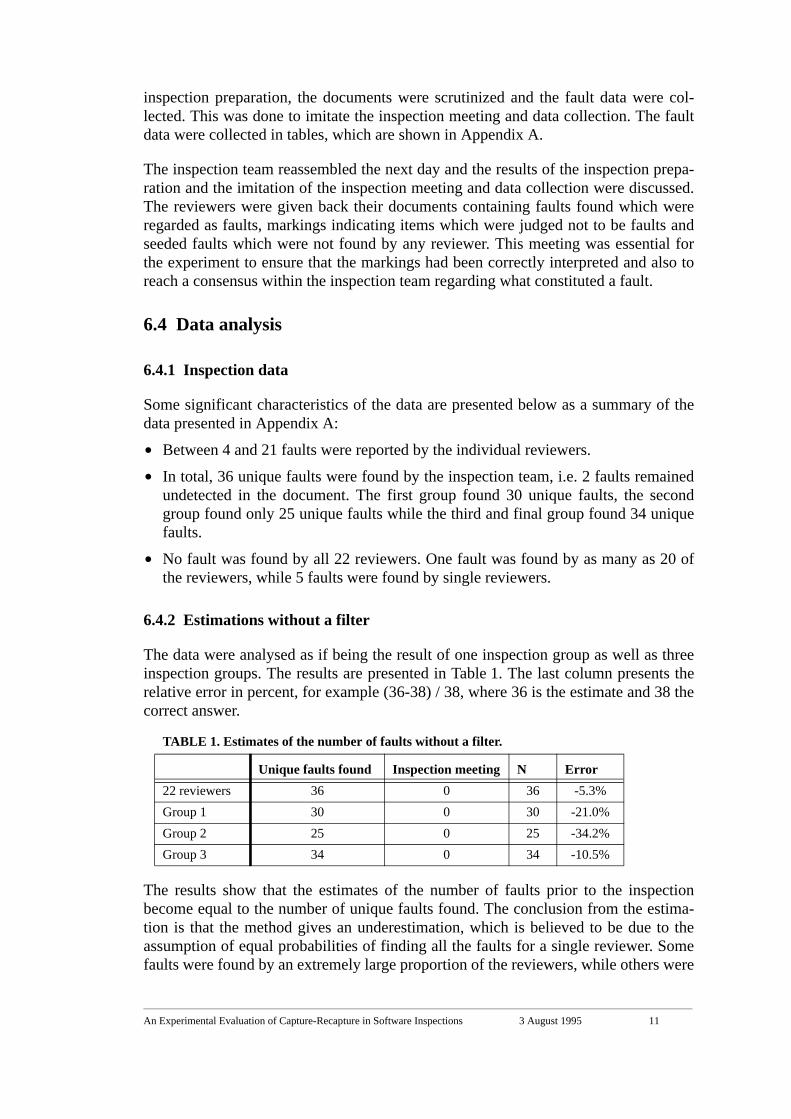
6.4.2 Estimations without a filter
The data were analysed as if being the result of one inspection group as well as threeinspection groups. The results are presented in Table 1. The last column presents therelative error in percent, for example (36-38) / 38, where 36 is the estimate and 38 thecorrect answer.
The results show that the estimates of the number of faults prior to the inspectionbecome equal to the number of unique faults found. The conclusion from the estima-tion is that the method gives an underestimation, which is believed to be due to theassumption of equal probabilities of finding all the faults for a single reviewer. Somefaults were found by an extremely large proportion of the reviewers, while others were
TABLE 1. Estimates of the number of faults without a filter.
Unique faults found Inspection meeting N Error22 reviewers 36 0 36 -5.3%Group 1 30 0 30 -21.0%Group 2 25 0 25 -34.2%Group 3 34 0 34 -10.5%

An Experimental Evaluation of Capture-Recapture in Software Inspections 3 August 1995 12
not found by any reviewer, hence indicating that it is very unlikely that the assumptionis valid, see Section 3.0.
It is possible to derive the probability that a fault will not be found by any of thereviewers.
• When using the Maximum-Likelihood method, the probability of a single reviewerof finding a fault is estimated, as the number of faults found by that reviewerdivided by the estimate of the total fault content, i.e. pj = nj / N for reviewer j.
• The reviewers are independent, hence non-detection probabilities for the differentreviewers can be multiplied by each other.
In the experiment the probability can be derived from the fault data in Appendix A.The probability of a fault not being found is as low as 7.1 * 10-5. This probability isobtained from:
p = (1-15/30) * (1-12/30) * … * (1-10/30) * (1-14/25) * … * (1-18/25) * (1-15/34) *… *(1-10/34),
where, for example 15/30 is the probability of reviewer 1 to finding a fault and thenone minus this probability is the probability that a fault is not found by the firstreviewer. The probability that none of the 22 reviewers finds a specific fault is, ofcourse, the product of the probabilities that none of the individual reviewers finds thefault. This clearly explains why the Maximum-Likelihood estimate becomes equal tothe number of faults found. All the same, when studying the 22 reviewers as onegroup, it is known that two faults were not found by any of the 22 reviewers. This isthe case as this was a controlled experiment where the faults were seeded, which is notthe case when applying the method in practice.
6.4.3 Estimations with a filter
A filter of 40% was chosen, dividing the fault data into two classes as follows:
• 22 reviewers => 22 * 0.40 = 8.8, therefore class 2 becomes faults found by eight orfewer reviewers while class 1 are those faults found by more than eight reviewers.Truncation is used throughout the calculations when applying a filter.
• Group 1 => 7 * 0.40 = 2.8, which gives class 2 as the faults found by one or tworeviewers and class 1 are those faults found by three or more reviewers.
• Group 2 is treated the same as group 1 since it has the same the number of review-ers, i.e. 7.
• Group 3 => 8 * 0.4 = 3.2, hence class 2 becomes faults found by three or fewerreviewers while class 1 are those faults found by more than three reviewers.
An Experimental Evaluation of Capture-Recapture in Software Inspections 3 August 1995 13
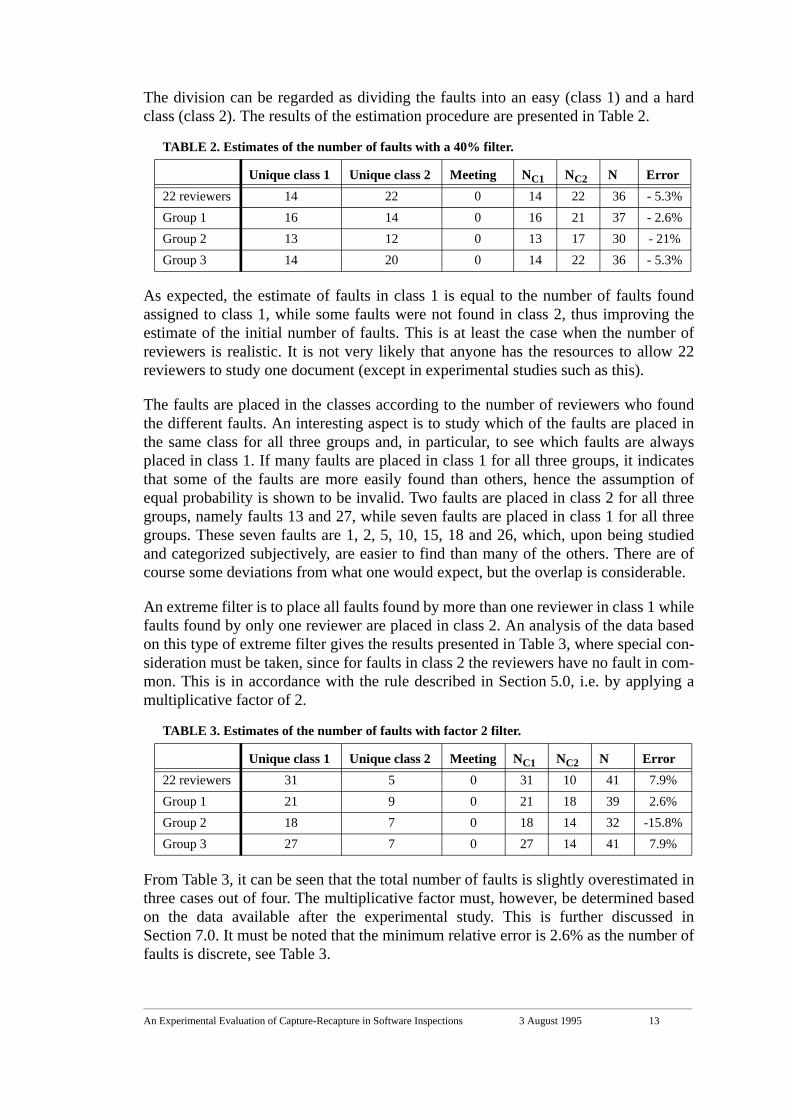
The division can be regarded as dividing the faults into an easy (class 1) and a hardclass (class 2). The results of the estimation procedure are presented in Table 2.
As expected, the estimate of faults in class 1 is equal to the number of faults foundassigned to class 1, while some faults were not found in class 2, thus improving theestimate of the initial number of faults. This is at least the case when the number ofreviewers is realistic. It is not very likely that anyone has the resources to allow 22reviewers to study one document (except in experimental studies such as this).
The faults are placed in the classes according to the number of reviewers who foundthe different faults. An interesting aspect is to study which of the faults are placed inthe same class for all three groups and, in particular, to see which faults are alwaysplaced in class 1. If many faults are placed in class 1 for all three groups, it indicatesthat some of the faults are more easily found than others, hence the assumption ofequal probability is shown to be invalid. Two faults are placed in class 2 for all threegroups, namely faults 13 and 27, while seven faults are placed in class 1 for all threegroups. These seven faults are 1, 2, 5, 10, 15, 18 and 26, which, upon being studiedand categorized subjectively, are easier to find than many of the others. There are ofcourse some deviations from what one would expect, but the overlap is considerable.
An extreme filter is to place all faults found by more than one reviewer in class 1 whilefaults found by only one reviewer are placed in class 2. An analysis of the data basedon this type of extreme filter gives the results presented in Table 3, where special con-sideration must be taken, since for faults in class 2 the reviewers have no fault in com-mon. This is in accordance with the rule described in Section 5.0, i.e. by applying amultiplicative factor of 2.
From Table 3, it can be seen that the total number of faults is slightly overestimated inthree cases out of four. The multiplicative factor must, however, be determined basedon the data available after the experimental study. This is further discussed inSection 7.0. It must be noted that the minimum relative error is 2.6% as the number offaults is discrete, see Table 3.
TABLE 2. Estimates of the number of faults with a 40% filter.
Unique class 1 Unique class 2 Meeting NC1 NC2 N Error22 reviewers 14 22 0 14 22 36 - 5.3%Group 1 16 14 0 16 21 37 - 2.6%Group 2 13 12 0 13 17 30 - 21%Group 3 14 20 0 14 22 36 - 5.3%
TABLE 3. Estimates of the number of faults with factor 2 filter.
Unique class 1 Unique class 2 Meeting NC1 NC2 N Error22 reviewers 31 5 0 31 10 41 7.9%Group 1 21 9 0 21 18 39 2.6%Group 2 18 7 0 18 14 32 -15.8%Group 3 27 7 0 27 14 41 7.9%
An Experimental Evaluation of Capture-Recapture in Software Inspections 3 August 1995 14
6.5 Conclusions of the experiment
It is impossible to state which type of filter is best in general, but it can be concludedthat it is possible to find a filter which gives good estimates. Thus, the experiment sup-ports the hypothesis that it is possible to improve the estimates by introducing a filter-ing technique when applying capture-recapture to inspections. Therefore, it isimportant to try to identify the best possible filter for a particular environment andtype of document. Two different types of filters have been suggested, and these mustbe investigated further to determine an optimal filter.
The filter for each organisation must be based on experience and continuous collectionof data, hence it is not possible to reuse the quantitative results of this experiment, butthe filtering technique as a general method can be applied to other types of documentsand environments. A more thorough study of the influence of the choice of filter basedon the collected data is presented in Section 7.0.
7.0 Filter analysis
7.1 Introduction
Based on the conclusion that it is possible to find filters which improve the predictiveability of the capture-recapture method, it was decided to identify the best filters forthis particular data set. The objective was to identify filters which could be used in thefuture in similar experiments to evaluate the technique even further. In the experiment,two different filters were used: a 40% filter and a factor 2 filter. The latter means usingthe faults found by a single reviewer as a filter. These values can now be improvedbased on the experience from the experiment.
The three groups were considered individually and some different types of filters werechosen to illustrate how the estimate changes with the filter. The filters were chosen sothat the fault data were divided into two classes for all the filters. The filters werebased on varying the percentage thresholds defining the different fault classes, where alow percentage value indicates that class 2 is small, i.e. faults which could be consid-ered difficult to find.
Two possible ways of creating a realistic filter have been identified.
1. The percentage value defining the filter is chosen such that the estimate becomesequal to the correct value found in the experimental study. This can actually bedone in two ways.• either a suitable percentage is determined for each group and the mean value of
the percentage values is chosen as an appropriate filter, or• a line is derived by taking the mean value of the three groups for each percentage
value. The filter is then chosen based on the line derived.
An Experimental Evaluation of Capture-Recapture in Software Inspections 3 August 1995 15
The first method means that a filter is chosen for each group, then a mean value isdetermined based on the three values derived, hence obtaining a mean percentagevalue which should be the best filter in some sense. In the second case, a meanvalue is derived for each percentage figure and a line is constructed from which thefilter is determined. These approaches are illustrated in the example in Section 7.2.
2. Another method is to use a filter where faults found by only one reviewer areplaced in class 2. The estimation of the total number of faults in this class can befound through a scaling factor, i.e. the multiplicative factor discussed inSection 5.0. The factor from Section 5.0 is replaced by a mean value based on theexperimental study.
The percentage value or scaling factor identified is, of course, highly dependent on thenumber of reviewers, environment, application and type of document. Therefore, it isnecessary to conduct a similar investigation to the one presented in Section 7.2 for aspecific organisation with its own characteristics. The objective of the subsequent sec-tion is primarily to illustrate how a filter can be determined.
7.2 Example
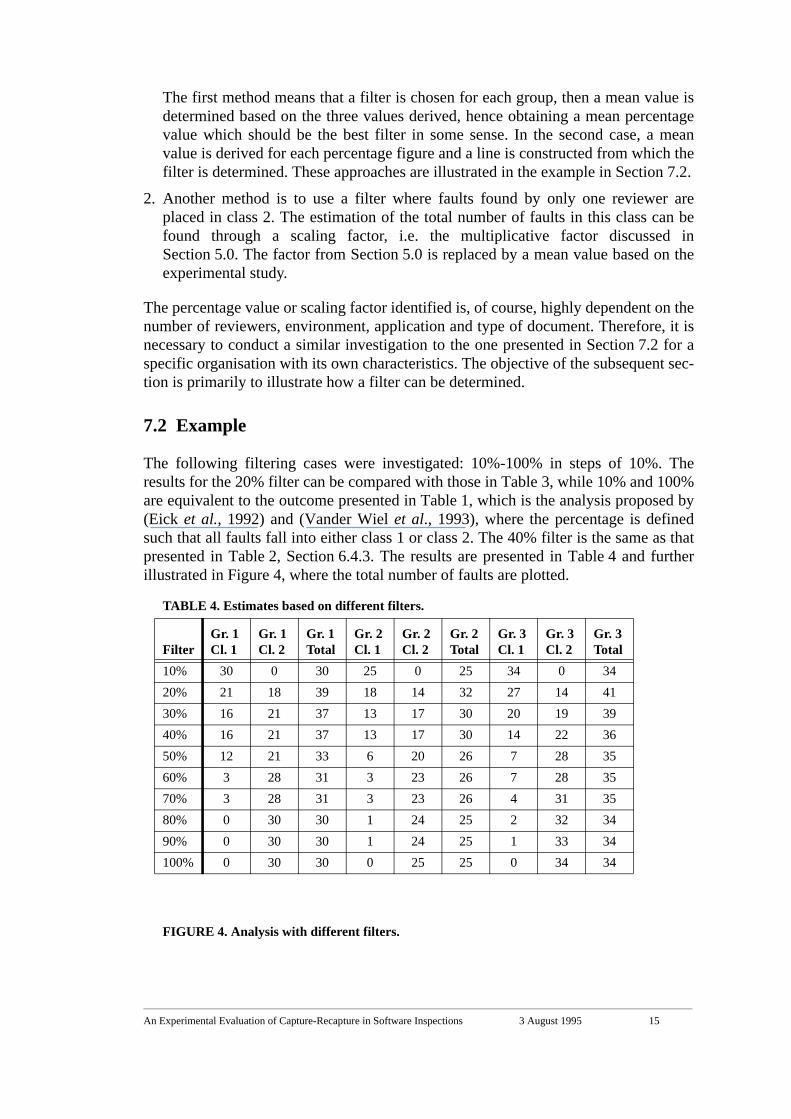
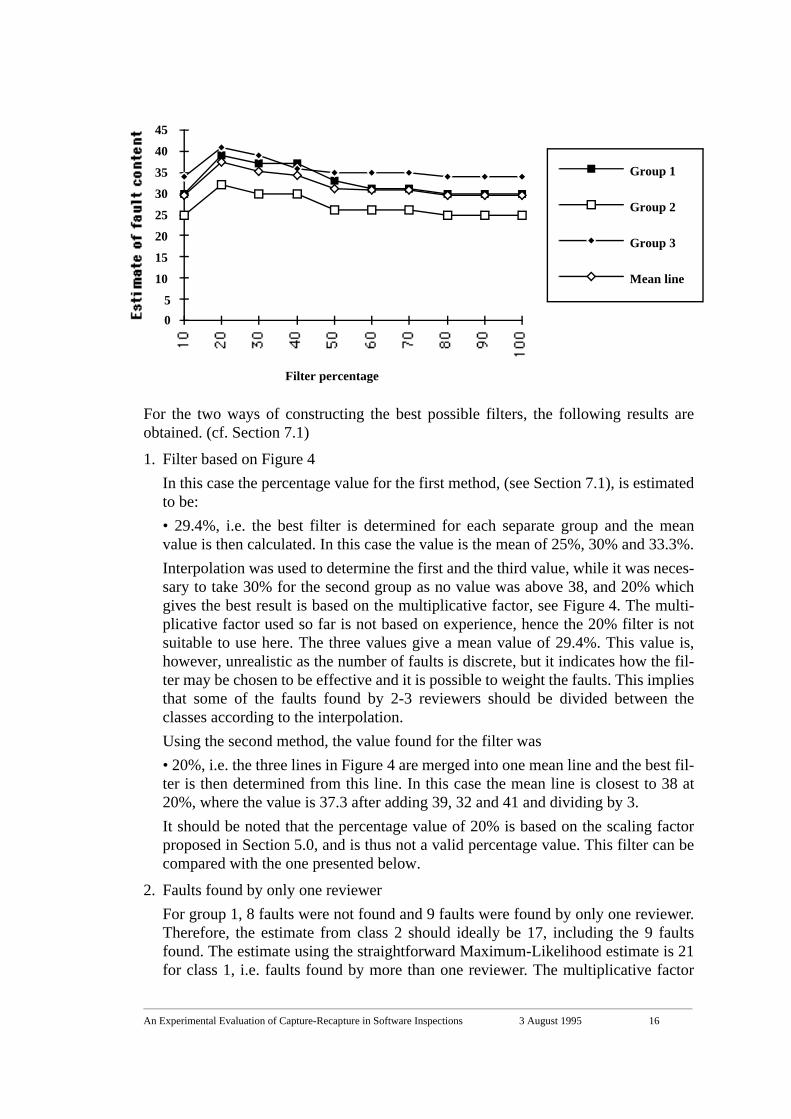
The following filtering cases were investigated: 10%-100% in steps of 10%. Theresults for the 20% filter can be compared with those in Table 3, while 10% and 100%are equivalent to the outcome presented in Table 1, which is the analysis proposed by(Eick et al., 1992) and (Vander Wiel et al., 1993), where the percentage is definedsuch that all faults fall into either class 1 or class 2. The 40% filter is the same as thatpresented in Table 2, Section 6.4.3. The results are presented in Table 4 and furtherillustrated in Figure 4, where the total number of faults are plotted.
FIGURE 4. Analysis with different filters.
TABLE 4. Estimates based on different filters.
FilterGr. 1 Cl. 1
Gr. 1 Cl. 2
Gr. 1Total
Gr. 2Cl. 1
Gr. 2Cl. 2
Gr. 2Total
Gr. 3Cl. 1
Gr. 3Cl. 2
Gr. 3Total
10% 30 0 30 25 0 25 34 0 3420% 21 18 39 18 14 32 27 14 4130% 16 21 37 13 17 30 20 19 3940% 16 21 37 13 17 30 14 22 3650% 12 21 33 6 20 26 7 28 3560% 3 28 31 3 23 26 7 28 3570% 3 28 31 3 23 26 4 31 3580% 0 30 30 1 24 25 2 32 3490% 0 30 30 1 24 25 1 33 34100% 0 30 30 0 25 25 0 34 34
An Experimental Evaluation of Capture-Recapture in Software Inspections 3 August 1995 16
For the two ways of constructing the best possible filters, the following results areobtained. (cf. Section 7.1)
1. Filter based on Figure 4In this case the percentage value for the first method, (see Section 7.1), is estimatedto be:• 29.4%, i.e. the best filter is determined for each separate group and the meanvalue is then calculated. In this case the value is the mean of 25%, 30% and 33.3%.Interpolation was used to determine the first and the third value, while it was neces-sary to take 30% for the second group as no value was above 38, and 20% whichgives the best result is based on the multiplicative factor, see Figure 4. The multi-plicative factor used so far is not based on experience, hence the 20% filter is notsuitable to use here. The three values give a mean value of 29.4%. This value is,however, unrealistic as the number of faults is discrete, but it indicates how the fil-ter may be chosen to be effective and it is possible to weight the faults. This impliesthat some of the faults found by 2-3 reviewers should be divided between theclasses according to the interpolation.Using the second method, the value found for the filter was• 20%, i.e. the three lines in Figure 4 are merged into one mean line and the best fil-ter is then determined from this line. In this case the mean line is closest to 38 at20%, where the value is 37.3 after adding 39, 32 and 41 and dividing by 3.It should be noted that the percentage value of 20% is based on the scaling factorproposed in Section 5.0, and is thus not a valid percentage value. This filter can becompared with the one presented below.
2. Faults found by only one reviewerFor group 1, 8 faults were not found and 9 faults were found by only one reviewer.Therefore, the estimate from class 2 should ideally be 17, including the 9 faultsfound. The estimate using the straightforward Maximum-Likelihood estimate is 21for class 1, i.e. faults found by more than one reviewer. The multiplicative factor
Filter percentage
05
10
15
20
25
30
35
40
45
Group 1
Group 2
Group 3
Mean line
An Experimental Evaluation of Capture-Recapture in Software Inspections 3 August 1995 17
hence becomes: 17/9 = 1.89, which would give the estimate 38, since 21 + 1.89 * 9= 38. The same reasoning can be applied to groups 2 and 3. A mean value of thefactor can then be derived from the outcome of the three groups. The result is (1.89+ 2.86 + 1.57) / 3 = 2.11. A factor of 2.11 should thus in the future be used in theestimation procedure, instead of the initially assumed factor 2.
7.3 Summary
The choice between the two approaches discussed in the previous section must bebased on experience, and initially it is suggested that both approaches be used. It must,however, be observed that both approaches mean that one factor must be determinedbased on actual experience, i.e. experimental studies are needed in the specific envi-ronment and for the different types of document that are inspected, as well as for typi-cal sizes of inspection teams.
The adoption of one of the approaches should, however, mean that fault content esti-mations, which can form the basis for approval or disapproval of a document, can beformulated in terms of thresholds.
8.0 Conclusions
The capture-recapture method appears to be promising in attempts to estimate the faultcontent of documents. As the capture-recapture method with Maximum-Likelihoodestimates notoriously gives underestimated values evidenced by the experiment aswell as by (Vander Wiel et al., 1993), it is necessary to find methods of overcomingthis problem in order to obtain reliable estimates.
The solutions presented are founded on identifying a filter based on experience. Thefilter must be used to divide the faults found into more than one class, and it is recom-mended that two classes be initially identified. The classes are defined such that someof the assumptions of the method are better fulfilled, hence the estimate is improved.Two main filters have been discussed:
• a percentage value dividing the faults into two groups based on the number ofreviewers who found a specific fault,
• a filter which ensures that faults found by only one reviewer are collected into oneclass.
The latter approach requires that it must be possible to perform estimations even if thereviewers have no fault in common. An experience factor is proposed to overcome thisproblem. In the first approach, the percentage value must be based on experience.
The capture-recapture method is easily adopted, but it must be combined with a met-ric, i.e. an experience factor which determines the division into different fault classes.The metric must hence reflect the actual situation in a specific organisation as theassumptions of the models are probably not fully fulfilled in practice. Capture-recap-ture estimations combined with a filtering technique provide an important method of
An Experimental Evaluation of Capture-Recapture in Software Inspections 3 August 1995 18
performing fault content estimations throughout the software life cycle. The methodwill therefore provide useful support for managers and decision makers regarding theacceptance of documents in software development.
Acknowledgements
Part of this study was carried out on behalf of Telia (Swedish Telecom), and in partic-ular the authors would like to thank Jan-Eric Johansson at Telia for letting the resultsbe published. The authors would also like to express their gratitude to the personnel atQ-Labs and the students at Lund University who participated in the experiment. Thecomments from the anonymous referees have been very valuable and they haveimproved the quality of the paper considerably. Finally, the authors would like toacknowledge Helen Sheppard, Word for Word for improving the English.
References
Eick, S. G., Loader, C.R., Long, M.D., Votta, L.G and Vander Wiel, S. A. (1992)‘Estimating Software Fault Content Before Coding’, Proceedings 14th InternationalConference on Software Engineering (IEEE conference), Melbourne, Australia, pp.59-65.
Fagan, M. E. (1976) ‘Design and Code Inspections to Reduce Errors in ProgramDevelopment’, IBM Systems Journal, Vol. 15, No. 3, pp. 182-211.
Gilb, T. and Graham, D. (1993) ‘Software Inspections’, Addison-Wesley, Reading,Massachusetts, USA, pages 471.
Vander Wiel, S.A., and Votta, L.G. (1993) ‘Assessing Software Designs Using Cap-ture-Recapture Methods’, IEEE Transactions on Software Engineering, Vol. 19, No.11, pp. 1045-1054.
Wohlin, C., and Runeson, P. (1994) ‘Certification of Software Components’, IEEETransactions on Software Engineering, Vol. 20, No. 6, pp. 494-499.

Appendix A: Fault data 3 August 1995 19
Appendix A: Fault dataThe reviewers have been divided into three groups by random. The results are pre-sented in table 5-7 for the three groups separately.
TABLE 5. Faults found by reviewers in group 1.
Fault R1 R2 R3 R4 R5 R6 R7 Sum1 1 0 0 1 1 0 1 42 1 0 0 1 1 0 1 43 0 1 1 1 0 1 0 44 0 1 1 1 0 1 0 45 1 1 0 1 1 0 0 46 1 1 0 1 1 0 0 47 0 0 0 0 0 0 0 08 0 0 0 0 0 0 0 09 0 0 1 0 0 1 0 210 1 0 0 1 1 0 0 311 0 0 0 0 1 1 0 212 0 0 0 0 1 0 0 113 1 0 0 0 0 0 0 114 1 1 0 1 0 0 0 315 1 1 0 1 1 0 1 516 1 0 0 0 1 0 0 217 0 0 0 0 0 0 0 018 1 1 0 1 1 0 1 519 0 0 0 0 1 0 0 120 1 1 0 1 1 0 0 421 1 0 0 0 1 0 1 322 1 1 0 0 1 0 1 423 0 0 0 0 0 0 1 124 0 0 0 0 0 0 0 025 1 0 0 0 0 0 1 226 0 1 1 0 1 0 1 427 1 0 0 0 1 0 0 228 0 0 0 0 0 0 0 029 0 0 0 0 0 0 0 030 0 0 1 0 0 0 0 131 0 0 0 0 0 0 0 032 0 0 0 0 1 0 0 133 0 1 0 1 1 1 1 534 0 0 0 0 0 0 0 035 0 0 0 0 1 0 0 136 0 1 0 1 1 0 0 337 0 0 1 0 0 0 0 138 0 0 0 0 1 0 0 1Sum 15 12 6 13 21 5 10

Appendix A: Fault data 3 August 1995 20
TABLE 6. Faults found by reviewers in group 2.
Fault R8 R9 R10 R11 R12 R13 R14 Sum1 1 0 0 0 1 1 0 32 1 0 0 1 1 0 1 43 1 0 0 0 0 0 1 24 1 0 0 0 0 0 1 25 1 0 1 0 0 0 1 36 1 0 0 1 0 0 0 27 0 0 0 0 0 0 0 08 0 0 0 0 0 0 1 19 1 0 0 1 0 0 1 310 1 0 1 0 0 1 1 411 1 1 0 1 0 0 1 412 0 0 1 1 0 1 0 313 0 0 0 0 0 1 0 114 0 0 0 0 0 0 1 115 1 0 0 1 1 1 1 516 0 0 0 0 0 0 0 017 0 0 0 0 0 0 0 018 1 1 1 1 1 1 1 719 0 0 0 0 0 0 0 020 0 0 0 0 0 0 1 121 0 1 0 0 0 0 0 122 0 0 1 0 0 0 0 123 0 0 0 0 0 0 0 024 0 0 0 0 0 0 0 025 1 0 0 0 0 1 1 326 1 1 1 1 0 0 1 527 1 1 0 0 0 0 0 228 0 0 0 0 0 0 0 029 0 0 0 0 0 0 1 130 0 0 0 0 0 0 0 031 0 0 0 0 0 0 0 032 0 0 0 0 0 0 0 033 0 0 1 0 0 0 1 234 0 0 0 0 0 0 0 035 0 0 0 0 0 0 0 036 0 0 1 0 0 1 1 337 0 0 0 0 0 0 0 038 0 1 0 1 0 0 1 3Sum 14 6 8 9 4 8 18

Appendix A: Fault data 3 August 1995 21
TABLE 7. Faults found by reviewers in group 3.
Fault R15 R16 R17 R18 R19 R20 R21 R22 Sum1 1 1 0 1 0 1 0 0 42 1 0 0 0 1 1 1 0 43 1 0 0 0 1 1 0 0 34 1 0 0 0 1 1 0 0 35 1 1 0 1 1 1 1 1 76 1 0 0 0 1 0 0 0 27 0 1 0 0 0 0 0 0 18 0 1 0 1 0 0 0 0 29 0 0 0 1 0 0 1 1 310 0 1 1 1 0 1 0 0 411 1 0 0 1 0 0 1 0 312 0 1 1 1 0 1 1 1 613 0 1 0 1 0 0 1 0 314 0 0 0 1 0 1 1 1 415 1 1 0 1 0 1 1 1 616 1 0 0 0 0 0 0 0 117 0 1 1 1 0 0 1 1 518 1 1 1 1 1 1 1 1 819 0 0 0 0 0 0 0 0 020 0 0 0 0 0 0 1 0 121 1 1 1 0 0 0 1 0 422 1 1 1 0 0 0 1 0 423 1 0 0 1 1 0 0 0 324 0 0 0 0 0 0 0 0 025 1 1 0 1 1 1 0 0 526 0 1 1 1 0 1 0 1 527 0 1 1 0 0 0 0 0 228 0 0 0 1 0 0 0 0 129 0 1 0 0 0 0 0 0 130 0 0 0 1 0 0 1 0 231 0 0 0 0 0 0 0 0 032 0 0 0 1 0 0 0 1 233 1 0 0 1 1 0 1 0 434 0 1 0 0 0 0 0 0 135 0 1 0 0 1 0 0 0 236 0 0 0 1 0 0 0 1 237 0 0 0 0 0 0 0 0 038 0 0 0 1 0 0 0 0 1Sum 15 18 8 21 10 12 15 10