arcs ii program - records collections
TRANSCRIPT
ARCS II PROGRAM
Remedial Planning Activities at Selected Uncontrolled Hazardous Substance Disposal Sites Within EPA Region 11
(NY, NJ, PR, VI)
FINAL SUPPLEMENTAL
REMEDIAL INVESTIGATION REPORT SEALAND "REsTORA TION INC. SITE
• ~•"•o • •
... · . TOW~ OF LISBON, .· . ",' .. NEW YORK
APRIL 1995
VOLUME II
EPA Contract 68-WB-0110
An ENSERCH® Engineering and Construction Company
SLR-0010405
-
-
EPA WORK ASSIGNMENT NUMBER: 022-2L2M EPA CONTRACT NUMBER: 68-WS-0110
EBASCO SERVICES INCORPORATED
FINAL SUPPLEMENTAL
REMEDIAL INVESTIGATION REPORT SEA~ND1' .• RATION INC. SITE
. . TOWJf OF LISBON, ;;, .. REwYORK
;APRIL 1995
VOLUME II
THE INFORMATION IN TIDS DOCUMENT HAS BEEN FUNDED BY THE UNITED STATES ENVIRONMENTAL PROTECTION AGENCY (USEPA) UNDER ARCS Il CONTRACT NO. 68-WS-0110 TO EBASCO SERVICES INC. (EBASCO). TiilS DOCUMENT IS A DRAFT AND HAS NOT BEEN FORMALLY RELEASED BY EBASCO TO EPA. AS A DRAFr, THIS DOCUMENT SHOULD NOT BE CITED OR QUOTED, AND IS CJRCUI..ATED FOR COMMENT ONLY.
EDIS/ENG/ay071494.rpt
SLR-0010406
-
-
Table of Contents _______________ _
Executive Summary
Glossary of Abbreviations
1.0 Introduction . . . . . . . . . . . . . . . . . . . . • . . . . . . . . . . . . . . . . . . . . . . . . . . . . . 1-1
1.1 Purpose ...............••.••.••......................... : . 1-1
1.2 Site Background . . . . . . . • . . • • . . • • • . . . . . . . . . . . . . . . . . . . . . . . . . . . 1-1
1.2.1 Site I>escription ....•••.•••.................... · . . . . . . . 1-1
1.2.2 Site History . . . . • • • . • . . • • • . . . . . . . . . . . . . . . . . ; . . . . . . . . . 1-1
1.2.3 Previous Investigations • . . . . . . . . . . . . . . . . . .' . . . . . . . . . . . . . 1-11
1.2.4
1.2.3.1 Previous Somce Investigations/Remediations ........... 1-12
1.2.3.2 Previous Site Soil Investigations . . . . . . . . . . . . . . . . . . . . 1-12
1.2.3.3 Previous Groundwater Investigations ................ 1-47
1.2.3.4 Previous Smface W liter Investigations . . . . . . . . . . . . . . . 1-64
1.2.3.5 Chemical Oiaractedstics of Sediments Associated with the
SRI Site . . • • • • • . _. • . . . . . . . . . . . . . . . . . . . . . . . . . . 1-67
1.2.3.6 Previous Biota Investigations . . . . . . . . . . . . . . . . . . . . . . 1-69
1.2.3. 7 Previous Air Monitoring . . . . . . . . . . . . . . . . : . . . . . . . . 1-69
1.2.3.8 Summary of Pievioas Investigations ........... ~ ..... 1-69
Current Conditions . . • . . • • • . . . . . . . . . . . . . . . . . . . . . . . . . . . 1-71
1.3 Report Organization ..........•............................. 1-71
2.0 Study Area Investigation . . . . . . . . . . . . . . . . . . . . . . . . . . . . . . . . . . . . . . . . . 2-1
2.1 Site Survey and Topographic Mapping . . . . . . . . . . . . . . . . . . . . . . . . . . . . 2-5
2.2 Cultural Resources Survey ........•............................ 2-8
2.3 Ecological Investigation . . . . . . . . . . . . . . . . . . . . . . . . . . . . . . . . . . . . . . 2-8
2.3.1 I>elineation of Wetlands Boundaries ........................ 2-9
2.3.2 Terrestrial Vegetation Inveiltory . . . . . . . . . . . . . . . . . . . . . . . . . . 2-10
2.3.3 Aquatic Habitat Survey ••••••.......................... 2-11
2.3.4 Preliminary Endangered Species Reconnaissance .............. 2-11
2.3.5 Terrestrial Mammal and Bhd Survey ...................... 2-11
2.4 Surface Water and Sediment Investigation . . . . . . . . . . . . . . . . . . . . . . . . . 2-12
2.4.1 Surface Water and Sediment Sampling ..................... 2-12
2.4.2 Surface Water Flow Owacteristics . . . . . . . . . . . . . . . . . . . . . . . 2-15
• 2.5 Geophysical Investigation 2-16
EDIS/ENG/ay071494.toc i · .. :·t r·: ,.. , ... , ·· ,.··., _,., , ... / .. . . •1 '\ '········.·• .. •
SLR-0010407
-
-
-
Table of Contents (Contlnued.1-----------2.6 Soil Investigation . . . . . . . . . . . . . . . . . . . . . . . . . . . . . . . . . . . . . . . . . . 2-17
2.6. l Soil Investigation Objectives . . . . . . . . . . . . . . . . . . . . . . . . . . . . 2-17
2.6.2 Soil Samples Collected . . . . . . . . . . . . . . . . . . . . . . . . . . . . . . . . 2-20
2.6.2.1 Hand-Auger Borings ............................ 2-21
2.6.2.2 Hollow Stem Auger Soil Borings . . . . . . . . . . . . . . . . . . . 2-21
2.6.2.3 Hollow-Stem Auger Monitoring Well Borings .......... 2-22
2. 7 Groundwater Investigation . . . . . . • • • . . . . . . . . . . . . . . . . . . . . . . . . . . . 2-26
2.7.1 Monitoring Well Installation ..................... ~ ...... 2-26
2.7.2 Staff Gauge Installation and Standing Water Level Measurement ... 2-30
2.7.3 Groundwater Sampling ......•............. ; ............. 2-36
2.7.3.1 Monitoring Wells . • • . . . . . . . . . . . . . . . . . . . . . . . . . . . 2-36
2. 7 .3.2 Residential Well Sampling . . . . . . . . . . . . . . . . . . . . . . . 2-39
2. 7 .4 Aquifer Testing . . . . . . . • . . . . . . . . . . . . . . . . . . . . . . . . . . . . . 2-40
2.8 Field Investigation Quality Control •............................. 2-40
2.8.1 Field Equipment Decontamination ........................ 2-43
2.8.2 _ Quality Control Samples .•••........................... 2-44
3.0 Physical Characteristics of the Study Area •............................ 3-1
3.1 Demography and Land Use .....••................... · .......... 3-1
3.2 Cultural Resources Survey .............................. ·. . . . . . . 3-2
3.3 Climatology . . . . . . . . . . . . . . . . . . . . . . . . . . . . . . . . . . . . . . . . . . . . . . . 3-3
3.4 Topography and Drainage ..................................... 3-6
3.4.1 Regional Topography and Drainage ........................ 3-6
3.4.2 Local Topography and Drainage ............•............. 3-8
3.4.3 Flood Plain Potential . . . . . . . . . . . . . . . . . . . . . . . . . . . . . . . . . 3-13
3.5 Ecology . . . . . . . . . . . . . . . . . . . . . . . . . . . . . . . . . . . . . . . . . . . . . . . . . 3-13
3.6 Geophysical Smvey ........................................ 3-15
3. 7 Geology . . . . . . . . . . . . . . . . . . . . . . . . . . . . . . . . . . . . . . . . . . . . . . . . 3-15
3.7.1 Regional Geology ................................... 3-15
3.7.2 Local Geology ...................................... 3-16
3. 7 .2.1 Overburden Geology . . . . . . . . . . . . . . . . . . . . . . . . . . . 3-16
3.7.2.2 Bedrock Geology .............................. 3-26
3.8 Hydrogeology . . . . . . . . . . . . . . . . . . . . . . . . . . . . . . . . . . . . . . . . . . . . 3-31
3.8.l Regional Hydrogeology . . . . . . . . . . . . . . . . . . . . . . . . . . . . . . . 3-31
3.8.2 Local Hydrogeology . . . . . . . . . . . . . . . . . . . . . . . . . . . . . . . . . . 3-32
EDIS/ENG/ay071494.toc ii
SLR-0010408
-
-
Table of Contents (Contlnued1------------4.0 Nature and Extent of Contamination ................................. 4-1
4.1 Potential Contaminated Media ...•.•............................ 4-2
4.2 Soils .......................•........................... 4-17
4.3 Groundwater ............................................. 4-74
4.3.1 Overburden Groundwater . • . . . . . . . . . . . . . . . . . . . . . . . . . . . . 4-75
4.3.2 Bedrock Groundwater ..•..•.......................... 4-106
4.3.3 Residential Wells . . . . . • • . • . . . . . . . . . . . . . . . . . . . . . . . . . . 4-114
4.4 Surface Water and Sediment ......•..................... ·. . . . . 4-154
4.4.1 Surface Water Analyses ..••.................. , . . . . . . . 4-154
4.4.2 Sediment Analyses ...................... ·. . . . . . . . . . . . 4-163
5.0 Environmental Fate and Transport .................................. 5-1
5.1 Potential Routes of Migration ...• -•.•............................ 5-1
5.1.1 Airborne Contaminants . . • • • . . . . . . . . . . . . . . . . . . . . . . . . . . . . 5-2
5.1.2 Percolation lbrough Native Soils to Groundwater .............. 5-2
5.1.3 Groundwater Transport ................................. 5.:2
5.1.4 - Groundwater Recharge to Smface Water Streams . . . . . . . . . . . . . . . 5-3
5.1.5 Surface Water Runoff . . . • • . . . . . . . . . . . . . . . . . . . . . . . . . . . . . 5-3
5.1.6 Foodchain Bioaccwnulation ••.................. : . . . . . . . . . 5-3
5.2 Contaminant Persistence ............................... ~ ...... 5-4
5.2.1 Factors Affecting :Environmental Fate and Transport Processes ..... 5-8
5.2.2 Fate and Transport Data .•............................. 5-10
5.2.2.1 Organic Compounds • . . . . . . . . . . . . . . . . . . . . . . . . . . . 5-10
5.2.2.2 Inorganic Analytes ............................. 5-18
5.3 Contaminant Migration ...................................... 5-21
5.3.1 Lateral Migration of Volatile Organic Compounds ............. 5-22
5.3.2 Vertical Migration of Contaminants ....................... 5-22
5.3.3 Downgradient Migration of Contaminants ................... 5-24
6.0 Baseline Risk Assessment ........................................ 6-1
6.1 Public Health Evaluation . . . . . . . . . . . . . . . . . . . . . . . . . . . . . . . . . . . . . . 6-1
6.1.1 Identification of Constituents of Concern .................... 6-2
6.1.1.1 Data Collection ..•............................. 6-2
6.1.1.2 Data VaJidation and Evaluation ..................... 6-4
6.1.1.3 Data Screening Procedures ....................... 6-24
6.1.1.4 Summary of Constituents of Concern ................ 6-25
EDIS/ENG/ay071494.toc iii :·· i f:.
'· !"•
SLR-0010409
-
Table of Contents (Continued),_ _________ _
6.1.2 Exposure Assessment ................................... 6-30
6.1.2.1 Source Areas Release Mechanisms .................. 6-30
6.1.2.2 Identification of Exposure Pathways ................. 6-30
6.1.2.3 Current Land Use Exposure Pathways ............... 6-32
6.1.2.4 Possible Fotme Land Use Exposure Pathways .......... 6-35
6.1.2.5 Exposure Parameters ........................... 6-36
6.1.2.6 Summary of Exposure Assessment .................. 6-38
6.1.3 Toxicity Assessment •••••••••................... ·. . . . . . 6-39
6.1.3.1 Toxicity Assessment for Carcinogenic Effects . , ........ 6-41
6.1.3.2 Toxicity Assessment of Non-Carcinogenic· Effects ....... 6-42
6.1.3.3 Toxicity Profiles for the Constituents of Concern ........ 644
6.1.3.4 Toxicity Assessn>entSummary .................... 644
6.1.4 Risk Characterizatioo • • • • • • • • . . . . . • . . . . . . . . . . . . . . . . . . . 6-45
6.1.4.1 CUITCDt Land Use .••........................... 6-45
6.1.4.2 Future Residential Land Use ...................... 6-48
_ 6.1.4.3 Cumulative Risks/Hazards to Potentially Exposed
Populations . . . . • . • • . . . . . . . . . . . . . . . . . . . . . . . . . . 6-52
6.1.4.4 Summary of Risk Omacterization ......... : . . . . . . . . 6-56
6.1.5 Uncertainty Analysis . . . . • • • . . . . . . . . . . . . . . . . . . . . ~ . . . . . 6-65
6.1.5.1 Analytical Data and Identification of COCs ............ 6-65
6.1.5.2 Exposure Assessment ........................... 6-66
6.1.5.3 Toxicity Assessment •........................... 6-67
6.1.5.4 Risk Characterization ........................... 6-69
6.1.6 Summary . . . . . • • • • • • • • • • • • . . . . . . . . . . . . . . . . . . . . . . . . 6-70
6.2 Environmental Assessment . . . . . • • . . . . . . . . . . . . . . . . . . . . . . . . . . . . 6-72
6.2.1 Ecological Descriptions • . • . . . . . . . . . . . . . . . . . . . . . . . . . . . . . 6-73
6.2.1.1 Aquatic Habitats •............................. 6-74
6.2.1.2 Wetlands . . . . . . • . . • . . . . . . . . . . . . . . . . . . . . . . . . . . 6-82
6.2.1.3 Vegetation . . . . . • . . . . . . . . . . . . . . . . . . . . . . . . . . . . . 6-88
6.2.1.4 Soils ....................................... 6-91
6.2.1.5 Hydrological Associations ........................ 6-91
6.2.1.6 Rare, Endangmed and Threatened Species ............. 6-97
6.2.1.7 Value of Fish and WilcDife Resources . . . . . . . . . . . . . . . . 6-99
6.2.2 Identification of Constituents of Concern . . . . . . . . . . . . . . . . . . 6-101
EDIS/ENG/ay071494.toc iv .·. ·, ., ·;i'.I
SLR-0010410
-
Table of Contents (Continued) __________ _
6.2.3 Selection of Target Species . . . . . . . . . . . . . . . . . . . . . . . . . . . . 6-111
6.2.3.1 Raccoon . . . . . . . . . . . . . . . . . . . . . . . . . . . . . . . . . . . 6-114
6.2.3.2 American Kestrel . . . . . . . . . . . . . . . . . . . . . . . . . . . . . 6-115
6.2.3.3 Meadow Vole . . . . . . . . . . . . . . . . . . . . . . . . . . . . . . . 6-115
6.2.4 Exposure Assessment ................................ 6-116
6.2.4.l Exposure Scenario . • . . . . . . . . . . . . . . . • . . . • . • • • . . 6-116
6.2.4.2 Potential Exposure Pathways and Media Calculations . . . . 6-117
6.2.4.3 Methodology for Calculation of Target Species Total Daily
Exposure . . . . . . . . . . . . . . . . . . . . . . . . . . . • . . . . . . . 6-117
6.2.5 Risk Oiaractcrization ................... : . . . . . . . . . . . . 6-129
6.2.5.1 Inorganic Constituents . . . . . . . . . . . . . . . . . . . . . . . . . 6-129
6.2.5.2 Pesticides . . . . . . . . . . . . . . . . . . . . . . . . . . . . . . . . . . 6-132
6.2.5.3 Polychlorinated Biphenyls (PCBs) ....•............ 6-134
6.2.5.4 Polycyclic Aromatic Hydrocarbons (PAHs) ........... 6-134
6.2.5.5 Di-n-butylphthalate . . . . . . . . . . . . . . . . . . . . . . . . . . . . 6-135
6.2.6 _ Hazard Indices . . . . . . . . • . . . . . . . . . . . . . . . . . . . . . . . . . . . . 6-135
6.2.7 Uncenainty Analysis . . . . . . . . . . . . . . . . . . . . . . . . . . . . . . . . 6-137
6.2.7.1 Receptor Species .•................••. : . • . . . • . 6-137
6.2.7.2 Fate and Transport Estimates ................ ~ .... 6-138
6.2.7.3 Exposure Estimates . . . . . . . . . . . . . . . . . . . . . . . . . . . 6-138
6.2.7.4 Toxicological Data and Risk Characterization ......... 6-139
6.2.7.5 Complex Interaction of Uncertainty Elements ......... 6-139
6.2.8 Summary . . . . . . . . . . . . . . . . . . . . . . . . . . . . . . . . . . . . . . . . 6-139
7.0 Summary and Conclusions ........................................ 7-1
7 .1 Nature and Extent of Contamination . . . . . . . . . . . . . . . . . . . . . . . . . . . . . . 7-1
7 .1.1 Leachate Collection System Samples . . . . . . . . . . . . . . . . . . . . . . . 7-1
7.1.2 Soil Contamination .................................... 7-2
7.1.3 Groundwater Contamination ............................. 7-3
7 .1.3 .1 Ovctburden Groundwater . . . . . . . . . . . . . . . . . . . . . . . . . 7-4
7.1.3.2 Bedrock Groundwater ............................ 7-5
7.1.3.3 Residential Wells ............................... 7-7
7.1.4 Surface Water and Sediment ............................. 7-9
7.2 Fate and Transport ......................................... 7-10
7.2.l Groundwater Transpon ................................ 7-10
EDIS/ENG/ay071494.toc v ., t ..
SLR-0010411
Table of Contents (Contlnued1-----------·-- 7 .2.2 Groundwater Recharge to Surface Water . . . . . . . . . . . . . . . . . . . . 7-12
7.3 Baseline Risk Assessment .................................... 7-14
7.3 .1 Public Health Evaluation . . . . . . . . . . . . . . . . . . . . . . . . . . . . . . . 7-14
7.3.1.1 Current Land Use .............................. 7-15
7.3.1.2 Future Land Use .............................. 7-15
7.3 .2 Ecological Asses.mient Evaluation . . . . . . . . . . . . . . . . . . . . . . . . 7-17
7.4 Data Limitations and Recommendations for Future Work .............. 7-20
7.5 Recommended Remedial Action Objectives ................. · ....... 7-21
8.0 References ...................•................................ 8-1
-
EDIS/ENG/ay071494.toc vi ·-... '
SLR-0010412
-
--
..
Table
1-1
1-2 1-3 1-4 1-5 1-6
1-7
1-8
1-9
1-10
1-11
1-12
1-13
1-14
1-15
1-16
1-17
1-18
1-19
1-20
1-21
1-22
Chronology of SRI Site Events . . . . . . . . . . . . . . . . . . . . . . . . . . . . . . . 1-4
Results of Chemical Analyses in SRI Site Drum Storage Area (1985) . . . . 1-15 Results of Chemical Analyses in SRI Site Landspreading Arca (1985) . . . . 1-16 Results of Chemical Analyses in SRI Site Disposal Cell Arca (1985) . . . . . . 1-17 Results of Chemical Analyses in SRI Site Landspreading Arca ( 1986) . . . . 1-18 Ranges and Typical Values of Metals Detected in Soil Samples Collected in 1986 . . . . . . . . • . . • . . . . . . . . . . . . . . . . . . . . . . . . . . . . . . 1-24
Cadmium Concentrations Detected in Surface Soil Samples (1986) . . . . . . 1-25
Pesticides/PCBs Detected in Surface Soil Samples (July 1986) . . . . . . . . . 1-26
Soil Samples Results.from the SRI Site Drum Storage Area -December, 1986 . . . . . . . . . . . . . • . • . . . . . . . . . . . . . . . . . . . . . . . . . . 1-32
Test Pit Sample Results ObWned by NYSDEC - September 1987 . . . . . . . 1-35
BP Toxicity Results for Test Pit Samples Obtained by NYSDEC -September 1987 . . . . . . . . • . . . . • . . . . . . . . . . . . . . . . . . . . . . . . . . . . 1-37
Post-Construction Surface Soil Sample Results for SRI Site . . . . . . . . . . . 1-41
Confirmatory Soil Samples for the SRI Site Former Disposal Cell . . . . . . . 1-43
Concentrations of HSL Compounds Detected in Groundwater Samples (July, 1986) ................................. ·. . . . . 1-52
Results of Resampling of Selected On-Site Wells (December, 1986) . . . . . 1-54
NYSDEC Groundwater Sampling Data for SRI Site - September, 1989 . . . 1-55
Results of Residential Well Sampling - December 1986 . . . . . . . . . . . . . . 1-58
Results of Residential Well Groundwater Resampling - January 1987 . . . . 1-63
Results of Residential Well Sampling - November 1990 . . . . . . . . . . . . . 1-65
HSL Compounds Detected in Surface Water Samples (1986) . . . . . . . . . . 1-66
Sediment Sample Results (July 1986) - Inorganic Analyses . . . . . . . . . . . . 1-68
Detectable Perimeter Air Monitoring Results . . . . . . . . . . . . . . . . . . . . . . 1-70
EDIS/ENG/ay071494.toc Vll , I ".;I ..
SLR-0010413
-
-
List of Tables (Continued) ___________ _
Table Title
2-1 Round 1 Surface Water Cbaracteristics . . . . . . . . . . . . . . . . . . . . . . . 2-14
2-2 Soil Sample Intervals . . . . . . . . . . . . . . . . . . . . . . . . . . . . . . . . . . . 2-23
2-3 Summary of Well Construction . . . . . . . . . . . . . . . . . . . . . . . . . . . . 2-31
2-4 Summary of Water Level Measmcment Data ............... ~ .. 2-33
2-5 Summary of Available Resider>tial Well Construction Data .......... 2-41
3-1 Estimated Thickness of Geological Units in On-Site Monitoring
Wells and Borings . . . . . . . . . . . . . . . . . . . . . . . . . . . . . . . . . . . . . 3-23
3-2 Elevation of Bedrock Surface ... r. • • • . . . . . . . . • • . • • • • . . . • • . 3-28
3-3 Summary of Characteristics of Uppermost Bedrock at SRI Site . . . . . . 3-29
3-4 Summary of Vertical Hydraulic Gradients (VHG) Data ........... 3-40
3-5 Summary of Hydraulic Conductivity (K) Values for New Wells 3-43
3-6 SUilllPary of Hydraulic Conductivity (K) Values for Dames and
Moore Wells . . . . . . . . . . . . . . . . . . . . . . . . . . . . . . . . . . . . . . . . . 3-46
4-1 Industrial Waste Materials Disposed at the SRI Site
April, 1979 - March, 1980 . . . . . . . . . . . . . . . . . . . . . . . . . . . . . · . . . 4-4
4-2 Analysis of Waste in Storage Tank March, 1986 . . . . . . . . . . . . . . . . . 4-6
4-3 Analysis of Waste in Tanker Trailer October, 1986 ............... 4-8
4-4 Concentrations of Contaminants Detected in Waste Samples . . . . . . . . 4-10
4-5 Summary of Detected Compounds in SRI Site Waters During 1980 ... 4-12
4-6 Disposal Cell Leachate Sample . . . . . . . . . . . . . . . . . . . . . . . . . . . . 4-13
4-7 Waste Materials Landsprcad at the SRI Site . . . . . . . . . . . . . . . . . . . 4-16
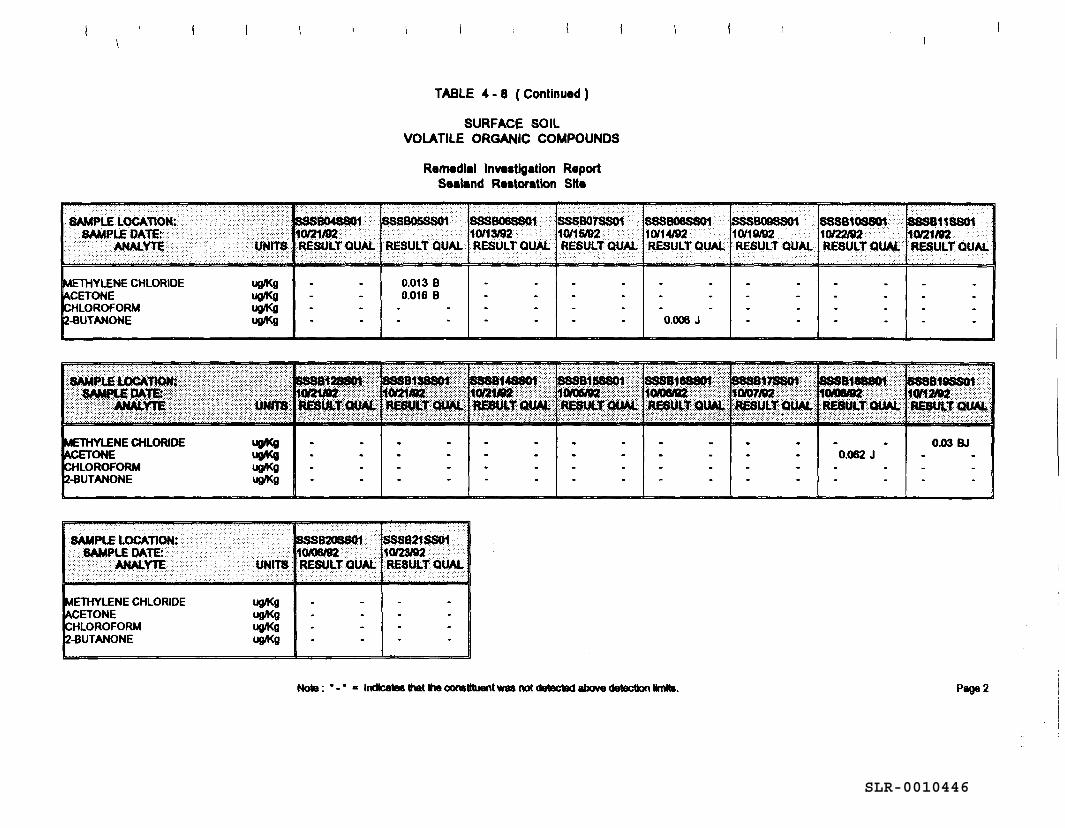
4-8 Surface Soil Volatile Organic Compounds .................... 4-20
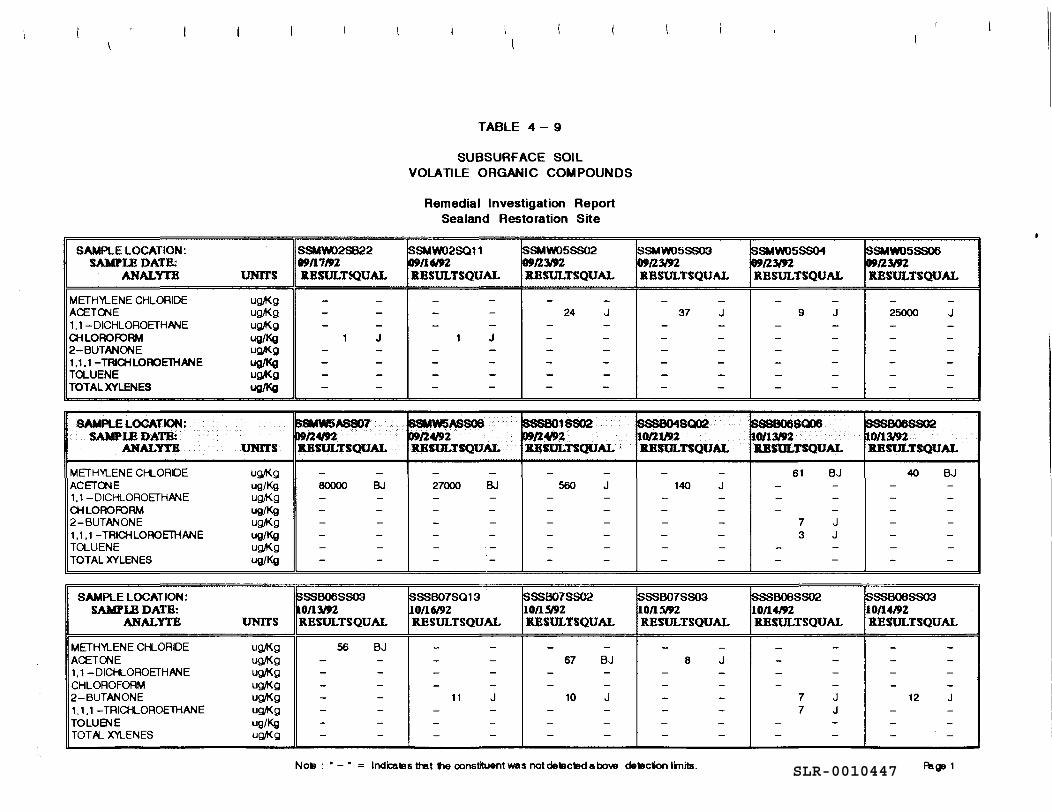
4-9 Subsurface Soil Volatile Organic Compounds .................. 4-22
4-10 Surface Soil Semivolatilc Organic Compounds ................. 4-30
4-11 Subsurface Soil Semivolatile Organic Compounds ............... 4-34
4-12 Surface Soil Pesticides and PCBs . . . . . . . . . . . . . . . . . . . . . . . . . . . 4-41
4-13 Subsurface Soil Pesticides and PCBs ........................ 4-45
4-14 Surface Soil Inorganic Analytes . . . . . . . . . . . . . . . . . . . . . . . . . . . . 4-53
4-15
4-16
Subsurface Soil Inorganic Analytcs ......................... 4-57
ARARs and Background Analytical Data ..................... 4-71
EDIS/ENG/ay071494.toc viii
SLR-0010414
-
-
-
List of Tables (Continued) ___________ _
4-17
4-18
4-19
4-20
4-21
4-22
4-23
4-24
4-25
4-28
4-26
4-27
4-27
Overburden GroWldwater Volatile Organic Compounds 4-78
Overburden Groundwater Semivolatile Organic Compounds . . . . . . . . 4-89
Overburden GroWldwater Pesticides and PCBs . . . . . . . . . . . . . . . . . 4-93
Overburden Groundwater Inorganic Analytes ................ ; . . 4-96
Bedrock Groundwater Volatile Organic Compounds ............. 4-108
Bedrock GroWldwatcr Pesticides and PCBs ......... ; . . . . . . . . 4-109
Bedrock Groundwater Inorganic Analytes . . . . . . . . . . . . . . . . . . . . 4-111
Residential Wells Volatile Organic Compounds . . . . . . . . . . . . . . . . 4-116
NYSDOH Residential Well Sampling Results Volatile Organic
Compounds . . . . . . . . . . . . . . . . . . . . . . . . . . . . . . . . . . . . . . . . . 4-118
Residential Wells Semivolatile Organic Compounds . . . . . . . . . . . . . 4-123
Residential Wells Pesticides and PCBs . . . . . . . . . . . . . . . . . . . . . . 4-133
Residential Wells Inorganic Analytes Unfiltered Samples . . . . . . . . . 4-138
NYSDOH Residential Well Sampling Results Semi-Volatile
Organic Compounds . . . . . . . . . . . . . . . . . . . . . . . . . . . . . . . . . . ~ 4-125
4-29 NYSDOH Residential Well Sampling Results Pesticides and
PCBs . . . . . . . . . . . . . . . . . . . . . . . . . . . . . . . . . . . . . . . . . . . . . 4-136
4-31 NYSOOH Residential Well Sampling Results Inorganic Analytes
Unfiltered Sainples . . . . . . . . . . . . . . . . . . . . . . . . . . . . . . . . . . . . 4-146
4-32 Surface Water Volatile Organic Compowids . . . . . . . . . . . . . . . . . . 4-156
4-33 Surface Water Semivolatile Organics Compounds . . . . . . . . . . . . . . 4-157
4-34 Surface Water Pesticides and PCBs ........................ 4-158
4-35 Surface Water Inorganic Analytes . . . . . . . . . . . . . . . . . . . . . . . . . 4-159
4-36 Sediment Volatile Organic Compounds. . . . . . . . . . . . . . . . . . . . . . 4-165
4-37 Sediment Semivolatilc Organic Compowids . . . . . . . . . . . . . . . . . . 4-166
4-38 Sediment Pesticides and PCBs . . . . . . . . . . . . . . . . . . . . . . . . . . . . 4-167
4-39 Sediment Inorganic Analytes . . . . . . . . . . . . . . . . . . . . . . . . . . . . . 4-168
5-1 Parameters Governing the Environmental Fate of Organic Chemicals
Detected in the Site Media ................................ 5-5
5-2 Contamination Migration Rates . . . . . . . . . . . . . . . . . . . . . . . . . . . . 5-27
EDIS/ENG/ay071494.toc lX
SLR-0010415
-
---------- "----
List of Tables (Continued,1-------------
Table Title
6-1
6-2
6-3
6-4
6-5
6-6
6-7
6-8
6-9
6-10
6-11
6-12
6-13
6-14
6-15
6-16
6-17
6-18
6-19
6-20
6-21
6-22
6-23
6-24
Surficial Soil Data Statistical Analyses . . . . . . . . . . . . . . . . . . . . . . . . 6-6
Surface Water Data Statistical Analyses . . . . . . . . . . . . . . . . . . . . . . . 6-9
Sediment Data Statistical Analyses . . • . . . . . . . . . . . . . . . . . . . . . . . 6-12
Off-Site Residential Groundwater Data Statistical Analyses . . . . . . . . . 6-15
On-Site Groundwater Statistical Analyses .................. : . . 6-18
Combined Groundwater Data Statistical Analyses .......... "• .... 6-21
Summary of Constituents of Concem in F.nvironmental Media ...... 6-26
Carcinogenic and Noncarcinogenic Effects of Constituents of Concern . 6-27
Summary of Current On-Site Trespassed Pathways . . . . . . . . . . . . . . 6-33
Summary of Future On-Site/Off-Site Residential Exposure Pathways .. 6-34
Sumary of Carcinogenic Risks and Non-Carcinogenic Hazards-Current Land
Use Reasonable Maximum Exposure . . . . . . . . . . . . . . . . . . . . . . . . 6-53
Summary of Carcinogenic Risks and Non-Carcinogenic Hazards - Future Land
Use Reasonable Maximum Exposure ........................ 6-60
Comparison of RME and CTE Results • . . . . . . . . . . . . . . . . . ·. . . . . 6-64
Avian Species Found on or in the O.S Mile Radius Around SRI ... " .. 6-75
Mammalian Species Found on or in the 0.5 Mile Radius Around SRI . 6-76
Vegetative Species Found on or in the 0.5 Mile Radius Sunounding SRI 6-77
Sealand Round 1 Surface Water Characteristics . . . . . . . . . . . . . . . . . 6-81
Summary of On-Site Soil Complex . . . . . . . . . . . . . . . . . . . . . . . . . 6-93
Rare, Threatened and Endangered Species in the Vicinity of
Sealand Restoration Site . . . . . . . . . . . . . . . . . . . . . . . . . . . . . . . . . 6-98
Significant Habitat in the Vicinity of the SRI Site . . . . . . . . . . . . . . 6-100
Constituents of Ecological Concem • . • . . . . . . . . . . . . . . . . . . . . . 6-102
Camparison of Surficial Soil Inorganic Constituents
to Background . . . . . . . . . • . . • . . . . . . . . . . . . . . . . . . . . . . . . . . 6-107
Comparison of Surface Water Constituents to Standards
or Criteria . . . . . . . . . . . . . . . . . . . . . . . . . . . . . . . . . . . . . . . . . . 6-108
Comparison of Sediment Constituent Concentrations to Criteria
and Effect Values . . . . . . . . . . . . . . . . . . . . . . . . . . . . . . . . . . . . 6-109
EDIS/ENG/ay071494.toc x
SLR-0010416
List of Tables (Continuedr1-------------
6-25 Surti.cial Soil Organic Constituent Log (K_) Values 6-112
6-26 Physical chemical and Fate Data for COECs . . . . . . . . . . . . . . . . . . 6-121
6-27 Species-Specific Parameters . . . . . . . . . . . . . . . . . . . . . . . . . . . . . 6-125
6-28 Total Daily Exposure Values for the Meadow Vole ............. 6-126
6-29 Total Daily Exposure Values for the American Kestrel ......... : . 6-127
6-30 Total Daily Exposure Values for the Racoon .................. 6-128
6-31 Hazard Quotients and Indices . . . . . . . . . . . . . . . . . . . ~ . . . . . . . . 6-136
7-1 Summary of VOC Contamination in the Former Disposal Cell Area
Monitor Wells .... · ........... ·. . . . . . . . . . . . . . . . . . . . . . . . . . 7-5
7-2 Summary of Carcinogenic Risks and Non-Carcinogenic Hazards -
Current Land Use Reasonable Maximum Exposure .............. 7-16
7-3 Summary of Carcinogenic Risks and Non-Carcinogenic Hazards -
Future Land Use Reasonable Maximum Exposure ............... 7-18
-
--EDIS/ENG/ay071494.toc xi
SLR-0010417
-
-
Figure No. Title
1-1
1-2
1-3
1-4
1-5
1-6
1-7
1-8
1-9
1-10
1-11
1-12
1-13
1-14
1-15
1-16
1-17
1-18
1-19
1-20
2-1
2-2
2-3
3-1
3-2
3-3
3-4
Regional Location Map
Site I...ocation Map ....•..................................
On-Site Disposal Areas •..............................•..
Phase II Sampling Locations . . . . . . . . . . . . . . . . . . . . . . . . . . . . . . .
Soil, Surface Water and Sediments - Sampling Locations for the Dames & Moore RI/PS Investigation . . . . . . . ~ . . . . . . . . . . . .
Cadmium in Surface Soils and Sediments ..................... .
Total Pesticide Levels in Site Soils . . . . . . . . . . . . . . . . . . . . . . . . . .
PCBs in Surface Soils and Sediments - Aroclor 1260 . . . . . . . . . . . . .
Disposal Cell Test Pit :Locations . . . . . . . . . . . . . . . . . . . . . . . . . . . .
Post-Construction Soil Sampling I...ocations .................... .
Disposal Cell - Confirmatory Sampling Diagram . . . . . . . . . . . . . . . . .
Overburden Growidwater Well Locations ..................... .
Overburden Growidwater Well Locations .............. · ....... .
HSL Volatile Compounds Detected in Overburden Groundwater · From September 1985 to December 1986 ..................... .
Acetone & Methylene Chloride in Overburden Groundwater -September 1985 - December 1986 .......................... .
Cadmium in Site Overburden Groundwater ................... .
Homeowner Well Sampling Locations . . . . . . . . . . . . . . . . . . . . . . . .
Lead Levels in Residential Groundwater - December 1986 ......... .
Selective Solvent Levels in Residential Groundwater December 1986 ..
Acetone Levels in Residential Groundwater - December 1986 ...... .
Regional Topographic Map .............................. .
Site Plan/Actual Sample Locations ......................... .
Former Disposal Cell Area .............................. .
Precipitation During RI Field Activities . . . . . . . . . . . . . . . . . . . . . . .
Surficial Geologic Province . . . . . . . . . . . . . . . . . . . . . . . . . . . . . . .
Site Drainage Map .................................... .
Pray Road Tributary Flow Characteristics ..................... .
EDIS/ENG/ay071494.toc xii
1-2
1-3
1-7
1-14
1-27
1-28
1-30
1-31
1-34
1-38
1-39
1-40
1-48
1-49
1-50
1-53
1-57
1-60
1-61
1-62
2-6
2-7
2-29
3-5
3-7
3-9
3-11
SLR-0010418
-
LlstofF/gures(Conttnued)~~~~~~~~~~~-
Figure No. Title
3-5
3-6
3-7
3-8
3-9
3-10
3-11
3-12
3-13
3-14
3-15
3-16
4-1
4-2
4-3
4-4
4-5
4-6
4-7
McFadden Road Tributary Flow Characteristics . . . . . . . . . . . . . . . . . 3-12
Generalized Stratigraphic Column . . . . . . . . . . . . . . . . . . . . . . . . . . . 3-17
Cross Sectional Di.agrmns • • • . . . . . . . . . . . . . . . . . . . . . . . . . . . . . . 3-19
Isopach Map of Pluvial Deposits ............................. 3-20
lsopach Map of Glacial Till . . . . . . . . . . . . . . . . . . . . . . . . . . . . . . . 3-22
Top of Bedrock Surface Contour Map . . . . . . . . . . . . . . . . . . . . . . . . 3-27
Groundwater Flow Contoms 11/30/92 ................ '. . . . . . . . 3-33
Groundwater Contour Map - Shallow Overburden l0/8i93 . . . . . . . . . . 3-34
Groundwater Contour Map - Deep Overburden 11130/92 . . . . . . . . . . . 3-35
Groundwater Contour Map - Deep Overburden 10/8/93 . . . . . . . . . . . . 3-36
Bedrock Groundwater Contour Map 11130/92 . . . . . . . . . . . . . . . . . . . 3-37
Bedrock Groundwater Contour Map 10/8/93 . . . . . . . . . . . . . . . . . . . . 3-38
Surface Soil Concentrations Detected Map - Volatile and
Semi-Volatile Organic Compounds . . . . . . . . . . . . . . . . . . . . . . . . . . 4-18
Surface Soil Concentrations Detected Map - Pesticides and PCBs . . . . . 4-19
Organic Groundwater Concentrations Detected Adjacent to the Fonner Disposal Cell Area ...................... ·. . . . . 4-76
Selected Unfiltered Inorganic Groundwater Concentrations in the Former Disposal Cell Alea . . . . . . . . . . . . . . . . . . . . . . . . . . . . . . . . 4-77
IT Residential Well Sample Detected Concentrations .............. 4-115
Surface Water Concentrations - Detected Pesticides and PCBs, Volatile and Semi-Volatile Compounds ....................... 4-155
Sediment Concentrations - Detected Pesticides and PCBs, Volatile and Semi-Volatile Compounds . . . . . . . . . . . . . . . . . . . . . . . 4-164
• - '. l •" I /.\. i ~
EDIS/ENG/ay071494.toc xiii
SLR-0010419
-
LlstofFigures(Conttnued)~~~~~~~~~~~-
Figure No. Title
5-1
5-2
6-1
6-2
6-3
6-4
6-5
6-5
6-7
6-8
6-9
6-10
6-11
6-12
6-13
6-14
6-15
6-16
6-17
7-1
7-2
Lateral Extent of Volatile Organic Contamination . . . . . . . . . . . . . . . . 5-23
Vertical Extent of Volatile Organic Contamination . . . . . . . . . . . . . . . 5-25
Conceptual Site Model Human Health Risk: Assessment . . . . . . . . . . . . 6-31
Carcinogenic Risks Cmrent Land Use On-Site Trespasser . . . . . . . . . . . 6-54
Noncarcinogenic Hazards Current Land Use On-Site Trespasser . . . . . . 6-55
Carcinogenic Risk Currmt Land Use . . . . . . . . . . . . . . . . . . . . . . . . . 6-57
Noncarcinogenic Hazard Current Land Use ............ : . . . . . . . 6-58
Carcinogenic Risks Reasonable Maximum Exposure Future
Land Use . . . . . . . . . . . . . . . . . . . . . . . . . . . . . . . . . . . . . . . . . . . . 6-59
Noncarcinogenic Hazards Reasonable Maximum Exposure -
Future l..and Use . . . . . . . . . . . . . . . . . . . . . . . . . . . . . . . . . . . . . . . 6-61
Carcinogenic Risk Future Land Use . . . . . . . . . . . . . . . . . . . . . . . . . 6-62
Noncarcinogenic Hazards Future Land Use . . . . . . . . . . . . . . . . . . . . 6-63
Wetlands Map . . . . . . . . . . . . ~ . . . . . . . . . . . . . . . . . . . . . . . . . . . . 6-83
USFWS NWI Map . . . . . . . . . . . . . . . . . . . . . . . . . . . . . . . . . . . . . 6-84
NYS Freshwater Wetlands Map .................... : . . . . . . . 6-85
Vegetation Cover Types . . . . . . . . . . . . . . . . . . . . . . . . . . . . . . . . . . 6-89
Soil Types . . . . . . . . . . . . . . . . . . . . . . . . . . . . . . . . . . . . . . . . . . . 6-92
American Kestrel Food Web . . . . . . . . . . . . . . . . . . . . . . . . . . . . . . . 6-118
Raccoon Food Web . . . . . . . . . . . . . . . . . . . . . . . . . . . . . . . . . . . . . 6-119
Meadow Vole Food Web ................................. 6-120
Conceptual Site Model Human Health Risk: Assessment . . . . . . . . . . . . 7-11
Vertical Extent of Volatile Organic Contamination . . . . . . . . . . . . . . . 7-13
EDIS/ENG/ay07 I 494.toc xiv
SLR-0010420
-
,...
-
Appendix
A
B
c D
E
F
G
H
Chemical and Geoteclmical Analytical Data
Boring Logs
Monitoring Well Construction Logs Diagrams
Aquifer (Slug) Test Analyses
Geophysical Investigation
Cultural Resource Survey
Human Health Risk Assessment
Toxicity Profiles for Constituents of Concern
EDIS/ENG/ay071494.toc xv '·l
SLR-0010421
-
-
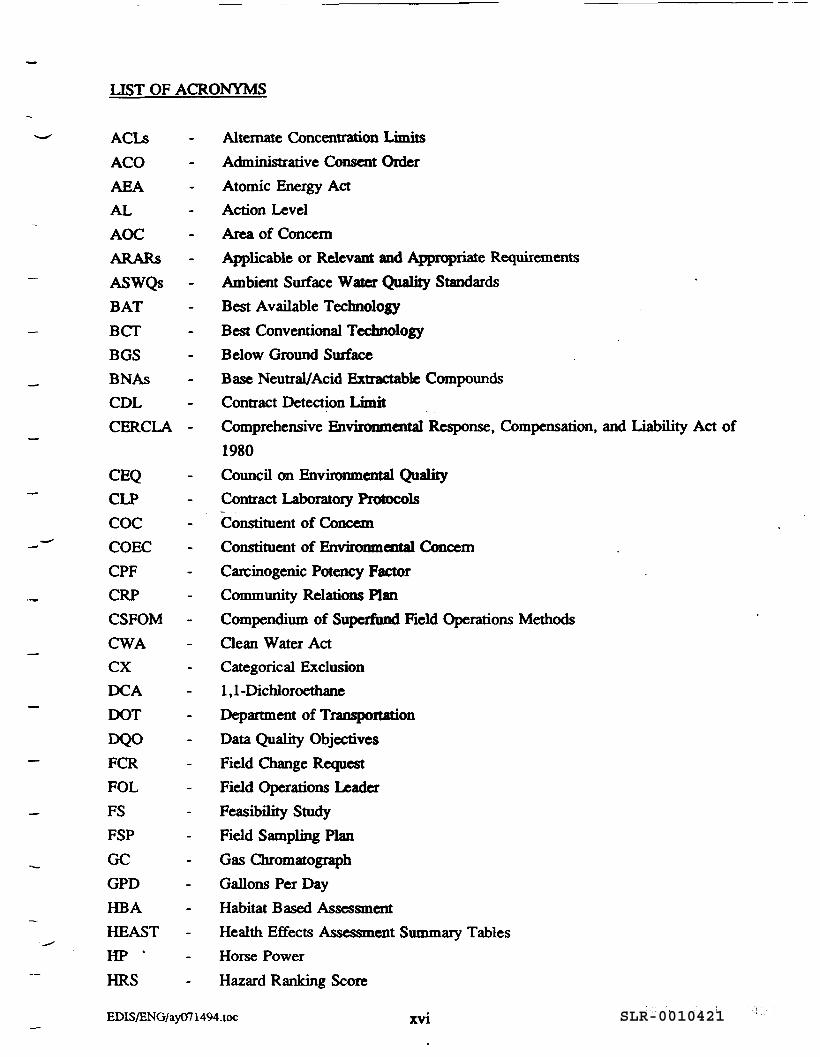
UST OF ACRONYMS
ACI..s
ACO
AEA
AL
AOC ARARs
ASWQs
BAT
BCT
BOS
BNAs
COL
CERCLA -
CEQ CLP
coc COEC
CPF CRP
CSFOM
CWA
ex DCA
DOT DQO
FCR FOL
FS
FSP
GC
GPO
HBA
HEAST
Alternate Concentration Limits
Administrative Consent Order
Atomic Energy Act
Action Level
Arca of Concern
Applicable or Relevant and Appropriate Requirements
Ambient Surface Water Quality Standards
Best Available Technology
Best Conventional Technology
Below Ground Surface
Base Neutral/Acid Extractable Compounds
Contract Detection Limit
Comprehensive F.nviromnental Response, Compensation, and Liability Act of
1980
Council on Enviromnental Quality
Contract Laboratory Protocols -ConstituentofConceDl
Constituent of Environmental Concern
Carcinogenic Potency Factor
Community Relations Plan
Compendium of Supcrfund Field Operations Methods
Clean Water Act
Categorical Exclusion
1, 1-Dichloroethane
Department of Transportation
Data Quality Objectives
Field Change Request
Field Operations Leader
Feasibility Study
Field Sampling Plan
Gas Chromatograph
Gallons Per Day
Habitat Based Assessment
Health Effects Assessment Summary Tables
HP · Horse Power
HRS Hazard Ranking Score
EDIS/ENG/ay071494.toc xvi
SLR-0010422
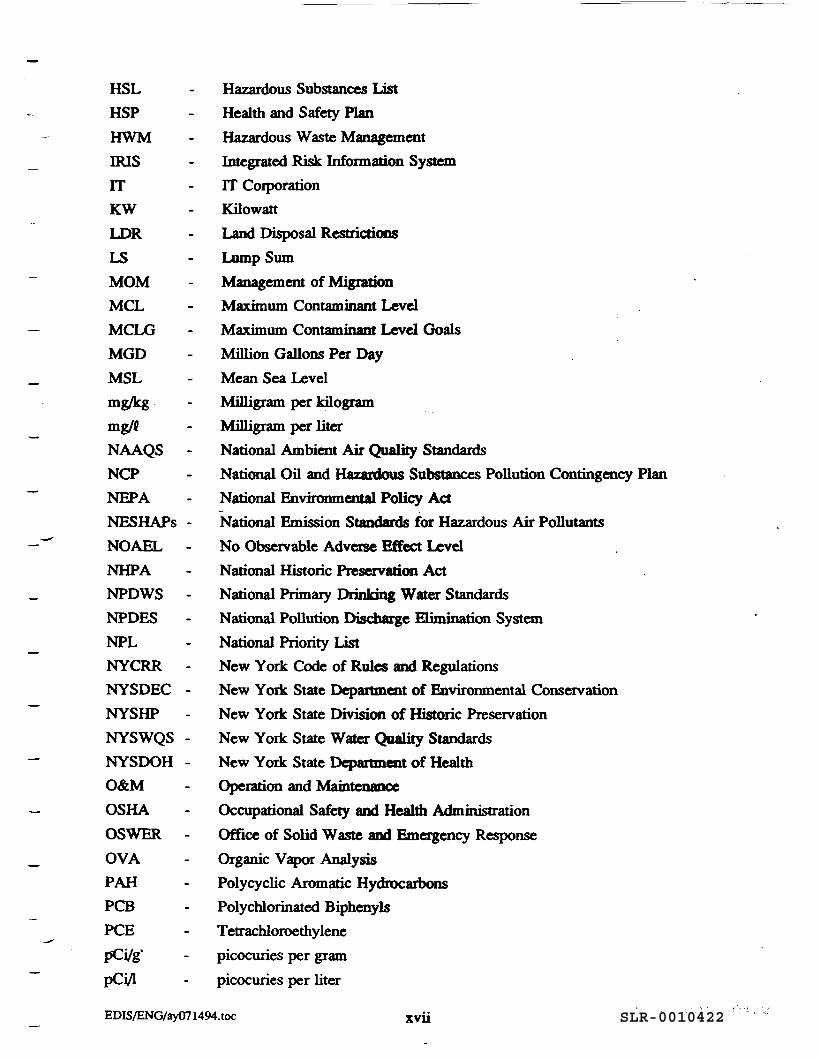
HSL Hazardous Substances List
HSP Health and Safety Plan
HWM Hazardous W astc Management
IRIS Integrated Risk Information System
IT IT Corporation
KW Kilowatt
LDR Land Disposal Restrictions
LS Lump Sum
MOM Management of Migration
MCL Maximum Contaminant Level
MCLG Maximum Contaminant Level Goals
MGD Million Gallons Per Day
MSL Mean Sea Level
mg/kg Milligram per kilogram
mg/e Milligram per liter
NAAQS National Ambient Air Quality Standards
NCP National Oil and Hazardous Substances Pollution Contingency Plan
NEPA National Environmental Policy Act -
NESHAPs - National Emission Standards for Hazardous Air Pollutants - NOAEL No Observable AdvCISC Effect Level
NHPA National Historic Preservation Act
NPDWS National Primacy Drinking Water Standards
NPDES National Pollution Discharge Elimination System
NPL National Priority List
NYCRR New York Code of Rules and Regulations
NYSDEC - New York State Departmmt of Environmental Conservation
NYSHP New York State Division of Historic Preservation
NYSWQS - New York State Water Quality Standards
NYSDOH New York State Depanmmt of Health
O&M Operation and Maintenance
OSHA Occupational Safety and Health Administration
OSWER Office of Solid Waste and Emergency Response
OVA Organic Vapor Analysis
PAH Polycyclic Aromatic Hydrocarbons
PCB Polychlorinated Biphcnyls
PCE Tetrachloroethylene _ _,,
p-Ci/g' picocuries per gram
pCi/l picocuries per liter
' EDIS/ENG/ay071494.toc xvii .. , '
SLR-0010423
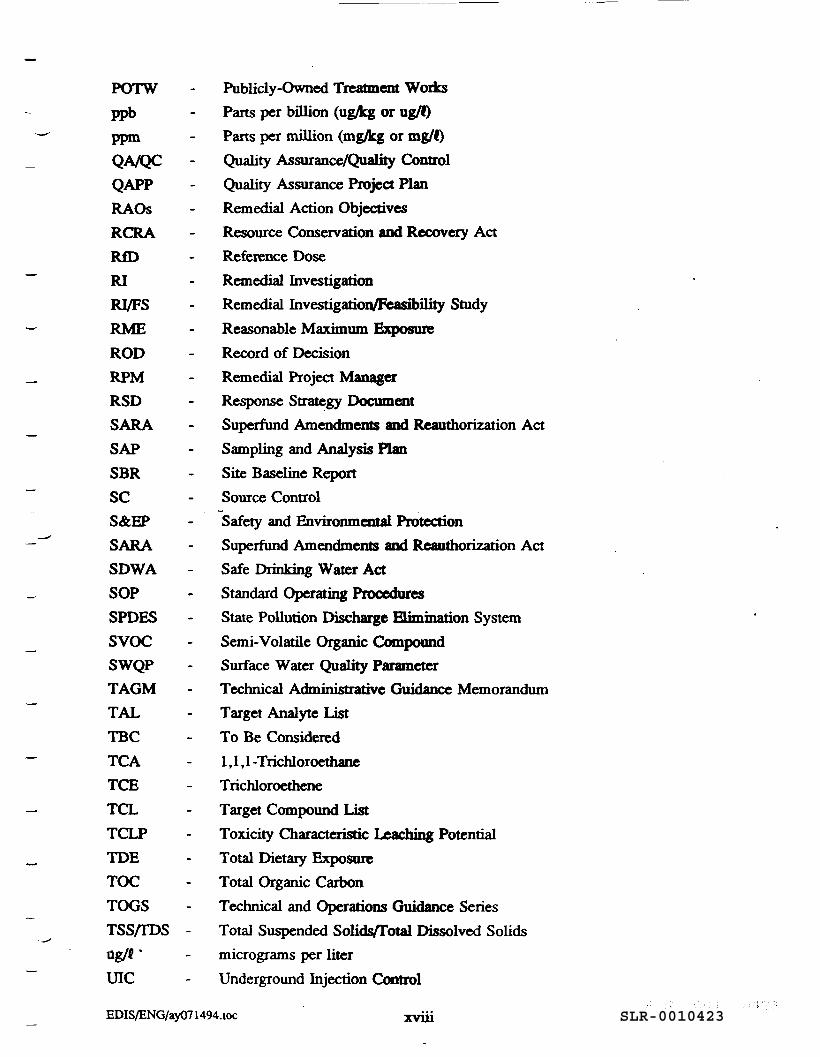
POTW Publicly-Owned Treatment Works
ppb Parts per billion (ug/kg or ug/f) - ppm Parts per million (mg/kg or mg/I)
QA/QC Quality Assurance/Quality Control
QAPP Quality Assurance Project Plan
RA Os Remedial Action Objectives
RCRA Resource Conservation and Recovery Act
RID Reference Dose
RI Remedial Investigation
RI/FS Remedial Investigation/Feasibility Study
RME Reasonable Maximum Exposure
ROD Record of Decision
RPM Remedial Project Manager
RSD Response Strategy Document
SARA Superfund Amendments and Reauthorization Act
SAP Sampling and Analysis Plan
SBR Site Baseline Report
SC Source Control -
S&FJ> Safety and Environmental Protection - SARA Superfund Amendments and Reauthorization Act
SDWA Safe Drinking Water Act
SOP Standard Operating Procedures
SPDES State Pollution Discharge Eimination System
svoc Semi-Volatile Organic Compound
SWQP Surface Water Quality Parameter
TAGM Technical Administrative Guidance Memorandum
TAL Target Analyte List
TBC To Be Considered
TCA 1, 1, I-Trichloroethane
TCE Trichloroethene
TCL Target Compound List
TCLP Toxicity Characteristic Leaching Potential
IDE Total Dietary Exposure
TOC Total Organic Carbon
TOGS Technical and Operations Guidance Series
TSS/IDS - Total Suspended Solids/I'otal Dissolved Solids - _.,
ng/f · micrograms per liter
UIC Underground Injection Control
~ . j .
EDIS/ENG/ay071494.toc xviii
SLR-0010424
-
-
USEPA
USGS
voe WQC
United States Environmental Protection Agency
United States Geological Survey
Volatile Organic Compound
Water Quality Criteria
EDIS/ENG/ay071494.toc xix .. ',L , ,..,

SLR-001042590~ 9 91
SLR-0010426
-
4.0 Nature and Extent of Contamination
This chapter presents a discussion of the concentrations and spatial distributions of the chemical
compounds detected at the SRI site. The areas of investigation were identified based on previous
field investigations conducted by Dames & Moore (1988) and Velzy/West.on (1990). The IT
sampling program was designed to focus on the areas that required further site investigation and
characterization.
This chapter has been organized into four sections. Section 4.1 discusses the potential sources
of contaminants at the SRI site. Section 4.2 presents the results of the soil investigation program.
The soil investigation explored the areas of suspected soil contamination, as well as determined
the nature and extent of soil contamination throughout the site. Section 4.3 discusses the results
of the groundwater investigation and evaluates possible sources for the contamination, as well
as delineates horizontal and vertical contamination present in the site overburden and bedrock
aquifers. A discussion of the water quality of nearby residential wells is also included in this
section. Section 4.4 presents the results of the sediment and surface water investigation
performed at the SRI site.
The data used in this nature and extent of contamination evaluation consist of analytical results
obtained by IT during the Phase I investigation conducted in the Fall of 1992 and the Phase II
investigation conducted in the Fall of 1993. Tables 4-1through4-39 summarize the constituents
detected in the wast.e material, soils, groundwater, surface water, and sediment of the SRI site.
Figure 2-3 presents the locations of the environmental media samples collected as part of this RI.
In addition, residential well sampling analytical results from the New Y oik State Department of
Health (NYSDOH) has been included in Section 4.3.3.
All of the RI analyses were performed by BP A-approved laboratories under the Contract
Laboratory Program (CLP) and have been validated by Ebasco and approved by BP A. Results
of these validators' scrutiny are data sets with qualifiers that describe the quality of the data
strictly from an analytical chemistry quality assurance viewpoint. Data with the following
qualifiers were included as detected concentrations in their respective media:
"J" estimated concentration;
"B" - (inorganic data) compound detected above instrument detection limit but below the contract required detection limit;
EDIS/ENG/ay071494.rp4 4-1 '):::
SLR-0010427
-
-_..
"B" -
"E" -
"D"
"M" -
"S"
"*"
"+" -
"W" -
(organic data) indicates detection of the same compound in the associated blank;
presence of interference for inorganics or exceedence of a calibration range of the GC,MS instrumentation for organics;
analysis conducted at a secondary dilution factor;
duplicate injection precision was not met;
spiked sample recovery was not within control limits;
duplicate analysis is not within control limits;
correlation coefficient for the Method of Standard Additions is less than 0.995; and
Post-digestion spike is not within control limits.
Data reported as not detected, indicated by a "U" qualifier, were not included in the database.
Data with an "R" qualifier, indicating a rejected value, were not included in the database. All
other data, regardless of the respective qualifier are considered in the development of the
database.
The objective of the RI is to determine the natme and extent of contamination sufficiently to ( 1)
perform a baseline risk assessment, and (2) develop and evaluate remedial action alternatives.
The data acquisition phase of the RI focused on obtaining the proper quality and quantity of data
necessary to meet these two RI objectives.
Conclusions regarding the nature and extent of constituents present in the environmental media
are based on the data collected during this RI and previous studies. The purpose of this RI is
to confirm the presence of suspected contaminants and delineate their extent.
4.1 Potential Contaminated Media
The original sources of contamination on the SRI site were located within the former disposal
cell, the drum storage area, the landspreading areas, the waste storage tank, and the tanker trailer
(Figure 2-1). As a result of the three remedial actions already implemented at the SRI site
(Section 1.2), much or most of the contamination sources associated with the former disposal cell,
the drum storage area, the waste storage tank, and the tanker trailer have been remediated. As
discussed in detail in the Dames & Moore RI/FS report (1988) and the Velzy/Weston final report
EDIS/ENG/ay071494.rp4 4-2 (""i ! : . ·" ..
SLR-0010428
-
-
-
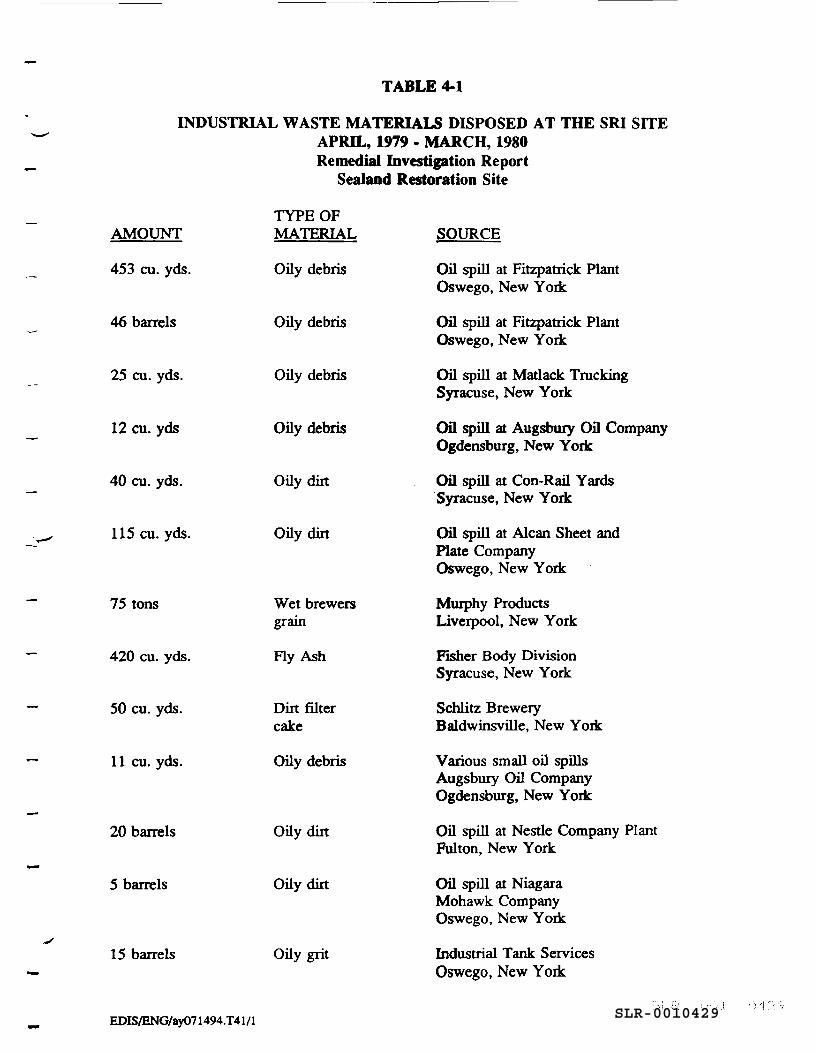
( 1990), these waste sources consisted largely of drummed organic liquids (including petroleum
derivatives and chlorinated solvents) and soils contaminated with these liquids. Table 4-1 lists
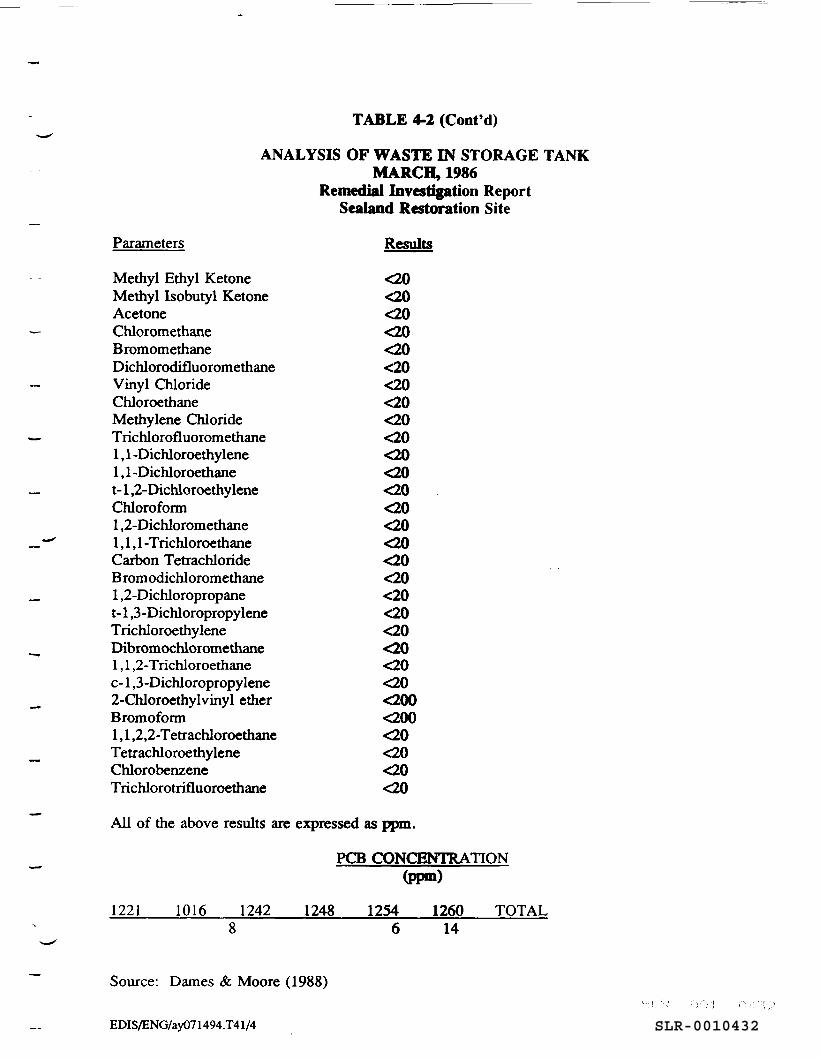
the wastes disposed at the former disposal cell. Tables 4-2 and 4-3 contain the results of the
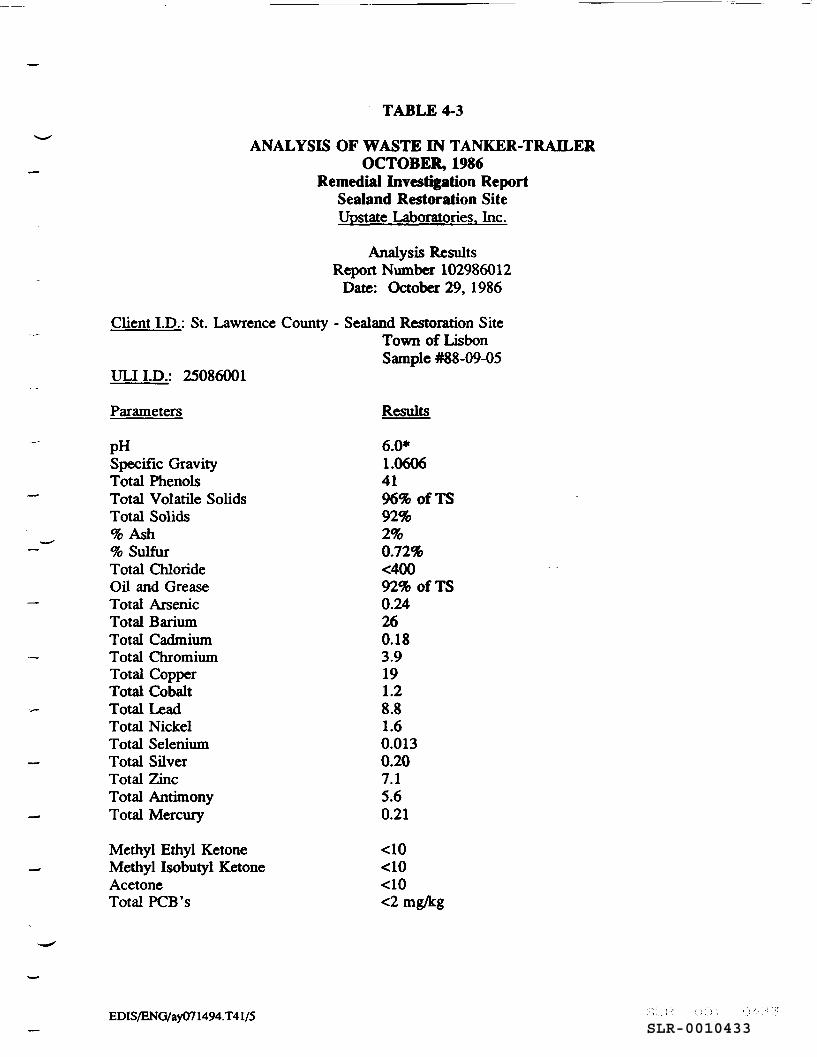
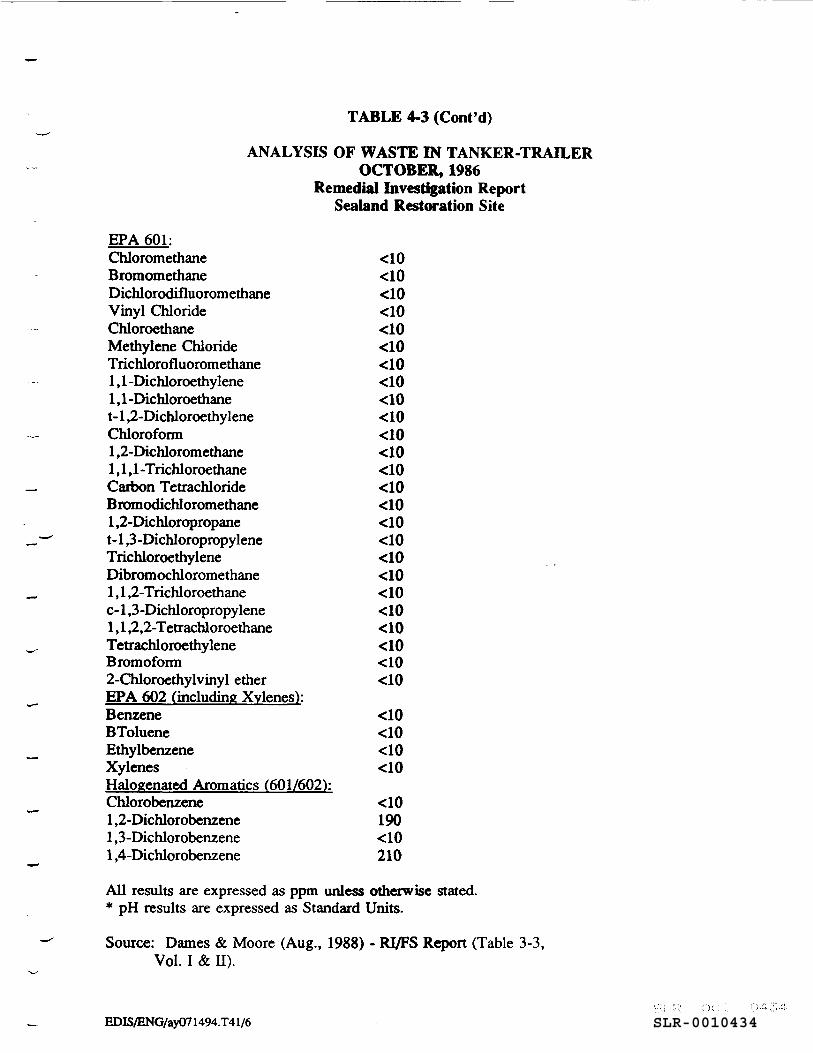
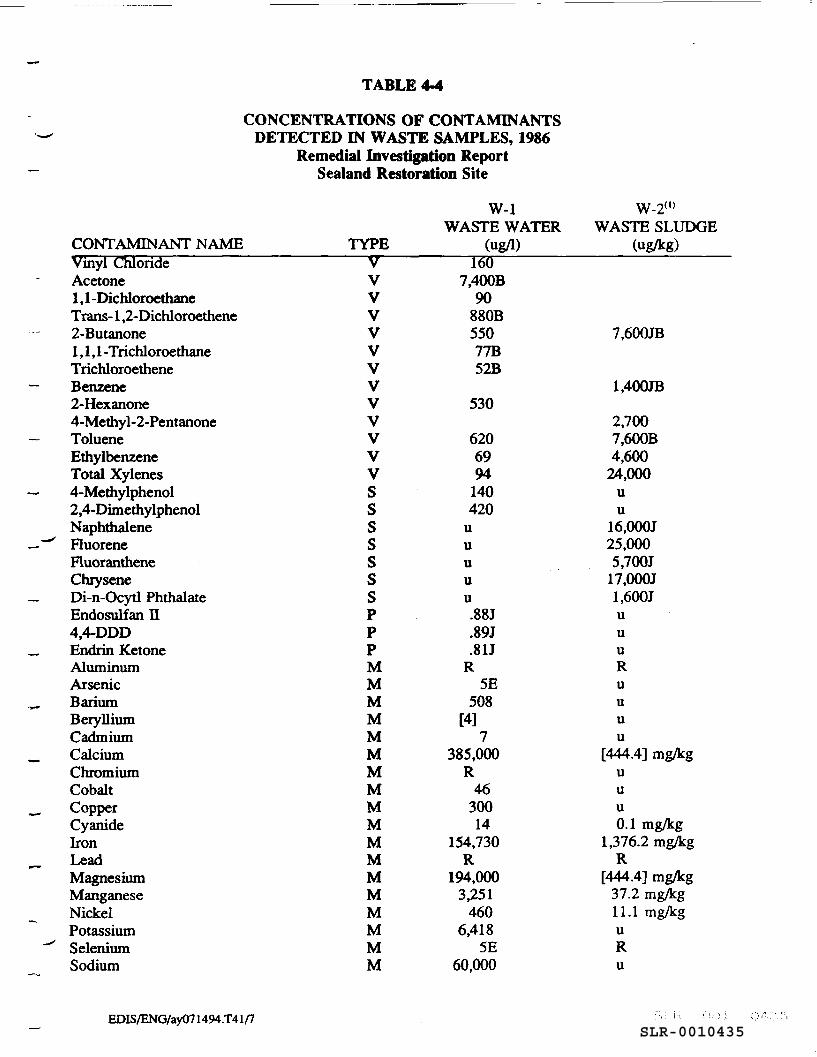
analyses of the contents of the waste storage tank and the tanker-trailer, respectively. Table 44
lists the contaminant levels detected in two waste samples collected from the site during the
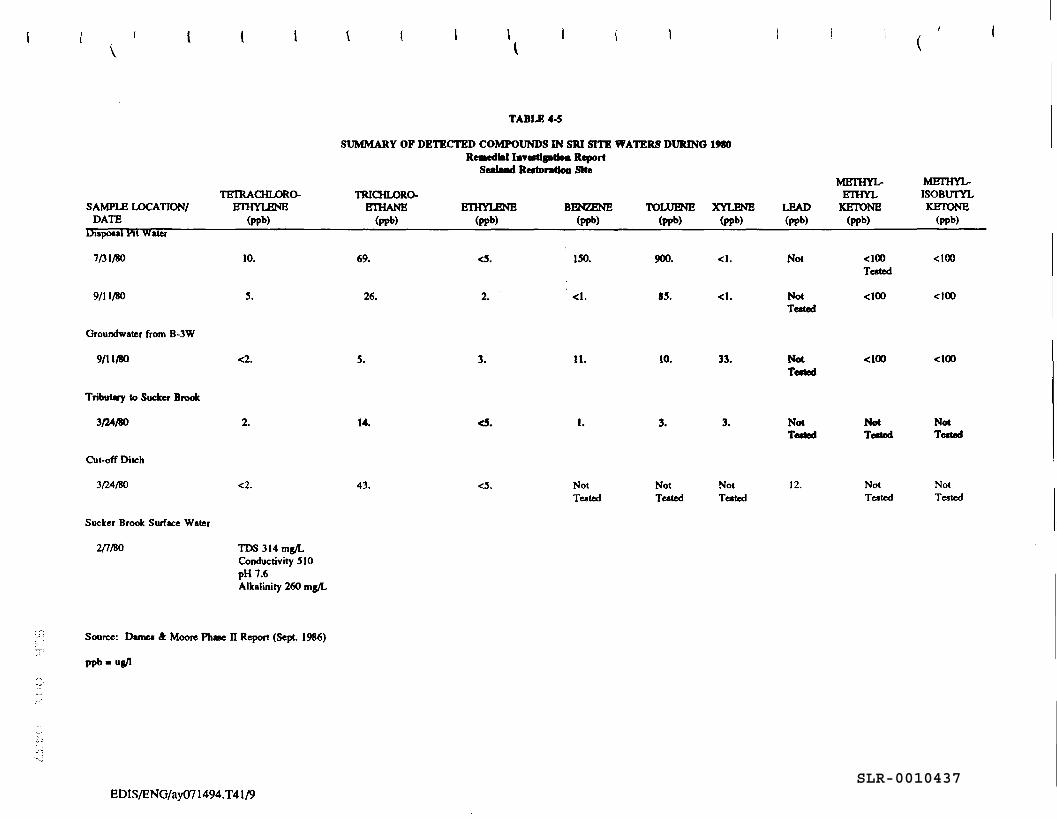
Dames & Moore RI/FS investigation (1988). Table 4-5 lists the analysis of water samples taken
from the disposal pit as well as other water samples collected during 1980. All known drums,
all tank liquids, and much of the contaminated soils have been removed from the site (Section
1.2.2). However, based on the Velzy/Weston results, some contaminated soils still remain in the
disposal area and possibly in the drum storage area.
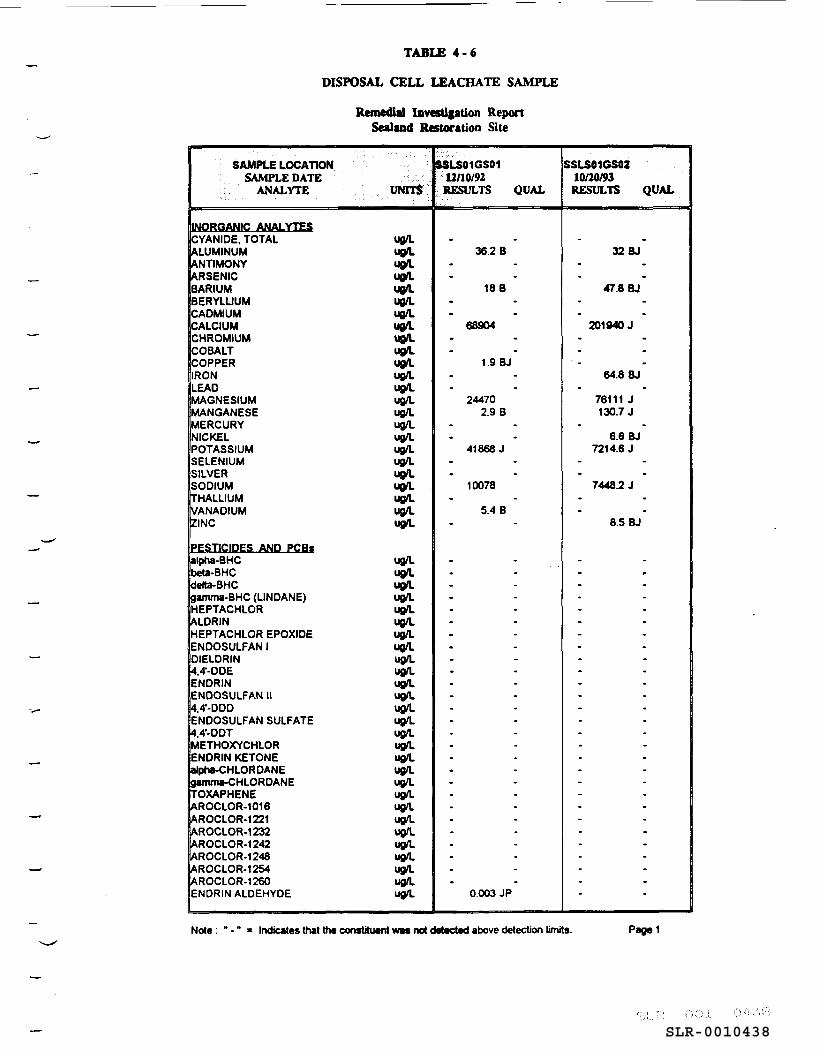
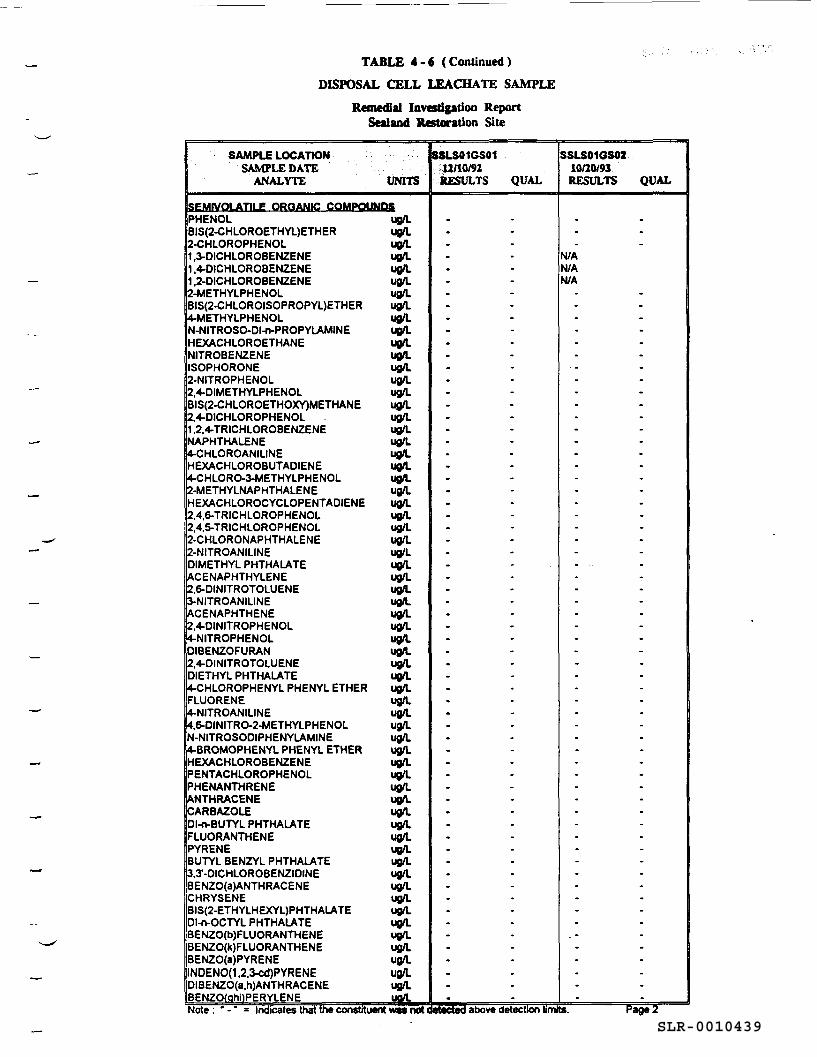
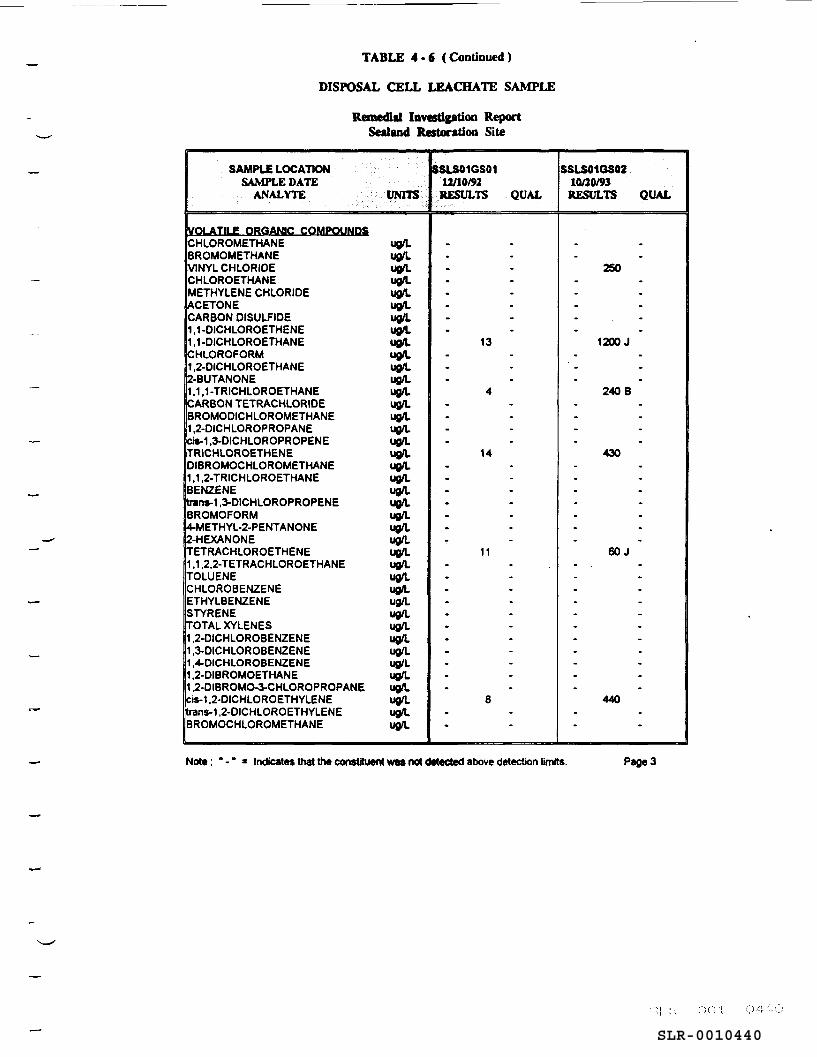
As part of this RI groundwater sampling investigation, the leachate collection system situated
within the former disposal cell area was sampled and analyzed for full TCL and TAL parameters.
Concentrations of a number of chlorinated volatile organic compounds (ie., 1,1,1-trichloroethane
[l,1,1-TCA], 1,1-dichloroethane [1,1-DCA], trichlorothene [TCE], tetrachloroethene [PCE], cis-
1,2-dichloroethylene [cis-1,2-DCE] and vinyl chloride [VC]) ranging in concentrations from
8 pg/L to 1200 pg/L were detected in the cell's leachate (Table 4-6). The pesticide endrin
aldehyde was also detected in the leachate sample. Magnesium was the only elevated inorganic
analyte above proposed cleanup criteria. No semivolatile organic compounds or PCBs were
detected in the leachate sample.
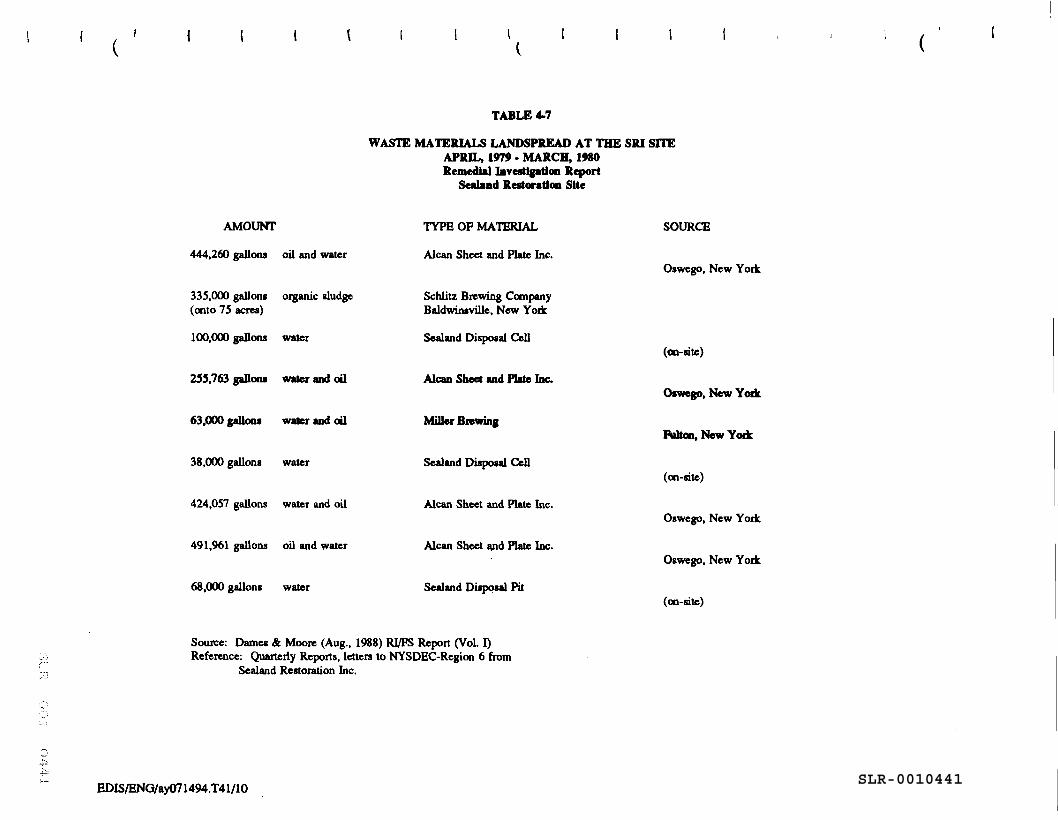
The large landspreading areas shown in Figure 2-3 were sprayed with PCB and metal
contaminated soils and have not been remediated to date (Dames & Moore, 1988). Table 4-7
lists the type of waste fluids spread over the landspreading areas.
In summary, many of the original and most concentrated sources of contamination on the site
have been removed. However, contaminated soils associated with the landspreading areas and
some of the soil associated with the former disposal cell area and drum storage area still remain
on site. These soils are potential sources of contamination to the surface water and sediments
via lateral overland flow into the wetland areas, as well as a potential source of groundwater
contamination via vertical migration into the overburden and bedrock aquifers. These
contaminated soils are discussed in Section 4.2.
EDIS/ENG/ay071494.rp4 4-3
SLR-0010429
TABLE 4-1
INDUSTRIAL WASTE MATERIALS DISPOSED AT THE SRI SITE - APRIL, 1979 • MARCH, 1980 Remedial Investigation Report
Sealand Restoration Site
TYPE OF AMOUNT MATERIAL SOURCE
453 cu. yds. Oily debris Oil spill at Fitzpatrick Plant Oswego, New York
46 barrels Oily debris Oil spill at Fitzpatrick Plant Oswego, New York
25 cu. yds. Oily debris Oil spill at Matlack Trucking Syracuse, New York
12 cu. yds Oily debris Oil spill at Augsbury Oil Company Ogdensburg, New York
40 cu. yds. Oily dirt Oil spill at Con-Rail Yards Syracuse, New York
.- 115 cu. yds . Oily dirt Oil spill at Akan Sheet and Plate Company Oswego, New York
75 tons Wet brewers Mwphy Products grain Liverpool, New York
420 cu. yds. Fly Ash Fisher Body Division Syracuse, New York
50 cu. yds. Dirt filter Schlitz Brewery cake Baldwinsville, New York
11 cu. yds. Oily debris Various small oil spills Augsbury Oil Company Ogdensburg, New York
20 barrels Oily dirt Oil spill at Nestle Company Plant Fulton, New York
5 barrels Oily dirt Oil spill at Niagara Mohawk Company Oswego, New York
,J
15 barrels Oily grit Industrial Tank Services Oswego. New York
·,; ,.'. ,, ; ! ,.:> ... I'.·
EDIS/ENG/ay071494.T41/l
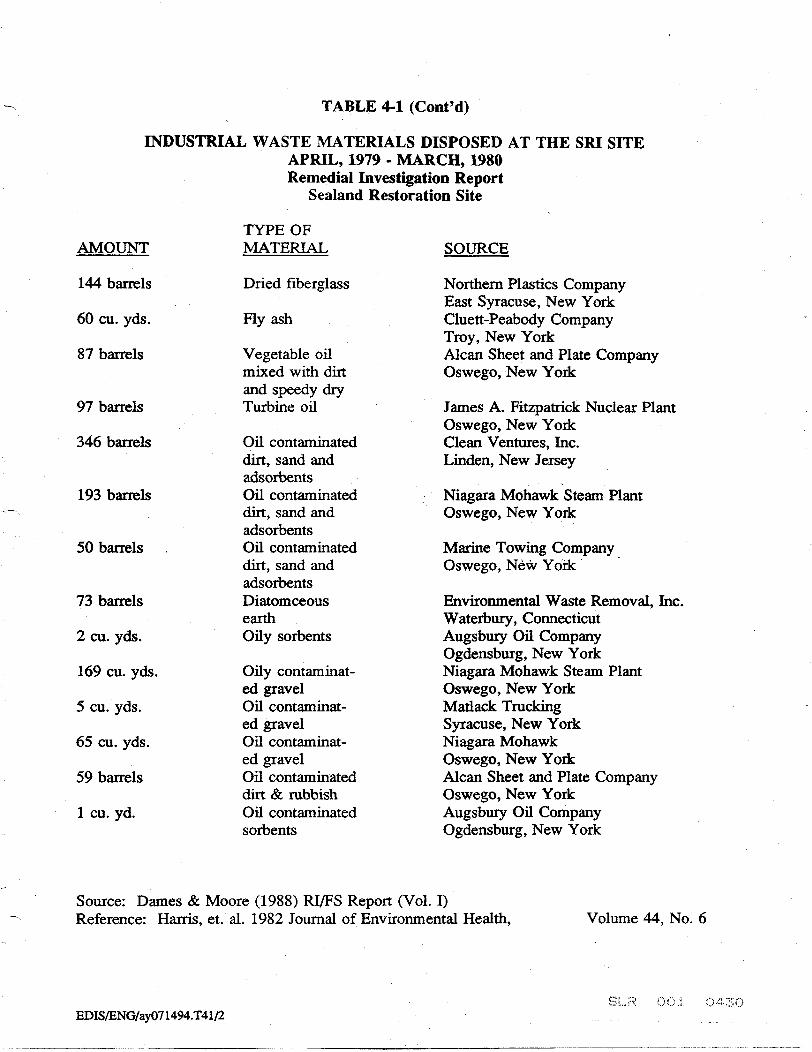
TABLE 4-1 (Cont'd)
INDUSTRIAL WASTE MATERIALS DISPOSED AT THE SRI SITE APRIL, 1979 - MARCH, 1980
AMOUNT
144 barrels
60 cu. yds.
87 barrels
97 barrels
346 barrels
193 barrels
50 barrels
73 barrels
2 cu. yds.
169 cu. yds.
5 cu. yds.
65 cu. yds.
59 barrels
1 cu. yd.
Remedial Investigation Report Sealand Restoration Site
TYPE OF MATERIAL
Dried fiberglass
Fly ash
Vegetable oil mixed with dirt and speedy dry Turbine oil
Oil contaminated dirt, sand and adsorbents Oil contaminated dirt, sand and adsorbents Oil contaminated dirt, sand and adsorbents Diatomceous earth Oily sorbents
Oily contaminated gravel Oil contaminated gravel Oil contaminated gravel Oil contaminated dirt & rubbish Oil contaminated sorbents
SOURCE
Northern Plastics Company East Syracuse, New York Cluett-Peabody Company Troy, New York Alcan Sheet and Plate Company Oswego, New York
James A. Fitzpatrick Nuclear Plant Oswego, New York Clean Ventures, Inc. Linden, New Jersey
Niagara Mohawk Steam Plant Oswego, New York:
Marine Towing Company Oswego, New York·
Environmental Waste Removal, Inc. Waterbury, Connecticut Augsbury Oil Company Ogdensburg, New York Niagara Mohawk Steam Plant Oswego, New York Matlack Trucking Syracuse, New York Niagara Mohawk Oswego, New York Alcan Sheet and Plate Company Oswego, New York Augsbury Oil Company Ogdensburg, New York
Source: Dames & Moore (1988) RI/FS Report (Vol. I) Reference: Harris, et. al. 1982 Journal of Environmental Health, Volume 44, No. 6
EDIS/ENG/ay071494.T41/2
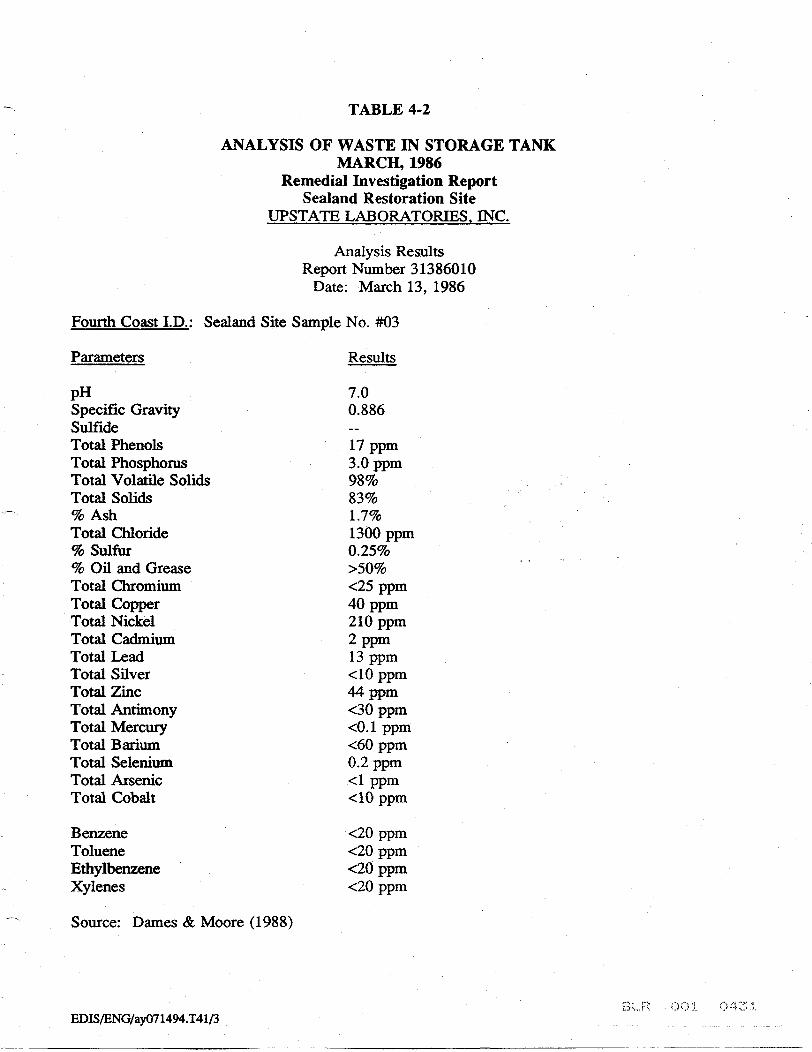
TABLE 4-2
ANALYSIS OF WASTE IN STORAGE TANK MARCH, 1986
Remedial Investigation Report Sealand Restoration Site
UPSTATE LABORATORIES, INC.
Analysis Results Report Number 31386010
Date: March 13, 1986
Fourth Coast l.D.: Sealand Site Sample No. #03
Parameters
pH Specific Gravity Sulfide Total Phenols Total Phosphorus Total Volatile Solids Total Solids % Ash Total Chloride % Sulfur % Oil and Grease Total Chromium Total Copper Total Nickel Total Cadmium Total Lead Total Silver Total Zinc Total Antimony Total Mercury Total Barium Total Selenium Total Arsenic Total Cobalt
Benzene Toluene Ethyl benzene Xylenes
Source: Dames & Moore (1988)
EDIS/ENG/ay071494. T41/3
Results
7.0 0.886
17 ppm 3.0 ppm 98%. 83% 1.7% 1300 ppm 0.25% >50% <25 ppm 40ppm 210 ppm 2ppm 13 ppm <10 ppm 44ppm <30 ppm <0.1 ppm <60 ppm 0.2ppm <1 ppm <10 ppm
<20 ppm <20 ppm <20 ppm <20 ppm
SLR-0010432
-
-
TABLE 4-2 (Cont'd)
ANALYSIS OF WASTE IN STORAGE TANK MARCH, 1986
Remedial Investigation Report Sealand Restoration Site
Parameters Results
Methyl Ethyl Ketone <20 Methyl Isobutyl Ketone <20 Acetone <20 Chloromethane <20 Brom om ethane <20 Dichlorodifluoromethane <20 Vinyl Chloride <20 Chloroethane <20 Methylene Chloride <20 Trichlorofluoromethane <20 1, 1-Dichloroethylene <20 1, 1-Dichloroethane <20 t-1,2-Dichloroethylene <20 Chloroform <20 1,2-Dichloromethane <20 1, 1, 1-Trichloroethane <20 Carbon Tetrachloride <20 Bromodichloromethane <20 1,2-Dichloropropane <20 t-1,3-Dichloropropylene <20 Trichloroethy lene <20 Dibromochloromethane <20 1 , 1,2-Trichloroethane <20 c-1,3-Dichloropropylene <20 2-Chloroethylvinyl ether <200 Bromoform <200 1, 1,2,2-Tetrachloroethane <20 Tetrachloroethylene <20 Chlorobenzene <20 Trichlorotrifluoroethane <20
All of the above results are expressed as ppm.
1221 1016 1242 1248 8
Source: Dames & Moore (1988)
EDIS/ENG/ay071494.T41/4
PCB CONCENTRATION (ppm)
1254 1260 TOTAL 6 14
SLR-0010433
-
-
__,
TABLE 4-3
ANALYSIS OF WASTE IN TANKER-TRAILER OCTOBER, 1986
Remedial Investigation Report Sealand Restoration Site Upstate Laboratories, Inc.
Analysis Results Report Number 102986012
Date: October 29, 1986
Client l.D.: St. Lawrence County - Sealand Restoration Site Town of Lisbon Sample #88-09-05
ULI I.D.: 25086001
Parameters Results
pH 6.0* Specific Gravity 1.0606 Total Phenols 41 Total Volatile Solids 96% of TS Total Solids 92% % Ash 2% % Sulfur 0.72% Total Chloride <400 Oil and Grease 92% of TS Total Arsenic 0.24 Total Barium 26 Total Cadmium 0.18 Total Chromium 3.9 Total Copper 19 Total Cobalt 1.2 Total Lead 8.8 Total Nickel 1.6 Total Selenium 0.013 Total Silver 0.20 Total Zinc 7.1 Total Antimony 5.6 Total Mercury 0.21
Methyl Ethyl Ketone <10 Methyl Isobutyl Ketone <10 Acetone <10 Total PCB's <2 mg/kg
EDIS/ENG/ay071494.T41/5 ~. ; . ..; . . . .
SLR-0010434
-
-
TABLE 4-3 (Cont'd)
ANALYSIS OF WASTE IN TANKER-TRAILER OCTOBER, 1986
EPA 601: Chloromethane Bromomethane Dichlorodifluoromethane Vinyl Chloride Chloroethane Methylene Chloride Trichlorofluoromethane 1, 1-Dichloroethylene 1, 1-Dichloroethane t-1,2-Dichloroethylene Chloroform 1,2-Dichloromethane l, 1,1-Trichloroethane Carbon Tetrachloride Bromodichloromethane 1,2-Dichloropropane t-1,3-Dichloropropylene Trichloroethylene Dibromochloromethane 1, 1,2-Trichloroethane c-1,3-Dichloropropylene 1, 1,2,2-T etrachloroethane Tetrachloroethylene Bromoform 2-Chloroethylvinyl ether EPA 602 (including Xylenes): Benzene BToluene Ethylbenzene Xylenes
Remedial Investigation Report Sealand Restoration Site
<10 <10 <10 <10 <10 <10 <10 <10 <10 <10 <10 <10 <10 <10 <10 <10 <10 <10 <10 <10 <10 <10 <10 <10 <10
<10 <10 <10 <10
Halogenated Aromatics (601/602): Chlorobenzene 1,2-Dichlorobenzene 1,3-Dichlorobenzene 1,4-Dichlorobenzene
<10 190 <10 210
All results are expressed as ppm unless otherwise stated. * pH results are expressed as Standard Units.
Source: Dames & Moore (Aug., 1988) - Rl/FS Report (Table 3-3, Vol. I & II).
EDIS/ENG/ay071494.T41/6
,· .. ,., :.,, r·. ::):.
SLR-0010435
TABLE4-4
CONCENTRATIONS OF CONTAMINANTS ·- DETECTED IN WASTE SAMPLES, 1986 Remedial Investigation Report
Sealand Restoration Site
W-1 W-2<1) WASTEWATER WASTE SLUDGE
CONTAMINANT NAME TYPE (ug/l) (ug/kg) Vinyl Chloride v 160 Acetone v 7,400B 1, 1-Dichloroethane v 90 Trans-1,2-Dichloroethene v 880B 2-Butanone v 550 7,600JB l, 1,1-Trichloroethane v 77B Trichloroethene v 52B Benzene v l,400JB 2-Hexanone v 530 4-Methyl-2-Pentanone v 2,700 Toluene v 620 7,600B Ethylbenzene v 69 4,600 Total Xylenes v 94 24,000 4-Methylphenol s 140 u 2,4-Dimethylphenol s 420 u Naphthalene s u 16,000J - Fluorene s u 25,000 Fluoranthene s u 5,700J Chrysene s u 17,000J Di-n-Ocytl Phthalate s u l,600J Endosulf an II p .88J u 4,4-DDD p .891 u Endrin Ketone p .811 u Aluminum M R R Arsenic M 5E u Barium M 508 u Beryllium M [4] u Cadmium M 7 u Calcium M 385,000 [444.4] mg/kg Chromium M R u Cobalt M 46 u Copper M 300 u Cyanide M 14 0.1 mg/kg Iron M 154,730 1,376.2 mg/kg Lead M R R Magnesium M 194,000 [444.4] mg/kg Manganese M 3,251 37.2 mg/kg Nickel M 460 11.1 mg/kg Potassium M 6,418 u _,, Selenium M 5E R Sodium M 60,000 u
EDIS/ENG/ay071494.T4ln : . : i·· .. ;.:_·j: :):1•· .

SLR-0010436
--
-
CONTAMINANT NAME Tuallium Vanadium Zinc
TABLE 4-4 (Cont'd)
CONCENTRATIONS OF CONTAMINANTS DETECTED IN WASTE SAMPLES, 1986
Remedial Investigation Report Sealand Restoration Site
TYPE M M M
W-1 WASTEWATER
{ug/l) R 293
R
W-2<1) WASTE SLUDGE
(ug/kg) u R R
If the result is a value greater than or equal to the instrument detection limit but less than the contract-required detection limit, the value is reported in brackets (i.e., [10]).
B = analyte found in blank as well as sample
E= indicates an estimated value or not reported due to the presence of interference
R= data validation recommends value to be rejected
J= data validation recommends value to be designated as "estimated"
* = indicates duplicate analysis is not within control limits
V= volatile
s = semi-volatile
P= pesticide
m = metal
( 1) = Tiris sample is a composite of waste sludge and soils from the drum storage area
Source: Dames & Moore (Aug, 1988) RI/FS Report (Table 3-2, Vol. I & II)
EDIS/ENG/ay071494.T41/8
SLR-0010437
·~ .. :
SAMPLE LOCATION/ DATE
7f31/80
9/11/80
Groundwater from B-3W
9/11/80
Tribut#y to Sucker Broolc
3{}.4/11)
Cut-off Ditch
3/24/80
Sucker Brook Surface Water
2{7/80
TirrRAOD...ORO-ETHYLENE
(ppb)
10.
s.
<2.
2.
<2.
TDS 314 mg/L Conductivity SIO pH 7.6 Alkalinity 260 mg/L
Source: Dmnes 4: Moore PhMe D Report (Sept. 1986)
ppb • ug/I
EDIS/ENG/ay071494.T41/9
TABLE 4-5
SUMMARY OF DETECTED COMPOUNDS IN SRI SITE WATERS DURING 1980
TRIOD...ORO-E1HANE
(ppb)
69.
26.
s.
14.
43.
Remedlal la•lltlpdoa Report Seal8acl Re9tonidoa Site
B11tYl.BNB (ppb)
<.5.
2.
3.
<5.
<.5.
BENZENE (ppb)
150.
<I.
lt.
1.
Not Tested
TOLUBNE (ppb)
900.
SS.
10.
3.
Not Teated
XYLF.NE (ppb)
<I.
<I.
33.
3.
Not Tested
LBAD (ppb)
Not
Not Teated
Not Telted
Not Telted
12.
MB11IYL-E11IYL
KETONE (ppb)
<100 Teated
<100
<100
Not Temted
Not Teated
(
MB11IYL-ISOBUl'YL KETONE
(ppb)
<100
<100
<100
Not Tcstecl
Not Tested
SLR-0010438
TABLE 4-6
DISPOSAL CELL LEACHATE SAMPLE
Remedial Investlptlon Report Sealand Restoration Site ---
SAMPLE LOCATION SSLS01GS02 SAMPLE DATE lOJl0/93
ANALYTE VNITS .. QUAL RESULTS QUAL
CYANIDE, TOTAL uglL LUMINUM uglL 36.2 B 32BJ NTIMONY uglL RSENIC uglL
BARIUM ugll 18 B 47.8 BJ BERYLLIUM uglL CADMIUM uglL CALCIUM uglL 68904 201940 J CHROMIUM uglL COBALT ugll COPPER uglL 1.9 BJ IRON uglL 64.8 BJ LEAD uglL MAGNESIUM uglL 24470 76111 J MANGANESE uglL 2.9 B 130.7 J MERCURY uglL NICKEL uglL 6.6 BJ POTASSIUM uglL 41868 J n14.6 J SELENIUM uglL SILVER uglL SODIUM uglL 10078 7448.2 J
HALLI UM uglL ANADIUM uglL 5.4 B INC uglL 8.5 BJ -lpha·BHC uglL
beta·BHC uglL elta-BHC uglL amma-BHC (LINDANE) uglL
HEPTACHLOR uglL LORIN uglL
HEPTACHLOR EPOXIDE uglL ENOOSULFAN I uglL DIELDRIN uglL
,4'-DDE uglL EN ORIN uglL ENDOSULFAN II uglL
...... ,4'-000 uglL ENOOSULFAN SULFATE uglL
,4'·DDT uglL METHOXYCHLOR uglL ENORIN KETONE uglL lpha-CHLORDANE uglL amma-CHLORDANE uglL OXAPHENE uglL ROCLOR-1016 uglL ROCLOR-1221 uglL ROCLOR-1232 uglL ROCLOR-1242 uglL ROCLOR-1248 uglL ROCLOR-1254 ug/L ROCLOR-1260 uglL
ENORIN ALDEHYDE uglL 0.003 JP
Note : • - • = Indicates that the constituent wn not detected above detection limits. Page 1 -: : . ~· ' .. . ' . :,
SLR-0010439
----
/• .' l 1.-i
TABLE ' - 6 ( Continued )
DISPOSAL CELL LEACHATE SAMPLE
Remedial Investiption Report Sealand Restaration Site
'--"
SAMPLE LOCATION LS01GS01 SSLS01GS02 SAMPLE DATE U/10/92 10120/93
ANALYTE UNITS - R.E.WLTS QUAL RESULTS QUAL
PHENOL uglL 815(2-CHLOROETHYL)ETHER uglL 2-CHLOROPHENOL uglL 1,3-DICHLOROBENZENE uglL NIA 1,4-DICHLOR08ENZENE uglL NIA 1,2-DICHLOR08ENZENE ug/L NIA -METHYLPHENOL ug/L
815(2-CHLOR0150PROPYL)ETHER ug/L METHYLPHENOL uglL
N-NITROSO-Dl-n-PROPYLAMINE uglL HEXACHLOROETHANE uglL NITR08ENZENE uglL ISOPHORONE uglL 2-NITROPHENOL ug/L
,4-DIMETHYLPHENOL ug/L 815(2-CHLOROETHOXY)METHANE uglL 2,4-DICHLOROPHENOL uglL 1,2,4-TRICHLOR08ENZENE uglL NAPHTHALENE uglL
CHLOROANILINE uglL HEXACHLOR08UTADIENE uglL
CHLOR0-3-METHYLPHENOL uglL -METHYLNAPHTHALENE ug/L
HEXACHLOROCYCLOPENTADIENE ug/L ,4,6-TRICHLOROPHENOL ug/L
2,4,5-TRICHLOROPHENOL ug/L - 2-CHLORONAPHTHALENE uglL 2-NITROANILINE ug/L DIMETHYL PHTHALA TE uglL
CENAPHTHYLENE uglL ,6-DINITROTOLUENE uglL NITROANILINE ug/L CENAPHTHENE ug/L
2,4-DINITROPHENOL ug/L NITROPHENOL ug/L
D18ENZOFURAN uglL ,4-DINITROTOLUENE uglL
DIETHYL PHTHALATE uglL HLOROPHENYLPHENYLETHER uglL
FLUORENE uglL NITROANILINE ug/L
,6-DINITR0-2-METHYLPHENOL uglL N-NITR050DIPHENYLAMINE ug/L
8ROMOPHENYLPHENYLETHER uglL HEXACHLOR08ENZENE uglL PENTACHLOROPHENOL uglL PHENANTHRENE uglL
NTHRACENE uglL CAR8AZOLE uglL Dl-n-8UTYL PHTHALA TE uglL FLUORANTHENE uglL PYRENE ug/L 8UTYL8ENZYLPHTHALATE ug/L 3,3'-DICHLOROBENZIDINE ug/L BENZO(a)ANTHRACENE ug/L CHRY5ENE uglL 815(2-ETHYLHEXYL)PHTHALA TE ug/L Dl-n-OCTYL PHTHALA TE uglL
----BENZO(b)FLUORANTHENE uglL BENZO(k)FLUORANTHENE uglL BENZO(a)PYRENE uglL INOEN0(1,2,3-ed)PYRENE ug/l DIBENZO(a,h)ANTHRACENE ug/L BENZO hi PERYLENE Note : • - • = Indicates that above detection limits.
SLR-0010440
TABLE 4 ·' (Continued )
DISPOSAL CELL LEACHATE SAMPLE
Remedial Inwstlptioo Report ,,__, Sealand Restoration Site
SAMPLE LOCATION SSLS01GS02 SAMPLE DATE 10/l0/93
ANALYTE lJNlTS .• QUAL RF..WLTS QUAL
CHLOROMETHANE ug/L BROMOMETHANE ug/L
INYL CHLORIDE ug/L 250 CHLOROETHANE ug/L METHYLENE CHLORIDE ug/L
CETONE ug/L CARBON DISULFIDE uglL 1, 1-0ICHLOROETHENE uglL 1, 1-DICHLOROETHANE ug/L 13 1200 J CHLOROFORM uglL 1,2-DICHLOROETHANE uglL 2-BUTANONE uglL 1, 1, 1-TRICHLOROETHANE ug/L 4 240 B CARBON TETRACHLORIDE ug/L BROMODICHLOROMETHANE uglL 1,2-DICHLOROPROPANE uglL is-1,3-DICHLOROPROPENE uglL
TRICHLOROETHENE ug/L 14 430 OIBROMOCHLOROMETHANE ug/L 1, 1,2-TRICHLOROETHANE ug/L BENZENE ug/L
ns-1,3-DICHLOROPROPENE ug/L BROMOFORM uglL
ETHYL-2-PENTANONE uglL - 2-HEXANONE ug/L ETRACHLOROETHENE ug/L 11 60 J
1, 1,2,2-TETRACHLOROETHANE ug/L OLUENE ug/L
CHLOROBENZENE ug/L ETHYLBENZENE ug/L STYRENE ug/L
OTAL XYLENE$ uglL 1,2-DICHLOROBENZENE uglL 1,3-DICHLOROBENZENE ug/L 1,4-DICHLOROBENZENE ug/L 1,2-DIBROMOETHANE ug/L 1,2-DIBROM0-3-CHLOROPROPANE ug/L is-1,2-DICHLOROETHYLENE uglL 8 440
ns-1,2-DICHLOROETHYLENE ug/L BROMOCHLOROMETHANE uglL
Note : • - • • Indicates that the constituent was not detected above detection limits. Page3
•:.i ;'~ ..
SLR-0010441~::::
( l l
TABLE 4-7
WASTE MATERIALS LANDSPREAD AT THE Sill SITE APR.D., 1979 • MARCH, 1980 Remedial lavestlptlon Report
Sealand Restoration Site
AMOUNT TYPE OF MATBRIAL
444,200 gallom oil and water Alcan Sheet and Plate Inc.
335,000 gallon• organic sludge Schlitz BRlwing Company (onto 15 acres) Baldwimville, New Yodt
100,000 gallom water Sealand Disposal Cell
25.5,763 gallona water and oil Alcan Sheet and Plate Inc.
63,000 gallon• water and oil Miller Bl9Win1
38,000 gallons water Sealand Disposal Cell
424,057 gallons water and oil Alcan Sheet and Plate Inc.
491,961 gallons oil and water Alcan Sheet 1111d Plate Inc.
68,000 gallons water Sealand Disposal Pit
Source: Dames & Moore (Aug., 1988) RI/PS Report (Vol. I) Reference: Quarterly Reports, letters to NYSDBC-Region 6 from
Sealand Restoration Inc.
SOURCE
Oswego, New York
(on-site)
Olwego, New Yolk
Fulton, New Yodt
(oo-site)
Oswego, New York
Oswego, New York
(oo-site)
EDIS/ENG/ay071494.T41/10
(
SLR-0010442
, __
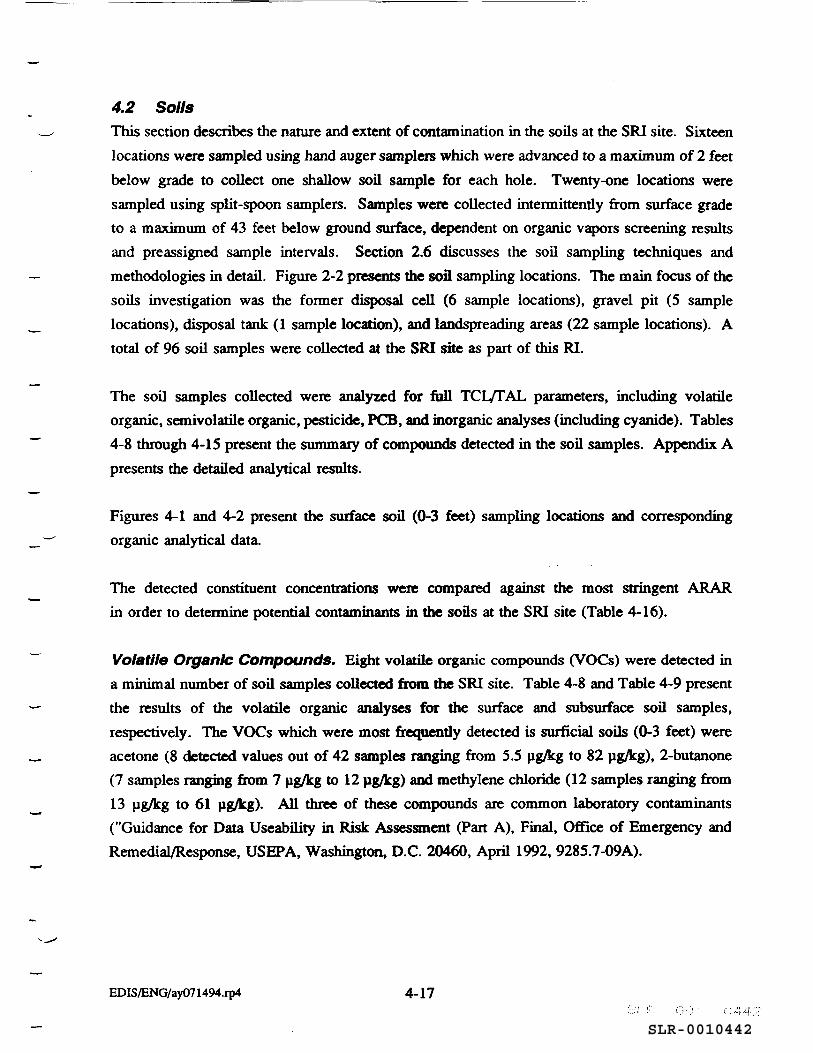
4.2 Soils This section describes the nature and extent of contamination in the soils at the SRI site. Sixteen
locations were sampled using hand auger samplers which were advanced to a maximum of 2 feet
below grade to collect one shallow soil sample for each hole. Twenty-one locations were
sampled using split-spoon samplers. Samples were collected intermittently from surface grade
to a maximum of 43 feet below ground surface, dependent on organic vapors screening results
and preassigned sample intervals. Section 2.6 discusses the soil sampling techniques and
methodologies in detail. Figure 2-2 presents the soil sampling locations. The main focus of the
soils investigation was the former disposal cell (6 sample locations), gravel pit (5 sample
locations), disposal tank (1 sample location), and landspreading areas (22 sample locations). A
total of 96 soil samples were collected at the SRI site as part of this RI.
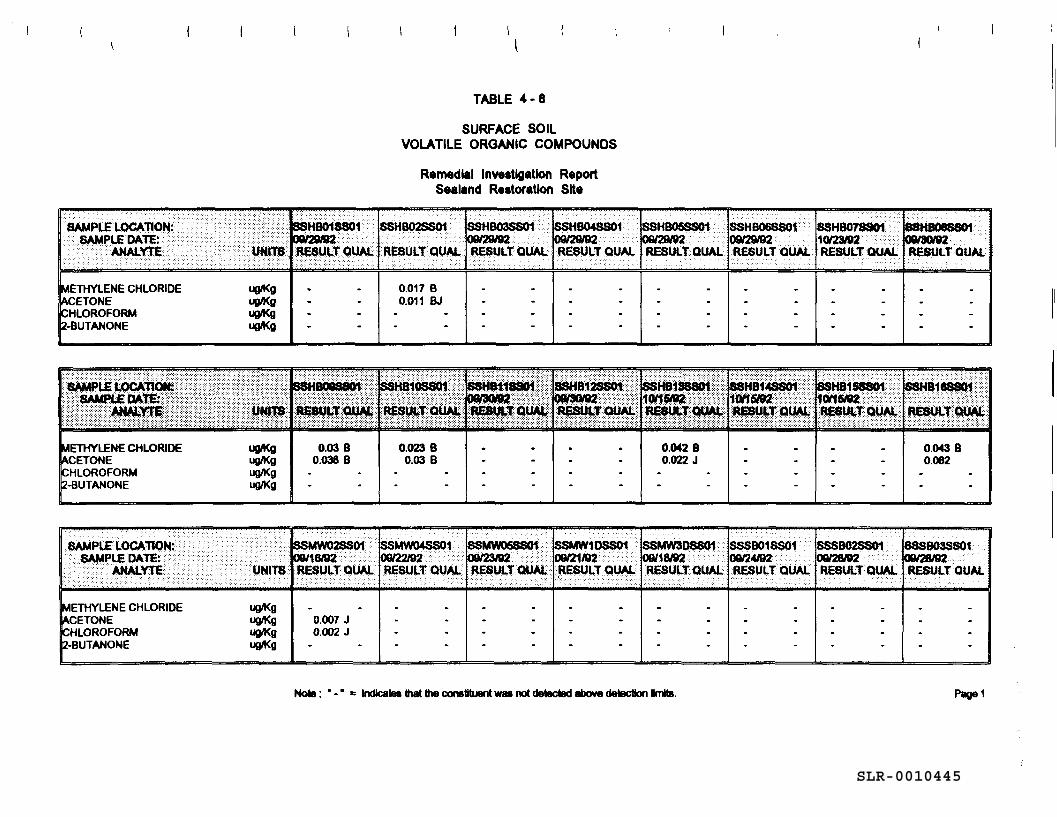
The soil samples collected were analyzed for full TCl./f AL parameters, including volatile
organic, semivolatile organic, pesticide, PCB, and inorganic analyses (including cyanide). Tables
4-8 through 4-15 present the summary of compounds detected in the soil samples. Appendix A
presents the detailed analytical results.
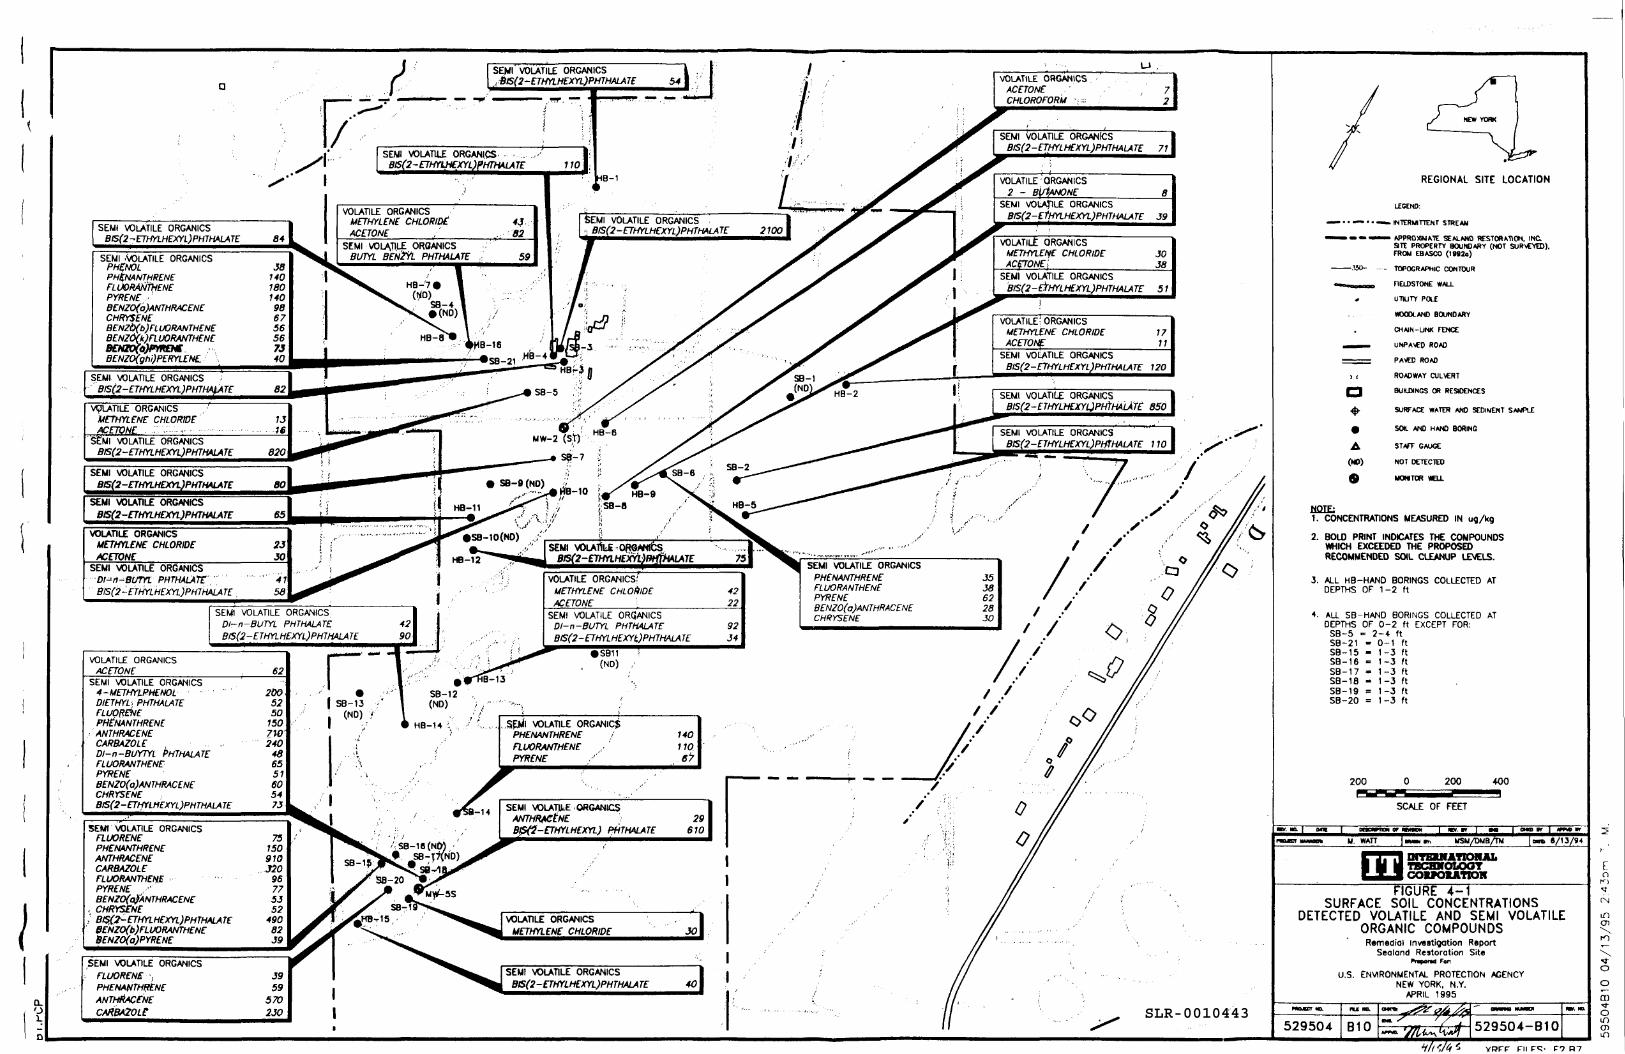
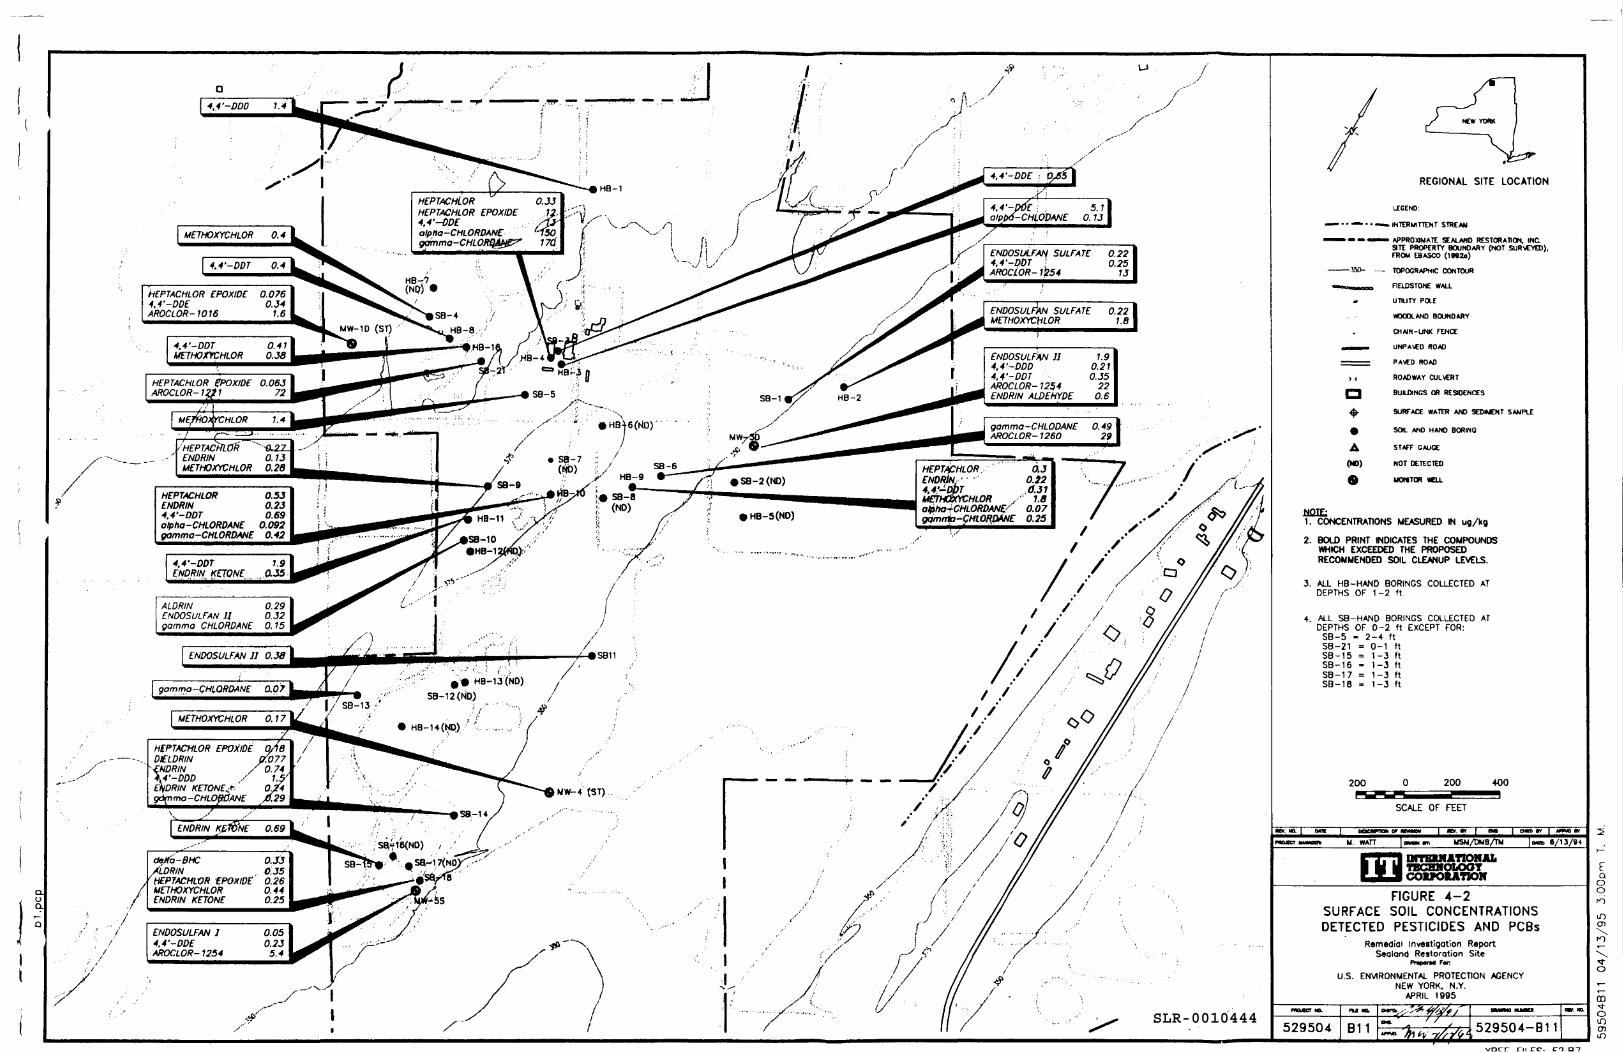
Figures 4-1 and 4-2 present the surface soil (0-3 feet) sampling locations and corresponding
organic analytical data.
The detected constituent concentrations were compared against the most stringent ARAR
in order to determine potential contaminants in the soils at the SRI site (Table 4-16).
Volatile Organic Compounds. Eight volatile organic compounds (VOCs) were detected in
a minimal number of soil samples collected from the SRI site. Table 4-8 and Table 4-9 present
the results of the volatile organic analyses for the surface and subsurface soil samples,
respectively. The VOCs which were most frequently detected is surficial soils (0-3 feet) were
acetone (8 detected values out of 42 samples ranging from 5.5 µg/kg to 82 µg/kg), 2-butanone
(7 samples ranging from 7 µg/kg to 12 µg,lkg) and methylene chloride (12 samples ranging from
13 µg/kg to 61 µg/kg). All three of these compounds are common laboratory contaminants
("Guidance for Data Useability in Risk Assessment (Part A), Final, Office of Emergency and
Remedial/Response, USEPA, Washington, D.C. 20460, April 1992, 9285.7-09A).
EDIS/ENG/ay071494.rp4 4-17 (;4.4·:)
SLR-0010443
J I
Q_ I.) l..
D
a
SEMI VOLATILE ORGANICS 815(2-ETHYLHEXYL)PHTHALA TE
SEMI •\.oLATILE ORGANICS PH~NOL PH~NAN~J:IRENE FU.JORANT/:ffNE PYRENE , BfNZo(a)ANTHRACENE CHl?YSENE BENZO{b)FLUORANTHENE
EJf/:fzff/j;::THE~: 8£NZO(ghi)PERYL£~ ·.
SEMI \A'.JLATILE ORGANICS .. 815(2-fTHYLHEXYL}PHT
VGJLATILE ORGANICS MfTHYC.ENE CHLORIDE AC
VOLATILE ORGANICS AC ETON[
SEMI VOLATILE ORGANICS 4-METHYLRHCNOL DIETHYL> PHTH.ALAT[ FLU08f!NE PHfNANTHRfN[
'. ANTHRAC£NE CARBAZOLf .. Dl-n-8/JYTYL PHTHALATE FLUORANTHENE PYRENf BENZO( a)ANTHRACf Nf CHRYSENE 815(2-ETtfYLHEXYL)PHTHALATE
SEMI. WLATILE ORGANICS FLUORENE PHENANTHRfN[ ANTHRACENE CARBAZOLE FLUORANTHENE , PYRENE , " BENZo(a/ANTHRACENf
• CHRYSE:NE ,' BIS_(!/~ETHYLHEXYL)PHTHAU.Tf . IJCNZo(b)FLllORANTHENE
BENZo(a)PYRENE
SEMI VOLATILE ORGANICS FLUORENE 'i PHENANTHF,l[NE ANTHR-'C£NE CARfJAtOL(
r! 'ff·;:-~-
SENI VOLATILE ORGANICS w· ,.B/S(2-ETHYLHEXYL)PHTHALATE 54 ''
.,..._. ________ ..,.,_ __________ .! .
_...,... ~,- -.~.··.
! ,. SEMI l.QLATU.E ORGANICS· ·· · .. ,,.' ' / " . BIS 2-ETHYU-tCXYL HTHALATE
.,.;" I
84 l VOLATILE ORGANICS MITHYLENf CHLORIDt ACETONf '
EMI VOLATILE ORGANICS "815(2-ETHYLHEXYL)PHTHAl..ATE
J8 140 180 140 98 67 56 56 1J '40
82
7J 11
62
200 52 50
150 no 240
48 65 51 60 54 7.J
75 150 910
.. .120 96 77 5.J 52
490 82 J9
.J9 59
570 2.JO
S[MI VOLATILE ORGANICS BUTYL BENii'L PHTHALATE
,i ! . " ./ ;
59
VOLATILE ORGANICS! METHYLENE CHLORIDE ,tC£TONE
SEMI VOLATILE ORQANICS Dl-n-BUTYL PHTHALATE 815(2-ETHYLHEXYt)PHTHAU\ TE
esa11 (ND) .'
, ... $pll l.QLATILE ORGANIC$ PHENANTHRENE / FLUORNVTHENE PYR£NE
SEMI l.QLAlJ.l~ ·ORGANICS ANTHRJ,CtNE . 8~-ETHYLHEXYL} rf,THALATE
VOLATILE ORGNlllCS METHYLENE CHLORIDE
SEMI l.QLAnLE ORGANICS BIS(2-ETHYLH£XYL}PHTHAU.T£
140 110 8'7
29 610
.JO
40
42 22
92 J4
I I
I /
', '· '···
2100
·" _,.,.,,.
SEMI VOLATILE ORGANICS PHfNANTHRfN£ FLUORANTHEN[ PYRfNf BENZO(a}ANTHRAC[N[ CHRYSENE
i
VOLATILE ORGANICS ACETONE CHLOROFORM '''"
VOLATILE! ORGANICS METHYLENE CHLORIDE ACETO
u.
7 2
71
8
J9
JO .JB
51
77 17
SEMI VOLATILE ORGANICS 815(2-£1HYLHEXYL PHTHALATE 120
SEMI VOLATILE ORGANICS 815(2-fTHYLHfXYL)PHTHAi.).t[ 850
/',-·., .·'' ';,,, ...
.J5 J8 62 28 JO
1/ I/
_j/ /' 0
I / ..
/ , ..
·'
REGIONAL SITE LOCATION
LEGEND:
- • • - • • - INlERMTIENf STREAM
---- -.PPROXIN~'lt: S£~HIO RESlOR~l10ti, 11\C. Silt PROPERTY BOUNDARY (NOl SUR\£YED), FROM ESASCO (1912G)
-.150- .. - lOPOGRAPHIC CONlOOR
- nEtDSTONE WALL
'' Cl
• • A
(NO)
•
Ul1UTY PQE
WOOOUNO BOUNDARY
CH AIN-UNK f'£HCE
UNPA\£0 ROAD
PAllED ROAD
ROADWAY CUL\£RT
BUii.DiNGS OR RESIOENC£S
SOil ANO HANO BORING
SHIT GAUCE
NOT OETEC1Ell
MONTOR WEll.
.HQIE: 1, CONCENTRATIONS MEASURED IN ug/kg
2. BOLO PRINT INDICATES THE COMPOUNDS WHICH EXCEEDED THE PROPOSED RECOMMENDED SOIL CLEANUP l.E'.£LS.
J. ALL HB-HAND BORINGS COLLECTED AT DEPTHS OF 1 -2 ft
4. ALL SB-HAND BORINGS COLLECTED AT
--
DEPTHS OF 0-2 ft EXCEPT FOR: SB-5 - 2-4 ft SB-21 - 0- 1 ft SB-15 - 1-J ft SB-16 = 1-J ft SB-17 • 1-J ft SB-18 • 1-J ft SB-19 1-J ft SB-20 1 -J ft
200 0 P"'\+*--
200
SCALE OF FEET
FIGUR 4-1
400
SURFACE SOIL CONCENTRATIONS DETECTED VOLATILE AND SEMI VOLATILE
ORGANIC COMPOUNDS Remedial lnveatigotion Report
Seolond Restoration Site
U.S. ENVIRONMENTAL PROTECTION .tGENCY NEW YORK, N.Y.
APRIL 1995 .......
E 0 t')
.q
N
l[)
C1l ----... n
----... '<t 0
0
m v 0 l[) C1l l[)
SLR-0010444
I J (
0
1.4
. /f· ,,,,.· I
METHOXYCHLOR I ~-
<f.'l'-DDT
Hf PTACHLOR £ POX!Df -#,4'-DDE AROCLOR-1016
'l,'l'-DDT !.IETHO!'ftCHLOR
ALDRIN ENDOSULFAN IJ gamma CHLORDANE
dt!.lt°6-BHC O.JJ ,(LORIN • 0'.35 tiEPrACHLOR £POX/DE 0.26 METHOXYCHLOR 0. 44 ENDRIN KETONE 0.25
ENDOSULFAN 1 <f,4'-DDE AROCLOR-1254
,/··
/_/,..-/' I .!fl/ I
'.'"""" ----/'!'!I". j
!
HB-1
I I
I I I r
/ _,.,·
5.1 0.13
0.22 0.25
13
fNDOSUL lW SULFATE 0.22 METHOXYCHLOR 1.8
ENDOSULF,W 11 '1,4'-DDD 4,4'-DDT AROCLOR-12~4 fNDRIN ALDEHYDE
/
1.9 0.21 0.35
22 0.6
I I
/
//
I
<1'
·/
/ I
/ ·7
/
/
REGIONAL SITE LOCATION
LEGEND'
- • • - • • - INTERMITlENT STREAM
---- llPPROlONATE SEl\LAHD RESTORATION. INC.
--."\!I(}-
)(
CJ
• • A
(ND)
•
SITE PROPERTY 80.JNOARY (NOT SURIODl), F'RON EB..SCO (111112")
TOPOGRN'HIC CON TOUR
FlElDSTDNE WALi.
UTILITY POU:
WOODLl\NO BOUltOl\RY
CHAIN -LINK FENa:
UNPA\£0 ROAD
PA-.t:D ROAD
ROADWAY CULl£RT
BUil.DiNGS CR RESIDENCES
SOIL AND HANO BORING
STAFT GAUGE
NOT DETECTED
UONTOR llE.L
.tiQIE; 1. CONCENTRATIONS MEASURED IN ug/kg
2. BOl.D PRINT INDICATES THE COMPOUNDS WHICH EXCEEDED THE PROPOSED RECOMMENDED SOtL C~UP LEIJELS.
3. ALL HB-HAND BORINGS COLLECTED AT DEPTHS OF 1 -2 ft
-4. ALL SB-HANO BORINGS COLLECTED AT DEPTHS OF 0-2 ft EXCEPT FOR:
SB-5 • 2--4 ft SB-21 = 0-1 ft SB-15 1-3 ft SB-16 1-3 ft SB-17 1-3 ft SB-18 = 1-3 ft
200 0 200
SCALE OF FEET
400
lllV.ND. DltlS
_.,_ ...... --- M. WAIT - "" MSN/llMB/TN ...., 8/13/94
FIGURE 4-2 SURFACE SOIL CONCENTRATIONS DETECTED PESTICIDES AND PCBs
Remedial Investigation Report Sealand Restoration Site
-For.
U.S. ENVIRONMENTAL PROTECTION AGENCY NEW YORK, N.Y.
APRIL 1995
529504
t ci
0 0 n L[) (JJ
"-.. n "-.. '<t" 0
SLR-0010445
SAMPLE LOCATION:·
SAMPLE DATE: .···•·· .·. . . AtW.YTE ·.·
ETHYLENE CHLORIDE CETONE HLOROFORM -BUTANONE
ETHYLENE CHLORIDE CETONE HLOROFORM -BUTANONE
SAMPLE LOCATION:···•·.• SAMPLE DATE: · .. ······· • ANAL.YTE.: .. ·····
ETHYLENE CHLORIDE CETONE HLOROFORM -BUTANONE
uglKg uglKg uglKg uglKg
uglKg uglKg ug/Kg ug/Kg
ugn<g uglKg uglKg ugn<g
0.03 B 0.038 B
\ l
TABLE '4- 8
SURFACE SOIL VOLATILE ORGANIC COMPOUNDS
Remedial lnve1tlgatlon Report Saaland RHtoratlon Sil•
HB03SS01 HB048801 SSH805SS01 SSHB068801. H8078S01
0.017 B 0.011 BJ
0.023 B 0.03 B
2 OQl29l92.. 09l29l92 1Q123192 RESULT QUAL RESULT.QUAL RESULT QUAL RESULT QUAl.
0.042 B 0.022 J
0.043 B 0.082
MW02SS01 SSMW04SS01 10SS01 SSMW3D8801 SSSB01SS01 SSSB02SS01 803SS01 1619i 00/22192 . 1192 OBl18192 09fl4192
RESULT QI.JAL RESULT QUAL JWiUlTOUAI.: ~ESULT QUAL RESULTOUAl. RESULT QUAL RESULT QUAL RESULT OUAL
0.007 J 0.002 J
No'8 : • - • "' lndk:ale8 that the constituent was not detected above dMBction llrnlta. Page 1
SLR-0010446
TABLE 4 - 8 (Continued )
SURFACE SOIL VOLATILE ORGANIC COMPOUNDS
Remedial lnveatlgatlon Report Sealand Reatoratlon Site
8078801 SSSB08SS01 SSSB09SS01 8SSB10SS01 8118801 10/13192 10/16192 10/1-i/92 10/19192 10/22192 10/21182 -RESUl.TOUAl RESUL,TQUAL. RESULTOUAL RESULTQUAL RESULTQUAl ~ULTQUAL
ETHYLENE CHLORIDE CETONE HLOROFORM -BUTANONE
uglKg uglKg uglKg uglKg
0.013 B 0.016 B
0.006 J
>~p~-..,; i~iW~~U U it := T ..·•• ::<:?:? •• <>a••_•,_ 2&._••_<_:••.·•.=•.-.b.rt.··-•.••.•= .. ·.·.·.=.=•_ ... · : - -.- · ---- _e_ -.·-1•·.--.,.•.:_s_•--•_._••_-_a.n_=~--•=•= ... •· .. =.··_:._ · --=.-. =_-=_•_•_•=_:a=•=•_··~~-11_:.=_sc_=:_=•_o_~.'.···.•·.·.•·•· •••• a_>a_••_s_:·--·-~-·:_·=-~.··--.:•_••.==_••_•=_•= .. ·•.o.•~.11-•_=_=·.•• .\ sssa'_:.•_••_•_·•=_<_=._<_=._':_=1•_=•_i_a_=:_=•=_._:_=: .. a_'1.-.•.•:_ .. ·_·_ .. • .... =· .... =.•.· =•••
•• 18.i~1'108 <·• :•,,.:: ' =-===-=·=====----·=·=·===·=·=-=··-=-NMLm·=·===============.=======·= ::~;·:·~ml•.:=:.••.•'.•/'i:)i:IJ.·.:2_-,-,-,·,·,c,·,'.•,r.'.·.:,•_:,•,_••D.:_•_:.·.'.·.·_•,•_-•,·.·:,•.·,· . .:.'.•_ .. ·.·•_=•.-:,•_-•,
1,=•,-,mc,0121A12, .. •_,-,.-_-.,.--,_,_.-_•-.·---"" ...... __ .,tD•m,-.-_,•-· .. r_-_=_-.·_-.• ,','.:_'_•,:.•_. __ .. OUAC.·,•.·.-,·,•.·.·,:,·,•'.•,·,·.•_ ... ·_-·,-·.-'-•,:,:_•.·_·.·.J•i.•:•=•m.:.r•:•
... • . .,_. .. '··-: ,,/}• ·.•.••_-.•• .. •.•·----··-·-·-··-··-•:.•:,,·_=_ .• _ .... ,-.----· ..... , " -- "' ............. " .'.·.·.-.·.:-:-:-:.:-:-:-:·:-·-:-:->:·:-:;::::::::>:::--::::::: :::::::::::::::::::;:~::::;:::::::::::: ·:.:.::::;:::::::::::::;;:::f::::::: .:::::::::: >.·>'.· ·'.;:.:::::::::~:::: .· .•.•. -:.;.:.;.:.:·:·.·:-·······. ···.·.·.·-.········:: :::·:::::::>:;::::·::; :,:;::; .;:;:::;{:::::::}~::::::::::-:-:-:-··.<-'·"·'-······
ETHYLENE CHLORIDE uglKg CETONE uglKg HLOROFORM uglKg -BUTANONE uglKg
No'8 : • - • • lndlcaa that the constituent was not datec:'8d alXMt de'8ctlon llmlta.
0.03 BJ 0.062 J
Page 2
SLR-0010447
SAMPLE LOCATION: SAMl'LB DATE:
ANALYTR UNfl'S
METHYLENE CHLORIDE ugft(g ACETONE ugft(g 1, 1 -DICHLOROETHANE ug,4(g CHLOROFORM ug/Kg 2-BUTANONE ug,4(g 1,1,1-TRICHLOAOETHANE ug/Kg T<X...UENE ug,4(g TOTAL XYLENES ug/Kg
SAMPLE LOCATION: SANPLB DATB:
ANAL'YTB UNITS
METHYLENE CHLORIDE ug,4(g ACETONE ug/Kg 1,1-DICHLOROETHANE ugft(g CHLOROFORM ug/Kg 2-BUTANONE ugft(g 1,1,1-TRICHLOROETHANE ug/Kg T<X...UENE ugft(g TOTAL XYLENES ug/Kg
SAMPLE LOCATION: SAMPl.E DATE:
ANALYTE UNITS
METHYLENE CHLORIDE ug,4(g ACETONE ug,4(g 1,1-DICHLOROETHANE ug,4(g CHLOROFORM ug,4(g 2-BUTANONE ug,4(g 1, 1, 1 - TRICHLOROETHANE ugft(g TOLUENE ug/Kg TOT /IL X'r'LENES ugJKg
SSMW02SB22 8'/17/92 llESULT!QUAL
- -- -- -
1 J - -- -- -- -
$SMW5AS$07 1>9124192 llESULTSQUAL
- -80000 BJ - -- -- -- -- -- -
:)SSB06SSOO 0/13192 llBSULTSQUAL
56 BJ - -- -- -- -- -- -- -
TABLE 4 - 9
SUBSURFACE SOIL VOLATILE ORGANIC COMPOUNDS
Remedial Investigation Report Sealand Restoration Site
ISSMW02SQ11 ISSMW05SS02 18'11"'2 18'1Z3192 R.ESULTSQUAL llESULTSQUAL
- - - -- - 24 J - - - -
1 J - -- - - -- - - -- - - -- - - -
ISSMW5ASS08 SSSB01SS02 ~/24192 °'n .. 1n llESULTSQUAL QSIJLTSQUAL ·
- - - -27000 BJ 560 J - - - -- - - -- - - -- - - -- - - -- - - -
SSSB07SQ13 SSSB07SS02 10/16192 10/1.S/92 RESULTSQUAL RESULTSQUAL
- - - -- - 67 BJ - - - -- - - -
11 J 10 J - - - -- - - -- - - -
SSMW05SSOO 18'1Z3192 llESULTSQUAL
- -37 J
- -- -- -- -- -- -
SSSB04SQ02 10/21JIJ2 llESULTSQUAL
- -140 J
- -- -- -- -- -- -
SSSB07SS03 10/1.S/92 RESULTSQUAL
- -8 J
- -- -- -- -- -- -
Noa : • - • = Indicates th!it tie constituent was notde'9ct&dabow det&ction linits.
SSMW05SS0'4 ISSMW05SS06 f11J/Z3192 •n3"'2 llBSULTSQUAL llESULTSQUAL
- - - -9 J 25000 J
- - - -- - - -- - - -- - - -- - - -- - - -
SQ06 ISSSB06SS02 10/13.'92 ~0/13192 JlBSULTSQUAL JlBSULTSQUAL
61 BJ 40 BJ - - - -- - - -- - - -
7 J - -3 J - -
- - - -- - - -
SSSBOOSS02 SSSBOOSSOO 10/14192 10/14/92 :RESULTSQUAL R.BSULTSQUAL
- - - -- - - -- - - -- - - -
7 J 12 J 7 J - -
- - - -- - - -
Page 1
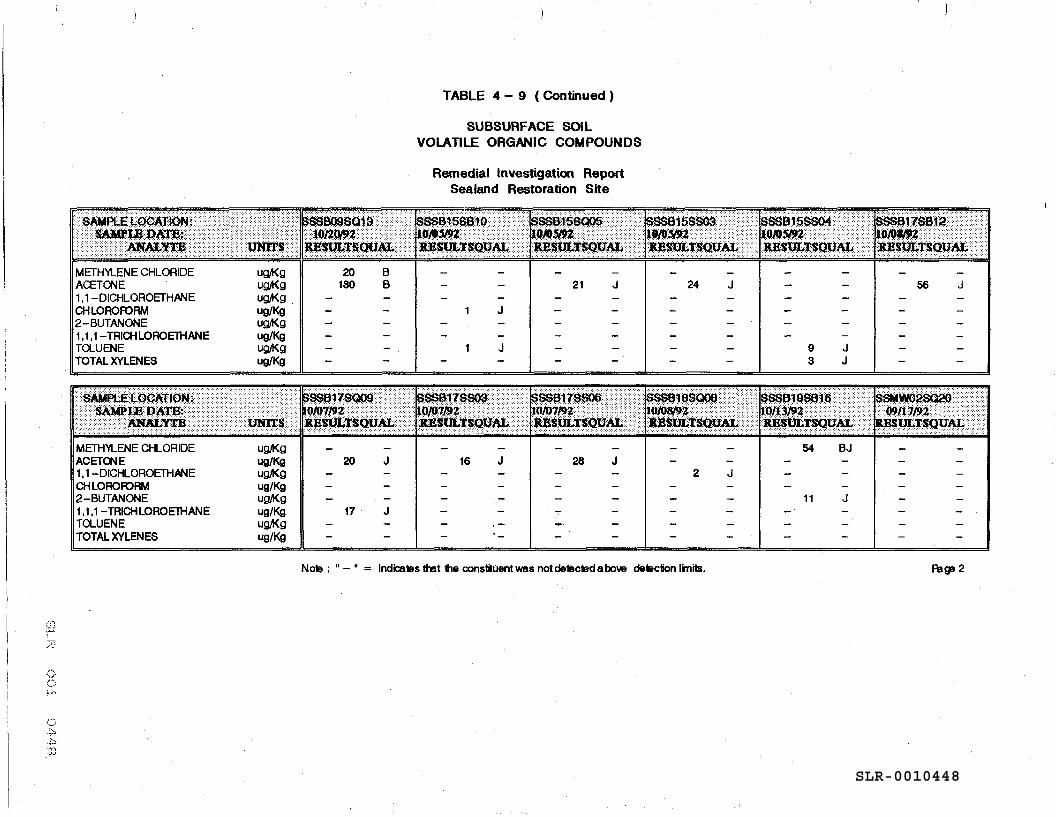
SLR-0010448
TABLE 4 - 9 (Continued)
SUBSURFACE SOIL VOLATILE ORGANIC COMPOUNDS
Remedial Investigation Report Sealand Restoration Site
i 2~ .•.••..•..••.• R£ ............................... ~.L ............ o ... •·.·•·.:.D ....•...•... ATE: .. ····=-········ .. ···l·O···· .• · .• ·.···.•~ .•.•..•••.• ~.' .... i.•········ ic·········· .. ··L···.······•.1.·•.••.•~•.···.················:·····s ................ •.·••··•·•.·•·•••·••• -=~~m / ...•.•.....•..••......•.•....•... •~ ... ·.·.··.o .. sss.·····.·~•./O.····.·•.· .• ·s· .. ~.···T···.1 .• n·.·····5··········.··.$8.•.•.·•.······s··.·•.•·.L.•·.·····o·U····.·.·.···.··.·.·· .. •·.····.·.•.·.·.·T•.·•.··.••.• .. •.·.························ .. •.·•··•·•·••· r;r.~~) ••••.••.•..•.... t.•·.··Ss.~~.···.·······~···········1·····5····• .. :,.·•.·•.•·.····.soo .. ~.•.•.··.n.•·.···········n······.········· ..... •· .•. •·.••T• .. •·.·········.·•.·•.·.···· ·······~~~sStJ.i.••••······························~.-.•.·.r:.•• .. ·.·./0··.•.·.•.•·•.~.8/JZ.·.••.·• ....... ····.··1··1T······7··.•·.•.•.·:s.• .. ·.·.•·.•.•s•.•.·.·.···"1······2···n·•.·•.••.••·.·•.t.··.········T··· .. ·.•·.••.i .. ·•····\\ ~"',_.••» ......... ,,.... ~~'t~9Y':Y; ...,. "'""" ~ ~ U~T:SQY,M.i -•.YA< ........ ..ev~ i Jt~~'JjQYJ\t.< A»"'"""'"" ¥ ..... ~
METHYLENE CHLORIDE ug.iKg 20 B ACETONE ug.iKg 130 B 21 J 24 J 56 J 1, 1 -DICHLOROETHANE ug.iKg . CHLOROFORM ug/Kg J 2-BUTANONE ug.iKg 1, 1, 1 - TRICH LOROElHANE ug/Kg TOLUENE ug.iKg J 9 J TOTAL XYLENES ug/Kg 3 J
······siMP££t..o&Ki10N'.···················· •············································ •·•·····• sssa17s009··•····· •·•(•···~ssa17ssoo•·•······················· •· ~§$ai7~•.••••••·•·•i< ••· ~ijjij$Q® ... •••••··•·· ···········~019sa16· >•··•·>·•· >j~'W?~ ?> ·.•.·•··· .. ·.·.•.•.••.•••.•s•ii-.·•• .... •·.· .. ·• .. •• .. ·.•.•.~.•.u·•···.·•·.•.D··.··.··•• •. •.•·.,T ....... *" .. • ... !.··.•• .. • .. ••.·.:.•.·.···········································.• / . . . ) ····.···.•.···.··. "'·· ....... ·.·.· ... ·.·.·.~ ... • ... ·.·.··.·•.2··.• •• •·.· .. ·•.·.·••.·.•.•.•.•.• ... •.·•.••.••.·.··················· .. •·.······ .·•.··.·.••·•.· •.. • •. · .. • .. ··.·•.·•·.· •... ··•.··.•·.•.··.· .. ·.•.· •.. •.".···.····D··.·.rt··· .. · .. ·.·..,..· ........ · .• ·.· .. • .. · .. ·.:··.· .... ·;·,..··.··.· .• ··w ... · •..• • .... ··.·· .. ·•· ....... ·• .•. ·• .. • •.. ·.•.• .. •.·.··~··· .. ·.·.• .• ·.···n···.· .. · .. • .. • •. •.·.• ... •.•.·.·T···.···.•.•ALAL····.·.··.··.···.···· .. • .....•. ·.•.·· ... •.·.· •. •.· ... ·· ... ·.•.·.·· ... ·.· .. • .. ··.·· ... ··.·.• ... · .. · .. · • 1n·m'Y~'····•········· .···.·· •••·••• ·•· 1··0· ,,, .. ,.,.,. ........ ···········•·•····· ... )/' 1····0·····1··1~*'~ / / 0'0A;t1¢"Y.i · < ~~ < ii$Pt'f:$QV~ :::::: ... ¥U •• ---~~qy~/ ••• tiiim.~(}y~ ••••••••••• ~~W~Qq~/ }~~iltiA.i_I ( METHYLENE CHLORIDE ug.iKg 54 BJ ACETOllE ug/Kg 20 J 16 J 28 J 1, 1 -DICHLOROETHANE ug.iKg 2 J CHLOROFORM ug/Kg 2-BUTANONE ug.iKg 11 J 1, 1, 1 - TRICHLOROElHANE ug/Kg 17 J TOLUENE ug.iKg TOTAL XYLENES ug/Kg
Noe : " - " = Indicates that 1he constituent was notdeecedabove detection linits. Page 2
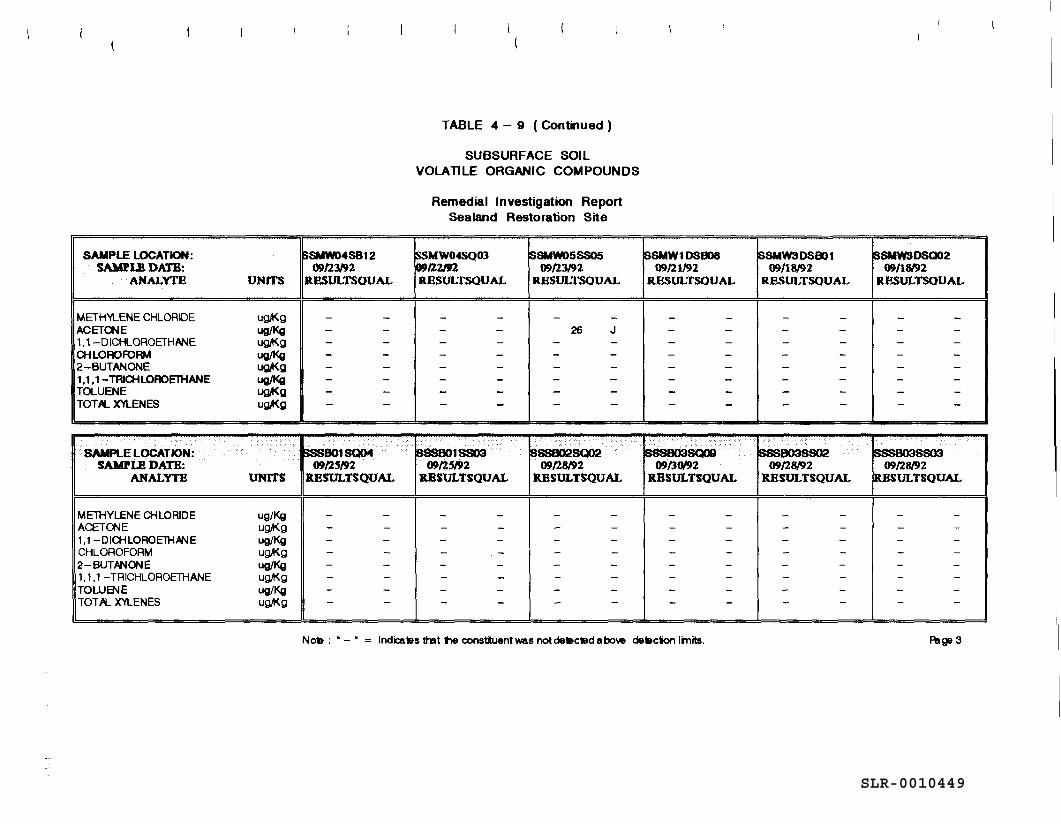
SLR-0010449
SAMPLE LOCATION: SAMPLR DATB:
ANALYfB UNffS
METH'l'LENE CHLORIDE ugiKg ACETGJE ug/Kg 1, 1 -DICHLOROETHANE ugiKg CHLOROFORM ug/Kg 2-BUTANONE ugiKg 1, 1, 1 -TRICHLOROETHANE ug/Kg TO...UENE ug,4(.g TOTlt... X'il.ENES ug,4(.g
· SAMPLELOCATION: SAMPLE DATB:
ANALYTE UNITS
METHYLENE CHLORIDE ug/Kg ACETONE ugft(g 1,1-DICHLOROETH.6NE ug/Kg CHLOROFORM ugft(g 2-BUTANONE ug/Kg 1,1,1-TRICHLOROETHANE ugft(g TOLUBllE ug/Kg TOT It.. X'il.ENES ugft(g
SSMW04SB12 C»fJ.'3192
R.ESOLTSOUAL
- -- -- -- -- -- -- -- -
$SSB01SQ04 OOflS/92
IIBSULTSQUAL
- -- -- -- -- -- -- -- -
l (
TABLE 4 - 9 (Continued )
SUBSURFACE SOIL VOLATILE ORGANIC COMPOUNDS
Remedial Investigation Report Sealand Restoration Site
SSMW04SQQ3 SSMW05SS05 9'fl2192 OOfJ.'3192 R.BSULTSOUAL RESULTSOUAL
- - - -- - 26 J - - - -- - - -- - - -- - - -- - - -- - - -
,,
IS9SB01SS03 88SB02SQ02 00125192 00128192
IWSULTSQUAL IIBSULTSQUAL
- - - -- - - -- - - -- - - -- - - -- - - -- - - -- - - -
SSMW1DSB08 00121}92
RBSULTSOUAL
- -- -- -- -- -- -- -- -
... ·> ..
,~SQOO
tJ'JfJ0/92 RBSULTSQUAL
- -- -- -- -- -- -- -- -
Noe : • - • = Indicates tmt Ile oonstituent was not detected a bow detecion linits.
IBSMW3DSB01 ISSMW3DSQ02 00/18192 09/18/92
RBSULTSOUAL RBSULTSOUAL
- - - -- - - -- - - -- - - -- - - -- - - -- - - -- - - -
' SSSB03S802 SSSBOOSS03
fYJl28192 09/28/92 IIBSULTSQUAL llBSULTSQUAL
- - - -- - - -- - - -- - - -- - - -- - - -- - - -- - - -
~ge3
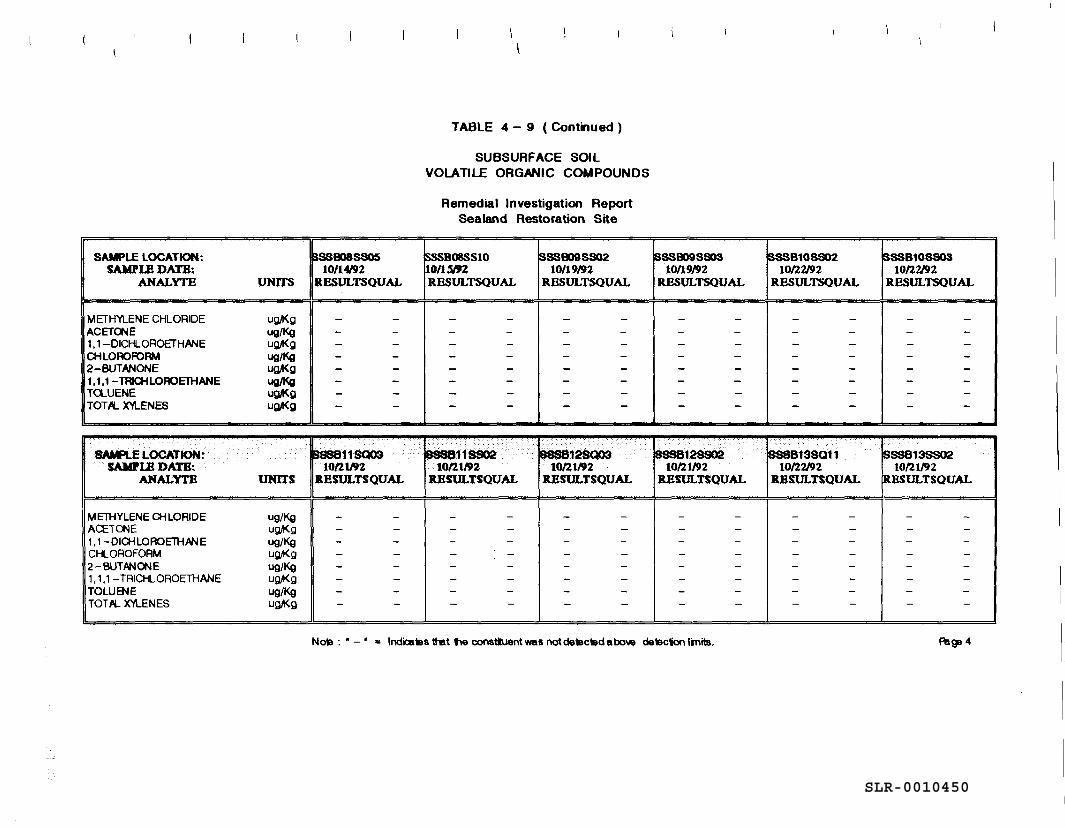
SLR-0010450
SAMPLE LOCATION: SAMPLE DA.TB:
ANALYfB UNO'S
METHYLENE CHLORIDE ug,Kg ACETCJllE ug/Kg 1, 1-DICHLOROETHANE ug,Kg CHLOROFORM ug/Kg 2-BUTANONE ug,Kg 1, 1, 1 - TRIOiLOROElHANE ug/Kg TQUENE ug.4(g TOT IL XYL.ENES ug,4<g
SAMPLE LOCATION: SAMl'LE DATB:
ANALYTE UNITS
METHYLENE a-!LORIDE ug/Kg ACET()llE ug,Kg 1, 1-0IQiLOROETHANE ug/Kg CHLOROFORM ug,Kg 2-BUTANCJllE ug/Kg 1,1,1-TRICHLOROETHANE ug,Kg TOLUENE ug/Kg TOT It.. XYLENES ug,4<g
SSSB08SS05 10/14192
llESULTSQUAL
- -- -- -- -- -- -- -- -
BSSB11SQ03 tOfll/92
llESULTSQUAL
- -- -- -- -- -- -- -- -
l \
TABLE 4 - 9 (Continued)
SUBSURFACE SOIL VOLATILE ORGANIC COMPOUNDS
Remedial Investigation Report Sealand Restoration Site
SssB08SS10 SSSB09SS02 1011""2 10/19/92 RBSULTSQUAL RBSULTSQUAL
- - - -- - - -- - - -- - - -- - - -- - - -- - - -- - - -
.
~,2~Q03 ' 8Sse11SS02
10111192 10/21192 llESULTSQUAL llESULTSQUAL
- - - -- - - -- - - -- - - -- - - -- - - -- - - -- - - -
SSSB09SSOS 10/19/92
RBSULTSQUAL
- -- -- -- -- -- -- -- -
.· ' ISSSB12SS02
10111192 RBSULTSQUAL
- -- -- -- -- -- -- -- -
Nota : • - • = Indicates ht tw oonstkuent was not detected a bow detecton lini1s.
SSSB10SS02 SSSB108603 10fl1192 l0fl1192
RESULTSQUAL llESULTSQUAL
- - - -- - - -- - - -- - - -- - - -- - - -- - - -- - - -
SSSB13SQ11 SSS813SS02 10fl1192 lOfll/92
RBSULTSQUAL RESULTSQUAL
- - - -- - - -- - - -- - - -- - - -- - - -- - - -- - - -
Page4
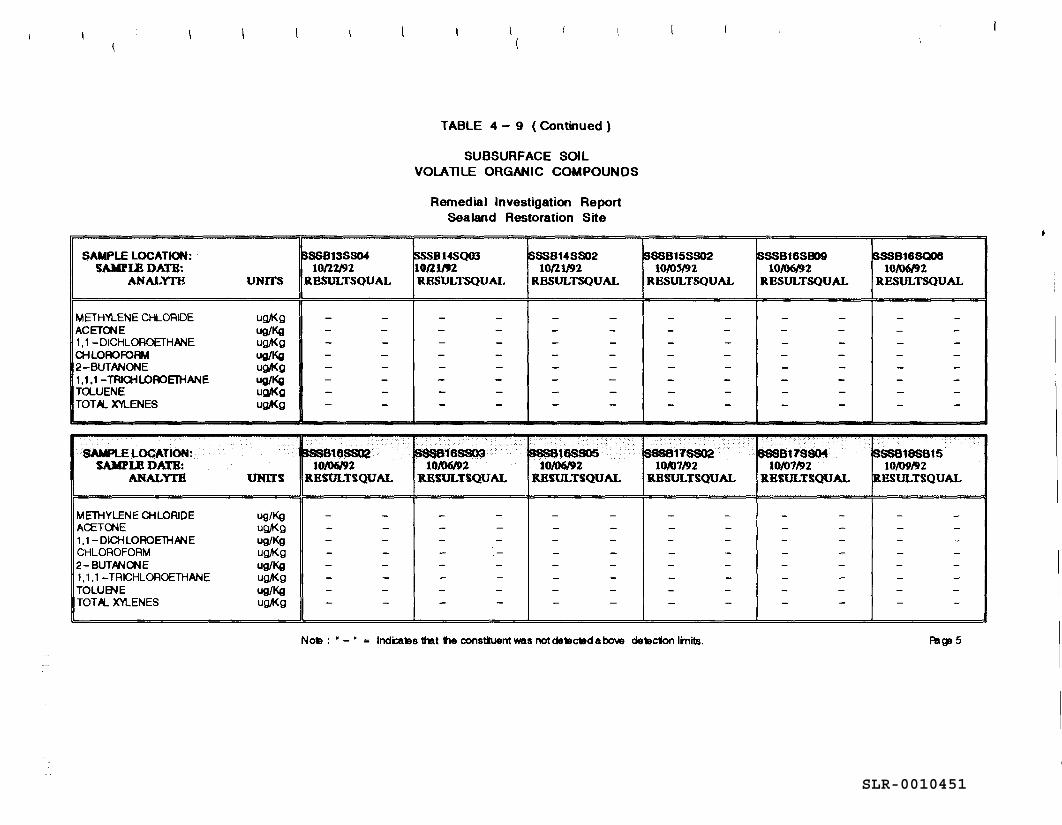
SLR-0010451
SAMPLE LOCATION: SAMPIB DATE:
ANALYfE UNITS
METH'r'l...ENE CHLORIDE ugA<g ACETa-.IE ug/Kg 1, 1 -DICHLOROETHANE ugA<g CHLOROFORM ug/Kg 2-BUTANONE ugA<g 1,1,1-TRICHLOAOETHANE ug/Kg TCX...UENE ug,t<g TOT I(. X'r'l...ENES ug,t(g
SAMPLE LOCATION: SAMPIB DATE:
ANALYTE UNITS
METHYLENE CHLORIDE ug/Kg ACETOOE ugA<g 1,1-DICHLOROETHANE ug/Kg CHLOROFORM ugA<g 2-BUTANa-.IE ug/Kg 1, 1, 1 - TRICHLOROETHANE ugA<g TOLUB"E ug/Kg TOTI(. X'r'l...ENES ugA<g
$SSB13SSCM 1on2192
RBSULTSOUAL
- -- -- -- -- -- -- -- -
SSS816SS02 10/06192
llRSULTSQUAL
- -- -- -- -- -- -- -- -
l (
TABLE 4 - 9 (Continued)
SUBSURFACE SOIL VOLATILE ORGANIC COMPOUNDS
Remedial Investigation Report Sealand Restoration Site
SSSB14SQ03 ISSSB14SS02 10121.192 10121.JIJl RESULTSQUAL RESULTSQUAL
- - - -- - - -- - - -- - - -- - - -- - - -- - - -- - - -
.. . ..
BSS816SS03 98S816SS05 10/06192 10/002
IWSULTSQUAL llRSULTSQUAL
- - - -- - - -- - - -- - - -- - - -- - - -- - - -- - - -
SSS815SS02 10/0S/92
RESULTSOUAL
- -- -- -- -- -- -- -- -
..
~8178802 10/07/92
llRSULTSQUAL
- -- -- -- -- -- -- -- -
Noa: ' - ' = lndicaas ht tie consthlentwas notdeteciltdabow detecton linits.
SSS816S809 8SSB16SQ06 10/06/92 10/06/92
RESULTSQUAL R.ESULTSQUAL
- - - -- - - -- - - -- - - -- - - -- - - -- - - -- - - -
.
·. 8888178804 ISSSB188815 10/07/92 10/09/92
llRSULTSQUAL llESULTSQUAL
- - - -- - - -- - - -- - - -- - - -- - - -- - - -- - - -
Fage 5
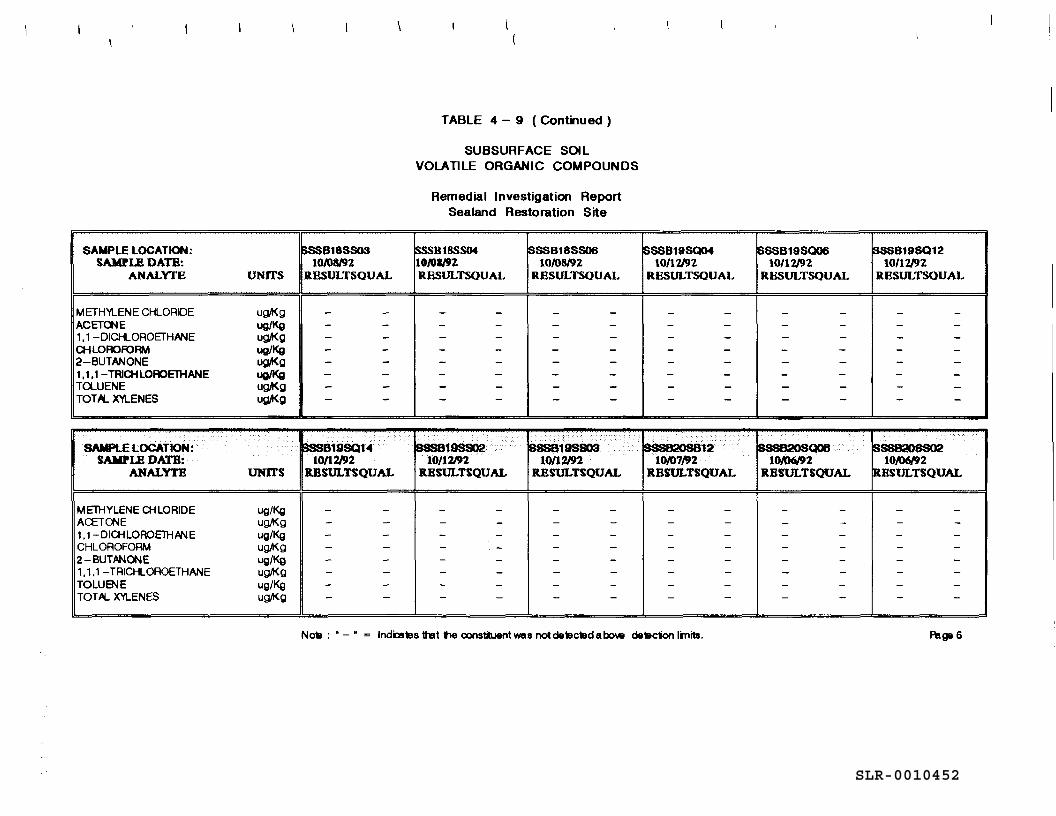
SLR-0010452
SAMPLE LOCATION: SAYrlE DATE:
ANALYfE UNITS
METH'l'LENE CHLORIDE ugft<g ACETo-.IE ug/Kg 1, 1 -DICHLOROETHANE ugft<g CHLOROFORM ug/Kg 2-BUTANONE ug,4(g 1,1,1-TRICHLOROETHANE ugJKg TU..UENE ugft<g TOT IL X'll.ENES ugft<g
..
SAMPLE LOCATION: SAMPLE DATB:
ANALYTE mars
METHYLENE QiLORIDE ug/Kg ACETONE ugft<g 1, 1-DIQiLOROETHANE ug/Kg CHLOROFORM ugft<g 2-BUTANONE ug/Kg 1, 1, 1 - TRICHLOROETHANE ugft<g TOLUENE ug/Kg TOT IL X'll.ENES ugft<g
$SSB18SS03 10/08192
RBSULTSOUAL
- -- -- -- -- -- -- -- -
SSSB19SQ1-t 10/12192
llESULTSQUAL
- -- -- -- -- -- -- -- -
\ (
TABLE 4 - 9 (Continued )
SUBSURFACE SOIL VOLATILE ORGANIC COMPOUNDS
Remedial Investigation Report Sealand Restoration Site
~818SS04 ISSSB18SS06 lOJOl/92 10/08192 llESULTSOUAL llESULTSOUAL
- - - -- - - -- - - -- - - -- - - -- - - -- - - -- - - -
..
SSS819SS02 8SS819SS03 10/12192 10/12192
llESULTSQUAL llRSULTSQUAL
- - - -- - - -- - - -- - - -- - - -- - - -- - - -- - - -
, .. ·
ISSSB19SQ04 10/12192
llESULTSOUAL
- -- -- -- -- -- -- -- -
8612 10/07/92
llRSULTSQUAL
- -- -- -- -- -- -- -- -
No9 : • - • = Indicates ht tie constiuent was not detected a bow detecion linits.
SSSB19SQ06 SSSB19SQ12 10/12192 10/12192
llESULTSOUAL RESULTSOUAL
- - - -- - - -- - - -- - - -- - - -- - - -- - - -- - - -
$SSB20SQ06 ISS8820SS02 10/06/92 10ft>6192
llBSULTSQUAL llBSULTSQUAL
- - - -- - - -- - - -- - - -- - - -- - - -- - - -- - - -
Paga 6
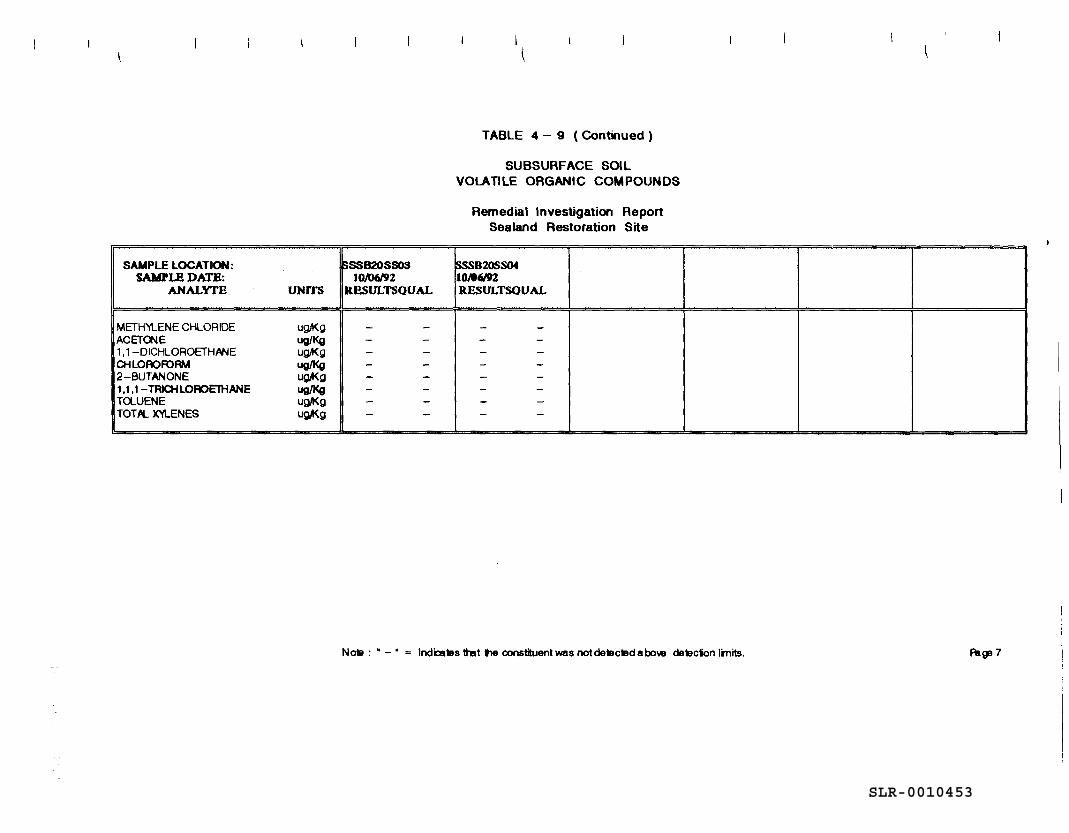
SLR-0010453
SAMPLE LOCATION: SAMPLB DA.TB:
ANALYl'E UNITS
METHYLENE CHLORIDE ug,Kg ACETQ.IE ug/Kg 1, 1 -DICHLOROETHANE ug,Kg QiLOROFORM ug/Kg 2-BUTANONE ug,1<.g 1, 1, 1 - TRIOiLOROETHANE ug/Kg TQUENE ug.4(.g TOT PL X'iLENES ug,Kg
SSSB20SS03 10/06/'92
RESULTSQUAL
- -- -- -- -- -- -- -- -
I \
TABLE 4 - 9 (Continued )
SUBSURFACE SOIL VOLATILE ORGANIC COMPOUNDS
Remedial Investigation Report Sealand Restoration Site
$.SSB20SS04 1018"'2 RBSULTSOUAL
- -- -- -- -- -- -- -- -
Noe : • - • = lndbl'9s that tle constituent was notcleecedabo\18 cleecion linits. Fage 7
SLR-0010454
In addition, the voes chloroform (4 samples ranging from 1 µg/kg to 2 µg/k:g), 1,1,1-
trichloroethane (3 samples: borings SB-06 at 10-12 ft, SB-08 at 2-4 ft and SB-17 at 18-20 ft; at
3 µg/kg, 7 µg/kg and 17 µg/kg, respectively), toluene (2 samples at 1 µg/kg and 9 µg/kg, both
in boring SB-15 at 18-20 ft and 6-8 ft, respectively), 1,1-dichloroethane (boring SB-18 at 2
µg/kg [14-16 ft]), and total xylenes (boring SB-15 [6-8 ft] at 3 µg/kg) were also detected in the
soil samples.
The majority of the volatile organic contamination appears to be located within the saturated
subsurface soil in the vicinity of the former disposal cell area, in particular, boring locations SB-
17 and SB-18. Acetone concentrations exceeded their respective "soil cleanup objective levels"
in these two borings. None of the other potential source areas (i.e., landspreading area, drum
storage area, gravel pit, or waste storage tank area) or the areas between source areas contained
substantial levels of voes.
Semivolatlle Organic Compounds. A total of 20 semivolatile organic compounds were
detected in the soil samples. Tables 4-10 and 4-11 present the results of the semivolatile organic
analyses for the surface and subsurface soil samples, respectively. The most frequently detected
semivolatiles were bis(2-ethylhexyl)phthalate (59 samples ranging from 34 µg/kg to
2,100 µg/kg) and di-n-butyl phthalate (9 samples ranging from 23 µg/kg to 48 µg/kg). Both of
these compounds are common laboratory contaminants (USEPA, 1992}. The majority of the
remaining 18 detected semivolatile organic compounds are polycyclic aromatic hydrocarbons
(PAH). PAHs were detected in a minimal number of samples (i.e., 14) in concentrations ranging
from 17 µg/kg to 710 µg/kg. The majority of these P AH compounds were detected within the
top 3 feet of soil in the vicinity of the former disposal cell area; in particular, soil borings SB-14,
SB-15, SB-18, SB-19, SB-20, and SB-21.
The highest total semivolatile organic concentration (1753 mg/kg) was detected within the 1 to
3 foot sample depth interval of location SB-18, located adjacent to the northeast comer of the
disposal cell. Bis(2-ethylhexyl)phthalate, di-n-butylphthalate, 4-methylphenol, diethylphthalate,
phenanthrene, anthracene, fluoranthene, pyrene, benzo(a)anthracene, and chrysene concentrations
exceeded their respective NYSDEC "soil cleanup objective levels" in this boring. These were the
only semivolatile compounds to be in exceedance of NYSDEC "soil cleanup objective levels."
Pesticides and PCBs. Seventeen pesticides were detected at low concentrations (0.022 µg/kg
-170 µg/kg) in the surface and subsurface soils of the SRI site (Tables 4-12 and 4-13,
respectively). The most frequently detected pesticides were heptachlor epoxide (10 samples), 4,4'
EDIS/ENG/ay071494.rp4 4-29
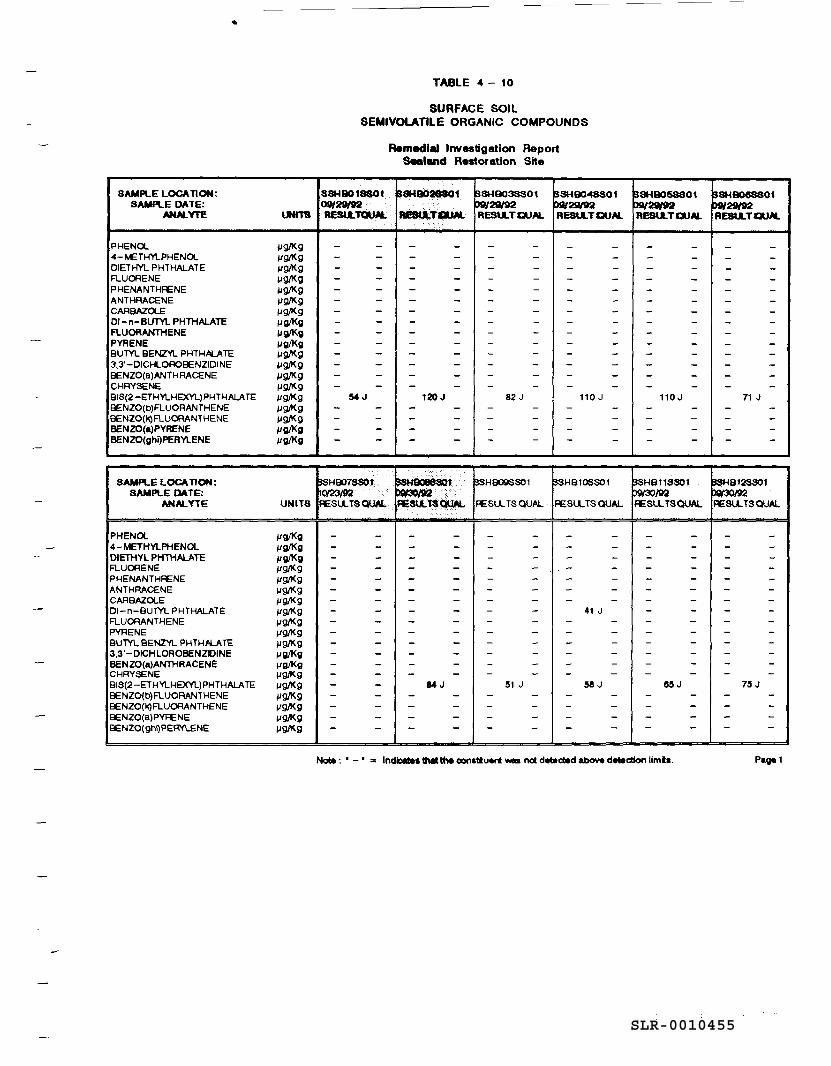
SLR-0010455
SAMPLE LOCATION: SAMPLE DATE:
NW..YTE \HTS
PHENOL µg/l(g 4-~TH'll...PHENOL µg/Kg DIETHYL PHTHALATE µg/Kg FLUORENE µg/Kg PHENANTHFENE µg/l(g ANTHRACENE µg/Kg CARBAZOLE µg/Kg 01-n-BUTYL PHTHALATE µg/Kg FlUORAN'THENE µg/Kg PYRENE µg/Kg BUTYL BENZYL PHTH~TE µg/Kg 3,3'-DICHLOROBENZIDINE µg/Kg BENZO(a)ANTHRACENE µg/l(g CHRYSENE µg/Kg 918(2-ETHV\...HEXYL) PHTHALA TE µg/Kg BENZO(b)FLUORANTHENE µg/Kg BENZO(k)FLUORANTHENE µg/l(g BENZO(a)PYRENE µg/Kg BENZO(ghi)PERYLENE µg/Kg
SAMPLE LOCATION: SAMPLE DA TE:
ANAL.TIE UNITS
PHENOL µg/Kg 4 -METHYi.PHENOL µg/Kg DIETHYL PHTHALATE µg/Kg FLUOAENE µg/Kg PHENANTHFENE µg/Kg ANTHRACE:NE µg/l(g CARBAZOLE µg/l(g Dl-n-BUTYL PHTHALATE µg/Kg FLUORANTHENE µg/Kg PYRE NE µg/Kg BUTYL BENZYL PHTH~ATE µg/l(g 3,3 ' - DICH LOROBENZIDINE µg/Kg BENZO(a)ANTHRACENE µg/Kg CHRYSENE µg/Kg 918(2-ETHVLHEXYL)PHTHALATE µg/Kg BENZO(b)FLUORANTHENE µg/Kg BENZO(k)FLUORANTHENE µg/Kg BENZO(a)PYRENE µg/Kg BENZO(gh~PERYLENE µg/l(g
TABLE 4 - 10
SURFACE SOIL SEMIVOLATILE ORGANIC COMPOUNDS
SSHBOt880t 09/29192 RESll.. TQUAL
- -- -- -- -- -- -- -- -- -- -- -- -- -- -
54J - -- -- -- -
9SHB07SSOf ~Q/23192
Remedial Investigation Report Sealand Restoration Site
S8HB028801 BSHQ03SSOt BSH90'4SSOt 09/29192 09/29192
RESU.TGW. RESU.TQUAL RESLl. TQUAL
- - - - - -- - - - - -- - - - - -- - - - - -- - - - - -- - - - - -- - - - - -- - - - - -- - - - - -- - - - - -- - - - - -- - - - - -- - - - - -- - - - - -
120J 82 J 110 J - - - - - -- - - - - -- - - - - -- - - - - -
:; .'· sen ~,·
6$HB()gSS01 SSHB10SS01
R:SU.. TS QUAL. J£Sll.T$~ R:SU.. TS QUAL FESLl. TSQUAL
- - - - - - - -- - - - - - - -- - - - - - - -- - - - - - - -- - - - - - - -- - - - - - - -- - - - - - - -- - - - - - 41 J - - - - - - - -- - - - - - - -- - - - - - - -- - - - - - - -- - - - - - - -- - - - - - - -- - 84J 51 J 58J - - - - - - - -- - - - - - - -- - - - - - - -- - - - - - - -
BSHQ05880t -----RES\l..TQUAL
- -- -- -- -- -- -- -- -- -- -- -- -- -- -
110J - -- -- -- -
SSHB11SSOI P9130J9'2 FESU.. TSQUAL
- -- -- -- -- -- -- -- -- -- -- -- -- -- -
MJ - -- -- -- -
Nolle: • - • = lndieaH lhlllthe conatluert - not d.C.ctied abo\19 d.C.ction limta.
!JSHQOGSSOt "19129192 RESU.. T aJlll.
- -- -- -- -- -- -- -- -- -- -- -- -- -- -
71 J - -- -- -- -
~B12SS01
~ FEstL TS QUAL.
- -- -- -- -- -- -- -- -- -- -- -- -- -- -
75 J - -- -- -- -
Paget
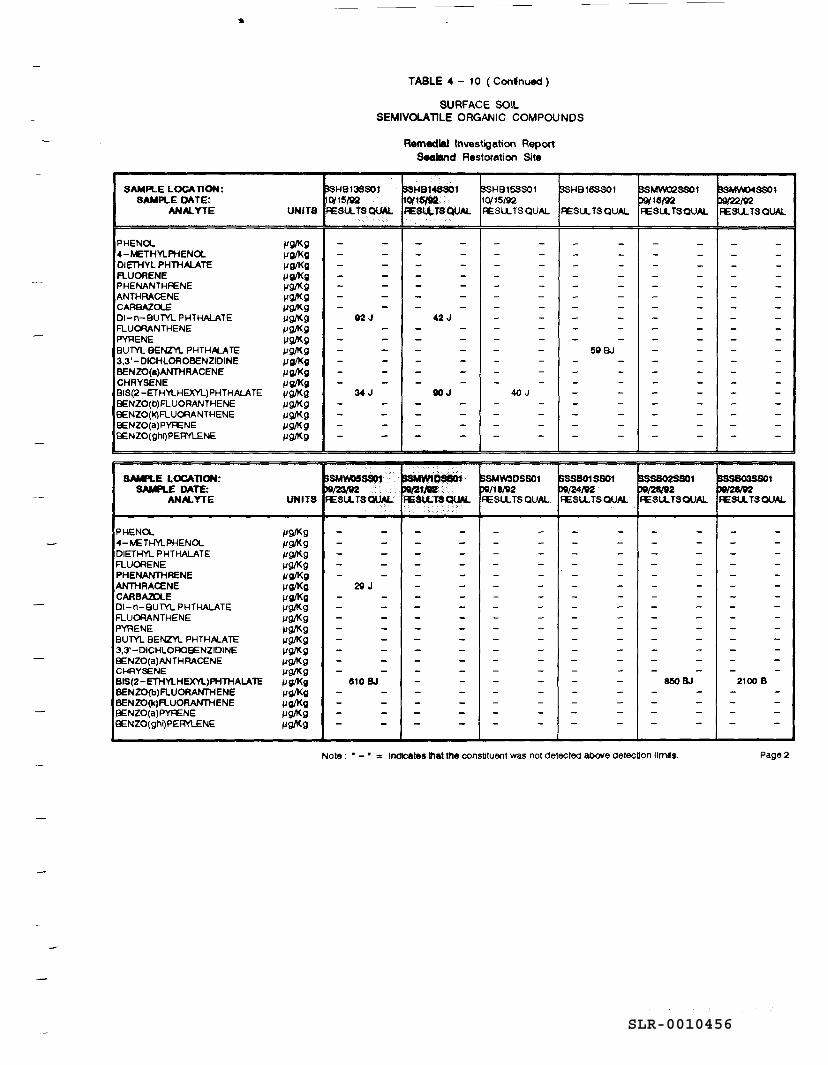
SLR-0010456
SAMPLE LOCATION: SAMPLE Do\ TE:
ANM..YTE
PHENOL 4-METHYLPHENOL DIETHYL PHTHAl..ATE FLUOR ENE PHENANTHR::NE ANTHRACENE CAABAZOLE 01-n-BUTYL PHTHALATE FLUORANTHENE P'ffiENE BUTYL BENZYL PHTHllLATE 3,3'-DICHLOROBENZIOINE BENZO(a)ANTHRACENE CHRYSENE BIS(2-ETHYLHEXYL) PHTHALA TE BENZO(b)FLUORANTHENE BENZO(k)FLUORANTHENE BENZO(a) PYR::NE BENZO(gh~PERVLENE
SAMPLE LOCATION: SAMPLE DATE:
ANM..YTE
PHENOL 4- ~Tl-M..PHENOL DIETHYL PHTHALATE FLUORENE PHENANTHRENE ANTHRACENE CARBAZOLE Dl-n-BUTYL PHTHALATE FLUORANTHENE PYRE NE BUTYL BENZYL PHTHllLATE 3,3'-DICHLOROBENZIDINE BENZO(a)ANTHRACENE CHAYSENE BIS(2-ETHYLHEXYL)PHTHALA1C BENZO(b)FLUORANTHENE BENZO(k)FLUORANTHENE BENZO(a)PYR::NE BENZO(ghQPERVLENE
UNITS
µg/Kg µg/Kg µg/Kg µg/Kg µg/Kg µg/Kg µQ/l(g µQ/l(g µQ/l(g µg/Kg µQ/l(g µg/Kg µg/Kg µg/Kg µg/Kg µQ/l(g µQ/l(g µQ/l(g µg/Kg
UNITS
µQ/l(g µQ/l(g µQ/l(g µQ/l(g µg/Kg µg/Kg µg/Kg µQ/l(g µQ/l(g µQ/l(g µg/Kg µQ/l(g µQ/l(g µQ/l(g µg/Kg µg/Kg µg/Kg µQ/l(g µg/l(g
TABLE 4 - 10 ( Coninued)
SURFACE SOIL SEMIVOL.ATILE ORGANIC COMPOUNDS
Remedial Investigation Report Sealand Restoration Site
~HB13SSOf SSHB1~1 ~HB15SS01 SSHB16SS01 ~Ol15/9'l 1()f1~ 10/1519'2 FESU.. TS QUAL FESll. TSQUAL FESU.. TS QUAL. FESU.. TS QUAL
- - - -- - - -- - - -- - - -- - - -- - - -- - - -
92J 42J - - - -- - - -- - - -- - - -- - - -- - - -
34J 90J - - - -- - - -- - - -- - - -
29 J
510 BJ
- -- -- -- -- -- -- -- -- -- -- -- -- -- -
40 J - -- -- -- -
SMW30SS01 V18/92
FESLl. TS QUAL
- -- -- -- -- -- -- -- -- -- -
59BJ - -- -- -- -- -- -- -- -
~MW:.12SS01 1>9/16'92 FESU.. TSQUAL
- -- -- -- -- -- -- -- -- -- -- -- -- -- -- -- -- -- -- -
850BJ
Nole : • - • = lndlOates that the consutuent was not detectee1 above detecuon 11mns.
SSMW:>4SSOt ~ FESU.. TS QUAL
- -- -- -- -- -- -- -- -- -- -- -- -- -- -- -- -- -- -- -
FESl..l. TSQUAL
2100 B
Page2
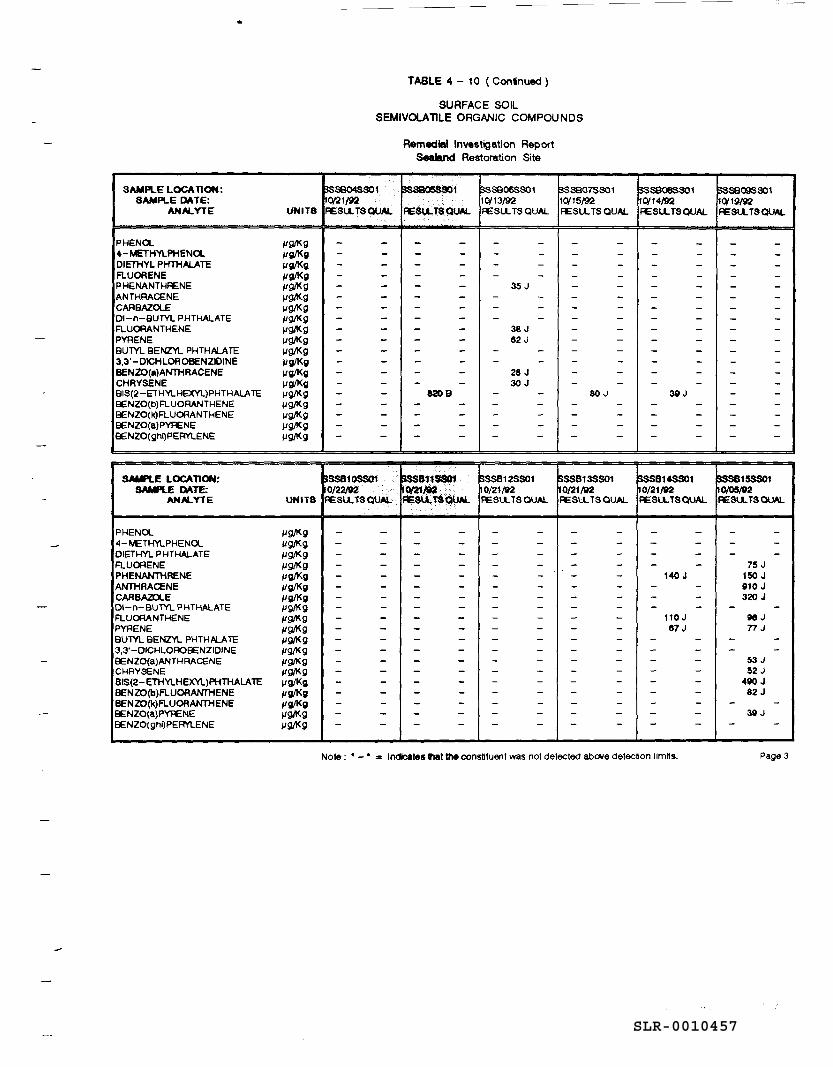
SLR-0010457
SAMPLE LOCATION: SAMPLE DA TE:
ANALYTE UNITS
PHENOL 11Q/Kg 4-METHYLPHENOL 11g/Kg DIETHYL PHTHALATE 11g/Kg FLUORENE 11g/Kg PHENANTHFENE 11gJKg ANTHRACENE µg/Kg CARBAZOl.E 11gJKg 01-n-BUTYL PHTHALATE 11Q/Kg FLUORANTHENE 119J1(g PYRE NE 119J1<g BUTYL BENZVL PHTHALATE 11gJKg 3,3'-DICHLOAOBENZIDINE 11g/Kg BENZO(a)ANTHRACENE 11g/Kg CHRYSENE µg/Kg BIS(2-ETHVLHEXYL)PHTHALA TE 119J1<g BENZO(b)FLUORANTHENE 11gJKg BENZO(k)FLUORANTHENE 119/Kg BENZO(a)PYFENE 119/Kg 9£NZO(gn~PERVLENE 119/KQ
SAMPLE LOCATION: SAM'l.E DATE:
ANALYTE UNITS
PHENOL 119/Kg <I-~THYLPHENOL µg/Kg DIETHYL PHTHALATE 11g/Kg FLU ORE NE 119/Kg PHENANTHRENE 11g/Kg ANTHRACENE 11g/Kg CARBA2CLE 11g/Kg 01-n-BUTYL PHTHALATE 11gJKg FLUORANTHENE 119/Kg PYRE NE 11gJKg BUTYL BENZVL PHTHALATE µg/Kg 3,3'-DICHLOAOBENZIOINE 11gJKg ElENZO(a)ANTHRACENE 119/Kg CHAYSENE 119/Kg BIS(2-ETHYLHEXYL)PHTHALA'TE µg/Kg BENZO(b)FLUORANTHENE 11g/Kg BENZO(k)FLUORANTHENE 11g/Kg 9£NZO(a)PYFENE 119/KQ ElENZO(gtlQPERVLENE µgJKg
TABLE 4 - 10 ( Contnued)
SURFACE SOIL SEMIVOLATILE ORGANIC COMPOUNDS
Remedial Investigation Report Sealand Restoration Site
SSS804SS01 SSSS05SS01 SSSB06SS01 ~SB07SS01 0/21/9'4 10{13/9'2 10{15/'1'4 FESlL TSQUAL. FESll. TS QUAL. FESLl. TS QUAL FESlL TS QUAL
- - - - - - - -- - - - - - - -- - - - - - - -- - - - - - - -- - - - 35J - -- - - - - - - -- - - - - - - -- - - - - - - -- - - - 38 J - -- - - - 62 J - -- - - - - - - -- - - - - - - -- - - - 28 J - -- - - - 30 J - -- - 8209 - - 80J - - - - - - - -- - - - - - - -- - - - - - - -- - - - - - - -
!ISS810SS01 ass&ttssin SSS812SS01 SSSB13SS01 10/22192 l~M ~0/21/92 10121192 FESll. TS QUAI.. fi:Sll.TS~ FESll. TS QUAL FESll. TS QUAL
- - - - - - - -- - - - - - - -- - - - - - - -- - - - - - - -- - - - - - - -- - - - - - - -- - - - - - - -- - - - - - - -- - - - - - - -- - - - - - - -- - - - - - - -- - - - - - - -- - - - - - - -- - - - - - - -- - - - - - - -- - - - - - - -- - - - - - - -- - - - - - - -- - - - - - - -
ssseoesso1 10{1<1/9'2 FESlL TSQUAL
- -- -- -- -- -- -- -- -- -- -- -- -- -- -
311 J - -- -- -- -
SssB14SS01 10/21192 FESlLTSQUAL
- -- -- -- -
140 J - -- -- -
110J 67J
- -- -- -- -- -- -- -- -- -
No1e: • - • = lndleates that the oonstituent was not detected abCNe detecnon 11mns.
SSSBOOSS01 10{19/92 FESLl. TSOUAL.
- -- -- -- -- -- -- -- -- -- -- -- -- -- -- -- -- -- -- -
BSSB15SS01 !0/05/92 FESLl. TS QUAL
- -- -- -
75 J 150 J 1110 J 320 J
- -ge J nJ
- -- -~J
52 J 4llO J 82 J
- -311 J
- -
Page3
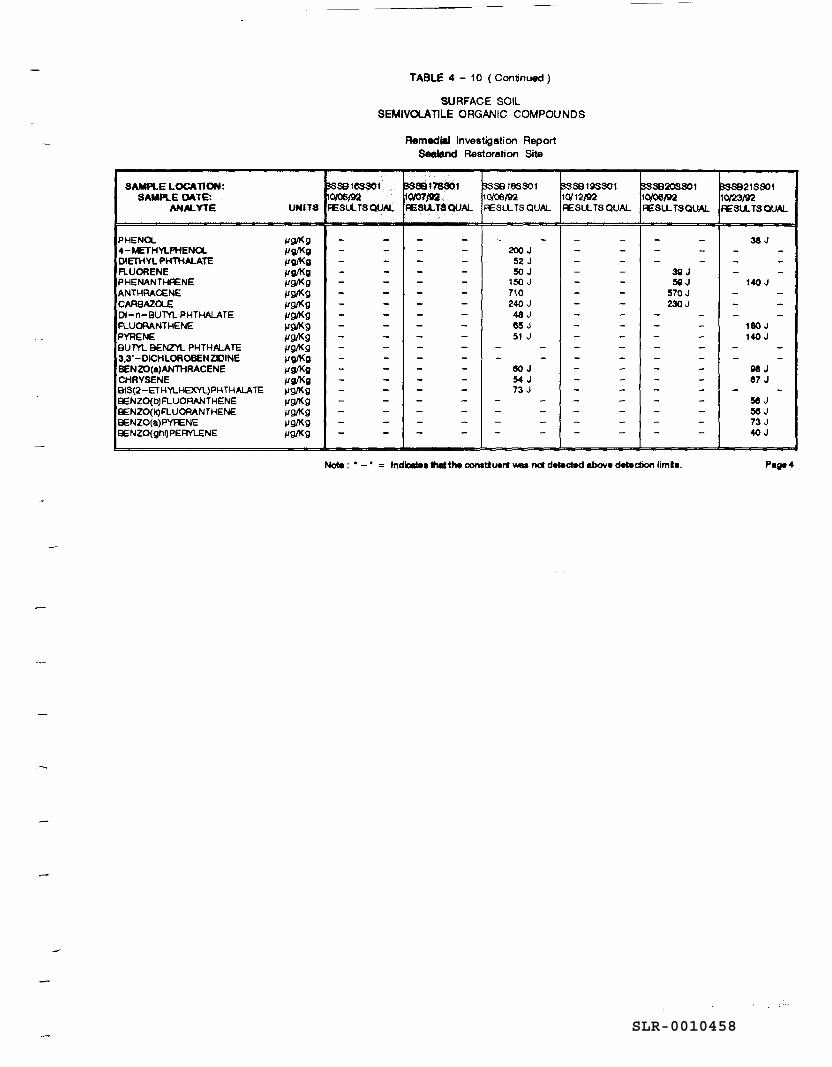
SLR-0010458
SAMPLE LOCATION: SAMPLE DA TE:
ANALYTE UNITS
PHENOL µgi!(g 4-METHYLPHENOL µg/Kg DIETHYL PHTHALATE µg/Kg FLUOR ENE µg/Kg PHENANTHFENE µgi!(g ANTHRACENE µgi!(g CAASAZOLE µgi!(g Dl-n-aum PHTHALATE µgi!(g FLUORANTHENE µgi!(g PYRE NE µgi!(g aum BENZYL PHTH.ALATE µgi!(g 3,3'-DICHLOROBENZDtNE µg/Kg BENZO(a)ANTHRACENE µg/Kg CHRYSENE µg/Kg BIS(2-ETH'll.HEXYL)PHTHALA TE µgi!(g BENZO(b)FLUORANTHENE µgi!(g BENZO(k)FLUORANTHENE µgi!(g BENZO(a)PYFENE µgi!(g BENZO(gnQ PERl'l.£NE µgi!(g
TABLE 4 - 10 (Continued)
SURFACE SOIL SEMIVOLATllE ORGANIC COMPOUNDS
Remedial Investigation Report Seeland Restoration Site
~SB16SS01 ~88178801 ~S818SS01 3SSB19SS01 ~0/06192 ~0{01192 10/00/92 10/12/92 FESL.l. TS QUAL FESLl. T$ QUAL FESLL TS QUAL FESLL TS QUAL
- - - - - - - -- - - - 200 J - -- - - - 52 J - -- - - - 50 J - -- - - - 150 J - -- - - - 710 - -- - - - 240 J - -- - - - 48 J - -- - - - 85 J - -- - - - 51 J - -- - - - - - - -- - - - - - - -- - - - eo J - -- - - - 54 J - -- - - - 73 J - -- - - - - - - -- - - - - - - -- - - - - - - -- - - - - - - -
3SSB20SS01 10/06/92 FESL.l. TSQUAL
- -- -- -
39J 5QJ
570J 230J
- -- -- -- -- -- -- -- -- -- -- -- -
Nole: • - ' = lndicllllH ltMltthe conattuert - net detect.d above det9c:tion limla.
l:33SB:21SS01 10(Z3/92 FESU..TSQUAL
38J - -- -- -
140 J - -- -- -
180 J 140J
- -- -
gs J fJ7 J
- -5fJ J MJ 73 J 40 J
Page4
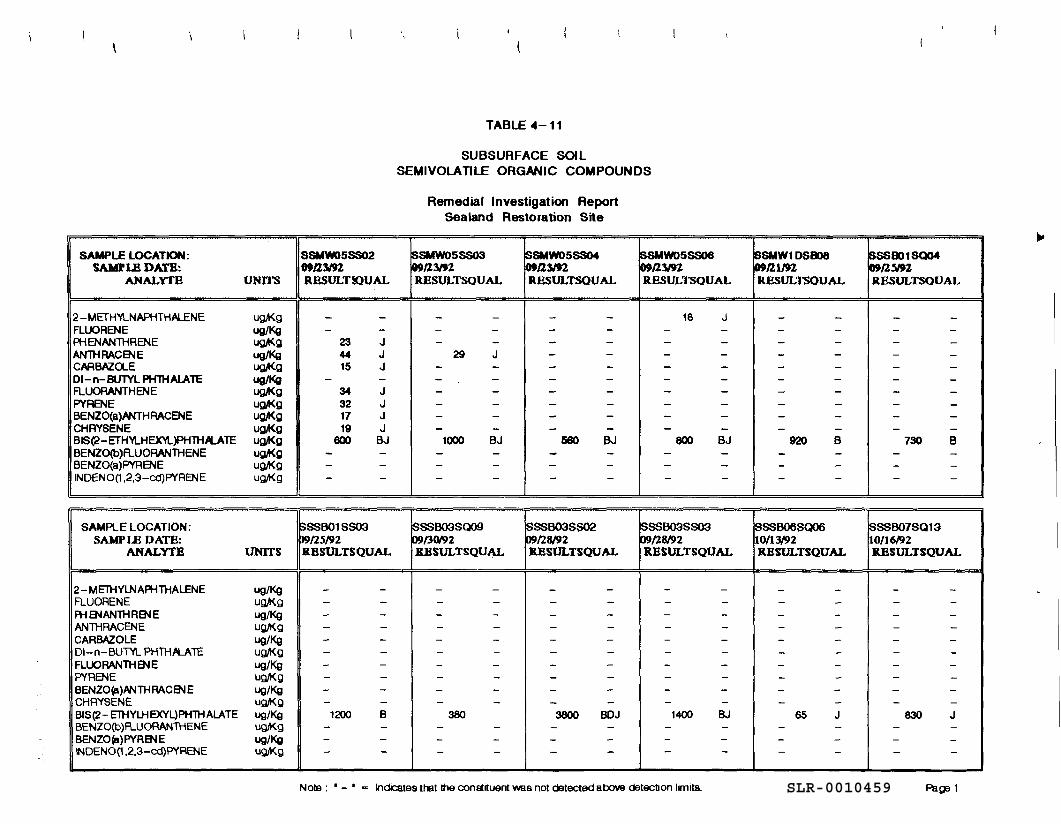
SLR-0010459
SAMPLE LOCATION: SA.Mrl.H DA.TB:
ANALYfB UNITS
2-METH'l'l...NAPHTHM..ENE ug,oKg FLUORENE ug/Kg PHENANTHRENE ugft(g ANlHRACENE ug/Kg CARBAZO....E ug,oKg 01-n-BUTYL PHTHALATE ug/Kg FLUORANTHENE ugft(g PYRENE ug,oKg BENZO(a)ANTHRACENE ug,oKg CHRYSENE ug,oKg BIS('2-ETH'rt.HEX'1...)PH1HILA TE ug,oKg BENZO(b)R.UORANTHENE ug,oKg BENZO(a)PYRENE ugit<g INDEN0(1,2,3-Cd)PYRENE ugit<g
SAMPLE LOCATION: SAMPLE DATE:
ANALYTE UNITS
2-METHYLNAPHTHALENE ug/Kg FLUORENE ugit<g FHENANlHRENE ug/Kg ANTHRACENE ugit<g CARBAZOLE ug/Kg Dl-n-BUT'l'l... PHTHJ!t..ATE ugit<g FLUORANTH ENE ug/Kg PY RENE ugit<g BENZO(a)ANTHRACENE ug/Kg CH RYS ENE ug,oKg BIS(2-ETHYLHEXYL)PHTHALATE ug/Kg BENZO(b)R..UORANTHENE ugit<g BENZO(a)PYRENE ug/Kg INDEN0(1,2,3-cd)PYRENE ugit<g
SSMW05SS02 09123i/92 RESULT!OUAL
- -- -
23 J 44 J 15 J
- -34 J 32 J 17 J 19 J
600 BJ - -- -- -
~SS601SSOO PAJflS/92 B.HSULTSQUAL
- -- -- -- -- -- -- -- -- -- -
1200 B - -- -- -
TABLE 4-11
SUBSURFACE SOIL SEMIVOLATILE ORGANIC COMPOUNDS
Remedial Investigation Report Sealand Restoration Site
SSMW05SS03 SSMW05SS04 09flll92 09fl.3192 RESULTSQUAL RESULTSQUAL
- - - -- - - -- - - -
29 J - -- - - -- - - -- - - -- - - -- - - -- - - -
1000 BJ 560 BJ - - - -- - - -- - - -
~SSB03SQ09 SSS603SS02 ~/3W92 ~fl8192 ll.ESULTSQU~ ll.ESULTSQUAL
- - - -- - - -- - - -- - - -- - - -- - - -- - - -- - - -- - - -- - - -
380 3800 BOJ - - - -- - - -- - - -
SSMW05SS06 01>123191. RBSULTSQUAL
18 J - -- -- -- -- -- -- -- -- -
800 BJ - -- -- -
SSSB03SSOO 00(28192 ll.ESULTSQUAL
- -- -- -- -- -- -- -- -- -- -
1400 BJ - -- -- -
Note : ' - • = Indicates tt-et the constituent was not detected aOOlle detecbon limits.
~SMW1DSBD8 SSSBD1SQ04 •rz.1.191. 01>11.!1192 RBSULTSOUAL RBSULTSQUAL
- - - -- - - -- - - -- - - -- - - -- - - -- - - -- - - -- - - -- - - -
920 B 730 B - - - -- - - -- - - -
~SSB06SQ06 SSS607SQ13 10/13192 10/16192 ll.ESULTSQUAL B.ESULTSQUAL
- - - -- - - -- - - -- - - -- - - -- - - -- - - -- - - -- - - -- - - -
65 J 830 J - - - -- - - -- - - -
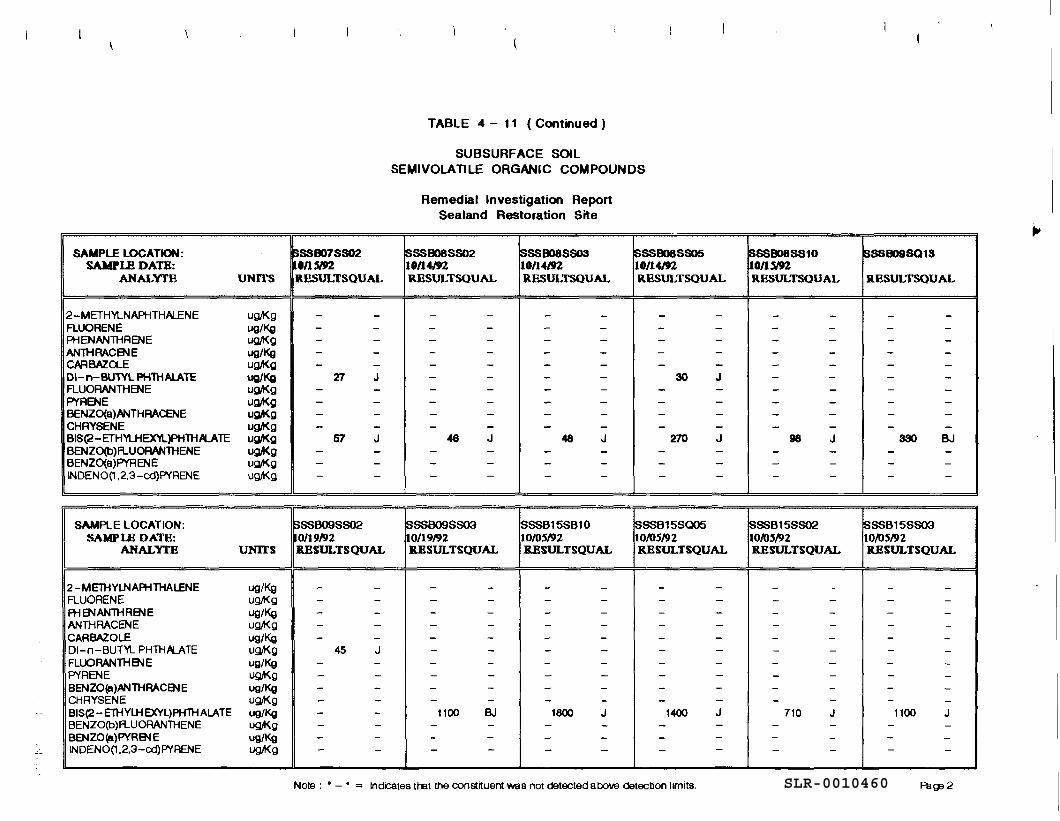
SLR-0010460
SAMPLE LOCATION: SAMPLE DATE:
ANALYfE UNITS
2-METH'T'LNAPHTHALENE ug,Kg FLUORENE ug/Kg PHENANTHAENE ug,Kg ANTHRACENE ug/Kg CAABAZCX..E ugit<g 01-n-BUlYL PH1l-IALATE ug/Kg FLUOAANTHENE ug,Kg PYRENE ug,Kg BENZO(a)ANTHRACENE ugit<g CHRYSENE ug,oKg BIS(2-ETHYl...HEX'l'L)PHTHILA TE ugit<g BENZO(b)A..UORANTHENE ugit<g BENZO{a)PYRENE ug,Kg INDEN0(1,2,3-cd)PYAENE ug,Kg
SAMPLE LOCATION: SAMPIB DATB:
ANALYTE UNITS
2-METHYLNAPHTHALENE ug/Kg FLUOAENE ug,Kg PH ENANTH RB\I E ug/Kg ANTHAACENE ug,Kg CARBAZOLE ug/Kg Dl-n-BUTYL PHTHILATE ug,Kg FLUORANTH 811 E ug/Kg PYRENE ug,Kg BENZO{a)ANTHRACB\I E ug/Kg CHRYSENE ug,Kg BIS{2- ETHYLJ-l EXYL)PHTH ALATE ug/Kg BENZO(b)A..UORANTHENE ug,Kg BENZO{a)PYRBll E ug/Kg INDEN0(1,2,3-cd)PYAENE ug,Kg
$SSBD7SS02 l0/1~ llESULTSOUAL
- -- -- -- -- -
27 J - -- -- -- -
57 J - -- -- -
SSSB09SS02 l0/19/92 JlHSlll.TSQUAL
- -- -- -- -- -
45 J - -- -- -- -- -- -- -- -
TABLE 4 - 11 (Continued)
SUBSURFACE SOIL SEMIVOLATILE ORGANIC COMPOUNDS
Remedial Investigation Report Sealand Restoration Site
SSSB08SS02 SSSBD8SS03 10114192 10/14192 llHSULTSQUAL llBSULTSQUAL
- - - -- - - -- - - -- - - -- - - -- - - -- - - -- - - -- - - -- - - -
46 J 46 J - - - -- - - -- - - -
ISSSB09SS03 SSSB15S810 10/19/92 10/0S/92 ll.ESULTSQUAI.. ll.ESULTSQUAL
- - - -- - - -- - - -- - - -- - - -- - - -- - - -- - - -- - - -- - - -
1100 BJ 1800 J - - - -- - - -- - - -
~SSB08SS05 10/14192 RBSULTSOUAL
- -- -- -- -- -
30 J - -- -- -- -
270 J - -- -- -
ISSSB15SQ05 10/0S/92 ll.ESULTSQUAL
- -- -- -- -- -- -- -- -- -- -
1400 J - -- -- -
Note : ' - • = Indicates that the constituent was not detected aoove detection limits.
. I
SSSB08SS10 SSSBD9SQ13 1011.WZ RBSULTSOUAL R.ESULTSOUAL
- - - -- - - -- - - -- - - -- - - -- - - -- - - -- - - -- - - -- - - -
98 J 330 BJ - - - -- - - -- - - -
SSSB15SS02 SSSB15SS03 10/0S/92 10/0S/92 ll.ESULTSQUAL ll.ESULTSQUAL
- - - -- - - -- - - -- - - -- - - -- - - -- - - -- - - -- - - -- - - -
710 J 1100 J - - - -- - - -- - - -
Pa~2
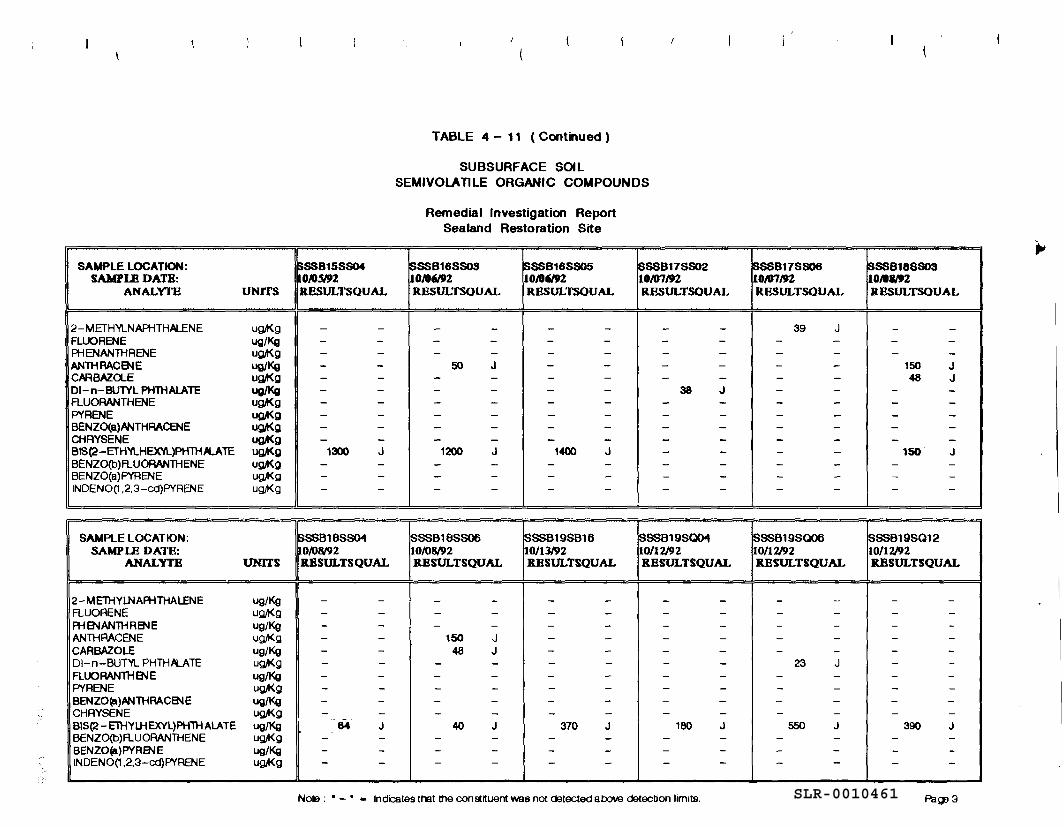
SLR-0010461
SAMPLE LOCATION: SAMl"LE DATB:
ANALYfE UNITS
2-METHYLNAPHTHALENE ug,Kg FLUOAENE ug/Kg A-IENANTHAENE ug,Kg ANlHRACENE ug/Kg CAABAZa...E ug,Kg 01-n-BUlYL PHlHALATE ug/Kg FLUORANTHENE ug,4(g PVRENE ug,4(g BENZO(a}ANTHRACENE ugA<g CHAYSENE ug,4(g BIS('2-ETHYLHEX'il}PH1HILA TE ug,4(g BENZO(b)A...UORANTHENE ug,4(g BENZO(a)PYRENE ug,4(g INDENO(l ,2,3-cd)PYRENE ug,4(g
SAMPLE LOCATION: SAMPIB DATE:
ANALYTH UNITS
2-METHYLNAPHTHAL.ENE ug/Kg FLUORENE ug,Kg PH ~ANTH RB'<I E ug/Kg ANTHRACENE ugiKg CAABAZOLE ug/Kg Dl-n-BUTYL PHTHILATE ugiKg FLUORANTHB'<IE ug/Kg PVRENE ugiKg BENZO(a)ANTHRACB'<IE ug/Kg CHRYSENE ugiKg BIS(2-ETHYLri EXYL)PHll-1 ALATE ug/Kg BENZO(b)A...UORANTHENE ugiKg BENZO(a)PYRB'<I E ug/Kg INDENO(l ,2.3-cd)PYRENE ugiKg
SSSB15SS04 lOAJ~ RESULTSQUAL
- -- -- -- -- -- -- -- -- -- -
1300 J - -- -- -
SSSB18SSO'l •o/08192 B.BStn.TSQUAL
- -- -- -- -- -- -- -- -- -- -. -
64 J .. - -- -- -
TABLE 4 - 11 (Continued)
SUBSURFACE SOIL SEMIVOLATILE ORGANIC COMPOUNDS
Remedial Investigation Report Sealand Restoration Site
~SSB16SSOS SSSB16SS05 10/06192 10/06192 RESULTSQUAL RESULTSQUAL
- - - -- - - -- - - -
50 J - -- - - -- - - -- - - -- - - -- - - -- - - -
1200 J 1400 J - - - -- - - -- - - -
SSSB18SS06 SSSB19SB16 10/08192 10/13192 llESULTSQU~ .llESULTSQUAL
- - - -- - - -- - - -
150 J - -48 J - -
- - - -- - - -- - - -- - - -- - - -
40 J 370 J - - - -- - - -- - - -
ISSSB17SS02 10/fYl/P2 RESULTSQUAL
- -- -- -- -- -
38 J - -- -- -- -- -- -- -- -
SSSB19SQ01 10/12192 llESULTSQUAL
- -- -- -- -- -- -- -- -- -- -
180 J - -- -- -
Note : • - ' = Indicates that the constituent was not detected abolle detection limits.
SSSB17SS06 SSSB18SS03 10/07192 ~0/01192 RESULTSQUAL RESULTSQUAL
39 J - -- - - -- - - -- - 150 J - - 48 J - - - -- - - -- - - -- - - -- - - -- - 150 J - - - -- - - -- - - -
SSSB19SQOO ~SSB19SQ12 10/12192 10112192 B.BSULTSQUAL llESULTSQUAL
- - - -- - - -- - - -- - - -- - - -
23 J - -- - - -- - - -- - - -- - - -
550 J 390 J - - - -- - - -- - - -
Pa1P3
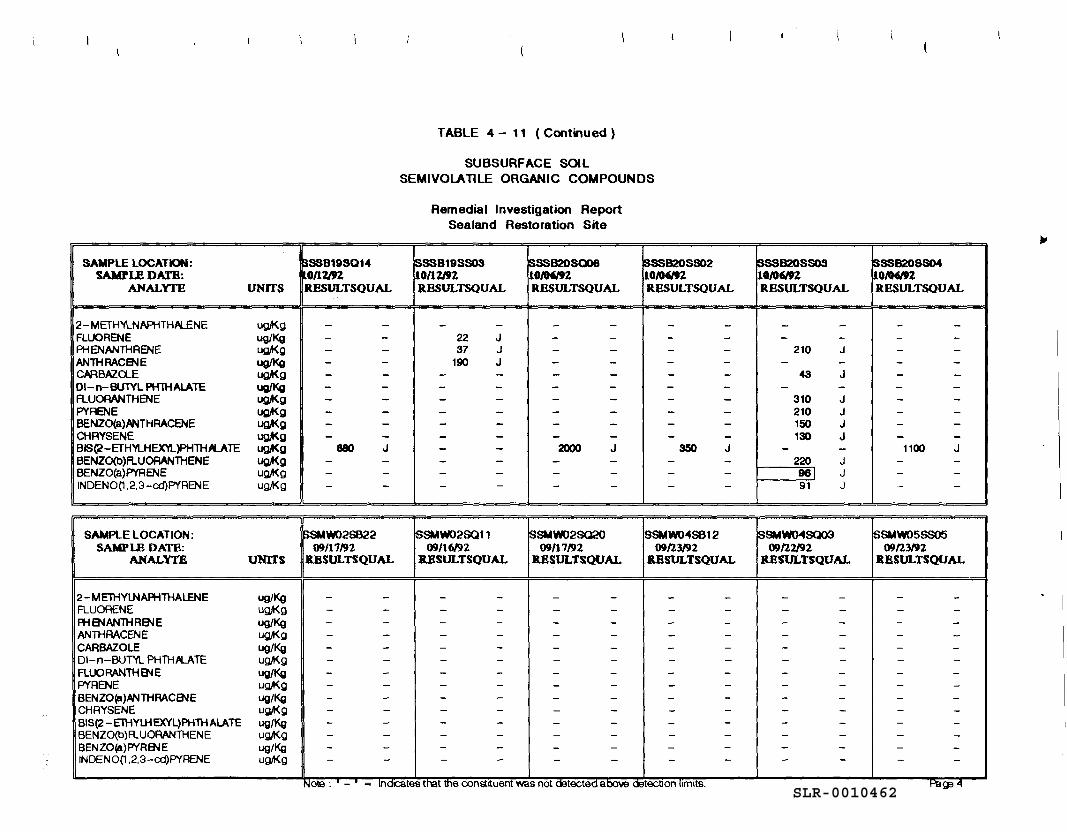
SLR-0010462
SAMPLE LOCATION: SAMPLE DA.TR:
ANALYTE UNITS
2-METH'ILNAA-ITHALENE ug,Kg FLUORENE ug/Kg PH ENANTHRENE ug,Kg ANlHRACENE ug/Kg CAABAZO...E ug,Kg 01-n-BUlYL PHlHALATE ug/Kg FLUORANTHENE ug,t<g PYRENE ug,t<g BENZO(a)ANTHRACENE ug,Kg CHRYSENE ug,4(g BIS(2-ETHYLHE:n..)PHTHILATE ug,4(g BENZO(b)FLUORANTHENE ug,Kg BENZO(a)PYRENE ug,Kg INDENO(l ,2,3-cd)PYRENE ug,Kg
SAMPLE LOCATION; SAMPI.E DATE:
ANALYTE UNITS
2-METHYLNAPHTHALENE ug/Kg FLUORENE ug,Kg PH 8'-JANTH RENE ug/Kg ANTHRACENE ug,Kg CARBAZOLE ug/Kg Dl-n-BUTYL PHTHILATE ug,Kg FLUORANTH ENE ug/Kg PYRENE ug,Kg BENZO(a)ANTHRACENE ug/Kg CHRYSENE ug,Kg BIS(2-ETHYLHEXYL)PH1HALATE ug/Kg BENZO(b)R..UORANTHENE ug,Kg BENZO(a)PVREN E ug/Kg INDENO(l ,2,3-cd)PYRENE ug,Kg
l:lSSB19SQ14 l0/11.ln R.ESULTSQUAL
- -- -- -- -- -- -- -- -- -- -
880 J - -- -- -
$SMW02SB22 00/11/92
B.BSULTSQUAL
- -- -- -- -- -- -- -- -- -- -- -- -- -- -
TABLE 4 - 11 (Continued)
SUBSURFACE SOIL SEMIVOLATILE ORGANIC COMPOUNDS
Remedial Investigation Report Sealand Restoration Site
SSSB19SS03 ISSSB20SQ06 10112112 101'9"92 RBSULTSOUAL RBSULTSQUAL
- - - -22 J - -37 J - -
190 J - -- - - -- - - -- - - -- - - -- - - -- - - -- - 2000 J - - - -- - - -- - - -
SSMW02SQ11 SSMW02SQ20 00/16/92 00117/92
llESULTSQUAL llESULTSQUAL
- - - -- - - -- - - -- - - -- - - -- - - -- - - -- - - -- - - -- - - -- - - -- - - -- - - -- - - -
ISSSB20SS02 lOI0"92 RBSULTSOUAL
- -- -- -- -- -- -- -- -- -- -
3SO J - -- -- -
SSMW0'4SB12 ran3192
llESULTSQUAL
- -- -- -- -- -- -- -- -- -- -- -- -- -- -
Nola: - - lndcates that the constituent was not 00tected aoow 00tecbon hm1ts.
ISSSB20SSOS SSSB20SS04 101'9"92 lOI0"92 RBSULTSOUAL RBSULTSOUAL
- - - -- - - -
210 J - -- - - -
43 J - -- - - -
310 J - -210 J - -150 J - -130 J - -
- - 1100 J 220 J - -961 J - -91 J - -
SSMW0<4SQOO $SMW05SS05 oon2192 r1Jn3/92
KESULTSQUAL llESULTSQUAL
- - - -- - - -- - - -- - - -- - - -- - - -- - - -- - - -- - - -- - - -- - - -- - - -- - - -- - - -
Kig34
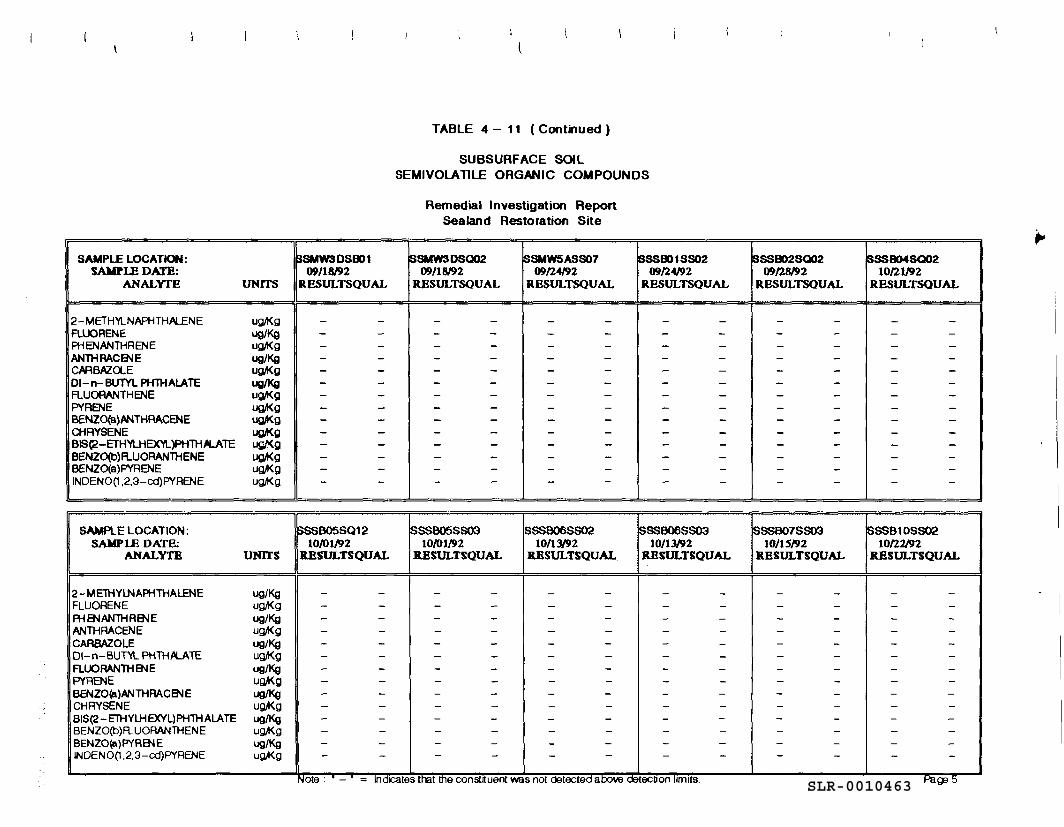
SLR-0010463
SAMPLE LOCATION: SAMPLE DATR:
ANALYfE UNITS
2-METHYLNAA-iTHALEN E ug,Kg FLUORENE ug/Kg A-"i ENANTHAENE ug,Kg ANlHRACENE ug/Kg CARBAZQE ug,Kg 01-n-BUTYL PHlHALATE ug/Kg FLUOAANTHENE ug,Kg PY RENE ug,Kg BENZO{a)ANTHRACENE ug,Kg CHRYSENE ug,Kg BIS(.2-ETH'Vl...HEXYL)PHTH It.ATE ugf!(g BENZO(b)R..UORANTHENE ug,Kg BENZO(a)PYRENE ug,Kg INDEN0(1,2,3-cd)PYRENE ug,Kg
SAMPLE LOCATION: SAMPLE DATE:
ANALYTE UNITS
2-ME1HYLNAPHTHALENE ug/Kg FLUORENE ug,Kg PHENANTHRENE ug/Kg ANTHAACENE ug,Kg CARBAZOLE ug/Kg 01-n-BUTYL PHTHPLATE ug,Kg FLUORANlH ENE ug/Kg PY RENE ug,Kg BENZO(a)ANTHRACEN E ug/Kg CHRYSENE ug,Kg 81$(2-ETHYLHEXYL)PHTHALATE ug/KQ BENZO(b)A...UORANTHENE ug,Kg BENZO(a)PYRENE ug/Kg INDENO(l ,2,3-cd)PYRENE ug,Kg
SSMW30SBD1 09/18192
RBSULTSQUAL
- -- -- -- -- -- -- -- -- -- -- -- -- -- -
SSSB05SQ12 10/01/92
B.BSULTSQUAL
- -- -- -- -- -- -- -- -- -- -- -- -- -- -
TABLE 4 - 11 (Continued)
SUBSURFACE SOIL SEMIVOLATILE ORGANIC COMPOUNDS
Remedial Investigation Report Sealand Restoration Site
~SMWSDSQ02 ~SMW5ASS07 09/18192 09n4192
RESULTSQUAL RBSULTSOUAL
- - - -- - - -- - - -- - - -- - - -- - - -- - - -- - - -- - - -- - - -- - - -- - - -- - - -- - - -
SSSB05SS03 SSSBOOSS02 10/01/92 10/13192
llESULTSQUAL llESULTSQUAL
- - - -- - - -- - - -- - - -- - - -- - - -- - - -- - - -- - - -- - - -- - - -- - - -- - - -- - - -
issseo1sso2 09n4192
RESULTSOUAL
- -- -- -- -- -- -- -- -- -- -- -- -- -- -
SSSBOOSS03 10/13/1)2
KESULTSQUAL
- -- -- -- -- -- -- -- -- -- -- -- -- -- -
NOie: ' - Indicates tnat tne constituent was not aetected aoove oe tecbon 11rn1ts.
SSSBD2SQ02 SSSB04SQ02 mnl!/92 1on1192
RESULTSOUAL RESULTSOUAL
- - - -- - - -- - - -- - - -- - - -- - - -- - - -- - - -- - - -- - - -- - - -- - - -- - - -- - - -
SSSB07SS03 ISSSB10SS02 10/1SJ92 1on2192
KESULTSQUAL JtESULTSQUAL
- - - -- - - -- - - -- - - -- - - -- - - -- - - -- - - -- - - -- - - -- - - -- - - -- - - -- - - -
..-age::>
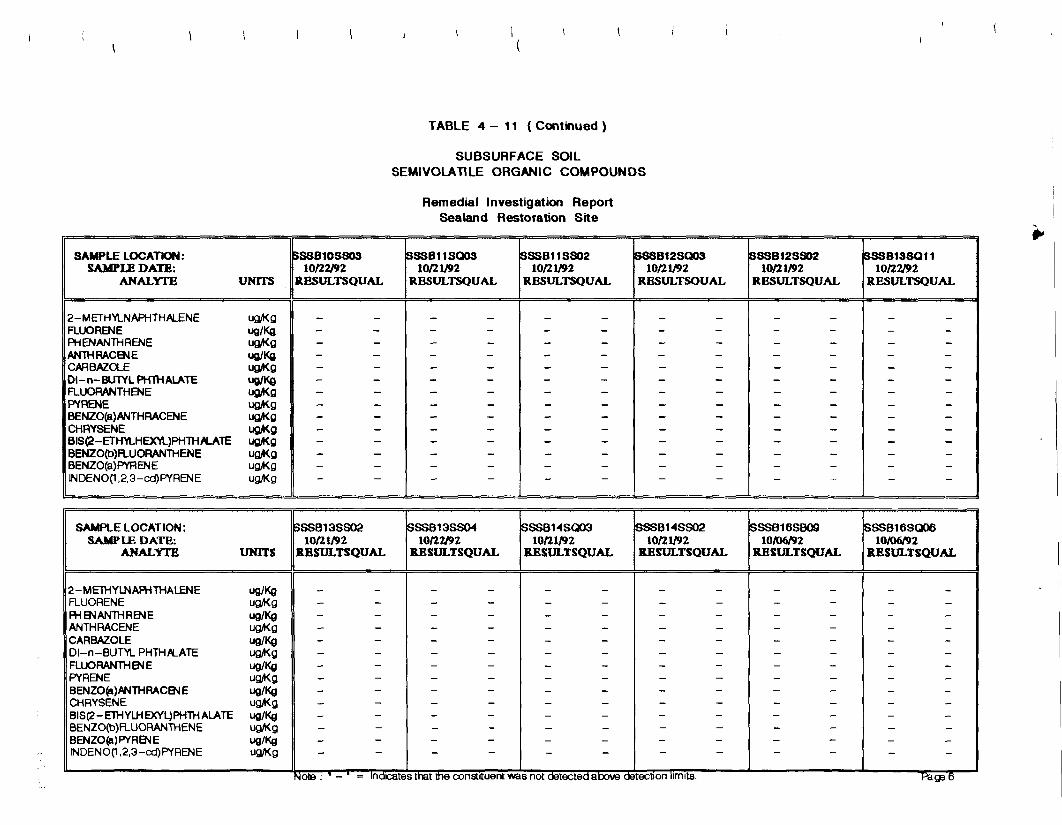
SLR-0010464
SAMPLE LOCATION: SAMPI.E DATB:
ANALYfB UNITS
2-METH"l'LNAPHTHALENE ug,Kg FLUORENE ug/Kg A-iENANTHRENE ug,Kg ANTHRACelE ug/Kg CARBAZQE ug,Kg 01-n-BUlYL PHTHALATE ug/Kg FLUORANTHENE ug,4(.g PY RENE ug,Kg BENZO(e)ANTHRACENE ug,Kg CHRYSENE ug,4(.g BIS(2-ETH"l'LHEX"l'L)PHTHILATE ug,Kg BENZO(b)A..UORANTHENE ug,Kg BENZO(a)PYRENE ug,o1(g INDENO(l ,2,3-cd)PYRENE ug,Kg
SAMPLE LOCATION: SAMPLE DATE:
ANALYT.B UNITS
2-METHYLNAPHTHAL.ENE ug/Kg FLUORENE ug,Kg Ft! ENANTH RENE ug/Kg ANTHRACENE ug,Kg CARBAZOLE ug/Kg 01-n-BUT"l'L PHTH.aLATE ug,Kg FLUORANTH ENE ug/Kg PY RENE ug,Kg BENZO(a)ANTHRACEN E ug/Kg CHRYSENE ug,Kg 818(2-ETHYLHEXYL)PHTHALATE ug/Kg BENZO(b)A..UORANTHENE ug,Kg BENZO(a)PYRENE ug/Kg INDENO(l ,2,3-cd)PYRENE ug,Kg
SSSB10SS03 10/21.J92
llP.SULTSOUAL
- -- -- -- -- -- -- -- -- -- -- -- -- -- -
SSSB13SS02 10(21)92
JlBSW..TSQUAL
- -- -- -- -- -- -- -- -- -- -- -- -- -- -
I (
TABLE 4 - 11 (Continued)
SUBSURFACE SOIL SEMIVOLATILE ORGANIC COMPOUNDS
Remedial Investigation Report Sealand Restoration Site
SSSB11SQ03 SSS811SS02 10/21192 10/21192
RBSULTSOUAL RESULTSOUAL
- - - -- - - -- - - -- - - -- - - -- - - -- - - -- - - -- - - -- - - -- - - -- - - -- - - -- - - -
ISSSB13SS<M ISSS61<4SQ03 10/22192 10fl.1l92
JlESULTSQUAL JlESW..TSQUAL
- - - -- - - -- - - -- - - -- - - -- - - -- - - -- - - -- - - -- - - -- - - -- - - -- - - -- - - -
ISSSB12SQ03 10/21)92
RBSULTSOUAL
- -- -- -- -- -- -- -- -- -- -- -- -- -- -
SSS61'4SS02 10(21192
JlESULTSQUAL
- -- -- -- -- -- -- -- -- -- -- -- -- -- -
Note: • - lnacates tret tne constituent was not aetecteo eoove aetecnon 11m1ts.
ISSSB12SS02 SSSB13SQ11 10/21192 10/22192
RBSULTSOUAL R.ESULTSOUAL
- - - -- - - -- - - -- - - -- - - -- - - -- - - -- - - -- - - -- - - -- - - -- - - -- - - -- - - -
SSSB16SBOO SSSB16SQ06 10/06192 10/06/92
KESULTSQUAL ltESULTSQUAL
- - - -- - - -- - - -- - - -- - - -- - - -- - - -- - - -- - - -- - - -- - - -- - - -- - - -- - - -
t-a 5
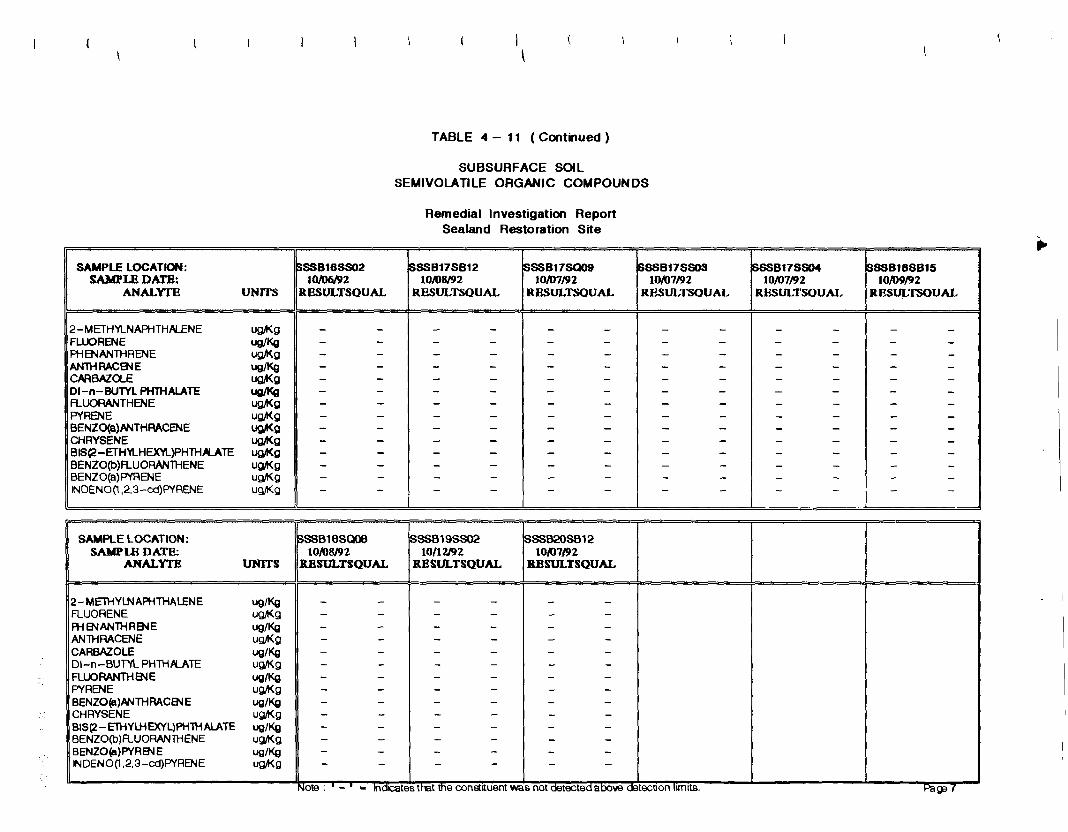
SAMPLE LOCATION: SAMrl.B DA.TB:
ANALYfE UNITS
2-METH'r'LNAA-tTHALENE ugft<g FLUORENE ug/Kg PHENANTHRENE ugft<g ANlHRACe.IE ug/Kg CAABAZQE ug,.t<g 01-n-BUTYL PH1HALATE ug/Kg FLUORANTHENE ugft<g PfRENE ug,.t<g BENZO(a)NffHAACENE ugA<.g CHRYSENE ug,.t<g BIS(2-ETH'VLHEXYL..)PHTHILATE ugA<.g BENZO(b)R...UORANTHENE ug,.t<g BENZO(a)P'fRENE ugft<g INDENO(l ,2,3-cd)PYRENE ugft<g
SAMPLE LOCATION: SAMPLE DATE:
A.NALYTE UNITS
2-METHYLNAPHTHALENE ug/Kg FLUORENE ugft<g FHENANTHRENE ug/Kg ANTHRACENE ugft<g CARBAZOLE ug/Kg 01-n-BUT'r'L PHTHPLATE ugft(g FLUORANTHENE ug/Kg PfRENE ug,.t<g BENZO(a)ANTHRACEN E ug/Kg CHRYSENE ugft(g BIS(2-ElHYLHEXYL)PH1HALATE ug/Kg BENZO(b)R...UORANTHENE ugft(g BENZO(a)PYREN E ug/Kg INDENO(l ,2,3-cd)PYRENE ugft(g
SSSB16SS02 10/06/92
RBSULTSOUAL
- -- -- -- -- -- -- -- -- -- -- -- -- -- -
SSSB18SQ06 10/08192
JlHSULTSQUAL
- -- -- -- -- -- -- -- -- -- -- -- -- -- -
I \
TABLE 4 - 11 (Continued}
SUBSURFACE SOIL SEMIVOLATILE ORGANIC COMPOUNDS
Remedial Investigation Report Sealand Restoration Site
SSSB17SB12 ~SSB17SQ09 SSS817SS03 10/08192 10/07/92 10/07/92
RBSULTSOUAL RBSULTSQUAL RBSULTSOUAL
- - - - - -- - - - - -- - - - - -- - - - - -- - - - - -- - - - - -- - - - - -- - - - - -- - - - - -- - - - - -- - - - - -- - - - - -- - - - - -- - - - - -
~SSB19SS02 SSSB20SB12 10/12192 10/07/92
llESULTSQUAL llESULTSQUAL
- - - -- - - -- - - -- - - -- - - -- - - -- - - -- - - -- - - -- - - -- - - -- - - -- - - -- - - -
NOie: ' = 1nm:::ates tnat the constituent was not oetectea auove aatectJon hm1ts.
~8178804 SSSB18SB15 10/07/92 10/09/92
RBSULTSOUAL R.ESULTSOUAL
- - - -- - - -- - - -- - - -- - - -- - - -- - - -- - - -- - - -- - - -- - - -- - - -- - - -- - - -
1-"a '
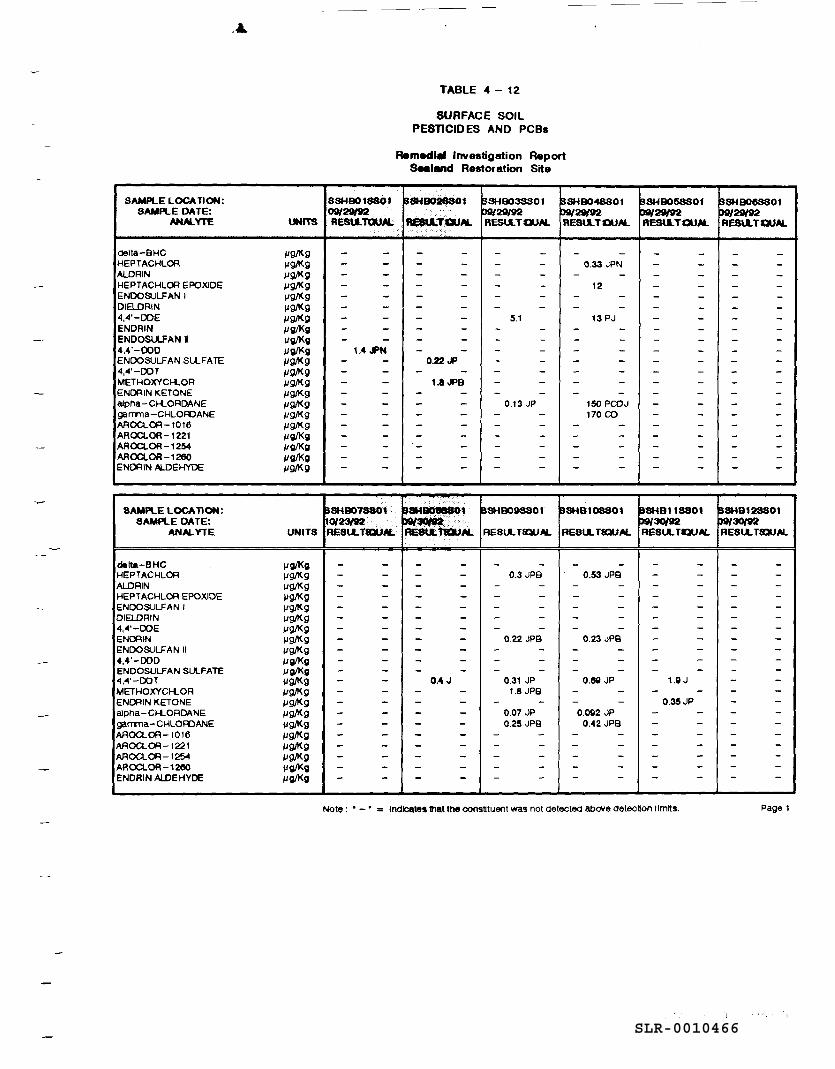
SLR-0010466
SAMPLE LOCATION: SAMPLE °"TE:
ANALYrE \MfTS
delta-BHC µg/Kg HEPTACHLOR µg/Kg ALDRIN µg/Kg HEPTACHLOR EPOXIDE µg/Kg ENOOSULFAN I µg/Kg DIEL.DAIN µg/Kg 4,4'-DDE µg/Kg ENDRIN µg/Kg ENOOSu..FAN I µg/Kg 4,4'-000 µg/Kg ENDOSULFAN SU.FATE µg/Kg 4,4'-00T µg/Kg METHOXYCH..OR µg/Kg ENDRIN KETONE µ911<g aJptla-CH...ORDANE µg/Kg garrrna-CHLOFVANE µg/Kg AROCLOR-1016 µg/Kg AROCl..OR-1221 µg/Kg AROCl..OR-1254 µg/Kg AROCl..OR-1260 µg/Kg ENDRIN lt.LDEHYDE µg/Kg
SAMPLE LOCATION: SAMPLE DA TE:
ANALYTE UNITS
mltA-BHC µg/Kg HEPTACHLOR µg/Kg ALDRIN µg/Kg HEPTACHLOR EPOXJDE µg/Kg ENOOSULFAN I µg/Kg DIEL.DAIN µg/Kg 4,4'-00E µg/Kg ENDA IN µg/Kg ENOOSULFAN II µg/Kg 4,4'-000 µg/l<g ENDOSULFAN SULFATE µg/Kg 4,4'-00T µg/Kg METHOXYCH..OR µg/Kg ENDRIN KETONE µ9J'(g alpha-CH..ORDANE µ9J'(.g garrrna-CHLOFVANE µ9J'(g AROCLOR-1016 µ9J'(.g AROCLOR-1221 µ9J'(.g AROCLOR-1254 µ9J'(.g AROCLOR-12e0 µg/Kg ENDRIN ALDEHYDE µg/l<g
SSHB018801 C»/29/02 RESll..TQWL
- -- -- -- -- -- -- -- -- -
1.4 JPN - -- -- -- -- -- -- -- -- -- -- -
~SH9078801 ~0/23192 RE8ll.. TQJAL
- -- -- -- -- -- -- -- -- -- -- -- -- -- -- -- -- -- -- -- -- -
TABLE 4 - 12
SURFACE SOIL PESTICIDES AND PCBs
Remedial Investigation Report S-land Restoration Site
B8H902880t $SHB03SS01 SSHBO..SSOt bSI/~ ~~
RESU.TGJM.. RESU..TQUM.. RESU..TQUAL ':. .·•·
- - - - - -- - - - 0.33 JPN - - - - - -- - - - 12 - - - - - -- - - - - -- - S.1 13 PJ - - - - - -- - - - - -- - - - - -
0.22 JP - - - -- - - - - -
1.a JPB - - - -- - - - - -- - 0.13 JP 150 PCOJ
- - - - 170 co - - - - - -- - - - - -- - - - - -- - - - - -- - - - - -
~8HB0'8801 15SHB098801 BSHB10SS01
~~····.·· RE8tLta:lUAL RE8LLTfQUAL RE8LLTfQUAL
- - - - - -- - 0.3 JPB 0.53 JPS - - - - - -- - - - - -- - - - - -- - - - - -- - - - - -- - 0.22 JPB 0.23 JPB - - - - - -- - - - - -- - - - - -
0.4J 0.31 JP o.ee JP - - 1.8 JPS - -- - - - - -- - 0.07 JP O.OQ2 JP
- - 0.2S JPB 0.42 JPB
- - - - - -- - - - - -- - - - - -- - - - - -- - - - - -
S8HB058SOt 09/~ RESU..TQUAL
- -- -- -- -- -- -- -- -- -- -- -- -- -- -- -- -- -- -- -- -- -
15SHB11S801 PGl3Cll92 RESll.. TQJAL
- -- -- -- -- -- -- -- -- -- -- -
1.QJ - -
0.3SJP - -- -- -- -- -- -- -
Note : • - • = tndlea.tes tnat tile constttuent was not aetectea aboYe aetectton llmtts.
BSHBOGS801 09/29192. RESll.. T QUAI..
- -- -- -- -- -- -- -- -- -- -- -- -- -- -- -- -- -- -- -- -- -
$81-18128801 Pltl30/92 RESl.l..TQJAL
- -- -- -- -- -- -- -- -- -- -- -- -- -- -- -- -- -- -- -- -- -
Page 1
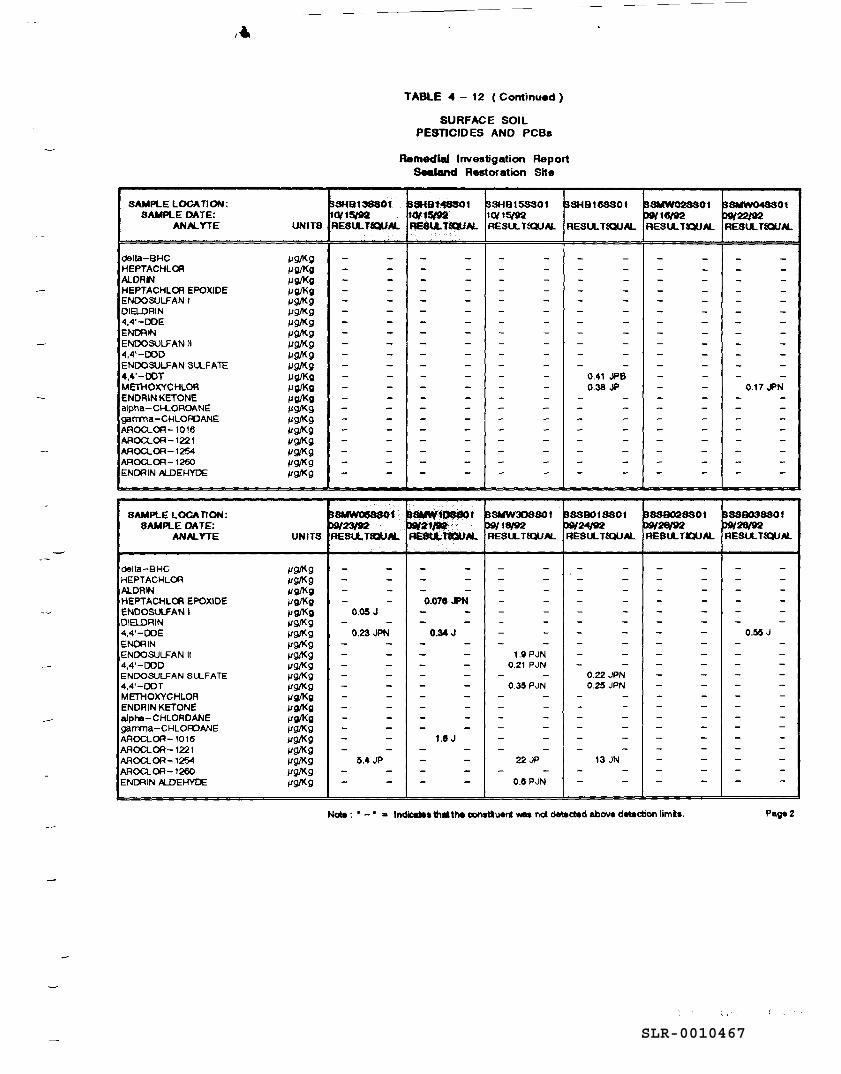
SLR-0010467
,-ii.
SAMPLE LOCATION: SAMPLE DA TE:
ANALYTE UNITS
delta-BHC µQJ1<g HEPTACHLOA µg/Kg ALDRIN µg/Kg HEPTACHLOA EPOXJDE µg/Kg ENOOSULFAN I µQJ1(g DIEL.ORIN µQJ1(g 4,4'-00E µQJ1(g ENORIN µQJ1(g ENDOSULFAN II µg/Kg 4,4'-000 µQJ1(g ENOOSULFAN Sll..FATE µgJKg 4,4'-00T µg/Kg METHOXYCHLOR µg/Kg ENDA IN KETONE µg/Kg alpha-CHLORDANE µQJ1(g garrma-CHLOFOANE µQJ1(g AROCLOA-1016 µQJ1(g AROCLOA-1221 µQJ1<g AAOCLOA-1254 µQJ1(g AROCLOA-1260 µQJ1<g ENORIN ALDEHYDE µQJ1(g
SAMPLE LOCATION: SAMPLE DA TE:
ANALYTE UNITS
delta-BHC µgJKg HEPTACHLOR µg/Kg ALDRIN µg/Kg HEPTACHLOA EPOXIDE µg/Kg ENDOSULFAN I µg/Kg OIELDRIN µQJ1<g 4,4'-0DE µQJ1<g ENORIN µQJ1<g ENOOSULFAN II µQJ1<g 4,4'-000 µQJ1<g ENDOSULFAN Sll..FATE µQJ1<g 4,4'-00T µQ/1(g METHOXYCHLOR µg/Kg ENDRIN KETONE µg/Kg aJpt..-CHLORDANE µg/Kg garrrna-CHLOFOANE µQJ1(g AROCLOR-1016 µQJ1(g AROCLOA-1221 µQJ1(g AAOCLOR-1254 µg/Kg AROCLOA-1260 µg/Kg ENORIN JtLOEHYDE µg/K.g
TABLE 4 - 12 (Continued)
SURFACE SOIL PESTICIDES AND PC Ba
Remedial Investigation Report Seeland Restoration Site
SSHB138801 ~8HBt48801 ~SHB158801 SSHB1GSS01 '°'15i.'92 1Q.11fil02 10{ 15192 RESlLTQJAL RE8l.l.TQJAL RESULTQJAL RESULTQJAL
- - - - - - - -- - - - - - - -- - - - - - - -- - - - - - - -- - - - - - - -- - - - - - - -- - - - - - - -- - - - - - - -- - - - - - - -- - - - - - - -- - - - - - - -- - - - - - 0.41 JPB - - - - - - 0.38 JP - - - - - - - -- - - - - - - -- - - - - - - -- - - - - - - -- - - - - - - -- - - - - - - -- - - - - - - -- - - - - - - -
IJSMW05880t ~8MW1Q8801 BSMW308801 IJSSB018S01 ~23192 ~21··· IM>(t&/92 ~2'4192 RESLLTtQUAL AEStLTIQUAL RESlL TQJAL RESLL TfQUAL
- - - - - - - -- - - - - - - -- - - - - - - -- - 0.079 .PN - - - -
0.05 J - - - - - -- - - - - - - -
0.23JPN 0.34J - - - -- - - - - - - -- - - - 1.Q PJN - -- - - - 0.21 PJN - -- - - - - - 0.22 JPN - - - - O.~ PJN 0.25 JPN - - - - - - - -- - - - - - - -- - - - - - - -- - - - - - - -- - UJ - - - -- - - - - - - -
5.4JP - - 22 JP 13 JN - - - - - - - -- - - - o.e PJN - -
BSMW028801 ~18192 RESUL T:QUAL
- -- -- -- -- -- -- -- -- -- -- -- -- -- -- -- -- -- -- -- -- -
BSSB028S01 IM>l28/92 RESLLTQJAL
- -- -- -- -- -- -- -- -- -- -- -- -- -- -- -- -- -- -- -- -- -
Note: • - • = lndicma thltthe conatluert - net detected abov. detection limb.
BSMW04SS01 ~2.2192 RESUL TQJN...
- -- -- -- -- -- -- -- -- -- -- -- -
0.17 JPN - -- -- -- -- -- -- -- -
~88B03880f
P0/28m RESll.. TQJAL
- -- -- -- -- -- -
O.MJ - -- -- -- -- -- -- -- -- -- -- -- -- -- -
Pa~2
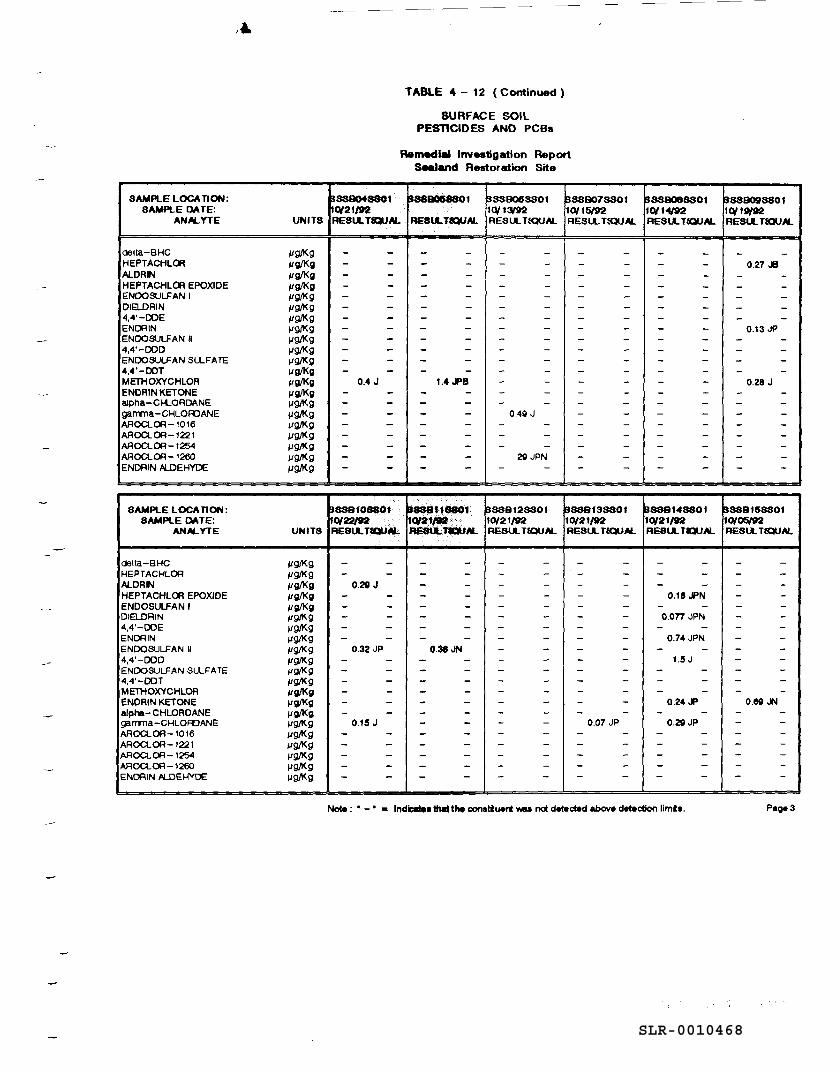
SLR-0010468
SAMPLE LOCATION: SAMPLE DA TE:
ANALYTE UNITS
delta-BHC µgJl<.g HEPTACHLOA f.lg/Kg AL ORN µg/Kg HEPTACHLOA EPOXIDE µg/Kg ENDOSULF AN I µg,n<g DIELDRIN µgJl<.g 4,4'-DOE µgJl(g ENORIN µgJl(g ENOOSIJLFAN II j.lgJl(g 4,4'-DOD f.lgJl(Q ENOOSULFAN SU.FATE j.lgJl(g 4,4'-DDT µg/Kg METHOXYCHLOR µg/Kg ENDRIN KETONE µg/Kg aiplla-Cf.l..ORDANE µgJl(g garrrna-CHLOffiANE µgJl(g AROCLOR-1016 µg,n<g AROCLOR-1221 µgJl<.g AROCLOR-1254 µgJl(g AROCLOR-1260 µg,n<g ENDRIN ALDEHYDE: µgJl<.g
SAMPLE LOCATION: SAMPLE DA TE:
ANN...YTE UNITS
delta-BHC µgJl(g HEPTACHLOR µgJl<.g ALDRIN j.lg/Kg HEPTACHLOA EPOXIDE µg/Kg ENDOSULFAN I µg/Kg DIEL.ORIN µgJl(g 4,4'-DDE f.lgJl(Q ENDRIN µgJl(g ENOOSULFAN II µgJl<.g 4,4'-00D µg,n<g ENOOSULFAN SU.FATE f.IQl!<Q 4,4'-DOT µgJl<.g METHOXYCHLOA µg/Kg ENDRIN KETONE µg/Kg alpt.-CHLORDANE µg/Kg garrrna-CHLOffiANE µg,n<g AROCLOR-1016 µg,n<g AROCLOR-1221 µgJl<.g AROCLOR-1254 f.IQl!<Q AROCLOR-1260 µg,n<g ENORIN ALDEHYDE: f.lgJl(g
9889048801 IOl21/92
TABLE 4 - 12 (Continued)
SURFACE SOIL PESTICIDES AND PCBa
Remedlel Investigation Report s-land Restoration Site
98880G8801 B8SB06SS01 B8SB07SS01 10l13/n 10l15/92
RESlA.. TQJN... RESlt. TQJN... RESIA. HQUN... RESlA.. T{QUAL
- - - - - - - -- - - - - - - -- - - - - - - -- - - - - - - -- - - - - - - -- - - - - - - -- - - - - - - -- - - - - - - -- - - - - - - -- - - - - - - -- - - - - - - -- - - - - - - -
0.4 J 1.4.l'B - - - -- - - - - - - -- - - - - - - -- - - - 0.4Q J - -- - - - - - - -- - - - - - - -- - - - - - - -- - - - 2Q JPN - -- - - - - - - -
$88Bf0880t B888H8801 BSSB12SS01 BSS8f3SS01 10/2a/92 10/2t1W•· 10/21/92 10/21/92 REBl.LTIQU.M. RE8ULTIQUAL RESlA..TfQUAL RESlA..TfQUAL
- - - - - - - -- - - - - - - -
0.2Q J - - - - - -- - - - - - - -- - - - - - - -- - - - - - - -- - - - - - - -- - - - - - - -
0.32 JP 0.38 JN - - - -- - - - - - - -- - - - - - - -- - - - - - - -- - - - - - - -- - - - - - - -- - - - - - - -
0.15 J - - - - 0.07 JP - - - - - - - -- - - - - - - -- - - - - - - -- - - - - - - -- - - - - - - -
SSSB088801 10l14/92 RESlA.. TQJN...
- -- -- -- -- -- -- -- -- -- -- -- -- -- -- -- -- -- -- -- -- -
8888148801 10/21/92 REBlA.. TIQUAL
- -- -- -
0.18 JPN - -o.on JPN - -
0.74JPN - -
1.5 J - -- -- -
0.24.1' - -
0.2QJP - -- -- -- -- -
Note: • - • = lndic111111 !Nd the conatiuert _. not detected above detection limb.
8889098801 ICliltfti RESll. natl.AL
- -0.27 JS
- -- -- -- -- -
0.13 JP - -- -- -- -
0.28 J - -- -- -- -- -- -- -- -
8888158801 ~OIOSl'n RESlA.. TQJAL
- -- -- -- -- -- -- -- -- -- -- -- -- -
O.SQ .#'! - -- -- -- -- -- -- -
Page3
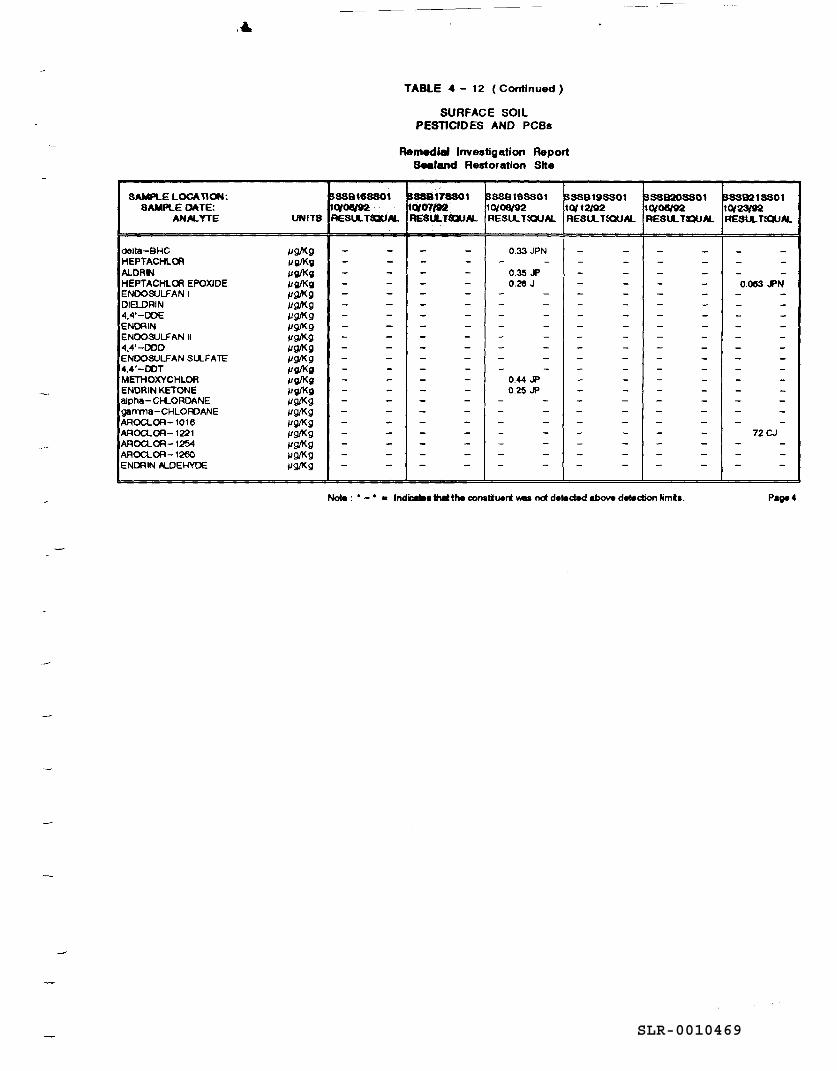
SLR-0010469
SAMPLE LOCATION: SAMPLE DATE:
ANALYTE UNITS
oetta-BHC µg/Kg HEPTACHLa\ µg/Kg ALDRIN µg/Kg HEPTACHLa\ EPOXIDE µg/Kg ENOOSULFAN I µg/Kg 018-DRIN µg/Kg <l,<1'-DOE µg/Kg ENDA IN µg/Kg ENOOSULFAN II µg/Kg <l,<l'-DOD µg/Kg ENOOSULFAN SLLFATE µg/Kg 4,4'-00T µg/Kg METHOXYCHLOR µg/Kg ENDRIN KETONE µg/Kg alpha-CH..ORDANE µg/Kg garrma-CHLOFVANE µg/Kg AROCLOR-1016 µg/Kg AROCLOR-1221 µg/Kg AROCLOR- 1254' µg/Kg AROCLOR-1260 µg/Kg ENORIN -"LOEHYDE µg/Kg
8SSBtCS880t
'°'oetsta RESLLTQJM.
- -- -- -- -- -- -- -- -- -- -- -- -- -- -- -- -- -- -- -- -- -
TABLE 4 - 12 (Continued)
SURFACE SOIL PESTICIDES AND PCBs
Remedial Investigation Report Sealand Restoration Site
SS8Bl7880t $SSB18SS01 1$SSB1stSS01 'Q/07/92 10/08(92 10/12192 RESUL TtlQUN... RESU.. T{QUN... RESU..T{QUAL
- - 0.33 JPN - -- - - - - -- - 0.35 ... - -- - 0.2e J - -- - - - - -- - - - - -- - - - - -- - - - - -- - - - - -- - - - - -- - - - - -- - - - - -- - 0.4" JP - -- - 0.25 JP - -- - - - - -- - - - - -- - - - - -- - - - - -- - - - - -- - - - - -- - - - - -
SSSB208801 10I08192 RESLL TtQUAL
- -- -- -- -- -- -- -- -- -- -- -- -- -- -- -- -- -- -- -- -- -
Nol8: ' - • = lndic.lltsl*the c:onatiuenl - nd detect.d above detection limb.
sss921sso1 10/23'02 RESU. TfQUAI..
- -- -- -0.083 .J>N
- -- -- -- -- -- -- -- -- -- -- -- -- -
72 CJ - -- -- -
Page4
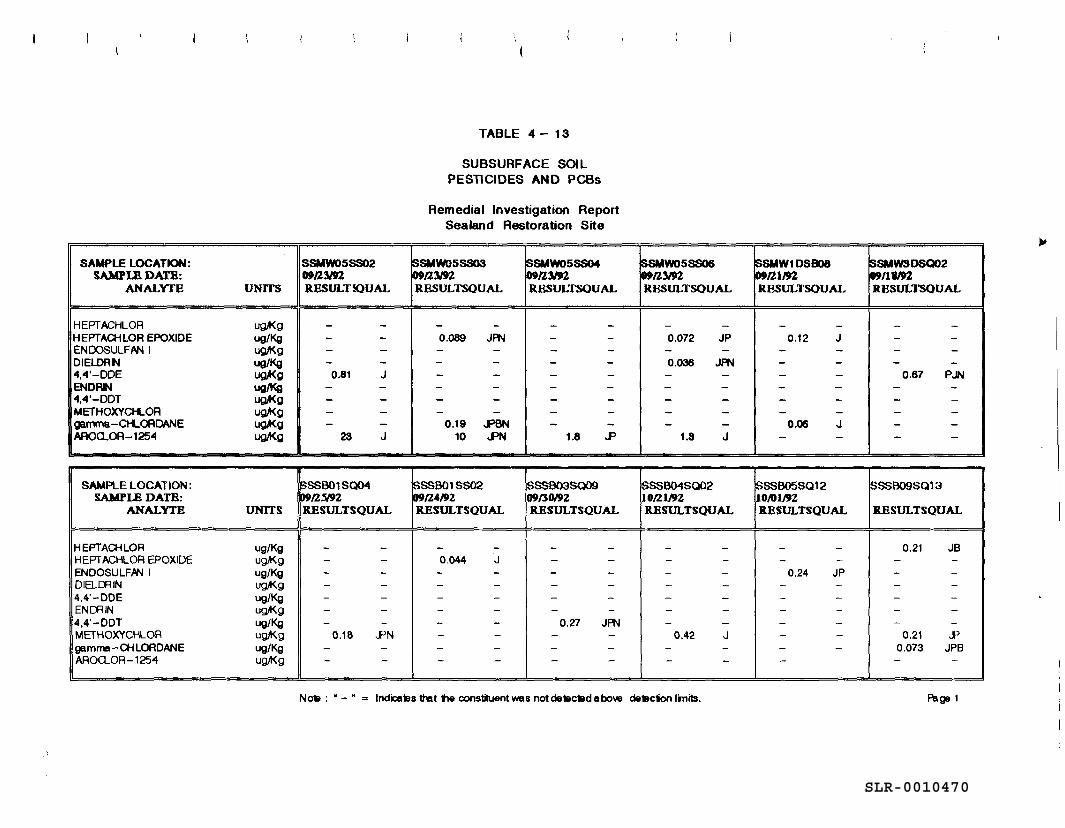
SLR-0010470
SAMPLE LOCATION: SAMPLB DATB:
ANALYfE UNITS
HEPTACHLOA ugft(g HEPTACHLOR EPOXIDE ug/Kg ENOOSULFAN I ugft(g DIELDRN ug/Kg 4,4'-DDE ug,4(g END RN ug/Kg 4,41'-DDT ug,4(g METHOXYCHLOR ug,4(g gamma-CHLORDANE ug,4(g AROO..OR-1254 ug,4(g
SAMPLE LOCATION: SAMPLE DATB:
ANALYTE UNITS
HEPTACHLOR ug/Kg HEPTACHLOA EPOXIDE ugft(g ENDOSULF>N I ug/Kg 018...ffilN ugft(g 4,4'-DDE ug/Kg ENffilN ugft(g 4,4'-DDT ug/Kg METHOXYCHLOR ug,Kg gamma-CHLORDANE ug/Kg AAOO..OR-1254 ug,Kg
SSM'M>5SS02 09fl3J92 RBSULT!OUAL
- -- -- -- -
0.81 J - -- -- -- -
23 J
SSSBOlSQCM 1)911.S/92 RESULTSQUAL
- -- -- -- -- -- -- -
0.18 ..PN - -- -
TABLE 4 - 13
SUBSURFACE SOIL PESTICIDES AND PCBs
Remedial Investigation Report Sealand Restoration Site
$SMW05SS03 $SMW05SS04 i09fl3J92 I09fl3192 RBSULTSOUAL RBSULTSOUAL
- - - -0.089 JPN - -- - - -- - - -- - - -- - - -- - - -- - - -
0.19 ..PBN - -10 ..PN 1.8 ..P
SSSB01SS02 SSSB03SQ09 0911.4/92 09/30/92 RESULTSQUAL RESULTSQUAL
- - - -0.044 J - -- - - -- - - -- - - -- - - -- - 0.27 JPN - - - -- - - -- - - -
$SMW05SS06 IOJ!l3J92 RBSULTSQUAL
- -0.072 JP - -0.036 JPN - -- -- -- -- -
1.3 J
SSSB04'SQ02 1011.1192 RESULTSQUAL
- -- -- -- -- -- -- -
0.42 J - -- -
Noa : • - " = lndi::ates ttet tie constituent was not detected a bow detecion lrnits.
SSMW1DSB08 SSMW3DSQ02 IOJ/21192 09/11192 RBSULTSOUAL RESULTSQUAL
- - - -0.12 J - -
- - - -- - - -- - 0.67 PJN - - - -- - - -- - - -
0.06 J - -- - - -
~SSB05SQ12 SSSB09SQ13 10/01192 RBSULTSQUAL RESULTSQUAL
- - 0.21 JB - - - -
0.24 JP - -- - - -- - - -- - - -- - - -- - 0.21 ..P - - 0.073 JPB - - -
Page 1
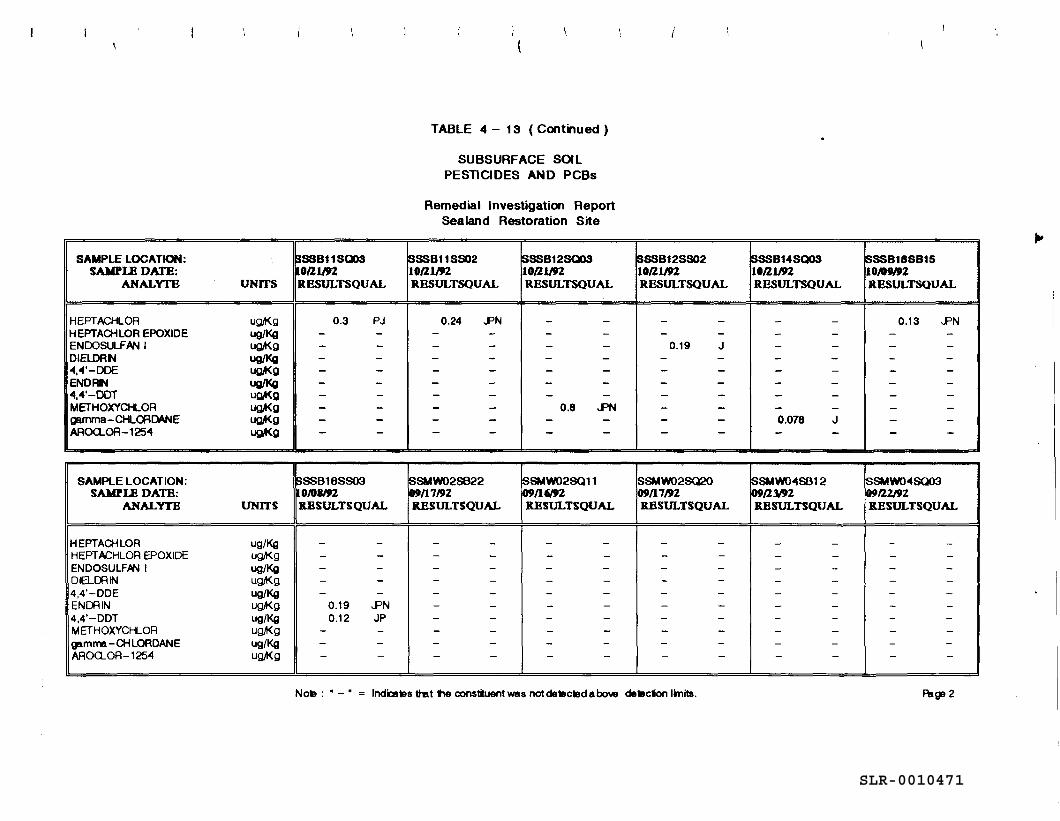
SLR-0010471
SAMPLE LOCATION: SAMPI.E DATE:
ANALYfB UNITS
HEPTACHLOR ug,Kg HEPTACHLOR EPOXIDE ug/Kg ENOOSULFAN I ug,Kg DIELDRN ug/Kg "4,"4'-DDE ug,4<g ENDRfll ug/Kg "4,"4'-DDT ug,Kg METHOXYCHLOR ug,Kg gamma-CHLORDANE ug,4<g AROO..OA-125"4 ug.4(g
SAMPLE LOCATION: SAMPLE DATB:
ANALYTB UNITS
HEPTACHLOR ug/Kg HEPTACHLOR EPOXIDE ug,Kg ENDOSULFPN I ug/Kg DIELOOIN ug,Kg 4,4'-DDE ug/Kg ENOOIN ug,Kg 4,4'-DDT ug/Kg METHOXYCHLOR ug,Kg gamm11 -CHLORDANE ug/Kg AROQOA-1254 ug,Kg
$SSB11SQ03
••lll.J92 llESULTSQUAL
0.3 PJ - -- -- -- -- -- -- -- -- -
SSSB16SS03 l0/01192 llESULTSQUAL
- -- -- -- -- -
0.19 JPN 0.12 JP
- -- -- -
I
(
TABLE 4 - 13 (Continued)
SUBSURFACE SOIL PESTICIDES AND PCBs
Remedial Investigation Report Sealand Restoration Site
SSSB11SS02 SSSB12SQ03 10/lJ.Jt2 10/lJ.Jt2 RESULTSQUAL RESULTSQUAL
0.24 JPN - -- - - -- - - -- - - -- - - -- - - -- - - -- - 0.8 JPN - - - -- - - -
ISSMW02SB22 ISSMW02SQ11 f)IJ/17192 !09/16192 llESULTSQUAL llESULTSQUAL
- - - -- - - -- - - -- - - -- - - -- - - -- - - -- - - -- - - -- - - -
ISSSB12SS02 10/l1J92 RBSULTSQUAL
- -- -
0.19 J - -- -- -- -- -- -- -
ISSMW02SQ20 f)IJfl 7192 llESULTSQUAL
- -- -- -- -- -- -- -- -- -- -
Noe : • - • = Indicates ltllt tle consliuent was not detected a bow detec•on linits.
SSSB14SQ03 ISSSB18SB15 10/l1J92 10/0"'2 RBSULTSQUAL llBSULTSQUAL
- - 0.13 JPN - - - -- - - -- - - -- - - -- - - -- - - -- - - -0.078 J - -- - - -
SSMW0"4SB12 ISSMW04SQ03 f)l)fll/92 ~11.ZRZ B.ESULTSQUAL KESULTSQUAL
- - - -- - - -- - - -- - - -- - - -- - - -- - - -- - - -- - - -- - - -
Page 2
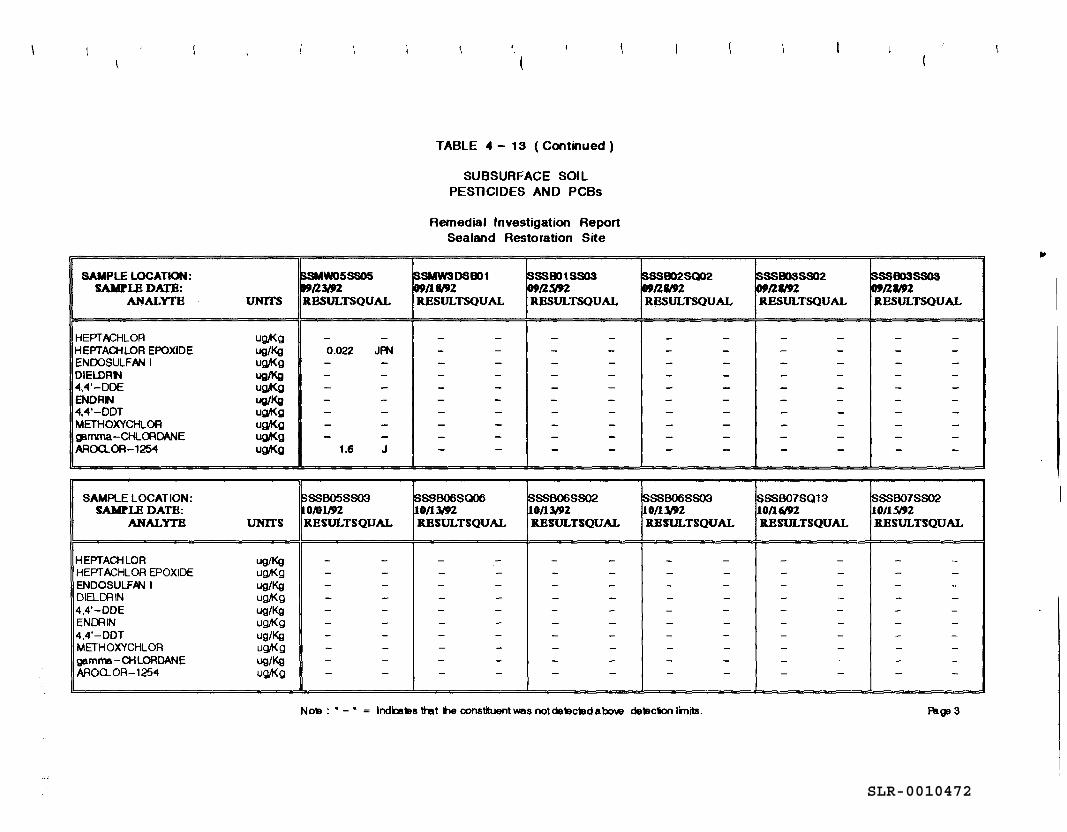
SLR-0010472
SAMPLE LOCATION: SAMPLB DA.TB:
ANALYfB UNITS
HEPTACHLOR ug,it<g HEPTAOiLOR EPOXIDE ug/Kg ENOOSULFMI I ug,it<g DIELDRN ug/Kg 4,4'-DDE ug,it<g END RN ug/Kg 4,4'-DDT ug,it<g METHOXYCHLOR ug,it<g gamma-CHLOODANE ug..Kg AROQOR-1254 ug,it<g
SAMPLE LOCATION: SAMPLE DATE:
ANALYTE UNITS
HEPTAOiLOR ug/Kg HEPTACHLOR EPOXIDE ug,it<g ENDOSULF~ I ug/Kg DIEL.CAIN ug,it<g 4,4'-DDE ug/Kg ENCAIN ug,it<g 4,4'-DDT ug/Kg METHOXYCHLOR ug,Kg gamrtwl-OiLORDANE ug/Kg AROQOR-1254 ugft(g
$SM\\'05SS05 .,/Zlt'n R.BSULTSOUAL
- -0.022 JPN - -- -- -- -- -- -- -
1.6 J
SSSB05SS03 l0/0IJ92 RESULTSQUAL
- -- -- -- -- -- -- -- -- -- -
TABLE 4 - 13 (Continued )
SUBSURFACE SOIL PESTICIDES AND PCBs
Remedial Investigation Report Sealand Restoration Site
ISSMWSOSBOt ISSSBO 1 SS03 •111192 •a~ RESULTSOUAL RESULTSOUAL
- - - -- - - -- - - -- - - -- - - -- - - -- - - -- - - -- - - -- - - -
SSSB06SQ06 SSSB06SS02 10/13192 10/13192 ltESULTSQUAL ltESULTSQUAL
- - - -- - - -- - - -- - - -- - - -- - - -- - - -- - - -- - - -- - - -
ISSS002SQ02 •a1tn RESULTSQUAL
- -- -- -- -- -- -- -- -- -- -
SSSB06SS03 10/IJIPZ ltESULTSQUAL
- -- -- -- -- -- -- -- -- -- -
No& : • - • = lndica•s ht ht constituent was notde'9c'8dabow de'8cion limits.
SSSBOSSS02 SSSB03SSOS f)Jfll"2 flf!llll2 RESULTSQUAL JlBSULTSOUAL
- - - -- - - -- - - -- - - -- - - -- - - -- - - -- - - -- - - -- - - -
SSSB07SQ13 SSSB07SS02 10/lflJZ 10/l.S/92 ltESULTSQUAL ltESULTSQUAL
- - - -- - - -- - - -- - - -- - - -- - - -- - - -- - - -- - - -- - - -
Page 3
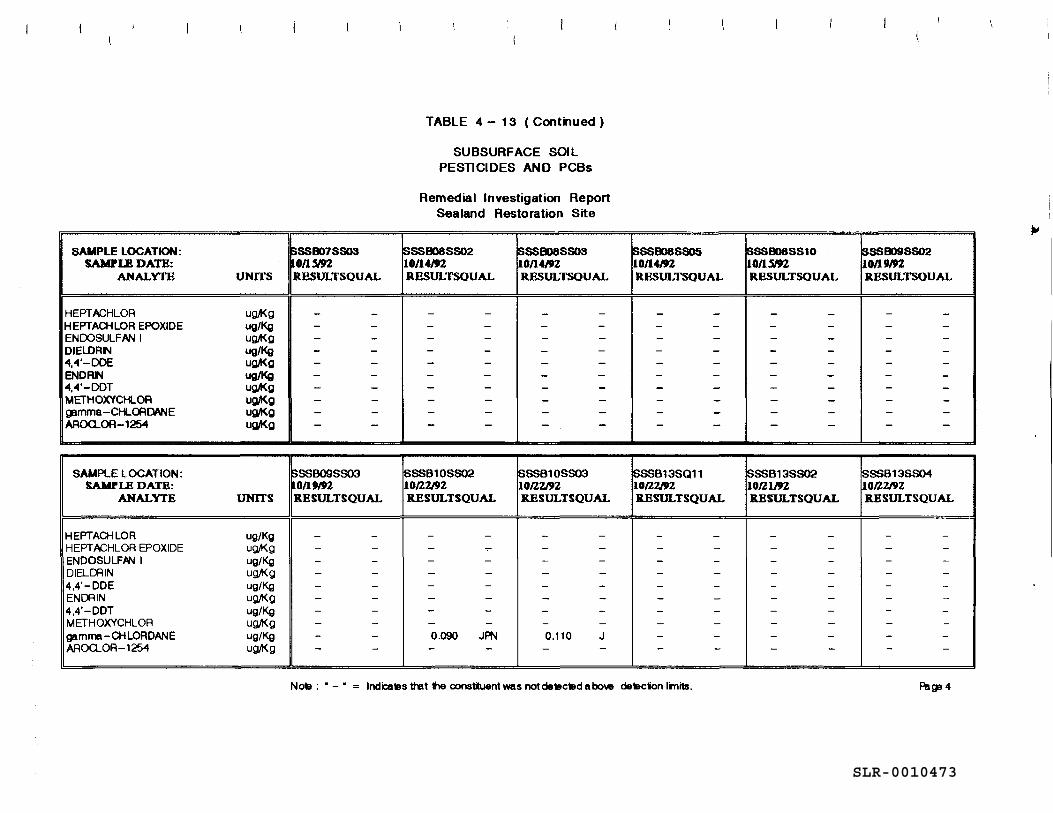
SLR-0010473
SAMPLE LOCATION: SAMPLE DATE:
ANALYfB UNITS
HEPTACHLOR ugft<g HEPTACHLOR EPOXIDE ug/Kg ENOOSULFAN I ug,ot<g DIELDRN ug/Kg 4,""'-DDE ug,4<g END RN ug/Kg 4,4'-DDT ug,4<g METHOXYCHLOA ug,4<g gamma-CHLORDANE ug,4(g AROQ.OA-1254 ug,4<g
SAMPLE LOCATION: SAM!'IE DATE:
ANALYTE UNITS
HEPTACHLOR ug/Kg HEPTACHLOR EPOXIDE ugft<g ENDOSULFPN I ug/Kg DIELDRIN ugft<g 4,4'-DDE ug/Kg ENDRIN ugft<g 4,4'-DDT ug/Kg METHOXYCHLOR ugft<g gamma-CHLORDANE ug/Kg AROQOR-1254 ugft<g
SSSB07SS03 l0/1"92 JtBSULTSOUAL
- -- -- -- -- -- -- -- -- -- -
SSSB09SS03 1011"'2 RESULTSQUAL
- -- -- -- -- -- -- -- -- -- -
TABLE 4 - 13 (Continued)
SUBSURFACE SOIL PESTICIDES AND PCBs
Remedial Investigation Report Sealand Restoration Site
ISSSB08SS02 SSSB08SS03 10/14192 10/14192 RBSULTSQUAL RBSULTSOUAL
- - - -- - - -- - - -- - - -- - - -- - - -- - - -- - - -- - - -- - - -
ISSSB10SS02 ISSSB10SS03 10/Z7J92 10/Z7J92 RESULTSQUAL RESULTSQUAL
- - - -- - - -- - - -- - - -- - - -- - - -- - - -- - - -0.090 JPN 0.110 J - - - -
SSSB08SS05 10/14192 ltBSULTSOUAL
- -- -- -- -- -- -- -- -- -- -
$SSB13SQ11 10/Z7J9Z RESULTSQUAL
- -- -- -- -- -- -- -- -- -- -
Noe : • - • = lndica1Els ttet fie constluent was not deac1Eld a bow de1Elcion linits.
asseoess10 ISSSB09SS02 1011.5192 11011"'2 JtBSULTSOUAL RBSULTSOUAL
- - - -- - - -- - - -- - - -- - - -- - - -- - - -- - - -- - - -- - - -
~SSB13SS02 ISSSB 13880-4 10/Zl192 ilO/ZZ/92 RESULTSQUAL RESULTSQUAL
- - - -- - - -- - - -- - - -- - - -- - - -- - - -- - - -- - - -- - - -
Page 4

SLR-0010474
SAMPLE LOCATION: SAMPIB DATB:
ANALYfB UNITS
HEPTACHLOR ug/r(g HEPTACHLOR EPOXIDE ug/Kg ENDOSULFMI I ug/r(g DIELDRN ug/Kg 4,4'-DDE ug,t(g ENDRf.I ug/Kg 4,4'-DDT ug/r(g METHOXYCHLOR ug,t<g gemma-CHLOODANE ug/r(g AAOQOR-1254 ug/r(g
SAMPLE LOCATION: SAMPIB DATE:
ANALYTE UNITS
HEPTACHLOR ug/Kg HEPT ACHLOR EPOXIDE ug/r(g ENDOSULF,6N I ug/Kg DlaCfHN ug/r(g 4.4'-DDE ug/Kg ENCAIN ug/r(g 4,4'-DDT ug/Kg METHOXYCHLOR ug/r(g gamma-CHLORDANE ug/Kg AAOQOA-1254 ug/r(g
SSSB14SS02 lolltm ltf.SULTSOUAL
- -- -- -- -- -- -- -- -- -- -
SSSB16S009 lOl'lflPZ RBSULTSQUAL
- -- -- -- -- -- -- -- -- -- -
TABLE 4 - 13 ( Continued )
SUBSURFACE SOIL PESTICIDES AND PCBs
Remedial Investigation Report Sealand Restoration Site
SSSB15SB10 ISSSB15SQ05 lOl'ISIJZ lOl'ISIJZ RESULTSQUAL RESULTSQUAL
- - - -- - - -- - - -- - - -- - - -- - - -- - - -- - - -- - - -- - - -
SSSB16SQOO SSSB16SS02 101'16192 101'16/92 KES:ULTSQUAL KES:ULTSQUAL
- - - -- ~ - -- - - -- - - -- - - -- - - -- - - -- - - -- - - -- - - -
ISSSB15SS02 lOl'IS/tZ RESULTSOUAL
- -- -- -- -- -- -- -- -- -- -
SSSB16SS03 10J0"'2 KESULTSQUAL
- -- -- -- -- -- -- -- -- -- -
Noa : • - • = lndicatBs tl'llt Ile constituent was notdeacad abo.,. detBcton linits.
SSSB15SS03 SSSB15SS04 101'1SIJZ 10/0.wl RESULTSOUAL RESULTSOUAL
- - - -- - - -- - - -- - - -- - - -- - - -- - - -- - - -- - - -- - - -
SSSB16SS05 SSSB17SB12 10J0"'2 101'11192 R.HSULTSQUAL R.HSULTSQUAL
- - - -- - - -- - - -- - - -- - - -- - - -- - - -- - - -- - - -- - - -
Paga 5
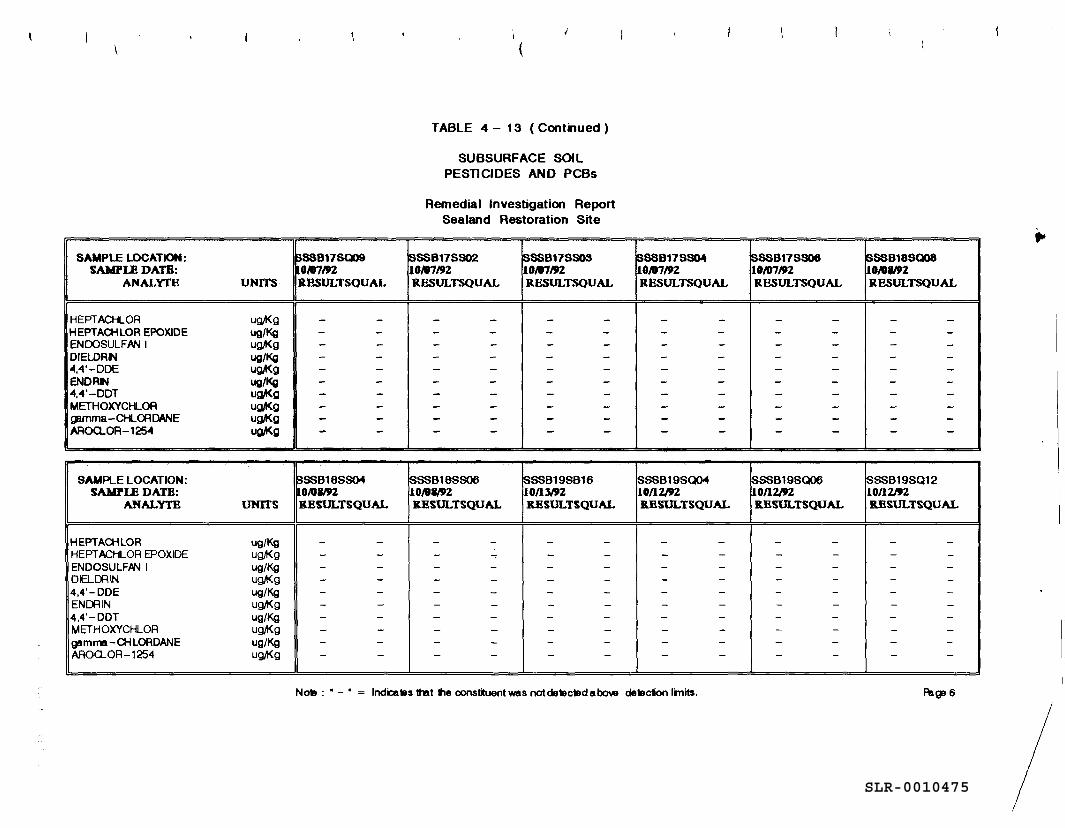
SLR-0010475
SAMPLE LOCATION: SAMrLE DATB:
ANALYfE UNITS
HEPTACHLOA uQ/l(g HEPTACHLOR EPOXIDE ug/Kg ENOOSULFAN I uQ/l(g OIELDRN ug/Kg "'1,"'1'-DDE ug,4(g END RN ug/Kg "'1,4'-DDT ug,4(g METHOXYCHLOR ug,4(g gemrna-CH...a=u:lANE uQ/l(g .AROQ.OR-125"'1 uQ/l(g
SAMPLE LOCATION: SAMPLE DATB:
ANALYTE mars
HEPTACHLOR ug/Kg HEPT ACHLOA EPOXIDE ugft<g ENDOSULF.AN I ug/Kg DIELOOIN uQ/l(g 4,4'-DDE ug/Kg ENOOIN ugft<g 4,4'-DDT ug/Kg METHOXYCHLOA ugft<g gam1111'1-CHLORDANE ug/Kg AAOQ.OR-1254 ugft<g
SSSB17SQ09 l0/07"2 llBSULTSOUAL
- -- -- -- -- -- -- -- -- -- -
SSSB18SS04 l0/01192 llESULTSQUAL
- -- -- -- -- -- -- -- -- -- -
I
(
TABLE 4 - 13 (Continued)
SUBSURFACE SOIL PESTICIDES AND PCBs
Remedial Investigation Report Sealand Restoration Site
ISSSB17SS02 SSSB17SS03 18/07/f2 10/07"2 RBSULTSQUAL JtBSULTSQUAL
- - - -- - - -- - - -- - - -- - - -- - - -- - - -- - - -- - - -- - - -
SSSB18SS06 ISSSB19SB16 l0/01/92 l0/ll"2 llESULTSQUAL llESULTSQUAL
- - - -- ...,. - -- - - -- - - -- - - -- - - -- - - -- - - -- - - -- - - -
8SSB17SS04 10/07"2 RESULTSOUAL
- -- -- -- -- -- -- -- -- -- -
ISSSB 19SQOo4 10/12"2 IIBSULTSQUAL
- -- -- -- -- -- -- -- -- -- -
Nota: • - ' = lndk:ates lttlt tie constituent was notde'9c'9dabow de'9cton linits.
SSSB17SS06 SSS818SQ08 10/07"2 10/0"'2 RESULTSOUAL RESULTSOUAL
- - - -- - - -- - - -- - - -- - - -- - - -- - - -- - - -- - - -- - - -
SSSB19SQ06 SSSB19SQ12 10/12"2 10/12"2 IIBSULTSQUAL JlESULTSQUAL
- - - -- - - -- - - -- - - -- - - -- - - -- - - -- - - -- - - -- - - -
Page 6
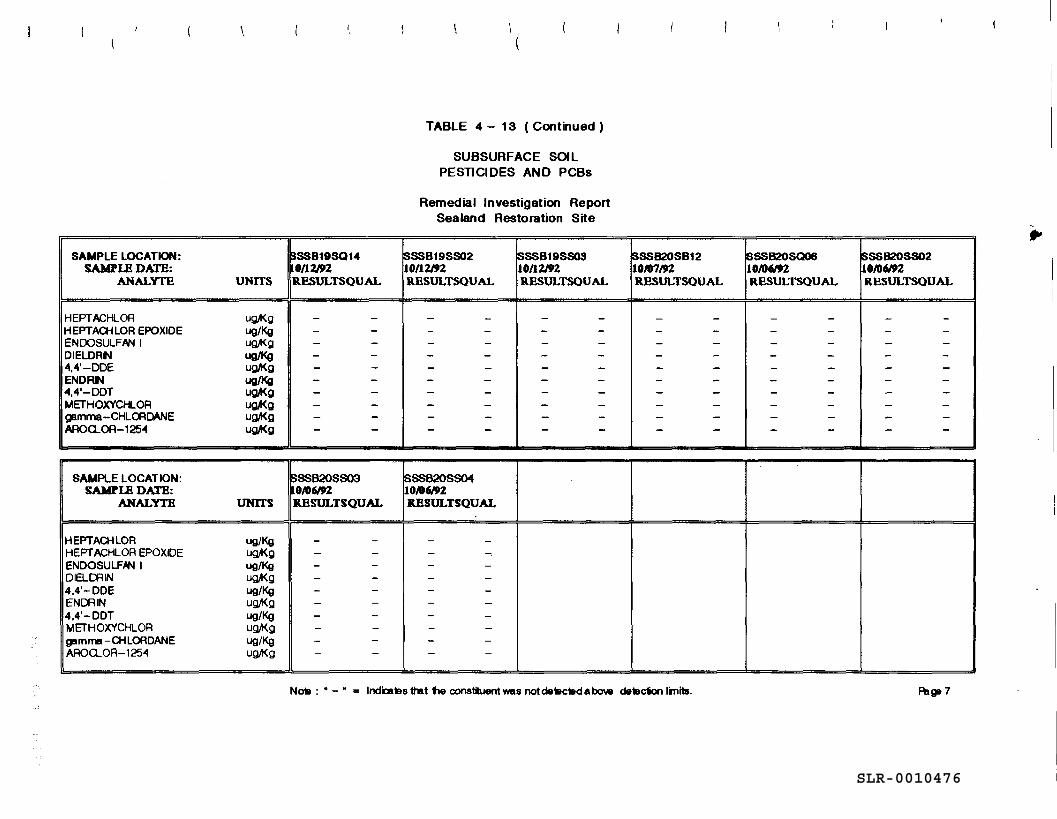
SLR-0010476
SAMPLE LOCATION: SAMPLE DATE:
ANALYfE UNITS
HEPTACHLOR ug,Kg HEPTACHLOR EPOXIDE ug/Kg ENDOSULFAN I ug,Kg DIELDRN ug/Kg 4,4'-DDE u~g ENDRIN ug/Kg 4,4'-DDT u~g METHOXYCHLOR u~g gamma-CHLOODANE ug,Kg AROQOR-1254 ~g
SAMPLE LOCATION: SAMPLE DATE:
ANALYTH UNITS
HEPTACHLOR ug/Kg HEPT ACHLOR EPOXIDE ug,Kg ENDOSULFA'll I ug/Kg DlaCfllN ug,Kg 4,4'-DDE ug/Kg ENOOIN ug,Kg 4,4'-DDT ug/Kg METHOXYCHLOR ug,Kg gamma -CH LOADANE ug/Kg AROQOR-1254 ug,Kg
SSSB19SQ14 0/12/JZ R.ESULTSOUAL
- -- -- -- -- -- -- -- -- -- -
~SSB20SS03 l0/06.192 RESULTSQUAL
- -- -- -- -- -- -- -- -- -- -
\ (
TABLE 4 - 13 (Continued )
SUBSURFACE SOIL PESTICIDES AND PCBs
Remedial Investigation Report Sealand Restoration Site
ISSSB19SS02 SSS819SS03 10/12192 10112192 llBSULTSOUAL llESULTSQUAL
- - - -- - - -- - - -- - - -- - - -- - - -- - - -- - - -- - - -- - - -
SSSB20SS0'4 10/06192 llESULTSQUAL
- -- ...., - -- -- -- -- -- -- -- -
ISSSB20SB12 10/07192 RESULTSOUAL
- -- -- -- -- -- -- -- -- -- -
No9 : • - • = Indicates th!lt he constituent was not detactad a bow det&cton linits.
SSSB20SQ06 iSSSB20SS02 10/06192 '10/06192 RESULTSOUAL llESULTSOUAL
- - - -- - - -- - - -- - - -- - - -- - - -- - - -- - - -- - - -- - - -
Paga 7
SLR-0010477
DDT (9 samples) and heptachlor (8 samples). The majority of the pesticide contamination was
present within the zero to 2-foot interval. The highest pesticide concentrations were present in
the drum storage area, at locations HB-03 and HB-04.
It is not unexpected that pesticides would be present at the SRI site since the area has been used
for agricultural purposes in the past. The detected pesticides are very persistent in the
environment and concentrations would be present in soils for many years after application.
Based on site history, pesticides were not known to have been disposed at the site as part of
normal disposal operations.
Four PCB compounds were detected in 6 separate surface (i.e., zero to 3 feet) soil samples.
Aroclor-1254 was detected in the most samples (i.e., 3) in concentrations ranging from 5.4 µg/kg
to 22 µg/kg. Only boring locations SB-01 (13 pg/kg), MW-03D (22 µg/kg), and MW-05S (5.4
µg/kg) exhibited detected concentrations of aroclor-1254. In addition, aroclor-1221 (SB-21 at 72
µg/kg), aroclor-1260 (SB-06 at 29 µg/kg) and aroclor-1016 (MW-OlD at 1.6 µg/kg) were
detected in the soils at the SRI site.
No pesticides or PCBs exceeded their respective NYSDEC "soil cleanup objective levels."
Inorganic Analytes. In order to assess site-related inorganic contamination, the soil samples
were compared against the results of the two background soil borings (i.e., HB-01 and MW-010).
This comparison was used to determine if the concentrations of inorganic analytes detected in
the soil samples were elevated above naturally occurring background concentrations indigenous
to the area. Table 4-16 presents the inorganic data collected from soil sample locations HB-01
and MW-OlD.
Twenty of the 24 inorganic constituents analyzed for were detected in concentrations above
background levels. The only constituents not detected above background levels were cadmium,
selenium, thorium, and cyanide (see Tables 4-14 and 4-15).
The two most predominant inorganic constituents detected were calcium and magnesium. This
is expected due to the dolomitic bedrock subsurface environment which is composed mostly of
(Ca,Mg) C03.
The sample location which exhibited the highest number of elevated constituents above
background (i.e., 8) in the surface soils (zero to 3 feet) was MW-OlD. In addition, three
EDIS/ENG/ay07 l 494.rp4 4-52
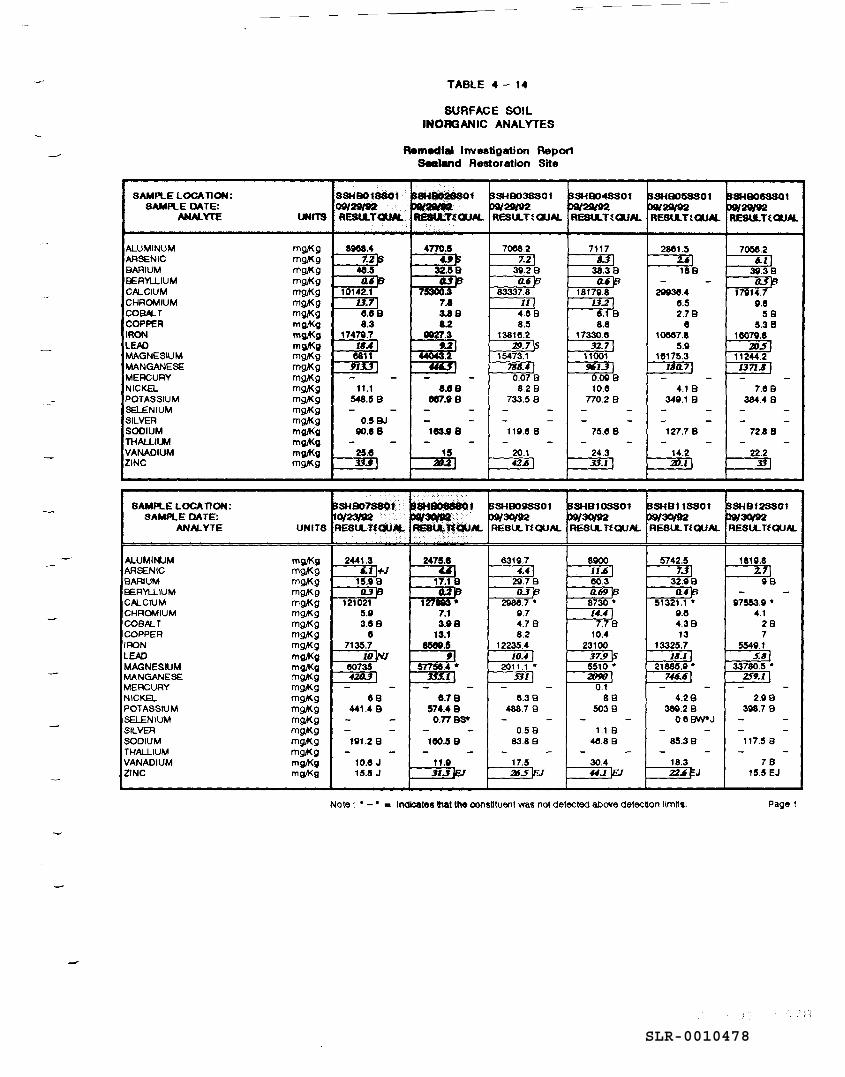
SLR-0010478
SAMPLE LOCATION: SAMPLE DATE:
ANALYTE lMrTS
ALUMINUM mg.Kg ARSENIC mg.Kg BARIUM mg.Kg BERYLLIUM mg.Kg CALCIUM mg.Kg CHROMIUM mg.Kg COB.6LT mg.Kg COPPER mg.<Kg IRON mg,.t<g LfllD mg.<Kg MAGNESIUM mg,Kg MANGANESE mg.Kg MERCURY mg.Kg NICKE... mg,l(g POTASSIUM mg.Kg SELENIUM mg.Kg SILVER mg.Kg SODIUM mg.<l<g THALLll.M mg,.t(g VANADIUM mg.<Kg ZINC mg,l(g
SAMPLE LOCATION: SAMPLE DA TE:
ANALYTE UNITS
Al.UMIN.JM mg.<l<g ARSENIC mg.Kg BARIUM mg.Kg BERYLLIUM mg,l(g CALCIUM mg.Kg CHROMIUM mg.Kg COBALT mg.Kg COPPER mg,l(g IRON mg.Kg LEAD mg.<l<g MAGNESIUM mg.<l<g MANGANESE mg.Kg MERCURY mg.Kg NICKB.. mg,Kg POTASSIUM mg.Kg SELENIUM mg.Kg SILVER mg.Kg SODIUM mg.Kg THALLIUM mg.Kg VANADIUM mg,1(g ZINC mg.<Kg
TABLE 4 - 14
SURFACE SOIL INORGANIC ANAL YTES
Remedial Investigation Report Sealand Restoration Site
SSH901880f ll8HEIQ2"801 $SH903SS01 SSH9048801 00/29/ft PQ/~ 09/29192 RESU..TQUM.. RE!i8tLTfQUAL Resu.nauAL. RESll. T~ QUA&..
8QGll.4 4770.5 7oe8.2 7117 7.21.S ... ~ 7.21 u1
48.5 32.59 3g_29 38.3 8 0.6 J;J 43 J;J 0.6IB 0.618
10142.1 70300.3 83337.8 1811g.8 13.11 7.8 11 I 13.21 8.89 3.89 4.88 8.1 8 8.3 8.2 8.5 8.8
17479.7 11927.3 138H!.2 17330.G 16..41 f.ZI 29.7 IS n.11
8811 ""°43.2 15473.1 11001 913.J ~· 78&.4 I JitU.J I - - - - O.o7 9 O.OG 9
11.1 8.89 8.2 8 10.8 548.5 9 887.t B 733.5 9 no.2 e - - - - - - - -
0.59J - - - - - -90.8 B Ul3.t B 11g.e B 75.8 B
- - - - - - - -25.8 15 20.1 24.3 31.f I 20..21 42-41 .n.11
IJSHB07S801 p9f80eseot ~SHeogsso1 BSHB10S801 ~O/~ ~" ~" .. -:·:··:. ~30l92 l>0/30l92 RESLl. TfQUM.. RE8ll.1tQU~ RESLl. TfQUAL RESLl. TfQUAL
2441.3 2475.1 631g_7 8900 6.1 J UI f.41 JUI
15.9 9 17.1 9 29.79 80.3 11..JIB O.ZIB IUIB 0.69 IB
121021 1ZTW;s. 298e.7. 8730. 5.G 7.1 g_7 14..41 3.89 3.99 4.7 9 7.7 8
8 13.1 8.2 10.4 7135.7 8588.5 12235.4 23100
10 'l'U " 10.4 I J7.9 L5 80735 57759.4 .. 2011.1 • 5510. 420.J I :nil I 5111 .2r1!IO I
- - - - - - 0.1 88 8.79 8.39 89
441.4 0 574.4 9 488.7 9 5039 - - o.nese - - - -- - - - 0.5 9 1.1 9
1g1 .2 8 180.5 8 83.8 9 48.8 9 - - - - - - - -
10.8 J 11.0 17.5 30.4 15.5 J 31.J IBJ 26.5 IEJ 44.11FJ
$SHB058801 b9129192 RESU.. n WAL
2881.5 2.61 18 8
- -~-4
8.5 2.78
8 10GG7.8
5.9 18175.3
180.71 - -
4.1 8 34g_1 9 - -- -
127.7 B - -
14.2 .20.11
PSHBf 18801 pg/3()192 RESLl. TfQUAL
5742.5 7.JI
32.99 0.418
51321.1. g_e 4.39 13
13325.7 111.11
21885.g. 746.61
- -4.20
389.2 9 o.e FJN"J
- -85.39
- -18.3 22.4EJ
Note : • - • .. Indicates that tile oonstttuent was not detected above detectton llmtts.
SSHBOSSS01 09129192 RESU. T t WM..
705e.2 UI ~.38
0.5p 1]g14.7
g_9 58
5.3 B 1801g.8
Z0.51 11244.2 1.371.81 - -
7.88 384.4 9 - -- -
72.8 8 - -
22.2 .Ui
~SHBf2SS01 P9/30l92 RESLl. TfQUAL
131g.8 Z.71
99 - -
g7553_g. 4.1
29 7
554g_1 5.6 I
33780.5. 251J.1 i
- -2.ge
398.7 9 - -- -
117.5 9 - -
78 15.5 EJ
Paget
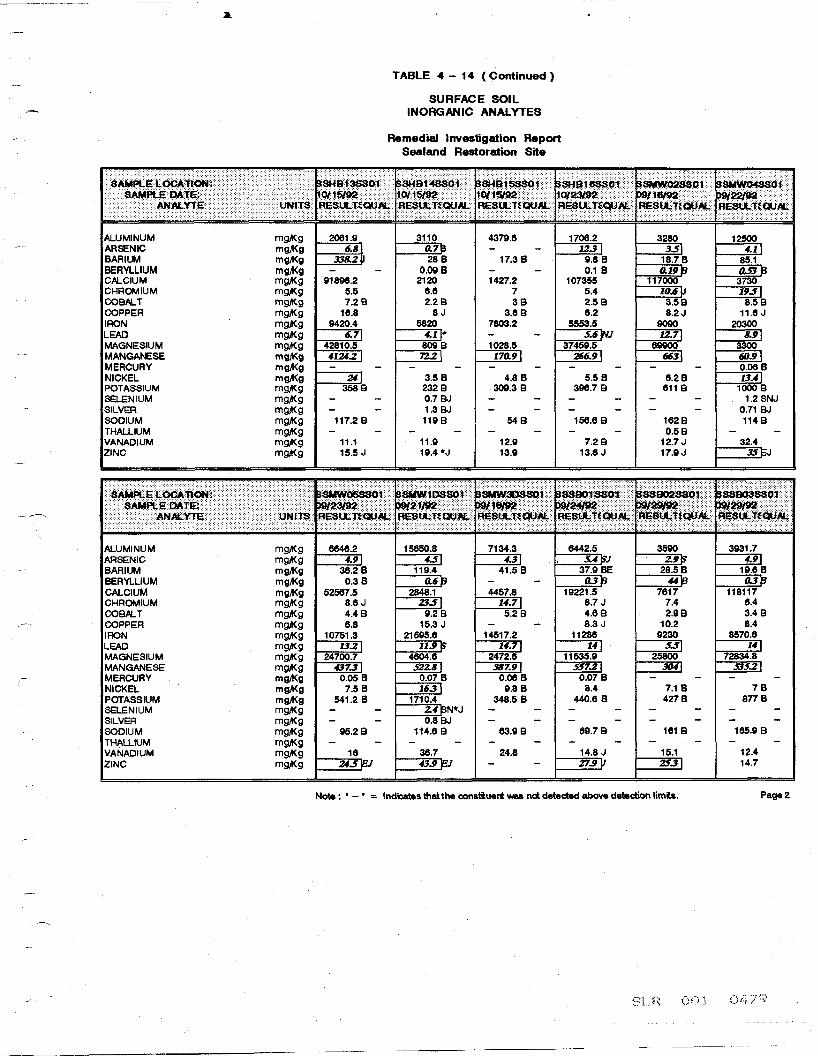
ALUMINUM mg,1(g ARSENIC mgft<g 8ARILM mgft<g BERYLLIUM mgft<g CALCIUM mg,1(g CHROMIUM mg,1(g COBALT mg,1(g COPPER mg,1(g IRON mg,1(g LEAD mg,1(g MAGNESIUM mg,1(g MANGAl'ESE mgft<g MERCURY mgft<g NICKEL mgft<g POTASSIUM mg,1(g SELENIUM mg,1(g SILVER mg,1(g SODIUM mg,1(g THALLIUM mg,1(g VANADIUM mg,1(g ZINC mg,1(g
ALUMINUM mg,1(g ARSENIC mg,1(g 8ARILM mgft<g BERYLLIUM mgiKg CALCIUM mgft<g CHROMIUM mg,1(g COBALT mg,1(g
/--. COPPER mg,1(g IRON mg,1(g LEAD mg,1(g MAGNESIUM mg,1(g MANGANESE mg,1(g MERCURY mgft<g NICKEL mgft<g POTASSIUM mgft<g SELENIUM mg,1(g SILVER mg,1(g SODIUM mg,1(g THALLIUM mg,Kg VANADIUM mg,1(g ZINC mg,1(g
2061.9 6.81
338.Zll
91898.2 5.5 7.28
18.8 9420.4
6.71 42810.5 4124.Z I
241 3588
117.2 8
11.1 15.5 J
6646.2 4.91
36.2 8 0.38
52567.5 8.6J 4.48 6.8
10751.3 13.ZI
24700.7 437.31
0.05 B 7.58
541.2 8
95.28
18 24.S~
TABLE 4 - 14 (Continued)
SURFACE SOIL INORGANIC ANALYTES
Remedial Investigation Report Sealand Restoration Site
3110 4379.8 0.7B 28 8 17.3 B
0.09 B 2120 1427.2
8.8 7 2.28 38
SJ 3.8 9 5820 7803.2
4..11* 8098 1028.5
72.Z I 170.91
3.5 B 4.8 B 2328 309.3 8 0.7BJ 1.3 BJ 119 9 548
11.9 12.9 19.4 •J 13.9
15650.8 7134.3 4.51 4.31
119.4 41.5 8 0.68
2848.1 4457.8 23.51 14.71
9.2 9 5.29 15.3 J
21595.8 14517.2 11.9 IS' 14.71
4604.6 2472.8 522.81 387.91
O.o7 8 0.08 8 16.3 I 9.88
1710.4 348.5 8 Z.4 rsN•J 0.8BJ
114.8 9 83.9 8
36.7 24.8 43.91BJ
1708.2 3280 12.31 3..51
9.8 8 18.78 0.1 B 0.19B
107355 117000 5.4 10.61.I 2.58 3.58 8.2 8.2J
5553.5 9090 5.6'tlJ 12.71
37459.5 89900 266.91 6631
5.5 8 6.28 396.7 B 811 8
156.6 8 1628 0.58
7.29 12.7 J 13.6 J 17.9J
6442.5 3590 S.4 '51 Z.9'5
37.9 BE 28.58 D.3B #fl
19221.5 7617 8.7 J 7.4 4.6 9 2.98 8.3J 10.2
11286 9230 141 5.51
11535.9 25800 SS7.ZI 30ll
0.07 8 8.4 7.1 B
440.6 8 4278
89.7 9 161 8
14.8 J 15.1 27.9 ZS.31
Note : • - • = Indicates that the constiuert was net detected above detection limits.
12500 4.11
85.1 o..DB 3730 19..:JI
8.58 11.6 J
20300 8.91
3300 60.91 0.088 13..41
1000 9 1.2 SNJ
0.71 BJ 114 9
32.4 35EJ
3931.7 4.91
19.88 0.3B
118117 8.4 3.4 8 8.4
8570.6 141
72834.8 535.ZI
78 877 8
165.9 8
12.4 14.7
Page2
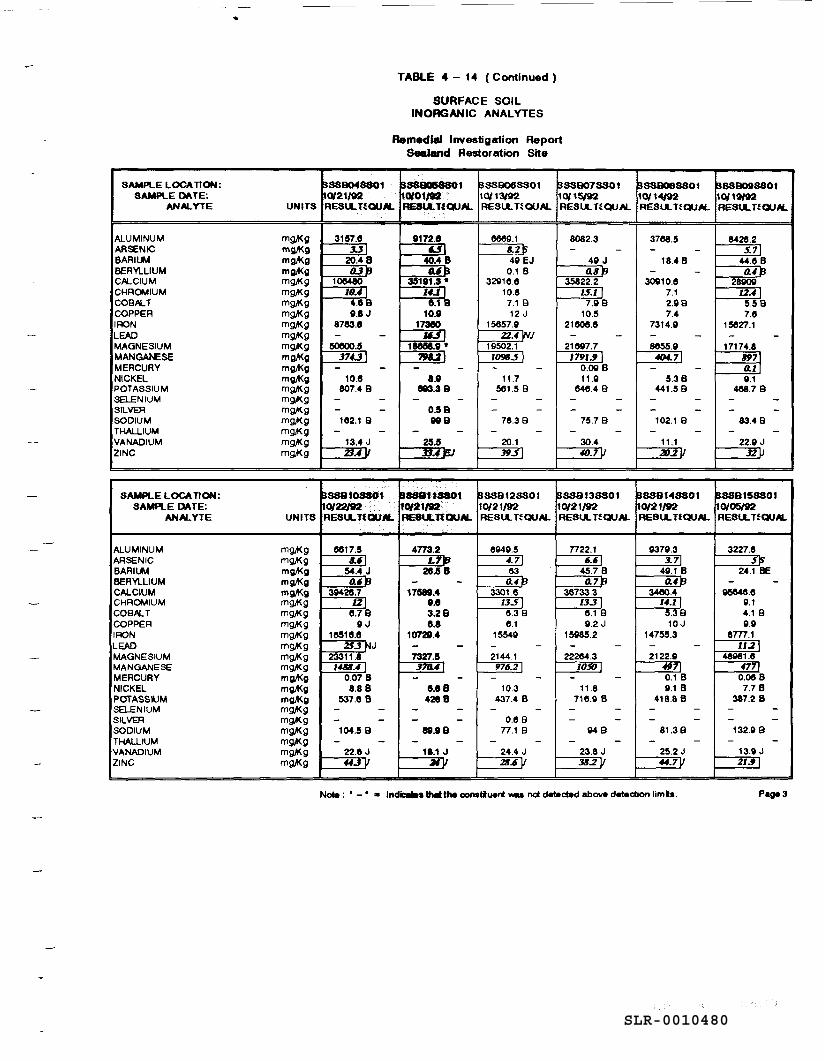
SLR-0010480
SAMPLE LOCATION: SAMPLE DA TE:
ANALYTE UNITS
ALUMINUM mg,+<g ARSENIC m~g BARILM m~g BERYl..LIUM mg,t<g CALCIUM mg,+<g CHROMIUM mg,+<g COBALT mg,+<g COPPER mg,+<g IRON mg,+<g LEAD mg,+<g MAGNESIUM mg,+<g MANGAt£SE mg,t<g MERCURY m~g NICKEL mg,t<g POTASSIUM mg,+<g SELENIUM mg,+<g SILVEl'1 mg,+<g SODIUM mg,+<g THALLIUM mg,+<g VANADIUM mg,+<g ZINC mg,+<g
SAMPLE LOCATION: SAMPLE DATE:
ANALYTE UNITS
ALUMINUM mg,+<g ARSENIC mg,+<g BARILM mg,t(g BERYl..LIUM m~g CALCIUM mg,t<g CHROMIUM mg,+<g COBALT mg,+<g COPPER mg,+<g IRON mg,+<g LEAD mg,+<g MAGNESIUM mg,+<g MANGANESE mg,+<g MERCURY mg,t<g NICKEL mg,t<g POTASSIUM mg,t(g SELENIUM mg,+<g SILVEl'1 mg,+<g SODIUM mg,+<g THALLIUM mg,+<g VANADIUM mg,+<g ZINC mg,+<g
TABLE 4 - 14 (Continued)
SURFACE SOIL INORGANIC ANAL YTES
Remedial Investigation Report Sealand Restoration Site
BSSB048801 "'SSBQl58801 BSSB06SS01 SSSB07SS01 10/21/92 11oto1m 10/13192 10/15192 RESlL TfQUN.. RESUL.TfQUAL RESLt. TfQUAL RESU..TfQUAL
3157.8 0172.0 1!689.1 8082.3 .J..J I U'I 8.215 - -
20.4 B 40.4 B 40 EJ 40 J VB O.IB 0.1 B 48B
1oe480 35101.a. 32018.8 35822.2 10.41 14.J I 10.8 LUI
4.08 0.1 B 7.1 B 7.08 UJ 10.t 12 J 10.5
8783.8 173e0 15657.0 21e<le.8 - - 14.51 22.4 ,,., - -
50e00.5 18858.t. 19502.1 211597.7 3701 79&.ZI 1098..5 1791.9 I - - - - - - 0.00 B
10.8 u 11.7 11.0 807.4 B 893.3 B 581.5 B Me.4 B
- - - - - - - -- - 0.59 - - - -182.1 B IKI B 711.3 B 75.7 B
- - - - - - - -13.4 J 25.5 20.1 30.4 23.4 v 3J.4 ElJ 39..51 40.7
SSSBtOS801 BsSa1tsSot BSSB12SS01 BSSB138801 10/22192 10l211'92 10/21/92 10/21/92 RESU..TfQUN.. RE8lA..UQUAL RESlLTfQUAL RESlL TfQUAL
ef517.5 4"3.2 8040.5 7722.1 &..i L7B 4.71 6.61
54.4 J 28.58 63 45.7 B 46B - - 449 479
30428.7 17589.4 3301.8 36733.3 UI u 13..51 13.31 8.7B 3.29 8.3 B 8.1 B
II J a.a 8.1 0.2 J 16518.a 10729.4 15540 15085.2
25.J fllJ - - - - - -23311.8 7327.5 2144.1 22264.3 14811.4 I JIU.4 I 976.21 1050 I
0.07 B - - - - - -8.8 8 UB 10.3 11.8
537.8 8 4288 437.4 8 718.9 8 - - - - - - - -- - - - 0.8 B - -
104.5 B 88.0B 77.18 04 8 - - - - - - - -
22.SJ 18.1 J 24.4 J 23.8 J 44 .. flT M 211..6 36.2 v
BSSD08SS01 10/1-4192 RESU.. TfQUN..
37«18.5 - -
18.4 B - -
30010.8 7.1 2.08 7.4
7314.0 - -BM5.0
40«.71 - -
5.38 441.5 B
- -- -
102.1 B - -
11.1 20.2V
BSSBt-48801 10/21/92 RESlL TfQUAL
0370.3 3.71
40.1 8 449
34e0.4 14.11 5.38 10 J
14755.3 - -2122.0
4971 0.1 B 0.1 B
418.8 8 - -- -
81.38 - -
25.2 J 44.7
Note : • - • = lndiclaa thlll the conatiuenl - net detea.d above detection limb.
lSSSB098801 10/1~ RESlLTfQIJN..
8428.2 .S:.71
44.8 B 44JJ
28900 12.4 I 5.58 7.8
15827.1 - -
17174.8 8971 411 11.1
4«18.7 B - -- -
83.4 B - -
22.0 J 32lJ
ssse15sso1 10/05'92 AESlL TfQUN...
3227.8 .)L)'
24.1 BE - -
QM48.8 0.1 4.1 B 0.11
sm.1 11.21
48G81.8 4771 0.08 B 7.7 B
387.2 8 - -- -
132.11 8 - -
13.11 J 21..f I
Page3
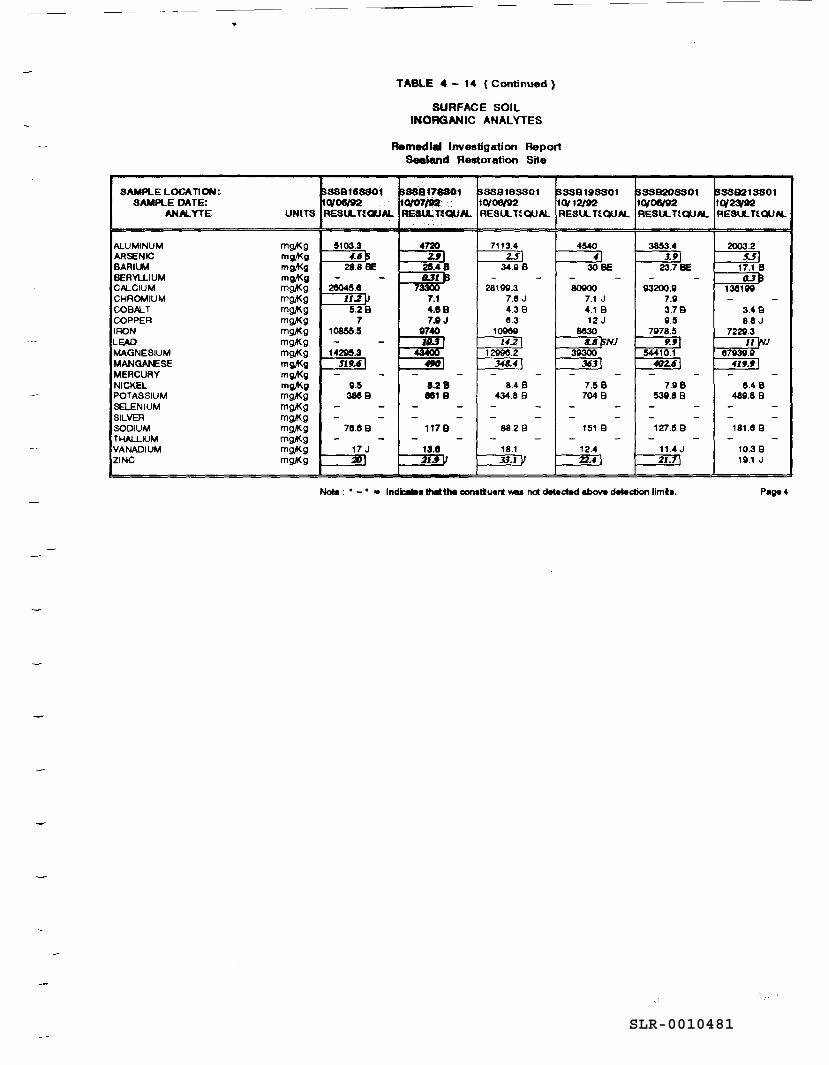
SLR-0010481
SAMPl..E LOCATION: SAMPl..E D.\ TE:
ANALYTE UNITS
ALUMINUM m9J'(g ARSENIC mgft<g BARILM mgft<g BERYLLIUM mgft<g CALCIUM m9J'(g CHROMIUM m9J'(g COBALT m9J'(g COPPER m9J'(g IRON m9J'(g LEAD m9J'(g MAGNESIUM m9J'(g MANGAtESE mg..Kg MERCURY mgft<g NICKEL mgft<g POTASSIUM m9J'(g SELENIUM m9J'(g SILVER m9J'(g SODIUM m9J'(g THALLIUM m9J'(g VANADIUM m9J'(g ZINC m9J'(g
BSSB18S801 10/CM!i92
TABLE 4 - 14 (Continued)
SURFACE SOIL INORGANIC ANAL YTES
Remedial Investigation Report Sealand Rastor ation Site
BSSB178801 SS8918SS01 SSSB19SS01 1°'°7/92 1 Q,'<Jel92 10/1"92
RESll.. nQUN... RE8lL ltQUN... RESlA...TfQUN... RESlA...nQUN...
5103.3 4720 7113.4 4540 4.65 z." 2.51 41
28.8 BE 25.48 34.11 B 30 BE - - D..Jl B - - - -
2e045.l!I [~ 281911.3 80QOO 11.2 7.1 7.e J 7.1 J 5.29 UB 4.39 4.1 B
7 7.9J e.3 12 J 10855.5 9740 1()96g 8830 - - JO.JI 14.21 ti.II '(;NJ
142115.3 43400 12990.2 39300 519.61 #01 34.UI 3631
- - - - - - - -9.5 8.28 8.4 B 7.5 B 38eB M1 B 434.8 9 704 9
- - - - - - - -- - - - - - - -71!1.l!IB 117 B 88.2 B 151 B
- - - - - - - -17 J 13.1!1 18.1 12.4 201 2.Ulf .J.J.J 22.4 I
BSSB20S801 1Q,'CM!i92 RESll...TfQUM..
3853.4 3.91
23.7 BE - -
93200.9 7.9 3.79 9.5
71178.5 9.91
54410.1 402.61
- -7.98
538.8 9 - -- -
127.5 B - -
11.4J 21.11
Not.: • - ' = lnda.t.1 lhlltthe conatl:uert - nd detect.d above ddc:tion limb.
$888218801 10/23(92 RESU...HQUN...
2003.2
"' 17.1 B D.38
138199 - -
3.49 8.8 J
72211.3 11 NJ
579311.11 419.9 I - -
tl.4 B 4811.8 B - -- -
181.e a - -
10.3 B 19.1 J
Page4
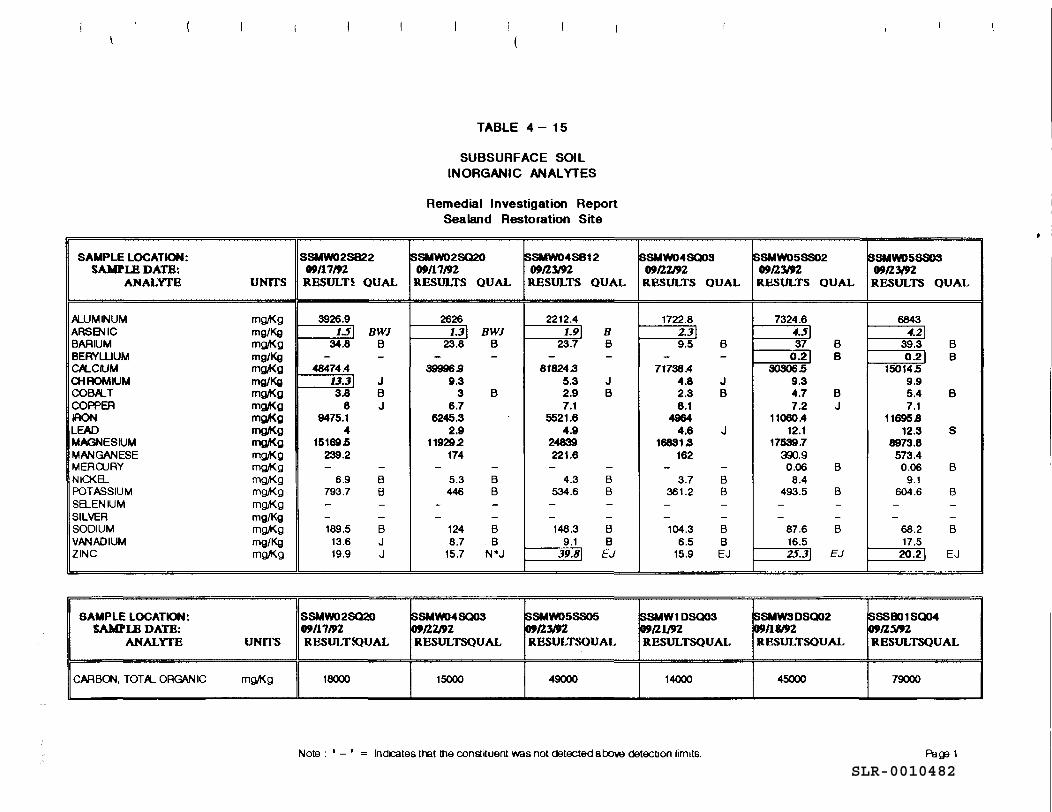
SLR-0010482
SAMPLE LOCATION: SAMPLE DATE:
ANALYfB UNITS
ALUMINUM mg..Kg ARSENIC mg/Kg BARIUM mg..Kg BERYLLIUM mg/Kg Cll.CIUM mg..Kg OiAOMIUM mg/Kg COB/LT mg..Kg COPPER mg,4<g IRON mg,4<g LEAD mg,4(.g MAGNESIUM mg,A<g MANGANESE mg,A<g MEAOJRY mg..Kg NICKa mg..Kg POTASSIUM mg..Kg saENIUM mg..Kg SILVER mg/Kg SODIUM mg..Kg VANADIUM mg/Kg ZINC mg..Kg
SAMPLE LOCATION: SAMPLB DATE:
ANALYTB UNITS
CARBON, TOTIL ORGANIC mg..Kg
SSMW02S822 ()Jf17NJ,
RESULTi QUAL
3926.9 1.51 BWJ
34.8 B - -
48474.4 13.31 J 3.8 B
8 J 9475.1
4 15169.5
239.2 - -
6.9 B 793.7 B - -- -189.5 B
13.6 J 19.9 J
SSMW02SQ20 fl9/17NJ. RESULT!QUAL
18000
I (
TABLE 4 - 15
SUBSURFACE SOIL INORGANIC ANAL YTES
Remedial Investigation Report Sealand Restoration Site
SSMW02SQ20 SSMW04SB12 ()Jf17NJ, ()9fl3192
RESULTS QUAL RESULTS QUAL
2626 2212.4 1.31 BWJ 1.91 B
23.8 B 23.7 B - - - -
399969 81824.3 9.3 5.3 J
3 B 2.9 B 6.7 7.1
6245.3 5521.6 2.9 4.9
11929.2 24839 174 221.6
- - - -5.3 B 4.3 B 446 B 534.6 B
- - - -- - - -
124 B 148.3 B 8.7 B 9.1 B
15.7 N*J 39.BI EJ
SSMW04SQ03 SSMWOSSSOS i091l219Z f11Jfl319Z RESULTSQUAL RESULTSQUAL
15000 49000
SSMW04SQ03 f11Jll219Z RESULTS QUAL
1722.8 2.31 9.5 B
- -71738A
4.8 J 2.3 B 8.1
4964 4.6 J
16831.3 162
- -3.7 B
361.2 B - -- -104.3 B
6.5 B 15.9 EJ
SSMW1DSQ03 f11Jfll.J9Z RESULTSQUAL
14000
Note : ' - ' = lndcates that the constituent was not detected above detection limits.
' '
ISSMW05SS02 ISSMW05SS03 f11Jfl319Z f11Jfl319Z RESULTS QUAL RESULTS QUAL
7324.6 6843 4.51 4.21 37 B 39.3 B
0.21 B 0.21 B 30306.5 15014.5
9.3 9.9 4.7 B 5.4 B 7.2 J 7.1
11060A 11695.8 12.1 12.3 s
17539.7 8973.8 390.9 573.4
0.06 B 0.06 B 8.4 9.1
493.5 B 604.6 B - - - -- - - -
87.6 B 68.2 B 16.5 17.5 25.31 EJ 20.21 EJ
SSMW3DSQ02 SSSB01SQ04 f>9/10Z i09fl!il92 RBSULTSQUAL RESULTSQUAL
45000 79000
Paga 1
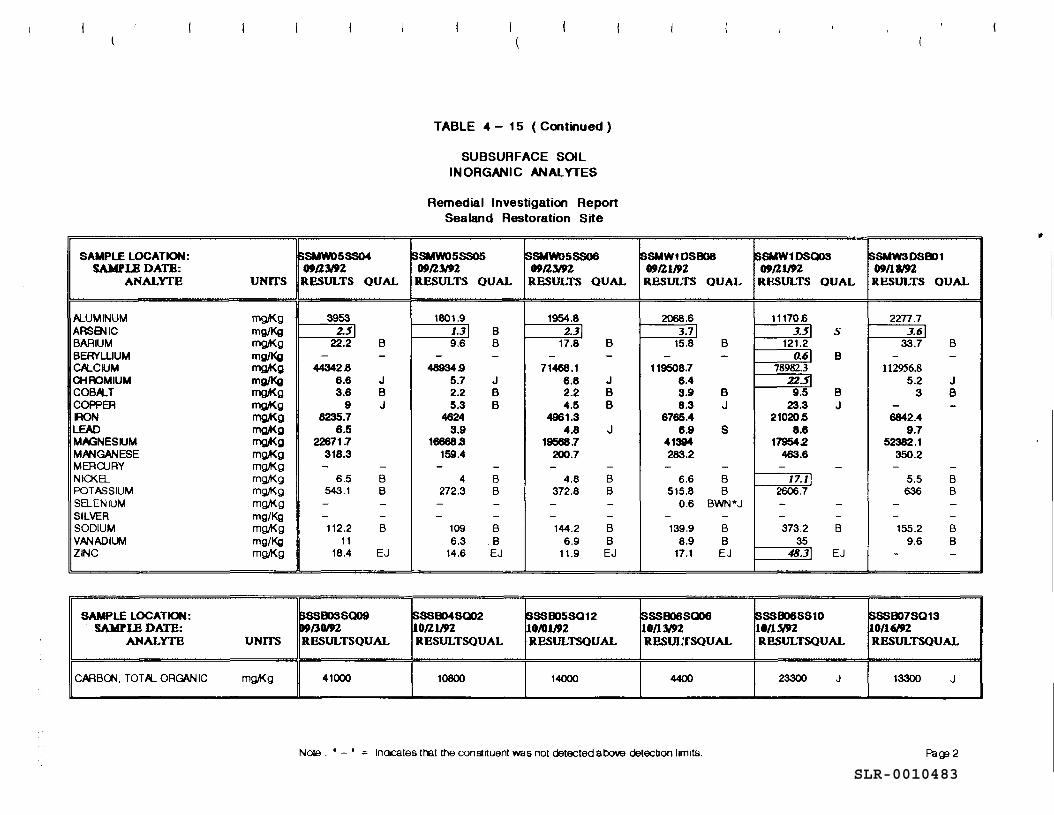
SLR-0010483
SAMPLE LOCATION: SAMPLB DATB:
ANALYfE UNITS
ALUMINUM mg,Kg ARSENIC mg/Kg BARIUM mg,Kg BERYLLIUM mg/Kg CA..CIUM mg.Kg CHROMIUM mg/Kg COBA..T mg.Kg COPPER mg.Kg IRON mg.Kg LEAD mg.Kg MAGNESIUM mg.Kg M.MIGANESE mg,Kg MERCURY mg.Kg NIO<B... mg,Kg POTASSIUM mg,Kg saENIUM mg,Kg SILVER mg/Kg SODIUM mg,Kg V.MIADIUM mg/Kg ZINC mg,Kg
SAMPLE LOCATION: SAMPLB DATE:
ANALYTB UNITS
CAR BOO, TOT A.. ORGAN IC mg,Kg
$SMW'05SS04 ttQ'll'JZ RESULTS QUAL
3953 2.51
22.2 B - -
44342.8 6.6 J 3.6 B
9 J 8235.7
6.5 22671.7
318.3 - -
6.5 B 543.1 B - -- -112.2 B
11 18.4 EJ
$SSB03SQ09 '9130/n RBSULTSOUAL
41000
I (
TABLE 4 - 15 ( Continued)
SUBSURFACE SOIL INORGANIC ANAL YTES
Remedial Investigation Report Sealand Restoration Site
SSMW'05SS05 SSMW'05SS06 ttf1.3J9Z ttf1.3Nl
RESULTS QUAL RESULTS QUAL
1801.9 1954.8 1.31 B 2.31 9.6 B 17.8 B
- - - -48934.9 71468.1
5.7 J 6.8 J 2.2 B 2.2 B 5.3 B 4.5 B
4624 4961.3 3.9 4.8 J
16668.3 19568.7 159.4 200.7
- - - -4 B 4.8 B
272.3 B 372.8 B - - - -- - - -
109 B 144.2 B 6.3 B 6.9 B
14.6 EJ 11.9 EJ
SSSB04SQ02 ~SSB05SQ12 10!1.1192 110/01192 llESULTSQUAL RESULTSQUAL
10800 14000
SSMW1DSB08 09!1.1192 RESULTS QUAL
2068.6 3.71
15.8 B - -
119508.7 6.4 3.9 B 8.3 J
6765.4 6.9 s
41394 283.2 - -
6.6 B 515.8 B
0.6 BWN*J - -139.9 B
8.9 B 17.1 EJ
SSSB06SQ06 10/1'3/tZ RP.SUL TSOU AL
4400
Nora : ' - ' = lndcates that the constituent was not detected above datacbon limits.
SSMW1DSQ03 SSMW30SB01 09!1.1192 09/l&n RBSULTS QUAL RESULTS QUAL
11170.6 22n.1 3.51 s 3.61
121.2 33.7 B 0.61 B - -
78982.3 112956.8 .ZZ.51 5.2 J 9.5 B 3 B
23.3 J - -21020.5 6642.4
8.6 9.7 17954.2 52382.1
463.6 350.2 - - - -
17.11 5.5 B 2606.7 636 B - - - -- - - -373.2 B 155.2 B
35 9.6 B 48.31 EJ - -
$SSB06SS10 SSSB07SQ13 10/lYPZ 10/16192 RBSULTSQUAL RESULTSQUAL
23300 J 13300 J
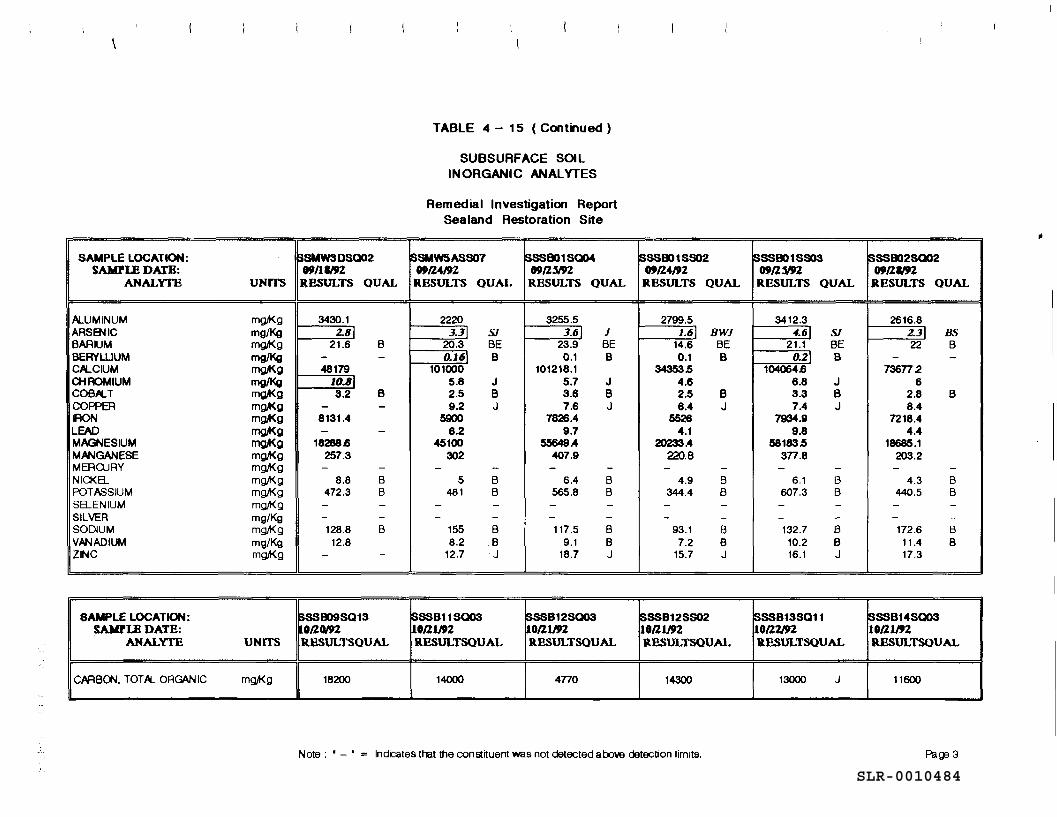
SLR-0010484
SAMPLE LOCATION: SAMl'U DATE:
ANALYTE UNn'S
ALUMINUM mgft<g ARSENIC mg/Kg BARIUM mgft<g BERVWUM mg/Kg CJILCIUM mg,Kg OiROMIUM mg/Kg COBJILT mg,Kg COPPER mg,Kg IRON mg,Kg LEAD mg,Kg MAGNESIUM mg,Kg MANGANESE mgft<g MERCURY mgft<g NICKB_ mgft<g POTASSIUM mgft<g S8-ENIUM mg,Kg SILVER mg/Kg SODIUM mgft<g VANADIUM mg/Kg ZINC mgft<g
SAMPLE LOCATION: SAMl'l.B DATE:
ANALYfE UNITS
CARBO\j, TOT JIL ORGAN IC mg,Kg
BSMW3DSQ02 09111192 RESULTS OUAL
3430.1 2.81
21.6 B - -48179
10.81 3.2 B
- -8131.4 - -
18288.6 257.3
- -8.8 B
472.3 B - -- -128.8 B
12.8 - -
SSSB09SQ13 lOllG/92 RESULTSOUAL
18200
I \
TABLE 4 - 15 ( Continued )
SUBSURFACE SOIL INORGANIC ANALYTES
Remedial Investigation Report Sealand Restoration Site
SSMW5ASS07 SSSB01SQ04 09fl4/9Z 09flS/92 RESULTS OUAL RESULTS OUAL
2220 3255.5 3.31 SJ 3.61 J
20.3 BE 23.9 BE 0.161 B 0.1 B
101000 101218.1 5.8 J 5.7 J 2.5 B 3.6 B 9.2 J 7.6 J
5900 7826.4 8.2 9.7
45100 55649A 302 407.9
- - - -5 B 6.4 B
481 B 565.8 B - - - -- - - -
155 B 117.5 B 8.2 8 9.1 8
12.7 J 18.7 J
SSSB11SQ03 ISSSB12SQ03 10fll/P2 110fll/P2 RESULTSOUAL RESULTSOUAL
14000 4nO
SSS801SS02 09fl4192 RESULTS OUAL
2799.5 1.61 BWJ
14.6 BE 0.1 B
34353.5 4.6 2.5 B 6.4 J
5526 4.1
20233A 220.8 - -
4.9 B 344.4 B - -- -
93.1 B 7.2 8
15.7 J
SSSB12SS02 10fll/P2 llESULTSOUAL
14300
Note : ' - • == Indicates that the constituent was not detected above detection limits.
.. SSSB01SSOS SSS802SQ02 09fl"'2 09fllln RESULTS OUAL RESULTS OUAL
3412.3 2616.8 4.61 SJ 2.31 BS
21.1 BE 22 B 0.21 B - -
104064.6 136n2 6.8 J 6 3.3 B 2.8 B 7.4 J 8.4
7934.9 7218.4 9.8 4.4
58183.5 18685.1 3n.8 203.2 - - - -
6.1 B 4.3 B 607.3 B 440.5 B - - - -- - - -132.7 B 172.6 B 10.2 B 11.4 8 16.1 J 17.3
SSSB13SQ11 ISSSB14SQ03 10fl2Wl 10/21/P2 llF..SULTSOUAL l\F..SULTSOUAL
13000 J 11600
Pag:i3
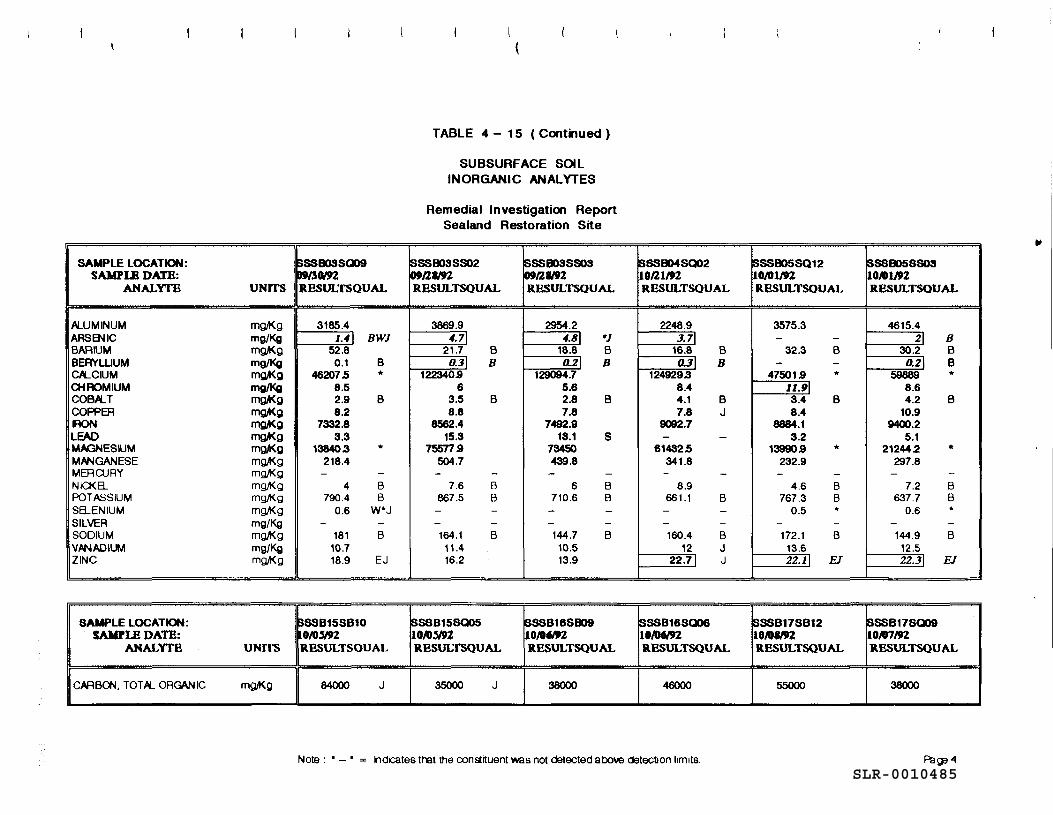
SLR-0010485
SAMPLE LOCATION: SAMPIB DATB:
ANALYfB UNITS
ALUMINUM mgft(g ARSENIC mg/Kg BARIUM mgft(g BERYWUM mg/Kg CJLCIUM mg.Kg OiROMIUM mg/Kg COBJLT mgft(g COPPER mg,4(g IRON mg,4(g LEAD mg,4(g MAGNESIUM mg,Kg MANGANESE mgft(g MERCURY mgft(g NIO<B.. mgft(g POTASSIUM mgft(g SB..ENIUM mgft(g SILVER mg/Kg SODIUM mgft(g Vi\NADIUM mg/Kg ZINC mgft(g
SAMPLE LOCATION: SAMPIB DATE:
ANALYfB UNITS
CARBON, TOT.PL ORGANIC mgft(g
$SSB03SQ09 .,/l0"2 RBSULTSOUAL
3185.4 1.41 BWJ
52.8 0.1 B
46207.5 * 8.5 2.9 B 8.2
7332.8 3.3
13840.3 * 218.4
- -4 B
790.4 B 0.6 W*J
- -181 B
10.7 18.9 EJ
$SSB15SB10 lO/O:w? RESULTSOUAL
84000 j
I (
TABLE 4 - 15 (Continued )
SUBSURFACE SOIL INORGANIC ANAL YTES
Remedial Investigation Report Sealand Restoration Site
ISSSB03SS02 SSSB03SS03 189/llM OflllM RESULTSOUAL RBSULTSOUAL
3869.9 2954.2 4.71 4.81 -1
21.7 B 18.8 B 0.31 B 0.21 B
122340.9 129094.7 6 5.6
3.5 B 2.8 B 8.8 7.8
8562.4 7492.9 15.3 13.1 s
755779 73450 504.7 439.8 - - - -
7.6 B 6 B 867.5 B 710.6 B
- - - -- - - -164.1 B 144.7 B 11.4 10.5 16.2 13.9
ISSSB15SQ05 ISSSB16SB09 10/0.sJPl 10/002 RESULTSOUAL RBSULTSOUAL
35000 j 38000
ISSSBD4SQ02 10/llJ92 RBSULTSOUAL
2248.9 3.71
16.8 B 0.31 B
124929.3 8.4 4.1 B 7.8 J
9092.7 - -
61432.5 341.8 - -
8.9 661.1 B
- -- -160.4 B
12 J 22.71 j
SSSB16SQ06 10/002 RBSULTSOUAL
46000
Note : • - • = lndcates that the constituent was not detected abolle detection limits.
SSSBD5SQ12 ISSSBD58803 Ul/Ol.J9Z 10/01J92 RBSULTSOUAL RESULTSOUAL
3575.3 4615.4 - - 21 B
32.3 B 30.2 B - - 0.21 B
47501.9 * 59889 * 11.91 8.6 3.4 B 4.2 B 8.4 10.9
8884.1 9400.2 3.2 5.1
13990.9 * 21244.2 * 232.9 297.8 - - - -
4.6 B 7.2 B 767.3 B 637.7 B
0.5 * 0.6 * - - - -172.1 B 144.9 B 13.6 12.5 22.11 EJ 22.31 EJ
SSSB17SB12 ISSSB17SQ09 10/0""2 10/07/92 llBSULTSOUAL l\BSULTSOUAL
55000 38000
Pag3 4
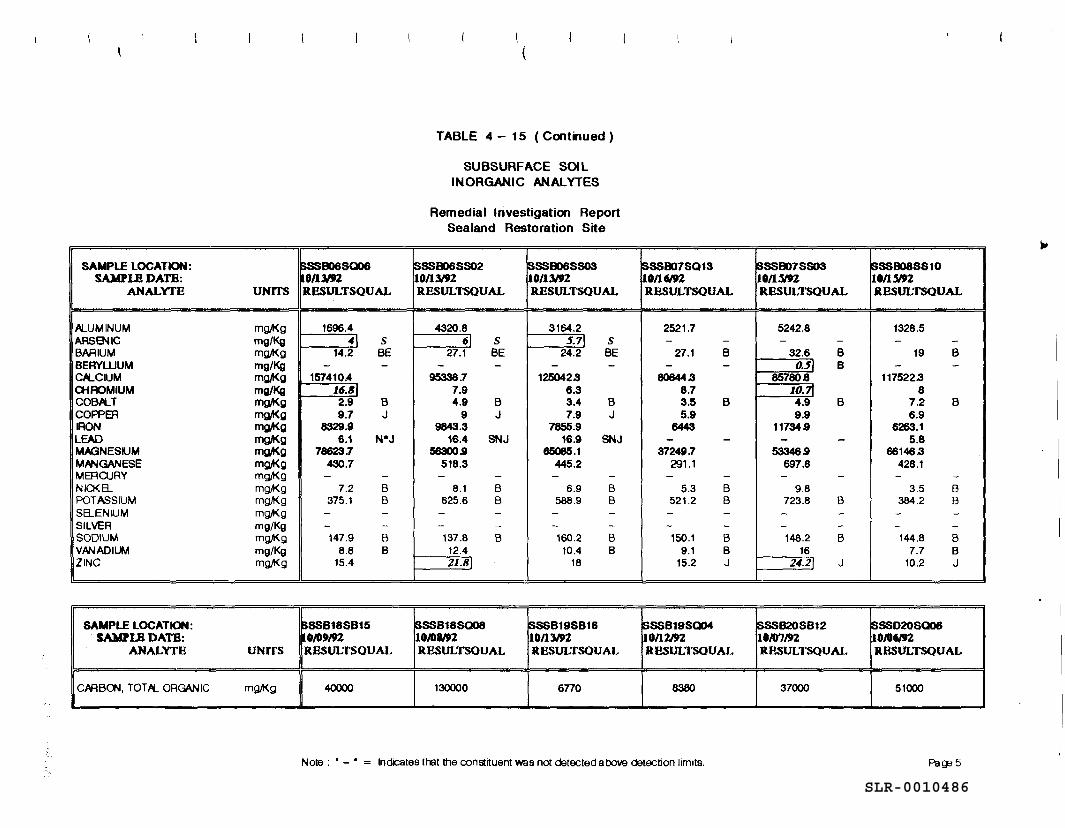
SLR-0010486
SAMPLE LOCATION: SAMPLB DATE:
ANALYfE UNITS
ALUMINUM mg,Kg ARS~IC mg/Kg BARIUM mg,Kg BERYWUM mg/Kg Clt...CIUM mg,4(g CHROMIUM mg/Kg COB/LT mg,Kg COPPER mg,Kg IRON mg,4(g LEAD mg,4(g MAGNESIUM mg,4(g MANGANESE mg,4(g MER OJ RY mg,Kg Nia< a mg,Kg POTASSIUM mg,Kg saENIUM mg,Kg SILVER mg/Kg SODIUM mg,Kg VANADIUM mg/Kg ZINC mg,Kg
SAMPLE LOCATION: SAMPLB DATE:
ANALYfE UNITS
CARBON, TOT,6L ORGANIC mg,Kg
SSSB06SQ06 l0/U"2 R.ESULTSOUAL
1696.4 41 s
14.2 BE - -
157410.4 16.81 2.9 B 9.7 J
8329.9 6.1 N*J
78623.7 430.7 - -
7.2 B 375.1 B - -- -147.9 B
8.8 8 15.4
SSSB18SB15 lOJ09/92 RBSULTSOUAL
40000
TABLE 4 - 15 (Continued)
SUBSURFACE SOIL INORGANIC ANAL YTES
Remedial Investigation Report Sealand Restoration Site
SSSB06SS02 SSSB06SS03 10113192 10113192 RESULTSOUAL RESULTSOUAL
4320.8 3164.2 61 s 5.7 s
27.1 BE 24.2 BE - - - -
95338.7 125042.3 7.9 6.3 4.9 B 3.4 B
9 J 7.9 J 9843.3 7855.9
16.4 SNJ 16.9 SNJ 56300.9 65085.1
518.3 445.2 - - - -
8.1 B 6.9 B 625.6 B 588.9 B
- - - -- - - -137.8 B 160.2 B 12.4 10.4 8 21.BI 18
ISSSB188008 ISSSB19SB16 10.IOl/92 110113192 RESULTSOUAL RBSULTSOUAL
130000 6no
SSSB07SQ13 10/1"9Z RBSULTSOUAL
2521.7 - -
27.1 B - -
80644.3 8.7 3.5 B 5.9
6443 - -
37249.7 291.1
- -5.3 B
521.2 B - -- -150.1 B
9.1 8 15.2 J
SSSB19SQ04 10/11.J92 RESULTSOUAL
8380
Note : ' - ' = lndcatas that the constituent was not detected above detection limits.
SSSB07SS03 SSSB08SS10 1011.WZ 10/1.WZ RBSULTSOUAL RESULTSOUAL
5242.8 1328.5 - - - -
32.6 B 19 B 0.51 B - -
857808 117522.3 10.71 8 4.9 B 7.2 B 9.9 6.9
11734.9 6263.1 - - 5.8
53346.9 66146.3 697.8 428.1 - - - -
9.8 3.5 B 723.8 B 384.2 B - - - -- - - -148.2 B 144.8 B
16 7.7 8 24.21 J 10.2 J
ISSS820SB12 SSSD20SQ06 10/07192 10/06192 RESULTSOUAL RESULTSOUAL
37000 51000
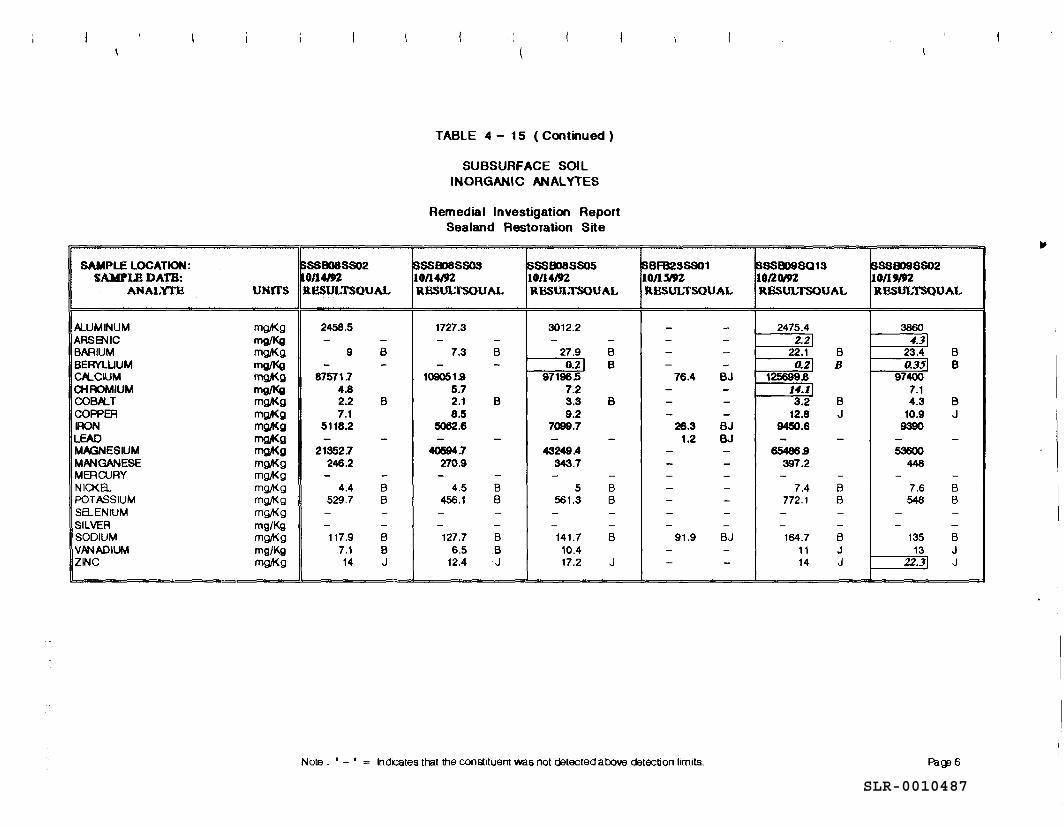
SLR-0010487
SAMPLE LOCATION: SAMPLE DATE:
ANALYfB UNffS
ALUMINUM mg,Kg ARSENIC mg/Kg BARIUM mg,Kg BERYLLIUM mg/Kg Cll.CIUM mg.Kg a-tAOMIUM mg/Kg COBJllLT mg,Kg COPPER mg,Kg IRON mg.Kg LEAD mg.Kg MAGNESIUM mg,4(g MANGANESE mg.Kg MER a.JAY mg,Kg NICKEL mg,Kg POTASSIUM mg,Kg SELENIUM mg,Kg SILVER mg/Kg SODIUM mg,Kg VANADIUM mg/Kg ZINC mg,Kg
$SSB08SS02 lO/l-02 R.BSULTSOUAL
2458.5 - -
9 B - -
87571.7 4.8 2.2 B 7.1
5118.2 - -
21352.7 246.2 - -
4.4 B 529.7 B - -- -117.9 B
7.1 B 14 J
TABLE 4 - 15 (Continued)
SUBSURFACE SOIL INORGANIC ANAL YTES
Remedial Investigation Report Sealand Restoration Site
SSSB08SS03 ~SSB08SS05 10/14192 10/14192 RBSULTSOUAL RBSULTSOUAL
1727.3 3012.2 - - - -
7.3 B 27.9 B - - 0.21 B
109051.9 971965 5.7 7.2 2.1 B 3.3 B 8.5 9.2
5062.6 7<»9.7 - - - -
40594.7 43249.4 270.9 343.7 - - - -
4.5 B 5 B 456.1 B 561.3 B - - - -- - - -127.7 B 141.7 B
6.5 .B 10.4 12.4 J 17.2 J
SBFB2SSS01 10/1.WZ RBSULTSQUAL
- -- -- -- -
76.4 BJ - -- -- -
26.3 BJ 1.2 BJ
- -- -- -- -- -- -- -
91.9 BJ - -- -
Note : ' - ' = lndcates that the constituent was not detected abo110 detection limits.
BSSBD9SQ13 SSSBD9SS02 10/lQ/92 10119112 RBSULTSOUAL IU!SULTSQUAL
2475.4 3860 2-21 4.31
22.1 B 23.4 B 0.21 B 0.351 B
125699.8 97400 14.11 7.1 3.2 B 4.3 B
12.8 J 10.9 J 9450.6 9390
- - - -65486.9 53600
397.2 448 - - - -
7.4 B 7.6 B n2.1 B 548 B - - - -- - - -164.7 B 135 B
11 J 13 J 14 J 22.31 J
Pag36
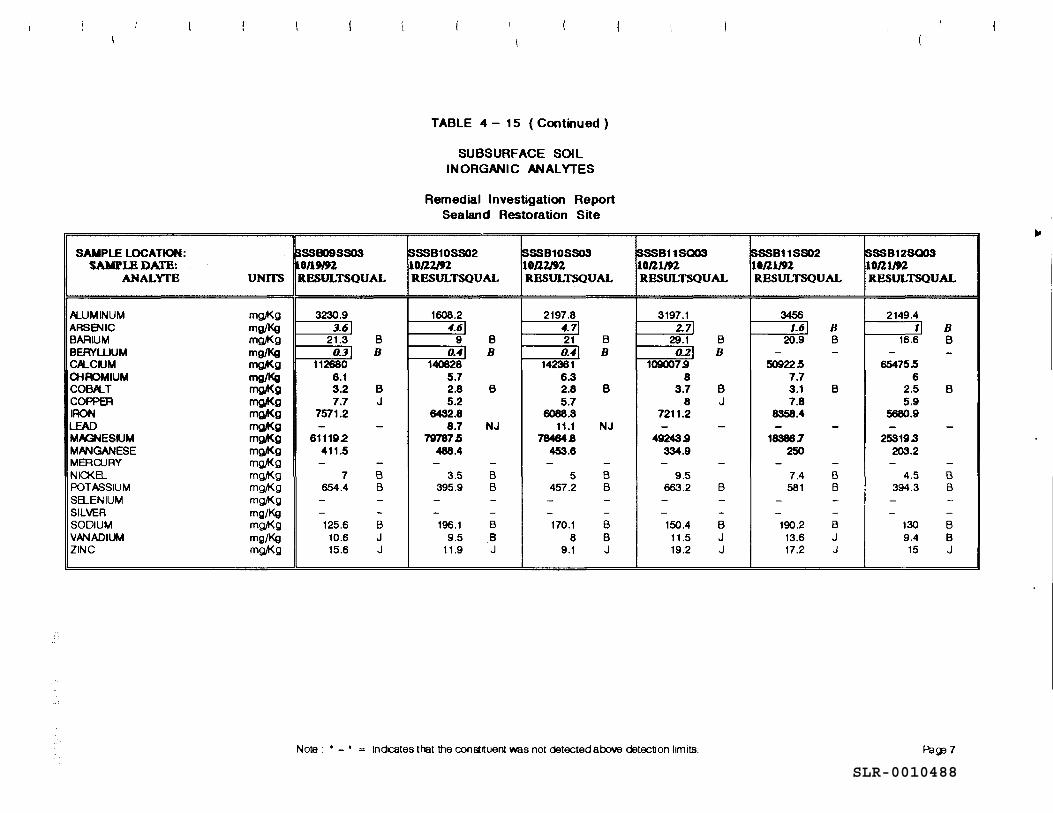
SLR-0010488
SAMPLE LOCATION: $AMrl.B DATE:
ANALYfB UNITS
ALUMINUM mg,t<.g ARSBlllC mg/Kg BARIUM mg,t<.g BERYLLIUM mg/Kg Clt...CIUM mg,4(g OiROMIUM mg/Kg COBILT mg,4(g COPPER mg,4(g IRON mg,4(g LEAD mg,4(g MAGNESIUM mg,4<g MANGANESE mg,t<.g MERCURY mg,t<.g NI0<.8- mg,t<.g POTASSIUM mg,t<.g S8-ENIUM mg,t<.g SILVER mg/Kg SODIUM mg,t<.g VANADIW mg/Kg ZINC mg,t<.g
SSSB09SS03 l0/1"'2 R~ULTSOUAL
3230.9 3.61
21.3 B 0..31 B
112680 6.1 3.2 B 7.7 J
7571.2 - -
61119.2 411.5 - -
7 B 654.4 B
- -- -125.6 B 10.6 J 15.6 J
TABLE 4 - 15 (Continued)
SUBSURFACE SOIL INORGANIC ANAL YTES
Remedial Investigation Report Sealand Restoration Site
SSSB10SS02 SSS810SS03 10/l2192 10/l2192 RBSULTSOUAL RBSULTSOUAL
1608.2 2197.8 4.61 4.71
9 B 21 B 0..41 B 0.41 B
140828 142361 5.7 6.3 2.8 B 2.8 B 5.2 5.7
6432.8 6088.3 8.7 NJ 11.1 NJ
79787.5 78464B 488.4 453.6 - - - -
3.5 B 5 B 395.9 B 457.2 B
- - - -- - - -196.1 B 170.1 B
9.5 B 8 B 11.9 J 9.1 J
SSSB11SQ03 10/llM RBSULTSOUAL
3197.1 2.71
29.1 B 0..21 B
109007.9 8
3.7 B 8 J
7211.2 - -
49243.9 334.9 - -
9.5 663.2 B - -- -150.4 B 11.5 J 19.2 J
Note : • - • = Indicates that the constituent was not detected above detection limits.
SSSB11SS02 SSSB12SQ03 10/llM 10/ll/P2 RBSULTSOUAL RBSULTSOUAL
3456 2149.4 1.61 B 11 B
20.9 B 16.6 B - - - -
50922.5 65475.5 7.7 6 3.1 B 2.5 B 7.8 5.9
8358.4 5680.9 - - - -
18386.7 25319.3 250 203.2
- - - -7.4 B 4.5 B 581 B 394.3 B
- - - -- - - -190.2 B 130 B 13.6 J 9.4 B 17.2 J 15 J
Pag3 7
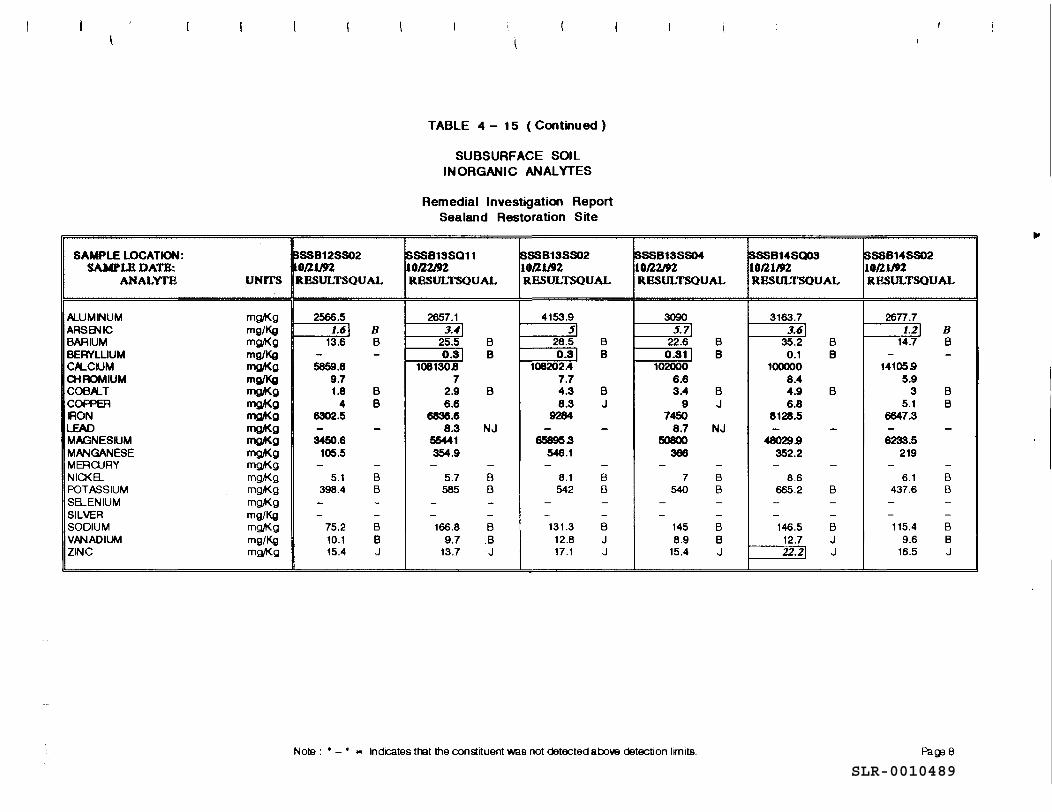
SLR-0010489
SAMPLE LOCATION: SAMPLE DATE:
ANALYfB UNITS
ALUMINUM mg,Kg ARSENIC mg/Kg BARIUM mg,Kg BERYLLIUM mg/Kg Clt...CIUM mg,4(g OiROMIUM mg/Kg COB/LT mg,Kg COPPER mg,4(g flON mg,Kg LEAD mg,Kg MAGNESIUM mg,4(g MANGANESE mg,Kg MER OJ RY mg,Kg NICK8- mg,Kg POTASSIUM mg,Kg SB._ENIUM mg,Kg SILVER mg/Kg SODIUM mg,Kg VANADIUM mg/Kg ZINC mg,Kg
asse12sso2 ~O/llJ92 RBSULTSOUAL
2566.5 1.61 B
13.6 B - -5859.8
9.7 1.8 B
4 B 6302.5 - -3450.6
105.5 - -
5.1 B 398.4 B - -- -
75.2 B 10.1 B 15.4 J
TABLE 4 - 15 {Continued)
SUBSURFACE SOIL INORGANIC ANAL YTES
Remedial Investigation Report Sealand Restoration Site
ssse13sa11 SSSB13SS02 10/l2192 10/lJm RBSULTSOUAL RBSULTSOUAL
2657.1 4153.9 3.41 51
25.5 B 28.5 B 0.31 B 0.31 B
108130B 108202A 7 7.7
2.9 B 4.3 B 6.6 8.3 J
6836.6 9284 8.3 NJ - -
55441 65895.3 354.9 546.1
- - - -5.7 B 8.1 B 585 B 542 B
- - - -- - - -166.8 B 131.3 B
9.7 .B 12.8 J 13.7 J 17 .1 J
iSSSB13SS04 10/l21'2 RESULTSOUAL
3090 5.71
22.6 B 0.31 I B
102000 6.6 3.4 B
9 J 7450
8.7 NJ 50800
366 - -
7 B 540 B
- -- -
145 B 8.9 B
15.4 J
Note : ' - ' = lndcates that the constituent was not detected atx:>ve detection limits.
SSSB14SQ03 ISSSB14SS02 10/llln ltO/llJ92 RESULTSOUAL RBSULTSOUAL
3163.7 'l6n.1 3.61 1.21 B
35.2 B 14.7 B 0.1 B - -
100000 14105.9 8.4 5.9 4.9 B 3 B 6.8 5.1 B
8128.5 6647.3 - - - -
48029.9 6233.5 352.2 219 - - - -
8.6 6.1 B 665.2 B 437.6 B - - - -- - - -146.5 B 115.4 B
12.7 J 9.6 B 22.21 J 16.5 J
Pag3 6
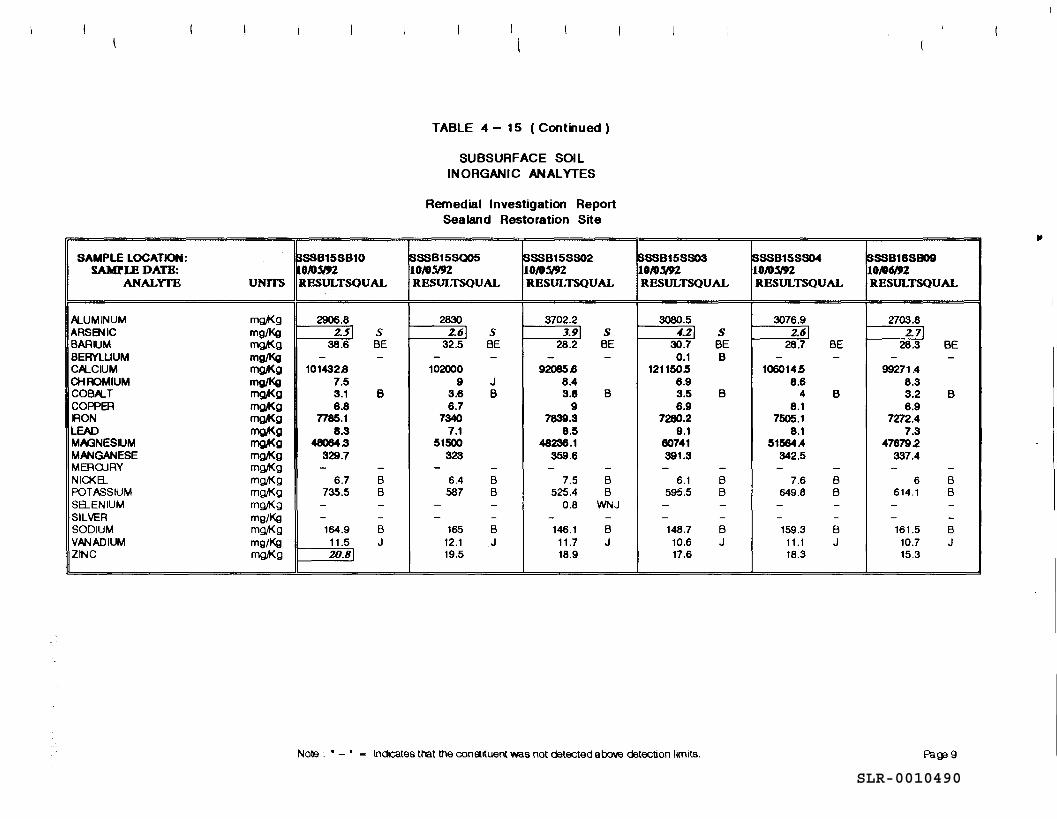
SLR-0010490
SAMPLE LOCATION: SAMrLE DATB:
ANALYfE UNITS
.ALUMINUM mgft(g ARSENIC mg/Kg BARIUM mgiKg BERYLLIUM mg/Kg Clt...CIUM mg,4(g CHROMIUM mg/Kg COBlt...T mgft(g COPPER mg,t<g IRON mg,4(g LEAD mg,4(g MAGNESIUM mg,4(.g MANGANESE mg,4(g MEROJRY mgft(g NICKB.. mgft(g POTASSIUM mgft(g SB..ENIUM mgft(g SILVER mg/Kg SODIUM mgft(g VANADIUM mg/Kg ZINC mgft(g
SSSB15S810 ••to.WZ RESULTSOUAL
2906.8 2.51 s
38.6 BE - -
101432B 7.5 3.1 B 6.8
7785.1 8.3
48064.3 329.7 - -
6.7 B 735.5 B - -- -164.9 B
11.5 J 20.BJ
I (
TABLE 4 - 15 (Continued )
SUBSURFACE SOIL INORGANIC ANAL YTES
Remedial Investigation Report Sealand Restoration Site
SSSB15SQ05 ISSSB15SS02 10/0.WZ 1011.5192 RESULTSQUAL RESULTSQUAL
2830 3702.2 2.61 s 3.91 s
32.5 BE 28.2 BE - - - -
102000 92085.8 9 J 8.4
3.6 B 3.8 B 6.7 9
7340 7839.3 7.1 8.5
51500 48236.1 323 359.6
- - - -6.4 B 7.5 B 587 B 525.4 B
- - 0.8 WNJ - - - -
165 B 146.1 B 12.1 .J 11.7 J 19.5 18.9
SSSB15SS03 10/0!WZ RESULTSOUAL
3080.5 4.21 s
30.7 BE 0.1 B
121150.5 6.9 3.5 B 6.9
7280.2 9.1
60741 391.3 - -
6.1 B 595.5 B - -- -148.7 B 10.6 J 17.6
Note : • - ' = lndeates that the constituent was not detected a bow detection limits.
SSSB15SS04 ISSSB168B09 1011.WZ 10/002 RESULTSOUAL RESULTSOUAL
3076.9 2703.8 2.61 2.71
28.7 BE 28.3 BE - - - -
106014.5 99271.4 8.6 8.3
4 B 3.2 B 8.1 6.9
7505.1 7272.4 8.1 7.3
51564.4 47679.2 342.5 337.4 - - - -
7.6 B 6 B 649.8 B 614.1 B - - - -- - - -159.3 B 161.5 B
11.1 J 10.7 J 18.3 15.3
PaS,13 9
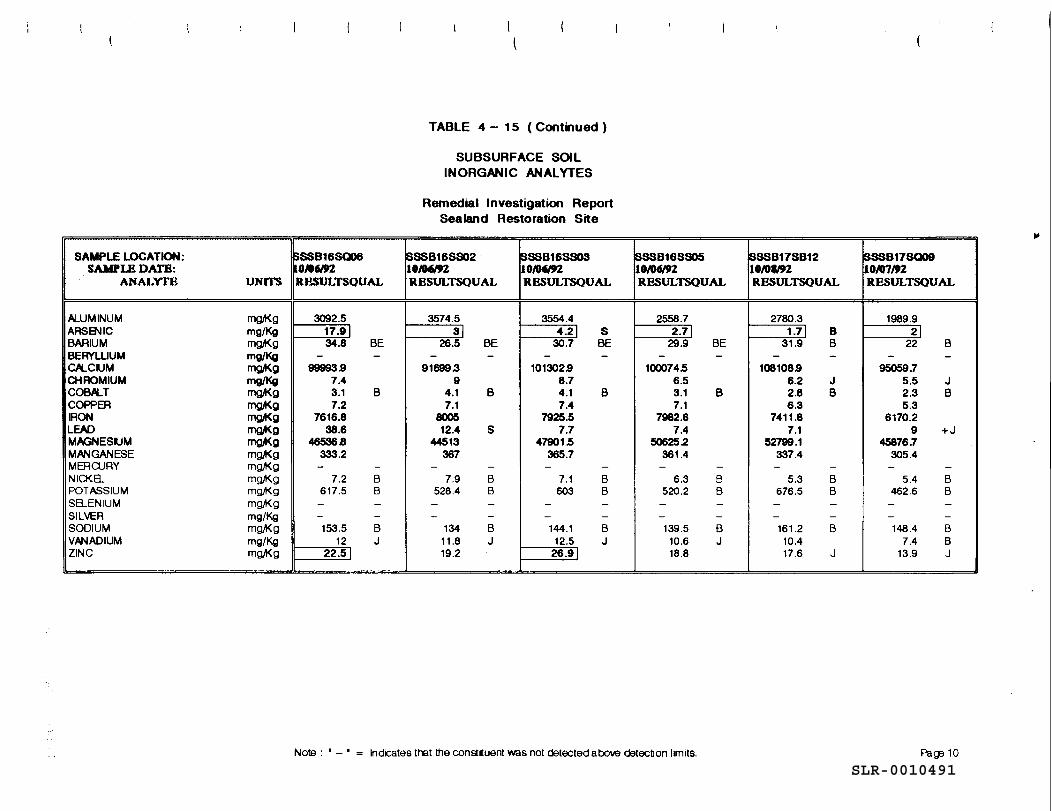
SLR-0010491
SAMPLE LOCATION: SAMPLE DA.TB:
ANALYl'B UNITS
ALUMINUM mg,oKg ARSB\llC mg/Kg BARIUM mg,oKg BERYWUM mg/Kg Clt...CIUM mg,4<g OiROMIUM mg/Kg COB/LT mg,4<g COPPER mg.Kg IRON rng,4<g LEAD mg,4<g MAGNESIUM mg,4<g MANGANESE mg,4<g MERCURY mg,4<g NICKa mg,oKg POTASSIUM mg,oKg saENIUM mg,oKg SILVER mg/Kg SODIUM mg,oKg VANADIUM mg/Kg ZINC mg,oKg
SSS816SQ06 l8/06192 RESULTSQUAL
3092.5 17.91 34.8 BE
- -99993.9
7.4 3.1 B 7.2
7616.8 38.8
485388 333.2 - -
7.2 B 617.5 B - -- -153.5 B
12 J 22.51
I l
TABLE 4 - 15 (Continued )
SUBSURFACE SOIL INORGANIC ANAL YTES
Remedial Investigation Report Sealand Restoration Site
ISSSB16SS02 SSSB16SS03 18 .. 6.'92 10 .. 6192 RESULTSOUAL RESULTSOUAL
3574.5 3554.4 31 4.21 s
26.5 BE 30.7 BE - - - -
91699.3 101302.9 9 8.7
4.1 B 4.1 B 7.1 7.4
8005 7925.5 12.4 s 7.7
44513 47901.5 367 365.7
- - - -7.9 B 7.1 B
528.4 B 603 B - - - -- - - -
134 B 144.1 B 11.8 J 12.5 J 19.2 26.91
SSS816SS05 10/06192 RESULTSOUAL
2558.7 2.71
29.9 BE - -
100074.5 6.5 3.1 B 7.1
7982.8 7.4
50625.2 361.4 - -
6.3 B 520.2 B
- -- -139.5 B
10.6 J 18.8
Note : • - • = Indicates that the constituent was not detected abo\le detecbon limits.
ISSSB17SB12 SSS817SQ09 10 .. 1192 10/07"2 RESULTSOUAL RESULTSOUAL
2780.3 1989.9 1.71 8 21
31.9 B 22 B - - - -
108108.9 95059.7 6.2 J 5.5 J 2.8 B 2.3 B 6.3 5.3
7411.8 8170.2 7.1 9 +J
52799.1 45876.7 337.4 305.4 - - - -
5.3 B 5.4 B 676.5 B 462.6 B
- - - -- - - -161.2 B 148.4 B 10.4 7.4 B 17.6 J 13.9 J
Pa9310
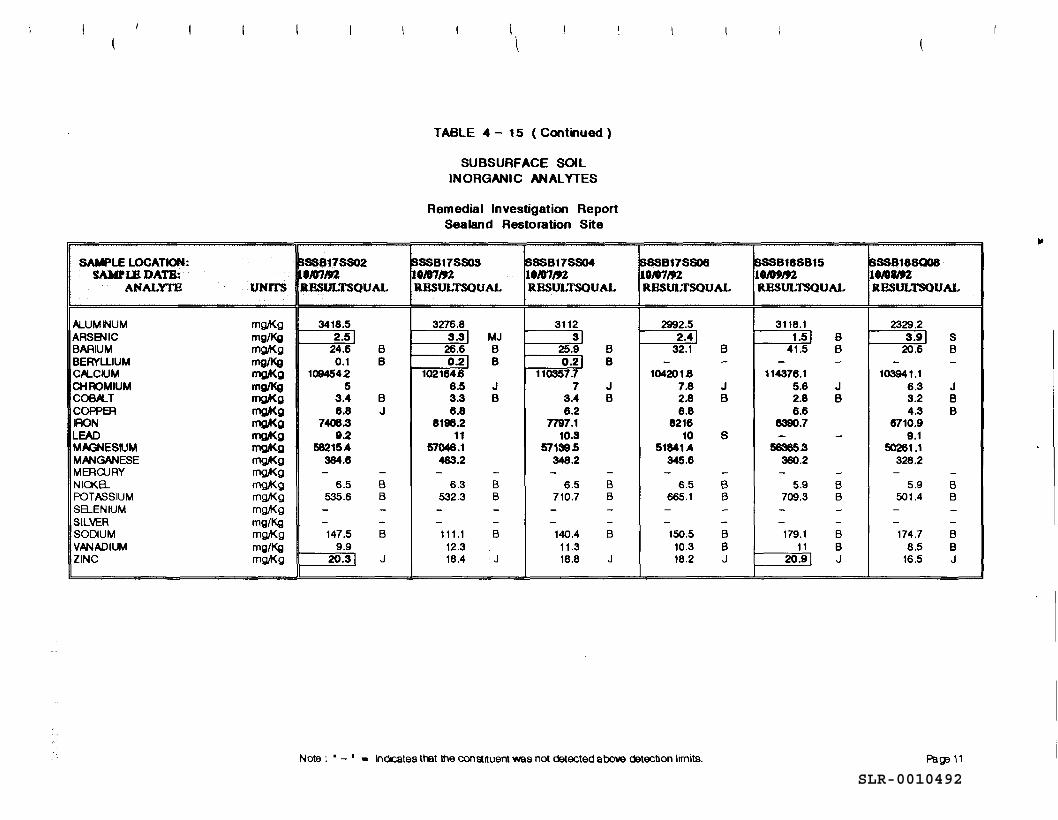
SLR-0010492
SAMPLE LOCATION: SAYPLB DATB:
ANALYl'B UNITS
ALUMINUM mg,t<g ARSENIC mg/Kg BARIUM mg,t<g BERYLLIUM mg/Kg Clt...CIUM mg.4<g CHROMIUM mg/Kg COB/LT mg.4<g COPPER mg.4<g IRON rngKg LEAD mg,4(g M~ESIUM mg.4<g MANGANESE mg,+<.g MER OJ RY mg,t<g NICKa mg,t<g POTASSIUM mg,t<g saENIUM mg,t<g SILVER mg/Kg SODIUM mg,t<g VANADILM mg/Kg ZINC mg,t<g
$SSB17SS02 ~·/07"2 llESULTSQUAL
3418.5 2.51
24.6 B 0.1 B
109454.2 5
3.4 B 6.8 J
7408.3 9.2
158215A 384.8 - -
6.5 B 535.6 B - -- -147.5 B
9.9 20.31 J
I \
TABLE 4 - 15 (Continued)
SUBSURFACE SOIL INORGANIC ANAL YTES
Remedial Investigation Report Sealand Restoration Site
SSSB17SS03 SSSB17SS04 10/07/92 10/07/92 lU!SULTSQUAL RBSULTSQUAL
3276.8 3112 3.31 MJ 31
26.6 B 25.9 B 0.21 B 0.21 B
102164.6 110357.7 6.5 J 7 J 3.3 B 3.4 B 8.8 6.2
8198.2 7797.1 11 10.3
57048.1 57139.5 483.2 348.2 - - - -
6.3 B 6.5 B 532.3 B 710.7 B - - - -- - - -111.1 B 140.4 B
12.3 11.3 18.4 J 18.8 J
SSSB17SS06 10/07/92 RBSULTSQUAL
2992.5 2.4
32.1 B - -
104201.6 7.8 J 2.8 B 6.8
8216 10 s
51841A 345.6 - -
6.5 B 665.1 B - -- -150.5 B
10.3 B 18.2 J
Neta : ' - ' = lndteates tret the constituent was not detected abOve detection limits.
iSSSB18SB15 ISSSB18SQ08 lll09/92 110/0"'2 RBSULTSQUAL llESULTSQUAL
3118.1 2329.2 1.51 B 3.91 s
41.5 B 20.6 B - - - -
114376.1 103941.1 5.6 J 6.3 J 2.8 B 3.2 B 6.6 4.3 B
8390.7 6710.9 - - 9.1
156365.3 50261.1 380.2 328.2 - - - -
5.9 B 5.9 B 709.3 B 501.4 B - - - -- - - -179.1 B 174.7 B
11 B 8.5 B 20.91 J 16.5 J
Pa~ 11
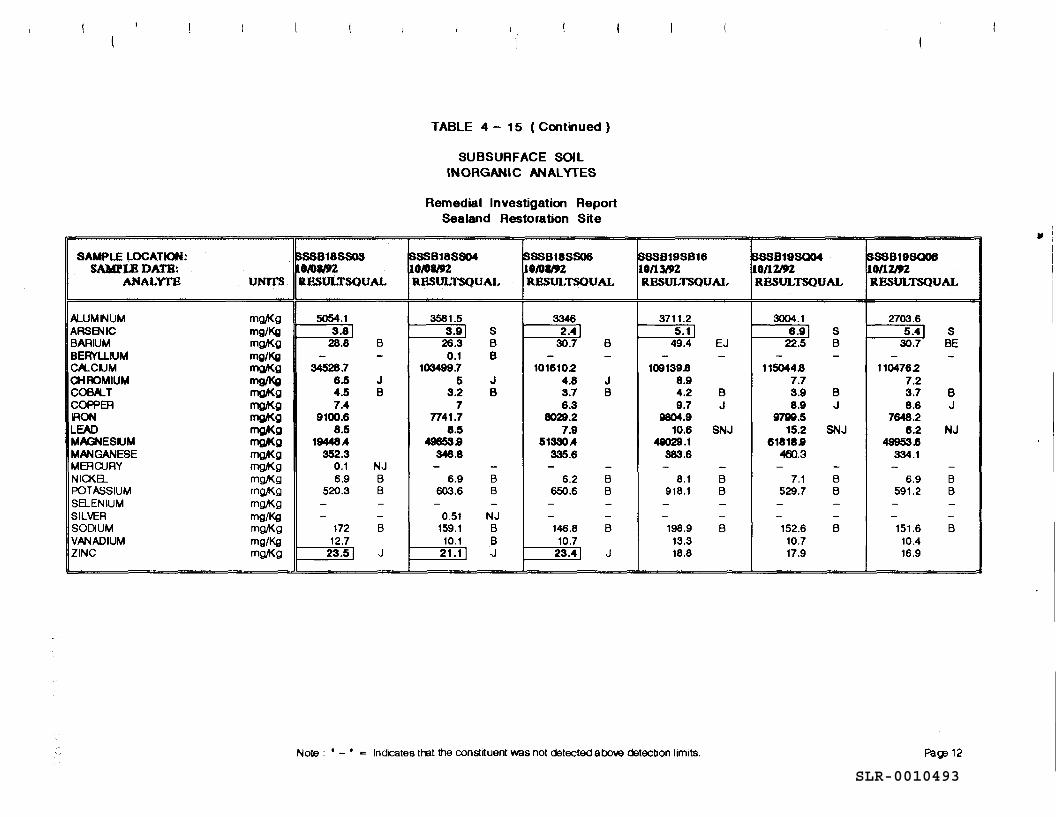
SLR-0010493
SAMPLE LOCATION: SAMPLE DATB:
ANALYrB mars
ALUMINUM mg,Kg ARSBlllC mg/Kg BARIUM mg,Kg BERYLLIUM mg/Kg C.ILCIUM mg,4(g a-tAOMIUM mg/l(Q COBA.T mg,t(g COPPER mg,4(g IRON mg,4(g LEAD mg,4(g MAGNESIUM mg,4(g MANGANESE mg,Kg MER OJ RY mg,Kg NICKB_ mg,Kg POTASSIUM mg,Kg saENIUM mg,Kg SILVER mg/Kg SODIUM mg,Kg VANADIUM mg/Kg ZINC mg,Kg
$SSB18SS03 lOJOllJZ RBSULTSQUAL
5054.1 3.81
28.8 B - -
34528.7 6.5 J 4.5 B 7.4
9100.6 8.5
19448.4 352.3
0.1 NJ 6.9 B
520.3 B - -- -
172 B 12.7
23.51 J
TABLE 4 - 15 (Continued )
SUBSURFACE SOIL INORGANIC ANAL YTES
Remedial Investigation Report Sealand Restoration Site
SSSB18SS04 ISSSB18SS06 10181"2 10/08192 RBSULTSQUAL RBSULTSQUAL
3581.5 3346 3.91 s 2.41
26.3 B 30.7 B 0.1 B - -
103499.7 101610.2 5 J 4.8 J
3.2 B 3.7 B 7 6.3
n41.1 8029.2 8.5 7.9
49653S 51330.4 346.8 335.6 - - - -
6.9 B 6.2 B 603.6 B 650.6 B - - - -
0.51 NJ - -159.1 B 146.8 B
10.1 B 10.7 21.1 I .J 23.41 J
~8198816 10/13'92 RBSULTSQUAL
3711.2 5.11
49.4 EJ - -
109139B 8.9 4.2 B 9.7 J
9804.9 10.6 SNJ
48029.1 383.6 - -
8.1 B 918.1 B
- -- -198.9 B
13.3 18.8
Note : ' - ' = lndK::ates that the constituent was not detected al:x>Ye detecbon limits.
.. I
ISSSB19SQ04 ISSSB19SQ08 10/12192 10/12192 RBSULTSQUAL RBSULTSQUAL
3004.1 2703.6 6.91 s 5.41 s
22.5 B 30.7 BE - - - -
115044B 110476.2 7.7 7.2 3.9 B 3.7 B 8.9 J 8.6 J
9799.5 7648.2 15.2 SNJ 6.2 NJ
61818.9 49953B "6>.3 334.1
- - - -7.1 B 6.9 B
529.7 B 591.2 B - - - -- - - -152.6 B 151.6 B
10.7 10.4 17.9 16.9
Pa113 12
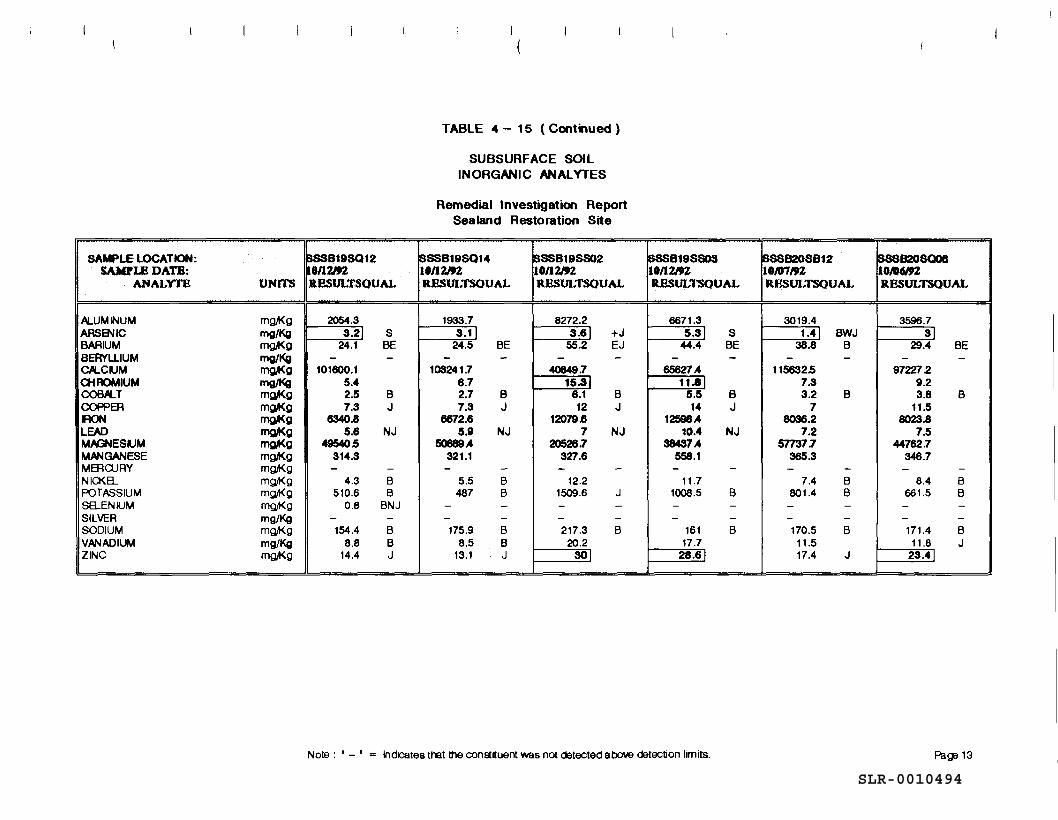
SLR-0010494
SAMPLE LOCATION: SAMPLB DATB:
ANALYI'E UNfl'S
ALUMINUM mg,.Kg ARSe-llC mg/Kg BARIUM mg,.Kg BERYWUM mg/Kg CILCIUM mg.Kg a-tROMIUM mg/Kg COBJLT mg.Kg COPPER mg.Kg MN rng,4(g LEAD mg.Kg MAGNESIUM rng,4(g MANGANESE mg,.Kg MER OJ RY mg,.Kg NI0<8- mg,.Kg POTASSIUM mg,.Kg S8-ENIUM rng,.Kg SILVER mg/Kg SODIUM mg,.Kg VANADIUM mg/Kg ZINC mg,.Kg
SSSB19SQ12 18/11.IPZ RESULTSQUAL
2054.3 3.21 s
24.1 BE - -
101600.1 5.4 2.5 B 7.3 J
6340.8 5.6 NJ
49540.5 314.3 - -
4.3 B 510.6 B
0.8 BNJ - -154.4 B
8.8 B 14.4 J
I (
TABLE 4 - 15 (Continued)
SUBSURFACE SOIL INORGANIC ANAL YTES
Remedial Investigation Report Sealand Restoration Site
SSSB19SQ14 ~SSB19SS02 l0/12Jn l0/12Jn RESULTSOUAL RESULTSOUAL
1933.7 8272.2 3.11 3.61 +J
24.5 BE 55.2 EJ - - - -
103241.7 40849.7 6.7 15.31 2.7 B 6.1 B 7.3 J 12 J
6672.6 12079.8 5.9 NJ 7 NJ
50889.4 20526.7 321.1 327.6 - - - -
5.5 B 12.2 487 B 1509.6 j
- - - -- - - -175.9 B 217.3 B
8.5 B 20.2 13.1 J 301
8SSB19SS03 l0/l2Jn RBSULTSOUAL
6671.3 5.31 s
44.4 BE - -
65627A 11.8 I
5.5 B 14 J
125S6A 10.4 NJ
38437.4 558.1 - -
11.7 1008.5 B - -- -
161 B 17.7
28.61
Note : ' - ' = Indicates tt"et the constituent was not detected at:iove detecnon limits.
8SSB20SB12 SSSB20SQ08 10Jr17/fl'l 10/06192 RBSULTSQUAL R.ESULTSOUAL
3019.4 3596.7 1.41 BWJ 31
38.8 B 29.4 BE - - - -
115632.5 972272 7.3 9.2 3.2 B 3.8 B
7 11.5 8036.2 6023.8
7.2 7.5 57737.7 44762.7
365.3 346.7 - - - -
7.4 B 8.4 B 801.4 B 661.5 B - - - -- - - -170.5 B 171.4 B
11.5 11.8 J 17.4 J 23.41
Pa~ 13
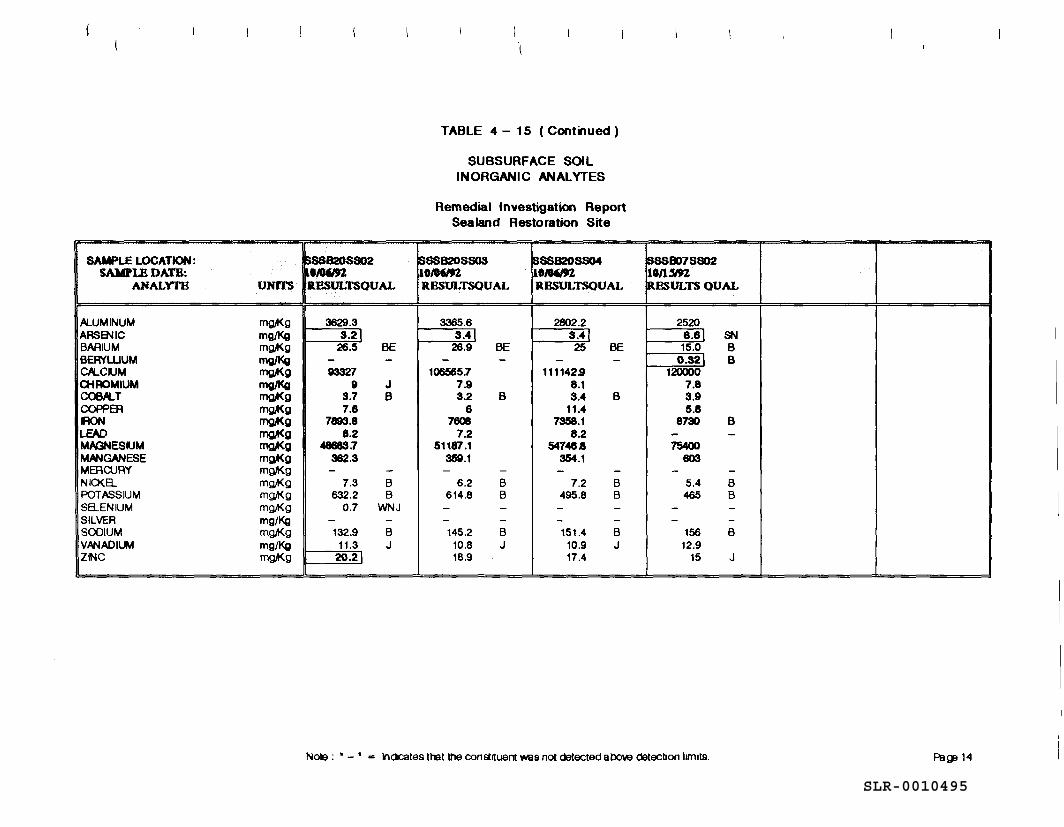
SLR-0010495
SAMPLE LOCATION: SAMPLH DA.TB~
ANALYfB UNfl'S
ALUMINUM mg,Kg ARSENIC mg/Kg BARIUM mg,Kg BERVWUM mg/Kg Clt..CIUM mg,4(g a-tROMIUM mg/Kg COBILT mg,4(g COPPER mg,4(g IRON mg,4(g LEAD mg,4(g M~ESIUM mg,4(g MANGANESE mg,4(g MER OJ RY mg,Kg NIO<B... mg,Kg POTASSIUM mg,Kg SB...ENIUM mg,Kg SILVER mg/Kg SODIUM mg,Kg VANADIUM mg/Kg ZINC mg,Kg
SSSB20SS02 l8'""2 llf.SULTSOUAL
3629.3 3.21
26.5 BE - -93327
9 J 3.7 B 7.8
7893.8 8.2
48683.7 382.3 - -
7.3 B 632.2 B
0.7 WNJ - -132.9 B
11.3 J 20.21
TABLE 4 - 15 (Continued)
SUBSURFACE SOIL INORGANIC ANALYTES
Remedial Investigation Report Sealand Restoration Site
ISSS820SS03 SSS820SS04 10186192 10186192 R.BSULTSOUAL RBSULTSOUAL
3365.6 2802.2 3.41 3.41
26.9 BE 25 BE - - - -
106565.7 111142.9 7.9 8.1 3.2 B 3.4 B
8 11.4 7608 7358.1
7.2 8.2 51187.1 547488
359.1 354.1 - - - -
6.2 B 7.2 B 614.8 B 495.8 B - - - -- - - -145.2 B 151.4 B
10.8 J 10.9 J 18.9 17.4
~BD7SS02 11113.'91 !RESULTS OUAL
2520 8.81 SN 15.0 B
0.821 B 120000
7.8 3.9 5.8
8730 B - -75400
603 - -
5.4 B 465 8
- -- -
156 B 12.9
15 J
Nore : • - • = lndcates that the constituent was not detected above detecbon limits.
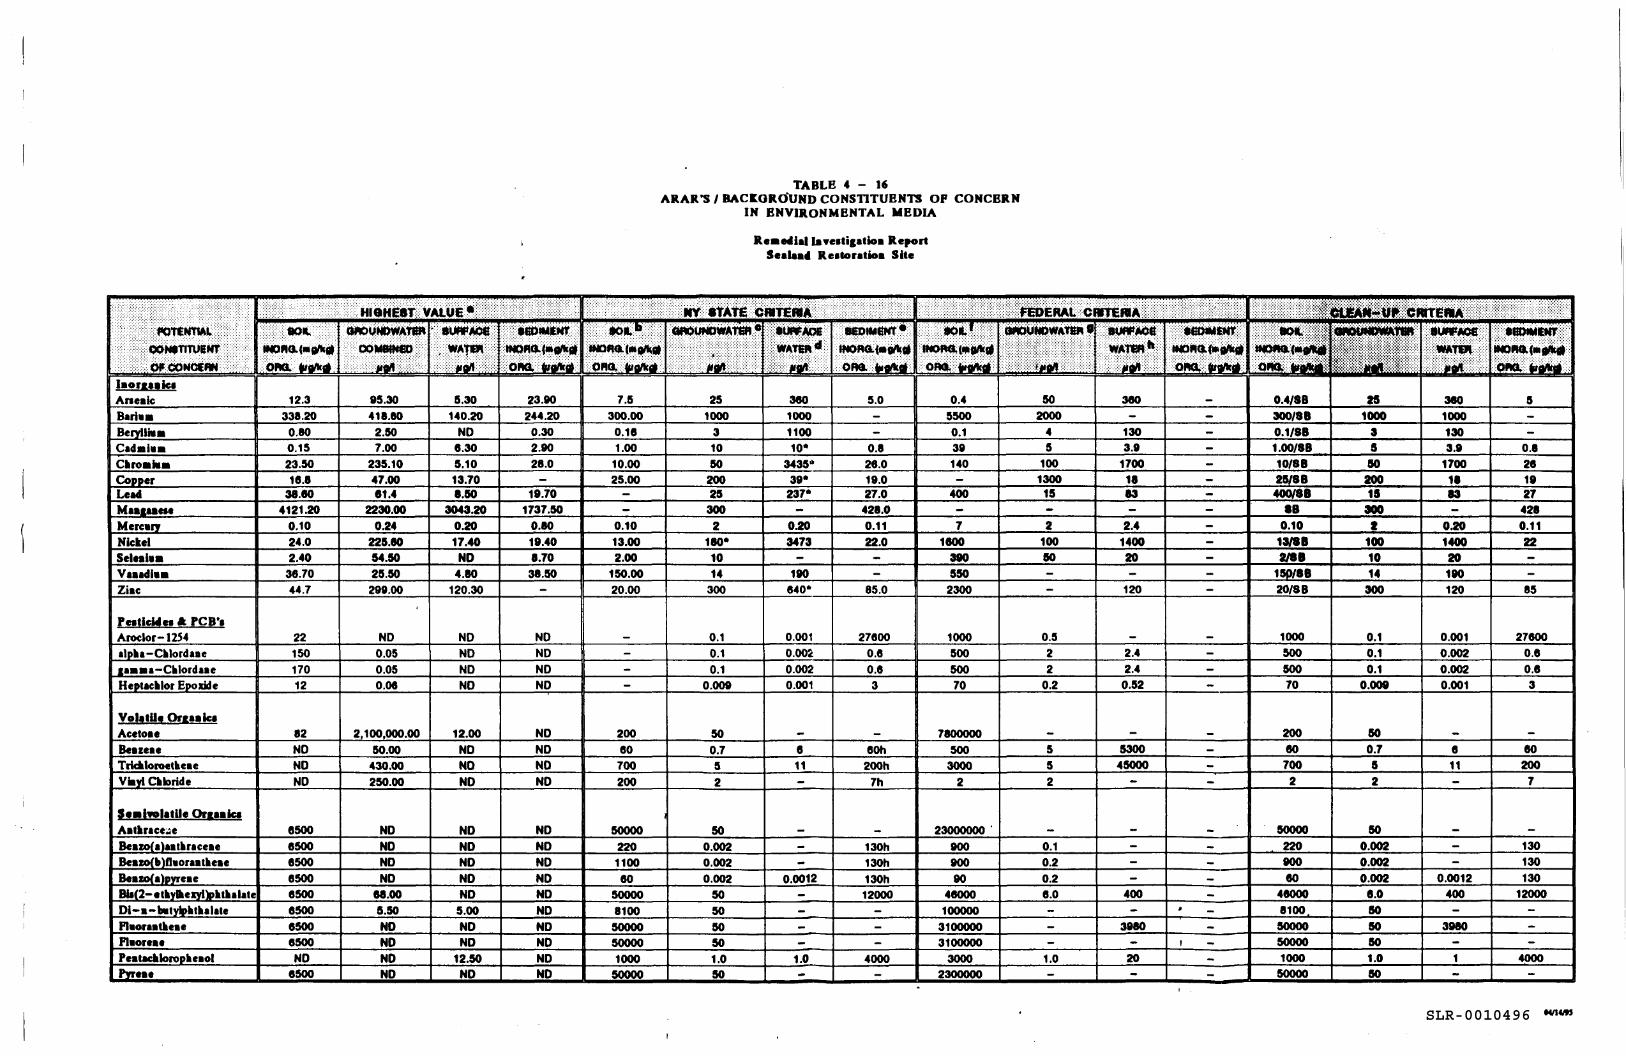
SLR-0010496
laoraaaiCI Aneaic Baria a Bemlilla Cada la a
Conner Lead Maauaete MercarY Nickel Seleal•• VaHdi•• Ziac
PatlcWe1 A rce•1 Aroclor- t2S4
1••••-C .. lordaae
VolttUe OrgaaiCI Acetoae Beazeae Triclloroet•eae ViaYI Ciloride
SealwlttUe Or1aaiCI A•t•race:.le
Beamlblftaoraat .. eae Beaml a\nvreae
Di-a-batvln .. t•alate Plaoraatleae
Peataclaloropleaol rw ...
12.3 338.20
0.80 0.15 23.50 18.1
38.80 4121.20
0.10 24.0 2.40
36.70 44.7
22 150 170 12
82 ND ND ND
8500 8500 8500 8500 8500 8500 8500 8500
ND 8500
95.30 411.80
2.50 7.00
235.10 47.00 eu
2230.00 0.24
225.80 54.50 25.50 299.00
ND 0.05 0.05 0.08
2, 100,000.00
50.00 430.00 250.00
ND ND NO NO
11.00 5.50 ND ND NO ND
5.30 23.90 7.5 140.20 244.20 300.00
ND 0.30 0.18 8.30 2.90 1.00 5.10 28.0 10.00 13.70 25.00 1.50 19.70
3043.20 1737.50 0.20 0.80 0.10 17.40 19.40 13.00
ND 8.70 2.00 4.80 38.50 150.00
120.30 20.00
ND ND ND ND ND ND ND ND
12.00 ND 200 ND ND 80 NO NO 700
ND ND 200
ND NO 50000 ND NO 220 ND NO 1100 ND NO 80 NO ND 50000
5.00 ND 8100 ND ND 50000 ND NO 50000
12.50 ND 1000 ND ND 50000
TABLE 4 - 16 ARAR 'SI BACK.GROUND CONSTITUENTS OP CONCERN
IN ENVIRONMENTAL MEDIA
25 1000
3 10 50
200 25
300 2
180* 10 14
300
0.1 0.1 0.1
0.009
50 0.7 5
2
50 0.002 0.002 0.002
50 50 50 50 1.0 50
Rea .. ial Ian1tigatioa Report Sealaa• Re11oratioa Site
5.0 1000 1100 10* 0.8
3435" 28.0 39* 19.0
27.0 421.0
0.20 0.11 3473 22.0
190 840* 85.0
0.001 27800 0.00~ 0.8 0.002 0.8 0.001 3
• 80h 11 200h
7h
130h 130h
0.0012 130h 12000
1.0 4000
0.4 5500 0.1 39 140
400
7 1800
550 2300
1000 500 500 70
7800000 500
3000 2
23000000.
900
900
90 48000
100000 3100000 3100000
3000 2300000
50 2000
4 5
100 1300
15
2 100
0.5 2 2
0.2
5 5 2
0.1 0.2 0.2 8.0
1.0
0.4/88 300/88 1000 1000
130 0.1/88 3 130 3.9 1.00/88 5 3.9 0.1
1700 10/88 50 1700 28 11 25/88 200 11 19 13 400/88 15 13 27
18 421 2.4 0.10 I 0.20 0.11
1400 13/88 100 1400 22 20 2188 10 20
150/88 14 190 120 20/88 300 120 85
1000 0.1 0.001 27800 2.4 500 0.1 0.002 0.8 2.4 0.1 0.002 0.8
0.52 70 0.009 0.001 3
200 50 5300 80 0.7 8 80
45000 700 5 11 200 2 2 7
50000 50 220 0.002 130 900 0.002 130 80 0.002 0.0012 130
400 48000 8.0 400 12000 8100 50
3980 50000 50 3980 50000 50
20 1000 1.0 4000 50000 50
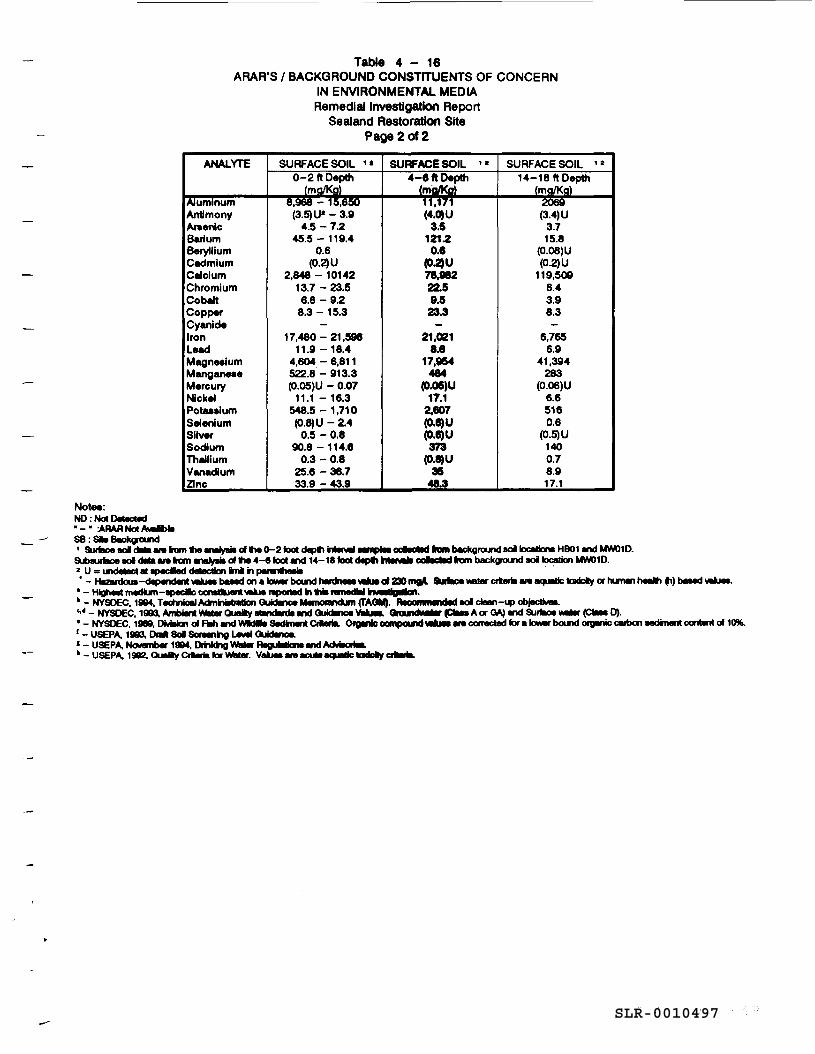
SLR-0010497
Table 4 - 16 ARAR'S I BACKGROUND CONSTITUENTS OF CONCERN
IN ENVIRONMENTAL MEDIA
Notes: NO : Nat Detl8Cted " - • :ARAR Nat A~ S8 : Sb BaclqJ'llund
ANALYTE
umnum Antimony Araenlc Barium Beryllium Cadmium Calcium Chromium Coblilt Copper Cyanide Iron Lead MagnMlum Manganese Mercury Nickel Potualum Selenium Silvef' Sodium Thallium Vanadium Zinc
Remedial Investigation Report Sealand Restoration Site
Page 2 of2
SURFACE SOIL ' • SURFACE SOIL 1 I SURFACE SOIL 1 a
0-2 ft Depth 4-8ft0.plh 14-18 ft Depth
' ' ' (3.5) u• - 3.9 (4.0)U (3.4)U 4.5 - 7.2 3.5 3.7
45.5 - 119.4 121.2 15.8 0.6 0.8 (0.08)U
(0.2)U (0.2)U (0.2)U 2,848 - 10142 78,882 119,509
13.7 - 23.5 22.5 6.4 6.6 - 9.2 9.5 3.9
8.3 - 15.3 23.3 8.3
17,480 - 21,598 21,021 6,765 11.9 - 18.4 8.8 6.9
4,604 - 6,811 17,954 41,394 522.8 - 913.3 484 283 (0.05)U - 0.07 (0.0'5)U (0.06)U
11.1 - 16.3 17.1 6.6 548.5 -1,710 2,607 516 (0.8)U - 2.4 (0.8)U 0.6
0.5 - 0.8 (0.8)U (0.5)U 90.8 - 114.8 373 140
0.3 - 0.8 (0.8)U 0.7 25.8 - 36.7 35 8.9 33.9 - 43.9 48.3 17.1
' &Mllce aol dlla- flom ht~ of ht 0-2 loat depll irdaMI..,.,... oole*d flUll l>Kkground llOil locllllcrw HB01 Ind M\W10. &balrflloe eo1 dllla- flOm ~ of ht 4-e toot Ind 14-1a toat dtpfl ;..- callctld "°"' backp.ncl eo11oa111on M\W1D . • u = undelect • IPeclled deeecllorl hit ii ~ . ' - Hazllrdoua-dep41rident *- bawl on a "-" boWld ~-. d 230119\ a.llcie Mtlr' crbril - aqumlic talclcly or hunw1 healh fl) bawl ...U.. . -~ medUn-..,.. CCllWllUn .... nipoftld ii .. Nmedill 1n-+41tt'"A. ~ - NYSDEC, 1994, TechnlclllAdmilillndlon Guidmnce u.nc-icMn (fAGM). ~lllld eol clwl-up ob~ .,4 - NYSDEC, 1993, Ambient Wallr Qulllly mndlld8 lrld Ouidllnce .,..,_, On:iundMllr pi. A or G4) lrld SUrflloe WllflS (ales D). • - NYSOEC, 1989, DMllarl of Allh mnd Wldlllt Sedm.nt CrllllriL Otgll1iD OO!llpOIRI.._ - correctlld tor a"-" boWld organic CIUbon ~ oonta1t of 10%. 1 - USEPA, 1993, Dnll Sol ~hg UM!~ I - USEPA, Noilwnber 1994, Drinkhg Wallr Alguillllona Ind AcMlort.a. ~ - USEPA. 1992. Qulllly Crt.-1a tor Wallr. V...,_ - acU9 aqumlic laldelly cdlfla.
SLR-0010498
locations showed elevated levels above background of at least four constituents each (Table 4-
14). These locations are HB-03 and HB-04 (both located near the drum storage area) and HB-13
(located in landspreading area C).
Within the subsurface soils (>3 feet), the locations exhibiting the most elevated inorganic analytes
above background were SB-19 (15 analytes at 31 to 33 ft) and SB-20 (12 analytes at 23 to 24 ft),
both located south of the former disposal cell area (Table 4-15). In addition, two other sample
locations present in the vicinity of the former disposal cell area exhibited elevated inorganic
constituents above background, SB-16 (11 analytes at 16 to 18 ft) and SB-18 (9 analytes at 30
to 31 ft). Table 4-16 presents state, federal and clean-up criteria, as well as background
analytical soil data.
Common elevated inorganic analytes above background were calcium, magnesium, manganese,
and lead. Since only two background samples have been collected, a thorough statistical analysis
has not been performed. Thus elevated concentrations above background may not be truly
indicative of actual soil contamination.
Soils Summary. Concentrations of volatile organic compounds ranging from 1 µg/kg to
80,000 µg/kg were detected primarily within the subsurface soils located in the vicinity of the
former disposal cell area. The highest VOC concentrations were detected at soil boring locations
MW05 and MW5A. A number of PAHs were detected in the surface soils in the vicinity of the
former disposal cell area in concentrations ranging from 17 µg/kg to 710 µg/kg, as well.
Concentrations of pesticides were detected in the surface soils situated near the drum storage area
ranging from 0.07 µg/kg to 170 µg/kg. Six isolated surface.samples (MW-010, MW-030, MW-
05S, SB-01, SB-06, and SB-21) exhibited low concentrations of PCBs ranging from 1.6 µg/kg
to 72 µg/kg.
Elevated levels of a number of inorganic constituents above background were detected in the
surface soils, primarily in the vicinity of the drum storage area and landspreading areas J and C.
Within the subsurface soils, the greatest amount of inorganic contamination was present in the
vicinity of the former disposal cell area at depths ranging from 16 to 34 feet below grade. The
main elevated inorganic constituents above background were calcium, magnesium, manganese,
and lead.
Soil contamination was not found in the waste storage tank area, gravel pit and landspreading
areas.
EDIS/ENG/ay071494.rp4 4-73
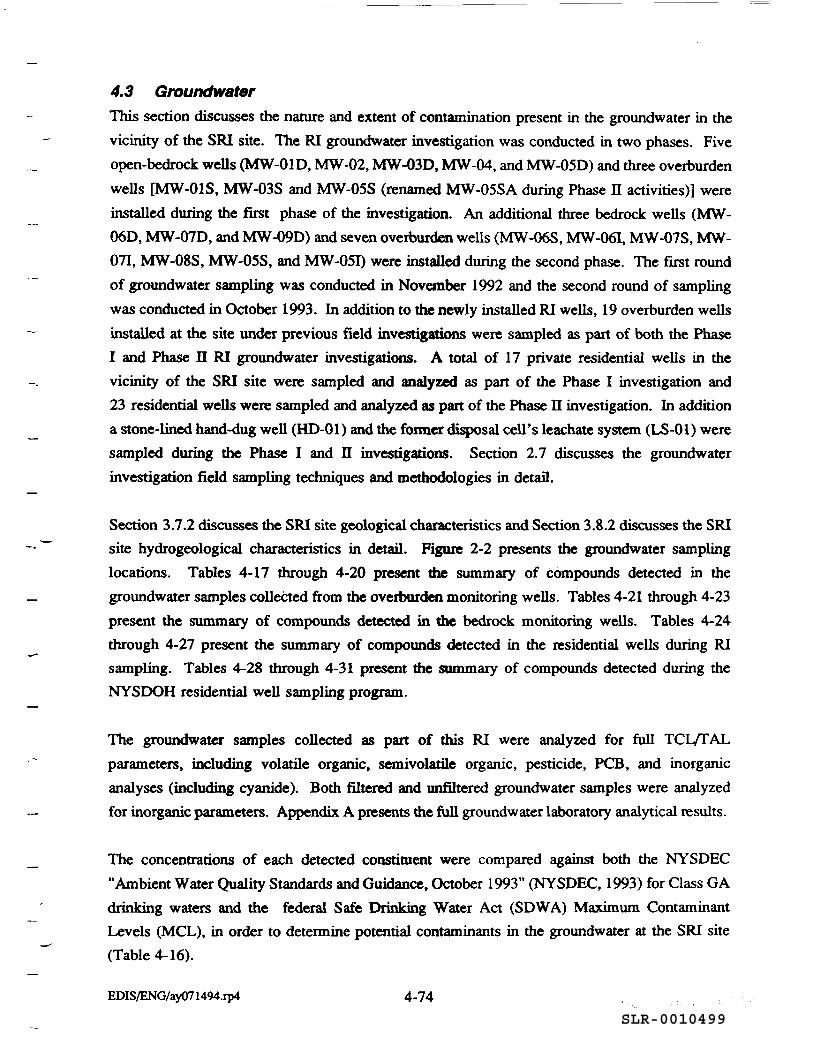
SLR-0010499
4.3 Groundwater
This section discusses the nature and extent of contamination present in the groundwater in the
vicinity of the SRI site. The RI groundwater investigation was conducted in two phases. Five
open-bedrock wells (MW-010, MW-02, MW-030, MW-04, and MW-050) and three overburden
wells [MW-OlS, MW-03S and MW-05S (renamed MW-05SA during Phase II activities)] were
installed during the first phase of the investigation. An additional three bedrock wells (MW -
060, MW-070, and MW-090) and seven overburden wells (MW-06S, MW-061, MW-07S, MW-
071, MW-08S, MW-05S, and MW-051) were installed during the second phase. The first round
of groundwater sampling was conducted in November 1992 and the second round of sampling
was conducted in October 1993. In addition to the newly installed RI wells, 19 overburden wells
installed at the site under previous field investigations were sampled as part of both the Phase
I and Phase II RI groundwater investigations. A total of 17 private residential wells in the
vicinity of the SRI site were sampled and analy7.Cd as part of the Phase I investigation and
23 residential wells were sampled and analyzed as part of the Phase II investigation. In addition
a stone-lined hand-dug well (HD-01) and the fonner disposal cell's leachate system (LS-0 l) were
sampled during the Phase I and Il investigations. Section 2. 7 discusses the groundwater
investigation field sampling techniques and methodologies in detail.
Section 3.7.2 discusses the SRI site geological characteristics and Section 3.8.2 discusses the SRI
site hydrogeological characteristics in detail. Figure 2-2 presents the groundwater sampling
locations. Tables 4-17 through 4-20 present the summary of compounds detected in the
groundwater samples colleeted from the overburden monitoring wells. Tables 4-21 through 4-23
present the summary of compounds detected in the bedrock monitoring wells. Tables 4-24
through 4-27 present the summary of compounds detected in the residential wells during RI
sampling. Tables 4-28 through 4-31 present the summary of compounds detected during the
NYSOOH residential well sampling program.
The groundwater samples collected as part of this RI were analyzed for full TCl./f AL
parameters, including volatile organic, semivolatile organic, pesticide, PCB, and inorganic
analyses (including cyanide). Both filtered and unfiltered groundwater samples were analyzed
for inorganic parameters. Appendix A presents the full groundwater laboratory analytical results.
The concentrations of each detected constituent were compared against both the NYSDEC
"Ambient Water Quality Standards and Guidance, October 1993" (NYSDEC, 1993) for Class GA
drinking waters and the federal Safe Drinking Water Act (SOWA) Maximum Contaminant
Levels (MCL), in order to determine potential contaminants in the groundwater at the SRI site
(Table 4-16).
EDIS/ENG/ay071494.rp4 4-74
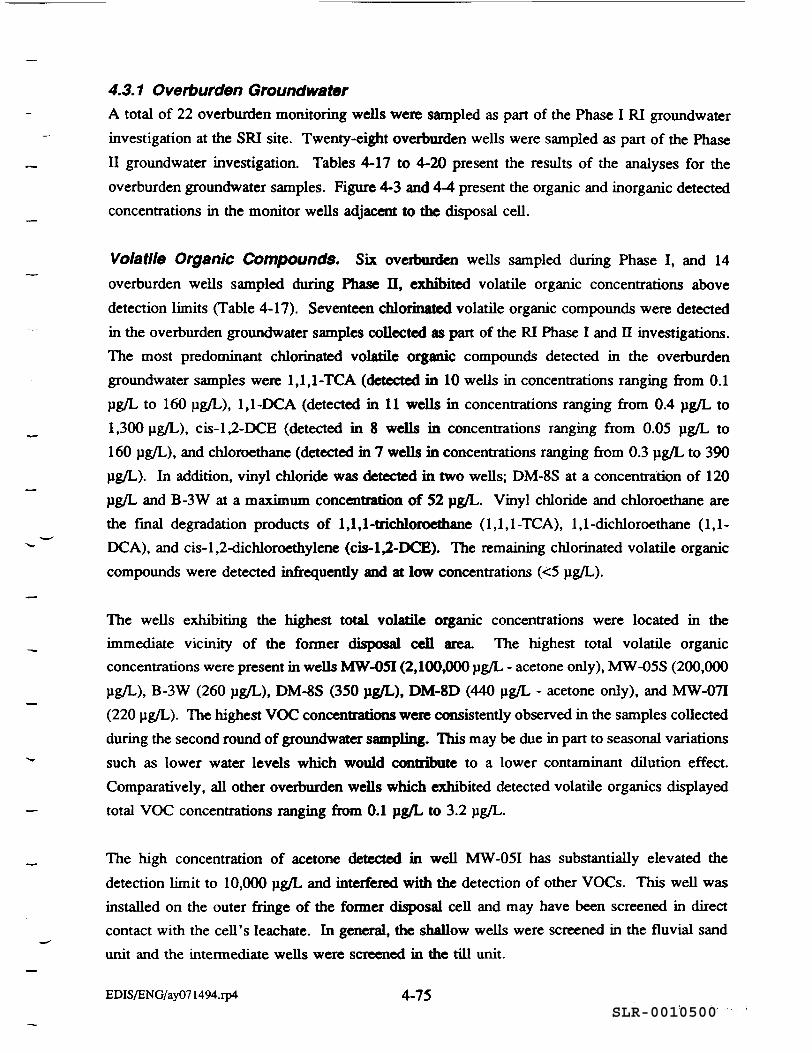
SLR-0010500
-
-
4.3.1 Overburden Groundwater A total of 22 overburden monitoring wells were sampled as part of the Phase I RI groundwater
investigation at the SRI site. Twenty-eight overburden wells were sampled as part of the Phase
II groundwater investigation. Tables 4-17 to 4-20 present the results of the analyses for the
overburden groundwater samples. Figure 4-3 and 4-4 present the organic and inorganic detected
concentrations in the monitor wells adjacent to the disposal cell.
Volatile Organic Compounds. Six overburden wells sampled during Phase I, and 14
overburden wells sampled during Phase Il, exhibited volatile organic concentrations above
detection limits (Table 4-17). Seventeen chlorinated volatile organic compounds were detected
in the overburden groundwater samples collected as part of the RI Phase I and II investigations.
The most predominant chlorinated volatile organic compounds detected in the overburden
groundwater samples were 1,1,l-TCA (detected in 10 wells in concentrations ranging from 0.1
µg/L to 160 µg/L), 1,1-DCA (detected in 11 wells in concentrations ranging from 0.4 µg/L to
1,300 µg/L), cis-1,2-DCE (detected in 8 wells in concentrations ranging from 0.05 µg/L to
160 µg/L), and chloroethane (detected in 7 wells in concentrations ranging from 0.3 µg/L to 390
µg/L). In addition, vinyl chloride was detected in two wells; DM-8S at a concentration of 120
µg/L and B-3W at a maximum concentration of 52 µg/L. Vinyl chloride and chloroethane are
the final degradation products of 1,1,1-trichloroethane ( 1, 1, 1-TCA), 1, 1-dichloroethane ( 1, 1-
DCA), and cis-1,2-dichloroethylene (cis-1,2-DCE). The remaining chlorinated volatile organic
compounds were detected infrequently and at low concentrations (<5 µg/L).
The wells exhibiting the highest total volatile organic concentrations were located in the
immediate vicinity of the fonner disposal cell area The highest total volatile organic
concentrations were present in wells MW-OSI (2,100,000 µg/L- acetone only), MW-05S (200,000
µg/L), B-3W (260 µg/L), DM-8S (350 µg/L), DM-80 (440 µg/L - acetone only), and MW-071
(220 µg/L). The highest voe concentrations were consistently observed in the samples collected
during the second round of groundwater sampling. This may be due in part to seasonal variations
such as lower water levels which would contribute to a lower contaminant dilution effect.
Comparatively, all other overburden wells which exhibited detected volatile organics displayed
total voe concentrations ranging from 0.1 µg/L to 3.2 µg/L.
The high concentration of acetone detected in well MW-051 has substantially elevated the
detection limit to 10,000 µg/L and interfered with the detection of other voes. This well was
installed on the outer fringe of the former disposal cell and may have been screened in direct
contact with the cell's leachate. In general, the shallow wells were screened in the flu vial sand
unit and the intermediate wells were screened in the till unit.
EDIS/ENG/ay071494.rp4 4-75
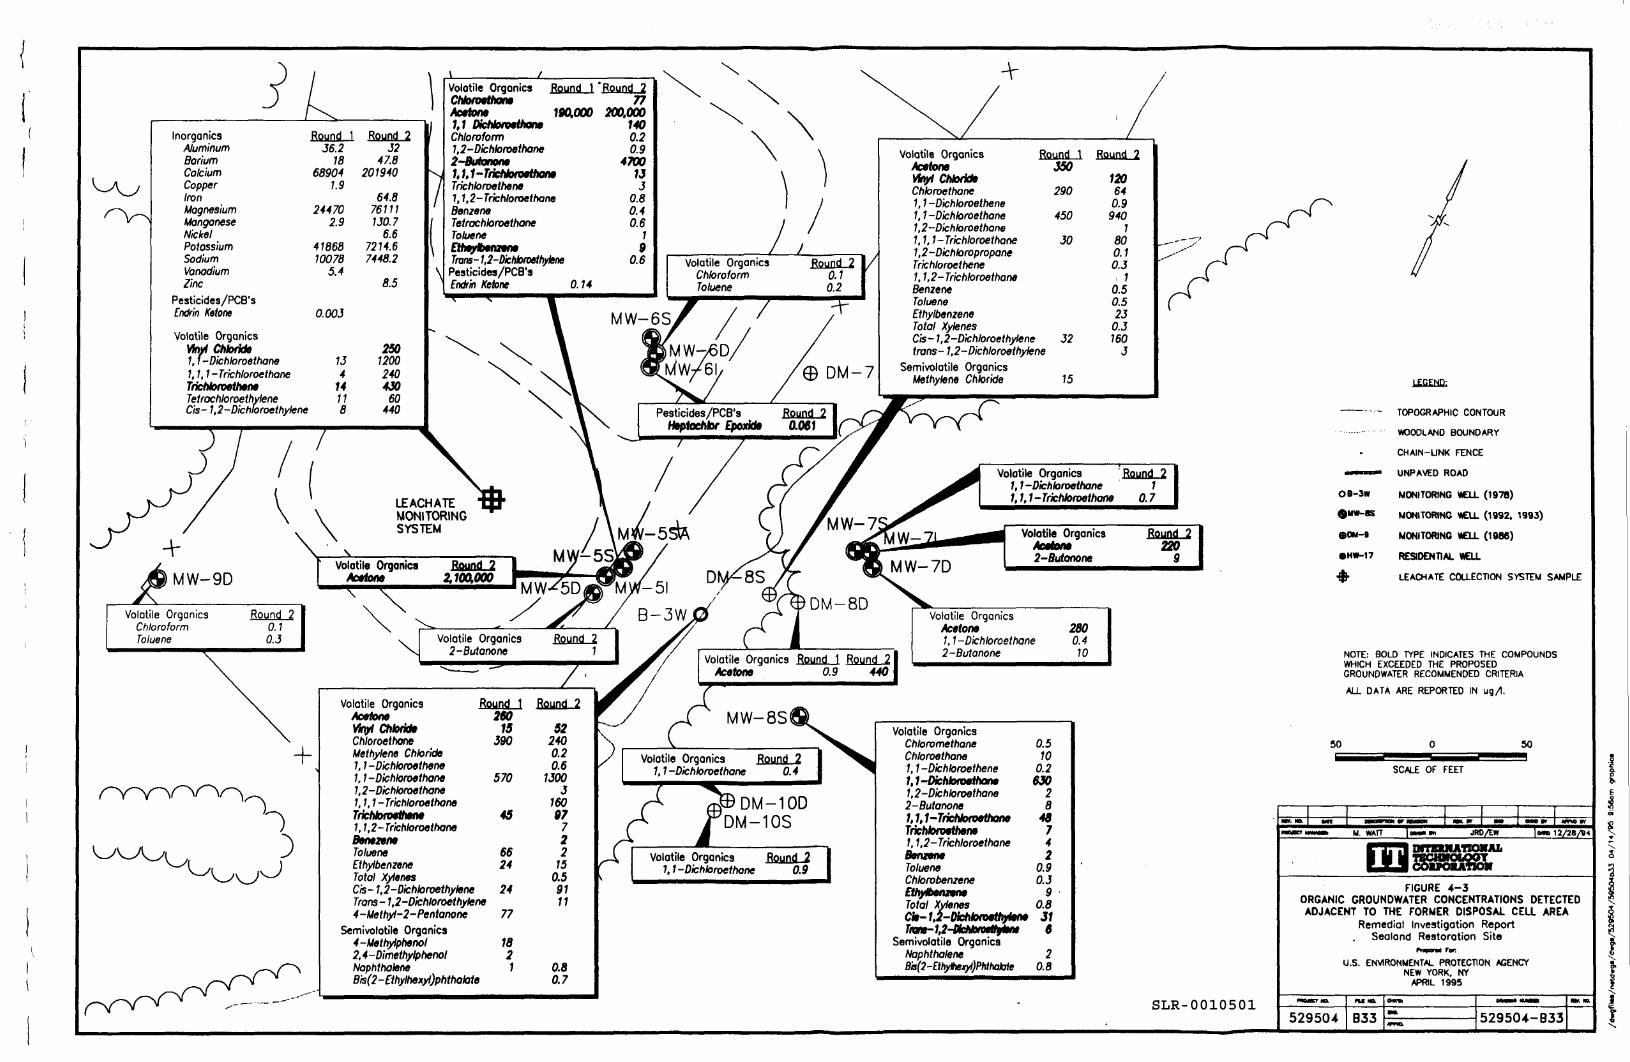
SLR-0010501
{
i (
l
""' ] \ Volatile Organics Round 1 'Round 2 ~ ~~ Cllloloethone Acefont 190.000 1. 1 Dichloroelhol•
lnorganics BQuDd l BQuDd 2 Chloroform Aluminum Barium Calcium Copper Iron Magnesium Manganese Nickel Potassium Sodium Vanadium line
Pesticides/PCB's Endrin Ketone
Volatile Organics ~r- Chloridf 1, -Dichloroethane 1, 1, 1-Trichloroethane Trichloroethene Tetrochloroeth{!ne Cis-1,2-Dich oroethylene
MW-90
Volatile Organics Chloroform Toluene
,,.-
Round 2 0. 1 0.J
+
-- -- __ .. ------
J6.2 J2 1,2-Dichtoroethane 78 47.8 2-IJutotttJM
68904 201940 1, 1, 1-Trit:liloro«hon 1.9 T rich/oroethene
64.8 1, 1,2-Trich/oroethane 24470 76111 Benzene
2.9 130.7 Tetrach/oroethane 6.6 To/~ne
41868 72H.6 =bmethyene 10078 7448.2 Pesticides/PCB's 5.4
O.OOJ
1J 4
14 11 8
8.5 Endrin Ketone
250 1200 240 4J()
60 440
LEACHATE MONITORING SYSTEM
Volatile Organics Acetone
Round 2 2, 100.000
Volatile Organics 2-Butonone
Volatile Organics Acetone Vinyf Chloride Chloroethone Methylene Chloride 7, 1-Dichtoroethene 1, 1-Dichtoroethone 1,2-DichloroethOM 1, 1, 1-Trichloroethane Tricltlotodtettl 1, 1,2-Trichloroethane Bentnne Toluefl6 £thy/benzene
RQyng 1 260
16 .390
570
66 24
Total Xylenn Cis-1,2-Dich/oroethytene Trans-1,2-Dichtoroethy/ene 4-Methyl-2-Pentonone
24
77 Semivolotile Organics
4-Methylphenol 2, 4-Dimethylphenol Naphthalene Bis(2-£thy/h8xyl}phtholote
18 2 1
~2 240 0.2 0.6
1300 J
160 ,, 7 2 2
15 o.s 91 11
0.8 0.7
0.14
71 200.000
140 '\ '\ 0.2 0.9
4'100 ) ) 1J J
0.8 0.-f / 0.6
1 9
0.6 Volatile Organics BQuDd 2 Chloroform o. 1 Toluene 0.2
Volatile Organics BQund 1 RQuDd 2 Acetone 0.9 440
MW-SS
Volatile Organics RQuDd 2 1, 1-Dichloroethone 0.4
OM-100 OM-10S
Volatile Organics Royad 2 1, 1-Dichloroethane 0.9
+ /
Volatile Organics Ro1.1ad l B111.1ad 2 Acetone J50 ~yt Chlorldt 120 Chloroethane 290 64 1, 1-Dichloroethene 0.9 1, 1-Dichloroethane 450 940 1,2-Dichloroethone 1 1, 1, 1-Trichloroethane JO 80 -- -::' 1,2-Dichloropropane 0.1 __ ,,,,,.. ............. '·
Trichloroethene 0.J
~ 1, 1,2-TrichloroethanB ' 1 Benzene 0.5 Toluene 0.5 £thy/benzene 23 Total Xy/enes O.J Cis-1,2-Dichloroethylene 32 160 trons-1,2-Dichloroethy/ene J
Semivolatile Organics Methylene Chloride 15
Volatile Organics 1, 1-Dichtoroethane
· RQuad 2 . 1
1, 1, 1-Trich/oroethot'lfl 0.7
Volatile Organics Acttolae 2-Butonone
Volatile Organics Acetone 1, 1-Dichloroethane 2-Butanone
Volatile Organics Chloromethane 0.5 Chloroethane 10 1, 1-Dichloroethene 0.2 1, 1-0ichlotoetholle 6JO 1,2-Dichloroethane 2 2-Butanone B 1, 1, 1-TrichloroethoM 48 Tricltloroefhene 7 1, 1,2-Trichloroethane 4 ,.,..,,. 2 Toluene 0.9 Ch/orobenzene 0.J £tltyll»nntte 9 . Total Xylenes 0.8 Cltl- 1,2-0lt:ltltHHth,,.,_ J1 TRllt-1,2-Dlt:Nol.,_ 8
Semivolatile Organics Naphthalene 2 Bis(2-Ethylhexyt)Phtholate 0.8
280 0.4 10
Roynd 2 220
9
--
· - TOPOGRAPHIC CONTOUR
¥IOOOLAND BOUNDARY
CHAIN-LINK FENCE
- UNPAVED ROAD
OB-3W
euw-as
eDM-1
MONITORING \IEU.. (1978)
MONITORING \IEU.. (1992, 1993)
MONITORING \IEU.. (1986)
RESIDENTIAL. ¥£U. OHW-17
• LEACH A TE COU.ECTION S'YSTEM SAMPLE
50
NOTE: BOLD TYPE INDICATES THE COMPOUNDS WHICH EXCEEDED THE PROPOSED GROUNDWATER RECOMMENDED CRITERIA
ALL DATA ARE REPORTED IN ug;1.
0
SC..U: OF FEET
-12 211 4
FIGURE 4-3 ORGANIC GROUNDWATER CONCENTRATIONS DETECTED ADJACENT TO THE FORMER DISPOSAL CELL AREA
Remedial Investigation Report
--Sealand Restoration Site
U.S. ENlllRONMENT"'-.. PROTECTION ~ENCY NEW YORK, NY
APRIL 1995
....... - --52950.4 833 1--------152950.4-833 -
....
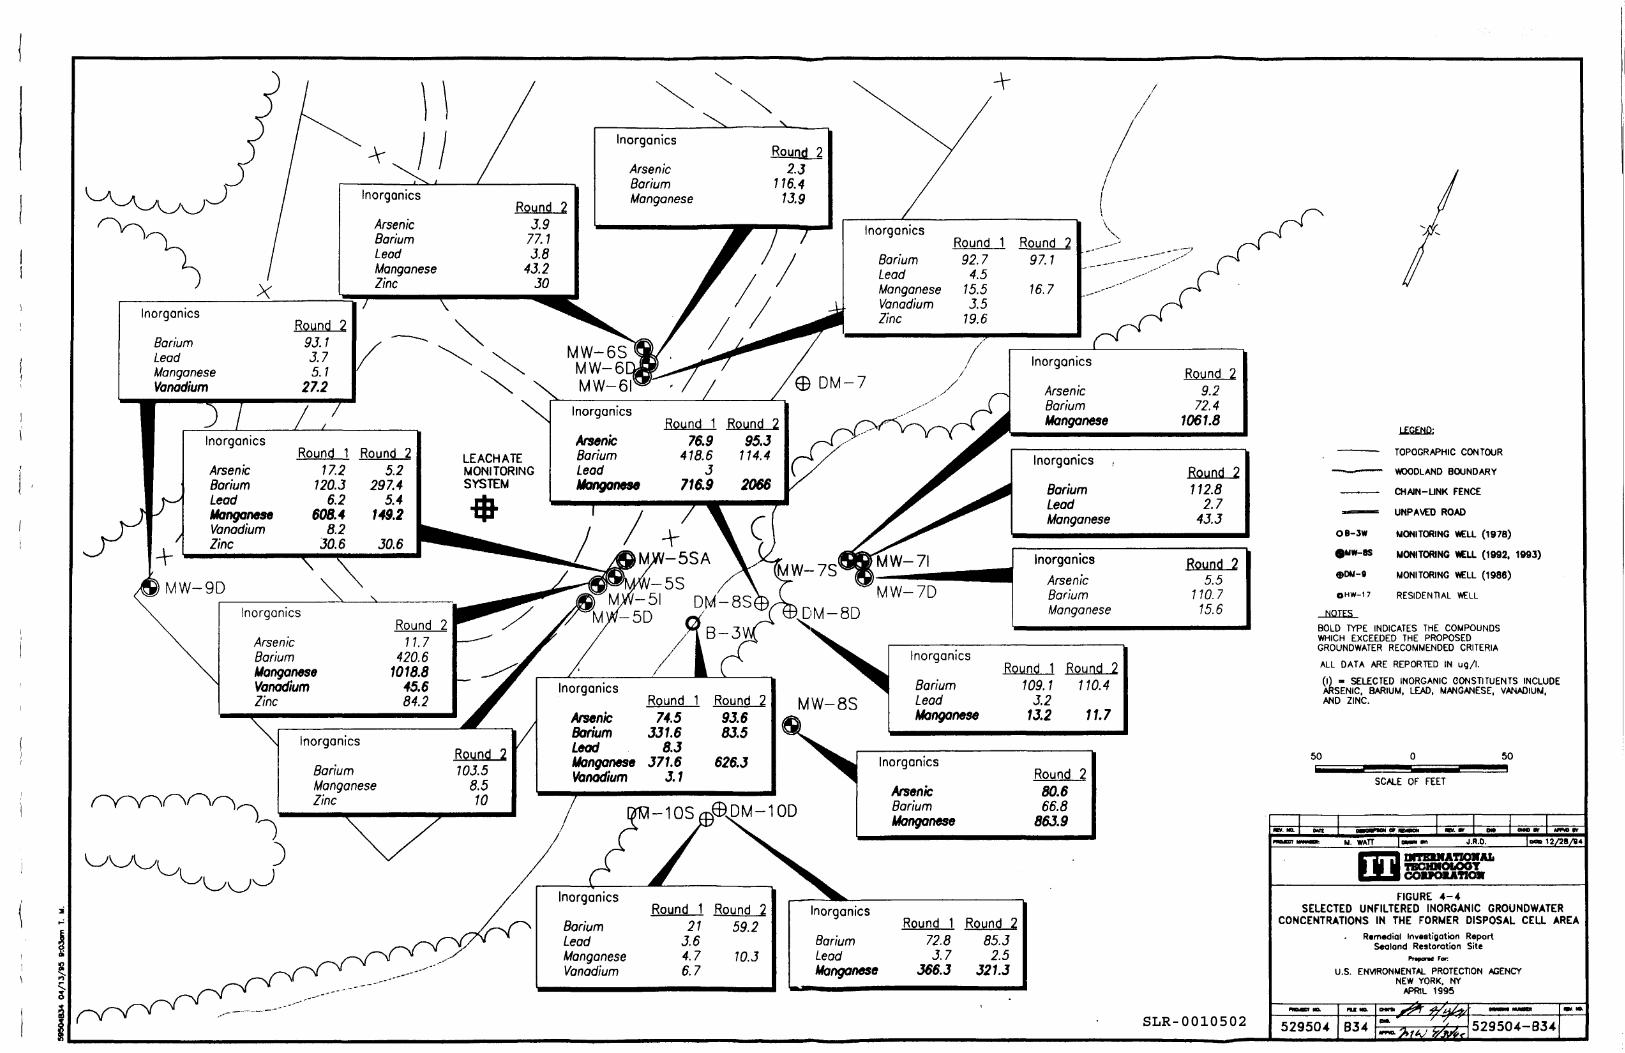
SLR-0010502
,..:
~ ~
lnorgonics
Barium Lead Manganese Vanadium
Round 2 93.1 3.7 5.1
27.2
lnorganics Roung 1
Arsenic 17.2 Barium 120.J Lead 6.2 IAanganese 608.4 Vanadium Zinc
lnorganics
Arsenic Barium Manganese Vanadium Zinc
8.2 30.6
lnorganics
\ \
~ / / lnorganics
Arsenic Barium Lead Manganese Zinc
Royng 2 5.2
297.4 5.4
149.2
30.6
Round 2 11.7
420.6 1018.8
45.6 84.2
Barium Manganese Zinc
---- ----
---
LEACHATE MONITORING SYSTEM
•
Round 2 103.5
8.5 10
2
I I
lnorganics
Arsenic Barium Manganese
lnorganics
Arsenic Barium Lead Alangonne
Arsenic Barium Lead l.longonese Vanadium
Round 1 76.9
418.6 3
716.9
Round 74.5
JJ1.6 8.J
J71.6 J.1
~norgonics Round 1
Barium 21 Lead 3.6 Manganese 4.7 Vanadium 6.7
Round 2 2.J
116.4 13.9
+ Ii
Round 2 95.J
114.4
2066
Round 2 9J.6 BJ.5
626.J
Round 2 59.2
10.J
( lnorgonics
Round 92.7
4.5 15.5 J.5
19.6
Round 2 97.1
E9 OM- 7
Barium Lead Manganese Vanadium Zinc
--- -
16.7
lnorganics
Arsenic Barium Manganese
lnorganics
Barium Lead Manganese
lnorganics
Arsenic MW-70 Barium
MW-8S
lnorganics
Barium Lead Manganese
Manganese
lnorganics
Barium Lead Manganese
Bound 1 109.1
J.2 1J.2
Round 2 110.4
lnorganics
Arsenic Barium Manganese
Round 1 72.8 J.7
J66.J
Round 2 85.J
2.5 J21.J
Round 2 80.6 66.8
86J.9
11.7
----.~~/'·'
BQynd 9.2
72.4 1061.8
BQuod 112.8
2.7 43.3
B2!.md 5.5
110. 7 15.6
2
2
2
TOPOGRAPHIC CONTOUR
WOODLAND BOUNDARY
CHAIN-LINK FENCE
-=--= UNPAl.e> ROAD
08-3W MONITORING WELL (1978)
... w-as MONITORING WELL (1992, 1993)
$DM-I MONITORING WELL (1986)
OHW-17 RESIDENTIAL WELL
__.llillES_
BOLD TYPE INDICATES THE COMPOUNDS WHICH EXCEEDED THE PROPOSED GROUNDWATER RECOMMENDED CRITERIA
ALL DATA ARE REPORTED IN ug/I.
50
--
(1) • SELECTED INORGANIC CONSTITUENTS INCLUDE ARSENIC, BARIUM, LEAD, MANGANESE, VANADIUM, AND ZINC.
0
SCALE OF FEET
-·- .,.. -M. WATT - "" J.R.O.
m DITDKATIOllAL TBCllllOLOOT COUOUTIO.-
FIGURE 4-4
50
SELECTED UNFILTERED INORGANIC GROUNDWATER CONCENTRATIONS IN THE F'ORMER DISPOSAL CELL AREA
R•m•dial Investigation Report Sealand Restoration Site
U.S. ENVIRONMENTAL PROTECTION AGENCY NEW YORK, NY
APRIL 1995
l._ __________________________________________________________________________________________________________________ ....J~5~2~9~5~0~4J.:.B3~4~~~:.._=~~&a~i~~5=2~9=50~4~-~B=3~4l...~ ---- --_ .... ....... - --

SLR-0010503
\
SAMPLE LOCATION: SAMPLE DATE:
ANALYTE UNITS
CHLOROMETHANE ug/L VINYL CHLORIDE ug/L CHLOAOETHANE ug/L METHYLENE CHLORIDE ug/L ACETONE ug/L CARBON DISULFIDE ug/L 1, 1 -DICHLOROETHENE ug/L 1, 1-DICHLOROETHANE ug/L CHLOROFORM ug/L 1,2-DICHLOROETHANE ug/L 2-BUTANONE ug/L 1 , 1 , 1 - lRI CHLOROETHANE ug/L 1,2-DICHLOAOPROPANE ug/L lRI CHLOROETHENE ug/L 1, 1,2-lRICHLOROETHANE ug/L BENZENE ug/L 4- METHYL-2-PENTANONE ug/L TElRACHLOROETHENE ug/L TOLUENE ug/L CHLOAOBENZENE ug/L ETHYLBENZENE ug/L TOTAL XYLENES ug/L cis-1 ,2- DI CHLOROETHYLENE ug/L trans-1,2-0ICHLOROETHYLENE ug/L
J \
TABLE 4 - 17
'I
OVERBURDEN GROUNDWATER VOLATILE ORGANIC COMPOUNDS
Remedal Investigation Report Sealand Restoration Site
SSB02WGS01 SSB03WGS01 SSB03WGS02 12/04/92 12/02/92 10/14/93 RESULTSlUAL RESU LTSQUAL RESULTSQUAL
- - - - - -- - 151 52 - - 390 240 - - - - 0.2 J - - 260J - -- - - - - -- - - - 0.6 J - - 570 1300 - - - - - -- - - - 3 - - - - - -- - 49 160 - - - - - -- - 45 97 - - - - 7 - - - - 2 - - 77 J - -- - - - - -- - 66 2 - - - - - -- - 24 15 - - - - 0.5 J - - 24 91 J - - - - 11
SS008WGS01 SSB08WGS02 12/03/92 10/13/93 RESULTSQUAL RESU LTSQUAL
- - - -- - - -- - - -- - - -- - - -
1 - -- - - -- - - -- - - -- - - -- - - -- - - -- - - -- - - -- - - -- - - -- - - -- - - -- - - -- - - -- - - -- - - -- - - -- - - -
Note: • - • = Indicates that the constituent was not detected above detection limits. Page 1
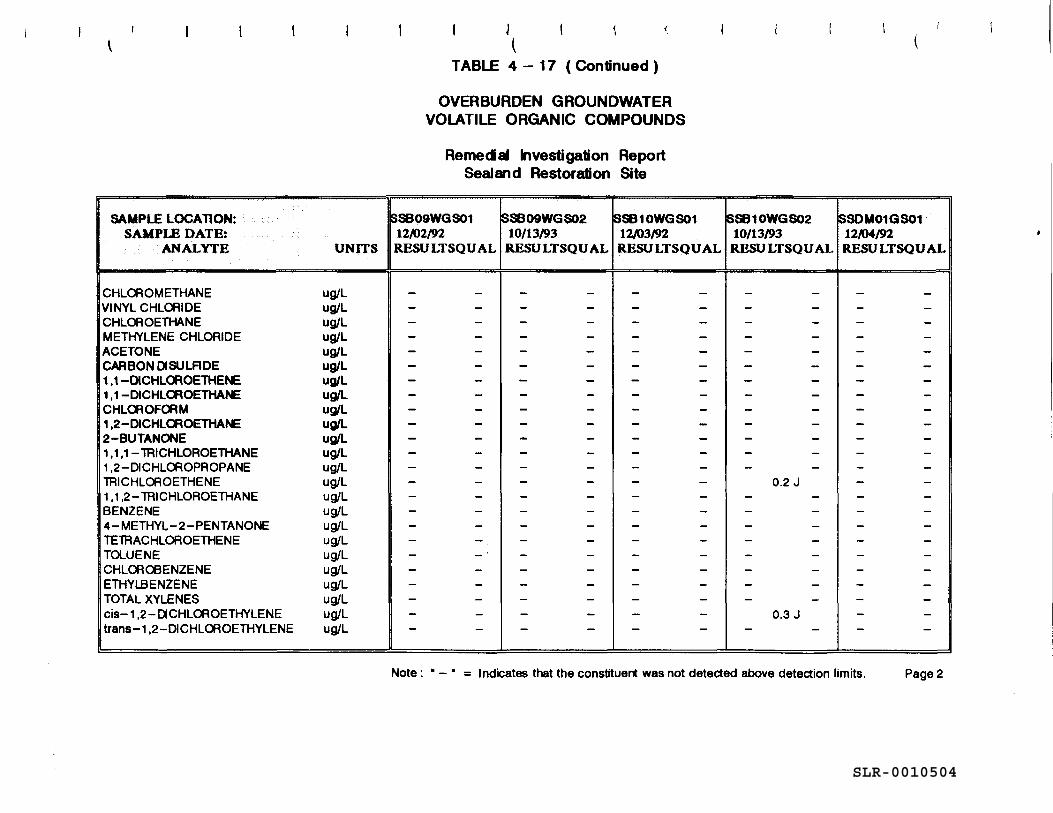
SLR-0010504
SAMPLE LOCATION: SAMPLE DATE:
ANALYTE UNITS
CHLOROMETHANE ug/L VINYL CHLORIDE ug/L CHLOROETHANE ug/L METHYLENE CHLORIDE ug/L ACETONE ug/L CARBON DISULADE ug/L 1, 1-DICHLOROETHEtE ug/L 1, 1 -DICHLOROETHAtE ug/L CHLOROFORM ug/L 1,2-DICHLOROETHAtE ug/L 2-BUTANONE ug/L 1 , 1 , 1 - lRICHLOROETHANE ug/L 1 ,2-DICHLOROPROPANE ug/L lRICHLOROETHENE ug/L 1, 1,2-lRICHLOROETHANE ug/L BENZENE ug/L 4-METHYL-2-PENTANONE ug/L TElRACHLOROETHENE ug/L TOLUENE ug/L CHLOROBENZENE ug/L ETHYLBENZENE ug/L TOTAL XYLENES ug/L cis-1,2-DICHLOROETHYLENE ug/L trans-1,2-DICHLOROETHYLENE ug/L
J l
TABLE 4 - 17 ( Continued )
OVERBURDEN GROUNDWATER VOLATILE ORGANIC COMPOUNDS
Remedal Investigation Report Sealand Restoration Site
SSB09WGS01 SSB09WGS02 SSB10WGS01 12/02/92 10/13/93 12/03/92 RESULTSQUAL RESULTSQUAL RESULTSQUAL
- - - - - -- - - - - -- - - - - -- - - - - -- - - - - -- - - - - -- - - - - -- - - - - -- - - - - -- - - - - -- - - - - -- - - - - -- - - - - -- - - - - -- - - - - -- - - - - -- - - - - -- - - - - -- - - - - -- - - - - -- - - - - -- - - - - -- - - - - -- - - - - -
ISSB 1 OWGS02 $SOM01GS01 10/13/93 1~/92
RESULTSQUAL RESULTSQUAL
- - - -- - - -- - - -- - - -- - - -- - - -- - - -- - - -- - - -- - - -- - - -- - - -- - - -
0.2 J - -- - - -- - - -- - - -- - - -- - - -- - - -- - - -- - - -
0.3 J - -- - - -
Note: • - • = Indicates that the constituent was not detected above detection limits. Page2
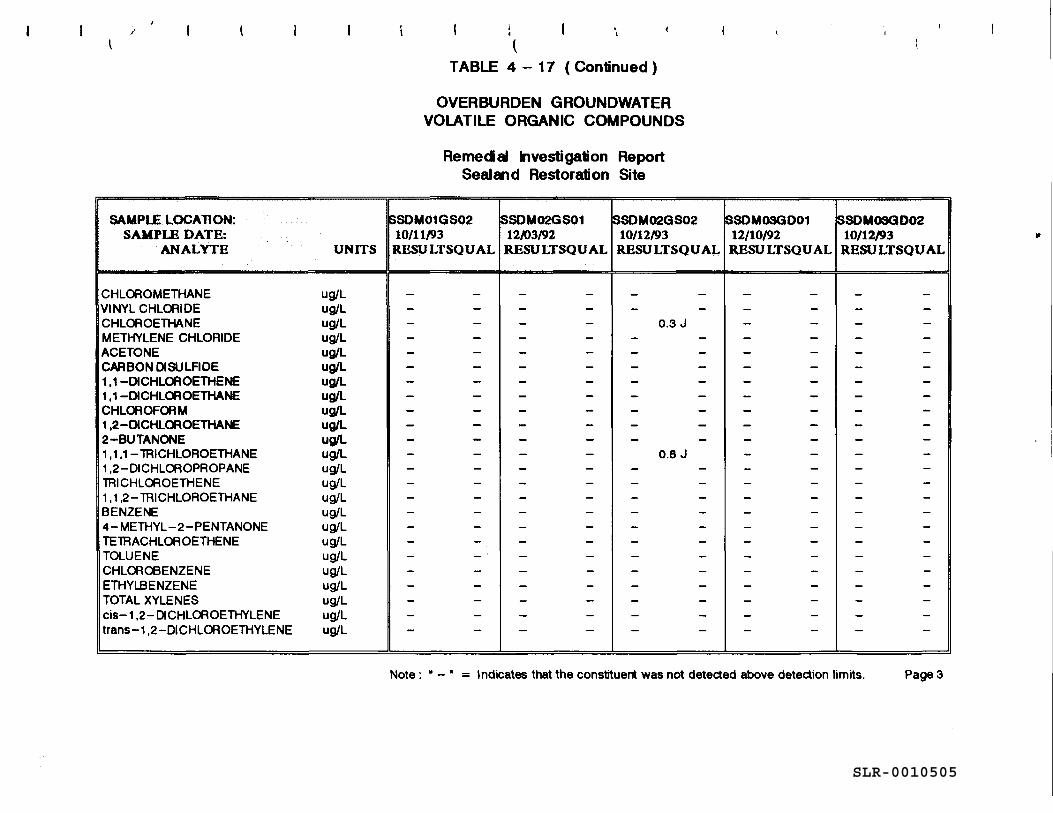
SLR-0010505
I
SAMPLE LOCATION: SAMPLE DATE:
ANALYTE UNITS
CHLOROMETHANE ug/L VINYL CHLORIDE ug/L CHLOROETHANE ug/L METHYLENE CHLORIDE ug/L ACETONE ug/L CARBON DISULFIDE ug/L 1.1-DICHLOROETHENE ug/L 1, 1-DICHLOROETHANE ug/L CHLOROFORM ug/L 1,2-DtCHLOROETHANE ug/L 2-BUTANONE ug/L 1, 1, 1 - 'TRICHLOROETHANE ug/L 1,2-DICHLOROPROPANE ug/L 'TRI CHLOROETHENE ug/L 1, 1,2- lRICHLOROETHANE ug/L BENZENE ug/L 4-METHYL-2-PENTANONE ug/L TE'TRACHLOROETHENE ug/L TOLUENE ug/L CHLOROBENZENE ug/L ETHYLBENZENE ug/L TOTAL XYLENES ug/L cis-1 ,2- DICHLOROETHYLENE ug/L trans-1,2-DICHLOROETHYLENE ug/L
I • (
TABLE 4 - 17 ( Continued )
OVERBURDEN GROUNDWATER VOLATILE ORGANIC COMPOUNDS
Remecial Investigation Report Sealand Restoration Site
$SOM01GS02 SSOM02GS01 SSOM02GS02 10/11/93 12103/92 10/12/93 RESULTSQUAL RESULTSQUAL RESULTSQUAL
- - - - - -- - - - - -- - - - 0.3 J - - - - - -- - - - - -- - - - - -- - - - - -- - - - - -- - - - - -- - - - - -- - - - - -- - - - 0.8 J - - - - - -- - - - - -- - - - - -- - - - - -- - - - - -- - - - - -- - - - - -- - - - - -- - - - - -- - - - - -- - - - - -- - - - - -
ISSOM03G001 SSOMOSGD02 12/10/92 10/12/93 RESU LTSQUAL RESULTSQUAL
- - - -- - - -- - - -- - - -- - - -- - - -- - - -- - - -- - - -- - - -- - - -- - - -- - - -- - - -- - - -- - - -- - - -- - - -- - - -- - - -- - - -- - - -- - - -- - - -
Note : • - • = Indicates that the constituent was not detected above detection limits. Page3

SLR-0010506
SAMPLE LOCATION: SAMPLE DATE:
ANALYTE UNITS
CHLOROMETHANE ug/L VINYL CHLORIDE ug/L CHLOROETHANE ug/L METHYLENE CHLORIDE ug/L ACETONE ug/L CARBON DISULADE ug/L 1 , 1 -DICHLOROETHENE ug/L 1, 1 -DICHLOROETHANE ug/L CHLOROFORM ug/L 1,2-DICHLOAOETHANE ug/L 2-BUTANONE ug/L 1 , 1 , 1 - lRI CHLOROETHANE ug/L 1 ,2-DICHLOROPROPANE ug/L 1RICHLOROETHENE ug/L 1,1,2-lRICHLOROETHANE ug/L BENZENE ug/L 4-METHYL-2-PENTANONE ug/L TElRACHLOROETHENE ug/L TOLUENE ug/L CHLOAOBENZENE ug/L ETHYLBENZENE ug/L TOTAL XYLENES ug/L cis-1,2-DICHLOROETHYLENE ug/L trans-1,2-DICHLOROETHYLENE ug/L
( TABLE 4 - 17 ( Continued )
OVERBURDEN GROUNDWATER VOLATILE ORGANIC COMPOUNDS
Remedal Investigation Report Sealand Restoration Site
~SOM04GS01 ~SOM04GS02 SSOM05AGS01 12/04/92 10/13/93 12/03/92 RBSULTSQUAL RESULTSQUAL RESULTSQUAL
- - - - - -- - - - - -- - - - - -- - - - - -- - - - - -- - - - - -- - - - - -- - - - - -- - - - - -- - - - - -- - - - - -- - - - - -- - - - - -- - - - - -. - - - - - -- - - - - -- - - - - -- - - - - -- - - - - -- - - - - -- - - - - -- - - - - -- - - - - -- - - - - -
~SOM05GS02 ~SOM06GS01 10/13193 12~2192
RBSULTSQUAL RESULTSQUAL
- - - -- - - -- - - -- - - -- - - -- - - -- - - -- - 0.9 J - - - -- - - -- - - -- - - -- - - -- - - -- - - -- - - -- - - -- - - -- - - -- - - -- - - -- - - -
0.4 J - -- - - -
Note: • - • = Indicates that the constituent was not detected above detection limits. Page4
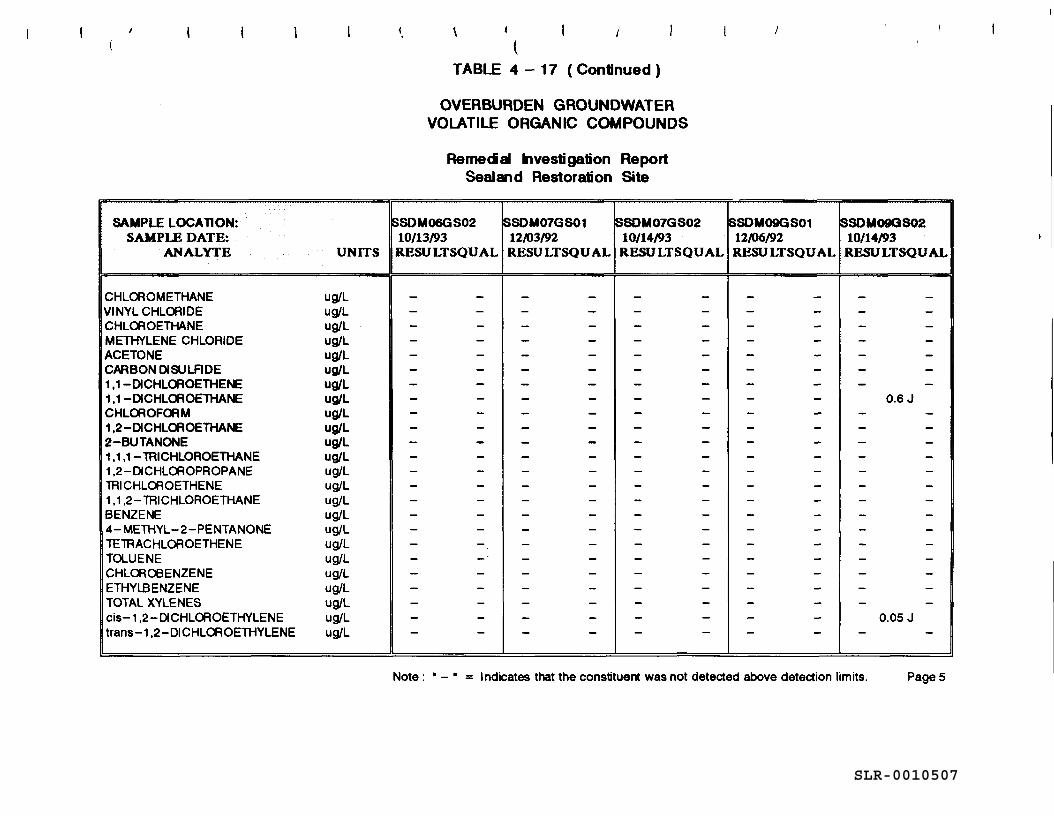
SLR-0010507
SAMPLE LOCATION: SAMPLE DATE:
ANALYTE UNITS
CHLOROMETHANE ug/L VINYL CHLORIDE ug/L CHLOROETHANE ug/L METHYLENE CHLORIDE ug/L ACETONE ug/L CARBON DISULFIDE ug/L 1, 1-DICHLOAOETHENE ug/L 1, 1 -DICHLOAOETHANE ug/L CHLOROFORM ug/L 1,2-DICHLOAOETHANE ug/L 2-BUTANONE ug/L 1,1,1-lRICHLOROETHANE ug/L 1,2-DICHLOROPROPANE ug/L lRI CHLOROETHENE ug/L 1, 1,2-lRICHLOROETHANE ug/L BENZENE ug/L 4-METHYL-2-PENTANONE ug/L TElRACHLOROETHENE ug/L TOLUENE ug/L CHLOROBENZENE ug/L ETHYLBENZENE ug/L TOTAL X'YLENES ug/L cis-1,2-DICHLOROETHYLENE ug/L trans-1,2-DICHLOAOETHYLENE ug/L
l TABLE 4 - 17 ( Continued )
OVERBURDEN GROUNDWATER VOLATILE ORGANIC COMPOUNDS
Reme<ial Investigation Report Sealand Restoration Site
SSOM06GS02 ISSOM07GS01 ISSOM07GS02 10/13/93 12J03/92 10/14/93 RESULTSQUAL RESU LTSQUAL RESULTSQUAL
- - - - - -- - - - - -- - - - - -- - - - - -- - - - - -- - - - - -- - - - - -- - - - - -- - - - - -- - - - - -- - - - - -- - - - - -- - - - - -- - - - - -- - - - - -- - - - - -- - - - - -- - - - - -- - - - - -- - - - - -- - - - - -- - - - - -- - - - - -- - - - - -
ISSOM09GS01 SSOM09GS02 12/06/92 10/14/93 RESULTSQUAL RESULTSQUAL
- - - -- - - -- - - -- - - -- - - -- - - -- - - -- - 0.6 J - - - -- - - -- - - -- - - -- - - -- - - -- - - -- - - -- - - -- - - -- - - -- - - -- - - -- - - -- - 0.05 J - - - -
Note: • - • = Indicates that the constituent was not detected above detection limits. Pages
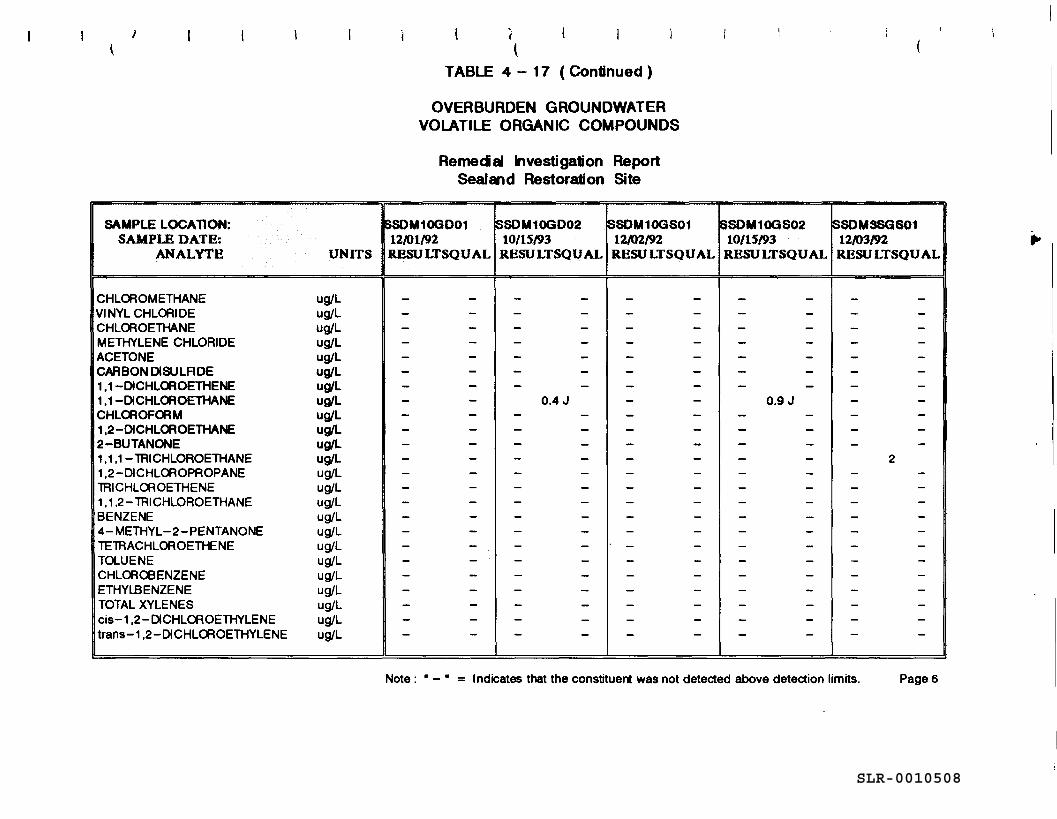
SLR-0010508
SAMPLE LOCATION: SAMPLE DATE:
.ANALYTE UNITS
CHLOROMETHANE ug/L VINYL CH LORI DE ug/L CHLOROETHANE ug/L METHYLENE CHLORIDE ug/L ACETONE ug/L CARBON DISULFIDE ug/L 1, 1 -DICHLOROETHENE ug/L 1, 1-DICHLOROETHANE ug/L CHLOROFORM ug/L 1,2-DICHLOAOETHANE ug/L 2-BUTANONE ug/L 1, 1, 1 - lRICHLOROETHANE ug/L 1,2-DICHLOAOPROPANE ug/L lRICHLOROETHENE ug/L 1 , 1,2- lRI CHLOROETHANE ug/L BENZENE ug/L 4-METHYL-2-PENTANONE ug/L TElRACHLOROETHENE ug/L TOLUENE ug/L CHLOROBENZENE ug/L ETHYLBENZENE ug/L TOTAL XYLENES ug/L cis-1 ,2-DICHLOROETHYLENE ug/L trans-1,2-DICHLOROETHYLENE ug/L
'
' l TABLE 4 - 17 ( Continued )
OVERBURDEN GROUNDWATER VOLATILE ORGANIC COMPOUNDS
Remedal Investigation Report Sealand Restoration Site
6SOM10GD01 SSOM10GD02 SSOM10GS01 12/01/92 10/15/93 12/02/92 RESULTSQUAL RESULTSQUAL RESUl..J'SQUAL
- - - - - -- - - - - -- - - - - -- - - - - -- - - - - -- - - - - -- - - - - -- - 0.4 J - -- - - - - -- - - - - -- - - - - -- - - - - -- - - - - -- - - - - -- - - - - -- - - - - -- - - - - -- - - - - -- - - - - -- - - - - -- - - - - -- - - - - -- - - - - -- - - - - -
$SDM10GS02 SSOM3SGS01 10/lS/93 12/03/92
RESULTSQUAL RESU LTSQUAL
- - - -- - - -- - - -- - - -- - - -- - - -- - - -
0.9 J - -- - - -- - - -- - - -- - 2 - - - -- - - -- - - -- - - -- - - -- - - -- - - -- - - -- - - -- - - -- - - -- - - -
Note: • - • = Indicates that the constituent was not detected above detection limits. Pages

SLR-0010509
I
SAMPLE LOCATION: SAMPLE DATE:
ANALYTE UNITS
CHLOROMETHANE ug/L VINYL CHLORIDE ug/L CHLOROETHANE ug/L METHYLENE CHLORIDE ug/L ACETONE ug/L CARBON DISULADE ug/L 1, 1-DICHLOROETHENE ug/L 1, 1 -DICHLOROETHANE ug/L CHLOROFORM ug/L 1,2-DICHLOROETHANE ug/L 2-BUTANONE ug/L 1 , 1 , 1 - lRI CHLOAOETHANE ug/L 1,2-DICHLOAOPROPANE ug/L lRICHLOROETHENE ug/L 1, 1,2- lRICHLOAOETHANE ug/L BENZENE ug/L 4-METHYL-2-PENTANONE ug/L TElRACHLOROETHENE ug/L TOLUENE ug/L CHLOROBENZENE ug/L ETHYLBENZENE ug/L TOTAL XYLENES ug/L cis-1,2-DICHLOROETHYLENE ug/L trans-1,2-DICHLOAOETHYLENE ug/L
< l '·
TABLE 4 - 17 ( Continued )
OVERBURDEN GROUNDWATER VOLATILE ORGANIC COMPOUNDS
Remeclal Investigation Report Sealand Restoration Site
SSOM3SGS02 ISSOM80GD01 ISSDM8DGD02 10/12193 12/02/92 10/14/93 RESULTSQUAL RESU LTSQUAL RESULTSQUAL
- - - - - -- - - - - -- - - - - -- - - - - -- - 0.9J 440 J - - - - - -- - - - - -- - - - - -
0.2 J - - - -- - - - - -- - - - - -
2 - - - -0.4 J - - - -0.1 J - - - -0.3 J - - - -
- - - - - -- - - - - -
0.2 J - - - -- - - - - -- - - - - -- - - - - -- - - - - -- - - - - -- - - - - -
SSOM8SGS01 ISSOM8SGS02 12/02/92 10/14/93
RESULTSQUAL RESU LTSQUAL
- - - -- - 120
290 64 15 J - -
350 J - -- - - -- - 0.9 J
450 940 - - - -- - 1 - - - -
30 80 - - 0.1 J - - 0.3 J - - 1 - - 0.5 J - - - -- - - -- - 0.5 J - - - -- - 23 - - 0.3 J
32 160 - - 3
Note: • - • = Indicates that the constituent was not detected above detection limits. Page7

SLR-0010510
SAMPLE LOCATION: SAMPLE DATE:
ANALYTE UNITS
CHLOROMETHANE ug/L VINYL CH LORI DE ug/L CHLOROETHANE ug/L METHYLENE CHLORIDE ug/L ACETONE ug/L CARBON DISULFIDE ug/L 1, 1 -DICHLOROETHENE ug/L 1, 1 -DICHLOROETHANE ug/L CHLOROFORM ug/L 1,2-DICHLOROETHANE ug/L 2-BUTANONE ug/L 1 , 1 , 1 - TRICHLOROETHANE ug/L 1,2-DICHLOAOPROPANE ug/L lRI CHLOAOETHENE ug/L 1, 1,2-TRICHLOROETHANE ug/L BENZENE ug/L 4-METHYL-2-PENTANONE ug/L TETRACHLOROETHENE ug/L TOLUENE ug/L CHLOROBENZENE ug/L ETHYL.BENZENE ug/L TOTAL XYLENES ug/L cis-1 ,2- DICHLOAOETHYLENE ug/L trans-1,2-DICHLOROETHYLENE ug/L
' ( TABLE 4 - 17 ( Continued )
OVERBURDEN GROUNDWATER VOLATILE ORGANIC COMPOUNDS
Rerne<ial Investigation Report Sealand Restoration Site
SSHD01GS01 ISSHD01GS02 ISSMW01GS01 12/10/92 10/21/93 12/06/92 RBSULTSQUAL RESULTSQUAL RESULTSQUAL
- - - - - -- - - - - -- - - - - -- - - - - -- - - - - -- - - - - -- - - - - -- - - - - -- - - - - -- - - - - -- - - - - -- - - - - -- - - - - -- - - - - -- - - - - -- - - - - -- - - - - -- - - - - -- - - - - -- - - - - -- - - - - -- - - - - -- - - - - -- - - - - -
$SMW01GS02 SSMW02G002 10/11/93 10/11/93
RESULTSQUAL RESULTSQUAL
- - - -- - - -- - - -- - - -- - - -- - - -- - - -- - - -- - - -- - - -- - - -- - - -- - - -- - - -- - - -- - - -- - - -- - - -- - - -- - - -- - - -- - - -- - - -- - - -
Note: • - • = Indicates that the constituent was not detected above detection limits. Pagee
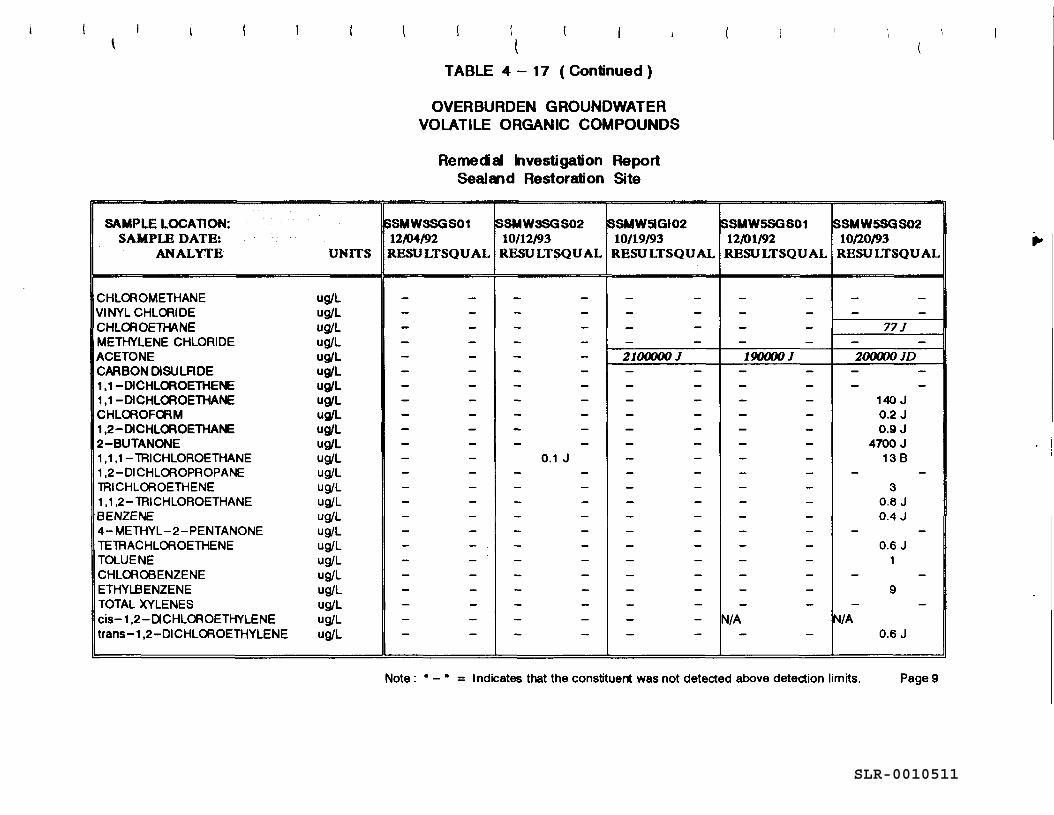
SLR-0010511
\
SAMPLE LOCATION: S.uf PLB DATE:
ANALYTE UNITS
CHLOAOMETHANE ug/L VINYL CHLORIDE ug/L CHLOAOETHANE ug/L METHYLENE CHLORIDE ug/L ACETONE ug/L CARBON DISULFIDE ug/L 1, 1-DICHLOROETHEllE ug/L 1, 1-DICHLOROETHANE ug/L CHLOROFORM Ug/L 1,2-DICHLOROETHAllE Ug/L 2-BUTANONE ug/L 1 , 1 , 1 - lRI CHLOROETHANE ug/L 1,2-DICHLOROPROPANE ug/L lRICHLOROETHENE ug/L 1 , 1 ,2 - lRI CHLOROETHANE ug/L BENZENE ug/L 4-METHYL-2-PENTANONE ug/L TElRACHLOROETHENE Ug/L TOLUENE ug/L CHLOROBENZENE ug/L ETHYLBENZENE Ug/L TOTAL XYLENES ug/L cis-1,2-DICHLOROETHYLENE ug/L trans-1,2-DICHLOROETHYLENE ug/L
TABLE 4 - 17 ( Continued )
OVERBURDEN GROUNDWATER VOLATILE ORGANIC COMPOUNDS
Remecial Investigation Report Sealand Restoration Site
SSMW3SGS01 ISSMW3SGS02 ISSMW51GI02 12/04/92 10/12/93 10/19/93 RESULTSQUAL RESULTSQUAL RESULTSQUAL
- - - - - -- - - - - -- - - - - -- - - - - -- - - - 21000001 - - - - - -- - - - - -- - - - - -- - - - - -- - - - - -- - - - - -- - 0.1 J - -- - - - - -- - - - - -- - - - - -- - - - - -- - - - - -- - - - - -- - - - - -- - - - - -- - - - - -- - - - - -- - - - - -- - - - - -
SSMW5SGS01 SSMW5SGS02 12/01/92 10(1.0/93 RESULTSQUAL RESULTSQUAL
- - - -- - - -- - 771 - - - -1900001 200000JD - - - -- - - -- - 140 J
- - 0.2 J - - 0.9J
- - 4700 J - - 13 B - - - -- - 3 - - 0.6 J - - 0.4 J - - - -- - 0.6 J - - 1 - - - -- - 9 - - - -
N/A N/A - - 0.6 J
Note: • - • = Indicates that the constituent was not detected above detection limits. Page9
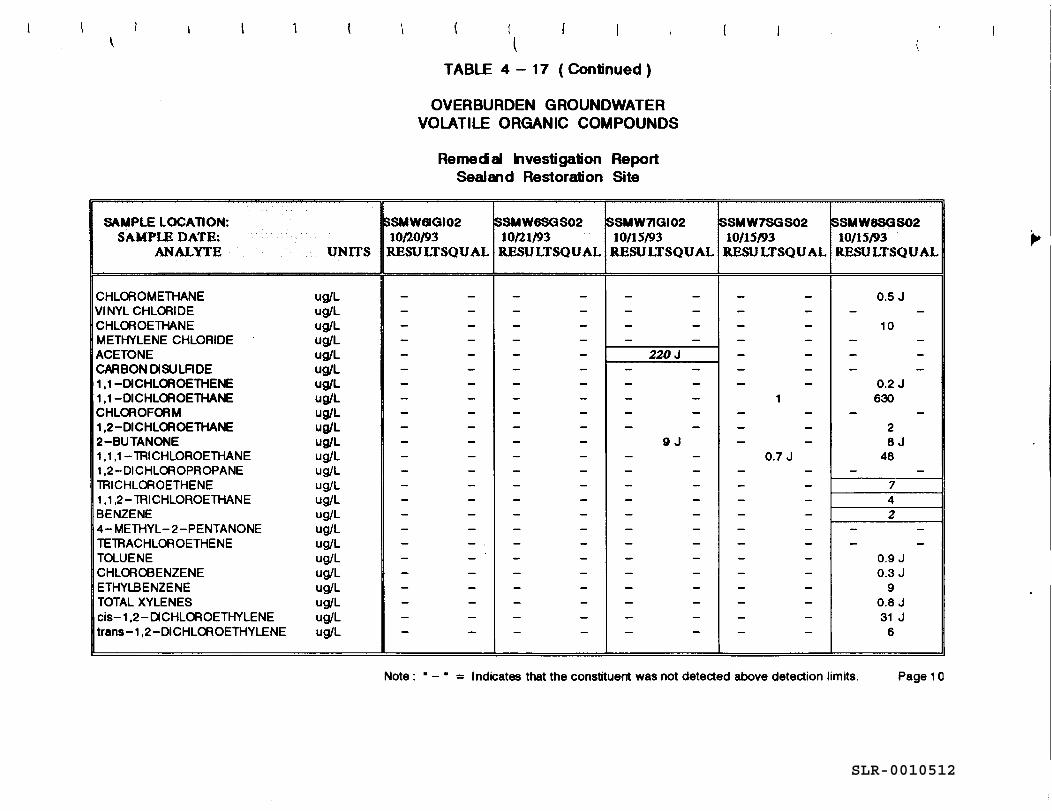
SLR-0010512
SAMPLE LOCATION: SAMPLE DATE:
ANALYTE UNITS
CHLOROMETHANE ug/L VINYL CHLORIDE ug/L CHLOROETHANE ug/L METHYLENE CHLORIDE ug/L ACETONE ug/L CARBON DISULFIDE ug/L 1, 1-DICHLOROETHENE ug/L 1, 1 -DICHLOROETHANE ug/L CHLOROFORM ug/L 1,2-DICHLOROETHANE ug/L 2-BUTANONE ug/L 1, 1, 1 - lRICHLOROETHANE ug/L 1,2-DICHLOROPROPANE ug/L lRICHLOROETHENE ug/L 1, 1,2- lRICHLOROETHANE ug/L BENZENE ug/L 4-METHYL-2-PENTANONE ug/L TElRACHLOROETHENE ug/L TOLUENE ug/L CHLOROBENZENE ug/L ETHYLBENZENE ug/L TOTAL XYLENES ug/L cis-1,2-DICHLOROETHYLENE ug/L trans-1,2-DICHLOROETHYLENE ug/L
(
l TABLE 4 - 17 ( Continued )
OVERBURDEN GROUNDWATER VOLATILE ORGANIC COMPOUNDS
Remedal Investigation Report Sealand Restoration Site
SSMW61GI02 SSMW8SGS02 ISSMW71GI02 lOfJ.0/93 tOfJ.1/93 10/15/93
RESULTSQUAL RESU LTSQUAL RESULTSQUAL
- - - - - -- - - - - -- - - - - -- - - - - -- - - - 220J - - - - - -- - - - - -- - - - - -- - - - - -- - - - - -- - - - 9J - - - - - -- - - - - -- - - - - -- - - - - -- - - - - -- - - - - -- - . - - - -- - - - - -- - - - - -- - - - - -- - - - - -- - - - - -- - - - - -
SSMW7SGS02 ISSMW8SGS02 10/15/93 10/lS/93
RESULTSQU AL RESULTSQUAL
- - 0.5 J - - - -- - 10 - - - -- - - -- - - -- - 0.2 J
1 630 - - - -- - 2 - - BJ
0.7 J 48 - - - -- - 7 - - 4 - - 2 - - - -- - - -- - 0.9 J - - 0.3 J - - 9 - - 0.8 J - - 31 J - - 6
Note: • - • = Indicates that the constituent was not detected above detection limits. Page 1 O
SLR-0010513
-
Of the 17 detected chlorinated volatile organic compounds, only 1,1,l-TCA, 1,1-DCA, cis-1,2-
DCE, methylene chloride, chloroethane, and vinyl chloride exceeded their respective NYSDEC
A WQ standards (NYSDEC, 1993). The elevated levels of one or more of the above mentioned
VOCs were limited to the following wells: B-3W, DM-8S, MW-05S and MW-08S. All of
which are located east (downgradient) of the former disposal cell area. Vinyl chloride and 1,2-
DCE were chosen to represent the chlorinated organic plume since these compounds are the
major constituents affecting the carcinogenic risks of the future use scenario evaluated in the
baseline risk assessment (Section 6.1 ).
Eight nonchlorinated volatile organic compounds were detected in the overburden groundwater
samples, the most predominant of which were acetone (detected in 7 wells in concentrations
ranging from 220 µg/L to 2,100,000 µg/L) and 2-butanone (detected in 3 wells in concentrations
ranging from 8 µg/L to 4,700 µg/L). In addition, relatively low levels of the constituents of
gasoline (i.e., BTEX) were detected in wells B-3W, DM-8S, DM-80, MW-05S and MW-08S in
concentrations ranging from 0.4 µg/L to 66 µg/L.
Of the detected nonchlorinated voes, acetone, 2-butanone, benzene, toluene, and ethylbenzene
concentrations exceeded their respective NYSDEC AWQ standards (see Table 4-16). These
elevated levels occurred in wells M-3W, DM-8S, MW-05S, MW-05!, MW-07S, MW-071, and
MW-08S, only. Acetone was chosen to represent the nonchlorinated organic plume since acetone
is the major constituent affecting the noncarcinogenic risks of the future use scenario evaluated
in the baseline risk assessment (Section 6.1).
No voes were detected in upgradient wells MW-06S and MW-061, located north of the former
disposal cell area.
Each of the Voes detected in the overburden groundwater in the vicinity of the former disposal
cell area were also detected in subsurface soil samples collected from this area. It is apparent
that the former disposal cell is leaching voe contamination into the groundwater immediately
downgradient (ic., east) of the former disposal cell.
Semlvolatlle Organic Compounds. A total of five semivolatile organic compounds were
detected in the groundwater samples collected from four separate on-site overburden monitoring
wells (Table 4-18). The monitoring wells which exhibited detected concentrations of semivolatile
compounds were B-3W, located approximately 70 feet east of the former disposal cell area,
MW-08S, located approximately 100 feet east of the former disposal cell area, B-8W, and MW
OlS, located west of the gravel pit. The semivolatile compounds detected were bis(2
EDIS/ENG/ay071494.rp4 4-88
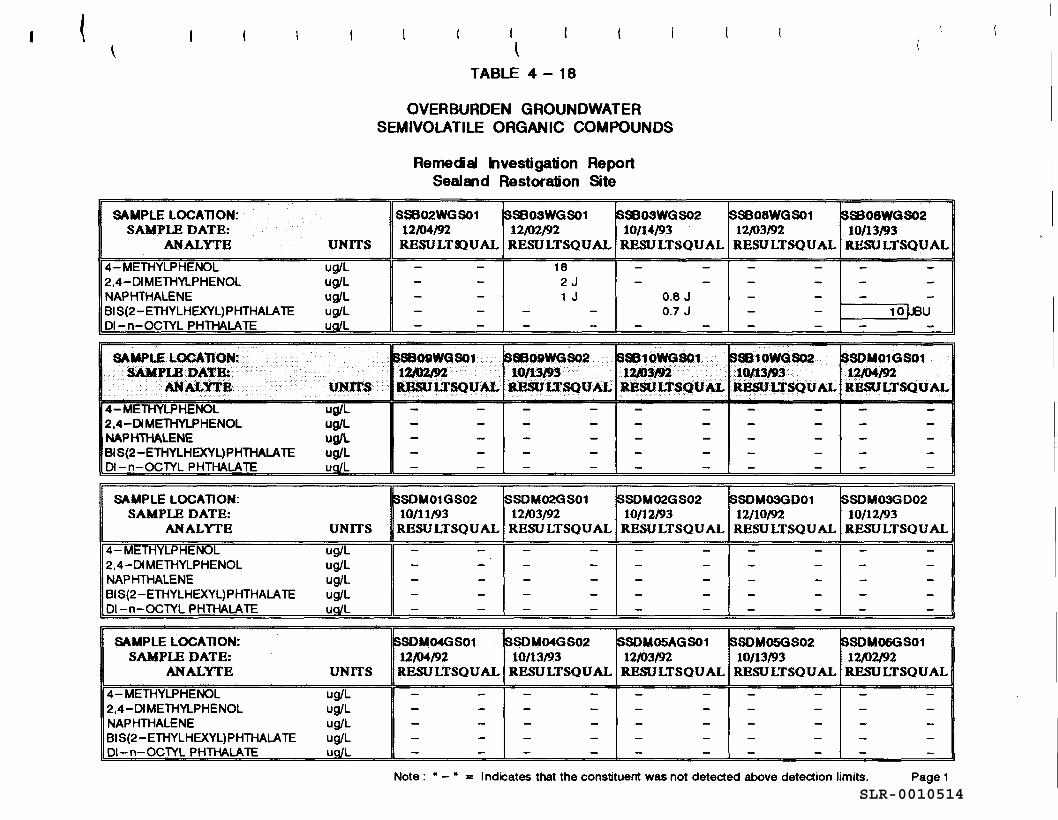
SLR-0010514
SAMPLE LOCATION: SAMPLE DATE:
ANALYTE UNITS
4-METHYLPHENOL ug/L 2,4-DI METHYLPHENOL ug/L NAPHTHALENE ug/L 815(2-ETHYLHEXYL)PHTHALATE ug/L Dl-n-OCTYL PHTHALATE ua/L
SAMPLE LOCATION: .. . ..
SAMPLE DATE: ···.··· A.NAI..nn UNrtS
4-METHYLPHENOL ug/L 2,4-DI METHYLPHENOL ug/L NAPHTHALENE ug/L 815(2-ETHYLHEXYL)PHTHALATE ug/L Dl-n-OCTYL PHTHALATE ua/L
SAMPLE LOCATION: SAMPLE DATE:
ANALYTE UNITS
4-Mt:. IHl'LPHENUL ug/L 2.4-DI METHYLPHENOL ug/L NAPHTHALENE ug/L 815(2-ETHYLHEXYL)PHTHALATE ug/L Dl-n-OCTYL PHTHALATE uQ/L
SAMPLE LOCATION: SAMPLE DATE:
ANALYTE UNITS
4- METHYLPHENOL ug/L 2,4-DIMETHYLPHENOL ug/L NAPHTHALENE ug/L 815(2-ETHYLHEXYL)PHTHALATE ug/L Dl-n-OCTYL PHTHALATE uQ/L
I l
TABLE 4 - 18
OVERBURDEN GROUNDWATER SEMIVOLATILE ORGANIC COMPOUNDS
Reme<ial Investigation Report Sealand Restoration Site
SS802WGS01 SSBOSWGS01 $SB03WGS02 12/04192 12/02/92 10/14/93 RHSULT~UAL RESULTSQUAL RESULTSQUAL
- - 18 - -- - 2J - -- - 1 J 0.8 J - - - - 0.7 J - - - - - -
S8809WGS01 ISSB09\YGS02 SSBlC>WGSOt .. ·~ ·. ·.·
10113'93 12.1»3192 · .. ltJ,3$U LTSQU/J, llBSULTSQUAL ImmJLTSQUAL
- - - - - -- - - - - -- - - - - -- - - - - -- - - - - -
SSOM01GS02 ISSDM02GS01 SSDM02GS02 10/11/93 12/03/92 10/12/93 RESU LTSQUAL RESULTSQUAL RESULTSQUAL
I
- - .
I
- -
I
- -- - - - - -- - - - - -- - - - - -- - - - - -
SSOM04GS01 SSDM04GS02 SSOM05AGS01 12/04192 10/13/93 12/03/92 RESULTSQUAL RESULTSQUAL RESULTSQUAL
- - - - - -- - - - - -- - - - - -- - - - - -- - - - - -
SSB08WGS01 ISSB08WGS02 12/03/92 10/13/93 RESULTSQUAL RESULTSQUAL
- - - -- - - -- - - -- - 10Leu - - - -
EJQP10WGS02 ISSOM01GS01 •.tOJtMJ3•·•. 1~/92 RESULTSQUAL RESULTSQUAL
- - - -- - - -- - - -- - - -- - - -
SSOM03G001 ISSOM03GD02 12/10/92 10/12/93 RESULTSQUAL RESULTSQUAL
I
- -
I
- -- - - -- - - -- - - -- - - -
SSDM05GS02 ISSOM06GS01 10/13/93 1U>2/92 RESULTSQUAL RESULTSQUAL
- - - -- - - -- - - -- - - -- - - -
Note: • - • = Indicates that the constituent was not detected above detection limits. Page 1
I
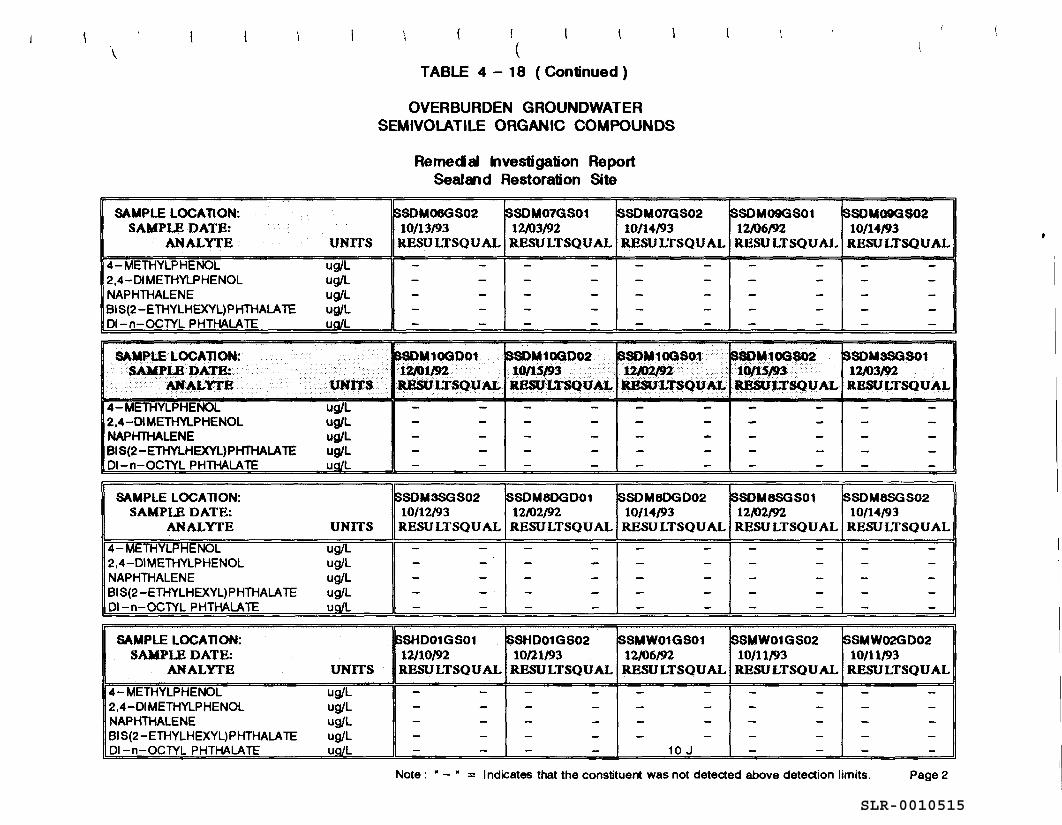
SLR-0010515
\
SAMPLE LOCATION: SAMPLE DATE:
ANALYTE UNITS
4-METHYLPHENOL ug/L 2,4-0IMETHYLPHENOL ug/L NAPHTHALENE ug/L Bl S(2-ETHYLHEXYL)PHTHALA TE ug/L 01-n-OCTYL PHTHALATE ua/L
SAMPLE LOCA110N: SAMPLB·oATB:.
ANALYTE .UN.lTS 4-METHYLPHENOL ug/L 2,4-DIMETHYLPHENOL ug/L NAPHTHALENE ug/L BIS(2-ETHYLHEXYL)PHTHALATE ug/L 01-n-OCTYL PHTHALATE ua/L
SAMPLE LOCATION: SAMPLB DATE:
ANALYTE UNITS
4-Mt: 1HYLPHENUL ug/L 2,4-DIMETHYLPHENOL ug/L NAPHTHALENE ug/L BIS(2-ETHYLHEXYL)PHTHALATE ug/L Dl-n-OCTYL PHTHALATE ua/L
SAMPLE LOCATION: SAMPLE DATE:
ANALYTE UNITS
4- METHYLPHENOL ug/L 2,4-0IMETHYLPHENOL ug/L NAPHTHALENE ug/L BIS(2-ETHYLHEXYL)PHTHALATE ug/L 01-n-OCTYL PHTHALATE ua/L
! (
TABLE 4 - 18 ( Continued )
OVERBURDEN GROUNDWATER SEMIVOL.ATILE ORGANIC COMPOUNDS
.·
Remedal Investigation Report Sealald Restoration Site
$SOM06GS02 SSOM07GS01 SSDM07GS02 10/13/93 12/03/92 10/14/93 RESULTSQUAL RBSULTSQUAL RESULTSQUAL
- - - - - -- - - - - -- - - - - -- - - - - -- - - - - -
SSDM10G001 SSOM10G002 ~SDM10GS01 ·12A>tm 10/lS/93 .. 12J02192. ·.·· ...•.. ·.••• RJlSUI.:rSQIJAL RSSU(.TSQUAt tmstJLT$Qt1M.
- - - - - -- - - - - -- - - - - -- - - - - -- - - - - -
SSDM3SGS02 SSOM80GD01 ISSOM6DG002 10/12/93 12/02/92 10/14/93 RESULTSQUAL RESULTSQUAL RESULTSQUAL
I
-
I
-
I
- -- - - - - -- - - - - -- - - - - -- - - - - -
$SHD01GS01 SSHD01GS02 SSMW01GS01 12/10/92 10/21/93 12/06/92 RESULTSQUAL RESULTSQUAL RESULTSQUAL
- - - - - -- - - - - -- - - - - -- - - - - -- - - - 10 J
SSOM09GS01 SSOM09GS02 12/06/92 10/14/93 RESULTSQUAL RESULTSQUAL
- - - -- - - -- - - -- - - -- - - -
S80M10G802 SSDM3SGS01 tQ/t:SJ93 •.... 12/03/92 aBSUlXSQUAL llESULTSQUAL
- - - -- - - -- - - -- - - -- - - -
SSDM8SGS01 SSOM8SGS02 12/02/92 10/14/93 RESULTSQUAL RESULTSQUAL
I
- -
I
- -- - - -- - - -- - - -- - - -
SSMW01GS02 SSMW02GD02 10/11/93 10/11/93 RESULTSQUAL RESULTSQUAL
- - - -- - - -- - - -- - - -- - - -
Note: • - • = Indicates that the constituent was not detected above detection limits. Page2
I
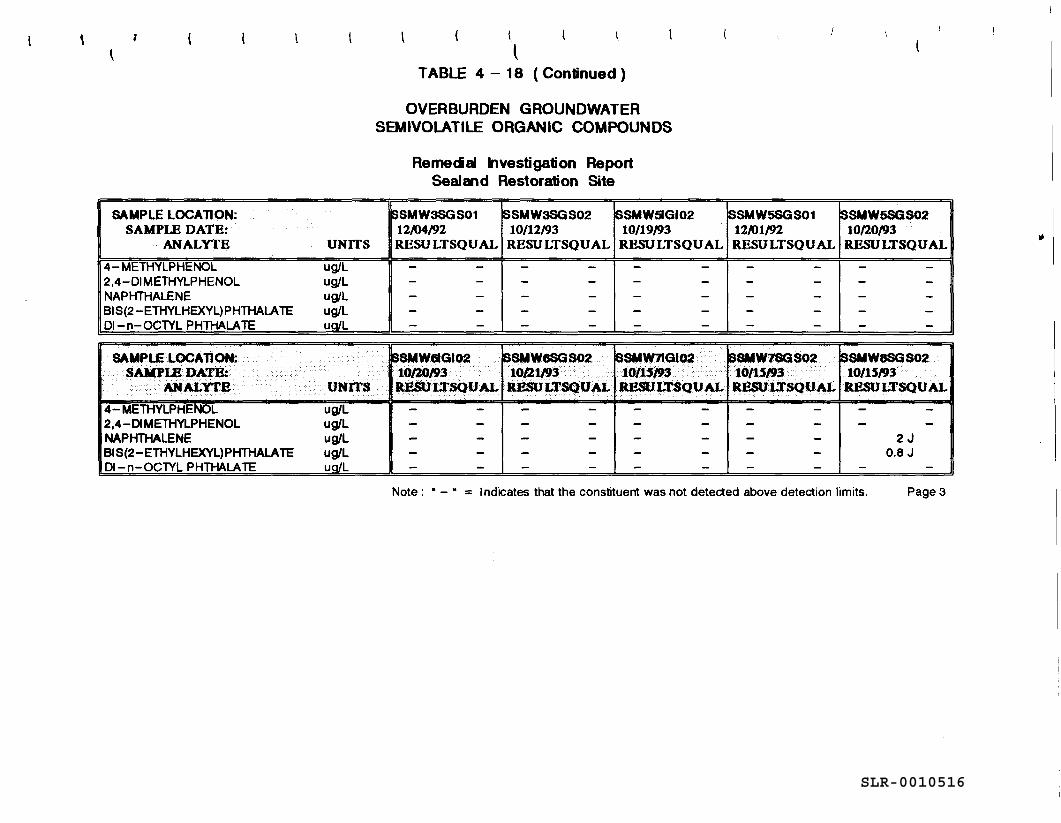
SLR-0010516
\
SAMPLE LOCATION: SAMPLE DATE:
ANALYTE UNITS
4- METHYLPHENOL ug/L 2,4-0IMETHYLPHENOL ug/L NAPHTHALENE ug/L Bl S(2-ETHYLHEXYL) PHTHALA TE ug/L 01-n-OCTYL PHTHALATE ua/L
SAMPLE LOCATION: SAMPL8DATE: . ANALYTE UNITS
4- METHYLPHENOL ug/L 2,4-DI METHYLPHENOL ug/L NAPHTHALENE ug/L BIS(2-ETHYLHEXYL)PHTHALATE ug/L 01-n-OCTYL PHTHALATE ua/L
l. l
TABLE 4 - 18 ( Continued )
OVERBURDEN GROUNDWATER SEMIVOLATILE ORGANIC COMPOUNDS
Remedal Investigation Report Sealand Restoration Site
~SMW3SGS01 $SMW3SGS02 $SMW51GI02 12/04/92 10/12/93 10/19/93 RESULTSQUAL RESU LTSQUAL RBSULTSQUAL
- - - - - -- - - - - -- - - - - -- - - - - -- - - - - -
SSMW61GI02 ISSMWGSGS02 SSMW7'GIO~. 10/20193 10/lt/93· · 10/t$1'3 RJ!SU J..TSQU Al. RBSULTSQUAL IWSUJ.,TSQUAL
.·... ..
- - - - - -- - - - - -- - - - - -- - - - - -- - - - - -
SSMW5SGS01 SSMW5SGS02 12J01/92 10/20/93 RESULTSQUAL RESULTSQUAL
- - - -- - - -- - - -- - - -- - - -
$SMW7SGS02 SSMW8SGS02 10/U/93 10/U/93 RESQLTSQUAL RESULTSQUAL
- - - -- - - -- - 2J - - 0.8 J - - - -
Note: • - • = Indicates that the constituent was not detected above detection limits. Page 3
SLR-0010517
ethylhexyl)phthalate (detected in wells MW-08S [Phase II at 0.8 µg/L], B-08W (Phase II at 10.0
µg/L], and B-3W [Phase Il at 0.7 µg/L]), di-n-octyl phthalate (detected in well MW-OlS [Phase
I at 10 µg/L]) and naphthalene (detected in wells MW-08S [Phase II at 2 µg/L] and B-3W
[Phases I and II, at 1 µg/L and 0.8 µg/L, respectively]). In addition, 4-methylphenol and 2,4-
dimethylphenol were detected in well B-3W at 18 µg/L and 2 µg/L, respectively.
None of the semivolatile organic compounds detected exceeded their respective NYSDEC A WQ
standards. Bis(2-ethylhexyl)phthalate concentrations exceeded the federal SDW A MCL in one
of three samples it was detected.
Pesticides and PCBs. A total of four pesticides were detected in low concentrations (<0.1
µg/L) in the overburden groundwater samples collected from four isolated monitoring wells
located within the SRI property (fable 4-19). These pesticides were beta-BHC (also known as
hexachlorocyclohexane), detected in monitoring well MW-OlS at 0.008 µg/L, endrin ketone,
detected in well MW-05S at 0.014 µg/L, and heptachlor epoxide, detected in well MW-061 at
0.061 µg/L. Of the three pesticides detected, only heptachlor epoxide and beta-BHC have
applicable NYSDEC A WQ standards ("non-detect"). In addition, heptachlor epoxide has a
SDW A MCL (0.0002 µg/L).
The hand-dug well (HD-01), located in the western portion of the site, exhibited a pesticide
concentration above the detection limit. The pesticide dieldrin was detected at location HD-01
during Phase I sampling at a concentration of 0.0024 µg/L. This concentration exceeded the
NYSDEC A WQ standard of "non-detect" for this compound.
No PCBs were detected in the overburden groundwater samples.
Inorganic Analytes. Eight inorganic analytes were detected in elevated concentrations above
NYSDEC A WQ standards and/or SDWA MCLs in the overburden groundwater samples
(Table 4-20). These constituents were iron (elevated in 22 wells), magnesium (elevated in 18
wells), manganese (elevated in 8 wells in concentrations ranging from 321.3 µg/L to 2066 µg/L),
sodium (elevated in 5 wells), arsenic (elevated in 4 wells in concentrations ranging from 80.6
µg/L to 95.3 µg/L), lead (l well [B-8W] at a concentration of 25.5 µg/L), and chromium (l well
[DM-01] at a concentration of 235.1 pg/L). In addition, nickel (which does not have an available
NYSDEC AWQ standard) exceeded the EPA SDWA MCL of 100 µg/L in well DM-01, at a
concentration of 225.6 µg/L. Lead concentrations exceeded the more stringent SDW A MCL of
15 µg/L in hand-dug well HD-01 at 16.3 µg/L.
EDIS/ENG/ay07 I494.rp4 4-92
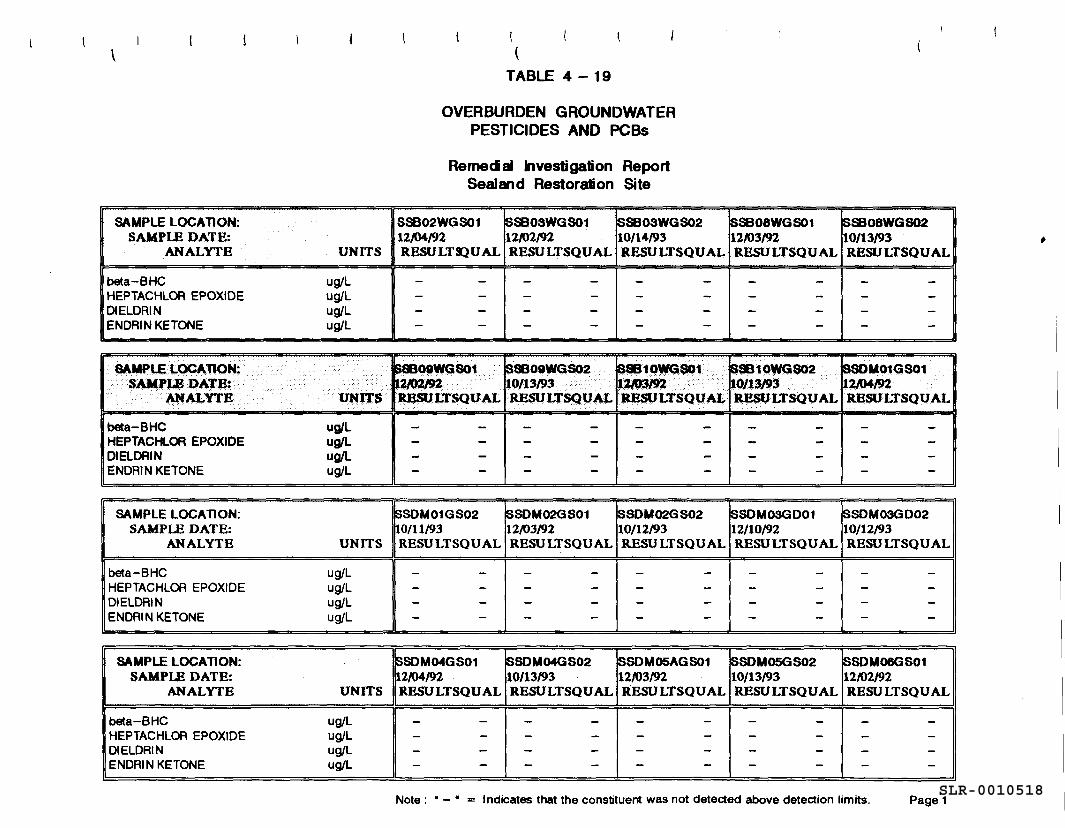
SLR-0010518
\
SAMPLE LOCATION: SAMPLE DATE:
ANALYTE UNITS
beta-BHC ug/L HEPTACHLOR EPOXIDE ug/L OIELDRIN ug/L ENDRI N KETONE ug/L
SAMPLE L()CA.TION: SAMPU! DATB:
ANALYTE UNJTS
beta-BHC ug/L HEPTACHLOA EPOXIDE ug/L OIELDAIN ug/L ENDRIN KETONE ug/L
SAMPLE LOCATION: SAMPLE DATE:
ANALYTE UNITS
beta-BHC ug/L HEPTACHLOR EPOXIDE ug/L DIELDRIN ug/L ENDRI N KETONE ug/L
SAMPLE LOCATION: SAMPLB DATE:
ANALYTE UNITS
beta-BHC ug/L HEPTACHLOA EPOXIDE ug/L DIELDRIN ug/L ENDRI N KETONE ug/L
(
(
TABLE 4 - 19
OVERBURDEN GROUNDWATER PESTICIDES AND PCBs
Rernedal Investigation Report Sealand Restoration Site
SSB02WGS01 ISSB03WGS01 SSB03WGS02 12/04/92 12/02/92 10/14/93 RESULTS) UAL RESULTSQUAL RESULTSQUAL
- - - - - -- - - - - -- - - - - -- - - - - -
Sa309WGS01 Sa309WGS02 ~S81()WGS01 12tV2192 10/13/93 ·~3192 RBSULTSQUAL RESULTSQUAL llESULTSQUAL
- - - - - -- - - - - -- - - - - -- - - - - -
SSOM01GS02 SSDM02GS01 ISSDM02GS02 ~0/11/93 12/03/92 10/12/93 RESULTSQUAL RESULTSQUAL RESULTSQUAL
I
- -
I
- -
I
- -- - - - - -- - - - - -- - - - - -
SSDM04GS01 SSOM04GS02 ISSDM05AGS01 12/04/92 10/13/93 12/03/92 RESULTSQUAL RESULTSQUAL RESULTSQUAL
- - - - - -- - - - - -- - - - - -- - - - - -
ISSB08WGS01 ISSB08WGS02 12/03/92 10/13/93 RESULTSQUAL RESULTSQUAL
- - - -- - - -- - - -- - - -
SS810WGS02 SSDM01GS01 10/13/93 llAM/92 RESULTSQUAL RESULTSQUAL
- - - -- - - -- - - -- - - -
SSDM03GD01 ISSDM03GD02 12/10/92 10/12/93 RESULTSQU AL RESULTSQUAL
I
- -
I
- -- - - -- - - -- - - -
SSDMOSGS02 SSDM06GS01 10/13/93 12/02/92 RESULTSQUAL RESULTSQUAL
- - - -- - - -- - - -- - - -
Note: • - • = Indicates that the constituent was not detected above detection limits. Page 1
I
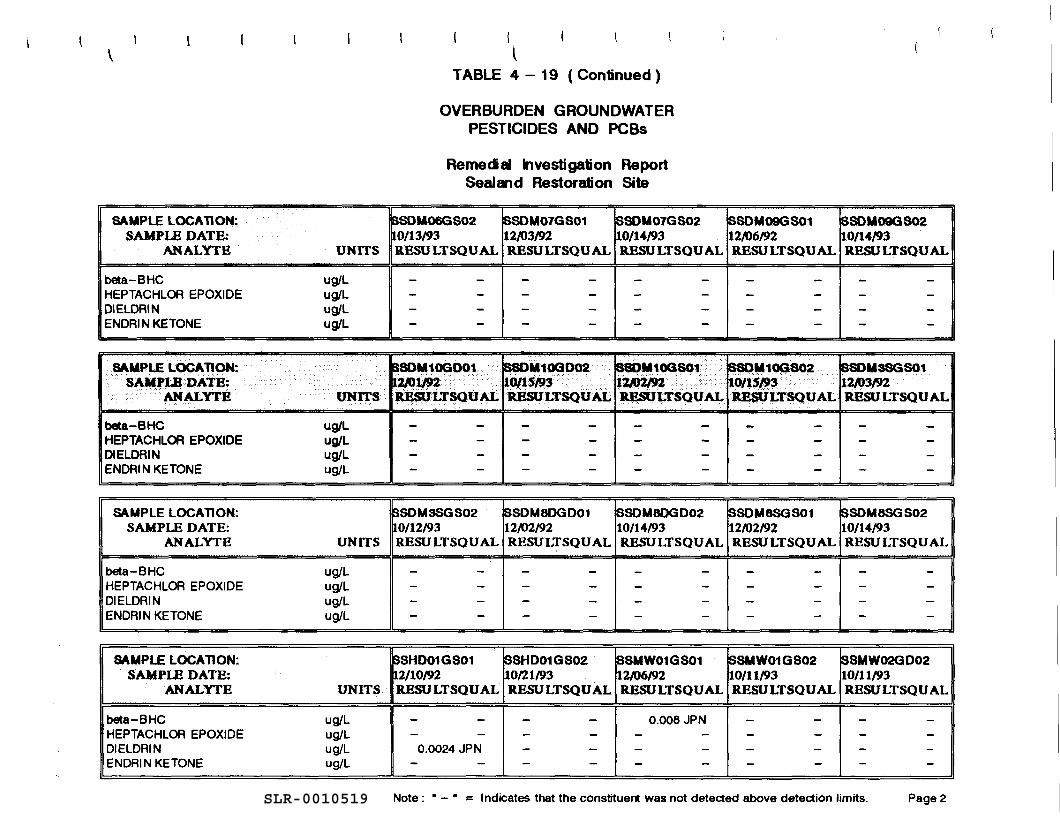
SLR-0010519
\
SAMPLE LOCATION: SAMPLE DATE:
ANALYTE
beta-BHC HEPTACHLOA EPOXIDE DIELDRIN ENDRI N KETONE
SAMPLE LOCATION: SAllPLI! DATE:
ANALYTB
beta-BHC HEPTACHLOR EPOXIDE OIELDRIN ENDRI N KETONE
SAMPLE LOCATION: SAMPLE DATE:
ANALYTE
beta-BHC HEPTACHLOA EPOXIDE DIELDRIN ENDRI N KETONE
SAMPLE LOCATION: SAMPLE DATE:
ANALYTB
beta-BHC HEPTACHLOA EPOXIDE DIELDRIN ENDRIN KETONE
UNITS
ug/L ug/L ug/L ug/L
I l
TABLE 4 - 19 ( Continued )
OVERBURDEN GROUNDWATER PESTICIDES AND PCBs
Remedal Investigation Report Sealand Restoration Site
SSDM06GS02 SSDM07GS01 SSDM07GS02 ~0/13/93 12/03/92 10/14/93 R.E.SULTSQUAL RE.SULTSQUAL R.E.SULTSQUAL
- - - - - -- - - - - -- - - - - -- - - - - -
SSDM09GS01 8SDM09GS02 12/'06192 10/14/93 RE.SU LTSQU AL RBSULTSQUAL
- - - -- - - -- - - -- - - -
SSOIOOGD01 S$0M1GGD02 $8()M10GSQ1 SSDM10G802 SSOM3SGS01 l~tm· 10/1~193 · .. ·.. 12.m/92 .. 10/lSl':J·· U/03/92
UNITS lWSULTSQUAL lt.ESULTSQUAL ImSULTSQUAL RESULTSQUAL RESULTSQUAL
ug/L ug/L ug/L ug/L
UNITS
ug/L ug/L ug/L ug/L
UNITS
ug/L ug/L ug/L ug/L
$SOM3SGS02 SS0M80GD01 SSOM80GD02 SSOM8SGS01 SSOM8SGS02 10/12/93 12/02/92 10/14/93 12/'02/92 10/14/93 RBSULTSQUAL RESULTSQUAL RESULTSQUAL R.E.SULTSQUAL RESULTSQUAL
- - - - - - - - - -- - - - - - - - - -- - - - - - - - - -- - - - - - - - - -
SSHD01GS01 ISSHD01GS02 ISSMW01GS01 ~SMW01GS02 ISSMW02GD02 12/10/92 10/21/93 12/06192 10/11/93 10/11/93 R.ESU LTSQU AL RESULTSQUAL RESULTSQUAL R.E.SULTSQUAL RBSULTSQUAL
- - - - 0.008 JPN - - - -- - - - - - - - - -
0.0024 JPN - - - - - - - -- - - - - - - - - -
Note: • - • ::::: Indicates that the constituent was not detected above detection limits. Page2
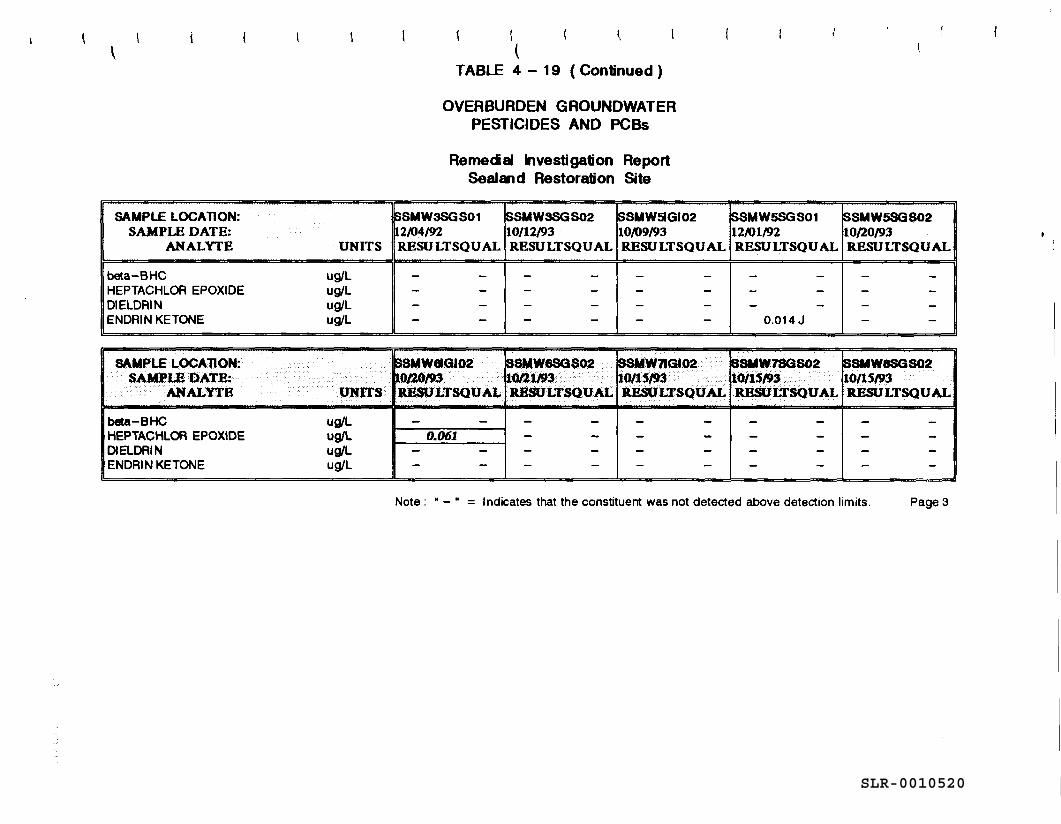
SLR-0010520
\
SAMPLE LOCATION: SAMPLE DATE:
ANALYTE UNITS
beta-BHC ug/L HEPTACHLOA EPOXIDE ug/L DIELDRIN ug/L ENDRIN KETONE ug/L
SAMPLE LOCATION: &LE DATE:
ANALYTE UNITS
beta-BHC ug/L HEPTACHLOR EPOXIDE ug/L DIELDRIN ug/L ENDRI N KETONE ug/L
\ l
TABLE 4 - 19 ( Continued )
OVERBURDEN GROUNDWATER PESTICIDES AND PCBs
Remecial Investigation Report Sealand Restoration Site
ISSMW3SGS01 SSMW3SGS02 SSMWSIGI02 12/04/92 10/12/93 10/09/93 RESULTSQUAL RESULTSQU AL RESULTSQUAL
- - - - - -- - - - - -- - - - - -- - - - - -
SSMW«!IGI02 SSMW8SGS02 ~Sy\¥7'GI02 J,0(1.0/9'J. 1Q411P3 .. J0/15/93 .. RESULTSQUAL RHSULTSQUAL IWSULTSQUAL
- - - - - -0.061 - - - -- - - - - -
- - - - - -
SSMW5SGS01 SSMW5SG802 12/01/92 lOfl0/93 RESULTSQUAL RESULTSQUAL
- - - -- - - -- - - -
0.014 J - -
~SMW7SGS02 SSMW8SGS02 lO/U/93 .. 10/IS/93 RBSULTSQUAL RBSULTSQUAL
- - - -- - - -- - - -- - - -
Note: • - • = Indicates that the constituent was not detected above detection limits. Page3
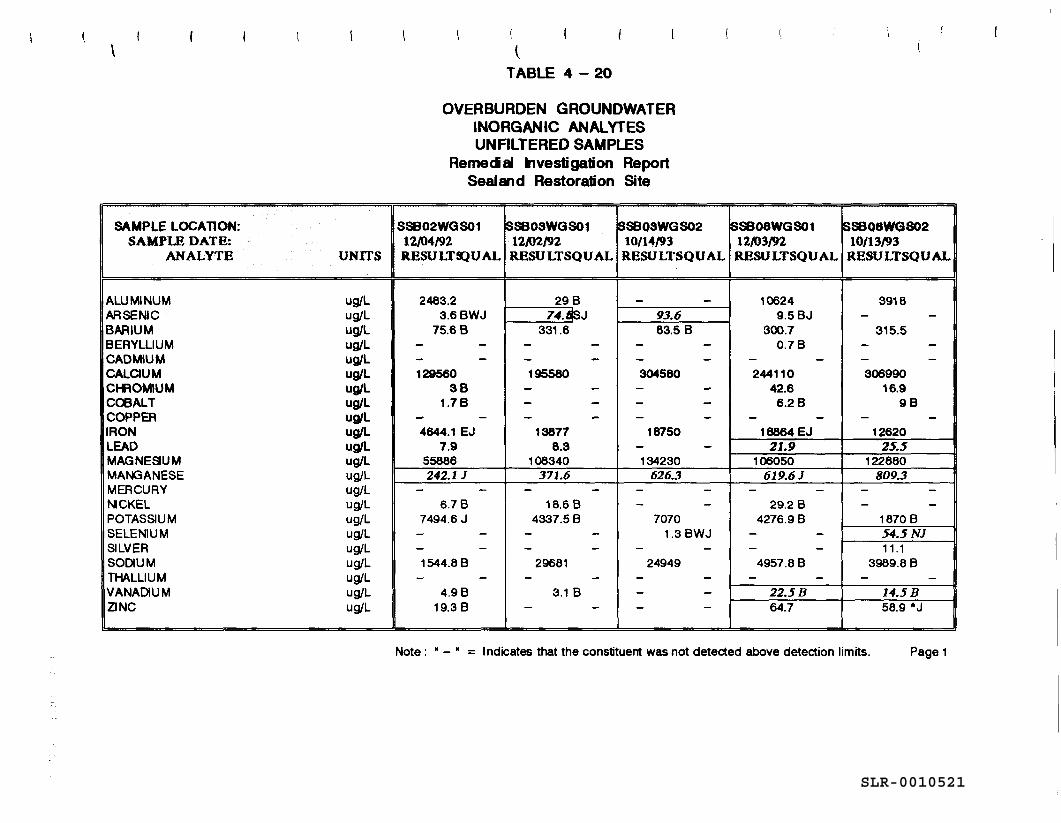
SLR-0010521
\
SAMPLE LOCATION: SAMPLE DATE:
ANALYTE UNITS
ALUMINUM ug/L ARSENIC ug/L BARIUM ug/L BERYLLIUM ug/l CADMIUM ug/L CALOUM ug/L C~OMIUM ug/L COOALT ug/L COPPER ug/L IRON ug/L LEAD ug/L MAGNESIUM ug/L MANGANESE ug/L MERCURY ug/L NCKEL ug/L POTASSIUM ug/L SELENIUM ug/L SILVER ug/L SODIUM ug/L THALLIUM ug/L VANADIUM ug/L ZINC ug/L
I
l TABLE 4 - 20
OVERBURDEN GROUNDWATER INORGANIC ANAL YTES UNFILTERED SAMPLES
Remedal Investigation Report Sealaid Restoration Site
SS802WGS01 ISSB03WGS01 ISSB03WGS02 12~/92 12/02/92 10/14/93 RESULTSJUAL RESULTSQUAL RESULTSQUAL
2483.2 29B - -3.6BWJ 74. J 93.6
75.6B 331.6 83.5 B - - - - - -- - - - - -129560 195580 304580
38 - - - -1.78 - - - -- - - - - -
4644.1 EJ 13877 18750 7.9 8.3 - -
55886 108340 134230 242.1 J 371.6 626.3
- - - - - -6.7B 18.6 B - -
7494.6 J 4337.5 B 7070 - - - - 1.3 BWJ - - - - - -1544.8 8 29681 24949
- - - - - -4.98 3.1 8 - -
19.3 8 - - - -
SSB08WGS01 ISSB08WGS02 12/03/92 10/13/93 RESULTSQUAL RESU LTSQUAL
10624 3918 9.5BJ - -
300.7 315.5 0.7B - -
- - - -244110 306990
42.6 16.9 6.2B 9B
- - - -18864 EJ 12620
21.9 25.5 106050 122880
619.61 809.3 - - - -
29.2 B - -4276.9 B 1870 B
- - 54.5 NJ - - 11.1
4957.88 3989.8 B - - - -
22.5B 14.5B 64.7 58.9 "J
Note: • - • = Indicates that the constituent was not detected above detection limits. Page 1
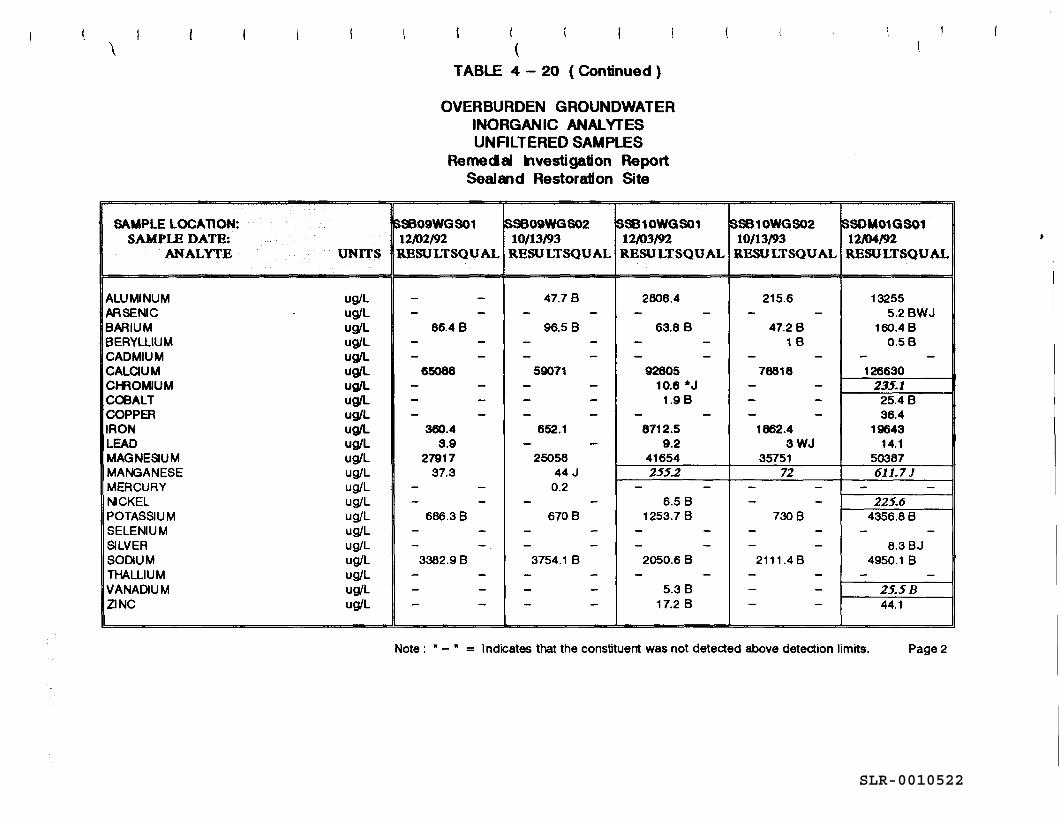
SLR-0010522
\
SAMPLE LOCATION: SAMPLE DATE:
ANALYTE UNITS
ALUMINUM ug/L ARSENIC ug/L BARIUM ug/L BERYLLIUM ug/L CADMIUM ug/L CALCIUM ug/L Ct-ftOMIUM ug/L COBALT ug/L COPPER ug/L IRON ug/L LEAD ug/L MAGNESIUM ug/L MANGANESE ug/L MERCURY ug/L NCKEL ug/L POTASSIUM ug/L SELENIUM ug/L SILVER ug/L SODIUM ug/L THALLIUM ug/L VANADIUM ug/L ZINC ug/L
(
( TABLE 4 - 20 ( Continued )
OVERBURDEN GROUNDWATER INORGANIC ANAL YTES UNFILTERED SAMPLES
Remedal Investigation Report Sealand Restoration Site
SSB09WGS01 ISSB09WGS02 SS810WGS01 12/02/92 10/13/93 12/03/92 RESULTSQUAL RESU LTSQU AL RESULTSQUAL
- - 47.7 8 2606.4 - - - - - -
66.4 8 96.58 63.6 B - - - - - -- - - - - -
65088 59071 92605 - - - - 10.6 *J - - - - 1.9 B - - - - - -
360.4 652.1 6712.5 3.9 - - 9.2
27917 25056 41654 37.3 44 J 255.2
- - 0.2 - -- - - - 6.5 8
666.3 B 670 B 1253.7 8 - - - - - -- - - - - -
3362.9 B 3754.1 B 2050.6 B - - - - - -- - - - 5.3 8 - - - - 17.2 8
$SB10WGS02 SSOM01GS01 10/13/93 12/04/92 RESULTSQUAL RESULTSQUAL
215.6 13255 - - 5.28WJ
47.2 B 160.4 B 1 B 0.58
- - - -78616 126630
- - 235.1 - - 25.4 8 - - 36.4
1862.4 19643 3WJ 14.1
35751 50387 72 611.7 J
- - - -- - 225.6
730 B 4356.8 8 - - - -- - 6.3 BJ
2111.48 4950.1 B - - - -- - 25.5B - - 44.1
Note : • - • = Indicates that the constituent was not deteded above detedion limits. Page2

SLR-0010523
SAMPLE LOCATION: SAMPLE DATE:
ANALYTE UNITS
ALUMINUM ug/L ARSENIC ug/L BARIUM ug/L BERYLLIUM ug/L CADMIUM ug/L CALOUM ug/L Ct-AOMIUM ug/L COBALT ug/L COPPER ugfL IRON ug/L LEAD ugfL MAGNESIUM ug/L MANGANESE ug/L MERCURY ug/L NCKEL ug/L POTASSIUM ug/L SELENIUM ug/L SILVER ug/L SODIUM ug/L THALLIUM ug/L VANADIUM ug/L ZINC ug/L
(I
~ TABLE 4 - 20 ( Continued )
OVERBURDEN GROUNDWATER INORGANIC ANAL YrES UNFILTERED SAMPLES
Remecial Investigation Report Sealand Restoration Site
SSOM01GS02 ISSOM02GS01 SSOM02GS02 10/11/93 12~JJ92 10/12/93
RHSULTSQU AL RESULTSQUAL RESU LTSQUAL
424.5 35.6 B - -- - - - - -
88.4 B 96.1 B 92.7 B - - - - - -- - - - - -
74901 89926 8<Yi90
- - - - - -11.8 B - - - -
- - - - 13 B 1266.4 197.8 399.8
- - 3.7 - -35064 44144 37554
61.1 9.38 9.9 B - - - - - -- - - - - -
1200 B 918.1 B 1020 B - - - - - -- - - - - -
2732.4 8 3417.1 B 3071 B 1.1 B - - 1 B
- - - - - -- - - - - -
ISSOM03G001 SSOMOSGD02 12/10/92 10/12/93 RHSULTSQUAL RESU LTSQUAL
18.7 B - -- - - -
96.68 86.8 B - - - -- - - -
65075 61574 - - - -- - - -
1.9BJ 11.6 8 192.3 J 396.2
- - - -34326 31565
18.7 21.3 0.1 B - -
- - - -1013.2 B 8708
- - - -- - - -
8881.2 8034.1 - - 1 8 - - - -- - - -
Note : • - • = Indicates that the constituent was not detected above detection limits. Page3
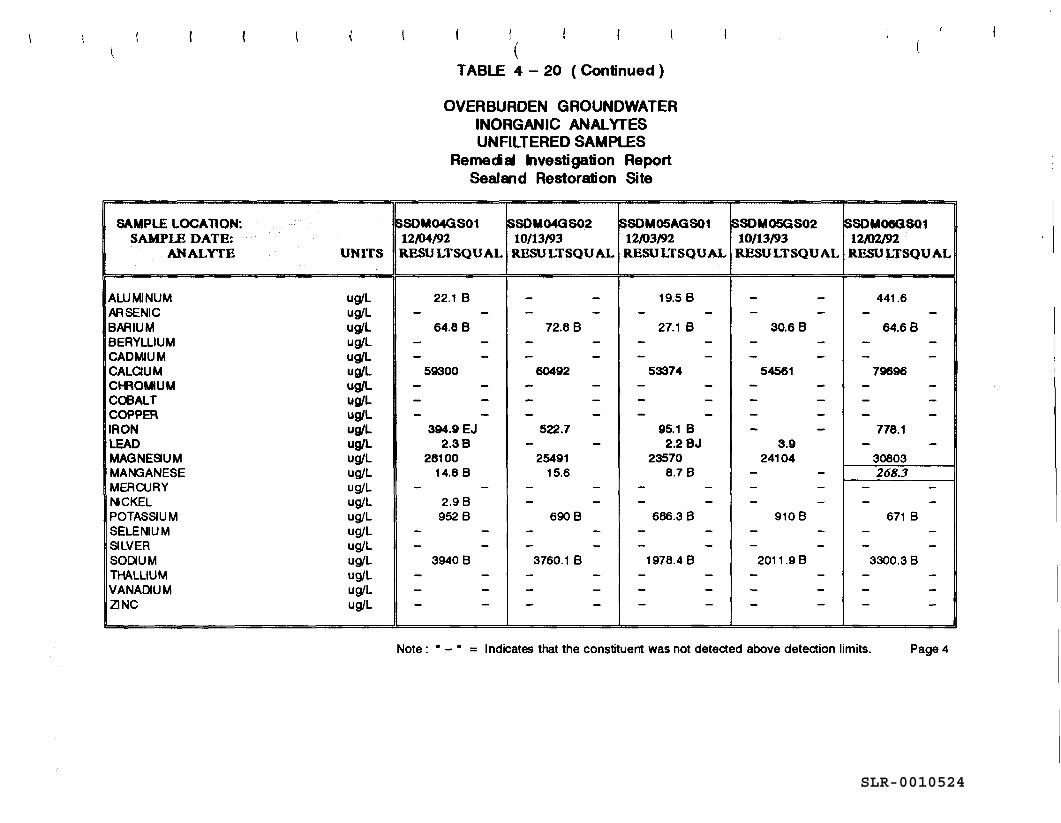
SLR-0010524
SAMPLE LOCATION: SAMPLE DATE:
ANALYTE UNITS
ALUMINUM ug/L ARSENIC ug/L BARIUM ug/L BERYLLIUM ug/L CADMIUM ug/L CALCUM ug/L C~OMIUM ug/L COBALT ug/L COPPER ug/L IRON ugtl LEAD ug/L MAGNESIUM ug/L MANGANESE ug/L MERCURY ug/L NCKEL ug/L POTASSIUM ug/L SELENIUM ug/L SILVER ug/L SODIUM ug/L THALLIUM ug/L VANADIUM ug/L ZINC ug/L
I (
TABLE 4 - 20 ( Continued )
OVERBURDEN GROUNDWATER INORGANIC ANAL YTES UNFILTERED SAMPLES
Remeclal Investigation Report Sealand Restoration Site
$SOM04GS01 SSOM04GS02 SSOM05AGS01 12ft}4/92 10/13/93 12/03192 RESULTSQUAL RESULTSQUAL RESULTSQUAL
22.1 B - - 19.5 B - - - - - -
64.8 B 72.8 B 27.1 8 - - - - - -- - - - - -
59300 60492 53374 - - - - - -- - - - - -- - - - - -
394.9 EJ 522.7 95.1 B 2.38 - - 2.2BJ
28100 25491 23570 14.8 B 15.6 B.7 B
- - - - - -2.9 B - - - -
952 B 6908 686.3 B - - - - - -- - - - - -
39408 3760.1 B 1978.4 B - - - - - -- - - - - -- - - - - -
~SOM05GS02 SSOM08GS01 10/13/93 12/02/92
RESULTSQU AL RESULTSQUAL
- - 441.6 - - - -
30.68 64.68 - - - -- - - -
54561 79696 - - - -- - - -- - - -- - 778.1
3.9 - -24104 30603
- - 268.3 - - - -- - - -
910 B 671 B - - - -- - - -
2011.9 B 3300.3 B - - - -- - - -- - - -
Note: • - • = Indicates that the constituent was not detected above detection limits. Page4
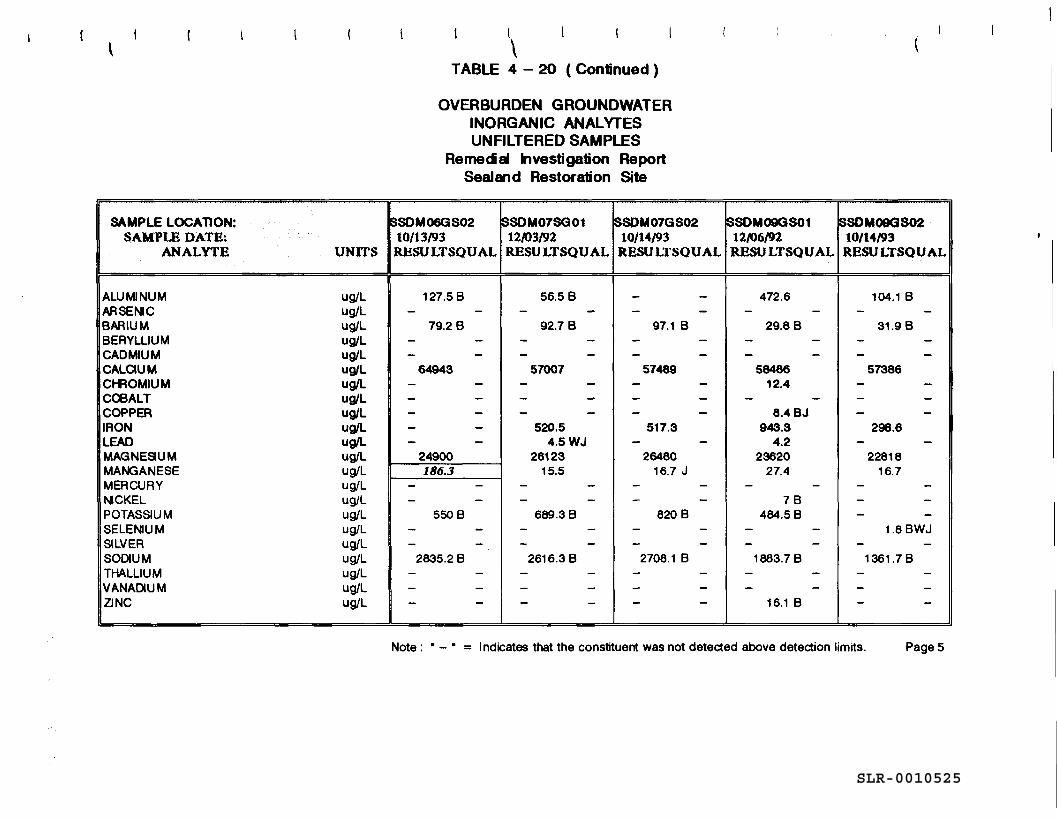
SLR-0010525
SAMPLE LOCATION: SAMPLE DATE:
ANALYTE UNITS
ALUMINUM ug/L ARSENIC ug/L BARIUM ug/L BERYLLIUM ug/L CADMIUM ug/L CALOUM ug/L Cl-AOMIUM ug/L COBALT ug/L COPPER ug/L IRON ug/L LEAD ug/L MAGNESIUM ug/L MANGANESE ug/L MERCURY ug/L ~CKEL ug/L POTASSIUM ug/L SELENIUM ug/L SILVER ug/L SODIUM ug/L THALLIUM ug/L VANADIUM ug/L ZINC ug/L
(
\ TABLE 4 - 20 ( Continued )
OVERBURDEN GROUNDWATER INORGANIC ANAL YTES UNFILTERED SAMPLES
Remecial Investigation Report Sealand Restoration Site
$SOM06GS02 $SOM07SG01 $SDM07GS02 10/13193 12/03192 10/14/93 RESULTSQUAL RESU LTSQUAL RBSULTSQUAL
127.5 B 56.5 B - -- - - - - -
79.2 B 92.7 B 97.1 B - - - - - -- - - - - -
64943 57007 57489 - - - - - -- - - - - -- - - - - -- - 520.5 517.3 - - 4.5WJ - -
24900 26123 26480 186.3 15.5 16.7 J
- - - - - -- - - - - -
5508 689.3 B 820 B - - - - - -- - - - - -
2835.2 B 2616.3 B 2708.1 B - - - - - -- - - - - -- - - - - -
(
~SOM09GS01 $SOM09GS02 12/06/92 10/141'93 RESULTSQUAL RESU LTSQUAL
472.6 104.1 B - - - -
29.88 31.9 B - - - -- - - -
58486 57386 12.4 - -
- - - -8.4BJ - -
943.3 298.6 4.2 - -
23620 22818 27.4 16.7
- - - -7B - -
484.5 B - -- - 1.8 BWJ - - - -
1863.7 B 1361.78 - - - -- - - -
16.1 B - -
Note: • - • = Indicates that the constituent was not detected above detection limits. Pages
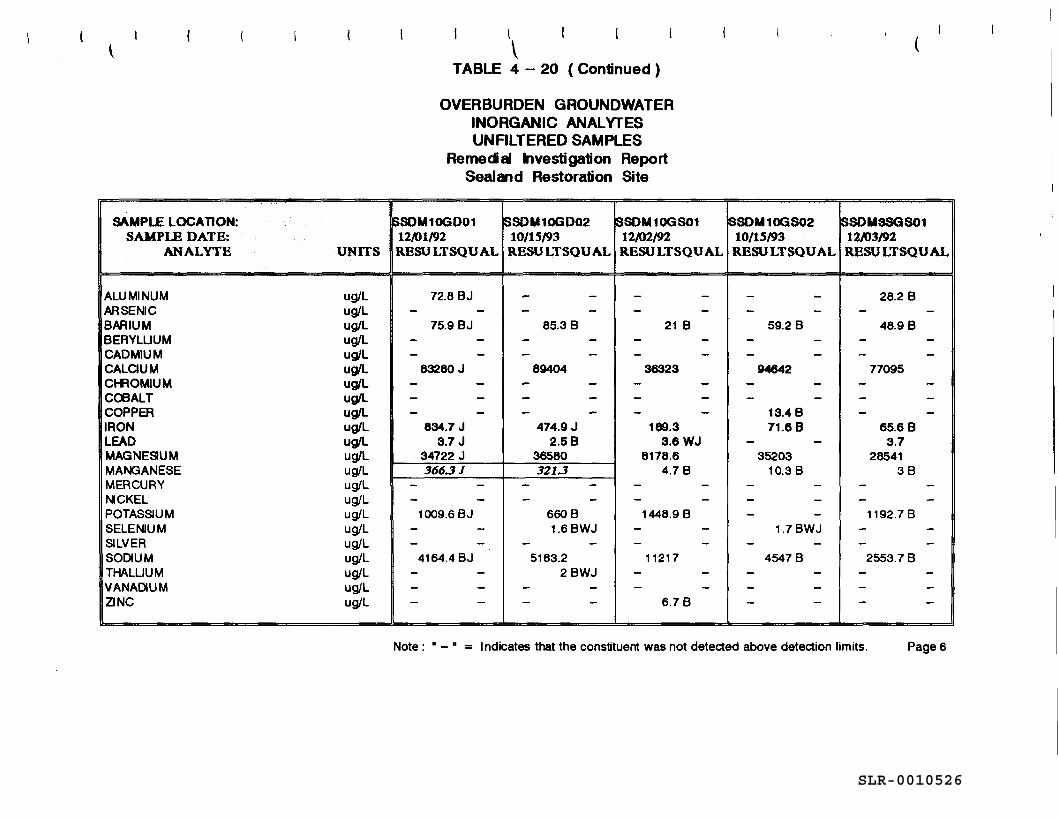
SLR-0010526
SAMPLE LOCATION: SAMPLE DATE:
ANALYTE UNITS
ALUMINUM ug/L ARSENIC ug/L BARIUM ug/L BERYLLIUM ug/L CADMIUM ug/L CALOUM ug/L Ct-AOMIUM ug/L COBALT ug/L COPPER ug/L IRON ug/L LEAD ug/L MAGNESIUM ug/L MANGANESE ug/L MERCURY ug/L NCKEL ug/L POTASSIUM ug/L SELENIUM ug/L SILVER ug/L SODIUM ug/L THALLIUM ug/L VANADIUM ug/L ZINC ug/L
(
\ TABLE 4 - 20 ( Continued )
OVERBURDEN GROUNDWATER INORGANIC ANAL YTES UNFILTERED SAMPLES
Remedal Investigation Report Sealand Restoration Site
SSDM10G001 SSDM10GD02 ISSDM10GS01 12J01/92 10/15/93 12J02/92 RESULTSQUAL RESU LTSQUAL RESULTSQUAL
72.6 BJ - - - -- - - - - -
75.9 BJ 65.3 B 21 B - - - - - -- - - - - -
83260 J 89404 36323 - - - - - -- - - - - -- - - - - -
834.7 J 474.9J 189.3 3.7 J 2.58 3.6WJ
34722 J 36580 6178.6 366.3 J 321.3 4.7 B
- - - - - -- - - - - -
1009.6 BJ 660B 1446.9 B - - 1.6 BWJ - -- - - - - -
4164.4 BJ 5163.2 11217 - - 2BWJ - -- - - - - -- - - - 6.7 B
(
SSDM10GS02 SSOM3SGS01 10/lS/93 12J03J92
RESULTSQUAL RESU LTSQUAL
- - 26.2 B - - - -
59.2 B 46.9 B - - - -- - - -
94642 77095 - - - -- - - -
13.4 B - -71.6 8 65.68
- - 3.7 35203 28541
10.3 B 3B - - - -- - - -- - 1192.7 B
1.7 BWJ - -- - - -
45478 2553.7 B - - - -- - - -- - - -
Note: • - • = Indicates that the constituent was not detected above detection limits. Page6
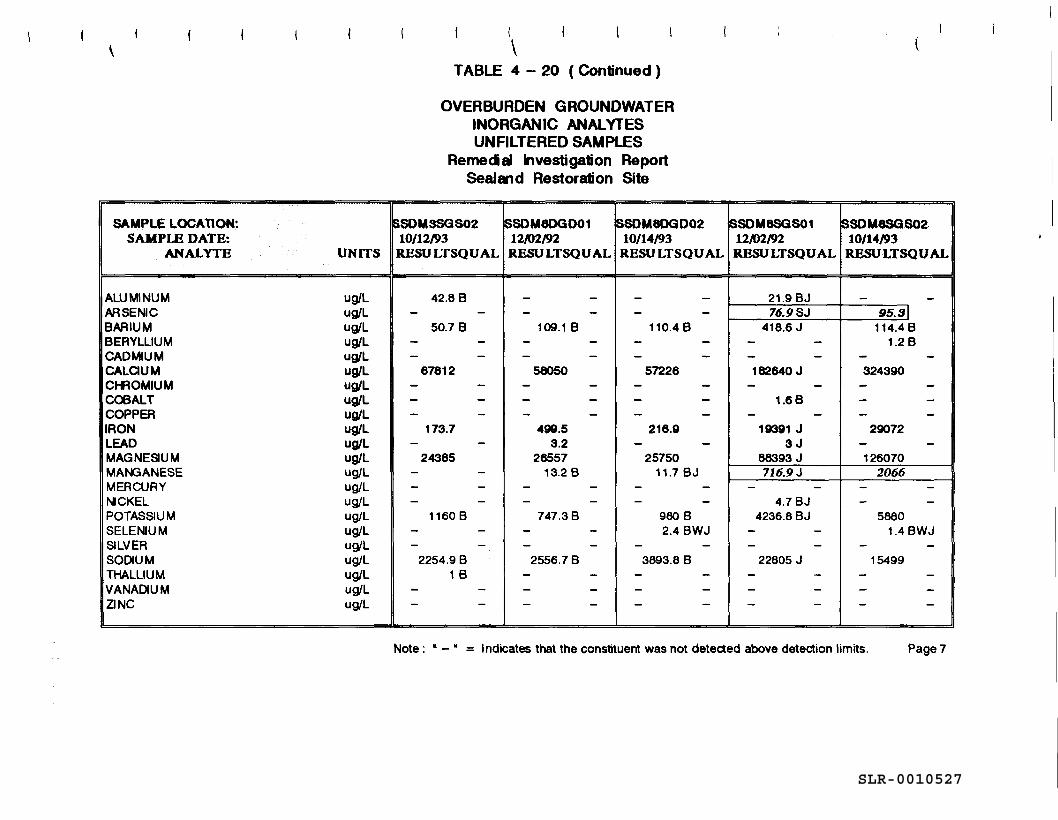
SLR-0010527
SAMPLE LOCATION: SAMPLE DATE:
ANALYTB UNITS
ALUMINUM ug/L ARSENIC ug/L BARIUM ug/L BERYLLIUM ug/L CADMIUM ug/L CALCUM ug/L Ct-AOMIUM ug/L COBALT ug/L COPPER ug/L IRON ug/L LEAD ug/L MAGNESIUM ug/L MANGANESE ug/L MERCURY ug/L NCKEL ug/L POTASSIUM ug/L SELENIUM ug/L SILVER ug/L SODIUM ug/L THALLIUM ug/L VANADIUM ug/L ZINC ug/L
(
\ TABLE 4 - 20 ( Continued )
OVERBURDEN GROUNDWATER INORGANIC ANAL YTES UNFILTERED SAMPLES
Remedal Investigation Report Sealand Restoration Site
$SOMSSGS02 ISSOM80G001 ~SOM80G002 10/12/93 12..u2192 10/14/93
RESULTSQUAL RESU LTSQUAL RESULTSQUAL
42.BB - - - -- - - - - -
50.7 B 109.1 B 110.4 B - - - - - -- - - - - -
67812 58050 57226 - - - - - -- - - - - -- - - - - -
173.7 499.5 216.9 - - 3.2 - -
24385 26557 25750 - - 13.2 B 11.7 BJ - - - - - -- - - - - -
1160 B 747.3 B 980 B - - - - 2.4 BWJ - - - - - -
2254.9 B 2556.7 B 3893.8 B 1 B - - - -
- - - - - -- - - - - -
(
SSOM8SGS01 ISSOM8SGS02 12/02192 10/14193 RESU LTSQUAL RESULTSQUAL
21.9 BJ - -76.9SJ 95.sl
418.6 J 114.4 B - - 1.2 B - - - -182640 J 324390 - - - -
1.6B - -- - - -
19391 J 29072 3J - -
88393 J 126070 716.9 J 2066
- - - -4.7 BJ - -
4236.8 BJ 5880 - - 1.4 BWJ - - - -
22805 J 15499 - - - -- - - -- - - -
Note: • - • = Indicates that the constituent was not detected above detection limits. Page7
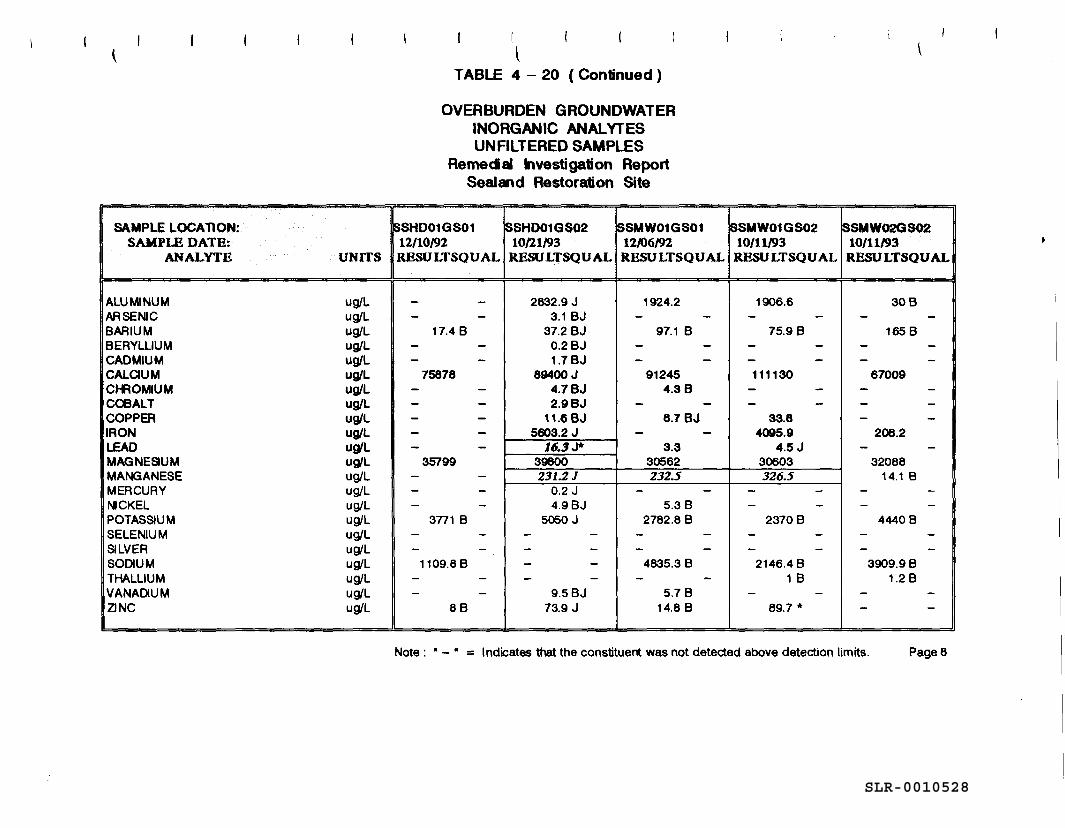
SLR-0010528
SAMPLE LOCATION: SAMPLE DATE:
ANALYTE UNITS
ALUMINUM ug/L ARSENIC ug/L BARIUM ug/L BERYLLIUM ug/L CADMIUM ug/L CALCIUM uwL Ct-f'IOMIUM UWL COBALT ug/L COPPER UWL IRON uwL LEAD uwL MAGNESUM ug/L MANGANESE ug/L MERCURY ug/L NCKEL ug/L POTASSIUM ug/L SELENIUM ug/L SILVER ug/L SODIUM ug/L THALLIUM ug/L VANADIUM ug/L ZINC ug/L
I
l TABLE 4 - 20 ( Continued )
OVERBURDEN GROUNDWATER INORGANIC ANAL YTES UNFILTERED SAMPLES
Remeclal Investigation Report Sealand Restoration Site
SSHD01GS01 SSHD01GS02 SSMW01GS01 12/10/92 10/21/93 12/06/92 RESULTSQUAL RESULTSQUAL RESULTSQUAL
- - 2632.9 J 1924.2 - - 3.1 BJ - -
17.4 B 37.2 BJ 97.1 B - - 0.2BJ - -- - 1.7BJ - -
75878 89400 J 91245 - - 4.7BJ 4.3 B - - 2.9BJ - -- - 11.6 BJ 8.7BJ - - 5603.2 J - -- - 16.3J* 3.3
35799 39800 30562 - - 231.2 J 232.5 - - 0.2 J - -- - 4.9BJ 5.3 B
3771 B 5050 J 2782.8 8 - - - - - -- - - - - -
1109.8 8 - - 4635.3 B - - - - - -- - 9.5BJ 5.7 B
8B 73.9 J 14.8 B
\
SSMW01GS02 SSMW02GS02 10/11/93 10/11/93
RESU LTSQUAL RESULTSQUAL
1906.6 308 - - - -
75.98 165B - - - -- - - -111130 67009 - - - -- - - -
33.8 - -4095.9 206.2
4.5 J - -30603 32088 326.5 14.1 B
- - - -- - - -
23708 4440 8 - - - -- - - -
2146.4 B 3909.9 B 1 8 1.28
- - - -89.7 * - -
Note: • - • = Indicates that the constituent was not detected above detection limits. Page a
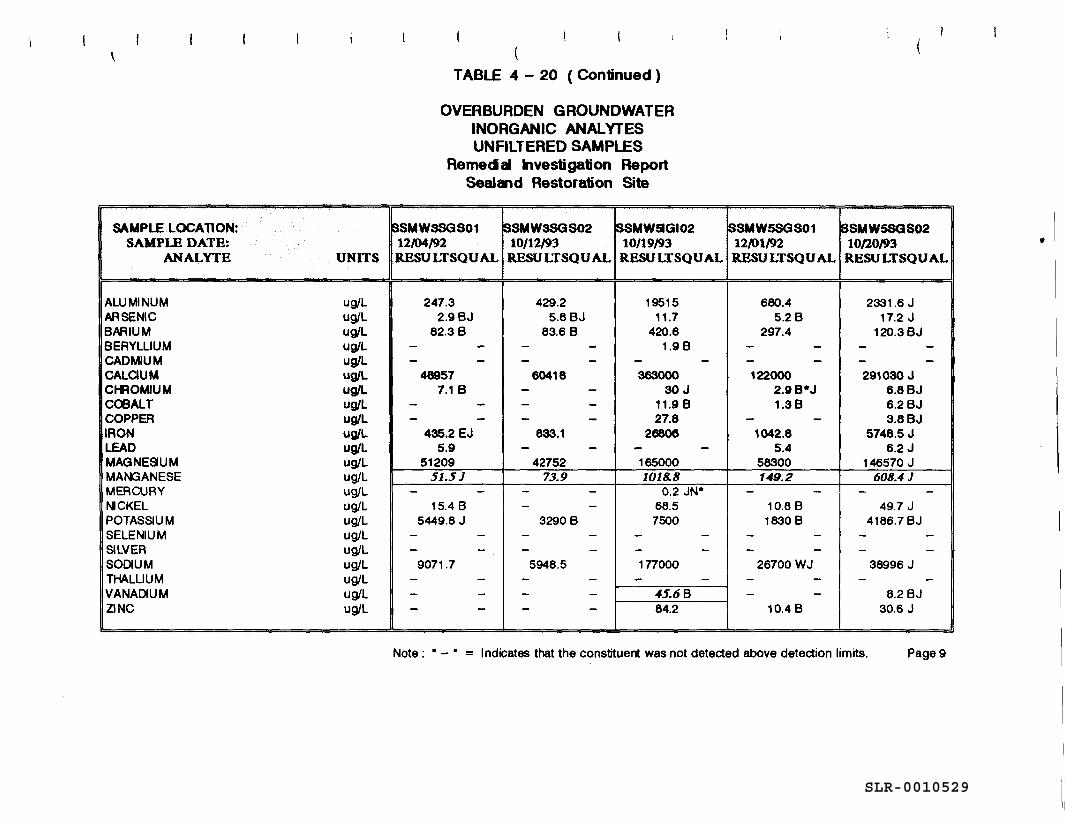
SLR-0010529
'
SAMPLE LOCATION: SAMPLE DATE:
ANALYTE UNITS
ALUMINUM ug/L ARSENIC ug/L BARIUM ug/L BERYLLIUM ug/L CADMIUM ug/L CALCIUM ug/L CHROMIUM ug/L CCBALT ug/L COPPER ug/L IRON ug/L LEAD ug/L MAGNESIUM ug/L MANGANESE ug/L MERCURY ug/L llilCKEL ug/L POTASSIUM ug/L SELENIUM ug/L SILVER ug/L SODIUM ug/L THALLIUM ug/L VANADIUM ug/L ZINC ug/L
TABLE 4 - 20 ( Continued )
OVERBURDEN GROUNDWATER INORGANIC ANAL YTES UNFILTERED SAMPLES
Remedal Investigation Report Sealand Restoration Site
SSMW3SGS01 SSMW3SGS02 SSMW51GI02 12/04/92 10/12/93 10/19/93 RESULTSQUAL RESULTSQU AL RESULTSQUAL
247.3 429.2 19515 2.9BJ 5.8BJ 11.7
82.3 B 83.6 B 420.6 - - - - 1.9 B - - - - - -
48957 60418 363000 7.1 B - - 30 J
- - - - 11.9 B - - - - 27.8
435.2 EJ 833.1 26806 5.9 - - - -
51209 42752 165000 51.51 73.9 1018.8
- - - - 0.2 JN* 15.4 B - - 68.5
5449.8 J 32908 7500 - - - - - -- - - - - -
9071.7 5948.5 1nooo - - - - - -- - - - 45.68 - - - - 64.2
SSMW5SGS01 SSMW5SGS02 12/01/92 10/20/93 RESU LTSQUAL RESULTSQUAL
680.4 2331.6 J 5.2 B 17.2 J
297.4 120.3 BJ - - - -- - - -122000 291030 J
2.98*J 6.8BJ 1.38 6.2BJ
- - 3.8BJ 1042.8 5748.5 J
5.4 6.2 J 58300 146570 J 149.2 608.4 J
- - - -10.8 B 49.7 J 1830 B 4186.7 BJ
- - - -- - - -
26700 WJ 38996 J - - - -- - 6.2 BJ
10.4 B 30.6 J
Note: • - • = Indicates that the constituent was not detected above detection limits. Page9
"
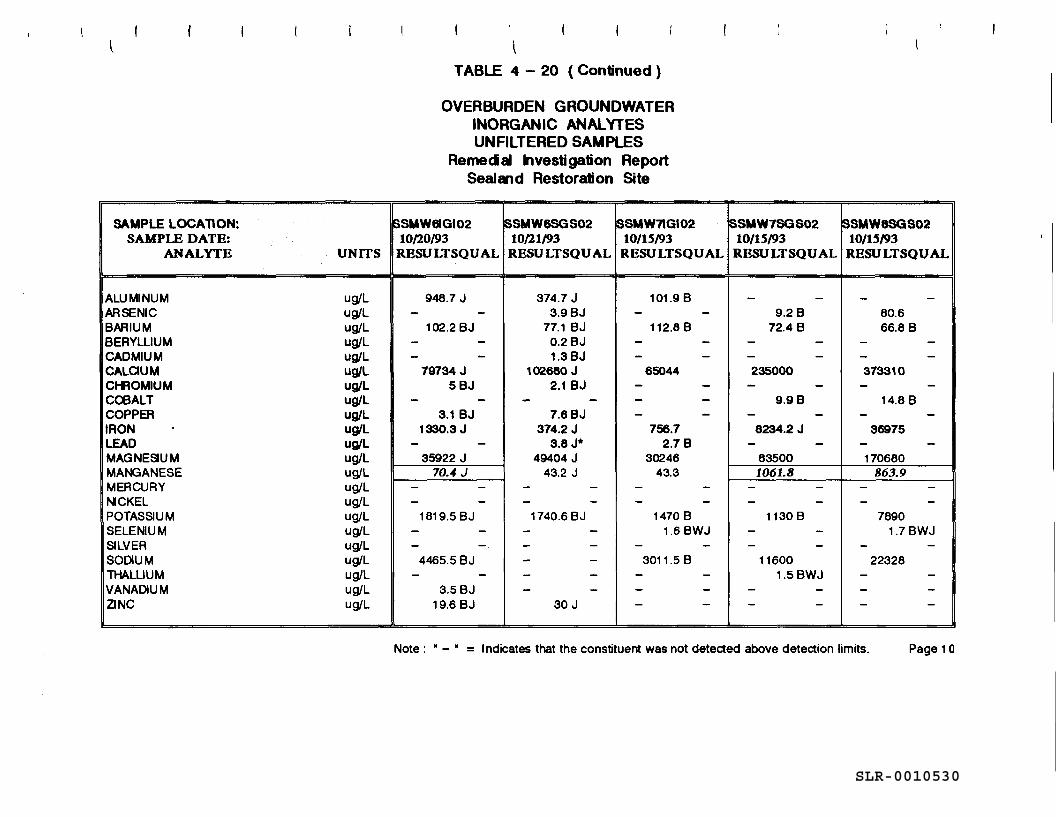
SLR-0010530
SAMPLE LOCATION: SAMPLE DATE:
ANALYTE UNITS
ALUMINUM ug/L ARSENIC ug/L BARIUM ug/L BERYLLIUM ug/L CADMIUM ug/L CALOUM ug/L Cl-AOMIUM ug/L CCBALT ug/L COPPER ug/L IRON - ug/L LEAD ug/L MAGNESIUM ug/L MANGANESE ug/L MERCURY ug/L NCKEL ug/L POTASSIUM ug/L SELENIUM ug/L SILVER ug/L SODIUM ug/L THALLIUM ug/L VANADIUM ug/L ZINC ug/L
TABLE 4 - 20 ( Continued )
OVERBURDEN GROUNDWATER INORGANIC ANALYTES UNFILTERED SAMPLES
Rernecial Investigation Report Sealand Restoration Site
SSMW6lGI02 SSMW6SGS02 $SMW71GI02 10120/93 10121/93 10/lS/93
RESULTSQUAL RESU LTSQU AL RESULTSQUAL
948.7 J 374.7 J 101.9 B - - 3.9BJ - -
102.2 BJ 77.1 BJ 112.8 B - - 0.2BJ - -- - 1.3BJ - -
79734 J 102680 J 65044 5BJ 2.1 BJ - -
- - - - - -3.1 BJ 7.6BJ - -
1330.3 J 374.2 J 756.7 - - 3.8J* 2.7 B
35922 J 49404 J 30246 70.4 J 43.2 J 43.3
- - - - - -- - - - - -
1819.5 BJ 1740.6 BJ 1470 B - - - - 1.6 BWJ - - - - - -
4465.5 BJ - - 3011.5 B - - - - - -
3.5BJ - - - -19.6 BJ 30 J - -
SSMW7SGS02 SSMW8SGS02 10/lS/93 10/15/93
RESULTSQUAL RESU LTSQUAL
- - - -9.2 B 80.6
72.4 B 66.8 B - - - -- - - -235000 373310 - - - -
9.9B 14.8 B - - - -
8234.2 J 36975 - - - -
83500 170680 1061.8 863.9
- - - -- - - -
1130 B 7890 - - 1.7 BWJ - - - -
11600 22328 1.5 BWJ - -
- - - -- - - -
Note : • - • = Indicates that the constituent was not detected above detection limits. Page 1 o
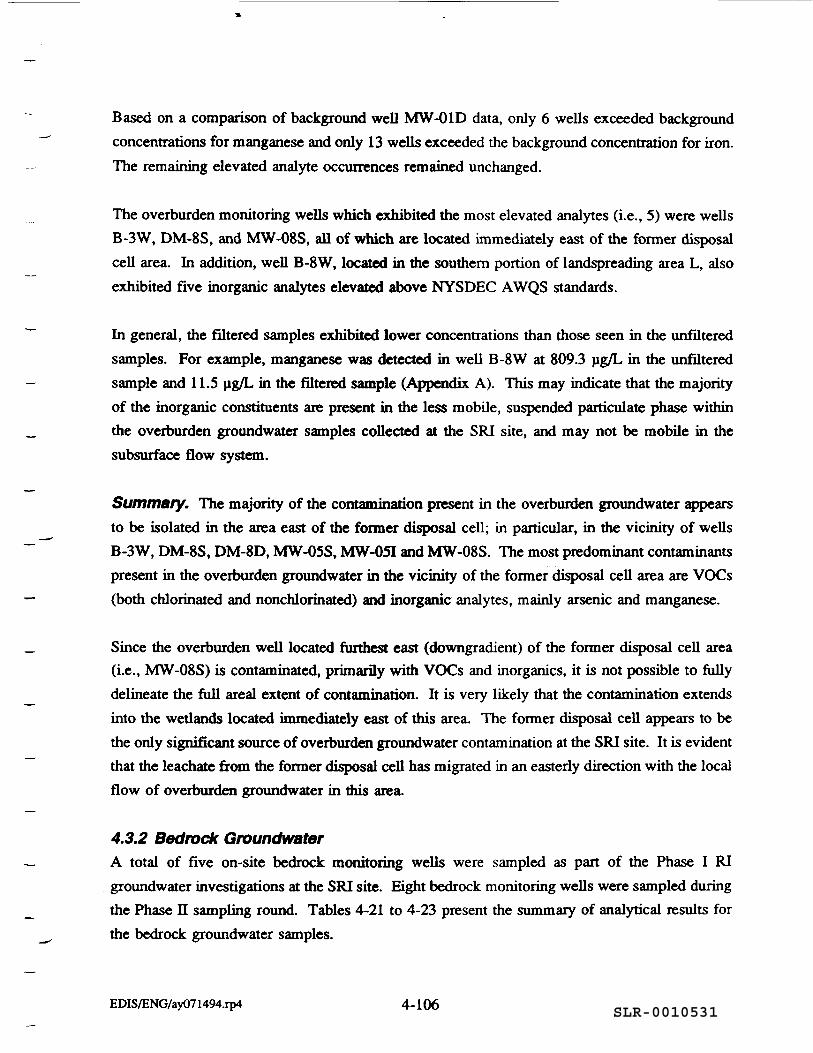
SLR-0010531
-
-
Based on a comparison of background well MW-010 data, only 6 wells exceeded background
concentrations for manganese and only 13 wells exceeded the background concentration for iron.
The remaining elevated analyte occurrences remained unchanged.
The overburden monitoring wells which exhibited the most elevated analytes (i.e., 5) were wells
B-3W, OM-8S, and MW-08S, all of which are located immediately east of the former disposal
cell area. In addition, well B-8W, located in the southern portion of landspreading area L, also
exhibited five inorganic analytes elevated above NYSOEC A WQS standards.
In general, the filtered samples exhibited lower concentrations than those seen in the unfiltered
samples. For example, manganese was detected in well B-8W at 809.3 µg/L in the unfiltered
sample and 11.5 µg/L in the filtered sample (Appendix A). This may indicate that the majority
of the inorganic constituents are present in the less mobile, suspended particulate phase within
the overburden groundwater samples collected at the SRI site, and may not be mobile in the
subsurface flow system.
Summary. The majority of the contamination present in the overburden groundwater appears
to be isolated in the area east of the former disposal cell; in particular, in the vicinity of wells
B-3W, OM-8S, OM-80, MW-05S, MW-051 and MW-08S. The most predominant contaminants
present in the overburden groundwater in the vicinity of the former disposal cell area are voes
(both chlorinated and nonchlorinated) and inorganic analytes, mainly arsenic and manganese.
Since the overburden well located furthest east (downgradient) of the former disposal cell area
(i.e., MW-08S) is contaminated, primarily with VOCs and inorganics, it is not possible to fully
delineate the full areal extent of contamination. It is very likely that the contamination extends
into the wetlands located immediately east of this area. The former disposal cell appears to be
the only significant source of overburden groundwater contamination at the SRI site. It is evident
that the leachate from the former disposal cell has migrated in an easterly direction with the local
flow of overburden groundwater in this area.
4.3.2 Bedrock Groundwater A total of five on-site bedrock monitoring wells were sampled as part of the Phase I RI
groundwater investigations at the SRI site. Eight bedrock monitoring wells were sampled during
the Phase II sampling round. Tables 4-21 to 4-23 present the summary of analytical results for
the bedrock groundwater samples.
EDIS/ENG/ay071494.rp4 4-106
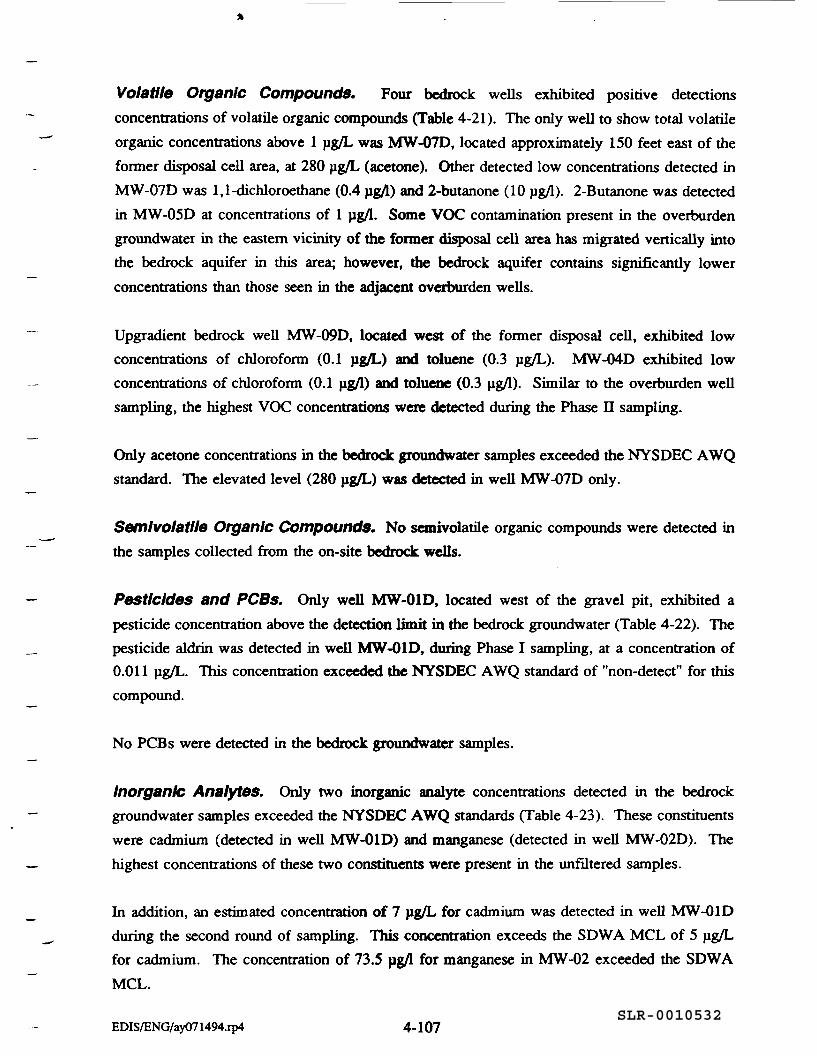
SLR-0010532
-
Volatile Organic Compounds. Four bedrock wells exhibited positive detections
concentrations of volatile organic compounds (Table 4-21). The only well to show total volatile
organic concentrations above 1 µg/L was MW-07D, located approximately 150 feet east of the
former disposal cell area, at 280 µg/L (acetone). Other detected low concentrations detected in
MW-07D was 1,1-dichloroethane (0.4 µg/l) and 2-butanone (10 pg/I). 2-Butanone was detected
in MW-05D at concentrations of 1 µg/l. Some VOC contamination present in the overburden
groundwater in the eastern vicinity of the former disposal cell area has migrated vertically into
the bedrock aquifer in this area; however, the bedrock aquifer contains significantly lower
concentrations than those seen in the adjacent overburden wells.
Upgrad.ient bedrock well MW-09D, located west of the former disposal cell, exhibited low
concentrations of chloroform (0.1 µg/L) and toluene (0.3 µg/L). MW-040 exhibited low
concentrations of chloroform (0.1 µg/l) and toluene (0.3 µg/l). Similar to the overburden well
sampling, the highest VOC concentrations were detected during the Phase II sampling.
Only acetone concentrations in the bedrock groundwater samples exceeded the NYSOEC A WQ
standard. The elevated level (280 µg/L) was detected in well MW-070 only.
Semlvolatlle Organic Compounds. No semivolatile organic compounds were detected in
the samples collected from the on-site bedrock wells.
Pesticides and PCBs. Only well MW-OlD, located west of the gravel pit, exhibited a
pesticide concentration above the detection limit in the bedrock groundwater (Table 4-22). The
pesticide aldrin was detected in well MW-OlD, during Phase I sampling, at a concentration of
0.011 µg/L. This concentration exceeded the NYSDEC AWQ standard of "non-detect" for this
compound.
No PCBs were detected in the bedrock groundwater samples.
lnorgank Analytes. Only two inorganic analyte concentrations detected in the bedrock
groundwater samples exceeded the NYSDEC AWQ standards (Table 4-23). These constituents
were cadmium (detected in well MW-OlD) and manganese (detected in well MW-020). The
highest concentrations of these two constituents were present in the unfiltered samples.
In addition, an estimated concentration of 7 µg/L for cadmium was detected in well MW-010
during the second round of sampling. This concentration exceeds the SOW A MCL of 5 µg/L
for cadmium. The concentration of 73.5 µg/l for manganese in MW-02 exceeded the SOWA
MCL.
EDIS/ENG/ay071494.rp4 4-107
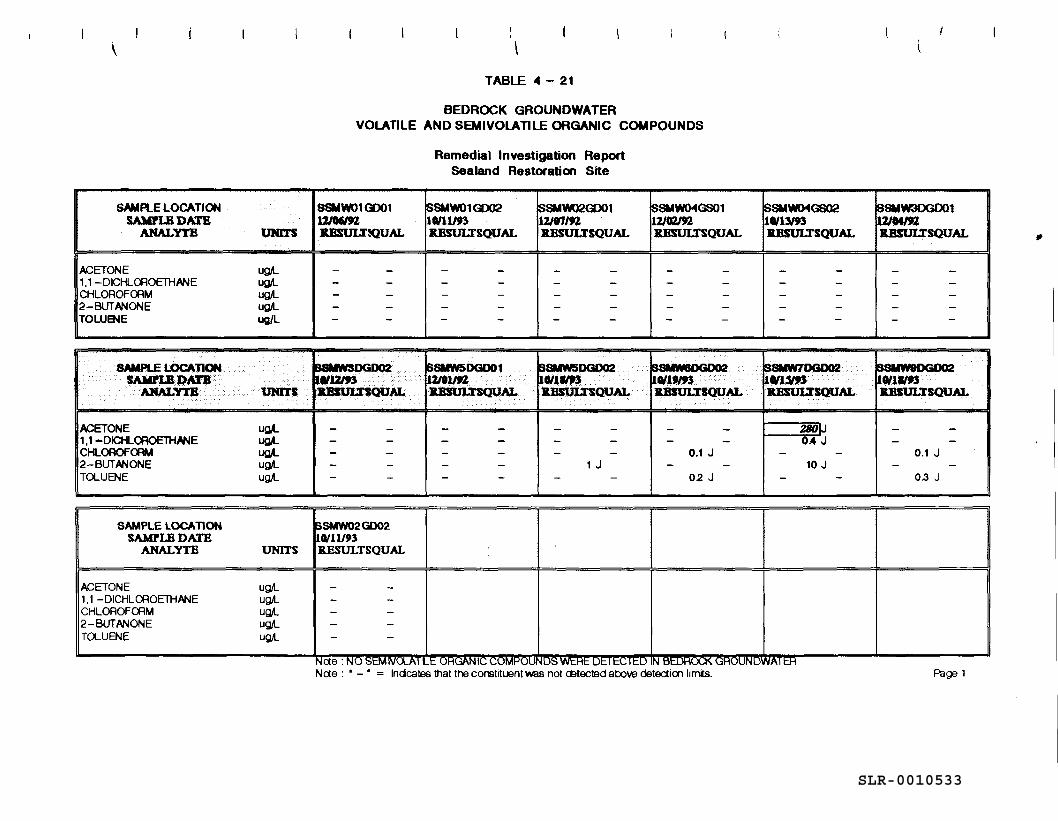
SLR-0010533
SAMPLE LOCATION SAM:rLBDATE
ANAL'YTB mars
ACETONE ug,l. 1,1-DICHLOOOETHANE ug,l. CHLOROFOOM ug,l. 2-BUTANONE ug,l. TOWelE ug/L
SAMPLE LOCATION SAMPLB DATB·
ANAL'YTB··• mars
ACETONE ug,L 1, 1 .... DICHLOROE1HANE ug,L CHLOAOFOOM ug,l. 2-BUTANONE ug,l. Ta...UENE ug,l.
I \
TABLE 4 - 21
BEDROCK GROUNDWATER VOLATILE AND SEMIVOLATILE ORGANIC COMPOUNDS
SSMW01G001 12/tfm B.BSULT!QUAL
- -- -- -- -- -
~ lltl12m KBIUUSQUAI.
- -- -- -- -- -
SMW02GD02 Olll/93
Remedial Investigation Report Sealand Restoration Site
SSMW010002 SSMW02<D01 10/Ultl 17J117Wl. llESULTSQUAL llESULTSQUAL
- - - -- - - -- - - -- - - -- - - -
SSMW5D<m01 $SMW5DGD02 ....... _ u111rm JU!SULTSQUAL Rl!SUJ.;rSQUAL
- - - -- - - -- - - -- - 1 J - - - -
ISSMwo-4GS01 17JGZl92 KBSULTSQUAL
- -- -- -- -- -
DG002 1Wlfm JU!S1JU'SQUAL
- -- -0.1 J
- -02 J
SAMPLE LOCATION SA.MPLB DATE
ANALYTE UNITS RESULTSQUAL
ACETONE ug,l. 1,1-DICHLOOOETHANE ug,l. CHLOROFOOM ug,l. 2-BUTANONE ug,l. Ta...UENE ug,l.
cte: Ncte : • - • = lndcates that the constituent was not cetected above detecticn limits.
SSMW04GS02 SSMW30GD01 10/tl/93 [1'1-.0 .....
.B.BSULTSQUAL B.BSULTSQUAL
- - - -- - - -- - - -- - - -- - - -
~-···DGD02 DGD02 Hll~ 1W11/ts B.BSULTSQUAL BB$ULTSQUAL
280 - -OA J - -
- - 0.1 J 10 J - -
- - 0.3 J
Page 1
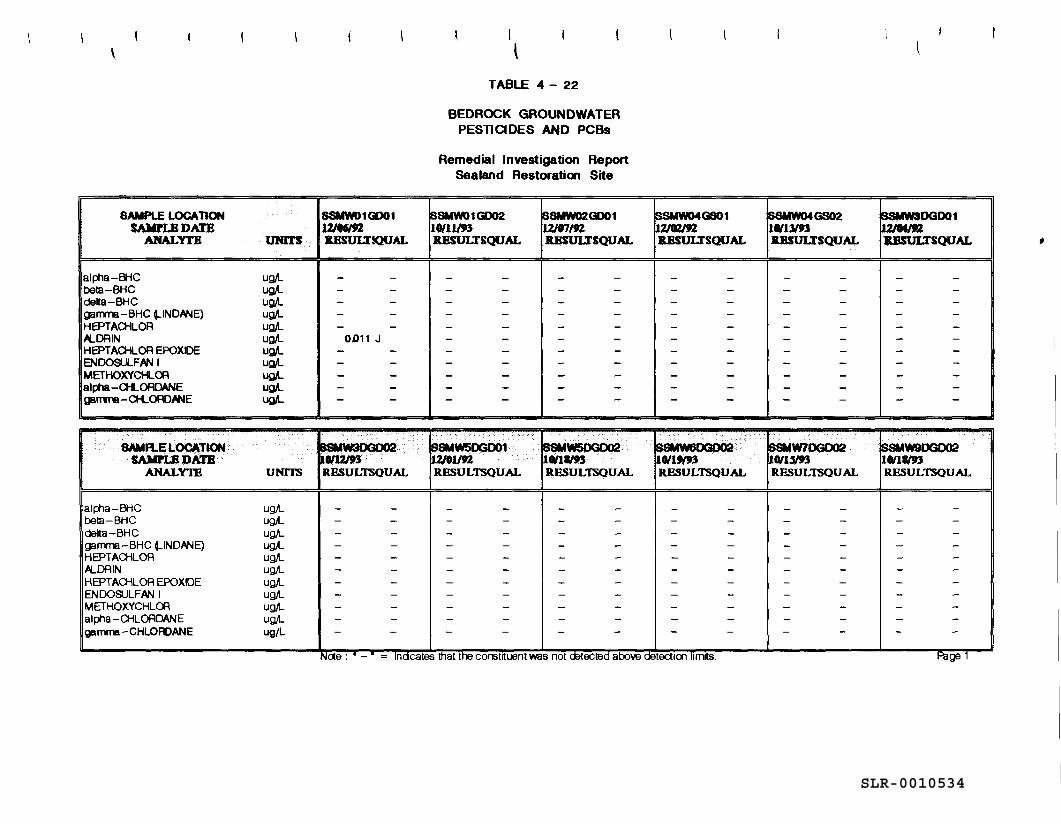
SLR-0010534
SAMPLE UlCATION SAMPLBDATE
ANALYTB
alpha-BHC beta-BHC delta-BHC gamrra-BHC ~INDANE) HEPTAQ-il.OR lt...DRIN HEPTAQ-il.OR EPOXIDE ENDOSULFAN I METHOXYCHLOR alpha-o-LOROANE garrma-Ct-LORDANE
SAMR..E LOCATION SAMPLBDATB
ANALYTB
URITS
ug,ot. ug,ot. ug,ot. ug,ot. ug,ot. ug,ot. ug,ot. ug,ot.
~ ug.t_ ~
UNITS
~~-BHC ug,ot. bela-BHC ug,ot. delta-BHC ug,ot. gamrna-BHC ~INDANE) ug,ot. HEPTACHLOR ug,ot. lt...DRIN ug,ot. HEPTACHLOR EPOXIDE ug,ot. ENDOSULFAN I ug,ot. METHOXYCHLOR ug,ot. alp"la-CHLORDANE ug,ot. gammri-CHLORDANE ug/l
SSMW01GD01 UIMt9Z JlBSUU"!QUAL
- -- -- -- -- -
OD11 J - -- -- -- -- -
cte: -
l l
TABLE 4 - 22
BEDROCK GROUNDWATER PESTlaDES AND PCBs
Remedial Investigation Report Sealand Restoration Site
ISSMW01 GD02 10/11/13 KESULTSQUAL
- -- -- -- -- -- -- -- -- -- -- -
SMW5DG001· 11/92
RF.SULTSQUAL
68MW02GD01 UJV1/9'1. .llBSULTSQUAL
- -- -- -- -- -- -- -- -- -- -- -
constituent was not
SSMW04GS01 UIO'llfJ'I. llBSULTSQUAL
- -- -- -- -- -- -- -- -- -- -- -
tect100 l1mJts.
.GS02 ~Olllm IBSULTSQUAL
- -- -- -- -- -- -- -- -- -- -- -
W700002 1Gfl.\'f3 RF.SULTSQUAL
DGD01 _ _. ...... __ -
KBSULTSQUAL
- -- -- -- -- -- -- -- -- -- -- -
W9DG002 lGfll/93 RESULTSQUAL
ge
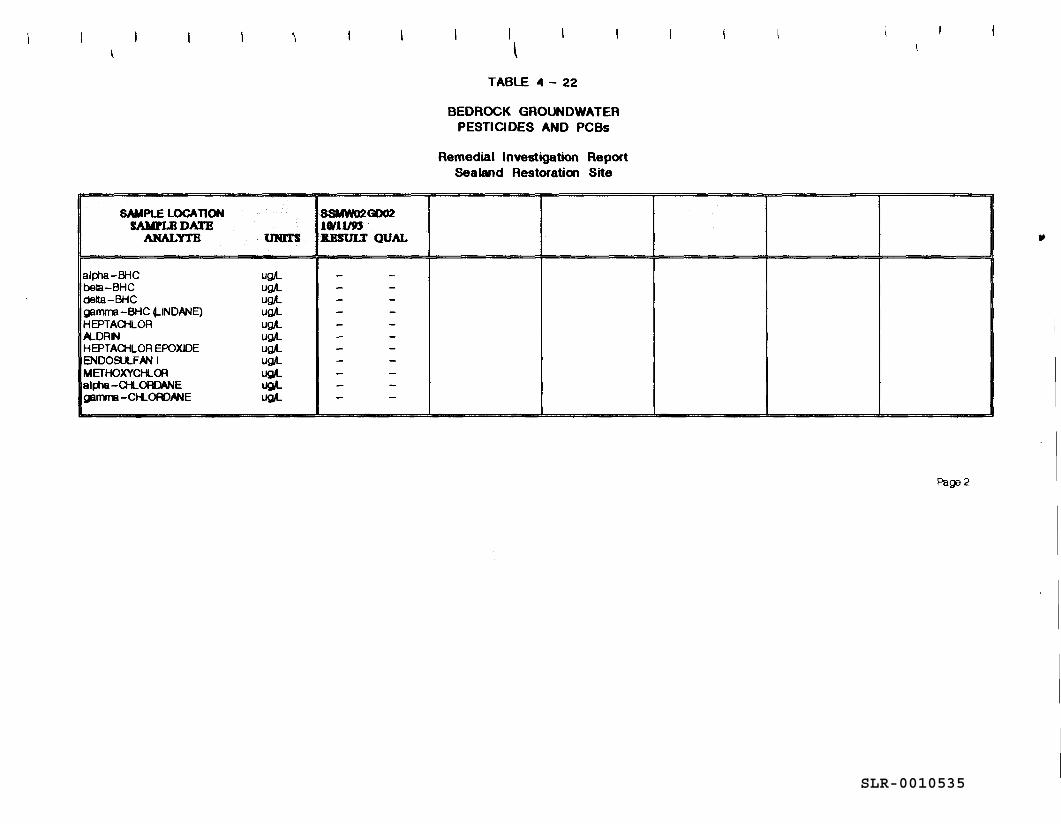
SLR-0010535
SAMPLE LOCATION SAMPLE DATE
ANALYTR URlTS
ali:tia-BHC ug,t_ bela-BHC ug,t_ delta-BHC ug,t_ gamma-BHC "-INDANE) ug,t_ HEPTAo-!LOR ug,t_ It.DAIN ug,t_ HEPTAQ-ILOR EPOXIDE ug,t_ ENDOSULFAN I ug,t_ METHOXYCHLOA ug,4_ ali:tia-a-LORDANE ug,4_ gamma-CHLORDANE ug,4_
SSMWD2GD02 1111119.J :a.BSULT QUAL
- -- -- -- -- -- -- -- -- -- -- -
I \
TABLE 4 - 22
BEDROCK GROUNDWATER PESTICIDES AND PCBs
Remedial Investigation Report Sealand Restoration Site
Page2
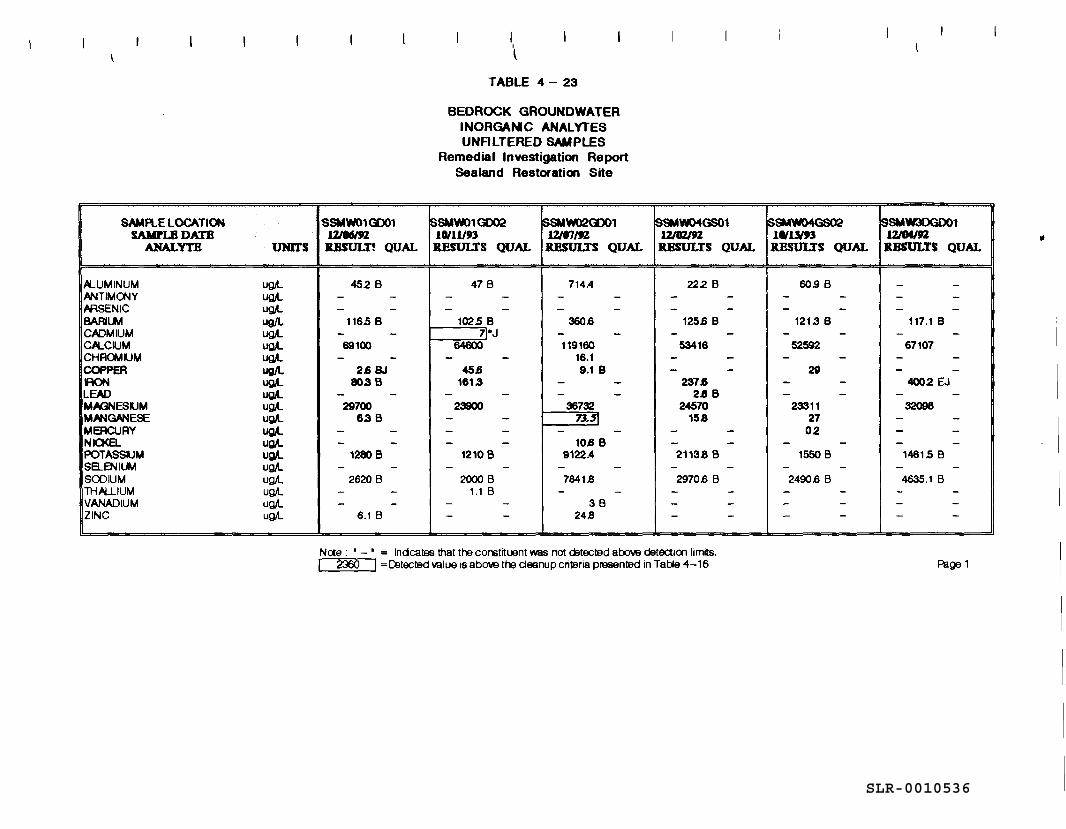
SLR-0010536
'
SAMPLE LOCATION SAMPLE DATE
ANALYTE UNITS
lt...UMINUM ugA.. ANTIMOOY ugA.. ARSENIC ugA.. BARll..M ug/L CADMIUM ugA.. CA.CIUM uQA. CHRCMIUM ug,t. COPPER ug/L IRON ug.4_ LEAD ug,4.. MAGNESUM ug,4_ MANGANESE ug,4.. MERCURY uQA. NICKa ug,t. POTASSIUM ug,4.. saENIUM ug,ot. SOOIUM ugA_ THALLIUM ug,ot. VANADIUM ugA_ ZINC ugA_
I \
TABLE 4 - 23
BEDROCK GROUNDWATER INORGANC ANAL YTES UNALTERED SAMPLES
Remedial Investigation Report Sealand Restoration Site
SSMW01<D01 ~SMW01GD02 ~'M>20001 SSMW04GS01 l2I06m 10/11193 11JV'ltn 12llZl92 JlBSULT! QUAL JlESULTS QUAL ltESULTS QUAL RESULTS
452 B 47 B 714.4 222 B - - - - - - -- - - - - - -
116.5 B 102.5 B 360.6 125.6 B - - 71*J - - -
69100 64600 119160 53416 - - - - 16.1 -
2.6 BJ 45.6 9.1 B -80.3 B 161.3 - - 237.6
- - - - - - 2.6 B 29700 23900 36732 24570
6.3 B - - 7.J.51 158 - - - - - - -- - - - 10.6 B -
1280 B 1210 B 9122.4 21138 B - - - - - - -
2620 B 2000 B 7841.8 2970.6 B - - 1.1 B - - -- - - - 36 -
6.1 B - - 24.8 -
Ncte : ' - ' = lndcates that the constituent was not detected aOOlle detection limits. I 2360 I =D:ltected value ts ab0\19 the deanup criteria prasented 1n Ta~e 4-16
QUAL
-----
---
---
SSMW04GS02 $SMW30G001 10/13(93 12/fM/92 " RESULTS QUAL JlBSULTS QUAL
60.9 B - -- - - -- - - -
121.3 B 117 .1 B - - - -
52592 67107 - - - -
29 - -- - 4002 EJ - - - -
23311 32098 27 - -02 - -- - - -
1550 B 1461.5 B - - - -
2490.6 B 4635.1 B - - - -- - - -- - - -
Page 1
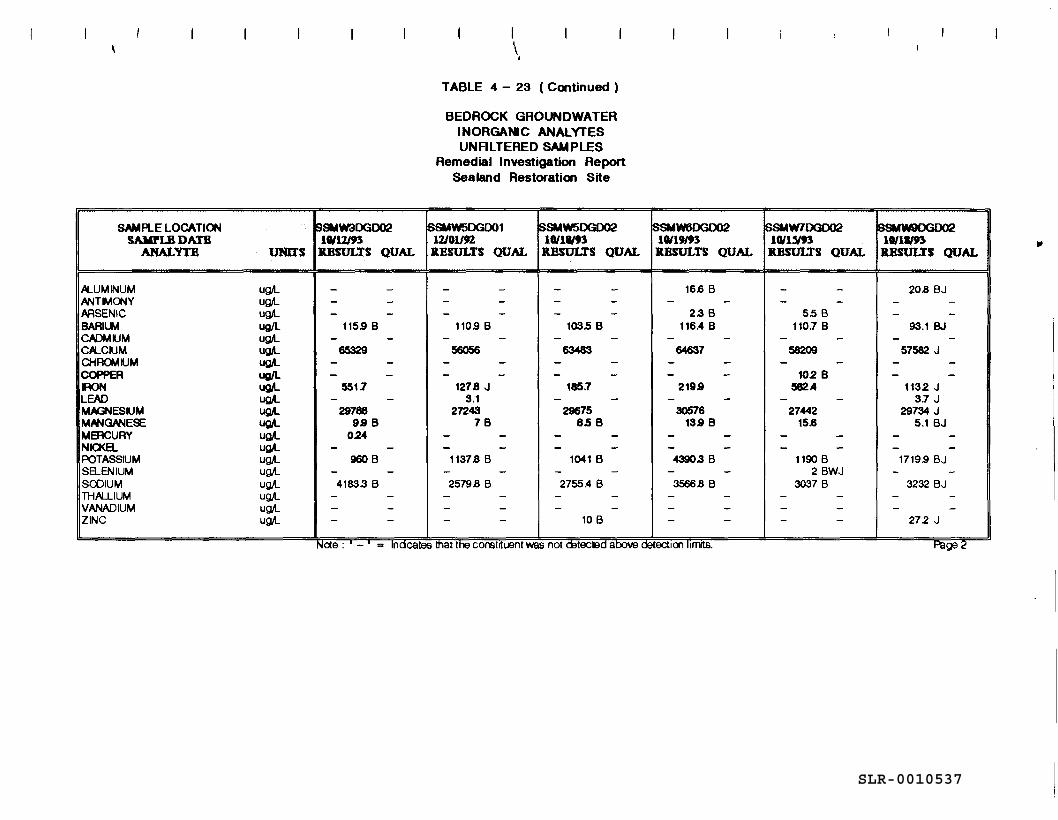
SLR-0010537
'
SAMPLE LOCATION SAllPLB DATE
ANALYTE mo.TS
Jll.UMINUM ugA... ANTIMO'llY ugA... AASEN IC ugA... BARILM ug/L CADMIUM ugA... CJll.CIUM ug,4... CHROMIUM ug,4... COPPER ug/L ~ ug,4... LEAD ug,4... MAGNESIUM ug,l. MAN~ESE ug,l. MERCURY ug,l. NIO<EL ug,l. POTASSIUM ugA... saENIUM ugA... SOOIUM ugA... THAU_IUM ugA... VANADIUM ugA... ZINC ugA...
SSMW30G002 11/12193 JlBSULTS QUAL
- -- -- -
115.9 B - -
65329 - -- -
551.7 - -
29788 9.9 B
024 - -
960 B - -
41833 B - -- -- -
I \ •
TABLE 4 - 23 ( Continued )
BEDROCK GROUNDWATER INORGANC ANALYTES UNFILTERED SAMPLES
Remedial Investigation Report Sealand Restoration Site
~SMW5DG001 ~W50G002 17J01/92 11/11('1
llBSULTS QUAL RESULTS QUAL
- - - -- - - -- - - -
110.9 B 1035 B - - - -
56056 63483 - - - -- - - -
1278 J 185.7 3.1 - -
27243 29675 76 8.5 B
- - - -- - - -11378 B 1041 B
- - - -2579B B 2755.4 B
- - - -- - - -- - 10 B
~SMW600002 11/19193 RESULTS QUAL
16.6 B - -
23 B 116.4 B
- -64637
- -- -
219.9 - -
30576 13.9 B
- -- -43903 B
- -35668 B
- -- -- -
Neta: - - lnelcatss tnat the constituent was not rnteclBd aoove aetect101 11m1ts.
SSMW7DG002 SSMW900002 11/1~ 11/11193
llBSULTS QUAL llBSULTS QUAL
- - 20B BJ - - - -
55 B - -110.7 B 93.1 BJ
- - - -58209 57582 J
- - - -102 B - -
582A 1132 J - - 3.7 J
27442 29734 J 15.8 5.1 BJ
- - - -- - - -
1190 B 1719.9 BJ 2 BWJ - -
3037 B 3232 BJ - - - -- - - -- - 272 J
t-'Bge 2
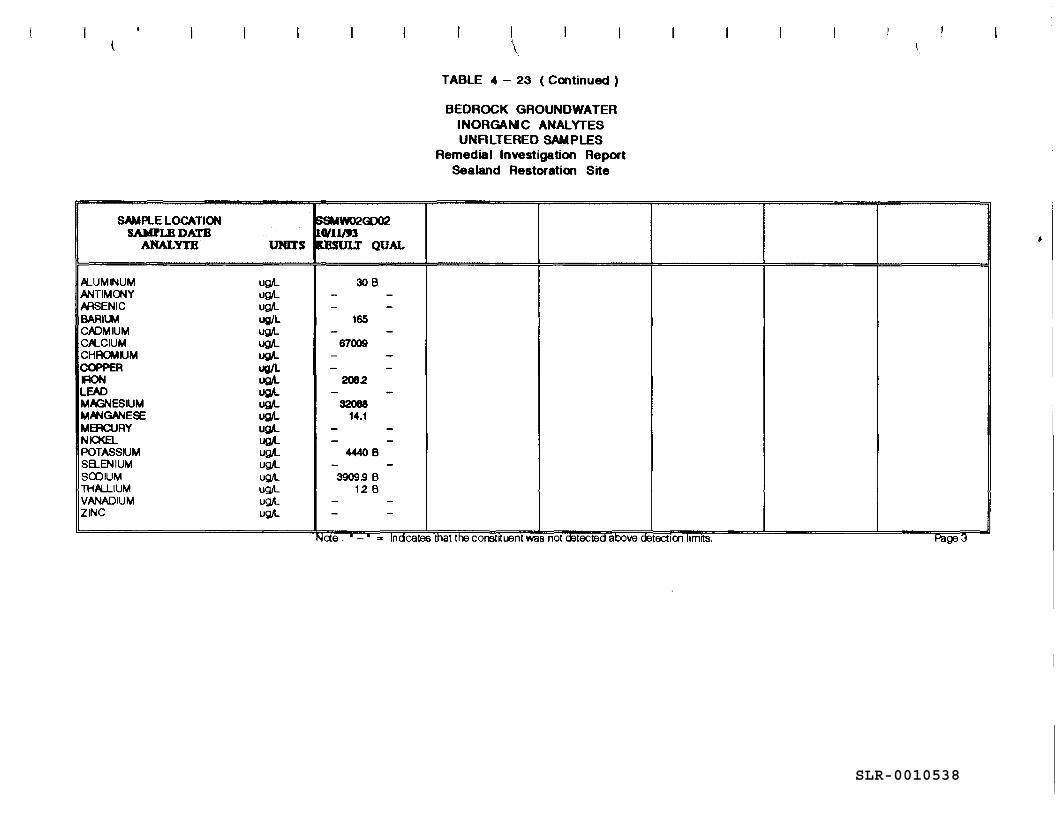
SLR-0010538
SAMPLE LOCATION SAMl'LBDATB
ANALYTE
A...UMINUM ANTIMONY ARSENIC BARll.M CADMIUM CA...CIUM CHROMIUM COPPER ~ LEAD MAGNESIUM MANGANESE MERCURY NIO<El... POTASSIUM saENIUM SOOIUM THALLIUM VANADIUM ZINC
ISSMW02CD02 11Wll/f3
I \
TABLE 4 - 23 ( Continued )
BEDROCK GROUNDWATER INORGANIC ANALYTES UNALTERED SAMPLES
Remedial Investigation Report Sealand Restoration Site
UNlTS • 11T QUAL
ug,ot. 30 B ug,ot. - -ug,ot. - -ug/L 165 ug,ot. - -ug,l. 67009 ug,4.. - -ug/L - -ug,l. 2082 ug,4.. - -ug,l. 32088 ug,l. 14.1 ug.4._ - -ug,L - -ug,L 4440 B ug,ot. - -ug,ot. 3909.9 B ug,t_ 12 B ug,ot. - -ug,ot. - -
Neta : • - • == lndcates that the constituent was not ootectea aoove detect100 llmlts. Page3
SLR-0010539
..
Summary. The most significant contamination present in the bedrock groundwater is localized
in the area east of the former disposal cell; in particular in the vicinity of well MW-07D. The
main form of contamination is voes, especially acetone. It is likely that the contamination
present in the overburden wells in this area has migrated from the fluvial sands into the dolomite
bedrock. Once into the highly fractured bedrock aquifer, the contamination would likely migrate
with the flow of groundwater in a east-northeasterly direction, and possibly off the SRI property.
4.3.3 Residential Wells
A total of 17 off-site private residential wells were sampled as part of the Phase I groundwater
investigation and a total of 23 residential wells were sampled as part of the Phase IT RI
groundwater investigation at the SRI site. Most of these wells are installed in the local bedrock
aquifer. Tables 4-24, 26, and 28 present the analytical results of the Phase I and Phase Il RI
residential well groundwater samples. The NYSOOH collected additional residental well samples
on November 5, 1992 and August 9-10, September 9, September 30, and October 20-21, 1993.
Tables 4-25, 27, and 29 present the analytical results of the NYSDOH residential well sampling
program. Figure 4-5 presents organic and inorganic detected concentrations in the residential
wells.
Volatile Organic Compounds. During the RI, five residential wells showed low levels of
volatile organic compounds ranging from 0.03 µg/L to 1.0 µg/L (Table 4-24). Four of these
wells (i.e., HW-01, HW-02, HW-06, and HW-08) are located generally northeast of the southern
portion of the SRI property. Well HW-06 exhibited the most detections of volatile organic
compounds (i.e., 4); tetrachloroethene (0.6 µg/L), trichloroethene (0.1 µg/L), 1,4-dichlorobenzene
(0.2 µg/L), and cis-1,2-dichloroethylene (0.08 µg/L). Well HW-08, located approximately 250
feet south of well HW-06, exhibited a single detection of trichloroethene (0.03 µg/L).
The remaining three residential wells only exhibited low detections (i.e., 0.8 µg/L - 1 µg/L) of
methylene chloride, a common laboratory contaminant, in the Phase I sampling only. Methylene
chloride was not detected in the former disposal cell leachate sample.
None of the detected voe concentrations exceeded their respective NYSDEC A WQ standard
(NYSDEC, 1993).
In the NYSDOH residential well samples, only 1 TCL compound, 1,1,1-trichloroethane, was
detected at 2.1 µg/L at HW-20 (Table 4-25).
EDIS/ENG/ay071494.rp4 4-114
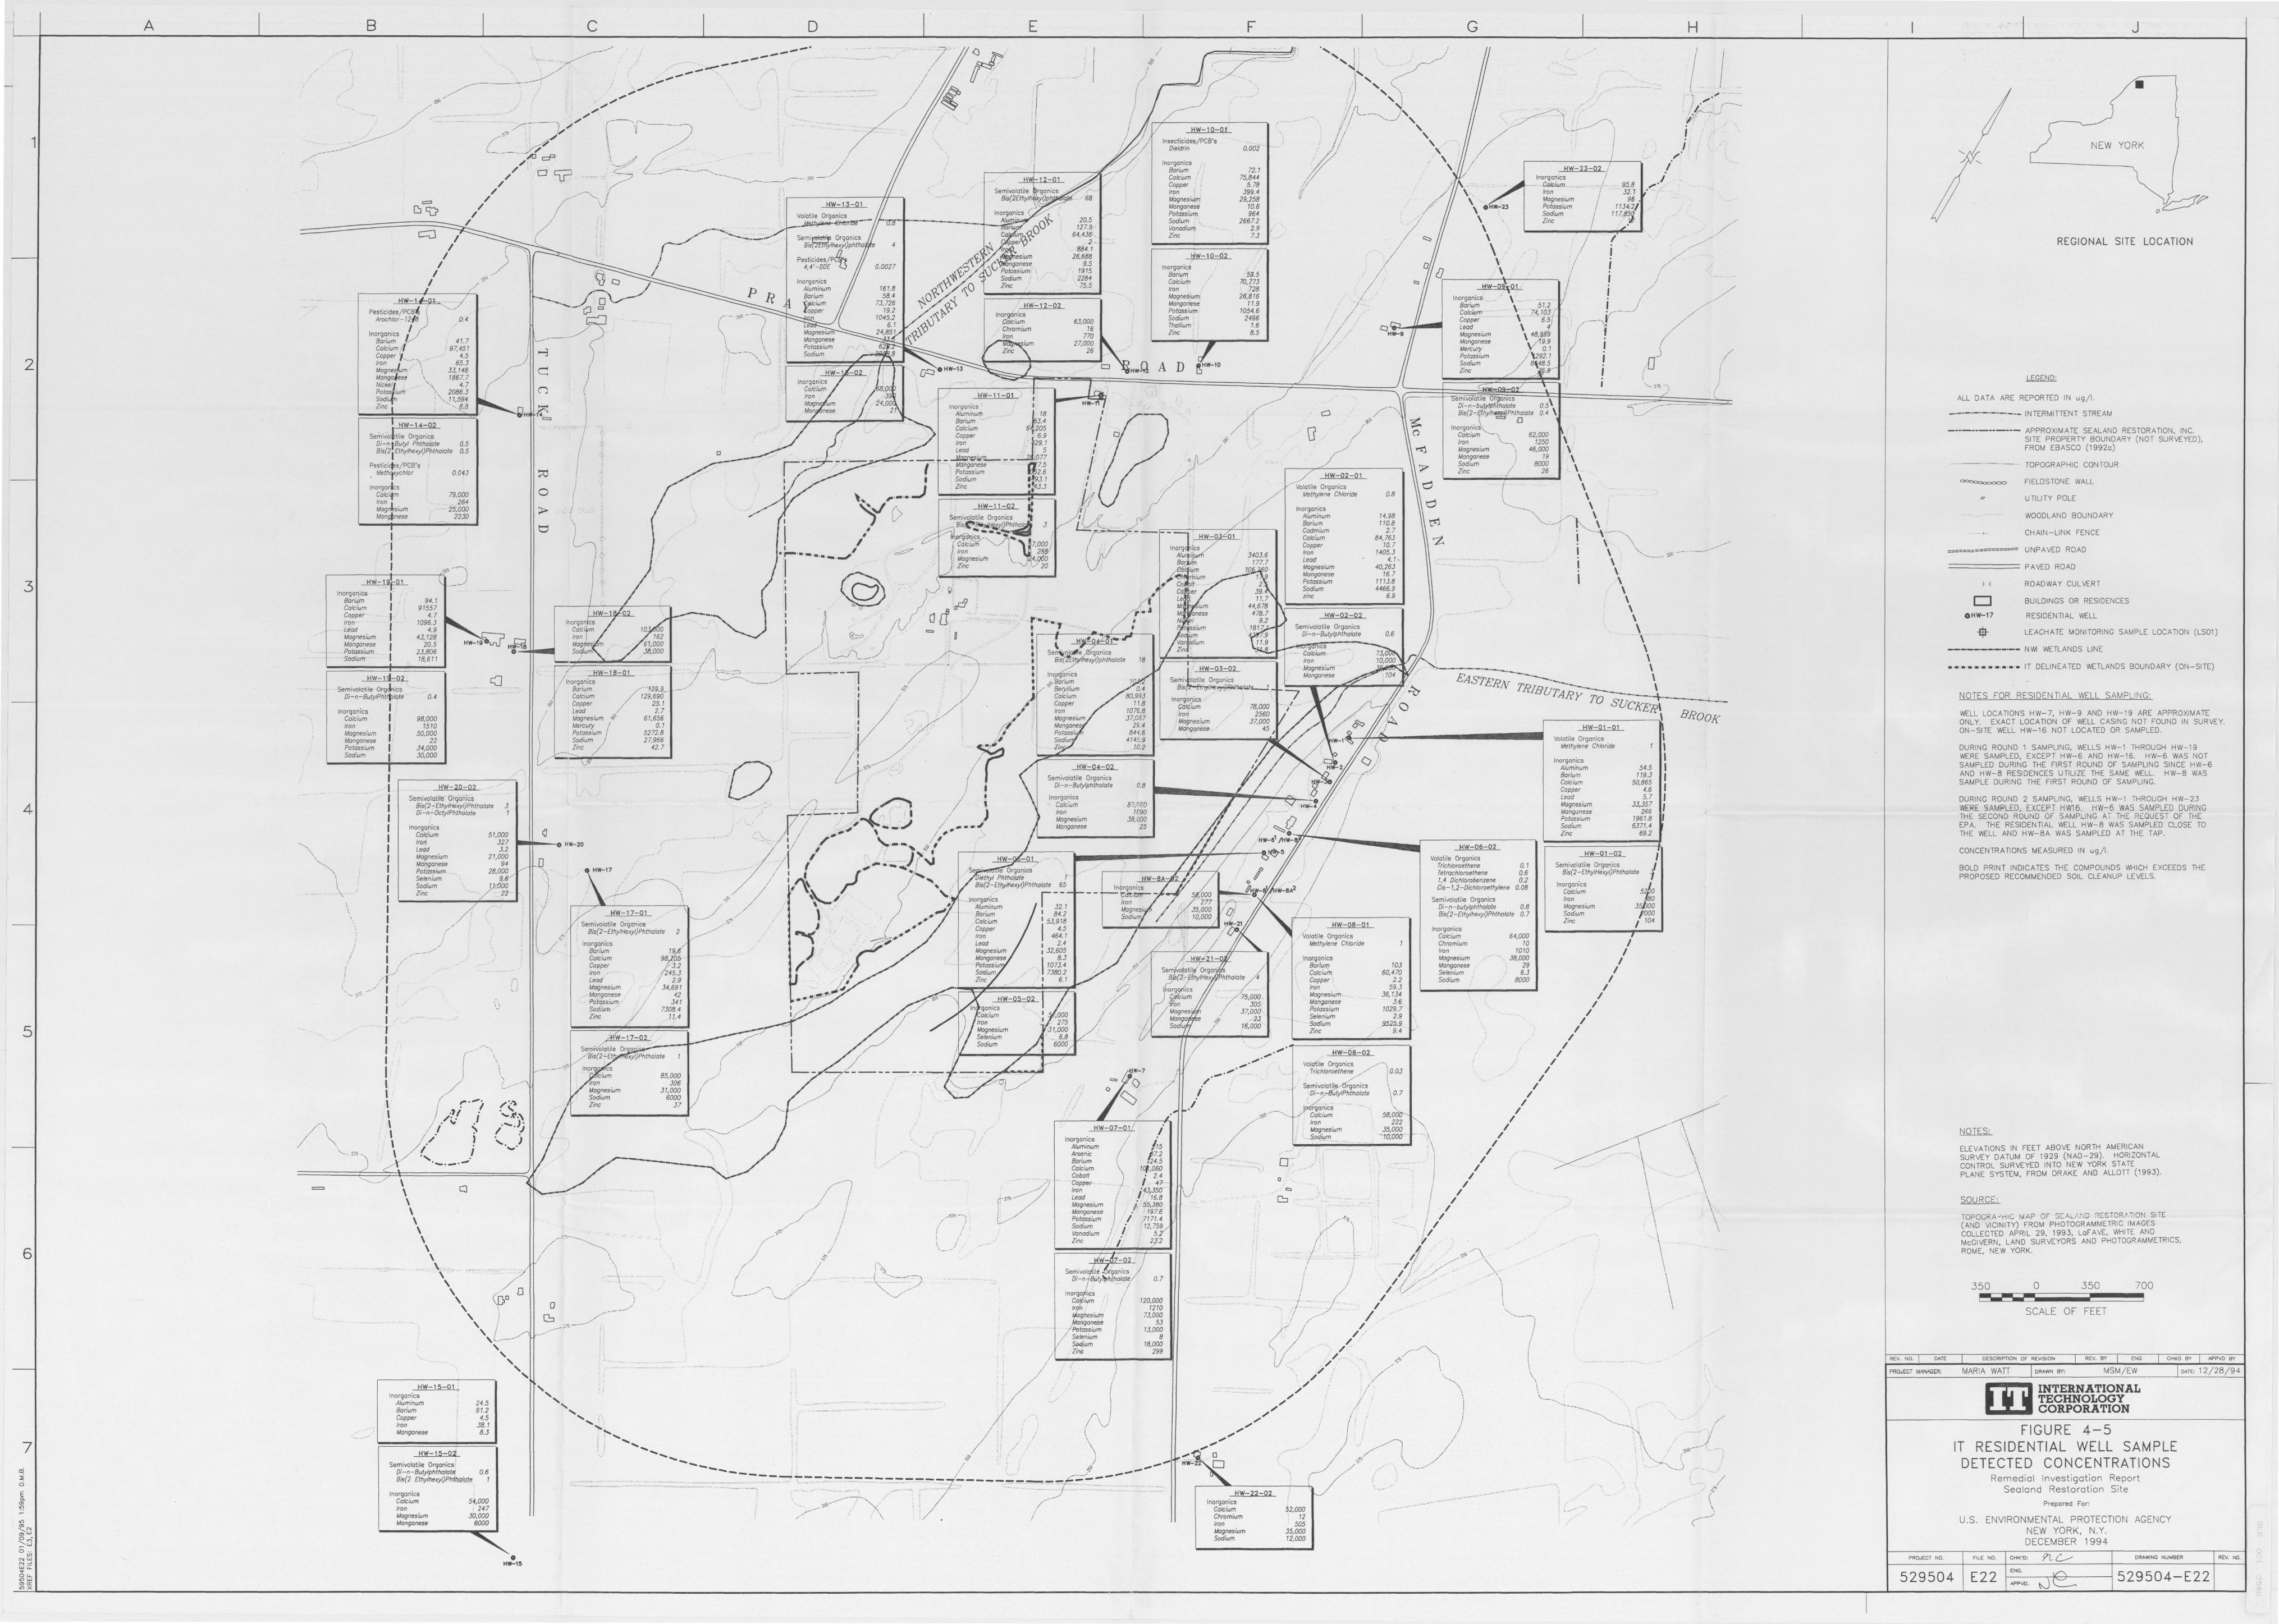
1
2
3
4
5
6
7
A
/ . /
/\ / '" I
=
8
I /
I
I I
I
I HW-1 '=94-· . ;!
Pesticides/PCB~ ( Aroch/or- 12/ 8 ) 04
. I , lnorg~n1cs J /
Bonum _,. 41.7 Calcium// 97,451
Copper ~------· 4.5 Iron 1 '' 65.3 Mogneslum ': 33, 148 MongoJese ' 1867. 7 Nick.el/ -~ -.... _ 4.7 Potos1 ium \ 2086.3 Soditfl "'· 11,594 Zinc - ' --, .!}:8 /
~~~==='"d· HW-14-0"
Seinivol tile OrgonicS Di-n j Buty/ Phthcbte 0.5 Bis(2 I [thy/hexyl}Phthalate 0.5
Pesticicts/PCB's Methf ychlor
lnorgank s Colcif m Iron 1 Mag~sium Mangf:inese
I
I ,', I I
. HW-J.9f01 lnorgo.r:1cs 1 ..
Banum Calcium I Copper I Iran I Lead Magnesium Manganese
- Potassium Sodium ·
I I I
94. 1 91557
4.7 1096.J
4.9 43, 128
20.5 23,806 18,611
0.043
79,000 264
. -· 25;000 2230
' /
HW-1 !l-02 (] Semivototi!~ Orgdnics
Di-n - Butyl Ph ttfi late
lnorganics Calcium Iron Magnesium Manganese Potassium Sodium
I I I I I I
I I I I I I
0.4
98,000 1510
50,000 22
34,000 J0,000
HW-20-02
Semivalatile -Org'ciilics Bis(2 - Ethy!Hexyl}Phthalote Di- n -OctylPhthalate
3 1
I
(
c D E
/'*' Semivolatile rgonics ::;;#',,,..'" ,--._, Bis(2Ethylh' . :yt}p_ "Tg;e. .. 68
)· '-·-- __.,.,.-; lnorganics r .~ ~
"-··-··-.. - ··- ··-·- ··- ·· Nu~iii .. 0i 20.5
HW-13-01
Volatile Organics _ .. .JJ.r.ib~·-Brrtor'lt!I/-··-
""~ , ; f
I
/
HW-10-0 1
lnsecticides/PCB's Dieldrin
lnorgonics Barium t Calcium f' Copper
F
- ... -
0.002
72. 1 75,844
5.78 399.4
29.258
.,... .. -.. , / _,,..,.·· ··..,··-··~u-..... ·· ~ - Semi~ Organ ics
,.·-··-·· Bis'(7mi'ylhexyl)phtha
' .. ··-··tfO?rur}f 0 12 7. 9. ,-ea~f,,"J\ ~ 64,436 .
~\ (:£ppe'\) 2 ·
Iron MagnesiumMangonestf Potassium Sodium Vanadium Zinc ·
10.6 964
2667.2 2.9 73
- 1- 4 \~·~"tr 884.1
{'('~ _,,. .. ' esium 26,688 C: \. (i onganese 9.5
~i.i~,J .. / · Pot~ssium~ ;', 1915 lnorgonics il "\' ,.·" Sodium ; 2284
1 •. 1/ Pesticides/P,LL,
4,4'- DD£ "'t..) 0.0027
tfW-t0-02
lnorganics Barium Calciufri Iron Magnesium Manganese' Potassium . Sodium , Thallium ; . line ·
_59.5 7.0, 77J
_728 26,816
11.9 1054.6
2496 1.6 8.5
I
I ! ) ' ! r ' I -~-
·-"\ . ) ,, I -~,
I ~
I HW-lnorgan/cs
Ca/cifm Iran 1
Mag~es· m Sod/um
(~ HW-18-01 I .
/ lnorgan1cs Barium Calcium Copper Lead
_,..-'-f29JL.t-- ·· / 129.690
/' 25. 1 / 2.7
Magnesium 4? 61,656 Mercury / 0. 1 Potassium 5272.8
P Aluminum 161.8 <\,\ '"/ .. ~O line . 7_5.5
!? 12::: 1/~2i ~°.~,··'~ (----- - ;,:,~ ----~" ~per 10;~:~ ,,..-" :\~<(;. ( ; 1 e 6.1 •• / <!<;J\j ' \ ( Magnesium 24,851, «'<f.\
\ 1 Manganese _' \.
-, Sodium . \,_) f•
\''------- ·-. \ ~"""P~o~to~'~"~·,m~~';!~::;~6~2~·~· ~ r;::i 0 HW-13 -02 . .
; i lnorgonics Calcium Iron - -39
-~---~ '
HW-12-02 lnorg6nics
{:Olcium Chromium Iron
HW-11-0 1 I
63,000 16
770 27,000
26
A D ~HW-10
Moone um 1,1a;
1£8.0t / , 24,00
.• / ' 21 lnorgonics I
Aluminum t 18 Baoum - ' 3.4 Calcium 6 205 Copper 6.9
'"'' J.291 Lead 5
HW-
1 1
I n ,/ /:, _,J ,/
/~ I~~~_.
I I
I I I
- ~"5~'ll...- - - , .077 Manganese " 7.5 Potassium U 2.6
I ,,,,,,,, ~;:/ Sodium •f9J. 1
. Zinc •!4J.J ·I I I /'. &U // . /,/
)~ ~~ -'---.L--,/_·~ ( ... /! ---, . Hw-93 01 ,
( ,, '// l norgc{i~;c, ! /'.l\ Alurvi' ' 8 . \ ; Of ITT
/ - . , ,...,.,, m1um .,___., _- ea~·um
3403.B 177. 7
70Jl. 0
---- 1
----,.-_ >;C ... c ·:·· ,, r r ....... , I .,, -· , ' \ H,.~O 01-'
/·-:~· --·-.-~-- i Serr\f'~;0{ganics ,,.,.------ _ ~ . --\~.·" _ '"" + Bis( 'fpfthexyl)phthalate ,/,/ . ',. ; i ~J;!f ~' 1¢"
.:,~ // )• Beryllium .,... 0. 4
1/ Calcium 80,993
/ Copper 11.8 · ,/ / Iron 1076.8 " · MagnesitJm 37,087
. ·-;~~ /) , Mangones 29. 4 / - ' Polassi 844.6
18
' Ca It -Co l M M
' HW-03-02
Semi e Organics
2. 39. 11.7
44,678 478.7
9.2
.9 11.9
. \!(817
Bis fr?IHe~fl.Q~e..._.J,,
lnorqaoics -" [Jall;ium lrori Magnesium
, MD:19?!1§5e.
78,000 2560
37,000 45 I
HW-02-01
Volatile Organics Methylene Chloride
lnorganics Aluminum Barium Cadmium Calcium Copper Iran Lead Magnesium Manganese Potassium Sodium zinc
HW-02 02
Sem ivolatile Organics Di- n - Butylpht ho/ate __ ,,-,,,,.-----
--mt11gd n1cs Calcium., - ,. Iron
7
MognesiumMongonese
// /
./
0.8 14.98 110.8
2.7 84, 763
10. 7 1405.J
4. 1-. 40,263
16. 7 1113.8 4466.9
6.9
0.6
G
lnorgonics - Calcium . ,., . __ ,.
Iron Mo9nesium Potassium Sodium Zinc
HW-09,0 1 ·
lnorgonics · \ Barium \ 51.2 Calcium·· ·· · 74, 103 ( -Copp-er \ 6.5 r Lead \ f Magnesium \ 48,!JB9 Manganese , /f9.9 Mercury V O. 1 Potassium / \ 292. 1 Sodium / 8\ 48.5 Zinc _g~-
. -~
' · - srfrTI1volo1ile- Of_9an1cs \
Di- n-b2_:rf!5hthalate 0.5 Bis(2-lihylh~Phtblate 0.4 \
Inorganic~ Calcium ~ 62,000 Iron \..._'\ 1250 Magnesium 1 46,000 Manganese ! 19 Sodium ' 8000 Zinc __ ./ 26
_,_,
I
I I '·
!'
I I I
I
I I
-- - 95.B -------- 32.1
96 1134.2/
117,85};
. ·-·-
I . -"':_ . /
. I
I ,, .
H
I I I
.:::::..,-- ~r-·--··-- ·
l,___/ ...
Sodium j 27,966
I ,..-·\;,.._;;;;z, .. " ,...,_,/ ______ 4_2_.7...1
L..--'
HW-01-01
Volati le Organics Methylene Chloride 11 , // if' ~~~f,~dio==~~'=41 .. :; .... ~--!
.-- I .· lnorganics
I I I I I I I I I
_// _ ___,..t-"'~ _ ( / HW-04-02 1, /.,''/ :~:z~um 54.5
[___,../ , 1_, i (\'\, Semivolotile Organics 119.3
: I I- Di-n-Butylphtholote 0.8 r·······-.:,t.~ .. /~,,~··..,!..~. "'·)-.. -~ I g~~~~~ 50,84~~ /·" _j' ....-....... // I l no~~~;~~ 81, rQD _,.. / I ;a0g~esium JJ,]Si _ 7 J.___ '..(.'··' ' I .)' Iron 1l90 A · / ---·
11; Mon911nese 266
1 , , ' .) Magnesium 38,C()O / ,., ' " ' {J r Potassium 1961.8 _,_ \ ' •""' / -....:::;.
r·) [__,,,,
I l
lnorgon ics Caldium Iron
51,000 327 32
21,000
i-ioioioo--<> HW-20
'' ·.v• •.• , - J I , ~, , 1-. , _ 1 , / .,. ,. ,. ,J Manganese 25 I/ .. :' t:::_...._ Sodium 6371.4
/,.,,., ' / ·' / 1.o------------' l 1 0~~7'-;,.:.--........ i---:::;;;;:;;;§;;Q;L" ___ 1 Zinc 69.2 : ,/ , , ,_ ,_ , , #I f ··''i. HW-6 /HW- .......................................................... :;.,
' 1' , . { y ... ~'f' f r--:---=H~W;-;l!~-~OUl-:--:-::--111111---.... , ... -----:f'.f;,,.:..-;:,.t--;:~~ HW-OS 02
' HW-0 1 -02
! \
94
Lead Magnesium Manganese PotOssium Selenium Sodium Zinc
28,0~~--··· ,,.
A~ ' \
' I ,
_ _,!
/ /
' , /
/ /
/
/ l . / I -- ,-... I
I I I I I I ( I !
I. /' \ ( ,. ......
! .1; / I /.. .1 I I . " I I I ~ I /../· !
' '' -
\
' \ \ \ I
,.__ } ')5 --- I / I I / .. , . J ~Jr ·---·..
\ \ \ \ \ \ \ \ \ \ \
\ \
CJ
' ' ' // []
\c,o '
' i
HW-15-01 : lnorgonics
Aluminum Barium Copper Iron Mangonese
' I ____,...-, ,L.--
24.5 91.2
4.5 38.1 8.3
' ' ' ' '
HW- 15-02'
Semivolotile Organics ; Di-n-Butylphthalotr! Bis(2 [thylhexyl)PhthQ(qje
0.6 1
In organics Calcium Iron Magnesium Manganese
54,000 247
30,000 6000
D HW-1~
' ! . / •.
I I I
! I I ,.,
I,/' ''.. __ .
O HW-17
'/. HW-17-01
/; Semivolotile Organics Bis( 2-£thy1Hexyi} Phthalale
lnorgonics
( I ' Volatile Organics / s 0 . i/ -; Trichloroethene 0. 1 Semivolatile Organics I
-' e . th 1 ;ht:Ol~rncs I, Tetrochloroethene 0.6 Bis(2-£1hy1Hexy/)Phthalote B':(j [thy/h 0 QPhth 1 t 65 HW- i" 1,4 Dichforobenzene 0.2 I .
/ is - exy 0 0 e lnorgani~s '_,J.1' / Cis-1,2-Dichlaroethylene 0.08 "0J9?~ics 5 '1l0
/ ,+ ./ \ ' ) , '':z~m ! g;; t"'-- - ///i~~~ /. s'f;~~~~~},~~~~:,,a,ate g~ ~g~;,m 3~~ ____ __ / ,,5\'> .r I } // •' Coloium II 53,918 I 1 • _: lO,OOO HW-OB-Ol Zinc / 104
2 ,.-- _ ___,.. ) -' . .,.,.,..,' ' fr~~per 46!.~ / ---Volatile Organics l noJ61~~~C,.:: 64.000 i -z:-,,;;,..,. Lead I 2.4 -~- // Methylene Chloride 1 Chromium 10 / Barium Calcium Capper Iron lead Magnesium Manganese PatOssium.Sodium Zinc
/ ~ / Magnesium 1 32,605 Iron 1010 / 9·'8 · 1 ( • j _,,, ,;; Manganese I 8.3 lnor.gonics Magnesium 38,000 / ,,. ...,.,. . .,, - Potassiu 1073,4 ~" Jl ill , · Boriuf1) 103 Manganese 29
. /j3:~t~~ r. ~·~/ , ,.... ~f,~um ' 738~~ /' ~~,'::%;(~.'~,Y~~a . hthala~! ~~~~~~· 60~¥~ ~:::;;,m sto~ 1' 42 _,,..J-- ~ ~~+~""..;,,.""""~"""°i~ t/;J' . , M · 36 134 I
·/ 1/ 730~~: I •'/~: ~7'~1 ~~" gan ic~W-05-02 /' '/ 1 ) ~~oiium ·/ 75'~-.- ~~72~7:: · , 1;2~:~ 11
1 ----,- / / _, 1 Magnesi 1 37,ooo· I
-___..; ' /' / } ~'::;,nesium ,___,../ , _ _ Sodiu 16,000 ~fn~um _ .,9.52~~ /
,/ _l 1.4 ~(._,- / ; \! alcrvm /- h Mango #' , 23 .. __ " ., Selenium 2.9 /
.J"!W-17- 02 --- / Selenium 1 /' I
~f~~;~~;1, ·-1 - // ,,ro :L 4:.:,..--/ /;<''---S-ad-lo_m __ _,..__1--.,.:...1 .,, . .,,·""' Hw-68-02 Ill ____ .._,,,, lnorg i / / lo ---· _,,.' Volatile Organics ... -----.
85,000 ) - ~ - -- - - -- - - - , W-7 j -·"" Trichloroethene // )0.03 /
J16~~3g1 )( ___ ... ... ~ j '"[__/, i/ {'.._ 0 // I/. . .... s,;;:~~/~~i;;,~;~~~:i1~ \ o.7 1111
I / )...._? // v ·' ,.,,~ ~ r2,~~~;;; 58.oi5o- I
/
/ ,.-\.--.... ---.., _ ___,,,- -/'/' "· HW- 07- 01 . // ~~;nesium 35,~~~ ~ \ . 111
. ' loocgooi" / ~; / i •. Sodiym ··10;000
~---·-----~~/// ·' / i~~r~m ( 1~,0:~ c,1(- . . ~; ao ,\,) ,1111 . '•
~,/
·~I -~\ \ ~ ' .
~ ·· ··• \ •c ... / \
/ /. _ ..... / ,,, - copper- I / _, . .,,,_, ,. /
--~ // 1·'/i rs~ ___ .--..... -;·/! ~~~d . (. , ,if~·ff.g \_,-· C:J ~ ,;· , ·'/ II ·' / Magnesium - / 55,380 / )- ,,.' Manganese i • J 197.6 ,I• / ,,,,-., " . I I _. .// // l------"' Potassium } '7171.4 _,./··'.)) ::::-· / /
f 11 ~~~~d%m / - i ,72'7£Y' / '!. / /
/ Zinc 11 j ~}'.2 · ¥ ,_ j I i ,f ,.,··\
Semivo1o£%wlrg;~~;// ,//___ 11
/ , ---/~( - ~,,./ ...... /,,. \" Di-n-jBWty~htha!/ 0. 7 1 / ( ;....- ---' \
lnor2~1cs . 1 / ( / __ -"(/ \
~°Jium ' / 120;~~g __ J .;-- 1 1
I \
' ' 0
· M'agiiesium 73,000 jl ~" / Aanganese I 5J · 1 /' I ~ ~,,./ .... ----~ ])'.i-
/
' I
' I
atassium r'I 13,000 _.// / I /" elenium 8 , I
5/J:!:"m 18~~ ,1 .. • //~/
\,') ///
... -· _,,,,""
i'J -I __ ,,,.,,,.,,,.""'
\ --,,,.
HW-22-02 lnorganics
Calcium Chromium Iron Magnesium Sodium
· ..
52,000 12
505 35,000 12,000
•' -'"'..... ,, ._,.,
; '
.,. ··-"
\ \\ \ \ I
\
I
(
REV. NO. DATE
PROJECT M~AGER;
PROJECT NO.
J
•
NEW YORK
REGIONAL SITE LO CATIO N
LEGEND:
ALL DATA ARE REPORTED IN ug/I.
- ··- ··-··-··-··- ··-··- ··- INTERMITTENT STREAM
--···-- - ·
APPROXIMATE SE ALAND RESTORATION, INC. SITE PROPERTY BOUNDARY (NOT SURVEYED). FROM EBASCO (1992a)
TOPOGRAPHIC CONTOUR
FIELDSTONE WALL
UTILITY POLE
WOODLAND BOUNDARY
CHAIN-LINK FENCE
PAVED ROAD
i ' ROADWAY CULVERT
D BUILDINGS OR RESIDENCES
OHW-17 RESIDENTIAL WELL
-$- LEACHATE MONITORING SAMPLE LOCATION (LS01)
---·----·--·-- N~ WETLANDS LINE
. ,. ,. ,. ,. , • .• ,. • . ,. IT DELINEATED WE TLANDS BOUNDARY (ON-SITE)
NOTES FOR RESIDENTIAL WELL SAMPLING;
WELL LOCATIONS HW-7, HW-9 AND HW-19 ARE APPROXIMATE ONLY. EXACT LOCATION OF VV'ELL CASING NOT FOUND IN SURVEY. ON-SITE WELL HW-16 NOT LOCATED OR SAMPLED.
DURING ROUND 1 SAMPLING, WELLS HW-1 THROUGH HW- 19 WERE SAMPLED, EXCEPT HW-6 AND HW- 16. HW-6 WAS NOT SAMPLED DURING THE FIRST ROUND OF SAMPLING SINCE HW-6 AND HW-8 RESIDENCES UTILIZE THE SAME WELL. HW-8 WAS SAMPLE DURING THE FIRST ROUND OF SAMPLING.
DURING ROUND 2 SAMPLING, WELLS HW-1 THROUGH HW-23 WERE SAMPLED, EXCEPT HW16. HW-6 WAS SAMPLED DURING THE SECOND ROUND OF SAMPLING AT THE f-Zr:QUEST OF THE EPA. THE RESIDENTIAL WELL HW-8 WAS SAMPLED CLOSE TO THE WELL AND HW-8A WAS SAMPLED AT THE TAP.
CONCENTRATIONS MEASURED IN ug/I.
BOLD PRINT INDICATES THE COMPOUNDS WHICH EXCEEDS THE PROPOSED RECOMMENDED SOIL CLEANUP LEVELS.
NOTES:
ELEVATIONS IN FEET ABOVE NORTH AMERICAN SURVEY DATUM OF 1929 (NAD-29). HORIZONTAL CONTROL SURVEYED INTO NEW YORK STATE PLANE SYSTEM, FROM DRAKE AND ALLOTT (1993).
SOURCE:
TOPOGRA-'rllC MAP OF SCAL/-.~! ~ R[STCR/.T!Ot-l SITE (AND VICINITY) FROM PHOTOGRAMMETRIC IMAGES COLLECTED APRIL 29, 1993, LoFAVE, WHITE AND McGIVERN, LAND SURVEYORS AND PHOTOGRAMMETR ICS, ROME, NEW YORK.
350 0 350 700
SCALE OF FEET
DESCRIPTION OF REVISION REV. BY CHKO BY APPVD BY
MARIA WA n DRAWN aY: MSM /Ew rn INTERNATIONAL TECHNOLOGY
· CORPORATION
FIGURE 4-5 IT RESIDENTIAL WELL SAMPLE
DETECTED CONCENTRATIONS Remedial Invest igation Report
Sealand Restoration Site
Prepared For:
U.S. ENVIRONMENTAL PROTECTION AGENCY NEW YORK, N.Y. DECEMBER 1 994
O>TE• 12/28/94
FILE NO. CHK'D: 91_ {__--- DRAWING NUMBER REV. NO.
529504 E22 ENG.
APPVD. 529504-E22
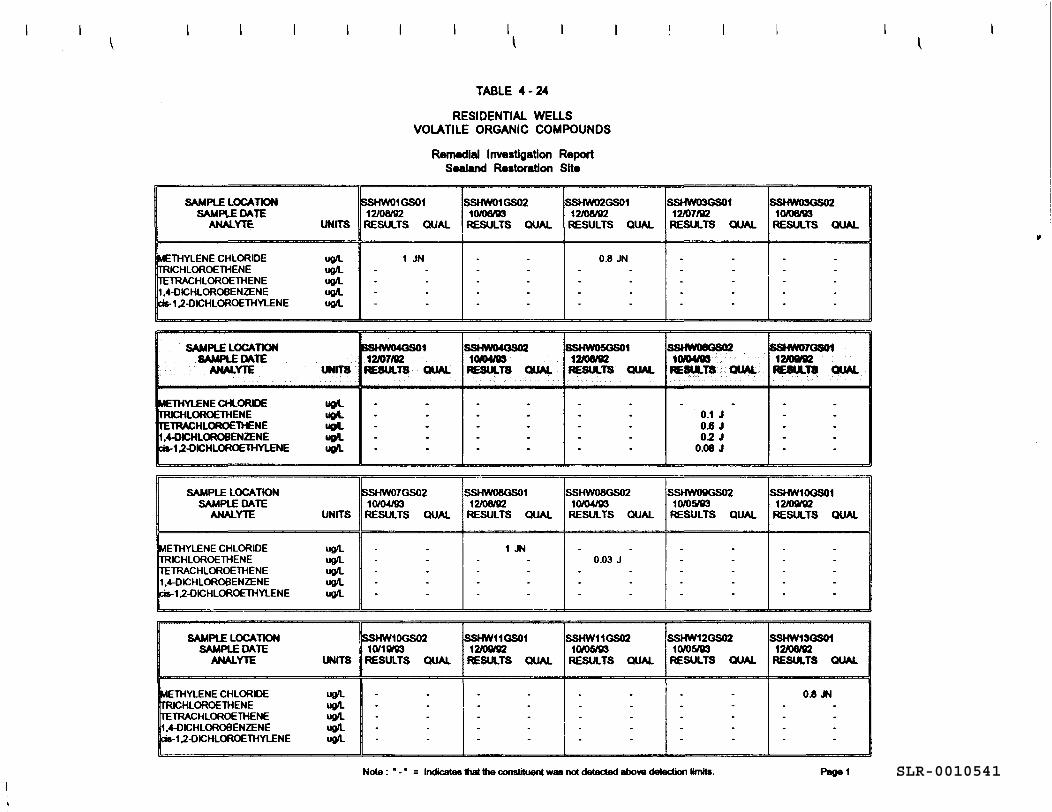
SLR-0010541
\
SAMPLE LOCATION SAMPLE DATE
ANALYTE UNITS
METHYLENE CHLORIDE ug/L TRICHLOROETHENE ug/L TETRACHLOROETHENE ug/L 1,4-0ICHLOROBENZENE ug/L cis-1,2-0ICHLOROETHYLENE ug/L
SAMPLE LOCATION SAMPLE DATE
ANM.YTE UNITS
METHYLENE CHLORIDE ug/L TRICHLOROETHENE ug/L TETRACHLOROETHENE ug/L 1,4-0ICHLOROBENZENE ug/L cis-1,2-0ICHLOROETHYLENE ug/L
SAMPLE LOCATION SAMPLE DATE
ANALYTE UNITS
METHYLENE CHLORIDE ug/L ITRICHLOROETHENE ug/L ITETRACHLOROETHENE ug/L 1,4-0ICHLOROBENZENE ug/L cis-1,2-0ICHLOROETHYLENE ug/L
-
SAMPLE LOCATION SAMPLE DATE
ANALYTE UNITS
METHYLENE CHLORIDE ug/L ITRICHLOROETHENE ug/L ITETRACHLOROETHENE ug/L 1,4-0ICHLOROBENZENE ug/L k:is-1.2-0ICHLOROETHYLENE ug/L
I \
TABLE 4-24
RESIDENTIAL WELLS VOLATILE ORGANIC COMPOUNDS
Remedial Investigation Report Sealand Restoration Site
SSHW01GS01 SSHW01GS02 SSHW02GS01 12/08/92 10/06l93 12/08192 RESULTS QUAL RESULTS QUAL RESULTS QUAL
1 JN - - 0.8 JN - - - - - -- - - - - -- - - - - -- - - - - -
- 1 SSHW04GS02 SSHW05GS01 12107/fQ 1CW419S 12JOMl2 RESULTS QUA&. RESULTS ClUAL RESULTS QUAL
. . . . - -- . - . . -. - . . . . . . . . - -- . . . - -
-·
SSHW07GS02 SSHW08GS01 SSHW08GS02 10/04/93 12108/fQ 10/04/93 RESULTS QUAL RESULTS QUAL RESULTS QUAL
- - 1 JN - -- - - - 0.03 J - - - - - -- - - - - -- - - - - -
SSHW10GS02 SSHW11GS01 SSHW11GS02 10/1W113 12/0IW2 10/05193
RESULTS QUAL RESULTS QUAL RESULTS QUAL
- - - - - -- - - - - -- - - - - -- - - - - -- - - - - -
SSHW03GS01 12107/fQ RESULTS QUAL
- -- -- -- -- -
SSHW08GS02 10IOWS RESUl.18 . ClUAL
- . 0.1 J 0.6 J 0.2 J
0.08 J
SSHW09GS02 10/05193 RESULTS QUAL
- -- -- -- -- -
SSHW12GS02 10/05193 RESULTS QUAL
- -- -- -- -- -
Note : • - • = Indicates that the constituent was not delected above detection limits.
SSHW03GS02 10/06l93 RESULTS QUAL
- -- -- -- -- -
GS01 12IOMl2 RESULTS ClUAL
. -. -. . - . . -
SSHW10GS01 12/0IW2 RESULTS QUAL
- -- -- -- -- -
SSHW13GS01 12108/fQ RESULTS QUAL
0.8 JN - -- -- -- -
Page1
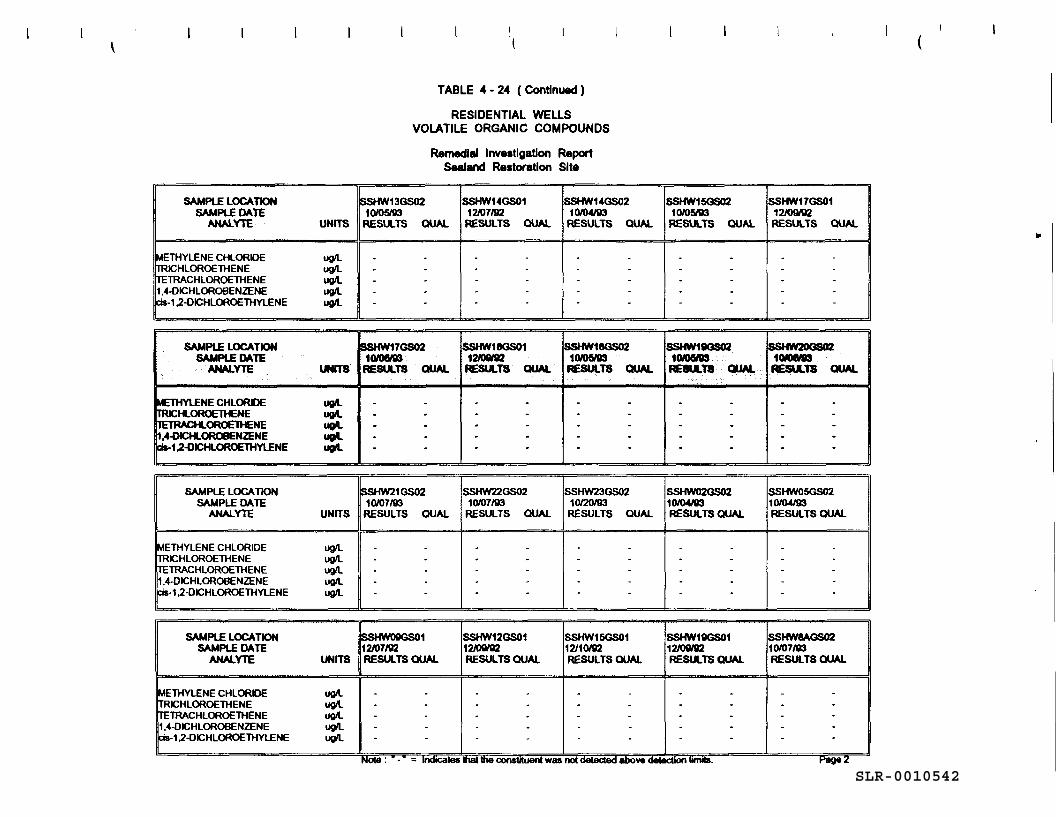
SLR-0010542
\
SAMPLE LOCATION SAMPLE DATE
ANALYTE UNITS
!METHYLENE CHLORIDE ug/l TRICHLOROETHENE ug/l TETRACHLOROETHENE ug/L 1,4-DICHLOROBENZENE ug/l cis-1.2-0ICHLOROETHYLENE ug/L
SAMPLE LOCATION SAMPLE DATE
ANALYTE UNITS
~THYLENE CHLORl>E ug/L ITRICHLOROETHENE ugo'l 11c 1~HLOROE1HENE ugo'l 1,4-0ICHLOROSENZENE ugo'l ica-1.2-0ICHLOROETHYLENE ugo'l
SAMPLE LOCATION SAMPLE DATE
ANALYTE UNITS
METHYLENE CHLORIDE ug/l TRICHLOROETHENE ug/L TETRACHLOROETHENE ug/l 1,4-DICHLOROBENZENE ug/l cis-1.2-DICHLOROETHYLENE ug/l
I (
TABLE 4 - 24 (Continued)
RESIDENTIAL WELLS VOLATILE ORGANIC COMPOUNDS
Remedial Investigation Report Sealand Restoration Site
$SHW13GS02 SSHW14GS01 SSHW14GS02 10/05193 12/07192 10/04Xl3 RESULTS QUAl. RESULTS QUAl. RESULTS QUAI..
- . . . . . . . . . . . . . . . . . . . . . . . . . . . .
SSHW17GS02 SSHW18GS01 SSHW18GS02 1Qloetm 12JCK!t92 10/05'93 RESULTS QUAl. RESULTS QUAL RESULTS QUAL.
- - - - - -. . . - . -. . . - . . - - - . . -. . . - - -
SSHW21GS02 SSHW22GS02 SSHW23GS02 10/07193 10/07193 10/20/93 RESULTS QUAI.. RESULTS QUAI.. RESULTS QUAI..
- . . - . . . - . . - . . . - . - . - . . - . -- - . - - .
12/07/92 SAMPLE LOCATION
SAMPLE DATE ANALYTE UNITS RESULTS QUAL
SSHW12GS01 12/CMW2 RESULTS QUAI..
SSHW15GS01 12/1CW2 RESULTS QUAI..
ETHYLENE CHLORIDE ug/l ICHLOROETHENE uglL TRACHLOROETHENE ugll
1,4-DICHLOROBENZENE ug/L . 1.2-0ICHLOROETHYLENE ug/L
constituent was not
SSHW15GS02 10/05193 RESULTS QUAI..
. .
. . - . . . . .
SSHW19GS02 1CWMD RESUl.111 QUAL
- -. . - -- -. .
SSHW02GS02 10/0.w3 RESULTS QUAl.
- . . -. . - . - .
SSHW19GS01 12/CMW2 RESULTS QUAl.
SSHW17GS01 12/0WV2 RESULTS QUAI..
. .
. .
. .
. .
. .
tMMll83 RESULTS QUAL
- -. -- -- -- -
SSHW05GS02 10/04/93 RESULTS QUAl.
. -
. . - -- -- .
SSHW8AGS02 10/07193 RESULTS QUAl.
(
..
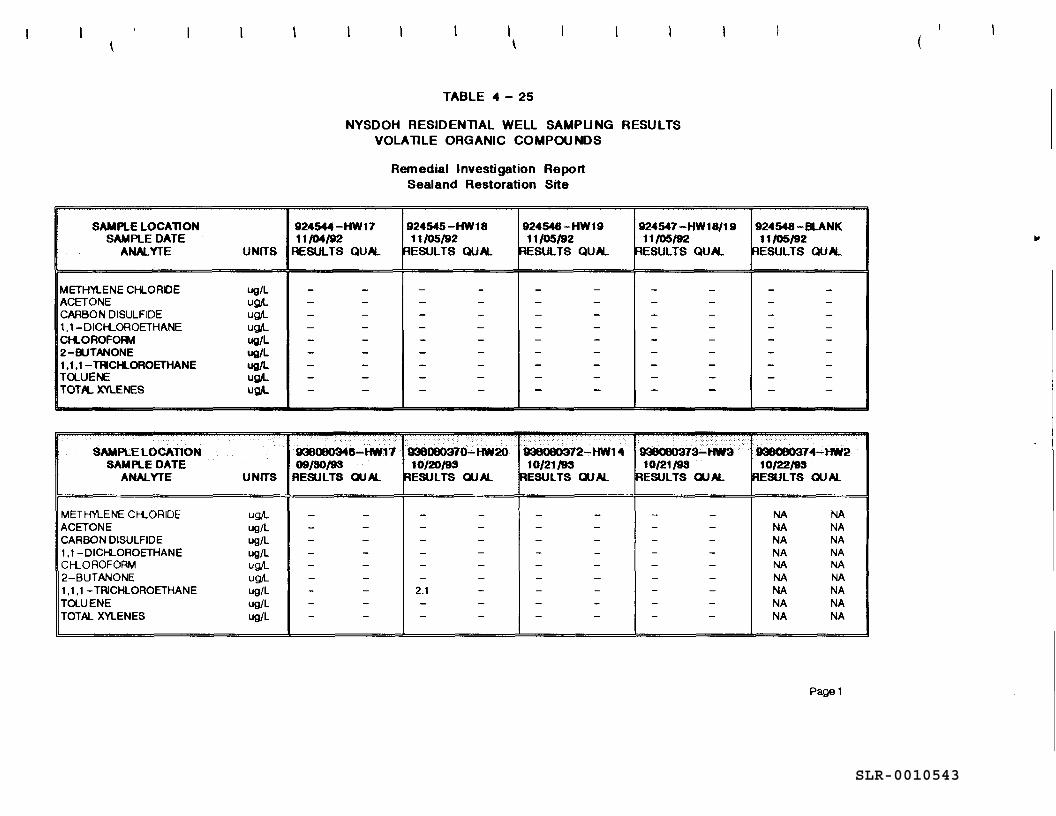
SLR-0010543
SAMPLE LOCATION SAMPLE DATE
ANALYTE UNITS
METHVl...ENE CHLORIDE ug/L ACETONE ug,t. CARBON DISULFIDE ug,t. 1, 1-DICHLOROETHANE ug,t. CH.OROFOFM ug/L 2-BUTANONE ug/L 1, 1, 1 - TFICHL.OROETHANE ug/L TO...UEllE ug,t. TOTA. XYLENES ug,t.
SAMPLE LOCATION SAMPLE DATE
ANALYTE UNITS
METHYLENE CHLORIDE ug,t. ACETONE ug/L CARBON DISULFIDE ug/L 1,1-DICH...OROETHANE ug/L CHLOROFORM ug,t. 2-BUTANONE ug,t. 1, 1, 1 - TRICHLOROETHANE ug/L TOLUENE ug/L TOTAL XYLENES ug/L
I
' TABLE 4 - 25
NYSDOH RESIDENTIAL WELL SAMPLING RESULTS VOLATILE ORGANIC COMPOUNDS
924544-HW17 11/04192
RESULTS QUAL
- -- -- -- -- -- -- -- -- -
Remedial Investigation Report Sealand Restoration Site
924545-HW18 924548-HW19 11/05/92 11/05/92
RESULTS QUAL RESULTS QUAL
- - - -- - - -- - - -- - - -- - - -- - - -- - - -- - - -- - - -
:·. ..... ... , 938080348-Hw11 938080370-HW20 938080372-HW14 09/S0/93 10/21'/93 10/21/93
RESULTS QUAL RESULTS QU AL [RESULTS QUAL
- - - - - -- - - - - -- - - - - -- - - - - -- - - - - -- - - - - -- - 2.1 - - -- - - - - -- - - - - -
924547-HW18/19 11/05/92
RESULTS QUAL
- -- -- -- -- -- -- -- -- -
· ... -... :-· .. ······:::·:· .
938080373~HW3
10/21/93 RESULTS QI.JAL
- -- -- -- -- -- -- -- -- -
924548-BLANK 11/05/92
~ESULTS QUAL
- -- -- -- -- -- -- -- -- -
.:
938080374-HW2 10/22/93
IRESUL TS QU AL
NA NA NA NA NA NA NA NA NA NA NA NA NA NA NA NA NA NA
Page1
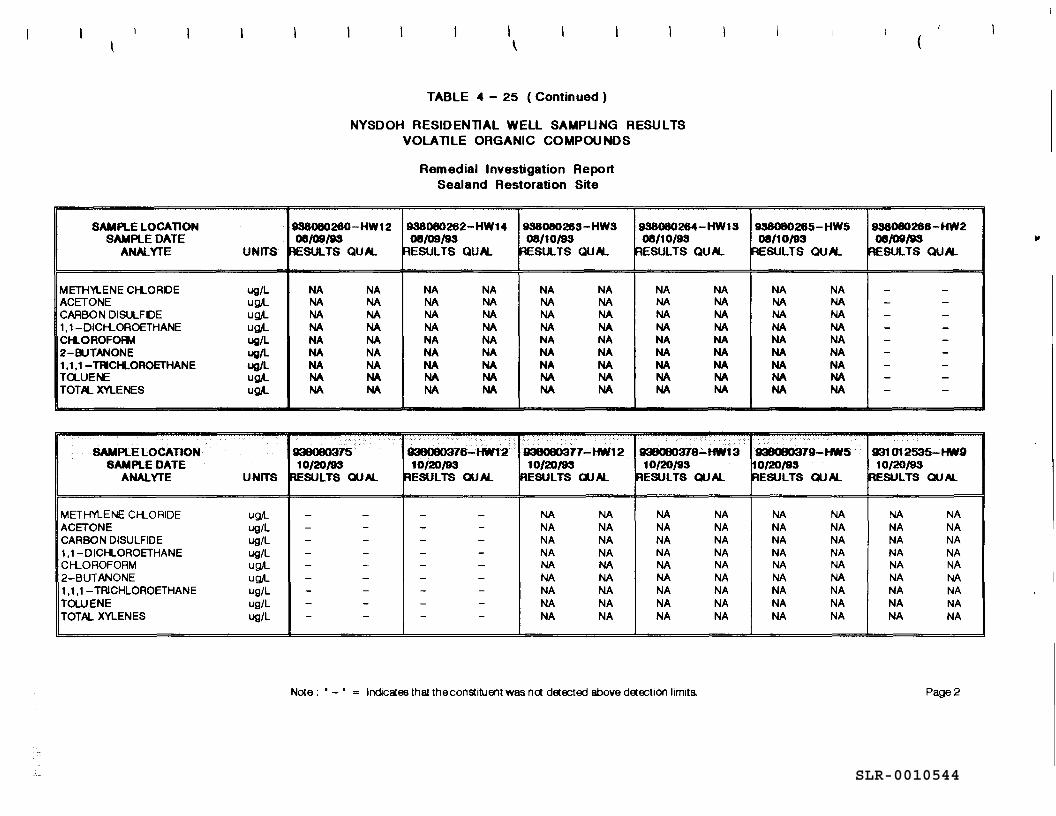
SLR-0010544
SAMPLE LOCATION SAMPLE DATE
ANALYTE UNITS
METHYLENE CH...ORDE ug/L ACETONE ug,L CARBON DISULFIDE ug,L 1, 1-DICH...OROETHANE ug,L CH...OROFOFM ug/L 2-BUTANONE ug/L 1, 1, 1 -TRICHLOROETHANE ug/L TCX...UENE ug.t. TOTAL XYLENES ug.t.
SAMPLE LOCATION· SAMPLE DATE
ANALYTE UNITS
METH'r'l.ENE CHLORIDE ug,L ACETONE ug/L CARBON DISULFIDE ug/L 1, 1-DICH...OROETHANE ug/L CHLOROFORM ug,L 2-BUTANONE uQJL 1, 1, 1 - TRICHLOROETHANE ug/L TOLUENE ug/L TOTAL XYLENES ug/L
I
' TABLE 4 - 25 ( Continued )
NYSDOH RESIDENTIAL WELL SAMPLING RESULTS VOLATILE ORGANIC COMPOUNDS
938080260-HW12 08/09/93
RESULTS QUAL
NA NA NA NA NA NA NA NA NA NA NA NA NA NA NA NA NA NA
. . .
938080375 10/20193
RESULTS QUAL
- -- -- -- -- -- -- -- -- -
Remedial Investigation Report Sealand Restoration Site
938080262-HW14 938080263-HW3 08/09/93 08/10/93
RESULTS QUAL RESULTS QUAL
NA NA NA NA NA NA NA NA NA NA NA NA NA NA NA NA NA NA NA NA NA NA NA NA NA NA NA NA NA NA NA NA NA NA NA NA
. .
938080376-HW12 93B080377...:HW12 10/20/93 10/20/93
RESULTS QUAL RESULTS au AL
- - NA NA - - NA NA - - NA NA - - NA NA - - NA NA - - NA NA - - NA NA - - NA NA - - NA NA
938080264-HW13 08/10/93
RESULTS QUAL
NA NA NA NA NA NA NA NA NA NA NA NA NA NA NA NA NA NA
938080378-HW13 10/20/93
~ESUL TS au AL
NA NA NA NA NA NA NA NA NA NA NA NA NA NA NA NA NA NA
Note: • - ' Indicates that the constituent was net detected above detection limits.
938080265-HWS 938080266-HW2 08/10/93 08/09/93
RESULTS QUAL RESULTS QUAL
NA NA - -NA NA - -NA NA - -NA NA - -NA NA - -NA NA - -NA NA - -NA NA - -NA NA - -
.. 938080379-HW5 931 012535-HWD ~0/20/93 10/20/93 J:!ESUL TS au AL RESULTS QUAL
NA NA NA NA NA NA NA NA NA NA NA NA NA NA NA NA NA NA NA NA NA NA NA NA NA NA NA NA NA NA NA NA NA NA NA NA
Page2
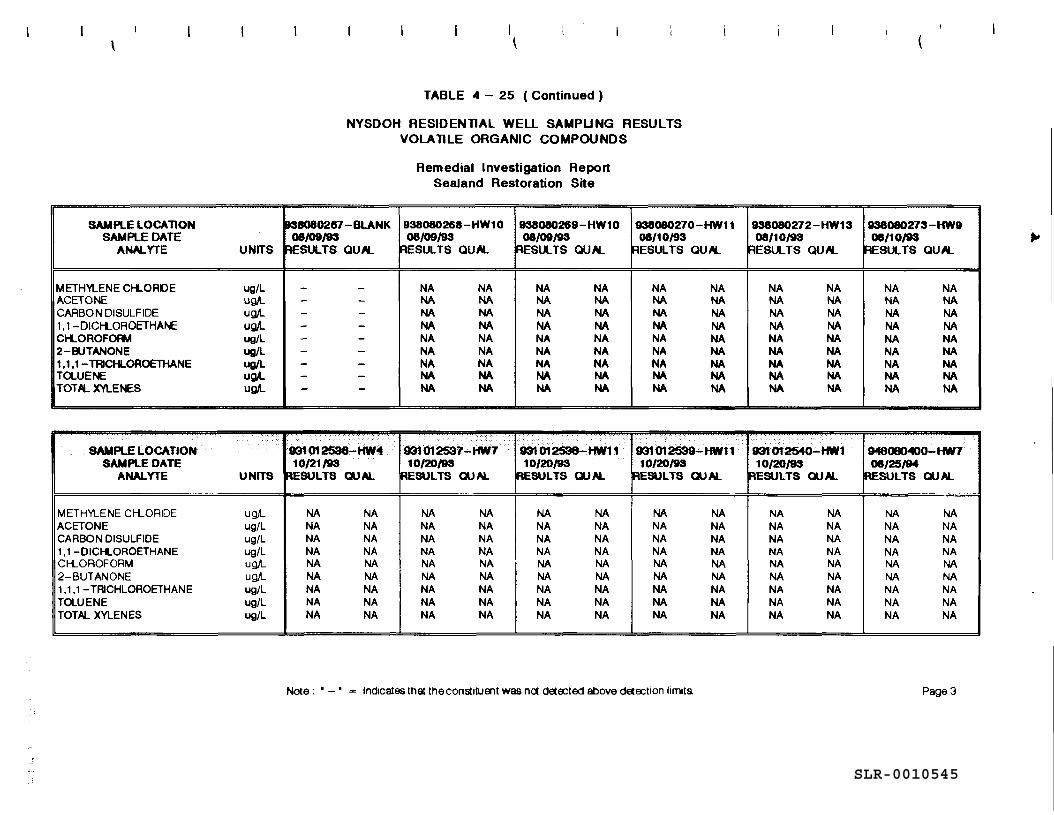
SLR-0010545
SAMPLE LOCATION SAMPLE DATE
ANALYTE UNITS
METHYLENE CH.CADE ug/L ACETONE ug,t_ CARBON DISULFIDE ug,t_ 1, 1-DICHLOROETHANE ug,l CH.OROFOFM ug/L 2-BIJTANONE ug/l 1, 1, 1 -TRICH..OROETHANE ug/l TQUENE ug,l. TOTA.. XYLENES ug,l.
SAMPLE LOCATION SAMPLE DATE
ANALYTE UNITS
METHYLENE CHLORIDE ug,L ACETONE ug/L CARBON DISULFIDE ug/L 1, 1 -DICHLOROETHANE ug/L CHLOROFORM ug,L 2-BUTANONE ug,t_ 1, 1, 1 -TRICHLOROETHANE ug/L TOLUENE ug/L TOTAL XYLENES ug/L
I \
TABLE 4 - 25 ( Continued )
NYSDOH RESIDENTIAL WELL SAMPLING RESULTS VOLATILE ORGANIC COMPOUNDS
Remedial Investigation Report Sealand Restoration Site
~8080287-BLANK 938080268-HW10 938080269-HW10 938080270-HW11 08/09/93 08/09/93 08/09193 08/10/93
RESULTS QU/t.. AESUL TS QU/t.. ~SULTS QU/t.. RESULTS QU/t..
- - NA NA NA NA NA NA - - NA NA NA NA NA NA - - NA NA NA NA NA NA - - NA NA NA NA NA NA - - NA NA NA NA NA NA - - NA NA NA NA NA NA - - NA NA NA NA NA NA - - NA NA NA NA NA NA - - NA NA NA NA NA NA
·•· .. ..
931012536-HW4 931012537-HW7 931012538-HW11 931012539-HW11 10/21/93 10/20/93 10/20193 10/20/93
RESULTS QU AL RESULTS QU AL RESULTS QUAL RESULTS QUAL
NA NA NA NA NA NA NA NA NA NA NA NA NA NA NA NA NA NA NA NA NA NA NA NA NA NA NA NA NA NA NA NA NA NA NA NA NA NA NA NA NA NA NA NA NA NA NA NA NA NA NA NA NA NA NA NA NA NA NA NA NA NA NA NA NA NA NA NA NA NA NA NA
Note: • - • = Indicates that the constituent was net d€ta::ted above daa::tion limits.
(
938080272-HW13 938080273-HWS 08/10/98 08/10/93
RESULTS QU/t.. ~SULTS QU/t..
NA NA NA NA NA NA NA NA NA NA NA NA NA NA NA NA NA NA NA NA NA NA NA NA NA NA NA NA NA NA NA NA NA NA NA NA
931012540-HW1 9480804'00-HW7 10/20/93 08/25/94
RESULTS QUAL Jll:SULTS QUAL
NA NA NA NA NA NA NA NA NA NA NA NA NA NA NA NA NA NA NA NA NA NA NA NA NA NA NA NA NA NA NA NA NA NA NA NA
Page3
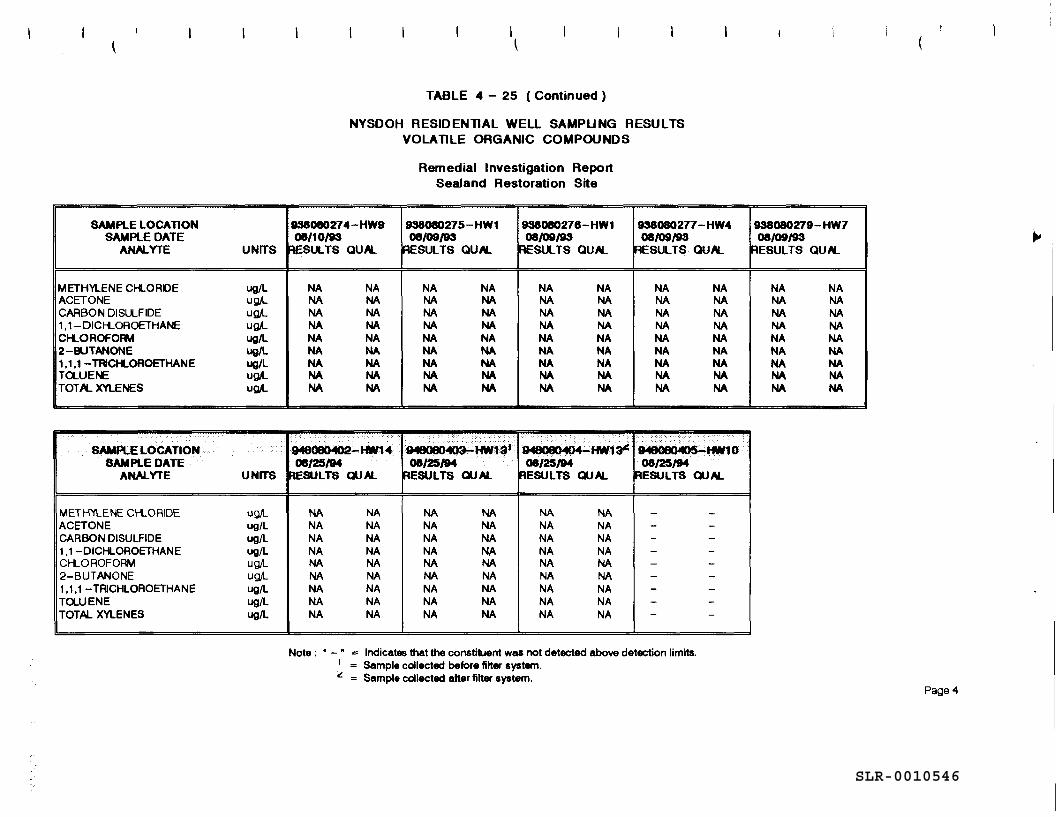
TABLE 4 - 25 ( Continued )
NYSDOH RESIDENTIAL WELL SAMPLING RESULTSVOLATILE ORGANIC COMPOUNDS
Remedial Investigation ReportSealand Restoration Site
SAMPLE LOCATIONSAMPLE DATE
ANAIYTE UNITS
METHYLENECHLORDE ug/LACETONE ug/LCARBON DISULFIDE ug/L1,1-DICH.OROETHANE ug/LCHLOROFORM ug/L2-BUTANONE ug/L1 ,1 ,1 -TWCHLOROETHANE ug/LTOLUENE ug/LTOT A. XYLENES ug/L
838080274 -HW908/10/93
RESULTS QU*.
NA NANA NANA NANA NANA NANA NANA NANA NANA NA
938080275- HW108/09/93
RESULTS QUAL
NA NANA NANA NANA NANA NANA NANA NANA NANA NA
938080276-HW108/09/93
RESULTS QUAL
NA NANA NANA NANA NANA NANA NANA NANA NANA NA
938080277-HW408/09/93
RESULTS QU*.
NA NANA NANA NANA NANA NANA NANA NANA NANA NA
938O80279-HW708/09/93
RESULTS QUAL
NA NANA NANA NANA NANA NANA NANA NANA NANA NA
SAMPLE LOCATIONSAMPLE DATE
ANALYTE UNITS
METHYLENE CHLORIDE ug/LACETONE ug/LCARBON DISULFIDE ug/L1,1-DICHLOROETHANE ug/LCHLOROFORM ug/L2-BUTANONE ug/L1,1.1 -TRICHLOROETHANE ug/LTOLUENE ug/LTOTAL XYLENES ug/L
948080402-HW1408/25/94
RESULTS QUAL
NA NANA NANA NANA NANA NANA NANA NANA NANA NA
948080409- HW1 3*08/25/94
RESULTS QUAL
NA NANA NANA NANA NANA NANA NANA NANA NANA NA
049080404- HW1 3*08/25/94
RESULTS QUAL
NA NANA NANA NANA NANA NANA NANA NANA NANA NA
948080405-HW1006/25/94
RESULTS QUAL
-
Note : " - " = Indicates that the constituent was not detected above detection limits.' = Sample collected before filter system.* = Sample collected otter filter system.
Page 4
SLR-0010546
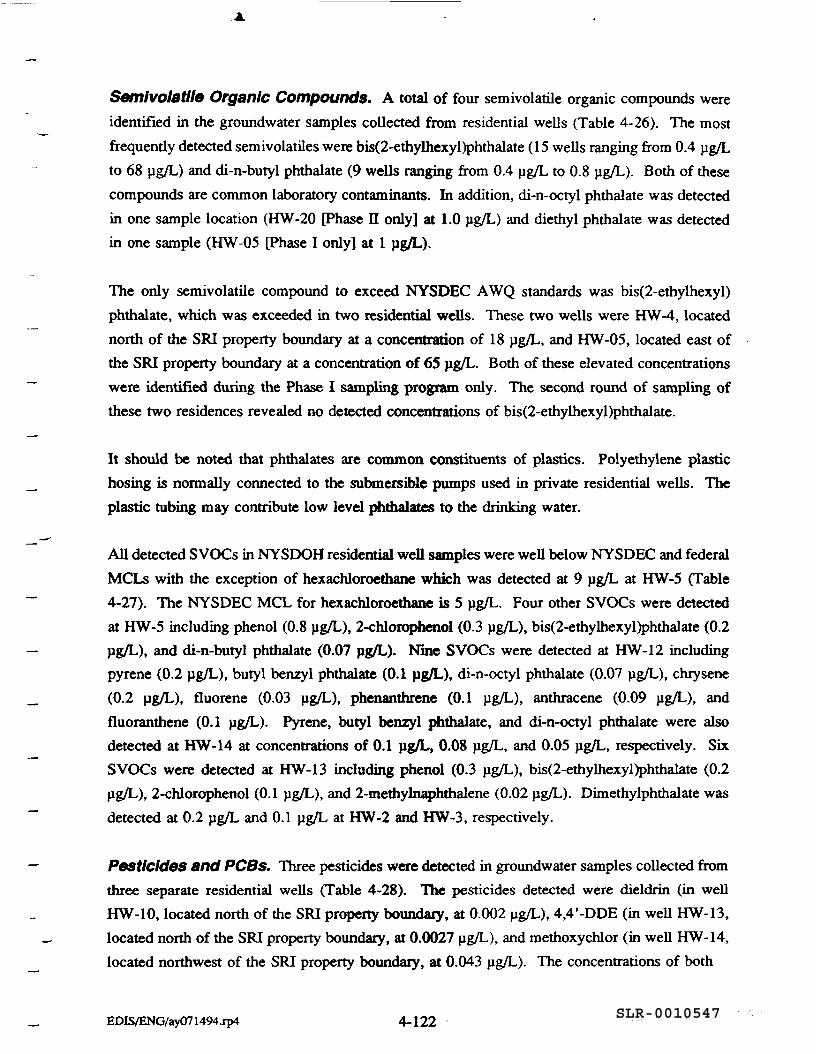
Semivolatile Organic Compounds. A total of four semivolatile organic compounds wereidentified in the groundwater samples collected from residential wells (Table 4-26). The mostfrequently detected semivolatiles were bis(2-ethylhexyl)phthalate (15 wells ranging from 0.4 pg/Lto 68 pg/L) and di-n-butyl phthalate (9 wells ranging from 0.4 pg/L to 0.8 pg/L). Both of thesecompounds are common laboratory contaminants. In addition, di-n-octyl phthalate was detectedin one sample location (HW-20 [Phase n only] at 1.0 pg/L) and diethyl phthalate was detectedin one sample (HW-05 [Phase I only] at 1 pg/L).
The only semivolatile compound to exceed NYSDEC AWQ standards was bis(2-ethylhexyl)phthalate, which was exceeded in two residential wells. These two wells were HW-4, locatednorth of the SRI property boundary at a concentration of 18 pg/L, and HW-05, located east ofthe SRI property boundary at a concentration of 65 ug/L. Both of these elevated concentrationswere identified during the Phase I sampling program only. The second round of sampling ofthese two residences revealed no detected concentrations of bis(2-ethylhexyl)phthalate.
It should be noted that phthalates are common constituents of plastics. Polyethylene plastichosing is normally connected to the submersible pumps used in private residential wells. Theplastic tubing may contribute low level phthalates to the drinking water.
All detected SVOCs in NYSDOH residential well samples were well below NYSDEC and federalMCLs with the exception of hexachloroetnane which was detected at 9 pg/L at HW-5 (Table4-27). The NYSDEC MCL for hexachloroethane is 5 pg/L. Four odier SVOCs were detectedat HW-5 including phenol (0.8 pg/L), 2-chlorophenol (0.3 pg/L), bis(2-ethylhexyl)phthalate (0.2pg/L), and di-n-butyl phthalate (0.07 pg/L). Nine SVOCs were detected at HW-12 includingpyrene (0.2 pg/L), butyl benzyl phthalate (0.1 pg/L), di-n-octyl phthalate (0.07 pg/L), chrysene(0.2 pg/L), fluorene (0.03 pg/L), phenanthrene (0.1 pg/L), anthracene (0.09 pg/L), andfluoranthene (0.1 pg/L). Pyrene, butyl benzyl phthalate, and di-n-octyl phthalate were alsodetected at HW-14 at concentrations of 0.1 pg/L, 0.08 pg/L, and 0.05 pg/L, respectively. SixSVOCs were detected at HW-13 including phenol (0.3 pg/L), bis(2-ethylhexyl)phthalate (0.2pg/L), 2-chlorophenol (0.1 pg/L), and 2-methylnaphthalene (0.02 pg/L). Dimethylphthalate wasdetected at 0.2 pg/L and 0.1 pg/L at HW-2 and HW-3, respectively.
Pesticides and PCBs. Three pesticides were detected in groundwater samples collected fromthree separate residential wells (Table 4-28). The pesticides detected were dieldrin (in wellHW-10, located north of the SRI property boundary, at 0.002 pg/L), 4,4'-DDE (in well HW-13,located north of the SRI property boundary, at 0.0027 pg/L), and methoxychlor (in well HW-14,located northwest of the SRI property boundary, at 0.043 pg/L). The concentrations of both
EDIS/ENG/ay071494.rp4 4-122 :SLR-0010547
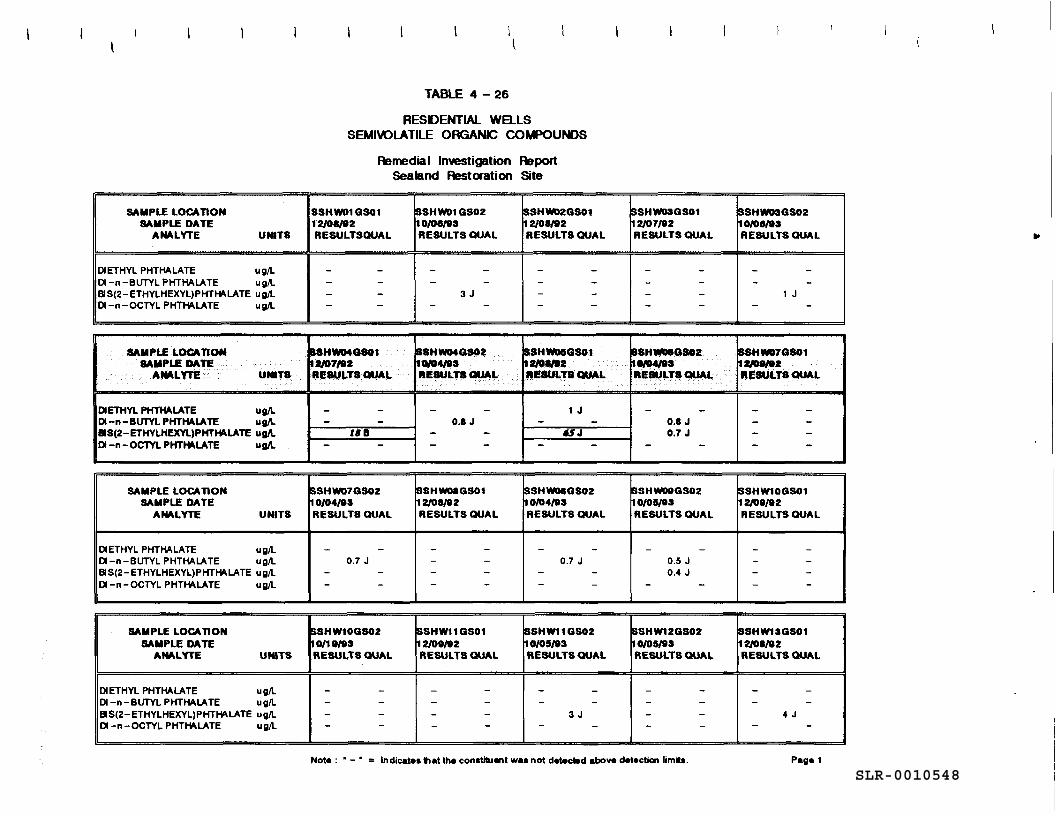
TABLE 4-26
RESIDENTIAL WELLSSEMIVOLATILE ORGANIC COMPOUNDS
Remedial Investigation ReportSea land Restoration Site
SAMPLE LOCATIONSAMPLE DATE
ANALYTE UNITS
Dl ETHYL PHTHALATE ug/LDl-n -BUTYL PHTHALATE ug/LBS(2-ETHYLHEXYL)PHTHALATE ug/LDI-n-OCTYL PHTHALATE ug/L
SSHW01QS0112/08/02RESULTSQUAL
_ _
SAMPLE LOCATIONSAMPLE DATE
ANALYTE UNITS
METHYL PHTHALATE ug/LDI-n-BUTYL PHTHALATE ug/LHS(2-ETHYLHEXYL)PHTHALATE ug/L01 -n-OCTYL PHTHALATE ug/L
KSHW04O80112/07/02RESULTSQUAL
-
KB_ _
SSHW01GS0210/00/03RESULTS QUAL
3 J
SSHW02GS0112/08/02RESULTS QUAL
~ ~
SSHW03GS011 2/07/02RESULTS DUAL
-
SSHW04GS0210/04/03RESULTS OUAL
0.8 J
SAMPLE LOCATIONSAMPLE DATE
ANALYTE UNITS
DIETHYL PHTHALATE ug/LDI-n-BUTYL PHTHALATE ug/LBS(2-ETHYLHEXYL)PHTHALATE ug/LDl -n-OCTYL PHTHALATE ug/L
5SHW07GS0210/04/03RESULTS QUAL
0.7 J
SSHWD8GS0112/08/02RESULTS OUAL
~~ ~
SSHWOBGS0112/03/02HCSULTSQUAL
1 J
45 J"~ ~
BSHW06QS0210/04/03RESULTS OUAL
0.8 J0.7 J
SSHW03GS0210/00/03RESULTS QUAL
1 J
SSHWD7GS0112/00/02RESULTS OUAL
JL —
SSHWD8GS021O/04/B3RESULTS QUAL
0.7 J
SSHW00QS0210/05/03RESULTS OUAL
0.5 J0.4 J
SAMPLE LOCATIONSAMPLE DATE
ANALYTE UNITS
Dl ETHYL PHTHALATE u g/LDl-n -BUTYL PHTHALATE ug/LBIS(2-ETHYLHEXYL)PHTHALATE ug/LDI-n-OCTYL PHTHALATE ug/L
5SHW10GS0210/10/03RESULTS QUAL
-
SSHW11GS0112/00/02RESULTS QUAL
_
SSHW11QS0210/09/93RESULTS QUAL
3 J
SSHW12GS02IO/OS/09RESULTS QUAL
-
SSHW10GS0112/00/02RESULTS QUAL
-
SSHW13GS0112/08/02RESULTS QUAL
4 J
Note: Indicates tiat In* con»titu«nt was not detected abov* detection limits. Pag* 1SLR-0010548
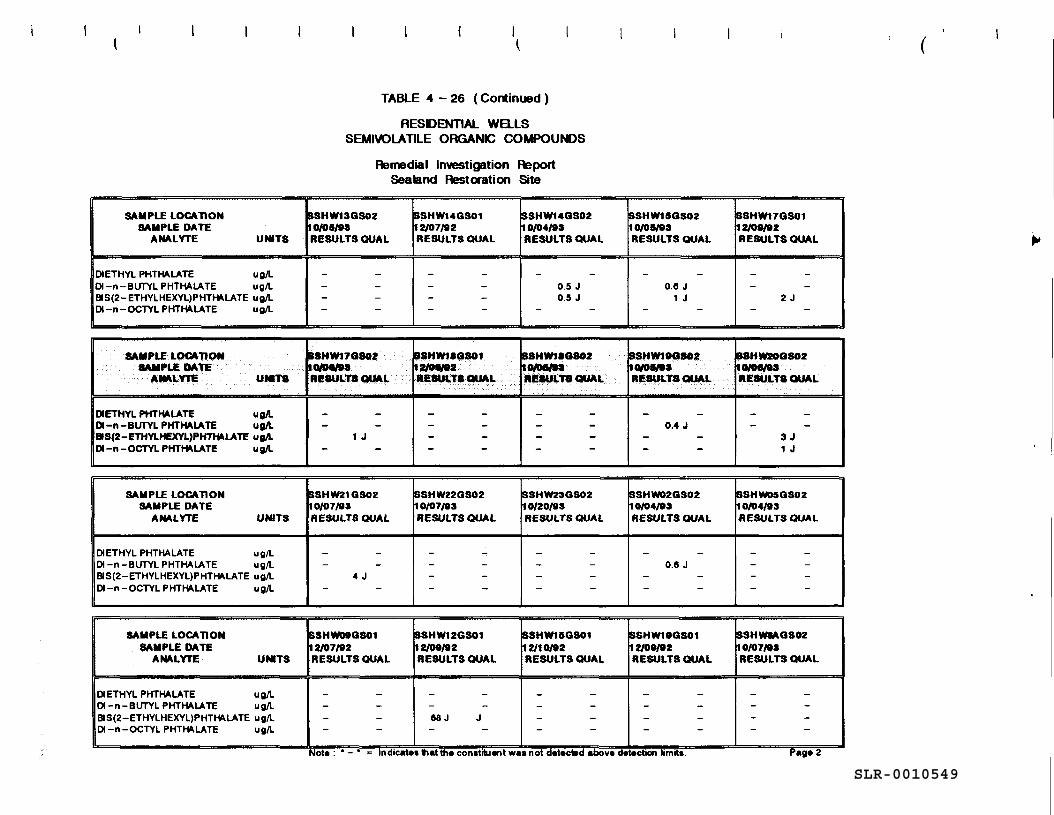
TABLE 4 - 26 (Continued )
RESIDENTIAL WELLSSEMIVOLATILE ORGANIC COMPOUNDS
Remedial Investigation ReportSealand Restoration Site
SAMPLE LOCATIONSAMPLE DATE
ANALYTE UNITS
CHETHYL PHTHALATE ug/LCM -n- BUTYL PHTHALATE ug/LBIS(2-ETHYLHEXYL)PHTHALATE ug/LCM -n- OCTYL PHTHALATE ug/L
SAMPLE LOCATIONSAMPLE DATE
ANALYTE UNITS
DIETHYL PHTHALATE ug/LCM -n- BUTYL PHTHALATE ug/LBS(2-ETHYLHEXYL)PHTHALATE ug/LU -n -OCTYL PHTHALATE ug/L
3SHW13GS0210/05/03RESULTS QUAL
-
SSHW14GS0112/07/02RESULTS QUAL
~ —
SSHW17Q302IO/Dfl/03RESULTS OUAL
1 J
SAMPLE LOCATIONSAMPLE DATE
ANALYTE UNITS
DIETHYL PHTHALATE ug/LDI-n-BUTYL PHTHALATE ug/LBIS(2-ETHYLHEXYL)PHTHALATE ug/LDI-n-OCTYL PHTHALATE ug/L
5SHW21QS0210/07/03RESULTS QUAL
4 J
9SHW13GS0112/00/112RESULTS OUAL
V ___
SSHW14GS021 0/04/03RESULTS QUAL
0.5 J0.5 J
SSHW1SGS0210/06/03RESULTS QUAL
-
SSHW15GS0210/05/03RESULTS QUAL
o.e j1 J
SSHW10GS0210/05/03RESULTS QUAL
0.4 J
BSHW22GS0210/07/03RESULTS QUAL
-
SSHW23GS0210/20/03RESULTS QUAL
; ;3SHWD2Q30210/04/03RESULTS QUAL
o.e j
BSHW17GS0112/00/02RESULTS QUAL
2 J
BSHW20GS0210/06/03RESULTS QUAL
3 J1 J
SSHW05QS0210/04/03RESULTS QUAL
-
SAMPLE LOCATIONSAMPLE DATE
ANALYTE UNITS
DIETHYL PHTHALATE ug/LDI-n-BUTYL PHTHALATE ug/LBIS(2-ETHYLHEXYL)PHTHALATE ug/LCM -n -OCTYL PHTHALATE ug/L
3SHW00GS0112/07/02RESULTS QUAL
_ _
BSHW12GS0112/00/02RESULTS QUAL
M J J
SSHW15QS0112/10/02RESULTS QUAL
— —
BSHW10GS0112/00/02RESULTS QUAL
-
3SHWSAGS0210/07/03RESULTS QUAL
_ _
Note: '-' = Indicate* that th« con»trtu«nt was not detected above detection limit*. Pag* 2
SLR-0010549
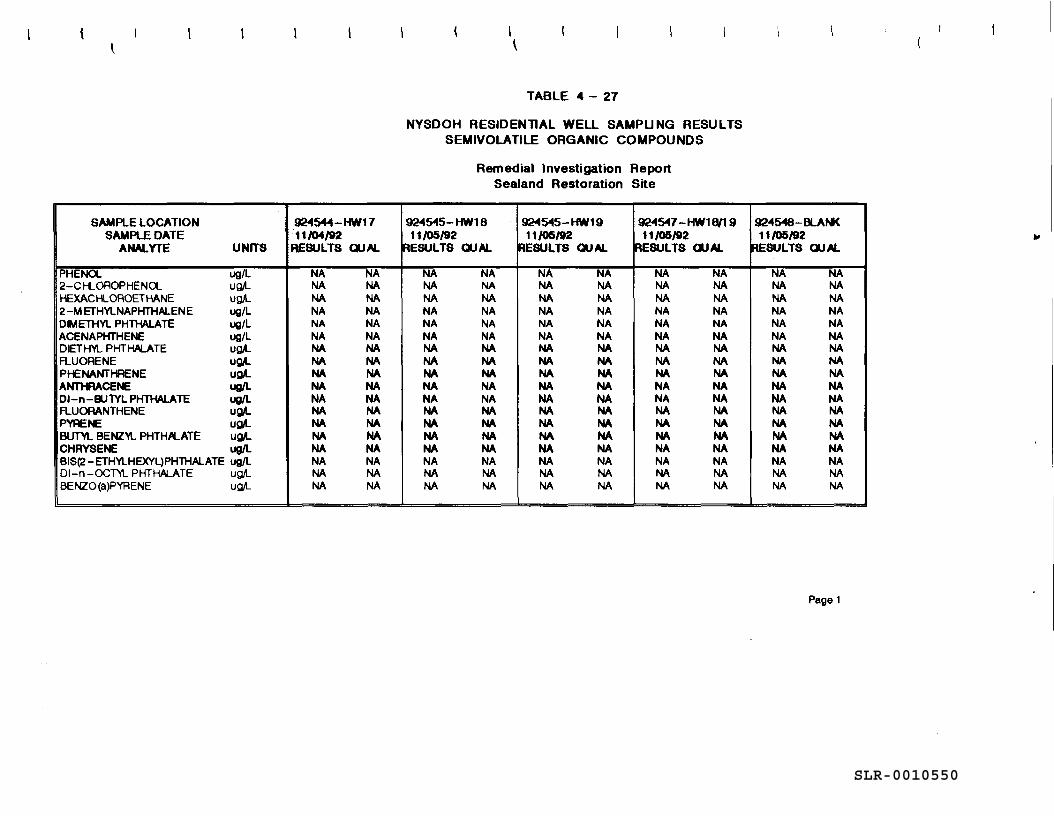
TABLE 4 - 2 7
NYSDOH RESIDENTIAL WELL SAMPLING RESULTSSEMIVOLATILE ORGANIC COMPOUNDS
Remedial Investigation ReportSealand Restoration Site
SAMPLE LOCATIONSAMPLE DATE
ANALYTE UNITS
PHENOL ug/L2-CHLOROPHENOL ug/LHEXACHLOROETHANE ug/L2 -M ETHYLNAPKTHALEN E ug/LDMETHYL PHTHALATE ug/LACENAPHTHENE ug/LDIETHYL PHTHALATE ug/LFLUORENE ug*.PHENANTHRENE ug/LANTHRACENE ug/LDI-n-BUTYL PHTHALATE ug/LFLUORANTHENE ugA.PYRENE ug*.BUTYL BENZYL PHTHA.ATE ufl*.CHRYSENE ug/LBIS(2-ETHYLHEXYL)PHTHALATE ug/LDI-n-OCTYL PHTHALATE ug/LBENZO(a)PYRENE ug/L
924544-HW1711/04/92
RESULTS QUAL
NA NANA NANA NANA NANA NANA NANA NANA NANA NANA NANA NANA NANA NANA NANA NANA NANA NANA NA
924545- HW1 811/05/92
RESULTS QUAL
NA NANA NANA NANA NANA NANA NANA NANA NANA NANA NANA NANA NANA NANA NANA NANA NANA NANA NA
924545-HW1911/05/92
RESULTS QUAL
NA NANA NANA NANA NANA NANA NANA NANA NANA NANA NANA NANA NANA NANA NANA NANA NANA NANA NA
924547-HW18/1911/05/92
RESULTS QUAL
NA NANA NANA NANA NANA NANA NANA NANA NANA NANA NANA NANA NANA NANA NANA NANA NANA NANA NA
924548-BLANK11/05/92
RESULTS QUAL
NA NANA NANA NANA NANA NANA NANA NANA NANA NANA NANA NANA NANA NANA NANA NANA NANA NANA NA
Page 1
SLR-0010550
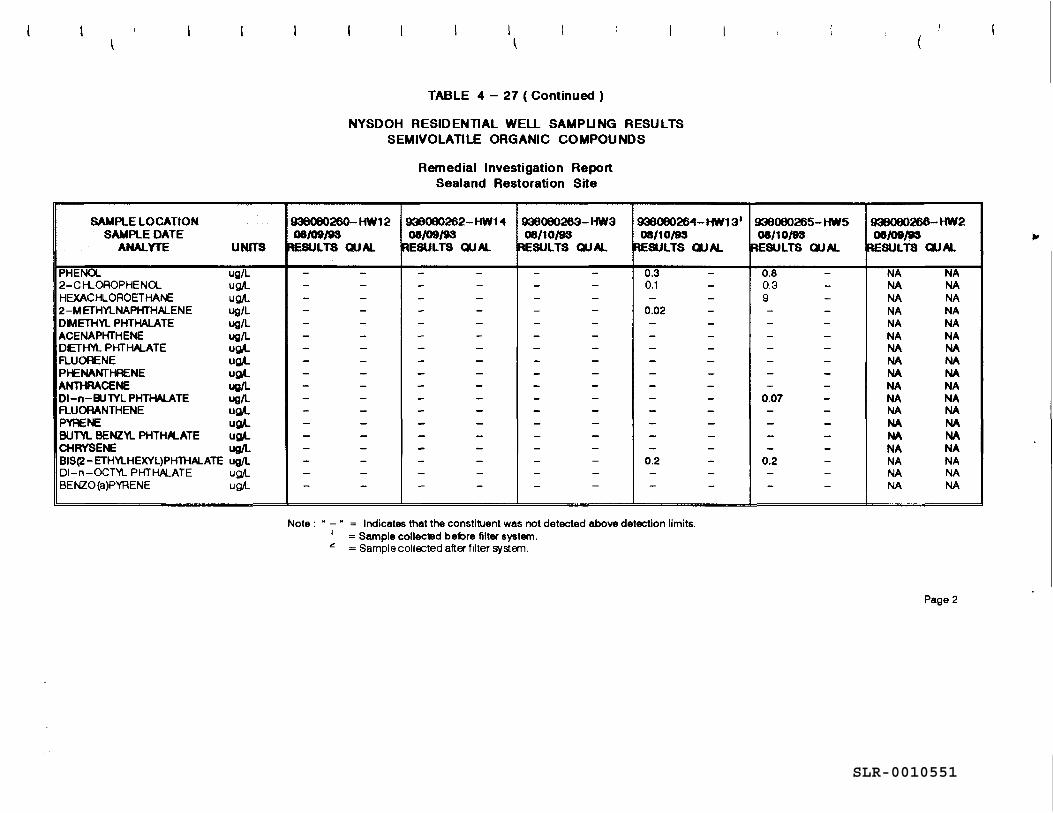
TABLE 4 - 27 ( Continued )
NYSDOH RESIDENTIAL WELL SAMPLING RESULTSSEMIVOLATILE ORGANIC COMPOUNDS
Remedial Investigation ReportSealand Restoration Site
SAMPLE LOCATIONSAMPLE DATE
ANALYTE UNITS
PHENOL ug/L2-CHLOROPHENOL ug/LHEXACHLOROETHANE ug/L2-METHYLNAPHTHALENE ug/LDMETHYL PHTHALATE ug/LACENAPHTHENE ug/LDIETHYL PHTHALATE ufl/LFLUORENE ug/LPHENANTHRENE ug/LANTHRACENE ug/LDI-n-BUTYL PHTHALATE ug/LFLUORANTHENE ug/LPYRENE ug/LBUTVL BENZYL PHTHALATE ug/LCHRYSENE ug/LBIS(2-ETHYLHEXYL)PHTHALATE ug/LDI-n-OCTYL PHTHALATE ug/LBENZO(a)PYRENE ug/L
938080260- HW1 206/09/93
RESULTS QUAL
-- -- ---- -- -- -- -- -- -- -- -- -- --- -— —
938080262- HWH08/09/93
RESULTS QUAL
-- -- -
-- --- -- -- -- -- -- -- -- -- -
-- -— —
938080263- HW308/10/93
RESULTS QUAL
--
- --
--- -- -- -- -- -- -- -- -- --- -— —
938080264- HW1 3'08/10/93
RESULTS QUAL
0.30.1- -
0.02- -- -- -- -- -- -- -_ _- -- -- -
0.2— -— —
938080265- HW508/10/93
RESULTS QUAL
0.80.3g _
-- -- -- -- -- -- -
0.07- -- -- -- -
0.2- -— —
938060266- HW208/09/93
RESULTS QUAL
NA NAMA NANA NANA NANA NANA NANA NANA NANA NANA NANA NANA NANA NANA NANA NANA NANA NANA NA
Note : " - " = Indicates that the constituent was not detected above detection limits.Sample collected before filter system.Sample collected after filter system.
1 =
Page 2
SLR-0010551
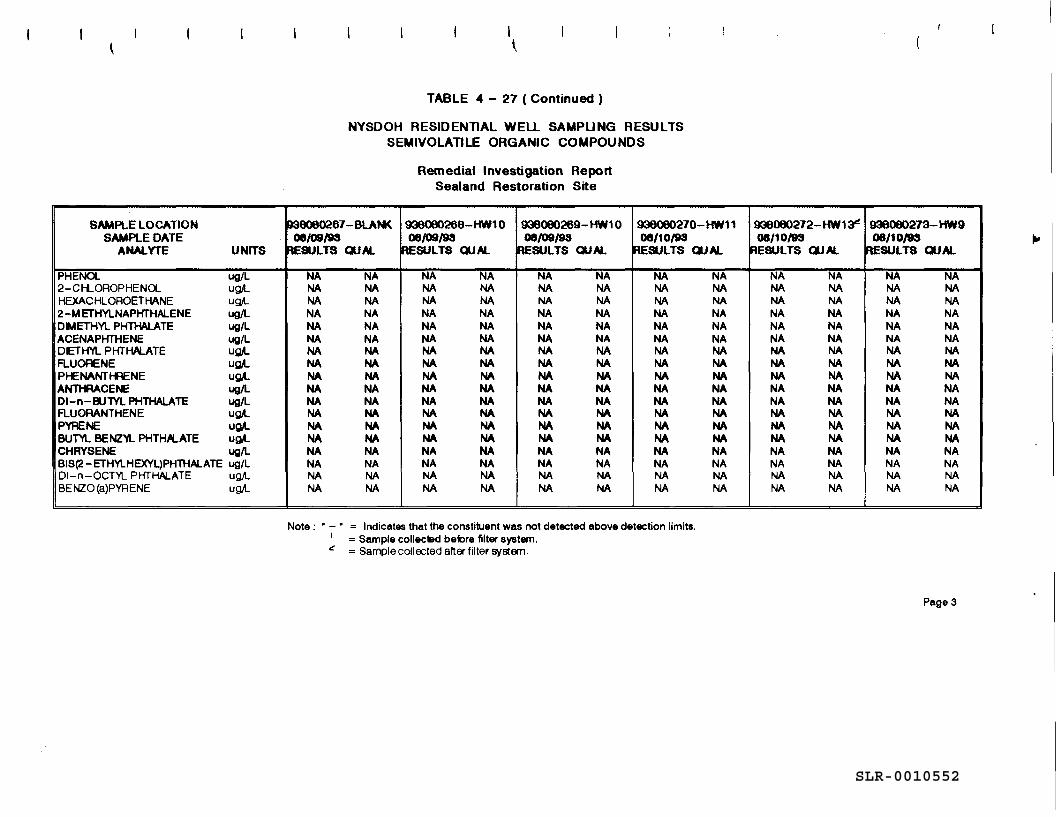
TABLE 4 - 27 ( Continued )
NY8DOH RESIDENTIAL WELL SAMPLING RESULTSSEMIVOLATILE ORGANIC COMPOUNDS
Remedial Investigation ReportSealand Restoration Site
SAMPLE LOCATIONSAMPLE DATE
ANALYTE UNITS
PHENOL ug/L2-CH-OROPHENOL ug/LHEXACHLOROETHANE ug/L2-METHYLNAPHTHALENE ug/LDMETHYL PHTHALATE ug/LACENAPHTHENE ug/LDETHYL PHTHALATE ug/LFLUORENE ug/LPHENANTHRENE ug/LANTHRACENE ug/LDI-n-BUTYL PHTHALATE ug/LFLUORANTHENE ug/LPYRENE ug/LBUTYL BENZYL PHTHALATE ug/LCHRYSENE ug/LBIS(2-ETHYLHEXYL)PHTHALATE ug/LDI-n-OCTYL PHTHALATE ug/LBENIZO(a)PYRENE ug/L
936060267-BLANK08/08/93
RESULTS QUAL
NA NAMA NANA NANA NANA NANA NANA NANA NANA NANA NANA NANA NANA NANA NANA NANA NANA NANA NA
938060268- HW1008/09/93
RESULTS QUAL
NA NANA NANA NANA NANA NANA NANA NANA NANA NANA NANA NANA NANA NANA NANA NANA NANA NANA NA
998080 269- HW1008/09/93
RESULTS QUAL
NA NANA NANA NANA NANA NANA NANA NANA NANA NANA NANA NANA NANA NANA NANA NANA NANA NANA NA
939080270- HW1108/10/93
RESULTS QUAL
NA NANA NANA NANA NANA NANA NANA NANA NANA NANA NANA NANA NANA NANA NANA NANA NANA NANA NA
936060272- HW1 3*08/10/93
RESULTS QUAL
NA NANA NANA NANA NANA NANA NANA NANA NANA NANA NANA NANA NANA NANA NANA NANA NANA NANA NA
936060273- HW908/10/93
RESULTS QUAL
NA NANA NANA NANA NANA NANA NANA NANA NANA NANA NANA NANA NANA NANA NANA NANA NANA NANA NA
Note : " - " = Indicates that the constituent was not detected above detection limits.1 = Sample collected before filter system.
= Sample collected after filter system.
Page3
SLR-0010552
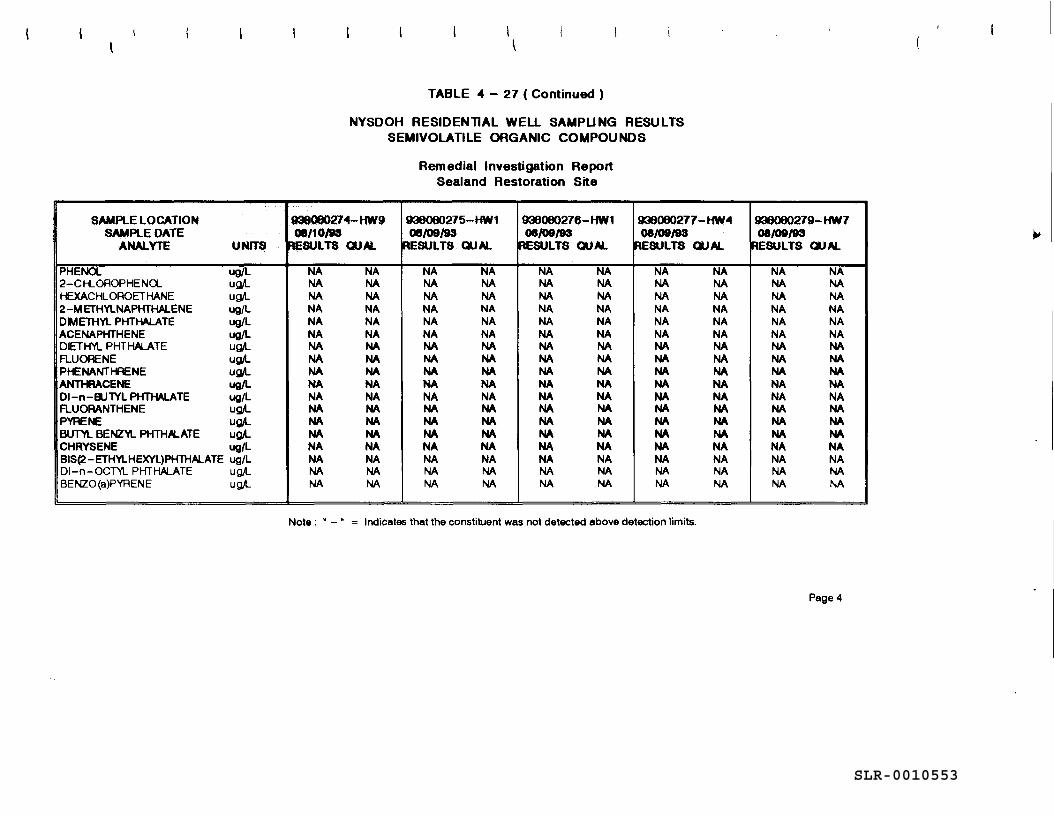
TABLE 4 - 27 ( Continued )
NYSDOH RESIDENTIAL WELL SAMPLING RESULTSSEMIVOLATILE ORGANIC COMPOUNDS
Remedial Investigation ReportSealand Restoration Site
SAMPLE LOCATIONSAMPLE DATE
ANALYTE UNITS
PHENOL ug/L2-CH.OROPHENOL ug/LHEXACHLOROETHANE ug/L2-METHYLNAPKTHALENE ug/LDWETHYL PHTHALATE ug/LACENAPHTHENE ug/LDIETHYL PHTHALATE ug/LFLUORENE ug/LPHENANTHRENE ug/LANTHRACENE ug/LDI-n-BUTYL PHTHALATE ug/LFLUORANTHENE ug/LPYRENE ug/LBUTYL BENZYL PHTHA.ATE ugA-CHRYSENE ug/LBIS(2-ETHYLHEXYL)PHTHALATE ug/LDI-n-OCTYL PHTHALATE ug/LBENZO(a)PYRENE ug/L
938060274- HW906/10/93
RESULTS QUAL
NA NANA NANA NANA NANA NANA NANA NANA NANA NANA NANA NANA NANA NANA NANA NANA NANA NANA NA
936080275- HW108/09/93
RESULTS QUAL
NA NANA NANA NANA NANA NANA NANA NANA NANA NANA NANA NANA NANA NANA NANA NANA NANA NANA NA
939090276- HW108/09/93
RESULTS QUAL
NA NANA NANA NANA NANA NANA NANA NANA NANA NANA NANA NANA NANA NANA NANA NANA NANA NANA NA
936090277- HW408/09/93
RESULTS QUAL
NA NANA NANA NANA NANA NANA NANA NANA NANA NANA NANA NANA NANA NANA NANA NANA NANA NANA NA
936090279- HW708/09/93
RESULTS QUAL
NA NANA NANA NANA NANA NANA NANA NANA NANA NANA NANA NANA NANA NANA NANA NANA NANA NANA NA
Note : " - " = Indicates that the constituent was not detected above detection limits.
Page 4
SLR-0010553
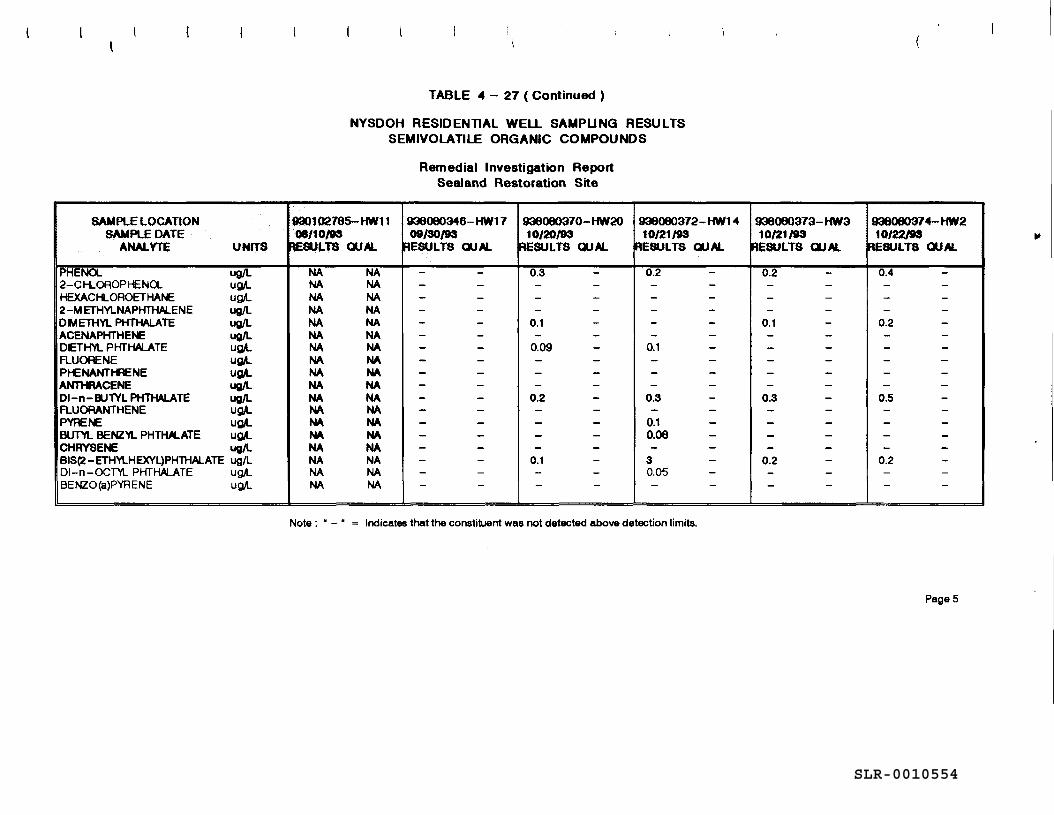
TABLE 4 - 27 ( Continued )
NYSDOH RESIDENTIAL WELL SAMPLING RESULTSSEMIVOLATILE ORGANIC COMPOUNDS
Remedial Investigation ReportSealand Restoration Site
SAMPLE LOCATIONSAMPLE DATE
ANALYTE UNfTS
PHENOL ug/L2-CH.OROPHENOL ug/LHEXACHLOROETHANE ug/L2-METHYLNAPHTHALENE ug/LDMETHYL PHTHALATE ug/LACENAPHTHENE ug/LDETHYL PHTHALATE ug/LFLUORENE ug/LPHENANTHRENE ug/LANTHRACENE ug/LDI-n-BUTYL PHTHALATE ug/LFLUORANTHENE ug/LPYRENE ug/LBUTYL BENZYL PHTHALATE ug/LCHRYSENE ug/LBIS(2-ETHYLHEXYL)PKTHALATE ug/LDI-n-OCTYL PHTHALATE ug/LBENZO(a)PYRENE ugA-
930108785- HW1106/10/93
RESULTS QUAL
NA NANA NANA NANA NANA NANA NANA NANA NANA NANA NANA NANA NANA NANA NANA NANA NANA NANA NA
938080346- HW1 709/30/93
RESULTS QUAL
-- -- -- -- -- -- -_ _- -- -- -- -- -- -- --- -— —
936080370- HW2010/20/93
RESULTS QUAL
0.3- -- --
0.1-
0.09- -- -- -
0.2- -- -- -- -
0.1- -— —
936080372- HW1 410/21/93
RESULTS QUAL
0.2- -- ---- -
0.1- -- -- -
0.3- -
0.10.08- -
30.05
— —
936080373- HW310/21/93
RESULTS QUAL
0.2- -- --
0.1- -- -- -- -- -
0.3- -- -- —- -
0.2-
— —
936060374- HW210/22/99
RESULTS CUM.
0.4- -- --
0.2-
- -- -- -- -
0.5- -- -- -- -
0.2- -— —
Note : " - " = Indicates that the constituent was not detected above detection limits.
PageS
SLR-0010554
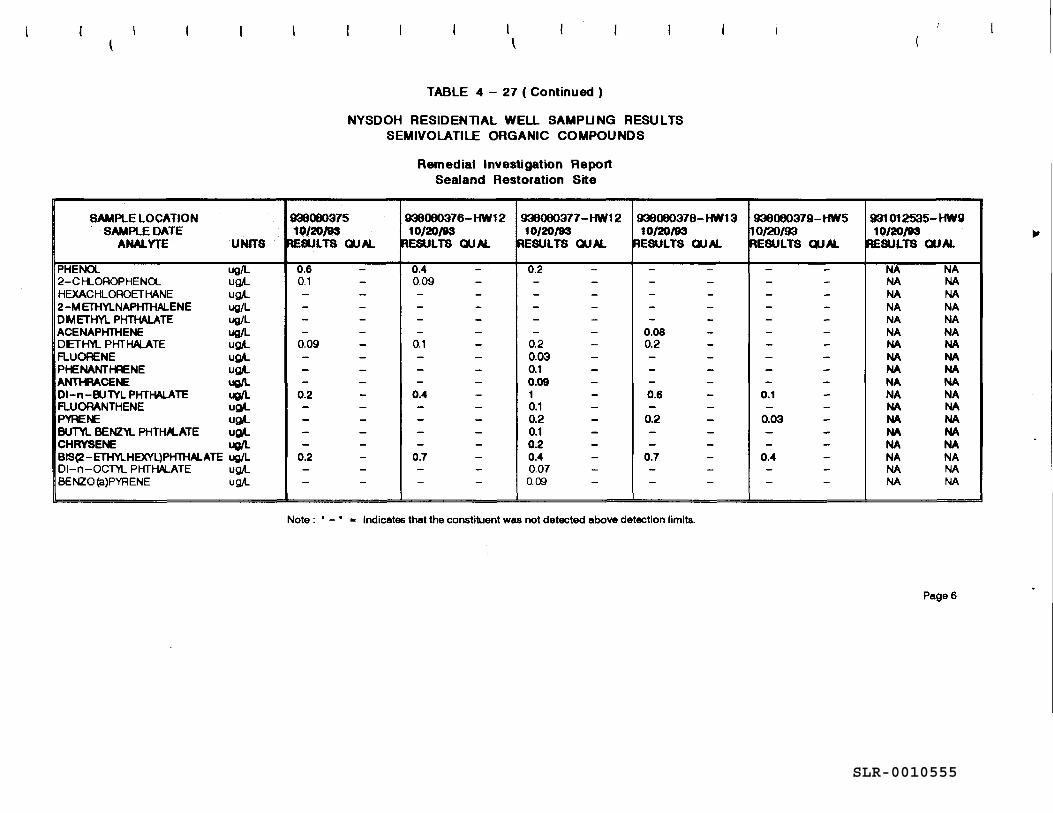
TABLE 4 - 27 ( Continued )
NYSDOH RESIDENTIAL WELL SAMPLING RESULTSSEMIVOLATILE ORGANIC COMPOUNDS
Remedial Investigation ReportSeal and Restoration Site
SAMPLE LOCATIONSAMPLE DATE
ANALYTE UNITS
PHENOL ug/L2-CHLOROPHENOL ug/LHEXACHLOROETHANE ug/L2-METHYLNAPHTHALENE ug/LDMETHYL PHTHALATE ug/LACENAPKTHENE ug/LDETHYL PHTHALATE ug/LFLUORENE ug/LPHENANTHRENE ug/LANTHRACENE ug/LDI-n-BUTYL PHTHALATE ug/LFLUORANTHENE ug/LPYRENE ug/LBUTY. BENZYL PHTHALATE ug/LCHRYSENE ug/LBIS(2-ETHYLHEXYL)PHTVIALATE ug/LDI-n-OCTYL PHTHALATE ug/LBEN2O(a)PYRENE ug/L
93808037510/20/93
RESULTS QUAL
0.60.1- -- -- --
0.09- -- -- -
0.2- -- -- -- -
0.2- -— —
936080376- HW1 210/20/93
RESULTS QUAL
0.40.09- -- -- -- -
0.1- -- -- -
0.4- -- -- -- -
0.7- -— —
938080377- HW1 210/20/93
RESULTS QUAL
0.2- -- --
--
0.20.030.10.0910.10.20.10.20.40.070.09
938080378- HW1 310/20/93
RESULTS QUAL
- -- --- --
0.080.2- -- -- -0.6- -
0.2- -- -
0.7- -— —
938080379- HW510/20/93RESULTS QUAL
-- -- -_- -- -- -- -— -- -
0.1- -
0.03_ _- -
0.4- -— —
931 01 2535- HW910/20/93
RESULTS QUAL
NA NAMA NANA NANA NANA NANA NANA NANA NANA NANA NANA NANA NANA NANA NANA NANA NANA NANA NA
Note : " - ' Indicates that the constituent was not detected above detection limits.
PageS
SLR-0010555
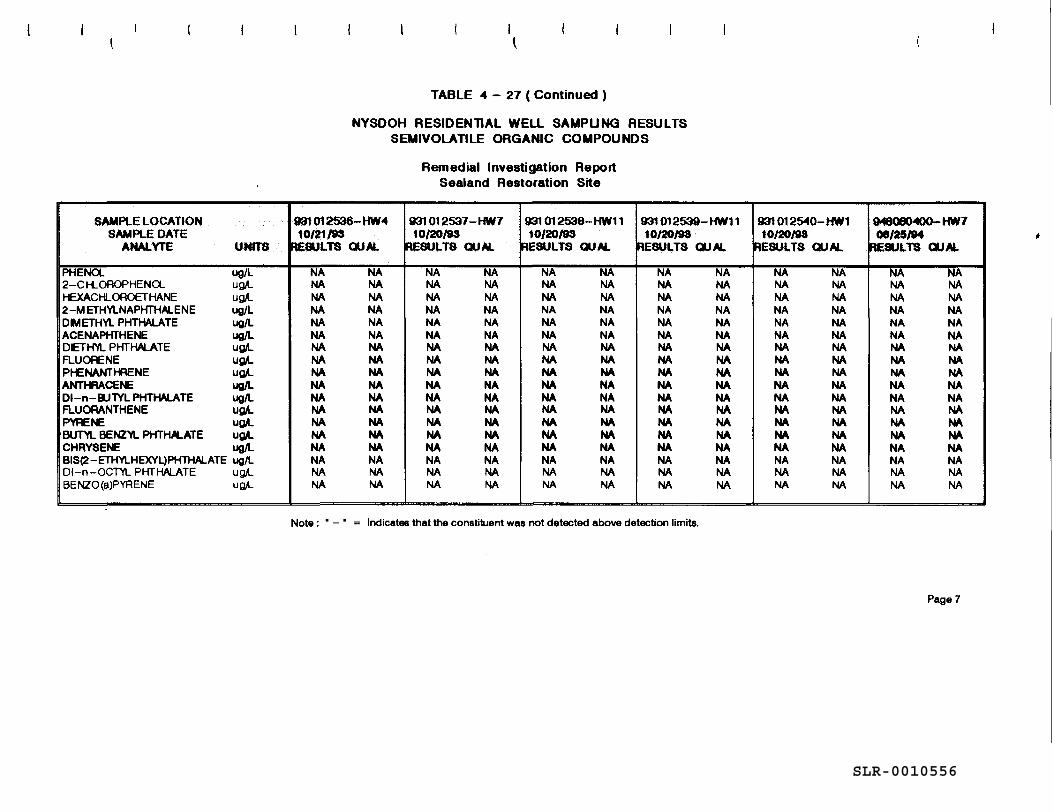
TABLE 4 - 27 ( Continued )
NYSDOH RESIDENTIAL WELL SAMPLING RESULTSSEMIVOLATILE ORGANIC COMPOUNDS
Remedial Investigation ReportSealand Restoration Site
SAMPLE LOCATIONSAMPLE DATE
ANALYTE UNITS
PHENOL ug/L2-CH.OROPHENOL ug/LHEXACHLOROETHANE ug/L2-METHYLNAPHTHALENE ug/LDWETHYL PHTHALATE ug/LACENAPHTHENE ug/LDETHYL PHTHALATE ug/LFLUORENE ug/LPHENANTHRENE ug/LANTHRACENE ug/LDI-n-BUTYL PHTHALATE ug/LFLUORANTHENE ug/LPYRENE ug/LBUTYL BENZYL PHTHA.ATE ug/LCHRYSENE ug/LBIS(2-ETHYLHEXYL)PHTHALATE ug/LDI-n-OCTYL PHTHALATE ug/LBENZO(a)PYRENE ug/L
931 01 2536- HW410/21/93
RESULTS QUAL
NA NANA NANA NANA NANA NANA NANA NANA NANA NANA NANA NANA NANA NANA NANA NANA NANA NANA NA
931012537-HW710/20/93
RESULTS QUAL
NA NANA NANA NANA NANA NANA NANA NANA NANA NANA NANA NANA NANA NANA NANA NANA NANA NANA NA
931012538-HW1110/20/93
RESULTS QUAL
NA NANA NANA NANA NANA NANA NANA NANA NANA NANA NANA NANA NANA NANA NANA NANA NANA NANA NA
931012539-HW1110/20/93
RESULTS QUAL
NA NANA NANA NANA NANA NANA NANA NANA NANA NANA NANA NANA NANA NANA NANA NANA NANA NANA NA
931 01 2540- HW110/20/93
RESULTS QUAL
NA NANA NANA NANA NANA NANA NANA NANA NANA NANA NANA NANA NANA NANA NANA NANA NANA NANA NA
949080400- HW709/29/94
RESULTS QUAL
NA NANA NANA NANA NANA NANA NANA NANA NANA NANA NANA NANA NANA NANA NANA NANA NANA NANA NA
Note : " - " = Indicates that the constituent was not detected above detection limits.
Page?
SLR-0010556
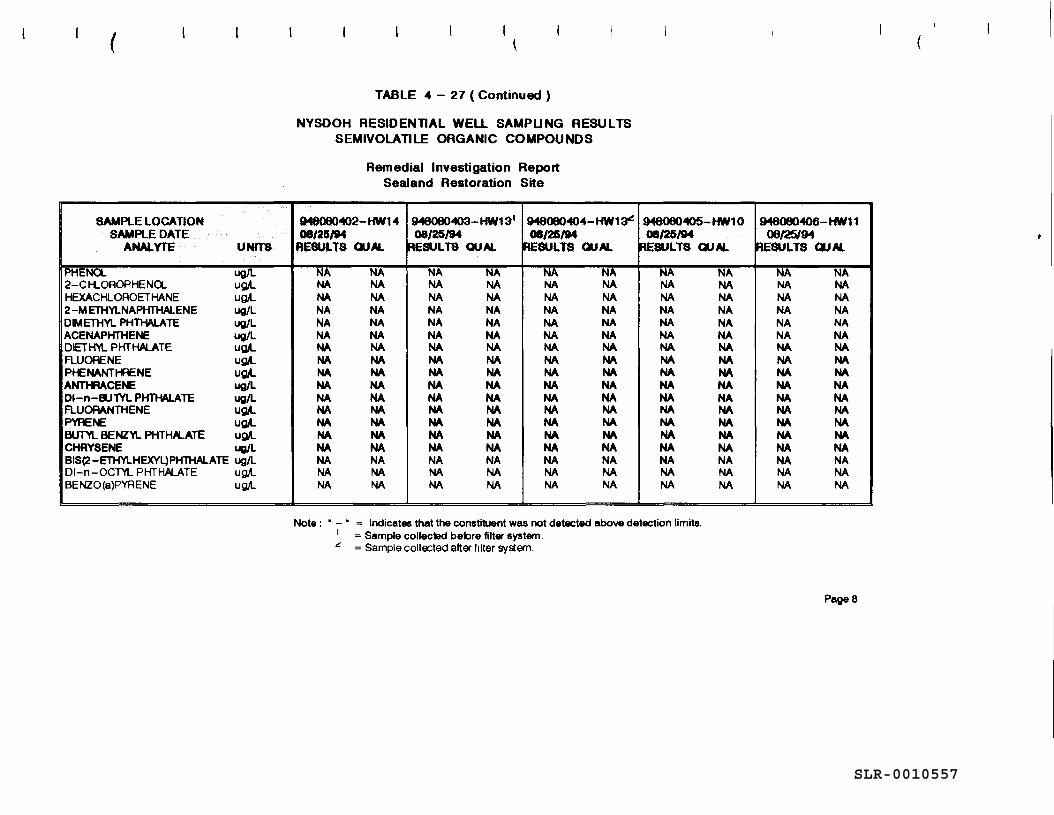
TABLE 4 - 27 ( Continued )
NYSDOH RESIDENTIAL WELL SAMPLING RESULTSSEMIVOLATILE ORGANIC COMPOUNDS
Remedial Investigation ReportSealand Restoration Site
SAMPLE LOCATIONSAMPLE DATE
ANALYTE UNTTS
PHENOL ug/L2-CH.OROPHENCX ug/LHEXACHLOROETHANE ug/L2-METHYLNAPHTHALENE ug/LDMETHYL PHTHALATE ug/LACENAPHTHENE ug/LDETHYL PHTHALATE ugA.FLUORENE ug/LPHENANTHRENE ug/LANTHRACENE ug/LDI-n-BUTYL PHTHALATE ug/LFLUORANTHENE ug/LPYRENE ug/LBUTYL BENZYL PHTHALATE ug/LCHRYSENE ug/LBIS(2-ETHYLHEXYL)PHTHALATE ug/LDI-n-OCTYL PHTHALATE ug/LBENZO(a)PYRENE ug/L
948080402- HW1 408/23/94
RESULTS QUAL
NA NAMA NANA NANA NANA NANA NANA NANA NANA NANA NANA NANA NANA NANA NANA NANA NANA NANA NA
948060403- HW1 3'08/25/94
RESULTS QUAL
NA NANA NANA NANA NANA NANA NANA NANA NANA NANA NANA NANA NANA NANA NANA NANA NANA NANA NA
946060404- HW1 3*08/25/94
RESULTS QUAL
NA NANA NANA NANA NANA NANA NANA NANA NANA NANA NANA NANA NANA NANA NANA NANA NANA NANA NA
948080405-HW1008/25/94
RESULTS QUAL
NA NANA NANA NANA NANA NANA NANA NANA NANA NANA NANA NANA NANA NANA NANA NANA NANA NANA NA
948080406- HW1108/25/94
RESULTS QUAL
NA NANA NANA NANA NANA NANA NANA NANA NANA NANA NANA NANA NANA NANA NANA NANA NANA NANA NA
Note : " - " = Indicates that the constituent was not detected above detection limits.' = Sample collected before filter system.* = Sample collected after filter system.
PageS
SLR-0010557
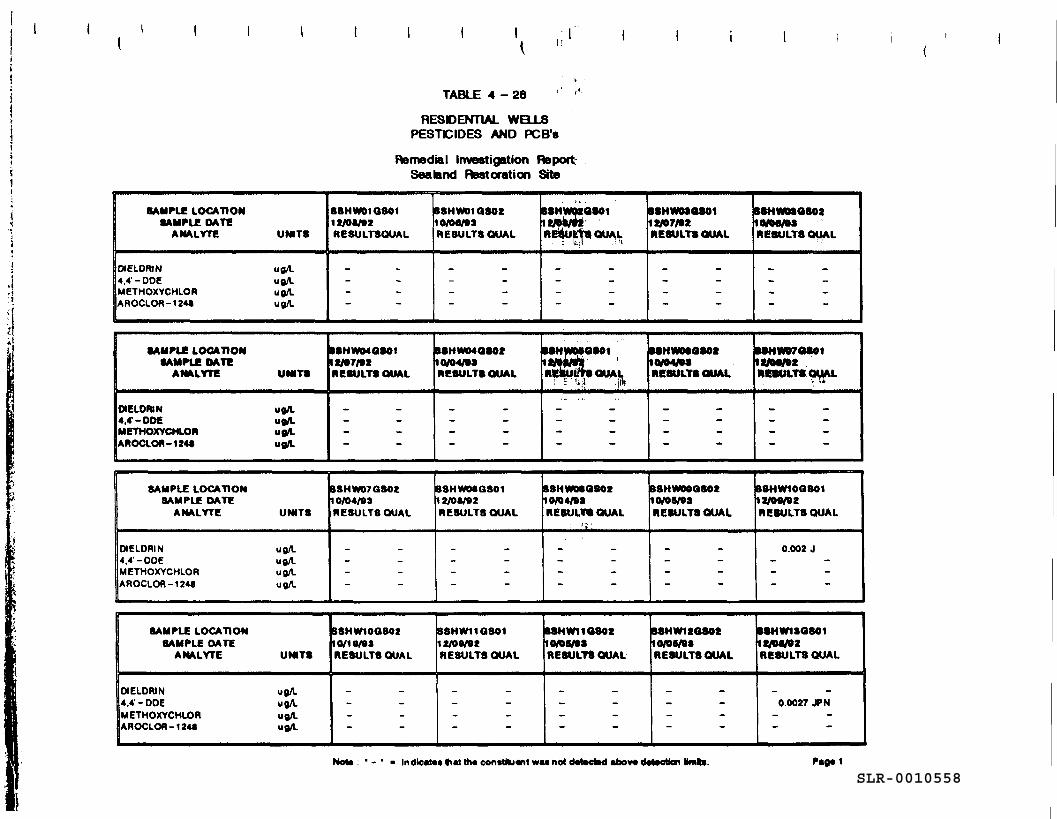
TABLE 4-28
RESDENT1AL WELLSPESTICIDES AND PCB's
Ramedial Investigation ReportSeatand Restoration Site
SAMPLE LOCATIONSAMPLE DATE
ANALYTE UNITS
DIELORIN ug/L4.4' -DDE ufl/LMETHOXYCHLOR ug/LAROCtOR-124« ug/L
SAMPLE LOCATION•AMPLE DATE
ANALVTE UMTS
DIELORIN UQ/L4.4- -DDE ugA.METHOXYCHLOR ug/LAROCLOR-124* og/L
88H«M>1Q80112/01/92RESULT3OUAL
-
ISHW04QS01It/07/92RESULTS OUAL
-
SSHWOlQSOt10/00/93RESULTS QUAL
-
BSHW04QS02IQ/04/93RESULTS OUAL
-
ssHwotasoti«jW»LR^u^OUAVl
— _
•SHJMMfaSOl
RckulrrsouAi.i : 'V,1 :.jj»
•" ~
BSHWMQSOI12/07/02RESULTS OUAL
— —
•SHWMOSOt10/04/9*RESULTS QUAL
-
BSHWMQS0210/00*3RESULTS QUAL
•• —
BSHW07QS01lt/0«/92RESULTS OUAL
_ _
SAMPLE LOCATIONSAMPLE DATE
ANALYTE UNITS
DIELDRIN ugA.4,4' -DDE ugA.METHOXYCHLOR ugA.AROCLOR-124a ugA.
SAMPLE LOCATIONSAMPLE DATE
ANALYTE UMTS
OtELDRIN ugA.4.4' -DDE ugA.METHOXYCHLOR ugA.AROCLOR-124* ugA.
BSHW07QS0210/04/93RESULTS OUAL
-
S8HW10QS0210/19/93RESULTS OUAL
~ •"
8SHWMQSO112/01/02RESULTS QUAL
_ _
BSHWIiaSOl12/00/92RESULTS OUAL
-
BSHWOOQ80210/04/93RESULTS QUAL
' ' ' 1 '
— _
BSHW11QS0210/08/93RESULTS QUAL
-
B8HWWQS0210/05/93RESULTS OUAL
-
BSHWItOSOtIO/OM*RESULTS OUAL
-
S8HW10QS0112>0«/«2RESULTS QUAL
0.002 J
BSHW13O801IX/04/02RESULTS QUAL
0.0027 JPN
» Indtc«J«» fr«t th« con««U«nt WM no< d«t *»d «bov« detection Urnto.SLR-0010558
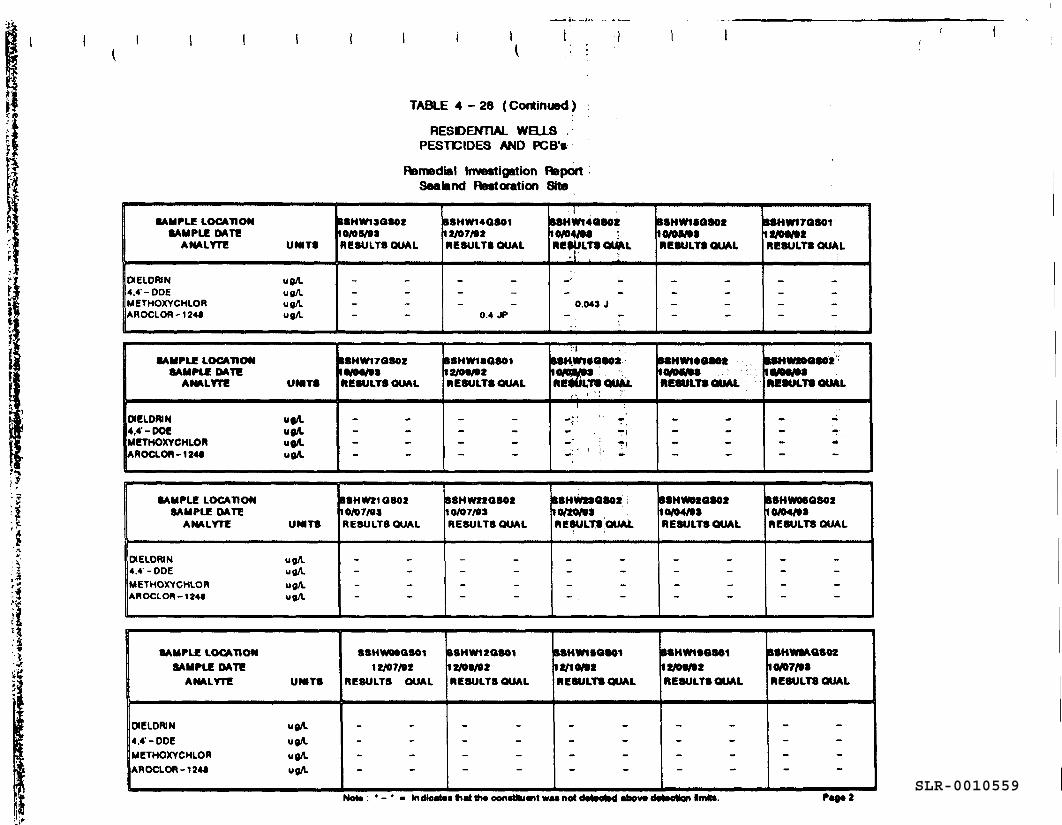
TABLE 4 - 28 (Continued)
RESIDENTIAL WELLSPESTICIDES AND PCB's
Remedial Investigation ReportSeatand Restoration Site
SAMPLE LOCATIONSAMPLE DATE
ANALYTE UNITS
OIELDRIN uo/L4.4' -DDE ugA.METHOXYCHLOR ug/LAROCIOR-124* ug/L
SAMPLE LOCATIONSAMPLE DATE
ANALYTE UMTS
DIELDRIN ug/L4,4' -DOB ug/LMETHOXYCHLOR ugA.AROCLOR-1244 ug/L
18HW11Q80Z10/00/01RESULTS OUAL
-
I8HW17Q802IOAMVO*RESULTS OUAL
_ .
8SHW14QS0112/07/02RESULTS QUAL
0.4 JP
BSHW18Q80112/00/02RESULTS QUAL
-
• 1BSHWUQSOS10/04/M :RESULTS QUAL
• i , :
0.043 J
VI
88HWISQSOX
REMILTSQUAL
1 ;
-|". : " T-
"• ! ^)•- ' i i , ; '
BSHWISOSOt10SOO/MRESULTS OUAL
-
MHWteoaax10/OWMRESULTS OUAt
-
8SHW17G8011t/OS/OtRESULTS OUAL
— —
BSHWMasoxIS/OWMRESULTS OUAL
— .4
SAMPLE LOCATIONSAMPLE DATE
ANALYTE UNITS
DIELDRIN ug/L4.4' -DDE ugA.METHOXYCHLOR ug/lAROCLOR-124* ugA.
ISHW21O802IDA) 7/03RESULTS OUAL
-
ssHwnaset10/07/03RESULTS OUAL
-
ssHvmasoi10/XO/OSRESULTS QUAL
-
SSHMOXaSOtio/04/taRESULTS QUAL
-
BSHVWMQSOZ10/04/VSRESULTS QUAL
-
SAMPLE LOCATIONSAMPLE DATE
ANALYTE UNITS
tXELDRIN ugA.4.4' -DOE ug/LMETHOXYCHLOR ug/LAROCLOR-124* u0/L
8SHW09Q80112/07/02
RESULTS OUAL
-
88HW12QS0112/00/02RESULTS OUAL
-
B8HW15Q801tt/ta/stRESULTS QUAL
-
8SHW10SS0112/08/V2RESULTS QUAL
-
BSHVMAQSOZ10/07/OSRESULTS QUAL
— -
Note: •-• - InMettmt lh«l th« eon«Mti«it w«i not detected ahava d«teetk»i Irnte. Pao* 2SLR-0010559
dieldrin and 4,4'-DDE exceeded their respective NYSDEC AWQ standards of "non-detect."
The PCS aroclor-1248 was detected in well HW-14 at a concentration of 0.4 pg/L. Thisconcentration exceeded the NYSDEC AWQ standard for PCBs of 0.1 pg/L. Aroclor-1248 wasnot detected in any media samples collected from the SRI site.
No pesticides or PCBs were detected in NYSDOH residential well samples (Table 4-29).
Inorganic Analytes. Four inorganic analytes were detected in elevated concentrations abovetheir respective NYSDEC AWQ standards (Table 4-30). These constituents were magnesium(elevated in 15 wells), iron (elevated in 11 wells), sodium (elevated in 3 wells), and arsenic(elevated in well HW-07 only, at a concentration of 37.2 pg/L). In addition, lead concentrationsexceeded the EPA action level of 15 pg/L in well HW-07 (16.8 pg/L) during Phase I samplingonly. It was not detected in this homeowner well during Phase n sampling. Manganeseconcentrations exceeded the secondary MCL in well HW-07 (Phase I and II), HW-20 (Phase H),HW-02 (Phase H), HW-14 (Phase I and U) and HW-3 (Phase I only). The unffltered samplesexhibited higher concentrations of the above mentioned inorganics than did the filtered samples.
In the NYSDOH samples, lead was detected above the EPA action level for lead of 15 pg/L atHW-11 (170 pg/L), HW-7 (15 pg/1) and at HW-13 (78 pg/L) (Table 4-31). Arsenic was detectedabove the NYSDEC MCL of 25 pjj/L at HW_-JJ$J pg/L). Iron was detected at concentrationsexceeding the EPA secondary MCL of 300 pg/L at HW-7, HW-9, HW-10, HW-11, HW-12, andHW-13. Manganese was detected at concentrations exceeding of the EPA secondary MCL (300pg/L) at HW-14 (2,360 pg/f). Copper was detected at concentrations above the NYSDEC MCLof 200 pg/1 at HW-13 (577 pg/1). Zinc was detected at concentrations above the NYSDEC MCLof 300 pg/1 at HW-11 (1,220 pg/1). Manganese ws detected above the NYSDEC MCL of 300pg/1 at HW-14 (2360 pg/1).
Summary. Low concentrations of volatile organic, semivolatile organic, and pesticidecompounds were detected in a limited number of residential wells; in particular, those locatedeast of the SRI property boundary. The only inorganic constituent of significance was arsenic,which was detected in well HW-07, located immediately east of the SRI property boundary.All of the contaminants detected in the residential well samples were also detected in the on-siteSRI overburden monitoring wells, with the exception of aroclor-1248.
EDIS/ENG/ay071494.rp4 4-135 SLR-0010560
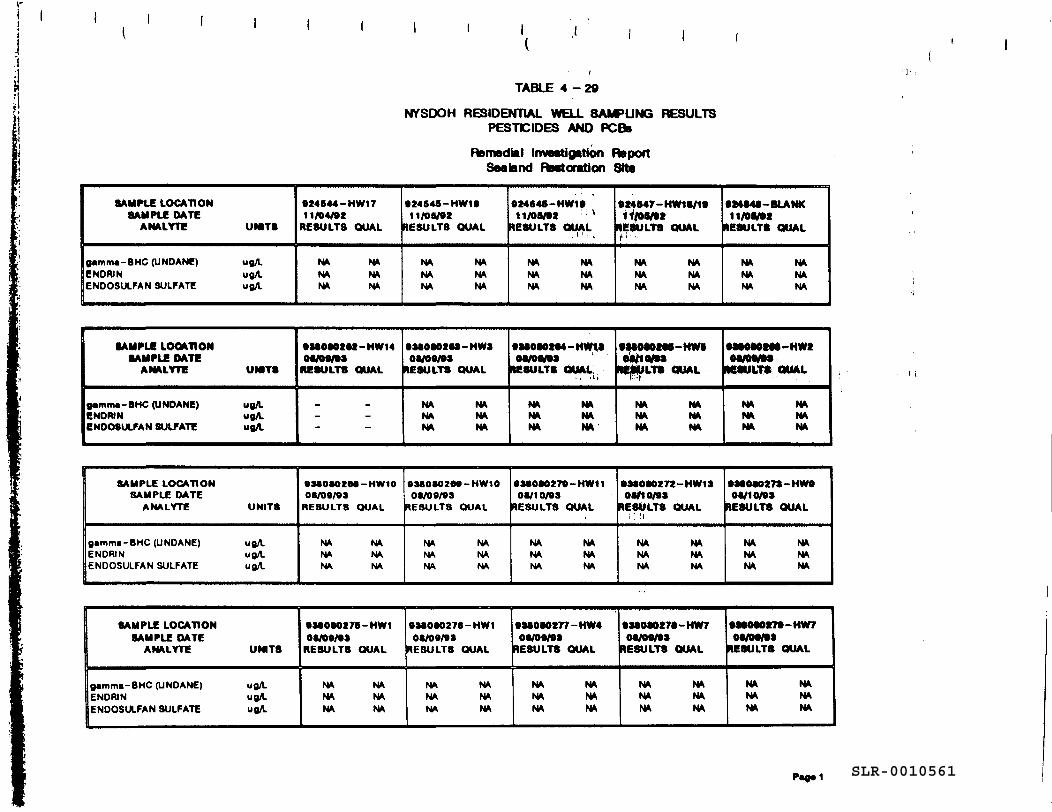
TABLE 4-20
NYSDOH RESIDENTIAL WELL SAMPLING RESULTSPESTCIDES AND PCBa
Remedial Investigation ReportSeatand Reatoration Site
SAMPLE LOCATIONSAMPLE DATE
ANALYTE UMTS
g*mm«-BHC (UNDANE) ugA.ENOR1N ugA.ENDOSULFAN SULFATE ug/L
914544 -HW1 711/04/9t
RESULTS OUAL
NA NANA NANA NA
92454S-HW1811/05/92
RESULTS OUAL
NA NANA NANA NA
924845-HW1911/05/91 : v
RESULTS OUAL
NA NANA NANA NA
924547-HW18/19ifjos/flx
RESULTS OUAL( ( * ,
NA NANA NANA NA
924«4*-BLANK11/05/02
RESULTS DUAL
NA NANA NANA NA
•AMPLE LOCATIONSAMPLE DATE
ANALYTE UNITS
gamma-BHC (UNDANE) ug/LENDRIN ugA.ENDOSULFAN SULFATE ugA
•MOMtU-HW14oa/oa/ea
RESULTS OUAL
-
938080283 -HW308/09/93
RESULTS OUAL
NA NANA NANA NA
asaoaom-HWt*oa/oe/ea
IESULTS OUAL.
NA NANA NANA NA
•asosotM-HWiowte/ra
HEJHULTS OUAL
NA NANA NANA NA
•ateaoMa-HwtOvfWVv "• "lESULTS OUAL
NA NANA NANA NA
SAMPLE LOCATIONSAMPLE DATE
ANALYTE UNITS
g«mm«-BHC (UNDANE) ugA.ENDRIN ugA.ENDOSULFAN SULFATE ugA.
OMOMZM-HW10OB/09/B3
RESULTS OUAL
NA NANA NANA NA
93aOM2M-HW1001/09/93
RESULTS QUAL
NA NANA NANA NA
9UOM270-HW11OB/10/93
RESULTS QUAL
NA NANA NANA NA
93(OMZ72-HW13OV10/93
RESULTS QUAL' !l
NA NANA NANA NA
9M090273-HW9Ot/10/93
HE8ULT8 OUAL
NA NANA NANA NA
SAMPLE LOCATIONSAMPLE DATE
ANALYTE UNITS
g«mm«-BHC (UNDANE) ugA.ENDRIN ugA.ENDOSULFAN SULFATE ugA.
9MOMZ7B-HW1Ot/09/93
RESULTS OUAL
NA NANA NANA NA
•MOM276-HW108/09/93
RESULTS QUAL
NA NANA NANA NA
9MOM277-HW408/09/93
RESULTS QUAL
NA NANA NANA NA
938080*78 -HW708/09/93
RESULTS OUAL
NA NANA NANA NA
•3809OI78-HW7oa/oa/aa
1E8ULTS OUAL
NA NANA NANA NA
SLR-0010561
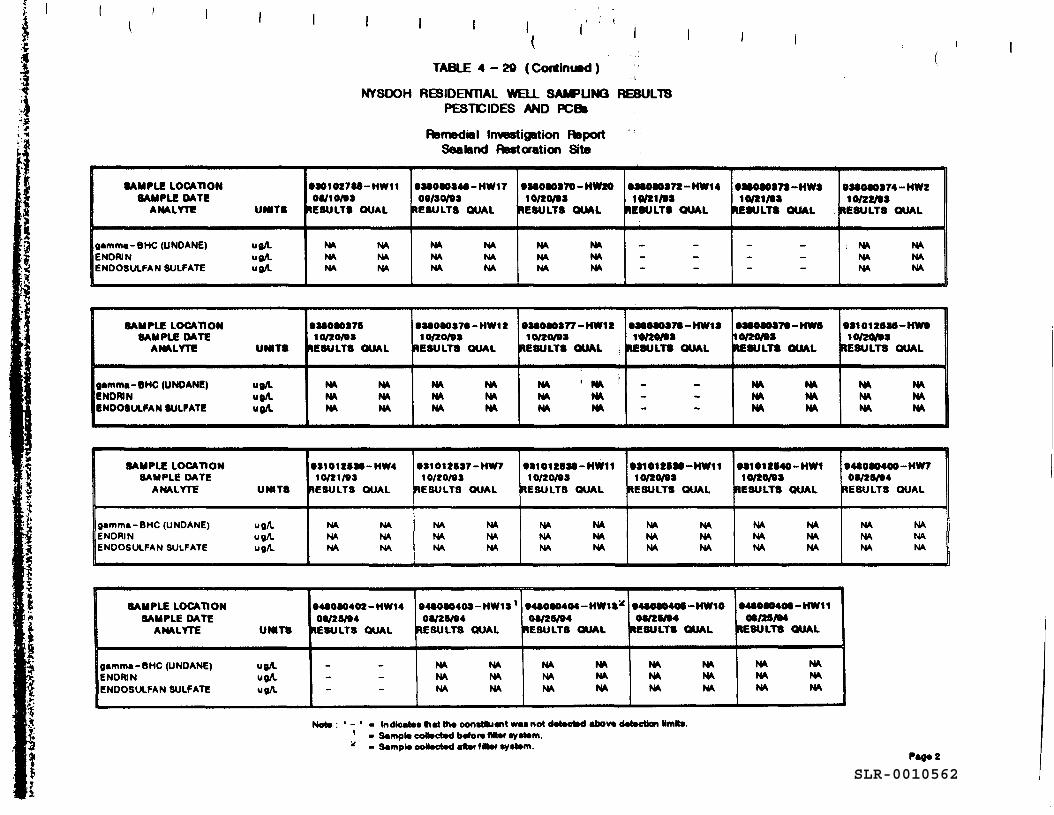
ITABLE 4-20 (Continued)
NYSDOH RESIDENTIAL WELL SAMPLING RESULTSPESTICIDES AND PCB»
Remedial Investigation ReportSea land Restoration Site
•AMPLE LOCATIONSAMPLE DATE
ANALYTE UNITS
0«mm«-BHC(UNOANE) ug/LENORIN ug/LENOOSULFAN SULFATE ug/L
9301M7SB-HW1109/10/93
RESULTS OUAL
NA NANA NANA NA
939090344-HW1709/30/93
RESULTS OUAL
NA NANA NANA NA
9 33090370 -HW2010/20/ti
RESULTS DUAL
NA NANA NANA NA
933090372-HW1410/21/93
RESULTS QUALi
_ _
939090373 -HW310/21/03
ICSULTS QUAL
- -
•MOM374-HWZ10/ZX/S*
RESULTS QUAL
; NA NANA NANA NA
SAMPLE LOCATIONSAMPLE DATE
ANALYTE UNITS
gamma -BHC(UNDANE) ug/LENORIN ug/LENOOSULFAN SULFATE ug/L
93309037510/20/93
IESULTS OUAL
NA NANA NANA NA
9MOMS76-HW1t10/20/93
RESULTS QUAL
NA NANA NANA NA
939090377 -HWIt10/20/93
RESULTS OUAL
NA ' NA 'NA NANA NA
939090379-HW1310/20/93
IESULTS QUAL
-
933090379-HWS10/20/93IE8ULTS QUAL
NA NANA NANA NA
931012530-HW910/20/93
RESULTS QUAL
NA NANA NANA NA
SAMPLE LOCATIONSAMPLE DATE
ANALYTE UNITS
gemma -BHC(UNDANE) ug/LENDRIN ug/LENDOSULFAN SULFATE ug/L
931012539-HW410/21/93
RESULTS OUAL
NA NANA NANA NA
931012S37-HW710/ZO/93
RESULTS OUAL
NA NANA NANA NA
931012S3S-HW1110/20/93
RESULTS QUAL
NA NANA NANA NA
931012530-HW1110/20/93
RESULTS QUAL
NA NANA NANA NA
931012S40-HW110/20/93
RESULTS QUAL
NA NANA NANA NA
943090400 -HW703/26/94
RESULTS QUAL
NA NANA NANA NA
I
SAMPLE LOCATIONSAMPLE DATE
ANALYTE UNITS
gamma- BHC (UNDANE) ug/LENORIN ug/LENOOSULFAN SULFATE ug/L
949090402 -MW1 403/25/94
IESULTS QUAL
-
03/25/94RESULTS QUAL
NA NANA NANA NA
949030404-HW13* I943O904O5-HW1003/25/94 03/28/94
RESULTS QUAL RESULTS QUAL
NA Wk I Wk W^NA NA NA NANA NA NA NA
0»/2*/34tESULTS QUAL
NA NANA NANA NA
• Samptocotocted baton fHteriyttem.- Samptocoltoctedaltof tutor cystem.
P«g«2
SLR-0010562
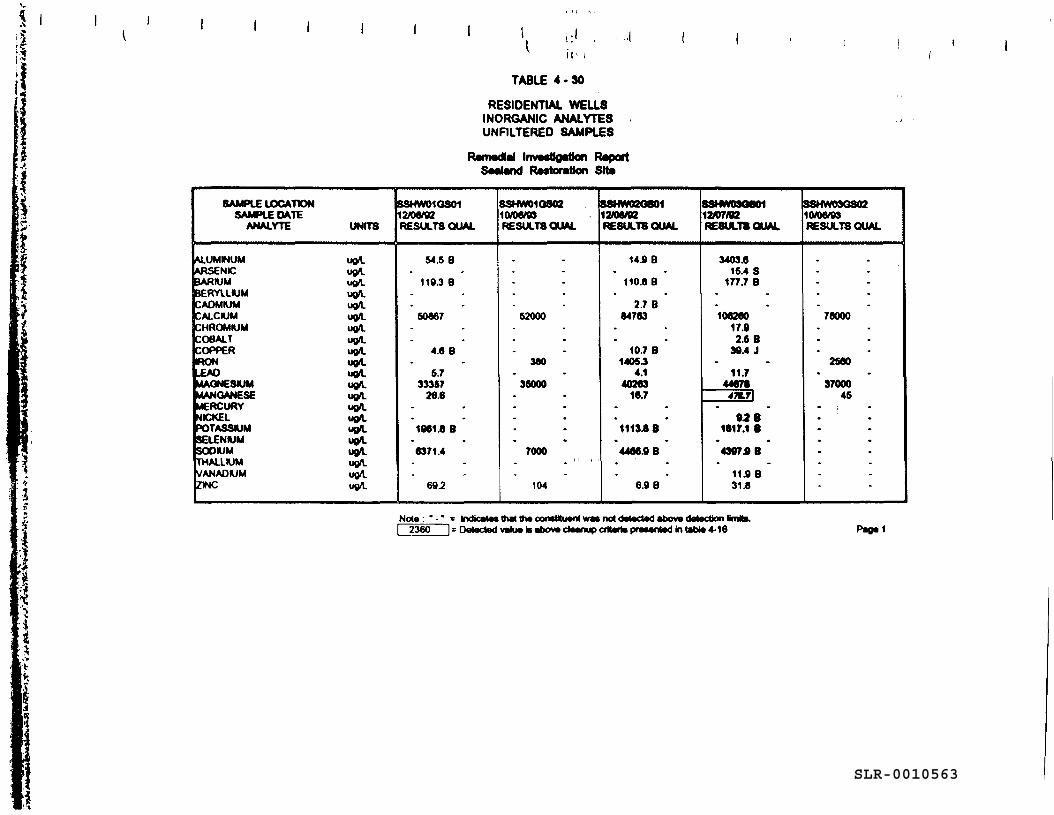
is-
• ,:• , ..v io i
TABLE 4 • 30
RESIDENTIAL WELLSINORGANIC ANALYTESUNFILTERED SAMPLES
Remedial Investigation ReportRestoration Site
SAMPLE LOCATIONSAMPLE DATE
ANALYTE UNITS
ALUMMUM ugA.ARSENIC ugA.BARIUM ugA.BERYLLIUM ugA.CADMIUM ugA,CALCIUM ugA.CHROMIUM ugA.COBALT ugA.COPPER ugA,IRON ugA.-EAO ugA.MAGNESIUM ugA,MANGANESE ugA.MERCURY ugA.NICKEL ug/LBOTASSWM ugA.SELENIUM ugA.SODIUM ugA.THALLIUM ugA.VANADIUM ugA.ZINC ugA.
S8HW010S0112/06/B2RESULTS QUAL
54.5 B-
110.3 B--
50867-.
4.6 B.
5.733367
26.6..
1981 .88.6371.4
--
69.2
8SHW01OS0210/06/93RESULTS QUAL
_-.--
52000---
380.
36000.....
7000- " '
-104
SSHW02GS0112/06/92RESULTS QUAL
14.9 B-
110.8 B-
2.7 B84763
-.
10.7 B1405.3
4.140263
16.7..1113.88.4466.9 B.-
6.98
ssHwosoeoi12/07792RESULTS QUAL
3403.615.4 S
177.7 B--106260
17.92.6 B
39.4 J-
11.74467647KT1
.9.2 B
1817.1 8.4397.9 B
-11.9 B31.8
SSHW030S0210/06/93RESULTS QUAL
a B
--•-
78000---
2560.
3700045
.
.
.
.--•
Note : ' - • » todfcalM lhal th« coratttuM* ww not detected above dotocton fcnto.I 2360 n'Dotrctedvalu* to •bov«d«aiM>q*«ri»P''»««n»«d to <•*><• 4-16 Pagcl
i
SLR-0010563
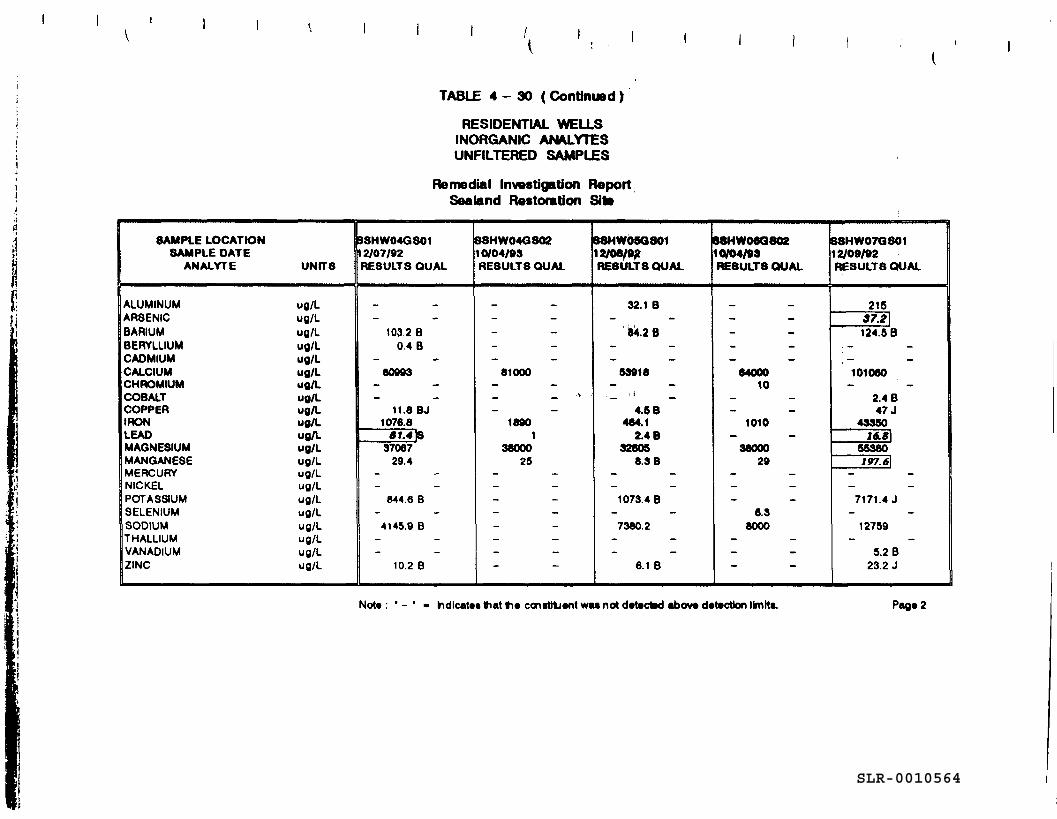
TABLE 4 - 30 ( Continued )
RESIDENTIAL WELLSINORGANIC ANALYTESUNFILTERED SAMPLES
Remedial Investigation ReportSealand Restoration Site
SAMPLE LOCATIONSAMPLE DATE
ANALYTE UNO'S
ALUMINUM ug/LARSENIC ug/LBARIUM ug/LBERYLLIUM ug/LCADMIUM ug/LCALCIUM ug/LCHROMIUM ug/LCOBALT ug/LCOPPER ug/LIRON ug/LLEAD ug/LMAGNESIUM ug/LMANGANESE ug/LMERCURY ug/LNICKEL ug/LPOTASSIUM ug/LSELENIUM ug/LSODIUM ug/LTHALLIUM ug/LVANADIUM ug/LZINC ug/L
BSHW04G8012/07/92RESULTS OUAL
__ __-
103 2 B0.4 B
-80993
--
11.8 BJ1076.8
07.4)837067
29.4-
-S44.6 B
-4145 9 B
--
10.2 B
83HW04G80210/04/93RESULTS OUAL
_ _---
_81000
-_ _ >»
-1890
138000
25- -
----
--— —
88HW05GS0112/06/92RESULTS OUAL
32.1 B-
S4.2B-- -
53918- -
. _ i i _4.SB
464.12.4 B
326058.3 B
- --
1073.4B-7380.2
--
6.1 B
88HW06Q80210/04/93RESULTS QUAL
_ _- ---- -
6400010
- -- -
1010- -
3800029
- ---
6.36000
--~ ~
88HW07G80112/09/92RESULTS QUAL
21537.2]124.58
-, - -
101080- -
2.4 B47 J
4335016.8]
55380197.6\
— --
7171.4 J-
12759-
5.2 B23.2 J
Not*: •-' - hdlcat*«»iatti*ccn*tlti*nt wa* not detected abov* detection limit*. Pag* 2
SLR-0010564
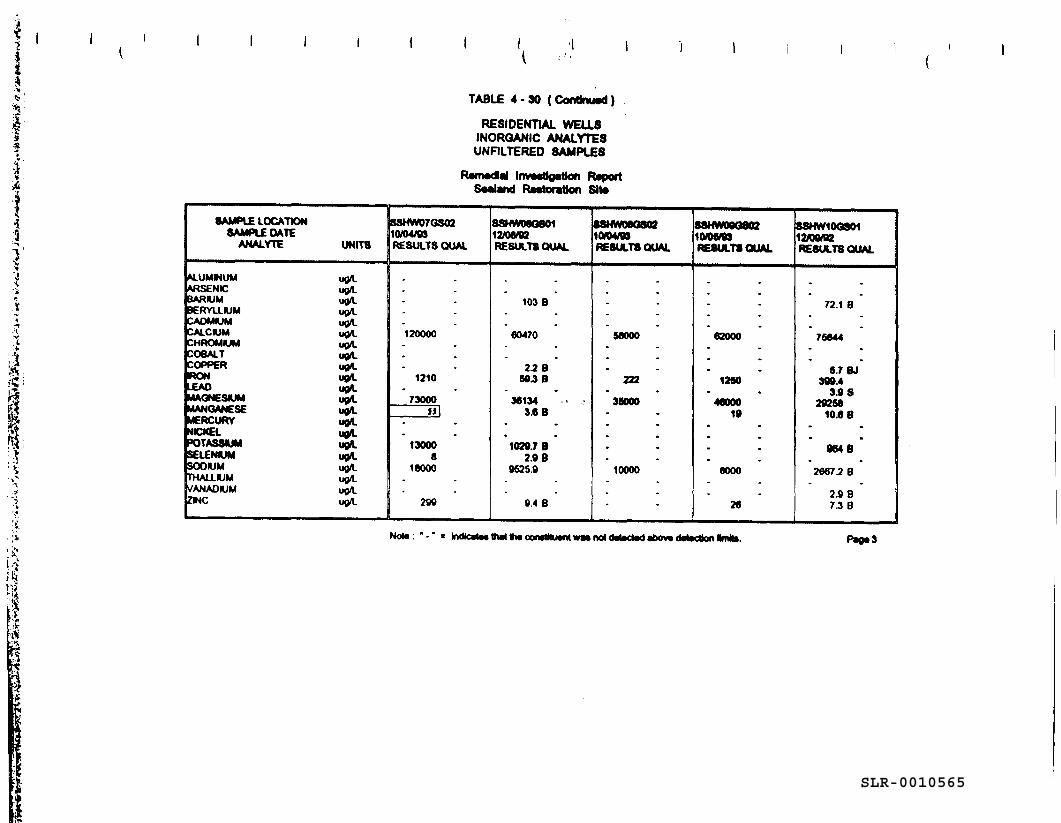
ins? fyg- 9p
!3 Sgc
9 2§§
OD flD
(0
(D
0 Q
D
00 03
s i
^jpp s i 2
2
0 flft 0
CO
Q
B C
D
CD
£ »
»«iaC*>
eioi* »
i"
I********************
!U.
> Z:
illiiliig
ili§|g
||li
fiI
^"
.-.i?V I*.. _5c_%
2i3B¥St*»sir_ -.. . ^_ . " ."
,T • .»Z-.. »* f-'
~ ''L-'t i o^
. ,LA£_M
3Eja
aBB
IM^B
Mi
^^
BS
fc»*Miite»
«MM
B
SLR-0010565
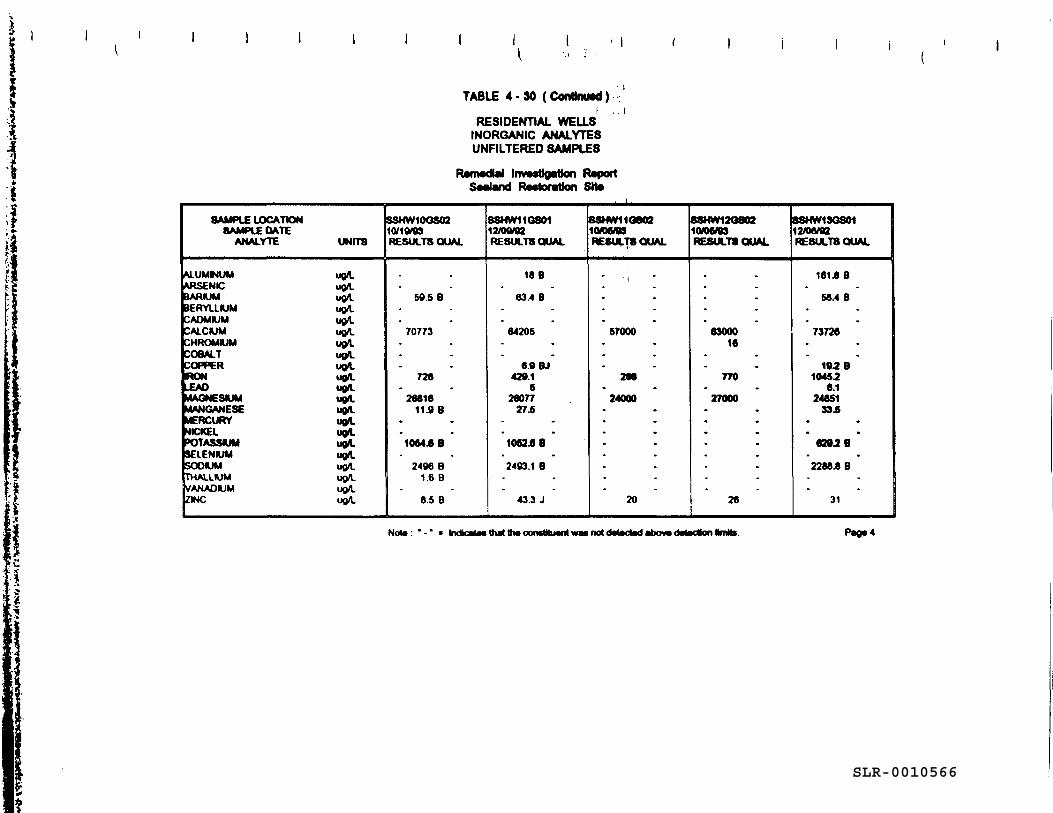
TABLE 4 - 30 (Continued) ,
RESIDENTIAL WELLSINORGANIC ANALYTESUNFILTEREO SAMPLES
RwncdW Investigation ReportRestoration Site
SAMPLE LOCATIONSAMPLE DATE
ANALYTE UNITS
ALUMMUM ugA.ARSENC ugA.3ARUM ugA.BERYLLIUM ugA.CADMIUM ugA.CALCIUM ugA.CHROMIUM ugA.COBALT ugA.COPPER ugA.RON ugA..HAD ugA.MAGNESIUM ugA.
MERCURY ugA.NICKEL ugA.>OTASSIUM ugA.SELENIUM ugA.SODIUM ugA.THALLIUM ugA.VANADIUM ugA.ZINC ugA.
SSHW100S0210/19/03RESULTS QUAL
.
.50 5 B
-•
70773••-
728-
2661611.0 B
.1054.6 B
-2406 B
1.6 B.
65 B
SSHW11OS0112/DA/B2RESULTS QUAL
18 B.
63.4 B--
6420S--
6.9 BJ429.1
526077
27.6
.1052.6 8
•2403.1 B
--
43.3 J
8SHW11O80210/06*09RESULTS QUAL
. 1
---
57000•--
266-
24000
..
.----
20
8SHW12O80210/06/03RESULTS QUAL
.
.-•-
6300016
--
770-
27000
. .
.
.----
26
8SHW13OS0112/06/02RESULTS QUAL
161.8 B.
58.4 B--
73726.-
192810452
6.124651
33.5
.6202 B
-2288.88
--
31
Nou: Indicate* to* ttw oorwttbwnl WM not detected above (totodlon hnte. Pag.4
SLR-0010566
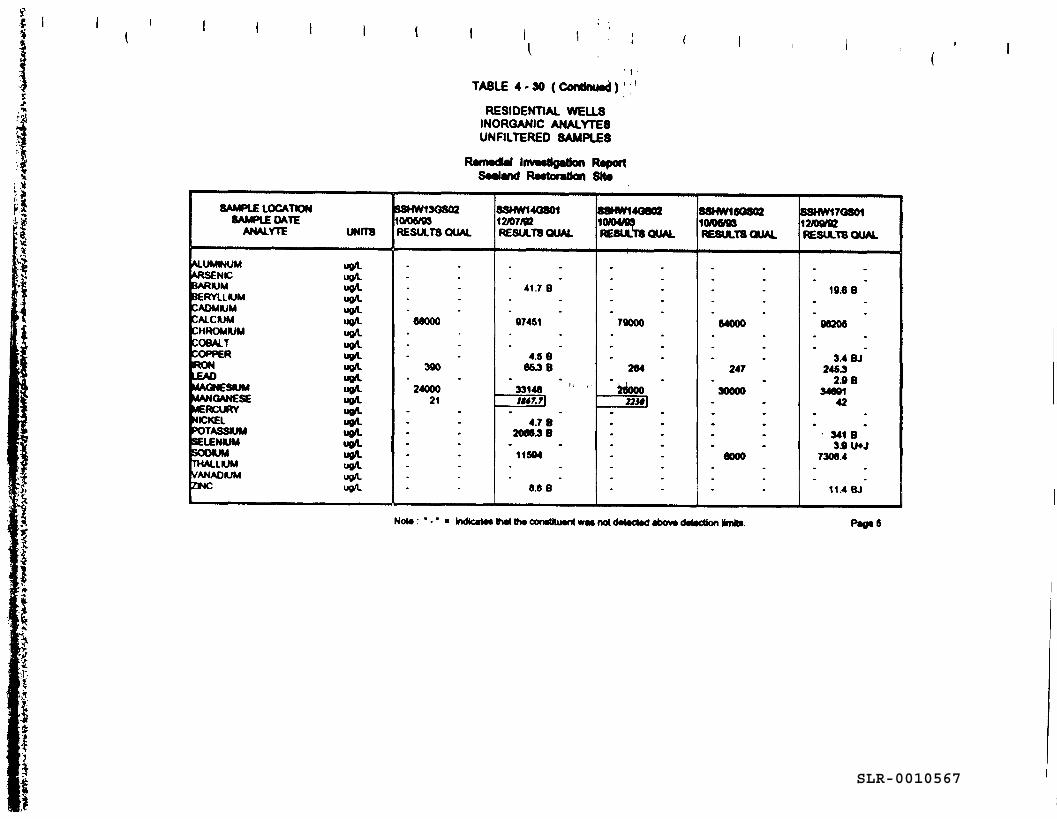
» W
O)
ifi* Is
!- sisIS
Sg£t•ise
2OPCB
^ i
I l~
*********************
!U-
i Z !
u u
i> ft
I!
SLR-0010567
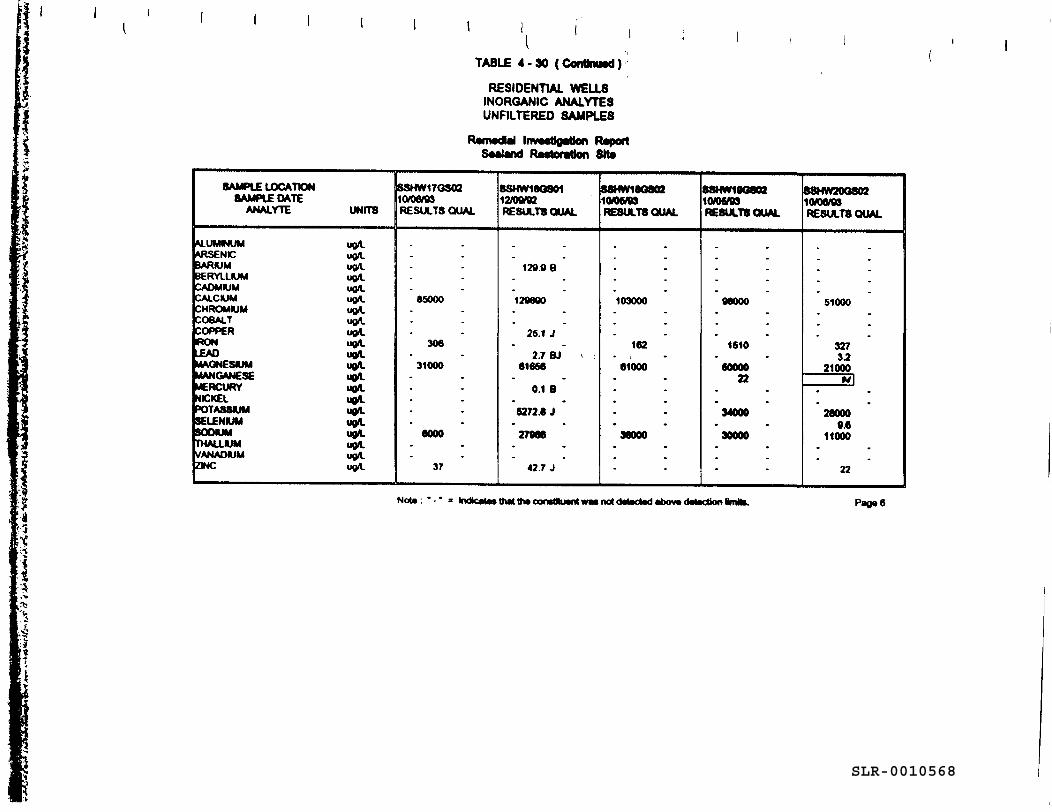
I I
I O
O O
I
iff?ffii
8 2
So
il
« -
$•to CD
i i
•
I 8
B!
PiiE 0» OB
SLR-0010568
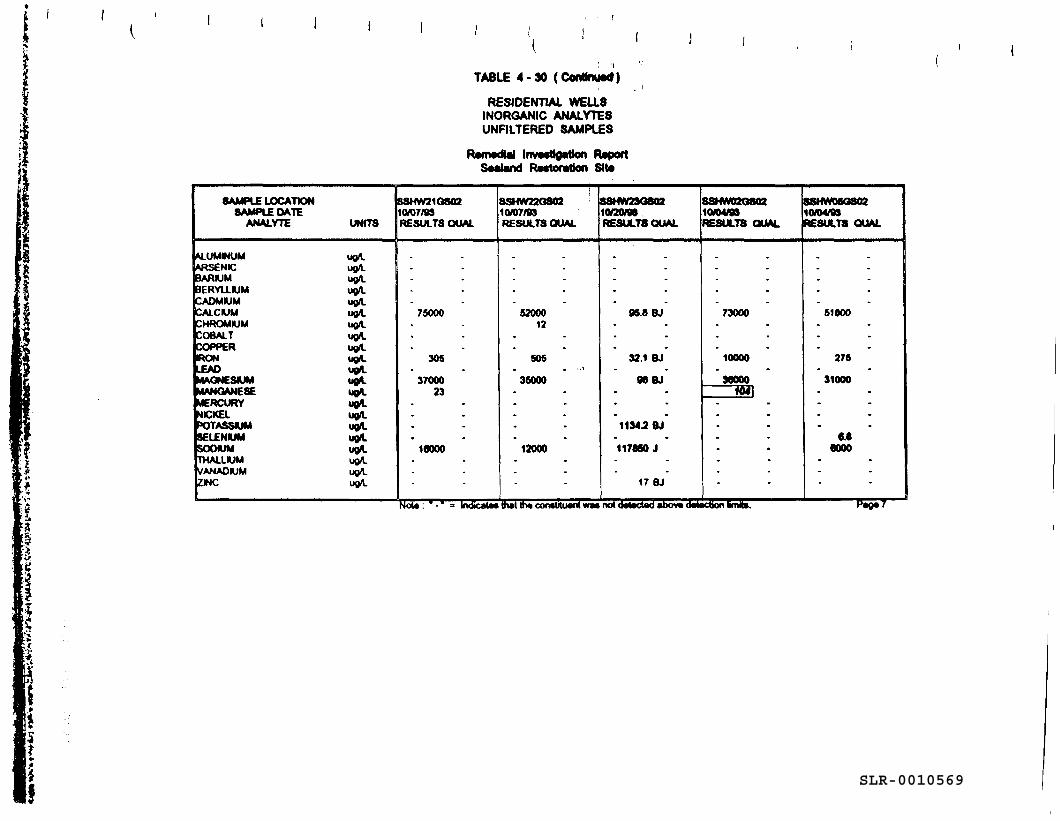
TABLE 4-30 (Contfnuw*)
RESIDENTIAL WELLSINORGANIC ANALYTESUNFILTEREO SAMPLES
Rwmdlal Investigation ReportS«aland RMtoratton Site
f.,SAMPLE LOCATION
SAMPLE DATEANALYTE UNITS
ALUMMUM ugA.ARSENIC ugA.BARIUM ug/lBERYLLIUM ugA.CADMIUM ugA.CALCIUM ugA.CHROMIUM ugA.COBALT ug/LCOPPER ugA.RON ugA.LEAD ugA.MAGNESIUM ugA.MANGANESE ugA.MERCURY ugA.UICKEL ugA.OTASStUM ugA.SELENIUM ugA.SODIUM ugA.THALLIUM ugA.VANADIUM ugA.ZINC ugA.
BSHW21QS0210(07/83RESULTS QUAL
.
.---
75000...
305.
3700023
.
.
.16000
-.•
iSSHW22OS0210/07/B3RESULTS QUAL
.---.
5200012
.
.SOS
. ..' i35000. ...-.
12000--•
S8HW23080210/20/99 ;RESULTS QUAL
.--•.
958BJ...
32.1 BJi '86 BJ
. .
.
.11542 BJ.117860 J--
17 BJ
88HWD2OS0210XM/B3RESULTS QUAL
_---.
73000-..
10000-
36000104]
-•.---
•
SSHWOSOS0210/04/83RESULTS QUAL
w
---.
51000--.
276-
31000. ..•-
9*•000
--• •
NoU: = lodic»U« WS m« coraMuwit was not (tatocMd abov* datocfion bnto. P*g«7
IS
SLR-0010569
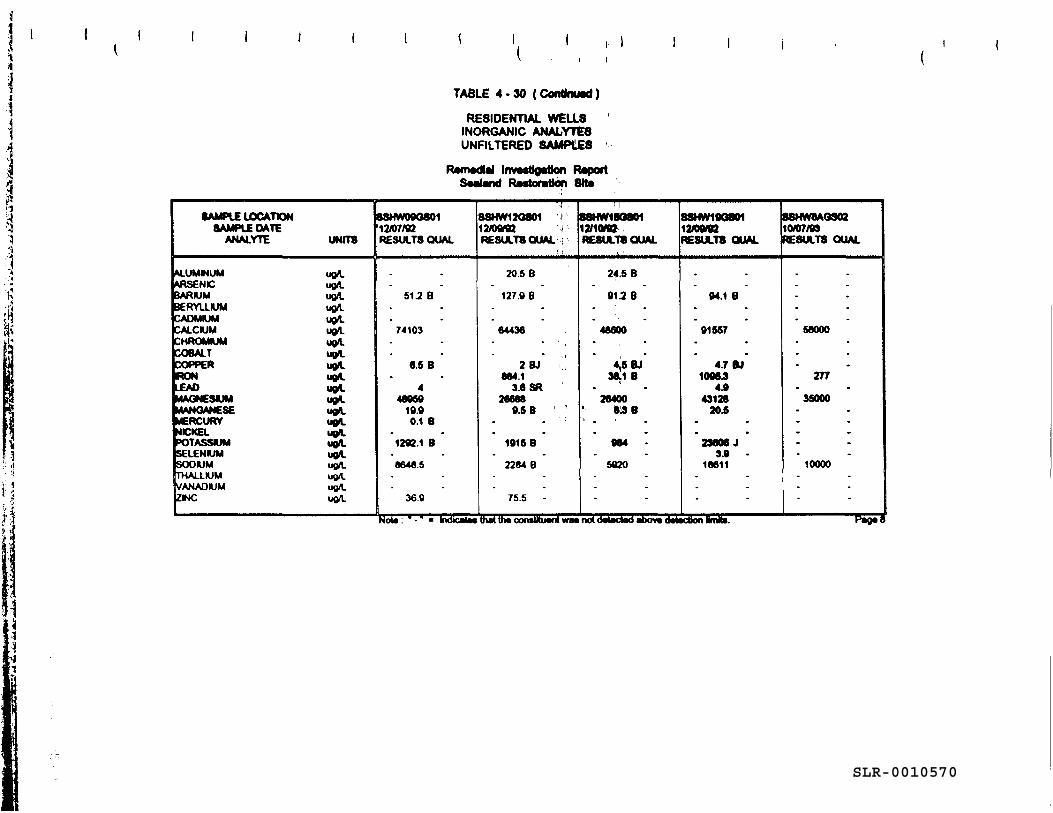
TABLE 4 - 30 (Continued)
RESIDENTIAL WELLSINORGANIC ANALVTE8UNFILTERED SAMP1LE8
Remedial Investigation ReportSealand RMtonrtlon Site
SAMPLE LOCATIONSAMPLE DATE
ANALYTE UNITS
ALUMMUM ugA.ARSENIC ugA.iARUM ugA.BERYLLIUM uflA.CADMIUM ugA.CALCIUM ugA.CHROMIUM ugA.COBALT ugA.COPPER ugA.RON ugA..EAD ugA.MAGNESIUM ugA.LjAuriAi^ccc tin AMERCURY ugA.4CKEL ugA.BOTASSMM ugA.SELENIUM ugA.SODIUM ugA.THALLIUM ug/LVANADIUM ug/LZWC ugA.
S8HW00O80112AJ7/82RESULTS QUAL
.-
517 B•.
74103•-
6.5 B.
4JMMQ4OTV3V
1990.1 B
.1292.1 B.8640.5.-
36.9
M
8SHW12OS01 I12/oe/n iRESULTS QUAL i
f i
20.5 B-
127.9 B-.
64436- ' ,
• • /2BJ ,
884.13.6 SR
*MM|*<|/9OOO
0.5 B;
.1015 B
-2284 B
--
75.5 -
= '•18SHW1BOSO112/10/ttRESULTS QUAL
24.5 B' '
913 B-.
48600--
4.5 BJ38,1 B•)
284008JB1 .
.084 -
-5020
--•
S8HW19Q80112/00/02RESULTS QUAL
.-
04.1 B-.
01557--
4.7 BJ10063
4.043128
205-.
23806 J3.9 •
18611.-•
S8HW8AG80210/07/03RESULTS QUAL
.---.
68000••-
277-
35000
-.--
10000--~
Note: ' - • ' kxlk UM that thacoratitiMn(wMno(ctotoctodabov«(tatodionHmN*. Pag«8
SLR-0010570
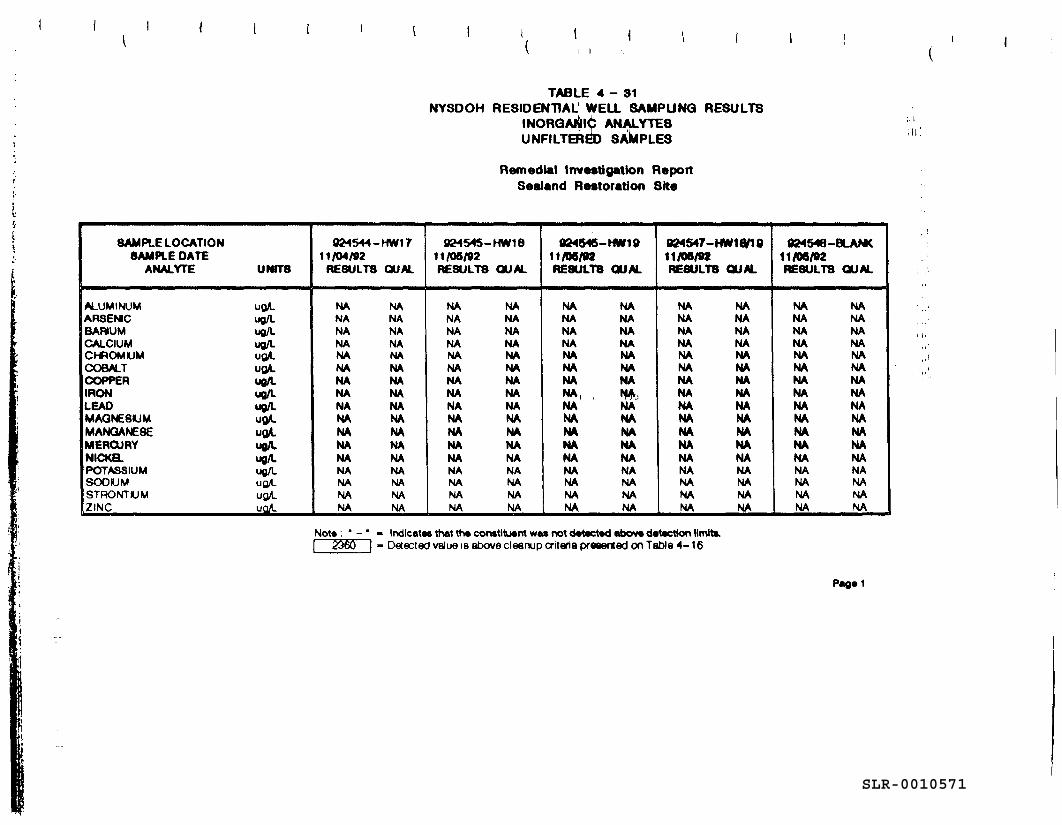
TABLE 4 -31NYSDOH RESIDENTIAL WELL SAMPLING RESULTS
INORGANIC ANALYTESUNFILTERED SAMPLES
Remedial Investigation ReportSealand Restoration Site
SAMPLE LOCATIONSAMPLE DATE
ANALYTE UNITS
ALUMINUM uflA.ARSEMC ug/LBARIUM ug/LCALCIUM ug/LCHROMIUM ufl/LCOBALT U(J/LCOPPER ug/LIRON ug/LLEAD ug/LMAGNESIUM ug/LMANGANESE UQ/LMERCURY ug/LNJICKa ug/LPOTASSIUM ug/LSODIUM ufl/LSTRONTIUM UQ/LZINC uoA-
924544-HW1711/04/92RESULTS OUAL
NA NANA NANA NANA NANA NANA NANA NANA NANA NANA NANA NANA NANA NANA NANA NANA NANA NA
92454S-HW1811 /OS/92RESULTS OUAL
NA NANA NANA NANA NANA NANA NANA NANA NANA NANA NANA NANA NANA NANA NANA NANA NANA NA
924945-HMM911/08/92RESULTS QUAL
NA NANA NANA NANA NANA NANA NANA NANA, , NA,NA NANA NANA NANA NANA NANA NANA NANA NANA NA
924S47-HW18/1911/06/92RESULTS QUAL
NA NANA NANA NANA NANA NANA NANA NANA NANA NANA NANA NANA NANA NANA NANA NANA NANA NA
924548-BLANK11/08/92RESULTS QUAL
NA NANA NANA NANA NANA NANA NANA NANA NANA NANA NANA NANA NANA NANA NANA NANA NANA NA
Note: ' -' - Indicate* that th« constituent wa» not detected abov» detection llmttm.| 2360 ~[ - Detected value ia above cleanup criteria presented on Table 4-16
SLR-0010571
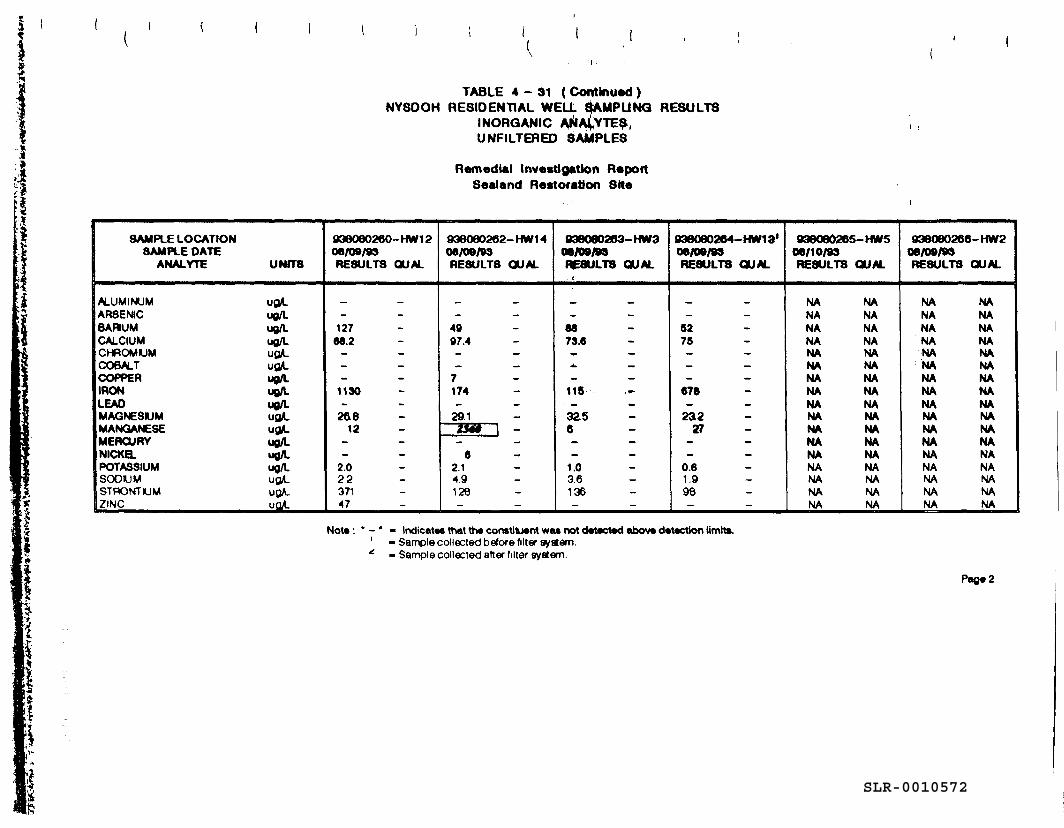
1I
TABLE 4 - 31 ( Continued )NY800H RESIDENTIAL WELL SAMPLING RESULTS
INORGANIC ANALYTES,UNFILTERED SAMPLES
Remedial Investigation ReportSealand Restoration Site
SAMPLE LOCATIONSAMPLE DATE
ANALYTE UNITS
ALUMINUM ug/LARSENIC ug/LBARIUM ug/LCALCIUM ug/LCHROMIUM ufl/LCOBALT ug/LCOPPER ug/LIRON ug/LLEAD ug/LMAGNESIUM ug/LMANGANESE ug/LMERCURY ug/LNICKa ug/LPOTASSIUM ug/LSODIUM ugj.STRONTIUM uflA-ZINC uo/L
936060260- HW1 206/08/93RESULTS QUAL
12766.2
1130
26612
2.02237147
936060262- HWH08/09/BSRESULTS OUAL
4097.4
7174
29.1ZM» ] -
62.14.9129
038080263- HW308/09/93RESULTS QUAL. (
6873.6
±. _
115
3258
1.03.6136
938080264-HW19'08/08/93RESULTS OUAL
5275
678
23227
0.61.998
938080265- HW508/10/93RESULTS QUAL
NA NANA NANA NANA NANA NANA NANA NANA NANA NANA NANA NANA NANA NANA NANA NANA NANA NA
938060266- HW208/09/93RESULTS QUAL
NA NANA NANA NANA NANA NANA NANA NANA NANA NANA NANA NANA NANA NANA NANA NANA NANA NA
PI
Not* : " - • - Indicate that the constituent was not detected above detection limits.' - Sample collected before filter system.* - Sample collected after filter system.
Page 2
SLR-0010572
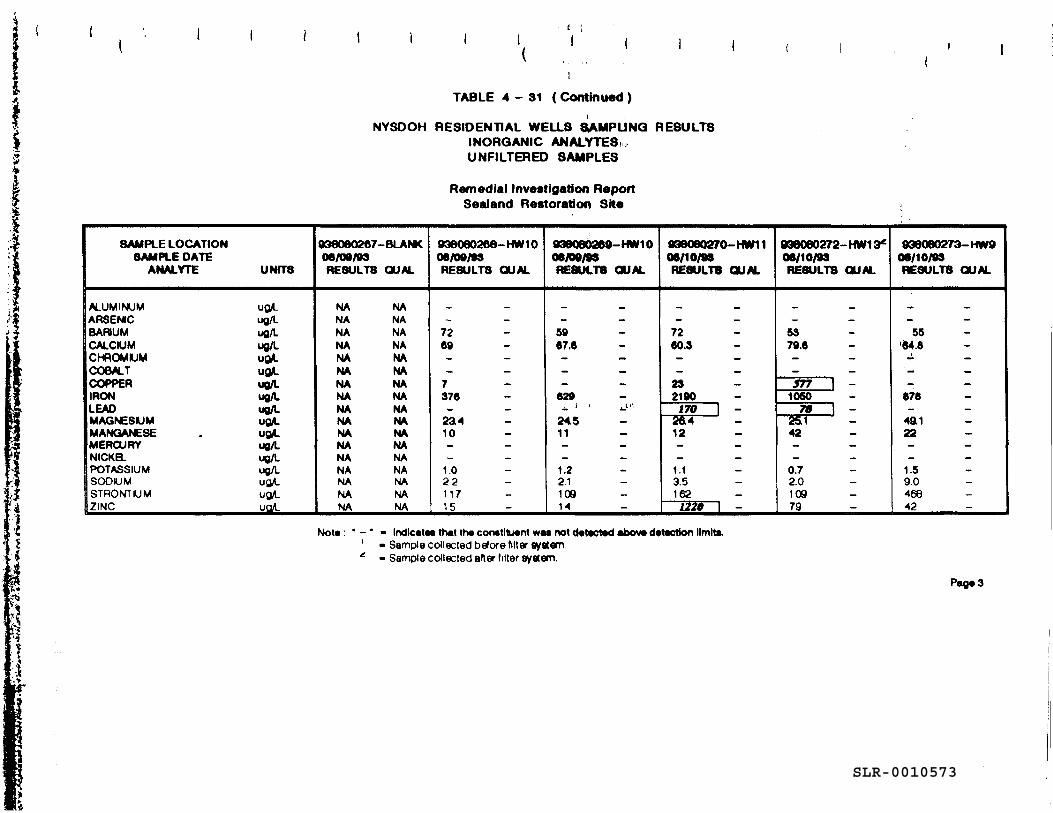
t \
TABLE 4 - 31 ( Continued )
NYSOOH RESIDENTIAL WELLS SAMPLING RESULTSINORGANIC ANALYTE8,UNFILTERED SAMPLES
Remedial Investigation ReportSealand Restoration Site
SAMPLE LOCATIONSAMPLE DATE
ANALYTE UNITS
ALUMINUM uflA-ARSENIC ug/LBARIUM ug/LCALCIUM ug/LCHROMIUM ug/LCOBALT UQ/LCOPPER ug/LIRON ug/LLEAD ug/LMAGNESIUM ug/LMANGANESE . ug/LMERCURY ug/LNICKEL ug/LPOTASSIUM ug/LSOOIUM ugA-STRONTIUM ug/LZINC UQ/L
938080267-BLANK08/00/89RESULTS OUAL
NA NANA NANA NANA NANA NANA NANA NANA NANA NANA NANA NANA NANA NANA NANA NANA NANA NA
938080268- HW1006/O9/93RESULTS OUAL
7289
7376
23.410
1.02211715
9380802O9-HW1008/09/99RESULTS OUAL
5967.6
629_ ! ' ^rt
24511
1.22.1109H
938080270- HW1106/10/93RESULTS QUAL
7260.3
232190170 1 -
26.412
1.13.5162li29 | -
938080272-HW13*08/10/93RESULTS OUAL
5379.6
577 | -1050n i -
25.142
0.72.010979
938080273- HW908/10/93RESULTS OUAL
55M.e
878
49.122
1.59.046842
Not* : " - ' - Indicates that the constituent w«» not detected above detection llmlte.1 - Sample collected before Mter syatem,* - Sample collected after filter syatem.
Page3Srtj
SLR-0010573
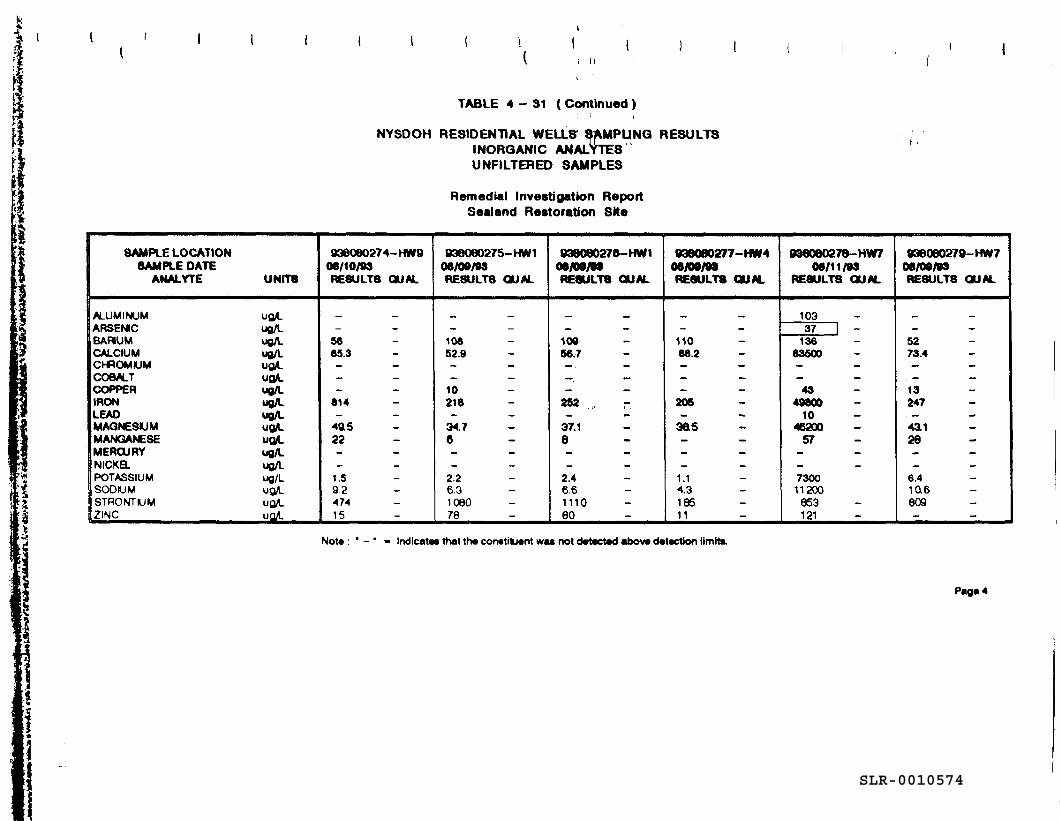
TABLE 4 - 31 ( Continued )
NYSDOH RESIDENTIAL WELLS' SAMPLING RESULTSINORGANIC ANALYTE8UNFILTERED SAMPLES
Remedial Investigation ReportSealand Restoration Site
SAMPLE LOCATIONSAMPLE DATE
ANALVTE UNITS
ALUMINUM ug/LARSENIC ug/LBARIUM ug/LCALCIUM ug/LCHROMIUM ug/LCOBALT ug/LCOPPER ug/LIRON ug/LLEAD ug/LMAGNESIUM ug/LMANGANESE ug/LMERCURY ug/LNICKa ug/LPOTASSIUM ug/LSODIUM UQ/LSTRONTIUM ufl/LZINC ufl/L
936060274- HW908/10/09RESULTS QUAL
_ _-
5665.3-- --
814- -
49.522--
1.59.247415
936060275- HW108/00/93RESULTS OUAL
_ _-
10852.9- -- -
10218- -
3478--
2.26.3108078
938060276- HW109/W/MRESULTS QUAL
_ _- -
10956.7-, -— -- -
282 „ -— -
37.16 ••- --
2.46.6111090
938080277-HW408/09/99RESULTS QUAL
_ _-
11088.2- -- -- -
205— —
36LS- -- --
1.14.318511
938060278- HW708/11/93
RESULTS QUAL
10337 I -
13683500- -- -43
4980010
4620057- --7300
11200853121
938080279- HW708/09/93RESULTS OUAL
_ _- -
5273.4— -- -
13247
— -43126- --
6.410,6809-
Not* : ' - ' - Indicates that the constituent was not detected above detection limits.
Page 4
SLR-0010574
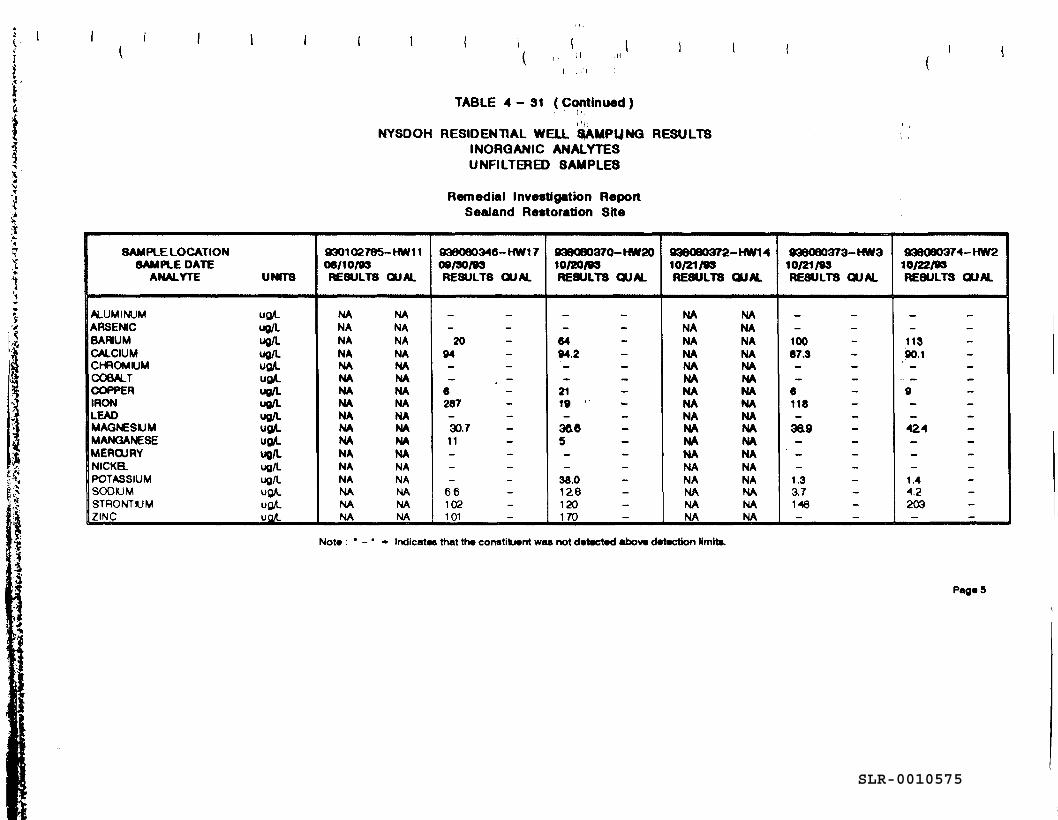
TABLE 4 - 31 ( Continued )
NYSDOH RESIDENTIAL WELL SAMPLING RESULTSINORGANIC ANALYTESUNFILTERED SAMPLES
Remedial Investigation ReportSealand Restoration Site
SAMPLE LOCATIONSAMPLE DATE
ANALVTE UNITS
ALUMINUM ug/LARSENIC ug/LBARIUM ug/LCALCIUM ug/LCHROMIUM ug/LCOBALT ug/LCOPPER ug/LIRON ug/LLEAD ug/LMAGNESIUM ug/LMANGANESE ug/LMERCURY ug/LNICKa ug/LPOTASSIUM ug/LSODIUM ugA.STRONTIUM ufl/LZINC ufl/L
930102785- HW1108/10/93RESULTS QUAL
NA MANA NANA NANA NANA NANA NANA NANA NANA NANA NANA NANA NANA NANA NANA NANA NANA NA
936080346- HW1 708/30/93RESULTS QUAL
_-20
94- -- , -
6287-30.711---
66102101
938080370-HW2010/20/93RESULTS QUAL
_-
6494.2- -— —
2119-
3665
--
38.0128120170
938080372- HW1 410/21/93RESULTS QUAL
NA NANA NANA NANA NANA NANA NANA NANA NANA NANA NANA NANA NANA NANA NANA NANA NANA NA
938060373- HW310/21/93RESULTS QUAL
_-
10087.3- -- -
6118- -
36.9- ---
1.33.7148- -
938080374- HW210/22/93RESULTS DUAL
_-
11390.1
— —- _ _9- -_ _
424- -_-
1.44.2203-
Not* : • - • - Indicate that th* constituent was not d*tsct*d above detection limits.
Pag* 5
SLR-0010575
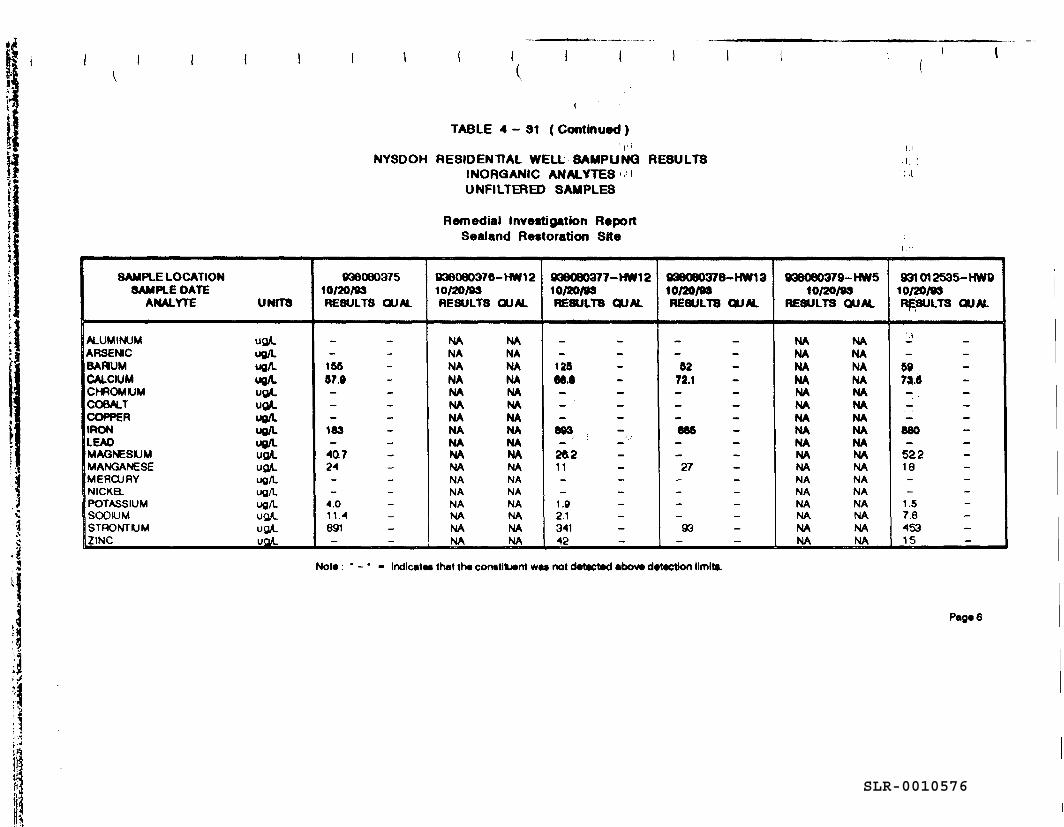
TABLE 4 - 31 ( Continued )1 1 ' '
NYSDOH RESIDENTIAL WELL SAMPLING RESULTSINORGANIC ANALVTE8 iUNFILTERED SAMPLES
Remedial Investigation ReportSealand Restoration Site
SAMPLE LOCATIONSAMPLE DATE
ANALVTE UNITS
ALUMINUM ufl/LARSEMC UO/LBARIUM ug/LCALCIUM UO/LCHROMIUM uo/LCOBALT u0LCOPPER ug/LIRON ug/LLEAD uo/LMAGNESIUM Ufl/LMANGANESE UQ/LMERCURY ug/LNICKB. ugA.POTASSIUM ug/LSOODM uuA.STRONTIUM uflA.ZINC UOX-
93006037510/20/03RESULTS QUAL
_-
165579-- --
183-
40.724--
4.011.4891-
038060376- HW1 210/20/03RESULTS QUAL
MA NANA NANA NANA NANA NANA NANA NANA NANA NANA NANA NANA NANA NANA NANA NANA NANA NA
938060377- HW1 210/20/03RESULTS QUAL
_-
125M.6- -- -- -
893- ' ' -'"
2&211_-
1.92.134142
938060378- HW1310/20/03RESULTS QUAL
_-
5272.1- -- -- -885- -- -27---- -93-
938060379- HW510/20/03
RESULTS QUAL
NA NANA NANA NANA NANA NANA NANA NANA NANA NANA NANA NANA NANA NANA NANA NANA NANA NA
931 01 2535- HW910/20/03RESULTS QUAL
'.;l
_
?»W.8- . -_ -— -
880- -
52218--
1.57.845315
Not* : • - ' Indicate* that th« corwtikwnt wu not detected above detection limit*.
Pag* 6
SLR-0010576
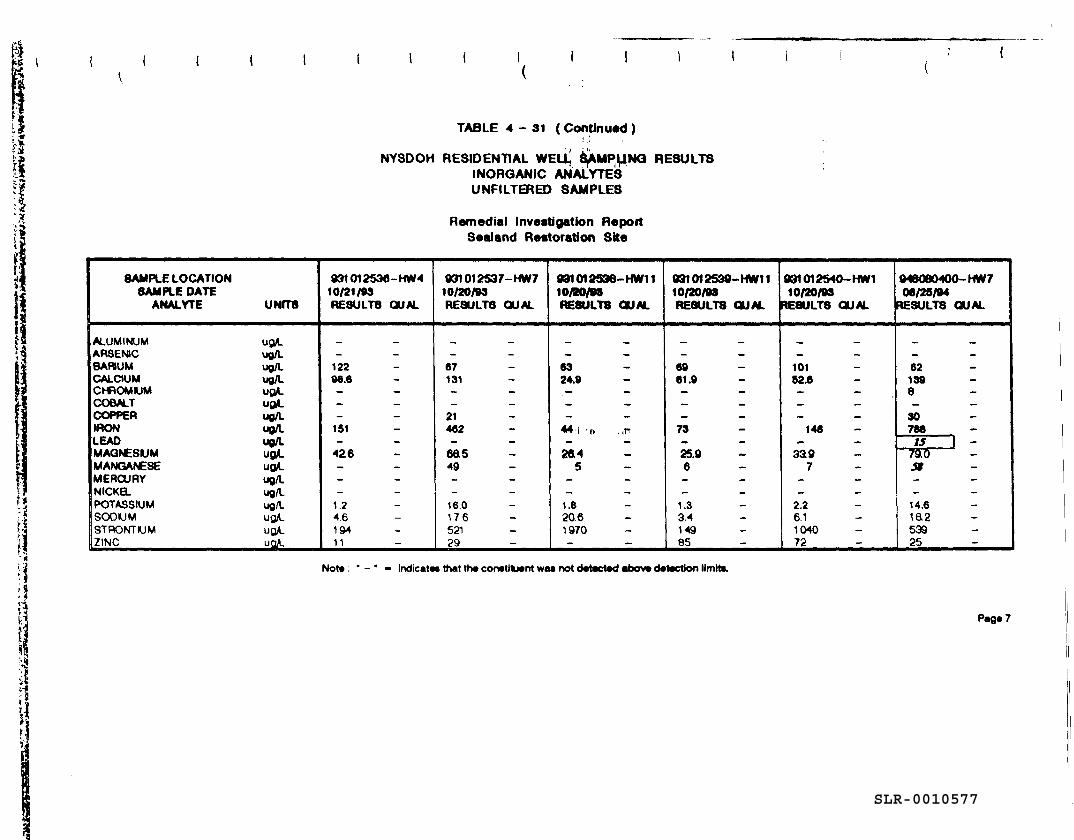
t3H
r.im
II
TABLE 4 - 31 ( Continued)
NYSDOH RESIDENTIAL WELL, 6JAMF>LfNQ RESULTSINORGANIC ANALYTESUNFILTERED SAMPLES
Remedial Investigation ReportSealand Restoration Site
SAMPLE LOCATIONSAMPLE DATE
ANALVTE UNITS
ALUMINUM ufl/LARSENIC ug/LBARIUM ug/LCALCIUM ug/LCHROMIUM ufl/LCOBALT ug/LCOPPER ug/LIRON ug/LLEAD ug/LMAGNESIUM ug/LMANGANESE ufl/LMERCURY ug/LNICKB. ug/LPOTASSIUM ug/LSODIUM uflA.STRONTIUM ufl/LZINC uoA-
931 01 2536- HW410/21/99RESULTS QUAL
_-
12298.6- -- --
151-
•426---
1.24.619411
931 01 2537- HW710/20/93RESULTS QUAL
_-
67131- -- -
21462-
eas49--
16.017.652129
931012536-HW1110/BO/MRESULTS QUAL
_ _ll_
- -8324.9- -- -- -
44 :i 1t>. ,,r- -
26.45
--
1.820.61970-
991012S39-HW1110/20/98RESULTS DUAL
_- -
6961.9- -- -- -
78- -25.96--
1.33.414985
091 01 2540- HW110/20/93
RESULTS QUAL
1I_ _
- -10152.6- -- -_ _
148- -
3397
--
2.26.1104072
948080400- HW700/25/94
RESULTS QUAL
_-621398- -
30788IS \ -
7aoj»--
14.6ia253925
Not* : • - ' - Indicates that th* constituent WM not detected above detection limit*.
Page?
SLR-0010577
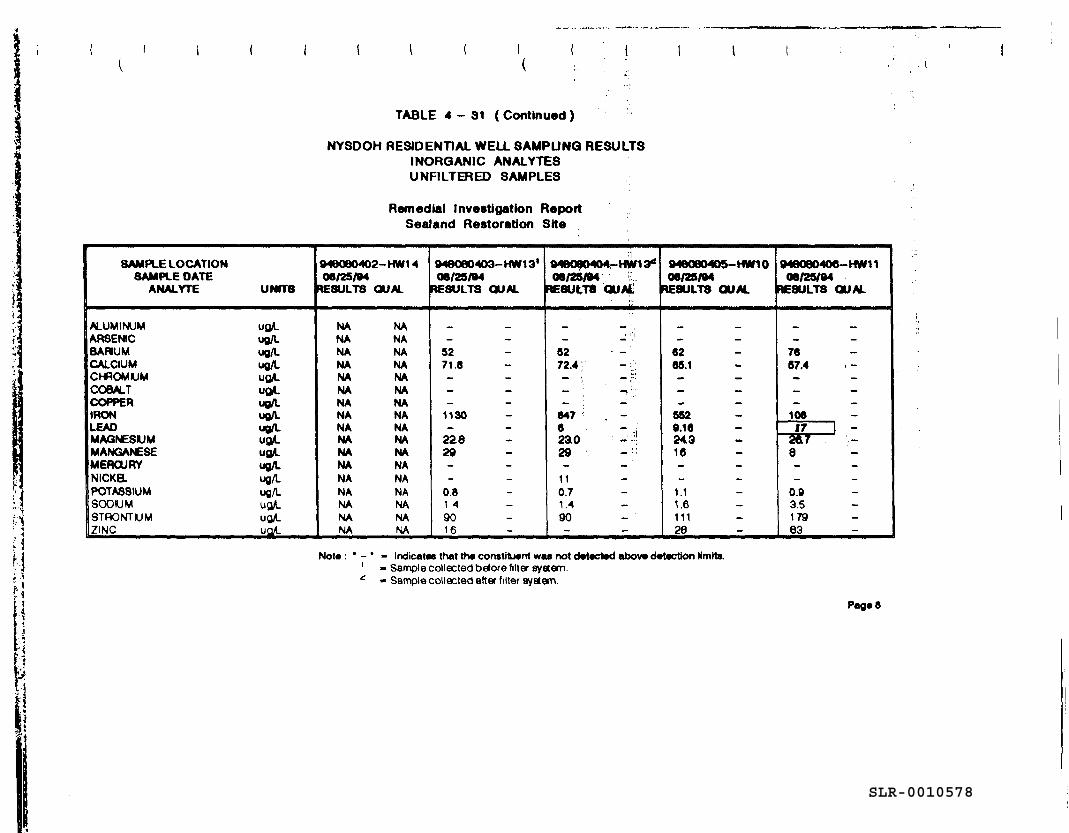
TABLE 4 - 31 ( Continued )
NYSDOH RESIDENTIAL WELL SAMPUNQ RESULTSINORGANIC ANALYTESUNFILTERED SAMPLES
Remedial Investigation ReportSealand Restoration Site
SAMPLE LOCATIONSAMPLE DATE
ANALYTE UNfTB
ALUMINUM ug/LARSENIC ug/LBARIUM ug/LCALCIUM ug/LCHROMIUM ug/LCOBALT ufl/LCOPPER ug/LIRON ug/LLEAD ug/LMAGNESIUM ug/LMANGANESE Ufl/LMERCURY ug/LNICKa ug/LPOTASSIUM ug/LSODIUM UQ/LSTRONTIUM uflA.ZINC uaL
046060402- HW1 406/25/94
RESULTS OUAL
NA MANA NANA NANA NANA NANA NANA NANA NANA NANA NANA NANA NANA NANA NANA NANA NANA NA
9480804O3-HW13'08/25/04
RESULTS OUAL
__ _-
5271.8-- --
1130-
22820--
0.81.49016
046060404-HW13"06/25/04 ;:.:
RESULTS QUAt
_ __".'
52 -72-4 -iJ- v - r:
~ -i ;;'- : -
8476 • - • ;2ao -;•!20 ,:: -;:-
110.71.490 -
-
048060405- HW1006/25/04
RESULTS OUAL
_ _- -
8268.1- -- -- -
5520.1624.316--
1.11.611129
046060406- HW1106/25/04
RESULTS OUAL
•n. __
-
7867.4- -- —- -
10817 I -
26.78--
0.93.517993
Not* : ' - ' - Indicate that th« coratiLwnt wa* not detected abov* detection limits.' - Sample collected before filter system.* - Sample collected after filter system.
Pag«8
SLR-0010578
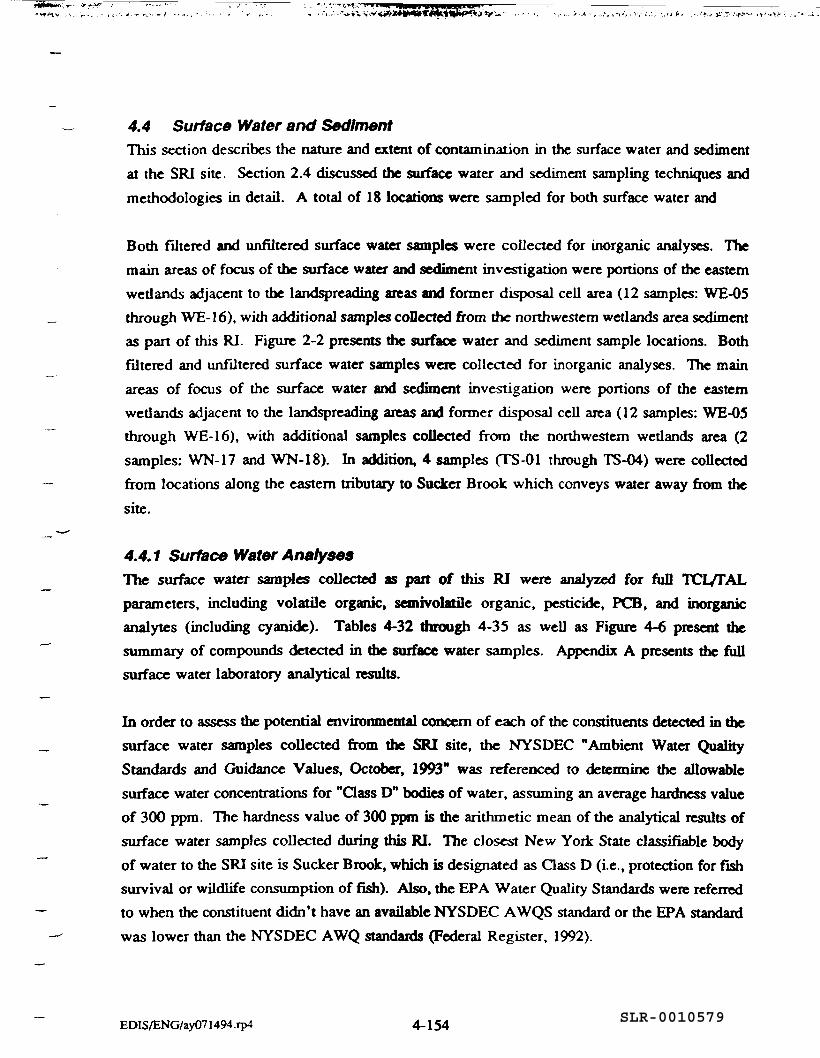
',»-• »>;>»••
"">.v . •. '. V- . . •
4.4 Surface Water and SedimentThis section describes the nature and extent of contamination in the surface water and sedimentat the SRI site. Section 2.4 discussed the surface water and sediment sampling techniques andmethodologies in detail. A total of 18 locations were sampled for both surface water and
Both filtered and unfiltered surface water samples were collected for inorganic analyses. Themain areas of focus of the surface water and sediment investigation were portions of the easternwetlands adjacent to the landspreading areas and former disposal cell area (12 samples: WE-05through WE-16), with additional samples collected from the northwestern wetlands area sedimentas pan of this Rl. Figure 2-2 presents the surface water and sediment sample locations. Bothfiltered and unfiltered surface water samples were collected for inorganic analyses. The mainareas of focus of the surface water and sediment investigation were portions of the easternwetlands adjacent to the landspreading areas and former disposal cell area (12 samples: WE-05through WE-16), with additional samples collected from the northwestern wetlands area (2samples: WN-17 and WN-18). In addition, 4 samples (TS-01 through TS-04) were collectedfrom locations along the eastern tributary to Sucker Brook which conveys water away from thesite.
4.4.1 Surface Water AnalysesThe surface water samples collected as part of this RI were analyzed for full TCL/TALparameters, including volatile organic, semrvolatflc organic, pesticide, PCB, and inorganicanalytes (including cyanide). Tables 4-32 through 4-35 as well as Figure 4-6 present thesummary of compounds detected in the surface water samples. Appendix A presents the fullsurface water laboratory analytical results.
In order to assess the potential environmental concern of each of the constituents detected in thesurface water samples collected from the SRI site, the NYSDEC "Ambient Water QualityStandards and Guidance Values, October, 1993" was referenced to determine the allowablesurface water concentrations for "Class D" bodies of water, assuming an average hardness valueof 300 ppm. The hardness value of 300 ppm is the arithmetic mean of the analytical results ofsurface water samples collected during this RI. The closest New York State classifiable bodyof water to the SRI site is Sucker Brook, which is designated as Class D (i.e., protection for fishsurvival or wildlife consumption of fish). Also, the EPA Water Quality Standards were referredto when the constituent didn't have an available NYSDEC AWQS standard or the EPA standardwas lower than the NYSDEC AWQ standards (Federal Register, 1992).
EDIS/ENG/ay071494.rp4 4-154 SLR-0010579
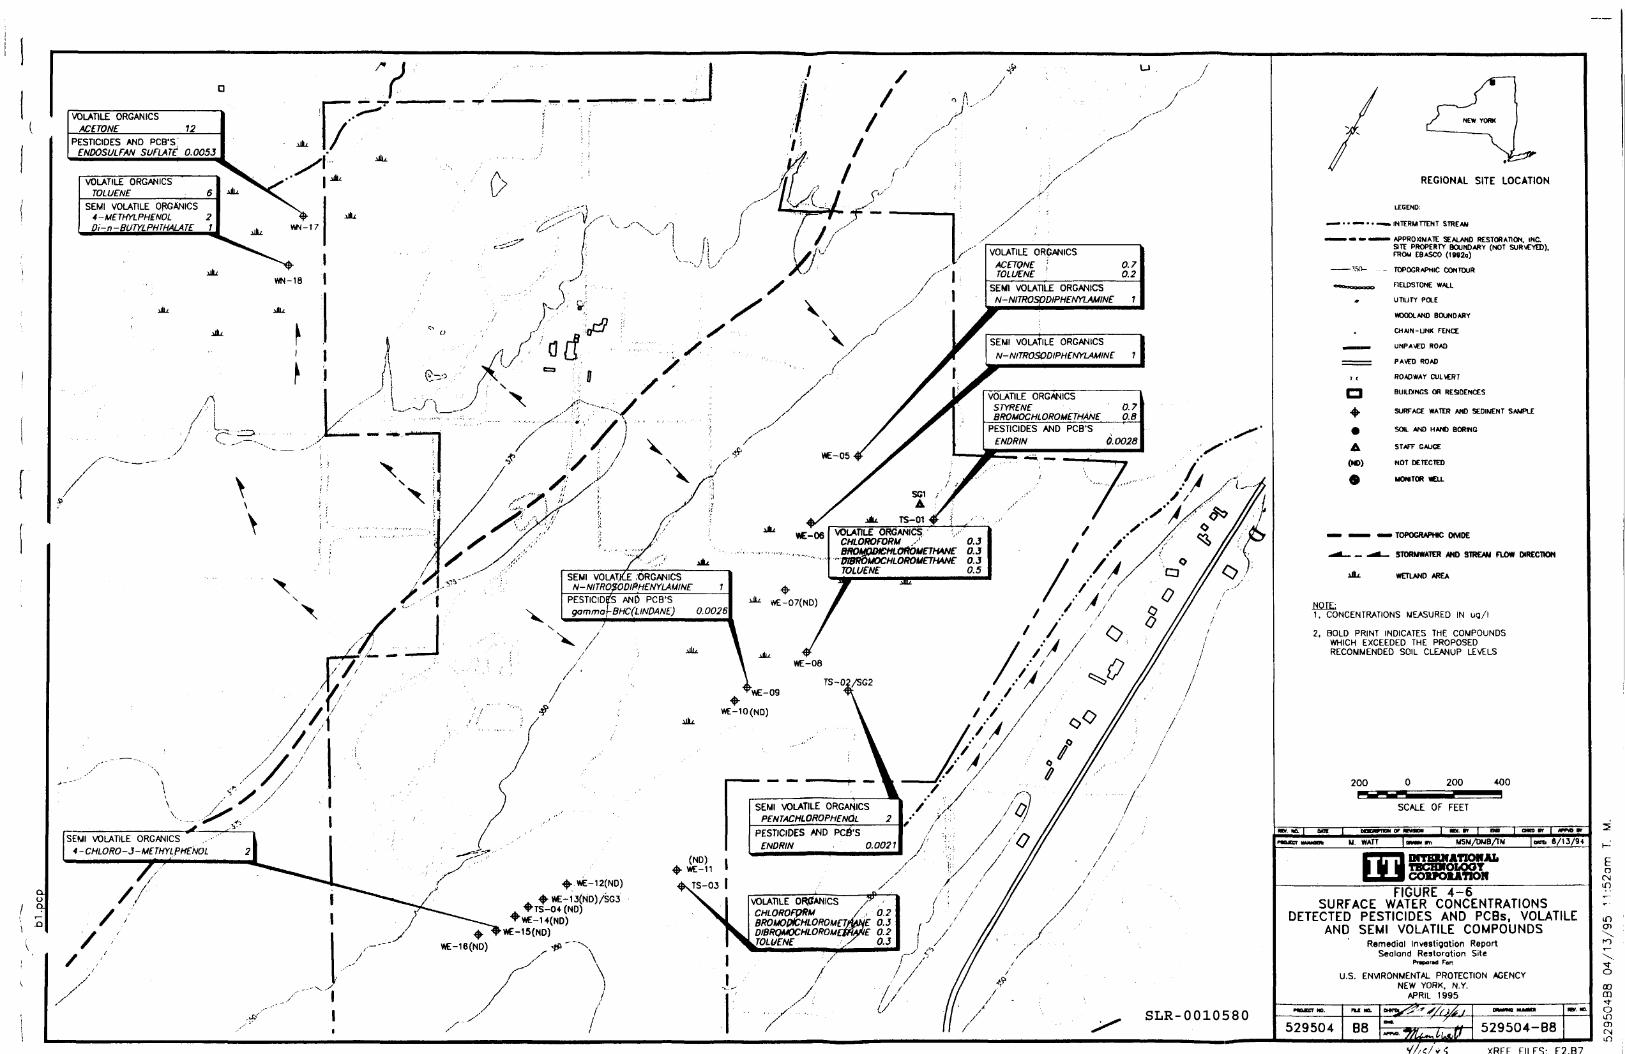
VOLATILE ORGANICSACETONE 12
PESTICIDES AND PCB'SENDOSULFAN SUFLATE 0.0053
REGIONAL SITE LOCATIONVOLATILE ORGANICS
SEMI VOLATILE ORGANICS4-METHYLPHfNOL 2Di-n-BUTYLPHJHALATE 1
LEGEND:
INTERMITTENT STREAM
APPROXIMATE SEALAND RESTORATION. INC.PROPERTY BOUNDARY (NOT SURVEYED).
FROM EBASCO (1»92a)VOLATILE ORGANICSACETQNE ;TOLUENE TOPOGRAPHIC CONTOUR
FIELDSTONE WALL
UTILITY POLE
HOOCH.AND BOUNDARY
CHAIN-LINK FENCE
UNPAID ROAD
PAVED ROAD
ROADWAY CULVERT
BUILDINGS OR RESIDENCES
SEMI VOLATILE ORGANICSN-NITROSpDIPHENYLAUINE 7
SEMI VOLATILE ORGANICSN-NITROSODIPHENYLAMINE 7
VOLATILE ORGANICSSTYRENE 0.7BROUOCHLOROMETHANE 0.8
SURFACE WATER AND SEDIMENT SAMPLE
SOIL AND HAND BORING
STAFF GAUGE
PESTICIDES AND PCB'SENDRIN 6.0028
NOT DETECTED
MONITOR WELL
VOLATILE ORGANICS TOPOGRAPHIC OMDE
STORMWATER AND STREAM FLOW DIRECTION
WETLAND AREA
CHLOROFORM ..•'BaOMOtHEHLOROUETHANCDSIROUOCHLOROUETHANCTOLUENE
SEMI VOLATILE ,'ORGANICSN-NITROSODIPHENYLAUINE 7
PESTICIDES AND PCB'Sgamma\-BHC(LINDANE) 0.0026 NOTE:
1. CONCENTRATIONS MEASURED IN uq/l
2, BOLD PRINT INDICATES THE COMPOUNDSWHICH EXCEEDED THE PROPOSEDRECOMMENDED SOIL CLEANUP LEVELS
WE-09
WE-10(ND)
SEMI VOLATILE ORGANICSPENTACHLOROPHENQL 2
PESTICIDES AND PCB'SENDRIN 0.0021
SEMI VOLATILE ORGANICS4-CHLORO-J-METHYLPHENOL INTERNATIONAL
TECHNOLOGYCORKMAtlOIf
(ND) iVYE-11 '
TS-03 IFIGURE 4-6
SURFACE WATER CONCENTRATIONSDETECTED PESTICIDES AND PCBs, VOLATILE
AND SEMI VOLATILE COMPOUNDS
VOLATILE ORffANICS /*CHLOROFQRU /, 0.2BROUODlCHLOROUETtWiE 0.3DlBRQMOCHLOROMEtftWE 0.2TOLUENE / 0.3 Remedial Investigation Report
Sealand Restoration SitePnporxl Far
U.S. ENVIRONMENTAL PROTECTION AGENCYNEW YORK. N.Y.
APRIL 1995
529504-B8
XRFF Fll F^r F2.B7
SLR-0010580
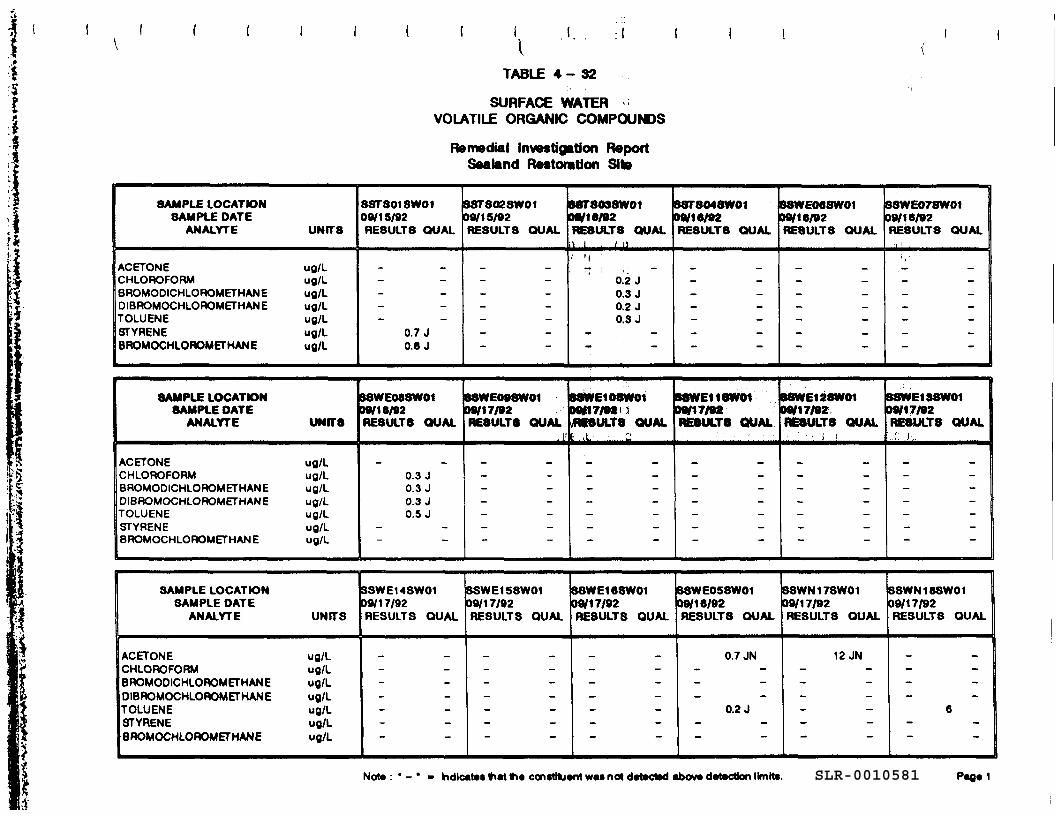
TABLE 4-32
pb-
SURFACE WATER <VOLATILE ORGANIC COMPOUNDS
Remedial Investigation ReportSealand Restoration Site
SAMPLE LOCATIONSAMPLE DATE
ANALYTE UNITS
ACETONE ug/LCHLOROFORM ug/LBROMOOICHLOROMETHANE ug/LDIBROMOCHLOROMETHANE ug/LTOLUENE ug/LSTYRENE ug/LBROMOCHLOROMETHAN E ug/L
SAMPLE LOCATIONSAMPLE DATE
ANALYTE UNITS
ACETONE ug/LCHLOROFORM ug/LBROMODICHLOROMETHANE ug/LDIBROMOCHLOROMETHANE ug/LTOLUENE ug/LSTYRENE ug/LBROMOCHLOROMETHAN E ug/L
88T8018W0109/1 5/92RESULTS QUAL
-----
0.7 J0.8 J
S8WE08SW0199/18/92RESULTS QUAL
_ __
0.3 J0.3 J0.3 J0.5 J
-~~ —
88T8028W0109/15/92RESULTS QUAL
- --
----~- —
S8T8038W0109/1 6/92RESULTS QUAL\ i . t i]' 'I
0.2 J0.3 J0.2 J0.3 J
- .•• •"
B8WE098W01 BSVVEIOSWOI99/17/92 bft/17/9anRESULTS QUAL LRKSULTS QUAL
;. |* ,L- • C
-----*~ "•"
-----•"• ^
8ST8048W0109/16/92RESULTS QUAL
_ ------•• ~
B8WE11SW01D9/17/92RESULTS QUAL
_-----~~ •"•
88WE068W0109/16/92RESULTS QUAL
_ _- --- ---~ —
BSWE12SW01D9/17/92RESULTS QUAL
• ; i :
_
--
--
-~~ ~~
88WE078W0109/16/92RESULTS QUAL
•( 'i .
. — i --
- ----— ~
8SWE19SW0109/17/92RESULTS QUAL..:': 1 1..
_ _
-----_ _
SAMPLE LOCATIONSAMPLE DATE
ANALYTE UNITS
ACETONE ug/LCHLOROFORM ug/LBROMOOICHLOROMETHANE ug/LDIBROMOCHLOROMETHANE ug/LTOLUENE ug/LSTYRENE ug/LBROMOCHLOROMETHAN E ug/L
3SWE14SW01D9/1 7/92RESULTS QUAL
_. _-----« —
SSWE15SW0109/17/92RESULTS QUAL
_ _----
-~ ^
88WE168W0109/17/92RESULTS QUAL
_ __--- --
-«. -•
B8WE058W0109/16/92RESULTS QUAL
0.7 JN---
0.2 J- -™ —
83WN178W0109/17/92RESULTS QUAL
12 JN- ---- -- -
"
SSWN18SW0109/17/92RESULTS QUAL
_ _- ---
6- -
"
Note: • - hdlcctes tout <h« constituent WM not detected above detection limits. PagelSLR-0010581
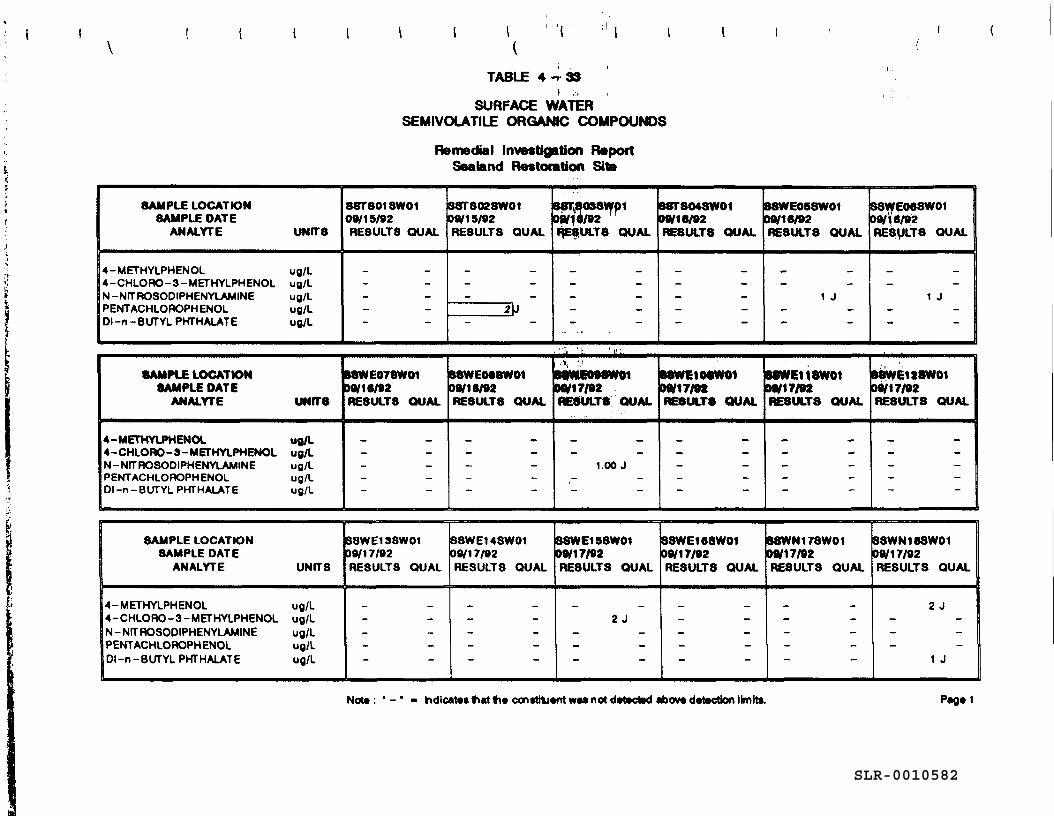
TABLE 4-r 33
SURFACE WATERSEMIVOLATILE ORGANIC COMPOUNDS
Remedial Investigation ReportSeatand Restoration Site
SAMPLE LOCATIONSAMPLE DATE
ANALYTE UNITS
4-METHYLPHENOL ug/L4-CHLORO-3-METHYLPHENOL ug/LN-NfTROSODIPHENYLAMINE ug/LPENTACHLOROPHENOL ug/LDI-n-BLTTYLPHTHALATE ug/L
SAMPLE LOCATIONSAMPLE DATE
ANALYTE UNITS
4-METHYLPHENOL ug/L4-CHLORO-3-METHYLPHENOL ug/LN-NfTROSODIPHENYLAMINE ug/LPENTACHLOROPHENOL ug/LDI-n-BUTYLPHTHALATE ug/L
SST8018W0109/15/92RESULTS QUAL
-
MWE078W0100/16/92RESULTS OUAL
-
88T8028W0109/15/92RESULTS QUAL
-
2\J
BSWEOeSWOI09/16/92RESULTS QUAL
-
SSTljBOSSWplOW#/92RESULTS QUAL
-
• s • i ' i.' i
3SWE098W01DA/17/92RESULTS QUAL
1.00 J
88T804SW0109/16/92RESULTS QUAL
-
B8WE10SW01M/17/92RESULTS QUAL
-
88WE05SW0109/16/92RESULTS QUAL
1 J
SSWE118W01»9/ 17/92RESULTS QUAL
-
ss^Eoeswoi09/16/92RESULTS QUAL
1 J
BSWEItSWOI09/17/92RESULTS QUAL
-
SAMPLE LOCATIONSAMPLE DATE
ANALYTE UNITS
4-METHYLPHENOL ug/L4-CHLORO-3-METHYLPHENOL ug/LN-NfTROSODIPHENYLAMINE ug/LPENTACHLOROPHENOL ug/LDI-n-BLfTYLPHTHALATE ug/L
68WE138W0119/17/92RESULTS OUAL
-
88WE14SW0109/17/92RESULTS QUAL
-
88WE15SW0109/17/92RESULTS QUAL
2 J
88WE168W0109/17/92RESULTS QUAL
-
S8WN178W0109/17/92RESULTS QUAL
-
8SWN188W0109/17/92RESULTS QUAL
2 J
1 J
Note: • kndlcato* that th* conttitJcntwM not d«t»cM«bov* detection limits. Pag*1
SLR-0010582
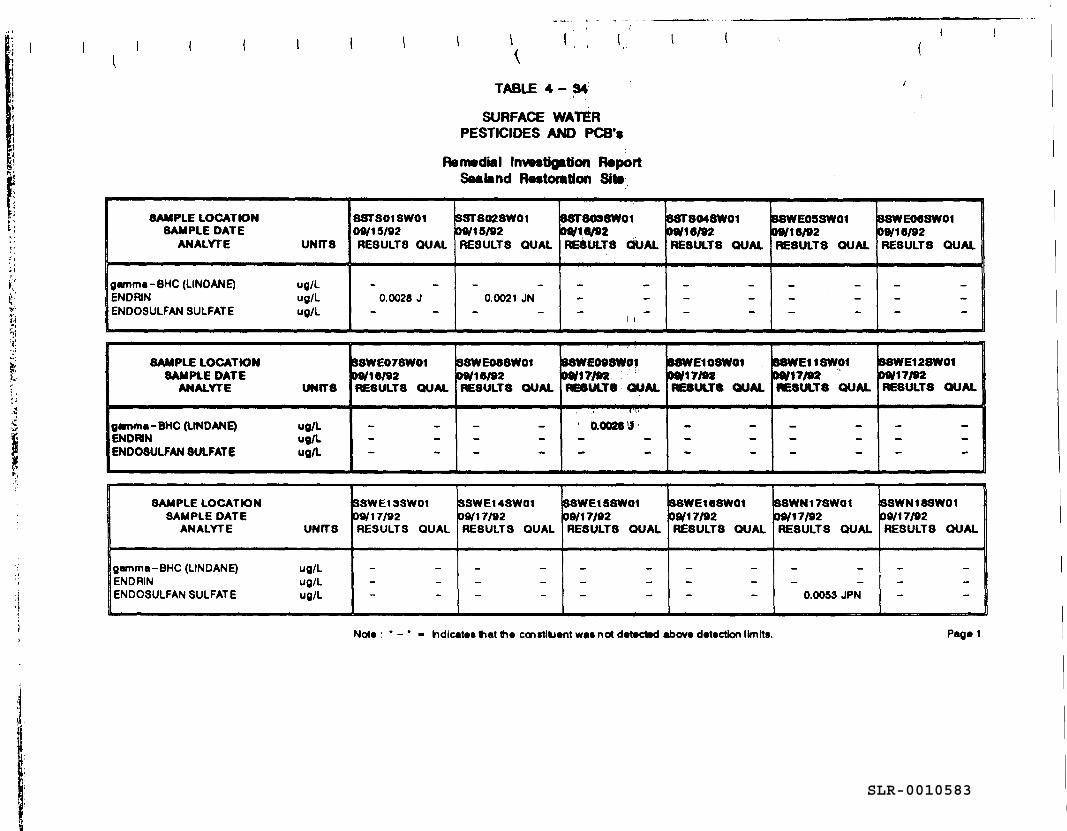
TABLE 4-34
SURFACE WATERPESTICIDES AND PCS'*
Re madia I Investigation ReportSaaland Restoration Site
SAMPLE LOCATIONSAMPLE DATE
ANALYTE UNITS
gamma - 8HC (LINOANE) ug/LENDRIN ug/LENDOSULFAN SULFATE ug/L
SAMPLE LOCATIONSAMPLE DATE
ANALYTE UNITS
gamma- BHC (LINOANE) ug/LENOMN ug/LENDOSULFAN SULFATE ug/L
SAMPLE LOCATIONSAMPLE DATE
ANALYTE UNITS
gamma-BHC(LINDANE) ug/LENDRIN ug/LENDOSULFAN SULFATE ug/L
8STS01SW0109/15/92RESULTS QUAL
0.0028 J
SSWE078W0199/16/92RESULTS QUAL
-
3SWE13SW0100/17/92RESULTS QUAL
-
SST8028W0109/15/92RESULTS QUAL
0.0021 JN
SSWE088W0109/16/92RESULTS QUAL
- -
SSWE148W0109/17/92RESULTS QUAL
-
S8T80S8W0109/10/92RESULTS QUAL
-
8SWE09SW0109/17/92RESULTS QUAL
.1 .*!'.'
0.0026 !T
8SWE1S8W0109/17/92RESULTS QUAL
-
B8TS048W0109/16/92RESULTS QUAL
-
B8WE1O8W01Oft/17/92RESULTS QUAL
-
88WE16SW0109/17/92RESULTS QUAL
-
B8WE05SW0108/16/92RESULTS QUAL
-
88WE11SW01Dft/17/92RESULTS QUAL
-
B8WN178W0109/17/92RESULTS QUAL
0.0053 JPN
B8WE068W0109/16/92RESULTS QUAL
-
88WE123W0109/17/92RESULTS QUAL
-
88WN18SW0109/17/92RESULTS QUAL
-
Not* : • - ' • hdicates friat th« constiu»nt was not detected abov* detection limits. Pag»1
SLR-0010583
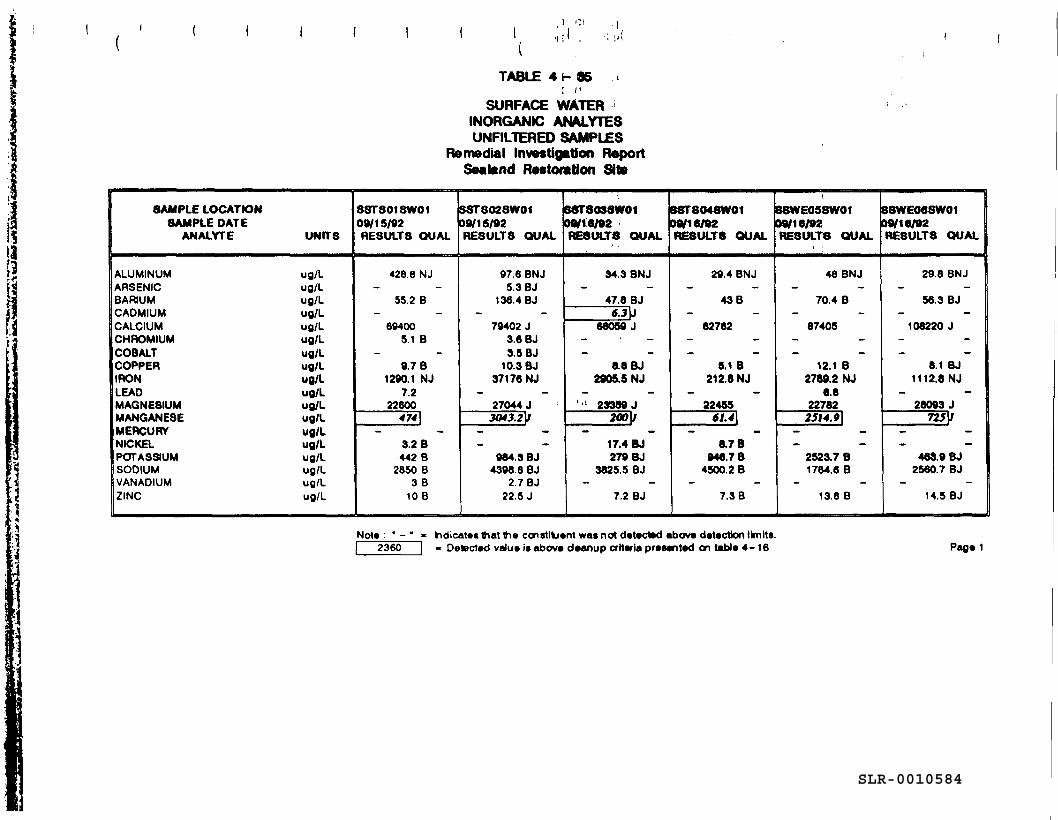
TABLE 4 H 06r c
SURFACE WATERINORGANIC ANALYTESUNFILTERED SAMPLES
Remedial Investigation ReportSealand Restoration Site
SAMPLE LOCATIONSAMPLE DATE
ANALYTE UNITS
ALUMINUM ug/LARSENIC ug/LBARIUM ug/LCADMIUM ug/LCALCIUM ug/LCHROMIUM ug/LCOBALT ug/LCOPPER ug/LIRON ug/LLEAD ug/LMAGNESIUM ug/LMANGANESE ug/LMERCURY ug/LNICKEL ug/LPOTASSIUM ug/LSODIUM ug/LVANADIUM ug/LZINC ug/L
S8TS018W0109/15/92RESULTS QUAL
426.8 NJ-
55.2 B-
604005.1 B
_9.7 B
1290.1 NJ7.2
22600«M|
3.2 B442 B
2850 B3B
10 B
SST802SW0109/15/92RESULTS QUAL
97.6 BNJ5.3 BJ
136.4BJ-
79402 J3.6 BJ3.6 BJ
10.3BJ37176NJ
-27044 J
3043.2\f--
984.3 BJ4398.8 BJ
2.7 BJ22.5 J
BST8033W0109/16/92RESULTS QUAL
34.3 BNJ-
47.6 BJtf.Jp
66059 J--
8.8 BJ2905.5 NJ
- -' • 23359 J
200 1/- -
17.4 BJ279 BJ
3825.5 BJ-
7.2 BJ
B8T8048W0109/18/92RESULTS QUAL
29.4 BNJ-
43 B-
62762--
5.1 B212.8NJ
- -22455
•L4\
8.7 B948.7 B
4500.2 B-
7.3 B
B8WE058W0109/19/92RESULTS QUAL
48 BNJ-
70.4 B-
87405--
12.1 B2789.2 NJ
6.8227822514.9|
- -- -
2523.7 B1784.6 B
-13.8B
8SWE06SW0109/16/92RESULTS QUAL
29.8 BNJ-
56.3 BJ-
108220 J-
-8.1 BJ
11 12.8 NJ- -
28093 J725 1/
- -- -
463.9 BJ2560.7 BJ
-14.5 BJ
Note : * - • - hdicates that »ie constltient was not detected above detection limit*.| 2360 | » Detected value is above deanup criteria presented on table 4-16 Page 1
SLR-0010584
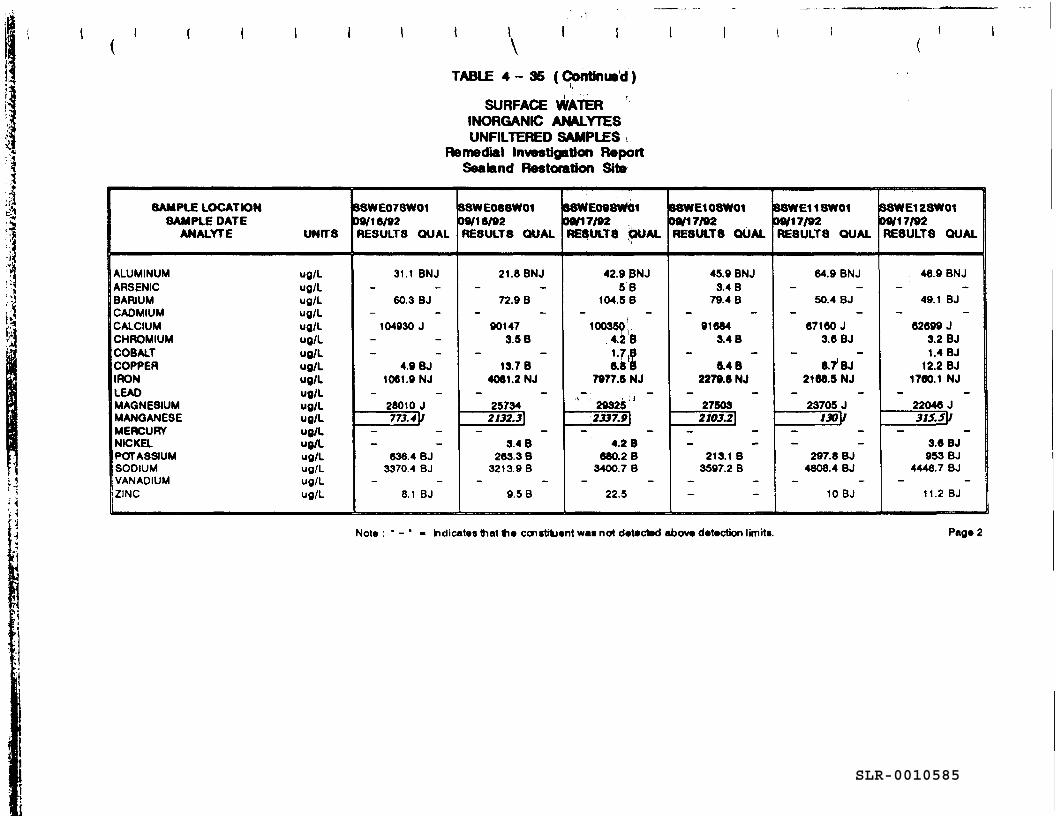
VTABLE 4 - 36 (Continued)
SURFACE WATERINORGANIC ANALYTESUNFILTERED SAMPLES
Remedial Investigation ReportSeakmd Restoration Site
SAMPLE LOCATIONSAMPLE DATE
ANALYTE UNITS
ALUMINUM ug/LARSENIC ug/LBARIUM ug/LCADMIUM ug/LCALCIUM ug/LCHROMIUM ug/LCOBALT ug/LCOPPER ug/LIRON ug/LLEAD ug/LMAGNESIUM ug/LMANGANESE ug/LMERCURY ug/LNICKEL ug/LPOTASSIUM ug/LSODIUM ug/LVANADIUM ug/LZINC ug/L
SSWE078W0109/16/92RESULTS QUAL
31.1 BNJ-
60.3 BJ-
104930 J-_ _
4.9 BJ1061.9 NJ
-28010 J773.4\/
--
636.4 BJ3370.4 BJ
-8.1 BJ
SSWE088W0109/16/92RESULTS QUAL
21. 8 BNJ-
72.9 B-
901473.5 B
_ _13.7B
4061. 2 NJ-
257342I32.3\
-3.4 B
263.3 B321 3.9 B
-9.5 B
SSWE098W0109/17/92RESULTS QUAL
42.9 BNJSB
104.5 B-
10036Q,4.2 B1l7lg6.8 B
7977.5 NJ
293252337.9\
- -4.2 B
660.2 B3400.7 B
-22.5
SSWE108W0109/17/92RESULTS QUAL
45.9 BNJ3.4 B
79.4 B-
916843.4 B
_ _5.4 B
2279.6 NJ- -
275032103.2\
- -- -
213.1 B3597.2 B
-_ _
88WE11SW0109/17/92RESULTS QUAL
64.9 BNJ-
50.4 BJ-
87180 J3.6 BJ
_ _8.7 BJ
2188.5 NJ-
23705 J130 ]l
- -- -
207.8 BJ4808.4 BJ
-10 BJ
S8WE12SW0109/17/92RESULTS QUAL
46.9 BNJ-
49.1 BJ-
62699 J3.2 BJ1.4 BJ
12.2 BJ1760.1 NJ
-22046 J31S.S\I
- -3.6 BJ953 BJ
4446.7 BJ-
11.2 BJ
Note : ' - ' - Indicates Ihat tie ccnstrLient was not detected above detection limits. Page 2
SLR-0010585
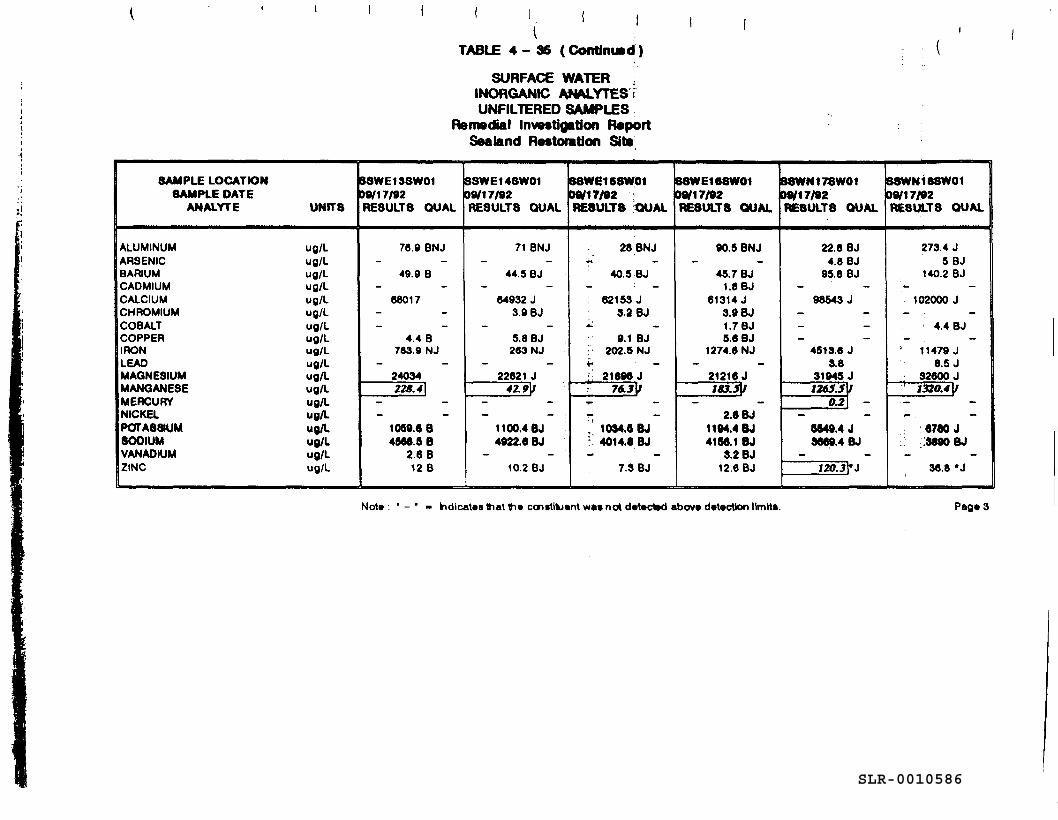
TABLE 4 - 35 ( Continued)
SURFACE WATERINORGANIC ANALYTESUNFILTERED SAMPLES
Remedial Investigation ReportSealand Restoration Site
SAMPLE LOCATIONSAMPLE DATE
ANALYTE UNITS
ALUMINUM ug/LARSENIC ug/LBARIUM ug/LCADMIUM ug/LCALCIUM ug/LCHROMIUM ug/LCOBALT ug/LCOPPER ug/LIRON ug/LLEAD ug/LMAGNESIUM ug/LMANGANESE ug/LMERCURY ug/LNICKEL ug/LPOTASSIUM ug/LSODIUM ug/LVANADIUM ug/LZINC ug/L
B8WE1S8W0109/17/92RESULTS QUAL
70.9 BNJ-
49.9 B-
68017--
4.4 B783.9 NJ
-24034228.4]
--
1059.6 B4S66.SB
2.6 B12 B
SSWE148W0109/17/92RESULTS QUAL
71 BNJ-
44.5 BJ-
64932 J3.9 BJ
-5.8 BJ
263 NJ-
22821 J42.9V
- ,- ::
1100.4 BJ4922.6 BJ
-10.2 BJ
S8WE15SW0109/17/92 :RESULTS QUAL
28 BNJ—.
40.5 BJ: _
: 62153 J3.2 BJ
4- —
9.1 BJ202.5 NJ
+• • -; 21696 J
76.3Vi. -*•, 1094.6 BJ! 4014.8 BJ- -
7.3 BJ
88WE168W0109/17/92RESULTS QUAL
90.5 BNJ-
45.7 BJ1.8BJ
61314 J3.9 BJ1.7BJ5.6 BJ
1274.6 NJ- -
21216 J183.3V
- -2.0 BJ
1 194.4 BJ4156.1 BJ
3.2 BJ12.6 BJ
88WN178W0109/17/92RESULTS QUAL
22.6 BJ4.6 BJ
95.6 BJ_ _
98543 J-- -- -
4513.6 J3.8
31945 J120*5 1
OJ --
8549.4 J3669.4 BJ
- -120. JN
S3WN188W0109/17/02RESULTS QUAL
273.4 J5BJ
140.2 BJ•- -
102000 J_ , _
4.4 BJ-
11479J8.5 J
32600 J! I320.4]f_ _-
6760 J;3890BJ
- -36.8 *J
Not* : hdicates that th» ccnttiti«nt was not detected abov* detection (knit*. Pag* 3
SLR-0010586
Volatile Organic Compounds. Seven volatile organic compounds were detected at very lowconcentrations (near or slightly above the detection limits) in 6 of 18 surface water samplescollected as part of this RI. Table 4-32 presents the results of the VOC analyses for the surfacewater samples.
The samples which exhibited the highest volatile organic concentrations were WN-17 (acetone -12 pg/L) and WN-18 (toluene - 6 pg/L), both located in die area of the northwestern wetlands.
The remaining samples had total VOC concentrations ranging between 0.2 ug/L to 0.8 pg/L.No VOCs detected in the surface water samples exceeded NYSDEC AWQ standards.
Semivolatile Organic Compounds. A total of five different semivolatfle organic compoundswere detected at low concentrations (<5 pg/L) in the surface water samples collected as pan ofthis RI (Table 4-33). Only 6 of 18 surface water samples exhibited detections of at least one ofthese compounds. The sample with the highest total semivolatile organic concentration was WN-18 (4-methylphenol - 2 pg/L and di-n-butyl phthalate - 1 pg/L), located in the area of thenorthwestern wetlands. In addition, sample WE-15, located directly east of the former disposalcell, exhibited a detection of 4-chloro-3-methylphenol (2 pg/L) and sample TS-02 showed adetection of pentachlorophenol (2 pg/L). N-nitrosodiphenylamine was detected in sample WE-05,WE-06, and WE-09 at a concentration of T^pg/1.
No semivolatile organic compounds detected in the surface water sarapfes exceedea"NYSDECAWQ standards.
PestlCld0S and PCBs. Four pesticides were detected at low concentrations (<0.01 pg/L) inthe surface water samples collected at the SRI site (Table 4-34). These constituents are endrin,endosulfan sulfate, and gamma-BHC (also referred to as lindane). Only 4 of 18 surface watersamples exhibited detections of one of these constituents. Endrin was detected in samples TS-01(0.0028 pg/L) and TS-02 (0.0021 pg/L), both of which are located at the eastern tributary toSucker Brook. Both samples slightly exceeded the NYSDEC AWQ standard for endrin of 0.002pg/L. Gamma-BHC was detected only in sample WE-09, located east and topographicallydowngradient of landspreading area L, at an estimated concentration of 0.0026 pg/L. Endosulfansulfate was detected in sample WN-17, located in the northwestern wetlands, at 0.0053 pg/L.There are no NYSDEC AWQ standards for gamma-BttC and endosulfan sulfate. No pesticideexceeded their respective EPA Water Quality Standards.
EDIS/ENG/ay071494jp4 4-162 SLR-0010587
PCBs were not detected in any of the surface water samples collected.
Inorganic Analytes. Eighteen inorganic constituents were detected in the surface watersamples collected from the SRI site (Table 4-35). In general, the filtered samples exhibited lowerconcentrations than the unfiltered samples indicating that the majority of the inorganicconstituents detected in the surface water were present suspended-phase particulates.
The only inorganic constituent to exceed die NYSDEC AWQ standard was iron. The standardfor iron is 300 ug/L. The concentrations of iron in the surface water samples ranged from202.5 pg/L to 37,176 ug/L for unfiltered samples and 136 ug/L to 3071 pg/L for filteredsamples. The sample which exhibited the highest iron concentration (unfiltered) was from asample collected from location TS-02, which is located at the eastern tributary to Sucker Brook.In addition, copper exceeded the EPA Water Quality Standard of 18 pg/L in sample TS-04 at45.2 pg/L and cadmium exceeded its EPA Water Quality Standard of 3.9 pg/L in sample WE-12at 12.2 pg/L.
Surface Water Summary. Surface water organic contamination at the SRI site is minimal.Low concentrations of a few volatile and semivolatile organic compounds and pesticides weredetected, primarily in the area of the northwestern wetlands and the eastern tributary to SuckerBrook. The only inorganic constituent to exceed the NY State Ambient Water Quality Standardsfor Qass D waters was iron, which was detected in concentrations as high as 37,176 pg/L in thesuspended-phase in the eastern tributary to Sucker Brook. Copper and cadmium concentrationsexceeded EPA Water Quality Standards in surface water samples TS-04 (45.2 pg/L) and WE-12(6.3 pg/L), respectively.
4.43 Sediment AnalysesSediment samples were collected coincidentally with the surface water samples at the same18 sample location points (Figure 2-2). The sediment samples were analyzed for full TCL/TALparameters, including cyanide. Tables 4-36 through 4-39 as well as Figure 4-7 present thesummary of compounds detected in the sediment samples. Appendix A presents the sedimentlaboratory analytical results.
Volatile Organic Compounds. Three volatile organic compounds were detected in 4 of 18sediment samples collected as part of this RI (Table 4-36). These compounds are chloroform,2-butanone and toluene. All three compounds were detected in sample WE-13, located east ofthe former disposal cell, at 1 pg/kg, 17 pg/kg and 6 pgAg, respectively. Other sediment samples
EDIS/ENG/ay071494.ip4 4-163
SLR-0010588
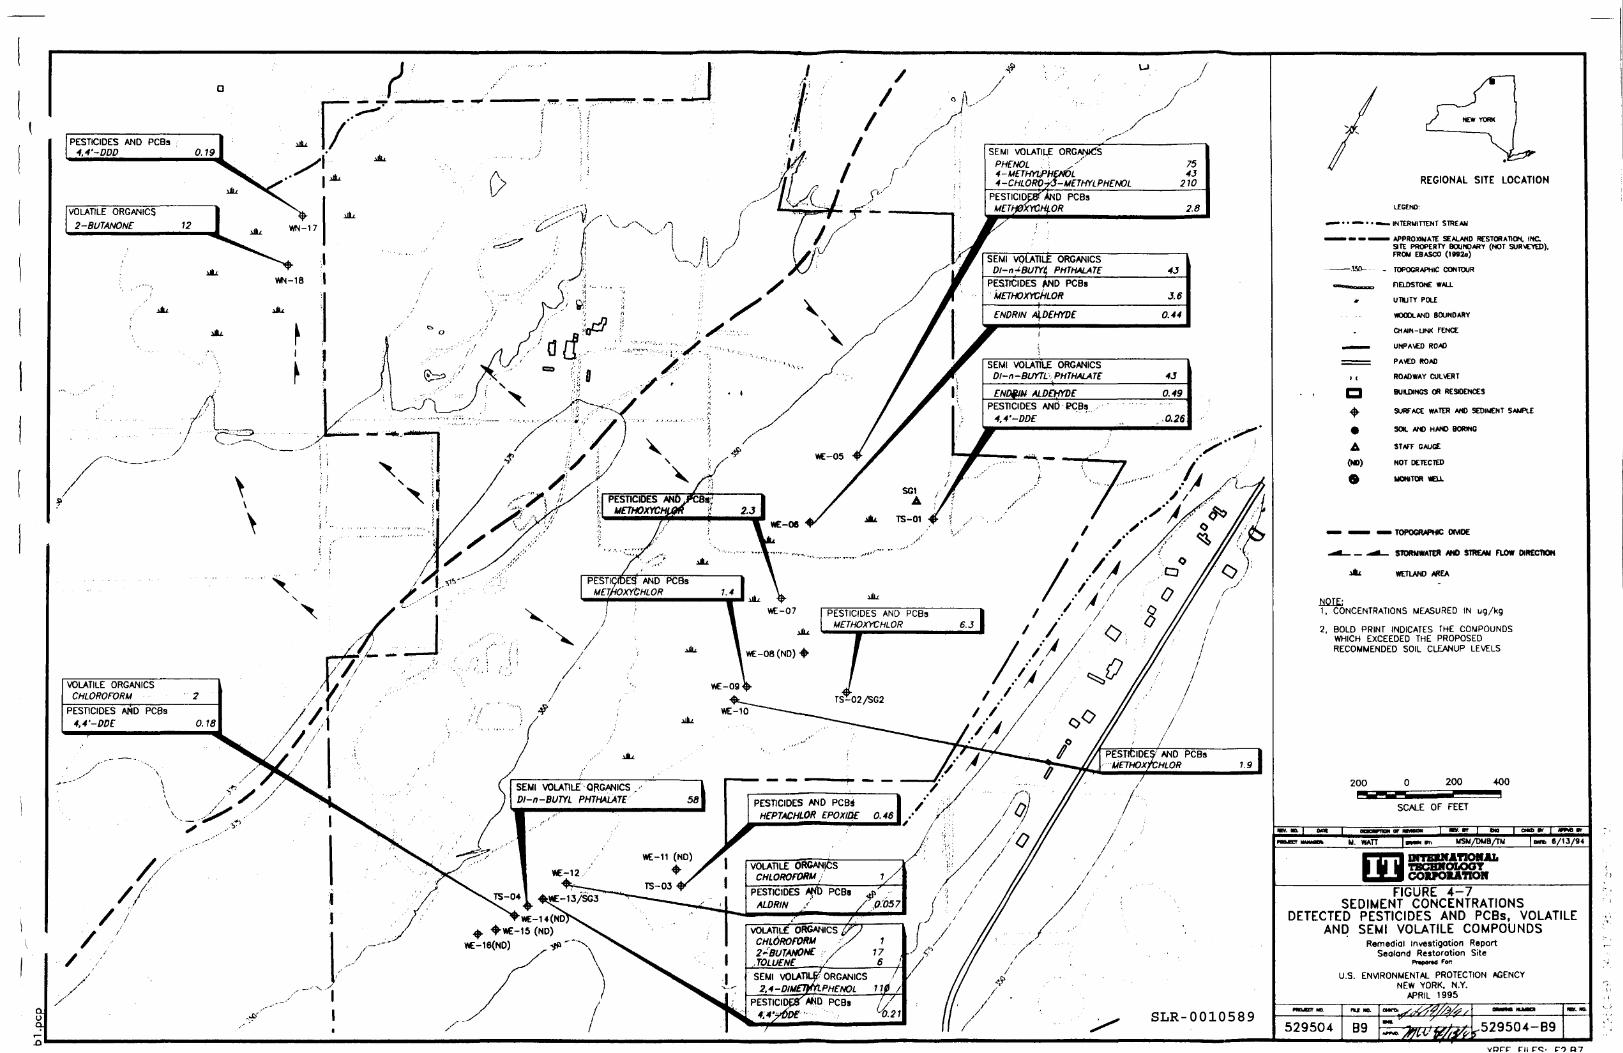
#
PESTICIDES AND PCBs4,4'-DDD__________ft 79 | Ju
Ju
VOLATILE ORGANICS2-BUTANONE 12 uLt
0WN-17
M-18 I
JU
JU
^
X
>
X
VOLATILE ORGANICSCHLOROFORM 2
PESTICIDES AND PCBs4.4'-DDE 0.18
SEMI VOLATILE ORGANJCSPHENOL \ xX
4-M£THYLPHE*fDL4-CHLORO-&-UETHYLPHENOL
PESTICIDES!" AND PCBsMETHJ0XYCHLOR
PESTICIDESHETHOXYCHUaR * 2.3
PESTICIDE3 AND PCBsMETHOXYCHLOR
PESTICIDES AND PCBsMETHOXYCHLOR
PESTICIDES AND PCBsUEJHOXrCHLOR
VOLATILE ORGANICS-BUTYL PHTHALATE PESTICIDES AND PCBi • /
HEPTACHLOR EPOXIOE 0.461 .' /'
VOLATILE ORGANICSCHLOROFORM
PESTICIDES AND PCBsALDRIN
2~BUTANONETOLUENE
SEMI VOLATILEf ORGANICS2.4-DIUETtM.PHENOL 110 /
PESTICIDES WD PCBs-*'
/'
AL
REGIONAL SITE LOCATION
LEGEND:
. INTERMITTENT STREAM
• APPROXIMATE SEALAND RESTORATION. INC.SITE PROPERTY BOUNDARY (NOT SURVEYED).FROU EBASCO (1M2o)
TOPOGRAPHIC CONTOUR
FIELDSTONE WALL
UTILITY POLE
WOODLAND BOUNDARY
CHAIN-LINK FENCE
UNPAVED ROAD
PAKD ROAD
ROADWAY CULVERT
BUILDINGS OR RESIDENCES
SURFACE WATER AND SEDIMENT SAMPLE
SOU. AND HAND BORING
STAFF GAUGE
NOT DETECTED
MONITOR WELL
'TOPOGRAPHIC DIVIDE
STORMWATER ANO STREAM FLOW DIRECTION
WETLAND AREA
NOTE:1. CONCENTRATIONS MEASURED IN ug/kg
2. BOLD PRINT INDICATES THE COMPOUNDSWHICH EXCEEDED THE PROPOSEDRECOMMENDED SOIL CLEANUP LEVELS
200 0 200____400
SCALE OF FEET
\ MSM/DUB/TM S/13/94
FIGURE 4-7SEDIMENT CONCENTRATIONS
DETECTED PESTICIDES AND PCBs, VOLATILEAND SEMI VOLATILE COMPOUNDS
Remedial Investigation ReportSealond Reiteration Site
Pnporad FOR
U.S. ENVIRONMENTAL PROTECTION AGENCYNEW YORK. N.Y.
APRIL 1995
529504 B9vorr rn re. n 07
SLR-0010589
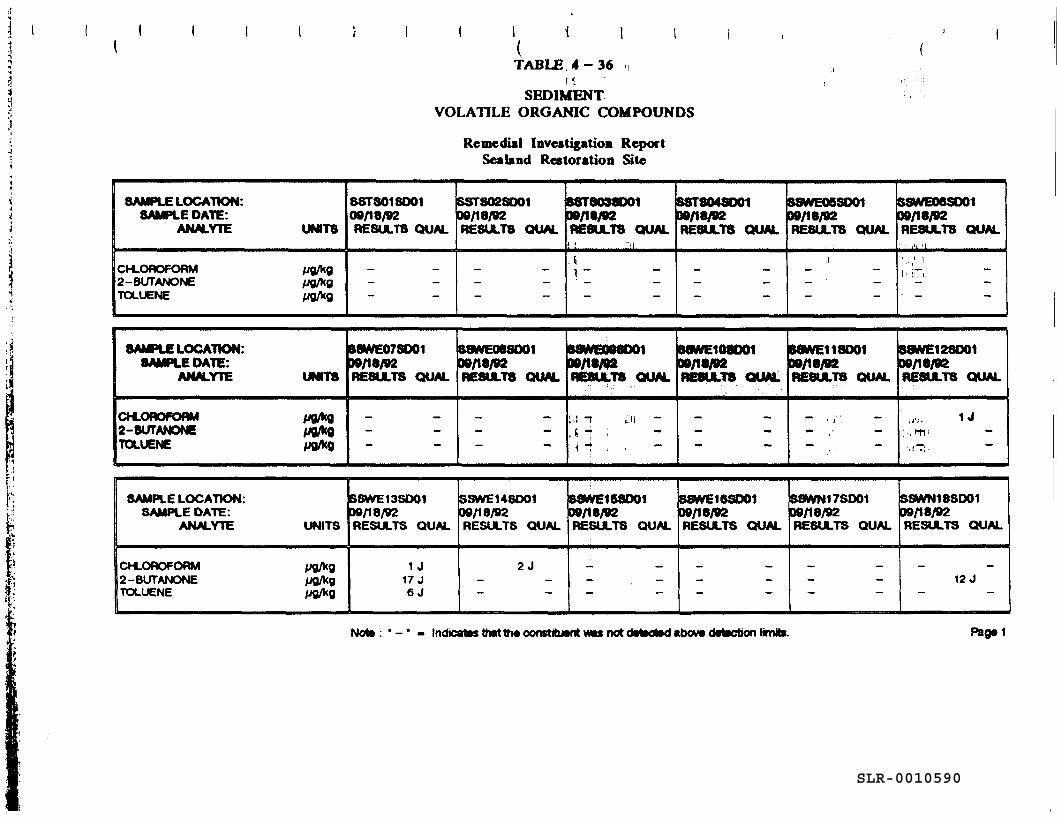
TABLE 4-36
SEDIMENTVOLATILE ORGANIC COMPOUNDS
Remedial Investigation ReportSealand Restoration Site
SAMPLE LOCATION:SAMPLE DATE:
ANALYTE UNITS
CHLOROFORM pg/kg2-BUTANONE /Jg/KgTOLUENE /vg/kg
SAMPLE LOCATION:SAMPLE DATE:
ANALYTE UNITS
CHLOROFORM pg/kg2-BUTANONE pg/kgTOLUENE pg/kg
SSTS01SD0100/18/02RESULTS QUAL
- -
B8WE078D01)0/18/02RESULTS QUAL
— —
SSTS02SD0100/18/02RESULTS QUAL
- -
88WE08SD01DO/18/02RESULTS QUAL
-
8ST8038D0100/18/02RESULTS QUAL! . ~tl
\
\ ~
B8WE008001DO/18/02RESULTS QUAL
!.! ~! til -;< ~ i'-H , .
SST8048D0100/18/02RESULTS QUAL
-
B8WE108O0100/18/02RESULTS QUAL
-
SSWE06SD0100/18/02RESULTS QUAL
B8WE1 18001DO/18/02RESULTS QUAL
""* 1 j' . *""
SSWE08SD0100/18/02RESULTS GOAL
,ii 'i. ' : ; , ' 1 :i ' :!Ti
88WE128D01DO/18/OC2RESULTS QUAL
.:„',. 1 U; .; f(i i -
•.(T:
SAMPLE LOCATION:SAMPLE DATE:
ANALYTE UNITS
CHLOROFORM tfj/kg2-BUTANONE pg/kgTOLUENE / g/kg
SSWE13SD01DO/1 8/92RESULTS QUAL
1 J17 J6J
SSWE14SD0100/18/02RESULTS QUAL
2 J
8SWE158D01DO/I 8/02RESULTS QUAL
-
SSWE16SO01DO/18/02RESULTS QUAL
- —
SSWN17SD0100/18/02RESULTS QUAL
-
SSWN18SD0100/18/02RESULTS QUAL
12 J
Note • - Indicates that th«oons«uw* was not detected abov* detection limte. Pagel
SLR-0010590
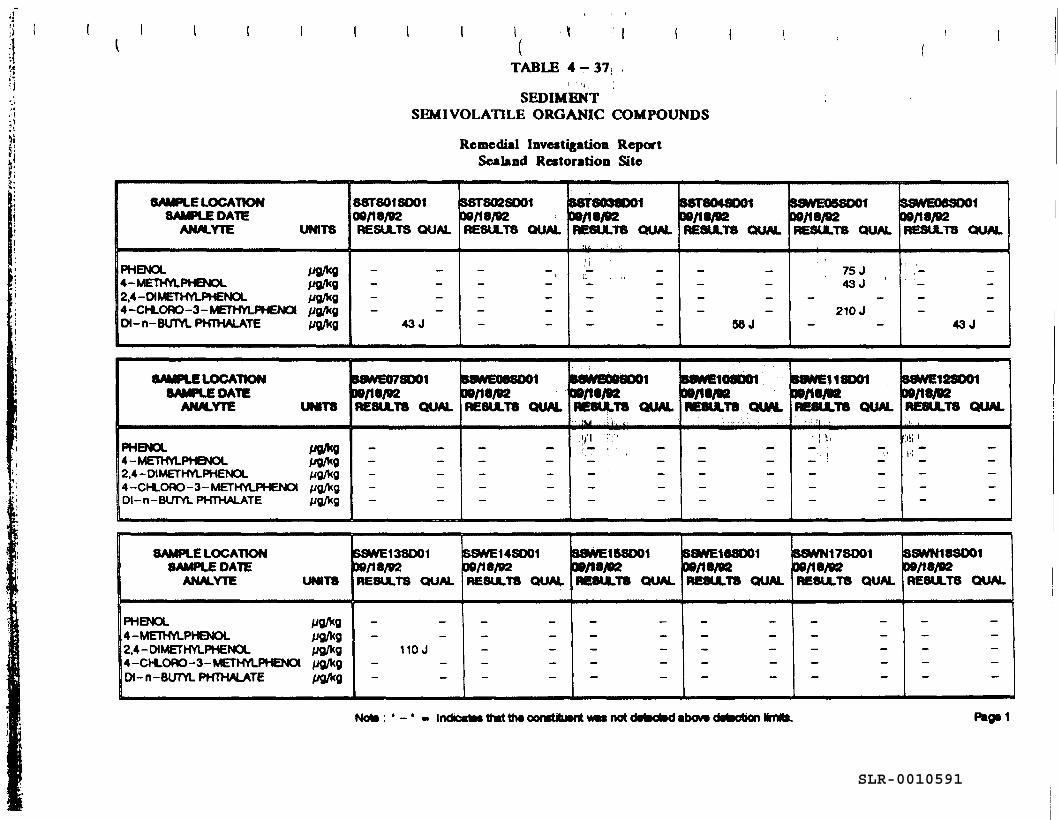
TABLE 4-37,
SEDIMENTSEMI VOLATILE ORGANIC COMPOUNDS
Remedial Investigation ReportSealand Restoration Site
Q^Mt C L&JvnimiVSAMPLE DATE
ANALYTE UNITS
PHENOL pg/kg4-METHVLPHENOL fig/kg2,4-DIMETHYLPHENOL //g/kg4-CH.ORO-3- METHYLPHENO» ^g/kgD»-n-BUTYL PHTHALATE yg/kg
SAMPLE LOCATIONSAMPLE DATE
ANALYTE UNITS
PHENOL Pg/kg4-METHYLPHENOL *«g/kg2.4-DIMETHYLPHENOL />g/kg4-CHLOflO-3-METHYLPHENOI ^g/kgDl - n - BUTYL PHTHALATE /jg/kg
S8TS01SD0100/18/92RESULTS QUAL
43J
BSWE078D01W/18/92RESULTS QUAL
-
&&T802SO0100/18/92RESULTS QUAL
1
SSWE08SD01DO/18/92RESULTS QUAL
-
&ttfd03S00100/18/92RESULTS QUAL
/ i
JO/18/92RESULTS QUAL
'•• aa •'••'f ii
'!'l ' ' • ' • '1- •
5ST8048O0100/18/92RESULTS QUAL
58 J
BSWE108O0100/18/92RESULTS QUAL
-
SSWEO5SD0100/18/02RESULTS QUAL
75 J43J '
210 J
BSWE118O01W/18/92RESULTS QUAL
! '!'.1 } 1 ', '
SSWE06SD01M/I8/B2RESULTS QUAL
43 J
S8WE12SD01D9/18/92RESULTS QUAL
:>!i 'i ;
SAMPLE LOCATIONSAMPLE DATE
ANALYTE UNITS
PHENOL jyg/Vg4-METHYLPHENOL /;g/kg2,4-CXMETHYLPHENOL ^g/kg4-CHLORO-3-METHYLPHENOI pg/kgDI-n-BUTYL PHTHALATE j/g/kg
5SWE138O0109/18/92RESULTS QUAL
110J
8SWE14SO0109/18/92RESULTS QUAL
-
S8WE158D0109/18/92RESULTS QUAL
; ::S8WE1S8D0100/18/92RESULTS QUAL
; iSSWN178D0100/18/92RESULTS QUAL
; ;SSWN18SO0109/18/82RESULTS QUAL
-
Note: '-' - lrxte«^1hrtth«oon8tihJ»it\*iwrKjtdrts<*»d«tx)v»drtsc«k«finite.
SLR-0010591
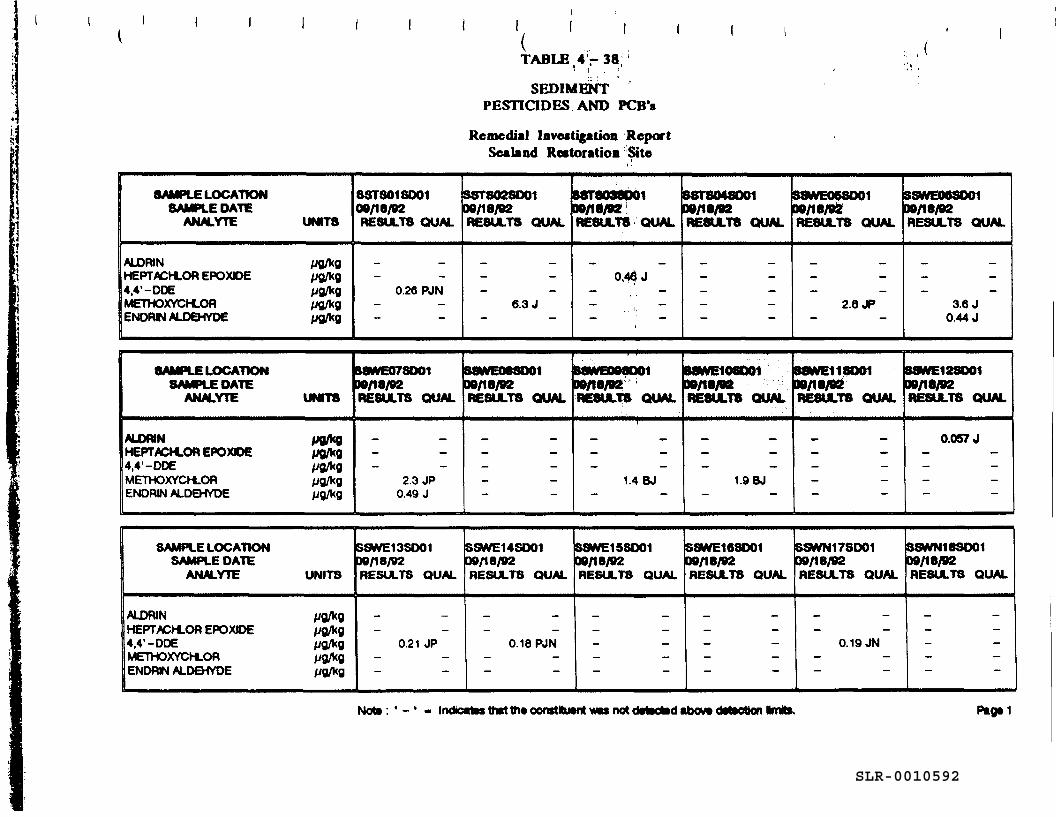
TABLE 4r38;" i . 'SEDIMENT
PESTICIDES AND PCB's
Remedial Investigation ReportSealand Restoration Site
SAMPLE LOCATIONSAMPLE DATE
ANALYTE UNITS
ALOFUN pfl/KgHEPTACHLOR EPOXOE pg/kg4,4' -DOE pg/kgMETHOXYCHLOR //g/kgENDRW ALDEHYDE pg/Kg
SAMPLE LOCATIONSAMPLE DATE
ANALYTE UNITS
ALOfVN JJ0/I<0HEPTACHLOR EPOXDE //Q/kfl4,4' -DDE PO/VgMETHOXYCHLOR pg/kgENDRIN ALDEHYDE pg/kg
6ST8018D01oe/ie/92RESULTS QUAL
0.26 PJN
MNVE07SD0110/18/92RESULTS QUAL
2.3 JP0.49 J
SSTS02SD0100/18/92RESULTS QUAL
6.3 J
8CWE088D0100/18/92RESULTS QUAL
-
8ST803SP01D0/I8y92RESULTS QUAL
O^J
, , I-1
BSWCOOSD01DO/18/92RESULTS QUAL
1.4 BJ
S8TS04S00100/18/92RESULTS QUAL
-
S8WE108Q01W/18/92RESULTS QUAL
1.9 BJ
SSWE06SD0100/18/92RESULTS QUAL
2.8 JP
BSWE11SO01DO/18/92RESULTS QUAL
-
SSWE06S00100/18/92RESULTS QUAL
3.6 J0.44 J
SSWE12S001DO/18/92RESULTS QUAL
0.057 J
SAMPLE LOCATIONSAMPLE DATE
ANALYTE UNITS
ALDR1N /jg/kgHEPTACHLOR EPOXIDE pg/kg4,4' -DDE pg/kgMETHOXYCHLOR pg/kgENDRIN ALDEHYDE pg/kg
SSWE13SD01W/18/92RESULTS QUAL
0.21 JP
SSWE14SD0109/18/92RESULTS QUAL
0.18 PJN
SSWE15SD0100/18/92RESULTS QUAL
-
SSWE16SD0100/18/92RESULTS QUAL
-
SSWN17SD0109/18/92RESULTS QUAL
0.19JN
SSWN18SD0109/18/92RESULTS QUAL
_
Note: '-• - Pag*1
SLR-0010592
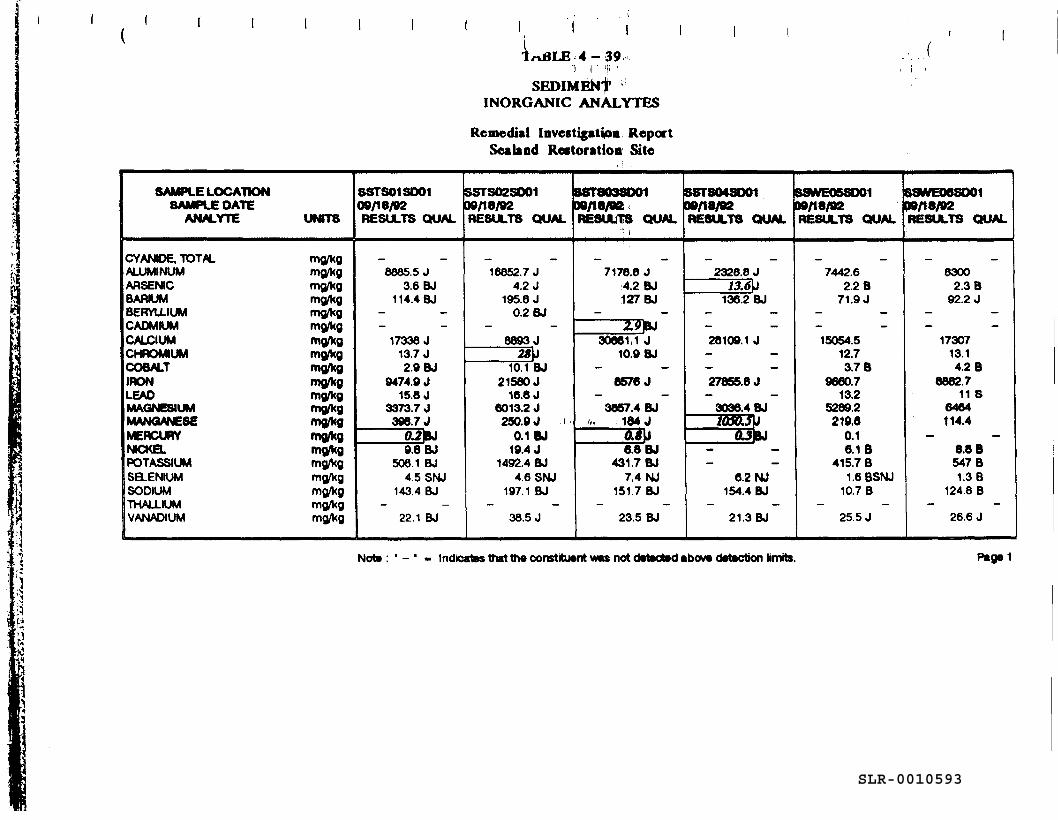
4-39') l' f •
SEDIMENtINORGANIC ANALYTES
Remedial Investigation ReportSealand Restoration Site
OnMn.C LAA*nimraSAMPLE DATE
AMALYTE UNITS
CYANIDE, TOTAL mg/KgALUMINUM mg/kgARSENIC mg/KgBARIUM mg/KgBERYLLIUM mg/KgCADMIUM mg/kgCALCIUM mg/KgCHROMIUM mg/KgCOBALT mg/KgIRON mg/KgLEAD mg/KgMAGNESIUM mg/KgMANGANESE mg/KgMERCURY mg/kgNICKEL mg/KgPOTASSIUM mg/KgSB.ENHJM mg/kgSODIUM mg/kgTHALLIUM mg/kgVANADIUM mg/kg
SSTS01SD0109/18/02RESULTS QUAL
8665.5 J3.6 BJ
114.4 BJ
-17336 J
13.7 J2.9 BJ
9474.9 J15.8 J
3373.7 J398.7 J
0.2BJ9.8 BJ
506.1 BJ4.5 SNJ
143.4 BJ
22.1 BJ
SSTS02S00109/18/92RESULTS QUAL
16652.7 J4.2 J
195.6 J0.2 BJ
-8893 J
2*p10.1 BJ
21580 J16.8 J
6013.2 J250.9 J i
0.1 BJ19.4 J
1492.4 BJ4.6 SNJ
197.1 BJ
38.5 J
SSTS03SD0100/18/92RESULTS QUAL
~ i
7178.8 J4.2 BJ127 BJ
ZPPJ306611 J
10.9 BJ
6576 J
3857.4 BJ'.. 184 J
OJU6.8 BJ
431.7 BJ7,4 NJ
151.7 BJ
23.5 BJ
SSTS048O0109/18/92RESULTS QUAL
2328.8 J13.6\J
136.2 BJ
_ _28109.1 J- -
27855.8 J
3036.4 BJ1050.5})
flUBJ
6.2 NJ154.4 BJ
21.3 BJ
SSWE05SO0109/18/92RESULTS QUAL
7442.62.2 B
71.9 J
-15054.5
12.73.7 B
9660.713.2
5289.2219.6
0.16.1 B
415.7 B1.6BSNJ
10.7 B
25.5 J
&SWE06SO0109/18/92RESULTS QUAL
63002.3 B
92.2 J
- -17307
13.14.2 B
8882.711 S
6464114.4
- -8.8 B547 B1.3 B
124.8 B
26.6 J
Note: ' Indicates that the constituent VMS not detected above detection limits. Pagel
;-1't>
SLR-0010593
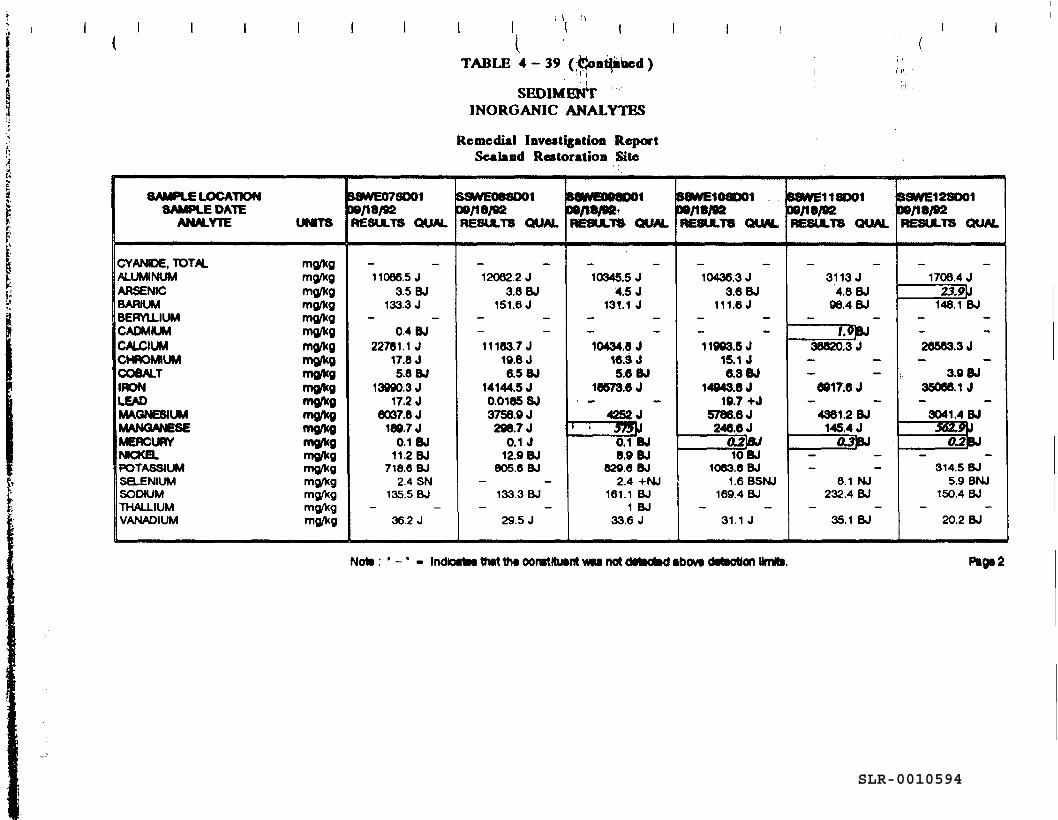
TABLE 4-39 ( tiont^nued )
SEDIMENTINORGANIC ANALYTES
Remedial Investigation ReportSealand Restoration Site
SAMPLE LOCATIONSAMPLE DATE
ANALYTE UNnTS
CVANOE, TOTAL mg/kgALUMINUM mg/KgARSENIC mg/KgBARIUM mg/KgBERYLLIUM mg/kgCADMIUM mg/kgCALCIUM mg/kgCHROMIUM mg/kgCOBALT mg/kgIRON mg/kgLEAD mg/kgMAGNESIUM mg/kgMANGANESE mg/kgMERCURY mg/kgMCKEL mg/kgPOTASSIUM mg/KgSB.ENIUM mg/KgSODIUM mg/KgTHALLIUM mg/KgVANADIUM mg/Kg
SSWE07S00100/18/92RESULTS QUAL
11086.5 J3.5 BJ
133.3 J
0.4 BJ22781.1 J
17.8 J5.8 BJ
13900.3 J17.2 J
6037.8 J160.7 J
0.1 BJ11.2 BJ
718.6 BJ2.4 SN
135.5 BJ
36.2 J
SSWE08SD0100/18/92RESULTS QUAL
12082.2 J3.8 BJ
151.6 J
- -1 1 163.7 J
10.6 J6.5 BJ
14144.5 J0.0165 SJ3756.9 J296.7 J
0.1 J12.9 BJ
805.6 BJ
133.3 BJ
29.5 J
B8WE008D01DO/t8/9eRESULTS QUAL
10345.5 J4.5 J
131.1 J
-10434.6 J
16.3 J5.6 BJ
16573.6 J
4252 J' ' yrf\j
0.1 BJ6.9 BJ
829.6 BJ2.4 +NJ
161.1 BJ1 BJ
33.6 J
B8WE108D0100/10/92RESULTS QUAL
10436.3 J3.6 BJ
111.6 J
_1 1993.5 J
15.1 J6.3 BJ
14043.6 J19.7 +J
5786.6 J246.6 J
O2\BJ10 BJ
1063.6 BJ1.6 BSNJ
169.4 BJ
31.1 J
B8WE11SD0100/18/92RESULTS QUAL
3113 J4.6 BJ
98.4 BJ
/.OJBJ36620.3 J
6917.6 J
4381.2 BJ145.4 J
(UBJ
8.1 NJ232.4 BJ
35.1 BJ
SSWE12SD0100/18/92RESULTS QUAL
1708.4 J23.9\J
148.1 BJ
_26563.3 J
3.9 BJ35066.1 J
3041.4 BJ362.9JJ
02BJ
314.5 BJ5.9 BNJ
150.4 BJ
20.2 BJ
Note : ' - ' - indicates that tht oonstKuant VMM not detected abov* detection Nrntto. Pag* 2
SLR-0010594
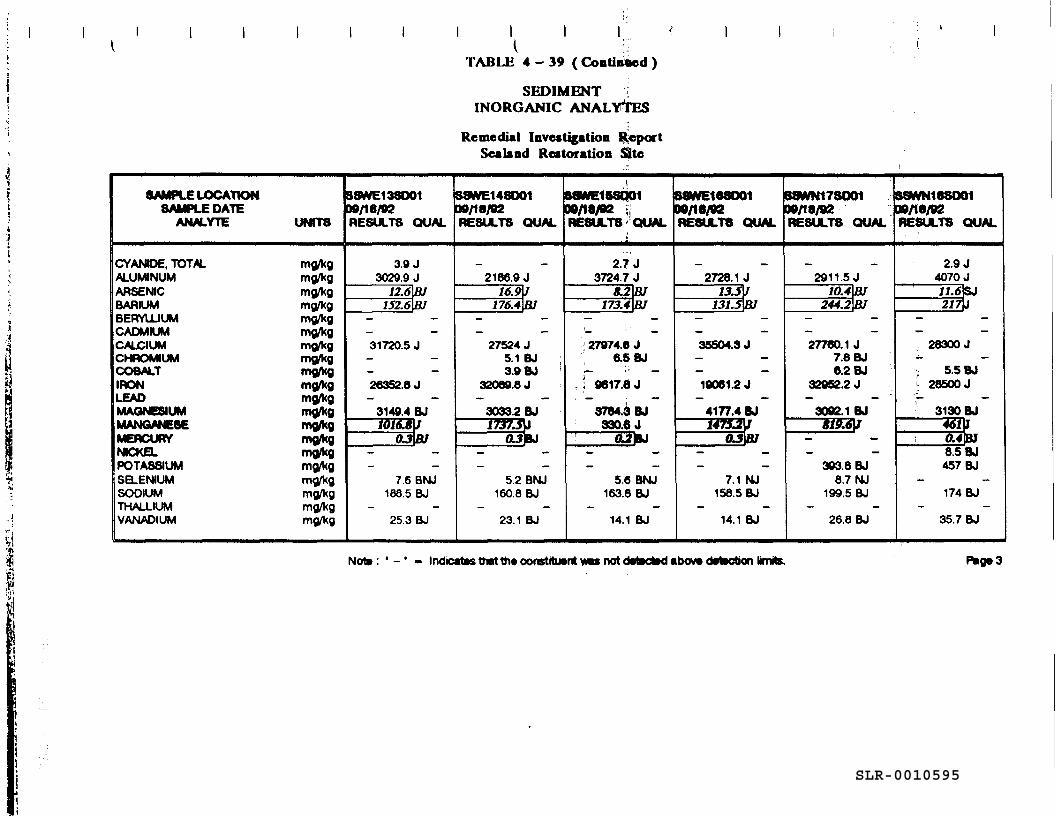
I( I ITABLE 4 - 39 ( Continued )
SEDIMENTINORGANIC ANALYTES
Remedial Investigation ReportSealand Reitoration Site
SAMPLE LOCATIONSAMPLE DATE
ANALYTE UNITS
CYANIDE, TOTAL mg/kgALUMINUM mg/kgARSENIC mg/kgBARIUM mg/kgBERYLLIUM mg/kgCADMIUM mg/kgCALCIUM mg/kgCHROMIUM mg/kgCOBALT mg/kgIRON mg/kgLEAD mg/kgMAGNESIUM mg/kgMANGANESE mg/kgMERCURY mg/kgNICKEL mg/kgPOTASSIUM mg/kgSB.ENIUM mg/kgSODIUM mg/kgTHALLIUM mg/kgVANADIUM mg/kg
S8WE138D01DO/1 8/92RESULTS QUAL
3.0 J3029.9 J
JZtffl/J52.tfH7
31720.5 J
26352.8 J
3148.4 BJ1016.8 J
0.3 BJ
7.6 BNJ188.5 BJ
25.3 BJ
SSWE14SD0109/18/92RESULTS QUAL
2186.9 J16.9 J
176.4 BJ
27524 J5.1 BJ ;3.9 BJ '
32089.8 J
3033.2 BJ1737.5 t
O.J8J
5.2 BNJ160.8 BJ
23.1 BJ
BflNMEIftSQOIDO/18/92 \lRESULTS 'QUAL
2.7 J3724.7 J
8.2 BJ173.4 BJ
27974.8 J6.5 BJ
. ! 9617.8 J
3784.3 BJ330.6 J
OL2DJ
5.6 BNJ163.8 BJ
14.1 BJ
SSWE16SD01DO/1 8/92RESULTS QUAL
2728.1 J13.5 J
131.SBJ
35504.3 J
19061.2 J
4177.4 BJ14753 J
O3BJ
7.1 NJ158.5 BJ
14.1 BJ
BSWN17SD0199/18/92RESULTS QUAL
2911.5J10.4 BJ
244.2 BJ
27760.1 J7.8 BJ6.2 BJ
32952.2 J
3092.1 BJ819.6\J
— —
393.8 BJ8.7 NJ
199.5 BJ
26.8 BJ
SSWN18SO01D9/18/92RESULTS QUAL
2.9 J4070 J11.6 SJ217 i
28300 J
. 5.5 BJ'; 28500 J
3130 BJ46i\
i 0.4 BJ8.5 BJ457 BJ
174 BJ
35.7 BJ
Note: - Indicates that the constituent vw» not detected abow cMMfion limte. Pag* 3
SLR-0010595
to exhibit detected concentrations of volatile organic compounds were WE-12 (chloroform - 1pg/kg) and WE-14 (chloroform - 2 pg/kg), both of which are located east of the former disposalcell, as well. Sample WN-18, collected from the northwestern wetlands, exhibited a detectionof 2-butanone (12 pg/L).
Setntvolatile Organic Compounds. Five semivolatile organic compounds were detected inthe sediment samples collected as part of this RI (Table 4-37). These compounds are di-n-butylphthalate, phenol, 4-methylphenol, 4-chloro-3-methylphenol, and 2,4-dimethylphenol. Five of18 samples exhibited a detection of at least one of these compounds. The sample whichexhibited the highest concentration of total semivolatile organics was WE-05, located in theeastern wetlands downgradient of landspreading area M (phenol, 75 pg/kg; 4-methylphenol, 43pg/kg; and 4-chloro-3-methylphenol, 210 pg/kg). The only other sample to show a significantsemivolatile concentration was WE-13, located east and directly downgradient of overland flowfrom the former disposal cell area (2,4-dimethylphenol - 110 pg/kg). The three remainingsamples, TS-01, TS-04, and WE-06, only had detected concentrations of di-n-butyl phthalate at43 pg/kg, 58 pg/kg, and 43 pg/kg, respectively.
Pesticides and PCBs. Five pesticides were detected in the sediment samples collected at theSRI site as part of this RI (Table 4-38). These constituents are heptachlor epoxide,methoxychlor, endrin aldehyde, aldrin, and 4,4'-DDE. Twelve of 18 sediment samples exhibiteddetections of at least one of these constituents. •"
The highest pesticide concentration was detected in sample location TS-02 (methoxychlor -6.3 pg/L). In addition, sample locations WE-06 (methoxychlor - 3.6 pg/kg, endrin aldehyde -0.44 pg/kg), WE-05 (methoxychlor - 2.8 pg/kg), and WE-07 (methoxychlor - 2.3 pg/kg andendrin aldehyde - 0.49 pg/kg) exhibited pesticide detections. All three of these samples werecollected southeast and topographically downgradient of landspreading area M.
The remaining samples which had detections of pesticides exhibited concentrations below2 pg/kg.
There were no detections of PCBs in the sediment samples collected as part of this RI.
Inorganic AnalytOS. Twenty inorganic analytes were detected in the sediment samples (Table4-39). There are no true representative site background (upstream) sediment data available forcomparison. Therefore, in order to determine if any of the analytes detected are at concentrationsof potential concern, the NYSDEC Technical Administrative Guidance Memorandum (TAGM)
EDIS/ENG/ay071494jp4 4-171SLR-0010596
"Determination of Soil Cleanup Objectives and Cleanup Levels," January 24, 1994 (NYSDBC,1994) and the NYSDEC Sediment Criteria Methodology were used as a preliminary screeningtool.
Based on this comparison, 7 analytes exhibited detected concentrations which exceeded theirrespective NYSDEC "soil cleanup objective levels" listed in the above mentioned guidancedocument These constituents are arsenic (7 samples), cadmium (2 samples), chromium(1 sample), iron (18 samples), manganese (8 samples), and mercury (11 samples).
The sample locations which exhibited the greatest number of elevated analytes (i.e., 5) wereTS-03, located near the eastern tributary to Sucker Brook, and WE-12, located in the easternwetlands, east of the former disposal cell area. In general, the sample locations which weresituated downgradient of overland flow from the former disposal cell area (i.e., WE-11 throughWE-16 and TS-03 and TS-04) exhibited the highest number of elevated analytes. In particular,the analytes which were most consistently elevated in the samples collected from these locationswere arsenic (4200 pg/kg - 23,900 pg/kg), selenium (5200 pg/kg - 8100 pg/kg), mercury(200 pg/kg - 800 pg/kg), and iron (6,917,600 pgAg - 85,760,000 pg/kg). Conversely, thesamples collected from the northwest wetlands exhibited the lowest number of elevated analytes.
Cyanide, which does not have an available NYSDEC "soil cleanup level objective," was detectedin WN-18 (2,900 pg/kg), located in the northwestern wetlands.
Sediment Summary. Similar to the surface water data, only low concentrations of a fewvolatile and semivolatfle organic compounds and pesticides were detected in the sedimentsamples. The majority of the volatile and semivolatile organic compounds were detected in thearea east of the former disposal cell area. The pesticides were primarily detected in the area ofthe eastern wetlands, southeast of landspreading area M. The highest number of elevatedinorganic analytes were detected in samples collected east and downgradient of overland flowfrom the former disposal cell area.
EDIS/ENG/ay071494jp4 4-172SLR-0010597
904-9-giSLR-0010598
5.0 Environmental Fate and Transport
Knowledge of the environmental fate and transport of the constituents present at the SRI site wasused to determine the potential for migration of the constituents of concern and to assess thepotential for exposure to these constituents. Two major factors affecting the fate and transportof a chemical are its chemical mobility and its persistence in environmental media. Mobility isa measure of the tendency for a chemical to migrate through the environment and is affected bysite characteristics and by the physical/chemical characteristics of the compound. The chemical-specific characteristics are: chemical aqueous solubility, volatilization, sorption, hydrolysis,photolysis, and oxidation rates. Persistence, a measure of the time a chemical remains in theenvironment, is influenced by many of the factors affecting chemical mobility, such as photolysis,hydrolysis, and oxidation. Persistence is also a function of chemical-biological interactions inthe environment such as biodegradation and/or bioaccumulation.
Presented in this chapter is a summary of the environmental fate and transport processes of thechemicals of potential concern at the site. Section 5.1 describes the potential routes of migrationfrom the site. Section 5.2 describes the fate and transport processes that affect the constituentsfound on the site. Section 5.3 discusses contaminant migration; particularly in the groundwaterflow regime.
5.1 Potential Routes of MigrationContaminants can be transported from their source(s) to other areas as a result of several potentialmigration pathways. Potential migration pathways for transport of contamination from the SRIsite include transport by surface water and groundwater. These contaminant transport pathwaysprovide a potential link between known sources and potential receptors.
The transport of contaminants away from source areas is dependent on several factors. Theseinclude site characteristics such as geology (including soil and bedrock conditions); hydrology(including groundwater and surface water conditions); climatology (including precipitationconditions); and contaminant characteristics such as physical/chemical properties, chemicalconcentration, and chemical distribution. Physical characteristics of the SRI site study area arepresented in Chapter 3.0 (Physical Characteristics of the Study Area). Chemical distributions andconcentrations are presented in Chapter 4.0 (Nature and Extent of Contamination). Fate andTransport Properties and Site-Specific Contamination Migration are presented in Sections 5.2 and5.3, respectively, of this chapter.
EDIS/ENG/ay071494.rpt 5-1SLR-0010599
For the SRI site, the potential migration pathways of contaminants from the source areas include:
• Vapors and airborne particulates transported via air currents• Percolation through native soils to groundwater• Groundwater transport• Groundwater recharges to surface water• Surface water runoff• Foodchain bioaccumulation.
5.1.1 Airborne ContaminantsSince the surficial soil (0-2 feet deep) does not contain significant levels of contaminants, organicvapors and contaminated dust particulates are not likely to be transported off-site. Furthermore,the fields on the SRI site are heavily vegetated with grasses, reducing the potential for migrationof dust particulates. This exposure pathway was not considered significant for the SRI site andit was not evaluated in detail.
5.13 Percolation Through Native Soils to GroundwaterThe primary routes of contaminant migration from surface and subsurface soils are leaching intogroundwater. Volatile organics present at the SRI site adjacent to the northeastern corner of theformer disposal pell at a depth of approximately 18-24 feet deep have migrated into groundwaterby the percolation of rainwater (or snow melt). The original contents of the former disposal cellleached into groundwater and migrated through percolation through native soils to the overburdengroundwater. However, since the former disposal cell's remediation in 1990, the significantcontamination remaining adjacent to the northeastern section of the former disposal cell area iscontained in the saturated zone.
5.1.3 Groundwater TransportOnce a soluble-phase substance is in groundwater, it is transported in the direction ofgroundwater flow. The hydrogeology in the immediate vicinity of the SRI site is discussed inSection 3.8 (Hydrogeology). The predicted overburden groundwater flow direction at the sitewest of the ridge is toward the north and west and to the east of the ridge groundwater flows inan east-southeast direction. The predicted bedrock groundwater flow is in an east-northeasterlydirection. Should soluble chemical constituents enter the groundwater they would flow in thedirection of groundwater movement. The rate of transport of these chemical constituents in theoverburden zone of the aquifer is determined, in part, by equilibrium partitioning between themobile aqueous phase and the stationary soil particles. The degree of partitioning is governedby the organic matter content of the soils.
EDIS/ENG/ay0714M.rpt 5_2SLR-0010600
Release and transport to groundwatei is the primary route and mechanism of on-site contaminantmigration for both dissolved inorganic and organic compounds detected at the SRI site. Tocharacterize this important migration pathway, groundwater flow direction, velocity andtransmissivity were calculated during both phases of the RI. The high transmissivity of thebedrock unit facilitates the transport of dissolved contaminants via groundwater movement.Additional information on the hydrogeology, aquifer conditions, and groundwater flow directioncan be found in Section 3.8.
5.1.4 Groundwater Recharge to Surface Water StreamsThe eastern tributary to Sucker Brook is located within the site boundary. Sucker Brook isdesignated a Class D water body by the State of New York (i.e., protection for fish survival).Sucker Brook flows north, ultimately entering the St. Lawrence River near Waddington, NewYork. The headwaters to the tributary are formed by low lying wetlands located in the easternportion of the site. These waters are considered perennial and intermittent. The results of thePhase I and Phase n investigation have determined that the overburden as well as the bedrockaquifers are hydraulically connected to the surface water present in the wetlands. However, dueto such seasonal variations in the groundwater table and the intermittent nature of the stream, thesurface water can be an expression of groundwater discharge during wet periods with a highgroundwater table or the surface water runoff can recharge the overburden aquifer during dryperiods. The overburden groundwater recharge or discharge condition is highly dependent on theseasonal fluctuation of the water table.
5.7.5 Surface Water RunoffSurface water runoff at the SRI site flows in two directions; easterly and westerly. Surface waterrunoff from the easternmost landspreading areas and the former disposal cell area drains into theeastern wetlands. An arcuate cutoff ditch constructed along the central-eastern edge of the siteseparates the landspreading areas from the wetland, however, a break in the cut-off ditch (nearMonitoring Well B-8W) allows water in the ditch to enter the wetland.
Runoff to the west of the SRI topographic divide generally flows unimpeded into thenorthwestern wetlands. The on-site gravel pit likely intercepts some flow to the west. A smallintermittent stream flows from the northwestern wetlands to an area of standing water on thenorth side of Pray Road.
5.1.6 Foodchaln BloaccumulatlonMany organic and some inorganic constituents have a potential to bioconcentrate andbioaccumulate in the foodchain. Such contaminants can enter the foodchain through direct
EDIS/ENG/ay071494.rpt 5-3SLR-0010601
bioconcentration from an aqueous media, root uptake from soils to plants, ingestion of water,incidental ingestion of soils and sediments, and ingestion of contaminated plants or animal preyas food sources. The ability to bioaccumulate through the foodchain is related to the persistenceof the constituent and the resistance to metabolic breakdown or removal.
5.2 Contaminant PersistenceThis section defines the factors affecting environmental persistence and mobility processes andsummarizes pertinent environmental fate and transport data for the chemical classes detected atthe SRI site. Environmental persistence parameters for organic chemicals detected at the facilityare presented in Table 5-1.
Based on site-specific characteristics of the SRI site, the most important persistence and mobilityprocess for organic constituents is likely to be aqueous solubility. The greater the solubility, thegreater the potential for migration via groundwater transport. Of the organics detected at thefacility, those with "high" solubilities (i.e., greater than 10,000 mg/f) are listed below(Verschueren, 1983):
• Acetone• 1,1-Dichloroethane
1,2-Dichloroethene• Vinyl chloride• Trichloroethene• Benzene• Methylene chloride
For inorganics, potential migration in groundwater is related to the constituents' distributioncoefficient (Kd) (Section 5.2.2.2). Of the inorganics detected at the site, those with the greatestpotential for migration (i.e., with Kd values less than 50) are presented below (Baes, et al., 1984):
• Cadmium• Mercury• Copper• Zinc• Antimony• Silver
Cobalt.
The fate and transport mechanisms discussed in detail below deal with the chemical and physicalreactions that take place in the environment and their effect on contaminant transport.
EDIS/ENG/ay071494.rpt 5-4SLR-0010602
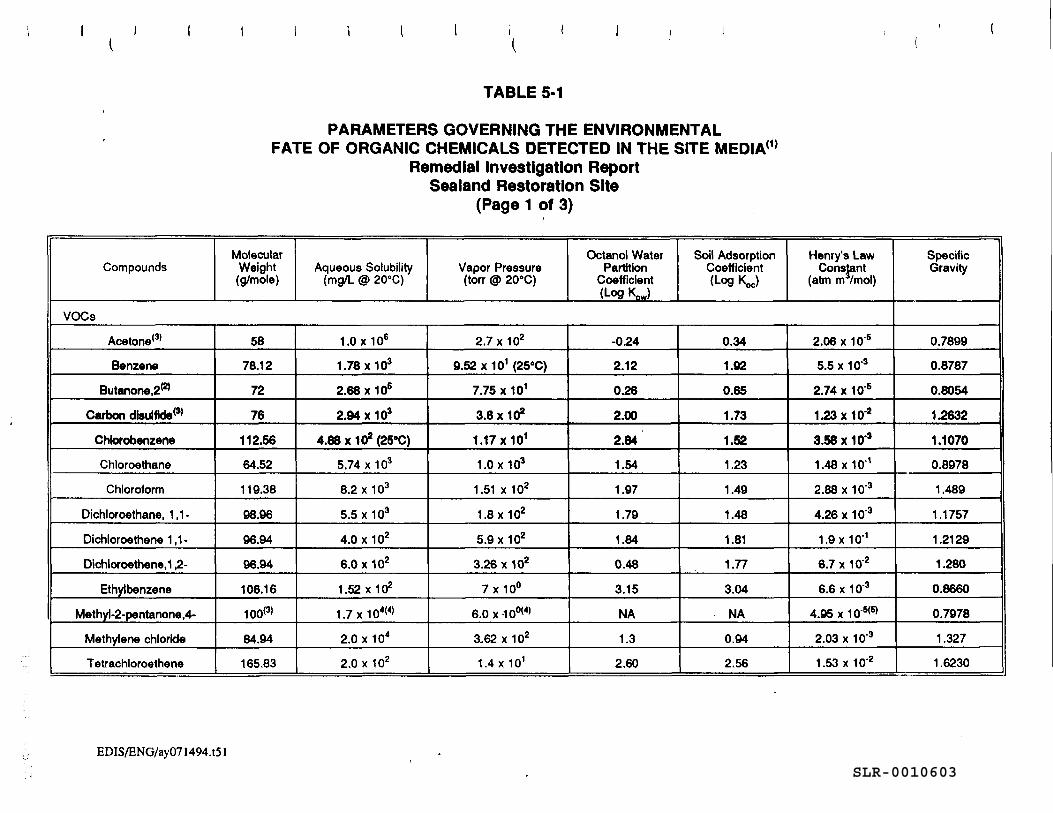
TABLE 5-1
PARAMETERS GOVERNING THE ENVIRONMENTALFATE OF ORGANIC CHEMICALS DETECTED IN THE SITE MEDIA<1)
Remedial Investigation ReportSealand Restoration Site
(Page 1 of 3)
CompoundsMolecular
Weight(g/mole)
Aqueous Solubility(mg/L @ 20°C)
Vapor Pressure(torr <§> 20°C)
Octanol WaterPartition
Coefficient(Log Kow)
Soil AdsorptionCoefficient(Log KJ
Henry's LawConstant
(atm rrr/mol)
VOCs
Acetone*3'
Benzene
Butanone,2(2)
Carbon disulfkte'3'
Chlorobenzene
Chloroethane
Chloroform
Dichloroethane, 1,1-
Dichloroethene 1,1-
Dichloroethene,1,2-
Ethyt benzene
Methyl-2-pentanone,4-
Methylene chloride
Tetrachloroethene
58
78.12
72
76
112.56
64.52
119.38
98.96
96.94
96.94
106.16
100<3>
84.94
165.83
1.0 x10⁶
1.78X10³
2.68 x 10⁶
2.94 X 10³
4.88 X 10² (25°C)
5.74 x10³
8.2 x10³
5.5 x10³
4.0 x10²
6.0 x10²
1.52X10²
1.7x10⁴(4)
2.0 x10⁴
2.0 x 10²
2.7 x10²
9.52 x 101 (25°C)
7.75 x 101
3.6 X 10²
1.17 X101
1.0x10³
1.51 x 10²
1.8x10²
5.9 x 10²
3.26 x 10²
7x10°
6.0x100(4)
3,62 x 10²
1.4x 101
-0.24
2.12
0.26
2.00
2.84
1.54
1.97
1.79
1.84
0.48
3.15
NA
1.3
2.60
0.34
1.92
0.65
1.73
1.52
1.23
1.49
1.48
1.81
1.77
3.04
NA
0.94
2.56
2.06 x10'6
5.5 x 10'3
2.74 x 1Q-5
1. 23x10*
3.58 X 10*
1.48X1Q-1
2.88 x10'3
4.26 x10⁻³
1.9x10'1
6.7 x10'2
6.6 x10'3
4.95x10'5(5)
2.03 x 10'3
1.53x 10'2
SpecificGravity
0.7899
0.8787
0.8054
1.2632
1.1070
0.8978
1.489
1.1757
1.2129
1.280
0.8660
0.7978
1.327
1.6230
EDIS/ENG/ay071494.151SLR-0010603
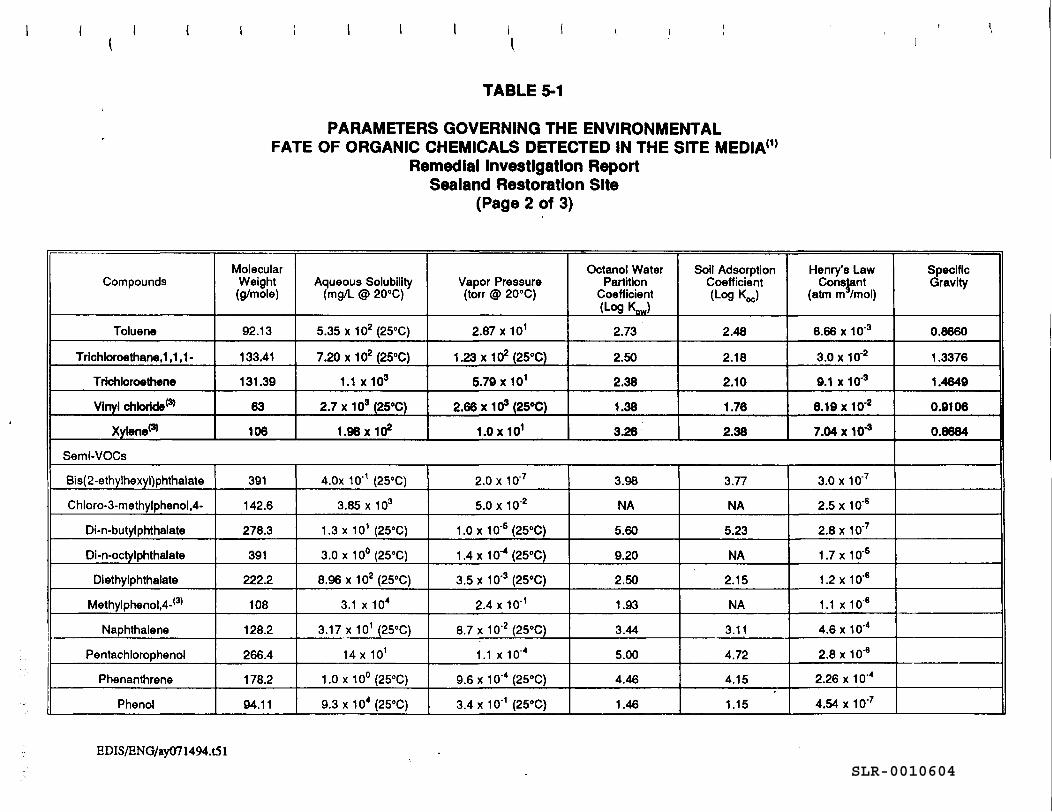
TABLE 5-1
PARAMETERS GOVERNING THE ENVIRONMENTALFATE OF ORGANIC CHEMICALS DETECTED IN THE SITE MEDIA(1)
Remedial Investigation ReportSealand Restoration Site
(Page 2 of 3)
Compounds
Toluene
Trichloroethane,1 ,1,1-
Trichloroethane
Vinyl chlorlde(3>
Xytene^
MolecularWeight(g/mole)
92.13
133.41
131.39
63
106
Aqueous Solubility(mg/L @ 20°C)
5.35x10²(25°C)
7.20 x 10² (25°C)
1.1 x10³
2.7 x 10³ (25eC)
1.98 X10²
Vapor Pressure(torr <§> 20°C)
2.87 x101
1.23x10*(25°C)
5.79 X 101
2.66x10³(25°C)
1.0X101
Octanol WaterPartition
Coefficient(Log K0J
2.73
2.50
2.38
1.38
3.26
Soil AdsorptionCoefficient(Log KJ
2.48
2.18
2.10
1.76
2.38
Henry's LawConstant
(atm rrr/mol)
6.66 x 10⁻³
3.0 x 10⁻²
9.1 x 10'3
8.19 x10'2
7.04 x 10*
Semi-VOCs
Bis(2-ethylhexyl)phthalate
Chloro-3-methylphenol,4-
Di-n-butylphthalate
Di-n-octylphthalate
Diethylphthalate
Methylphenol,4-<3)
Naphthalene
Pentachlorophenol
Phenanthrene
Phenol
391
142.6
278.3
391
222.2
108
128.2
266.4
178.2
94.11
4.0x 10'1 (25°C)
3.85 x10³
1.3x 101 (25°C)
3.0x10°(25°C)
8.96x10²(25°C)
3.1 x 10⁴
3.17 x 101 (25°C)
14 x 101
1.0x10°(25°C)
9.3x10* (25^)
2.0 x10'7
5.0 x10'2
1.0x10⁻⁵(25°C)
1.4x10⁻⁴(25°C)
3.5x10⁻³(25°C)
2.4x10 -1
8.7 x 10'2(25°C)
1.1 x 10'4
9.6x10⁻⁴(25°C)
3.4x10'' (25°C)
3.98
NA
5.60
9.20
2.50
1.93
3.44
5.00
4.46
1.46
3.77
NA
5.23
NA
2.15
NA
3.11
4.72
4.15
1.15
3.0 x10'7
2.5 x10'6
2.8x10⁻⁷
1.7 x10'5
1.2X10'6
1.1 x 1Q-6
4.6 x 10⁻⁴
2.8 x 10'6
2.26x10"*
4.54 x 10'7
SpecificGravity
0.8660
1.3376
1.4649
0.9106
0.8684
EDIS/ENG/ay071494.151SLR-0010604
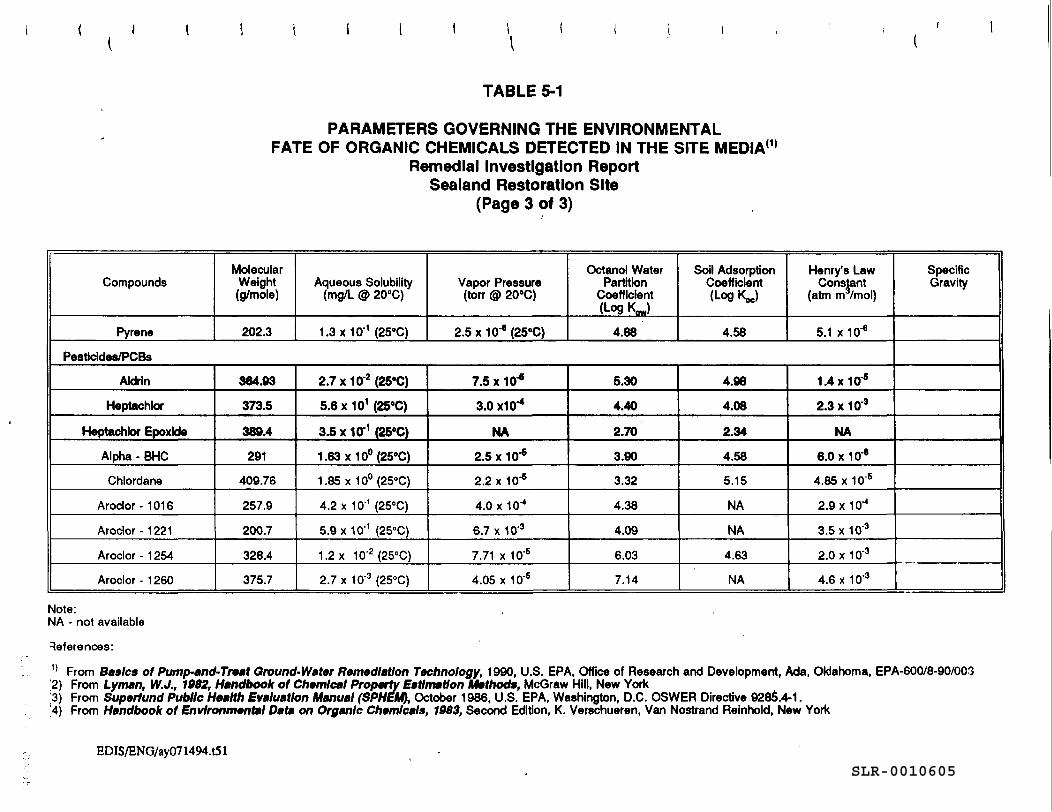
TABLE 5-1
PARAMETERS GOVERNING THE ENVIRONMENTALFATE OF ORGANIC CHEMICALS DETECTED IN THE SITE MEDIA(1)
Remedial Investigation ReportSealand Restoration Site
(Page 3 of 3)
Compounds
Pyrene
MolecularWeight(g/mole)
202.3
Aqueous Solubility(mg/L @ 20°C)
1.3x10⁻¹ (25°C)
Vapor Pressure(torr @ 20'C)
2.5x10⁻⁶(25°C)
Octanol WaterPartition
Coefficient(Log K.J
4.88
Soil AdsorptionCoefficient(LogKJ
4.58
Henry's LawConstant
(atm m /mol)
5.1 x10'6
Pesticides/PCBs
Aldrin
Heptachlor
Heptachtor Epoxide
Alpha - BHC
Chlordane
Arodor - 1016
Aroclor - 1221
Aroclor - 1 254
Aroclor - 1 260
364.93
373.5
380.4
291
409.76
257.9
200.7
328.4
375.7
2.7x10⁻²(25°C)
5.6x101(25"C)
3.5 x 10'1 (25*C)
1.63x10°(25eC)
1.85x10°(25°C)
4.2 x10'1 (25°C)
5.9 x10'1 (25°C)
1.2x 1Q-2(25°C)
2.7 x ID'3 (25°C)
7.5 x KX6
3.0 X10"4
NA
2.5 x 10's
2.2 x 10'5
4.0 X10"4
6.7 x1Q-3
7.71 x 10'5
4.05 x 10'5
5.30
4.40
2.70
3.90
3.32
4.38
4.09
6.03
7.14
4.96
4.08
2.34
4.58
5.15
NA
NA
4.63
NA
1.4x10⁻⁶
2.3 x10'3
NA
6.0x10-'
4.85 x10'6
2.9x10-*
3.5 x 10⁻³
2.0 x10'3
4.6 x 10'3
SpecificGravity
Note:NA • not available
References:1) From Basics of Pump-and-InMf Ground-Wafer Remediation Technology, 1990, U.S. EPA, Office of Research and Development, Ada, Oklahoma, EPA-600/8-90/0032) From Lyman, W.J., 1982, Handbook of Chemical Property Estimation Methods, McGraw Hill, New York;3) From Superfund Public Health Evaluation Manual (SPHEM), October 1986, U.S. EPA, Washington, D.C. OSWER Directive 9285.4-1.:4) From Handbook of Environmental Data on Organic Chemicals, 1983, Second Edition, K. Verechueren, Van Nostrand Reinhold, New York
EDIS/ENG/ay071494.151SLR-0010605
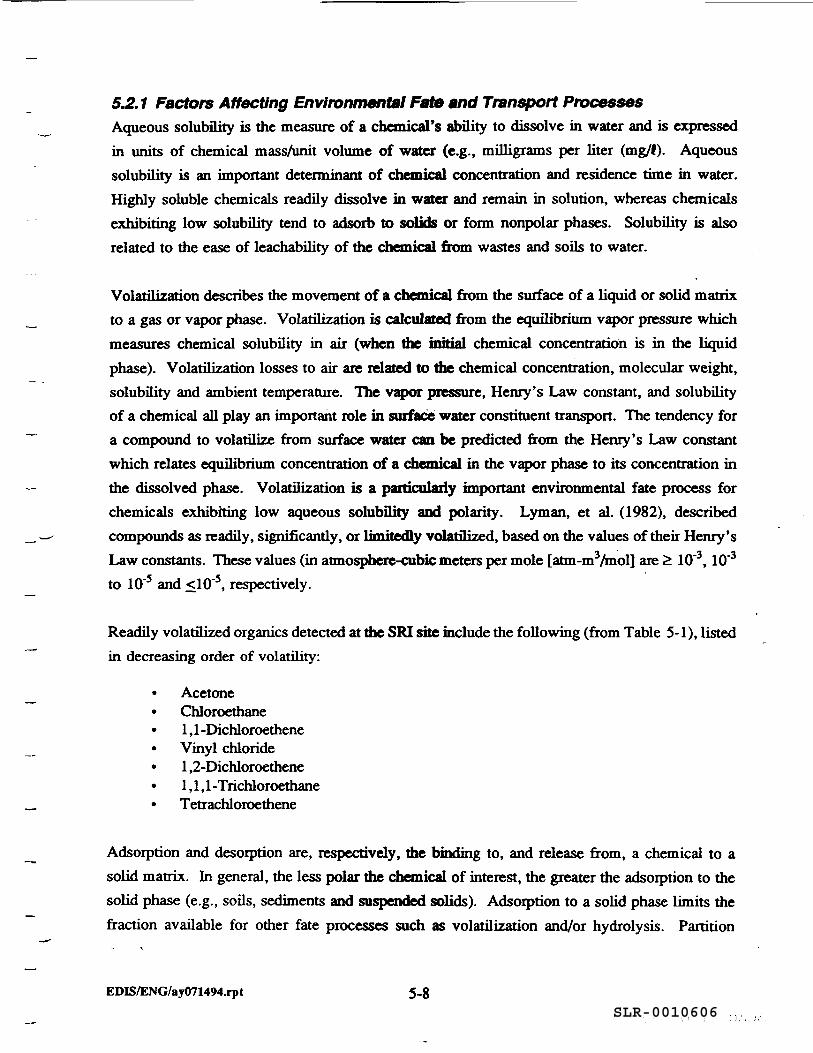
5.2.1 Factors Affecting Environmental Fate and Transport ProcessesAqueous solubility is the measure of a chemical's ability to dissolve in water and is expressedin units of chemical mass/unit volume of water (e.g., milligrams per liter (mg/{). Aqueoussolubility is an important determinant of chemical concentration and residence time in water.Highly soluble chemicals readily dissolve in water and remain in solution, whereas chemicalsexhibiting low solubility tend to adsorb to solids or form nonpolar phases. Solubility is alsorelated to the ease of teachability of the chemical from wastes and soils to water.
Volatilization describes the movement of a chemical from the surface of a liquid or solid matrixto a gas or vapor phase. Volatilization is calculated from the equilibrium vapor pressure whichmeasures chemical solubility in air (when the initial chemical concentration is in the liquidphase). Volatilization losses to air are related to die chemical concentration, molecular weight,solubility and ambient temperature. The vapor pressure, Henry's Law constant, and solubilityof a chemical all play an important role in surface water constituent transport. The tendency fora compound to volatilize from surface water can be predicted from the Henry's Law constantwhich relates equilibrium concentration of a chemical in the vapor phase to its concentration inthe dissolved phase. Volatilization is a particularly important environmental fate process forchemicals exhibiting low aqueous solubility and polarity. Lyman, et al. (1982), describedcompounds as readily, significantly, or limitedly volatilized, based on the values of their Henry'sLaw constants. These values (in atmosphere-cubic meters per mole [atm-m3/mol] are £ 10~3,10~3
to 10~5 and <10~5, respectively.
Readily volatilized organics detected at the SRI site include the following (from Table 5-1), listedin decreasing order of volatility:
• Acetone• Chloroethane• 1,1 -Dichloroethene• Vinyl chloride• 1,2-Dichloroethene• 1,1,1 -Trichloroethane• Tetrachloroethene
Adsorption and desorption are, respectively, the binding to, and release from, a chemical to asolid matrix. In general, the less polar the chemical of interest, the greater the adsorption to thesolid phase (e.g., soils, sediments and suspended solids). Adsorption to a solid phase limits thefraction available for other fate processes such as volatilization and/or hydrolysis. Partition
EDIS/ENG/ay071494.rpt 5-8SLR-0010606
coefficients, which are important measures of sorptive characteristics, define the relativeconcentration of a given chemical in two phases or matrices.
Partition coefficients are expressed as concentration ratios between two phases. Partitioncoefficients useful in describing the environmental behavior of a chemical include Kow, Kj andK^. These factors are briefly discussed below:
The octanol-water partition coefficient is the ratio of the chemical concentration inoctanol to that in water at equilibrium conditions. Octanol serves as a surrogate forhighly nonpolar lipid or organic phases. The Kow is often used to estimate theextent to which a chemical will be expected to partition from water into lipidportions of organisms. Compounds with low KDW values have smallbioconcentration factors (BCF), small sediment/soil partition coefficients, andrelatively high water solubilities. A high Kow level is indicative of the chemical'spotential to partition into sediments or soils, a large BCF, and a low water solubility(Lyman et al., 1982).
The soil-water partition coefficient is the ratio of the chemical concentration in thesolid and aqueous phases. The Kj values are dependent upon the organic carboncontent of the solid phase for organic compounds.
The organic carbon partition coefficient of a chemical is one parameter that isindicative of its potential to adsorb to soil. High K^ values usually indicate a hightendency of an organic compound to adsorb to the soil organic matter. K^. valuesare calculated only for organic compounds since adsorption of inorganics to solidsis less dependent upon the organic carbon fraction of the solid phase.
Bioconcentration is the accumulation of a chemical by plants or animals usually due to anaqueous exposure. The potential for bioconcentration is quantified by BCFs, which are theconcentration ratios of the constituent in the animal or plant tissue and the environmental mediumconcentration. Organic chemicals with large BCFs (e.g., pesticides) generally are lipophilic andtend to accumulate in animal fat tissues. Some metals (e.g., mercury) can also bebioconcentrated. Bioaccumulation is the accumulation of a constituent both via the water andthrough food. Utilizing BCFs alone would tend to underestimate the potential concentration inthe organism if the food chain transfer contributes significantly to the exposure.
Biotransformation/Biodegradation: Many microorganisms and biota can metabolically transformxenobiotic compounds to products which may be more or less as toxic than the originalcompounds. Biotransformation includes a variety of enzyme-catalyzed reactions such asoxidation and reduction.
EDIS/ENG/ay0714M.rpt 5-9SLR-0010607
Hydrolysis is the reaction of a chemical with hydrogen ions (H+) and hydroxyl radicals (OH")resulting in the breakdown or structural modification of the chemical in the environment Theextent of a chemical's hydrolytic reactivity depends on both the pH of the environment and themolecular structure of the specific chemical.
Photolysis is a chemical decomposition process which is induced by radiant energy (sunlight).The rate of loss of a chemical from photochemical reactions depends on both its molecularstructure, the proximity and character of the light source, and the presence of other reactantcompounds.
Oxidation is a chemical reaction which involves the removal of electrons from a metal or otherchemical. Conversely, electrons are added to chemical substrates in reduction reactions. Bothoxidation and reduction reactions are significant in that they influence the mobility and fate ofchemicals in environmental matrices. Oxidized and reduced forms of the same chemical mayalso exhibit unique chemical, ecological, and/or lexicological properties (e.g., mercury).
5.2.2 Fate and Transport DataThis section summarizes the chemical characteristics and the available environmental fate andtransport data for organic and inorganic chemicals detected at the SRI site. The chemicalsdetected were grouped into two groups: organic and inorganic. The organic constituents weregrouped into four generalized classes sharing similar characteristics. These classes are:(1) chlorinated volatile organics, (2) nonchlorinated volatile organics, (3) semivolatiles (BNAs[base neutral/acid extractable compounds]), and (4) chlorinated pesticides and polychlorinatedbiphenyls. The following subsections provide a discussion of the characteristics of each classof compounds.
5.2.2.1 Organic CompoundsVolatile organics and semivolatile organics were detected in the environmental media samplesfrom the SRI site.
Volatile OrganicsBoth chlorinated and nonchlorinated VOCs were detected in groundwater, surface water, surfacesoils, subsurface soils, and sediments sampled during the site investigation. VOCs detectedduring laboratory analysis of various media are presented in Chapter 4.0, Nature and Extent ofContamination. Table 5-1 presents the parameters governing the environmental fate of theseindividual constituents.
EDK/ENG/ay071494.rpt 5-10SLR-0010608
Because of the differences in the physico-chemical properties of the two groups of compounds,their environmental fate and transport processes are discussed separately below.
• Chlorinated volatiles- Solubility. As presented in Table 5-1, the chlorinated VOCs associated with the
SRI site are highly water soluble. The high solubilities for these compounds aredue to their small molecular size, low molecular weights, and high polarity. Giventhe highly soluble nature of these compounds in water, surface runoff andgroundwater transport of chlorinated VOCs are principal environmental fateprocesses.
- Volatilization. Volatile chlorinated organics would be readily transported into theatmosphere from soils and water when in contact with the atmosphere.
- Adsorption/Desorption. The log K^ values are comparatively low for the volatileorganics (Table 5-1). Thus, adsorption to soils or organic matter is not a significantenvironmental fate process for die chlorinated solvents associated with the site.This does not imply that there would not be soil-associated volatile organics, butrather that the volatile organics associated with the soils would be miscible andhave the potential to be a source for groundwater and/or air contamination.
- Bioaccumulation. Bioaccumulation of volatile organics associated with the site soilsmay be of limited significance since BCFs for volatile compounds are generally low(Howard, 1990).
- Biodegradarion/Biotransfonnarion. The biodegradation of chlorinated volatilecompounds is typically a slow process (EPA, 1979). However, biodegradation ratesare generally faster than abiotic degradation rates (e.g., hydrolysis; Vogel, et al.,1987). Halogenated methanes and ethenes can all undergo oxidation transformationby bacteria and higher organisms (Vogel, et al., 1987). Reductive dechlorinationof chlorinated volatile compounds under anaerobic conditions is another significanttransformation process.
- Hydrolysis/Photolysis. Hydrolysis of chlorinated volatile compounds occurs veryslowly, with half-lives ranging tram approximately 0.1 to 3,500 years (Howard,1991). Direct photolytic degradation of chlorinated volatile organics viaphotodissociation is usually restricted to the stratosphere (EPA, 1979). In aqueousenvironments, direct photodissociation is generally negligible or nonexistent. Formost of the chlorinated VOCs associated with the site, photo-oxidation mediated byhydroxyl radicals would be the predominant process of degradation in theatmosphere (EPA, 1979). Therefore, photolytic degradation of chlorinated volatileorganics is not a significant removal mechanism for these compounds (Howard,1990).
- Oxidation. Direct oxidation of chlorinated volatile organics is generally aninsignificant process in natural environments (EPA, 1979). As mentioned
EDIS/ENG/ay071494.rpt 5-11SLR-0010609
previously, photo-oxidation within die stratosphere is the predominant, thoughrelatively minor, degradation process.
• Nonchlorinated volatiles:
- Solubility. The nonchlorinated VOCs present in the environmental media at the siteare presented in Table 5-1. These compounds exhibit high water solubilities.Considering their highly soluble nature in water, surface runoff and groundwatertransport of these compounds will be the principal environmental fate processes atthe site.
- Volatilization. Because of their high vapor pressures, these compounds would bereadily transported into the atmosphere from surficial soils and surface water.
- Adsorption/Desorption. Adsorption to soils/sediments or organic matter is generallynot a significant environmental fete process for nonchlorinated volatile compounds.They exhibit low K^ and low K^ coefficients, indicating a low affinity foradsorption to organic matter (Table 5-1). Low K^. values coupled with the highwater solubility and volatility of most of these compounds make adsorption aninsignificant environmental fate process, in relation to water and airborne transportmechanisms.
- Bioaccumulation. Bioaccumulation of the nonchlorinated volatile organicsassociated with site soils may be a limited fate process, since BCFs for mostnonchlorinated VOCs are generally low (Howard, 1990).
- Biodegradation/B iotransf ormarion. Slow biodegradation of these compounds occursvia microbial processes or metabolic pathways of higher organisms. Underanaerobic conditions, slow degradation has been reported for these compounds(Howard, 1990).
- Hydrolysis/Photolysis. Hydrolysis of these compounds generally does not occur(EPA, 1979). Direct photodissociation within aqueous and/or atmospheric matricesis typically insignificant or negligible (EPA, 1979).
- Oxidation. Direct oxidation of these compounds associated with the site isgenerally an insignificant process in natural environments (EPA, 1979).Photooxidation within the stratosphere is the predominant (though relativelyinsignificant) degradation process.
Semivolatile OrganicsSemivolatile organic compounds were detected in the environmental media analyzed from thesite. These included phthalate esters (e.g., bis(2-ethylhexyl)phthalate), polyaromatic hydrocarbons(PAH) (e.g., pyrene), and phenolic commpounds (e.g. phenol). Semivolatile organic compounds'detected during laboratory analysis of the various environmental media are presented in
EDIS/ENG/ay0714M.rpt 5-12
SLR-0010610
Chapter 4.0, Nature and Extent of Contamination. Table 5-1 presents the environmental fateparameters for these individual constituents. The processes controlling the fate and transport ofthese contaminants in the environment are discussed in the following sections.
• Phthalate Esters: Phthalate esters were detected in various environmental matrices atthe SRI site. These compounds are presented in Chapter 4.0, Nature and Extent ofContamination. Table 5-1 presents parameters governing the environmental fate ofthe individual constituents detected.
- Solubility. Phthalate esters are typically some of the more soluble BNAs, primarilydue to their low aromaticity (i.e., only one benzene ring) and the high polarityimparted to the molecule by the diester linkage. However, compared to the VOCsat the site, the solubility of phthalate esters is generally low (Table 5-1). Variabilityin aqueous solubility among die different phthalate esters depends upon thehydrophobia character of the functional groups attached to the diester linkage.Phthalate esters readily form complexes with fulvic acids which result in fulvicacid-phthalate complexes which are very soluble in water (EPA, 1979).
Because of their generally low solubilities, runoff and groundwater transport of thephthalate esters will not be an important environmental fate processes at the site.
- Volatilization. In general, phthalate esters are not very volatile. Due to their lowvolatilization rates, as indicated by their Henry's Law constants and vapor pressures(Table 5-1), volatilization of phthalate esters at the site will not be a significantenvironmental fate process.
- Photolysis. Direct photolysis of phthalate esters is unlikely to occur, and indirectphotolysis via hydroxyl radical interaction with the aromatic ring is a negligibleprocess in the natural environment (EPA, 1979). Thus, photolysis would be anenvironmentally insignificant degradation process for these compounds at the site.
- Oxidation. No information was found in the literature to suggest that oxidation isa significant environmental fate process for phthalate esters in the naturalenvironment.
- Hydrolysis. Phthalate esters are susceptible to hydrolytic reactions, but thesereactions typically proceed at such a slow rate (e.g., half-lives on the order of years)that hydrolysis of these compounds is not significant in the natural environment(EPA, 1979). In general, the hydrolysis rate is slower for longer-chain esters andmay be catalyzed by both acids and bases (EPA, 1979). The low hydrolysis ratesof the compounds detected in water samples at the site may relegate thisenvironmental fate mechanism to one of little importance.
EDIS/ENG/ay071494.rpt 5-13SLR-0010611
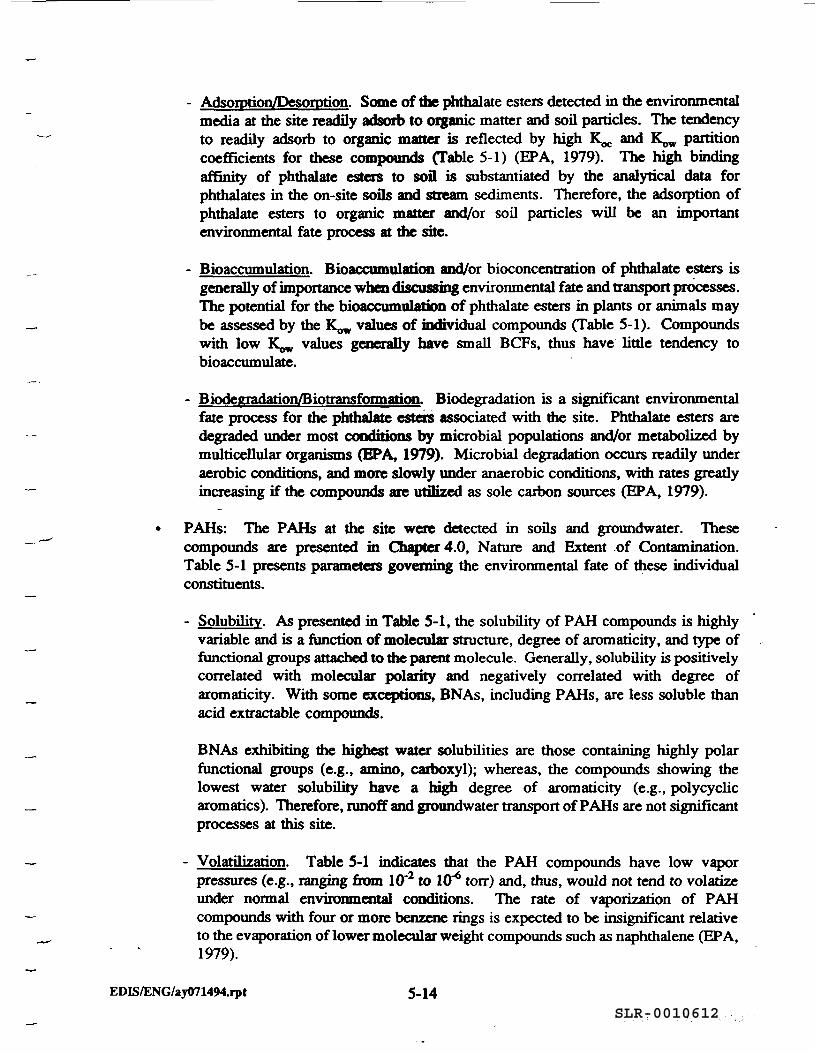
- Adsorption/Dcsorption. Some of the phthalate esters detected in the environmentalmedia at the site readily adsorb to organic matter and soil particles. The tendencyto readily adsorb to organic matter is reflected by high K^. and K^ partitioncoefficients for these compounds (Table 5-1) (EPA, 1979). The high bindingaffinity of phthalate esters to soil is substantiated by the analytical data forphthalates in the on-site soils and stream sediments. Therefore, the adsorption ofphthalate esters to organic matter and/or soil particles will be an importantenvironmental fate process at the site.
- Bioaccumulation. Bioaccumulation and/or bioconcentration of phthalate esters isgenerally of importance when discussing environmental fate and transport processes.The potential for the bioaccumulation of phthalate esters in plants or animals maybe assessed by the K^ values of individual compounds (Table 5-1). Compoundswith low K^ values generally have small BCFs, thus have little tendency tobioaccumulate.
- Biodegradation/Biotransformation. Biodegradation is a significant environmentalfate process for the phthalate esters associated with the site. Phthalate esters aredegraded under most conditions by microbial populations and/or metabolized bymulticellular organisms (EPA, 1979). Microbial degradation occurs readily underaerobic conditions, and more slowly under anaerobic conditions, with rates greatlyincreasing if the compounds are utilized as sole carbon sources (EPA, 1979).
• PAHs: The PAHs at the site were detected in soils and groundwater. Thesecompounds are presented in Chapter 4.0, Nature and Extent of Contamination.Table 5-1 presents parameters governing the environmental fate of these individualconstituents.
- Solubility. As presented in Table 5-1, the solubility of PAH compounds is highlyvariable and is a function of molecular structure, degree of aromaticity, and type offunctional groups attached to the parent molecule. Generally, solubility is positivelycorrelated with molecular polarity and negatively correlated with degree ofaromaticity. With some exceptions, BNAs, including PAHs, are less soluble thanacid extractable compounds.
BNAs exhibiting the highest water solubilities are those containing highly polarfunctional groups (e.g., amino, carboxyl); whereas, the compounds showing thelowest water solubility have a high degree of aromaticity (e.g., polycyclicaromatics). Therefore, runoff and groundwater transport of PAHs are not significantprocesses at this site.
- Volatilization. Table 5-1 indicates that the PAH compounds have low vaporpressures (e.g., ranging from 10"2 to 10"6 torr) and, thus, would not tend to volatizeunder normal environmental conditions. The rate of vaporization of PAHcompounds with four or more benzene rings is expected to be insignificant relativeto the evaporation of lower molecular weight compounds such as naphthalene (EPA,1979).
EDIS/ENG/ay0714M.rpt 5-14SLR-0010612
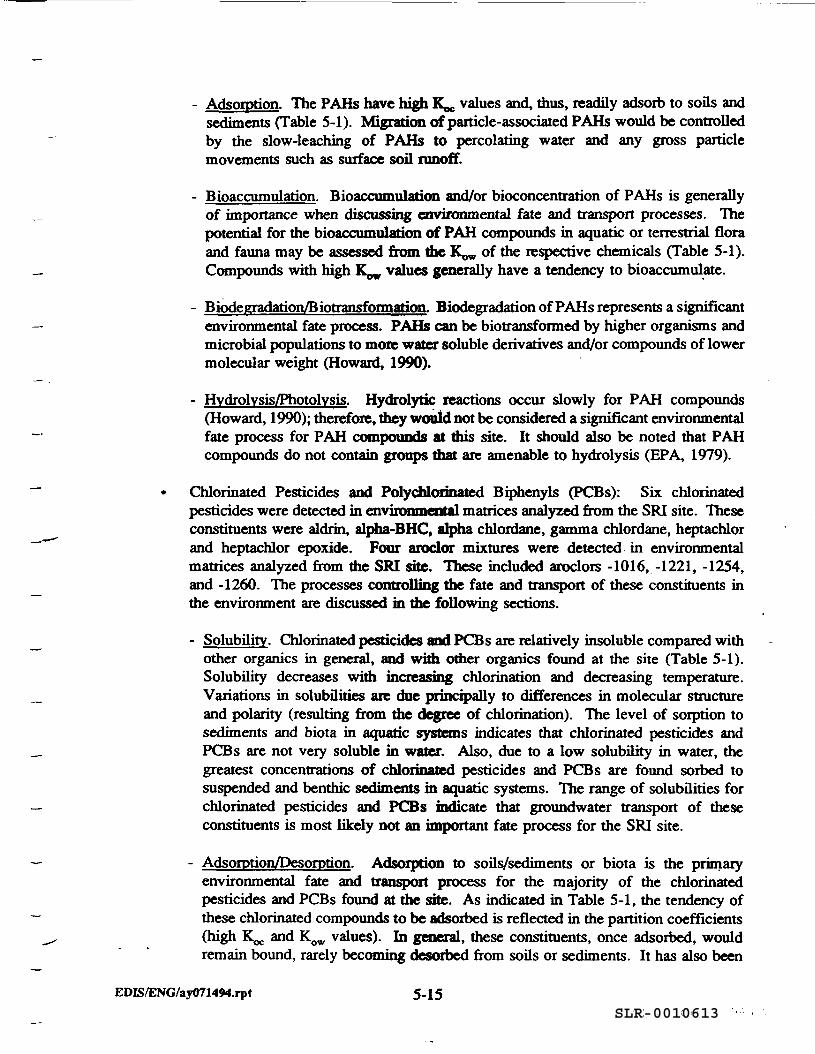
- Adsorption. The PAHs have high K^. values and, thus, readily adsorb to soils andsediments (Table 5-1). Migration of particle-associated PAHs would be controlledby the slow-leaching of PAHs to percolating water and any gross particlemovements such as surface soil runoff.
- Bioaccumulation. Bioaccumulation and/or bioconcentration of PAHs is generallyof importance when discussing environmental fate and transport processes. Thepotential for the bioaccumulation of PAH compounds in aquatic or terrestrial floraand fauna may be assessed from the K^ of the respective chemicals (Table 5-1).Compounds with high K^ values generally have a tendency to bioaccumulate.
- B iodegradarion/B transformation. Biodegradation of PAHs represents a significantenvironmental fate process. PAHs can be biotransformed by higher organisms andmicrobial populations to more water soluble derivatives and/or compounds of lowermolecular weight (Howard, 1990).
- Hydrolysis/Photolysis. Hydrolytic reactions occur slowly for PAH compounds(Howard, 1990); therefore, they would not be considered a significant environmentalfate process for PAH compounds at this site. It should also be noted that PAHcompounds do not contain groups that are amenable to hydrolysis (EPA, 1979).
• Chlorinated Pesticides and Polychlorinated Biphenyls (PCBs): Six chlorinatedpesticides were detected in environmental matrices analyzed from the SRI site. Theseconstituents were aldrin, alpha-BHC, alpha chlordane, gamma chlordane, heptachlorand heptachlor epoxide. Four aroclor mixtures were detected in environmentalmatrices analyzed from the SRI site. These included aroclors -1016, -1221, -1254,and -1260. The processes controlling the fate and transport of these constituents inthe environment are discussed in the following sections.
- Solubility. Chlorinated pesticides and PCBs are relatively insoluble compared withother organics in general, and with other organics found at the site (Table 5-1).Solubility decreases with increasing chlorination and decreasing temperature.Variations in solubilities are due principally to differences in molecular structureand polarity (resulting from the degree of chlorination). The level of sorption tosediments and biota in aquatic systems indicates that chlorinated pesticides andPCBs are not very soluble in water. Also, due to a low solubility in water, thegreatest concentrations of chlorinated pesticides and PCBs are found sorbed tosuspended and benthic sediments in aquatic systems. The range of solubilities forchlorinated pesticides and PCBs indicate that groundwater transport of theseconstituents is most likely not an important fate process for the SRI site.
- Adsorption/Desorption. Adsorption to soils/sediments or biota is the primaryenvironmental fate and transport process for the majority of the chlorinatedpesticides and PCBs found at the site. As indicated in Table 5-1, the tendency ofthese chlorinated compounds to be adsorbed is reflected in the partition coefficients(high K^. and Kow values). In general, these constituents, once adsorbed, wouldremain bound, rarely becoming desorbed from soils or sediments. It has also been
EDIS/ENG/ay«71494.rpt 5-15SLR-0010613
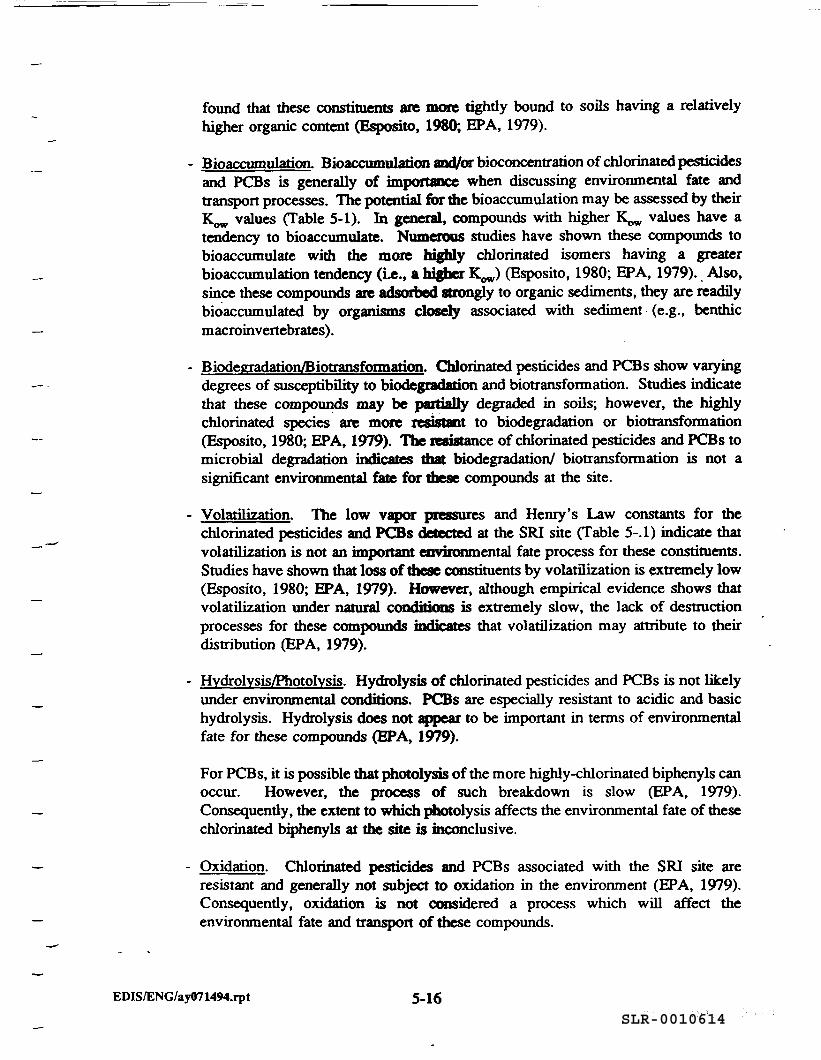
found that these constituents are more tightly bound to soils having a relativelyhigher organic content (Esposito, 1980; EPA, 1979).
Bioaccumulation. Bioaccumulatioa and/or bioconcentration of chlorinated pesticidesand PCBs is generally of importance when discussing environmental fate andtransport processes. The potential for the bioaccumulation may be assessed by theirK^ values (Table 5-1). In general, compounds with higher Kow values have atendency to bioaccumulate. Numerous studies have shown these compounds tobioaccumulate with the more highly chlorinated isomers having a greaterbioaccumulation tendency (Le., a higher Kw) (Esposito, 1980; EPA, 1979). Also,since these compounds are adsorbed strongly to organic sediments, they are readilybioaccumulated by organisms closely associated with sediment (e.g., benthicmacroinvertebrates).
Biodegradation/Biotransformation. Chlorinated pesticides and PCBs show varyingdegrees of susceptibility to biodegradation and biotransformation. Studies indicatethat these compounds may be partially degraded in soils; however, the highlychlorinated species are more resistant to biodegradation or biotransformation(Esposito, 1980; EPA, 1979). The resistance of chlorinated pesticides and PCBs tomicrobial degradation indicates that biodegradation/ biotransformation is not asignificant environmental fate for these compounds at the site.
Volatilization. The low vapor pressures and Henry's Law constants for thechlorinated pesticides and PCBs detected at the SRI site (Table 5-.1) indicate thatvolatilization is not an important environmental fate process for these constituents.Studies have shown that loss of these constituents by volatilization is extremely low(Esposito, 1980; EPA, 1979). However, although empirical evidence shows thatvolatilization under natural conditions is extremely slow, the lack of destructionprocesses for these compounds indicates that volatilization may attribute to theirdistribution (EPA, 1979).
Hydrolysis/Photolysis. Hydrolysis of chlorinated pesticides and PCBs is not likelyunder environmental conditions. PCBs are especially resistant to acidic and basichydrolysis. Hydrolysis does not appear to be important in terms of environmentalfate for these compounds (EPA, 1979).
For PCBs, it is possible that photolysis of the more highly-chlorinated biphenyls canoccur. However, the process of such breakdown is slow (EPA, 1979).Consequently, the extent to which photolysis affects the environmental fate of thesechlorinated biphenyls at the site is inconclusive.
Oxidation. Chlorinated pesticides and PCBs associated with the SRI site areresistant and generally not subject to oxidation in the environment (EPA, 1979).Consequently, oxidation is not considered a process which will affect theenvironmental fate and transport of these compounds.
EDIS/ENG/ay0714M.rpt 5-16
SLR-0010614
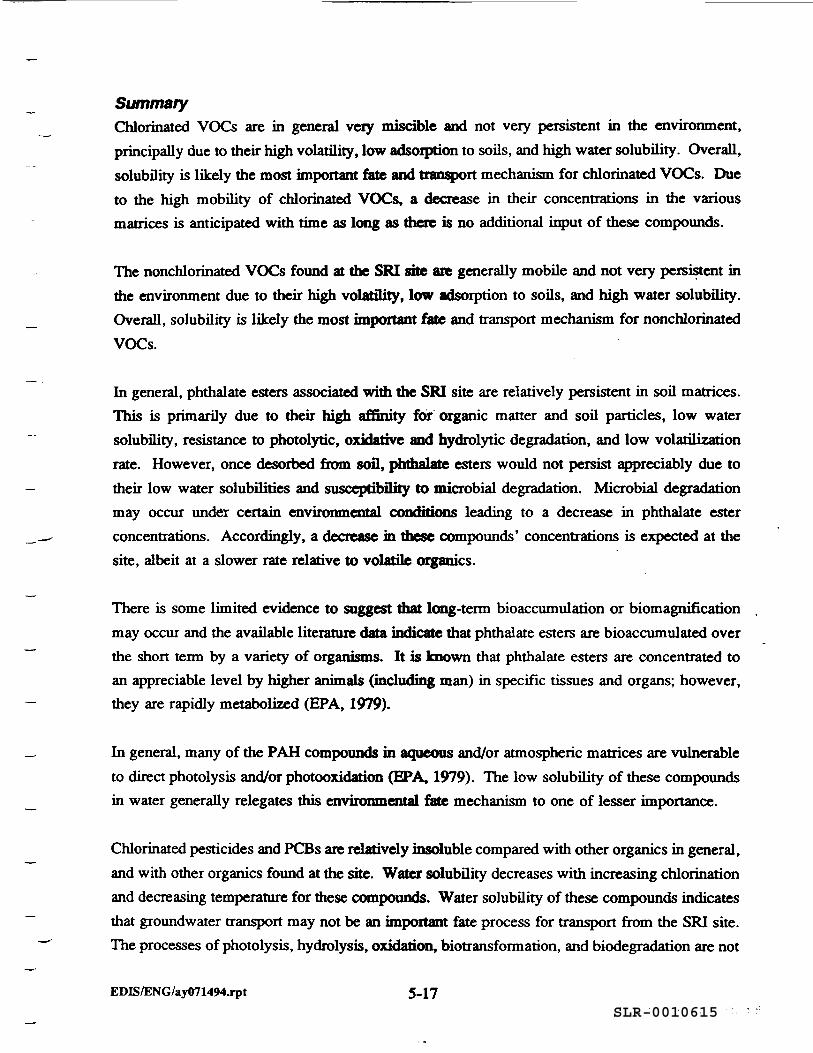
SummaryChlorinated VOCs are in general very miscible and not very persistent in the environment,principally due to their high volatility, low adsorption to soils, and high water solubility. Overall,solubility is likely the most important fate and transport mechanism for chlorinated VOCs. Dueto the high mobility of chlorinated VOCs, a decrease in their concentrations in the variousmatrices is anticipated with time as long as there is no additional input of these compounds.
The nonchlorinated VOCs found at the SRI site are generally mobile and not very persistent inthe environment due to their high volatility, low adsorption to soils, and high water solubility.Overall, solubility is likely the most important fate and transport mechanism for nonchlorinatedVOCs.
In general, phthalate esters associated with the SRI site are relatively persistent in soil matrices.This is primarily due to their high affinity for organic matter and soil particles, low watersolubility, resistance to photolytic, oxidative and hydrolytic degradation, and low volatilizationrate. However, once desorbed from soil, phthalate esters would not persist appreciably due totheir low water solubilities and susceptibility to microbial degradation. Microbial degradationmay occur under certain environmental conditions leading to a decrease in phthalate esterconcentrations. Accordingly, a decrease in these compounds' concentrations is expected at thesite, albeit at a slower rate relative to volatile organics.
There is some limited evidence to suggest that long-term bioaccumulation or biomagnificationmay occur and the available literature data indicate that phthalate esters are bioaccumulated overthe short term by a variety of organisms. It is known that phthalate esters are concentrated toan appreciable level by higher animals (including man) in specific tissues and organs; however,they are rapidly metabolized (EPA, 1979).
In general, many of the PAH compounds in aqueous and/or atmospheric matrices are vulnerableto direct photolysis and/or photooxidation (EPA, 1979). The low solubility of these compoundsin water generally relegates this environmental fate mechanism to one of lesser importance.
Chlorinated pesticides and PCBs are relatively insoluble compared with other organics in general,and with other organics found at the site. Water solubility decreases with increasing chlorinationand decreasing temperature for these compounds. Water solubility of these compounds indicatesthat groundwater transport may not be an important fate process for transport from the SRI site.The processes of photolysis, hydrolysis, oxidation, biotransformation, and biodegradation are not
EDIS/ENG/ay071494.rpt 5-17SLR-0010615
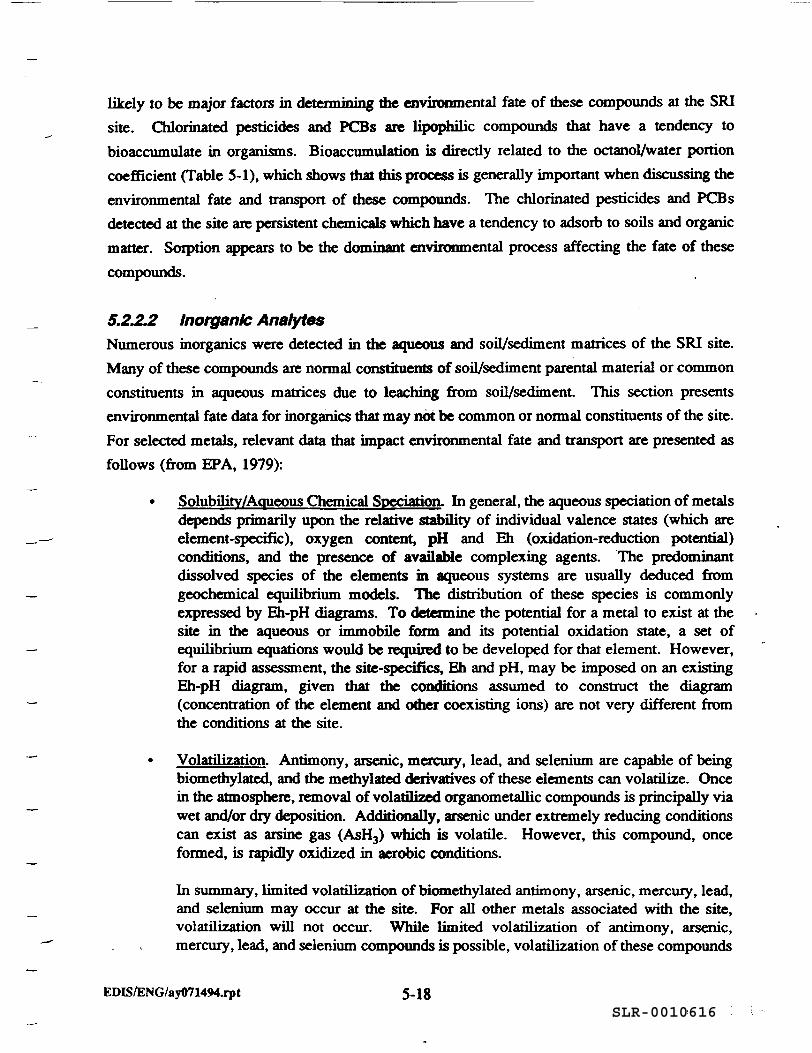
likely to be major factors in determining the environmental fate of these compounds at the SRIsite. Chlorinated pesticides and PCBs are lipophilic compounds that have a tendency tobioaccumulate in organisms. Bioaccumulation is directly related to the octanol/water portioncoefficient (Table 5-1), which shows that this process is generally important when discussing theenvironmental fate and transport of these compounds. The chlorinated pesticides and PCBsdetected at the site are persistent chemicals which have a tendency to adsorb to soils and organicmatter. Sorption appears to be the dominant environmental process affecting the fate of thesecompounds.
5.2.2.2 Inorganic AnalytesNumerous inorganics were detected in the aqueous and soil/sediment matrices of the SRI site.Many of these compounds are normal constituents of soil/sediment parental material or commonconstituents in aqueous matrices due to leaching from soil/sediment This section presentsenvironmental fate data for inorganics that may not be common or normal constituents of the site.For selected metals, relevant data that impact environmental fate and transport are presented asfollows (from EPA, 1979):
• Solubility/Aqueous Chemical Speciation. In general, the aqueous speciation of metalsdepends primarily upon the relative stability of individual valence states (which areelement-specific), oxygen content, pH and Eh (oxidation-reduction potential)conditions, and the presence of available complexing agents. The predominantdissolved species of the elements in aqueous systems are usually deduced fromgeochemical equilibrium models. The distribution of these species is commonlyexpressed by Eh-pH diagrams. To determine the potential for a metal to exist at thesite in the aqueous or immobile form and its potential oxidation state, a set ofequilibrium equations would be required to be developed for that element. However,for a rapid assessment, the site-specifics, Eh and pH, may be imposed on an existingEh-pH diagram, given that the conditions assumed to construct the diagram(concentration of the element and other coexisting ions) are not very different fromthe conditions at the site.
• Volatilization. Antimony, arsenic, mercury, lead, and selenium are capable of beingbiomethylated, and the methylated derivatives of these elements can volatilize. Oncein the atmosphere, removal of volatilized organometallic compounds is principally viawet and/or dry deposition. Additionally, arsenic under extremely reducing conditionscan exist as arsine gas (AsH3) which is volatile. However, this compound, onceformed, is rapidly oxidized in aerobic conditions.
In summary, limited volatilization of biomethylated antimony, arsenic, mercury, lead,and selenium may occur at the site. For all other metals associated with the site,volatilization will not occur. While limited volatilization of antimony, arsenic,mercury, lead, and selenium compounds is possible, volatilization of these compounds
EDIS/ENG/ay0714«M.rpt 5-18SLR-0010616
would be an insignificant environmental fate process, considering existing siteconditions.
Photolysis. Photolytic reactions do not occur for arsenic, beryllium, cadmium, lead,nickel, selenium, silver, and thallium. Some copper compounds are photosensitive;however, there are insufficient data at this time to conclude that photolysis is animportant degradative mechanism for copper-containing compounds. Considering siteconditions, photolysis would be an insignificant degradation process.
Adsorption/Desorption. In general, metals readily adsorb to inorganic mineralsurfaces and organics. Adsorption for most metals is highly pH dependent, withdesorption being favored at low pH and adsorption dominating at higher pHconditions. The types of clays, their surface areas, and surface changes dictate theextent of the adsorption (Karickhoff et al., 1979). Consequently, adsorption alsovaries with chemical speciation.
Complexation. In general, the metals of interest associated with the site are capableof forming numerous inorganic and organic complexes in the natural environment.All of the metals of interest readily form organo-metallic complexes, especially withnaturally occurring organic acids (e.g., humic and fulvic acids). Some of the metalsassociated with the site may form metaUo-inorganic complexes with inorganic ligandssuch as carbonate, chloride, hydroxyl and sulfate (e.g., copper, lead, arsenic, andcadmium). Among lead, arsenic, copper and cadmium, metallo-organic complexformation is usually favored over metallo-inorganic complexes. Beryllium typicallyforms complexes with hydroxide ions and may, at elevated pH, form polynuclearhydroxide complexes with me inorganic ligands hydroxide, carbonate, and sulfate.All of the various complex formations mentioned above alter the aqueous solubilitiesof the metals of interest. Therefore, complexation with various organic and inorganicligands is a significant environmental fate process for the metals of interest at the site.
Precipitation/Co-precipitation. Precipitation and/or co-precipitation are importantremoval mechanisms of dissolved aqueous metal species. Co-precipitation withhydrous iron, manganese, and/or aluminum oxides may occur for arsenic, cadmium,copper, and beryllium, particularly under nonreducing or basic conditions. Also, inreducing environments, thallium may precipitate as a sulfide.
With regard to precipitation, cadmium typically precipitates as Cd(OH)2 above pH 9,CdO2
2" above pH 10, and CdS under reducing conditions. In the environment, copperusually precipitates as malachite [Qij (OH)2 CO3], whereas lead may precipitate ascerussite (PbCO3) and/or anglesite (PbSO , depending upon environmental conditions.Beryllium may precipitate as the insoluble hydroxide or oxide. Considering theabove, and depending upon numerous aqueous environmental conditions (e.g., pH,metallic and anionic species present, etc.), precipitation and/or co-precipitation can beimportant environmental fate processes for the metals associated with the site. Thisphenomenon would be reflected in comparison of filtered and unfiltered watersamples.
EDK/ENG/ay071494.rpt 5_19SLR-0010617
Canonic Exchange. All the metals of interest are capable of undergoing isomorphicsubstitution with cations present in the lattice structure of crystalline soils andsediments. This process can be an effective means of removal from solutiondepending upon environmental conditions. Similar to sorption processes, numerousfactors such as pH, organic content, and type of soil will influence cationic exchange.
• Biotransformation/Biodegradarion. Biomethylation of lead and arsenic mediated bymicrobial populations can occur to a limited extent in the environment and thisprocess may occur under aerobic and/or anaerobic conditions. Additionally, biogenicligands have been reported to form complexes with some metals, particularly withlead. Biotransformation of copper does not occur, and cadmium can be complexedin vivo by polydentate ligands that are normally involved in the binding skes ofessential metal ions such as iron, copper, zinc, manganese, etc. Antimony is onlyslightly bioaccumulated and has been little studied in aquatic organisms. Also, asmentioned, biomethylation of antimony could occur in the environment.Biotransformation of selenium may result in methylation with subsequentvolatilization, as mentioned previously. The other metals of interest at the site are notsusceptible to biotransformation mechanisms.
The potential for inorganic constituents to migrate in groundwater is related to each constituent'sdistribution coefficient (Kd). Kj values for commonly encountered inorganics range from nearzero to 1,000 milliliters per gram (mL/g) or greater. Inorganic solutes in groundwater areessentially immobile with Kj values mat exceed 100. Kj values between 0.1 and 50 mL/gsuggest moderate mobility in groundwater, while Kj values below 0.1 mL/g suggest highmobility. Generally, trace metals have a very high potential for immobility (i.e., retardation).Cations are moderately immobile, and anions are the most mobile in groundwater as they havelow retardation factors (Walton, 1985).
A list of potentially toxic constituents detected at the SRI site is presented below, with associatedKd values (Baes, et al., 1984) and potential mobility in groundwater.
InorganicConstituentAntimonyArsenicBariumBerylliumCadmiumChromiumCobaltCopperLeadManganese
Distribution Coefficient(Ka)
45200606506.4850473590065
Potential GroundwaterMobilityMedium
LowMedium to low
LowMedium
LowMediumMedium
LowMedium to Low
EDIS/ENG/ay0714Mapt 5-20SLR-0010618
InorganicConstituentMercuryNickelSeleniumSaverThalliumVanadiumZinc
Distribution Coefficient
1015030045
1,5001,00040
Potential GroundwaterMobilityMedium
LowLow
MediumLowLow
Medium
SummaryIn general, the metals of interest associated with the SRI site are typically persistent withinenvironmental matrices. This persistence is primarily related to recycling mechanisms withinenvironmental matrices for some metals (e.g., arsenic, lead, and copper), and removalmechanisms (precipitation, cationic exchange adsorption, etc.) which decrease mobility.Chemical speciation of metals in the environment can result in metal concentrations in both solidand aqueous media or preferential presence entirely in one medium.
Among the mechanisms described above, only solubility/aqueous chemical speciation,adsorption/desorption, complexation, precipitation/co-precipitation, and cationic exchange havethe potential to significantly influence the fate and transport of the metals of concern at the SRIsite.
Depending on how the metals from the site enter the environment, some metals may persist inthe environment near the source area longer than the others. For example, some metals (e.g., ironand manganese) may enter the soil aquifer under a highly reduced condition. These dissolvedmetals would be expected to migrate in the groundwater until the pH and Eh conditions becomefavorable to precipitate forms of these metals (e.g., surface water seeps create conditions wheremetals are oxidized and precipitate out of solutions). These metals may also enter the bedrockwhile they are in the aqueous phase. If dissolved metals enter the bedrock, they would beexpected to migrate long distances (through the fractures in the bedrock) due to the morechemically reduced conditions and the lower percentage of naturally occurring organic matter inthe bedrock.
5.3 Contaminant MigrationThe migration of volatile organic compounds and inorganic analytes is controlled by the localnydrpgeology. As discussed in Chapter 3.0, groundwater from the area of the former disposal
EDIS/ENG/ay0714M.rpt 5-21SLR-0010619
cell moves to the east toward the eastern wetlands. The concentrations of volatile organics thathave been detected in the monitoring wells are lower than their solubility limits (Table 5-1).Therefore, these contaminants are transported in their soluble form, rather than as free phasecompounds.
The following sections discuss the horizontal and vertical migration of volatile organiccompounds from the former disposal cell area.
5.3.1 Lateral Migration of Volatile Organic CompoundsVolatile organic compounds have migrated downgradient from the former disposal cell area ina relatively narrow plume. Based on the data presented in Chapter 4.0, most of the volatileorganic compounds have been detected in wells that are located on flow lines (based on waterlevel maps) leading downgradient from the source area on the SRI. High concentrations ofvolatile organic compounds were detected in monitoring wells MW-05S, MW-05I, MW-07S,MW-07I, MW-07D, MW-08S, B-3W, and DM-8S. These wells are located downgradient of theformer disposal cell. Other data that support this interpretation of the width of the plume are theabsence of contamination in wells MW-04S, MW-04D, DM-IOS and DM-IOD which are notdirectly downgradient of the former disposal cell area. The lateral limits of the projected plumeare interpreted near wells where contamination has not been detected. However, the plume isshown to increase in width downgradient of the former disposal cell because of hydrodynamicdispersion of the contaminants. Figure 5-1 shows the lateral extent of volatile organiccontamination.
The leading edge of the plume has not been defined. The presence of contamination in wellsMW-OS, MW-OI, MW-OD and MW-OS indicate that the plume has migrated as far as the westernedge of the eastern wetlands. The absence of contamination in well DM-9 indicates that theplume has not migrated as far as DM-9. However, based on the groundwater contour maps, wellDM-9 is not directly downgradient of the former disposal cell area.
5.3.2 Vertical Migration of ContaminantsThe vertical migration of dissolved contaminants is a function of the hydraulic gradient, thedirection of groundwater movement, and the ratio of horizontal to vertical hydraulic conductivity.The vertical gradient has been measured to be both upward and downward at the SRI site. Adiscussion of the vertical hydraulic gradient is presented in Chapter 3.0.
EDIS/ENG/ay0714M.rpt 5-22SLR-0010620
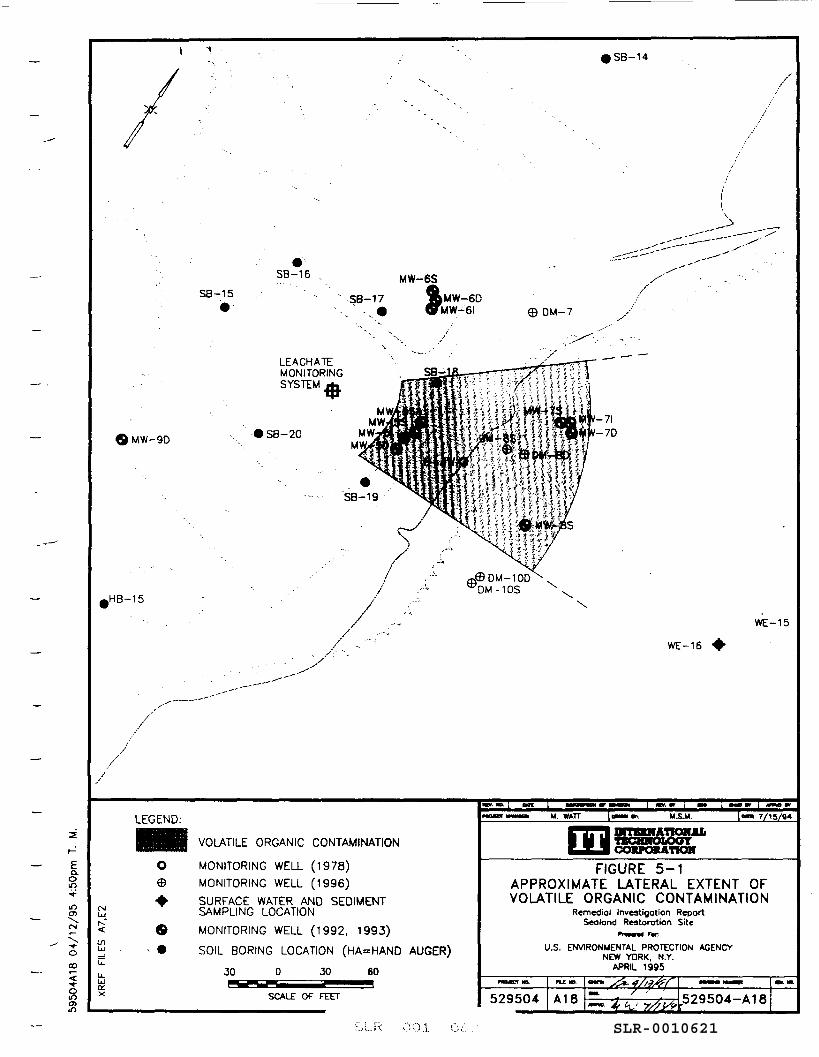
SB-14
•SB-16 MW-6S
SB-15•
SB-17 &MW-6DFMW-6I DM-7
MW-9D
LEACHA7EMONITORINGSYSTEM
I SB-20
hHB-15
WE-15
WE-16
a.o\r>
o00
<io>in
LEGEND:
VOLATILE ORGANIC CONTAMINATION
MONITORING WELL (1978)MONITORING WELL (1996)SURFACE WATER AND SEDIMENTSAMPLING LOCATION
MONITORING WELL (1992, 1993)
SOIL BORING LOCATION (HA=HAND AUGER)
30 D 30 60
SCALE OF FEET
M. WATT M.S.U !«•• 7/15/84
FIGURE 5-1APPROXIMATE LATERAL EXTENT OFVOLATILE ORGANIC CONTAMINATION
Remedial Investigation ReportSeoland Restoration Site
U.S. ENVIRONMENTAL PROTECTION AGENCYNEW YORK, N.Y.
APRIL 1995
529504 A18 529504-A18
OO1 SLR-0010621
The specific gravity of each of the volatile contaminants detected in the site wells is listed onTable 5-1. Thus, in a separate phase, or at concentrations approaching the contaminantssolubility limit (see Table 5-1), these compounds would be expected to sink in the aquifer.However, density is not a factor in the vertical migration of dissolved volatile organiccontaminants in the plume because the concentrations are too low.
The data indicates that the further the plume migrates away from the former disposal cell, thedeeper the contamination moves. This could be the result of several factors. Figure 5-2 wasprepared to present a view of the approximate extent of vertical contamination. This figureshows that contamination is present in well MW-OI but not in MW-OD. This could be a resultof the till that is situated between the two screen zones. It is possible that the contamination ismigrating downward in the area of MW-0 until it encounters the till layer. The contaminantsthen migrate above the low permeable till layer until the till pinches out. The contaminationcontinues to migrate downward, after the till pinches out, and into the bedrock.
The downgradient edge of the plume has not been delineated. As mentioned above, Figure 5-2has been prepared to present the approximate extent of vertical migration of contaminants.However, well Cluster MW-0 is not directly downgradient of the former disposal cell. Wellcluster MW-0 was used in this cross-section because it contains the only bedrock well east of theformer disposal cell. Monitor well MW-OS appears to be directly downgradient of the formerdisposal cell, but MW-OS is not paired with a deeper well. Therefore, the presence ofcontamination in the bedrock at the MW-OS location is unknown. It is possible that there arehigher contaminant concentrations in the bedrock at the MW-OS location than found at wellcluster MW-0. The contamination in MW-0 could be attributed to the east-northeast directionof groundwater flow in the bedrock. However, it is impossible to define the leading edge andvertical extent of the contaminant plume without additional wells.
The vertical hydraulic gradient measurements collected during this investigation suggest a strongtendency for an upward vertical gradient in the former disposal cell area. However, both of thesemeasurements were taken in autumn. It is possible that in the spring, when there is moreprecipitation, the vertical hydraulic gradient is downward. A seasonal downward gradient wouldassist in substantiating the presence of contaminants in the lower part of the overburden aquiferand the upper part of the bedrock aquifer.
EDIS/ENG/ay0714M.rpt 5-24SLR-0010622
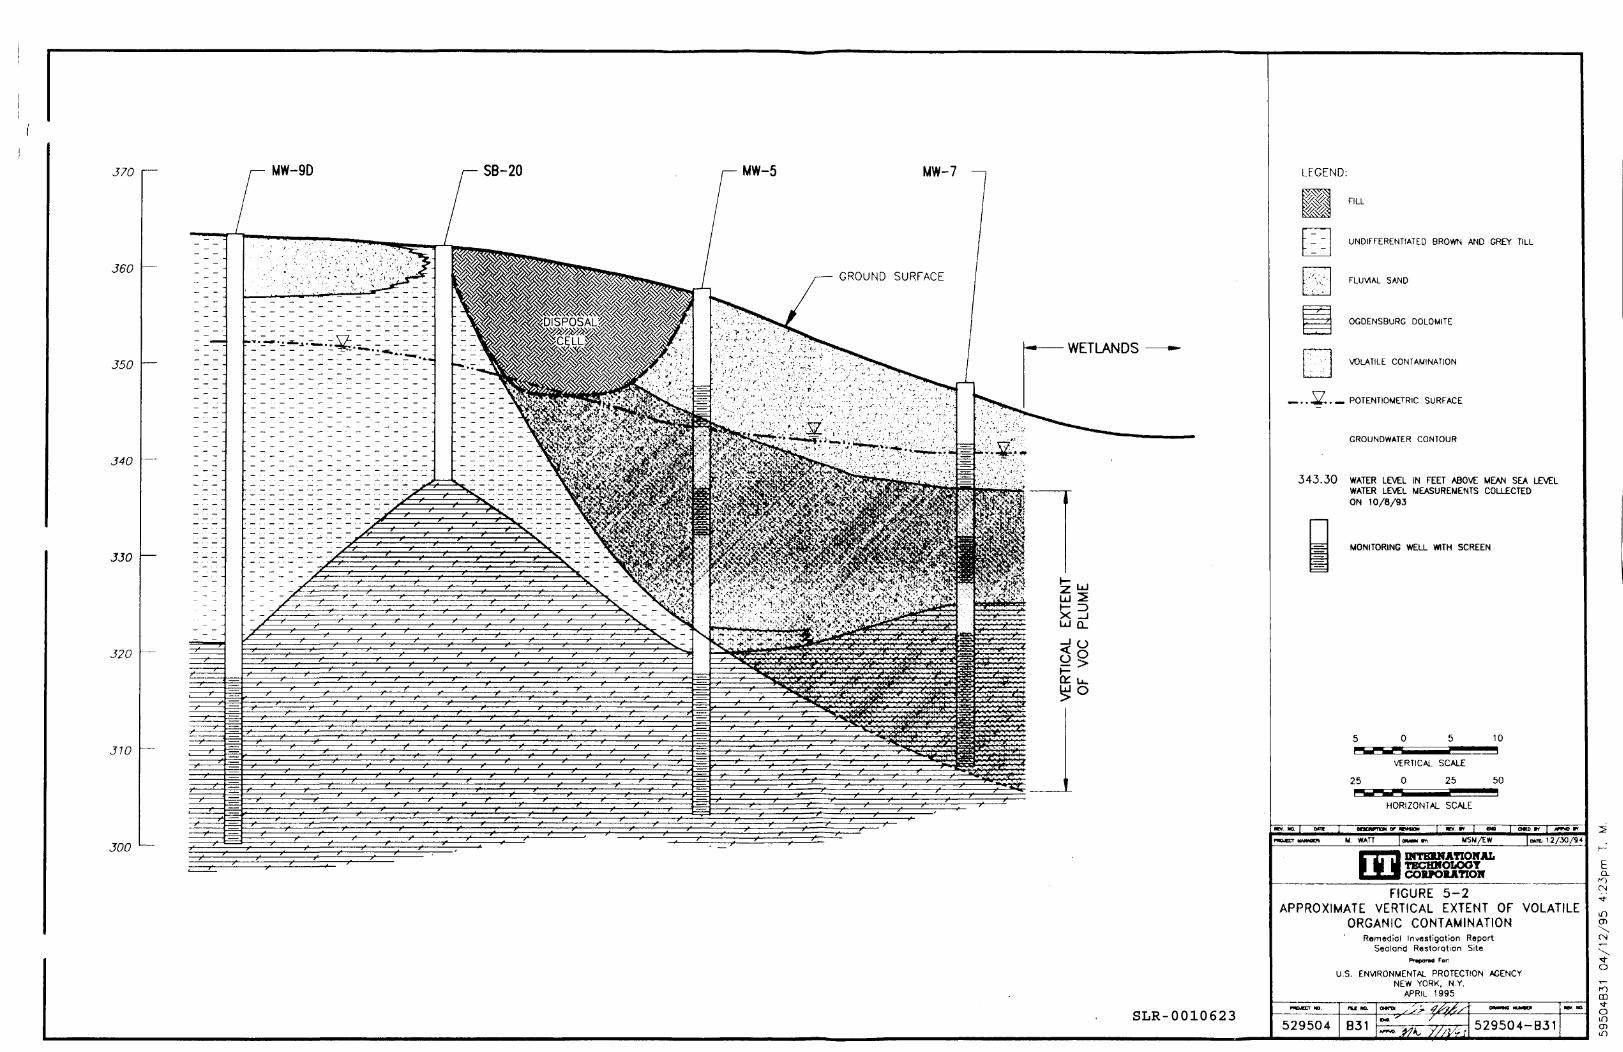
370 MW-9D SB-20 MW-5 MW-7
360
350
340
330
320
310
300
^^^jSm
LEGEND:
FILL
UNDIFFERENTIATED BROWN AND GREY TILL
FLUVIAL SAND
OGDENSBURG DOLOMITE
VOLATILE CONTAMINATION
. _ POTENTIOMETRIC SURFACE
GROUNDWATER CONTOUR
343.30 WATER LEVEL IN FEET ABOVE MEAN SEA LEVELWATER LEVEL MEASUREMENTS COLLECTEDON 10/8/93
MONITORING WELL WITH SCREEN
25
VERTICAL SCALE
0 25~—
HORIZONTAL SCALE
10
50
my. Na I one
1°_L tm I CHRO i
MSM/EW , 12/30/9
I INTEXMATIONALI TECHWOLOOTI CORPORATION
FIGURE 5-2APPROXIMATE VERTICAL EXTENT OF VOLATILE
ORGANIC CONTAMINATIONRemedial Investigation Report
Sealand Restoration Site
U.S. ENVIRONMENTAL PROTECTION AGENCYNEW YORK. N.Y.
APRIL 1995
529504 B31 529504-B31SLR-0010623
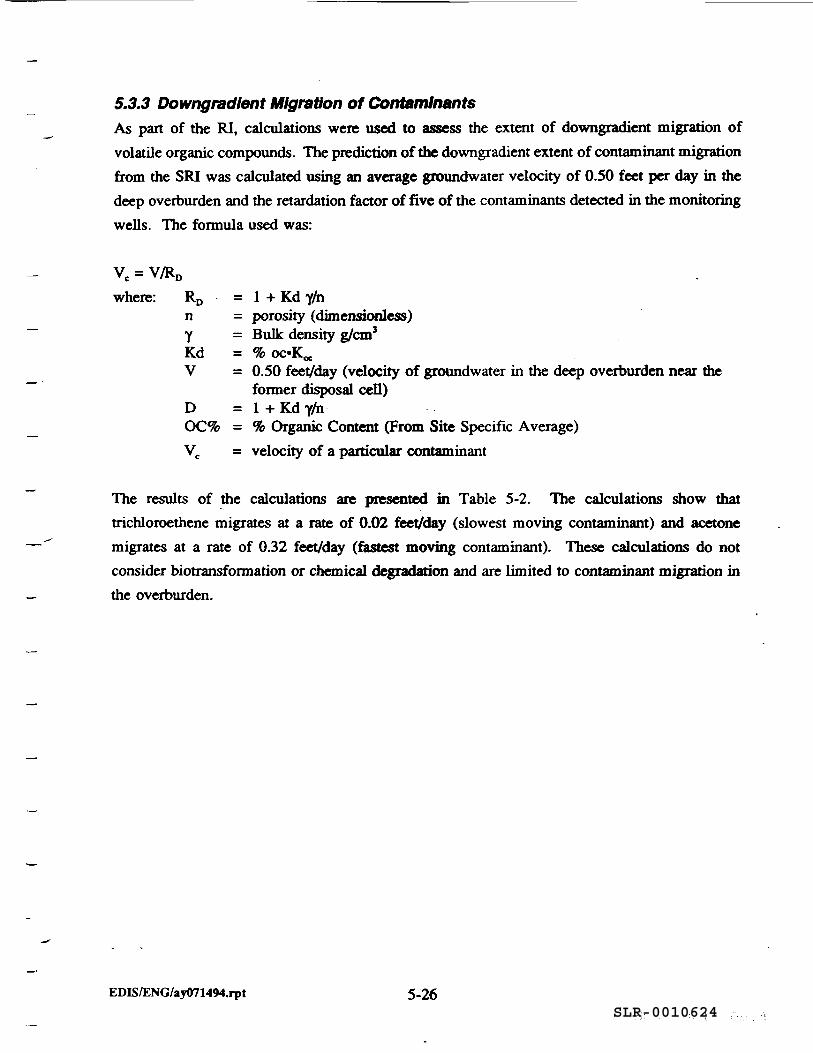
5.3.3 Downgradlent Migration of ContaminantsAs part of the RI, calculations were used to assess the extent of downgradient migration ofvolatile organic compounds. The prediction of the downgradient extent of contaminant migrationfrom the SRI was calculated using an average groundwater velocity of 0.50 feet per day in thedeep overburden and the retardation factor of five of the contaminants detected in the monitoringwells. The formula used was:
Ve = V/RD
where: RD = 1 + Kd f/nn = porosity (dimensionless)y = Bulk density g/cm3
Kd = %oc'Y^V = 0.50 feet/day (velocity of groundwater in the deep overburden near the
former disposal cell)D = 1+Kdy/nOC% = % Organic Content (From Site Specific Average)Vc = velocity of a particular contaminant
The results of the calculations are presented in Table 5-2. The calculations show thattrichloroethene migrates at a rate of 0.02 feet/day (slowest moving contaminant) and acetonemigrates at a rate of 0.32 feet/day (fastest moving contaminant). These calculations do notconsider biotransformation or chemical degradation and are limited to contaminant migration inthe overburden.
EDIS/ENG/ay071494.rpt 5-26SLR-0010624
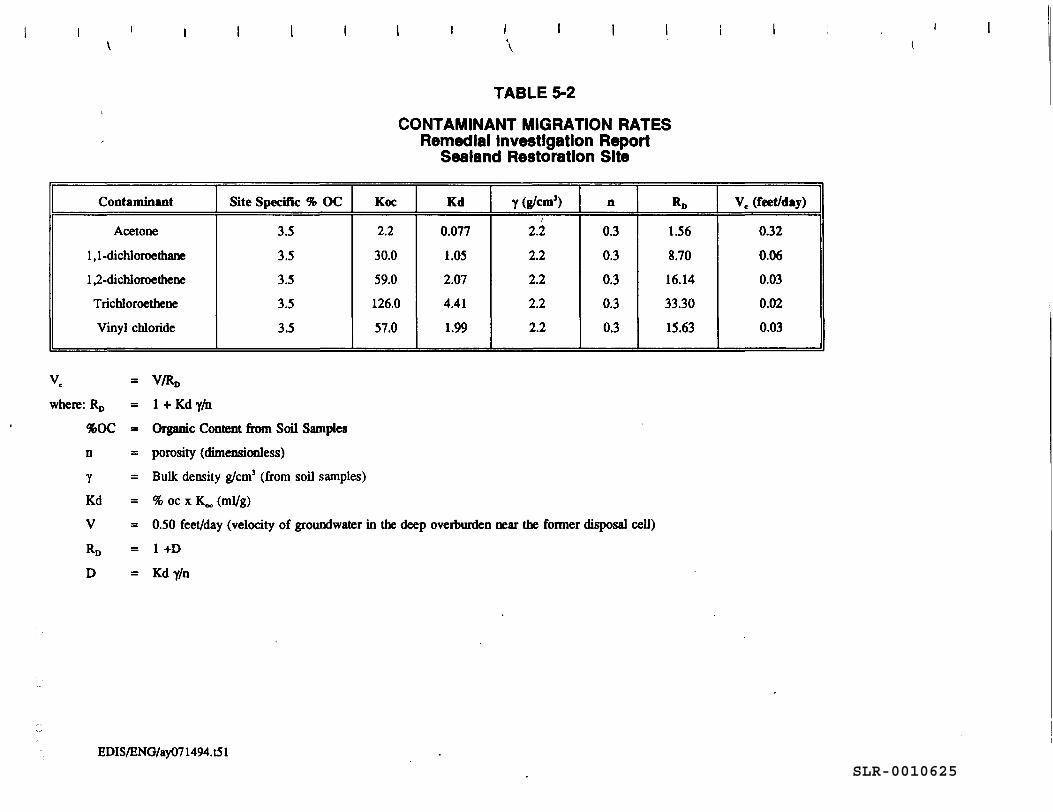
TABLE 5-2
CONTAMINANT MIGRATION RATESRemedial Investigation Report
Sealand Restoration Site
Contaminant
Acetone1,1-dichloroe thane1,2-dichloroetheneTrichloroetheneVinyl chloride
Site Specific % OC
3.5
3.5
3.5
3.5
3.5
Koc
2.2
30.0
59.0
126.0
57.0
Kd
0.077
1.05
2.074.41
1.99
y (g/cm1)
2.22.2
2.2
2.2
2.2
n
0.3
0.3
0.30.30.3
RD
1.56
8.7016.14
33.30
15.63
V« (feet/day)
0.320.060.030.020.03
v« = V/R,,where: RD = 1 + Kd y/n
%OC = Organic Content from Soil Samplesn = porosity (dimensionless)y = Bulk density g/cm3 (from soil samples)Kd = % oc x K^ (ml/g)V = 0.50 feet/day (velocity of groundwater in the deep overburden near the former disposal cell)RD = 1 +D
D = Kdy/n
EDIS/ENG/ay071494.t51SLR-0010625

SLR-0010626
6.0 Baseline Risk Assessment
6.1 Public Health EvaluationThe human health risk assessment for the SRI site in Lisbon, New York is based on theanalytical results obtained from the sampling efforts from the SRI site and collection of off-siteresidential well water samples from homes adjacent to the site. This risk assessment providesan analysis of baseline risks if no further action is taken at the site and to assist in establishingremedial goals, if necessary. Procedures and methodologies used in this risk assessment complywith the following USEPA guidance documents:
• USEPA (U.S. Environmental Protection Agency), 1989, Risk Assessment Guidancefor Superfund, Vol I., Human Health Evaluation Manual (Part A), Office ofEmergency and Remedial Response, Cincinnati, OH, EPA/540/1-89/002.
USEPA (U.S. Environmental Protection Agency), 1989, Exposure Factors Handbook,Office of Health and Environmental Assessment, Washington, D.C., IP A/600/8-89/04 3.
USEPA (U.S. Environmental Protection Agency), 1992, Dermal ExposureAssessment: Principles and Applications, Office of Health and EnvironmentalAssessment, Washington, D.C., EPA/600/8-91/01 IB.
USEPA (U.S. Environmental Protection Agency), 1992, Risk Assessment Guidancefor Superfund, Vol L, Human Health Evaluation Manual Supplemental Guidance.Dermal Risk Assessment, Office of Emergency and Remedial Response, Cincinnati,OH, Draft.
USEPA (U.S. Environmental Protection Agency), 1991, Human Health EvaluationManual Supplemental Guidance. Standard Default Exposure Factors, OSWERDirective 9285.6-03, Office of Emergency and Remedial Response, Cincinnati, OH,Draft.
This human health risk assessment provides a conservative approach which approximatescarcinogenic risk and noncarcinogenic hazard estimates for some sub-populations of potentiallyexposed receptors. Upper bound estimates of potential health risks are calculated for bothpresent-use and future-use exposure scenarios. If potential health risks estimated by theseconservative "reasonable maximum exposure" and risk analysis methodologies are above the EPAtarget levels (i.e., l.OE-04 for carcinogenic risk and 1.0 for the non-carcinogenic hazard index),then an average case scenario (Central Tendency Exposure) is analyzed and presented forexposure pathways exhibiting excessive risk.
EDIS/ENG/ay071494.rp6SLR-0010627
This human health risk assessment chapter of the RI report is divided into the following fivesections:
• Section 6.1.1 (Identification of Constituents of Concern) provides the availableanalytical database and the identification of constituents of concern (COC);
• Section 6.1.2 (Exposure Assessment) addresses the physical components of thesite and the exposure pathways by which site-related constituents may reachhuman exposure points;
• Section 6.1.3 (Toxicity Assessment) summarizes and reviews relevant toxicityinformation for each of the COC;
• Section 6.1.4 (Risk Characterization) combines information from previoussection to quantitatively characterize the health risks associated with exposureto media from the SRI site.
• Section 6.1.5 (Uncertainty Analysis) discusses the uncertainty and inherentassumptions that impact the risk analysis of the SRI site.
• Section 6.1.6 (Summary) of this risk assessment are summarized and re-statedin this section.
6.1.1 Identification of Constituents of Concern6.1.1.1 Data CollectionAs stated in Chapter 2.0 of this document, an extensive field investigation was initiated tocharacterize the extent of constituents present and the potential for migration from the site.These investigations included collection of samples of on-site soils and groundwater, and the off-site collection of sediment, surface water and groundwater samples. Samples collected wereanalyzed for the presence of metals, volatile organic constituents, semi-volatile constituents,pesticides and PCBs.
Appendix G provides information detailing selection of COCs, exposure assessment parametersused, and media-specific exposure pathway risk and hazard characterizations for the SRI site.Appendix H is a compilation of the COC toxicity profiles.
The sampling processes performed at the SRI site during the phased remedial investigations forthe risk characterizations and analysis are described below:
EDIS/ENG/ay071494.rp6 6-2SLR-0010628
SoUSoil samples collected within the top three feet were utilized for assessing risks to on-sitetrespassers and off-site residents and potential future users of the SRI site if no remedial actionsare to be initiated.
A total of 42 surficial soil samples comprise the soil database for this risk assessment. Thesesamples were collected from hand auger borings and hollow-stem auger borings throughout theSRI site between September 1992 to December 1992, and September 1993 to December. 1993.It should be noted that these soils borings were located with a bias toward areas of suspectedcontamination, and as such, represent "worst case" conditions as opposed to average conditionsexpected throughout the site.
GroundwaterThe groundwater database for this RI is comprised of two separate data sets, on-site groundwaterand off-site groundwater. Two rounds of groundwater quality samples were collected from on-site overburden monitoring wells (including the leachate sump) and on-site bedrock monitoringwells. Two rounds of off-site residential well sampling and analysis were conducted tocharacterize the quality of the groundwater used in local residences adjacent to the SRI site. Adetailed description of the groundwater sampling was presented in Chapter 2.0.
As there are no current exposure pathways for on-site groundwater units, these data were notaddressed separately in this risk assessment.
The off-site residential wells adjacent to the SRI site were sampled twice during this RIinvestigation and die New York State Department of Health has established baseline waterquality data for the residential wells through several rounds of sampling and analysis over aperiod of years. The results of these studies demonstrate that off-site residential wells are notimpacted by site-related contaminants at this time. Because site-related constituents are notimpacting off-site residential wells at this time, no quantitative risk analyses were conducted foroff-site resident groundwater usage in the current land-use scenarios.
However, both on-site and off-site groundwater data sets were combined to present a conceptualsimple groundwater source for potential future land use scenarios (USEPA, 1994). Thishypothetical groundwater data set was used to evaluate and characterize the risk/hazard of bothoff-site and on-site residential usage of groundwater in the future land-use scenarios.
EDIS/ENG/ay071494.rp6 6-3SLR-0010629
Surface Water/SedimentSixteen surface water and sediment sampling stations were established in the southwesternwetland area the southern boundary of the SRI site. Two additional sampling stations wereestablished in the northwestern wetland area. The 18 sampling stations were sampled during asingle event, corresponding to the ecological field investigations.
6.1.1.2 Data Validation and EvaluationThe analytical data from this remedial investigation were evaluated by independent datavalidators. Results of these validators' scrutiny are data sets with qualifiers that describe thequality of the data strictly from an analytical chemistry quality assurance viewpoint.
Data with the following qualifiers were included as detected concentrations in their respectivemedia:
"J" - estimated concentration;
"B" - (inorganic data) compound detected above instrument detection limit butbelow the contract required detection limit;
"B" - (organic data) indicates detection of the same compound in the associatedblank;
"E" - presence of interference for inorganics or exceedence of a calibration rangeof the GC/MS instrumentation for organics;
"D" - analysis conducted at a secondary dilution factor;
"M" - duplicate injection precision was not met;
"S" - spiked sample recovery was not within control limits;
"*" - duplicate analysis is not within control limits;
"+" - correlation coefficient for the Method of Standard Additions is less than0.995; and
"W" - Post-digestion spike is not within control limits.
EDIS/ENG/ay071494jp6 6-4SLR-0010630
Data reported as not detected, indicated by a "U" qualifier, were not included in the database.Data with an "R" qualifier, indicating a rejected value, were not included in the database. Allother data, regardless of the respective qualifier, are considered in the development of thedatabase.
A number of steps were taken in the evaluation of validated data for useability of samplesanalyzed from the SRI site to determine whether reported concentrations are of acceptable qualityfor use in the quantitative risk assessment. Prior to any statistical analysis, the data werereviewed to determine the representativeness of the sample population, and the useability ofindividual values. Inspection of the validated groundwater data sets indicated the analyticalresults for volatile organic constituents in two groundwater samples were very different from therest of the data set. Volatile organics such as benzene and vinyl chloride had detection limitsin monitoring well samples SSMW5IGI02 (10/19/93) and SSMW5GS01 that were, respectively,10,000 and 2,500 times greater man the typical detection limit of 1 ug/f for such constituents.These very high detection limits were due to dilution factors encountered in reporting the analyteacetone results. Acetone was quantitated at 2,100,000 ug/( in sample SSMW5IGI02. Analyticalresults for other classes of analytes (e.g. metals, semi-volatiles) were also suspect in these twogroundwater samples because matrix interferences and detection limits exceeded the highest valuefor certain analytes in other samples in the data set. Therefore, acetone values for these twogroundwater samples were included, but all other analytes were excluded from the statisticalanalyses for risk assessment of on-site groundwater.
To generate constituent concentrations that are conservatively representative of the SRI site, one-half the detection limit of all non-detects meeting the above criterion were also used. Byapplying the above evaluation procedures, a set of constituents was identified from the datacollected at the SRI site that qualify for inclusion in the quantitative risk assessment. Tables 6-1through 6-6 lists frequency of detection, arithmetic mean, range, and 95% upper limits ofconstituents detected at least once in surficial soil, off-site groundwater, surface water, sedimentsamples and the combined groundwater data sets from the site.
EDIS/ENG/ay071494.rp6 6-5SLR-0010631
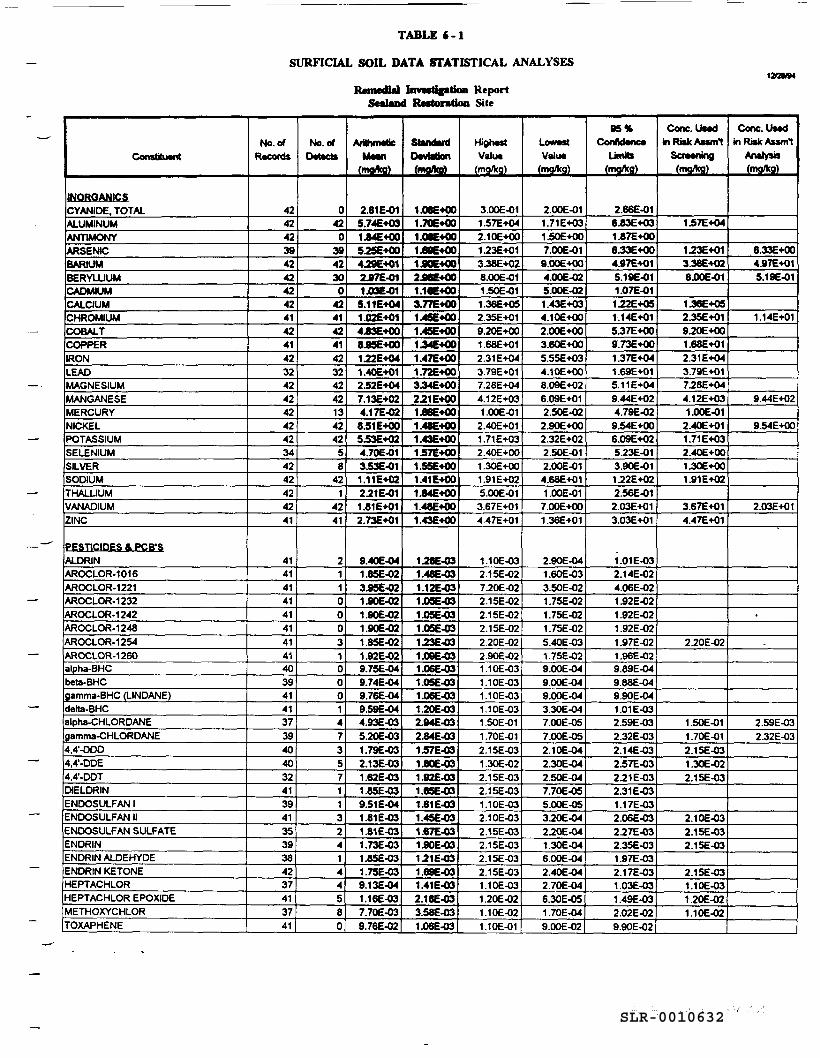
TABLE C-l
SURFICIAL SOIL DATA STATISTICAL ANALYSES
Remedial Inveatifation ReportSealant! Restoration Site
12OS/M
Constituent
INORGANICSCYANIDE. TOTALALUMINUMANTIMONYARSENICBARIUMBERYLUUMCADMIUMCAtaUMCHROMIUMCOBALTCOPPERIRONLEADMAGNESIUMMANGANESEMERCURYNICKELPOTASSIUMSELENIUMSILVERSODIUMTHALLIUMVANADIUMZINC
PESTICIDES & PCB'SALDRINAROCLOR-1016ARCCLOR-1221AROCLOR-1232AROCLOR-1242AROCLOR-1248AROCLOR-1254AROCLOR-1260alpha-BHCbeta-BHCgamma-BHC (LINDAN6)delta-BHCalpha-CHLORDANEgamma-CHLORDANE4,4'-DDD4,4'-DDE4.4'-DDTDIELDRINENDOSULFAN 1ENDOSULFAN IIENDOSULFAN SULFATEENDRINENDRIN ALDEHYDEENDRIN KETONEHEPTACHLORHEPTACHLOR EPOXIDEMETHOXYCHLORTOXAPHENE
No. ofR^coras
424242394242424241424142324242424242344242424241
41414141414141414039414137394040324139413539384237413741
No. ofDetects
0420
3842300
424142414232424213424258
421
4241
2110003100014735711324144580
ArtnfOiwCMMn
(moAg)
2.616-015.746*031.846*00S2SE+QO4.296+012.976-011.03E-015.11E+041.02E+014.836*008.956*00122E+041.40E+01252E+047.1 36+024.17E-028.51 E+005.536*024.70E-013.536-011.11E*022.216-011.816*012.736*01
9.406-041.856-023.956-021.906-021.906-021.906-021.856-021.926-029.756-049.746-049.766-049.596-044.936-035.206-031.796-032.136-031.626-031.856-039.516-041.816-031.816-031.736-031.856-031.756-039.136-041.166-037.706-039.766-02
StandardHai JalliinuwaWHi(mo/Vg)
1.066*001.706*001 .086+001.68E+001 .906+002J6E+001.16E+003.77E+001.45E+OO1.456+001346+001.476+001.726+003.346*002.216*001.666+001.486+001.436+001576+001556+001.416*001.646*001.486*001.436+00
1.286-031.486-031.126-031.056-031.056-031.056-031.236-031.096-031.066-031.056-031.066-031 .206-032.946-032.846-031576-031.806-031.926-031.656-031.616-031.456-031 .676-031.906-031.216-031.696-031.416-032.186-033.58E-031.066-03
High**Value
(mg/kg)
3.00E-011.576+042.106+001.236+013.386+028.006-011.506-011.366+052.356+019.206+001.686+012.316*043.796*017.28E*044.12E+031. 006-01
2.406+011.71E+032.406*001.30E+001.91E*025.00E-013.67E+014.476+01
1.106-032.15E-027.20E-022.15E-022.15E-022.15E-022.20E-022.90E-021.10E-031.106-031.10E-031.10E-031.50E-011.70E-012.15E-031.30E-022.156-032.156-031.10E-032.10E-032.15E-032.15E-032.15E-032.15E-031.10E-031.20E-021.106-021.10E-01
LowestValue
(mg/kg)
2.006-011.716+031506+007.006-019.006+004.006-025.00E-O21.436+034.106+002.006+003.606*005.556*034.106+008.096+026.096*012.506-022.90E+002.32E+022.506-012.006-014.686*011.006-017.006*001.366*01
2.90E-041.60E-033.50E-021.756-021.756-021.756-025.406-031.75E-029.00E-049.006-049.006-043.306-047.006-057.00E-052.106-042.306-042.506-047.706-055.00E-053.206-042.206-041.30E-046.00E-042.40E-042.706-046.306-051.70E-O49.00E-02
95%Confidence
Limits(mg/kg)
2.666-016.836*031.875+006.336+004.97E+015.196-011.076-011226*051.146*015.376*008.736*001.376*041.69E+015.11E+049.446*024.796-029.546*006.096*025.23E-013.906-011.226*022.566-012.036*013.036*01
1.016-032.146-024.066-021.926-021.926-021.926-021.976-021. 966-029.896-049.886-O49.90E-041.016-032.596-032.326-032.146-032.576-032.216-032.316-031.176-032.066-032776-032.356-031.976-032.176-031.036-031.496-032.026-029.90E-02
Conc.UaedinRiskAnml
Screening(mg/kg)
1.576*04
1236+013.386+028.006-01
1.366+052.356+019206+001.686+012.316+043.796+017.286*044.126+031.006-012.406*011.716*032.406*001.306*001.916+02
3.676+014.476+01
2.20E-02
1.50E-011.706-012.156-031.306-022.156-03
2.106-032.156-032.156-O3
2.156-031.106-031. 206-021.106-02
Conc.U»edinRiskAisml
Analysis(mg/kg)
6.336*004.976*015.196-01
1.146*01
9.44E+02
9.546*00
2.03E+01
.
2.59E-032.32E-03
SLR-0010632
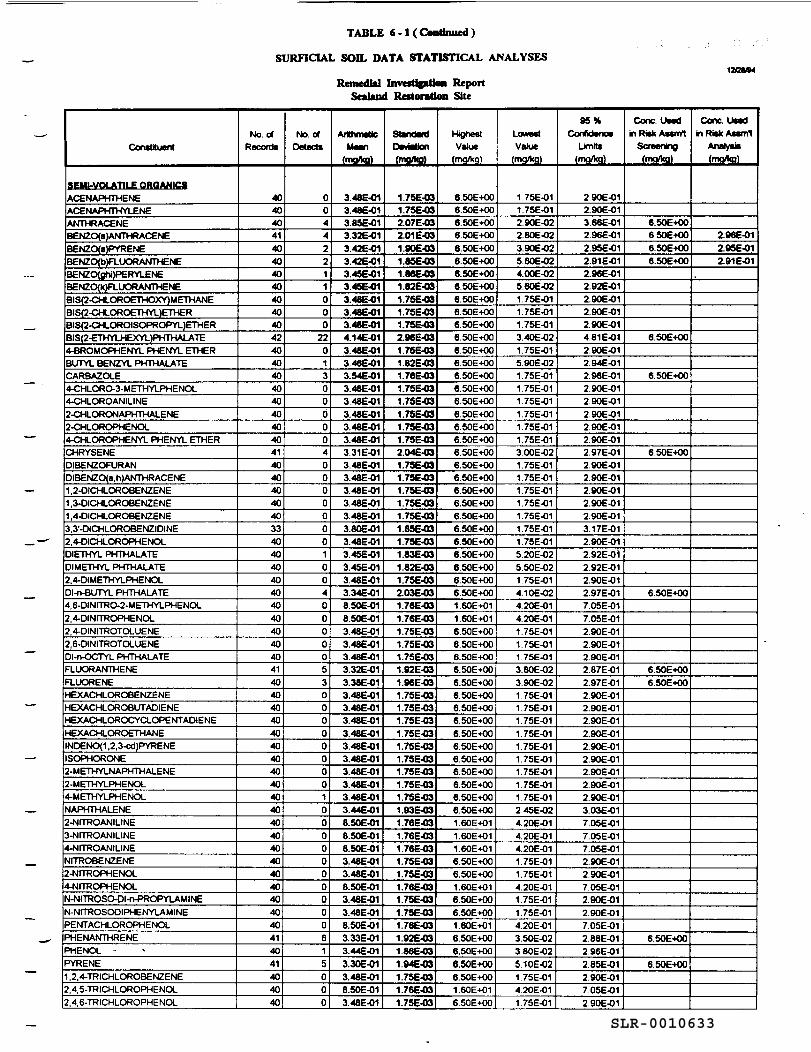
TABLE 6-1 (CMrtlnued)
SURFICIAL SOIL DATA STATISTICAL ANALYSES
Remedial Invertfcattan ReportSealand Restoration Site
12I2M4
Constituent
SEMI-VOLATILE QRQAHICSACENAPHTHENEACENAPHTHYLENEANTHRACENEBENZO(a)ANTHRAC£NEBENZO(a)PYRENEBENZO(b)FLUORANTHENEBENZO(ghi)PERYLENEBENZO(k)FLUORANTHENEBIS(2-CHLOROETHOXY)METHANEBIS(2-CHLORC€THYL)ETHERBIS(2-CHLOROISOPROPYL)ETHERBIS(2-ETHYLHEXYL)PHTHALATE4-BROMOPHENYL PHENYL ETHERBUTYL BENZYL PHTHALATECARBAZOLE4-CHLORO-3-METHYLPHENOL4-CHLOROANILINE2-CHLORONAPHTHALENE2-CHLOROPHENOL4-CHLOROPHENYL PHENYL ETHERCHRYSENEDIBENZOFURANDIBENZO(a,h)ANTHRACENE1 ,2-DICHLOROBENZENE1 ,3-OICHLOROBENZENE1 ,4-DICHLOROBENZENES.y-DICHLOROBENZIDINE2.4-OICHLOROPHENOLDIETHYL PHTHALATEDIMETHYL PHTHALATE2.4-OIMETHYLPHENOLDI-n-BUTYL PHTHALATE4,6-DINITRO-2-METHYLPHENOL2,4-DINITROPHENOL2,4-DINITROTOLUENE2,6-DINITROTOLUENEDI-n-OCTYL PHTHALATEFLUORANTHENEFLUORENEHEXACHLOROBENZENEHEXACHLOROBUTADIENEHEXACHLORCCYCLOPENTADIENEHEXACHLOROETHANEINDENO(1 ,2,3-cd)PYRENEISOPHORONE2-METHYLNAPHTHALENE2-METHYLPHENOL4-METHYLPHENOLNAPHTHALENE2-NITROANILINE3-NITROANILINE4-NITROANILINENITROBENZENE2-NITROPHENOL4-NITROPHENOLN-NITROSO-OI-n-PROPYLAMINEN-NITROSODIPHENYLAMINEPENTACHLOROPHENOLPHENANTHRENEPHENOL -PYRENE1 ,2.4-TRICHLOROBENZENE2,4,5-TRICHLOROPHENOL2.4.6-TRICHLOROPHENOL
No. OfRecords
40404041404040404040404240404040404040404140404040403340404040404040404040414040404040404040404040404040404040404040414041404040
No. of
00442211000
220130000040000000100400000530000000010000000000615000
ArithmeticMOT
(mo/kg)
348E-013.48E-013.8SE-013.32E-01342E-01342E-013.45E-0134SE-013.48E-01348E-01348E-014.14E-01348E-01346E-013.54E-013.48E-01348E-013.48E-013.48E-013.48E-01331E-013.48E-013.48E-013.48E-013.48E-01348E-013.80E-01348E-01345E-013.45E-013.48E-013.34E-01850E-018.50E-013.48E-01348E-01348E-01332E-013.38E-013.48E-013.48E-01348E-013.48E-01348E-013.48E-013.48E-013.48E-013.48E-013.44E-018.50E-018.50E-018.50E-013.48E-013.48E-018.50E-013.48E-01348E-018.SOE-013.33E-013.44E-013.30E-01348E-01850E-013.48E-01
StandardDeviation(mo*g)
1.75E-03175E-03207E-03201E-031.90E-031.85E-031.ME-03182E-03175E-031.75E-031.75E-032.96E-03175E-031.82E-031.76E-03.75E-03.75E-0375E-03.756-03.756-03
2.04E-03.756-03.756-03.75E-03.75E-03.75E-03
1.85E-031.75E-031.83E-O31.82E-031.75E-032.03E-031. 766-03176E-031.75E-031.75E-031.75E-031.92E-031.966-031.75E-031.75E-031.75E-031.75E-031.7SE-031.75E-031. 756-031.75E-031.7SE-03193E-031.76E-031.76E-031.76E-031.7SE-031.75E-031.76E-031.75E-031.7SG-031.76E-03
92E-0386E-0394E-03.75E-03.76E-03.75E-03
HighestValue
(mg/kQ)
6.50E+OO6.50E+00650E+OO6.50E+OO6.50E+00650E-KX)8.50E+006.50E+OO650E+OO6.SOE+006.50E+OO6.50E+006.50E+006.50E+006.50E+OO6.50E+006.50E+006.50E+006.50E+OO6.50E+006.50E+006.50E+006.50E+006.50E+006.50E+006.50E+006.50E+006.50E-KX)6.50E+006.50E+006.50E+006.50E+OO1.60E+011.60E+016.50E+006.50E+006.50E+006.50E+OO6.50E-KX)6.50E+OO6.50E+006.50E+006.50E+OO6.50E+OO6.50E+OO6.50E+006.50E+006.50E+006.50E+001.60E+011.60E+011.60E+016.50E+006.50E+001.60E*016.SOEiOO6.50E+OO1.60E+016.SOE-KX)6.50E+OO6.50E+006.50E+001.60E+016.50E+00
LowestValue
(mq/kg)
1.75E-011.75E-012.90E-022.BOE-023.90E-02560E-02400E-02560E-021.75E-011.75E-011.75E-013.40E-021.75E-01590E-021.75E-011.75E-011.75E-01.75E-01.75E-01.75E-01
3.00E-02.75E-01.75E-01.75E-01.75E-01.75E-01.75E-01
1.75E-015.20E-025.50E-021.75E-014.10E-024.20E-014.20E-011.75E-011.75E-011 75E-01380E-023.90E-02.75E-01.75E-01.75E-01.75E-0175E-01.75E-0175E-01
1.75E-011.75E-01245E-O24.20E-014.20E-01420E-011.75E-011.75E-014.20E-011.75E-011.75E-014.20E-013.SOE-02380E-025.10E-021.75E-014.20E-011.75E-01
95%Confidence
Limits(mg/kg)
290E-01290E-013.66E-01296E-012.95E-012.91 E-01296E-012.92E-012.90E-01290E-01290E-014 81 E-012.90E-012.94E-012.98E-012.90E-012.90E-012.90E-01290E-01290E-012.97E-01290E-01290E-012.90E-012.90E-012.90E-013.17E-01290E-012.92E-01292E-012.90E-01297E-017.05E-017.05E-012.90E-012.90E-012.90E-012.87E-012.97E-012.90E-012.90E-012.90E-012.90E-012.90E-012.90E-012.90E-01290E-012.90E-013.03E-017.05E-017.05E-017.05E-012.90E-01290E-017.05E-01290E-012.90E-017.05E-012.88E-01296E-012.85E-01290E-017.05E-012.90E-01
Cone UsedinRiskAssmt
Screening(moAO)
6.50E+OO6506+00650E+006.50E+00
650E+00
6.50E+00
650E+00
6.50E+00
650E+00650E+OO
650E+00
6.50E+00
Cone. UMdin Risk AssnTt
Analysis(mg/kg)
2.96E-012.95E-012.91E-01
SLR-0010633
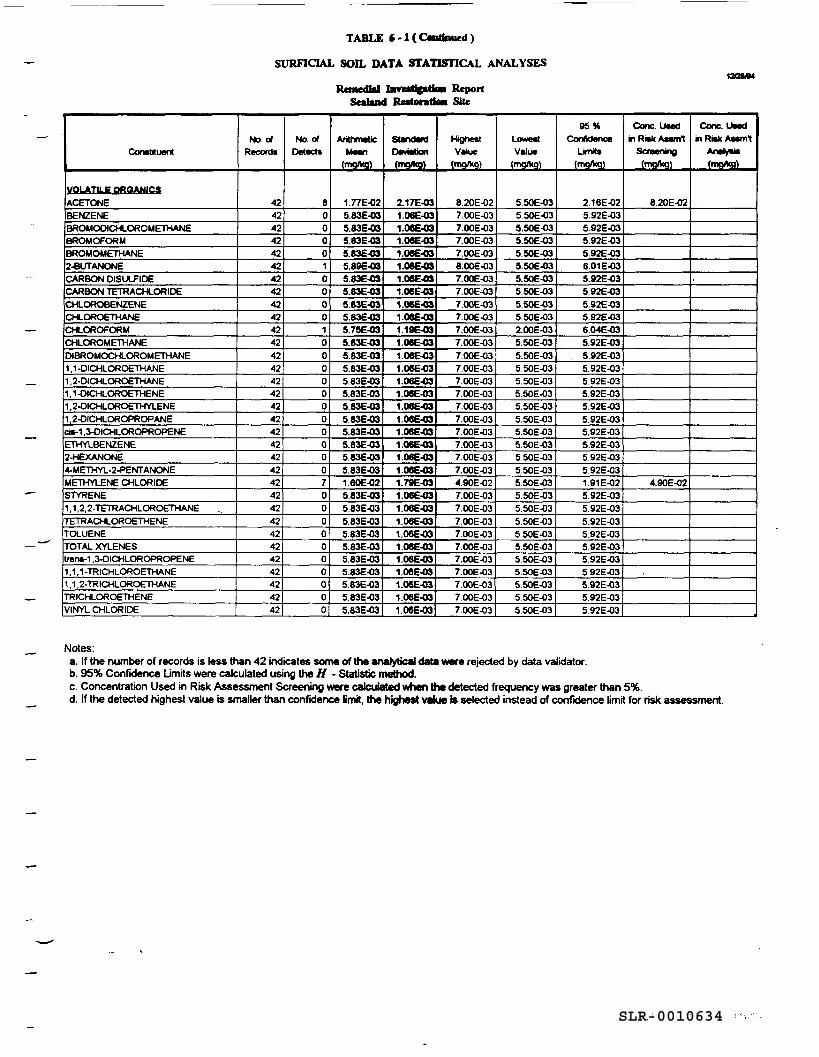
TABLE 6-1 (Continued)
SURFICIAL SOIL DATA STATISTICAL ANALYSES
Remedial Investigriton ReportSeakutd Restontton Site
Conctituent
VOLATILE OROANICSACETONEBENZENEBROMOOICHLOROMETHANEBROMOFORMBROMOMETHANE2-BUTANONECARBON DISULFIDECARBON TETRACHLORIDECHLOROBENZENECHLOROETHANECHLOROFORMCHLOROMETHANEDIBROMOCHLOROMETHANE1 , 1 -DICHLOROETHANE1 ,2-DICHLOROETHANE1 , 1 -DICHLOROETHENE1 ,2-OICHLOROETHYLENE1 ,2-DICHLOROPROPANEciS-1 ,3-DICHLOROPROPENEETHYLBENZENE2-HEXANONE4-METHYL-2-PENTANONEMETHYLENE CHLORIDESTYRENE1 , 1 ,2,2-TETRACHLOROETHANETETRACHLOROETHENETOLUENETOTAL XYLENEStr»n»-1 ,3-OICHLOROPROPENE1 , 1 , 1 -TR ICHLOROETH ANE1 .1 ,2-TRICHLOROETHANETRICHLOROETHENEVINYL CHLORIDE
No. ofRecords
424242424242424242424242424242424242424242424242424242424242424242
No. oTDetects
800001000010000000000070000000000
ArithmeticMean
(mg/tcg)
1.77E-02S.83E-035.83E-035.83E-035.S3E-035.89E-03583E-035.83E-03583E-035.83E-035.7SE-035.83E-035.83E-035.83E-035.83E-03583E-035.83E-03583E-035.83E-03583E-03583E-03583E-03160E-02583E-03583E-035.83E-035.83E-03583E-03583E-03583E-03583E-03S.83E-03S.83E-03
StandardDeviation(mg/kg)
2.17E-031.06E-031.06E-031.0SE-031.08E-031.06E-031.08E-031.06E-031.06E-031.06E-031.19E-03106E-03106E-031.06E-031.06E-031.06E-031.06E-031.00E-031.06E-03106E-031.06E-03108E-03V79E-031.06E-03106E-03
06E-03.06E-0306E-0306E-03.06E-03
1.06E-031.06E-031.06E-03
HighestValue
(mq/kq)
8.20E-027.00E-037.00E-037.00E-037.0OE-038.00E-037.00E-037.00E-037.00E-037.00E-037.00E-037.00E-037.00E-037.00E-037.00E-037.00E-037.00E-037.00E-037.00E-037.00E-037.00E-037.00E-034.90E-027.00E-037.00E-037.00E-037.00E-037.00E-037.00E-037.00E-037.00E-037.00E-037.00E-03
LowestValue
(rrxj/Vg)
5.50E-03550E-03550E-035.SOE-03S.SOE-03550E-03550E-03550E-03S50E-035.50E-032.00E-03550E-035.50E-035.50E-035.50E-035.50E-035.50E-035.50E-03S.SOE-03550E-035.50E-035.50E-035.50E-03550E-035.50E-035.50E-035.50E-035.50E-03S.SOE-035.50E-035.50E-035.50E-035.50E-03
95%Confidence
Limte(mo/kg)
2.16E-025.92E-03592E-03592E-03592E-03601E-035.92E-03592E-03592E-03S92E-036.04E-03592E-03592E-035.92E-035.92E-035.92E-03S92E-03592E-03592E-035.92E-035.92E-03592E-031.91E-025.92E-035.92E-035.92E-03592E-03592E-03592E-03S92E-035.92E-035.92E-035.92E-03
Cone. UsedinRiskAssmt
Screening(mg/kg)
820E-02
4.90E-02
Cone. Usedin Risk Assmt
Analyiis(mg/kg)
.
Notes:a. If the number of records is less than 42 indicates some of the analytical data were rejected by data validator.b. 95% Confidence Limits were calculated using the H - Statistic method.c. Concentration Used in Risk Assessment Screening were calculated when the detected frequency was greater than 5%.d. If the detected highest value is smaller than confidence Emit, the highest value * selected instead of confidence Umit for risk assessment.
SLR-0010634
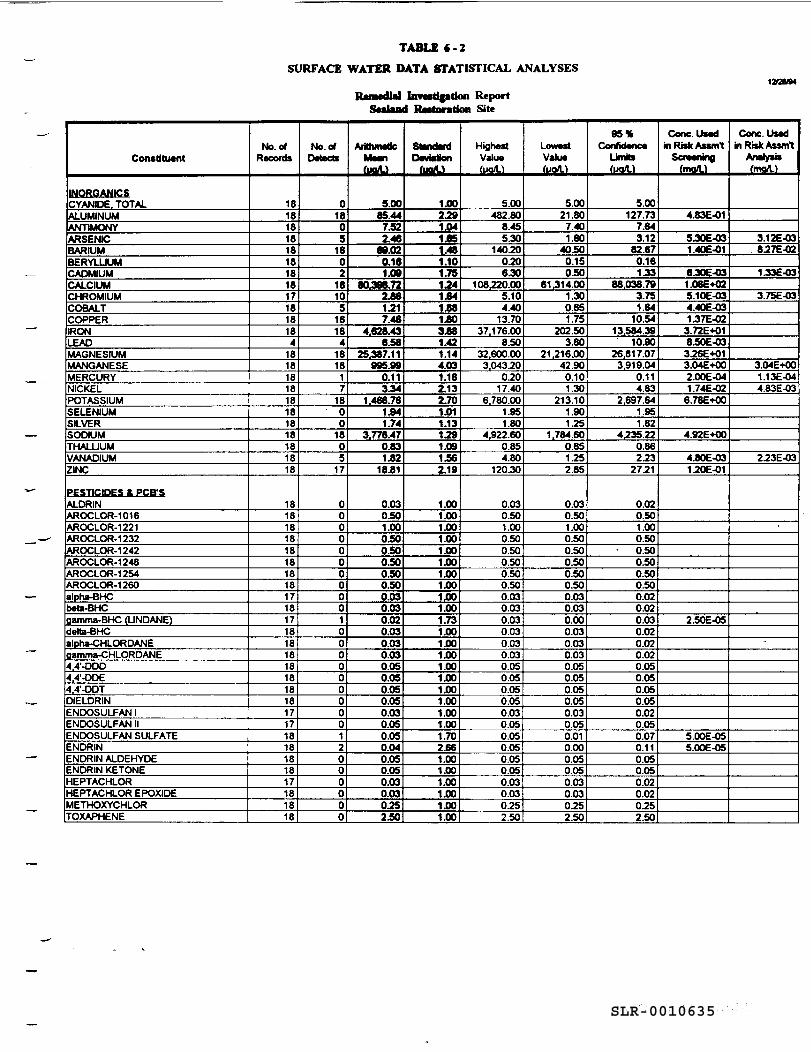
TABLE 6-2SURFACE WATER DATA STATISTICAL ANALYSES
Remedial Investigation ReportSealand Restoration Site
ConstitaMnt
INORGANICSCYANIDE. TOTALALUMINUMANTIMONYARSENIC3ARIUMBERYLLIUMCADMIUMCALCIUMCHROMIUMCOBALTCOPPERIRON.HADMAGNESIUMMANGANESEMERCURYNICKELPOTASSIUMSELENIUMSILVERSODIUMTHALLIUMVANADIUMZINC
PESTICIDES & PCB'SALDRINAROCLOR-1016AROCLOR-1221AROCLOR-1232AROCLOR-1242AROCLOR-1248AROCLOR-1254AROCLOR-1260alpha-BHCbeta-BHCgamma-BHC (LINDANE)detta-BHCalpha-CHLORDANEgamma-CHLORDANE4,4'-DDD4,4'-DDE4,4'-DDTDIELDRINENDOSULFAN IENDOSULFAN IIENDOSULFAN SULFATEENDRINENDRIN ALDEHYDE•NDRIN KETONEHEPTACHLORHEPTACHLOR EPOXIDEMETHOXYCHLORTOXAPHENE
No. ofRecords
1818181818181818171818184
1818181818181818181818
18181818181818181718171818181818181817171818181817181818
No. ofDetects
01805
1802
18105
16184
181817
1800
1805
17
0000000000100000000012000000
ArithmeticMeanfuafU
5.0085.447.522.46
69.020.161.09
80.39S.722*61217.46
4.628.436.58
25.387.11995.99
0.11334
1.466.761.941.74
3.776.470.831*2
18*1
0.030.501.000*00.500.500.500.500.030.030.020.030.030.030.050.050.050.050.030.050.050.040.050.050.030.030752*0
StandardDeviation
ruoA.1
1.002291.041*51/481.101.751241*41*81*03*81.421.144.031.162.132.701.011.131291*91*62.19
1.001.001.001.001.001.001.001.001.001.001.731.001.001.001.001.001.001.001.001.001.702.661.001X101.001*01*01.00
HighestValue(uo/L)
5.00482.80
8.455.30
140200.206.30
108,220.005.104.40
13.7037.176.00
8.5032.600.003,043.20
0.2017.40
6,780.001.951.80
4,922.600.854.80
120.30
0.030.501.000.500.500.500.500.500.030.030.030.030.030.030.050.050.050.050.030.050.050.050.050.050.030.030.252.50
LowestValuefuo/L)
5.0021.80
7.401.60
40*00.150.50
61.314.001.300.651.75
202.503.80
21.216.0042.900.101.30
213.101.901.25
1.784.600.651.252.85
0.030.501.000.500.500.500.500.500.030.030.000.030.030.030.050.050.050.050.030.050.010.000.050.050.030.030252.50
95%Confidence
Limits'uo/U
5.00127.73
7.643.12
82.670.161*3
86.038.793.751.64
10.5413,584.39
10*026.817.073,919.04
0.114.83
2.697.641.951.82
4235.220.86223
2721
0.020.501.000.50
• 0.500.500.500.500.020.020.030.020.020.020.050.050.050.050.020.050.070.110.050.050.020.020252.50
Cone. UsedinRiskAssmt
Screening(man.)
4.83E-01
5.30E-031.40E-01
6.30E-031.06E+025.10E-034.40E-031.37E-02
3.72E+018.50E-O33.26E+013.04E+002.00E-041.74E-02
6.78E+00
4.92E+00
4.80E-03120E-01
2.50E-05
5.00E-OS5.00E-OS
Cone. UsedinRiskAssmt
Analysis(mart.)
3.12E-03627E-02
1.33E-03
3.75E-03
3.04E+001.13E-044.83E-03
223E-03
SLR-0010635
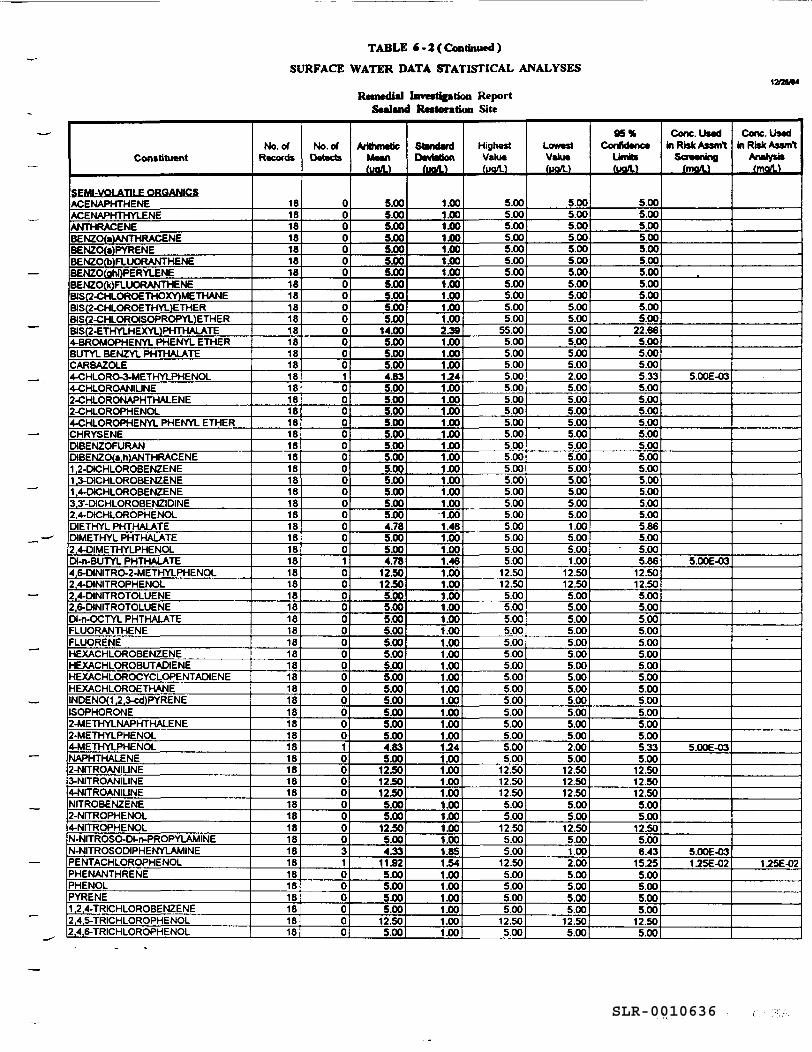
TABLE «-2(Continu*d)
SURFACE WATER DATA STATISTICAL ANALYSES
Remedial Investigation ReportScaland Rettoration Site
vmutt
Constituent
SEMI-VOLATILE ORQANICSACENAPHTHENEACENAPHTHYLENEANTHRACENEBENZO(a)ANTHRACENEBENZ(Xa)PYRENEBENZO(b)FLUORANTHENEBENZO(ghOPERYLENEBENZO(k)FLUORANTHENE3IS(2-CHLOROETHOXY)METHANEBIS(2-CHLOROETHYL)ETHERBIS(2-CHLOROISOPROPYL)ETHERBIS(2-ETHYLHEXYL)PHTHALATE4-8ROMOPHENYL PHENYL ETHERBUTYL BENZYL PHTHALATECARBAZOLE4-CHLORO-3-METHYLPHENOL4-CHLOROANIUNE2-CHLORONAPHTHALENE2-CHLOROPHENOL4-CHLOROPHENYL PHENYL ETHERCHRYSENEDIBENZOFURAN3IBENZO(a.h)ANTHRACENE1 .2-DtCHLOROBENZENE1 .3-DCHLOROBENZENE1 ,4-DtCHLOROBENZENE3.3'-DICHLOROBENZIDINE2.4-DICHLOROPHENOLDIETHYL PHTHALATEDIMETHYL PHTHALATE2,4-DIMETHYLPHENOLDI-n-BUTYL PHTHALATE4.6-DINITRO-2-METHYLPHENOL2,4-CHNITROPHENOL2.4-DINITROTOLUENE2,6-CHNITROTOLUENEDI-n-OCTYL PHTHALATEFLUORANTHENEFLUORENEHEXACHLOROBENZENEHEXACHLOROBUTACHENEHEXACHLOROCYCLOPENTACMENEHEXACHLOROETHANEINDENOd ,2.3-cd)PYRENEISOPHORONE2-METHYLNAPHTHALENE2-METHYLPHENOL4-METHYLPHENOLNAPHTHALENE2-NfTROANIUNE3-NfTROANILINE4-NITROANILINENITROBENZENE2-NITROPHENOL4-NITROPHENOLN-NITROSO-DI-r>-PROPYLAMINEN-NITROSODIPHENYLAMINEPENTACHLOROPHENOLPHENANTHRENEPHENOLPYRENE1 ,2.4-TRICHLOROBENZENE2.4,5-TRICHLOROPHENOL2,4,6-TRICHLOROPHENOL
No. ofRecords
18181818181818181818181818181818181818181818181818181818181818181818181818181818181818181818181818181818181818181818181818181818
No. ofDetects
0000000000000001000000000000000100000000000000010000000031000000
ArithmeticMeanfuo/U
5.005.005.005.005.005.005.005.005.005.005.00
14.005.005.005.004.635.005.005.005.005.005.005.005.005.005.005.005.004.785.005.004.78
12.5012505.005.005.005.005.005.005.005.005.005.005.005.005.004.835.00
12.50125012505.005.00
12305.004.33
11.925.005.005.005.00
12.505.00
StandardDeviation
(uoU
1X101.001.001.001.001.001.001.001.001.001.002.391.001.001.001.241.001.001.001.001.001.001.001.001.001.001.001.001.461.001.001.461.001.001.001.001.001.001.001.001.001.001.001.001.001.001.001241.001.001.001.001.001.001.001.001.851.541.001.001.001.001.001.00
HighestValue(uo/U
5.005.005.005.005.005.005.005.005.005.005.00
55.005.005.005.005.005.005.005.005.005.005.005.005.005.005.005.005.005.005.005.005.00
12.5012.505.005.005.005.005.005.005.005.005.005.005.005.005.005.005.00
12.5012.5012.505.005.00
12.505.005.00
12.505.005.005.005.00
12.505.00
LowestValueOio/U
5.005.005.005.005.005.005.005.005.005.005.005.005.005.005.002.005.005.005.005.005.005.005.005.005.005.005.005.001.005.005.001.00
12.5012.505.005.005.005.005.005.005.005.005.005.005.005.005.002.005.00
12.5012.5012.505.005.00
12.505.001.002.005.005.005.005.00
12.505.00
95%Conncwnct
Untofuo/L)
5.005.005.005.005.005.005.005.005.005.005.00
22.665.005.005.005.335.005.005.005.005.005.005.005.005.005.005.005.005.865.005.005.86
12.5012.505.005.005.005.005.005.005.005.005.005.005.005.005.005.335.00
12.5012.5012.50
5.005.00
12.505.006.43
15755.005.005.005.00
12.505.00
Cone. Usedin Risk Assort
Screeningfmo/U
5.00E-03
5.00E-O3
5.00E-03
5.00E-031.25E-02
Cone. Usedin Risk Assail
Analysis(moA.)
1.25E-02
SLR-0010636
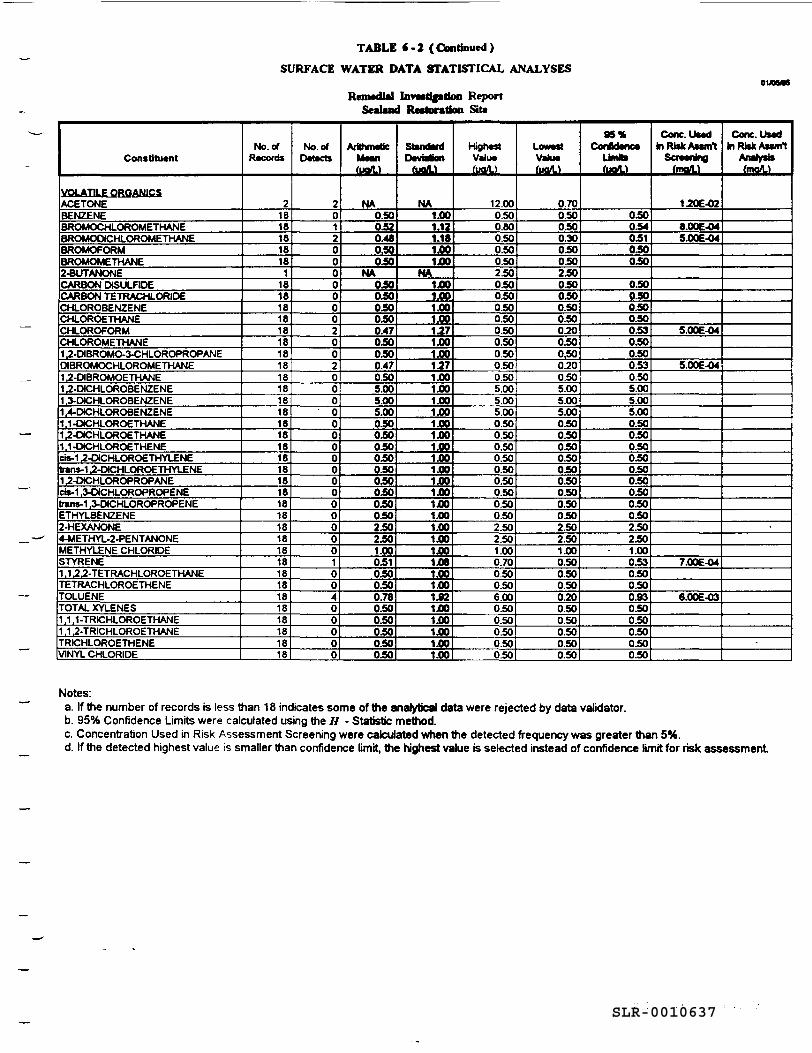
TABLE «-2 (Continued)
SURFACE WATER DATA STATISTICAL ANALYSES
Remedial Investigation ReportSemlmnd Restoration Site
01/OOM
Constituent
VOLATILE ORGANIC SACETONEBENZENEBROMOCHLOROMETHANE8ROMODICHLOROMETHANE3ROMOFORMBROMOME THANE2-8UTANONECARBON DtSULFIDECARBON TETRACHLORIDECHLOROBENZENECHLOROETHANECHLOROFORMCHLOROMETHANE1 7-DIBROMO-3-CHLOROPROPANE3IBROMOCHLOROMETHANE17-DIBROMOETHANE1 .2-DICHLOROBENZENE1 .3-DICHLOROBENZENE1 .4-DtCHLOROBENZENE1.1-OCHLOROETHANE1 ,2-OICHLOROETHANE1 .1 -DICHLOROETHENEcrs-1 ,2-DICHLOROETHYLENEtrans-1 2-OICHLOROETHYLENE1 ,2-DCHLOROPROPANEcis-1 ,3-OICHLOROPROPENEtrans-1 ,3-CMCHLOROPROPENEETHYLBENZENE2-HEXANONE4-METHYL-2-PENTANONEMETHYLENE CHLORIDESTYRENE1 .1 ,2.2-TETRACHLOROETHANETETRACHLOROETHENETOLUENETOTAL XYLENES1,1,1-TRICHLOROETHANE1 ,1 ,2-TRICHLOROETHANETRICHLOROETHENEVINYL CHLORIDE
No. ofRecords
218181818181
181818181818181818181818181818181818181818181818181818181818181818
No. ofDetects
2012000000020020000000000000000100400000
Arithmetic»,<-— —HMBT1
(uafl.)
NA0.500.520.480.50050
NA0500500.500.500.470500.500.470.505.005.005.000500500500500500500500500502502501.000510.500.500.780.500.500500500.50
StmostfflDeviation
ruafl.)
NA1.001.21.1 •1.00IJOO
NA1.001.001.001.001.271.001.001571.001.001.001.001.001.001.001.001.001.001.001.001.001.001.001.001.081.001.001.921.001.001.001.001.00
HighestValuefuo/U
12.000.500.800.500.500.502.500.500.500.500.500.500.500.500.500.505.005.005.000.500.500.500.500.500.500.500.500.502.502.501.000.700.500.506.000.500.500.500.500.50
LowestValueruofl.)
0.700.500.500.300.500.502.500.500.500.500.500.200.500.500.200.505.005.005.000.500.500.500.500.500.500.500.500.502.502.501.000.500.500.500200.500.500.500.500.50
85%Coflnoonct
Umtofuo/U
0500.54051050050
0500500500500530500.500.530.505.005.005.000.500500.500500500500500.500.502.502501.000530.500500.930.500.500.500.500.50
Cone.UMdInRiskAssml
Screening(ma/L)
1.20E-02
8.00E-045.00E-04
5.00E-04
5.00E-04
7.00E-04
6.006X33
Cone. Usedin Risk Assort
Analysis(man.)
Notes:a. If the number of records is less than 18 indicates some of the analytical data were rejected by data validator.b. 95% Confidence Limits were calculated using the H - Statistic method.c. Concentration Used in Risk Assessment Screening were calculated when the detected frequency was greater than 5%.d. If the detected highest value is smaller than confidence Kmit, the highest value is selected instead of confidence limit for risk assessment
SLR-0010637
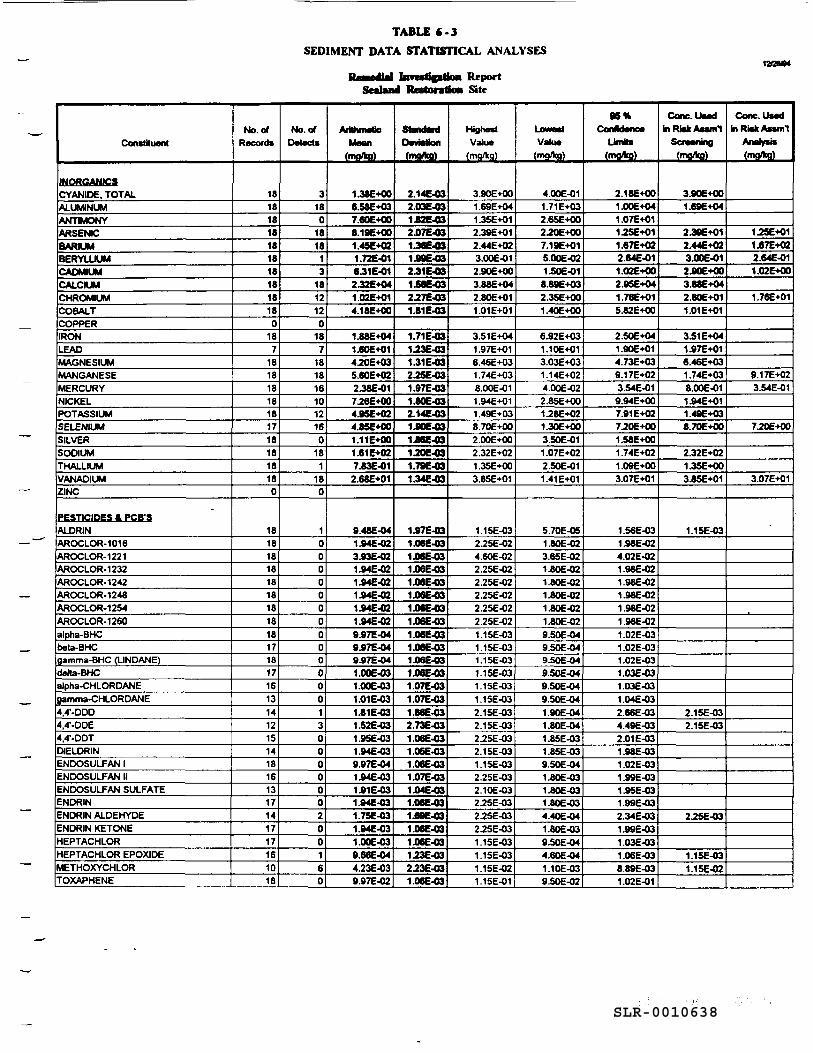
TABLE «-3SEDIMENT DATA STATISTICAL ANALYSES
12MMReport
Sealand Restoration Site
Constituent
INORGANICSCYANIDE. TOTALALUMINUMANTMONYARSENICBARIUMBERYLLIUMCADMIUMCALCIUMCHROMIUMCOBALTCOPPERIRONLEADMAGNESIUMMANGANESEMERCURYNICKELPOTASSIUMSELENIUMSILVERSODIUMTHALLIUMVANADIUMZINC
PESTICIDES ft. RGB'SALDRINAROCLOR-1016AROCLOR-1221AROCLOR-1232AROCLOR-1242AROCLOR-1248AROCLOR-1254AROCLOR-1260alpha-BHCbela-BHCgamma-BHC (LINDANE)delta-BHCalpha-CHLORDANEgamma-CHLORDANE4,4'-DDD4.4--DDE4,4'-DDTDIELDRINENDOSULFAN 1ENDOSULFAN IIENDOSULFAN SULFATEENDRINENDRIN ALDEHYDEENDRIN KETONEHEPTACHLORHEPTACHLOR EPOXIDEMETHOXYCHLORTOXAPHENE
No. ofRecord*
181818181818181818180
187
181818181817181818180
18181818181818181817181716131412151418161317141717161018
No. ofDetects
3180
181813
1812120
187
1818161012160
181
180
1000000000000013000000200160
ArithmeticMean
(mg/kg)
1.38E+008.58E+037.60E+008.19E+001.456+021.72E-016.31E-012.32E+041.02E+014.18E+00
1.886+041. 606+014.20E+035.60E+022.38E-01776E+004.95E+024.85E+001.11E+001.61E+027.83E-012.68E+01
9.48E-041.94E-023.93E-021.94E-021.946-021.84E-021.94E-021.94E-029.97E-049.97E-049.87E-041.00E-031.00E-031.01E-031.81E-031.52E-031.95E-031.94E-039.97E-041.946-031.91E-031.94E-031.75E-031.94E-031.00E-039.66E-044.23E-039.97E-02
StandardDeviation(mg/kg)
2.14E-032.03E-031.826-032.07E-031.3664)31-996-032.31E-031.SSE-C32.27E-031.81E-03
1.71E-031.23E-031.31E-032.256-031.97E-031.60E-032.14E-031.90E-031J8E-031706-031.796-031.34E-03
1.97E-031.06E-031.06E-031.06E-031.06E-031.066-031.08E-031.06E-031.06E-031.08E-031.06E-031.06E-031.07E-031.07E-031.86E-032.73E-031.06E-031.05E-031.06E-031.07E-031.04E-031.06E-031.69E-031.06E-031.066-03173E-03273E-031.06E-03
HighestValue
(mg/kg)
3.90E+001.69E+041.35E+012.39E+012.446+023.00E-012.906+003.88E+042.80E+011.01E+01
3.51 E+041.97E+016.46E+031.74E+03800E-011.94E+011.49E+038.70E+002.00E-HX2.32E+021.35E+003.85E+01
1.15E-032.25E-024.60E-022.25E-022.25E-022.25E-022.25E-022.25E-02.15E-03.15E-03.15E-03.15E-03.15E-03.15E-03
2.15E-032.15E-03275E-032.15E-031.15E-032.25E-032.10E-032.25E-032.25E-032.25E-031.15E-031.15E-031.15E-021.15E-01
LOWMI
Value(mg/kg)
4.00E-011.71E+032.65E+002.20E+007.19E+015.00E-021.506-018.896+032.356+001. 406+00
6.92E+031.106+013.03E+031.14E+024.00E-022.85E+00178E+021.30E+003.SOE-011.07E+022.50E-011.41E+01
5.706-051.80E-023.65E-021.80E-021.806-021.80E-O21.806-021.806-029.50E-049.50E-049.SOE-049.506-049.SOE-049.SOE-041.90E-041.806-041.856-031.85E-039.50E-041.80e-031. 806-031.80E-034.40E-041.80E-039.SOE-044.60E-041.1 06-039.SOE-02
96%ConMeno*
Umte(mg/kg)
2.18E+001.006+041.07E+011i5E+011.67E+022.64E-011.02E+002.956+041.76E+015.82E+00
2.50E+041.906+014.736+039.176+023.546-019.94E+007.91 E+02770E+001.586+001.74E+021.09E+003.07E+01
1.566-031.98E-024.02E-021.986-021.986-021.986-021.98E-021.98E-021.02E-031.02E-031.02E-O31.03E-031.036-031.046-032.666-034.496-032.01E-031.98E-031.02E-031.99E-O31.95E-031.996-032.346-031.996-031.036-031.06E-038.896-031.02E-01
Cone. UsadinRMkAnrnt
Screening(mg/kg)
3.90E+001.696+04
2.396+012.44E+023.00E-012JOE+003.886+042.806+011.016+01
3.516+041.976+016.46E+031.746+038.006-011.946+011.496+038.706+00
2.326+021.356+003.856+01
1.15E-03
2.15E-032.156-03
2756-03
1.156-031.15E-02
Conc.U*adinRUAMrnt
Analyiis(mg/kg)
1756+011.67E+022.646-011.02E+00
1.766+01
9.176+023.54E-01
7.20E+00
3.07E+01
SLR-0010638
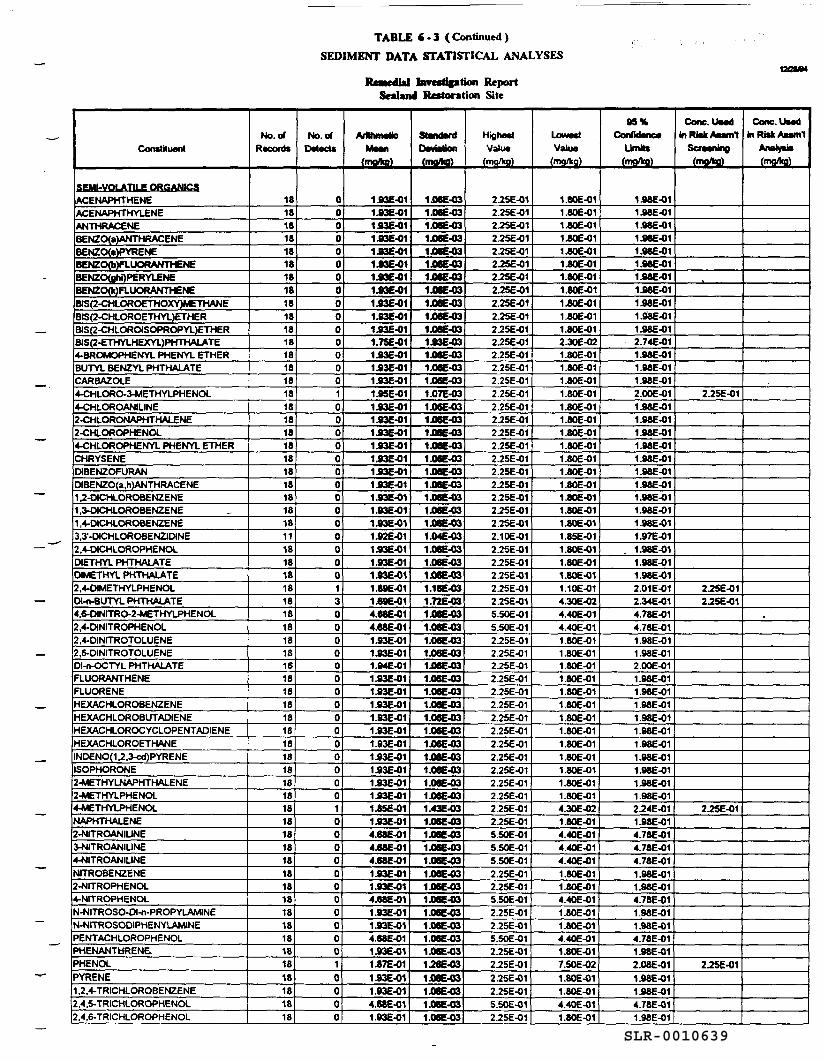
TABLE 6-3 (Continued)
SEDIMENT DATA STATISTICAL ANALYSES
Remedial iHvotication ReportSealand Restoration Site
12CSM
Constituent
SEMI-VOLATILE ORGANICSACENAPHTHENEACENAPHTHYLENEANTHRACENEBENZO(a)ANTHRACENEBENZO(a)PYRENEBENZO(b)FLUORANTHENEBENZO(ghi)PERYLENEBENZO(k)FLUORANTHENEBIS(2-CHLOROETHOXY)METHANEBIS(2-CHLOROETHYL)ETHERBIS(2-CHLOROISOPROPYL)ETHERBIS(2-ETHYLHEXYL)PHTHALATE4-BROMOPHENYL PHENYL ETHERBUTYL BENZYL PHTHALATECARBAZOLE4-CHLORO-3-METHYLPHENOL4-CHLOROANILINE2-CHLORONAPHTHALENE2-CHLOROPHENOL4-CHLOROPHENYL PHENYL ETHERCHRYSENEDIBENZOFURANDIBENZO(a,h)ANTHRACENE1 ,2-DICHLOROBENZENE1,3-CHCHLOROBENZENE1 ,4-OICHLOROBENZENE3.3--OICHLOROBENZIDINE2,4-OICHLOROPHENOLDIETHYL PHTHALATEDMETHYL PHTHALATE2,4-OIMETHYLPHENOLCM-n-BUTYL PHTHALATE4.6-OINITRO-2-METHYLPHENOL2.4-D)NITROPHENOL2,4-DINITROTOLUENE2,6-DINITROTOLUENEDI-n-OCTYL PHTHALATEFLUORANTHENEFLUORENEHEXACHLOROBENZENEHEXACHLOROBLTTADIENEHEXACHLOROCYCLOPENTADIENEHEXACHLOROETHANEINDENO(1 ,2,3-cd)PYRENEISOPHORONE2-METHYLNAPHTHALENE2-METHYLPHENOL4-METHYLPHENOLNAPHTHALENE2-NITROANIUNE3-NITROANILINE4-NITROANIUNENITROBENZENE2-NITROPHENOL4-NITROPHENOLN-NITROSO-DI-n-PROPYLAMINEN-NITROSODIPHENYLAM1NEPENTACHLOROPHENOLPHENANTURENEPHENOLPYRENE1 ,2,4-TRICHLOROBENZENE2,4.5-TRICHLOROPHENOL2.4,6-TRICHLOROPHENOL
No. ofRecords
18181818181818181818181818181818181818181818181818181118181818181818181816181818181818181818181818181818181818181818181818181818
No. ofDetects
0000000000000001000000000000001300000000000000010000000000010000
Afttmettcly Mit
(mg/kg)
1.93E-011.936-011.936-011 .93*011J36-011.936-011.936-011.936-011.936-011.936-011.93E-011.75E-011.936-011.936-011.83E-011.95E-011.93E-011.936-011.936-011.936-011.93E-011.936-011.936-011.936-011.93E-011.93E-011.92E-011.936-011.936-011.936411.88E-011.69E-014.68E-014.68E-011.93E-011.93E-011.946-011.936-011.936-011.93E-011.93E-011.93E-011.93E-011.936-011.936-011.93E-011.93E-011.85E-011.936-014.68E-014.686-014.88E-011.93E-011J36-014.666-011.93E-011.93E-014.68E-011.936-011.87E-011.936-011.93E-014.686-011.93E-01
StandardDeviationOnoftO)
1JWE-031JME-031.06E-031-08E-03UOK-031ME-031ME-031ME-031:086-031XWE-031JME-031A3E-031.08E-031.08E-031.06E-031.07E-031.0SE-031JME-031.08E-031.08E-C31ME-031JME-031.08E-031.06E-03tME-031.06E-031ME-031.06E-031.06E-031.06E-031.16E-031.72E-031ME-031.066-031.066-031.066-031JME-031M6-031.066-031.066-031.066-031 •066431.06E-031.066-031.066-031.066-031.066-031.436-031.066-031.066-031.066-031.066-031.066-031.066-031.066-031.066-031.066-031.066-031.066431 .266.031.066-031M6-031.066-031.066-03
HighestValue
(mg/kg)
2^5E-012.25E-0122SE-012.25E-012.2SE-012.25E-012.25E-012.25E-012.25E-012.2SE-012J5E-0127SE-012.25E-012.25E-012.2SE-012.25E-012.25E-012^5E-012^5E-012.25E-012.25E-012.2SE-012J5E-012.25E-012.25E-012.25E-012.10E-012.25E-012^5E-012.25E-012.25E-012.25E-01S.SOE-015.SOE-012.25E-012.25E-012.25E-012.25E-012.25E-012.25E-012.25E-012.25E-012.2SE-012^5E-012.25E-012.25E-012.2SE-012.25E-012.25E-015.SOE-01S.50E-015.50E-012.25E-012^5E-015.50E-012.25E-012.25E-015.50E-012^5E-012.25E-012.2SE-012.25E-015.50E-01275E-01
LowestValue
(mg/kg)
1.80E-011.80E-011 JOE-011 JOE-011 JOE-011 JOE-011.606-011.606-011 JOE-011 JOE-011 JOE-012.306-021 JOE-011.BOE-011.806-011.806-011 JOE-011.80E-011.80E-011 JOE-011 JOE-011.80E-011.80E-011.8OE-011 JOE-011.806-011.856-011.806-011.80E-011.80E-011.106-014.306-024.40E-014.40E-011.80E-011.80E-011.80E-011.80E-011.80E-011.80E-011.80E-011.80E-011.80E-011.80E-011.80E-011 .806-011.80E-014.306-021.806-014.40E-014.40E-014.40E-011.806-011. 806-014.40E-011.80E-011.80E-014.406-011.80E-017.SOE-021.80E-011.80E-014.40E-011.80E-01
95%ConTidenc*
Limits(mg/kg)
1.986-011 .986-011.98E-011.98E-011.98E-011.986-011.98E-011.98E-011.986-011.98E-011.986-012.746-011.986-011.98E-011.98E-012.006-011S8E-011.98E-011.98E-011.98E-011.98E-011.98E-011.98E-011.98E-011.986-011.98E-011.976-01
. 1.98E-011.986-011.986-012.01 E-012.34E-014.786-014.786-01.98E-01.986-01.OOE-01.98E-01.986-01.98E-01.986-01
1.98E-011.986-011.986-011.986-011.98E-011.98E-012^4E-011.98E-014.786-014.786-014.78E-011.986-011.986-014.786-011.98E-011.98E-014.78E-011.98E-012.086-011.986-011.98E-014.78E-011.98E-01
Cone. UsedInRiskAaaml
Screening(mg/kg)
2.25E-01
275E-012^56-01
2^56-01
2J5E-01
Cone. UsedkiRiskAasml
Analysis(mg/kg)
SLR-0010639
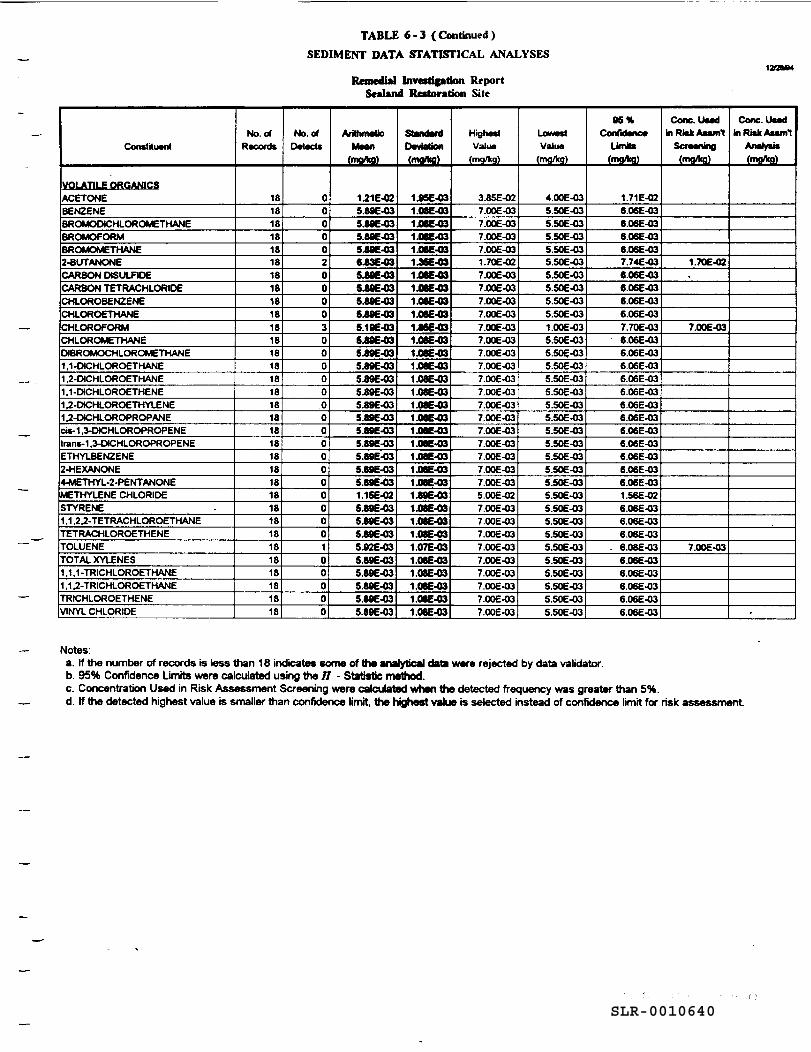
TABLE 6 - 3 ( Continued )SEDIMENT DATA STATISTICAL ANALYSES
Remedial Investigation ReportSealand Restoration Site
122004
Constituent
VOLATILE ORGANICSACETONEBENZENEBROMOCHCHLOROMETHANEBROMOFORMBROMOM6THAN62-6UTANON6CARBON CHSULFIDECARBON TETRACHLORIDECHLOROBENZENECHLORO6THAN6CHLOROFORMCHLOROM6THANECMBROMOCHLOROMETHANE1 ,1-OICHLOROeTHANe1 ,2-DICHLOROETHANE1.1-CMCHLOROETHENE1 ,2-OICHLOROeTHYLeNE1 .2-DICHLOROPROPANEc«-1 ,3-DtCHLOROPROPENElrans-1 ,3-DtCHLOROPROPENEETHYLB6N2EN62-HEXANONE4-M6THYL-2-PENTANONEM6THYL6N6 CHLORIDESTYR6N61 ,1 ,2,2-T6TRACHLOROeTHANeTETRACHLOROETHENETOLUENETOTAL XYLENES1.1.1 -TRICHLOROETHANE1 .1 .2-TRICHLOROETHANETRICHLOROETHENEVINYL CHLORIDE
No. ofRecords
181818181818181818181818181818181818181818181818181818181818181818
No. of
000002000030000000000000000100000
a,ai,,.. irNMNIWUL
Mean(mo/kg)
1.216-025496-035.896-035496-035496-036436-035496-035496-035496-035496-035.196-035486-035496-035.896-035.896-035.896-035.896-035.896-035.896-035.896-035.896-035.896-035.896-031.156-025.896-035.896-035.896-035.926-035.896-035.896-035496-035.896-035.896-03
StandardDeviation(mg/kg)
1.956-031.086-031.086-031. 086-031.086-031.356-031.086-031JME-031 .086-031.086-031J5E-031.086-031.086-031.08E-031.086-031.086-031.086-031.086-031.086-031.086-031.086-031.066-031.086-031496-031.086-031.086-031.086-031.076-031.086-031.086-031.086-031.08E-031.086-03
HighestValue
(mg/kg)
3.85E-027.00E-037.00E-037.006-037.00E-031.70E-027.006-037.006-037.006-037.006-037.006-037.00E-037.006-037.00E-037.00E-037.00E-037.00E-037.00E-037.00E-037.00E-037.00E-037.00E-037.00E-035.00E-027.006-037.00E-037.00E-037.006-037.006-037.006-037.006-037.00E-037.00E-03
LowestValue
(mg/kg)
4.006-035.506-035.506-035.506-035.506-035.506-035306-035.506-035.506-O35.50E-031.006-035.506-035.50E-035.506-035.50E-035.50E-035.50E-035.50E-035.506-035.50E-035.506-035.506-035306-035.506-035.506-035.50E-035.506-035506-035.506-035.506-035.506-O35.506-035.50E-03
95%Confidence
Limit*(mg/kg)
1.716-026.066-036.066-036.066-036.066-037.746-036.066-036.066-036.066-036.066-037.706-036.066-036.066-036.066-036.06E-036.06E-036.06E-036.06E-O36.066-036.06E-036.066-036.06E-036.06E-031.56E-026.066-036.066-036.06E-03
- 6.086-036.066-036.066-036.06E-O36.066-036.066-03
Conc.UMdinRiskAssmt
Screening(mg/kg)
1.706-02,
7.006-03
7.006-03
Cone. UsedInRickAumt
Analytic(mg/kg)
•
Notes:a. If the number of records is less than 18 indicates some of the analytical data were rejected by data validator.b. 95% Confidence Limits were calculated using the H - Statistic method.c. Concentration Used in Risk Assessment Screening were calculated when the detected frequency was greater than 5%.d. If the detected highest value is smaller than confidence limit, the highest value is selected instead of confidence limit for risk assessment
SLR-0010640
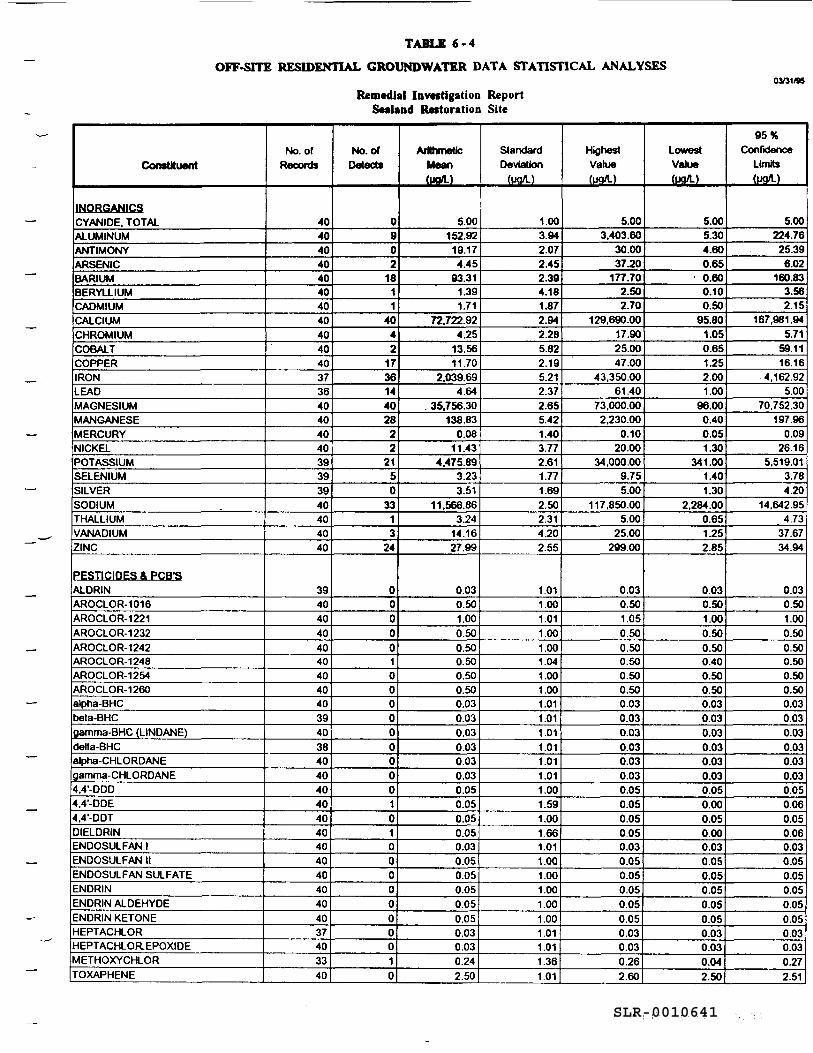
TABLE 6-4
OFF-SITE RESIDENTIAL GROUNDWATER DATA STATISTICAL ANALYSES
Remedial Investigation ReportSealand Restoration Site
Constituent
INORGANICSCYANIDE. TOTALALUMINUMANTIMONYARSENICBARIUMBERYLLIUMCADMIUMCALCIUMCHROMIUMCOBALTCOPPERIRONLEADMAGNESIUMMANGANESEMERCURYNICKELPOTASSIUMSELENIUMSILVERSODIUMTHALLIUMVANADIUMZINC
PESTICIDES & FOB'SALDRINAROCLOR-1016AROCLOR-1221AROCLOR-1232AROCLOR-1242AROCLOR-1248AROCLOR-1254AROCLOR-1260alpha-BHCbeta-BHCgamma-BHC (LINDANE)detta-BHCalpha-CHLORDANEgamma-CHLORDANE4,4'-DDD4,4-DDE4.4'-DDTDIELDRINENDOSULFAN 1ENDOSULFAN IIENDOSULFAN SULFATEENDRINENDRIN ALDEHYDEENDRIN KETONEHEPTACHLORHEPTACWLOR.EPOXIDEMETHOXYCHLORTOXAPHENE
No. ofRecords
404040404040404040404037364040404039393940404040
39404040404040404039403840404040404040404040404037403340
No. ofDetects
0902
1811
4042
173614402822
2150
3313
24
0000010000000001010000000010
ArithmeticMoan(port.)
5.00152.9219.174.45
93.311.391.71
72.722.924.25
13.5611.70
2.039.694.64
35.756.30138.83
0.0811.43
4.475.893.233.51
11,566.863.24
14.1627.99
0.030.501.000.500.500.500.500.500.030.030.030.030.030.030.050.050.050.050.030.050.050.050.050.050.030.030.242.50
StandardDeviation
(M9/L)
1.003.942.072.452.394.181.872.942.285.822.195.212.372.655.421.403.772.611.771.692.502.314.202.55
1.011.001.011.001.001.041.00.00.01.01.01.01.01.01
1.001.591.001.661.011.001.001.001.001.001.011.011.361.01
HighestValue(U9/L)
5.003.403.60
30.0037.20
177.702.502.70
129,690.0017.9025.0047.00
43.350.0061.40
73.000.002.230.00
0.1020.00
34.000.009.755.00
117,850.005.00
25.00299.00
0.030.501.050.500.500.500.500.500.030.030.030.030.030.030.050.050.050.050.030.050.050.050.050.050.030.030.262.60
LowestValue(P9/L)
5.005.304.600.65
• 0.600.100.50
95.801.050.651.252.001.00
96.000.400.051.30
341.001.401.30
2,284.000.651.252.85
0.030.501.000.500.500.400.500.500.030.030.030.030.030.030.050.000.050.000.030.050.050.050.050.050.030.030.042.50
95%Confidence
Limits(UQ/L)
5.00224.7625.396.02
160.833.562.15
167,981.945.71
59.1116.16
4,162.925.00
70,752.30197.96
0.0926.16
5,519.013.784.20
14.642.954.73
37.6734.94
0.030.501.000.500.500.500.500.500.030.030.030.030.030.030.050.060.050.060.030.050.050.050.050.050.030.030.272.51
SLR-0010641
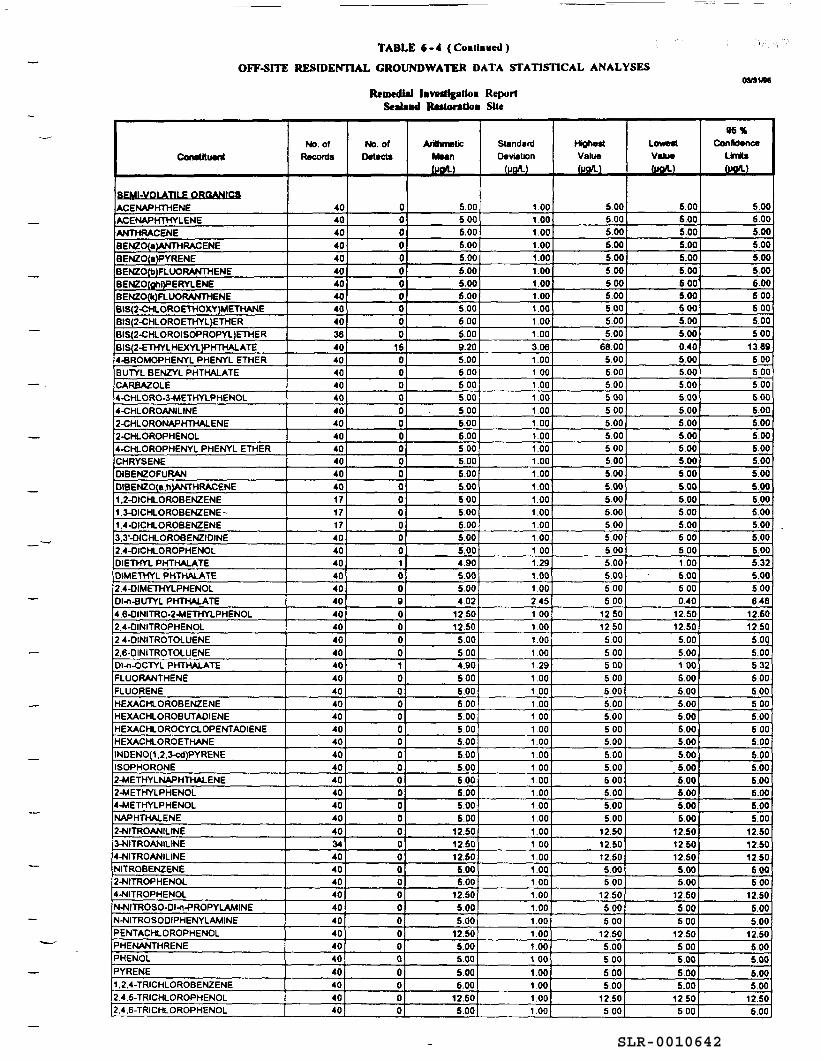
TABLE 6-4 (CoBllnueU)
OFF-SITE RESIDENTIAL GROUNDWATER DATA STATISTICAL ANALYSES
Remedial Uvestigafioa ReportSealaid Re*lor*Uoa SUe
OMWM
Constituent
SEMI-VOLATILE OROANIC8ACENAPHTHENEACENAPHTHYLENEANTHRACENEBENZO(a)ANTHRACENEBENZO(a)PYRENEBENZO(b)FLUORANTHENEBENZO(ghQPERYLENEBENZO{k)FLUORANTHENEBIS(2-CHLOROETHOXY)METHANEBIS(2-CHLOROETHYL)ETHERBIS(2-CHLOROISOPROPYL)ETHERBIS(2-ETHYLHEXYL)PHTHALATE4-BROMOPHENYL PHENYL ETHERBUTYL BENZYL PHTHALATECARBAZOLE4-CHLORO-3-METHYLPHENOL4-CHLOROANILINE2-CHLORONAPHTHALENE2-CHLOROPHENOL4-CHLOROPHENYL PHENYL ETHERCHRYSENEDIBENZOFURANOIBENZO(a.h)ANTHRACENE1 .2-OICHLOROBENZENE1 .3-OICHLOROBENZENE -1 .4-OICHLOROBENZENE3.3'-DICHLOROBENZIOINE2.4-DICHLOROPHENOLDIETHYL PHTHALATEDIMETHYL PHTHALATE2.4-DIMETHYLPHENOLDI-fi-SUTYL PHTHALATE4 .6-OINITRO-2-METHYLPHENOL2.4-DINITROPHENOL2.4-DINITROTOLUENE2.6-DINITROTOLUENEOI-n-OCTYL PHTHALATEFLUORANTHENEFLUORENEHEXACHLOROBENZENEHEXACHLOROBUTADIENEHEXACHLOROCYCLOPENTADIENEHEXACHLOROETHANEINOENO(1.2,3-cd)PYRENEISOPHORONE2-METHYLNAPHTHALENE2-METHYLPHENOL4-METHYLPHENOLNAPHTHALENE2-NITROANILINE3-NITRO ANILINE4-NITROANILINENITROBENZENE2-NITROPHENOL4-NITROPHENOLN-NITROSO-DI-n-PROPYLAMINEN-NITROSODIPHENYLAMINEPENTACHLOROPHENOLPHENANTHRENEPHENOLPYRENE1 ,2.4-TRICHLOROBENZENE
.4 ,5-TRICHLOROPHENOL2.4 ,6-TRICHLOROPHENOL
No. OfRecords
40404040404040404040364040404040404040404040401717174040404040404040404040404040404040404040404040403440404040404040404040404040
NO. OfDetects
00000000000
150000000000000000100900001000000000000000000000000000
ArithmeticMean(MOO.)
5.005.005.005.005.005.005.005.005.005005.009.205.005.005005.005.005.005.005.005.005.005.005.005.005.005.005.004.905.005,004.02
12.5012.50
S.OO5.004.905.005.00S.OO5.005.005.005.00S.OO5005.005.00S.OO
12.5012.5012.506.00S.OO
12.505.005.00
12.50S.OO5.00S.OOS.OO
12.505.00
StandardDeviation
(MPA)
1.001.001.001.001.001.001.001.001.001.001.003.061 001 001.001 001 001.001.001.001.001.001.001.001.001.001 001 001.291.001.002451 001 001 001 001.291.001.001 001.001 001 001.001 001.001 001.001.001.001 001.001.001 001.001.001 001.001 001 001 001 001.001 00
HighestValue(USA)
5005.005005005005005005.00500500500
68.005.005005005005005005.005005005005.005.00S.OO500S.OO5005.005.00500500
125012.505.005.005005005.005.00S.OO5005005.005005.005.00S.OO500
12.5012.5012.50
S.OO500
1250500S.OO
12.505.00500500500
12505.00
LowestValue(po/L)
5.00S.OO5.00500S.OO500S.OO500500500500040S.OO5005005005005.005.00S.OO5005.005.00S.OO5.00S.OOS.OOS.OO1 00S.OO5000.40
125012.505.005001 005.005.005.005.005.005.005005005.005.00500S.OO
125012.5012.50
S.OO5.00
12.50S.OO5.00
12.505005005005.00
12.505.00
95%Confidence
UmKs(pg/L)
S.OOS.OOS.OOS.OO5.005.005006005.005.005.00
13895005.005005.005.005005.00S.OO5.005.00500500S.OO5.00S.OOS.OO5.32500500648
12.6012.50500.5.005325.005.00S.OO5.00S.OOS.OO5.005.00S.OO6.005.00S.OO
12.5012.5012.50600500
12505.005.00
12.505.005.005.00500
1250500
SLR-0010642
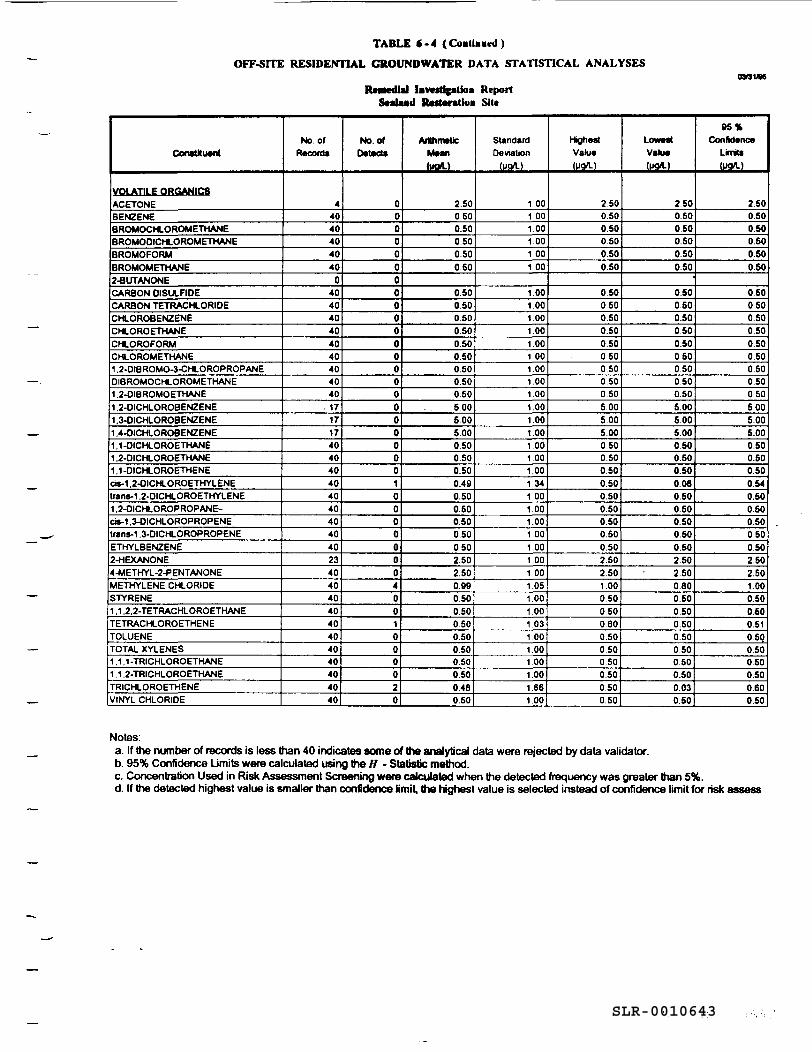
TABLE 6-4 (Co.tla.ieil)
OFF-SITE RESIDENTIAL GROUNDWATER DATA STATISTICAL ANALYSES
Remedial ImfttOgfOom ReportSealMd Rcttoratioi Site
OMVW
ConeUtuent
VOLATILE ORGANIC8ACETONEBENZENEBROMOCHLOROMETHANEBROMOOICHLOROMETHANEBROMOFORMBROMOMETHANE2-BUTANONECARBON OISULFIOECARBON TETRACHLORIOECHLOROBENZENECHLOROETHANECHLOROFORMCHLOROMETHANE1 .2-DIBROMO-3-CHLOROPROPANEDIBROMOCHLOROMETHANE1.2-DIBROMOETHANE1 .2-OICHLOROBENZENE1,3-OICHLOROBENZENE1.4-OICHLOROeENZENE1,1-OICHLOROETHANE1 .2-OICHLOROETHANE1.1-DICHLOROETHENEcis-1 ,2-OICHLOROETHYLENEtrans-1 ,2-OICHLOROETHYLENE1 .2-OICHLOROPROPANE-CO-1 ,3-DICHLOROPROPENEtrans-1 .3-DICHLOROPROPENEETHYLBENZENE2-HEXANONE4-METHYL-2-PENTANONEMETHYLENE CHLORIDESTYRENE1 .1 ,2.2-TETRACHLOROETHANETETRACHLOROETHENETOLUENETOTAL XYLENES1 .1 ,1-TRICHLOROETHANE1 ,1 ,2-TRICHLOROETHANETRICHLOROETHENEVINYL CHLORIDE
No OfRecords
44040404040
0404040404040404040171717404040404040404040234040404040404040404040
No. ofDetect*
0000000000000000000000100000004001000020
ArithmeticMeantotA.)
2.500500.500.500.500.50
0.500.500.500.500.500500.500500.505.00S.OO5.000.500.500.500.490.500.500.500.500.502.502.500.990.500.500.500.500.500.500.500480.50
StandardDeviation
(part-)
1 001 001.001.001 001 00
1.001.001.001.001.001.001.001 001 001.001.001.001.001 001.001 341 001 001.001 001.001.001 001.051.001 001 031 001 001 001.001 661.00
HighestValue(P9/L)
2500500.500500.500.50
0.500.500.500.500.500500500.50050500S.OO5.000.500500500.500.500.500.500.500.502.502.501 000500500600.500500500500500.50
LowedValue<ug/L)
2500500500.500.500.50
0.500.500.500500500.500.500500.505.00S.OO5000500.500.500.080.500.500.500.500.502.502.500.800.500.500.500.500500500.500.030.50
05%Confidence
LirriU(ugfl.)
2500.500.500.500.500.50
0500500.500.500.500.500.500.500.50S.OOS.OO5.00O.SO0.500.500.54O.SOO.SO0.50O.SOO.SO2.SO2.SO1.00O.SO0.600.510500.500.500.500.600.50
Notes:a. If the number of records is less than 40 indicates some of the analytical data were rejected by data validator.b. 95% Confidence Limits were calculated using the H - Statistic method.c. Concentration Used in Risk Assessment Screening were calculated when the detected frequency was greater than 5%.d. If the detected highest value is smaller than confidence limit, Ihe highest value is selected instead of confidence limit for risk assess
SLR-0010643
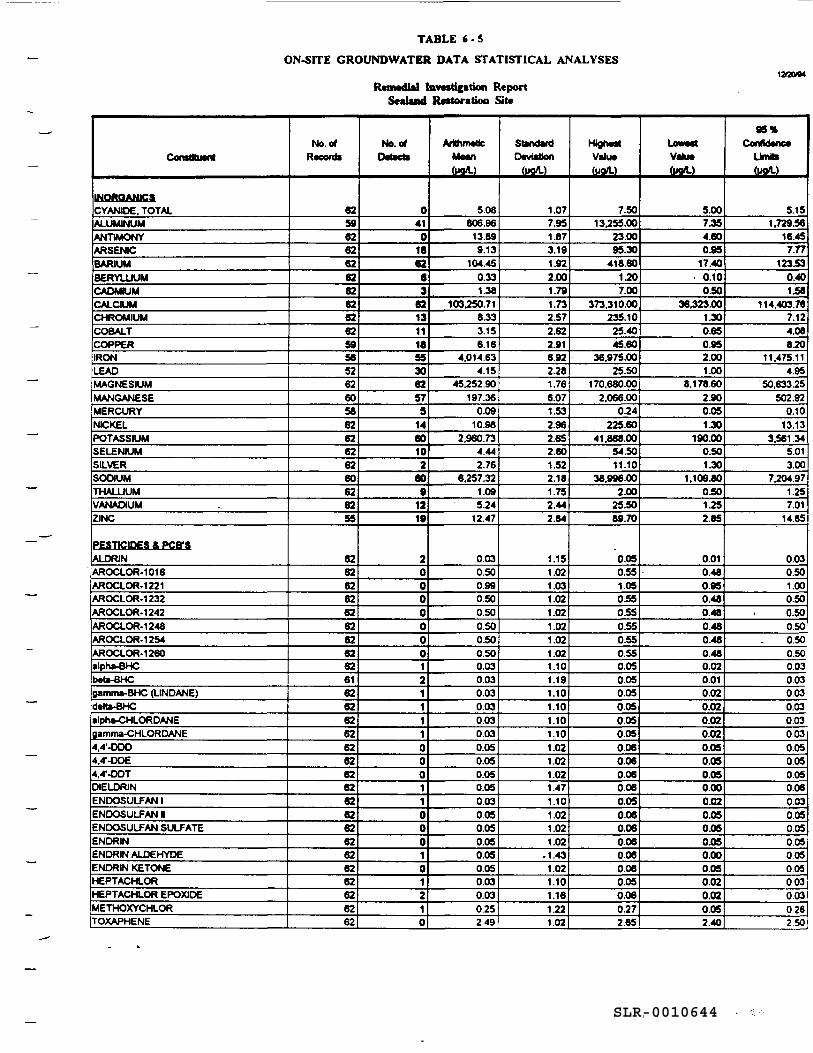
TABLE 6 - S
ON-SITE GROUNDWATER DATA STATISTICAL ANALYSES
Remedial Investigation ReportSeahnd RMtoratioa Site
1200*4
Constituent
INORGANICS
CYANIDE. TOTALALUMINUMANTIMONYARSENICBARIUMBERYLLIUMCADMIUMCALCIUMCHROMIUMCOBALTCOPPERIRONLEADMAGNESIUMMANGANESEMERCURYNICKELPOTASSIUMSELENIUMSILVERSODIUMTHALLIUMVANADIUMZINC
PESTICIDES & RGB'SALDRINAROCLOR-1016AROCLOR-1221AROCLOR-1232AROCLOR-1242AROCLOR-1248AROCLOR-1254AROCLOR-1260•Ipha-BHCbeta-BHCgamm*-BHC (LINDANE)deta-BHCalpha-CHLORDANEgamma-CHLORDANE4,4'-DDD4.4--DDE4,41-DDTCHELDRINENDOSULFAN 1ENDOSULFAN NENDOSULFAN SULFATEENDRINENDRIN ALDEHYDEENDRIN KETONEHEPTACHLORHEPTACHLOR EPOX1DEMETHOXYCHLORTOXAPHENE
No. ofRecords
625962626262626262625956526260586262626260626255
62626262626262626261626262626262626262626262626262626262
No. ofDetects
0410
166263
6213111855X62575
1460102
609
1219
2000000012111100011000101210
ArithmeticMean(M9/U
5.08806.9613.899.13
104.450.331.38
103.250.718.333.156.16
4.014.634.15
45.252.90197.36
0.0910.98
2,960.734.442.76
6.257.321.09524
12.47
0.030.500.990.500.500.500.500.500.030.030.030.030.030.030.050.050.050.050.030.050.050.050.050.050.030.030.25249
StandardDeviation
{W/L)
1.077.951.873.191.922.001.791.732.572.622.916.922.281.766.071.532.962.652.601.522.181.752.442.84
1.151.021.031.021.021.021.021.021.101.191.101.101.101.101.021.021.021.471.101.021.021.02
-1.431.021.101.161.221.02
LJirtt--— *ntgnwValue(U9/L)
7.5013,255.00
23.0095.30
410.601.207.00
373.310.00235.1025.4045.60
36.975.0025.50
170.680.002.066.00
0.24225.60
41.868.0054.5011.10
38.996.002.00
25.5089.70
0.050.551.050.550.550.550.550.550.050.050.050.050.050.050.060.060.060.060.050.060.060.060.060.060.050.060.272.65
Lowest
Value(PQfl.)
5.007J54.600.95
17.400.100.50
36.323.001.300.650.952.001.00
8,178.602.900.051.X
190.000.501.30
1.109.800.501252.85
0.010.480.950.460.480.460.480.480.020.010.020.020.020.020.050.050.050.000.020.050.050.050.000.050.020.020.052.40
95%Confident*
Umtts(tat)
5.151,729.56
16.457.77
123530.401.58
114.403.767.124.068.20
11.475.114.95
50,633.25502.92
0.1013.13
3.561.345.013.00
7,204.971.257.01
14.85
0.030.501.000.500.500.50 '0.500.500.030.030.030.030.030.030.050.050.050.060.030.050.050.050.05005003j003 1026250
SLR-0010644
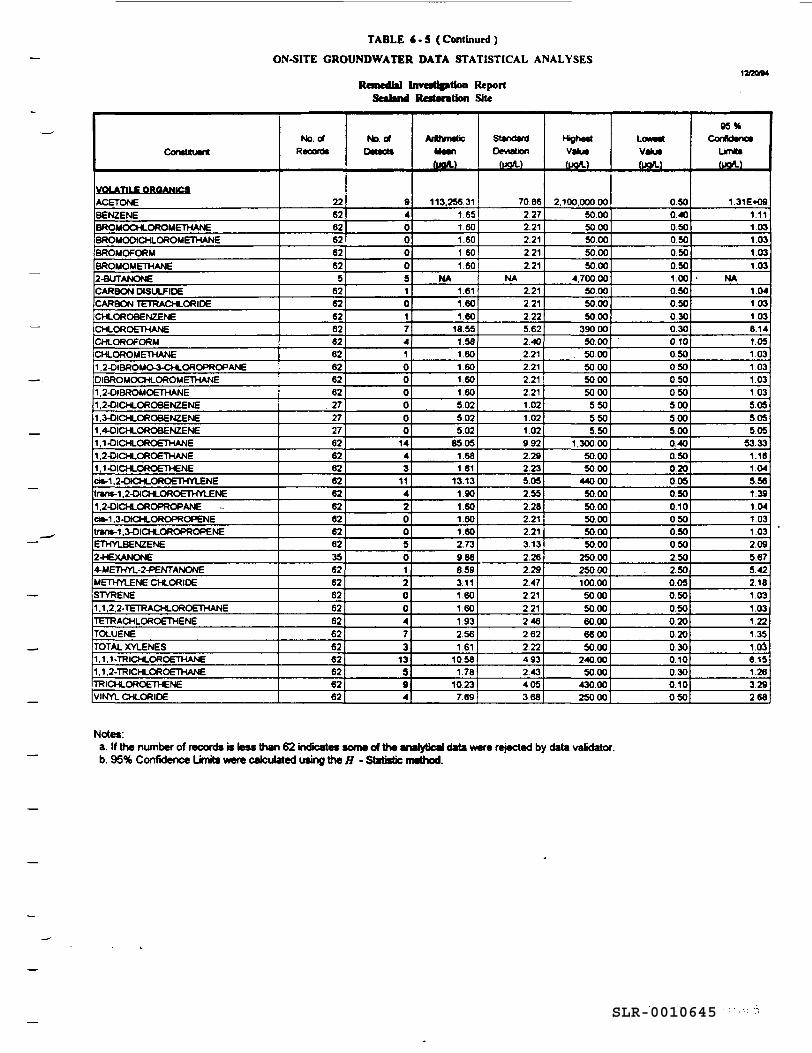
TABLE 6-5 (Continued)
ON-SITE GROUNDWATER DATA STATISTICAL ANALYSES
Remedial Investifrion ReportScsJand Restoration Site
1MOW4
Conctftuant
VOLATILE r>BI3ANI SACETONEBENZENEBROMOCHLOROMETHANEBROMOOICHLOROMETHANEBROMOFORMBROMOMETHANE2-BUTANONECARBON OISULFIOECARBON TETRACHLORIDECHLOROBENZENECHLOROETHANECHLOROFORMCHLOROMETHANE1 .2-OIBROMO-3-CHLOROPROPANEDIBROMOCHLOROMETHANE,2-OIBROMOETHANE,2-OICHLOROBENZENE,3-OICHLOROBENZENE,4-OICHLOROBENZENE, 1 -OICHLOROETHANE,2-DlCHLOROETHANE
1,1-OICHLOROETHENEc«-1 ,2-CMCHLOROETHYLENEtran»-1 ,2-OICHLOROETHYLENE1,2-OICHLOROPROPANE -c«-1 ,3-CHCHLOROPROPENEtran»-1 ,3-OICHLOROPROPENEETHYLBENZENE2-HEXANONE4-METHYU-2-PENTANONEMETHVLENE CHLORIDESTYRENE1 .1 .2,2-TETRACHLOROETHANETETRACHLOROETHENETOLUENETOTAL XYLENES1,1.1 -TRICHLOROETHANE1 , 1 ,2-TRICHLOROETHANETRICHLOROETHENEVINYL CHLORIDE
No. ofRscofds
2262626262625
626262626262626262
. 272727626262626262626262356262626262626262626262
No. ofDatacts
9400005101741000000
1443
114200501200473
13S94
AitttvmticM**nfuo/U
113,256311 651601 601 601.60
NA1.61160160
18.551.581.601601.601.605.025025.02
85051.68161
13.131.901601.601602.739868593.111.601.601 932.561.61
10581.78
10237.69
StandardDeviation
(WQ/L)
70862272212.212212.21
NA2.212.212225.622.402.212212.212.211.021.02]1029922.292.235.052.552.262.212.213.132.262.292.472.212.212462622.22493243405368
HignntValue(uoA)
2.100,0000050.005000500050005000
4,70000500050005000
3900050.00
. 50.005000500050005505.505.50
1.300.0050.0050.00
44000500050.0050.00500050.00
250.00250.0010000500050006000660050.00
240005000
430.0025000
LowaatValua(Udrt.)
0500400.500500.500.501.000.500500300300.100.500500500.505005.005.000.400.500.200.050.500.100500500502.502.500.050.500.500200.200300.100300.10050
95%Confidence
Unto(wort.)
1 31E+091.11
03030303
NA040303
6141.051.031 031.031.03S.OSSOS505
53331.161.045561.391041.031 032.095.675422181.031.031.221.351.036.15126329268
Notes:a. If the number of records is less than 62 indicates some of the analytical data were rejected by data validator.b. 95% Confidence Limiti were calculated using the H - Statistic method.
SLR-0010645
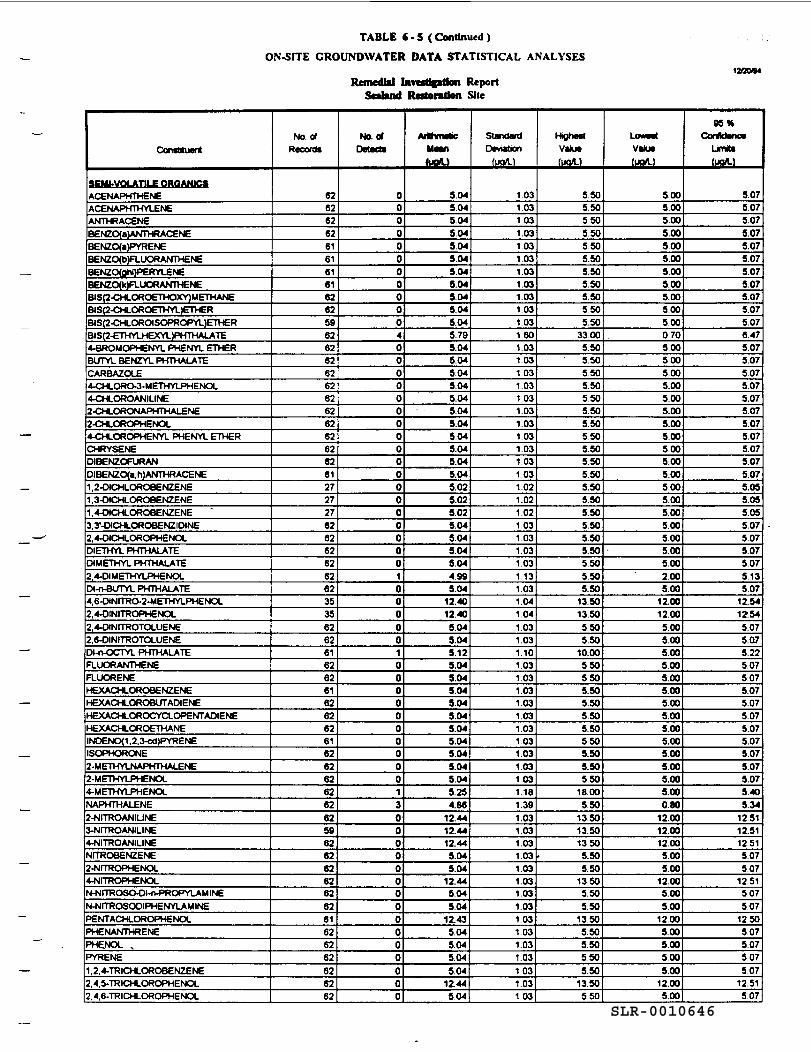
TABLE 6 - 5 ( Continued )
ON-SITE CROUNDWATER DATA STATISTICAL ANALYSES
Remedial Investigation ReportSeabnd Reparation Site
12OOA4
Constituent
3EMM/OLAT1LE ORQANJCSACENAPHTHENEACENAPHTHYLENEANTHRACENEBENZO(a)ANTHRACENEBENZO(a)PYRENEBENZO(b)FLUORANTHENEBENZO(gni)PERYLENEBENZO(k)FLUORANTHENEBIS(2-CHLOROETHOXY)METHANEBIS(2-CHLORC€THYL)ETHERBIS(2-CHLOROISOPROPYL)ETHERBIS(2-£THYLHEXYL)PHTHALATE4-BROMOPHENYL PHENYU ETHERBUTYL BENZYL PHTHALATECARBAZOLE4-CHLORO-3-METHYLPHENOL4-CHLORO ANILINE2-CHLORONAPHTHALENE2-CHUOROPHENOL4-CHLOROPHENYL PHENYL ETHERCHRYSENEDIBENZOFURANDIBENZO(a,h)ANTHRACENE1 ,2-OICHLOROBENZENE1 ,3-OICHLOROBENZENE1,4-OICHLOROBENZENE "3,?-OICHLOROBENZONE2,4-DICHLOROPHENOLDIETHYL PHTHALATEDIMETHYL PHTHALATE2,4-DIMETHYLPHENOLDI-o-BUTYL PHTHALATE4,6-DINITRO-2-METHYLPHENOL2,4-OINITROPHENCX2,4-OINITROTOLUENE2,6-OINITROTOLUENEDI-n-OCTYL PHTHALATEFLUORANTHENEFLUORENEHEXACHLOROBENZENEHEXACHLC3ROBUTADIENEHEXACHLOROCYCLOPENTADIENEHEXACHLOROETHANEINDENOO ,2.3-cd)PYRENEISOPHORONE2-METHYLNAPHTHALENE2-METHYLPHENOL4-METHYLPHENOLNAPHTHALENE2-NITRO ANILINE3-NITRO ANILINEA IITROANILINENITROBENZENE2-NITROPHENOL4 IITROPHENOLN-NITROSO-OI-O-PROPYLAMINEN-NITROSOOIPHENYLAMINEPENTACHLOROPHENOLPHENANTHRENEPHEJSKX ,PYRENE1 ,2,4-TRICHLOROBENZENE2,4,5-TRICHLOROPHENOL2,4,6-TRICHLOROPHENOL
No. OfRecords
62626262616161616262596262626262626262626262612727276262626262623535626261626261626262616262626262625962626262626261626262626262
No. OfDetects
0000000000040000000000000000001000001000000000013000000000000000
AfMMM^M*AJNJNimicMeanftJO/U
5.045.045045045.045.045.045.045.045.045.045.795.045.045.045.045.045.045.045.045.045.045.045.025.025.025.045.045.045.044.995.04
12.4012.40
5.045.045.125.045.045.045.045.045.045.045045.045.045.254.86
12,4412.4412.44
5.045.04
12.445.045.04
12.435045.045.045.04
12.445.04
StandardDeviation
(PPA)
1 031 031031.031031 031031031031.031.031.601.031.031 031 031031.031 031.031.031.03.03.02.02020303.03
1.031 131.031.041041031031.101.031.031.031.031.031.031.031.03103
03.16.39.03.03.0303.03.03030303
1.031.031.031.031.031.03
HighestValue(UOA)
5.505.505505505505.505.505.505.50550550
33005505.505.505.505.505.505.505505.505505505.505505.505.505.505.505505.505.50
13.5013.505505.50
10.005.505505.505.505.505505505.505.50550
1800550
135013501350550550
1350550550
13.505.505505505.50
13.505.50
LOWMt
Value(UQ/U
5.005.005.005.005005005005.005.005.005.000.705005005.005.005.005.005.005.005005.005.005005.005.005.005005.005.002.005.00
1ZOO12.005005005005005.005.005005.005.005.005005.005.005.00080
12.0012.0012.00
5.00500
12.005.005.00
12.005.005.005005.00
12.00500
05*ConActanov
LJntts(MQ/Li
5075.075.075.075.075.075.075075.075075.076475075075.075.075.07
[ 5.075075.075075075075.055055.055.075.075075075.13507
12.541254
5.075.075225.075075075.075.075.075.075075.075.075.405.34
125112.511251
5.075.07
1251507507
12505.075.07507507
12.51507
SLR-0010646
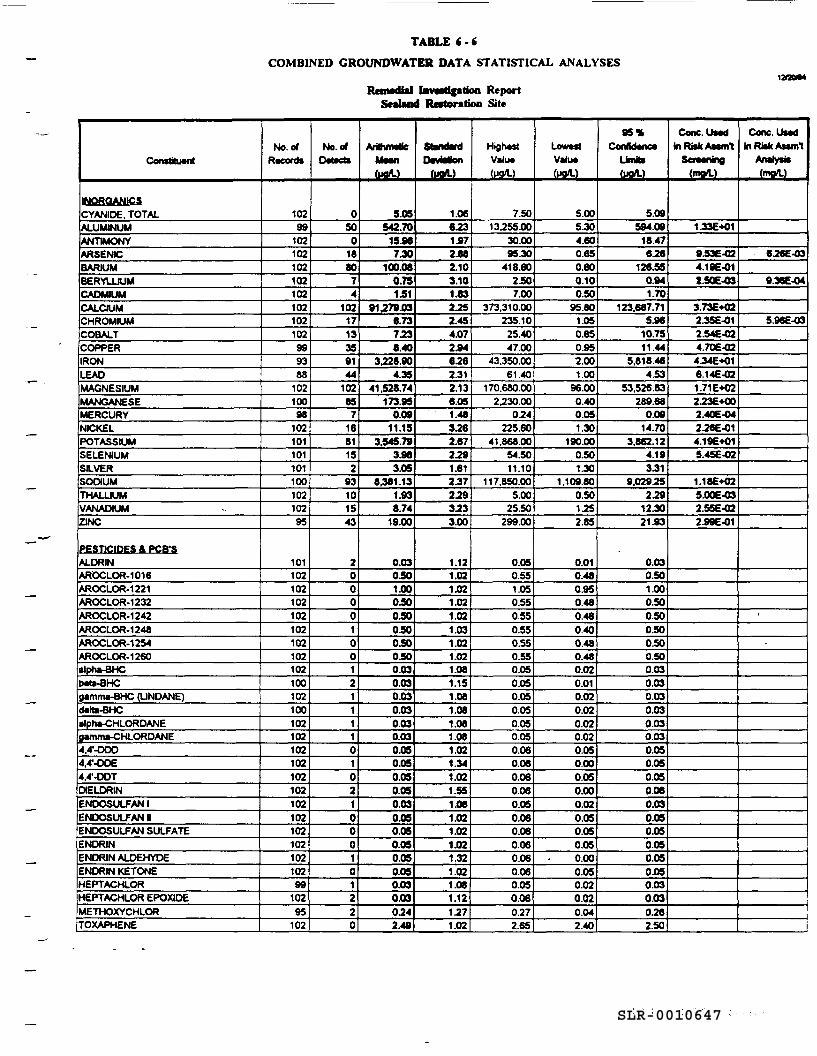
TABLE 6-6COMBINED CROUNDWATER DATA STATISTICAL ANALYSES
RmtMlial faveedfatioo ReportScaland Restoration Site
1200*4
Constituent
INORGANICSCYANIDE, TOTALALUMINUMANTIMONYARSENICBARIUMBERYLLIUMCADMIUMCALCIUMCHROMIUMCOBALTCOPPERIRONLEADMAGNESIUMMANGANESEMERCURYNICKELPOTASSIUMSELENIUMSILVERSODIUMTHALLIUMVANADIUMZINC
PESTICIDES & RGB'SALDRINAROCLOR-1016AROCLOR-1221AROCLOR-1232AROCLOR-1242AROCLOR-1248AROCLOR-1254AROCLOR-1260alpha-BHCbeta-BHCgamma-BHC (UNDANE)deta-BHCalpha-CHLORDANEgamma-CHLORDANE4.41-DDD4.4'-DOE4.4--ODTDtELDRINENDOSULFAN 1ENDOSULFAN 1ENDOSULFAN SULFATEENDRINENDRIN ALDEHYDEENDRIN KETONEHEPTACHLORHEPTACHLOR EPOXIDEMETHOXYCHLORTOXAPHENE
No. ofRecords
10299
102102102102102102102102999388
10210098
10210110110110010210295
10110210210210210210210210210010210010210210210210210210210210210210210299
10295
102
No. ofDated*
0500
188074
1021713359144
102857
1681152
93101543
2000010012111101021000101220
ArithmeticMeanftM/U
5.05542.70
15.967.30
100.080.75151
91.279.036.737.238.40
3,228.904.35
41.528.74173.95
0.0911.15
3.545.793.983.05
8,381.131.938.74
19.00
0.030.501.000.500.500.500500300.030.030.030.030.030.030.050.050.050.050.030.090.050.050.050.050.030.030.242.49
StandardDeviation
(M/L)
1.066731.972.882.103.101.832752.454.072546762.312.136.051.483.262.672791.612.372793733.00
1.121.021.021.021.021.031.021.021.081.151.081.061.081.081.021.341.021.551.081.021.021.021.321.021.081.121771.02
HighestValue<ug/L)
7.5013755.00
30.0095.30
418.602507.00
373,310.00235.1025.4047.00
43.350.0061.40
170.680.002730.00
074225.60
41.868.0054.5011.10
117.850.005.00
25.50299.00
0.050.551.050.550.550.550.550.550.050.050.050.050.050.050.060.060.060.060.050.060.060.060.060.060.050.060772.65
LowestValue(U9/U
5.005.304.600.650.600.100.50
95.801.050.650.952.001.00
96.000.400.051.30
190.000.501.30
1.109.800.501752.85
0.010.480.950.480.480.400.480.480.020.010.020.020.020.020.050.000.050.000.020.050.050.050.000.050.020.020.042.40
95%Confidence
Umax(UQ/L)
5.09594.09
18.47676
126.550.941.70
123.687.715.96
10.7511.44
5,818.464.53
53.526.63289.68
0.0914.70
3.862.124.193.31
9.02975279
12.X21.93
0.030.501.000.500.500500.500.500.030.030.030.030.030.030.050.050.050.060.030.050.050.050.050.050.030.030762.50
Cone. Usedin Risk Assort
Screening(mg/L)
1.33E+01
9.53E-024.19E-01Z.50E-03
3.73E*022.35E-01254E-024.70E-024.34E+016.14E-021.71E+O2273E+002.40E-04276E-014.196*015.45E-02
1.18E+C25.00E-032.55E-022.99E-01
Cone. UsedinRiskAssmI
Analysis(ma/U
676E-03
936E-04
5.96E-03
•
-
SLR-0010647
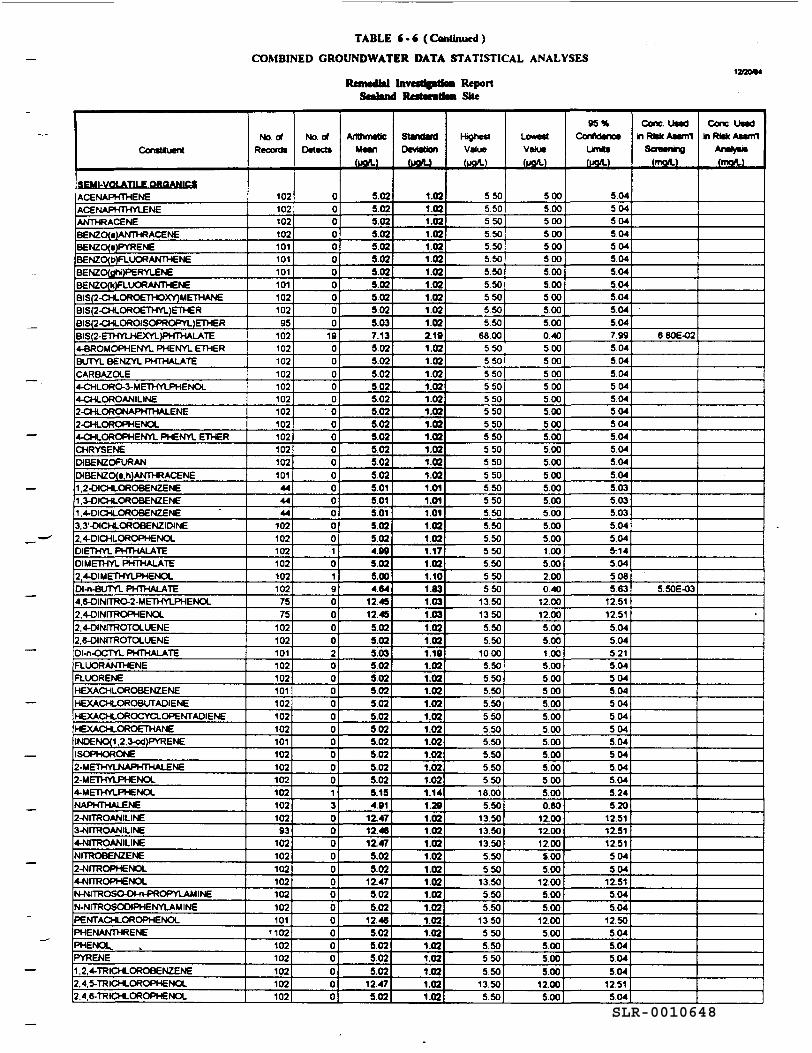
TABLE «•« (Continued)
COMBINED GROUNDWATER DATA STATISTICAL ANALYSES12OOA4
ReportScahnd RcftondM Site
Constituent
SEMI-VOLATILE OROANICSACENAPHTHENEACENAPHTHYLENEANTHRACENEBENZOfsJANTHRACENEBENZO(8)PYRENEBENZO<b)FLUORANTHENEBENZO(gni)PERYLENEBENZOOOFLUORANTHENEBIS(2-CHLOROeTHOXY)METHAN£BIS(2-CHLORC€THYL)ETHERBIS(2-CHLOROISOP9OPYL)ETHERBIS(2-ETHYLHEXYL)PHTHALATE4-BROMOPHENYL PHENYL ETHERBUTYL BENZYL PHTHALATECARBAZOLE4-CHLORO-3-METHYLPHENOL4-CHLOROANILINE2-CHLORONAPHTHALENE2-CHLOROPHENOL4X»LOROPHENYL PHENYL ETHERCHRYSENEDIBENZORJRANDIBENZO<i,h)ANTHRACENE1 ,2-CHCHtOROBENZENE1 ,3-OICHLOROBENZENE1.4-OICHLOROBENZENE3,3'-OICHLOROBENZIOINE2,4-OICHLOROPHENOLDIETHYL PHTHALATEDIMETHYL PHTHALATE2.443IMETHYLPHENOLDI-n-BUTYL PHTHALATE4,6-DINITRO-2-METHYLPHENOL2,4-DINITROPHENOL2,4-DINITRCTOLUENE2.6-OINITROTOLUENEDI-n-OCTYL PHTHALATEFLUORANTHENEFLUORENEHEXACHLOROBENZENEHEXACHLOROBUTADIENEHEXACHLOROCYCLOPENTADIENEHEXACHLOROETHANEINOENO(1 ,2,3-cd)PYRENEISOPHORONE2-METHYLNAPHTHALENE2-METHYLPHENOL4-METHYLPHENOLNAPHTHALENE2-NITROANILINE3-NITROANILINE4-NITROANILINENITROeENZENE2-NfTRCPHENOL4-NITROPHENOLN-NITROSO-CH-n-PROPYLAMINEN-NITROSOOIPHENYLAM INEPENTACHLOROPHENOLPHENANTHRENEPHENOL.PYRENE1 ,2,4-TRICHLOROBENZENE2,4,5-TRICHLOROPHENOL2.4,6-TRICHLOROPHENOL
No OfRecord!
10210210210210110110110110210295
102102102102102102102102102102102101444444
1021021021021021027575
10210210110210210110210210210110210210210210210293
102102102102102102101
'102102102102102102
No. ofDetects
00000000000
190000000000000000101900002000000000013000000000000000
ArithmeticMean(PQ/L)
S.02S.025.025.025.025.025.025.025025025.037.135025.025.025.025.025.025.029.025.025.025.025.015.015.015.025.024.995.025.004.64
124512.455.025.025.035.025.025.025.025.025.025.025.025.025.025.154.91
12.4712.4612.475.025.02
12.475.025.02
12465025.025.025.02
12.475.02
SUndertDeviation
(uoA.)
1.021.021.021.021.021.021.021.021.021.021.022.191.021.021.021.021.021.021.021.021.021.021.021.011.011.011.021.021.171.021.101.831.031.031.021.021.191.021.021.021.021.021.021.021.021.021.021.141.291.021.02.02.02.02.02.02
1.021.021.021.021.021.021.021.02
HighestValue(UQ/L)
5505505505505505505.50550550550550
68005505505505505505505505505505.505.505.505505.50550550550550550550
13.501350550550
10005505.505505.505505.505505.505505.50
18.00550
13.5013.5013.505.50550
13.50550550
13505505.50550550
1350550
LowestValue(ug/L)
5005005005005005005005005005.005.000405005005005005005.005005005005.005.005005.005005.005.001005.002.00040
12.0012.005.005001.005.005.005005.005005.005.005.005.005005.000.80
12.0012.0012.00
S.OO5.00
12.005.00500
12005005.005.00S.OO
12.00S.OO
95%Conftdance
Units(uoA)
5045045045045045.045.045.045045.045.047.995045045045045045045045.045.045045.045.035035.035.045.045:14504508563
12.5112.515.045.045215.045045045.045.045045045045.045045.24520
12.5112.5112.515045.04
12.515.04504
1250504504504504
12.51504
Cone Usedm Risk AssnY1
Queening(mgrt.)
680E-02
5.50E-03
Cone. Usedin Risk Assort
Analysis(mcAJ
SLR-0010648
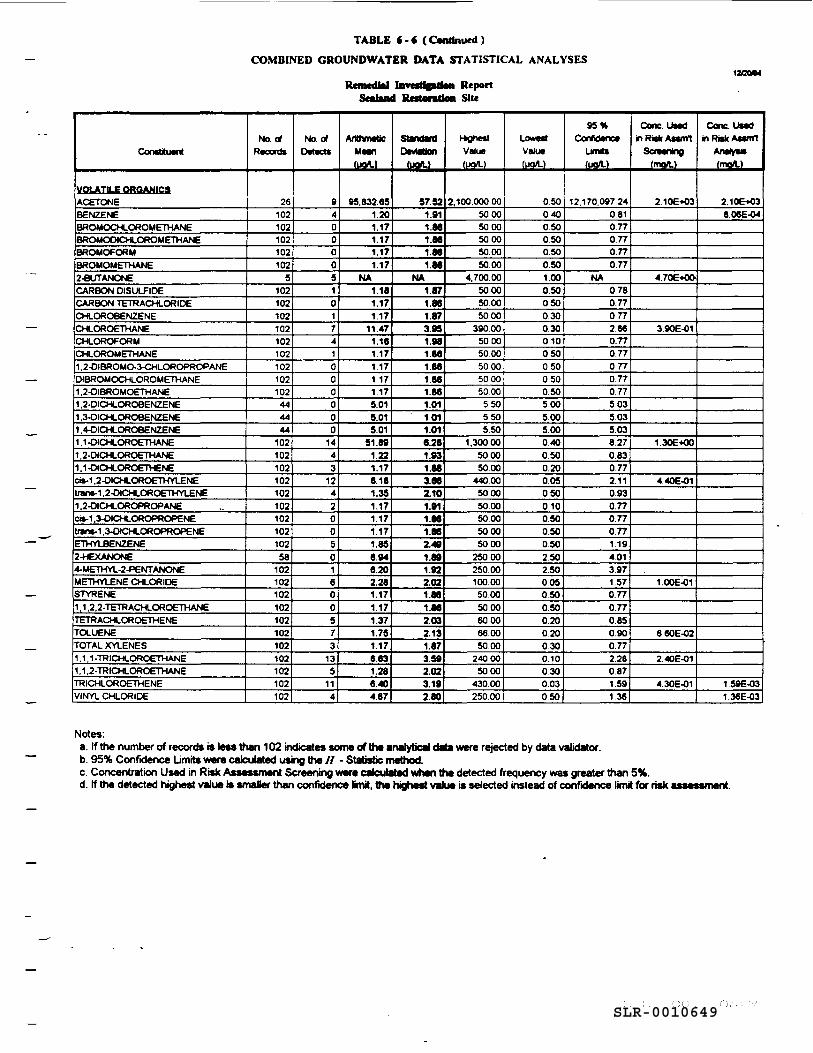
TABLE 6 • *" ( Continued )
COMBINED GROUNDWATER DATA STATISTICAL ANALYSES
Remedial InvestfgatlMi Report12/20A4
Constituent
VOLATILE ORQANICSACETONEBENZENEBROMOCHLOROMETHANEBROMOdCHLOROMETHANEBROMOFORMBROMOMETHANE2-BUTAMONECARBON DISULFIDECARBON TETRACHLORIDECHLOROBENZENECHLOROETHANECHLOROFORMCHLOROM ETHANE1 .2-OIBROMO-3-CHLOROPROPANEDIBROMOCHLOROMETHANE1,2-DIBROMOETHANE1 ,2-DICHLOROBENZENE1 ,3-DICHLOROBENZENE1 ,4-OICHLOROBENZENE1 , 1 -OICHLOROETHANE1 ,2-OICHLOROETHANE1.1-OICHLOROETHeNEcis-1 ,2-OICHLOROETHYLENEtranc-1 ,2-OICHLOROETHYLENE1 ,2-OICHLOROPROPANEc*-1 ,3-OICHLOROPROPENEtran*-1 ,3-OICHLOROPROPENEETHYLBENZENE2-HEXANONE4-METHYL-2-PENTANONEMETHYLENE CHLORIDESTYRENE1 , 1 .2,2-TETRACHLOROETHANETETRACHLOROETHENETOLUENETOTAL XYLENES1,1,1 -TRICHLOROETHANE1 , 1 ,2-TRICHLOROETHANETRICHLOROETHENEVINYL CHLORIDE
No. OfRecords
26102102102102102
5102102102102102102102102102444444
10210210210210210210210210258
102102102102102102102102102102102
No. OfDetects
9400005101741000000
1443
124200501600573
135
114
ArithmeticMean(ucVU
95.832.651.201.171.171.171.17
NA1.181.171.17
11471.161.171.171 171.175.015.01501
51.891.221.178181.351.171.171.171.856.946.202.281.171.171.371.751.176.631.288.404.67
StindwitDeviation
(uoft.)
57521.911.861.M1.861.86
NA1.871.861.873.931.981861.861.861.861.011.011.016.281.931.883.662.101.911.661.662.491.891.922.021.861.862.032.131.873.592.023.192.80
HigheitValuefWO/L)
2,100.00000500050005000500050.00
4,700.0050.0050005000
39000500050005000500050005505505.50
1,3000050005000
440.00500050.00500050005000
25000250001000050.005000600066.005000
240.005000
4300025000
LowestValue(uq/U
0500400500.500500.501000.500.500.300.300100500500500505005005.000.400.500.200050.50010050050050250250DOS0500.500200.200.300100.300.030.50
95%Confident*
Unit*<uq/U
12.170.097240.810770.770.770.77
NA0780.770772660.770.770770770775035035.038.270.830772.110.930.770.770.771.194013971.570.770.770850.900.772.280871.591.36
Contusedin Risk A*smt
ScfMnmQ(man.)
210E+O3
4.70E««>
390E-01
1.30E+00
440E-01
1 OOE-01
6.60E-02
240E-01
430E-01
Contusedin Risk Assort
Anrtyc*(mart.)
210E+03806E-04
159E-031.36E-03
Notes:a. If the number of records is less than 102 indicates some of the analytical data were rejected by data validator.b. 95% Confidence Limits ware calculated using the H - Statistic method.c. Concentration Used in Risk Assessment Screening were calculated whan the detected frequency was greater than 5%.d. If the detected highest value is smaller than confidence Nmit, the highest value is selected instead of confidence limit for risk assessment.
SLR-0010649
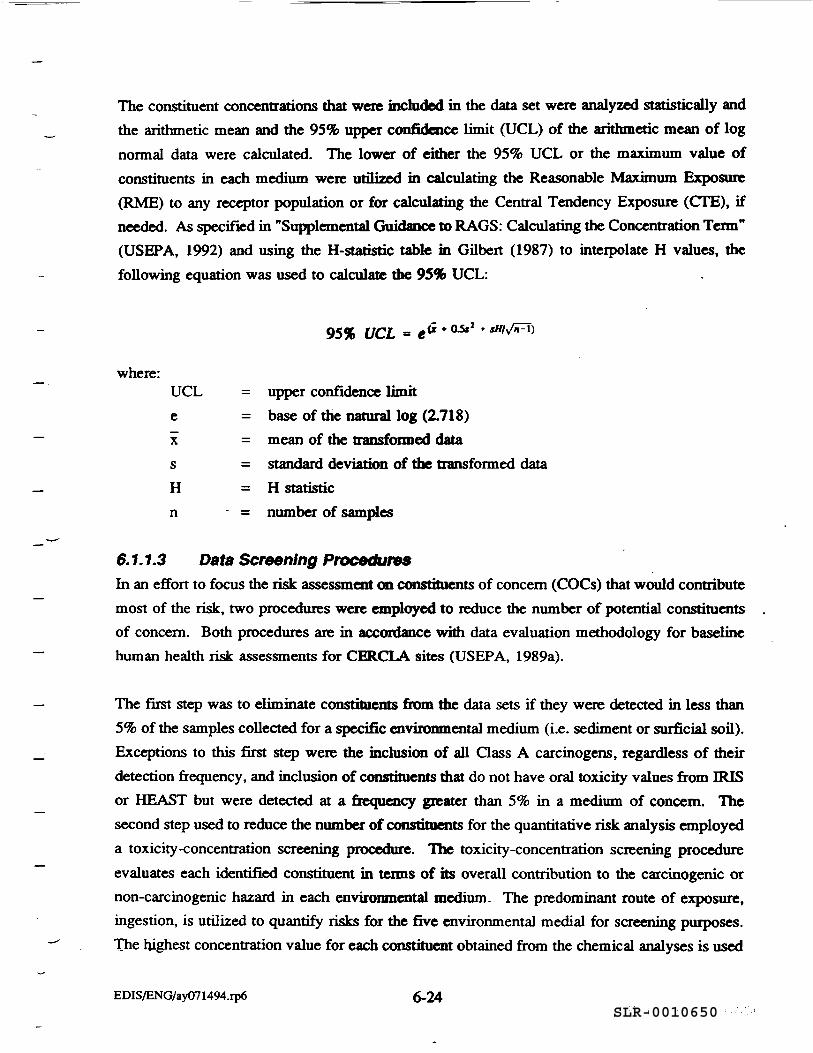
The constituent concentrations that were included in the data set were analyzed statistically andthe arithmetic mean and the 95% upper confidence limit (UCL) of the arithmetic mean of lognormal data were calculated. The lower of either the 95% UCL or the maximum value ofconstituents in each medium were utilized in calculating the Reasonable Maximum Exposure(RME) to any receptor population or for calculating the Central Tendency Exposure (CTE), ifneeded. As specified in "Supplemental Guidance to RAGS: Calculating the Concentration Term"(USEPA, 1992) and using the H-statistic table in Gilbert (1987) to interpolate H values, thefollowing equation was used to calculate the 95% UCL:
95% UCL - e& * 05*2
where:UCL = upper confidence limite = base of the natural log (2.718)x = mean of the transformed datas = standard deviation of the transformed dataH = H statisticn - - = number of samples
6.1.1.3 Data Screening ProceduresIn an effort to focus the risk assessment on constituents of concern (COCs) that would contributemost of the risk, two procedures were employed to reduce the number of potential constituentsof concern. Both procedures are in accordance with data evaluation methodology for baselinehuman health risk assessments for CERCLA sites (USEPA, 1989a).
The first step was to eliminate constituents from the data sets if they were detected in less than5% of the samples collected for a specific environmental medium (i.e. sediment or surficial soil).Exceptions to this first step were the inclusion of all Class A carcinogens, regardless of theirdetection frequency, and inclusion of constituents mat do not have oral toxicity values from IRISor HEAST but were detected at a frequency greater than 5% in a medium of concern. Thesecond step used to reduce the number of constituents for the quantitative risk analysis employeda toxicity-concentration screening procedure. The toxicity-concentration screening procedureevaluates each identified constituent in terms of its overall contribution to the carcinogenic ornon-carcinogenic hazard in each environmental medium. The predominant route of exposure,ingestion, is utilized to quantify risks for the five environmental medial for screening purposes.The highest concentration value for each constituent obtained from the chemical analyses is used
EDIS/ENG/ay071494.ip6 6-24SLR-0010650
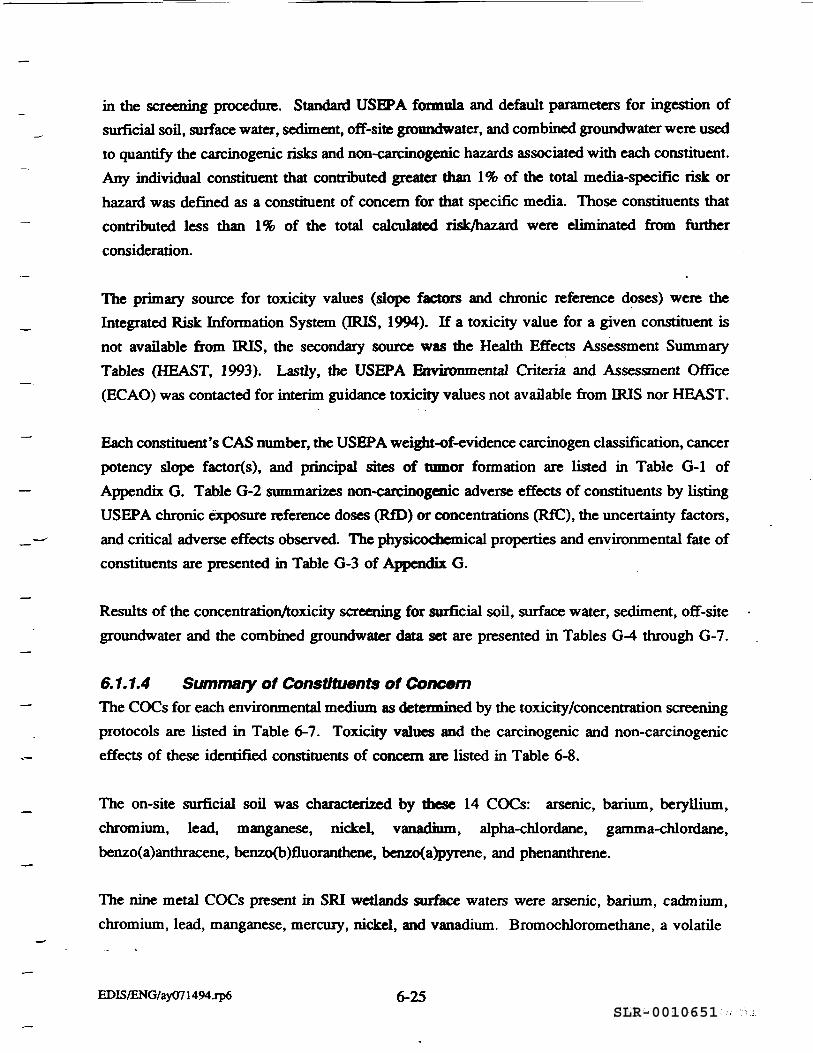
in the screening procedure. Standard USEPA formula and default parameters for ingestion ofsurficial soil, surface water, sediment, off-site groundwater, and combined groundwater were usedto quantify the carcinogenic risks and non-carcinogenic hazards associated with each constituent.Any individual constituent that contributed greater than 1% of the total media-specific risk orhazard was defined as a constituent of concern for that specific media. Those constituents thatcontributed less than 1% of the total calculated risk/hazard were eliminated from furtherconsideration.
The primary source for toxicity values (slope factors and chronic reference doses) were theIntegrated Risk Information System (IRIS, 1994). If a toxicity value for a given constituent isnot available from IRIS, the secondary source was the Health Effects Assessment SummaryTables (HEAST, 1993). Lastly, the USEPA Environmental Criteria and Assessment Office(ECAO) was contacted for interim guidance toxicity values not available from IRIS nor HEAST.
Each constituent's CAS number, the USEPA weight-of-evidence carcinogen classification, cancerpotency slope factors), and principal sites of tumor formation are listed in Table G-l ofAppendix G. Table G-2 summarizes non-carcinogenic adverse effects of constituents by listingUSEPA chronic exposure reference doses (RfD) or concentrations (RfC), the uncertainty factors,and critical adverse effects observed. The physicochemical properties and environmental fate ofconstituents are presented in Table G-3 of Appendix G.
Results of the concentration/toxicity screening for surficial soil, surface water, sediment, off-sitegroundwater and the combined groundwater data set are presented in Tables G-4 through G-7.
6.1.1.4 Summary of Constituents of ConcernThe COCs for each environmental medium as determined by the toxicity/concentration screeningprotocols are listed in Table 6-7. Toxicity values and the carcinogenic and non-carcinogeniceffects of these identified constituents of concern are listed in Table 6-8.
The on-site surficial soil was characterized by these 14 COCs: arsenic, barium, beryllium,chromium, lead, manganese, nickel, vanadium, alpha-chlordane, gamma-chlordane,benzo(a)anthracene, benzo(b)£luoranthene, benzo(a)pyrene, and phenanthrene.
The nine metal COCs present in SRI wetlands surface waters were arsenic, barium, cadmium,chromium, lead, manganese, mercury, nickel, and vanadium. Bromochloromethane, a volatile
EDIS/ENG/ay071494jp6 6-25SLR-0010651
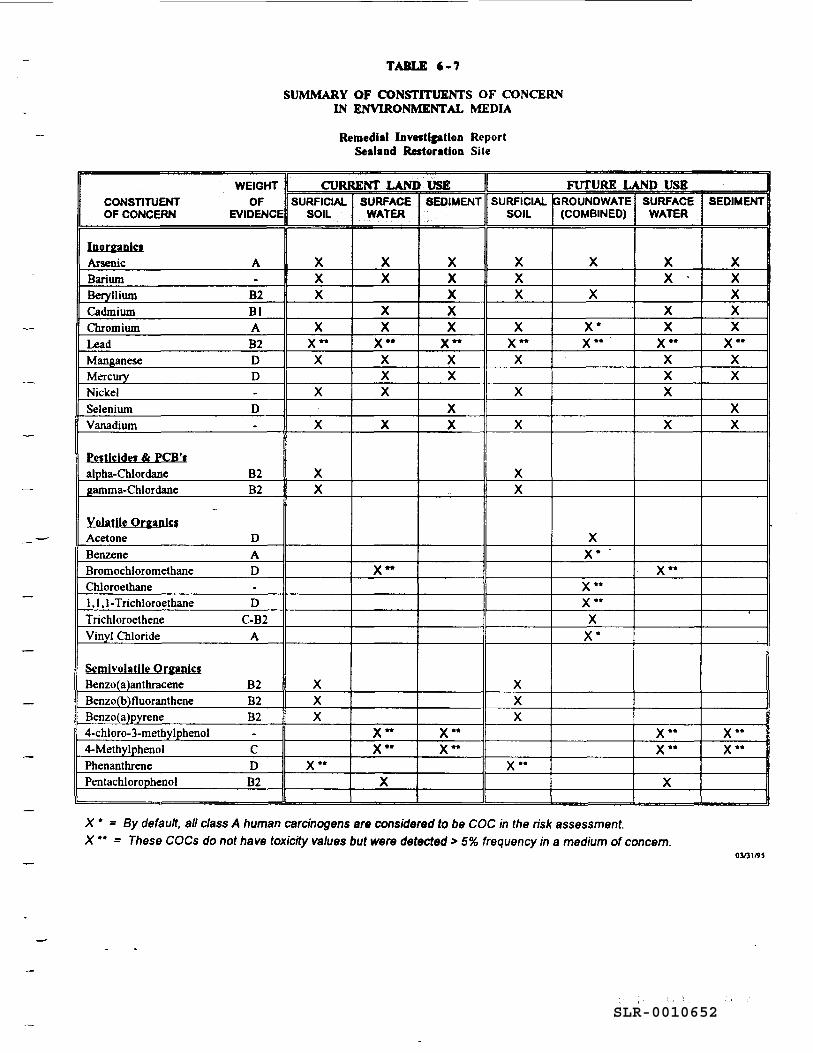
TABLE C-7
SUMMARY OF CONSTITUENTS OF CONCERNIN ENVIRONMENTAL MEDIA
Remedial Investigation ReportSealand Restoration Site
WEIGHTCONSTITUENT OFOF CONCERN EVIDENCE
Inprgan|cfArsenic ABariumBeryllium B2Cadmium BlChromium ALead B2Manganese DMercury DNickelSelenium DVanadium
Pesticides & PCB'salpha-Chlordane B2gamma-Chlordane B2
Volatile Organic*Acetone DBenzene ABromochloromethane DChloroethane1,1,1-Trichloroethane DTrichloroethene C-B2Vinyl Chloride A
Semivolatile OrganicsBenzo(a)anthracene B2Benzo(b)fluoranthene B2Benzo(a)pyrene B24-chloro-3-methylphenol4-Methylphenol CPhenanthrene DPentachlorophenol B2
CURRENT LAND USESURFICIAL
SOIL
XXX
XX"
X
X
X
XX
XXX
X"
SURFACEWATER
XX
XX
X"XXX
X
x-
X"X"
X
SEDIMENT
XXXXX
X**XX
XX
X"X"*
FUTURE LAND USESURFICIAL
SOIL
XXX
XX"
X
X
X
XX
XXX
X"
QROUNDWATE(COMBINED)
X
X
X*X"
XX*
X"X"
XX*
SURFACEWATER
XX
XX
X"XXX
X
X"
X"X"
X
SEDIMENT
XXXXX
X"XX
XX
X"X"
X ' - By default, all class A human carcinogens are considered to be COC in the risk assessment.X " = These COCs do not have toxicity values but were detected > 5% frequency in a medium of concern.
SLR-0010652
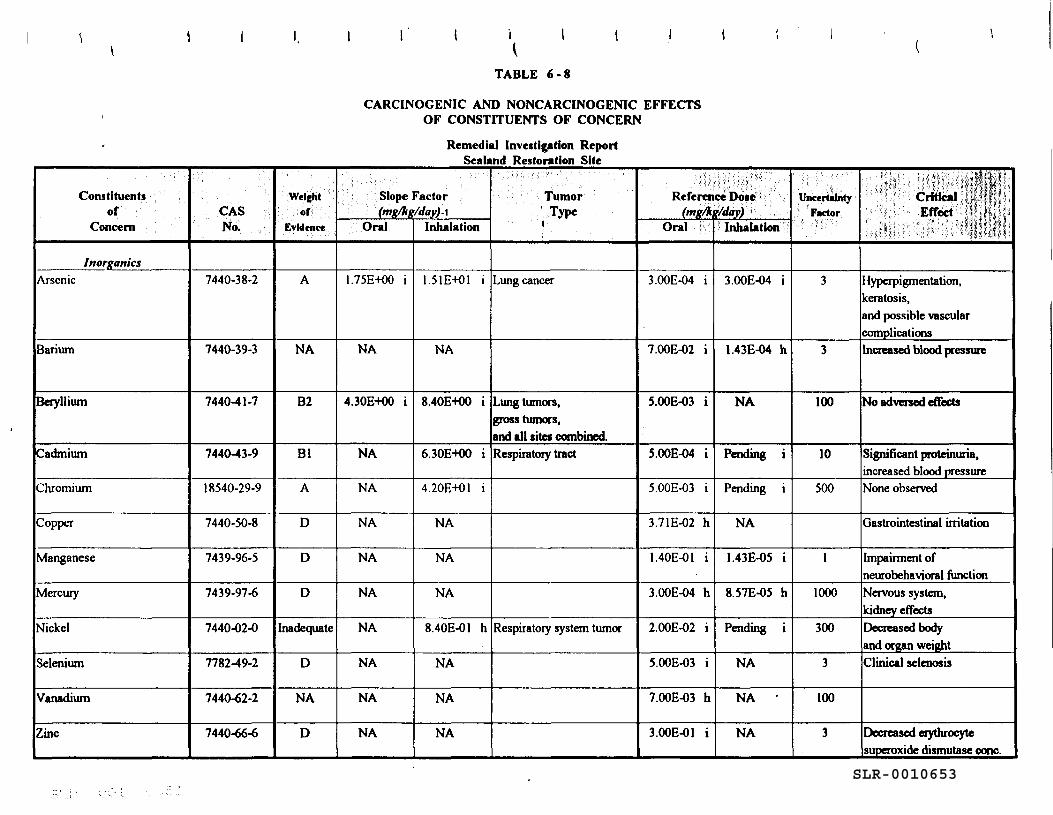
TABLE 6-8
CARCINOGENIC AND NONCARCINOGENIC EFFECTSOF CONSTITUENTS OF CONCERN
Remedial Investigation ReportSealand Restoration Site
Constituentsof
Concern
InorganicsArsenic
Barium
Beryllium
Cadmium
Chromium
Copper
Manganese
Mercury
Nickel
Selenium
Vanadium
Zinc
CASNo.
7440-38-2
7440-39-3
7440-41-7
7440-43-9
18540-29-9
7440-50-8
7439-96-5
7439-97-6
7440-02-0
7782-49-2
7440-62-2
7440-66-6
Weightof
Evidence
A
NA
B2
Bl
A
D
D
D
Inadequate
D
NA
D
Slope Factor(mg/kg/day)^
Oral
1.75E+00 i
NA
4.30E-HX) i
NA
NA
NA
NA
NA
NA
NA
NA
NA
Inhalation
1.51E-KH i
NA
8.40E400 i
6.30E-KK) i
4.20E-KH i
NA
NA
NA
8.40E-01 h
NA
NA
NA
TumorType
Lung cancer
Lung tumors,gross tumors,and all sites combined.Respiratory tract
Respiratory system tumor
Reference Dose(mg/kg/day)
Oral
3.00E-04 i
7.00E-02 i
5.00E-03 i
5.00E-04 i
5.00E-03 i
3.71E-02 h
1.40E-01 i
3.00E-04 h
2.00E-02 i
5.00E-03 i
7.00E-03 h
3.00E-01 i
Inhalation
3.00E-04 i
1.43E-04 h
NA
Pending i
Pending i
NA
1.43E-05 i
8.57E-05 h
Pending i
NA
NA •
NA
UncertaintyFactor
3
3
100
10
500
1
1000
300
3
100
3
^•m^nwsf^^"^^ctwM^^mn^'•>'-'':•*•''•:-'• .Effcd'<flM%; ' '•:- :•:*;* v^-ii,*;;;^'^i^ ^••V'$1$®$$:-
iyperpigmentation,ceratosis,and possible vascularcomplicationsIncreased blood pressure
No adversed effects
Significant proteinuria,increased blood pressureNone observed
Gastrointestinal irritation
Impairment ofneurobehavioral functionNervous system,kidney effectsDecreased bodyand organ weightClinical selenosis
Decreased erythrocytesuperoxide dismutase cone.
SLR-0010653
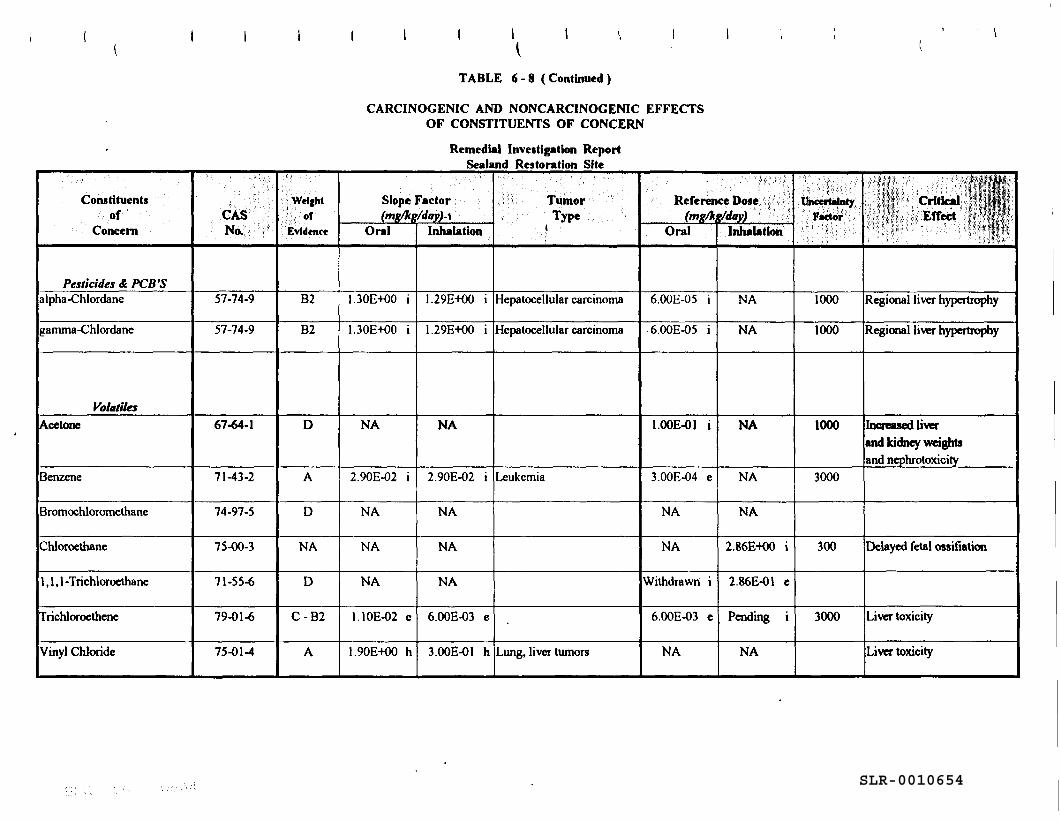
TABLE 6-8 (Continued)
CARCINOGENIC AND NONCARCINOGENIC EFFECTSOF CONSTITUENTS OF CONCERN
Remedial Investigation ReportSealand Restoration Site
Constituentsof
Concern
Pesticides & PCB'Salpha-Chlordane
gamma -Chlordane
Volatile!Acetone
Benzene
Bromochloromethane
Chloroethane
1,1,1 -Trichloroethane
Trichloroethene
Vinyl Chloride
- •' • V'
CAS. - • • N O . /. '••;?•
57-74-9
57-74-9
67-64-1
71-43-2
74-97-5
75-00-3
71-55-6
79-01-6
75-01-4
vj j . Weight'.: •:{••' of
Evidence
B2
B2
D
A
D
NA
D
C-B2
A
Slope Factor(mg/kg/day)-\
Oral
1.30E+00 i
1.30E400 i
NA
2.90E-02 i
NA
NA
NA
1.10E-02 e
1.90E-HX) h
Inhalation
1.29E-KK) i
1.29E-KK) i
NA
2.90E-02 i
NA
NA
NA
6.00E-03 e
3.00E-01 h
.;;.':ii" '. Tumor :' ':- 'Type
t
Hepatocellular carcinoma
Hepatocellular carcinoma
Leukemia
Lung, liver tumors
• /: : '-'-'' •••- i'-'": :•" v
Reference Dose(mg/kg/day) !
Oral
6.00E-05 i
6.00E-05 i
100E-01 i
3.00E-04 e
NA
NA
Withdrawn i
6.00E-03 e
NA
Inhalation
NA
NA
NA
NA
NA
2.86E-KX) i
2.86E-01 e
Pending i
NA
•' •'! i • •''•''.'•i'\i- - -•• •'
Uncertainty..;;::;,F««tor;::v/::
1000
1000
1000
3000
300
3000
r*f :-' : ::™ ; 'liit
Regional liver hypertrophy
Regional liver hypertrophy
Increased liverand kidney weightsand nephrotoxicity
Delayed fetal ossifiation
Liver toxicity
Liver toxicity
SLR-0010654
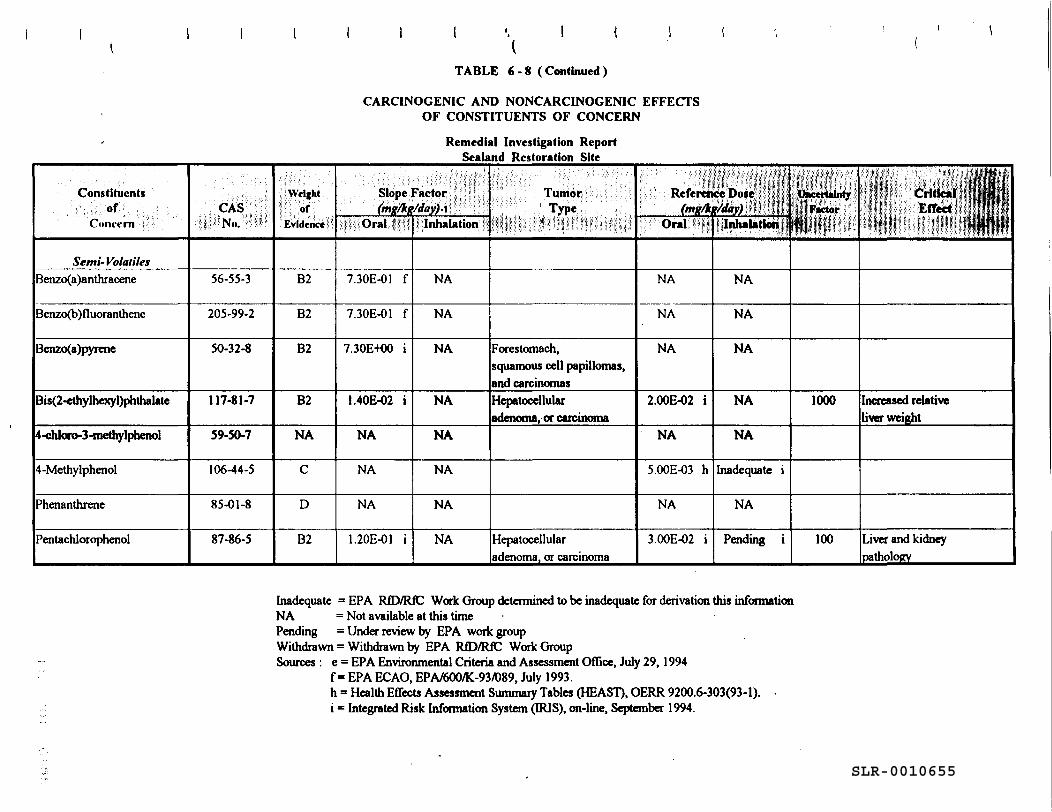
ITABLE 6-8 (Continued)
CARCINOGENIC AND NONCARCINOGENIC EFFECTSOF CONSTITUENTS OF CONCERN
Remedial Investigation ReportScaland Restoration Site
Constituents;;•:,, /;, of '._. • .Concern : :•
Semi- Volatile*Benzo(a)antnracene
Benzo(b)fluoranlhene
Benzo(a)pyrene
Bis(2-cthylhexyl)phthalate
4-chloro-3-methylphenol
4-Methylphenol
Phenanthrene
Pentachlorophenol
I^::.;CAS;::I:;;|
56-55-3
205-99-2
50-32-8
117-81-7
59-50-7
106-44-5
85-01-8
87-86-5
. . . : . • • .
Weight
Evidence
B2
B2
B2
B2
NA
C
D
B2
• ' ': Slope :F actor 3l|y?':•' • (mg/kft/day)-ifff':^i;
;fttf':0rai::||||
7.30E-01 f
7.30E-01 f
7.30E+00 i
1.40E-02 i
NA
NA
NA
1.20E-01 i
Inhalation
NA
NA
NA
NA
NA
NA
NA
NA
'-"••'.^ ' Tumor ' : :
"ff:":..> ' Type ,
Forestomach,squamous cell papillomas,and carcinomasHepatocellularadenoma, or carcinoma
Hepatocellularadenoma, or carcinoma
i;; ',; ' ' ';:K|f
.;f:i?,:;0ral;:«||[l!
NA
NA
NA
2.00E-02 i
NA
5.00E-03 h
NA
3.00E-02 i
liilftWitiHililpSiijslWliiil
Inhalation
NA
NA
NA
NA
NA
Inadequate i
NA
Pending i
P
1000
100
Increased relativeliver weight
Liver and kidneypathology
Inadequate = EPA RfD/RiC Work Group determined to be inadequate for derivation this informationNA = Not available at this timePending = Under review by EPA work groupWithdrawn = Withdrawn by EPA RfD/RfC WorkGroupSources : e = EPA Environmental Criteria and Assessment Office, July 29,1994
f = EPA ECAO, EPA/600/K-93/089, July 1993.h = Health Effects Assessment Summary Tables (HEAST), OERR 9200.6-303(93-1). -i = Integrated Risk Information System (IRIS), on-line, September 1994.
SLR-0010655
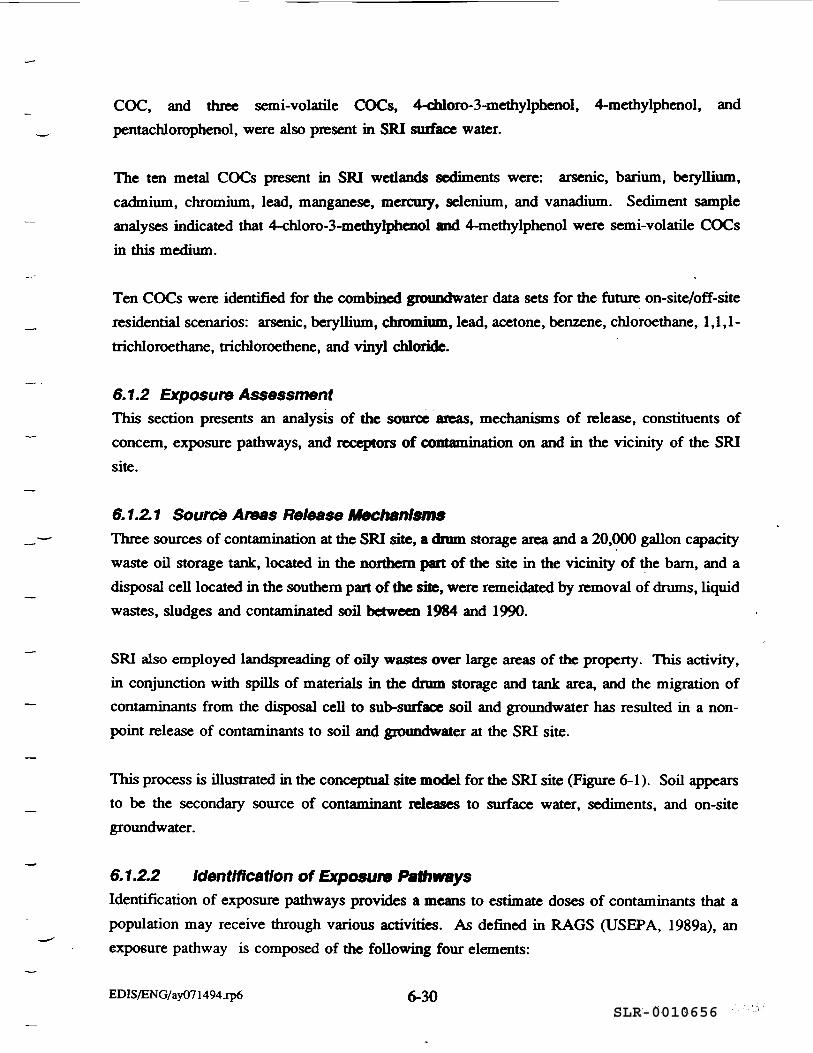
COC, and three semi-volatile COCs, 4-cMoro-3-methylphenol, 4-methylphenol, andpentachlorophenol, were also present in SRI surface water.
The ten metal COCs present in SRI wetlands sediments were: arsenic, barium, beryllium,cadmium, chromium, lead, manganese, mercury, selenium, and vanadium. Sediment sampleanalyses indicated that 4-chloro-3-methylphenol and 4-methylphenol were semi-volatile COCsin this medium.
Ten COCs were identified for the combined groundwater data sets for the future on-site/off-siteresidential scenarios: arsenic, beryllium, chromium, lead, acetone, benzene, chloroethane, 1,1,1-trichloroethane, trichloroethene, and vinyl chloride.
6.1.2 Exposure AssessmentThis section presents an analysis of the source areas, mechanisms of release, constituents ofconcern, exposure pathways, and receptors of contamination on and in the vicinity of the SRIsite.
6.1.2.1 Source Areas Release MechanismsThree sources of contamination at the SRI site, a drum storage area and a 20,000 gallon capacitywaste oil storage tank, located in the northern part of the site in the vicinity of the barn, and adisposal cell located in the southern part of the site, were remeidated by removal of drums, liquidwastes, sludges and contaminated soil between 1984 and 1990.
SRI also employed landspreading of oily wastes over large areas of the property. This activity,in conjunction with spills of materials in the drum storage and tank area, and the migration ofcontaminants from the disposal cell to sub-surface soil and groundwater has resulted in a non-point release of contaminants to soil and groundwater at the SRI site.
This process is illustrated in the conceptual site model for the SRI site (Figure 6-1). Soil appearsto be the secondary source of contaminant releases to surface water, sediments, and on-sitegroundwater.
6.1.2.2 Identification of Exposure PathwaysIdentification of exposure pathways provides a means to estimate doses of contaminants that apopulation may receive through various activities. As defined in RAGS (USEPA, 1989a), anexposure pathway is composed of the following four elements:
EDIS/ENG/ay071494.rp6 6-30SLR-0010656
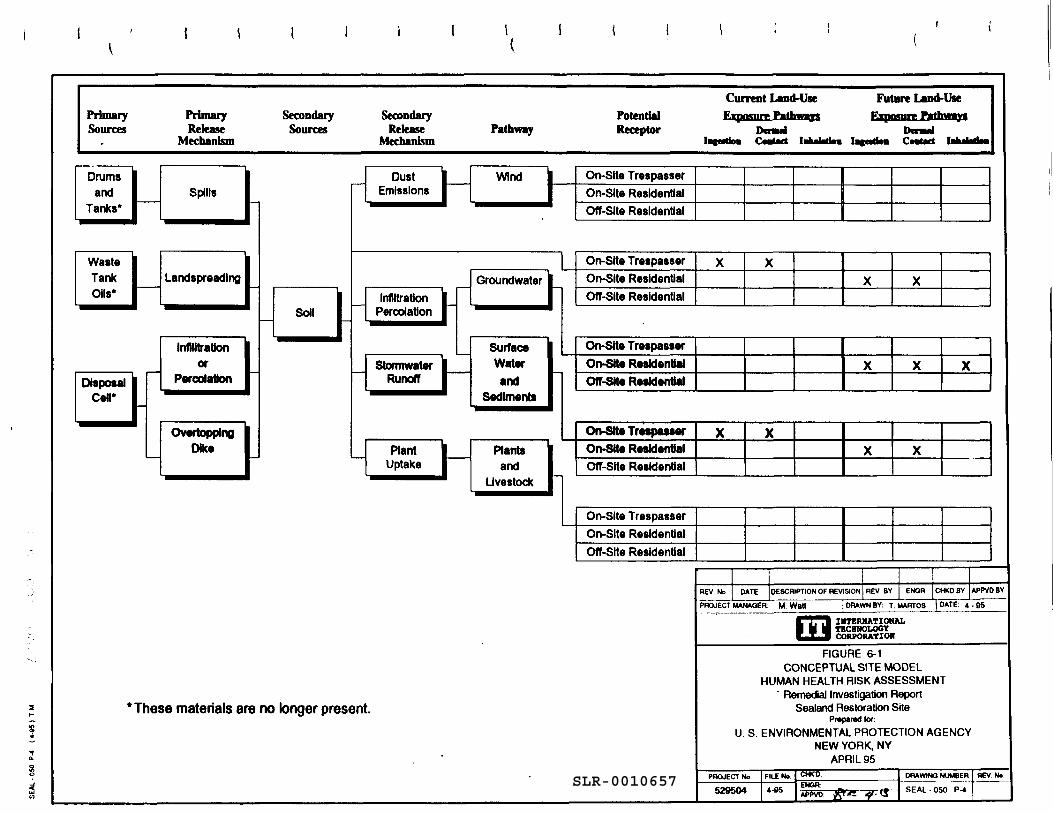
PrimarySources
PrimaryRelease
Mechanism
SecondarySources
SecondaryRelease Pathway
Mechanism
PotentialReceptor
Current Land-UseExpo™1* Pathways
Dcmrilatatfaa Ccatact lahafadra
Future Land-Use
Omullaji«rt»a CovUct Iihil«rita
Drumsand
Tanks*Spills
WasteTankOils*
Landspreading
InfUitrattonor
Percolation
Soil
DustEmissions
Wind I- On-Slte TrespasserOn-Slte ResidentialOff-Site Residential
InfiltrationPercolation
Groundwater
StormwaterRunoff
SurfaceWaterand
Sediments
PlantUptake
Plantsand
Livestock
* These materials are no longer present.
Off-Site Residential
On-Site TrespasserOn-Slto ResidentialOff-Site Residential
X X XOff-Site Residential
On-Slto TrespasserOn-SJte ResidentialOff-Site Residential
X XX X
On-Site TrespasserOn-Slte ResidentialOff-Site Residential
DESCRIPTION OF REVISION REV BY
PROJECT MANAGER: M Watt
ENOR CHKDBY APPVDBY
DRAWN BY: T MARTOS DATE ^ . 95
INTERNATIONALTECHNOLOGYCORPORATION
FIGURE 6-1CONCEPTUAL SITE MODEL
HUMAN HEALTH RISK ASSESSMENT' Remedial Investigation Report
Sealand Restoration SitePrepared lor:
U. S. ENVIRONMENTAL PROTECTION AGENCYNEW YORK, NY
APRIL 95PROJECT No
529504 "*>* . ^ ,.**S l- (3
DRAWINQ NUMBER
SEAL-050 P-4
REV NoSLR-0010657
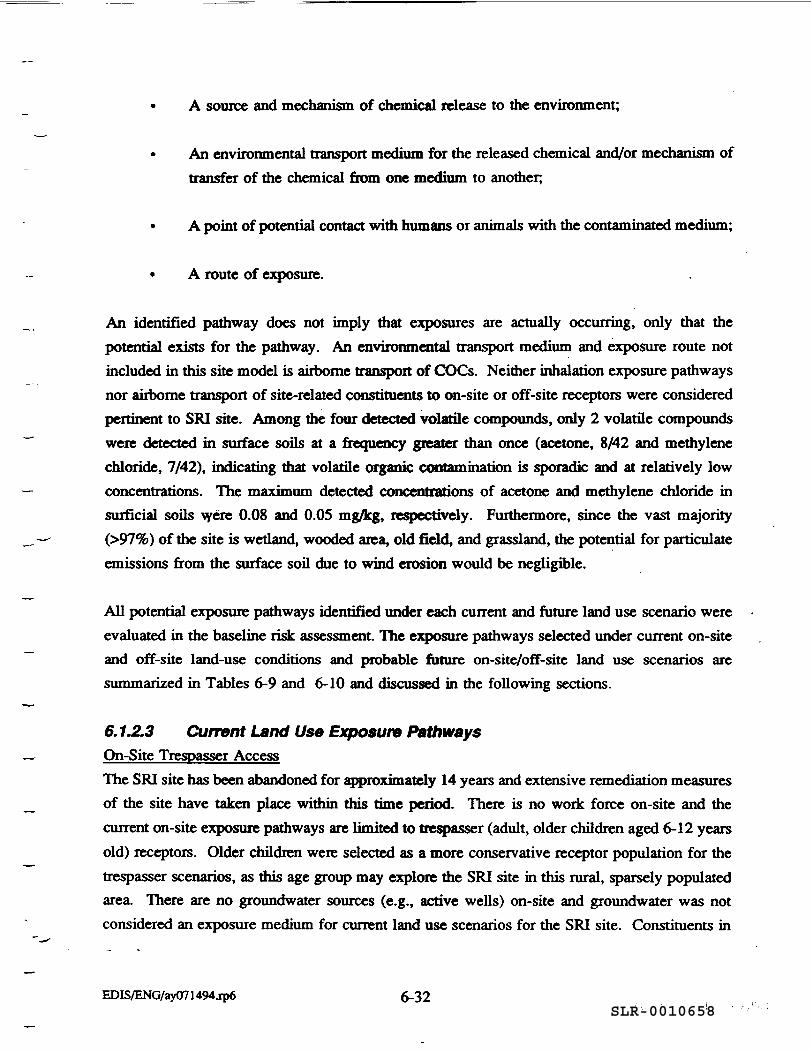
• A source and mechanism of chemical release to the environment;
• An environmental transport medium for the released chemical and/or mechanism oftransfer of the chemical from one medium to another,
• A point of potential contact with humans or animals with the contaminated medium;
• A route of exposure.
An identified pathway does not imply that exposures are actually occurring, only that thepotential exists for the pathway. An environmental transport medium and exposure route notincluded in this site model is airborne transport of COCs. Neither inhalation exposure pathwaysnor airborne transport of site-related constituents to on-site or off-site receptors were consideredpertinent to SRI site. Among the four detected volatile compounds, only 2 volatile compoundswere detected in surface soils at a frequency greater than once (acetone, 8/42 and methylenechloride, 7/42), indicating that volatile organic contamination is sporadic and at relatively lowconcentrations. The maximum detected concentrations of acetone and methylene chloride insurficial soils were 0.08 and 0.05 mg/kg, respectively. Furthermore, since the vast majority(>97%) of the site is wetland, wooded area, old field, and grassland, the potential for paniculateemissions from the surface soil due to wind erosion would be negligible.
All potential exposure pathways identified under each current and future land use scenario wereevaluated in the baseline risk assessment. The exposure pathways selected under current on-siteand off-site land-use conditions and probable future on-site/off-site land use scenarios aresummarized in Tables 6-9 and 6-10 and discussed in the following sections.
6.1.2.3 Current Land Use Exposure PathwaysOn-Site Trespasser AccessThe SRI site has been abandoned for approximately 14 years and extensive remediation measuresof the site have taken place within this time period. There is no work force on-site and thecurrent on-site exposure pathways are limited to trespasser (adult, older children aged 6-12 yearsold) receptors. Older children were selected as a more conservative receptor population for thetrespasser scenarios, as this age group may explore the SRI site in this rural, sparsely populatedarea. There are no groundwater sources (e.g., active wells) on-site and groundwater was notconsidered an exposure medium for current land use scenarios for the SRI site. Constituents in
EDIS/ENG/ay071494jp6 6-32SLR-0010658
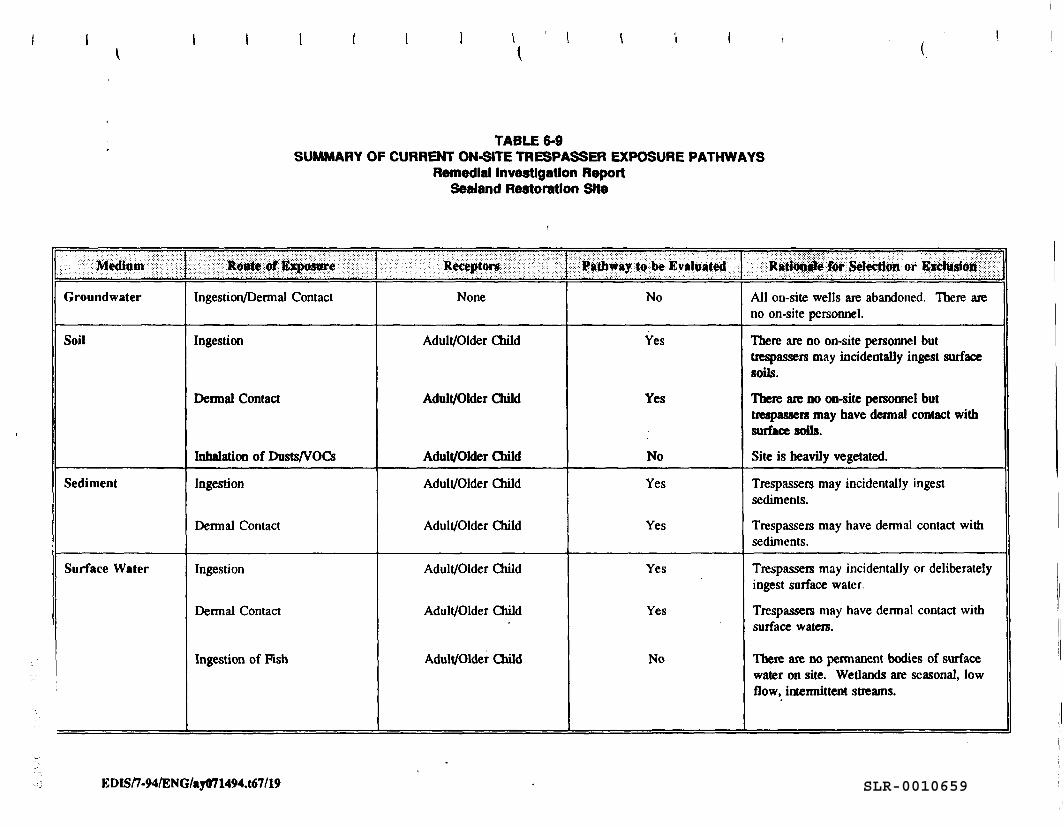
TABLE 6-9SUMMARY OF CURRENT ON-SITE TRESPASSER EXPOSURE PATHWAYS
Remedial Investigation ReportSealand Restoration Site
|:-|§P : SGroundwater
Soil
Sediment
Surface Water
iiiiili ^Ingestion/Dermal Contact
Ingestion
Dermal Contact
Inhalation of Dusts/VOCs
Ingestion
Dermal Contact
Ingestion
Dermal Contact
Ingestion of Fish
•'•• ; x.'.V' : V. :: .:. .;.:«: f^^;::^:'ff:fff:ffMM:--Xi ::''S>'-:i?;:::
:.;H-:::f----;::f::'Ifcf^
None
Adult/Older Child
Adult/Older Child
Adult/Older Child
Adult/Older Child
Adult/Older Child
Adult/Older Child
Adult/Older Child
Adult/Older Child
|:; i|iflb^ay:;i«;;:l>*: :E valuated j>
No
Yes
Yes
No
Yes
Yes
Yes
Yes
No
' V';$li*ii$iii or IKlSiii lli: : .••.'• :• • • :•::•:•: :'::::r':-x'x:.-.-.-x:x-;' : :oy :';:':•:•:: : : • . . • • • • • : • : • . ' ' .xox^ ••• ••• • iX^O
All on-site wells are abandoned. There areno on-site personnel.
There are no on-site personnel buttrespassers may incidentally ingest surfacesoils.
There are no on-site personnel buttrespassers may have dermal contact withsurface soils.Site is heavily vegetated.
Trespassers may incidentally ingestsediments.
Trespassers may have dermal contact withsediments.
Trespassers may incidentally or deliberatelyingest surface water.
Trespassers may have dermal contact withsurface waters.
There are no permanent bodies of surfacewater on site. Wetlands are seasonal, lowflow, intermittent streams.
EDIS/7-94/ENG/ay071494.t67/19 SLR-0010659
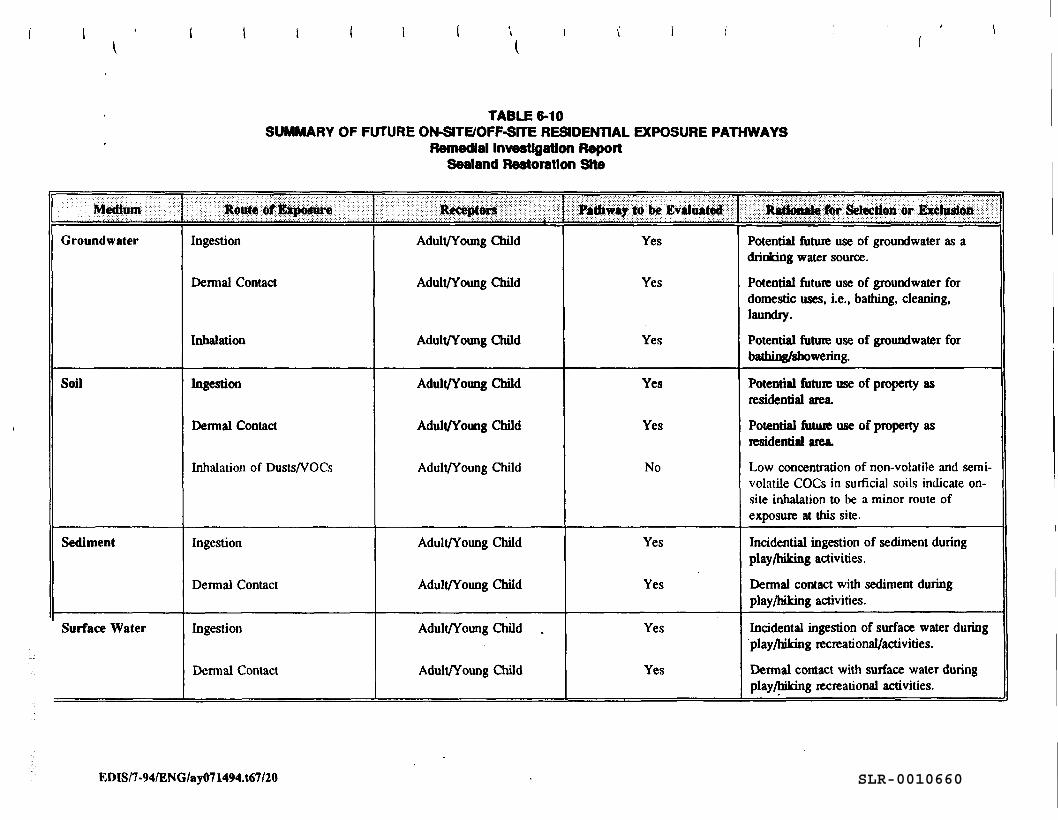
TABLE 6-10SUMMARY OF FUTURE ON-SITE/OFF-SITE RESIDENTIAL EXPOSURE PATHWAYS
Remedial Investigation ReportSealand Restoration Site
:';;::.:':; :| ^Groundwater
Soil
Sediment
Surface Water
^S^ii^iii^i^i^iii^^M.: \ :•:•:•:•: :•: : .•. :•:-:•:•:•.• •.•:•:•:•:•:••••• •'•'•'•:•••:•:•:•:•:•:•:•: *:•:•: : ;•:•:•:•:•:•.•:•:•:• -:-:•••••'.•'-'-'.•:-'•:•:•'•'.•
Ingestion
Dermal Contact
Inhalation
Ingestion
Dermal Contact
Inhalation of Dusts/VOCs
Ingestion
Dermal Contact
Ingestion
Dermal Contact
Adult/Young Child
Adult/Young Child
Adult/Young Child
Adult/Young Child
Adult/Young Child
Adult/Young Child
Adult/Young Child
Adult/Young Child
Adult/Young Child
Adult/Young Child
P.tbw.y to be Evaluated
Yes
Yes
Yes
Yes
Yes
No
Yes
Yes
Yes
Yes
||||fi|$ ^Potential future use of groundwater as adrinking water source.
Potential future use of groundwater fordomestic uses, i.e., bathing, cleaning,laundry.
Potential future use of groundwater forbathing/showering.
Potential future use of property asresidential area.Potential future use of property asresidential area.Low concentration of non-volatile and semi-volatile COCs in surficial soils indicate on-site inhalation to be a minor route ofexposure at this site.
Incidental ingestion of sediment duringplay/hiking activities.
Dermal contact with sediment duringplay/hiking activities.
Incidental ingestion of surface water duringplay/hiking recreational/activities.
Dermal contact with surface water duringplay/hiking recreational activities.
EDIS/7-94/ENG/ay071494.t67/20 SLR-0010660
the surficial soils, wetlands sediments, and seasonal-related intermittent surface water may behazardous to on-site trespassing receptors.
Based on analysis of identified surficial soil constituents of concern, six trespasser exposurepathways were quantified in this assessment for current on-site abandoned land use:
• Incidental ingestion of site soil;• Dermal absorption of constituents from site soil;• Incidental ingestion of on-site surface water,• Dermal absorption of constituents from surface water;• Incidental ingestion of on-site sediments;• Dermal absorption of constituents from sediments.
6.13.4 Possible Future Land Use Exposure PathwaysAlthough the SRI site is presently listed as a NPL site, one possible future use of this land wouldbe to eventually build residential properties on the site. Under this possible future use scenario,it was also assumed mat the surrounding off-site property is limited to residential land use.
On-Site Residential UseExposure assessments were based on current concentrations of constituents in on-site surficialsoils, wetland sediments, surface water, and groundwater. Nine exposure pathways werequantified in this assessment for potential future residential land use of the SRI site. Five wereresidential exposure scenarios; four were related to play and recreational activities in thewoodlands/wetlands of the site. These nine exposure scenarios were as follows:
• Ingestion of groundwater (potable well water);
• Dermal contact with groundwater (bathing, household uses of tap water);
• Inhalation of volatile COCs in groundwater by bathing and showering;
• Incidental ingestion of site soil;
• Dermal contact absorption of constituents from site soil;
• Incidental ingestion of on-site surface water through recreational activities;
• Dermal absorption of COCs from surface waters through recreational activities;
EDIS/ENG/ay071494jp6 6-35SLR-0010661
Incidental ingestion of on-site sediments through recreational activities;
• Dermal contact absorption of COCs from sediments through recreational activities.
6.1.2.5 Exposure ParametersParameters specific to each exposure scenario were used in combination with the exposure pointconcentrations for each constituent of concern. A Reasonable Maximum Exposure (RME)scenario was included in each exposure pathway risk assessment. If the RME analysis indicatedpotential risk above USEPA target levels, a Central Tendency Exposure (CTE) risk analysis,employing median parameter values was presented for each exposure pathway.
Default parameter assumptions used in exposure assessments are presented in Table G-8.Physical characteristics of adult and children receptors in all exposure assessments are standarddefault values or were derived in discussions with the USEPA (1994b) about potential exposurepathways as well as frequency and duration of exposure events for the SRI risk assessment. TheRME values are largely those presented as standard default exposure factors. Average case(CTE) parameters differ from RME values in soil/sediment ingestion rates, exposure frequency,and duration for.exposures pathways.
Soil
Parameters for Incidental Ingestion of Soil/SedimentYoung children aged 1 - 6 are important receptors for the incidental soil ingestion pathway inresidential land use scenarios. An upperbound value of 200 mg/day ingestion rate was used foryoung children in residential and recreational scenarios. A value of 100 mg/day was used forolder children (6-12 years old) in the trespasser scenarios. The default parameter assumptionsused in exposure pathways by environmental media are discussed below and are presented inTables G-10 and G-l 1 for RME and CTE, respectively. Adults may ingest dust/soil indoors andduring the performance of outdoor activities such as gardening, and a default soil ingestion valueof 100 mg/day was used in all current and future residential land use scenarios. Adult trespassersingest 100 mg/day of soil when on-site. All ingested constituents are assumed to be 100%absorbed. In the CTE analysis, ingestion rates of SO mg/day for adults and older children and100 mg/day for young children were employed. Again, all ingestion constituents are assumedto be 100% absorbed.
EDIS/ENG/ay071494jp6 6-36SLR-0010662
Soil exposure frequencies of 90 and 180 days for adults and older children trespassers,respectively, are assumed in the RME risk analysis. Exposure frequencies for adults and olderchildren trespassers arc 40 and 130 days, respectively, in the CTE analysis. Exposure frequenciesare based on the assumption that older children trespass onto the SRI site daily from May toOctober.
Exposure Parameters for Contact Dermal Uptake from SoilThis pathway assumes dermal contact with soils containing measurable constituent concentrations.Quantitative estimates of the dermal uptake of constituents in dust or soil contain moreuncertainty than estimates for other routes of entry.
Contact exposures assume about 25% of the body surface area in contact with the medium. Thisincludes the head, hands, forearms, and lower legs. The parameters for estimating the absorbeddermal dose from contact with soils are listed in Tables G-12 and G-13. The contact dermalexposure equation term for soil-skin adherence factor is 1.0 mg/cm2 for RME and 0.2 mg/cm2
for CTE exposure analyses. Absorption factors of 6% and 1% were employed for PCBs, andcadmium, respectively. Soil-dermal contact absorption factors are not available for other COCs.
Groundwater
Exposure Parameters for Ingestion of GroundwaterThe groundwater ingestion scenario assumes an individual (child or adult) drinks only tap waterand beverages made from tap water at his/her residence. Ingestion rates are two liters per dayfor adults and one liter a day for children. Groundwater COCs are assumed to be completely(100%) absorbed from the gastrointestinal tract (Tables G-14 and G-15).
Exposure Parameters for Dermal Contact with GroundwaterThese exposure pathway calculations assume daily total body contact with residential water whichtakes into account all facets of use including bathing and showering, hand-washing, laundering,and other domestic uses of tap water. In dermal uptake exposure assessment of COCs, apermeability coefficient (Kp) is used to estimate diffusion of the chemical through the skin(Table G-3). If not available, a permeability coefficient was estimated by an equation for organiccompounds, or if the COC is an inorganic, the default K,, value of l.OE-03 cm/hr was used(USEPA, 1992b). Tables G-9, G-16, and G-17 show standard default parameters for thisexposure assessment.
EDIS/ENG/ay071494.rp6 6-37SLR-0010663
Parameters for Inhalation of Volatile Groundwater ConstituentsThis potential pathway for exposure to volatile constituents in groundwater assumes inhalationthrough volatilization of constituents from groundwater. This is most likely to occur duringbathing and/or showering. Under this simplified exposure assessment scenario (Tables G-18 andG-19), it is assumed that all (100%) of the volatile constituents in the hot water are convertedto vapor in a bathroom of a given size. It is also assumed that pulmonary retention (i.e.,absorption) is 100% of all inspired airborne emissions.
Surface Water and Sediments
Trespasser and Recreational Activities Exposure PathwaysSite-related constituents were detected in surface water and sediment samples collected from theSRI site. It is noted that these on-site wetlands are only seasonally inundated; there are nopermanent bodies of standing water on the SRI site.
Two exposure pathways, incidental dermal contact and ingestion, were evaluated for both mediain trespasser scenarios and residential recreational activities, such as play or hiking. Defaultsparameters for these exposure assessments are presented in Tables G-20 through G-27.
6.1.2.6 Summary of Exposure AssessmentThe exposure assessment evaluates a given population's chronic daily intake of each selectedconstituent of concern identified in samples taken from the SRI site. Exposure pathways wereassumed for the SRI site under current land use and future land use scenarios. The quantifiedpathways under current land-use conditions are as follows:
On-Site Trespasser Access• Incidental ingestion of site soils
• Dermal absorption of constituents from site soil
Incidental ingestion of on-site surface water
• Dermal absorption of constituents from surface water
• Incidental ingestion of on-site sediments
• Dermal Absorption of constituents from sediments
EDIS/ENG/ay071494.rp6 6-38SLR-0010664
The quantified exposure pathways under the future on-site/off-site land-use conditions are asfollows:
On-Site/Off-Site Residential Use• Ingestion of groundwater (potable well water)
• Dermal contact with groundwater (bathing, household uses of tap water)
• Inhalation of groundwater-derived volatile constituents (through showering andbathing)
• Incidental ingestion of site soils
• Dermal absorption of constituents from site soil
• Incidental ingestion of on-site surface water through recreational activities
• Dermal absorption of constituents from surface water through recreational activities
• Incidental ingestion of on-site sediments through recreational activities
• Dermal absorption of constituents from sediments through recreational activities.
Exposure parameters specific to each exposure scenario were used in combination with theexposure point concentrations for each constituent of concern. A reasonable maximum exposure(RME) is included, and if that RME analysis indicates potential risk above EPA target levels,an average scenario (Central Tendency Exposure) is analyzed for each relevant exposure pathway.
6.1.3 Toxlcfty AssessmentThe toxicity assessment weighs the available evidence of the potential for constituents to causeadverse effects in exposed individuals (receptors) and provide, where possible, as estimate of therelationship between the extent of exposure to a constituent and the increased likelihood and/orseverity of adverse effects.
Two broad categories of chemically-induced disease states are evaluated in the toxicityassessment of each identified constituent, carcinogenic effects and non-carcinogenic effects. Asexposure assessment attempts to define the chronic lifetime dosage of COCs received by anindividual in a given scenario, toxicity assessment attempts to link adverse effects associated withexposure to the particular COC. The linking of exposure to a constituent with possible adverse
EDIS/ENG/ay071494.rp6 6-39SLR-0010665
effects is the major tenet of toxicology; the dose received determines the magnitude of adverseeffects related to the constituent's inherent toxicity.
Fundamental concepts of toxicity assessment and the algorithms used to express risks associatedwith exposure to COCs are presented in the following sub-sections. The concept of toxicityvalues for quantifying carcinogenic and non-carcinogenic effects is introduced to show theimportance of these parameters in risk characterization. An assessment of COCs for carcinogeniceffects is described by discussion of USEPA's weight-of-evidence carcinogen classificationscheme and the utilization of cancer potency slope factors. Toxicity assessment of COCs fornon-carcinogenic effects takes a different approach, using the ratio of the estimated dose to aconstituent-specific reference dose to characterize the hazard potential for such adverse effects.Toxicity profiles for each of the COCs is presented in Appendix H. These summaries brieflydescribe the absorption, metabolism, mode of action, and significant toxic effects observed inexperimental animal studies or in human investigations.
Exposure assessment establishes a conservative daily intake of the constituent by all relevantpathways of exposure, and the toxicity assessment uses USEPA toxicity values to characterizethe dose-response relationship of adverse effects. The two main toxicity values used to expressa constituents's dose-response relationship is a slope factor for carcinogenic effects and referencedose or reference concentration for non-carcinogenic effects.
The slope factor (SF) is a plausible upper-bound estimate of the probability of a carcinogenicresponse per unit intake of a chemical over a lifetime. The slope factor is used in riskassessments to estimate an upper-bound lifetime probability of an individual developing canceras a result of exposure to a particular level of a potential carcinogen.
Chronic reference doses (RfD) or concentrations (RfC) are estimates, with uncertainty spanningperhaps an order of magnitude or greater, of a daily exposure level for the human population,including sensitive subpopulations, that is likely to occur without an appreciable risk ofdeleterious effects during a lifetime. Chronic RfD or RfC values are specifically developed tobe protective for long-term exposure to a constituent.
In general, SF and RfD or RfC values are based on long-term animal studies and expressed inthe units of mg/kg-day. For a few constituents, however, adequate human data are available andare used.
EDIS/ENG/ay071494jp6 6-40SLR-0010666
6.1.3.1 Toxicity Assessment for Carcinogenic EffectsFor carcinogens, risks are estimated as the incremental probability of an individual developingcancer over a lifetime as a result of exposure to the potential carcinogen. In carcinogenassessment the USEPA evaluates the available data to determine the likelihood that an agent isa human carcinogen. Based on the extent to which a constituent has been shown to be acarcinogen in animal studies, in humans, or in both, the agent is given a provisional weight-of-evidence classification. USEPA's current classification of the overall weight of evidence has thefollowing five categories:
Class A Human Carcinogen - Sufficient evidence from epidemiological studiessubstantiated by causal association between exposure and carcinogenicity.
Class B1 Probable Human Carcinogen - Limited evidence of carcinogenicity in humansfrom available epidemiological data.
Class B2 Probable Human Carcinogen - Sufficient evidence of carcinogenicity inanimals, but inadequate or no evidence in humans.
Class C Possible Human Carcinogen - Limited evidence of carcinogenicity in animals.
Class D Not Classified - Inadequate evidence of carcinogenicity in animals to supportclassification.
Class E Not a Human Carcinogen - No evidence of carcinogenicity in at least twoadequate animal tests in different species or in both epidemiological andanimal studies.
Based on the evidence that a constituent is a known or probable human carcinogen, a toxicityvalue that defines a quantitative relationship between dose and response (i.e., slope factor) iscalculated by the USEPA. A slope factor (SF) converts estimated daily intakes averaged overa lifetime of exposure directly to incremental risk of an individual developing cancer. Becauserelatively low intakes, compared to those received by test animals, are more comparable toenvironmental exposures, a critical assumption is that the dose-response relationship will be linearin the low-dose portion of the multistage model dose-response curve. Under this assumption, theslope factor is a constant and risk win be directly related to intake. Thus, the linear form of thecarcinogenic risk equation is usually applicable for estimating site risks. This linear low-doseequation is defined as:
EDIS/ENG/ay071494.rp6 6-41SLR-0010667
Risk = GDI x SF
where:
Risk = a unitless probability (e.g., 1 x 10"6) of an individual developing cancer overa lifetime
GDI = chronic daily intake averaged over 70 years (mg/kg-day)SF = slope factor, expressed in (mg/kg-day) '
The aggregate carcinogenic risk from exposure to several constituents is calculated by summationof the individual cancer risks for each constituent in the media identified in each appropriateexposure pathway assessment and then summing the total carcinogen risk for all relevantexposure pathways.
where:
the total cancer risk, expressed as a unitless probability;the risk estimate for the i* constituent in the j* exposure medium pathway.
The resultant summation of constituent-specific cancer risks is a very conservative upper boundestimate of cancer risk for the following reason. Each SF is an upper 95th percentile estimateof potency and because percentiles of probability distributions are not strictly additive, the totalcancer risk estimate becomes more conservative as the number of cancer risk estimates aresummed. Regardless, this method is used to ensure that carcinogenic risks will not beunderestimated.
6. 1.3.2 Toxicity Assessment of Non-Carcinogenic EffectsFor non-carcinogenic constituents, the measure used to describe the potential for non-carcinogenicchronic toxicity to occur in an individual is evaluated by comparing the estimated exposure levelover a specified time period with the appropriate non-carcinogenic toxicity value (i.e., RfD orRfC). This ratio of exposure to toxicity is called a non-carcinogenic hazard quotient:
EDIS/ENG/ay071494jp6 6-42SLR-0010668
CD/Non-Cancinogemc Hazard Quotient = ——
where:
GDI = Chronic daily intake (mg/kg-day)RfD = Reference dose
The non-carcinogenic hazard quotient assumes mat mere is a level of exposure (e.g., RfD or RfC)below which it is unlikely for even sensitive subpopulations to experience adverse health effects.
For assessing the health impacts of several non-carcinogenic constituents, reference doses orconcentrations are compared to exposure-specific intake rates of each constituent of concern. Asummation of these hazard quotients is termed the hazard index (HI). If the hazard indexexceeds unity (i.e. >1.0), there may be concern for potential non-carcinogenic effects.
The aggregate HI is expressed as:
Hazard Mdexr
where:
Hip = Total Hazard Index for an individual in any land use scenariok = k* exposure pathway
j = Hazard quotient for the i* constituent in the j* exposure medium
If this ratio of the chronic daily intake to the reference dose or concentration exceeds 1.0 (unity)for the defined exposure scenario, this provides an indication that the exposed receptor may besubject to an adverse impact. If the ratio is below unity, then it is generally assumed that noadverse impact to human health will occur.
The Hazard Index approach does have limitations and should be interpreted carefully based onthe known aspects of additive toxic effects from exposure to mixtures of chemicals. First,because the Hazard Index is a ratio, after unity has been exceeded, the magnitude of the indexhas little bearing on the potential severity of adverse effects that may be anticipated. Forexample, a HI of 5 does not indicate the non-cancer hazard is greater than a HI of 3. Secondly,as pointed out by the USEPA's Science Advisory Board (USEPA, 1993b) it is inappropriate to
EDIS/ENG/ay071494.rp6 6-43SLR-0010669
sum non-cancer hazard quotients for constituents that do not have similar toxic modes of actionor that do not affect the same organ system.
Current USEPA guidance recommends that action is generally warranted at a site when thecumulative carcinogenic risk is greater than l.OE-04 to l.OE-06 or the cumulative non-carcinogenic hazard index is greater than 1.0. Thus, when the human health risk assessment,based on RME assumptions, indicates that the cumulative risk associated with a medium isgreater than l.OE-04 or that the hazard index is greater than 1.0, that medium presents a potentialconcern.
6.1.3.3 Toxlclty Profiles for the Constituents of ConcernFrom the toxicity/concentration screening protocol used for identifying site-related COCs, thirteenmetals, two pesticides and PCBs and fifteen organic constituents were identified as theconstituents of concern that would drive die human health risk assessment of the SRI site. Atoxicity profile is developed below for each constituent and summarizes important informationregarding constituent uptake by various routes of exposure, its metabolism and elimination,toxicity information, and target organs. Toxicity profiles for all COCs are found in AppendixH. This summaries emphasize chronic exposure and potential disease states associated withchronic low dose exposure, including cancer.
6.1.3.4 Toxlclty Assessment SummaryThe toxicity assessment component of die human health risk assessment is based on the use ofUSEPA-derived toxicity values. As specified in RAGS (USEPA, 1989a), the resource hierarchyfor selection of the most current and appropriate toxicity values are, in descending order:
• IRIS (Integrated Risk Information System), an on-line database maintained by USEPA
• HEAST (Health Effects Assessment Summary Tables), published annually by theUSEPA
• ECAO (Environmental Criteria and Assessment Office) guidance documents, generaltoxicology information, extrapolations, and guidance for constituents without toxicityvalues.
Using the IRIS slope factor for benzo(a)pyrene as the reference toxicity value, cancer slopefactors for other Class B PAH carcinogens were developed from the order-of-magnitude potencyestimates for toxic equivalent factors of PAHs (USEPA, 1993). Toxicity values for the identifiedCOCs are listed in Table 6-8. The state-of-the-science of toxicology and epidemiology is such
EDIS/ENG/ay071494jp6 6-44SLR-0010670
that there are many sources of uncertainty associated with the use of assigned toxicity values todetermine carcinogenic risks and hazard assessment of non-cancer adverse effects of aconstituent.
6.1.4 Risk CharacterizationThe risk characterization combines the information presented in Section 6.1.2 (ExposureAssessment) with the information presented in Section 6.1.3 (Toxicity Assessment) to describethe type and magnitude of potential carcinogenic risks and non-carcinogenic hazards .due toexposure to contaminants originating at the SRI site. The magnitude and types of risks dependon the nature, duration, and frequency of exposure to constituents of concern, and thecharacteristics of the exposed populations. Potential exposures in this assessment are separatedinto two general categories. Current land use describes the potential exposure routes thatcurrently exist to on- and off-site if no remedial action was taken. Future land use describes thepotential exposure routes that may exist at some time in the future if the SRI site was developedresidentially and no remedial action was taken. Calculated health-related risks are further dividedinto carcinogenic risks and non-carcinogenic hazards.
6.1.4.1 Current Land UseThe SRI site is an abandoned 210-acre site in a rural and sparsely populated area. Thecarcinogenic risks and non-carcinogenic hazards associated with the current land use of the SRIsite and the surrounding area are summarized and discussed in the following subsections.
Carcinogenic Risk CharacterizationAs described in Section 6.1.3.1, carcinogenic risks are expressed as the probability of anindividual developing a career over a lifetime. These risks were calculated by multiplying thechronic daily intake (GDI) of an individual constituent of concern by the slope factor (SF)associated with that particular constituent to yield constituent-specific risks for each pathway ofinterest These individual constituent-specific risks were then summed to yield a total risk foreach exposure pathway. The following sections summarize the total carcinogenic risks to thereceptor populations based on current land usage.
On-Stte Trespasser Scenarios:
Ingestion of On-Site SoilThe SRI site has been abandoned and no work force is presently on site. However, trespassersmay ingest incidentally small quantities of on-site soil. Carcinogenic risk estimates for incidental
EDIS/ENG/ay071494jp6 6-45SLR-0010671
soil ingestion by on-site trespassers is presented in Table G-28. Under reasonable maximumexposure conditions, calculations for incidental ingestion of on-site soil estimated a carcinogenicrisk of 2.51E-06 for adults and 2.51E-06 for older children (ages 6-12 years) trespassers. Arsenicwas the major contributor to carcinogenic risk from ingestion of on-site soils.
Dermal Contact from On-She SoilTrespassers at the SRI site may absorb constituents of concern from surficial soils through directsoil contact with their skin. However, because no USEPA soil-to-skin absorptions factors for soilCOCs are available, carcinogenic rides were not qualified for this exposure pathway.
Ingestion of Surface WaterSurface runoff from the SRI site and groundwater infiltration may result in site-relatedconstituents of concern in the surface waters. Trespassers may ingest small amounts of surfacewater. The total carcinogenic risk to adults and older children due to incidental ingestion ofsurface water during trespassing activities was 5.26E-07 and 4.21E-07, respectively. Themajority of this risk is due to arsenic in the surface water (Table G-30).
Dermal Contact from Surface Water (Recreational)Dennal absorption of site-related constituents of concern in the surface water may occur as aresult of trespasser activities. The total carcinogenic risk to adults and older children from dermalabsorption of constituents of concern in surface water was 8.55E-06 and 6.45E-06, respectively.The majority of this risk was due to pentachlorophenol in the surface water (Table G-31).
Ingestion of SedimentSite-related constituents of concern may become sequestered in the SRI wetlands sediment fromsurficial runoff and groundwater infiltration. Incidental ingestion of these wetlands sediment mayoccur during trespasser activities. The carcinogenic risk from incidental ingestion of sedimentwas 2.78E-06 for both adult and older children trespassers. Arsenic in the sediment contributes95% of the cancer risk from this pathway (Table G-32).
Dermal Contact to SedimentNo carcinogenic risks were calculated for the dermal contact exposure with wetlands sedimentsbecause either dermal absorption factors or slope factors are not available for metals in sediments(Table G-33).
EDIS/ENG/ay071494.rp6 6-46SLR-0010672
Non-Carcinogenic Hazard CharacterizationAs described in Section 6.1.3.2, non-carcinogenic hazards are expressed as hazard quotients. Ahazard quotient is derived for a given constituent of concern by comparing an exposure level overa specified time interval to a reference dose or concentration derived for a similar exposureperiod. Hazard quotients were calculated for each constituent of concern for each exposurepathway of interest. These individual constituent-specific hazard quotients were then summedto yield a total hazard quotient for each exposure pathway. The following sections summarizethe total noncarcinogenic hazards to receptor populations based on current land usage. .
On-Site Trespasser Scenarios-.
Ingestion of SoilTrespassers at the SRI site may ingest small quantities of soil. Incidental ingestion of on-site soilwas calculated, producing non-carcinogenic hazards of 1.21E-02 and 4.85E-02, for adults andolder children, respectively (Table G-34).
Dermal Contact with SoilTrespassers at the SRI site may absorb constituents of concern from surficial soils through theirskin. Non-carcinogenic hazard by soil dermal absorption to trespassers was not calculated(Table G-3S) because dermal absorption factors are not available for the COCs.
Ingestion of Surface WaterThe total non-carcinogenic hazard to adult and older children trespassers due to incidentalingestion of surface water was 6.7IE-03 and 2.68E-02, respectively (Table G-36). The majorityof this hazard was contributed by manganese in SRI site surface water.
Dermal Contact to Surface WaterThe total non-carcinogenic hazard to adult and older children trespassers from dermal absorptionof constituents of concern in surface water is 6.28E-03 and 2.37E-02, respectively (Table G-37).Pentachlorophenol was the major contributor to non-cancer hazard in surface waters.
Ingestion of SedimentSite-related constituents of concern may become sequestered in the wetland sediments fromsurficial runoff and subsequent deposition. The non-carcinogenic hazard from incidentalingestion of sediment is 2.23E-02 and 8.92E-02 for adults and children, respectively (Table G-38). Arsenic was the major contributor to the non-cancer health hazard of this sediment pathway.
EDIS/ENG/ay071494jp6 6-47SLR-0010673
Dermal Contact with SedimentThe calculated non-carcinogenic hazard for deimal absorption of cadmium from sediments was1.60E-04 and 6.02E-04 for adult and older children trespassers, respectively (Table G-39).Cadmium was the only COC in sediment that has a defined soil-to-skin absorption factor.
6.1.4.2 Future Residential Land UseThe future use of the SRI site is most probably applicable for use as agricultural lands.However, in order to provide a conservative assessment of the potential risks and/or hazardsposed by constituents at the SRI site, a residential land use scenario was selected. Severaldifferences are noted between the cunent land use scenarios and future land use scenarios andthese are reflected in both environmental media and receptor populations. In the future usescenarios, on-site soil constituent concentrations are used for the hypothetical on-site residentialexposure scenarios. In the future residential use scenarios, wetlands surface water and sedimentCOCs are examined for risk/hazards to adults and children under recreational use exposurescenarios.
Furthermore, in accordance with USEPA Region n, the groundwater data sets collected in theSRI remedial investigation, (on-site groundwater and off-site residential well water data sets),were combined to establish a hypothetical single groundwater aquifer. This theoreticalgroundwater source was used to estimate future off-site/on-site carcinogenic risk and non-carcinogenic hazards for residential use of groundwater. The following sections present thecarcinogenic risks and non-carcinogenic hazards associated with this hypothetical residential landuse scenario.
Carcinogenic Risk CharacterizationCarcinogenic risks were characterized for future land use in the identical manner as they werefor current land use with the exceptions noted above regarding changes in the receptor populationand a different groundwater data set for the future use scenarios.
Ingestion of Soil:Hypothetical future residents of the SRI site may ingest soil during regular daily activities suchas playing and gardening. The carcinogenic risk from ingestion of on-site soil by residents wascalculated to be 1.22E-05 and 2.28E-05 for adults and young children, respectively (Table G-40).The majority of the total risk from mis pathway is attributable to arsenic.
EDIS/ENG/ay071494jp6 6-48SLR-0010674
Dermal Contact with Soil:Individuals (adults and children) living at the site could be exposed to site-related constituentsof concern through dermal absorption during normal daily activities. The carcinogenic risk toresidential adults and children from dermal absorption of constituents in the soil at the SRI sitewas not calculated (Table G-41). Quantitative risk analysis was limited because there are no soil-to-skin absorption factors for soil COCs.
Incidental Ingestion of Surface Water:The exposure pathways for wetlands surface water and their associated carcinogenic risks werecalculated for both adults and young children using recreational exposure scenarios to establishcarcinogenic risk. The total carcinogenic risk to adults and youg children due to incidentalingestion of surface water during recreational play activities was 5.26E-07 and 9.82E-07,respectively. The majority of this risk was due to arsenic in the surface water (Table G-42).
Dermal Contact with Surface Water:Dermal absorption of site-related constituents of concern in the surface water may occur as aresult of recreational activities. The carcinogenic risk to adults and younger children from dermalabsorption of constituents of concern in surface water was 8.55E-06 and 9.47E-06, respectively.The majority of this risk was due to pentachlorophenol in the surface water (Table G-43).
Incidental Ingestion of Sediment:Site-related constituents of concern may become sequestered in the SRI wetlands sediment fromsurficial runoff and groundwater infiltration. Incidental ingestion of these wetlands sediment mayoccur during play and other recreational activities. The carcinogenic risk from incidentalingestion of sediment is 3.48E-06 and 1.30E-05 for adult and young children, respectively.Arsenic in the sediment contributed 95% of the cancer risk from this pathway (Table G-44).
Dermal Contact of Sediment:No carcinogenic risks are calculated for the dermal contact exposure with wetlands sedimentsbecause either dermal absorption factors or slope factors are not available for the potential metalcarcinogens in sediments (Table G-45).
Ingestion of Groundwater:As stated previously, a hypothetical single groundwater aquifer was used to estimate future off-site/on-site cancer risk from residential use of groundwater. Based on the hypothetical futureland use scenario of residential development of the SRI site, ingestion of the pooled area
EDIS/ENQ/ay071494.ip6 6-49SLR-0010675
groundwater has been calculated to produce a total RME carcinogenic risk of 2.07E-04 and9.65E-05 for adults and children, respectively (Table G-46). The majority of the cancer risk fromthis pathway was attributable to arsenic in this hypothetical aquifer.
When this pathway was evaluated by CTE analysis, carcinogenic risk was reduced for adults to6.20E-05 but the risk to children remained the same at 9.65E-05 (Table G-58 and Table G-13).
Dermal Contact to Groundwater:Residential use of the on-site/off-site groundwater by the hypothetical on-site resident wouldresult in dermal absorption of constituents of concern. The total calculated carcinogenic riskfrom dermal absorption of constituents in the groundwater was 1.02E-06 for adults and 3.46E-07for children (Table G-47).
Inhalation of VOCs in Groundwater:Hypothetical on-site residential populations may be exposed to site-related constituents of concernthrough inhalation of volatile constituents present in the groundwater. These volatile constituentswill be available via inhalation during bathing and showering activities. The carcinogenic riskfrom inhalation of volatile constituents of concern in the overburden groundwater has beencalculated to be 1.88E-06 and 1.75E-06 for adults and children, respectively (Table G-48).
Non-Carcinogenic Hazard CharacterizationHazard quotients were calculated for each constituent of concern for each exposure pathway ofinterest in the hypothetical future land use scenario. These individual constituent-specific hazardquotients were then summed to yield a total hazard quotient for each exposure pathway. Thefollowing sections summarize the total noncarcinogcnic hazards to receptor populations based onhypothetical future land usage.
Ingestion of Soil:The total non-carcinogenic hazard from ingestion of on-site soil by residents was calculated tobe 4.71E-02 and 4.40E-01 for adults and children, respectively (Table G-49). Arsenic was themajor contributor to non-carcinogenic hazard.
Dermal Contact with Soil:The total non-carcinogenic hazard to residential adults and children from dermal absorption ofconstituents in the soil at the SRI site was not calculated (Table G-50). Soil-dermal contactabsorption factors are not available for soil COCs.
EDIS/ENG/ay071494jp6 6-50SLR-0010676
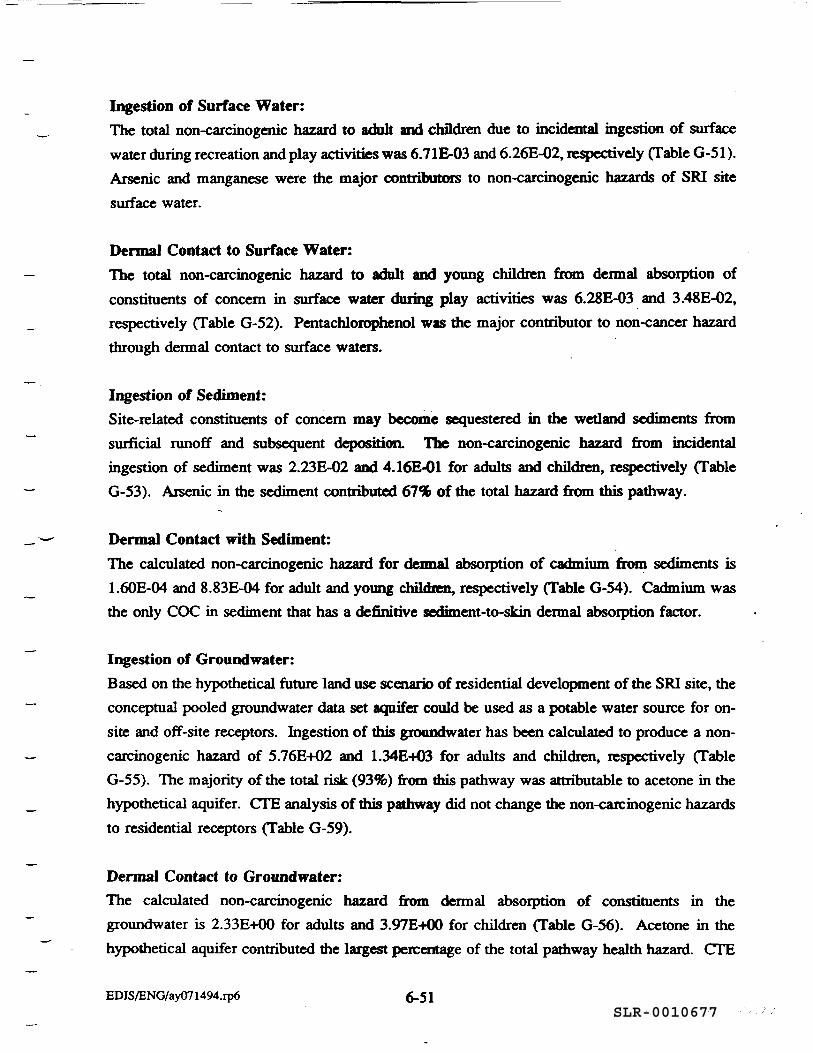
Ingestion of Surface Water:The total non-carcinogenic hazard to adult and children due to incidental ingestion of surfacewater during recreation and play activities was 6.7 IE-03 and 6.26E-02, respectively (Table G-51).Arsenic and manganese were the major contributors to non-carcinogenic hazards of SRI sitesurface water.
Dermal Contact to Surface Water:The total non-carcinogenic hazard to adult and young children from dermal absorption ofconstituents of concern in surface water during play activities was 6.28E-03 and 3.48E-02,respectively (Table G-52). Pentachlorophenol was the major contributor to non-cancer hazardthrough dermal contact to surface waters.
Ingestion of Sediment:Site-related constituents of concern may become sequestered in the wetland sediments fromsurficial runoff and subsequent deposition. The non-carcinogenic hazard from incidentalingestion of sediment was 2.23E-02 and 4.16E-01 for adults and children, respectively (TableG-53). Arsenic in the sediment contributed 67% of the total hazard from this pathway.
Dermal Contact with Sediment:The calculated non-carcinogenic hazard for dermal absorption of cadmium from sediments is1.60E-04 and 8.83E-04 for adult and young children, respectively (Table G-54). Cadmium wasthe only COC in sediment that has a definitive sediment-to-skin dermal absorption factor.
Ingestion of Groundwater:Based on the hypothetical future land use scenario of residential development of the SRI site, theconceptual pooled groundwater data set aquifer could be used as a potable water source for on-site and off-site receptors. Ingestion of this groundwater has been calculated to produce a non-carcinogenic hazard of 5.76E+02 and 1.34E+03 for adults and children, respectively (TableG-SS). The majority of the total risk (93%) from this pathway was attributable to acetone in thehypothetical aquifer. CTE analysis of mis pathway did not change the non-carcinogenic hazardsto residential receptors (Table G-59).
Dermal Contact to Groundwater:The calculated non-carcinogenic hazard from dermal absorption of constituents in thegroundwater is 2.33E+00 for adults and 3.97E-KX) for children (Table G-56). Acetone in thehypothetical aquifer contributed the largest percentage of the total pathway health hazard. CTE
EDIS/ENG/ay071494.rp6 6_51SLR-0010677
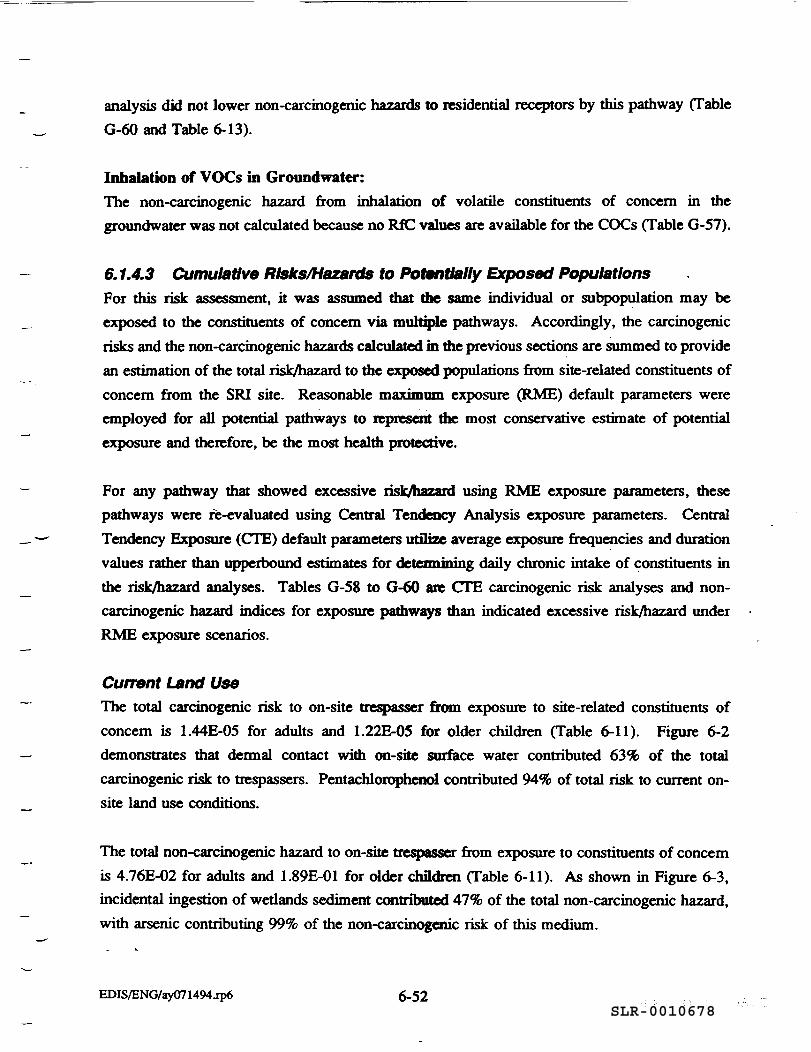
analysis did not lower non-carcinogenic hazards to residential receptors by this pathway (TableG-60 and Table 6-13).
Inhalation of VOCs in Groundwater:The non-carcinogenic hazard from inhalation of volatile constituents of concern in thegroundwater was not calculated because no RfC values are available for the COCs (Table G-57).
6.1.4.3 Cumulative Risks/Hazards to Potentially Exposed PopulationsFor this risk assessment, it was assumed that die same individual or subpopulation may beexposed to the constituents of concern via multiple pathways. Accordingly, the carcinogenicrisks and the non-carcinogenic hazards calculated in the previous sections are summed to providean estimation of the total risk/hazard to the exposed populations from site-related constituents ofconcern from the SRI site. Reasonable maximum exposure (RME) default parameters wereemployed for all potential pathways to represent the most conservative estimate of potentialexposure and therefore, be the most health protective.
For any pathway that showed excessive risk/hazard using RME exposure parameters, thesepathways were re-evaluated using Central Tendency Analysis exposure parameters. CentralTendency Exposure (CTE) default parameters utilize average exposure frequencies and durationvalues rather than upperbound estimates for determining daily chronic intake of constituents inthe risk/hazard analyses. Tables G-58 to G-60 are CTE carcinogenic risk analyses and non-carcinogenic hazard indices for exposure pathways than indicated excessive risk/hazard underRME exposure scenarios.
Current Land UseThe total carcinogenic risk to on-site trespasser from exposure to site-related constituents ofconcern is 1.44E-05 for adults and 1.22E-05 for older children (Table 6-11). Figure 6-2demonstrates that dermal contact with on-site surface water contributed 63% of the totalcarcinogenic risk to trespassers. Pentachlorophenol contributed 94% of total risk to current on-site land use conditions.
The total non-carcinogenic hazard to on-site trespasser from exposure to constituents of concernis 4.76E-02 for adults and 1.89E-01 for older children (Table 6-11). As shown in Figure 6-3,incidental ingestion of wetlands sediment contributed 47% of the total non-carcinogenic hazard,with arsenic contributing 99% of the non-carcinogenic risk of this medium.
EDIS/ENG/ay071494jp6 6-52SLR-0010678
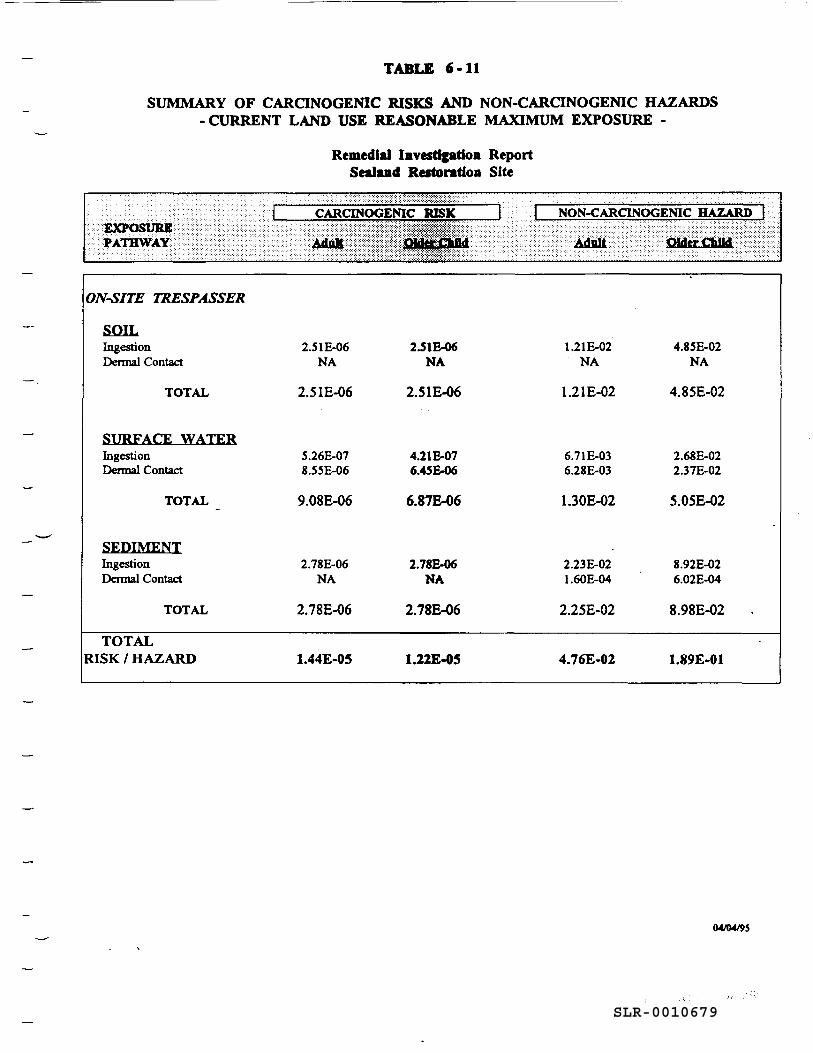
TABLE 6-11
SUMMARY OF CARCINOGENIC RISKS AND NON-CARCINOGENIC HAZARDS-CURRENT LAND USE REASONABLE MAXIMUM EXPOSURE -
Remedial Investigation ReportSealand Restoration Site
H m^mmmm^:--::: : : :• : :. •• : : ; : • > : - ; $ . W: : :; : ^ :! : 1; ;: :: . . ; ' : ; < ^ . ; : \ CARCINOGENIC RISK f :
||i|::f|||||;||llSS'-; 'Si::! ?:!';:•:!•:: i:iS*??™S;i*^| llillllj^Sll^S;*:;:::^:^1
• . • • " • . :: :• . ' • ' . . ' ' • ' • ' . '.'.
I NON-CARCINOGENIC HAZARD I
iiiiiii^iMim ;if::-^i ';ciiiiiiii;i|iiiii^;mf-r\$.ti*:--^-?m?mm
ON-SITE TRESPASSER
SOILIngestionDermal Contact
TOTAL
SURFACE WATERIngestionDermal Contact
TOTAL
SEDIMENTIngestionDermal Contact
TOTAL
TOTALRISK / HAZARD
2.5 IE-06NA
2.5 IE-06
5.26E-078.55E-06
9.08E-06
2.78E-06NA
2.78E-06
1.44E-05
2.51E-06NA
2.51E-06
4.21E-076.45E-06
6.87E-06
2.78E-06NA
2.78E-06
1.22E-05
1.2 IE-02NA
1.2 IE-02
6.71E-036.28E-03
1.30E-02
2.23E-021.60E-04
2.25E-02
4.76E-02
4.85E-02NA
4.85E-02
2.68E-022.37E-02
5.05E-02
8.92E-026.02E-04
8.98E-02 .
1.89E-01
04/04/95
SLR-0010679
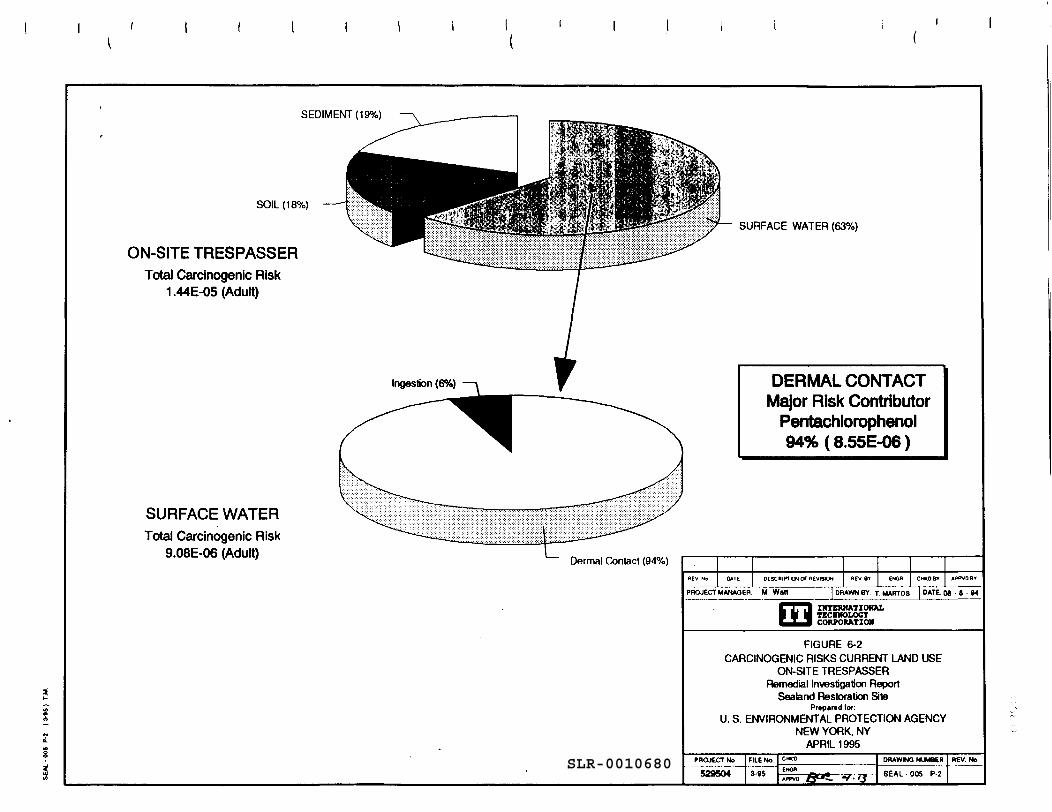
SEDIMENT (19%)
SOIL (18%)
ON-SITE TRESPASSERTotal Carcinogenic Risk
1.44E-05 (Adult)
SURFACE WATERTotal Carcinogenic Risk
9.08E-06 (Adult)
SURFACE WATER (63%)
DERMAL CONTACTMajor Risk Contributor
Pentachlorophenol94% (8.55E-06)
DESCRIPTOR Of REVISION ENOfl CHKO B» APPVD9V
PROJECT MANAGER: M. Watt DRAWN BY T MART03 DATE. 08 8 - 04
INTERNATIONALTECHNOLOGYCORPORATION
FIGURE 6-2CARCINOGENIC RISKS CURRENT LAND USE
ON-SITE TRESPASSERRemedial Investigation Report
Sealant! Restoration SitePr»p«r«dlon
U. S. ENVIRONMENTAL PROTECTION AGENCYNEW YORK, NY
APRIL 1995
529504 3-85
DRAWINQ NUMBER
SEAL -005 P2SLR-0010680
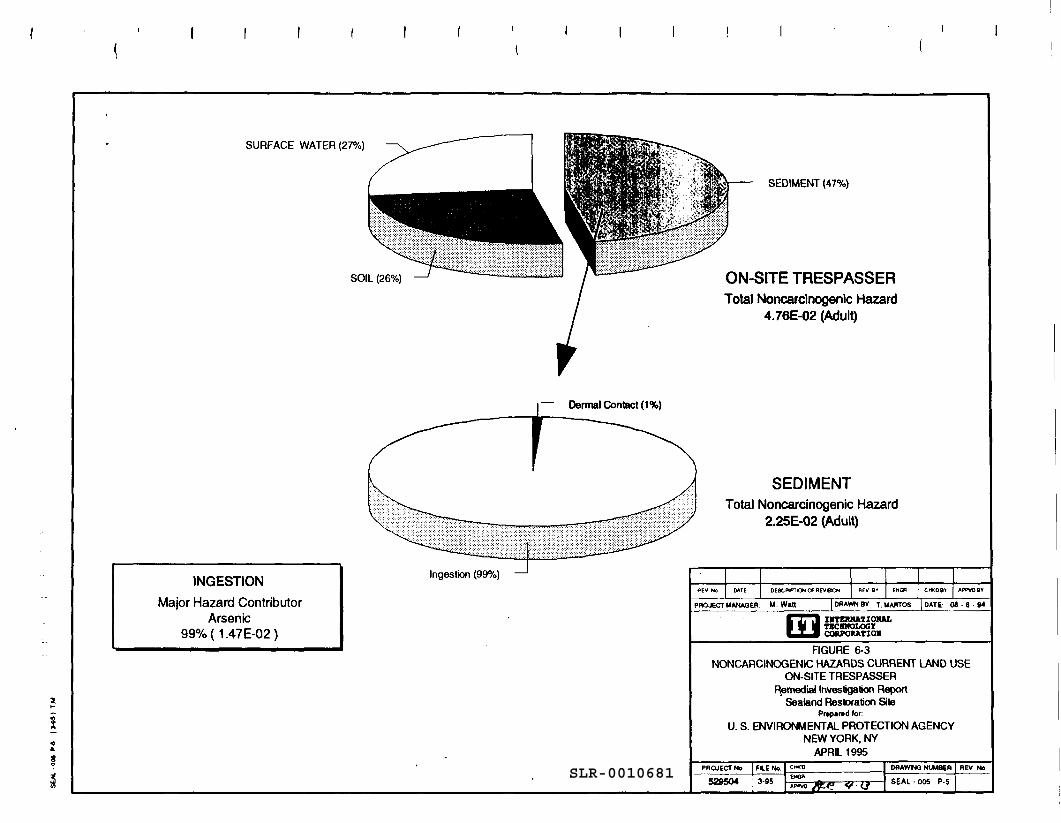
SURFACE WATER (27%)
SEDIMENT (47%)
SOIL (26%) ON-SITE TRESPASSERTotal Noncarcinogenic Hazard
4.76E-02 (Adult)
— Dermal Contact (1%)
INGESTIONMajor Hazard Contributor
Arsenic99%(1.47E-02)
SEDIMENTTotal Noncarcinogenic Hazard
2.25E-02 (Adult)
Ingestion (99%)DATE DESCRIPTION OF REVBIOW
PROJECT MANAGER: M. Watt DRAWN BV T. MART08 DATE: 0» - 8 •
I I1CTERHATIONJUncBMOLocyI CORPORATION
FIGURE 6-3NONCARCINOGENIC HAZARDS CURRENT LAND USE
ON-SITE TRESPASSERRemedial Investigation Report
Sealand Restoration SitePrapand lor:
U. S. ENVIRONMENTAL PROTECTION AGENCYNEW YORK, NY
APRIL 1995
529504 3-95
DRAWING NUMBER
SEAL • OK PSSLR-0010681
Figures 6-4 and 6-5 are bar graph charts for current land use that show cancer risk and non-carcinogenic hazard contribution for each media-specific exposure pathway to on-site trespassers.
Future Land UseThe total carcinogenic risk to residential adults and young children based on future on-siteresidential exposures has been calculated to be 2.34E-04 and 1.45E-04, respectively (Table 6-12).As illustrated in Figure 6-6, groundwater is accountable for 89% of the carcinogenic risks tofuture on-site residential populations. Arsenic was the major contributor to this calculatedcarcinogenic risk. The bar chart graph (Figure 6-8) indicated groundwater ingestion was inexceedence of USEPA's risk guidance.
In the future land use scenario, the total non-carcinogenic hazard to adults and children in an on-site residential setting has been calculated to be 5.78E+02 and 1.34E+03, respectively (Table6-12). Figure 6-7 shows that 99.9% of the non-carcinogenic hazard is attributed to use ofgroundwater from the composited groundwater aquifer. Acetone was the principal COC andaccounts for 99% of the non-carcinogenic hazard of this groundwater.
Figure 6-9 shows non-carcinogenic hazards for each media-specific pathway for this future landuse residential scenario. Ingestion of groundwater and dermal contact with groundwater werepathways that indicated excessive hazard All other pathways for both children and adults hadhazard indices of less than unity.
6.1.4.4 Summary of Risk CharacterizationQuantitative characterization of the carcinogenic risks and non-carcinogenic hazards has beenperformed based on current land use and potential future land use scenarios. Carcinogenic risksare expressed as the increased probability of an individual developing cancer over a lifetime, andnon-carcinogenic hazards are expressed as hazard quotients of exposure levels over referencedoses or concentrations.
EDIS/ENG/ay071494.rp6 6-56SLR-0010682
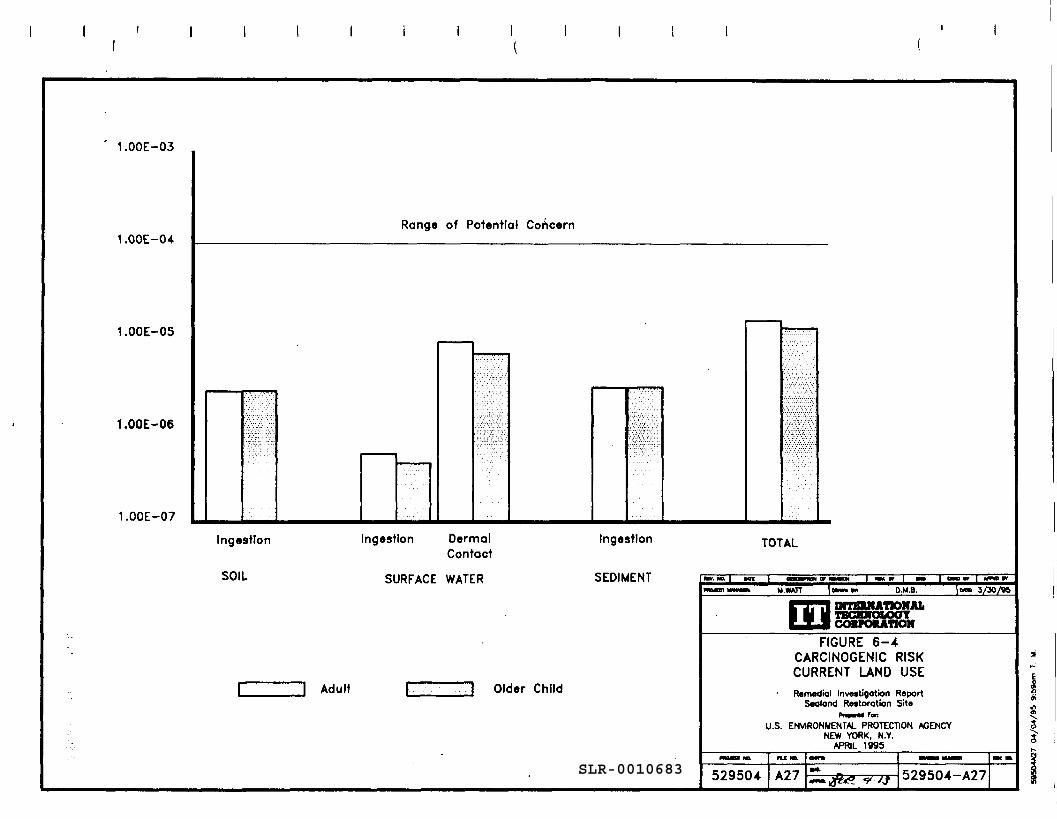
1.00E-03
1.00E-04
1.00E-05
1.00E-06
1.00E-07
Range of Potential Concern
Ingestlon
SOIL
Ingestlon DermalContact
SURFACE WATER
Ingestlon
SEDIMENT
J Adult Older Child
TOTAL
M.WATT D.M.B. 3/30/B5
ITIONAL
FIGURE B-4CARCINOGENIC RISKCURRENT LAND USERemedial Investigation Report
Seolond Restoration SitePi !>•••) Fon
U.S. ENVIRONMENTAL PROTECTION AGENCYNEW YORK, N.Y.
APRIL 1995
529504 A27 529504-A27SLR-0010683
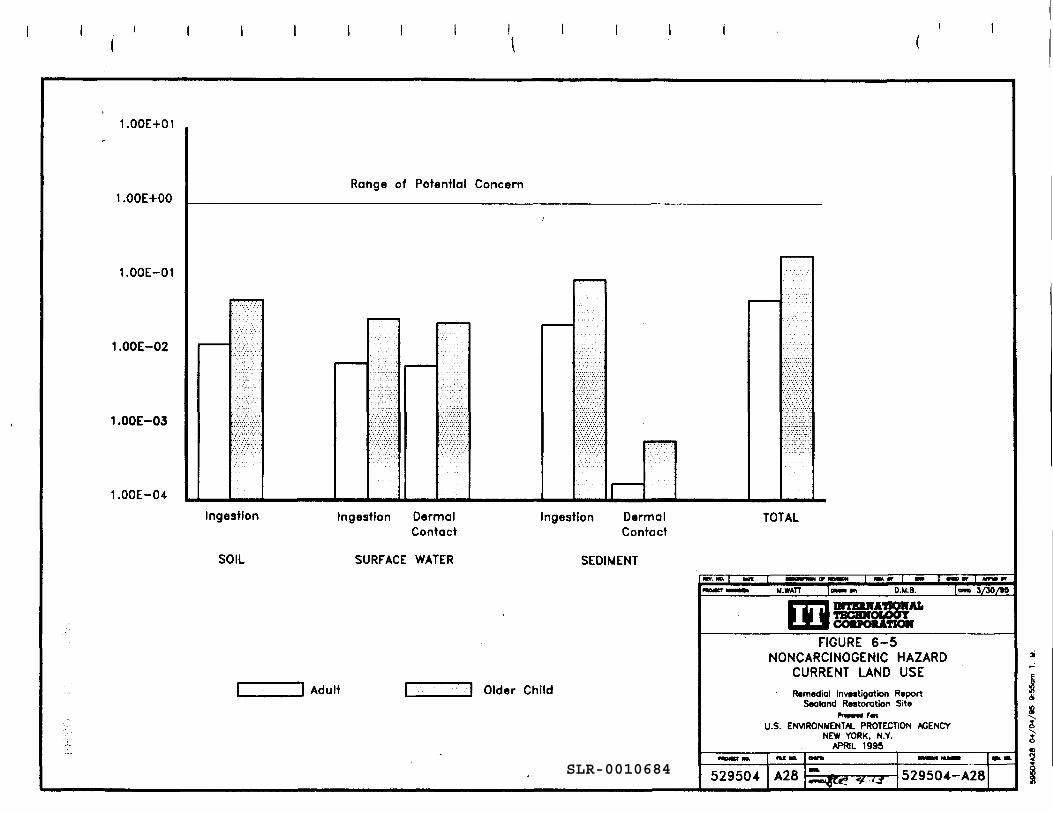
1.00E+01
1.00E+00
1.00E-01
1 .OOE-02
1 .OOE-03
1.00E-CH
Range of Potential Concern
Ingestion
SOIL
Ingestion DermalContact
SURFACE WATER
Ingestion DermalContact
SEDIMENT
J Adult Older Child
TOTAL
M.WATT O.M.B. _ 3/30/8S
MTBBMATlQlfAlt
FIGURE 6-5NONCARCINOGENIC HAZARD
CURRENT LAND USER»m«dial Invntigation Report
Sealand Reatoration SiteP il ii i J fen
U.S. ENVIRONMENTAL PROTECTION AGENCYNEW YORK. N.Y.
APRIL 1995
I
529504 A28 529504-A28SLR-0010684
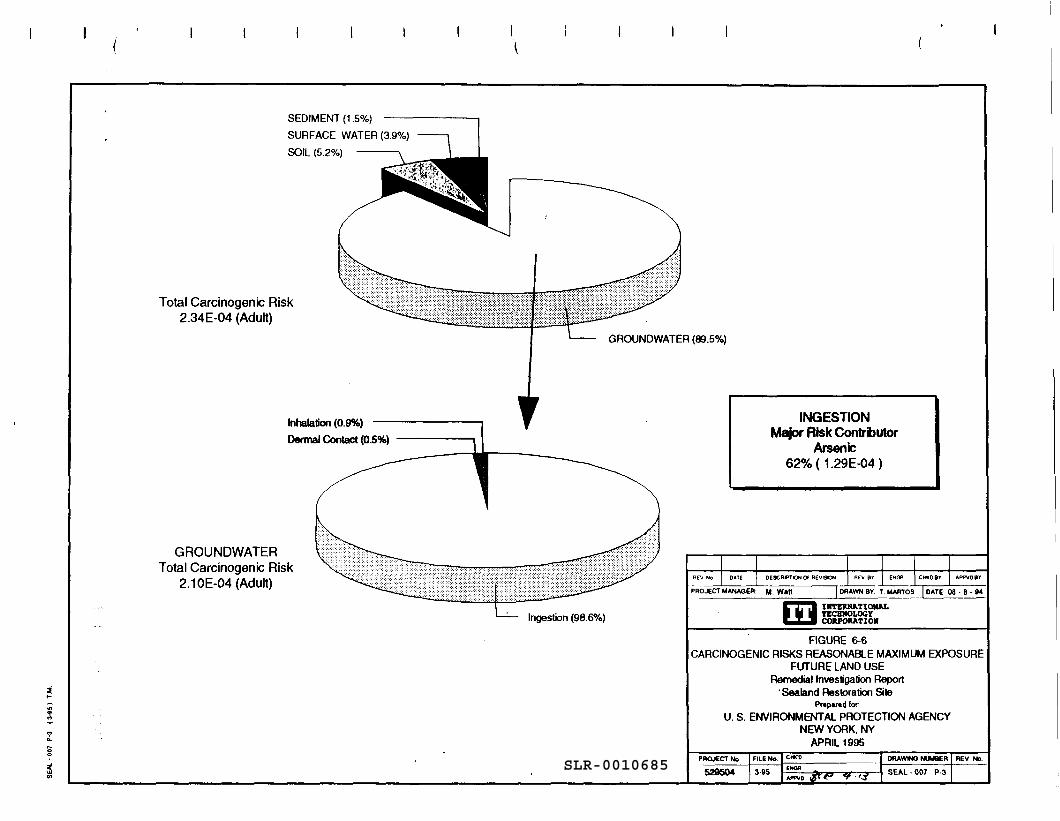
SEDIMENT (1.5%)SURFACE WATER (3.9%)SOIL (5.2%)
Total Carcinogenic Risk2.34E-04 (Adult)
GROUNDWATER (89.5%)
GROUNDWATERTotal Carcinogenic Risk
2.1 OE-04 (Adult)
Inhalation (0.9%)Dermal Contact (0.5%)
INGESTIONMajor Risk Contributor
Arsenic62%(1.29E-04)
Ingestbn (98.6%)
DESCatfTICN Of REVISION
PROJECT MANAGER: M Wan DRAWN BY T MARTOS DATE: 08 • 8 • M
INTERNATIONALTECHNOLOGYCORPORATION
FIGURE 6-6CARCINOGENIC RISKS REASONABLE MAXIMUM EXPOSURE
FUTURE LAND USERemedial Investigation Report
Sealand Restoration SitePrepared for
U. S. ENVIRONMENTAL PROTECTION AGENCYNEW YORK, NY
APRIL 1995
529504 395
DRAWING NUMBER
SEAL - 007 P-3SLR-0010685
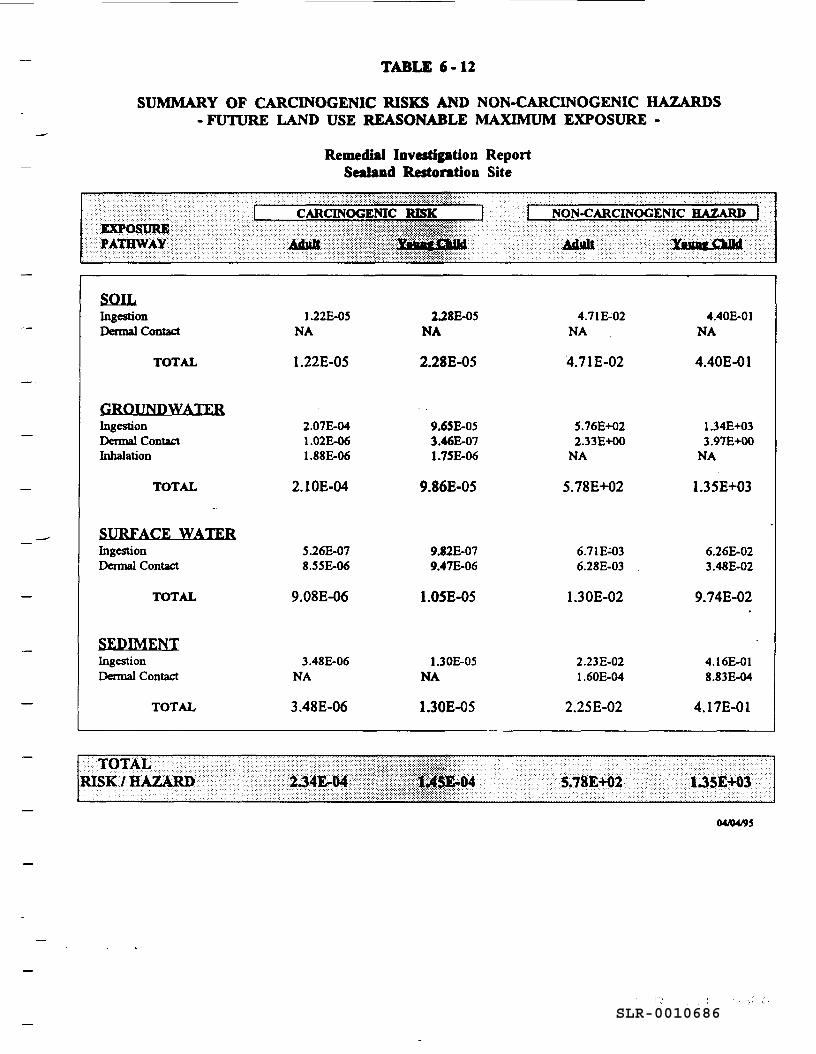
TABLE $-12
SUMMARY OF CARCINOGENIC RISKS AND NON-CARCINOGENIC HAZARDS- FUTURE LAND USE REASONABLE MAXIMUM EXPOSURE -
Remedial Investigation ReportSealand Restoration Site
• :; '•' • • \ :: « k - i ::.;:: :f i:;.Si;:i;: I ;•;£•;: ; ; '; : • :: ::" -; .; : : S : :- • : : -. ' - i - ; • • -'•": • • ^W^mm*SXZm§m*®mX;-^ • : ' •': : ' ; • :: : : . -. . . " " ' : : • : ': : • ii; : .-! r :: - : : : .. : • ;-;::?;;-H;-;, :•. :: :; : '. ;: i; ; :.i :
: .:; •: mmmmm^&m ]mm : \ • •• \ CARCINOGENIC RISK 1 : :, ; ? ;; ; ;iiS^P^ iiSil
;:;:::;:S:;j::i;S5:j:?S;|jiiii|jS|SjgjSS '•'-.: ; .. ..::.:;:;:;:;:;:;:;:¥:::x:x:o:v:|>xo¥ ^ $:i::v:;:;:L:; ;: : ; :
1 NON-CARCINOGENIC HAZARD I
:::. : ': :": "•• "•• • "• .'• ' '• '- ' ::: ' : : : :'"":-: • • - " " • " - '-" :ii SSSiHjSlli
SOILIngestionDermal Contact
TOTAL
GROUNDWATERIngestionDermal ContactInhalation
TOTAL
SURFACE WATERIngestionDermal Contact
TOTAL
SEDIMENTIngestionDermal Contact
TOTAL
1.22E-05NA
1.22E-05
2.07E-041.02E-061.88E-06
2.10E-04
5.26E-078.55E-06
9.08E-06
3.48E-06NA
3.48E-06
2.28E-05NA
2.28E-05
9.65E-053.46E-071.75E-06
9.86E-05
9.82E-079.47E-06
1.05E-05
1.30E-05NA
1.30E-05
4.7 IE-02NA
4.7 IE-02
5.76E+022.33E-HK)
NA
5.78E+02
6.7 IE-036.28E-03
1.30E-02
2.23E-021.60E-04
2.25E-02
4.40E-01NA
4.40E-01
1.34E+033.97E+00
NA
1.35E+03
6.26E-023.48E-02
9.74E-02
-4.16E-018.83E-04
4.17E-01
;,; :. • :TTf|T* A ¥ : -' :: :: •-•: :'• '•: :-! '^•••'••' : -:"::-;.':".:.:i .: ": :: -'--'-:• :~ :- :~ ^^ - / • _TT-:::- :-.-.-:• ':'::.:.-:'':.::::: :: ::."::: •• '•\'-:'-:'-:-m.'-:-:':'-:'.'' x::::::::':"
Wf w §^* ' /" 1 1 A 'W A- f> ¥^-':':':' '- : :": '' ':'": ' '" "• ' ':":":1% 1 |J J^^ / ' «• ^\fjJ^ n. U : :• •' '-•'•'. ' '-••'- '•• •' - •'- • •'-' '•'••'• '••Ms:;3w34B<-04^
: .;: X;:::: :: : •••":>0 ^:::':::::;::r:::::'i:::::::::::::
^^£t£ •:• ¥jSSSSHS->:>:::::--: - -: • ' . • ' • ' . ' '<<<<<: '•:'<:'•;• <:'•<<:'•: v 3~f$$}<iy$<£',^:,<yy....::.\:-' . . . : . '
SPPiisi ? i! i§J6-i04 : -: <:: : :
mmiml |lilll|;S?:::-: -"- : ; : ; - ; ; .::: • £ '•- • -• '-• :5«78E^H02^ ; : -- -:
• • • ; • : • • ; : • • . • • - • • : : - . - : - -• • • . - . • . . • - . • : • . - . • : : • . - . • •- . - - . : : - • ::: : . ; . . : . _ _ :-. :-. .•.; .-:;-. .-; : - •-• : • : •• ; : : '•_•_. :• .-••-.. ";;:.:..;.;. v
:;-;j; i ;:.;•; ;::5 ii. :: ;:t.35E-H)3 -^ ' :
04AM/9S
SLR-0010686
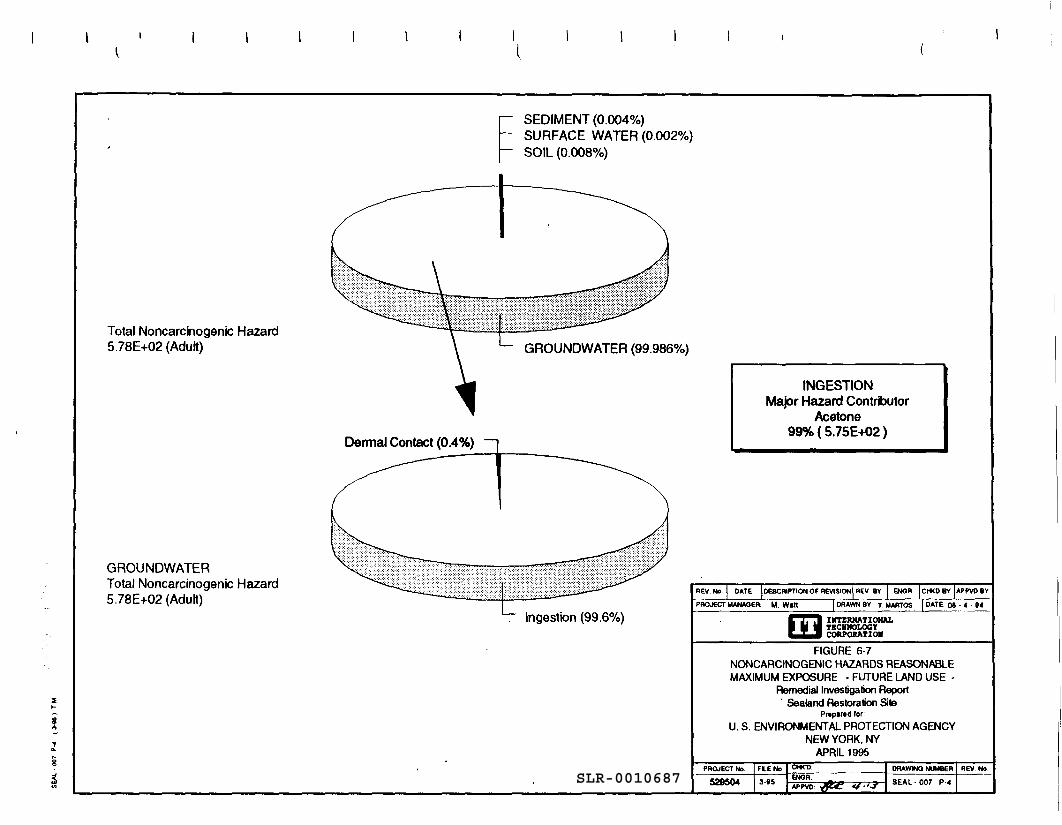
SEDIMENT (0.004%)SURFACE WATER (0.002%)SOIL (0.008%)
Total Noncarcinogenic Hazard5.78E+02 (Adult) GROUNDWATER (99.986%)
Dermal Contact (0.4%)
GROUNDWATERTotal Noncarcinogenic Hazard5.78E+02 (Adult)
INGESTIONMajor Hazard Contributor
Acetone99% (5.75E+02)
Ingestion (99.6%)
REV NO. DATE DESCRIPTION OF REVISION REV BY ENOH CWD BY APPVD BY
PROJECT MANAGER: M. WMI I DRAWN BY T MABTOS I DATE: 08 • 4 - 94
IKTERMATIOHALI TECHNOLOGY
CORPORATION
FIGURE 6-7NONCARCINOGENIC HAZARDS REASONABLEMAXIMUM EXPOSURE - FUTURE LAND USE -
Remedial Investigation Report' Sealand Restoration Site
Prepared lor:U. S. ENVIRONMENTAL PROTECTION AGENCY
NEW YORK. NYAPRIL 1995
526504DRAWMQ NUMBER
SEAL -007 P<SLR-0010687
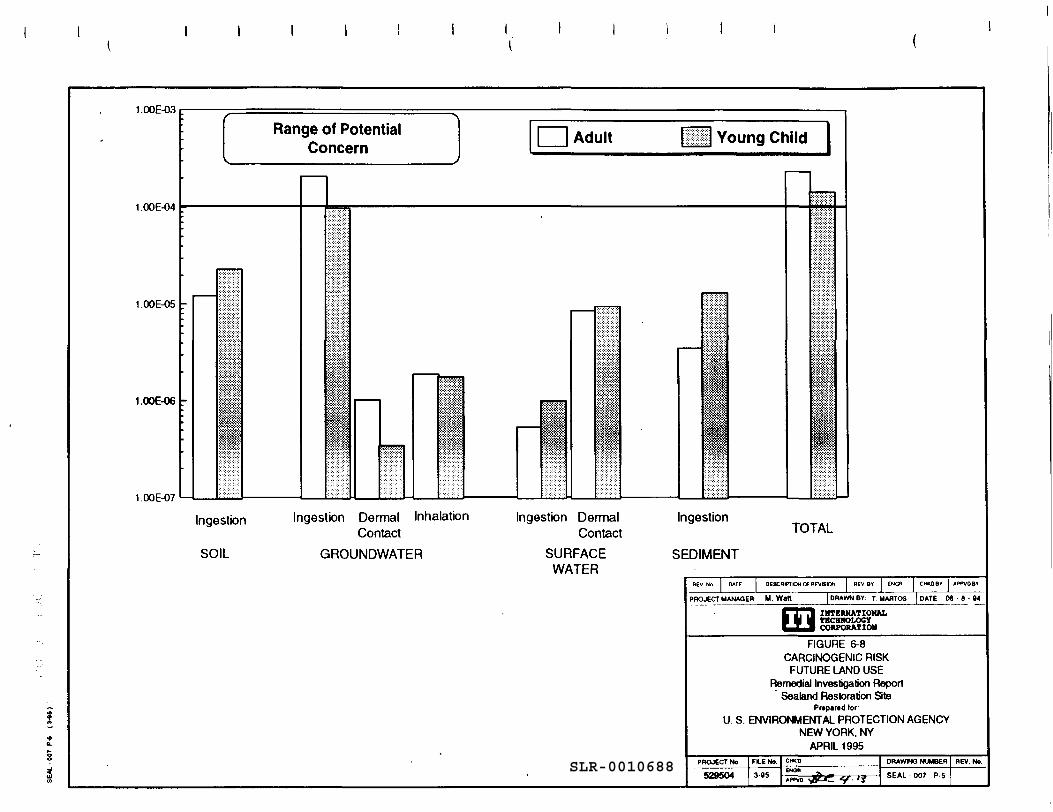
1.00E-03
1.00E-04
1 .OOE-05
1.00E-06
1.00E-07
Range of PotentialConcern Adult Young Child
Ingestion Ingestion Dermal InhalationContact
SOIL GROUNDWATER
Ingestion DermalContact
SURFACEWATER
Ingestion
SEDIMENT
TOTAL
«EV No DESCRIPTION OF WEVSION
PROJECT MANAGER M. Watt DRAWN BY T MARTOS DATE: 08 • 8 • M
, INTERNATIONALRCBNOLOCYCORPORATION
FIGURE 6-8CARCINOGENIC RISK
FUTURE LAND USERemedial Investigation Report' Sealand Restoration Site
Prepared for:U. S. ENVIRONMENTAL PROTECTION AGENCY
NEW YORK, NYAPRIL 1995
529504DBAW1NO NUMBER
SEAL-007 P-SSLR-0010688
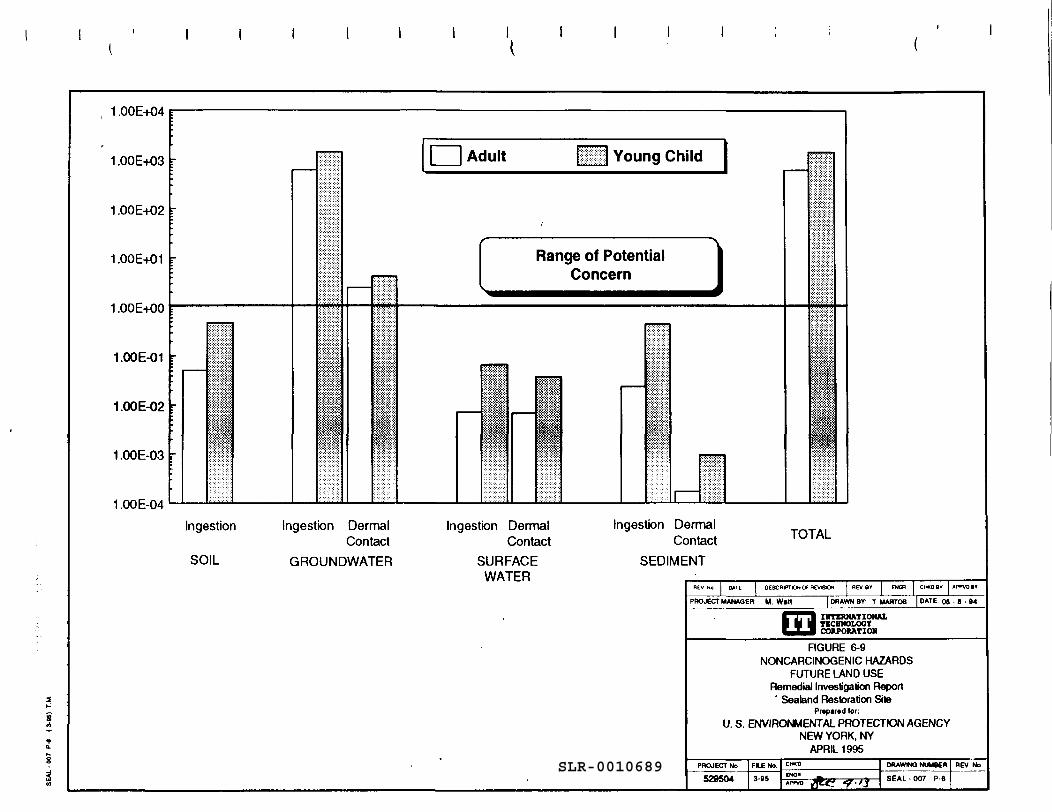
1 .OOE+04 r
1 .OOE+03
1 .OOE+02
1 .OOE+01
1 .OOE+00
1.00E-01
1.00E-02
1.00E-03
1.00E-04Ingestion
SOIL
Adult Young Child
Range of PotentialConcern
Ingestion DermalContact
GROUNDWATER
Ingestion DermalContact
SURFACEWATER
Ingestion DermalContact
SEDIMENT
TOTAL
DESCfllPTIOWOf REVSOJ
PROJECT MANAGER M. Wan DRAWN BY T MARTOS DATE: 04 8 • 9<
INTERNATIONALTECHNOLOGYCORPORATION
FIGURE 6-9NONCARCINOGENIC HAZARDS
FUTURE LAND USERemedial Investigation Report' Sealand Restoration Site
Prepared lor:U. S. ENVIRONMENTAL PROTECTION AGENCY
NEW YORK, NYAPRIL 1995
528504 V-'J
DftAWma NUMBER
SEAL - 007 P 6SLR-0010689
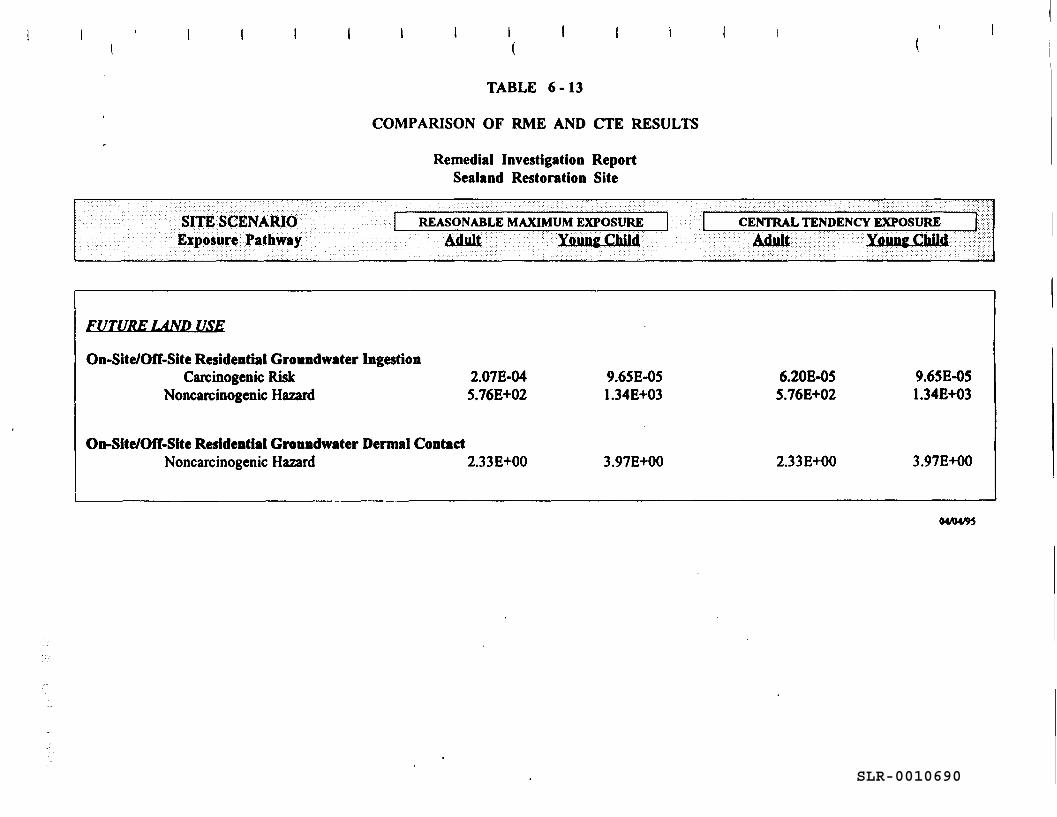
TABLE 6-13
COMPARISON OF RME AND CTE RESULTS
Remedial Investigation ReportSealand Restoration Site
SITE SCENARIOExposure Pathway
REASONABLE MAXIMUM EXPOSUREAdult Young Child
| CENTRAL TENDENCY EXPOSURE I" r'3 '^;^:Adu^
FUTURE LAND USE
On-Site/Oft-Site Residential Groundwater IngestionCarcinogenic Risk 2.07E-04 9.65E-05
Noncarcinogenic Hazard 5.76E+02 1.34E+03
On-Site/OfT-Site Residential Groundwater Dermal ContactNoncarcinogenic Hazard 2.33E+00 3.97E+00
6.20E-05 9.65E-055.76E+02 1.34E+03
2.33E+00 3.97E-KX)
04/M/95
SLR-0010690
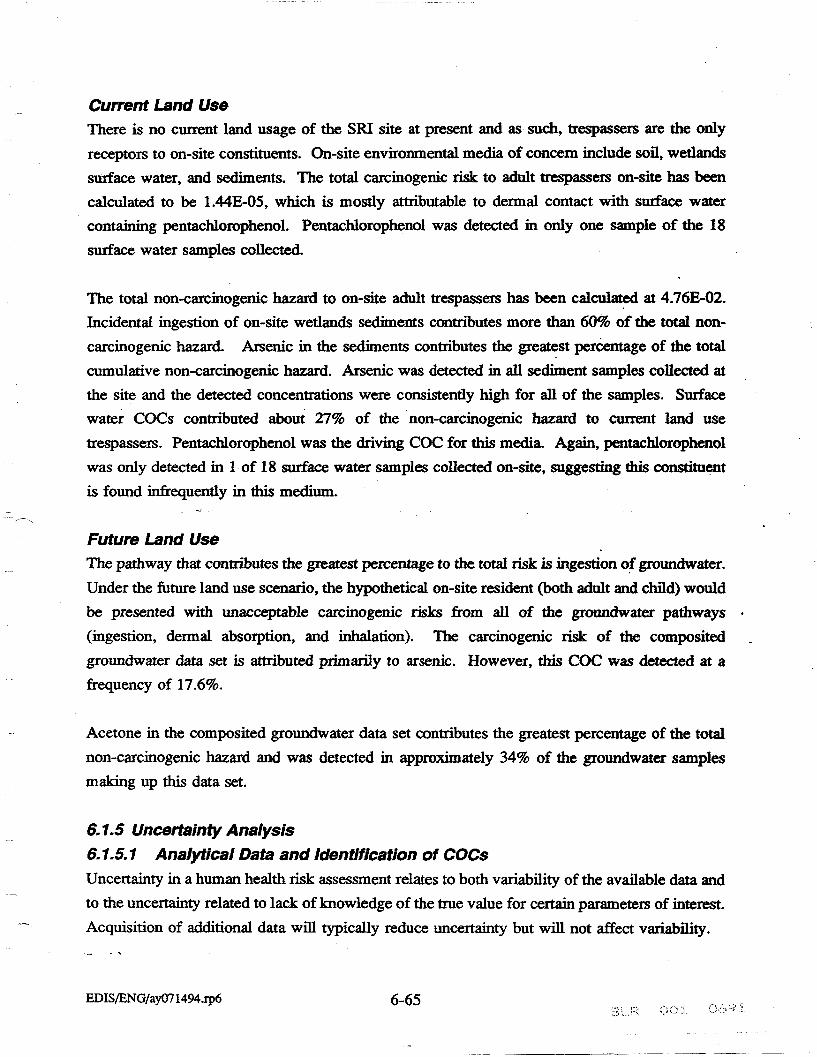
Current Land UseThere is no current land usage of the SRI site at present and as such, trespassers are the onlyreceptors to on-site constituents. On-site environmental media of concern include soil, wetlandssurface water, and sediments. The total carcinogenic risk to adult trespassers on-site has beencalculated to be 1.44E-05, which is mostly attributable to dermal contact with surface watercontaining pentachlorophenol. Pentachlorophenol was detected in only one sample of the 18surface water samples collected.
The total non-carcinogenic hazard to on-site adult trespassers has been calculated at 4.76E-02.Incidental ingestion of on-site wetlands sediments contributes more than 60% of the total non-carcinogenic hazard. Arsenic in the sediments contributes the greatest percentage of the totalcumulative non-carcinogenic hazard. Arsenic was detected in all sediment samples collected atthe site and the detected concentrations were consistently high for all of the samples. Surfacewater COCs contributed about 27% of the non-carcinogenic hazard to current land usetrespassers. Pentachlorophenol was the driving COC for this media. Again, pentachlorophenolwas only detected in 1 of 18 surface water samples collected on-site, suggesting this constituentis found infrequently in this medium.
Future Land UseThe pathway that contributes the greatest percentage to the total risk is ingestion of groundwater.Under the future land use scenario, the hypothetical on-site resident (both adult and child) wouldbe presented with unacceptable carcinogenic risks from all of the groundwater pathways(ingestion, dermal absorption, and inhalation). The carcinogenic risk of the compositedgroundwater data set is attributed primarily to arsenic. However, this COC was detected at afrequency of 17.6%.
Acetone in the composited groundwater data set contributes the greatest percentage of the totalnon-carcinogenic hazard and was detected in approximately 34% of the groundwater samplesmaking up this data set.
6.7.5 Uncertainty Analysis6.1.5.1 Analytical Data and Identification of COCsUncertainty in a human health risk assessment relates to both variability of the available data andto the uncertainty related to lack of knowledge of the true value for certain parameters of interest.Acquisition of additional data will typically reduce uncertainty but will not affect variability.
EDIS/ENG/ay071494jp6 6-65
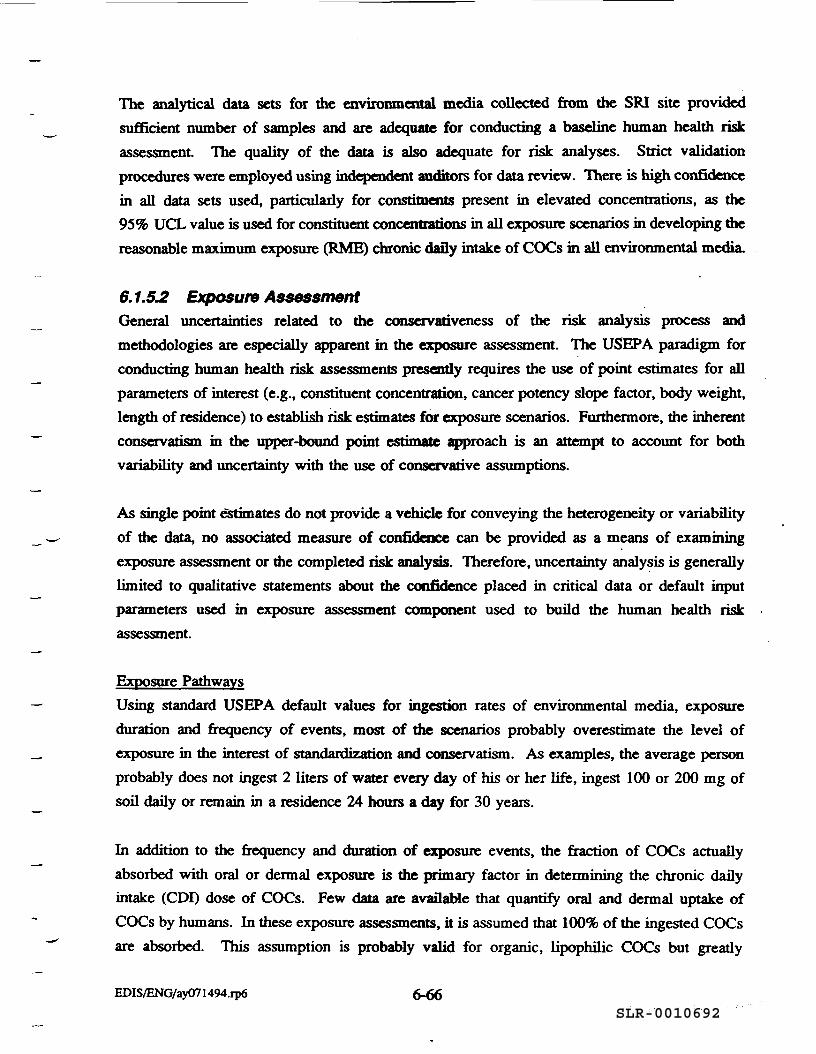
The analytical data sets for the environmental media collected from the SRI site providedsufficient number of samples and are adequate for conducting a baseline human health riskassessment. The quality of the data is also adequate for risk analyses. Strict validationprocedures were employed using independent auditors for data review. There is high confidencein all data sets used, particularly for constituents present in elevated concentrations, as the95% UCL value is used for constituent concentrations in all exposure scenarios in developing diereasonable maximum exposure (RME) chronic daily intake of COCs in all environmental media.
6.1.53 Exposure AssessmentGeneral uncertainties related to the conservativeness of the risk analysis process andmethodologies are especially apparent in the exposure assessment. The USEPA paradigm forconducting human health risk assessments presently requires the use of point estimates for allparameters of interest (e.g., constituent concentration, cancer potency slope factor, body weight,length of residence) to establish risk estimates for exposure scenarios. Furthermore, the inherentconservatism in the upper-bound point estimate approach is an attempt to account for bothvariability and uncertainty with the use of conservative assumptions.
As single point estimates do not provide a vehicle for conveying the heterogeneity or variabilityof the data, no associated measure of confidence can be provided as a means of examiningexposure assessment or the completed risk analysis. Therefore, uncertainty analysis is generallylimited to qualitative statements about the confidence placed in critical data or default inputparameters used in exposure assessment component used to build the human health riskassessment.
Exposure PathwaysUsing standard USEPA default values for ingestion rates of environmental media, exposureduration and frequency of events, most of the scenarios probably overestimate the level ofexposure in the interest of standardization and conservatism. As examples, the average personprobably does not ingest 2 liters of water every day of his or her life, ingest 100 or 200 mg ofsoil daily or remain in a residence 24 hours a day for 30 years.
In addition to the frequency and duration of exposure events, the fraction of COCs actuallyabsorbed with oral or dermal exposure is the primary factor in determining the chronic dailyintake (GDI) dose of COCs. Few data are available that quantify oral and dermal uptake ofCOCs by humans. In these exposure assessments, it is assumed that 100% of the ingested COCsare absorbed. This assumption is probably valid for organic, lipophilic COCs but greatly
EDIS/ENG/ay071494jp6 6-66SLR-0010692
overestimates the metals intake. Many animal (and limited human) oral availability studiesindicate that less than 10% of most metals, even in soluble form, are absorbed from thealimentary tract into the body.
Dermal uptake of COCs by direct dermal contact to soil, sediment, or water is also an exposureparameter with inherent uncertainty. Dermal absorption coefficients for estimating absorbeddoses from direct skin contact with water are available or can be calculated (USEPA, 1992a), andthese estimated parameters were used for uptake of COCs from water in direct contact with skin.Dermal uptake of COCs by skin in direct contact with COCs adsorbed on soil/sediment is moreuncertain. Because of the dearth of published soil-to-skin absorption factors, soil/sedimentdermal absorption calculations were only available for PCBs and cadmium. Dermal uptake oforganic, lipophilic COCs from soil is probably underestimated in this risk assessment.
Site-Specific UncertaintiesIncidental ingestion and direct dermal contact with soil, surface water and sediments areestimated and considered complete pathways for trespasser exposure. However, the fact that themajority of the on-site surficial soil is covered by a grassy vegetation is not taken into account,and it is understood that this environmental medium pathway overestimates contact with on-sitesoil. In addition, the SRI site is located in tipper New York state. This area of the country oftenexperiences harsh winter conditions and it would not be uncommon for the SRI site to be frozenand snow-covered for up to 6 months a year.
6.1.5.3 Toxicity AssessmentToxicity assessment relies upon the use of toxicity values (cancer potency slope factors, non-carcinogen reference doses) developed by the USEPA to quantitate chronic toxicity of theconstituents of concern. These toxicity values may be estimated from human data but the processis largely dependent upon laboratory animal data generated from a variety of toxicology andsafety testing studies conducted on constituents. More often than not, these original toxicologystudies were not designed to support risk assessment assumptions. Rather, these studies weredesigned to answer specific questions about constituents' adverse effects at specified, and usuallyhigh doses, or to answer specific questions about a constituent's disposition after administration.
Toxicity values are not available for all constituents of concern; therefore risks/hazards cannotbe quantitatively characterized for these constituents and the total cumulative risk/hazard for thesite may be underestimated in such circumstances.
EDIS/ENG/ay071494jp6 6-67SLR-0010693
Carcinogen Toxicity ValuesThe carcinogen toxicity values, slope factors (SF), are derived from cancer bioassay orepidemiologic dose-response data that have been transformed using linear models to estimatecarcinogenic risk at constituent concentrations mat may be several orders of magnitude lower thatthe given dose or estimated exposure concentration. There are a number of uncertaintiesassociated with this methodology including the following concerns:
• The extrapolation of carcinogenic effects observed at the high doses necessary to conductanimal cancer studies to possible cancer effects at substantially lower doses is based onthe hypothesis that there is no threshold dose for carcinogens. No experimental evidenceis available to support this thesis.
• The extrapolation of carcinogenic and non-carcinogenic effects in animals to effects inhumans may not be appropriate for all constituents, particularly if there are large speciesdifferences in metabolism of the constituent.
• While the USEPA has established a weight-of-evidence classification for carcinogens, thecancer risk equation sums all carcinogens equally whether they are known humancarcinogens (Class A) or suspect carcinogens (Class C).
Each of these three uncertainty factors tend to overestimate carcinogenic risk. There are alsoquestions concerning the summation of carcinogenic risks when different constituents havespecific target organs or induce quite different neoplastic disease states.
Non-carcinogen Toxicity ValuesToxicity values derived to estimate chronic dosages that may induce non-carcinogenic adverseeffects also have a number of limitations. Unlike cancer risk assessment, by convention, non-carcinogen adverse effects are assumed to occur in a dose-response manner only after a thresholddose has been exceeded. This is the basis for the use of the reference dose (RfD) or referenceconcentration (RfC) in estimating hazards associated with exposure to constituents. Theestimated chronic daily intake (GDI) dosage is divided by the RfD or RfC. If this ratio is > 1.0,the exposure is considered to be hazardous and this hazard index is used to qualitatively rank thepossibility of adverse non-carcinogenic effects occurring. This process is repeated for eachconstituent for all routes of exposure in summing the cumulative hazard index for the exposurescenario. The following uncertainties are probable with the use of the hazard index to describenon-carcinogenic health hazards:
• Reference doses are derived from no-observed-adverse-effect-level (NOAEL) or lowest' observed-adverse-effect-level (LOAEL) doses determined from animal studies or human
EDIS/ENG/ay071494jp6 6-68SLR-0010694
exposure investigations. Depending on die quality of the data used to determine the noobserved or lowest observed adverse dose, die NOAEL or LOAEL is divided by anuncertainty factor that can range from 1 to 10,000. The larger the uncertainty factor, theless confidence can be placed in the calculated RfD or RfC. Large uncertainty factors areused in extrapolating animal effects to human effects, and effects observed for shortexposure times compared to life-time exposures. This conservative approach tends tooverestimate non-carcinogenic hazard indices.
• The hazard index approach assumes that all non-carcinogenic adverse effects are additive.While this approach may be sound for assessing a series of constituents that have similarmodes of action and act on the same target organ (e.g., chlorinated alkene solvents), suchan approach is clearly not appropriate for combining potential adverse effects forconstituents with very different target organs and toxic insult outcomes (e.g., manganeseand arsenic).
• The addition of hazard indices determined from different pathways to calculate acumulative hazard index for an exposure scenario can often generate a very large number.It must be kept in mind that the hazard index is a ratio of an estimated exposure comparedto a "safe" exposure dose. If this ratio exceeds 1, a health hazard is indicated. It iswrong, and would be a misnomer, to place emphasis on a large calculated cumulativehazard index value being an indicator of the probability of adverse effects to occur. Afterthe hazard index exceeds 1, the magnitude of the hazard index has little bearing on thepotential severity of adverse effects that may be anticipated.
6.1.5.4 Risk CharacterizationThere are a number of factors mat contribute to uncertainties in this risk characterization. Theseuncertainties are attributable to the risk characterization procedure itself and to several site-specific factors.
The summation of carcinogenic risks from individual constituents to derive a total carcinogenicrisk from a given environmental medium (eg. soil, groundwater, surface water, or sediment) maynot be applicable. Each individual constituent of concern may act on a different organ or systemin the human body; therefore, summing the effects from these different constituents may grosslyover-estimate the potential risks from multiple constituents. Additionally, antagonistic orsynergistic effects are not accounted for in this characterization, resulting in potential over- orunder-estimations of carcinogenic risk.
The dermal absorption of COCs through contact with soil and sediment may be underestimatedfor exposure pathways concerning skin contact with these media. At present the USEPA Regionn recognizes dermal absorption factors only for PGBs, dioxin, and cadmium. Thus, dermalabsorption of organic COCs, such as benzo(a)pyrene and bis(2-ethylhexyl)phthalate were not
EDIS/ENG/ay071494.rp6 6-69SLR-0010695
calculated in these dermal exposure pathways. Inorganic COCs, such as arsenic and manganese,as with most metals, are poorly absorbed through the skin and most probably would not resultin significant contributions to the exposure to these inorganics.
A significant level of uncertainty is introduced into the future land use scenarios of thisassessment through the use of a hypothetical aquifer. This groundwater source was created perUSEPA guidance by combination of three groundwater data sets collected in the SRI remedialinvestigation. Although it is possible that the site could be developed for residential purposesat some time in the future, potable wells would normally be screened in a single groundwaterunit, and would, therefore, not produce water from the three groundwater units combined.Therefore, the future use scenario utilizing die three groundwater units combined, is ahypothetical scenario and most likely would ot occur.
6.1.6 SummaryA human health risk assessment was performed for the SRI site in Lisbon, New York toinvestigate potential risks to receptor populations on-site and in the near vicinity of the facility.This risk assessment, conducted in accordance with the Risk Assessment Guidance for Superfund,Volume I, Human Health Evaluation Manual (USEPA, 1989a), examined potential exposures toand the corresponding health risks and hazards associated with site-related constituents ofconcern. Separate risk analyses were conducted for both current land-use and possible futureland-use of the site. Samples were collected from all environmental media of concern (i.e.,surficial soil, groundwater, sediment, and surface water) to quantify constituent concentrations.The resulting analytical data from remedial investigations conducted at the SRI site and vicinityin 1992 and 1993 were used as the data base for this risk assessment.
Groundwater is the principal medium of concern at the SRI site. Acetone was the majorcontributor to the non-cancer health hazard index and arsenic was the major contributor to cancerrisk through residential usage of groundwater in the future land-use scenarios for both on-site andoff-site residents. In this future land-use scenario, unacceptable cancer risk and non-cancer healthhazards were indicated for a hypothetical groundwater aquifer used as the drinking water source.However, it is emphasized that site-related constituents are not impacting off-site residential wellsat this time.
For on-site exposure to surficial soil, sediment, and surface water in both current and future land-use scenarios, arsenic (probably naturally-occurring) was the principal COC for all incidentalingestion pathways. Additional risk/hazard estimates for dermal contact exposure pathways were
EDIS/ENG/ay071494jp6 6-70SLR-0010696
driven by a limited number of constituents (Le., benzo(a)pyrene, pentachlorophenol) at low (e.g.2/40) frequencies of detection.
Constituents of ConcernAnalytical data sets for the four environmental media were scrutinized by an independentvalidator to examine data quality, and were then evaluated for useability in risk assessmentthrough statistical analyses and best professional judgment. Using the highest detectedconcentration values for all constituent concentrations detected in each medium, a risk screeningprotocol identified the constituents of concern (COCs) in each environmental medium. Inaddition to Class A carcinogens, all COCs that contributed >1% of the carcinogenic risk or non-carcinogenic adverse health effects in the risk screening procedure were identified for inclusionin the definitive risk assessment. Table 6-6 summarizes analytical data of the COCs for eachenvironmental medium.
Exposure AssessmentA number of exposure pathways were evaluated in die exposure assessment to estimate chronicdoses of COCs by on-site and off-site populations. These pathways are diagrammed in theConceptual Site^iodel (Figure 6-1). Exposure parameters specific to each exposure scenariowere used in combination with the exposure point concentrations for each constituent of concern.Reasonable maximum exposure (RME) is included, unless that RME analysis indicated potentialrisk above EPA's target criteria (l.OE-04 for carcinogenic risks; 1.0 for non-carcinogenichazards). If so, an average case exposure scenario (Central Tendency Exposure) is analyzed foreach exposure pathway.
General uncertainties related to the conservative nature of the risk assessment process areespecially apparent in exposure assessment. The USEPA paradigm for human health riskassessment presently requires the use of point estimates for all parameters of importance. Therepeated use of upper bound estimates for COC levels, ingestion quantities, andfrequency/duration of exposure events leads to conservative exposure assessments. However,such conservative quantification of exposure is justified for baseline risk analyses as it providesassurances that sensitive sub-populations are included in the analyses.
Toxicity AssessmentThe toxicity assessment component of human health risk analysis is based on the use of USEPA-derived toxicity values for both carcinogenic risk calculations (i.e., slope factors), and for non-carcinogenic adverse health effects (i.e., reference doses).
EDIS/ENG/ay071494jp6 6-71SLR-0010697
The chronic toxicity and adverse health effects associated with principal COCs driving the risksat the SRI site are listed below. Each COCs carcinogen classification and the uncertainty factorrelated to its non-carcinogenic adverse health effects are as follows:
Acetone: A USEPA Class D carcinogen; not considered a carcinogen in thisassessment The noncancer toxicity value has an uncertainty factor of1,000. The kidney and liver are target organs.
Arsenic: A USEPA Class A known human carcinogen; cancer slope factors areavailable for oral and inhalation exposure. The lung is the target organ ofprimary tumor sites. The noncancer toxicity value has an uncertainty factorof 3.
Benzo(a)pyrene: A USEPA Class B2 probable human carcinogen; slope factor is availablefor oral exposure. Noncancer effects were not evaluated.
Manganese: A USEPA Class D carcinogen; not considered a carcinogen in thisassessment The noncancer toxicity value has an uncertainty factor of 1.
Pentachlorophenol: A USEPA Class B2 probable carcinogen. The liver and kidney are targetorgans. The noncancer toxicity value has an uncertainty factor of 100.
Risk Characterization
Current On-site Trespasser ExposureThe calculated carcinogenic risk and hazard index values indicate that USEPA recommendedguidelines are not exceeded under current on-site land-use by adult and older children trespassers.
Future On-Site Residential ExposureThe cumulative carcinogenic risks to future residents being on the SRI site exceed the USEPArecommended guidelines, and were calculated to be 2.34E-04 and 1.4SE-04 (see Table 6-12) foradults and children, respectively. Groundwater contaminated with arsenic accounts for 62% ofthe residential carcinogenic risk. The majority (>99%) of the non-carcinogenic risk of the siteis also attributed to groundwater contaminated with acetone.
6.2 Environmental AssessmentThe objective of the Environmental Assessment at the Sealand Restoration, Inc. (SRI) site is toassess the potential risk of site-related contaminants upon the ecosystems in and around the site.This Environmental Assessment evaluates potential adverse impacts associated with estimatedexposure concentrations relative to maximum acceptable exposure concentrations for selected
EDIS/ENG/ay071494j-p6 6-72SLR-0010698
ecological receptors. This assessment is <V«ignaH to be protective of the environment andconservative in nature, and may, therefore, overestimate actual receptor exposure levels. ThisEnvironmental Assessment was conducted as a site-wide assessment, covering all areas locatedat the SRI site, including the open fields, forested areas, wetlands and tributaries.
Section 6.2.1, Ecological Descriptions, describes the general ecology of the major ecosystemtypes at the site. Section 6.2.2, Identification of Constituents of Concern, identifies the site-related constituents that will be analyzed in detail as to their potential effects on the biota at thesite. Section 6.2.3, Selection of Target Species describes the methods used to select a smallnumber of species that will be used as indicators of potential adverse environmental impact.Section 6.2.4, Exposure Assessment, describes the potential exposures of on-site and nearby biotato site-related contaminants. Section 6.2.5, Risk Characterization, describes the potential risksto ecological receptors from site-related contaminants Section 6.2.6, Uncertainty Analysis,describes the uncertainties in each step of this environmental assessment, and Section 6.2.7summarizes the results of this assessment
6.2.1 Ecological DescriptionsThis section provides a general ecological description of the SRI site. The project area ischaracterized by a mixture of broad-leaved deciduous and coniferous forested areas, scrub/shrubareas, emergent marsh areas, and upland old field areas. Surrounding land-use is a mixture ofrural properties, small farms with cultivated fields and land for livestock grazing. Ecologicaldescriptions of the site are divided into three habitat types: aquatic, wetlands, and terrestrial.Additional sections discussing soil ecology; vegetation survey results; and rare, threatened, andendangered species information are also presented.
An ecological survey of the SRI site and its surrounding environs was performed in September1992. The primary objective of the field investigation was to determine the location and extentof terrestrial, wetland, and aquatic habitats, and their associated species assemblages and the
EDIS/ENG/ay071494jp6 6-73
SLR-0010699
degree of human (physical/chemical) disturbance, particularly stresses associated with a hazardouswaste site. Methods of species identification included the observation of species-specific tracks,scat, dwelling type or signs thereof, and the audible calls or songs of the individual animals.Identification of vegetation, presence or absence of surface water, and soil type are some of themethods used in classifying habitat types. Detailed methodology is provided in Chapter 2.0.
Lists of the avian species, mammalian species, and vegetative species identified during theSeptember 1992 field investigation are presented in Tables 6-14, 6-15, and 6-16, respectively.
6.2.1.1 Aquatic HabitatsThe on-site types of aquatic environments of the SRI site are limited to two main types:tributaries and seasonally inundated areas. Neither of these were observed to support fishpopulations; the low dissolved oxygen content of these surface water bodies prevents their use
as fish habitats; but they could support macroinvertebrates and serve as amphibian breedinggrounds. Off-site aquatic habitats include Sucker Brook, seasonally inundated areas and smallponded areas. General water quality parameters were measured for all surface water samplingstations as discussed earlier in this report. The in-situ water quality measurements are presentedin Table 6-17.
TributariesThe on-site tributaries are the northwestern and eastern tributaries to Sucker Brook. Both ofthese tributaries flow off-site through culverts, emptying into Sucker Brook, whose ultimate pointof discharge is the St. Lawrence River. The flow and cross-sectional area of the tributaries weremeasured during the fall (September 1992) sampling event and the results are presented inSection 3.4 of this report.
Seasonally Inundated AreasThe entire eastern and northwestern portions of the site are characterized by seasonallyinundated/wetland areas. The amount of water present in these areas is a direct function of theamount of precipitation that is received by the area. The amount of precipitation received variesgreatly, depending on season. Seasonal variations in precipitation can be attributed to theinfluence of Lake Ontario. This lake tends to cause a reduction in precipitation in summer andan increase in winter. Section 3.3 gives a detailed description of the climatic conditions for thisregion.
EDIS/ENG/ay071494.rp6
SLR-0010700
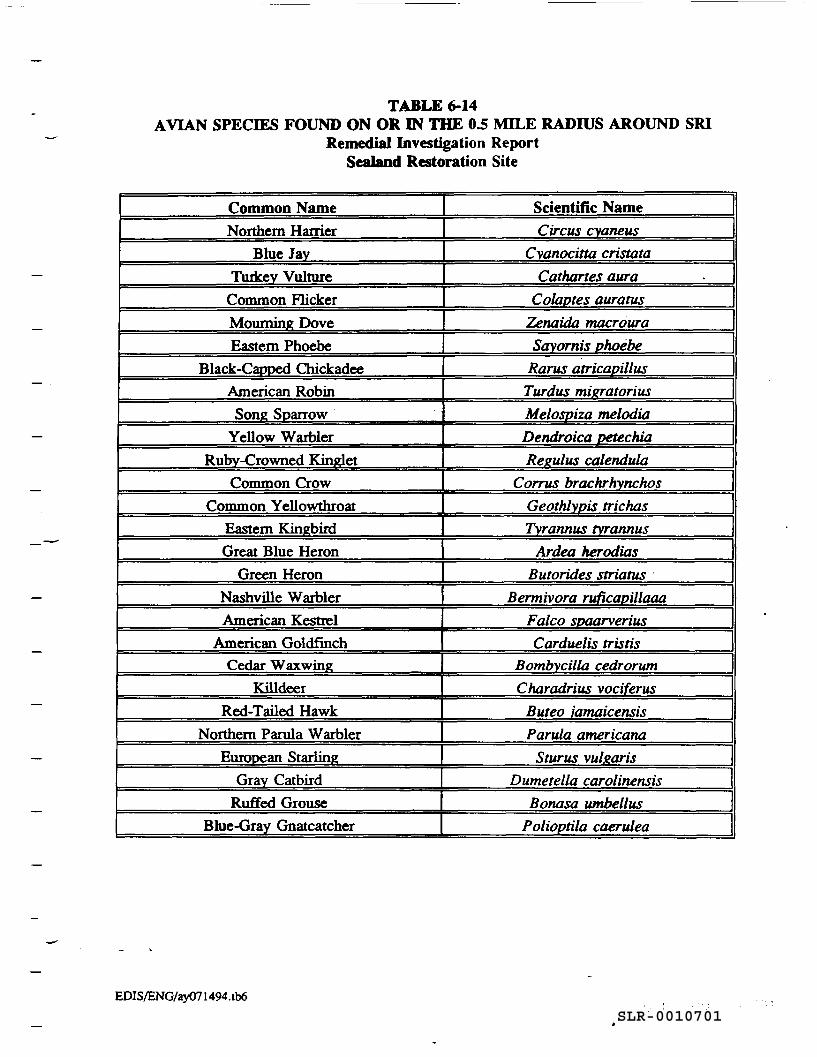
TABLE 6-14AVIAN SPECIES FOUND ON OR IN THE 0.5 MILE RADIUS AROUND SRI
Remedial Investigation ReportSealand Restoration Site
Common NameNorthern Harrier
Blue JavTurkey Vulture
Common FlickerMourning DoveEastern Phoebe
Black-Capped ChickadeeAmerican RobinSong Sparrow
Yellow WarblerRuby-Crowned Kinglet
Common CrowCommon Yellowthroat
Eastern KingbirdGreat Blue Heron
Green HeronNashville WarblerAmerican Kestrel
American GoldfinchCedar Waxwing
KilldeerRed-Tailed Hawk
Northern Parula WarblerEuropean Starling
Gray CatbirdRuffed Grouse
Blue-Gray Gnatcatcher
Scientific NameCircus cyaneus
Cyanocitta cristataCathartes aura
Colaptes auratusZenaida macrouraSayornis phoebe
Rarus atricapillusTurdus migratoriusMelospiza melodiaDendroica petechiaRezulus calendula
Corrus brachrhynchosGeothlypis trichasTyrannus tyrannus
Ardea herodiasButorides striatus
Bermivora ruficapillaaaFalco spaarveriusCarduelis tristis
Bombycilla cedrorumCharadrius vociferus
Buteo iamaicensisParula americana
Sturus vulgarisDumetella carolinensis
Bonasa umbellusPolioptila caerulea
EDIS/ENG/ay071494.tb6SLR-0010701
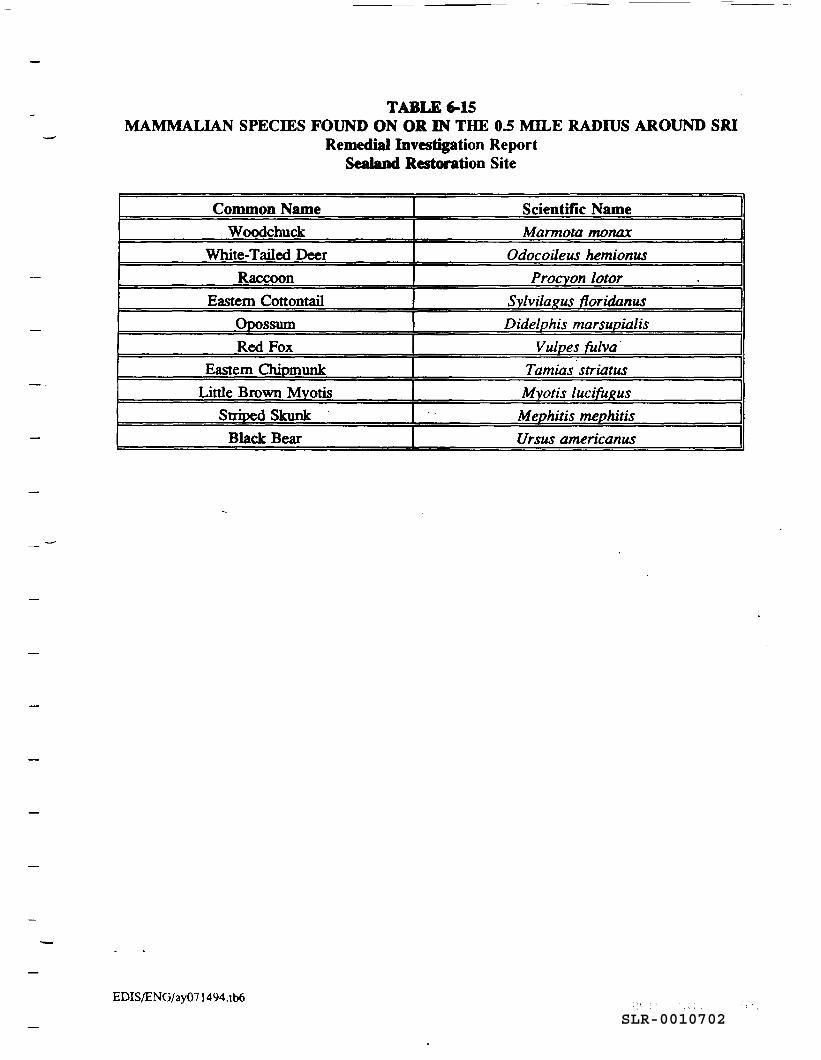
TABLE 6-15MAMMALIAN SPECIES FOUND ON OR IN THE 0.5 MILE RADIUS AROUND SRI
Remedial Investigation ReportSealand Restoration Site
Common NameWoodchuck
White-Tailed DeerRaccoon
Eastern CottontailOpossumRed Fox
Eastern ChipmunkLittle Brown Myotis
Striped SkunkBlack Bear
Scientific NameMarmota monax
Odocoileus hemionusProcyon lotor
Sylvilagus floridanusDidelphis marsupialis
Vulpes fulvaTamias striatus
Myotis lucifugusMephitis mephitisUrsus americanus
EDIS/ENG/ay071494.tb6
SLR-0010702
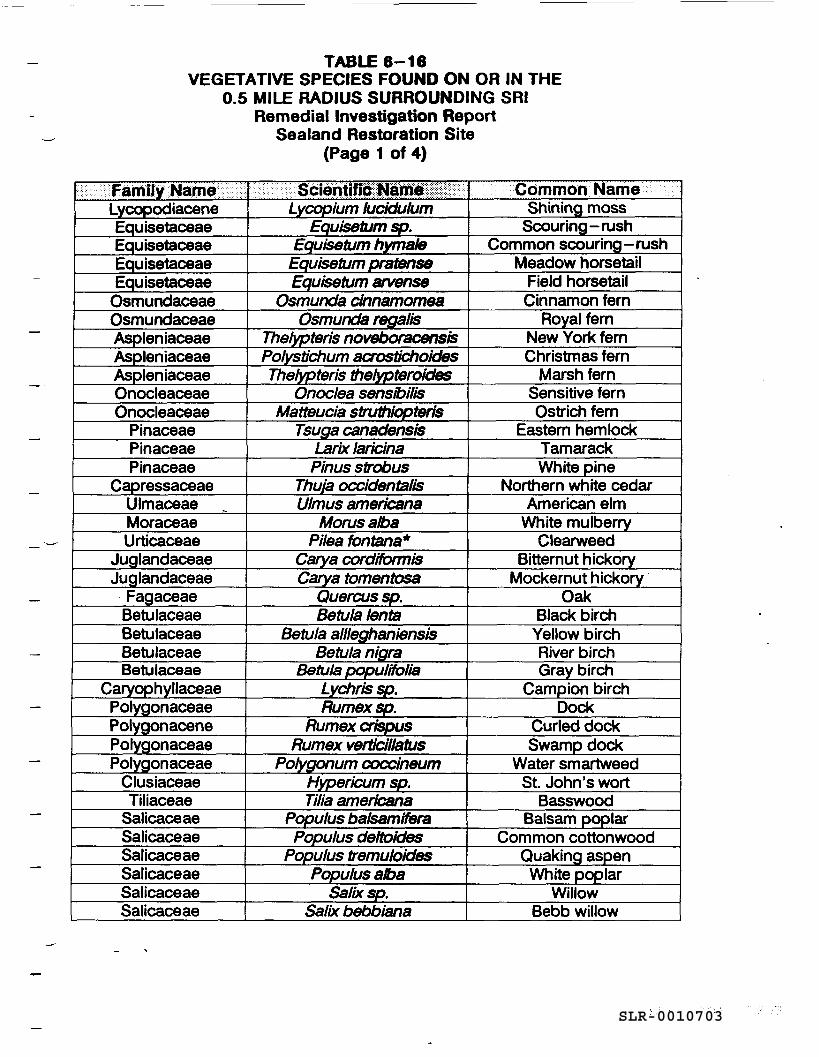
TABLE 6-16VEGETATIVE SPECIES FOUND ON OR IN THE
0.5 MILE RADIUS SURROUNDING SRIRemedial Investigation Report
Sealand Restoration Site(Page 1 of 4)
FamiiyNarneLycopodiaceneEquisetaceaeEquisetaceaeEquisetaceaeEquisetaceae
OsmundaceaeOsmundaceaeAspleniaceaeAspleniaceaeAspleniaceaeOnocleaceaeOnocleaceae
PinaceaePinaceaePinaceae
CapressaceaeUlmaceaeMoraceaeUrticaceae
JuglandaceaeJuglandaceae
FagaceaeBetulaceaeBetulaceaeBetulaceaeBetulaceae
CaryophyllaceaePolygonaceaePolygonacenePolygonaceaePojygonaceae
ClusiaceaeTiliaceae
SalicaceaeSalicaceaeSalicaceaeSalicaceaeSalicaceaeSalicaceae
1iH^P§SpW8MM fcKLycopium lucidulum
Equisetum sp.Equisetum hymafe
Equisetum pratenseEquisetum arvense
Osmunda cinnamomeaOsmunda regalis
Thelypteris noveboracensisPolystichum acrostichoktesThelypteris thelypteroides
Onoclea sensibilisMatteucia struthiopteris
Tsuga canadensisLarix laricinaPinus strobus
Thuja occidentalsUlmus americana
Mows albaPilea fontana*
Gary a cordfformisCarya tomentosa
Quercussp.Betula lenta
Betula allleghaniensisBetula nigra
Betula populttoliaLychris sp.Rumexsp.
Rumex crispusRumex verticillatus
Polygonum coccineumHyper icum sp.Tilia americana
Populus balsamiferaPopulus deftoides
Populus tremuloidesPopulus atoa
Salixsp.Salix bebbiana
Common NameShining moss
Scouring -rushCommon scouring -rush
Meadow horsetailField horsetailCinnamon fern
Royal fernNew York fernChristmas fern
Marsh fernSensitive fernOstrich fern
Eastern hemlockTamarackWhite pine
Northern white cedarAmerican elm
White mulberryClearweed
Bitternut hickoryMockernut hickory
OakBlack birchYellow birchRiver birchGray birch
Campion birchDock
Curled dockSwamp dock
Water smartweedSt John's wort
BasswoodBalsam poplar
Common cottonwoodQuaking aspenWhite poplar
WillowBebb willow
SLR-0010703
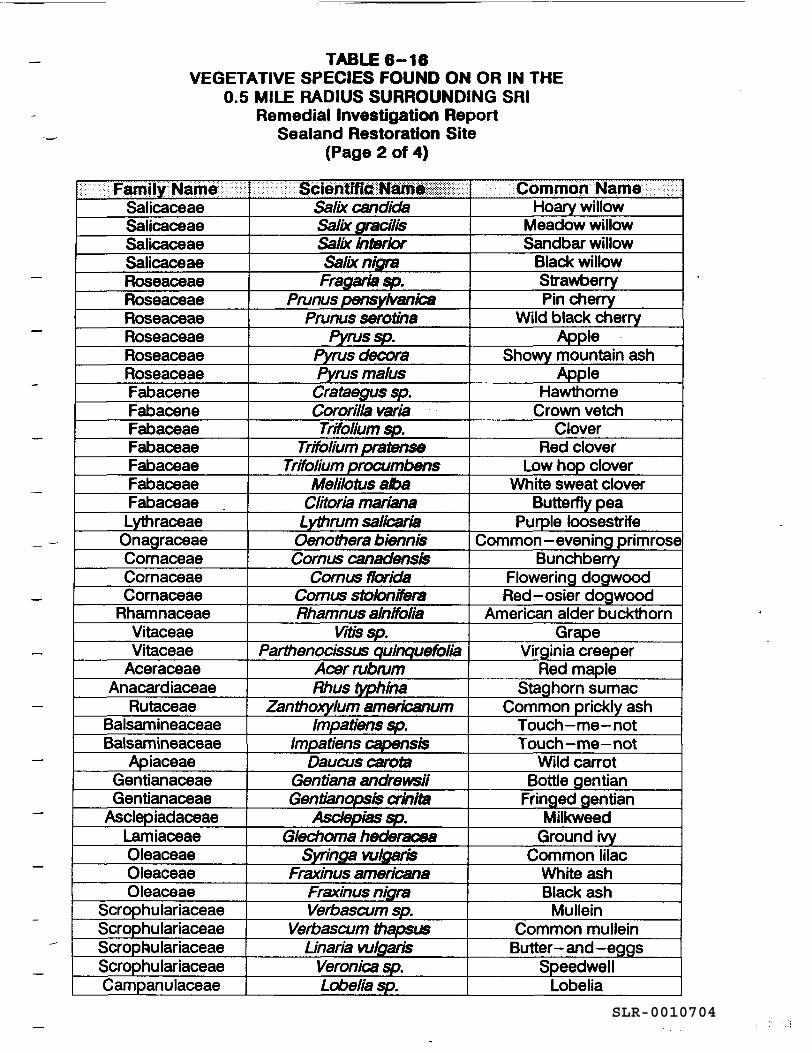
TABLE 6-16VEGETATIVE SPECIES FOUND ON OR IN THE
0.5 MILE RADIUS SURROUNDING SRIRemedial Investigation Report
Sealand Restoration Site(Page 2 of 4)
l ^Fiaiiiiny?NSiifi iSalicaceaeSalicaceaeSalicaceaeSalicaceaeRoseaceaeRoseaceaeRoseaceaeRoseaceaeRoseaceaeRoseaceaeFabaceneFabaceneFabaceaeFabaceaeFabaceaeFabaceaeFabaceaeLythraceaeOnagraceaeCornaceaeCornaceaeComaceae
RhamnaceaeVitaceaeVitaceae
AceraceaeAnacardiaceae
RutaceaeBalsamineaceaeBalsam ineaceae
ApiaceaeGentianaceaeGentianaceae
AsclepiadaceaeLamiaceaeOleaceaeOleaceaeOleaceae
ScrophulariaceaeScrophulariaceaeScrophulariaceaeScrophulariaceaeCampanulaceae
Salix CandidaSalix gracilisSalix interiorSalix nigraFragariasp.
Prunus pensylvanicaPrunus serotina
Pyrussp.Pyrus decoraPyrus malus
Crataegus sp.Cororilla variaTrifolium sp.
Trffolium pratenseTrifolium procumbens
MelHotus albaClitoria mariana
Lythrum salicariaOenothera biennisComus canadensis
Comus floridaComus stolonfferaRhamnus alnifolia
Vitissp.Parthenocissus quinquefolia
AcerrubrumRhus typhina
Zanthoxylum americanumImpatiens sp.
Impatiens capensisDaucus carota
Gentiana andrewsiiGentianopsis crinita
Asciepiassp.Glechoma hederacea
Syringa vulgarisFraxinus americana
Fraxinus nigraVerbascum sp.
Verbascum ihapsusLJnaria vulgaris
Veronica sp.Lobelia sp.
Common NameHoary willow
Meadow willowSandbar willow
Black willowStrawberryPin cherry
Wild black cherryApple
Showy mountain ashApple
HawthorneCrown vetch
CloverRed clover
Low hop cloverWhite sweat clover
Butterfly peaPurple loosestrife
Common -evening primroseBunchberry
Flowering dogwoodRed -osier dogwood
American alder buckthornGrape
Virginia creeperRed maple
Staghorn sumacCommon prickly ash
Touch-me-notTouch-me-not
Wild carrotBottle gentian
Fringed gentianMilkweed
Ground ivyCommon lilac
White ashBlack ashMullein
Common mulleinButter- and -eggs
SpeedwellLobelia
SLR-0010704
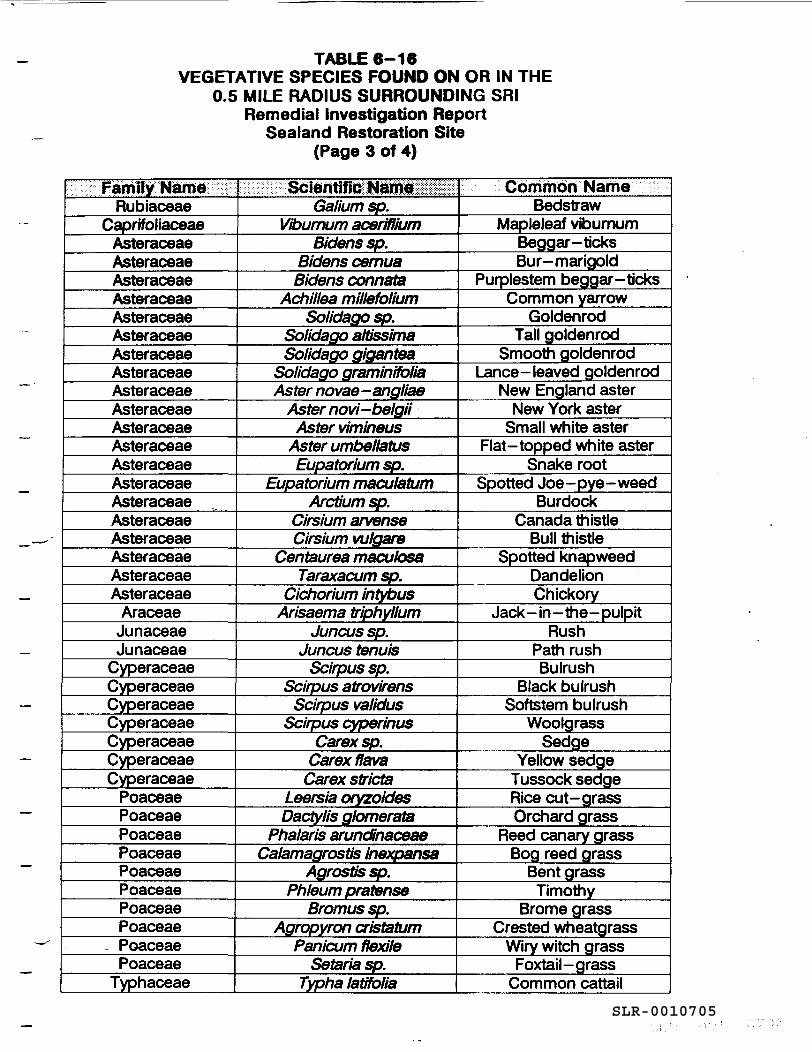
TABLE 6-16VEGETATIVE SPECIES FOUND ON OR IN THE
0.5 MILE RADIUS SURROUNDING SRIRemedial Investigation Report
Sealand Restoration Site(Page 3 of 4)
FamiiyNamlRubiaceae
CaprifoliaceaeAsteraceaeAsteraceaeAsteraceaeAsteraceaeAsteraceaeAsteraceaeAsteraceaeAsteraceaeAsteraceaeAsteraceaeAsteraceaeAsteraceaeAsteraceaeAsteraceaeAsteraceaeAsteraceaeAsteraceaeAsteraceaeAsteraceaeAsteraceae
AraceaeJunaceaeJunaceae
CyperaceaeCyperaceaeCyperaceaeCyperaceaeCyperaceaeCyperaceaeCyperaceae
PoaceaePoaceaePoaceaePoaceaePoaceaePoaceaePoaceaePoaceae
- PoaceaePoaceae
Typhaceae
Galium sp.Viburnum aceriflium
Bidenssp.Bidens cemuaBidens connata
Achillea millefoliumSolidago sp.
Solidago altissimaSolidago gigantea
Solidago graminffdliaAster novae-angliae
Aster novi—belgiiAster vimineus
Aster umbellatusEupatorium sp.
Eupatorium maculatumArctium sp.
Cirsium arvenseCirsium vulgare
Centaurea maculosaTaraxacum sp.
Cichorium intybusArisaema triphyllum
Juncus sp.Juncus tenuis
Scirpus sp.Scirpus atrovirens
Scirpus validusScirpus cyperinus
Carexsp.Carexffava
Carex strictaLeersia oryzoidesDactylis gtomerata
Phalaris arundinaceaeCalamagrostis inexpansa
Agrostis sp.Phleum pratense
Bromussp.Agropyron cristatum
Panicum flexileSetaria sp.
Typha latifblia
Common NameBedstraw
Mapleleaf viburnumBeggar- ticksBur- marigold
Purplestem beggar- ticksCommon yarrow
GoldenrodTall goldenrod
Smooth goldenrodLance- leaved goldenrod
New England asterNew York aster
Small white asterFlat- topped white aster
Snake rootSpotted Joe -pye- weed
BurdockCanada thistle
Bull thistleSpotted knapweed
DandelionChickory
Jack-in-the-pulpitRush
Path rushBulrush
Black bulrushSoftstem bulrush
WoolgrassSedge
Yellow sedgeTussock sedgeRice cut- grassOrchard grass
Reed canary grassBog reed grass
Bent grassTimothy
Brome grassCrested wheatgrass
Wiry witch grassFoxtail-grass
Common cattailSLR-0010705
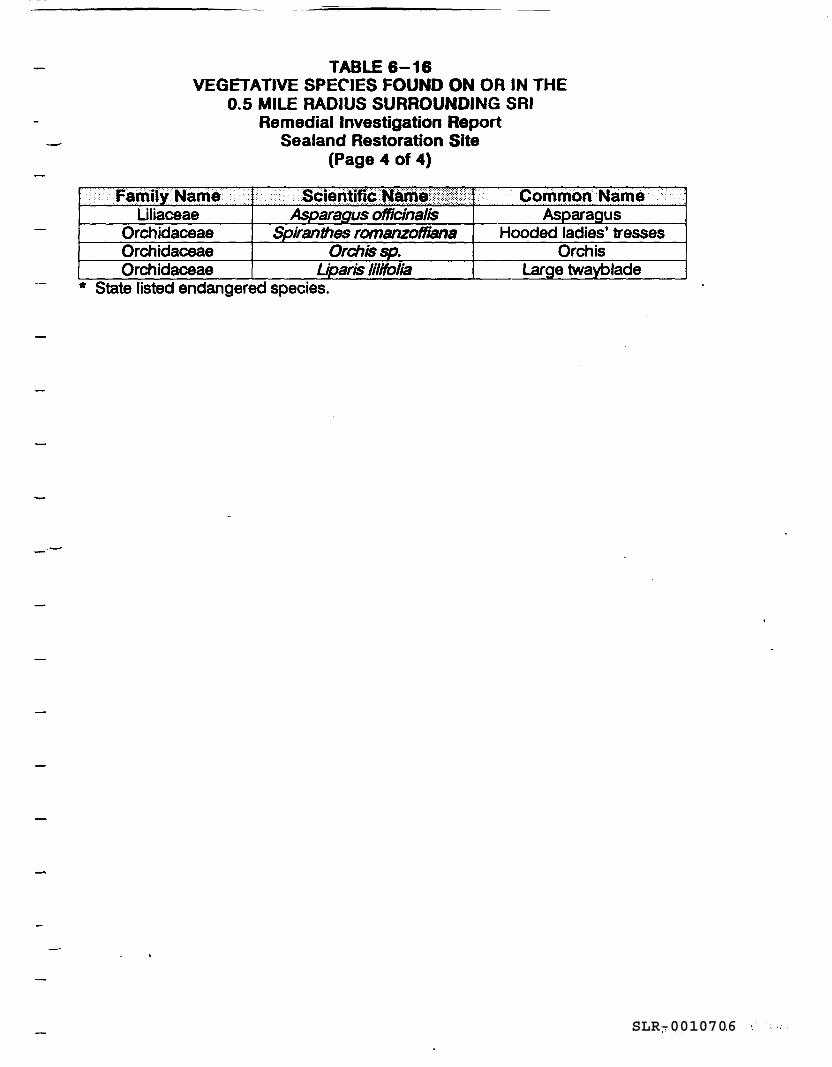
TABLE 6-16VEGETATIVE SPECIES FOUND ON OR IN THE
0.5 MILE RADIUS SURROUNDING SRIRemedial Investigation Report
Sealand Restoration Site(Page 4 of 4)
reuuiiy iconicLiliaceae
OrchidaceaeOrchidaceaeOrchidaceae
;:::-:; : : . : - *9V*IOI 1 11 HU-.JTKMMWSSSHSWsS.!
Asparagus officinalisSpiranthes romanzoffiana
Orchis sp.LJparis liltfolia
... ouiiiniwii i^aiuoAsparagus
Hooded ladies' tressesOrchis
Large twayblade* State listed endangered species.
SLR-0010706
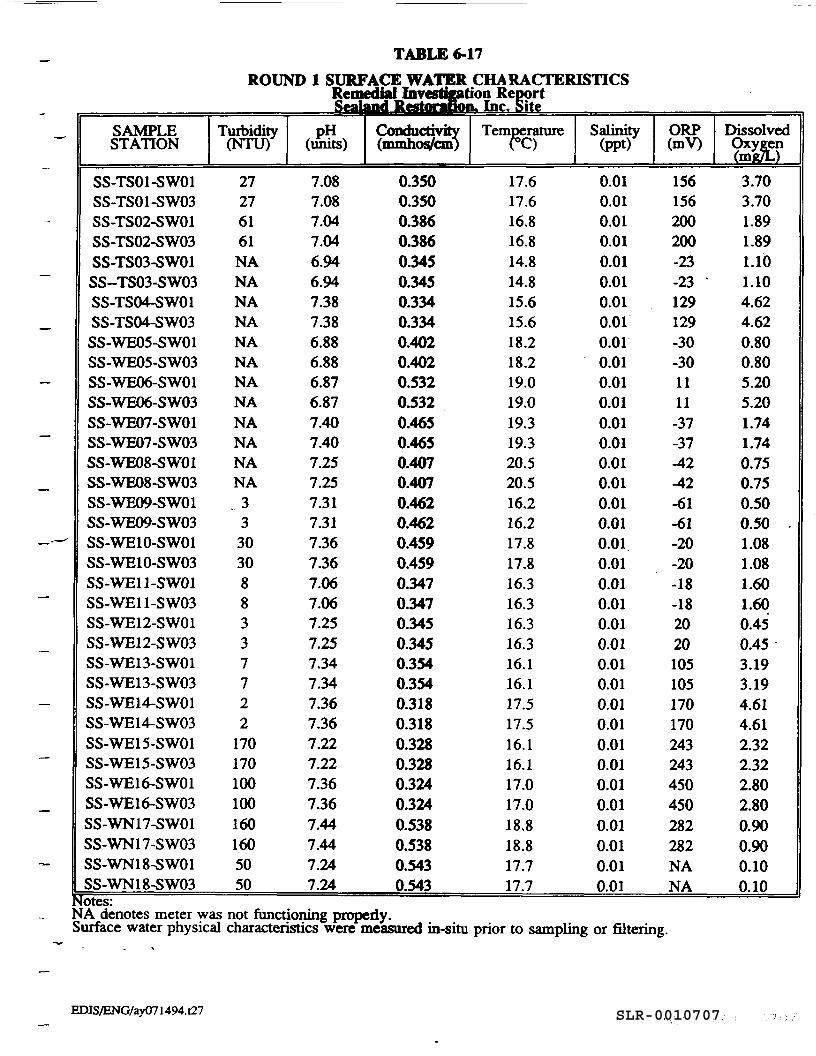
TABLE 6-17ROUND 1 SURFACE WATER CHARACTERISTICS
Remedial Investigation ReportSealand Restoration. Inc. Site
SAMPLESTATION
SS-TS01-SW01SS-TS01-SW03SS-TS02-SW01SS-TS02-SW03SS-TS03-SW01SS-TS03-SW03SS-TS04-SW01SS-TS04-SW03SS-WE05-SW01SS-WE05-SW03SS-WE06-SW01SS-WE06-SW03SS-WE07-SW01SS-WE07-SW03SS-WE08-SW01SS-WE08-SW03SS-WE09-SW01SS-WE09-SW03SS-WE10-SW01SS-WE10-SW03SS-WE11-SW01SS-WE11-SW03SS-WE12-SW01SS-WE12-SW03SS-WE13-SW01SS-WE13-SW03SS-WE14-SW01SS-WE14-SW03SS-WE15-SW01SS-WE15-SW03SS-WE16-SW01SS-WE16-SW03SS-WN17-SW01SS-WN17-SW03SS-WN18-SW01SS-WN18-SW03
Turbidity(NTU)
27276161NANANANANANANANANANANANA. 3
3303088337722
1701701001001601605050
pH(units)
7.087.087.047.046.946.947.387.386.886.886.876.877.407.407.257.257.317.317.367.367.067.067.257.257.347.347.367.367.227.227.367.367.447.447.247.24
Conductivity(mmhos/cm)
0.3500.3500.3860.3860.3450.3450.3340.3340.4020.4020.5320.5320.4650.4650.4070.4070.4620.4620.4590.4590.3470.3470.3450.3450.3540.3540.3180.3180.3280.3280.3240.3240.5380.5380.5430.543
TemperatureTO
17.617.616.816.814.814.815.615.618.218.219.019.019.319.320.520.516.216.217.817.816.316.316.316.316.116.117.517.516.116.117.017.018.818.817.717.7
Salinity(PPt)
0.010.010.010.010.010.010.010.010.010.010.010.010.010.010.010.010.010.010.010.010.010.010.010.010.010.010.010.010.010.010.010.010.010.010.010.01
ORP(mV)
156156200200-23-23 '129129-30-301111-37-37-42-42-61-61-20-20-18-182020105105170170243243450450282282NANA
DissolvedOxygen(mKTL)3.703.701.891.891.101.104.624.620.800.805.205.201.741.740.750.750.500.50 -1.081.081.601.600.450.453.193.194.614.612.322.322.802.800.900.900.100.10
Notes:NA denotes meter wasSurface water physical
not functioning properly.characteristics were measured in-situ prior to sampling or filtering.
EDIS/ENG/ay071494.t27 SLR-0010707
These areas arc dominated by typical wetland vegetation species, such as cattail (Typhaaugustfolia) and arrow-wood (Viburnum dentation) and function as the headwaters for the easternand northwestern tributaries to Sucker Brook. A detailed discussion of these areas is presentedin Section 6.2.1.2.
Sucker BrookThe main surface water body that receives runoff/discharge from the SRI site and its surroundingenvirons is Sucker Brook. It exists to the north and northeast of the boundary of the site. SuckerBrook flows northward and ultimately discharges into the St Lawrence River.
Ponded AreaA medium-size pond of approximately 300 square feet exists off-site to the northwest of thewetland in the northwest corner of the site area. The banks of the pond are heavily vegetatedwith cattail (Typha augustifolia). Its water is supplied by the seasonally inundated areas aroundit. It is relatively shallow in nature with a maximum depth of about one meter. Such an areacan serve as a drinking and/or bathing source for many different terrestrial and avian animals.It also provides sufficient habitat for frogs and other amphibians and reptiles, as noted during thefield investigations. Larger animals may also use this pond as a feeding area for such species.
6.2.1.2 WetlandsThis section describes the type and extent of wetlands identified within the 210 acre SRI site.Wetlands generally include swamps, marshes, bogs and similar areas. Three parameters that arediagnostic of wetlands are: (1) the land is dominated by hydrophytes; (2) the substrate isundrained hydric soil; and (3) the substrate is saturated with groundwater or flooded for asignificant part of the growing season each year (FICWD, 1989). The on-site wetland boundaryis presented in Figure 6-10. The National Wetlands Inventory Map and New York StateFreshwater Wetlands map which were used to focus the field delineation are presented in Figures6-11 and 6-12, respectively.
The wetlands on site are part of a larger wetland complex identified on New York StateFreshwater Wetlands Map, (St Lawrence County Map 16 of 69), as LI-8 Class IE Shrub Swampand LI-10 Class IV, Predominantly Coniferous, in the southern and eastern portions of the siteand LJ-12 Class n Emergent Swamp in the western comer of the site. Based on the New YorkState Freshwater Wetlands Maps, wetland U-8 is approximately 64.20 acres of which 19.83 acresare within the site boundaries, LI-10 is approximately 25.20 acres of which 12.17 acres are within
EDIS/ENG/ay071494.rp6 6-82SLR-0010708
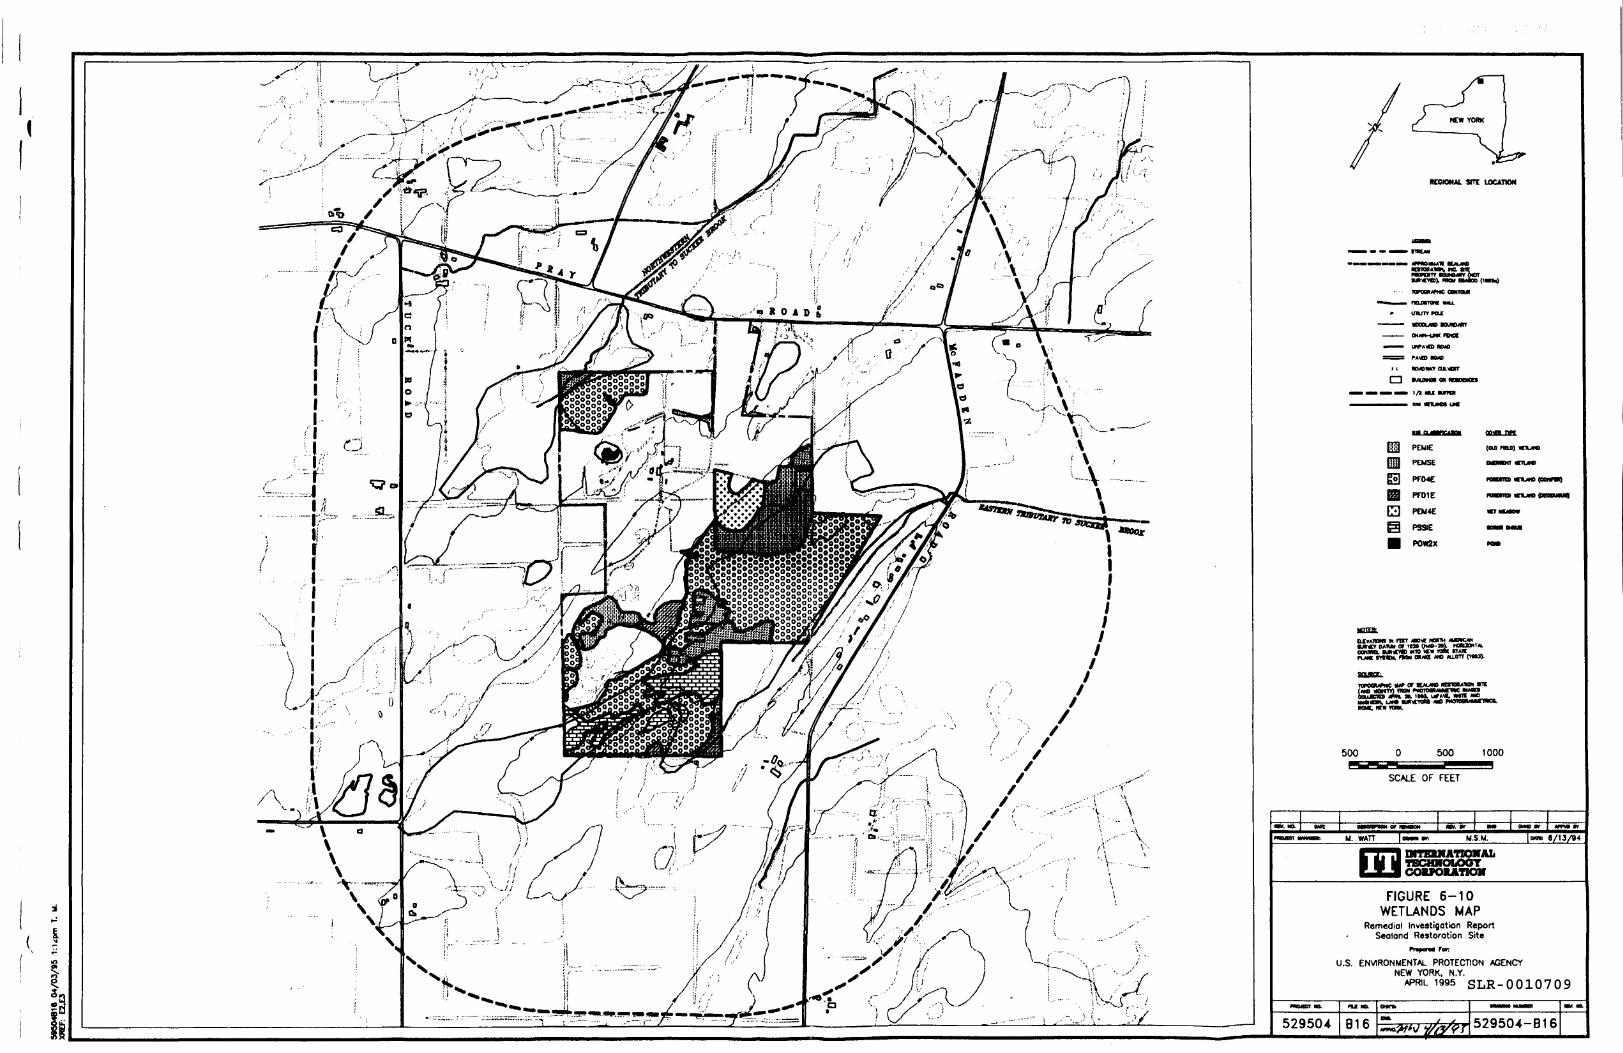
r^^-JL_ J.
RCCIONAL STTt LOCATION
MttCKD), >•» MAte (in)
nroMAfHC Gamut. narvnnc IMU.
UIUIYPCU
OUM-UNC FVCC
UWAtKD KMO
PAMD 110*0
I—I >uura en nononM«M 1/2 HU WflUI
PEMIE (oifi rma)
iCH/Mt (OOHfV)
Q PFD1E
ED POME
@ PSSIE
• POW2X
i M PIKT MD« NttHHuwr DAIUI or tm
s w»orwr "—-»»ime icwnnc
500 0 500 1000EE=as
SCALE OF FEET
M.S.M. g/13/94
IMTEKIfATIOHAIi,TBCHXouxrrI COIPOIATIOM
FIGURE 6-10WETLANDS MAP
Remediol Investigation ReportSealond Restoration Site
far.
U.S. ENVIRONMENTAL PROTECTION AGENCYNEW YORK. N.Y.
APRIL 1995
529504 816 529504-B16
SLR-0010709
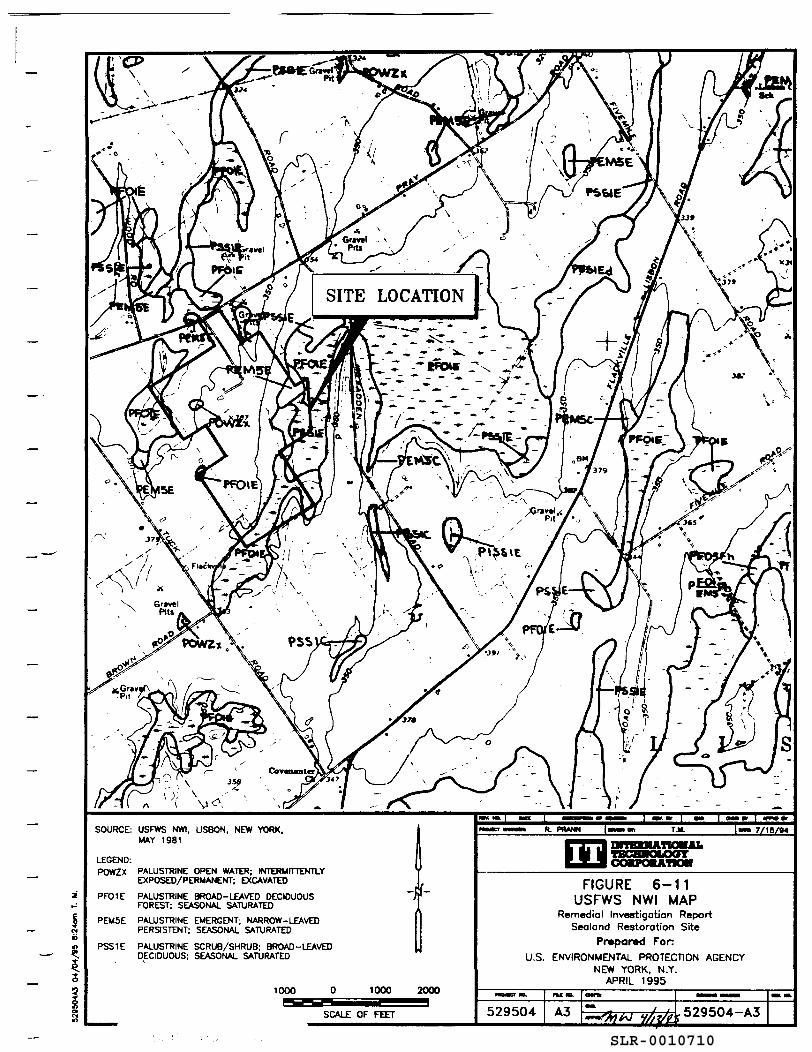
I
SOURCE: USFWS NWI, USBON, NEW YORK.MAY 1981
LEGEND:POWZX PALUSTRINE OPEN WATER; INTERMITTENTLY
EXPOSED/PERMANENT; EXCAVATED
PF01E PALUSTRINE BROAD-LEAVED DECIDUOUSPOREST; SEASONAL SATURATED
PEM5E PALUSTRINE EMERGENT; NARROW-LEAVEDPERSISTENT; SEASONAL SATURATED
PSS1E PALUSTRINE SCRUB/SHRUB; BROAD-LEAVEDDECIDUOUS; SEASONAL SATURATED
-ft
1000 0 1000 2000^s^ss^
SCALE OF FEET
R. IMwHN TJI. |«» 7/15/B4
FIGURE 6-11USFWS NWI MAP
Remedial Investigation ReportSealand Restoration Site
Prepared ForU.S. ENVIRONMENTAL PROTECTION AGENCY
NEW YORK, N.Y.APRIL 1995
529504 A3
SLR-0010710
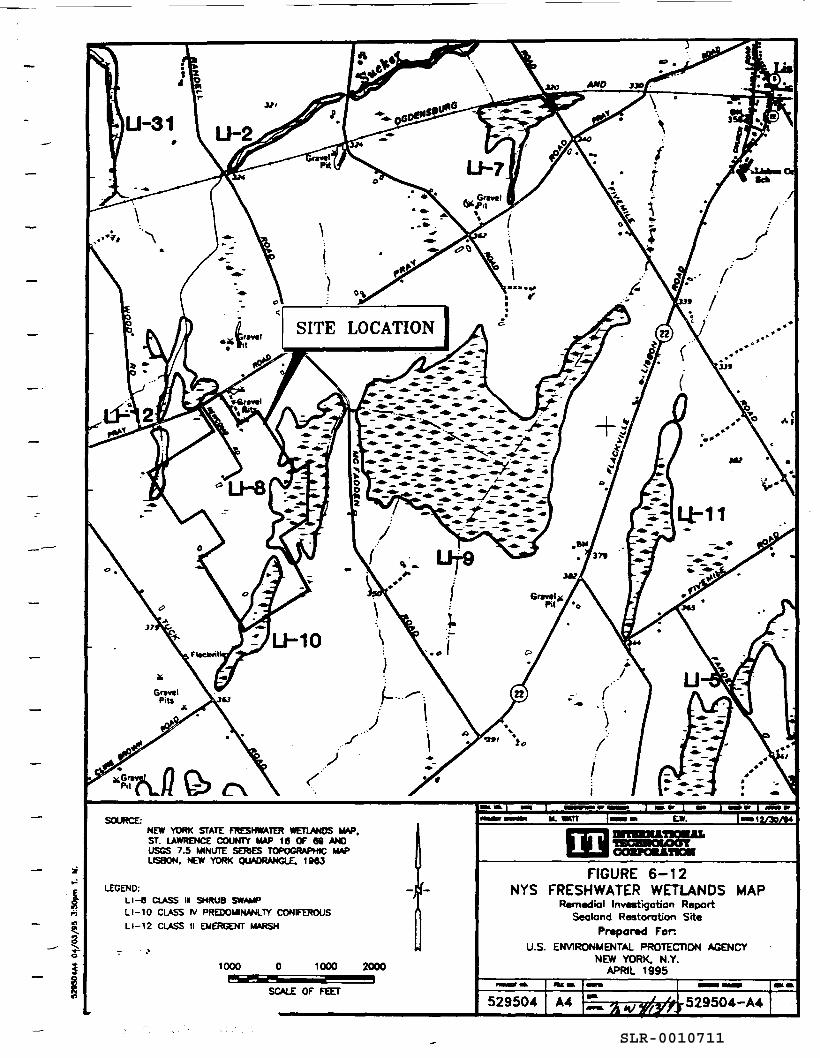
SOURCE:
—— 21-T
iri
-— n
-I
NEW YORK STATE FRESHWATER WETLANDS MAP.ST. LAWRENCE COUNTY MAP 16 OF 69 ANDUSCS 7.5 MINUTE SERIES TOPOGRAPHIC MAPLISBON. NEW YORK QUADRANGLE. 1063
LEGEND:LI-0 CLASS III SHRUB SWAMPLI-10 CLASS IV PREDOMINANLTY CONFEROUSLI-12 CLASS II EMERGENT MARSH
1000 2000
FIGURE 6-12NYS FRESHWATER WETLANDS MAP
Remedial Investigation ReportSeoland Restoration Site
Prepared FenU.S. ENVIRONMENTAL PROTECTION AGENCY
NEW YORK, N.Y.APRIL 1995
529504 A4
SLR-0010711
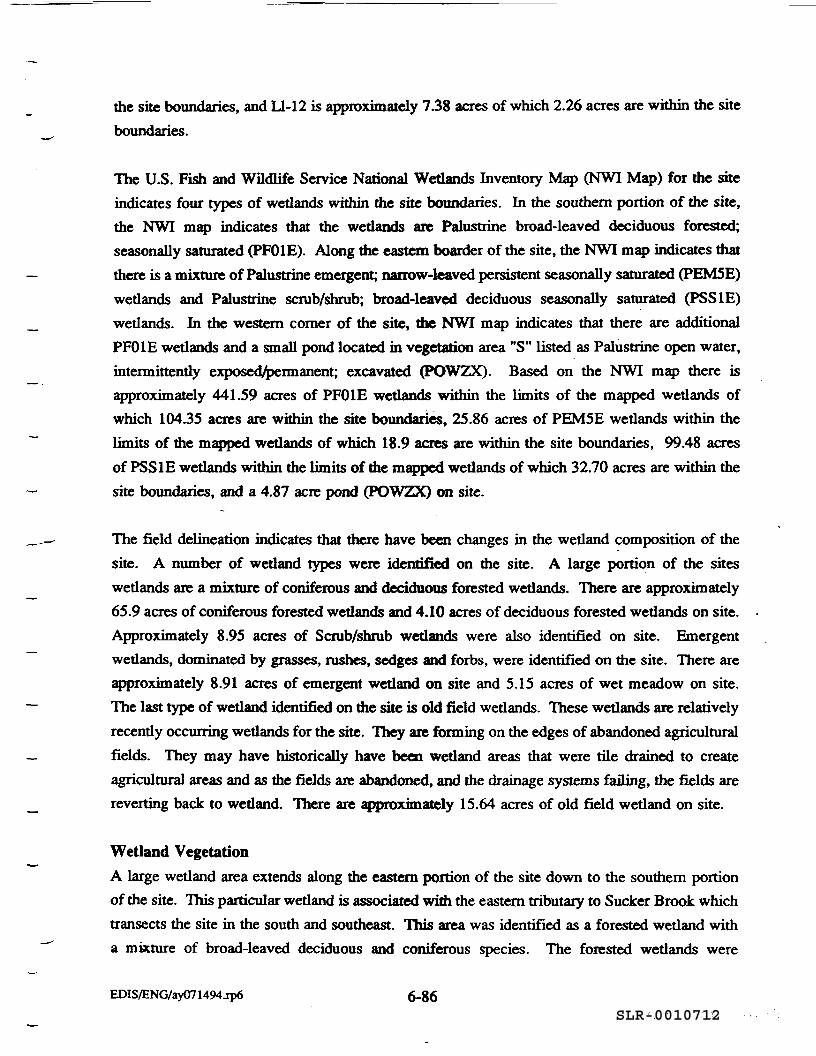
the site boundaries, and LI-12 is approximately 7.38 acres of which 2.26 acres are within the siteboundaries.
The U.S. Fish and Wildlife Service National Wetlands Inventory Map (NWI Map) for the siteindicates four types of wetlands within the site boundaries. In the southern portion of the site,the NWI map indicates that the wetlands are Palustrine broad-leaved deciduous forested;seasonally saturated (PF01E). Along the eastern boarder of the site, the NWI map indicates matthere is a mixture of Palustrine emergent; narrow-leaved persistent seasonally saturated (PEM5E)wedands and Palustrine scrub/shrub; broad-leaved deciduous seasonally saturated (PSS1E)wetlands. In the western comer of the site, the NWI map indicates that there are additionalPF01E wetlands and a small pond located in vegetation area "S" listed as Palustrine open water,intermittently exposed/permanent; excavated (POWZX). Based on the NWI map there isapproximately 441.59 acres of PF01E wetlands within the limits of the mapped wetlands ofwhich 104.35 acres are within the site boundaries, 25.86 acres of PEM5E wetlands within thelimits of the mapped wetlands of which 18.9 acres are within die site boundaries, 99.48 acresof PSS1E wetlands within the limits of the mapped wetlands of which 32.70 acres are within thesite boundaries, and a 4.87 acre pond (POWZX) on site.
The field delineation indicates that there have been changes in the wetland composition of diesite. A number of wetland types were identified on the site. A large portion of die siteswedands are a mixture of coniferous and deciduous forested wetlands. There are approximately65.9 acres of coniferous forested wetlands and 4.10 acres of deciduous forested wedands on site.Approximately 8.95 acres of Scrub/shrub wetlands were also identified on site. Emergentwetlands, dominated by grasses, rushes, sedges and forbs, were identified on the site. There areapproximately 8.91 acres of emergent wetland on site and 5.15 acres of wet meadow on site.The last type of wetland identified on the site is old field wedands. These wetlands are relativelyrecently occurring wetlands for the site. They are forming on the edges of abandoned agriculturalfields. They may have historically have been wetland areas that were tile drained to createagricultural areas and as the fields are abandoned, and the drainage systems failing, the fields arereverting back to wetland. There are approximately 15.64 acres of old field wetland on site.
Wetland VegetationA large wetland area extends along the eastern portion of the site down to the southern portionof the site. This particular wetland is associated with the eastern tributary to Sucker Brook whichtransects the site in the south and southeast. This area was identified as a forested wetland witha mixture of broad-leaved deciduous and coniferous species. The forested wetlands were
EDIS/ENG/ay071494jp6 6-86SLR-0010712
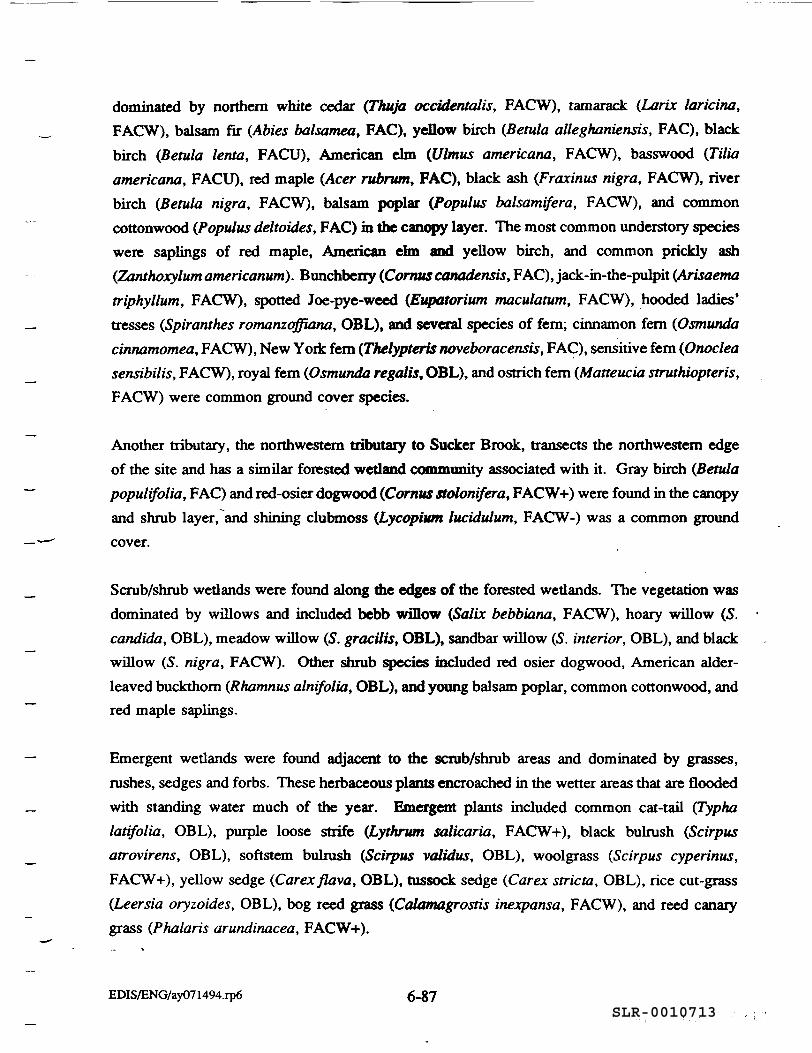
dominated by northern white cedar (Thuja occidental, FACW), tamarack (Larix laricina,FACW), balsam fir (Abies balsamea, FAC), yellow birch (Betula alleghaniensis, FAC), blackbirch (Betula lenta, FACU), American elm (Ulmus americana, FACW), basswood (Tiliaamericana, FACU), red maple (Acer rubrum, FAC), black ash (Fraxinus nigra, FACW), riverbirch (Betula nigra, FACW), balsam poplar (Populus balsamifera, FACW), and commoncottonwood (Populus deltoides, FAC) in the canopy layer. The most common understory specieswere saplings of red maple, American elm and yellow birch, and common prickly ash(Zanthoxylum americanum). Bunchberry (Cornuscanadensis, FAC), jack-in-the-pulpit (Arisaematriphyllum, FACW), spotted Joe-pye-weed (Eupatorium maculatum, FACW), hooded ladies'tresses (Spiranthes romanzoffiana, OBL), and several species of fern; cinnamon fern (Osmundacinnamomea, FACW), New York fern (Thelypteris noveboracensis, FAC), sensitive fem (Onocleasensibilis, FACW), royal fem (Osmunda regalis, OBL), and ostrich fem (Matteucia struthiopteris,FACW) were common ground cover species.
Another tributary, the northwestern tributary to Sucker Brook, transects the northwestern edgeof the site and has a similar forested wetland community associated with it. Gray birch (Betulapopulifolia, FAC) and red-osier dogwood (Cornus stolonifera, FACW+) were found in the canopyand shrub layer, and shining clubmoss (Lycopium lucidulum, FACW-) was a common groundcover.
Scrub/shrub wetlands were found along the edges of the forested wetlands. The vegetation wasdominated by willows and included bebb willow (Salix bebbiana, FACW), hoary willow (5.Candida, OBL), meadow willow (S. gracilis, OBL), sandbar willow (S. interior, OBL), and blackwillow (5. nigra, FACW). Other shrub species included red osier dogwood, American alder-leaved buckthorn (Rhamnus alnifolia, OBL), and young balsam poplar, common cottonwood, andred maple saplings.
Emergent wetlands were found adjacent to the scrub/shrub areas and dominated by grasses,rushes, sedges and forbs. These herbaceous plants encroached in the wetter areas that are floodedwith standing water much of the year. Emergent plants included common cat-tail (Typhalatifolia, OBL), purple loose strife (Lythrum salicaria, FACW+), black bulrush (Scirpusatrovirens, OBL), softstem bulrush (Scirpus validus, OBL), woolgrass (Scirpus cyperinus,FACW+), yellow sedge (Carexflava, OBL), tussock sedge (Carex stricta, OBL), rice cut-grass(Leersia oryzoides, OBL), bog reed grass (Calamagrostis inexpansa, FACW), and reed canarygrass (Phalaris arundinacea, FACW+).
EDIS/ENG/ay071494.rp6 6-87SLR-0010713
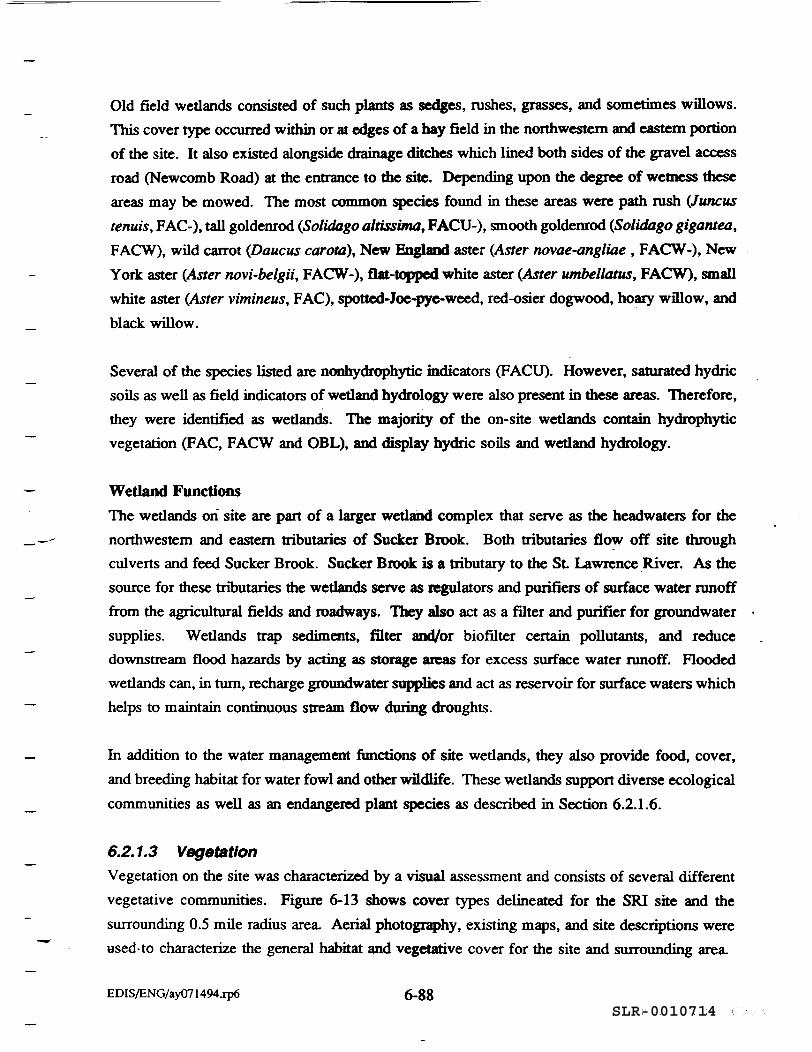
Old field wetlands consisted of such plants as sedges, rushes, grasses, and sometimes willows.This cover type occurred within or at edges of a hay field in the northwestern and eastern portionof the site. It also existed alongside drainage ditches which lined both sides of the gravel accessroad (Newcomb Road) at the entrance to the site. Depending upon the degree of wetness theseareas may be mowed. The most common species found in these areas were path rush (Juncustenuis, FAC-), tall goldenrod (Solidago altissima, FACU-), smooth goldenrod (Solidago gigantea,FACW), wild carrot (Daucus carota), New England aster (Aster novae-angliae , FACW-). NewYork aster (Aster novi-belgii, FACW-), flat-topped white aster (Aster umbellatus, FACW), smallwhite aster (Aster vimineus, FAC), spotted-Joe-pye-weed, red-osier dogwood, hoary willow, andblack willow.
Several of the species listed are nonhydrophytic indicators (FACU). However, saturated hydricsoils as well as field indicators of wetland hydrology were also present in these areas. Therefore,they were identified as wetlands. The majority of the on-site wetlands contain hydrophyticvegetation (FAC, FACW and OBL), and display hydric soils and wetland hydrology.
Wetland FunctionsThe wetlands on site are part of a larger wetland complex that serve as the headwaters for thenorthwestern and eastern tributaries of Sucker Brook. Both tributaries flow off site throughculverts and feed Sucker Brook. Sucker Brook is a tributary to the St. Lawrence River. As thesource for these tributaries the wetlands serve as regulators and purifiers of surface water runofffrom the agricultural fields and roadways. They also act as a filter and purifier for groundwatersupplies. Wetlands trap sediments, filter and/or biofilter certain pollutants, and reducedownstream flood hazards by acting as storage areas for excess surface water runoff. Floodedwetlands can, in turn, recharge groundwater supplies and act as reservoir for surface waters whichhelps to maintain continuous stream flow during droughts.
In addition to the water management functions of site wetlands, they also provide food, cover,and breeding habitat for water fowl and other wildlife. These wetlands support diverse ecologicalcommunities as well as an endangered plant species as described in Section 6.2.1.6.
6.2.1.3 VegetationVegetation on the site was characterized by a visual assessment and consists of several differentvegetative communities. Figure 6-13 shows cover types delineated for the SRI site and thesurrounding 0.5 mile radius area. Aerial photography, existing maps, and site descriptions wereused-to characterize the general habitat and vegetative cover for the site and surrounding area.
EDIS/ENG/ay071494jp6 6-88SLR-0010714
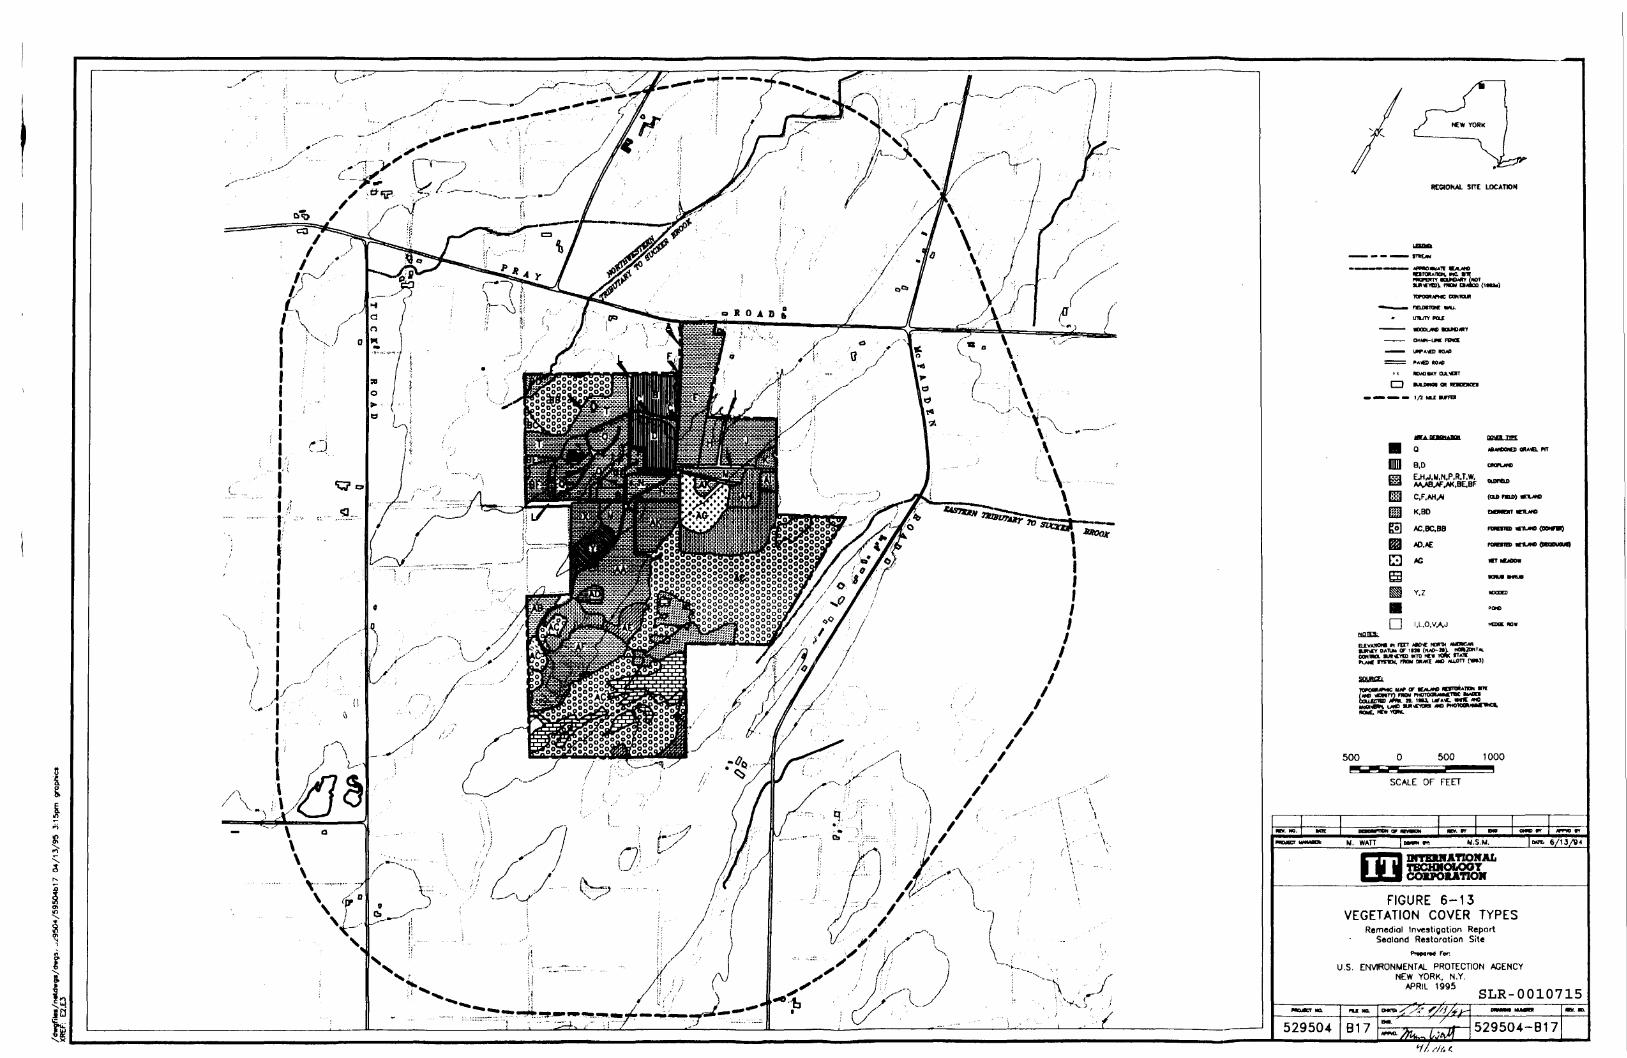
Ig.
RJ ' " " "~^J._ ,. "' , •/ ' _J ""' '—'
REGIONAL StTE LOCATION
. lr (NOTQMOO (I
» UHUTY POJE
———— MIODUWD KU
—.— 04NN-UM nn—^^ UWAVED ROM
. PA«D ROAD
> « NOAOVAY CULtf
1 I KUM01 CR
^M M i/a «ax KF
I I I.L.O.VAJ
« rttr AK>< raraY OAIUH cr ini (»»->•>. »o«2««T«.
OOH1HO. Wt*YID 1ITO «• K« """,__..FLAM trm. mi m«t «o lussn (wu)
SBUUZl.ttff •"_«**«*g™A
15*L?11
«O f
500 0 500 1000^S
SCALE OF FEET
M. WATT |D». »f o*
FIGURE 6-13VEGETATION COVER TYPES
Remedial Investigation ReportSealand Restoration Site
U.S. ENVIRONMENTAL PROTECTION AGENCYNEW YORK, N.Y.
APRIL 1995
529504 B17 529504-B17I,
SLR-0010715
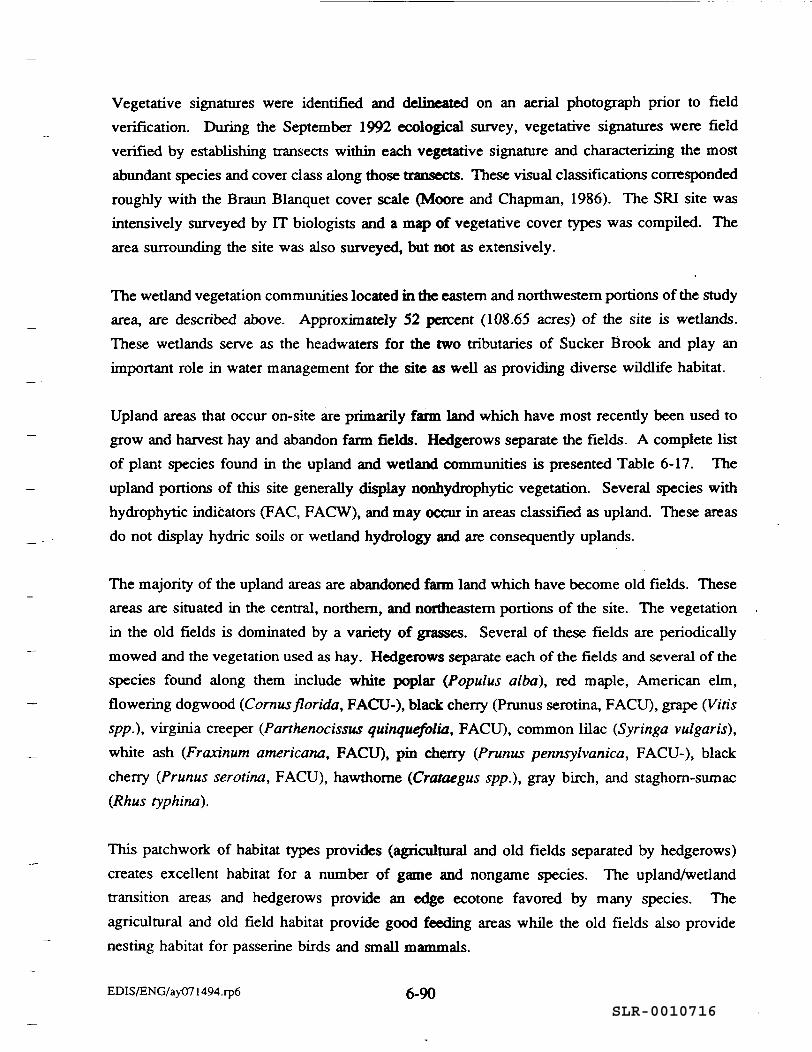
Vegetative signatures were identified and delineated on an aerial photograph prior to fieldverification. During the September 1992 ecological survey, vegetative signatures were fieldverified by establishing transects within each vegetative signature and characterizing the mostabundant species and cover class along those transects. These visual classifications correspondedroughly with the Braun Blanquet cover scale (Moore and Chapman, 1986). The SRI site wasintensively surveyed by IT biologists and a map of vegetative cover types was compiled. Thearea surrounding the site was also surveyed, but not as extensively.
The wetland vegetation communities located in the eastern and northwestern portions of the studyarea, are described above. Approximately 52 percent (108.65 acres) of the site is wetlands.These wetlands serve as the headwaters for the two tributaries of Sucker Brook and play animportant role in water management for the site as well as providing diverse wildlife habitat.
Upland areas that occur on-site are primarily farm land which have most recently been used togrow and harvest hay and abandon farm fields. Hedgerows separate the fields. A complete listof plant species found in the upland and wetland communities is presented Table 6-17. Theupland portions of this site generally display nonhydrophytic vegetation. Several species withhydrophytic indicators (FAC, FACW), and may occur in areas classified as upland. These areasdo not display hydric soils or wetland hydrology and are consequently uplands.
The majority of the upland areas are abandoned farm land which have become old fields. Theseareas are situated in the central, northern, and northeastern portions of the site. The vegetationin the old fields is dominated by a variety of grasses. Several of these fields are periodicallymowed and the vegetation used as hay. Hedgerows separate each of the fields and several of thespecies found along them include white poplar (Populus alba), red maple, American elm,flowering dogwood (Cornusflorida, FACU-), black cherry (Prunus serotina, FACU), grape (Vitisspp.), Virginia creeper (Panhenocissus quinquefolia, FACU), common lilac (Syringa vulgaris),white ash (Fraxinum americana, FACU), pin cherry (Prunus pennsylvanica, FACU-), blackcherry (Prunus serotina, FACU), hawthorne (Crataegus spp.), gray birch, and staghorn-sumac(Rhus typhina).
This patchwork of habitat types provides (agricultural and old fields separated by hedgerows)creates excellent habitat for a number of game and nongame species. The upland/wetlandtransition areas and hedgerows provide an edge ecotone favored by many species. Theagricultural and old field habitat provide good feeding areas while the old fields also providenesting habitat for passerine birds and small mammals.
EDIS/ENG/ay071494.rp6 6-90SLR-0010716
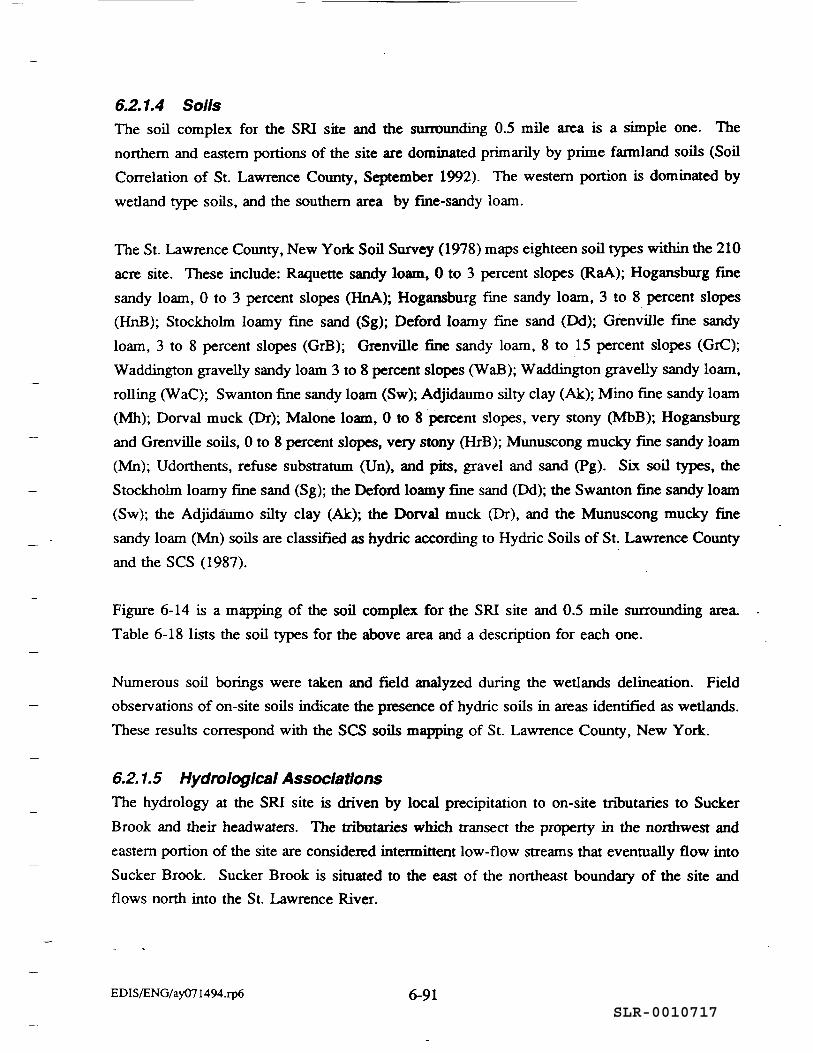
6.2.1.4 SoilsThe soil complex for the SRI site and the surrounding 0.5 mile area is a simple one. Thenorthern and eastern portions of the site are dominated primarily by prime farmland soils (SoilCorrelation of St. Lawrence County, September 1992). The western portion is dominated bywetland type soils, and the southern area by fine-sandy loam.
The St. Lawrence County, New York Soil Survey (1978) maps eighteen soil types within the 210acre site. These include: Raquette sandy loam, 0 to 3 percent slopes (RaA); Hogansburg finesandy loam, 0 to 3 percent slopes (HnA); Hogansburg fine sandy loam, 3 to 8 percent slopes(HnB); Stockholm loamy fine sand (Sg); Deford loamy fine sand (Dd); Grenville fine sandyloam, 3 to 8 percent slopes (GrB); Grenville fine sandy loam, 8 to 15 percent slopes (GrC);Waddington gravelly sandy loam 3 to 8 percent slopes (WaB); Waddington gravelly sandy loam,rolling (WaC); Swanton fine sandy loam (Sw); Adjidaumo silty clay (Ak); Mino fine sandy loam(Mh); Dorval muck (Dr); Malone loam, 0 to 8 percent slopes, very stony (MbB); Hogansburgand Grenville soils, 0 to 8 percent slopes, very stony (HrB); Munuscong mucky fine sandy loam(Mn); Udorthents, refuse substratum (Un), and pits, gravel and sand (Pg). Six soil types, theStockholm loamy fine sand (Sg); the Deford loamy fine sand (Dd); the Swanton fine sandy loam(Sw); the Adjidaumo silty clay (Ak); the Dorval muck (Dr), and the Munuscong mucky finesandy loam (Mn) soils are classified as hydric according to Hydric Soils of St. Lawrence Countyand the SCS (1987).
Figure 6-14 is a mapping of the soil complex for the SRI site and 0.5 mile surrounding area.Table 6-18 lists the soil types for the above area and a description for each one.
Numerous soil borings were taken and field analyzed during the wetlands delineation. Fieldobservations of on-site soils indicate the presence of hydric soils in areas identified as wetlands.These results correspond with the SCS soils mapping of St. Lawrence County, New York.
6.2.1.5 Hydrologlcal AssociationsThe hydrology at the SRI site is driven by local precipitation to on-site tributaries to SuckerBrook and their headwaters. The tributaries which transect the property in the northwest andeastern portion of the site are considered intermittent low-flow streams that eventually flow intoSucker Brook. Sucker Brook is situated to the east of the northeast boundary of the site andflows north into the St. Lawrence River.
EDIS/ENG/ay071494.rp6 6-91SLR-0010717
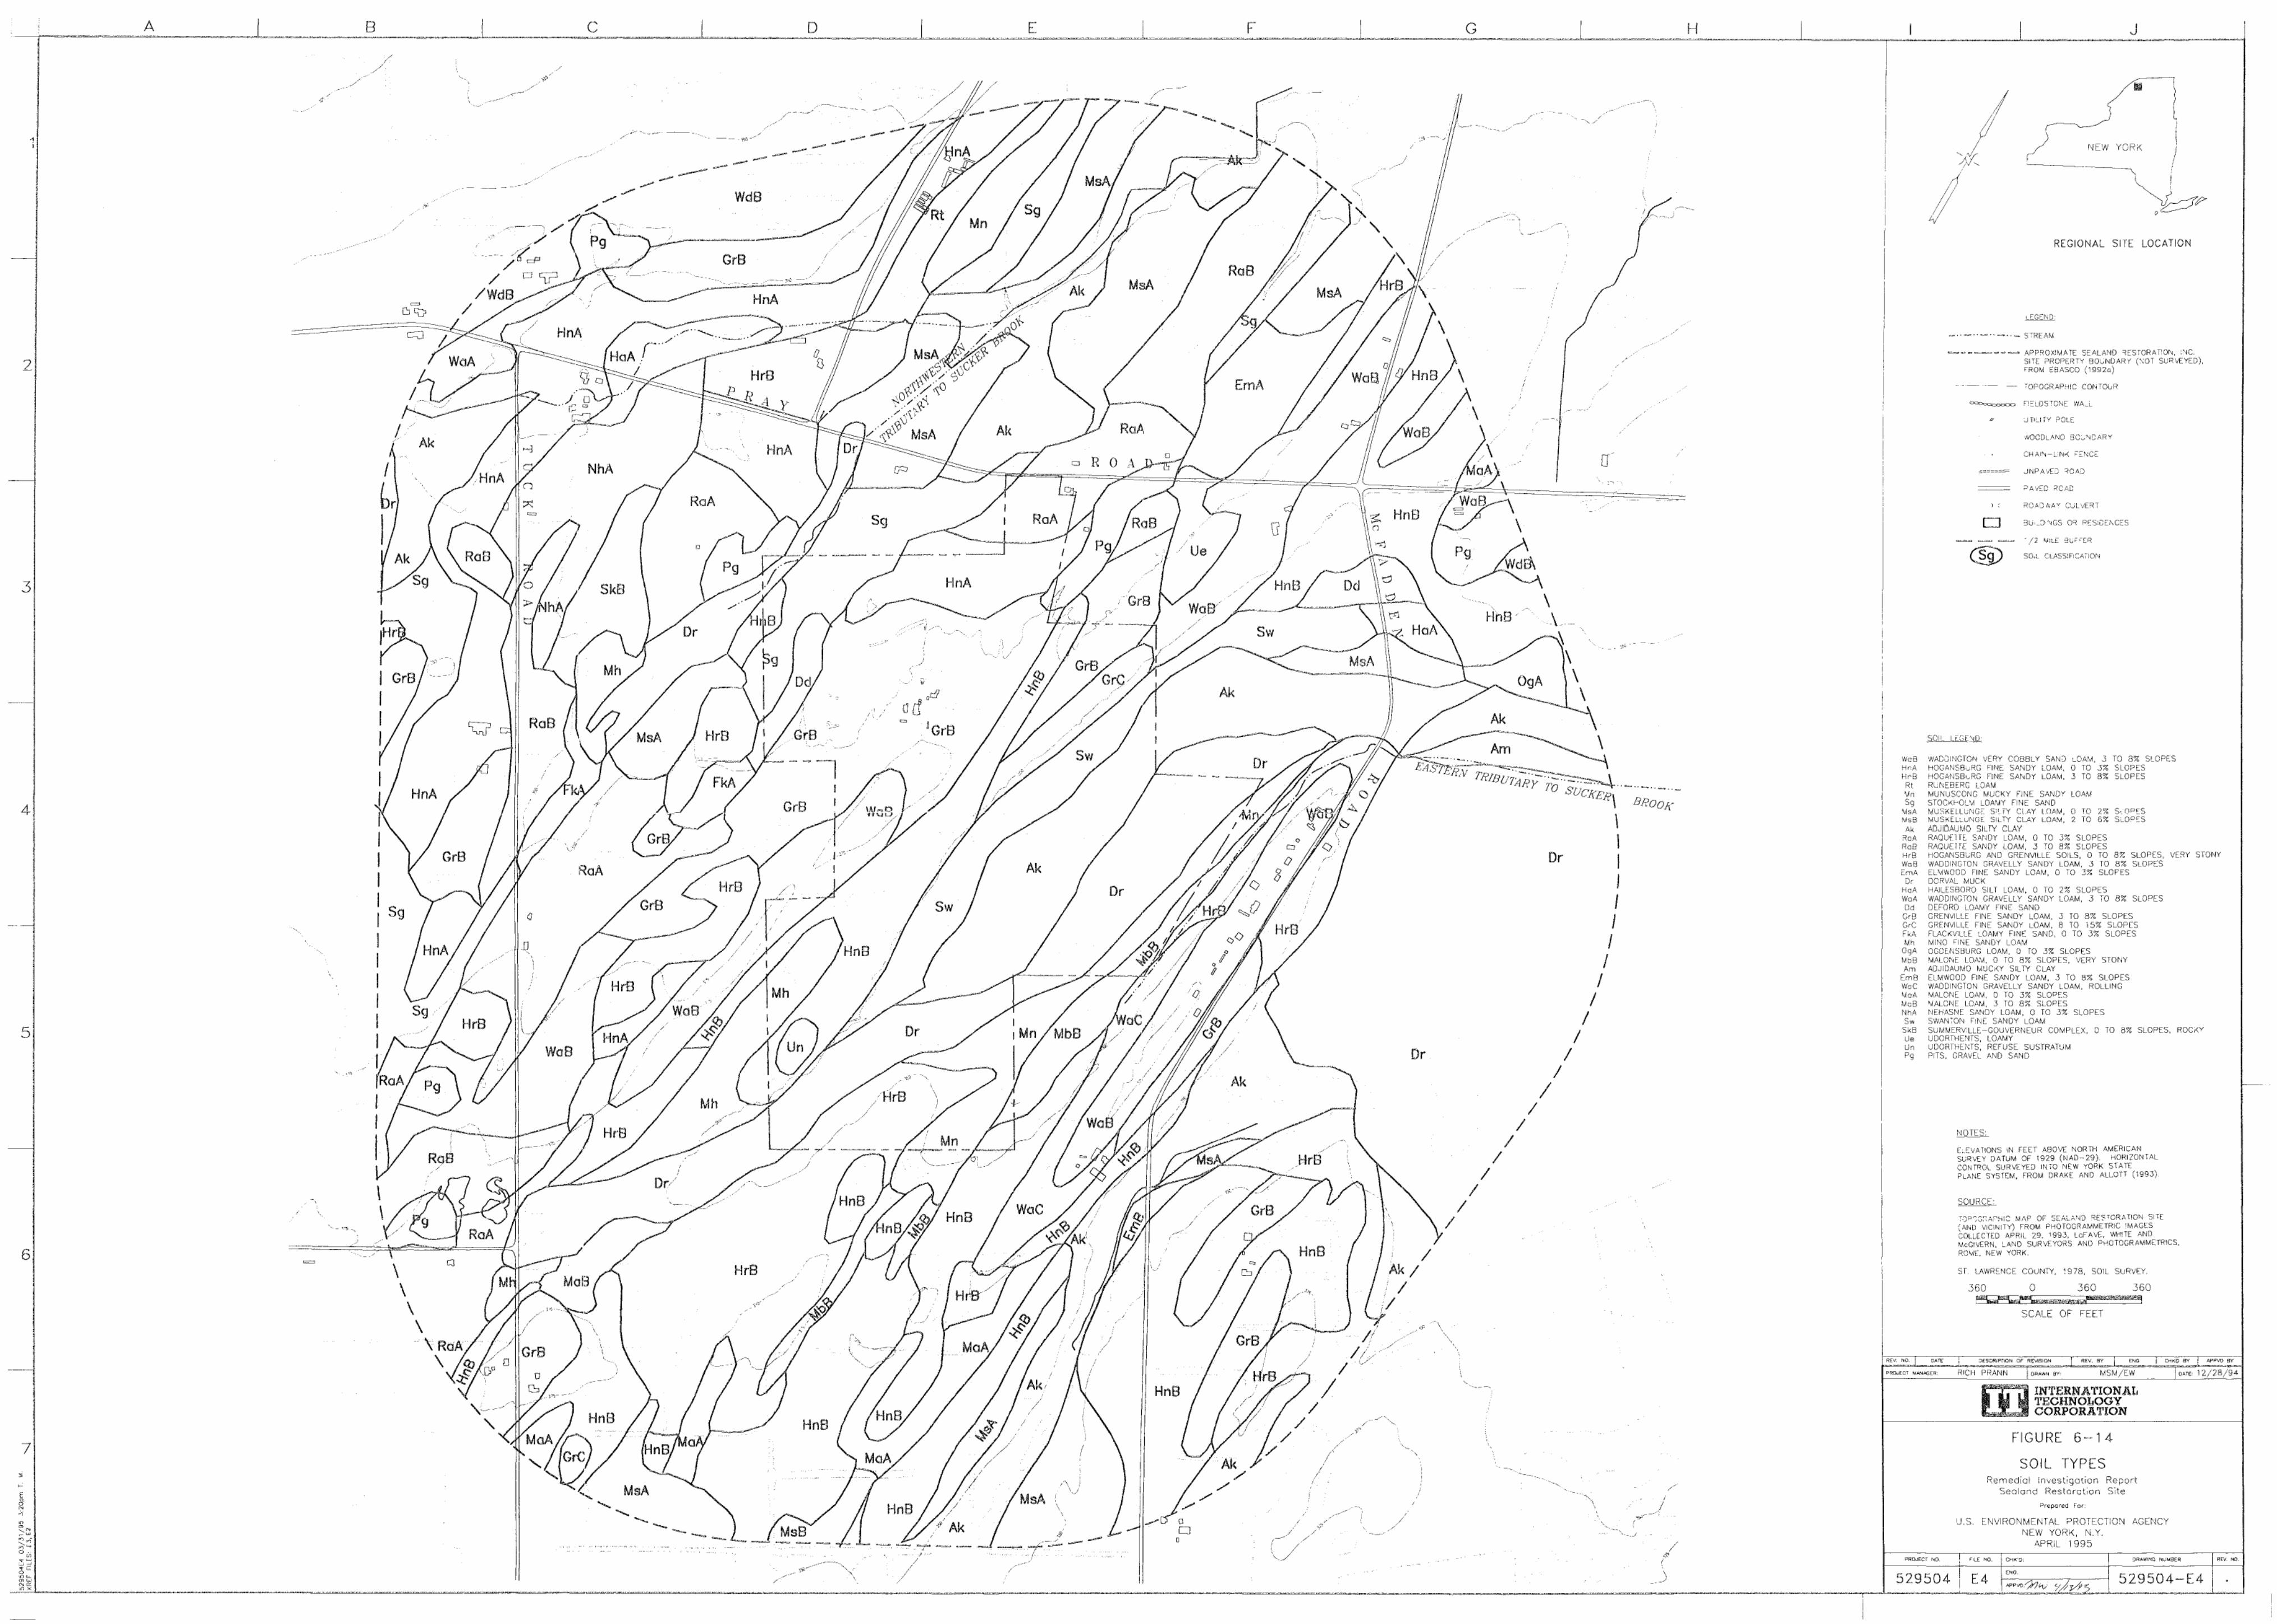
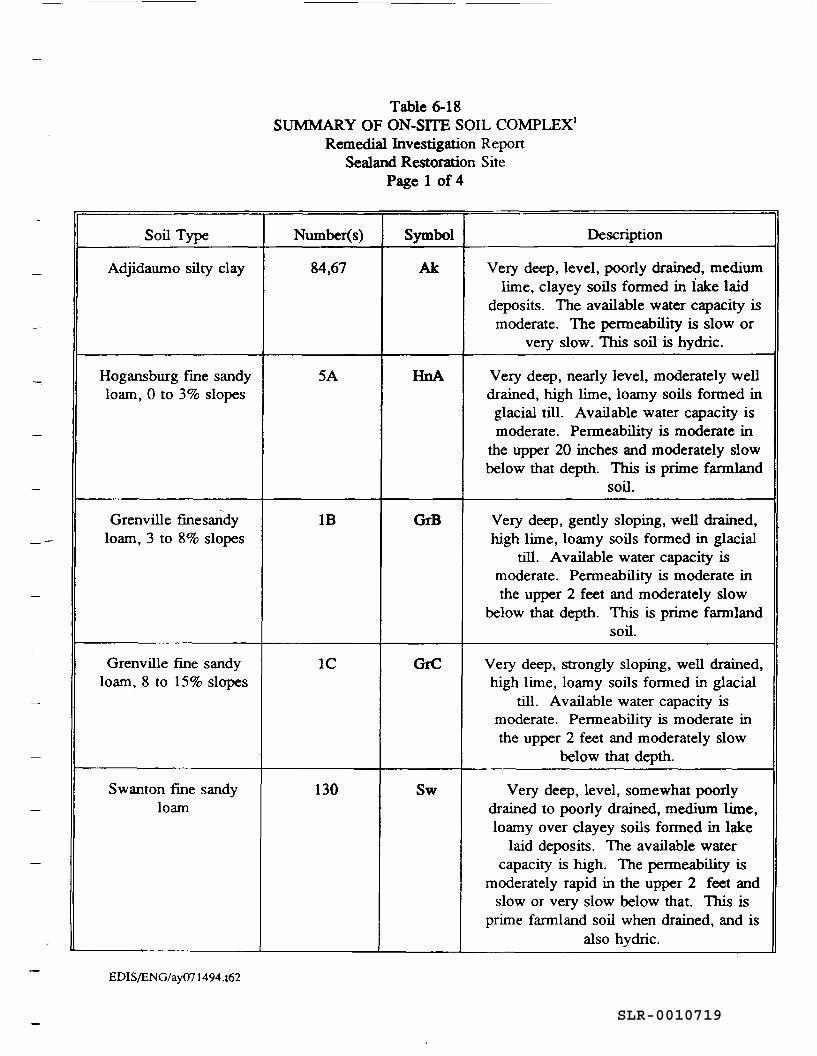
Table 6-18SUMMARY OF ON-SITE SOIL COMPLEX1
Remedial Investigation ReportSealand Restoration Site
Page 1 of 4
Soil Type Numbers) Symbol Description
Adjidaumo silty clay 84,67 Ak Very deep, level, poorly drained, mediumlime, clayey soils formed in lake laid
deposits. The available water capacity ismoderate. The permeability is slow or
very slow. This soil is hydric.
Hogansburg fine sandyloam, 0 to 3% slopes
5A HnA Very deep, nearly level, moderately welldrained, high lime, loamy soils formed inglacial till. Available water capacity ismoderate. Permeability is moderate in
the upper 20 inches and moderately slowbelow that depth. This is prime farmland
soil.
Grenville finesandyloam, 3 to 8% slopes
IB GrB Very deep, gently sloping, well drained,high lime, loamy soils formed in glacial
till. Available water capacity ismoderate. Permeability is moderate inthe upper 2 feet and moderately slow
below that depth. This is prime farmlandsoil.
Grenville fine sandyloam, 8 to 15% slopes
1C GrC Very deep, strongly sloping, well drained,high lime, loamy soils formed in glacial
till. Available water capacity ismoderate. Permeability is moderate inthe upper 2 feet and moderately slow
below that depth.
Swanton fine sandyloam
130 Sw Very deep, level, somewhat poorlydrained to poorly drained, medium lime,loamy over clayey soils formed in lake
laid deposits. The available watercapacity is high. The permeability is
moderately rapid in the upper 2 feet andslow or very slow below that. This is
prime farmland soil when drained, and isalso hydric.
EDIS/ENG/ay071494.162
SLR-0010719
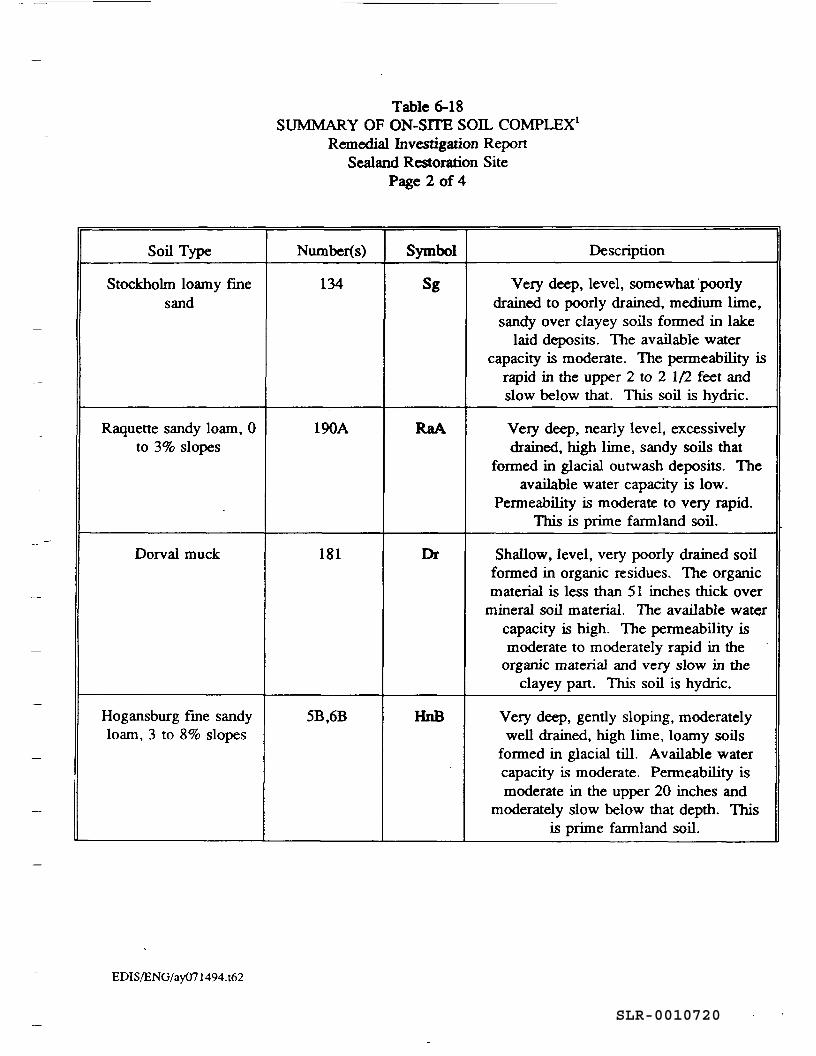
Table 6-18SUMMARY OF ON-SITE SOIL COMPLEX1
Remedial Investigation ReportSealand Restoration Site
Page 2 of 4
Soil Type Numbers) Symbol Description
Stockholm loamy finesand
134 Sg Very deep, level, somewhat'poorlydrained to poorly drained, medium lime,sandy over clayey soils formed in lake
laid deposits. The available watercapacity is moderate. The permeability is
rapid in the upper 2 to 2 1/2 feet andslow below that. This soil is hydric.
Raquette sandy loam, 0to 3% slopes
190A RaA Very deep, nearly level, excessivelydrained, high lime, sandy soils that
formed in glacial outwash deposits. Theavailable water capacity is low.
Permeability is moderate to very rapid.This is prime farmland soil.
Dorval muck 181 Dr Shallow, level, very poorly drained soilformed in organic residues. The organicmaterial is less than 51 inches thick over
mineral soil material. The available watercapacity is high. The permeability ismoderate to moderately rapid in the
organic material and very slow in theclayey part. This soil is hydric.
Hogansburg fine sandyloam, 3 to 8% slopes
5B.6B HnB Very deep, gently sloping, moderatelywell drained, high lime, loamy soils
formed in glacial till. Available watercapacity is moderate. Permeability ismoderate in the upper 20 inches and
moderately slow below that depth. Thisis prime farmland soil.
EDIS/ENG/ay071494.t62
SLR-0010720
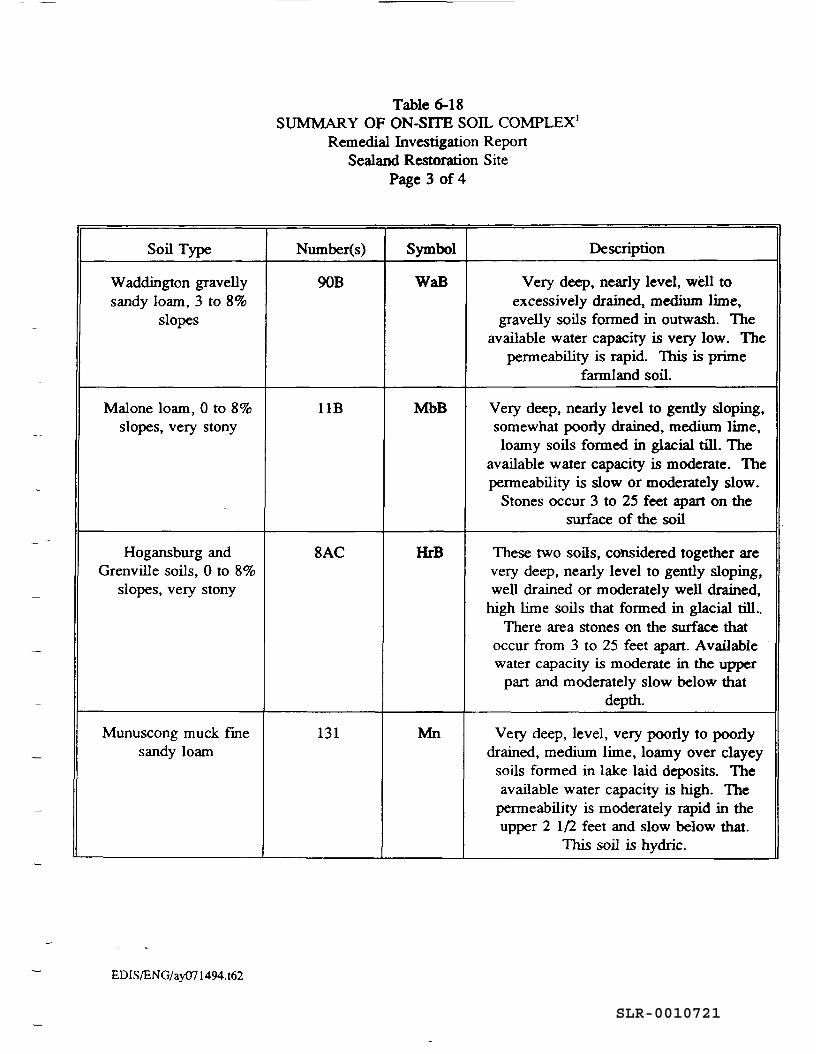
Table 6-18SUMMARY OF ON-SITE SOIL COMPLEX1
Remedial Investigation ReportSealand Restoration Site
Page 3 of 4
Soil Type Numbers) Symbol Description
Waddington gravellysandy loam, 3 to 8%
slopes
90B WaB Very deep, nearly level, well toexcessively drained, medium lime,
gravelly soils formed in outwash. Theavailable water capacity is very low. The
permeability is rapid. This is primefarmland soil.
Malone loam, 0 to 8%slopes, very stony
11B MbB Very deep, nearly level to gently sloping,somewhat poorly drained, medium lime,loamy soils formed in glacial till. The
available water capacity is moderate. Thepermeability is slow or moderately slow.
Stones occur 3 to 25 feet apart on thesurface of the soil
Hogansburg andGrenville soils, 0 to 8%
slopes, very stony
SAC HrB These two soils, considered together arevery deep, nearly level to gently sloping,well drained or moderately well drained,
high lime soils that formed in glacial till..There area stones on the surface that
occur from 3 to 25 feet apart. Availablewater capacity is moderate in the upper
part and moderately slow below thatdepth.
Munuscong muck finesandy loam
131 Mn Very deep, level, very poorly to poorlydrained, medium lime, loamy over clayey
soils formed in lake laid deposits. Theavailable water capacity is high. The
permeability is moderately rapid in theupper 2 1/2 feet and slow below that.
This soil is hydric.
EDIS/ENG/ay071494.162
SLR-0010721
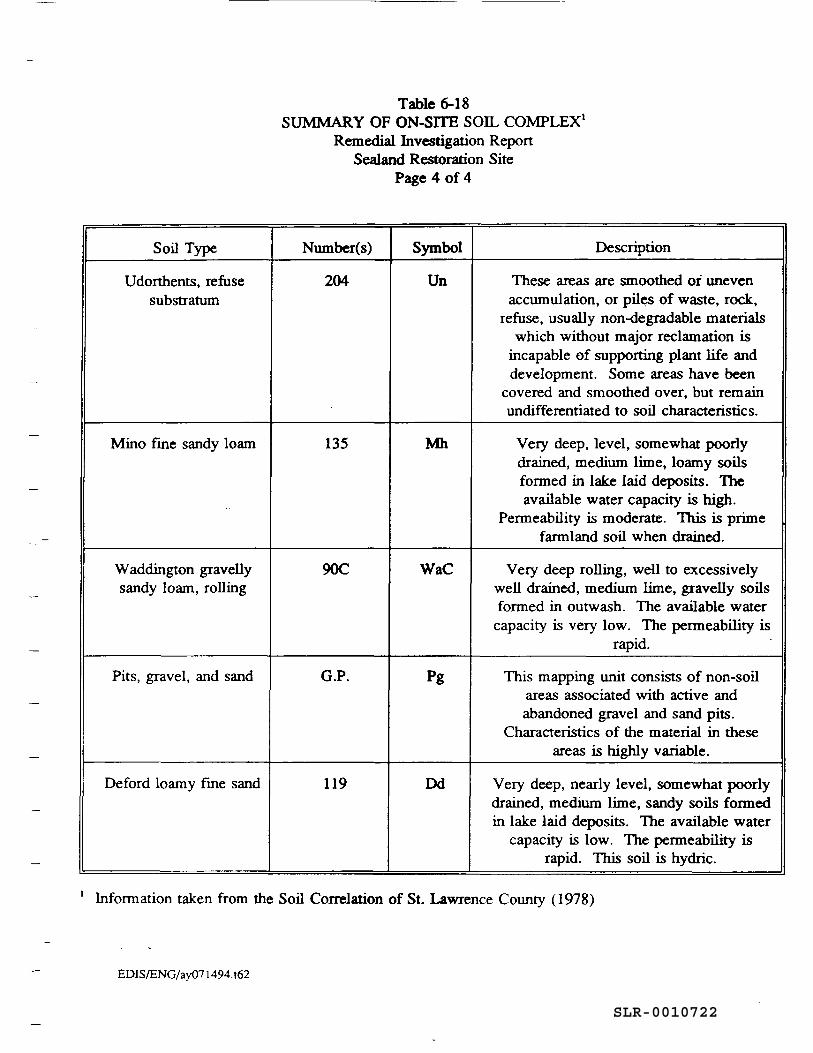
Table 6-18SUMMARY OF ON-SITE SOIL COMPLEX1
Remedial Investigation ReportSealand Restoration Site
Page 4 of 4
Soil Type Number(s) Symbol Description
Udorthents, refusesubstratum
204 Un These areas are smoothed of unevenaccumulation, or piles of waste, rock,
refuse, usually non-degradable materialswhich without major reclamation is
incapable of supporting plant life anddevelopment. Some areas have been
covered and smoothed over, but remainundifferentiated to soil characteristics.
Mino fine sandy loam 135 Mh Very deep, level, somewhat poorlydrained, medium lime, loamy soilsformed in lake laid deposits. Theavailable water capacity is high.
Permeability is moderate. This is primefarmland soil when drained.
Waddington gravellysandy loam, rolling
90C WaC Very deep rolling, well to excessivelywell drained, medium lime, gravelly soilsformed in outwash. The available water
capacity is very low. The permeability israpid.
Pits, gravel, and sand G.P. This mapping unit consists of non-soilareas associated with active andabandoned gravel and sand pits.
Characteristics of the material in theseareas is highly variable.
Deford loamy fine sand 119 Dd Very deep, nearly level, somewhat poorlydrained, medium lime, sandy soils formedin lake laid deposits. The available water
capacity is low. The permeability israpid. This soil is hydric.
Information taken from the Soil Correlation of St. Lawrence County (1978)
EDIS/ENG/ay071494.162
SLR-0010722
The topography of the site is characterized by nearly level, to gently sloping hills with a slightlydepressed area to the east. Because of the topography on-site and in the surrounding areas, thewetlands have expanded to create a broader floodplain along the tributary, especially along theeastern boundary down to the southern boundary.
The wetland areas of the site exhibit ponded and/or saturated soil conditions as well asmorphological indicators of wetland hydrology. These morphological indicators includedadventitious roots, surface root systems, buttressed tree trunks, multiple trunks, debris and driftlines, sediment deposits on vegetation, and water-stained leaves. Upland areas of the site did notexhibit saturated soil conditions or hydrologic indicators such as those mentioned above.
6.2.1.6 Rare, Endangered and Threatened SpeciesThe SRI site and the surrounding 0.5 mfle area were surveyed for the presence of rare,endangered, and threatened species and the potential for such species to be present based on theexistence of suitable habitat. A detailed description of the field methods used can be found inSection 2.3.4.
Season can have a large impact on the presence or absence of species. Summer and spring arefrequently the best times of year for a high species diversity. During fall, some animals beginto migrate for the winter. Hibernating animals, in addition to the migratory ones, would beabsent during the winter months.
The large amount of wetlands present both on- and off-site in the northwestern, eastern andsouthern portions of the study area could provide suitable habitat for a variety of such species.A rare species and unique habitat list, provided by the New York Natural Heritage Program, wasused as a guide in assessing the area; however, the scope of field surveys was not limited tolisted species. All species observed were noted and recorded. Table 6-19 presents those specieslisted in the New York Natural Heritage database in the eight townships surrounding the SRI site.All observed species were referenced against this listing to verify their status.
Of all of the species observed in the study area, only one species was listed on the New YorkNatural Heritage Program list as an endangered/threatened species. The species observed wasthe clearweed (Pilea fontana), located in the wetlands. There have been other sitings of thisspecies on quadrangles adjacent to the SRI site. It is a facultative wetland plant speciescommonly found in wet, boggy or springy soil areas.
EDIS/ENG/ay071494.rp6 6-97SLR-0010723
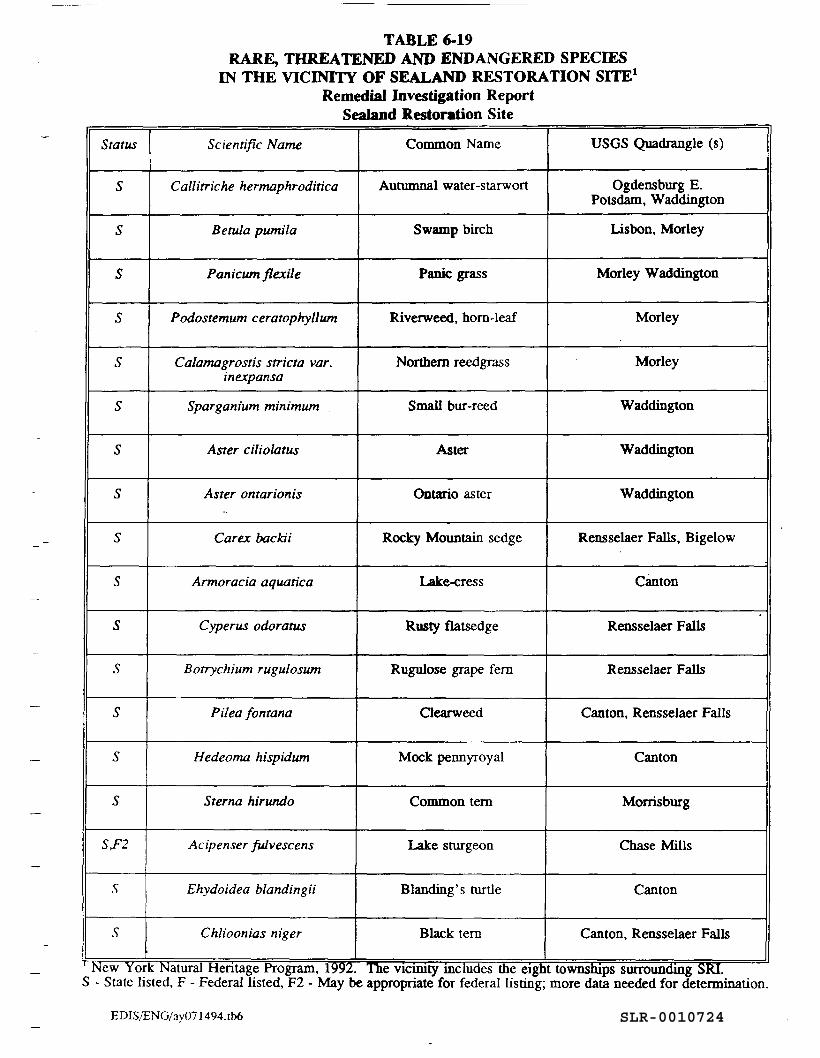
TABLE 6-19RARE, THREATENED AND ENDANGERED SPECIES
IN THE VICINITY OF SEALAND RESTORATION SITE1
Remedial Investigation ReportSealand Restoration Site
Status
S
S
S
S
S
S
S
S
S
S
s
s
s
s
s
Sf2
S
s
Scientific Name
Callitriche hermaphroditica
Be tula pumila
Panicum flexile
Podostemum ceratophyllum
Calamagrostis stricta var.inexpansa
Sparganium minimum
Aster ciliolatus
Aster ontarionis
Carex bacldi
Armoracia aquatic a
Cyperus odoratus
Botrychium rugulosum
Pilea fontana
Hedeoma hispidum
Sterna hirundo
Acipenser fulvescens
Ehydoidea blandingii
Chlioonias niger
Common Name
Autumnal water-starwort
Swamp birch
Panic grass
Riverweed, horn-leaf
Northern reedgrass
Small bur-reed
Aster
Ontario aster
Rocky Mountain sedge
Lake-cress
Rusty flatsedge
Rugulose grape fern
Clearweed
Mock pennyroyal
Common tern
Lake sturgeon
Blanding's turtle
Black tern
USGS Quadrangle (s)
Ogdensburg E.Potsdam, Waddington
Lisbon, Morley
Morley Waddington
Morley
Morley
Waddington
Waddington
Waddington
Rensselaer Falls, Bigelow
Canton
Rensselaer Falls
Rensselaer Falls
Canton, Rensselaer Falls
Canton
Morrisburg
Chase Mills
Canton
Canton, Rensselaer Falls
New York Natural Heritage Program, 1992. The vicinity includes the eight townships surrounding SRI.S - State listed, F - Federal listed, F2 - May be appropriate for federal listing; more data needed for determination
EDIS/ENG/av071494.tb6 SLR-0010724
Heron rookeries are listed as significant habitats by the New York Natural Heritage Program onthe Reusselaer Falls and Heuvelton USGS 7.5 minute series quadrangles. Even though thesehabitats do exist beyond the 0.5 mile area surrounding the site, a potential still exists for variousheron species to use the area as a feeding or stopover zone while in route to the rookeries.Several great blue heron (Ardea herodias) were seen on-site during the September 1992 fieldinvestigations. Table 6-20 lists those significant habitats in the vicinity of the SRI Site (NewYork Natural Heritage, 1992), none of which were present in the SRI site.
6.2.1.7 Value of Fish and Wildlife ResourcesThe SRI site and the surrounding 0.5 mile area was surveyed qualitatively to determine theoverall quality of the ecosystems and their ability to support biotic communities. Historical datawere also used in assessing the ability of the study area to support fish and wildlife species.
The value of a particular habitat is determined by the degree to which animals and humans canuse the area. For animals, a habitat is of high value when it has the ability to provide shelter,food, and cover. For humans, a habitat is of high value when it provides a food and/or recreationsource. The value of a habitat to humans and animals decreases with a lessening of the abilityto utilize an area as a food, shelter, cover or recreation source.
Value of Habitat to Associated FaunaTerrestrial habitats consist of old field, cropland, forest, and wetland areas. Cover types rangefrom open in old field areas to wooded, deciduous canopies in the forested areas. All of thesehabitats could provide food, cover, and shelter for a variety of species. Open areas, being heavilyvegetated by sedges and grasses, would serve as a food and cover source for deer and smalleranimals such as rodents. Forested areas would also be an attractive dwelling for avian speciesin addition to the previously mentioned mammalian species.
Aquatic habitats include headwaters, seasonally inundated areas, tributaries, and a pond. The lowdissolved oxygen levels measured in on-site surface waters during the September 1992 fieldinvestigations eliminate the potential for any fish species to be present. Dissolved oxygen levelsranged from 0.10 mg/1 to 5.20 mg/1. Only 4 stations of the 18 surface water stations haddissolved oxygen levels above 3.0 mg/1, a level that would have the potential to support fishspecies. Thus, overall the on-site tributaries to Sucker Brook would be limited to invertebratespecies due to the lack of oxygen present in the surface waters.
EDIS/ENG/ay071494.rp6 6-99SLR-0010725
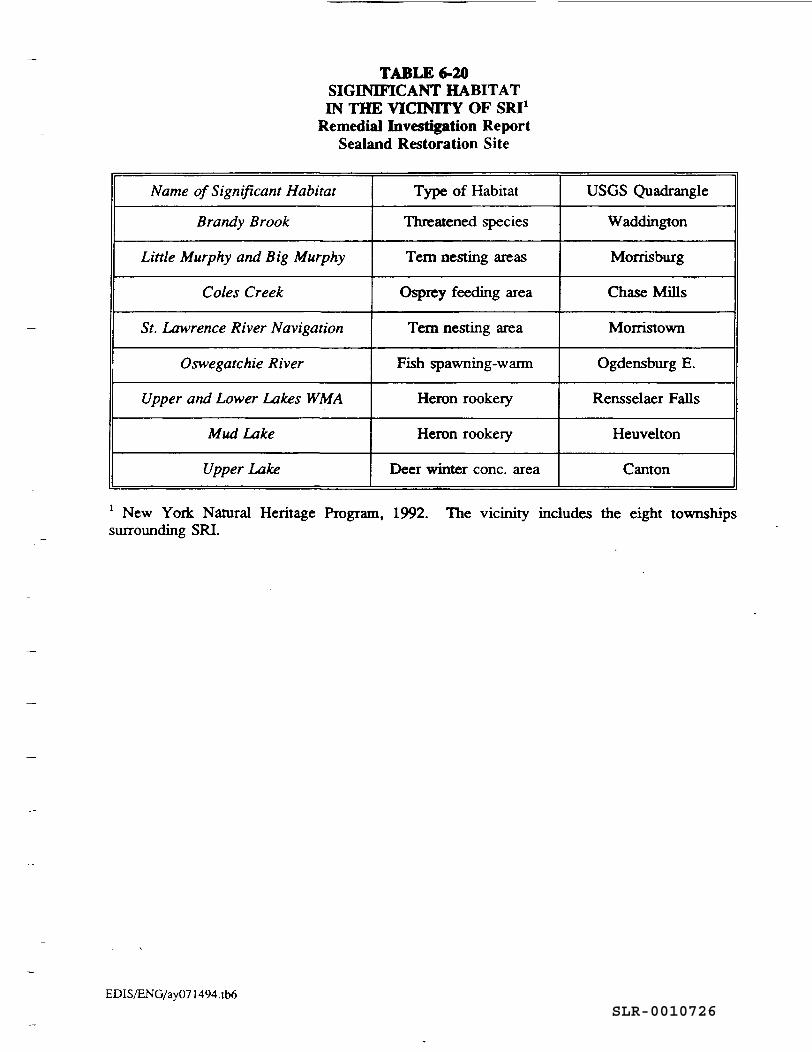
TABLE 6-20SIGINIFICANT HABITATIN THE VICINITY OF SRI1
Remedial Investigation ReportSealand Restoration Site
Name of Significant Habitat
Brandy Brook
Little Murphy and Big Murphy
Coles Creek
St. Lawrence River Navigation
Oswegatchie River
Upper and Lower Lakes WMA
Mud Lake
Upper Lake
Type of Habitat
Threatened species
Tern nesting areas
Osprey feeding area
Tern nesting area
Fish spawning-warm
Heron rookery
Heron rookery
Deer winter cone, area
USGS Quadrangle
Waddington
Monisburg
Chase Mills
Morristown
Ogdensburg E.
Rensselaer Falls
Heuvelton
Canton
' New Yoric Natural Heritage Program, 1992. The vicinity includes the eight townshipssurrounding SRI.
EDIS/ENG/av071494.tb6SLR-0010726
The headwaters to Sucker Brook and seasonally inundated areas occur on-site. Off-site, SuckerBrook, a pond, and more seasonally inundated areas exist. These areas provide a drinking, food,and dwelling source for various types of aquatic animals, amphibians, and terrestrial animals.Aquatic mammals might use the permanent surface water bodies, such as Sucker Brook, as adwelling. The rhizomes and tubers of the cattail in the seasonally inundated areas might be usedas a food source by aquatic mammals, such as muskrats and voles.
Value of Resources to HumansThe value of resources on-site to humans is limited. The low dissolved oxygen levels measuredin the on-site tributaries prevent these surface waters from supporting fish species. Therefore,humans would not have the opportunity to fish in these waters. The most valuable vegetationcommunities are the old field, wetland, and forested areas. Old field areas are harvested and thehay is used by farmers as feed. The wetland and forested areas provide cover and forage to birdsand mammals. These areas may be used by local residents as hunting and trapping areas. Theyalso are aesthetically pleasing to viewers.
Sucker Brook is the only permanent surface water body that exists off-site in the SRI study area.It can provide a possible recreation source for the general population, in addition to habitat forlocal wildlife.
6.2.2 Identification of Constituents of ConcernThe primary stressors at the SRI site are physical, related to the original habitat alteration. Otheranthropogenic stressors include excavation, mowing and farming. This assessment focuses onthe chemical constituents potentially contaminating environmental media. Constituents ofEcological Concern (COEC) are contaminants in the envkonmental media that were used in, orresult from, past operations at the SRI site, and have the potential to adversely impact naturalpopulations or ecosystems. Identification of contaminants as COECs provides a focus for thisEnvironmental Assessment. The COECs for surficial soil, surface water and sediment arepresented in Table 6-21. The derivation of this list is presented below.
Analytical results and areal distribution of contaminants in surficial soil, surface water andsediments are presented in Chapter 4.0. Analytical data for chemicals detected at the SRI werescreened to determine which chemicals met the criteria for selection as COECs. The followingdata were included as detected concentrations:
-. data reported with a "J" qualifier indicating an estimated concentration;
EDIS/ENG/ay071494.rp6 6-101 SLR-0010727
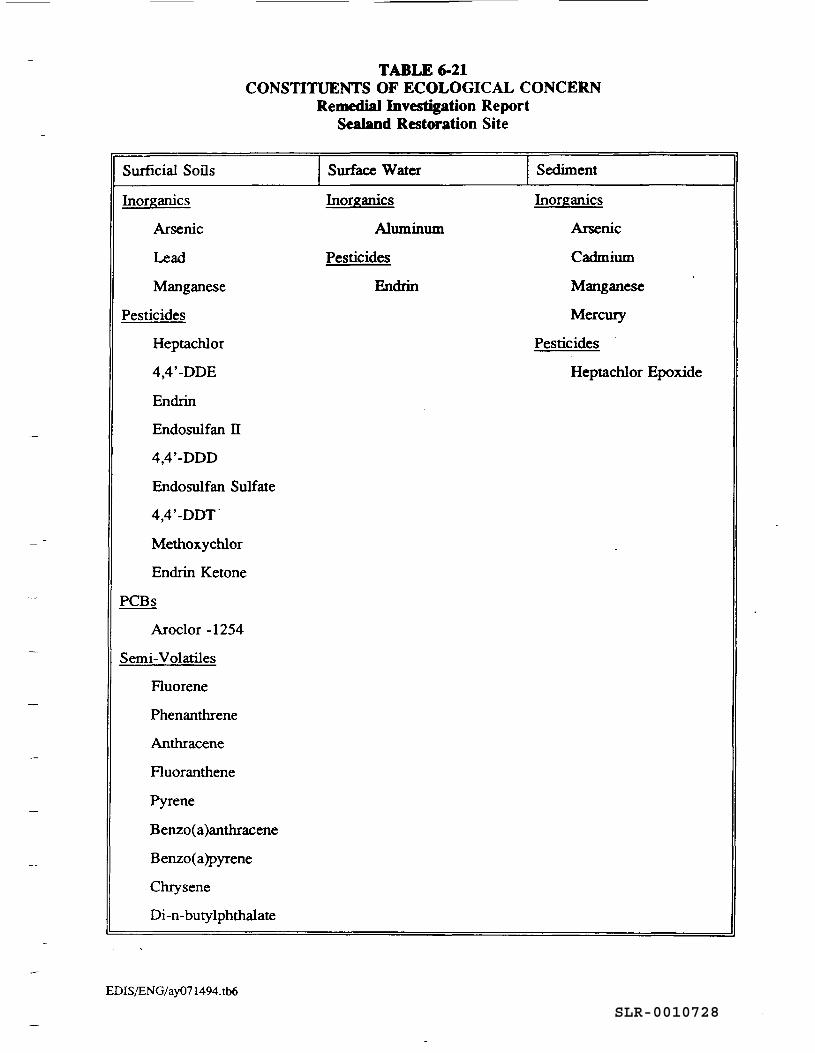
TABLE 6-21CONSTITUENTS OF ECOLOGICAL CONCERN
Remedial Investigation ReportSealand Restoration Site
Surficial Soils Surface Water Sediment
Inorganics
Arsenic
Lead
ManganesePesticides
Heptachlor
4,4'-DDE
Endrin
Endosulfan n
4,4'-DDD
Endosulfan Sulfate
4,4'-DDT
Methoxychlor
Endrin Ketone
PCBs
Aroclor -1254
Semi-Volatiles
Fluorene
Phenanthrene
Anthracene
Fluoranthene
Pyrene
Benzo(a)anthracene
Benzo(a)pyrene
Chrysene
Di-n-butylphthalate
Inorganics
Aluminum
Pesticides
Endrin
Inorganics
Arsenic
Cadmium
ManganeseMercury
Pesticides
Heptachlor Epoxide
EDIS/ENG/ay071494.tb6SLR-0010728
• inorganic data reported with a "B" qualifier indicating that the compound was detectedabove the instrument detection limit but below the contract required detection limit;
• data reported with an "E" qualifier indicating either the presence of interference forinorganics or exceedence of a calibration range of the GC/MS instrumentation fororganics;
• data reported with a "D" qualifier indicating an analysis conducted at a secondary dilutionfactor;
• data reported with an "M" qualifier indicating that duplicate injection precision was notmet;
• data reported with an "N" qualifier indicating that duplicate injection precision was notmet;
• data reported with an "S" qualifier indicating that the spiked sample recovery was notwithin control limits;
• data reported with an "*" qualifier indicating that the duplicate analyses were not withincontrol limits;
• data reported with a "+" qualifier indicating that the correlation coefficients for the Methodof Standard Additions were less than 0.995;
• data reported with a "W" qualifier indicating a post-digestion spike out of control limits.
Data reported as not detected, indicated by a "U" qualifier, were not considered detectedconcentrations. When necessary for statistical analyses, these values were considered to be one-half the reported detection limit. Organic data reported with a "B" qualifier were detected in theassociated blanks and were not considered detected.
Laboratory contaminants or contaminants which are artifacts of sampling procedures or fielddecontamination procedures may be present and are often found in virtually all environmentalsamples. USEPA's guidance for eliminating these contaminants from consideration as COECsis applied in this report. As part of the data screening process, a chemical was not consideredto be a detected concentration if the sample concentration did not exceed 10 times the highestblank concentration for all common laboratory contaminants (e.g., acetone, 2-butanone, methylenechloride, toluene, and phthalates) or five times the highest blank concentration for otherchemicals. Several laboratory contaminants were detected in field, trip, and method blanks.
EDIS/ENG/ay071494.rp6 6-103 SLR-0010729
Acetone is reported in 8 of 42 surficial soil samples ranging from 11 to 82 ug/kg. However, itwas detected in field blanks at levels ranging from 10 to 590 ug/kg. Therefore, acetone is notconsidered positively detected in surficial soils. 2-Butanone was detected in one surficial soilsample as well as a field blank at 8 fig/kg; therefore, 2-butanone is not considered positivelydetected in surficial soils. Methylene chloride was detected in 7 surficial soil samples (17-43ug/kg) and in blanks (2-21 ug/kg); methylene chloride is not considered positively detected.Chloroform was detected in two surficial soil samples (1-2 pg/kg) and in blanks at 9 ug/kg;chloroform is not considered positively detected in surficial soils. Bis(2-ethylhexyl)phthalate wasreported in 22 samples most of which were reported with associated method blank detections ofbis(2-ethylhexyl)phthalate. Field blanks report levels of bis(2-ethylhexyl)phthalate as high as 61pg/kg. The highest site sample detect without associated method blank contamination is 120pg/kg. This is less than 10 times the highest level reported in all blanks. Therefore, bis(2-ethylhexyl)phthalate is not considered positively detected in surficial soils.
Surficial soil field blanks also contained detectable levels of di-n-butyl phthalate, methoxychlor,heptachlor, endrin aldehyde, endosulfan sulfate, 4,4'-DDT, 4,4'-DDD, gamma-chlordane, andphenol. However, site sample levels are reported greater than 10 times the highest blankconcentration. Therefore, these are regarded as positive detects and not eliminated fromconsideration as COECs based on blank contamination.
Bis(2-ethylhexyl)phthalate, acetone, bromodichloromethane, chloroform, dibromochloromethane,and toluene were reported in surface water blanks. All surface water sample concentrations ofbis(2-ethylhexyl)phthalate, bromodichloromethane, chloroform, and dibromochloromethane werebelow 10 times the highest blank concentration. Therefore, these constituents are not consideredpositively detected in surface water. Only one reported value of toluene exceeds 10 times thehighest blank contamination. This is considered a positive detect. Acetone in field blanks andall but two surface water samples were rejected during validation. The two remaining surfacewater samples are considered positive detects.
Chemicals that are infrequently detected may be artifacts in the data due to sampling, analytical,or other anthropogenic contamination. Chemicals which were positively detected in less than 5percent of the soil samples from the site were eliminated as COECs. Thallium, delta-BHC,aldrin, endosulfan I, dieldrin, aroclor-1016, aroclor-1221, aroclor-1260, endrin aldehyde, phenol,4-methylphenol, diethyl phthalate, butyl benzyl phthalate, benzo(b)fluoranthene,benzo(k)fluoranthene, and benzo(g,h,i)perylene were positively detected in less than 5 percent ofthe surficial soil samples; therefore, these were not considered COECs.
EDIS/ENG/ay071494jp6 6-104 SLR-0010730
For surface water and sediments this screening procedure could not be applied since the totalnumber of samples for each of these media was less than twenty. Therefore, for surface waterand sediments, a chemical was eliminated as a COEC if there was only one detectedconcentration for that particular medium. However, if a constituent was a COEC in soil and wasonly detected once in surface water or sediment, it was retained as a COEC in that medium sinceit was assumed to be site-related. Mercury, gamma-BHC, styrene, 4-methyl-phenol, 4-chloro-3-methyl phenol, pentachlorophenol, and bromochloromethane were detected in only one of 18surface water samples and were not considered COECs. Toluene is considered to be positivelydetected only once in surface water and was not considered a COEC. Beryllium, thallium, aldrin,toluene, 4,4'-DDD, phenol, 4-methylphenol, 2,4-dimethylphenol, and 4-chloro-3-methyl phenolwere detected in only one of 18 sediment samples and were not considered COECs. Endosulfansulfate and di-n-butylphthalate were detected only once in surface water and heptachlor epoxidewas detected only once in sediment. However, these constituents were not eliminated as COECsin soil; therefore, they were not eliminated as COECs in surface water and sediment, respectively.
Some inorganic constituents such as iron, magnesium, calcium, sodium, and potassium areconsidered essential macronutrients and are generally toxic only at very high concentrations.These were not considered COECs for the SRI site.
General water chemistry parameters, such as sulfates, carbonate, bicarbonate, chloride, dissolvedsolids, and fluoride, are also generally toxic only at very high levels. Measurements of these areuseful in determining the nature of a water body being studied, but were not considered COECsfor the SRI site.
A conservative screening approach was used in establishing COECs in surficial soil by comparingarithmetic mean and exposure point concentrations on the SRI site to background conditions.Two soil borings (HB01 and MW-01D) were designated as background stations. Thiscomparison was used to determine if the on-site inorganic concentrations were elevated abovethe naturally occurring levels indigenous to the area.
Arithmetic means of on-site data for all media were calculated. Where a value was reported asnon-detect, one-half of the detection limit was used for statistical calculations. Exposure pointconcentrations were calculated as the 95% upper confidence limit (UCL) of the arithmetic meanof log normal data.
EDIS/ENG/ay071494.rp6 6-105 SLR-0010731
Background or upgradient concentrations were measured for surficial soil but not for surfacewater or sediment. Therefore, no background or reference comparisons could be made and thisscreening procedure was not employed for surface water or sediment COECs.
Aluminum, barium, beryllium, chromium, cobalt, copper, mercury, nickel, selenium, silver,vanadium, and zinc average and exposure point concentrations were at or below the average ofnaturally occurring background concentrations and were eliminated as COECs for surficial soil.Manganese, lead, and arsenic exposure point concentrations did exceed the average value of thebackground data. These constituents were retained as COECs in soil, utilizing this conservativeapproach. The exposure point concentrations and range of background concentrations arepresented in Table 6-22 for the inorganic constituents.
The potential effects of constituents are fundamental in selecting COECs. The potential foreffects to aquatic life can be assessed through comparison of surface water concentrations ofconstituents with ambient water quality criteria for the protection of aquatic life or, when theseare unavailable, threshold values as determined from the scientific literature. The state andfederal ambient water quality standards and criteria established to protect the aquatic environmentare the primary benchmark for these comparisons. The NYSDEC Ambient Water QualityStandards and Guidance Values (October 1993) designates Sucker Brook and its tributaries asClass D waters. Ambient water quality standards for Class D waters should be protective for fishsurvival and wildlife consumption of fish. These values were the primary standard used foridentifying surface water COECs. When no NYSDEC standard was available, USEPA criteriawere used. If both of these sources provided no benchmarks, then a threshold level from thescientific literature was used to identify COECs. A hardness of 300 mg/l as CaCO3 (as measuredin samples collected from the surface water bodies on-site during the September 1992 fieldinvestigation) was assumed for evaluation of hardness dependent standards. A comparison ofsurface water average and exposure point concentrations to standards or criteria is presented inTable 6-23.
The potential for effects on benthic organisms from sediment constituents can be assessedthrough comparison of the sediment average and exposure point concentrations to sedimenteffects-range median (ER-M) values (Long and Morgan, 1990), sediment criteria derived fromthe equilibrium partitioning (EqP) approach (USEPA, 1989, 1990, 1991, 1992), or sedimentlowest effect level (LEL) from Persaud et al. These comparisons are presented in Table 6-24.
EDIS/ENG/ay071494.rp6 6-106 SLR-0010732
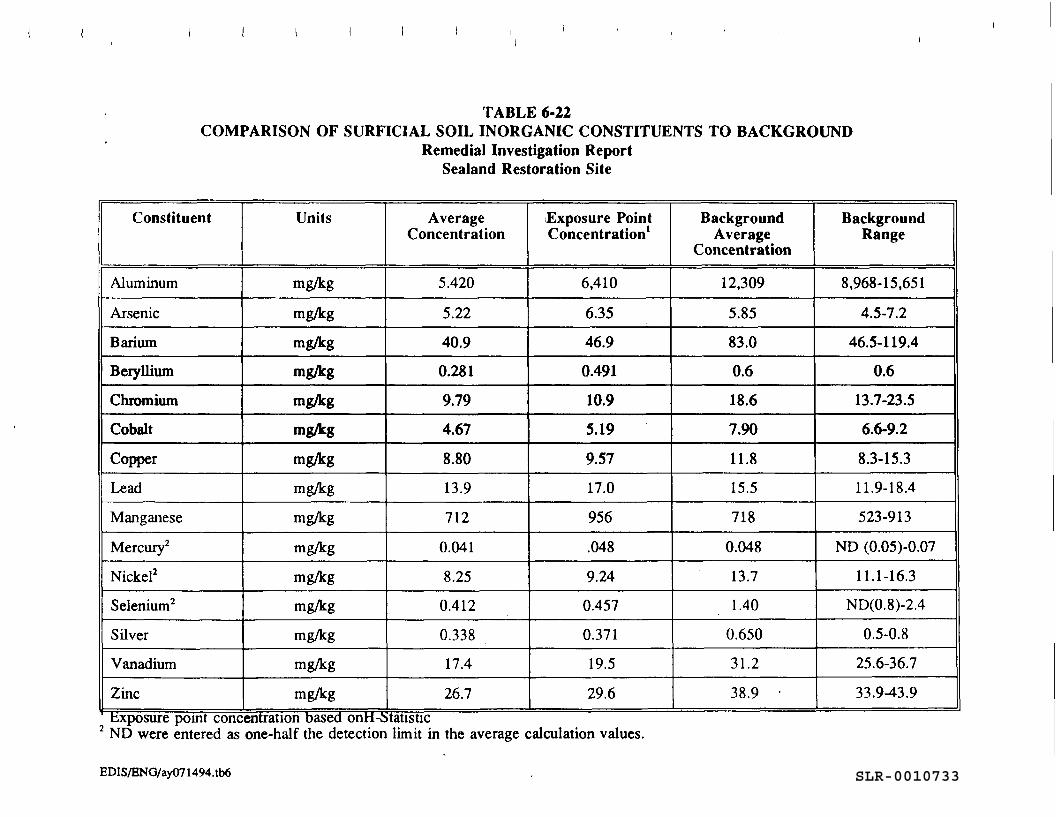
TABLE 6-22COMPARISON OF SURFICIAL SOIL INORGANIC CONSTITUENTS TO BACKGROUND
Remedial Investigation ReportSealand Restoration Site
Constituent
Aluminum
Arsenic
Barium
Beryllium
Chromium
Cobalt
Copper
Lead
Manganese
Mercury2
Nickel2
Selenium2
Silver
Vanadium
Zinc
Units
mg/kg
mg/kg
mg/kg
mg/kgmg/kg
mg/kg
mg/kg
mg/kg
mg/kg
mg/kg
mg/kg
mg/kg
mg/kg
mg/kg
mg/kg
AverageConcentration
5.420
5.22
40.90.281
9.79
4.67
8.8013.9
712
0.041
8.25
0.412
0.338
17.4
26.7
Exposure PointConcentration1
6,410
6.35
46.9
0.491
10.9
5.19
9.5717.0
956
.048
9.24
0.457
0.371
19.5
29.6
BackgroundAverage
Concentration
12,309
5.85
83.0
0.6
18.6
7.90
11.815.5
718
0.048
13.7
1.40
0.650
31.2
38.9 •
BackgroundRange
8,968-15,651
4.5-7.2
46.5-119.4
0.6
13.7-23.5
6.6-9.2
8.3-15.311.9-18.4
523-913
ND (0.05)-0.07
11.1-16.3
ND(0.8)-2.4
0.5-0.8
25.6-36.7
33.9^3.9exposure point concentration based onH-Matistic
2 ND were entered as one-half the detection limit in the average calculation values.
EDIS/ENO/ay071494.tb6 SLR-0010733
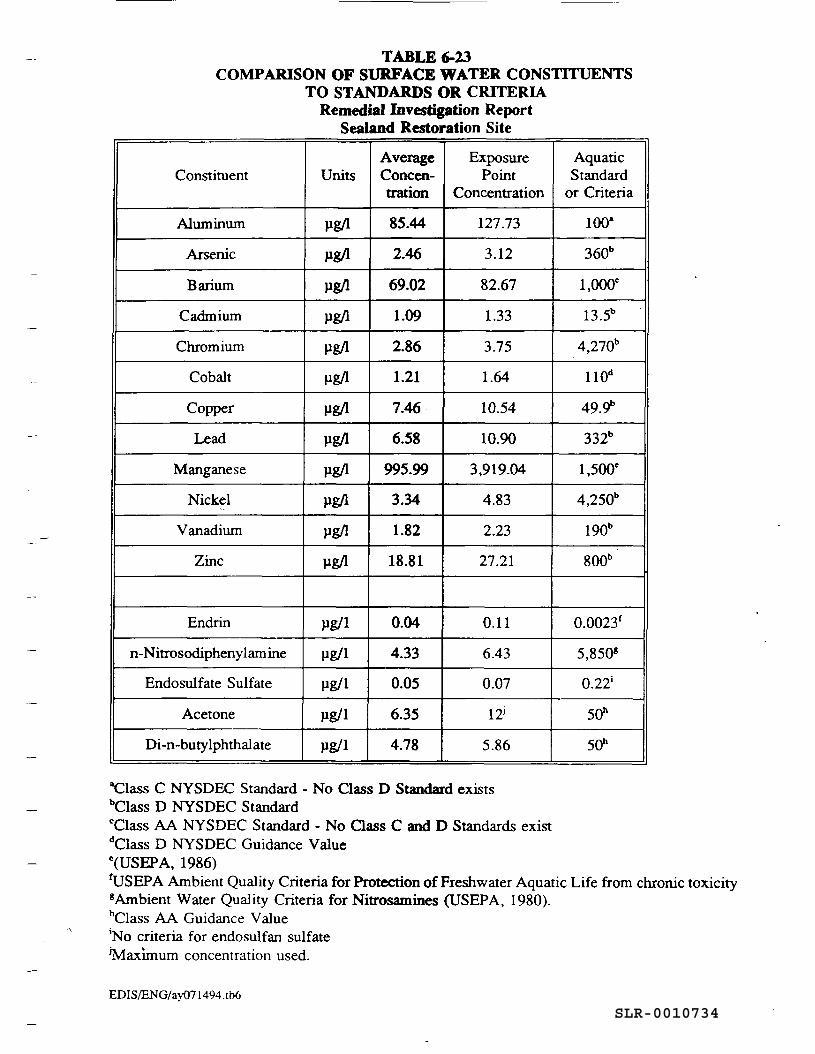
TABLE 6-23COMPARISON OF SURFACE WATER CONSTITUENTS
TO STANDARDS OR CRITERIARemedial Investigation Report
Sealand Restoration Site
Constituent
Aluminum
Arsenic
Barium
Cadmium
Chromium
Cobalt
Copper
Lead
Manganese
Nickel
Vanadium
Zinc
Endrin
n-Nitrosodiphenylamine
Endosulfate Sulfate
Acetone
Di-n-butylphthalate
Units
Pg/1
Pg/l
Pg/1
Pg/l
Pg/l
Pg/l
P8/1
Pg/l
Pg/1
Pg/l
Pg/l
Pg/l
Pg/1
Pg/1
Pg/1
Pg/1
Pg/1
AverageConcen-tration
85.44
2.46
69.02
1.09
2.86
1.21
7.46
6.58
995.99
3.34
1.82
18.81
0.04
4.33
0.05
6.35
4.78
ExposurePoint
Concentration
127.73
3.12
82.67
1.33
3.75
1.64
10.54
10.90
3,919.04
4.83
2.23
27.21
0.11
6.43
0.07
12j
5.86
AquaticStandard
or Criteria
100m
360b
1,000C
13.5"
4,270b
110d
49.9"
332b
l,500e
4,250"
190b
800b
0.0023f
5,850*
0.22'
50"
50"
•Class C NYSDEC Standard - No Class D Standard exists"Class D NYSDEC Standard'Class AA NYSDEC Standard - No Class C and D Standards exist"Class D NYSDEC Guidance Valuee(USEPA, 1986)fUSEPA Ambient Quality Criteria for Protection of Freshwater Aquatic Life from chronic toxicitygAmbient Water Quality Criteria for Nitrosamines (USEPA, 1980).hClass AA Guidance Value"No criteria for endosulfan sulfate^Maximum concentration used.
EDIS/ENG/ay071494.tb6SLR-0010734
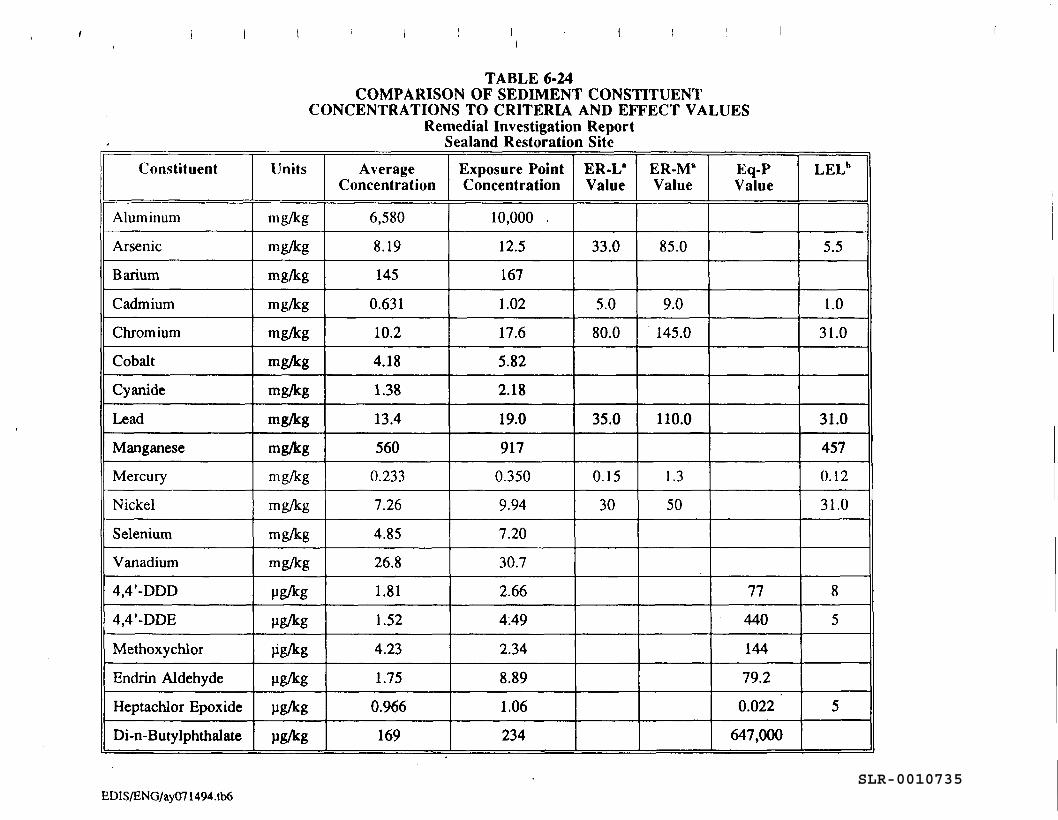
TABLE 6-24COMPARISON OF SEDIMENT CONSTITUENT
CONCENTRATIONS TO CRITERIA AND EFFECT VALUESRemedial Investigation Report
Sealand Restoration SiteConstituent
Aluminum
Arsenic
Barium
Cadmium
Chromium
Cobalt
Cyanide
Lead
ManganeseMercury
Nickel
Selenium
Vanadium
4,4'-DDD
4,4 '-DDE
Methoxychlor
Endrin Aldehyde
Heptachlor Epoxide
Di-n-Butylphthalate
Units
mg/kg
mg/kg
mg/kg
mg/kg
mg/kg
mg/kg
mg/kg
mg/kg
mg/kg
mg/kg
mg/kg
mg/kg
mg/kg
Pg/kg
Pg/kg
Pg/kg
Mg/kg
Pg/kg
Pg/kg
AverageConcentration
6,580
8.19
145
0.631
10.2
4.18
1.38
13.4
560
0.233
7.26
4.85
26.8
1.81
1.52
4.23
1.75
0.966
169
Exposure PointConcentration
10,000 .
12.5167
1.02
17.6
5.82
2.18
19.0
9170.350
9.94
7.20
30.7
2.66
4:492.34
8.891.06234
ER-L'Value
33.0
5.0
80.0
35.0
0.1530
ER-M"Value
85.0
9.0
145.0
110.0
1.3
50
Eq-PValue
77
440
144
79.2
0.022
647,000
LELb
5.5
1.0
31.0
31.0
4570.12
31.0
8
5
5
EDIS/ENG/ay071494.tb6SLR-0010735
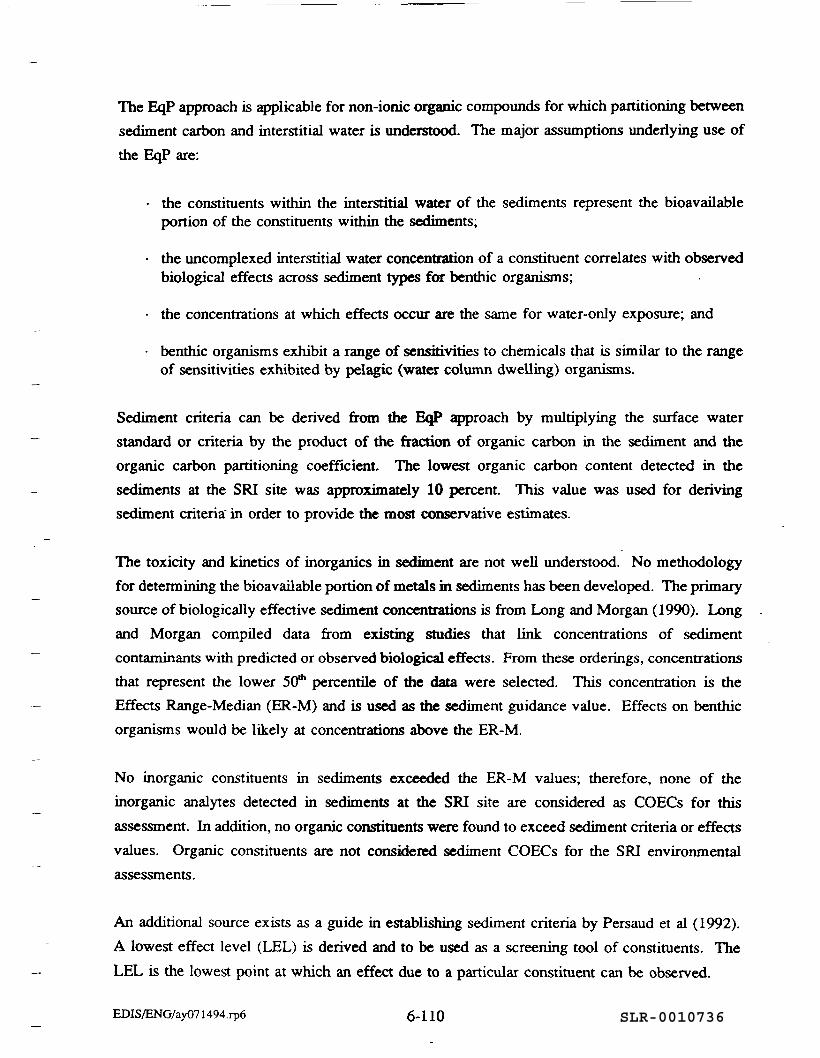
The EqP approach is applicable for non-ionic organic compounds for which partitioning betweensediment carbon and interstitial water is understood. The major assumptions underlying use ofthe EqP are:
• the constituents within the interstitial water of the sediments represent the bioavailableportion of the constituents within the sediments;
• the uncomplexed interstitial water concentration of a constituent correlates with observedbiological effects across sediment types for benthic organisms;
• the concentrations at which effects occur are the same for water-only exposure; and
• benthic organisms exhibit a range of sensitivities to chemicals that is similar to the rangeof sensitivities exhibited by pelagic (water column dwelling) organisms.
Sediment criteria can be derived from the EqP approach by multiplying the surface waterstandard or criteria by the product of the fraction of organic carbon in the sediment and theorganic carbon partitioning coefficient. The lowest organic carbon content detected in thesediments at the SRI site was approximately 10 percent. This value was used for derivingsediment criteria in order to provide the most conservative estimates.
The toxicity and kinetics of inorganics in sediment are not well understood. No methodologyfor determining the bioavailable portion of metals in sediments has been developed. The primarysource of biologically effective sediment concentrations is from Long and Morgan (1990). Longand Morgan compiled data from existing studies that link concentrations of sedimentcontaminants with predicted or observed biological effects. From these orderings, concentrationsthat represent the lower 50* percentile of the data were selected. This concentration is theEffects Range-Median (ER-M) and is used as the sediment guidance value. Effects on benthicorganisms would be likely at concentrations above the ER-M.
No inorganic constituents in sediments exceeded the ER-M values; therefore, none of theinorganic analytes detected in sediments at the SRI site are considered as COECs for thisassessment. In addition, no organic constituents were found to exceed sediment criteria or effectsvalues. Organic constituents are not considered sediment COECs for the SRI environmentalassessments.
An additional source exists as a guide in establishing sediment criteria by Persaud et al (1992).A lowest effect level (LEL) is derived and to be used as a screening tool of constituents. TheLEL is the lowest point at which an effect due to a particular constituent can be observed.
EDIS/ENG/ay071494.rp6 6-110 SLR-0010736
Arsenic, cadmium, manganese, and mercury were retained as COECs in sediment. Average andexposure point concentrations exceeded LELs for all constituents except cadmium. Onlycadmium exposure point concentrations exceeded LELs.
The potential to bioaccumulate is a cause for selecting constituents as COECs with respect towildlife exposure through food chain pathways. The octanol-water partitioning coefficients (KoW)provide a rapid method for screening organic compounds on the basis of bioaccumulationpotential (i.e., tendency to occur in biota at higher concentrations than the surroundingenvironment). A log(KoW) value > 3.5 has been reported as a useful physicochemical screeninglevel for identifying xenobiotics that will potentially bioaccumulate in wildlife even if present inenvironmental media at low, non-toxic concentrations (Garten and Trabalka, 1983). Constituentswith logCKov) < 3.5 were not considered COECs for surficial soils and the terrestrialenvironment. Table 6-25 lists surficial soil organic constituents and their log(KoW) values. Allorganic constituents listed except heptachlor epoxide, alpha chlordane, gamma chlordane, andcarbazole have log(KoW) values above 3.5 and are, therefore, considered as COECs for the SRIenvironmental assessment.
In surficial soil, nineteen organic constituents were identified as COECs. Organic COECs insurficial soil are heptachlor, 4,4'-DDD, 4,4'-DDE, 4,4'-DDT, endrin, endrin ketone, endosulfann, endosulfan sulfate, methoxychlor, aroclor-1254, fluorene, phenanthrene, anthracene,fluoranthene, pyrene, benzo(a)anthracene, benzo(a)pyrene, chrysene, and di-n-butylphthalate.Three inorganic constituents were identified as COECs: arsenic, lead, and manganese.
In surface water, only aluminum and endrin were identified as COECs. Both had exposure pointconcentrations above standards or criteria.
Sediment contained no inorganic constituents above the ER-M or ER-L values. However,arsenic, manganese, and mercury exceeded the lowest effect level (LEL) as reported by Persaudet al. (1992). Therefore, these are retained as sediment COECs. All organic constituents exceptheptachlor epoxide were determined to be below sediment criteria as derived by the EqPapproach for protection of aquatic life in Class D waters. All were, however, below reportedLELs. Therefore, heptachlor epoxide was identified as a COEC in sediment for the SRIenvironmental assessment.
6.2.3 Selection of Target SpeciesThe SRI site and its surrounding environs have been described in Section 6.2.1 of this report.The SRI site is composed of old field, cropland, wetland, and forested areas. The northwestern
EDIS/ENG/ay071494.rp6 6-111 SLR-0010737
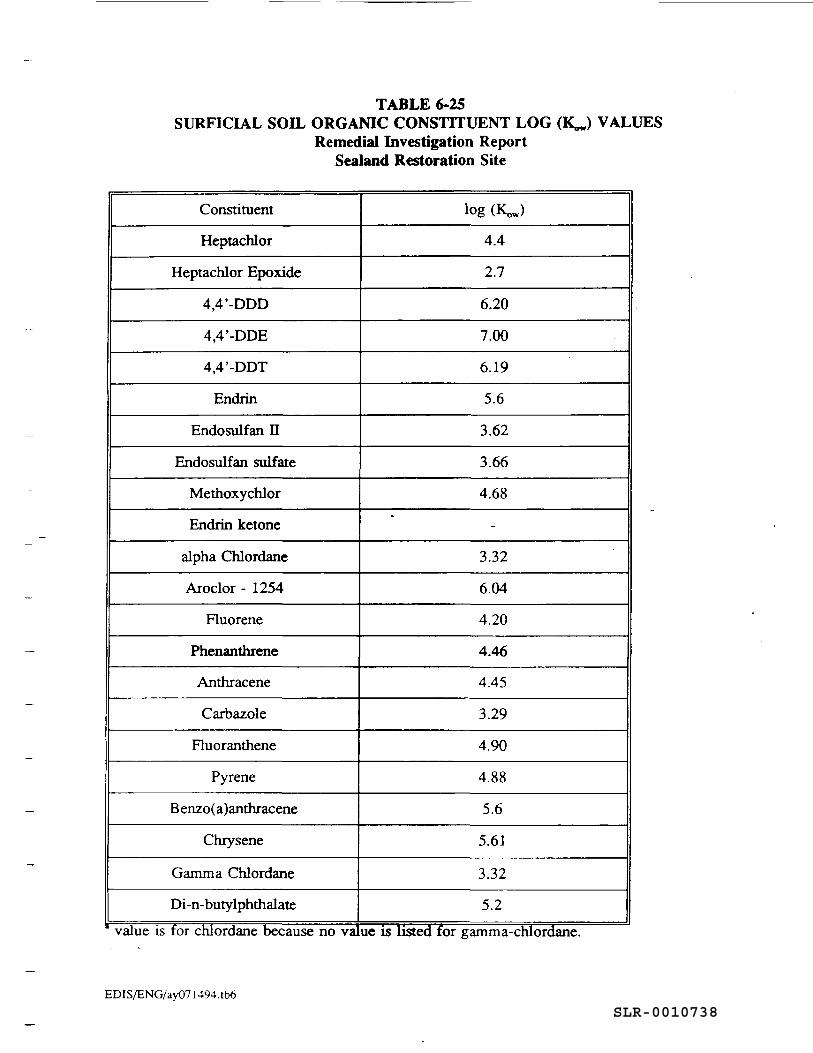
TABLE 6-25SURFICIAL SOIL ORGANIC CONSTITUENT LOG (K^) VALUES
Remedial Investigation ReportSealand Restoration Site
Constituent
Heptachlor
Heptachlor Epoxide
4,4 '-ODD
4,4 '-DDE
4,4'-DDT
Endrin
Endosulfan n
Endosulfan sulfate
Methoxychlor
Endrin ketone
alpha Chlordane
Aroclor - 1254
Fluorene
Phenanthrene
Anthracene
Carbazole
Fluoranthene
Pyrene
Benzo(a)anthracene
Chrysene
Gamma Chlordane
Di-n-butylphthalate
value is for chlordane because no va
log (K^)
4.4
2.7
6.20
7.00
6.19
5.6
3.62
3.66
4.68
*
3.32
6.04
4.20
4.46
4.45
3.29
4.90
4.88
5.6
5.61
3.32
5.2
ue is listed for gamma-chlordane.
EDIS/ENG/ay071494. tb6SLR-0010738
and eastern tributaries to Sucker Brook are located in those geographical areas of the SRI site.Both of these tributaries flow through wetland areas, both on- and off-site.
There is suitable habitat on the SRI site for terrestrial, avian, and amphibian species. Mammals,such as raccoon, could have a high frequency of exposure because they may inhabit the area fulltime. Signs of these medium sized mammals (tracks and scat) were noted during the September1992 field investigations. Exposure to contaminated soils, sediments, and surface waters couldoccur during normal daily activities.
Numerous avian species are expected to inhabit the SRI site and also use the site for feeding andbreeding activities. An appropriate avian target species should have the potential to be exposedto surface water, sediment, and soil. The American kestrel, which was observed on-site duringthe September 1992 field investigations, has a diet consisting of insects, macroinvertebrates, smallreptiles, amphibians, small mammals, and other birds. Exposure to potentially contaminated soils,sediment, and surface water could occur during daily activities.
Suitable habitat does not exist on-site for fish species to inhabit the surface waters of the SRIsite. Both tributaries occur in seasonally inundated areas, and, therefore may be dry duringportions of the year. The dissolved oxygen content of the water limits its value to fish species.These factors would inhibit the potential for fish species to exist and thrive. Macroinvertebratecommunities and some amphibians are likely to depend on these areas for propagation andsurvival.
The target species chosen for the SRI site are the raccoon (Procyon lotor), and the Americankestrel (Falco sparverius) and the meadow vole (Microtus sp). These species were chosen sincetheir feeding behavior and normal daily activities provide potential exposure to site-relatedcontaminants in sediment, surface water and soil. The raccoon and the American kestrel are bothomnivorous, that is their diet is a mixture of meat and vegetation and are therefore exposed tosite-related COECs through a number of exposure pathways. The meadow vole (Microtus sp.)was chosen as both a target species and a key prey species of the American kestrel. The meadowvole is herbivorous, lives in burrows underground, and is found throughout the United States inareas of good grass cover. The daily maintenance and cleaning activities of these species wouldalso put them in direct contact with any COECs that might be present in surface waters.
The following assumptions illustrates the conservative approach applied in defining ecologicalvariables:
EDIS/ENG/ay071494.rp6 6-113 SLR-0010739
• Target receptors are exposed chronically to upper 95% confidence interval constituentconcentrations.
• Target receptors are exposed to the constituents of ecological concern daily.
• Target receptors are exposed only to a water supply that contains the constituents ofecological concern.
• Target receptors are exposed only to a food supply that contains the constituents ofecological concern.
• Target receptors remain within the zone of impact 24 hours a day, every day of the year,for their entire lifetime.
It should also be noted that a large level of uncertainty is introduced into this assessment due tothe small size of the analytical data set. Surface water samples may or may not representconstituent contributions from the SRI site, as other potential sources of contamination exist inthe vicinity of the SRI site. This is also true of the sediment and surficial soil data.
The location of the various farms in the area surrounding the SRI site have the potential tocontribute constituents to surface water, sediment, and soils.
6.2.3.1 RaccoonThe raccoon is a widespread medium sized omnivorous mammal. They are found throughout theUnited States, Mexico, Central America, and Canada (USEPA, 1993). They occupy aquatichabitats, especially those near saltwater and freshwater marshes as they often feed onmacroinvertebrates in such habitats. Freshwater marshes might also be used for bathing anddrinking.
Raccoons eat fleshy fruits, nuts, com, grain, insects, frogs, macroinvertebrates, and eggs.Foraging might take place in abandoned farmlands, farmyards, or freshwater wetlands.
Raccoons are chiefly nocturnal, but occasionally are abroad during the day. They can adjustfeeding times to daylight hours if environmental factors offer better food yields.
Raccoons feed on a wide variety of sources depending on seasonal availability. During thespring and early summer months, raccoons typically eat more animal than plant materials. Theraccoon diet changes to one of mainly fruits during the late summer and early fall months.Winter diets consist mainly of acorns and any other corns of fruits that are still available.
EDIS/ENG/ay071494.rp6 6-114 SLR-0010740
The body size of a raccoon varies with location and availability of resources. An adult canmeasure from 46 to 71 cm in length, excluding the length of it's tail which ranges from 20 to30 cm. Weights, depending on sex and resources, may vary from 5.4 to 15.8 kg. During theirwinter dormancy, raccoons may lose up to 50 percent of their total body weight.
Raccoons present on the SRI site could be exposed to on-site contamination via several exposureroutes. Exposure to COECs in soils can be a result of feeding on worms or vegetation, or fromcleaning their fur. Surface water COECs could reach the raccoon during drinking, .eating,bathing, and swimming activities. COECs in sediment might reach the raccoon during feedingon invertebrates.
6.2.3.2 American KestrelThe American kestrel is the smallest falcon native to the United States. It is part of thestreamlined species of birds known as raptors and it is a year round resident of New York state.They consume a wide variety of animals, such as reptiles, insects, small mammals, invertebrates,and other smaller birds (USEPA, 1993).
Body sizes vary seasonally, but, are, on average, in the neighborhood of 27 cm from bill tip totail tip. Males are generally 10 to 20 percent smaller than the females. Body weights reach amaximum in winter and a minimum in summer.
Seasonaliry plays a large factor in dietary habits. Invertebrates are generally eaten year round.During the summer, the diet of the American kestrel consists mainly of large insects, dependingon availability. Small mammals and birds might also be eaten in the absence of adequatesupplies of insects. Winter diets are composed mainly of small mammals and birds.
The American kestrel is a solitary species, except during the breeding season. During this time,usually spring, males feed females and nestlings.
The potential for exposure to COECs in surface water, soils, and sediments is high for theAmerican kestrel. Feeding, bathing, nest building, and drinking activities expose this raptor toall of the potentially contaminated environmental media at the SRI site.
6.2.3.3 Meadow VoleThe meadow vole is a primarily herbivorous rodent that makes it burrows in runaways alongherbaceous vegetation. They are found throughout the United States and Canada wherever good
EDIS/ENG/ay071494.rp6 6-115 SLR-0010741
grass cover exists. They are diurnal organisms and serve as prey to many large avian predators,such as the American kestrel (USEPA, 1993).
Body sizes vary from 8.9 to 13.0 cm from head to toe and tail lengths range from 3.6 to 6.6 cm.Males are usually larger than females. Typically, meadow voles lose weight in winter and reachweight maxima in summer due to prey population availability.
Habitat is primarily grassy fields, marshes and bogs. The more grass that an area has, the morelikely a meadow vole is to take residence. Meadow voles are uncommon in areas of standingwater.
Dietary habits include succulents sedges, seeds, fungi, some insects, and animal matter. Insectsand animal matter rarely comprise more than 1% of a meadow vole's diet.
Meadow voles on the SRI site have the potential for exposure to COECs via general pathways.Their main food source, vegetation, uptakes contaminants from the soil. They also liveunderground, another direct exposure route to soil. Surface water and sediment COECs mightreach these rodents while swimming, drinking, or even eating.
6.2.4 Exposure AssessmentThe main objective of the exposure assessment is to describe and quantify any potential exposureof the local biota to site-related contaminants. The exposure assessment is divided into threeparts: exposure scenario, potential exposure pathways and media calculations, and methodologyfor calculation of target species total daily exposures. The first part of the exposure assessmentwill develop a food web for the SRI site and identify potential exposure pathways for the targetspecies. The second subsection will quantify the potential exposures of the target species to theCOECs via media calculations. The final part of this section will identify those methodologiesused in calculating the daily exposure of the target species to the COECs.
6.2.4.1 Exposure ScenarioA food web is a series of interconnecting food chains that link the producer species to theconsumer species. Primary producers, such as green plants, form the base trophic level of thefood web. They derive their energy directly from the sun. Consumers comprise the other trophiclevels at varying degrees. A primary consumer, for instance, feeds on primary producers,whereas, a secondary consumer can feed on both the primary consumer and producer levels. Anexample of the later is the raccoon. It is an omnivore, having a diet that is a mixture ofvegetation and meat. Foods webs were developed for the target species : the American kestrel
EDIS/ENG/ay071494.rp<5 6-116 SLR-0010742
(Falco spaarverius) and the raccoon (Procyon lotor). These target species best represent themajor trophic levels present at the SRI site. Figures 6-15, 6-16 and 6-17 are food webs for theAmerican kestrel, raccoon and meadow vole, respectively.
The total daily intake (mg/kg/day) for each of the target species was calculated by adding 1) theamount of constituent ingested through consumption of vegetation, 2) the amount of constituentabsorbed through direct ingestion of soil, 3) amount of constituent absorbed through ingestionof surface water, and 4) the amount of constituent absorbed through ingestion of prey. .
Exposure via the inhalation pathway was not evaluated for the purposes of the environmental riskassessment. The site is heavily vegetated and the generation of fugitive dust and volatile organicsis expected to be minimal. Therefore, the inhalation of COECs was not considered a viableexposure pathway within this ecological risk assessment.
6.2.4.2 Potential Exposure Pathways and Media CalculationsThree environmental media were examined for concentrations of site related constituents: surfacewater, soil, and sediment. All target species were assumed to be exposed to on-site mediacontamination, only, i.e. their home range is limited to the SRI site, even though they may onlyspend a portion of their time on-site. In addition, it was assumed that each target species' entiredietary intake originated from the SRI site and therefore had the potential for contamination, eventhough food collected on-site may comprise a small fraction of the target species' actual diet.This exposure is the worst case scenario for these target species.
Twenty-six constituents have been identified as being of concern in surficial soil, sediment,and/or surface water. These COECs are aluminum, arsenic, cadmium, lead, manganese, mercury,heptachlor, 4,4'-DDE, endosulfan H, 4,4'-DDD, endosulfan sulfate, 4,4'-DDT, methoxychlor,endrin ketone, endrin, heptachlor epoxide, arochlor-1254, fluorene, phenanthrene, anthracene,fluoranthene, pyrene, benzo(a)anthracene> benzo(a)pyrene, chrysene and di-n-butylphthalate. Thephysicochemical and environmental fate constants of the COECs are p.. sented in Table 6-26.
6.2.4.3 Methodology for Calculation of Target Species Total Dally ExposureTotal exposure of a target species is defined as the summation of exposure from each individualpathway. Exposure of the target species to the COECs are quantified in the following pathwaycalculations.
EDIS/ENG/ay071494.rp6 6-117 SLR-0010743
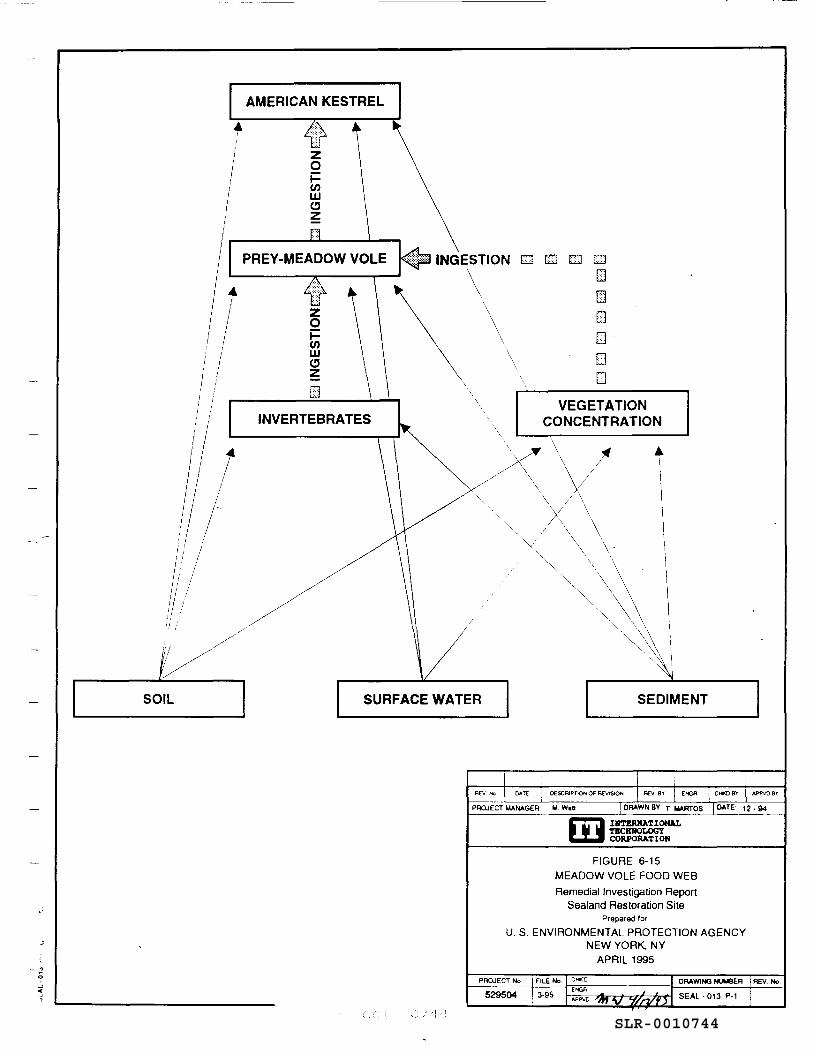
AMERICAN KESTREL
PREY-MEADOW VOLE INGESTION m m m m
VEGETATIONCONCENTRATIONINVERTEBRATES
SURFACE WATER
DESCRIPTION Of REVISION REV BY ENGfl I Crt<D BY APPVD
PROJECT MANAGER: M. Win I DRAWN BY T. MURTOS DATE 12 . 94
, INTERNATIONALTECHNOLOGYCORPORATION
FIGURE 6-15MEADOW VOLE FOOD WEBRemedial Investigation Report
Sealand Restoration SitePrepared lor
U. S. ENVIRONMENTAL PROTECTION AGENCYNEW YORK, NY
APRIL 1995
PROJECT No FILE No. DRAWING NUMBER
529504 3-95 SEAL-013 P-1
SLR-0010744
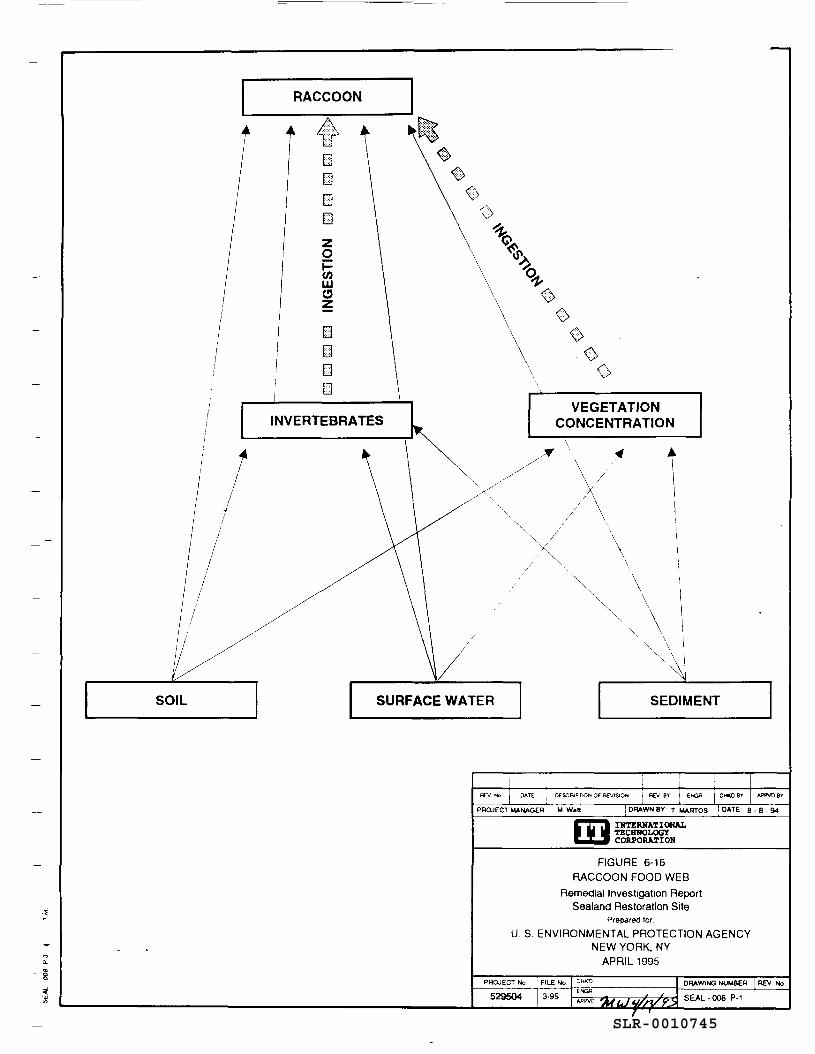
VEGETATIONCONCENTRATION
DATE . DESCRIPTION OF REVISION j REV BY CHKD 8V APPVD BY
PROJECT MANAGER M W*tt DRAWN BY T MARTOS I DATE 8 - 8 - 9 4
IMTERMATIOMALTECHNOLOGYCORPORATION
FIGURE 6-16RACCOON FOOD WEB
Remedial Investigation ReportSealand Restoration Site
Prepared lor
U. S. ENVIRONMENTAL PROTECTION AGENCYNEW YORK, NY
APRIL 1995
PROJECT No ! FILE No DRAWING NUMBER
529504 3-95 SEAL-008 P-1
SLR-0010745
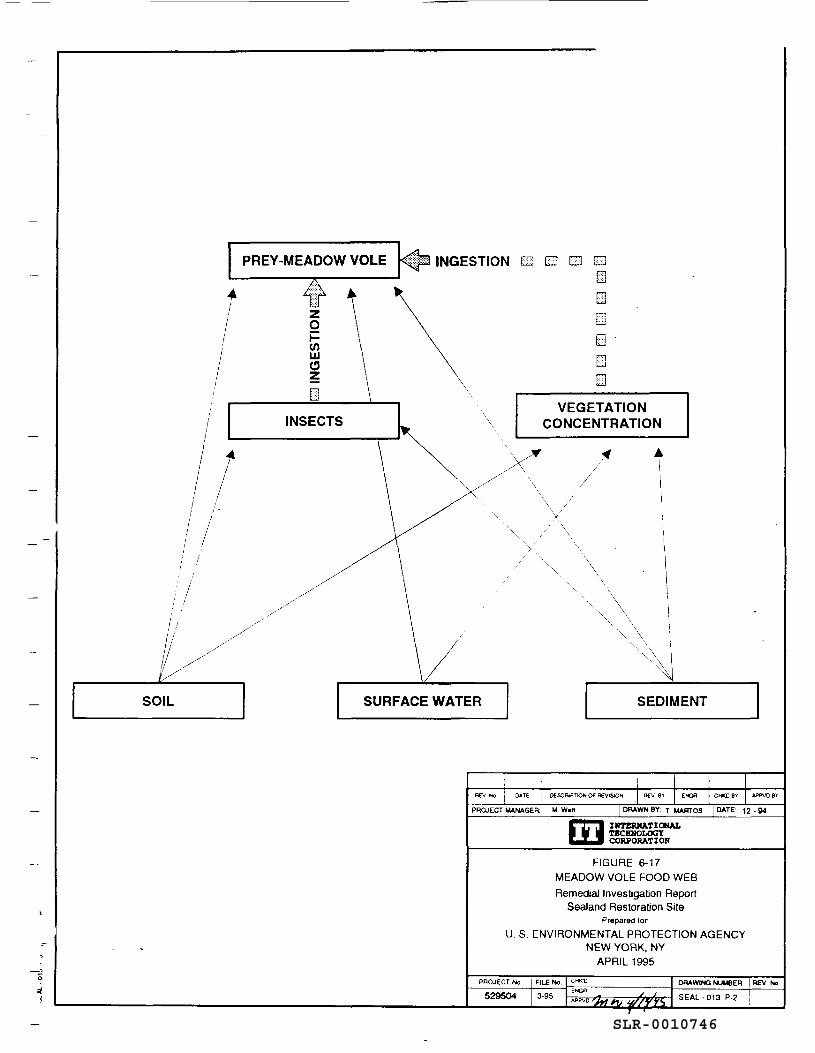
INGESTION m m m mI1Iiim
PREY-MEADOW VOLE
VEGETATIONCONCENTRATION
SEDIMENT
DESCRIPTION Of REVISION CMKD BY APPVO B'
PROJECT MANAGER M W.n DRAWN BY T. MAflTOS DATE: 12-94
INTERNATIONALTHCHHOLOGYCORPORATION
FIGURE 6-17MEADOW VOLE FOOD WEBRemedial Investigation Report
Sealand Restoration SitePrepared lor
U. S. ENVIRONMENTAL PROTECTION AGENCYNEW YORK, NY
APRIL 1995
529504DRAWING NUMBER REV No.
SEAL-013 P-2
SLR-0010746
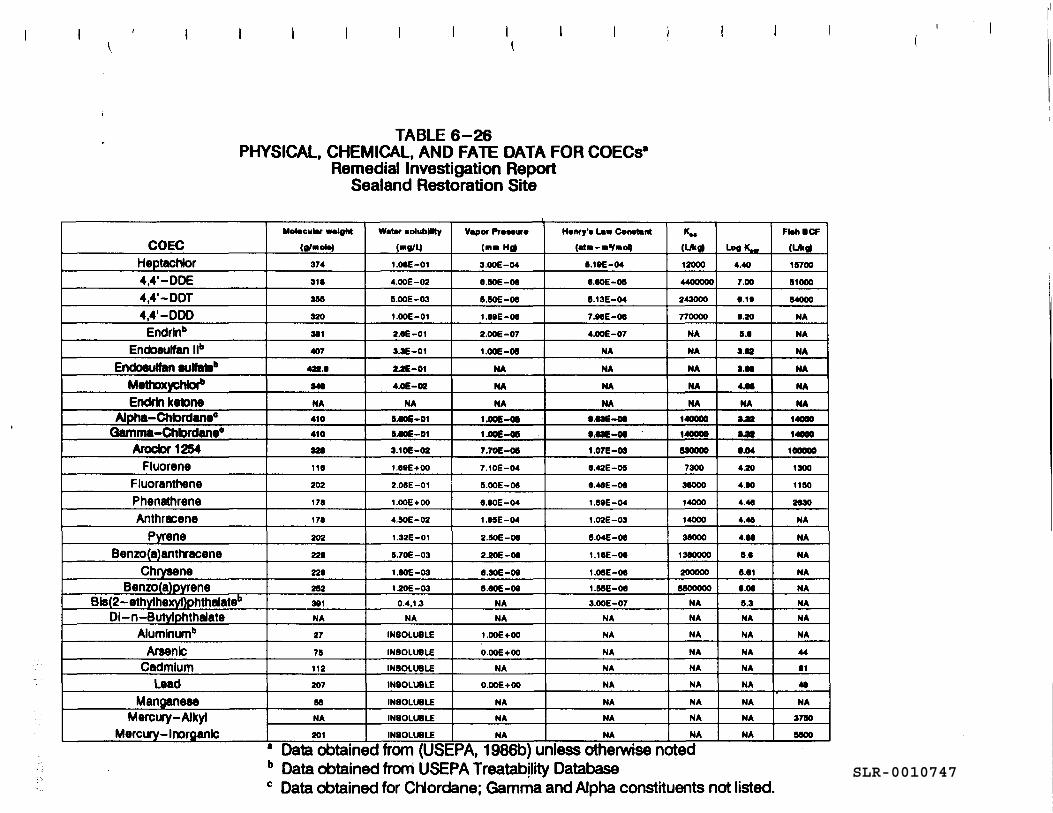
TABLE 6-26PHYSICAL, CHEMICAL, AND FATE DATA FOR COECs'
Remedial Investigation ReportSealand Restoration Site
COECHeptachtor4,4'-DDE4,4'-DDT4,4'-DDDEndrln"
Endosulfan II"Endosulfan sutfate"
Methoxychtar*Endrin ketone
Alpha-Chtordane0
Oamma-Chtordane0
Arodor1254Fluorene
FluoranthenePhenathreneAnthracene
PyreneBenzo(a)anthracene
ChryseneBenzo(a)pyrene
Bis(2-ethylhexyl)phthalateb
Di-n-ButylphthalateAluminum"
ArsenicCadmium
LeadManganese
Mercury-Alky)Mercury- Inorganic
Molecular walgM
(g/moto)
374
311
356
320
301
407
422.0
346
NA
410
410
320
118
202
178
17S
202
228
228
252
301
NA
27
75
112
207
55
NA
201
Water lolubllrry
(mg/U
1.08E-01
4.00E-02
5.00E-03
1.00E-01
2.8E-01
3.3E-01
2.2E-01
4.0E-02
NA
B.60E-01S.OOE-01
3.10E-02
1.8SE+00
2.06E-01
1.00E + 00
4.50E-02
1.32E-01
5.706-03
1.80E-03
1 JOE-03
0.4,13
NA
INSOLUBLE
INSOLUBLE
INSOLUBLE
INSOLUBLE
INSOLUBLE
INSOLUBLE
INSOLUBLE
Vapor Praaaura
(niaHg)
3.00E-04
8.BOE-08
5.50E-08
1.80E-08
2.00E-07
1.00E-08
NA
NA
NA
1.00E-OB
1.00E-08
7.70E-OB
7.10E-04
5.00E-08
6.60E-04
1.0SE-04
2.50E-08
2.20E-08
8.30E-00
5.80E-00
NA
NA
1.00E+00
O.OOE+00
NA
O.OOE+00
NA
NA
NA
Hanry't Law Constant
(mtm-mtmott
8.10E-04
8.80E-OB
5.13E-04
7.08E-08
4.00E-07
NA
NA
NA
NA
8.83E-08
8.83E-08
1.07E-OS
8.42E-05
8.46E-08
1.59E-04
1.02E-03
B.04E-08
1.18E-08
LOSE -08
1.B5E-08
3.00E-07
NA
NA
NA
NA
NA
NA
NA
NA
K~(LAB)
12000
4400000
243000
770000
NA
NA
NA
NA
NA
140000
140000
530000
7300
38000
14000
14000
38000
1380000
200000
5800000
NA
NA
NA
NA
NA
NA
NA
NA
NA
LogK^4.40
7.00
8.10
8.20
8.0
3.02
1.00
4.00
NA
142
•.at0.04
4.20
4.00
4.48
4.45
4.00
8.8
8.01
0.08
5.3
NA
NA
NA
NA
NA
NA
NA
NA
FMiBCF
(LAB)
15700
81000
54000
NA
NA
NA
NA
NA
NA14000
14000
100000
1300
1180
2830
NA
NA
NA
NA
NA
NA
NA
NA
44
81
40
NA
3780
8800
• Data obtained from (USEPA, 1986b) unless otherwise notedb Data obtained from USEPA Treatability Databasec Data obtained for CNordane; Gamma and Alpha constituents not listed.
SLR-0010747
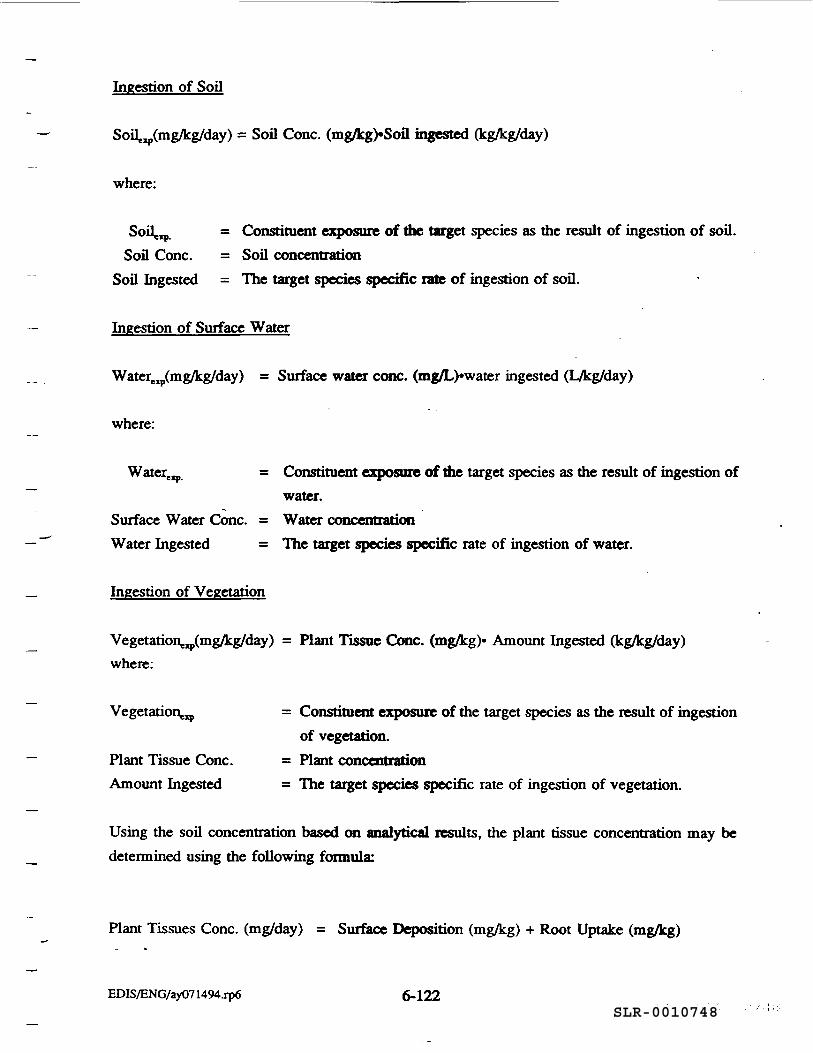
Ingestion of Soil
Soil^mg/kg/day) = Soil Cone. (mg/kg>Soil ingested (kg/kg/day)
where:
. = Constituent exposure of die target species as the result of ingestion of soil.Soil Cone. = Soil concentration
Soil Ingested = The target species specific rate of ingestion of soil.
Ingestion of Surface Water
Watere]lp(mg/kg/day) = Surface water cone. (mg/L)»water ingested (L/kg/day)
where:
Waterexp = Constituent exposure of the target species as the result of ingestion ofwater.
Surface Water Cone. = Water concentrationWater Ingested = The target species specific rate of ingestion of water.
Ingestion of Vegetation
Vegetation^mg/kg/day) = Plant Tissue Cone. (mg/kg> Amount Ingested (kg/kg/day)where:
Vegetation^ = Constituent exposure of the target species as the result of ingestionof vegetation.
Plant Tissue Cone. = Plant concentrationAmount Ingested = The target species specific rate of ingestion of vegetation.
Using the soil concentration based on analytical results, the plant tissue concentration may bedetermined using the following formula:
Plant Tissues Cone, (mg/day) = Surface Deposition (mg/kg) + Root Uptake (mg/kg)
EDIS/ENG/ay071494jp6 6-122SLR-0010748
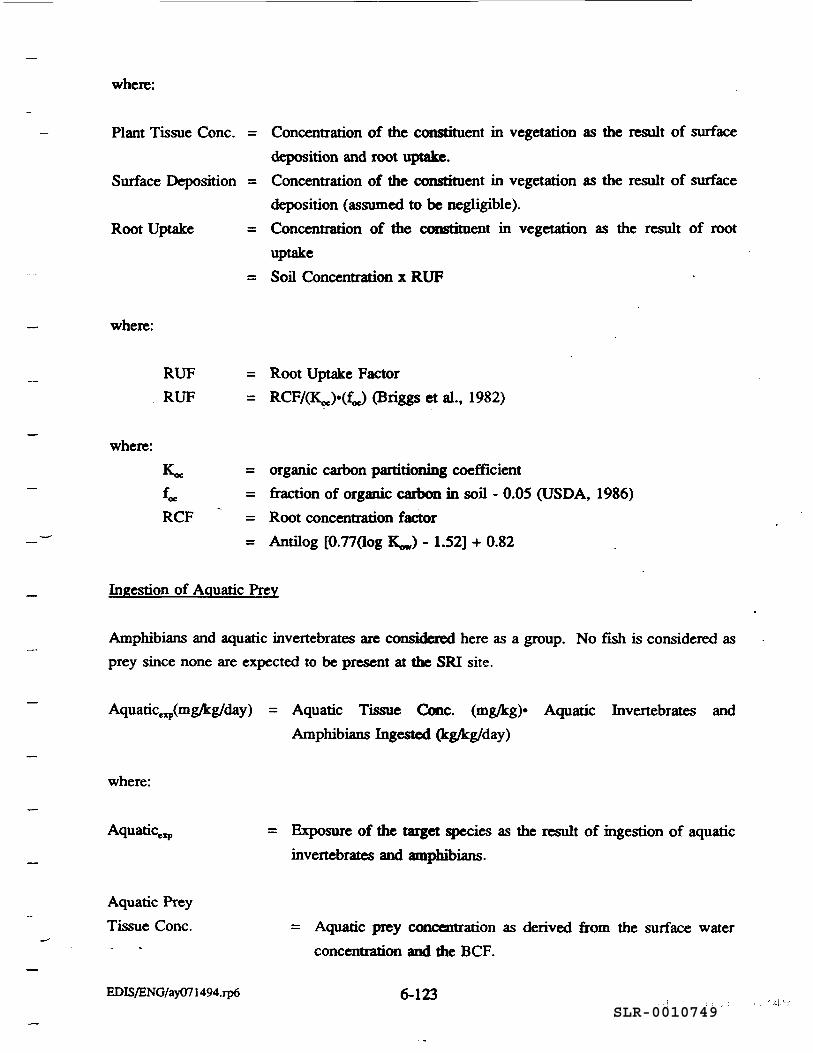
where:
Plant Tissue Cone. = Concentration of the constituent in vegetation as the result of surfacedeposition and root uptake.
Surface Deposition = Concentration of the constituent in vegetation as the result of surfacedeposition (assumed to be negligible).
Root Uptake = Concentration of die constituent in vegetation as the result of rootuptake
= Soil Concentration x RUF
where:
RUF = Root Uptake FactorRUF = RCF/(KJ-(fJ (Briggs et al., 1982)
where:K^. = organic carbon partitioning coefficientf,,,. = fraction of organic carbon in soil - 0.05 (USDA, 1986)RCF = Root concentration factor
= Antilog [0.77(log K^J - 1.52] + 0.82
Ingestion of Aquatic Prey
Amphibians and aquatic invertebrates are considered here as a group. No fish is considered asprey since none are expected to be present at the SRI site.
Aquaticexp(mg/kg/day) = Aquatic Tissue Cone. (mg/kg)« Aquatic Invertebrates andAmphibians Ingested (kg/kg/day)
where:
Aquaticejp = Exposure of the target species as the result of ingestion of aquaticinvertebrates and amphibians.
Aquatic PreyTissue Cone. = Aquatic prey concentration as derived from the surface water
concentration and die BCF.
EDIS/ENG/ay071494.ip6 6-123SLR-0010749
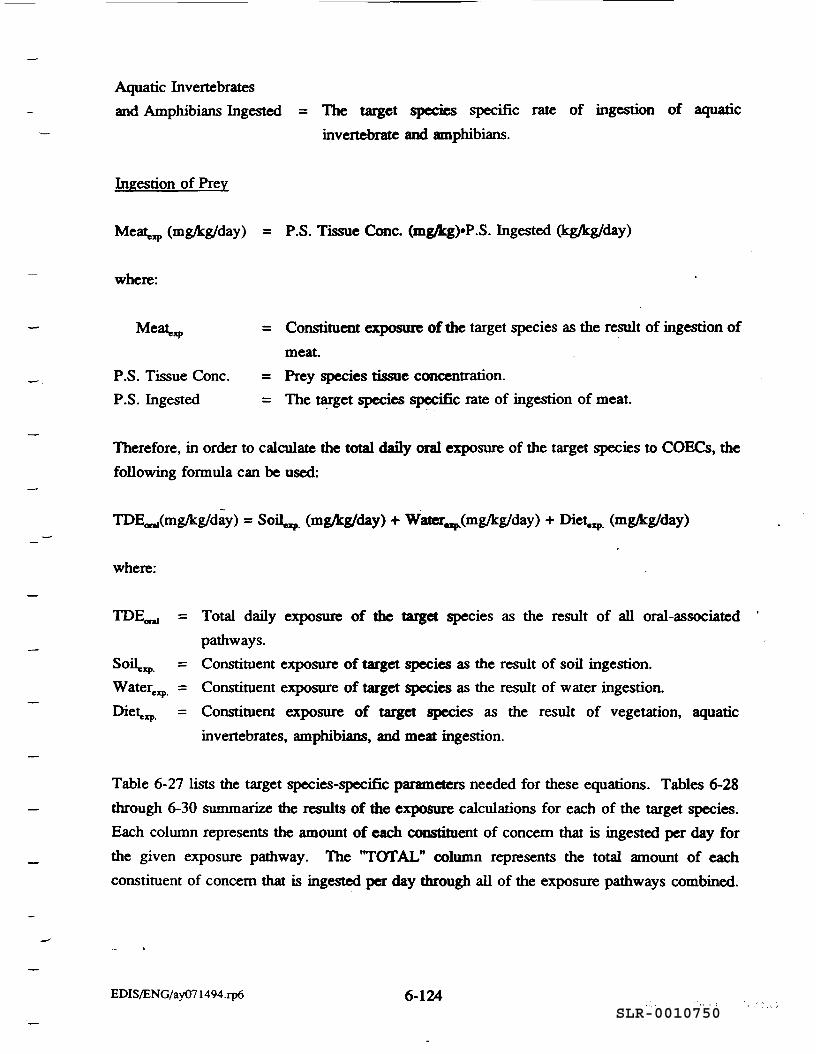
Aquatic Invertebratesand Amphibians Ingested = The target species specific rate of ingestion of aquatic
invertebrate and amphibians.
Ingestion of Prey
Meat,,,, (mg/kg/day) = P.S. Tissue Cone. (mgflcg)»P.S. Ingested (kg/kg/day)
where:
Meat^ = Constituent exposure of the target species as the result of ingestion ofmeat
P.S. Tissue Cone. = Prey species tissue concentration.P.S. Ingested = The target species specific rate of ingestion of meat.
Therefore, in order to calculate the total daily oral exposure of the target species to COECs, thefollowing formula can be used:
TDE^mg/kg/day) = Soil (mg/kg/day) + Water^mg/kg/day) + Dietexpt (mg/kg/day)
where:
= Total daily exposure of the target species as the result of all oral-associatedpathways.
= Constituent exposure of target species as the result of soil ingestion.Waterexp = Constituent exposure of target species as the result of water ingestion.Dietexp = Constituent exposure of target species as the result of vegetation, aquatic
invertebrates, amphibians, and meat ingestion.
Table 6-27 lists the target species-specific parameters needed for these equations. Tables 6-28through 6-30 summarize the results of the exposure calculations for each of the target species.Each column represents the amount of each constituent of concern that is ingested per day forthe given exposure pathway. The "TOTAL" column represents the total amount of eachconstituent of concern that is ingested per day through all of the exposure pathways combined.
EDIS/ENG/ay07l494.rp6 6-124SLR-0010750
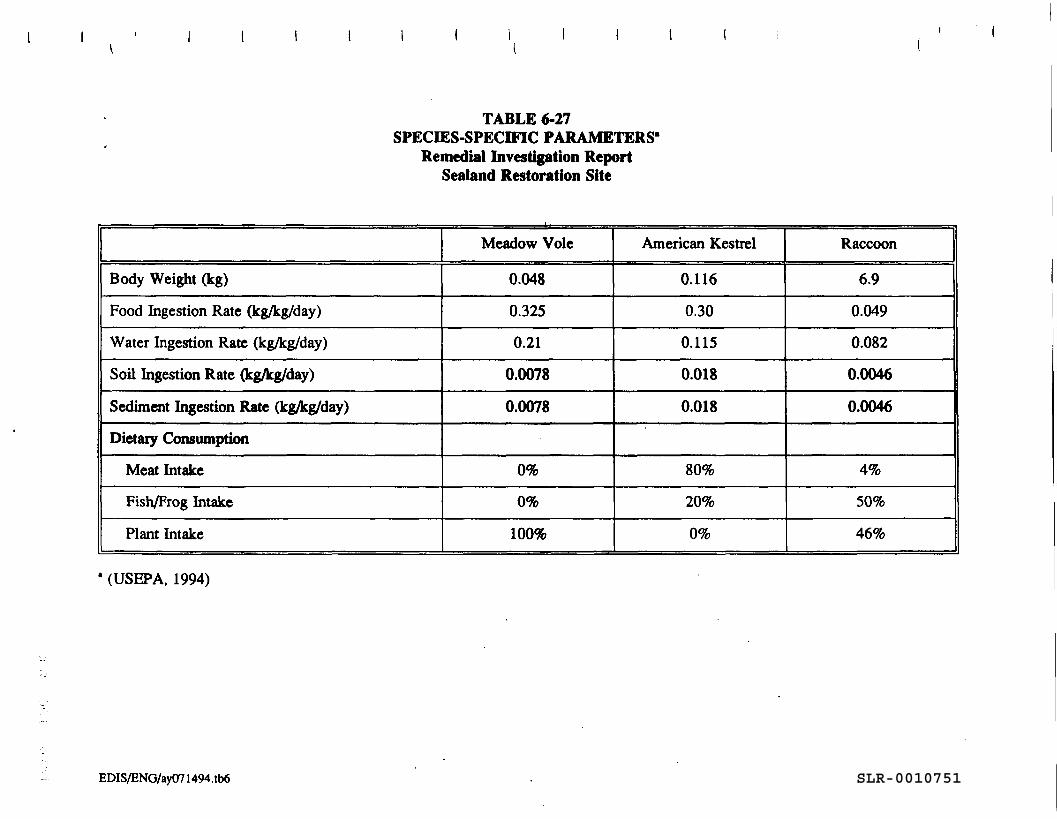
TABLE 6-27SPECIES-SPECIFIC PARAMETERS'
Remedial Investigation ReportSealand Restoration Site
Body Weight (kg)
Food Ingestion Rate (kg/kg/day)
Water Ingestion Rate (kg/kg/day)
Soil Ingestion Rate (kg/kg/day)
Sediment Ingestion Rate (kg/kg/day)
Dietary Consumption
Meat Intake
Fish/Frog Intake
Plant Intake
Meadow Vole
0.048
0.325
0.21
0.0078
0.0078
0%
0%
100%
American Kestrel
0.116
0.30
0.115
0.018
0.018
80%
20%
0%
Raccoon
6.9
0.049
0.082
0.0046
0.0046
4%
50%
46%
(USEPA, 1994)
EDIS/ENG/ay071494.tb6 SLR-0010751
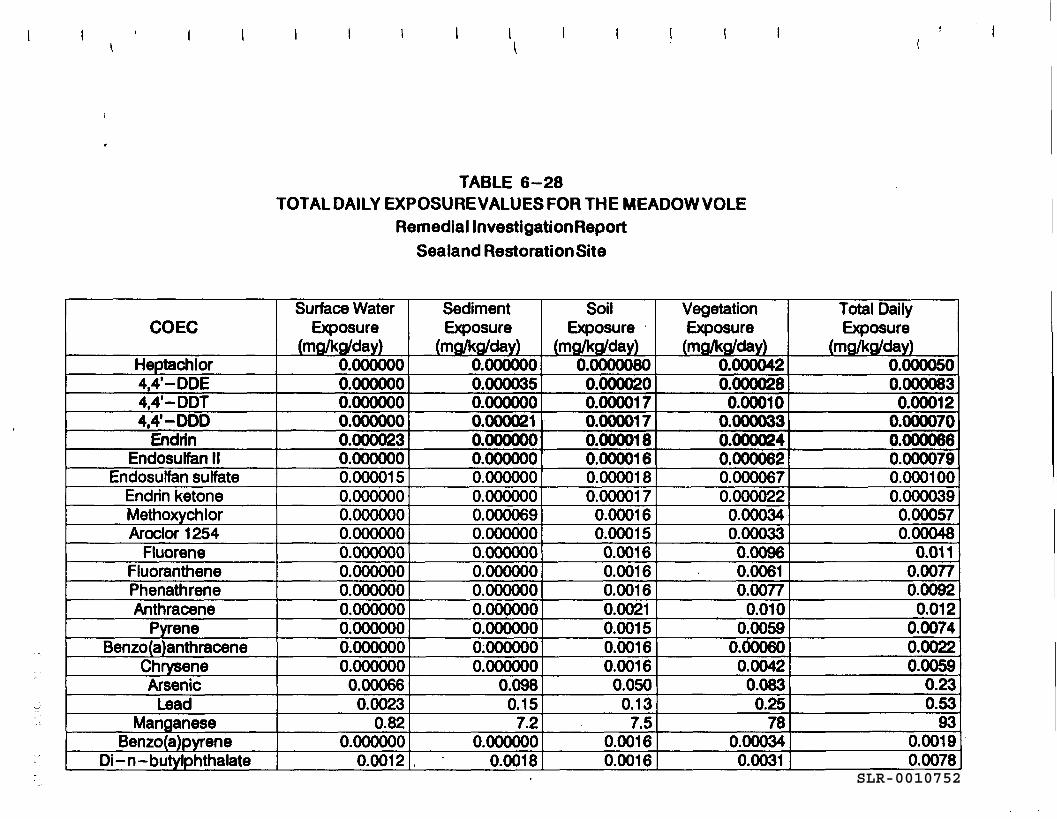
TABLE 6-28TOTAL DAILY EXPOSURE VALUES FOR THE MEADOW VOLE
Remedial InvestigationReportSealand Restoration Site
COEC
Heptachlor4,4'-DDE4,4'- DOT4,4'-DDD
EndrinEndosutfan II
Endosulfan sulfateEndrin ketoneMethoxychlorAroclor 1254
FluoreneFluoranthenePhenathreneAnthracene
PyreneBenzo(a)anthracene
ChryseneArsenic
LeadManganese
Benzo(a)pyreneDi - n - butylphthalate
Surface WaterExposure
(mg/kg/day)0.0000000.0000000.0000000.0000000.0000230.0000000.0000150.0000000.0000000.0000000.0000000.0000000.0000000.0000000.0000000.0000000.0000000.000660.0023
0.820.000000
0.0012
SedimentExposure
(mg/kg/day)0.0000000.0000350.0000000.0000210.0000000.0000000.0000000.0000000.0000690.0000000.0000000.0000000.0000000.0000000.0000000:0000000.000000
0.0980.157.2
0.0000000.0018
SoilExposure
(mg/kg/day)0.00000800.0000200.0000170.0000170.0000180.0000160.0000180.0000170.000160.000150.00160.00160.00160.00210.00150.00160.00160.050
0.137.5
0.00160.0016
VegetationExposure(mg/kg/day)
0.0000420.0000280.00010
0.0000330.0000240.0000620.0000670.0000220.000340.000330.00960.00610.0077
0.0100.0059
0.000600.00420.083
0.2578
0.000340.0031
Total DailyExposure
(mg/kg/day)0.0000500.0000830.00012
0.0000700.0000660.0000790.0001000.0000390.000570.00048
0.0110.00770.0092
0.0120.00740.00220.0059
0.230.53
930.00190.0078
SLR-0010752
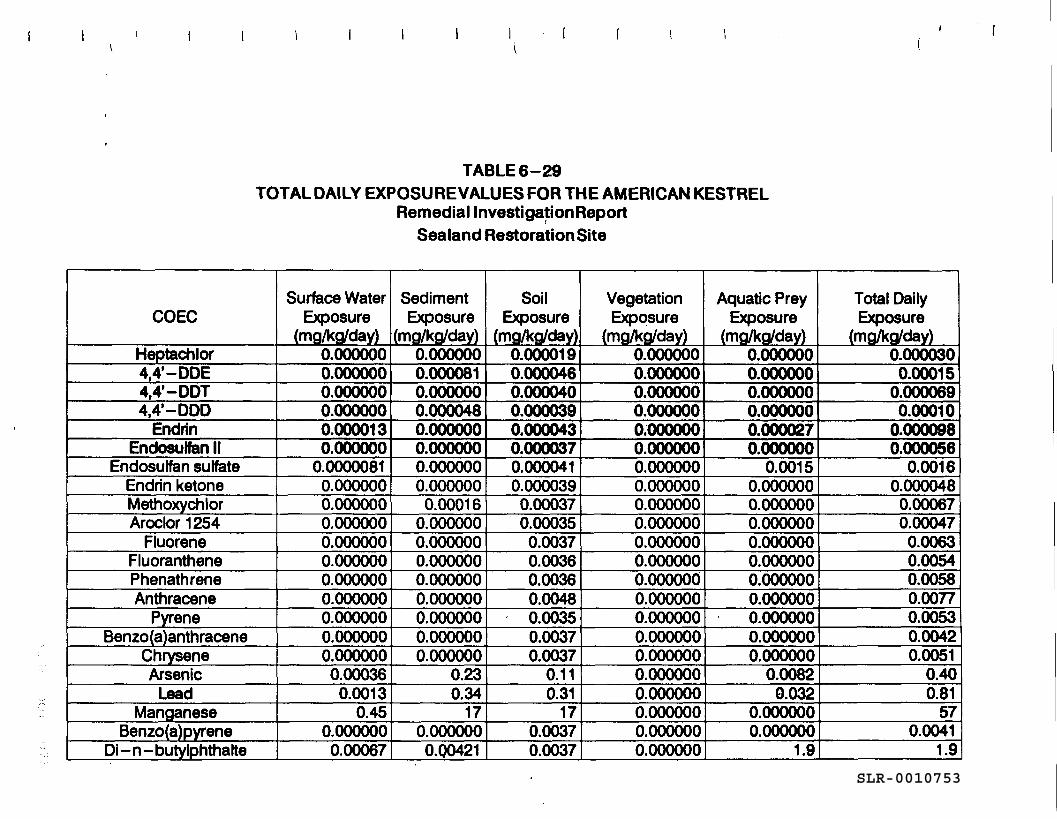
TABLE6-29TOTAL DAILY EXPOSURE VALUES FOR THE AMERICAN KESTREL
Remedial Investigation ReportSealand Restoration Site
COEC
Heptachlor4,4'-DDE4,4'-DDT4,4'- ODD
EndrinEndosulfan II
Endosulfan sulfateEndrin ketoneMethoxychlorAroclor 1254
FluoreneFluoranthenePhenathreneAnthracene
PyreneBenzo(a)anthracene
ChryseneArsenic
LeadManganese
Benzo(a)pyreneDi-n-butylphthalte
Surface WaterExposure
(mg/kg/day)0.0000000.0000000.0000000.0000000.0000130.000000
0.00000810.0000000.0000000.0000000.0000000.0000000.0000000.0000000.0000000.0000000.0000000.000360.0013
0.450.0000000.00067
SedimentExposure
(mg/kg/day)0.0000000.0000810.0000000.0000480.0000000.0000000.0000000.0000000.00016
0.0000000.0000000.0000000.0000000.0000000.0000000.0000000.000000
0.230.34
170.0000000.00421
SoilExposure
(mg/kg/day)0.0000190.0000460.0000400.0000390.0000430.0000370.0000410.0000390.000370.000350.00370.00360.00360.00480.00350.00370.0037
0.110.31
170.00370.0037
VegetationExposure
(mg/kg/day)0.0000000.0000000.0000000.0000000.0000000.0000000.0000000.0000000.0000000.0000000.0000000.0000000.0000000.0000000.0000000.0000000.0000000.0000000.0000000.0000000.0000000.000000
Aquatic PreyExposure
(mg/kg/day)0.0000000.0000000.0000000.0000000.0000270.000000
0.00150.0000000.0000000.0000000.0000000.0000000.0000000.0000000.0000000.0000000.000000
0.00820.032
0.0000000.000000
1.9
Total DailyExposure
(mg/kg/day)0.0000300.00015
0.0000690.00010
0.0000980.000056
0.00160.0000480.000670.000470.00630.00540.00580.00770.00530.00420.0051
0.400.81
570.0041
1.9SLR-0010753
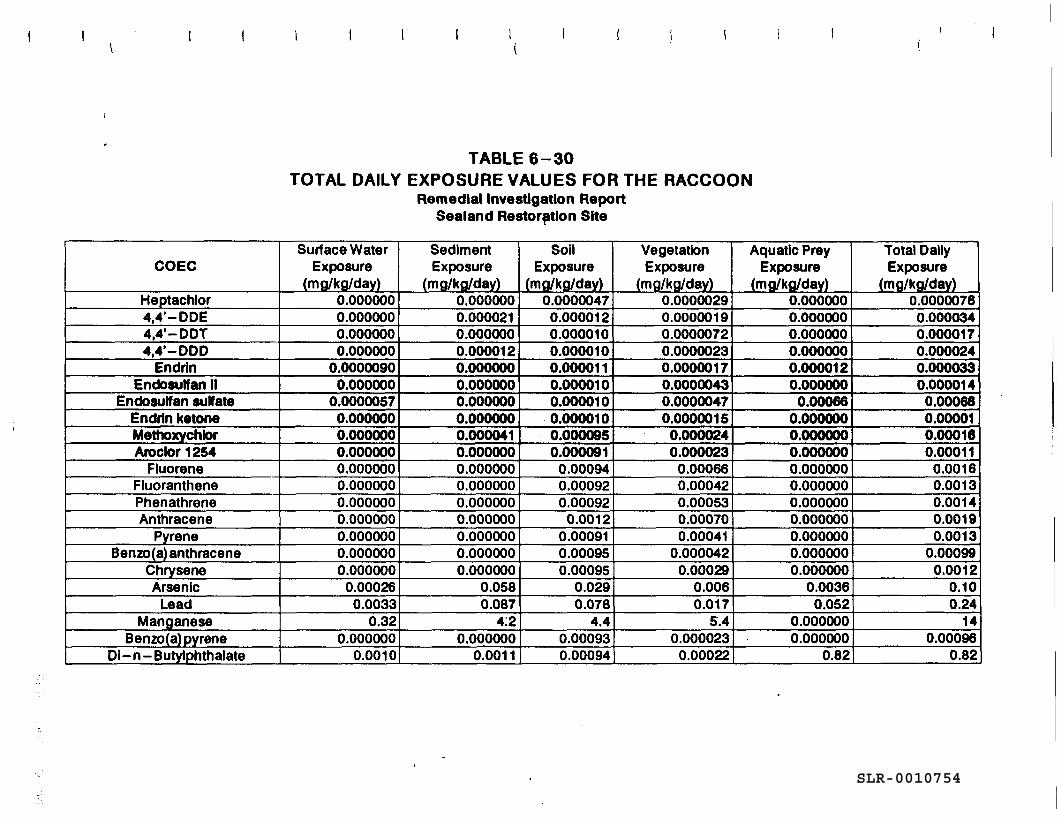
TABLE 6-30TOTAL DAILY EXPOSURE VALUES FOR THE RACCOON
Remedial Investigation ReportSealand Restoration Site
COEC
Heptachlor4,4'-DDE4,4'- DOT4,4'-DDD
EndrinEndosulfan II
Endosulfan sulfateEndrin ketoneMetnoxychtorAroclor1254
FluoreneFluoranthenePhenathreneAnthracene
PyreneBenzo(a) anthracene
ChryseneArsenicLead
ManganeseBenzo(a)pyrene
Di-n-Butylphthalate
Surface WaterExposure
(mg/kg/day)0.0000000.0000000.0000000.000000
0.00000900.000000
0.00000570.0000000.0000000.0000000.0000000.0000000.0000000.0000000.0000000.0000000.0000000.000260.0033
0.32j0.000000
0.0010
SedimentExposure
(mg/kg/day)0.0000000.0000210.0000000.0000120.0000000.0000000.0000000.0000000.0000410.0000000.0000000.0000000.0000000.0000000.0000000.0000000.000000
0.0580.087
4:20.000000
0.0011
SoilExposure
(mg/kg/day)0.00000470.0000120.0000100.0000100.0000110.0000100.0000100.0000100.0000950.0000910.000940.000920.000920.0012
0.000910.000950.00095
0.0290.078
4.40.000930.00094
VegetationExposure
(mg/kg/day)0.00000290.00000190.00000720.00000230.00000170.00000430.00000470.00000150.0000240.0000230.000660.000420.000530.000700.00041
0.0000420.00029
0.0060.017
5.40.0000230.00022
Aquatic PreyExposure
(mg/kg/day)0.0000000.0000000.0000000.0000000.0000120.0000000.00066
0.0000000.0000000.0000000.0000000.0000000.0000000.0000000.0000000.0000000.000000
0.00360.052
0.0000000.000000
0.82
Total DailyExposure
(mg/kg/day)0.00000760.0000340.0000170.0000240.0000330.0000140.000680.000010.000160.000110.00160.00130.00140.00190.0013
0.000990.0012
0.100.24
140.00096
0.82
SLR-0010754
6.2.5 Risk CharacterizationThis section characterizes the nature and degree of adverse impact associated with the exposureof COECs to endemic target species at the SRI site. Characterization includes exposure via threemedia pathways: soils, surface water, and sediment.
Detections of constituents in surface water and sediment were initially compared to availablewater quality standards and sediment criteria. The comparisons are presented in Tables 6-23 and6-24. The total daily exposures calculated in previous sections are based on species-specificparameters. The information for the toxicity data is not, however, target species-specific.Therefore, the approach in this risk characterization is only semi-quantitative. Total dailyexposures for the target species are compared to die range of toxicity values for the organismsof concern or other organisms, as available. A qualitative presentation of the potential for effectis presented below.
Laboratory data provides information on the relative toxicity of the various compounds; thesensitivity of a diversity of species tested (usually not the target species of this assessment); theinfluence of diets and routes of administration; and variance in response due to sex, age, andreproductive status. Because the information is usually not specific to the target species, theextrapolation of laboratory toxicity tests to die field is, in most instances, uncertain andinadvisable. The numerically calculated species-specific daily intake of the constituents ofconcern are compared to the range of acute and chronic toxicity data available for the COECs.The calculated daily intake for the target species at the SRI site are presented in Tables 6-28through 6-30. These comparisons are presented in the next section. A Hazard Index (USEPA,1986) is calculated, based on these comparisons.
6.2.5.1 Inorganic ConstituentsThe inorganic COEC that exists at the SRI site are aluminum, arsenic, cadmium, lead,manganese, and mercury. The mercury exposure point concentration in sediment (0.350 mg/kg)is below the ER-M (1.3 mg/kg) but above both the ER-L (0.15 mg/kg) and the LEL (0.12mg/kg). Sediment levels elevated above these are found throughout the site.
The NYSDEC standard for Class C waters is 100 ug/f of aluminum. No Class D criteria exists.Studies conducted regarding aluminum suggest that when the pH is between 6.5 and 9.0,freshwater aquatic organisms should not be affected negatively by a chronic exposure less than87 ug/f or by an acute exposure of less than 750 ng/{ (USEPA, 1988). Acute criteria were notexceeded at any surface water station at the SRI site. However, exposure to constituents shouldbe considered a continuous and, therefore, chronic exposure. Only one sampling location at the
EDIS/ENG/ay071494jp6 6-129SLR-0010755
SRI site exceeded chronic criteria levels and the NYSDEC standard. The dissolved amount ofaluminum at this station was less than both USEPA criteria. The dissolved concentration isusually considered the bioavailable portion of the total concentration and toxic part. Therefore,the potential for sub-lethal impacts to sensitive organisms at the SRI site with respect toaluminum is minimal.
Inorganic arsenic, (i.e., arsenic combined with one or more other elements such as chlorine orsulfur) is the most commonly found form in in surface water (USEPA, 1989c). This form enterswater bodies primarily through runoff. The presence of biota in water bodies has been -knownto play an important role in determining speciation of arsenic (USEPA, 1984a). Inorganic arsenicis much more toxic than the organic form (USEPA, 1984a).
Arsenic acute toxicity, as well as sub-lethal effects, has been observed in fish and invertebrates.Toxicity can be highly influenced by temperature, pH, speciation, and many other factors.Inorganic arsenic is acutely toxic to freshwater aquatic animals at concentrations as low as 850mg/f in water and affects marine plants at concentrations as low as 13 to 56 mg/l. The ER-Lis reported as 33 mg/kg.
Trivalent arsenic is more toxic to wildlife than either pentavalent arsenic or organic arsenicals.Arsenic poisoning has been reported in acute episodes but chronic arsenosis is rarely encountered.Sensitive species of birds have died following single oral doses of 17.4 to 47.6 mg/kg bodyweight. Adverse effects in mammals were noted in single oral doses of 2.5 to 33 mg/kg bodyweight, and at chronic doses of 1 to 10 mg/kg body weight. As little as 1.7 mg/kg has beenshown to produce fetal death and malformations during critical stages of hamster embryogenesis(Eisler, 1988b).
The arsenic exposure point concentration in sediment (125 mg/kg) is below the ER-M and ER-Lvalues but exceeds the LEL (5.5 mg/kg). The elevated sediment concentrations are contained inthe wetlands directly cost of the disposal cell and to the northwest of the site. Effects in biotafrom arsenic are expected to be localized. Food chain exposure to arsenic is predicted to bebelow the LOELs reported in the literature.
Cadmium is known to occur naturally at relatively low concentrations (0.1 ug/(). The manydifferent forms that it can take complicate the level of impact it may have on a freshwatersystem. Toxicity of cadmium is hardness dependent.
EDIS/ENG/ay071494jp6 6-130SLR-0010756
Eisler (1985) reported effects of cadmium exposure to aquatic organisms including mortality,reduced growth, inhibited reproduction, and other adverse effects. A relatively large amount ofdata exists for cadmium in sediments, suggesting an ER-L of 5 mg/kg.
Freshwater acute toxicity values for cadmium range from 1 to 73,500 pg/f for fish and from 3.5to 28,000 pg/t for invertebrates (USEPA, 1980). The sediment ER-L and ER-M are reportedas 5.0 and 9.0 mg/kg, respectively. The T.PJ, is given as 1.0 mg/kg.
Lead can adversely affect survival, growth, reproduction, development, and metabolism of manyspecies. Organolead compounds are more toxic than inorganic lead compounds. Lead poisoningof waterfowl through ingestion of lead shot is a significant cause of mortality to these species.Among sensitive species of birds, survival was reduced at doses of 75 to 150 mg/kg body weight.Reproductive impairment was noted at 50 mg^cg and signs of poisoning were evident at dosesas low as 2.8 mg/kg body weight. Survival of rats was reduced at acute oral doses as low as 5mg/kg body weight. Survival of dogs was reduced by chronic oral doses of 0.3 mg/kg bodyweight (Eisler, 1988a).
The cadmium exposure point concentration in sediment (1.02 mg/kg) is below both the ER-Mand ER-L but slightly exceeds the LEL (1 mg/kg). Only two sediment samples exceeded thislevel. Both are contained east of landscaping area and adjacent to each other.. Effects on benthicbiota from cadmium exposure is expected to be very localized.
It has been shown that the removal of lead from aquatic media is pH dependent. Lead is moremobile in alkaline waters than in acidic ones (USEPA, 1984b). Lead water criteria are hardnessdependent. Lead exposure can produce many types of adverse effects, among which aremodifications of the function and structure of kidneys, bones and the central nervous system(Eisler, 1988a). Organolead compounds are generally more toxic than inorganic forms. Adverseeffects in water usually occur at concentrations ranging from 1.3 mg/( to 7.7 mg/f. From thesediment data collected an ER-L of 35 mg/kg is suggested.
Dietary exposure to lead through food chain and media to organism transfer is predicted toexceed the LOEL reported in the literature. The exceedences are predicted for the meadow volethrough consumption of contaminated plants and for the American kestrel through consumptionof contaminated prey.
Mercury occurs in the environment in three states: elemental, mercurous compounds, andmercuric compounds. Acute toxicity of inorganic mercury to freshwater invertebrates ranges
EDIS/ENG/ay071494jp6 6-131SLR-0010757
from 2.2 mg/L to 2,000 mg/L (USEPA, 1986a). Organomercury compounds, particularlymethylmercury, are more toxic than inorganic forms (Eisler, 1987) and mercury is considered themost toxic trace metal to aquatic organisms. Based on collected sediment data, an ER-L of 0.15mg/kg for mercury is suggested.
The mercury exposure point concentration in sediment (0.350 mg/kg) is below the ER-M (1.3mg/kg) but above both the ER-L (0.15 mg/kg) and the LEL (0.12 mg/kg). Sediment levelselevated above these are found throughout the site.
Manganese does not typically occur in the pure form, rather it occurs in combination with otherelements and is a common constituent found in pesticides and fertilizers (ATSDR, 1991 a). It isa vital micronutrient and is only toxic at high concentrations. Data on toxicity of manganese tofreshwater aquatic life indicate values ranging from 1.5 mg/f to over 1000 mg/f (USEPA, 1986).No acute or chronic criteria exist at the federal level nor do any standards exist at the state level.Sediment quality criteria for Ontario list an T-FflL of 457 mg/kg.
The effects of manganese on wildlife has not been extensively researched. A survival NOEL fororal exposure to rats is reported as 290 mg/kg/day whereas a system effects NOEL for mice isreported as 250 mg/kg/day.
The manganese exposure point concentration in sediment (970 mg/kg) exceeds the LEL (457mg/kg). No ER-L or ER-M are provided for manganese. Dietary exposure to manganesethrough foodchain and media to organism transfer are not predicted to exceed the LOEL'sreported in the literature.
6.2.5.2 PesticidesPesticides are synthetic chemicals originally made for the purposes of pest control and fertilizersused in lawn maintenance. Due to the harmful impacts they can cause, some, such as DDT, havebeen banned in the United States (USEPA, 1994).
Soil moisture and evaporation of water have a strong impact on the rate of volatilisation of suchcompounds from soils and sand. Constituents of this nature are more likely to adsorb to sedimentor soils, therefore, limiting volatilization. Concentrations of pesticides/PCBs are thus more likelyto be higher in sediment than surface water. They are also highly lipophilic in nature, resultingin high bioconcentration factors (BCFs).
EDIS/ENG/ay071494jp6 6-132SLR-0010758
The COECs that are of this type are heptachlor, 4,4'-DDE, 4,4'-DDD, 4,4'-DDT, endrin, endrinketone, endosulfan sulfate, endosulfan n, and methoxychlor. All of these are COECs in surficialsoils. Endrin is the only COEC of this nature in surface waters and heptachlor epoxide insediments.
Heptachlor is commonly present as an impurity in the pesticide chlordane. In much of theliterature, it is documented as being highly toxic. This pesticide is no longer available in theUnited States due to the amount of negative impacts that resulted from its use (USEPA, 1989).No observable adverse effects level (NOAEL) values in rats ranged from 750 pg/kg/day to 1350pg/kg/day. Calculated total daily exposure (TDE) values for all target species are orders ofmagnitude less than the NOAEL values. Therefore, negative impacts from heptachlor on theecological community are not expected
Three of the pesticides identified as COECs are typically not detected alone. 4,4'-DDT, 4,4'-DDE, and 4,4'-DDD are usually found as a mixture of all three constituents. DDD and DDE aredegradation and metabolic products of DDT. NOAEL values of 56 pg/kg/day and 41 pg/kg/daywere sited in the literature for 4,4'-DDT in Cooper's hawk and the red-tailed hawk, respectively(Oak Ridge National Labs, 1993). None of die calculated TDE values for the target speciesexceed these values. Negative impacts to the environment are not expected from the low levelsof DDT, DDE, and DDD present at the SRI site.
Methoxychlor is also known as methoxy DDT. It is an insecticide that is most effectivecombating mosquitos and house flies. In mammals an acute oral LDX in rats of 6,000 mg/kg isreported in the literature (1983). TDE values for this constituent are well below this value.Thus, this pesticide is not expected to present negative environmental impacts at SRI.
Endrin was used for the control of rodents and insects prior to the cessation of its production.An NOAEL for chronic exposure in rats has been determined to be between 250 and 300pg/kg/day (ATSDR, 1990). The toxicity of endrin ketone is expected to be similar. None of thecalculated TDE values exceed or approach these NOAEL values. Thus, endrin and endrin ketoneare not expected to cause negative ecological impacts at SRI.
Endrin is a COEC in surface waters as well as soil. A standard does not exist for this constituentat the NY state level, therefore, the USEPA chronic criteria of 0.0023 pg/C will be used forpurposes of comparison. Only two of eighteen samples exhibited concentrations detected abovethe method detection limit. One value was below the chronic criteria, and, the other was above
EDIS/ENG/ay071494jp6 6-133SLR-0010759
it. The presence of endrin is isolated and not prevalent across the site; therefore, it is not of highconcern for potential negative ecological impact.
Endosulfan is used for the control of insects on crops. It is possible that farmers in the area ofthe site use it for insect control and contribute to the concentrations of this constituent at the site.Endosulfan sulfate is a breakdown product of endosulfan. NOAEL values range from 800 - 2500ug/kg/day in rats (ATSDR, 1993) for endosulfan. None of the calculated TDEs for the targetspecies exceeded these values. Based on this lack of exceedance of NOAEL values, it isexpected that neither endosulfan nor endosulfan sulfate will negatively impact the environmentof the SRI site.
6.2.5.3 Polychlorinated Biphenyls (PCBs)Polychlorinated biphenyls (PCBs) are chlorinated derivatives of biphenyls, a class of aromaticorganic compounds. The production of PCBs is no longer permitted in the United States due totheir negative ecological and health impacts. Substantial portions of PCBs manufactured priorto 1971 contained up to 68 percent chlorine and are believed to still be present in theenvironment due to their persistence. Their environmental persistence and ability tobioaccumulate cause PCBs to be of potential concern (USEPA, 1980).
Each PCB congener has a different way of behaving in the environment. Some breakdown morereadily than others. It has been determined that soil moisture and evaporation have a stronginfluence on the rate of chlorinated hydrocarbon volatilization from soils and sand. PCBs arehighly lipophilic and readily bioconcentrate in animal tissue. The only PCB identified as aCOEC for the SRI site is aroclor-1254.
NOAELs for aroclor-1254 of 0.186, 0.07, and 0.035 mg/kg/day have been documented for theshort-tailed shrew, mink, and fox, respectively. For avian species, Cooper's hawk and the red-tailed hawk have NOAELS of 2,150 and 1,570 ngflcg/day, respectively. Calculated TDE valuesfor the target species at the SRI site do not exceed any of the NOAELs; therefore, negativeimpacts due to arochlor-1254 at the SRI site are not expected.
6.2.5.4 Pofycycllc Aromatic Hydrocarbons (PAHs)PAHs are chemicals formed during the incomplete burning of coal, oil, gas, wood, and otherorganics. A few such chemicals were also used to make pesticides (USEPA, 1994).
Most PAHs do not occur singularly in die environment, rather they occur as a mixture ofchemicals. They generally do not dissolve in water. PAHs have the potential to evaporate, but,
EDIS/ENG/ay071494jp6 6-134SLR-0010760
most adsorb tightly to panicles in soils or sediment. In surface water and sediment,microorganisms speed up the breakdown of these chemical complexes. Sorption of PAHs in soilis directly dependent on particle size, and organic carbon content Microbial degradation is themain degradation process for PAHs in soils. The rate of PAH breakdown depends on a varietyof environmental factors, such as pH. The amount of degradation determines the availability toterrestrial plant species. Bioaccumulation studies have been conducted for PAH compounds onhigher trophic level consumers and showed no significant affect.
All of the COECs that are PAHs were detected in surficial soils. These COECs are flnorene,phenanthrene, anthracene, pyrene, benzo(a)anthracene, chrysene, and fluoranthene.
All seven of the PAHs identified as COECs for die SRI site were treated as one class of PAHcompounds (US Department of Health, 1994). No PAH compounds were found in surface watersso this discussion will primarily focus on the surficial soils where all of the PAH COECs weredetected. NOAEL values were derived for die group, that included all seven of the SRI sitePAHs, rather than the individual constituents. A dose of 133300 ug/kg/day is reported in theliterature to have a negative impact on reproduction in rats (USEPA, 1994). None of thecalculated IDE values for the PAHs identified at die SRI site exceed this value. Thus, they arenot expected to negatively impact the surrounding ecology of the SRI site.
6.2.5.5 Dl-n-butylphthalateDi-n-butylphthalate was detected infrequently in all three media. The available aquatic data forphthalate esters indicate that acute and chronic toxicity to aquatic life occurs at concentrationsas low 940 and 3 pg/f, respectively. The effects of di-n-butylphthalate on terrestrial wildlife islimited. Eggshell thinning is reported to occur in ring doves at 1.11 mg/kg/day.
Dietary exposure via foodchain transfer may exceed the LOELs reported in the literature. Thedietary exposure is predicted based on die exposure point concentration; the exposure pointconcentration is actually greater than die maximum detected concentration because the detectionlimits for the non-detects are high. Dietary exposure calculated for detected concentrations doesnot exceed die LOELs. The risk to biota from di-n-butyl phthalate is considered minimal.
6.2.6 Hazard IndicesA Hazard Quotient (HQ) can be derived for each constituent and each species and die total dailyexposure (TDE) divided by die acceptable daily exposure (ADE) found in die literature. Further,a Hazard Index for a species can be calculated as die sum of die individual Hazard Quotientsfor diat species. Table 6-31 presents die Hazard Quotients and Hazard Indices for each species.
EDIS/ENG/ay071494jp6 6-135SLR-0010761
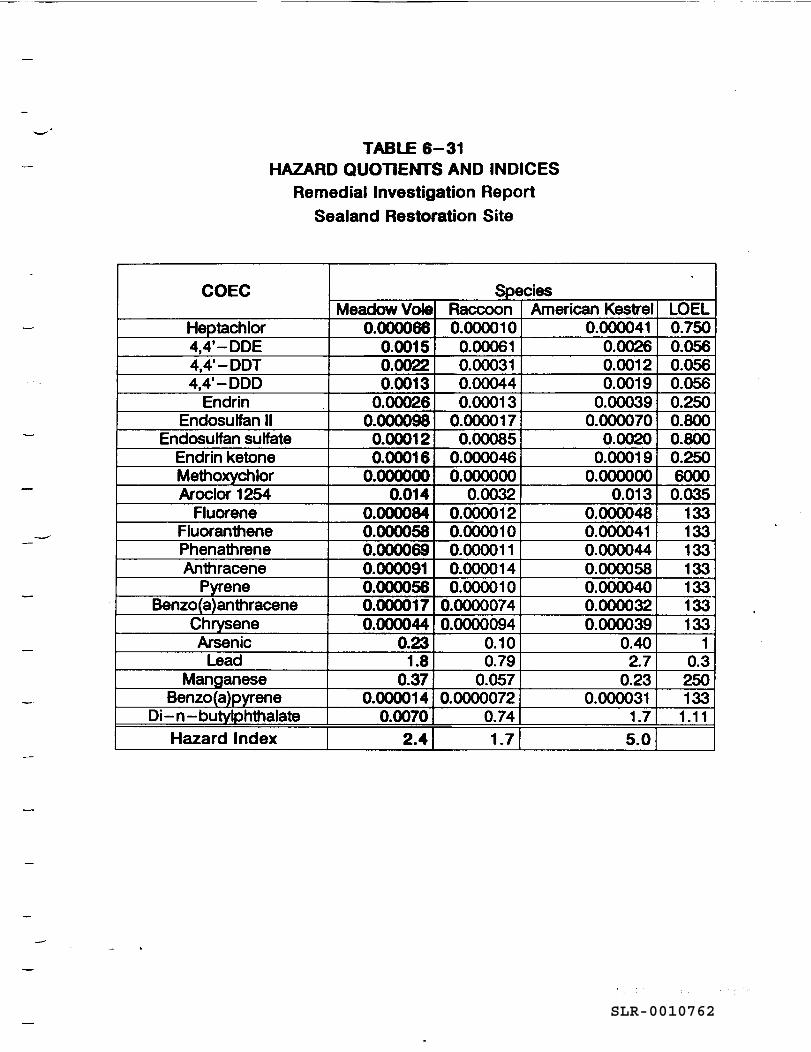
TABLE 6-31HAZARD QUOTIENTS AND INDICES
Remedial Investigation ReportSealand Restoration Site
COEC
Heptachlor4,4' -DDE4,4' -DOT4,4' -ODD
EndrinEndosutfan II
Endosulfan sulfateEndrin ketoneMethoxychbrAroclor 1254
FluoreneFluoranthenePhenathreneAnthracene
PyreneBenzo(a)anthracene
ChryseneArsenic
LeadManganese
Benzo(a)pyreneDi - n - butylphthalate
Hazard Index
SpeciesMeadow Vote
0.0000660.00150.00220.0013
0.000260.0000980.000120.00016
0.0000000.014
0.0000840.0000580.0000690.0000910.0000560.0000170.000044
0.231.8
0.370.000014
0.00702.4
Raccoon0.0000100.000610.000310.000440.00013
0.0000170.00085
0.0000460.000000
0.00320.0000120.0000100.0000110.0000140.000010
0.00000740.0000094
0.100.79
0.0570.0000072
0.741.7
American Kestrel0.000041
0.00260.00120.0019
0.000390.000070
0.00200.00019
0.0000000.013
0.0000480.0000410.0000440.0000580.0000400.0000320.000039
0.402.7
0.230.000031
1.75.0
LOEL0.7500.0560.0560.0560.2500.8000.8000.25060000.035
133133133133133133133
10.3250133
1.11
SLR-0010762
Only two constituents of concern have hazard quotients calculated greater than one: lead and di-n-butylphthalate. The high value for di-n-butyiphthalate is related to the high detection limitsreported for non-detects. Based on detected levels, the hazard quotient would be below one. Thehazard quotient for lead exceeds one for both the meadow vole and American kestrel. Theelevated soil levels could produce food chain transfer of lead which could effect biota. It shouldbe pointed out mat background levels of lead would also produce exceedences of the LOELs.
The Hazard Indices for all three species exceed one. Lead and di-n-butylphthalate contribute themost to the hazard indices. Manganese and arsenic are of secondary importance.
6.2.7 Uncertainty AnalysisThe precision of an ecological assessment is limited by the size and quality of the database.There are varying degrees of uncertainty associated with estimating the impacts of constituentexposure. Uncertainties of this nature have been compensated for throughout this assessment bymaking conservative assumptions where necessary. Specific areas of uncertainty include:
• Receptor species• Fate and transport estimates• Exposure estimates• Toxicological data and risk characterization• Complex interactions of uncertainty elements
These areas of uncertainty are addressed in the following sections.
6.2.7.1 Receptor SpeciesTo achieve an estimate of the potential risk to an ecological community, target speciesrepresenting various exposure pathways and scenarios were modeled. These target species wereselected because they represented the types of species that were observed on-site, and whosepotential exposures were through varied pathways. These target species were assumed to resideon-site 100% of their lives and obtained 100% of their dietary intake from on-site sources.Therefore, they are assumed to be maximally exposed to any site-related contaminants. Actualindividuals of these species probably do not spend their entire lifetimes on-site or obtain 100%of the dietary intake from the SRI site.
Although these target species were selected because they are potentially exposed to site-relatedcontaminants through varied pathways, other species exist on-site and individuals of these species
EDIS/ENG/ay071494.rp6 6-137SLR-0010763
may have greater or lesser exposures than those calculated in this assessment. Target specieswere chosen which should represent maximum exposure.
£2.7.2 Fate and Transport EstimatesMany of the constituents are subject to attenuation in soil or surface water by such processes asphotodecomposition, sorption, deposition, and biodegradation. However, the half-life valuesassociated with these fate processes are site-specific, constituent-specific, and dependent on manyenvironmental factors. Because of the uncertainty associated with measuring these fate processes,this assessment assumes that none of these processes are operative. In addition, this assessmentassumes that no transport mechanisms are acting on the environmental media at the site.Therefore, the constituent concentrations detected in the various environmental media (soil,surface water, and sediment) at the SRI site are assumed to be constant over the duration ofpotential exposure. Both of these assumptions provide an added degree of conservatism to thisassessment.
6.2.7.3 Exposure EstimatesThe exposure assessment utilized mathematical models that rely heavily on estimates of themagnitude of exposure to the constituents of concern. Analytical data that were used to quantifyexposures were the 95% upper confidence limit of the mean concentration of each constituent.Using these values as exposure point concentrations for the entire SRI site, overestimates themagnitude of potential exposure for the sake of conservation.
Paste for the Mathematical Models of Exposure AssessmentMathematical models, such as those employed in the exposure assessment, are helpful inproviding an estimate of the potential for a biological system's response given a particular setof input conditions and constraints. The assessment models provide for comparisons ofmaximum exposure concentrations to a biological system to concentrations found to cause effects.Here, the biological systems examined are the individual target receptors.
Any attempt to model a biological system incorporates some degree of uncertainty. For example,in modeling the transfer of a constituent through a food chain pathway such as forage ingestion,it is necessary to quantify the constituent transfer rates from soil to plant and from plant toanimals. If these values do not exist as a result of previous scientific inquiry, assumptions aremade that permit estimation from the best available, most relevant information. The precisionof the resulting estimate of dose incurred depends on the accuracy of these assumptions reflectingreal-world events.
EDIS/ENG/ay071494jp6 6-138SLR-0010764
In essence, the scientist has taken a system in which many variables exist and constructed amanageable model of that system by assuming those variables are constant at a defined level.This approach sets the input constituent concentration as the only independent variable in themodel. A linear relationship is assumed that is not necessarily reflective of real-world conditions.The dependent variable (the dose incurred) becomes a function of constituent concentration alone,which may not adequately represent site-specific conditions. This dose is qualified by theconstraints on the model.
6.2.7.4 Toxlcologlcal Data and Risk CharacterizationThe overriding uncertainty associated with the risk characterization is the lack of specifictoxicological data. Not all constituents have sufficient data, if any at all, for the target speciesin the toxicological literature. In addition, not all endpoints of concern for ecological assessmentare addressed. This forces the use of a range of toxicity values used as an across-the-boardspecies toxicity value. The use of non-species specific toxicity data generates a large level ofuncertainty in this risk evaluation.
6.2.7.5 Complex Interaction of Uncertainty ElementsAn ecological assessment of a site is ultimately an integrated evaluation of historical, chemical,analytical, environmental, demographic, and toxicological data that is as site-specific as possible.To minimize the effect of uncertainties in the evaluation, each step is biased toward conservativeestimations. Since each step builds on the previous one, this biased approach more man compen-sates for assessment uncertainties. In addition, these calculations do not represent currentlyexisting or expected future exposures or impacts. Rather, they are estimations that may occuronly if all of the conservative assumptions are realized. Thus, this assessment is designed to bequite conservative and, therefore, protective of the environment.
6.2.8 SummaryThe SRI site and the surrounding 0.5 mile radius area were investigated to determine existingecological conditions. All of the environs within the above mentioned study area werecharacterized and grouped into three habitat types: aquatic, wetlands and terrestrial. Observationsobtained during September 1992 field investigations were reviewed and species lists for avians(Table 6-14), mammals (Table 6-15) and vegetation (Table 6-16) were compiled.
Only one species listed within the New York Natural Heritage Program Database was observedwithin the study area. Clearwood (Pilea fontand) is a vegetative species typically found withinwetland habitats and was present on-site during September 1992 field investigation. Table 6-19
EDIS/ENG/ay071494jp6 6-139
SLR-0010765
and Table 6-20 present the New York Natural Heritage identified endangered/threatened speciesand significant habitat areas in the vicinity of SRI site, respectively.
Several individual great blue heron (Ardea kerodias) were noted during field investigations. Thepresence of this species on-site may be a result of the heron rookeries which are listed as"Significant Habitat" by the New York Natural Heritage Program Database as existing in thevicinity of the SRI site.
Three target species were identified in order to calculate potential impacts to ecological receptorsas a result of the contamination present on-site. The raccoon (Procyon lot or), the Americankestrel (Falco sparverius) and the meadow vole (fdicrotus sp.) were selected as target species.
Twenty-six constituents of environmental concern were identified and evaluated for potentialimpacts to the selected target species and aquatic biota in general. A comparison of the totaldaily intake of the COECs for target species with the range of available lexicological data foundin the literature was the basis for the risk characterization. This assessment is more qualitativein nature due to the limited availability of species-specific, chemical-specific and endpoint-specific data. The combination of these factors, therefore, contribute to the uncertainty of suchcomparisons.
Total daily intakes for each of the target species were calculated as a result of the ingestion ofsoil, sediment, surface water, vegetation and food. Species-specific dietary ingestion ratesobtained from the literature were used in these calculations.
Only two of the calculated TDE values for the target species exceeded appropriate NOAELs forany of the COECs for the SRI site. These are lead and di-n-butylphthalate. However, the di-n-butylphthalate exposure point concentration used to calculate the TDE values was based on highdetection limits for non-detects. Detected concentrations do not predict unacceptable TDE values.Lead exposure is high throughout the site. Though exposure to lead may have an effect, it isimportant to point out that effect are predicted from background levels also.
It is also important to note that the nature of some of the contamination at the SRI site may notbe solely attributed to previous site activities. The area surrounding the site has a large numberof farms. Some crops even exist in the northern area of the site. The pesticides used inmaintaining the local farms could be transported to the SRI site via surface runoff or aerialdeposition. Some PAHs can also be attributed to such activities.
EDIS/ENG/ay071494.ip6 6-140SLR-0010766
In conclusion, while the SRI site exhibits low levels of contamination, it does not pose anysignificant environmental hazard above that naturally occurs. Concentrations of most COECs areat levels such that target species would not receive constituents at levels known to cause hannto the individual animals. Overall, the ecology of the SRI site is typical for such a system. Thedata shows a low potential for future negative impacts from the identified COECs.
EDIS/ENG/ay071494jp6 6-141SLR-0010767

SLR-0010768
7.0 Summary and Conclusions
A two phased investigation was conducted by IT Corporation, under contract with and on behalfof the EPA, at the SRI site in order to characterize and evaluate existing contamination at thesite. Dames and Moore conducted a previous RJ/FS under the direction of NYSDEC in 1986-1987 which recommended source removal. Between 1987 and 1990, the drum storage area,waste tanks, and disposal cell were remediated. IT conducted a Phase I Supplemental RI fieldinvestigation from September through December of 1992 to investigate any residualcontamination remaining in the environmental media after the source removal had beencompleted. The results of the Supplemental Phase I RI field investigation indicated that a secondinvestigation was necessary to characterize the nature and extent of the residual contaminationnear the disposal cell. IT conducted a Supplemental Phase II RI field investigation during Augustthrough October of 1993. The collective data set was used to characterize the hydrogeologicalconditions at the site, evaluate contaminant fate and transport, and conduct a baseline riskassessment.
This section presents a summary of the results of die remedial investigation, transport evaluationand the baseline risk assessment. Presented in detail in previous sections; "Nature and Extentof Contamination" describes the results of the remedial investigation, "Fate and Transport"describes the potential routes of contaminant migration, and "Baseline Risk Assessment"summarizes the findings of the human health and environmental risk assessments. The majorresults and conclusions of these evaluations are presented in the following subsections.
7.1 Nature and Extent of ContaminationThe major concerns on the SRI site is groundwater contamination in the overburden and bedrockaquifers and soil contamination found in the saturated soil zone adjacent to the northeasterncomer of the disposal cell. The small slug of soil contamination appears to be locatedapproximately 20 to 22 feet below grade (10 feet below the water table) and does not appear tobe significant in size.
7.1.1 Leachate Monitoring System SamplesBased upon the results of the IT Corporation Supplemental RI Phase I and Phase n investigationconducted in 1992 and 1993, the major concerns on the SRI site is groundwater contaminationin the overburden and bedrock aquifers and soil contamination found in the saturated soil zoneadjacent to the northeastern comer of the former disposal cell. The small slug of soil
EDIS/ENG/ay071494.rp7 7-1 !SLR-0010769
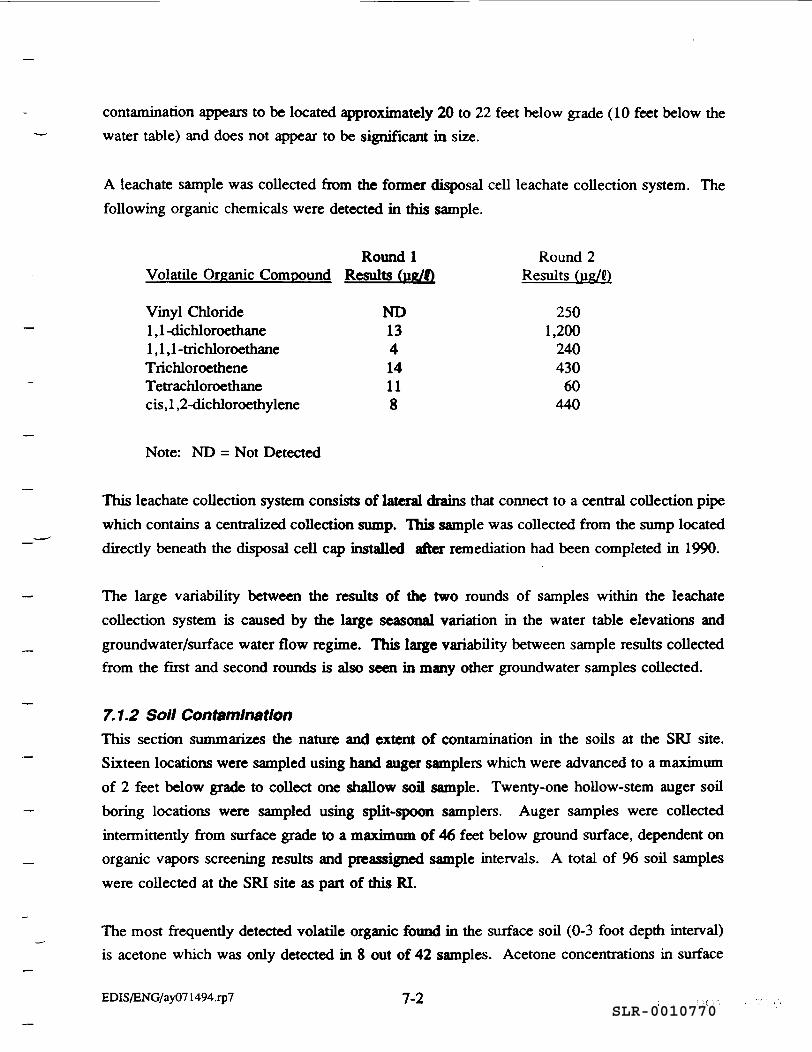
contamination appears to be located approximately 20 to 22 feet below grade (10 feet below thewater table) and does not appear to be significant in size.
A leachate sample was collected from the former disposal cell leachate collection system. Thefollowing organic chemicals were detected in this sample.
Round 1 Round 2Volatile Organic Compound Results (ug/ft Results (ue/t)
Vinyl Chloride ND 2501,1-dichloroethane 13 1,2001,1,1-trichloroethane 4 240Trichloroethene 14 430Tetrachloroethane 11 60cis,l,2-dichloroethylene 8 440
Note: ND = Not Detected
This leachate collection system consists of lateral drains that connect to a central collection pipewhich contains a centralized collection sump. This sample was collected from the sump locateddirectly beneath the disposal cell cap installed after remediation had been completed in 1990.
The large variability between the results of the two rounds of samples within the leachatecollection system is caused by the large seasonal variation in the water table elevations andgroundwater/surface water flow regime. This large variability between sample results collectedfrom the first and second rounds is also seen in many other groundwater samples collected.
7.7.2 Soil ContaminationThis section summarizes the nature and extent of contamination in the soils at the SRI site.Sixteen locations were sampled using hand auger samplers which were advanced to a maximumof 2 feet below grade to collect one shallow soil sample. Twenty-one hollow-stem auger soilboring locations were sampled using split-spoon samplers. Auger samples were collectedintermittently from surface grade to a maximum of 46 feet below ground surface, dependent onorganic vapors screening results and preassigned sample intervals. A total of 96 soil sampleswere collected at the SRI site as part of this RI.
The most frequently detected volatile organic found in the surface soil (0-3 foot depth interval)is acetone which was only detected in 8 out of 42 samples. Acetone concentrations in surface
EDIS/ENG/ay071494.rp7 7-2 , , , - , ,SLR-0010770
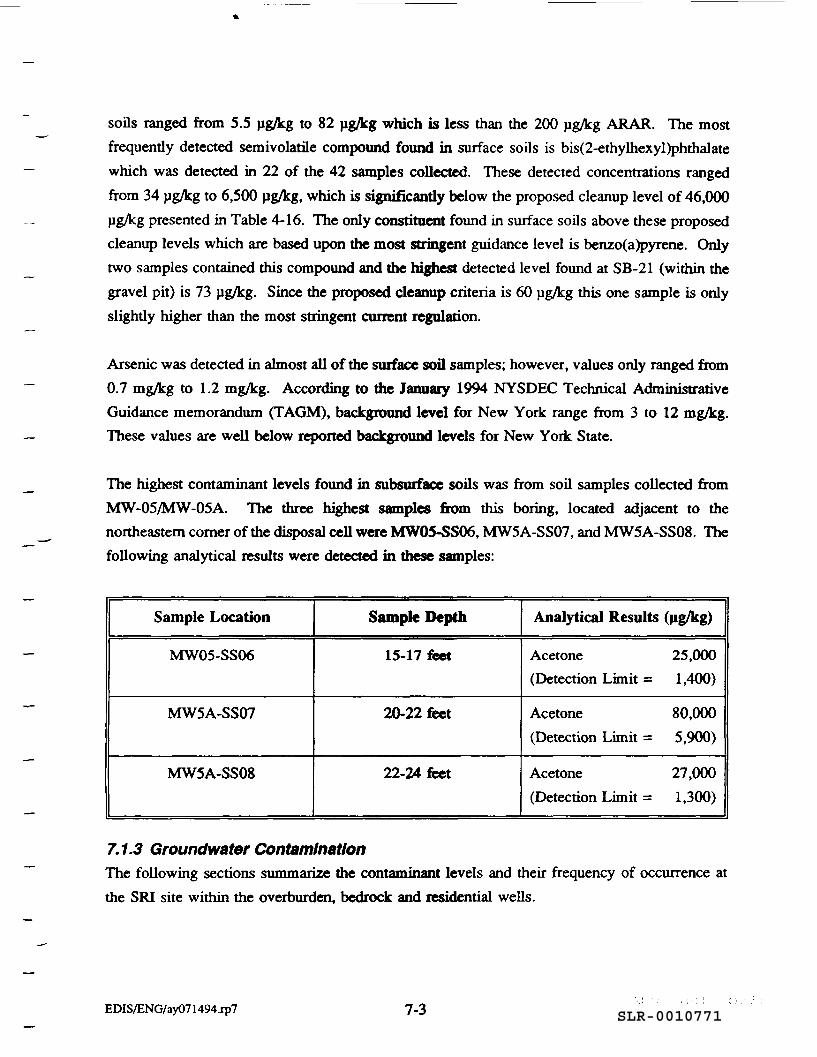
soils ranged from 5.5 pg/kg to 82 pg/kg which is less than the 200 pg/kg ARAR. The mostfrequently detected semivolatile compound found in surface soils is bis(2-ethylhexyl)phthalatewhich was detected in 22 of the 42 samples collected. These detected concentrations rangedfrom 34 pg/kg to 6,500 pg/kg, which is significantly below the proposed cleanup level of 46,000pg/kg presented in Table 4-16. The only constituent found in surface soils above these proposedcleanup levels which are based upon the most stringent guidance level is benzo(a)pyrene. Onlytwo samples contained this compound and the highest detected level found at SB-21 (within thegravel pit) is 73 pg/kg. Since the proposed cleanup criteria is 60 pg/kg this one sample is onlyslightly higher than the most stringent current regulation.
Arsenic was detected in almost all of the surface soil samples; however, values only ranged from0.7 mg/kg to 1.2 mg/kg. According to the January 1994 NYSDEC Technical AdministrativeGuidance memorandum (TAGM), background level for New York range from 3 to 12 mg/kg.These values are well below reported background levels for New York State.
The highest contaminant levels found in subsurface soils was from soil samples collected fromMW-05/MW-05A. The three highest samples from this boring, located adjacent to thenortheastern comer of the disposal cell were MW05-SS06, MW5A-SS07, and MW5A-SS08. Thefollowing analytical results were detected in these samples:
Sample Location
MW05-SS06
MW5A-SS07
MW5A-SS08
Sample Depth
15-17 feet
20-22 feet
22-24 feet
Analytical Results (Mg/kg)
Acetone 25,000(Detection Limit = 1,400)
Acetone 80,000(Detection Limit = 5,900)
Acetone 27,000(Detection Limit = 1,300)
7.1.3 Groundwater ContaminationThe following sections summarize the contaminant levels and their frequency of occurrence atthe SRI site within the overburden, bedrock and residential wells.
EDIS/ENG/ay071494.rp7 7-3 SLR-0010771
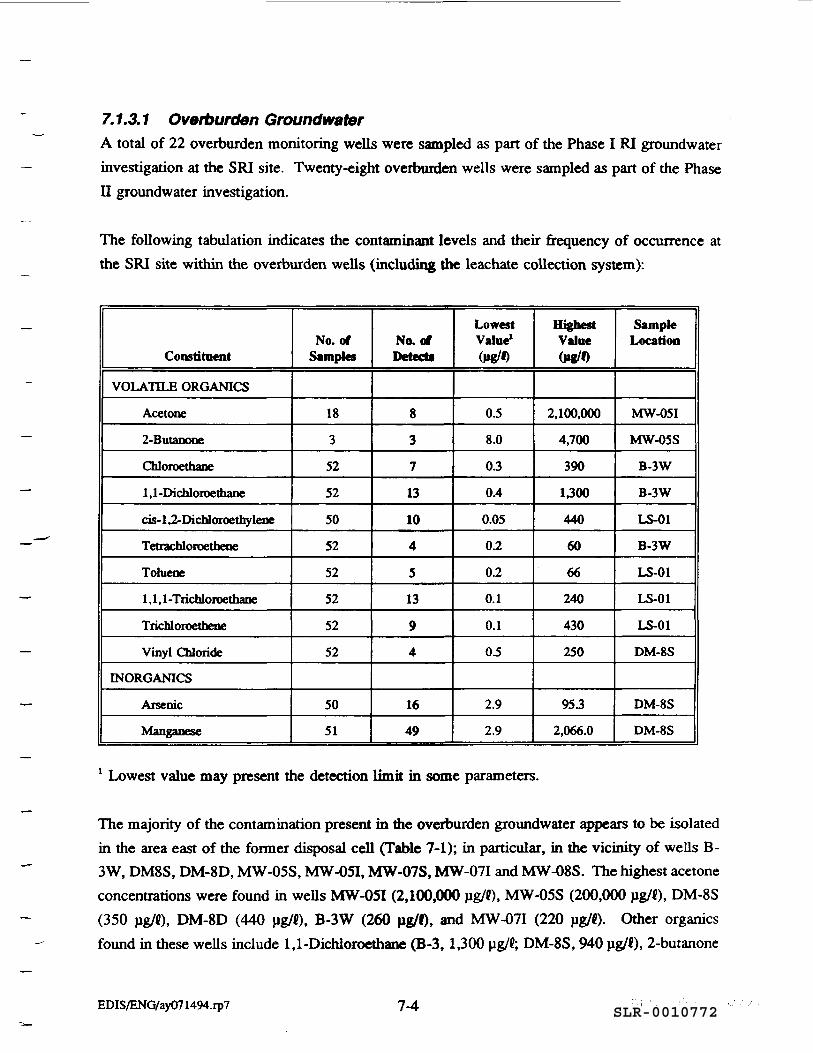
7.1.3.1 Overburden GroundwaterA total of 22 overburden monitoring wells were sampled as part of the Phase I RI groundwaterinvestigation at the SRI site. Twenty-eight overburden wells were sampled as part of the Phasen groundwater investigation.
The following tabulation indicates the contaminant levels and their frequency of occurrence atthe SRI site within the overburden wells (including the leachate collection system):
Constituent
VOLATILE ORGANICS
Acetone
2-Butanone
Chloroethane
1 , 1 -Dichloroe thane
cis-l,2-Dichloroethylene
Tetrachloroetbene
Toluene
1 , 1 , 1 -Trichloroethane
Trichloroethene
Vinyl Chloride
INORGANICS
Arsenic
Manganese
No. ofSamples
18
3
52
52
50
52
52
52
52
52
50
51
No. ofDetects
8
3
7
13
10
4
5
13
94
16
49
LowestValue1
(ng/D
0.5
8.0
0.3
0.4
0.05
0.2
0.2
0.1
0.1
0.5
2.9
2.9
HighestValue(ug/D
2,100,000
4,700
390
1300
440
60
66
240
430
250
953
2,066.0
SampleLocation
MW-05I
MW-05S
B-3W
B-3W
LS-01
B-3W
LS-01
LS-01
LS-01
DM-8S
DM-8S
DM-8S
1 Lowest value may present the detection limit in some parameters.
The majority of the contamination present in me overburden groundwater appears to be isolatedin the area east of die former disposal cell (Table 7-1); in particular, in the vicinity of wells B-3W, DM8S, DM-8D, MW-05S, MW-05I, MW-07S, MW-07I and MW-08S. The highest acetoneconcentrations were found in wells MW-05I (2,100,000 pg/«), MW-05S (200,000 pg/«), DM-8S(350 ug/{), DM-8D (440 pg/{), B-3W (260 ug/«), and MW-07I (220 pg/C). Other organicsfound in these wells include 1,1-Dichloroethane (B-3, 1,300 pg/{; DM-8S, 940 pg/<), 2-butanone
EDIS/ENG/ay071494.rp7 7-4 SLR-0010772
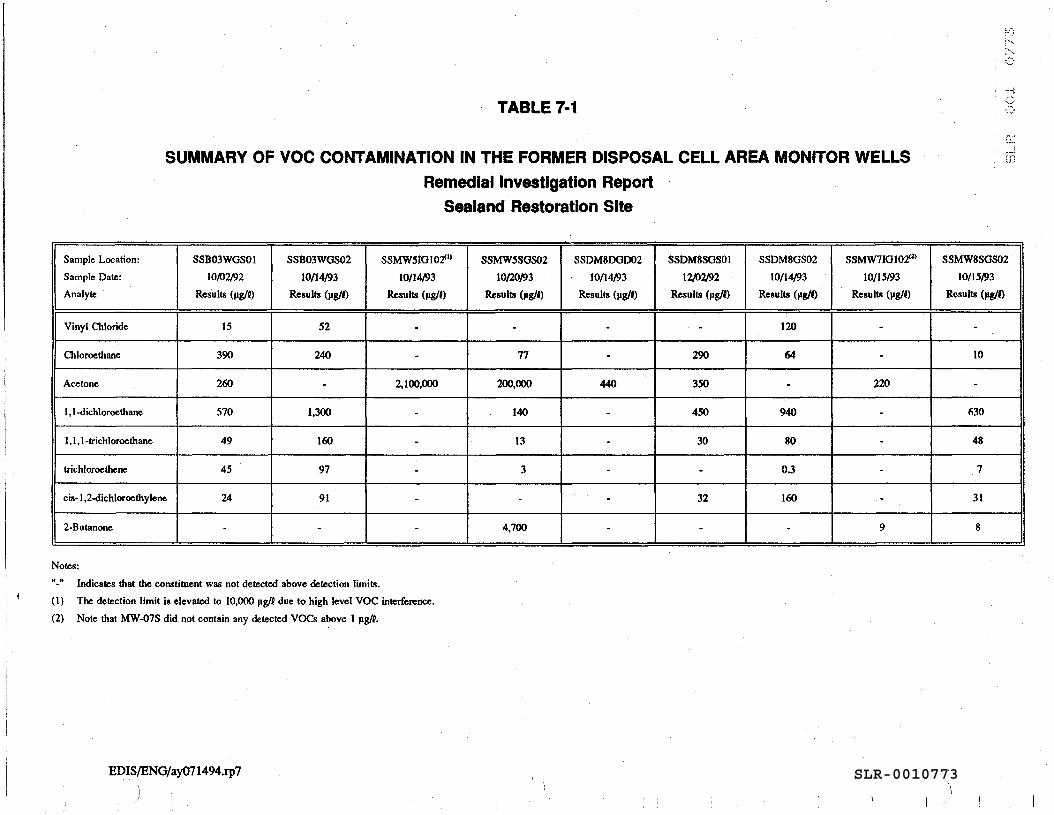
TABLE 7-1
SUMMARY OF VOC CONTAMINATION IN THE FORMER DISPOSAL CELL AREA MONITOR WELLSRemedial Investigation Report
Sealand Restoration Site
Sample Location:Sample Date:Analyte
Vinyl Chloride
Chloroe thane
Acetone
1 , 1 -dichloroe thane
1,1,1 -trichloroethanc
trichloroethene
cis- 1 ,2-dichloroethylene
2-Butanone
SSB03WOS0110/02/92
Results (ug/t)
15
390
260
570
49
45
24
-
SSB03WGS0210/14/93
Results (ug/t)
52
240
-
1,300
160
97
91
-
SSMW5IG102"'10/14/93
Results (ug/t)
-
-
2,100,000
-
-
-
-
-
SSMW5SGS0210/20/93
Results (ng/t)
-
77
200,000
140
13
3
-
4,700
SSDM8DGD0210/14/93
Results (ug/t)
-
-
440
-
-
-
-
-
SSDM8SGS0112/02/92
Results (ug/t)
-
290
350
450
30
-
32
-
SSDM8GS0210/14/93
Results (ug/t)
120
64
-
940
80
0.3
160
-
SSMW7IG10201
10/15/93Results (ug/t)
-
-
220
-
-
-
-
9
SSMW8SGS0210/15/93
Results (ug/t)
-
10
-
630
48
7
31
8
Notes:"-" Indicates that the constituent was not detected above detection limits.(1) The detection limit is elevated to 10,000 ug/t due to high level VOC interference.(2) Note that MW-07S did not contain any detected VOCs above 1 ug/t.
EDIS/ENG/ay071494.rp7 SLR-0010773
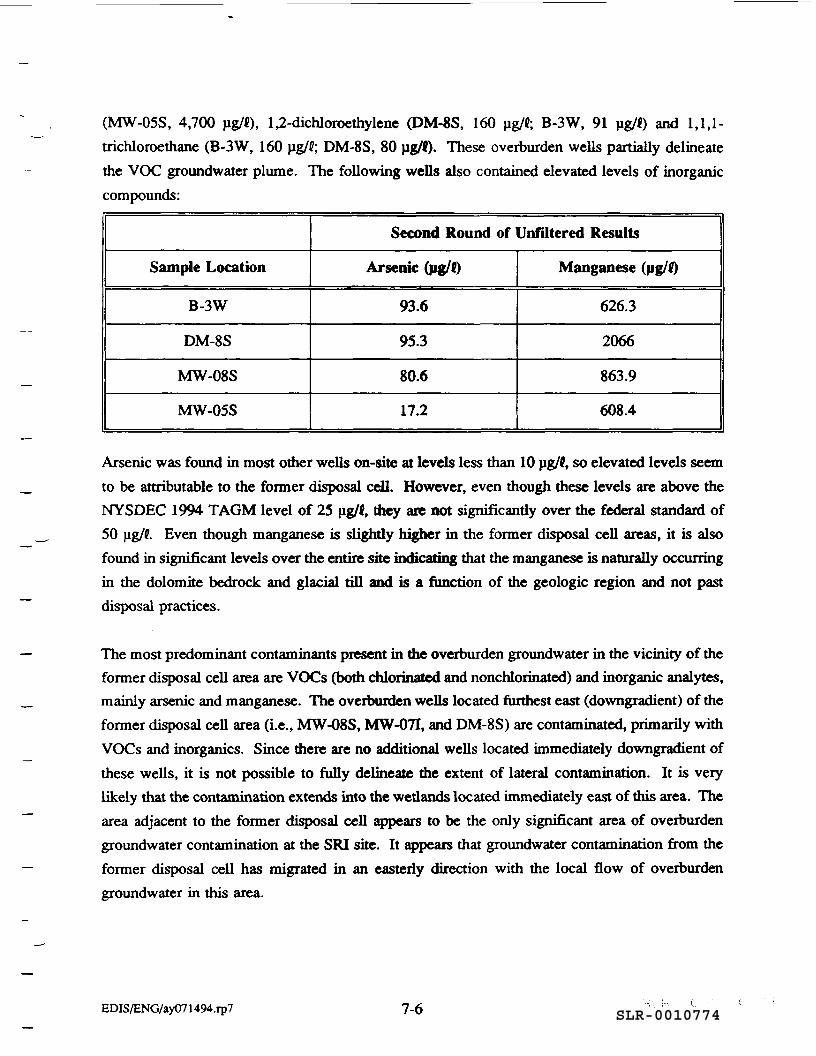
(MW-05S, 4,700 pg/«), 1,2-dichloroethylene (DM-8S, 160 pg/f; B-3W, 91 pg/«) and 1,1,1-trichloroethane (B-3W, 160 pg/C; DM-8S, 80 pg/<). These overburden wells partially delineatethe VOC groundwater plume. The following wells also contained elevated levels of inorganiccompounds:
Sample Location
B-3W
DM-8S
MW-08S
MW-05S
Second Round of Unfiltered Results
Arsenic (ug/f)
93.6
95.3
80.6
17.2
Manganese (ug/0
626.3
2066
863.9
608.4
Arsenic was found in most other wells on-site at levels less than 10 pg/C, so elevated levels seemto be attributable to the former disposal cell. However, even though these levels are above theNYSDEC 1994 TAGM level of 25 pg/f, they are not significantly over the federal standard of50 pg/f. Even though manganese is slightly higher in the former disposal cell areas, it is alsofound in significant levels over the entire site indicating that the manganese is naturally occurringin the dolomite bedrock and glacial till and is a function of the geologic region and not pastdisposal practices.
The most predominant contaminants present in the overburden groundwater in the vicinity of theformer disposal cell area are VOCs (both chlorinated and nonchlorinated) and inorganic analytes,mainly arsenic and manganese. The overburden wells located furthest east (downgradient) of theformer disposal cell area (i.e., MW-08S, MW-07I, and DM-8S) are contaminated, primarily withVOCs and inorganics. Since there are no additional wells located immediately downgradient ofthese wells, it is not possible to fully delineate the extent of lateral contamination. It is verylikely that the contamination extends into the wetlands located immediately east of mis area. Thearea adjacent to the former disposal cell appears to be the only significant area of overburdengroundwater contamination at the SRI site. It appears that groundwater contamination from theformer disposal cell has migrated in an easterly direction with the local flow of overburdengroundwater in this area.
EDIS/ENG/ay071494.rp7 7-6 SLR-0010774
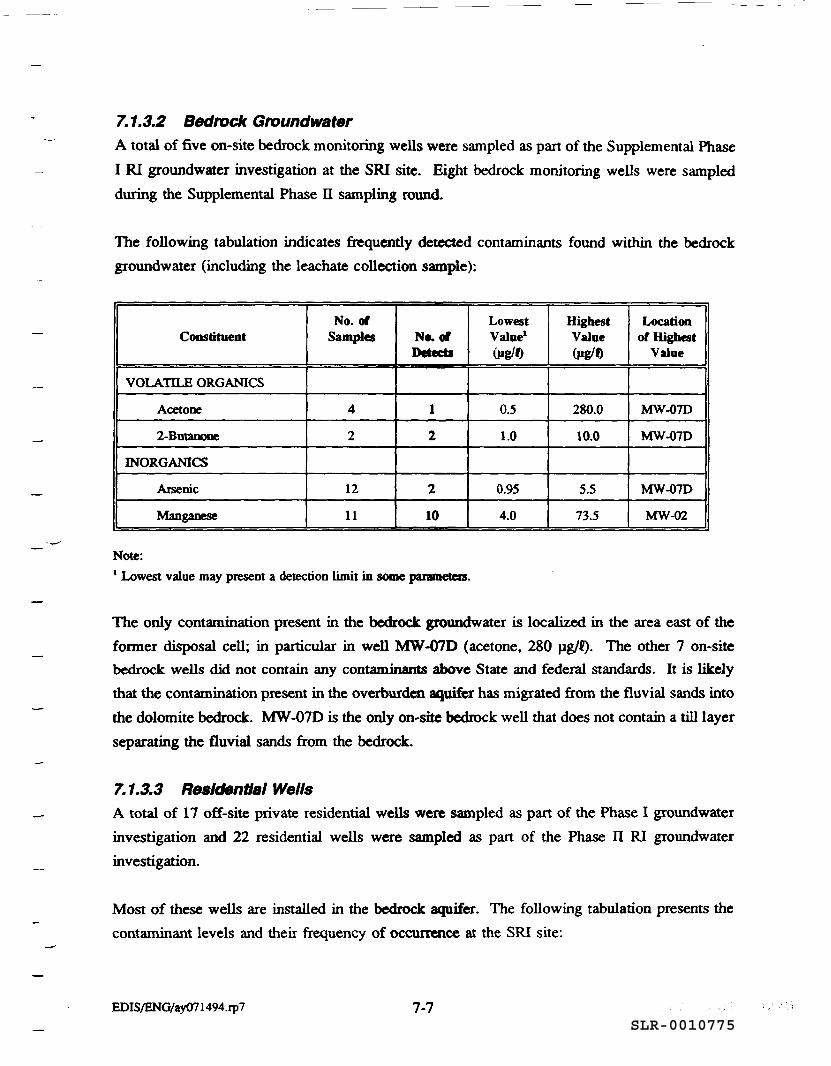
7.1.3.2 Bedrock GroundwaterA total of five on-site bedrock monitoring wells were sampled as part of the Supplemental PhaseI RI groundwater investigation at the SRI site. Eight bedrock monitoring wells were sampledduring the Supplemental Phase n sampling round.
The following tabulation indicates frequently detected contaminants found within the bedrockgroundwater (including the leachate collection sample):
Constituent
VOLATILE ORGANICS
Acetone
2-Butanone
INORGANICS
Arsenic
Manganese
No. ofSamples
4
2
12
11
No. ofDetects
1
2
2
10
LowestValue1
<ug/f)
0.5
1.0
0.95
4.0
HighestValue(ug/0
280.0
10.0
5.5
73.5
Locationof Highest
Value
MW-07D
MW-07D
MW-07D
MW-02
Note:1 Lowest value may present a detection limit in some parameters.
The only contamination present in the bedrock groundwater is localized in the area east of theformer disposal cell; in particular in well MW-07D (acetone, 280 pg/f). The other 7 on-sitebedrock wells did not contain any contaminants above State and federal standards. It is likelythat the contamination present in the overburden aquifer has migrated from the fluvial sands intothe dolomite bedrock. MW-07D is the only on-site bedrock well that does not contain a till layerseparating the fluvial sands from the bedrock.
7.1.3.3 Residential WellsA total of 17 off-site private residential wells were sampled as part of the Phase I groundwaterinvestigation and 22 residential wells were sampled as part of the Phase n RI groundwaterinvestigation.
Most of these wells are installed in the bedrock aquifer. The following tabulation presents thecontaminant levels and their frequency of occurrence at the SRI site:
EDIS/ENG/ay071494.rp7 7-7SLR-0010775
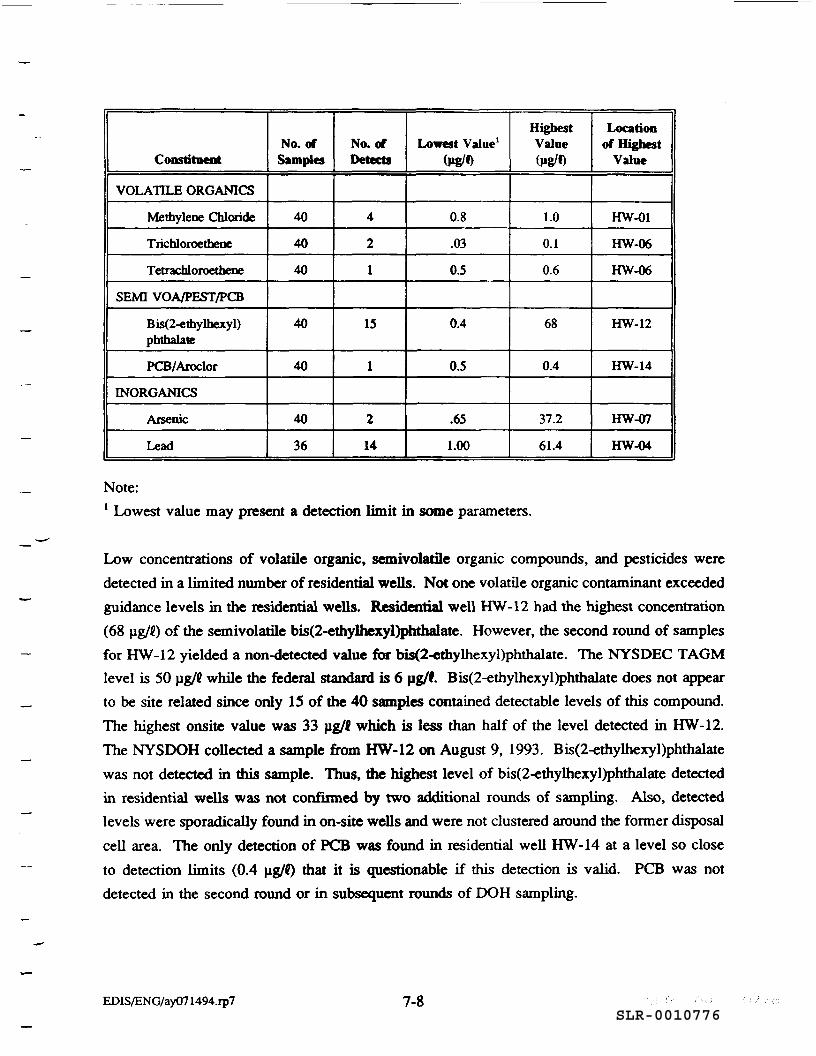
Constituent
VOLATILE ORGANICS
Methylene Chloride
Trichloroethene
Tetrachloroethene
SEMI VOA/PEST/PCB
Bis(2-etiiylhexyl)phthalate
PCB/Aroclor
INORGANICS
Arsenic
Lead
No. ofSamples
40
40
40
40
40
40
36
No. ofDetects
4
2
1
15
1
2
14
Lowest Value1
(pg/0
0.8
.03
0.5
0.4
0.5
.65
1.00
HighestValue(ug/D
1.0
0.1
0.6
68
0.4
37.2
61.4
Locationof Highest
Value
HW-01
HW-06
HW-06
HW-12
HW-14
HW-07
HW-04
Note:1 Lowest value may present a detection limit in some parameters.
Low concentrations of volatile organic, semivolatfle organic compounds, and pesticides weredetected in a limited number of residential wells. Not one volatile organic contaminant exceededguidance levels in the residential wells. Residential well HW-12 had the highest concentration(68 pg/f) of the semivolatile bis(2-ethylhexyl)phthalate. However, the second round of samplesfor HW-12 yielded a non-detected value for bis(2-emylhexyl)phthalate. The NYSDEC TAGMlevel is SO ug/C while the federal standard is 6 ug/f Bis(2-ethylhexyl)phthalate does not appearto be site related since only 15 of the 40 samples contained detectable levels of this compound.The highest onsite value was 33 ug/{ which is less than half of the level detected in HW-12.The NYSDOH collected a sample from HW-12 on August 9, 1993. Bis(2-ethylhexyl)phthalatewas not detected in this sample. Thus, the highest level of bis(2-ethylhexyl)phthalate detectedin residential wells was not confirmed by two additional rounds of sampling. Also, detectedlevels were sporadically found in on-site wells and were not clustered around the former disposalcell area. The only detection of PCB was found in residential well HW-14 at a level so closeto detection limits (0.4 ug/C) that it is questionable if this detection is valid. PCB was notdetected in the second round or in subsequent rounds of DOH sampling.
EDIS/ENG/ay071494.rp7 7-8SLR-0010776
Two inorganics found to exceed ARARs are lead and arsenic. The highest hit of lead on-site is25.5 pg/f which is approximately equal to the most stringent ARAR (25 pg/{). Also, thedetected levels were sporadically located throughout the site and were not clustered adjacent tothe former disposal cell. Since HW-04 detected a level of 61.4 ug/C which is more than twicethe highest value on-site, this contaminant does not appear to be site related.
Arsenic detected in HW-07 (37.2pg/l) may be caused by naturally occurring arsenic. Thisdetected value of arsenic at this distance from the site is not considered site-related since thereis no evidence of a direct exposure pathway. It should be noted that arsenic was non-detect inthe second round of sampling as well as subsequent DOH sampling. The high variabilitybetween sampling rounds found at the SRI site may be caused by the high fluctuation in thewater table and the dilution/concentration effects of seasonal variation. This high level ofseasonal fluctuation is common in this region.
7.7.4 Surface Water and SedimentA total of 18 locations were sampled for both surface water and sediment as part of this RI.Both filtered and unfiltered surface water samples were collected for inorganic analyses. Themain areas of focus of the surface water and sediment investigation were:
Location No. of Samples Sample Designation
Eastern Wetland Adjacent to 12 WE-05 through WE-16Landspreading Areas andFormer Disposal Cell
Northwestern Wetlands 2 WN-17 and WN-18Locations along Eastern 4 TS-01 through TS-04Tributary to Sucker Brookwhich Conducts WaterAway from the Site
Surface water organic contamination at the SRI site is minimal. Low concentrations of a fewvolatile and semivolatile organic compounds and pesticides were detected, primarily in the areaof the northwestern wetlands and the eastern tributary to Sucker Brook (see Section 4.4).
Similar to the surface water data, only low concentrations of a limited number of volatile andsemivolatile organic compounds and pesticides were detected in the sediment samples. Themajority of the volatile and semivolatile organic compounds were detected in the area east of theformer disposal cell area. The pesticides were primarily detected in the eastern wetlands,
EDIS/ENG/ay071494.rp7 7-9SLR-0010777
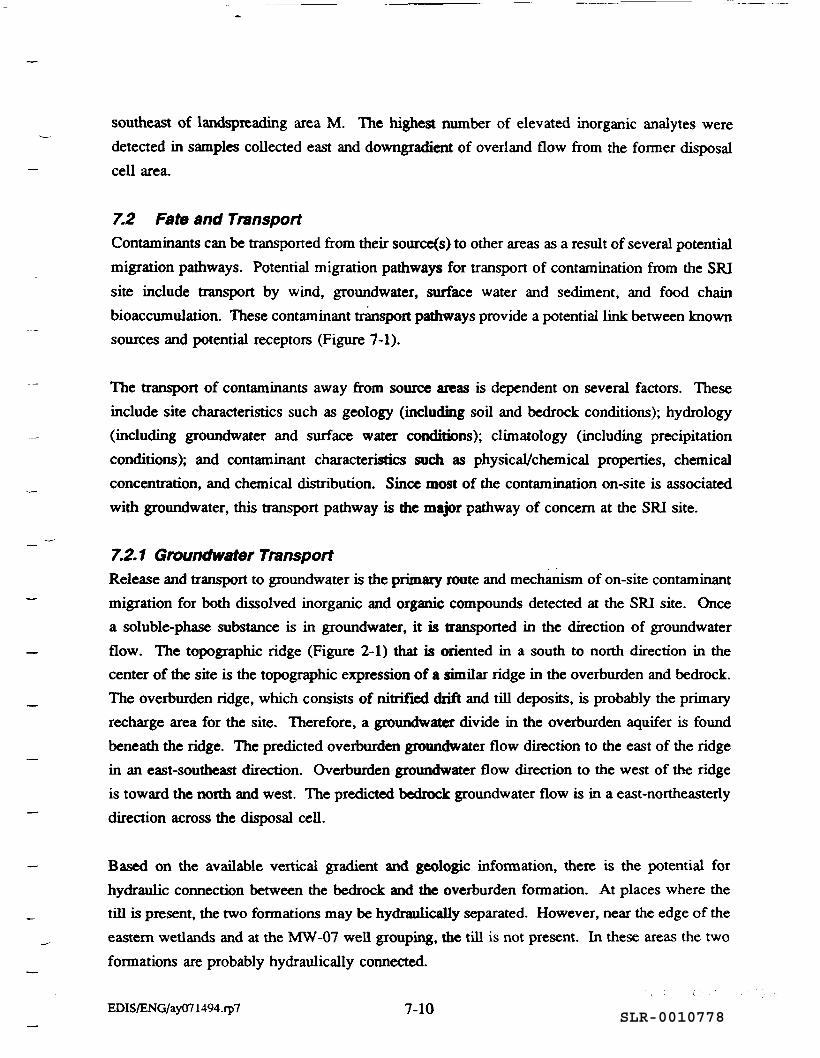
southeast of landspreading area M. The highest number of elevated inorganic analytes weredetected in samples collected east and downgradient of overland flow from the former disposalcell area.
7.2 Fate and TransportContaminants can be transported from their source(s) to other areas as a result of several potentialmigration pathways. Potential migration pathways for transport of contamination from the SRIsite include transport by wind, groundwater, surface water and sediment, and food chainbioaccumulation. These contaminant transport pathways provide a potential link between knownsources and potential receptors (Figure 7-1).
The transport of contaminants away from source areas is dependent on several factors. Theseinclude site characteristics such as geology (including soil and bedrock conditions); hydrology(including groundwater and surface water conditions); climatology (including precipitationconditions); and contaminant characteristics such as physical/chemical properties, chemicalconcentration, and chemical distribution. Since most of the contamination on-site is associatedwith groundwater, this transport pathway is the major pathway of concern at the SRI site.
7.2.1 Groundwater TransportRelease and transport to groundwater is the primary route and mechanism of on-site contaminantmigration for both dissolved inorganic and organic compounds detected at the SRI site. Oncea soluble-phase substance is in groundwater, it is transported in the direction of groundwaterflow. The topographic ridge (Figure 2-1) that is oriented in a south to north direction in thecenter of the site is the topographic expression of a similar ridge in the overburden and bedrock.The overburden ridge, which consists of nitrified drift and till deposits, is probably the primaryrecharge area for the site. Therefore, a groundwater divide in the overburden aquifer is foundbeneath the ridge. The predicted overburden groundwater flow direction to the east of the ridgein an east-southeast direction. Overburden groundwater flow direction to the west of the ridgeis toward the north and west. The predicted bedrock groundwater flow is in a east-northeasterlydirection across the disposal cell.
Based on the available vertical gradient and geologic information, there is the potential forhydraulic connection between the bedrock and the overburden formation. At places where thetill is present, the two formations may be hydraulically separated. However, near the edge of theeastern wetlands and at the MW-07 well grouping, the till is not present. In these areas the twoformations are probably hydraulically connected.
EDIS/ENG/ay071494.rp7 7-10 SLR-0010778
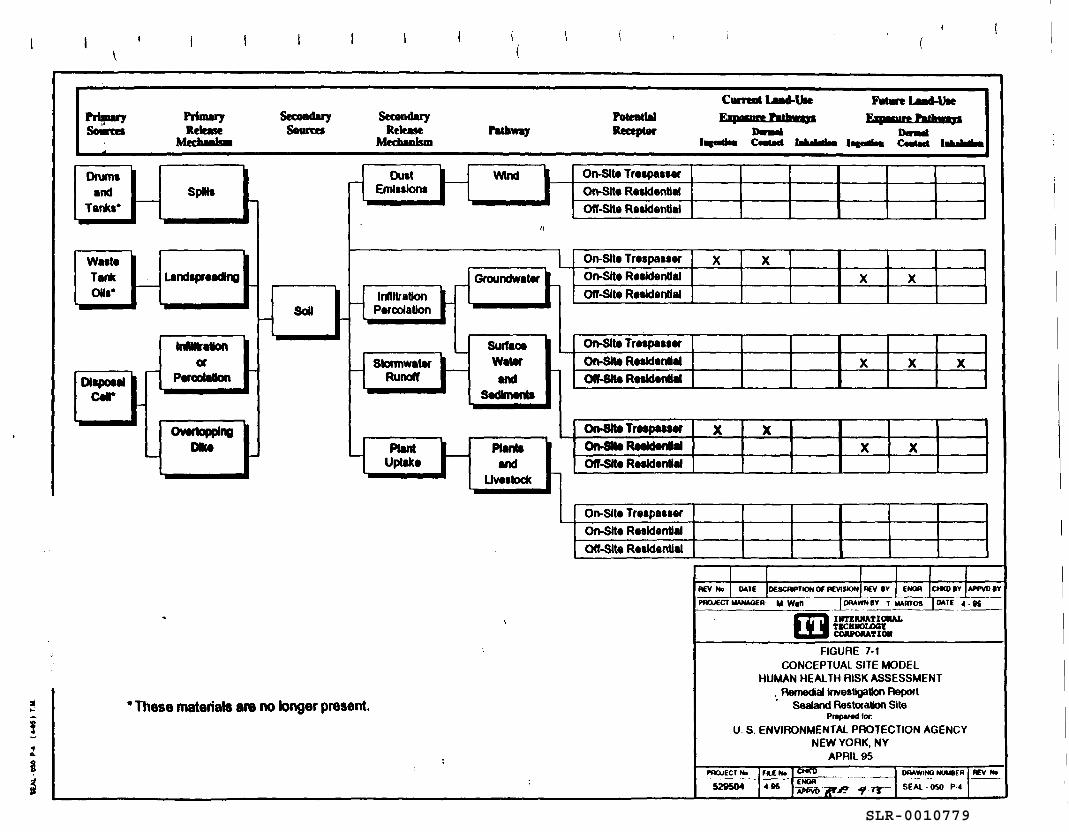
Current Land-Use Future Land-UsePrimarySOURCS
PrimaryRelease
Mechanism
SecondarySources
SecondaryRelease
MechanismPathway
PotentialReceptor
Drumsand
Tanks*SpWs
DustEmissions
Wind 1- On-SIt* TrespasserOn-Slt« ResidentialOff-Site Residential
InfiltrationPercolation
Groundwaler
SlormwaterRunoff
SurfaceWaterand
Sediments
Off-Site Residential
On-Slte TrespasserOn-Slte ResidentialOff-SHe Residential
X X X
PlantUptake
Off-SKe Residential
On-Site TrespasserOn-SMe ResidentialOff-Site Residential
X XX X
On-Slte TrespasserOn-Slte ResidentialOff-Site ResldenUal
a*-'
!T&
2
•These materials are no longer present.
REV No DATE KSCWTION OF REVISION
PflOUECT IMNAOCR M Wilt
gy »Y I ENQR" CMCOIY AHMXV
[pfUWNBY: T MABTOS 10*TE 4.86
INTZRMATICMALTICBNOLOOfCOKPOMTIOII
FIGURE 7-1CONCEPTUAL SITE MODEL
HUMAN HEALTH RISK ASSESSMENT. Remedial Investigation Report
Saaland Restoration SitePrepared lor
U S. ENVIRONMENTAL PROTECTION AGENCYNEW YORK. NY
APRIL 95PHOJECTr*.
529504 4-M ENOfloivwwiNa wuuetnSEAL • OSO P 4
SLR-0010779
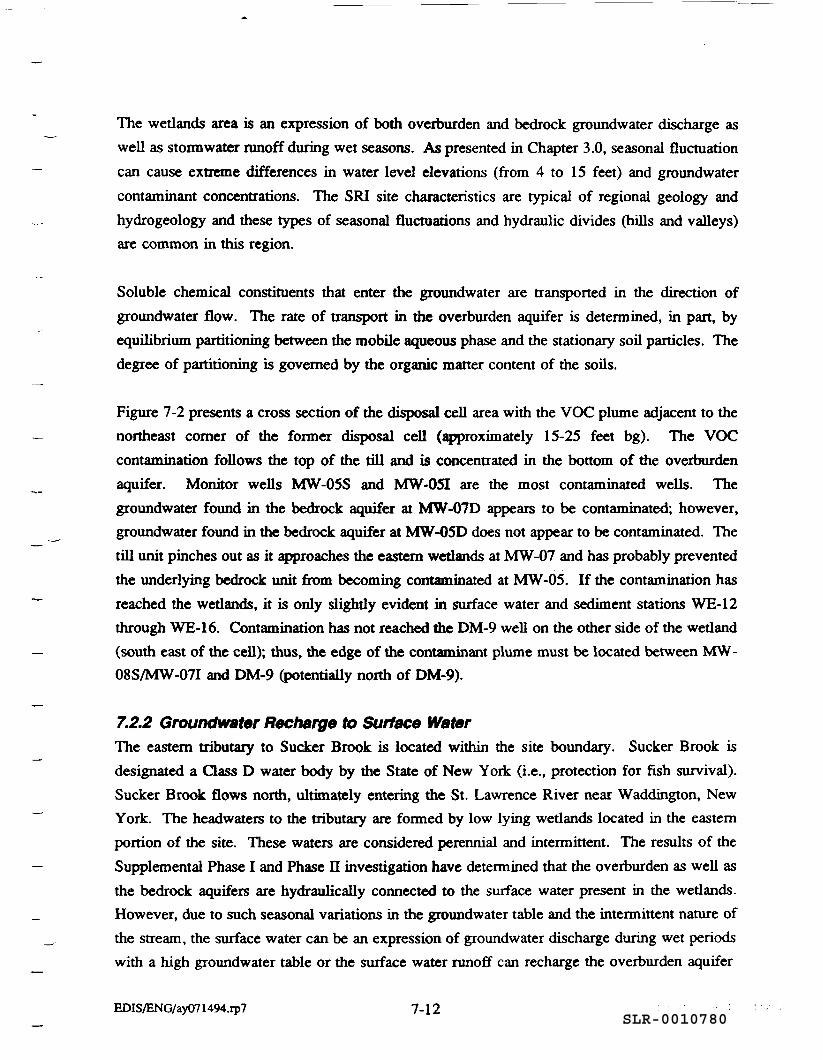
The wetlands area is an expression of both overburden and bedrock groundwater discharge aswell as stormwater runoff during wet seasons. As presented in Chapter 3.0, seasonal fluctuationcan cause extreme differences in water level elevations (from 4 to 15 feet) and groundwatercontaminant concentrations. The SRI site characteristics are typical of regional geology andhydrogeology and these types of seasonal fluctuations and hydraulic divides (hills and valleys)are common in this region.
Soluble chemical constituents that enter the groundwater are transported in the direction ofgroundwater flow. The rate of transport in the overburden aquifer is determined, in part, byequilibrium partitioning between the mobile aqueous phase and the stationary soil particles. Thedegree of partitioning is governed by the organic matter content of the soils.
Figure 7-2 presents a cross section of the disposal cell area with the VOC plume adjacent to thenortheast corner of the former disposal cell (approximately 15-25 feet bg). The VOCcontamination follows the top of the till and is concentrated in the bottom of the overburdenaquifer. Monitor wells MW-05S and MW-05I are the most contaminated wells. Thegroundwater found in the bedrock aquifer at MW-07D appears to be contaminated; however,groundwater found in the bedrock aquifer at MW-05D does not appear to be contaminated. Thetill unit pinches out as it approaches the eastern wetlands at MW-07 and has probably preventedthe underlying bedrock unit from becoming contaminated at MW-05. If the contamination hasreached the wetlands, it is only slightly evident in surface water and sediment stations WE-12through WE-16. Contamination has not reached the DM-9 well on the other side of the wetland(south east of the cell); thus, the edge of the contaminant plume must be located between MW-08S/MW-07I and DM-9 (potentially north of DM-9).
7.2.2 Groundwater Recharge to Surface WaterThe eastern tributary to Sucker Brook is located within the site boundary. Sucker Brook isdesignated a Class D water body by the State of New York (i.e., protection for fish survival).Sucker Brook flows norm, ultimately entering the St. Lawrence River near Waddington, NewYork. The headwaters to the tributary are formed by low lying wetlands located in the easternportion of the site. These waters are considered perennial and intermittent. The results of theSupplemental Phase I and Phase n investigation have determined that the overburden as well asthe bedrock aquifers are hydraulically connected to the surface water present in the wetlands.However, due to such seasonal variations in the groundwater table and the intermittent nature ofthe stream, the surface water can be an expression of groundwater discharge during wet periodswith a high groundwater table or the surface water runoff can recharge the overburden aquifer
EDIS/ENG/ay071494.rp7 7-12SLR-0010780
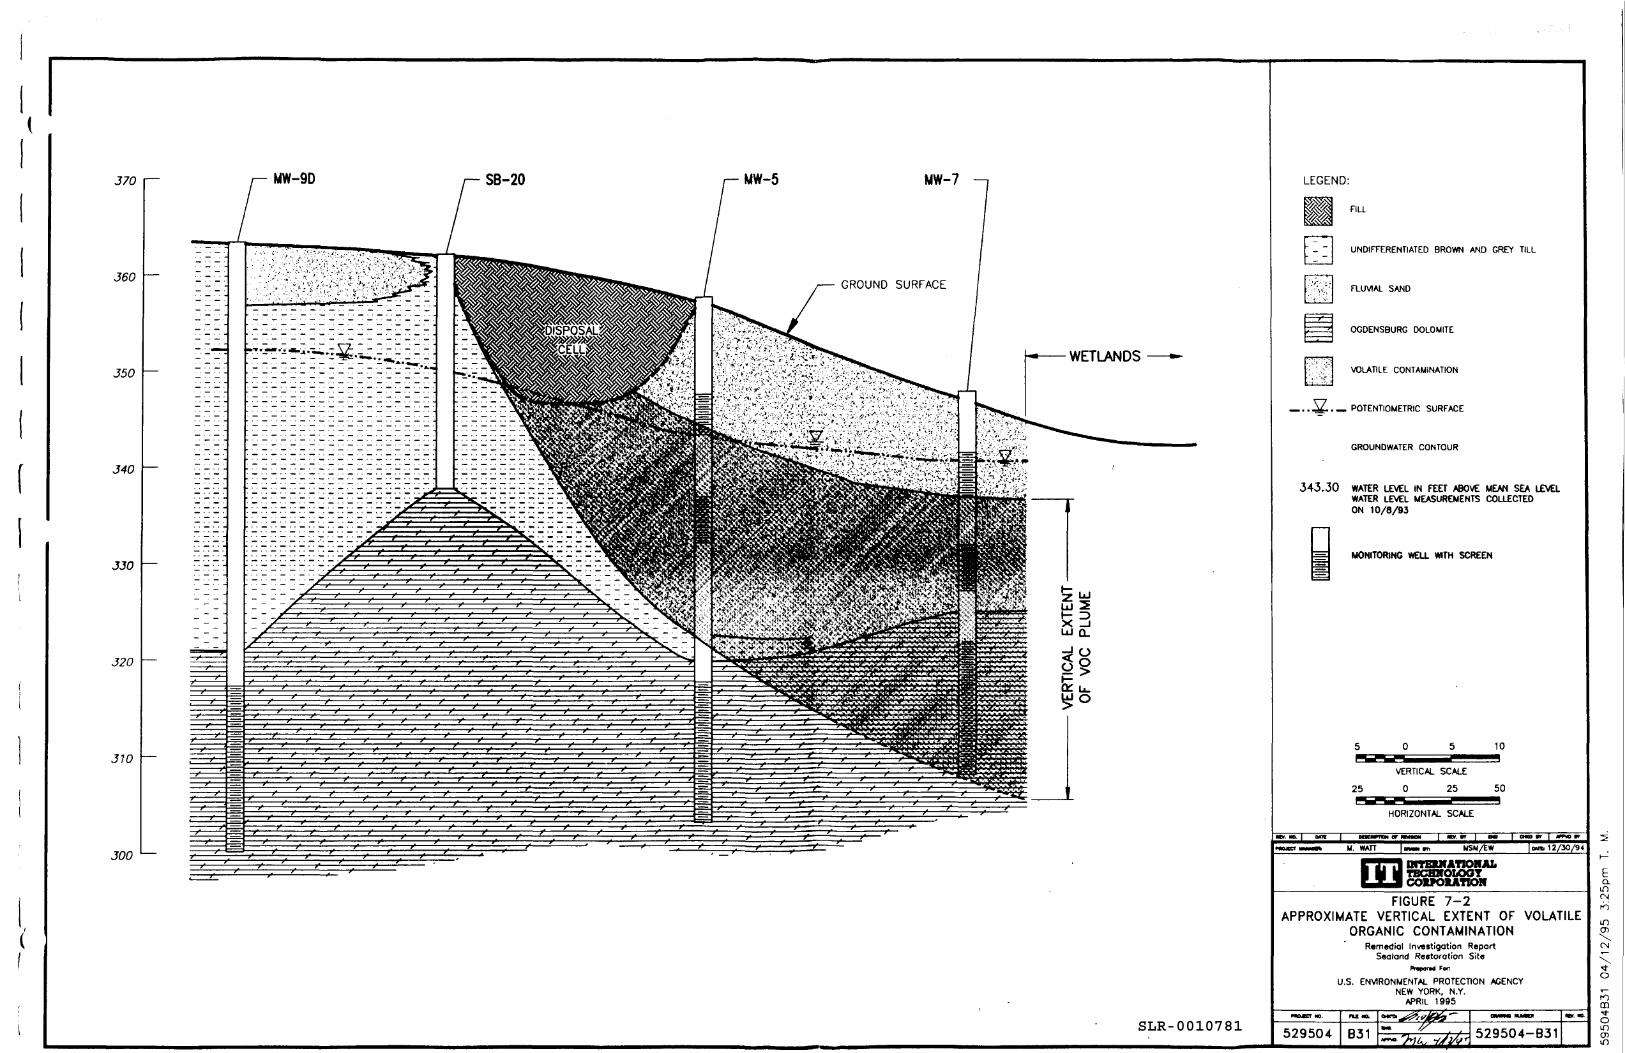
370 |— MW-9D SB-20 MW-5 MW-7
360
350
340
330
320
310
300
LEGEND:
FILL
UNDIFFERENTIATED BROWN AND GREY TILL
FLUVIAL SAND
OGDENSBURG DOLOMITE
VOLATILE CONTAMINATION
._ POTENTIOMETRIC SURFACE
GROUNDWATER CONTOUR
343.30 WATER LEVEL IN FEET ABOVE MEAN SEA LEVELWATER LEVEL MEASUREMENTS COLLECTEDON 10/8/93
MONITORING WELL WITH SCREEN
25
VERTICAL SCALE
0 25^ Z!
HORIZONTAL SCALE
10
50
M. WATT \anm*r, MSM/EW ]»n. 12/30/94
| INTEBNATIONALTBCHHOLOOT
ICOWOIATIOICFIGURE 7-2
APPROXIMATE VERTICAL EXTENT OF VOLATILEORGANIC CONTAMINATION
Remedial Investigation ReportSealand Restoration Site
PnporM For
U.S. ENVIRONMENTAL PROTECTION AGENCYNEW YORK, N.Y.
APRIL 1995
529504MI Ml CMCfe
B31 529504-B31
EQ.inCNro
o
CD•>«-O
enin
SLR-0010781
during dry periods. The overburden groundwater recharge or discharge condition is highlydependent on the seasonal fluctuation of the water table.
7.3 Baseline Risk AssessmentBoth a human health and an ecological assessments were performed for the SRI site. The humanhealth risk assessment provides a conservative approach to approximating plausible exposurescenarios to potential receptors. The ecological assessment evaluates potential adverse impactsassociated with estimated exposure concentrations for selected ecological receptors.
7.3.1 Public Health EvaluationSeparate risk analyses were conducted for both current land-use and possible future land-use ofthe site. Samples were collected from all media of concern (i.e., surficial soil, groundwater,sediment, surface water) to quantify constituent concentrations. The resulting analytical datafrom remedial investigations conducted at the SRI site and vicinity in 1992 and 1993 were usedas the database for this risk assessment.
For this risk assessment, it was assumed that die same individual or subpopulation may beexposed to the constituents of concern via multiple pathways. Accordingly, the carcinogenicrisks and the non-carcinogenic hazards calculated are summed to provide an estimation of thetotal risk/hazard to the exposed populations from site-related constituents of concern from the SRIsite. Reasonable maximum exposure (RME) default parameters were employed for all potentialpathways to represent the most conservative estimate of potential exposure and, therefore, be themost health protective.
For any pathway that showed excessive risk/hazard using RME exposure parameters, thesepathways were re-evaluated using Central Tendency Analysis exposure parameters. CentralTendency Exposure (CTE) default parameters utilize average exposure frequencies and durationvalues rather than upperbound estimates for determining daily chronic intake of constituents inthe risk/hazard analyses.
7.3.1.1 Current Land UseThe SRI site has been abandoned for approximately 14 years, and extensive remediation measuresof the site have taken place within this time period. There is no work force on-site, and thecurrent on-site exposure pathways are limited to trespasser (adult, older children aged 6-12 yearsold) receptors. Older children were selected as a more conservative receptor population for thetrespasser scenarios, as this age group may explore the SRI site in this rural, sparsely populated
EDIS/ENG/ay071494.rp7 7-14SLR-0010782
area. There are no groundwater sources (e.g., active wells) on-site and groundwater was notconsidered an exposure medium for current land-use scenarios for the SRI site. Constituents inthe surficial soils, wetlands sediments, and seasonal-related intermittent surface water may behazardous to on-site trespassing receptors.
Based on analysis of identified surficial soil constituents of concern, six trespasser exposurepathways were quantified in this assessment for current on-site abandoned land use:
• Incidental ingestion of site soil;• Dermal absorption of constituents from site soil;• Incidental ingestion of on-site surface water,• Dermal absorption of constituents from surface water;• Incidental ingestion of on-site sediments;• Dermal absorption of constituents from sediments.
The total carcinogenic risk to an on-site trespasser from exposure to site-related constituents ofconcern is 1.44E-05 carcinogenic risk for adults and 1.22E-OS carcinogenic risk for children(Table 7-2). These risks are within the acceptable carcinogenic risk range of l.OE-04 to l.OE-06total carcinogenic risk. Dermal contact with on-site surface water contributed 63% of the totalcarcinogenic risk to trespassers. Pentachlorophenol contributed 94% of the total risk to currenton-site land use conditions.
The total non-carcinogenic hazard to an on-site trespasser from exposure to constituents ofconcern is 4.76E-02 hazard index for adults and 1.89E-01 hazard index for children. Thesehazard indices are below 1.0 and considered acceptable. Incidental ingestion of wetlandssediment contributed 47% of the total non-carcinogenic hazard, with arsenic contributing 99%of the non-carcinogenic risk of this medium.
7.3.1.2 Future Land UseThe on-site future residential use exposure assessments were based on current concentrations ofconstituents in on-site surficial soils, wetland sediments, surface water, and groundwater. Nineexposure pathways were quantified in this assessment for potential future residential land use ofthe SRI site. Five were residential exposure scenarios; four were related to play and recreationalactivities in the woodlands/wetlands of the site. These nine exposure scenarios were as follows:
EDIS/ENG/ay071494.rp7 7-15SLR-0010783
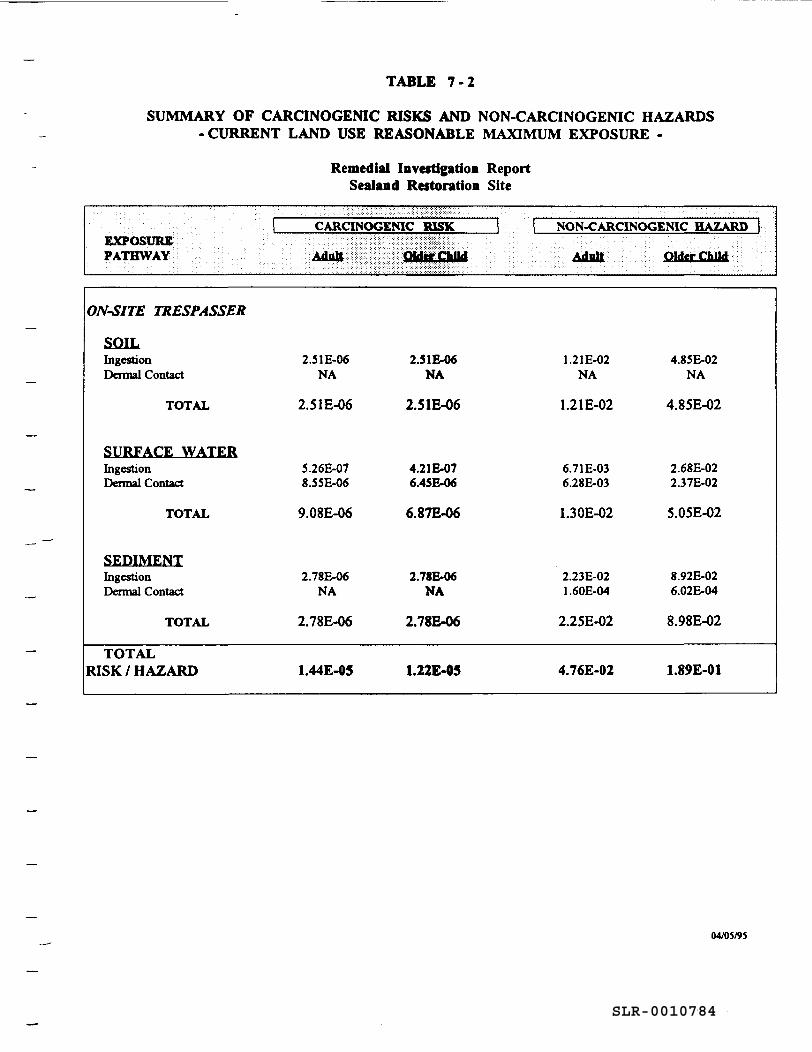
TABLE 7-2
SUMMARY OF CARCINOGENIC RISKS AND NON-CARCINOGENIC HAZARDS-CURRENT LAND USE REASONABLE MAXIMUM EXPOSURE -
Remedial Investigation ReportSealand Restoration Site
^•;<:^sy*$mxmf:.1 CARCINOGENIC RISK [
EXPOSUREPATHWAY , /•:Wlii ojdjijckiid : : :- : •: • :: ; : : • :: ' • : • :- ^x^5- !v??v;v^^^::::':'.::;::.;:::; : .":::::":":: :':•:•:•:•:•:•;•:-;•:•: : :
1 NON-CARCINOGENIC HAZARD 1
Adult Older Child
ON-SITE TRESPASSER
SOILIngestionDermal Contact
TOTAL
SURFACE WATERIngestionDermal Contact
TOTAL
SEDIMENTIngestionDermal Contact
TOTAL
TOTALRISK /HAZARD
2.5 IE-06NA
2.51E-06
5.26E-078.55E-06
9.08E-06
2.78E-06NA
2.78E-06
1.44E-05
2.5 IE-06NA
2.5 IE-06
4.21E-076.45E-06
6.87E-06
2.78E-06NA
2.78E-06
1.22E-05
1.2 IE-02NA
1.21E-02
6.7 IE-036.28E-03
1.30E-02
2.23E-021.60E-04
2.25E-02
4.76E-02
4.85E-02NA
4.85E-02
2.68E-022.37E-02
5.05E-02
8.92E-026.02E-04
8.98E-02
1.89E-01
04/05/95
SLR-0010784
• Ingestion of groundwater (potable well water);
• Dermal contact with groundwater (bathing, household uses of tap water);
• Inhalation of volatile COCs in groundwater by bathing and showering;
• Incidental ingestion of site soil;
• Dermal contact absorption of constituents from site soil;
• Incidental ingestion of on-site surface water through recreational activities;
• Dermal absorption of COCs from surface waters through recreational activities;
• Incidental ingestion of on-site sediments through recreational activities;
• Dermal contact absorption of COCs from sediments through recreational activities.
The total carcinogenic risk to residential adults and children based on future on-site residentialexposures has been calculated to be 2.34E-04 and 1.45E-04, respectively (Table 7-3).Groundwater is accountable for 89% of the carcinogenic risks to future on-site residentialpopulations. Arsenic was the major contributor to this calculated carcinogenic risk. Groundwateringestion was in exceedence of USEPA's risk guidance (1 x 10~* to 1 x 10"6).
In the future land-use scenario, the total non-carcinogenic hazard to adults and children in an on-site residential setting has been calculated to be 5.78E+02 and 1.34E+03, respectively. A totalof 99.9% of the non-carcinogenic hazard is attributed to use of groundwater from the compositedgroundwater aquifer. Acetone was the principal constituent of concern (COC) and accounts for99% of the non-carcinogenic hazard of this groundwater.
Ingestion of groundwater and dermal contact with groundwater were pathways that indicatedexcessive hazard (above 1.0). All other pathways for both children and adults had hazard indicesof less than unity.
7.3.2 Ecological Assessment EvaluationThe SRI site and the surrounding 0.5 mile radius area were investigated to determine existingecological conditions. All of the environs within the above mentioned study area werecharacterized and grouped into three habitat types: aquatic, wetlands and terrestrial. Observationsobtained during September 1992 field investigations were reviewed and species lists for avians(Table 6-15), mammals (Table 6-16) and vegetation (Table 6-17) were compiled.
EDIS/ENG/ay071494.rp7 7-17 SLR-0010785
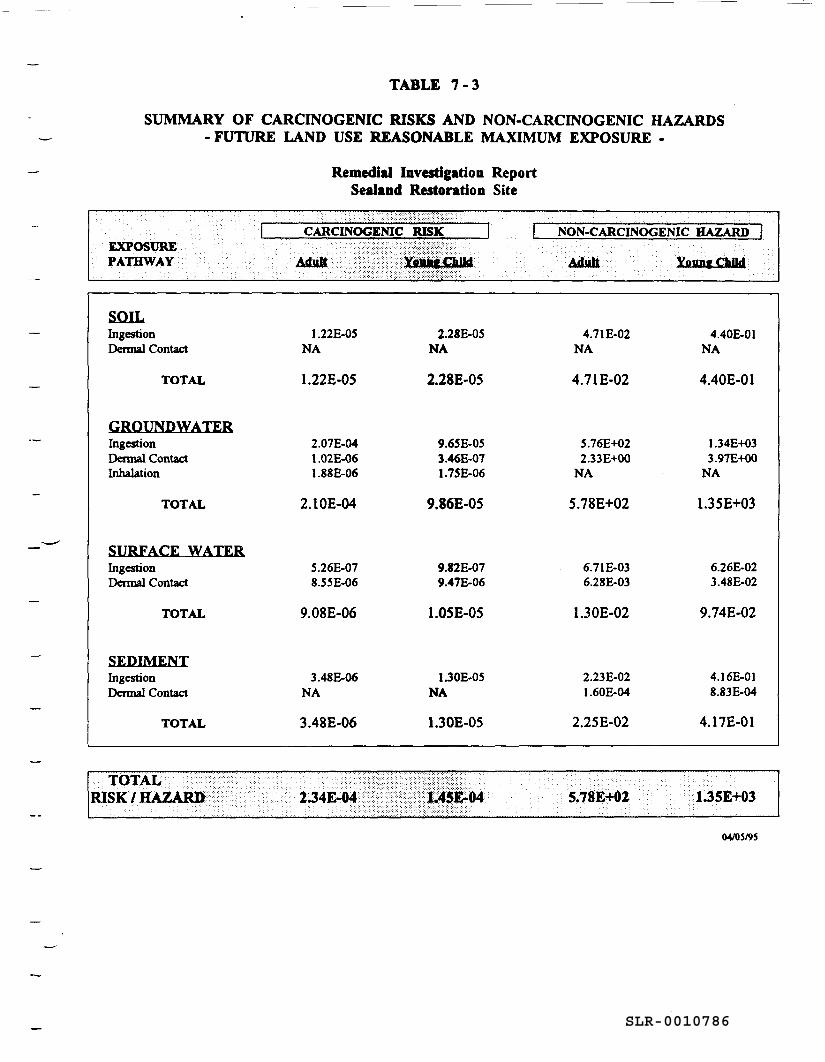
TABLE 7-3
SUMMARY OF CARCINOGENIC RISKS AND NON-CARCINOGENIC HAZARDS- FUTURE LAND USE REASONABLE MAXIMUM EXPOSURE -
Remedial Investigation ReportSealand Restoration Site
• . • • . ' • ' - : ' : CEXPOSUREPATHWAY
CARCINOGENICl:^Miiii^
RISK 1
iSIiiiiitsss&ssiSjBS
1 NON-CARCINOGENIC HAZARD t
Adult Young Chlkfl
SOILIngestionDennal Contact
TOTAL
GROUNDWATERIngestionDennal ContactInhalation
TOTAL
SURFACE WATERIngestionDennal Contact
TOTAL
SEDIMENTIngestionDennal Contact
TOTAL
1.22E-05NA
1.22E-05
2.07E-041.02E-061.88E-06
2.10E-04
5.26E-078.55E-06
9.08E-06
3.48E-06NA
3.48E-06
2.28E-05NA
2.28E-05
9.65E-053.46E-071.75E-06
9.86E-05
9.82E-079.47E-06
1.05E-05
1 JOE-OSNA
1.30E-05
4.71 E-02NA
4.7 IE-02
5.76E+022.33E+00
NA
5.78E+02
6.71E-036.28E-03
1.30E-02
2.23E-021.60E-04
2.25E-02
4.40E-01NA
4.40E-01
1.34E+033.97E+00
NA
1.35E+03
6.26E-023.48E-02
9.74E-02
4.16E-018.83E-04
4.17E-01
. ' " : • . • : " ' ' ':'' :: :;:" :-":'H :: : ; '':'''.'•'-''• ' I ' ' . ''-.'.'^^^^iiiSi•:>: ^t^^i^^-: '' - ' .
IIIII104; 5.78EN2• : • • _. - . : : - . . : • : : • :
I.35E+03
04/05/95
SLR-0010786
Only one species listed within the New York Natural Heritage Program Database was observedwithin the study area. Clearweed (Pilea fontana) is a vegetative species typically found withinwetland habitats and was present on-site during September 1992 field investigation. Table 6-20and Table 6-21 present the New York Natural Heritage identified endangered/threatened speciesand significant habitat areas in the vicinity of SRI site, respectively.
Several individual great blue heron (Ardea herodias) were noted during field investigations. Thepresence of this species on-site may be a result of the heron rookeries which are listed as"Significant Habitat" by the New York Natural Heritage Program Database as existing in thevicinity of the SRI site.
Three target species namely, the raccoon (Procyon lotor), the American kestrel (Falco sparverius)and the meadow vole (Microtus sp.) were identified in order to calculate potential impacts toecological receptors as a result of the contamination present on-site.
Twenty-six constituents of ecologocal concern were identified and evaluated for potential impactsto the selected target species and aquatic biota in general. A comparison of the total daily intakeof the COECs for target species with the range of available toxicological data found in theliterature was the basis for the risk characterization. This assessment is more qualitative in naturedue to the limited availability of species-specific, chemical-specific and endpoint-specific data.The combination of these factors, therefore, contribute to the uncertainty of such comparisons.
Total daily intakes for each of the target species were calculated as a result of the ingestion ofsoil, sediment, surface water, vegetation and food. Species-specific dietary ingestion ratesobtained from the literature were used in these calculations.
Only two of the calculated TDE values for the target species exceeded appropriate NOAELs forany of the COECs for the SRI site. These are lead and di-n-butylphthalate. However, the di-n-butylphthalate exposure point concentration used to calculate the TDE values was based on highdetection limits for non-detects. Detected concentrations do not predict unacceptable TDE values.Lead exposure is high throughout the site. Though exposure to lead may have an effect, it isimportant to point out that effect are predicted from background levels also.
It is also important to note that the nature of some of the contamination at the SRI site may notbe solely attributed to previous site activities. The area surrounding the site has a large numberof farms. Some crops even exist in the northern area of the site. The pesticides used in
EDIS/ENG/ay071494.rp7 7-19SLR-0010787
maintaining the local farms could be transported to the SRI site via surface runoff or aerialdeposition. Some PAHs can also be attributed to such activities.
In conclusion, while the SRI site exhibits low levels of contamination, it does not pose anysignificant environmental hazard above that naturally occurs. Concentrations of most COECs areat levels such that target species would not receive constituents at levels known to cause harmto the individual animals. Overall, the ecology of the SRI site is typical for such a system. Thedata shows a low potential for future negative impacts from the identified COECs.
7.4 Data Limitations and Recommendations for Future WorkThe samples taken by IT during the field investigations for this RI report, were analyzed andvalidated by a USEPA CLP laboratory. These analyses were considered confinnational level,that is, the highest level of data quality. The analyses required full CLP analytical and validationprocedures, and were designed to be legally defensible.
The quantity estimates, results and conclusions presented in this RI report are based on this CLPvalidated analytical data. Data that were rejected in the validation process were not consideredwhen drawing conclusions about the nature and extent of the site contamination.
Data previously obtained by the NYSDEC, NYSDOH, Dames and Moore, SevensonEnvironmental Services and others were also considered in the preparation of this report. Whilethe chemical analyses presented in many of the previous studies may not have been performedto the same QA/QC standards as the samples taken for this RI report; nevertheless, the previousbody of existing data could not be ignored in attempting to define the contamination in the soiland groundwater of the site. While the previous investigations provided significant assistance,the location of contamination and its fate are fully supported by the USEPA and the IT validatedanalytical data.
The soils investigation adequately characterized the source of contamination (i.e., the disposalcell soils) as well as the nature and extent of contamination found in the soil media. Thegroundwater plume originating from the site has been partially defined via isopleths. The fartheston-site monitoring well cluster MW-07D and MW-07I contained contaminated groundwater; thusthe extent of the Sealand groundwater plume has not been clearly delineated in either the verticalor horizontal directions. DM-9, MW-04 and MW-06 wells contained relatively cleangroundwater samples; however, a finer delineation of the extent of the overburden/bedrock plumeis recommended prior to further remedial action.
EDIS/ENG/ay071494jp7 7-20SLR-0010788
The additional data requirements necessary to fully characterize the overburden and bedrockgroundwater flow regime and contaminant plume boundaries are as follows:
• Additional clustered monitoring wells to the east of the disposal cell between theMW-07/DM-8 wells and the surface water/sediment sampling locations WE-14 throughWE-15 in order to vertically and horizontally delineate the groundwater plume.
• Two additional wells at MW-08S to investigate the stratification of the overburden/bedrock plume.
• Pump tests to determine hydraulic characteristics of the aquifer.
• Additional quarterly sampling and water level measurements to investigate seasonalvariation to determine the effect of stonnwater/surface water infiltration/discharge onlocal groundwater hydraulics.
The data requirements should be fulfilled prior to or in conjunction with a design phase.
7.5 Recommended Remedial Action ObjectivesBased on evaluation of the chemical data and its associated risks, the following remedial actionobjectives have been developed.
1) Minimize migration of contaminated groundwater; and
2) Restore the groundwater quality currently being degraded as a result of the SRI site.
EDIS/ENG/ay071494.rp7 7-21SLR-0010789
SLR-0010790
8.0 References
Adamus, P.R., EJ. Clairain, Jr., R.D. Smith, and R.E. Young, 1987. "Wetland EvaluationTechnique (WET) Vol H: Methodology," U.S. Army Corps of Engineers, Washington, DC.
Agency for Toxic Substances and Disease Registry (ATSDR), 1994, Toxicological Profile forPolycyclic Aromatic Hydrocarbons (PAHs), U.S. Department of Health and Human Service, U.S.Public Health Service.
ATSDR, 1989, Toxicological Profile for HeptacMor/heptachlor Epoxide, U.S. Department ofHealth and Human Service, U.S. Public Health Service.
ATSDR, 1993, Toxicological Profile for Endosnlfan, U.S. Department of Health and HumanService, U.S. Public Health Service.
ATSDR, 1980, Toxicological Profile for PCBs, U.S. Department of Health and Human Service,U.S. Public Health Service.
ATSDR, 1988a, Toxicological Profile for Arsenic, ATSDR/TP-88/02.
ATSDR, 1988b, Toxicological Profile for BeryOium, ATSDR/IP-88/07.
ATSDR, 1988c, Toxicological Profile for Cadmium, ATSDR/TP-88/08.
ATSDR, 1988d, Toxicological Profile for Chromium, ATSDR/TP-88/10.
ATSDR, 1988e, Toxicological Profile for Nickel, ATSDR/TP-88/19.
ATSDR, 1989a, Toxicological Profile for Silver, (Draft for Public Comment).
ATSDR, 1989b, Toxicological Profile for Trichloroethylene, ATSDR/TP-88/24.
ATSDR, 1989c, Toxicological Profile for Vinyl Chloride, ATSDR/TP-88/25.
ATSDR, 1992d, Toxicological Profile for Barium, ATSDR/TP-91/03.
ATSDR, 1992e, Toxicological Profile for Manganese, ATSDR/TP-91/19.
ATSDR, 1992f, Toxicological Profile for Mercury (Draft for Public Comment).
ATSDR, 1992h, Toxicological Profile for Vanadium, ATSDR/TP-91/29.
ATSDR, 1992i, Toxicological Profile for Zinc (Draft for Public Comment).
ATSDR, 1993a, Toxicological Profile for PolycycUc Aromatic Hydrocarbons (PAHs), (UpdateDraft for Public Comment).
EDIS/8-<>4/ENG/ay0714!>4jp8 g-1SLR-0010791
Booz-Allen & Hamilton, 1983. "Overview of the Contaminants of Concern in the Disposal andUtilization of Municipal Sewage Sludge", revised draft, USEPA Sludge Task Force.
Britton, N.L., and HA. Brown, 1970, An Illustration of the Northern United States and Canada,Volumes 1,2,3, Dover Publications, Inc., New York, New York.
Brown, L., 1979, Grasses, An Identification Guide, Houghton Mifflin Company, Boston,Massachusetts.
Callahan, M.A., M.W. Slimak, N.W. Gabel, IP. May, C. F. Fowler, J.R. Freed, P. Joinings, R.L.Durfee, F. C. Whitmore, B. Maestri, W.R. Mabey, B.R. Holt and C. Gould, 1979, Water-RelatedEnvironmental Fate of 129 Priority Pottutants, VoL L Office of Water Planning and Standards,Office of Water and Waste Management, U.S. EPA, Washington, DC, EPA 440/4-79-029a.
Cowardin, L.M., V. Carter, F.C. Golet, and E.T. Laroe, December 1979, "Classification ofWetlands and Deepwater Habitats of the United States," Publication Number FWS/OBS-79-31,U.S. Fish and Wildlife Services, Washington, DC.
Dames and Moore, September 1986, "Engineering Investigations at Inactive Hazardous WasteSites in the State of New York - Phase n Investigations", prepared for NYSDEC.
Dames and Moore, August, 1988. "Sealand Restoration Site, Town of Lisbon, New York,Remedial Investigation and Feasibility Study, Volumes I and IT'.
Dethier, B. E. and Pack, A. B., 1967, Cornell University, Department of Agronomy Mimeo67-14.
Driscoll, F., 1986, Ebasco 1992, "Groundwater and Wells. "Johnson Division, St. Paul, MN.
Environmental Criteria Assessment Office (ECAO), 1994, Memorandum from J.S. Dollarhida,Director - Superfund Health Risk Technical Support Center, Chemical Mixtures AssessmentBranch, ECAO, to Mr. Joel Singerman, USEPA, Region JJ, Memorandum Dated July 29, 1994.
Engineering-Science, 1984, "Phase I Report".
Federal Insurance Administration, 1984. Letter to David Reynolds, Supervisor, Town of Lisbon,from Charles A. Lindsay, Chief, Technical Operations Division.
Federal Interagency Committee for Wetlands, 1989, "Federal Manual for Identifying andDelineating Jurisdictional Wetlands".
Federal Interagency Committee for Wetland Delineation, 1989, Federal Manual for Identifyingand Delineating Jurisdictional Wetlands, prepared by U.S. Army Corps of Engineers, U.S.Environmental Protection Agency, U.S. Fish and Wildlife Service, and USDA Soil ConservationService, Washington, DC, Cooperative Technical Publication, pp. 107.
Fernald, M.L., 1950, Grays Manual of Botany, American Book Company, New York, New York.
EDIS/8-94/ENG/«y071494.rp8 g-2SLR-0010792
Garten, C.T., Jr. and JJR. Trabalka, 1983, "Evaluation of Models for Predicting Terrestrial FoodChain Behavior of Xenobiotics," Environmental Science and Technology, Vol. 17, No. 10, pp.590-595.
Gleason, H.A., and A. Cronquist, 1963, Manual of Vascular Plants of Northeastern United Satesand Adjacent Canada, D. Van Nostrand Co., New York, New York.
Health Effects Assessment Summary Tables (HEAST), FY-1993 Annual, USEPA, OERR 9200.6-303 (93-1), Office of Solid Waste and Remedial Response, Washington, DC.
Integrated Risk Information System (IRIS), 1994, On-line database (January 1994) maintainedby USEPA.
IT Corporation (IT), January 1992, "Final Work Plan, Remedial Investigation/Feasibility Study(RI/FS), Sealand Restoration Site, Volume I and II."
Jax, N.I., 1984, Dangerous Properties of Industrial Materials, 6th Edition, Van Nostrand Reinhold,New York.
Klaassen, C.D., Mary O. Amdur and John Doull, 1986, Casarett and Doutt's Toxicology, TheBasic Science of Poisons, Third Edition, Macmfllan Publishing Company, New York.
KoUmorogen Corporation, 1975, "Munsell Soil Color Charts," Macbeth Division of KollmorgenCorporation, Baltimore, Maryland.
Long, E.R. and L.G. Morgan, 1990, The Potential for Biological Effects of Sediment-SorbedContaminants Tested in the National Status and Trends Program, NOAA Technical MemorandumNos. OMA 52, Seattle, Washington.
Mitsch, WJ., and Gosselink, J.G., 1986, Wetlands, Van Nostrand Reinhold, New York, NewYork.
New York State Department of Environmental Conservation (NYSDEC), January, 1994,"Division of Technical and Administrative Guidance Memorandum: Determination of SoilCleanup Objectives and Cleanup Levels", prepared by NYSDEC, Division of Hazardous WasteRemediation.
NYSDEC, 1994a, "Ambient Water Quality Standards and Guidance Values," prepared byNYSDEC, Division of Water, Albany, New York.
NYSDEC, 1992, New York Natural Heritage Program, Wildlife Resources Center, Latham, NewYork.
NYSDEC, September 1989. "New York State Air Guide-1, Guidelines for the Control of ToxicAmbient Air Contaminants," prepared by NYSDEC, Division of Air Resources, 1985-86 Edition.
EDIS/8-94/ENG/ay071494.rp8 g-3SLR-0010793
NYSDEC, December 1989, "Habitat Based Assessment, Guidance Document for ConductingEnvironmental Risk Assessments at Hazardous Waste Sites", prepared by NYSDEC.
NYSDEC, December 1989, "Sediment Criteria", prepared by NYSDEC, Division of Fish andWildlife.
NYSDEC, January 1990, "Air Cleanup Criteria", prepared by NYSDEC, Division of AirResources.
NYSDEC, September 1990, "Water Quality Standards and Guidance Values", prepared byNYSDEC, Division of Water.
NYSDEC, October 1993, Ambient Water Quality Standards and Guidance Values, prepared byNJYDEC, Division of Water Technical and Operational Guidance Series (1.1.1).
Porter, 1986, 1987, "Interim Guidance on Superfund Selection of Remedy", USEPA.
Reed, P.B., Jr., 1988. "National List of Plant Species that Occur in Wetlands: Northeast (RegionI)," Biological Report 88 (26.1), U.S. Fish and Wildlife Service, Washington, DC.
Reed, P.B., Jr., 1988, "National List of Plant Species that Occur in Wetlands: NationalSummary," Biological Report 88 (24), U.S. Fish and Wildlife Service, Washington, DC.
St. Lawrence-Eastern Ontario Commission, 1979, Technical Report Series "Soils".
Strahler, A. N. and Strahler, A. H., 1976, "Elements of Physical Geography", John Wiley andSons, Inc.
Trainer, Frank W. and Edward H. Salvas, 1962, "Groundwater Resources of the Massena -Waddington Area, St. Lawrence County, New York with the Emphasis on the Effect of Lake St.Lawarence on Groundwater, Bulletin G-47", prepared by U.S. Geological Survey in Cooperationwith the Power Authority of the State of New York and the New York Water ResourcesCommission.
U.S. Fish and Wildlife Service (USFWS), March 19, 1990, Correspondence to USEPA.
U.S. Department of Agriculture (USDA), Soil Conservation Service, 1987, "Hydric Soils of theUnited States," USDA-SCS, In cooperation with the National Technical Committee for HydricSoils, Washington, DC.
USDA, Soil Conservation Service, 1978, "Soil Survey of St. Lawrence County, New York."
USEPA, 1989, Briefing Report to the EPA Science Advisory Board on the EquilibriumPartitioning Approach to Generating Sediment Quality Criteria, prepared by USEPA, Office ofWater, Washington, DC.
EDIS/8-94/ENG/ay071494.rp8 g-4SLR-0010794
USEPA, 1990, Report of the Sediment Criteria Subcommittee of the Ecological Processes andEffects Committee - Evaluation of the Equilibrium Partitioning Approach for Assessing SedimentQuality, prepared by USEPA, Science Advisory Board, Washington, DC.
USEPA, 1991, Technical Basis for Establishing Sediment Quality Criteria for Non-PolarChemicals using Equilibrium Partitioning, prepared by USEPA Office of Science Technology.
USEPA, 1992, Sediment Classification Methods Compendium, prepared by USEPA, SedimentOversight Technical Committee, Washington, DC.
USEPA, 1993, Wildlife Exposure Factors Handbook, prepared by USEPA, Office of Researchand Development, Washington, DC.
USEPA, 1988, Ambient Water Quality Criteria for Aluminum, prepared by USEPA, Office ofWater, Washington, DC.
USEPA, 1986, Ambient Water Quality Criteria - 1986, prepared by USEPA Office of Water,Washington, DC.
USEPA, 1980, Ambient Water Quality Criteria for Nitrosamines, prepared by USEPA, Office ofWater, Washington, DC.
USEPA, 1986, Superfund Public Health Evaluation Manual, prepared by USEPA, Office ofEmergency and Remedial Response, Washington, DC.
USEPA, 1992, Treatability Database, Rev. 4.0, prepared by Water Engineering ResearchLaboratory, Cincinnati, Ohio.
USEPA, June 1985, "Guidance on Remedial Investigations Under CERCLA",USEPA/540/6-85/002.
USEPA, June 1985a; "Guidance on Feasibility Studies Under CERCLA", USEPA/540/6-85/003.
USEPA, 1985b; "Endangerment Assessment Handbook", 1985 TR-693-24B.
USEPA, September 1985c; "Compendium of Costs of Remedial Technologies at HazardousWaste Sites".
USEPA, June 1985d, "Handbook Remedial Action at Waste Disposal Sites," USEPA1625/6-85/006.
USEPA, 1986; United States Environmental Protection Agency, "Interim Guidance On SuperfundSelection of Remedy", Memorandum, OSWER Directive Number 9355.0-19.
USEPA, 1986, "Guidelines for Estimating Exposures", Fed. Reg. 51:34042-34054.
EDIS/8-94/ENG/«y071494jp8 g_5SLR-0010795
USEPA, September 1986b, "Guidelines for Carcinogen Risk Assessment", Fed. Reg.51:33992-34003.
USEPA, 1986c, "Guidelines for Assessing Chemical Mixtures", Fed. Reg. 51:34014-34025.
USEPA, March 1987, "Data Quality Objectives: Development Guidance for the UncontrolledHazardous Waste Site. Remedial Response Activities", USEPA/540/G-87/003 and 004.
USEPA, 1987a, "Additional Interim Guidance for FY-87 Records of Decision", OSWERDirective 9355.0-21.
USEPA, 1988, Office of Environmental and Remedial Response, "Superfund ExposureAssessment Manual".
USEPA, 1988, "CERCLA Compliance with other Environmental Statutes;" OSWER Directive9234.0-02.
USEPA, December 1988, "Interim Final Guidance on Remedial Action for Contaminated GroundWater at Superfund Sites," EPA/540/G-88/ 003.
USEPA, September 1988, "Technology Screening Guide for the Treatment of CERCLA Soils andSludges," EPA 540/2-88/004.
USEPA, March 1989, "Risk Assessment Guidance for Superfund Volume JJ - Interim FinalEnvironmental Evaluation Manual," EPA/540/1-89/001.
USEPA, July 1989a, "Risk Assessment Guidance for Superfund - Interim Final Human HealthEvaluation Manual - PART A", EPA/9285.701A.
USEPA, April 1989b, "Final Guidance for Conducting Remedial Investigation and FeasibilityStudies Under CERCLA", OSWER Directive 9335.3-01.
USEPA, July 1990, "Proposed Plan for Sealand Restoration Site, Lisbon, N.Y.
USEPA, 1991, "Site Analysis, Sealand Restoration, Lisbon, New York, document TS-PIC, 91064(aerial photography)".
USEPA, 1994d, Drinking Water Regulations and Health Advisories, December 1993, Office ofWater, Washington, DC.
USEPA, 1994b, Risk-Based Concentration Table, First Quarter 1994, USEPA Region m,Philadelphia, PA.
USEPA, 1989a, Risk Assessment Guidance for Superfund, Vol I., Human Health EvaluationManual (Part A), prepared by Office of Emergency and Remedial Response, Cincinnati, OH,EPA/540/1-89/002.
EDIS/8-94/ENG/ay071494.rp8 g-6
SLR-0010796
USEPA, 1989b, Exposure Factors Handbook, prepared by Office of Health and EnvironmentalAssessment, Washington, DC, EPA/600/8-89/043.
USEPA, 1992a, Dermal Exposure Assessment: Principles and Applications, prepared by Officeof Health and Environmental Assessment, Washington, DC, EPA/600/8-91/D11B.
USEPA, 1992b, Risk Assessment Guidance for Superfund, Vol I, Human Health EvaluationManual Supplemental Guidance. Dermal Risk Assessment, prepared by Office of Emergency andRemedial Response, Cincinnati, OH, Draft.
USEPA, 1991, Human Health Evaluation Manual Supplemental Guidance. Standard DefaultExposure Factors, OSWER Directive 9285.6-03, prepared by Office of Emergency and RemedialResponse, Cincinnati, OH, Draft.
USEPA, 1994b, Communication with Ms. Gina Feneira, Environmental Scientist, Region n, NewYork City.
USEPA, 1993, Provisional Guidance for Quantitative Risk Assessment of Polycyclic AromaticHydrocarbons, ECAO, Cincinnati, Ohio, EPA/600/R-93/089).
USEPA, 1992, Supplemental Guidance to RAGS: Calculating the Concentration Term, preparedby Office of Solid Waste and Emergency Response, Washington, DC, Publication No. 9285.7-08.
Velzy/Weston, October 1990, "Post Construction Report for Site No. 6-45-014, The SealandRestoration Site, Lisbon, New York".
Velzy/Weston, June 1990a,"Final Maintenance and Monitoring Plan" for the Sealand RestorationSite."
W.A. and JM. Rutherford, Inc., August 1978. "Baseline Data Report, Sealand-Lisbon Landfill,Lisbon, New York".
Warren-Hicks, W., B.R. Parkhurst, and S.S. Baker, Jr., 1989. "Ecological Assessment ofHazardous Waste Sites: A field and laboratory reference", USEPA/600/3-89/013.
Waste Resource Associates Inc., November 1981, "Proposed Oily Waste Disposal Cell".
Water Resources Investigation (WRI) Report 85-4119.
Water Resources Investigation (WRI) Report 87-4133.
EDIStt-94/ENG/ay071494.rp8 g_7
SLR-0010797