report - records collections - environmental protection agency
TRANSCRIPT

SITE OPERATIONS PLANSECOND OPERABLE UNIT
REMEDIAL INVESTIGATIONSYOSSET LANDFILL, SYOSSET, NEW YORK
May 1992
Prepared for
Town of Oyster Bay
Prepared by
Geraghty & Miller, Inc.125 East Bethpage Road
Plainview, New York 11803(516) 249-7600
300G4<i o
GERAGHTY & MILLER, INC.

SITE OPERATIONS PLANSECOND OPERABLE UNIT
REMEDIAL INVESTIGATIONSYOSSET LANDFILL, SYOSSET, NEW YORK
May 13, 1991
Geraghty & Miller, Inc. is submitting this work plan to the Town of Oyster Bay forwork to be performed at the Syosset Landfill. The work plan was prepared in conformancewith Geraghty & Miller's strict quality assurance/quality control procedures to ensure thatthe work plan meets the highest standards in terms of the methods used and the informationpresented.
Respectfully submitted,
GERAGHTY & MILLER, INC.
VJG/AJB/MFW:mbNYO»41\»op.tit
Vincent J, UiasserSenior Sciiefltist/Project Manager
Andrew J. BarberSenior Consultant/Project Director
Michael F. WolfertVice President/Project QA/QC Manager
300G44
GERAGHTY & MILLER. INC.

CONTENTS
SECTION I: SITE OPERATIONS PLAN OVERVIEW
SECTION II: SAMPLING AND ANALYSIS PLAN
SECTION III: QUALITY ASSURANCE PROJECT PLAN
SECTION IV: HEALTH AND SAFETY PLAN
TABLES
1. Summary of the Sampling and Analytical Program for the Second Operable UnitRemedial Investigation, Syosset Landfill, Syosset, New York.
2. Summary of Construction Details for On-Site Monitoring Wells Installed at the SyossetLandfill, Syosset, New York.
3. Potential Applicable or Relevant and Appropriate Requirements Identified for Ground-Water, Second Operable Unit Remedial Investigation, Syosset Landfill, Syosset, NewYork.
4. Summary of Water Sample Preservation and Container Specifications, Second OperableUnit Remedial Investigation, Syosset Landfill, Syosset, New York.
5. Current Occupational Airborn Contaminants Standards and Guidelines for SelectedVolatile Organic Compounds Detected During the First Operable Unit RemedialInvestigation, Syosset Landfill, Syosset, New York.
FIGURES
1. Locations of Proposed Ground-Water Gas Monitoring Wells, Syosset Landfill, Syosset,New York.
2. OU-2 RI Project Schedule.
3. Generalized Construction of Monitoring Well Installed in Exploratory Boring, SyossetLandfill, Syosset, New York.
4. Generalized Construction of Monitoring Well Installed in Mud Rotary Boring, SyossetLandfill, Syosset, New York.
5. Generalized Construction of Monitoring Well Installed in Hollow Stem Auger Boring,Syosset Landfill, Syosset, New York.
6. Generalized Construction of Gas Monitoring Well, Syosset Landfill, Syosset, New York.300G45
GERAGHTY & MILLER. INC.

r
m
6
300646

SECTION I
SITE OPERATIONS PLAN OVERVIEWSECOND OPERABLE UNIT
REMEDIAL INVESTIGATIONSYOSSET LANDFILL, SYOSSET, NEW YORK
300647
GERAGHTY & MILLER. INC.

CONTENTS
SECTION I: SITE OPERATIONS PLAN OVERVIEW
Page
1.0 INTRODUCTION . . . . . . . . . . . . . . . . . . . . . . . . . . . . . . . . . . . . . . . . . . . . . . I-l
1.1 PURPOSE AND SCOPE . . . . . . . . . . . . . . . . . . . . . . . . . . . . . . . . . . . . . . 1-21.2 FORMAT . . . . . . . . . . . . . . . . . . . . . . . . . . . . . . . . . . . . . . . . . . . . . . . . . 1-31.3 PROJECT ORGANIZATION . . . . . . . . . . . . . . . . . . . . . . . . . . . . . . . . . . 1-31.4 SITE DESCRIPTION AND HISTORY . . . . . . . . . . . . . . . . . . . . . . . . . . . 1-4
2.0 REFERENCES . . . . . . . . . . . . . . . . . . . . . . . . . . . . . . . . . . . . . . . . . . . . . . . . 1-5
APPENDIX
A. Resumes of Key Project Personnel.
300G48
GERAGHTY & MILLER. INC.

SECTION I
SITE OPERATIONS PLAN OVERVIEWSECOND OPERABLE UNIT
REMEDIAL INVESTIGATIONSYOSSET LANDFILL, SYOSSET, NEW YORK
1.0 INTRODUCTION
Geraghty & Miller, Inc. was retained by Lockwood, Kessler and Bartlett, Inc. (LKB)under contract to the Town of Oyster Bay (Town) to prepare this Site Operations Plan(SOP) for conducting the Second Operable Unit (OU-2) Remedial Investigation (RI) of theSyosset Landfill Syosset, New York.
This SOP for the OU-2 (off-site) RI for the Syosset Landfill was prepared to providea detailed description of the methodologies for conducting the OU-2 RI. The rationale andscope of the OU-2 RI program was described in the April 1991 work plan (Geraghty &Miller, Inc. 1991) that was approved by the United States Environmental Protection Agency(USEPA) in their letter dated July 5, 1991. Specifically, the OU-2 RI will consist of an Off-Site Ground-Water Study to determine the horizontal and vertical extent of a plume ofleachate that may be emanating from the landfill and to determine the plume thickness on-site. Leachate-impacted ground water was detected during the On-Site Ground-Water Studythat was performed as part of the First Operable Unit (OU-1) RI (Geraghty & Miller, Inc.1989). The OU-2 RI field program also includes an Off-Site Subsurface Gas Study todetermine whether landfill gases are migrating off-site from the landfill.
This document was prepared in accordance with the most recent USEPA guidancedocument (Interim) (USEPA 1988) for the conducting of a remedial investigation/ feasibilitystudy (RI/FS) and also follows the terms of the Administrative Order signed by the USEPAand the Town of Oyster Bay on June 19, 1986. The completion of the tasks and deliverablesdescribed in the SOP will ensure consistency with the National Contingency Plan (NCP).
300G49
GERAGHTY & MILLER, INC.

1-2
1.1 PURPOSE AND SCOPE
The OU-2 RI will consist of an Off-Site Ground-Water Study and an Off-SiteSubsurface Gas Study. The purposes of the Off-Site Ground-Water Study will be todetermine the plume thickness, define the off-site extent of a leachate plume that may beemanating from the landfill, and confirm the direction of ground-water flow. Leachate-impacted ground water was detected beneath the landfill and inside the northern propertyboundary (downgradient) during the OU-1 RI. The purpose of the Off-Site Subsurface GasStudy is to determine the extent of off-site subsurface gas migration from the landfill whereelevated concentrations of methane were detected during the OU-1 RI.
During the Off-Site Ground-Water Study, eleven monitoring wells will be installedat five locations; two of the proposed drilling locations are on-site where a single deepmonitoring well will be installed next to existing well clusters (SY-3 and SY-6) (Figure 1).One on-site location is upgradient of the landfill where a deeper well will be installed atexisting upgradient Well Cluster SY-6 to provide additional upgradient water-quality data.The second on-site location is downgradient of the landfill where a deeper well will beinstalled at existing Well Cluster SY-3 to determine the plume thickness on-site. The threeproposed off-site drilling locations will each have three wells per location. An exploratoryboring will be drilled using a Barber rig (cased boring method) to install the proposed deepwell on-site next to existing Well Cluster SY-3 and the deep well at the middle location ofthe three proposed off-site well cluster locations.
During the Off-Site Subsurface Gas Study, three shallow gas monitoring wells will beinstalled on or in the vicinity of the Great Eastern Printing Company property, which islocated adjacent to the southwestern portion of the landfill but separated from it by theLong Island Rail Road (LIRR). In addition to the three off-site gas monitoring wells, fivenew gas monitoring well clusters will be installed on-site as part of the OU-1 Remedial
300G50
GERAGHTY & MILLER. INC.

1-3
Design Program, in accordance with the amendment to the OU-2 RI work plan (Geraghty& Miller, Inc. 1991) that was submitted by the Town of Oyster Bay in their letter to theUSEPA dated June 26, 1991. Although the additional on-site work will be conducted as partof the OU-1 Remedial Design Program, the monitoring results will be presented in the OU-2RI report.
1.2 FORMAT
This document consists of four distinct parts or sections as follows: Section I: SiteOperations Plan (SOP) Overview; Section II: Sampling and Analysis Plan (SAP); SectionIII: Quality Assurance Project Plan (QAPP), and Section IV: Health and Safety Plan(HASP). All four sections are included as one volume. Because each of these sections servea separate specific function and may be used individually, they each contain tables ofcontents, references, and appendices. However, all tables and figures are placed in tabs atthe back of this volume. This format facilitates removal of individual sections. The SAPprovides detailed descriptions of the methodologies of the OU-2 RI field program. TheQAPP ensures that the precision, accuracy, representativeness, comparability, andcompleteness (the PARCC parameters) of the collected data are known, documented, andadequate to satisfy the data quality objectives of the investigation. The HASP providesassurance that field personnel will conduct their tasks in a manner that will minimize healthand safety risks to themselves, the public, and the environment.
1J PROJECT ORGANIZATION
The Town is the owner of the Syosset Landfill and will serve as the ProjectCoordinator. LKB is the RI/FS Program Manager and Geraghty & Miller is the RI ProgramManager. Technical and administrative roles for performance of the RI/FS were assignedto staff who have the appropriate qualifications to carry out their respective responsibilities.More details on project responsibilities are provided in Section 8.0 (Project Organization)
300651
GERAGHTY & MILLER. INC.

1-4
of the SAP (Section II) and Section 2.0 (Project Organization and Responsibilities) of theQAPP (Section III). Resumes of key project personnel are provided in Appendix A of theSOP Overview (Section I).
1.4 SITE DESCRIPTION AND HISTORY
The Syosset Landfill is located in central Nassau County in the Town of Oyster Bay,Syosset, New York. The site is roughly rectangular in shape and encompasses approximately38 acres. The office and facilities of the Town of Oyster Bay Department of Public Works(TOB-DPW) are located adjacent (east) to the landfill and occupy approximately 15 acres;together the landfill and the adjacent facilities total approximately 53 acres. Currently theTown controls access to the site, which is surrounded by a fence. Topographically, the siteis relatively flat and at a similar elevation to the surrounding area. As illustrated in Figure1, the site is bounded by the Long Island Expressway and Miller Road to the southeast,Cerro Wire & Cable Corporation to the southwest, and the LIRR to the northwest. Aresidential area and the South Grove Elementary School border the site to the northeast.The entire landfill area is enclosed by a 6-foot high cyclone fence. The three proposed off-site ground-water monitoring well clusters are located northeast of the landfill and the off-site gas monitoring wells are located southwest of the landfill (see Figure 1). The OU-2 RIwill also present and evaluate gas monitoring results obtained from the on-site gas OusterWells CW-2, 4, 5, 6, 7, and 8 that will be installed and monitored during the OU-1 RemedialDesign Program (see Figure 1).
300652
GERAGHTY & MILLER. INC.

1-5
2.0 REFERENCES
Federal Register. 1988. National Oil and Hazardous Substances Pollution ContingencyPlan, Proposed Rule. December 21, 1988, pp. 51394-51520.
Geraghty & Miller, Inc. 1989. Interim Remedial Investigation Report, Syosset Landfill,Syosset, New York. August 1989.
Geraghty & Miller, Inc. 1991. Work Plan for the Second Operable Unit RemedialInvestigation at the Syosset Landfill, Syosset, New York. April 1991.
U.S. Environmental Protection Agency (USEPA) 1988. Guidance for Conducting RemedialInvestigations and Feasibility Studies Under CERCLA. Office of Emergency andRemedial Response. USEPA Washington, D.C., October 1988.
300G53
GERAGHTY & MILLER. INC

mz
300654

SECTION I: SITE OPERATIONS PLAN OVERVIEW
APPENDIX A
RESUMES OF KEY PROJECT PERSONNEL
300G55
GERAGHTY & MILLER. INC.

NAME: RICHARD W. LENZ, P.E.ADDRESS: TOWN OF OYSTER BAY
DEPARTMENT OF PUBLIC WORKS150 MILLER PLACESYOSSET, NEW YORK 11791
QUALIFICATIONS:
- Bachelor's Degree from Polytechnic Institute of NewYork.
- Professional Engineer's license.
- Worked for Nassau County Dept. of Public Works -Sanitation and Work supply for 16 year lateralSewer Construction and Design of Sewage TreatmentPlants.
- Project Manager for approximately $100 million -Plant Construction in the Design Phase/ConstructionPhase.
- Liaison between County and D.E.C., responsible forquarterly reports and grant applications.
- Working for Town of Oyster Bay for 21/2 years -responsible for finalizing Remedial InvestigationReport with EPA for Syosset Landfill.
- Draft and finalization of Feasibility Study.
- Discussed modifications to Consent Decree.
- Responsible for several other types of projectsfrom Design through Construction.
JOB TITLE: PROJECTION MANAGER/CIVIL ENGINEER III
TELEPHONE NO.: (516) 921-7347
300G56

THERESA CURRAN HENEYELD, P.E. _ ____Environmental Engineer 11^ §-§ ENGINEERS0
EDUCATION/REGISTRATION ——•————~~
BCE, Civil Engineering, Manhattan College, 1982MEE, Environmental Engineering, Manhattan College, 1983
Registered Professional Engineer, State of New York
EXPERIENCE
Ms. Heneveld 1s an Environmental Engineer with over seven years ofexperience 1n solid waste management, the preparation of hazardous wastesite remedial Investigations, feasibility studies and remedial actiondesigns, the design of water and wastewater collection and treatmentsystems, the development of hydraulic and hydrologlc analyses, and thepreparation of environmental Impact statements. At LKB, Ms. Heneveld 1scurrently a Project Engineer for several environmental engineering projectsInvolving hazardous waste site remedial Investigations and feasibilitystudies, groundwater monitoring programs, landfill gas system evaluationsand environmental Impact statements.
As project engineer for the Syosset Landfill RemedialInvestigation/Feasibility Study process, Ms. Heneveld developed work plans,reports, remedial action design alternatives and construction costestimates for this Superfund site 1n accordance with USEPA, CERCLA andNYSDEC requirements. The remedial action design alternatives Involvedcapping and gas control technologies, 1n addition to related site work andair and groundwater monitoring programs. In addition, Ms. Heneveld 1scurrently Project Engineer for the Second Operable Unit RemedialInvestigation (OU2 RI) process at the former Syosset Landfill. The 01)2 RIwill Identify off-site conditions attributable to the site.
Ms. Heneveld recently acted as design engineer for the GroundwaterRemediation Program at the Old Bethpage Solid Waste Disposal Complex(OBSWDC), which was an Integral part of the Remedial Action Plan developedfor this Superfund site. Her responsibilities Included: the design ofapproximately 1.25 miles of a groundwater transmission line from fivegroundwater recovery wells; the design of a 1.5 MGD groundwater treatmentplant to remove Volatile Organic Compounds, Iron and Manganese; and adischarge system consisting of 2,000 feet of piping and a series ofdiffusion wells to recharge the treated water back Into the underlyingaquifer. The treatment processes she designed Included an air stripper,four manganese greensand pressure filters, three activated carbon columns,and sludge handling and dewateHng equipment.
As Environmental Engineer for a major New York City engineering firm, Ms.Heneveld was principal design engineer for a performance evaluation of awastewater treatment plant 1n Suffolk County, NY. She was responsible forInvestigations, Innovative treatment technologies, selecting a treatmentprocess and obtaining approval from the Suffolk County Department ofHealth.
300G57

5 5'7'5' B CONSULTINGJOHN P. LEKSTUTTS. P.E. = ,S^ g-s> ENGINEERSVice President - Project D1r./Pr1nc1pal-1n-Charge «-*i* S s.-ce ee9
EDUCATION/REGISTRATION
B.E., Civil Engineering, Manhattan College, 1965M.E., Sanitary Engineering, Manhattan College, 1966
Registered Professional Engineer 1n NY, NJ, CT, MA, RI, ME, VT, WA
EXPERIENCE
Mr. Lekstutls has more than 25 years of experience in the fields of civiland sanitary engineering, environmental assessment and hazardous wastemanagement. During this time, Mr. Lekstutls has developed an expertise inthe management of hazardous waste site remedial Investigations, feasibilitystudies and remediation design and construction programs. He has managedmore than five such programs.
Mr. Lekstutls has been actively involved with the First Operable Unitremedial Investigation/feasibil1ty study process for the Syosset Landfill.This project entailed negotiation of a Consent Decree with USEPA and thedevelopment of a remedial investigation and feasibility study for thecapping and closure of the Syosset Landfill. As part of hisresponsibilities, Mr. Lekstutls is also assisting the Town 1n obtainingEQBA Title 3 funds for Implementation of the design and construction phasesof this program. In addition, Mr. Lekstutls is currently managing theSecond Operable Unit Remedial Investigation for the site.
Mr. Lekstutls's recent project experience Involves the successfulcompletion of the remedial Investigation and design program at the OldBethpage Landfill for the Town of Oyster Bay. The program addressed threeseparate remedial action components, which are either under construction,1n the bid phase or 1n the final design and approval phase. These Include:a groundwater remediation a project, which entails the capture andtreatment of up to 1.5 million gallons per day of contaminated groundwater;the design of a landfill capping and closure program that addresses severeslope conditions; and the design and Installation of an up-gradedperimeter landfill gas migration control system, comprised of extractionwells, a header system, a blower facility and a combustion unit for thedestruction of captured gases.
As project manager, Mr. Lekstutis's activities Involved the management andcontrol of a multi-disciplined team of engineers and scientists. He wasalso responsible for interfacing with the USEPA, NYSDOL and NYSDEC in thenegotiation of the landfill's Consent Decree, in obtaining approvals forboth the conceptual and final design plans and specifications, and Inobtaining EQBA Title 3 funds for the project. In addition, he had tointerface with local community residents to keep them advised of theprogram's progress and to respond to related areas of concern.Construction for all remedial components 1s expected to be completed beforethe end of 1992, at which time the Old Bethpage Landfill will be the firstLong Island landfill to be fully remediated under USEPA's Superfund Program.
300658

ANDREW J. BARBER
Senior Project Advisor & Senior AssociateCorporate Safety Manager
CREDENTIALS/REGISTRATIONB.S. Chemistry, Union College, 1979
PROFESSIONAL AFFILIATIONSAmerican Chemical SocietyAmerican Industrial Hygiene AssociationAmerican Society of Safety EngineersAssociation of Ground Water Scientists and Engineers (NWWA)
FIELDS OF SPECIALIZATION- Hazardous waste site remediation- Field sampling and analysis- Health and safety- Analysis of water-quality and geochemical data- Fate and transport of contaminants in soil and ground-water systems- Regulatory analysis
EXPERIENCE SUMMARYPrior to joining Geraghty & Miller, Inc., Mr. Barber was employed by Peabody CoastalServices of Linden, New Jersey, as a member of its Hazardous Material Response Team.While at Peabody, he was directly involved with cleanup activities at several uncontrolledhazardous waste sites. His responsibilities included data and sample collection, supervisionof heavy equipment operations, and classification and segregation of waste materials.
Mr. Barber joined the firm in 1980; his responsibilities include geochemistry, projectmanagement, and management of the company's Health & Safety Program. As ageochemist with the firm, he has worked on numerous ground-water investigations tocharacterize the transport and fate of chemical contaminants. He has extensive experiencein the development and implementation of subsurface investigations and monitoring plans.
As a project officer, Mr. Barber has directed investigative and remedial efforts at numeroussites in the northeast. Projects have been conducted under RCRA and CERCLA, as wellas under various state or local regulations, and have included discharge permit issues,underground storage tank removal, hazardous waste storage, property transfer and closureplans. Activities include: negotiation with Federal, state and/or local regulatory agencies;preparation of work plans and reports; management of field activities; scheduling; regulatorycompliance; quality assurance/quality control, and contract administration. Mr. Barber isalso the manager of the Albany, New York office, which opened in November, 1989.
300G59
GERAGHTY & MILLER. INC.

ANDREW J. BARBER/2
As Corporate Safety Manager for the firm, Mr. Barber has developed and managed thecompany health and safety program. This program includes medical monitoring andextensive training, in compliance with OSHA hazardous waste regulations. He is alsoresponsible for the preparation, review, and implementation of site-specific health and safetyplans.
KEY PROJECTSSupervised remediation of disposal pit containing residual solvents and PCB oil inupstate New York.
Developed and applied field techniques to analyze volatile organic contaminants in soiland water samples using a portable gas chromatograph.
Continually involved in analysis and presentation of water quality and geochemical dataand the determination of contaminant fate and transport mechanisms.
Project officer for the Remedial Investigation/Feasibility Study for a CERCLA landfillsite on Long Island.
Co-authored three volume technical report as part of on-going litigation support for amajor environmental lawsuit.
Project officer for investigation and remedial activities at a major petroleum transferfacility.
Continually involved in developing work plans for taking representative samples forcontaminants in soil, air, and water.
Project officer for feasibility study, ground-water monitoring and remediation for majorCERCLA site on Long Island.
Negotiated, and subsequently directed, investigation and remediation of contaminatedsoils at an industrial property on Long Island.
Provided technical oversight and review of USEPA contractor performance at amunicipally-owned CERCLA site.
- Currently negotiating Remedial Investigation/Feasibility Studies on behalf of twoseparate industrial clients listed on the New York State Superfund list.
Provided expert testimony on behalf of an industrial client in relation to allegeddischarge permit violations.
300660
GERAGHTY & MILLER. INC.

ANDREW J. BARBER/3
KEY PROJECTS (Continued)Continually involved as project officer on environmental assessments of commercial andindustrial real estate prior to purchase or refinancing.
Officer for project involving the evaluation of the hydrogeologic aspects of candidatelandfill sites for a two-county region in upstate New York.
SELECTED PUBLICATIONS
Barber, A.J., and O.C. Braids, Application of a Portable Organic Vapor Analyzer in Ground-Water Contamination Investigations, "Proceedings of the Second National Symposiumon Aquifer Restoration and Ground-Water Rehabilitation," National Water WellAssociation, Worthington, Ohio, 1982 (paper presented May 27, 1982).
Barber, A.J., Case Histories in Safety Programs for Hazardous Waste Site Investigations, Paperpresented to the National Water Well Association, "Aquifer Restoration and Ground-Water Monitoring," Third National Symposium, Columbus, Ohio, May 25-27, 1983.
Lobasso, T. and A.J. Barber, A Monitoring and Removal Plan for Leaked Propane in theVadose Zone, "Proceedings of Characterization and Monitoring of the Vadose(Unsaturated) Zone," National Well Water Association, Worthington, Ohio (Paperpresented December 9, 1982, Las Vegas, Nevada).
Barber, A.J. and B.V. Moran, Health and Safety Considerations for Working with HazardousChemical Wastes - A Consultant's Perspective, Paper presented to the AmericanChemical Society, Twentieth Middle Atlantic Regional Meeting, Baltimore, Maryland(paper presented September 4, 1986).
Barber, A.J., Human Error and Groundwater Sampling, Waste Age, Volume 17, No. 6, pp.183-184.
Barber, A.J. and R.D. Raskin, Application of a Portable Gas Chromatograph to SubsurfaceContamination Investigations, "Proceedings of the First Annual Hazardous MaterialsManagement Conference/Central," Tower Conference Management, Glen Eleyn, IL,1988 (paper presented March 15, 1988, Chicago, IL)
1/90
300G61
GERAGHTY & MILLER. INC.

TOM C. ENG
Senior Engineer/Industrial HygieneNortheast Regional Health & Safety
CREDENTIALS/REGISTRATIONB.S. Chemical Engineering, City College, 1984Industrial Hygienist in Training (IHIT), American Board of Industrial Hygiene, 1989
PROFESSIONAL AFFILIATIONSAmerican Industrial Hygiene Association, National and Local Chapter MemberAmerican Board of Industrial Hygiene, Member
FIELD OF SPECIALIZATION- Occupational Health & Safety- Identification, Evaluation and Control of Occupational Disease Exposures- Development of Comprehensive Control Strategy- Field sampling and data analysis
EXPERIENCE SUMMARYPrior to joining Geraghty & Miller Environmental Services, Inc., Mr. Eng was the NewYork Division Industrial Hygienist/Pollution Control Coordinator for Liberty MutualInsurance Group, Inc. His responsibilities included consulting with clients on industrialhygiene and pollution liability issues, designing, implementing and teaching in trainingseminars for both clients and internal personnel, field surveys to identify potential healthhazards, and sampling and data analysis.
Associated with Liberty Mutual for 5 plus years, Mr. Eng has extensive industrial hygieneexperience in a major cross section of industries and has appreciable knowledge of currentoccupational health and safety standards and guidelines. He has accompanied andrepresented clients in regulatory meetings as a technical expert in the negotiation processto determine adequate control measures.
Joining the firm in 1990, his responsibilities include managing portions of the company'sHealth and Safety Program, preparing and reviewing Site Safety Programs, providingtechnical expertise in the field of industrial hygiene, and participating in training programsdesign for clients.
KEY PROJECTSFormaldehyde and ethylene oxide surveys for New York area health facilities.
Indoor air quality surveys for commercial and industry facilities.
Laser hazard surveys for medical and high tech equipment manufacturers.300G62
GERAGHTY & MILLER. INC.

TOM C. ENG/2
KEY PROJECTS (Continued)Noise surveys for a variety of industries, from food to industrial clients, punch pressoperations, bakeries, print rooms.., etc.
Lead surveys in various industries, foundries, indoor firing ranges, electronics ... etc.
Organic solvent surveys, degreasing operations, spray painting, printing press,electronics..., etc.
Ionizing radiation survey for a watch manufacturing client.
Hazard communication program development and implementation for various industries.
Assisting clients in implementing monitoring programs to address occupational diseaseexposures.
5/90
300G63
GERAGHTY & MILLER. INC.

VINCENT J. GLASSER
Senior Scientist
CREDENTIALS/REGISTRATIONB.A. Environmental Studies, S.U.N.Y.-Binghampton, 1980
PROFESSIONAL AFFILIATIONSAssociation of Ground-Water Scientists and Engineers (NWWA)North Jersey Water Conference
FIELDS OF SPECIALIZATIONCoordinating field drilling and sampling programsUtilizing and maintaining data - collection instrumentsContouring of ground-water flow regimes and contaminant plumesConstructing hydrogeologic cross sectionsCoordinating and carrying out pumping tests and analyzing pumping test data
EXPERIENCE SUMMARYIn addition to his duties as a field hydrogeologist, Mr. Glasser has been a member of Geraghty &Miller's sampling van team, collecting ground-water samples in accordance with federal and stateprotocols. Prior to joining Geraghty & Miller in 1981, Mr. Glasser was employed as a well driller'sassistant by Habernicht Water Well Systems in Bellmore, New York.
KEY PROJECTSConducted field investigation for a Superfund project involving contamination of municipal andprivate water-supply wells. Responsible for supervising the installation of monitoring wells andcoordinating water and soil sampling protocols with EPA representatives.
Supervised monitoring well installation at a chemical storage facility and collected water samplesafter completion. Prepared report that was submitted to the county as required under countydirective.
Analyzed pumping test data from an investigation of a gas spill affecting a complex fractured-rock aquifer system. The results of this test were used to determine the zone of capture undervariable pumping conditions and to design schemes for containment of the spill.
Supervised the redevelopment of abatement wells at a hazardous waste disposal facility.
Carried out field investigation at a chemical plant in order to determine if a waste lagoon linerwas leaking. Supervised the installation of a series of monitoring wells and sampled them fortracer compounds introduced into the lagoon. Contributing author to the report.
Measured volatile organic compounds in soils with an Organic Volatile Analyzer at a formerdump site. Field program was designed to confirm the presence of a "hot spot" of volatilecontamination as predicted by a computer model of the ground-water system. In addition, soilsamples were collected and analyzed for volatile organic contamination.
7/88300G64
GERAGHTY & MILLER, INC.

CASEY SUSAN SCHMIDT
Staff Scientist
CREDENTIALS/REGISTRATIONM.S. Geology, University of Nevada, Las Vegas, 1987B.S. Geology, University of Idaho, 1980Registered Geologist State of Arkansas
PROFESSIONAL AFFILIATIONSGeological Society of AmericaAssociation of Ground Water Scientists and Engineers (NWWA)American Geophysical UnionSigma Xi (The Scientific Research Society)
FIELDS OF SPECIALIZATION- Supervision of field projects relating to the investigation and evaluation of sediment and ground-
water contamination at municipal landfills and industrial facilities.- Design and supervision of drilling programs utilizing a variety of drilling methods in
unconsolidated rock and bedrock.Geophysical well logging and interpretation.Field sampling.Geologic mapping and remote sensing interpretation.
- Evaluating and organizing data using Excel, D-base, Golden Graphics, word processing and othercomputer software.
EXPERIENCE SUMMARYMs. Schmidt has been with Geraghty & Miller since 1988. She participates in hydrogeologic studiesof hazardous-waste sites where she is responsible for installing monitoring wells, collecting watersamples, preparing geologic logs of bore holes, and preparing maps and cross sections of thehydrogeologic data. She has helped write workplans, proposals and final reports for a wide rangeof projects relating to municipal landfills and industrial sites, site assessments, and hydrocarbonremediation.
Prior to joining Geraghty & Miller, Inc. in 1988, Ms. Schmidt participated in the geologic evaluationof sites used for underground nuclear weapons testing for the University of California, LawrenceLivermore Laboratory. She has supervised the drilling and geophysical logging of bore holes andthe quality assurance of the data obtained. She has applied experience using a wide variety ofgeophysical tools to interpret the structural geology and stratigraphy of geologic settings. She hasdone extensive geologic mapping in a variety of geologic terrains for the U.S. Geological Survey andfor the Center for Volcanic and Tectonic Studies, University of Nevada, Las Vegas.
KEY PROJECTS- Supervised several field investigations to delineate the lateral and vertical extent of ground-water
contaminated with chlorinated solvents and hydrocarbons in New Jersey and Connecticut.
- Prepared a hydrogeologic report and data interpretation for a municipal landfill in Nassau County,New York in compliance with 6NYCRR, Part 360 monitoring. Q 0 0 P G 5
GERAGHTY & MILLER. INC.

CASEY SUSAN SCHMIDT/2
KEY PROJECTS (Continued)Prepared budgets, technical specifications and drilling contracts for RCRA and CERCLA sites.
- Responsible for scheduling of ground-water sampling and investigations at a municipal landfillin Nassau County, New York.
- Research on the recent volcanism in Crater Flat, Nye County, Nevada and how it might affectthe adjacent proposed nuclear-waste storage facility at Yucca Mountain.
Responsible for scheduling and field supervision of drilling and geophysical work performed ondrill holes at the Nevada Test Site.
PUBLICATIONS
Schmidt, C.S., Smith, E.I., 1985, The Tertiary volcanic stratigraphy of the southern McCullough Range,Clark County, Nevada: Abstracts of the Symposium on Southwestern Geology and Paleontology,Dept. of Geology, Museum of Northern Arizona, Flagstaff, Arizona.
Anderson, J.L., Young, E.D., Clarke, H.S., Orrel, S.E., Winn, M., Schmidt, C.S., Smith E.I., 1985,The geology of the McCullough Range Wilderness Area, Clark County, Nevada: University ofSouthern California Technical Report submitted to the U.S. Geological Survey, 45 p.
Smith, E.I., Schmidt, C.S., 1986, Mid-Tertiary volcanic rocks of the McCullough Range, Clark County,Nevada: Geological Society of America Abstracts with Programs, v. 18, No. 2, p. 187.
Schmidt, C.S., Smith, E.I., 1987, The McCullough Pass Caldera: a mid-Miocene caldera in the centralMcCullough Mountains, Clark County, Nevada: Geological Society of America Abstracts withPrograms, v. 19, No. 6, p. 447.
Smith, E.I., Schmidt, C.S., Mills, J.G., 1988, Mid-Miocene volcanoes in the Lake Mead area ofsouthern Nevada and Northwestern Arizona, in Weide, D.L. Faber, M.L., eds., This Extended Land,Geological Journeys in the Southern Basin and Range: Geological Society of America, CordilleranSection, Field Trip Guidebook, pp. 107-122.
3/91
300GG6GERAGHTY & MILLER. INC.

GREGORY K. SHKUDA. Ph.D.
Senior Project Advisorand Associate
CREDENTIALS/REGISTRATIONPh.D. Organic Chemistry, New York University, 1976M.S. Organic Chemistry, New York University, 1973B.A. Chemistry, New York University, 1968
PROFESSIONAL AFFILIATIONSAmerican Chemical SocietyAssociation of Ground Water Scientists and Engineers (NWWA)
FIELDS OF SPECIALIZATION- In-depth knowledge of federal and state environmental regulations- Evaluation of complex ground-water quality problems- Knowledge of biodegradation of complex organics in ground water- Provides expert testimony and reports on hazardous waste compliance issues- Review of QA/QC plans and development of analytical protocols for litigation purposes
EXPERIENCE SUMMARYDr. Shkuda, a Senior Project Advisor for Geraghty & Miller's New York office, evaluatescomplex problems relating to the chemical contamination of ground water and soil. Dr.Shkuda participates in every aspect of the firm's work relating to ground-water contaminationand provides expert testimony on behalf of the firm's clients.
Prior to joining the firm in 1986, Dr. Shkuda was an environmental scientist at the NewYork State Department of Law, Environmental Protection Bureau where he participated inmajor environmental litigation as a member of a unique staff of attorneys and scientists.From 1980 to 1982, Dr. Shkuda was employed by a consulting engineering firm where hedeveloped sampling strategies to characterize hazardous waste sites located in two EPAregions as part of a national contract. As part of this work, Dr. Shkuda supervised thechemical assessments needed to characterize hazardous waste sites and was responsible forcollecting enforcement data. During the period 1976-1980, Dr. Shkuda was a ResearchAssociate in the Department of Microbiology and Immunology, Albert Einstein College ofMedicine.
KEY PROJECTS- Directed the Remedial Investigation/Feasibility Studies at two municipal landfills on Long
Island. Dr. Shkuda was responsible for negotiating the scope of the work plans for theseprograms with the New York State Department of Environmental Conservation. Imple-menting the studies, coordination with the client, state and local community.
300GG7
GERAGHTY & MILLER. INC.

GREGORY K. SHKUDA, PH.D./2
KEY PROJECTS (Continued)- Directed the hydrogeologic investigation at a Superfund site located in Eastern Tennessee
for a Fortune 500 client. This site received large quantities of liquid chemical wastes.Dr. Shkuda was responsible for the evaluation of previously collected data, proposal ofadditional scopes-of-work and negotiations with the State of Tennessee. He participatedin the delineation of the extent of contamination and proposed solutions to the problemof the collection of the non-aqueous phase liquids encountered at the site.
- Directed the environmental investigation at a closed aircraft manufacturing facility onLong Island. Dr. Shkuda's role included negotiations with the State as to the scope ofthe investigation, evaluation of the monitoring data, supervision of RCRA closureactivities and coordination of proposals for cleanup activities.
- Directed hydrogeologic investigations for a major defense contractor at seven sites locatedin three states. Dr. Shkuda played a key role in the collection and review of historicaldata, preparation of work plans, supervision of field investigations, report preparationnegotiations with Federal and state regulatory agencies, and the implementation ofremedial activities at several of the facilities.
SELECTED PUBLICATIONS
Geller, S., Wei, S.C., Shkuda, G.K., Marcus, D.M., Brewer, C.F.: Carbon-13--EnrichedTetra-L-Alanine Hapten to Fab' Fragments of Antipoly(L-Alanine) Antibodies.Biochemistry 1980, 3614-3623.
Shkuda, G.K., Wei, S.C., Geller, S., Brewer, C.F., Marcus, D.M.: A 13C NMR Study. NewYork University, New York 1976.
Shkuda, O.K.: The Decomposition of Bicyclic Diazo Compounds: A Mechanistic Study. NewYork University, New York 1976.
Rodgers, J.A., Shkuda, G.K.: Training and Safety Considerations in Using Self-ContainedBreathing Apparatus (SCBA) and Tethered Cascade Breathing Apparatus (TCBA) inHazardous Atmospheres at Uncontrolled Hazardous Waste Sites. American ChemicalSociety 184th Annual Meeting, Kansas City, Mo., September 184th Annual Meeting,Kansas City, Mo., September 1982.
10/90
300663
GERAGHTY S VTILLER. INC.

LAUREN E. SJOGREN
Scientist III
CREDENTIALS/REGISTRATIONM.S. Analytical Chemistry, University of Maryland, MD, 1988B.S. Chemistry, C.W. Post Center of Long Island University, NY, 1983
PROFESSIONAL AFFILIATIONSAmerican Chemical SocietyAssociation of Ground Water Scientists and Engineers (NWWA)
FIELDS OF SPECIALIZATIONField samplingChemical data validation
EXPERIENCE SUMMARYPrior to joining Geraghty & Miller, Ms. Sjogren was employed by a consulting firm as anenvironmental chemist. Her responsibilities included validation of chemical data, assistingin the preparation of quality assurance project plans and participation in field samplingprograms. The chemical validation of data included the screening of all laboratory data todetermine the laboratory compliance with New York State Department of EnvironmentalConservation (NYSDEC) Contract Laboratory Protocols (CLP). Ms. Sjogren's professionalexperience also includes laboratory positions in both academic and industrial sectors.
As a research assistant at the University of Maryland, Ms. Sjogren utilized instrumentalneutron activation analysis of several types of environmental samples. In addition, aqueoussamples were also analyzed for sulfate and nitrate using ion chromatography. During hertenure at the University of Maryland, Ms. Sjogren also served as a summer intern at FMCCorporation's Baltimore, Maryland facility as a process laboratory technician. This positionincluded responsibility for conducting pesticide and herbicide analysis utilizing gaschromatography.
Upon completion of the Master's Program at the University of Maryland, including thepreparation of a research thesis, Ms. Sjogren took a position as quality control chemist witha chemical manufacturing firm in New York. Responsibilities included stability testing andrelease of finished products according to United States Pharmacopeia (USP) specificationsutilizing liquid chromatography, gas chromatography and UV spectroscopy.
As a chemist and scientist with Geraghty & Miller, Ms. Sjogren has been responsible forthe validation of chemical data by USEPA CLP for Federal Superfund sites in Indiana andNew Jersey.
300G69
GERAGHTY & MILLER. INC.

LAUREN J. SJOGREN/2
PUBLICATIONS/PRESENTATIONS
American Chemical Society; Middle Atlantic Regional Meeting "Atmospheric Concentrationsand Wet Deposition of Elements Used for Tracing Source Emissions," May 1987.
Thesis Research: Wintertime Composition of Precipitation, Atmospheric Particles and Gases inCollege Park, MD.
4/90
300G70
GERAGHTY & MILLER. INC.

MICHAEL F. WOLFERT
Vice President/Hydrogeologist
CREDENTIALS/REGISTRATIONB.A. Geology, Hofstra University, 1971Certified Professional Geologist: American Institute of Professional Geologists, States ofArkansas, Indiana, North Carolina, South Carolina, Tennessee, & Commonwealth of Virginia
PROFESSIONAL AFFILIATIONSAssociation of Ground Water Scientists and Engineers (NWWA)Geological Society of AmericaAmerican Institute of Professional Geologists
FIELDS OF SPECIALIZATION- Planning, organizing and managing large-scale projects concerning the evaluation and
remediation of ground-water contamination and ground-water resource development- Planning, organizing, and interpreting complex aquifer testing programs- Development and evaluation of hydrogeological data
EXPERIENCE SUMMARYMr. Wolfert has been a member of the firm since 1971 and has carried out ground-waterinvestigations in Canada, Puerto Rico and throughout the United States. He has beeninvolved with the development of ground-water supplies for industry, municipalities andprivate water companies. He has carried out ground-water management studies formunicipalities and planned, supervised, and analyzed data from many complex aquiferevaluation tests. He has planned and organized many investigations of ground-watercontamination covering a wide range of contaminants and hydrogeologic settings includingSuperfund sites. He has also been involved with evaluation and implementation of remedialmeasures at hazardous waste sites.
KEY PROJECTS- Developed a 2 million gallons per day ground-water supply for a new town (proposed
20,000 people) in coastal plain of New Jersey next to a sensitive wildlife area (BrigamineWildlife Preserve). The study proved the availability of the water supply while alsoquantifying the effect of the proposed withdrawal on other major ground-water users inthe region. Effects on surface water were also evaluated.
- Developed a detailed description of the geology and ground-water system of MiddlesexCounty, New Jersey for the county's 208 study.
- Designed field and analytical program to determine movement and extent of elementalphosphorus in the subsurface from a leak at an industrial site in New Jersey.
300G71
GERAGHTY & MILLER. INC

MICHAEL F. WOLFERT/2
KEY PROJECTS (Continued)- Planned, organized, and provided technical oversight for a supplemental RI/FS that was
conducted at a solvent reclaiming facility (Superfund site) in the coastal plain of NewJersey. The study involved a detailed and critical evaluation of a complex multi-layeredaquifer system that resulted in the identification of previously unidentified upgradientcontributions to the contamination problem.
- Planned and managed a hydrogeologic investigation program for Amherst, Massachusettsthat resulted in the development of an additional 1 million gallons per day ground-watersupply and evaluated the impacts of this new diversion on existing wells and wetlands.
- Planned, organized, and provided technical oversight for an RI/FS that was conducted atthe Islip municipal landfill on Long Island, New York.
- Planned, organized and currently providing technical oversight for an RI/FS beingconducted at the Babylon municipal landfill on Long Island, New York.
- Carried out and evaluated data from a detailed field testing program, including severalcomplex aquifer tests, to evaluate the feasibility of developing a 2,000 gallons per minuteground-water supply from a tract of land in the coastal plain along the Delaware Riverfor a proposed gasification plant.
- Planned and managed a large-scale hydrogeologic field study, including an aquifer testingprogram to collect hydrogeologic data as part of the Suffolk County Flow AugmentationNeeds Study (FANS). The collected data was input to a U.S. Geological Survey ground-water computer flow model of a portion of Suffolk County, Long Island, New York. Themodel predicted the impacts on the hydrologic system and on stream flow in particularfrom proposed sewering.
- Provided technical assistance to the USEPA concerning its investigation of a ground-watercontamination problem in Iowa.
- Prepared a detailed description of the geology and hydrology of the New Jersey PineBarrens region as part of the planning effort for the area.
- Planned, organized, and currently providing technical oversight for an RFI (RCRAFacilities Investigation) of a commercial hazardous waste treatment facility in New Jersey.
- Carried out and evaluated data from a detailed field testing program, including severalcomplex aquifer tests, to quantify the effects of developing a 2.7 million gallons per dayground-water supply for a proposed refinery site in the Atlantic coastal plain.
- Developed and managed a test drilling program to determine the extent, severity, andsource of ground water contaminated with volatile organic compounds at an industrial sitein Connecticut. _ -. A r n o300b /«-
GERAGHTY & MILLER. INC.

MICHAEL F. WOLFERT/3
KEY PROJECTS (Continued)- Planned, organized, and managed a study of ground-water contamination (PCBs and
volatile organic compounds) resulting from an abandoned disposal area. Preparedconceptual design for slurry wall that was used to remedy problem at an industrial site insouthern New Jersey.
- Designed and implemented a pumping well abatement system to contain and remedy aplume of ground water contaminated with organic compounds at a hazardous wastetreatment site in the New Jersey coastal plain.
- Planned, organized, and managed a study that developed a detailed methodology forapportioning responsibility between two parties for investigation and clean-up costs relatedto ground-water contamination at a large military installation in the western United States.
- Designed and supervised the installation and testing of a high capacity production well fora development in the coastal plain near the Delaware River. Analyzed the data from thewell testing and determined a safe yield for the well of 2 million gallons per day takinginto account the potential effects on surrounding well users.
- Planned and organized a field program to develop hydrogeologic data that was used onbehalf of a client to have his property removed from a State of New Jersey list ofcandidate sites for a toxic waste incinerator.
- Planned, organized, and managed a regional ground-water sampling program coveringnine states to develop data that was used by a major pesticide manufacturer in re-registration procedures with the U.S. Environmental Protection Agency.
- Supervised the installation and testing of a high capacity production well (2 million gallonsper day) for a northern New Jersey community.
- Planned and managed a large-scale field hydrogeologic study, including an aquifer testingprogram to gather data for input to a ground-water computer flow model of a segment ofthe North Fork of Long Island. The computer modeling predicted the effects of large-scale ground-water withdrawals on the local hydrogeologic environment including effectson salt water intrusion. As part of the study, a 2 1/2 million gallons per day test well wasdeveloped. The work was carried out for a proposed nuclear power plant project.
- Developed a comprehensive ground-water management plan for the Hop Brook drainagebasin located in the towns of Amherst, Belchertown, Granby, and Pelham, Massachusetts.The plan gave recommendations, including land use planning, for maintaining andpreserving the quantity and quality of the resource, outlined a detailed sampling andanalysis plan for continual monitoring of the resource, assessed, through computermodeling, the vulnerability of the resource to contamination, evaluated the basin ground-water safe yield, and assessed prospects for future ground-water development.
300G73
GERAGHTY & MILLER. INC.

MICHAEL F. WOLFERT/4
KEY PROJECTS (Continued)- Provided an overview of waste disposal practices in the United States as part of a
Canadian project to develop a regional waste management facility.
- Provided technical guidance to a national company related to compliance with the NewJersey Environmental Cleanup Responsibility Act (ECRA).
- Planned, organized, and managed a New York State Part 360 hydrogeologic investigationfor a construction debris/clean fil l landf i l l site in Melville, Long Island, New York as partof the permitting process.
- Designed and analyzed the testing of a 3 million gallons per day production well for theTown of Southington, Connecticut. The study included an analysis of the potential yieldof the ground-water basin.
- Designed a 1 1/2 million gallons per day well for Amherst, Massachusetts as a back upsupply.
- Planned, organized, and currently providing technical oversight on a ground-watercontamination plume delineation/remediation project in Nassau County, Long Island, NewYork.
- Assisted in the design of remedial wells for the clean up of the Old Bethpage landfill,Long Island, New York ground-water contamination plume.
- Providing technical oversight to the Town of North Hempstead, Long Island, New Yorkconcerning their Port Washington Municipal Landfill.
TESTIMONY- Appeared at an administrative law hearing and before the Water Policy and Supply
Council of the New Jersey Department of Environmental Protection on behalf of theHistoric Towne of Smithville Development Company. Testimony resulted in the grantingof the full ground-water diversion requested in an environmentally sensitive area.
- Testified before a New Jersey Senate Sub-Committee on issues related to the New JerseyWater Supply Master Plan.
1/91
300G74GERAGHTY & MILLER. INC.

SECTIO
N 2
COOoCO

SECTION II
SAMPLING AND ANALYSIS PLANSECOND OPERABLE UNIT
REMEDIAL INVESTIGATIONSYOSSET LANDFILL, SYOSSET, NEW YORK
300G7GGERAGHTY & MILLER. INC.

CONTENTS
SECTION II: SAMPLING AND ANALYSIS PLANPage
I.0 INTRODUCTION . . . . . . . . . . . . . . . . . . . . . . . . . . . . . . . . . . . . . . . . . . II-l
2.0 FIELD CONTROL PROCEDURES . . . . . . . . . . . . . . . . . . . . . . . . . . . . II-2
2.1 ACCESS . . . . . . . . . . . . . . . . . . . . . . . . . . . . . . . . . . . . . . . . . . II-22.2 SECURITY . . . . . . . . . . . . . . . . . . . . . . . . . . . . . . . . . . . . . . . . II-22.3 CLEARANCE . . . . . . . . . . . . . . . . . . . . . . . . . . . . . . . . . . . . . . II-22.4 FIELD PROJECT COORDINATION . . . . . . . . . . . . . . . . . . . . II-3
3.0 MONITORING PARAMETERS AND FREQUENCY OF SAMPLECOLLECTION AND MONITORING . . . . . . . . . . . . . . . . . . . . . . . . . . . II-4
3.1 OFF-SITE GROUND-WATER STUDY . . . . . . . . . . . . . . . . . . II-43.2 OFF-SITE SUBSURFACE GAS STUDY . . . . . . . . . . . . . . . . . . II-5
4.0 STANDARD OPERATING PROCEDURES . . . . . . . . . . . . . . . . . . . . . . II-6
5.0 SAMPLE HANDLING AND CUSTODY . . . . . . . . . . . . . . . . . . . . . . . . II-7
6.0 DATA VALIDATION PROCEDURES AND RESPONSIBILITIES . . . . . II-8
7.0 SCHEDULE . . . . . . . . . . . . . . . . . . . . . . . . . . . . . . . . . . . . . . . . . . . . . . II-9
8.0 PROJECT ORGANIZATION . . . . . . . . . . . . . . . . . . . . . . . . . . . . . . . . 11-10
9.0 DOCUMENTATION . . . . . . . . . . . . . . . . . . . . . . . . . . . . . . . . . . . . . . . 11-12
9.1 SAMPLE DESIGNATIONS . . . . . . . . . . . . . . . . . . . . . . . . . . . 11-129.2 DATA REDUCTION AND REPORTING . . . . . . . . . . . . . . . . 11-13
10.0 FIELD QA/QC AND CORRECTIVE ACTION . . . . . . . . . . . . . . . . . . . 11-15
10.1 PERFORMANCE AND SYSTEMS AUDITS . . . . . . . . . . . . . . 11-1510.2 CORRECTIVE ACTION . . . . . . . . . . . . . . . . . . . . . . . . . . . . . 11-15
II.0 DELIVERABLES . . . . . . . . . . . . . . . . . . . . . . . . . . . . . . . . . . . . . . . . . 11-16
12.0 REFERENCES . . . . . . . . . . . . . . . . . . . . . . . . . . . . . . . . . . . . . . . . . . . 11-17
300G77
GERAGHTY & MILLER. INC.

APPENDICES
A. Ground-Water Monitoring Well Specifications and Installation Protocols.
B. Ground-Water Sampling Protocols.
C. Ground Water-Level Measurement Protocols.
D. Gas Well Installation and Monitoring Protocols.
E. Field Instrumentation Operating Procedures.
F. Chain-of-Custody Procedures.
G. Borehole Geophysical Logging Protocols.
H. Geraghty & Miller, Inc. Quality Assurance/Quality Control Forms.
300G73
GERAGHTY & MILLER. INC.

SECTION II
SAMPLING AND ANALYSIS PLANSECOND OPERABLE UNIT
REMEDIAL INVESTIGATIONSYOSSET LANDFILL, SYOSSET, NEW YORK
1.0 INTRODUCTION
The Sampling and Analysis Plan (SAP) addresses the field portion of the RI datacollection activities. The purpose of the SAP is to provide a detailed description of the fieldprogram and how it will be organized, managed, and conducted. The methodologies forconducting each field task are described in the Standard Operating Protocols and Procedures(SOPs), which are given in the appendices to this SAP (see Section 4.0 [Standard OperatingProcedures] of this SAP). The format and contents of the SAP have been prepared inaccordance with the following USEPA guidance documents: "Guidance for ConductingRemedial Investigations and Feasibility Studies Under CERCLA" (USEPA 1988a) and"Compendium of Superfund Field Operations Methods" (USEPA 1988b). The findings ofthe OU-1 (on-site) RI indicate that the on-site plume thickness, potential off-site extent ofthe leachate plume, and the potential off-site extent of landfill gas migration must bedefined.
300679
GERAGHTY & MILLER. INC.

II-2
2.0 FIELD CONTROL PROCEDURES
2.1 ACCESS
Field activities are to be performed in and around residential areas near the landfill.Access to drilling sites will be controlled by the Geraghty & Miller field hydrogeologist whowill oversee the completion of the soil borings and monitoring well installations. Individualsnot involved in the RI and not authorized by Geraghty & Miller, LKB, the Town, orregulatory authorities will be denied access to the drilling and sampling sites. Individuals willbe required to log in as described in the HASP (Section IV).
2.2 SECURITY
At the completion of each day of drilling, the drilling site will be surrounded by atemporary fence and a caution sign will be posted nearby to warn intruders not to enter thearea. For the three off-site drilling locations, a security guard will also be stationed at thecompletion of each work day until the following morning and during the weekend. Allpartially completed boreholes will be secured to prevent the introduction of foreign matterinto the borehole. Equipment used in monitoring well drilling and installation and for thecollection of samples will be secured daily to discourage theft and prevent injury to intruders.After completion, each monitoring well will be capped and a protective locking well headassembly (curb box or protective steel casing) will be installed.
2.3 CLEARANCE
Prior to the start of field operations, Geraghty & Miller will establish the exactdrilling locations in the field and ensure that all the necessary clearances are obtained. Aftersite selection, it will be the responsibility of the drilling subcontractor to obtain any necessarystate or local permits for monitoring well drilling. The Town will be responsible for
300630GERAGHTY & .MILLER. INC.

II-3
obtaining any work easements that are needed. Geraghty & Miller is responsible forsecuring a source of potable water and for contacting the appropriate authorities or agenciesto locate buried utilities.
2.4 FIELD PROJECT COORDINATION
Responsibilities of field personnel are described in Section 8.0 (Project Organization)of this SAP. Field project coordination will be carried out by the project director, projectmanager, and field hydrogeologist in consultation with the Town and LKB, as necessary.The responsibilities of each are fully described in Section 2.0 (Project Organization andResponsibilities) of the QAPP (Section III).
300681
GERAGHTY & MILLER. INC.

II-4
3.0 MONITORING PARAMETERS AND FREQUENCY OF SAMPLE COLLECTIONAND MONITORING
This section discusses the monitoring parameters and frequency of collection ofground-water samples during the Off-Site Ground-Water Study and frequency of airmonitoring during the Off-Site Subsurface Gas Study.
3.1 OFF-SITE GROUND-WATER STUDY
Ground-water samples will be collected during the Off-Site Ground-Water Study asfollows:
1. Nassau County Monitoring Wells and Public Supply Wells. One round of watersamples will be collected from all Nassau County monitoring wells and public supplywells within a 2-mile radius of the site to determine background water quality.Samples will be analyzed in the field for hardness, alkalinity, and ammonia (primaryleachate indicators) and for pH, temperature, chloride, and specific conductance(secondary leachate indicators). Twenty percent of the samples collected will bereplicated and sent to the laboratory for confirmatory analysis. This information willbe used in conjunction with any existing water quality data for the area (e.g. 2-mileradius from the site) to establish action levels of leachate indicator parameters.These action levels will then be used to determine when to terminate the drilling ofthe exploratory well borings (see Section 2.1.2 of the OU-2 RI work plan [Geraghty
& Miller, Inc. 1991]).
2. Exploratory Borings. During the drilling of the on- and off-site exploratory boringsto determine the vertical water quality profiles, water samples will be collected fromeach exploratory boring at 20-foot intervals from the water table to the terminationdepth (see Section 2.1.2 of the OU-2 RI work plan [Geraghty & Miller, Inc. 1991]).
300682
GERAGHTY 8 MILLER. INC.
II-5
Samples will be analyzed in the field for leachate indicator parameters (hardness,alkalinity, ammonia, pH, temperature, chloride, and specific conductance).
3. Site Monitoring Wells (On-Site and Off-Site). Two rounds of samples will becollected from the 15 existing on-site monitoring wells and the 11 proposedmonitoring wells to determine on-site and off-site ground-water quality conditions.These samples will be collected at least 1 month apart following the well installationprogram. Samples will be analyzed for the parameters discussed in detail in theQAPP (Section III).
•The monitoring parameters, designated locations, anticipated number, and frequency
of sample collection for each of the purposes described above are summarized in Table 1.
3.2 OFF-SITE SUBSURFACE GAS STUDY
The three new gas monitoring and existing on-site gas monitoring wells in thesouthwestern portion of the site (G-7, G-8, and G-10) will be monitored on 3 days of lowbarometric pressure for methane and total volatile organic compounds (TVOCs) using anorganic vapor analyzer (OVA).
In addition, on-site gas monitoring cluster wells CW-2, 4, 5, 6, 7, and 8 will bemonitored for VOCs and methane as part of the OU-1 Remedial Design Program. Themonitoring results from these wells will be presented and evaluated in the OU-2 RI report.
300683
GERAOHTYc' MILLER. INC.

II-6
4.0 STANDARD OPERATING PROCEDURES
The SOPs for collecting the samples during the field program are described in detailin the appendices for this SAP. Equipment decontamination for each applicable procedureis also included within these appendices.
The SOPs for the RI field program (Off-Site Ground-Water Study and Off-SiteSubsurface Gas Study) are included in the appendices indicated below:
SOP Appendices in this SAP
Ground-Water Monitoring Well Specifications andInstallation Protocol (includes formation sampling). A
Ground-Water Sampling Protocols. B
Ground-Water Level Measurement Protocols. C
Gas Well Installation and Monitoring Protocols. D
Field Instrumentation Operating Procedures. E
Chain-of-Custody Procedures. F
Borehole Geophysical Logging Protocols. G
300684
GERAGHTY & MILLER. INC.

II-7
5.0 SAMPLE HANDLING AND CUSTODY
Samples will be handled in accordance with the chain-of-custody procedures(Appendix F of this SAP). These procedures include instructions for selecting samplecontainers, sample preservation, and sample security from the time of collection to arrivalat the laboratory. Analytical suites for samples are listed in Table 1. The data usage andrequirements, and analytical support levels for each type of sample, are described in detailin Section 3.3 (Quality Control Objectives) of the QAPP (Section III).
300G85
GERAGHTY & MILLER. INC

II-8
6.0 DATA VALIDATION PROCEDURES AND RESPONSIBILITIES
The data validation procedures consist of a systematic review of the analytical resultsand quality control (QC) documentation, and will be performed in accordance with thefollowing two Region II data validation SOPs: (1) SOP: Evaluation of Metals Data for theContract Laboratory Program (CLP), Revision 11, January 1992, and (2) SOP No. HW-6:CLP Organic Data Review and Preliminary Review, Revision 8, January 1992. Based onthat review, the data validator will be responsible for making judgements and expressingconcerns and comments on the quality and limitations of specific data, as well as on thevalidity of the overall data package. The data validator will prepare documentation of thatreview and provide conclusions using the standard USEPA Inorganic Regional DataAssessment and Organic Regional Data Assessment forms to summarize any overalldeficiencies that require attention. The data validator will also evaluate general laboratoryperformance. These forms will be accompanied by appropriate supplementarydocumentation, clearly identifying specific problems.
The data validator will inform the project manager of data quality and limitations, andassist the project manager in interacting with the laboratory to correct data omissions anddeficiencies. The laboratory may be required to rerun or resubmit data depending on theextent of the deficiencies and their importance in regard to the data quality objectives(DQOs). A detailed discussion of the data reduction and validation procedures is providedin Section 8.0 (Data Reduction, Validation, and Reporting) and Appendix A of the QAPP
(Section III).
300G8G
GERAGHTY & MILLER. INC.

II-9
7.0 SCHEDULE
A schedule of tasks and deliverables, including field activities, is provided onFigure 2.
300G87
GERAGHTY & MILLER. INC.

11-10
8.0 PROJECT ORGANIZATION
This project has been organized in a manner that ensures that the field program willbe conducted effectively and efficiently. The following is a list of key personnel with theircorresponding project titles.
Town of Oyster Bay - Site OwnerProject Coordinator Richard W. Lenz, P.E.
LKB - RI/FS Program ManagerProgram DirectorProgram Manager
John P. Lekstutis, P.E.Theresa C. Heneveld, P.E.
Geraghty & Miller - RI Project ManagerProject DirectorProject ManagerField HydrogeologistProject QA/QC ManagerProject Health and Safety Coordinator
Data ValidatorRI Project Support Team
Sampling Team
Support FunctionsData ProcessingData Processing QC
Andrew J. BarberVincent J. GlasserCasey S. SchmidtMichael F. WolfertTom C. EngLauren E. Sjogren
David VinesBrendan Mulholland
Laurie KleckaGregory K. Shkuda, Ph.D.
300G83
GERAGHTY & MILLER. INC.

11-11
SubcontractorsLaboratory
Well DrillerWaste Disposal Hauler
Industrial & Environmental Analysts, Inc.(IEA)
To be bidTo be bid
A further description of the responsibilities of the RI personnel is provided in Section2.0 (Project Organization and Responsibilities) of the QAPP (Section III).
Geraghty & Miller site personnel will consist of the field hydrogeologist. Sitesubcontractors will include a well driller, a waste disposal hauler, and a land surveyor. Theresponsibilities of each of these on-site individuals are as follows:
Site Personnel Responsibilities
Field Hydrogeologist
Well Driller
Waste Disposal Hauler
Land Surveyor (LKB)
Site health and safety (site safety officer).Coordinate all field and subcontracting activities.Insure adherence to field QA/QC protocols.Supervise monitoring well installation.Collection of soil samples.Collection of water-level measurements.Collection of ground-water samples.
Drilling and installation of monitoring wells underthe supervision of the field hydrogeologist.
Hauling and disposal of Rl-generated wastematerials.
Determine elevation of measuring points andhorizontal location of monitoring wells.
300689
GERAGHTY & MILLER. INC.

11-12
9.0 DOCUMENTATION
Project files containing data and reports generated during the RI including laboratorydocumentation will be maintained at Geraghty & Miller's Plainview, New York officeaccording to the procedures outlined in this section. Laboratory documentation (e.g.,chromatogram and results of spiked samples) will be maintained for purposes of validatinganalytical data collected during the RI. All summary reports will be kept in the project filein Plainview. All incoming data will be logged and dated. All information generated fromfield activities will be documented on appropriate log forms listed below.
• Sample/Core Log.• Water Sampling Log.• Gas Monitoring Log.• Chain-of-Custody Record.• Daily Log.• Drilling and Installation of Monitoring Wells Daily Checklist.• Utilities and Structures Checklist.• Location Sketch.• Water Level/Pumping Test Record.• Materials/Cost Log.• Sample Container Inventory.• Well Construction Log.• Sampling of Monitoring Wells Daily Checklist.• Telephone Conversation Log.
9.1 SAMPLE DESIGNATIONS
This section provides information on the designations for use on the ground-watersamples that will be collected for laboratory analysis. Each ground-water sample will begiven a unique designation that will be recorded in the field log book on the water sampling
300690GERAGHTY & MILLER. INC.
11-13
log form, on the label affixed to the sample container, and on the chain-of-custody record.The sample designation will consist of the following four elements:
1. The site code.2. The matrix code.3. The location number of the ground-water monitoring well.4. The consecutive sample number collected from the location.
Incoming documents will be date-stamped and filed. If distribution is required, theappropriate number of copies will be made and distributed to project personnel. Inaddition, all notes from project meetings and telephone conversations will be filed along withother project documents.
9.2. DATA REDUCTION AND REPORTING
The reduction of field and analytical data will consist of compiling and summarizingfield data (water-level measurements, soil boring logs, well logs, field parameters, gasmonitoring logs, and laboratory analytical results). Reduction, validation, and reporting oflaboratory data are discussed in Section 8.0 (Data, Reduction, Validation, and Reporting)of the QAPP (Section III). These data will be presented as tables, illustrations, and graphsas appropriate. The original data arid reduced forms will be maintained at Geraghty &
Miller's Plainview, New York office until final reports are accepted.
Chemical and physical data will be stored and managed using a data-managementcomputer system. Data entry will be performed by a designated person (see Section 8.0[Project Organization] of this SAP), so that access to the data base is limited.
300G91
GERAGHTY 8 MILLER. INC.

11-14
The field measurement data will be similarly reduced into a tabulated format suitablefor inclusion in the RI Report and will be designed to facilitate the comparison andevaluation of the data. These tabulations will include but not be limited to the following:
• Field screening (OVA) results.• Field analyses (leachate-indicator parameters).• Well construction details.• Water-level measurements and surveyed measuring point elevations.
Field logs will be transferred into typed formats or will be presented in their originalform for inclusion as RI Report appendices. The following logs will be used:
• Sample/Core Logs.• Well Construction Logs.• Water Level/Pumping Test Logs.• Geophysical Logs.• Water Sampling Logs.• Gas Monitoring Logs.
The tables will be compiled whenever feasible by the field team member whocollected the data. The data compiler will inform the project manager of any problemsencountered during data collection and of apparent inconsistencies, and will also provideopinions on the data quality and limitations. The tables and logs will be used as the basisfor data interpretation and will be checked against the original field documentation prior touse.
300G92
GERAGHTY & MILLER. INC.

11-15
10.0 FIELD OA/QC AND CORRECTIVE ACTION
10.1 PERFORMANCE AND SYSTEMS AUDITS
The project QA/QC manager will audit all field aspects of the implementation of theRI on a regular basis. Any significant QA/QC deficiencies will be reported and identified,and they will be corrected to the extent practicable. Performance and systems auditsrelevant to the RI as a whole are discussed in detail in Section 10.0 (Performance andSystem Audits) of the QAPP (Section III). Reviews will also be performed at thecompletion of each field activity and will include an assessment of field data quality and theresults of system and/or performance audits.
10.2 CORRECTIVE ACTION
If the quality control audit results in the identification of unacceptable conditions, theproject QA/QC manager and field hydrogeologist will be responsible for developing andinitiating corrective efforts, in consultation with the project manager and project director.The condition or problem will be specifically identified and investigated, and the cause willbe determined. Efforts necessary to eliminate the problem will be initiated. Correctiveefforts may include the following:
• Repeating field measurements.• Reanalyzing the samples if the holding-time criteria and sample volume
permits.• Resampling and analyzing.• Evaluating and amending sampling and analytical procedures.
Upon completion of the corrective effort, its effectiveness will be evaluated, and theelimination of the condition will be verified.
300G93
GERAGHTY & MILLER. INC.

11-16
11.0 DELIVERABLES
The data generated during the RI will be provided to the USEPA in data validationreports and also in the RI report.
300694
GERAGHTY & MILLER. INC.

11-17
12.0 REFERENCES
Geraghty & Miller, Inc. 1989. Interim Remedial Investigation Report, Syosset Landfill,Syosset, New York. August 1989.
Geraghty & Miller Inc. 1991. Work Plan for the Second Operable Unit RemedialInvestigation at the Syosset Landfill, Syosset, New York. April 1991.
U.S. Environmental Protection Agency (USEPA). 1981. Manual of Ground-WaterSampling Procedures, NWWA/USEPA.
U.S. Environmental Protection Agency (USEPA). 1982. Handbook for Sampling andSample Preservation of Water and Wastewater.
U.S. Environmental Protection Agency (USEPA). I988a. Guidance for ConductingRemedial Investigations and Feasibilities Under CERCL' Office of Emergency andRemedial Response. USEPA, Washington, D.C
U.S. Environmental Protection Agency (USEPA). 1988b. A Compendium of SuperfundField Operations Methods.
U.S. Environmental Protection Agency (USEPA). 1992a. CLP Organics Data Review andPreliminary Review. SOP No. HW-6, Revision 8.
U.S. Environmental Protection Agency (USEPA). 1992b. Evaluation of Metals Data forthe Contract Laboratory Program (CLP), Revision 11.
300G93
GERAGHTY & .MILLER. INC.

mg;'X:
>•
300G96
SECTION II: SAMPLING AND ANALYSIS PLAN
APPENDIX A
GROUND-WATER MONITORING WELL SPECIFICATIONS
AND INSTALLATION PROTOCOLS
300697
GERAGHTY & MILLER. INC.

SECTION II: SAMPLING AND ANALYSIS PLAN
APPENDIX A
GROUND-WATER MONITORING WELL SPECIFICATIONSAND INSTALLATION PROTOCOLS
DRILLING METHODOLOGY
During the Off-Site Ground-Water Study, eleven monitoring wells will be installedat five locations; two of the proposed drilling locations are on-site where a single deepmonitoring well will be installed next to existing well clusters (SY-3 and SY-6) (Figure 1).One on-site location is upgradient of the landfill where a deeper well will be installed atexisting upgradient Well Cluster SY-6 to provide additional upgradient water-quality data.The second on-site location is downgradient of the landfill where a deeper well will beinstalled at an existing Well Cluster SY-3 to determine the plume thickness on-site. Thethree proposed off-site drilling locations will each have three wells per location. Anexploratory boring will be drilled using a Barber rig (cased boring method) to install theproposed deep well on-site next to existing Well Cluster SY-3 and the deep well at themiddle location of the three proposed off-site well cluster locations. Three drilling methodswill be employed during the Off-Site Ground-Water Study: (1) the cased boring method (airrotary), (2) the modified mud rotary method (which includes the reverse rotary method), and(3) the hollow-stem auger method. The cased boring method (air rotary) will be used fordrilling the two exploratory borings (one on-site and one off-site) and installing a deep wellat these locations, while the mud rotary method (modified) will be used to drill and installthe remaining wells except the shallow wells, which will be installed by the hollow-stem augermethod. The reasons for the selection of these drilling methods are outlined in Sections2.1.3.1, 2.1.3.2, and 2.1.3.3 of the OU-2 RI work plan (Geraghty & Miller, Inc. 1991), whichwas approved by the USEPA on July 5, 1991. The proposed monitoring well locations areshown on Figure 1.
300G93
GERAGHTY & MILLER. INC.

II-A-2
A summary of the well data for wells proposed to be installed during the SecondOperable Unit RI is given below.
Estimated Depth Per WellDrilling Method Number of Wells (Feet)
Cased BoringMud Rotary (Modified)Mud Rotary (Modified)Hollow Stem AugerTotal
233311
600600400185
4,755
The field hydrogeologist will be present at the operating drill rig and will beresponsible for the collection and logging of soil samples, monitoring of drillingdecontamination operations, recording of ground-water data, deciding on final drilling depthsand screen intervals (in consultation with the USEPA, the Town and LKB), preparing theboring logs and well completion diagrams, and recording the well installation procedures.Additionally, the field hydrogeologist will maintain a log recording daily events, includingarrivals and departures at the site by any and all personnel and equipment, and times ofwork start-up and stoppage. Forms to be used by the hydrogeologist as part of the QualityAssurance/Quality Control (QA/QC) measures of the project are included in Appendix Hof this SAP.
Drilling fluids, soil cuttings, purge water, development water, and decontaminationwater will be disposed on landfill property. A recharge area will be designated on-site over
8«r*n£,native soil for purge water, development water, and decontamination water. Bsmasnaybales, or other means will be used to prevent runoff of the water. This recharge area willbe located a sufficient distance from existing monitoring wells to prevent potential impactsto these wells. A separate area on the landfill surface will be designated for drilling fluidsand soil cuttings.
300G99
OERAGHTY & MILLER. INC.

II-A-3
If any problems are encountered or questions arise during the field investigation thatare beyond the scope of responsibility of the field hydrogeologist, then field activities will betemporarily halted and the project manager and/or the project director will be consulted.In this way, a technically sound decision can be made by more experienced individuals.
CASED BORING METHOD
The cased boring method (air rotary) will be employed using a Barber rig, whichadvances the boring by hydraulically rotating the steel casing into the ground whilesimultaneously drilling with a roller bit. Cuttings are continuously removed from the casingby forcing compressed air through the drilling rods. An oil filter will be installed in the airline that will be placed in the well being drilled. Small volumes of water are used forcontrolling dust while drilling through the unsaturated zone. The collection of formationsamples and ground-water samples for analysis in the field is discussed later in this appendix.
MODIFIED MUD ROTARY METHOD
The modified mud rotary method consists of drilling each boring to within 20 feet ofthe screen zone by employing the conventional mud rotary method (described below). Thescreen zones will have been already determined based on the lithological profile at eachdrilling location and on the vertical water quality profiles established during the drilling ofthe two exploratory borings (see Appendix B of this SAP). The mud rotary method uses aroller bit that loosens formation material (cuttings) for removal. The cuttings are removedby a drilling fluid composed of potable water mixed with 100 percent bentonite clay thatcontains no additives. The source of potable water will be from the water district firehydrants located near the site. The viscosity of the drilling fluid (mud) can be varied inresponse to formation changes. The mud rotary method is a direct rotary drilling methodwhereby drilling fluid is pumped down the drill pipe and forced up through the annularspace between the drill pipe and borehole wall to the land surface. To prevent the loss of
300700
GERAGHTY & MILLER. INC.

II-A-4
drilling fluids in the unsaturated zone (upper 100 feet), 10-inch diameter steel casing will beinstalled by the cased boring method before drilling begins using the mud rotary method.The final 30 feet of each boring will be drilled by the reverse rotary method (describedbelow). The same drilling rig for both drilling methods (or a conventional reverse rotarydrilling rig) may be used to complete each boring. After drilling the portion of the boringusing the mud rotary method, the swivel on the drilling head will be changed. Because thefinal 30 feet of each boring will use potable water as the drilling fluid (see below), a residualmud cake will not form on the borehole wall in this interval where the screen will be set.The mud will then be flushed out of the boring by pumping fresh potable water through thedrilling rods to force the mud out of the boring annulus. The drilling mud will be pumpedinto a tanker truck and will be disposed at a designated location at the landfill. As soon asthe mud is removed, the reverse rotary method will be employed to complete the boring.As discussed previously, the source of the potable water used for flushing the drilling mudfrom the well boring and for the reverse rotary drilling method will be from the water districtfire hydrants located near the site. Before the reverse rotary drilling method begins, a 1-inchdiameter air line will be inserted inside the 3-inch diameter drilling rods. Compressed airpumped through the air line will force the water (drilling fluid) out of the drilling rods andinduce water from the well annulus to flow back up into the drilling rods, constantly
»
replacing the water removed through the drilling rods and out of the boring. Although aresidual mud cake will remain on the borehole wall in the depth interval drilled using mud,there will still be some fluid or water loss to the aquifer. Thus, it will be necessary to addpotable water to the well annulus to supplement the water being recirculated in the boring.
HOLLOW-STEM AUGER METHOD
The shallow monitoring wells will be installed using the hollow-stem auger method,provided that the well depths do not exceed the method's depth limits (about 165 feet +. 20feet). This method involves rotating a string of auger flights into the subsurface. Soilcuttings are continuously lifted to land surface along the outside of the flights, while drill
300701
GERAGHTY & MILLER. INC.

II-A-5
rods and a plug are used inside the flights to keep the soil out. The plug and rods areremoved for well installation inside the flights.
Potable water may be used during or after drilling (if necessary) to keep loose sandfrom heaving inside the auger flights (due to differential hydrostatic pressure) becauseheaving would prevent installation of well screen and casing. If water is added, the volumeused will be carefully documented so that at a minimum, an equivalent volume can beremoved during well development.
SAMPLING
GROUND-WATER SAMPLING FOR ANALYSIS IN THE HELD
During the drilling of the on-site and off-site exploratory borings by the cased boringmethod, ground-water samples will be collected through the drilling rods with a bailer at 20-foot intervals until the boring is terminated. Samples will be analyzed for leachate indicatorparameters. After each 20-foot sampling depth is reached, and before a water sample iscollected for in-field analysis, water will be pumped from the boring using the air compressoron the drilling rig. Thus, a representative ground-water sample from each sampling depthwill be available for collection. The bailer used to collect the samples will be lowered usinga winch-operated cable from the drilling rig. These samples will be analyzed in the field forleachate indicator parameters to determine the vertical water-quality profiles at these twolocations (see Appendix B of this SAP).
FORMATION SAMPLING
Formation samples will be collected from the deep boring at each of the five drillingsites. Composite formation samples will be collected from the exploratory borings on acontinuous basis from the cyclone discharge, which is a device that reduces the pressure ofthe cuttings travelling up the boring to a gravity feed and permits sample collection at
300702GERAGHTY & MILLER, INC.

II-A-6
ground surface. Split-spoon samplers will be used to collect formation samples at 20-footintervals from the deep borings at the three remaining drilling sites by the modified mud-rotary method. To collect a sample, the split-spoon sampler will be sent down the inside ofthe drilling rods by a wire line. Samples are collected by advancing the split spoon aheadof the drill bit into the undisturbed formation at the desired depth. Before and after eachuse, the split spoons will be decontaminated by scrubbing with Micro solution and rinsingwith analyte-free deionized water.
Data collected during formation sampling will be used to supplement the geophysicallogs that will be conducted in each of the five deep well borings. The geophysical logs willprovide an excellent continuous lithologic profile. The geophysical log in conjunction withthe water-quality data from the two exploratory borings will provide an accurate depictionof the vertical subsurface conditions for selecting monitoring well screen intervals.
At a minimum, the following information will be recorded by the field hydrogeologist:
• Soil sample interval.• Sample color.• Sample texture.• Sample moisture content.• Organic vapor readings.• Unusual characteristics.• Depth to water.• Drill rig behavior and penetration rate.
A sample/core log form is included in Appendix H of this SAP. Representative soilsamples from each sampling interval will be placed in glass jars with screw-type lids. Eachsample container will be labeled with the site name and the boring and sample number.These jars will be stored in cardboard boxes for future reference.
300703GERAGHTY & MILLER. INC.

II-A-7
MONITORING WELL INSTALLATION
The installation of each monitoring well will begin immediately after boreholecompletion, or as directed by the field hydrogeologist. Once monitoring well installation hasbegun, breaks will not be taken until the well has been completed and secured againstunauthorized access. In cases of unscheduled delays, such as personal injury, equipmentbreakdowns, or sudden inclement weather, installation will be resumed as soon as practical.
The monitoring wells to be installed in the cased borings, modified mud rotary boringsand hollow-stem auger borings will be constructed of the same materials and follow the sameprotocols as the wells installed during the On-Site Ground-Water Study. The only exceptionis that stainless-steel screens will be used instead of PVC screens to facilitate welldevelopment. The stainless-steel screens will be 10-feet long and will have openings of 0.010inches (10 slot).
MONITORING WELLS INSTALLED IN CASED BORINGS
The construction details of the monitoring wells to be installed in the cased boringsare depicted on Figure 3. Temporary 14-inch diameter surface casing will be installed to thewater table (approximately 100 feet below land surface) to reduce the surface friction on the10-inch diameter casing, which will be installed to a depth where excessive resistance isencountered. At this point, an 8-inch diameter casing will be used to complete the boring.After the 8-inch diameter casing has been advanced to its full depth, the 4-inch diameterstainless steel screen and PVC casing will be set inside the 8-inch casing and the gravel packand grout seal will be emplaced as the 8-inch diameter casing is pulled back to the watertable and left for final well construction. The gravel pack will extend from the bottom ofthe borehole to at least 3 feet above the top of the screen and will be emplaced by pouringit slowly by hand in the annular space between the borehole wall and the well casing. Thegravel pack will consist of J. Morie Co. No. 1 clean silica graded sand. The grout seal(Volclay) will be emplaced using a side port tremie pipe above the gravel pack and willextend to 2 feet below land surface. Volclay grout is a high density, 100 percent polymer-
1t*J ^r **
GERAGHTY & MILLER. INC.

II-A-8
free bentonite grout that will form a continuous and flexible seal that will not crack. Afterthe grout seal is emplaced, the 10-inch diameter casing will be removed. The annulusbetween the 8-inch and 14-inch diameter casings will then be grouted to ground surface asthe 14-inch diameter casing is being removed. The 14-inch casing will be left in the groundif there is an excessive loss of grout to the formation as the casing is being removed.
If the 8-inch diameter casing becomes too difficult to advance before the terminationcriteria are met (see Section 2.1.2 of the OU-2 RI work plan [Geraghty & Miller, Inc. 1991),6-inch diameter casing will be used to complete the boring to the termination depth. Thegrout will then be pumped through a tremie pipe from the bottom of the borehole tobetween 5 and 10 feet of the bottom of the selected screen setting for the intermediatedepth well. The 6-inch diameter casing will be pulled back during the grouting process andwell construction will continue in the prescribed fashion (see discussion above). Because thevertical profile of the water quality and lithology would have already been obtained from theexploratory boring where the intermediate well would be installed, the deep monitoring wellwill be drilled and installed by the mud rotary method.
MONITORING WELLS INSTALLED IN THE MODIFIED MUD ROTARY BORINGS
The construction details of the monitoring wells to be installed in the modified mudrotary borings are depicted on Figure 4. As previously mentioned, the upper permeabledeposits will be cased off (10-inch diameter steel casing) to a depth of approximately 100feet below land surface to prevent the loss of drilling fluid. The boring will be continued ata diameter of 8 inches until the completion depth has been reached (the final 30 feet ofdrilling to be accomplished by the reverse rotary method), whereupon the well constructionwill proceed as described previously.
300705
GERAGHTY & MILLER. INC.

II-A-9
MONITORING WELLS INSTALLED IN THE HOLLOW-STEM AUGER BORINGS
The shallow monitoring wells will be installed in the approximately 11-inch diameterboreholes according to the same procedure described above. The construction details of themonitoring wells to be installed in the hollow-stem auger borings are depicted on Figure 5.
Well Construction
Monitoring wells will be constructed of new 4-inch diameter schedule 40 PVC casingsand 4-inch diameter 10-foot lengths of stainless-steel screen (10 slot). The well screens willbe fabricated and have an inside diameter equal to the well casing. Fittings (couplings) willnot restrict the inside well diameter as joints will be internally threaded. Glues, solvents, orchemical cleaners will not be used to join the casing and screen lengths. The lengths ofcasing and screen will be measured and recorded by the field hydrogeologist.
A monitoring well construction diagram will be prepared by the field hydrogeologistfor each well and will show the following information:
1. The total drilled depth of the borehole.2. The borehole and well casing diameters.3. The casing and screen composition.4. The screen setting.5. The gravel pack interval.6. The grout seal interval.7. The height of the well casing (without cap/plug) above ground surface.8. The protective casing.
Each well construction diagram will be included as part of the QA/QC procedures.An example of a well construction diagram is provided in Appendix H of this SAP.
300706
GERAGHTY & MILLER. INC.

II-A-10
Monitoring well depths and screen zones will be determined based on the water-quality profile established during the drilling of the two exploratory borings and the lithologicprofiles determined from formation sampling and geophysical logging (see Appendix G ofthis SAP).
Gravel Pack
As mentioned previously, gravel pack consisting of clean silica sand (J. Morie Co. No.1) will be emplaced by pouring it slowly by hand in the annular space between the boreholewall and the well casing. During emplacement of the gravel pack, a weighted steel tape willbe placed down the annulus periodically to measure its depth to ensure that the gravel is notbridging and that it extends from the bottom of the borehole to at least 3 feet above the topof the screen. The gravel pack material will be examined to confirm its identification.
Grout Seal
A grout seal consisting of Volclay grout will be emplaced using a side-port tremiepipe above the gravel pack and will extend to 2 feet below land surface. Volclay grout isa high-density, 100 percent polymer-free bentonite grout that sets up like putty and will forma continuous and flexible seal that will not crack.
Well Completion
The wells will be completed with an aboveground, locking steel protective casing ora locking flush-mounted curb box that will be set over each well head to protect againstvandalism. The number for each well will be clearly marked on the protective casing or curbbox.
The top of the well casing will be surveyed by a professional surveyor, licensed inNew York State to the nearest 0.1 foot and will serve as the measuring point for ground-
300707GERAGHTY & MILLER. INC.

II-A-11
water level measurements. The measuring point will be clearly indicated on the well casingfor easy identification.
MONITORING WELL DEVELOPMENT
Well development will be accomplished using compressed air, a submersible pump,and/or surge block or any combination of these techniques. If compressed air is used todevelop a well, then an oil filter will be installed in the air line placed in the well beingdeveloped. Well development will not be attempted until at least 24 hours after installation.Development will continue until the well responds to water-level changes in the formation,and the well produces clear, sediment-free water to the extent possible. The wells will bedeveloped with a goal of producing water of a turbidity of 50 nephelometric units (NTUs)or less. However, in some instances, water may have noticeably high-turbidity levels due toa relatively high percentage of finer grained deposits indigenous to the Magothy Formation.A portable nephelometer will be used in the field to measure turbidity levels. Developmentwater will be disposed at a designated location at the landfill.
Dispersing agents, acids, disinfectants, or other additives will not be used duringdevelopment nor will they be introduced into the well at any other time. Duringdevelopment, water will be removed from the entire column of water standing in the wellby periodically lowering and raising the pump intake.
A record of well development will be maintained along with the other pertinent welldata as part of the QA/QC procedures. The following data will be recorded as part ofdevelopment and QA/QC procedures:
1. The static water level measured from the top of the well casing before, duringand after, development is completed.
2. The calculated quantity of fluid standing in the well prior to development.300703
GERAOHTY & MILLER. INC.

II-A-12
3. The sounded depth of the well before and after development to determine ifsilt has accumulated inside the well.
4. The physical character of water removed including changes duringdevelopment such as water clarity, color, particulates, and odor.
5. The type and size/capacity of pump used.
6. The surging technique(s) used.
7. The quantity of fluid/water removed and the time for removal (bothincremental and total values).
DECONTAMINATION
The drilling casings, rods, split-spoon samplers, tools, water tanks, drilling rig, and anypiece of equipment that can come in contact (directly or indirectly) with the formation willbe steam cleaned prior to being set up for drilling. The same steam-cleaning protocol willbe followed between boreholes (at a fixed site location) and before leaving the site at theend of the project. Decontamination water will be disposed at a designated location at thelandfill. The steam-cleaning activities will be monitored by the field hydrogeologist. Casingsand screens will be purchased from a manufacturer (Johnson or an approved equal) thatsteam cleans the casings and screens, and individually wraps them (i.e. they are hermeticallysealed).
300709
GERAGHTY & MILLER. INC.

APPEN
DIX
B
O
oO00

SECTION II: SAMPLING AND ANALYSIS PLAN
APPENDIX B
GROUND-WATER SAMPLING PROTOCOLS
300711
GERAGHTY & MILLER. INC.

SECTION II: SAMPLING AND ANALYSIS PLANAPPENDIX B
GROUND-WATER SAMPLING PROTOCOLS
INTRODUCTION
The collection, handling, and analysis of ground-water samples will be performedaccording to the protocols set forth in this appendix to ensure quality assurance/qualitycontrol (QA/QC). Quality control includes proper sampling procedures for well purgingprior to sampling, sample-removal methods that utilize acceptable materials for allequipment and supplies, sample processing (including filtration, preservation, labeling, andbottle filling), and sample shipment. The Geraghty & Miller project manager and fieldhydrogeologist will work closely with the analytical laboratory to assure that samples reachthe laboratory in proper condition. Water-quality data will be scrutinized according toGeraghty & Miller's QA/QC protocols for data validation as discussed in the QualityAssurance Project Plan (QAPP in Section III).
This sampling protocol is based on technically sound standard practices as publishedin "Manual of Ground-Water Sampling Procedures" (NWWA/USEPA 1981) and "Handbookfor Sampling and Sample Preservation of Water and Wastewater" (USEPA 1982) as well ason the firm's experience.
Pertinent information regarding ground-water sampling procedures will be recordedon the Geraghty & Miller daily log forms and water sampling log forms (see Appendix Hof this SAP).
PREPARATION FOR SAMPLING
A written sampling fact sheet containing the information needed by the field teamwill be prepared by the project manager. The fact sheet will be reviewed and verified bya Geraghty & Miller chemist and will include the protocol to be followed. Information on
300712GERAGHTY & VflLLER. INC.

II-B-2
the types and nature of chemicals that may be encountered during sampling will be provided
along with a list of special precautions that may be needed for the collection, handling,storage, and transportation of the samples. Wells will not be sampled until a minimum of7 to 14 days have elapsed after well development.
PREPARATION OF SAMPLING EQUIPMENT
The sampling equipment (e.g., bailers, submersible pumps, M-scopes, buckets,filtration equipment for metals) will be thoroughly cleaned before each use following theprotocols described on Page II-B-13. Any supplies, such as tubing, that cannot be properlycleaned after each use will be discarded in an appropriate manner. Specific conductanceand pH meters will be calibrated according to manufacturer's instructions (see Appendix Eof this SAP).
SAMPLING EQUIPMENT
The equipment and materials that will be needed for the collection of ground-watersamples are listed below:
Stainless-steel/Teflon Submersible Pumps
Electric water-level probe (M-Scope)
Clean rags
Analyte-free deionized water
Plastic sheetingPolypropylene ropeBailers (Teflon)Bailer cord leaders (15-foot lengths ofTeflon-covered wire)
Prefilters (cellulose-based membrane)
Filters (0.45-um, and 5-um cellulose-basedmembraneFilter funnels (Gelman polyethylene orglass)Vacuum flasks (1-liter polyethylene orglass)Vacuum pump (electric or hand operated)ThermometersSample bottlesIndelible marking pens
300713
GERAGHTY & MILLER. INC.

II-B-3
Buckets (graduated) BrushesGloves (Latex, Nitrile, or equivalent) Measuring tapepH meter and buffers 3/4-inch Polyethylene tubingSpecific conductance meter and standard Clear tapeBeakers
PREPARATION OF WELL FOR SAMPLING
OPENING THE WELL
Upon arrival at the well site, sampling personnel will record the well designations,inspect the well head for damage, wipe the top of the well clean, and then remove the capand wipe the top of the well casing with clean paper towels. Plastic sheeting will be placedaround the well so sampling equipment will be protected from potential contamination onthe ground surface.
SOUNDING THE WELL
The total depth of each well will be measured (sounded) to an accuracy about 0.1foot using a weighted steel or plastic tape prior to sampling. This information together withthe depth to water allows the sampling team to calculate the volume of water in the well andto determine if formation material has accumulated at the bottom of the well.
MEASURING THE HEIGHT OF THE MEASURING POINT
The height of the measuring point above or below ground surface will be measuredto an accuracy of 0.01 feet as an indication of whether the well may have been disturbedsince installation.
300714
GERAGHTY & MILLER. INC.

II-B-4
MEASURING THE WATER LEVEL
A full round of water levels will be collected prior to sampling the first well. Thedate and time of each measurement will be recorded. Each measurement will be made toan accuracy of 0.01 feet. Care will be taken to avoid cross contamination of wells bythoroughly cleaning the measuring instrument (M-scope or measuring tape) between wellsfollowing the protocols described on Page II-B-15.
The procedure for accessing the well and for measuring the water level is summarizedbelow:
1. Record the well number.
2. Wipe the top of the well casing with a clean paper towel.
3. Remove the well cap and/or plug and wipe the inside of the casing with a cleanpaper towel. The cap will be placed face up on the plastic sheeting to keep itclean. Personnel will wait approximately 10 minutes prior to measuring thewater level to allow the water level in the well to stabilize under atmosphericpressure.
4. Analyze the air within the well casing for volatile organic compounds (VOCs)using an OVA.
5. Decontaminate the first 5 feet of the electric probe or measuring tape and thenmeasure the depth to water from the top of the well casing.
6. Calculate the volume of water in the well.
300715
GERAGHTY & MILLER. INC.

II-B-5
PURGING THE WELL
Well evacuation is performed to ensure that all standing water is removed from a wellbefore sample collection so that the sample will be representative of the ground water in thevicinity of the screen zone. Before evacuating, the volume of standing water in each wellwill be calculated by subtracting the depth to water from the sounded depth of the well; thisnumber, the height of the water column in the well, will then be multiplied by a coefficientwhich relates the diameter of the well to gallons per linear foot to obtain the volume ofstanding water in the well. The monitoring wells will be evacuated either by bailing or byusing a submersible pump based on the diameter of the well being sampled. Purge waterwill be disposed at a designated location at the landfill. A summary of construction detailsfor the existing on-site monitoring wells is provided in Table 2. Five of the existing on-sitewells are constructed of 4-inch diameter casing and each has a permanently installedsubmersible pump for evacuation and sampling. The remaining ten existing on-site wells areconstructed of casing that is less than 4-inch diameter and these must be evacuated bybailing or using a small diameter submersible pump. All the new proposed monitoring wellswill be constructed of 4-inch diameter casing and will have permanently installed submersiblepumps that will be used for evacuation and sampling. Three well volumes will be evacuated(either by pumping or by bailing) from each well prior to sample collection. Temperature,Ph, and specific conductance will be measured prior to purging and twice before sampling.Unless there is an unusual difference in the readings between the final two successfulmeasurements of these parameters, samples will be collected following the removal of threewell volumes.
COLLECTION OF GROUND-WATER SAMPLES
The order of sample collection will be based on the water-quality data base from theOU-1 RI and from the exploratory borings. The cleanest wells will be sampled first followedprogressively by more contaminated wells. After the well has been evacuated, a ground-
300716
GERAGHTY & MILLER. INC.

II-B-6
water sample will be collected within 24 hours and will be placed on ice immediately aftercollection. Samples to be analyzed for VOCs will be collected first using a bailer afterpurging three volumes from the well using a submersible pump. The remaining parameterswill be collected from the pump discharge in order of decreasing volatility (semi-volatiles,PCBs, metals, cyanide, and leachate indicators). New disposable gloves will be worn bysampling personnel for each well sampled. The sample containers will be inspected toensure that they are the correct type and number for the respective analytical parametersand have the correct preservative, if required. The labels will then be properly filled out andaffixed to the containers and protected by clear tape affixed to the containers. Samples willbe carefully poured into each container, avoiding agitation or turbulence, which might resultin loss of volatile organics and/or excessive oxygenation of the samples. Care will also beexercised to avoid breakage and to eliminate the entry or contact of, any substance with theinterior surface of the bottles, vials, or caps, other than the water sample being collected.Caps will not be removed until sampling begins and then they will be replaced as soon asthe container has been filled. The sample containers will be kept cool, dust-free, and outof the sun. The procedures that the sampling team will follow to collect water samples aredescribed below in the order in which they will be performed:
1. Complete labels on all containers and protect labels by wrapping them to eachcontainer with clear tape. Information that will be provided on labels includesthe following: project name, well numbers, sampling date, etc.
2. Acidify the volatile organic samples to a pH of less than 2 with 1:1 HC1.Determine the amount of acid needed by adding acid drop by drop on aseparate 40 milliliter (mL) aliquot. This aliquot will be discarded after use andmay be collected at the end of the purge and prior to sampling. The pH will beconfirmed with pH paper. After the number of drops have been determined,that amount of acid will be added to the sample vials. Fill the 40 mL vials for
300717
GERAGHTY & MILLER, INC.

II-B-7
volatile organic analysis first in such a manner as to ensure that there are no airbubbles.
3. Analyze for field parameters (see Appendix E of this SAP for FieldInstrumentation Operating Procedures).
4. Fill the remaining sample containers in the order of the parameter's volatilizationsensitivity. All parameters requiring chemical preservation will be preservedimmediately. The pH will be confirmed by pouring a small amount of thesample on pH paper. The pH paper will not be immersed in the sample bottle.Unfiltered and filtered samples will both be collected for metals analysis. Allsamples will be placed on ice immediately after collection.
5. Replace the well cap and lock the well.
6. Pack the samples on ice in a cooler with the completed Geraghty & Miller chain-of-custody record form. Samples will be delivered or shipped to the laboratorywithin 24 hours after sample collection and the recipient's signature will beobtained on the chain-of-custody record form.
7. Discard the disposable sampling equipment such as used cord, gloves, and plasticsheeting.
The samples for metals analysis will be filtered through a 0.45-micrometer (um) filter.Prefilters or a 5.0-um filter will only be used if the sample cannot be filtered through the0.45-um filter due to the presence of excessive suspended paniculate matter. After filtration,the sample will be transferred to the pre-acidified container for metals analysis, and pHpaper will be used to ensure that the sample has been acidified to less than pH 2.Unfiltered samples will also be collected for metals analysis.
300718
GERAGHTY & MILLER. INC.

II-B-8
HELD TESTING FOR LEACHATE INDICATORS
Primary and secondary landfill leachate-indicator parameters will be analyzed in thefield according to the procedures described in this appendix. Ammonia, alkalinity, andhardness are the primary leachate indicators, and chloride, specific conductance,temperature, and pH are the secondary leachate indicators (see Section 2.1.8 of the OU-2RI work plan [Geraghty & Miller, Inc. 1991]). These analyses will be conducted on ground-water samples collected from 20-foot intervals during the drilling of the two exploratoryborings and from the Nassau County monitoring wells and public supply wells located withina 2-mile radius of the landfill. Twenty percent of the samples will be sent to the laboratoryfor confirmatory analysis of ammonia, alkalinity, chloride, and hardness. The analyticalresults of the field testing (in conjunction with the lithologic profiles) will be used to establishthe action levels for determining the termination depths of the two exploratory borings andalso for determining the screen zones for all of the monitoring wells at the five drillinglocations.
Control samples will be prepared and analyzed on a daily basis, and field meters willbe recalibrated, as necessary. Prior to analysis, water samples from each 20-foot samplinginterval will be decanted from a bailer and composited into a clean 10-gallon plastic bucketthat will be used to distribute the sample for analyzing the field parameters. Immediatelyfollowing sample collection a total-immersion type thermometer will be placed into thebucket to record the temperature of the water sample. An aliquot of the sample will thenbe poured into a plastic beaker for each field parameter and covered in order to avoidexcessive agitation or prolonged exposure to air. Because the analytical methods for thefield analyses are sensitive to turbidity and because the samples will be collected from anopen borehole and are, therefore, expected to be turbid, samples from each 20-foot intervalwill be prefiltered using Whatman 2V filter membranes. These filters are designed to retainparticles of 8 um or larger. The procedure for the analysis of each of the field parametersis described below.
300719
GERAGHTY & MILLER. INC.

II-B-9
AMMONIA
The ammonia concentration in the water samples will be determined using anammonia-ion-specific electrode (Corning Model No. 476130) and meter (Corning Model No.620). A 100-mL sample of water will be placed into an Erlenmeyer flask, set on top of amagnetic stirrer, and a Teflon-coated stirring bar will be placed in the flask. The ISE willbe immersed into the water sample. Once the meter reading stabilized, a 1 mL solution of10 normal sodium hydroxide (NaOH) is added to the sample to convert ammonium ion toammonia [NH4OH -» NH3] by raising the pH to above 11. The ammonia contained in thesample diffuses through the electrode's membrane and changes the pH of its internalsolution. The pH change is measured by the electrode and converted to an ammoniaconcentration by Standard Method 417 (APHA, AWWA, and WPCF 1985).
ALKALINITY
The alkalinity determinations will performed by using a digital titration kit, suppliedby the Hach Company (Hach). Sample volumes are selected according to the Hach manual.The sample volume will be placed in a 250-mL Erlenmeyer flask. When the sampleconcentration is above the instrument calibration range, the sample is diluted with deionizedwater. The titration end point is monitored with a pH meter, as well as a bromeresolmethylred indicator. The endpoint of the titration is reached when the sample pH reaches 4.5 andturns a light pink color.
HARDNESS
The hardness determinations will performed by using a digital titration kit, suppliedby Hach. Sample volumes will be selected according to the Hach manual. The sample willbe placed in a 250-mL Erlenmeyer flask. When the sample concentration is above theinstrument calibration range, it is diluted with deionized water. Eriochrome Black T(ManVer Hardness Indicator Powder Pillow) is then added to the sample, turning it red.
300720GERAGHTY & MILLER, INC.

II-B-10
The sample is titrated with ethylenediaminetetracetic (EDTA) until a deep blue color isachieved, indicating the end point of the titration.
CHLORIDE
The chloride determinations will be performed by using a digital titration kit, suppliedby Hach. Sample volumes are selected according to the Hach instruction manual. Thesample will be placed in a 250-mL Erlenmeyer flask. When the sample concentration isabove the instrument calibration range, the sample is diluted with deionized water. Diphenylcarbazone powder pillow is then added to the sample, turning it a pale yellow. The sampleis titrated with mercuric nitrate [Hg(NO3)2] until a pink color is achieved indicating the endpoint of the titration.
TEMPERATURE
Temperature will be measured with a rapidly equilibrating, mercury-filled Celsiusthermometer.
SPECIFIC CONDUCTANCE
Specific conductance of the sample will be measured using a Cole-Parmer fieldconductivity meter (Model No. 9999-99). The conductivity meter will be calibrated daily withknown standard concentrations before field measurements are taken. The conductivityprobe is rinsed with deionized water before and after each measurement (see Appendix Eof this SAP).
300721
GERAGHTY & MILLER. INC.

II-B-11
pH
The pH of the sample will be measured using a Cole-Parmer pH meter (Model No.5996-80). The pH meter will be calibrated daily with two standard buffer solutions beforeany field measurements are taken (see Appendix E of this SAP). The pH meter will berecalibrated frequently during the day to ensure accurate and precise measurements. ThepH probe will be is rinsed with deionized water before and after each measurement.
QUALITY CONTROL
QC samples will be used to monitor sampling and laboratory performance. The typesof QC samples that will be included in this investigation are replicates and blanks. Toensure unbiased handling and analysis by the laboratory, the identity of replicates will bedisguised by means of coding so that the laboratory does not know which samples are usedfor this purpose. Detailed QC procedures are outlined in the QAPP (Section III).
REPLICATE ANALYSES
Replicate samples are samples collected from the same well and are identical withinthe limits of normal concentration fluctuations. Collection and analysis of such samplesallow a check to be made on laboratory reproducibility. Five percent of all ground-watersamples collected at this site will be replicated.
When collecting replicate samples for VOC analysis, each of the two sample vials forthe sample and replicate will be alternately filled. For other analytes, the discharge waterwill be distributed to fill portions of each sample container until the containers are filled.Sampling for replicates is discussed in more detail in the QAPP.
300722
GERACHTY & MILLER. INC.

II-B-12
BLANKS
The analysis of trip blanks will be incorporated into this field investigation. Since thetrip blank cannot be more than 24 hours older than the associated field samples, trip blankswill be shipped daily to the field from the laboratory. A trip blank is a sample composedof analyte-free water acidified to a pH of less than 2 with 1:1 HC1 (prepared by thelaboratory), which is filled at the laboratory and travels unopened with the sample bottlesback to the laboratory. It is analyzed to determine whether samples may have beencontaminated by VOCs as a result of handling in the field, during shipment, or in thelaboratory. One trip blank will accompany each day's shipment of water samples to thelaboratory for VOC analysis. A field blank for all analytes, except leachate parameters, willalso be prepared using analyte-free deionized water provided by the laboratory during eachday of sampling to determine whether samples may have been contaminated by air-bornecontaminants or the sampling equipment. Field blanks will be collected for dissolved metalsby rinsing the clean filtering apparatus. Field blanks will be preserved following the sameprocedure used for the samples. Blank analyses are discussed in more detail in the QAPP(Section III).
RECORD KEEPING
All Geraghty & Miller personnel involved in sample collection will carefully documentthe handling history of all ground-water samples and blanks collected. Standard Geraghty& Miller forms (see Appendix H in this SAP) will be completed for this purpose asdescribed below.
DAILY LOG
Daily logs will be used by the field team for QA/QC purposes to record all samplingevents and field observations. Entries in the daily log forms will be dated by the person
300723GERAGHTY & MILLER. INC.

II-B-13
making the entry, and the logs will be kept in a secure, dry place. The following informationwill be included on each daily log form:
1. Project name.2. Date and time of arrival at the site.3. Client.4. Location.5. Weather.6. Sampling team members.7. Work progress.8. QC samples.
9. Departure time.10. Delays.11. Unusual situations.12. Well damage.13. Departure from established QA/QC field procedures.14. Instrument problems.15. Accidents.
WATER SAMPLING LOG
The sampling team will complete a Geraghty & Miller water sampling log form forQA/QC purposes (see Appendix H of this SAP) at the time of sampling to recordinformation about each sample collected. The following information will be included oneach Water Sampling Log form:
1. Date and time of sampling.2. Well evacuation data.3. Physical appearance of samples (e.g., color and turbidity).
300724
GERAGHTY & MILLER, INC.

II-B-14
4. Field observations.5. Results of field analyses.6. Sampling method and material.7. Constituents sampled for.8. Sample container size, composition, and color.9. Preservative.
10. Sampling personnel.11. Weather conditions.
SAMPLE LABELS AND CHAIN-OF-CUSTODY RECORD FORM
Sample labels are necessary for proper sample identification. The labels will beaffixed to the sample containers prior to the time of sampling: Labels will not be affixed tocontainer lids or caps. To track QA/QC handling protocols the labels will be filled out bysampling personnel, and the Geraghty & Miller chain-of-custody record form (see AppendixH of this SAP) will be completed in the field before the sampling team leaves the site.Labels will include sample identification, project number, date and time collected, analysesto be performed, and pH adjustment information as required.
The sampling team will be responsible for maintaining custody of the samples untilthey are delivered to the carrier or the laboratory. The chain-of-custody record form willthen be signed and custody formally relinquished. The contai srs (bearing custody seals)will be in view at all times or will be stored in a secure place restricted to authorizedpersonnel. Chain-of-custody procedures are discussed in more detail in Appendix F of thisSAP.
300725
GERAGHTY & MILLER. INC.

II-B-15
EQUIPMENT DECONTAMINATION
Before sampling begins, between each well sampled, and prior to leaving the site,equipment such as a water-level measuring tape or M-scope, bailers, filtration apparatus(flasks, funnels, and beakers), and buckets will be decontaminated. Decontamination waterwill be disposed at a designated location at the landfill. Disposable equipment will bediscarded in an appropriate manner. Bailers and Teflon bailer cords will be cleaned asfollows:
1. Wash with Micro detergent/potable water solution.2. Rinse with potable water.3. Rinse with 10% nitric acid solution (acid will be ultra-pure grade).4. Rinse with potable water.5. Rinse with analyte-free deionized water.6. Air dry.7. Wrap in aluminum foil until ready for use.
Submersible pumps will be flushed inside and out with a Micro detergent/potablewater solution, and rinsed inside and out with potable water followed by rinsing with analyte-free deionized water. Pump tubing will be cleaned in the same manner before use anddiscarded after use. The filtering apparatus will be rinsed with 10 percent nitric acid solutionand rinsed with analyte-free deionized water before every use. Water-level measuring tapeor M-scope and buckets will be decontaminated by scrubbing with a Micro detergent/potablewater solution followed by rinsing with analyte-free deionized water.
30072G
GERAGHTY & MILLER. INC.

APPEN
DIX C
c?r-ooCO

SECTION II: SAMPLING AND ANALYSIS PLAN
APPENDIX C
GROUND-WATER LEVEL MEASURMENT PROTOCOLS
300728
GERAGHTY & MILLER. INC.

SECTION II: SAMPLING AND ANALYSIS PLAN
APPENDIX C
GROUND-WATER LEVEL MEASUREMENT PROTOCOLS
Depth-to ground water in the monitoring wells will be measured as part of the fieldprogram. These data will be converted to water-level elevations using surveyed verticalmeasuring points on individual well casings.
An electronic measuring tape (M-scope) graduated in tenths of a foot will be theprimary instrument of measuring the depth to ground water. Prior to insertion, themeasuring tape will be cleaned with Micro solution and rinsed with potable water followedby analyte-free deionized water. The tape will be lowered slowly down the center of thecasing. After the electronic buzzer sounds and the light illuminates, signifying that water hasbeen encountered in the well, the tape will be held at the pre-marked surveyed point at thetop of the well. The measurement (depth to water) will be recorded on a Geraghty & MillerWater-Level/Pumping Record form (Appendix H). The tape will then be removed from thewell and cleaned in the same manner as before insertion into the well.
300729GERAGHTY & MILLER. INC.

r
m'Z.2;'x •o
300730
O

SECTION II: SAMPLING AND ANALYSIS PLAN
APPENDIX D
GAS WELL INSTALLATION AND MONITORING PROTOCOLS
300731
GERAGHTY & MILLER, INC.

SECTION II: SAMPLING AND ANALYSIS PLAN
APPENDIX D
GAS WELL INSTALLATION AND MONITORING PROTOCOLS
OFF-SITE SUBSURFACE GAS STUDY
The location of the three proposed off-site shallow gas monitoring wells is depictedon Figure 1. Also shown on Figure 1, are the locations of the proposed on-site gasmonitoring cluster wells, which will be installed and monitored during the OU-1 RemedialDesign Program. The installation and monitoring protocols for the proposed on-site gascluster wells are contained in the OU-1 Remedial Design work plan (LKB 1991). Themethodology and protocols for installing the three off-site shallow gas monitoring wells aredescribed below:
CONSTRUCTION OF GAS MONITORING WELLS
The gas monitoring wells will be constructed of hand-slotted, 1-inch diameter PVCcasing, installed in boreholes drilled to a depth of 3 to 5 feet using a hand-operated bucketauger or a power auger, depending on soil conditions. The screened portion of each gasmonitoring well will be approximately 3 feet long. Each borehole will be backfilled withclean sand (No. 1 J. Morie Co.) to above the top of the screen, and then sealed with abentonite slurry. The construction details of a typical gas monitoring well are shown onFigure 6. The tops of the wells will be capped and fitted with short lengths of polyethyleneand silicone tubing to allow attachment of the OVA probe and sampling equipment. Eachgas well will be completed at grade level with protective covers (plates) cemented in placeto protect against vandalism.
300733
GERAGHTY & MILLER. INC.

II-D-2
SUBSURFACE GAS MONITORING
The three off-site gas monitoring wells, the on-site gas monitoring wells in thesouthwestern portion of the site, and on-site gas monitoring Wells G-13 and G-14 will bemonitored for methane and total VOCs on three days of low barometric pressure. ACentury Systems Model 88 organic vapor analyzer (OVA), calibrated to a methane standard,will be used for these measurements. A charcoal filter probe will be used for measuringmethane, and a standard probe will be used to measure total VOCs (including methane).
300733
GERAGHTY & MILLER. INC.

APPENDIX E
COr-oCDCO

SECTION II: SAMPLING AND ANALYSIS PLAN
APPENDIX E
FIELD INSTRUMENTATION OPERATING PROCEDURES
300735
GERAGHTY & MILLER. INC.

SECTION II: SAMPLING AND ANALYSIS PLAN
APPENDIX E
FIELD INSTRUMENTATION OPERATING PROCEDURES
INTRODUCTION
Field instruments used during the investigation will be calibrated and operated inaccordance with the following standard operating procedures and with the manufacturers'instructions.
GAS MONITORING EQUIPMENT
A Century Systems Model 88 organic vapor analyzer (OVA) flame-ionization detector(FID) will be used during the Off-Site Subsurface Gas Study to monitor the gas monitoringwells for landfill gas (methane and total VOCs). The OVA will be calibrated prior to useon a daily basis using zero air and a mixture of 100 parts per million (ppm) methane andair. The calibration procedure is detailed in the manufacturer's instructions.
AIR MONITORING EQUIPMENT
PHOTOIONIZATION DETECTOR
A photoionization detector (PID) such as a TIP or HNU meter will be used formonitoring VOCs in the breathing zone during the Off-Site Ground-Water Study (see HASP[Section IV]). The PID will be calibrated prior to use on a daily basis. First the PID willbe zeroed using background ambient air followed by a mixture of 100 ppm isobutylene andair. The calibration will be checked using a 50 ppb isobutylene in air.
300736
GERAGHTY & MILLER. INC.

II-E-2
COMBUSTIBLE GAS INDICATOR
A GasTech Model 4320 meter will be used to measure the Lower Explosive Limit(LEL) of explosive gases during the Off-Site Ground-Water Study. This instrument iscalibrated by the manufacturers, and therefore, requires no field calibration.
FIELD ANALYSIS INSTRUMENTS
Field analysis of water samples will consist of measurements of pH, temperature, andspecific conductance. A description of the equipment that will be used and the calibrationprocedure for each is provided below.
TEMPERATURE
This field parameter will be measured using a Taylor Pocket Thermometer with atemperature measuring range of -15°C to 105°C
pH
This field parameter will be measured using an Orion Research (Model 20) pH meterhand-held, portable, digital meter, or equivalent. Two buffer standards (nominal pH valuesof 4 and 7 or 7 and 11) will be used to calibrate the instrument, prior to analysis of eachsample. The probe will be lowered into the sample container and gently stirred on thesample to allow equilibration before the reading is taken.
SPECIFIC CONDUCTANCE
This field parameter will be measured using a battery-powered conductivity meter(Horizon Model 1484-10). Calibration will be made using a 2000 umho standard solution.Calibration of the meter will be adjusted to temperature. The meter will be calibrated daily
300737
GERAGHTY & MILLER. INC.

II-E-3
when in use. To measure this parameter, the probe will be lowered into the samplecontainer until a stable reading is obtained.
NY02»»youp.afw
300733
GERAGHTY & MILLER. INC.

COoo•-aCO
d XIQN3ddV

APPENDIX F
COi>oCDCO

SECTION II: SAMPLING AND ANALYSIS PLAN
APPENDIX F
CHAIN-OF-CUSTODY PROCEDURES
300740
GERAGHTY & MILLER. INC.

SECTION II: SAMPLING AND ANALYSIS PLAN
APPENDIX FCHAIN-OF-CUSTODY PROCEDURES
The chain-of-custody procedure for the collection of samples that will be sent to thelaboratory for analysis is given below:
1. The Field Hydrogeologist or sampling team will maintain custody of any samples thatare collected until they are delivered to the overnight common carrier or courier forshipment to the laboratory. All samples shipped to a laboratory will be accompaniedby the Geraghty & Miller, Inc. Chain-of-Custody Record form (see Appendix H).The Chain-of-Custody Record form (duplicate) will be completed in the field; theoriginal form will accompany the shipment, and the other copy will be retained by theField Hydrogeologist for the project file. The Chain-of-Custody Record form will listeach of the individual sample containers from each well sampled and will be signedby each of the sampling team members who participated in the sampling program.
2. A separate Chain-of-Custody Record form will be filled out for the contents of eachshipment container (cooler). The form will be placed in a plastic bag and taped tothe underside of the lid of the cooler.
3. To provide a means of detecting any potential tampering during shipment, allshipment containers (coolers) will have a signed Geraghty & Miller seal placed acrossthe outside of the cooler where the lid and cooler join. In addition, a 2-inch widetransparent tape will be wrapped entirely around the cooler securing the lid firmlyto the cooler.
4. Receipts from couriers, air bills, and bills of lading will be retained in the field projectfile.
NY02-WM\iyo«»p.«p<
300741
CERAGHTY & MILLER. INC.

APPENDIX G
oCDCO

SECTION II: SAMPLING AND ANALYSIS PLAN
APPENDIX G
BOREHOLE GEOPHYSICAL LOGGING
300743
GERAGHTY & MILLER, INC.

SECTION II: SAMPLING AND ANALYSIS PLAN
APPENDIX G
BOREHOLE GEOPHYSICAL LOGGING PROTOCOL
Natural gamma geophysical logs will be obtained from the deep boring at each of thefive drilling locations using a Model II Mount Sopris Instrument Company Logging System.Electric logging will also be performed in the three deep mud rotary borings, but will not bepossible in the two exploratory borings because of interference from the steel casing. Beforeand after each use, the logger probe and cable will be cleaned with a solution of Microlaboratory-grade detergent and potable water, and rinsed with distilled water.
Gamma logging involves the measurements of naturally occurring radiation originatingfrom geologic material in the borehole and provides a qualitative guide to correlatingstratigraphy and evaluating permeability. Gamma radiation is emitted from certain elementswhich are unstable and decay spontaneously into other, more stable elements. Althoughother types of radiation are given off by natural radioactive minerals (alpha and betaemissions), only gamma rays are measured in well logging because only these rays canpenetrate materials such as casing and cement grout. Gamma logging has a uniqueadvantage over electric logging because it can be done in either cased wells or openboreholes, whereas electric logging can be conducted only in uncased boreholes filled withfluid.
The minerals commonly found in sedimentary materials such as clay, limestone, andsandstone contain small amounts of radioactive potassium-40 and decay products of uraniumand thorium. Potassium is an important constituent of clay, mica, feldspar, and shale, andits radioactive isotope (potassium-40) emits gamma rays. Because these materials tend tobe finer grained, elevated gamma responses are often interpreted as corresponding tosediments of relatively low permeability. Coarser grained sand contains no potassium orradioactive potassium-40, and emits gamma rays at relatively low levels. Consequently, the
300744GERAGHTY & MILLER. INC.

II-G-2
gamma log shows more radiation (counts per second) at depths corresponding to clay or silt,and lower radiation levels (fewer counts per second) at depths corresponding to sand orsandstone layers, if the sand is mostly quartz.
Geraghty & Miller will conduct the geophysical logging program by using its truck-mounted EG&G Mount Sopris Model II logging system, which consists of a logger andprobe. The probe consists of a scintillation-type receiver and counting circuit. The probe,which is attached to a cable, will be lowered and raised the entire length of each well whilegraphs are produced by the digital logger recorder, located in the truck. Radiation intensityfor a given geologic formation is measured by the probe and expressed as the averagenumber of counts per second. Since the logger is fully automated and the probe is factorysealed, no calibration is required.
The following procedure will be followed for the geophysical logging at each location:
1. Activate the power system for the Winch and Cable Depth and Speed Module. Asufficient length of cable will be spooled out to allow the Model II probe to becentered over the well. Tension will be kept on the cable at all times to avoidforming tangles or loop on the cable spool.
2. Set up the tripod, which supports the probe, over the well and center the probe inthe well to ensure that the bottom of the probe is even with land surface.
3. Turn the SPEED control fully counterclockwise, the DIRECTION switch in the OFFposition, and engage the brake mechanism.
4. Use the DEPTH PRESET switch on the Cable Depth and Speed Module to set thedistance from the reference point to the main measuring point for the probe. TheLOAD button will be pressed and the LED display will be checked for the propersetting.
300745
GERAGHTY & MILLER. INC.
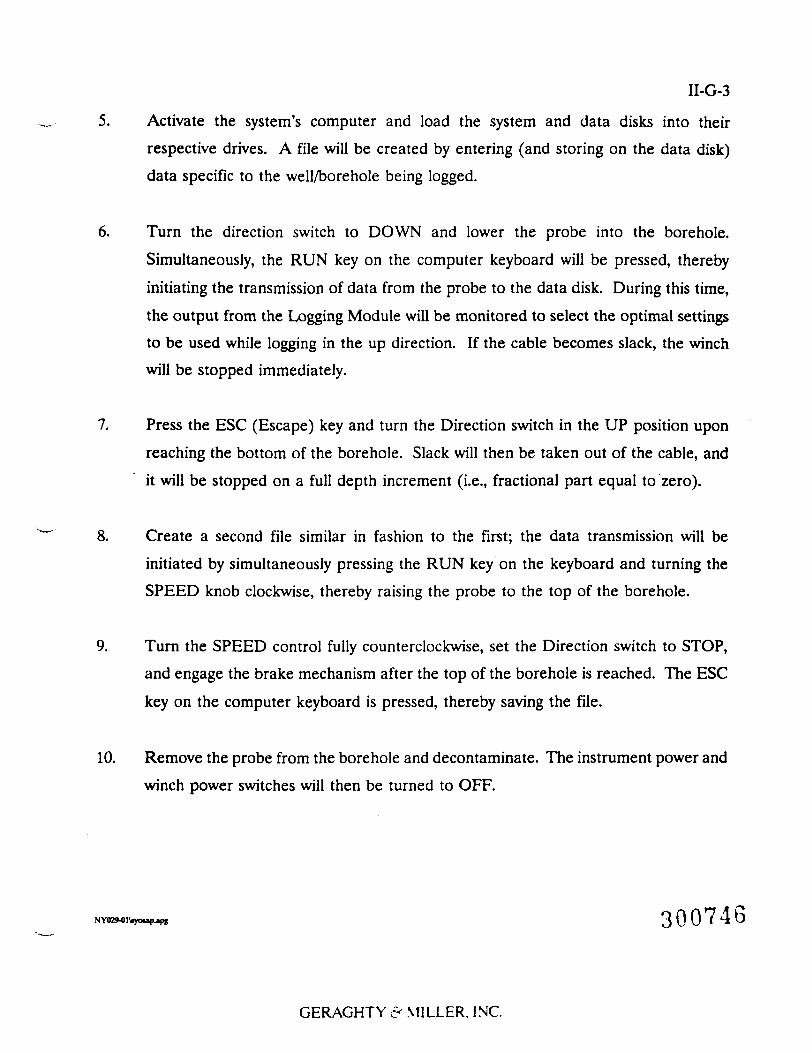
II-G-3
5. Activate the system's computer and load the system and data disks into theirrespective drives. A file will be created by entering (and storing on the data disk)data specific to the well/borehole being logged.
6. Turn the direction switch to DOWN and lower the probe into the borehole.Simultaneously, the RUN key on the computer keyboard will be pressed, therebyinitiating the transmission of data from the probe to the data disk. During this time,the output from the Logging Module will be monitored to select the optimal settingsto be used while logging in the up direction. If the cable becomes slack, the winchwill be stopped immediately.
7. Press the ESC (Escape) key and turn the Direction switch in the UP position uponreaching the bottom of the borehole. Slack will then be taken out of the cable, andit will be stopped on a full depth increment (i.e., fractional part equal to zero).
8. Create a second file similar in fashion to the first; the data transmission will beinitiated by simultaneously pressing the RUN key on the keyboard and turning theSPEED knob clockwise, thereby raising the probe to the top of the borehole.
9. Turn the SPEED control fully counterclockwise, set the Direction switch to STOP,and engage the brake mechanism after the top of the borehole is reached. The ESCkey on the computer keyboard is pressed, thereby saving the file.
10. Remove the probe from the borehole and decontaminate. The instrument power andwinch power switches will then be turned to OFF.
3 0 0 i 4 b
GERAGHTY & MILLER. INC.

APPENDIX H
OoCO

SECTION II: SAMPLING AND ANALYSIS PLAN
APPENDIX H
GERAGHTY & MILLER, INC.
QUALITY ASSURANCE/QUALITY CONTROL FORMS
300743
GERAGHTY & MILLER. INC.

'& MILLER. INC.Ground-Water Consultants
SAMPLE/CORE LOGBoring/Well.SiteLocation _
. Project/No. .Page. .of.Drilling
. Started.Drilling
. Completed.
Total Depth Drilled.
Hole Diameter ___Length and Diameterof Coring Device __
. (feet)Type of Sample/
(inches) Coring Device _
Drilling Fluid UsedDrillingContractor
. Sampling Interval.
. Drilling Method_
.feet
Driller.Prepared Hammer HammerBy Weight Drop inches
Sampta/Core Depth Time/Hydraulic(feet below land surface) Core Pressure or
Recovery Blows per 6From To (feet) inches Sample/Core Description
300749

& MILLER, INC.Environmental Services
WATER SAMPLING LOGProject/No. Page. .of.
Site Location
Site/Well No._
Weather __
Description of Measuring Point (MP).
Coded/Replicate No. _Time SamplingBegan____
Date _____Time SamplingCompleted __
EVACUATION DATA
Height of MP Above/Below Land Surface
Total Sounded Depth of Well Below MP
Held_____ Depth to Water Below MP.
Wet _____ Water Column in Well.
Gallons per Foot.
Gallons in Well.
Evacuation Method ____________
MP Elevation
Water-Level Elevation,
Diameter of Casing__Gallons Pumped/BailedPrior to Sampling ___
Sampling Pump Intake Setting(feet below land surface) ___
Color. .Odor.
SAMPLING DATA/FIELD PARAMETERS
________ Appearance________
Other (specific ion; OVA; HNU; etc.).
.Temperature
Specific Conductance,umhos/cm______ -PH.
Sampling Method and Material
Constituents SampledContainer Description
From Lab __ or G&M _ Preservative
Remarks
Sampling Personnel
GAL/FTWELL CASING VOLUMES ^ fl f 1 7 5 0
1-V4" - 0.06 2" - 0.16 3" - 0.37 4" - 0.65 J U U 1 «J1-Vi" - 0.09 2-Vi" » 0.26 3-V4" = 050 6" - 1.47
G&M F<ym 12 6-86 Southern 89-1473
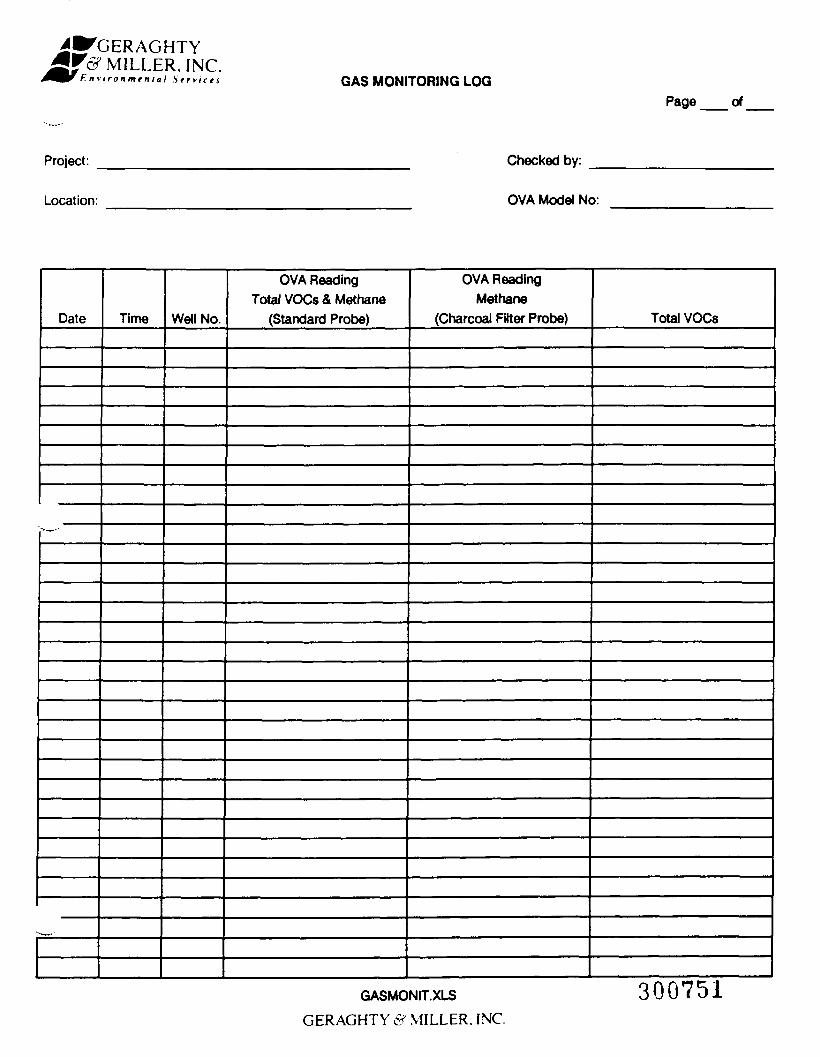
MILLER, INC.F. nvironmtnial Struct! GAS MONITORING LOG
Page
Project. Checked by:
Location:
Date
"-— "
^ _ .
OVA Model No:
Time Well No.
OVA ReadingTotal VOCs & Methane
(Standard Probe)
OVA ReadingMethane
(Charcoal FHter Probe) Total VOCs
GASMONIT.XLS
GERAGHTY & MILLER. INC.
300751

AGHTY&v LERJNC.nvir. <;nial Services
Laboratory Task Order No. CHAIN-OF-CUSTODY RECORD Page
Project Number
Project Location
Laboratory _
SAMPLE BOTTLE / CONTAINER DESCRIPTION
Sampler(s)/Affiliation
Date/TimeSAMPLE IDENTITY Code Sampled Lab ID TOTAL
CO*-»-«
o , /-* -j i i ,j c o i,j A A Total No. of Bottles/Sample Code: L = Liquid; S = Solid; A = Air Containers
Relinquished by: Organization:Received by: Organization: Date / / Time
Relinquished by: Organization:Received by: Organization: Date / ../ Time
Seal Intact?Yes No N/A
Seal Intact?Yes No N/A
OSpecial Instructions/Remarks:-3
CJT—— —— ———
Delivery Method: D In Person D Common Carrier D Lab Courier D OtherSPECIFY

& MILLER. INC.Environmental Services DAILY LOG
Well(s)_ . Project/No.
Site Location _
Prepared By _
. Page, .of.
Date/Time Description of Activities
G&M Form 02 6 86 Soumpnnt 89-1256

£Sf& MILLER, INCGround- Wattr Consultants
PROJECT:
DRILLING & INSTALLATION OF MONITORING WELLSDAILY CHECKLIST
LOCATION:
G&M PERSONNEL ON SITE:
CHECKED BY:
WELLS/BORINGS:
DATE:________
TIME:
ITEMS OK/NA COMMENTS
PRIOR TO DRILLING:
Contractor has checked for underground utilitiesWell locations stakedWell drilling permits securedG&M OA Manual/OA plan availableHealth & Safety plan (HASP) availableSafety equipment on siteContractor equipment adequateDrilling equipment steam cleanedDrilling water source approved/sampledDrilling equipment water sample takenDrilling mud & additives approvedSand or gravel pack sample approvedGrout composition approved
DURING INSTALLATION:
Formation samples properly taken andbottled or bagged
Rock color chart usedOVA monitoring during drilling & samplingCores properly marked and storedHard hat wornProper safety procedures followedHazardous soil, mud or water properly handled*Daily Log keptSample/Core Log form filled outWell Construction Log preparedMaterials/Cost Log preparedLocation Sketch madeTremie pipe used in groutingAbandoned well/boring grouted & stakedProtective casing/well cap/lock installedWell identification no. attachedWell development adequateWell elevation and location surveyed in*See QA Manual, Drilling and Installation of Monitoring Wells, Sect. 2.16.2,
300754Instructions: Original to Field Project File; copy to Project Manager and to QA
Representative.
JUNE 1986

^GERAGHTY'& MILLER, INC.
Ground- Water Consultants
Project:
UTILITIES AND STRUCTURES CHECKLIST______________________ Prepared by: __
Location: .Date:Instructions. This checklist has to be completed by a G&M staff member as a safety measure to insure that all undergroundutility lines, other underground structures as well as above-ground power lines are clearly marked out in the area selectedfor boring or excavation. DRILLING OR EXCAVATION WORK MAY NOT PROCEED UNTIL LINES ARE MARKED ANDTHIS CHECKLIST HAS BEEN COMPLETED. Arrangements for underground utility markouts are best made at the time ofthe preliminary site visit to allow client and/or utility company sufficient time. Keep completed checklist and maps onsite;send copy to Project Manager.Assignment of Responsibility. Client is responsible for having underground utilities and structures located and marked.Preferably, the utilities themselves should mark out the lines.Drilling or Excavation Sites. Attach a map of the property showing the proposed drilling or excavation site (or if sites arewidely separated, several maps) clearly indicating the area(s) checked for underground utilities or underground structuresand the location of above-ground power lines.Utilities and Structures
NotType
Petroleum products lineNatural gas lineSteam lineWater lineSewer lineStorm drainTelephone cableElectric power lineProduct tankSeptic tank/drain fieldOverhead power line
Pfeeent Present How Merited?'*
1) Flags, paint on pavement, wooden stakes, etc.
Name and affiliation of person who marked out underground lines or structures.
NAME ORGANIZATION PHONE
Emergency ProceduresPersons at site or facility to contact in case of emergency1.2.
PhonePhone
FireDept.: Phone
Utility: Phone __Utility: Phone __Directions to nearest hospital (describe or attach map).
Ambulance: PhoneUtility: Phone ___
Utility: Phone ___
300755

MILLER. INC.und- H mer Consultant
LOCATION SKETCH
Well(s) ______ Project/No. ______________________________ Page ____ of ____
Site Location ___________________________._________:__________________
Observer ___________________________________________._______________
(Locate all wells, borings, etc. with reference to three permanent reference points; tape all distances; clearly label allwells, roads, and permanent features)
N
300750Oft ft
36

^GERAGHTY'& MILLER. INC.in , rriiinit-ntal Servit e\
WATER LEVEL/PUMPING TEST RECORD PAGE. .OF.
PROJECT WELL SITE.SCREENSETTING
STATICWATER LEVEL
DRAWDOWN "~RECOVERY G
DISTANCE FROM WELLMEASURED TO PUMPINGWELL (rl
MEASURING POINTDESCRIPTION
MEASURED WITH
START OF TEST
END OF TEST
DISCHARGERATE
HEIGHT ABOVEGROUND SURFACEDATE/TIME
PUMPINGWELL
ORIFICE
DATE&TIME
WELLOR
t (mins)
HELDIft)
WET(ft)
DEPTH TOWATER
(ft)
s(ft)
DEW.1
CORR(ft)
ART.2
8'
(ft)
Q(gpml
MANO-METER
(in)
REMARKS31
r> A A "9 PC 1 ——-300707
1) Dewatering Correction 2) Equivalent Artesian DrawdownG&M Form 10 6-86
3) pH, Spec. Cond., Temp., Weather, Sand, Turbidity, etc.Somflpnrt 89-1249

IAGHTYLLER,INC.
GrounJ-Huler (.'omul/nun
O/W4MATERIALS/^JST LOG Page of
Wells: ___Site Location:
. Project/No.: _
. Calculated By: . Checked By:
Footage SplitDrilled Spoons
Well (ft) (ea)
<•••O
GO
Totals
UnitCost
CostTotal*
$
$
$
$
Screen Casing
Diam/Length Diam/Length(ft) («)
s
$
$
$
Sand orGravel(bag)
$
$
Bentonite
Pellets Powder(Ib) (bag)
$
$
$
$
Devel-oping Rig
Cement Time time(bag) (hrs) (hrs) Other Items*
$
$
$
$
$
$
$
$' Include items such as Shelbv tubes, standby lime orotprtivp rn<;inn<;
1/flfi

& MILLER, INC.Ground- Water Consultants
Project _____
SAMPLE CONTAINER INVENTORY
Shipped from Shipped to(laboratory)
Phone
Bottle Size and Composition
ShippedPreservative
SHIPMENT
Quantity
Attn.
CONTENTS
Quantity
ReceivedCondition/Comments
i!
Packed byDate
Shipped byDate
Sealing Method
Received byDate
Inspected byDate
Seal Intact?
Remarks:
300759
G&M Fofm 08 1-87 Southpnm 87-1783

'& MILLER, INC.W Ground- Water Consultants
WELL CONSTRUCTION LOG(UNCONSOLIDATED)
rtLAND SURFACE
drilled hole
-Well casing,
. inch diameter
. inch diameter,
Q BackfillQ Grout _
.ft*
Bentonite D slurry____ft* D pellets
.ft*
Well Screen._____ inch diameter_____, _____ slot
D Gravel Pack'<• —D Sand Pack
Q Formation Collapse
.ft*
.ft*
Measuring Point isTop of Well CasingUnless Otherwise Noted.
* Depth Below Land Surface
Project __Town/City.
County __Permit No.
.Well.
. State.
Land-Surface Elevationand Datum ______ feet Surveyed
EstimatedInstallation Date(s)Drilling Method _Drilling ContractorDrilling Fluid ___
Development Technique(s) and Date(s)
Fluid Loss During Drilling ______Water Removed During Development.Static Depth to Water _______Pumping Depth to Water __Pumping Duration _____Yield _________ gpmSpecific Capacity ______Well Purpose________
_____ gallons____ gallons.feet below M. P..feet below M. P.
hoursDate.
gpm/ft
Remarks.
3007GOPrepared by
G&M Foffp 05 5-87 Soutnpnnl 871776

& MILLER, INC.Environmental Services
SAMPLING OF MONITORING WELLSDAILY CHECKLIST
PROJECT .
LOCATION:
G&M PERSONNEL ON SITE:
CHECKED BY: _______
WELL(S):
DATE: _
TIME: _
ITEMS OK/NA COMMENTSPRIOR TO SAMPLING:Health & safety precautions (HASP) received; equipment ready.
Sample containers, coolers, received from laboratory; ice or icepacks ready.
Sampling equipment and supplies inventoried, clean andoperational.
Check in with client at site.
Integrity of well noted.
Well area prepared for sampling; plastic placed around well;gasoline-powered pumps placed downwind.
Well and water-level measurements made and recorded alongwith other pertinent field information on water sampling log.
Field instruments calibrated.
Sample containers labelled; preservatives added, if necessary.
DURING AND AFTER SAMPLING:Well purged three to five times its volume.
Sample collected using a bailer or pump as per sampling plan.
Measurement of field parameters recorded on sampling log.
Sample containers filled according to collection protocol ofanalyses.
Field and trip blanks collected; replicates or split samplescollected as per sampling plan.
Samples stored at 4°C in coolers for transport to lab.
Water sampling log and chain-of-custody form completed.
Reusable equipment decontaminated; non-reusable equipmentdisposed of in appropriate manner
Well secured and locked.
Laboratory contacted to confirm receipt and condition ofsamples.
Additional Comments:300761
Instructions: Original to Field Project File; copy to Project Manager and to QA Representative.G&M Form 13 11-90 Southpnrt 90-2349

& MILLER, INC.nvironmental Services
TELEPHONE CONVERSATION RECORD
DATE:__________________________________ TIME:______________PROJECTS
FROM: _________________________________ TO: _____________________
COMPANY:_______________________________ COMPANY:.
TELE NO: _______________________________ TELE NO:
RE: ______________________________________________
300762
G&M Form 16 6-86 SoKhpnnt 89-1013

COm
Ow
300763

SECTION III
QUALITY ASSURANCE PROJECT PLANSECOND OPERABLE UNIT
REMEDIAL INVESTIGATIONSYOSSET LANDnLL, SYOSSET, NEW YORK
300764GERAGHTY & MILLER, INC.

CONTENTS
SECTION III: QUALITY ASSURANCE PROJECT PLANPage
I.0 INTRODUCTION . . . . . . . . . . . . . . . . . . . . . . . . . . . . . . . . . . . . . . . . . III-l
2.0 PROJECT ORGANIZATION AND RESPONSIBILITIES . . . . . . . . . . . HI-3
3.0 QUALITY ASSURANCE/QUALITY CONTROL . . . . . . . . . . . . . . . . . HI-5
3.1 DATA USAGE AND REQUIREMENTS . . . . . . . . . . . . . . . . III-53.2 LEVEL OF QUALITY CONTROL EFFORT . . . . . . . . . . . . . III-7
3.2.1 Precision . . . . . . . . . . . . . . . . . . . . . . . . . . . . . . . . . . . . . III-73.2.2 Accuracy . . . . . . . . . . . . . . . . . . . . . . . . . . . . . . . . . . . . . HI-83.2.3 Representativeness . . . . . . . . . . . . . . . . . . . . . . . . . . . . . III-83.2.4 Comparability . . . . . . . . . . . . . . . . . . . . . . . . . . . . . . . . . HI-83.2.5 Completeness . . . . . . . . . . . . . . . . . . . . . . . . . . . . . . . . . HI-9
3.3 QUALITY CONTROL OBJECTIVE . . . . . . . . . . . . . . . . . . . . 111-10
4.0 SAMPLING PROCEDURES . . . . . . . . . . . . . . . . . . . . . . . . . . . . . . . . . HI-12
5.0 SAMPLE CUSTODY . . . . . . . . . . . . . . . . . . . . . . . . . . . . . . . . . . . . . . 111-14
6.0 CALIBRATION PROCEDURES . . . . . . . . . . . . . . . . . . . . . . . . . . . . . . HI-15
7.0 ANALYTICAL PROCEDURES . . . . . . . . . . . . . . . . . . . . . . . . . . . . . . HI-16
8.0 DATA REDUCTION, VALIDATION, AND REPORTING . . . . . . . . . . HI-17
9.0 INTERNAL QUALITY CONTROL . . . . . . . . . . . . . . . . . . . . . . . . . . . 111-19
10.0 PERFORMANCE AND SYSTEM AUDITS . . . . . . . . . . . . . . . . . . . . . HI-21
II.0 PREVENTIVE MAINTENANCE . . . . . . . . . . . . . . . . . . . . . . . . . . . . . HI-23
12.0 DATA ASSESSMENT PROCEDURES . . . . . . . . . . . . . . . . . . . . . . . . . 111-24
13.0 CORRECTIVE ACTIONS . . . . . . . . . . . . . . . . . . . . . . . . . . . . . . . . . . . 111-26
14.0 QUALITY ASSURANCE REPORTS . . . . . . . . . . . . . . . . . . . . . . . . . . IH-27
15.0 REFERENCES . . . . . . . . . . . . . . . . . . . . . . . . . . . . . . . . . . . . . . . . . . . HI-28
300765GERAGHTY & MILLER. INC.

APPENDICES
A. Laboratory Quality Assurance Project Plan.
B. Analytical Parameters and Quantitation Limits.
3007B6GERAGHTY & MILLER. INC.

SECTION III
QUALITY ASSURANCE PROJECT PLANSECOND OPERABLE UNIT
REMEDIAL INVESTIGATIONSYOSSET LANDFILL, SYOSSET, NEW YORK
1.0 INTRODUCTION
This Quality Assurance Project Plan (QAPP) presents the organizational structure,data quality objectives (DQOs) and data management scheme for conducting the OU-2Remedial Investigation (RI) field program audit and defines the specific quality control (QC)checks and quality assurance (QA) auditing processes. The QAPP is designed to assure thatthe precision, accuracy, representativeness, comparability, and completeness (the PARCCparameters) of the collected data are known, documented, and adequate to satisfy theDQOs of the study. The format and contents of the QAPP have been prepared inaccordance with the following United States Environmental Protection Agency (USEPA)guidance documents: "Interim Guidelines and Specifications for Preparing QualityAssurance Project Plans" (USEPA 1983); "Guidance for Conducting Remedial Investigationsand Feasibility Studies Under CERCLA" (USEPA 1988); "Data Quality Objectives:Development Guidance for Uncontrolled Hazardous Waste Site Remedial ResponseActivities" (USEPA 1987); "NEIC Policies and Procedures" (USEPA 1986); and "Region IICERCLA Quality Assurance Manual" (USEPA 1989a).
The QAPP serves as an overall summary of the QA/QC structure of the project.Some parts of the structure are described in this document (e.g., data management); andother parts are described in the SAP and are incorporated into the QAPP by reference (e.g.,Standard Operating Protocols and Procedures [SOPs], which provide detailed descriptionsof the methodologies that will be followed for the RI field tasks).
The internal laboratory SOPs and quality assurance/quality control (QA/QC)procedures are described in the laboratory QAPP, an independent plan provided by the
300767CERAGHTY & MILLER. INC.

ni-2
analytical laboratory (Industrial & Environmental Analysts, Inc. [IEA] Monroe, Connecticut),and appended to this document (Appendix A). The SOPs provided by IEA are consistentwith the USEPA Contract Laboratory Program (CLP) Statements of Work (SOWs) plannedfor this project.
The RI will be performed to obtain representative data to define the off-site ground-water quality conditions north-northeast of the landfill and the off-site extent of subsurfacegas migration southwest of the landfill. These data will be used to evaluate the nature andextent of the contamination for the development of appropriate remedial alternatives for thefeasibility study (FS).
300768GERAGHTY & MILLER. INC.

III-3
2.0 PROJECT ORGANIZATION AND RESPONSIBILITIES
The project organizational structure is discussed in Section 8.0 of the Sampling andAnalysis Plan (SAP) (Section II). The responsibilities of the key personnel are detailedbelow.
• The Project Coordinator is responsible for overseeing the implementation ofthe Consent Order. To the maximum extent possible, all documents, includingreports, approvals and other correspondence concerning the activitiesperformed pursuant to the terms and conditions of the Consent Order will bedirected through the project coordinator.
• The Project Director is responsible for the overall QA including technicaladequacy of the RI activities and reports, and conformance to the scope ofwork
• The Project Manager is responsible for the following: sampling QC; overallproject coordination; adherence to the project schedules; directing, reviewing,and assessing the adequacy of the performance of the technical staff andsubcontractors assigned to the project; implementing corrective action, ifwarranted; interacting with the project coordinator; preparing the monthlyprogress and RI reports; and maintaining full and orderly projectdocumentation.
• The Project QA/QC Manager is responsible for performing systems auditing,and for providing independent data quality review of project documents andreports.
300769GERAGHTY & MILLER. INC.

ni-4
• The Project Health and Safety Coordinator is responsible for implementingthe site-specific health and safety directives in the HASP (Section IV) and forcontingency response.
• The Field Hydrogeologist is responsible for coordination of the activities offield personnel and of the drilling and surveying subcontractors; adherence ofthe field work to the procedures specified in the QAPP and SAP (Section II);and rigorous documentation of the field work. The field hydrogeologist is alsodesignated as the site safety officer.
• The Data Validator is responsible for review of laboratory data for compliancewith the QA objectives for the PARCC parameters; and notifications to theproject manager of any QC deficiencies.
• The RI Project Support Team members include the sampling team, supportstaff (e.g., data processors, secretaries, and in-house experts in hydrogeologyand chemistry, etc.) who are responsible for the technical direction andadequacy of the work in their respective areas of specialty which are or maybe required to meet the project objectives.
Tasks that will be performed by subcontractors include drilling, surveying, andanalytical (laboratory) testing. The internal project organizational structure within thelaboratory is described in the laboratory QAPP (Appendix A of this QAPP). Resumes ofkey project personnel are presented in Appendix A of the SOP Overview (Section I).
300770GERACHTY 6? MILLER. INC.

ni-5
3.0 QUALITY ASSURANCE/QUALITY CONTROL
The overall QA objective is to develop and implement procedures for fieldmeasurements, sampling, and analytical testing that will provide data of known quality thatis consistent with the intended use of the information. This section defines the objectivesby (1) describing the use of the data (2) specifying the applicable QC effort (field checks andanalytical support levels), and (3) defining the QC objectives (data quality acceptancecriteria).
3.1 DATA USAGE AND REQUIREMENTS
The field measurements and laboratory analyses will be used to support one or moresteps in the RI process. These field steps include off-site characterization of the potentialcontamination, evaluation of remedial alternatives, if necessary, and engineering design ofremedial alternatives. The intended uses of the data from each of the RI activities aresummarized in Table 1. The data to be collected range from qualitative information (basedon field observations) to quantitative laboratory analyses.
An important factor in the use of the data will be the ability to evaluate siteconditions with respect to the applicable or relevant and appropriate requirements(ARARs). The RI will generate analytical data that will allow comparison with ARARs aslisted in Table 3.
During the well installation program, a photoionization detector (PID), such as a TIPor HNU meter will be used to monitor for the presence of VOCs in the breathing zone (seethe HASP in Section IV of this document). During the subsurface gas study, the new off-sitegas monitoring wells and the existing gas monitoring wells in the southwestern portion of thelandfill will be monitored for total volatile organic compounds (TVOCs) and methane. The
300771GERAGHTY & MILLER. INC.

HI-6
operating procedures for the PID, including calibration and QC, are discussed in AppendixE of the SAP (Section II). Leachate indicators (hardness, alkalinity, ammonia, pH,temperature, chloride, and specific conductance) will be analyzed in the field during thedrilling of the two exploratory borings to determine the vertical water-quality profiles atthese locations. Ground-water samples collected from the Nassau County monitoringwells/and public supply wells will also be analyzed in the field for the leachate indicators.The field analysis procedures for the leachate indicators are discussed in Appendices B andE of the SAP. Twenty percent of these samples will be sent to the laboratory forconfirmatory analysis. The methods and quantitation limits to be used to analyze thesesamples by the laboratory are listed in Appendix B of the QAPP.
For both sampling rounds, ground-water samples will be collected from the existingand new monitoring wells and analyzed for the same parameters employed during the OU-1(on-site) RI (Geraghty & Miller, Inc. 1989) as listed in Appendix B of this QAPP. Toprovide for lower quantitation limits, the document, "Contract Laboratory ProgramStatement of Work for Low Concentration Water for Organics Analysis" (USEPA 1990) willbe followed to analyze the ground-water samples collected for VOCs.
The documents, "Contract Laboratory Program Statement of Work for InorganicsAnalysis" (USEPA 1990b) and the "Contract Laboratory Program Statement of Work forOrganics Analysis" (USEPA 1991) will be followed by the laboratory for the analyses ofinorganics, semivolatiles, and PCBs for the ground-water samples collected during the OU-2RI. SOPs for sample control, calibration, analysis of samples, data analysis, data validation,data reporting, internal QC checks, system performance audits, preventive maintenance, anddata assessment were prepared in accordance with the Statements of Work (SOWs) forUSEPA CLP analysis. Analytical procedures are described in more detail in Section 7.0(Analytical Procedures) of this QAPP. The sample handling procedures described in the
300772GERAGHTY & MILLER. INC.

ni-7
laboratory QAPP (Appendix A of this QAPP) are consistent with the SOWs mentionedabove.
Quantitation limits for the organic and inorganic parameter analyses are provided inthe parameters list (Appendix B of this QAPP); however, dilution or interference effects maymake it necessary to raise these limits. The laboratory will make every effort to achievequantitation limits as low as practicable and will report estimated concentration values at lessthan the detection limit by flagging the value with J.
3.2 LEVEL OF QUALITY CONTROL EFFORT
The laboratory will follow standard QC measures to provide data of known anddefensible quality. The data quality elements that will be checked and documented includethe PARCC parameters which are discussed separately below:
3.2.1 Precision
Measurements of data precision are necessary to demonstrate the reproducibility ofthe analytical data. Precision of the ground-water sample data will be determined from theanalyses of matrix spike and matrix spike duplicates (MS/MSDs). MS/MSD samples will becollected at a frequency of 5 percent (one MS/MSD pair per 20 samples), or one per 2-weeksampling period. An extra sample volume will be collected for each replicate and MS/MSDsample taken. MS/MSD samples will be labeled on the sample container and appropriatesample log and chain-of-custody forms. Laboratory precision requirements are provided inAppendix A of this QAPP.
300773
GERAGHTY & MILLER. INC.

III-8
3.2.2 Accuracy
Accuracy is the relationship of the reported data to the "true" value. The accuracyof the methods used for the analyses of ground-water samples will be evaluated through theuse of calibration standards, MS/MSD analyses, and surrogate spikes. MS/MSD samples willbe collected and analyzed at a frequency of 5 percent (one MS and one MSD per 20samples per matrix), or one MS/MSD pair per 2-week period. An extra sample volume willbe collected for each MS/MSD sample taken. Laboratory accuracy requirements areprovided in Appendix A of this QAPP.
3.23 Representativeness
All data obtained during the RI, including data from replicate samples, should berepresentative of actual conditions at the sampling location. Field replicates will be collectedand analyzed at a frequency of 5 percent (one per 20 samples) or at least one per samplematrix (ground-water only) if less than 20 samples are to be collected. Considerations forevaluating the representativeness of the data include, but are not limited to, the following:the sampling location; the methods used to obtain samples at the site; and theappropriateness of the analytical method to the type of sample obtained. All field samplingactivities will be performed according to the protocols and SOPs described in the SAP(Section II). Laboratory representativeness requirements are provided Appendix A of thisQAPP.
3.2.4 Comparability
Comparability will be achieved by utilizing standardized sampling and analysismethods and data reporting format. The data will be generated such that it is comparableto the existing data base.
300774
GERAGHTY & MILLER. INC.

ni-9
3.2.5 Completeness
Completeness is a measure of the amount of valid data obtained from a measurementprogram compared to the total amount collected. The validity of the collected data will beevaluated utilizing the appropriate QA/QC guidelines. Laboratory completenessrequirements are provided in Appendix A of this QAPP.
The sampling team will use many different types of QA/QC samples to ensure anddocument the integrity of the sampling procedures, laboratory sample handling procedures,and the validity of the measurement data.
Field replicate samples will be collected to also demonstrate the reproducibility of thesampling technique. These analyses will be in addition to the replicates that IEA must runand will not be replaced by a laboratory-generated replicate. The replicate samplinglocations will be selected for each sampling event. Since the replicate will be "blind" to thelaboratory, it will have a coded identity on its label and on the chain-of-custody record form.The actual sampling location will be recorded on a daily log form and on the water samplinglog form.
Analyte-free deionized water will be obtained from the laboratory to be used for tripblanks, collecting field blanks, and the final decontamination rinse -where required. Thiswater will be prepared and analyzed by the laboratory on a monthly basis and a record ofthis procedure will be kept on file. Protocols for the handling of trip blanks, collection offield blanks, and decontamination of equipment are provided in the SAP (Section II). Todetermine if cross-contamination has occurred during ground-water sampling, one field blankper day of sampling will be prepared using analyte-free deionized water provided by thelaboratory. Field blanks will be analyzed for all the test parameters, except leachateparameters, listed in Appendix B of this QAPP using CLP methods.
30077^
GERAGHTY & MILLER. INC.

Ill-10
One trip blank, consisting of two 40-mL vials filled by the laboratory with analyte-freedeionized water, will be provided by IEA daily for each container used to ship and storevolatile organic samples during each sampling event. Trip blanks will not be more than 24hours older than the associated ground-water samples and will be analyzed for VOCs only.
The USEPA standard series of analytical support levels to denote types of analysisand the associated level of QC effort are listed below.
Level 1. Field screening or analysis using portable instruments.Level 2. Field analyses using more sophisticated instruments.Level 3. Standard USEPA-approved laboratory methods.Level 4. USEPA CLP routine analytical services laboratory methods.Level 5. USEPA CLP non-standard services laboratory methods.
The analytical support levels which will be used to generate the project data aresummarized in Table 1. As shown in this table, the analyses that will be performed duringthe RI will fall within Levels 1, 3, and 4. Ground-water samples that will be tested in thefield for primary and secondary leachate indicators will be performed at Level 1. Themeasurements for TVOCs and methane in the gas monitoring wells will also be performedat Level 1. The ground-water samples that will be sent to IEA for analysis will beperformed using standard USEPA laboratory methods (Level 3) and by the routineanalytical services methodology in CLP SOWs for Inorganics and Organics Analyses (Level
4).
3J QUALITY CONTROL OBJECTIVE
The QC objective for the OU-2 RI is to provide data of known and defensible quality.Several different types of QC check samples will be analyzed and the results will be
300776
GERAGHTY & MILLER. INC.

Ill-11
compared to data quality acceptance criteria and/or QC control limits that are specified foreach method. The laboratory will routinely run these QC samples in accordance with theprotocols and frequencies specified in the CLP SOWs for Organics and Inorganics Analysesand will provide a comparable level of QC effort for the non-CLP analytical parameters.The QC check samples include the following:
• Blank samplesPreparationMethodHoldingCalibration
• Initial and continuing calibrations• Surrogate spikes• Matrix spikes/analytical spikes• Duplicate samples• Control samples• Reagent check samples
The QC control limits, or data quality acceptance criteria, for each of the types of QCcheck samples are also specified in the laboratory QAPP (Appendix A of this QAPP). Thespecific types and frequencies of QC checks which will be performed in support of each testmethod, the calibration procedures for each instrument, and the QC control limits and/ordata quality acceptance criteria for each of the types of QC check samples, are specified indetail in the laboratory QAPP (Appendix A of this QAPP).
300777
GERAGHTY & MILLER. INC.

Ill-12
4.0 SAMPLING PROCEDURES
Samples will be collected in accordance with the approved project SOPs. These areprovided in the SAP (Section II) and include the following:
• Ground-Water Monitoring Well Specifications and Installation Protocols(Appendix A of the SAP).
• Ground-Water Sampling Protocols (Appendix B of the SAP).• Ground Water-Level Measurement Protocols (Appendix C of the SAP).• Gas Monitoring Well Installation and Sampling Protocols (Appendix D of the
SAP).• Field Instrumentation Operating Procedures (Appendix E of the SAP).• Chain-of-Custody Procedures (Appendix F of the SAP).• Borehole Geophysical Logging Protocols (Appendix G of the SAP).
Geraghty & Miller, Inc. QA/QC Forms (Appendix H of the SAP).
The SOPs specify detailed step-by-step protocols for sample collection and addressthe following as appropriate:
• Use of sampling equipment.• Decontamination of sampling equipment.• Pre-sampling requirements (well evacuation volumes).• Field screening procedures.• Field analysis procedures (for hardness, alkalinity, ammonia, and chloride).• Field QC check sample collection procedures (blanks, rinsates, replicates).• Sample packaging and shipment.• Sampling documentation and chain-of-custody.
3Q0773GERAGHTY & MILLER. INC.

Ill-13
All samples will be delivered to the laboratory 24 hours from time of collection.Preservation, container, and holding time requirements for the parameters to be analyzedare listed in Table 4.
300779
GERAGHTY & MILLER, INC.

111-14
5.0 SAMPLE CUSTODY
A chain-of-custody record will be maintained for each sample collected and willprovide an accurate written record that can be used to trace the possession and holding ofsamples from collection through analysis and reporting. Sample bottles to be used for thisproject will be selected, prepared, and quality controlled according to OSWER Directive#9240-0-005 "Specifications and Guidance for Obtaining Contaminant-Free SampleContainers" (USEPA 1989b).
The procedures that will be followed to provide the chain-of-custody in the field fromsample collection through shipment to the laboratory (including sample preservation) arespecified in Appendices B, E, and F of the SAP (Section II). The procedures that will beused to continue the chain-of-custody for each sample from its arrival in the laboratorythrough analysis and reporting are specified in the laboratory QAPP (Appendix A of thisQAPP). The laboratory sample custody procedures conform to the guidelines in the USEPACLP. The project samples will be retained by the laboratory until the holding times areexceeded, or until permission to discard is received.
300780
GERAGHTY & MILLER. INC.

IIM5
6.0 CALIBRATION PROCEDURES
The calibration procedures for field instrumentation are discussed in the SAP (SectionII). These procedures are described for the following instruments:
• Water-level recorder (M-scope).• OVA flame ionization detector.
PID (TIP or HNU).• pH meter.• Specific conductance/temperature meter.• Ammonia meter.• Geophysical logger.• Hach test kits.• Combustible gas indicator.
The calibration procedures for laboratory instrumentation are discussed in thelaboratory QAPP (Appendix A of this QAPP).
300731
GERAGHTY & MILLER. INC.

111-16
7.0 ANALYTICAL PROCEDURES
The methods for analyzing the leachate parameters are listed in Table 1 and thelaboratory QAPP (Appendix A of this QAPP). The analytical methods for testing for thevolatile, semivolatile, PCB, and inorganic parameters are those specified in the USEPA CLPSOWs. The types and frequencies of QC checks will be those specified in the analyticalmethods and are discussed in Section 3.3 (Quality Control Objectives) of this QAPP. FullCLP data packages will be requested for the volatile, semivolatile, PCB, and inorganicparameters and comparable data packages for the non-CLP analytical parameters.
300782
GERAGHTY & MILLER. INC.

111-17
8.0 DATA REDUCTION. VALIDATION. AND REPORTING
The laboratory procedures for reducing, validating, and reporting the analytical dataare described in the laboratory QAPP (Appendix A of this QAPP). The laboratory data willalso be validated consisting of a systematic review of the analytical results and QCdocumentation, and will be performed in accordance with the guidelines in "CLP OrganicsData Review and Preliminary Review" (USEPA 1992a) and "Evaluation of Metals Data forthe Contract Laboratory Program (CLP)" (USEPA 1992b).
On the basis of this review, the data validator will make judgments and comments onthe quality and limitations of specific data, as well as on the validity of the overall datapackage. The data validator will prepare documentation of his or her review andconclusions using the standard USEPA Inorganics Regional Data Assessment and OrganicsRegional Data Assessment forms to summarize any overall deficiencies that requireattention. General laboratory performance will also be assessed by the data validator.These forms will be accompanied by appropriate supplementary documentation, clearlyidentifying specific problems.
The data validator will inform the project manager of data quality and limitations, andassist the project manager in interacting with the laboratory to correct any data omissionsand/or deficiencies. The laboratory may be required to rerun or resubmit data dependingon the extent of the deficiencies, and their importance in meeting the data quality objectiveswithin the overall context of the project.
The validated laboratory data will be reduced and tabulated electronically. Thetabulated format will be suitable for inclusion in the data validation report and the RI reportand will be designed to facilitate comparison and evaluation of the data. The datatabulations will be sorted by classes of constituents (e.g., VOCs, semivolatile organiccompounds, inorganics). Each individual table will contain the following information:
300733
GERAGHTY & MILLER. INC.

Ill-18
sample number; analytical parameters; detection limits; concentrations detected; andqualifiers, as appropriate.
The field measurement data will be similarly reduced into a tabulated format suitablefor inclusion in the RI report and will be designed to facilitate comparison and evaluationfor the data. These tabulations will include but not be limited to the following information:
• Field screen (OVA) results.• Field analyses (pH, temperature, leachate indicators, and specific
conductance).• Well construction details.• Water-level measurements and surveyed measuring point elevations.• Gas monitoring results.
Field logs will be transferred into typed formats or organized in their original formfor inclusions as RI report appendices. The following log forms will be used:
• Sample/Core Logs.• Well Construction Logs.• Water Level Logs.• Water Sampling Logs.• Gas Sampling Logs.
The tables and logs will be compiled whenever feasible by the field hydrogeologist,who will inform the project manager of any problems encountered during data collection,identify apparent inconsistencies, and provide opinions on the data quality and limitations.The tables and logs will be used as the basis for data interpretation and will be checkedagainst the original field documentation by an independent reviewer prior to use.
300784
GERAGHTY & MILLER. INC.

111-19
9.0 INTERNAL QUALITY CONTROL
The field hydrogeologist will make use of the following types of QA/QC samples toensure and document the integrity of the sampling and sample handling procedures and thevalidity of the measurement data: field replicates, field blanks, and laboratory-prepared tripblanks. The frequencies for collecting the QA/QC samples are specified in Section 3.2(Level of Quality Control Effort) of this QAPP. The procedures for collecting the QA/QCsamples are specified in the SAP (Section II).
Two types of quality assurance mechanisms are used to ensure the production ofanalytical data of known and documented quality: analytical method QC, and program QA.The internal quality control procedures for the analytical services on samples to be providedare specified in the laboratory QAPP (Appendix A of this QAPP). These specificationsinclude the types of control samples required (sample spikes, surrogate spikes, referencesamples, controls, blanks), the frequency of each control, the compounds to be used forsample spikes and surrogate spikes, and the quality control acceptance criteria. Thelaboratory will be responsible for documenting that both initial and ongoing instrument andanalytical QC criteria are met in each package. This information will be included in thepackages generated by IEA and will be evaluated during the validation performed byGeraghty & Miller.
The field QA/QC analytical results will also be compared to acceptance criteria, anddocumentation will be performed showing that those criteria have been met. Any samplesin nonconformance with the QC criteria will be identified and reanalyzed by the laboratory,if possible. The following QC procedures will be employed by the laboratory for analysesof ground-water samples:
• Proper storage of samples.
300785GERAGHTY & MILLER. INC.

111-20
Use of qualified and/or certified technicians.Use of calibrated equipment traceable to National Bureau of Standards orUSEPA standards.Formal independent confirmation of all computation and reduction oflaboratory data and results.Use of standardized test procedures.Inclusion of replicate samples at a frequency of one replicate per 20 samples.
300786
GERAGHTY & MILLER, INC.

111-21
10.0 PERFORMANCE AND SYSTEM AUDITS
System audits will be performed on a periodic basis, as appropriate, to assure thatthe RI field program is implemented in accordance with the approved project SOPs and inan overall satisfactory manner. Examples of systems audits that will be performed byGeraghty & Miller project personnel during the RI are as follows:
• The field hydrogeologist will supervise and check on a daily basis the followingtasks: that the ground-water program, subsurface gas program and other fieldprograms are conducted correctly; that monitoring wells are installed anddeveloped correctly; that field measurements are made accurately; thatequipment is thoroughly decontaminated; that samples are collected andhandled properly; and that all field work is accurately and neatly documented.QA checklists will be filled out daily during the drilling, installation, anddevelopment of new monitoring wells, and during sampling programs. TheQA daily checklists for these activities are provided in Appendix H of the SAP(Section II).
• On a timely basis, the data validator will review the data package submittedby the laboratory to check the following information: that all requestedanalyses were performed; that sample holding times were met; that the datawere generated through the approved methodology with the appropriate levelof QC effort and reporting; and that the analytical results are in conformancewith the prescribed acceptance criteria. The data validator will evaluate thedata quality and limitations on the basis of these factors.
300787
GERAGHTY & MILLER. INC.

111-22
• The project manager will oversee the field hydrogeologist and data validator,and check that the management of the acquired data proceeds in an organizedand expeditious manner.
• System audits of the laboratory are performed on a regular basis by theUSEPA, as well as by the New York State Department of EnvironmentalConservation (NYSDEC). These audits are discussed in the laboratory QAPP(Appendix A of this QAPP).
Performance audits of laboratories participating in the CLP are performed quarterlyin accordance with the procedures and frequencies established by USEPA for the CLP. Thelaboratory performance evaluation audits are discussed in the laboratory QAPP (AppendixA of this QAPP).
300783
GERAGHTY & MILLER, INC.

HI-23
11.0 PREVENTIVE MAINTENANCE
Geraghty & Miller has established a program for the maintenance of field equipmentto ensure the availability of equipment in good working order when and where it is needed,as indicated in the following examples:
• An inventory of equipment, including model and serial number, quantity, andcondition will be maintained. Each item will be tagged and signed out whenin use, and its operating condition and cleanliness will be checked upon return.Routine checks will be made on the status of equipment, and spare parts willbe stocked. An equipment manual library will also be maintained.
• The field hydrogeologist is responsible for making sure that the equipment istested, cleaned, charged, and calibrated in accordance with the manufacturer'sinstructions before being taken to the field.
The laboratory also follows a well-defined program to prevent the failure oflaboratory equipment and instrumentation. This preventive maintenance program isdescribed in the laboratory QAPP (Appendix A of this QAPP).
300739
GERAGHTY & MILLER. INC.

111-24
12.0 DATA ASSESSMENT PROCEDURES
The field- and laboratory-generated data will be assessed for the PARCC parameters.Both quantitative and qualitative procedures will be used for these assessments. Thecriterion for assessment of field measurements will be that the measurements were takenproperly using calibrated instruments. Assessment of the sampling data with respect to fieldperformance will be based on the criteria that the samples were properly collected andhandled. Field QC check sample results will also be considered in assessing therepresentativeness and comparability of the samples collected. The project manager willhave overall responsibility for data assessment and integration of that assessment into datause and interpretation.
The laboratory will calculate and report the precision, accuracy, and completeness ofthe analytical data. Precision will be expressed as the relative percent difference (RPD)between values for duplicate samples. Accuracy will be expressed as percent recoveries(PR) for surrogate standards and matrix spike compounds. The precision and accuracyresults will be compared to the prescribed QC acceptance criteria. The QC acceptancecriteria prescribed for each test method are presented in the laboratory QAPP. For theorganic and inorganic parameters listed in Appendix B of this QAPP, the QC acceptancecriteria conform to control limits established in the CLP SOWs. Completeness is expressedas the percentage of valid data, based on the total amount of data intended to be collected.
Rigorous QA/QC procedures will be followed for the collection of samples. The SAPsampling protocols will be strictly adhered to in order to maintain consistency in samplingand representativeness and comparability of the samples.
The assessment of data representativeness with respect to laboratory performance willbe based on sample handling and analyses with respect to holding times and also on the
300730
GERAGHTY & MILLER. INC.

IH-25
method blank results. Data comparability will be assessed based on laboratory performancewith respect to USEPA analytical protocols.
Split or duplicate samples may be collected by the USEPA or its authorizedrepresentative during the RI field programs. These samples will be collected in accordancewith the procedures provided in Appendix B of the SAP (Section II). The USEPA willprovide the project manager with the oversight work plan or similar document identifyingthe number and location of split samples to be taken. The USEPA will be provided at least10 days advance notice by the project manager for each sampling event. Split or duplicatesamples may also be collected by Geraghty & Miller, if any samples are collectedindependently by the USEPA that relate to the RI program. The same 10-day minimumnotification is applicable.
300731
GERAGHTY & MILLER. INC.

111-26
13.0 CORRECTIVE ACTIONS
The QA/QC program contained in this QAPP will enable problems to be identified,controlled, and corrected. Potential problems may involve non-conformance with the SOPsand/or analytical procedures established for the project, or other unforeseen difficulties. Anypersons identifying an unacceptable condition will notify the field hydrogeologist, whereapplicable, and/or the project manager. The project manager, with assistance from theproject QA/QC manager, will be responsible for developing and initiating appropriatecorrective action and verifying that the corrective action has been effective. For laboratoryanalysis, both the identified deviations and corrective actions will be documented on theCorrective Action report, which is provided in the laboratory QAPP (Appendix A of thisQAPP).
Corrective actions may include repeating measurements, resampling and/or reanalysisof samples, and amending or adjusting project procedures. If warranted by the severity ofthe problem (e.g., if monitoring wells require resampling or if the project schedule may beaffected), the project coordinator and USEPA remedial project manager will be notified.Additional work, which is dependent upon an unacceptable activity, will not be performeduntil the problem has been eliminated.
The laboratory maintains an internal closed-loop corrective action system and isdescribed in the laboratory QAPP (Appendix A of this QAPP).
300792GERAGHTY & MILLER. INC.

111-27
14.0 QUALITY ASSURANCE REPORTS
Regular QA reporting throughout the duration of the project, as well as reporting onan as-needed basis will include the following:
• Monthly progress reports will be submitted to the USEPA remedial projectmanager. At a minimum these reports will include the following: adescription of the activities that have taken place during the month; allvalidated results of sampling, tests, analytical data, and interpretationsreceived; a description of all data anticipated and activities scheduled for thenext month; and a description of any problems encountered or anticipated.
• Conference calls and/or meetings will be scheduled if requested by the projectcoordinator or by the USEPA remedial project manager to discuss anyconcerns that may arise during the course of the RI field program that mightrequire significant corrective actions, changes to the scope of work, ordepartures from the approved project SOPs.
• Serious deficiencies in sampling and/or monitoring data will be reported to theUSEPA as soon as practicable after such deficiencies have been noted.
The laboratory's internal QA reporting is described in the laboratory QAPP(Appendix A in this QAPP).
300793
GERAGHTY & MILLER, INC.

111-28
15.0 REFERENCES
Geraghty & Miller, Inc. 1989. Interim Remedial Investigation Report, Syosset Landfill,Syosset, New York. August 1989.
U.S. Environmental Protection Agency (USEPA). 1983. Interim Guidelines andSpecifications for Preparing Quality Assurance Project Plans. QAMS-005/80.
U.S. Environmental Protection Agency (USEPA). 1986. NEIC Policies and Procedures.EPA-330/9-78-001-R.
U.S. Environmental Protection Agency (USEPA). 1987. Data Quality Objectives:Development Guidance for Uncontrolled Hazardous Waste Site Remedial ResponseActivities. OSWER Directive 9355.0-7B. Washington D.C.: Hazardous Site ControlDivision.
U.S. Environmental Protection Agency (USEPA). 1989a. Region II CERCLA QualityAssurance Manual, Revision I.
U.S. Environmental Protection Agency (USEPA). 1989b. Specifications and Guidance forObtaining Contaminant-Free Sample Containers. OSWER Directive 9240.0-005.
U.S. Environmental Protection Agency (USEPA). 1990a. Contract Laboratory ProgramStatement of Work for Low Concentration Water for Organics Analysis. OLCOl.O
U.S. Environmental Protection Agency (USEPA). 1990b. Contract Laboratory ProgramStatement of Work for Inorganics Analysis. ILMO1.0.
U.S. Environmental Protection Agency (USEPA). 1991. Contract Laboratory ProgramStatement of Work for Organics Analysis OLM01.6.
U.S. Environmental Protection Agency (USEPA). 1992a. CLP Organics Data Reviewand Preliminary Review. SOP No. HW-6, Revision 8.
U.S. Environmental Protection Agency (USEPA). 1992b. Evaluation of Metals Data forthe Contract Laboratory Program (CLP), Revision 11.
300734
GERAGHTY & MILLER, INC

APPENDIX A
O.10
OOCO

SECTION IH: QUALITY ASSURANCE PROJECT PLAN
APPENDIX A
LABORATORY QUALITY ASSURANCE PROJECT PLAN
300796GERAGHTY & MILLER. INC.

CONTENTS
I.0 QUALITY ASSURANCE PROGRAM PLAN
2.0 STANDARD OPERATING PROCEDURE - GLASSWARE/PLASTICWARECLEANING
3.0 STANDARD OPERATING PROCEDURE - SAMPLE CONTAINERPREPARATION
4.0 STANDARD OPERATING PROCEDURE - SAMPLE RECEIPT AND LOG-IN
5.0 STANDARD OPERATING PROCEDURE - SOIL/SEDIMENT SAMPLEPREPARATION
6.0 STANDARD OPERATING PROCEDURE - SAMPLE PREPARATION OFWATERS
7.0 STANDARD OPERATING PROCEDURE - STANDARD AND SAMPLEPREPARATION LOGS
8.0 STANDARD OPERATING PROCEDURE-SAMPLE HANDLING AND CHAINOF CUSTODY
9.0 STANDARD OPERATING PROCEDURE - STORAGE AND DISPOSAL OFSAMPLES AND RELATED EXTRACTS
10.0 STANDARD OPERATING PROCEDURE - ANALYSIS OF VOLATILEORGANICS BY PURGE AND TRAP GC/MS
II.0 STANDARD OPERATING PROCEDURE - FOR THE PREPARATION OFAQUEOUS SAMPLES FOR PESTICIDE/PCB ANALYSIS
12.0 STANDARD OPERATING PROCEDURE - FOR THE PREPARATION OFAQUEOUS SAMPLES FOR BNA ANALYSIS
13.0 STANDARD OPERATING PROCEDURE - FOR THE PREPARATION OFSOIL/SEDIMENT SAMPLES FOR BNA/PESTICIDE/PCB ANALYSIS
14.0 STANDARD OPERATING PROCEDURE - THE ANALYSIS OFPESTICIDES/PCBs IN ENVIRONMENTAL EXTRACTS
15.0 STANDARD OPERATING PROCEDURE - THE ANALYSIS OF SAMPLEEXTRACTS FOR SEMI-VOLATILE ORGANICS BY USEPA CLP PROTOCOLS
300797GERAGHTY & MILLER. INC.

16.0 STANDARD OPERATING PROCEDURE - THE ANALYSIS OF SAMPLEEXTRACTS FOR PESTICIDE/PCBs BY USEPA CLP PROTOCOLS
17.0 STANDARD OPERATING PROCEDURE - PERKIN-ELMER 3030 ATOMICABSORPTION SPECTROMETER (GRAPHITE FURNACE)
18.0 STANDARD OPERATING PROCEDURE - PERKIN-ELMER 5100PC ATOMICABSORPTION SPECTROMETER (GRAPHITE FURNACE) 5100N
19.0 STANDARD OPERATING PROCEDURE - COLD VAPOR ATOMICABSORPTION (CVAA) FOR THE DETERMINATION OF MERCURY INWATER
20.0 STANDARD OPERATING PROCEDURE - THERMO JARRELL ASH ICAP61
21.0 STANDARD OPERATING PROCEDURE - ICP SET UP PE6500
22.0 STANDARD OPERATING PROCEDURE - ANALYSIS OF SAMPLES FORTOTAL CYANIDE CLP PROTOCOL
23.0 STANDARD OPERATING PROCEDURE - TRACKING METALS ANDCYANIDE SAMPLE ANALYSIS
24.0 STANDARD OPERATING PROCEDURE - ANALYSIS OF TOTALALKALINITY IN WATER SAMPLES
25.0 STANDARD OPERATING PROCEDURE - ANALYSIS OF TOTAL DISSOLVEDSOLIDS IN WATER
26.0 STANDARD OPERATING PROCEDURE - ANALYSIS OF AMMONIA -NITROGEN
27.0 STANDARD OPERATING PROCEDURE - FOR CHLORIDE
28.0 STANDARD OPERATING PROCEDURE - ANALYSIS OF SULFATE INWATER
29.0 STANDARD OPERATING PROCEDURE - ANALYSIS OF HARDNESS INWATER
30.0 STANDARD OPERATING PROCEDURE - ANALYSIS OF NITRATE ANDNITRITE FOR WATER SAMPLES
ny029-01\QAPCON.CON
300793
GERAGHTY & MILLER. INC

an environmental test ing company
_2031 263-5346
1991 QUALITY ASSURANCE PROGRAM PLAN (QAPmP)
FOR
IEA, INC.-CONNECTICUT
MONROE, CONNECTICUT 06463
300799

1991 QUALITY ASSURANCE PROGRAM PLAN (QAPmP)
FOR
IEA, INC. -CONNECTICUT
MONROE, CONNECTICUT 06463
1.0 INTRODUCTION
This Quality Assurance Program Plan (QAPmP) covers laboratory operation atIndustrial and Environmental Analysts, Inc. -Connecticut {IEA, Inc.-CT) locatedat 200 Monroe Turnpike, Monroe, Connecticut. The purpose of this general ^AP^pis to provide information on laboratory operations as required for specificQuality Assurance Project Plans (QAPjPs), and to provide the basis for the Q u a l -ity Assurance Program at IEA, Inc.-CT.
This QAPmP is based upon USEPA guidelines as are specified in the following EPAdocuments:
1) NPO and PRO QAPP Guidance. Quality Assurance Management Staff (QAMS),USEPA, September, 1987.
2) QAMS -004/80, Guidelines and Specifications for Preparing QualityAssurance Program Plans. Quality Assurance Management Staff (QAMS),USEPA, 1979.
.The -second document is also available as EPA publication, EPA-600/8-83-024.Regulatory guidance for preparing QAPmPs is given in CFR part 30, *30.503, para-graph (e).
2.0 QUALITY ASSURANCE (QA) POLICY STATEMENT
It is the policy of IEA, Inc.-CT that the Quality Assurance (QA) Program w i l l beappropriate to assure that all data collected and reported will be of known anddocumented value.
The objective of the QA Program (QAPmP) is to ensure, assess and document thatall data collected, stored and reported are scientifically valid, defensible andof the precision and accuracy required to meet the objectives of our clients.
It is the goal of IEA, Inc.-CT to provide the best laboratory services to ourclients. To accomplish this, the product which we produce, analytical measure-ment data, must be of defined quality and at the same time conform to governmentregulations and requirements.All laboratory activities, from sample receipt to analysis to final report gen-eration, must adhere to the laboratory Standard Operating Procedures (SOPs)which have been developed to provide quality environmental data with adequatedocumentation to be legally defensible and hence of maximum use by our custom-ers.
300300

Laboratory SOPs form the framework of the Quality Assurance Program Plan <QA?T,P'?J IEr',i"?rCI; The PurP°ses of the QAPmp are basically to ensure that ourSOPs f u l f i l l all government and/or private client requirements, that properdocumentation of all quality control (QC) activities is accomplished, and thatthe SOPs are followed by the laboratory staff.
It is the policy of the laboratory, therefore, to build the quality controlrequirements into our SOPs. By adhering to the SOPs, laboratory management -3thereby assured that the quality of the data produced w i l l provide the basis forlong term relationships with our clients through customer satisfaction.
3.0 MAJOR MISSION ELEMENTS REQUIRING QUALITY ASSURANCE
The primary focus of the laboratory is measurement of specific analytes in e n v i -ronmental samples (air, soil and water). All elements of laboratory measure-ments are subject to the requirements of the laboratory's QAPmP. The majortypes of laboratory operations affected are as follows:
Characterization of waste samples per the Resource Conservation andRecovery Act (RCRA) for either disposal or delisting purposes.
Analysis of drinking water samples in support of the Safe DrinkingWater Act.
Analysis of environmental samples in accordance with contracts withthe USEPA CLP program and various state agencies.
Analysis of environmental samples for contaminants such as thosecompounds found on the EPA priority pollutant list, target compoundlist, etc. for site assessment purposes.
4.0 PLANNING FOR ENVIRONMENTAL DATA COLLECTION ACTIVITIES (EDCAs)
According to EPA's (JAMS1, IEA, Inc.-CT is defined as an "Analytical SupportGroup". EPA's QAMS defines an "Analytical Support Group" as "any group -- sec-tion, branch, or entire laboratory -- that provides physical, chemical or bio-logical sampling or analysis on a service basis". According to QAMS, such ana-lytical support groups do not manage the EDCA projects but only provide servi-ces. IEA, Inc.-CT, as an analytical support group, does not determine or writeData Quality Objectives (DQOs) or Quality Assurance Project Plans (QAPjPs).
4.1 Adherence to Data Quality Objectives (OQOs)
Data Quality Objectives (DQOs) have been specified by EPA as the processof defining that type of data will be required by the client for a site orproject. The following two steps of defining OQOs must be taken before aproject begins:1) "...the user (of data) must first specify the quality of data he
needs, then..."2) "...the degree of quality control necessary to assure that the resul-
tant data satisfy his specifications must be determined."
300801

nThe laboratory is in the business of measuring environmental samolesorder to generate data which is to be used by our customers to make'sounddecisions in relation to site contamination (or lack of), water/air/soilquality, public health concerns and the environment in general Some ofthe sites have formal QAPjPs with specified DQOs, however, most sites "onot have a formal QAPjP.
Each sample analyzed from a given site can present a set of unique ana l y -tical problems which potentially fall outside the realm of establishedmethodologies and protocols. It is the goal of the laboratory to producedata which is 100 percent usable to the client but in the real world th i sis not always possible. For some projects or sites, achieving 50 percentusable data may be considered an excellent achievement by the laboratorywhile at another site, achieving 90 percent usable data may be consideredbarely adequate.
It is the policy of IEA, Inc.-CT to meet the requirements of DQOs inQAPjPs when the laboratory has contracted to provide measurement data insupport of an on-going client contract. These DQOs must be clearly de-fined by the client to the laboratory.
4.2 Guidance for the Preparation of Standard Operating Procedures (SOPs)
Routine analytical work will be performed according to standard operatingprocedures (SOP's must satisfy the requirements of the regulations forwhich they were developed). All measurements will be made using methodsdeveloped in the laboratory or methods mandated by regulatory or legal/contractual requirements. No method will be used to obtain data until itis known to be applicable and competence has been gained in its use. Ifit appears that available techniques are not sufficient to obtain reliablemeasurements, the user will be informed and advised of any research re-quired and the estimated cost. The attainment of statistical control isa prerequisite for reporting, any data. Any deviations from SOPs must besupportable and documented in the case narrative in the final report tothe client.
Existing SOPs must be reviewed and updated as required but at a minimum ofonce per year.
The QAO will maintain an index of all SOPs in use.
RCRA has proposed in SW846, 3rd Edition, 1st Update, a standardized 10element format for all revised RCRA methods. In light of RCRA's new re-quirements, the following SOP format should be employed when new measure-ment SOPs are written or when major rewrites are made to SOPs.
All SOPs should provide complete documentation as to how each sample wasmeasured for each parameter. This formal documentation in the form ofsample preparation logs, standard preparation logs, instrument logs, cor-rective action reports/case narrative reports (CAR/CNRs), Quality ControlApproval Reports (QCARs), and similar logs must provide an immediate,complete and long-term description of how samples were measured and whatproblems were encountered. It is the laboratory policy to retain labora-tory measurement records for a minimum period of five years. It is very
,00802

important that all measurement records be well organized and that *«eyprovide a complete description of how each sample was measured.
Of special importance in writing good SOPs is that each SOP meet the regu-latory requirements of both the method and of any governing contract's).It is important that IEA, Inc.-CT have SOPs prepared and ready to use'foreach of the environmental regulations which we support. This means thatsome groups may have four or five SOPs to cover one type of neasureiient(all five SOPs could be printed separately or compiled into one 5CP).
New SOPs are developed by line supervisors and/or their designated staffwhen any sampling, or analytical procedure is recognized to be r e p e t i t i v eand routine. The Quality Assurance (QA) Officer w i l l be a v a i l a b l e toassist in the development of SOPs. -
Newly developed SOPs shall be reviewed by the analytical group, the groupleader and by laboratory management and contain a sign off page.
The following outline lists some of the necessary elements that should becovered in most measurement SOPs. SOPs should cover each element. If alisted element in the outline does not apply, then the element shouldstill be listed with the additional descriptor, "Not Applicable".
1) Introduction
IEA. Inc. Policy on Business Ethics and Conduct
State in the beginning of each SOP that "It is the intent of this proce-dure to comply with the IEA business ethics policy". Each member of thegroup/section should read and understand this ethics policy statement. Itis the responsibility of all division managers to communicate and trainemployees about the requirements of the IEA, Inc. Policy on Business Eth-ics and Conduct to ensure compliance with this policy. A copy of the IEAEthics Policy is in Appendix- A of this qAPmP.
2) Scope and Application - Generally describe the SOP and its generalapplication.
a) Other related SOPs and analytical methodsb) Water samplesc) Son/sediment samples
3) Summary of Method - Summarize the method in one paragraph.
4) Interferences - Describe any interferences to the method.
5) Apparatus and Materials - List in detail.
6) Reagentsa) Inventory of Reagents, Standards and Solvents
It is laboratory policy that each measurement group set up and main-tain a system to inventory all standards, reagents and solvents used
300803

in measurements. The inventory system should record the date -heitem was received and the lot/batch number. A unique IEA inventorynumber should be given to each item in the inventory. A set of"'"dexcards or a computer spread sheet (with hard copy and magnetic backup)may be used to maintain inventory records and updates. Each i n v e n -toried item should be marked with the date of receipt and an inven-tory record number. Self-sticking sample seals may be used as la-bels. The inventory system should also provide for documentation ofthe date the material was opened and used up. It is the section/group leader's responsibility to maintain an inventory system ofreagents, standards and solvents.
b) Quality of Solvents, Reagents and Standards
Traceability of Calibration Standards - It is laboratory policy topurchase standards for organics and inorganics measurements whichhave been previously traced to reference standards.
If traceable standards are not available, then the measurement grouptraces the non-certified standard to EPA or NBS reference standardsor other certified standards.
Assay of Purity - The chemical purity of the reagents and chemicalsshould be specified in the SOP. Any assays of materials should bekept in a central file.
Recordkeeping Requirements - Strict control of reagents used in labo-ratory operations shall be maintained to minimize contamination ordegradation. Dilutions and solutions prepared from them w i l l beinitialed, dated and clearly labeled as to content. All reagentswill be appropriate to the operation performed. A record w i l l bemaintained of all reagents used. Laboratory records should be keptorganized and accessible for five years (minimum).
7) Sample Collection, Preservation and Handling
a) Preservation Requirements and Procedures - Each measurement SOPshould clearly specify the preservation and holding time re-quirements of the regulatory method. Specify a system in theSOP to ensure that preservation and holding time requirementsare met and documented. Corrective action reports should beused to document all preservation blank problems, contamina-tion, etc.
b) Regulatory Holding Times - Clearly list all holding times forenvironmental samples and extracts.
For samples:
. water samples
. soil/sediment samples
. other matrixes
For extracts and concentrates
300804

8) Procedure
a) Safety - General safety rules as outlined in the IEA HealthSafety Manual shall be followed. Use of gloves, eye protectionand lab coats is required for work with dangerous chemicalsHazardous materials with high vapor pressures should only oeopened under hoods.
The^responsibility of following good safety practices is every-one's. No employees should be using hazardous chemicals w i t h -out proper training and safety equipment.
b) Sample and Data Chain of Custody Procedures - Upon receipt ofthe samples in the laboratory the sample custodian and the sam-ple control group are responsible for obtaining all necessaryshipping documentation and verification of all data entered inthe laboratory sample custody records.
The specific procedures and requirements for receiving samplesare specified in the SOP for sample control. In general thegroup signs and dates all shipping records, verifies the sam-ples are in good condition and properly preserved, verifies thefield chain of custody documents (if present) are in order, andassigns laboratory sample numbers to the incoming samples andstores the samples according to the requirements of the analy-tical protocols (refrigeration).
Each measurement SOP should specify procedures for mainta i n i n gsample and data chain of custody records. It is the responsi-bility of the group leader to ensure that chain of custodyrecords are signed and maintained.
Any and all deviations from established laboratory chain ofcustody procedures must be noted on the CAR/CNRs and also docu-mented in the case narrative for the job.
c) Sample Preparation - Each and every sample received by the lab-oratory will be handled in a conscientious manner. All aspectsof sample preparation will be performed according to anapproved SOP. The integrity of each sample shall be maintainedthrough appropriate chain of custody procedures. Any l i m i t a -tions on analytical results due to the sample will be specifiedin the case narrative. All preparation methods shall include aQCAR which states the minimum quality control requirements ofthe SOP.
d) Sample Screeninge) Standards Preparation Log - It is the laboratory policy to pro-
vide full and complete documentation on the use and compositionof all standards used for preservation or measurement or spik-ing of all environmental samples. This includes lot numbers ofsolvents, reagents, and standards used and the date and i n i -tials of the analyst who prepared the standard.

Specify instructions in the SOP (or a separate SOP) on rnemaintenance of a standards preparation log notebook, tot "''-n-bers, weights, volumes and the initials of the analyst shouldbe recorded. Assign an IEA preparation code number to each andevery standard prepared including dilutions of standards. Usethe following labeling convention: group:date:page number (ofstandards prep book).
f) Calibration - Each analytical method has its own set of c a l i -bration procedures and verification. Each measurement SOP nustspecify calibration requirements of the method. For specificprocedures, each SOP must be consulted.
If the measurement requires the use of RCRA procedures, thenthe following general guidelines apply:
Volatile Orqanics (VOA) GC/HS - Instrument tuned to BFB.5-point initial calibration verified every 12 hours perSW846/CLP protocols.
Semi-Volatile Orqanics (GC/HS): Instrument tuned to OFTPP.5-point initial calibration verified every 12 hours perSW846/CLP protocols.
Oroanochlorine Pesticides/PCB's (GC/ECD): Calibration perSW846/CLP protocols. Verification every 10 samples. Dualcolumn confirmation.
Metals (ICP. GFAAS and FAAS): Calibration per SW845/CLPprotocols. Verification every 10 samples.
Miscellaneous: Calibration and verification per method.
g) Measurement of Samples - It is laboratory policy that allmeasurements be made using appropriate SOPs. All SOPs shall bein writing and available for review. Any significant changesto or deviations from a SOP shall be documented in case narra-tives and include the reasons for any changes.
Laboratory measurement SOPs are based upon the following regu-latory methods:
Test Methods for Evaluating Solid Wastes. RCRA SW846 Meth-ods (both 2nd and 3rd editions).Methods for Chemical Analysis of Water and Wastes. EPA600/4-79-020. Revised March, 1983.
USEPA "Contract Laboratory Program Statement of Work forInorganic Analysis, Multi-Media, Multi-Concentration," SOW7/88, Revisions 2/89 and 6/89.
300806

USEPA "Contract Laboratory Program Statement of Work forOrganic Analysis, Multi-Media, Multi-Concentration ' ^w2/88. ' "
Methods for the Determination of Organic Compound in F i n -ished Drinking Water and Raw ource Water, EPA EMSL/CISeptember, 1986.
h) Quantitation of Results - The SOP should clearly state the re-quirements of the method concerning the calculation of results.Provide examples as to how results are determined.
i) Qualitative Decisions (if any) - SOPs that require the i d e n t i -fication of Tentatively Identified Compounds (TICs) must speci-fy the EPA CLP procedures that must be followed in order toproperly identify non-target compounds. CLP SOW guidelines forthe identification of TICs are currently being evaluated byEPA. SOPs must require that the current CLP guidelines be fol-lowed. The QAO will audit TIC data for conformance to thesewritten guidelines.
9) Quality Control
a) Quality Control Approval Reports (QCARs) - The laboratory groupand section leaders are responsible for the data their groupsgenerate. As such, all data must be reviewed and approved pri-or to release. This is documented in Quality Control ApprovalReports (QCARs) which must accompany each data package as it issubmitted to the data management group.
The laboratory Quality Assurance Officers wil l periodicallyexamine data packages at random to ensure that all QCARs arepresent and to ascertain that the data package meets the re-quirements as stated in the SOP. These findings are transmit-ted to laboratory management via Monthly QA Progress Reports(MQAPRs).
b) Required Method QC Limits - Each SOP explains the type and fre-quency of quality control checks. This includes such items asanalysis of EPA reference standards, matrix spikes, laboratoryduplicates, blanks, the use of internal standards and surrogatespikes, etc. In general all calibration are checked before ananalysis can begin. If the analytical system does not pass theinitial QC limits, then the system is determined to be out ofcontrol, and cause of the problem is determined before measure-ments can continue. Once the problem is corrected, QC measure-ments are repeated to verify the calibration. If the system isstill out of control, the instrument is re-examined until theproblem is corrected. The following are examples of typicalmethod QC items.
Tuning and/or Calibration of InstrumentOther Types of Calibration

a. Laboratory Reagent Blank (LRB) - The laboratory measures areagent blank sample at the frequency required by the meth-od. These LRBs must, be within required QC l i m i t s beforesample analysis can begin.Internal Standard PrecisionSurrogate Spike Analysis - Surrogate spikes are added toall organics samples prior to extractions or analysisResults of these are checked to verify the recoveries Tieetthe requirements of the SOP. If the recoveries are out."the sample is reanalyzed to prove that the system is incontrol .Laboratory Fortified Blank (LF8)Laboratory Fortified Matrix Sample (LFM) - In general thelaboratory performs a matrix spike/matrix spike duplicatefor organic QC and a duplicate/matrix spike for inorganicQC. The results of these analyses are used to generatecontrol charts to monitor the precision and accuracy ofeach parameter analyzed.Quality Control Sample (QCS)Laboratory Duplicates (LD1 and LD2)
c) Preventive Maintenance of Equipment - The policy of the labora-tory is to have service contracts for all of its major instru-ments. These contracts provide routine preventive maintenanceaccording to the manufacturer's requirements. Additionally thelaboratory maintains an inventory of expendable parts and sup-plies to minimize downtime and to allow laboratory personnel to
iriTior repairs if necessary.
Each measurement SOP must list the preventive maintenanceschedule for each instrument which is to be followed by in-house and extramural repair contractors. In addition, eachmeasurement group .must maintain a log of all in-house and ex-tramural preventive maintenance activities.
10) Method Performance
a) Regulatory Requirements - Each regulatory method requires dif-ferent approaches in determining method performance. SOPs muststate the basis for the measurement and documentation of methodperformance for each method of analysis.
The laboratory is constantly assessing the changing Method Per-formance requirements of EPA regulations. For example, pro-posed drinking water organics methods may require a newapproach to mandatory quality control. These new method per-formance requirements may require new software and computerhardware to meet the mandatory QC requirements of the regula-tory methods.
b) Method Detection Limits (MDLs) - It is laboratory policy todetermine MDLs for all methods prior to implementation of SOPs.Requirements for the determination of MOLs are specified ineach regulatory method.
300803

c) Accuracy of the Method - In order to routinely assess the orecision and accuracy of the data generated, the laboratory per-forms monthly statistical analysis of the spike and spike du-plicate data as part of our QA program. These results are usedto generate control charts based upon the ERA Handbook of Ana-lytical Quality Control for Environmental Laboratories. Thesecharts allow for trend analysis to identify potential problemsprior to their occurrence.
d) Precision of the Method
11) Data Reduction and Data Handling
a) Recordkeeping Procedures - It is the responsibility of all mem-bers of the laboratory to maintain complete records of all op-erations performed. All records shall be neat and organized.All laboratory records are the property of the laboratory andshall not be removed from the premises without permission fromsupervisors. All records are considered confidential and shallbe safeguarded. Unauthorized changes, loss or destruction ofrecords can be grounds for dismissal from the laboratory. Con-sult the IEA. Inc. Ethics Policv regarding integrity of dataand employee conduct.
All measurement data will be recorded in logbooks or on pre-printed log sheets in permanent ink. Transcriptions wil l beavoided whenever possible. The record will reflect themeasurement performed and all appropriate details for conclu-sions related to the measurement. The record shall be signedand dated by the individual performing the measurement of theday the measurement is performed. Corrections shall be made bydrawing a single line through the error, and i n i t i a l i n g anddating the error. .
As described above, all SOPs should provide complete documenta-tion as to how each sample was measured for each parameter.SOPs should not permit measurement data or QC results to beroutinely recorded in personal lab notebooks. Measurement re-cords must be recorded in preprinted record logs or preprintedmeasurement logs. This policy will facilitate the organizationand archiving of all laboratory data for future reference.
All injection forms, instrumentation forms, sample prep formsand QC forms which are used to process samples and measurementresults should be described and attached to the SOP. The SOPshould specify where these records and forms are cataloged andstored.
b) Data Validation - At a minimum, all data will be subject tosupervisory review. Sensitive data requires higher level re-view and release. All releases must be in writing. Oral pre-liminary releases are prohibited unless prior permission of the
300809

appropriate supervisor(s) is granted and provided that thev a-=subsequently followed by written confirmation of " r e v i e wresults. r e v i . w
c) Delivery Times for Reporting Results
d) Preparation of Final Report - Each analytical group in the l a b -oratory is responsible for generating the data for all analysesthe group performs. In general the data must first meet allthe specific QA/QC associated with the SOP that was used forthe analysis prior to any release of the data. The analyticalgroup leader (supervisor) is responsible for the final v e r i f i -cation of the data from the analysis.
The laboratory employs a system of QA sign-off sheets calledQuality Control Approval Reports (QCARs), where each analystmust sign off that their respective part of the analysis iscomplete and meets the QA/QC requirements of the governing SOP.QCARs are signed and placed in each job folder along with anyCAR/CNRs which detail any problems which were encountered inthe measurement of samples. Any deviations in SOPs are noted.on CAR/CNRs and explained in the case -narrative which is incor-porated into the final report. The group leader has finalsign-off responsibility on the QCAR and is responsible for as-suring the overall quality of the data.
12) Special Procedures
13) Use of Other Required SOPs
14) Documentation of Problems
a) Corrective Action Reports - Include and attach to each measure-ment SOP a copy of the most recent revision of the IEA, Inc./CTCorrective Actions Report/Case Narrative Report (CAR/CNR)attached). Provide instructions as to when a CAR/CNR should becompleted. The CAR/CNR provides a routine written communica-tion vehicle to describe most types of problems which may occurthroughout the laboratory. In many cases, CAR/CNRs should beused instead of memos or notes. Most problems described incase narratives should be supported by a CAR/CNR. Eachgroup/section may also have additional unique CARs which arespecific for the group/section.
The CAR/CNR system requires that the provider of the correctiveaction (solution to the problem) sign and date the CAR/CNR andsend secondary copies of the solution to the problem back tothe originator of the CAR/CNR and to the QAO.
The system requires that the originator of the CAR/CNR be theperson who is responsible to see that a solution is found tothe documented problem. Each originator of CAR/CNRs w i l l re-port to the QAO if corrective actions have not been taken bythe designated provider of solutions.
O

Under the CAR/CNR system, the QAO will monitor and lo- >-*progress of CAR/CNRs and w i l l report in his/her Monthly's*Progress Report the status of major corrective actions taken ?nthe past month. It is the QAO's responsibility to see thatlaboratory problems are documented and solved in a t i m e l y ran"norner.
b) Case Narratives - It is laboratory policy that any and anproblems related to client samples and the measurement of c l i -ent samples be documented in the case narrative of the finallaboratory report which goes to the client. The mechanise fordocumenting problems which should be included in the case nar-rative are described above' in Section a (above). It is theresponsibility of the data management group to see that infor-mation on CAR/CNRs be included in the final case narrative.
15) References for SOP
5.0 THE AUDIT/REVIEW PROGRAM
5.1 Categories of Audits and Reviews - EPA has classified audits of aQAPmP into four categories. According to NPO and PRO OAPP Guidance.Quality Assurance Management Staff, USEPA, September 1987, audits areclassified into the following areas:
Management System Reviews (MSRs). Audits of Data Quality (AOQs)
Technical Systems Audits (TSAs)Performance Evaluations (PEs)
5.2 Management System Reviews (MSRs) - Management System Reviews (MSRs)"assess the effectiveness of the implementation of the approvedQAPmP(s). MSRs evaluate a specific group's QA program associatedwith environmental data collection activities to either affirm or toidentify areas where additional attention would bring significantbenefits". MSRs have been historically a review of one's organiza-tions QA management system. This type of review of IEA, Inc.-CT's QAmanagement system by IEA, Inc.-CT will continue, however, the labora-tory will may have MSRs conducted by outside organizations and con-tractors.
5.3 Audits of Data Quality (ADQs) - ADQs are normally conducted by theend user of the data to determine if specific data of QAPjP meets therequirements of the data quality objectives (OQOs).
At IEA, Inc.-CT, ADQs are conducted by both external auditors andinternal auditors. The results from external ADQs is usually a re-port submitted to the laboratory with a request for corrective ac-tions. The QAO reviews the external ADQs and issue requests forcorrective actions of deficiencies. The QAO will look for both tech-nical and managerial causes of QA deficiencies and will make recom-mendations to the Laboratory Operations Manager (LOM) for correctiveactions. It is the responsibility of the LOM to implement thesecorrective actions.
300811

Internal AOQs are normally initiated by a QAO. The results of -heaudit are reviewed by the QAO and corrective actions similar to thos»described above are submitted by the QAO to the LOM for implementa-tion.
5.4 Technical Systems Audits (TSAs) - According to EPA QAMS2 "TechnicalSystems Audits (TSAs) focus on the actual quality control and en v i -ronmental measurement data collection systems. A TSA entails anexamination of calibration records, sampling and measurement proce-dures, general laboratory cleanliness, support systems, equipment andfacilities, maintenance and repair records, control charts, etc. TSAauditors must be competent scientists who are familiar with the par-ticular data collection technology and quality control procedures".
At IEA, Inc.-CT, TSAs are performed by both external and internalauditors. Externally auditors are from EPA, state and private clientorganizations.
The QAO may conduct a TSA on any project or group in the laboratoryat any time. Internal TSAs by the QAO are essential to the QA pro-gram of the laboratory. The results of any deficiencies noted in allTSAs must be addressed by the LOM and his staff.
5.5 Performance Evaluation Audits (PEs) - According to EPA QAMS2, "A Per-formance Evaluation (PE) is the means of evaluating the performanceof laboratory technicians and the instrumentation or analytical sys-tems on which they work. A PE is accomplished by providing PE sam-ples containing specific pollutants (in appropriate matrices) unknownto the technician in their concentration and/or identity. PEs areimplemented by the QAOs, project officers (POs) or laboratory manage-ment".1
At IEA, Inc.-CT, PEs are conducted routinely by a number of externalorganizations. The QAO* may submit internal PEs to any group in thelaboratory at any time. The QAO routinely submits double-blind PEsamples to each measurement group during each quarter of the year.Internal PEs by the QAO are essential to the QA program of the labo-ratory. The results of any deficiencies noted in all PEs must beaddressed by the LOM and his staff. QAOs routinely submit additionalPE samples to groups who show deficiencies in measurement accuracy orquality of data.
5.6 Management System Reviews (MSRs)External Audit Program - On an annual basis, IEA, Inc. w i l l conductaudits of all groups at IEA, Inc.-CT. The results of this comprehen-sive QA audit will be reported as an External Management SystemsAudit Report (EMSAR) to corporate and laboratory management.
The above audit will review the entire, current QAPmP at IEA, Inc.-CTand make recommendations to corporate and laboratory management inthe following areas:
The quality of the existing QAPmP.
3008122.

Current procedures for developing, revising and approving SGPsOverall data quality and technical capability.Procedures and criteria for designing and conducting auditsRecommendations for changes to the IEA, Inc.-CT QAPmP.
5.7 Audits Program - The.results of all external audits w i l l be reportedby the QAO in their monthly QAPR. These would include all state,federal and private client on-site inspections.
5.8 Internal Audits of Data quality - On a regular basis the QAO w i l lreview data to check for compliance to SOPs. Additionally the QAOw i l l review SOPs to ensure they meet the requirements of the Tiethod-ologies and applicable regulations.
5.9 Internal Technical System Audits - On a periodic basis the QAO w i l lperform unannounced TSAs. The purpose of this will be to determineif the laboratory staff is following the SOPs, if the SOPs need revi-sion, proper documentation through corrective action reports, casenarratives, etc. and conformance to identified critical controlpoints-.
5.10 Internal Performance Evaluation Audits - On a quarterly basis the QAOwill submit double blind QC samples to the laboratory. The purposeof this will be to check the accuracy of results, assess data quali-ty, assess documentation and completeness of data reporting.
5.11 Audit Reports
Monthly Quality Assurance Progress Report - By the 15th of each monththe QAO will issue a report to corporate and laboratory managementsummarizing all QA/QC activities from the previous month.
6.0 QUALITY ASSURANCE AUTHORITIES AND RESPONSIBILITIES
6.1 Organization Chart - The IEA, Inc.-CT Functional Organizational Chartis also attached. This chart indicates the chain of command for eachof the managers and groups at IEA, Inc.-CT.
6.2 Facilities and Equipment - A list of facilities and equipment isattached in Appendix A.
7.0 TRAINING
7.1 Technical Training - All laboratory personnel must have adequateeducation, training, and experience to carry out their responsibili-ties at IEA, Inc.-CT. To ensure that each laboratory member hasacquired both sufficient and applicable knowledge to carry out theirtasks, the QAOs and the Laboratory Management will periodically re-view the training needs of the staff and make recommendations for anyadditional training needs.
300813'

8.0 REFERENCES
1) NPO and PRO QAPP Guidance, quality Assurance Management Staff (QAMS)USEPA, September, 1987.
2) QAMS-004/80, Guidelines and .Specifications for Preparing Q u a l i t /Assurance Program Plans. Quality Assurance Management Staff (QAMS),USEPA, 1979.
300814

ATTACHMENTS
300815

APPENDIX A
IEA, Inc. Policy Statement on Business Ethics and Conduct
IEA, Inc.-CT Organization Chart
IEA, Inc.-CT Floor Plan
IEA, Inc.-CT Capital Equipment Inventory
IEA, Inc.-CT Corrective Action Report/Case Narrative Report (CAR/CNR)
APPENDIX B
Laboratory Detection Limits
300816

APPENDIX A
IEA, Inc.-Connecticut
300S17

Industrial & Environmental Analysts, Inc.
INDUSTRIAL & ENVIRONMENTAL ANALYST'S, ESC.
ETHICS POLICY
The management of Industrial &. Environmental Analyst's, Inc. (IEA) recogruzes ourresponsibility to clients and fellow employees to ensure that fair and ethical business practicesare followed at all facilities.
Management is fully aware that any ethical violations severly damage the reputation of the entireorganization as well as individual employees at all levels. Therefore, it is imperative that highethical standards be maintained at all times by all employees.
The management and staff are committed to maintaining a carefully controlled analyticalenvironment which assures the consistent generation of accurate data which meets the dataquality objectives of our clientele.
The following represents the EEA ethics policy which has been adopted to clearly identify thecorporate position on ethical practices. Failure to comply with this policy cannot and will not betolerated.
The Company and All its Employees will:
o Fully comply with all applicable federal, state, and local laws and regulations.
o Produce analytical products that are accurate, defensible and which represent soundprofessional judgement at all times.
o Provide employees with guidance and an understanding of the ethical and qualitystandards required in the environmental industry. In this regard, ail employees should feelfree to identify any ethical misconduct without fear of retribution. Any employee involvedin any form of ethical misconduct will be subject to immediate disciplinary actionincluding potential termination of employment.
o Present services to clients in a confidential, honest and forth-right manner and strive todeliver quality products at a fair price.
300818

INDUSTRIAL & ENVIRONMENTAL ANALYST'S, INC.
ETHICS POLICY -Continued...
Treat employees equitably by compensating them fairly, acknowledging their scientificcontributions, and providing them opporrunides for professional growth and development.
Offer employment opportunities to qualified candidates regardless of their race, creed,color, sex or age.
Be a responsible corporate cidzen of the community by operating in an environmentallysound manner at all times.
Maintain all facilities in a safe amd professional manner through maintenance of a safetyawareness program and providing the necessary safety equipment and training to protectall employees from preventable injury and chemical exposure.
300819

COooCOK>o
DATA/SAMPLE MANAGEMENT
Sup«rvt sor
Section Leader
5
Section Leader
Saq>le Control
3
IEA/CT. INC.ORGANIZATION (BY FUNCTION) 1/91
CORPORATE QA/QC
1I
CLIENT SERVICES
Manager
2
LABORATORY QA/QC
1
ORGANIC MANAGER
1
CLASSICAL CHEMISTRY
Group Leader
11
GC/MS
Group Leader
Asst. Group Leader
7
GC GROUP
Group Leader
4
EXTRACTIONS GROUP
Group Leader
4
ATOMIC SPECTROSCOPY
Group Leader
8

GC Lab
OrganicExtraction*
Lab
InorganicsPreparation Lab
StorageChemical
I E A . r s c . - ' o s s i :200 MCN'SOi TV?. '
M O V R O S , " '.:FLCCsJ ?1.-.:.•
30082J

IEA, INC. - COHNECTICUT
EQUIPMENT LIST
Equipment Name
Spectrophotometer, UV-VISIR-SpectrophotometerTurbidimeterTOG AnalyzerTOX AnalyzerFluororaeterpH/ISE MeterConductivity MeterFlash Point ApparatusOvenIncubatorBio RefrigeratorCentrifugeWater BathD.O. MeterAutoclaveGas ChromatographGel Permeation Chromato-tographRefrigeratorOvenOvenSonicatorSonicatorMercury AnalyzerICP-SequentialICP-SemiultaneousFlame AAFurnace AAFurnace AAFurnace AAComputerGas ChromatographGas ChromatographAuto SamplerAuto SamplerMass Selective DetectorMass Selective DetectorComputer TerminalComputer TerminalComputer TerminalComputer Terminal
Manufacturer
Perkin-ElmerPerkin-ElmerHach Company
Xertex-Dohrmann _Xertex-Dohrmann
Sequoia-Turner Corp.Orion
Cole-Parmer InstrumentPrecision ScientificFisher ScientificBlue M Electric
Frost QueenGarver Manufacturing
Blue M ElectricYSI
Market ForgePerkin-Elmer
ABC
wwASPASP
Sonics & MaterialsTekmer
Spectro-ProductsPerkin-ElmerJarrell-AshPerkin-ElmerPerkin-ElmerPerkin-ElmerPerkin-Elmer
NECHewlett PackardHewlett PackardHewlett PackardHewlett PackardHewlett PackardHewlett PackardHewlett PackardHewlett PackardHewlett PackardHewlett Packard
ModelNumber
Hitachi 20013102100ADC-80
MC3 A,B112-003SA 7201484-20
Pensky-Martin55G100 AR20/L549
MW-122051A
STM-E83201002B
4EFD 1142D 1162SM500TM500HG46500JA612380Z3030Z5100
Z5100 PCPower Mate2
589058907673A76732A59705970150 II2623A150 II150 II
SerialNuricer
522-5134423
351017142HF2025MF 2105D 01491SR45A1421
10 Au-12291
IN1-13620002910333
MX-25200241
03420083N546502
7323
F3973144011149010639272644703128233677321264433131130911135141
7700069037518A054222728A146152607A024332441A034532513A009232716A106332528A05525
2720Y057932720Y03266
300822

"ouJPTnent:
Scanning InterfaceScanning InterfaceTape DriveDisc Drive9 Track Magnetic Tape9 Track Magnetic TapeComputerComputerDisc DriveDisc DriveP&TP&TP&TP&TP&TP&TP&TP&TP&TGC/MSGC/MSGC/MSTerminalterminal*Tr-rinters (partial list)
PrintersPrintersPrintersTerminalCRTMagnetic Tape UnitScanning InterfaceScanning InterfaceCart. Tape Unit5010 Auto DesorberCart. Tape UnitGC AnalyzerGC data SystemAuto SamplerSatellite IntegratorSatellite IntegratorIntegra tor/ PlotterIntegrator/Plotter
Manufacturer
Hewlett PackardHewlett PackardHewlett PackardHewlett PackardHewlett PackardHewlett PackardHewlett PackardHewlett PackardHewlett PackardHewlett Packard
TekmarTekmarTekmarTekmarTekmarTekmarTekmarTekmarTekmar
Hewlett PackardHewlett PackardHewlett PackardHewlett PackardHewlett PackardHewlett PackardHewlett PackardHewlett PackardHewlett PackardHewlett PackardHewlett PackardHewlett PackardHewlett PackardHewlett PackardHewlett PackardHewlett Packard
TekmarHewlett PackardPerkin-ElmerPerkin-ElmerPerkin-ElmerPerkin-ElmerPerkin-ElmerPerkin-ElmerPerkin-Elmer
ModelNumber
59824A59824A914479587970E7970E
HP1000AHP100079147914LSC-240004000
14-2000-000LSC-2ALS
14-2962-200ALSALS5995B5995C5995C45849A3575135731A2934A2934A2225A2225A3575135731A7970E59824A59824A7914
14-2150-0007914
Sigma 1Sigma 1-data system
AS100SI316SI316LCI-100LCI-100
SerialNur.be r
227192398
380680011324679
380610154941068
2217A003532413A006592413A004302530A135412643A075553633K2631:2635A3294:2715A4394325123303*92510S323592630A066223610K20515
N/AN/AN/AN/A
133-GTN/A
0815150019081515001019
94975N4397071316N671510
N431931C
300823

Model SeriEquipment Name Manufacturer ' Number v;.,~u&
GC Perkin-Elmer- Sigma 3 0933170:2Autosampler Perkin-Elmer AS100 B 95234Cata Station Perkin-Elmer 7500 901732Printer Perkin-Elmer P-132 05259"Plotter Perkin-Elmer GP100 0620C5GC Hewlett-Packard 5890 2541A06:GC Hewlett-Packard 5890 2750A143GC Hewlett-Packard 5730A 16C9A004Autosampler Hewlett-Packard 7673A-Dual Tower 2546A007Autosampler Hewlett-Packard 7673A 2718A065Integrator Hewlett-Packard 3396A 2804A011Integrator Hewlett-Packard 3393A 2332AOC2Integrator Hewlett-Packard 3392A 2736A119Auto Analyzer LaChat Quikchera Ion Analyzer ——GC Varian Hall/PID 3300 ——
300824

i - A , r.vc. -~:.vNE:r::.~Reported By:
f 3
Date: __________Time: __
nVE ACTION REPORT / CASE NARRATIVE REPORTClient:_______Job Number:________ Sample Number (a);______
Problem Reported By:_________________________________
Category of Problem:? a<s i C o m m u n i c a t i o n W t t n _ _ _ . S a m p l e M a t r i i : .-. a : - .
Description of Problem: ________;_____________ _________^_
g • • b a c k of C A R / C M R or » t t » c n « 4 tb«« t if • o r • * p « c • i* f • q T~eT
Racomaended Corrective Action(a):
Person Who Is Requested To Provide Corrective Actions:.
Deadline For CAB:_____________ Reply to Originator Required? [
Actual Corrective Action(s) Taken:Doeua«a t A c t u a l C o r r e c t i v e A c t i o n * O n T n .
F o r « m o d 2 « n 4 a C o p y e < C o a p l a t c t f C A I / C N M t o « A O f f i c e r a a d J o b f o . i « r
——————————————'——————'————"" lifaature aad DataIs this a recurring Froble«?____Sbould SOP be Modified or Updated?_____
Initial Lab manager, Marketing Manager, Branch Manager, QA OfficerDistribution: Client Services, Job Folder, Other: ——————————————SECONDARY DISTSIBUTIQM: ORIGINATOR. QA. OFFICES., QTHSR' —————— ____---
Document Problem and Corrective ActionU) In Case ****«*i™: Jv.JAttachments: Telephone Log, Services Change Bequest, <»-*—•

APPENDIX B
IEA, Inc.-Connecticut
300826

IA3LE 1.0VOLATILE TARGET COMPOUND LIST
Compound NameLow Level Watsr
CAS*
748737483975014750037509267641751507535475343
) 540590676631070627893371556562351080547527478875100610157901612448127900571432
> 1006102675252108101591786127184
s 793451083831089071004141004251330207
Precision
±37±27±28r23±16±64
±108±16±16±16±92±17±29±17±17±4±18±18±39±15±22±19±15±26±17±20±25±13±18±10±15±13±18±24
Accuracy
999910797105106138109109106170112102861039097971221041099998128102114112106101102100989097
L i m i t sCRQL
101010105
1055555510551055555555510105555555
..(COD;Mpi «
31-*
3333i211113311111111111232111112
ChloromethaneBromomethaneVinyl ChlorideChloroethaneMethylene ChlorideAcetoneCarbon Disulfide1,1-Oichloroethene1.1-Dichloroethane1.2-Dichloroethene (total)Chloroform1,2-Dichloroethane2-Butanone1,1,1-TrichloroethaneCarbon TetrachlorideVinyl AcetateBromod i chloromethane1,2-Dichloropropanecis-l,3-0ichloropropeneTrichloroetheneDibromochioromethane1,1,2-TrichloroethaneBenzenetrans-1,3-DichloropropeneBromoform4-Methyl-2-Pentanone2-HexanoneTetrachloroethene1,1,2,2-TetrachloroethaneTolueneChlorobenzeneEthylbenzeneStyreneXylene (total)
Low Level Soil CRQLs and MDLs are the same as above.Medium Level Soil CRQLs and HOSs are 125 times higher.* The reference to the MDL calculation is Federal Register 40 CFR Part 136
Appendix 8, October 26, 1984.
5/90
300827

TABLE 2.0
TAK6ET COMPOUND LIST (TCL) AKDCQKTMCT REQUIRED QUAMTITATIQM
Seml-Volatnes Case Number Precision Accuracy
1.2.3.4.5.6.7.8.9.10.11.12.13.14.15.16.17.18.19.20.21.22.23.24.
25.26.27.28.29.30.31.32.33.34.35.36.37.38.39.40.41.42.43.44.
Phenolbis(2-Chloroethyl)ether2-Chlorophenol1,3-Oichlorobenzene1,4-DichlorobenzeneBenzyl alcohol1,2-Qichlorobenzene2-Methyl phenolbis(2-Chloro1sopropy1)ether4-MethylphenolN-Nitroso-d1-n-d1propylam1neHexachloroethaneNitrobenzeneIsophorone2-Nitrophenol2,4-OimethylphenolBenzole acidb1s(2-Ch!oroethoxy}methane2,4-Oichlorophenol1,2,4-TrichlorobenzeneNaphthalene4-ChloroanllineHexachlorobutadlene4 -Chloro-3 -methyl phenol(para-chloro-meta-cresol)2-MethylnaphthalentHexachlorocyclopentadlent2,4,6-Trlchlorophenol2 , 4 , 5 - Tr 1 chl orophenol2-Chloronaphthalent2-N1troan11lM01 methyl phtteltUAcenaphthylof2,6-OlnltrotolWM3-Nitroan111ntAcenaphthent2,4-01n1trophenol4-NitrophenolOlbenzofuran2,4-01nitroto1uen«Olethylphthalatt4-Chlorophenyl-phenyl etherFluorene•4-Nitroan1l1ne4, 6 -Oinitro-2 -methyl phenol
108-95-211-44-495-57-8541-73-1106-46-7100-51-695-50-195-48-7108-60-1106-44-5621-64-767-72-198-95-378-59-183-75-5105-67-965-85-0111-91-8120-83-2120-82-191-20-3106-47-887-63-359-50-7
91-57-677-47-483-06-295-95-491-58-783-74-4131-11-3208-96-8606-20-299-09-283-32-951-28-5100-02-7132-64-9121-14-284-66-2
7005-72-386-73-7100-01-6534-52-1
16±14±11±13±13±21±13±11±14±10±14±14±12±14±11±15±20±13±12±14±12±36±15±15
±11±11±12±14±10±16±23±9±13±19±9±30±20flO±19±21±10±12±42±18
Quantitation*'
37 1082 1077 1067 1068 1077 1071 1072 1081 1066 1081 1060 1081 1087 1083 1069 1027 5087 1084 1075 1077 10 :65 10 :67 10 :82 10 :
72 10 !28 10 183 10 290 50 583 10 191 50 149 10 i85 10 197 10 2109 50 386 10 174 50 422 50 491 10 1104 10 180 10 294 1093 1090 5070 50

IASLZ 2 .1COMPOUND LIST (TCL) AXO
COKTUCT REQUIRED QUANTITATIQN LIMITS fpMLWCont'
Quantitation L(water ^g/i » h
Semi-VolatHes Case Number Precision Accuracy CRQL45. Nr-ni trosodioheriylamine 36-30-6 •>• L 5 99 1046. 4-BromophenyT-phehylether 101-55-3 ~±9 91 1047. Hexachlorobenzene 118-74-1 ±10 93 1048. Pentachlorophenol 87-86-5 ±19 68 5049. Phenanthrene 85-.01-8 ±10 90 1050. Anthracene 120-12-7 ±9 87 1051. 01-n-butylphthalate 84-74-2 ±12 88 1052. Fluoranthene 206-44-0 ±13 88 1053. Pyrene 129-00-0 ±13 91 1054. Butylbenzylphthalate 85-68-7 ±15 93 1055. 3,3'-01chlorobenzidine 91-94-1 ±6 68 2056. Benzo(a)anthracene 56-55-3 ±11 91 1057. Chrysene 218-01-9 ±11 95 1058. bis(2-£thylhexyl)phthalate 117-81-7 ±13 96 1059. 01-n-octylphthalate 117-84-0 ±16 102 1060. Benzo(b)fluoranthene 205-99-2 ±14 88 1061. Benzo(k)f1uoranthene 207-08-9 ±30 86 1062. Benzo(a)pyrene 50-32-8 ±11 87 1063. Indeno(l,2,3-cd)pyrene 193-39-5 ±13 98 1064. 01benz(a,h)anthracene 53-70-3 ±12 94 1065. Benzo(g,h,1)perylene 191-24-2 ±13 94 10
a. Low so1l/sed1»tnt contract required quantltatlon 1 lilts (CRQL and MOL's) for semi-vtile TCL compounds are 33 times the Individual water CRQL and HOL.b. Medium soi1/i*d1»ent contract required quantltatlon Halts (CRQL and HOL) for semi-v<tile TCL compound! art 60 tilts the Individual low soil/sediment CRQL and HOL.* Specific quMtUatlon Hilts are highly matrix dependent. The quantltatlon lir
listed herein art provided for guidance and may not always be achievable.** Quantltatlon Hilts listed for soil/sediment are based on wet weight. The quantita'limits calculated by the laboratory for so11/sedlMnt, calculated on dry weight basisrequired by the contract, will be higher.* The reference to the HOL calculation 1$ Federal' Register 40 CFR, Part 136 Appendix
October 26, 1984.The reference to the Precision and Accuracy 1s SW846, 3* Edition, Chapter One, Sect
1 - 1 - 3 - 300829.

ooCOCOo
Instrument 10: GC4A/GC4B
Compoundalpha-BMCbeta-BHCgaMtt-BHCdelta-BHCHeptachlorAldrln4,4'DOEOieldrin4,4'000Endrin Aldehyde4,4'DOTalpha-Chlordaneganu-ChlordaneEndosulfan IEndosulfan IIEndosulfan SulfateEndrinHeptachlor EpoxideHethoxychlorEndrin KetoneToxaphenePCB-1016PCB-1221PCB-1232PCB-1242PCB-1248PCB 1254PCB 1260
la h I ir i.O
Laboratory: I K A - C T
ERA PRIORITY POLLUTANT AND TCL PESTICIDES/PCB'S LIST AND MDL
All values are ug/L.
Replicate Analyses
HOL
_Jil —
0.0930.0900.0740.0890.0880.0880.1050.2190.4370.0820.5000.4980.5110.1020.4930.5900.3970.1030.4210.4790.784
.558
.655
.451
.483
.442
.287
.280
_B2_
0.1010.1040.0830.1000.0950.1040.1180.1270.4450.0910.5170.4850.5000.1380.5020.6160.4650.1430.5100.4700.8327
.383
.307
.553
.514
.465
.0541 . 4 1 1
-B»-
0.0990.0970.0800.0950.0920.0920.1180.1200.4450.0920.5030.5150.5330.1560.4970.6300.4710.1410.5090.4910.7776
.492
.342
.548
.440
.619
.244
.694
-B*- -0.093 (0.090 (0.074 (0.090 (0.088 (0.084 (0.102 (0.113 (0.449 (0.094 (0.503 10.503 (0.507 (0.115 <0.503 (0.597 (0.473 (0.111 (0.493 (0.485 (0.8637 (
.463
.618
.437
.467
.508
.368
.358
-JU).096).0913.0803.0903.0903.0843. 1013.1083.4553.0983.5313.4953.5043.1173.5183.6103.4743.1073.5153.4783.8236.520.411.406.552.656.332.628
-V-
0.0970.0950.0790.0930.0920.0910.1060.1110.4550.0960.5070.4820.4870.1200.5090.6050.4840.1170.5320.4690.7826
.697
.311
.384
.520
.544
.665
.413
-fir—
0.1000.1030.0820.0970.0930.0980.1100.1140.4550.0910.4980.4950.5090.1490.4970.5900.4830.1270.5000.04900.8226
.452
.326
.325
.440
.514
.260256
so0.00320.00590.00360.00410.00260.00730.0070.03960.00690.00510.01170.0110.0140.01980.00850.0150.03020.01610.03570.00890.03210.09950.14940.08370.04260 07800.18370. 1670
MCl f0.0100.0190.0110.0130.0080.0230.0220.1240.0220.0160.0370.0350.0440.0620.0270.0460.0950.0510.1120.0280.1010.3130.4700.2630.1340 2450 5770 S?S

p«'The reference to the MOL ca l cu la t i on is Federal R e g i s t e r 40 CPRAppendix 8, October 26, 1984. -53-*is-
The reference to the Prec is ion and Accuracy is from SW 845 - 3 rd E d i t i o n '"laptOne Sect ion 1 .1 .8
2 Low and Medium soi l /sediment MOL for Pest ic ides/PCB TCL compounds are 150 ai2400 times the individual low water MOL respect ively.
Instrument ID: 6C4A/GC4B Laboratory: York/CT - HOL
EPA PRIORITY POLLUTANT AM? TCL PESTICIDES/PCB'S
Compound
alpha-BHCbeta-BHCgamma-8HCdelta-BHCHeptachlorAldrin4,4'OOEOieldrin4,4'DOOEndrin Aldehyde4,4'DOTalpha-Chlordanegamma-ChlordaneEndosulfan IEndosulfan IIEndosulfan SulfateEndrinHeptachlor EpoxideMethoxychlorEndrin KttoncToxaphentPCS-1016PCS-1221PCS-1232PCS-1242PCS-1248PCS-1254PCS-1260
Precision±10±17±15±15±16±38±35±21±41±5.5±36±14±11±28±26±16±15±11±23±1.7±4
±6.6±11±5.8±22±5.1±14±18
Accuracy
107.109100101347091
105104
• 9210910811510392
115103115949681
151142144117154132114
300831

ICAP
ELEMENTAg
Al
Ba
Be
Ca
Cd
Co
Cr
Cu
Fe
K
Mg
Mn
Na
Ni
Pb
Sb
Se
V
Zn
Ti
Mo
Sn
As
Tao la ~ . 0INSTRUMENT DETECTION
IDL(ug/l)3.4
104
1.3
0.2
14.0
0.9
1.6
2.2
3.2
57.3
449.0
17.6
0.8
73.5
4.1
14.4
17.8
35.6
1.9
2.8
1.8
3.0
7.6
18.0
LIMITS ( IDL'S)
ROUNDED CDL (ug/1)4.0
104
2.0
1.0
14.0
1.0
2.0
3.0
4.0
58.0
449.0
18.0
1.0
74.0
5.0
15.0
18.0
36.0
2.0
3.0
2.0
3.0
8.0
18.0
CRDLiug,-!10.0
200.0
200.0
5 0
(1000.0) 5000.0
5.0
50.0
10.0
25.0
100.0
(1000.0) 5000.0
(1000.0) 5000.0
15.0
(1000.0) 5000.0
40.0
(100.0)
60.0
(500.0)
50.0
20.0
(20.0)
(20.0)
(100.0)
(300.0)
i I', CRDL's iri parenthesis are either normally run by graphite furnace, or are not typically reponed bythe metals departrnent and represent the detection limits employed in reporting these parameters.
300832

T a b l e -*. 1
FURNACE INSTRUMENT DETECTION LIMITS
INSTRUMENT A$
Perkin Elmer 3030
Perkin Elmer 5 100 (0.4)1.0
Perkin Elmer 5 100N (0.4) 1 .0
PARA
& u
(1.6)2.
fl. 1)2.0 (0.6)1.
ffl.8H.fl (0.7)1
METERS in -jg/l
*
0 (1.0)1.0
0 (0.9) l.p
.0 (0.7)1.0
Values in parentheses are the unrounded values. These are used whenever NYSDEC '87 protocolsare requested. However whenever CLP 7/88 protocols are requested, the rounded values areemployed.
30083^

Table 4.2IEA I.VC.-CT
ELEMENT PRECIS ICN* ACCURACY"
ALUMINUM 7.7 * S ' 2ANTIMONY 13.3 ~94.3ARSENIC 19.1 90.4BARIUM S.I 93.7BERYLLIUM 3.2 93.9CA2MIUM 7.9 99.5CALCIUM 3.6 93.3CHROMIUM 7.1 96.3COBALT 7.3 94.4COPPER 8.5 95.8IRON 7.8 107.9LEAD 13.6 98.0MAGNESIUM 7.5 ' 91.3MANGANESE 10.3 97.1MERCURY 14.1 101.9NICKEL 6.2 96.3POTASSIUM 2.4 98.3SELENIUM 9.7 96.3SILVER 6.5 98.9SODIUM 1.7 97.7VANADIUM 6.2 95.2ZINC 6.1 99.5
* PRECISION = %RELATIVE STANDARD DEVIATION%RSD = (RSD/AVERAGE % RECOVERY)«100
** ACCURACY - AVERAGE SPIKE RECOVERY
300834

COMMON CLASSICAL CHEMISTRY DETECTION I.TMJTS
All concentrations are mg/L.
Parameter
Ammonia-Nitrogen
Chloride
Chemical Oxygen Demand
Cyanide
Cyanide
Fluoride
Nitrate-Nitrogen
Phosphorus, total
Sulfate
Total Organic Carbon
Total Organic Hal ides
Phenols
Total Kjeldahl Nitrogen
Method
350.1
325.1
410.1
CLP
335.2
340.2
353.2
365.2
375.3
415.2
450.1
420.2
351.2
RDL
0.04
3.0
10.0
0.010
0.005
0.10
0.10
0.15
10.0
0.50
0.010
0.005
0.100
MDL
0.01
0.43
4.7
0.008
0.001
0.02
0.02
0.06
6.70
0.28
0.008
0.005
0.058
Precision1
±8.2
±7.6
±13.3
±5.1
±10.1
±14.0
±9.8
±13.1
±3.9
±1.7
±9.2
±4.6
±3.8
Accuracy'
91.4
92.5
94.1
97.3
98.3
94.5
97.7
95.8
103.2
105
105
96.1
97.4
Percent RSD2Average spike recovery (percent)
300835

STANDARD OPERATING PROCEDURE
GLASSWARE/PLASTICWARE CLEANING
AS:071587:2
300836SchaufTft^f rt
ll.oo..
708-705-0740C*V. OMi Junctor
20I-4.H-81S1

AS:C;
STANDARD OPERATING PROCEDUREGLASSWARE/PLASTICWARE CLEANING
Abstract
In order to assure that all samples are prepared free from contamination, allbeakers, volumnetrics and plasticware are cleaned according to a prescribedprocedure.
300831

AS:07i537:2INTRODUCTION
This procedure outlines the steps necessary in order to wash all associatesglassware and plasticware for sample preparation in the Atomic spectroscopy GrouDto insure that it is free from contamination.
It is the intent of this procedure to comply with the IEA business ethics pol icy.
1.0 SCOPE AND APPLICATION
1.1 This procedure is applicable to all glassware necessary in thestandard and sample preparation of both water and soil samples f-.~metals analysis.
2.0 SUMMARY OF METHOD
2.1 The glassware is washed with a phosphate-free detergent and thenacid washed.
3.0 INTERFERENCES-N/A
4.0 APPARATUS AND MATERIALS
4.1 Pertinent glassware for the specific procedure.
5.0 REAGENTS
5.1 Pertinent glassware for the specific procedure.
6.0 SAMPLE COLLECTION, PRESERVATION AND STORAGE-N/A
7.0 PROCEDURE
7.1 All graduated cylinders, beakers and volumetric flasks are i n i t i a l l ywashed thoroughtly with Liquinox and then rinsed with tap water toremove any soap residue. Detergent washed glassware is then storeduntil ready for use.
7.2 All graduated cylinders, beakers and volumnetric flasks must be acidwashed immediately before use. To acid wash, rinse twice with 1:1HNO,, discarding into the acid waste drum, followed by two rinseswith nanopure water, which is also discarded into the acid wastedrum. Exception: Volumetrics may be acid washed and set aside forlater use provided that they are kept capped until use.
300838

AS:071537:2
7.3 Before using any of the Class A pipettes, rinse thoroughly with !•'HN03 and nanopure water, then rinse pipette with a small volume"::"the liquid to be pipetted and discard into the acid waste drum.After use, rinse the pipette thoroughly with 1:1 HN03 and nanoourewater and return to the drawer.
7.4 Watch glasses are kept in a large beaker of 1:1 HN03 under the hooaand must be rinsed with nanopure water before use. They should bedetergent washed and rinsed with tap water before being returned tothe beaker.
7.5 All plasticware currently used is disposable and received in "clean 1
condition, therefore no detergent wash is required. All plasticwareshould, however, be rinsed with nanopure water before use. Thisrinse water may be discarded down the sink.
7.6 BOD bottles, used for Cold Vapor Analysis by AA (CVAA), for thedetermination of mercury, are cleaned differently. After a mercuryrun, the BOD bottles should be emptied into the acid waste drum andrinsed thoroughly with tap water. Pour approximately 20 ml of hot1:1 HN03 into each botte, cap it, and carefully shake. Afterallowing the acid to cool, discard into the acid waste drum andthoroughly rinse the bottles with nanopure water.
8.0 QUALITY CONTROL
8.1 Using an aliquot of nanopure water treated in the same manner as thesamples, a preparation blank during each digestion provides a meansof checking for contamination of the sample.
8.2 If the level of any analyte of interest exceeds the CRDL for thatanalyte in the preparation blank it is assumed that the samplesthemselves were contaminated, possibly due to inadequate cleaning ofthe glassware used in the preparation.
9.0 METHOD PERFORMANCE-N/A
10.0 DATA PERFORMANCE-N/A
1.1.0 SPECIAL PROCEDURES-N/A
12.0 USE OF OTHER REQUIRED SOP'S
12.1 Applicable SOP's include those dealing with sample or standardpreparation, the specific instrument operation as well as anynecessary corrective action required.
300839

AS:07!537:2
13.0 DOCUMENTATION OF PROBLEMS
13.1 If a preparation blank exceeds the CRDL during analysis, andcontamination is suspected, a corrective action must be filed by theanalyst who discovered the problem. Refer to the Corrective ActionSOP for instructions on how to proceed.
14.0 REFERENCES
14.1 "Methods for Chemical Analysis of Water and Wastes," EPA-600/4-79-020.
300840

AS:071587:2
STANDARD OPERATING PROCEDUREGLASSWARE/PL ASTICWARE CLEANING
ABSTRACTIn order to assure that all samples are prepared free from contamination, all beakers,volumetrics and plasticware are cleaned according to a prescribed procedure.
INTRODUCTIONThis procedure outlines the steps necessary in order to wash all associated glassware andplasticeware for sample preparation in the Atomic Spectroscopy Group to insure that itis free from contamination.
It is the intent of this procedure to comply with the^SVQ business ethics policy.
1.0 SCOPE AND APPLICATION
1.1 This procedure is applicable to all glassware necessary in the standard and samplepreparation of both water and soil samples for metals analysis.
2.0 SUMMARY OF METHOD
2. 1 The glassware is washed with a phosphate-free detergent and then acid washed.
3.0 LNTERFERENCES-N/A
4.0 APPARATUS AND MATERIALS
4. 1 Pertinent glassware for the specific procedure.
5.0 REAGENTS
5.1 Liquinox5.2 Nitric acid, mixed 1:1 with nanopure water (1:1 HNO3).
6.0 SAMPLE COLLECTION, PRESERVATION AND STORAGE-N/A
7.0 PROCEDURE
7. 1 All graduated cylinders, beakers and volumetric flasks are initially washedthoroughly with Liquinox and then rinsed with tap water to remove any soapresidue. Detergent washed glassware is then stored until ready for use.
7.2 All graduated cylinders, beakers and volumetric flasks must be acid washedimmediately before use. To acid wash, rinse twice with 1:1 HNO3, discardinginto the acid waste drum, followed by two rinses with nanopure water, whichis also discarded into the acid waste drum. Exception: Volumetrics may be acidwashed and set aside for later use provided that they are kept capped until use.
' ': : : '-' -7.3 Before using any of the Class A pipettes, rinse thoroughly with 1:1 HNO3and nanopure water, then rinse pipette with a small volume of the liquid to be
300841

pipetted and discard into the acid waste drum. After use, rinse the pipettethoroughly with 1:1 HNO3 and nanopure water and return to the drawer.
7.4 Watch glasses are kept in a large beaker of 1:1 HNO3 under the hood and mustbe rinsed with nanopure water before use. They should be detergent washedand rinsed with tap water before being returned'to the beaker.
7.5 All plasdcware currendy used is disposable and received in "clean" condition,therefore no detergent wash is required. All plasticware should, however, berinsed with nanopure water before use. This rinse water may be discarded downthe sink.
7.6 BOD bottles, used for Cold Vapor Analysis by AA (CVAA), for the determinationof mercury, are cleaned differently. After a mercury run, the BOD bottles shouldbe emptied into the acid waste drum and rinsed thoroughly with tap water. Pourapproximately 20 ml of hot 1:1 HNO3 into each bottle, cap it, and carefully shake.After allowing the acid to cool, discard into the acid waste drum and thoroughlyrinse the bottles with nanopure water.
8.0 QUALITY CONTROL
8.1 Using an aliquot of nanopure water treated in the same manner as thesamples, a preparation blank during each digestion provides a means ofchecking for contamination of the samples.
8.2 If the level of any analyte of interest exceeds the CRDL for that analyte in thepreparation blank it is assumed that the samples themselves were contaminated,possibly due to inadequate cleaning of the glassware used in the preparation.
9.0 METHOD PERFORMANCE-N/A
10.0 DATA REDUCTION AND DATA HANDLING-N/A
11.0 SPECIAL PROCEDURES-N/A
12.0 USE OF OTHER REQUIRED SOP'S
12.1 Applicable SOP's include those dealing with sample or standard preparation,the specific instrument operation as well as any necessar* corrective action required.
13.0 DOCUMENTATION OF PROBLEMS
13.1 If a preparation blank exceeds the CRDL during analysis, and contamination issuspected, a corrective action must be filed by the analyst who discovered theproblem. Refer to the Corrective Action SOP for instructions on how to proceed.
14.0 REFERENCES
14.1 "Methods for Chemical Analysis of Water and Wastes," EPA-600/4-79-020.
300842

AS:071587:2
STANDARD OPERATING PROCEDUREGLASSWARE/PLASTICWARE CLEANING
ABSTRACTIn order to assure that all samples are prepared free from contamination, all beakers,volumetrics and plasticware are cleaned according to a prescribed procedure.
INTRODUCTIONThis procedure oudines the steps necessary in order to wash all associated glassware andplasticeware for sample preparation in the Atomic Specrroscopy Group to insure that itis free from contamination.
/: is the intent of this procedure to comply with the IE A business ethics policy.
1.0 SCOPE AND APPLICATION
1.1 This procedure is applicable to all glassware necessary in the standard and samplepreparation of both water and soil samples for metals analysis.
2.0 SUMMARY OF METHOD
2.1 The glassware is washed with a phosphate-free detergent and then acid washed.
3.0 INTERFERENCES-N/A
4.0 APPARATUS AND MATERIALS
4.1 Pertinent glassware for the specific procedure.
5.0 REAGENTS
5.1 Liquinox5.2 Nitric acid, mixed 1:1 with nanopure water (1:1 HNO3).
6.0 SAMPLE COLLECTION, PRESERVATION AND STORAGE-N/A
7.0 PROCEDURE
7.1 All graduated cylinders, beakers and volumetric flasks are initially washedthoroughly with Liquinox and then rinsed with tap water to remove any soapresidue. Detergent washed glassware is then stored until ready for use.
7.2 All graduated cylinders, beakers and volumetric flasks must be acid washedimmediately before use. To acid wash, rinse twice with 1:1 HNO3, discardinginto the acid waste drum, followed by two rinses with nanopure water, whichis also discarded into the acid waste drum. Exception: Volumetrics may be acidwashed and set aside for later use provided that they are kept capped until use.
-, • ) ;. 7.3 Before using any of the Class A pipettes, rinse thoroughly with 1:1 HNO3and nanopure water, then rinse pipette wich a small volume of the liquid to be
30OB43

pipetted and discard into the acid waste drum. After use, rinse the pipettethoroughly with 1:1 HNO3 and nanopure water and return to the drawer.
7.4 Watch glasses are kept in a large beaker of 1:1 HNO3 under the hood and mustbe rinsed with nanopure water before use. They should be detergent washedand rinsed with tap water before being returned to the beaker.
7.5 All plasticware currently used is disposable and received in "clean" condition,therefore no detergent wash is required. All plasticware should, however, berinsed with nanopure water before use. This rinse water may be discarded downthe sink.
7.6 BOD bottles, used for Cold Vapor Analysis by AA (CVAA), for the determinationof mercury, are cleaned differently. After a mercury run, the BOD bottles shouldbe emptied into the acid waste drum and rinsed thoroughly with tap water. Pourapproximately 20 ml of hot 1:1 HNO3 into each bottle, cap it, and carefully shake.After allowing the acid to cool, discard into the acid waste drum and thoroughlyrinse the bottles with nanopure water.
8.0 QUALITY CONTROL
8.1 Using an aliquot of nanopure water treated in the same manner as thesamples, a preparation blank during each digestion provides a means ofchecking for contamination of the samples.
8.2 If the level of any analyte of interest exceeds the CRDL for that analyte in thepreparation blank it is assumed that the samples themselves were contaminated,possibly due to inadequate cleaning of the glassware used in the preparation.
9.0 METHOD PERFORMANCE-N/A
10.0 DATA REDUCTION AND DATA HANDLING-N/A
11.0 SPECIAL PROCEDURES-N/A
12.0 USE OF OTHER REQUIRED SOP'S
12.1 Applicable SOP's include those dealing with sample or standard preparation,the specific instrument operation as well as any necessare corrective action required.
13.0 DOCUMENTATION OF PROBLEMS
13.1 If a preparation blank exceeds the CRDL during analysis, and contamination issuspected, a corrective action must be filed by the analyst who discovered theproblem. Refer to the Correcuve Action SOP for instructions on how to proceed.
14.0 REFERENCES
14.1 "Methods for Chemical Analysis of Water and Wastes," EPA-600/4-79-020.
300344

00845
SOP/FORM MODIFICATIONAPPROVAL SHEET
SCP/Fcrm Modification Requested Byi'D.
Deadline for Modification of SCP/Form: 1 MPC\IO\9D
Deadline for Implementation cf Modified SOP/Form: \*S
:=:e SCP/rcrrr, yc-dif iea: IfS f
Date Typing of Modification Sent to Typist:.
Date Typing of Modification Completed:___
Cc-e cf SOP/Fc-T:______ftS '. Cj,
Pages Changed:__________
Approval cf Modi f i c a t i o n to SCP/Fcrr,
- _. „/ c c .-*;«.• i_ g»d e r: ^
CA Director:_______________;——————_————.» D£te:
Lab Director:__________________—————————• Date:
Date Modification to be Implemented:. ? / /. /9oCopies of Final Approved Modification Sent to:
Section/Group Members, Lab Manager, Lab Directors (all labs), Market-Manager, QA Directors (all labs)

an environmental testing company_ J •
268-5346
STANDARD OPERATING PROCEDURE
SAMPLE CONTAINER PREPARATION
SC:042590:2 00846
305- M9-0«2«
Schaumburg,lllmoi*
70«-70S-0740
N.Uaa»8I7-Z77-S212 201-
NoiUlC*
91M77-0080

SC:G42590:2
Abstract
Sample control procedures at IEA, Inc.-CT are comprised of five key interrelatedelements:
(1) Sample Container Preparation(2) Sample Receipt(3) Sample Log-In(4) Sample Storage(5) Sample Disposal
The SOP for sample control therefore addresses in three separate SOP's, items(1); (2) and (3); and (4) and (5).
The intention of this SOP is to delineate sample control procedures from prepa-ration of sample bottles to their ultimate disposal.
These procedures are designed to ensure that sample integrity is maintained fromreceipt to analysis to final disposition.
This SOP is intended for all outgoing sample containers.
,00841

SC:042530:Z
STANDARD OPERATING PROCEDURESAMPLE .CONTAINER PREPARATION
Introduction
It is the responsibility of the sample control group and especially the samplecustodian to ensure that all sample containers sent and received by IEA are ingood condition upon receipt, the samples are labeled properly, the proper docu-mentation is filled out, and the samples^are stored in a manner to ensure properchain-of-custody. The purpose of this document is to delineate the proceduresfollowed by the sample control group in achieving proper custody procedures andmaintenance of sample integrity from preparation through receipt and analysis tofinal disposal. A copy of this section of the laboratory SOP is to be kept inthe sample control area and known to all personnel in the group.
1.0 SAMPLE CONTROL PERSONNEL RESPONSIBILITIES IN BOTTLE PREPARATION
The responsibilities and duties of the bottle preparation staff should include,but not be limited to:
1) Prepare and label appropriate sample bottles.
2) Carefully package sample bottles, field blank water and trip blanks toprevent bottle breakage.
3) Initiate client chain of custody.
4) Ship or deliver sample coolers, meet shipping requirements of theUSOOT or common carrier.
2.0 BOTTLE PREPARATION
2.1 Bottle orders will be issued from project management upon final sched-uling of a sampling event. I-Chem Series 300 or equivalent pre-cleaned sample containers are to be used for NJDEP and NYSDEC bottleorders.All employees responsible for bottle preparation wi l l be trained andfamiliarized with the following procedures:
1) Take bottles from stock and label for appropriate parameter(s).
2) Organize bottles in sample sets, i.e. TCL organics for 1 sample:3/40 Ml VOA vials, 2/11 amber BNA bottles, 2/1L amber pesticide/PCS bottles.All bottles are preserved according to the specifications outlinedin Attachment 1.
300848

SC:0425SC:2
3) Wrap each sample container with bubble wrap.
4) Open a cleaned cooler, l i n e with bubble wrap. For NJDEP samplesrecord cooler ID number on NJOEP cooler tracking log (Figure l'.i).
5) Include a trip blank if v o l a t i l e sample containers are included inthe sample sets. Reference section 5.0.
6) Count and record sample sets and individual bottles packaged intocooler. Allow space for sufficient ice packs to maintain 4'Ctemperature within the cooler.
2.2 Chain-of-custody documentation is initiated at the time of bottlepreparation. Each cooler must have enough field chain-of-custodyforms (see Figure 1.0) for the bottles present.
1.) Determine the number of bottle sets in the cooler. Count outsufficient field chain-of-custody forms.
2) Put in the client name and project identification (if known). Putthe bottle set number in the box on the far left of the form. Inthe box labeled "bottle type and preservative" put in the bottletype (i.e. VOA-vial) and preservative (i.e. HC1, H2S04, etc.). Inthe same row in the box labeled "tests" put in the test to be doneon the sample in the particular bottle (i.e. VOA, BNA, metals).
3) Fill out the rest of the form in the same way. Note that totaland dissolved metals w i l l require two separate boxes (see Figure1.2).
4) At the bottom of the form print your name, the date and time ( m i l -itary) . Sign the form.
5) In the box at the lower right fill in the shipper (i.e. FederalExpress) and the airbill number.
6) Get two numbered cooler seals (see Figure 1.3) and a plastic bag.Put one of the seals in the box. Print your name and date on theother. In the same box as in step 5 put the seal number on theline labeled "outgoing seal IDsf" make a copy of the chain-of-cus-tody form.
7) Put the original chain-of-custody form(s) in the plastic bag alongwith the unlabeled cooler seal. Keep the signed and dated coolerseal aside. Put the bag in the cooler (make sure ice packs arealready in the cooler). Close the cooler and secure with tape.
8) Put the cooler seal on the cooler over the seam where the cooleropens (on the front). Put a piece of clear tape over the seal.
2
^^

SC:042530:2
9) Give the copy(s) of the form to your supervisor.
10) If the bottle order required I-Chem 300 series glassware or equiv-alent (pre-cleaned and documented) give the documentation to yoursupervisor also.
Special Notes for NJDEP
For NJDEP the DEP Form 095 is required. Only one sample is allowed perform. Calculate the number of sample-bottles sets in the cooler and obtainthe proper number of forms (see Figure 2.0). F i l l out the top box of theform (see Figure 2.1) for each sample, put in plastic bag and proceed withstep 7. Do not put an IEA field custody form with NJDEP samples.
3.0 SHIPMENT, DELIVERY, PICKUP OF SAMPLE COOLERS
Secured coolers can be shipped by overnight carrier, personally delivered by anIEA carrier or picked up at the laboratory.
1) Coolers may be sent by common carrier, appropriate airbill must becompleted and copied to project management for tracking purposes.Shipping is to be billed directly to IEA, and invoiced through projectmanagement.
2) Coolers may be delivered directly to the client. .Directions to thedelivery site will be supplied. The delivery trip should be recordedon the IEA delivery log.
3) Coolers may be picked-up from IEA by client personnel during normalhours of lab operations (Monday through Friday, 8:30 a.m. to 9:00 p.m.- sample control hours are 8:30 a.m. to 5:00 p.m., lab hours are 8:30a.m. to 9:00 p.m.).
4.0 BOTTLE TYPES - I-Chem Series 300 Pre-Cleaned Containers or Equivalent
300350

AQUEOUS SAMPLES'
Parameter Sottle Type
Volatiles
Semi-volatiles
Pesticides/PCB's
Volatiles*(drinking water)
Parameter
Volatiles
Semi - v o l a t i 1 e sand/or pesti-cides/PCB's
40 ml glass teflon-1ined septum
1L amber glass tef-lon-1ined cap
1L amber glass tef-lon-1ined cap
40 ml glass teflonlined septum
NON-AQUEOUS SAMPLES
Bottle Type
40 mL glass wide-mouth, teflon-linedcap
250 mL glass (shortform) teflon-linedcap
^/Sample2
3
2
2
^/Sample2
1
Preservative
Cool , 4'C, darkor HC1, 4'C(Note 1)
Cool, 4'C, dark
Cool, 4'C, dark
Cool, 4'C, dark
Preservative
•Cool, 4'C, dark
Cool, 4'C, dark
Note 1: Client will determine if HC1 is to be added to VOA v i a l s at the timethe order is placed with client services.
Project manager will ascertain the presence of chlorine in a sample. If chlo-rine is found or chlorine content cannot be determined, a chlorine test kitw i l l be provided along with ascorbic acid to neutralize chlorine.
1 Including field blanks for aqueous and non-aqueous matrices.2 When matrix spike and matrix spike duplicate volumes are required, triplicate
(3x) number of sample containers will be supplied.
5.0 FIELD BLANK WATER AND TRIP BLANKS
5.1 Water for field blanks wi l l be obtained and trip blanks prepared imme-diately before sample coolers are packaged.
30Q851

SC:042530:2
5.2 NJDEP requires that ASTM Type I water must be transferred from "3a~ebottle type" to "sample bottle type" to generate an appropriate f i e l dblank.
1) Ample water w i l l be provided for field blank preparation for illparameters.
VolatilesField blank: 3/40 ml septum v i a l sWater supplied: 1/250 mi glass septum bottle filled withorganic-free reagent water
Semi-volatilesField blank: 2/1L amber glass bottlesWater supplied: 3/11 glass bottles filled with organic-freereagent water
Pesticides/PCB'sField blank: 2/1L amber glass bottlesWater 'Supplied: 3/1L glass bottles filled with organic-freereagent water
Note: If both semi-volatiles and pesticides/PCB's are required from thesame site, only 5L of organic-free reagent water will be supplied.
5.3 Trip blank will be provided in each cooler when volatile analyses arerequired per approval of the client. A trip blank set consists of2/40 mL septum vials "over filled" with organic-free reagent water(reverse meniscus). The vials should be capped tightly, inverted andtapped. If the sample vials contain any air bubbles, they are consid-ered inval id and must be emptied and reprepped.
For NJDEP:
Field and trip blank water for all organic compounds must be traceable toan analyzed laboratory blank. Upon filling the containers, fill an extraset of bottles. Contact the Project Manager or Laboratory Manager who w i l lassign a job number and fill out the analytical request forms.
300852

an environmentaFIELD CHAIN OF CUSTODY RECORD 1LA JUU «
as ting companyL « .s* 200 itooroe turnpikemn| Honroe, Connecticut DIUI
Client : <-•*.,O
Proiect ID : QOOf
IEA Project Mgr : 1&
Rush: Y N T A T : Due Date:
Bottle II fiite/liieJet 1 Client Siiple ID Siipled
/
/
/
/
/
/
/
/
/
/
AS CC EX GC BNA VO
* Mat r i x Codes
\ - Kit S - SoilW - SQutouj - Sludge
riilibII
1ESTS
lottletype IPrejer-vitite
fieldHUT
'$$mjt^SJ^S
18XwXwXW*
I vl'nviviv/iSSSftS^p*ftsfi
Hi§»ffjS»!
Ill
»§|&iw;!#Mft¥ftS¥
Ref . «
YN
YN
Bottles Prepped ly :0«te/lue : /Signilure :
YN
YN
YN
YN
YN
YN
Bottles .Dec 'd By :Oile/liie : .. /Signature :
Siipln Collected By : 'In Ub By :D«te/lm : / ne : /
YN
YN
ac
Kequired
I
-
P*9« ut
Protocols :
Oeliicuble: :
Snipper :AH Bill | .(lulijjifni Sal 11)1;Intact On litU Kt-^ipi ' nIlKOIIIh) k'j| |il|
hil.i, 1 H. i Ltd hv •. i

EA-CT/ NJDEP Cooler Tracking Log
DATE______NAME_____Cooler ID______# Sample Sets * Bottles Seal Number
COMMENTS:
300354

MELD CHAIN OF CUSTODY RECORD 1EA•^m~an~envi ronmentaL « -=* 200 HonroejurnpikeBHH RoflrM' £onnecticut MM
Client : /^L>C (£
Project ID : (Cbrt/?fr#
IEA Project Mgr :
Rush: Y N T A T : Du
lolUe II 1Jet 1 Client Siiple It
&>\
oozQcft
OD^ov*
• ———— -
1 test i ng company
T
0 E
*>m0flv\ CD T7* C/l S
M /w/J jp i'/v^ CH
e Date:
lile/liieSiipltd
/
/
/
/
/——— y« —— -
/
/
//
AS CC EX GC BNA VO
* Ma t r i x Codes
» - »ir 5 - Soil«U Aqueous ri - SludgeI Coiplei ";oeU • Oiui Hi ti
•litrii
libU
lottle
Prejer-»iti»e
fieldfill?
liilll
Ml: y; y,iSSSWSS.'.v.v.v.v.v.;
||;;S|S
•i'/iVA^KXvX'X'X'Xv
AVAVAV.V.*
,Vl\VAVA\V
Ref . »
1Vl'A '
-t-
YN
333•3Z
_._-.- —
,i1-tK
YN
333^>
O
— -—
Bottlej Prepped 8) : CfbntJ Stv\ i fV\Dite/liie : O^l^^j^O / U3°l-\^Signiturt .-T\ / 5 ->/
M^/VVV. r *7yi C/l
1l-lrlc*
H^%
YN
f
((
0
1
SYN
f
f
f
f
0
^.^
I0 ^J
cfYN
zZ--z-•Z-
O
YN
- ———
_--
YN
——— .....
^^
YN
'
-
• — -
Bottles Rec'd 8f :Oite/lue .- __ /Signiture :
Saiplti Col/Ated Br : In IdD 11 r .Ojte/liie ;J / Mut : /
YN
- —— ..
YN
QC
Required
N
Protocols ;
Delueublti :
l uiiiinenti,
Tl%*K
Shipper : ft-t* £",*/'•«ir tin i .- y^/^V'-/ '^y /Oulyoinq Sedi 101: /OO/O ^InUU un t icIJ HfLt i^ t ' H1 IK 01 ing ( j f i \ IU|IlllJi I (In Ub Kf, ri i \ II

Figure L . 3
CUSTODY SEAL 10(1101
CUSTODY SEAL 100100
300856

New Jersey Department of Environmental Protection
EXTERNAL CHAIN OF CUSTODY AND SAMPLE ANALYSIS REQUEST FORM*(with Shipping Container)
1 form per sample.dates and times on this form in the following 'ormat: (24 hr. clock, day/monthsyear)
Name of Laboratory:
Name/Title of indivwual Preparing Sample Bottle(s) and Shipping Container: (Print)Name__________________________ Title
Time/Date Sample Shipping Container Sealed: Laboratory Affixed Seal No.
DivisionTime/Date Sample Shipping Container OpenedTime/Date Sampling Initiated: __________/Sample Location:Company: _____________________Address: __
Time/Date Sampling Terminated:.
Physical Location of Sample:OEP Field Sample Number.
REQUESTED ANALYSISfESlContainer
Parameter Method Preserv. Volume QtyDescription ofSample Matrix
Preservative Added: (Chock one) f~| Laboratory f"| FieldContract No.: ___________________ Task No.:
N/AReport Format:.
Samples are: (Check one) f"l Emergency f~j Non-emergency
Relinquished
XXXXXXXXXXXXXXXXXXXX
Received Time/DateReason for Changeof External Custody
Break Seal/Sample
Name/Title of Individual Resealing Shipping Container (Print/Sign)Name: ____________________________________Time/Date Sample Shipping Container Reseated:.
Title:OEP Affixed Seal No..
Name/Title of IndividuaJ Breaking Shipping Container Seal and Accepting Responsibility at tne Laboratory for the Sample:(Print/Sign) Name: _____________________________________ ritto: ———————————Time/Date Sample Shipping Container Opened: ________ / _________.Time/Date Internal Chain of Custody Initiated on OEP Form 077 (Internal Chain of Custody) /
Dumbuaoii: • Original litnt with ripen)CritH • Contractor Sport, main »*(* rtpenfil*Ytllaw • Samfit CtatoiHait
Pint - D£f FitldSampltnf fenoitnttCoU • SampU Prtpanoon Shipment

'*!•.New Jersey Department of Environmental Protection
EXTERNAL CHAIN OF CUSTODY AND SAMPLE ANALYSIS REQUEST FORM(with Shipping Container)
i Use t form par sampto.Enter ail dates and times on this form in the following format: (24 hr. clock, day/menttvyoar)
Name of Laboratory: ^Eft~ -
/TtonfioZC
Name/Title of individual Praoarmg Sample Bottle(s) and Shipping Container: (Print)Name 3o)\}J Sn^fU , __________________ Title ^ r*/) (£.
Time/Gate Sampla Shipping Container Sealed: Laboratory Affixed Seal No. /0O/O /
DivisionTime/Date Sample Shipping Container Opened:Time/Date Sampling Initiated: ________ / _Sample Location;Company: ____________________Addrea*: ____
Time/Date Sampling Terminated:
Physical Location of Sample:DEP Field Sample Number: _
REQUESTED ANALYSIS/ESIContainer
Parameter Method Preeerv. Volum* QtyDescription ofSimple Matrix
Preservative Added: (Check one) f~| Laboratory f] ReldContract No.: _ ___________________ Task No.:
N/AReport Format:.
Samples are: (Chock on«) Q Em«f8«ney f~I Non-emergency
R«llnquiah«d
XXXXXXXXXXXXXXXXXXXX
Received T1m«/Dat«Reaeon for Changeof External Custody
Break Seal/Sample
Name/Ttt)« of Individual ReseaJing Shipping Container (Print/Sign)Name: _______________________________________Time/Date Sample Shipping Container Reseated:.
Title:OEP Affixed Seal No..
Name/Title of Individual Breaking Shipping Container Seal and Accepting Responsibility at the Laboratory for the Sample:(PrinvSign) Name: _______________________________________Time/Date Sample Shipping Container Opened: ________ / _________Time/Date Internal Chain of Custody Initiated on DEP Form 077 (Internal Chain of Custody)
Ditmbunon: Wbu • On final (stti wuA report!Grttn • Contactor Sport, niaiit MI* rtportfil*Yellow • Sanpit Cuuxtta*
Pint • DEP FutlaI Samptinf PenonntiGold • Sampi* Preparation/Snipmtni

ATTACHMENT 1
Parameter
VOL
SNA
Pest/PCB
Metals
Cyanide
Preservati on/Amount
HCL - 4 drops or Unpreserved
Unpreserved
Unpreserved
HN03 1 ml to pH under 2
NaOH & ascorbic 1 ml to pHover 12.0
Container
40 ml glass teflon-1ined septum screw cap
2/1L glass amber tef-lon-lined cap
1/1L glass amber tef-lon-1ined cap
1/1L plastic
1/1L plastic
300859

NJDEP X-408 SAMPLE CONTAINER ORDER CHECKLIST
The following items must be verified for NJDEP Sample Container Shipment
Item
Is a NJDEP Form-095 present? ,
Is the NJDEP Form-095 filled out correctly?
Are custody seals present and numbered?
Is there adequate field blank/trip blank water present?
Are blue ice or ice packs present?
Is the cooler sealed with a custody seal?
Is the shipping address correct?
300860

an environmental testing company
STANDARD OPERATING PROCEDURE
SAMPLE RECEIPT AND LOG-IN
SC:120588:4
300861Mir»m«r.
illinox
708-70S-0740 20l-« 29-8181 S19-677-OOW

SC: 120:23:4
Item
Abstract
Introduction
Sample Receipt
List of Figures
Figure 1.0
Figure 1.1
Figure 1.2
Figure 2.0
Figure 2.1
Figure 3.0
Figure 4.0
Figure 5.0
Revision History
December, 1988
February, 1989
April, 1990
June, 1990
April, 1991
TABLE OF CONTENTS
1 - 4
SC:120588:0
SC:120588:1
SC:120588:2
SC: 120588:3
SC:120588:4
300862

SC:12C5B3:4
STANDARD OPERATING PROCEDURESAMPLE RECEIPT AND LOG-IN
1-0 SAMPLE RECEIPT
Upon receipt of samples at IEA, Inc.-CT, the sample control group is notified bvthe receptionist. The samples are brought to the sample control center of thelaboratory and placed by the sample control hood. Sign and date any a i r o i l l s ,packing slips, etc. Sample control department operates Monday through Fridayfrom 8:30 a.m. to 5:00 p.m. Sample receipt after normal hours is handled by thesecond shift supervisor who signs the chain of custody, checks for short holdingtime samples, then ices the samples with blue ice overnight and locks the sam-ples in the sample control office.
The personnel involved in opening sample kits or coolers wear appropriate safetyclothing including eye protection, gloves, and lab coats. The sample shippingcarton (cooler, box, etc.) is placed in the hood (which is on). The carton isopened and the sample containers are checked for leaks, breakage, potentialhazards, etc. If no problems are observed the samples are transferred to thearea for the log-in process. If a problem is noticed, STOP and immediatelynotify the Sample Custodian and/or the Laboratory Manager. They wil l decidewhat actions to take.
Unpack the samples from the shipping container and group them by client ID andwipe off the outside of the bottles with paper towels. Obtain the client chainof custody form. For NJDEP samples, check the shipping container for a NJDEPForm 095 or 096-Sample Analysis Request. (If no Form 095 or 096 is present,contact the Project Manager or the Laboratory Manager immediately. They w i l ladvise on whether to proceed or not, see Figure 1.1.) Sign all forms in theappropriate space and check to see there are no discrepancies with sample ID's,bottle types and number of bottles for each sample, etc. Note discrepancies onthe custody sheet - sign and date. Sign and date the custody sheet (no i n i -tials).
Next obtain an IEA Log-In Record (See Figure 1.0). Do the following:
If a shipping document is present (airbill, etc.) it should be signed and dated.Then do the following:
1) Determine whether or not the project is a continuation of a previouslysubmitted job. This can be accomplished by checking with theappropriate sales person or project manager. If the job is a continu-ation of a project, assign the appropriate job number. F i l l in thejob numbers in the bookings record and circle in red.
2) If the project, is a new job, assign it the next number in the jobsbooking record, and fill in the job number in the bookings record (donot circle).

SG:1205S3:i
3) F i l l in the appropriate information at the top of the field chain ofcustody or Sample Log-In Record, including job number, date received,and your name. F i l l in client name, client project identification!and total number of samples.
4) Assign each sample a laboratory sample number starting with the lowestnumber (or letter) as sample number one, unless the job is a continua-tion of a previous job. If this is the case, determine what the nextlaboratory sample number is and start with that number on the custodysheet. The convention for sample numbering is that the sample numoerwill be a seven digit number comprised of the last four digits of theIEA job number, followed by a hyphen and a separate number (startingwith one) for each sample. The convention is comprised of threepieces of information. The following example illustrates this.
30xx-YYYYwhere: "3" = the lab divisionwhere: "xx" = fiscal yearwhere: "YYYY" = the sample number
Suppose four samples were received from a client wHh the followingidentifications:
SW-1MW-2AMW-2BTB
The project was assigned job number 3089-0015. The samples should belined up in the following order:
MW-2A, MW-2B, SW-1, TB
Sample MW-2A will receive laboratory sample number 0015-001. SampleMW-2B will receive laboratory sample number 0015-002. Sample SW-1will receive laboratory sample number 0015-003 and sample TB w i l lreceive laboratory sample number 0015-004.
5) The client sample identification is filled in on the appropriate l i n enext to the laboratory number (up to 12 characters).
6) Labels are attached to each sample container with the client name andlaboratory sample number. These labels are attached to the samplecontainer in such a fashion that they do not obscure any client iden-tification (if possible).
7) F i l l in the bottle type(s) present in the column headers for thesample bottle descriptions and the test required.
300864

SC:12C523:4
8} For each sample received record the number of each bottle tyce cres-ent. If no bottles are- present put in a zero. Add up the total" andfill in the appropriate space with the value.
9) Under matrix f i l l in the sample type (soil, water, etc.) and any otherappropriate information.
10) Sign and date the form in the appropriate box. F i l l out the refrig-erator locations and page information at the bottom of the form.
11) Obtain a manilla folder. Put the IEA project number, client name andclient project ID on the folder. Put the custody sheet in the folder.
For USEPA (See Figure 2.0):
1) Locate the traffic reports. Sign and date the traffic reports in boxsix.
2) The sample condition and tag number must be noted. Use column F todocument this information. If the tags do not match note this on thetraffic report. If bottles are broken note this also.
3) Put forms in job folder.
For NJDEP:
1) New Jersey OEP samples require a NJDEP Form 077, Internal Chain ofCustody Form (see Figure 2.1). Obtain the form and fill out the re-quired information on the top of the form.
2) Place all forms in the job folder.
For NYSDEC:
1) Find the NYSDEC Contract Lab Information Sheet (see Figure 1.2).Insure the client sample identifications match all bottles.
2) If the caution box is checked, contact the Project Manager or Labora-tory Manager immediately. They will advise on how to proceed.
3) Put all forms in the job folder.
Sample Control Record In-House Custody Sheet (See Figure 3.0)
1) F i l l out the information required in the upper right-hand corner.
2) Circle the appropriate information in the upper left-hand corner ofthe form.
300865

SC:i2C533:-
3) Put the sheet in the appropriate chain of custody notebook by ^obnumber. ' ^
Next obtain a Sample Preservative Record (See Figure 4.0). F i l l in the headerinformation. For each sample bottle which contains a preservative the preserva-tive must be verified (except for volatile v i a l s and TOX bottles).
First, fill in the sample number in the appropriate column. Record in preserva-tive type in the next column. Each preservative type is checked as follows:
1) Pour a small amount of the sample into a disposable beaker.
2) Nitric acid (for metals) pH must be less than 2. Check with pH paper.
3) Sulfuric acid (for phenols, oil 4 grease, ammonia, chemical oxygendemand, total kjeldahl nitrogen, total nitrate-nitrite, total organiccarbon, total phosphorus) pH must be less than 2. Check with pHpaper.
4) Sodium hydroxide/ascorbic acid (for cyanide) check i n i t i a l l y with KIpaper. No blue color should be present. Next check with pH paper toverify pH greater than 12.
5) Sodium hydroxide/zinc acetate (for sulfide) pH greater than 9. Checkwith pH paper.
Put the appropriate test paper into the liquid in the plastic beaker forapproximately 5 seconds and remove. Wait approximately 5 additional seconds andthen compare the color to the chart on the container.
Record the pH value in the first "pH" space on the sample preservation record.If the pH is incorrect do the following:
1) For ERA, NJDEP and NYSDEC samples contact the project manager. Theywill call the agency for instructions. Do not add any material to thesamples without permission from the project manager.
2) For all other clients add the appropriate preservative (use gloves andeye protection) to the container, mix and retest. Record the final pHin the adjustment column.
NOTE: If a government agency (USEPA, NJDEP, NYSDEC, etc.) requestspreservative be added to a sample this must be noted as follows:
For EPA, note on the traffic reportFor NJDEP, note on the Internal Chain of Custody (Form 077)For NYSDEC, note on the Contract Laboratory Information Sheet
300866

SC:120538:4
If you are unsure of what action to take, check with your supervisoror the Laboratory Manager.
Record the result of the Kl-Starch paper in the KI column (positive ornegative). If the test is p o s i t i v e add ascorbic acid, mix and retest. Cont-nueuntil the test is negative.
Sign and date in the appropriate column. Staple sheet(s) to back i n s i d e coverof the job folder.
Check over all the forms to ensure there are no discrepancies or errors. Anycrosscuts must be signed and dated.
Circle each group which has to work to do on the samples. Issue a copy to eachgroup which has responsibilities for the samples (make an appropriate number ofcopies). Put the original in the job folder. Put a copy for each group in theGroup Leader's mailbox.
Send the job folder to the Project Manager/Client Services.
2.0 SAMPLE STORAGE
Samples are segregated by preservative and stored in refrigerators. Volatilesare stored in separate refrigerators. NJDEP samples are stored in separaterefrigerators and are ALWAYS locked. The sample custodian (Group Leader) andthe Laboratory Manager have keys. See them for access to those refrigerators.EPA samples also have their own refrigerators.Sample refrigerator temperatures must be maintained between 4-6*C. Freezertemperatures are kept below -12*C.
A temperature log should be taken on a daily basis. The temperature log shouldbe kept in the sample control center. The sample control center is unlocked at8:00 a.m. by the sample custodian and is locked after normal business hours.
Each refrigerator has its temperature checked on a daily basis. These tempera-tures are recorded in the temperature logbook. All entries are signed anddated. If a refrigerator is out of service, it should be noted in the logbook.Also, if temperature excursions occur, the corrective action taken should benoted in the logbook.
4/90
300387

an environmentaLOGIN RECORD IEA JOB #
eating companyI «s «. 200 loiroe TirifikeHHM loiroe, Couecticit 0(4(8
•- • ccClient : < — i
Proje
IEA P
Rush:
Bottle ||Set, |
Oct ID : QO
ro.iect Mgr : CD
Y N TAT:
Clieit Suple ID
Due Date:
Ditc/Ttie
/
/
/
/
/
/
/
/
/
/
/
/
AS CC EX GC BNA VO
tlitrii
Lib10
TESTS
BottleType tfreier-utiie
FieldFill?
.-.-.•.-.-.-.•.-.•.•,;.•
XvAWA'y,;.y5H*!w!«5?-?l'.y/.yAj. v
f.y3!jS|Xw.v.
vwI'SX'.'.'l'XX'X'MvXvX*
S!AyAM*>*AW
Ref . f
YN
YN
* M a L r 'odea1 - tu lei 8 - toil t • lipe FB - Field Bluk
YN
YN
YN
YN
YN
YN
c'd li Lib Bf : ....... ... ._ _.•t/tiie : .... ._. /
YN
YN
C
eeqiired
r1
P»ge _ .__ 0(
Fro toco li :
Deliienblei :
Comments
licoiiig Setl ID|:l iUcl Oi Lib Eern i N

V91
Figure 1.INew Jersey Department of Environmental Protection of
EXTERNAL CHAIN OF CUSTODY AND SAMPLE ANALYSIS REQUEST FORM(with Shipping Container)
INSTRUCTIONS- Use 1 form per sample.________ Enter all dates and times on this form in the following format: (24 hr. clock, day/month/year)
Name of Laboratory:
Name/Title of Individual Preparing Sample Bottl«(s) and Shipping Container: (Print)Name____________________________ Title
Time/Date Sample Shipping Container Sealed: Laboratory Affixed Seal No..
Division __________________________Time/Date Sample Shipping Container Opened:Time/Date Sampling Initiated: __________ /_Sample Location:
Bureau./
Phone <_
Time/Date Sampling Terminated:.
Company:.Address:
Physical Location of Sample:OEP Field Sample Number
REQUESTED ANALYSIS/ES1Container
Parameter Method Preeerv. Volume QtyDescription ofSample Matrix
Preservative Added: (Check one) Qj Labor atory O FieldContract No.: ________________________ Task No.:
N/AReport Format: .
Samples are: (Check one) l""| Emergency fl Non-emergency
Relinquished
XXXXXXXXXXXXXXXXXXXX
Received Time/DateReason for Changeof External Custody
Break Seal/Sample
Name/Title of IndivtduaJ Resealing Shipping Container: (Print/Sign)Name: ________________________________________"'"'me/Date Sample Shipping Container Resealed:.
Title:OEP Affixed Seal No..
.me/Title of Individual Breaking Shipping Container Seal and Accepting Responsibility at the Laboratory for the Sample:(Print/Sign) Name: ___________________________________._____ Titl*: —————————Time/Date Sample Shipping Container Opened: __________I ___________Time/Date Internal Chain of Custody Initiated on OEP Form 077 (Internal Chain of Custody). >
Diimbunon: Wlvit . Original Sstni w«/i rtport)CrttK • Contractor Spar*, rtuiit «(Yellow • Sampit Custodian
fink , DEP Fittd Sampling ferjonnelGold • Sample PreparanonjSnipmeni 300869

CONTRACT LAB SAMPLE INFORMATION SHEETPrint legibly r , ,..
COLLECTED ar
CONTRACT CAB:
TELEPHONE NUMBER; ' — "', SES.CN ..- — ~
COUNTY: SAUOi iur n»7T ————— " ————SAMPLING DATE. , MII /TASY *
CASE NuM8£S SOC NUMBER SAMPLE NUMBER
OUTFALL NUMBER CHECK IF SAMPL.NQ $'PART OF INSPECT CN
SPOES NUMBER PLOW —————
CHECK FOR MS'MO TYPE OF SAMPLE ~ -C r^ ' — • wr c;s •«
THI* SatlOle ' !Gf*b ! :T.rm
SAMPLE MATRIX: ——————————— ——
GA.C Li Soil/Sediment Garoundwaltr D Surface Water Owa»lr»ater Ootrter rSe«eitvi
CHECK THE IOX MECCANO THE HEQUESTEO ANALYSIS
'RlORITY POLLUTANTS (Watef Part 136)—SPOES
G 1. AH (SPOES)—include* 2-6 G 2. 13 PP Metal*G 4. Acid* Bate/Neutrals (USEPA 62S-GC/MS) G 5. CyanideG 7. Haiogenaied Volatile* (USEPA 801-GOG 10. OH
G 13. SettteaoieG 16. Nitrate/NllrIt*Gl9
Ga.
G ». Arom«tlC Voiltlltl (USEPA 602-00
Qn. cooQ 14. TKN
Gl7. Total PtK5»pfirou*QjO. TOCG 99. PCS'i at 0.06S ugA.
Gl VeUtllM—USEPA S24 (QDUS)
Ge. p««ti«id«»^C8'i (USER*Ga. BOOGl2. TSSG IS. A/nmonliG It. KMCtlV*
Or. TettlLJ 60. PCS'i con4«n«f m«irio4
CONTRACT LABORATORY PROTOCOLS
G 23. (ALU—Water—lnetud«« 24-2SG 24. Ba*«^«wtrauAcid (B/N/A)—Wat«f—OC-MSG 25. Volatll* Organic Analytic VOA—Watar—QC-**S
P«*t«i««*/PCa'*—Water—OCMctmlt—WaterCy*nM«—wataf
G 29. (ALU— SolU344lm«nts—InchjdM 3<X34QjO. B^4/A/-S<Hla«*dtfTvtM-OC-M9Gst. VGA—SeiiaAcdUTMnu—QC44SGli P«*liei0««/PC8't—Se«ls/S«dirrMnt—OC
M«tals-So<VS«4lm«ntCyintM—Setl«A«dUn«nt
Gas.
HAZARDOUS WASTES/RCRA ANALYSIS SW446
Qj6. EPTexicityQj9. Corro«ly11yG 42. P««tlcl<Je«/PC8'« (USEPA IQ44. Reactivity
Q 37. EP Toilcrty (Metal* Only)G 40. VOA—OISEPA 8240)Q43. TCl>
G«a. otoiin (USEPA tan
G 3*.G41. BNA-<USEP* S2701
G 44. TCLP (Metall Onry)G 47. Aeeendlx IX
MUNICIPAL SLUOQEG49. R50B-01 GSO. RSSrVOtG w RSHCM51 G sa.
Qjt. P3OA41Das.
Gu. RSRS-01Q»7. KSAA-02
Qs3. RSM-OKEP Teilctty-Metal* only » RSRR-OD
CAUTION (check if applicable)GLab Personnel are expected to use caution when handling DEC
samples, however, please use special precautions when handlingthis sample since It is believed to contain significant concentrationsof hazardous and/or toxic material(s).
rPlace QA Label Here
300870 A-7 9/89

«EGION NO; SAMPUNO
-CllCWICWv wHrtl - LAlCOPYfOHMTiMMToi

z/t«
INTERNAL CHAIN OF CUSTODY
_/ /
3AU»U MO. AUOWOT'tXTHACT HO.
0«t« Tim* o* OOMOI of corroot
lie
ItOHkXUH
mxnati 1:5
nuvrxo119
tic
<t«
30087.2

Itn, INC.IN-HOUSB CUSTODY SHEET
Client:
Custody Seal
Chain of CustodySanpla Tags
SMO Forma
present/absentintact/not intactpresent/absentpresent/absentlisted/not listedprfsent/absent
DATE:SAMPLE CUSTODIAN SIGNATURE:JOB NUMBER:CASE NUMBER:AIRBILL NUMBER:SAMPLE NUMBERS:
LABORATORYSAMPLE NUMBER
•
1j
>i 'Tir ' - '-\'&> ———— ——
i
REMOVEDBY
»
DATE AND TIMEREMOVED
t
REASONDATE AND TIMERETURNED
RETURNED TOREP. f
KEF*

•*. f
, INC. SAMPLE PRESERVATIVE RECORD JOB NUHUER:CLIENT:-3 ££» »
LAD NUMBER
)
PRESERVATIVE
«
i
•"
CLIENT PROJECT:
PH KI
}
ADJUSTMENT INITIALS .
,
1 DATE
————
- - ' )

SAMPLE CONTROLQUALITY CONTRTOL APPROVAL REPORT
Job #:___________________ Client:
New/Cont.:___________________Sample *:____________________
I- Initial Inspection
A) Sample condition - all samples intact? ___If not, group leader notified? - ___
8) All airbills and client paperwork signed and dated? ___
C) Client sample ID's match custody sheets? ___If not, inform group leader.
D) Coolers emptied and lab sample numers match client paperwork ____and bottles?
E) YWC custody sheet correctly filled out, signed and dated? ___
II. Documentation
^*^ A) Job folders contain: client chain of custody, traffic ___reports/airbilIs/all client paperwork, archive/disposalform, result sheet?
B) Preservation requirements have been check and recorded ___on sample preservation record which is stapled to jobfolder?
C) Preliminary sample notifications have been issued and ___present in job folder?
III. Final Inspection
A) YWC labels on correct bottles? ———
8) Refrigerator locations noted? ———
C) All problems documented? ———
0) All custody/airbills, etc. signed? ———
E) Folder to group leader? ———
The above samples have been received according to the current SOP. AW problemsdocumented and approved by the Group Leader.
Sample Custodian Oate
W0875
an environmental testing company200 Monre* r
i MonfO«. Conn«ciicu2031 261-443*
STANDARD OPERATING PROCEDURE
SOIL/SEDIMENT SAMPLE PREPARATION
AS :041791:0
390B76c«r. ittft .^~r-x-
MMMCKVMR*70». 704-0740 201-4M4K1

AS:041791:0
SOIL /SEDIMENT SAMPLE PREPARATION
INTRODUCTION
It is the policy of EEA Laboratories and of the Atomic Spectroscopy group to ensue that weadminister contracts and orders for goods and services in a manner that is fullv compliant withgovernmental laws and regulations, as well as the IEA, Inc. Policy Statement'on Business Ethicsand Conduct.
1.0 SCOPE AND APPLICATION1.1 This method is an acid digestion procedure used to prepare sediments, sludges, and soilsamples for analysis by furnace atomic absorption spectroscopy (AAS) or by inductively-coupled plasma spectroscopy (ICP) for the following metals:
Aluminum Chromium PotassiumAntimony Cobalt SeleniumArsenic Copper SiliconBarium Iron SilverBeryllium Lead SodiumBoron Magnesium ThalliumCadmium . Manganese TinCalcium Molybdenum Titanium
Nickel VanadiumZinc
1.2 This method was derived from 1990 EPA contract and complies with New York State,New Jersey, and SW846 contracts.
2.0 SUMMARY OF METHOD
2.1 A representative Ig (wet weight) sample is digested in nitric acid and hydrogen peroxide.The disestate is then refluxed with either nitric acid or hydrochloric acid. Hydrochloric acid isused as the final reflux acid for the ICP analysis of Al, Sb, Ba, Be, Ca, Cd, Cr, Co, Cu, Fe,Mg, Mn, Ni, K, Ag, Na, V and Zn. Nitric acid is employed as the final reflux acid for theFurnace AA analysis of As, Pb, Se, Tl. A separate sample is dried for a percent solidsdetermination.
3.0 INTERFERENCES N/A
4.0 APPARATUS AND MATERIALS
4.1 250mi pyrex beaker4.2 watch glasses4.3 filter paper4.4 200ml volumetric flasks4.5 disposable plastic funnels4.6 500ml pastic bottles4.7 Top loading scale4.8 tins4.9 class "A" pipets
5.0 REAGENTS

5.1 ASTM Type II water (ASTM D1193)5.2 Concentrated nitric acid (sp. gr. 1.41)-5.3 Concentrated hydrochloric acid.(sp.gr. 1.19)5.4 Hydrogen peroxide (30%)5.5 1:1 nitric acid5.6 1:1 hydrochloric acid
6.0 SAMPLE PRESERVATION AND HANDLING
6.1 Soil/sediment samples must be refrigerated at 4 C from receipt until analysis.6.2 All glassware must be detergent, acid, "and nano washed.6.3 All disposable plastic ware must be nano rinsed.6.4 All samples must be signed out of sample control log book and signed in whenreturned. Refer to Documentation SOP.6.5 Samples must be returned to their designated refrigerator at the end of each working day.
7.0 PROCEDURE
7.1 Safety goggles, lab coat, and gloves must be worn at all times in the laboratory.7.2 Generate a LIMS printout of samples to be prepared.
7.2.1 Type in "S MTL,134,METALS" <return>7.2.2 Type in "MASTERX3" <retum>7.2.3 Type in "5", (user report management) <return>7.2.4 Type in "4", (generate a predefined report) <return>7.2.5 For "criteria filename" type in "PREPS" <retum>7.2.6 "Change output devise", type "N" for no, to have the list printed at the wetchem lab printer.7.2.7 "Enter range/U'st-test", type in "ICAPMCAPZ", to obtain a list of sampleswhich need preparing for the ICP. "FURNXFURNZ" will give a list ofsamples which need to be done for the furnace. <rerurn>7.2.8 Hit the "ESC" key to exit the program.7.2.9 Type in "OFF* <return> and shut down the computer.
7.3 Determine samples to prep.7.3.1 Under column tided "analysis", the first four digits are the job number and theLast three are the sample identification number. The abbreviations "Dup" for duplicate and
"SPK" for spike may appear after certain samples and indicates that the specific samplewas chosen by the client for Quality Control purposes. Refer to section 8.0 beforepropping.7.3.2 Prep separately ICAP and Furnace. Determine according to due date, up to 20samples / QC (See 8.0) to prep. Consider keeping samples from the same jobtogether.7.3.3 Choose matrix 2 or 3 samples. Matrix "2" = soil, matrix "3" = other.7.3.4 Under the column tided "protocol". SOP may be prepped with any otherprotocol. NYS89 must be prepped seperately from all other protocols, theexception being SOP (this rule applies to furnace preps only).7.3.5 Note the refrigerator number under the "location" column on printout7.3.6 Check job folder for special instructions. Some CLP jobs comprise manysamples and need to be broken down into SDG's for ease of review. SDG's arecomplete two weeks after the receipt of the first sample. Wait for an SDG to becomplete before propping. If no QC has been indicated and more than one job is beingprepped together, choose a sample that has the most elements being indicated for analysis.TAL" refers to ail elements.
300878

7.4 Obtain a pagenated soil prep sheet7.4.1 Fill in the case * or S AS * and SDG if doing an EPA case.7.4.2 Circle ICP or Furnace whichever is applicable.7.4.3 _ Fill in the sample ED* given, under the column "EEA ED", and if an EPA case orSAS is being prepped, be sure to fill in the EPA sample ED, under the column 'EFB ED"
7.5 Samples are to be found in sample control."To. 1 Sign out samples in log book after removing from refrigerator.
7.6 Sample preparation can begin.7.6.1 Assign (write in black marker) each 250ml beaker and 125ml plastic containerwith a sample ED, which corresponds with each sample to be prepped. Includeinitials, date, job number, and sample ED's on the prep blank and LCS containers.7.6.2 Acid wash all glassware and plasticware to be used according to GlasswareSOP.7.6.3 Calibrate the top loading balance with the Ig and0.5g Class "S" wt. and record onsoil prep log on the line for "Calibration".7.6.4 Mix the sample thoroughly to acheive homogeneity. For each sample,weigh (to the nearest 0.0Ig) out 1.0 to 1.5 g in a tared beaker, and record its weight.7.6.5 Describe sample color (column 1), using these abbreviations: R=red,B=blue, Y=yellow, G=green, O=orange, V=violet, W=white, C=colorless, BN=brownGY=gray, BL=black.7.6.6 Describe sample texture in column 2: "F" = fine, "M" = medium, "C" =coarse.7.6.7 Describe artifacts if any in column 4, ex. roots.7.6.8 Add 10ml of 1:1 HNO3, mix the slurry , and cover with a watch glass.7.6.9 Heat the sample to 95 C and reflux for 10 minutes. It is critical that the samplereflux, this operation constantly mixes the sample with the acid matrix allowingdissolution and leaching of the analytes of interest7.6.10 Cool and add 5ml concentrated HNO3, and reflux for 30 minutes (maintain acovering of solution over the bottom of the beaker).7.6.11 Cool and rinse sides of beaker and bottom of watch glass with nanopure water,then add 3ml of 30% hydrogen peroxide.7.6.12 Warm beaker on hot plate to start peroxide reaction, heat until effervescencesubsides. Be careful not to lose sample due to excessively vigorous effervescence.Samples with high organic content will require more hydrogen peroxide and more timethan sandy samples low in organic content.7.6.13 Continue to add peroxide in 1 ml aliquots with warming until the effervescence isminimal or until the general sample appearance is unchanged. Do not add more thanI Oml.7.6.14 For ICP analysis, add 5ml of 1:1 HCL and 10ml of nanopure water, heat for anadditional 10 minutes. Do not boil. Antimony is lost in hydrochoioric medium.7.6.15 For Furnace analysis, continue heating the acid-peroxide digestate until it isreduced in volume to 2ml. Add 10ml nanopure water and warm.7.6.16 Allow sample to cool.7.6.17 Filter sample (using pre-rinsed filter paper) into a 200ml volumetric flask.Rinse down beaker walls and filter paper into volumetric to recover as much ofdigestate as possible.7.6.18 Readjust acidity by adding 5ml nitric acid and 5ml hydrochloric acid to the ICPprep and 2ml nitric acid to the furnace prep.7.6.19 Bring to volume with nanopure water.7.6.20 Transfer digestate to pre-rinsed and pre-labeled 500ml plastic container.7.6.21 Wash glassware in soapy water. Return samples to Sample Control and sign log.
7.7 Percent Solids Determination (should be done on the same day as the sample prep)

7.7.1 Calibrate top loading balance with the 5.0g, l.Og, andO 5g Class "S" weiehtrecord on Percent Solid form. . 5'7.7.2 Write sample ED's on each weighing dish and fill out % solids log.7.7.3 Mix sample to be weighed to acheive homogeneity.7.7.4 Weigh weighing dish to nearest O.Olg, record, tare balance.7.7.5 Alliquot approximately S.OOg of sample into the pre-weighed, tared dish. Recordweight of sample.7.7.6 The sample chosen for duplicate analysis must also have a duplicate percentsolid determination performed.7.7.7 Place samples in drying oven, note time and temp on % solids log. Oven must bemaintained between 103-105 C.7.7.8 Dry until stable weight is attained, at least 12 hours and no longer than 24hours.7.7.9 Remove dry sample from oven, note time and date, and allow to cool in thedessicator.7.7.10 Weigh and record the sample weight to the nearest O.Olg.7.7.11 Calculation
% solids = Sample drv weight (%) X 100Sample wet weight (g)
7.7.12 A computer program is available for percent solids calculation on the NEC.7.7.12.1 Turn computer on and type in "solids" at the "C:V>" que.7.7.12.2 Type in sample ED's and weights7.7.12.3 Be sure printer is on, hit the F10 key to have the solids calculated andprinted.
7.7.13 The LCS need not have a percent solids determination performed, and is equalto 100%.
7.8 Place prep and prep log on appropriate instrument work shelf.7.9 Remove samples prepped from computer.
7.9.1 Sign on to LEMS. Type "S MTL, 134, METALS" <retum>7.9.2 Type "COMPLETE/G", <retum>7.9.3 Enter the full seven digit sample ED. A backslash'V denotes all inclusive.For example: 0123001M) 123010 will erase samples 1-10 of job 0123. Use a commato seperate individual samples. <retum>7.9.4 Enter the test to be completed. Five tests may be entered. For example: Typein "ICAP-PREP" <retum> defaults to 1, enter a numeral 2 if total and dissolvedsamples were prepped.<return>, "FURN-PREP" <retum> 2X.7.9.5 The sample ED's listed on the screen have been deleted from the file.7.9.6 If more samples are to be deleted hit <retum> and continueentering. Type "N" for no when all sample ED's have been entered and <return>.7.9.7 Type "OFF" <return>, and turn off computer.
7.10 Filing7.10.1 After the ICP or Furnace operator signs the soil prep log and % solids log, it isthen signed by the group leader, and returned to the individual who did the prep. Make onecopy for each job.7.10.2 File in job folder7.10.3 Fill out a chain of custody form, include job number and sample ED'scompleted, sign and date. Date it for the day that the samples were prepped.7.10.4 The data within the job folder must follow a certain order to facilitate thereview process. Chain of Custody, ICP data. Furnace data. Mercury data. Prep log,Traveler.7.10.5 File the original Preparation Log in the black notebook marked "Soils", and the %solids log in the appropriate notebook.
300880

3.0 QUALITY CONTROL (for each 20 samples prepped)
8.1 Blank sample (ie. nanopure water)8.1.1 Prep along with other samples exactly as above instructions indicate8.1.2 The blank is useful in determining if samples are being contaminatedthe prep.
8.2 Duplicate sample.8.2.1 Choose a sample to duplicate from the 20 being prepped, if one is r.otdesignated.8.2.2 Take the duplicate sample along the entire sample preparation proceedure.8.2.3 The duplicate sample is used to determine precision.
8.3 Spiked sample.8.3.1 The sample chosen for duplicate should also be the sample chosen for spikins.8.3.2 Before the acid addition :8.3.3 Add 5ml / 200ml (using Class "A1 pipets) of the ICP spike solution(designated by the iea-w-#) to the soil sample designated as the ICP spike.8.3.4 Add 4ml / 200mi (using class "A" pipets) of the furnace spike solution(designated by the iea-w-#) to the soil sample designated as the furnacespike.8.3.5 Take the spiked sample along the entire sample preparation proceedure.8.3.6 The spike sample provides information about the effect of the sample matrix onthe digestion and measurement methodology.
8.4 Laboratory control sample.8.4.1 A solid LCS must be prepped along with the other samples.8.4.2 Weigh out as close to l.OOg as possible8.4.3 The LCS provides information on how adequately the digestion processwas done.8.4.4 Record LCS ED on prep log in appropriate space.
9.0 METHOD PERFORMANCE N/A
10.0 DATA HANDLING
10.1 All soil prep sheets are pagenated and completed originals filed.10.2 A copy of the prep sheet is filed in the appropriate job folder, and a chain of custodysigned and dated.10.3 All corrections on forms are to be crossed out with a single line, initialed and dated.
11.0 SPECIAL PROCEDURES
11.1 Oysters11.1.2 Shuck oysters11.1.3 Acid wash blender11.1.4 Blend oysters thoroughly11.1.5 Percent solids determination is unnecessary11.1.6 Proceed with soil prep
11.2 Animal tissue11.2.1 Grind with tissue miser11.2.2 Percent solids determination is unnecessary11.2.3 Proceed with soil prep
12.0 USE OF OTHER REQUIRED SOP'S
300831

12.1 Documentation and Paperwork12.2 Glassware
13.0 DOCUMENTATION OF PROBLEMS '
13.1 Corrective Action Reports.13.1.1 Preps must be reprepped if the analysis of the prepblank indicated contamination problems, or the LCS has not been adequatelydigested and fails outside the specified percent recovery limits set by the EPA.13.1.2 Nodfy sample control if a problem occurs with the sample while in yourpossession, i.e. sample container breaking, mislabled samples.
U.O REFERENCES
12.1 SW84612.2 1990 EPA contract12.3 1989 N.Y. State Dept. of Environmental Conservation

I an environmental testing companyQ I 230 M
STANDARD OPERATING PROCEDURE
SAMPLE PREPARATION OF WATERS
AS :041791:0300883
M.r«m«».= icf>««
3CS-*«»-0«2l
N. Mute*.
70i-70S-07«0 91*-»77OJ90

AS:04179l:0SAMPLE PREPARATION OF WATERS
INTRODUCTION: It is the policy of IE A Laboratories and of the Atomic Spectroscopy Grout: :oensure that we administer contracts and orders for goods and services in a manner that'is fully ~ 'compliant with governmental laws and reguladons, as well as the EEA, Inc. Policy Statement onBusiness Ethics and Conduct.
1.0 Scope and ApplicadonThis method is an acid digestion procedure used to prepare aqueous samples for analysisby furnace atomic absorption spectroscopy or by inductively coupled plasmaspectroscopy. Samples prepared by this method may be analyzed by AAS or ICP for thefollowing metals:
Aluminum Cobalt SeleniumAntimony Copper SiliconArsenic Iron SilverBarium Lead SodiumBeryllium Magnesium ThalliumBoron Manbanese TinCadmium Molybdenum TitaniumCalcium Nickel VanadiumChromium Potassium Zinc
2.0 SUMMARY OF METHOD
2.1 Samples alloted for ICP analysis are heated with nitric and hydrochloric acids andsubstantially reduced in volume. The digestate is filtered and diluted to volume, andis then ready for analysis.
2.2 Samples alloted for furnace analysis are heated with nitric acid and hydrogen peroxideand substantially reduced in volume. The digestate is filtered and diluted to volume,and is then ready for analysis.
3.0 INTERFERENCES N/A
4.0 .APPARATUS AND MATERIALS
250ml pyrex beakerwatch glassesfilter paperdisposable funnels100 ml volumetric flasks100ml graduated cylinderhot platessqueeze bottlesclass "A" glassware pipets
5.0 REAGENTS
5.1 ASTM Type II water (ASTMD1193)

5.2 concentrated nitric acid (sp.gr. 1.41)5.3 concentrated hydrochloric acid (sp.gr. 1.19)5.4 30% hydrogen peroxide5.5 1:1 nitric acid5.6 1:1 hydrochloric acid
6.0 SAMPLE PRESERVATION AND HANDLING
6.1 All aqueous samples must be nitric preserved (pH<2), and refrigerated.6.2 All glassware and plastic containers must be prewashed with detergents. ac:d andType II water. Refer to SOP on glassware acid washing.6.3 All samples removed from sample control must be signed out, and signed in whenreturning.6.4 Samples must be returned to their designated re&igerator at the end of each workingday.
7.0 PROCEDURE
7.1 Safety goggles, lab coat, and gloves must be worn at all times in the laboratory.7.2 Generate a LIMS printout of samples to prepare.
7.2.1 Type in "S MTL,134,METALS" <return>7.2.2 Type in "MASTER/G" <rerum>7.2.3 Type in "5", (user report management) <retum>7.2.4 Type in "4", (generate a predefined report) <rerum>7.2.5 For "criteria filename" type in "PREPS" <retum>7.2.6 "Change output devise", type "N" for no, to have the list printed at the wetchem lab printer.7.2.7 "Enter range/list-test", type in "ICAPMCAPZ", to obtain a list of sampleswhich need preparing for the ICP. "FURN\FURNZ" will give a list ofsamples which need to be done for the furnace. <rerurn>7.2.8 Hit the "ESC" key to exit the program.7.2.9 Type in "OFF" <rerum> and shut down the computer.
7.3 Determine samples to prep7.3.1 Under column tided "analysis", the first four digits are the job number and thelast three are the sample identification number.7.3.2 Prep seperately ICAP and Furnace. Determine according to due date, up to 20samples / QC (See 8.0) to prep. Consider keeping samples from the same jobtogether.7.3.3 Choose matrix I samples. Matrix "1" - water7.3.4 Under the column tided "protocol". SOP may be propped with any otherprotocol. NYS89 must be prepped seperately from all other protocols, theexception being SOP (this rule applies to furnace preps only).7.3.5 Note the refrigerator number under the "location" column on printout. MostHNO3 preserved water samples can be found in refrigerators 26,27,28,29, and 36.7.3.6 Check job folder for special instructions. Some CLP jobs comprise manysamples and need to be broken down into SDG's for ease of review. SDG's arecomplete two weeks after the receipt of the first sample. Wait for an SDG to becomplete before propping.
7.4 Obtain a pagenated water prep sheet.7.4.1 Fill in the case # or S AS # if doing an EPA case.7.4.2 Circle ICP or Furnace, whichever is applicable.7.4.3 Fill in the sample ID # given under the column "IEA ID", and if an EPA caseor SAS is being prepped, be sure to fill in EPA sample ID given under the column•IFB ID".
.300885

7.5 Samples are to be found in sample control.7.5.1 Sign out samples in log book after removing from refrigerator.
7.6 Sample preparation can begin.7.6.1 Assign (write in black marker) each 250ml beaker and 125ml plastic conta^e-with a sample ID, which corresponds with each sample to be preoped. Includeinitials, date, job number, and sample CD's on the prep blank and LCS containers7.6.2 Acid wash all glassware and plasticware to be used according to Glassware
7.6.3 Shake sample to obtain homogeneity.7.6.4 Transfer a 100ml sample aliquot (using a 100ml graduated cylinder, pre-rinsedwith sample) to a 250ml beaker. Record initial volume used under the column tided"Volume i (ml)".
7.6.5 Describe sample color and clarity under the column for "Physical Description".Color is described in the first column using the abbreviations listed here: R=red,B=blue, Y=yellow, G=green, O=orange, V=violet, W=white, C=colorless,BN=brown, GY=gray, BL=black. Clarity is described in the third column using theabbreviations listed here: CL=clear. CD=cloudy, O=Opaque7.6.6 Add reagents: For ICP prep, add 2ml 1:1 HNO3 and 10ml 1:1 HC1. Swirl tomix. For furnace prep, add 1ml 1:1 HNO3 and 2ml of 30% H2O2. Swirl to mix7.6.7 Cover with a watch glass and heat on a hot plate for 2 hours at 95 C or untilsample volume is reduced to between 25 and 50ml. Do not allow sample to boil.(Antimony is easily lost by volatilization from hydrochloric acid media).7.6.8 When this volume is obtained, remove from heat. Allow sample to cool.7.6.9 Filter sample (using pre-rinsed filter paper) into a 100ml volumetric flask.Rinse down beaker walls, and filter paper, with nano, to recover as much ofdigestate as possible.7.6.10 Bring to volume with nanopure water (100ml).
* 7.6.11 Record on prep log the final volume under column "Volume f (ml)". Recordthe color of the sample in the second column under "Physical Description", andclarity of the sample in the fourth column under "Physical Description".7.6.12 Transfer digestate to pre-rinsed and labeled 125ml plastic container. Sign anddate sample prep log. Include the number on acid bottles used for that particularprep.
7.7 Place sample digestates on appropriate instrument work shelf and includecompleted prep log.7.8 Remove samples prepped from computer.
7.8.1 Sign on to LEVtS. Type "S MTL,134, METALS" <return>7.8.2 Type "COMPLETE/G", <return>7.8.3 Enter the full seven digit sample ID. A backslash 'V denotes all inclusive.For example: Q123QQVQ123QIQ will erase samples 1-10 of job 0123. Use a commato seperate individual samples. <retum>7.8.4 Enter the test to be completed. Five tests may be entered. For example: Typein "ICAP-PREP" <return> defaults to I, enter a numeral 2 if total and dissolvedsamples were prepped.<retum>, "FURN-PREP" <return> 2X.7.8.5 The sample ID's listed on the screen have been deleted from the file.7.8.6 If more samples are to be deleted hit <retum> and continueentering. Type "N" for no when all sample ID's have been entered and <retum>.7.8.7 Type "OFF" <return>, and turn off computer.
7 . 9 Filing . . . • _ , .7.9.1 After the ICP or Furnace operator signs the water prep log, it is then signed bythe group leader, and returned to the individual who did the prep. Make one copy foreach job.7.9.2 File in job folder
360886

7.9.3 Fill out a chain of custody form, include job number and sample ED'scompleted, sign and date. Date it for the day that the samples were prepped.7.9.4 The data within the job folder must follow a certain order to facilitate thereview process. Chain of Custody, ICP data. Furnace data, Mercurv data Pren WTraveler. ' ' K' ='7.9.5 File the original Preparation Log in the black notebook marked "Waters".
8.0 QUALITY CONTROL (for each 20 samples prepped)
8.1 Preparation blank (ie. nanopure water)8.1.1 A preparation blank must be prepared for each batch of waters digested orevery 20 samples, whichever is more frequent8.1.2 Prep along with other samples exactly as above instructions indicate.8.1.3 The blank is useful in determining if samples are being gnnraminarc.fi
8.2 Laboratory control sample.8.2.1 An aqueous LCS must be prepared for each batch of waters digested or every20 samples, whichever is more frequent.8.2.2 Spike 100ml of nanopure water, using Class "A" pipets with: 5ml of the ICPLCS (designated by the iea-w-#), or 1ml of the furnace LCS (designated by theiea-w-#), for ail protocol with the exception of EPA case work. For EPA work,spike 100ml of nanopure water with 10 ml of ICV1 and 10ml of ICV3 solution forICP preps. Spike 100ml of nanopure water with 5mi of ICV2 and 5ml of ICV3solution for furnace preps.8.2.3 Fill out prep sheet under "QC addition" with "IEA-W- and the number thatappears on the LCS botde", also include the amount spiked in ml. When using theICV solutions include amount used in ml, appropriate solution, and the ICV ED.
8.3 Duplicate sample.8.3.1 If a client wishes to designate a specific .c?mcle for duplication it will beindicated on the computer printout next to the sample ID as "DUP". If this is notindicated choose a sample to duplicate from, the 10 being prepped.Field blanks can not be used as QC.8.3.2 Take the duplicate sample along the entire sample preparation proceedure.8.3.3 The duplicate sample is used to determine precision.
8.4 Spiked sample.8.4.1 The sample chosen for duplication should also be the sample chosen forspiking unless otherwise specified.8.4.2 Before the acid addition :
Add 2.5ml (using Class "A1 pipets) of the ICP spike solution(designated by the iea-w-#) to 100ml of the ICP sample designated as thespike.Add 2ml (using class "A" pipets) of the furnace spike solution(designated by the iea-w-#) to 100ml of the furnace sample designated as thespike.
8.4.3 Take the spiked sample along the entire sample preparation proceedure.8.4.4 The spike sample provides information about the effect of the sample matrix onthe digestion and measurement methodology.
9.0 METHOD PERFORMANCE N/A
10.0 DATA HANDLING
10.1 All water prep sheets are pagenated and completed originals filed.10.2 A copy of prep is filed in the appropriate job folder, and chain of custody signed ar.ddated.
3MS87

L0.3 All corrections on forms must have a single line through them, initialed and dated.
11.0 SPECIAL PROCEDURES
11.1 Occassionaly we receive samples of an oily nature. These should be prepped withcaution. Heat slowly and use stirring rods in the beaker. Additional acid may'be needed.The oil layer forms an impenetrable film on the surface by which the water vapor can notescape causing a small explosion to occur, consequently sample is lost.11.2 Performance evaluations (PE's).
11.2.1 Read instructions given by client.11.2.2 Acid wash ail glassware to be used. Use class "A" pipets. Label allvolumetrics11.2.3 To a 500ml volumetric, add enough nanopure water to cover bottom andacidify to 1% HNO3. Pipet in 5mi of sample, bring to volume with nano, shake toobtain homogeneity, and stopper.11.2.4 Make a duplicate.11.2.5 To a 50ml and 25ml volumetric, add enough nano to cover bottom andacidify with 1ml HNO3. Pipet in 1ml of sample, bring to volume with nano, shakeand stopper.11.2.6 Complete a water prep log and place it along with the PE's on the ICAPworkshelf.
12.0 USE OF OTHER REQUIRED SOP'S
12.1 Documentation and Paperwork
13.0 DOCUMENTATION OF PROBLEMS
13.1 Corrective Action Reports.13.1.1 Preps must be reprepped if the analysis of the prep blank indicatedcontamination problems, or the LCS has not been adequately digested andfalls outside the specified percent recovery limits set by the EPA.13.1.2 Notify sample control if a problem occurs with the sample while in yourpossession, i.e. sample container breaking, mislabled samples.
14.0 REFERENCES
14.1 SW84614.2 1990 EPA contract14.3 1989 N.Y. State Dept of Environmental Conservation

i an environmental testing company
STANDARD OPERATING PROCEDURE
STANDARD AND SAMPLE PREPARATION LOGS
AS :041891:0 300889
Cor.
1CS-949-042*li.no..
ro«-704-0740

AS:04l89l:0
STANDARD AND SAMPLE PREPARATION LOGS
ABSTRACT: This proceedure describes the inventory and tracking of sample preparation andstandard preparation.It is the interact" this procedure to comply with the EEA business ethics policy.
1.0 SCOPE AND APPLICATION
1.1 The standard preparation log book tracks receipt of standards, preparation, and s.xpLra::ondates.
1.2 The sample preparation log book contains preprinted data sheets, which track sarr.plepreparation, dates, additions of acids, and analytes, and th? preparation blank and LCSassociated with each group of samples prepared together.
1.3 The percent solid log book tracks the determination of solid sample weights forcalculation purposes.
1.4 The leachate log book is a record of leachates received from the wet chemistry group, andincludes information on samples spiked, and their preservation.1.5 The nitration log book is a record of all samples filtered and preserved in the metalslaboratory before the sample is prepared for analysis.
1.6 The mercury sample preparation log book contains ir formation on reagents, acids, andspikes added to samples being prepared for mercury. It also contains information on standarrpreparation, blanks, and LCS's used for each mercury run.
2.0 SUNLMARY OF METHOD
2.1 Standard log book - the first secdon includes the stock standard solutions in which allpertinent information supplied by the manufacturer is rec-. ded upon receipt. The secondsection is for recording the preparation of working standard solutions, such as, the ICP andFurnace spikes and LCS's, Mercury standards, etc.
2.2 Sample log book must be completed as samples are prepped, spiked, preserved, filtered,etc. Any test, preparation, or addition must be recorded in these log books.
2.3 All entries to the logbooks must be signed and dated by the analyst and the individualdoing the work.2.4 All entries to the logbooks must be completed in ink.
2.5 If an error is made, corrections shall be made by crossing a line through the error andentering the correct information. Initial and date the change.
3.0 INTERFERENCES N/A
4.0 APPARATUS AND MATERIALS
4.1 standard log book

4.2 sample log book4.3 percent solids log book4.4 leachate log book4.5 filtration logbook4.6 mercury log book
5.0 REAGENTS
5.1 All acid and reagent bottles are number sequentially upon receipt. If a contaminationoccurs with sample preparation or standard preparation, the acid or reagent bottle may betraced.
6.0 SAMPLE COLLECTION PRESERVATION-AND STORAGE
6.1 All samples are to be refrigerated in sample control6.2 Purchased stock standards and solutions can be stored as received at room temperature.6.3 ICV solutions must be refrigerated when received6.4 All prepared standards are acidified and stored at room temperature.
7.0 PROCEDURE
7.1 Stock standard log book. Refer to fig. 1. Record the following information from thebottle.
7.1.1 Stock ED (not found on bottle). This is a code specific to the laboratory andalways begins with "MTL-S(for stock)-0001"(the last four digits are numerical entriesgenerated in sequential order.7.1.2 element name7.1.3 manufacturer name7.1.4 date received7.1.5 element concentration7.1.6 manufacturer lot number7.1.7 expiration date (if no expiration date is given the analyst should assume a one-yearexpiration date from the date received)
7.2 Working standard log book. Refer to fig. 2.7.2.1 Standard ID. This code is specific to the laboratory and always begins with"MTL-W(for working standard)-0001" (the last four digits are numerical entriesgenerated in sequential order.7.2.2 date standard is prepared7.2.3 Under "element" list the elements being prepared.7.2.4 Next for "stock/standard ID" list the stock or standard ID used to make thedilution.7.2.5 For "concentration" list the concentration of this stock or standard being used.7.2.6 Vi = initial volume in milliliters of stock or standard taken.7.2.7 Vf = final volume in milliliters standard was diluted to.7.2.8 "concentration f" = the final concentration in ppm or ppb of the standard.7.2.9 For "chemist" sign your name and include type of acid used, %, and numberfound on bottle assigned by laboratory.
7.3 Water and TCLP sample preparation log book. Refer to fig. 3.7.3.1 Circle "water" on top of form.7.3.2 If using eppendorf for spiking additions calibrate using Iml of water on toploading balance and record weight, ex. Imi» l.OOg, otherwise indicate "class A pipetsused".7.3.3 "Case/SAS" enter case number or SAS number if doing EPA work.7.3.4 "SDG #" used for EPA case work or CLP work.
300391

Z'H S?le low °r medium level f'or EPA w°rk or Std (standard) for rezuiar work/J.o ICAP/Furnace ' circle appropriate prep.7.3.7 "EEA ED" column. List sample CD's.7.3.8 "EFB ED" column, used for.EPA work, list EPA's sample ED.7.3.9 ."Vol i (ml)" = initial volume in milliliters.7.3.10 "Vol f (ml)" = final volume in millilicers.7.3.11 "Phys. Desc. before/after" enter sample color using color key in column
I as sample appears before prep begins. Enter sample color after sample is brouehtto volume. In column 2, enter clanty of sample using abbreviations from key be'rbresample was prepped and after sample was brought to a final volume.
7.3.12 "QA/QC" - "PB" = preparation blank, only initial volume and final volume needto be completed,7.3.13 "LCS" = laboratory control-sample. Enter initial and final volumes. "QCAdditions" enter standard stock ED and amount, ex. 2.5ml MTS-w-0001.7.3.14 "D" = duplicate sample. Enter sample ED, initial and final volumes.7.3.15 "S" = spike sample. Enter sample ED, initial and final volumes, standard stockED and amount.7.3.16 "Prepared by" individual preparing samples signature goes here.7.3.17 "date" = date prepared7.3.18 "Accepted by" individual analyzing samples signature and date.7.3.19 "Supervisor" = supervisors' signature and date.7.3.20 Record laboratory # given to acid and reagent bottles at bottom of page.
7.4 TCLP sample preparation log is similar to above, exceptions are: circle TCLP at top ofform. Refer to fig. 4.7.5 Soil sample preparation log. Refer to fig. 5. Similar to Water preparation log,differences are listed below.
7.5.1 Circle "soil" at top of form.7.5.2 "Calibration" refers to the calibration of the top loading balance with class "S"weights. Record as, ex. l.OOg = l.OOg class "S" wt.7.5.3 "Weight (g)" refers to the weight in grams of sample used in digestion.7.5.4 "Volume (ml)" refers to the final volume digestate was diluted to.7.5.5 Under the heading "Physical Description", the first column lists the color of thesoil before digestion/ color of liquid at final volume. Column 2, list the texture of the soilbefore digestion procedure. Column 3, list the clarity of the liquid at final volumeafter digestion is complete. Column 4, list artifacts, ex. roots.
7.6 Percent solids log book. Refer to fig. 6.7.6.1 "case/SAS/batch no" refers to EPA cases and S AS7.6.2 "SDG no." refers to EPA and CLP work, record number.7.6.3 "Calibration" record Class "S" wt. from top loading balance.7.6.4 "Oven temp" record the oven temperature in degrees Celsius at the time the soilsample went in and the temperature at the time the soil was taken out,7.6.5 "EEA ID" record EEA sample ED.7.6.6 "IFB ED" record EPA sample ED.7.6.7 "DishWt" record the aluminum tin weight in grams7.6.8 "Sample wet weight" record the soil weight in grams, before placing in the oven.7.6.9 "Sample dry weight plus dish" this is the weight of the soil after it has been driedin the oven and includes the dish weight.7.6.10 "Sample dry weight minus dish weight", record here the weight of the soil aftersubtracting the dish weight from column 3.7.6.11 "% solids" record here the final result by dividing the wet weight from column 4by the dry weight minus the dish wt. in column 6.7.6.12 "date in" record date soils were put into the oven.7.6.13 "time in" record in military time, that soils were placed in the oven.7.6.14 "date out" record date soils were taken out of the oven.
V *3€» w
300892

7.6.15 "time out" record in military time, that the soils were taken out of the oven7.6.16 "prepared by" requires a signature7.6.17 "date" record date results were calculated.7.6.18 "witnessed by" requires signature and date.
7.7 Leachate log book. Bound notebook. •7.7.1 Record EEA job number, and blank associated with batch7.7.2 Record EEA sample ED numberts).7.7.3 Record date received from Wet Chemistry7.7.4. Initials7.7.5 Refrigerator location in which samples will be stored.7.7.6 Comments: include, sample ED spiked and standard ED of spiking solution,preserved with HN03 and acid bottle ED.
7.8 Filtration log book. Bound notebook.7.8.1 Record EEA job number7.8.2 Record EEA sample ED numbers).7.8.3 Record date received from sample control, which must also be the date filtered.7.8.4 Initials7.8.5 Record refrigerator location in which samples will be stored.7.8.6 Record any comments off the original bottle.
7.9 Mercury sample preparation log book. Refer to fig. 7.7.9.1 Circle water or soil which ever matrix is applicable.7.9.2 "top loading balance calibration" record weight of class "S" wt off top loadingbalance.7.9.3 "analytical balance calibration" record weight of class "S" wt. off the analyticalbalance.7.9.4 "page _of _" record page number and number of pages in run.7.9.5 "EEA ED" column, list the EEA sample ED.7.9.6 "IFB ED" column, list the EPA sample ED.7.9.7 "Wi(g)/Vi(ml)" record the weight in grams of the soil sample or the initial volumeof the water sample in millileters.7.9.8 "Vf(ml)" record the final volume in millileters the sample was diluted to.7.9.9 "BOD CD" = the bottle ED into which the sample was poured.7.9.10 "QA/QC ED" List the standards, CCV's, ICV's, CCB's, LCS'S, prep blanks.spikes, and duplicates for the run in this column.7.9.11 "Wi/Vi" record the initial weight or initial Volume.7.9.12 "QCadd" record QC ED addition and amount added.7.9.13 "Vf(mi)" record the final volume in millileters.7.9.14 "BOD ED" record the bottle ID into which the sample was poured.7.9.15 "standard ED =" enter the fu^ standard ED for calibration standards.7.9.16 "ICV ED" enter the EPA initial calibration verification standard ED used.7.9.17 "CCV ED" enter the continuing calibration verification standard ED used.7.9.18 "LCS ED" enter the EPA laboratory control solid sample ED used.7.9.19 "spike ED" enter the spiking standard ED used.7.9.20 "prepared by" signature of individual preparing samples.7.9.21 "date" enter date samples prepared.7.9.22 "lot #" enter the number given by the laboratory on the acid and reagent bottleslisted.7.9.23 "accepted by" signature and date of supervisor reviewing data.
8.0 QUALITY CONTROL8.1 Sample preparation forms are signed, dated, and reviewed by supervisor as they areprepared.8.2 Preprinted sample preparation forms are filed in numerical sequence to ensure easyaccessabiliy when backtracking samples.
300393

8.3 A bound leachate log book is filled out immediately as leachates are received fromthe Wet Chemistry group for inventory purposes. This is also the case with the fi'rrar-cnlog book.8.4. Stock standards are recorded upon receipt to keep track of expiration dates.3.5 Standards are recorded using the stock ID from which they came, to ensure ability -oback track to the source if any contamination problems occur.8.5 All samples, stock standards, standards, reagents, and acids are given in houselaboratory CD's to ensure the ability to backtrack through everything if contaminationproblems occur.
9.0 METHOD PERFORMANCE
9.1 In the event of an LCS, or prep blank, failure on the insruments resulting in thebatch of samples having to be reprepared, sequential numerical entry allows for an easyway to retreive information.9.2 Likewise sequential numerical entry of standards in the log book allows for easyaccesibility to the previous standard made, so that preparation may be uniform,9.3 The leachate log book makes accessible the date when samples were leached fromWet Chemistry, so the individual preparing the samples for analysis may know whichsamples were leached.
10.0 DATA REDUCTION AND DATA HANDLING - N/A
11.0 SPECIAL PROCEDURES • N/A
12.0 USE OF OTHER REQUIRED SOP'S12.1 The SOP that applies to the particular procedure should be consulted beforesample or standard entry begins.
13.0 DOCUMENTAION OF PROBLEMS13.1 Corrective action reports-any mislabeled samples or standards, any misreporteddata, or any incorrectly entered forms warrants generation of a corrective action reportper the Atomic Spectroscopy Corrective Action Report Procedure.
14.0 REFERENCES14.1 USEPA Contract Laboratory Program, SOW 3/9014.2 Standard and Sample Logbooks.
300894

STOCK ID ;_ELEMENT :
•NUFACTURER :_DATE RECEIVED :
CONCENTRATION:MANUFACTURER LOT * :
EXPIRATION GATE:
STOCK ID :
ELEMENT :_
"MANUFACTURER :DATE RECEIVED :
CONCENTRATION:
MANUFACTURER LOT # :
EXPIRATION DATE:
STOCK ID :
ELEMENT :
MANUFACTURER :_
DATE RECEIVED :
STOCK ID :
ELEMENT :_
_ MANUFACTURER :_
DATE RECEIVED :
CONCENTRATION^
MARUFACTURER LOT » :_
EXPIRATION DATE:
CONCENTRATION :__
MANUFACTURER LOT t :_
EXPIRATION DATES
STOCK ID :_
ELEMENT :_
MANUFACTURER :_
DATE RECEIVED :
CONCENTRATION^
MANUFACTURER LOT t :_
EXPIRATION DATE:
STOCK ID :_
ELEMENT :_
. .ANUFACTURER :_
DATE RECEIVED :
CONCENTRATION:_
MANUFACTURER LOT I :_
EXPIRATION DATE:

STO
6_7
IHEMIST:
STK/STDID CCNC.
STD ID:STK/STDID OONC.
DATE:Vl
(mi)v
(MI!)
5_6
CHEMIST:
STO ID:
ELEMEKT(S)STK/STD
ID CONC.
DATE!
, vi(MLS)
. )ff.(«-?)
CCNC.f
CHEMIST:
300896

environmental testing companyCCC onrc* "j"*0'«« V J 00117
METALS SAMPLS PREP LOG! Calibration of eppendorf
Low/Med/StdICAP/Furnace
SDC 4:
TEA ID IFB ID |Vol i !nl)iVol • (ml)?hys. o«se.»b«for«/a£c«r j Color :<«'/•
-• / |2- / 'R - :ad
: :l- / |2- / a • blue
1- /
1- /
1- /
1- /
I- /
1- /
1- /
1- /
1- /
I- /
1- /
1- /
I- /
1- /
i- /
I- /
1- /
I- /
2- / V • yeilcw
2- / G • green2- / 0 « orange2- / V - violec
2- /
2- /
C • colorless.Bn • brown
2- / Gy - gray ;
2- / 31 - blacfc i
2- / clatizy |2- / CL • clear !2- /
2- /
2- /
2- /
2- /
2- /
2- /
2- /
C « cioucy0 « opacrue
'Eacii physical d««ctipcioa involve* i-Color and 2-Clarity both before and after
OA/OCISA ID
?B
LCS
0
1 S
IFB ID Volujn* i ;ml) volum* f !ml) QC Addition
Prepared by:Data?_____'Acceptea by:ICP: HNO, HCl H,0
30089?

an environmental testing company
.J03li«1-4«si
METALS SAMPLE ?RE? 1.CC000022
'Calibration of ej!Case/SAS
IEA ID IF!
jpencorfLow/Mad/ ScdI CA?/ Furnace
i3 ID Vol i (si) j Vol f (nil)
SCC *:
?hyg . Oeac. •before/afrar Color :<ev
2 - :ed
i
i1 ——————————1
;i- / ,2- / • 3 - blue
-
!•• / 2- / . Y • yellow1- /
1- /
1- /1- /1- /1- /1- /1- /
1- /
1- /
1- /1- /
1- /
2- / , 3 • green
2- / 0 • orar.ge
2- / v - violac2- /
2- /
2- /
2- /
C • colorless'
3n • brownGy • gray \31 • black
2- / Clarity2- /2- /
2- /
2- /
2- /
1- / 12- /
i- /
1- /
1- /
2- /
2- /
2- /
CL - clearC • cloudyO » opao^ie
•Each physical description involves 1 -Color and 2 -Clarity both before and after
300898
Prepared by:_Date: _____"Accepted by:1C?: HNO,
QA/QC
ISA ID
I P8
LCS
S
S
S
IFB ID volume i (ml) volusn* t 'nil) OC Addition
Supervisor:Date:Date:
HC1 Furnace: HNOr'age

•METALS SAMPLi = RZP LOO
Case/SAS^__'Calibration: Low/Med/scd
"A?/?uraace
ISA ID IFB IDWeight! Volume(g) | (ml)
i
• Physical Description*before/after
1- / 2- 3- 4-
Color Key-
R • red
B • blue
Y • yellowG • green0 • orange :V • violet i
C • colorless
Bn • brown
Gy • grayBl • black
Clarity*Cl - clearC • cloudy0 • opa<7ue
Texture*
F • fineM • mediumC • coarse
•Each physical description involves l-Color (before and a f t e r ) , 2 :Texture(before) , 3-Clarity ( a f t e r ) , and 4-Art i fac ts (yes or no description)
QA/OC
IEA ID
P9
LCS
^repared3ace:
0
sbv:
IFB ID weight (g) volume f (ml) QC Addition - ;1I
1
^
Supervisor : ____ _ ____ . —————————— -—————— " Date : ___ _ ______ . ———— . ————————
Accented bv: „,„,.,. .„„.,._.,„ Gate. ____ , ——— ———————— —————tCP: HNO, _____ HCl _____ H,02 _____ Furnace: ww, ————— -2-2 —————J ———— page __ of __
300899

501105 DETER.MIMATIOM
Case/SAS/Batch Mo:
IEA 200 Monroe Turnpi>eMonroe, Connecticut 06463 '2:
SDG No: Calibration :% Solids = (Dry wt / Wet wt) x 100 Oven Temp (C): In:
:=A : [0 (9) Wds3ampie wee wt
(3) ««• (minus dtsn)Sample 3ry .t ';)
LS aisn -.-us i: 5.1
Date in: Time in: AM/PM Date out: Time out:
* 1) A mininum of S.OOg of wet sample should be taken for this analysis2) Do not exceed a 24 hour drying tine.3) One sample must be determined in duplicate (see ICP prep for dup s,
Prepared by: Date: witnessed by:
300900

ISA200 Monroa Turnpike
Monroe, CT 06463 (203) 452-a20o023"
METALS WATER/SOIL PREPERATION LOG - MERCURY
Top Loading Balance CalibrationAnalytical Balance Calibration
ISA 10
Prepared by:Date:
IPS 10 ;;;::, ,,«, 90010 10
Paae -f
,_:A/QC
y i / V i SC aod / f ; i i ; 3X ':
i • • - - -j1ij!
i
!
I
1QA/QC
Sttndcrd 10 >
!CV 10 *
CCV 10 •
LCJ 10 •
Seik* 10 «
Accepted bDate:
v:
Lot *: Hydroxylamine Hydrochloride ___ Stannous cnionae ——— tsi.^-* __H2S04 HN03 K208S2 NaCl ...
300901

an tnvironmental testing company
268-S344
STANDARD OPERATING PROCEDURE
SAMPLE HANDLING AND
CHAIN OF CUSTODY
AS:022189:0
Scftaunttu'f.
70*-70i-07»0
UMUCKUMIO 3C2-J-9-S
3^15902

AS : -221Er
STANDARD OPERATING PROCEDURESAMPLE HANDLING AND CHAIN OP cpSTQnv
1.0 SAMPLE EANDLING/CHAIN OP CUSTODY
while samples are in a work-in-progress state, it is theresponsibility of each analyst working on a sample(s) to do thefollowing:
Sign the chain-of-custody upon removing and returningeach sample for preparation and analysis (Metals seeFigure 1.0)Be sure to return the sample (unused portion—does notapply to volatiles) to the appropriate refrigerator/freezer.
2.0 EXTRACT STORAGE
After analysis the extracts (prepared samples) may bestored for up to one month in the AS laboratory. After onemonth the samples are to be boxed and relocated to the basementstorage area. All boxes must be labeled with the case/job +and date of disposal.
3.0 SAMPLE ARCHIVAL/DISPOSAL
Subsequent to analysis and final data review, the sampleand any related extracts are archived and/or disposed of ac-cording to SOP SC:110386:1.
300903

an environmental testing company200 Monro* Turnoi««Momo«, C«AA«cacui 9444*'2031;
CHAIN OF CUSTODYATOMIC 5PECTRQSCOPV 3EPARTMENT
Job Number __________________ Sample Numbers
WATER - SOIL - SLUDGE - EPTOX/TCLP
I confirm that I have performed the preparation below following SOP guidelines a-aauthorize the release of this preparation:
Sample Prep _____________________________ ________
___________________________________. __________ ICP/FLME
__________________________________ __________ FURN
__________________________________ __________ MERCURYChemist Oate(s)
I confirm that I have performed the analysis below following SOP guidelines and au-thorize the release of all associated data:
Analysis ____________________________ ________ 1C?
_______________________________ _________ FLAME
________________________________ _________ FURN
__________________________________ __________ MERCURYChemist Oate(s)
I have reviewed and authorize the release of this job:
Complete ________Supervisor Date
Batch Assignment200 MONR06 Tt_RNPlK£ • WONROE. CDNN6CTICLT 06-166 • !2Q3! -
coeooe300904
an •nvironm«ntal testing company
STANDARD OPERATING PROCEDURE
STORAGE AND DISPOSAL OF SAMPLES
AND RELATED EXTRACTS
SC:042690:2
300905

S C : 0 4 2 6 5 Q : 2
STANDARD -OPERATING PROCEDURESTORAGE AND DISPOSAL OF SAMPLES AND RELATED EXTRACTS
A b s t r a c t
This SOP addresses the storage and dispo-sal of client samples (and related 3x-tracts) at IEA, Inc.-CT.
No aqueous or soil/sediments are to be disposed of by any other means than asexpressly directed in this document and its revisions.The general approach to waste disposal at IEA involves transfer of samples, acidwaste, alkaljne waste, solvent and extract waste and PCS waste to segregatedlabeled drums for disposal by EPA and State of Connecticut licensed (as appro-priate) firms, through appropriate Resource Conservation and Recovery Act (RCRA)mandated methods.
This system ensures that all samples, related extracts and other laboratorychemicals/waste are disposed of in an environmentally acceptable manner and inaccordance with Good Laboratory Practice (GLP).
Additionally, all waste disposal must be in accordance with State and FederalLaws and Regulation. See the Hazardous Waste Coordinator if you have questions.

SC:C42590:2
1.0 STORAGE
Samples are segregated by preservative and stored in refrigerators. Volat'lesare stored in separate refrigerators.
Sample refrigerator temperatures must be maintained between 4-6'C. Froozortemperatures are kept lower than -12*C.
A temperature log should be taken on a daily basis. The temperature log is keptin the sample control center. Sample refrigerators are located in sample con-trol center. Sample control center is unlocked at 8:00 a.m. by the samplecustodian and is kept locked after normal business hours.
2.0 SAMPLE DISPOSAL
Upon completion of all analyses, a report is generated and an invoice is pre-pared. At the time of invoicing, samples are removed from the refrigerators andthe sample storage time begins. The length of time each set of samples is heldvaries by client and is as follows:
Normal holding time (most clients) 21 days* USEPA 60 days* NYSOEC 90 days* USEPA Extracts 365 days* NJOEP 1 year*
*Note: See Section 3.0
Samples are then placed in the appropriate drums for disposal. Personnel d i s -posing of samples should be properly trained in safe handling procedures andshould utilize proper personal protective equipment.The disposal drums, when full, (target hauling frequencies are once/month) aremanifested and hauled by an EPA licensed firm. A copy of the manifest is thenplaced in the central file.3.0 DISPOSAL OF CONTRACT SAMPLES AND EXTRACTS
The laboratory's government contracts require specific archive storage times forsamples, sample extracts, and sample digestates. These are as follows:
USEPAInorganic samples (metals and cyanide): 60 days after report (soil andsediments must be refrigerated during this time)
Inorganic Acid Digestates: 60 days after report submission
Organic Samples: 60 days after report submission
1
300907

300B08
Organic Sample Extracts: 365 days after data submission
NJOEP
All samples and associated extracts must be held for 1 year after iate :fdata submittal. The laboratory must notify the NJDEP at least 30 ci/sprior to disposal in writing. Letters should be addressed to the i n d i v i d -ual requesting the work with a copy to the NJOEP Contract Administrate(A. Fishman)
Organic extracts must be kept refrigerated at less than 4'C. Unusedsample volumes need not to be refrigerated.
NYSDEC
Unused sample volumes must be held for 90 days after data submission.Samples do not require refrigeration after analysis.
Organic sample extracts must be stored at less than 4*C for 365 days afterdata submission.

an environmental testing company
STANDARD OPERATING PROCEDUREFOR THE PREPARATION OF
AQUEOUS SAMPLESFOR PESTICIDE/PCB ANALYSIS
EX:062389:2
300903
s SJtenca.Nortf* C
3C3-M9-092* 70«-705-0740
TABLE OF CONTENTS
Item ?ac:e ;
1.0 Scope and Application 1
2.0 Summary of Method 1
3.0 Interferences - 1
4.0 Apparatus and Materials 2
5.0 Reagents 2-4
6.0 Sample Preservation and Storage 4
7.0 Sample Analysis 4-9
3.0 Quality Control 9 - 1 0
9.0 Method Performance 10
10.0 Data Reduction and Handling 10
Revision History
Code Revision Date Reason
EX:062389:0 6/23/39 Original Issue.
EX:062389:1 2/12/90 Update to NJDEP & NYSEDC39requirements.
EX:062389:2 3/26/91 Change to IEA forms andminor text changes.
Rev: 3 / 2 6 / 9 1
300910

EX:062339:2
STANDARD OPERATING PROCEDUREFOR THE PREPARATION OF AQUEOUS SAMPLES
FOR PESTICIDE/PCS ANALYSIS
1.0 SCOPE AND APPLICATION
1.1 The analyst is referred to the 02/88 version of the"USEPA Contract Laboratory Program Statement of Work forOrganics Analysis Multi-Media/Multi-Concentration forfurther information about these procedures.
1.2 This procedure is applicable to the analysis of watersamples.
1.3 It is the policy of IEA, Inc. and of the ExtractionsGroup to ensure that we administer contracts and ordersfor goods and services in a manner that is fullycompliant with governmental laws and regulations, aswell as the IEA. Inc. Policy Statement on BusinessEthics and Conduct.
2.0 SUMMARY OF METHOD
Water samples are serially extracted in a separatory funnel usingmethylene chloride. The extract is dried using sodium sulfate, andconcentrated using a Kuderna-Danish (K-D) apparatus.
3.0 INTERFERENCES
3.1 Method interferences may be caused by contaminants insolvents, reagents, glassware, and other sampleprocessing apparatus. This can lead to discreteartifacts and/or elevated baselines in the gaschromatograph. All these materials must be demonstratedto be free from interferences by the running of reagentblanks. A specific interference that can cause aproblem is the presence of phthalate esters, which arecommonly found in plastics. Those interferences can beavoided by not using plastics in the laboratory.
3.2 Matrix interferences may be caused by contaminants thatare co-extracted from the sample. The extent of matrixinterferences will vary considerably from source tosource.
Rev: 3 / 2 6 / 9 1
300911

4.0 APPARATUS AND MATERIALS
4.1 Glassware
4.1.1 Separatory funnel, 2,000 ml with teflon stopcock.
4.1.2 Drying column, chrotnatographic colu-napproximately 400 mm long x 19 mm ID.
4.1.3 Concentrator tube, K-D, 10 ml, graduated.
4.1.4 Evaporative flask, K-D, 500 ml.
4.1.5 Snyder column, three ball macro.
4.1.6 Vials, 10 to 20 ml capacity with teflon linedscrew cap.
4.1.7 Alumina column, chromatographic columnapproximately 200 mm long x 8 mm ID.
4.1.3 Erlenmeyer flask, 250 or 500 ml.
4.1.9 Graduated cylinder, 1,000 ml.
4.2 Pyrex glass wool, extracted in ultrasonic cleaner withmethylene chloride for 30 minutes and dried at 130'C.
4.3 Silicon carbide boiling chips, approximately 10/40 mesh,extracted in ultrasonic cleaner with methylene chloridefor 30 minutes and dried at 180*C.
4.4 Water bath, heated, should be in a hood.
4.5 Balance, analytical, capable of weighing ±0.0001 g.
4.6 Nitrogen evaporation device equipped with a water baththat can be maintained at 35-40*C.
4.7 Chlorine test kit, capable of detecting 0.1 ppm residualchlorine.
5.0 REAGENTS
5.1 Reagent water - Water in which an interferant is notobserved at the method detection limit for eachanalytical parameter.
2 Rev: 3/25/91

EX:062333:2
5.2 Acetone, hexane, methylene chloride, - Pesticide qual'-vor equivalent.
5.3 Sodium sulfate - (ACS) granular anhydrous, purify cvextracting in methylene chloride for 30 minutes' andplace in the drying oven overnight at 130'C.
5.4 Alumina, Super I Woelra or equivalent, prepare by adding7 percent (v/w) reagent water and tumble'for a minimumof 2 hours. There should be no lumps present.
5.4.1 Each batch must be assayed using the aluminaequivalency test. If the batch does not meetcriteria, it may be deactivated with up to 9percent water.
5.5 Sodium hydroxide solution, (ION) - Dissolve 40 g NaOH inreagent water and dilute to 100 ml.
5.6 Tetrabutylammonium (TBA) - Sulfite reagent. Dissolve3.39 g of TBA in 100 mis of reagent water. Extractthree times with 20 ml portions of hexane. Discard thehexane extracts, and add 25 g of sodium sulfite to thewater solution. The resulting solution can be stored atroom temperature for at least one month in an amberbottle with a teflon screw cap.
5.7 Sulfuric acid solution (1+1) - (ACS) Slowly add 50 mlsulfuric acid to 50 ml of reagent water.
5.8 Dibutylchlorendate (DBC) surrogate solution (for waters)- Prepare DBC solution at a concentration of 1 ug/ml inmethanol. The solution must be stored at 4'C (±2'C) inteflon sealed containers for a maximum of 12 months.
5.8.1 Add 1.0 ml of the DBC solution to all samples,blanks and matrix spikes.
5.8.2 The solution must be stored at 4°C (± 2°C) for amaximum of 12 months in a sealed container with ateflon lined cap.
Rev: 3/26/91
mnn

£X:062239:2
5.9 Pesticide matrix spiking solution.
5.9.1 The spiking solution .will contain the follow:--pesticides at the specified concentrations "•'-methanol:
Pesticide ' Concentration, ccr.
Lindane 0.2Heptachlor 0.2Aldrin 0.2Dieldrin 0.5Endrin 0.54,4'DOT 0.5
5.9.2 Matrix spikes and matrix spike duplicates will get1.0 ml of the pesticide spiking solution.
5.9.3 The solution must be stored at 4°C (* 2°C) for amaximum of 12 months in a sealed container with ateflon lined cap.
6.0 SAMPLE PRESERVATION AND STORAGE
6.1 Preservation Requirements
6.1.1 Water samples must be protected from light andrefrigerated at 4'C from the time of receipt untilextraction and analysis.
6.2 Holding Times
6.2.1 CLP water samples shall be extracted within 5 daysof Validated Time of Sample Receipt (VTSR), andSOP water samples shall be extracted within 7 daysof collection. NYSDEC89 samples shall beconcentrated within 5 days of VTSR.
a) If SOP water samples are not received within1 day of collection, the Extractions GroupLeader and the Organics Manager must =enotified. A CAR will be issued to ClientServices to contact the client forinstructions on how to proceed.
Rev: 3/25,

EX:062:=9:2
7.0 SAMPLE ANALYSIS
7.1 Safety
7.1.1 Analysts shall treat all samples as if they arehazardous and take all appropriate safetvprecautions, including but not limited tosafety glasses, lab coats and imperviousgloves.
'7.2 Chain of Custody Procedures
7.2.1 All analysts are responsible for maintainingsample custody in accordance with EPAguidelines.
7.2.2 All samples must be signed out on the chain ofcustody forms located in sample control.
7.3 Water Sample Extraction Procedure - Separatory Funnel
7.3.1 When the sample is brought to the laboratoryfrom sample control, the extraction logbook forthe batch is started. A copy of the logbook
/*""*"• page is labeled Figure 1.0. The appropriateinformation is entered into blocks 1 and 3.
7.3.2 The pH of the sample is checked using widerange pH paper. If the pH is outside the rangeof 5-9, a Corrective Action Report (CAR) isfilled out. A copy of a CAR is labeled Figure2.0. The pH is adjusted to be in the range of5-9 using 1:1 sulfuric acid or 10 N sodiumhydroxide.
7.3.3 The chlorine residual of the sample is checkedusing the chlorine test kit. If a residual isdetected, a CAR is filled out.
7.3.4 If the sample is submitted in a 1 liter bottle,the level of the sample is marked on the sideof the bottle with an indelible marker so thevolume can be determined. The sample is mixedto ensure homogeneity, and transferred to a 2liter separatory funnel. If the sample issubmitted in a larger volume bottle, a pre-cleaned graduated cylinder is used to measure 1liter of well mixed sample. The appropriateinformation is entered into block 4 of the
5 Rev: 3/26/31

EX:052239::
extraction logbook.
7.3.5 With every batch of samples processed, a bU-kmust be run. The blank will consist of 1 "•"-='-of reagent water.
7.3.6 Tracking labels (see Figure 3.0) or anequivalent system must be used for every sa.-cleand blank..
7.3.7 Add 1,000 ul of DBC for Waters surrogate toevery blank, sample and matrix spike/matrixspike duplicate (MS/MSD).
7.3.3 If an MS/MSD is to be run with a. batch, add1,000 ul of pesticide spike solution to the MSand the MSD.
a) For the NYSDEC 89 protocol prepare a blankMS every time a MS/MSD is extracted byadding 1000 ul of Pesticide Matrix spikesolution to a liter of reagent water.
7.3.9 Fill in the appropriate information in block 5of the extraction logbook.
7.3.10 Add 60 ml of methylene chloride directly to theseparatqry funnel. Extract the sample byshaking the funnel for 2 minutes with periodicventing to release the excess pressure. Allowthe organic layer to separate from the waterphase for at least 10 minutes. If an emulsionforms at the interface between the two layers,and it is greater than one-third the volume ofthe solvent layer, the analyst must employmechanical techniques to break the emulsion.
a) Acceptable mechanical techniques forbreaking an emulsion include: stirring,filtering the emulsion through glass wool,or centrifugation.
b) If the emulsion cannot be broken, it will benecessary to use a continuous liquid-liquidextractor. Details on the procedure can beobtained in the liquid-liquid extractionprocedure in section 7.4.
Rev: 3/25/91
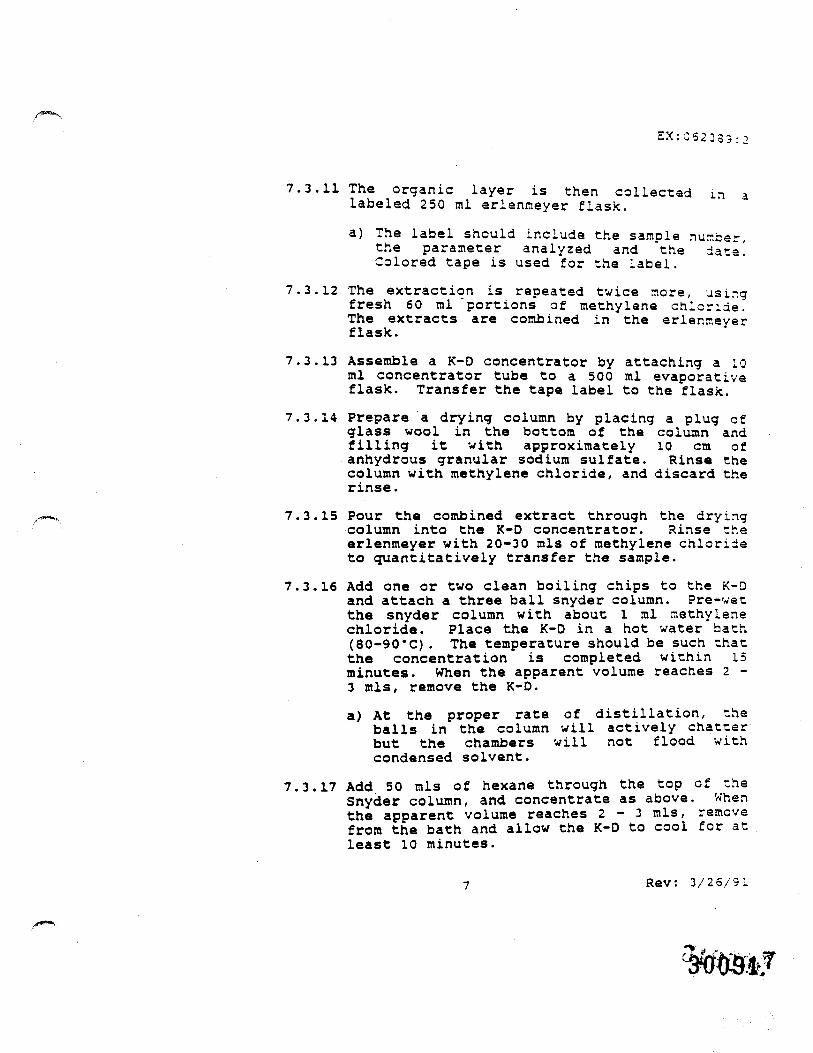
EX:C52333:2
7.3.11 The organic layer is then collected in alabeled 250 ml erlenraeyer flask.
a) The label should include the sample nurr.ber,the parameter analyzed and the date'.Colored tape is used for the label.
7.3.12 The extraction is repeated twice :rtore, usingfresh 60 ml "portions of methylene chloride.The extracts are combined in the erlenmeyerflask.
7.3.13 Assemble a K-D concentrator by attaching a 10ml concentrator tube to a 500 ml evaporativeflask. Transfer the tape label to the flask.
7.3.14 Prepare a drying column by placing a plug ofglass wool in the bottom of the column andfilling it with approximately 10 cm ofanhydrous granular sodium sulfate. Rinse thecolumn with methylene chloride, and discard therinse.
7.3.15 Pour the combined extract through the dryingcolumn into the K-D concentrator. Rinse theerlenmeyer with 20-30 mis of methylene chlorideto quantitatively transfer the sample.
7.3.16 Add one or two clean boiling chips to the K-Dand attach a three ball snyder column. Pre-wetthe snyder column with about 1 ml methylenechloride. Place the K-D in a hot water bath(80-90*C). The temperature should be such thatthe concentration is completed within 15minutes. When the apparent volume reaches 2 -3 mis, remove the K-D.
a) At the proper rate of distillation, theballs in the column will actively chatterbut the chambers will not flood withcondensed solvent.
7.3.17 Add 50 mis of hexane through the top of theSnyder column, and concentrate as above. Whenthe apparent volume reaches 2-3 mis, removefrom the bath and allow the K-D to cool for atleast 10 minutes.
Rev: 3/26/91

EX:
7.3.13 Remove the Snyder column, and rinse the flas'<and its lower joint into the concentrator" tube"with hexane. If sulfur crystals are noted, itwill be necessary to perform a sulfur clear.us(as detailed below) on the sample.
a) Place the concentrator tube on the M-Evacand blow the sample down to 1 ml.
b) Transfer the 1 ml to a 22 ml vial with ateflon lined screw cap and rinse theconcentrator tube with 1 ml of hexane.Transfer the washings to the bottle.
c) Add 1 ml of TBA-Sulfite reagent and 2 ml of2-propanol. Shake for 1 minute. if thesolution clears, add crystalline sodiumsulfite (in approximately 100 mg portions)until a solid residue remains.
d) Add 5 ml of distilled water and shake for atleast 1 minute. Allow the sample to standfor at least 10 minutes. Transfer thehexane layer (top) to a concentrator tubeand continue with the procedure.
7.3.19 If the sample is CLP level, prepare the sanplefor alumina cleanup by placing the concentratortube in the N-Evap which has a water bathmaintained at 35*C. Evaporate the solventvolume to 0.5 ml using a gentle stream ofclean, dry nitrogen. During the concentraticr.step, the solvent level must be kept below thewater level of the bath. The extract mustnever be allowed to go dry. Dilute the extractto 1 ml with acetone,and follow the procedureoutlined below. If the sample is SOP, bringthe extract to a final volume of 10 mis withhexane in a receiving vessel.
a) Add 3 g activity III alumina to the 10 mlchromatographic column. Tap the column tosettle the alumina. Do not pre-wet thealumina. Place a clean 10 ml concentratortube beneath the alumina column to collectthe eluate.
Rev: 3 / 2 6 / 5 1
300918

EX:062339:2
b) Transfer the acetone/hexane extract to thetop of the alumina using a disposablepasteur pipet. Add 1 ml of hexane to thecolumn,and rinse the original concentratortube with hexane and transfer the rinsingsto the top of the alumina column. • Elute thecolumn with additional hexane to make afinal volume of 10 mis. Do not allow thecolumn to go dry during the elution.
c) If necessary, place the concentrator tube onthe N-Evap and blow the sample down. Bringup to a final volume of 10 mis in areceiving vessel.
7.3.20 Transfer the extract to a labeled teflon linedscrew cap vial.
7.3.21 Fill in the appropriate spaces in block 6 ofthe extractions logbook.
7.3.22 The PCB/Pesticid« extract is now ready foranalysis. Place the extract in the appropriatefreezer in sample control. Fill out block 8 ofthe extraction logbook. A copy of labels withthe appropriate information is included asFigure 4.0.
7.4 Sample Extraction - Continuous Liguid/LiquidExtraction7.4.1 Transfer the emulsified sample to the contin-
uous extractor and add 120 mis methylenechloride. A reagent water blank withsurrogates added must accompany each batch ofsamples extracted.
7.4.2 Add 500 mis of methylene chloride to theboiling flask and extract for 13 hours. Allowthe flask to cool and remove the labeledboiling flask.
7.4.3 Dry and concentrate the sample as in 7.3 above.
Rev: 3/26/91
300919

SX:055233:2: 2
3.0 QUALITY CONTROL
3.1 A blank will be run with every batch. A batch isdefined as a grcup of samples for an analysis rurwithin a 24 hour period. A batch can have a r.axi.T.u-r!of 20 samples.
3.2 A matrix spike/matrix spike duplicate will be run at afrequency of 1 sample in 20. However, if more than 14days elapses and 20 samples have not been run, it willbe necessary to run a MS/MSD. For samples extractedusing the NYSDEC 89 protocol it is also necessary toextract a Blank MS every time a MS/MSD is extracted.
8.3 The extractions Batch Approval Sheets must be filledout on a daily basis. They are located on the back ofthe extractions logbook page. A copy of the sheet isincluded as Figure 5.0
8.4 A case narrative must be filled out for every batchassigned on a daily basis. There is space provided onthe Batch Approval Form for the case narrative. ifthe information requires transmission to other groups,a CAR should be used. Final case narratives will alsobe included in the client job folder. An example of aFinal Case Narrative is provided as figure 6.0.
8.5 The Extractions Logbook and the tracking log must becompletely filled out on a daily basis for every batchextracted or concentrated.
8.6 The Extractions Group Leader or his designee will fillout the Extractions QCAR (Figure 7.0) for inclusion ineach clients job folder.
9.0 METHOD PERFORMANCE
9.1 The method performance is determined by the finalmeasurement results of each sample and the accuracy ofsurrogate and MS/MSD measurement results.
10.0 DATA REDUCTION AND HANDLING
Not Applicable
Rev: 3/25/91

^M*M«4LrCK 1nu
"Hfey:w: OM: :
2o -5M
o i
I",: 'i: 'ri:i:»».-::.:»
i••':: :
- ..........
....
3 - j BLOCK 4!M :mi
M :M:«KS:s. ...... i ....!•ii•
"""::•
•
•i
:**
................
::ii
• ! • • " " - !
Sat : uu•i: n:M
s!:::::!::
: :.....:.. :: :...... .
!!:;:;:ii
•.:*
| BL
\m »i.i- Si"
...„ ..... .
...... ........ .....
.....
. .. ... ... ....
HI
OCK 5 I BLOCK ^ 1 BLOC
: ::»iu: »iMil !«MM,•
s......:....:l_:!:.....: .. ..!i:......:_..._.:
.„_!......:... .; ......:......I.......-N.....:.. ...:
!..... .......:
......i:......:
i
i
i:::::. ......::::•
::«M: M;XM
::.»::i:!1
......
-*
. ....:.:. . . :
:Mil:M::•
•
i::••::i::
i i ii tit :M|M; :•:: : ::... ..:..!...
M: :: j: :.......:...:..: :._...:...:_: :* t
: :.......!. !_..: :.„:...:....: :! •
: :.....!...!....
« KMI MIII M
..... ...... ....
..
...
_LL .__.._.; ;! : J| ! :
...:.....:..:....:: : : :....:......: .:....::::......*..i:•
:«
: :
: : :....:.;..:: :...:..:.: :...:. :.: ;..: : . .......... .
i: :.....!........!. ...: :
: ::......:...1.....I....: :,....:....: :
: : :... : : : .....:......: : : :: : : : :: : : : : :
BLOCK 2HIMMIM Mil ..................
mwiuwi;;;; ";;;;~~^^ ................. .._..( 7 1 BLOCK 8|
• •»••" ; ««""i«
j.....
MlM
.;:::i::
: M ; i 111 • UM ; mi: « :»IM s :: : :: . ! ;
*
[.....:1
.. .............
! i: :i . ..._...
: ;i: ;:........:._.: ::......_:..._J :_}...-j-: i
i:!•
....:.::
ii:::.... . . . . . : . . . ,
....... ...;- ..... . . . . .:... . . :i I
: : :
:......:.... •... ...i:...... _..::.... ....::
*
:: :: :• *« . . *: :: :; :: :; ;
: :: ;! ::_...;_i i: :h.s......::_...:...._. .
:.:•-.:1 ! •; ii : awmI tut'.:.:_..
i«
i..: .................. . . .....i•
: ::....: ... . . . . . . . . ._.... .....: :: ?::.....L.:•
: : sh-i-i-!_.:....1 i:......:. ...: :....:.....:: :......:::
. . . ::. .:...
•
:-:-••------- —::1- ................ .•: .... ..-
...._..,
-~.. .
:1 -. ... ..... ._..
. . . — , . . . „ . . . ... —

ACTION RTOTT / CASE NARFUOTVEClient: Job
L«a Raport«<i By;
of
0«acripKioa of» « « r C a « « u a i e t t i « A wt t n .,.. Si
CAI/CII «r
Vho la B*«u*rt«4 ToFor CAB:______
COTT*O-UT% jkrtl
Actual Conroetiw Actloa(a) Tatea:A«t«*l
f « f « ••« •••« ft C«ff •« C««fl«««« CAI/CII !• «A Off icer «»4 ( a l i i
Problva *»4 CorrwrtlT* Aotiea(s) la
F I G U R E 2 . 0

; SUft-1 MS FH3 THTO pH BN AI
F I G U R E 3 .0
300923

sa-
F I G U R E 4 . 0

IIX CTBXTRACTIQMS BATCH APPROVAL TQRM
Parameter ___________ • MatrixBlank ID. ________
Extraction ConcentrateInit/Oate Ir.it.'3a-a~
1) All required QA/QC wasperformed or referenced
2) Extraction logbook was completed
3) The sample tracking log hasbeen updated
4) Case narrative was completed
5) Was a corrective action formsubmitted?
6) The assignment was performedaccording to the SOP and ailexceptions have been documented
CASE NARRATIVE
Final Approval:
FIGURE 5.0

:EA - CTFINAL
EXT?ACT::NS :ASE NARRATIVE
CLIENT NAME : XYZ Cor?. CASE NUMBER: 3091-G5"3
CATE: 3/19/91 SAMPLE NUMBERS : C5~ 3CC 1
All samples were extracted .and concentrated without any apparentproblems, except as noted below. Sample 0573015 screened wi'tr. l:vacid surrogates. The sample was run by Mass Spec, and -r.escreening results were confirmed. The sample was re-extracted :.-.2/20/91, which was within holding time. The results of the re-extraction confirmed matrix problems.
CASE NARRATOR^ / -* V DATE '/f'V
APPROVED BY (/ ^ DATE
3e as specific Wnd detailed as possible. Please be sure to includeany conversations with the client
FIG ' JRE 6 . 0
30092G

EXTRACTIONS QaXtlTg- CONTROL APPRQVM.
CIient: .______________. Job Number:
Parameter: ______________ Samples:
Init / Dace
1) Batch Approval Form is complete
2) Holding times are met
3) Case Narrative has been completed
4) Copies of corrective actions made
5) Copies of any required data made
6) Logbook has been checked
These extractions have been performed in accordance with theextractions SOP unless otherwise noted in the case narrative.
Final Approval: ________________ Date:
F I G U R E 7 . 0f i"
300927

EX:062539:2
STANDARD OPERATING PROCEDUREFOR THE PREPARATION OF AQUEOUS SAMPLES
BASE-NEUTRAL/ACID EXTRACTABLB ORGANIC COMPOUNDS
1.0 SCOPE AND APPLICATION
1.1 The analyst is referred to the 02/88 version of the"USEPA Contract Laboratory Program Statement of work forOrganics Multi-Media, Multi-Concentration" for furtherinformation about these procedures.
1.2 This procedure is applicable to the analysis of watersamples.
1.3 It is the policy of IEA, Inc. and of the ExtractionsGroup to ensure that we administer contracts and ordersfor goods and services in a manner that is fullycompliant with governmental laws and regulations, aswell as the IEAr Inc. Policy Statement on BusinessEthics and Conduct.
2.0 SUMMARY OF METHOD
Water samples are serially extracted in a separatory funnel usingmethylene chloride at a pH >11 and again at a pH of <2. Theextract is dried using sodium sulfate, and concentrated using aKuderna-Danish (K-D) apparatus.
3 . 0 INTERFERENCES
3.1 Method interferences may be caused by contaminants insolvents, reagents, glassware, and other sampleprocessing apparatus. This can lead to discreteartifacts and/or elevated baselines in the gaschroma tograph . All these materials must be demonstratedto b« free from interferences by the measurement ofreagent blanks. Interferences that can causecontamination problems are the presence of phthalateesters, which are commonly found in plastics. Thoseinterferences can be avoided by using clean solvents andnot permitting samples to contact plastics in thelaboratory.
3.2 Matrix interferences may be caused by contaminants thatare co-extracted from the sample. The extent of matrixinterferences will vary considerably from source tosource.
i Rev: 4/2/91
300928

£ X : G S 2 5 3 9 : 2
4.0 APPARATUS, AND MATERIALS
4.1 Glassware
4.1.1 Separator'/ funnel, 2000 ml with teflon stopcock.
4.1.2 Drying column, chromatographic column appro*. 400mm long x 19 mm ID.
4.1.3 Concentrator tube, K-D, 10 ml, graduated.
4.1.4 Evaporative flask, K-D, 500 ml.
4.1.5 Snyder column, three ball macro.
4.1.6 Vials, 1.8 ml capacity with teflon lined screwcap.
4.1.7 Erlenmeyer flask, 250 or 500 ml.
4.1.8 Graduated cylinder, 1,000 ml.
4.2 Pyrex glass wool, extracted in ultrasonic cleaner withmethylene chloride for 30 minutes and dried at 180'C.
4.3 Silicon carbide boiling chips, approximately 10/40 mesh,extracted in ultrasonic cleaner with raethylene chloridefor 30 minutes and dried at 180'C.
4.4 Water bath, heated, should be in a hood.
4.5 Balance, analytical, capable of weighing ±0.0001 g.
4.6 Nitrogen evaporation device equipped with a water baththat can be maintained at 35-40'C.
4.7 Chlorine test kit, capable of detecting 0.1 ppm residualchlorine.
5.0 REAGENTS
5.1 Reagent Water - Water in which an interferant is notobserved at the method detection limit for eachanalytical parameter.
5.2 Acetone, Methanol, Methylene Chloride - Pesticide qualityor equivalent.
Rev: 4 / 2 / 9 1
300923

an environmental testing company•
(2031 2M-S341
STANDARD OPERATING PROCEDUREFOR THE PREPARATION OF AQUEOUS
SAMPLES FOR BNA ANALYSIS
EX:062689:2
a ii,,, ffxmifr. Cw
J1M77-OOM
300930

EX:052539:2
TABLE OF CONTENTS
Item
1.0 Scope and Application
2.0 Summary of Method
3.0 Interferences
4.0 Apparatus and Materials
5.0 Reagents
6.0 Sample Preservation and Storage
7.0 Sample Analysis
8.0 Quality Control
9.0 Method Performance
10.0 Data Reduction and Handling
Code
EX:062689:0
EX:062689:1
EX:062689:2
Revision History
Revision Date . Reason
Pace *
2
2 - 4
4
4 - 3
8 - LQ
10
10
6/26/89
2/12/90
4/2/91
Original Issue.
Update to NJDEP 4 NYSEDC39requirements.
Change to IEA forms andminor text revisions.
\ C'-£!- ;'| "Vfi
Rev: 4 /2 /91
300931

EX:062633:2
5.3 Sodium Sulfate - (ACS) granular anhydrous, purify ^vextracting in rnethylene chloride for 30 minutes and placein the drying oven overnight at 130'C.
5.4 Sodium Thiosulfate - (ACS) - 10% solution.
5.5 Sodium Hydroxide Solution, (ION) - Dissolve 40 g NaOH inreagent water and dilute to 100 ml.
5.6 Sulfuric Acid Solution (H-l) - (ACS) Slowly add 50 mlsulfuric acid to 50 ml of reagent water.
5.7 Base Neutral/Acid Surrogate Solution.
5.7.1 The BNA surrogate will contain the followingcompounds at the specified concentrations inmethanol:
Surrogates Concentration, ppm
Nitrobenzene-d, 100Terphenyl-du 1002-fluorobiphenyl 1002 , 4 , 6-tribromophenol 2002-fluorophenol 200Phenol-d, 200
5.7.2 Add 100 ul of the BNA surrogate solution to allsamples, blanks, and matrix spike/matrix spikeduplicates.
5.7.3 The solution must be stored at 4°C (i 2°C) for amaximum of 12 months in a sealed container with ateflon lined cap.
5.8 Base Neutral/Acid Matrix Spiking Solution.
5.8.1 The BNA spiking solution will contain thefollowing compounds at the specifiedconcentration in methanol.
Compound Concentration, ocn
1,2,4-trichlorobenzene 100Acenaphthene 1002,4-dinitrotoluene 100Pyrene 100
3 Rev: 4/2/91
300933

HX:062539 : 2
N-nitroso-di-n-propylamine 100I,4-dichlorobenzene . {QQPentachlorophenol 200Phenol 200 •2-chlorophenol 2004-chloro-3-methylphenol 2004-nitrophenol . 200
5.8.2 The matrix spike and the matrix spike duplicate(MS/MSD) will each get 1.0 ml of the BNA"r,acrixspiking solution.
5.8.3 The solution must be stored at 4°C (± 2°C) for amaximum of 12 months in a sealed container with ateflon lined cap.
6.0 SAMPLE PRESERVATION AND STORAGE
6.1 Preservation Requirements
6.1.1 Water samples must be protected from light andrefrigerated at 4*C from the time of receiptuntil extraction and analysis.
6.2 Holding Times
6.2.1 CLP water samples shall be extracted within 5days of receipt, and SOP water samples shall beextracted within 7 days of collection. NYS.DEC 39samples shall be concentrated within 5 days VTSR.'
a) If SOP water samples are not received within 1day of collection, the Extractions Group Leaderand the Organics Manager must be notified. ACAR will be issued to Client Services tocontact the client for instructions on how toproceed.
7.0 SAMPLE ANALYSIS
7.1 Safety7.1.1 Analysts shall treat all samples as if they are
hazardous and take all appropriate safetyprecautions, including but not limited tosafety glasses, lab coats and imperviousgloves.
Rev: 4/2/ 3 1
300933

E X : 0 6 2 5 3 9 : 2
7.2 Chain of Custody Procedures
7.2.1 All analysts are responsible for maintainingsample custody in accordance with Z?Aguidelines.
7.2.2 All samples must be signed out on the chain ofcustody forms located in sample control.
7.3 Water Sample Extraction\Concentration Procedure-Separatory Funnel
7.3.1 When the sample is brought to the laboratoryfrom sample control, the extraction logbook forthe batch is started. A copy of the logbookpage is labeled Figure 1. The appropriateinformation is entered into blocks 1 through 3.
7.3.2 The pH of the sample is checked using widerange pH paper. If the pH is outside the rangeof 5-9, a Corrective Action Report (CAR) isfilled out. A copy of a CAR is labeled Figure2.
7-. 3. 3 The chlorine residual of the sample is checkedusing the chlorine test kit. If a residual isdetected a CAR is filled out, and clientservices is notified.
a) For SOP samples, the chlorine residual isneutralized using 500 ul of a 10 percentsodium thiosulfate solution. If after thethiosulfate is added, a chlorine residualstill exists a second 500 ul aliquot ofthiosulfate is added to the sample. If thatdoes not neutralize the chlorine, this isnoted on the CAR and in the case narrative.The extraction is continued.
b) For CLP level samples, a second 1 literaliquot of the sample will be extractedconcurrently with the original sample.
Rev: 4/2/91
300934
ceeooe

E X : 0 6 2 6 3 3 : 2
7.3.4 If the sample is submitted in a 1 liter sot-1-"the level of the sample is marked en ihe sideof the bottle with an indelible marker so thevolume can be measured at a later time. ~hssample is mixed to ensure homogeneity, andtransferred to a 2 liter separatory funnel. Ifthe sample is submitted in a larger volumebottle, a pre-cleaned graduated cylinder isused to measure 1 liter of sample. Theappropriate information is entered into block 4of the extraction logbook.
7.3.5 With every batch of samples processed, a blankmust be run. The blank will consist of 1 literof reagent water.
7.3.6 Tracking labels (see Figure 3) or an equivalentsystem must be used for every sample and blank.
7.3.7 Add 1,000 ul of SNA surrogate to every blank,sample and MS/MSD.
7.3.8 If an MS/MSD is to be run with a batch, add1,000 ul of SNA spike solution to the MS andthe MSD.
a) For the NYSDEC 89 protocol prepare a blankMS every time a MS/MSD is extracted byadding 1000 ul of SNA spike solution to aliter of reagent water.
7.3.9 Fill in the appropriate information in block 5of the extraction logbook.
7.3.10 Using ION sodium hydroxide adjust the samplesto a pH >11. Check the pH with wide range pHpaper.
7.3.11 Add 60 ml of methylene chloride directly tothe separatory funnel. Extract the sample byshaking the funnel for two minutes withperiodic venting to release the excesspressure. Allow the organic and aqueous phasesto separate for at least 10 minutes. If anemulsion forms at the interface between the twolayers, and it is greater than one-third thevolume of the solvent layer, mechanicaltechniques must be used to break the emulsion.
6 Rev: 4/2/91
300935

EX:062633 : 2
a) acceptable mechanical techniques forbreaking an emulsion include: stirrir.g,filtering the emulsion through glass wool,'or centrifugation.
b) If the emulsion cannot be broken, it will benecessary to use a continuous liquid-liquidextractor. Details on the procedure can beobtained iri the liquid-liquid extractionsection following.
7.3.12 The organic layer is then collected in alabeled 250 ml erlenmeyer flask. Colored tapeis used for the label.
a) The label should include the sample number,the parameter analyzed and the date.
7.3.13 The extraction is repeated twice more, usingfresh 60 ml portions of methylene chloride.The extracts are combined in the erlenmeyerflask.
7.3.14 Adjust the pH of the aqueous phase to <2 using1-1 sulfuric acid. Check the pH with wide
range pH paper.
7.3.15 The extraction is repeated three more timesusing fresh 60 ml portions of methylenechloride. The acid extracts are combined in aseparate, labeled erlenmeyer flask.
7.3.16 Assemble a K-D concentrator for each fractionby attaching a 10 ml concentrator tube to a 500ml evaporative flask, and transfer the tapelabel.
7.3.17 Prepare a drying column for each fraction byplacing a plug of glass wool in the bottom ofthe column and filling it with approximately 10cm of anhydrous granular sodium sulfate. Rinsethe column with methylene chloride, and discardthe rinse.
7.3.18 Pour the extract from each fraction through itsdrying column into its K-D concentrator. Rinsethe erlenmeyer with 20-30 mis of methylenechloride to quantitatively transfer the sample.
7 Rev: 4 /2 /91
300936
eceooc

7.3.19 Add one or two clean boiling chips to the K-Dand attach a three ball snyder column. ?re-wetthe Snyder column with about 1 ml -ethyienechloride. Place the K-D in a hot water bath(80 to 90*C). The temperature should be suchthat the concentration is completed within 15minutes. When the apparent volume reaches 2 -3 mis, remove the K-D and allow it to drain andcool for 10 minutes.
a) At the proper rate of distillation, theballs in the column will actively chatterbut the chambers will not flood withcondensed solvent.
7.3.20 Remove the Snyder column, and rinse the flaskand its lower joint into the concentrator tubewith methylene chloride. Transfer the label tothe recieving vessel. Place the concentratortube in the N-Evap which has a water bathmaintained at about 35'C. Evaporate thesolvent volume to <1 ml using a gentle streamof clean, dry nitrogen. During theconcentration step, the solvent level must bekept below the water level of the bath. Theextract must never be allowed to go dry. Bringup to a final volume of 1.0 ml in the recievingvessel using methylene chloride.
7.3.21 Transfer the extract from each fraction to aseparate labeled teflon lined screw cap vial.A copy of labels with the appropriateinformation are included as Figure 4.0.
7.3.22 Fill in the appropriate spaces in block 6 ofthe extractions logbook.
7.3.23 The base neutral and acid extracts are nowready for analysis. Place the extracts in theappropriate freezer in sample control. Fillout block 8 of the extraction logbook.
Rev: 4/2/91

EX:062639:2
7.4 Sample Extraction - Continuous Liquid/LiquidExtraction
7.4.1 Transfer the emulsified base neutral fracticr.to the continuous extractor and add 120 rrilsraethylene chloride. A reagent water blank withsurrogate.? added, and the pH adjusted to >llmust accompany each batch of samples extracted.
a) The initial attempt at extraction in aseparator/ funnel is not mandatory. Asample may be extracted initially using thisprocedure. Surrogates must be added, andthe pH must be adjusted to >11 prior tobeginning the extraction process.
7.4.2 Add 500 mis of methylene chloride to theboiling flask and extract for 18 hours. Allowthe flask to cool and remove the labeledboiling flask.
7.4.3 Add 500 ml of methylene chloride to a cleanboiling flask and attach to the extractor.
7.4.4 Adjust the pH of the aqueous phase to <2 using1-1 sulfuric acid, and extract for 13 hours.
7.4.5 Dry and concentrate the base neutral and acidfractions as in 7.3 above.
8.0 QUALITY CONTROL
8.1 A blank will be run with every batch. A batch isdefined as a group of samples for an analysis runwithin a 24 hour period. A batch can have a maximumof 20 samples.
8.2 A matrix spike/matrix spike duplicate will be run at afrequency of 1 sample in 20. However, if more than 14days elapses and 20 samples have not been run, it willbe necessary to run a MS/MSD. For samples extractedusing the NYSDEC 89 protocol it is also necessary toextract a Blank MS every time a MS/MSD is extracted.
Rev: 4/2/91
300958

EX=062639:2
3.3 The extractions Batch Approval Sheets must be filledout on a daily basis. They are located on the back cfthe extractions logbook page. A copy of the sheet 13included as Figure 5.0
8.4 A case narrative must be filled out for every batchassigned on a daily basis. There is space provided onthe Batch Approval-Form for the case narrative. ifthe information requires transmission to other groups,a CAR should be used. Final case narratives will alsobe included in the client job folder. An example of aFinal Case Narrative is provided as figure 6.0.
3.5 The Extractions Logbook and the tracking log must becompletely filled out on a daily basis for every batchextracted or concentrated.
8.6 The Extractions Group Leader or his designee will fillout the Extractions QCAR (Figure 7.0) for inclusion ineach clients job folder.
9.0 METHOD PERFORMANCE
9.1 The method performance is determined by the finalmeasurement results of each sample and the accuracy ofsurrogate and MS/MSD measurement results.
10.0 DATA REDUCTION AND HANDLING
Not Applicable
10 Rev: 4/2/91

•MM
•-J
n/i
~
1
1
i
:
•— •
*iu1
;T|i i i
i iM i
n
ti
«•••
u
*
3"
in
1
en
i.
' •iiisrl:""
is 1...j.... i*n-§*5
-»!«5s
5 = 3
- « l
iiiiiilifI*s25
Iis
la
1"KM"
i
:
: : : :; : .
: , : :' . ' ; ' : ' • '
: '' :
...J..— :. ...... J ...... -J ........ :...j. ........ ..:.._.
_J__...LJ__
*
\
iiiT
.....J.J....:
...j....
. .j....
i !
.... ....
..J....! I !
....
j...
....j--—
!
....
...L...
j
** «
FI
i i
_j__i..i...i
!
!
......J....
4...
;. ,.
"::."jz
!•
i
** ••
...j...
•••
I ; ."---:---........v.... ...............................
I ;
.......j........ ...........................
........;....;................„. j...........
...j j J :. ..........
...M...L. ...... ....
...J.......J... ... . ...
.......j...j... ......................i ! i :
......J...J... ......... ...... ............ ...
...J.......J... ......... ... .. ..
..I..]...]..........]...!..:.....
...J..J.............J...:..,......
......J..J...:....,.....:.........1 ; ; i i : •...J...J...J...J...J..J.........i i , i :
...J«J..J...J...J.......J...J......i ! i : ' : :
\ i i ''
'. :
M i :
'; M ;_ J.......J.......J. .................
CURE 1.0 ... _ _
Of-

an environmental test ing company
CORflBCTME ACTION PEPORf/ CASE NARRATIVEJob Nuatxr:———. S*«pl, Hu«b«r(s)
Problem H*port«d 87:
of Probl«i:P o o r Ca««uai c«i; T« wt t A , _ _ . $ •«» ; t * . , . .—:-: , . :———-
Description of Probloa: _____________ " • ' • • • •
U«« t t t aK of CAI /CVI «r *c t *« f t«4 <&««t i f • r
Pttxsoo Who Is IUqu«rt«d To Prorida Corr^etlrw Actioa«:
For CA«: _______„ &*9lr t« QrlftnatorActual Corr«ctiv% Aetioa(a) T*^**t
Actual C « t r « « t i v * A « t i « a * o
•••« « C«§f •« C«afl«ta4 CAl/Ci» t« 44 O f f i c e r **4
laitial Lak _Loa: Clioat Sarrioaa* Job Foldar( Otbar^ntanttBtrfTnii! QHTQTIIATQ«. 94 QHlfiHL
,t Prool4M aad Corrwtir* Actioa(s) la
F I G U R E 2 . 0Scn«gmo<jffl. Wifim4r. £«•«• junction.
300941

. SUR-1 M3 FHS THIO pH BNi SUR-3I
F I G U R E 3 . 0
300942

F I G U R E 4 . 0
300943

S~*^ ISA C.EXTRACTIONS BATCH APPROVAL FORM
Parameter ____________ • Matrix,
Blank 10. _____
Extraction C^r.cer.trazrInit/Date Ir.i-/Da-^
1) All required QA/QC wasperformed or referenced
2) Extraction logbook was completed
3) The sample tracking log hasbeen updated
4) Case narrative was completed
5) Was a corrective action formsubmitted?
6) The assignment was performedaccording to the SOP and allexceptions have been documented
CASE NARRATIVE
Final Approval:
F I G U R E 5 . 0
300943

IEA - CTFINAL
CLIENT NAME : XYZ Corp. CASE NUMBER: 3091-05"3
2 ATE : 3/19/91 SAX? IE NUMBERS : 0 5 " 3 C : 1 - : :
3 / ? / ?
All samples were extracted and concentrated without any apparer.tproblems, except as noted below. Sample 0573015 screened with l;vacid surrogates. The sample was run by Mass Spec, and thescreening results were confirmed. The sample was re-extracted cr.2/20/91, which was within holding time. The results of the re-extraction confirmed matrix problems.
CASE NARRATOR O-1 DATE
APPROVED 3Y I/ A fo^J^ DATE J
3e as specific «nd detailed as possible. Please be sure to includeany conversations with the client
FIGURE 6.0

Client: _;______————————————•— Job Number:
Parameter:—————•———————— ' Samples:
Init / Sate
1) Batch Approval Form is complete _________
2) Holding times are met ____________
3) Case Narrative has been completed _________
4) Copies of corrective actions made _________
5) Copies of any required data made _________
6) Logbook has been checked
These extractions have been performed in accordance with theextractions SOP unless otherwise noted in the case narrative.
Final Approval: _____________________ Date:
FIGURE 7.0
30

an environmental testing company^ ^ A 2CO MQr*.'c6 "• j r"'0 'K«
^^_~^^^^^_ vionro^ conr^cticijt :c<aa
FAX ,2031 268-5346
STANDARD OPERATING PROCEDUREFOR THE PREPARATION OFSOIL/SEDIMENT SAMPLES
FOR BNA/PESTICIDE/PGB ANALYSIS
EX:061689:2
300947illmoi* Ma*»jcf»yt*n» N«w J**»*T North <
704-705-0740 S17-272-W2 201^2»-«(«1 91W77XX390

EX:051533:2
TABLE OF CONTENTS
Item Page =
1.0 Scope and Application
2.0 Summary of Method 1
3.0 Interferences l
4.0 Apparatus and Materials 2
5.0 Reagents 3-5
6.0 Sample Preservation and Storage 5-6
7.0 Sample Analysis 6 - 1 4
8.0 Quality Control 14 - 15
9.0 Method Performance 15
10.0 Data Reduction and Handling 15
Revision History
Code Revision Date Reason
EX:061689:0 6/16/89 Original Issue.
EX:061689:1 2/12/90 Update to NJDEP & NYSEDC39requirements.
EX:061689:2 3/18/91 Change to IEA forms andminor text changes.
Rev: 3/13/91
300948

IEA - C?FINAL
EX7PACTICN5 CASE NARRATIVE
CLIENT NAME : . XYZ Corp
CATE: 3/19/91
CASE NUMBER: 3091-0573
SAMPLE NUMBERS : 35 7300 1
All samples were extracted and concentrated without any apparentproblems, except as noted below. . Sample 0573015 screened with levacid surrogates. The sample was run by Mass Spec, and thescreening results were confirmed. The sample was re-extracted on2/20/91, which was within holding time. The results ofextraction confirmed matrix problems.
.s r-
ASE NARRATOR
APPROVED BY
DATE
DATE
Be as specific Wnd detailed as possible. Please be sure to includeany conversations with the client
F I G U R E 6 .030094$

300950
gXTRACTIONSIZA CT
CONTROL XPPRQVXL REPORT
Client:
Parameter:
Job Number:
Samples:
Init / Date
1) Batch Approval Form is complete
2) Holding times are met
3) Case Narrative has been completed
4) Copies of corrective actions made
5) Copies of any required data made
6) Logbook has been checked
These extractions have been performed in accordance with theextractions SOP unless otherwise noted in the case narrative.
Final Approval: Date:
FIGURE 7.0

EX:061539: 2
STANDARD OPERATING PROCEDUREFOR THE PREPARATION OF SOIL/SEDIMENT SAMPLES
FOR BNA/PESTICIDE/PCB ANALYSIS
1.0 SCOPE AND APPLICATION
1.1 The analyst is referred to the 2/88 version of the"USEPA Contract Laboratory Program Statement of Workfor Organics analysis Multi-Media, Multi-Concentrationfor further information about these procedures.
1.2 This procedure is applicable to the analysis ofsoil/sediment samples.
1.3 It is the policy of IEA, Inc. and of the ExtractionsGroup to ensure that we administer contracts andorders for goods and services in a manner that isfully compliant with governmental laws andregulations, as well as the IEA. Inc. Policy Statementon Business Ethics and Conduct.
2.0 SUMMARY OF METHOD
Soil/sediment samples are serially extracted using an ultrasonicprobe with 1:1 methylene chloride/acetone. The extract isconcentrated using a Kuderna-Danish (K-D) apparatus. The extractcan be split and analyzed for .semi-volatiles as well aspesticide/PCB's.
3 . 0 INTERFERENCES
3.1 Method interferences may be caused by contaminants insolvents, reagents, glassware, and other sampleprocessing apparatus. This can lead to discreteartifacts and/or elevated baselines in the gaschromatograph. All these materials must bedemonstrated to be free from interferences by themeasurement of reagent blanks. Interferences that cancause contamination problems are the presence cfphthalate esters, which are commonly found ir:plastics. Those interferences can be avoided by usingclean solvents and not permitting samples to contactplastics in the laboratory.
3.2 Matrix interferences may be caused by contaminantsthat are co-extracted from the sample. The extent otmatrix interferences will vary considerably fromsource to source.
l Rev: 3/13/91
300951

EX:C61~33:2
4 . 0 APPARATUS AND MATERIALS '
4 .1 Glassware
4.1.1 Glass beakers, 400 ml
4.1.2 Side arm flask, 500 ml.
4.1.3 Concentrator tube, K-D, 10 ml, graduated.
4.1.4 Evaporative flask, K-D, 500 ml.
4.1.5 Snyder column, three ball macro
4.1.6 Vials, 1.7 to 15 ml capacity with teflon linedscrew cap.
4.1.7 Alumina column, chromatographic columnapproximately 200 mm long x 8 mm ID.
4.1.8 Buchner funnels, 100 mm diameter.
4.1.9 Disposable pasteur pipets, cotton plugged.
4.2 Pyrex glass wool, extracted in ultrasonic cleaner withmethylene chloride for 30 minutes and dried at 180'C.
4.3 Silicon carbide boiling chips, approximately 10/40mesh, extracted in ultrasonic cleaner with methyler.echloride for 30 minutes and dried at 180*C.
4.4 Water bath, heated, should be in a hood
4.5 Balance, analytical, capable of weighing ±0.0001 g.
4.6 Nitrogen evaporation device equipped with a water baththat can be maintained at 35-40'C.
4.7 Sonicator, equipped with 3/4" and 1/8" disrupter hornsand a minimum of 375 watt capability.
4.8 Oven, drying, capable of maintaining 104 ± 2°C.
4.9 Desiccator
4.10 Weighing dishes
4.11 Whatman GFA Filter Paper, 100 mm (or equivalent)
2 Rev: 3/18/91
300952

5 . 0 REAGENTS
5.1 Reagent water - Water in which an interferar.t is r.;-observed at the method detection limit for eachanalytical parameter,
5.2 Acetone, hexane, nethylene chloride, methanolPesticide quality or equivalent.
5.3 Sodium sulfite - (ACS) ~ reagent grade.
5.4 Sodium sulfate - (ACS) granular - Prepare by coveringsodium sulfate with methylene chloride in a beaker andplacing in ultrasonic cleaner. Sonicate for 30minutes, drain off the excess methylene chloride andplace in drying oven.
5.5 Alumina, Super I Woelm or equivalent, prepare byadding 7 percent (v/w) reagent water and tu:r..ole for aminimum of 2 hours. There should be no lumps present.
5.5.1 Each batch must be assayed using the aluminaequivalency test. If the batch does not meetcriteria, it may be deactivated with up to 9percent water.
5.6 Tetrabutylammonium (TBA) - Sulfite reagent Dissolve3.39 g of TBA in 100 mis of reagent water. Extractthree times with 20 ml portions of hexane. Discardthe hexane extracts, and add 25 g of sodium sulfite tothe water solution. The resulting solution can bestored at room temperature for one month in an amberbottle with a teflon screw cap.
5.7 Dlbutylchlorendate (DEC) surrogate solution (forsoils) - Prepare DBC solution at a concentration of 20ug/ml in methanol . The solution must be stored at 4'C(±2'C) in teflon sealed containers for a maximum of 12months .
5.7.1 Add 100 ul of the DBC solution to all samples,blanks and matrix spikes/matrix spikeduplicates (MS/MSD) . If the sample requires GPCcleanup, the surrogate amount will be doubled.
Rev: 3/18/91
300953

EX:361639:2
5.8 Base Neutral/Acid Surrogate Solution
5.8.1 The BNA surrogate will contain the followingcompounds at the specified concentrations inmethanol:
Surrogates Concentration, oom
Nitrobenzene-d5 100Terphenyl-d14 1002-fluorobiphenyl 1002,4,6-tribromophenol 2002-fluorophenol 200Phenol-d5 200
The solution must be stored at 4'C (±2°C) inteflon sealed containers for a maximum of 12months.
5.8.2 Add 500 ul of the BNA surrogate solution to allsamples, blanks, and matrix spike/matrix spikeduplicates. If the sample requires GPC cleanup,the amount of surrogate will be doubled.
5.9 Pesticide Matrix Spiking Solution.
5.9.1 The spiking solution will contain the followingpesticides at the specified concentrations inmethanol:
Pesticide Concentration, oom
Lindane 2.0Heptachlor 2.0Aldrin 2.0Dieldrin 5.0Endrin 5.04,4'-DOT 5.0
The solution must be stored at 4'C (±2'C) inteflon sealed containers for a maximum of 12months.
5.9.2 Matrix spikes and matrix spike duplicates willget 400 ul of the pesticide spiking solution.If the sample requires GPC cleanup, the amountof matrix spike will be doubled.
Rev: 3/13/91
300954

EX:06I539:2
5.10 Base Neutral/Acid Matrix Spiking Solution
5.10.1 The BNA spiking solution will contain thefollowing compounds at the specifiedconcentration in methanol.
Compound Concentration, opm
1,2,4-trichlorobenzene 100Acenaphthene 1002,4-dinitrotoluene 100Pyrene 100N-nitroso-di-n-propylamine 1001,4-dichlorobenzene 100Pentachlorophenol 200Phenol 2002-chlorophenol 2004-chloro-3-methylphenol 2004-nitrophenol 200
The solution must be stored at 4'C (±2'C) inteflon sealed containers for a maximum of 12months.
5.10.2 The matrix spike and the matrix spike duplicatewill each get 1.0 ml of the BNA matrix spikingsolution. If the sample requires GPC cleanup, ^heamount of spiking solution will be doubled.
6.0 SAMPLE PRESERVATION AND STORAGE
6.1 Preservation Requirements
6.1.1 Soil/sediment samples must be protected fromlight and refrigerated at 4'C from the time ofreceipt until extraction and analysis.
Rev: 3/18/91
300955

6.2 Holding Times
6.2.1 CLP level soil/sediment samples shall teextracted within 10 days cf VTSR (ValidatedTime of Sample Receipt) , and SO? soii/sedir.entsamples shall be extracted within 14 days ofcollection. NYSDEC 39 soil/sediment samplesshall be concentrated within 5 days of VTSR.
a) If SOP soil/sediment samples are notreceived within 1 day of collection, theExtractions Group Leader and the OrganicsManager must be notified. A CAR will beissued to Client Services to contact theclient for instructions on how to proceed.
7.0 SAMPLE ANALYSIS
7.1 Safety
7.1.1 Analysts shall treat all samples as if they arehazardous and shall take all appropriate safetyprecautions, including but not limited tosafety glasses, lab coats and imperviousgloves.
7.2 Chain of Custody Procedures
7.2.1 All analysts are responsible for maintainingsample custody in accordance with EPAguidelines.
7.2.2 All samples must be signed out on the chain ofcustody forms located in sample control.
7.3 Low Level Soil Extraction/Concentration Procedure7.3.1 When the sample is brought to the laboratory
from sample control, the extraction logbook forthe batch is started. A copy of the logbookpage is labeled Figure 1. The appropriateinformation is entered into blocks 1 through 3.
a) If both BNA and pesticide/PCB analyses arerequested on a sample, a separate logbookpage will be started for each fraction.
Rev: 3/13/91
300956

EX:061633:2
7.3.2 If there is free water present in the sanpia,decant and discard the excess water on thesample. Record the approximate percentage offree water in the comments section of' theextractions logbook.
7.3.3 Thoroughly mix the sample and discard anyforeign objects (eg. sticks, rocks, etc.)-Transfer 50 g of sample to a 150 ml beaker andadd 50 ml of water. Stir for 1 hour, and readthe sample pH using a pH meter equipped with aglass electrode. Record this information ir.block 7 of the extractions logbook. Discardthis portion of the sample.
a) If the pH is outside the range of 5-9, aCorrective Action Report (CAR) is filledout. A copy of the CAR is labeled Figure 2.The client will be notified, and hisinstructions will be noted in the casenarrative.
7.3.4 Weigh 30.0 g. ±0.1 g. into a labeled 400 mlbeaker, add 60 g. of anhydrous sodium sulfate,and mix well. The sample should have a sandytexture at this point. If the sample is stillwet at this point, add up to an additional 30g. of sodium sulfate. Immediately add 100 misof 1:1 methylene chloride\acetone to cnesample. The appropriate information is enteredinto block 4 of the extraction logbook.
7.3.5 With every batch of samples processed, a blankmust be run. The blank will consist of blanksand.
a) If the sample is from the NJDEP or for X-403protocols the blank will consist of solventonly.
7.3.6 Tracking labels (see Figure 3) or an equivalentsystem must be used for every sample and blank.
Rev: 3/18/91
30095?

7.3.7 Add 100 ul of DEC for soils and 500 ul of SN'Asurrogate solution to every blank, sample andmatrix spike/matrix spike duplicate (MS/MSD)If the sample requires GPC cleanup, double theamount of surrogates.
a) If only one parameter is requested, it willonly be necessary to add the appropriatesurrogate' to the sample.
7.3.3 If a MS/MSD is to be run with a batch, add 1000ul of BNA matrix spike solution and 400 ul ofpesticide matrix spiking solution to the MS/MSDsamples. If the sample requires GPC cleanup,double the amount of matrix spiking solution.
a) If only one parameter is requested, it willonly be necessary to add the appropriatespiking solution to the samples.
b) For the NYSDEC 89 protocol prepare a blankMS every time a MS/MSD is extracted byadding the appropriate spiking solution(s)to a sand blank.
7.3.9 Immediately after weighing the sample forextraction, weigh 5-10 g of the sample into atared weighing dish and dry overnight at 105'C.Allow the sample to cool in a desiccator beforeweighing. Record this information in block 7of the extractions logbook.
7.3.10 Sonicate the samples for 3 minutes using the3/4" horn with the output control knob set at10 and a pulse rate of 50 percent. The bottomof the sonicator horn should be about 1/2"below the surface of the solvent, but above thesediment layer.
a) It may be necessary to break up lumps in thesodium sulfate using a clean spatula priorto each extraction.
Rev: 3/13/91
300S58

EX:061639:2
7.3.11 Decant the extracts and filter through Whatmanglass fiber filter paper using vacuumfiltration into a labeled side arm flask.
a) The label should include the sample number,the parameter analyzed and the date.Colored tape is used for the label.
7.3.12 The extraction is repeated twice with 2additional 100 "ml portions of 1:1 acetone -methylene chloride. Decant off the solventafter each extraction.
7.3.13 After the final sonication, the entire sampleis poured into the Buchner funnel and rinsedwith 30 - 40 mis 1:1 acetone\ methylenechloride. Fill in the appropriate informationin block 5 of the extractions logbook.
7.3.14 If the sample is to be screened for low/mediumlevel analysis, take 5 ml of the total extractand concentrate to 1 ml using the nitrogenblowdown technique. After screening, theremainder of the extract is re-combined withthe rest of the extract.
7.3.15 Transfer the extract to a K-D concentrator.Rinse the side arm with 20-30 mis of methylenechloride to quantitatively transfer the sample.Transfer the tape label to the K-D flask.
7.3.16 Add one or two clean boiling chips to the K-Dand attach a three ball snyder column. ?re-wetthe Snyder column with about 1 ml methylenechloride. Place the K-O in a hot water bath(80 to 90 *C). The temperature should be suchthat the concentration is completed within 15minutes. When the apparent volume reaches 2 -3 ml, remove the K-D and allow it to drain andcool for 10 minutes.
a) At the proper rate of distillation, theballs in the column will actively chatterbut the chambers will not flood withcondensed solvent.
Rev: 3/18/91
30095?•

7.3.17 Remove the Snyder column, and rinse the flaskand its lower joint into the concentrator tubewith methylene chloride. Transfer the tacelabel to the recieving vessel. If the sar.slerequires GPC cleanup, place the concentratortube in the N-Evap and concentrate to o. 5 ml toremove, the majority of the acetone. in allcases make up to a final volume of 10 mis usingmethylene chloride. For information enperforming GPC cleanup, see the latest versionof the "Standard Operating Procedure for GelPermeation Chromatography".
a) If the sample is from the NJDEP or for X-408protocols written permission must 'beobtained prior to performing GPC cleanup onthe BNA fraction.
7.3.18 The extract is split for semi-volatile andPCB/pesticide analysis at this point. Transfer0.5 ml of the extract to a clean labeledconcentrator tube to prepare for pesticide/PC3analysis. The remaining 9.5 mis is preparedfor semi-volatile analysis.
a) If the sample is for semi-volatiles only,the extract will not be split.
7.3.19 Place the concentrator tube containing thesemi-volatile fraction in the N-Evap which hasa water bath maintained at about 35 'C.Evaporate the solvent volume to approximately0.5 ml using a gentle stream of clean, drynitrogen. During the concentration step, thesolvent level must be kept below the waterlevel of the of the bath. The extract mustnever be allowed to go dry.
7.3.20 If the extract was split, the semi-volatileportion is brought to a volume of 0.95 ml. Ifthe extract was not split, the sample isbrought to a final volume of 1.0 ml.
7.3.21 Add 5 ml of hexane to the 0.5 ml portion of theextract that was split out for pesticide/PCSanalysis and mix well. Use the nitrogenblowdown technique to concentrate to 0.5 ml.
1 o Rev: 3/13/31
3009GO

EX:061639:2
7.3.22 Prepare the .sample for alumina cleanup cvdiluting the extract to 1 ml with acetone!
7.3.23 Add 3 g of activity III alumina to a ::• -ichromatographic column. Tap the colunn tosettle the alumina. Do not pre-wet thealumina. Place a clean 10 ml concentrator tubebeneath the alumina column to collect theeluate.
7.3.24 Transfer the acetone/hexane extract to the topof the alumina using a disposable pasteurpipet. Add 1 ml hexane to the column, andrinse the original concentrator tube with i mlhexane. Transfer the rinsings to the top ofthe alumina column and elute the column with anadditional 8 mis of hexane.
a) Do not allow the column to go dry during theelution.
7.3.25 Place the concentrator tube on the N-Evap andblow the sample down to 1.0 ml.
7.3.26 Transfer the 1 ml to a 15 ml vial with a teflonlined screw cap and rinse the concentratortube with 1 ml of hexane. Transfer thewashings to the bottle.
7.3.27 Add 1 ml of TBA-Sulfite reagent and 2 ml of 2-propanol. Shake for 1 minute. If the solutionclears, add crystalline sodium sulfite (inapproximately 100 mg portions) until a solidresidue remains.
7.3.28 Add 5 ml of reagent water and shake for atleast 1 minute. Allow the sample to stand 5-10minutes. Transfer the hexane layer (top) to aconcentrator tube and concentrate to approx.0.5 ml. using the N-Evap. Bring up to a finalvolume of 1.0 ml in a volumetric flask.
7.3.29 Transfer the semi-volatile and pesticide/PCBextracts to labeled separate teflon lined screwcap vials. A copy of the labels with theappropriate information is included as Figure4.0.
11 Rev: 3/18/91
300961

£X:G61539:2
7.3.30 Fill in the appropriate spaces in block 5 cfthe extractions logbook.
7.3.31 The extracts are now ready for analysis. Placethe extract in the appropriate freezer insample control, and fill out block 3 of theextractions logbook.
7.4 Semi-volatile Medium- Level Sample Preparation
7.4.1 In a fume hood weigh 1.0 ±0.1 g sample into a22 ml vial. Wipe the mouth of the vial toremove any excess material and record the exactweight in the extractions logbook. Cap thevial to avoid cross contamination.
7.4.2 If necessary, determine the pH and percentsolids on the sample as in section 7.3 above.
7.4.3 Weigh out 1.0 g blank soil for each batch ofsamples. For NJDEP samples or for X-403protocol samples the blank will consist ofsolvent only.
7.4.4 Add 2.0 g of anhydrous sodium sulfate to thesample and the blank, and mix well.
7.4.5 Add 1.0 ml of BNA surrogate to all samples andblanks, and MS/MS'D.
7.4.6 If a MS/MSD is to be run with a batch cfsamples, add 1.0 ml of BNA matrix spikingsolution to the sample.
a) For NYSDEC89 samples, it will be necessaryto extract a Blank MS every time a MS/MSD isextracted.
7.4.7 Immediately make up to 10 mis with methylenechloride. Sonicate the sample for 2 minutesusing the l\8" tapered microtip horn. Theoutput control knob is set at 5 in thecontinuous mode.
a) Prior to starting the extraction, make surethat the sodium sulfate is free flowing. Itmay be necessary to break up the lumps witha spatula.
12 Rev: 3/13/91

EX:Q61539:2
7.4.8 Loosely pack disposable Pasteur pipets with 2-3cm glass wool plugs. Filter the extractthrough the glass wool and collect 5 ml in aclean concentrator tube.
7.4.9 Concentrate the extract to 1.0 ml using thenitrogen blowdown technique.
7.4.10 Transfer the extract to a labeled vial, fillout the extractions logbook, and place theextract in a freezer in sample control.
7.5 Pesticide/PCB Medium Level Sample Preparation
7.5.1 In a fume hood weigh 1.0 ±0.1 g sample into a22 ml vial. Wipe the mouth of the vial toremove any excess material and record the exactweight in the extractions logbook. Cap thevial to avoid cross contamination.
7.5.2 If necessary, determine the pH and percentsolids on the sample as in section 7.3 above.
7.5.3 Weigh out 1.0 g blank soil for each batch ofsamples. For NJDEP samples or X-408 protocolsamples the blank will consist of solvent only.
7.5.4 Add 2.0 g of anhydrous sodium sulfate to thesample and the blank, and mix well.
7.5.5 Add 50 ul of DEC for soils surrogate to allsamples and blanks, and MS/MSD.
7.5.6 If a MS/MSD is to be run with a batch ofsamples, add 1.0 ml of Pesticide matrix spikingsolution for soils to the samples chosen.
a) For NYSDEC89 samples it is necessary toextract a Blank MS every time a MS/MSD isextracted.
13 Rev: 3/18/91

7.5.7 Immediately make up to 10 nis withSonicate the sample for 2 minutes using -he1\8" tapered microtip horn. The output ccntrolknob is set at 5, and the pulse rate is at 53percent.
a) Prior to starting the extraction, make surethat the sodium sulfate is free flowing, itmay be necessary to break up the lumps witha spatula.
7.5.8 Loosely pack disposable Pasteur pipets with 2-3cm glass wool plugs. Filter the extractthrough the glass wool and collect 5 ml in aclean concentrator tube.
7.5.9 Transfer 1.0 ml to a concentrator tube andconcentrate the extract to 0.5 ml using thenitrogen blowdown technique. Add 0.5 ml ofacetone and clean up the sample using thealumina and sulfur clean up procedures detailedin section 7.3.
7.5.10 Transfer the extract to a labeled vial, fillout the extractions logbook, and place theextract in a freezer in sample control.
8.0 QUALITY CONTROL
8.1 A blank will be run with every batch. A batch isdefined as a group of samples for an analysis runwithin a 24 hour period. A batch can have a maximumof 20 samples.
8.2 A matrix spike/matrix spike duplicate will be run at afrequency of 1 sample in 20. However, if more than 14days elapses and 20 samples have not been run, it willbe necessary to run a MS/MSD. For samples extractedusing the NYSDEC 89 protocol it is also necessary toextract a Blank MS every time a MS/MSD is extracted.
8.3 The extractions Batch Approval Sheets must be filledout on a daily basis. They are located on the back ofthe extractions logbook page. A copy of the sheet isincluded as Figure 5.0
14 Rev: 3/13/91
30096.4

EX:061639:2
8.4 A case narrative must' be filled out for every batchassigned on a daily basis. There is space provided onthe Batch Approval Form for the case narrative. ifthe information requires transmission to other groups,a CAR should be used. Final case narratives will alsobe included in the client job folder. An example of aFinal Case Narrative is provided as figure 6.0.
8.5 The Extractions Logbook and the tracking log must becompletely filled out on a daily basis for every batchextracted or concentrated.
8.6 The Extractions Group Leader or his designee will fillout the Extractions QCAR (Figure 7.0) for inclusion ineach clients job folder.
9.0 METHOD PERFORMANCE
The method performance is determined by the final measurementresults of each sample and the accuracy of surrogate and MS/MSDmeasurement results.
10.0 DATA REDUCTION AND HANDLING
Not Applicable
!5 Rev: 3/18/91

" "'1.............:. . . . . . . .tt..... ...... .......
-:................:. " - • - - • ;•...... .. .:.. . ..... .•»............ ..^
..... ........... .... .:
...................................
!i:
|H^.. ................. ajul—-• • - - • • - »,,„«7 *mi«l«!
.....
' :;
'"}i'......:•;::•:i....•
«:..,......
:
11:
M:
*:;:::
:: ••
i 'i.......:.............;! ,•:.....:......!... ,. ..„! '
i ••.............i ............:.... ........J :..... ........:
-.i...wn»
xnw
i :i •I ii-i •: :: :: :; :» »......... .• :- i....... ... ..
:...........:i •: ::.............:•:.............:j!...... ......t-- iT"
!HI«
.««•;.'!
J!21_...
: :•s :i i. . . . . . ; . - . . . .
:. . ......:.... ....... . ....:. .. .. .. ..:...:..............
......................: :................... ....
!.........................!........................
H !•--;---,
:..........................: :... ...... ....... .......i :......................
. ' '. .....: ;: :
F.............
: :........... .......: :.....................: ;.......... ........• •• •
ii ; ii :..!"...! f.J. "" .iwiinotiL MO'lfl
••* «» I
t «i t
!..... .
:...........:• ••••.-•i..........:......:J»
!!:S;
"T"i......................:..............:...............
...:...... .....;....... ..;! II
H :in»t! im\\ $
/ ' 1(. :•:* * «; : :: : :; : :: : :- •: : :; : ! ': : :.,..,.,..; i :...................; : :............: : :> . i: ; :......................: : :i ii............. .........: : :........... .........: ; :! ! !! ! !.....................
: : :...........! ! !
i i !....... ...........: : ;...................: : ;...... T]
...................: ; :
mi :m:N III ill! tit«mi ;ni!
: : ;^fD'O'lflnun nm/iwMH
in
' ''
....
•
.....
.....
HIt]
!>
i i i i ii l l • •: ' ' i i1 :.....!..... ; : ,
.; |...:. . . . . . . . : . ......i .j. i..f... ;......•-...: : : : : :....... ... ....................
! ; ; : :............. ........ ....... ...... .......—.: : : :.............. ........ ........... ,...-,; : : : : ,• — : - • ; : ; : i•' : A........:........:......" ! i i i !
IITXIIIX;I I I . . 1:....._;.......!......;........;...... ;...-: : : : : s: ...I.. ..|.....;.... .1..;...•, ; : ! : :: : : : s ..............................................
; : : : ;: i > i: i : : :...... .............—..,..-......,... .
: : I...:......:. ;...... ............... , , . .: : : : : :. . . . . . . . . ........................... ...: I ! ! : !: ; : : : !
! ! ! ! ! 5 !; ; i : : :, ! J : ! i :• nx : ; : J win ! • : «»
H :m»: IMSIMMMI !«/»: •*im; in :wi«!n«i iwt i m :in; : i ! : ;
s MO'itt 1 *? Moo'ia
- ! • -:: •:... .......:;............•!i
i!!!!" ::.....!!:......... ..::•:*!!!!;:!:!
! »m; mIDJIJII:
:.L .
. . . . V1
•» • • • t• i: :.......... .
:...... .... . —— ;-;
...._..... .......... ... ..;..:: :! !: :..................
.....y. iii
; •i::!; :-•--.---- -:•!: :...................
........................... .........: :: :-----;---•— ;
........... ;........._.......;...: :: ... _._.„!.! i
'"'T T. . . . . .: :
. i _ Ui - i rI >I301H
......... ...t!!(?. yiOBH*HJIWI
l )!:)()•!«
e>
>K)0'iu

an grmronrngnUI (eating company
12031
ACTION RSOrT/ CASE NAflRAHVE—————— Job
Probl«» R«port«d By;
C*t«forr of Probl^a;
of Probl«a:J » . p l . M* t r ;«.;.,, .
U«« t*att ol CAl/CIt or i»««t if m*t»
*• Aetioa<«):_Who la Boquostod To ProridoFor CAB:____________
LT» Action*:____________loylr to Orlg±a*tor B*9uir»d? C f
A«tit«l
?•*• !••« • C«9f •« C««ffl«t«4 CAt/CII t« «A 0<fi««t ••« ( « l i « r
PTaTHTBOTTO^t QKtOTMATQa.
FIGURE 2.0£«§«* Junction.
t QA Officer.

' ' "
' a,::«?
1- L ^ J
"1 BLOCK 1UUIIIIpttiraMK H/iil '| BLOCK: :tin;j - jI i: ;:..:.._... .........Mi : ::.:. ._..:: : ::...:......._......;; : ::..:.._.........:: :.....................: : ..: ::...:..........._.. .: :i..:.._...........:j!: :! :: :}~ —::
!.;....• .....: :i *
* i* *. . .: :. .! ':*1 4
.1...
tM!•
........
........
...
........
'•
,:J:!i
::......::
.......:1
. ....
......
.....
"
......stamCK
......
...................
•......
. " "
.
.-
•
BLOCK it j: : ; .
ClI ! III! till ! MM ! HU ,nil* u/m:nuii!iiii;
JMI . SUM: !
_L .......I.........!....;...j..... _L._L.: : :
: ... ...:.... ... :.....: : :i . *........ ....... ...........: : :: « i: : i....:..... ......i.......:......: : :... :. ... .......:......_..:._...
U : :..... .....:........:....i : :! ...: . :: - : :;.... ......i.......:. .: : :....s...... .......:.........:......s : :
._..:...... ......:......: ...! ...J. ...L.! i !: : :
....:...... .....i........:.....: : :
„..:...... . .... :.. ... . . : . . .: : :....... . ....: ....:....: :...',.. . . :.........:...: : :t . . . . : . ...:....: : :: : : . : .: : : : :: : : : •: : : :
inMflllC UIUCIIM IttMNMt/MUl UIIII
BLOCK 5 J BLOCK: : : ; : ; :cut : in : HII : in : :m: :«HM
mi IHIM: ii :n : c/i :»!ii: M{ ;xu: ; ;wi: ;»i; ; : ; ; : :
.......:........:.....:.....!......:.:.. .:. ...: : ! : : : :
..._.i.......:. ...I.....1.......!..:....:.....; : : : ; ; :
......: ......:......:... :..... .!...:..!. ...: ; : ; ; :.....!...;...: ...:......!..:...:.....
; ; : ; : ; :....I.......:..:...;.......!..;...:......: : ; i : : :... ...:... ...I....:....:......:..:....:.....: : : : : ; :.......s.......:.. ..-.:...-.:.......!..:...:.....: : i : : : ;......I,...:....!.....:....:...:....:......: : : ; : : :
: ; .:...! ....:._: ...!.. .: ; : : : : ;.......:........!.....:..:......:..:....:............L.J....L.L.1L ......: : : : : ;.......!........:......:.... :..:....:...:.... ......: : : : : :.. ....:.......:. ..I...:.......:...:....:.....: : : : : : :.......!........:.. :. .:....:;...:.....: : : : : : :. ....:. ...:. :.. .:. ...: :..:: : : : i : :
....!.. . : . . . : :. ..:.!..: : : : :. : : : :. . :
: ; : : :....:. : :.. .!.. .. :: : : : :.. ... : .. .!. . : : . . . :: : : :
; : : : : :: : : :: : : i v: : : :
..6......J......:OKI :
XWIIrtH !
:.. :......:.. .. :.....
•i
... :.....ii
.....:...::.... .. :.....
: ::.....:.....: :: :: :! :
:. . ..:............:_..
:::
-T... ..!
..:....:
.... .:. .;. ..:.....
:. .. .:. ....
i;.... i
»Kf
BLOCI; ttoti...............mi ; HI
: ii••:
......i...::...... :......: ::... ....:.....
::..... .:......:!-- i-:......!......i i
:::...... .:.......
;t
;*
....:..*
:.. :... . .:
.. . :......
. . . .L.......:......:
. : .. •': :: :. .. i
i( -? ~
...........
...I...:....... :.... ..:;!
!: •
.......:........:
.. ...:......_:-......:.....„.
.......i.. .....
..... ... .
|
::,
:
L::
:..i!....•i!:...:•
h:...'........
..
..::•
««
BLOCK
. ... .. .:«"; iu. ; not ; it; : : KM: : ::......: .._:_....: : :i......:....:......: : ;:.....:....:_ .: : ;: . . . . : . . : . .: : ;:.....:..._.:...._: : :{.....j -:.....:-_:.....!... .: : ;: : •: : ::......;....:...: : :L...:.....:.....; : :!......:_....:......! : :: . . ! . . . : . .: : ::.. : :...: : :'...: . : . . .: :
: :::
i t•:•»: »i:•i
i•
»
BLOCK 2IllUCIItt tillNIIHMII .;....HIMSIIf COMIflll OMiffioniii. ......
::* ftiUtlHI W»iS«4
:
i ... ........i... . . . - . : . . . . "ii| .... :
1
•'
:........ ... .::. . .... . . ..::
i .... . . . .::I. .. .

5 0
F I G U R E 4 . 0S '*
300969
'<* ,

SU«-1 MS FMS THIO pH BN ASUR-2
300970F I G U R E 3 . 0

This Page Was Intentionally Left Blank.
300971

IZA CTEXTRACTIONS BATCH APPROVAL FORM
Parameter ____________ MatrixBlank 12 . ___________
ExtractionInit/Date
1) Ail required QA/QC wasperformed or referenced
2) Extraction logbook was completed
3) The sample tracking log hasbeen updated
4) Case narrative was completed
5) Was a corrective action formsubmitted?
6) The assignment was performedaccording to the SOP and allexceptions have been documented
CASE NARRATIVE
Final Approval:
30Q97 FIGURE 5.0

an environmental testing company' ~-\ •
STANDARD OPERATING PROCEDURE
THE ANALYSIS OF PESTICIDES/PCB'S
IN ENVIRONMENTAL EXTRACTS
GC:010687:6

GC:010687:5
TABLE OF CONTENTS (Continued)Item ' paqe 8
List of Tables (Continued!
TABLE VII - Individual Mix A Stock 20TABLE VIII - Individual Mix A Dilutions 21TABLE IX - Pesticide Individual Mix 8 - Stock 22TABLE X - Pesticide Individual Mix 8 - Dilutions 23TABLE XI - Multi-Response Compounds 24TABLE XII - Pesticide Evaluation Mix Standards 25TABLE XIII - DOT Series Mix Standards 26TABLE XIV - Standard Range 27
List of Figures
Batch Reference Forms (Figures 1 - 4)Chromatograms (Figures 5 - 20)Calculation Summary (Figures 21 - 23)CRQL (Figure 23a)MOL (Figure 23b)Initial QC Forms (Figures 24 - 27)Result Forms (Figures 28 - 42)QC Forms - Final Package (Figures 43 - 51)Standard Log-In (Figure 52)
Revision History Code
October, 1987 GC:010637:iDecember, 1988 GC:OL0687:2February, July, August, 1989 GC:010687:3May, 1990 GC:010687:4June, 1990 GC:010687:5April, 1991 GC:010687:o
4/91
300974
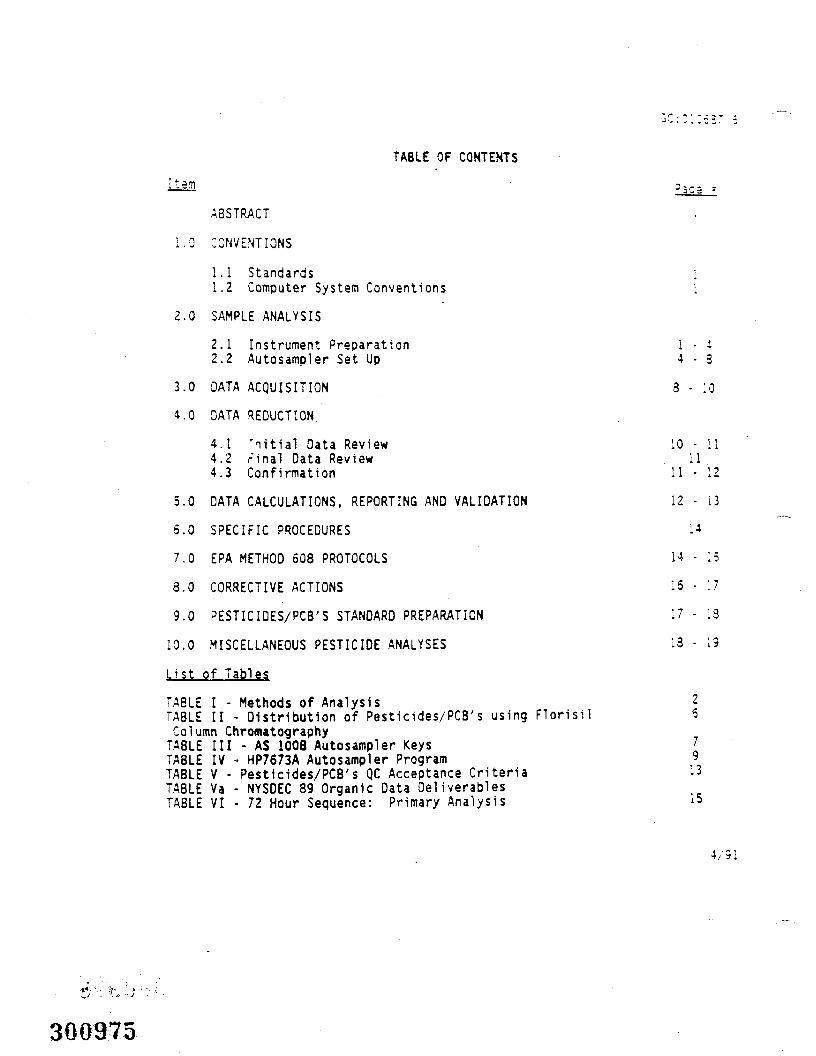
TABLE OF CONTENTS
Item
ABSTRACT
1.0 CONVENTIONS
1.1 Standards ;1.2 Computer System Conventions 1
2.0 SAMPLE ANALYSIS
2.1 Instrument Preparation 1 - 42.2 Autosampler Set Up 4-3
3.0 DATA ACQUISITION 3 - 10
4.0 DATA REDUCTION
4.1 'nitial Data Review 10 - 114.2 rinal Data Review . 114.3 Confirmation 11 - 12
5.0 DATA CALCULATIONS, REPORTING AND VALIDATION 12 - 13
6.0 SPECIFIC PROCEDURES 14
7.0 EPA METHOD 608 PROTOCOLS 14 • 15
8.0 CORRECTIVE ACTIONS 16 - 17
9.0 PESTICIDES/PCB'S STANDARD PREPARATION 17 - 13
10.0 MISCELLANEOUS PESTICIDE ANALYSES 13 - 19
List of Tables
TABLE I - Methods of Analysis 2TABLE II - Distribution of Pesticides/PCB's using Florisil 5Column ChrowatographyTABLE III - AS 1008 Autosampler Keys 7
TABLE IV - HP7673A Autosampler Program 5TABLE V - Pesticides/PCB's QC Acceptance Criteria 13TABLE Va - NYSDEC 89 Organic Data OeliverablesTABLE VI - 72 Hour Sequence: Primary Analysis 15
4/91
300975

GC:QiC537:5
1.0 CONVENTIONS
For organizational purposes all activities in the GC section have strict conven-tions for coding standards, data files, peak reports, analysis methods andinstrument nomenclatures.
1.1 Ethics Policy - IEA
It is the policy of IEA, Inc.-Connecticut and the GC group to ensure thatanalyses of samples fully comply with governmental laws and regulations aswell as the IEA, Inc. Ethics Policy.
1.2 Standards
All standards are traceable to EPA and are ordered from the EPA Reposito-ry. All standards, upon receipt, are logged in the appropriate card filewith the date of receipt, source and lot numbers.
All standards preparations are logged and coded (see Pesticide/PCB stand-ards prep SOP).
1.3 Computer System Conventions
At the time of preparation of this SOP the Perkin Elmer 7500 Computer withChrom 3 software is utilized for the collection of data.
Under this mode of operation each GC has an operating environment with its/"****•-• own methods. Currently four environments are utilized. The following
table lists the methods utilized for data collection and handling.Method 106 is used for raw data collection. Other methods are then c a l i -brated against associated peak files for re-reports of standard peakfiles.Data files are named depending on the particular analysis being run, andthe column used. The following table gives an example of file naming.Only ten digits are allowed. For confirmation runs, add a "C" or Conf tothe file name.C1 ientfsl • ____File Naming Convention______
ERA "epa nnnn" (the numbers (n) being theEPA case number)pestn (add a number (n) if this name
Miscellaneous Clients has been used so as not to overwriteprevious data)
4/91
300976

STANDARD OPERATING PROCEDURETHE ANALYSIS OF PESTICIDES/PCS'S IN ENVIRONMENTAL EXTRACTS
abstract
This Standard Operating Procedure (SOP) addresses the analysis of aqueous a-cs o i i d sample extracts for Pesticides and PCB's as defined by EPA Method 5C3(10/84) for priority pollutants, EPA Method 8080 SW846 3rd edition, and JSEPACLP SOW 2/88 Hazardous Substance List. Extracts are analyzed using Gas Chronia-tography with Electron Capture Detection (GC/ECD). Specific protocols should _ereviewed for complete descriptions of-sample analysis.
The intention of this SOP is to consolidate all aspects of the analyses in onedocument isions as required) for the purposes of consistency in data q u a l i -ty.
The basic methodology involves solvent extraction of waters or s o i l s followed byconcentration to required volume. The extract is then injected into gas chroma-tographs equipped with electron capture detectors. If target compounds aretentatively identified then the extract is injected on second column for confir-mation.
4/91
300977

GC: 010587:5
If the column has not been used recently, heat up slowly (approxi-mately IO'C/min) by temperature programming the GC. If column -snew then it must be conditioned. Columns are conditioned by temcer-ature programming. Setting the initial temperature at 40*C for 15minutes to stabilize flow then heating at 2*C/min up to 220'C m o l d -ing at this temperature for approximately 18 hours.
(3) When desired oven temperature is obtained and detector is above250*C, prime column by injecting approximately 10 ul of a 10 ppm ?C31254 standard or high concentration of mixed pesticide standard(i.e. stock standard of Mix A or 8). Turn power on at detectorcontrol box for PE SIGMA GC. For HP GC check that detector is on(Reference GC Manual).
(4) When all temperatures are reached, wait 15 minutes for equilibra-tion. Turn ECO to current setting - 4 and let equilibrate for 15 to20 minutes (for PE SIGMA only).
When utilizing Chrom 3 software the signal from detector should bestabilized between 8-12 millivolts. This can be adjusted by thezero control on ECD control box (PE SIGMA only).
2.1.1 Daily Instrument Maintenance
Injection port septa should be changed daily or after approximately60 injections. To do this do the following: Turn ECD to "Balance,"cool all GC temperatures to 30*C. When GC is cool shut off gas flowat toggles and let bleed until back pressure is zero. Replace sep-tum. Turn carrier gas on and heat to required temperatures. Recordall maintenance activity in GC log book.
2.1.2 Routine Preventive MaintenanceThe following is a list of tasks to be performed on a routine basisas preventive maintenance for the instruments used by the GC group.Record all maintenance in appropriate log.
1) Change diverter valve septa in Perkin-Elmer autosampler every200 injections.
2) Check flushing efficiency of Perkin-Elmer autosampler each timea run 1s started. Adjust helium/air pressure as needed. Cleansyringe when indicated.
3) Check syringe on the Hewlett-Packard autosampler for clogs aac.itime a run is started. Clean with solvents once a month orsooner to prevent freezing of the syringe.
4/91
300978

j C : 0 IC 5 3 !*
2.0 SAMPLE ANALYSIS
2.1 Instrument Preparation
(1) Verify that flow to column is off and no back pressure -3 ores-'Change injection port septa, and install appropriate column r';r'
TABLE IMETHODS OF ANALYSIS
Application
Column:
Raw Data FileCol lection
Re-reports:
EvaluationMixes
Ind AInd 8DOT Series
Chrom 1
1.5%SP2250/1.95X
SP2401
Method 206
Method 100
Method 820Method 821
N/A
Chrom 2 Chroi 4
3% OV-1
Method 206
Method 100
Method 810Method 811Method 102
1,.5'iSP2250/1.35",
SP2401
Method 2C6
Method 100
Method 320Method 321
N/A
analysis. When using on column injection columns for PE SIGMA, install leavingapproximately one quarter inch from end of injection port. Turn on carrier gasand establish flow at 60 ml/min for 4 mm ID columns and 30 ml/min for 2 .nm !Dcolumns. Ensure flow through detector is approximately 60 ml/min. Check nitro-gen pressure in the gas cylinder. Oo not allow pressure to go below 300 psig.Leak check all fittings.
(2) If GC is off, turn instrument power on.as follows:
Set instrument parameters
Column*0ven TempZones (Detector 4Injector)
1.5% SP2250/1.95* SP2401 3% OV-l210*C 190'C325'C 325*C
Pesticide/PCB analysis by packed column is isothermal, therefore.initial and final temperatures are the same. These may also vary tomeet EPA/CLP criteria for 4,4'DOT retention time.
4/91
300979

*Note: 2.2.2 may not be performed on CLP samples withoutfrom cllent.
2.2.3 AS1008 Set Up
Change septum in autosampler diverter valve. This should be :oneafter approximately 100 injections. Check to see that AS-10C8 so'"vent or gas lines are not crimped and that syringe moves freely.(Reference Section 5 of AS-100B manual.) Place autosampler on :rac<-et and position it approximately 1/2" from the injection sort.
Check the alignment by carefully moving the syringe towards treinjection port, piercing the septum and making sure that the needlemoves freely into the injection port. Slide sample tray ;nto :necarriage assembly and plug in the interface cable.
Turn on the autosampler controller. The autosampler w i l l now bepressurized, so do not attempt to move the syringe. Position thetray to the flush vials and manual!/ flush the syringe by pressingthe flush button. Do not flush each vial more than twice. Checkflow through the sample, waste lines and into the waste vessel (15-20drops per flush),
2.3 Autosampler Set Up
2.3.1
Remove samples to be analyzed from their respective freezers and signappropriate chain of custody sheets. The chain of custody sheets areto be signed with the date and time when removing extracts from thefreezer and when they are returned to the freezer. If it is neces-sary to sign the chain of custody at a later time, fill in the cor-rect information then initial and date that information with thecurrent date. Remove standards necessary for the run. Let allsamples and standards equilibrate to room temperature. If using theAS1008 autosampler, flushes can be prepared at this time. F i l l eachflush vial with hexane and place in the odd numbered slots in tneautosampler tray.
2.3.2Properly complete injection log book for the respective tray (SeeFigure 1). Initiate QC Batch Approval Form. Note any deviationsoccurring throughout the run, initial and date each task performed.(See Figure 2) Clearly label each vial for standards and samples.For soil samples use the autosampler vials which are designed forsmall volume analysis. Place the vials in the tray as noted on theautosampler log sheet. For AS100B, place 2-3 vials before the first
4/91
300980

>Ki : iV
GC:010537:5
4). Check solvent flush v i a l s and waste v i a l s on the Hewlett-'M'-<a'--autosampler at the start of each run. *
5) Clean by sonication or replace ECO anode in Perkin-Elmer GC *r="linearity exceeds criteria and standard prep is correct.
6) When breakdown criteria exceeds 13 percent change glass wool a:injection end of the column and inspect for breakage.
7) When breakdown exceeds 20 percent change glass wool and s i i a n - z 2injection port.
8) Maintain adequate directory space in the data station by archiv-ing and deleting data every week.
2.2 Extract Cleanups
2.2.1
Check the extractions log book for the type of clean-up performed onthe samples. Certain clean-ups are required depending on matrix andprotocols required. Some samples are required to be extracted byEPA-CLP protocols. Sulfur and alumina column clean-ups are performedin this extraction procedure. If after running the samples extractedas per EPA SW846, the scans still indicate the presence of interfer-ences, a florisil column cleanup may be required. Reference Table .'Ifor the elution of pesticides in the Florisil Fractions. -Mgnl/colored samples may require dilution.
Soils and some waters may contain sulfur which can be removed by theaddition of mercury. A few drops are added to the sample, whichshould then be shaken for 1-2 minutes. If sulfur is present a blackprecipitate will form. If this is the case, let the precipitatesettle out and carefully pipet sample to another vi a l . Repeat aboveuntil no precipitate forms.
2.2.2
If an extract is to be analyzed for PCB's only, then an acid clean upmay be done. This is to remove any organic compounds which may in-terfere with the analysis. The ratio for the clean up is 1 part acid(Cone. H,S04) to 2 parts extract. The acid is added to the samplethen shaken. The acid layer should be at the bottom layer. Careful-ly pipet extract layer to another vial. Repeat until acid layer islight brown to orange. End with a sulfur cleanup to remove any re-sidual acid.
4/91
300911

TABLE'11DISTRIBUTION AND RECOVERY OF CHLORINATED PESTICIDES
AND PCB'S USING FLORISIL COLUMN CHROHATOGRAPHY
Percent Recovery by Fraction*
Parameter
Aldrina-BHCb-BHCd-BHCg-BHC (Lindane)Chlordane4,4'-OOD4,4'-DDE4,4'-ODTOieldrinEndosulfan IEndosulfan IIEndosulfan SulafteEndrinEndrin AldehydeHeptachlorHeptachlor EpoxideMethoxychlorToxaphenePCS 1016PCB 1221PCB 1232PCB 1242PCS 1248PCB 1254PCB 1260
1 (6%)
10010097
- 9810010039931000370040
10010010096979795971039095
2 (15%) 3 (SOS)
10064709668
91106
26
*Percent.age of ether in hexane
4/91
300 82

GC:Oi;637:5
required injection as flushes to clean out the syringe before i n i t i -ating the run. Reference Table VI for the correct analytical se-quence. Load the autosampler tray according to this sequence.
2.3.3
Analyze an instrument blank after standard sequence every time a pewsequence is started on each GC. This is prepped with QBC at a con-centration of 0.1 ug/mL.
4/91
300983

If everything functions properly proceed to the "set-tic" as -er -•=autosampler method (Reference Table III). Be sure that the%e>^ritank has more than 500 psig for correct autosampler operation.
Also check that the house air is on.
2.2.4 HP7673A
If HP GC is ready then prep the autosampler sequence via tie -Pintegrator. Using the shift key hit [Prep] [Seq]. This w i l l thenprompt you a series of questions. Reference Table IV for sro^pti.Enter any changes, then hit the [Enter] key. If no cnanges \<-required just hit [Enter].
To end or cancel sequence use the [Break] key. Any changes made w i l lbe stored.
Now check to make sure vial trays are in the autosampler and that thetray holder is set all the way forward towards the autosampler tower.Make sure tower is straight. Empty solvent waste v i a l s and fillsolvent flush v i a l .
To start sequence run, hit [Shift] [Seq] and then [Start]. The auto-sampler program entered will now start running.
3.0 DATA ACQUISITION
Data is acquired using the Chrom 3 software and each run is processed into adata file and a peak file. Set up of the system is required before data can ceprocessed. The following steps outline the set-up procedure. Data may also oeacquired utilizing integrators but cannot be archived.
3.0.1
Check the system configuration by selecting "config" key. The configura-tion page will show whether the devices are linked to chromatographicenvironments. If changes are required, refer to the Chrom 3 manual.
3.0.2
To proceed to set up, press the "select" key and choose the appropriatechromatograph. Select the "set up" key under the operate section of thekeyboard.
4/91
300984
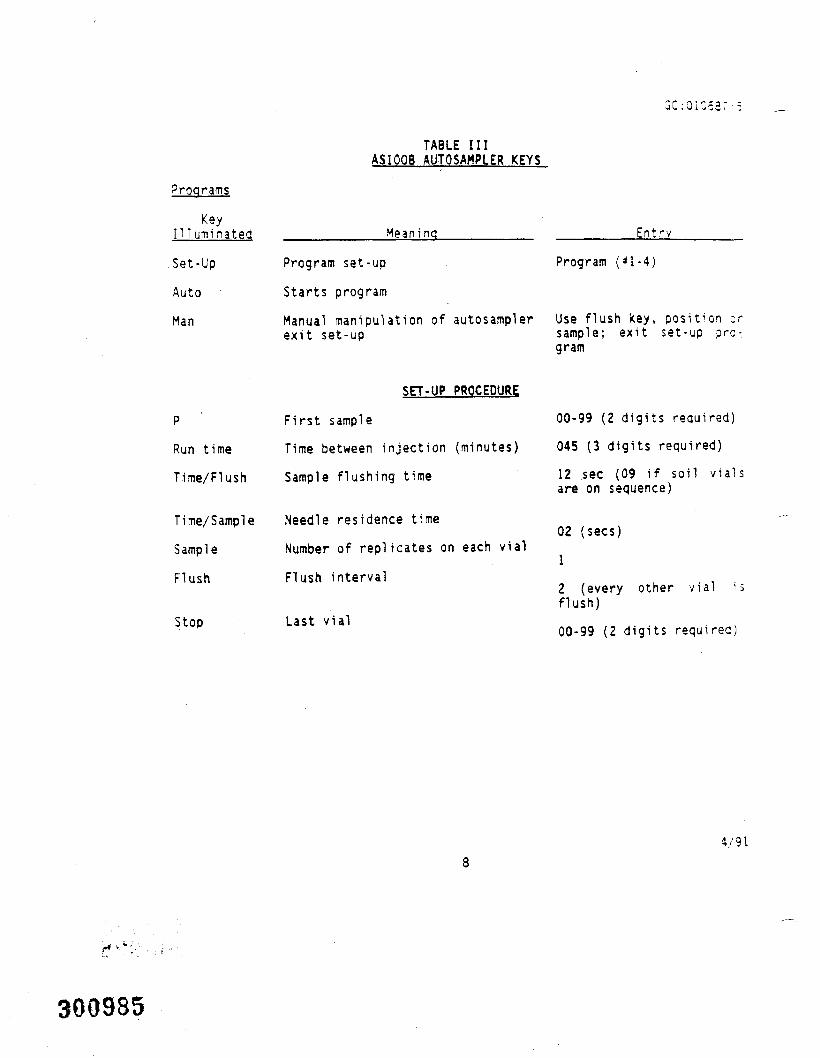
Programs
KeyIIluminated
Set-Up
Auto
Man
Run time
Time/Flush
Time/Sample
Sample
Flush
Stop
TABLE IIIAS10Q8 AUTOSAMPLER KEYS
Meaning Entry
Program set-up
Starts program
Program (*l-4)
Manual manipulation of autosampler Use flush key, position orexit set-up sample; exit set-up pro-
gram
SET-UP PROCEDURE
First sample
Time between injection (minutes)
Sample flushing time
Needle residence time
Number of replicates on each vial
Flush interval
Last vial
00-99 (2 digits required)
045 (3 digits required)
12 sec (09 if soil v i a l sare on sequence)
02 (sees)
1
2 (every other v i a l -sflush)
00-99 (2 digits required)
300985

GC:Q1G587:5
3.0.3
To set up the method of choice select "set up method" under the sofv <aysection. Enter appropriate responses for set-up page, then press "accsot
_____ Response _____
Analyst: InitialsMethod: Analysis methodSample: - Data file nameDescr: Column, ul injected, GC*Save Files AllApplication NoneRead BCD NoFlag Increment
3.0.4
Press the "plot" key to bring the plot to the screen. Select the "scaley" key to adjust scaling applicable to the GC environment. Select "moni-tor" soft key to monitor the detector output for PE SIGMA. Adjust to 0.01with detector zero knob. Exit the monitor after the signal is stable. Ifthe system indicates ready then the run may be started via the autosampleror integrator.
4.0 DATA REDUCTION
4.1 Initial Data Review
Check the continuing standards while the run is in progress. Initial andcomment on any criteria. If any standard is out of QC requirements thensamples following that standard must be reanalyzed. If run was stopped atthat standard, try reinjectlng standard. If QC is still not met, then anew 72 hour sequence period must be started. Reference Table V for re-quired analytical QC criteria. After a run is complete or while it isstill in progress check each chromatograra to ensure an appropriate injec-tion was made. This can be done by checking for the presence of 1) sol-vent peak and 2) DBC surrogate. Reanalyze any sample that looks suspi-cious (I.e. no DBC peak or DBC peak with <30 percent the area of theaverage- area of the standards). Before reanalysis see Group Leader. Ifscan Indicates Interferences, check area integration for that data file byselecting the data analysis section of the Chrom 3 and checking integra-tion with the "interactive reintegration" mode. If necessary go ^to"method development" to adjust integration algorithm for proper integra-tion. See Group Leader for approval to change the integration method.Check for dilutions at this point. Complete the analysis secion of the QCBatch Approval Form.
4/9111
300986

TABLE IV' HP 7673A AUTOSAMPLER PROGRAM
Prompt Meaning
ALS InformationINET Sampler Control
7573A Sampler Loop Address:3
Front Injector
Inj/Bottle 1-
First Bottle 13-
Last Bottle 13-
* of Sample Washes 3-
* of Pumps 5-
Viscoslty 3-
Volume 2-
* of Solvent A Washes fr»* of Solvent B Washes Q~
Priority Sample (1-Yes) 0*
Capillary On-Column 0-
Equilibrium Time in Seconds[10]
Method [M:CLP1.MET]
Sample Information Table
Bottle or Run Sample Indexed[R/B*]Bottle #
*This will end sequence program
Controlled
Communications
7673AINET
by
Injections/Bottle
Starting Vial
Last Vial
Rinses Syringe withsample to waste
Solvent Viscosity
Injection Volume
Solvent Rinses
Solvent Rinses
Capillary vs. Packed
Bottle or Run # (can belabeled at this point)
No Entry
1
* to start at
4 to end saq.
3
5
3
2
5
0
0
0
10
Anal. Method
B
Enter*
104/91
300987

GC:010537:5
For samples analyzed according to the NJOEP contract, TIC must be -one -npesticide/PCB (Task IV) samples. This is done by recording on appropnV*forms the retention times for the ten largest peaks that have a responsegreater than 2x the background noise leve. For external standard calcula-tion only retention times are required. If using internal standard con-centrations, it should be calculated from the nearest internal standard.
4.3 Confirmation
Any samples with possible target pesticides/PCB hits must be run on theconfirmatory column (3 percent OV-1). Associated method blanks mist alsobe run.
Toxaphene is always quantified using this column and requires three ievelsof toxaphene standards be run. If DOT is to be quantified using thiscolumn and the percent RSD for DOT in the evaluation mixes is greater than10 percent, then the DOT series standards must be analyzed and the percentRSD calculated for each compound. The DOT compounds (4,4'-DOT, 4,4'-000and 4,4'-DDE) must also have a calibration curve plotted by graphing areavs. ng injected. This is done by using the Super Plot Program on thePE-7500 computer. If the percent RSD is greater than 10 percent for acompound, then the concentration of that compound in the sample is readfrom the curve.
Only standards of compounds to be confirmed are to be analyzed at both thebeginning and the end of the run. The analytical sequence for the samplesis the same as the primary run (Reference Table VI).
Data reduction is performed in the same manner as the primary column data.A compound is confirmed if it is tentatively identified on primary analy-sis and if the retention time falls within the retention time window of acorresponding standard on the confirmation run. See Group Leader if youare not confident on a peak.
5.0 DATA CALCULATIONS, REPORTING AND VALIDATION
5.1 Subsequent to analysis (data acquisition), final results are calcu-lated using the LIMS-2000 (correct areas should be in the standardsdata set). Results are then put on the appropriate report forms (SeeFigures 28-42) (i.e. Priority Pollutants, TCL/CLP). The followingIndicates the type of documentation required for the different levelsof reporting:Level 1 - requires only tabular results given to client, with all
other documentation (standards and sample scans) placed inclient job file.
4/9113
300988

After the analytical run is fin-ished the GC instrument log book shou^ - =completed with the information required on the page. It should be s-<—=aby the Group .Leader and copied to be put with the raw data. A copy 3io-:aalso go with EPA.
4.2 Final Data Review
After evaluation of data, re-reports against appropriate methods can ;edone for standards and matrix spikes. Any replots of scans snould also :edone at this time. The methods for Pesticide Individual Mix A ana 3should be calibrated and updated against the corresponding peak files forthat run. When doing this be certain that all compounds in the mixes arerecognized, if not the method must be modified to do so. All samplesshould have a raw area re-report (Method 206) on a single page. If roiri-tegration was necessary a 206 report should be pulled for job and raw datafile. Results can then be compared against calculated RT windows forpossible nits.
Examine the raw data and calculate the required QC acceptance criteria forthe run. This should be done on the LIMS-2000 computer. F i l l out theappropriate QC forms (See Figures 24-27) continue filling out QC BatchApproval Form. Reference Figures 21-23 if LIMS is not operable and QCmust be done manually. To fill out forms refer to Section B of the EPACLP Manual. If QC is done on LIMS, then forms are printed by the comput-er. Reference SOP for LIMS. Have another analyst fill out Forms ReviewedSection of the QC Batch Approval Form.
Sample analysis is done by reviewing the scans, comparing peak retentiontimes to the retention time windows calculated on Form 9 for that a n a l y t i -cal sequence. Multi-responding compounds should be identified by patternrecognition (i.e. Aroclors). After sample analysis is complete then aconfirmation list should be filled out (primary analysis only), refer toFigure #4. Associated Method Blanks must also be analyzed on the confirm-atory column. Submit form to Group Leader.If sample analysis is to be done on a confirmatory run, then only thosecompounds identified in the primary analyses are looked for. At this timethe QC Batch Approval Form should be completed and approved by GroupLeader. A copy should be made for each job analyzed in the batch.
The analytical run is then labeled with appropriate information (client.sample information, column, GC, uL injected). Standard peaks should alsobe labeled with compound identification and nanograms injected. The runis then copied and packaged. All raw data used for NJOEP x408 work mustbe signed. If continuous data, then (it is only necessary to sign) tnebeginning and end.
4/9112
300989

G C : O i 0 6 3 7 : 5
This program is on the LIMS computer and should becolumn. Column identifications are as follows: ^n <„ oeing '-he -»xtcSn ^ installed) for mixed P^se column and Cn for confimatorv
4/9115
300990

I - requires tabular results, QC Forms DBC recovery and reun-ion time shift, method blank summary sheet, MS/'MSD for-s ir.:ita, standard and sample scans and integration reports.
* 2/88 - requires IFB deliverables: method blank summary,VHSD forms, surrogate recovery, pesticide Form X, E-A ^Cjrms VIII, IX, Form I, Page 3.
<408 - requires IFB .2!iverables plus TIC form.
1989 SOW - see Table Va.
:arting to complete a job package, a GC Packaging Review Forrf3 50) should be started. Each item should be checked off as itjleted. Any deviations from protocols should be anotated under:s section and in the case narrative. All information requiredobtained from the traveler. This form, along with the corre-ig QC Batch Approval Forms, should be handed in to the Groupwith the complete job package. At this time the Group Leaderignate will complete the Quality Control Approval Report (Fig-). The QCBAF forms are reviewed for deviations from criteria,:kaging review form is checked to make sure comments and formsJ match requested protocols and all deviations are noted in thearrative. This form will be placed in the job folder alonghe data package. The other forms will be on file with theLeader.
OCEDURES
ibration: When a new column is installed or detector is chang-ration curve of the compounds of interest is run. At leasts of each compound are to be analyzed. The three pesticidemix standards must be run prior to starting 'curve and allr these must be met {Reference Table V).
'line Windows: Upon initial set up of a column, a standardf component retention times must be established. This is doneijections of all single component pesticide mixtures, multi-sticides and PCB's over a 72-hour period. Retention time shiftt be less than 2 percent difference (packed column). A stand-on of the three retention times is calculated. Plus or Tiinusthe standard deviation is used to calculate a daily window.
NCE CRITFPTA
Level of
All
xed phase Allled for 3%
All
nt column Allfirmatory
in sam- Allmtinuing1 within
All
;ory on- All
try only CLP, Level II
NYSOEC 89
mixed phase column, then anyould be calculated from the 3
)les to be considered accept
4/9114 4/91
300991

GC:010587:5
TABLE VI72 HR. ANALYTICAL SEQUENCE: PRIMARY ANALYSIS
_______EPA CLP________
Pesticide Evaluation Mix APesticide Evaluation Mix 8Pesticide Evaluation Mix CPesticide Individual Mix APesticide Individual Mix 8ToxaphenePCB 1221*PCS 1232*PCB 1242PCB 1248PCB 1016/1260PCB 12545 SamplesPesticide Evaluation Mix B5 SamplesPesticide Individual Mix A or B5 Samples (etc.)
Analytical sequences may continue until one or more of the criteria is not met.
Sequence must end with both Individual Mix A and Individual Mix 8.*PCB 1221 and PCB 1232 are required once per month, or whenever the column ordetector have been changed.
4/9117
300992

j t: 0 i G 5 3 7: 5
7.0 ERA METHOD 608 PROTOCOLS
Analysis of Pesticides/PCB's using EPA Method 508 protocols varies wun *-eexternal standard calibration.
7.1
Calibration standards at a minimum of three levels are analyzed for eachparameter of interest. From the data calculate a calibration factor andpercent RSO for each compound. If the percent RSD is <10 percent, then anaverage Cf may be used for quantitation. If the RSO >10 percent, resultsshould be calculated from a calibration curve (area vs. mass injected).This curve must be checked daily. Percent difference for any analytsshould not exceed 15 percent difference from the original curve. If th i sis the case, then a new curve must be run.
7.2
Quality control consists of a method blank to be analyzed for each set ofsamples extracted or change of reagents. Ten percent of all samplesshould be spiked at the time of extraction. Quality control samplesshould also be analyzed at the same frequency. Before analyzing anysamples, all quality control set by EPA (Reference Federal Register10/26/84) should be met.
8.0 CORRECTIVE ACTIONS
The following are some of the problems which may be encountered with analysis ofpesticides/PCB extracts. If any problems occur a corrective action report nustalways be handed in (Reference Figure 3) to Group Leader. If the problem shouldbe noted in the case narrative then a CAR/Case Narrative Report (QA:111086:4)should be filled out and submitted with the job checking off the appropriate box(see Figure 3a).
3.1DOT and endrin breakdown is caused by active sites either within thecolumn or injection port. The first thing to check is the glass wool inthe front of the column. If the glass wool is discolored, then it must bechanged. ATso check for discoloration of the packing. The first fewinches may require changing.If using off column injection system then silanizing the injection portarea will be necessary. If none of these solutions correct the problem,then you must replace the column. See Group Leader before changing col-umn.
4/9113
300993

GC:C10S37:5
3.2 . ' .
All compounds in the continuing calibration standards <nust fall *i^incalculated retention time windows. This is an occasional problem ;-'-n*septa is worn or not pierced correctly. Restarting the 72 hour secuenceis the solution in this case. If this becomes a repeated problem over afew analytical runs, then new SO must be determined (see 6.2).
8.3
Linearity criteria is critical for all analytical runs. If this is out ofcriteria, re-inject standards. If it is s t i l l out, new standards shouldbe prepped. If the percent RSO's are s t i l l consistently out, the anode onthe ECO may require changing (P.E. Sigma Series) or detector replacementmay be necessary.
8.4
DBC is added as a surrogate for pesticide analysis. The retention time ofthe compounds must not shift more than 2 percent from the initial'evaluation mix A. If DBC is greater than 2 percent for a sample, then tnesample must be reanalyzed.
If the DBC retention time shift is still out, then the sample matrix isprobably affecting the retention time. If the sample is not from £PA nofurther analysis is required. If the sample is from EPA, inform the GroupLeader who will contact SMO for instructions.
9.0 PESTICIDES/PCB STANDARD PREPARATION
9.1 CalibrationDue to the coelution of Pesticides/PCB's on packed columns, two separateind i v i d u a l mixes of pesticides are required, as well as separate standardsfor all multi-response compounds. All standards are prepped from EPAstocks for traceability. Oibutylchlorendate is added to all solutions assurrogate at a concentration of 0.1 ug/ml. Tables 9.1 through 9.6 l i s tthe preparation instructions for all standards used. All standards areprepared using hexane as the solvent. They are to be stored under refrig-eration at all times. For c a l i b r a t i o n , each stock is diluted as required.(See following Tables.)All standards are to be prepared using Class A volumetric glassware andstored in silanized v i a l s with teflon lined caps. A new v i a l is to beused each time a standard is prepared. Two separate v i a l s of p e s t i c i d e
4/9119
300994
STANDARD OPERATING PROCEDURE
THE ANALYSIS OF SAMPLE EXTRACTS
FOR SEMI-VOLATILE ORGANICS
BY USEPA CLP PROTOCOLS
'Ion**»$•
MSSV:120586:7
300995
lit 41M77- t't-i •»
MSSV:i2C535
TABLE OF CONTENTS
?age ,Abstract ' ,
Conventions i . -,
Sample Analysis 2 - 5
Manual Tuning Procedure 6 - 7
Autosampler Vial Cleaning Procedure 7
Schedule of QA/QC Validation Checks 7.3
Initial Data Review 8 - 9
Final Data Review 9 - 15
Data Reporting Collation 15
Data Validation 15
List of Figures
Figure 1.0 - Maintenance Checklist
Figure 2.0 - Injection Logbook
Figure 2.1 - Batch Summary Sheet
Figure 3.0 - Quant ReportFigure 4.0 - Quality Control Approval Report - Deliverables
Figure 4.1 - Quality Control Approval Report - Analysis
Figure 5.0 - Corrective Action ReportFigure 6.0 - Semi-volatile Job Breakdown Sheet
Figure 7.0 - Case Narrative Form
Figure 8.0 - CRQL and MOL Table
7,90
300996
MSSV:L2C536:r
STANDARD OPERATIN6 PROCEDUREANALYSIS OF SAMPLE EXTRACTS FOR
SEMI-VOLATILE ORGANICS BY USEPA CLP PROTOCOL^
Abstract
This SOP addresses analysis of aqueous and solid matrix samples for s e m i - v o l a -tile (Base-Neutral/Acidic) organics as defined by the USEPA TCL List (EPA CL3}.Samples are extracted, screened using capillary GC/FID, and then analyzed Dycapillary GC/HS. The specific protocol^ - the USEPA Contract Lab Program IF3.SOW 2/88 and updates are to be reviewed for complete descriptions includingextraction, screening, sample analysis, data review, standard preparation andcalibration protocols.
The intention of this SOP is to consolidate all aspects of the analyses in oneworking document (to be revised as necessary) for purposes of consistency indata quality.
The basic methodology involves extraction of samples with suitable solvent andconcentration of the extract to obtain acceptable recoveries and detection lim-its for target compounds. A portion of the extract is then injected into thegas chromatograph for compound separation, and subsequently an electron Impactlonization Mass Spectrometer for identification/quantitation.
7/90
300997

Vs.-
1.0 CONVENTIONS
For organizational purposes all activities in the semi-volatile sect-on "a,-astrict conventions for coding standards, data files, archive tapes, 10 *-'es~quantitation output files, header information and custom programs.
1.1 Standards
All standards are traceable to EPA and are either purchased through S^ce'-co, Inc. or obtained from the EPA Repository. All standards, <joon -?-ceipt, are logged in the appropriate log book with the date of recent.source and lot number(s).
All standard preparations (see semi-volatile standard preparation SOP) arelogged and coded. Our convention for coding all semi-volatile standardsis as follows:
SV:xxxxxx:N:N
where SV » semi-volatileswhere xxxxxx » date of preparationwhere the first N - page I of standard prep, logwhere the second N - preparation log book I
On all vials labeled for storage, this code must appear along with a de-scription (i.e., 40 ng/ul IS, etc.). All injection log entries of DFTPP.calibration checks, or calibration curve points must be annotated *unthis code.
1.2 MiscellaneousThe following naming conventions are utilized to consistently identifyvarious files, programs, etc. to the respective instrument they are eitherutilized or generated on.
a) Data files>Nxxxx
b} Quantitation output filesNxxxx
c) ID fHes
d) Calibration filesC_N
7.'90
3&Q99S
MSSV:12C53S:
e) Batch sequence files •S_Nxx
f) Tuning filesT_N
where N « Instrument 10where x » Alpha numeric characters used in sequencing
2.0 SAMPLE ANALYSIS
2.1 Preliminary Activities
1) Check that the helium tank (carrier gas) has more than 250 psi. Ifit does not, please change the tank before proceeding.
2) Execute the command "FREE* to check that the data cartridge you areusing and the QT cartridge have enough available space. If avail-able space is <25 percent, purge files before proceeding.
3) If soils had been analyzed in the previous day's run, cool the ovenand injection port (oven to 30*C, injection port to 50'C). Removeand replace the injection port septum. Replace the injection portliner and cut off the first 2 inches of the capillary column. Aclean injection port liner should always be available that has beenheated gently in chromic acid and then pre-silanized to deactivatethe surfaces. If exceptionally dirty soils or waters have been run,deactivate the injection port with silanizing reagent. The si l a n *izing reagent used is Sylon-CT, purchased from Supelco, Inc. Pleasefollow the directions supplied with the Sylon-CT bottle explicitlywhen silanizing.
4) After analysis of water samples, step 3 may not be necessary and itsnecessity can only be determined after injection of the DFTPP 50ppm/Call brat-Ion Check I mixture. If the 50 ppm DFTPP/Cali brat ionCheck standard does not meet USEPA criteria because of low acidicanalyte recoveries, this step is mandatory.
5) Once the above has been completed inject 10 ul of 200 ug/ml acidshock .mixture and heat the oven to 290'C and allow it to remainth«r« for 15 minutes. Toggle purge B on for 10 seconds then turnoff. During this same period of time, heat the injection port to265'C.
6) Once the system has "baked" for 15 minutes, set it for the injectionof 1.0 ul of the tuning check compound DFTPP/Calibrat Ion Check I ata concentration of 50 ng/ul. This is done in the following manner:
7/90

MSSV:120555
a) Remove from the refrigerator the current DFTPP/Calibrar--Check I standard mixture. This contains DFTPP, the acid 3=m-'-volatile compounds and 3,3' -dichlorobenzidine. Allow it-" •-temperature equilibrate at room temperature for 5 minutes
b) Place in autosampler position #1.c) Using the Aquarius II program "8EOIT," set the run to the f:1-
lowing standard parameters (consult Aquarius II manual for fjr-ther information and more detail:
Sample size - 1 (1 ul)Bottle number » 1Archive the data file, quant identification file, and quantoutput file (answer "Y" to the appropriate prompts).Consult the injection log for the proper data file name anacodes for standard and internal standard mix.Insert the proper identification file.Insert the proper method file.Dilution factor - 1.0
7) Once the run is finished (or at elapsed time • 25 minutes or lon-ger), the DFTPP spectrum must be examined to determine if analysiscan proceed.a) Use the custom transfer file EZ to evaluate this. This win-
automatically evaluate the maximum scan of the OFTPP peak wit:averaging of the spectra (-2, +2 scans).
b) If not in criteria first manually examine other straight for-ward averaging to ensure a proper distribution of the massranges throughout the peak has been obtained.
c) If the instrument is not within EPA criteria, the system mustbe manually tuned. After tuning, DFTPP must be injected againand the mass spectrum evaluated again (See manual tuning sec-tion). Please save copies of all peak profiles for future ref-erence in the appropriate instrument logbook.
d) If the DFTPP mass spectrum is in criteria, please print thefollowing report.
Put the log bottom soft key on and type MSH to pring themass spectral header information.
. . Take log bottom off and type DR.ll.X.A to draw the massspectrum. Press the graph display key and examine it tosee if it is what you want to print. Press the graph copykey after this check.
5 •*•'.
7/90
301000

MSSV:120536:7
Type in NRM.100, which normalizes all masses to the basepeak, which is set at 100 percent. Then, put log bottom onand type in:
TAB to list the masses.Fill out the DFTPP Form V and place in a daily tuning/cali-bration folder (these will be filed once completed).
3) If DFTPP meets criteria, analysis can proceed. If running an i n i -tial calibration curve, nine-additional data points need to be c o l -lected. Please consult the SNA standards SOP for preparation andcalibration range. For sample analysis, proceed directly to step9b.
9a) Once the quantitation report is produced, a combined calibrationcheck report must be generated and evaluated, using the Aquariuscommand C8CHK. All calibration check compounds (CCC) must have apercent difference less than 25 percent. All system performancecheck compounds (SPCC) must have a response factor equal to orgreater than 0.050. Furthermore, all TCL compounds in the initialcalibration must be present in the 50 ppm calibration check mixture.The SNA 50 ppm Calibration Check II (which contains the base-neutralcompounds) solution must next be run. This is set up in 8EDIT inthe same manner as the OFTPP/Calibration Check I run.
9b) Once the quantitation report is produced, a calibration check reportmust be generated and evaluated, using the Aquarius command CBCHK.All calibration check compounds (CCC) must have a percent differenceless than 25 percent. All system performance check compounds (SPCC)must have a response factor equal to or greater than 0.050. Further-more, all TCL compounds in the initial calibration must be presentin the 50 ppn calibration check mixture.
10) For EPA CLP work, OFTPP and the calibration check standards must beperformed for each 12-hour analysis period.
2.2 Batch Acquisition of Sample Data
1) Hake surt that the methanol rinse vial is full and any waste con-tainers necessary for the autosampler are empty. Additionally,inspect syringe for proper alignment and freedom of movement of theplunger.
2) Please be sure that all samples to be run are correctly entered intothe injection log.
7/90
301001

MSSV: 120536 :.'
a) For NJDEP contract work, the injection time must be recordsnext to each data file acquired in the instruments injecVsn1 og.
b) All logs used for NJDEP contract work must be ?ernanen>?'/bound. " '
c) All NJDEP contract injection logs must contain each analystssignature, not just the initials.
d) The unused areas at the bottom of every injection log page rustbe crossed out with -a "Z" or "X" to prevent any further entriesat a later date. The crosscuts must be initialed and dated ~vthe analyst performing the crosscut,
3) Before starting up the "batch," use the QCAL command to update res-ponse factors from that day's calibration check mixture for tneidentification files which will be employed in the "batch."
4) Please ensure that the sequence file for the day's run contains thefollowing standard items.
a) Sample size • 1 (1 ul)b) Bottle numbers are sequenced 1 through the number of samples to
be run.c) All data files and output files need to be sequenced correctly.d) Archive all data files, quant files, and identification files.e) Employ the appropriate method and tune file.f) Do a double check to make sure that the dilution factors are
properly entered.g) The header and miscellaneous information sections should con-
tain the Case #, sample number and York Labs sample ID at aminimum.
5) Check that there is sufficient printer paper for the number of re-ports that Mill be hard copied.
6) Make sure that the printer is on-line and that the report terminal1s logged off (to allow Aquarius to dump reports).
7) As th» data comes off the printer, check surrogate and internalstandad area criteria and enter in Injection logbook. After examin-ing the chromatography place any additional information necessary inthe comments section.a) If either internal standard areas or surrogate recoveries do
not meet EPA CLP criteria, please notify the section leader sothat reanalysis or re-extraction reanalysls may be. scheduled asnecessary.
7/90
301002

MSSV:120536:'
2.3 Aqueous Sample Analysis Preparation - Low Level
Combine 300 ul of the base/neutral fraction, 300 ul of the acid fract-;nand 6 ul of the working internal standard mix (4,000 ng/ul) in an arcerscrew-cap type vial. Transfer 100 ml to a 110 ml autosampler v i a l . E.ite'-the appropriate quantitation factor, calculated as follows:
_____1.000_____ x 1.000 - QFamount (extracted (ml) 500
Please note that this quantitation factor 1s for the purposes of calcula-tion only -- when reporting results, the dilution 1s 1.0, unless a 2-fold.3-fold, or other dilution was necessary due to high viscosity and/or h:gnanalyte concentrations.
2.4 Soil Sample Analysis Preparation • Low Level
Place 300 ul of the soil extract in an amber screw-cap v i a l , along with 3ul of the working internal standard mix. Enter the appropriate quantita-tion factor, calculated as follows:
1.000 o/kq - QFdry weight (g)
dry weight - (x g extracted) (X solids (decimal notation)
Please note that this quantitation factor 1s for the purposes of calcula-tion only. As in aqueous samples, when reporting results, the dilution is1.0, unless a higher level of dilution was necessary because of high v i s -cosity and/or high analyte levels. If GPC clean up is used the QF must bemultiplied by a factor of 2 and the CRQL adjusted accordingly.2.5 Soil Sample Analysis Preparation • Medium Level
Place 300 ul of the soil extract In an autosampler vial, along with 3 ulof the Internal standard mix. Enter the appropriate quantitation factor,calculated as follows:
1.000 o/kQ x 10 ml - QFdry weight (g) 5 mldry weight - (x g extracted) (% solids (decimal notation)
Please note that this quantitation factor Is for the purposes of calcula-tion only. The same holds true for the reporting of dilution factors asfor aqueous and low level soil samples.
7/90
301003

MSSV:12C53t
3.0 MANUAL TUNING PRQCEpURE;
If you cannot achieve OFTPP criteria or the source has been cleaned the for-w-ing procedure can be followed to achieve OFTPP criteria.
1) Perform a full autotune after opening PFTBA valve.
2) With the PFTBA valve still open, go to manual tune and select EDIT.Press "scan parameters* and set the tune masses to 131, 219 and 502.Return to the top level of manual tune, press "execute" then press"parameter ramp" and the "ion focus." From the display note the ionfocus setting which corresponds to the intersection of the 131 and219 plots. Place the cursor at this intersection and press "set tocursor."
3) Confirm that the abundances of masses 131 and 219 are equal by re-turning to the top level, pressing "execute" and then "profilescan." Make a hard copy of this using the graph copy key. Turn offPFTBA.
4} At this point save the tune parameters by returning to the top leveland pressing "store tune." Save the file as T N (where N » instru-ment ID). Then exit Mtune.
5) Verify MS performance by injecting OFTPP and evaluating the soectrum.
6) Additional adjustment of lens voltages may be necessary if DFTPP isnot in criteria at this point.
4.0 IIP ul AUTOSAMPLER VIAL CLEANIN6 PROCEDURE (other vialsare discarded)I) In the extraction lab, in a hood, and while wearing gloves - remove
and dispose of the septum cap;I) Place vials In a 400 ml beaker of acetone;3) PTact beaker 1n ultrasonic cleaner water bath for 10-15 minutes with
heat applied to the water bath;4) Decant solvent into waste solvent drum;5) Add sufficient methylene chloride to the beaker to cover the v i a l s
and resonlcate for 20 minutes with heat;
7/90
50 :'•*.:•;;301004

MSSV:12053S:-
6) Decant solvent to waste solvent drum. Repeat 5 again;
7) Add sufficient methanol to the beaker to cover the v i a l s and soni-cate for 10 minutes;
8) Decant methanol into water solvent drum.
9) Oven dry for one hour 9 103*C.
5.0 SCHEDULE OF OA/QC VALIDATION CHECKS
1) All working solutions must be traced to ERA reference standards whenprepared and once per quarter if not purchased from a supplier whoperforms this.
2) Blind and double blind QC checks must be run as required by theorganics QA/QC officer.
6.0 INITIAL DATA REVIEW
Once the data acquisition for a batch of samples has been started, the GC/MSoperator immediately completes initial data review for the data collected thepreceding shift. This data review examines six key criteria for semi-volatiles:
. 12-hour Clock CriteriaSurrogate RecoveriesInternal Standard AreasChromatographyTarget Analyte ConcentrationsUpdated Response Factors (QCAL)Method Blank Criteria
These criteria are examined and summarized on the semi-volatile injection log-book and batch summary sheet (Figures 2.0 and 2.1). These will be verified andcountersigned within one working day by the section leader or his designate.The preliminary data rejection criteria for a RERUN flag on the injection logare as follows:
Surrogates - recoveries are evaluated using the following criteria(EPA CIR, SOW 2/88):
Surrogates Water % Soil *•
Base/Neutral NUrobenzene-d, 35-114 23-120Surrogates 2-F1uorob1pnenyl 43-116 . fj' "
Terphenyl-d14 33-141 13-137
7/90
301005

Surrogates Water %
Acid Phenol -d, 10-94Surrogates 2-Fluorophenol 21-100
2,4,6-Tribromophenol 10-123
1) All surrogates for method blanks must be within the above ranges.
2) For samples no more than one surrogate can be outside the aoovsranges in either the Base/Neutral or Acid fraction. (If out aftsrreanalysis a corrective action must be submitted to the ExtractionsGroup to schedule re-extraction of the sample.)
3) Recoveries must be >10 percent for all surrogates.
Internal Standards - must not be <50 percent or >100 percent ofthe EICA (extracted ion current area) of the correspondingcalibration check internal standards (DFTPP/Calibration CheckI). (If the same internal standard is out on reanalysis bothmust be submitted.)
Chromatography - there should be no "ghost" peaks present inthe chromatogram.
Target compound concentrations - For a diluted sample all sam-ples must have the analyte of the highest concentration under160 ppb (times the dilution factor). They must also be aoove80 ppb (times the dilution factor).
A case folder is then prepared and all data applicable to that particularcase is placed in it to await further reduction. The case folder mustinclude the following.
Case narrative sheet describing all irregularitiesCopy of injection logForm V OFTPP and spectral tab for DFTPP for initial calibrationcurveInitial calibration curve (Form VI)* plus medium quant reportsfor Individual standards if CLP.
. OFTPP for "batch" of samples (Form V and spectral tab)Continuing calibration checlc report (Form VII)*Continuing calibration quant report (medium)Copies of the injection logbookSample quant reports (full)Matrix spike/matrix spike duplicate quant reports (medium)
*P1ease note these are the Hewlett-Packard generated forms.7/90
301006

MSSV:i2C536:r
Method Blank Criteria
Method Blanks must contain less than the CRQL of the TCL List ofexceoting common phthalateesters which must be less than 3X the CRQL , SeeFigure 8.0).
7-0 FINAL DATA REVIEW
All final data judgment/review for target compounds and tentatively identifiedcompounds is done according to USEPA CLP protocols (SOW 2/88).
The target analytes are flagged appropriately in accordance with the followingconventions. The flags are placed directly to the right of the rounded-offvalue. All semi-volatile data is reported to two significant figures exceptwhen values are less than 10, then one significant figure is used.
Flag Conventions:
See SheetSurrogates are calculated according to USEPA CLP protocols (SOW 2/88). If adilution of the extract is made flag the surrogate recovery as (DL). Recordsurrogate recoveries to the right of the concentration columns of the quantreport (see Figure 3.0).Sign and date all quantitatlon reports when reviewing data (see Figure 3.0). Allmass spectra which do not meet EPA CLP criteria must be crossed out with a cleansingle line drawn through the quant report hit and concentration for that com-pound. Only the quantitatlon reports, chromatograms and positive hits arereported. All other spectra are saved to be placed in the case purge file.Subsequent to final data review, the package is signed and dated and given tothe data reporting/reduction section. Every page of raw data must be signed anddated by the data reviewer for NJOEP contract work.
7.1 Quality Control Approval Report (QCAR)A QCAR is completed for each deliverables report prepared and submittedalong *1tn the package. Please refer to Figure 4.0.The QCA* consists of ten check points which are carefully reviewed by thepersoiTperfornIng the initial data review and/or the final data reviewer.The ten approval check points are as follows:
7/9010
00010!-301007

MSSV:12C535
7.1.1 Analysis QCAR's are complete
Each QC batch associated with the deliverable report should have --associated analysis QCAR (Figure 3.0), which has been completed >--filed with the QC batch. " *
7.1.2 Client and sample ID's match
The deliverable* report is checked to ensure that the client 1C'3reported match the lab ID's from the traveler reports.7.1.3 Raw data has been sorted
All raw data which is not required in the deliverables report -nustbe removed and placed in an extra data file which will accompany thereport.
7.1.4 All samples and QC present
A review is made to ensure that all required samples, reanalyses,blanks, duplicates and matrix spikes/matrix spike duplicates arepresent and reported.
7.1.5 All raw ata present and legible
A review is performed to ensure that all original and/or photocopiesof the data are legible and present.
7.1.6 All required forms completed
A review 1s performed of the delfverables package to ensure that allforms are completed which are required for the level of report re-quested.
7.1.7 Case narrative completedEvery deliverables report must have a completed case narrative whichdocuments any deviations from the SOP which were required or anyproblems which were encountered.
7.1.8 Result transcriptions checkedThe final reviewer checks all reported results to ensure that notranscription errors have occurred.
7/9011
301008

MSSV:120586:7
7.1.9 Analysis holding times meet criteria
Each sample is checked by the final reviewer to ensure rhat --9protocol required holding times have been met and that any devo-tions have been documented in the case narrative.
7.1.10 Oeliverables in correct order
The final reviewer places the deliverables report in its properorder before submission to data management.
The final reviewer signs the bottom of QCAR as final approval to re-lease the data to data management.
7.2 Qualitative and quantitative identification of target compounds7.2.1 Qualitative determination
1) Relative intensities of major Ions in the reference spectrum(Ions greater than 10 percent of the most abundant ion) shouldbe present in the sample spectrum.
2) The relative intensities of the major ions should agree withint 20 percent. (Example: For an ion with an abundance of 50percent in the standard spectra, the corresponding sample ionabundance must be between 30 and 70 percent.)
3) Molecular ions present in the reference spectrum should bepresent in sample spectrum.
4) Ions present in the sample spectrum but not in the referencespectrum should be reviewed for possible background contamina-tion or presence of coeluting compounds.
5) Ions present in the reference spectrum but not in the samplespectru» should be reviewed for possible subtraction from thesample spectrum because of background contamination or coelut-ing compounds. NOTE: Data system library reduction programscan sometimes create these discrepancies.
If a compound cannot be verified by all of the criteria listedabove, but in th« technical judgment of the mass spectral interpre-tation specialist the identification 1s correct, then the contractorshall report that identification, with comment.
7/9012
301009

MSSV: 120536:?
1) Target compounds identified shall be quantified by the "it°r-nal standard method. The internal standard used shall ^e *keone nearest the retention time to that of a given analyte" ''«&EICP area of the characteristic ions for the target compoundsare used.
2) Internal standard responses and retention times in all stand-ards must be evaluated during or immediately after data acqui-sition. If the retention time for any internal standard changesby more than 30 seconds from the latest daily (12 hour) c a l i -bration standard, the chromatographic system must be inspectedfor malfunctions and corrections made as required. The ex-tracted ion current profile (EICP) of the internal standardsmust be monitored and evaluated for each sample, blank, matrixspike and matrix spike duplicate. If the EICP area for anyinternal standard changes by more than a factor of two (-50% to•t-100%), the mass spectrometric system must be inspected formalfunction and corrections made as appropriate. If the analy-sis of a subsequent sample or standard indicates that thesystem is functioning properly, then corrections may not berequired. The samples or standards with EICP areas outside thelimits must be reanalyzed and treated according to sections 3}and 4) below. If corrections are made, then the laboratorymust demonstrate that the mass spectrometric system is func-tioning properly. This must be accomplished by the analysis ofa standard or sample that does meet the EICP criteria. Aftercorrections are made, the reanalysis of samples analyzed whilethe system was malfunctioning is required.
3) If after reanalysis, the EICP areas for all internal standardsare inside the contract limits (-50% to +100%), then the prob-lem with the first analysis is considered to have been withinthe control of the laboratory. Therefore, only submit datafrom the analysis with EICP's within the contract limits. ThisIs considered the initial analysis and must be reported as suchon all data deliverables.
4) If the reanalysis of the sample does not solve the problem,I.e. the EICP areas are outside the contract limits for bothanalyses, then submit the EICP data and sample data from bothanalyses. Distinguish between the initial analysis and thereanalysis on all data deliverables. Document in the casenarrative all inspection and corrective actions taken.
The relative response factor (RRF) from the daily standard analysisIs used to calculate the concentration in the sample1. Secondaryions may be used if interferences are present. The area of a
7/9013
v •....••••*'. '"'• '-

MSSV:120586:7/""""N
secondary ion cannot .be substituted for the area of a primary ;-nunless a relative response factor is calculated using the secondaryion. When target compounds are below required quantitation l i m i t sbut the spectra meets the identification criteria, report t-econcentration with a "J". For example, if CRQl is 10 ug/L ardconcentration of 3 ug/L is calculated, report as "3J".
WaterConcentration ug/L «
Where:
Ax - Area of the characteristic ion for the compound to bemeasuredArea of the charactlerstlc ion for the internal standardAmount of internal standard added in nanograms (ng)Volume of water extracted in mllllliters (ml)Volume of extract injected (uL)Volume of total extract
(Use 2000 uL or a factor of this when dilutions are made. The2000 uL Is derived from combining half of the 1 mL 8N extractand half of the 1 mL A extract.)Sediment/Soil
Concentration ug/Kg - (A UI.HVJ__(dry weight basis) (Alt)(RRF)(?,)(H,)(0)
Where:
AX» !$» At» " same as 9 en f°r water, aboveVt « Volume of low level total extract (use 1000 uLor a factor of this when dilutions are made).If GPC cleanup Is used, the volume is 2000 uL.The 1000 uL Is derived from concentrating the9.5 mL extract to 0.95 mL.)
• OR -
VL - Volume of medium level extract (use 2000 uL or afactor of this when dilutions are made. The2000 uL 1s derived from concentrating 5 mL ofthe 10 mL extract to 1 mL.).
V, - Volume of extract injected (uL)0 • 100 - percent moisture
100Wt - Weight of sample extracted (g)
7/9014
301011

MSSV:120:35
7.3 Tentatively identified compounds
A library search is executed when requested for up to 20 non-target --n-pounds of greatest apparent concentration for the purpose of tentat^sidentification and quantitation. Compounds with responses less than" 13percent of the nearest internal standard are not required to be searched.Aldol condensation product should not be counted toward the 20 non-tar^tcompound total.
7.3.1 The following guidelines are for making tentative identifi-cation
1) Relative intensities of major ions in the reference spec-trum (ions greater than 10 percent of the most abundantion) should be present in the sample spectrum.
2) The relative intensities of the major ions should agreewithin ±20 percent. (Example: For an ion with an abun-dance of 50 percent in the standard spectra, the corre-sponding sample ion abundance must be between 30 and 70percent.)
3) Molecular ions present in reference sectrum should be pres--ent in sample spectrum.
4) Ions present in the sample spectrum but not in the refer-ence spectrum should be reviewed for possible backgroundcontamination or presence of co-eluting compounds.
5) Ions present in the reference spectrum but not in the sam-ple spectrum should be reviewed for possible subtractionfrom the sample spectrum because of background contamina-tion or coelutlng compounds. NOTE: Data system libraryreduction programs can sometimes create these discrepan-cies.
7.3.2 If 1n the technical judgment of the mass interpretationspectral specialist, no valid tentative identification canbe made, the compounds should be reported as unknown. The
. mass spectral specialist should give additional classifica-tion of the unknown compound, if possible (i.e., unknownphthalate, unknown hydrocarbon, unknown add type, unknownchlorinated compound). If probable molecular weights canbe distinguished, include then.
7/9015
301012

MSSV:1205a5:
7.3.3 An estimated-concentration for the tentatively identifiedcompounds is quantified by the internal standard .nettedassuming a relative response factor of one. The valueobtained is qualified as estimated using the "J" qualifier.
3.0 DATA REPQRTIN6/CQLUTING
Subsequent to final data review, all forms must be generated on the appl'tablePC and a diskette produced (See Diskette SOP). Once all forms are generates thecase narrative materials which include corrective action reports (figure 5.0)and comments noted on the semi-volatile job breakdown sheet (Figure 6.0) arecollated and a case narrative for seml-volatiles is written. This is then datedand signed (see Figure 7.0).9.0 DATA VALIDATION
Once a case has been reported, it is then double checked by a second person.All criteria listed on the semi-volatile quality approval form must be counter-signed.Once complete, the case is submitted to the semi-volatile Section Leader forfinal approval. The case is then submitted to the Project Manager.
7/9016
301013

SEKI-YOUTILE MAIKTO«*C€ CHECKLIST - MS
Changt UntarChangt SeptaCut ColumnAdd Shock(s)Changt SyMngtChangt Ht TankChangt ColumnCltan Souret
WN
WN
WN
WN
WN
Changt UntarChangt StptaCut Col innAcid Shock(s)Changt SyrIng*Changt Ht Tan*Change Cola*Cltan
FrtqWN
0
WN
0WN
WN
Ml
Ml
17
-
18 19 20 21 22 23 24 25 26 27 28 29 30 31
301014

.. ... . . . . _ _ _._. jCUS H,EC~CN '.33 3OCK|gT^SC^DCCCto ^ ———————— . ———————
///
-V
Fraction" VOA SNA(cird«)
DATA RLE*
*
*
*
*
*
*
*
*
*
*
*
*
*
*
*
>
*
»
»
>
CUENTJOB NUMBER
•
PROTOCOL.
SAMPLE 10
WITNESSED BY:
PE*VO«
£ALA3O=A~CPv ->^c- -
QG B
Mv
UST. TAL ) PP ( )CLP 2/M ( ) CLP 3/90 ( )
INJ.TIME
•
:
:
:
ALSPOS OP
D«t»:
OF
•
ATCH:OATH.KTRIX:OFILE QCALEC3 <J
OtrttrOtti«f
ANALYSTSSJGNATTJRE
Boo* NO.
CCM^s
PagtNo.
301015

riGURX 2
lAtrai "m^ji
«• 4 s (
if v7.
. 1
I*I
mimi
C% OCd 9PM SA >C8J2 SISana !!(«
2! Till*•
**
« : v *• ?tJ«
>C1WZ29C1 S M
K/3W1 X41« <W123431
18781 *7T7 1221
IJ7X
4S77J I77KI IMHI «21
K5*
J77Z
H!7« 12S2c2fl 23 il
^ A:-/-
OUHM M14 74
144*J7
UiTTSMrr
'03 •d jr »57
04/2H02 1717724519 ZOTSi 92
V x t A o
£?M,*
2SSI12 212771 ISS71I M "0
•155001* >C12ff *31t 171X1] 100M » IS I2t >0:iI7« 20QH tSDU) IS 31 ii
Itfgn
51 US213121 225R
9i 1IU Ml «3« « 85
CX irfuit
2S7W nint tSKis 84
U«t te u *•
SHUD • «525334 (K) • ftmi-4SS (2TP) •Si <fV) • 2,4.t-rntriM)lwii (It-123}
UMIJ
S81L
(S-114) (23-I2V
(5-114)<1H«) CHID
M wt*i* tf cvtrvt r«ur«< K UM(J
i • V» ii) 20K r < SO i• IT 11 FHi r ft** .5 «fc «f Ul QMek
I • riMTt II I WWW* I* U» W»i< tMT Itf

S 3.0
QUANT REPORT
Quant Rav! 6Qparator I0» flSCOutput Ft la: AC4050s:QTData Pila' >C4050J;C4Nam«: ;;;SBLKC4050rtisc: 06/12-902 INST.10:C;;061289;LLU;1;;SEPF
10 Ft la: I_C::N2T i t l e : SEMI VOLATILE SNA COMPOUNDSLast Calibration: 990616 12:53
Quant T i ma;Injactad at:
Dilution Fac tor
390616990616
2
9TL* 1
Compound R. T. Q ion Arta Cane
1 )A .16 )
20 J21)35)39)^2 J56)57;68 )^1)T"l 1
6 .'77'
• 1 ,4-Oich lorodanzana-d*2-Fluorophano IPhanol-d5
•Napnthalana-d8Ni t robanzana-d5•«ean*pnthana-dlO2-FluorobipnanylOiat hy Iph tna 1 a t a2,4,6-Trib'romopnanol
•Phananthrena-dlO•Chrysana-dl2Terphany 1 -d 14*"* ». 1 W I W k h . 1 k -.
Sis'. 2-Etnylhaxyl ) p h t n a 1 a t a•Parylana-dl2
11.8.11.15.13.19.17.20.21.23.30.27.ae.38.36.
879013103371969679566675
ai87
151.111.98.135.81.163.171.148.329.187.240.244.-4-44,148.264.
888989886900a
90
56630785496637820478265213115166127440270278585294030175385259516
a x <
15706106391
40925740664067
135404072
340
. 00
.91
.61
.00
.49
.00
.64
.97
.97
. 00
.00
.61T •t
.71
. 00
-9- 9 *f'
-9~ OC/ug
ugug £,fugug
-rr ————
-9•-9
• Compound is 1STO

301019
QUALITY CONTRbL0" APPROVAL RSPORT
GC/MS Group Volaciiea
Wuaiber: Client:
Case Muaber:, 300 Huafter:
:eiiveraJ9ies Revested:
;c
1. Th« An«ly»i* QCXK's *r«
2. Client «nd s««pi« IO'j match
3. Raw dtta h*« b«*a aort«4
4. All aaoplca tad QC pf*««at
i. All caw data pr*a«at aad
6. All cvquirvd 5oza« eo
7. Cas* MarratiT* coapl«t«d
a. Result transcription* ea«ek«|t
9. Analysis ho!41&9 timu n»»t criteria
.3. Deliverable* ia correct order
Semivoiaciles
InitialApproral
Initials Date
Approval
Initials :«t*
Thische cas«
* thei ats of the (XT/MJ SO»» unless otherwise dacuaent*d i.
final Approve!eo Release Data; Date:

6-TOtOS
pvat 7*0*6
TT
TTY 'IT
TT»
TTY '<
BO
taoasr;
*Tp*ad*39* TT*
TTV *i
'»
ZXI
DO
< ) **tiao < » o< /co-no ( )»a
muoj

in •rtmonm«rt?al t»*ting cofnptnf
com a* nvt ACTION RTCIT /
•* Cii/C»t
For
t*
r, QA Off!
flA*• AMl«.(a) la ,-•< C I

CLJKNT -'OB NUMBER : PROTOCOL : COMPOUND LIST :
JU Loc . pH olid
•
fe'i?'
, i * *
'inalVol.
GPCYorN
Oil.fac.
Quant .Factor Factor
'
Rerun Comments
t
Da I a FileAflftlY?'3
•
Oat a Fi |eReanalyaia
••i1 1i. i
0-
COoM-*O
C o m m e n t

** «"*''Qnnvgtj< iMtlno co*nMfly«O M0rr.», -^,.OI,, ——————————————
McorMTcon^^CTe iliuZrJoailiuZJgs——^"*jt fiiai jgrtzr
GC/MSGnx^
Volatilea:.Semivolatiles:
CASE NARRATIVEEA Job No.Client: __Case No.:SDG No.:"
Signature: DateCtn
*K»C«rw,^•i«-*rr.oo«d
301022

FI6UIII 3.0TARfiET COMPOtM) LIST (TCL)
1.2.3.4.5.6.7.3.9.
10.11.12.13.14.15.16.17.13.19.20.21.22.23.24.
25.26.27.23.29.30.31.32.33.34.35.36.37.38.39.40.41.42.43.44.45.
Semi-Volatile^
Phenolbis(2-Ch1oroethyl)ether2-Chlorophenol1.3-01chlorobenzene1.4-01chlorobenzeneBenzyl alcohol1,2-Dichlorobenzene2-Methyl phenolb1s(2-Chloro1sop4-Methyl phenolN-N1troso-d1-n-dHexachloroethaneNitrobenzeneIsophorone2-N1trophenol2,4-OlmethylphenolBenzole acidb1s(2-Chloroetl2,4-01ch1oropheno11,2,4-Tr1chlorobenzeneNaphthalene4-ChloroanlllneHexachlorobutad1ene4-Chloro-3-methy1phenol(para-chloro-Mta-c2-Methyl naphtha!eneHexachlorocyclopent2,4,6-TMchlorophenol2,4,5-Trlchlorophenol2 • Ch 1 oronaphthal ene)2-NUroan111n«DimethylphthalateAcenaphthylen«2,6-01n1trotolue«e>3-N1troan111n*2,4-01n1t4-HHropDlbenzofur2,4-01n1trotolB«DUthylphthalaU4-Chlorophenyl-plF1uorent4-N1troan111n«4,6-01n1tro-2-MiN-n1tro$od1phenylan1n«
Case Number
108-95-2)ether 11-44-4
95-57-8ne 541-73-1ne 106-46-7
100-51-6ne 95-50-1
95-43-7opyl)ether 108-60-1
106-44-5propylaalne 621-64-7
67-72-198-95-378-59-138-75-5
1 105-67-965-8S-0
y)Mthant 111-91-81 120-83-2nzene 120-82-1
91-20-3106-47-8
ne 87-69-3phenol 59-50-7-cresol }ne 91-57-8ntadlen* 77-47-4enol 88-06-2enol 9S-9S-4ne 91-58-7
88-74-4131-11-3208-94-8
• 606-20-299-09-283-32-9
t 51-28-5100-02-7132-64-9
• 121-14-284-64-2
•nyl eth4f 700S-72-384-73-7100-01-6
hylphtflol 534-52-1tame 84-30-6
Precision
16±14til±13±13±21±13±11±14±10±14±14±12±14±11±15±20±13±12±14±12±36±15±15±11±11±12±14±10±16±23±9±13±19±9±30±20±10±19±21±10±12±42±18±15
Accuracy
378277676877717281668160813783692787847577656782
72283890839149859710984742291104809493907099
Quantltatlon i:
(watar uq/L a.bCRQ|,
101010101010101010101010101010105010101010101010
1010105010so101010501050501010101010505010
iI12315121
25I1112314411I1I422
301023

F!SUR£ 3.0TWSET COMPOUND LIST (TCL) AM)
CflfTMCT REQUIRED QUAMTITATIQM
Semi-Volatile*
46. 4-Bromophenyl-phenylether47. Hexachlorobenzene48. ?entach1orophenol49. Phenanthrene50. Anthracene51. 01-n-*uty1phthalate52. F1uor«nthene53. Pyrene54. Butyl benzylphthalate55. 3,3'-01ch1orobenz1d1ne56. Benzo(a)anthracene57. Chrysene53. bis(2-Ethy1hexy1)phtha1ate59. 01-n-octylphthalate60. 8enzo(b)f1uoranthene61. 8enzo(k)fluoranthene62. Benzo(a)pyrene63. Indeno(l,2,3-cd)pyrene64. 01benz(a,h)anthracene65. 8enzo(g,h,1)perylene
Case Number Precision AccuracyQuantUatlon(*ater uo/L a
101-55-3118-74-187-86-585-01-8120-12-784-74-2206-44-0129-00-085-68-791-94-156-56-3218-01-9117-81-7117-84-0205-99-2207-08-950-32-8193-39-553-70-3191-24-2
19tlO119ilO19H211311311516
±11til113±16±14±30±11±13±12±13
91936890878888919368919596102883687989494
1010501010101010102010101010101010101010
a. Low soil/sediment contract required quant Uat Ion Halts (CRQL and MOL's) fort i l e TCL compounds are 33 t1«es the Individual water CRQL and HOL.b. Hedfun soil/sediment contract required quantltatlon Halts (CRQL and MDL) for seal-volatile TCL compounds are 60 tlaes th« Individual low so11/sed1aent CRQL and NDL.* Specific quantltatlon Halts are highly Mtrlx dependent. The quantltatlon l i m i t
listed herein are provided for guidance and aay not always be achievable.** Quantltatlo* He**» Hite* for soll/sedlaent are based on wet weight. The quantitat:climits calculateeltti'tiaft laboratory for soll/sedlaent, calculated on dry weight basis arequired by the ceJBrect* will be higher.+ The reference~ti» tfcift MDt calculation 1s Federal Bj&lliiC U CFR, p»rt 13fi Appendix 3October 26, 1984.
The reference to the Precision and Accuracy Is SW44, 3* Edition, Chapter One, Sec-.-::1.1.8.
9

GC:010687:5
individual Mix A and B at Level II (See Table 9.3) are prepared to 2S -nlvolumes as needed. These are used for the 72 hour run saquence. (250 jlof the stock is diluted to 25 ml hexane). For multi-response compoundsany one of the working standards may be used.
9.2 Standard Preparation Frequency
The following table directs the frequency with which all Pesticide/PC3standards are to be prepared.
Upon preparation of a standard, it is to be labeled with date, i n i t i a l s ,concentration, and code. This information is also entered into the Stand-ards Preparation Log Book. EPA stocks are to be dated upon receipt andcoded and dated when opened.
Preparation___Standard____ Replenishment Frequency Storage Containers
EPA I n d i v i d u a l Open new stock every 6 months 2 ml amber vials -Stocks silanized
every 6 monthsMixed Stocks 15 ml silanized v i a l s
every 6 monthsWorking Standards silanized vials for
volume size
9.3
The convention for coding Pesticide/PCB standards is as follows:
GC:xxxxxx:n
Where GC - GC GroupWhere xxxxxx « date of preparationWhere n » page of standards prep log book
On all vials labeled for storage, this code must appear along with adescription (I.e. PCS 1242 2.0 ug/ml). Codes shall be annotated in injec-tion log book. Standard vials should always be marked at the bottom ofthe meniscus to detect any evaporation of the standard.
9.4 Stock Standard Log-InWhen standards are received they are logged-in on a 4x6 index card.Compound identification, concentration and solvent determine the headingof the card. If the new standard has the same concentration and solvent,it is tagged with the next ampule number and a sample seal stamped withthe date received and ampule number.
4/9120

GC:OIC637:5'
The index card has further information about the lot number of the stand-ard location of the standard, date received and by whom, date used and :/whom. All of these must be filled in for each standard received. If riocard exists for the standard a new card is made up. This is illustratedin Figure 52.
10.0 MISCELLANEOUS PESTICIDE ANALYSIS
10.1
Analysis of Pesticides not on the PP list or TCL list is frequently re-quested. An example of this would be Pesticides from the Appendix IX l i s tsuch as Isodrin, Kepone and Chlorobenzilate. Any of the miscellaneouspesticide standards may be added to the existing 72-hour sequence as longas EPA/CLP samples are not being analyzed.
10.2
Prior to sample analysis, an initial-5 point calibration should be run onthe GC and column the samples w i l l be analyzed on. The date from thecurve should be one file so Cf can be referred to. Reference Table XIVfor concentration ranges for miscellaneous pesticides currently analyzedfor. If not on this li s t then retention time and response must be estab-lished prior to the curve.
10.3
If samples are analyzed independent of the 72-hour sequence, then a 3point standard curve must be analyzed. Compare the average Cf to that ofthe original 5-point curve. If the percent difference is <±20 percentthen proceed with samples if not the 5 point curve must be reanalyzedevery 10 samples and must be <±15 percent difference from the daily 3pointcurve before proceeding with any more samples.
4/9121
-301026

TABLE VIIPESTICIDE INDIVIDUAL MIX A - STOCK
GC: 010637:5
Compound
LindaneHeptachlorAldrinHeptachlor EpoxideEndosulfan IQieldrin4,4'-OOTEndrin AldehydeEndosulfan IIMethoxychlor08C (Surrogate)
InitialConcentration
5,0005,0005,0005,0005,0005,0005,0005,0005,0005,0005,000
ug/mlug/mlug/mlug/mlug/mlug/mlug/mlug/mlug/mlug/mlug/ml
AmountAdded
ululul
10 ul10 ul10 ul40 ul40 ul20 ul50 ul20 ul
FinalVolume
10 ml10 ml10 ml10 ml10 ml10 ml10 ml10 ml10 ml10 ml10 ml
f inalC o n c e n t r a t i o n
fug/ill )
5.20.020.010.025.010.0
224/91
•;36J027

TABLE V I I IPESTICIDE INDIVIDUAL MIX A - DILUTTfm
Compound
LindaneHeptachlorAldrinHeptachlorEpoxide
Endosulfan I .Dieldrin4,4'-ODTEndrin AldehydeEndosulfan IIMethoxychlorDBC (Surrogate)
ConcentrationStock
fup/ml)
2.02.02.05.0
5.05.020.020.010.025.010.0
Level
0.010.010.01"0.025
0.0250.0250.100.100.050.1250.05
... ConcentrationsLevel II'100 uli
0.020.020.020.05
0.050.050.200.200.100.250.10
Level II!(200 t i l l
0.040.040.040.10
0.0.0.
10,10.40
0.400.200.500.20
L e v e l •/(SCO J ;
O.iO0.10O.iO0.25
0.250.251.01.0
0.501.250.50
Final volumes are 10 ml
234/91
301023

GC: 010637:5
TABLE IXPESTICIDE INDIVIDUAL MIX B - STOCK
Compound
Alpha 8HCBeta 8HCDelta 8HCAldrinGamma ChlordaneAlpha Chlordane4,4'-DOEEndrin4,4'-ODDEndosulfan SulfateEndrin KetoneDBC
I n i t i a lConcentration
500500000000000000000000
5,0005,0002,0005,000
ug/mlug/mlug/mlug/mlug/mlug/mlug/mlug/mlug/mlug/mlug/mlug/ml
AmountAdded
3 ul20 ul4 ul4 ul20 ul20 ul10 ul20 ul20 ul100 ul50 ul20 ul
FinalVolume
10 ml10 ml10 ml10 ml10 ml10 ml10 ml10 ml10 ml10 ml10 ml10 ml
F i n a lConcentration
2.05.02.02.010.010.05.010.010.050.010.010.0
244/91
301029

GC:01C637:5
TABLE XPESTICIDE INDIVIDUAL MIX B • DILUTIONS
Concentrations
Compound
alpha BHCbeta BHCdelta BHCgamma Chlordanealpha ChlordaneAldrin4,4'-DDEEndrin4,4'-OODEndosulfan SulfateEndrin KetoneDBC
ConcentrationStock (uq/ml)
2.05.02.010.010.02.05.010.010.050.010.010.0
Level I(50 ul)
0.010.025-0.010.050.050.010.0250.050.050.250.050.05
Level II(100 ul)
0.020.050.020.100.100.020.050.100.100.500.100.10
Level III(200 ul)
0.040.100.040.200.200.040.100.200.201.00,200.20
Level IV(500 ul )
0.100.250.100.500.500.100.250.500.502.50.500.50
Final volumes are 10 ml.
254/91

an environmental testing company•
Mpnroa. ConnecKcut S««S8
EAX i2031 268-5346
STANDARD OPERATING PROCEDURE
PERKIN-ELMER 3030 ATOMIC ABSORPTION
SPECTROMETER (GRAPHITE FURNACE)
AS:070987:2

A S : 0 7 C 9 3 7 : 2
301032
STANDARD OPERATING PROCEDUREPERKIN-ELMER 3030 ATOMIC ABSORPTION
SPECTROMETER (GRAPHITE FURNACES
INTRODUCTION
This method outlines the operation of the Perkin-Elmer 3030 for graphite furnaceanalysis of environmental samples.
It is the intent of this procedure to comply with the IEA business ethics p o l i -cy.
1.0 SCOPE OF APPLICATION
1.1 This procedure describes the analysis of water and soil samplesusing the Perkin-Elmer Model 3030 Atomic Absorption Spectrophotom-eter.
1.2 The analytes determined using this procedure are:
Arsenic Thallium Selenium Lead
2.0 SUMMARY OF METHOD
2.1 Samples are digested with acid and peroxide according to the samplepreparation standard operating procedure for furnace.
2.2 Appropriate quality control check standards are measured accordingto EPA or routine protocols at the beginning, throughout, and at theend of the analysis to assure measurement is accurate.
3.0 INTERFERENCES
Refer to manufacturer's instructions regarding specific elements.
4.0 APPARATUS AND MATERIALS
4.1 Perkin-Elmer Model Zeeman/3030 Atomic Absorption Spectrophotometer
4.2 Perkin-Elmer Autosampler Model AS-60
4.3 Perkin-Elmer HGA-600 Graphite Power Unit
4.4 Perkin-Elmer PR-100 Printer
4.5 1,000 uL variable Eppendorf pipette
4.6 2.0 mL autosampler cups
1

AS:070337:2
4.7 20 uL f ixed Eppendorf pip-ette
4.8 Furnace stock standards as described in the Furnace Standards ar:Solutions Preparation Logoook (Appendix A)
4.9 EPA Quality Control Standard Solutions as described per EPA in theAtomic Spectroscopy Reagents Logbook (Appendix C)
4.10 Matrix modifier solutions as described in Furnace Standards andSolutions Preparation Logbook (Appendix 0)
5.0 REAGENTS
5.1 Furnace working standards are made fresh daily from a standard stocksolution and recorded in the Furnace Standards and Solutions Prepa-ration Logbook (Appendix B).
6.0 SAMPLE COLLECTION, PRESERVATION AND STORAGE
6.1 Samples should be preserved by acidification with nitric acid to apH of 2 or lower immediately at the time of collection.
6.2 Holding times for furnace analysis are 180 days for both the currentEPA SOW 2nd SW846 protocols.
7.0 PROCEDURE
7.1 Start up of the Zeeman 3030
Warning: Not to be operated in proximity to heart patients wearing elec-tronic pacemakers. This instrument contains powerful magnets which mayaffect pacemakers, watches and magnetic storage media, such as recordingtape and computer disks.
A) Prior to startup, the operator should be familiar with theuser's manual and reference manual supplied by Perkin-Elmer.
B) Before starting the instrument check the exhaust vent abovethe furnace to be sure it is working. The switch is on thewall next to the telephone. It should always be on. Also,check to make sure the cooling water is on and draining at arate of approximately 1.0 liter/minute.
C) Check that the pressure of the argon supply gas is at 50 psiand that there is ample argon in the tank.
D) Check flush water to capillary system. Be sure rinse reser-voir is full (0.5 percent HN03 solution) and that waste reser-voir is empty.
301033

AS:070937:2
E) Check that there is'plenty of paper feeding to the printer anathat it is aligned at the top of the page.
7.2 Turn instrument on in this order:
A) Depress power button on the HGA-600 power unit to "on" p o s i -tion.
B) Turn on power to spectrometer and wait until "element selectmode" page is presented.
C) Switch on PR-100 printer and make sure the green "on-line"indicator is lit.
0) Turn on EDL power supply by lifting toggle switch up to the"on" position.
1) Select appropriate lamp. Connect lamp to channel cable.Light the lamp by holding ignitor in front of lamp whileturning appropriate channel knob fully clockwise (metershould go full scale). Now turn knob counterclockwise torequired wattage printed on lamp. Let lamp warm up forapproximately 30 minutes, making sure to maintain properwattage.
2) Press the "user index" key to see a listing of programsfor the elements. Select the program for the element youwish to run by entering the method number and pressingblue "recall" key (Appendix E). Depress "prog" key toview the 3 pages of the element program.
3) On page 3, enter the position number of the last cup youwant to run by cursoring down to "sample 05 to _ '_" andhitting the enter key (Appendix E).
4) Store the program by depressing blue "store" key.
5) Put the spectrometer into "set-up" mode by pressing blue"set-up" key. Adjust wavelength to proper setting byturning first the coarse (inner), then the fine tuning(outer) adjustment knob on the far left of the instru-ment. A bar graph on the computer screen indicatesproper optimization. If bar goes off scale, hit the"gain" button.
6) Optimize lamp position by turning both adjustment screws(on lamp turret) back and forth until a maximum energy isachieved. (Again, depress "gain" button if bar graphgoes off scale.)
301034

AS:070987:2
7) Clean al 1 windows on the furnace. Take out windows :iboth sides of the furnace compartment and remove any c;qor dirt with Kimwipes. Unscrew the left-hand side of *nsfurnace housing and remove the quartz windows to clean.
Turn (either way) the small window on the right side ofthe furnace housing and p u l l out, cleaning ootn sides ofthis window with a cotton swab and Kimwipe.
8) Open furnace by pressing "furnace" button on the HGA-600power unit. Remove graphite tube and clean inner andouter portions of the contact rings with a cotton swaband a Kimwipe. Tubes and platforms last approximately 16to 20 hours, therefore check the "daily run and mainte-nance logbook" (Appendix F) to see if it needs replacing.
9) Insert the L'vov platform into the graphite tube usingthe following method:
a) Place platform with cavity downward onto flat sur-face of insertion tool.
b) Hold tube horizontally so that the grooves are atthe top and the sample introduction hole is on thebottom.
c) Guide the edges of the platform into the groovesand push into tube with the insertion tool. W h i l einserting the platform, squeeze the handle of thetool so that the edges of "the platform are pressedinto the grooves in the tube. Shake lightly toensure that the platform is securely seated.
10) Take the graphite tube, with grooved-end facing left,and place it into the left-hand contact cylinder so thatthe sample introduction hole in the tube lines up withthe sample port in the contact cylinder. Close the fur-nace by pressing the "furnace" button.
11) Align the sampler arm through the sample introductionhole of the graphite tube using the following method.
a) Enter "continuous mode" by pressing "cont" hardkey.
b) Depress "as standby" soft key to release samplingarm.
c) Use the knob on the sampling arm assembly to swingthe arm to the furnace and over the sample intro-duction port.
301035

AS:070937:2
d) Release'lock control by turning the red knob on :-eautosampler assembly, counterclockwise.
12) If necessary, use the front knob (gray), to adjust *.-.=arm backward or forward, and use the side knob to adjustthe arm side to side, so that the capillary tip can selowered into the sample port. Lock, the tip into placeby turning (red) lock control knob clockwise.
13) Adjust the penetration depth to 2-3 mm above the L'vovplatform by turning the front knob on top of the samplearm assembly (knob closest to sampling tray). The tipis at the correct height when the sample droplet con-tacts the platform just before leaving the end of tnecapillary tip.
14) Bring the sampling arm back to "run" position by de-pressing "as home" soft key.
a) Condition the graphite tube as follows:
Depress "run" key to go into run mode. Type in"900" using the key pad on the right side of thecomputer, and hit the "manual temp" soft key on thecomputer screen. You should see a faint orangeglow after a few seconds, hit "manual temp" againto deactivate. Type 1400 and hit "manual temp".You should see a brighter orange glow. Depress"manual temp" again to deactivate this. Repeatthis sequence going next to 1800, 2200, and then2600"C. Repeat this procedure three times to en-sure the tube is fully conditioned.
15) Hit "cont" key then depress "AZ" soft key to zero oninstrument absorbance display.
16) Enter program mode, to check user method, by depressing"program" key. Check the number and concentration ofstandards to be used for analysis (see Appendix £).
17) Hit "program" key again and check the temperature condi-tions. Confirm there are at least five steps beingutilized (see Appendix E).
18) Hit "program" key again and check run sequence. Makesure that there is a sample cup position assigned to tneblank (always location 1) and all standards are beinganalyzed as part of the initial calibration. Also checkthat a "matrix modifier cup" position is assigned. 8e
301036

AS:C7C937:2
sure that sample location range is entered and that -"=>matrix modifier ID is entered (i.e. one or two) i's=eAppendix E). ""
19) Enter 'run iiode" by depressing "run" key.
20) Load the tray always starting with a reagent b l a n k ;r\cup ?1 and appropriate standards in ascending concentra-tion in next cups (see Appendix E).
21) Enter ID number for first cup after calibration and hit"print" key (light should come on).
22) Be sure autosampler is at position "0" on computerscreen by depressing "autosampler reset" soft key, thendepress "check" soft key and display w i l l change to"sampler on/off". Depress "sampler on/off" soft key.Analysis is now initiated.
7.3 Sample Run Log (Appendix G)
A) Analysis starts with in i t i a l calibration as follows, withdouble injections of all standards and samples the resultbeing the average of the two burns.
1) Cups 1-4 are for reagent blank and three standards.
2) Cup 5 ICV (initial calibration verification)
3) Cup 6 ICB (initial calibration blank)
4) Cup 7 CRA - this standard is equivalent to the CRDL forthe element being analyzed.
B) Depending on protocol, a continuing calibration verification(CCV) and continuing calibration blank (CCB) are run immedi-ately after the CRA, or nine samples can be run, followed byanother CCV and CCB.
C) Each sample must be immediately followed by its analyticalspike and cannot be separated by QC. An analytical spike isnot required on the actual pre-digest spike sample.
D) Monitor the run frequently during the analysis. Check :reprecision to assure that the replicates are within acceptablelimits (RSD <20 percent) for samples greater than the CRDL.Check that i n i t i a l and continuing QC passes and analyticalspike recoveries are acceptable. If any of these fa i l , itmay be an indication that a problem exists. Stop the run,
301037

AS:070987:Z
identify the problem and make the appropriate corrective ac-tion before proceeding.
7.4 System Shut Down
A) Turn EQL channel knob fully counterclockwise8) Turn off EDL power supplyC) Turn off power to 3030 spectrometerD) Turn off power to HGA-600E) Turn off printer
7.5 The 3030 has a bound maintenance logbook that is filled out everytime an analysis is to be performed. The book is kept underneaththe furnace on top of the HGA-600 power unit. The first column isfor the date of analysis. The second column is for the analyst'sinitials. The next column is for recording maintenance performed,such as changing the graphite tube and platform, contact rings, orsampling capillary. The next column is for how many hours theinstrument was operating and the last column is for the element andthe job/case number that was analyzed (Appendix F).
A) A separate folder in the main filing cabinet is maintainedfor repair work which required a service call from a certi-fied Perkin-Elmer technician. There is a folder labeled"3030" with the completed service tags, describing problem,along with the corrective action.
8) A furnace auto ample logbook is also kept under the 5100 PCdesk. Every time analysis is performed - a copy of the fur-nace data sheet goes in the book, the elements that were ana-lyzed for are written in the "element" space on the upperleft hand corner (Appendix G).
8.0 QUALITY CONTROL
Wheti the run is complete, check that all quality control (ICV's, prep blanks andlaboratory control samples) meets acceptable criteria. If contamination isevident in prep blanks or LCS's fail to recover, refer to protocol to determinecorrective action. If necessary submit a "corrective action report" with a copyof the data and prep sheet attached explaining the problem, to the supervisorfor immediate action (Appendix H).
9.0 METHOD PERFORMANCE
9.1 Instrument detection l i m i t s are determined quarterly per the cur-rent EPA contract as stated in Exhibit E, Section II, page E-14.
30103S
/"""*V AS: 070937:2
9.2 Control charts are kept for tracking of accuracy (LCS and sp:<erecoveries), and precision (RPD on the duplicate analysis).
10.0 DATA REDUCTION AND DATA HANDLING
If data meets all criteria, calculate results and keep track of any reruns ordilutions needed. Once a job has been ful1y completed, sign and date all rele-vant chain of custody sheets. At the end of each completed analysis, report allsensitivities for analyses that were run, in the appropriate logbook for stan-dards (Appendix I). For non-CLP work, report results and quality control onfinal report sheets. CLP work should go into the appropriate job folder.
11.0 SPECIAL PROCEDURES - N/A
12.0 USE OF OTHER REQUIRED SOP'S
Glassware cleaning SOP, standards and sample preparation SOP, standards andsample prep log SOP and corrective action SOP.
13.0 DOCUMENTATION OF PROBLEMS
13.1 Corrective Action Reports
If any discrepancy occurs during analysis that requires attentionsuch as standard or instrument problem, sample prep problem, etc.,a corrective action report is warranted. This report should beprepared per the atomic spectroscopy corrective action report SOP(AS:040590:0).
13.2 All CLP-type reports and regular reports require case narratviesthat specifically address any anomolies and their possible causesthat may have occurred during analysis.
14.0 REFERENCES
14.1 Methods for Chemical Analysis of Water and Wastes, EPA.-600/4-82-055, December, 1982.
14.2 USEPA Contract Laboratory Program, SOW 7/88
14.3 Test Methods for Evaluating Solid Waste, Volume 1A, USEPA SW846,3rd Edition, November, 1986.
301039

APPENDIX A
301040

Stock Standard Solution
Pipette 1.0 ml each of 1,000 mg/L (ppm) of arsenic, selenium, t h a l l i u m , and leadstandards into a 200 ml volumetric flask. Bring to volume with 0.5 percentnitric acid. This solution contains 5,000 ppb of each element.
CRA Stock Standard Solution
Pippette 1.0 ml each of 1,000 mg/L (ppm) arsenic and thallium, 0.5 ml of l.OCOmg/L (ppm) selenium and 0.3 ml of 1,000 mg/L (ppm) lead into a "00 ml volumetricflask. Bring to volume with 0.5 percent nitric acid. This solution contains5,000 ppb arsenic and thallium, 2,500 ppb/selenium and 1,500 ppb lead.
Analytical Spike Solution
Pipette 9.4 ml each 1,000 mg/L (ppm) of arsenic, thallium and lead and 0.2 ml of1,000 mg/L (ppm) selenium into a 200 ml volumetric flask. Bring to volume with0.5 percent nitric acid. This solution contains 2,000 ppb arsenic, thallium andlead, 1,000 ppb selenium.
In-house Continutinq Calibration Verification Solution
Pipette 1.0 ml each 1,000 mg/L (ppm) arsenic, selenium, thallium and lead intoa 200 ml volumentric flask. Bring to volume with 0.5 percent nitric acid. Thissolution contains 5,000 ppb for all elements.
301041

M
"\<>
.7 *: '-> v.
, ',
vj
O
:( .<.
:.:!:0o
O^
o 3~
VI "JC
A
'-tIiC '<1
;. s> Q0
00
o o V
n^ ^ -= 6
o
o
o o
Ci
O
- V
- u "
° c. -
•>
T.
.- > ^
f-' c Cy - ;;
<-- .-'•"•'
t-^ Ik \\ u . J
n 1-.
o °
<
*
t f
w r
. S
v> <>P." <i j
V ?
? ?
'r. .
"-^ 9.
<i. cL <J-
•i d
0 J
tt,
V)§
•: - :- ^ -,•
>• -a\pci
<'
xo-
nr
f'--^
fo
.^d
cV-
'XJ"
v."
- -
"^ -
-i
-o ?•
4- a "" f«- d.
f 7 **• * ~
<t. i-
?• « 5
V
v> O
V
J J
ii ."
^•^h" U
ubr
W S
^ f»|73
fc fr U
M ^
H S
HH
H
^~
£1a.
- in
vrt ccr
iC"a.
Q-
r<?}^>
at. a>I-c;
O")

APPENDIX B
301043

Working Standard Solution
100 pob standard - Pipette 4.0 ml of the stock standard solution into a 2CC ~;volumetric flask and bring to /olume with 0.5 percent n i t r i c acid.
50 ppb Standard - Pipette 2.0 ml of the stock standard solution into a 2CO nlvolumetric flask and bring to volume w i t h 0.5 percent nitric acid.
Intermediate CRA Solution - Pipette 4.0 ml of the stock CRA solution into a 200ml volumetric flask and bring to volume with 0.5 percent nitric acid.
CRA Solution: 10.0 ppb As, Tl5.0 ppb Se3.0 ppb Pb
Pipette 20.0 ml of the intermediate CRA solution into a 200 ml volumetric flaskand'bring to volume with 0.5 percent nitric acid.
Blank Solution - Add 0.5 percent nitric acid to 100 ml nano pure water.
In-house Continuing Calibration Verification Solution (CCV) - Pipette 2.0 ml ofthe stock CCV solution into a 200 ml volumetric flask and bring to volume with0.5 percent nitric acid. This solution contains 50.0 ppb all elements.
301044

\
-a :
«. «
3
t"_
__
—V
^I ]
Se£*oft2i-
•iftCO

APPENDIX C
361046
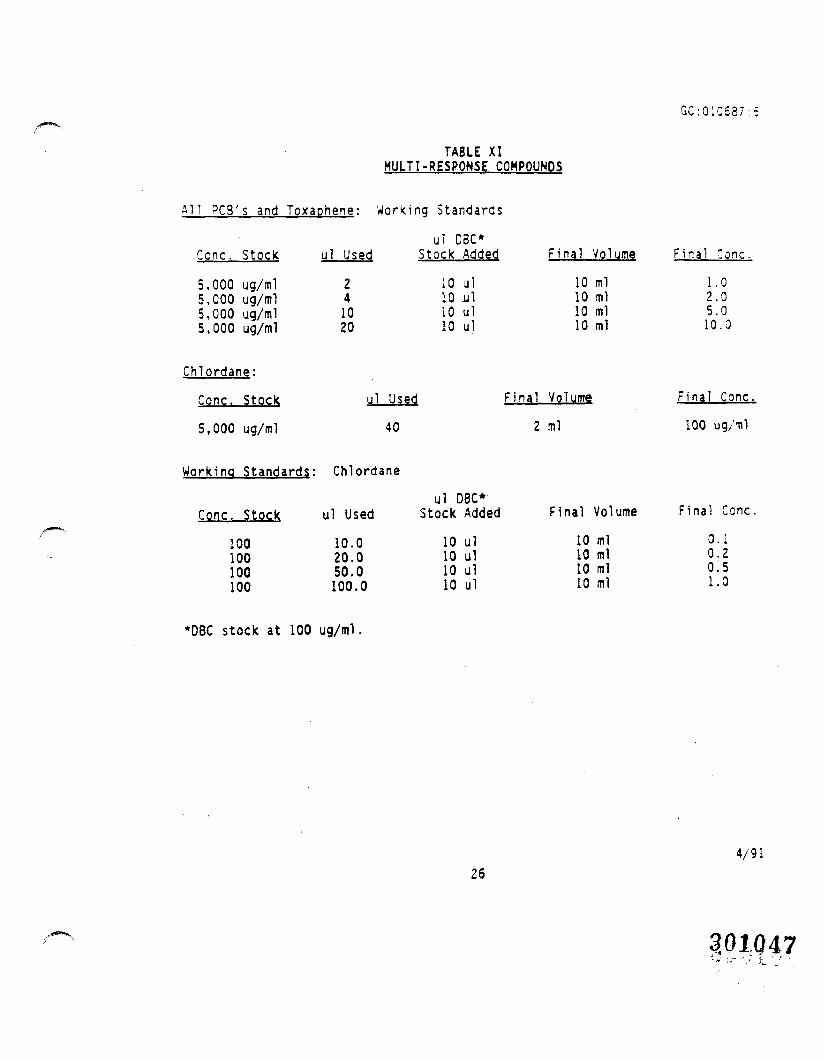
GC:01C537:5
TABLE XIHULTI-RESPONSE COHPOUNDS
All PCB's and Toxachene: Workinq Standards
Cone. Stock
5,000 ug/ml5,000 ug/ml5,000 ug/ml5,000 ug/ml
Chlordane:
Cone. Stock
5,000 ug/ml
ul Used
241020
ul
ul DBC*Stock Added
10 ul10 ul10 ul10 ul
Used Final
40 2
Final Volume
10 ml10 ml10 ml10 ml
Volume
ml
Final Cone.
1.02.05.010.0
Final Cone.
100 ug/ml
Workinq Standards: Chlordane
. Stock
100100100100
ul Used10.020.050.0100.0
ul DBC*Stock Added
10 ul10 ul10 ul10 ul
Final Volume
10 ml10 ml10 ml10 ml
Final 0
0.10.20.51.0
*08C stock at 100 ug/ml.
264/91

TABLE XIIPESTICIDE EVALUATION MIX STANDARDS
CompoundStock
Concentration ul Used
AldrinEndrin4,4'-DOTDBC
5,000 ug/ml5,000 ug/ml5,000 ug/ml5,000 ug/ml
20.040.080.0200.0
Final Volume
10 ml10 ml10 ml10 ml
Concentrationfua/ml}
10.020.040.0100.0
Mixes:
MIX A
Compound
AldrinEndrin4,4'-ODTOBC
MIX 8
Compound
AldrinEndrin4,4'-ODTDBC
MIX C
Compound
AldrinEndrin4,4'-DOTOBC
StockConcentration
10 ug/ml20 ug/ml40 ug/ml100 ug/ml
StockConcentration
10 ug/ml20 ug/ml40 ug/ml100 ug/ml
StockConcentration
10 ug/ml20 ug/ml40 ug/ml100 ug/ml
ul Used
25 ul
10 ul
ul Used
125 ul
25 ul
ul Used
100 ul
10 ul
Final Volume
10 ml10 ml10 ml10 ml
Final Volume
25 ml25 ml25 ml25 ml
Final Volume
10 ml10 ml10 ml10 ml
FinalConcentration
0.025 ug/ml0.05 ug/ml0.125 ug/ml0.05 ug/ml
FinalConcentration
0.05 ug/ml0.10 ug/'ml0.25 ug/'ml0.10 ug/ml
FinalConcentration
0.10 ug/ml0.20 ug/ml0.50 ug/ml0.20 ug/ml
274/91
301048

GC:01C537:5
TABLE X I I IDPT SERIES MIX STANDARDS
Stock Standard:
Compound
4,4'-DDT4,4'-ODE4,4'-ODD
StockConcentration
5,000 ug/ml5,000 ug/ml5,000 ug/ml
ul Used
40.020.020.0
Final Volume
101010
mlmlml
FinalConcentrat-on
20.010.010.0
Mix Standards:
MIX 1
Compound
4,4'-ODT4,4'-OOD4,4'-OOE08C
MIX 2
Compound
4,4'-OOT4,4'-0004,4'-ODEOBC
MIX 3
Compound
4,4'-DOT4,4'-OOD4,4'-DOEOBC
StockConcentration
20 ug/ml10 ug/ml10 ug/ml100 ug/ml
StockConcentration
20 ug/ml10 ug/ml10 ug/ml100 ug/ml
StockConcentration
20 ug/rhl10 ug/ml10 ug/ml100 ug/ml
ul Used
50 ul50 ul50 ul10 ul
ul Used
100 ul100 ul100 ul10 ul
ul Used
250 ul250 ul250 ul10 ul
Final Volume
10 ml10 ml10 ml10 ml
Final Volume
10 ml10 ml10 ml10 ml
Final Volume
10 ml10 ml10 ml10 ml
FinalConcentration
0.10 ug/ml0.05 ug/ml0.05 ug/ml0.10 ug/ml
FinalConcentration
0.20 ug/ml0.10 ug/ml0.10 ug/ml0.10 ug/ml
FinalConcentration
0.50 ug/ml0.25 ug/ml0.25 ug/ml0.10 ug/ml
284/91
301049

3*>105-0
TABLE XIV
Compound
Mi rex
Dichloran
Isodrin
Kepone
Chlorobenzilate
Alachlor
Atrazine
Oicofor
Standard Ranae
0.025 - 0.50
0.025 - 0.50
0.025 - 0.50
0.025 - 0.50
0.05 - 0.50
0.10 - 2.0
2.0 - 32.0
0.01 - 0.18
294/91

§ 5 '
iliiii*
: s"
I! is
*. is" z"
s= ;;
i::
S::
2
:
a ] li• »>•!
1 => •• •
— V
LM
i t —
— .
— •
, i »—
—' I
II 35
i•
' i
i t
• •
f: S
• >:
; II
2•»
•-S i
li»:;
i'•
^• t• •• i
»
O.
>
> 1 1
1 . .
i •
1*4
' :
,•|:i• »• •• •;i••;•ii*«::•«•i•«•«•i•t•••*i« t
.« i
•* i
• i
*i
i!II
;
,,
'
•
-•
Iii>i1i!!:'
•
;;• *< -• •::
* ;
: • ::• I
; ', '':
: ...
• ;;• •. i
i > -i •
i '
• 'i
i •
381051

GAS CB3JOKATOGKAPHYQC BATCH APPROVAL
Run ID
Initial/Analysis Y/H Date Coaaents
AR1221/AJU232 RequiredDo Extracts Require o/u or DilutionAnalytical Sequence CheckedFirst Injection OKChain of Custodies Signed$C Checked and Reported in InJ. LogChromatography Checked:
Solvent PeakBaselinesSurrogatesDilutionsMatrix ProblemsMS Compounds OS
Forms Reviewed.Form 3:
Dates/TimesBreakdown% RSD in Criteria
Form 82:DBC Shift CriteriaDates/TimesYVC Sample * Check to Inj. Log
Form 9:All Compounds PresentAll Cf/RT PresentDates/Times of Standards CorrectWindows (spot check)
Correct SDG on All FormaCheck Case * on Forma- (to 82)Sample Analysis,Primary - Dilution* OXTarget Compound* in RT VlndovsConfirmation List WrittenConfirmation Compounds of Interestin WindowsSigned Out in Red Book
Approved By:
301052

s«v. oa/ia/:
Reported BT:___________________5 f o up
,/******- . • — Date:.__________Time:____
CORRECTIVE ACTION REPORT/CASE NARRATIVE REPOFClient:___________Job/Case Humber:__________. Sample Number(s):________
Problem Reported 87:______________ Deadline To Complete CA:_________
Person Who la Requested To Provide Corrective Actions:_________________
Category of Problem:__________________________________________.Poor Co__unicatlo- With .... taaala Hatcti,In.trua.ne
Description of Problem: __________________________________________
(!•• baek of CAt/CHl or attaohad chaat II aor* *p«o« It c t n u t r « d
Recommended Corrective Action(s):.
Actual CorrectIT* Aotioa(s) Taken:.Ooeuaant Aatutl Corraotiva Aotiona Oa Tht»
fora *o« Ian4 • COBJ ol Coa»lata« CAft/CMI to 4A O t f l e a r aad Job f a l d . c
Is this a recurring ProblemT_____Should SOP be Modified or Updated?.
Help in solving problem is requested of:———_————————————————
Di«tribution: Lab Di«ctor, Lab mana««r, J 1 * 11**0* •?r?nch !(circle) Group/Section Leader, QA Off ioer: OrganioC 1. Inorganic C
Client Service*, Job Folder, Other:
Document Problem and Corrective ActionU) In Ca»« H*rra*fj*:/J. JAttachment.: Telephone Log, Service* Chang* Hequeat, Hemo, Other.
301053
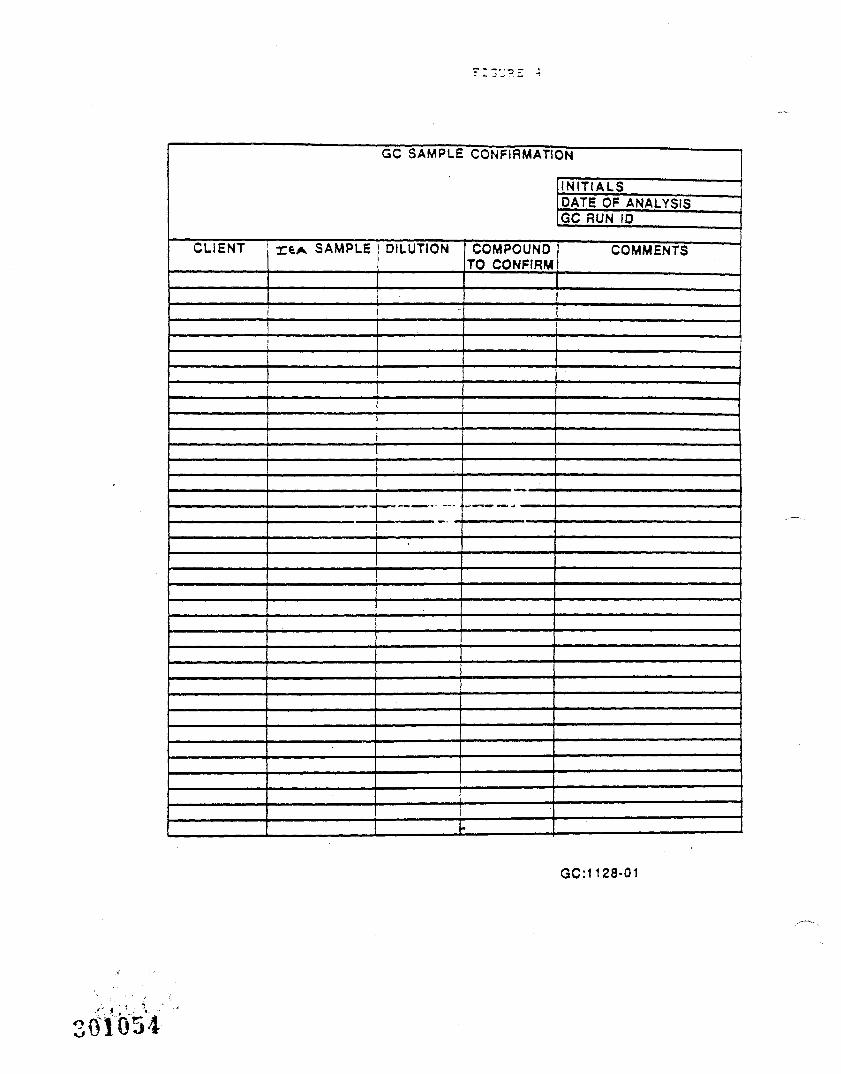
CLIENT r*A SAMPLE
GC SAMPLE
DILUTION
-
CONFIRMATl
' COMPOUNDTO CONFIRM
ON
INITIALSDATE OF ANALYSISGC RUN ID
COMMENTS
GC:1128-01
.-' «., '_, V -ori'l'A^^

\
I
I
C......1AT.-. »PH _ _ETL on ... 28 :51 iylFILE pest3.002a METHOD 106 Primary Pest
FILE 469 RUN 2 STARTED 14:54.5 87/09/28 PEST/PCB:-. METHOD 999 Primary Pest LAST EDITED 19:38.1 87/07/08
U_-6 A_4 C_5 0_5
o
t 8.UM BGN I B 1.10f 1.75L2.58 , ,o „ ,ft(>•*• 3<ia 3.40
23.69
25.95
*•>. " Oc t^J <T>r* iv» v'
• 4.
I

CO'.
^'. CHROMATOGRAPH »2 SETUP Mon ScP 28 15:28:54 158?"" ' FILE pest3.003a METHOD 106 Prmar-j Pest
FILE 470 RUN 3 STARTED 15:31.7 87/09/28 PEST/PCB'/. METHOD 999 Primary Pest LAST EDITED 19:38.1 87/07/08
W_-6 A_4 C_5 0.5
3.40
5.385.98
8.43 V, V '9.22
0.54
-t.18
15.06
5
s
'Mi )L. I

-'..*
•-fc*
. OttA ...{API. ..J SEU. lion o«rp 2o t6:0o.i/ Ibo.FILE pest3.004a METHOD 106 Primary Pest
FILE 171 RUN 4 STARTED 16:09.0 87/09/28 PE3T/PCB5C HETHOD 999 Primary Pest LAST EDITED 19:38.1 87/07/08
W_-6 A_4 C_5 0_5t .a .m
- J . I ?
t i .ee
15.84 ^ (<
\-*roKJlp
r *^ .-,
n

COs*CT
t2 SEiur tlon Sep 28 16:43:27 1987FILE pest3.685a METHOD 186 Priory Pest
FILE 472 RUN 5 STARTED 16:46.2 87/89/28 PEST/PCB•/. METHOD 999 Primary Pest LAST EDITED 19:38.1 87/87/66
W_-6 A_4 C_5 0_58.55
\^

CHROHATOGRAPH 12 SETUP Mon Sep 28 17:20:38 1987FILE pest3.086a METHOD 186 Priftary Pest
FILE 473 RUN 6 STARTED 17:23.5 87/09/28 PEST/PCB>. METHOD 999 PrUary Pest LAST EDITED 19:38.1 87/07/08
W.-6 A_4 C_5 0_5
O3
,.,. ..8. BCHI, ,.2,a.:
b.63
i 9i
7.25
I M fy8 I
C
N V-A

COoO CHROMATOGRAPH *2 SETUP Mon Sep 28 17:57:46 1987& FILE pest3.007a METHOD 106 Primary Pest
FILE 474 RUN 7 STARTED 18:00.7 87/89/28 PEST/PCBV. METHOD 999 Pn.arj Pest LAST EDITED 19:38.1 87/07/08
U_-6 A_4 C_5 0_5
BGN B 1,22
2.78
15.00
3.24
7.24
3.49
25.88 £>BC
0.55
I £. !/\ \J
\ IG §J £

criKOMAiuuRAPH §2 SETUP Jlon Sep 28 18:35:88 1987FILE pest3.008a METHOD 106 Prinary Pest
FILE 475 RUN 8 STARTED 18:38.0 87/89/28 PE3T/PCB'/. METHOD 999 Primary Pest LAST EDITED 19:38.1 87/07/88
_-6 A_4 C_5 0,5
0.55
16.03
\"«JI3\r-TJf o

COpr«-Mr;.
LHI IUL hiFILE pest.009a METHOD 106 Priuarii Ptsl
FILE 311 RUN 43 STARTED 13:42.7 87/09/14 PCB''. METHOD 999 Primary Pest LAST EDITED 19:38.1 87/07/08
H.-6 A_4 C_5 0.50.55
1.79
o3
23.80
26.07

ro
CHROHATOGRAPH 12 SETUP Hon Sep 14 16:13:88 1987FILE MSt.818* METHOD 186 Primary Ptst
«™ RUH ** STARTED 16 J 21. 8 87/89/14 PCB< METHOD 999 PrUary Pe$1 LAST EDITED 19:38.1 87/07/88
M--6 A_4 C.5 0_5a.55

COoOGO
CHROMATOGRAPH 12 SETUP Mon Sep 28 19:12:46 1987FILE pest3.889a METHOD 186 Primary Pest
FILE 476 RUN 9 STARTED 19:15.2 87/09/28 PEST/PCBX METHOD 999 Primary Pest LAST EDITED 19s38.1 67/87/68
H.-6 A_4 C_5 0_5
6.877.88
9.18
23.61 fl
N(M
(A
I
8.54
,. v« _-*> IA IVI

CHROI1ATOGRAPH 12 SETUP Hon SeP 28 19:49:38 1987FILE pest3.01Ba METHOD 186 Primary Pest
FILE 477 RUN 10 STARTED 19:52.5 87/09/28 PEST/PCB'/. HETHOD 999 Priaary Pest LAST EDITED 19s38.i 87/07/08
H.-6 A_4 C.5 0.5
6.097.08
9.18
18.91
25.87 J|/}C
28.97
1 -

COoH >OCDO>
CHROHftTOGRAPH 12 SETUP lion Sep 28 20:26:42 1987' FILE pes13.0lla METHOD 186 Primary Pest
' FILE 478 RUN 11 STARTED 20:29.7 87/09/28 PEST/PCB'< HETHOB 999 Primary Pest LAST EDITED 19:38.1 87/07/06
H_-6 A_4 C_5 0.5
iN I B 1.10 1.38
3.69-2.67V.
4.18
22.53
28.88
9.54

tr
i
ft
ft
ft
ft
ft
ft
ft
I
I
i1'»
I
I
I
I
1 COo> h*o
t CD
CHROHATOGRAPH 12 SETUP Mon Sep 28 21:63:54 1987FILE pes13.ei2a METHOD 166 Priaary Pest
FILE 479 RUN 12 STARTED 21:87.8 87/09/28 PEST/PCB% METHOD 999 Primary P*s1 LAST EDITED 19:38.I 87/87/08
W_-6 A_4 C_5 0.5
9.54
XJI'l

lJvi*X '
i/^f •>;
flp.S. :. Jfe: S: • J
CfO i-"?
J'SS:?? 03110? i'.
^uioc-^Fac :-,03sc :>;i •.•:•! »i , 3
o; -»•
COCOo
CO

• CHROK.ttTGGRftPri Hi SETUP Tu-r Nc." L'^ lc.:5d:45 l^b'-:FILE f-«stconf9.005a METHOD 20t p^s tcon f^ >• ^«- . • . . f
%« ^ ~ FILE 39 ftUH 5 i-THRTED 1&:?6.? Se/li/2i1
fc-^ . J; METHOD 933 p*stconf LA-oT ZDITED 23:53. =3 33/03/02
M.6 A_4 C_4 0.5
•CO• O
CDCO

• vr:.»' ^ '•'
;
*'• '"•' ', '•«»£ 4 ;
CvJ
O
Oo
t-9'M t
c .:.':*•:<;!? nny
or-ooCO

CALCULATION SUMMARY - qc
1) Calibration Factor;cf " ————— area' _____ r:g - ug/aiL x uL in 1
mass injected (rig)
2) Response Factor:Rf " csnc std Cug/mL)
total area3) Percent RSD - SD x 100
x4) Percent Difference - Rj - R^ x 100
Cf : where RI - Cf from first analysisR2 • Cf from second analysis
DBG Shift: where RI - RT DBC initial injectionR2 - RT DBC in subsequent samples
5 ) Breakdown
_____ area DPS + area DDD _____% for DDT area DDT + area DDE * area DDO% for Endrin area Endrin Ketone + area Endrin Aldehyde
area Endrin Ketone + area Endrin Aldehyde+• Endrin area
% Combined area DDE + area B.K. •+• area DDD/Endrin___________Aldehyde_________________area DDE + area E.K. * area DDD/EndrinAldehyde * area Endrin + area DDT
6) Matrix Spike Percent Recovery: SSR - SR x 100SA
where: SSR - Spiked Sample ResultSR - Sample ResultSA - Spike Added
7) Surrogate Percent Recovery: gd x 100Qa
where: Qd - Quantity DeterminedQa - Quantity Added

SAMPLE CALCULATIONS
?6sticilgs, ?C3's ff Herbicides:
low Level area sample (r.g injected) final volCuL)(20*)(DF) - ug/xgSoils: area std. (uL inj) (wt x dec. % solids)
Waters: -area sample (r.g in'e'cted) fir.al vol CuL) - ug/Larea std. (uL inj) sample vol. extracted (mLs)
Miscellaneous:
wipe samples: (Rf std x area sample) final volume - total ug
Oils: B x Vf. - mg/KgA x W
where: A - area std 3 - area sampleng std uL iaj
V^ - volume sample CmL)W - weight sample (gms)
Miscellaneous GC:Rf std x area unknown - ug/mL
Impinger: ug/mL x Initial vol sample - total ug
Note: all calculations are by external standard method•for mediua level soils use 10 as cjuantitation factor instead of20. If GPC was done use DP of 2 times any other required dilutionfactor.
301072

MATRIX SPIES CALCS
Percent RPD - MS - MSD x 100MS - MS2
2
Theoretical Calc:
a)
LindaneHeptachlorAldrinDieldrinEndrin4.4'DDT
spiking solutionconcentration
2 ug/mL2 ug/mL2 ug/mL5 ug/raL.3 ug/mL5 ug/mL
spike1 mlto1L
sample
10 ml final volumefinal concentration
.20 Ug/L
.20 Ug/L
.20 ug/L
.50 ug/L
.50 ug/L
.50 ug/L
b) Soilsspiking solutionconcentration
LindaneHeptachlorAldrinDieldriaEndrin4,4'DDT
ug/Kg calc. as follows:
2.0 ug/mL2.0 ug/mL2.0 ug/mL5.0 ug/mL3.0 ug/mL5.0 ug/mL
spikewith .4yn , — —30g
sample
total
eg. Lindane - .8 us?vt (gins) x dec % solids
.8
.8
.32.02.02.0
x 1000 - ug/Kg
301073

TARGET COMPOUND LIST (TCL) AND
Pesticides/PCB's
alpha-BHCbeta-BHCdelta-BHCgamma-8HC (lindane)Heptachlor
AldrinHeptachlor epoxideEndosulfan IDieldrin4,4'-DOE
EndrinEndosulfan II4,4'-000Endosulfan sulfate4,4'-DDT
MethoxychlorEndrin ketonealpha-Chlordanegamma-ChlordaneToxaphene
Aroclor-1016Aroclor-1221Aroclor-1232Aroclor-1242Aroclor-1248
Aroclor-1254Aroclor-1260
Ouantitation
Water. ua/L
0.050.050.050.050.05
0.050.050.050.100.10
0.100.100.100.100.10
0.50.100.50.51.0
0.50.50.50.50.5
1.01-0
LJ_
U-ni ts"Low Soil/
Sediment*, ja • <a
8.08.08.08.08.0
8.08.08.016.016.0
16.016.016.016.015.0
80.016.080.080.0160.0
80.080.080.080.080.0
160.0160.0
'Medium soil/sediment contract required quantitation l i m i t s (CRQL) for pesti-cide/PCB TCL compounds are 15 times the individual low soil/sediment CRQL.
'Specific quantitation limits are highly matrix dependent. The quantitationlimits listed herein are provided for guidance and may not always be achiev-able.
'Quantitation limits listed for soil/sediment are based on wet weight. Thequantitation limits calculated by the laboratory for soil/sediment, calculatedon dry weight basis as required by the contract, will be higher.
301074

Instrument ID: GC4A/GC4B Laboratory: ILA, Inc. Cl - MDl
CO „,o ,.o ;;en /:
EPA PRIORITY POLLUTANT AND TCl PESTICIOES/PCB'S LIST AND HPl
All values are ug/L.
Replicate AnalysesCompound
alpha-BHCbeta-BHCdelta-BHCgamma-BHCHeptachlorAldrtnHeptachlor EpoxideEndosulfan IDieldrin4,4'DOEEndrinEndosulfan II4,4'DDOEndosulfan Sulfate4,4'ODTHethoxchlorEndrin AldehydeToxaphenealpha Chlordanegamma-ChlordaneEndrin KetonePCB-1016PCB-1221PCB-1232PCB-1242PCB-1248PCB 1254PCB 1260
— KI —
0.0440.0480.0470.0410.0570.0440.0480.0250.0480.0500.2310.4930.3330.3220.2650.2560.1220.7840.4980.5110.4791.5581.6551.4511.4831.4421.2871.280
_B2_
0.0460.0490.0460.0410.0580.0460.0520.0250.0480.0500.2410.5020.3430.3350.2710.2560.1150.83270.4850.5000.470
.383
.307
.553
.514
.465
.054
.411
_J*_
0.0460.0500.0460.0420.0570.0460.0530.0300.0470.0500.2340.4970.3430.3740.2720.2560.1130.77760.5150.5330.4911.4921.342
.548
.440
.619
.244
.694
R,
0.0460.0500.0470.0410.0580.0470.0490.0250.0490.0490.2290.5030.3550.4190.2820.2560.1300.83670.5030.5070.485
.463
.618
.437
.467
.508
.368
.358
_B5_
0.0440.0490.0470.0410.0560.0450.0520.0290.0470.0500.2310.5180.3410.3770.2710.2560.1160.82360.4950.5040.478
.520
.411
.406
.552
.656
.332
.628
-L
0.0460.0510.0480.0430.0580.0460.0510.0260.0480.0490.2240.5090.3590.4010.2880.1920.1340.78260.4820.4870.469
.697
.311
.384
.520
.544
.665
.413
_B/_0.0460.0490.046,0.0420.0560.0450.0520.0240.0470.0490.2260.4970.3610.3650.2820.3210.1300.82260.4950.5090.04901.4521.3261.3251.4401.5141.2601.256
SO
0.0010.0010.0010.0010.0010.0010.0020.0020.0010.0010.0050.0850.0110.0340.0080.0370.0090.03210.0110.0140.0890.09950.14940.08370.04260.07800.18370.1670
MPl1'*
0.0030.0040.0020.0020.0030.0030.005 "i0.007 o0.003 £0.002 m0.017 tJ0.027 £0.0340.1070.0260.1160.0270.1010.0350.0440.0280.3130.4700.2630.1340.2450.5770.525

The reference to the.MOL calculation is Federal Register 40 CFR Part :T;
Appendix 8, October 26, 1984.
The reference to the Precision and Accuracy is from SW 846 - 3ra Edi^—nChapter One Section 1.1.8
2 Low and Medium soil/sediment MDL for Pesticides/PCB TCL compounds are 150 ana2400 times the individual low water MDL respectively.
Instrument ID: GC4A/GC4B Laboratory: IEA, Inc.-CT - MDL
EPA PRIORITY POLLUTANT AND TCL PESTICIDES/PCB'S
Compound
alpha-BHCbeta-BHCgamma -BHCdelta-BHCHeptachlorAldrin4,4'DDEDieldrin4,4'DDOEndrin Aldehyde4,4'ODTalpha-Chlordanegamrna-ChlordaneEndosulfan IEndosulfan IIEndosulfan SulfateEndrinHeptachlor EpoxideMethoxychlorEndrin KetoneToxaphenePCB-1016PCB-1221PCB-1232PCB-1242PCB-1248PC8-1254PCS- 1260
Precision
tlO±17±15±15±16±38±35±21±41±5.5±36±14±11±28±26±16±15±11±23±1.7±4±6.6±11±5.8±22±5.1±14±18
107109100101847091105104921091G811510392
115103115949681
151142144117154132114
301076

Calibration Date:.
Instrument ID:__
Laboratory:____
BPA PRIORITY POLLUTAliTS PESTICIDES/PCS'8
Initial Calibration Data
Calibration LevelCompound
alpha BHCbeta BHC2amma BHCdelta BHCHeotachlorAldrin4.4' DDEDieldrin4,4' DDDEndrin Aldehvde4.4' DOTChlordaneEndosulfan IEndosulfan IIEndosulfan SulfateEndrinHeptachlor EpoxideToxaphenePCS - 1016PCS - 1221PCS - 1232PCS - 1242PCS - 1248PCS - 1254PCS - 1260
RF RF
-
RF RF RF % RSD !
111
1
iI!
RF - Response FactorRF - Average Response Factor% RSD - Percent Relative Standard Deviation
301077 -

soPESTICIDE EVALUATION STANDARDS SUMMARY
Lab Name:
Lab Code: Case No.:
Contract:
SAS No.: SDG No.
Instrument ID: GC Column ID:
Dates of Analyses: to
Evaluation Check for Linearity
I PESTICIDECALIBRATIONFACTOREVAL MIX A
CALIBRATIONFACTOREVAL MIX B
CALIBRATIONFACTOREVAL MIX C
%RSD '(</= i10.0%) ;
ALDRIN 1 1 1 1ENDRIN 1 1 1 14, 4 '-DOT 1 1 ! 1DBC ! I f 1
I
(1) If > 10.0% RSD, plot a standard curve and determine the ngfor each sample in that set from the curve.
Evaluation Check for 4,4'-DDT/Endrin Breakdown(percent breakdown expressed as total degradation)
INITIALEVAL MIX BEVAL MIX BEVAL MIX BEVAL MIX BEVAL MIX BEVAL MIX BEVAL MIX BEVAL MIX BEVAL MIX BEVAL MIX BEVAL MIX BEVAL MIX BEVAL MIX BEVAL MIX B
DATEANALYZED
TIMEANALYZED
ssssssstssssssyssss
ENDRIN 4,4' -DOT COMBINED |(2)
!.
0102030405060708091011121314
(2) See Fora instructions.
FORM VIII PEST-1 1/87 Rev.

8EPESTICIDE EVALUATION STANDARDS -UIWLA**
Evaluation of Retention Tine Shift for DibutylchlorendateLab Name:
Lab Code: Case No.:
Instrument ID:
Contract:
SAS No. :
GC Column ID:
SDG No. :
Dates of Analyses: to
1 EPA| SAMPLE NO.
Oil02|03|04|05|06|07|08|09|101HI12113114|15|16117|18119120121122123124|25|26|27|28129130131132133134135 1.361371381
LAB SAMPLEID
DATEANALYZED
..
TIMEANALYZED
%D
««»...
'
*
* Values outside of QC Halts (2.0% for packed columns,0.3% for capillary columns)
page _ of _FORM VIII PEST-2 1/87 Rev.
30?079

PESTICIDE/PCB STANDARDS
Lab Name:
Lab Code: Case No.:
Contract:
SAS No.: SDG No.:
Instrument ID: GC Column ID:
1| COMPOUND1| =__=»= —— = ——| alpha-BHCIbeta-BHCIdelta-BHC| gamraa-BHC ___| HeptaclorI AldrinIHept. epoxideI Endosulfan I| Dieldrin|4,4' -DDE ____| Endrin| Endosulfan II|4,4 '-ODD| Endo. -sulfate| 4, 4 '-DPTIMethoxychlor| Endrin ketone|a. Chlordane_|g. Chlordane_I Toxaphene| Aroclor-1016| Aroclor-1221I Aroclor-1232| Aroclor-1242(Aroclor-1248! Aroclor-1254_i Aroclor-1260_
DATE(S) OF FROM:ANALYSIS TO:TIME(S) OF FROM:ANALYSIS
RTF
WIJ,FROM
TO:
>TFDOW
TOCALIBRATION
FACTOR
1
DATE OF ANALYSISTIME OF ANALYSISEPA SAMPLE NO.(STANDARD)
RT CALIBRATION QNT IDFACTOR Y/N
i11i
I •—
III
1!1
111
I" 1 . 1 1
rnder QNT Y/N: enter Y if quantitation was performed, w ir not pei-tojnneu.D must be less than or equal to 15.0% for quantitation, and less thanor equal to 20.0% for confirmation.ote: Determining that no compounds were found above the CRQL is a form ofquantitation, and therefore at least one column must *««t the 15.0% criteria.or multicomponent analytes, the single largest pea* that is characteristic
~t the component should be used to establish retention time and *°; . .Identification of such analytes is based primarily on pattern recognition
jge _ ofFORM IX PEST 1/87 Re
301080

NYSDBC Contract Laboratory Programaureau of ^technical Service* t Jtesearch50 WOlf toad, Boon 317Albany, New York 12233-3502(518) 457-7470
Nun±jer
Method 608, 8080
ORGAHICS ANALYSIS DATA SHEET
Concentration: LowDate Extracted/Prepared:Data Analyzed: ______Gone/Oil Factor:
Medium
Pesticide/PCBe
(Circle Ore) GPC Cleanup /T Yea £7 No.Separatery Fvanel
Bttraction £7 •*•* £7 VoOorttlnunut liquid-liquid
Betraction 7 Yea
CASNwber
319-84-6319-85-7319-86-858-89-976-44-8
309-00-21024-57-3959-98-860-57-172-55-972-20-8
33213-65-972-54-1
1031-07-1SO-2f-3S7-74-»
8001-35-212674-11-211104-28-211141-16-553469-21-912672-29-$11097-69-111096-82-5
wg/L or wgAg(Circle Qra)
alpha-BHCbeta-BHCdelta-BHCganma-BHC (Liniane)HeptachlorAldrinHeptachlor epoxid*Ehdofulfan IOieldrin4,4'-CDEBtbriABvioculfan II4,4'HXOBidoculfan aulfat*4,4*-trrrChlordaneItiacjgtan*AKC1CR-1016AHOdOR-1221ARXIOR-1232AIOCLCR-1242AHXLOR-1248ARXLCR-1254AKXXrR-1260
B-127
301081

IDPESTICIDE ORGANICS ANALYSIS DATA SHEET
EPA. SAM?IT
Lab Name:
Lab Code: Case No.:
Contract:
SAS No.: SDG No. :
Matrix: (soil/water)
Sample vt/vol:
Level: (low/ned)
% Moisture: not dec. dec.
Extraction: (SepF/Cont/Sonc)
GPC Cleanup: (Y/N)__ pH:.
Lab Sample ID:
Lab File ID:
Date Received:
Date Extracted:
Date Analyzed:
CAS NO. COMPOUND
Dilution Factor:
CONCENTRATION UNITS:(ug/L or ug/Kg)_______
319-84-6——————alpha-BHC _____319-85-7——————beta-BHC__________319-86-8———————delta-BHC_________58-89-9———————gaauna-BHC (Lindane)76-44-8———————Heptachlor_______\309-00-2 —— ————Aldrin________^_1024-57-3—————Heptachlor epoxide_959-98-8——————Endosulfan I_____60-57-1——————Dieldrin_________72-55-9 ———————— 4 , 4 ' -DDE__________72-20-8———————Endrin__________33213-65-9————Endosulfan II____72-54-8 ———————— 4 , 4 ' -ODD___________1031-07-8—————Endosulfan sulfate_50-29-3 ———————— 4 , 4 ' -DOT__________72-43-5———•——Methoxychlor_____53494-70-5————Endrin Jc«ton«____5103-71-9——-——alpha-Chlordana5103-74-2—————gasma -Chlordan*___8001-35-2—————Toxaph«ne_______12 674-11-2—————Aroclor-1016______11104-28-2—————ftroclor-1221______11141-16-5—————Aroclor-1232______53469-21-9—————Aroclor-1242______12672-29-6—————Aroclor-1248______11097-69-1—————Aroclor-1254______11096-82-5—————ATOClor-1260______
FORM I PEST 1/87
C, X
301032

10.PESTICIDE/PCB IDENTIFICATION
EPA SAMPLE
Lab Name:
Lab Code: Case No.:
Contract:
SAS No.: SDG No.:
GC Column ID (1):
Instrument ID (1) :
Lab Sample ID: __
Lab File ID:
GC Column ID (2):
Instrument ID (2):
(only if confirmed by GC/MS)
PESTICIDE/PCB RETENTION TIME RT WINDOWOF STANDARDFROM TO
QUANT? GC/MS?(Y/N) (Y/N)
01
02
03
04
05
06
07
08
09
10
11
12
>mments:
Column 1
Column 2
Column 1
Column 2
Column 1
Column 2
Column 1
Column 2
Column 1Column 2
Column 1
Column 2 - -
page _ of _FORM X PEST 1/87 Rev.
301083•' ' P .'•• -.

BPA TCL PBSTICIDBS/PCE'a
All results reported as ug/L,Sample Identification
Dilution Factor
Method Blank I.D.
Con-pound
alpha BHCbeta BHCjfamaa BHCdelta BHCHeptachlorAldrin4,4' DDBDieldrin4.4' ODDMethoxvchlorEndrln Ketone4,4' DDTalpha Chlordanegamma ChlordaneEndosulfan IEndosulfan IIEndosulfan SulfateEndrinHeptachlor EpoxideToxaphenePCS - 1016PCB - 1221PCS - 1232PCB - 1242PCB - 1248PCB - 1254PCB - 1260
-
1
Lower Limits cfDetection vith
no Dilution
0.050.05O.OS0.050.050.050.050.100.100.500.100. 100.50 "-•"0.500.100.100.100.100.101.00.50.50.50.50.51.01.0
U, J, B - See Appendix for definition.
30108:4

Soil
SPA TCL PSSTICIDBS/PCB'a
All results reported as ug/Kg,Sample Identification
Dilution Factor
Method Blank I.D.
Compound.
alpha BECbeta BHCdelta. BECs?amaa BECHeptachlorAldrinEeptachlor BpoxideEndosulfan IDieldrin4.4' DDEBndrinEndosulfan II4.4' DDDEndoaulfan Sulfate4.4' DDTMethojcychlorEndrin Ketonealpha ChlordanegATDcna ChlordaneToxaphenePCS - 1016PCB - 1221PCB - 1232PCB - 1242PCB - 1248PCB - 12S4PCB - 1260
Lower Liaits cfDetection vith
no Dilution
8.08.08.08.08.08.08.08.018161616161816301680801608080SO8080160160
U. J. B - Sea Appendix for definition.
301085

EPA TCL PESTICIDES/PCB'a
All results reported as ug/Kg,
Dilution Factor
Method Blank I.D.
Compound
alpha EECbeta BBCgamma BBCdelta BBCHeptaohlorAldrin4.4' DDEDleldrln4,4' DDDMethoxyohlorEndrln Ketone4.4' DDTalpha Chlordanesfanuna ChlordaneEndosulfan IEndosulfan IIEndosulfan SulfateEndrlnHeptaohlor BpoxldeToxaphenePCB - 1016PCB - 1221PCB - 1232PCB - 1242PCB - 1248PCB - 12B4PCB - 1260
-
MEDIUM LEV;
Lover LiaitsDetection v:
no Diluti-
120120120120120120120240240
1.20024024-0
1,'1,.120120120120120
2,4001 ,2001,2001 ,2001,2001.2002,4002,400
U. j, B - See Appendix for definition.
301086

TABLB_JOB *_CLIKHT
Soil
SPA PRIORITY POLLUTANT PBSTICIDSS/PCB'a
All results reported as ug/Kg.
Sample Identification
Dilution Factor
Method B.lanS: I.D.
Compound
alpha BHCbeta BHCtfanuna BHCdelta BHCHectachlorAldrin4,4' DDEDieldrin4,4' ODDEr.drin Aldehyde4.4' DOTalaha Chlordanesfarama ChlordaneEndosulfan ISndosulfan IIEndosulfan SulfateEr.drinHentachlor EisoxideToxauhenePCS - 1016PCS - 1221PCS - 1232PC3 - 1242PCS - 1248PCB - 1254PCS - 1260
- 1
Lower Limits ofDetection with ino Dilution
8.08.08.08.08.08.03.016161616303016161616161603080308080160160
17 - See Appendix for definition.J - See Appendix for definition.
B - See Appendix for definition.D - See Appendix for definition.
1Q87

TABLECLIENTJOB *
EPA PRIORITY POLLUTANTSPESTICIDES/PCB'8
All Results Reported as ug/L.
Sample Identification
Aqueous
Dilution Factor
Method Blank I.D.
Compound
alpha BHCbeta BHCgamma BHCdelta BHCHeptachlorAldrin4,4' DDEDieldrin4,4' ODDEndrin Aldehyde4,4' DOTChlordaneEndosulfan IEndosulfan IIEndosulfan SulfateEndrinHeptachlor EpoxideToxaphenePCB - 1016PCB - 1221PCB - 1232PCB - 1242PCB - 1248PCB - 1254PCB - 1260
"
Lower Limits of \Detection with
no Dilution
0.01 '0.010.01 ;
0.010.01 i0.01 ,0.01 :0.01 10.050.050.050. 10 ;
0.010.050.050.050.01 i1.0 !0.20 j0.20 10.20 |0.20 ;0.20 i0.200.20
*U - See Appendix for definition.«J - See Appendix for definition.«B - See Appendix for definition.«D - See Appendix for definition.
301088

Soi:
BPA PRIORITY POLLUTANTS PBSTICTPKS/PfTB'B
All results reported as ug/Kg.
Jilution Factortethod Blank I .D.
ZoapoundilPhA BHCseta, BHC'aana BHCLelta BHCteptaohloradrink . 4 ' DDBJieldrink . 4 ' ODDJndrin Ketone..4' DOTilpha Chlordaneramaa ChlordaneJndoffulfan ISndosulfan IISndosulfan SulfateZndrinleptaohlor Bvozlde'oxapheneJCB - 1016>CB - 1231'CB - 1232>CB - 1242=CB - 1248'CB - 1284»CB - 1260
Sample It lentifioat: on
MEDIUM L2VZL
Lower Liaits ofDetection vitJa. no Dilution
120120120120120120120240240240240
1.2001,200
120120120120120
2.4001,2001 ,2001.2001.2001.2002.4002.400
a, J. B - See Appendix for definition.
301089

Acrieov:
PKSTICIDB RESULTS
All results reported as ug/L.
Sample IdentificationDilution FactorMethod Blank I.D.
Compound
LindaneBndrinMethoxvohlorToxaphene
Lower Limits :Detection viti
no Dilution0.010.050.81.0
Sample Identification
Dilution Factor
Method Blank I.D.
Conrpotind
LindaneBndrinMethoxvonlorToxaphene
Lower Limi, '-.Detection
no Dilut_0.010.030.51.0
U, j. B - See Appendix for definition.

B.P. TOXICITY PKSTICIDg RESULTS
All results reported as rag/L.
Sample Identification
Aqueous
Dilution Factor
Method Blank I .D.
Compound
jindaneZndrinMethoxvchlorToxaphene
» \.
\
Lower Limits ofDetection with,
no Dilution
cO.Ol<0.001< 0 . 5<0 .1
Sample Identification
Dilution Factor
Method Blank I.D.
Compound
./indaneJndxinMethoacychlor?ozaphene
I
I
Lover Limits ofDetection vith
no Dilution
<0.01<0.001< 0 . 5< 0 . 1 '
T. J, B - See Appendix for definition.
301091

TABLB_JOB *_CLIENT
PCS'8 ANALYSIS
All results reported as ug/L.
Sample Identification
Dilution Factor
Method Blank I.D.
Coiti-oound
PCB - 1016PCS - 1221PCB - 1232PCB - 1242PCB - 1248PCB - 1254PCB - 1260
-Lower Limits of !Detection with !
no Dilution
0.500.50 i0.500.50 i0.50 ,0.500.50
Sample Identification
Dilution Factor
Method Blank I.D.
Compound
PCB - 1018PCB - 1221PCB 1232PCB - 1242PCB - 1248PCB - 1254PCB - 1260
Lower Liaits cfDetection with j
no Dilution !!
0.50 i0.50 i0.500.500.500.500.50
u - See Appendix for definition.J - See Appendix for definition.
B - See Appendix for definition.D - See Appendix for definition.
301092

TABLB__JOB *_CLIENT
Soil
PCB'S ARALYSIS
All results reported as mg/Kg
Sample Identification
Dilution Factor
Method Blank I.D.
Compound
PCB - 1016PCS - 1221PCB - 1232PCB - 1242PCB - 1248PCB - 1254PCB - 1260
Lover Limits cf ;Detection with ,
no Dilution •
0.20 iQ.20 i0.20 j0.20 i0.200.20 :0.20
Sample Identification
Dilution Factor
Method Blank I.D.
Compound
PCB - 1016PCB - 1221PCB - 1232PCB - 1242PCB - 1248PCB - 1254PCB - 1260
i
i
Lower Limits ofDetection withno Dilution
0.200.200.200.200.200.200.20
U - See Appendix for definition.J - See Appendix for definition.
B - See Appendix for definition.D - See Appendix for definition.
301093

PCB'S ANALYSIS
All results reported as mg/Kg.Sample Identification
Dilution P&otor
Method Blank I.D.
Compound
PCB - 1016PCB - 1221PCB - 1232PCB - 1242PCB - 1248PCB - 1294PCB - 1260
-
MEDIUM L2VZL
Lower LimitsDetection witno Dilution
3.03.03.03.03.03.03.0
Dilution PaotopMethod BI«.«V I.D.
Compound
PCB - 1016FOB - 1221PCB - 1232PCB - 1242PCB - 1248PCB - 1254PCB - 1260
-Lower Limi.tsDetection
no Dilu.
3.03.03.03.03.03.03.0
U, J, B - See Appendix for definition.
„> '.
301034

TABLB_JOB *__CLIBHT
Soil
PCS'8 ANALYSIS
All results reported as ug/Kg.
Sample Identification
Dilution Factor
Method Blank I.D.
Compound
PCS - 1016PCS - 1221PCS - 1232PCS - 1242PCS - 1248PCS - 1254PCB - 1260
Lower Liaits c-Detection vit:
no Dilution
10101010101010
Sample Identification
Dilution Factor
Method Blank I.D.
Compound
PCB - 1016PCB - 1221PCB - 1232PCB - 1242PCB - 1248PCB - 12S4PCB - 1260
1ii
Lower Limits cfDetection vitano Dilution
10101010101010
17 - See Appendix for definition.J - See Appendix for definition.
B - See Appendix for definition.D - See Appendix for definition.
301095

2EWATER PESTICIDE SURROGATE RECOVERY
Lab Naae:_
Lab Code: Case No.:
Contract:
SAS No.: SDG No.
| EPA| SAMPLE NO.
on02103104105106107103109110111112113114115116117118119120121122123124125126!271281291301
SI(DBC) «======
OTHER
ADVISORYQC LIMITS
SI (DBC) - Dibutylchlorendate (24-154)
f Column used to flag recovery values
* Values outside of QC limits
D Surrogates diluted out
age _ of _FORM II PEST-1 1/87
*•
301096

2FSOIL PESTICIDE SURROGATE RECOVERY
Lab Name:
Lab Code:
Level:(low/med)
Case No.:
Contract:_
SAS No.: SDG No.
I EPAI SAMPLE NO.
Oil02|"°3|.04|05|.06|07 I."08 |09f101."HI12|"I"
191.20|.211.22|231.24|25).26|.271.28|291.30|
SI jOTHER(DBC)f |
ADVISORYQC LIMITS
SI (DBC) - Dibutylchlorendate (20-150)
I Col mm to be used to flag recovery value*
* values outside of QC limits0 Surrogates diluted out
I g* _ of _FORM II PEST-2 1/87 Rev.
301097

III
3EWATER PESTICIDE MATRIX SPIKE/MATRIX SPIKE DUPLICATE RECOVERY
Lab Name:
Lab Code: Case No.:
Contract:
SAS No.: SDG No.:
| Matrix Spike - EPA Sample No.:
IIIII
COMPOUND
LindaneHeptachlorAldrinDieldrinEndrin4,4' DOT
SPIKEADDED(ug/L)
SAMPLECONCENTRATION
(ug/L)MS
CONCENTBATION(ug/L)
MS | -C* 1 LIMIT
REC * | REC.
156-12140-13140-12152-12156-12138-121
11| COMPOUND
j LindaneI Heptachlor| AldrinI Dieldrin1 Endrin1 4.4' DOT1
SPIKEADDED(ug/L)
{ MSD || CONCENTRATION |1 (ug/L) |
1 ' 1! 11 1t 11 11 11 1
MSD i% 1
REC f|
1111111
1% | QC LI
RPD f| RPD |.«._.(. ——— =|
1 15 1! 201 22 ;1 18 |1 21 11 27 |1 1
i >4f\_w .
56-114 : - 1 :i \* ~ * <52-1;56-i;38-i:
Column to be used to flag recovery and RPO values with an asteriskValues outside of QC limits
RPD:____ out of ____ outside limitsSpike Recovery: out of outside limits
FORM III PEST-1
301038

3FSOIL PESTICIDE MATRIX SPIKE/MATRIX SPIKE DUPLICATE RECOVERY
Lab Name:
Lab Code: Case No.:
Contract:
SAS No.: SDG NO.:
Matrix Spike - EPA Sample No.: Level:(low/med)
COMPOUND
LindaneHeptachlorAldrinDieldrinEndrin4,4' DOT
SPIKEADDED(ug/Kg)
- SAMPLECONCENTRATION
(ug/Kg)MS
CONCENTRATION(ug/Kg)
MS | QC* I LIMITS
REC *| REC.
146-127135-130134-132131-134142-139123-1341
COMPOUND
LindaneHeptachlorAldrinDieldrinEndrin4,4' DOT
SPIKEADDED(ug/Kg)
MSDCONCENTRATION
(ug/Kg)mmmmmmmmmm.mm
MSD%
REC I RPD fQC LIMITSRPD |. REC.
50 |46-12731 (35-13043 (34-13238 (31-13445 (42-13950 (23-134
1
I Column to be used, to flag recovery and RPD value* with an asterisk* Values outside of QC limits
RPD:____ out of _______ outside limitsspike Recovery:____ out of ____. outside limits
COMMENTS:
FORM III PEST-2 1/87 Rev.
301090

Client,
Job
Date Extracted
Date Analyzed_
PCB SPIKE RESULTS
Results Reported as ug/L rug/Kg .
PCB Spiked Amount Spiked Sample Results Cone . MS
\
% Recovery Cone. MSD
t
% Recovery RPD
)
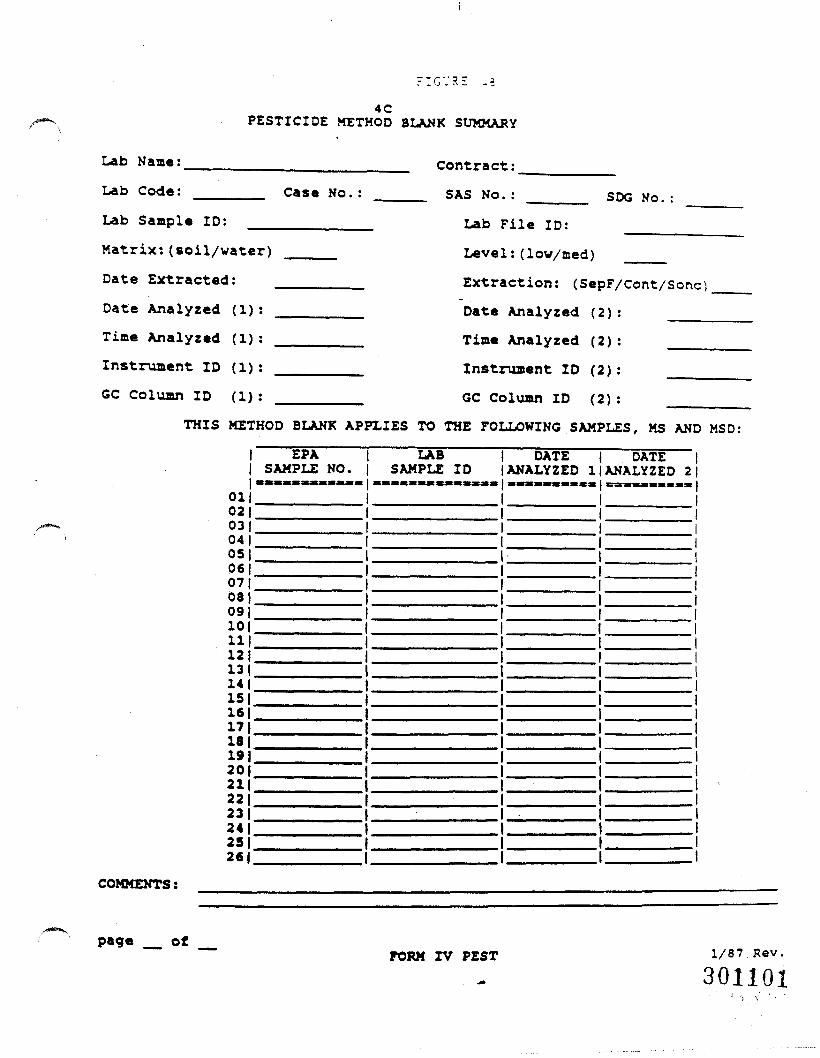
FIGURE ,3
4CPESTICIDE METHOD BLANK SUMMARY
Lab Name:
Lab Code: Case No.:Contract:
SAS No.: SDG No.:
Lab Sample ID:
Matrix:(soil/water)
Date Extracted:
Date Analyzed (1):
Time Analyzed (1):
Instrument ID (1):
GC Column ID (1) :
Lab File ID: ________
Level:(low/med) ____
Extraction: (SepF/cont/Sonc)
Date Analyzed (2): ____
Time Analyzed (2): ___
Instrument ID (2): ___
GC Column ID (2)THIS METHOD BLANK APPLIES TO THE FOLLOWING SAMPLES, MS AND MSD:
I EPA| SAMPLE NO.
Oil02103|04105|06|07|08109|101HI12113114115116117118119120121122123124125126J
LABSAMPLE ID
DATEANALYZED 1
DATEANALYZED 2
COMMENTS:
page _ of _FORM IV PEST 1/87 Rev.
301101

CO
O '10
METHOD BLANK SUMMARY
M.I*
*
0»ff Of«**.*$• UUCIKM MAf*W
^
uCKfc wsr.io CM MJMMH COWTOUMO (HIL.IIC ON U«IMO«WI
1
COMC. UMIFI CHOl.
Comment*:

OAflPACCAGOG RBVIgy FORM
Job #.Corresponding Run IDs________
Initial/Date ________Comments
All Samples Analyzed _____ _____________All Samples Calculated _____ 'Correct Deliverables _____ ZZZZZHZZZZZZZSigned Off Bed Book and LIMS - ______ ____________
Foraa Y/H _Form II - All Saaplea/Blanks Present ___Porn III ___Form IV ___
Dates Correct ___Corresponding Samples Correct ___
Fora I ___Sxt. Data Correct ____Dates Correot ___CRQL Correot ___Flags Correct ___Saaple Scans/Report Present ___
QC Forns Present/In Correot Order ___Fora Z ___
Header Data Correot ___Required Compounds Present ___
Standards ___Labeled Correctly ___Order Correot ___
Tabular Data ___IDs Correot ___,Blank IDs Correct ___D? Correot ___
Case Haxratire) ___Comments: _____'__________________ -
Prepared By.
Approved By_
301103

GAS CHaOMATOGBAPHYQUALITY COBTBQL APPBQ7AI. REPORT
Job *——————————————.—__________ Corresponding Run IDS
Client
Level of Reporting.
Approved
qc Baton Approval Sheets Completed and Authorized
Job Packaging Reviev Form Completed and Authorized
All Required Forms Present
Required Rav Data Present
Case Narrative Complete with Deviations fromProtocols/SOP Voted
Result Transcriptions and Calculations Checked
Logbook Copies Present
Approval to Release Data.
Date
Comments:
3

LfI? '
V/'/ff
A

ICK TKCHNOLOGY INCORPORATED
October 13, 1989
INITIAL CALIBRATION VERIFICATION SOLUTIONS FOR THECONTRACT LABORATORY PROGRAM
EPA-EMSL AND ICF TECHNOLOGY, INC.
The Initial Calibration Verification Solutions (ICVs) are tobe used to evaluate the accuracy of the initial calibrations ofICP and AA instruments. These solutions may also be used asaqueous Laboratory Control Solutions.
The values for each element in the ICVs are listed below inug/L (ppb) for the solutions that result after the concentrateshave been diluted according to the following instructions:
1. ICV-1 (0489) -- For ICP use, dilute the ICV-1 concentrate10-fold with 2% (v/v) nitric acid; pipet 10 mL of theconcentrate into a 100-mL volumetric flask and dilute to
-^ volume with 2% (v/v) nitric acid.
———^ (iT. ICV j>(Q989) — For furnace AA use, dilute the ICV-2————concentrate 20-fold with 2% (v/v) nitric acid; pipet 5 mL of
the concentrate into a 100-mL volumetric flask and dilute tovolume with 2% (v/v) nitric acid.
3. ICV-3 (0189) — For ICP use, dilute the ICV-3 concentrate10-fold with 2% (v/v) nitric acid; pipet 10 mL of theconcentrate into a 100-mL volumetric flask and dilute tovolume with 2% (v/v) nitric acid. For furnace AA use,dilute the ICV-3 concentrate 100-fold with 2* (v/v) nitricacid; pipet 1 mL of the concentrate into a 100-mL volumetricflask and dilute to volume with 2* (v/v) nitric acid.
ICV-4 (038J3>— For the furnace AA determination of lead andthallium, dilute the ICV-4 concentrate 10-fold with 2\ (v/v)nitric acid; pipet 10 mL of the concentrate into a 100-roLvolumetric flask and dilute to volume with 2% (v/v) nitricacid. For the furnace AA determination of silver andcadmium, dilute the ICV-4 concentrate 100-fold with 2% (v/v)nitric acid; pipet 1 mL of the concentrate into a 100-nLvolumetric flask and dilute to volume with 2% (v/v) nitricacid.
301106

ICV-1 (0489)(after 10-fold dilution)
ValueElement
AlBaBeCdCacrCocuFePbKgMnNiKAgNaVZn
20101960433502
487005105025152040480024600504480
49000500
49600488
3100
ICV-2 (0989)(after 20-fold dilution)
ValueElement; (ua/L1
•=5» As 52.652.6
ICV-3 (0189)(after 10-fold dilution)
ValueElement fua/L)
Sb 978
ICV-4 (0389)(after 10-fold dilution)
ValueElement fua/L)
95.897.598.697.0
301107

APPENDIX D

301103
Modifier Solutions
1) Nickel Nitrate for arsenic and selenium determinations. Dissolve 1.55 ;-of ACS reagent grade nickel .Titrate, Ni (N03)2'6H20 in 100 ml ml nano zJr=water.
2) Ammonium monobasic phosphate, magnesium nitratie for lead determinations.Dissolve 4.0 gm ACS reagent grade (NH4)2H2P04 and 0.2 gm Mg(N03)2'5H,0 in ICOml nano pure water.
3) One percent sulfuric acid for thallium determinations. Add 1.0 .itl concen-trated sulfuric acid to 99.0 ml nano pure water.
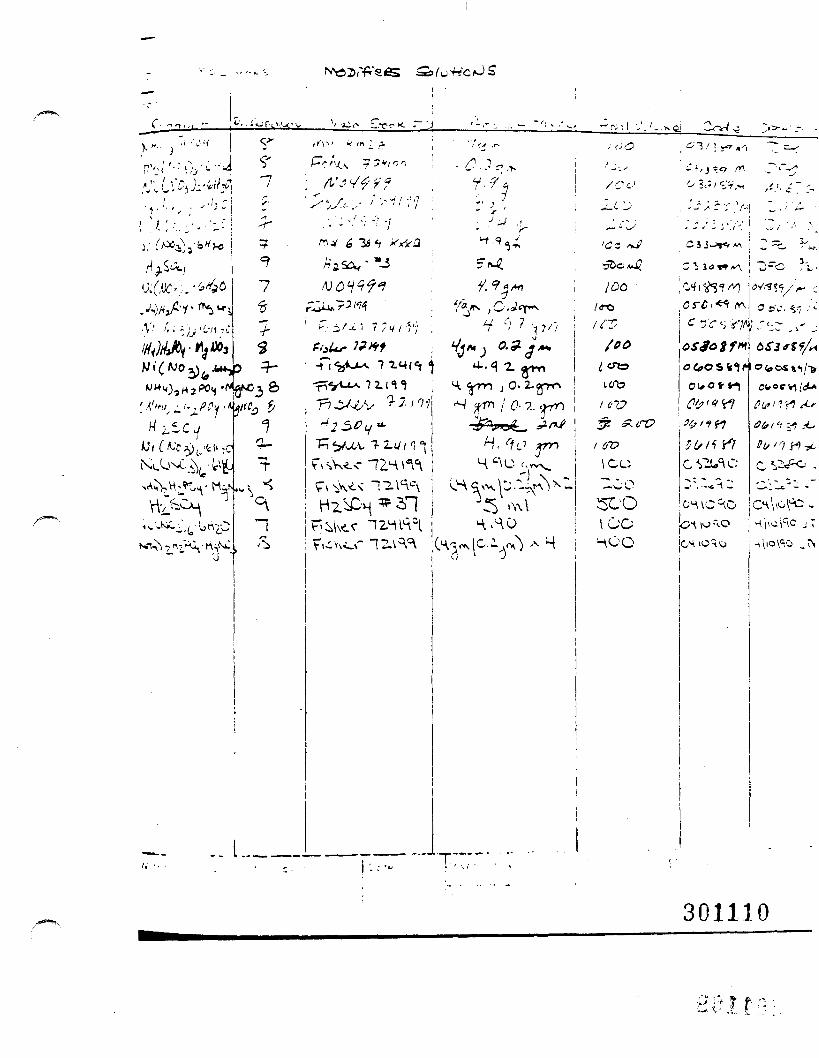
cx;
I',i.
7 iV
rc
3.
;- ~*-
\.
M
^ 8
L/1 J
f-
:.*. f,
<
50
o o
o
» ' ;
O-
- 9 t' 0
o
0
- j;
" *
^
- \
• • \
w t o L (A

APPENDIX E
301111

oin
- j -
i H
I 11
1 ii •
r uj n
i o.
• i t •m
i mm • i T
t.j i.i
t.j >-
— «
-J i->
'•'
- I
" I
IU '
f> 'I
J I
O <
•- "
I"
ci n
i
O O O ' I O O O
O O O
11) O O O
O O i i O O O O
•o o
I> O ? r?
o n
ui in
ni i
.fl in
'Ji n
i ui
M M
i 11
1111
111' i
IM in
ni I
M P
I ni P
I PI
in P
I PI in
in in
PI i
n
^ i
• • PI
1)11
I 1
PI I
(. i ni in
C i- c •- • • C L
i._
• i -
i • i
*• .:
H i •
ii >
i 1 1
) in n
i ' '
' t ' '
•(.- v
ni ui
to :TI ai
in in ui
in n
i i-
i m
ii PI
r - i
• i -
i • i
• i •
'II (•
•• H u m

FROC-FAMMING MODE INSTRUMENT USES METH # 06 - PB DATE: -30/05
.-'FE
.5.7.9..1.3.
.T: FB WAVELENGTH 'NM): 223.3 SLIT •*.,"!): O.T' COATED TUBE WITH PLATFCFH - MAX POWER HEATING - GAS STC'F - MATRIX "C7EAT TE^P: S50 ATOMIZC "EMP: 1200 CHARACT. MASS ! ?G ) 12.
TECHMQUE: ZEEMANSIGNAL PROCESS INC: PEAK AFEATIMI (SECONDS): 5.05CREE.\ FORMAT: 1.0 GRAPHICSFECOFDER SIGNAL: 0.2 CQNT ABSTATISTICS; 2 AVC . & SD ;< Cv'FOL-CVER(ASS) : 1.500
El :H4:
2, LAMP CURRENT : ,rA) : 104. CALIBRATION: AJ~C SELECT5. READ DELAY (SECONDS): 0.02. PRINTER: MAIN r'JFPL10. RECORDER EXF: 100012. NOMINAL WEM-I-T 1 .014. EC SCALE: 1.0
2? , R3LF:
301113
T I M E :

FFIX-?AW!ING >MODE HGA SOO USES METH # OS - PB DATE: 30/ :5
iLE If.T: PB WAVE-EN:.?!- ! NM) : 233.3 3LIT <,\M>: 0.~FYPG COATED TUBE WITH PLATFORM - MAX POWER HEATING - GAS 3TCP - MATRIX rCD.F'RETPEAT TE.1P: 350 ATOMIZE "EMP: 1200 CHARACT. MASS (PC) :2,0
' i T E ? F U R N A C E T I M E I N T E R N A L\UnBEff_____TEMPERATURE_____7 AMP HOLD_______GASFLC-J_____.-EAD PECZPT
1 130 5 55 3002 200 5 25 3003 350 " 20 30Q4 1500 05 0 • «5 2650 1 2 3006 - - - - 1 3007 - --- 1 -- 3003 -.-. 1 - - 3 0 0q - - - - 1 -- 300
301H4

rti u
j 01
m a>
f>i-
~a T
Ir
i~ i"
3
:r
:o m
uj i
n u
i ui u
i in
ui »
ii
M m
]> j.
i-i -
j • n
• j
-i
• i -
i • u
i •
-•)
• i in
i> T
- j>
i
- 'r>
j>
> I
- i
o >
o Ti
'n r
- r»
2 ,
-•• 2:
r-»
^?
r^ i:
7 :'
tn
i ui >
•-. -^
u o
a a
en
n u
o M
j>
x x
*D t>
i> j>
j>
i> j>
i- i
>• i
H •
j m
ro T
I T. T
I 11
TI •«
TI
•- O
O ^
"i
U
O t
1 U
t J
t) tt
C
lO
O
O
():s.
z
i IJLI
o u
co
i H
I ui
4. u
i M •-
o ui
i u
i ••-
•--
rn ro tn
-- •
-• m
nH
H ru
'ox i
to —
3 3
<")
OO
U',|
-T)
m r
>i i
o i
ro r
o i o
i
|.
i.j
I.J •-
|.j w
— o
M i .
.i u t
.j n M
r.j
M i.
jO
O O
UI O
O O
O O
O O
O O
-H m
m o PI r>
11 J. tj i i in in • i j. • i Ml

APPENDIX F
301116

•st rvrnei'.t : 3O3O
Date InitialsHoursRun
Rout ineMa i nt .
NonRout ineMa int.
"
QCFailure
*
Elements an,.
•*•:.. .1
301117

APPENDIX 6
-cjsfta-v.
301118

airt
*l»i
•• -
ta:
<i J
•—
» -*
at >
c*.<_» a»
«(.) *
•t v
i tt
3T, *
r»'.' ?
C,r-1Ml
v> 1at*-»•wr »
S13c»O'
VnTJ
• 't
Ci1<^>
«)
7 1
ML* t-
i r;
?*
fe|
*'
't 1
i • :
ft 1V
• 1
1
• y
?!.'
"• ,T' !
tr
at
u.*r »
-c\*
^cr»-
»—
t- ^
* rti
.-•,: r.!
jlIM1
_•CT
*
•4^Itf»«
Ul
"£*~J
^.j
5 B
"'If
-1 fT» Wu.
gS1 —7K
Si>•
!C
T
iinC3
CX: >
ilj"i.«"'I ««J
^w<0
"I 1>.UVJml «ouIT' P=5>
1-•».
?)iiV7;.)i\i9~*l <
S
«0XJi ft>b5vnV
i\1OJ
)'
^-03J
1r*ii I1§h
l4- ^8
1in
£-I»<j>hi*x> <<«s>oir-- <oftSvj
b«T>
Ot)v_u>.<0VJ<T>
f4^Q<jCj^>'»!
/ (TOOT? 2.*"*!
tN§Rl rt)§F>M•r»1
'^J <lR>or; •3-ftCj
R>vi
X5 <t1JG
vq§§»---*u «t§«
0f^J ^§SV
<c$§3
^-*Cj
V;
3001m
n0V)VJ
1»
/ (TTDrTOl-
I,3
^tv61-*r->
»c^§•*v
1.**
^<H<*§1,»
y^x
5iV>o<J1t—»ot
*'Co<j
,« 1^ 1 1,5
,
oCO

APPENDIX H
301120

301121
YORK LABS/CT Reported By:..
Date:___________Time:____ _
CORRECTIVE ACTION REPORT / CASE NARRATIVE REPORTClient:_______Job Number:_________ Sample Humberts ): ______
Problem Reported By:___________________________________
Category of Problem:_________________________________________Poor C o m m u n i c a t i o n Wi t h _ _ _ . S i m p l e M a t r . x , I r. s : .- _
Description of Problem: __________________________________
Use back of CAR/CNR or attached sheet if m o r « tpace if r e q u i r e d
Recommended Corrective Action(a):.
Person Who Is Requested To Provide Corrective Actions:.
Deadline For CAR:______________ Reply to Originator Required? [ ]
Actual Corrective Action(s) Taken:.Docum«nt Actual C o r r e c t i v e A c t i o n s On ~!-. i s
F o r m and S«nd a Copy of Completed CAR/CNR to QA Officer and Job foils:
———————————————————— Signature and DateIs this a recurritm Problem?____Should SOP be Modified or Updated?_____
Initial Lab manager, Marketing Manager, Branch Manager, QA Officer,Distribution: Client Services, Job Folder, Other: ——————————————————SECONDARY DISTRIBUTION: ORIGINATOR. fiA OFFICER. OTHER: ————————————————
Document Problem and Corrective Action(s) In Case Narrative: [ 1Attachments: Telephone Log, Services Change Request, Memo, Other:

APPENDIX I
301122

t\r> - 1 2. Ogens; 15 aob = 0 .137
-5 ^ ADate Lamp I Enerov I Blank BT-&
!
E 1 5'" e r• t : c (3I .'is" f o m e n t : 2030
5O.Ooob
301123

S.O.P. APPROVAL SHEET
REVISION CODE:
SIGNATURE AND DATE:
RETURN TO JEFFREY C. CURRAN FOR FINAL APPROVAL
JEFFREY C. CURRANLABORATORY MANAGER
301124

an environmental testing company
^___ ^onroa. Connacttcm :
STANDARD OPERATING PROCEDURE
PERKIN-ELMER 5100PC ATOMIC ABSORPTION
SPECTROMETER (GRAPHITE FURNACE) 5100N
AS:092089:2
301125
lllmo**? 04-705-0740

AS: 092039: 2
STANDARD OPERATING PROCEDUREPERKIN-ELMER 5100PC ATOMIC ABSORPTION SPECTROMETER_________CGRAPHITE FURNACE] 510QN________
INTRODUCTION
This method outlines the operation of the Perkin-Elmer 5100 PC for graphitefurnace analysis of environmental samples.
It is the intent of this procedure to comply with the IEA business ethics p o l i -cy.
1.0 SCOPE AND APPLICATION
1.1 This procedure describes the analysis of water and soil samplesutilizing the Perkin-Elmer Model 5100PC Atomic Absorption Spectrome-ter.
1.2 The analytes determined using this procedure are:
Arsenic ThalliumSelenium Lead
2.0 SUMMARY OF METHOD
2.1 The sample is digested with acid and peroxide according to the sam-ple preparation standard operating procedure for furnace.
2.2 The 5100PC graphite furnace is standardized using a blank and 3working standards.
2.3 Appropriate QC check standards are measured according to EPA orroutine protocols at the beginning, throughout the duration, and atthe end of the analysis to assure measurement is accurate.
3.0 INTERFERENCES
Please refer to manufacturer's instruction regarding specific elements
4.0 APPARATUS AND MATERIALS
4.1 Perkin-Elmer Model 5100PC Atomic Absorption Spectrometer
4.2 Perkin-Elmer Autosampler Model AS-60
4.3 Epson Equity III+ Personal Computer
4.4 1,000 ul variable Eppendorf pipette
1
301126

AS:092GS?:Z
4.5 2.0 ml autosampler cups
4.6 20 ul fixed Eppendorf pipette
4.7 Furnace working standards as described in the furnace standards ar,dsolutions preparation logbook - See Appendix B
4.8 EPA QC standard solutions as described per ERA in the atomic spec-troscopy reagents logbook as shown in Figure 1.0 - See Appendix C
4.9 Modifier solutions as described in furnace standards and solutionspreparation logbook as shown in Figure 1.0 - See Appendix D
4.10 Perkin-Elmer users manual and reference manual - Model 5100PC
5.0 REAGENTS
5.1 Nitric acid
5.2 1,000 ppm standard solutions of arsenic, selenium, thallium, andlead
5.3 Nickel nitrate Ni(NOj)2 x 6H20 ACS reagent grade
5.4 Ammonia monobasic phosphate (NH4)2H2P04 ACS reagent grade
5.5 Magnesium nitrate Mg(N03)2 x 6H20 ACS reagent grade
5.6 Sulfuric acid
5.7 Nanopure water
Stock standard solutions, CRA solution/analytical spike solution and in-housecontinuing calibration solutions are prepared from the 1,000 ppm standard solu-tions. See Appendix A for procedure. Stock standards are dated, initialed andcoded to allow for traceability of the 1,000 ppm solution, lot and batch ofnitric acid used. See Appendix E for example new stock stolutions are preparedmonthly.
Working standard solutions, CRA and continuing calibration solutions areprepared from the stock solutions. These solutions are also dated, initialedand coded for traceability. See Appendix B for example.Modifier solutions are prepared on an as needed basis, date coded, andinitialed. See Appendix D for example.
6.0 SAMPLE COLLECTION, PRESERVATION AND STORAGE
6.1 Samples should be preserved by acidification with nitric acid to apH of 2 or lower immediately at the time of collection.
301127

.-S:092C33:.
6.2 Holding times for furnace analysis are ISO days for both the cu^^EPA SOW and SW846 protocols. "
7.0 PROCEDURE
7.1 Startup of the 5100PC
WARNING: Not to be operated in proximity to heart patients wearingelectronic pacemakers. This instrument contains powerful magnetswhich may affect pacemakers, watches and magnetic storage media,such as recording tape and computer disks.
A) Prior to startup the operator should be familiar with theuser's manual and reference manual supplied by Perkin-Elmer.
8) Before starting the instrument, check the exhaust vents to besure they are operating. The switch is located on the wallby the telephone, it should always be on. Also check to makesure the cooling water is on and draining at a rate of ap-proximately 1.0 liter/minute.
C) Check that the pressure of the argon supply gas is at 50 psiand that there is ample gas in the tank.
D) Check that the rinse water bottle is full (0.5 percent HNOSsolution) and that the reservoir is empty.
E) Check that there is plenty -of paper feeding to the printerand that it is aligned at the top of the page.
F) Turn on the instrument in this order only:
1) Power switch to HGA-6002) Power switch to Zeeman 51003) Power switch on far left of instrument4) Power switch on far right side of computer5) Power switch on far right side of computer monitor6) Power switch on far left side of printer7) Turn on monitor, bottom knob on right hand side of mon-
itor
G) The screen on the monitor will show two large "windows" thetop one will be labeled "C:\5100_PC\", the bottom windowwill be labeled "C:\AA_USER\5100\". Both of these windowswill have many icons in them. If you do not see these win-dows you will see the prompt "C>". Type: "Gem" and hit en-ter key and these windows will appear. Using the mouse, movethe arrow to the top window and position arrow on the iconthat says "5100_PC.EXE". Hit the left hand button on theLigitech mouse twice (double click) in a rapid motion. This
30112S

3 c - i j : _
w i l l change the screen on the monitor to the ?erkin-E"~er-Atomic Absorption Laboratory Benchtop Software. Icons'*: "appear in- the right hand side of this screen. The icon 'a-beled 5100 w i l l be high l i g h t e d , double c l i c k w i t h the^c^eon the icon labeled "multi". The screen w i l l change to tr.s -iwindows used while analyzing samples, "Display Peaks, Oisci"a/Data, HGA Control and Multi -Element Control".
Electrodeless Discharge Lamps (EDL) can now be l i t . rurntoggle switch on EDL power supply to on. Turn Micronta ti-eron. Turn appropriate lamp number knob fully clockwise andturn lamp igniter on. Place igniter in front of EOL anawatch power supply wattage increase, turn knob counterclock-wise to the desired wattage, (8 watts for arsenic, 4.5 wantsfor selenium). Allow at least | hour for lamps to warm up,check wattage occasionally because lamp wattage increases asthey warm up.
Clean all windows on the furnace with Kimwipes. Take out thewindows on both sides of the furnace compartment and clean,unscrew the left hand side of the furnace housing and removethe quartz window to clean. Turn (either way) the smallwindow on the right side of furnace housing and pull out.Clean both sides of this window with a cotton swab and Kim-wipe.
/"""*""' Open the furnace housing by pressing the black button labeled"furnace" on the HGA-600 module. Remove the graphite tubeand clean the inner and outer portions of the contact ringswith a cotton swab and a Kimwipe. Tubes and platforms lastapproximately 16-20 hours (300 burns). Check the daily runand maintenance logbook to determine whether the tube isstill good or needs to be replaced. Also f i l l out the main-tenance logbook at this time for the run you are setting up.To put a tube back in the furnace make sure the lengthwisegrooves in the tube are facing the left side of the furnacehousing and use the alignment tool to get the proper locationof the entrance hole of the tube in the contact ring. Toclose furnace hit the black furnace button on the HGA-500module and replace all windows.
Put the autosampler in standby placing arrow on the diamondshape in the top right hand corner of the multi -elementcontrol window and click once. This w i l l enlarge the windowand bring it to the center of the screen. Click once on"sampler standby" and autosampler arm can now be removedmanually. Pull down mirror behind furnace so you can seeinside the graphite tube. Turn the gray knob on the lefthand side of autosampler arm counterclockwise to bring ar^iinto sample deposit position. Watch arm as it enters the
301123

AS:092053:2
small hole in the graphite tube making sure it does not ni:the side of the tube. If the arm needs adjustment turn thelock knob on front of AS-50 counterclockwise to unlock. Thegray knob on the left of autosampler table is the lateralcontrol, it will move the table left or right. The gray knooon the front of the table is the horizontal control, it w i l lmove the table forward or backward. Make the necessaryadjustment to allow the autosampler capillary to enter thesample introduction hole without striking the edges. Whenproperly aligned lock the tray into place. Check the pene-tration depth of the capillary by lowering the capillary tipinto the graphite until it is about 2-3 mm above the L'vovplatform. If the sampling arm contacts the stop before thisposition is reached, turn penetration depth control counter-clockwise to lower the stop. This is the tan knob closest toyou on the right hand side of the autosampler arm. The im-mersion depth of the capillary tip into the sample cups canalso be adjusted using the immersion depth control, the tanknob in front of penetration depth control. The immersiondepth should be adjusted so that the capillary tip is onlyimmersed in the sample solution as deep as necessary. Thedeeper the tip is immersed, the greater the risk that liquidwill hang up on the capillary.
After all adjustments are complete click on sampler standbyagain to take autosampler out of standby mode. Click on thediamond shape again to put window back in original position.Be sure to move mirror back out of the path of the detector.
The graphite tube must now be conditioned to remove anycontamination. Place arrow on "windows menus" and select"element parameter" from the dropdown menus. If the instru-ment was already on, the last element file run w i l l appear.Place arrow on "file window" and click on "open" dropdownmenu. The element files will appear in the center of thescreen. You are now looking for the file labeled "COND_HGA". If this is not in the window, move arrow to the bottomright hand side of window and click on the down arrow symbol.This will move files up one to see additional files. Continuedoing this until you see the "COND_HGA" file. Place arrowon this file and click once. Click once on "OK" box andinstrument will set up this file. Click once on "bow tie" inleft hand corner to remove element parameter window. If thearsenic lamp is not lit, you will get an error message stat-ing that there is not enough energy, click on "OK" box.Click once on HGA control window to bring it to the front.Click twice on "HGA ON/OFF" icon to start the conditioningprogram. The instrument will go through a series of heat upand cool down steps to burn off contamination. Do this twiceto make sure tube and platform are fully conditioned.
5
301130

Check lamp align.rent of all lamps befors starting run. 'J3;--the mouse move the arrow to the windows menu and se'ec:"align lamp" from the dropdown menus. Place arrow on desir=celement lamp number and click once. Ali g n lamps in the ;5;T9order as you intend to run them. The turret w i l l -rove int:position and the wavelength and s l i t w i l l adjust i t s e l fautomatically. When the instrument is ready you w i l l see anenergy bar graph on the screen and an energy valve. Hit th»F2 key (AGC/AIC) to bring the bar to the middle position. Toalign the lamp, turn horizontal and vertical alignment screwsholding the lamp in place, watching for maximum deflection(to the right) of the bar graph. If bar goes off scale, hitthe F2 key again to bring back to center position. Slidelamp back and forth until the graph can no longer be in-creased. Repeat this procedure for each lamp. Check to makesure power cords to the EDL's will not get tangled in theturret as it moves to next lamp position. To exit out ofthis menu, place arrow in upper left hand corner "bow tie"and click once.
7.2 Sample Evaluation
A) Locate the samples to be analyzed and compare them to theapplicable prep log and traveler in order to determine ifthey require CLP or routine analysis protocols, or New JerseyOEP procedures which will require signing their internalchain of custody and for completeness. To determine run se-quence, look at samples, paying attention to highly coloredsamples and sample identification (from traveler). Highlycolored samples are usually an indication of high analyteconcentration and high background. They should be put at theend of the run to avoid carryover and contamination of clean-er samples. Sometimes the sample identification supplied bythe client, located on the traveler, can give you an idea ofwhere the sample came from and also possible concentration ofanalytes.
B) You can now set up your furnace run log. The first 4 CUDpositions are reserved for blank and standards. The run logstarts at cup 5 and goes to cup 40. The Initial CalibrationVerification (ICV) standard goes in cup 5 followed by theInitial Calibration Blank (ICB). The CRA solution is next.then, depending on the protocol either a Continuing Calibra-tion Verification (CCV) and continuing calibration blank(CCB) is run if it is CLP protocol, or samples are run if itis regular protocol. Two cup positions are used for everysample, the first position is the sample run as prepared, thesecond position is the sample spiked with a known spikesolution. Calibration checks (CCV and CCB) are run afterevery 10 sample cups, the CRA solution is counted as a sample
301131

AS:092C39:2
but does not need to be spiked. The pre-digested sp^kesample also does not need to be analytically spiked Thesample is followed immediately by its analytical spike Cupposition 39 is reserved for the t h a l l i u m matrix modifier andcup 40 is for the lead modifier. Cup position 00 is locatedin the white part of the AS-60 just to the left of the rinseposition, this is the location of the arsenic and seleniummatrix modifier..
Once the run log is filled out completely the autosamplertray can be set up. Standards must be made daily, to make,see "standards and solutions preparation logbook" for direc-tions. Instructions are given in the preparation section ofthe book. Working standards must be dated and initialed ev-ery day and the "working solution" section of the logbookmust be filled in every time standards are made. It iseasier to pour out your blanks, standards, modifiers and QCfirst, then concentrate on your samples and analyticalspikes. Using the 1,000 ul pipette add exactly 2,000 ul ofsample to your autosampler cup and 20 ul of the spike solu-tion. Stir this solution with the 20 ul pipette tip toassure proper mixing of the spike into the sample. This isyour analytical spike and should immediately follow the cupwith approximately 2,000 ul of sample. This spiked sample islabeled on your run log as the sample number followed by thecapital letter "A", i.e. 1234001A,.
After the autosampler tray is set up, carefully place it inthe autosampler. The tray fits over the white piece in thecenter of the sampler. Line up the small cutout piece in thecenter of the sampler with position #36 on the tray and pressdown slowly.
7.3 Software - You are now ready to set up your ID/weight parametertable on the computer. Using the mouse, move arrow to the windowmenu bar, menus will drop down. Move arrow down to "ID/weightparameter" and click once. The ID/weight parameter window w i l lappear over the other windows. If the instrument was already on,the last ID/weight table will appear. Place arrow on file menu barand click on "new" dropdown menu. This will change ID/weight param-eter window to a blank window. Hit the caps lock key, then type inyour initials, hit enter. Move arrow to the "ug" box and clickonce, move arrow to "L" box and click once. Move arrow to the firstlong box under the position column and click once, it w i l l then behighlighted. Move arrow to the edit menu bar and click on theglobal entry dropdown menu. Fill in your starting cup positionnumber (usually 5), hit enter, then type in last sample position,hit enter again. Move arrow to the "OK" box and click once. Thisautomatically fills in your sample position locations which corre-sponds to the cup positions on your autosampler tray and your run
7
301132

1S:03ZQS3 :
log. Using the arrow keys, move the h i g h l i g h t e d bar one spacethe right, to "Sample ID". Type in the sample ID of your -^3;sample (usually ICV). Move arrow down one position and type in -extsample ID. Continue doing this until you have filled in all sa.-oieID's in this window. Hit the "Page Down" key to bring up the nextwindow and place arrow key at the first sample ID bar and die*mouse to highlight. Continue this procedure until you have typed •-.all your samples. Move arrow to the file menu and click on "SaveAs" menu. Type in the name selected for this ID weight file and mtenter. This name should also be written on your furnace run log.To close out ID/weight parameter window, move arrow to the "bow t i e 'in the left hand corner of the window and click once.
You are now ready to program the instrument as to which elements andsample locations you want to run. Under the "windows" menu barselect the "multi-element parameter" menu. If the instrument «asalready on, the last multi-element run will appear. Place arrow onfile menu bar and click on "new" dropdown menu. Type in your i n i -tials and hit enter. Under data storage file type in "raw", hitenter. The ID/weight file you just entered above will be listednext with the extension .A60 after its name. If it is not listed,hit the ESC key and type it in, then hit enter. Under sample posi-tions type in your first sample cup (usually 5), dash (-) then lastsample location, then hit enter. The first element file will now behighlighted. Always run elements in this order: arsenic, selenium,thallium and lead. The arsenic file is ASCLP, type this in and hitenter, the program automatically assigns the extension .GEL afteryour file. Delay should be between 0-5 minutes to allow lamps towarm up. Arsenic and selenium lamps are EDL's so they must be givenat least i hour to warm up, that is why they are lit up at the be-ginning of the set up. Thallium and lead are hollow cathode lampswhich are given a 5 minute warmup time. If you only want to runselected sample positions, move arrow to the "samples to analyze'bar and click once. Type in sample positions, consecutive positionsare listed as first cup location - last cup position (20-25), to f'-inselected locations, separate cups with a comma (20-25, 30-35). YOUare only allowed to separate 3 times so you must group samples withthe same sample analysis together as best as possible when settingup your run log.Continue filling in the element files, delay and samples to analyzefor the rest of the elements. Element files are: ASCLP, SECLP.TLCLP and PBCLP. These element files contain the proper standardconcentrations and sample replicates to meet EPA requirements. Seeattached printed of element parameter.
When the multi-element window is complete, add to the element fileOS. This is a dummy file that will turn the last hollow cathodelamp off when it is through. Close out this window by placing ir<-c*in the upper left hand corner "bow tie" and click the mouse once.
301133

AS:C92CS3:2
Put arrow anywhere in the multi-element control window (bottom rignthand window), and click once, this w i l l bring this window to kn=>front. Place arrow in printer on/off box and click once, this boxw i l l then be highlighted. Put arrow in start/stop auto run box andclick once. This w i l l start the run. Each standard and sample w i l lrequire double injections, with the result being the average of thetwo burns.
A message will appear over the windows to ask you if you want tooverwrite data in data file or append to file. Place arrow on "OK"box and click to overwrite data file. The run will now start. Eachstandard and sample will be injected into the furnace twice, therebygiving two burns per sample as prescribed in the current EPA con-tract.
Keep a close watch while the instrument is standardizing to assureconditions are optimal. Watch how the autosampler is picking upsample and how it deposits it on the platform. The blank shouldhave a peak area (A-S) between -0.005 and +0.005. Peak area (A-S)for standards should not deviate more than ±20 percent from thesensitivity check values listed in the Perkin-Elmer literature. Ifany of these criteria are out, stop the run and fix the problembefore you begin again. Without proper standardization the run w i l lfail so it is to your benefit to watch the beginning of each run asclosely as possible. Monitor the run frequently during the analy-sis. Check the precision to assure that the replicates are withinacceptable limits (RSO <20 percent) for those samples greater thanthe CRDL. Check that initial and continuing QC passes and analyti-cal spike recoveries are acceptable. Again, if any of these thingsfail, it is an indication that there is a problem somewhere. Stopthe run, identify the problem and make the appropriate correctiveaction before proceeding.
7.4 Instrument Shutdown - To shut down the instrument reverse steps ofstartup (4.1.6), computer first, 3 power switches on the instrument,then EDL's.
7.5 The 5100 has a bound maintenance logbook that is filled out everytime an analysis is to be performed. The book is kept underneaththe furnace on top of the HGA-600 power unit. The first column isfor the date of analysis. The second column is for the analyst'sinitials. The next column is for recording maintenance performed,such as changing the graphite tube and platform, contact rings, orsampling capillary. The next column is for how many hours the in-strument was operating and the last column is for the element andthe job/case number that was analyzed (Appendix E).
5/90
301134

AS:092CS9:2
A separate folder in the nain f i l i n g cabinet is maintained for re-pair work which required a service call from a certified Perion-Elmer technician. There is a folder labeled "5100" with the com-pleted service tags, describing the problem, along with the correc-tive action.
7.7 A furnace autosample logbook is also kept under the 5100 PC desk.Every time analysis is performed - a copy of the furnace data sheetgoes in the book, the elements that were analyzed for are written inthe "element" space on the upper left hand corner.
3.0 QUALITY CONTROL
When the run is complete, check that all quality control (ICV's, prep blanks andlaboratory control samples) meets acceptable criteria. If contamination isevident on prep blanks or LCS's fail to recover, refer to protocol to determinecorrective action. If necessary submit a "corrective action report" with a copyof the data and prep sheet attached explaining the problem, to the supervisorfor immediate action (Appendix I).
9.0 METHOD PERFORMANCE
9.1 Instrument detection limits are determined quarterly per the currentERA contract as stated in Exhibit E, Section II.
9.2 Control charts are kept for tracking of accuracy (LCS and spikerecoveries), and precision (RPO on the duplicate analysis).
10.0 DATA REDUCTION AND DATA HANDLING
If data meets all criteria, calculate results and keep track of any reruns ordilutions needed. Once a job has been fully completed, sign and date all rele-vant chain of custody sheets. At the end of each completed analysis, report allsensitivities for analyses that were run, in the appropriate logbook for stan-dards (Appendix J). For non-CLP work, report results and quality control onfinal report sheets. CLP work should go into the appropriate job folder.
11.0 SPECIAL PROCEDURES - N/A
12.0 USE OF OTHER REQUIRED SOP'S
Glassware cleaning SOP, standards and sample preparation SOP, standards andsample prep log SOP and corrective action SOP.
5/9010
301135

13.0 DOCUMENTATION OF PROBLEMS
13.1 Corrective Action Reports
If any discrepancy occurs during analysis that requires attentionsuch as standard or instrument problem, sample prep problem, etc.,a corrective action report is warranted. This report should beprepared per the atomic spectroscopy corrective action report SOP.
13.2 All CLP-type reports and regular reports require a case narrativethat specifically addresses any anomolies and their possible causesthat may have occurred during analysis.
14.0 REFERENCES
14.1 Methods for Chemical Analysis of Water and Wastes, EPA-600/4-82-055,December, 1982.
14.2 USEPA Contract Laboratory Program, SOW 7/88.
14.3 Test Methods for Evaluating Solid Waste, Volume 1A, USEPA SW846, 3rdEdition, November, 1986.
5/9011
Veil36

ELEMENT PARAMETERS

:S3IHIBd
"WO•t! :*MHrH
z/g»-a)l I t/re-»»i_133'

S a *l si ,9
CO o CO CO
DD 51 CD ai i
P 1 — 1
A (O
IT$
1 1i
a 8
fl"
as D a a r
8 rri »-* r I! CDS?
IS
B i s IM
ra cn

301140
Elonert Pyaaetar - C:\flfl_IJStR\5169\ELEMBfT\flSCLP.BEL
Main I I Calib HP
IHTEBWTIOH TINE (MC) : Q 1 D 3 5 Qtl
D5 D __
(rw): (F 193.7
Slew Peak
Q ___ (196-66*
follow* (flb«.): __
SLIT («0:
BOC TBC (MC): D3 Q4 aTVP€:
PEflK HEI6HT SWOTHIW (points) None Q 5 Q 9 Q 19 Q 37

Element Parametar - C:\MJJSER\51B9\ELEHB1T\flSCLP.6EL
Main Calib
StepHigher
FurnacaT<
Tim (sac)Ram? Hold
InternalFlow Tvt»a
Read Pr«lWRepeat
301141

Element Paranetar - C:\MJBER\5169\ELEKBfT\ftSCLP.GEL
301142
Main Calib Inat NBA
3*,? la Uolua*: 2fllOiluant Uoluna: _ Dlluant Location: _
HRTRIM MDIFIEX PHWHETEW:Modiflar *1 Location: 8. HodifUr HI Volum: 5
Pipat Bafora 3a«pla 0 Pipat With Saapla Q Pipat*Aftar
Modiflar N2 Location: _ Modifiar M2Pipet Bafbrv Saapla [F] Pipat Hith Saapla
IWuaa: _DP1**(ftftar Saaple
PIPET PMPJtETBtS:Protocol:Hutar of tfaah Stapa:
of Injactiona:
L Pipat Togathar
BPipat Saparataly
, 3_ _ (1-18) •--

H
[
Element
Main | | Calib
P
BEFWEMCE STAMMfSSSolutions
Std. BlankStandard 1Standard 2Standard 3Standard 4Standard 5Standard 6Standard 7Standard 8flailocs
aranetar - C:\«_LB£H\5188\ELafflT\PBCLP.6EL
Inst | | HEA M AS-tt/1 |
PCKM4ETB23:Location
BBBB1234
UoluM___
a2129
lUuantUoliaw
HIHodifiar «H
UoltaMT!I«
S
Sanpla liar* Location: _
Mditions fefinition: 0 flutoaatad Mditions Q
SJS^ | AS-tSa/3 i
Hodifiar =C.Voluw
Praaixad Mditions
r
301143

Elmer* P .6EL
Inetl HGA
SOCLE BEVOrtD CALIBRATION RttCE:Beyond Calibration Action: 0 Continue Q Dilute I ReanalyzeAlternate 8Mpl« OoliJM: [_ Sipy«U (Xxr<^l Bljnfc; Q VM >J fto
REGOVERV HCASURCMO1T PflRRNETERS:Uw _ ui of Uw _______ ug/LThe nat recovery concentration will be
at locationU8/L
PCftlOilC RCQM.IBRATIOH PWWETBQ:necalibretion Type: [Fj RMtanriardize [JRun Before 8an01e Loeatione: _ _
lope
PERIOMC CHEW SAWLE PAfiAKTERS:Location: __ Lower LU»it: . Upper Unit:*jn Before Sanpie Loeatione: „_ — « . _ „ _ »Out of Unit Action: 0 Continue \_J Reeelibrete I Continue
[J Stop [J Recalibrate I Rerun
301144

"CUO
E/g»-Sbl I Z/re-SU I I l/Bfr-at I I WH I I Wl I qn»3
HI

o
••:.
o>
B 3
I I si§Dtn
c
en H CD n CO
ICO CN 8 8
if
a* i? a I a a rPII i
O 3 on

: (tWF«l) SNIHiOOMS IH9I3N W3d
006
ea-2*§D1118
B'96l
cea-8)a DOV38
— in.- «in B) mil MOUW931HI
2/99-W I 1/B9-W
wva -

Element Parameter - C:\flfl_USER\5189\ELEMEm\SECLP. 6EL
Main Calib Inst ftS-68/1| 1 AS-60/2 I ftS-6fl/3
Stap Furnaca Tina (aac)Raw Hold
298119821982£58
8
IS
IntarnalFlow368968368
968
388388
181112 388
301148

Elenent Paraxetar - G:\aft_LSEK\5l99\ELEHB1T\StCLP.BEL
—^
Ha in Calib In«t HBft «-*a/3Saapl« UolDiluant «l: _; Diluent Location: __
MfiTKIX MODIFIER PMMHETESS:MorfifUr l»1 Location; 8.^, Modifier «1
Pip»t Before Sa«ple >] Pipet With Senpl*: 5.
HodiFlw »«2 Location: — ^ ItediflarPipet Before Sanpla [F] Pipet tfith Sample
_[J Pipat After Saepla
PIPET PttWProtocol:Number ofMuter oF
IE TEAS:
Mart Stepe:Inject lone: r
•••i
Ploet Together11 (J3 Bi —
Pipet Separately3_ (1-18)
30114'

Elenent Paraaetap - C;\»_JStH\5186\ELaEm\StClP.6EL
Main Calih Inat HEA AS-W3
REFCTOCg STftfMEPS PPJMKETBK;Solution* Location
Standard 3 28
liar* Location: __
Mditiona J*f Iflition: 0 Autmatad Additions Q Preaixed Mditiora
30115°

Elo«ent Paraaetar - C; \MJJSER\5189\ELEMEm\SECLP. BEL
Calib | In«t I HE*
»*PIE BEVOMD CALIBRATIOH RMCE:loyond Calibration Action: gj Continue Q Wluta I Raanalyzo
i: [_ S^arrtJ (Ktrcal >!•*: Q VM
R£OWEHV HCA8UREMEHT MRRHETER8:UM __ uL of th» _______ uoj/L «t«idvd at location _Th» net r«oov«ry cancantration will to ____ ug/L
PERI01IC RECftLIWmW PfiRflHETERS:ItKalibratiDn Type: [F] Rwtandardia [J RH!OP«Hun Biforo SaMpLa Location*: _ _ _ _ _ _
PCRIOIIC CHECK Sftff»ie PflMMCTEftS:Location: _ Lower Liwit: ______ Ufcpar Halt:Run Buforv Sappla Location*: __Out of Unit Action: Continuo "Tl Roealihrato C Continu*
J Stop LJ Racalibrata 8 Rerun
301151

Elenent Paranetar - C:\Aft_USGt\5tB9\EiaB1T\aCU.6EL
frwlyct: DFO.
PRINTER : Q NMM OhlyOPT IflMi : [HlCalib,
tainPM* Plot*
PBW STORAGE: D D
RBffMCS:

(66-L)
s D••n Mfe
**Ufa " rD
B/Bn Q §/•*[]Vs"
*-< - P 1/Bn[3 1/6" D:tiIHn
:BS"0'B
:9SUS :*
: —I n i/« n v8" n i/
8" H i/*
1 D i/
8 D " ^™* kHMtf fjfc« »!•** JVULftJB KJI tf%
n *qn»a *PW uLJ 'PW J° 'Hi u3dAi wiiwenw
£/g»-» I Z/B9-»I I l/P»-aM I MH
?uw»t3

ESb
rp10iml
nOb
JnnmTO
Dnf*1
5nneuDX^
i
DI2I
CM
D
••* ~.
« i
& 8
a nV *
*m*f
£
DD8CD
n•*»-•-4
C^
inaaa01
a^
|!nJ!
nOs
DIfl
aI(A|
• •
IS8•*•Si
•e?oCO

M Elenent Parameter - C:\Afl_JSER\5ie8\ELEXEin\rLCLP.6EL
Ha in Calih Inst AS-^fl/2 |ftS-6fl/3

Elemnt Paranetar - C;\flftJJSCR\S188\ELEXBfT\n.CLP.6£L
Main Califa Inct «* 1 «-tb«/3
UO!UM: 2fliDiluanb UO!UM: __ Dlluont Location: _
HR7RIM MODIFIER PARACTERS:HodlFUr »1 LoMtion: 39 _ Modlflw
Pi|»t kfona Swpla H Pi|»t Vith Swpl*VoLuw: 5.
Aftv
FUr »2 location: _Pipet Be Fore Swplft
Hodifi«« N2 UoL«,: _SMD!* Q Pipot Aft«r Svpla
PIPCT Pff¥WETB8:Protocol:
of M«h Step*:of Injection*:
Pipet Together11 B
Pipet Separately3
~ _ (1-18) "
3C1156
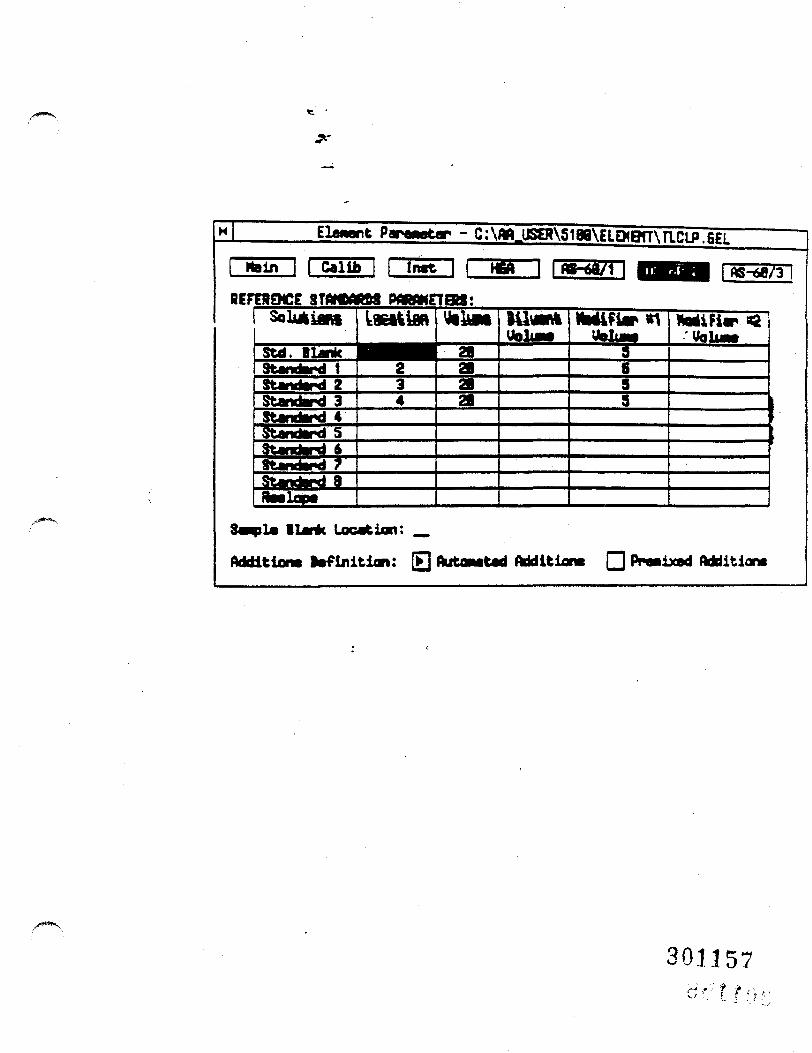
H Elaaent Paraoetar - C:\flftJJSER\5189\ELaBn\riCUi.figi'
BEFEBEHCE STflMKBM
Mditiorw
Location: _
: [F] AutOMted Addition* Q Prwixad Mditlom
301157

"rf
Elenent P - c:\flusmsieeAEiQiBm acipIn«t \ HBft
SPJW.E BEVOfO «IIB»TIW «W£:Bayand Calibration Action: 0 Cbntinua Q Wluta Iftltarnata Sa^»la UoLaia: _ aapartta Omrcai Hank Q VM
Uaa —
HCA8USMEHTui of tha ua/L
Tha nat racovary concantration will baat location
iaVl
PERIOBIC REGAL IBRAT mi PARAMETERS;Racalibration Typa: 0 Raatandardia QRun Bafora Saapla Locationa: _ „. _ _ „_
PCTIOllC CHECK SAMPLE PAJbYCTEBS:Location: _ Loner Li»it: _____ l*oar Unit:Hun Bafora Sanpla Locationa: _. — . - . - . _Out of LUit Action: M Contim^ n Raoalibrata I Contirua
(J Stop U Racalibrata t tanun
3011^8

CO CO
11 i CO ••—
• r D
«
3-«
«•• i* an p t
S I 9
@D
f *
I &
jacj
|T|
J!
^ r
m r
a
J11 i w i
(n
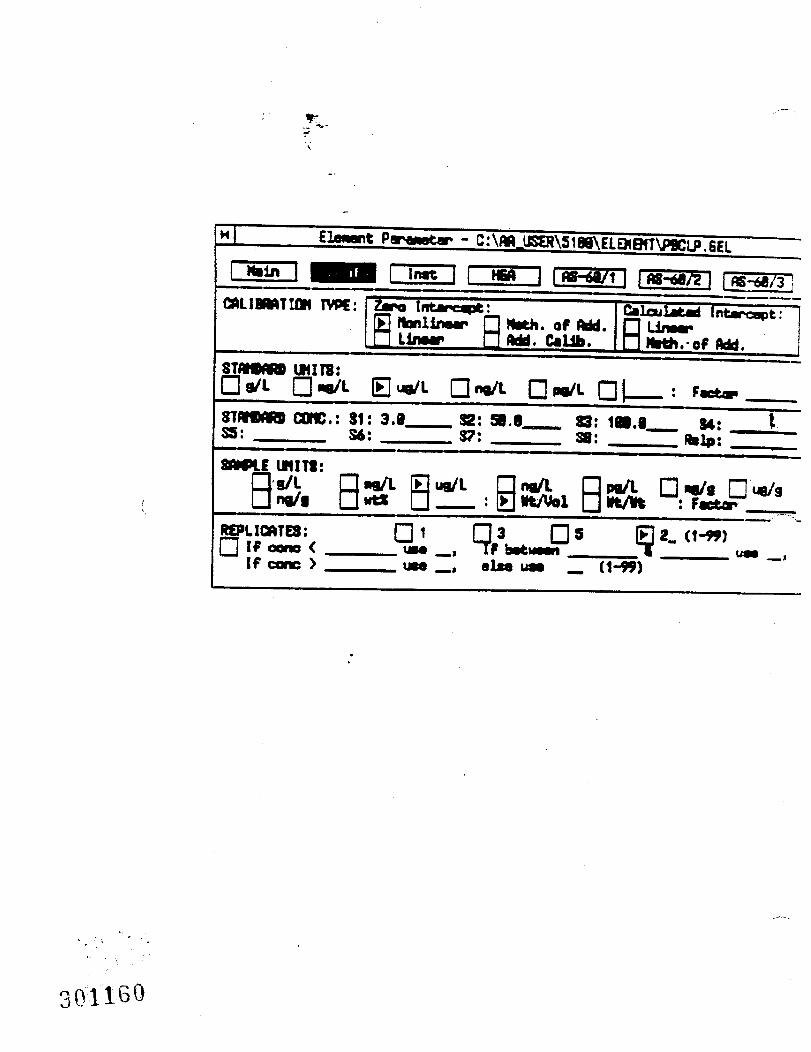
co o. o
ttl
§1°
I !
a S if .1° i i
US
• a
cn H CD P a if
a
i ..
*8f
i|r-
ra
i |
'"r s11"' "I

sD »D.••D
s D
e/gy-aii I VK-sa\ i t/»-»i \ an139 '
guiHIOOHS 1I6I3H »3d
C'ESZ :
I*1) H19ei3fNM
AtTDf
) mil HOI1WS31HI
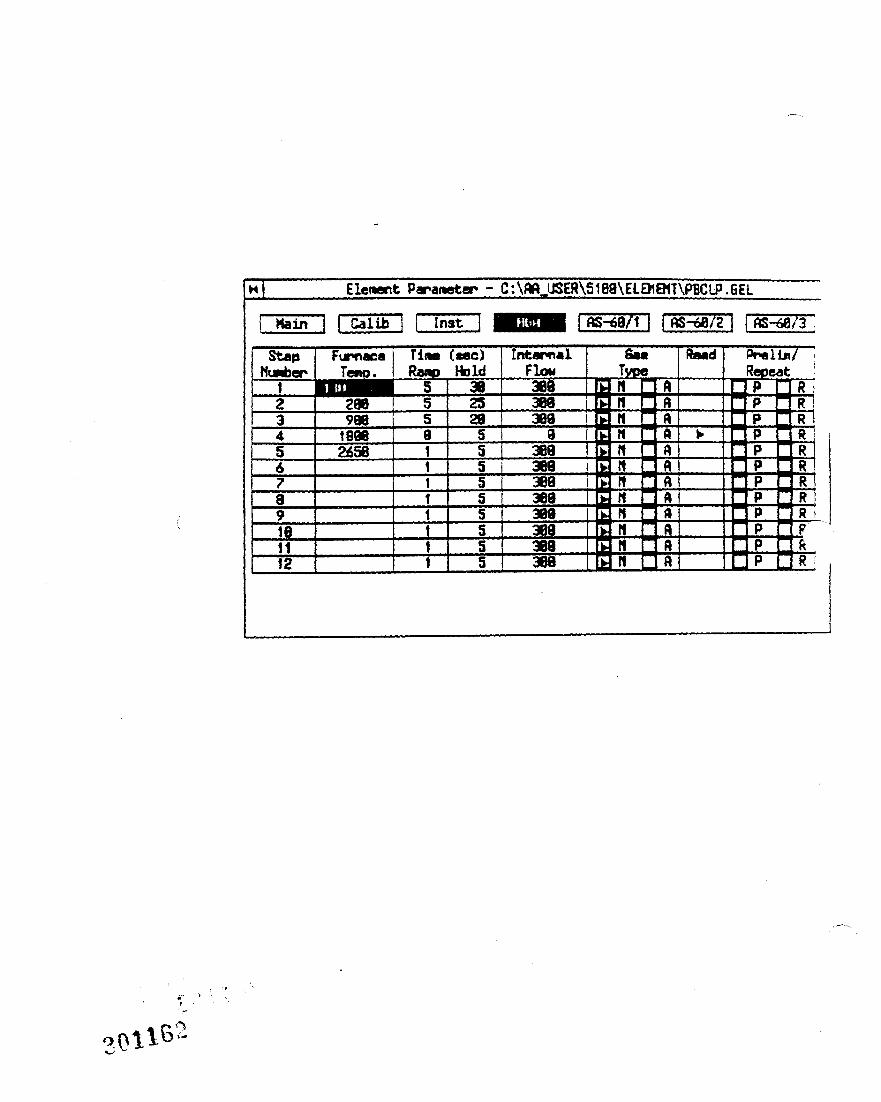

/*""\
Elanant P
Main | I Calib I In«t |
&•*>!• JO!LM:DiliMnt
MDIFIEXFiar "1 Loc«tiani
»2 Location: __
Pipit Kith
Kith
N1 VbLw: 5.UP1**'
PIPCT PMMCTERI:Protocol:
of InJ«ctiom: D3 Bi_ Pipvt Sipvttaly
3
301163c/ *• r

- c:\MjKE\5ieg\Eiaampttyi.6EL
Location; _
Addition, tof initial : AutOMted flridltiam PrmixKl addition.
301164

ElMant P
IMNI CM.IBRftTUM WnW:••pond CalibrationAltarmU
Contin« nWluUl
REOOMOIV MCMUREMQIT PflRRMETBW:UM _ uL of t*» _______Th» not recovery conc«ntr«tion Mill B»
PERIQBICHK-llfkn l»fop«
PW*W£TERS:Typ«: [
Samla Location*: __
PCIIOIIC WGCK MMPU PMPJCTEPJ:Location: _ LOMV* Unit:Run fcfam Sanpla LocaUorw: _Out of Unit Action: M.Co
U5t<
LUlt:
I ConfcinuBI brun

APPENDIX A
301166

APPENDIX A
Stock Standard Solution - Pipette 1.0 ml each of 1,000 mg/L (ppm) of arsenic,selenium, thallium, and lead standards into a 200 ml volumetric flask. Bring tovolume with 0.5 percent nitric aci'd. This solution contains 5,000 ppb of eacnelement.
CRA Stock Standard Solution - Pipette 1.0 ml each of 1,000 mg/L (ppm) arsenicand thallium, 0.5 ml of 1,000 mg/L (ppm) selenium and 0.3 mL of 1,000 mg/L (ppm)lead into a 200 ml volumetric flask. Bring to volume with 0.5 percent nitricacid. This solution contains 5,000 ppb arsenic and thallium, 2,500 ppb/seleniumand 1,500 ppb lead.Analytical Spike Solution - Pipette 0.4 mL each 1,000 mg/L (ppm) of arsenic,thallium, and lead and 0.2 mL of 1,000 mg/L (ppm) selenium into a 200 mL volu-metric flask. Bring to volume with 0.5 percent nitric acid. This solutioncontains 2,000 ppb arsenic, thalium, and lead, 1,000 ppb selenium.In-house Continuing Calibration Verification Solution - Pipette 1.0 mL each of1,000 mg/L (ppm) arsenic, selenium, thallium, and lead into a 200 ml volumetricflask. Bring to volume with 0.5 percent nitric acid. This solution contains5,000 ppb for all elements.
301167

i11•\>v'
,',-.V
- 1)
'' -
u' <(A
\.*V>-~ V
t7 y
y -
v> *
v c
o '*
" "?
a
9 l if
J C '
$i "?
^i
, q-
1..' V
'"v
vo • j-i
j j- - -
w-
?'
•
*
^
•i -.V"" "-
~« .- —
— sT
c^ "
£ """
^•
*"
*-
«*
"* ^1
-T
(v
tt V
y-
6»
—
——
V
i>
*-\ ^
S
'A
*• O
^
^
^
0
^V
i -
S
.' *-.
--
t y
5v's
^"^
r» ——
~-> "O
' "
<t
* " ^ 1
ri"^
r 0
o
^
~ -
- - -
. ^
^
——
-
,—
"^
-<
U
V
»
-^
-v.
"> - x *
?s\ « K * *
-r:- .%
c
^is
.'lJ
i"^
•*
o
Q.
"•* n
" 1
*. i.
.4
i |
r1
'->
. **-
, **-'?,
. T
- ^.
<U
Q
.
* ;" ^
^ c; o
?-; S
?.' ?• ^ &
^^ ^
h u ^t.' 1
u U c; t^ ^
Xl
"-^ o
~ V
n P
tT
VA
*•<
h~
i V
^O
C
" ••
t»
-0
«•»V"i
Q_
«» tf
in Q
_ ^
i-w^
«.- <n
c
^o
o o
c^ '-^ ^. ~
^
^ 5 VV Jp F f
lisle
-'r<
.P r>
*> o
-o(^
ft. ft- &. R
: ^- ^
^- §. ^S.
• » oc^
Q^
oo
^F
^a
IS
^^
^f
*^
?^
iX»
,M
|XJ
I,N
V^
^'
f>
O
^
- -_
...__
._...
... .. _
(-
i
*'
V^1
^^
t:
^
V ?
'J C
: ,'
«. .
^ \n
*C
">
•'I O
?
^3
~
--
It- fO
*> ^
~ ——
— —
~— <w
9
«P^ ? I
oO
0 rf.
Oo
Vi
'*
! ^
**
^
-^ ~
~ ^
O^
-i^
? 3sTv.|
*
|
J> ^
?^
§ <
L"°?^cl.
& sPi S ti? s•o
*• >-
.^
^
K^ V
?i5{<5v)l
vjV
i^n
vt^
tf *£
<&
5"
?*
-^
-*
9
-i) -i)
o
• f f 5 § J
1
j-i •
%
^
, v
/
^^
0
.0
J^n
0
- -
-,
~- *
•"• "
»"
*
t; «•' —
~> w
i
^?
? <T, ^
••<^.5
- t
-3
*___ _
__
_ _
^^ y*
1
N
,
O
-^
t? N
~>
f}
0
°
O O
o
^.
^
V
'~"
~"~
~--^
.'-fl'*' "^
"~
^
r-"^
.C
i 0
^
l
(V)
—
V*»
s
->
;^
^',
~«
*v
»,
-f
jo
!
'| 8
1 1
JL^
v^ ^ >
^ ? §
? S
5I
O_
*
^
' S^
«t
^" "^ ^L
"**" **
^*- "^
"*
'
**• '
*V «*- jJ A
**- . x*
<. ' C
"^ "^ -
~
l-O
z?T» tr ^ v^
T~ \ ^
c«
**^v'*^ -«
*:*^o
.
\£}
-^
V>
'x
i \
.
^
O
r~
j .^
"^
-^
"^
* ^
**
-^
v*
*-
»v
^
fl J:
i» ^
-f- 5-
^ ^
? '^
" ^
F i ^ rt^'S ;5 -^^ H s ,* x t*j
~*~ '
*
\\•': 1
L,;--',••'•
COCD^ "
«-4^"
<^
OCO

APPENDIX B
301169

APPENDIX B
Working Standard Solutions 100 ppb Standard - Pipette 4.0 of the stock standardsolution into a 200 ml volumetric flask and bring to volume with 0.5 percentnitric acid.
50 ppb Standard - Pipette 2.0 ml of the stock standard solution into a 2CO ~lvolumetric flask and bring to volure with 0.5 percent nitric acid.
Intermediate CRA Solution - Pipette 4.0 ml of the stock CRA solution into a 200mL volumetric flask and bring to volume with 0.5% nitric acid.
CRA Solution - 10.0 ppb As, Tl, 5.0 ppb Se, 3.0 ppb Pb - Pipette 20.0 ml of theintermediate CRA solution into a 200 ml volumetric flask and bring to volumewith 0.5% nitric acid.
Blank Solution - Add 0.5 nitric acid to 100 ml nanopure water.
In-house Continuing Calibration Verification Solution (CCU) - Pipette 2.0 ml ofthe stock CCU solution into a 200 ml volumetric flask and bring to volume with5 percent nitric acid. This solution contains 50.0 ppb all elements.

I '/"
^
/t*
fa"
O
"

APPENDIX C

ICFTKCHNOLOGY I N C O R P O R A T E D
October 13, 1389
INITIAL CALIBRATION VERIFICATION SOLUTIONS FOR THECONTRACT LABORATORY PROGRAM
EPA-EMSL AND ICF TECHNOLOGY, INC.
The Initial Calibration Verification Solutions (iCVs) are tobe used to evaluate the accuracy of the initial calibrations ofICP and AA instruments. These solutions may also be used asaqueous Laboratory Control Solutions.
The values for each element in the ICVs are listed below inug/L (ppb) for the solutions that result after the concentrateshave been diluted according to the following instructions:
1. ICV-1 (0489) — For ICP use, dilute the ICV-i concentrate10-fold with 2% (v/v) nitric acid; pipet 10 mL of the•concentrate into a 100-mL volumetric flask and dilute tovolume with 2* (v/v) nitric acid.
I
ICV >(0989) — For furnace AA use, dilute the ICV-2Concentrate 20-fold with 2% (v/v) nitric acid; pipet 5 mL ofthe concentrate into a 100-mL volumetric flask and dilute tovolume with 2% (v/v) nitric acid.
ICV-3 (0189) — For ICP use, dilute the ICV-3 concentrate10-fold with 2% (v/v) nitric acid; pipet 10 mL of theconcentrate into a 100-mL volumetric flask and dilute tovolume with 2% (v/v) nitric acid. For furnace AA use,dilute the ICV-3 concentrate 100-fold with 2% (v/v) nitricacid; pipet 1 mL of the concentrate into a 100-mL volunetricflask and dilute to volume with 2% (v/v) nitric acid.
ICV-4 (0389 >— For the furnace AA determination of lead ar-1thallium, "dilute the ICV-4 concentrate 10-fold with 2\ (v/nitric acid; pipet 10 mL of the concentrate into a 100-mLvolumetric flask and dilute to volume with 2% (v/v) nitricacid. For the furnace AA determination of silver andcadmium, dilute the ICV-4 concentrate 100-fold with 2\ (v/v)nitric acid; pipet 1 mL of the concentrate into a 100-mLvolumetric flask and dilute to volume with 2% (v/v) nitricacid.

ICV-I (0489)(after 10-fold dilution)
Valuefuq/Ll
AlBaBeCdCaCrCocuFePbMgHnNiKAgNavZn
20101960433502
487005105025152040480024600504480
49000500
49600488
3100
ICV-2 (0989):(after 20-fold dilution)
ValueElement fua/Li
=9 AS 52.652.6
ICV-3 (0189):(after 10-fold dilution)
ValueElement fua/H
Sb 978
ICV-4 (0389):(after 10-fold dilution)
ValueElement
95.897.598.697.0
3011*74

APPENDIX 0
301175

301176
APPENDIX D
Modifier Solutions
1. Nickel Nitrate for arsenic and selenium determination. Dissolve 4.95 ginof ACS reagent grade nickel nitrate, Ni (N03}2 x 6H20 in 100 ml nanopurswater.
2. Ammonium monobasic phosphate, magnesium nitrate for lead determinations.Dissolve 4.0 gm ACS reagent grade (NH,)2H2P04 and 0.2 gm Mg (NH3)2 x 6H20in 100 ml nanopure water.
3. One percent Sulfuric Acid for thallium determinations. Add 1.0 ml concen-trated sulfuric acid to 99.0 ml nanopure water.


APPENDIX E

CO o CO
o. /* 1 ,
t v,
to t-
LA
a *j u -€ a
Va -u O
11
M
I--^i =
£
1 Ck O
Ci Ck Q C) o c» «o «*• o
0 O se t;
O
V 0 a-C •X
i
I !
r-J
. if
Ci £.
•J-. r r.
—I—..
r1
r* -S.
o
(A
r n 3 a O o o a
i/i n
in 11
in • .
%
•i D U
~ n y rt. O


This Page Was Intentionally Left Blank.
iifti&i

an environmental testing company^^ 200 Mor"0» '..r-CMca_____
FAX ;203I 268-5346
STANDARD OPERATING PROCEDURE
COLD VAPOR ATOMIC ABSORPTION (CVAA)
FOR THE
DETERMINATION OF MERCURY IN WATER
AS:021590:3
u,,,-., £»•« Junction N a,.P«nc«. -"««moo.rr. Scn.umDurg. e -* v.rmonl M..l.cnul.lll • , : • • - - • ' : -»
o"^", -,,-'-oTJr.o «o,.3.a-=92. .«-.«•»"• ..'..».«,»• »•«-::«
301182

AS:02:590:3
STANDARD OPERATING PROCEDURECOLD VAPOR ATOMIC ABSORPTION (CVAA)
FOR THE DETERMINATION OF MERCURY IN HATER
INTRODUCTION
This procedure describes the manual cold vapor analysis of mercury in water andleachate samples.
It is the intent of this procedure to comply with the IEA business ethics p o l i -cy.
Abstract
The addition of HN03 and H2S04 serve to oxidize mercury. This is necessary asmercury in its elemental state is highly volatile. The addition of KMnO, en-sures that the mercury is in its most oxidized state while the addition of K208S2ensures that all organic mercurials are oxidized. The reaction continues and isdriven to completion in a heating step; it is probably most advantageous tobring the procedure to this point before letting any significant holding timeoccur. This is the best way to guarantee total oxidation of any mercury presentin the samples. Hydroxylamine hydrochloride is added to reduce the permanganateand to rid the sample of any excess oxidizing agents; it will not, however,reduce mercury. Stannous chloride is used to reduce mercury back to its elemen-tal state where it is easily volatilized and swept through the absorption cellfor measurement.
1.0 SCOPE AND APPLICATION
1.1 Other related SOP's - Glassware Cleaning Procedure, Standard andSample Prep Logs, Documentation SOP and Corrective Action SOP.
1.2 In addition to inorganic forms of mercury, organic mercurials mayalso be present. These organo-mercury compounds will not respond tothe CVAA technique without being converted to mercuric ions. Potas-sium permanganate oxidizes many of these compounds, and potassiumpersulfate has been found to give approximately 100 percent recoverywhen used as the oxidant with compounds only partially oxidized bypotassium permanganate. Consequently, a persulfate oxidation stepfollowing the addition of permanganate has been included to guaran-tee that any organo-mercurials present will be oxidized to the mer-curic ion prior to measurement. A heating step is required formethyl mercuric chloride when present in or spiked to a naturalsystem. For nanopure water this heating step is not necessary.
1.3 Using a 100 mL sample, a quantitation limit of 0.2 ug/L mercury canbe achieved.
301JL83

AS:021590:3
2.0 SUMMARY OF METHOD
2.1 The flameless AA procedure is a physical method based on the absorp-tion of radiation at 253.7 nm by mercury vapor. Organic mercurycompounds are oxidized and the mercury is reduced to the elementalstate and aerated from solution in a closed system. The mercuryvapor passes through a cell positioned in the light path of anatomic absorption spectrophotometer. Absorbance (peak height) ismeasured as a function of mercury concentration and recorded in theusual manner.
3.0 INTERFERENCES
3.1 Possible Interference from sulflde is elmlnlated by the addition ofpotassium permanganate. Concentrations as high as 20 mg/L of sul-flde as sodium sulfide do not interfere with the recovery of addedinorganic mercury from distilled water.
3.2 Copper has also been reported to interfere; however, copper concen-trations as high as 10 mg/L had no effect on recovery of mercuryfrom spiked samples.
3.3 Sea waters, brines and industrial effluents high in chlorides re-quire additional permanganate (as much as 25 ml). During the oxida-tion step, chlorides are converted to free chlorine which will alsoabsorb radiation of 253 nm. Care must be taken to assure that freechlorine is absent before the mercury 1s reduced and swept into thecell. This may be accomplished by using an excess of hydroxylaminehydrochloride reagent (25 ml). In addition, the dead air space inthe BOO bottle must be purged before the addition of stannous chlo-ride. Both inorganic and organic mercury spikes have been quantita-tively recovered from sea water using this technique.
3.4 Interference from certain volatile organic materials which willabsorb at this wavelength is also possible. A preliminary runwithout reagents should determine if this type of interference ispresent. This is mentioned only to caution the analyst of thepossibility; EHSL has not encountered such samples.
4.0 APPARATUS AND MATERIALS
4.1 Spectro Products, Inc. Mercury Analyzer (model HG-4)4.2 Kipp and Zonen Strip Chart Recorder (model B040)
4.3 KNF Neuberger, Inc. Vacuum Pump (1.5 amps)
4.4 Flowmeter
301184

AS.-021S90.
4.5 Aeration Tubing
4.6 Drying Tube
5.0 REAGENTS
5.1 Sulfuric acid, concentrated (H2SOJ
A) Sulfuric acid, 0.5N: Dilute 14 mi H,SO, to 1 L with nanopurewater. . z 4
5.2 Nitric acid, concentrated (HN03)
5.3 Potassium permanganate, 5 percent w/v (KMnOJ: Dissolve 125 g ofKMn04 in 2.5 L nanopure water.
5.4 Potassium persulfate, 5 percent w/v (K2O.S2): Dissolve 125 g ofK2OaS2 in 2.5 L nanopure water.
5.5 Hydroxylamine hydrochloride: Dissolve 120 g sodium chloride and 120g hydroxylamine hydrochloride in 1 L nanopure water.
5.6 Stannous chloride: Dissolve 100 g stannous chloride in 1 L 0.5NH2S04.
5.7 Preparation of working mercury standards (to be prepared freshdaily).
A) Standard A (10 mg/L mercury): I mL 1,000 mg/L mercury stockdiluted to 100 mL in 1 percent HN03.
8) Standard 8 (100 ug/L mercury): 1 ml Standard A diluted to 100ml in 1 percent HN03.
C) Standard C (10 ug/L mercury): 10 mL Standard B diluted to 100mL in 1 percent HN03.
5.8 Record the standard preparation in the appropriate standard logbookaccording to the procedures outlined in the standard and samplepreparation logbook SOP - AS:071587:2.
6.0 SAMPLE COLLECTION, PRESERVATION AND STORAGE
6.1 Samples should be preserved by acidification with nitric acid to apH of 2 or lower immediately at the time of collection.
301185

AS:021590:3
6.2 Holding times are according to the appropriate procedures:
A) SW846 - 28 days for water samples; 28 days after leaching forleachates
B) EPA SOW 7/88 - 25 days for water samples
C) Refer to any other applicable protocol requested by the client
7.0 PROCEDURE
7.1 The first step in sample'preparation is to determine which samplesto prepare, and beginning the associated worksheets. This is doneby generating a LIMS printout of samples that are in-house requiringmercury analysis.
A) Type "S MTL,134,METALS" at the * prompt of any LIMS terminalto sign on to the atomic spectroscopy group account.
8) Type in "MASTER/G", then 5, then 4 on the selections thatfollow. Finally, type "MERCURY" to send a printout to theprinter in the classical chemistry department. See Figure 3for a detailed explanation of this printout.
C) Choose appropriate samples to prepare and fill out the run log(Figure 2) and prep sheet (Figure 4). The samples are enteredon the left side of the form; standards, CCV's, CCB's, dupli-cates, spikes and prep blanks are on the right side of theform.
0) Remove the samples from Sample Control, taking care to signout the samples in the appropriate log, and any other applica-ble chains of custody such as the New Jersey chain of custody.Actual preparation of standards and samples can now proceed.
7.2 Preparation of Standards and QA/QC SamplesA) Blank: Pour 100 mL of nanopure water into the first BOD
bottle.B) 0.5 ug/L mercury: Pour 95 mL of nanopure water and 5 mL
Standard C into the next BOO bottle.
C) 1.0 ug/L mercury: Pour 99 mL of nanopure water and 1 mLStandard B into the next BOO bottle.
D) 2.0 ug/L mercury: Pour 98 mL of nanopure water and 2 mLStandard B into the next BOO bottle.
301186

AS:021530:3
£) 5.0 ug/L mercury: Pour 90 ml of nanopure water and 10 mLStandard 8 into the next 800 bottle.
F) 10.0 ug/L mercury: Pour 90 mL of nanopure water and 10 mlStandard B into the next BOD bottle.
G) Initial Calibration Verification (ICV): Dilute 1 -nl EPA ICV5stock solution to 100 mL and pour into a BOO bottle.
H) Initial Calibration Blank (ICB): Pour 100 mL nanopure waterinto a BOD bottle.
I) Continuing Calibration Verification (CCV): Pour 95 ml ofnanopure water and 5 mL Standard B into a BOD bottle.
J) Continuing Calibration Blank (CCB): Pour 100 mL of nanopurewater into a BOD bottle.
K) Preparation Blank (PB): Pour 100 mL of nanopure water intoa BOD bottle.
L) Spike - 1.0 ug/L: Add 1 mL Standard B to designated spikesample, except in the case of TCLP leachate spikes, which arespiked before preservation of the sample.
M) Reagents are to be added to the standards in the same fashionas samples.
7.3 Shake sample to obtain homogeneity. After shaking, no particulatematter should be adhering to the sample container. If more than onealiquot is required for preparation, the sample must be shakenbefore each additional aliquot is taken in order to maintain homo-geneity.
7.4 Transfer a 100 mL sample aliquot to a 300 mL BOO bottle using anacid-washed 100 mL graduated cylinder pre-rinsed with sample.Exception: when analyzing EPTOX or TCLP leachates, transfer only10 mL of sample to the 800 bottle and dilute to 100 mL with nanopurewater.
7.5 Add 5 mL H,SO, and 2.5 mL HN03 to each BOD bottle. Swirl to mix thesample witn the reagents.
7.6 Add 15 mL of 5 percent KMn04, mix and let stand for 15 minutes.The purple color must persist throughout the digestion since a lossof color indicates that the oxidizing agents are being used up. Ifthe color dissipates at this point, add another 15 mL of 5 percentKMnO, to the sample. If the purple color does not persist for atleast 15 minutes, discard contents of the BOD into acid waste and
301187

AS:021590:3
clean the 800 thoroughly. Take a new aliquot of sample at a volume<50 ml and dilute to., 100 ml with nanopure water. Proceed wit hpreparation from Section 7.5.
7.7 Add 8 ml of 5 percent K208S2 and swirl to mix.
7.8 Autoclave samples on slow for 15 minutes at 120'C and 15 Ibs pres-sure, following the set-up procedure stated below.
A) Fill the autoclave with water to the bottom lip of the cham-ber, just below where the door meets the chamber.
B) Load the autoclave with samples and close the door (maximumload - 36 samples).
C) Set the exhaust selector switch on slow.
D) Set the mixer knob to 15 minutes.
E) The timer will shut the autoclave off automatically. Waituntil the autoclave has had time to release pressure and cooldown to approximately 60*C (about 45 minutes). Carefully openthe door and unload the autoclave. (NOTE: Use high tempera-ture gloves.)
F) Drain the autoclave and fill in the autoclave logbook as shownin Figure 5.
7.9 Set up the mercury analyzer as described below:
A) Turn the instrument power on.
B) Adjust lamp B to 100 percent absorbance.
C) Wait approximately 5 minutes for the instrument to stabilize.
0} Readjust lamp B to 100 percent absorbance.
E) Turn the AGC on; instrument should read 100 percent absorb-ance.
F) Adjust lamp A to 0 percent absorbance.
G) Allow the lamps to warm up for at least 45 minutes.
H) Set up air flow system (see Figure 1).
I) Readjust lamp A to 0 percent absorbance.
j) Turn the strip chart recorder on.
6

AS:021590:3
K) Adjust the damping as necessary.
L) Turn the air flow system on. The flow meter should readbetween 3 and 4.
M) Allow the system to equilibrate, usually about 5 minutes.
7.10 Add 6 ml hydroxylamine hydrochloride to each sample and swirl tomix.
7.11 As chlorine is known to interfere with this procedure, the analystis instructed to sparge the sample after the hydroxylamine has beenadded and immediately before the addition of 6 ml of stannous chlo-ride. If chlorine is present, it will be swept through the cell atthis point, causing a sharp peak response. Sparge until no furtherresponse is noted and then proceed with the addition of stannouschloride. Note: It may not be possible to entirely clear thesample of such interferences. If this is the case, the sample mustbe prepared at a dilution and rerun.
7.12 Immediately after the addition of stannous chloride, place thesparger in the sample to be analyzed, creating a closed system.Should no peak occur, remove sparger after approximately 15 seconds.If peak occurs, remove sparger after peak has reached its maximumheight.
7.13 Repeat steps 7.9 - 7.11 for each standard and sample, following theanalytical sequence outlined in Figure 2.
7.14 After analysis is complete, shut the system down.
A) Turn the air flow system off.
B) Turn the strip chart recorder off.
C) Turn the AGC off.
0) Center damping and zero set controls.
E) Turn lamps A and 8 off.
F) Turn instrument power off.
G) Disassemble the air flow system.
H) Wipe out the hood.I) Clean out the BOO bottles using the procedure outlined in the
glassware cleaning SOP.
301189

AS:021590:3
7.15 Maintenance logs are kept for recording of routine and non-routinemaintenance performed on the instrument.
A) Tubes are changed and repacked after each analytical run thatexceeds 30 minutes in duration.
8) The absorption cell is cleaned about once a month using 1:1HNOj and nanopure water.
C) Lamps are changed when necessary - refer to manufacturer'sinstructions.
8.0 QUALITY CONTROL
8.1 The calibration curve is composed of a blank and five standards:0.5 ug/L mercury, 1.0 ug/L mercury, 2.0 ug/L mercury, 5.0 ug/Lmercury and 10.0 ug/L mercury.
8.2 Samples are to be diluted if they are more concentrated than thehighest standard or if they fall between the 5.0 and the 10.0 stand-ards of the curve.
8.3 Calibration is verified initially with an independently preparedcheck standard (see ICV, section 7.2 G) and blank (see ICB, section7.2 H).
8.4 Calibration is verified throughout the course of analysis by runningcheck standards and blanks every 10 samples (see CCV, section 7.2I and CCV, section 7.2 J). In the event the continuing calibrationfails, the samples prior to and following the failed standard(s)must be rerun. Refer to the current SOW.
8.5 Batch QC consists of a minimum of one preparation blank (PBW),duplicate and spike per every 20 samples. Every EPA SDG must haveits own PBW, duplicate and spike. If the prep blank exceeds thecontract required detection limits (0.2 ug/L) then the samplesassociated with that prep blank must be reprepped and reanalyzed.Refer to the current SOW.
8.6 An abbreviated method of standard additions is used for the analysisof all EP and TCLP extracts (see method 7000, section 8.7, SW846).
9.0 METHOD PERFORMANCE
9.1 Instrument detection limits are determined quarterly per the currentEPA contract.
9.2 Control charts are kept for tracking of accuracy (spike recoveries),and precision (RPO on the duplicate analysis).
3011EH)

AS:02i590:3
10.0 DATA REDUCTION AND DATA HANDLING
10.1 Label all peaks on the strip chart and draw a baseline for eachpeak. Measure and record the height (in mm) of each peak on thechart.
10.2 Generate report sheets using the "MERCURY" program on LIMS.
A) Type "S MIL,134,METALS" at the * prompt of any LIMS terminalto sign on to the atomic spectroscopy group account.
B) Type in "MERCURY" when the * prompt returns to access the dataprocessing program for mercury analysis. This program isself-explanatory with a few exceptions. Enter 100 mL as theinitial volume for all CCV's, CCB's and PB's. When finishedentering samples, type "END" and hit return. Type in therequested information and proceed. When processing is com-plete, the program will request that a printer destination bespecified. Printer 0 is in the LIMS office, printer 1 is inGC and printer 3 is in classical chemistry.
C) After the report sheets have been generated type "OFF" at the* prompt to sign off the LIMS system.
10.3 After checking these report sheets for data entry errors, i n i t i a leach page and turn in the entire data package for review. Afterbeing reviewed the data will be returned.
A) Make complete copies of the data for each CLP job and copiesof the data report sheets for each regular job.
8) Record the reported values for each regular job on finalreport sheets and have them double checked by another memberof the group.
C) Sign all pertinent chains of custody and return the folder tothe file cabinet.
10.4 After recording all mercury data for a particular job, if the jobis complete, place the entire folder on the supervisor's desk fordata review. If the job requires additional analysis, return thefolder to the file cabinet. For CLP-type jobs that require comput-er-generated forms, return the completed folder to the file cabinetand notify the computer operator when the job is complete and readyfor data entry.
11.0 SPECIAL PROCEDURES - N/A
12.0 USE OF OTHER REQUIRED SOP'S - N/A
301191

AS:021590:3
13.0 DOCUMENTATION OF PROBLEMS
13.1 Corrective Action Reports - If any discrepancy occurs during theanalysis that requires the attention of others (such as low samplevolume, standard or instrument problems), a corrective action reportis generated per atomic spectroscopy corrective action report proce-dure - AS:040590.
13.2 All CLP-type reports and regular reports require case narrativesthat specifically address any anomalies and their possible causesthat may have occurred during analysis.
14.0 REFERENCES
14.1 Methods for Chemical Analysis of Water and Wastes. EPA 600/4-82-055.December 1982, Method 245.1.
14.2 USEPA Contract Laboratory Program, SOW 7/88.
14.3 Test Methods for Evaluating Solid Waste. Volume 1A, USEPA SW846, 3rdEdition, November 1986, Method 7470.
10
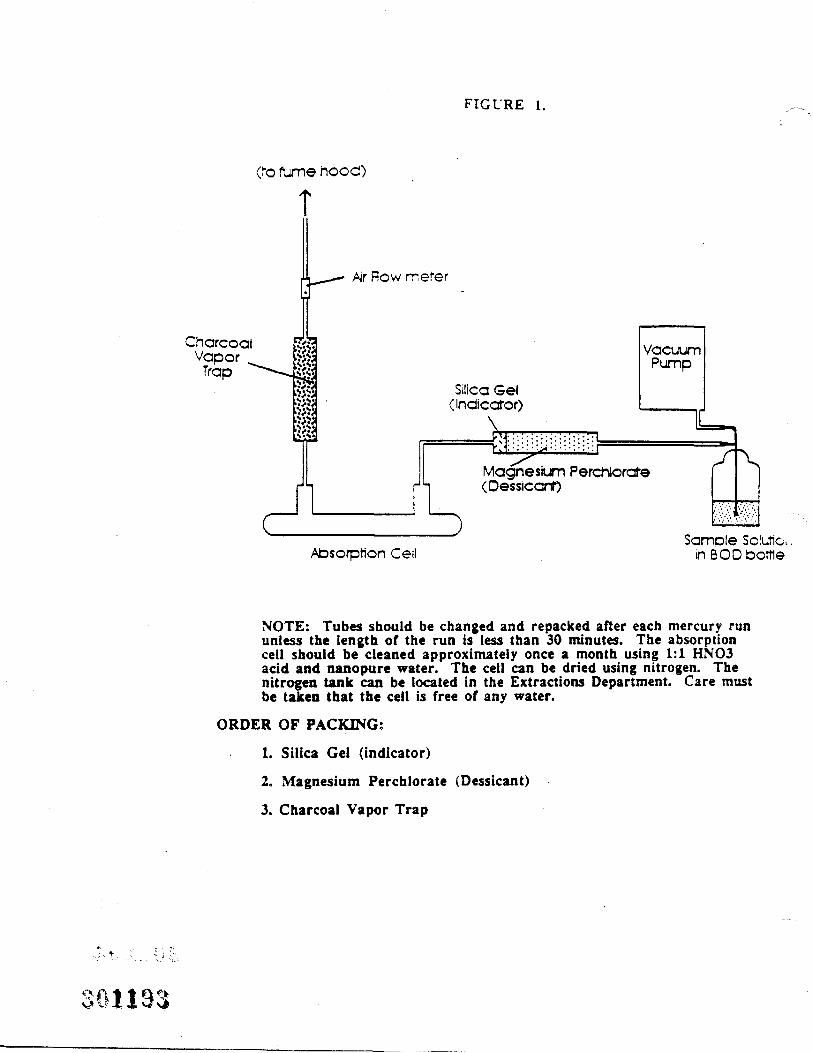
FIGURE 1.
(to fume hood)
CharcoalVaporTrap
Ar Row merer
Silica Gel(indicator)
\
VacuumPump
Magnesium Perchlorate(Dessicarf)
Absorption CellSample Solutio,.
in BOD bottle
NOTE: Tubes should be changed and repacked after each mercury rununless the length of the run is less than 30 minutes. The absorptionceil should be cleaned approximately once a month using 1:1 HNO3acid and nanopure water. The cell can be dried using nitrogen. Thenitrogen tank can be located in the Extractions Department. Care mustbe taken that the ceil is free of any water.
ORDER OF PACKING;
1. Silica Gel (indicator)2. Magnesium Perchlorate (Dessicant)
3. Charcoal Vapor Trap
;01193.

a_jo>-4
u.
oor>lCOr*i in
Q.~
C nU O
W « w
M o <o*< •*C
Wo o
oorM
CO
a3
ClJin
j<MO^r-4
O
O•a *J trS
<« <r>a o.
(Awse
,*w** o
otoO•IV*I*-•5 2
oo•1«/t
<yt/(<<(T<C<•C-JjctG
lrrf<t(»r\rC
XIX((rrc
' rfr
rcrr(1*<nn
OCr\
r»(t'/<:'/
935*(CiJCc
sVt,>!t<n70
o\\arrr7I(Jr»-<Ca:dc
%.cftfr<VX.
(T^a
mrr-(JdnC0((Ccc
^rrCCi-r0C1
urrt<ffr1
om001
xSrr0rftC1f(/r0Oi
5fVftc<1rKcc1
ocrnfs<*.oI4c01
£ccrmf<tI•*.Vcc1
<TOCMrrtjVVn
t
s3C01
(<rc<:i
<9ocrtt
con<
^-*f0ii
f((
frrtl
Cf5CD
c «
^ V

g. X. ft; £. £
r. ?, - r. s£ jg 55 59
on~jOu.
-s
S5
- Ss
^S
^^jX
ligf.
2S
sl^
Se
srS
^s
tAA
AT
****
HIS
ssr I^fff^
cS
S^
^i-S
slt^
i. • 5 «
«w
- g
€R
g^
f.it^$
^^
ac
JfS
S:ftW
*-V
&£
••-• f>
o»
c»
it*v^
-v^
«*4
>v
»>
v-^
'Vv
%*»
(»r»
-^»
£***'**'
u. &
. ffM
* i
• <
Cu
ii^^
<^
*-j«
t*
tt«
^iE
Mj|-
4iM
lo«
«I,.|*
-«
ini
35?^i^s?^p?.j?«~??^^ri5si*5ii*SR
^*3!Jgsl
r* ••««-•fv
i «
to
r*
~«f*
> »-4 c» €5* »•*
' V S
^5 It •%
' Y
I
•
* 7* O
» ]
!gfc£
2:n
ni ft i
i e c
'
8R
RR
RR
fc
«^ «3
\1
^^ C
i Bi STj Cj J?i fc P. gi iTi C
i C i &x s x s S S ? S st :; :; i^ ft f¥ ¥
¥ V
i' ¥ 9
¥ ¥
y ¥
V. V8 ?
: 8 5? 8
^; g
? 8
? ?
?: 8
• -
^:^
a^
&ftft&
ftftft*^^
g!i >
;:*l??
*^g
glh
llIft&&
at!&
S^
Ml 81 Bi Ri U| fo d ft Bi Bi ft fc 81 Bi ft 8| & 8| Pi B| fo fi| ft gi g C| R J9 Cl HIv
o
u
u
if • «»: S- 52 «. o
C
t» IP <>'. v
o
•> •» **- o
9- 0 ^
•- 9- •-
«F »
A. of \
<»- a
•* *i
o. a" «f
JC a. u
«T
tL. &
. o.
a. *t •*
*i O
. u.
a.. Q. iV
- a. a-
«L <^- it
A. 9.
if ¥
?: ?:S
¥ ¥
¥ ¥
¥8 g 8 J? 8 :.^
8 ?• 8
8 8
8 8
8 8
8
OCO

M U L R E 4.ISA
200 Monro« aMonroe, CT 06468 ( 2 0 3 ) 452-8200 023
METALS <gATEB>SOIL PREPERATIOK LO<5 - MERCURY
top i-oaaing Balance CalibraticAnalytical Balance Calibratior
ICA 10
- ^-*~,2.
-oo-i"
-<~>«<XrtA««-»«-v^ *
-aa 3-rtrt »
~o°*fr* \ J ^(~.^v 1
—^f*> 1-rtA A-><*»^ A-Arts'
a a o A rt/-s i— o>« •a-On *
:FI to
*•
WU|)V < ( * 4 >
.,La<3,,
1
iT
^
>n ov A1 . i \A
«.,i on
^
tooto
, L \
, ^«1 //»I-J.,9S^ \a ia*a A-IXIt*S "*•1a0!?rtx a^ <a.i5
Page j _ -;
QA/OC
to
i aa nC Ai A ai <L*
f t L * *
f f J •*
t f A
^•^- At/-/• «i<LtlA 31!A\o«*.PAt^lVk>r*lli^L
A\ A ****f^ £ O
/-..rtrt ^. A 3 «?o:»i3A»* o^^ ^. ^ A ^ N Y ^
WI/V1
4«l 0a* aa< o£p.O
s
1 ^
N
H1
/in
<
stvdM^ 10 • |ut1
tcv to • \f.\t
cet to • _j_ q;V
LM ID • Ivt \..
9C tdd
\ a , i>
|0.<S-L fl
« j<
/
I < » L. [J
\ —i_ 3
«/aer I_-\A^ -< /4A9»<
< rt^.ft
P
V»(.D sa
; 1 .
'
•5.i i ^
i_,
^Ic.^^ c•5 -4.^
Vq
*•"?:,3.
\ A
at.-a, -3.
ft
a eiQ arv
ipik* ID • —-&&Z ' ™ ^ ' — O S P\
/^A, Accepted by:.Date: a i i r i o i ™ d u«*.«* ———————— __Lot i: Hydtoxy lamina Hydrocalorida^a. stannou« Uilosia.
H2S04 <^ HNO3 JfbiO K2O8S2 4- , NaCl,a XMH04 '^L
30119*

F I G U R E 5.
301197

r/
SOP/FORM MODIFICATIONAPPROVAL SHEET
SOP/Fern Mcdi f icaticn Requested 3y:,\oS£E>H Xlg.ttE.ziA. Date:
Deaaiirs 'or M o d i f i c a t i o n of SCP/Fcrm:
Deaslir.e for Implementation of Modified SCP/Form:_
:=te SCr/Form Koii'.fieo: -5 \3> -
Date Typing of Modification Sent to Typist:
Date T.,:-,na cf '•'.oiification CoT.pletea:_______' C
Cci£ cf SOF/Fc'-:____A 6 •'
Peges Changed:_____
- - ; _ - / C i r - - ; - |_
A:proval of Mcdificcf.cn to SOP/F:rm
.ac.r: jO"T?1
c ~ c. - e :
QA Director:^___________________________, Date:
Lab Director:^__________________________, Date:
Date Modification to be Implemented:.
Copies of Final Approved Modification Sent to:
Section/Group Members, Lab Manager, Lab Directors (all labs),Manager, QA Directors (all labs)
301198

an environmental testing company
STANDARD OPERATING PROCEDURE
THERMO JARRELL ASH ICAP61
AS:020689:0
407.989-0929 S17-272-5212
301199

AS:020539:0
STANDARD OPERATING PROCEDURETHERMO JARRELL ASH ICAP61
Abstract
This method outlines the simultaneous analysis of water and soil samples throughthe measurement of atomic emission by an optical spectroscopic technique. Thesamples are aspirated through a nebulizer, which results in an aerosol, that isthen introduced into the plasma. In the plasma excitation of the sample resultsin characteristic atomic emission spectra. The spectra are dispersed by a grat-ing with the resultant intensities monitored by specific photomuHipl iers locat-ed along the focal curve.
It is the intent of this procedure to comply with the IEA business ethics p o l i -cy.
301200

AS:020689:0
INTRODUCTION
This procedure describes th.e analysis of water and soil samples utilizing theThermo Jarrell Ash inductively coupled argon plasma (ICAP).
1.0 Scope and Application
1.1 Other related SOP's - Glassware cleaning procedure, standard 4 sam-ple preparation logs, standard & sample preparation SOP's and cor-rective action SOP.
1.2 The analytes determined using this procedure are:
Aluminum Cobalt PotassiumAntimony Copper SeleniumArsenic Iron SilverBarium Lead SodiumBeryllium Magnesium TinCadmium Manganese TitaniumCalcium Molybdenum VanadiumChromium Nickel Zinc
2.0 Summary of Method
2.1 The sample is digested with the appropriate acids according to thesample preparation SOP.
2.2 The Thermo Jarrell Ash ICAP61 is standardized using 7 working stan-dards.
2.3 Appropriate QC check standards are measured according to EPA orroutine protocols at the beginning, throughout the duration and atthe end of the analysis to assure measurement is accurate.
2.4 Linearity of high analytes is monitored and measured. Check solu-tions are run to assure all applicable interelement corrections areapplied.
2.5 The data files are copied onto a floppy disk for transfer to Smart-log software for CLP deliverable generation.
3.0 Interferences - N/A
4.0 Apparatus and Materials
4.1 Thermo Jarrell Ash ICAP61 (Inductively Coupled Argon Plasma)
301201

AS:020529:D
4.2 Gilson M i n i p l u s 2 Peristaltic Pump including sample tubing (0 20 IDand rinse tubing (0.06 ID) '.
4.3 Thermo Jarrell Ash Autosampler Model #ICS-240
4.4 IBM AT Personal Computer and 5.25 floppy diskettes
4.5 1,000 uL variable Eppendorf pipette
4.6 Serological pipettes
4.7 10 ml capacity polypropylene test tubes
4.8 ICAP working standards as described in the ICAP standards logbook
4.9 EPA QC standard solutions as described per EPA in the atomic spec-troscopy reagents logbook, or equivalent
4.10 Thermo Jarrel Ash Operator's Manual - January 1988 Part *125791-01
5.0 Reagents
5.1 ICAP working standards for each analyte
5.2 ICAP QC standard solutions
5.3 Nitric acid
5.4 Hydrochloric acid
5.5 Hydrogen peroxide
5.6 Triton x-100
6.0 Sample Collection, Preservation and Storage - N/A
7.0 Procedure
7.1 Startup of the ICAP61WARNING: Ensure that no pacemaker users are in the vicinity of thespectrometer. RF generator radiation may interfere with pacemakeroperation.A) Prior to initiation of the plasma, the operator should be fa-
miliar with the operator's manual supplied by Thermo JarrellAsh.
301202

AS: 020589:0
8) Before starting the instrument, check the exhaust vents andcooling water to ensure they are operating.
C) Check that the pressure of the argon supply is 50 psi.
0) On the front of the instrument check that the standby (SB) andfatigue (FAT) lights are l i t . At the back of the instrumentcheck that the high voltage (HV) power switch is on. If thelights are not on, consult the Thermo Jarrell Ash operator'smanual to conduct a "cold startup" (TJA 5.1.1).
E) Check that the drain tube is immersed in at least 8 inches ofwater in the plastic waste container. Ensure there are nocrimps in this tubing.
F) On the RF generator panel (front of the instrument) (Figure1.0), working from the top down, and left to right, the con-trols should be set as follows:
1) Automatic power switch in MANUAL mode
2) Automatic forward power control set at approximately 3.7
3) Forward power switch - ON
4) Auto tuner control - AUTOMATIC
5) Reflected power alarm (preset per manufacturer's instruc-tions)
6) Forward power manual control rheostat - set the knob asfar as it will go counterclockwise
7) Control switch OFF and line switch ON
G) Turn the control switch up to the on position. The white pow-er on lamp should be illuminated.
H) Connect the rinse and sample tubing on the peristaltic pump.Check that there is sufficient rinse solution in the rinsesupply container. Start the pump, making sure that the sipperis immersed in the rinse solution.
I) On the gas flow control panel turn the toggle switches for thetorch and the sample argon flows on. The torch flow metershould register about 15 or 16 when measuring on the center ofthe bead. The sample flow bead measures at a reading of 0.6or more, depending on the optimum conditions for that specifictorch (See the TJA manual for optimizing the torch).
301203
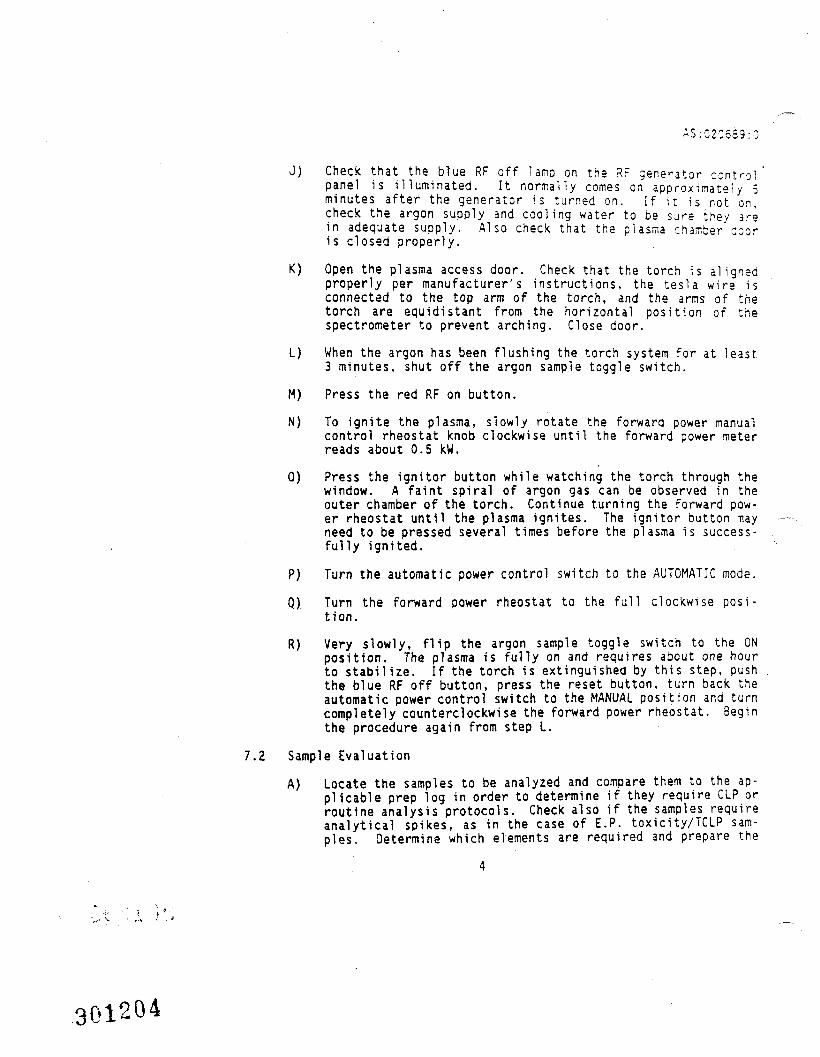
AS:020639:0
J) Check that the blue RF off lamp on the RF generator control'panel is illuminated. It normally comes on approximately 5minutes after the generator is turned on. If it is not on.check the argon supply and cooling water to be sure they ar=>in adequate supply. Also check that the plasma chamber door-is closed properly.
K) Open the plasma access door. Check that the torch is alignedproperly per manufacturer's instructions, the tesla wire isconnected to the top arm of the torch, and the arms of thetorch are equidistant from the horizontal position of thespectrometer to prevent arching. Close door.
L) When the argon has been flushing the torch system for at least3 minutes, shut off the argon sample toggle switch.
M) Press the red RF on button.
N) To ignite the plasma, slowly rotate the forward power manualcontrol rheostat knob clockwise until the forward power meterreads about 0.5 kW.
0) Press the ignitor button while watching the torch through thewindow. A faint spiral of argon gas can be observed in theouter chamber of the torch. Continue turning the forward pow-er rheostat until the plasma ignites. The ignitor button mayneed to be pressed several times before the plasma is success-fully ignited.
P) Turn the automatic power control switch to the AUTOMATIC mode.
Q) Turn the forward power rheostat to the full clockwise posi-tion.
R) Very slowly, flip the argon sample toggle switch to the ONposition. The plasma is fully on and requires about one hourto stabilize. If the torch is extinguished by this step, pushthe blue RF off button, press the reset button, turn back theautomatic power control switch to the MANUAL position and turncompletely counterclockwise the forward power rheostat. Beginthe procedure again from step L.
7.2 Sample Evaluation
A) Locate the samples to be analyzed and compare them to the ap-plicable prep log in order to determine if they require CLP orroutine analysis protocols. Check also if the samples requireanalytical spikes, as in the case of E.P. toxicity/TCLP sam-ples. Determine which elements are required and prepare the
301204

A S : 0 2 0 6 3 3 : 3
appropriate calibration standards according to the standardspreparation procedures outlined in the ICAP standards logbook.Complete all entries in the logbook regarding stock solutionsand acids used for their preparation.
NOTE: Elements for an E.P. toxicity/TCLP include those nor-mally analyzed by furnace AA - i.e. As, Se and Pb. In orderto analyze for these elements using the ICAP a third i n i t i a land continuing calibration verification standard denoted ICV1Bmust be employed in the analysis. However, E.P. toxicity sam-ples do not require Sb, and therefore do not need the EPA-sup-plied ICV3, etc. -
B) Visually inspect the samples, noting which samples were induplicate and were spiked. Also note initial and final samplevolumes, which laboratory control samples were used and alsothe sample weights. Check this against the sample prep logfor completeness for all these mentioned items. During thisinspection any highly colored samples (usually an indicationof high analyte concentrations) should be noted. These sam-ples may require a rinse cup after them during analysis tominimize carryover effects.
C) Estimate the number of sample cups necessary for the auto-sampler table. If CLP protocol is required, count also thepossibility of all spiked samples needing a post-digest spike,as well as a serial dilution for each sample matrix.
7.3 Program Setup
A) On the main menu of the thermospec software cursor to the SET-UP option and press ENTER.
8) The method name is selected at this time. The name can beeither typed in or by pressing the <F6> function key to listall available programs. Currently, method name IEALA8 is usedfor all CLP and routine samples and should be entered here.
C) The first page of the program will appear on the monitor. Onthe lower righthand portion of the screen the function keyswill be listed with a variety of options. Select <F3>(Samplnfo).
0) Cursor down 13 times to the default table names, specificallyAUTOSAMPLER. Enter the name of the autosampler table you areabout to create using the format: WMMDDYY. For instance, iftoday's date is February 6, 1989, then the autosampler tableentered here would be: W020689.
301205

^5:02:539::
E) Cursor to the default file names portion and enter under :-=data file the same name as the autosampler table in vvscase: W020689.
F) Press the function key <F9> (done/keep) until back to the set-up option (entered twice). The program now has stored thename of the new autosampler table and the name of the new datafile in which the information is to be stored.
7.4 Setup of the Autosampler Table
A) On the main menu cursor once again to the setup mode and pressenter.
B) Cursor through the setup options to AUTOSAMPLER and press en-ter.
C) As with the program portion, here you w i l l be required to en-ter an autosampler table name. Use the name selected in theprogram portion, which, in this case is: W020689 and pressenter.
D) The autosampler screen will display information regarding thisspecific table. At this point under "set # description", itwill read, "this table is empty". Choose the <F3> (add set)function key to enter the information for this table.
E) For CLP work use the following entries here:
"SET DESCRIPTION" - leave blank"METHOD NAME" - IEALA8 or current method in use"DEFAULT COMMENT" - enter the SDG number"DEFAULT OPERATOR ID" - enter the i n i t i a l of the ICAP
operator"LABORATORY ID" - enter the inititals of the person who
prepared the samples"CUSTOMER ID" - enter the date that the samples wer pre-
pared using MM/DD/YY format"AUTO-RINSE BETWEEN SAMPLES?" - leave YES"RINSE TIME" - enter 90 seconds"# SAMPLE POSITIONS NEEDED" - enter the number of cups
required, remembering to include extras for rinsecups and any high analytes that may be needed tocheck for interelement corrections (lEC's).
Cursor down to "default limit check table name" - andtype in LIMITS.
301206

AS:020639:0
For non-CLP type work the only entries required are:
"METHOD NAME" - IEALA8"DEFAULT OPERATOR ID" - ICAP operator's i n i t i a l s "RINSE
TIME" - 50 seconds"* SAMPLE POSITIONS NEEDED" - as required"DEFAULT LIMIT CHECK TABLE NAME" - LIMITS
This page is complete. Now press <FI> (ed samples) toset up the sample cup designations.
F) Press <F5> (ins stds). This allows the insertion for astandardization standard. Type STD2 then enter. Onceagain press <F5> (ins stds).
Type STD3 then press enter. Use this same sequence toenter STD4, STDS, STD6, STD7, and STD1. All the stand-ards are now entered for standardization of the instru-ment.
STD2STD3STD4ST05STD6STD7STD1
G) Initial QC must now be entered. Press <F3> (insQC) andtype ICV1 then press enter. Cursor to the check tablescolumn and type in again ICV1 and press enter. Cursorback to the next sample name column and press <F3> again.This time type ICV1A. Use this same procedure to enter:
<F3> ICV1---------ICV1<F3> ICV1A--------ICV1A<F3> ICV1B--------ICV1B<F3> ICB----------ICB<F3> CRII---------CRII<F3> ICSAI--——-ICSAI<F3> ICSABI-------ICSABI
All initial QC is now entered.
H) To enter the sample names a specific format must be uti -lized for CLP protocol in order to facilitate proper datastorage in the appropriate SMARTLOG software files.

AS: 020539::
Ini t vol or wt/ Fi-nal volume/ EPA sample name/ Suffix(5 characters) (5 characters) (5 characters) (1 character)
The initial and final volumes are 5 characters includingdecimals. The EPA sample name is the sample name provid-ed 'by the EPA - NOT the in-house job name. The suffix isfor duplicate (0), spike (S), post-digest (P) and serialdilution (L) designations.
Examples:
Water sample, EPA001, having initial and final volumes of100 mLs is entered: I.OOOI.OOOEPAOOI, DUP = 1.0001.000EPA001D.
Soil sample, EPA002, having an i n i t i a l weight of 1.07grams, and a final volume of 200 mLs is entered:1.0700.200EPA002.
NOTE: The difference in decimal placement in 100 and 200mLs for water and soil sample final volumes is to accom-modate the mg/Kg calculation for soil samples.
Prep blanks are entered: 1.0001.OOOP8W (water samples),1.0000.200PBS (soil samples).
Laboratory Control Samples (LCS) are entered:I.OOOI.OOOLCSW (water samples), 1.XXX0.200LCSS (soil sam-ples).
I) When entering sample names for non-CLP samples, the in-housejob name and sample number may be used i.e. Job 123, sample001 may be entered as: 0123-001.
In both CLP and non-CLP work, only an entry in the sample namecolumn is necessary.
0) According to contract, CLP samples must have QC run after ev-ery 10 samples. The difference in time between two samplesand QC may not exceed the lowest difference in time betweenany two consecutive analytical samples. In the case of i n i -tial QC, the CRI, ICSA and ICSAB count as samples. Therefore,only 7 actual samples can be analyzed before the next seriesof QC. When running CLP work several things must be kept inmind, calculations must be made during the analysis to deter-mine if spike recoveries are within the 75-125 percent win-dows. Also, all prep blank and laboratory control samples(LCS) must pass all parameters, otherwise the sample prepara-tion may need to be repeated. Therefore, it is prudent to
8
301208

AS:02QS89:<
place these samples near the beginning to allow sufficienttime for calculation and determination of all acceptable pa-rameters, whether post-digest spike samples are necessary, andwhich sample{s) is appropriate for serial d i l u t i o n . An exam-ple setup could be:
STD2STD3STD4STD5STD6
"STD7STD1
ICV1ICV1AICBCRIIICSAIICSABI
RINSE1.0001.000AAA0021.0001.000AAA002D1.0001.000AAA0002S1.1000.200AAA003D1.1100.200AAA0003S
CCV1ACCV1CCB1
1.0001.000PBW1.0001.000PBS1.0001.000LCSW1.0000.200LCSS1.0001.000AAA001
QC(x)
1.0001.000AAA002P1.1000.200AAA003P1.0005.000AAA L1.0005.000AAA L
FINAL QC
301209

AS:020533::
K) The final QC is run in the following order- TRIP jc^fICSA8F-, CCV A, CCV_, and CCB . As in the case of~r*ai n i t i a l QC, the CRIF, ICSAF and ICSABF count as samples"therefore only 7 samples can precede them.
L) Double check autosample table making sure all samples andQC are entered correctly.
M) In order to store the completed autosampler table press<F9> (done/keep), then press again to get back to themain menu.
N) Cursor through setup and go to the autosampler sectionagain to check that the table is in memory. Check papersupply to be sure there is enough for the entire run.Then press <F2> to print out the table. Get two print-outs, one to keep on file in.the ICAP run logbook and oneto go with the data. Both copies should be dated andinitialed by the [CAP operator. Press <F9> (done/keep)to get back to the main menu.
0) Using the printed autosampler table, pour fresh standardsand all the samples into the cups and test tubes andplace them in their designated positions on the autosam-pler tray.
7.5 Operation of the ICAP
A) Cursor to the main menu. Select the operation mode andpress enter. Select ANALYSIS and press enter. Onceagain the method name will be requested. Type IEALAB andpress enter.
B) Open the front portion of the instrument that containsthe mercury (Hg) lamp, and place the lamp in front of theentrance slit of the spectrometer. Select <F5> (profile)in order to optimize the light path before operation.Profiling the instrument may be done manually or automat-ically per manufacturer's instructions, on the monitor.However, if the manual mode is selected, check the pro-file setting using the automatic mode. Oo NOT beginanalysis unless the offset value at the end of the pro-filing procedure is less than 0.1. Move the mercury lampout of the path of the entrance slit and shut the door ofthis compartment.
C) To initiate the analysis, press <F9> (autosampler). Thiswill call the autosampler table from memory. On the mon-itor should be the first sample, usually STD2. Check
10
301210

AS: 020539:0
that the sipper is firmly in the autosampler, and tneheight is adequate for both standard cup and test tubelevels. To start the analysis, press <F1> (run). Theautosa.mp1er will move to the first sample and begin oper-ation.
8.0 Quality Control
8.1 Frequent monitoring of the results during an analysis is crucial.Check the precision during the standardization stage to assure thatthe three replicate exposures are similar. Also check to determinethat all initial QC passes. If it does not, stop the analysis,determine the problem and restart the analysis.
8.2 Check the ICSA sample for any lEC's attributed to iron, aluminum,calcium or magnesium. Normally, the one that recurs is slightchanges of beryllium resulting from iron.
8.3 Once the sample results are available, check the sample and du p l i -cate to see if their values are close. Then calculate the spikerecoveries for both water and soil samples, remembering to calculateusing proper weights and percent solids. Determine if any post-digest spike samples are necessary and add these to the autosamplertray in the spaces that were pre-set on the autosampler table. Onthe autosampler table note which elements required a post-digestspike and the level of the spike. If any discrepancies occur withthe sample, its duplicate or spike, a corrective action reportshould immediately be submitted to a supervisor to evaluate thesituation.
9.0 Method Performance
9.1 Check the prep blanks and LCS's to make sure they pass all require-ments. If they do not, submit a corrective action report to a su-pervisor immediately.
9.2- Once most of the samples are run, determine which samples would besuitable for a serial dilution, making sure one of each matrix, i.e.soil and water is made in a 1:5 dilution. On the autosampler tablenote which sample was diluted.
9.3 If any analyte exceeds the linear range (determined quarterly) adilution must be made to bring the analyte into range. If thissample was chosen as the serial dilution, further 1:5 dilution isneeded for those analytes exceeding the linear range.
9.4 Assure all QC is within limits and final QC passes. The analysis iscomplete.
11
301211

AS:0205S3:j
9.5 Once the analysis is finished, check all values again, all qc ^athen do all appropriate calculations of lEC's from other elementsare necessary. Standard prep dates must be recorded on each stan-dard printout.
10.0 Data Reduction and Data Handling
10.1 Making Diskette for Data Transfer to Smartlog
A) On main menu cursor to EXIT and press enter.
8) The computer will respond with "C>". Type CD\STATION\DATA\ANALYTIC then press enter.
C) Type DIR and press enter. A directory of all analytical ta-bles will appear.
D) Place a formatted floppy disk in the disk drive and type COPYSAMPLES.DBF A: and press enter. The red light over the diskdrive will turn on. The light will go out and the computerwill respond with "C> 1 file copied" when complete.
E) Type COPY W020689.DBF A: (using same example as before), whichis the data file used to store the analysis, entered in theprogram setup mode. Once again, the light will be on duringthe copying sequence. Again, the computer returns with theprompt "C> 1 file copied" and the light will be off. Removethe disk and affix a label to it on which is the case or jobname, data file name and the sample file name that it w i l l bechanged to.
F) Change the samples file to another file name, such as 01SAM-PLE.D8F. To do this type RENAME SAMPLES.DBF 01SAMPLE.DBF andpress enter. Now the samples associated with that specificanalysis are called 01SAMPLE.DBF. Approximately once a monthold files should be deleted in order to allow sufficient memo-ry space for new files. To delete a file type DEL followed bythe file name to be deleted.
G) To return to the Ther"mospec software, type AUTOEXEC and enter.
10.2 Data Reporting ProcedureA) Once all values for CLP analysis are complete, and all associ-
ated lEC's are calculated, sign the appropriate chain of cus-tody, which may include a New Jersey chain of custody and en-ter the date(s) of analysis.
12
301212

AS: 020533:0
B) For non-CLP reporting, select the appropriate report sheetsincluding the QC batch sheet and enter all pertinent informa-tion, including all required elements, prep blanks, laboratorycontrol samples, duplicates and spike recoveries. After allforms are completed, sign the applicable chain of custody andenter the date(s) of analysis. Note any discrepancies orproblems encountered with analysis that should be included ina case narrative.
11.0 Special Procedures
11.1 Instrument Shutdown
A) Press the blue RF off button.
B) Turn the automatic forward power switch to MANUAL and turnforward power manual control rheostat fully counterclockwise.
C) Shut off the peristaltic pump and loosen the tubing.
D) Flip the control power switch down to the OFF position. Leavethe 1 ine switch on.
E) Shut off the torch and sample argon toggle switches.
F) On the computer main menu, cursor to EXIT. Press enter.
G) Shut off the computer and monitor.
H) The plasma system is now shut down.
11.2 Preventive Maintenance
A) At least once a week or as necessary, replace rinse and sampletubing on peristaltic pump.
B) Once a week vacuum fan filter and screens in back of ICAP andfans on IBM PC.
C) Periodically check torch for contamination. If buildup doesoccur, remove torch and wash in aqua regia. Rinse well, dryand replace.
0) Record all standard and QC preparation in logbook and recordprep data and initials on flask.
E) Periodically empty drain bucket half way and dispose of wasteacid carefully into a proper waste acid container.
F) Document all maintenance, both routine and non-routine,including service calls in the logbook.
13
301213

301214
R.F. GENERATOR CONTROL PANEL
\ /
n n
I I
FIGURE 1.02-10

an environmental testing company
FAX (203) 268-5348
STANDARD OPERATING PROCEDURE
ICP SET UP
PE6500
AS:070887:1
Uixnwr.C>OII«(
MS-8i»-O«2lIllmort
70»-70S-O740
H OIIIUmttcnntf*5172724212
Name*SI9-477JXSO
301215
v- -i

AS:070887:
STANDARD OPERATING PROCEDUREICP SET UP PE6500
Abstract
This method outlines the analysis of water and soil samples through the measure-ment of atomic emission by an optical spectroscopic technique. The samples areaspirated through a nebulizer which results in an aerosol that is then intro-duced into the plasma. In the plasma, excitation of the sample results in char-acteristic atomic emission spectra.
301216

AS:070837:i
INTRODUCTION
This procedure describes the analysis of water and soil samples utilizing thePerkin-Elmer 6500 Inductively Coupled Argon Plasma (ICAP).
It is the intent of this procedure to comply with the IEA, Inc. business ethicspolicy.
1.0 Scope and Application
Related SOP's - Glassware cleaning procedure, standards and sample praplogs, standard and sample preparation SOP's and corrective action SOP.
2.0 Summary of Method
2.1 The sample is digested with the appropriate acids according to thesample preparation SOP.
2.2 The PE6500 is standardized separately for each analyte.2.3 Appropriate QC check standards are measured according to EPA or
routine protocols at the beginning, throughout the duration, and atthe end of the analysis to assure measurement is accurate.
2.4 Linearity of high analytes is monitored and measured.
3.0 Interferences - N/A
4.0 Apparatus and Materials
4.1 Perkin-Elmer ICAP 65004.2 Gilson Miniplus 2 Peristaltic Pump including sample tubing (0.30 ID)4.3 Perkin-Elmer 7700 PC4.4 1,000 uL variable Eppendorf pipette4.5 Seriological pipettes4.6 ICAP working standards as described in ICAP standards logbook4.7 EPA QC standard solutions as described per EPA in the Atomic Spec-
troscopy Reagents logbook
5.0 Reagents
5.1 ICAP working standards for each element5.2 ICAP QC standard solutions5.3 Nitric acid5.4 Hydrochloric acid5.5 Hydrogen peroxide5.6 Triton X-100
6.0 Sample Collection, Preservation and Storage - N/A
30121?
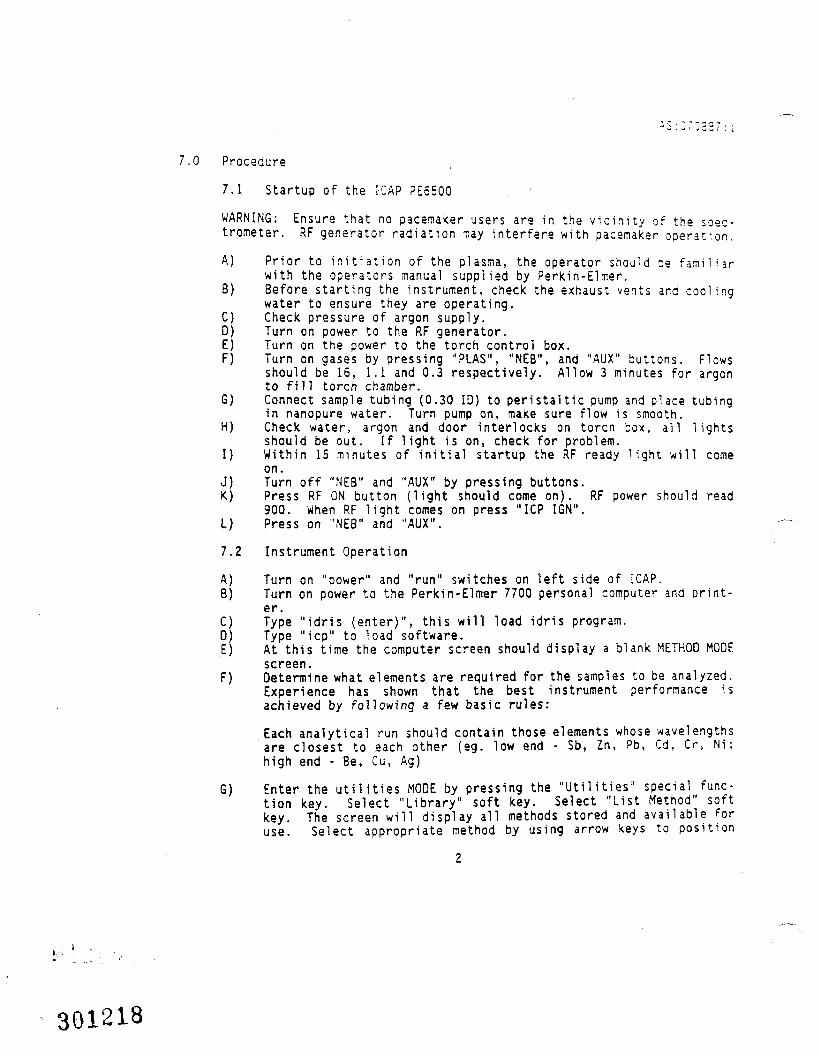
7.0 Procedure
7.1 Startup of the [-CAP PE6500
WARNING: Ensure that no pacemaker users are in the v i c i n i t y of the sosc-trometer. RF generator radiation may interfere with pacemaker operation.
A) Prior to i n i t i a t i o n of the plasma, the operator should be f a m i l i a rwith the operators manual supplied by Parkin-Elmer.
B) Before starting the instrument, check the exhaust vents and coolingwater to ensure they are operating.
C) Check pressure of argon supply.D) Turn on power to the RF generator.E) Turn on the power to the torch control box.F) Turn on gases by pressing "PIAS", "NEB", and "AUX" buttons. Flows
should be 16, 1.1 and 0.3 respectively. Allow 3 minutes for argonto fill torch chamber.
G) Connect sample tubing (0.30 ID) to peristaltic pump and place tubingin nanopure water. Turn pump on, make sure flow is smooth.
H) Check water, argon and door interlocks on torch box, all lightsshould be out. If light is on, check for problem.
I) Within 15 minutes of i n i t i a l startup the RF ready light will comeon.
J) Turn off "NEB" and "AUX" by pressing buttons.K) Press RF ON button (light should come on). RF power should read
900. When RF lig h t comes on press "ICP IGN".L) Press on "NEB" and "AUX".
7.2 Instrument Operation
A) Turn on "power" and "run" switches on left side of ICAP.B) Turn on power to the Perkin-Elmer 7700 personal computer and print-
er.C) Type "idris (enter)", this will load idris program.D) Type "icp" to load software.E) At this time the computer screen should display a blank METHOD MODE
screen.F) Determine what elements are required for the samples to be analyzed.
Experience has shown that the best instrument performance isachieved by following a few basic rules:
Each analytical run should contain those elements whose wavelengthsare closest to each other (eg. low end - Sb, Zn, Pb, Cd, Cr, Ni;high end - Be, Cu, Ag)
G) Enter the utilities-MODE by pressing the "Utilities" special func-tion key. Select "Library" soft key. Select "List Method" softkey. The screen w i l l display all methods stored and available foruse. Select appropriate method by using arrow keys to position
301218

AS:Q7C887:I
cursor (blue high! ight),on desired method. Hit "Recall" specialfunction key.
H) The system will enter the GRAPHICS MODE and automatically set upoperating parameters.
I) Hit "Print Elem Parameters" special function key. A listing of theelement parameters for selected method will automatically be printedon the PR-210 printer.
Check the calibration standard against the standard cores listed onprintout. They should match.
0) Hit "Run Manual" special function key. The 6500 should begin in i -tialization sequence. (This can be noted by printout on PR-210.)Screen will display "depress Hold then Print key and depress Enter"- DO SO. (The Hold mu$t be hit before the Print key.)
K) Start aspirating the calibration standard.L) System will prompt "Aspirate Standard 1", Depress "Standard" spe-
cial function key. The system will set gain and run standard. Ifsystems misreads standard 1 it will display "Peak offset aspiratestandard 1". Repeat #7 above (????????). This occurrence is notunusual; however, if it happens again there may be a significantproblem, consult with supervisor.
M| Depending on the number of calibration standards in the method thesystem will continue the prompt sequence as follows:
for 2 calibration standards - Aspirate Standard 2for 3 calibration standards - Aspirate Standard 3
Up to 5 standard positions.
If After all standards are run the system will prompt "aspirate BLANKand depress read" hit "Blank" special function key. If system dis-plays "Standards out of sequence" after blank is run a significantproblem exists, consult supervisor.
0| System will next prompt "Aspirate sample and depress read", fromthis point on all analyses will be conducted by hitting the "Sample"special function key.
T«««nplete analysis and begin a new one:P| Hit "Method" special function key and proceed as in #16 (??????).
Incomplete analysis and shut down:Q| Hit "Quit" special function key. Screen will prompt "Confirm desire
to exit ICP 6500 Program? Y or N", type "Y".fl| Screen will return to "login:" prompt. Turn monitor knob counter-
clockwise to turn off screen.
301219

AS:070337:i
S) Remove sample capillary from rinse water and wait approximately oneminute. Press "RF OFF" button on torch box, the plasma should imme-diately go out. Hit gas buttons to turn flows off. Turn off peri-staltic pump and release side area and relax tubing.
T) Turn power to torch box off.U) Turn 6500 to stand by.V) Turn RF power supply off.
8.0 QUALITY CONTROL
8.1 The instrument must be calibrated at the start of each new analyti-cal run. (The analytical run is based on the specific elementsbeing run within a specific method: i.e. one run may contain alllow wavelength elements while another run will contain high wave-length elements, each of these runs requires a separate calibra-tion.) The calibration consists of a standard at the end of thelinear range for each element analyzed (standards can be in lowerconcentrations in regular sample analysis). The calibration isended with a calibration blank (reagent water).
8.2 Immediately following calibration an Initial Calibration Verifica-tion solution (ICV) must be run for each wavelength analyzed. Theconcentration found for this standard must fall within ± 10 percentof the true concentration or the run is voided.NOTE: The ICV is prepared from EPA-supplied solutions. In theevent EPA standards are not available a certified solution may beused or a mixture of independent standards may be prepared. Thestandards must be from a source other than that used to preparecalibration and continuing calibration standards.
8.3 To confirm the linearity at the lower end of ICP instrumental detec-tion a standard equivalent to 2x CRDL must be run for each wave-length analyzed at the beginning and end of each run or every 8hours.
8.4 To confirm appropriate background correction factors two ICP inter-ference check samples (ICS) must be run starting with ICSA (onlyinterferents) followed by ICSAB (both interferents and analytes).If results obtained fall outside ± 20 percent of true concentrationsthe analysis is terminated. ICSA and ICSAB must be run at the be-ginning and end of each analytical run or every eight hours.
8.5 A CCV must be run at the beginning of each analytical run; at afrequency of 10 percent during the run (i.e. every 10 samples) andafter the last analytical sample. The CCV must not exceed t 10percent of the true concentration or the analysis is terminated andall samples run since the last good CCV must be reanalyzed.
8.6 After each ICV and CCV (continuing calibration verification) stan-dard a calibration blank (CB) must be analyzed, this reagent blankmust not exceed the CRDL (contract required detection l i m i t ) for anyanalyte run, if it does the analysis is terminated.
301220

AS:070887:1
8.7 The following represents QC which is associated with a given batchof samples. For a batch to be considered complete, the followingmust be analyzed for each wavelength required:
1} Preparation Blank - PB - reagent blank put through same diges-tion procedure as samples. The P8 must not exceed the CROL orall samples associated with that PB must be redigested.
2) Laboratory Control Sample - LCS - liquid or solid depending onsample batch (i.e. water or soils). This sample is usuallyprovided by the ERA and represents a sample with known and cer-tified levels of analytes tested for. The LCS is digested witheach batch of samples and provides information on digestionefficiency. As such, the concentration found for each analytemust not exceed ± 20 percent of true or all samples associatedwith that LCS must be redigested.
3) Duplicate Sample Analysis - For each batch digested at leastone sample must be digested in duplicate.
4) Spiked Sample Analysis - For each batch digested at least onesample must be spiked with a known quantity of the analytes ofinterest. The concentration found must not exceed ± 25 percentof the true (except in the case where the sample itself has theanalyte present at a level greater than 4 times the spike con-centration). When the spike is out of required control l i m i t sa post-digestion spike must be performed. Spike the unspikedaliquot of sample at 2x the concentration present in that sam-ple or at 2x the CRDL, whichever is greater.
301221
1 (jr
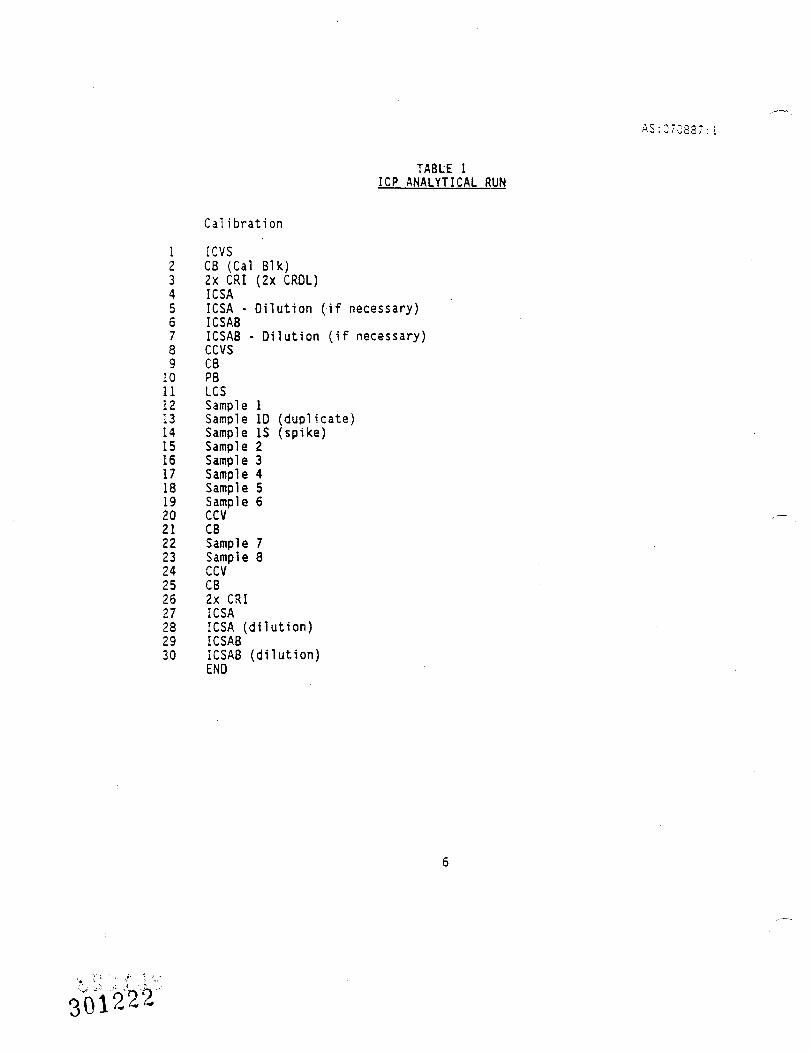
AS:07C837:
TABLE 1ICP ANALYTICAL RUN
Calibration
1 ICVS2 CB (Cal Blk)3 2x CRI (2x CRDL)4 ICSA5 ICSA - Dilution (if necessary)6 ICSAB7 ICSAB - Dilution (if necessary)8 CCVS9 CB10 P811 LCS12 Sample 113 Sample ID (duplicate)14 Sample IS (spike)15 Sample 216 Sample 317 Sample 418 Sample 519 Sample 620 CCV21 CB22 Sample 723 Sample 824 CCV25 CB26 2x CRI27 ICSA28 ICSA (dilution)29 ICSAB30 ICSAB (dilution)
END

an environmental testing company
STANDARD OPERATING PROCEDURE
ICP SET UP
PE6500
AS:070887:1
Schtumburg,Illinoo
7 0«-704-0 740
N . IUMUCKuMIti
C«y.»C*<T
919-477-0080
EI
301223

STANDARD OPERATING PROCEDUREICP SET UP PE6500
Abstract
This method outlines the analysis of water and soil samples through the measure-ment of atomic emission by an optical spectroscopic technique. The samples areaspirated through a nebulizer which results in an aerosol that is then intro-duced into the plasma. In the plasma, excitation of the sample results in char-acteristic atomic emission spectra.
301224

A S : 0 7 0 8 3 7 : i
INTRODUCTION
This procedure describes the analysis of water and soil samples u t i l i z i n g thePerkin-Elmer 6500 Inductively Coupled Argon Plasma (ICAP).
It is the intent of this procedure to comply with the IEA, Inc. business ethicspolicy.
1.0 Scope and Application
Related SOP's - Glassware cleaning procedure, standards and sample preplogs, standard and sample preparation SOP's and corrective action SOP.
2.0 Summary of Method
2.1 The sample is digested with the appropriate acids according to thesample preparation SOP.
2.2 The PE6500 is standardized separately for each analyte.2.3 Appropriate QC check standards are measured according to EPA or
routine protocols at the beginning, throughout the duration, and atthe end of the analysis to assure measurement is accurate.
2.4 Linearity of high analytes is monitored and measured.
3.0 Interferences - N/A
4.0 Apparatus and Materials
4.1 Perkin-Elmer ICAP 65004.2 Gilson Miniplus 2 Peristaltic Pump including sample tubing (0.30 ID)4.3 Perkin-Elmer 7700 PC4.4 1,000 uL variable Eppendorf pipette4.5 Seriological pipettes4.6 ICAP working standards as described in ICAP standards logbook4.7 EPA QC standard solutions as described per EPA in the Atomic Spec-
troscopy Reagents logbook
5.0 Reagents
5.1 ICAP working standards for each element5.2 ICAP QC standard solutions5.3 Nitric acid5.4 Hydrochloric acid5.5 Hydrogen peroxide5.6 Triton X-100
6.0 Sample Collection, Preservation and Storage - N/A
301225

7.0 Procedure
7.1 Startup of the ICAP PE6500
WARNING: Ensure that no pacemaker users are in the vicinity of the spec-trometer. RF generator radiation may interfere with pacemaker operation.
A) Prior to i n i t i a t i o n of the plasma, the operator should be f a m i l i a rwith the operators manual supplied by Perkin-Elmer.
B) Before starting the instrument, check the exhaust vents and coolingwater to ensure they are operating.
C) Check pressure of argon supply.D) Turn on power to the RF generator.E) Turn on the power to the torch control box.F) Turn on gases by pressing "PLAS", "NEB", and "AUX" buttons. Flows
should be 16, 1.1 and 0.3 respectively. Allow 3 minutes for argonto fill torch chamber.
G) Connect sample tubing (0.30 ID) to peristaltic pump and place tubingin nanopure water. Turn pump on, make sure flow is smooth.
H) Check water, argon and door interlocks on torch box, all lightsshould be out. If light is on, check for problem.
I) Within 15 minutes of initial startup the RF ready light will comeon.
J) Turn off "NEB" and "AUX" by pressing buttons.K) Press RF ON button (light should come on). RF power should read
900. When RF light comes on press "ICP IGN".L) Press on "NEB" and "AUX".
7.2 Instrument Operation
A) Turn on "power" and "run" switches on left side of ICAP.B) Turn on power to the Perkin-Elmer 7700 personal computer and print-
er.C) Type "idris (enter)", this will load idris program.0) Type "icp" to load software.E) At this time the computer screen should display a blank METHOD MODE
screen.F) Determine what elements are required for the samples to be analyzed.
Experience has shown that the best instrument performance isachieved by following a few basic rules:
Each analytical run should contain those elements whose wavelengthsare closest to each other (eg. low end - Sb, Zn, Pb, Cd, Cr, Ni;high end - Be, Cu, Ag)
G) Enter the utilities MODE by pressing the "Utilities" special func-tion key. Select "Library" soft key. Select "List Method" softkey. The screen w i l l display all methods stored and available foruse. Select appropriate method by using arrow keys to position
301226

AS: 070887:1
cursor (blue highlight) on desired method. Hit "Recall" specialfunction key.
H) The system will e'nter the GRAPHICS MODE and automatically set upoperating parameters.
I) Hit "Print Elem Parameters" special function key. A listing of theelement parameters for selected method will automatically be printedon the PR-210 printer.
Check the calibration standard against the standard cores listed onprintout. They should match.
0) Hit "Run Manual" special function key. The 6500 should begin ini-tialization sequence. (This can be noted by printout on PR-210.)Screen will display "depress Hold then Print key and depress Enter"- DO SO. (The Hold must be hit before the Print key.)
K) Start aspirating the calibration standard.1) System will prompt "Aspirate Standard 1". Depress "Standard" spe-
cial function key. The system will set gain and run standard. Ifsystems misreads standard 1 it will display "Peak offset aspiratestandard 1". Repeat #7 above (????????). This occurrence is notunusual; however, if it happens again there may be a significantproblem, consult with supervisor.
N| Depending on the number of calibration standards in the method thesystem will continue the prompt sequence as follows:
for 2 calibration standards - Aspirate Standard 2for 3 calibration standards - Aspirate Standard 3
Up to 5 standard positions.
N| After all standards are run the system will prompt "aspirate BLANKand depress read" hit "Blank" special function key. If system dis-plays "Standards out of sequence" after blank is run a significantproblem exists, consult supervisor.
0| System will next prompt "Aspirate sample and depress read", fromthis point on all analyses will be conducted by hitting the "Sample"special function key.
Incomplete analysis and begin a new one:II Hit "Method" special function key and proceed as in #16 (??????).
Incomplete analysis and shut down:(f Hit "Quit" special function key. Screen will prompt "Confirm desire
to exit ICP 6500 Program? Y or N", type "V".ff Screen will return to "login:" prompt. Turn monitor knob counter-
clockwise to turn off screen.
30122?

AS:072S37:;
S) Remove sample capillary from'rinse water and wait approximately ^eminute. Press "RF OFF" button on torch box, the plasma should i-rne-diately go out. Hit gas buttons to turn flows off. Turn off p e r i -staltic pump and release side area and relax tubing.
T) Turn power to torch box off.U) Turn 6500 to stand by.V) Turn RF power supply off.
8.0 QUALITY CONTROL
8.1 The instrument must be calibrated at the start of each new analyti-cal run. (The analytical run is based on the specific elementsbeing run within a specific method: i.e. one run may contain alllow wavelength elements while another run will contain high wave-length elements, each of these runs requires a separate calibra-tion.) The calibration consists of a standard at the end of thelinear range for each element analyzed (standards can be in lowerconcentrations in regular sample analysis). The calibration isended with a calibration blank (reagent water).
8.2 Immediately following calibration an Initial Calibration Verifica-tion solution (ICV) must be run for each wavelength analyzed. Theconcentration found for this standard must fall within ± 10 percentof the true concentration or the run is voided.NOTE: The ICV is prepared from EPA-supplied solutions. In theevent ERA standards are not available a certified solution may beused or a mixture of independent standards may be prepared. Thestandards must be from a source other than that used to preparecalibration and continuing calibration standards.
8.3 To confirm the linearity at the lower end of ICP instrumental detec-tion a standard equivalent to 2x CRDL must be run for each wave-length analyzed at the beginning and end of each run or every 8hours.
8.4 To confirm appropriate background correction factors two ICP inter-ference check samples (ICS) must be run starting with ICSA (onlyinterferents) followed by ICSAB (both interferents and analytes).If results obtained fall outside ± 20 percent of true concentrationsthe analysis is terminated. ICSA and ICSAB must be run at the be-ginning and end of each analytical run or every eight hours.
8.5 A CCV must be run at the beginning of each analytical run; at afrequency of 10 percent during the run (i.e. every 10 samples) andafter the last analytical sample. The CCV must not exceed ± 10percent of the true concentration or the analysis is terminated andall samples run since the last good CCV must be reanalyzed.
8.6 After each ICV and CCV (continuing calibration verification) stan-dard a calibration blank (CB) must be analyzed, this reagent blankmust not exceed the CRDL (contract required detection limit) for anyanalyte run, if it does the analysis is terminated.
301228-

AS:070887:1
8.7 The following represents QC which is associated with a given batchof samples. For a batch to be considered complete, the followingmust be analyzed for each wavelength required:
1) Preparation Blank - P8 - reagent blank put through same diges-tion procedure as samples. The PB must not exceed the CRDL orall samples associated with that PB must be redigested.
2) Laboratory Control Sample - LCS - liquid or solid depending onsample batch (i.e. water or soils). This sample is usuallyprovided by the EPA and represents a sample with known and cer-tified levels of analytes tested for. The LCS is digested witheach batch of samples and provides information on digestionefficiency. As such, the concentration found for each analytemust not exceed ± 20 percent of true or all samples associatedwith that LCS must be redigested.
3) Duplicate Sample Analysis - For each batch digested at leastone sample must be digested in duplicate.
4) Spiked Sample Analysis - For each batch digested at least onesample must be spiked with a known quantity of the analytes ofinterest. The concentration found must not exceed ± 25 percentof the true (except in the case where the sample itself has theanalyte present at a level greater than 4 times the spike con-centration). When the spike is out of required control limitsa post-digestion spike must be performed. Spike the unspikedaliquot of sample at 2x the concentration present in that sam-ple or at 2x the CRDL, whichever is greater.
301229

AS:07CS37:
TABLE 1ICP ANALYTICAL RUN
Calibration
1 ICVS2 CB (Cal Blk)3 2x CRI (2x CRDL)4 ICSA5 ICSA - Dilution (if necessary)6 ICSAB7 ICSAB - Dilution (if necessary)8 CCVS9 CB10 PB11 LCS12 Sample 113 Sample ID (duplicate)14 Sample IS (spike)15 Sample 216 Sample 317 Sample 418 Sample 519 Sample 620 CCV21 CB22 Sample 723 Sample 824 CCV25 CB26 2x CRI27 ICSA28 ICSA (dilution)29 ICSAB30 ICSAB (dilution)
END
301230

STANDARD OPERATING PROCEDURE>
ANALYSIS OF SAMPLES
FOR TOTAL CYANIDE CLP PROTOCOL
WC:070187:4
20O VOwROe TURNPIKE • VOMROE. CONNECTCUT 06468 • (2O3I 452 S5OO
301S31

W C : 0 7 0 1 8 7 : 4
TABLE OF" CONTENTS
Abstract
1.0 Scope and Application
2.0 Summary of Method
3.0 Interferences
4.0 Apparatus and Materials
5.0 Reagents6.0 Sample Collection, Preservation and Storage
7.0 Procedure
8.0 Quality Control
9.0 Method Performance10.0 Data Reduction and Data Handling
11.0 Documentation of Problems
12.0 References
Appendix I: Figures
Appendix II: Spectrophotometer Instructions
Appendix III: Forms
Appendix IV: Absorbance Criteria
301232

WC:070187:4
STANDARD OPERATING PROCEDUREANALYSIS OF ENVIRONMENTAL STANDARDS FOR TOTAL CYANIDE_____________CLP PROTOCOL_____
Abstract
This procedure is designed for the analysis of cyanide in water and soil samplesby acidified distillation and collecting the hydrogen cyanide gas, HCN, in asodium hydroxide, NaOH, scrubber and analyzing colorimetrically utilizing thepyridinebarbituric acid method or titrimetrically with silver nitrate.
301233

WC:070137:4
METHOD FOR TOTAL CYANIDE ANALYSIS
1.0 SCOPE AND APPLICATION
1.1 This method is applicable to the determination of cyanide in drink-ing, surface and saline waters, soils, domestic and industrialwastes.
1.2 The titration procedure using silver nitrate with p-dimethylamino-benzalrhodanine indicator is used for measuring concentrations ofcyanide exceeding 1 mg/L (0.25 mg/250 ml of absorbing liquid).
1.3 The manual colorimetric procedure is used for concentrations below1 mg/L of cyanide and is sensitive to about 0.02 mg/L.
1.4 The detection limit for soils is dependent on the dry weight basisof the sample taken for analysis.
2.0 SUMMARY OF METHOD
2.1 The cyanide as hydrocyanic acid (HCN) is released from cyanidecomplexes by means of a reflux-distillation operation and absorbedin a scrubber containing sodium hydroxide solution. The cyanide ionin the absorbing solution is then determined by volumetric titrationor colorimetrically.
2.2 In the colorimetric measurement the cyanide is converted to cyanogenchloride, CNC1, by reaction with chloramine-T at a pH less than 8without hydrolyzing to the cyanate. After the reaction is complete,color is formed on the addition of pyridine-barbituric acid reagent.The absorbance is read at 578 nm for pyridine-barbituric acid. Toobtain colors of comparable intensity, it is essential to have thesame salt content in both the sample and the standards.
2.3 The titimetric measurement uses a standard solution of silver ni-trate to titrate cyanide in the presence of a silver sensitiveindicator.
3.0 INTERFERENCES
3.1 Interferences are eliminated or reduced by using the distillationprocedure described in Procedure 7.1.
3.2 Sulfides adversely affect the colorimetric and titration procedures.If a drop of the distillate on lead acetate test paper indicates thepresence of sulfides, treat 25 mL more of the sample than that
301234

WC:070137:4
required for the cyanide determination with powdered cadmium carbon-ate. Yellow cadmium sulfide precipitates if the sample containssulfide. Repeat this operation until a drop of the treated samplesolution does not darken the lead acetate test paper. Filter thesolution through a dry filter paper into a dry beaker, and from thefiltrate measure the sample to be used for analysis. Avoid a largeexcess of cadmium carbonate and a long contact time in order tominimize a loss by complexation or occlusion of cyanide on theprecipitated material.
3.3 The presence of surfactants may cause the sample to foam duringrefluxing. If this occurs, the addition of an agent such as DowCorning 544 anti-foam agent will prevent the foam from collectingin the condenser. Fatty acids will distill and form soaps underalkaline titration conditions, making the end point almost impossi-ble to detect. When this occurs, one of the spectrophotometricmethods should be used.
4.0 APPARATUS
4.1 Reflux distillation apparatus such as shown in Figure 1 or Figure2. The boiling flask should be of 1 liter size with inlet tube andprovision for condenser. The gas absorber maybe a Fisher-Milliganscrubber.
4.2 Mlcroburet, 5.0 mL (for titration).4.3 Spectrophotometer suitable for measurements at 578 nm with a 1.0 cm
cell.5.0 REAGENTS
5.1 Distillation and Preparation Reagents5.1.1 Sodium hydroxide solution, 1.25N: Dissolve 50 g of NaOH in
distilled water, and dilute to 1 liter with distilled water.
5.1.2 Cadmium carbonate: powdered
5.1.3 Ascorbic acid: crystals5.1.4 Sulfurlc acid: concentrated5.1.5 Magnesium chloride solution: Weigh 510 g of MgCl2.6H,0 into
a 1000 mL flask, dissolved and dilute to 1 liter with dis-tilled water.
301235
' i *"

WC:070187:4
5.2 Stock Standards and Titration Reagents
5.2.1 Stock cyanide solution: Dissolve 2.51 g of KCN and 2 g KOHin 1 liter of distilled water. Standardize with 0 0192 NAgNOj.
5.2.2 Standard cyanide solution, intermediate: Dilute 5.0 ml ofstock (1 mi - 1 mg CN) to 100 ml with distilled water. Thestock solution is to be titrated weekly to verify concentra-tion.
5.2.3 Standard cyanide solution: Prepare fresh daily by diluting2.0 ml of intermediate cyanide solution to 100 ml withdistilled water and store in a glass-stoppered bottle. 1ml - 1.0 ug CN (1.0 mg/L).
5.2.4 Standard silver nitrate solution, 0.0192 N: Prepare bycrushing approximately 5 g AgNO, crystals and drying toconstant weight at 40*C. Weight out 3.2647 g of driedAgNO,, dissolve in distilled water, and dilute to 1000 ml (Iml - 1 mg CN).
5.2.5 Rhodanine indicator: Dissolve 20 mg of p-dimethylaminoben-zalrhodanine in 100 ml of acetone.
5.2.6 Sodium hydroxide solution, 0.25 N: Dissolve 10 g of NaOHin distilled water and dilute to 1 liter.
5.3 Manual Spectrophotometric Reagents
5.3.1 Sodium dihydrogenphosphate, 1 M: Dissolve 138 g ofNaH2P04.H20 in a liter of distilled water. Refrigerate thissolution.
5.3.2 Chloramine-T solution: Dissolve 1.0 g of white, watersoluble chloramine-T in 100 ml of distilled water and re-frigerate until ready to use. Prepare fresh weekly.
5.3.3 Color Reagent: Pyridine-barbituric acid reagent: Place 15g of barbituric acid in a 250 mL volumetric flask and addjust enough distilled water to wash the sides of the flaskand wet the barbituric acid. Add 75 ml of pyridine and mix.Add 15 ml of HC1 (sp gr 1.19), mix, and cool to room temper-ature. Dilute to 250 ml with distilled water and mix. Thisreagent is stable for approximately six months if stored ina cool, dark place.
301236

WC:070187:4
6.0 SAMPLE COLLECTION
6.1 All bottles must be thoroughly cleaned and rinsed to remove solublematerial from containers.
6.2 Water samples are preserved with 2 mL of ION sodium hydroxide perliter of sample (pH >12) and ascorbic acid at the time of collec-tion.
6.3 Samples must be stored at 4*C (±2*C) and must be analyzed within 12days of the verified time samples received.
7.0 PROCEDURE
7.1 Distillation - Test samples with pH paper to assure pH is >12.0.Record in distillation log whether pH is or is not greater than12.0. Test samples for presence of chlorine by placing a drop ofsample on potassium iodide starch test paper. A blue color indi-cates the presence of chlorine. If chlorine is present, add a fewcrystals of ascorbic acid at a time, until a drop of sample procuresno color on the test paper. Record in distillation log whetherchlorine was or was not present.
7.1.1 For waters place 500 mL of sample, or an aliquot diluted to500 mL, in the 1 liter boiling flask. Add 50 mL, of sodiumhydroxide (5.1.1) to the absorbing tube and dilute if neces-sary with distilled water to obtain an adequate depth ofliquid in the absorber. Connect the boiling flask, conden-ser, absorber and trap in the train.
7.1.2 For solids, accurately weigh a representative 1-5 portionof wet sample and transfer it to a boiling flask. Add 500mL of distilled water. Shake or stir the sample so that itis dispersed. Add 50 mL, of sodium hydroxide (5.1.1) to theabsorbing tube and dilute If necessary with distilled waterto obtain an adequate depth of liquid in the absorber.Connect the boiling flask, condenser, absorber and trap inthe train.
7.1.3 Start a slow stream of air entering the boiling flask byadjusting the vacuum source. Adjust the vacuum so thatapproximately one bubble of air per second enters the boil-ing flask through the air inlet tube.NOTE: The bubble rate will not remain constant after the
reagents have been added and while heat is beingapplied to the flask. It will be necessary to
ft
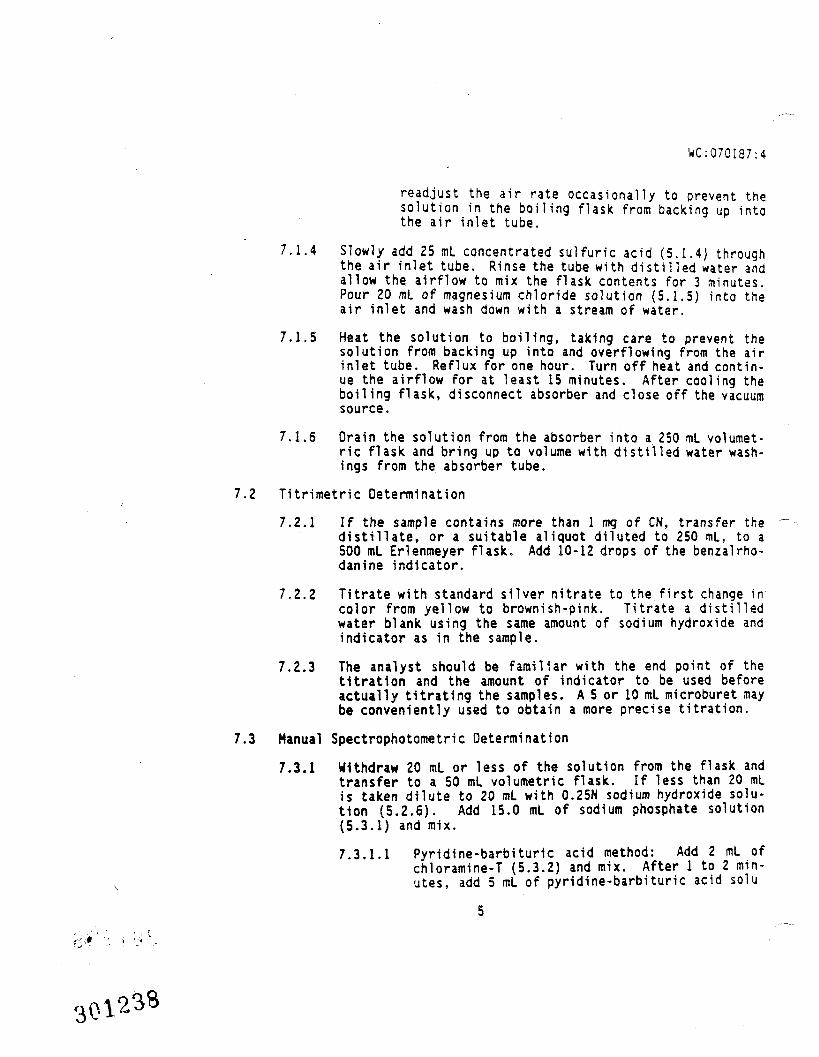
WC:070I87:4
readjust the air rate occasionally to prevent thesolution in the boiling flask from backing up intothe air inlet tube.
7.1.4 Slowly add 25 mL concentrated sulfuric acid (5.1.4) throughthe air inlet tube. Rinse the tube with distilled water andallow the airflow to mix the flask contents for 3 minutes.Pour 20 ml of magnesium chloride solution (5.1.5) into theair inlet and wash down with a stream of water.
7.1.5 Heat the solution to boiling, taking care to prevent thesolution from backing up into and overflowing from the airinlet tube. Reflux for one hour. Turn off heat and contin-ue the airflow for at least 15 minutes. After cooling theboiling flask, disconnect absorber and close off the vacuumsource.
7.1.6 Drain the solution from the absorber into a 250 mL volumet-ric flask and bring up to volume with distilled water wash-ings from the absorber tube.
7.2 Titrimetric Determination
7.2.1 If the sample contains more than 1 mg of CN, transfer thedistillate, or a suitable aliquot diluted to 250 mL, to a500 mL Erlenmeyer flask. Add 10-12 drops of the benzalrho-danine indicator.
7.2.2 Titrate with standard silver nitrate to the first change incolor from yellow to brownish-pink. Titrate a distilledwater blank using the same amount of sodium hydroxide andindicator as in the sample.
7.2.3 The analyst should be familiar with the end point of thetitration and the amount of indicator to be used beforeactually titrating the samples. A 5 or 10 mL microburet maybe conveniently used to obtain a more precise titration.
7.3 Manual Spectrophotometric Determination7.3.1 Withdraw 20 mL or less of the solution from the flask and
transfer to a 50 mL volumetric flask. If less than 20 mLis taken dilute to 20 mL with 0.25N sodium hydroxide solu-tion (5.2.6). Add 15.0 mL of sodium phosphate solution(5.3.1) and mix.7.3.1.1 Pyridine-barbituric acid method: Add 2 mL of
chloramine-T (5.3.2) and mix. After 1 to 2 min-utes, add 5 mL of pyridine-barbituric acid solu
301233

WC:070187:4
tion (5.3.3) and mix. Dilute to mark with dis-tilled water and mix again. Allow 8 minutes forcolor development then read absorbance at 578 nmin a 1 cm cell within 15 minutes. Spectrophotome-ter operating instructions are available in Appen-dix II.
7.3.2 Prepare a minimum of 3 standards and a blank by pipettingsuitable volumes of- standard solution into 100 ml volumetricflasks. NOTE: One calibration standard must be at thecontract required detection limit (CRDL). To each standard,bring to 20 ml volume with 0.2SN sodium hydroxide solution(5.2.6). Standards must bracket the concentration of thesamples. If dilution is required, use the blank solution.
As an example, standard solutions could be prepared asfollows:
ml of Standard Solution Cone, ug CN(1.0 - 1 uo CN1 per 50 ml
0 Blank1.0 12.0 23.0 34.0 45.0 56.0 6
7.3.2.1 It 1s not imperative that all standards be dis-tilled in the same manner as the samples. Atleast one standard (mid-range) must be distilledand compared to similar values on the curve toensure that the distillation technique is reli-able. If the distilled standard does not agreewithin ± 15 percent of the undistilled standards,the operator should find and correct the cause ofthe apparent error before proceeding.
7.3.2.2 Prepare a standard curve by plotting absorbanceof standard vs. cyanide concentrations (per 50ml).
30J23S

WC:070187:4
7.4 Percent Solids Determination Procedure
7.4.1 Immediately following the weighing of the sample to beanalyzed for cyanide, add 5-10 g of sample to a tared weigh-ing dish. Weigh and record the weight to the nearest 0 01g.
7.4.2 Place weighing 'dish plus sample, with the cover tipped toallow for moisture escape, in a drying oven maintained at103-105*C. Sample handling and drying should be conductedin a well-ventilated area.
7.4.3 Dry the sample overnight (12-24 hours) but not longer than24 hours. If dried less than 12 hours, it must be docu-mented that constant weight was attained. Remove the samplefrom the oven and cool in a dessicator with the weighingdish cover in place before weighing. Weigh and recordweight nearest 0.01 g. Do not analyze^the dried sample.
7.4.4 Duplicate percent solids determinations are required at thesame frequency as are other analytical determinations.
7.4.5 For the duplicate percent solids determinations, designateone sample aliquot as the "original" sample and the otheraliquot as the "duplicate" sample. Calculate dry weightusing the results of the "original" sample aliquot.
NOTE: For the purpose of Section 7.4.3, drying time is defined asthe elapsed time in the oven; thus raw data must record timein and out of the oven to document the 12 hour drying timeminimum. In the event it is necessary to demonstrate theattainment of constant weight, data must be recorded for aminimum of two repetitive weigh/dry/dessicate/weigh cycleswith a minimum of one hour drying time in each cycle. Con-stant weight would be defined as a loss in weight of nogreater than 0.01 g between the start weight and finalweight the last cycle.
7.4.6 Calculate percent solids by the formula below. This valuewill be used for calculating analytical concentration on adry weight basis.
Sample Drv Weight x 100% Solids - Sample Dry Weight
3

WC:070187:4
7.5 Quantification of Results
7.5.1 Using the titrimetric procedure, calculate concentration ofCN as follows:
CN, mg/L - (A-B1 l.QQO ml/I x _____250 mlmL orig. sample ml of aliquot titrated
where A - volume of. AgN03 for titration of sample (1 ml - 1mg Ag)where 8 - volume of AgNO, for titration of blank (1 ml - 1
mg Ag)
and: 250 ml - distillate volume (7.1.5)1000 ml - conversion ml to LmL original sample (see 7.1.1)mL of aliquot titrated (see 7.2.1)
7.5.2 If the colorimetric procedure is used, calculate the cya-nide, in ug/L, in the original sample as follows:CN, ug/L - A x 1.000 ml/I x Q
B C
where A • ug CN read from standard curve (per 50 mL)where B - mL of original sample for distillation (see 7.1.1)where C - mL taken for. colorimetric analysis (see 7.3.1)where 0 - total volume of absorbing solution from the dis-
tillation, mL
and: 1,000 mL/L - conversion mL to L
7.5.3 Titration Calculation (For Soils):
(A-B) x ____250 mL x 1,000 g/KgmL aliouot t
CN, ing/Kg - C x ft soltrated
100
where A • mL of AgNO, for titration of sample (1 mL - 1 mgAg)
where B - mL of AgNO, for titration of blank (1 mL - 1 mgAg)
where C - wet weight of original sample in g

WC:070187:4
7.5.4 Colorimetric (Soil) Calculation:
CN, mg/Kg •
where A - ug CN read standard curve (per 50 ml)where B « total volume of abosrbing solution from the dis-
tillation, mlwhere C - wet weight of original sample in gwhere D - volume of absorbing solution used in colorimetric
test, mlwhere S - decimal percent solids in sample
8.0 QUALITY CONTROL
8.1 For organizational purposes all activities for cyanide analysis havestrict conventions for coding standards and batching of samples.
8.1.1 Standards • Standards are prepared from ACS grade potassiumcyanide salt and dilutions thereof. All standard prepara-tions are logged and coded. Our convention for coding allcyanide standards is as follows:
CN:xxxxxx:n:nwhere CN - cyanidewhere xxxxxx • date of preparationwhere the first n - page t of standards prep, logwhere the second n - preparation log book *Stock cyanide preparation log book must contain the follow-ing information:
Date of preparationAnalyst's initialsWeight of KCN usedRaw data generated for standardization of solutionNormality of stock cyanide solution
301242

WC:070187:4
All stock cyanide standards are labeled for storage, label-ing must include concentration (1000 ug/ml cyanide), datesolution made, weight of KCN used, normality of solution,page number of standards prep log, log book number andanalyst's initials.
8.2 Instrument Calibration
Spectrophotometer must be calibrated daily or once every 24 hours and eachtime instrument is set up. The instrument standardization date and m i l i -tary time (24-hour clock) started and time completed must be included inthe raw data. Calibration standards must be prepared fresh each time ananalysis is to be made and discarded after use. Prep a blank and a mini-mum of three standards in graduated amounts in the appropriate range.NOTE: One calibration standard must be at the Contract Required DetectionLimit (CROL). Standards must bracket the concentration of the samples.At least one additional standard (mid-range) must be distilled and com-pared to similar values on the curve to ensure that the distillationtechnique is reliable. If the distilled standard does not agree within± IS percent of the undistilled standards, the operator should find andcorrect the cause of the apparent error before proceeding.
8.3 Initial Calibration Verification (ICV)Immediately after the spectrophotometer has been calibrated, the accuracyof the initial calibration shall be verified and documented by the analy-sis of ERA Initial Calibration Verification Solution for cyanide. Thissolution must be distilled. When measurements exceed the control limitsfor initial and continuing calibration verification the analysis must beterminated, the problem corrected, the instrument recalibrated, and thecalibration reverlfied. The control limit for cyanide is t 15 percent ofthe true value as set by EPA. The values for the initial and subsequentcontinuing calibration verifications shall be recorded on Form II-IN (seeAppendix III).8.4 Continuing Calibration Verification (CCV)To ensure calibration accuracy during each analysis run a mid-range stand-ard must be prepared to be used for continuing calibration verificationand must be analyzed at a frequency of 10 percent of samples or every twohours, whichever is more frequent. The standard must be analyzed at thebeginning of the run, after ten samples and after the last analyticalsample. The same continuing calibration standard must be used throughoutthe analysis runs for a case of samples received. If the deviation of thecontinuing calibration is greater than the control limit (± 15 percent)of the true value, the instrument must be recalibrated and the precedingten analytical samples or all analytical samples analyzed
10

WC:070187:4
since the last good calibration verification must be analyzed againInformation regarding the continuing verification of calibration shall berecorded on FORM 11-IN.
8.5 Initial Calibration Blank (ICB), Continuing Calibration Blank (CCB)and Preparation Blank (P8) Analyses
A calibration blank must be analyzed for cyanide analysis at the beginningof the run, after every initial and continuing calibration verificationat a frequency of 10 percent of samples or every two hours, whichever ismore frequent and after the last analytical sample. The results for thecalibration blanks shall be recorded on FORM III-IN (see Appendix III).If the magnitude (absolute value) of the calibration result exceeds theinstrument detection limit (IDL), the result must be reported in ug/L onFORM III-IN (see Appendix III), otherwise report as IDL-U. If the abso-lute value blank result exceeds the contract required detection limit(CRDL), terminate analysis, correct problem, recalibrate and reanalyze thepreceding ten analytical samples or all analytical samples analyzed sincethe last good calibration blank.
At least one preparation blank (or reagent blank) processed through thedistillation procedure must be prepared and analyzed with every sampledelivery group (SOG) or with each batch of samples digested whichever ismore frequent. A batch is a group of samples prepared at the same time.
The first batch of samples in an SOG is to be assigned to preparationblank one, the second batch of samples to preparation blank two, etc. FORMIII-IN, Figure 2.0. Each data package must contain the results of all thepreparation blank analyses associated with the samples in that SOG.
This blank is to be repeated for each SDG and used in all analyses toascertain whether sample concentrations reflect contamination in thefollowing manner:1) If the absolute value of the concentration of the blank is less than
or equal to the CRDL, no correction of sample results is performed.
2) If the cyanide concentration in the blank is above the CRDL, thelowest concentration of cyanide in the associated samples must be lOxthe blank concentration. Otherwise, all samples associated with theblank with the cyanide concentration less than lOx the blank concen-tration and above the CRDL must be redigested and reanalyzed (exceptfor an identified aqueous soil field blank).
11
301244

WC:070187:4
3) If the concentration of the blank is below the negative CROL, then allsamples reported below lOx CRDL associated with the blank must beredigested and reanalyzed.
The values for the preparation blank must be recorded in ug/L foraqueous samples and in mg/Kg for solid samples on FORM III-IN (seeAppendix III).
8.6 Spike Sample Analysis (S)_
The spike sample analysis is designed to provide information about theeffect of the soil matrix on the digestion and measurement methodology.The spike is added prior to any distillation steps. At least one spikesample analysis must be performed on each group of samples of a similarmatrix (i.e. water, soil) or for each sample delivery group, whichever ismore frequent. Samples Identified as field blanks cannot be used forspike sample analysis.
The analyte spike must be added in the concentration of 100 ug/L for bothwater and soil matrices. If the spike recovery 1s not within tne limitsof 75-125 percent, the data of all samples associated with that spikesample must be flagged with the letter "N" on FORM I-IN and V-IN (seeAppendix III). An exception to this is when the sample concentrationexceeds the spike level by a factor of four or more. In this case thedata shall be reported unflagged even if the percent recovery does notmeet the 75-125 percent recovery criteria.When the pre-distillatlon spike recovery falls outside the control limitsand the sample result does not exceed 4x the spike added, a post-distilla-tion spike must be performed. Spike the unspiked aliquot of the sampleat 2x the indigenous level or 2x CROL, whichever is greater. Results ofthe post-distillation spike must be reported on FORM V (Part 2)-IN (seeAppendix III).
Spike recoveries are calculated as follows:
% Recovery - fSSR-SRl x 100SA
where SSR - Spiked Sample Resultwhere SR • Sample Resultwhere SA - Spike AddedWhen sample concentration is less than the Instrument detection limit, useSR-0 for calculating percent recovery. The spike sample results, samplesresults and percent recovery must be reported on FORM V-IN (see AppendixIII).
12
301245

WC:070I87:4
8.7 Duplicate Sample Analysis (0)
One duplicate must be analyzed from each group of samples of a similarmatrix type (i.e. water, soil). Duplicates cannot be averaged for report-ed on FORM I-IN (see Appendix III).
Duplicate sample analyses are required for percent solids. Samples iden-tified as field blanks cannot be used for duplicate analysis. The rela-tive percent differences (RPO) are calculated as follows:
RPO - (S-D) x 100(S+D)/2
where RPD - relative percent differencewhere S - first sample value (original)where D - second sample value (duplicate)
The results of the duplicate sample analyses must be reported on FORMVI-IN in ug/L for aqueous samples and mg/Kg dry weight basis for solidoriginal and duplicate analyses (see Appendix III). A control limit of20 percent for RPO shall be used for original and duplicate sample valuesgreater than or equal to 5x the CRDL. A control limit of ± the CROL mustbe used for sample values less than 5x the CROL, and the absolute valueof the control limit (CRDL) must be entered in the "control limit" columnof FORM VI-IN (see Appendix III).
If one result is above the 5x the CRDL level and the other is below, usethe + CRDL criteria. If both sample values are less than the IDL, the RPDis not calculated on FORM VI-IN. For solid sample or duplicate results<5x CRDL, enter the absolute value of the CRDL, corrected for sampleweight and percent solids, in the "control limit" column. If the dupli-cate sample results are outside the control limits, flag all the data forsamples associated with the duplicate sample with an asterisk (*) on FORMSI-IN and VI-IN.
8.8 Laboratory Control Sample (LCS) Analysis
Solid laboratory control samples supplied by the EPA must be analyzed forcyanide using the same sample preparations, analytical methods and QA/QCprocedures employed for the EPA samples received. Percent solids determi-nation is not required on the EPA-provided LCS sample. One solid LCS mustbe prepared and analyzed for every group of solid samples in a SOG, or foreach batch of samples digested, whichever is more frequent.
13
,0124s

WC:070187:4
All LCS results and percent recovery (%R) will be reported on FORM V I I - I N(see Appendix III). If the results for the solid LCS fall outside thecontrol l i m i t s established by the EPA, the analysis must be terminated,the problem corrected and the previous samples associated with that LCSredistilled and reanalyzed.
8.9 Instrument Detection Limit (IOL) Determination
Before any field samples are analyzed the instrument detection limits (inug/L) must be determined at the start of the contract and at least quar-terly (every three calendar months).
The instrument detection limits (in ug/L) shall be determined by multiply-ing by three, the average of the standard deviations obtained on threenon-consecutive days from the analysis of a standard solution at a concen-tration 3x-5x the IDL, with seven consecutive measurements per day.IDL's must be reported on FORM XI-IN (see Appendix III) submitted witheach data package.
8.10 Summary of Quality Assurance/Quality Control
Listed below is the required QA/QC and order of events to be followed whenanalyzing samples for cyanide.
. Instrument Calibration - Blank, three standards in graduated amounts,one of which must be at the CRDL (non-distilled) include date, startanalysis time (military time, 24-hour clock) and finish analysistime.
. Initial Calibration Verification (ICV) and Continuing CalibrationVerification (CCV) - Analysis of distilled EPA known standard, (ICV),then a mid-range standard (not distilled) must be analyzed, (CCV). TheCCV is then analyzed after every tenth sample and after the last ana-lytical sample.
. Initial Calibration Blank (ICB), Continuing Calibration Blank (CCB),and Preparation Blank (PB) - Calibration blank (non-distilled) must beanalyzed at the beginning of the run, after every initial and continu-ing calibration verification. Preparation blank - Consisting of dis-tilled water processed through the distillation procedure must beanalyzed with each batch of samples.
. Spiked Sample - One spike of a sample must be performed on each batchof samples of a similar matrix. Field blanks cannot be used as spikes.
14
301247

WC:070137:4
. Duplicate Sample Analysis - One duplicate sample must be performed oneach batch of samples of a similar matrix. Field blanks cannot be usedas duplicates. For soil samples, duplicate sample analyses are re-quired for percent solids.
. Laboratory Control Sample (LCS) - Solid laboratory control samples mustbe prepared and analyzed for every batch of solid samples analyzed.
The recorded absorbances for each standard must be checked to ensure thatthey are within the acceptable range. If standards do not fall within theacceptable range, call your supervisor. (Acceptable ranges for CN- stand-ards are attached in Appendix IV).
8.11 Instrument Maintenance
8.11.1 Instrument maintenance logs are kept for each spectrophoto-meter.
8.11.2 An instrument performance log is kept for all spectrophoto-meters. The absorbance of the 2.0 ug standard is recordedweekly in order to monitor the lamp stability.
9.0 METHOD PERFORMANCE
9.1 A method detection limit (MOL) study performed on 03/14/90 yieldeda 7.7 ug/L MOL using the Milton Roy Spectrophotometer.
9.2 The last 20 water sample matrix spikes (100 ug/L CN) average recov-ery was 97.0 percent as of 12/20/89.
9.3 The last 20 soil sample matrix spikes average recovery was 88.0percent as of 12/11/89.
10.0 DATA REDUCTION AND DATA HANDLING
10.1 All distillation data including sample ID, sample volume, and volumedistilled are recorded in each analyst's notebook. Separate logsfor distillation, development and tltration are kept for CLP proto-cols (see Appendix III).
10.2 All results are entered into LIMS for reporting and sample trackingpurposes.
10.3 Technical Data Review10.3.1 The technical data review includes verifying that samples
were preserved and holding times were met. Absorbances ofstandards and batch quality control were within criteria
15
i0!248

WC:070187:4
(see Appendix 'IV). All result calculations are verifiedand each log is checked for transcription error.
11.0 DOCUMENTATION OF PROBLEMS
11.1 Corrective Action Reports - must be filed if any problems wereassociated with the analysis (see Appendix III).
301243

0,012 0
WC:070187:4
11.2 Case Narratives - should include any deviation from this SOP or anydifficulties encountered in the procedure.
12.0 REFERENCES
1. Methods for "Chemical Analysis of Water and Wastes", March 1979, EPApublication 1600/4-79-02.
2. "Operation RN Manual for Technicon Auto Analyzer IIC System", 1980.Technical publications ITA9-0460-00. Technicon Industrial Systems,Tarrytown, NY 10591.
3. "Users Guide for the Continuous Flow Analyzer Automation System", EMSLU.S. EPA, Cincinnati, OH (1981).
4. "Interim Methods for the Sampling and Analysis of Priority Pollutantsin Sediments and Fish Tissue", USEPA Environmental Monitoring andSupport Laboratory, Cincinnati, Ohio, August 1977, Revised October1980.
5. Op. cit. (#4), Methods 335.2.
17

APPENDIX I
(FIGURES)
301251

A L L I H N C O N D E N S E R —
AIR I N L E T TUBE
— C O N N E C T I N G T U B I N G
ONE LITER ——BOILING FLASK
SUCTION
FIGURE I
Cjr»ni<U dLicllUcioo
rvj01252

COOLING WATER
INLET
HEATC8-
SCREW CLAMP
TO LOW VACUUMSOURCE
- ABSORBER
D I S T I L L I N G F L A S K
O
FIGURE
301253

APPENDIX II
36125*

FOt THg REMltt-ELME! 01
1. Preparation
Powtr W daap • on (not D, damp)Pull out Vis lamp knobSlit • set at 2.0 notResponse • HedSuppression • OffScan - OffNH - Ignore (used with scan)Wavelength - put at 500 - reads In absorbance or X TPush XT (• X Transit ttance)w/o cells - adjust digital readout to 100% T with the knob on top (alwaysreads ± when It's +)Block front (saaple) cell path with board • should read OX T If not, adjustto OX T with OX T knob.Remove board.Back Cell « BlankFront Cell • Saaple • Lettering on cells should always point to the right
when 1n tht spec.2. Operation
Abs • depress 0-2 scaleClean cells; rinse out 1 tine with blank and dry sides with KlnwlpesPut blank cells 1n front and backAdjust wavelength to that required for tht analysis.With the blanks 1n, adjust 0 ab$ to read 0.Now take tht front cell out; rinse twice with tht sa^>1e, fill with sample,put in tht spec and takt down tht absorbance reading.When done • Just takt out cells, clean the* and leave on top to dry.
3. Shut Down
Switch off tht W laap and «a1n power.

IMSTttJCTIQNS F0» THE H1LTQH JOY
1. Turn the power on, and allow the Instrument to want up for 30 minutes.2. Enter the desired wavelength and press 'Go to A*
3. Set the test modt to ABS.4. Insert the saople cell with calibration blank Into the spectrophotometer,
close the sample door and press "Auto Zero*.5. Rinse the cuvette with sample twice and dry sides with Mnwlpes. Fill th
cell with saaple, place the cell back Into the spec, close the sample doorand record the absorbance.

III XIQNBddV

IHORSAMICS QA/OC
Analyte:. Date:
Notebook Ref:
SPIKES
Lab Sample 10 Spike Result Sample Result-
Amount Added
•
Percent Recovery
DUPLICATES
ib Sample 10 Result 1 Result 2 Mean RPO
BLANKS
Blank 10 Result
Samples In Batch: Comments:
301258

York Labs/CT ria«<,-ai ou' Classical Chemistry
CORRECTIVE ACTION REPORT/CASE NARRATIVE REPORT
Client:____________ Date:
Job/Case:__________ Analyst:
Sample(s):__________
Category of Problem: _ Preservative _ Holding Tine_ Sample Matrix _ Protocol_ Missing Sample _ Communication_ Other:________
Description of Problem:.
Corrective Action Taken:.
Distribution: Lab Manager, Project Manager, Client Services,(circle) QA Officer, Job Folder, Other:———————————
301259

toCP
fork Uboiatorles Contract 1 68-W8 ooi/200 Nonroe (urnpUe • Casa /Honroe. Cl 06466 SAS 1(203) ?6l-44!>8 SOG 11*6 Code rMK CYANIDE OISTIlLAflON LOG '
Batch Mo. ClUnt Oat* VMC SMP>« 10 £PA SMf>)« 10
out.App.No.
SaqploVOlUM
orMight
PH>I2.0
CI2Pr«s«nt?
VoluMOlstlllat*
. .._7..._
suirid*Prasant
Pag* 1
Initials CoMenti
Oat«He viewed t>y Classical CtiMlstry Supervisor

York laboratories200 Nonroe TurnpikeMonroe. CT 06466(203) 261-44S8Lab Cod* YORK
ContractCase f_SAS I__SOG I
I 66-H6 001/
CYANIDE OEVELOPNENT LOG Page I
Batch No. Client DateYUC
Saeple IDEPA
Saeple 10
SaepleVolUMor
WeightPercentSolids
VOlUMDistillate
VolUMfor ColorDevelopment
ABS at578 m
ugCyanide
TotalCyanide
units.•g/Kgor ug/L Initials CoeMnti
Standard Cyanide Code I0_Cyanide Curve SlopeCyanide Curve y Intercept.
Cyanide Curve Correlatlon_!!•• Analysis Start_____Tla» Analysis End_____
RevleMed by Classical ChMlstry Supervisor Date

CO
York Laboratorin2M Honrot TurnpikeNonrot, CTIMtfi(213) 281-4438Lab Codi Vorii
Contract ICast l__SflSiSDBI
CYflNIDE TIIMTION UK Paft I
Batch No.
—————
Client
—————————————
——————————————
——————————————
Date
————
————
————
——— _'
————
————
————
weSMflt ID
—————
—————
—————
—————
—————
—————
—————
———————————
______
EPR
_____
—————
—————
—————
—————
—————
—————
—————
—————
—————
UolMt
orUeltfit
—————
»Solids
.
UolMK
Distillate
——————
——————
——————
——————
_______
ttolwefor
Titration
——————
——————
——————
——————
——————
——————
——————
——————
—————
•IsAgMU
wsed
————
, ,
TotalCyanide
—————
—————
—————
—————
—————
—————
—————
- — . ——————— .
Units,ej/K,
or «|/L
—————
—————
—————
Initials
—————
—————
—————
Cowenti
———————
——————
Standard SiIvtr Nitrati Cod* ID_
Nonwltty of Silver Nitrati__
RrvicMd by Classical ChMistry Supervisor

COVER PAGE -
j-ab Naaa:
Lab Code:
SOW No.Caae HO.:
EPA Saaple No,
U. S. EPA - CLPINORGANIC ANALYSES DATA PACKAGE
___ Contract: __________
——— SAS NO.: ______ SEW NO.:
Lab Saaple ID
Were ICP interelement correction* applied?were ICP background correctiona appliad?
If yes, war a raw data ganaratad beforeapplication of background corractiona?
Yaa/NoYaa/NoYaa/No
Coaaenta:
I cart ify that this data package is in compliance with tha tarma andconditiona of tha contract, both technically and for complatanaaa, forother than tha conditions detailed above. Raleaae of tha data containedin this hardcopy data package and in tha computer-readable data submittedon floppy diakatta has been authorized by tha Laboratory Manager or theManager's dasignaa, as varifiad by tha following signature.signature:Data:
Naaa:Title:
COVER PAGE - IN
301283

U . S . E?A - CL?
INORGANIC ANALYSIS DATA SHEET SAWPLZ NO.
Name:
Lab Code:
Contract:
Case No . : SAS No.: SDG No,
Matrix (soil/water):
Level (low/zned) :
t Solids:
Lab Sample ID:
Date Received:
Concentration Units (ug/L or mg/kg dry weight):
1 1|CAS No. | Analyte1 1(7429-90-5 [Aluminum17440-36-0 (Antimony"17440-38-2 (Arsenic| 7440-39-3 (Barium(7440-41-7 (Beryllium(7440-43-9 (Cadmium(7440-70-2 (Calcium(7440-47-3 (Chromium(7440-48-4 (Cobalt(7440-50-8 (Copper(7439-89-6 I Iron(7439-92-1 |L«ad(7439-95-4 (Magnesium(7439-96-5 (Manganese(7439-97-6 (Mercury(7440-02-0 (Nickel(7440-09-7 (Potassium(7782-49-2 | Selenium(7440-22-4 (Silver(7440-23-5 ISodiua(7440-28-0 (Thallium(7440-62-2 IVanadiun"| 7440-66-6 (Zinc1 1 Cyanide1 1
Concentration C
""~"
1 Q
————
M
.or Before:
'.or After:
.intents:
Clarity Before:Clarity After:
Texture:Artifacts:
FORM I - IN7/88
,.01254

U.S. EPA - CLP
2AINITIAL AND CONTINUING CALIBRATION VERIFICATION
me :
ade: Case No. :
il Calibration Source:
Contract:
SAS No. : SDG No
luing Calibration Source:
Concentration Units: ug/L
Initial CalibrationI
/te
inuralony»ic "ira
un
LW-.11 am.t>r
iSlUfflganese
iry:1
assiua' ilUS
rimluaiua
de
True FoundContinuing Calibration
True Found %R(1) Found M
ontrol Liaits: Mercury 80-120; other Metals 90-110; Cyanide 85-115
FORM II (PART 1) - IN 301265

U.S. - CLP
BLANKS
Lab Name:
Lab Code:Contract:
SAS Mo.:Case No.: ___
Preparation Blank Matrix (soil/water):
Preparation Blank Concentration Units (ug/L or mg/kg)
SDG NO.
Analyte
Aluminum^I Antimony""'^rsenic ~»riumarylllum
1 Cadmium| Calciuaj Chromium1 Cobalt ~1 Copp«r[IronILead[MagnesiumManganese
[ Mercury{NickelI PotassiumI Selenium[Silver "1 Sodium|Thalliua_j Vanadium"IZinc ""(Cyanide1
InitialCalib.Blank(ug/L) c
I
I
Continuing CalibrationBlank (ug/L)
1 C 2 C 3
"~
_
~
_""
c
~
Prepa-rationBlank c
~"
1M |
11
f
OQ1266
FORM III - IN7/88

. S. - CLP
5ASPIKZ SAMPLE RECOVERY
EPA SAMPLE HO.
Level (lov/aed):Solids for Saaple:
Concentration Units (ug/L or ag/kg dry weight):
Analyt*
\luainuaantimony""
""B*riuji
CopperTronl^ad"XagnesiuaManganeselercuryUckel —PotassTuaSilver ~sodiuaThallium/anadiua
, _cyanide
ControlLiait%R
Spiked SaapleResult (SSR) C|
oaaents:
SaapleResult (SR) CJ
SpikeAdded (8A) %R Ql M|
V (Part 1) - IN

Lab Name:
U. S. £PA - CLP
SBPOST DIGEST SPIKE SAXPLC RXCOVZRK
Contract:
IPA SAMPLE HO,
I
Lab Cod*: Cat* No.: SAS Wo.:
Matrix:
1SOG No.:
Level (lov/aed) :
Concentration Units: ug/L
11I AnalyteII Al uttinun_JAntisony"1Ar»enic ~Iflariua'Beryllium^adaiua;alcium(Caromiua1 Cobalt "ICopp«rllron|L«ad ___j MagnTSTuS|Mangan«c«1 Mercury1 Nickel^ _|Pota««iun|S«l«nium1 Silver ™1 Sodium! Thalliumivanadiua"IZinc ™1
ControlLimit%R
ZIZZ!____________
___
Spiked SampleResult (SSR)
___________
________________________________________________________________________________________________________________________________________________
___________
c
~
StapleResult (SR) C
"~
""
_
SpikeAdded (SA) %R
.
Q
""
"*
_
c
!
I
MM
Comaents:
FORM V (Part 2) -
301268 Rev. :/93

U.S. EPA - CLP
DUPLICATESEPA SAMPLE NO,
mm:
de:
Contract:Case Ho SAS No.:
(soil/water):
ds for Sample:
SDG No.:
Level (low/Bed):
% Solids for Duplicate:
Concentration Units (ug/L or mg/kg dry weight):
ialyte
,uminua_itimony_•senie _iriumjry Iliumidmiumilciuraf "Biuav \t3— '«r .ronsadagnesiunanganeseercuryicJcel
I Potassium> elenium
ilveri J odium'-halliua
anadium"incyanide
ControlLimit Sample (S) c
,.,
11 Duplicate (D) c RPD
.
Q~
~
__
M— _
"""~—
_
301289FORM VI - IN
7/88s.

U.S. EPA - CLP
lABORATORY COKTROL SAMPLE
Lao Name:
Lab Code:
Solid LCS Sourc«:
\gueous LCS Source:
Case Ho.:
Contract:
SAS No.: SEW No.
11. Analyta1Aluminua_Antimony"(Arsenic ~~BariumBeryllium
, CadmiumICalciua
roaiuabait.0p«r
IronLeadMagnesiumManganeseMercury
i Nickel^ _j PotassiumSelenium.Silver ~{SodiumThallium_Vanadium"Zinc_^ __ "2Cyanide
Aqueous (ug/L)True Found %R
SolidTrue Found c
_
(•g/icg)Limits «R
"•
FORM VII - IN7/88

APPENDIX IV
301274

Cyan-CLP Development - CN:051490:18.1 OTN 06/20/90
Standard
10 ug/L100 ug/L300 ug/L
CCV (100 ug/L)
ICV6 (0789)
Distilled Standard:
25 ug/250 mL50 ug/500 mL
Spike:
25 ug/250 mL50 ug/500 mL
AcceptableAbsorbance Range
+0.018 - +0.020+0.184 - +0.203+0.552 - +0.610
+0.165 - +0.223
+0.062 - +0.084
+0.165+0.329
+0.145+0.291
+0.223+0.446
+0.242+0.484
Concentration Rangp
9.5 - 10.5 u/g/L95.0 - 105 ug/L285 - 315 ug/L
8 5 - 1 1 5 ug/L
79.9 - 115 ug/L
85.085.0
75.075.0
115 ug/L115 ug/L
125 ug/L125 ug/L
CN:051490:18:1
Calculation: ug
Slope: 0.0969 y-int - -0.0003
absorbance - (-0.0003)0.0969
For Liquids: CN(mg/L)
Cov. Coef. * 0.9994
ua x vol. distilled (mL)Sample vol. (mL) x vol. color (mL)
For Soils: CN(mg/Kg) uq x vol. distilled (mL)Sample wt. (g) x f. solids x vol. color (mL)
(decimal)
301272

an environmental testing company200 Monroa TurMonro», Connecticut 06*68
FAX (2031 268-534fl
STANDARD OPERATING PROCEDURE
TRACKING METALS AND
CYANIDE SAMPLE ANALYSIS
IN:050189:1
Scntumoufg.ilfinots
•oa-ros-0740
g»»«» Junction.vtfmonl
302-9M-SI34
3G1273

IN:050i39:l
STANDARD OPERATING PROCEDURETRACKING METALS AND CYANIDE SAMPLE ANALYSIS
Abstract
This Standard Operating Procedure addresses the tracking of samples for metalsand cyanide analysis from sample receipt through analysis and final reporting.It is meant to provide an analytical scheme of those forms required to adequate-ly trace a sample's path through the laboratory.
301274

!N:050139:1
SAMPLE TRACKING
As the process of sample tracking involves several different departments, thisSOP is broken into subgroups based upon each department's responsibilities.Included in this outline are references to the most current SOP appropriate toeach set of forms. The user is instructed to refer to these SOP's for furtherelaboration on the specific use and accurate generation of each form.
Sample Control - Sample Receipt and Log-In
Figure 1.0: lEA's log-in record - Upon receipt samples are logged-in and as-signed an IEA-CT job and sample number.
Figure 2.0: pH log - The pH of all samples is checked and recorded.
Figure 3.0: Sample control record in-house custody sheet - A sample controlchain of custody record is generated which includes the refrig-erator location of the samples.
Figure 4.0: Sample disposal/archive request - A sample disposal request formis generated.
Figure 5.0: SDG TR - A sample delivery group traffic report cover sheet isgenerated and sent to all appropriate departments.
At this point sample tracking diverges based upon analysis required (i.e. metalsand/or cyanide) and will be addressed separately.
Metals - Standard and Sample Preparation Logs
Figure 6.0: AS sample tracking sheet - The case is logged-in and ready forbatch generation in the metals department.
Figure 7.0: Metals sample preparation log - ICP and/or furnace preparationis started for either:*
7a: Waters7b: Soils
Figure 8.0: TCLPFigure 9.0: Mercury sample preparation log - Mercury preparation is perform-
ed for either water or soil.*
Figure 10.0: Percent solids determination - If soils are being prepared, per-cent solids are determined.*

IN:050133:1
Figure 11.0: ICP analysis is performed:
lla: ICP analytical run loglib: QC checklist - JA61 ICAPlie: QC checklist - PE6500 ICP (if required)
Figure 12.0: Furnace analysis is performed:
12a: Analytical run log/raw data worksheet12b: Furnace checklist
Figure 13.0: Mercury analysis is performed:
13a:13b:13c:
Figure 14.0:
Figure 15.0:
Mercury run logMercury data sheetMercury analytical checklist
Metals chain of custody record - This chain of custody is signedas each task is completed with final approval of the supervisorupon job completion.
QCAR - A final quality control approval report is signed as eachtask is completed and placed in job folder. Supervisor performsthe final review of this form when the job is completed.
Cyanide - Analysis of Environmental Standards for Total Cvanide
Figure 16.0:
16a:15b:
Figure 17.0:
Figure 18.0:
Figure 19a:
Preparation is set-up initially in the laboratory notebook asfollows:
Sequence of preparationColor, clarity and tests for oxidizing agents and sulfides areperformed.*
A cyanide distillation log is generated.Cyanide development log is generated during analysis.
If required (i.e. cyanide levels >1.0 mg/L) a cyanide titrationlog is generated.
Figure 19b: Cyanide auto-analyzer development log is generated.
Figure 20,0: A quality control approval report is signed and dated as eachtask is completed. Supervisor performs final review and signsreport upon job completion.
*Note: See Figure 3.0 - This chain of custody is signed whensamples are removed/returned to the refrigerator.
3

I N : 0 5 0 1 S 3 : i
CLP Del iverables
Figure 21.0: CLP review checklist - For jobs requiring CLP deliverables thedata entry clerk generates and signs a CLP review checklist af-ter deliverables generation.
Attachment 1: Final reports form required for CLP deliverables.
301277

an environmentaFIELD CHAIN OF CUSTODY RECORD IRA JOB I
eating company
goI «e a. 200 loiroe TiripikeHHH loiroe' toiieciicit wwi
Cl ien t :
Project ID :
IEA Project M«r :
Rush:
lolile 1Sel l
|
Y N TAT:
Clieit SupU ID
Due Date:
hte/tiieSupled
/
/
/
/
/
/
/
/
/
/
AS CC EX GC BNA VO
* Mat r ix Codes
» - »ir S - Soilill - lo- SI - SlidfeC 1 - K i p eII , 0 - OUer
lottlei freppedOtte/Tiie :Si^ittirc :
tillrii
libII
TESTS
kttleTjp.IFreier-utiit
FieldFill?,,,•,,,•,•<-•<,
M•• •
ff-yyjwff•»SM»S»K
Ref . |
l». .
YN
YN
/
Suplei Collected l| : ..... ... ..Dtte/tut : . . . . . / .
YN
YN
lottlei Iec'd Ir :lite/Tiie :Sifiitire
YN
YN
YN
YN
/:
Iec'd It Lib Ir :'Ue/Iiie : . . . . . . . . . . . . . /
YN
N'H" ...._... ........
YN
0C
Ie4i
re4
I/1
'«<< __ . »r
Fro toco li :
Dtliitriblei :
Comments
»if lill 1 :Oitfoiif Sell ID|:litict Oi f i e l d leceipt ' Nlicoiiig Jeil IH|:litict Oi Lib Btinp , N

IEA, INC. SAMPLE PRESERVATIVE RECORD JOB NUMBER:CLIENT:
CLIENT PROJECT:
JVB NUMBER PRESERVATIVE PH KI ADJUSTMENT INITIALS DATE
oc:50m

o
c|ient:V r;,..-'
Custody Seal
Chain of CustodySample Tags
SMO Forms
IEA, INC.1N-HOUSE CUSTODY SHEET
present/absentintact/not intactpresent/absentpresent/absentlisted/not listedpresent/absent
DATE:SAMPLE CUSTODIAN SIGNATURE:JOB NUMBER:CASE NUMBER:AIRBILL NUMBER:SAMPLE NUMBERS:
1t— 1oc;70171
LJo
LABORATORYSAMPLE NUMBER
REMOVEDBY
DATE AND TIMEREMOVED
1
REASONDATE AND TIMERETURNED
RETURNED TOREP. d
n-jK//

an environmental (eating company[ 200 Monrg* r^mon*
Monro«. Connecticut2031 2< 1-4444
SAMPLE' DISPOSAL/ARCHIVE REQUEST
CD
t./.TC KtO.UtSTCO;
t)/."C Or II. 'VC'ICC :_____ _______ FiCQUCSICO EV:
ur. (ARCH I'VEDISPOSAL DISPOSED Of
QUJLKTITV CODH1 BY _DXTC
. ' « f ? s / t - t f ' . r . t r.'.f
tilrietl
o»
01 - Cttpett ^ol. It «oll< %-ictc drum01 - dftpocc'cf in «^uceui %*«>tt druet '0> - trchlvt for CO tftjrt tl«t» dlcpeic of Ir, colvcM
0< -. i.Tchivc for' iMltUCtt Oft
OS - if* c i> ) Ir . tt iwetlora
™4'° 301281

8UCP&B DKXO.VUKY GROUP (SDG)TRAFFIC REPORT <TR) COVER 6HBET
Lab Name:
Lab Code: Case No.:
Contract No.: 68-
SAS No.:
Full Sample Analysis Price in Contract: $
SDG No./First Sample in SDG:(Lowest EPA Sample Numberin first shipment of
samples received under SDG)£
Last Sample in SDG:(Highest EPA Sample Numberin last shipment of
samples received under SDG)
Sample Receipt Date:
Sample Receipt Date:
(MM/DD/YY)
(MM/DO/YY)
EPA Sample Numbers in the SDG (listed in alphanumeric order):
5
6
7
6
9
10
11
12
13
K
\S
16
\7
18
19
ZO
Note: There are a maximum of 20 field samples in an SDG.
Attach Traffic Reports to this form in alphanumeric order(i.e., the order listed on this form).
301232
Sample Custodian Date
FIGURE 5.0

an environmental testing company200 Mgnro* lufnplk*Monroc, Connecticut 0646*(203) 261-4431FAX (2031 268 5346
ATOMIC SPECTROSCOPE SECTION SAMPLE TRACKING SHEET
Case/SAS f YWC Job 1
•
YWC/Contract Sa*>le f SOQ 1 Date Received Date Complete
'
Date to Purge Purged Analysts
TlI— lO
parn
COto

an environmental testing company
Monro«, Connecticut203) £81-4454
FAX (Z031 2««-J34«
MBTALS SAMPLZ ?RSP LOG - WATER
Calibtacion of eppendorfCow/Med/StdICAP/Furnace
SDG *:
IEA ID IFB ID Vol i (ml)Vol £ (ml)
-
Phya. Deac.*before/after
1- /
1- /
1- /
1- /
1- /
1- /
1- /1- /
1- /
1- /1- /
1- /1- /1- /
1- /1- /
1- /
1- /1- /
1- /
2- /
2- /
2- /
2- /
2- /
2- /
2- /
2- /
2- /
2- /
2- /
2- /
2- /
2- /
2- /
2- /
2- /
2- /
2- /
2- /
Color :<ay*
R - red
B • blue
Y • yellow
G • green0 • orange
V « violet
C « colorlessBn • brownGy « grayBl • blackClarity*
CL - clearC • cloudy
O • opaquej
|
1
'Each physical description involves l-Color and 2-Clarity both before and af te r
OA/OC
IEA
PB
LCS
'repared3ata:AcceptedCCP: HMC
ID
0
S
by:
by:),
IFB ID
HC1
Volume i (ml)
C
CC
HA
Volume f (ml)
Supervisor :3ace:
Furnace: H2K
OC Addition
23 ———— H2°2Page of
F I G U R E 7A
3012S4

METALS SAMPLE PREP LOG • SOIL
Case/SAS_i_____Calibration:
Low/Mect/StdICAP/Furnace SDG #:
ISA ID
1
IFB IDWeight i volume(g) 1 (ml)
Physical Description* |before/after ' Color Key*
1- / 2- 3- 4- R • red
'B • blue
Y • yellow
G - greenO - orange
V - violet
C • colorless
Bn • brown
Gy • grayBl • black
Clarity*Cl • claarC • cloudy
O « opaque
j
Texture* i
F • fine
M • medium
C • coarse
•Each physical description involves 1-Color (before and after), 2-Texture(before), 3-Clarity (after), and 4-Artifacta (yes or no description)
QA/OC
IEA ID
PB
LCS
D
S
IPS ID weight (g) volume f (ml)
-
QC Addition
Prepared by:.Date:______"Accepted by:ICP: HC
Supervisor:Date:____Date:
H,,2p
Furnace:age of
FIGURE 7B301285

an environmental testing company;00 Worroa '..r-ipii*
jt 0«4<8203) Jfll-njS
MX 1203) 2«8-534«
SAMPLE ?RE? LOG • TCL?
Calibration of appendorfCaaa/SAS Low/Med/std SDG #:
ISA ID IFB ID
I CAP/ Furnace ———————————————— -
Vol i (si)Vol f (ml)
-
?hya. Desc.*before/after
1- /
1- /
1- /
1- /
1- /
1- /
1- /
1- /1- /1- /1- /
1- /
1- /
1- /1- /
1- / .1- /
1- /
1- /
1- /
2- /
2- /
2- /
2- /
2- /
2- /
2- /
2- /
2- /
2- /
2- /
2- /
2- /
2- /
2- /
2- /
2- /
2- /
2- /
2- /
Color Key*
R • red
B • blue
Y • yellow
G • green ;
O • orangeV • violec
C • colorless
Bn • brownGy • grayBl - blacfcClarity*
CL • clearC • cloudy
O • opaque
*Each physical descriptioa involves 1 -Color and 2 -Clarity both before and aftei
OA/OC
ZEA ID
PB
LCS
Drepared2aca:
S
3
S
by:
ZFB ID Volum* i (ml) Voluam £ (ml) QC Addition
Date: ... ___________ ———— . ————Vceaocad bv: Dat*:_ —————————————————————————— - ——:CP: HNO, HC1 H,O, Furnace: tu«wj ———— _ "2 2— ————
FIGURE 8.U

IEA200 Monroe Turnpike
Monroe, CT 06463 (203) 452-8200
METALS WATER/SOIL PREPERATION LOG - MERCURY
Top Loading Balance CalibrationAnalytical Balance Calibration Page __ of
IEA ID IFB 10 wKg)Vl(»t>
vf(ml) 30010 ID
3A/OC
Ui/VI QC (KM1
vf(mu 300 ::
i
ii
I ;
QA/QC I1
Standard ID * ii
ICVS 10 • :
CCV 10 «
LCS 10 • i
1So Ik* 10 * :
Prepared by:Date:____
Accepted by:.Date:
Lot #: Hydroxylamine Hydrochloride___ Stannous Chloride,H2S04_______ HN03_______ K208S2_______ NaCl.
FIGURE 9.0
KMn04
301287

X SOLIDS DETERMINATIONCase/SA5/9atch No:.
Calibration:____SOG No:________
Oven Temp (*C): "v
X Solids • Dry wt x 100wet wt
IEA 10 IF8 10
•
01sh Wt(9) «ds
-
Sample Wet wt(9) V(minus dish)
••1 | !•!.•.••
Sample 0plusdish
ry Wt (g)minusdish
H^^-MM__^__
% Sol
Time in: Time out:
•Notes: 1) A minimum of 5.00 g of wet sample should be taken for this analysis.2) Oo not exceed a 24 hour drying time.3) One sample must be determined 1n duplicate (see ICP prep for dupiicat
selection).
Prepared by:.
Date:____
Witnessed by:.Date:_____
FIGURE 10.0

AutoSamoler Reoort Table: AO42BS9 Fri 04-28-99 04:28:27 =T1 caae
T > Name: A042B89 •Autosamoler Tvoe: TYPE 222S. jle Positionsi 206/240 QC Positions: 0/14 # Sets: 1Rinse Station location is rack -1. DOS. -1.
—— Racks ——
** Tvoe Usaae *Pos Left Analvses/P'as
12345
let
1
;ack
Pos
1r,567S910111213143516171819202122"?3.
Hack
' !*
Small Tubes SamolesSmall Tubes SamolesSmall Tubes SamolesSmall Tubes SamolesLaroe Tubes STD/QC/BLANK -
Samole Sets ——
# Description Method
X£A LAB#1
Row Col Samole Name
1 1 RINSE1 2 1.00O1 .OOOPBS1 3 1.0200.20OLCSS1 4 1.0600.2007470012 1 1. 0500.20074700 ID2 2 1.0600. 20074700 IS2 3 1 .0700.20O7470O22 4 1 .010O.2007470O33 1 1 .1100.20O7560O23 2 1.0100.20075600203 3 1.1200.200756002S3 4 1.0400.2007560034 1 1.0500.2007560044 2 1.0100.2007560054 3 1 .OOO1.000PBW4 4 1.0O01.00OLCSW5 1 l.OOOi .OOO7560O15 2 1. 0600. 20074700 1 P 5b'UK
5 4 1 .OO05.0O0747003 L6 1 1.00O5. 00075640 L6 2 Samol e-22
. .60 Not Used)
*2
Row Col Samole Name
#Pos
22
Set #
11111111111111111
3 1
111
Set #
336060480
Rack *
1
*Used
-NA--NA--NA--NA--NA--NA--NA--NA--NA--NA--NA--NA--NA--NA--NA--NA--NA--NA-
-NA--NA--NA-
ttUsed
111110
Start Pos
1
Tvpe
SamoleSamoleSamoleSamoleSa«oleSampl eSamol eSamoleSamoleSamoleSampleSamoleSamp 1 eSampleSampleSamoleSamoleSamoleSamoleSamoleSampleSamole
Tvpe
F I G U R E L 1 A 301239.!*•;;

AutoSamoler Report Table: A042889
<af #3
PC- Row Col Sample Name
Fri 04-23-89 04:29:27 PM caoe 2
1...60 Not Used)
?ack *4
KOS Row Col Samole Name
Set # #Used Tyoe
Set fcUsed Type
1 . .495051525353555657585960
ack
B"3\
1*2345678910il12-4
.48131313131414141415151515
*5
Row
11223344556677
Not L14.
34113412T;
4
Col
12121212121212
Jsed)CCB3CCV3CCV3AICSABFIC3AFICSAFCRIFCCB2CCV2CCV2ACCB1CCV1
Samole Name
STD2STD3STD4STD5STD6STD7STD1ICV1ICV1AICBCRIIICSAIICSABICCV1A
-NA--NA--NA--NA--NA--NA--NA--NA--NA--NA--NA--NA-
Set »
-NA--NA--NA--NA--NA--NA--NA--NA--NA--NA--NA--NA--NA--NA-
111111113111
*Used
11111111111111
QC StandardQC StandardQC StandardQC StandardQC StandardQC StandardQC StandardQC StandardQC StandardQC StandardQC StandardQC Standard
Tvpe
StandardStandardStandardStandardStandardStandardStandardQC StandardQC StandardQC StandardQC StandardQC StandardQC StandardQC Standard
II.
FIGURE 11A

/*>*"»», j- P^^Hj an environmental testing company Page 1 of 2200 Monro* Turneik*
Connecticut 0*««ICP APPROVAL CHBCKI.lflT
Batch:_____________I_______ Analyst:____
Autosampler Table #:____________ Date:_______
Approval of Senior Analyst:____________
Set-Uo
1) Appropriate standards for all analytes?
2} Is ICV2 or ICV3 necessary? i.e. EPTOX?
3) Autosampler table in correct order?STDS, ICV's, ICB, CRI, ICSA, ICSAB
4) Ten samples between CCV's? within 2 hours?
5) All analytical spikes made? enter prep code
6) For CLP protocol - room for postdigests?
7) Room for serial dilutions?
8) Room at end of run for analyte checks?
9) Print out (2) of table - dated and initialed?
Run
10) Initial QC pass?
11) Prep blanks and LCS pass?If no, corrective action reported?
12) Spike recoveries calculated?
13) Post digests made?
14) Serial dilutions made?
15) Continuing calibrations pass?
16) Did saturation occur?17) High analytes noted?
If yes, analyte check added to end of run?
18) Final QC pass?200 MONROE TURNPIKE • MOfSfDE. CQMSECnCLT Q646S • [2O31
• .'.r—•---•-• ^:V. .:S*5Fr C'JB1 ' 2O1 J£S 9IHt
• F I G U R E lib 301291

an environmental testing company200 M*,*. *«,.«. Pa(3e 2 of 2M«J«fo«, Connecticut M4tt1203)281-444*FAX! 2031 M«.$34«
Reporting
19) CLP protocol - diskette made? __________
20) Renamed sample file? __________
21) lEC's calculated? ' __________
22) Regular work reported on sheets? __________
23) Chain of custodies signed and dated? __________
24) Any further scans necessary? __________
25) CLP - copies of raw data required? __________If yes, copies made? __________
26) CLP - all runs labeled with regard to their __________applicability?
27) Were any problems noted requiring case __________narrative?
t ' i .300 MOJflOE TC.RNFHKE • VONRQE. CasNSmOJT 06466 • (2031 2Q 4438
F I G U R E L l b ( c o n t i n u e d )

an environmental testing company* | 204 Monro« Turnom*
' Monro* ConMcneut 0«4«1203) 241-MMFAX I2<J3) 2fl«-J3*«
6SOO ANALYTICAL APPROVAL CHECKLIST.
CASE/BATCH:___________ ANALYST:__________ DATE:
LOGBOOK PAGE:__________
1) Standardization acceptable?
2) Initial, continuing, final QC acceptable?
3) a) QA (PB, LCS) acceptable?b) If no, corrective action reported?
4) Weights, percent solids, volumes on datasheets?
5) Dilutions noted on data sheets?
6) lEC's
a) Present - determined and calculated?• b) Not required?
7) Data calculated?
3) Data reported?
9) Run recorded in logbook?
10) Copies of raw data required?If yes, copies made?
11) Were any problems noted requiring acase narrative?
2CC VGNFOE T\J9**K£ • VONROE. a>*CrnajT 06463 * (3031 ZB 44S8
"" ••'•'-™'--*•*• -'-** mi2mF I G U R E l i e

Std Preeeed Oate:Start ?un Time :
IEA200 Monroe Turnpike
Monroe CT 06468 ( 2 0 3 ) 452-8200
FURNACE DATA SHEET
Element: I . D . U t . F i l e : Instrunent: Analyst :
Cup Element Sample 10X
SolidsUt. Vol/
volOil.
FactorSanple
RecoveryX
Recovery Flags Value -,9/!.,-5,
567a910111213141516171819202122232425262728293031323334353637383940
F I G U R E 12A

ID/WT FIL£:___________________ BATCH:.
INSTRUMENT: _ DATE:
an environmental testing company ANALYST:.200 M«nro« furnoin*Me«fo«, Connecticut 04444 ,,,___' 203i 241.4444 ANALYTES;pAX 12031 284-S344
FPRUACB ANALYTICAL APPROVAL CHECKLIST Analyst
1) Run log generated, signed, dated & filed __________
2) Standardization acceptable _________
3) Initial continuing & final QC acceptable ________
4) Analytical spike criteria met ________
5) PB LCS pass:a) yes _______b) no, corrective action report submitted ________
6) Reruns noted ________
7) RSD's less than 20% (sample >CRDL) •______
8) Initial volume/wt, final volumes and _______percent solids recorded on calculatedsheets
9) Results calculated ________
10) Sensitivity check recorded in logbook ________
11) Results reported _______
12) Analytical run times recorded on raw data ________
13) Appropriate copies made of data ————————
14) Were any problems noted requiring a ————————case narrative
2OQ MONROE TURNPIKE • MONROE CONNECTICUT 06463 • (SO3) ZS 44S6
-301295F I G U R E i2B ,T - ,

IEA200 Monroe Turnpike
Monroe, CT 06468 (203) 452-8200
MERCURY RUN LOG
Matrix: water/soilJob 4:
Analyst:Date;Page __ of
Sample 10 BottleID
Tim* Sorple :0
F I G U R E 1 3 A

IEA200 Monroe Turnpike
Monroe, CT 06463 (203) 452-8200
Parameter: Mercury Matrix: Job *s'
FIGURE L3B
Samcle MuiiBer_
Concentration
RPO
Spike
Cone.
Found Cone.
Percent Recovery
1CV
rru« Cone.
Found Cone.
Percent Recovery
C of C
Analyst,
Pace
Reviewed Sy:
Page __. of
301297

CASE/ BATCH:____________ ANALYST :____________ DATE
MBRCPRY VNALY8IB APPROVAL CHECKLIST
an environmental testing company200 Monro« TUfnei*«Mon'o«. Conn«eticu< 0«4M: 203) 281.4444FAX 12031 2««.1344
1) Coefficient of correlation > 0.995 __
2) ICV, ICB pass? __
3) CCVs, CCBs pass?If no corrective action reported?
4) QC frequency met?a) CCVs, CCBs every 10 samplesb) Ending CCV, CCB present
5) PBs, PCSS pass?a) PB, LCSS run for each batch/SDG?b) If fail, corrective action reported?
6) Spike recoveries pass?a) Spike frequency met per batch/
SDG/Matrix?b) If fail, corrective action reported?c) Analytical spikes performed for E.P.
toxicity/EPDW/TCLP?
7) V,/Wj, Vf and percent solids recorded?
8) All data calculated?
9) Data entered on final report sheets?(non-CLP)
10) Appropriate number of copies made?
11) Original preplog and analysis logplaced in log books?
12) Copy of run log attached?
13) Were any problems noted requiring aCase Narrative?
2OO VONR06 TURNPIKE • MONRQE. CDNNECT1CL7 06468 • (3031 8Q *»S8
F I G U R E 1 3 C
1298

an environmental testing company200 M«nre« Turnout*Uanro*. Connecticut 044M(1031 2<1-*4««FAX (203) 2M-4344
CHAIN OF CUSTODYATOMIC SPECTROSCOPY DEPARTMENT
Job Number __________________ Sample Numbers
WATER - SOIL - SLUDGE - EPTOX/TCLP
I confirm that I have performed the preparation below following SOP guidelines andauthorize the release of this preparation:
Sample Prep _______________________________ _____________________________________ __________ ICP/FLME
________________________________ _________ FURN
______________________________ __________ MERCURYChemist Oate(s)
I confirm that I have performed the analysis below following SOP guidelines and au-thorize the release of all associated data:
Analysis ________________________ ________ ICP_____________________________ __________ FLAME
_____________________________ __________ FURN
_______________________________ ________ MERCURYChemist Oate(s)
I have reviewed and authorize the release of this job:
Complete ________Supervisor Date
Batch Assignmentsaa vcNRoe TURNPIKE • VONROE. CONNECTICUT o&aea • taoai
301299

an environmental testing companyZOO Monro* Turno**Uonre*. Cann«ctieut 0«-»M1203) 241.44S4PAX (J03I Z6«-»4«
JOB/SDG:______,______________ CASE/BATCH
REPORT LEVEL
QCXR - MBTAL3
Initials/Date Initials/DateChain of custody signed _________
a) ICP prep released ___________b) Furn prep released __________c) Mercury prep released __________
2. Data reviewed and reported
a) ICP checklist completedb) Furn checklist completedc) Mercury checklist completed
3. All forms complete
4. Batch QC reviewed and reported
a) ICPb) Furnacec) Mercury
All problems noted in case narrative
a) ICPb) Furnacec) Mercury
i
6. Case narrative complete
7. Release of data approved
3. Chain of custody complete
SOD VCNRO6 TURNPIKE • VWNRO6. CDMVJECnOjT 06466 • (Z03I 2S 4-56• • • - - - . . •.£.-. *:->=>=•< "33' • S-3 -iS= =19
F I G L ' R E f s . n
30130°

Project No..Book No..
_ . < ^ \ .!'. V_
"Huc
Understood Dy me. Date Invented Dy Oa:&
Recorded by
F I G U R E 3013D1

TITLE.
Project No... Book No. ' H '••U; I
No._ "SiX
•US
-co t
5 . 3
CC n
. ' .C- ' fCL. - D 1L- L- °l j^ ^ 1 ^l- .fcM,J
ic-ssecJ i Unaerstood by me,
301302
Date Invented by
Recorded by
. F I G U R E 1 6 A
To Page N
Oate

IEA200 Monroe TurnpikeMonroe, CT 06468(203) 452-8200Lab Code IEA
CaseSAS #SDG #
CYANIDE DISTILLATION LOG Page#
n-*.1an
-4
3
>->
Batch No. Client Oat*IEA
SanplaID
IPASampleID
Olst.App-HO.
SampleVolunor
Weight
P">12.0
C12Present?
VoluneDistillate
1
SulfldePresent? Initials Comments
CO-oDate
Reviewed by Classical Chemistry Supervisor

CO
IEA200 Monroe TurnpikeMonroe, CT 06468(203) 452-8200Lab Code IEA CYANIDE DEVELOPMENT LOG
Case |SAS #SDG #
Page#
Batch No. Client DateIEASaaple
10
EPASwpt*
ID
SampleVoluueor
Weight
XSolid*
VolumeDistillate
Volumefor Color
Oeveloprtent
ABS *C578 m
"8Cyanide
TotalCyanide
uoita.ma/KgOf
ug/LInitial* Conmenti
Standsrd Cyanide Code I0_
Cyanide Curve Slope____
Cyanide Curve y lntercept_
Cyanide Curve Correlniicxi
lime Analysis Start_____
lime Analysis tod __
C l a i i K U l t h e i n l b l l y

IEA200 Monroe TurnpikeMonroe, CT 06468(203) 452-8200Lab Code IEA CYANIDE AUTO-ANALYZER DEVELOPMENT LOG
Case #SAS K_JSDG #
Page #
-11an
oo
•\
Bitch NO. Client
1
DateIEA
SMpte IDEPA
Sanpte ID
SampleVotumor
Height
PercentSolid*
VolumeDistillate
CyanideDistillate
Cone.(ug/D
TotalCyanide
units«i9/Kgor
ug/LInitials
*" .
Comnenti
Standard Cyanide Code I0_Cyanide Curve Slope____
OCyanide Curve y Intercept
Reviewed by Classical Chemistry Supervisor
Cyanide Curve Correlation_Time Analysis Start______lime Analysis End______
Dale

CD
COoCD
'Y
an environmental testing company200 Monto* Turnpit*Monro*. Connecticut 0646812031 261-4448FAX (203) 26t-S348
Contract ICMC!__SAS I___SOB • __
6A-UMII7
CYflNIK TITMTKM LOB
Bitch No.
—————
—————
Client
——————————
Date
————
————
————
————
YtCSMpli ID
—————
—————
—————
—————
—————
EH)Sa*li»
—————
—————
—————
—————
S«pleVtolwe
orfcttfit
————
————
————
————
————
*Solids
VoluK
Distillate
——————
—————
—————
Vblwefor
Tltratlon
——————
——————
——————
——— ; ——
——————
•IsA0O3tied
TotalCyanide
— ————
—————
Units,•I/KI
or m/L
————
————
initials
————
————
CoMenti
——————
Standard Silver Nitrate Code I0_
Morwllty of Silver Nitrate__
DateRevlwwd by Classical Chevistry Supervisor

JOB »CtlENT : EM
I. ANALYTICAL CHECKS
CLASSICAL OOISTRYQUALITY CONTROL APPROVflL REPORT
REPORT LEVEL : CLP
ANflLYTE
CYftN-CLP
SAMPLE NUMBER
wi\ei«
I€THOD XACCEPTABLE DATE
ISflMPLE X 1ACCEPTABLE 1 MTE i
! 11 !11I1111111111111111I1111111111I!
1 11 i
APPROVflL DAT!II. CHflIN OF CUSTODY COMPLETE :
CASE NflRWTIVE COMPLETE :X DOOJOTATION COMPLETE :
III. FINfiL APPROVflL : ______SROUP LEADER DOTE
F I G U R E 2 0 . 0
Pfl6E __ of __
301307

an environmental testing company Page 1 of 2200 Uonro* Turnout*Monro«, Connecticut M*<*1203) 2«i-*«a« CLP REVIEW CHECKLISTFAX (2031 264-5344
Case/Batch #:__________________ Date:.
SDG/Job *: _____________________ Analyst: ——
All ICAP data has been calculated and copiedby analyst
All Furnace data has been calculated and copiedby analyst
All Mercury data has been calculated and copiedby analyst
All Cyanide data has been calculated and copiedby analyst
Raw data in job folder is as follows: ICAPanalysis with autosampler table
Furnace analysis with run log
Mercury analysis with run log
Cyanide analysis
ICAP prep sheets
Furnace prep sheets
Mercury prep sheets
Cyanide prep sheets
Percent solids
Chain of custodies have been signed
All final report forms are present with noentries missing
Form I's are checked for calculation errors andall manual calculations match form results
Form IIA calibration verification - all data ischecked to verify that ICV's and CCV's fallwithin limits
aoa viONRoe TLPNPIKE • v aNRae. CONNECTICUT a&aea • (SO3\
F I G U R E 21 .001308

an environmental testing company Page i of 2200 Momo« rurnoi««Monro* Conn«ct«rut Ot^M'2031 2fl1-444«PAX (2031 244-5344
Form III calibration blanks - all data is less ____________than the CRDL ————————
Forms VA, VI, IX are checked for flags and are ____________reported on Form I
Form VB post digest spikes are reported, if any ___________
Form VII LCS all LCSW and LCSS values are ____________within control for all analytes
Form VIII MSA all MSA's are reported, if any ___________
Complete data package given to supervisor for ___________final review
Case narrative is written ___________
Completed case is given to CLP project officer ___________for reporting
3OO V1ONRO6 TURNPIKE • VGNROE CONNECTICUT 0&466 • (203) 2S *458
crr.ro r

an environmental .testing company200 Monro* rumoi«»Monco*. Connecticut 044682031211.4494
FAX 1203) 2S«.534«
ATTACHMENT 1
200 MONRQE TLRNRKE « V1ONRO6. CONNECTCLT 0&468 • (2O3! 261
301310

COVER PAGE - INORGANIC ANALYSES DATA PACKAGE/"•""•*»,,
L-.J Name: __________________' Contract:f
ab Code: ____ Case No.: ____ SAS No.: _____ SDG No.
SOW No.: ____
EPA Sample No. Lab Sample ID.
/ere ICP interelement corrections applied? Yes/No
Were ICP background corrections applied? Yes/NoIf yes-were raw data generated beforeapplication of background corrections? Yes/No
Comments:
Release of the data contained in this hardcopy data package and in thecomputer-readable data submitted on floppy diskette has been authorized bythe Laboratory Manager or the Manager's designee, as verified by thefollowing signature.
Lab Manager: _______.___________
Date:COVER PAGE - IN 7/87
301311

U.S. EPA - CL?
INORGANIC ANALYSIS DATA SHEET
a. .me: Contract:
i._> Code: Case No.: SAS No.:
EPA SAMPLE NO,
SDG No,
. :rix (soil/water):
«vel (low/med):
lolids:
Lab Sample ID:
Date Received:
Concentration Units (ug/L or mg/kg dry weight):
1 1|CAS No. | AnalyteI 117429-90-5 (Aluminum17440-36-0 {Antimony17440-38-2 | Arsenic17440-39-3 | Barium17440-41-7 | Beryllium17440-43-9 | Cadmium| 7440-70-2 1 Calcium17440-47-3 {Chromium17440-48-4 1 Cobalt17440-50-8 1 Copper17439-89-6 1 Iron17439-92-1 (Leadj 74 39-95-4 (Magnesium1 7439-96-5 (Manganese[7439-97-6 (Mercury(7440-02-0 | Nickel(7440-09-7 (Potassium(7782-49-2 (Selenium17440-22-4 I Silver17440-23-5 (Sodium(7440-28-0 (Thallium(7440-62-2 (Vanadium(7440-66-6 (Zinc1 I Cyanide1 1
.Concentration
.
c~
"—
~~
_
-
„_
M Q
: lor Before:
:olor After:
Clarity Before:
Clarity After:
Texture:
Artifacts:
FORM I - IN 7/87

U.S. EPA - CL?
2AINITIAL AND CONTINUING CALIBRATION VERIFICATION
_ab Name:
ab Code: Case No.:
Contract:
SAS No.:
Initial Calibration Source:
ontinuing Calibration Source:
SDG No.:
Concentration Units: ug/L
lAnalytei
. Aluminum1 Antimony_I ArsenicBarium, Beryllium1 CadmiumCalciumromium
1 v-obalt1 CopperIron(Lead(MagnesiumManganese
, Mercury1 NickelPotassiumSelenium
1 Silver' SodiumThallium
I VanadiumiZinc2yanide
i
InitiTrue
•
al calibriFound
IContinuing Calibration
True Found %R(1) Pound *R(i)I IM
1) Control Limits: Mercury 80-120; Other Metals 90-110; Cyanide 85-115
FORK II (PART 1) - IN 7/87
301313.

'. vb Name:
Lab Code:
2BCRDL STANDARD FOR AA AND ICP
Contract:
SAS No.:Case No.: SDG No.:
, V CRDL Standard Source:
ICP CRDL Standard Source:
Concentration Units: ug/L
1•
Mialyte11 AluminumUltimo ny
i Arsenic1 BariumBeryllium
„ Cadmium|c£hiua~" >miumoalt
1 Copper'Iron' ead
i Hagnes iumI Manganese•lercuryUckel| Potassium' SeleniumSilver(Sodium'Thallium/anadium
i Zinc1
CRDL S
True
tandard fa
Found
r AA
*R
.
True
CRDL StazInitialFound
idard i
%R
for ICP" Fina]
Found
• •
•
L%R
t
FORM II (PART 2) - IM 7/87
30131*

./'"«*"'">»,.
3BLANKS
ib Name:
Lab Code: Case No.:
Contract:
SAS No. :
reparation Blank Matrix (soil/water) :
•"reparation Blank Concentration Units (ug/L or ing/kg) :
SDG No.:
1
11 \nalyte| Aluminum^1 \ntimony~Arsenic ~"
, BariumI Beryllium">diiumIcium
| Chrooium1 Cobalt ~~Topper
1 IroniLeadMagnesium
, ManganeseI MercurytfickelPotassium
I Selenium1 SilverSodium
i Thallium^I VanadiumZinc ___
, Cyanide1
InitialCalib.Blank(ug/L) c
"
—
—
—
-
:
Continuing CalibrationBlank (ug/L)
1 C 2 C 3
"~
"
—
""—
-
—
—-
"
-
.
c
"
~
"
—
\Prepa-rationBlank
•
.
c
--
—"™
M
I
FORM III - IN 7/87
301315

U.S. EPA - CLP
ICP INTERFERENCE CHECK SAMPLE
Lab Name:
\b Code:
'TP ID Number:
Case No:
Contract:
SAS No.:
ICS Source:
SDG No.
Concentration Units: ug/L
111I Analyse1| Aluminum| Antimony(ArsenicI Barium| BerylliumI Cadmium1 Icixun.uromium
1 CobaltI CopperI IronILead(Magnesium| ManganeseI Mercury| Nickel| Potassium| Selenium(Silver ~~| Sodium(Thallium| Vanadium1 Zinc1
TSol.A
•
rueSol.AB
InSol.A
-
Ltial FouncSol.AB
'
.
I
%R
•
: 1sol.A
?inal Foun<Sol.AB
,
i
%R
•
301316FORM IV 7 / S 7

U.S. EPA - CLP
5ASPIKE SAMPLE RECOVER*
EPA SAMPLE NO.
L. Name:
1 ib Code:
Contract:
Case No.: SAS Ho.: SDG No.:
Matrix (soil/water): Level (low/Bed):
Concentration Units (ug/L or mg/kg dry weight):
111 .i jialytei| Aluainum1 Ji1:imony__I .rsenicI Barium| "beryllium[ ladmiumI CalciumI chromiumI :obaltI JopperI Iron! -*adI /nesium| ManganeseI MercuryI 'ickelI Fotasslum[Seleniumt ilvert -odium| Thallium"I 'anadiumI incI CyanideI
ControlLimit%R
...
Spiked SampleResult (SSR)c
. SampleResult (SR)c
_
SpikeAdded (SA)
• .
,
.
*R
I l l l 1
Q"_
M
Comments:
FORM V (PART 1) - 7/37
301317

.me:
b Code:
U.S. EPA - CLf
SBPOST DIGEST SPIKE SAMPLE RECOVERY
_________ Contract:
SAMPLE NO
Case No.: SAS No.: SDG No.:
:atrix (soil/water) : Level (low/aed):
Concentration Units: ug/L
nalyte
Muminumntimonyrsenic ~~.ariumerylliumadaiumCalcium"hroniuaobalt
v-opperIron^ ' ' '"
;nesiuzaManganese"ercuryickel
, Potassium1 Selenium; ilveri - odium(Thallium'anadium.inc
1 Cyanidei
ControlLimit
" *R
•
1Spiked SampleResult (SSR)
•
c
•
•
SampleResult (SR)C
SpikeAdded (SA)
'
%R Q
.
_
_
1M
1
1
III
.,„ . „ '
'onunents:
FORM V (PART 2) -IN 7/87

Name:
-ab Code:
U.S. EPA - CL?
6DUPLICATES
___ Contract:
EPA SAMPLE NOI
Case No.: SAS No.: SDG No.:
Matrix (soil/water):
Solids for Sample:
Level (low/med):
Solids for Duplicate:
Concentration Units (ug/L or mg/kg dry weight):
11| AnalyteI| Aluminum1 Antimony1 Arsenic1 Barium| BerylliumI Cadmium1 Calciumj Chromium! Cobalt1 CopperllronILead| Magnesium{ ManganeseI MercuryINicJcel| Potassium| Selenium1 Silver ~I Sodium| Thallium| Vanadium(Zinc1 Cyanide1
ControlLimit
-
Sample (S) c rDuplicate .(D)•
,
c
•II
— -
'.RPD
,*"
Q
_
M
FORM VI - IN 7/87
301313

Name:
'„ b- Code:
LABORATORY CONTROL SAMPLE
Contract:
SAS No. :Case No.:
3-lid LCS Source:
Aqueous LCS Source:
SDG No.
;nalyte
Aluminum*ntimon>rsenicoanumBerylliumadniumalcium
Ch niun-' -it
perIronLeadagnesium..anganeseMercuryickelotassiiimSelenium"ilverodiumThalliumVanadiuminc
v.yanide
AguTrue
sous (ug/Found
•
Solid (ng/kg)True Found C Limits
III
FORM VII - ItJ 7/87
301320

U.S. c.rrv
8STANDARD ADDITION RESULTS
i~ u Name:
Lab Code: Case Ho.:
Contract:
SAS Ho.:
f
SDG No.
Concentration Units: ug/L
II EPA' Sample' No.
11
,1
1I
11
,1
1
11
1
An Oil0 ADDABS
'
• .
1 ADDCOH ABS .
"'
2 ADD.CON ABS
1
3 ADDCON ABS
FinalCone.
*
* ' r"1
Ql
—
FORM VIII - IN 7/67
O

U.S. EPA - CLP
ICP SERIAL DILUTIONS
fme:
3 Code: Case No.:
EPA SAMPLE NO.
SDG No.:
strix (soil/water): Level (low/med):
Concentration Units: ug/L
11JAnalyte1| Aluminum(Antimonyj Arsenicj Bariumj Beryllium| CadmiumI Calcium| Chromium| CobaltI CopperI Iron(Lead(Magnesium1 ManganeseI Mercury1 Nickel| Potassium1 Selenium1 SilverI Sodium| Thallium| VanadiumIZinc1
Initial SampleResult (I)
•
C
,
SerialDilution .Result (S) C
*Differ-ence
.
'
Q M
:
FORM IX - IN 7/87
301322'_

U.S. EPA - CI^L
1OHOLDING TIMES
Name:
Code: Case Mo.:
Contract:
SAS No.: SDG No.
EPASample No. Matrix
'
. DateReceived
'
MercuryPrepDate
.
.
MercuryHoldingTime
1 CyanidePrepDate
-
CyanideHoldingTi&e
<
FORM X - IN 7/87

form XINT DETECTION LIMITS
LAB NAJ-.t.
I C K / f i a m c AA ( C i r c l e O n e )
Ele .^enc
1 . A l u m i n u m
2. Ant imony
!• A r sen i c
*• • b a r i u m
5. be ry l l i um
0. Cadmiun
7. Ca lc ium
ti. Chromium
V. Cobalt
1U. Cooper
11. Iron
12. Lead
W a v e l e n g t h( n m )
Model N u m b e r F u r n a c e AA N u o b e r
10L( u ? / L )
-
Elemen t
U. M a g n e s i u m
- ————— _1
Wa ve l eng thL_ ( no )
14. Manganese
15. Mercury
16. Nickel
17. Potassiucc
la. Selenium
19. Si lver
20. Sodium
21. Thallium
22. Vanadius
23. Zinc
————————
I U L( u ? / L )
.
i
Footnotes: • Indicate the inscrunent for which the IUL applies with a ~f~ (for 1CPan "A" (for Fl*m« AA), or an "F~ (for Furnace AA) behind the IUL valu
• Indicate elements commonly run with background correction (AA) witha "IS" behind the analytical wavelength.
• If more than on« ICK/Klamc or Furnace AA is used, suomit separateKorns XI-X11I for each instrument.
COMrttNTb:
Lab Manager
ONE - 29Revision 0___Date September 1986
,01324

L2AICP INTERELEMENT CORRECTION FACTORS (QUARTERLY)
L«-_ Name:
ib Code: Case No.
ID Number:
Contract:
SAS No.:
Date:SDG No.
\\malyte
I' Muminumvntimony__
(Arsenic1 BariumJeryllium
, JadmiumJ CalciumrhromiumrobaltCopperT*-on
idnagnesiunManganeseercuryickel
Potassium"eleniumilver ~
Sodium^halliumanadiua
4-o.nc
Wave-length(run)
'
IJAl
nterelement
Ca
'
Correction
Fe
Factors foi
Kg
•
r:
2 mments:
FORM XII (PART 1) - IN 7/87
301325

U . S . EPA - CLP
12BICP INTERELEMENT CORRECTION FACTORS (QUARTERLY)
ab Name:
Lab Code:
:P ID Number:
Case No.
Contract:
SAS No.:
Date:
SDG No.
i
( AnalyteiAluminum
i AntimonyI ArsenicBarium
. Beryllium| Cadmium' Calciumchromium
1 Cobalti Cc— >er
, uead(MagnesiumManganeseMercury[Nickel' PotassiumSelenium
I Silveri SodiumThallium
i Vanadiumjzinc ~
Wave-length(nm)
Ii
.
iterelement
.
Correction
..
Factors foi
.
•
:
«• •
.
Comments:
FORM XII (PART 2) - III .7/37

U.S. - c:
ICP LINEAR RANGES (QUARTERLY)
Name:
ib Code:
ICP ID Number:
Case No.:
Contract;
SAS No.:
Date:
SDG No.:
111jAnalyte1| Aluminum| Antimony{Arsenic1 Barium1 BerylliumI Cadmium(Calciumj Chromium1 CobaltI Copper[Iron(Lead| Magnesium| ManganeseI Mercury1 Nickelj Potassium| Selenium1 Silver(SodiumI Thalliumj Vanadium(Zinc1
Integ.Time(Sec.)
'
Concentration(ug/L) M
omments:
FORM XIII - IN 7/87
30132?
IN:050139:0
STANDARD OPERATING PROCEDURETRACKING METALS AND CYANIDE SAMPLE ANALYSIS
Abstract
This Standard Operating Procedure addresses the tracking of samplesfor metals and cyanide analysis from sample receipt through analy-sis and final reporting. It is meant to provide an analyticalscheme of those forms required to adequately trace a sample's paththrough the laboratory.

STANDARD OPERATING PROCEDURE
MEASUREMENT OF CONDUCTIVITY
IN WATER SAMPLES
WC:082190:0
sao vcNRoe TURNPIKE • MONROE. CDNNECTCLT o&»6a • 12031452 saoot^o wnLTE iu • UHIPPAST \ew JERSE-T a^qe; "dan -<f« HIRI *^ (1 i 3 2 3l<?f] ^\G5TCE\TEHCOLrjr • SCHAI.MBI.Rfi ILLINOIS 6OI 95 • i 7081 'CTi 07-4O

TABLE OF CCNTSNTS
I.0 Scope and Application
2.0 Summary of Method
3.0 Interferences
4.0 Apparatus
5.0 Reagents
6.0 Sample Preservation and Storage
7.0 Procedure
8.0 Quality Control
9.0 Method Performance
10.0 Data Handling and Reduction
II.0 Documentation of Problems
12.0 References
Appendix I: Forms
301330

1.0 SCOPE AND APPLICATION
1.1 This method is applicable to the measurement ofconductivity in drinking, surface, and saline waters,and industrial wastes.
2.0 SUMMARY OF METHOD
2.1 The conductivity or specific conductance of asample is measured by use of a conductivity meter(Wheatstone bridge type).
2.2 Samples are to be analyzed at 25 C. A temperatureconversion can be made in order that results may bereported at 25 C when temperature control is notpossible.
3.0 INTERFERENCES
3.1 Temperature fluctuations represent the largestsource of errors.
4.0 APPARATUS AND MATERIALS
4.1 Conductivity Meter4.2 Conductivity cell, cell constant 1.0
4.3 Beakers, 50 mL
4.4 Thermometer
5.0 REAGENTS
5.1 Reagent Water (ASTM Type II)
5.2 Standard potassium chloride, 0.01 M: Dissolve 0.7456grams of pro-dried (2 hrs at 105 C) KC1 in reagentwater and dilute to 1 liter at 25 C.
5.3 Working standards are prepared by making a 10 and 100fold dilution of the potassium chloride stock (5.2).
TURNPIKE • VCNfSOE. CONNECTCLT O&466 • (2Q3I 452 8200
301331

6.0 SAMPLE PRESERVATION AND STORAGE
6.1 Samples must be unpreserved and analyzed as soon aspossible.
7.0 PROCEDURE
7.1 All samples to be analyzed must be signed out ofsample control on the chain-of-custody for each job.
7.2 Measurement of Conductivity
7.5.1 Calibrate the conductivity meter with two standardsthat bracket the expected conductivity of thesamples. Follow the manufacturer's instructions tocalibrate.
7.5.2 Allow the samples to come to room temp. (23 to 27 C)Determine the temperature of the sample and correctto 25 C if necessary (mathematically, section 10.0).
7.5.3 Place the sample or standard solution in a cleanglass beaker using a sufficient volume to cover thesensing element of the conductivity cell. Stirgently at a constant rate so as to insurehomogeneity. Record the conductivity.
7.5.4 Thoroughly rinse the cell with reagent water andwipe between measurements.
7.5.5 After the completion of all conductivitymeasurements, store the cell in reagent water.
8.0 QUALITY CONTROL
8.1 All chemicals should conform to minimum criteria setby the Reagent Chemical Committee of the AmericanChemical Society. All chemical inventories are usedon a first in first out basis.
8.2 All stock preparations are logged and coded. Allsolutions are labeled with the following: analyte,concentration, date and initials of the chemistpreparing the stock.
sao voNRoe TURNPIKE • s.io,Roe. CONNEC'CUT 06468 • 12021455 eaxi
.,01332

8.3 A reagent water blank is run with every batch ofsamples analyzed, however, the nature of the testis such that there is no blank criteria.
8.4 After the initial calibration of the meter at leastone known standard will be measured for conductivityand recorded.
8.5 A sample duplicate will be analyzed for every batchof twenty or fewer samples. The maximum acceptablecriteria for conductivity is a relative percentdifference (RPD) of 20.0 .
9.0 METHOD PERFORMANCE
9.1 No data submitted.
10.0 DATA HANDLING AND REDUCTION
10.1 All raw data is recorded in the analyst's notebook.The conductivity results are entered into LIMS forsample tracking and reporting purposes.
10.2 If the sample temperature is below 25 C, add 2% ofthe reading per degree. If the temperature is above25 C, subtract 2% of the reading per degree. Reportresults as Specific Conductance, umho/cm at 25 C.
10.3 The sample QA/QC is reported on the inorganic QA/QCsummary form (see appendix I).
10.4 Technical Data Review: includes verifying that batchQC is within criteria and the raw data entered intoLIMS is checked for transcription errors.
11.0 DOCUMENTATION OF PROBLEMS
11.1 Corrective Action Reports: must be filed if anyproblems are associated with the analysis (seeappendix I).
11.2 Case Narratives: should include any deviation fromthis SOP or any difficulties encountered in theprocedure.
SCO VONRQ6 TURNPIKE • MONWOE. CONNECTICUT 06468 • (2031.452 B2OQ
301333

12.0 REFERENCES
12.1 Methods of Chemical Analysis of Water and WastesEPA 600, 1983.
TURNPIKE • VCNROE. CONNECTICUT oeuea • 12031452 3200

APPENDIX I
300 VCNROE TURNPIKE • VCNROG. CONNECTCUT 0646B • 1333) 452 B2OO
501335

an environmental testing company200 Monro* Turnoi««Manro«, Connecticut 0646812031 281-44MPAX(203)268.S3««
Reported By:
Date:____G r o u p
Time:
CORRECTIVE ACTION REPORT / CASE NARRATIVE REPOF
Person Who Reported Problem:.
Person Who Is Requested To Provide Corrective Actions:_
Deadline To Complete Corrective Actions:____________
Category of Problem:________________________
Client:_____Poor Communication With _ _ _ . . Sample M a t r i x ; I n a t r u m e n t
.Job/Case Number:_________ Sample Number(s):_________
Description of Problem:
Summary of Corrective Action(s):Document C o r r e c t i v e Actions On
Form and Place a Copy of Corrective Actions In Job F o l d e r
Is this a recurring Problem?. Should SOP be Modified or Updated?.
Cooperative help of the following groups/people is requested:.
Distribution: Lab Director, Lab manager, Marketing Manager,Branch Manager(circle) Group/Section Leader, QA Officer: OrganicC 1, Inorganic[ ]
Client Services, Job Folder, Other: _____——————————————*
Note Problem and Corrective Action(s) In Case Narrative: [ 1
Attachments: Telephone Record Log, Services Change Request, Memo,———
$1336

IEA200 Monroe Turnpike
Monroe, CT 06468 (203) 452-8200
CLASSICAL CHEMISTRY QA/QC SUMMARY
Analyte:. Date: Ref:
DUPLICATES
(.tb SMplt 10 Result 1 Result 2 H««n in
PREP BLANK
8t«nk 10 •nutt
Samples in Batch: Comments :
391337

an environmental testing company200 Monroe TurnpikeMonroe. Connecticut 06468'203) 261-4458FAX(203I 268-5346
STANDARD OPERATING PROCEDURE
ANALYSIS OF TOTAL ALKALINITY
IN WATER SAMPLES
WC:040491:0
301338
M.-ar-ar.C:0''ca
JCS-939-C928Il l inois
708-705-07*0
V Sulanca.Massacnusens617-272-5212
New -«rs«y
Gary.North Carolina919-677-0090

TABLE OF CONTENTS
1.0 Scope and Application
2.0 Summary of Method
3.0 Interferences
4.0 Apparatus and Materials
5.0 Reagents
6.0 Sample Storage and Handling
7.0 Procedure
8.0 Quality Control
9.0 Method Performance
10.0 Data Handling and Reduction
11.0 Documentation of Problems
12.0 References
Appendix I: Forms
301339

Total Alkalinity
1.0 SCOPE AND APPLICATION
1.1 This method is applicable to drinking, surface, andsaline waters, domestic and industrial wastes.
1.2 The method has a practical quantitation limit (PQL) of1.0 mg/L (as CaCO3) and is suitable for all higherconcentration ranges of alkalinity. However, aliquotsshould be used to avoid a titration volume of greaterthan 50mL.
1.3 Automated titrametric analysis is equivalent.
2.0 SUMMARY OF METHOD
2.1 A sample is titrated with a standardized acid to anelectrometrically determined end point of pH 4.5. Thesample must not be filtered, or altered in any way.
3.0 INTERFERENCES
3.1 Organic material, soaps, oily matter, suspended soils,or precipitates may coat the glass electrode and causea sluggish response.
3.2 Allow sufficient time between titrant additions to letthe electrode response to come to equilibruim.
4.0 APPARATUS AND MATERIALS
4.1 A pH meter or electrically operated titrator that usesa glass electrode and can be read to 0.05 pH units.Standardize and calibrate according to manufacturer'sinstructions. If automatic temperature compensation isnot provided, perform total alkalinity analysis at25 ± 2°c.
4.2 Titration rack and electrode support
4.3 Magnetic stirrer plate and bar magnets.
4.4 Pipets (Class A); 3, 5, 10, and 20mL.
4.5 Erlenmeyer flasks (wide mouth); 100 and 250mL.
301340
WC:040491:0

4.6 Volumetric flasks; 200 and lOOOmL.
4.7 Burets (Class A); 50, 25, and lOmL.
4.8 Graduated Cylinders; 25 and lOOmL.
5.0 REAGENTS
NOTE: See 10.2 for acid normality calculation.
5.1 Sodium carbonate solution (approx. 0.05N):Place 2.5 ± 0.2 grams (to the nearest mg) Na2C03(dried at 250°C for 4 hours and cooled in desiccator)into a 1 liter volumetric flask and brought to volume.
5.2 Standard sulfuric acid (0.1 N):Dilute 3.0 mL of concentrated H2SO4 to 1 liter withreagent grade water. Standardize versus 40.0 mL of0.05 N Na2CO3 solution with 60 raL of reagent gradewater by titrating potentiometrically to a pH ofapprox. 5. Lift the electrode and rinse with reagentgrade water into the beaker. Boil the solution gentlyfor 3 to 5 minutes under a watch glass. Cool to roomtemperature. Rinse the watch glass into the beaker andcontinue the titration to the inflection point.
5.3 Standard sulfuric acid (0.02 N):Dilute 200.0 mL of 0.1000 N H2SO4 to ! liter withregent grade water. Standardize by the potentiometrictitration of 15.0 mL 0.05 N Na2C03 solution as in 5.2.
CAUTION: Sulfuric acid solutions are corrosive andcause burns. Avoid all contact. Wear glovesand appropriate eye protection at all times I
6.0 SAMPLE STORAGE AND HANDLING
6.1 Samples are to be stored unpreserved at 4°C.
6.2 Samples are to be analyzed within 14 days of samplingor within 12 days of receipt (NYSDEC protocol).
7.0 PROCEDURE
7.1 All samples to be analyzed must be signed out of samplecontrol on the chain-of-custody (COC) for each job. Allalkalinity data collected is recorded in the alkalinitylog (see appendix I).
301341
WC:040491:0

7.2 Place 100 mL or an appropriate smaller sample volumeinto a flask, measure the pH of the sample. Record thesample volume used.
NOTE: Use a sufficiently large sample size to requirea volume of titrant (>-10 mL in 50 ml buret)which will obtain good precision while keepingthe volume low enough to permit a sharp endpoint.
7.3 Add 0.0200 N H2SC>4 , being careful to stir thoroughlybut gently to allow for equilibrium. Titrate to pH 4.5and record the volume of titrant and exact normality.
NOTE: For samples containing >1000 mg/L as CaCO3 ofalkalinity, use 0.1000 N H2S04 as the titrant.
8.0 QUALITY CONTROL
8.1 All stock solutions and standard preparations arelogged and coded. All solutions are labeled with thefollowing: analyte, concentration, analyst's initials,date prepared, and expiration date.
8.2 All chemicals will conform to minimum specificationsset by the Reagent Chemicals Committee of the AmericanChemical Society. All chemical inventories are used ona first-in first-out basis.>
8.3 A prep blank (reagent water) is to be analyzed withevery batch of ten or fewer samples.
8.4 One laboratory control sample (LCS) is to be analyzedwith each batch of ten or fewer samples. LCS controllimits are + 15% of the known concentration.
NOTE: Should the LCS fail, the source of the problemmust be corrected and an acceptable LCS runbefore continuing with the analysis of samples.
8.5 One sample duplicate must be analyzed from each batchof ten or fewer samples. Samples identified as fieldblanks are not to be used for duplicate analysis. Therelative percent difference (RPD) between the sampleand duplicate must be less than or equal to 20.0 (seesection 10.4 for the RPD calculation). No RPD criteriais applied if both results are less than five times thePQL. No RPD criteria is applied if one result is lowerthan five times the PQL arid one above, if thedifference between the two results is no more than thePQL.
301342WC:040491:0

9.0 METHOD PERFORMANCE
9.1 The average relative percent' difference over the last25 positive duplicates was 2.36% as of 3/28/91.
9.2 The last ten LCS percent recoveries averaged 105.6% asOf 3/28/91.
10.0 DATA HANDLING AND REDUCTION
10.1 All raw data including sample volume, titrant volume,and acid normality are entered into LIMS. The LIMSsystem calculates the results.
10.2 The normality of the H2SO4 titrant is calculated:
N = A X B53. X C
where: A = grams Na2CO3 into 1 literB = mL Na^CO3 solutionC = mL acid used to inflection point
10.3 Manual alkalinity calculation (titration to pH 4.5).
Alkalinity (mg/L as CaCO3) = A x N x 50.000mL of sample
where: A = mL of acid titratedN = normality of acid
10.4 The relative percent difference is calculated:
RPD = (S - D1 x 100(S + D)/2
where: S = Original sample resultD = Duplicate sample result
10.5 The sample quality control and LCS recovery results arereported on the QA/QC summary form (see appendix I).
10.6 The technical data review includes verifying thatsamples analyzed were unpreserved and that holdingtimes were met. All quality control measures arechecked to insure that all QC criteria were met.Results entered into LIMS are checked for transcriptionerror against the raw data.
301343WC:040491:0

11.0 DOCUMENTATION OF PROBLEMS
11.1 Corrective Action Reports - must be filed if anyproblems are encountered during analysis.
11.2 Case Narratives - should include information collectedfrom corrective action reports and any deviations fromthis SOP.
12.0 REFERENCES
12.1 Methods of Chemical Analysis of Water and Wastes,EPA 600, Method 310.1, 1983.
12.2 STANDARD METHODS: For the Examination of Water andWastewater, 15th ed., Method 403, 1980.
301344
WC:040491:0

APPENDIX I
301345

IEA/CT Group(s)
Date:__
CORRECTIVE ACTION REPORT
Problem/Question reported by:.
Job/Case Number:,;______________ Sample Number(s):.
Description of Problem: _______- . ___________
Summary of Corrective Action(s):
Is this a recurring Problem?______________________________
Should SOP be modified or updated?________________________
Cooperative help of the following groups/people is requested:
Approval of Group/Section leader:
Distribution: Section/Group LeaderLab ManagerQA OfficerOther: ____________
301346

IEA200 Monroe Turnpike
Monroe, CT 06468 (203) 452-8200
CLASSICAL CHEMISTRY QA/QC SUMMARY
Analyte: Date: Ref;
LABORATORY CONTROL SAMPLE
Reference
.
True Value Value Found % Recovery
DUPLICATES
Lab Sample ID Result 1 Result 2 Mean RPO
PREP BLANK
Blank ID Result
Samples in Batch:
''Cl
Comments:
.
f
301347

AlkalinityIEA
200 Monroe TurnpikeMonroe, CT 06468 (203) 452-8200
QC #
^lormalitH2S04
Sample ID Ini t ialP H'
:y of
SampleVolume
Buret Measurement
I n i t i a l Fina l
Analyst
Date
misTitrated
•
A l k a l i n i t ymg/L as CaC03
\
Paqe
301348

an environmental testing company200 Monroe TurnpikeMonroe. Connecticut 06468(203)261-4458FAX (203)263-5346
STANDARD OPERATING PROCEDURE
ANALYSIS OF TOTAL DISSOLVED SOLIDS
IN WATER
WC:081290:0
301349
Wiramar.= lorida
3C 5- 989-0928
Schaumburg.Illinois
708-705-0740
N. Billonca.Massachusetts617-272-5212
New ^ersey
Gary.North Carolina9! 9-677-0090

/*-N TABLE OF CONTENTS
1.0 Scope and Application
2.0 Summary of Method
3.0 Interferences
4.0 Apparatus
5.0 Reagents
6.0 Sample Preservation and Storage
7.0 Procedure
8.0 Quality Control
9.0 Method Performance
10.0 Data Handling and Reduction
^^_ 11.0 Documentation of Problems
12.0 References
Appendix I: Forms
301350

1.0 SCOPE AND APPLICATION
1.1 This method is applicable to drinking, surface, andsaline waters, domestic and industrial wastes,
1.2 The practical range of the determination is 1.0 mg/Lto 20,000 mg/L.
2.0 SUMMARY OF METHOD
2.1 A well-mixed sample is filtered through a glass fiberfilter, and the filtrate is evaporated to dryness ina weighed beaker and dried to a constant weight at180 C. The increase in beaker weight represents thetotal dissolved solids (TDS).
2.2 If total suspended solids is being determined, thefiltrate may be utilized in the TDS determination.
3.0 INTERFERENCES
3.1 Highly mineralized waters containing significantconcentrations of calcium, magnesium, chloride, andsulfate may be hygroscopic and will require prolongeddrying, desiccation and rapid weighing.
3.2 Samples containing high concentrations of bicarbonatewill require prolonged drying at 180 C to insure thatall of the bicarbonate is converted to carbonate.
3.3 Too much residue in the beaker will crust over andentrap water that will not be driven off duringdrying. Total residue should be limited to 0.25 g.
4.0 APPARATUS AND MATERIALS
4.1 Glass Fiber Filters, 2.1 cm4.2 Gooch Crucible Adapter4.3 Side Arm Filtration Flask, 1 L4.4 Beakers, 150mL or 250mL4.5 Drying Oven, 180 C + 2 C4.6 Desiccator4.7 Gooch Crucibles4.8 Graduated Cylinder, lOOmL4.9 Analytical Balance
301351\in\r«T- ii .UM'iKi- • vmMin(:. rn\\t:cnn ir OG^BH

5.0 REAGENTS
5.1 ASTM Type II Reagent Water (Nano)
6.0 SAMPLE PRESERVATION, AND STORAGE
6.1 Samples are to be unpreserved and stored at 4 C. Theholding time for TDS is 48 hours from the time ofsampling, however, the NYSDEC 89 protocol holdingtime is 24 hours from the time of receipt in the lab.
7.0 PROCEDURE
7.1 Gooch Preparation: Insert a glass fiber filter discinto the bottom of a gooch crucible. While vacuum isapplied, wash the disc with three successive 20 mLvolumes of nano water.
7.2 Beaker Preparation: Heat clean beakers to 180 + 2 Cfor one hour. Cool in desiccator and store untilneeded. Weigh immediately before use.
7.3 All samples to be analyzed must be signed out ofsample control on the chain-of-custody for each job.
7.4 Assemble the filtering apparatus and begin suction.Shake the sample vigorously and rapidly transfer100 mL to the gooch, and filter.
NOTE: The use of Millipore setup and glass fiberfilter is an acceptable alternative to usinga gooch.
7.5 After the sample has passed through the the glassfiber filter, rinse with three 10 mL portions of nanowater and continue to apply vacuum for three minutesto insure that as much water has been removed aspossible.
7.6 Transfer the filtrate to a weighed beaker andevaporate to dryness in a drying oven set at 100 -105 C.
301352MUNICH- II .HM'IKI- • Ml 1\H( II l'( ]\M (" I Ifl ; I t JCi-Jlit I • I HI 1 II -»'iH I IrM )CJ
7.7 Dry the evaporated sample for at least four hours at180 C. Cool in a desiccator and record the weightafter a constant weight has been obtained.
NOTE: Choose a sample size to yield no mre than250 rag of dried residue. If more than five min.are required to complete filtration decreasethe sample volume.
8.0 QUALITY CONTROL
8.1 A reagent blank will be analyzed with every batch oftwenty or fewer samples. If the blank has a positivetotal dissolved solids value the sample results areacceptable if the blank is no more than 10% of thesample result.
8.2 Duplicates
One duplicate analysis should be analyzed with everybatch of twenty or fewer samples. Samples identifiedas field blanks should not be used for duplicateanalysis. The relative percent difference (RPD) iscalculated as follows:
RPD = (S - D1 x 100(S + D)/2
A control limit of 20 percent for RPD shall be usedfor sample and duplicate values equal to or greaterthan five times the lower detection limit.
8.3 Laboratory Control Samples
One independent standard (LCS) is to be analyzed witheach batch of twenty or fewer samples if available.The control limits for the LCS is ± 15 percent of thetrue value.
8.4 A class S weight of approx. the same mass of thebeakers used should weighed when the beakers aretared and weighed back.
301353n.:n\piKt:« \m\nnr. rn\\FrTin.,r nri-4t>n

9.0 METHOD PERFORMANCE
9.1 The average RPD over the last 25 duplicates was 5.8%as Of 08/03/90.
10.0 DATA HANDLING AND REDUCTION
10.1 All raw data including weights and sample volumes areentered into LIMS. The LIMS system will calculate theresult automatically.
10.2 Manual TDS Calculation:
Filterable Residue (mg/L) = (A - B) x 1000C
where:
A = Weight of dried residue and beaker in mg
B = Weight of beaker in mg
C = Sample Volume in mL
10.3 The sample QA/QC and LCS are reported on theinorganics QA/QC summary form (see appendix I).
10.4 Technical Data Review: includes verifying thatsample holding times were met, that batch QC iswithin criteria and the raw data entered intoLIMS is checked for transcription errors.
11.0 DOCUMENTATION OF PROBLEMS
11.1 Corrective Action Reports: must be filed if anyproblems are associated with the analysis (seeappendix I).
11.2 Case Narratives: should include any deviation fromthis SOP or any difficulties encountered in theprocedure.
301354<?rxj MHNnnr rnnM'iw- • vin\nnr rn\\i:mn •

12.0 REFERENCES
12.1 Methods of Chemical Analysis of Water and Wastes,EPA 600, 1983, Method 160.U
12.2 STANDARD METHODS For the Examination of Water andWastewater, 15th edition, 1980.
301355C?QQ vin\nni- 11 JPNPIKE • VOSJOHG. coNNFCncur QG^GO • 1^031 -i^?. n<eun

APPENDIX I
301356\HI\RQF n.n\nii\r • \io\Rnr cn\\r-r ncxi 05-401:1 •

CtflSSICflL DOISTRY Qfl/QC SJWflRY
pm.YTE: MTE: REF.
LflBORflTORY CONTROL SAMPLE
REFERENCEr
TRUE WLUE 1 VALUE FOUND1111
1 11 < RECOVERY 11 11 11 11 1
DUPLICATES
1LAB SAMPLE ID 1 RESULT 1
1111
RESULT I1
MEAN 1 RPO 11 11 11 11 1
PREP
BLANK ID
BLANK
1RESULT
SAMPLES IKBfiTCHl COMMENTS!

I E A / C T Group(s)
Date:__
CORRECTIVE ACTION REPORT
Problem/Question reported by:
Job/Case Number:j___________________ Sample Number(s):.
Description of Problem: _______- . ______________
Summary of Corrective Action(s):
Is this a recurring Problem?.
Should SOP be modified or updated?.
Cooperative help of the following groups/people is requested:.
Approval of Group/Section leader:
Distribution: Section/Group LeaderLtab ManagerQA OfficerOther: ____________
301358

an environmental testing company200 Monroe TurnpikeMonroe, Connecticut 06468[203)261-4458FAX (203) 268-5346
Standard Operating ProcedureAnalysis of Ammonia-Nitrogen
WC:021690:0301359
Miramar.P'onda
305-989-0928
Schaumburg.Illinois
708-705-0740
N 3-iionca,Massacnusatts617-272-5212
Sew .arsay20i-428-3'31
North Carolina919-677-0090

WC:021690:0
1.0 SCOPE AND APPLICATION
1.1
wastes.
The distillation method covers the determination of ammonia-nitrogenin drinking, surface and saline waters, domestic and industrial
1.2 The latest version of the automated phenate method should be utilized(after the preliminary distillation step) when sample load warrants.
1.3 This method covers the range from 0.05 to 4.0 mg NH,-N/L for thecolorimetric procedure, and from 4.0 mg/1 to 25 mg/1 for the titra-metric procedure.
2.0 SUMMARY OF METHOD
2.1 The sample is buffered at a pH of 9.5 with a borate buffer in orderto decrease hydrolysis of cyanates and organic nitrogen compounds,and is then distilled into a solution of boric acid. The ammonia inthe distillate can be determined colorimetrically by nesslerization,or titrametrically with standard sulfuric acid with the use of amixed indicator.
3.0 INTERFERENCES
3.1 Aromatic and aliphatic amines, as well as other compounds, bothorganic and inorganic, will cause turbidity upon the addition ofNessler reagent, these interferences can be removed via distillationof the sample.
3.2 Cyanates will hydrolyze to some extent even at the pH of 9.5 at whichthe distillation is carried out. Volatile alkaline compounds, suchas certain ketones, aldehydes, and alcohols, may cause an off-colorupon nesserlization in the distillation method.
3.3 Residual chlorine must be removed by pretreatment of the sample withsodium thiosulfate before distillation.
4.0 APPARATUS AND MATERIALS
4.1 Heating mantles with temperature controllers
4.2 Florence Flasks, 500 mLV
4.3 Erlenmeyer Flasks, 250 mL
4.4 Volumetrics, 250 mL
4.5 Graduated Cylinders, 50 mL
301360

WC: 021690:0
4.6 Pi pets
4.7 Nessler Tubes
4.8 Volumetrics, 1 Liter
5.0 REAGENTS
5.1 Ammonium chloride, stock solution: 1.0 ml = 1.0 mg NH3-N. Dissolve3.819 g NH4C1 in Nano water and tring to volume in a 1 liter volu-metric flask.
5.2 Ammonium chloride, standard solution: 1.0 ml = 0.01 mg NH3-N.Dilute 10 ml of stock solution (5.1) to 1 liter.
5.3 Boric acid solution: Dissolve 20 grams of boric acid in Nano waterand dilute to 1 liter.
5.4 Mixed indicator: Mix 20 ml of 0.2% methyl red in 95% ethanol with10 ml of 0.2% methylene blue is 95% ethanol. This solution shouldbe prepared fresh every 30 days.
5.5 Nessler reagent: Dissolve 100 g of mercuric iodide and 70 g ofpotassium iodide in a small amount of Nano water. Add this mixtureslowly, with stirring, to a cooled solution of 160 g of NaOH in 500ml of water. Dilute to 1 liter. If stored in an amber bottle thesolution will be stable for a period of up to 1 year.
5.6 Borate buffer: Add 88 mL of 0.1N NaOH solution to 500 ml of 0.025Msodium tetraborate solution (50 g anhydrous Na2B407 on 95 g Na2B407 perliter) and dilute to 1 liter.
5.7 Sulfuric acid, standard solution: (0.02N, 1 mL = 0.28 mg NH3-N).Dilute 200 mL 0.1N H2S04 (standardized against O.IOON Na2C03 solution)to 1 liter with Nano water.
5.8 Sodium carbonate, standard solution: Dissolve 1.060 g anhydrousNa2C03, oven dried at 140*C to 1 liter in C02 free distilled water.
6.0 SAMPLE HANDLING AND PRESERVATION
6.1 Water and soils are to be distilled within 28 days of sampling.
6.2 Water samples should be preserved to a pH <2 with sulfuric acid andstored at 4 C.
301381

WC:021690:0
7.0 PROCEDURE
7.1 All samples to be analyzed' must be signed out of sample control onthe chain-of-custody for each job.
7.2 Distillation
7.2.1 Each distillation apparatus is to be steamed out between sam-ples. To steam out; add approximately 250 mL of nano water,a drop of phenolphthalein, and sufficient 6N NaOH to turn thesolution pink to each florence flask. Add boiling stones tothe flask, and turn on the condenser water. Turn on the powerto the heating mantle. Continue to distil! until no trace ofammonia is observed (no reaction upon the addition of nesslerreagent).
NOTE: To minimize contamination, leave the distillation appa-ratus assembled until ready to distil! samples.
7.2.1 Add 250 ml of aqueous or 250 ml nano water and 5 grams of soilto a florence flask. Add a drop of phenolphthalein and suffi-cient 6N NaOH dropwise buffer to the flask.
NOTE: Percent solids must be determined for soil sampleanalysis.
7.2.3 Add 50 ml of boric acid solution to a 250 ml erlenmeyerreceiving flask. Raise the receiving flask so that the tipof the condenser is below the surface of the boric acid, butnot touching the bottom of the flask.
7.2.4 Turn on the heating mantles and condenser water, distill overa volume of 200 ml.
NOTE: When the volume of distillate has been received turnoff the heat and lower the receiving flask.
7.2.5 Transfer the distillate into 250 ml volumetrics.
NOTE: If the sample requires TKN or TON analysis, save thesample in the florence flask.
7.3 Development of Nesslerization
7.3.1 Place 50 ml or an aliquot diluted to 50 ml with nano water ina clean nessler tube.
301382

WC:021690:0
7.3.2 Prepare a 10 ug and a 200 ug standard from the standard ammo-nia solution.
7.3.3 Add 2 ml of nessler reagent to each nessler tube, allow 10minutes for color development and read at '425 nm.
7.3.4 See Appendix II for spectrophotometer instructions.
NOTE: If an aliquot of 0.5 ml of distillate has an absorbancehigher than the high standard the distillate will have to betitrated (7.4).
7.4 Analysis by Titration
7.4.1 To 50 ml of distillate, add 3.5 drops of mixed indicator andtitrate with 0.02 N H2S04 until the solution turns a palelavender. A 50 ml nano water blank must be titrated for cal-culation purposes.
8.0 QUALITY CONTROL
8.1 For the nesslerization method the 10 ug and 200 ug must agree withthe established curve ±15%, if the control limits are not met a newcurve should be prepared.
8.2 A new curve requires the preparation and nessler development of apreparation blank, 0.05, 0.20, 0.60, 1.00, 2.00, and 4.00 mg/L stan-dards.
8.3 For the titration analysis method the 0.02 N H2S04 should be stan-dardized against a 0.0200 Na2C03 solution.
8.4 A preparation blank is distilled each day that samples are distilled.
8.5 A sample duplicate is distilled per batch (20 samples max.).
RPD = (S-D) x 100%(S+DJ/2
where S « sample resultD = duplicate result
The RPD value must be <20 percent.
4 301363

WC:021690:0
8.6 A sample spike is distilled per batch (20 sample maximum).
% Recovery = (SSR-SR) x 100%SA
The acceptable spike recovery limits are 75-125 percent.
8.7 Batch QA/QC is reported on Inorganic QA/QC summary forms (See Appen-dix I).
9-0 METHOD PERFORMANCE
9.1 The detection limit for waters is established by the low standard onthe curve (0.05 mg/L). Soil detection limits must be calculatedtaking into account sample mass and percent solids.
9.2 Precision and Accuracy
Twenty-four analysts in sixteen laboratories analyzed natural watersamples containing exact increments of an ammonium salt, with thefollowing results:
Increment asNitrogen, Ammonia
mq N/liter
0.210.261.711.92
Precision asStandard Deviation
ma N/liter
0.1220.0700.2440.279
Accuracy asBias, Bias,% mq N/liter
-5.54 -0.01-18.12 -0.05+0.46 +0,01-2.01 -0.04
10.0 DATA REDUCTION AND DATA HANDLING
10.1 All distillation data including sample ID, sample volume, and volumedistilled are recorded in each analysts notebook. Development datais recorded with the distillation information. If titration is re-quired, the data is recorded in the analyst's notebook performingthe titration.
10.2 Raw data and results are entered onto LIMS, the final concentrationsare calculated by the system (for the colorimetric method).
10.3 Titration Calculation
mg NH3-N/L = (A-B) x 280ml Sample
301364

INORSAXICS QA/QC SUMMARY
Analyte:. Date:.
Notebook Ref:
SPIKES
Lab Sample 10 Spike Result Sample Result
•
Amount Added
•
Percent Recovery
DUPLICATES
Lab Sample 10 Result I Result 2 Mean RPO————— f
BLANKS
Blank ID Result
Samples in Batch r
i
Comments:

IEA/CT Group (is)
Date:
CORRECTIVE ACTION REPORT
Problem/Question reported by:,
Job/Case Number :j______________________ Sample Number (s):.
Description of Problem: _______- - ___________________
Summary of Corrective Action(s):
Is this a recurring Problem?.
Should SOP be modified or updated?.
Cooperative help of the following groups/people is requested:
Approval of Group/Section leader:.
Distribution: Section/Group LeaderUab ManagerQA OfficerOther: __________
301386

APPENDIX II
301387

INSTRUCTIONS FOR THE MILTON ROY SPECTROPHOTOHETER
1. Turn the power on, and allow the Instrument to warm up for 30 minutes.
2. Enter the desired wavelength and press "Go to A"
3. Set the test mode to ABS.
4. Insert the sample cell with calibration blank Into the spectrophotometer,close the sample door and press "Auto Zero".
5. Rinse the cuvette with sample twice and dry sides with klmwipes. Fill thecell with sample, place the cell back Into the spec, close the sample doorand record the absorbance.

INSTRUCTIONS FOR THE PERKIN-ELHER DB SPjftTR9pHQTQMETEg
preparation
Power W damp - on (not D2 damp)Pull out Vis lamp knobSlit - set at 2.0 ntnResponse - MedSuppression - OffScan - OffNM - ignore (used with scan)Wavelength - put at 500 - reads in absorbance or % TPush % T (- % Transmittance)w/o cells - adjust digital readout to 100% T with the knob on top (alwaysreads ± when it's +)Block front (sample) cell path with board - should read 0% T if not, adjustto 0% T with 0% T knob.Remove board.Back Cell - BlankFront Cell « Sample - Lettering on cells should always point to the right
when in the spec.Operation
Abs - depress 0-2 scaleClean cells; rinse out 1 time with blank and dry sides with KimwipesPut blank cells in front and backAdjust wavelength to that required for the analysis.With the blanks in, adjust 0 abs to read 0.
Now take the front cell out; rinse twice with the sample, fill with sample,put in the spec and take down the absorbance reading.When done - just take out cells, clean them and leave on top to dry.
Shut DownSwitch off the W lamp and main power.

an environmental testing company200 Monroe TurnpikeMonroe. Connecticut 06468.203)261-4458FAX (203) 268-5346
STANDARD OPERATING PROCEDURE
FOR CHLORIDE
WC:031189:0
Miramar.cionda
305-989-0928
Schaumtourg.ihnon
708-705-0740
N.Masiacnusetts617-272-5212
Gary,North Carolina919-677-0090
Essex JunctionVerrroft
302-878-5! 38

WCCY:031189:0
ABSTRACT
Chloride is one of the major inorganic anions in potable and waste-water supplies. When sodium is present in drinking water, chlorideconcentrations in excess of 250 rag/L give a salty taste. Chlorideis essential in the diet and passes through the digestive systemunchanged to become one of the major components of raw sewage. Theuse of zeolite in water softeners also contributes a large amountof chloride to sewage and wastewaters. Chlorides may be presentin high concentrations along coastal areas, due to the seepage ofseawater into the sewage system.
High chloride concentrations in water are not known to have toxiceffects on man, however, large amounts may act corrosively on metalpipes and be harmful to plant life. The maximum contaminant levelfor chloride in drinking water has been established at 25O mg/L forreasons of taste rather than as a safeguard against a physicalhazard.

WCCY:031189:0
1.0 SCOPE AND APPLICATION
There are four methods available for the determination of chloride.The Argentometric method is suitable for use in relatively clearwaters when 0.15 to 10 mg Cl" are present in the portion titrated.The same can be said for the mercuric nitrate method, except thatits endpoint is easier to detect. The potentiometric method issuitable for colored or turbid samples in which color-indicatedendpoints might be difficult to observe. The ferricyanide methodis an automated technique.
2.0 SUMMARY OF ARGENTOMETRIC METHOD
In a neutral or slightly alkaline solution, potassium chromate canindicate the endpoint of the silver nitrate titration of chloride.Silver chloride is precipitated quantitatively before red silverchromate is formed.
3.0 INTERFERENCES
Substances in amounts normally found in potable waters will notinterfere. Bromide, iodide and cyanide register as equivalentchloride concentrations. Sulfide, thiosulfate and sulfite ionsinterfere but can be removed by treatment with hydrogen peroxide.Orthophosphate in excess of 25 mg/L interferes by precipitating assilver phosphate. More than 10 mg/L of iron will mask the end-point.
4.0 APPARATUS
50 ml buret250 ml erlenmeyer flasks
5.0 REAGENTS
5.1 - Potassium chromate indicator solution: Dissolve 50 gK2CRO4 in approximately 50 ml nano water. Add AgN03 solutionuntil a definite red precipitate is formed. Let stand 12hours, filter, and dilute to 1L with nanopure water.

WC:021690:0
where A = mLs of titrant in the sampleB = mLs of titrant in the sample
11.0 USE OF OTHER SOP'S
11.1 The latest version of the automated phenate method may be utilizedfor developing distillates if sample quantities warrant.
12.0 DOCUMENTATION OF PROBLEMS
12.1 Corrective Action Reports - must be filed if any problems were asso-ciated with the analysis (See Appendix I).
12.2 Case Narratives - should include any deviation from this SOP or anydifficulties encountered in the procedure.
13.0 REFERENCES
13.1 EPA-600/4-79-020, Methods for Chemical Analysis of Water and Wastes,Method 350.2.
S01373

APPENDIX I
301374

WCCY:031189:0
5.2 - Standard silver nitrate titrate, 0.141 N: Dissolve2.395 g AgNO3 in .nanopure water and dilute to 1L. Standard-ize against 0.0141 N NaCl by the procedure described below.1.00 ml = 500 ug Cl". Store in a brown bottle.
5.3 - Standard sodium chloride, 0.014 N: Dissolve 824.0 mgNaCl (dried at 140°C) in nanopure water and dilute to 1L.1.00 ml = 500 ug Cl".
5.4 Phenolphthalein indicator solution5.5 Sodium hydroxide, NaOH, IN5.6 Sulfuric acid, H2SO4, IN
Note: When making a new reagent or standard record it in the preplog book!
Note; All reagents should be of A.C.S. reagent grade quality.
"X0 PROCEDURE
6.1 Sample Preparation - Acid wash erlenmeyer flasks andburet with 1:1 HNO3 and rinse three times with nano water.Use 50 ml of an unpreserved sample or a suitable portiondiluted to 50 ml with nanopure water. For a soil matrix,weigh out 10.00 g of the sample and place in a beaker. Addtwo drops of concentrated HNO3 and 100 ml nanowater. Stirand heat on hot plate until warm to touch. Filter through45 um filter and use 50 ml filtrate.
Adjust pH to neutralize sample by adding a drop of phenolpht-halein indicator solution. Then drop wise add IN NaOH untila pink color appears. Add IN H2SO4 just until the sampleturns colorless.
301375

WCCY:031189:0
6.2 Titration r Add 1.0 ml of K2CrO4 indicator solution.Titrate with standard AgNO3 titrant to a pinkish yellowendpoint. Be consistent in end-point recognition.
Standardize AgNO3 titrant by adding 5 ml of standard NaCl to45 ml of nano water. Titrate as described above. Establisha reagent blank of 0.3 ml is normal. Titrate two NaCl stan-dards and two blanks to average and use for calculations.
6.3 Dilutions: Normally, when the first few drops of AgNO3titrant go into the sample, a reddish color will appear fromthe red silver chromate. If this color does not appear, adilution is in order. Ideally, 1.0 - 10.0 ml of titrantshould be used on each sample.
7.0 QUALITY CONTROL
For every twenty chloride samples titrated, a sample dupli-cate and matrix spike should be performed. To spike, pipet5 ml of standard NaCl to the 50 ml of sample try not to spikea dilution) and titrate.
Calculation;
To find the normality of the standard AgNo3:
NNaCl x mis NaCl used = NAgN03 x mis AgNO3 used - avg. blank(0.0141) 5 mis
mg C1"/L = (A-B) x N x 35.450 where A = ml titrant sampleml sample B = ml titrant blank
N = Normality AgNO3 -
301376

WCCY:031189:0
Spikes
Spikes are used to calculate the recovery of an analyte:
% Recovery = (SSR - SR) x 100SA
Where: SSR = spiked sample result (mg/L)SR = sample result (mg/L)SA = spike added (mg/L)
The acceptable range is 75 - 125%
Duplicates
Relative Percent Difference (RPD) is used to determine the preci-sion of results.%
RPD = FS - PI x 100 Where S = sample result (mg/Kg)(S + D)/2 D = duplicate result (mg/L)
The RPD value must be £ 20%
Significant Figures: <10;2 >10;3LDL (Lower Detectable Limit) 1.0 mg/L
301377

WCCY:031189:0
Reporting of Results: .
Results are computed for samples on LIMS and may have to be mod-ified to take into account LDL's and significant figures.
Documentation of Problems:
Corrective action reports must be filed if any problems wereassociated with the analysis.
Case Narratives should include any departure from normal procedureor any difficulties encountered in the analysis.
References:
Standard Methods for the Examination of Water and Wastewater. 16thEdition, 1985, APHA-AWWA-WPCF.
301378

WCCY:031189:0
APPENDIX I:
BENCH SHEETS, REAGENT LOGS
AND CORRECTIVE ACTION FORM
301379

STANDARD OPERATING PROCEDURE
ANALYSIS OF SULFATE
IN WATER
WC:030489:0
301380aoo MOXRDC- TLRNPIKE • \ia\nnc. CONNECTICUT QG-ibo • i<?u .is •>'

Abstract
Sulfate (SO42~) occurs in natural waters in a wide range ofconcentrations. Mine drainage wastes and industrial effluents maycontribute large amounts of sulfate from pyrite oxidation and theuse of sulfuric acid. Secondary maximum contaminant levels fordrinking water call for no more than 250 mg/L of sulfate becauseof.its cathartic action. In domestic wa'ters, sulfates do not causeany increased corrosion on brass fittings, but concentrations above250 mg/L do increase the amount of lead dissolved" -from lead pipesor joints. . " " _
301381

1.0 SCOPE AND APPLICATION
The gravimetric method with ignition of residue and the gravimetricmethod with drying of residue are suitable for sulfateconcentrations above 10.0 mg/L; use only one of these methods foraccurate results. The turbidimetric method is applicable in therange of 1.0 to 40.0 mg SOA2"/L. '
2.0 SUMMARY OF GRAVIMETRIC METHOD WITH DRYING OF RESIDUE
Sulfate is precipitated .in a hydrochloric acid (HCl) solution as-barium sulfate (BaSOj by the addition of.barium chloride (BaCl2) .The precipitation is carried out near the boiling temperature, andafter, a period of digestion the precipitate is filtered, washedwith -water until free of Cl", dried, and weighed as BaSO,,.
3,0 INTERFERENCES . _ _ ~ri-
The interferences leading to high results are suspended matter,silica, BaCl2 -precipitant, nitrate, and sulfite. Alkali metalsulfates frequently yield low results, as do heavy metals such aschromium and iron. The latter two interfere with the completeprecipitation of SO42" and by the formation of heavy metal sulfates,BaSO4 has a small but significant solubility, which is increased inthe presence of acid. Although an acid medium is necessary toprevent precipitation of barium carbonate and phosphate, it isimportant to limit its concentration to minimize the solutioneffect.
4.0 APPARATUS
a) Drying oven, equipped with thermostatic controlb) Desiccatorc) Analytical balanced) Gooch cruciblese) Filter pads 934 AH, unsterile, 45 filter membranesf) Filtering apparatusg) Beakers (100 or 150 ruL)h) Hot platei) Grad. cylinder 50 raLj) 10 mL class A pipet
5.0 REAGENTS
a) Hydrochloric acid (HCl) cone.b) Barium chloride solution: Dissolve 100 g BaCl2 x 2H2O in 1L
nanopure water. Filter through a membrane filter before use.1 mL is capable of precipitating approximately 40 mg SO4 ".Record in prep logbook.
c) Standard sulfate solution: Dissolve 0.1479 g anhydrous Na2SO4in nano water and dilute to 1L. 1.00 mL = 100 ug
3013B2

Note: All chemicals should conform to minimum specifications setby the Reagent Chemicals Committee of the American ChemicalSociety (A.C.S. reagent).
6.0 SAMPLE ANALYSIS
Prepare crucibles by washing, fitting with two 934 AH filter padsand filtering through a half crucible of nano water to make surethe pads are snug. Place in drying oven for at least one hour,desiccate for one hour, and weigh on analytical balance. (.Be surethe Gooch I.D. number is recorded.)
Prep the same amount of beakers with 1:1 HNO3 and nano jwater.Clean millipoire filter apparatus in the same way. -~ •
Filter_a quantity of unpreserved;sample through a 0.45-um jnillipore-and from the filtrate,- measure!£§ mL in a .graduated cylinder. Pourinto—a labeled beaker. Repeat for each sample and blank, duplicateand matrix spike.
Place beakers on a hot plate until they are hot but not boiling 1Add 1-2 drops concentrated HC1 and approximately 5 mL BaCl2 toeach. A white precipitate will form in the presence of SO4 ". Coolsamples and cover to prevent contamination.
Filter samples through a weighed Gooch crucible. Add another 5 mLje-*vCl2 to the filtrate to ensure all the SO42" has been precipitated
If the filtrate turns white, filter it through the crucibleagain. Put the crucibles in the drying oven (at 105°C) for atleast one hour, desiccate for an hour and weigh back on the sameanalytical balance.
7.0 QUALITY CONTROL
Every 20 samples a duplicate and matrix spike are required. Spikewith r, QOg, ug SO42* (-ie mLs of sulfate standard where 1 mL = ioe- ug)to S3- rnUof sample. 5
v<->oa) Calculation
ma BamL sample
mg SO42"/L = ma BaSO, x 411.6
b) Spike recovery *
% recovery = (SSR - SR) x 100SA
where: SSR = spiked sample result (mg/L)SR = sample result (mg/L)SA = spike added (mg/L)
The acceptable range is 75-125%.
301383

c) Duplicates - relative percent difference (rpd) is used to"v determine the precision of results.
RPD = FS-D1 x 100 . where S = sample result (mg/L)(S+D)/2 D •= duplicate result (mg/L)
The RPD value must be <20%.
Significant figures = 3LDL (Lower Detectable Limit) =10.0 mg/L
8.0 REPORTING OP RESULTS -
Results are computed for samples on LIMS and may have to bemodified to take LDL's and significant figures "into account.
———— - ' ,T *
9.0 DOCUMENTATION OF PROBLEMS- - - - . ' '
Corrective action reports must be filed if any problems wereassociated with the analysis.
Case narratives should include any departure from normal procedureor any difficulties encountered in the analysis.
3013B4

REFERENCES
Standard Methods for the Examination of Water and Wastewaterf 16thEdition, 1985 (and revisions) .
301385

APPENDIX I:
BENCH SHEETS, REAGENT LOGS AND CORRECTIVE ACTION FORM
301386

SulfatesIEA
200 Monroe TurnpikeMonroe, CT 06468 (203) 452-8200
Sample ID
^
v-J. doLa O r
Batch10
PB
LCS
DUP
SPIKE
7eight
Samplevol. mis.
Gooch10
Tare weight (g) F i n a l w e i g h t ( g )
••
S u l f a t e mg/l
>•
LS4;ock Code ID
>pike Amount Added
Analyst
Date
Page
301387

<-wj nouroe TurnpiKeMonroe, CT 06468 (203) 452-8200
. CLASSICAL CHEMISTRY QA/QC SUMMARY
Date : Ref:
LABORATORY CONTROL SAMPLE
Reference True Value Value found X Recovery
SAMPLE SPIKE
Lab Soople 10 Spike Result Sample Result Amxnt Added\
X Recovery
DUPLICATES
Lab Sample (0 Result 1 Result 2 Mean RPO
PREP BLANK
Blank 10 Result
/"*
Samples in Batch:.
•
Comments:v •
301388

IEA/CT Group(s)
^ Date:__
CORRECTIVE ACTION REPORT
Problem/Question reported by:
Job/Case Number:.:______________ Sample Number(s):.
Description of Problem: _______- . ___________
Summary of Corrective Action(s):
Is this a recurring Problem?.
Should SOP be modified or updated?.
Cooperative help of the following groups/people is requested:
Approval of Group/Section leader:
Distribution: Section/Group LeaderLab Manager
. ' QA OfficerOther: ____________
301389

an environmental testing company200 Monroe TurnpikeMonroe. Connecticut 06468;203)261-4458FAX (203) 268-5346
Standard Operating ProcedureAnalysis of Hardness in Water
WC:081390:0
30139©
Miranar.
305-989-0928
Schaumburg,I l l inois
708-705-0740Massacnusens617-272-5212
•VSocany.Sew .e'sey
Caiy.North Carolina919-677-0090 8C2-3"5 5-38

-v TABLE OF CONTENTS
I.0 Scope and Application
2.0 Summary of Method
3.0 Interferences
4.0 Apparatus
5.0 Reagents
6.0 Sample Preservation and Storage
7.0 Procedure
8.0 Quality Control
9.0 Method Performance
10.0 Data Handling and Reduction
II.0 Documentation of Problems
j.2 .0 References
Appendix I: Forms
301391

Hardness
Scope and Application
1.1 This method is applicable to drinking, surface, and salinewaters, domestic and industrial waters.
1.2 The method is suitable for all concentration ranges ofhardness; however, in order to avoid large titration volumes, usea sample aliquot containing not more than 25 mg CaC03.
2.0 Summary of Method
Ethylenediaminetetraacetic acid and its sodium salts (EDTA)form a chelated soluble complex when added to a solution of certainmetal cations. If a small amount of dye such as Eriochrome BlackT of Calmagite is added to an ageous solution containing calciumand magnesium ions at a pH of 10.0 +_ 0.1, the solution becomes redwine, If EDTA is added as a titrant, the calcium and magnesiumwill be complexed, and when all of the magnesium and calcium has•been compexed the solution turns from wine red to blue, marking theend point of the titration. Magnesium ion must be present to yielda satisfactory end point. To insure this, a small amount ofcomplexometrically neutral magnesium salt of EDTA is added to thebuffer; this automatically introduces sufficient magnesium andobviates the need for a blank correction.
The sharpness of the endpoint increases with increasing pH.However, the pH cannot be increased indefinitely because of thedanger of precipitating calcium carbonate, CaC03, or magnesiumhydroxide, Mg(HO)2, and because the dye changes color at highvalues. The specified pH of 10.0 +_ 0.1 is a satisfactorycompromise. A limit of 5 min. is set for the duration of thetitration to minimize the tendency toward CaCOS precipitation.
3.0 Interferences
Some metal ions interfere by causing fading or indistinctendpoints of by stoichiometric consumption of EDTA. Reduce thisinterference by adding certain inhibitors, such as mg CDTA, beforetitration. When higher concentrations of heavy metals are present,determine calcium and magnesium by a non-EDTA method and obtainhardness by calculation.
301392

<.0 Apparatus
4.1 Standard laboratory titrimetric equipment.
5.0 Reagents
5.1 Buffer solution
5.1.1 If magnesium EDTA ia available: Dissolve; 16.9g NH4CLin 143ml cone. NH40H in a 250ml volumetric, add 125g of magnesiumsalt of EDTA and dilute to the mark with distilled water. THen goto 5.1.3.
5.1.2 If magnesium EDTA ia unavailable: Dissolve 1.179gdisodium EDTA (analytical reagent grade) and 780mg MgS04-7H20(or 644mg MgCL2•6H20) in 50ml distilled water. Add this solution
to a 250 ml volumetric flask containing 16.9g NH4CL and 143 mlcone. NH40H with mixing and dilute to the mark with distilledwater.
5.1.3 Store in tightly stoppered plastic bottle; stable for/—"oproximately one month. Dispense with bulb operated piped.
i.scard when 1 or 2ml added to sample fails to produce a pH of 10.0+_ 0.1 at end point of titration.
5.1.4 Commercially available "odorless buffers" which are norstable, may be used.
5.2 Inhibitors: For most waters inhibitors are not necessary, Ifinterfering ions are present use one of the following:
5.2.1 Inhibitor I: NaCN power. (Caution: extremelypoisonous) . Flush solutions on sample containing this down drainusing large quantities of water. Make sure no acids are presentwhich might liberate HCN gas.
5.2.2 Inhibitor II: Dissolve 5.0 g Na2S-H20 or 3.7 gNa2S-5H20 in 100 ml distilled water. Exclude air with tightlyfilled rubber stopper. This gives sulfide precipitates which mayobscure the end point if large quantities of heavy metals arepresent. Deteriorates rapidly through air oxidation.
5.2.3 Inhibitor III: Dissolve 4.5 g hydroxylaminehydrochloride in 100ml of 95% ethanol or isopropanol.
301393

5.3 Indicator: Use a commercially available indicator such asCalmagite indicator (Mallinckrodt) or one of the formulationsdescribed below (5.3.1 -5.3.3)
5.3.1 Mix 0.5 g Eriochrome Black T with 4.5 g hydroxylaminehydrochloride. Dissolve in 100 ml of 95% ethanol or isopropanol.
5.3.2 Dissolve 0.5 to 1.0 g Eriochrome Black T in anappropriate solvent such as triethanolamine or 2-methoxyethanol.Stable approximately one week.
5.3.3 Mix together 0.5g Eriochrome Black T and lOOg NaCI. .
5.4 Standard EDTA titrant, 0.02 N: Place 3.723 g analyticalreagent grade disodium ethylenediamine tetraacetate dihydrate,Na2H2C10H12O8N2•H20 In 1 liter volumetric flask and dilute to themark with distilled water. Check with standard calcium solution(5.4.1) by titration (5.4.5). Store in polyethylene. Checkperiodically because of gradual deterioration.
5.4.1 Standard calcium solution 0.02 N: Place l.OOOganhydrous calcium carbonate (primary standard low in metals) in a500 ml flask. Add a little at a time, 1+1 HCL (5.4.2) until allof the CaC03 has dissolved. Add 200 ml distilled water. Boil fora few minutes to expel C02. Cool. Add a few drops of methyl redindicator (5.4.3) and adjust to intermediate orange color by adding3NNH40H (5.4.4) or 1+1 HCL (5.4.2) as required. Quantitativelytransfer to a 1 liter volumetric flask and dilute to mark withdistilled water.
5.4.2 Hydrochloric acid solution, 1+1.
5.4.3 Methyl red indicator: Dissolve O.lOg methyl red indistilled water in a 100 ml volumetric flask and dilute to themark .
5.4.4 Ammonium hydroxide solution, 3n: Dilute 210 ml of cone;.NH40H to 1 liter with distilled water.
5.4.5 Standardization titration procedure: Place 10.0 mlstandard calcium solution (5.4.1) in vessel containing about 50mldistilled water. Add 1 ml buffer solution (5.1). Add 1-2 dropsindicator(5.3) or small scoop of dry indicator (5.3.3). Titrate
301394

slowly with continuous stirring until the last reddish tingedisappears, adding last few drops at 3-5 second intervals. At endpoint the color is blue. Total titration duration should be 5minutes from the time of buffer addition.
N of EDTA = 0.2ml of EDTA
5.5 Ammonium Hydroxide, IN: Dilute 70ml of cone. NH40H to 1 literwith distilled water.
6.0 Sample Collection, Preservation and storage
6.1 Cool to 4 c, preserve with nitric acid (HN03) to pH <2.
7.0 Procedure
\1 Pretreatment
7.1.1 For drinking waters, surface waters, saline waters, anddilutions thereof, no pretreatment steps are necessary. Proceedto 7.2.
7.1.2 For most wastewaters, and highly polluted waters, thesample must be digested as given in the Atomic Absorption Methodssection of this manual, paragraphs 4.1.3 and 4.1.4. Following thisdigestion, proceed to 7.2.
7.2 Titration of sample-normal to high hardness:
7.2.1 Sample should require <15 ml EDTA titrant ( 5.4) andtitration should be completed within 5 minutes of buffer addition.
7.2.2 Place 25.0 ml sample in titration vessels, neutralizewith IN ammonium hydroxide (5.5) and dilute to about 50 r.l.
7.2.3 Add 1 to 2 ml buffer solution (5.1).
7.2.4 If end point is not sharp (as determined by practicerun) add inhibitor at this point ( see 7.4) .

7.2.5 Add 1,to 2 drops indicator solution ( 5.3.1.or 5.3.2)or small scoop of dried powder indicator formulation (5.3.3).
7.2.6 Titrate slow with continuous stirring with standardEDTA titrant (5.4) until last reddish tint disappears. Solutionis normally blue at end point.
7.3 Titration of sample-low hardness (less than 5mg/l)
7.3.1 Use a larger sample (100ml)
7.3.2 Use proportionately larger amounts of buffer, inhibitorand indicator.
7.3.3 Use a microburet and run a blank amount usingredistilled, distilled or deionized water.
7.4 To correct for interferences:
7.4.1 Some metal ions interfere by causing fading orindistinct end points. Inhibitors reduce this accord with thescheme below for 25.0 ml samples diluted to 50ml.
301396

8.0 Quality Control
8.10 All stock standard preparations are logged and coded. Allstandards are labeled with the following: analyte, concentration,analyst's initials, and date prepared.
8.20 All chemicals should conform to minimum specifications set bythe Reagent Chemicals Committee of the American Chemical Society.All chemical inventories are used on a first in first out basis.
8.30 A sample prep blank is analyzed with every batch of twenty orfewer samples.
8.40 Laboratory Control Sample (LCS) Analysis
One independent standard (LCS) is to be analyzed with eachbatch of twenty or fewer samples. The control limits fir the LCSare + or - 15 percent of the true value.
8.50 Duplicates
One duplicate must be analyzes from each of twenty or fewersamples. Samples identified as field blanks cannot be used forduplicate analysis. The relative percent differences (RPD) arecalculated as follows:
RPD = ( S - D ) x 100(S - D) / 2
Where RPD = Relative Percent DifferenceS = Original Sample ValueD = Duplicate Sample Value
A control limit of 20 percent for RPD shall be used fororiginal and duplicate sample values greater that or equal to fivetimes the reporting detection limit (RPD) . If one result is abovefive times the RDL level and the other below, the differencebetween the two values should be no more than the RDL. If bothsample values are less than the RDL, the RPD is not calculated.
301397

8.6 Spike Sample Analysis (S)
The spike sample analysis is designed to provide informationabout the effect of the sample matrix and measurement methodology.At least one spike sample analysis must be performed on each batchof twenty or fewer samples. Samples identified as field blankscannot be used for spoke sample analysis.
If the spike recovery is not within the control limits 75 to125 percent and the sample concentration does not exceed four timesthe spiking level, a fresh aliquot of the sample is to be spike andanalyze.
Spike recoveries are calculated as follows:]
% Recovery = (SSR-SR)SA
Where sample concentration is less than the instrumentdetection limit, use SR = 0 for calculating percent recovery.
9.0 Method Performance
9.1 The average RPD over the last 25 duplicates was 2.18% as of7/27/90. The average spike recovery over the sample period was96.9%.
10.0 Data Handling and Reduction
10.1 All raw data including sample volume, titrant vol-ume, andnormality are entered into LIMS. The LIMS system calculates theresults.
10.2 Manual Hardness Calculation :
Hardness (EDTA) as mg CaC03/L = A x B x 100ml sample
Where: A = ml titration for sampleB = mg CaC03 equivalent to 1.00ml EDTA titratior.
301398

10.3 The sample QA/QC and LCS are reported on the inorganics QA/QCsummary form ( see Appendix I).
10.4 Technical Data Review
The technical data review includes verifying that samples werepreserved and holding times were met. All standards and batchquality control are checked to insure that they were withincriteria. All results entered into LIMS are checked fortranscription error against the raw data.
11.0 Documentation of Problems
11.1 Corrective Action Reports - must be filed if any problems areassociated with the analysis (see Appendix II).
11.2 Case Narratives - should include any deviation from this SOPor any difficulties encountered in the procedure.
12.0 References
12.1 Methods of Chemical Analysis of Water and Wastes, EPA 600,1983, Method 130.2.
301399

APPENDIX I
301400C?CXD \in\nnt TURNPIKE • \m\Rnc CO\\CCIICL T oe-isa • it?cm -4'J<

CLASSICAL QOISTRY Qfl/OC SUMMARY
f——,E: OflTE: REF.:
LABORATORY CONTROL SAMPLE
REFERENCE1 1
TRUE VALUE 1 VALUE FOUND 1 % RECOVERY1 11 11 11 1
SANPLE SPIKE
LAB SAMPLE ID SPIKE RESULT SAMPLE RESULT AMOUNT ADDED * RECOVERY
DUPLICATES
f . 11 LAB SAMPLE 10 1 RESULT 11 I1 11 11 1
RESULT Z MEAN1
RPO 11111
PREP BLANK
11 BLANK 101111
SAMPLES IN BffTCHi
1 *RESULT
COMMENTS:
,

IEA/CT Group(s):.
Date:__
CORRECTIVE ACTION REPORT
Problem/Question reported by:
Job/Case Number:_;_____________ Sample Number(s):.
Description of Problem: _______- - ____________
Summary of Corrective Action(s):
Is this a recurring Problem?.
Should SOP be modified or updated?.
Cooperative help of the following groups/people is requested:
Approval of Group/Section leader:
Distribution: Section/Group LeaderUab ManagerQA OfficerOther: __________
301402

an environmental testing company200 Monroe TurnpikeMonroe. Connecticut 06468(203)261-4458FAX (203)268-5346
STANDARD OPERATING PROCEDURE
ANALYSIS OF NITRATE AND NITRITE
FOR WATER SAMPLES
WC:050390:0
301403Miramar..-ionda
305-989-0923
Schaurpbgrg,JfJirois
708-705-0740Massdcnusons517-272-5212 201-«28-3I81
Cary.North Carolina919-677-0090
ESS4X junctionVarmorl
302-373-5138

TABLE OF CONTENTS
I.0 Scope and Application
2.0 Summary of Method
3.0 Interferences
4.0 Apparatus and Materials
5.0 Reagents and S tandards
6.0 Sample Collection, Preservation, and Storage
7.0 Procedure
8.0 Quality Control
9.0 Method Performance
10.0 Data Reduction and D ata Handling
II.0 Documentation of Problems
12.0 References
Appendix I: Instrument Schematic
Appendix II: Forms
301404

Nitrate (as NO3- + NO2-)
1.0 SCOPE AND APPLICATION
1.1 The automated cadmium reduction method can determine nitrate and nitrite singly ortogether in potable, surface, and saline waters and domestic and industrialwastewaters. The range is 0.02-2.0 mg N/L, for soil and water samples.
2.0 SUMMARY OF METHOD
2.1 Nitrate is quantatively reduced to nitrite by passage of the sample through acopperized cadmium column. The nitrite (reduced nitrate plus initial nitrite) is thendetermined by diazotizing with sulfanilamide followed by coupling with N-(l-naphthyl) ethylenediamine dihydrochloride. The resulting water soluble dyehas a magenta color which is read at 520 nm. Nitrite alone also can bedetermined by removing the cadmium column.
3.0 INTERFERENCES
3.1 Build up of suspended matter in the cadmium reduction column will restrict sampleflow. Since nitrate-nitrogen is soluble, the sample may be prefiltered.
3.2 Low results would be obtained for samples that contain high concentrations of iron,copper, or other metals. In this method, EDTA is added to the buffer to reduce thisinterference.
3.3 Samples that contain high concentrations of oil and grease should be pre-extractedwith an organic solvent so not to coat the surface of the cadmium,
4.0 APPARATUS AND MATERIALS
4.1 Lachat autoanalyzer system
5.0 REAGENTS
5.1 15 M sodium hydroxide Add 150 g NaOH slowly to 250 mL of nanopure water.CAUTION: The solution will get very hot! Swirl until dissolved, cool and store ina plastic bottle.
5.2 Ammonium chloride buffer, pH = 8.5 - In a 1 L volumetric flask, dissolve 85.0 gammonium chloride (NH4C1) and 1.0 g disodium ethylenediamine tetraacetic aciddihydrate (Na2 EDTA. 2H20) in about 800 ml. Adjust the pH up to 8.5 with 15 Msodium hydroxide. Dilute to volume and invert three times.
5.3 Sulfanilamide color reagent - To a 1 L volumetric flask add about 600 mL ofnanopure water. Then add lOOmL of 85% phosphoric acid (H3P04), 40.0 gsulfanilamide, and 1.0 g N-1-naphthyl-ethylenediamine dihydrochloride (NED).Shake to wet and stir to dissolve (about 20 rnins). Dilute to volume and invertthree times. Store in a dark bottle. This solution is stable for one month.
5.4 Cadmium - Copper Reduction Column - refer to QuickChem method # 10-107-04-1-C.
301405

5.5 Stock Nitrate solution - (2000 mg N/L as NO3-). In a IL volumetric flask dissolve14.44 g potassium nitrate (KNO3) in about 600 mL nano water. Add 2.0 mLchloroform. Dilute to volume and invert three times. This solution is stable for 6months.
5.6 Standard Nitrate solution (10 mg N/L NO3-) In a IL volumetric flask add about600 ml nano water. With a class A pipet, transfer 5.0 ml of stock nitrate solution(2000 mg/L) to volumetric and dilute to mark. Invert three times.
5.7 Nitrate working standards - Dilute as follows:
MLS of ConcentrationIQmg/LStd of Standards
A 50.0 Note: 2.0 mg/LB 20.0 0.8 mg/LC 10.0 Taken to volume with 0.4 mg/L *D 2.5 nano water in 250 mL 0.1 mg/LE 1.0 volumetric flasks. 0.04 mg/LF 0.5 0.02 mg/L
* Where standard C (0.4 mg/L) is used as the check standard.
5.8 Stock Nitrite Solution (2000 mg N/L as NO2-). In a 1 L volumetric flask dissolve9.86 g of sodium nitrite (NaNO2) or 12.14 g of potassium nitrite (KNO2) inapproximately 800 mL water. Add 2 mL chloroform and dilute to volume. KEEPREFRIGERATED!
5.9 Standard Nitrite Solution (10 mg N/L NO2-). In a 1 L volumetric flask add about600 mL nano water. Using a class A 5.0 mL pipet, transfer 5 mL of stock nitritesolution (2000 mg/L) and take to volume.
5.10 Standard Nitrite Solution (1.0 mg N/L NO2-). In a 100 mL volumetric flask pipet,add 10.0 mL of nitrite standard solution (10 mg N/L) and dilute to volume.
5.11 Nitrite working standards - Dilute as follows:
MLS of MLS of Concentration10 mg/L Std 1.0 mg/L Std of Standards
A 50.0 ----- Taken to volume 2.0 mg/LB 20.0 —— with nano water 0.8 mg/LC 10.0 ----- - in250mL 0.4 mg/LD 2.5 —— volumetric flasks 0.1 mg/LE 1.0 ----- 0.04 mg/LF -— 1.0 <-—Taken to volume in 0.005 mg/L
200 mL volumetric
301406

6.0 SAMPLE HANDLING AND PRESERVATION
6.1 Sample to be analyzed for Nitrite should be analyzed as soon as possible. Samplesmay be stored up to 48 hours at 4° C. '
6.2 Samples to be analyzed for Nitrate-Nitrate should be preserved with H2SO4(pH <2) and stored at 4* C. The Nitrate-Nitrite holding time is 28 days from thetime of sampling.
7.0 PROCEDURE
Nitrate + Nitrite: Cycle period: 40 sInject to start of peak period: 22 s Load period: 20 sInject to end of peak period: 58 s Inject period 20 s
Nitrite (no column):Inject to start of peak period: 15sInject to end of peak period: 51s
GAIN:
Gain = 260 x 1
7.10 System Operation
/"""""*" 7.11 Inspect modules for proper connections.
7.12 Turn on power and all modules, except sampler.
7.13 Place reagent feedlines into proper containers. Raise tension levers onpump tube cassettes.
7.14 Stop the pump and place reduction column in the manifold for NO3-. Startthe pump. For NO2-, do not connect the cadmium column.
7.15 Establish a stable baseline. Set zero on colorimeter. Manually inject a highstandard to check gain.
7.16 Place calibration standards and blank in sample tray in descending order ofconcentration followed by unknowns and check standards.
7.17 At end of run turn off the pump and remove reduction column frommanifold and connect ends with a union, taking care to avoid introduction ofair bubbles.
7.18 Turn on the pump and place all feedlines in water. Hush system and pumpdry.
7.19 Turn off pump, all modules and release tension levers on pump tubecassettes.
301407

System Notes: The Cd column efficiency should be above 90% if workingproperly. To check this, inject one or several different nitritestandards followed by one or several different nitrate standards. Fitthe nitrite standards' responses to a line. The ratio of the slope ofthe nitrate/nitrite lines x 100% is the efficiency of the column. If thecolumn is less than 80% efficient, it should be repacked with freshlycopperized Cd (Reagents, 5.).
8.0 QUALITY CONTROL
8.10 All stock standard preparations are logged and coded. All standards are labeledwith the following: analyte, concentration, analyst's initials, and date prepared.
8.20 All chemical should conform to minimum specifications set by the RegeantChemicals Committee of the American Chemical Society. All chemical inventoriesare used on a first in first out basis.
8.30 Tuning and Calibration of Instrument
8.31 The baseline is adjusted to a colorimeter L.ED output of approximately-0.200.
8.32 The high standard is manually injected and the gain set in such a manner thatthe peak height is the size of the background analytical window. The highstandard manual injection is repeated to verify the peak height criteria.
8.33 The instrument is then calibrated with the standards in section 5.7 or 5.11depending on whether nitrate-nitrites or nitrites are being analyzed.
8.40 Initial Calibration Verification (ICV)
Immediately after the instrument has been calibrated, the accuracy of the initialcalibration shall be verified by the analyst of the ICV. The control limit for the ICVis + or -15 percent of the true value.
8.50 Continuing Calibration Verification (CCV)
To ensure calibration accuracy during each analysis run, a mid-range standard mustbe analyzed at a frequency of 10 percent of samples. The standard must beanalyzed at the beginning of the run, after ten samples, and after the last analyticalsample. The same continuing calibration standard must be used throughout theanalysis run. If the deviation of the CCV is greater than the control limit + or - 15percent of the true value, the instrument must be recalibrated and all analyticalsamples analyzed since the last acceptable calibration verification must be re-analyzed.
8.60 Initial Calibration Blank (ICB), Continuing Calibration Blank (CCB), andPreparation Blank (PB) Analyses
A calibration blank must be analyzed after every initial and continuing calibrationverification. If the absolute value blank result exceeds the contract requireddetection limit (CRDL), terminate analysis, correct problem, recalibrate and
30140S

reanalyze all analytical samples run after the last acceptable blank.
At least one preparation blank (or reagent blank) must be analyzed with every batchof twenty samples or less.
8.70 Spike Sample Analysis (S)
The spike sample analysis is designed to provide information about the effect of thesample matrix and measurement methodology. At least one spike sample analysismust be performed on each batch of twenty or fewer samples. Samples identifiedas field blanks cannot be used for spike sample analysis.
If the spike recovery is not within the control limits 75 to 125 percent and thesample concentration does not exceed four times the spiking level, a fresh aliquot ofthe sample is to be spike and analyzed.
Spike recoveries are calculated as follows:
% Recovery = (SSR-SR) x 100SA
where SSR = Spiked Sample ResultSR = Sample ResultSA = Spike Added
When sample concentration is less than the instrument detection limit, use SR = 0for calculating percent recovery.
8.80 DUPLICATES
One duplicate must be analyzed from each batch of twenty or fewer samples.Samples identified as field blanks cannot be used for duplicate analysis. Therelative percent differences (RPD) are calculated as follows:
RPD = rs-m x 100(S + D)/2
where RPD = Relative Percent DifferenceS = Original Sample ValueD = Duplicate Sample Value
x
A control limit of 20 percent for RPD shall be used for original and duplicatesample values greater than or equal to five times the CRDL. If one result is above5x the CRDL level and the other is below, the difference between the two valuesshould be no more than the CRDL. If both sample values are less than theDDL, the RPD is not calculated,
8.90 LABORATORY CONTROL SAMPLE (LCS) ANALYSIS
One independent standard (LCS) is to be analyzed with each time the instrument is
301409

calibrated. The control limits established for the LCS are + or - 15 percent of thetrue value.
8.10 INSTRUMENT DETECTION LIMIT (IDL) DETERMINATION
Before any field samples are analyzed, the instrument detection limits must bedetermined quarterly.
The instrument detection limits shall be determined by multiplying by three, thestandard deviations obtained from the analysis of a standard solution at aconcentration 3x-5x the CRDL, with seven consecutive measurements.
8.11 INSTRUMENT MAINTENANCE
Separate maintenance logs are kept for each instrument.
9.0 METHOD PERFORMANCE
9.1 An instrument detection limit study performed on 03/04/90 yielded a 0.02 mg/Las N detection limit fir nitrate-nitrite.
9.2 The last 25 sample matrix spikes (0.400 mg/L as N) average recovery was 96.1percent as of 01/12/90. The average RPD over the same period was 6.12 percent
10.0 DATA REDUCTION AND DATA HANDLING
10.1 All sample ID's and dilution factors are entered into instrument controlling PC andare printed out with the tabular results.
10.2 All results are entered into LIMS for reporting and sample tracking purposes. Thetabular results are filed by analyte and in chronological order in the raw data file.
10.3 The sample QA/QC is repotted on the Inorganics QA/OC Summary form (seeAppendix II).
10.4 Technical Data Review
The technical data review includes verifying that samples were preserved andholding times were met. All standards and batch quality control are checked toinsure that they were within criteria. All results entered into LIMS are checked fortranscription error against the raw data.
11.0 DOCUMENTATION OF PROBLEMS
11.1 Corrective Action Reports - must be filed if any problems are associated with theanalysis (see Appendix H).
11.2 Case Narratives - should include any deviation from this SOP or any difficultiesencountered in the procedure.
301410

12.0 REFERENCES
12.1 Methods for QUIKCHEM Automated Ion Analyzer, Lachat Instruments, Method10-107-04-1-C, 1986.
12.2 Methods for Chemical Analysis of Water and Wastes, EPA 600, 1986.
301411

Appendix I
301412

QuikChem Method No. 10-107-04-1-CPage 9
Manifold Diagram:
Nitrate •+• Nitrite
i PUKP FLQHfro* waterfroH washbath drain
white
yellow/
CARRIERorangeSAMPLEsrreen
v to washr bath fill
SulfanilaaUe Color Reagents*\ Nitrite
Awnonia Buffer i _ - _ i————————— _ —————— i —— oi« or ————1 2" '— ° — /<\/^~~~ — -i ' |— i
Cd CoIuMn2 ___ 3 Nitrate + Nitrite/—A /v^ \ ., S*MpIe Loop - 17 c\ ^ / , k to pnnt & at Filter: 5216 \ .,., /a ' next value or waste
N
B ni flowee;!?
CARRIER is water.
1" is 70.0 cm of tubing on2" is 135 cm of tubing on2.5" is 168 cm of tubing on3" is 202 cm of tubing on4" is 255 cm of tubing on8" is 550 cm of tubing on
a 1 in coil supporta 2 in coil supporta 2.5 in coil supporta 3 in coil supporta 4 in coil supporta 8 in coil support
Heated tubing is shown inside a box with the temperature next tothe box. Heated tubing is 650 cm unless otherwise specified.
All manifold tubing is 0.8 mm (0.032 in) i.d. This is 5.2 uL/cm.
Notes: A new manifold includes two packed cadmium columns.
MANIFOLD DIAGRAM REVISION DATE: 30 December 1986
301413

Appendix II
301414

IEA/CT Grou'p( s)
Date:__
CORRECTIVE ACTION REPORT
Problem/Question reported by:.
Job/Case Number:.;_________________ Sample Nurober(s):.
Description of Problem: _______- - ____________
Summary of Corrective Action(s):
Is this a recurring Problem?.
Should SOP be modified or updated?.
Cooperative help of the following groups/people is requested:
Approval of Group/Section leader:,
Distribution: Section/Group LeaderLab ManagerQA OfficerOther: ____________
301415

INORGANICS QA/QC SUMMARY
Analyte:. Date:
Notebook Ref:
SPIKES
Lab Sample 10 Spike Result Sample Result Amount Added
•
Percent Recovery
\
DUPLICATES
ab Sample ID Result 1 Result 2 Mean RPD
BLANKS
Blank ID Result
Samples In Batch: Comments:
361416

•o•om•p:
xCO
301417
O

SECTION III: QUALITY ASSURANCE PROJECT PLAN
APPENDIX B
ANALYTICAL PARAMETERS AND QUANTITATION LIMITS
301418GERAOHTY 3 MILLER. INC.

APPENDIX B
ANALYTICAL PARAMETERS AND QUANTITATION LIMITSlll-B-1
Volatile Organic Compounds
ChloromethaneBromomethaneVinyl chlorideChloroethaneMethylene chlorideAcetoneCarbon disulfide1 , 1 -Dichloroethene1,1-Dichloroethane1,2-Dichloroethene (total)Chloroform1 ,2-Dichloroethane2-Butanone1,1,1 -TrichloroethaneCarbon tetrachloroethaneVinyl acetateBromodiohloromethane1 ,2-Dichloropropanecis-1 ,3-DichloropropeneTrichloroetheneDibromochloromethane1 , 1 ,2-TrichloroethaneBenzenetrans-1 ,3-DichloropropeneBromoform4-Methyl-2-pentanone2-HexanoneTetrachloroetheneToluene1 , 1 ,2,2-TetrachloroethaneChlorobenzeneEthyl benzeneStyreneXylenes (total)
CAS Number
74-87-374-83-975-01-475-00-375-09-267-64-175-15-075-35-475-34-3540-59-067-66-3107-06-278-93-371-55-656-23-5108-05-475-27-478-87-5
10061-01-579-01-6124-48-179-00-571-43-2
10061-02-675-25-2108-10-1591-78-6127-18-4108-88-379-34-5108-90-7100-41-4100-42-51330-20-7
EstimatedQuantitation Limit
Water'(ug/L)
1.01.01.01.02.05.01.01.01.01.01.01.05.01.01.01.01.01.01.01.01.01.01.01.01.05.05.01.01.01.01.01.01.01.0
CAS Chemical abstract service.* Analysis by USEPA Contract Laboratory Program Statement of Work for Low Concentration Water for Organic Analysis, 4/90.** Analysis by USEPA Contract Laboratory Program Statement of Work for Organic Analysis, 6/91.*** Analysis by USEPA Contract Laboratory Program Statement of Work for Inorganic Analysis, 3/90.
ug/L Micrograms per liter.mg/L Milligrams per liter.
301419TARAPP-B.XLS
GERAGHTY & MILLER. INC.

APPENDIX B
ANALYTICAL PARAMETERS AND QUANTITATION LIMITS
lll-B-2
Semivolatile Organic Compounds CAS Number
EstimatedQuantitation Limit
Water**
Phenolbis(2-Chloroethyl)ether2-Chlorophenol1 ,3-Dichlorobenzene1 ,4-DichlorobenzeneBenzyl alcohol1 ,2-Dichlorobenzene2-Methylphenolbis(2-Chloroisopropyl)ether4-MethylphenolN-Nitroso-di-n-dipropylamineHexachloroethaneNitrobenzeneIsophorone2-Nitrophenol2,4-DimethylphenolBenzole acidbis(2-Chloroethoxy)methane2,4-Dichlorophenol1 ,2,4-TrichlorobenzeneNaphthalene4-ChloroanilineHexachlorobutadiene4-Chloro-3-methylphenol2-MethylnapthaleneHexachlorocyclopentadiene2,4,6-Trichlorophenol2,4,5-Trichlorophenol2-Chloronaphthalene2-NitroaniiineDimethylphthalateAcenaphthylene2,6-Dinitrotoluene3-NitroanilineAcenaphthene2,4-Dinitrophenol4-Nitrophenol
108-95-2111-44^95-57-8541-73-1106-46-7100-51-695-50-195-48-7108-60-1106-44-5621-64-767-72-198-95-378-59-188-75-5105-67-965-85-0111-91-1120-83-2120-82-191-20-3106-47-887-68-359-50-791-57-677-47-488-06-295-95-491-58-788-74-4131-11-3208-96-8606-20-29909-283-32-951-28-5100-02-7
10101010101010101010101010101010501010101010101010101050105010101050105050
CAS Chemical abstract service.* Analysis by USEPA Contract Laboratory Program Statement of Work for Low Concentration Water for Organic Analysis, 4/90.** Analysis by USEPA Contract Laboratory Program Statement of Work for Organic Analysis, 6/91.*** Analysis by USEPA Contract Laboratory Program Statement of Work for Inorganic Analysis, 3/90.
ug/L Micrograms per liter.mg/L Milligrams per liter.
TARAPP-B.XLS 301420GERAGHTY & MILLER, INC.

APPENDIX B
ANALYTICAL PARAMETERS AND QUANTITATION LIMITS
lll-B-3
Semivolatile Organic Compounds
Dibenzofuran2,4-DinitrotolueneDiethylphthalate4-Chlorophenyl-phenyletherRuorene4-Nitroaniline4,6-Dinitro-2-methylphenolN-nitrosodiphenylamine4-Bromophenyl-phenyletherHexachlorobenzenePentachlorophenolPhenanthreneAnthraceneDi-n-butylphalateRuoranthenePyreneButylbenzylphthalate3,3'-DichlorobenzidineBenzo(a)anthraceneChrysenebis(2-Ethylhexyl)phthalateDi-n-octylphthalateBenzo(b)fluorantheneBenzo (k)f luorantheneBenzo(a)pyrenelndeno(1 ,2,3-cd)pyreneDibenz(a,h)anthraceneBenzo(g,h,i)perylene
CAS Number
132-64-9121-14-284-66-2
7005-72-386-73-7100-01-6534-52-186-30-6101-55-3118-74-187-86-585-01-8120-12-784-74-2206-44-0129-00-085-68-791-94-156-55-3
218-01-9117-81-7117-84-0205-99-2207-08-950-32-8193-39-553-70-3191-24-2
EstimatedQuantitation Limit
Water**(ug/L)
10101010105050101010501010101010102010101010101010101010
PCS Compounds
Aroclor-1016Aroclor-1221Aroclor-1232Aroclor-1242Aroclor-1248Aroclor-1254Aroclor-1260
12674-11-211104-28-211141-16-553469-21-912672-29-611097-69-111096-82-5
0.50.50.50.50.51.01.0
CAS Chemical abstract service.* Analysis by USEPA Contract Laboratory Program Statement of Work for Low Concentration Water for Organic Analysis, 4/90.** Analysis by USEPA Contract Laboratory Program Statement of Work for Organic Analysis, 6/91.*** Analysis by USEPA Contract Laboratory Program Statement of Work for Inorganic Analysis, 3/90.
ug/L Micrograms per liter.mg/L Milligrams per liter.
TARAPP-B.XLS 301421GERAGHTY & MILLER. INC.

APPENDIX B
ANALYTICAL PARAMETERS AND QUANTITATION LIMITS
lll-B-4
/•*"*"•>
Inorganic Parameters
AntimonyArsenicBerylliumCadmiumChromiumCopperLeadMercuryNickelSeleniumSilverThalliumZincCyanide
Leachate Indicator Parameters
EstimatedQuantitation Limit***
(ug/L)
60105510253
0.240510102010
USEPA Method EstimatedReference Number Quantitation Limit
Total dissolved solidsAmmoniaChlorideTotal hardnessNitrateSulfateAlkalinityIronPotassiumSodiumpH (field)Specific conductance (field)Temperature (field)
160.1350.2325.2130.2353.2375.3310.1CLPCLPCLP--
5mg/L0.04 mg/L
3mg/L1mg/L
0.1 mg/L10 mg/L1mg/L
100ug/L5000 ug/L5000 ug/L
0.1 unit0.1 umhos/cm0.1 degrees C
CAS Chemical abstract service.* Analysis by USEPA Contract Laboratory Program Statement of Work for Low Concentration Water for Organic Analysis, 4/90.** Analysis by USEPA Contract Laboratory Program Statement of Work for Organic Analysis, 6/91.*** Analysis by USEPA Contract Laboratory Program Statement of Work for Inorganic Analysis, 3/90.
ug/L Micrograms per liter.mg/L Milligrams per liter.
TARAPP-B.XLS301422
GERAGHTY 6? MILLER. INC.

09
II
301423

SECTION IV
HEALTH AND SAFETY PLANSECOND OPERABLE UNIT
REMEDIAL INVESTIGATIONSYOSSET LANDFILL, SYOSSET, NEW YORK
301424GERAGHTY & MILLER, INC.

CONTENTS
SECTION IV: HEALTH AND SAFETY PLANPage
I.0 INTRODUCTION . . . . . . . . . . . . . . . . . . . . . . . . . . . . . . . . . . . . . . . . . . IV-1
2.0 RESPONSIBILITIES . . . . . . . . . . . . . . . . . . . . . . . . . . . . . . . . . . . . . . . . . IV-2
3.0 SITE DESCRIPTION . . . . . . . . . . . . . . . . . . . . . . . . . . . . . . . . . . . . . . . . IV-3
4.0 PLANNED FIELD ACTIVITIES . . . . . . . . . . . . . . . . . . . . . . . . . . . . . . . IV-4
5.0 PERSONNEL TRAINING . . . . . . . . . . . . . . . . . . . . . . . . . . . . . . . . . . . . IV-5
6.0 HAZARD EVALUATION . . . . . . . . . . . . . . . . . . . . . . . . . . . . . . . . . . . . IV-6
6.1 PHYSICAL HAZARDS . . . . . . . . . . . . . . . . . . . . . . . . . . . . IV-66.2 CHEMICAL HAZARDS . . . . . . . . . . . . . . . . . . . . . . . . . . . IV-6
7.0 AIR MONITORING . . . . . . . . . . . . . . . . . . . . . . . . . . . . . . . . . . . . . . . . IV-7
8.0 ACTION LEVELS . . . . . . . . . . . . . . . . . . . . . . . . . . . . . . . . . . . . . . . . . . IV-8
9.0 LEVELS OF PROTECTION . . . . . . . . . . . . . . . . . . . . . . . . . . . . . . . . . . . IV-10
10.0 SITE CONTROL . . . . . . . . . . . . . . . . . . . . . . . . . . . . . . . . . . . . . . . . . . . IV-12
II.0 PERSONNEL DECONTAMINATION . . . . . . . . . . . . . . . . . . . . . . . . . . . IV-13
12.0 SAFE WORK PRACTICES . . . . . . . . . . . . . . . . . . . . . . . . . . . . . . . . . . . IV-14
12.1 HEAT STRESS . . . . . . . . . . . . . . . . . . . . . . . . . . . . . . . . . . IV-15
13.0 EMERGENCY PLAN . . . . . . . . . . . . . . . . . . . . . . . . . . . . . . . . . . . . . . . . IV-16
13.1 EMERGENCY TELEPHONE NUMBERS . . . . . . . . . . . . . . . . . . . IV-1713.2 DIRECTIONS TO THE HOSPITAL . . . . . . . . . . . . . . . . . . . . . . . . . IV-17
14.0 REFERENCE . . . . . . . . . . . . . . . . . . . . . . . . . . . . . . . . . . . . . . . . . . . . . . IV-18
301425GERAGHTY & MILLER. INC.

APPENDICES
A. Site Visitors Log.
B. Tailgate Safety Meeting Form.
C. Accident Reporting Form, OSHA 101.
D. Utilities and Structures Checklist.
nyO»«l\SYOSSE2.TOC
301426GERAGHTY & MILLER. INC.

SECTION IV
HEALTH AND SAFETY PLANSECOND OPERABLE UNIT
REMEDIAL INVESTIGATIONSYOSSET LANDFILL, SYOSSET, NEW YORK
1.0 INTRODUCTION
This Health and Safety Plan (HASP) has been developed to address the potentialphysical and chemical hazards that field personnel may face while performing the SecondOperable Unit (OU-2) Remedial Investigation (RI) of the Syosset Landfill. This HASP hasbeen developed to meet the requirements of the Occupational Safety and HealthAdministration (OSHA) regulation, Title 29, Code of Federal Regulations, Part 1910.120 (29CFR 1910.120), "Hazardous Waste Operations and Emergency Response." It is intendedfor the protection of the workers and establishes procedures to minimize workers' exposuresthrough the use of personal protective equipment and safe work practices.
S01427GERAGHTY & MILLER, INC. ^

IV-2
2.0 RESPONSIBILITIES
The field hydrogeologist is designated as the site safety officer (SSO) who will beresponsible for implementing the safe work practices and procedures that are establishedin this HASP. Whenever the SSO must leave the site while the work is in progress, analternate SSO will be designated to ensure that the HASP will continue to be followed. TheSSO will report all health and safety matters to the project manager who has responsibilityfor overseeing the planned field activities. The project health and safety coordinator(Geraghty & Miller Northeast Regional Health and Safety Manager) will be available on anas-needed basis. The project director for this investigation has overall responsibility forassuring that the HASP is implemented properly.
o n i A p oGERAGHTY & MILLER, INC. O Ul 3 £ O

IV-3
3.0 SITE DESCRIPTION
The Syosset Landfill encompasses approximately 38 acres and is located in the Townof Oyster Bay, Syosset, New York. The topography of the landfill is relatively flat and issimilar in elevation to the surrounding area. The landfill is surrounded by a 6-foot highcyclone fence, which limits access to it. A residential area and the South Grove ElementarySchool border the site to the north and northeast. The proposed ground-water monitoringwells are located in this area and the proposed gas monitoring wells are located on GreatEastern Printing Company property located southwest of the landfill (Figure 1). The OU-2RI will also present and evaluate gas monitoring results obtained from on-site gas ClusterWells CW-2, 4, 5, 6, 7, and 8 which will be installed and monitored during the OU-1Remedial Design Program (see Figure 1). Additional details on the site description and itshistory are provided in the OU-1 (on-site) RI report (Geraghty & Miller, Inc. 1989).
301429GERAGHTY & MILLER. INC.

IV-4
4.0 PLANNED FIELD ACTIVITIES
The following field tasks will be performed during the OU-2 RI.
• Installation of on-site and off-site ground-water monitoring wells.• Installation of off-site gas monitoring wells.• Sampling of new and existing ground-water monitoring wells.• Monitoring of new and existing gas monitoring wells.
Detailed descriptions of the RI field program are contained in the Sampling andAnalysis Plan (SAP) (Section II).
GERAGHTY# MILLER. INC. 301430

IV-5
5.0 PERSONNEL TRAINING
Anyone entering the work zone during the RI field program will be required to havecompleted an OSHA-required initial health and safety training course (24 or 40 hours). Inaddition, the project manager will have completed the 8-hour required supervisor andmanager's class. Each worker must also have completed the 8-hour refresher course, asrequired.
301431
GERAGHTY & MILLER, INC.
IV-6
6.0 HAZARD EVALUATION
The potential physical and chemical hazards associated with the OU-2 RI fieldprogram were evaluated based on the existing data base primarily from the OU-1 RI andthe field tasks that will be performed during the OU-2 RI.
6.1 PHYSICAL HAZARDS
The physical hazards associated with the planned field activities include the potentialfor workers being struck by falling objects while working near the drill rig; being splashedwith liquids during well installation and well sampling; slips or falls; and noise exposureduring the installation of monitoring wells. Heat stress is another potential physical hazardthat may occur during the summer months. Finally, underground utilities will be marked outbefore drilling begins and measures will also be taken to monitor for the potential presenceof landfill gas.
6.2 CHEMICAL HAZARDS
The potential chemical hazard of greatest concern with respect to the planned fieldactivities is the possible inhalation of vapors containing volatile organic compounds (VOCs).VOCs were detected in the low parts per billion (ppb) range in some of the ground-watermonitoring wells and/ or gas monitoring wells during the OU-1 RI but not at consistentconcentrations or distributions and may not be related to the landfill. Notwithstanding thelow detection of VOCs, protective measures will be followed to ensure worker andcommunity health and safety during the OU-2 RI field program.
GERAGHTY & MILLER, INC. 301432

IV-7
7-0 AIR MONITORING
Air monitoring for VOCs and the Lower Explosive Limit (LEL) will be conductedat this site during the ground-water and gas well installation programs to ensure that theworkers are adequately protected from the potential inhalation of vapors containing VOCsand explosion hazard. A photoionization detector (PID) such as a TIP or HNU meter, willbe used for monitoring VOCs. These instruments are designed to measure VOCs in air inthe low parts per million (ppm) range. The PID will be calibrated each morning before use(see Appendix E of the SAP [Section II]). Calibration records will be maintained. In orderto quantify specific compounds, Draeger tubes will be used (see Section 8.0 [Action Levels]of this HASP). A combustible gas indicator will be used to monitor the air inside eachboring as drilling proceeds (cased borings and auger borings only) to determine the explosionpotential in each boring.
301433GERAGHTY & MILLER. INC.

IV-8
8.0 ACTION LEVELS
Although VOCs were detected in some of the on-site ground-water monitoring wells,the concentrations were similar to background water-quality conditions for the area(Geraghty & Miller, Inc. 1989). Similarly, VOCs that were detected in some of the on-sitegas monitoring wells were not detected at a consistent concentration or distribution. Asstated in the Section 9.0 of this HASP, work will be conducted under Level D protection.However, protective measures will be followed to minimize the exposure of field personnelto the potential presence of these compounds in the work zone. This will be accomplishedby monitoring the air in the breathing zone for VOCs using a PID. A summary of the VOCsthat were found at this site and their current occupational exposure limits is presented inTable 5.
The following procedure for air monitoring has been established for off-site groundwater study and subsurface gas study to evaluate whether actual field conditions necessitatean upgrade in the level of protection. This procedure entails the establishment of actionlevels for the VOCs detected at the site having the lowest occupational exposure limits (seeTable 5). These compounds are vinyl chloride and benzene. An action level of 1 ppm PIDneedle deflection for a sustained period of 5 minutes in the worker's breathing zone hasbeen established for the presence of vinyl chloride and benzene. If the action level isexceeded, Draeger tubes for vinyl chloride and benzene will be used to determine whethereither compound is present. If the action level is exceeded for either compound, then thework will be discontinued. The level of protection will be upgraded to Level C before workresumes. This level requires that a full-face air purifying respirator equipped with organicvapor cartridges be used. Draeger tubes for vinyl chloride and benzene tubes will be usedevery 30 minutes to measure the concentrations of these compounds. If the concentrationof both compounds are below their respective action levels, then downgrading to Level Dwill be considered.
GERAGHTY & MILLER, INC.

IV-9
Measurements will be taken during the drilling of each well boring for the presenceof explosive vapors using a combustible gas indicator. Work will be discontinued if themeter readings are 20 percent of the LEL or greater at the borehole opening. Work willnot resume until the meter reading drops to below 20 percent of the LEL. If the readingdoes not drop to below 20 percent within a reasonable period of time (e.g., 1/2 hour); thenwater will be added to the borehole to suppress the explosive vapors.
301435GERAGHTY & MILLER, INC.

IV-10
9.0 LEVELS OF PROTECTION
Based upon the hazard evaluation results, all tasks will be performed in Level Dprotection. In the event that the established action level for vinyl chloride and/or benzeneis exceeded, the level of protection will be upgraded to Level C (see Section 7.0 [AirMonitoring] of this HASP). The following is a description of the personal protectiveequipment required for each level:
Level D
Level C
Hard hat.Disposable coveralls (optional).Safety glasses, goggles, or faceshield.Steel-toe and shank, chemical-resistant boots.Chemical-resistant gloves (optional except when handling soil, sediment orsurface water).Hearing protection, NRR of 35 decibels (mandatory during drilling).
Hard hatDisposable coveralls (optional).Safety glasses, goggles, or faceshield.Steel-toe and shank, chemical-resistant boots.Chemical-resistant gloves (optional except when handling soil, sediment orsurface water).Hearing protection, NRR of 35 decibels (mandatory during drilling).Full face air purifying respirator equipped with organic vapor cartridges
301435GERAGHTY & MILLER. INC.

IV-11
If the noise levels are found to be disrupting to the community, noise reductionmeasures will implemented.
301437GERAGHTY & MILLER, INC.
IV-12
10.0 SITE CONTROL
Prior to the start of the field activities, the SSO will be responsible for the designationof the work, support, and clean zones. The work zone will be an area surrounding theimmediate work being performed where the greatest potential hazards exist. Only thenecessary workers required to perform the work will be permitted in this zone. If there ismore than one work zone at any time, then a communication network (walkie-talkies) willbe established. A support zone will be established for equipment storage and personneldecontamination. A clean zone will be established for site control of visitors, equipmentdeliveries, and communications.
For the off-site work activities, the SSO will take additional measures to secure thework area by barricading the area and/or sign posting, in order to deter unauthorizedpersonnel from entering the work area.
301438
GERAGHTY & MILLER. INC.

IV-13
11.0 PERSONNEL DECONTAMINATION
A personnel decontamination station will be established in the support zone.Personnel decontamination will consist of washing potentially contaminated items, such asboots and gloves with a mild soap and water solution and a water rinse. Decontaminationwater will be disposed at a designated location at the landfill. All personnel leaving thework zone will go though the decontamination process before leaving the work area.
301439GERAGHTY & MILLER. INC.

IV-14
12.0 SAFE WORK PRACTICES
An itemized summary of the safe work practices that will be followed during the RIfield program is provided below:
• Anyone entering the work zone must have completed an OSHA-required initialhealth and safety training course. This includes 24 or 40 hours of initial training andan 8-hour annual refresher training course.
• All Geraghty & Miller site personnel are participants of the company's medicalsurveillance program.
• A copy of the HASP will be available for reference at the site during the plannedfield activities.
• Dust suppression, using a water spray, will be used when needed to reduce airborneparticulates during the field activities.
• A pre-entry, tailgate safety meeting will be conducted prior to the start of each taskto discuss the associated hazards.
• The SSO will inform all subcontractors of the potential hazards associated with thesite and the planned field activities. A copy of the HASP will be made available fortheir review.
• No eating, drinking, or smoking will be permitted in the work and support zones.
• No sources of ignition, such as matches or lighters, will be permitted in the work and
support zones.
301440GERAGHTY & MILLER. INC.

IV-15
• Before the field program begins, the Police Department, Fire Department, andhospital will be notified when and where the work will be conducted.
• The buddy system will be used in all work areas.
• During hazardous weather conditions, such as lightning and thunder storms, work willcease immediately.
12.1 HEAT STRESS
As portions of this job may be conducted during the summer months when ambienttemperatures may be high, the following procedures will be followed to recognize andprevent heat stress:
• The SSO will monitor the activities of the workers and the conditions of thework environment.
• The SSO will monitor the workers for initial signs of heat stress, which includedizziness, nausea, inability to concentrate, impaired performance, and loss ofcoordination.
• The number of rest periods will be increased. The SSO will designate restareas in shaded areas and when possible in air conditioned environments, suchas trailers and cars.
• Potable water will be available and all workers will be encouraged to drinkthroughout the day.
• Adjustment of the work schedule will be made, when possible, to conductlabor-intensive tasks during the early morning or later afternoon hours.
301441GERAGHTY & MILLER, INC.

IV-1613.0 EMERGENCY PLAN
Verbal communications may be difficult at times due to personal protectiveequipment and noise. A universal set of hand signals will then be used. They are asfollows:
Hand gripping throat: Can't breathe.
Grip partner's wrist orplace hands around waist: Leave work area immediately.
Hand on top of head: Need assistance.
Thumbs up: OK. I'm all right.
Thumbs down: No. Negative.
All job-related injuries and illnesses will be reported to the SSO. If medical attentionis needed, the injured worker will be decontaminated, if possible, prior to leaving the site.The SSO will investigate the cause of the accident and corrective measures will be takenbefore the work can resume. It will be the responsibility of the SSO to complete theaccident reporting form, OSHA 101, attached to this section for all injuries. The completedOSHA 101 form will be forwarded to the office health and safety manager within 6 days forrecording into the OSHA 200 log. In the event of a fatality or five or if more workers arehospitalized as a result of a single incident, the SSO will contact the office health and safetymanager immediately for OSHA reporting purposes.
301442GERAGHTY & MILLER, INC.

IV-17
13.1 EMERGENCY TELEPHONE NUMBERS
Police - 911Fire - 911Syosset Hospital - 496-6500
13.2 DIRECTIONS TO THE HOSPITAL
From the work areas, on-site and off-site, proceed to South Oyster Bay Road.Proceed north on South Oyster Bay Road to Jericho Turnpike. Proceed west on JerichoTurnpike, approximately 1/2 mile and Syosset Hospital will be on the right-hand side of theroad. These directions will be outlined on a local street map with a copy of this map postedat each drilling location.
301443GERAGHTY & MILLER, INC.

IV-18
14.0 REFERENCE
Geraghty & Miller, Inc. 1989. Interim Remedial Investigation Report, Syosset Landfill,Syosset, New York. August 1989.
301444GERAGHTY & MILLER, INC.

ino
OCO

SECTION IV: HEALTH AND SAFETY PLAN
APPENDIX A
SITE VISITORS LOG
GERAGHTY & MILLER, INC. 30 1 4 4 B

SITE VISITORS LOGTHE UNDERSIGNED VISITORS REQUIRE ENTRANCE TO THE EXCLUSION ZONE
AND HAVE THOROUGHLY READ THE HEALTH AND SAFETY PLANS, UNDERSTANDTHE POTENTIAL HAZARDS AT THE SITE AND THE PROCEDURES TO MINIMIZEEXPOSURE TO THE HAZARDS, WILL FOLLOW THE DIRECTION OF THE SITEHEALTH AND SAFETY MANAGER, AND WILL ABIDE BY THE HEALTH AND SAFETYPLAN.
NAME (print) COMPANY DATE SIGNATURE
3A3VUFRM
301447

•o•oraoxCD
301443
O

SECTION IV: HEALTH AND SAFETY PLAN
APPENDIX B
TAILGATE SAFETY MEETING FORM
GERAGHTY & MILLER. INC. M _301449

Ccraghty A Miller .
TAILGATE SAFETY MEETING
Prepared byClient _______________________ Project __Date _________________________ Project Numberwork Location _____________________Type of Work to be Done
SAFETY TOPICS PRESENTEDChemical Hazards
Physical Hazards/Underground Utilities
Protective Clothing/Equipment
Special Equipment _Emergency Procedures
Hospital/Clinic _____________________ Phone ( ).Paramedic Phone ( )_______________
Hospital Address _____________________________other _____________________________________
ATTENDEESNAME PRIMTED SIGNATURE
Meeting Conducted ByMane Printed Signature
Mote: This tailgate safety form must b« completed daily.
301450
/ APPENDIX C
LO
OCO

SECTION IV: HEALTH AND SAFETY PLAN
APPENDIX C
ACCIDENT REPORTING FORM, OSHA 101
GERAGHTY & MILLER. INC. 30145-

OCCUPATIONAL SAFETY A.NU HSALTH____________________________________OSHA FORM NO. 101
REGULATIONS AND PROCH3t,"R£S
OSHA No. 101 Form approvedCase or File No. ......———— 0MB No. 44R 1453
Supplementary Record of Occupational Injuries and IllnessesEMPLOYER
1. Name .______.______.————————.......——.————————————.................2. Mail address ___—————————————————————-......................................
(No. tad street) (City or town) (Sute)3. Location, if different from mail address ———————————.......................——————....
INJURED OR ILL EMPLOYEE4. Name _._____...........__...._-.__—-.— Social Security No. ......—..........
(First a»me> (Middle name) (La»t name)5. Home address .__.......________...————•---——————-.—•—-—————-•—....—...
(No. tad itreet) (City or town) (Sute)6. Age ________ 7. Sex: Male__————— Female———————— (deck one)8. Occupation __._____.__._......___._....—..........—.....—...——...——.......
(Eater regular job title, not the specific activity he wu performing at time of injury.)9. Department ——...._.........—.....—...—————.....—....—..........——..——.————
<Eater name of department or division ia which the injured penoa ii regularly employed, eventhough he may have beea temporarily working ia another department at the time of injury.)
THE ACCIDENT OR EXPOSURE TO OCCUPATIONAL ILLNESS10. Place of accident or exposure .....—..........—-..—..-—...................................
(No. aad street) (City or tow») (Scat*)If accident or exposure occurred on employer's premises, give address of plant or establishment ia whichit occurred. Do not indicate department or division within the plant or establishment If accident oc-curred outside employer's premises at an identifiable address, give that address. II it occurred on a pub*lie highway or at any other place which cannot be identified by number and street, please provide placereferences locating the place of injury as accurately as possible.
11. Was place of accident or exposure on employer's premises? .............. (Y*tor No)12. What was the employee doing when injured? ———.—......—.—.........———————————
(Be specific. If he was using tools or equipment or handling material,
name them and tell what he wat doing with them.)
13. How did the accident occur?(Describe fully the treats which retailed in the injury or occupational illnesa. Tell what
happened tod how it happened. Name any objects or substances involved aad tell how they were involved. Give
full details on all factors which led or contributed to the accident. Use separate sheet for additional space.)OCCUPATIONAL INJURY OR OCCUPATIONAL ILLNESS
14. Describe the injury or illness in detail and indicate the part of body affected. ..——————......——(e.g.: imputation of right indet finger
at second joint; fracture of ribs: lead poisoning; dermatitis of left hand, etc.)15. Name the object or substance which directly injured the employee. (For example, the machine or thing
he struck against or which struck him; the vapor or poison he inhaled or swallowed; the chemical or ra-diation which irritated his skin; or in cases of strains, hernias, etc., the thing he was lifting, pulling, etc.)
16. Date of injury or initial diagnosis of occupational illness —————————————.——————————•(Dau)
17. Did employee die? ——————_ (Ye* or N«)OTHER
18. Name and address of physician ..............—_..............................-.—-..-...19. If hospitalized, name and address of hospital ......._-_..-__—_---_._—————————-
Change t
Date of report ——————...— Prepared by ..Official position _........................
56.1
301453

mSxD
301454

SECTION IV: HEALTH AND SAFETY PLAN
APPENDIX D
UTILITIES AND STRUCTURES CHECKLIST
301455GERAGHTY & MILLER. INC.

^PTGERAGHTY? MILLER, INC.
Ground- Water Consultants
UTILITIES AND STRUCTURES CHECKLISTProject:
Location:
Prepared by:
____Date:Instructions. This checklist has to be completed by a Q&M staff member as a safety measure to insure that all undergroundutility lines, other underground structures as well as above-ground power lines are clearly marked out in the area selectedfor boring or excavation. DRILLING OR EXCAVATION WORK MAY NOT PROCEED UNTIL LINES ARE MARKED ANDTHIS CHECKLIST HAS BEEN COMPLETED. Arrangements for underground utility markouts are best made at the time ofthe preliminary site visit to allow client and/or utility company sufficient time. Keep completed checklist and maps onsite;send copy to Project Manager.Assignment of Responsibility. Client is responsible for having underground utilities and structures located and marked.Preferably, the utilities themselves should mark out the lines.Drilling or Excavation Sites. Attach a map of the property showing the proposed drilling or excavation site (or if sites arewidely separated, several maps) clearly indicating the area(s) checked for underground utilities or underground structuresand the location of above-ground power lines.Utilities and Structures „_
NotType
Petroleum products lineNatural gas lineSteam lineWater lineSewer lineStorm drainTelephone cableElectric power lineProduct tankSeptic tank/drain fieldOverhead power line
n,-.a — aritKfBSOfn PTMMflt Howltarfcad?')
1) Flags, paint on pavement, wooden stakes, etc.
Name and affiliation of person who marked out underground lines or structures.
NAME ORGANIZATION
Emergency ProceduresPersons at site or facility to contact in case of emergency1. _______________________________ Phone2. _______________________________ Phone
PHONE
Fire Dept.: Phone
Utility: Phone __Utility: PhoneDirections to nearest hospital (describe or attach map).
Ambulance: PhoneUtility: Phone __Utility: Phone __
G&M form 26 11-87 Soulhprint 87-2646
301456

-f•>-•CD:,r-:mCO
301457

Table 1. Sun , the Sampling and Analytical Program for the Second Operable Unit Remedial Investigation, Syosset Lan. sset, New York.
Data CollectionActivities
Monitoring WellInstallation
Monitoring WellInstallation withGround-WaterSampling
Monitoring WellInstallation withGround-WaterSampling
Ground-WaterSampling
Ground-WaterSampling
Ground-WaterSampling
Landfill GasMeasurements
Water-LevelMeasurements
GeophysicalLogging
SampleMedia Location
Ground Water See SAP
Ground Water See SAP
Ground Water See SAP
Ground Water See SAP
Ground Water See SAP
Ground Water See SAP
Landfill Gas See SAP
Ground Water See SAP
Unconsolidated DeepSediments Monitoring Wells
Number of AnalyticalSamples/Data Points* Analyses Level"
11 Not applicable Not applicable
See SAP VOC Screening Level IField Leachate Parameters
See SAP Field Leachate Parameters Level III
52 TCL Organics/PPL Inorganics Level IVExcept Pesticides
52 Leachate Parameters Level III
7 Leachate Parameters Level III
18 VOC Screening/ Level ICombustible Gas Screening
See SAP Water-table and piezometric Not applicablesurface elevations
5 Natural Gamma log Not applicable
AnalyticalMethod
Not applicable
Foxboro OVAHach Test KitsAmmonia Meter
Standard USEPAMethods
USEPA CLP
Standard USEPAMethods
Standard USEPAMethods
Foxboro OVA/Combustible Gas Indicator
M-scope/Steel tape andchalk, depth to watermeasurements
EG&G Mount SoprisModel II Logging System;HLP-2375 probe
Objectives/Rationale
Construction of monitoring wells capable ofproviding water-level measurements andground-water samples
Characterize ground-water quality conditionsfor evaluation of vertical and lateral extent ofpotential contamination and for remedial alternatives
Confirm ground-water leachate field testing
Characterize ground-water quality conditionsfor evaluation of remedial alternatives andengineering design
Characterize ground-water quality conditionsfor evaluation of remedial alternatives andengineering design
Characterize background ground-waterquality conditions
Determine extent of off-site gas migration
Characterize ground-water flow patterns andidentify pathways and migration routes todetermine appropriate remedial action
Characterize Irthology of the Unconsolidatedsediments
TCL Target compound listPPL Priority pollutant list
Not including QA/QC" The analytical levels are defined as follows:
Level I - Field screening or analysis using portable instruments. Results are often not compound-specific and not quantitative but results are available in real-time. It is the least costly of the analytical options.
Level II - Field analyses using more sophisticated portable analytical instruments; in some cases, the instruments may be set up in a mobile laboratory on-site. There is a wide range in the quality of data thatcan be generated, which depends on the use of suitable calibration standards, reference materials, and sample preparation equipment and the training of the operator. Results are available in real-time or several hours.
Level III • All analyses performed In an off-site analytical laboratory Level III analyses may or may not use CLP procedures, but do not usually utilize the validation or documentation procedures required of Level IVanalysis (New York Certified) The laboratory may or may not be a CLP laboratory.
Level IV - Routine analytical services (RAS) All analyses are perfomed in an off-site (New York Certified) analytical laboratory following NYSOEC ASP protocols. Level IV is characterized by rigorous QA/QC protocols and documentation.
COo
01CO
SYOSDATAXLSGERAGHTY & MILLER, INC.

Table 2. S ,> of Construction Details for On-Slte Monitoring Wells Installed a Syosset Landfill, Syosset, New York.
WellDesignation
SY-1 *SY-1DSY-2RSY-2DSY-3 *SY-3DSY-4 *SY-5 *SY-6 *SY-6DSY-7 *SY-8SY-9W-3W-4
CompletionDate
10/19/822/2/882/12/882/9/88
10/20/822/25/8810/20/8210/20/8210/19/823/9/88
10/21/8212/19/871/29/8811/10/8711/18/87
WellDiameter(Inches)
24442322.52424422
TotalDepth
(feet belowland surface)
135218150215145240153135145215145142140120120
IntervalScreen Setting(feet below
land surface)
125 - 135182 - 192115 - 125190 - 200135 - 145189 - 199143 - 153125 - 135135 - 145195 - 205135 - 145127 - 137110 - 120105 - 115104 - 114
Gravel Packed(feet below
land
351791121874718457463119252125107102102
surface )
- 135 b- 218- 150- 215- 145 b- 240- 153 b- 135 b- 145 b- 215- 145 b- 142- 140- 120- 120
Interval Sealedwith Bentonite
Pellets(feet below
land surface)
34 - 35177 - 179110 - 112185 - 18745 - 47181 - 18454 - 5744 - 4628 - 31190 - 19249 - 52122 - 125105 - 107100 - 102100 - 102
IntervalSealed with
Bentonite Slurry(feet below
land surface)
8 - 34 c2 - 1772 - 1102 - 1854 - 45 c2 - 1814- 5 4 c5-44 c5 - 28 c3 - 1925 - 49 c2 - 1222 - 1052 - 1002 - 100
Height of Elevation ofMeasuring Point a Measuring Point
(relative toland surface)
-0.15+2.31+1.95+2.18-0.50
-0.20+4.20-0.10-0.30-0.25+2.25-0.70+2.63+2.56
(feet above meansea level) d
194.52197.36187.48186.57191.38194.74193.32188.07185.85185.60199.63195.84199.41191.18192.82
Well Casing& ScreenMaterial
Black SteelPVCPVCPVC
Black SteelPVC
Black SteelGalvanized Steel
Black SteelPVC
Black SteelPVCPVCPVCPVC
a The measuring point of each well is the top of the well casing.b Information not available as to whether this interval was gravel-packed or formation was allowed to collapse.c Information not available as to whether grout or backfill (drill cuttings) was used to fill the annular space in this interval.d Survey performed to USGS datum.* Well installed during the ERM-Northeast site investigation.
GOo
01CO
CDSYLAND.XLS GKRAGHTY tf M I I . L I i R , INC

Page 1 of 7
Table 3. Potential Ground-Water Applicable or Relevant and Appropriate Requirements Identified for Ground Water, SecondOperable Unit Remedial Investigation, Syosset Landfill, Syosset, New York.
Inorganic Compounds
AntimonyArsenicBariumBerylliumCadmiumChromiumCopperIronLeadMercuryNickelPotassiumSeleniumSilverSodiumThalliumZincCyanide
USEPA.MCL
_
0.051.0-
0.010.05
1.00.3
0.050.002
--
0.010.05
_-
5.0~"
Revised10NYCRRSubpt 5-1
_
0.051.0-
0.010.05
1.00.3 (a)
0.050.002
-_
0.010.05
--
5.0""
10NYCRRPart 170
_0.05
1.0-
0.01-
<0.2-
0.050.005
--
0.010.05<20-
<0.3<0.1
6NYCRRPart 703.6
_
0.0251.0-
0.01-
1.00.3 (a)0.0250.002
--
0.020.05
--5
0.2
All ARARs are given in milligrams per liter unless indicated (mg/L).
ARARs Applicable or Relevant and Appropriate Requirements.MCL Maximum Contaminant Levels.PCBs Polychlorinated biphenyls.NO Not detected.- No standard available.(a) Combined concentration of iron and manganese shall not exceed 0.5 mg/L(b) Total trihalomethanes shall not exceed 0.1 mg/L(c) Total phenolic compounds.(d) Applies to total of para (i.e., 1,4-) and ortho (i.e., 1,2-) isomes only.(e) MCL for styrene will be set after public comment period.(f) Row limit is not applicable to storm-water runoff conditions.(g) Sum of concentrations of parameters given above.
301460
REMDSYO.XLS
GERAGHTY & MILLER. INC.

Page 2 of 7
Table 3. Potential Ground-Water Applicable or Relevant and Appropriate Requirements Identified for Ground Water, SecondOperable Unit Remedial Investigation, Syosset Landfill, Syosset, New York.
Volatile Organic Compounds
ChloromethaneBromomethaneVinyl ChlorideChloroethaneMethylene ChlorideAcetoneCarbon Oisulfide1,1-Dichloroethene1,1-Oichloroethane1 ,2-DichloroetheneChloroform1 ,2-Dichloroethane2-Butanone1,1,1-TrichloroethaneCarbon TetrachlorideVinyl AcetateBfomodichloromethane1 , 1 ,2,2-Tetrachloroethane1 ,2-Oichloropropanetrans-1 ,2-DichloropropeneTrichloroetheneDibromochloromethane
USEPAMCL
-0.002
-——-
0.007-—
0.1 (b)0.005
_0.2
0.005-
0.1 (b)---
0.0050.1 (b)
Revised10NYCRRSubpt 5-1
0.0050.0050.0020.0050.005
0.050.05
0.0050.0050.005
0.1 (b)0.0050.05
0.0050.005
0.050.1 (b)0.0050.0050.0050.005
0.1 (b)
10NYCRR 6NYCRRPart 170 Part 703.6
_-
0.005-
_- -- -
__
- -0.1
___
0.005----
_0.010
"~ ™*
All ARARs are given in milligrams per liter unless indicated (mg/L).
ARARs Applicable or Relevant and Appropriate Requirements.MCL Maximum Contaminant Levels.PCBs Polychlorinated biphenyis.ND Not detected.- No standard available.(a) Combined concentration of iron and manganese shall not exceed 0.5 mg/L(b) Total trihalomethanes shall not exceed 0.1 mg/L(c) Total phenolic compounds.(d) Applies to total of para (i.e., 1,4-) and ortho (i.e., 1,2-) isomes only.(e) MCL for styrene will be set after public comment period.(f) Row limit is not applicable to storm-water runoff conditions.(g) Sum of concentrations of parameters given above.
301461
REMDSYO.XLS
GERAGHTY & MILLER. INC.

Page 3 of 7
Table 3. Potential Ground-Water Applicable or Relevant and Appropriate Requirements Identified for Ground Water, SecondOperable Unit Remedial Investigation, Syosset Landfill, Syosset, New York.
Volatile Organic Compounds(continued)_________
USEPAMCL
Revised10NYCRRSubpt5-1
10NYCRRPart 170
6NYCRRPart 703.6
1,1,2-TrichloroethaneBenzenecis-1,3-DichloropropeneBromoform2-Hexanone4-Methyl-2-pentanoneTetrachloroetheneTolueneChlorobenzeneEthytbenzeneStyrene(g)Total Xylenes
0.005
0.1 (b)
0.0050.0050.005
0.1 (b)0.050.05
0.0050.0050.0050.0050.0050.005
NO
0.931
All ARARs are given in milligrams per liter unless indicated (mg/L).
ARARs Applicable or Relevant and Appropriate Requirements.MCL Maximum Contaminant Levels.RGBs Polychlorinated biphenyls.NO Not detected.- No standard available.(a) Combined concentration of iron and manganese shall not exceed 0.5 mg/L(b) Total trihalomethanes shall not exceed 0.1 mg/L(c) Total phenolic compounds.(d) Applies to total of para (i.e., 1,4-) and ortho (i.e., 1,2-) isomes only.(e) MCL for styrene will be set after public comment period.(f) Row limit is not applicable to storm-water runoff conditions.(g) Sum of concentrations of parameters given above.
301462
REMDSYO.XLS
GERAGHTY & MILLER, INC.

Page 4 of 7
Table 3. Potential Ground-Water Applicable or Relevant and Appropriate Requirements Identified for Ground Water, SecondOperable Unit Remedial Investigation, Syosset Landfill, Syosset, New York.
PCS Compounds
Arochlor-1016Arochlor-1221Arochlor-1232Arochior-1242Arochlor-1248Arochlor-1254Arochlor-1260
RevisedUSEPA 10NYCRR
MCL Subpt 5-1
0.0010.0010.0010.0010.0010.0010.001
10NYCRR 6NYCRRPart 170 Part 703.6
0.00010.00010.00010.00010.00010.00010.0001
All ARARs are given in milligrams per liter unless indicated (mg/L).
ARARs Applicable or Relevant and Appropriate Requirements.MCL Maximum Contaminant Levels.PCBs Poiychlorinated biphenyls.NO Not detected.
No standard available.(a) Combined concentration of iron and manganese shall not exceed 0.5 mg/L(b) Total trihalomethanes shall not exceed 0.1 mg/L(c) Total phenolic compounds.
/*****"•• (d) Applies to total of para (i.e.. 1,4-) and ortho (i.e., 1,2-) isomes only.(e) MCL for styrene will be set after public comment period.(f) Flow limit is not applicable to storm-water runoff conditions.(g) Sum of concentrations of parameters given above.
301463REMDSYO.XLS
GERAGHTY & MILLER, INC.

Page 5 of 7
Table 3. Potential Ground-Water Applicable or Relevant and Appropriate Requirements Identified for Ground Water, SecondOperable Unit Remedial Investigation, Syosset Landfill, Syosset, New York.
Semrvolatile Organic Compounds
Phenol (s)bis(-2-Chloroethyl)ether2-Chlorophenol1 ,3-Dichlorobenzene1 ,4-DichlorobenzeneBenzyl Alcohol1 ,2-Dichlorobenzene2-Mothylphenolbis(2-Chloroisopropy<)ether4-Methylphenoln-Nrtroso-di-propylamineHexachtoroethaneNitrobenzeneteophorone2-Nitrophenol2,4-DimethylphenolBenzole Addbis(-2-Chloroethoxy)methane2,4-Dichlorophenol1 ,2,4-TrichlorobenzeneNaphthalene4-Chloroaniline
RevisedUSEPA 10NYCRR
MCL Subpt 5-1
0.050.0050.005
- 0.0050.075 0.005
0.050.005
0.050.005
0.050.05
0.0050.005
0.050.005
0.050.05
0.0050.0050.005
0.050.005
10NYCRR 6NYCRRPart 170 Part 703.6
0.001 0.001 (c)0.001
0.001 (c)- -
4.7 (d)-
4.7 (d)0.001 (c)
-0.001 (c)
_- -_-
0.001 (c)0.001 (c)
- --
0.001 (c)-_——— H
All ARARs are given in milligrams per liter unless indicated (mg/L).
ARARs Applicable or Relevant and Appropriate Requirements.MCL Maximum Contaminant Levels.PCBs Polychlorinated biphenyls.NO Not detected.
No standard available.(a) Combined concentration of iron and manganese shall not exceed 0.5 mg/L.(b) Total trihalomethanes shall not exceed 0.1 mg/L(c) Total phenolic compounds.(d) Applies to total of para (i.e., 1,4-) and ortho (i.e., 1,2-) isomes only.(e) MCL for styrene will be set after public comment period.(f) Flow limit is not applicable to storm-water runoff conditions.(g) Sum of concentrations of parameters given above.
301464
REMDSYO.XLS
GERAGHTY & MILLER, INC.

Page 6 of 7
Table 3. Potential Ground-Water Applicable or Relevant and Appropriate Requirements Identified for Ground Water, SecondOperable Unit Remedial Investigation, Syosset Landfill, Syosset, New York.
Semivolatile Organic Compounds(continued)
Hexachlorobutadiene4-Chloro-3-methylphenol2-MethylnaphthaleneHexachlorocydopentadiene2,4,6-Trichlorophenol2,4,5-Trichlorophenol2-Chloronaphthalene2-NitroanilineDimethylphthalateAcenaphthylene3-NrtroanilineAcenaphthene2,4-Oinitrophenol4-NitrophenolDibenzofuran2,4-Dinitrotoluene2,6-DinitrotolueneDiethylphthalate4-Chlorophenyl-phenyletherRuorene4-Nitroaniline4,6-Dinrtro-2-methytph«nol
'RevisedUSEPA 10NYCRR
MCL Subpt 5-1
0.0050.0050.05
0.005"0.005
0.0050.0050.0050.050.05
0.0050.05
0.0050.0050.05
0.0050.0050.05
0.0050.05
0.0050.005
10NYCRR 6NYCRRPart 170 Part 703.6
__ _
0.001 (c)-_
0.001 (c)0.001 (c)
-_ _--- -_
0.001 (c)0.001 (c)
- -__--_ _-
0.001 (c)
All ARARs are given in milligrams per liter unless indicated (mg/L).
ARARs Applicable or Relevant and Appropriate Requirements.MCL Maximum Contaminant Levels.PCBs Polychlorinated biphenyis.ND Not detected.- No standard available.(a) Combined concentration of iron and manganese shall not exceed 0.5 mg/L(b) Total trihalomethanes shall not exceed 0.1 mg/L(c) Total phenolic compounds.(d) Applies to total of para (i.e., 1,4-) and ortho (i.e., 1,2-) isomes only.(e) MCL for styrene will be set after public comment period.(f) Row limit is not applicable to storm-water runoff conditions.(g) Sum of concentrations of parameters given above.
301465REMDSYO.XLS
GERAGHTY & MILLER. INC.

Page 7 of 7
Table 3. Potential Ground-Water Applicable or Relevant and Appropriate Requirements Identified for Ground Water, SecondOperable Unit Remedial Investigation, Syosset Landfill, Syosset, New York.
Semivolatile Organic Compounds(continued)
USEPAMCL
Revised10NYCRRSubpt 5-1
10NYCRRPart 170
6NYCRRPart 703.6
N-Nitrosodiphenylamine4-Bromophenyl-phenyletherHexachlorobenzenePenta-chlorophenolPhenanthreneAnthraceneOi-n-butyiphthalateFluorantnenePyreneButylbenzylphthalate3,3'-OichlorobenzidineBenzo(a)anthracenebis(2-Ethylhexyl)phthalateChrysenaDi-n-octyt phthalateBenzo(b)fluorantheneBenzo(k)fluorantheneBenzo(a)pyrenelndeno(1,2,3-c d)pyraneDibenz(g,h)anthraceneBenzo(g,h,i)perylene
0.0050.0050.0050.005
0.050.050.050.050.050.05
0.0050.050.050.050.050.050.050.050.050.050.05
0.000350.021
0.77
4.2
NO
All ARARs are given in Milligrams per Liter unless indicated (mg/L).
All ARARs are given in milligrams per liter unless indicated (mg/L).
ARARs Applicable or Relevant and Appropriate Requirements.MCL Maximum Contaminant Levels.PCBs Polychlorinated biphenyls.NO Not detected.
No standard available.(a) Combined concentration of iron and manganese shall not exceed 0.5 mg/L(b) Total trihalomethanes shall not exceed 0.1 mg/L(c) Total phenolic compounds.(d) Applies to total of para (i.e., 1,4-) and ortho (i.e., 1,2-) isomes only.(e) MCL for styrene will be set after public comment period.(f) Row limit Is not applicable to storm-water runoff conditions.(g) Sum of concentrations of parameters given above.
301466REMDSYO.XLS
GERAGHTY & MILLER. INC.

Table 4. Summary of Water Sample Preservation and Container Specifications, Second Operable Unit Remedial Investigation,Syosset Landfill, Syosset, New York.
Parameter Sample Container(s) (a)Chemical
Preservative (b) Holding Time (c)
Volatile OrganicCompounds
(3) 40 ml glass vials. Hydrochloric acid,pH <2
10 days
Base Neutrals,PCBs
(3) 1 liter glass bottle. Unpreserved. Extraction-5 daysAnalysis-40 days
following extraction
Metals
Cyanide
Total Dissolved Solids
Ammonia
Chloride
Total Hardness
Nitrate
(1) 1 liter plastic bottle.
(1) 1 liter plastic bottle.
(1) 1 liter plastic bottle.
(1) 1 liter plastic bottle.
(1) 1 liter plastic bottle.
(1) 1 liter plastic bottle.
(1) 1 liter plastic bottle.
Nitric acid,pH<2
Sodium hydroxide,pH>12
Sulfuric acid,pH <2
Nitric acid,pH <2
Mercury-26 daysMetals (other thanMercury) 180 days
12 days
7 days from time of collection
28 days from time of collection
28 days from time of collection
6 months from time of collection
48 hours from the time of collection
Sulfate
Alkalinity
(1) 1 liter plastic bottle.
(1) 1 liter plastic bottle.
28 days from time of collection
14 days from time of collection
(a) Sample containers will be of demonstrated cleanliness as described in Appendix A of the Qapp (Section III).(b) Samples will be cooled to approximately 4 C.(c) Starts from verified time of sample receipt, except where noted.
301467
TCLPAS.XLSGERAGHTY & MILLER. INC.

Table 5. Current Occupational Airborne Contaminants Standards and Guidelines forSelected Volatile Organic Compounds Detected During the First OperableUnit Remedial Investigation of the Syosset Landfill, Syosset, New York.
CompoundACGIH-TLV fppnriTWASTEL
OSHA-PEL (ppm)TWASTEL
BenzeneChloroformEthylbenzeneTetrachloroethyleneTolueneVinyl chlorideXylenes
1010100501005100
-
125200150-150
12100251001100
125-125-150
ACGIH American Conference of Governmental Industrial Hygienists, 1990-1991.OSHA Occupational Safety and Health Administration, 1989.TLV Threshold limit value.PEL Permissible exposure limit.TWA 8-hour time-weighted average.STEL 15-minute short-term exposure limit.ppm Parts per million.
301463
GERAGHTY & MILLER. INC.

CO o
saan
ou

MILLER, INC.Consultant*
yT^° V.J.GLASSER
KT E.DeLUCA
V.J.GLASSER
DATt j SCALE:
2/89 SHOWNHU MO:
NY0340SL4-III5
LOCKWOOD, KESSLER 8 BARTLETT jSyosset, New York ;.
EXPLANATION
m LOCATION AND DESIGNATION OFFUNCTIONING PUBLIC SUPPLY WELL
•LOCATION OF PROPOSED OFF-SITEEXPLORATORY BORING/MONITORINGWELL CLUSTER
A LOCATION OF PROPOSED ON-SITE^ EXPLORATORY BORING/MONITORING WELL
<-* LOCATION OF PROPOSED OFF-SITE^ CLUSTER BORINGS/MONITORING WELLS
•*• RD= Remedial Design Program
LOCATION ANDDESIGNATION OFm ABANDONED PUBLIC SUPPLY WELL
^ LOCATION OF THE THREE PROPOSED OFF-SITE** GAS MONITORING WELLS
^ LOCATION OF PROPOSED ON-SITE (OU-I RD)*™ GAS MONITORING WELLS
LOCATION OF PROPOSED DEEP ON-® SITE UPGRADIENT MONITORING
WELLGROUND-WATER FLOW DIRECTION1
LOCATIONS OF PROPOSED GROUND-WELLS, Syosset Landfill, Syosset,
-WATER AND GAS MONITORINGNew York
FIGURE
1301469A

SYOSSET LANDFILL OU2 REMEDIAL INVESTIGATION
DESCRIPTION OF ACTIVITY6
TIME (MONTHS)7 8 9 10 11 12 13 14 15 16 17 18 19
1. OU2 REMEDIAL INVESTIGATION WORK PLAN• SUBMIT OU2 RI WORK PLAN• USEPA REVIEW• REVISE & RESUBMIT OU2 RI WORK PLAN• USEPA APPROVAL
2. OU2 SITE OPERATIONS PLAN• PREPARE & SUBMIT OU2 SOP• USEPA REVIEW• REVISE & RESUBMIT OU2 SOP• USEPA APPROVAL
3. OU2 REMEDIAL INVESTIGATION• WORK EASEMENT PROCUREMENT• SUBCONTRACTOR PROCUREMENT
• BID PREPARATION• RESPONSE & SELECTION
• OFF-SITE GROUNDWATER MONITORING WELL INSTALLATION• OFF-SITE GROUNDWATER MONITORING• OFF-SITE GAS MONTTOING WELL INSTALLATION• OFF-SITE GAS MONITORING
4. DATA VALIDATION & EVALUATION
5. OU2 REMEDIAL INVESTIGATION REPORT• PREPARE & SUBMIT OU2 RI REPORT• USEPA REVIEW• REVISE & RESUBMIT OU2 RI REPORT• USEPA APPROVAL
6. DELIVERABLES• OU2 RI WORK PLAN• OU2SOP• OU2RI REPORT• MONTHLY PROGRESS REPORTS
«n*
*
4
^ A UMIA- DENOTES TOB DELIVERABLE 5fc- DENOTES USEPA REVIEW - DENOTES TIME SCHEDULE 301470
FIGURE 2
LKB OU2 RI PROJECT SCHEDULE

^GFPAGHTY **""" V.J.OLASSC* "?4fk MILLER, INC. IT*"8 E.DtLUCA ru *
tetU: ^MPMIB
'*' NONE . f\rVMif\rtTl WC*CCI CD A DA DTI CTT5; —— ' ———— LUv lvWUvU, fNCOoLtn tt DAnTLtTT^H c~~* w«*r emu*.*! «£«* V.J.GLASSER NY02908-IH5 Sfosset, New York
•
a r ~"%%Approx. 100 Ft / ^/Ss
/A//%
11&
3 Feet( Minimum)^
10 Ft /
V.
c
w
1$I
o *• , ,«' *
*
» *
o
*•
I V——V
^
MMMMM
»
» .
d ^
^3i111
' 4v«0 •' •
• ' '
f .^ -
o
•
^ •^ _ — - Locking Protective Steel Casing or Curb Box
W/L —— Cement Collar - 2 Fe«t
Oa^ « — 14- Inch Diameter Boreholeyfr (Casing To Be Removed )
II^fc — — 8 - Inch Diameter Steel CasingSYs (Permanent)
%Sj O ^^-" 10- Inch Diameter Borehole (Casing ToY '** Be Removed )
4 \^r- — — Grout Seal ( Volclay)/\
*»— —— — 8 - Inch Diameter Borehole
^^___^___ 4 - Inch Diameter Schedule 40— ~" PVC Casing
— . ——— -Gravel Pack ( J Morie Co. No.l )
4 -Inch Diameter Stain tots Stttl—— —— Scr««n(O.OIO Slot)
301411***** FIGURE
GENERALIZED CONSTRUCTION OF MONITORING WELL INSTALLED IN QEXPLORATORY BORING, Syo$t«t Londfill, Syo«stt, Ne* York O

GERAGHTYMILLER, INC.
Sr^ v J.GCASSE*Kr*~ E DtLUCA
V J . GL A SSE R
2/89 NONEw* netNY02908-III5
.KESSLER 8 BART LETTSyotMt, Ntw York
,i^M ''li f \i.».- /
i
Approx 100 Ft >
/• t
t
tt»*
t/t
^^f
\ ^^
\ 3 Feet ( Minimum)^
10 Ft i
\.
L
i $[
i
iI1A
\o •
t 4
6
01
*. «C»
_S^
^*
^
J
u»s
j^_______ Locking protective bieei cosmg or ^uro BOX
in
&•*- —— demerit Collar- 2 Feet
%^/* ** — • — 10 - Inch Diameter Steel Casing'// (Permanent)
iiI&
• i0
9-
a
• K
* •0
^ - ——— Grout Seal(Volctay)
^^^ 4-Inch Diameter Schedule 40 PVC Casing
— ___— - 8- Inch Diameter Borehole
— ——— Gravel Pack(J.Morie Co. No.l)
^~~~~— -4-Inch Diameter Stainless SttelScrt«n (0.010 Slot)
301472juffcr- FIGURE '
GENERALIZED CONSTRUCTION OF MONITORING WELL INSTALLED IN *MUD ROTORY BORING, Syosset Landfill, Syosset, New York ^

.—— v,
x
M& GERAGHTY •^y& MILLER INC. !
^V 0**** r*~ dn.mm,m, [
3 Feet ( Mini n
10 Ft ^
ST** V J GLASSER ""ST*"* E . O t L U C A M
SP V J GLASSER N
Vw, J
^^
num) n
V.
«. taut »»<«•)
8-91 NONE LOCKWQODiKESSLERaBARTLETT
f02908-IU5 Syoswt, Ntw York
!io •
4
O
0
. °«.*
_2_
^
••••MMBM
•••••••••1
^
d
»*!t<
\
i
0
a
•
o0 »
<" ys^__^_ Locking Protective Steel Casing or Cui*b Box
"* — —— Cement Collar- 2 Feet
"~~ — — -4- Inch Diameter Schedule 4O PVC Casing
—— - — Grout Seal(Volclay)
^^
^___— -11 - Inch Diameter Borehole
———— Gravel Pack ( J.Morie Co. No. I)
—— — — 4 -Inch Diameter Stainless SttelScreen (O.OIO Slot)
301473MB^CT Plf*! IQC*
GENERALIZED CONSTRUCTION OF MONITORING WELL INSTALLED IN ._HOLLOW STEM AUGER BORING, Syosset Landfill, Syosset, New York O

I DWG
. DA
TC: 1
0-3
0-9
0
I PRJ
CT.
NO
.: N
Y02
902
I FILE
NO
.: 11
15I C
AD F
ILE;
OAS
-WEU
. I C
HECK
ED:
V.
CLAS
SER
I APP
ROVE
D: V
. GL
ASSE
R
I DRA
FTER
: V.
CAR
UNCH
O
**- s< S- O
i £
w1 H
S3
I W
Oa »
Wgj *J
i—
i
I
I P
H Kj
c/> o
in (ft
m t
o
O m m • M rn o o O in o id O z o - o > c/j
O)
r
o
Z3 O 70 m
00 O
m