petition fqjft" ^ pump - records collections
TRANSCRIPT
I\II
r PETITION FQJft"^ PUMP
••ESVTIAMQISE
. . .' •^•••^Prepared fon
JDFPRP Group
GROUND WATER
I
I
I
I.EPA Region 5 Records Ctr.
223756
jffifiWti&A^-''•'•,.•':;•
p^ l ^* '''.--:-'' = .•:^^^^ l ^^^^
11
PETITION FOR ELIMINATING GROUNDWATERPUMP AND TREAT SYSTEM
"1 JANESVILLB DISPOSAL FACILITY
J JANESVILLE, WISCONSIN
JPrepared fon
J JDFPRP Group
]
1
MAY 1997REF. NO. 9702 (1) CONESTOGA-ROVERS & ASSOCIATESThis report printed on recycled paper
J
1
1J
J
J]
J
TABLE OP CONTENTSPage
1.0 INTRODUCTION 1
2.0 SITE BACKGROUND 2
3.0 SITE SETTING 53.1 HYDROGEOLOGIC CONDITIONS 53.2 CONTAMINANT PRESENCE 73.3 POTENTIAL GROUNDWATER RECEPTORS 8
4.0 REMEDIAL ACTIVITIES AFFECTING CONTAMINANT MIGRATION.... 104.1 1963 SITE 104.2 1978 SITE , 104.3 1985 SITE 114.4 JAB SITE 124.5 PARKER PEN 13
5.0 DATA EVALUATION AND DISCUSSION 155.1 REMEDIAL INVESTIGATION 155.1.1 1978 Site/1985 Site Well Group 155.1.2 JAB Site Well Group 165.1.3 JDF Site Well Group 165.2 COMPLIANCE MONITORING 165.2.1 1978 Site/1985 Site Well Group 175.2.2 JAB Site Well Group 185.2.3 JDF Site Well Group 195.4 STATISTICAL DATA EVALUATION 205.5 CHEMICALS OF CONCERN 21'5.6 DATA TRENDS FOR CHEMICALS OF CONCERN 22
6.0 NATURAL ATTENUATION EVALUATION 246.1 U.S. EPA PERSPECTIVE ON NATURAL ATTENUATION 246.2 WDNR PERSPECTIVE ON NATURAL ATTENUATION 276.3 OVERVIEW OF BIODEGRADATION PROCESSES 286.4 ASSESSMENT APPROACH. 326.5 CONCEPTUAL MODEL 336.5.1 Conceptual Hydrogeologic Model 336.5.2 Natural Attenuation Processes 346.6 EVIDENCE OF NATURAL ATTENUATION 346.6.1 Receding to Steady-State Plume Conditions 356.6.2 Decreasing Flow Path Concentrations 376.6.3 Limited COC Detections in Rock River 386.6.4 Redox Indicators . 386.6.5 Presence of COC Biodegradation Products 426.6.6 Organic Carbon Supply from Landfill Leachate 436.6.7 High Dilution Capacity of Rock River 44
CONBSTOGA-ROVBRS & ASSOCIATES
J]
1]
TABLE OF CONTENTS
7.0 COMPLIANCE WITH ARARs 457.1 CLEANUP AND PERFORMANCE STANDARDS 457.2 SURFACE WATER QUALITY 467.3 WAC CHAPTER NR140 48
8.0 CONCLUSIONS AND RECOMMENDATIONS 498.1 CONCLUSIONS 498.2 RECOMMENDATIONS 49
9.0 REFERENCES 50
"U (1) CONBSTOGA-ROVERS & ASSOCIATES
J1
]
]
J
J
T.TSJ OP FIGURES
FIGURE 2.1 SITE PLAN
FIGURE 3.1 GROUNDWATER CONTOURS - MARCH 1997
FIGURE 4.1 APPROXIMATE CAPTURE ZONE - PARKER PENGROUNDWATER EXTRACTION SYSTEM
FIGURE 6.1 TOTAL CHLORINATED ETHENE CONCENTRATIONS -JULY 1988
FIGURE 6.2 TOTAL CHLORINATED ETHENE CONCENTRATIONS -APRIL 1993
FIGURE 6.3 TOTAL CHLORINATED ETHENE CONCENTRATIONS -MARCH 1997
FIGURE 6.4 REDOX AND GEOCHEMICAL INDICATOR DATA - APRIL 1996
FIGURE 6.5 EXAMPLE RADIAL DIAGRAM OF REDOX INDICATORS
FIGURE 6.6 VISUALIZATION OF REDOX INDICATORS - APRIL 1996
T.TfiT OF JABLES
TABLE 3.1 HORIZONTAL HYDRAULIC GRADIENTS IN THE JAB VICINITY
TABLE 3.2 AVERAGE PCE AND TCE CONCENTRATIONSDOWNGRADffiNT OF THE JAB
TABLE 5.1 SUMMARY OF RI DATA EXCEEDING NR 140 STANDARDS
TABLE 5.2 SUMMARY OF COMPLIANCE MONITORING DATA EXCEEDINGCONCENTRATION LIMITS
LIST OF APPENDICES
APPENDIX A LABORATORY RESULTS OF APRIL 1997 RESIDENTIAL WELLSAMPLING EVENT
APPENDIX B SUMMARY OF COMPLIANCE MONITORING DATA EXCEEDINGNR 140 STANDARDS
APPENDIX C TREND GRAPHS OF PCE AND TCE CONCENTRATIONS
CONBSTOGA-ROVBRS & ASSOCIATES
1.0 INTRODUCTION
On behalf of the Janesville Disposal Facility (JDF) PRPGroup (Group), Conestoga-Rovers & Associates (CRA) has a prepared aPetition Report to demonstrate to the United States EnvironmentalProtection Agency (U.S. EPA) and the Wisconsin Department of NaturalResources (WDNR) that the a pump and treat system is an unnecessarycomponent of the selected remedy identified in the Record of Decision (ROD)for the JDF Site (Site). The Petition Report presents an evaluation of the Sitedata which demonstrates that natural attenuation processes are occurring atthe Site to the extent that the Applicable or Relevant and AppropriateRequirements (ARARs) specified in the ROD and the Consent Order for theSite are achievable without the installation and operation of a groundwaterpump and treat system.
Based on the data evaluation and natural attenuationassessment detailed herein, recommendations are presented for amendingthe ROD and Consent Order to specify natural attenuation as an alternative tothe pump and treat component of the selected remedy.
The Petition Report is organized as follows:
Section 1.0 Introduction
Section 2.0 Site Background
Section 3.0 Site Setting
Section 4.0 Remedial Activities Affecting Contamjn,apt Migration
Section 5.0 Data Evaluation and Discussion
Section 6.0 Natural Attenuation Evaluation
Section 7.0 Compliance with ARARs
Section 8.0 Conclusions and Recommendations
Section 9.0 References
970J(1) CONBSTOGA-ROVHRS & ASSOCIATES
]1]
2.0 SITE BACKGROUND
The JDF is located on the north side of Janesville,Wisconsin. A Plan view of the JDF is presented on Figure 2.1. The JDFconsists of the following four separate disposal facilities:
1985 Site A municipal solid waste landfill operated from 1978 to 1985.The landfill was constructed with a clay liner and a leachatecollection system. Closure of the landfill included theplacement of a clay cap.
1978 Site A municipal solid waste landfill operated from 1963 to 1978.No liner or leachate collection system exists beneath thelandfill. A cap consisting of clayey material was reportedlyconstructed upon closure of the landfill. The nature of thecover material was not documented.
1963 Site An unlined landfill operated from 1950 to 1963 with noleachate collection system. The types of waste accepted atthis facility are unknown. A final cover was placed over thelandfill upon closure, although the nature of the covermaterial was not documented.
Janesville Ash The JAB operated from 1974 to 1985. IndustrialBeds GAB) liquids and sludges were placed on a layer of ash and allowed
to evaporate or dry. Closure of JAB 1 and 2 during 1983 andi 1984 consisted of excavating residual waste material to
native soil beneath the beds. JAB 3, 4, and 5 were closed in, 1985 by excavating residual waste material to, and including
part of, the clay liner. Final closure of the JAB consisted ofbackfilling the beds with native material followed by theplacement of a 2-foot thick clay cap.
I A Remedial Investigation (RI) was conducted at the JDF' during 1987 and 1988 (Warzyn, 1989). Data collection activities werei completed to investigate subsurface conditions and determine the nature and
"02 (1) 2 CONHSTOGA-ROVHRS & ASSOCIATES
I
11I
extent of contaminant releases from the JDF. The RI identified the presenceof volatile organic compounds (VOCs) in groundwater beneath the JDF. Thegreatest VOC concentrations were detected beneath and downgradient of theJAB. In addition, significant levels of VOCs were detected in groundwatersamples collected from monitoring wells W6 and W20 downgradient ofParker Pen USA Limited (Parker Pen) located to the southwest of the JDF.The source of the VOCs was likely due to a 250 gallon trichloroethene (TCE)spill that occurred during February 1985 (RMT, 1992).
Following the RI, a Feasibility Study (FS) was conducted.The FS report (Warzyn, 1990) identified a number of remedial alternativeswhich were developed and evaluated for the Site. On the basis of the FS, aRecord of Decision (ROD) for the selected remedial alternative was signed bythe U.S. EPA Regional Administrator on December 29,1989. The selectedremedy for the Site included a groundwater pump and treat (if necessary)system to address the impacted groundwater beneath and downgradient ofthe JAB. The ROD also required various institutional controls and remedialconstruction activities be undertaken for the 1978 Site, 1985 Site and JAB Site.No action was required for the 1963 Site with the exception of deed and accessrestrictions and continued groundwater monitoring.
On December 4,1991, notice of the lodging of a ConsentDecree for the JDF Site was received by the Group. The Consent Decree andits Scope of Work set forth the requirements for the implementation of theremedial design and remedial action at the Site. The remedial actions definedin the SOW included fence installation, institutional controls, deed/accessrestrictions, installation and implementation of a groundwater monitoringprogram, installation and operation of a groundwater extraction/treatmentsystem (if necessary), landfill cover modifications (1978 and 1985 Sites),leachate collection system improvements (1985 Site), landfill gas recovery andtreatment, additional studies and compliance with Resource Conservationand Recovery Act (RCRA) requirements.
A Remedial Design/Remedial Action (RD/RA) WorkPlan (Woodward-Clyde Consultants, 1994) was developed pursuant to therequirements of the Consent Decree. The RD/RA Work Plan addressed
«X>2(1) 3 CONBSTOGA-ROVKRS & ASSOCIATES
111
general requirements of the SOW which include collecting additional data toinitiate or complete the remedial actions, performing groundwater treatabilitystudies, test-out procedures for the 1978 Site and qualifications of keypersonnel and organizations. Also addressed were the specific requirementsof the SOW which included additional studies, sampling and analysis, qualityassurance, permitting requirements and the project schedule.
In January 1996, the Group, U.S. EPA and WDNR agreedto delay the design of the groundwater pump and treat system until theremedial construction improvements to the 1978 and 1985 landfill coverswere complete and their performance had been assessed. Followingconstruction completion and data assessment, discussions to resolveoutstanding groundwater issues would be initiated.
Remedial construction activities consisting of landfillcover improvements and landfill gas recovery and treatment weresubstantially completed in December 1996. The improvements to the 1985Site leachate collection system specified in#ie SOW were determined to beunnecessary (Woodward-Clyde Consultants, 1996; WDNR, 1996).
During the RD/RA phase, compliance groundwatermonitoring has been conducted at the JDF on a quarterly basis fromApril 1993 to March 1997. The compliance monitoring has identified asignificant reduction in the levels of VOCs detected beneath anddowngradient of the JDF since the RI. Due to the reduction of VOCconcentrations and the extensive database generated since the RI, the Groupproposed to U.S. EPA and WDNR in February 1997 that the parameters forthe monitoring program be revised to VOCs, a select group of metals andindicator parameters. In March 1997, U.S. EPA and WDNR agreed inprinciple to reduce the scope of the monitoring program (U.S. EPA, 1997).The current monitoring program consists of sampling and analyzinggroundwater samples for VOCs and five dissolved metals (arsenic, barium,chromium, lead and mercury).
9702(1)' 4 CONESTOGA-ROVKRS & ASSOCIATES
]]1
3.0 SITE SETTING
3.1 HYDROGEQLOGIC CONDITIONS
The JDF is located in an area of glacial outwash depositswhich occupy the ancestral bedrock valley of the Rock River. The thicknessof the outwash deposits ranges from 80 feet west of the JDF to greater than215 feet northeast of the JDF. The outwash consists primarily of a uniformsand with intermittent sand and gravel deposits. A sandy clay depositapproximately 30 feet in thickness has been observed at approximately 30 feetbelow ground surface (BGS) along the eastern bank of the Rock River atmonitoring well locations W9A and W24B. The sandy clay deposit isdiscontinuous (Warzyn, 1989; cross-section A-A') and does not preventgroundwater flow beneath the JDF from discharging to the Rock River.Given the relatively consistent composition of the outwash deposit beneaththe JDF, groundwater flow is considered to occur under essentially uniform,unconfined conditions.
The depth to groundwater at the JDF generally variesfrom approximately 60 to 70 feet BGS. Groundwater flow occurs within theoutwash deposits under unconfined conditions. Groundwater elevationsmeasured during the March 1997 compliance monitoring event are presentedon Figure 3.1. Contours based on these groundwater levels indicate thatgroundwater flow is directed from the upland areas in the northeast to thesouthwest toward the Rock River located downgradient of the JDF.Groundwater levels measured during the RI and during the previouscompliance monitoring events all demonstrate the same generalgroundwater flow direction. Horizontal hydraulic gradients determined fromhistorical groundwater level measurements in the vicinity of anddowngradient of the JAB are presented in Table 3.1. A consistent hydraulicgradient of approximately 0.002 feet per feet (ft/ft) exists within anddowngradient of the JAB. This hydraulic gradient increases to approximately0.007 ft/ft near Rock River as the water table slopes toward the surface waterlevel in the river.
-RovBRS & ASSOCIATES
11
1
Based on groundwater levels measured during the RI andduring the compliance monitoring events, minor vertical hydraulic gradientsexist in both the upward and downward directions beneath the JDF. Adjacentto the Rock River, significant upward vertical hydraulic gradients exist onboth the east side of the river, downgradient of the JDF, and the west side ofthe river, opposite the JDF (Warzyn, 1990). During the RI, the water level inthe Rock River was measured at approximately 7 feet below the groundwaterlevels measured in monitoring wells W24, W24A, and W24B adjacent to theriver (Warzyn, 1989). This difference indicates a substantial upward hydraulicgradient from the outwash deposits toward the river. The upward hydraulicgradients on both sides of the river demonstrates that the Rock River is agroundwater flow divide and that groundwater discharge to the river occursfrom both the sides of the bedrock valley. As a result, groundwater flowbeneath the JDF discharges to the Rock River and significant underflow doesnot occur beneath the river.
In the vicinity of the JDF, the Rock River flows in ai southerly direction with an average discharge of approximatelyI 1,750 cubic feet per second (ft3/s) (Warzyn, 1990). The water level in the Rock
River near the JDF is controlled by a dam located in downtown Janesville andJ does not fluctuate significantly.
Hydraulic conductivity values of the outwash deposits-*•
beneath the JDF determined from single well response tests conducted during1 the RI range from 8.7 x 10~3 to 1.7 x 10"2 centimeters per second (cm/s)
(Warzyn, 1989). Due to the small change in water volume used to conduct asingle well response test, the zone of influence resulting from such tests isoften limited to only short distances away from the tested monitoring well.As a result, hydraulic conductivity values determined from single well
) response tests are commonly lower than the actual hydraulic conductivityvalues of the tested formation. For this reason, the range of hydraulic
, conductivity values determined from RI single well response tests isconsidered to underestimate the actual hydraulic conductivity of the outwash
I deposit.
W02(l) 6 CONBSTOGA-ROVBRS& ASSOCIATES
J
J1
health risk:
i
Based on the range of hydraulic conductivity values fromthe RI, the average horizontal hydraulic gradient of 0.002 ft/ft within anddowngradient of the JAB, and an assumed porosity of 0.3, horizontalgroundwater flow from the JAB occurs at calculated velocities ranging fromapproximately 60 to 120 feet per year (ft/yr). The Rock River is locatedapproximately 1,200 feet downgradient of the JAB. Applying the calculatedhorizontal groundwater flow velocities, the travel time for groundwaterbeneath the JAB to reach the Rock River ranges from approximately 10 to 20years. However, the calculated travel times are likely greater than the actualtime required for groundwater beneath the JAB to reach the Rock River sincesingle well response tests commonly underestimate the actual hydraulicconductivity, which is directly proportional to travel time.
3.2 CONTAMINANT PRESENCE
The following chemicals were identified in the ROD asbeing representative of Site contamination'and posing the greatest potential
• vinyl chloride• acetone• 1,2-dichloroethene• 1,1,1-trichloroethane• tetrachloroethene• arsenic• methylene chloride• 1,1 -dichloroethene• trichloroethene• benzene• bis(2-ethylhexyl)phthalate
Of these chemicals, only PCE and TCE currently exceed theWisconsin Administrative Code (WAC) Chapter NR 140 EnforcementStandard. Table 3.2 presents the average concentration of PCE and TCEdowngradient of the JAB.
»<n (1) 7 CONBSTOGA-ROVHRS & ASSOCIATES
j3.3 POTENTIAL GROUNDWATER RECEPTORS
There are no municipal water supply wells within theimmediate vicinity of the JDF. The nearest municipal water supply well isthe Janesville Well No. 9 (Station No. 7) located approximately 1 milenortheast and upgradient of the JDF (Warzyn, 1990). The residentialdevelopments to the east and south of the JDF are connected to the City ofJanesville water supply as city ordinances prohibit installing private wells inareas where municipal water supplies are available. An industrialproduction well was located downgradient of the JDF at Parker Pen and wasproperly abandoned in 1995. Parker Pen is presently connected to the City ofJanesville water supply. An abandoned industrial well exists downgradientof the JDF at the asphalt plant located south of the 1963 Site (Warzyn, 1990).There is, therefore, no demand on groundwater as a potable sourcedowngradient of the JDF.
Approximately 47 private residential water supply wellsare located north of Black Ridge Road to the west of U.S. HWY 51. Thesewells are located upgradient to crossgradient of the JDF. A select group ofprivate water supply wells closest to the JAB were sampled and analyzed forVOCs in April 1997. No Site-related VOCs were detected in the residential ,well samples. The laboratory report for the residential well samples isreproduced in Appendix A.
In addition, groundwater elevations were measured in allaccessible monitoring wells in the vicinity of the JAB. Groundwater contoursfor the area near the JAB Site indicate that the groundwater flow is to thesouthwest, consistent with the overall Site groundwater flow. The residentialwell VOC data and the groundwater flow contours indicate that impactedgroundwater beneath the JAB has not migrated toward the residential watersupply wells.
As described in Section 3.1, groundwater beneath the JDFdischarges to Rock River. Since there is no current demand on thegroundwater as a potable source downgradient of the JDF, and the residential
W02<1) 8 CONBSTOGA-ROVERS &: ASSOCIATES
Jwells located upgradient to crossgradient of the JDF have not been impactedby Site-related contaminants, the Rock River represents the only potentialexposure point to impacted groundwater emanating from the JDF.
CONHSIXXJA-ROVHRS& ASSOCIATES
4.0 REMEDIAL ACTIVITIES AFFECTING CONTAMINANT MIGRATION
4.1 1963 SITE
The 1963 Site was closed in 1963 after reaching capacity.
The landfill was an unengineered disposal area with no bottom liner,
leachate collection system or cap. Closure of the landfill consisted of
placement of a final cover over the Site, which consisted of material obtained
from a local borrow source. The composition of the material was not
documented. With the exception of the area where the JAB was located, the
RI determined the 1963 Site is not a source of significant groundwater
contamination, and no remedial construction activities were required.
4.2 1978 SITE
The 1978 Site was closed after reaching its design capacity.The landfill does not have a bottom liner or leachate collection system. The
landfill was capped with 2 feet of clayey material when closed. As noted in
the RI, the presence of the clay cap over the 1978 landfill likely deterred
infiltration of precipitation through the waste and lessened the leaching
action of the waste into the subsurface soils. However, the sandy soil beneath
the landfill was not expected to inhibit contaminant migration prior toreaching groundwater.
A multi-layer cap, consistent with the requirements of
WAC Chapter NR 504.07, was installed over the landfill as part of the
remedial construction activities which occurred in 1996. In addition, a
passive gas control system was installed above the grading layer to control
landfill gas (LFG) migration through the cover and help maintain the
long-term integrity of the cover system. A stormwater control system
consisting of drainage berrns, drainage flumes and perimeter collectionditches complete the cover system.
9702 (1) 10 CONBCTOCA-ROVBRS & ASSOCIATES
11
With the completion of the remedial constructionactivities, infiltration and percolation of precipitation will be reduced andmigration of contaminants into the groundwater will be minimized.
4.3 1985 SITE
The 1985 landfill was closed after reaching its designcapacity. The landfill was constructed with a 5-foot thick bottom clay linerand a leachate collection system. Leachate is collected and pumped to aleachate pumping station which discharges to a City of Janesville sanitarysewer. The landfill was capped with 2 feet of clay which was installed in two1-foot lifts. Final closure was completed in October 1985, in substantialcompliance with WAC Chapter NR 181, and was documented in a closureReport entitled "City of Janesville Landfill No. 2822, Site ClosureDocumentation Report", City of Janesville, 1986. Facility ClosureDocumentation Approval was received from WDNR in November 1986.
A multi-layer cap was built upon the existing clay cap aspart of the 1996 remedial construction activities. Low areas were backfilled,side slopes were graded and the existing clay layer was reworked to achieve afinal 24-inch clay layer thickness. An 18-inch thick rooting zone/protectivelayer and a 6-inch thick vegetated topsoil layer completed the new coversystem. In addition, an active LFG collection system consisting ofvertically-installed gas collection wells was included in the constructionactivities at the 1985 landfill. The gas collection wells were designed toaccommodate leachate removal pumps, should leachate levels exceed 1.0 footabove the bottom of the well.
It was noted in the RI report that contaminant migrationfrom the landfill to groundwater was not likely due to its construction. Thisconclusion was supported by analytical data from groundwater samplescollected from monitoring wells located south of the 1985 landfill. However,analytical data from groundwater samples collected between the 1978 and 1985landfills suggests that some impact to groundwater may have occurred. This
11 CONESTOGA-ROVERS& ASSOCIATES
J11
J]
may be due to waste spillage during landfilling operations at the 1978 and1985 landfills or possibly an effect of the unlined 1978 landfill.
4.4 TAB SITE
JAB 1 and 2 were unlined beds operated from 1974 to 1983.The beds were closed in 1983 and 1984. JAB 3, 4 and 5 were operated unlinedfrom 1974 to 1983. The beds were operated as lined facilities with a leachatecollection system from 1983 to 1985 and were closed completely in 1985.Closure activities for beds 1 and 2 consisted of excavating and removingmaterial below the bottom of waste and backfilling and regrading theexcavated areas. Closure activities for beds 3,4 and 5 consisted of excavatingbelow the waste, fly ash, underlying sand and clay liner to a depth wheresample analysis confirmed removal of VOC contaminated materials. "Beds 3,4 and 5 were backfilled and regraded to the surrounding contours. Finalclosure of the JAB was completed in August 1985 in substantial compliancewith WAC Chapter NR 181 and consisted "Of capping with 2 feet of clay,grading to promote positive drainage and establishing a vegetative cover.Final Closure was documented in a report entitled "GMAD Sludge BedFacilities, Site Closure Documentation Report", City of Janesville, 1985.Facility Closure Documentation Approval was received from WDNR inNovember 1986.
Remedial construction activities conducted in 1996consisted of removing approximately 10,000 cubic yards of ash which hadbeen stockpiled south of the JAB. The underlying soil was graded to promotepositive drainage and a vegetative cover was established.
With the closure of the JAB in 1985, the source ofcontaminants has been removed and contaminant concentrationsdowngradient of the JAB have been steadily decreasing over time.
12 CONBSTOGA-ROVERS 4 ASSOCIATES
J]
4.5 PARKER PEN
In February 1985, an accidental spill of approximately250 gallons of TCE from an above ground storage tank occurred at Parker PenUSA Limited (Parker Pen). Parker Pen is located at 1400 North Parker Drive,downgradient of the JDF. A hydrogeologic study was conducted by Parker Penin August 1989 to determine the extent of groundwater contamination. Thefindings of the study indicated that groundwater contamination with TCE
was likely the result of the spill and recommendations were made that soilvapor extraction systems be constructed at the TCE tank and a nearby PCEtank. The systems began operating in November 1990 and removedapproximately 557 pounds of VOCs during their 2.7 years of operation.
The report also recommended that an extraction well beinstalled in the area of monitoring well W20, which is located on thesouthwest property boundary downgradient of the plant. In May 1990, an8-inch diameter extraction well was installed approximately 10 to 15 feetnorth of monitoring well W20. The groundwater recovery system beganoperating in June 1993. Average pumping rates ranged from 25 to 80 gallonsper minute (gpm) and 74,869,000 gallons of groundwater were removedduring the 2.5 years of its operation. Influent TCE concentrations decreasedfrom 760 Hg/L to 4 ug/L when the system was shut down in December 1995.
The groundwater capture zone of an extraction welllocated at monitoring well W20 was calculated using an estimate of hydraulicconductivity from slug tests in the immediate area and a pumping rate of 50gpm. Figure 4.1 presents the output from the capture zone calculationssuperimposed on the JDF Site. Since the extraction well was operated for 2.5years at an average pumping rate of 60 gpm, the capture zone depicted islikely a reasonable approximation.
As noted on Figure 4.1, the capture zone extends beyondthe Parker Pen boundary to monitoring well W28 on the north, monitoringwell 60W on the northeast and monitoring well AT-1 on the southeast.Therefore, it is reasonable to assume that contaminants migrating from the
13 CONBSTOGA-ROVBRS& ASSOCIATES
JI JDF into the capture zone were removed during the operation of Parker Pen's
extraction system.
]
J9TO 0) 14 CONBSTOGA-ROVBRS & ASSOCIATES
11
5.0 DATA EVALUATION AND DISCUSSION
5.1 REMEDIAL INVESTIGATION
Three rounds of groundwater samples were collectedduring the RI. The first round of sampling was conducted in December 1987,the second in April 1988 and the third in July 1988. Round 1 samples wereanalyzed for the complete U.S. EPA Target Compound List/Target AnalyteList (TCL/TAL) suite of parameters. In addition, leachate collected from the1985 landfill and groundwater samples collected from the JAB were alsoanalyzed for the U.S. EPA RCRA Appendix DC list of landfill groundwaterparameters. Based on the detected compounds from the Round 1 analyticaldata, the Round 2 analysis requirements were reduced to VOCs, semivolatileorganic compounds (SVOCs), metals and indicator parameters. Similarly, theRound 3 analysis requirements were reduced to VOCs and metals. Thereductions to the analysis requirements were approved by U.S. EPA prior toRound 2 and Round 3 sampling.
Table 5.1 presents a summary of the RI groundwater dataexceeding Nk 140 standards. For comparison purposes, the monitoring welldata evaluated and presented are for those wells which have been included inthe compliance monitoring program.
5.1.1 1978 Site/1985 Site Well Group
During the RI, dissolved metals, including arsenic,barium, iron and manganese frequently exceeded their respective NR 140standards. Detected VOCs which exceeded their respective NR 140 standardsincluded benzene, 1,2-dichloroethene (1,2-DCE), vinyl chloride and TCE. TCE,1,2-DCE and vinyl chloride were generally detected at low or estimatedconcentrations in the monitoring wells between the 1978 and 1985 landfills.Benzene, 1,2-DCE, TCE and vinyl chloride were generally detected at low orestimated concentrations downgradient of the 1978 landfill.
9702(1) 15 CONESTOGA-ROVHRS & ASSOCIATES
]1 5.1.2 TAB Site Well Group
During the RI, dissolved arsenic, barium, iron andmanganese exceeded their respective MR 140 standards, primarily inmonitoring wells located in the downgradient portion of the JAB Site.Detected VOCs which exceeded their respective NR 140 standardsdowngradient of the JAB included TCE, PCE and 1,2-DCE. The highest VOCconcentrations were detected between the JAB and Parker Pen. In addition,TCE and PCE were detected to the northwest, crossgradient of the JAB. Thecrossgradient detections of TCE and PCE were attributed in the RI report tonortherly dispersion of the VOC plume. The ROD attributed the VOCdetections to a "small component" of the plume heading northwest prior toheading southwest. In any event, the VOC detections crossgradient of theJAB during the RI are likely due to VOCs associated with the JAB.
Chloride was also detected in one monitoring well duringone RI monitoring event, above its PAL but below its ES.
5.1.3 TDF Site Well Group
During the RI, dissolved iron, manganese and leadconcentrations exceeded their respective NR 140 standards in downgradientmonitoring wells. In addition, TCE, PCE and 1,2-DCE concentrations exceededtheir respective NR 140 standards in downgradient monitoring wells. The RIreport indicated that TCE detections in downgradient monitoring well W6were likely attributable to the spill at Parker Pen.
5.2 COMPLIANCE MONITORING
Five rounds of annual groundwater monitoring andtwelve rounds of quarterly groundwater monitoring have been completedduring the compliance monitoring period. Annual and quarterly compliancemonitoring sampling and analysis events from April 1993 to December 1996,were consistent with the requirements of the SOW and RD/RA Work Plan.
16 CONESTOGA-ROVHRS& ASSOCIATES
]
1In March 1997, U.S. EPA and WDNR amended the requirements forcompliance monitoring, as detailed in Section 2.0.
For the majority of the annual events, the samples fromthe 1978 Site/1985 Site and JAB well groups were analyzed for WAC ChapterMR 635 Appendix I parameters (VOCs, SVOCs, organochlorine andorganophosphorus pesticides, polychlorinated biphenyls, herbicides,polychlorinated dibenzo-p-dioxins and dibenzofurans, metals and indicatorparameters). Quarterly compliance monitoring for the 1978 Site/1985 Site andJAB well groups consisted of detected Appendix I constituents (VOCs) and aselect list of metals and indicator parameters. The JDF Site well group wassampled on an annual basis and analyzed for VOCs and a select list of metalsand indicator parameters.
Appendix B presents a summary of NR 140 standardexceedances for the compliance monitoring period.
5.2.1 1978 Site/1985 Site Well Group
Consistent with the RI data, dissolved arsenic, barium,iron and manganese have exceeded their respective NR 140 standards duringthe compliance monitoring period. Elevated concentrations of dissolved ironand manganese downgradient of the landfills are likely the result ofbiodegradation occurring beneath the landfills (see Section 6.0). Dissolvedarsenic and barium concentrations are generally consistent with the RI dataand have not exceeded their respective ESs during the compliancemonitoring period.
Additionally, in 1993, dissolved lead and mercury weredetected above their respective PALs but below their respective ESs indowngradient monitoring wells or in the monitoring wells between thelandfills. Dissolved lead and mercury have not been detected in samplescollected from the well group since that time.
97020) 17 CoNBSTOGA-RovHRs & ASSOCIATES
]J]
During the compliance monitoring period, VOCs whichexceeded their respective NR 140 standards consisted of benzene,l,2-dibromo-3-chloropropane, 1,2-dibromoethane, 1,2-dichloroethane,1,1-dichloroethene, PCE, 1,1,2-trichloroethane, TCE and vinyl chloride. Themajority of the 1,1-dichloroethene detections were likely artifacts of thelaboratory analyses since the associated laboratory blanks also contained1,1-dichloroethene. Also, all VOCs were detected at estimated concentrationsbelow the quantitation limits of the analyses and only benzene has beendetected since the December 1995 monitoring event. No VOCs were detectedin any monitoring wells downgradient of the 1978 Site/1985 Site during theMarch 1997 monitoring event
5.2.2 TAB Site Well Group
Consistent with the RI data, dissolved arsenic, barium,iron and manganese have exceeded their respective NR 140 standards duringthe compliance monitoring period. Elevated concentrations of dissolved ironand manganese downgradient of the landfills are likely the result ofbiodegradation occurring beneath the JAB. Additionally, dissolvedchromium concentrations exceeded the PAL in monitoring well W30 in thetwo compliance monitoring events in 1993, but has not been detected sinceMarch 1994.
Dissolved lead concentrations exceeded its PAL indowngradient, crossgradient and upgradient monitoring wells during theOctober 1993 monitoring event. Dissolved lead has not been detected sincethe October 1993 event.
Dissolved mercury concentrations exceeded its PAL inmonitoring wells in the downgradient portion of the JAB during theDecember 1993 monitoring event Dissolved mercury has not been detectedin subsequent monitoring events.
Dissolved selenium concentrations exceeded its PAL inupgradient and downgradient monitoring wells during the first two
18 CONBSTOGA-ROVHRS& ASSOCIATE
compliance monitoring events. Dissolved selenium has not been detected inthe well group since that time.
During the compliance monitoring period, VOCs whichexceeded their respective NR 140 standards consisted of benzene,l,2-dibromo-3-chloropropane, 1,2-dichloroethane, 1,1-dichloroethene, PCE,1,1,2-trichloroethane, TCE and vinyl chloride. While PCE and TCEconcentrations exceeding NR 140 standards are consistent with the RI data,the concentrations of both VOCs have decreased since the RI. The1,1-dichloroethene and l,2-dibromo-3-chloropropane detections were likelyartifacts of the laboratory, analyses since the associated laboratory methodblanks also contained these compounds. The remaining VOCs were detectedat estimated concentrations in the early compliance monitoring events andhave not been detected since March 1995.
Chloride concentrations have exceeded its NR 140standards in monitoring wells W5 and W23. The chloride exceedances arelikely due to biodegradation of chlorinated'.VOCs beneath the JAB (seeSection 6.0).
5.2.3 JDF Site Well Group
Only dissolved manganese during one compliancemonitoring event (March 1995) was detected above its PAL, in one upgradientmonitoring well. Dissolved manganese has not been detected above its PALin any other monitoring well during the compliance monitoring period.
During the compliance monitoring period, VOCs whichexceeded their respective NR 140 standards consisted of PCE, TCE,1,1-dichloroethene, benzene and 1,1/2-trichloroethane. The1,1-dichloroethene detections were likely artifacts of the laboratory analysessince the associated laboratory methods also contained these compounds.Benzene and 1,1,2-trichloroethane, which were detected at estimatedconcentrations in 1993 and 1994, have not been subsequently detected in the
9702 (l) 19 CONBSTOGA-ROVEHS & ASSOCIATES
J1
Ij
well group. PCE and TCE were detected at significantly lower concentrationsduring the March 1997 monitoring event than during the RI.
Chloride concentrations have exceeded its NR 140standards in downgradient monitoring wells. The chloride exceedances arelikely due to biodegradation of chlorinated VOCs.
5.4 STATISTICAL DATA EVALUATION
Consistent with the Consent Decree, compliancemonitoring data were evaluated to RCRA hazardous constituentconcentration limits as provided in WAC Chapter NR 181.49(6)(d).Establishing concentration limits includes consideration of backgroundconcentrations, Maximum Concentrations of Constituents for GroundwaterProtection (MCCGWP) from NR 181.49(6)(d) Table XI, PALs and any AlternateConcentration Limits (ACLs) developed for the Site pursuant to NR181.49(6)(d)2 and Section V, subparagraph 12.a.(l)(A) of the Consent Decree.The procedure for determining the concentration limits for each compliancemonitoring event is detailed in Appendix 2.0 of the RD/RA Work Plan. Thisprocedure involves pooling detected background monitoring well data,determining its distribution and calculating a background concentration uppertolerance limit (BGCtrrL)- The concentration limit determined for a particularanalyte is the highest concentration from the PAL, ACL, MCCGWP andBGCuTL- The actual concentration limits during the compliance monitoringperiod have been the PAL or BGCurL-
Table 5.2 presents a summary of the compliancemonitoring data exceeding the concentration limits determined using theprocedure specified above. In general, dissolved arsenic, barium, iron,manganese and sodium in downgradient monitoring wells have exceededmetals concentration limits during the compliance monitoring period. VOCsexceeding concentration limits primarily consist of PCE and TCE. Chemicaloxygen demand (COD) and hardness are the only indicator parameters whichhave exceeded their respective concentration limits during the compliancemonitoring period. The only non-VOC organic compound to exceed a
mam 20 CONBSTOGA-ROVBRS&ASSOOATBS
J111
]1
concentration limit was octachlorodibenzo-p-dioxin (OCDD) in the April 1996monitoring event. OCDD is a common contaminant of the analysis methodand its detection in the April 1996 event is likely anomalous.
5.5 CHEMICALS OF CONCERN
Based on the data obtained from the RI and compliancemonitoring sampling events compared to NR 140 standards andconcentration limits, the chemicals of concern at the Site consist of certaindissolved metals and VOCs. During the last full year of compliancemonitoring, dissolved iron, dissolved manganese, PCE and TCE exceeded ESsor BGCuTL concentration limits in downgradient monitoring wells at theSite. Dissolved arsenic has historically exceeded the PAL in certainmonitoring wells, but has never exceeded the ES. In addition, COD, dissolvedsodium and hardness exceeded the PALs in select monitoring wells.
) COD and hardness are indicator parameters, related to thepresence of oxidizable organic matter and certain divalent metals,
I respectively. Similarly, sodium is also an indicator parameter with limitedJ adverse health effects. Sodium is a landfill leachate indicator. As such, these
parameters should not be considered chemicals of concern for the Site.
Dissolved manganese and iron in groundwater associatedwith landfills is generally due to biodegradation processes occurring in thesubsurface (see Section 6.0). In addition, manganese and iron are defined in
I NR 140 as "substances of public welfare concern" and are regulated by the U.S.EPA under the secondary drinking water standards. Secondary drinking
1 water standards are nonenforceable guidelines regarding taste, odor, color and' certain other non-aesthetic effects of drinking water. Manganese and iron. should not be considered chemicals of concern for the Site.
Therefore, the current chemicals of concern (COCs) for theSite are arsenic, PCE and TCE.
21 CONESTOGA-ROVHRS& ASSOCIATES
J5.6 DATA TRENDS FOR CHEMICALS OF CONCERN
The RI and compliance monitoring data for the Site wereevaluated for concentration trends for the COCs discussed in Section 5.5.Dissolved arsenic concentrations, which have never exceeded the ES, werefound to have remained essentially unchanged since the RI, thusconcentration trends were not plotted. However, PCE and TCEconcentrations were found to be generally decreasing over time inmonitoring wells downgradient from the JAB well group and JDF well group.PCE and TCE have not been detected, or PCE and TCE detections have beeninfrequent at estimated concentrations in the 1978 Site/1985 Site well group,and the concentration trends were not plotted.
Appendix C provides trend charts of PCE and TCEconcentrations versus time for monitoring wells W30, W5, W23, W28 andW6. Each point on the graphs represent the data from a specific monitoringevent. These graphs indicate that PCE and TCE concentrations are generallydecreasing with time in the monitoring wells downgradient andcrossgradient of the JAB.
The trend charts for monitoring wells W5, W28 and W6downgradient of the JAB show an overall decreasing trend since the RI.Monitoring well W28 located between the JAB and Parker Pen provides themost compelling evidence of decreasing concentrations. This well is not partof the compliance monitoring program but has been included as anupgradient groundwater monitoring well for the Parker Pen TCE spillremediation. As illustrated on Figure 4.1, monitoring well W28 was notincluded in the capture zone of the groundwater extraction system, butgroundwater flow in the vicinity may have been affected.
Monitoring well W6 is downgradient of Parker Pen andthe trend graph likely represents the decrease over time due to both naturalattenuation and the Parker Pen TCE spill remediation. The inordinately highconcentrations of PCE and TCE for the March 1995 monitoring event areanomalous and may be due in part to the reconstruction of Highway 51 east ofthe monitoring well.
22 CONBSTOGA-ROVBRS & ASSOCIATES
J
111
•J1
Monitoring well W5 is located in the northwest corner ofthe JAB. PCE and TCE concentrations have decreased significantly since theRI. The PCE data obtained during the compliance monitoring period indicatea slight increasing trend which appears to have stabilized.
The trend charts for monitoring wells W30 and W23,which are located crossgradient of the JAB, are less straightforward. Thepresence of PCE and TCE in these wells is likely due to radial groundwaterflow or dispersion of contaminants from the JAB during its operating period.TCE concentrations have, significantly decreased in monitoring well W30since 1993, when monitoring commenced at this location. PCEconcentrations have remained relatively constant (i.e., non-detect orestimated concentrations).
PCE and TCE concentrations in monitoring well W23initially decreased then began increasing in September 1993 and have beendecreasing since April 1996. The reason for the increasing concentrationtrend from late 1993 to early 1996 is not clear but may be related to majorreconstruction of Black Ridge Road which intersects adjacent to W23 and theJAB. The major reconstruction was performed in 1993. Reportedly, a 25 feetdeep excavation below the former road surface was part of the project andgroundwater flow may have been influenced by the construction activities.Nevertheless, PCE and TCE concentrations have been decreasing since April1996.
23 CONIOTOGA-RQVBRS& ASSOCIATES
11
1
I
1
6.0 NATURAL ATTENUATION EVALUATION
6.1 U.S. EPA PERSPECTIVE ON NATURAL ATTENUATION
Over the past several years, remediation by naturalattenuation, or intrinsic remediation, has become increasingly accepted as aviable remedial alternative for organic compounds in the subsurface. TheU.S. EPA defines natural attenuation as naturally-occurring processes in soiland groundwater that act without human intervention to reduce the mass,toxicity, mobility, volume, and concentration of contaminants in thosemedia. Natural attenuation is recognized in the National ContingencyPlan (NCP) as an effective remedial alternative that can reduce contaminantconcentrations to levels which are protective of human health and theenvironment (Federal Register, 1990). Natural attenuation processes areclassified as destructive and non-destructive. Destructive processes arechemical degradation (where organic compounds are chemically transformedto degradation products) and biological degradation (where the respiration ofbacteria ubiquitous to subsurface environments effectively transforms organiccompounds to degradation products). Non-destructive processes includeadsorption, dispersion, dilution, and volatilization.
In the NCP, U.S. EPA recognizes, and acknowledges, thatnatural attenuation "will effectively reduce contaminants in the groundwater to concentrations protective of human health in a timeframecomparable to that which could be achieved through active restoration"(Federal Register, 1990). The U.S. EPA also recognizes that naturalattenuation can be a more cost effective, and therefore, a more appropriatealternative than the construction and operation of an intrusive remedialalternative. Regulatory acceptance of a natural attenuation remedy at a site iscontingent on the evaluation of observed site data to demonstrate thatnatural attenuation is effectively reducing contaminant levels andpreventing contaminant migration to potential receptors. A naturalattenuation remedy is particularly well suited for contaminated sites where
there is no demand on the groundwater as a resource while the naturalattenuation remedy is in progress.
"02 (1) 24 CONBSTOGA-ROVERS & ASSOCIATES
I1
I
)
The U.S. EPA strongly supports the use of naturalattenuation to remediate groundwater contamination (Feldman, 1995). Thisreflects U.S. EPA's recognition that, in certain circumstances, naturalattenuation can be sufficiently protective of human health and theenvironment, and can be more cost effective than other remedialalternatives. The U.S. EPA states that the successful utilization of a naturalattenuation remedy depends upon thorough Site characterization (i.e., thedevelopment of a representative conceptual hydrogeologic model), thecombination of natural attenuation with active measures as appropriate, andthe implementation of a detailed monitoring plan backed by contingencymeasures to ensure long-term reliability and protectiveness of the remedy(Feldman, 1995).
In view of recent advancements in the understanding ofnatural attenuation processes, the U.S. EPA recognizes that remedies selectedin the past might not be the same as remedies selected today under the samecircumstances. In its Superfund Reforms: Updating Remedy Decisions, theU.S. EPA encourages the various U.S. EPA Regions to "take a close look at,and modify as appropriate, past remedy decisions where those decisions aresubstantially out of date with the current state of knowledge in remediationscience and technology, and thus are not as effective from a technical or costperspective as they could be" (U.S. EPA, March 27, 1997). This indicates astrong effort to consider site-specific circumstances, including technicalimpracticability and future land use, as a larger factor when selecting orre-evaluating appropriate remedies.
Extensive research studies jointly have been conducted bythe U.S. EPA and the U.S. Air Force to identify the effectiveness of naturalattenuation processes in attenuating petroleum hydrocarbons and chlorinatedsolvents in groundwater. Together, the U.S. EPA and the U.S. Air Force haverecently developed technical protocols for implementing natural attenuationfor sites contaminated with petroleum hydrocarbons (Wiedemeier et al., 1995)and sites contaminated with chlorinated solvents (Wiedemeier et al., 1996).Both protocols state that to support remediation by natural attenuation, itmust be scientifically demonstrated using a "weight-of-evidence" approachthat natural attenuation of site-related contaminants is occurring at rates
2 5 CONESTOGA-ROVHRS If ASSOCIATES
]1)}
sufficient to be protective of human health and the environment. Threelines of evidence can be used to support the occurrence of naturalattenuation:
1) observed reductions in contaminant concentrations along the flowpath downgradient from the source of contamination;
' 2) documented loss of contaminant mass using chemical and] geochemical analytical data (i.e., decreasing parent compound/ concentrations, decreasing daughter compound concentrations, and
increasing metabolic byproduct concentrations); and
~T
3) field data that support the occurrence of biodegradation [i.e., observed1 oxidation-reduction (redox) conditions] (Wiedemeier et al., 1996).
I In principle, the lines of evidence used to demonstrate' natural attenuation are the same for both petroleum hydrocarbons andI chlorinated solvents.
, This Petition Report has been prepared consistent withthe U.S. EPA protocol described above. A detailed description of the JDF, withrespect to the observed hydrogeologic data, chemical presence, and potentialdowngradient receptors, was presented in Section 3.0. Based on these data, aconceptual model of the hydrogeologic conditions and natural attenuation
I processes occurring beneath me JDF is presented in Section 6.5. Section 6.6presents evidence of a decrease in the extent of COCs with time, a decrease in
. COC concentrations with time, and redox conditions which are supportive of/ COC biodegradation. This weight of evidence approach is used to
demonstrate the effectiveness of natural attenuation at the JDF. It isconsidered that the development of a long-term monitoring program willproceed in future negotiations with the U.S. EPA and WDNR following the
\
i acceptance of this Petition Report. This monitoring program will ensure thereliability and protectiveness of the natural attenuation remedy.
9702m 26 CONBSTOGA-ROVEKS & ASSOCIATES
1.} 6.2 WDNR PERSPECTIVE ON NATURAL ATTENUATION
I The WDNR recently released the natural attenuationguidance document entitled, "Interim Guidance for Selection of Natural
1 Attenuation for Groundwater Restoration and Case Closure" (WDNRGuidance) (WDNR, 1997). This document presents guidance relating to the
T selection of natural attenuation to restore contaminated groundwater to' NR 140 standards and presents criteria that must be addressed under• NR 726.05(2)(b) to close a case where natural attenuation is demonstrated to) be effective and acceptable as a final groundwater remedy. The WDNR
Guidance acknowledges mat a natural attenuation remedy may produce lesswaste, use less energy, reduce operation and maintenance costs and, therefore,provide a more economically feasible alternative than groundwater
1 extraction and treatment.
j The November 1,1996 revisions to Table 5 and 6 of WAC' Chapter NR 140 specifically identify natural attenuation as a remedialI alternative for the restoration of contaminated groundwater to NR 1407 standards if it can be demonstrated that natural attenuation will achieve
groundwater restoration within a reasonable period of time. Natural[ attenuation is defined in NR 140.05(14m) and NR 700.03(38m) as the
"reduction in concentration and mass of a substance and its breakdownproducts in groundwater, due to naturally occurring physical, chemical, andbiological processes without human intervention or enhancement. These
I processes include, but are not limited to, dispersion, diffusion, sorption, and' retardation, and degradation processes such as biodegradation, abiotici degradation, radio active decay". The physical processes of dispersion andI diffusion primarily result in the reduction of contaminant concentrations,
advection results in contaminant mixing, and sorption and retardation slowthe migration of contaminants. The processes of biodegradation andchemical, or abiotic, degradation serve to reduce the overall mass ofcontaminants.
Several qualitative criteria are listed in NR 722.07(4)(a)4 toaid in determining a reasonable period of time for groundwater restoration ata specific site. These qualitative criteria include consideration of the
27 CONBSTOGA-ROVERS & ASSOCIATES
IT
1
I1
3
3
1.1
3
J1
proximity and presence of receptors, aquifer use, contaminant characteristics,geologic and hydrogeologic conditions and the use of institutional controls.In the event that groundwater beneath a site discharges to a surface waterbody (as is the case with the JDF), a natural attenuation remedy is acceptableprovided surface water quality standards in NR102 and NR 105 are notexceeded.
The WDNR Guidance states that for natural attenuationto be accepted as a site remedy, it must be demonstrated that natural processesare reducing the total mass of contaminants in an effective and timelymanner. This must be demonstrated with historical data which indicates anoverall decreasing trend in contaminant concentrations over time anddistance downgradient of the source area, including a decreasing trend inbreakdown products. The WDNR Guidance outlines indicators supportingthe occurrence of natural attenuation that are consistent with those identifiedin the protocol developed by U.S. EPA (Wiedemeier et al., 1995). The WDNRGuidance indicates that natural attenuation as a sole remedy is acceptablewhen it has been demonstrated that the contaminant plume is stable orreceding, the restoration of groundwater quality will occur within areasonable period of time, all potential exposure pathways have beenaddressed, and there is no anticipated threat to human health and theenvironment.
6.3 OVERVIEW OF BIODEGRADATION PROCESSES
Biodegradation is one of the most important destructiveprocesses acting to reduce contaminant concentrations in groundwater. Manyorganic contaminants are readily biodegraded by microorganisms ubiquitousto subsurface environments. During biodegradation, microorganismstransform available nutrients into forms useful for energy and cellreproduction by facilitating the transfer of electrons from donors to acceptors.This results in the oxidation of an electron donor and the reduction of anelectron acceptor (i.e., a redox reaction). Electron donors represent theprimary substrate for cell respiration and include naturally occurring andanthropogenic sources of dissolved organic carbon, petroleum hydrocarbons
28 CoNHSTOGA-RovBits 4 ASSOCIATES
I
I3
(e.g., BTEX compounds), and, to a limited extent, some less oxidizedchlorinated aliphatic hydrocarbons [e.g., vinyl chloride (VC)] under aerobicconditions.
Organic contaminants may undergo biodegradationthrough three different pathways:
• use as an electron donor (i.e., primary growth substrate) where, asdescribed above, the transfer of electrons from BTEX compounds, andsome less oxidized chlorinated aliphatic hydrocarbons (e.g., VC underaerobic conditions), provides energy to the microorganisms;
• use as an electron acceptor (reductive dehalogenation or reductivechlorination) under anaerobic conditions where a chlorine atom froma chlorinated hydrocarbon is replaced by a hydrogen atom. In general,reductive dehalogenation occurs by sequential dechlorination of PCE toTCE to DCE to VC to ethene (resulting in increased chlorideconcentrations); and
• cometabolism where the degradation of a chlorinated aliphatichydrocarbon is catalyzed by an enzyme, or cofactor, that is fortuitouslyproduced by the microorganisms for other purposes. The chlorinatedhydrocarbon is indirectly transformed by the microorganisms as they
~~ use dissolved organic carbon or BTEX compounds as a primary! substrate for energy.
r At a given site, one or all of these processes may be1 occurring, although for chlorinated aliphatic hydrocarbons, reductive
dehalogenation appears to be most prominent and occurs under anaerobicJ conditions. The presence of both BTEX and chlorinated solvents in the same
contaminant plume presents favorable conditions for biodegradation since, inI addition to naturally occurring dissolved organic carbon, the BTEX
compounds are used by the microorganisms as a further source of growthj1 substrate for the biodegradation of the chlorinated solvents. Landfill leachate
containing organic matter may consist of dissolved organic carbonconcentrations in the range of thousands of milligrams per liter including, for
J
1 9702(1) 29 CONBSTOGA-ROVBRS & ASSOCIATES
]
1
11
1IJ
11
example, fatty acids and humic- and fulvic-like compounds (Lyngkilde andChristensen, 1992a). Organic rich landfill leachate provides a substantialsource of dissolved organic carbon for microbial respiration. In the case ofunlined landfills, leachate discharging to underlying groundwater suppliesmicroorganisms with a continuous supply of growth substrate over thecontaminating lifespan of the landfill.
Evaluating the distribution of naturally occurring electronacceptors can provide evidence of where and how biodegradation isoccurring. Naturally occurring electron acceptors available in groundwater,in the order of those that release the greatest energy to those that release theleast energy, are as follows: dissolved oxygen, nitrate, manganese and ironcoatings on soil sediments, dissolved sulfate/ and carbon dioxide. Thesequential reduction of these electron acceptors occurs as groundwaterbecomes increasingly more reducing during the biodegradation of organiccompounds. With the long-term migration of organic contaminants ingroundwater, a sequence of redox zones of increasing redox potential willdevelop downgradient from the source area (Lyngkilde and Christensen,1992a; Appelo and Postma, 1993). The sequence of these redox zones, in orderof the closest to the farthest away from the source area, will be as follows:
1. methanogenic zone (carbon dioxide reduction to methane);2. sulfidogenic zone (sulfate reduction to sulfide);3. ferrogenic zone [Fe(ni) reduction to Fe(n)];4. manganogenic zone [Mn(IV) reduction to Mn(n)];5. nitrate-reducing zone (nitrate reduction to nitrite); and6. aerobic zone (dissolved oxygen reduction to water).
The extent of each individual redox zone is site-specific,and will depend on substrate migration pathways, kinetics of redox processes,hydraulic retention times, and the availability of various electron acceptors ingroundwater. Identifying the redox zones downgradient of the source area ata site can provide strong evidence of the occurrence of biodegradation. Themost rapid rates of reductive dehalogenation, affecting the widest range ofchlorinated aliphatic hydrocarbons, occur under sulfate-reducing andmethanogenic conditions (Bouwer, 1994). However, the methanogenic and
30 CONH5TOGA-ROVHRS & ASSOCIATES
sulfate-reducing conditions may only extend a short distance downgradient ofthe source area. In a study of redox zones and contaminant degradation
I downgradient of the Vejen Landfill located in Vejen, Denmark, Lyngkildeand Christensen (1992b) found that the most significant degradation of
I organic contaminants emanating from the landfill took place in theferrogenic zone which extended significant distances of up to 1,000 feet
I downgradient of the landfill.
IWhen the groundwater becomes depleted of dissolved
oxygen and nitrate, conditions become anaerobic where the reduction andsubsequent dissolution of the iron and manganese oxide coatings from soilsediments can occur. These reactions will result in the mobilization offerrous iron [Fe(II)] and manganese [Mn(n)] in groundwater. In their oxidizedstate, Fe(ni) and Mn(IV) are practically insoluble at pH levels of 5 to 7 anddissolved concentrations are considered to represent the reduced species ofFe(H) and Mn(II) (Lyngkilde and Christensen, 1992a). The mobilization ofmanganese will begin prior to mat of iron because dissolved manganese isstable over a larger range of redox conditions than ferrous iron (Baedeckerand Back, 1979). However, the concentration of dissolved iron ingroundwater is often higher than that of manganese because soil sedimentstypically consist of a higher iron content (Hem, 1985). Various metals (e.g.,arsenic, barium, zinc, etc.) may be released from soil sediments during thereduction and dissolution of iron or manganese because some metals have atendency to sorb strongly to these oxide coatings. As a result, the ferrogenicand manganogenic redox zones are often associated with dissolved metalconcentrations above background levels. As groundwater conditions becomeincreasingly more oxidizing further downgradient of the source area, thesedissolved metals often re-adsorb to oxidized Fe(III) and Mn(IV) and theresulting oxides precipitate out of solution with groundwater (Baedecker andBack, 1979).
Geochemical conditions also can provide evidence of theoccurrence of biodegradation. The presence of geochemical parameters suchas alkalinity, carbonates, bicarbonates, calcium, and magnesium are indicativeof the capacity of groundwater to buffer pH against the acids generated duringboth aerobic and anaerobic biodegradation (Wiedemeier et al., 1996). For
ma. (l) 31 CONBSTOGA-ROVBRS & ASSOCIATES
1example, increased calcium and magnesium concentrations can indicate theoccurrence of carbonate mineral dissolution to buffer acids produced duringthe biodegradation of organic compounds (Kehew and Passero, 1990).
6.4 ASSESSMENT APPROACH
Based on the JDF Site setting presented in Section 3.0, aconceptual model was developed for the groundwater flow regime andnatural attenuation processes occurring beneath and downgradient of the JDF.The conceptual model is presented in Section 6.5.
The historical groundwater analytical data for the JDF wasreviewed in relation to the conceptual model of the hydrogeologic conditionsbeneath the JDF. These data were applied in a weight-of-evidence approach todemonstrate the effectiveness of natural attenuation at the JDF. The datawere used to illustrate the following definitive indicators of the occurrence ofnatural attenuation:
• steady-state (stable) to receding plume conditions;
• decreasing concentrations along flow path downgradient of the source-j. area; and
I • redox and geochemical indicators of biodegradation.
< Each of the above indicators represents a distinct line of1 evidence that supports the occurrence of natural attenuation that converge toi scientifically document the occurrence of natural attenuation' (Wiedemeier et al., 1996 and McAllister and Chiang, 1994). Identifying
multiple lines of evidence increases the likelihood of implementing natural) attenuation as the sole groundwater remedy at a site (Weidemeier et al., 1995
and Weidemeier et al., 1996). The lines of evidence that demonstrate theeffectiveness of natural attenuation at the JDF are presented in Section 6.6.
32 CoNBsrocA-RovHRSfc ASSOCIATES
J1 6.5 CONCEPTUAL MODEL
6.5.1 Conceptual Hydrogeologic Model
A conceptual model of the subsurface conditions beneaththe JDF was developed based on the hydrogeologic data collected during theRI.
The outwash deposits beneath the JDF consist of relativelyuniform sands and gravels. The outwash deposits are greater thanapproximately 100 to 150 feet in thickness in the vicinity of JDF. Bedrock liesbeneath the outwash deposits.
The depth to groundwater varies from approximately 60to 70 feet BGS. Unconfined groundwater flow occurs in the outwash depositto the southwest toward the Rock River. Although vertical hydraulicgradients beneath the JDF are relatively small, significant upward hydraulicgradients exist in monitoring wells adjacent to the Rock River, downgradientof the JDF. This indicates that groundwater beneath the JDF discharges to theRock River.
Beneath the JDF, groundwater flow occurs in thehorizontal direction under essentially uniform conditions. The averagehorizontal hydraulic gradient beneath the JDF is approximately 0.002 ft/ft.Based on the range of hydraulic conductivity values determined from singleresponse tests conducted during the RI, and an assumed porosity of 0.3,calculated horizontal groundwater flow velocities beneath the JDF range fromapproximately 60 to 120 ft/yr. These calculated groundwater flow velocitiesare considered to underestimate the actual groundwater flow velocity since,as described in Section 3.1, hydraulic conductivity values from single wellresponse tests tend to underestimate the actual hydraulic conductivity of adeposit.
33 CONBSTOGA-RQVHRS& ASSOCIATES
6.5.2 Natural Attenuation Processes
The natural attenuation processes occurring ingroundwater beneath and downgradient of the JDF include the following:
• advection;• dispersion;• adsorption;• dilution; and• biodegradation.
Collectively, all of these processes are considered to be reducing theconcentration and mass of JDF-related COCs beneath and downgradient of theJDF. Although the physical processes of advection, dispersion, adsorption,and dilution are effective in reducing COC concentrations, biodegradation isconsidered to be the most prevalent process with respect to COC massdestruction. Evidence supporting the occurrence of biodegradation ingroundwater beneath and downgradient of. the JDF, to an extent that isprotective of human health and the environment, is presented in Section 6.6.
6.6 EVIDENCE OF NATURAL ATTENUATION
Site-specific indicators of natural attenuation wereevaluated based on previous groundwater and surface water qualitymonitoring data obtained during the RI and during the groundwatercompliance monitoring conducted from April 1993 to March 1997. Based onthese data, and the conceptual model of the hydrogeologic conditions andnatural attenuation processes, the lines of evidence demonstrating theoccurrence of natural attenuation at the JDF are presented below. A naturalattenuation remedy is particularly well suited to the JDF since, as described inSection 3.3, there is no demand on the groundwater as a resource beneath,crossgradient, or downgradient of the JDF.
During the RI, significant levels of JDF-related COCs weredetected in groundwater samples obtained beneath the JAB and up to a
9702(1) 34 CONBSTOGA-ROVHRS& ASSOCIATES
distance of approximately 700 feet downgradient of the JAB. A limitednumber of these COCs were detected at low levels in surface water samplesobtained from the Rock River downgradient of the JAB. The detected COCslevels in the surface water samples were below the WAC Chapter NR 105surface water criteria (Warzyn, 1989).
The JAB operated as both unlined and lined liquid wastedisposal facilities for approximately 10 years. The travel time for groundwaterbeneath the JAB to reach the Rock River is likely less than the 10 to 20 yearrange calculated in Section 3.3 (due to the hydraulic conductivity determinedfrom single well response tests which likely underestimate the actualhydraulic conductivity of the outwash deposit). Given this consideration,and the duration of disposal activities in the JAB, a significantly greater COCextent and surface water impact would be expected downgradient of the JAB ifnatural attenuation processes were not acting to reduce the downgradientmigration of COCs from the JAB. The observed reduction in COCconcentrations between the JDF and the Rock River are attributed tonaturally-occurring processes which effectiyely reduce COC levels ingroundwater before this groundwater discharges to the Rock Riverdowngradient of the JAB. Since the fraction of organic carbon content of thesand and gravel comprising the outwash deposits is likely very low,attenuation of the VOC COCs due to adsorption to soil particles is consideredinsignificant. As a result, the predominant natural attenuation processcontributing to the effective attenuation of COC migration is most likelybiodegradation.
6.6.1 Receding to Steady-State Plume Conditions
The results of the RI sampling conducted at JDF during1987 and 1988 detected significant levels of VOCs beneath the JAB atmonitoring well W5 and downgradient of the JAB at monitoring well W28.Significant levels of VOC also were detected downgradient of Parker Pen atmonitoring wells W6 and W20. An isoconcentration map of totalchlorinated ethene concentrations (primarily PCE, TCE, and DCE whichcomprised the majority of the detected VOCs) was developed from the results
97020) 35 CONBSTOGA-ROVHRSAc ASSOCIATES
of the third RI groundwater sampling round conducted July 11-13,1988(Warzyn, 1989; Figure B-19). These total chlorinated ethene concentrationsand total chlorinated ethene isocontours have been reproduced on Figure 6.1.
Compliance monitoring at the JDF was initiated inApril 1993. Total chlorinated ethene concentrations detected at themonitoring wells sampled during April 1993 and total chlorinated etheneisocontours based on these concentrations are presented on Figure 6.2. TheApril 1993 sampling results demonstrate a significant reduction in totalchlorinated ethene concentrations beneath and downgradient of the JAB. Asignificant reduction in total chlorinated ethene concentrations also isevident downgradient of Parker Pen. Since no active groundwater remedialaction had been implemented prior to July 1993, when groundwaterextraction was initiated at Parker Pen, the reduction in total chlorinatedethene concentrations from July 1988 to April 1993 is attributable to naturalattenuation processes. The reduction in total chlorinated etheneconcentrations demonstrates that receeding plume conditions beneath anddowngradient of the JAB existed between July 1988 and April 1993 where boththe areal extent of COCs (i.e., the plume boundary) and the magnitude of COCconcentrations decreased.
The most recent compliance monitoring event wascompleted during March 1997. Total chlorinated ethene concentrationsdetected at the monitoring wells sampled during March 1997 and totalchlorinated ethene isocontours based on these concentrations are presentedon Figure 6.3. Both the areal extent and magnitude of the total chlorinatedethene concentrations detected March 1997 beneath and downgradient of theJAB are relatively unchanged from that of April 1993. These resultsdemonstrate that steady-state plume conditions existed beneath anddowngradient of the JAB between July 188 and April 1993. The totalchlorinated ethene concentration detected March 1997 at monitoring well W6is significantly lower than that detected April 1993. The reduction in the totalchlorinated ethene concentration at W6 between April 1993 and March 1997may be due, in part, to the pumping at Parker Pen from extraction well RW-1located near monitoring well W20. However, this reduction is significantlyless than the reduction in total chlorinated ethene concentrations observed at
36 CoNBSTOGA-RovBRSt ASSOCIATES
I W6 and W20 between July 1988 and April 1993 that resulted from naturalattenuation processes.
The receding plume conditions demonstrated betweenI July 1988 and April 1993, and the steady-state plume conditions demonstrated
between April 1993 and March 1997, provide strong evidence that naturalattenuation processes are effectively reducing COC levels beneath anddowngradient of the JAB. Large initial decreases in contaminant mass in
, groundwater are commonly followed by a period of steady-state conditionsJ where contaminant concentrations in groundwater are sustained somewhat
by the diffusion of contaminant mass initially sorbed to soil particles, ortrapped in dead-end pore throats between soil particles.
1 The receding plume conditions observed betweenJuly 1988 and April 1993 provide strong evidence that natural attenuation is
i occurring at the JDF to an extent that is protective of human health and theI environment. The steady-state plume conditions observed between
April 1993 and March 1997 also demonstrates the effectiveness of naturalI attenuation beneath and downgradient of the JAB. Since all potential sources
of contamination have been removed from the JAB, as described inj Section 4.0, receding plume conditions are expected to dominate in the future.
The analytical results obtained from the JDF indicate asignificant reduction in total chlorinated ethene concentrations in the lessthan nine years that elapsed between July 1988 and March 1997. A reduction
' of this magnitude over this relatively short time period demonstrates thatnatural attenuation is capable of restoring the groundwater beneath anddowngradient of the JDF within a reasonable time frame.
6.6.2 Decreasing Flow Path Concentrations
Monitoring wells W30, W5, W28, and W6 lie along thegroundwater flow path directed toward the Rock River from beneath the JAB.As detailed in Section 5.6, and as illustrated on the graphs included inAppendix B, decreasing concentrations over time are evident at monitoringwells W30, W5, W28 and W6. In addition, the concentrations of PCE and TCE
wn (« 37 CONBSTOGA'ROVBRS & ASSOCIATES
in this flow path from the former source area of the JAB downgradient to theRock River show decreasing TCE and PCE concentrations. The data from themost recent sampling event show decreasing TCE concentrations frommonitoring wells W30 to W5 and non-detectable TCE concentrations inmonitoring well W6. A similar decrease for PCE concentrations is apparentbetween monitoring wells W5 and W6. The decreasing flow pathconcentrations indicate that PCE and TCE are being naturally attenuateddowngradient of the JAB.
6.6.3 Limited COC Detections in Rock River
Surface water samples were collected during the RI fromthe Rock River at the locations indicated on Figure 6.4. No JDF-related COCswere detected at SW7. The compounds detected at SW8 were dissimilar fromthose detected in groundwater detected beneath the JDF (Warzyn, 1989). TheVOCs detected at SW9 and SW10 are similar to those detected at monitoringwell W20 and were attributed to the TCE spill at Parker Pen (Warzyn, 1989).None of the VOC detections in the surface water samples exceeded theNR105 criteria for surface water. The limited presence of organic compoundsin Rock River indicates that the COCs observed in groundwater beneath theJDF are naturally attenuated before groundwater beneath the JDF dischargesto Rock River.
6.6.4 Redox Indicators
The concentrations of the redox indicator parameters iron(II), manganese (II), sulfate, and sulfide detected in samples collected duringthe compliance monitoring conducted in April 1996 are presented onFigure 6.4. Sulfide was not detected and sulfate levels are relatively consistentthroughout the JDF indicating that sulfate reduction is limited. Iron (IT) andmanganese (II) are not present in the background monitoring wells W14 andW29. Significant iron (H) and manganese (II) concentrations are present atmonitoring wells downgradient of the 1985 Site, the 1978 Site, and the JABsource areas. The increase in dissolved iron and manganese indicates that
97020) 38 CONBSTOGA-ROVERS& ASSOCIATES
J
reducing conditions exist downgradient of these source areas. At theselocations, iron and manganese oxides are reduced during the biodegradationof the chlorinated COCs present in groundwater. Significant destruction oforganic compounds has been observed within the ferrogenic andmanganogenic redox zones downgradient of landfills (Lyngkilde andChristensen, 1992b).
Naturally-occurring arsenic is known to be tightly boundto soil constituents and, in particular, to iron oxide coatings on soil particles.As described in Section 6.3, the reduction of iron oxides often results in therelease of other metals associated with the iron oxides, such as arsenic, intosolution. Dissolved arsenic is not present at the background monitoringwells W14 and W29. Dissolved arsenic is present downgradient of the 1985Site, 1978 Site, and JAB source areas. The presence of arsenic at theselocations also indicates the occurrence of COC biodegradation.
The increased iron (II) and manganese (II) levels are notdetected further downgradient of the JAB at monitoring wells W6 and W9.This indicates that conditions become sufficiently oxidizing furtherdowngradient of the JDF for the dissolved iron and manganese to return toan oxidized state and precipitate out of solution. The oxidation of the iron (II)and manganese (II) creates favorable conditions for the coprecipitation ofother metals downgradient of the JDF released into solution within theferrogenic and manganogenic redox zones. This coprecipitation is a strongmechanism for the attenuation of metals, such as arsenic, released intosolution with groundwater as a result of biodegradation processes before thegroundwater discharges to the Rock River. The attenuation of arsenicdetected downgradient of the source areas is apparent since arsenic is notpresent at monitoring wells further downgradient of the JDF.
Assessing the distributions of multiple constituents thatare co-dependent (such as redox indicators of biodegradation) can be complex,and difficult to illustrate as well as interpret. To aid in the interpretation ofthe redox indicator distributions, a visualization method was utilized as partof the natural attenuation evaluation for the JDF. A summary of thevisualization methodology is presented below.
39 C&NBsnxA-RovBxsJc ASSOCIATES
Radial diagrams were used to depict the spatial variationsin redox potential relative to background conditions. This forms a clear andcomprehensive illustration of the redox conditions at a site. Figure 6.5presents a typical redox diagram for the JDF, representing the averagebackground concentrations for the redox parameters and the redox indicatorconcentrations at a downgradient monitoring well from the April 1996compliance monitoring event. A description of the construction of theseradial diagrams is presented below.
Each radial diagram consists of one radial axis for eachredox indicator parameter, with each of these axes extending from a commonorigin. The axes of each radial diagram are aligned in the same sequence asthe preferentially-reduced electron acceptors. For this natural attenuationevaluation, the redox indicators of manganese (II), iron (II), arsenic, andsulfate were presented, in this order, on the radial diagrams. The range inaxis concentrations was selected based on the range in measuredconcentrations for each redox parameter. 3]he use of a logarithmic scale wasnecessary due to the order of magnitude changes in redox indicatorconcentrations observed at the JDF.
The scale of each axis may be graduated to increase inconcentration in either an inward or outward direction from the origin. Thedirection of increasing scale for the axis of a particular parameter is selectedbased on the expected change in concentration of that indicator parameterwith respect to background conditions. In this manner, backgroundconcentrations are plotted on the outer extremity of the diagram and theexpected change in concentration relative to background conditions would beplotted toward the origin. For example, background sulfate concentrationsare typically expected to decrease under sulfate-reducing conditions; therefore,the axis representing sulfate was graduated to increase in an outwarddirection from the origin. Background iron (II), manganese (n), and arsenicconcentrations are typically expected to increase under suitable reducingconditions; therefore, the axes representing these indicators were graduated toincrease inward, toward the origin. The arrows on Figure 6.5 indicate thedirection of increasing concentration for each axis.
40 CONBSTOGA-ROVBRS& ASSOCIATES
I
j
A radial diagram representing the average redox indicatorconcentrations at background monitoring well locations is created first.Radial diagrams then are generated for the redox indicator concentrations ateach location downgradient of the background monitoring wells. Then, theradial diagram representing a specific monitoring well location is plotted witha radial diagram representing background conditions on a single set of radialaxes. By shading the radial diagrams for the downgradient monitoring welllocations, this method provides a readily interpretable visualization of wheresignificant changes in redox indicators exist with respect to backgroundconditions.
Figure 6.5 demonstrates a significant increase inmanganese (II), iron (H), and arsenic concentrations relative to backgroundconditions, while only a marginal decrease in sulfate concentration occurs.This radial diagram provides a readily interpretable visualization of the redoxconditions at the monitoring well location, and demonstrates that ferrogenicto manganogenic redox conditions exist.
The radial diagrams of the redox parameters at eachmonitoring well sampled during April 1996 are presented on Figure 6.6. It isevident from the radial diagrams that reducing redox conditions relative tobackground conditions exist downgradient of the 1985 Site (i.e., monitoringwells 1R and 2), the 1978 Site (i.e., monitoring wells W26, 3A, and W22), andthe JAB (i.e., monitoring wells B104 and 60W). The radial diagrams indicatethat ferrogenic to manganogenic redox conditions exist downgradient of thesesource areas. The absence of reducing conditions at monitoring well W5 maybe due to the fact that this well is screened across the water table, which wouldbe expected to provide oxidizing redox conditions. Although predominantlyferrogenic to manganogenic redox conditions exist at most locationsimmediately downgradient of the source areas, monitoring well 2demonstrates some sulfate-reducing activity.
To illustrate the correlation between iron and arsenic inthe ferrogenic zone at the Site, the axis representing arsenic was specified tolie adjacent to the axis representing iron. The co-dissolution of arsenic during
«702(1) 41 O3NHSTOGA-R0VBRS 4 ASSOCIATES
the ferrogenic redox stage is evident in the groundwater samples, where theconcentrations of dissolved arsenic increased simultaneously with those offerrous iron. Naturally-occurring arsenic in the soil and sediments is knownto be tightly bound to soil constituents, particularly iron. The reduction offerric iron to ferrous iron mobilizes arsenic into solution with groundwater.Dissolved arsenic increases immediately downgradient of the 1985 Site, the1978 Site and the JAB. In monitoring wells downgradient of the JDF (i.e., W6,W9, W9A, W23 and AT-1), the concentrations of dissolved iron and arsenicreturned to background conditions. The decrease in iron (II) andmanganese (II) concentrations downgradient of the JDF to backgroundconcentrations indicates that conditions are sufficiently oxidizingdowngradient of the JDF for dissolved manganese and iron to precipitate outof solution. This oxidation presents favorable conditions for thecoprecipitation of other metals downgradient of the JDF that have beenmobilized from the manganogenic and ferrogenic zones. This coprecipitationis a strong mechanism for the attenuation of dissolved metals, such asarsenic, in groundwater before this groundwater discharges to the Rock River.
The highly reducing conditions immediatelydowngradient of the 1985 Site, the 1978 Site, and the JAB provides strongevidence that JDF-related COCs are undergoing biodegradation ingroundwater. The biodegradation processes occurring in groundwater havecaused the significant reduction in the levels of COCs detected during the RI.This reduction, combined with the lack of downgradient receptors,demonstrates that natural attenuation is sufficiently protective of humanhealth and the environment.
6.6.5 Presence of COC Biodegradation Products
The chlorinated COCs detected at the JDF, listed in orderof decreasing observed concentrations, consist primarily of PCE, TCE, and1,2-DCE. TCE is a daughter product of the biodegradation of PCE, andlikewise, 1,2-DCE is a daughter product of the biodegradation of TCE. Greaterconcentrations of the parent compounds than of the daughter compoundssupports the occurrence of biodegradation. The 1,2-DCE concentrations
9TO (1) 42 CONBSTOGA-ROVERS Ac ASSOCIATES
detected during the RI were reported as total 1,2-DCE (i.e., both cis-l,2-DCEand trans-l,2-DCE). The samples collected over the duration of thecompliance monitoring were analyzed for trans-l,2-DCE which was notdetected. This suggests that the total 1,2-DCE detected during the RI consistedof ds-l,2-DCE which, during reductive dehalogenation of TCE, is producedmore predominantly than trans-l,2-DCE (Bouwer, 1994). The presence ofcis-l,2-DCE without any significant quantities of other forms of DCE isgenerally an indicator that biodegradation occurring, since chemicallymanufactured DCE contains a mixture of isomers, of which cis-l,2-DCE is aminor component (Ellis et al., 1996).
Chloride is a byproduct of the degradation of thechlorinated COCs. Figure 6.4 presents the results of chloride analysis onsamples obtained during the compliance monitoring conducted April 1996.Chloride concentrations in the background monitoring wells W14 and W29range from 16,000 to 42,000 Hg/L. Chloride concentrations detected inmonitoring wells downgradient of the 1985 Site (i.e., monitoring wells 1R and2), the 1978 Site (i.e., monitoring wells W26, 3A, and W22) and the JAB(i.e., monitoring wells W5, W23, and W9) are significantly greater than thechloride levels background monitoring wells W14 and W29. The increaseddowngradient chloride concentrations demonstrate the occurrence ofchlorinated COC biodegradation at the JDF.
6.6.6 Organic Carbon Supply from Landfill Leachate
Leachate emanating from landfills is rich in organiccarbon which serves as the primary substrate for microbial respiration. Asleachate continues to discharge into groundwater, indigenous bacteria aresupplied with a continuous source of growth substrate. In the case of unlinedlandfills, such as the 1963 and 1978 Sites at the JDF, the supply of organiccarbon to groundwater is further enhanced. As a result, the landfill leachaterepresents a significant source of the primary substrate necessary to sustainthe biodegradation of the chlorinated COCs detected in groundwater beneaththe pp.
9701(1) 43 GONBTOGA-RavntSA ASSOCIATES
6.6.7 High Dilution Capacity of Rock River
In the vicinity of the JDF, the average flow in the RockRiver is 1,750 cubic feet per second (ft3/s) (Warzyn, 1990). Assuming adischarge zone downgradient of the JDF with a length of 1,600 feet,corresponding to the approximate distance between monitoring wells W9 andSOW, and a conservatively large assumed vertical thickness of 40 feet, the areafor groundwater discharge to the Rock River downgradient of the JDF isapproximately 64,000 square feet. Applying the higher range of thegroundwater flow velocities observed during the compliance monitoring(220 ft/yr), groundwater discharge rate to the Rock River downgradient of theJDF is approximately 0.45 ft3/s. The groundwater discharge from beneath theJDF to the Rock River is, therefore, diluted by a factor of approximately 3,900.As a result, there exists a significant potential for the dilution of groundwaterdischarging from the JDF with the average flow in the Rock River.
The water level in the.Rock River adjacent to JDF iscontrolled by a dam located in downtown Janesville and the water level doesnot fluctuate significantly. The dilution capacity of the Rock River is,therefore, a constant natural attenuation mechanism downgradient of theSite.
9702(1) 44 CoNBSTOQt-RovBRSJt ASSOCIATES
7.0 COMPLIANCE WITH ARARa
7.1 CLEANUP AND PERFORMANCE STANDARDS
Cleanup and performance standards for Site groundwaterare provided in Section X of the ROD and Section VI, subparagraph 12.a. ofthe Consent Decree. Site groundwater is required by the ROD to be extractedand treated (if necessary) until no federal maximum contaminant levels(MCLs)/WAC NR 140 ES exceedances exist between JDF and the Rock River.The Consent Decree requires that the pump and treat system be operated for aminimum of five years after which time the technical or economicalfeasibility of continued operation of the system for contaminants exceedingNR 140 PALs will be evaluated pursuant to NR 140.28. If continued operationis determined to be unfeasible, ACLs not exceeding the NR 140 ESs will beestablished by U.S. EPA in compliance with the substantive requirements ofNR 140.28. In essence, and regardless whether or not the groundwater isextracted and treated, federal MCLs/NR 140 ESs are the groundwater cleanupstandards. ~. '.
Currently, only PCE and TCE exceed the most recentfederal MCLs downgradient of the JDF. PCE, TCE, iron and manganese exceedNR 140 ESs. PCE and TCE are being remediated by natural attenuationprocesses and are decreasing in concentration, as discussed in Sections 5.0 and6.0. Given the reduction in PCE and TCE concentrations since the RI, it isdoubtful that active remediation in the form of a pump and treat system willmore rapidly enhance groundwater quality.
Iron and manganese are federally regulated for aestheticpurposes under non-enforceable secondary drinking water standards and areregulated by WDNR under public welfare groundwater quality standards. Asdiscussed in Section 6.6.4, the elevated presence of iron and manganeseimmediately downgradient of the 1985 Site, the 1978 Site and the JAB sourceareas is due to natural attenuation processes (i.e., reducing conditions)occurring at these locations. Iron and manganese exceedances of the NR 140ESs immediately downgradient of the source areas will likely continue asbiodegradation of waste in the landfills occurs. However, as discussed in
45 CotfflsioGA-RovHiisfc ASSOCIATES
Sectipn 6.6.4, the elevated presence of iron and manganese are not detectedfurther downgradient, between the source areas and the Rock River, due tonatural attenuation processes (i.e., oxidizing conditions) occurring at thislocation.
7.2 SURFACE WATER QUALITY
The ROD requires that treated groundwater meets thesurface water quality standards pursuant to WAC NR Chapters 102,104,105,106, 200, 208 and 220. The Consent Decree requires that a Wisconsin PollutantDischarge Elimination System (WPDES) permit be applied for, obtained andcomplied with for extracted groundwater. The current surface water qualitycriteria for toxic substances pursuant to WAC Chapters NR 102 through NR105 requires that surface water discharges be protective of public health andwelfare, fish and aquatic life, and wild and domestic animal life.
Groundwater discharging naturally from the Site to theRock River is protective of public health and welfare and wild and domesticanimal life. The April 1996 and March 1997 groundwater data from themonitoring point closest to the Rock River downgradient of the Site,monitoring well W6, were evaluated to the applicable criteria in NR 105. Allwild and domestic animal criteria, human threshold criteria and humancancer criteria for the contaminants identified in NR 105.07 Table 7, NR 105.08Table 8 and NR 105.08 Table 9 were met.
The water quality criteria to determine protectiveness tofish and aquatic life are specified in NR 105.05 Tables 1 and 2, NR 105.06Tables 3 through 6 and are calculated using acute toxicity, chronic toxicity andgeneral water quality testing data. Compliance with the criteria in NR 105Tables 1 through 6 cannot be determined from the historical Site data.However, comparing the 1996 and 1997 data from monitoring well W6 to thedischarge criteria for the City of Janesville publicly owned treatment works(POTW) indicates that groundwater discharging naturally from the Sitewould be protective of fish and aquatic life. This is further discussed below.
9702(1) 46 CONBSTOGA-ROVHRS& ASSOCIATES
For comparison purposes, the WDNR General Permit toDischarge Under the Wisconsin Pollutant Discharge Elimination System(WPDES Permit No. WI-0046566-3) and the City of Janesville POTW WPDESpermit (WPDES permit No. WI-0030350-5) were reviewed.
The General Permit is applicable to any facility located inWisconsin discharging contaminated groundwater from remedial actionoperations which has been treated for pollutant removal prior to discharge,subject to the limitations provided in Section A of the permit. Based on thedata from the 1996 and 1997 annual monitoring events, the applicabilitycriteria in Section A would be satisfied for the Site groundwater. Section Dprovides additional requirements for discharges from remediation of VOCcontamination. The effluent limits specified in Section D for both PCE andTCE are 50 ug/L, calculated on a monthly average, based on a representativesample collected after treatment and prior to mixing with the receiving water.The concentration of PCE detected in the monitoring well closest to the RockRiver (W6) during the March 1997 monitoring event (27 ug/L) is well belowthe effluent limit without treatment and without taking into account thelarge dilution factor determined in Section 6.6.7. TCE and the remainingVOCs listed in Section D of the permit were not detected during the March1997 monitoring event.
The City of Janesville permit provides water quality-basedeffluent limitations based on its discharge design flow of 17.75 million gallonsper day to the Rock River. Effluent limitations are specified for variousconstituents based on acute toxicity criteria and chronic toxicity criteria. Basedon the data for monitoring well W6 from the 1996 and 1997 annualmonitoring events, groundwater discharging naturally would be acceptablewith respect to the City of Janesville's acute and chronic toxicity effluentlimitations. It should be noted that the calculated groundwater dischargeflow downgradient of the JDF is approximately 291,000 gallons per day, whichis less than 2 percent of the city's discharge. Based on the total mass loadingof contaminants in the discharges, the acute and chronic toxicity-relatedeffluent concentrations for the JDF discharge would likely be higher than thecity's discharge criteria.
47 CONBSTOGA-ROVKRS& ASSOCIATES
The City of Janesville permit effluent limitations for PCEand TCE based on human cancer criteria are 49 ug/L and 360 ug/L,respectively. The PCE concentration for monitoring well W6 from the April1997 monitoring event is well below this value and TCE was not detected.
Based on the discussions above, groundwaterdowngradient of the JDF discharging naturally to the Rock River meetssurface water quality criteria without treatment.
7.3 WAC CHAPTER MR 140
Comments on the selected remedy for the JDF wereresponded to by U.S. EPA in the Responsiveness Summary presented asAttachment 1 to the ROD. The Group commented that a pump and treatsystem was not required by NR 140 and that natural attenuation combinedwith capping activities would achieve the appropriate groundwater qualitylevels at the Site. U.S. EPA responded that'NR 140 ES exceedances areaddressed by taking one or more actions outlined in Table 6 of NR 140 andstated that NR 140 requirements are imposed through NR 181 correctiveaction, which requires that a facility remove or treat in place those hazardousconstituents that have migrated from the hazardous waste unit.
Effective November 1,1996, NR 140.26 Table 6 was revisedto include determining whether natural attenuation can be effective torestore groundwater quality within a reasonable period of time within therange of responses to ES exceedances. Since remedial construction activitieshave been taken to prevent the further release of substances to groundwater(i.e., final cover upgrades) and natural attenuation of the groundwatercontamination is occurring, the requirements of NR 140 have been satisfied.
48 CONBSTOGA-RoVBRSfc AS8OOATHS
8.0 CONCLUSIONS AND RECOMMENDATIONS
8.1 CONCLUSIONS
Based on the information presented in this report, thefollowing conclusions are made:
1. Natural attenuation processes are effectively remediating groundwatercontamination at the JDF Site;
2. Currently, only two VOCs and two metals consistently exceed the WACNR 140 enforcement standards and only the VOCs exceed federaldrinking water maximum contaminant levels;
3. Groundwater which discharges naturally from the Site to the Rock Riveris protective of human health and the environment; and
4. Natural attenuation coupled with the remedial actions completed to datewill fulfill the groundwater cleanup requirements of the ROD, ConsentDecree and NR 140 within a reasonable period of time.
/
8.2 RECOMMENDATIONS
Based on the above conclusions, it is recommended thatnatural attenuation with compliance monitoring replace the pump and treatcomponent of the selected remedy as the preferred groundwater remedy forthe Site.
49 CONBSTOGA-ROVHRS& ASSOCIATES
9.0 REFERENCES
Appelo, C. A. J., and D. Postma, 1993, Geochemistry, Ground water andPollution, A.A. Balkema, Rotterdam, Netherlands.
Baedecker, M. J., and W. Back, 1979, Modern Marine Sediments as a NaturalAnalog to the Chemically Stressed Environment of a Landfill, Journal ofHydrology, Vol. 43, pp. 393-414.
Bouwer, E.J., 1994, Bioremediation of Chlorinated Solvents using AlternateElection Acceptors, In Morris, R.D., Hinchee, R.E., Brown, R., McCarty, P.L.,Semprini, L., Wilson, J.T., Kambel, D.H., Reinhard, M., Bouwer, E.J., Borden,R.C., Vogel, T.M., Thomas, J.M., and Ward, C.H., editors, Handbook ofBioremediation, Lewis Publishers, pp. 149-175.
Jr
Conestoga-Rovers & Associates, 1996, April 1996 Groundwater ComplianceReport, Janesville Disposal Fadlity, Janesville, Wisconsin, July, Chicago,Illinois.
Ellis, D. E., E. J. Lutz, G. M. Klecka, D. L. Pardieck, J. J. Salvo, M. A. Heitkamp,D. J. Gannon, C. C. Mikula, C. M. Vogel, G. D. Sayles, D. H. Kampbell, J. T.Wilson, and D. T. Maiers, 1996, Remediation Technology DevelopmentForum Intrinsic Remediation Project at Dover Air Force Base, Delaware,Symposium on Natural Attenuation of Chlorinated Organics in GroundWater, Dallas, TX, Office of Research and Development, U. S. EnvironmentalProtection Agency, Washington DC, September, EPA/540/R-96/509.
Federal Register, 1990, Volume 55, No. 46, March 8, 40 CFR Part 300, NationalOil and Hazardous Substances Pollution Contingency Plan; Final Rule.
Feldman, P., 1995, EPA's Perspective on Remediating ContaminatedGroundwater Using Natural Attenuation, Conference Proceedings forIntrinsic Bioremediation Strategies for Effective Analysis, Monitoring andImplementation, Annapolis, Maryland.
50 GXHSTOGA-ROVHRS& ASSOCIATES
j Hem, J. D., 1985, Study and Interpretation of the Chemical Characteristics ofNatural Water, Third Edition, U.S. Geological Survey Water - Supply Paper
] 2254.
I Kehew, A.E., and R.N. Passero, 1990, pH and Redox Buffering Mechanisms ina Glacial Drift Aquifer Contaminated by Landfill Leachate, Ground Water,
I Vol. 28, No. 5, pp. 728-737.
Lyngkilde, J., and T. H. Christensen, 1992a, Redox Zones of a Landfill Leachatej Pollution Plume (Vejen, Denmark), Journal of Contaminant Hydrology,
Vol. 10, pp. 273-289.
"~ Lyngkilde, J., and T. H. Christensen, 1992b, Fate of Organic Contaminants in] the Redox Zones of a Landfill Leachate Pollution Plume (Vejen, Denmark),' Journal of Contaminant Hydrology, Vol. 10, pp. 291-307.
J McAllister, P.M. and C.Y. Chaing, 1994, A Practical Approach to EvaluatingNatural Attenuation of Contaminants in Ground Water, Ground Water
j Monitoring and Remediation, Vol. XIV No. 2., pp. 161-173.
1 RMT, Inc., 1992, Remedial Action Plan for Groundwater, Parker PenCompany, Janesville, Wisconsin, December, Madison, WI.
~ U.S. EPA, March 27,1997, Superfund Reforms: Updating Remedy Decisions,i Memorandum from S.D. Luftig and B.N. Breen, EPA Directive No. 9200.0-22.
, U.S. EPA, 1997, Correspondence from L. Evision (U.S. EPA) to L. Buetzer] (JDF), March 10,1997.
Warzyn Engineering Inc., 1989, Final Remedial Investigation, JanesvilleDisposal Facility, Janesville, Wisconsin, July, Madison, Wisconsin.
Warzyn Engineering Inc., 1990, Feasibility Study, Janesville Disposal Facility,Janesville, Wisconsin, March, Madison, Wisconsin.
9TO(l) 51 CONBSTOGA-ROVHRS & ASSOCIATES
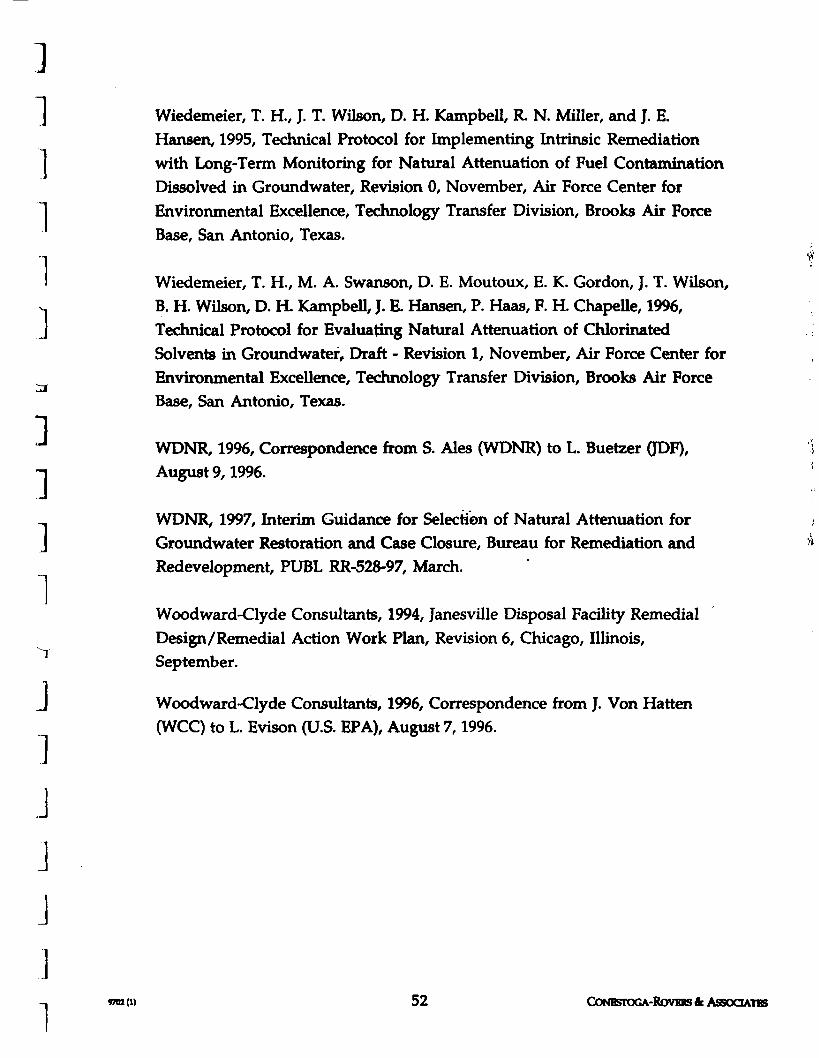
111
]]]1
September.
J
J
J
J
Wiedemeier, T. H., J. T. Wilson, D. H. Kampbell, R. N. Miller, and J. E.Hansen, 1995, Technical Protocol for Implementing Intrinsic Remediationwith Long-Term Monitoring for Natural Attenuation of Fuel ContaminationDissolved in Groundwater, Revision 0, November, Air Force Center forEnvironmental Excellence, Technology Transfer Division, Brooks Air ForceBase, San Antonio, Texas.
Wiedemeier, T. H., M. A. Swanson, D. E. Moutoux, E. K. Gordon, J. T. Wilson,B. H. Wilson, D. R Kampbell, J. E. Hansen, P. Haas, F. H. Chapelle, 1996,Technical Protocol for Evaluating Natural Attenuation of ChlorinatedSolvents in Groundwater, Draft - Revision 1, November, Air Force Center forEnvironmental Excellence, Technology Transfer Division, Brooks Air ForceBase, San Antonio, Texas.
WDNR, 1996, Correspondence from S. Ales (WDNR) to L. Buetzer (JDF),August 9,1996.
WDNR, 1997, Interim Guidance for Selection of Natural Attenuation forGroundwater Restoration and Case Closure, Bureau for Remediation andRedevelopment, PUBL RR-528-97, March.
Woodward-Clyde Consultants, 1994, Janesville Disposal Facility RemedialDesign/Remedial Action Work Plan, Revision 6, Chicago, Illinois,
Woodward-Clyde Consultants, 1996, Correspondence from J. Von Hatten(WCC) to L. Evison (U.S. EPA), August 7,1996.
152 CoNBsrocA-RovERS & ASSOCIATES
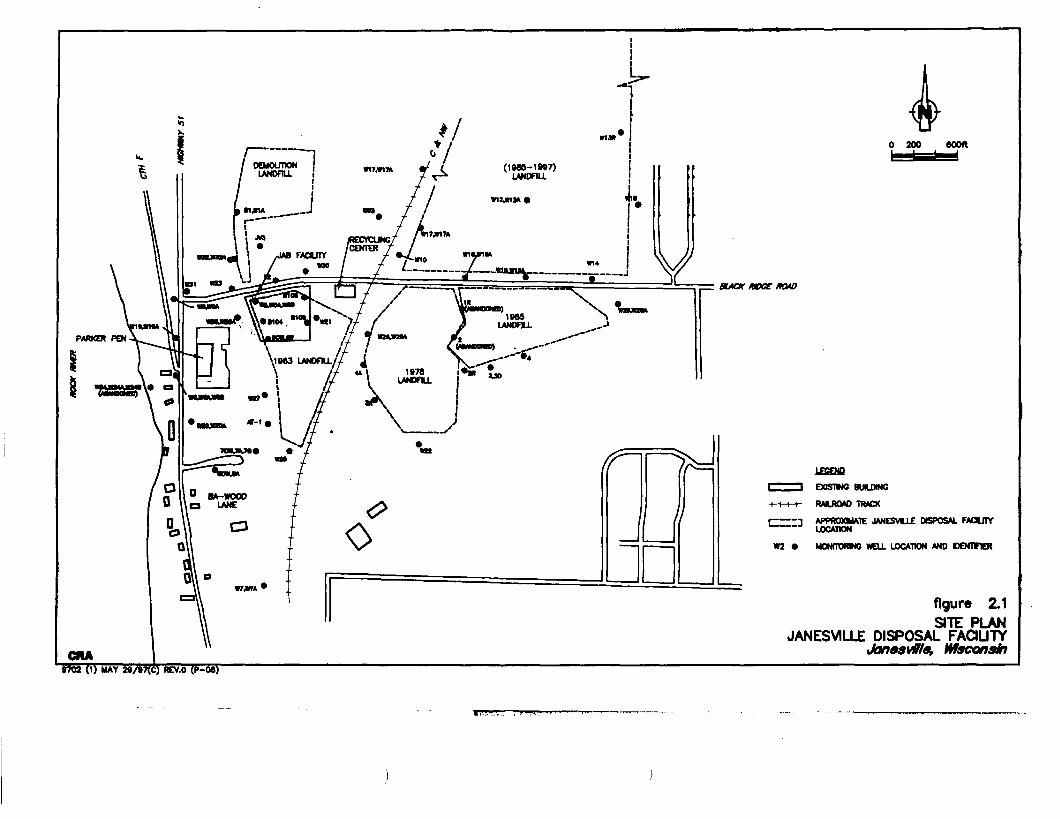
PARKER PEN
CftA
0 200 600ft
BUCK noee now
I I EMSTHG BUUXNG
I I I I RAILROAD TRACK
I 1 APPROXWATE JANE5VLLE MSPOSAL FAOUTYLOCATION
W2 • MONfTORMG WCLL LOCATION AND DENTHER
figure 2.1SITE PLAN
JANESVILLE DISPOSAL FAdUTYJonosvfflo, Wisconsin
9702 (1) MAY 28/»7(C) REV.O (P-08)
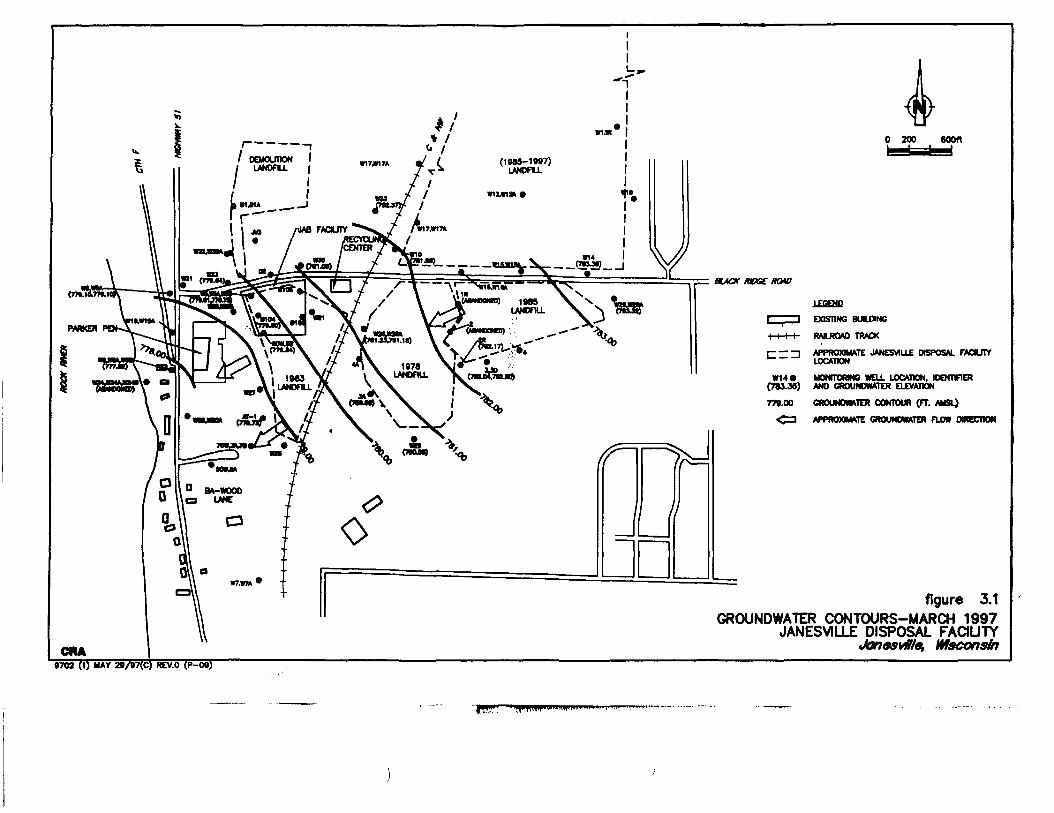
!iP WH.1IU X. PNJ*)_ . .
0 200 600ft
BLACK RXXX ROAD
LEGEND
EXISTING BUILDING
I I I I RAILROAD TRACK
^ — -I APPROXIMATE JANESVILLE DISPOSAL FAOUTYLOCATION
WU« UOMTORMO WOL LOCATION. IDENTIFIER(783-39) AND GROUNOWATER ELEVATION
779.00 GKXJNOVMTER CONTOUR (FT. AUSL)
<=J APPROXMME GROUNDWATER FLOW OMECTION
CMA
figure 3.1GROUNDWATER CONTOURS-MARCH 1997
JANESVILLE DISPOSAL FACILITYJonosvtilo, Wisconsin
9702 (1) MAY 29/97( REV.O (P-09)
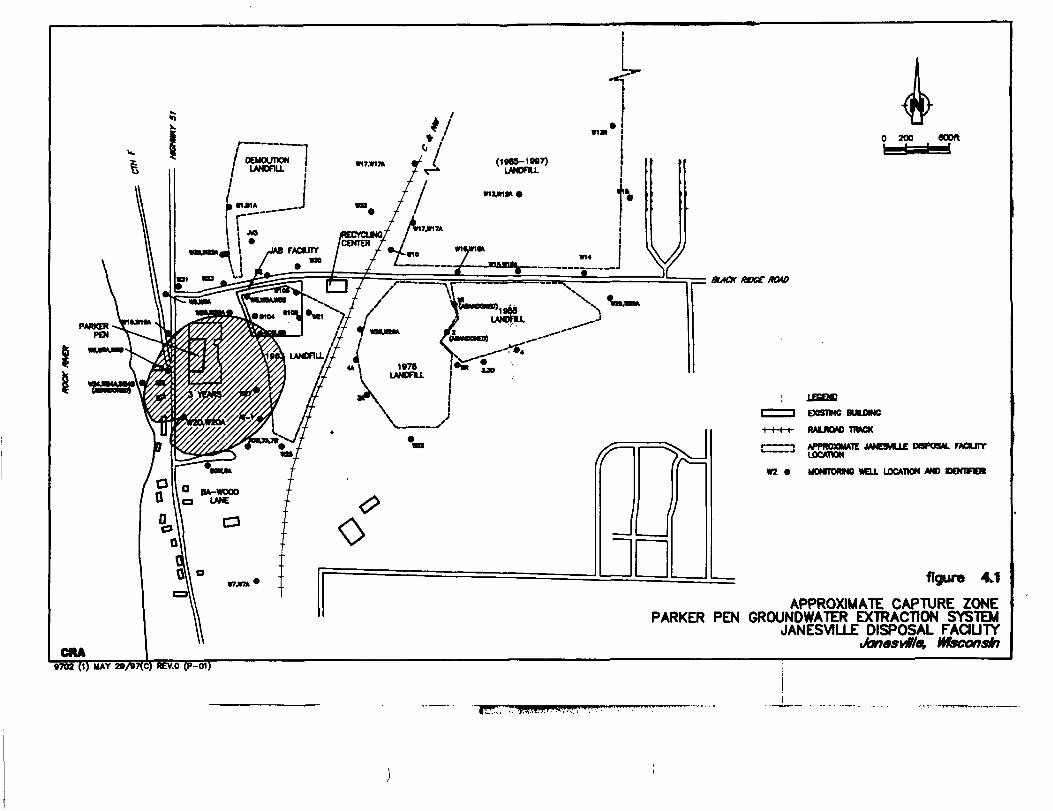
CftA
o 200 eoofi
BLACK /WOT MMD
EMSIMG BUUMG
RMUKMD TRMCK
MVROXMATE JMC9MLLE DBP05N. mdUTT
W2 • MOMTOMNG «CLL LXATNN MtD UtNlfrUt
figure 4.1
APPROXIMATE CAPTURE ZONEPARKER PEN GROUNDWATER EXTRACTION SYSTEM
JANESVILLE DISPOSAL FACIUTYJanesvHIa, Wisconsin
8702 (1) MAY 29/B7f«^
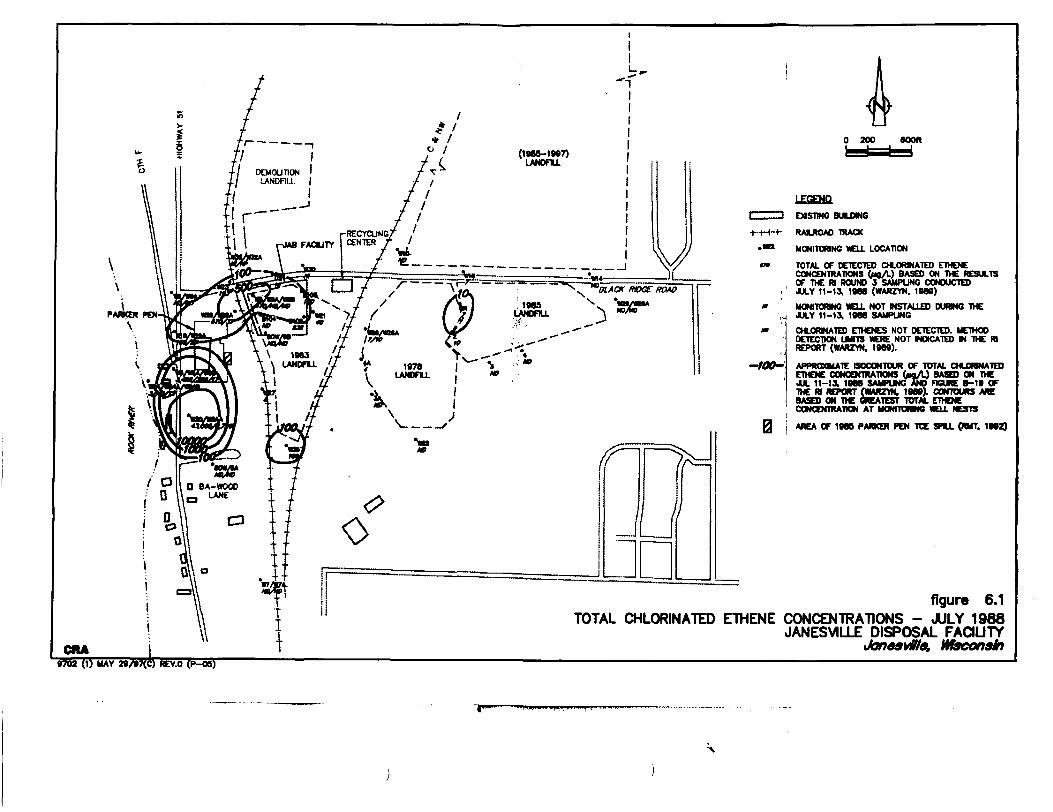
CRA
0 200 600ft
LEGEND
EMSTMO BULDMG
•t-M-4- RMLROAO TRACK
•«* MONITORING WELL LOCATION
«• TOTAL OF DETECTED CHLORINATED ETHENECONCENTRATIONS (m/L) BASED ON THE RESULTSOF THE Rl ROUND 3 SAMPLING CONDUCTED
.. JULY 11-13, 1988 (WARZYN. 198B)
» MONITORHW WELL NOT MSTAUED DURMO THEJULY 11-13, 1988 SAMPUNG
CHLORMATED ETHENES NOT DETECTED. METHODDETECTION UMTS WERE NOT INDICATED M THE RlREPORT (WARZYN. 1989).
-/OP- APPROMMATE BOCONTOUR OF TOTAL CHLORINATEDCTHENE CONCENTRATIONS feu/L) BASED ON THEJUL 11-1% 1988 SAUPUNG AND FIGURE 8-19 OFTHE Rl REPORT (WARZYN. 19891 CONTOURS AREBASED ON THE GREATEST TOTAL ETHENECONCENTRATION AT MONITORMG WEIL NESTS
(
0 j AREA OF 1988 PARKER PEN TCE SPU. (RMT. 1992}
figure 6.1TOTAL CHLORINATED ETHENE CONCENTRATIONS - JULY 1988
JANESVILLE DISPOSAL FACILITYWisconsin
ZV/v/\CJ KEV.O {r—OS)
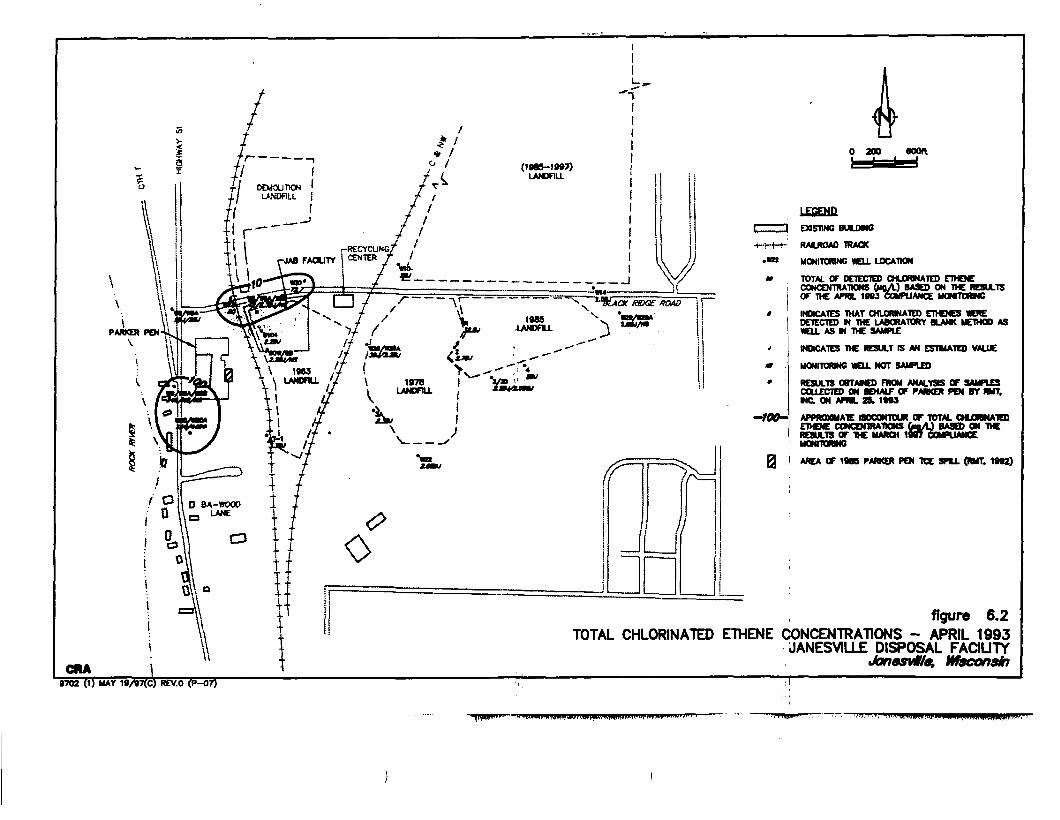
CftA
eoofi
LEGEND
EXISTING BUUM6
RAILROAD TRACK
MONITOWNC WEU. LOCATION
TOTAL OF OETECTEO CHJDWNATED ETHENEON THE RMONntMNC
CONCENTRATIONS («A) BASED ON THE RESULTSOF THE APMt. 10U COJyPUANCE MO
INDICATES THAT CHLORMA1ED ETHENES 1EHEDETECTED M THE LABORATORY BLANK METHOD ASWEU. ASM THE SAMPLE
INDICATES THE RESULT IS AN ESTIMATED VALUE
MONITORMG WEU. NOT SAMPLED
RESULTS OBTAMED FROM ANALY3S OF SAMPU3COU£CTED ON BEHALF OF PARKER PCM BY RMT.MC ON APRL 29. 1993
—tOO- APPROMMA1E ODCONTOUR OP TOTAL CHURMA1EDETHENE CONCENTRATIONS ta/L) BASED ON THERESULTS OF THE MARCH 1907 OOMPUANCCMOMTORMG
0 i AREA OF 1906 PARKER PEN TCE SPU. (RMT. 1992)
> figure 6.2TOTAL CHLORINATED ETHENE CONCENTRATIONS - APRIL 1993
JANESVILLE DISPOSAL FACILITYJanasvtle, Hfsconsfn
9702 (1) MAY 18/97(C)
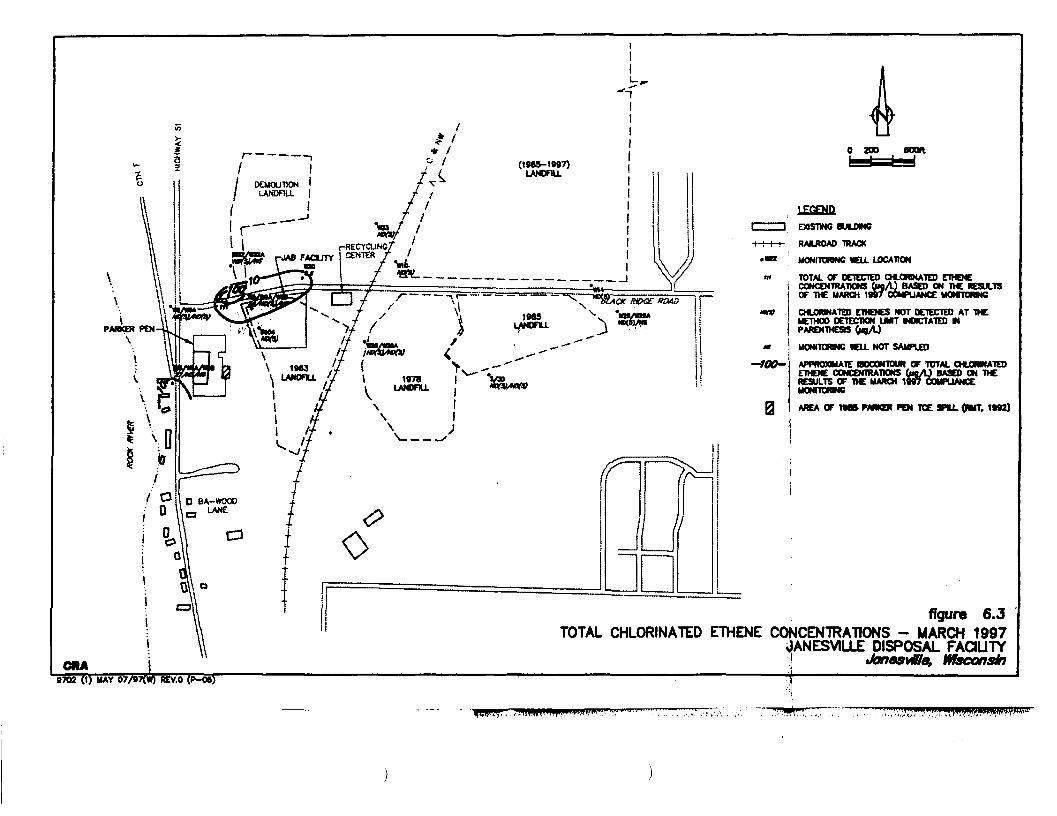
CftA
0 200 eoort
-1OO-
LEGEND
EMST1NG BUUM6
RAUKMO TRACK
MCNITORWC WELL LOCATION
TOTAL OF DETECTED CHLORMATED ETHENEN THE RlUOMTDMNC
iv/ifw. wr VbiCAvicA' k<nuwmnmcw c.inu*CONCENTRATIONS («A) BASED ON THE RESULTSOF THE MARCH 1997 COyPUANCC UOMTC
CHUMNATEOnHENES NOT DETECTED AT THE.METHOD DETECTION LMT tOCTATED MPARENTHESR
MCNITORMG KLL NOT SAMPLED
APPROXMATE ODCOMTOUR OF TOTAL CHLOMNATEDETHENE CONCENTRATIONS fagA) BASED ON THERESULTS OF THE MARCH 1997 COMPUANCEMONITORMC
AREA OF 190 rMMER PEN ICE SPU. (RUT. 1992)
figure 6.3TOTAL CHLORINATED ETHENE CONCENTRATIONS - MARCH 1997
lANESVILLE DISPOSAL FACILITYJanosvilo, Wisconsin
B7Q2 (t) MAY 07/B7(W) REV.O (P-06)
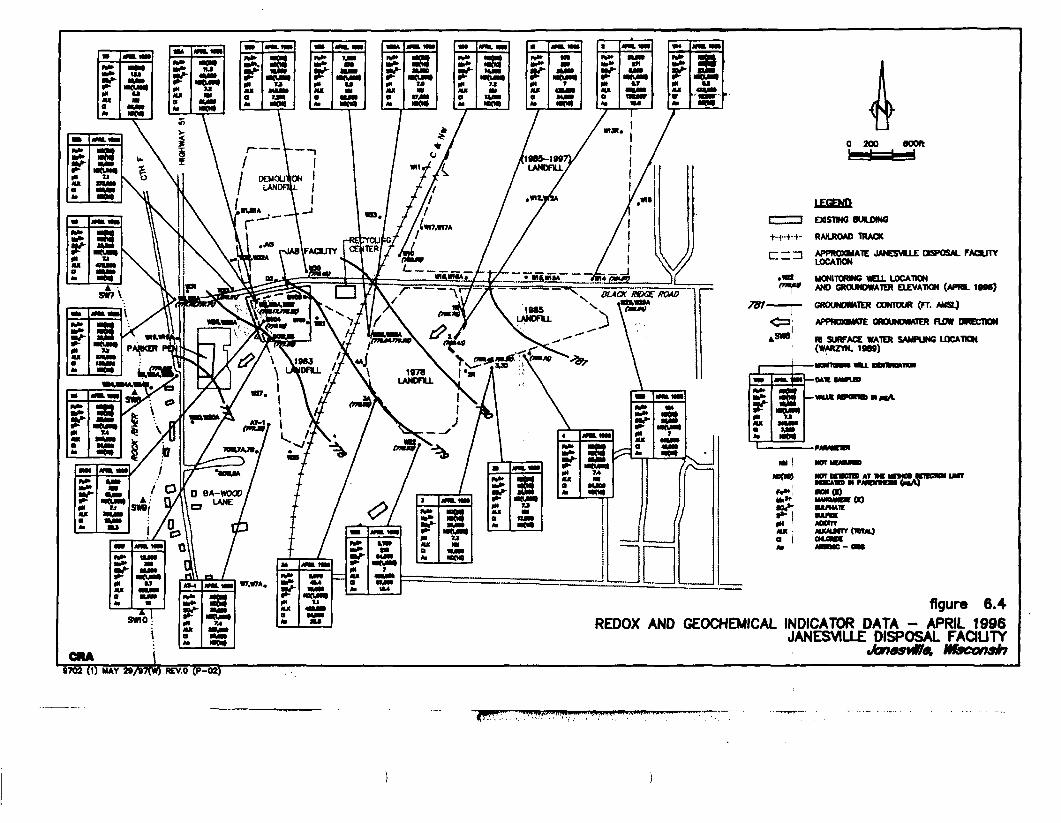
o 200 eooft
LEGEND
OOS1MG BULDMO
•+-!-•*-•*- RAILROAD TRACK
r- — -1 APPROMMATE JANESWif OSPOSAt FACUTY1 ' LOCATKJN
•««* MONITORING WELL LOCATIONf"^* AND GROUNDWATER ELEVATION (APRIL 1990)
781 GROUNDWATER CONTOUR (FT. AMSL)
<n' APPROX9MTE OROUNONATER FLOW DHECTK3H
4s** n SURFACE WATER SAMPUNC LOCATKM(WARZYN. 1989)
SWIO
CRA
figure 6.4REDOX AND GEOCHEMICAL INDICATOR DATA - APRIL 1996
JANESVILLE DISPOSAL FAQUTYJonesvtle, Wbconsin
9702 (1) MAY 29/B7(W) REV.O (P-02)
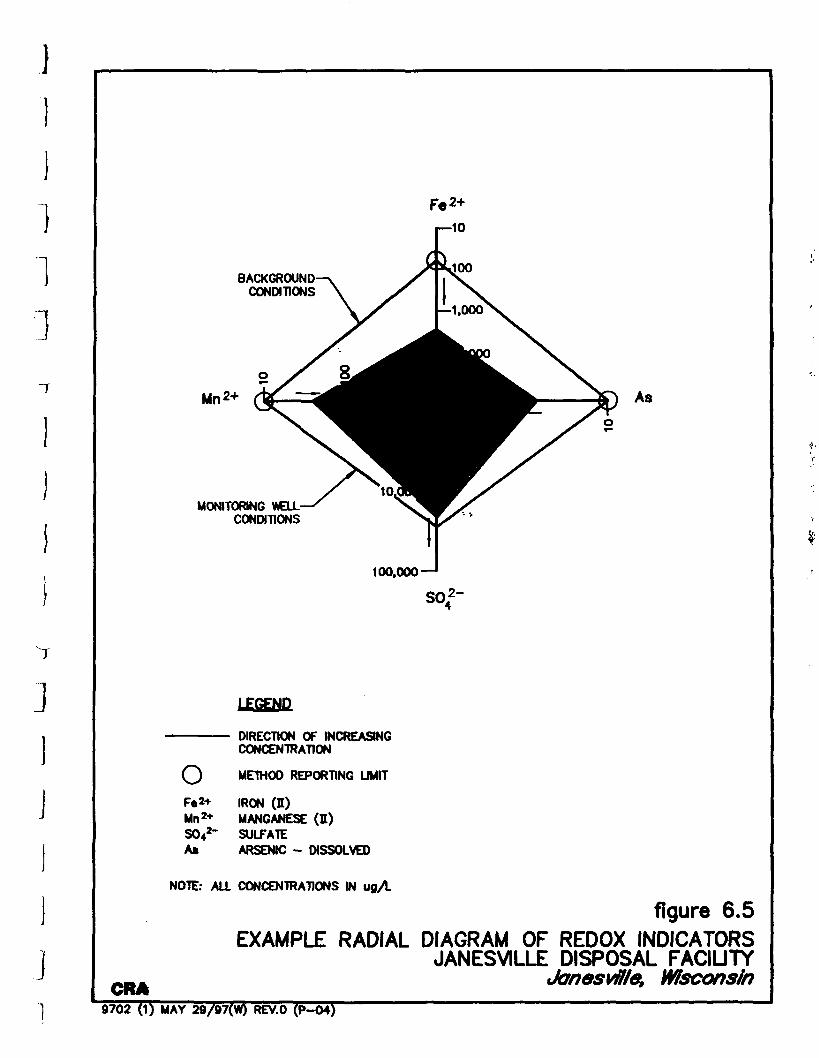
BACKGROUNDCONDITIONS
MONITORING WELLCONDITIONS
A3
100.000
so42~
o
LEGEND
DIRECTION OF INCREASINGCONCENTRATION
METHOD REPORTING LIMIT
Fa 2+ IRON (H)Mn2* MANGANESE (I)SC-42- SULFATEAa ARSENIC - DISSOLVED
CRA
NOTE: ALL CONCENTRATIONS IN ugA
figure 6.5EXAMPLE RADIAL DIAGRAM OF REDOX INDICATORS
JANESVILLE DISPOSAL FACILITYJanesvflle, Wisconsin
9702 (1) MAY 29/97(W) REV.O (P-04)
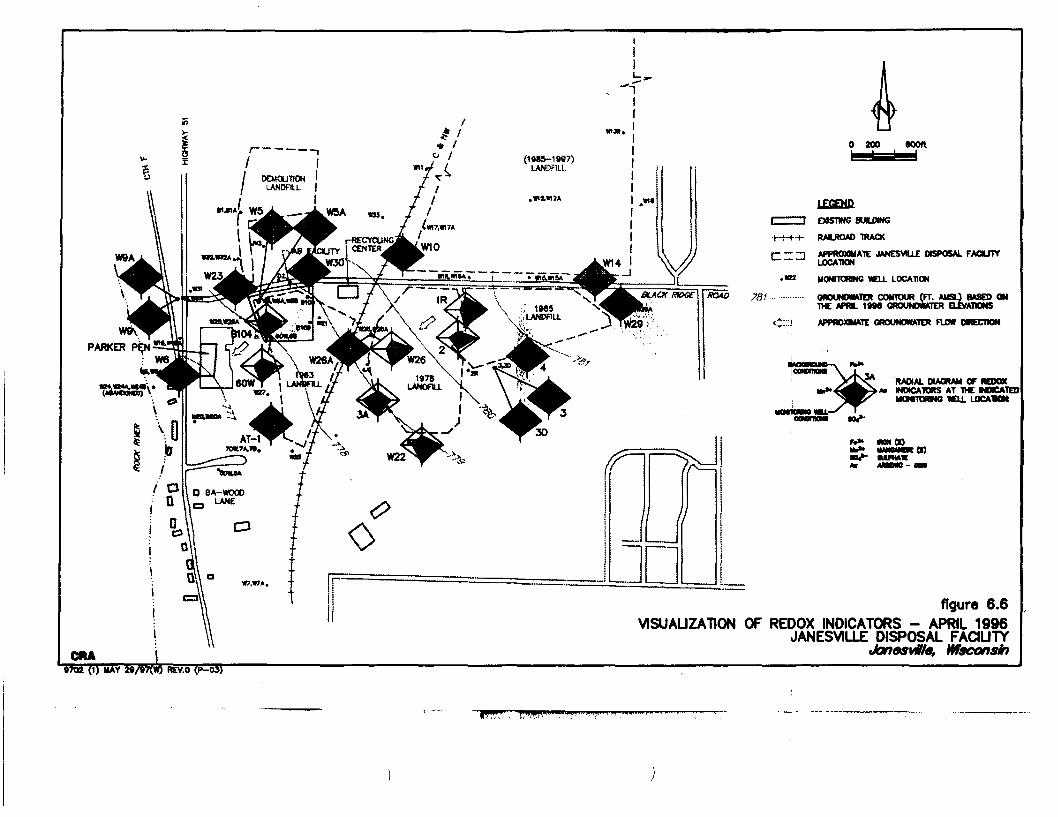
///
\\
PARKER
I
I DEMOLITION •/ LANDflLL |
0 200 600ft
|_ECENDENSTING BUUXNG
RAILROAD TRACK
APPROMMATE JANESWLLE DISPOSAL FACUTYLOCATION
UONITORMG WELL LOCATION
GROUMMMTER CONTOUR (FT. AMSL) BASED ONTHE APRL 1990 GROUNMATER ELEVATIONS
APPROXMATE GROUNDWATER FLOW DKECDON
ciu
RADIAL DIAGRAM OF REDOX«. INDICATORS AT THE MDCATED
MONnORMO «£LL LOCATION
figure 6.6VISUALIZATION OF REDOX INDICATORS - APRIL 1996
JANESVILLE DISPOSAL FACILITYJanosvtle, Wisconsin
9702 (1) HAY M/»7(*0 REV.O (P-03)
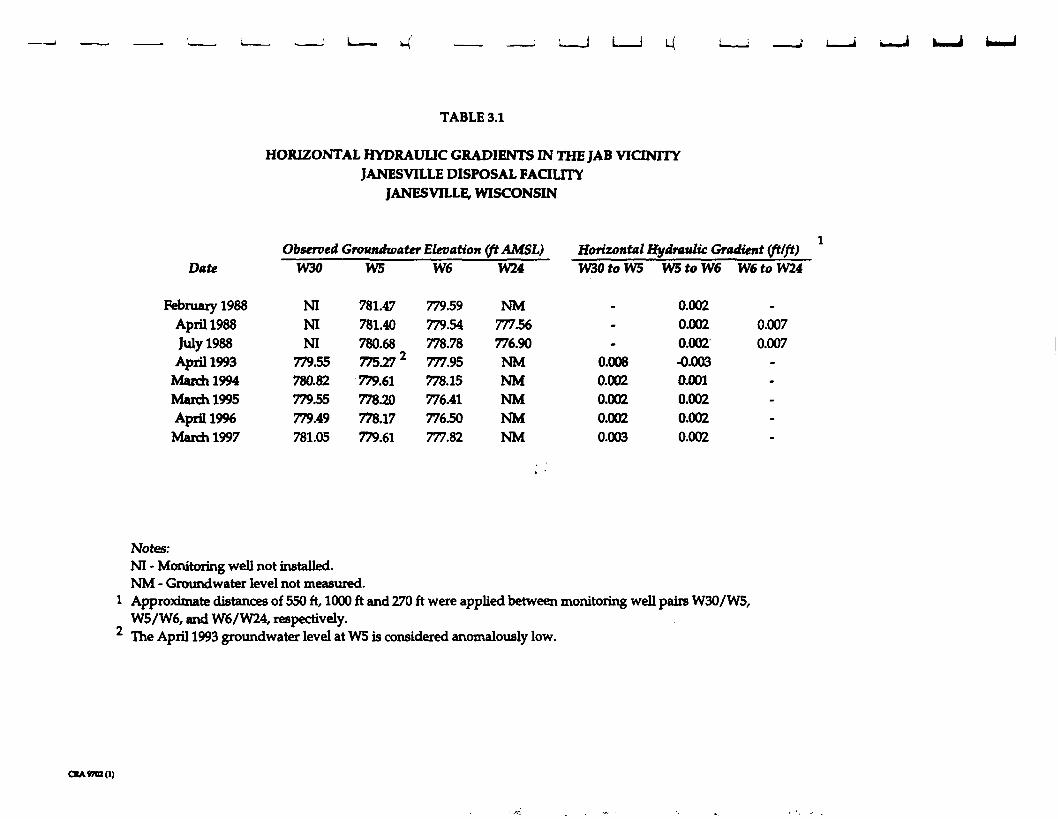
TABLE 3.1
HORIZONTAL HYDRAULIC GRADIENTS IN THE JAB VICINITYJANESVILLE DISPOSAL FACILITY
JANESVILLE, WISCONSIN
Observed Groundwater Elevation (ftAMSL)Date
February 1988April 1988July 1988April 1993
March 1994March 1995April 19%Match 1997
W30
NININI
779.55780.82779.55779.49781.05
W5
781.47781.40780.6877527 2
779.6177820778.17779.61
W6
779.59779.54778.78777.95778.15776.41776.50777.82
W24
NM77756776.90NMNMNMNMNM
Horizontal Hydraulic Gradient (ft/ft)W30 to W5 W5to W6 W6 to W24
0.0080.0020.0020.0020.003
0.0020.0020.002-0.0030.0010.0020.0020.002
0.007
0.007
Notes:NI - Monitoring well not installed.NM - Groundwater level not measured.
1 Approximate distances of 550 ft, 1000 ft and 270 ft were applied between monitoring well pairs W30/W5,W5/W6, and W6/W24, respectively.
2 The April 1993 groundwater level at W5 is considered anomalously low.
CIA «702 (1)
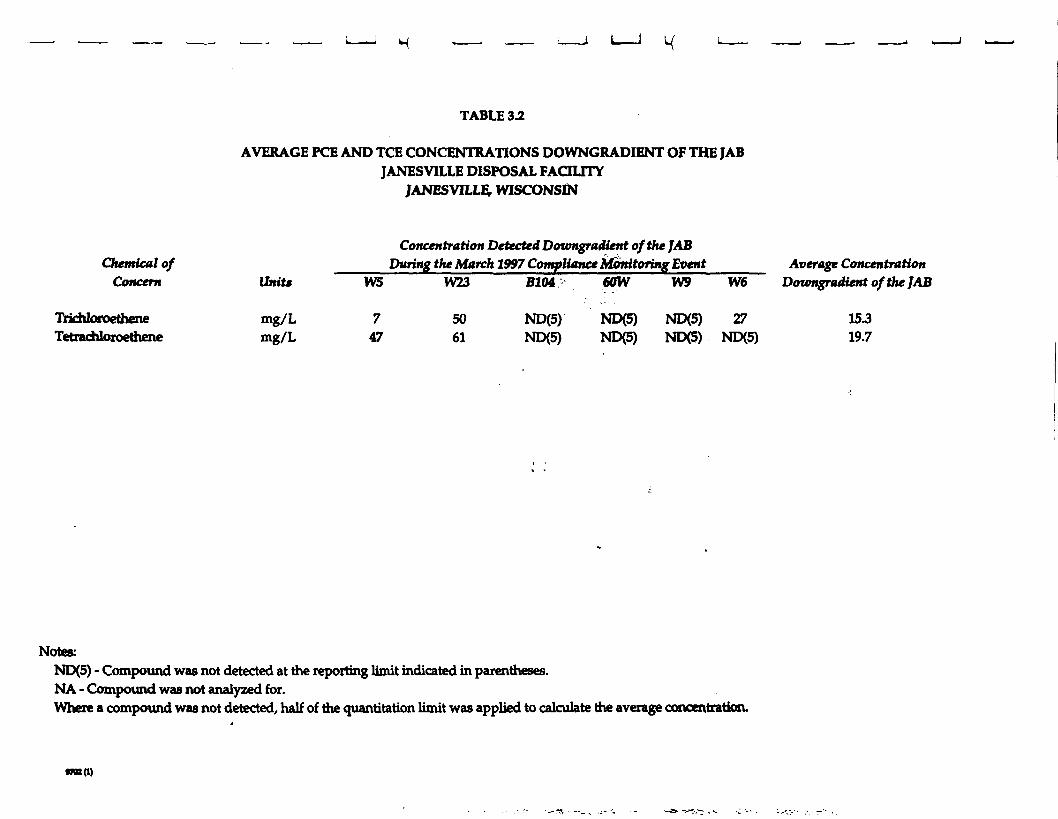
TABLE 3.2
AVERAGE PCE AND TCE CONCENTRATIONS DOWNGRADIENT OF THE JABJANESVILLE DISPOSAL FAOLITY
JANESVILLE, WISCONSIN
Concentration Detected Downgradient of the JABChemical of During the March 1997 Compliance Monitoring Event Average Concentration
Concern Unit* W5 W23 B104 60W W9 W6 Doitmgraditnt of the JAB
Triddorocthene mg/L 7 50 ND(5) ND(5) ND(5) 27 153Tetrachloroethene mg/L 47 61 ND(5) ND(5) ND(5) ND{5) 19.7
Notes:ND(5) - Compound was not detected at the reporting limit indicated in parentheses.NA - Compound was not analyzed for.Where a compound was not detected, half of the quantitation limit was applied to calculate the average concentration.
ova)
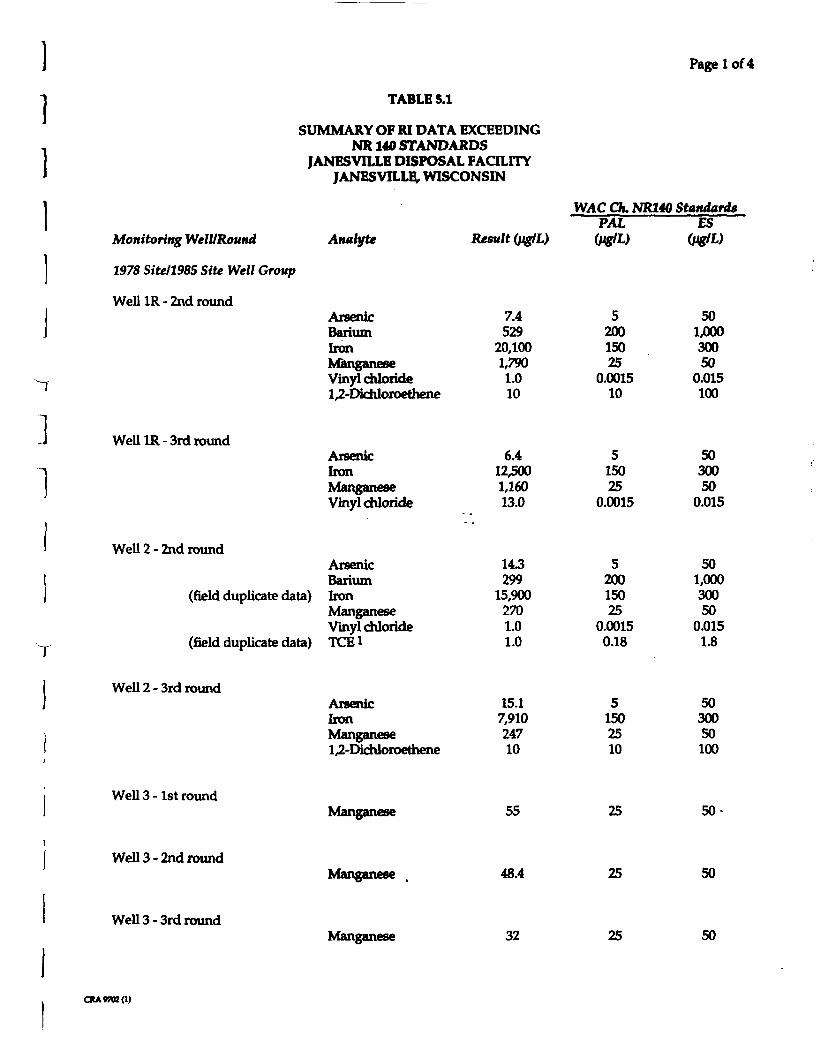
Page 1 of4
TABLE 5.1
SUMMARY OF HI DATA EXCEEDINGNR140 STANDARDS
JANESVILLB DISPOSAL FACILITYJANESVILLE, WISCONSIN
WAC Ch. NR140 StandardsPAL ES
Monitoring Well/Round
1978 Site/1985 Site Well Group
WelllR- 2nd round
Y
Analyte
ArsenicBariumIronManganeseVinyl chloride1,2-Dichloroethene
ArsenicIronManganeseVinyl chloride
Well 2-2nd roundArsenicBarium
(field duplicate data) IronManganeseVinyl chloride
(field duplicate data) TCE1
WeUIR-3rd round
Well 2-3rd roundArsenicIronManganese1,2-Dichloroethene
Result digfL)
7.4529
20,1001,7901.010
6.412,5001,16013.0
143299
15,9002701.01.0
15.17,91024710
520015025
0.001510
515025
0.0015
51502510
501,00030050
0.015100
5030050
0.015
520015025
0.00150.18
501,000300500.0151.8
5030050100
Well 3 - 1st round
Well 3-2nd round
Well 3-3rd round
Manganese
Manganese
Manganese
55
48.4
32
25
25
25
50
50
50
CRA«702(1)
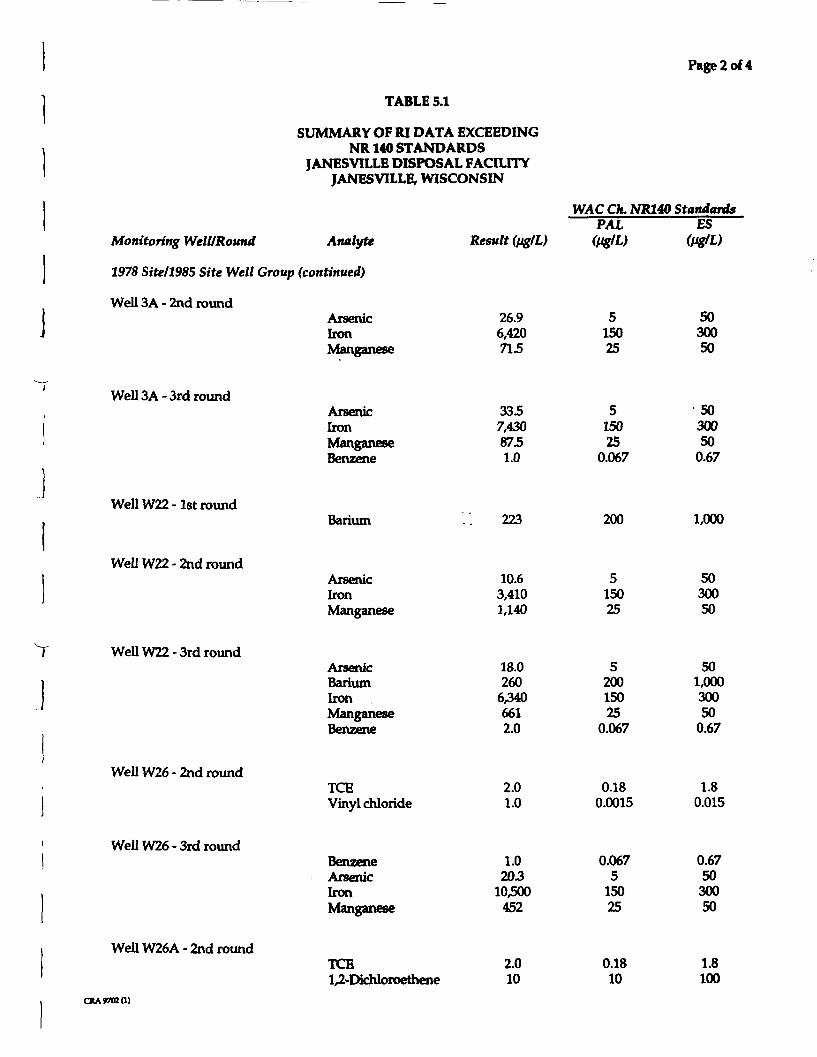
Page 2 of4
TABLE 5.1
SUMMARY OF RI DATA EXCEEDINGNR140 STANDARDS
JANESVILLE DISPOSAL FACILITYJANESVILLE, WISCONSIN
WAC Ch. NR140 Standards
Monitoring Well/Round Analyte
1978 Site/1985 Site Well Group (continued)
Well 3A-2nd roundArsenicIronManganese
Result
26.96,420715
PAL
515025
ES
5030050
Well 3A-3rd roundArsenicIronManganeseBenzene
3357,4308751.0
515025
0.067
•5030050
0.67
Well W22-1st roundBarium 223 200 1,000
Well VV22-2nd roundArsenicIronManganese
10.63,4101,140
515025
5030050
Well W22-3rd roundArsenicBariumIronManganeseBenzene
18.0260
63406612.0
520015025
0.067
501,00030050
0.67
Well W26-2nd roundTCEVinyl chloride
2.01.0
0.180.0015
1.80.015
WeUW26-3rd roundBenzeneArsenicIronManganese
1.0203
10500452
0.0675
15025
0.675030050
Well W26A-2nd roundTCE1,2-Dichloroethene
2.010
CRA 9702(1)
0.1810
1.8100
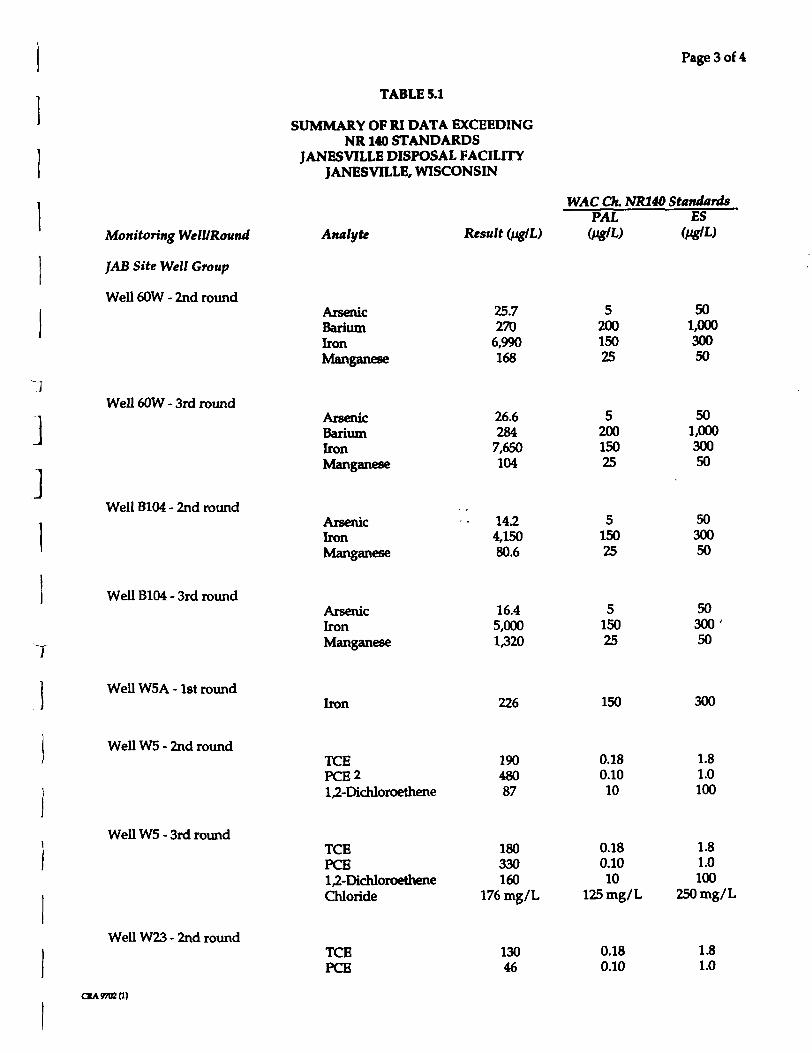
Page 3 of 4
TABLE 5.1
SUMMARY OF RI DATA EXCEEDINGNR140 STANDARDS
JANESV1LLE DISPOSAL FACILITYJANESVILLE, WISCONSIN
Monitoring Well/Round
JAB Site Well Group
Well 60W - 2nd round
Analyte
ArsenicBariumIronManganese
Result (tiglL)
25.7270
6,990168
WAC Ck. NR140 StandardsPAL ES
(fjg/L)
520015025
501,00030050
Well 60W- 3rd round
Well B104 - 2nd round
Well B104-3rd round
7
ArsenkBariumIronManganese
ArserucIronManganese
ArsenicIronManganese
26.6284
7,650104
1424,15080.6
16.45,0001320
520015025
515025
515025
501,00030050
5030050
5030050
WellWSA- 1st roundIron 226 150 300
Well W5 - 2nd roundTCEPCE21,2-Dichloroethene
19048087
0.180.1010
1.81.0100
Well W5-3rd round
Well W23 - 2nd round
TCEPCB1,2-DichloroetheneChloride
TCEPCE
180330160
176 mg/L
13046
0.180.1010
125 mg/L
0.180.10
1.81.0100
250 mg/L
1.81.0
CRA 9702(1)
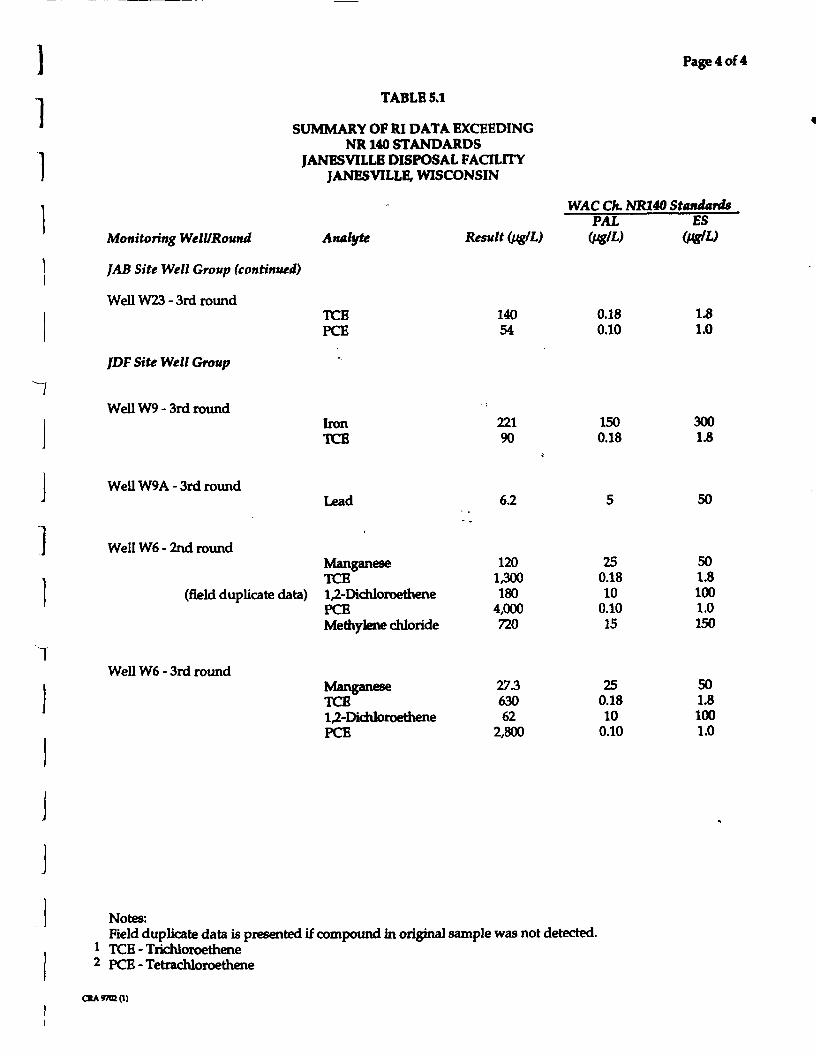
1
Page 4 of4
TABLE 5.1
SUMMARY OF RI DATA EXCEEDINGNR140 STANDARDS
JANESVILLE DISPOSAL FACILITYJANESVILLE, WISCONSIN
WAC Ch. NR140 StandardsPAL ES
Monitoring Well/Round Anatyte Result (fjg/L) (t^g/L) (fJgtL)
JAB Site Well Group (continued)
Well W23-3rd roundTCE 140 0.18 1.8PCS 54 0.10 1.0
JDF Site Well Group
Well W9-3rd roundIron 221 150 300TCE 90 0.18 1.8
Well W9A- 3rd roundLead 62 5 50
Well W6 - 2nd roundManganese 120 25 50TCE 1,300 0.18 1.8
(field duplicate data) U-DichJoroethene 180 10 100PCE 4,000 0.10 1.0MeAytene chloride 720 15 150
Well W6- 3rd roundManganese 273 25 50TCE 630 0.18 1.8l>Diddoroethene 62 10 100PCE 2,800 0.10 1.0
Notes:Field duplicate data is presented if compound in original sample was not detected.
1 TCE - Trichloroethene2 PCE-Tetrachloroethene
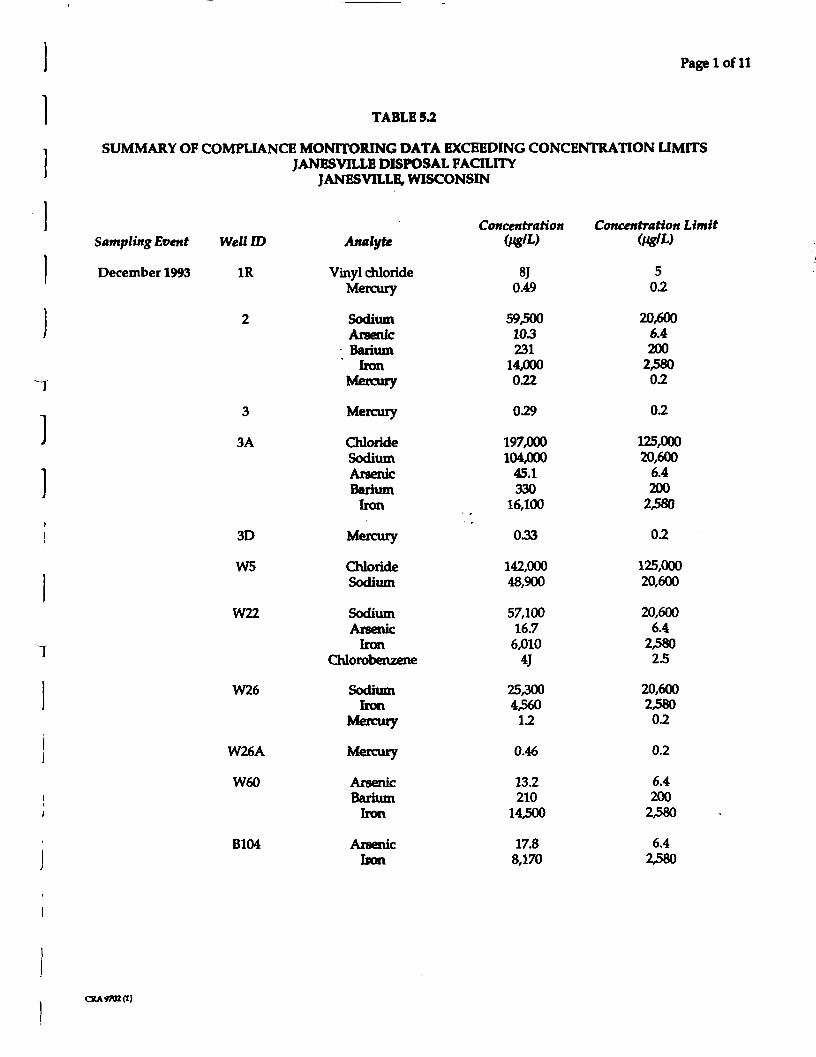
Page 1 of 11
TABLE 5.2
SUMMARY OF COMPLIANCE MONITORING DATA EXCEEDING CONCENTRATION LIMITSJANESVILLE DISPOSAL FACILITY
JANESVILLE, WISCONSIN
ConcentrationSampling Event Well ID
December 1993
AnalyteConcentration Limit
(VgIL)
1R
2
3
3A
3D
W5
W22
W26
W26A
W60
B104
Vinyl chlorideMercury
SodiumAreenic
- BariumIron
Mercury
Mercury
ChlorideSodiumArsenicBarium
Iron
Mercury
ChlorideSodium
SodiumArsenic
IronChlorobenzene
SodiumIron
Mercury
Mercury
ArsenicBarium
Iron
Arseniclion
8J0.49
59,50010.3231
14,000022
029
197,000104/JOO
45.1330
16,100
033
142,00048,900
57,10016.76,010
4J
253004,5601.2
0.46
13.2210
14,500
17.88,170
502
20,6006.4200
2,5800.2
0.2
125,00020,600
6.4200
2,580
0.2
125,00020,600
20,6006.4
2,58023
20,60023800.2
0.2
6.4200
2380
6.42380
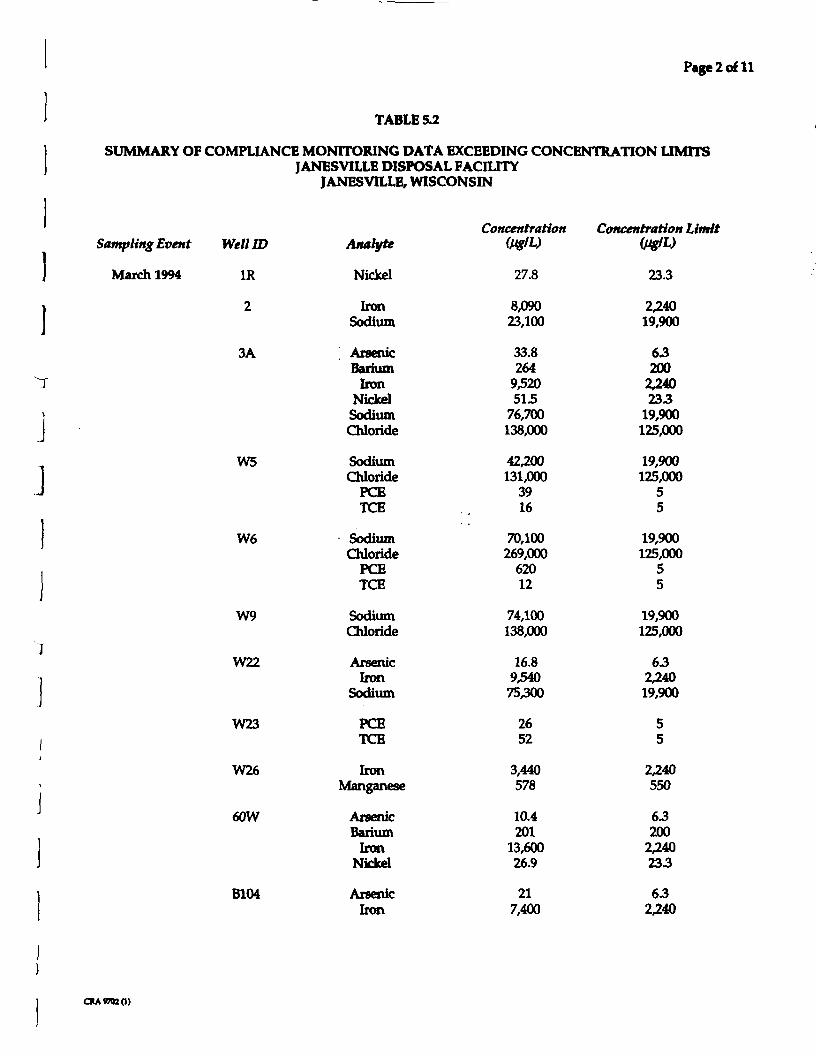
Page 2 of 11
TABLE 5.2
SUMMARY OF COMPLIANCE MONITORING DATA EXCEEDING CONCENTRATION LIMITSJANESVILLE DISPOSAL FACILITY
J ANESV1LLE, WISCONSIN
Sampling Event Well ID
March 1994
JJ
Ml ID
1R
2
3A
W5
W6
W9
W22
W23
W26
60W
B104
Analyte
Nickel
IronSodium
; ArsenicBarium
IronNickelSodiumChloride
SodiumChloride
PCETCB
SodiumChloride
PCETCE
SodiumChloride
ArsenicIron
Sodium
PCETCB
IronManganese
ArsenicBarium
IronNickel
ArsenicIron
Concentration(Hg/L)
27.8
8,09023,100
33.8264
9,520515
76,700138,000
42,200131,000
3916
70,100269,000
62012
74,100138,000
16.8954075,300
2652
3,440578
10.4201
13,60026.9
217,400
Concentration(VgIL)
23.3
2,24019,900
63200
2,240233
19,900125,000
19,900125,000
55
19,900125,000
55
19,900125,000
632,24019,900
55
2,240550
63200
2,240233
632,240
CXA 9702(1)
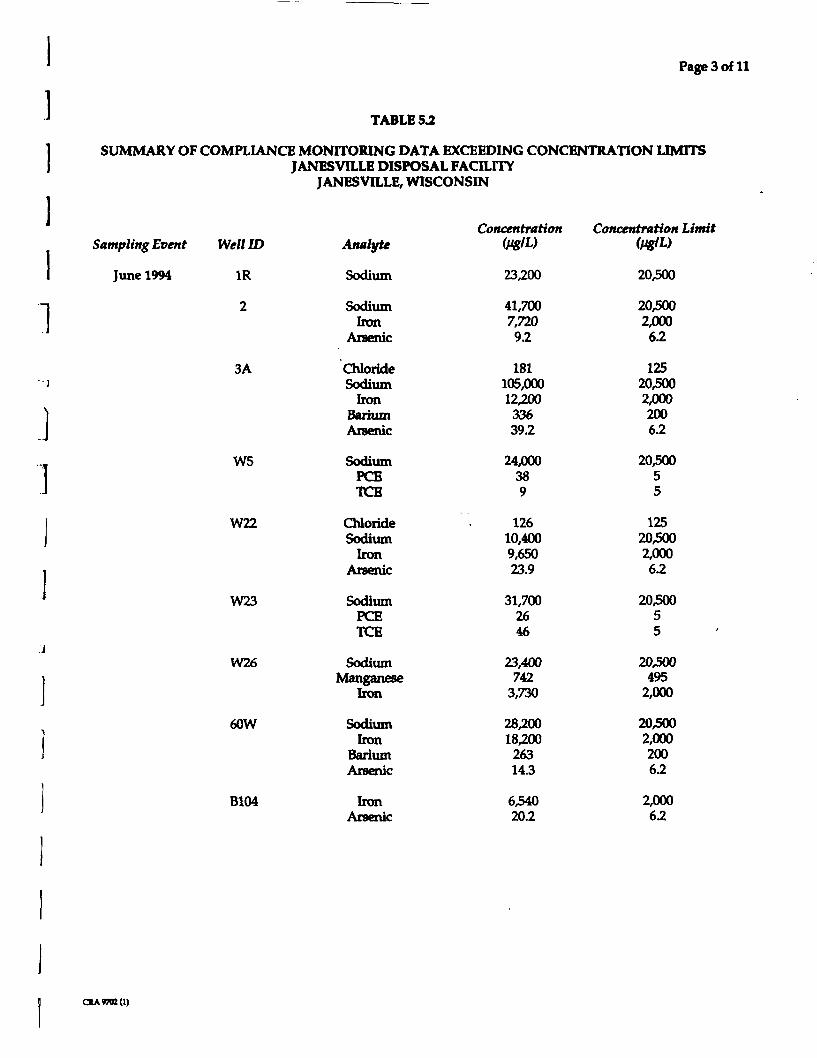
Page 3 of 11
TABLE 53.
SUMMARY OF COMPLIANCE MONITORING DATA EXCEEDING CONCENTRATION LIMITSJANESVILLE DISPOSAL FACILITY
JANESVILLE, WISCONSIN
Concentration Concentration LimitSampling Event Well ID
June 1994 1R
2
3A
J
]W5
W22
W23
W26
60W
B104
Analyte
Sodium
SodiumIron
Arsenic
ChlorideSodium
IronBariumArsenic
SodiumPCETCB
ChlorideSodium
IronArsenic
SodiumPCETCB
SodiumManganese
Iron
SodiumIron
BariumArsenic
IronArsenic
23,200
41,7007,72092
181105,00012,20033639.2
24,000389
12610,4009,65023.9
31,7002646
23,400742
3,730
28,20018,20026314.3
6340202
20,500
20,5002,0006.2
12520,5002,0002006.2
20,50055
12520,5002,00062
20,50055
20,500495
2,000
20,5002,0002006.2
2,00062
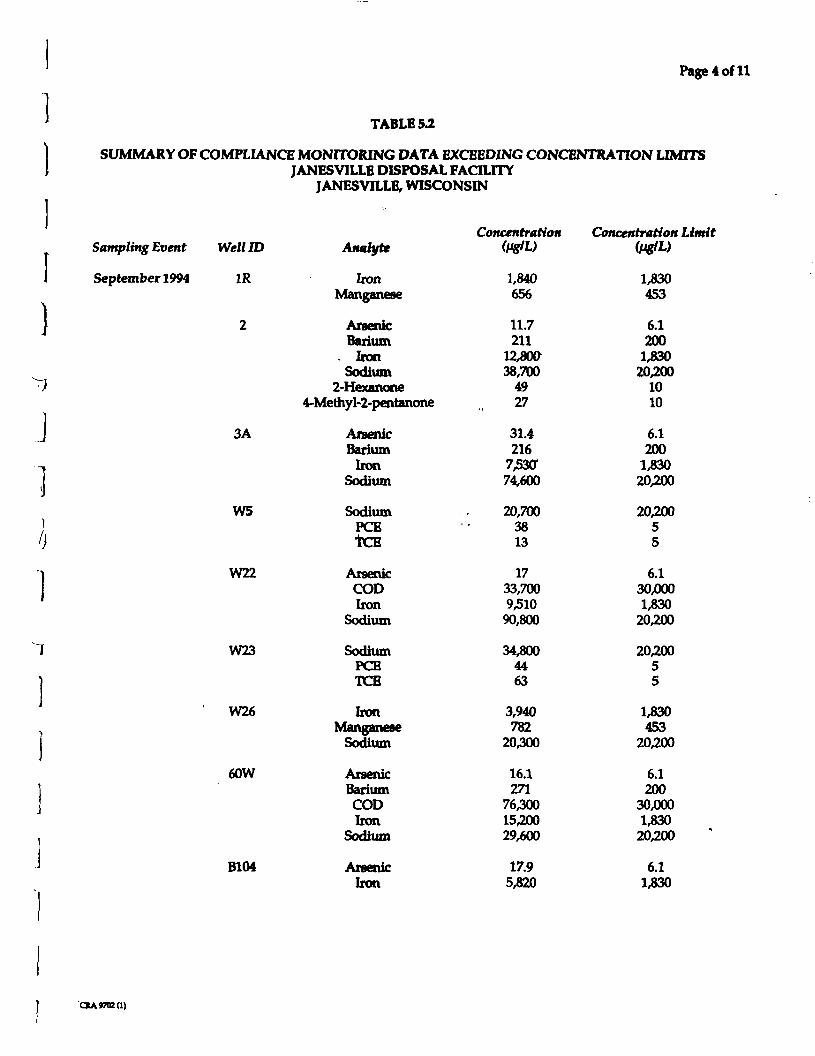
Page 4 of 11
TABLE 5.2
SUMMARY OF COMPLIANCE MONITORING DATA EXCEEDING CONCENTRATION LIMITSJANESVILLB DISPOSAL FACILITY
JANESVILLB, WISCONSIN
Sampling Event Well ID
September 1994 1R
3A
W5
W22
W23
W26
60W
B104
Analyte
IronManganese
AraenkBarium
. IronSodium
2-Hexanone4-Methyl-2-pentanone
ArsenicBarium
IronSodium
SodiumPCSTCE
ArsenicCODIron
Sodium
SodiumPCETCB
IronManganese
Sodium
ArsenicBariumCODIron
Sodium
ArsenicIron
Concentration(HS/D
1,840656
11.7211
123W38,700
4927
31.4216
7,530*74,600
20,7003813
1733,7009,51090,800
34^004463
3,940782
20,300
16.1271
76,30015,20029,600
17.95320
Concentration Limit
1330453
6.1200
133020,200
1010
6.1200
133020,200
20,20055
6.130,0001330
20,200
20,20055
1330453
20,200
6.1200
30,0001330
20,200
6.11330
CRA 9702(1)
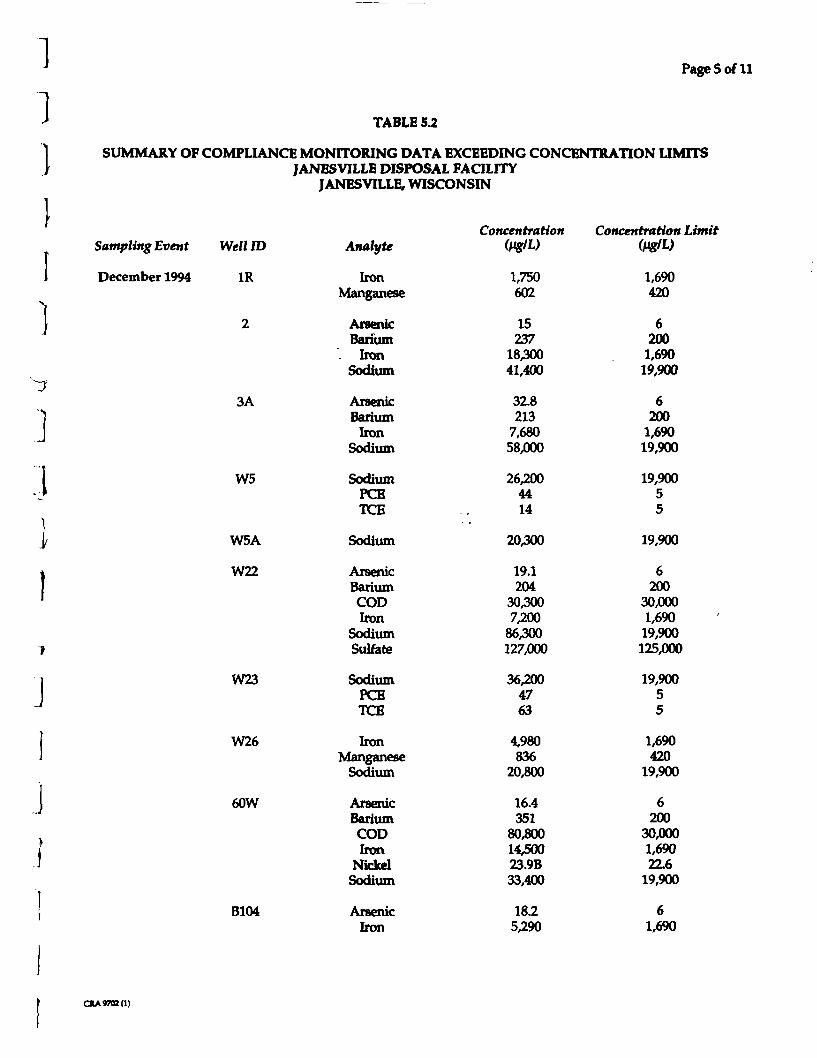
Page 5 of 11
TABLE 5.2
SUMMARY OF COMPLIANCE MONITORING DATA EXCEEDING CONCENTRATION LIMITSJANESVILLE DISPOSAL FACILITY
JANESVILLE, WISCONSIN
Concentration Concentration LimitSampling Event Well ID
December 1994 1R
3A
W5
W5A
W22
JW23
W26
60W
B104
Analyte
IronManganese
ArsenicBarium
. IronSodium
ArsenicBarium
IronSodium
SodiumPCETCE
Sodium
ArsenicBariumCODIron
SodiumSulfate
SodiumPCETCE
IronManganese
Sodium
ArsenicBariumCODIron
NickelSodium
ArsenicIron
1,750602
15237
18,30041,400
32.8213
7,68058,000
26,2004414
20,300
19.1204
30,3007,200
86,300127,000
36,2004763
4,980836
20,800
16.4351
80,80014 0023.9B33,400
5,290
1,690420
62001,690
19,900
6200
1,69019,900
19,90055
19,900
6200
30,0001,69019,900125,000
19,90055
1,690420
19,900
6200
30,0001,69022.6
19,900
61,690
CKA 9702(1)
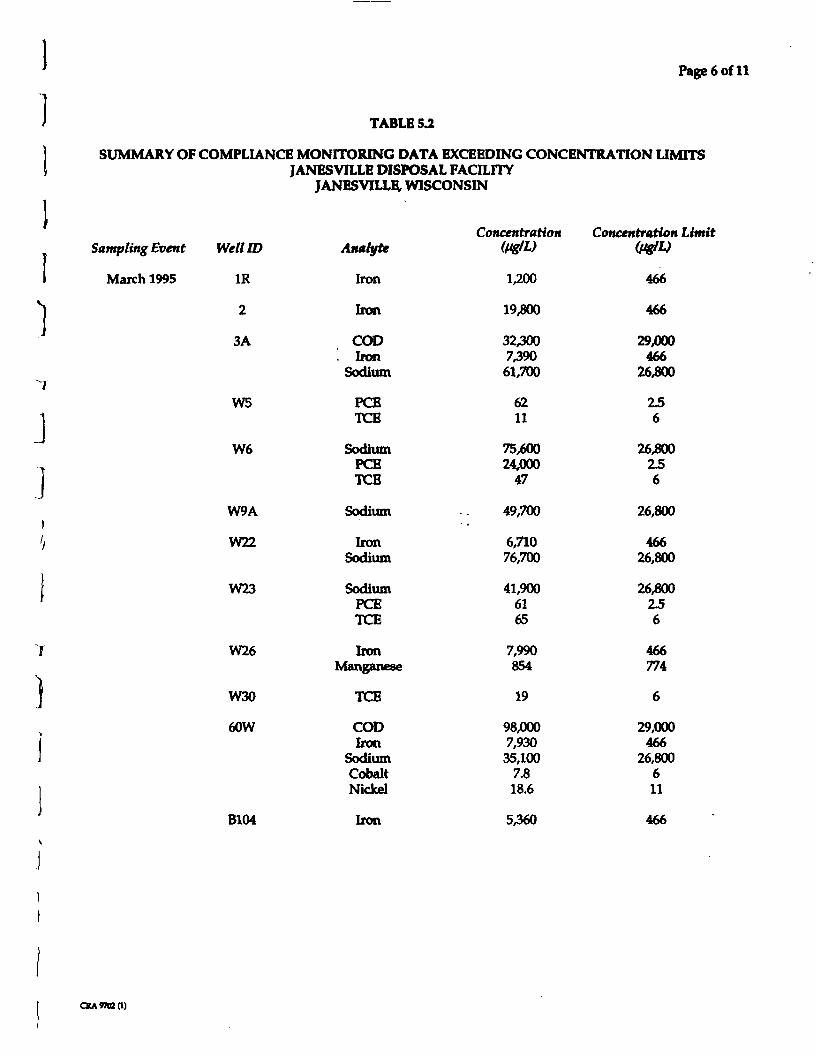
Page 6 of 11
TABLE 5.2
SUMMARY OF COMPLIANCE MONITORING DATA EXCEEDING CONCENTRATION LIMITSJANESVILLE DISPOSAL FACILITY
JANESVILLE, WISCONSIN
Sampling Event
March 1995
Well ID
1R
2
3A
W5
W6
W9A
W22
W23
W26
W30
60W
Analyte
Iron
Iron
COD. Iron
Sodium
PCBTCB
SodiumPCETCB
Sodium
IronSodium
SodiumPCETCE
IronManganese
TCE
CODIron
SodiumCobaltNickel
Concentration C(tig/L)
1,200
19,800
32,3007,39061,700
6211
75,60024/XX)
47
49,700
6,71076,700
41,9006165
7,990854
19
98,0007,93035,100
7.818.6
Concentration(t&L)
466
466
29,000466
26300
256
26,800256
26,800
46626,800
26^002.56
466774
6
29,000466
26,800611
B104 Iron 5,360 466
CKAWOZ(l)
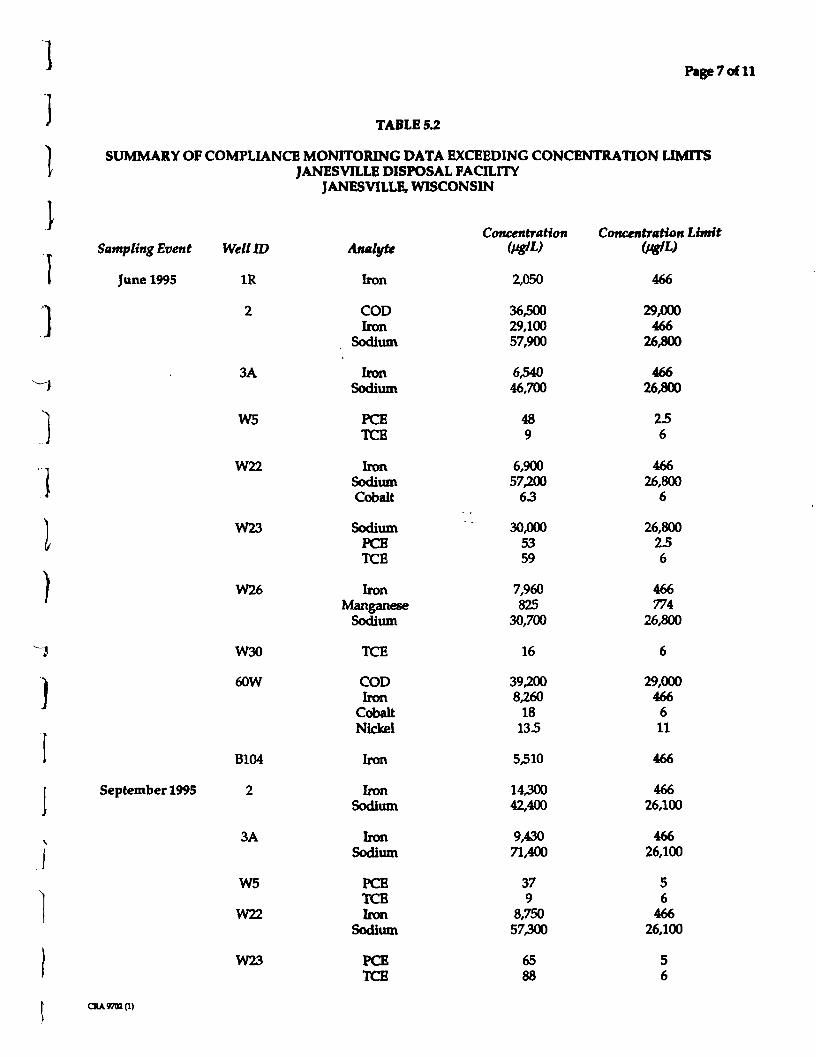
Page 7 of 11
TABLE 5.2
SUMMARY OF COMPLIANCE MONITORING DATA EXCEEDING CONCENTRATION LIMITSJANESVILLE DISPOSAL FACILITY
JANESVILLE, WISCONSIN
Sampling Event Well ID
June 1995
1
September 1995
relllD
1R
2
3A
W5
W22
W23
W26
W30
60W
B104
2
3A
W5
W22
W23
Analyte
Iron
CODIron
Sodium
IranSodium
PCETCE
IronSodiumCobalt
SodiumPCETCE
IronManganese
Sodium
TCE
CODIron
CobaltNickel
Iron
IronSodium
IronSodium
PCETCEIron
Sodium
PCETCB
Concentration(fig'L)
2,050
36,50029,10057,900
6,54046,700
489
6,90057,200
63
30,0005359
7,960825
30,700
16
39,2008,260
18135
5,510
1430042,400
9,43071,400
379
8,75057300
6588
Concentration(t&L)
466
29,000466
26300
46626,800
256
46626,800
6
26,800256
466774
26,800
6
29,000466611
466
46626,100
46626,100
56
46626,100
56
CRA 9702(1)
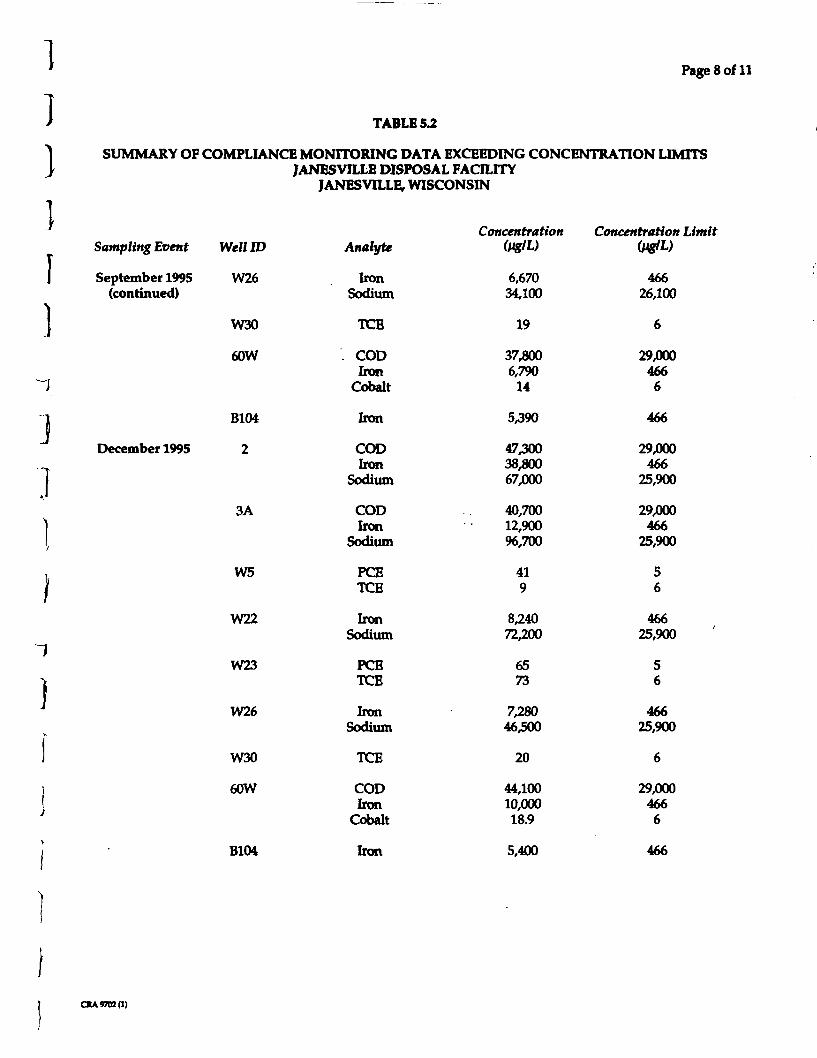
]])I
Page 8 of 11
TABLE 5.2
SUMMARY OF COMPLIANCE MONITORING DATA EXCEEDING CONCENTRATION LIMITSJANBSVILLE DISPOSAL FACILITY
JANESVILLE, WISCONSIN
Sampling Event
September 1995(continued)
December 1995
Concentration Concentration LimitWell ID
W26
W30
60W
B104
2
3A
W5
W22
W23
W26
W30
60W
Analyte
IronSodium
TCE
. CODIron
Cobalt
Iron
CODIron
Sodium
CODIron
Sodium
PCETCE
IronSodium
PCETCE
IronSodium
TCE
CODIron
Cobalt
C«/W
6,67034,100
19
37,8006,790
14
5^90
4730038,80067,000
40,70012,90096,700
419
8,24072,200
6573
7,28046,500
20
44,10010,00018.9
(VgIL)
46626,100
6
29,0004666
466
29,000466
25,900
29,000466
25,900
56
46625,900
56
46625,900
6
29,0004666
B104 Iron 5,400 466
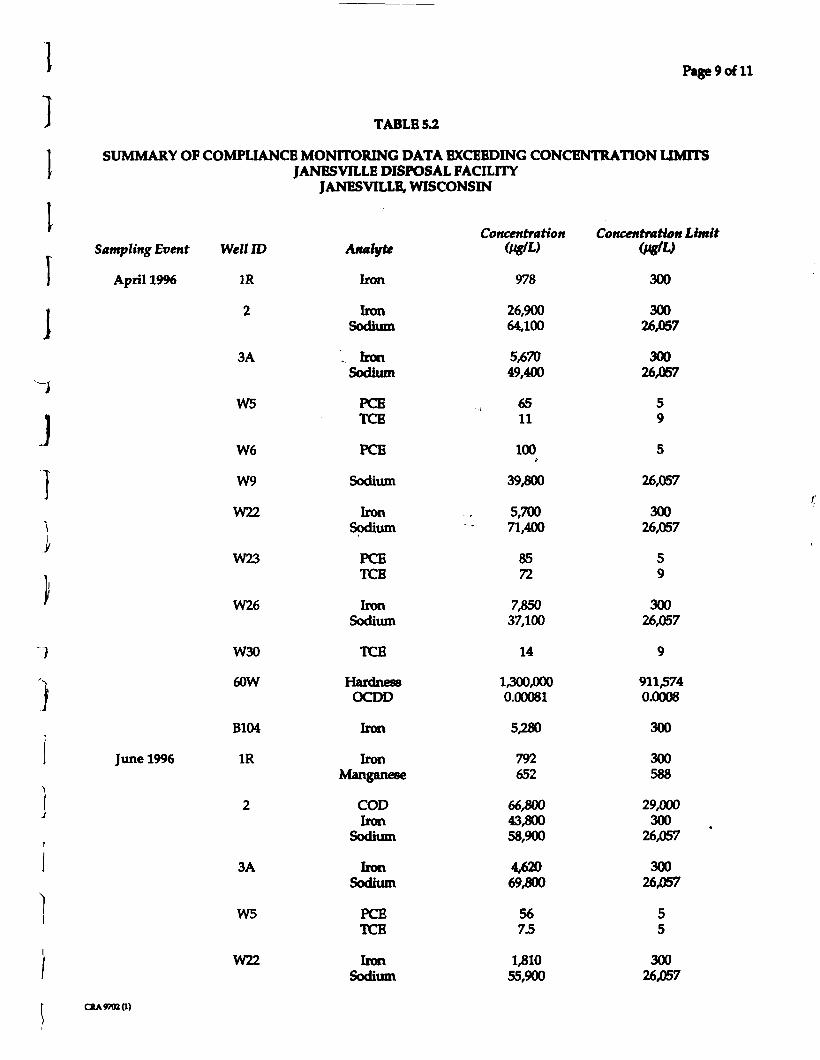
Page 9 of 11
TABLE 5.2
SUMMARY OF COMPLIANCE MONITORING DATA EXCEEDING CONCENTRATION LIMITSJANESVILLE DISPOSAL FACILITY
JANESVILLE, WISCONSIN
Concentration Concentration LimitSampling Event Well ID
April 1996
J
June 1996
fell ID
1R
2
3A
W5
W6
W9
W22
W23
W26
W30
60W
B104
1R
2
3A
W5
W22
Analyte
Iron
IronSodium
. IronSodium
PCETCE
PCE
Sodium
IronSodium
PCETCE
IronSodium
TCB
HardnessOCDD
Iron
IronManganese
CODIron
Sodium
IronSodium
PCETCE
IronSodium
<PglL)
978
26,90064,100
5,67049,400
6511
100
39,800
5,70071,400
8572
7,85037,100
14
1,300,0000.00081
5,280
792652
66,80043,80058,900
4,62069XWO
5675
1X*1055,900
(Mff/U
300
30026X67
30026X67
59
5
26X67
30026,057
59
30026,057
9
911,5740.0008
300
300588
29,000300
26X67
30026X67
55
30026X67
CIA 9702(1)
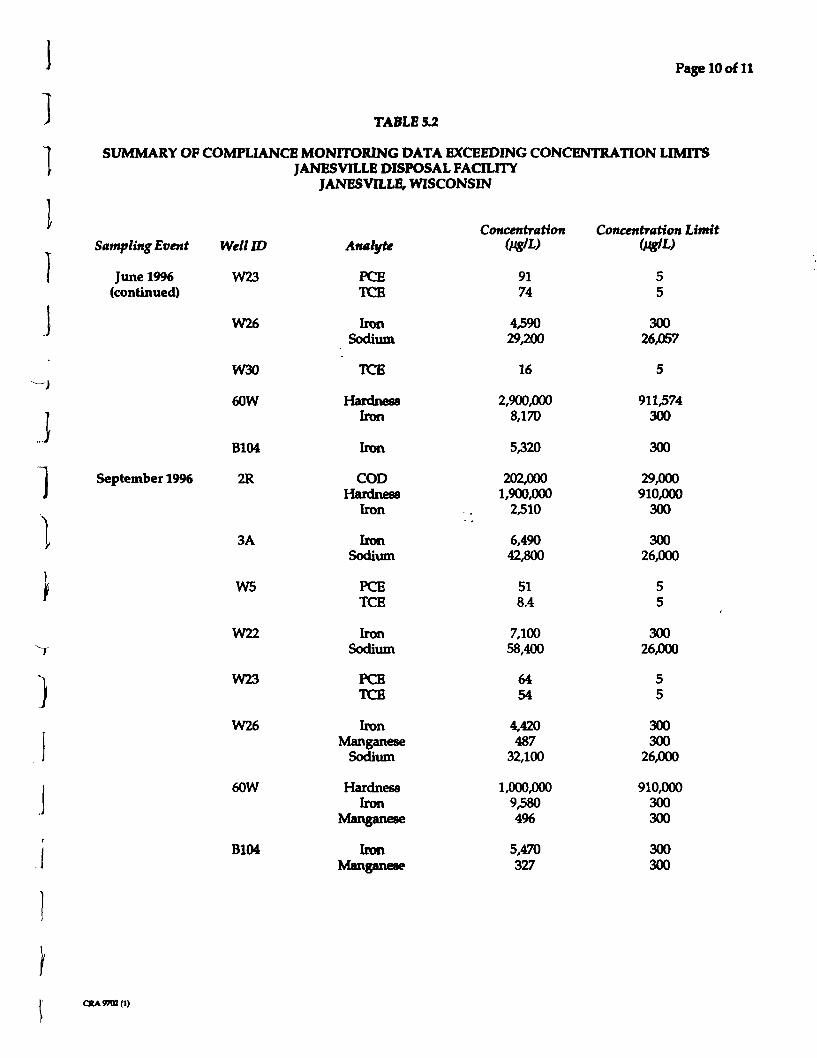
Page 10 of 11
]
1
TABLE 5.2
SUMMARY OF COMPLIANCE MONITORING DATA EXCEEDING CONCENTRATION LIMITSJANESVILLE DISPOSAL FACILITY
JANESVILLE, WISCONSIN
Concentration Concentration LimitSampling Event Well ID
\ June 1996 W23(continued)
W26
W30
60W
B104
1 September 1996 2R
N
[ 3A
If W5
W22r
I W23
W26
[ 60W
B104
Analytic
PCETCB
IronSodium
TCB
HardnessIron
Iron
CODHardness
Iron
IronSodium
PCETCE
IronSodium
PCETCB
IronManganese
Sodium
HardnessIron
Manganese
IronManganese
9174
4,59029,200
16
2,900,0008,170
5320
202,0001,900,000
2,510
6,49042,800
518.4
7,10058,400
6454
4,420487
32,100
1,000,0009,5804%
5,470327
55
30026,057
5
911,574300
300
29,000910,000
300
30026,000
55
30026,000
55
300300
26,000
910,000300300
300300
CRA 9702(1)
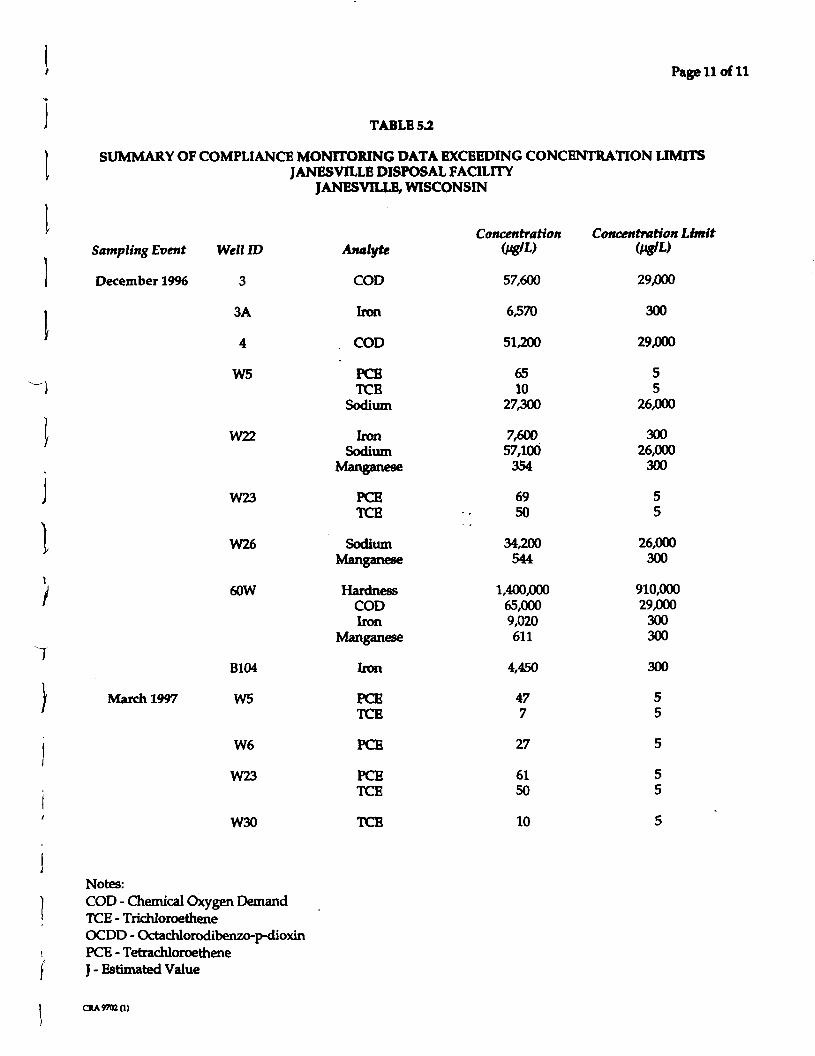
Page 11 of 11
TABLE 5.2
SUMMARY OF COMPLIANCE MONITORING DATA EXCEEDING CONCENTRATION LIMITSJANESVILLE DISPOSAL FACILITY
JANESVILLE, WISCONSIN
Concentration Concentration Limit
1
Sampling Event
December 19%
March 1997
Well ID
3
3A
4
W5
W22
W23
W26
60W
B104
W5
W6
W23
Analyte
COD
Iron
COD
FOBTCE
Sodium
IronSodium
Manganese
PCETCE
SodiumManganese
HardnessCODIron
Manganese
Iron
PCETCE
PCE
PCETCE
(Hpw57,600
6,570
51,200
6510
27,300
7,60057,100
354
6950
34,200544
1,400,00065,0009,020611
4,450
477
27
6150
(fJgfL)
29,000
300
29,000
55
26,000
30026,000
300
55
26,000300
910,00029,000
300300
300
55
5
55
W30 TCE 10
Notes:COD - Chemical Oxygen DemandTCE - TrichloroetheneOCDD - Octachlorodibenzo-p-dioxinPCE - TetrachloroetheneJ- Estimated Value
CRA 97020)
3I
31
f
J
APPENDIX A
LABORATORY RESULTS OF APRIL 1997j RESIDENTIAL WELL SAMPLING EVENT
1j1
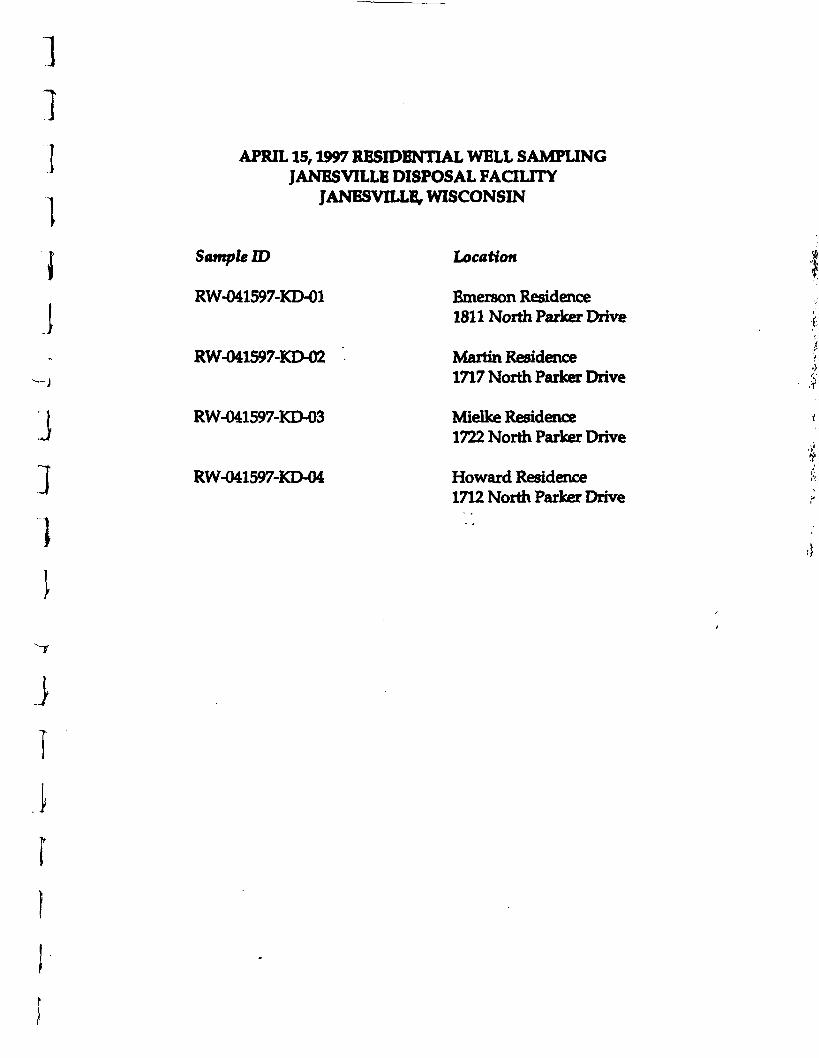
]]1]
J
J311
APRIL 15,1997 RESIDENTIAL WELL SAMPLINGJANES VILLE DISPOSAL FACILITY
JANESVILLE, WISCONSIN
Sample ID
RW-041597-KD-01
RW-041597-KD-02
RW-041597-KD-03
RW-041597-KD-04
Location
Emerson Residence1811 North Parker Drive
Martin Residence1717 North Parker Drive
Mielke Residence1722 North Parker Drive
Howard Residence1712 North Parker Drive
"TT
J
I
I
QuantumfMroameafW-v Eanrau
| Quartern! Incorporated StrriaetJ 4101 Shvfftl Drive, NW
North Canton, Ohio 44720
330 497-9396 Telephone330 497-0772 fax
ANALYTICAL REPORT
J
•0. 9703
ncxucrr
f: A7D170149
Starve Day
Asaociates Inc
B.Project Manager
Jprll 24, 1997
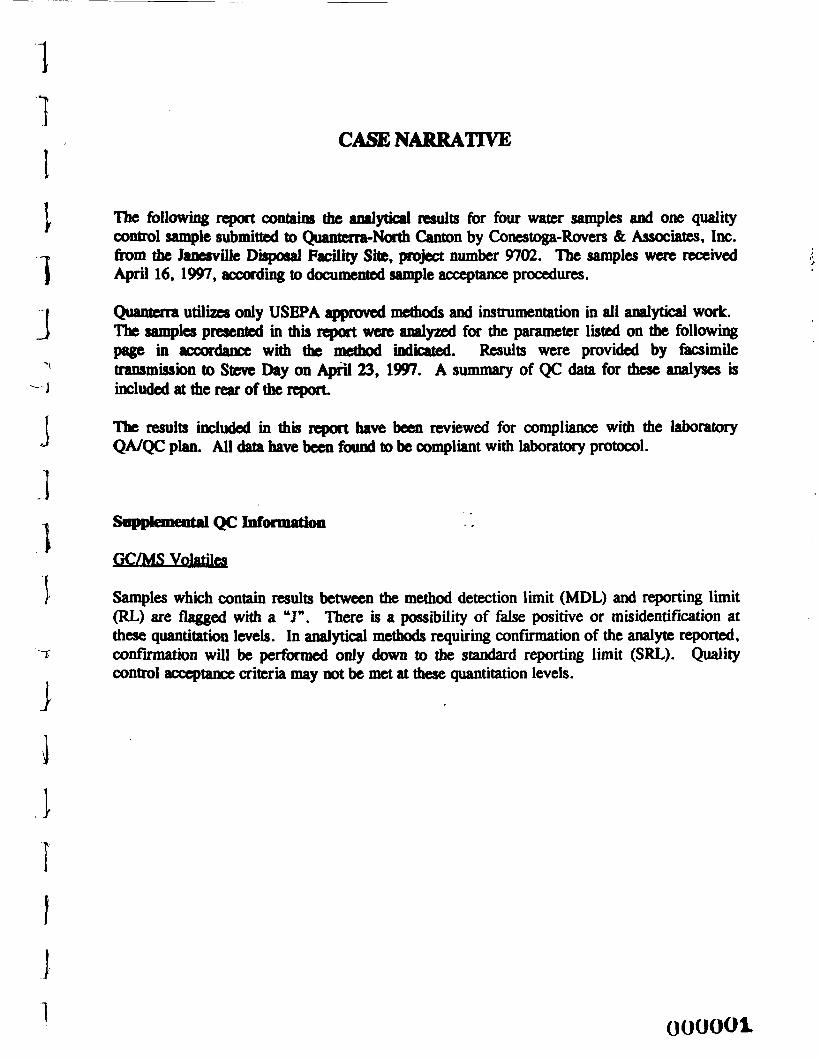
1111
3
1
iI
iiii
CASE NARRATIVE
The following report contains the analytical results for four water samples and one qualitycontrol sample submitted to Quanterra-North Canton by Conestoga-Rovers & Associates, Inc.from the Janesville Disposal Facility Site, project number 9702. The samples were receivedApril 16, 1997, according to documented sample acceptance procedures.
Quanterra utilizes only USEPA approved methods and instrumentation in all analytical work.The samples presented in mis report were analyzed for the parameter listed on the followingpage in accordance with the method indicated. Results were provided by facsimiletransmission to Steve Day on April 23, 1997. A summary of QC data for these analyses isincluded at the rear of the report.
The results included in this report have been reviewed for compliance with the laboratoryQA/QC plan. All data have been found to be compliant with laboratory protocol.
Supplemental QC Information
GC/MS Volatile*
Samples which contain results between the method detection limit (MDL) and reporting limit(RL) are flagged with a T. There is a possibility of false positive or misidentification atthese quantitation levels. In analytical methods requiring confirmation of the analyte reported,confirmation will be performed only down to the standard reporting limit (SRL). Qualitycontrol acceptance criteria may not be met at these quantitation levels.
000001
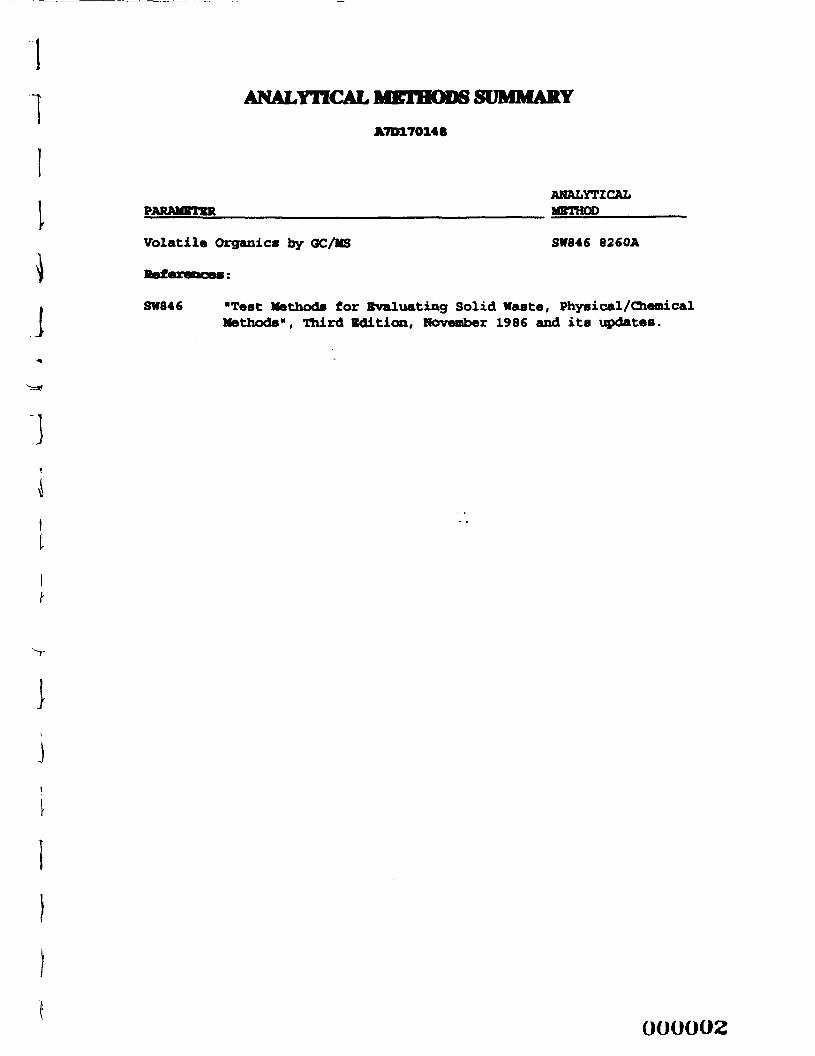
ANALYTICAL METHODS SUMMARY
A7D170148
ANALYTICALPARAMETER METHOD
Volatile Organics by OC/MS SW846 8260A
. SW846 "Test Methods for Evaluating Solid Waste, Physical/ChemicalI Methods", Third Edition, November 1986 and its updates.
1
i
OOOOO2
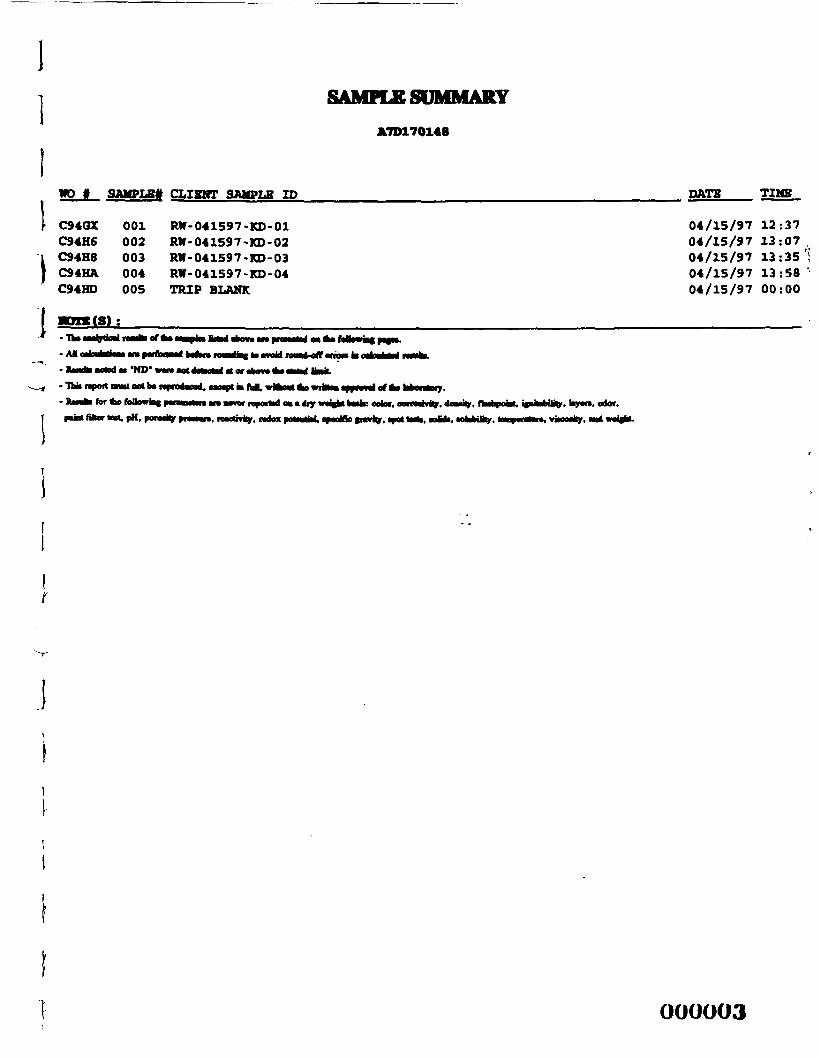
SAMPLE SUMMARY
A7D170148
HP i SAMPLBft CLIENT SAMPLE ID DATB TIME
C94GDC 001C94H6 002C94H8 003C94HA 004C94HD 005
•OTK(S):
RW-041597-KD-01RW-041597-KD-02RW- 041597 -KD- 03RW-041597-KD-04TRIP BLANK
04/15/9704/15/9704/15/9704/15/9704/15/97
12:3713:0713:3513:5800:00
Thi ••liliiMl ••§ nf * ' "j ' -*• . . . . . . . .
- fcMhi Bond M 'ND' mTO •BtvHMlM >t or •bov^ftv tf>Ml IBML
- to WtlmMttottonfnimc^v^mM. **<**» *i1*m wiiii* of t*Vto,*or,.
put fittw IMI. pH, pomlty tnmut*. nMtrvky. nda
J
OOOOO3
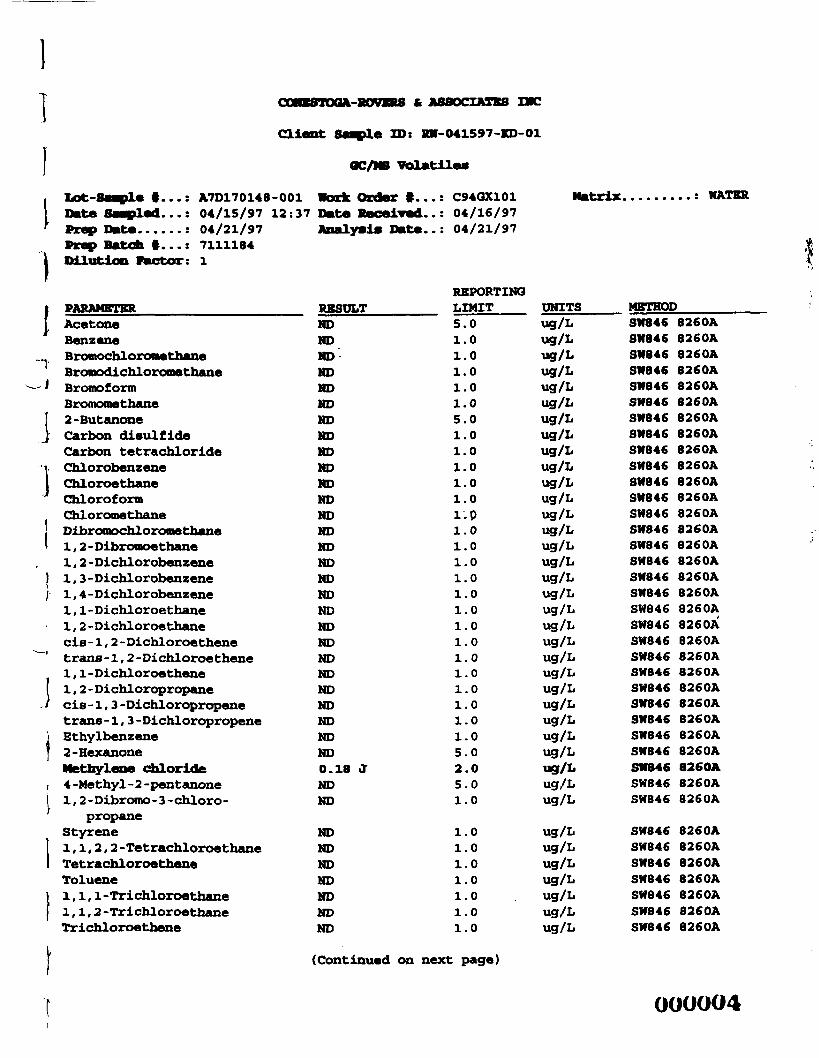
1 TOOA-KOVnS fc
I
]
Client Sople ID: KV-041597-KD-01
OC/NB Volatile*
UEH.-o« u.a *...: JWLU. f U.L*<
Date Saepled...: 04/15/97Prep Date : 04/21/97Prep Batch i. . . : 7111184nflnt-lm 9mi*t t*w • f
PARAMETERAcetoneBenzeneBromochlorone thaneBromodichlorome thaneBromoformBromome thane2-ButanoneCarbon disulfideCarbon tetrachlorideChlorobenzeneChloroe thaneChloroformChlororoe thane"1 bro«»or*'i "ro«"*t;h«nwl , 2 -Dibromoe thane1 , 2 -Dichlorobenzene1 , 3 -Dichlorobenzene1, 4-Dichlorobenzene1, 1-Dichloroethane1, 2-Dichloroethanecis - 1 , 2 -Dichloroethenetrans -1,2 -Dichloroethene1 , 1 -Dichloroethene1 , 2 -Dichloropropanecis- 1 , 3 -Dichloropropenetrans - 1 , 3 -DichloropropeneEthylbenzene2-HexanoneM»l-hvl«mA otil rvr-l A»
4 -Methyl - 2 -pentanone1 , 2 - Dibromo - 3 - chloro -
propaneStyrene1,1,2,2 -Tetrachloroe thaneTetrachloroetheneToluene1,1, l -Trichloroethane1,1,2 -TrichloroethaneTrichloroethene
12:37 Date Received..:Analyais Date . . :
RESULTNDNDNDNDNDNDNDNDNDNDNDNDNDNDNDNDNDNDNDNDNDNDNDNDNDNDNDND0.18 JNDND
NDNDNDNDNDNDND
V,7«UAA.VJL
04/16/9704/21/97
REPORTINGLIMIT5.01.01.01.01.01.05.01.01.01.01.01.0l.P1.01.01.01.01.01.01.01.0
1.01.0
1.01.01.0
1.05.02.05.01.0
1.01.01.01.01.01.01.0
UNITSug/Lug/Lug/Lug/Lug/Lug/Lug/Lug/Lug/Lug/Lug/Lug/Lug/Lug/Lug/Lug/Lug/Lug/Lug/Lug/Lug/Lug/Lug/Lug/Lug/Lug/Lug/Lug/Lug/LJ» ™
ug/Lug/L
ug/Lug/Lug/Lug/Lug/Lug/Lug/L
METHODSW846 8260ASW846 8260ASN846 8260ASN846 8260ASN846 8260ASW846 826 OASM846 8260ASW846 8260ASW846 8260ASH846 8260ASW846 8260ASW846 8260ASW846 8260ASW846 8260ASW846 826 OASW846 8260ASW846 8260ASH846 B260ASH846 8260ASH846 826 OASH846 8260ASH846 826 OASH846 8260ASH846 826 OASH846 8260ASN846 8260ASW846 8260ASK846 826 OASW846 8260ASH846 8260ASW846 8260A
SW846 8260ASH846 8260ASW846 8260ASH846 8260ASH846 8260ASW846 8260ASH846 8260A
(Continued on next page)
OOOOO4

Client Staple ID: KW-041597-KD-01
OC/MS Volatile*
I...: A7D170148-001 Work Order i...: C94OX101 Matrix : WATER
REPORTINGPARAMETER RESULT LIMIT UNITS METHODVinyl chlorideXylenes (total)
SURROQATB1, 2-Dichloroethane-d4Toluene-d8Bromofluorobenzene
•one (8) :
HDND
PERCENTRECOVERY101104109
1.0 ug/L1 . 0 ug/L
RECOVERYLIMITS(69 - 127}(90 - 112)(87 - 114)
•I)
SWB46 8260ASW846 826 OA
RcMk it In dun HL.
ooooos

B0VKBS fc ASSOCIATES IVC
Cliant Saaple ID: RW-041597-KD-02
OC/NB Volatile*
• 1/111]
"— I
1,1V
I
\]
TJ
\
\
\
\I
I
1
l4>t-B K)lA • • A7D170148-002**!**• MM Lr V W* • • • ^*»*^A f wJk^O WVA
Date Saapled. ..: 04/15/97 13:07Prep Data : 04/21/97Prep Batch t...: 7111184rrilut-lnfi »»rrl-mr. 1
PARAMETERAcetoneBenzeneTti-nmnrihl r>Y-nm«t-h«n»
BromodichloronethaneBrontofonnBroroomethane2-ButanoneCarbon disulfideCarbon tetrachlorideChlorobenzeneChloroethaneChloroformChlorome thaneDibromochloromethane1 , 2-Dlbromoethane1 , 2 -Di Chlorobenzene1, 3 -Di Chlorobenzene1, 4-Dichlorobenzene1, 1-Dichloroethane1 , 2 -Dichloroethanecis- 1 , 2 -Dichloroethenetrans - 1 , 2 -Dichloroethene1, l- Dichloroethene1, 2-Dichloropropanecis-1, 3-Dichloropropenetrans- 1 , 3 -DichloropropeneEthylbenzene2-HexanoneMethyl ene chloride4 -Methyl - 2 -pentanone1, 2-Dibromo-3-chloro-
propaneStyrene1 , 1 , 2 , 2-TetrachloroethaneTetrachloroetheneToluene1 , 1 , 1-Trichloroe thane1,1, 2 -TrichloroethaneTri chloroe thene
•kxrk n*Hmv *W*i * %«&«AW» V * • • •
Date Aeoalved. . :Analyviji Datei. . :
RESULTMDMDHD .NDNDNDMDNDNDNDNDMDNDNDNDNDNDNDNDNDNDNDNDNDNDMDNDNDNDNDND
NDNDNDNDNDNDND
C94H610104/16/9704/21/97
REPORTINGLIMIT5.01.01.01.01.01.05.01.01.01.01.01.0I/Oi'.b1.01.01.01.01.01.01.01.01.01.01.01.01.05.02.05.01.0
1.01.01.01.01.01.01.0
Matrix
UNITSug/Lug/Lug/L9 *
ug/Lug/Lug/Lug/Lug/Lug/Lug/Lug/Lug/Lug/Lug/Lug/Lug/Lug/Lug/Lug/Lug/Lug/Lug/Lug/Lug/Lug/Lug/Lug/Lug/Lug/Lug/Lug/L
ug/Lug/Lug/Lug/Lug/Lug/Lug/L
: WATER
METHODSN846 B260ASW846 8260ASN846 8260ASN846 8260ASH846 8260ASW846 8260ASH846 8260ASW846 8260ASW846 8260ASW846 8260ASW846 8260ASW846 8260ASH846 8260ASW846 8260ASW846 8260ASW846 8260ASH846 8260ASW846 8260ASH846 8260ASH846 8260ASN846 8260ASW846 8260ASW846 8260ASW846 8260ASW846 8260ASW846 8260ASW846 8260ASW846 8260ASW846 8260ASW846 8260ASW846 8260A
SW846 8260ASW846 8260ASW846 8260ASH846 8260ASH846 8260ASW846 8260ASW846 8260A
(Continued on next page)
OOOOOG
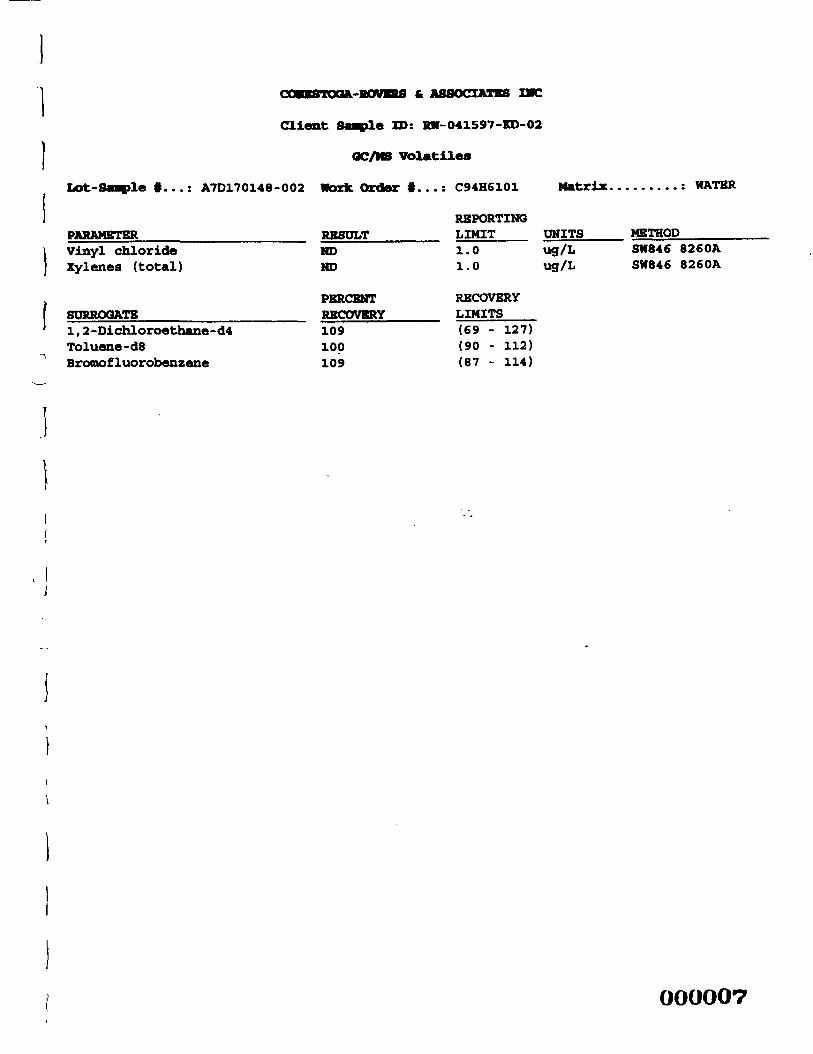
consTOGA-novns t ASSOCIATES arc
Client Suple ID: RN-041597-KD-02
OC/N8 Volatilea
Lot-Staple i...: A7D170148-002 Work Order i...: C94H6101 Matrix.
PARAMETER RESULTVinyl chlorideXylenes (total)
SURROGATE1,2-Dichloroethane-d4Toluene-d8Broraofluorobenzene
MDMD
PERCENTRECOVERY109100109
REPORTINGLIMIT1.01.0
RECOVERYLIMITS(69 - 127)(90 - 112)(87 - 114)
UNITS METHOD
WATER
ug/L SW846 8260Aug/L SH846 826OA
000007
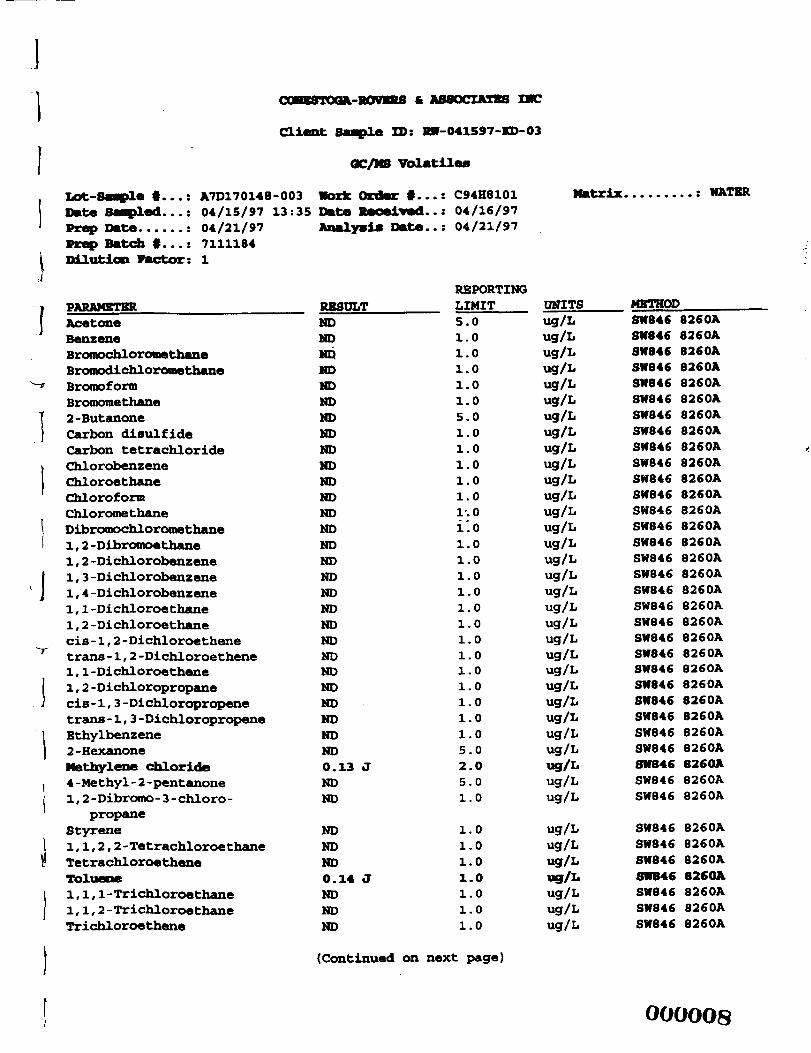
KXK8 IMC
Client Sample ID: KV-041597-KD-03
OC/MS Volatile*
uat-ummpj.9 ». . . : A/UJ./UI*BDate Sallied. . . : 04/15/97Prep Date : 04/21/97Prep Batch i. . . : 7111184Irtllfl '"* Vmi't or • 1
PARAMBTBRAcetoneBenzeneBromochlorome thaneBromodichlorome thaneBromoformBromomethane2-ButanoneCarbon disulfideCarbon tetrachlorideChlorobenzeneChloroethaneChloroformChlorome thaneDibromochlorome thane1 , 2 -Dibromoe thane1 , 2 -Dichlorobenzene1 , 3 -Dichlorobenzene1 , 4 -Dichlorobenzenel, 1-Dichloroethane1 , 2 -Dichloroethanecis-1, 2 -Dichloroethenetrans -1,2 -Dichloroethenel, l -Dichloroethene1 , 2 -Dichloropropanecis-1, 3-Dichloropropenetrans- 1 , 3 -DichloropropeneEthylbenzene2-HexanoneMethylene chloride4 -Methyl - 2 -pentanone1 , 2 - Dibromo - 3 - chloro -
propaneStyrene1,1,2,2 -Tetrachloroe thaneTetrachloroetheneToluene1,1, 1-Trichloroe thane1,1, 2 -TrichloroethaneTrichloroethene
l-UUJ MDXK UKOME *. • • •
13:35 Date Received..:Analyaia Date . . :
RESULTNDNDNDNDNDNDNDNDNDNDNDNDNDNDNDNDNDNDNDNDNDNDNDNDNDNDNDND0.13 JNDND
NDNDND0.14 JNDNDND
\.y aoj.vj.
04/16/9704/21/97
REPORTINGLIMIT5.01.01.01.01.01.05.01.01.01.01.01.0i-.oi'.o1.01.01.01.01.01.01.01.01.01.01.01.01.05.02.05.01.0
1.01.01.01.01.01.01.0
a- B»»* .
UNITSug/Lug/Lug/Lug/Lug/Lug/Lug/Lug/Lug/Lug/Lug/Lug/Lug/Lug/Lug/Lug/Lug/Lug/Lug/Lug/Lug/Lug/Lug/Lug/Lug/Lug/Lug/Lug/Lug/Lug/Lug/L
ug/Lug/Lug/Lug/Lug/Lug/Lug/L
METHODSW846 8260ASW846 8260ASW846 8260ASW846 8260ASW846 8260ASH846 8260ASW846 8260ASW846 8260ASW846 8260ASW846 8260ASH846 8260ASWB46 8260ASW846 8260ASH846 8260ASW846 8260ASH846 8260ASW846 8260ASW846 8260ASW846 6260ASH846 826 OASW846 8260ASN846 8260ASW846 8260ASN846 8260ASW846 8260ASW846 8260ASW846 8260ASW846 8260ASW846 8260ASH846 8260ASW846 8260A
SW846 8260ASW846 8260ASH846 8260ASWB46 82COASW846 8260ASH846 8260ASW846 8260A
(Continued on next page)
OOOOO8

1 l-BOVERS t ASSOCIATES IKC
di«nt flMjllli ID: KN-041597-KD-03
OC/MS Volatilea
•i v M HM PA * U • • • • ** * VA * W A W
PARAMETERVinyl chlorideZylenea (total)
SURROGATE1, 2-Dichloroethane-d4Toluene-d8Bromofluorobenzene
VOTB(S):
RESULTNOND
PERCENTRECOVERY104102108
I • • • W^^£*Q W • •t** fc b *
REPORTINGLIMIT UNITS1 . 0 ug/L1.0 ug/L
RECOVERYLIMITS(69 - 127)(90 - 112)(87 - 114)
METHODSW846 8260ASW846 8260A
rank. Rank h lot ten RU
OOOOO9
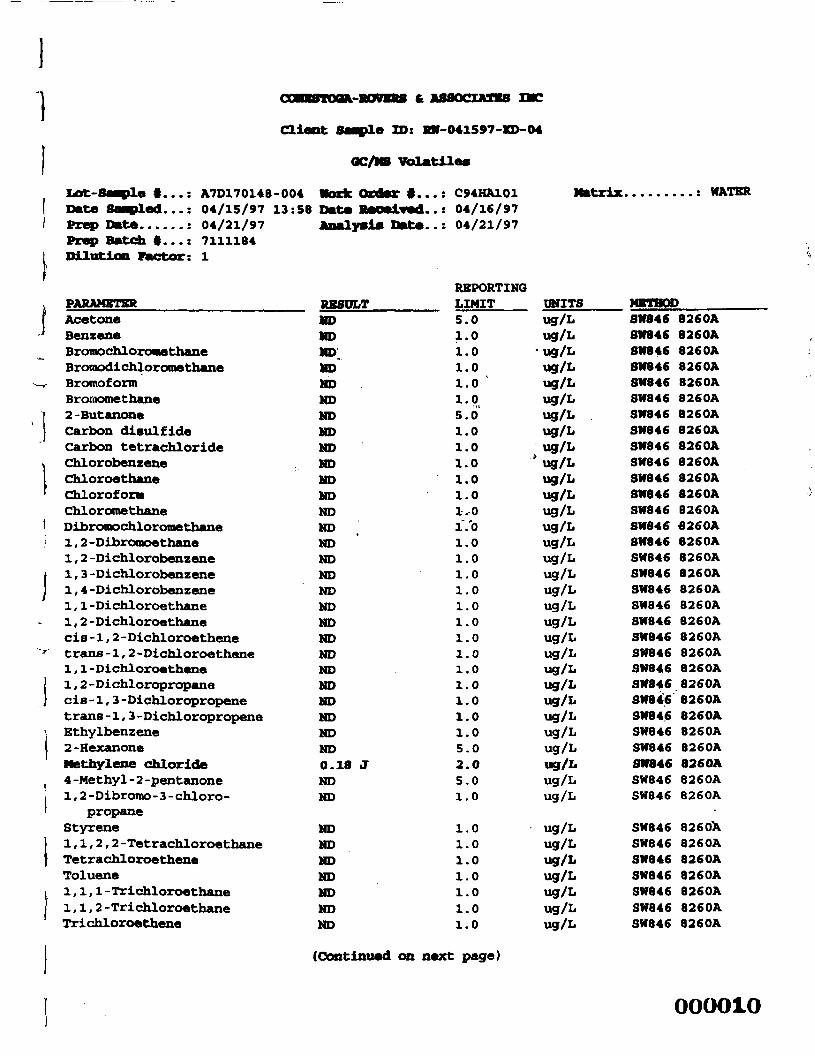
Client Sample ID: BW-041597-XD-04
OC/NB Volatile*
IjOt-Savple §...: A7D170148-004Data Saaplad. ..: 04/15/97 13:58Prep Date : 04/21/97Prep Batch •...: 7111184Pilntrlflt1 Factor- 1
PARAMETERAcetoneBenzeneBromochlorone thaneBroroodichloromethaneBromoformBrornomethane2-ButanoneCarbon disulfideCarbon tetrachlorideChlorobenzeneChloroethaneChlorofomChlorome thaneDibrotnochlorome thane1 , 2 -Dlbromoethane1 , 2 -Dichlorobenzene1 , 3 -Dichlorobenzene1 , 4 -Dichlorobenzene1, 1-Dichloroethane1 , 2 -Dichloroe thanecis - 1 , 2 -Dichloroethenetrans -1,2 -Dichloroethene1, l -Dichloroethene1 , 2 -Dichloropropanecis - 1 , 3 -Dichloropropenetrans -1,3 -DichloropropeneEthylbenzene2-HexanoneNethylene chloride4 -Methyl - 2 -pentanone1 , 2 -Dibrotno-3 -chloro-
propaneStyrene1,1,2,2 -Tet rachloroethaneTetrachloroetheneToluene1,1, 1 -Trichloroethane1,1,2 -TrichloroethaneTr i chloroethene
•ark ftxi^'i' §V WJ»*V %PartWWa» V • • • •
Oat* Raoeived. .;Analyaia Data. . :
RESULTMDMDMD.MD"HDNDMDMDMDMDMDMDMDMDMDMDMDMDMDMDMDMDMDMDMDMDMDMD0.18 JMDMD
MDMDMDMDMDMDMD
C94HA10104/16/9704/21/97
REPORTINGLIMIT5.01.01.01.01.01.05.01.01.01.01.01.01.-0I/O1.01.01.01.01.01.01.01.01.01.01.01.01.05.02.05.01.0
1.01.01.01.01.01.01.0
Matrix
OMITSug/Lug/L•ug/Lugr/Lug/Lug/Lug/Lug/Lug/L
'ug/Lug/Lug/Lug/Lug/Lug/Lug/Lug/Lug/Lug/Lug/Lug/Lug/Lug/Lug/Lug/Lug/Lug/Lug/Lug/Lug/Lug/L
ug/Lug/Lug/Lug/Lug/Lug/Lug/L
: WATER
METHODSH846 8260A8W846 8260ASM846 8260ASW846 8260A8W846 8260ASW846 8260ASM846 8260ASH846 826 OASM846 8260ASW846 8260ASW846 8260A8N846 8260ASW846 B260ASH846 B260ASW846 8260ASW846 8260ASH846 B260ASW846 8260ASH846 8260ASH846 8260A3W846 8260ASW846 8260ASW846 8260ASM846 8260ASH846 8260ASN846 8260ASW846 8260ASW846 8260ASWB46 8260ASW846 8260ASW846 8260A
SH846 8260XSH846 8260ASN846 8260ASW846 8260ASW846 8260ASH846 8260ASW846 8260A
(Continued on next page)
OOOO1O
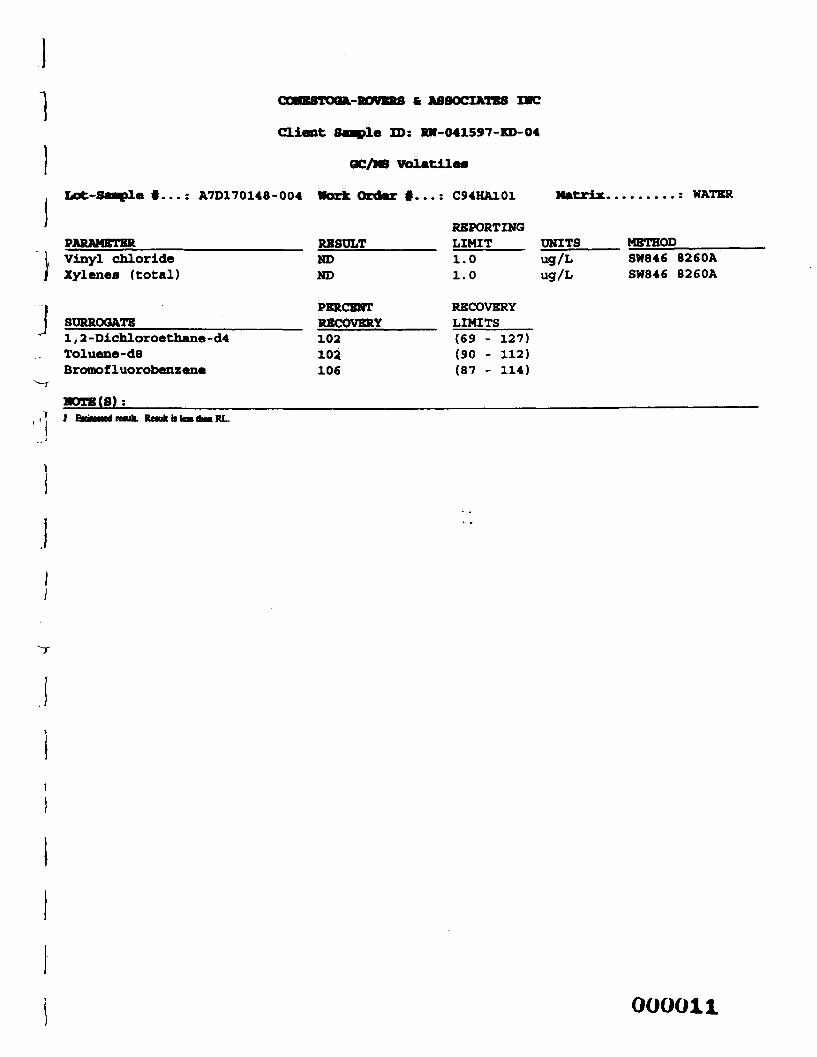
1 COMESTOGUl-ROVKBS & ASSOCIATES IMC
Client Saaple ID: HW-041597-KD-04
OC/MS Volatile*
JPARAMETERVinyl chlorideXylenes (total)
SURROGATE1 , 2 -Dichloroethane-d4Toluene -d8Bromofluorobenzene
BDTB(S) :
RESULTNDND
PERCENTRECOVERY102102106
REPORTINGLIMIT UNITS1 . 0 ug/L1 . 0 ug/L
RECOVERYLIMITS(69 - 127)(90 - 112)(87 - 114)
METHODSW846 8260ASW846 8260A
rank. Rook b lot dm RL.
000011
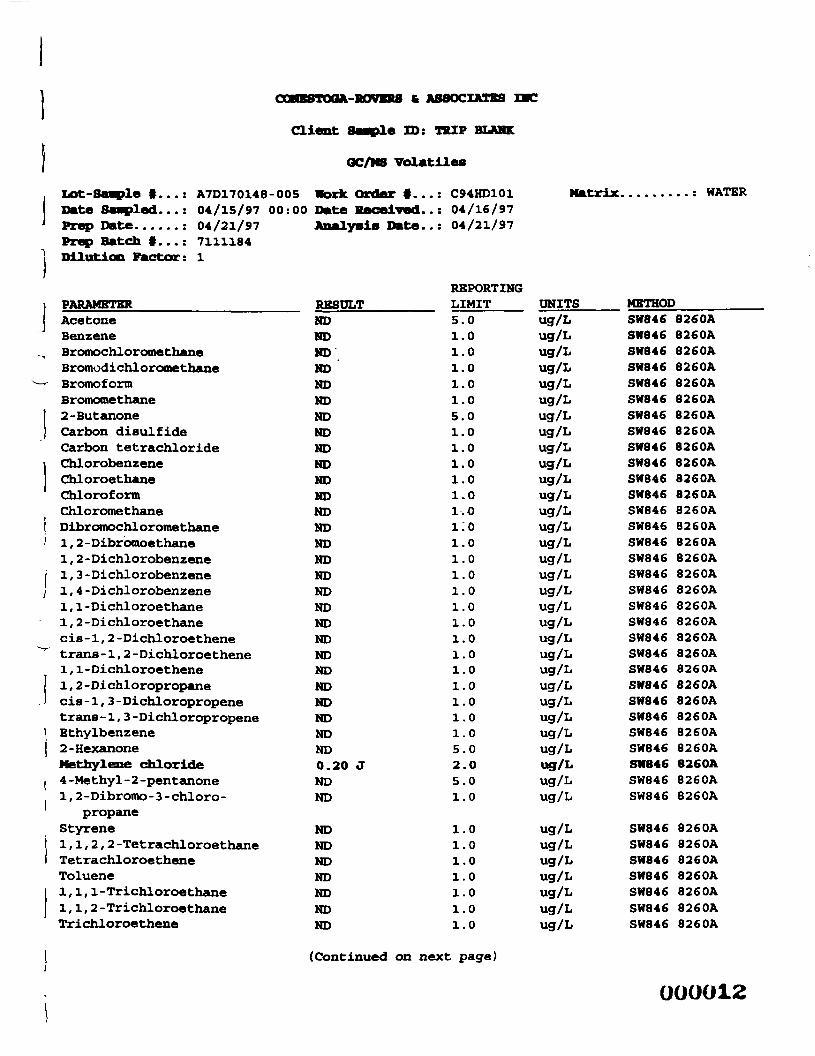
mxuk-Rovns & ASSOCIATES IMC
Client nssple ID: TKZP BLANK
OC/N8 Volatile*
ULJ1. — BWH TAVI «• • • * f\ILSJ. /UJ.*O~UU3
Date Saspled...: 04/15/97 00:00Prep Date : 04/21/97Prep Batch i... : 7111184Dilution Factor: 1
PARAMETERAcetoneBenzeneBromochloromethaneBromodichlorome thaneBromoforroBromomethane2-ButanoneCarbon disulfideCarbon tetrachlorideChlorobenzeneChloroethaneChloroformChlorome thaneDlbromochl orome thane1 , 2 -Dibroraoe thane1, 2-Dichlorobenzene1 , 3 -Di chlorobenzene1 , 4 -Dichlorobenzene1 , 1 -Dichloroe thane1 , 2 -Dichloroethanecis-1, 2-Dichloroethenetrans- 1 , 2 -Dichloroe thene1, l-Dichloroethene1 , 2 -Dichloropropanecis-1, 3-Dichloropropenetrans- 1, 3-DichloropropeneEthylbenzene2-HexanoneNethylene chloride4 -Methyl - 2 -pentanonel,2-Dibromo-3-chloro-
propaneStyrene1,1,2,2 -TetrachloroethaneTetrachloroe theneToluene1,1, 1-Trichloroethane1,1,2 -TrichloroethaneTrichloroe thene
• j&jw vmam. w • • • •
Date Received. . :Analysis Date. . :
RESULTNDNDMDMDMDMDMDNDNDNDNDNDNDNDNDNDNDNDNDNDNDNDNDNDNDMDNDND0.20 JNDND
NDNDNDNDNDNDND
W^^CUS^W J.
04/16/9704/21/97
REPORTINGLIMIT5.01.01.01.01.01.05.01.01.01.01.01.01.0IJO1.01.01.01.01.01.01.01.01.01.01.01.01.05.02.05.01.0
1.01.01.01.01.01.01.0
r m+~ f •* •
UNITSug/Lug/Lug/Lug/Lug/Lug/Lug/Lug/Lug/Lug/Lug/Lug/Lug/Lug/Lug/Lug/Lug/Lug/Lug/Lug/Lug/Lug/Lug/Lug/Lug/Lug/Lug/Lug/Lug/Lug/Lug/L
ug/Lug/Lug/Lug/Lug/Lug/Lug/L
METHODSW846 B260ASN846 8260ASW846 8260ASW846 8260ASH846 8260ASW846 8260ASW846 8260ASW846 8260ASW846 8260ASW846 8260ASW846 8260ASW846 8260ASH846 8260ASH846 8260ASW846 8260ASH846 826 OASW846 8260ASH846 8260ASH846 8260ASH846 8260ASW846 8260ASW846 8260ASW846 8260ASW846 8260ASW846 826 OASH846 8260ASW846 8260ASW846 8260ASW846 8260ASW846 8260ASW846 8260A
SH846 8260ASH846 8260ASW846 8260ASH846 8260ASH846 8260ASW846 8260ASW846 8260A
(Continued on next page)
OOOO12

TOOA-ROVEK8 6 ASSOCIATES IMC
Client Sample ID: TRIP BLAHK
OC/MB Volatilea
j
•M V* « VBM 0A » W • • • • «« » *^A r ifcV V
PARAMETERVinyl chlorideXylenes (total)
SURROGATEl , 2-Dichloroethane-d4Toluene -d8Bromofluorobenzene
BOXB(S) :
RESULTMDMD
PERCENTRECOVERY99105107
REPORTINGLIMIT UNITS1 . 0 ug/L1 . 0 ug/L
RECOVERYLIMITS(69 - 127)(90 - 112)(87 - 114)
METHODSW846 8260ASH846 8260A
nwk. RoukiileMdwiRL.
J
OOOO13
QUALITY CONTROL SECTION
OOOO14
QUALITY CONTROL ELEMENTS OF SW-S46 METHODS^.
Quanterra* Incorporated conducts a quality aawnncc/qnality control (QA/QC) program designed to providescientifically valid and legally defensible data. Toward this end, several types of quality control indicators areincorporated into the QA/QC program. These indicators are introduced into the sample testing process to providea mechanism for the assessment of the analytical data.
PC BATCHEnvironmental samples are taken through the testing process in groups called QUALITY CONTROL BATCHES(QC batches). A QC batch contains up to twenty environmental samples of a similar matrix (water, soil) that areprocessed using the yame reagents and standards. Quanterra requires that each environmental sample beassociated with a QC batch.
Several quality control samples are inctndod in etch QC batch and are processed identically to the twentyenvironmental samples. These QC samples mctode a METHOD BLANK (MB), a LABORATORY COKnROLSAMPLE (LCS) and, where appropriate, a MATRIX SPIKE/MATRIX SPIKE DUPLICATE (MS/MSD) pair or aMATRIX SPIKE/SAMPLE DUPLICATE (MS/DU) pair. If there is insufficient sample to perform an MS/MSD oran MS/DU, then a LABORATORY CONTROL SAMPLE DUPLICATE (LCSD) is included in the QC batch.
LABORATORY CONTROL ffABfflff -*•T I dfonit^Contirc^ Sjmjpl$~«t jf'Qfc maple that to created by adding known coucenlratioos of a mil or partialsetoftargetimarytestoama^'Sta^ The LCS analyterecovery results are used to monitor the analytical process and provide cvklence that the laboratoiy is perfOTmingthe method within acceptabk prildines. Failure to meet the established recovery guidelines requires therepreparation and reanalysis of all samples in the QC batch. The only exception is that if the LCS recoveries arebiased high and the associated sample is ND for the parameter(s) of interest, the batch is acceptable.
At times, a Laboratory Control Sample Duplicate (LCSD) is also included in the QC batch. An LCSD is a QCsample that is created and handled identically to the LCS. Analyte recovery data from the LCSD is assessed in thesame way as that of the LCS. The LCSD recoveries, together with the LCS recoveries, are used to determine thereproducibility (precision) of the analytical system. Precision data are expressed as relative percent differences(RPDs). Failure of the RH>s to fdl within the laboratory-generated acceptan^and reanalysis of all samples in the QC batch. The only exception is that if the MS/MSD RPDs are withinacceptance criteria, the batch is acceptable.
METHOD BLANKThe Method Blank is a QC sample consisting of all the reagents used in amlyzing the emiromncmral sampkscontained in the QC batch. Method Blank results are used to determine if interference or contamination in theanalytical system could lead to the repotting of false positive data or elevated analyte concentrations. All targetanalytes must be below the reporting limits (RL) or the associated sample(s) must be ND except for the commonlaboratory contaminants '"d'Cflfcd below.
Volatile (GC or CC/MS1 SffllfrlrtnUk ffrf7*18* Metals
Methylene chloride Phthalate Esters CopperAcetone Iron2-Butanone Zinc
Lead*
*for analyses run on TJA Trace 1CP or GFAA onfy
The listed volatile and semivolatile compounds may be piesent m concentnnions im to 5 times the reporting limits.The listed metals may be present in mmuertiHtom op to 2 times the reporting limit or must be twenty fold lessthan tiie results of the etrvironmoolal samples. Failure to meet these Method Blank criteria requires therepreparaiion and reanalysis of all samples in the QC batch. oooois
QUALITY CONTROL ELEMENTS OF SW-846 METHODS (cont)
MATRIX SPIK1/MATR1XA Matrix Spike and a Matrix Spike Duplicate are a pair of environmental samples to which known concentrationsof a full or partial set of target anafytes are added. The MS/MSD results are determined in the same manner as theresults of the environmental sample used to prepare the MS/MSD. The analyte recoveries and the relative percentdifferences (RPDs) of the recoveries are ffflntU***1 and used to evaluate the effect of the sample matrix on theanalytical results. When these values fail to meet arogManre criteria, the data is reviewed to determine the cause.If, in the analyst's judgment, sample matrix effects are indicated, no correction action is performed. Otherwise, theMS/MSD and the environmental sample used to prepare them are reprepared and reanalyzed
For certain methods, a Matrix Spike/Sample Duplicate (MS/DU) may be included in the QC batch in place of theMS/MSD. For the parameters (i.e. pH, ignitabiltty) where it is not possible to prepare a spiked sample, a SampleDuplicate may be included in the QC batch.
SURROGATE COMPOUNDSIn addition to these batch-related QC indicators, each organic environmental and QC sample are spiked withsurrogate compounds. Surrogates are organic chrmk^'p that behave similarly to the analytes of interest and thatare rarely present in the environment Surrogate recoveries are used to monitor the individual performance of asample in the analytical system.
The acceptance criteria do not apply to samples that are diluted If the dilution is more than 5X, the recoveries willbe reported as diluted out All other surrogate recoveries will be reported If the LCS.LCSD, or the Method Blanksurrogates fail to meet recovery criteria (except for dilutions), the entire batch of samples is reprepared andreanalyzed.
If the surrogate recoveries are biased high in the LCS, LCSD, or the Method Blank and the associated sample(s)are ND, the batch is acceptable. If the surrogate recoveries are outside criteria for environmental or MS/MSDsamples, the batch may be acceptable based on the analyst's judgment that sample matrix effects are indicated.
For the GC/MS BNA methods, the surrogate criteria is that two of the three surrogates for each fraction must meetacceptance criteria. The third surrogate must have a recovery of ten percent or greater.
For the Pesticide/PCB, PAH, TPH, and Herbicide methods, the surrogate criteria is that one of two surrogatecompounds meet acceptance criteria.
OOOO16
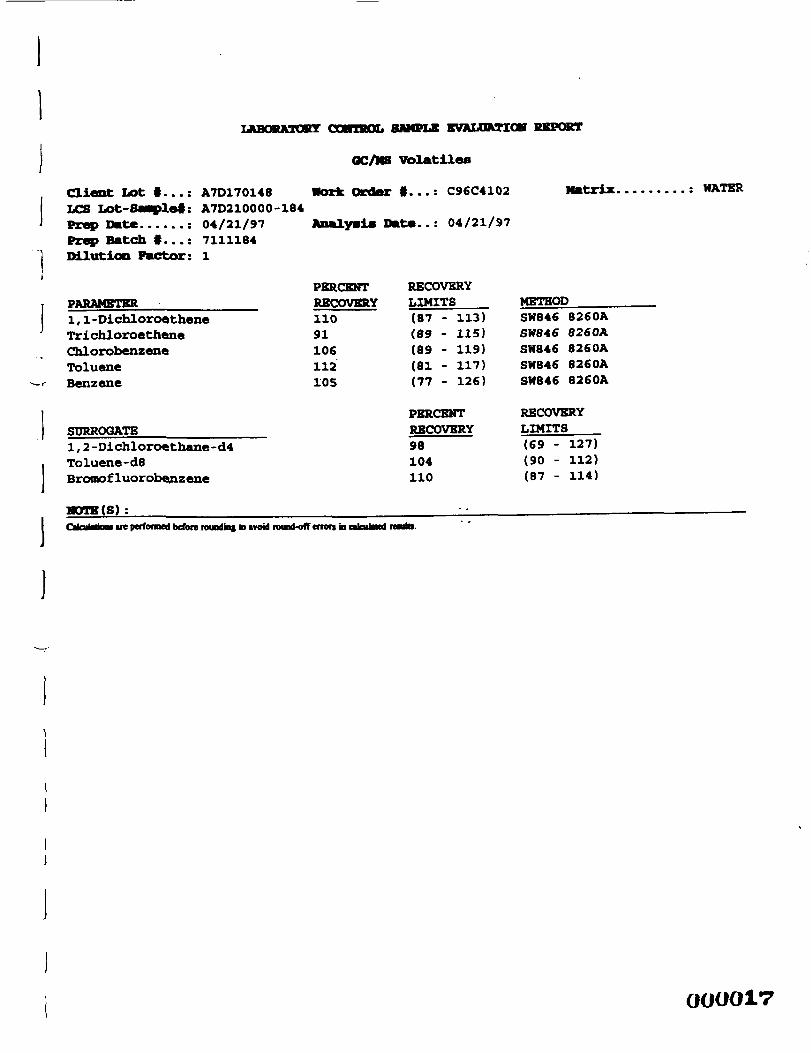
LABOSATOBY CPJJTOCT. SAMPLE EVALUATION KSPQRT
OC/NS Volatilea
Client Lot §...: A7D170148LCS Lot-Saaplef: A7D210000-184Prep Date : 04/21/97Prep Batch §...: 7111184Dilution Factor: 1
Work Order i...
Analysis Date..
: C96C4102
: 04/21/97
Matrix. HATER
PARAMETERl , 1 -DichloroetheneTrichloroethoneChlorobenzenctTolueneBenzene
SURROGATE1 , 2 -Dichloroethane-d4Toluene-daBromofluorobenzene
MOTR(S) :
PERCENTRECOVERY11091106112105
RECOVERYLIMITS(87 - 113)(89 - 115)(89 - 119)(81 - 117)(77 - 126)
PERCENTRECOVERY98104110
METHODSW846 8260ASW846 826 OASN846 8260ASH846 8260ASW846 8260A
RECOVERYLIMITS(69 - 127)(90 - 112)(87 - 114)
rumiMhm. ire pafmmej before rouodint to ivotd round-off erron in cikutolrrt raata.
OOOO17
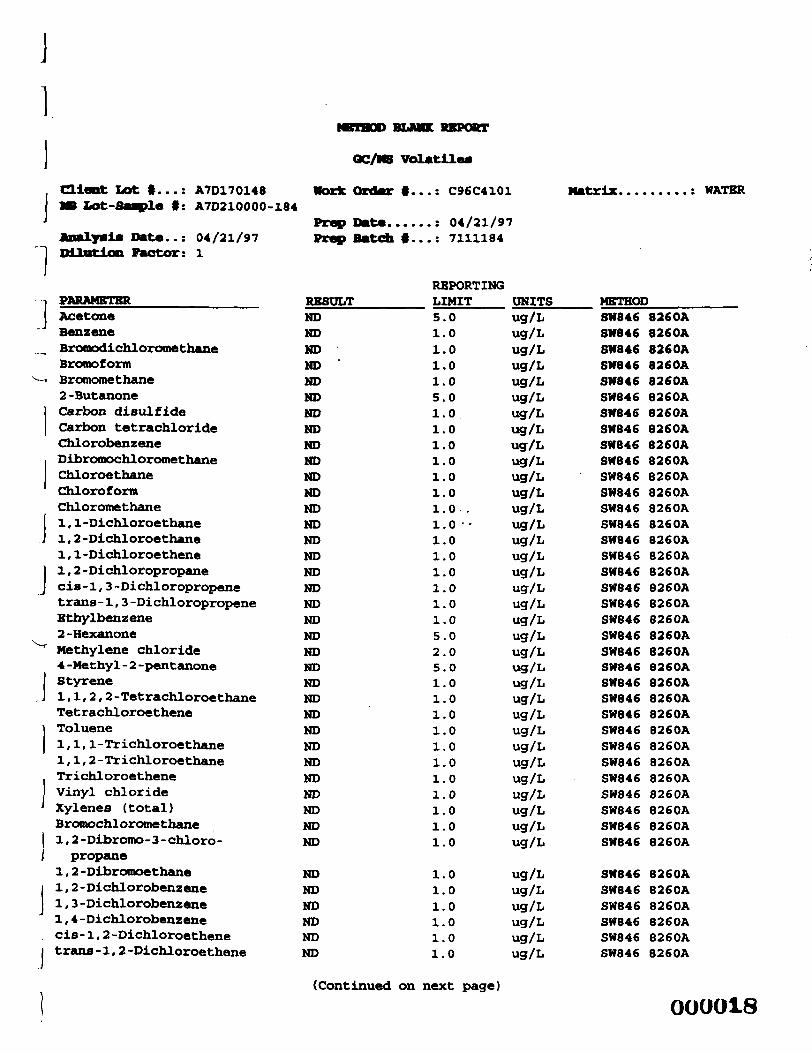
OC/MS Volatile
1Client Lot f...: A7D170148im Lot-Saqple f: A7D210000-184
Work Ordnr f. C96C4101 Matrix : WATER
Analysis Date..: 04/21/97fyHm^-lon Vmr -rvr-' 1
PARAMETERAcetoneBenzeneBromodichlorome thaneBromoformBromomethane2-ButanoneCarbon disulfideCarbon tetrachlorideChlorobenzeneDibromochloromethaneChloroethaneChloroformChlorotne thane1, 1-Dichloroe thane1 , 2 -Dichloroe thane1 , 1 -Dichloroe thene1 , 2-Dichloropropanecis - 1 , 3 -Di chl oropropenetrans- 1, 3-DichloropropeneBthylbenzene2-HexanoneMethylene chloride4 -Methyl - 2 -pentanoneStyrene1,1,2, 2 -TetrachloroethaneTetrachloroetheneToluene1,1, 1-Trichloroe thane1 , 1, 2-Trichloroe thaneTrichloroe theneVinyl chlorideXylenes (total)Bromochlorome thane1 , 2 -Dibromo-3 -chloro-propane
1 , 2 -Dibromoethane1 , 2 -Dichlorobenzene1 , 3 -Dichlorobenzenel , 4 -Dichlorobenzenecis-l, 2-Dichloroethenetrans -1,2 -Dichloroethene
Prep DatePrep Batch
RESULTNDNDHDNDNDNDNDNDNDNDNDNDNDNDNDNDNDNDNDNDNDNDNDNDNDNDNDNDNDNDNDNDNDND
NDNDNDNDNDND
: 04/21/9'f...: 7111184
REPORTINGLIMIT5.01.01.01.01.05.01.01.01.01.01.01.01.0 .i.o -•1.01.01.01.01.01.05.02.05.01.01.01.01.01.01.01.01.01.01.01.0
1.01.01.01.01.01.0
7
UNITSug/Lug/Lug/Lug/Lug/Lug/Lug/Lug/Lug/Lug/Lug/Lug/Lug/Lug/Lug/Lug/Lug/Lug/Lug/Lug/Lug/Lug/Lug/Lug/Lug/Lug/Lug/Lug/Lug/Lug/Lug/Lug/Lug/Lug/L
ug/Lug/Lug/Lug/Lug/Lug/L
METHODSW846 8260ASM846 826 OASW846 8260ASW846 8260ASW846 8260ASW846 8260ASK846 8260ASH846 8260ASW846 8260ASW846 8260ASH846 B260ASW846 8260ASW846 8260ASW846 8260ASW846 8260ASW846 8260ASW846 8260ASW846 8260ASW846 8260ASW846 8260ASW846 8260ASW846 8260ASW846 8260ASW846 8260ASH846 8260ASH846 8260ASW846 8260ASW846 8260ASH846 8260ASH846 8260ASW846 8260ASW846 8260ASW846 8260ASW846 8260A
SH846 8260ASH846 8260ASW846 8260ASW846 8260ASW846 8260ASW846 8260A
(Continued on next page)
000018
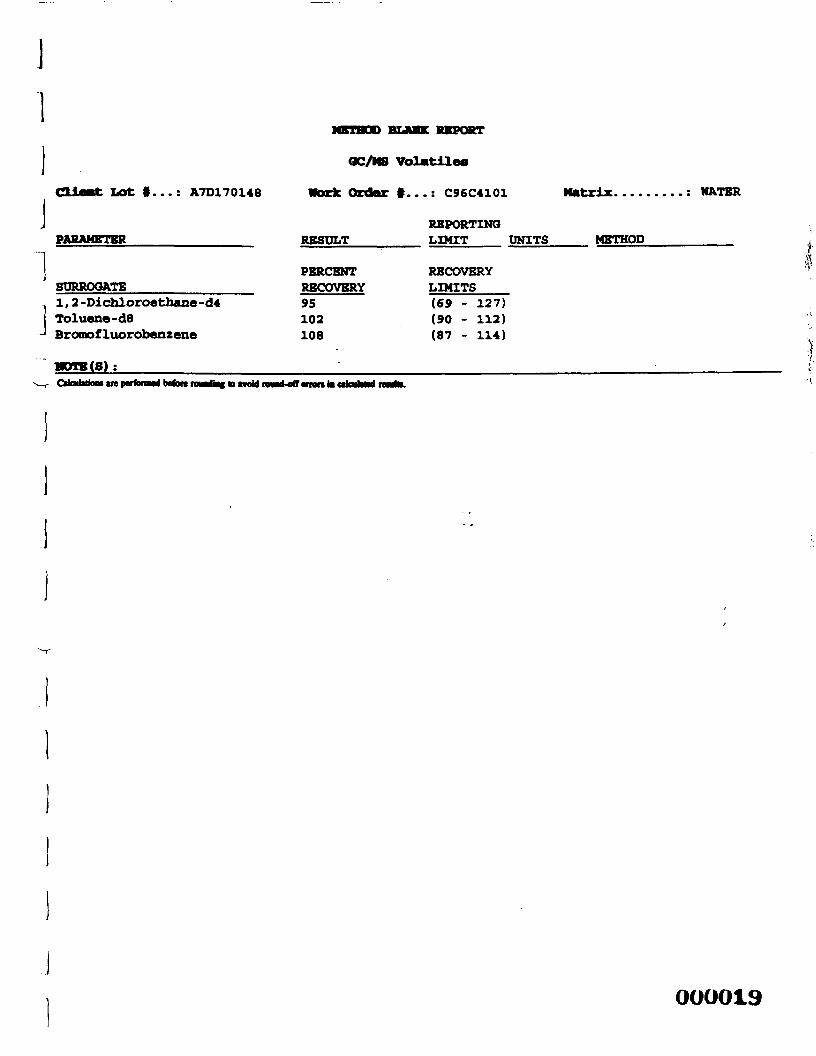
1
MKTHUU BLMHE HRPQRT
OC/NS Volatiles
Client Lot §...: A7D170148 Work Order f...: C96C4101 Matrix : WATER
REPORTINGPARAMETER RESULT LIMIT UNITS METHOD =
PKRCBNT RECOVERY ''V
SURROGATE RECOVERY LIMITSl,2-Dichloroethane-d4 95 (69 - 127)Toluene-d8 102 (90 - 112)Bromofluorobenzene 108 (87 - 114)
Cilabdaoi are perfbrac* befon modi* M tvoU i
000019
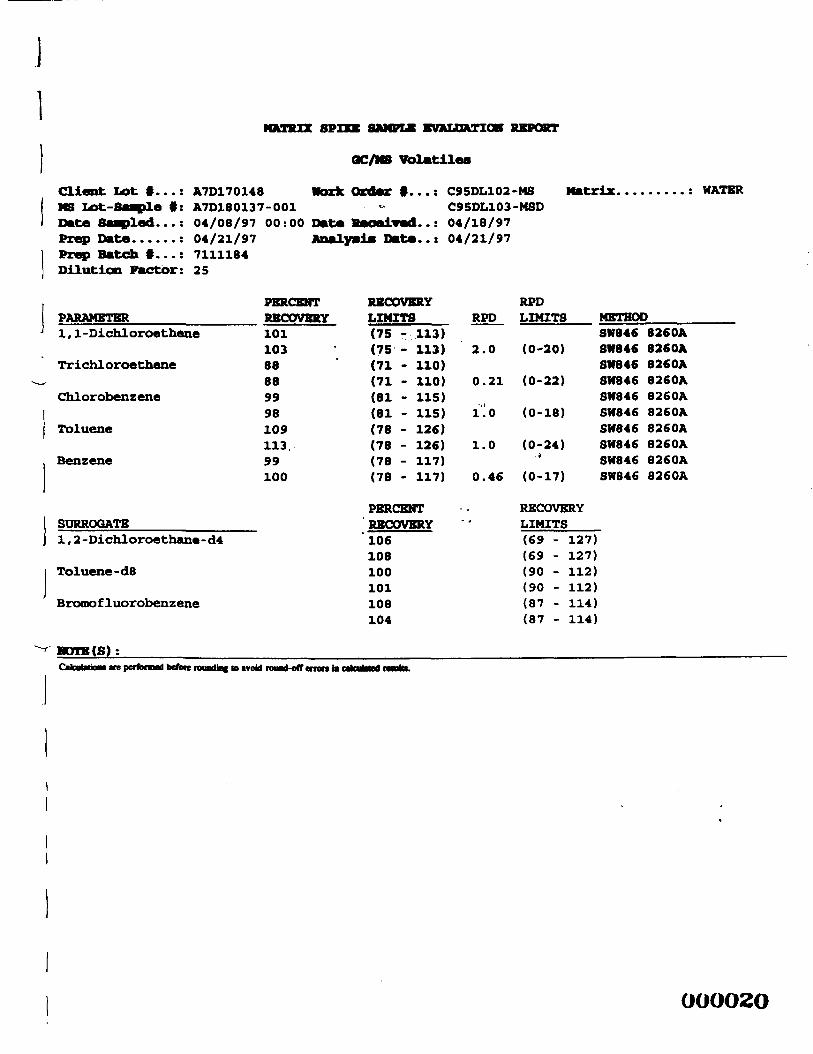
MATRIX 8P SAMPLE EVALOATIGRT REPORT
OC/NB Volatile*
Client Lot §...:MS Lot-Saaple f:Date Sampled...:Prep Date :Prep Batch i...:
A7D170148A7D180137-00104/08/97 00:0004/21/977111184
Work Order §. . ,
Date Received.Analyaia Date.,
C95DL102-MSC95DL103-MSD04/18/9704/21/97
Matrix. HATER
Dilution Factor: 25
FBfcOKfcrrPARAMETER RECOVERY1 , l -Dichloroethene 101
103Trichloroethene 88
88Chlorobenzene 99
Toluene
Benzene
98109113.99100
SURROGATE1 , 2-Dichloroethane-d4
Toluene -d8
Bromofluorobenzene
HDTB(S):CftfcUblMMM IK
RECOVERYLIMITS RPD(75 - 113)(75 - 113) 2.0(71 - 110)(71 - 110) 0.21(81 - 115)(81 - 115) l'!o(78 - 126)(78 - 126) 1.0(78 - 117)(78 - 117) 0.46
PERCENTRECOVERY106108100101108104
RPDLIMITS METHOD
SW846 826 OA(0-20) SW846 826 OA
SW846 8260A(0-22) SW846 8260A
SW846 8260A(0-18) SW846 8260A
SW846 8260A(0-24) SH846 8260A
•' SW846 8260A(0-17) SN846 8260A
RECOVERYLIMITS(69 - 127)(69 - 127)(90 - 112)(90 - 112)(87 - 114)(87 - 114)
performed before roundlnc to avoid rouad-off erran ta cakulMad footo.
OOOO2O
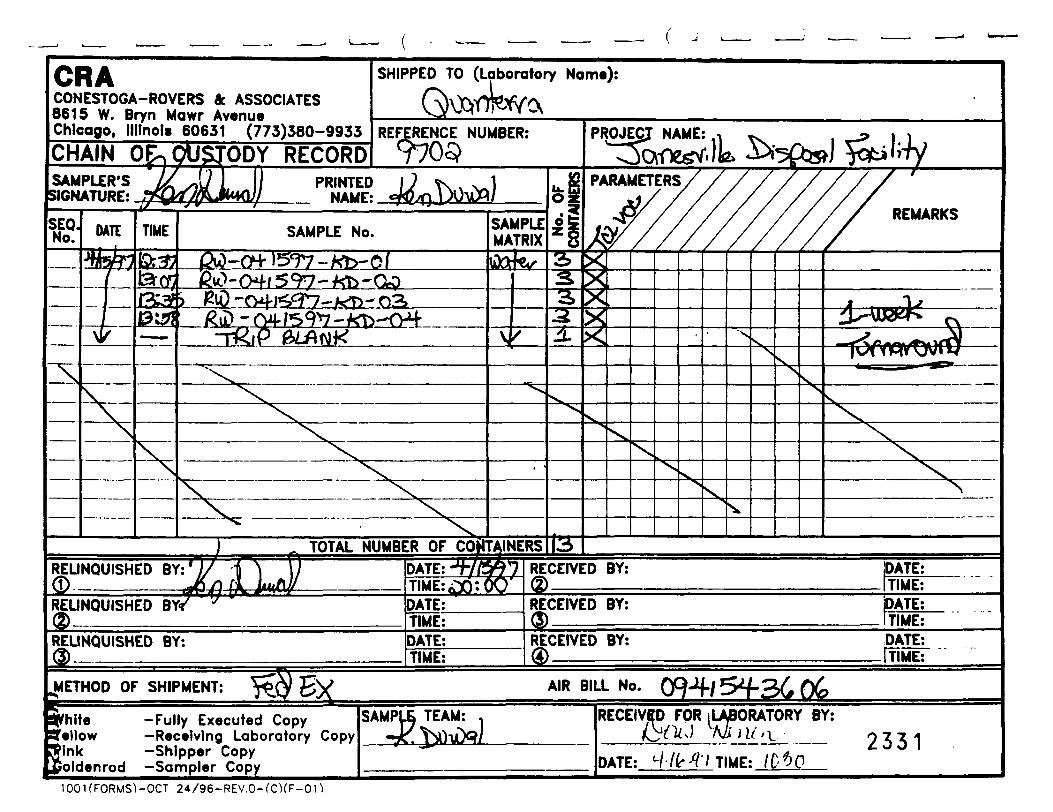
CRACONESTOGA-ROVERS & ASSOCIATES8615 W. Bryn Mawr AvenueChicago, Illinois 60631 (773)380-9933
CHAIN Ofo CUSTODY RECORD
SHIPPED TO (Laboratory Name):
REFERENCE NUMBER:
9703SAMPLER'SSIGNATURE:
PRINTEDNAUE:
SEQ.No. DATE TIME SAMPLE No. SAMPLE
MATRIX
OF
REMARKS
- ><T> - 03,
JKL\XX
'N
X.
TOTAL NUMBER OF CONTAINERS
RELINQUISHED ATE:TIME: 0
RECEIVED BY: ATE:TIME:
RELINQUISHED BY ATE:TIME:
RECEIVED BY:®
ATE:TIME:
REUNQUISHED BY: ATE: RECEIVED BY:TIME:
DATE:ftlME:
METHOD OF SHIPMENT: AIR BILL No.
hite -Fully Executed Copyellow —Receiving Laboratory Copy
Mnk -Shipper Copyoldenrod -Sampler Copy
RECEIVED FOR t LABORATORY BY:
— 2331DATE:
100KFORMS1-OCT 24/96-REV.O-fCKF-On
1
1
APPENDIX B
SUMMARY OF COMPLIANCE MONITORINGDATA EXCEEDING NR140 STANDARDS
J
]
T
]
J
J
OTB(l)
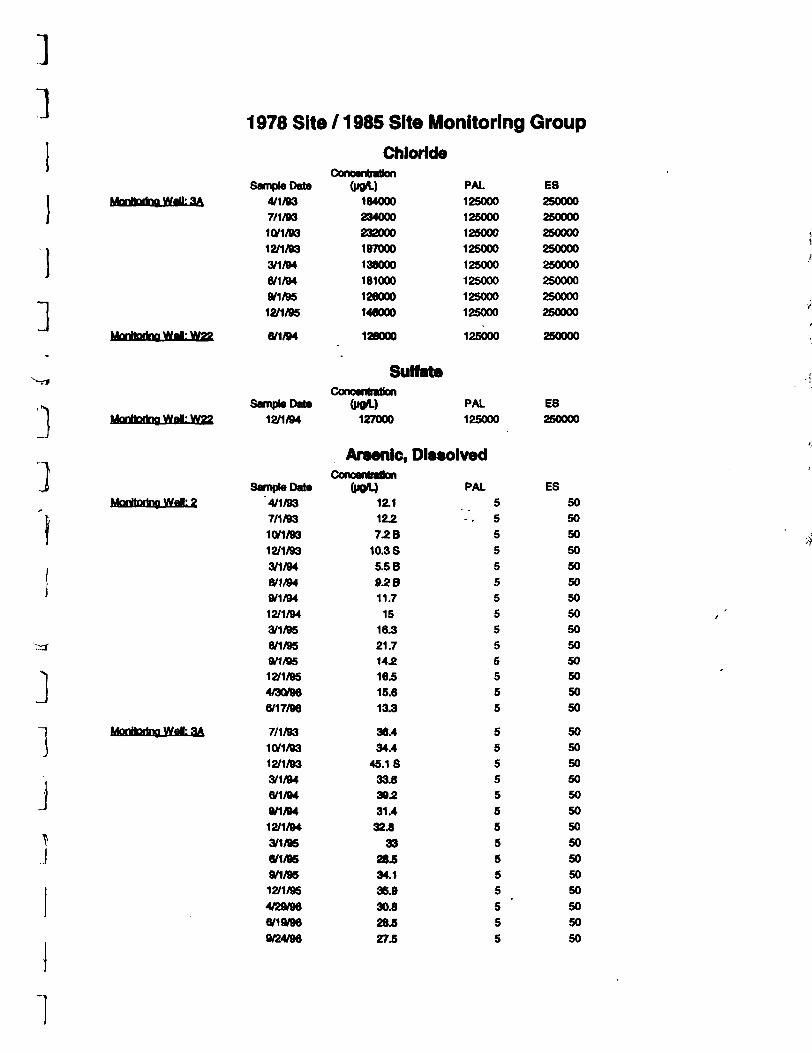
3
1
Monitoring Wai: W22
Morttorina Wai: 2
1J
Monitoring Wall: 3A
1978 Site /1985 Site Monitoring Group
Sample DataHA»dtortng Wdl: 3A 4/1/93
7/1/93
10/1/93
12/1/93
3/1/94
6/1/94
9/1/95
12/1/95
1 Inniaviilii in lif !•• tftfrin rt ft ki iManning WM: W22 ft/i/ni
Chloride
184000
234000
232000
197000
138000
181000
126000
146000
4*^MWW\126000
PAL
125000
125000
125000
125000
125000
125000
125000
125000
4 oe/ww%125000
ES
250000
250000
250000
250000
250000
250000
250000
250000
<^C/VW\250000
Sulfate
Sample Date12/1/94
Concentration(pgrt.)
127000
PAL
125000
Arsenic, Dissolved
ES250000
uSample Data
4/1/937/1/93
10/1/93
12/1/93
3/1/94
6/1/94
9/1/94
12/1/94
3/1/95
6/1/959/1/95
12/1/95
4/30/96
6/17/96
7/1/93
10/1/93
12/1/93
3/1/94
6/1/94
9/1/94
12/1/94
3/1/95
6/1/95
9/1/95
12/1/95
4/29/966/19/96
9/24/96
"o^r"12.1122
72 B10.3 S5.5 B9.2811.715
16.321.7142163
15.613.3
36.434.4
45.1 S33.8392
31.432.8
33
2&S34.136.930.8284
274
PAL
5'-'. 5
5
5
5
S
5
5
5
55
5
5
5
5
5
5
5
5
5
5
5
5
5
5
5
5
5
ES
50
50
50
50
50
50
50
50
50
5050
50
50
50
50
50
50
50
50
50
50
50
50
50
50
50
50
50
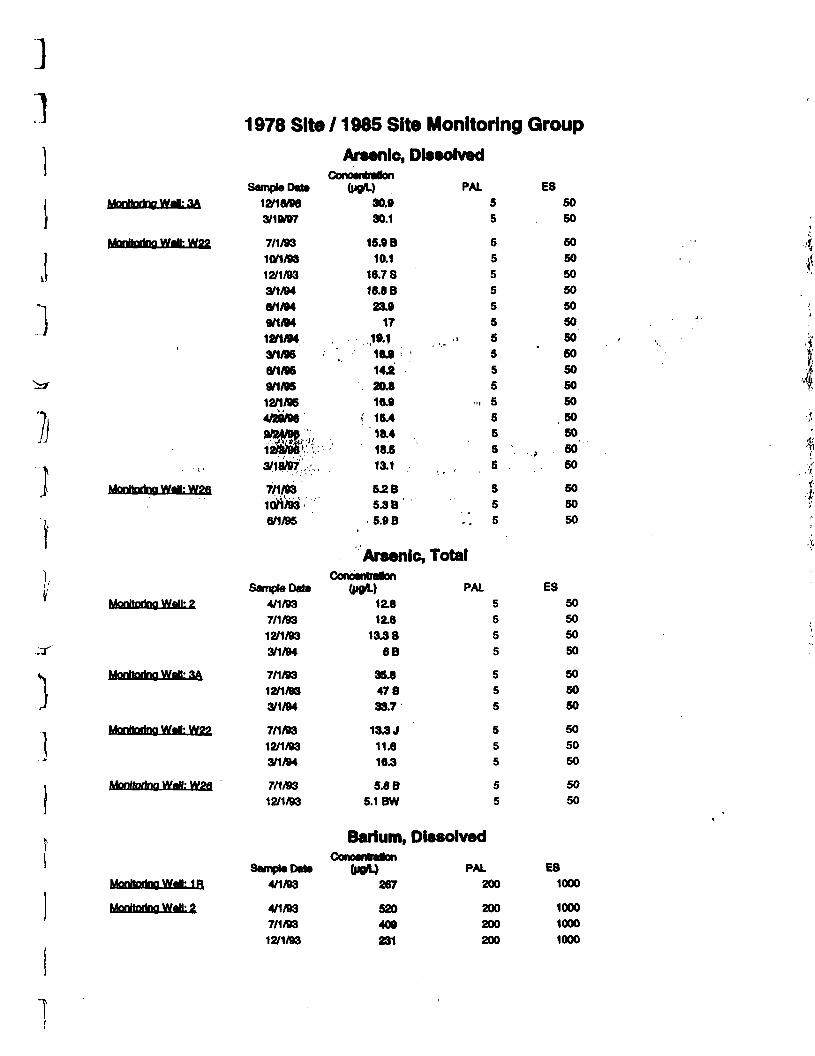
]
)j
Monitoring Wai; W3«
)1
MonttofkM Walk 2
Monitoring Wrf! 3A
Monitoring Wai: W99
Monitoring Wdt: WPfi
Monitoring WiJI: 1B
Monitoring Wall: 2
1978 Site / 1985 Site Monitoring Group
Arsenic, Dissolved
Sample Date
12/18/983/19/97
7/1/93
10/1/93
12/1/933/1/946/1/94
9/1/94
12/1/94
3/1/98
8/1/959^/95
12/1/96
4/29/96
SSfe3/18/97,', ,
7/1/93ION/93
6/1/95
uonoenranon(not)
30.930.1
15.9 B10.1
16.7 S18.8B23.9
17
.,1*116J14*20.816.9
( 15.4
18.513.1
5.2 B5.3 B5.9B
PAL55
5555555
> ' ' 555
„ S5585
55
-'. 5
Arsenic, Total
Sample Date4/1/93
7/1/93
12/1/93
3/1/94
7/1/9312/1/93
3/1/94
7/1/93
12/1/933/1/94
7/1/93
12/1/93
Sample Data4/1/93
4/1/937/1/93
12/1/93
(pgfl.)1Z812.6
13J86B
35.847833.7
13.3 J11.6165
SM B5.1 BW
Barium,couoenuaBuii
267
520409231
PAL5555
555
555
55
Dissolved
PAL200
200200200
E855
5555555555S5585
555
SO50
50505050505050SO5050SO50SO
-, W50
505050
ES5555
555
555
55
50505050
505050
505050
5050
E81000
100010001000
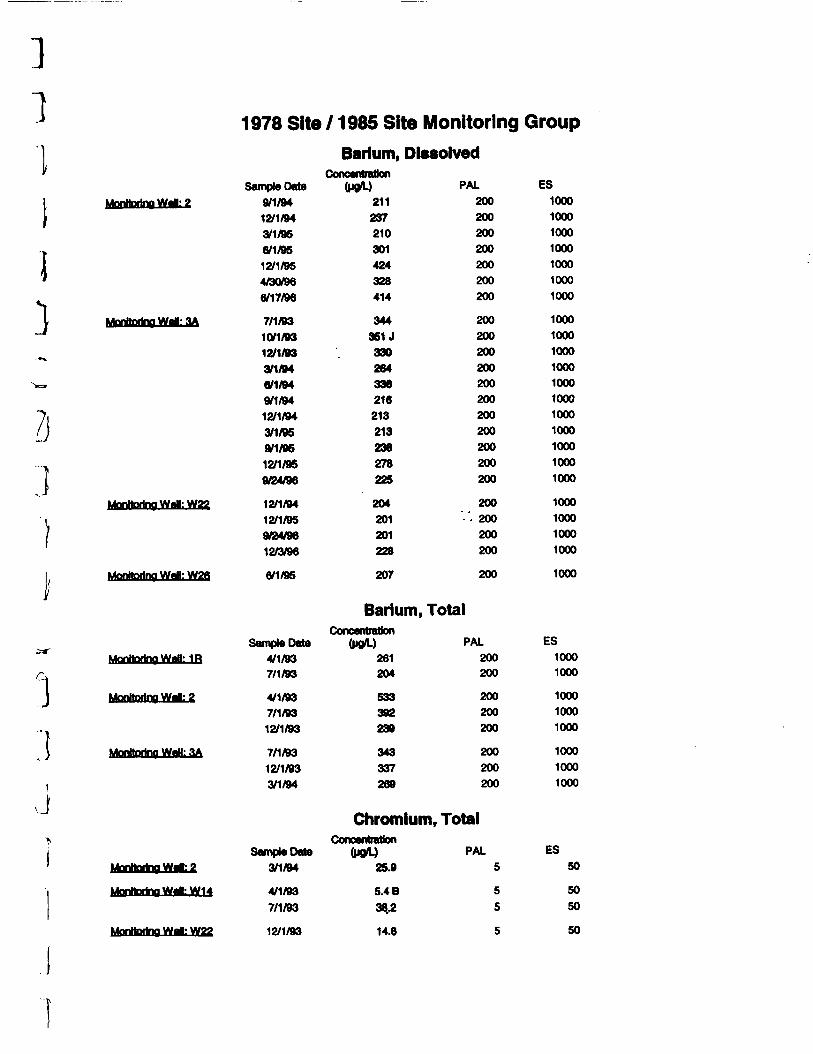
Monitoring WdL 2
Monitoring Wai: 3A
1}
Monitoring Wai: W22
Mentoring Wdl: W2B
Monitoring Wall: 1R
Monitoring Wat: 2
Monitoring WaH: 3A
Monitoring Wa
Monitorin Wai: W14
Monitorina Wai: W22
1978 Site /1985 Site Monitoring Group
Barium, Dissolved
Sample Date
9/1/94
12/1/94
3/1/95
6/1/95
12/1/95
4/30/96
6/17/96
7/1/93
10/1/93
12/1/93
3/1/94
6/1/94
9/1/94
12/1/94
3/1/95
9/1/95
12/1/95
9/24/96
12/1/94
12/1/95
9/24/96
12/3/96
(M0A.)211237210301424328414
344361 J
330284336216213213238278225
204201201228
PAL200200200200200200200
200200200200200200200200200200200
200"-'- 200
200200
ES1000
1000
1000
1000
1000
1000
1000
1000
1000
1000
1000
1000
1000
1000
1000
1000
1000
1000
1000
1000
1000
1000
6/1/95 207 200 1000
Barium, Totaluo
Sample Date
4/1/93
7/1/93
4/1/93
7/1/93
12/1/93
7/1/93
12/1/93
3/1/94
iicaiiuiiuuii(|IQ/L)
281204
533392239
343337269
PAL200200
200200200
200200200
ES10001000
1000
10001000
1000
1000
1000
Chromium, Totalix]
Sample Date
3/1/94
4/1/93
7/1/93
12/1/93
IIUMMUIuli(pg/L)
25.9
5.4 B
38.2
14.6
PAL5
5
5
5
ES50
50
50
50
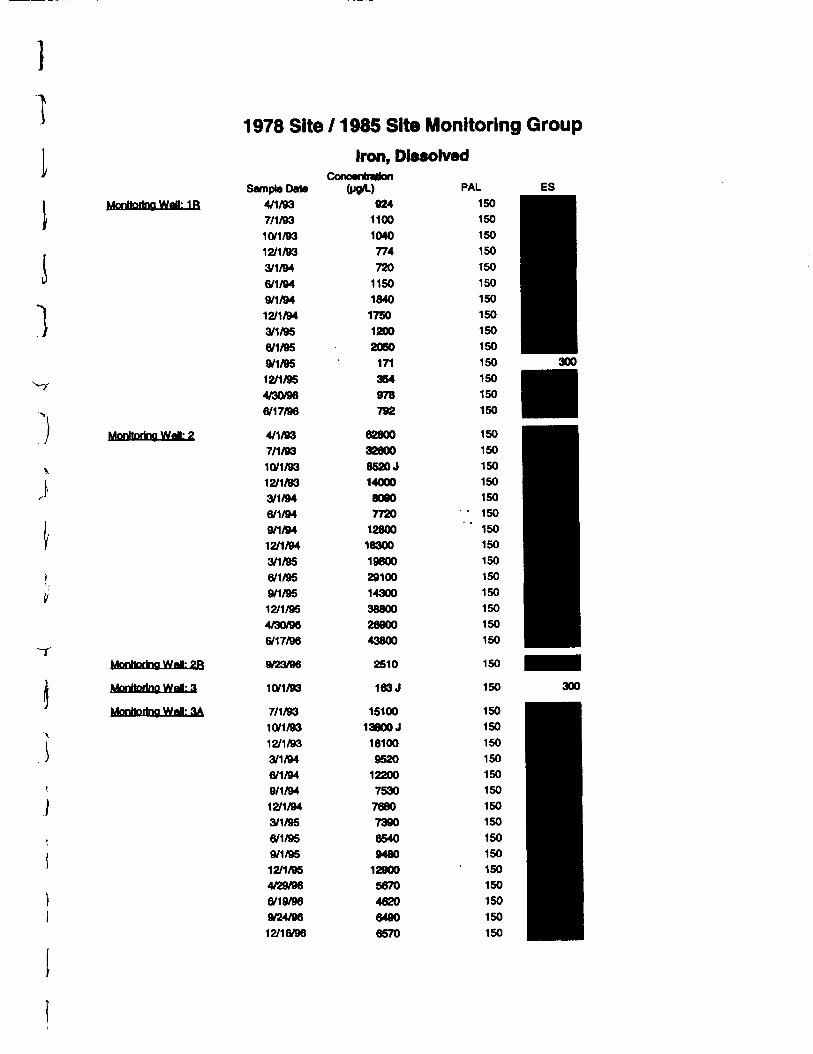
1978 Site /1985 Site Monitoring Group
Monitoring Watt: 1R
Monitoring Wai: 2
Monitoring Wai: 2R
Monitoring Wrfl: 3
Monitoring Wall: 1A
Sample Data
4/1/937/1/93
10/1/93
12/1/93
3/1/94
6/1/949/1/94
12/1/94
3/1/956/1/95
9/1/95
12/1/954/30/96
6/17/96
4/1/937/1/93KYI/93
12/1/933/1/946/1/949/1/94
12/1/94
3/1/956/1/95
9/1/9512/1/95
4/30/966/17/96
9/23/96
10/1/93
7/1/93
10/1/9312/1/93
3/1/946/1/949/1/94
12/1/94
3/1/95
6/1/959/1/9512/1/954/29/966/19/969/24/9612/16/96
Iron, Dissolveduonceouauon
(pg/L) PAL9241100104077472011501840175012002050171354978792
62800326008520 J14000809077201280018300198002910014300388002690043800
2510
163 J
1510013800J1610095201220075307680739065409480129005670462064906570
150150150150150150150150150150150150150150
150150150150150150150150150150150150150150
150
150
150150150150150150150150150150150150150150150
300
300
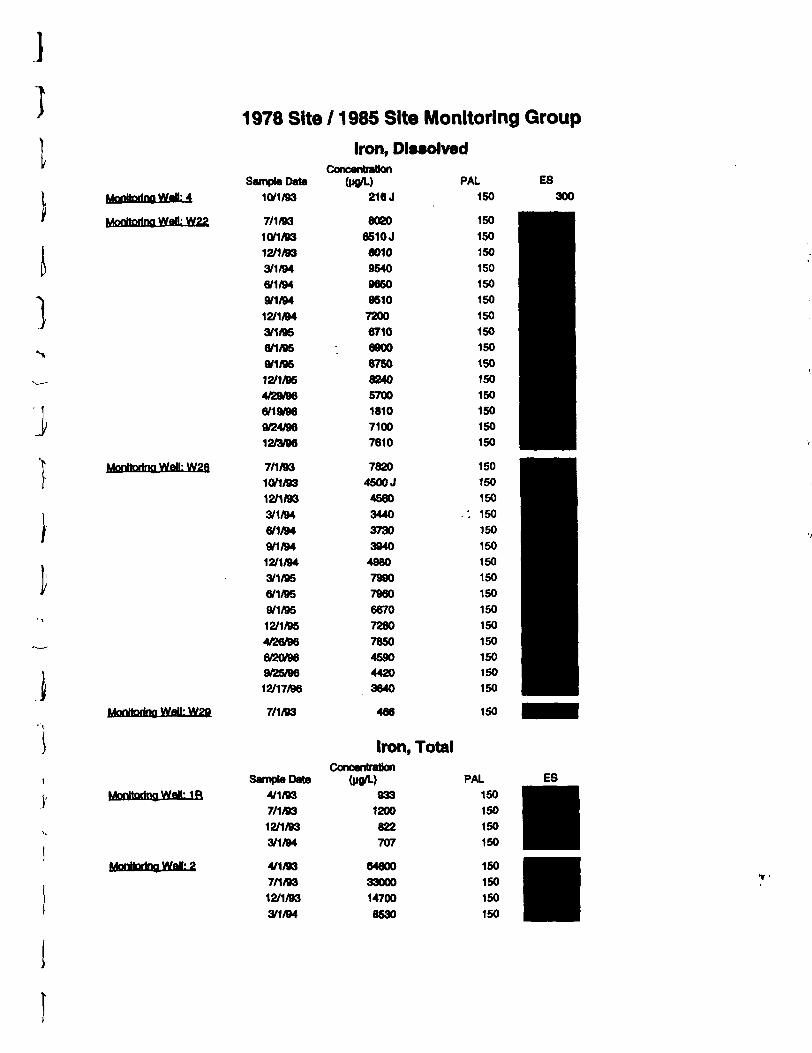
I
Monitoring Wall: W22
Morttorino Wall: W26
1978 Site /1985 Site Monitoring Group
UonHorifM Walt: W2fl
Sample Data
10/1/93
7/1/93
10/1/9312/1/93
3/1/94
6/1/94
9/1/94
12/1/94
3/1/96
6/1/95
9/1/95
12/1/95
4/29/966/19/969/24/9612/3/96
7/1/93
10/1/93
12/1/93
3/1/94
6/1/94
9/1/94
12/1/94
3/1/95
6/1/959/1/95
12/1/95
4/26/966/20/969/25/9612/17/96
7/1/93
Iron, DissolvedConcentration
(PPA)216 J
80206510 J6010954096509510720067106900875082405700181071007610
78204500 J4560344037303940498079907960667072807850459044203640
466
PAL150
ES
300
150
Iron, Total
Monitoring Wall: 1R
MonftDrina Wftfl: 2
Sample Date
4/1/93
7/1/93
12/1/933/1/94
4/1/93
7/1/93
12/1/93
3/1/94
9331200822707
6460033000147008530
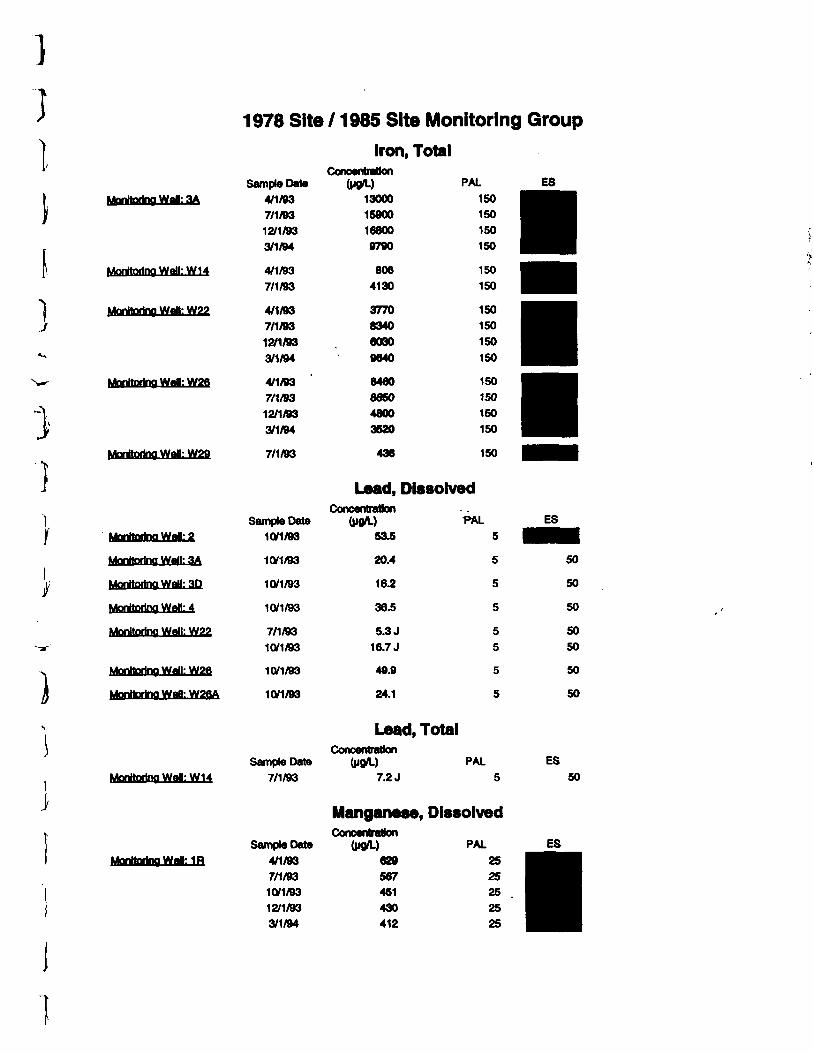
1
1
)
ai: 3A
MoritodnoWall: W14
Monitoring WeB: W22
Moritorina Wai: W26
Mentoring WaB: W29
Mtrttarino Wall: 2
Monitoring Wall: 3A
Monitoring Wall: 3D
Monttorina Wall: 4
Monitoring Wall: W22
Mentoring WaH: W26
Mentoring WaB: W2BA
Montorino Wai: W14
1978 Site /1985 Site Monitoring Group
Iron, Total
Sample Data
4/1/937/1/9312/1/933/1/94
4/1/93
7/1/93
4/1/937/1/9312/1/93
3/1/94
4/1/93
7/1/9312/1/93
3/1/94
7/1/93
(xnominaon(raft.)
130001590016800
9790
806
4130
37708340
6030
9640
8480
66504800
3520
436
PAL
150
150
150
150
150
150
150
150
150
150
150
150
150
150
150
Lead, Dissolved
Sample Date10/1/93
10/1/93
10/1/93
10/1/93
7/1/93
10/1/93
10/1/93
10/1/93
Sample Date
7/1/93
(PDA-)53.5
20.4
16.2
36.5
5.3 J
16.7 J
49.9
24.1
Lead, Totalcut MM ui auon
7.2 J
1»AL
5
5
5
5
5
5
5
5
PAL
5
Manganese, Dissolved
Sample Date
4/1/93
7/1/9310/1/93
12/1/933/1/94
Concentration(raft.)
629
567451
430
412
PAL
25
2525
25
25
ES
50
50
50
5050
50
50
ES
50
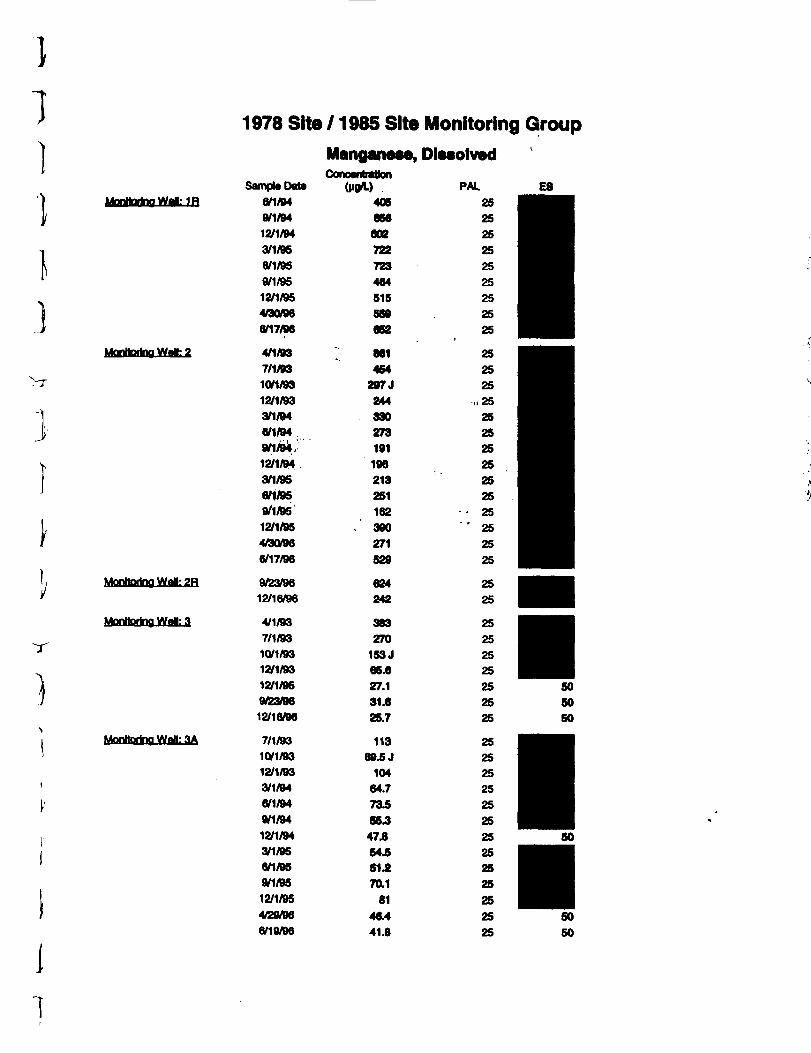
11
1
Monltorina Wrf- 2
Monitoring Wai: 2R
Morttorino Wall: 3
Monitoring Wall: 3A
I
1978 Site /1985 Site Monitoring Group
Sample Data
8/1/949/1/94
12/1/94
8/1/95
a/1/9512/1/95
4/30/986/17/96
4/1/93
7/1/93
10/1/93
12/1/933/1/94
6/1/949/1/94
12/1/94
an/959/1/95
12/1/95
4/30/96
6/17/98
9/23/96
12/16/96
4/1/93
7/1/93
10/1/9312/1/93
12/1/95
9/23/98
12/16/98
7/1/93
10/1/93
12/1/933/1/94
6/1/94
9/1/94
12/1/94
3/1/95
6/1/95
9/1/95
12/1/95
4/29/96
6/19/96
Manganese, DissolvedConcentration
(MSA) PAL408656602722723464515569652
861464297J244330273191196213251162390271529
624242
383270153 J66.627.131.625.7
11389.5 J10464.771556.347.864451.270.181
46.441.8
60
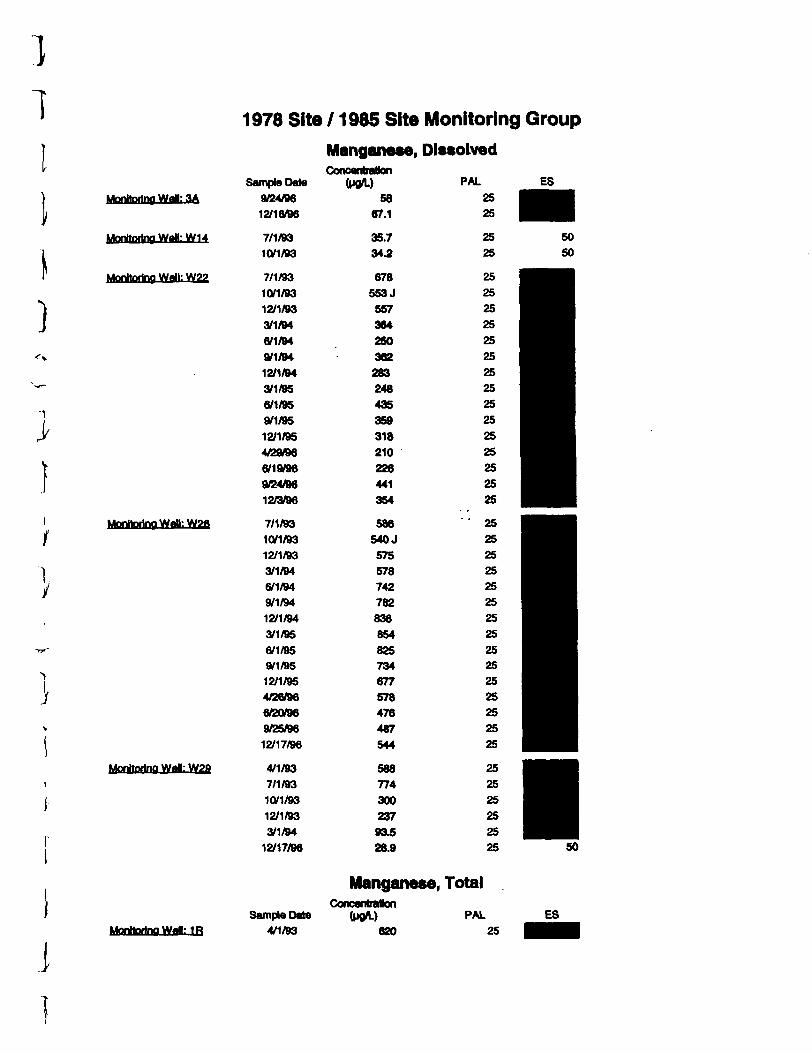
1
MnnJtailnn Wall: 3A
Monitoring WaH: W14
Monitoring Wall: W22
Morttorinn WaU: W2B
Monttorino Wall: Wgfl
1978 Site /1985 Site Monitoring Group
Manganese, DissolvedConcentration
Sample Data (pg/L) PAL
9/24/96 SB 2512/16/96 67.1 25
7/1/93 35.7 2510/1/93 34.2 25
7/1/93 678 2510/1/93 553 J 2512/1/93 557 253/1/94 364 256/1/94 250 259/1/94 362 2512/1/94 283 253/1/95 248 256/1/95 435 259/1/95 359 2512/1/95 318 254/29/96 210 256/19/96 226 259124/96 441 2512/3/96 354 25
7/1/93 586 '2510/1/93 540 J 2512/1/93 575 253/1/94 578 256/1/94 742 259/1/94 782 2512/1/94 836 253/1/95 854 256/1/95 825 259/1/95 734 2512/1/95 677 254/26/96 578 256/20/96 476 259/25/96 487 2512/17/96 544 25
4/1/93 588 257/1/93 774 2510/1/93 300 2512/1/93 237 253/1/94 9O5 25
12/17/96 28.9 25 50
MontodnaYValLlRSample Date
4/1/93
Manganese, TotalConcentration
PAL
620 25
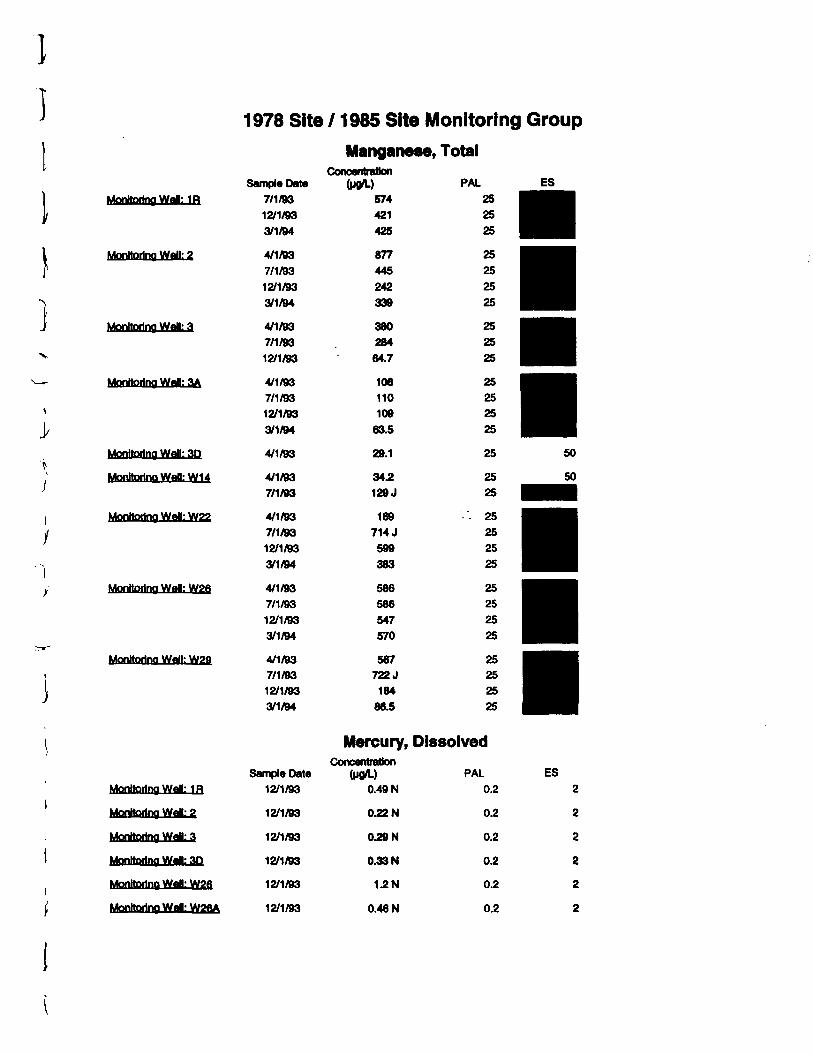
]I
Monitoring Wai-. 1R
Monitoring Wall: 2
Monitoring Wai: 3
Monitoring Wall: SA
Monitoring Wall: 3D
Monitoring Wan: W14
Monitoring Well: W22
Monitoring Wall: Wgfi
Monitoring Wall: W3fl
Monitoring Wall: 1R
Monitoring Wai: %
Monitoring Wai: q
Monitoring Wai: 3Q
Monitoring Wai: Wgfi
Monitoring Wai: W36A
1978 Site /1985 Site Monitoring Group
Sample Data
7/1/93
12/1/93
3/1/94
4/1/93
7/1/93
12/1/93
3/1/94
4/1/93
7/1/93
12/1/93
4/1/93
7/1/93
12/1/93
3/1/94
4/1/93
Manganese, TotalConcentration
PAL574421425
877445242339
38028464.7
10611010963.5
29.1
4/1/93
7/1/93
4/1/93
7/1/93
12/1/93
3/1/94
4/1/93
7/1/93
12/1/93
3/1/94
4/1/93
7/1/93
12/1/93
3/1/94
342
129J
169
714 J
599
383
586
586
547
570
567
722J184
86.5
252525
25252525
252525
25252525
25
2525
25252525
25252525
25252525
Mercury, DissolvedConcentration
Sample Date (pg/L) PAL12/1/93
12/1/93
12/1/93
12/1/93
12/1/93
12/1/93
0.49 N
022 N
029 N
0.33 N
12N
0.46 N
ES
0.2
02
0.2
02
0.2
0.2
2
2
2
2
2
2
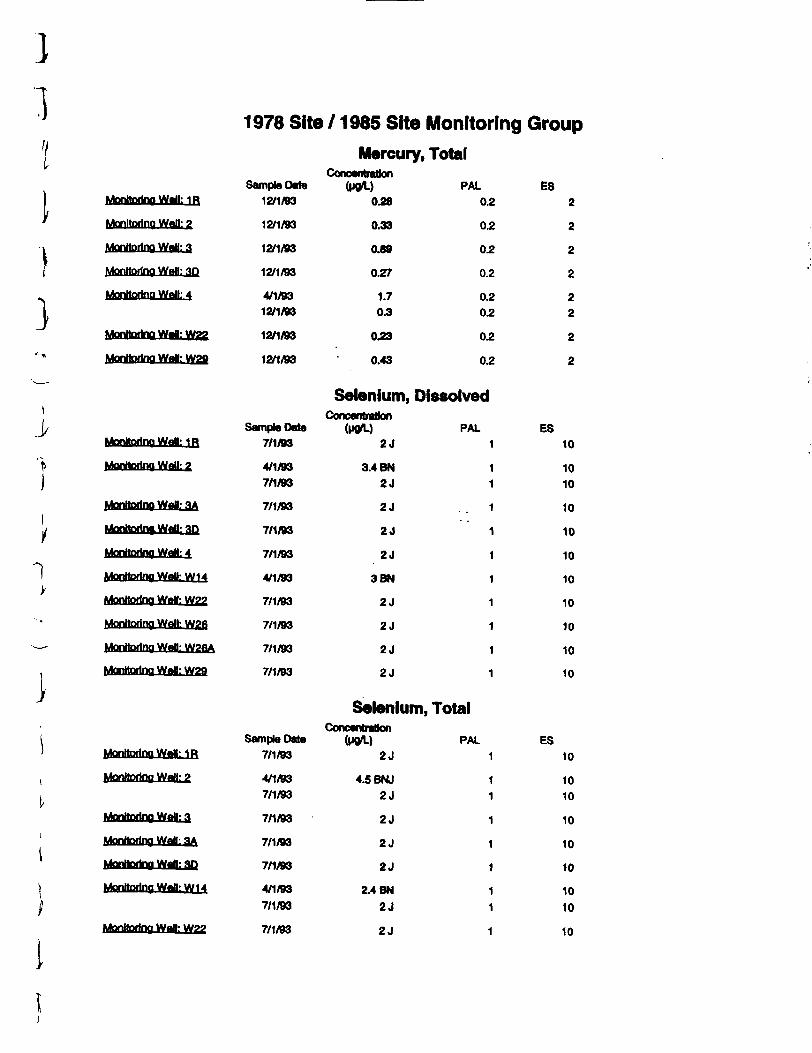
1 1978 Site /1985 Site Monitoring Group
Mercury, Total
I
Monitoring Wall: 1R
Monitoring Wall: 3
Monitoring Wall: 3
Monitoring Wefl: 3D
Monitoring Wall; 4
Monitoring Wafl: Wgg
Monitoring Wall: Wgft
Monitoring Wai: 1 R
Mentoring Wall: 2
Monitoring Wafl- a^
MonitorineWall-aj}
Monitoring WaH: 4
Monitoring Wall: W1A
Monitoring Wall; Wgg
Monitoring Wall: W9B
Mentoring Wad: WgBA
Monttorino Wall: Wgfl
Monitoring We*: 1R
Monltorinq Wall; g
Monitoring WaU: a
Monitoring Wall; flA,
MonHorina WaH: aq
Monitoring Wall: W1A
Monitoring Wall: Wgg
Sample Data12/1/93
12/1/93
12/1/93
12/1/93
4/1/9312/1/93
12/1/93
12/1/93
Sample Data7/1/93
4/1/937/1/93
7/1/93
7/1/93
7/1/93
4/1/93
7/1/93
7/1/93
7/1/93
7/1/93
Sample Data7/1/93
4/1/937/1/93
7/1/93
7/1/93
7/1/93
4/1/93
7/1/93
7/1/93
vsoncanmmon(MO*.)
028
0.33
0.89
0.27
1.70.3
023
0.43
PAL0.2
02
02
0.2
0.2
02
02
Selenium, DissolvedConcentration
(Mfl/L) PAL2J 1
3.4 BN2J
2J
2J
2J
3BN
2J
2J
2J
2J
Selenium,
2J
4.5 BNJ2J
2J
2J
2J
2J
2J
11
1
1
1
1
1
1
1
1
Total
PAL1
11
1
1
1
11
1
E82
2
2
2
22
2
2
ES10
1010
10
10
10
10
10
10
10
10
ES10
1010
10
10
10
1010
10
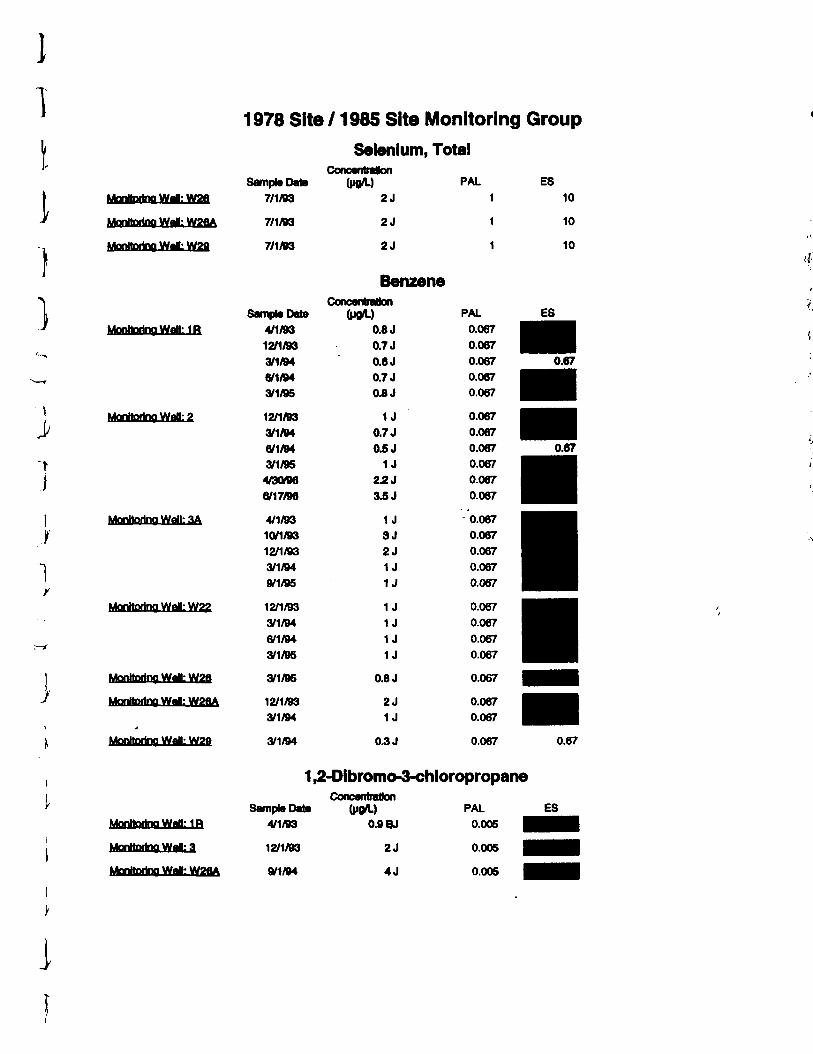
11II Monitoring Wdl: W2fl
Mentoring Wa»: W2flA
: W2fl
MQnttQdraiWeJMR
Monitoring Wrf: 2
Monitoring Wall: 3A
1
\
Monitoring Wall: W22
Monitoring Wdl:Wg8
Monltoilnq W«l: WgflA
^
MonHorino Wai: W2B
MonttoilnQWril: 1R
1978 Site /1985 Site Monitoring Group
Selenium, Total
ES
Morttorina Wai; WgftA
Sample Data
7/1/93
7/1/93
7/1/93
Sample Date
4/1/93
12/1/93
3/1/946/1/94
3/1/95
12/1/933/1/94
6/1/943/1/95
4/30/96
6717/96
4/1/9310/1/93
12/1/933/1/94
9/1/95
12/1/933/1/94
6/1/94
3/1/95
3/1/95
12/1/933/1/94
3/1/94
^ j
Sample Date4/1/93
12/1/93
9/1/94
2J
2J
2J
Benzene
(WD0.8 J0.7 J0.6 J0.7 J0.8 J
U
0.7 J0.5 JU
22 J3.5 J
U
3J
2J
U
U
1 JU
U
U
0.8 J
2JU
0.3 J
2-Dibromo-3-chloiConcentration
(raft.)0.9 BJ
2J
4J
PAL
1
1
1
PAL
0.067
0.067
0.0670.0670.087
0.0670.067
0.087
0.0670.087
0.067
0.067
0.067
0.067
0.0670.067
0.067
0.067
0.0670.067
0.067
0.0670.067
0.067
•oprop
PAL
0.005
0.005
0.005
10
10
10
0.67
0.67
0.67
\
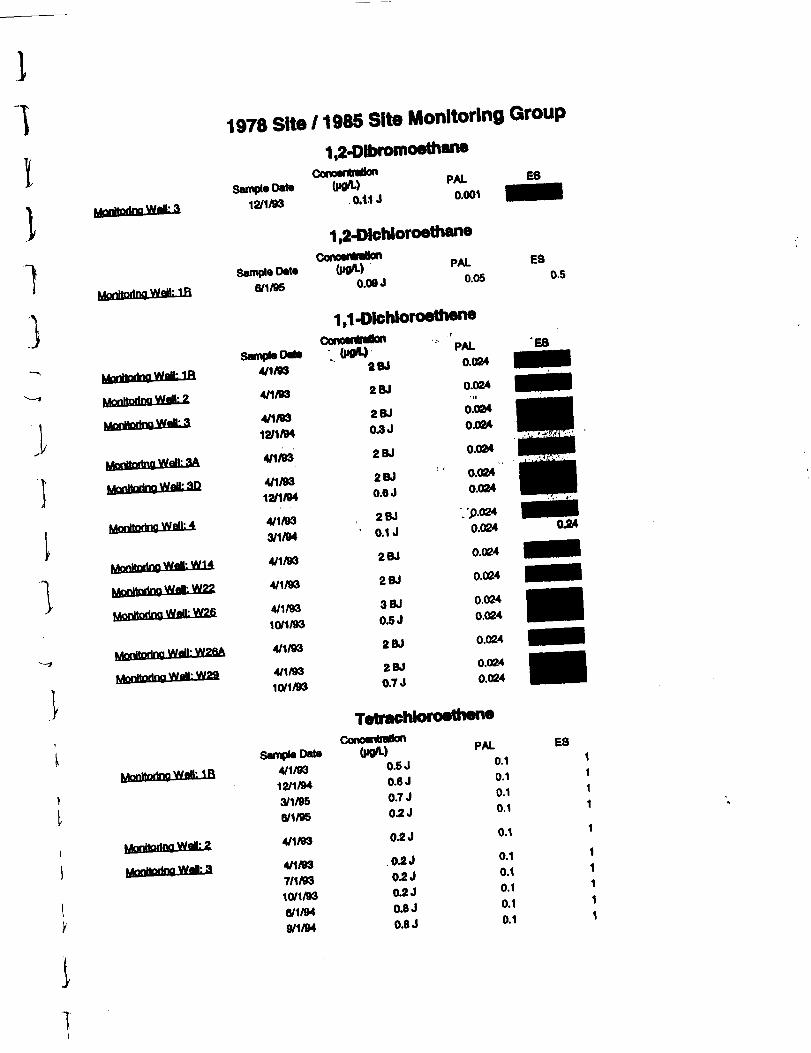
11I113
1978 Site / 1988 Site Monitoring Group
Mtmltm'"?™8":
MnnHmlmiWa":aA
Storing Wall: 3D
\
1,2-Dltanino«ttwiM
MnnHnrtngWrtMR
1
Sample Date12/1/93
Sample Date6/1/95
Concentration/L)0.11J 0.001
1,2-Dlchloroethane
Con(M0A.)
0.09 J
PAL ES
1,1-Dlchloroethene
npmwM _ MI4/1/93
4/1/93
4/1/9312/1/94
4/1/93
4/1/8312/1/94
4/1/933/1/94
4/1/93
4/1/93
4/1/9310/1/93
2BJ
A B_|ZBJ
2BJ0.3 J
2BJ
2BJ0.6 J
2BJ' 0.1 J
2BJ
2BJ
3BJ0.5 J
0.024
0.024•It
0.0240.024
0.024
0.0240.024
.'P-0240.024
0.024
0.024
0.0240.024
4/1/93
4/1/9310/1/93
4/1/93
4/1/937/1/9310/1/936/1/949/1/94
2BJ
2BJ0.7 J
0.024
0.0240.024
Tetrachtoroethene
0.2 J
0.8 J
0.8 J
0.1
0.1
0.1
0.1
0.1
0.1
0.5
054
COSample Date
4/1/9312/1/943/1/956/1/95
(M0rt->0.5 J0.6 J0.7 JA 4 102 J
PAL0.10.10.10.1
E8111
1
11111
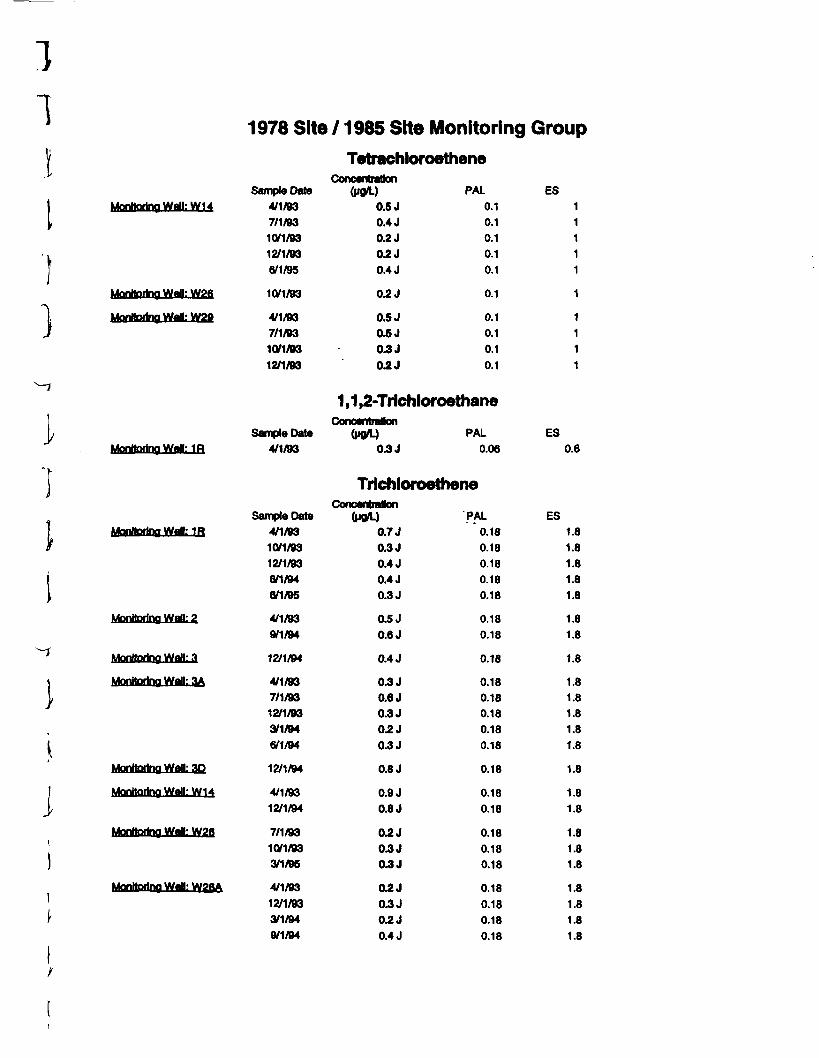
111I
Monitoring Wai: 1R
Monitoring Wai: 1R
\
Monitoring Wall: 2
Monitoring Wall: a
Monitoring Wdl: SA
IMonitoring Wall: 3Q
Monitoring Wall: W14
Monitoring Wai: W3B
Monitoring WaB: W28A
1978 Site /1985 Site Monitoring Group
Tatrachloroethene
Monitoring Wall: W1 4
Monitoring Wdl: W26
Monitoring Wai: W2fl
IX)
Sample Data
4/1/937/1/9310/1/93
12/1/93
6/1/95
10/1/93
4/1/93
7/1/93
10/1/93
12/1/93
ncanmraon(P0A-)
0.5 J
0.4 J
0.2 J
0.2 J
0.4 J
0.2 J
0.5 J
0.5 J
03 JOJ2J
PAL
0.1
0.1
0.1
0.1
0.1
0.1
0.1
0.1
0.1
0.1
ES
1
11
1
1
1
1
1
1
1
1 ,1 ,2-Trlchloroethane
Sample Data4/1/93
ConcantraHon(M9/L)
0.3 JPAL
0.06
Trlchloroethene
ES
0.6
Concenb'BtonSample Date (pg/L)
4/1/93 0.7 J
10/1/93
12/1/936/1/94
6/1/95
4/1/93
9/1/94
12/1/94
4/1/937/1/93
12/1/933/1/94
6/1/94
12/1/94
4/1/9312/1/94
7/1/93
10/1/933/1/95
4/1/93
12/1/933/1/949/1/94
0.3 J
0.4 J
0.4 J
0.3 J
0.5 J
0.6 J
0.4 J
0.3 J
0.6 J
0.3 J
0.2 J
0.3 J
0.8 J
0.9 J
0.8 J
0.2 J
03 J03 J
0.2 J
0.3 J
0.2 J
0.4 J
PAL
0.18
0.18
0.18
0.18
0.18
0.18
0.18
0.18
0.18
0.18
0.18
0.18
0.18
0.18
0.18
0.18
0.18
0.18
0.18
0.18
0.18
0.18
0.18
ES
1.8
1.8
1.8
1.8
1.8
1.8
1.8
1.8
1.8
1.8
1.8
1.8
1.8
1.8
1.8
1.8
1.8
1.8
1.8
1.8
1.8
1.8
1.8
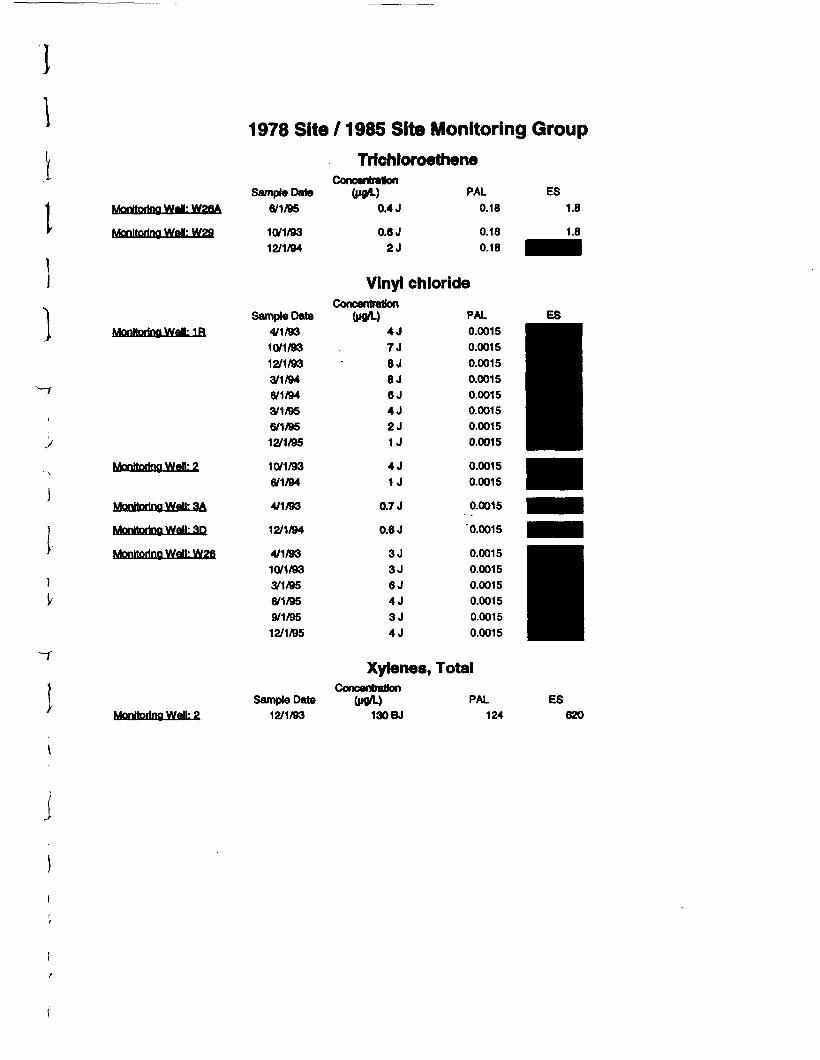
1978 Site /1985 Site Monitoring Group
t
1
Monitoring Wai: W2flA
Monitoring Wai: W2fl
Monitoring Wai: 1R
Monitoring Wall: 2
Monitoring Well: 3A.
Monitoring Wall: 3Q
Monitoring Wall: W26
Trichloroethene
Monitoring Well: 2
Sample Date
6/1/95
10/1/9312/1/94
uonceranroon(M0A-)
0.4 J
0.6 J2J
PAL0.18
0.180.18
Vinyl chloride
Sample Date4/1/93
10/1/93
12/1/933/1/946/1/94
3/1/956/1/95
12/1/95
10/1/936/1/94
4/1/93
12/1/94
4/1/93
10/1/933/1/95
6/1/95
9/1/95
12/1/95
Sample Date12/1/93
Concentration(Kg*-)
4J7J8J8J6J4J2J1J
4JU
0.7 J
0.6 J
3J3J6J4J3J4J
Xylenes,^f* -- — — • Jsaa !!<»•>cofkCttnuHOuo
(pgfl-)130 BJ
PAL0.0015
0.0015
0.00150.00150.0015
0.00150.0015
0.0015
0.00150.0015
0.0015
0.0015
0.0015
0.00150.0015
0.0015
0.0015
0.0015
Total
PAL124
ES
1.8
1.8
ES620
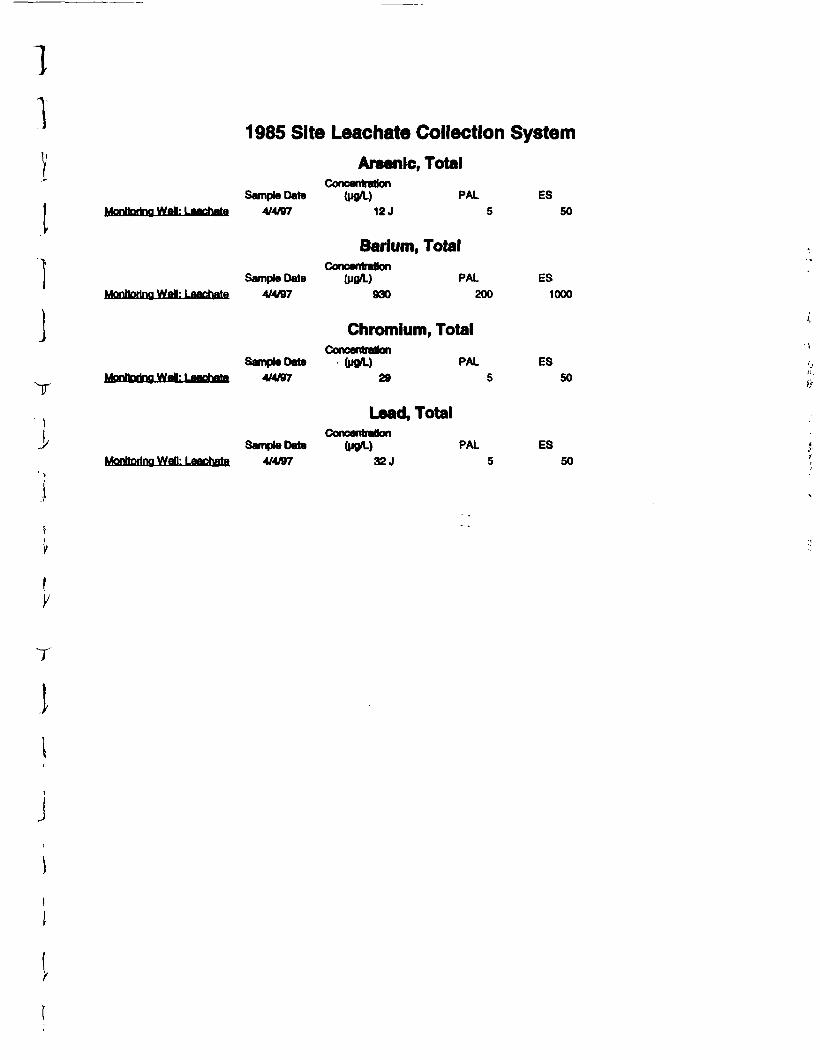
]1
I
V
T
1985 Site Leachate Collection System
Arsenic, TotalConcentration
Sample Date (jjg/L) PAL ESMonitoring Wn|-1 myjhntO 4/4/97 12 J 5 50
Barium, TotalConcentration
Sample Date ftjg/L) PAL ESMonitoring Wei: Laacnata 4/4/97 930 200 1000
Chromium, TotalConcentration
Sample Data (jig/L) PAL ESMonitoring Wn|-1 flflntHln 4/4/97 29 5 50
Lead, TotalConcentration
Sample Data (|ig/L) PAL ESMonitoring Well: Laachata 4/4/97 32 J 5 50
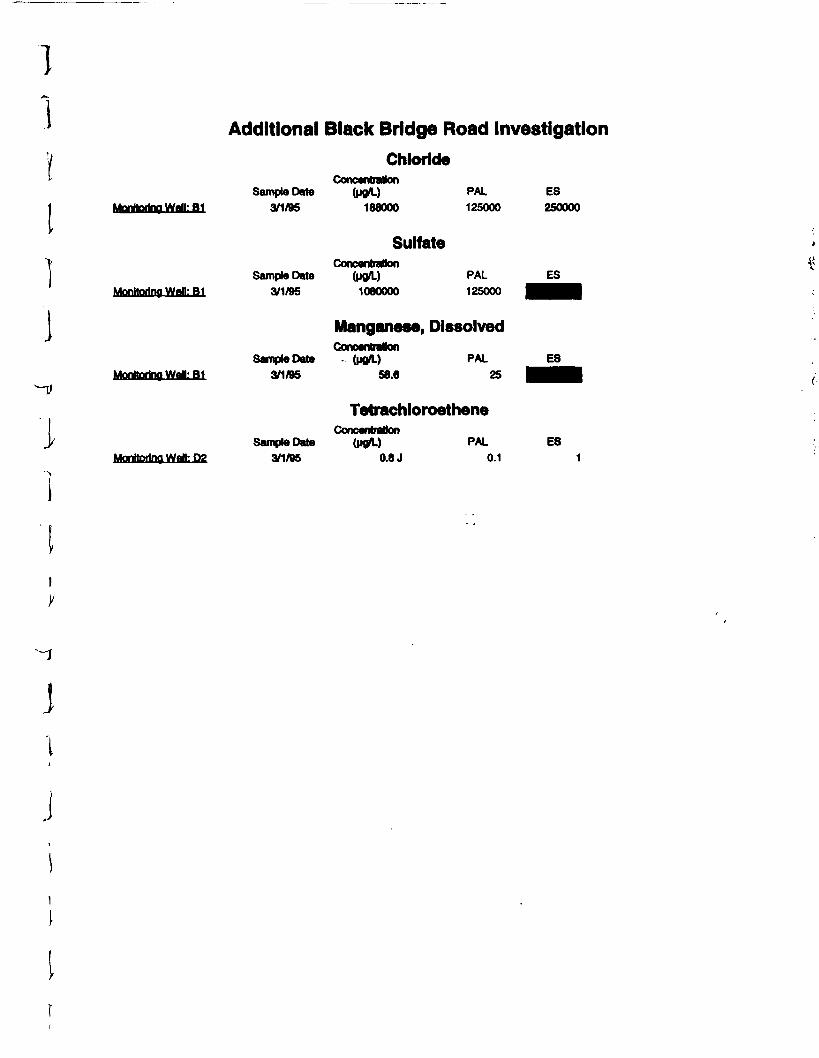
Additional Black Bridge Road Investigation
Chloride
MonHorino Wall: B1
Mcrttortno Wai: B1
\Monitoring Wall: D2
Sample Date3/1/95
Sample Date3/1/95
Sample Data3/1/95
188000
SulfateConcentration
(pg/L)1080000
PAL
125000
PAL
125000
Manganese, Dissolved
PAL
58.6 25
TetrachloroetheneConcentration
Sample Data (PQ/L)3/1/95 0.8 J
PAL0.1
ES250000
ES
ES
ES
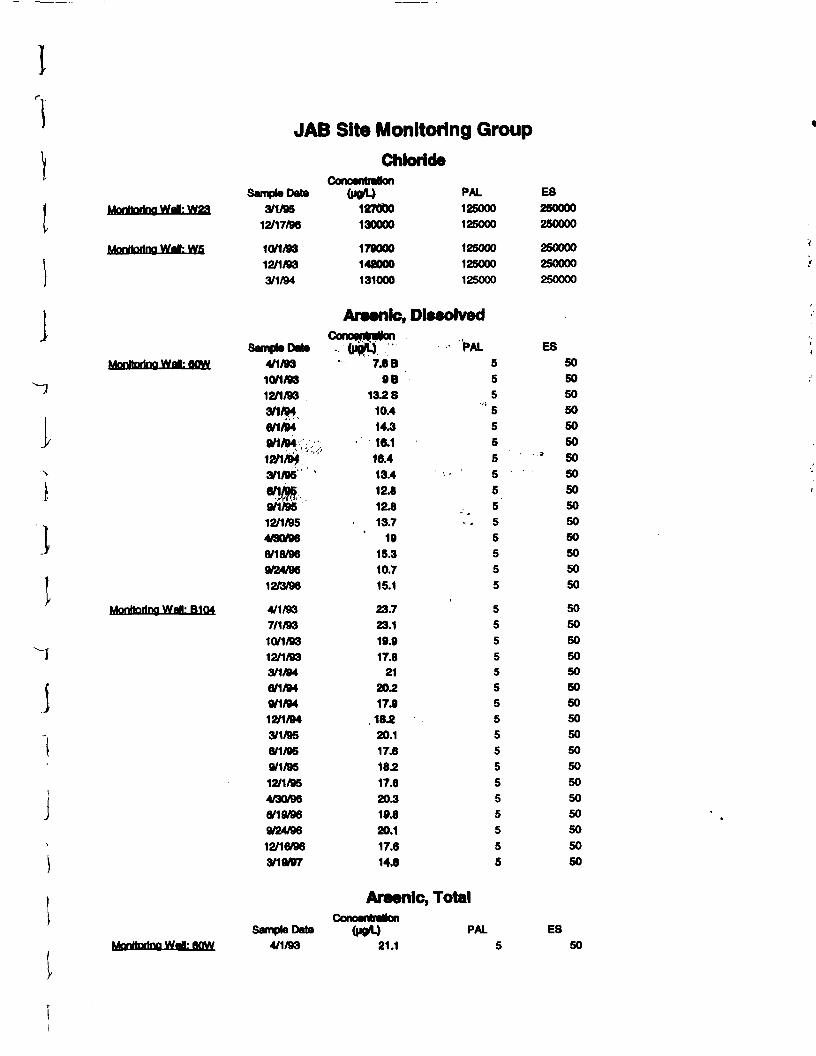
I
Morttoiton Wrf: W23
Monitoring Wei: WS
JAB Site Monitoring Group
Chloridet
Sample Date
3/1/9512/17/96
10/1/9312/1/933/1/94
4jHUWiUWIwli(P0i>
127000130000
179000142000
131000
PAL125000125000
125000
125000125000
E8250000250000
250000250000
250000
Arsenic, Dissolved
Monitoring Wai: flOW
Monitoring Wall: B1Q4
Sample Date
4/1/9310/1/93
12/1/93
3/1/946/1/94
9/1/94 ;v.12/1/94 "
3/1/95 '6/1/95
9/1/95
12/1/954/30/96
6/18/969/24/96
12/3/96
4/1/93
7/1/9310/1/93
12/1/933/1/946/1/949/1/94
12/1/94
3/1/95
6/1/95
9/1/95
12/1/95
4/30/966/19/969/24/96
12/16/963/19/07
v" oSLT"1-• 7.8B
9B13.2 S
10.414.31C.116.413412.812.813.7
1915.310.715.1
23.723.119.917.8
2120.217.918JZ20.117.618.217.620.319J20.117.614.8
PAL555
• "5565
' •• • ' 55555555
55555555555555555
ES505050505050
- . - » 505050505050505050
5050505050505050505050505050505050
MonHorinn Wrf; BOWSample Date
4/1/93
Arsenic, TotalConoontravon
PAL
21.1ES
50
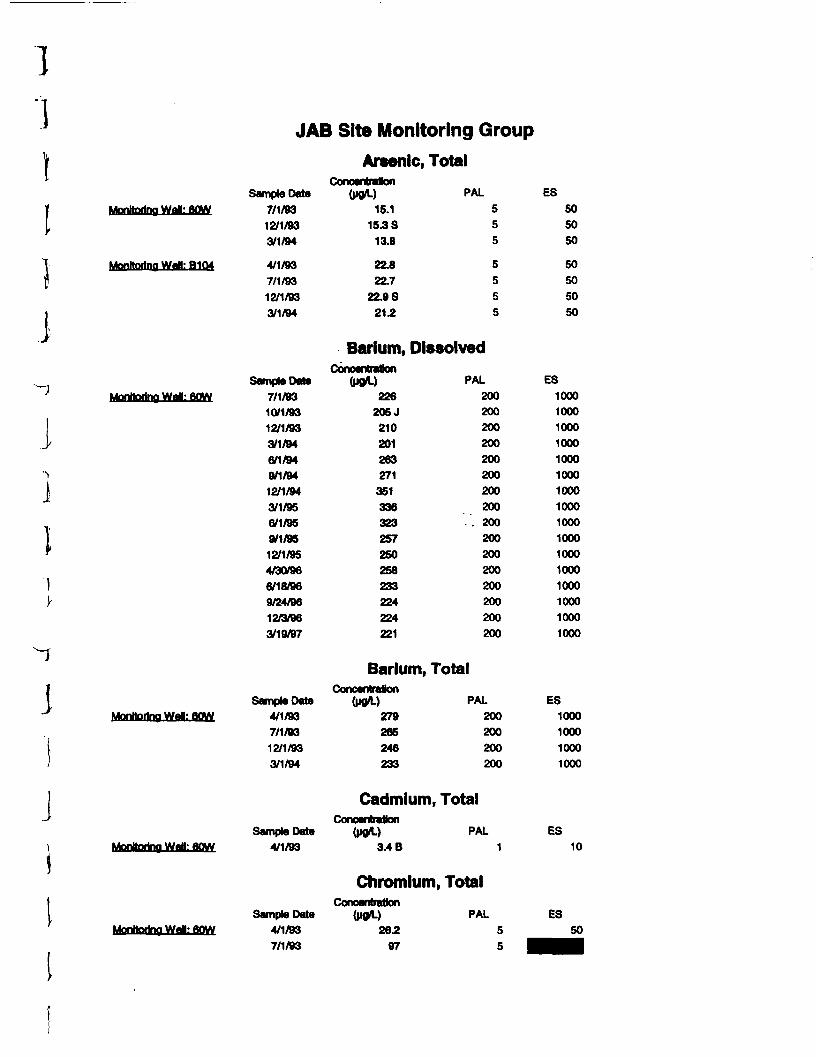
1JAB Site Monitoring Group
Monitoring Wal: flOW
Monitoring WaH: B104
JMonitoring Wai: BOW
1 Monitoring Wai: 6QW
JMonitoring Watt: BOW
Monitoring Wai; BOW
Sample Date
7/1/9312/1/93
3/1/94
4/1/93
7/1/93
12/1/93
3/1/94
Sample Date
7/1/9310/1/93
12/1/933/1/94
6/1/949/1/94
12/1/94
3/1/956/1/95
9/1/9512/1/954/30/966/18/96
9/24/9612/3/96
3/19/97
Sample Date
4/1/937/1/93
12/1/933/1/94
Sample Date4/1/93
Sample Date4/1/93
7/1/93
Arsenic, Totalom moi Hinuuvi
(pg/L) PAL
15.1 515.3 S 5
13.B 5
22.8 522.7 5
22,98 521.2 5
Barium, Dissolved
(pg/L) PAL226 200
205 J 200210 200201 200263 200271 200
351 200336 200323 .200257 200250 200258 200233 200224 200224 200221 200
Barium, Total\Ajt mvi ni luim i
(pg/L) PAL279 200265 200246 200233 200
Cadmium, TotaluouoMNiumn
<pg/L) PAL
3.4 B 1
Chromium, TotalCoocentnuon
(W-) PAL262 5
97 5
ES555
5555
505050
50505050
ES
1000
1000
1000
1000
1000
1000
1000
1000
1000
1000
1000
1000
1000
1000
1000
1000
ES
1000
1000
1000
1000
ES10
ES50
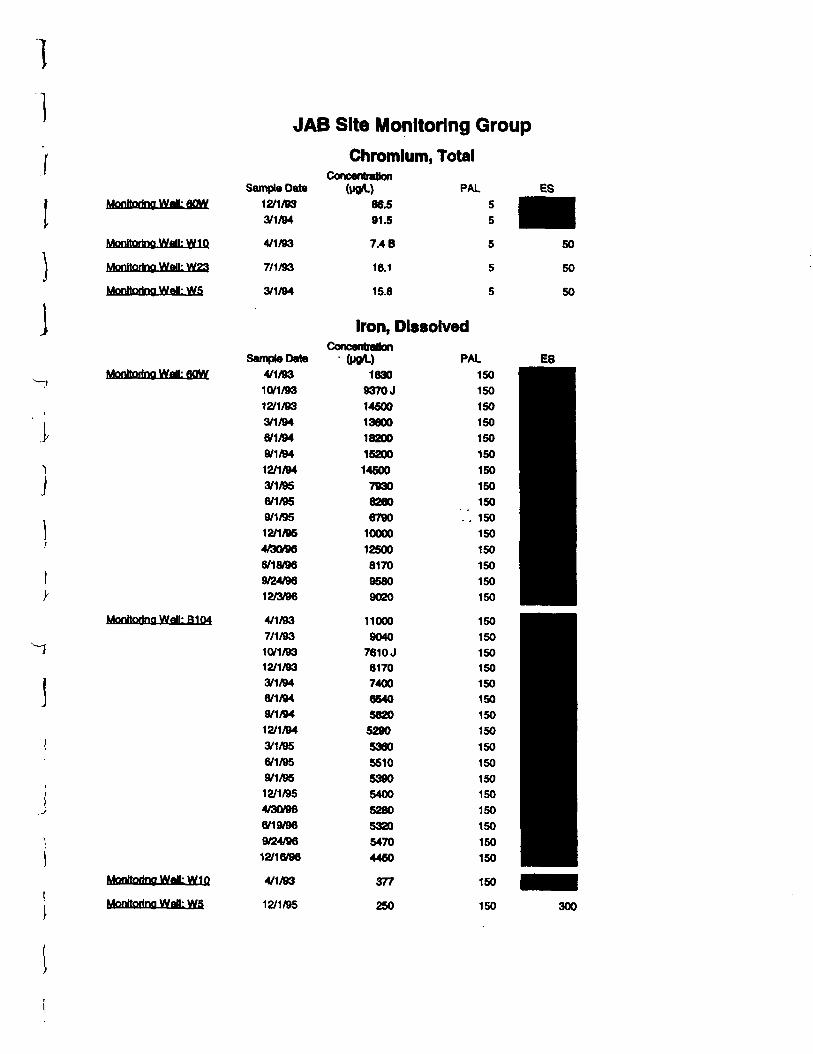
I
Monitoring Wai: gQW
Monitoring Wall: W10
Monitoring Wall: W23
Monitoring Wall: W5
Monitoring Wai: 60W
j.
Monitoring Wall: B1Od
Monitoring Wai.- Wlfl
Monitoring Wall: W5
JAB Site Monitoring Group
Chromium, Total
Sample Date
12/1/933/1/94
4/1/93
7/1/93
3/1/94
Concentration(MQ/L) PAL
86.591.5
7.4 B
18.1
15.8
Iron, DissolvedConcentration
Sample Date (pg/L)4/1/93
10/1/9312/1/833/1/94
8/1/94
9/1/94
12/1/94
3/1/95
6/1/959/1/95
12/1/95
4/90/966/18/96
9/24/9812/3/96
18309370 J
1450013800
18200
15200
14500793082808790
10000
12500817095809020
PAL150150150150150150150150150
. . 150150150150150150
4/1/93
7/1/9310/1/9312/1/933/1/948/1/949/1/94
12/1/94
3/1/95
6/1/95
9/1/9512/1/954/30/96
6/19/96
9/24/9612/16/96
4/1/93
12/1/95
1100090407610 J8170740065405820529053605510539054005280532054704450
377
250
150150150150150150150150150150150150150150150150
150
150
50
50
50
300
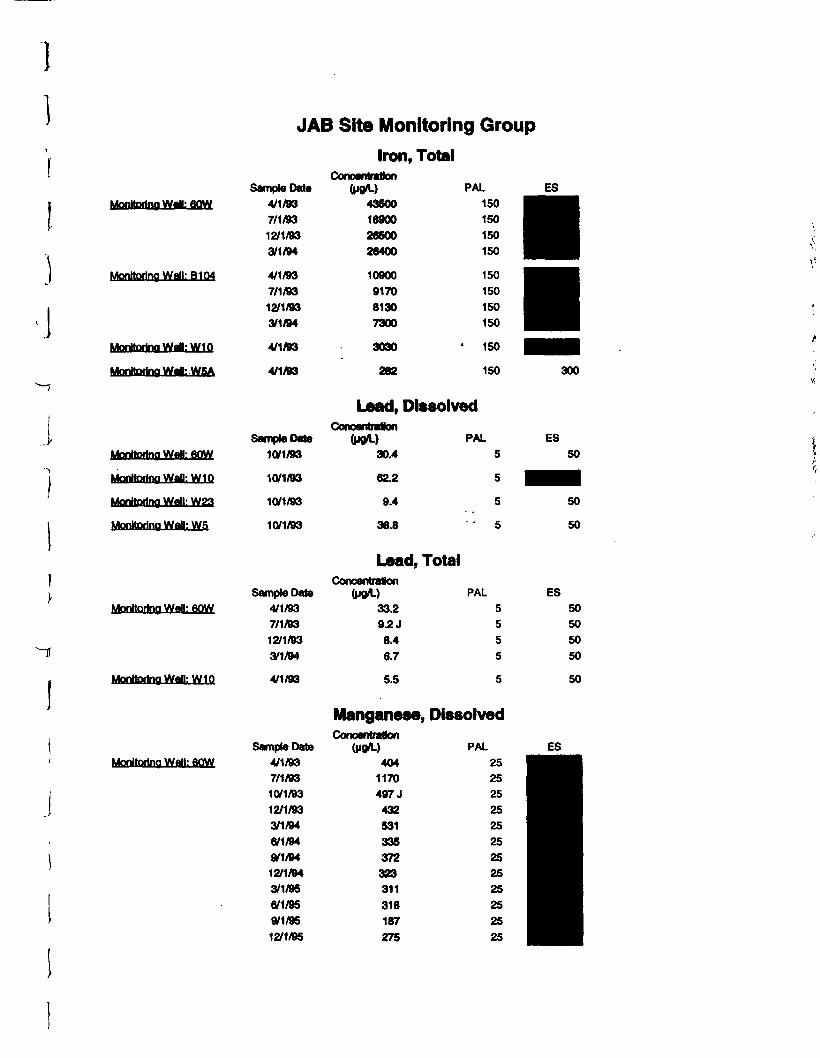
Monitoring Wai: BOW
Monitoring Weil: B104
MoritoringWrtrWIO
Morttorina Wdk WfiA
Moritorinq Wall: 6QW
Monitoring Wall: W10
Mentoring Wall: W23
Monitoring Wall: WS
Monitoring Wall: 6QW
Monitoring Well: W1Q
Monitoring Wall: SOW
JAB Site Monitoring Group
Iron, Total
Sample Date4/1/937/1/93
12/1/933/1/94
4/1/93
7/1/93
12/1/933/1/94
4/1/93
4/1/93
uoroemraDon(M8/L)
4360018900
2650026400
10900
9170
8130
7300
3030
282
PAL150150150150
150150150150
• 150
150
Lead, Dissolved
Sample Date10/1/93
10/1/93
10/1/93
10/1/93
Sample Date4/1/937/1/93
12/1/93
3/1/94
4/1/93
(MO*-)30.4
62.2
9.4
36.8
Lead, Totaluooconuftuoii
(Mflrt-)33.29.2 J8.46.7
5.5
PAL5
5
5
5
PAL5555
5
Manganese, DissolvedM. . .•
Sample Date
4/1/937/1/9310/1/93
12/1/933/1/94
6/1/94
9/1/94
12/1/943/1/95
6/1/959/1/95
12/1/95
"MM"'404
1170497 J432531335372323311318187275
PAL252525252525252525252525
300
ES
50
•50
50
ES50505050
50
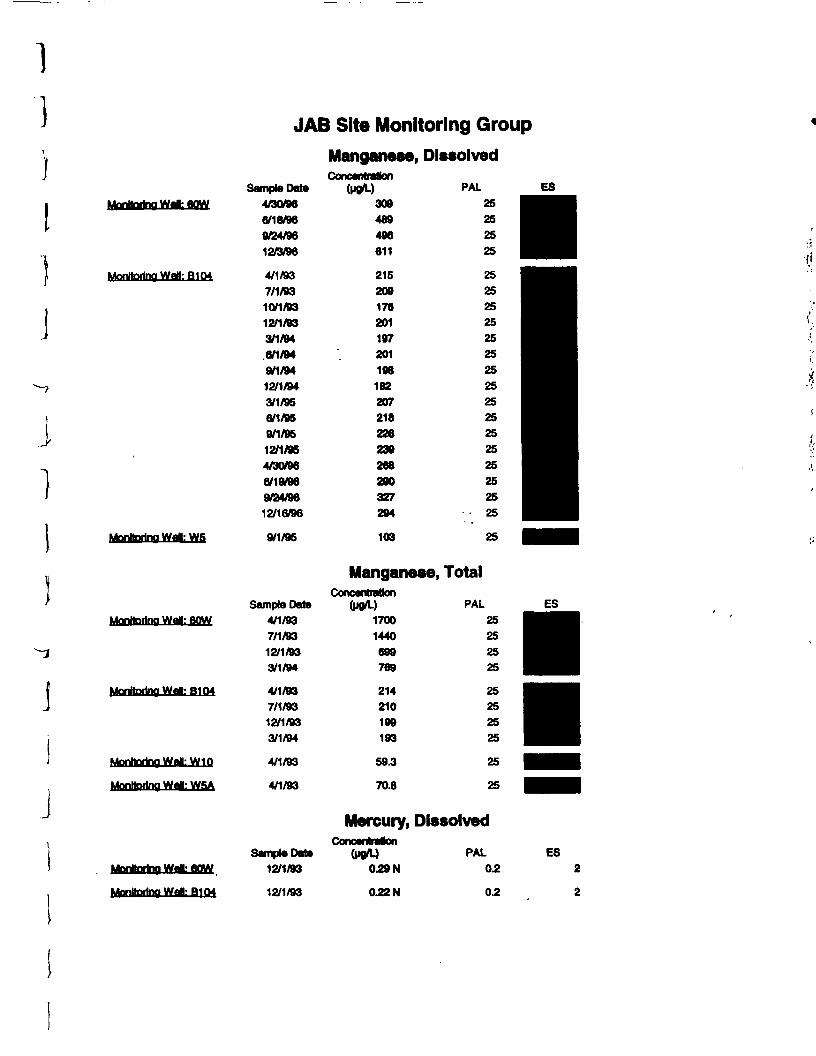
MM: 60W
Monitoring Wall: B1O4
Monitoring Wai: WS
JAB Site Monitoring Group
Manganese, DissolvedConcentration
Sample Data (pp/L) PAL
4/30/96 309 256/18/96 489 25
9/24/96 496 25
12/3/96 611 25
4/1/93 215
7/1/93 20910/1/93 17612/1/93 201
3/1/94 1976/1/94 . 201
9/1/94 198
12/1/94 182
3/1/95 2076/1/95 218
9/1/95 22612/1/95 239
4/30/98 268
6/19/96 2909/24/96 32712/16/96 294
9/1/95 103 25
j
J
Mentoring WaU: BOW
ManHorina Wai- B104
MonBoi1nqWal:W1Q
Monitoring Wa«: WSA
H
Wai! B1OA
Sample Date
4/1/93
7/1/93
12/1/933/1/94
4/1/937/1/9312/1/933/1/94
4/1/93
4/1/93
Sample Date12/1/93
12/1/93
Manganese, Total
PAL17001440699769
214210199193
59.3
70.8
25252525
25252525
25
25
Mercury, DissolvedConcentration
(MO*.)0.29 N
0.22 N
PAL ES0.2
0.2
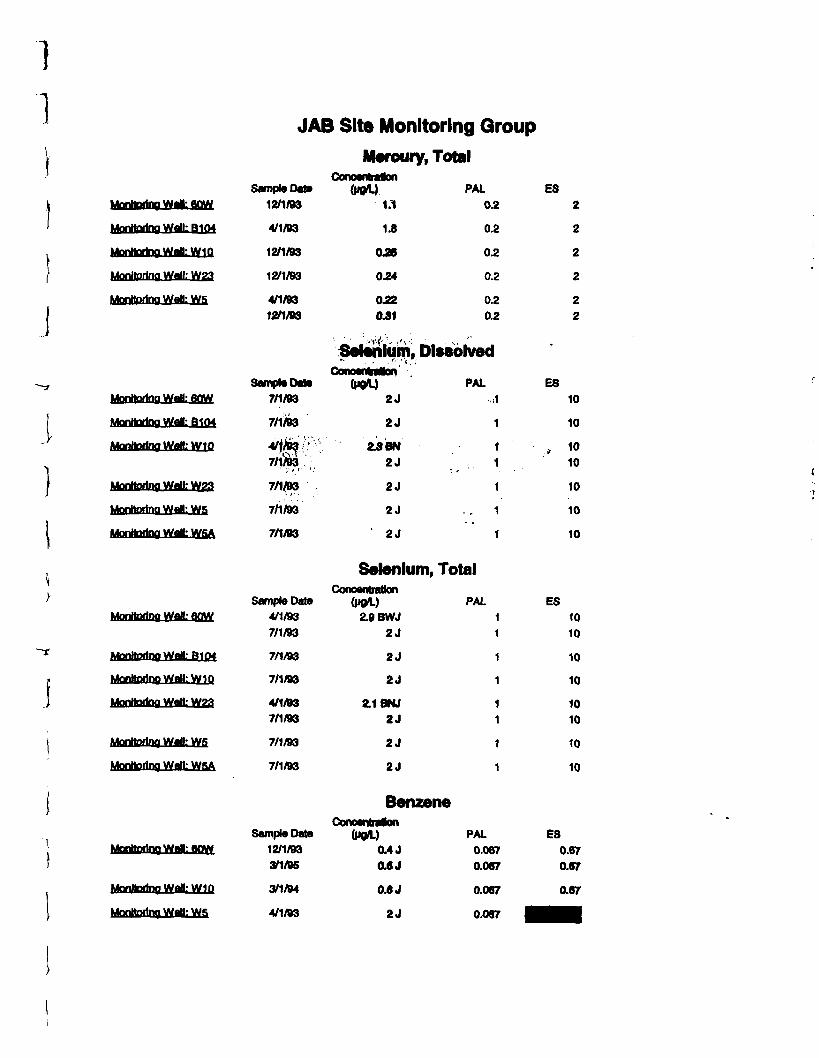
JAB Site Monitoring Group
Mercury, Total
MontorinaWaLflOW
Monitoring Wall: B1Q4
Monitoring Wall: W^O
Monitoring WaU: WJ>3
Monitoring Wall: Ws
Monitoring WaM: BOW
MonHorina Wai- B1M
Monitoring WflH: W^O
Monitoring Wall: Wga
MonttorinaWal:W5
Montoring Wai: WSA
Monitoring Wai: flow
Monitoring Wafc B1O4
Monitoring Wall: W10
MonHorino WaU: Wga
Monitoring Wai: WS
Monitoring WalL WSA
Mortaring Wai: BOW
j •*,>.-> IWtHrt** tat—M- VU4AnfnB Illr *** fnHi V* ' "-^
Monte^WeU. .;
Sample Date
12/1/93
4/1/93
12/1/93
12/1/93
4/1/93
12/1/93
Sample Data
7/1/93
7/1/93
7/1 ,
7/1/93
7/1/93
7/1/93
Sample Data
4/1/93
7/1/B3
7/1/93
7/1/93
4/1/937/1/93
7/1/93
7/1/93
Sample Data
12/1/93
3/1/95
3/1/94
4/1/93
Concentration(POt) PAL
1.1 05
1.8 0.2
0.26 05
0.24 0.2
0.22 0.2OJ1 0.2
Selenium, Dissolved
(po/L) PAL2J ,,1
2J 1
Z3BN 12J _' ,. 1 .
2J 1
2 J - . 1
2J 1
Selenium, TotalConcentration
(M01.) PAL2.9 BWJ 1
2J 1
2J 1
2J 1
ilBNJ 1
2J 1
2J 1
2J 1
BenzeneConcentration
(pg/L) PAL0.4 J 0.067
04 J 0.067
0.6 J 0.067
2J 0.067
ES2
2
2
2
2
2
-
ES
10
10
., 1010
10
10
10
ES
10
10
10
10
10
10
10
10
es0.67
0.67
0.67
•••
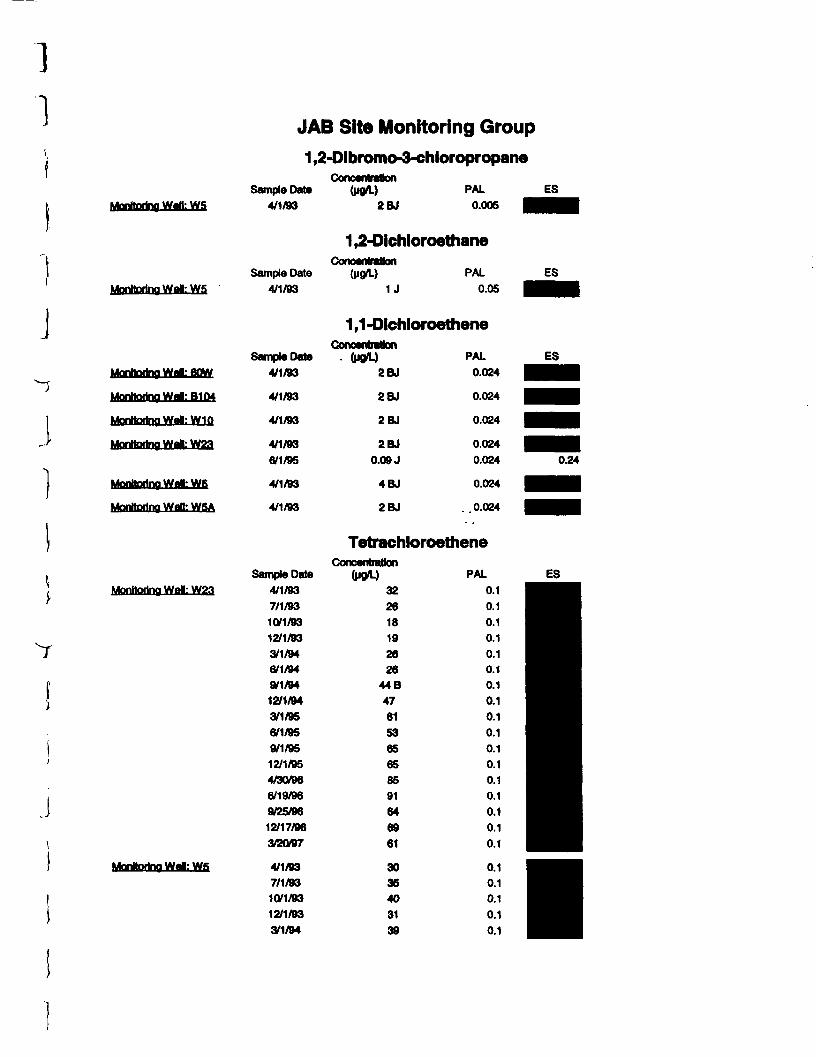
Monitoring Wall: WS
Monitoring Wai: WS
J
Monitoring Wdb 6QW
Monitoring Writ: B104
Monitoring Wai: W1Q
Mentoring Wrt: W23
Monitoring Wai: WS
Mentoring Wall: WSA
Monitoring Wai: W23
J
MonHnrtng Wei: WS
JAB Site Monitoring Group
1,2-Dlbromo-3-chloropropaneConcentration
Sample Data (pgA.)4/1/93 2BJ
PAL
0.005
Sample Date
4/1/93
Sample Date
4/1/93
4/1/93
4/1/93
4/1/93
8/1/95
4/1/93
4/1/93
Sample Date
4/1/93
7/1/93
10/1/9312/1/93
3/1/946/1/94
9/1/94
12/1/94
3/1/95
6/1/95
9/1/95
12/1/95
4/30/96
6/19/96
9/25/96
12/17/96
3/20/97
4/1/93
7/1/9310/1/93
12/1/93
3/1/94
1,2-OichloroethaneConcentration
(MO*-)1 J
PAL
0.05
1,1-DlchloroetheneConcentration
2BJ
2BJ
2BJ
2BJ0.09 J
4BJ
2BJ
PAL0.024
0.024
0.024
0.0240.024
0.024
0.024
TetrachtoroetheneConcentration
322618192626
44B47615365658591646961
3035403139
PAL0.10.10.10.10.10.10.10.10.10.10.10.10.10.10.10.10.1
0.10.10.10.10.1
ES
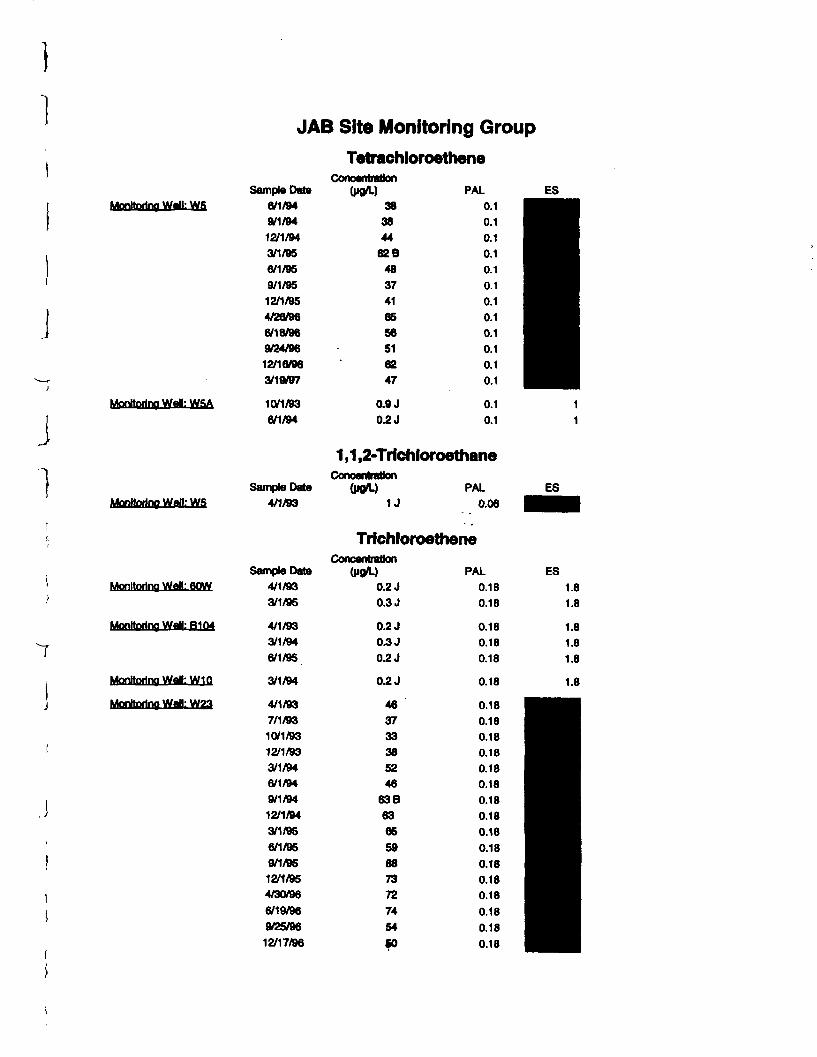
Monitoring Wdl: WS
J
1
Monitoring WeB: WSA
JAB Site Monitoring Group
Totrachloroethene
Monitoring Well: WS
Sample Date6/1/949/1/9412/1/943/1/956/1/959/1/9512/1/954/26/966/18/969/24/9612/16/963/19/97
10/1/936/1/94
Sample Data4/1/93
38384462B
4837
41
6656
516247
0,9 J0.2 J
PAL
0.10.10.10.10.10.10.10.10.10.10.10.1
0.10.1
1,1,2-TrlchloroethaneConcentration
1JPAL
0.06
Monitoring WaH: flOW
Monitoring Wall: B1Q4
Monitoring Well: W10
Monitoring Wall: W23
Sample Date4/1/933/1/95
4/1/933/1/946/1/95
3/1/94
4/1/937/1/9310/1/9312/1/933/1/946/1/949/1/9412/1/943/1/956/1/959/1/9512/1/954/30/966/19/969/25/9612/17/96
TrichloroetheneConcentration
(MPA)0.2 J0.3 J
0.2 J0.3 J0.2 J
0.2 J
46373338524663 B6366598873727454CO
PAL0.180.18
0.180.180.18
0.18
0.180.180.180.180.180.180.180.180.180.180.180.180.180.180.180.18
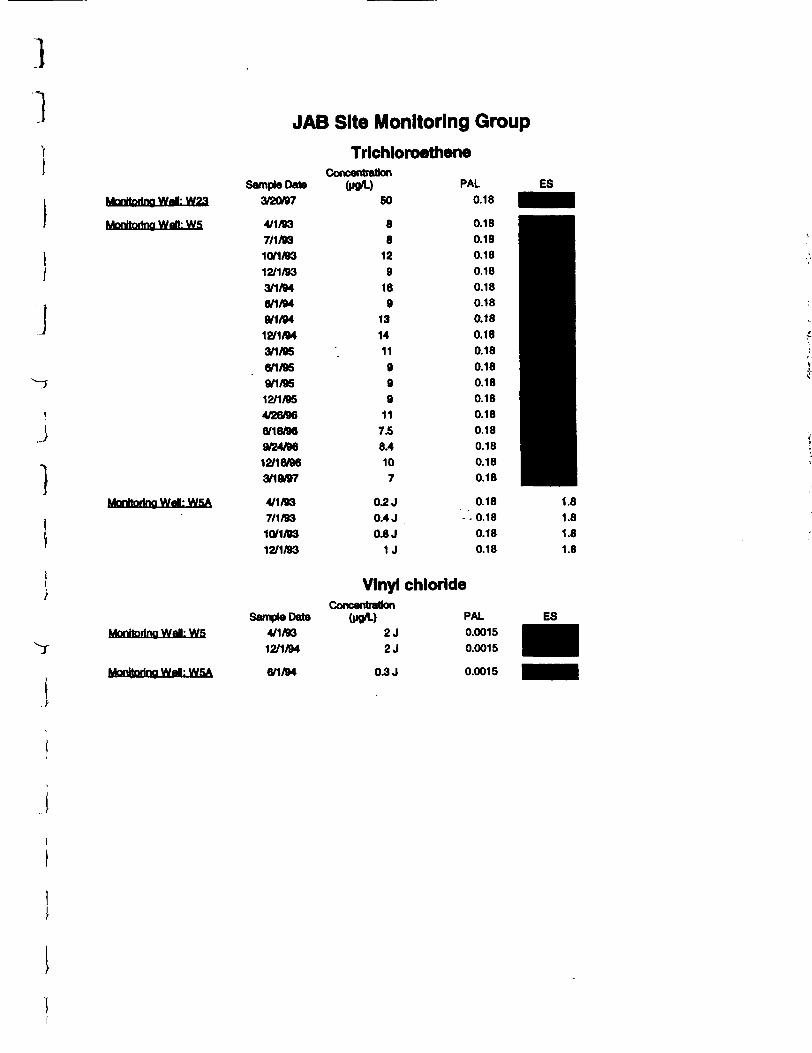
Monitoring Wai: W23
Monitoring Wall: WS
J
J
1Mentoring Wai: WSA
JAB Site Monitoring Group
TrichloroetheneConcentration
Sample Date (M0A.)
3/20/97 50
4/1/93 8
7/1/93 8
10/1/93 12
12/1/93 9
3/1/94 16
6/1/94 9
9/1/94 13
12/1/94 14
3/1/95 . 11
6/1/95 9
9/1/95 9
12/1/95 9
4/26/96 11
6/18/96 7.5
9/24/96 8.4
12/16/96 10
3/19/97 7
4/1/93 0.2 J
7/1/93 0.4 J
10/1/93 0.8 J
12/1/93 1J
Monitoring Wai: WS
Monhcxino WaH: WSA
Sample Date
4/1/93
12/1/94
6/1/94
Vinyl chlorideConcentration
2J
2J
0.3 J
PAL
0.0015
0.0015
0.0015
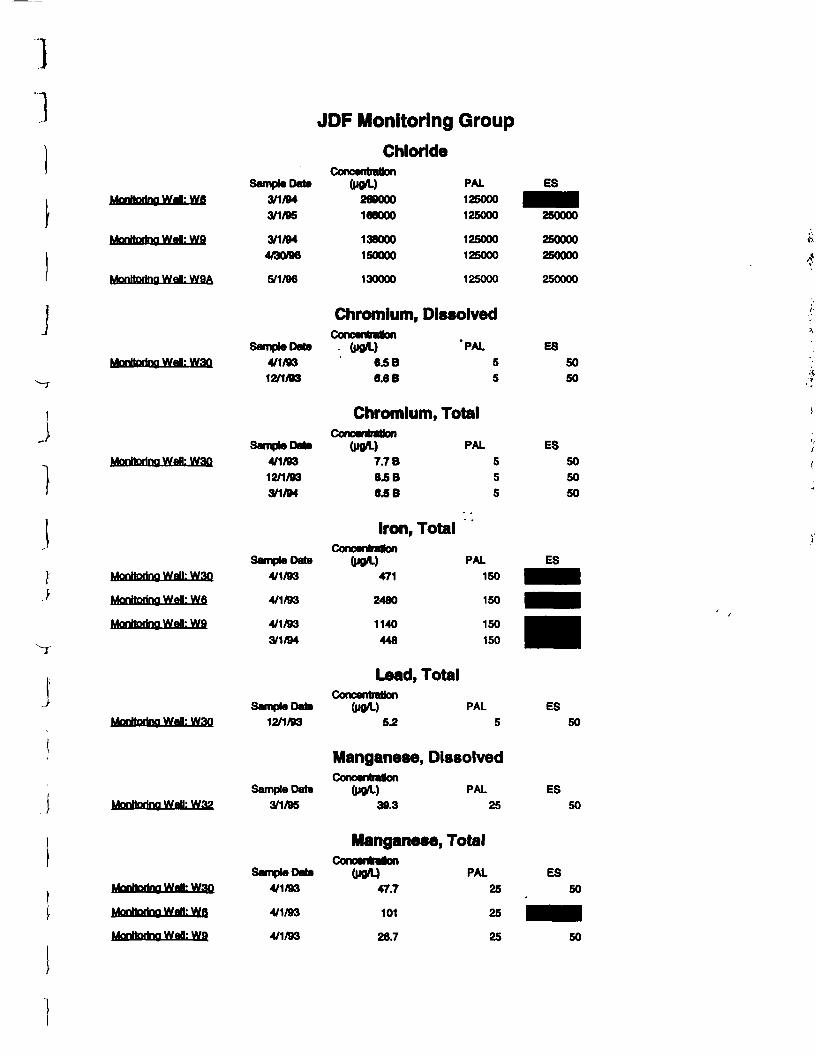
JDF Monitoring Group
j}
Chloridef* •«•»•» »«*4a il n nOOnCWIUUMJtl
Monitoring Wei: W6
Monitoring Wei: W9
Monitoring Well: W9A
Sample Date
3/1/94
3/1/95
3/1/94
4/30/96
5/1/96
(POA.)269000
166000
138000
150000
130000
PAL
125000
125000
125000125000
125000
ES
250000
250000250000
250000
Chromium, Dissolved
Monitoring Wei: W3OSample Data
4/1/9312/1/93
(ug/L)6.5 B6.8 B
'PAL
5
5
ES
50
50
Chromium, Total
Mentoring Well: W30
Monitoring WeU: W3Q
Monitoring Wei: W6
Monitoring Wei: W9
MonHoring Wefl: W30
Sample Data
4/1/93
12/1/933/1/94
Sample Data
4/1/93
4/1/93
4/1/93
3/1/94
Sample Date12/1/93
UMKOTWeilUII
Gig/L)
7.7 B
8.5 B
&5B
Iron, Total
(pgA.)
471
2480
1140
448
Lead, Total
(M0A.)5.2
PAL
5
5
5
PAL
150
150
150
150
PAL
5
ES
50
50
50
ES
• •Jl
ES
50
Manganese, Dissolved**• — — « — ** ~
Monitoring Wei: W3J2Sample Date
3/1/95
vxmo« luwion(pgA.)
39.3
PAL
25
ES
50
Manganese, Total
Monitoring Wei- Wan
Monitoring Wei: Wft
Monitoring Wei: Wa
Sample Data
4/1/93
4/1/93
4/1/93
vxmcenraoon(P»A)
47.7
101
26.7
PAL
25
25
25
ES
50
gpjpj50
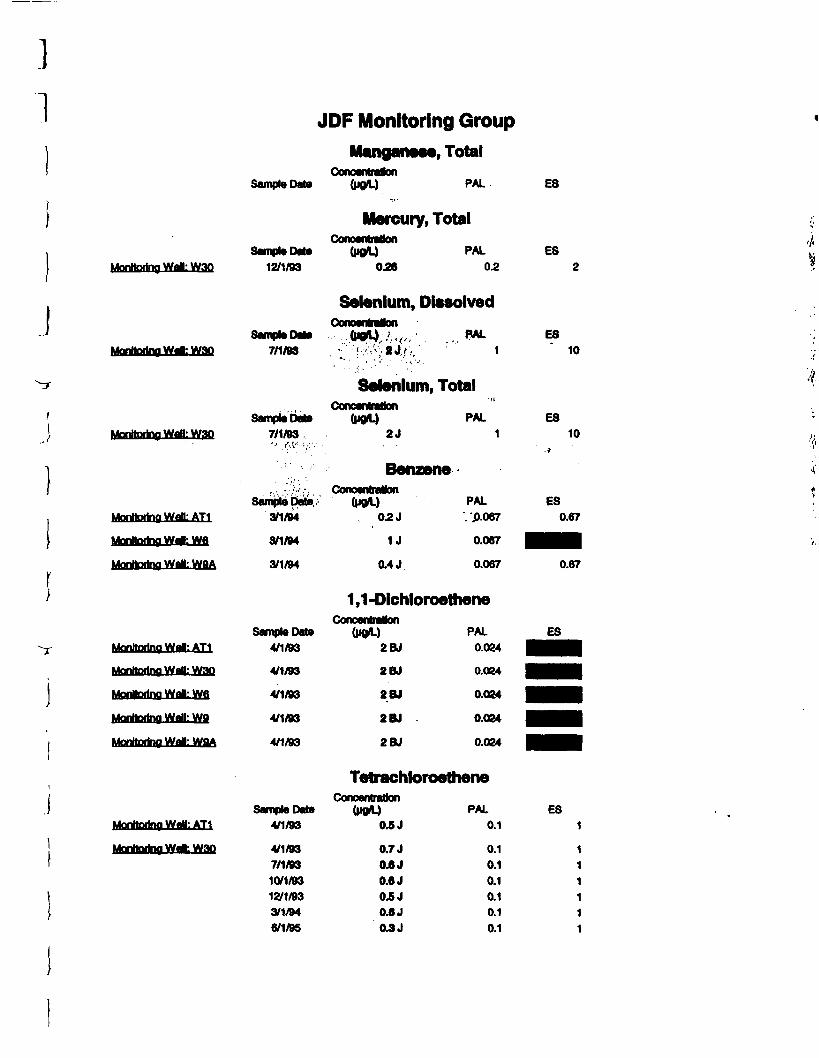
J
JDF Monitoring Group
Manganese, Total
Sample Date (MOD PAL ES
Mercury, Total
Monitoring Wai: W30Sample Date
12/1/93(MOD
0.26PAL
0.2ES
2
Selenium, Dissolved
Morttoring Wai: W3O
Montertng Watt: W3Q
Sample DM*7/1/93
Sample bate7/1/93'' ,''•«•; • • • . • • . ' • •
......UKJT!^/',^;!^;;«*/;/
Selenium,Concentration
(MOD2J
RAL
1
Total•ii
PAL1
ES10
ES10
.»
Benzene
Montoring Wad: AT1
Monitoring W*WA
Monitoring Wai: WflA
Sample Date3/1/94
3/1/94
3/1/94
(MOD0.2 J
1J
0.4 J
PAL.'.0.067
0.067
0.067
ES0.67
a^aH
0.67
1 ,1-Dlchloroethene
Montoring WaH: AT1
Montoring WaO: W3O
Monitoring WaH: WB
Montoring Wall: WB
Monterfng Wai: WflA
Sample Date4/1/93
4/1/93
4/1/93
4/1/93
4/1/93
Concentration(MOD
2BJ
2BJ
2BJ
2BJ
2BJ
PAL0.024
0.024
0.024
0.024
0.024
ES
aflaVa^aV
••HLB
•••••1Tetrachloroethene
Mentoring Wai: AT1
Montortng Wai: W3O
Sample Data4/1/93
4/1/937/1/8310/1/9312/1/933/1/946/1/95
ConoentraUon(MOD
0.5 J
0.7 JO^J0.0 JO^J0.6 J03 J
PAL0.1
0.10.10.10.10.10.1
ES
1
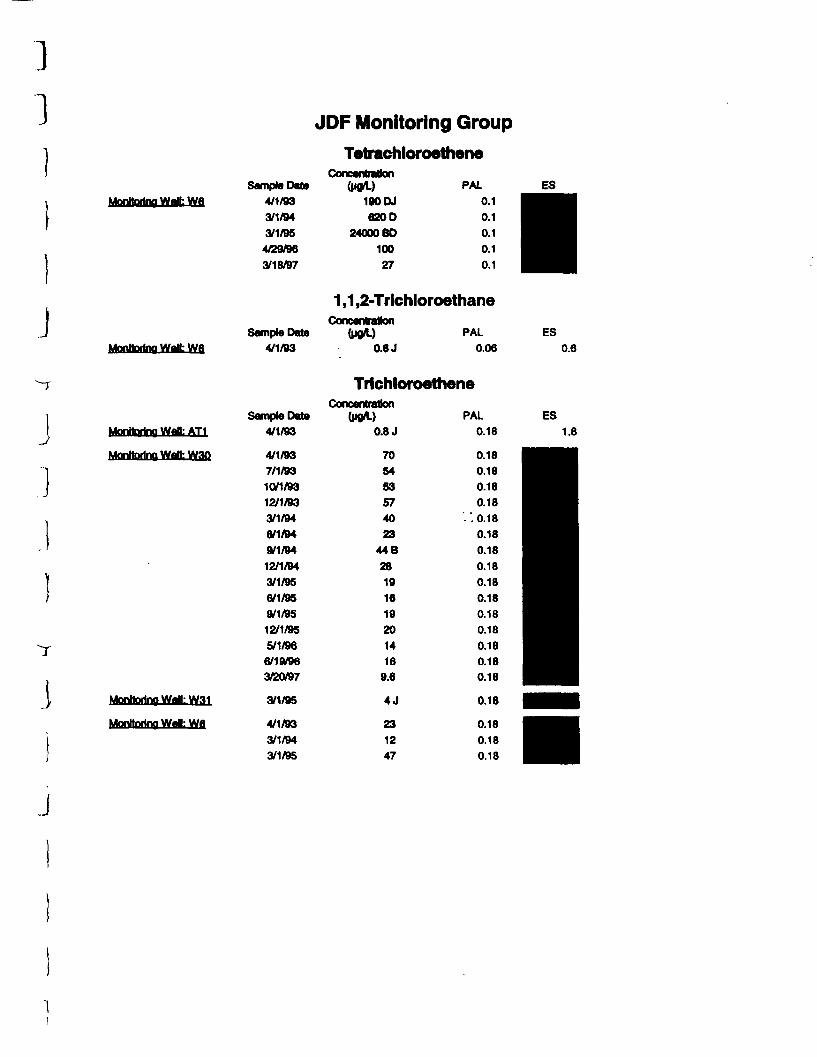
]1
Monitoring Walk Wfl
JMonltorina Wdl: Wfl
JDF Monitoring Group
TetrachloroatheneConcentration
Sample Date4/1/933/1/943/1/954/29/963/18/97
(pg/L)190 DJ620 D
24000 BO10027
PAL
0.10.10.10.10.1
Sample Date4/1/93
1,1,2-TrlchloroethaneConcentration
(pgA.)0.6 J
PAL0.06
ES
0.6
Monitoring Wall: AT1
Monitoring Wt l: Wan
] Monitoring Wall: W31
Monitoring Wai: Wfi
Sample Date4/1/93
4/1/937/1/9310/1/9312/1/933/1/946/1/949/1/9412/1/943/1/956/1/959/1/9512/1/955/1/966/19/963/20/97
3/1/95
4/1/93
3/1/943/1/95
TrichloroetheneConcentration
(P0VL)0.8 J
705453574023
44 B28191619201416
9.6
4J
231247
1.8
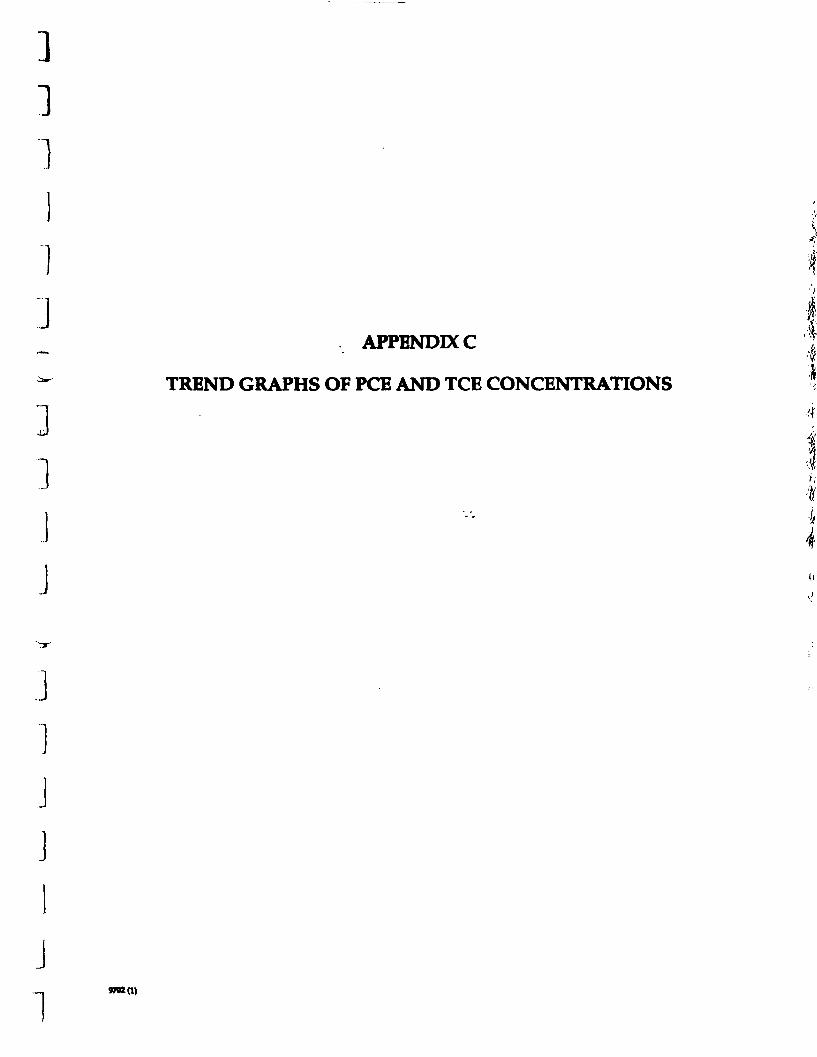
APPENDIX C
TREND GRAPHS OF PCE AND TCE CONCENTRATIONS
J
J
J
J
J
1
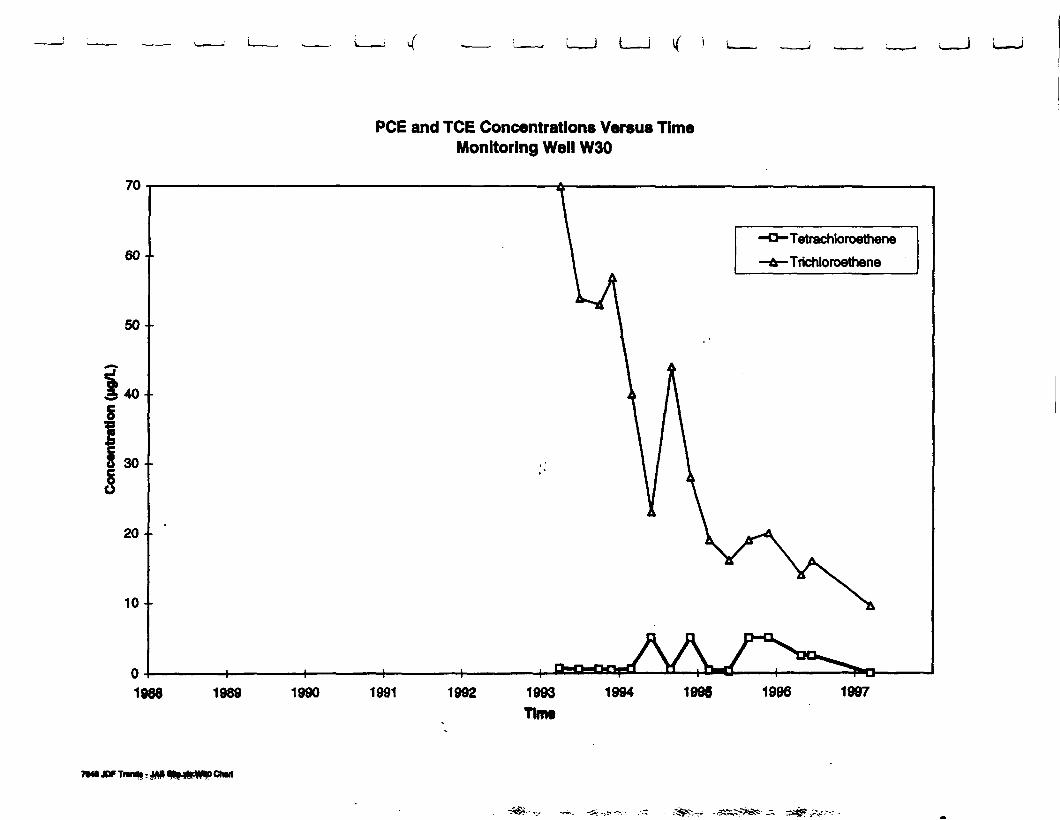
70
PCE and TCE Concentrations Versus TimeMonitoring Well W30
60
50
40
30
20
10
01988 1989 1990 1991 1992 1993
Tlrot
Tetrachloroethene
Trichloroethene
1994 1998 1996 1997
n* JOF Tmnd| • Ohm
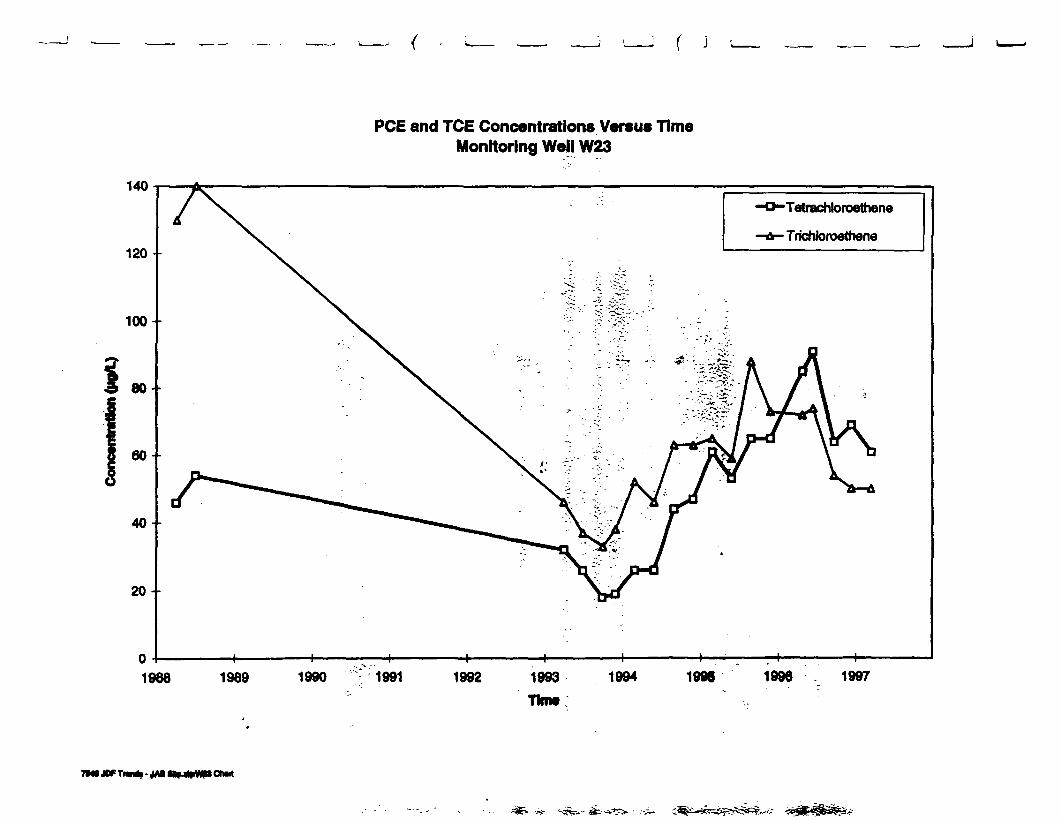
140
PCE and TCE Concentrations Versus TimeMonitoring Well W23
120 +
100 +
80 +
604-
40 +
20
•Tetrachloroethene
-Trichtoroethene
•4-
1968 1989 1990 1991 1992 1993Tlnw
1994 1998 1998 1997
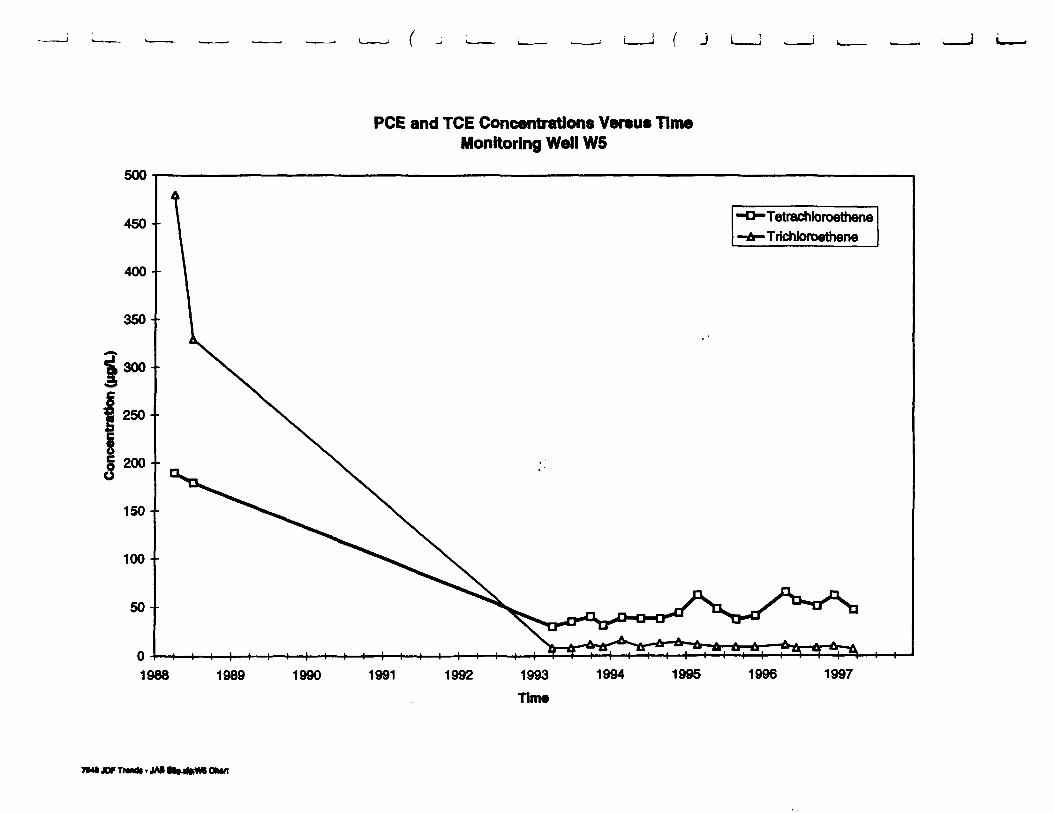
500
1988 1989
PCE and TCE Concentrations Versus TimeMonitoring Well W5
TetrachloroetheneTrichloroethene
1997
»4» JOF Tran*
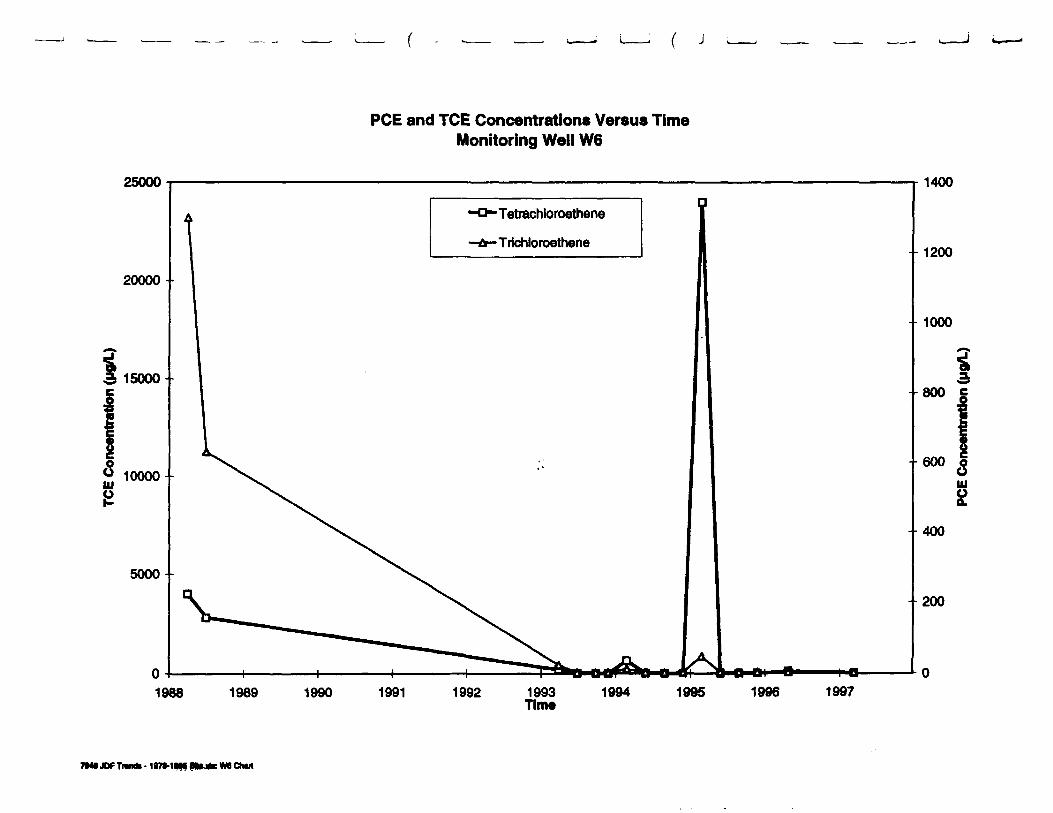
25000
20000
15000
10000
5000
PCE and TCE Concentrations Versus TimeMonitoring Well W6
Tetrachloroetnene
Trichloroethene
1988 1989 1990 1991 1992 1993Time
1994 1995 1996 1997
1400
1200
1000
800
600
400
200
8ill