application of process analytical technology (pat) tools to
TRANSCRIPT
II
Application of process analytical technology (PAT) tools to develop and
monitor scalable crystallization processes of pharmaceuticals
Dissertation
zur Erlangung des
Doktorgrades der Ingenieurwissenschaften (Dr.-Ing.)
des
Zentrums für Ingenieurwissenschaften
der Martin-Luther-Universität
Halle-Wittenberg,
vorgelegt
von Frau Dipl.-Ing. Lydia Helmdach
geb. am 17.09.1984 in Karl-Marx-Stadt, Deutschland
Gutachter:
1) Prof. Dr.-Ing. Dr. h.c. Joachim Ulrich
2) Dr. rer. nat. Martin Feth
3) Prof. Dr.-Ing. Ulrich Teipel
Tag der öffentlichen Verteidigung: 08.11.2013
Kahla, den 29.12.2013

II
Acknowledgement
The research work presented in this thesis was carried out from May 2010 to April 2013
during my time as PhD student at the chair of Thermal Process Technology, Center of
Engineering at Martin Luther University Halle-Wittenberg. The project was supported by the
department of Chemical & Biotechnological Development (C&BD) of Sanofi-Aventis
Deutschland GmbH.
My sincere thank goes to Prof. Joachim Ulrich who gave me the great opportunity to work at
his chair on the subject of crystallization, giving support and helpful discussions and also the
freedom to follow various ideas. I am very grateful to have had the opportunity to carry out
parts of my research at Sanofi-Aventis GmbH in Frankfurt, which I thoroughly enjoyed. In this
context I would like to express my deep appreciation to my supervisor at Sanofi-Aventis
GmbH, Dr. Martin Feth for his continuous support, encouragement and expert guidance
throughout my PhD. The enthusiasm, the enlightening suggestions and comments of both
supervisors, Prof. Joachim Ulrich and Dr. Martin Feth, allowed me to achieve my fully
potential and therefore enabling the development of this work. I thank them for the trust
and mind freedom they gave me as well as meaningful discussions I had in the research
work.
I very much appreciate the opportunity to attend several (international) conferences,
symposia and workshops such as the International Workshop on Industrial Crystallization
(BIWIC) in 2010 and 2011 as well as the International Symposium on Industrial Crystallization
(ISIC) in 2012, the ACHEMA in 2012, the PAT meeting in 2012 and the La Londe thesis day in
2013. It enables to get in contact with other researcher groups and opens the way for fruitful
discussions.
I would like to acknowledge the following people for their strong support during my PhD and
the excellent cooperation:
Stephan Böcher, Dirk Krekeler, Mario Kumpert, Mario Kunkel, Christian Mertens,
Alexander Putz, Willi Scharf, Oliver Schneider and Michael Scholz from the G838 Pilot
plant team at Sanofi-Aventis GmbH for operating the pilot plant, trouble shooting,
sensor installation and help in setting up the measurement equipment as well as
ensuring a safe working environment in the pilot plant.
Stephan Lörchner, Uwe Sauer from the mechanical workshop at Sanofi-Aventis
GmbH without whose fast help the installation of sensors in the pilot plant would not
have been possible.

III
Dr. Bruno Baumgartner, Dr. Lars Bierer, Dr. Christoph Tappertzhofen, Dipl.-Ing. Jörg
Jurascheck, Axel Knorz, Dr.-Ing. Mandy Mohnicke, Dipl.-Ing. Christine Petzoldt,
Markus Schulz, Michael Spitzenberg, Dipl.-Ing. Anita Storch and Joachim Wunner
from the laboratory and management team at Sanofi-Aventis GmbH for performing
XRPD measurements, preparation of measurements, setting up the equipment for
experiments, ensuring a safe working environment, helpful advises and fruitful
discussions.
Dr.-Ing. Clemens Minnich from S-PACT GmbH for providing the PEAXACT software,
building the IHM and fruitful discussions.
Friedel H. Schwartz from Sequip S&E GmbH for providing the ORM sensor (Advanced
Particle Analyzing System) and fruitful discussions.
Andrea Alles from Electrothermal GmbH for providing the STEM integrity multi
reactor station.
Dr.-Ing. Ingo Benecke and Dipl.-Ing. Stefan Nitschke from SensoTech GmbH for
providing the OCM device and fruitful discussions.
The work would not have been possible without the hard work of my students. In this way I
would like to thank Dominic Lorenz, Magdy Atta, David Jiahang Xu and Arthur Liu Peiran for
their help and friendly collaboration.
Special thank goes to all my previous and current TVT colleagues whose encouragement and
the moments we spent together I will always remember. At foremost I want to acknowledge
my office mates Sandra, Kyeong-Sill and Maryam for making my work place such a pleasant
place to be. Furthermore, my warm thanks are for Dan, Steffi, Sandra, Anke, Viviana and
Robert for working in a team, for sharing my enthusiasm and frustrations and for the
friendship we share. I would like to thank Claudia Kirchner, Christina Höser, Helmut
Weißbarth and Gerhard Schütze for administrative and technical support.
Moreover, I want to thank Prof. Dr.-Ing. Ulrich Teipel for his willingness to be the examiner
for this work and my special thanks also go to all the members of the examination
committee.
Finally, I thank my boyfriend Alex and my parents Sylvia and Wolfgang for their loving
support, patience and never giving up believing in me. I would not be able to manage all of
these achievements without them.
Lydia Helmdach
Table of Contents IV
1. Introduction .............................................................................................................. 1
2. Basics of solution crystallization ................................................................................ 3
2.1 Solubility and metastable zone width ..................................................................... 3
2.2 Nucleation and crystal growth ................................................................................. 6
2.3 Crystalline Form ....................................................................................................... 7
3. Process Analytical Technology (PAT) ........................................................................ 10
3.1 Importance for the pharmaceutical industry ........................................................ 10
3.2 Critical variables in crystallization processes ......................................................... 11
3.3 Sensor technologies for crystallization processes (PAT tools)............................... 11
4. Aim of the Work ...................................................................................................... 16
5. Materials, Methods and Procedures ........................................................................ 18
5.1 Materials ................................................................................................................ 18
5.2 Methods ................................................................................................................. 20
5.2.1 Inline/online measurement techniques ............................................................. 20
5.2.1.1 Ultrasound .................................................................................................. 20
5.2.1.2 Spectroscopic methods ............................................................................... 20
5.2.1.3 Turbidity measurement techniques ........................................................... 21
5.2.1.4 Optical reflectance measurement .............................................................. 21
5.2.2 Offline measurement techniques ...................................................................... 21
5.3 Experimental procedures ....................................................................................... 22
5.3.1.1 Ultrasound .................................................................................................. 22
5.3.1.2 Turbidity ...................................................................................................... 24
5.3.1.3 UV-Vis spectroscopy ................................................................................... 25
5.3.1.4 ATR-MIR spectroscopy ................................................................................ 26
5.3.1.5 Raman spectroscopy ................................................................................... 30
5.3.1.6 Optical Reflectance Measurement ............................................................. 35
6. Results and Discussion ............................................................................................. 36
6.1 Determination of solubility and nucleation points ................................................ 36
Table of Contents V
6.1.1 Ultrasound .......................................................................................................... 36
6.1.1.1 Applicability for pharmaceutical compounds ............................................. 36
6.1.1.2 Applicability in the pilot plant ..................................................................... 38
6.1.1.3 Case study of process development for citric acid ..................................... 43
6.1.2 Raman spectroscopy .......................................................................................... 46
6.1.3 UV-Vis and NIR spectroscopy as turbidity measurement technique ................. 51
6.1.4 ATR-MIR spectroscopy ....................................................................................... 53
6.2 Investigations in liquid phase ................................................................................. 55
6.2.1 Ultrasound .......................................................................................................... 55
6.2.1.1 Applicability for pharmaceutical compounds ............................................. 55
6.2.1.2 Applicability in the pilot plant ..................................................................... 59
6.2.1.3 Applicability of a protected ultrasound sensor…………………………………………65
6.2.2 MIR spectroscopy in a case study with Paracetamol ......................................... 67
6.2.2.1 MIR spectra and data inspection ................................................................ 67
6.2.2.2 Model building: peak integration (PI) and partial least square (PLS) ......... 70
6.2.2.3 Model building: indirect hard modeling (IHM) ........................................... 75
6.2.2.4 Crystal Growth ............................................................................................ 78
6.2.2.5 ATR-MIR probe encrustation ...................................................................... 80
6.3 Investigations in solid phase .................................................................................. 82
6.3.1 Raman spectroscopy in a case study with L-glutamic acid ................................ 82
6.3.1.1 Polymorph characterization and calibration of polymorph content .......... 82
6.3.1.2 Production of α-LGA ................................................................................... 88
6.3.1.3 Monitoring of the phase transformation .................................................... 90
6.3.1.4 Influence of process parameters ................................................................ 96
6.3.2 Optical reflectance measurement.................................................................... 101
6.4 Access unit design in the pilot plant .................................................................... 103
7. Overview of the results .......................................................................................... 106
8. Conclusions and recommendations ........................................................................ 108

Table of Contents VI
9. Summary ................................................................................................................ 112
10. Zusammenfassung .................................................................................................. 114
11. Abbreviations and symbols ..................................................................................... 116
12. References ............................................................................................................. 118
13. Appendix ................................................................................................................ 131
14. Statement of Authorship ........................................................................................ 167
15. Curriculum Vitae .................................................................................................... 168
Introduction
1
1. Introduction
The manufacturing of active pharmaceutical ingredients (APIs) often involves final or
intermediate products in solid state produced by precipitation or preferably by
crystallization. Crystallization processes are established for purification, and simultaneously
induce mixture separation [Mul01, Lew01]. Over 80 % of the drug products are produced by
at least one crystallization step [Reu06]. The product quality of the solid product has to meet
stringent specifications, such as particle size distribution, particle shape, crystallographic
phase and purity. These properties have the potential to impact bioavailability of the API
[Var08]. Often, however, batch-to-batch variations are observed in crystallization processes
which can lead to bad physicochemical product properties and a decrease of product quality
(e.g. wrong size distribution). Such variations can have a strong impact on the processability
of the API during the subsequent physical treatments like filtration, drying or milling of the
material [Fet11, Kad12], but also on the efficiency and profitability of the process.
A general trend of the pharmaceutical drug development is to speed up processes. The final
goal is to reduce costs and to extend patent protection for the drug molecule or its
application. Resulting by these demands high risk decisions are taken which involve the scale
up from lab to pilot plant to production without the full knowledge and understanding of the
process such as the kinetics, crystallization or filtration conditions [Fed09]. As shown for
instance in 1998 by Abbott`s Ritonavir marketed for AIDS treatment, the production of the
undesired metastable polymorphic form can lead to a market crises and to the loss of
hundreds of millions of dollars [Par08]. In order to produce quality products and to prevent
such failures during any stage of development, a deep knowledge and understanding of the
processes is necessary during industrial scale up as well as the possibility to monitor and
control crystallizations in-situ [Che07]. Consequently, the Food and Drug Administration
(FDA) recommends the pharmaceutical industry to pay more attention at drug development
and announced a new initiative in 2002 (cGMP for the 21st Century: A Risk based Approach),
followed by the PAT guidance (PAT - A Framework for Innovative Pharmaceutical
Development, Manufacturing and Quality Assurance) in 2004. This changes the direction of
the pharmaceutical industry from the traditional quality-by-testing method towards a
quality-by-design approach [San12].
Quality-by-design approaches involve the use of process analytical technology (PAT) tools as
for instance NIR-, MIR- or Raman spectroscopy, turbidity or ultrasound. These technologies
offer the possibility to monitor and control important process parameters (e.g.
concentrations) in real-time [Bak05], which can lead to increased and more constant
product quality by real-time process decision-making and process adjustment [Taw09]. In
order to analyze the complex data measured by PAT tools, the PAT approach requires the
Introduction
2
use of intelligent multivariate data acquisition and data analysis tools at the same time. In
order to facilitate the challenging scale up from laboratory to pilot plant or industrial scale,
the application of such techniques is not only preferable in the lab but also at higher scales.
The challenges arise from mixing and heat transfer effects, which change with the scale,
leading to differences in the temperature and supersaturation profiles. Furthermore, process
development at pilot plant or industrial scale without the use of online measurement
techniques is based on the assumption that metastable zone widths and kinetic parameters
determined at lab scale are the same at pilot or industrial scale, which ignores e.g. the fact
that the nucleation point depends on the process conditions. Also the impurity profile might
be significantly different in the pilot plant compared to the laboratory scale [Kad12].
Applying PAT tools in pilot plant scale, the process transferred from laboratory scale can be
optimized within a short time on the basis of fast and reliable data acquisition with
representative sampling.
In industrial practice, however, only recently some in situ sensors have started to be applied
at pilot or industrial level. In pharmaceutical industry, Raman spectroscopy for instance is
still mainly used as laboratory analytical method and usually not implemented in the
production process. The implementation of such techniques in pilot plant or industrial scale
is often time and cost intensive as modifications and adaptions of the equipment are
required. Therefore, in technical or industrial scale only few publications describe the
implementation of PAT tools [Kad11, Wir13, Fet13b, Hel13a, Hel13b]. Wirges et al. [Wir13]
for instance successfully implemented Raman spectroscopy at a production scale drum
coater to determine the correct endpoint of a coating operation by a Partial Least Squares
(PLS) calibration model. A publication of Kadam et al. [Kad11] shows the application of MIR
spectroscopy to monitor the supersaturation during the crystallization of ammonium
sulphate at a semi-industrial scale (PLS model). Furthermore, almost no information is given
in the literature, which limitations and problems can occur during applications in industrial
scales. Kadam et al. [Kad11] for instance already showed that the use of a PLS calibration
model developed at lab scale may lead to biased concentration measurements on semi-
industrial scales. Based on this information new problem-solving approaches can be tested
in the future, since calibration transfer between the different process scales is highly
desirable in order to minimize the efforts needed for model development and validation.
All these examples show the need for further investigations to test the application of PAT
tools in pilot plant or industrial scales aimed to monitor and develop robust crystallization
processes. The sensitivities, strengths and weaknesses of these different measurement
techniques have to be compared to facilitate the selection of suitable PAT tools for process
design and scale-up.
Basics of solution crystallization
3
2. Basics of solution crystallization
2.1 Solubility and metastable zone width
If a solid solute is added to a solvent, a homogeneous solution is formed by the complete
dissolution of the solid material. At a given temperature a maximum amount of solute which
can be dissolved in a given amount of solvent is reached. This temperature is called
saturation temperature and the solution is said to be saturated. The amount of the solute
material which is necessary to produce a saturated solution at given conditions (e.g.
temperature, solvent, pressure) is known as solubility [Sch02a]. Solubilities of
pharmaceutical and non-pharmaceutical materials are substance-specific and vary over a
wide concentration range. It is commonly recognized in the pharmaceutical industry that in
average more than 40 % of newly discovered drug candidates have a poor solubility in water
[Pra12]. The low solubility of Active Pharmaceutical Ingredients (API) in aqueous media
consequently might result in a low bioavailability, depending on the dissolution rate, and
moreover in a low pharmaceutical effect. Therefore, the solubility is one of the most
important physicochemical properties which is studied during the development of
pharmaceutical preformulations, deciding about success or failure [Wei07].
In the majority of cases the solubility concentration is increasing with the increase of
temperature. The rate of increase, however, varies widely from the used compound and
solvent [Sch02a]. The solubility of the used pharmaceutical compounds as a function of
temperature is shown in Fig. 2-1.
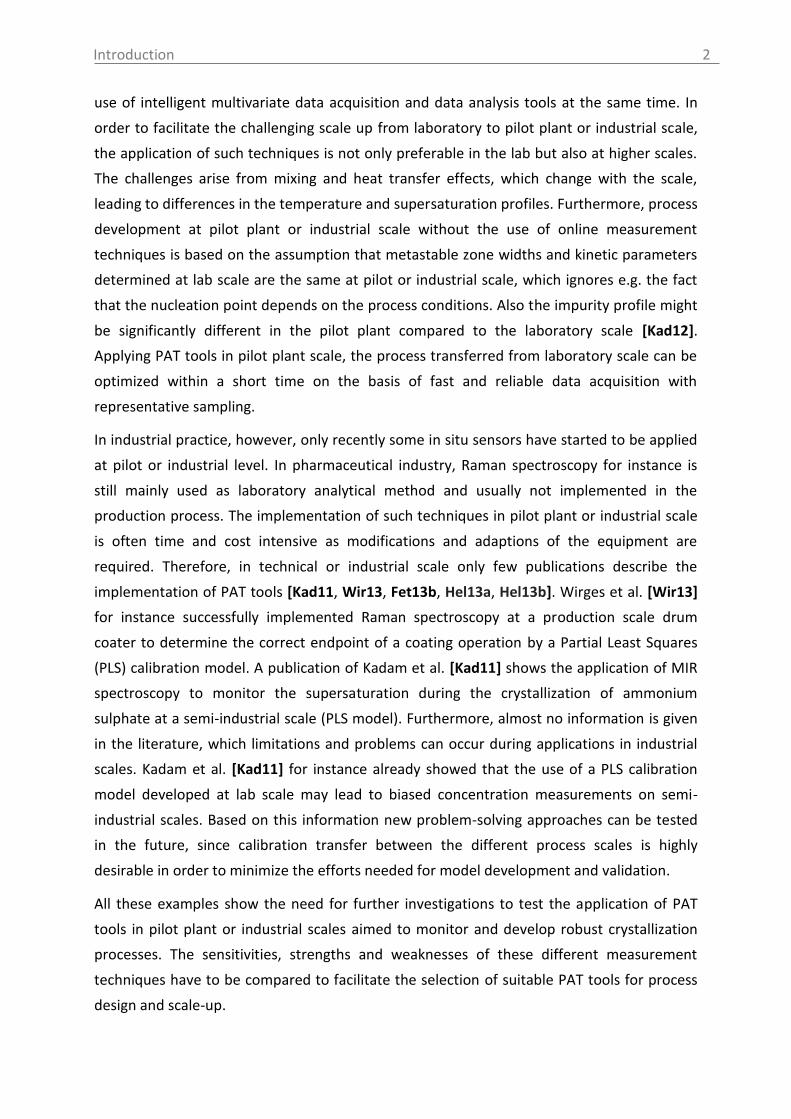
Fig. 2-1: Solubility data of the pharmaceutical compounds used in this study measured by
ultrasound (1) or turbidity (2). Used solvents: see section 5.1 (for citric acid: water).

Basics of solution crystallization
4
The investigated compounds can be classified according to their solubility to sparkling
soluble up to very soluble (Descriptive Classification of Drug Solubility) [Jou10].
From this kind of information important conclusions can be drawn concerning the product
yield of the crystallization process (mass balance) or if a cooling crystallization is the efficient
technique to crystallize the material or not. For compounds with low temperature
dependency of the solubility anti-solvent, evaporation or reactive crystallization has to be
considered [Sch02a].
The solubility of a compound in a particular solvent can be described graphically by a phase
diagram. From the thermodynamically point of view the solubility or saturation curve
describes that the chemical potential of the solute in the solution at a given temperature is
the same as the chemical potential of the species in the solid phase [Sch02a]. The
thermodynamically fixed solubility depends on concentration, temperature and pressure.
For most commercial applied crystallization processes the pressure plays a minor role,
therefore the phase diagram can be reduced to a temperature-concentration-diagram.
Phase diagrams can be of significant complexity and may involve additional stable phases
and/or species. A detailed discussion of this issue is given in the literature (e.g. Gor68,
Mer01a, Ros81).
For industrial crystallization processes frequently only a specific section of the complete
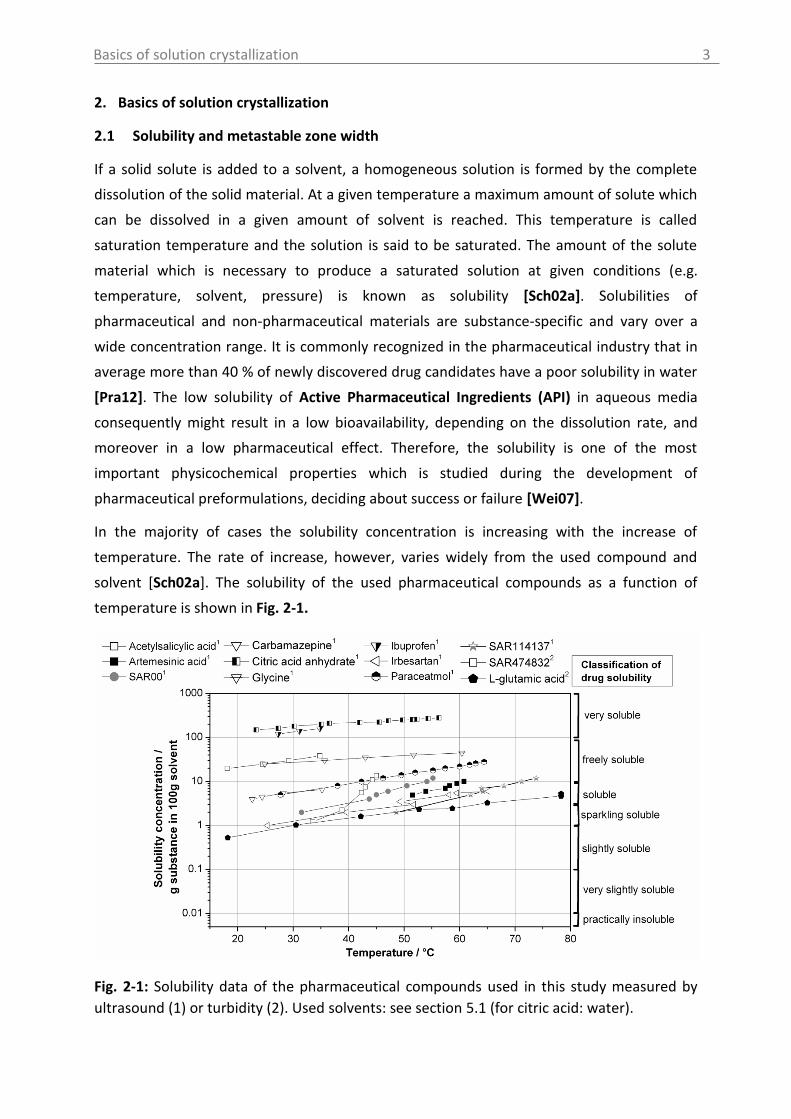
phase diagram is of interest (solubility curve) shown exemplary in Fig. 2-2. Additionally, to
the solubility curve the phase diagram in Fig. 2-2 can be extended by adding a nucleation
curve (the upper limit of the metastable zone), which is a non-thermodynamic factor. In
contrary to the solubility curve the nucleation curve depends on process parameters as for
instance cooling rate, mechanical disturbances induced e.g. by stirring or the presence of
impurities. The solubility and nucleation curve separate the phase diagram in three zones. In
the stable zone the solution is undersaturated. Therefore, crystallization is impossible and
the addition of crystals leads to their dissolution. The metastable zone represents the area
between the solubility and nucleation curve. Only in this zone crystal growth is possible after
the addition of seeds, which is also referred as controlled crystallization process. The larger
the zone width is the more stable is the solution. The metastable zone width defines,
therefore, the operating window of the process [Cro11]. Operating a crystallizer close to the
saturation curve by the addition of seed crystals result in slow growth rates and enables to
improve the product quality (particle size distribution, purity) and to control polymorphism.
Since very low supersaturations require long retention times, the optimal supersaturation
level for industrial applications is approximately half of the metastable zone width [Hof04,
Tit03]. Important parameters which have to be considered for seeding are the mass and the
size of the seed crystals, the quality of the material (milled, recrystallized, suspended), the
Basics of solution crystallization
5
supersaturation level at the time of seed addition, the cooling rate (controlled, linear) and
the location of the seed addition into the crystallizer [War06a].
If the supersaturated solution is cooled down further towards the nucleation temperature
(nucleation curve), spontaneous nucleation occurs. At this point supersaturation suddenly
decreases and the solubility concentration will be reached at the given temperature. The
crystalline product is of small size and has a wide particle size distribution. The system will
never reach the zone beyond the metastable zone (unstable zone). Please note the
importance to characterize the metastable zone width (MZW) under a specific set of
operating conditions (see nucleation temperature), which are closely to the conditions in the
final-scale of the crystallization process. Understanding the MZW is of fundamental
importance to be able to control crystal growth [Cro11].
Fig. 2-2: Schematic solubility diagram.
A solute is maintained in solution until a sufficiently high level of supersaturation has been
developed. A solution is known as supersaturated (metastable) when the solute
concentration exceeds equilibrium (saturated) concentration at a given temperature. The
supersaturation is the driving force of any crystallization process [Sch02a].
According to the literature numerous units of solubility concentrations and supersaturations
are available. Within this work the solubility will be expressed as [g/100g], which means 1 g
solid is dissolved in 100 g of solvent or in [wt%] which means the percentage of the mass of
salt based on the total mass of the solution. The supersaturation is expressed as
concentration difference (concentration at a given temperature minus equilibrium
concentration) in [g/100g] or [wt%]. For solutions of hydrates the term refers to the
concentration difference between the hydrate in supersaturated and saturated solutions,
respectively, even though the existence of a hydrate in solution may only be hypothetical
[Söh78].
Basics of solution crystallization
6
2.2 Nucleation and crystal growth
Supersaturation is the essential requirement for crystallization operations. This state,
however, is not at equilibrium. Since every system attempts to achieve an equilibrium state,
supersaturated solutions finally crystallize. Crystallization from solution can be divided into
two kinetic steps. The first step is the nucleation, and the second is the subsequent growth
of nuclei to crystals.
Nucleation
Nucleation results from the aggregation of molecules or ions in a supersaturated solution. It
plays a very important role in determining the final crystal properties (crystal size
distribution, morphology, polymorphic form). Thus, understanding the fundamentals of
nucleation is crucial to control crystallization processes. For nucleation to happen it needs
the molecules to come closer together and to form clusters. The formation of clusters is a
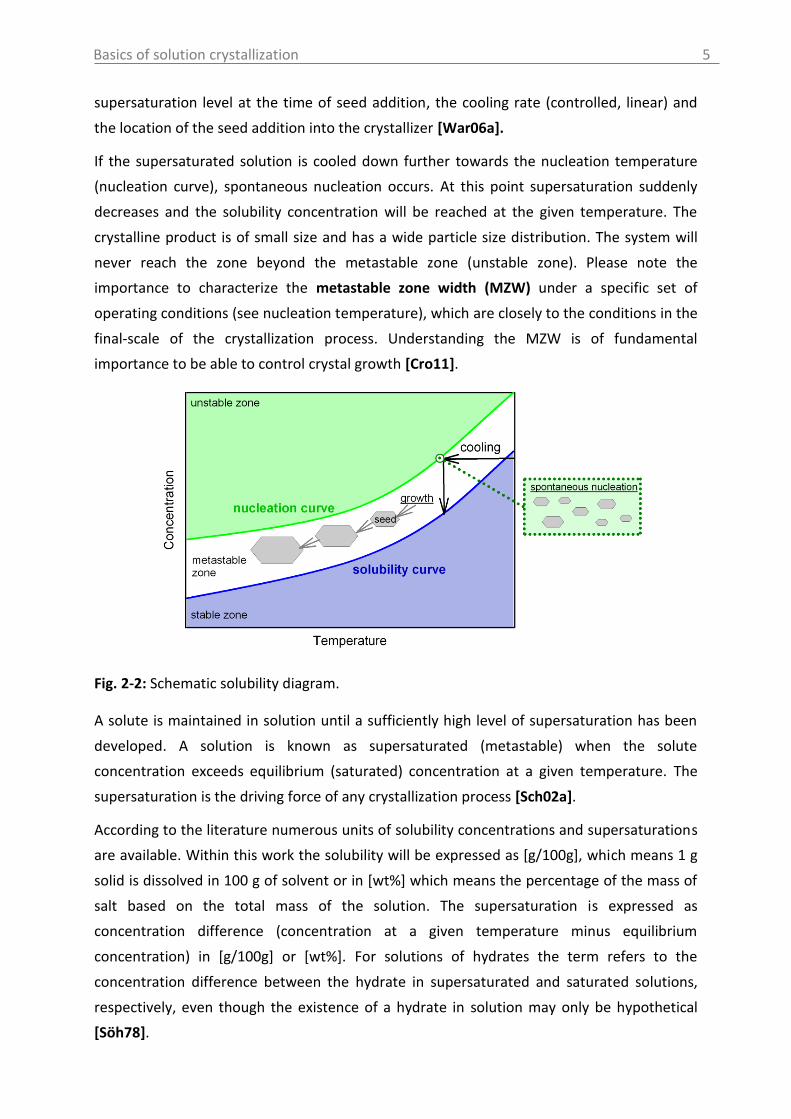
stochastic process and is described by the Classical Nucleation Theory (see Fig. 2-3). The
clusters continuously alter their sizes by the attachment or detachment of a molecule. The
clusters need to achieve a critical size until they are energetically stable. The critical cluster
size is an inverse function of the supersaturation and therefore of temperature. As the
supersaturation increases the critical cluster size decreases, leading to the formation of a
fine crystalline product since more nuclei will be formed [Kas00, Mul01]. Detailed
information on the classical theory of nucleation and nucleation kinetics is given e.g. by
Mersmann [Mer01b]. In addition, nucleation can be described by the Two-step Nucleation
Theory. According to this theory, density fluctuations occur initially and are followed by
structural fluctuations as shown in Fig. 2-3. Further information on the two-step nucleation
theory is given e.g. by Wolde et al. [Wol97].
Fig. 2-3: Schematic representation of the nucleation models [Che11].
The nucleation can be classified based on the presence or absence of crystalline material in
solution. If a solution doesn’t contain crystalline surfaces (neither solid foreign particles, nor
crystals of its own type) nuclei can be formed only by homogeneous nucleation. If foreign
particles are present, nucleation is facilitated and the process is known as heterogeneous
nucleation. Both homogeneous and heterogeneous nucleation are known as primary
Basics of solution crystallization
7
nucleation occurring when a specific supersaturation is obtained. Homogeneous nucleation
is not common during industrial crystallization processes. In most cases impurities lead to
the induction of heterogeneous nuclei formation.
When solution-own crystals are present (e.g. added seed crystals or attrition fragments)
nuclei occurs even at low supersaturations. Such kind of nucleation is known as secondary
nucleation. It should be noted that a distinction is made between secondary nucleation
resulting from contact, shearing action, breakage, abrasion and needle fraction [Mer01b,
Mul01]. Contact nucleation is probably the most common secondary nucleation mechanism
in industrial crystallizers. Contact nucleation is a result of micro abrasion which occurs when
crystal-crystal, crystal-impeller, crystal-crystallizer wall come in contact [Wis86]. According
to Ulrich [Ulr81] the major proportion of abrasion is formed in the recirculation pump.
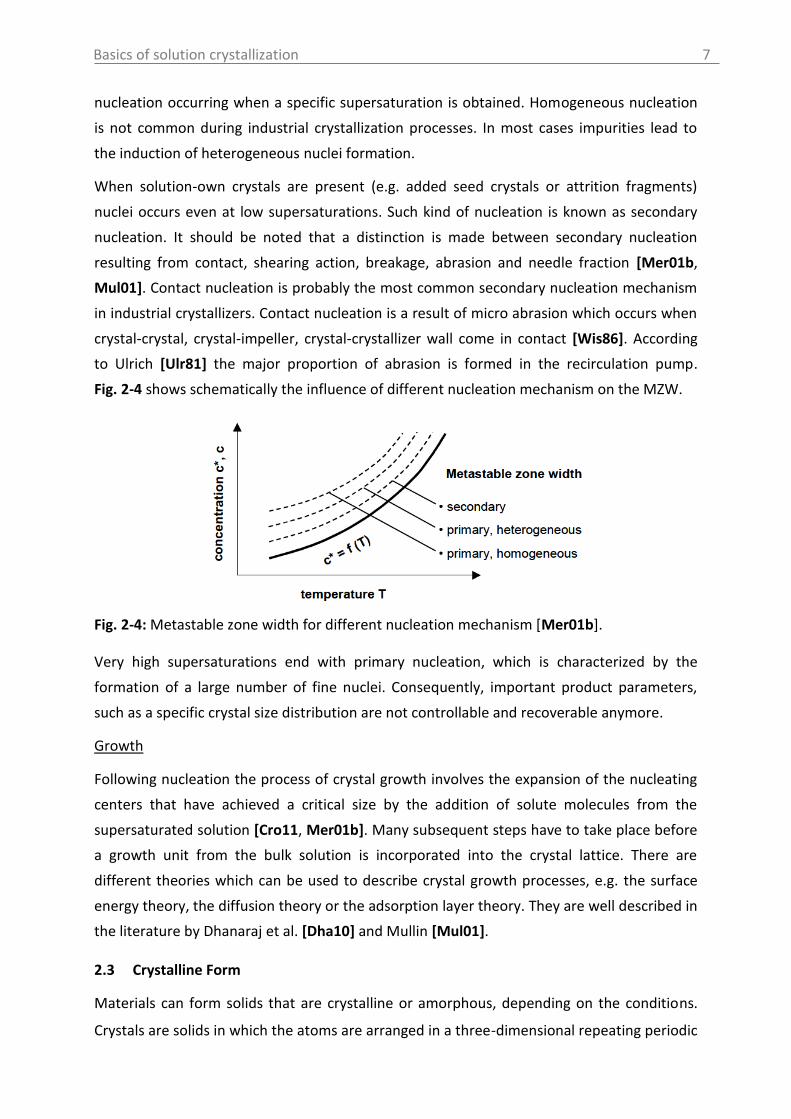
Fig. 2-4 shows schematically the influence of different nucleation mechanism on the MZW.
Fig. 2-4: Metastable zone width for different nucleation mechanism [Mer01b].
Very high supersaturations end with primary nucleation, which is characterized by the
formation of a large number of fine nuclei. Consequently, important product parameters,
such as a specific crystal size distribution are not controllable and recoverable anymore.
Growth
Following nucleation the process of crystal growth involves the expansion of the nucleating
centers that have achieved a critical size by the addition of solute molecules from the
supersaturated solution [Cro11, Mer01b]. Many subsequent steps have to take place before
a growth unit from the bulk solution is incorporated into the crystal lattice. There are
different theories which can be used to describe crystal growth processes, e.g. the surface
energy theory, the diffusion theory or the adsorption layer theory. They are well described in
the literature by Dhanaraj et al. [Dha10] and Mullin [Mul01].
2.3 Crystalline Form
Materials can form solids that are crystalline or amorphous, depending on the conditions.
Crystals are solids in which the atoms are arranged in a three-dimensional repeating periodic
Basics of solution crystallization
8
structure. The presence of a long-range order is characteristic for crystalline materials
(exceptions can be nanocrystalline materials). Amorphous materials are compounds without
any long-range order. Generally amorphous solids can have useful properties such as a
higher solubility and a faster dissolution rate, because they have higher free energies and
sometimes better compression characteristics than crystals. Unfortunately, amorphous
solids are physically and/or chemically less stable compared to crystals. Crystalline materials
can be polymorphs, solvates, hydrates, co-crystals or salts. In general, if a pharmaceutical
compound is insoluble, hygroscopic or difficult to crystallize, a search for salts or co-crystals
will be conducted. Salts make APIs more bioavailable, but more than 30 % of pharmaceutical
compounds lack suitable functionality for salt formation [Che11]. Crystals of the same
chemical composition but with different arrangements of the atoms forming different three-
dimensional structures are known as polymorphs [Hil06, Mer01b]. This phenomenon has
great importance in the pharmaceutical industry as different polymorphs can exhibit
different chemical properties such as reactivity and physical properties such as density,
melting point, color, solubility and dissolution rate, which consequently affects the
bioavailability and stability of the drug substance [Che11]. In addition polymorphism often
means a change of the external shape of the crystal, which is directly related to the
effectiveness of downstream processes, such as filtration [Mye02]. Furthermore, solvates or
hydrates can exist, which were also referred to as “pseudopolymorphs” in the past. In the
case of reversible solvates or hydrates the molecule(s) of the solvent or water can be
removed from the solvate or hydrate without affecting the crystallinity of the solid. For
irreversible solvates or hydrates the desolvation or dehydration leads to a reduction of
crystallinity (amorphization) [End11]. Cocrystals can be considered as a special case of
solvates, where the solvent is at ambient conditions not liquid. Instead of a solvent an
involatile compound bonded noncovalently or through hydrogen bonds to the molecular
solid in a regular ordered manner. Food additives, preservatives, excipients, vitamins,
minerals, amino acids, biomolecules, and other APIs can be selected as co-crystal formers
[Che11]. Polymorphs can have a monotropic or enantiotropic relationship [End11].
Polymorphs are defined as enantiotropic when the transition point between the two phases
is found at temperatures below the melting point. When there is no transition point below
the melting points of the two polymorphs, the forms are monotropically related [Che11].
Although the solid-liquid equilibrium is defined by thermodynamics, kinetic factors play an
important role during crystallization processes. Thus, the prediction and the control of the
polymorphic form of the crystals initially crystallizes out from solution is a complicated task
Basics of solution crystallization
9
[Lou08]. According to the Ostwald rule of stages, it is quite common for an unstable
polymorph to appear first (lowest energy barrier) and then to transform to the stable form
(highest energy barrier) [Mye02]. Therefore, the number of thermodynamically accessible
solid forms depends strongly on the level of supersaturation (concentration) [Che11]. But
also other operating parameters, such as solvent, temperature level, pressure, mixing
conditions, presence of impurities or additives and the seeding parameters might have an
influence on the crystallization of polymorphic forms [Che11, Lou08]. Another problem
related with polymorphism is, once the desired polymorph is obtained by the crystallization
procedure, it is necessary to prevent the transformation of the material to another
polymorphic form [Mye02]. The stability relationship between crystalline solid phases often
changes depending on the thermodynamic conditions (temperature, pressure,
concentration) from which the relative humidity of the environment can be one aspect
which has to be considered. The knowledge of mechanism of phase transformations is very
helpful in identifying the potential for such transitions and factors affecting their kinetics
[Sai09]. Typical solubility diagrams of monotropic and enantiotropic systems are shown in
Fig. 2-5.
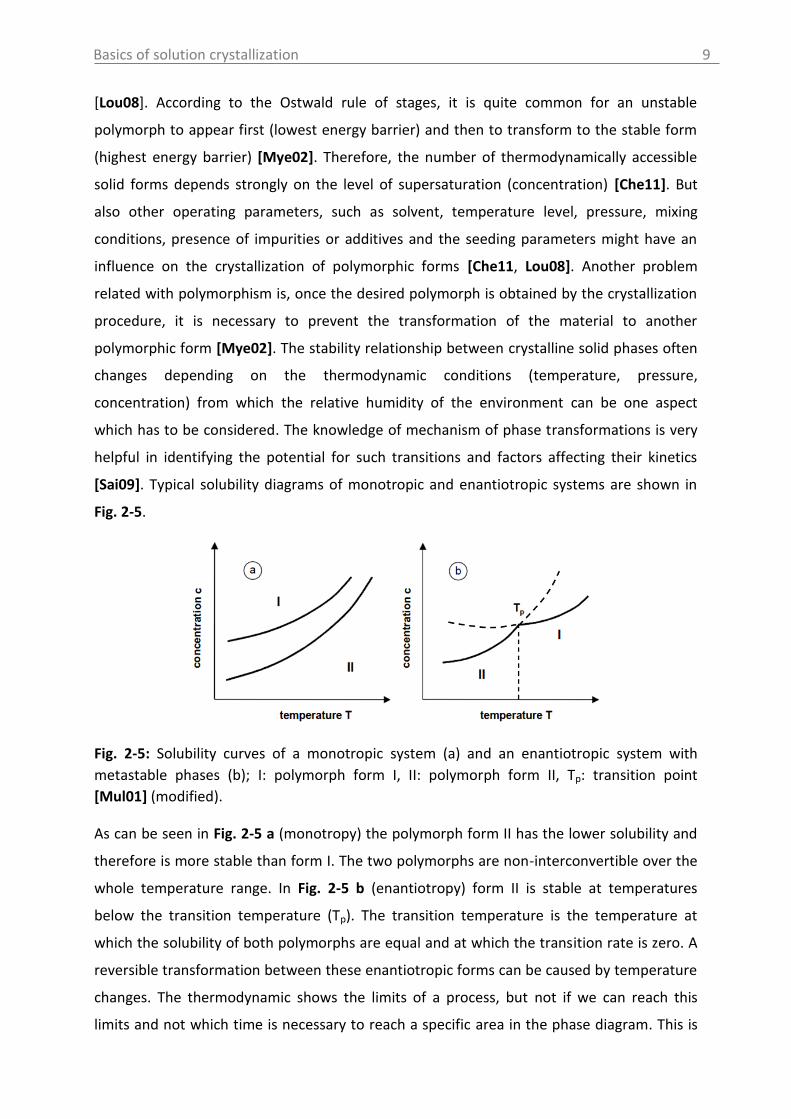
Fig. 2-5: Solubility curves of a monotropic system (a) and an enantiotropic system with
metastable phases (b); I: polymorph form I, II: polymorph form II, Tp: transition point
[Mul01] (modified).
As can be seen in Fig. 2-5 a (monotropy) the polymorph form II has the lower solubility and
therefore is more stable than form I. The two polymorphs are non-interconvertible over the
whole temperature range. In Fig. 2-5 b (enantiotropy) form II is stable at temperatures
below the transition temperature (Tp). The transition temperature is the temperature at
which the solubility of both polymorphs are equal and at which the transition rate is zero. A
reversible transformation between these enantiotropic forms can be caused by temperature
changes. The thermodynamic shows the limits of a process, but not if we can reach this
limits and not which time is necessary to reach a specific area in the phase diagram. This is

Process Analytical Technology (PAT)
10
influenced by the kinetics. For enantiotropic related polymorphs an interconvention of
metastable phases (extensions of the solubility curves beyond the transformation point,
dashed line) might occur leading to the nucleation of the metastable phase due to faster
nucleation and/or growth rates. This shows the importance of kinetic factors which may
override thermodynamic considerations. The observation that rapidly cooled solutions first
deposit crystals of the less stable form, and not that which normally crystallizes according to
thermodynamics, is described by the Ostwald’s rule [Mul01].
3. Process Analytical Technology (PAT)
3.1 Importance for the pharmaceutical industry
The Food and Drug Administration’s (FDA) Process Analytical Technology (PAT) initiative
(founded 2004) represent the basis of the Good Manufacturing Practice (GMP) rules in the
pharmaceutical industry [Bee11]. The major incentive behind the PAT initiative of the FDA is
defined in the FDA Guidance: “PAT – A Framework for Innovative Pharmaceutical
Development, Manufacturing and Quality Assurance” [Fda04]. Since the pharmaceutical
industry is highly regulated, the products must meet high quality specifications, such as
chemical and polymorph purity, particle size (distribution) or particle shape. This quality
attributes affect the physical (dissolution rate, solubility) and chemical (reactivity) properties
of the produced materials but also have an influence on downstream operations (e.g.
filtration, drying). Hence, achieving the desired crystalline product quality consistently is
essential for the pharmaceutical industry. One of the most important statements within the
PAT concept is that “quality should not be tested into products, but it should be built in by
design”. The PAT initiative emphasized the development and use of novel technologies as a
tool to analyze, control and to improve processes in order to prevent the risk of producing
products of poor quality. This PAT recommendation is valid also for other and related
branches of industry, such as biotechnology, the food industry, as well as the chemical
industry [Fda04, Kan12].
The FDA defines PAT as [Bal03, Fda04]:
a system for the analysis and control of manufacturing processes based on timely
measurements of critical quality parameters and performance attributes of raw
materials and in-process materials
a process to ensure acceptable end-product quality at the completion of the
processing
Process Analytical Technology (PAT)
11
FDA also states that PAT involves [Bal03, Fda04]:
the application of Process Analytical Technology (PAT) tools
product and process optimization
multivariate data analysis and information management tools
feedback process-control strategies
strategies for the manufacture of pharmaceuticals
3.2 Critical variables in crystallization processes
The measurement of critical process and product parameters is essential for process
analysis, monitoring, understanding, optimization and control. A critical process or product
parameter is a measurable independent value which predominantly influences the process
or product quality [Kan12]. As far as the crystallization step is concerned, the control
objectives (critical product parameters) defining the quality of the end products are the
particle size, the particle size distribution (PSD), the crystal shape, the polymorphic form
and the crystal purity [Kal12]. All these variables have an influence either on the solubility
and the dissolution rate (bioavailability, pharmaceutical effect) of the drug and/or on
downstream processes (filtration, drying). In general fine and/or needle shaped particles
show bad filtration behavior. Fine particles, furthermore, have a high surface area, which
increases the probability for impurities to be on the surface [Lio04]. In comparison, large
crystal with a narrow size distribution are usually required to improve the filterability, crystal
purity and the storage behavior of the crystalline product [Kal12].
An important critical process parameter which influences the resulting product quality
(critical product parameters) is the supersaturation. It is the driving force of any
crystallization process. Rates of nucleation, growth and agglomeration and as consequence
the crystal morphology, the PSD, and purity are a complex function of supersaturation.
Controlling the product properties implies manipulating the supersaturation to achieve a
favorable balance between nucleation, growth and agglomeration rates [Kal12].
The interaction between the crystallization step and the following product processing steps
(e.g. filtration, drying) is crucial for the overall performance of the production process. In
practice, a combined control of these objectives is required as it is often desired to achieve
both an acceptable efficiency of the production process (processing time, yield) and the
required product characteristics [Kal12].
3.3 Sensor technologies for crystallization processes (PAT tools)
Process analyzers are the essential PAT tools for real-time process monitoring and control as
they supply the data from which relevant process and product information and conclusions
Process Analytical Technology (PAT)
12
are extracted. Available tools can be distinguished between those that predominantly take
univariate process measurements (such as ultrasound, turbidity, pH, temperature or
pressure) to those that provide multivariate information related to physical and chemical
attributes of the investigated materials (such as Raman-, NIR-, MIR- or UV-VIS spectroscopy).
In a PAT environment, real-time process measurements can be distinguished by the location
of the PAT tool [Bee11, Fda04, Kes06]:
at-line measurements: the sample is removed, isolated and analyzed in close
proximity to the process stream
on-line measurements: the sample is diverted from the manufacturing process and
may be returned to the process stream (bypass); conditioning of the sample possible
in-line measurements: the sample is not removed from the process stream;
conditioning of the sample NOT possible; in the literature the word on-line is often
used as synonym for in-line
For non-PAT conditions also off-line measurements can be applied. For this kind of analysis
the sample is removed and has to be analyzed in the laboratory at a separate site. Off-line as
well as at-line measurements, however, lead to time delays for analysis, to statistical (no
representative sample) and physical (material changes) sampling errors. Therefore, non-
invasive sensors are the most desirable technology to analyze and control critical process
parameters as described in section 3.2 [Lio04]. Crystallization is a multiphase system.
Therefore, information on both phases, the solid and the liquid phase, have to be
considered. Generally, devices can be distinguished which track parameters of the solid
phase or the liquid phase. Tab. 3-1 and Tab. 3-2 show an overview of commonly applied PAT
tools to monitor crystallization processes. Detailed information on the measurement
principle are given in the listed references.
Abbreviations for Tab. 3-1 and Tab. 3-2 as follows: Function of temperature (F(T)) and of
solid particle concentration (F(S)), particle size (d), suspension density (SD), yes (Y), no (N),
Focused Beam Reflectance Measurement (FBRM), Optical Reflectance Measurement (ORM),
Advanced Particle Analyzing System (APAS), Metastable Zone Width (MZW).

Process Analytical Technology (PAT)
13
Tab. 3-1: Commonly used PAT tools for crystallization processes to analyze the solid phase. M
ETH
OD
REQ
UIR
EMEN
TS
CO
NTR
OLL
AB
LE
PA
RA
MET
ER
AP
PLI
CA
TIO
N
F(T)
F(S)
CA
LIB
RA
TIO
N
PR
OB
LEM
S A
ND
ER
RO
RS
MEA
SUR
EMEN
T
PR
INC
IPLE
FBRM, ORM, APAS
Suspensions with suitable optical properties of particles and solvent; SD: ≤ 80 wt% d: 0.5-2000 µm [Seq13]
Chord length (distribution) or Particle Surface Area (distribution); Particle shape and roughness (only APAS) [Hel13c]; Particle number
MZW; Nucleation and growth kinetics; Seeding events; Polymorph transitions; Improved downstream processing
N Y N No direct information on particle sizes (chord length or surface areas, length/area weighted distributions); Errors by bubbles
Laser backreflection [Sch12]
Inline microscopy
Suspensions SD: ≤ 40 wt% d: 2-1000 µm [Met13] or 3-500 µm [Mer09]
Particle size; Particle shape and roughness
MZW; Nucleation and growth kinetics; Seeding events Polymorph transitions
N Y N High precision requires large images; Limited application for wide size distribution; Limited speed of particles to acquire a sharp image [Mer09]
Image analysis [Kra12]
Raman spectroscopy
Suspensions; Protection against light
Special feature: non-contact optic
Polymorphic form; Concentration [Hel13a]
MZW; Polymorphic form and phase changes; solvate formation; Desolvation; Polymorphic (amorphous) content
Y Y (Y)
Florescence (hiding Raman features) at high laser powers [Nei11]; Influence of d, SD on the signal quality caused by sampling errors [Hel13a]; Safety concerns
Inelastic scattering of incident light [Cor12]
No
t n
eces
sari
ly
Turbidity Suspensions Presence of particles; (Mean particle size, particle number)
MZW; Polymorphic form and phase changes
Y Y
N (Y)
Influence of d, particle shape and roughness on the signal quality [Har09]
Backscattering of light (nephelometry) or light weakness (turbidimetry) [Chi12a] [Chi12b]
Ultrasound attenuation spectroscopy
Suspensions d: 0.01-3000 µm [Mer09] /0.01-1000 µm [Mou03] SD: 0.5-70 vol% [Mer09] / 0.1-50 vol% [Mou03]
Particle number; Particle size (distribution, volume-weighted)
MZW; Nucleation and growth kinetics; Seeding events; Phase transitions
Y Y Y Errors by bubbles, Long measurement time (1-10 min) [Mer09]
Ultrasound velocity and attenuation at a series of frequencies [Sco08]
Ultrasound (single frequency)
Suspensions d: 100-800 µm SD: 5-30 wt%
Particle number; Mean particle size [Per11]
MZW; Nucleation and growth kinetics; Seeding events; Phase transitions
Y Y Y Limited application for high molecular APIs with low SD, d and c; Errors by bubbles
Measurement of velocity and attenuation of a low-frequency sound wave [Ulr12]
NIR spectroscopy
Suspensions Mean particle size; Particle number; Distinction of polymorphs
MZW; Impurity monitoring
Y Y Y Low chemical selectivity (broad, overlapping bands) [Bon11]
Absorption in the NIR region, excitation of molecule vibrations by light [Abe08, Kad10]
Process Analytical Technology (PAT)
14
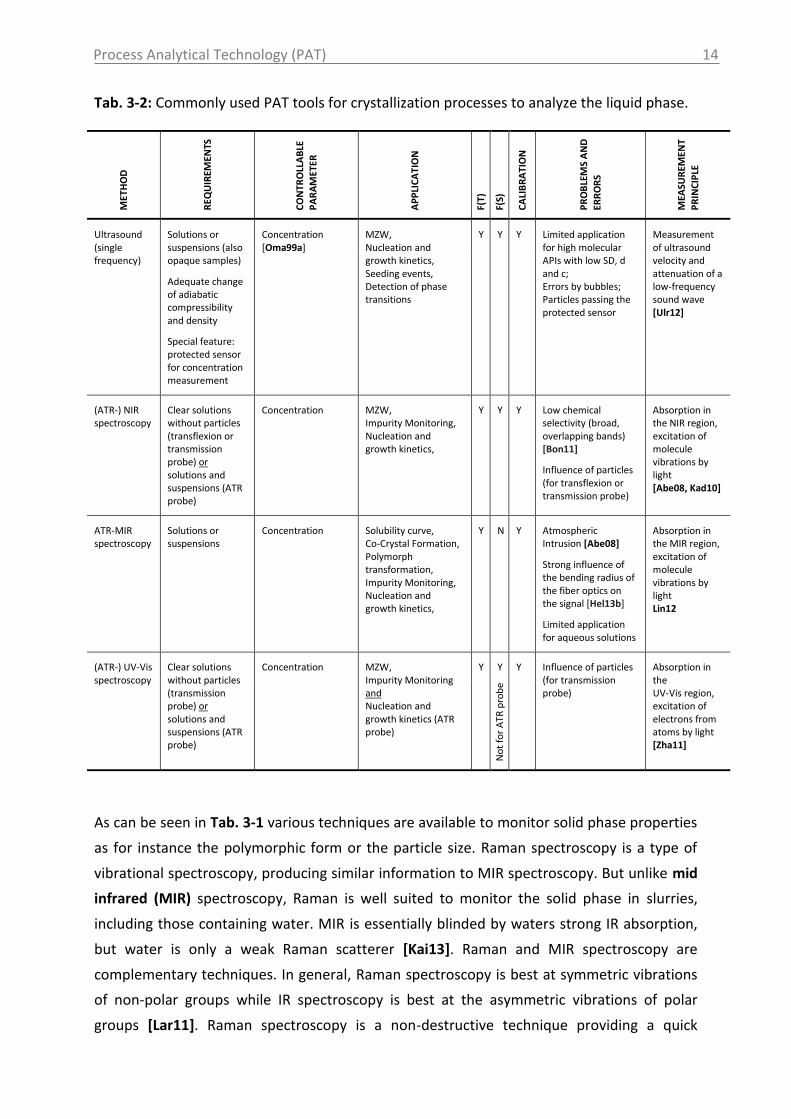
Tab. 3-2: Commonly used PAT tools for crystallization processes to analyze the liquid phase. M
ETH
OD
REQ
UIR
EMEN
TS
CO
NTR
OLL
AB
LE
PA
RA
MET
ER
AP
PLI
CA
TIO
N
F(T)
F(S)
CA
LIB
RA
TIO
N
PR
OB
LEM
S A
ND
ERR
OR
S
MEA
SUR
EMEN
T
PR
INC
IPLE
Ultrasound (single frequency)
Solutions or suspensions (also opaque samples)
Adequate change of adiabatic compressibility and density
Special feature: protected sensor for concentration measurement
Concentration [Oma99a]
MZW, Nucleation and growth kinetics, Seeding events, Detection of phase transitions
Y Y Y Limited application for high molecular APIs with low SD, d and c; Errors by bubbles; Particles passing the protected sensor
Measurement of ultrasound velocity and attenuation of a low-frequency sound wave [Ulr12]
No
t w
ith
pro
tect
ed s
enso
r
(ATR-) NIR spectroscopy
Clear solutions without particles (transflexion or transmission probe) or solutions and suspensions (ATR probe)
Concentration MZW, Impurity Monitoring, Nucleation and growth kinetics,
Y Y Y Low chemical selectivity (broad, overlapping bands) [Bon11]
Influence of particles (for transflexion or transmission probe)
Absorption in the NIR region, excitation of molecule vibrations by light [Abe08, Kad10]
ATR-MIR spectroscopy
Solutions or suspensions
Concentration Solubility curve, Co-Crystal Formation, Polymorph transformation, Impurity Monitoring, Nucleation and growth kinetics,
Y N Y
Atmospheric Intrusion [Abe08]
Strong influence of the bending radius of the fiber optics on the signal [Hel13b]
Limited application for aqueous solutions
Absorption in the MIR region, excitation of molecule vibrations by light Lin12
(ATR-) UV-Vis spectroscopy
Clear solutions without particles (transmission probe) or solutions and suspensions (ATR probe)
Concentration MZW, Impurity Monitoring and Nucleation and growth kinetics (ATR probe)
Y Y Y Influence of particles (for transmission probe)
Absorption in the UV-Vis region, excitation of electrons from atoms by light [Zha11]
No
t fo
r A
TR p
rob
e
As can be seen in Tab. 3-1 various techniques are available to monitor solid phase properties
as for instance the polymorphic form or the particle size. Raman spectroscopy is a type of
vibrational spectroscopy, producing similar information to MIR spectroscopy. But unlike mid
infrared (MIR) spectroscopy, Raman is well suited to monitor the solid phase in slurries,
including those containing water. MIR is essentially blinded by waters strong IR absorption,
but water is only a weak Raman scatterer [Kai13]. Raman and MIR spectroscopy are
complementary techniques. In general, Raman spectroscopy is best at symmetric vibrations
of non-polar groups while IR spectroscopy is best at the asymmetric vibrations of polar
groups [Lar11]. Raman spectroscopy is a non-destructive technique providing a quick
Process Analytical Technology (PAT)
15
analysis of untreated samples. In comparison to NIR spectroscopy, Raman spectroscopy
presents well resolved peaks. Thus, the interpretation of Raman data is easer and does not
require necessarily a chemometric method [Arm12].
In addition to information on the solid phase, liquid phase information is necessary and
beneficial. The monitoring and control of supersaturation (concentration) can provide an
optimal path to the final product quality, such as the PSD. Additionally, to the methods
tracking the liquid phase, shown in Tab. 3-2, several univariate techniques have been
reported in the past to monitor the concentration (supersaturation). They are based on the
measurement of properties such as the refractive index, the conductivity of the solution, the
density of the liquid phase or the pH of the solution. In comparison, to other techniques and
to multivariate process measurement analysis these techniques have several limitations
concerning the application to crystallization processes. The application of conductivity, for
instance, is restricted to conducting solvents. Most of the organic solvents, used in the
pharmaceutical industry, however, are non-conducting. The measurement of density at
industrial scales is still not widely accepted since it is sensitive to particles, impurities and
temperature changes [Kad10].
The attenuated total reflectance mid infrared (ATR-MIR) spectroscopy, the near infrared
(NIR) spectroscopy and the ultraviolet visible (UV-Vis) spectroscopy are the most common
techniques applied for on-line and in-line concentration measurements during crystallization
processes. The spectroscopic techniques are non-destructive and fast. Since complex
chemical information are available from the recorded spectra, effects such as chemical
reactions and transformations and the presence of impurities can be monitored in addition
to the concentration measurement [Kad10]. The accuracy of the concentration
measurement depends strongly on the properties of the used compound and solvent, on the
calibration model and on the devices used to record the data. Furthermore, water vapor and
carbon dioxide in the optical conduit of an ATR-MIR spectrometer are known to influence
the measurement sensitivity. In comparison to NIR spectra, ATR-MIR spectra show greater
chemical selectivity in terms of sharp and separated peaks resulting from specific functional
groups. Since MIR is strongly attenuated by most materials and cannot penetrate into the
sample, a special surface reflection probe must be utilized [Kai13]. The application of
ultrasound (OCM device) has the advantage to provide information on the liquid phase
(protected sensor) and simultaneously on the solid phase (unprotected sensor). Therefore,
in addition to the information on supersaturation e.g. seeding events can be tracked by an
increase of attenuation detected by the unprotected ultrasound sensor.
Aim of the Work
16
4. Aim of the Work
The previous sections 2 and 3 showed the actual state of the art concerning crystallization
and the use of PAT. In recent years a huge number of papers, books and reviews were
published with regard to the application of the PAT tools at laboratory scale to monitor and
understand industrial processes [Bor09, Cai06, Chi12a, Cor08, Eng11, Fuj02, Gla04, Hei08,
Oma99a, Per11, Ulr12]. Since the scale up from laboratory to industrial scales is challenging
(e.g. due to mixing and heat transfer effects), the application of such techniques is not only
preferable in the lab but also at higher scales. In industrial practice, however, only recently
some in situ sensors were applied at pilot plant or industrial scales. Therefore, only few
publications describe the implementation of these tools at industrial level [Kad11, Wir13,
Fet13b, Hel13a, Hel13b]. Furthermore, almost no information is given in the literature,
which limitations and problems can occur during applications in industrial scales. This shows
the need for further investigations concerning the implementation and use of PAT tools at
pilot or industrial level. The sensitivities, strengths and weaknesses of these different
measurement techniques have to be compared to facilitate the selection of suitable PAT
tools for process design and scale-up.
The thesis aims the strategic selection and application of PAT tools for pharmaceutical
compounds at laboratory scale which are beneficial for:
a rapid development and understanding of crystallization processes and
a fast transferability of the selected techniques to higher scales (pilot plant).
By the investigation of twelve pharmaceutical model compounds with seven different
measurement techniques (solid and liquid phase) recommendations for the selection of PAT
tools and practical consequences should be identified. Furthermore, realistic expectations
for online analytical measurement techniques should be shown in order to eliminate
unrealistic positive and negative expectations. Basically, measurement techniques which can
be applied in the lab are usable at industrial scales as well. The environment at industrial
level, however, is characterized by rougher measurement conditions. Therefore, it has to be
investigated, to what extent the robustness of the measurement techniques and the
calibration methods enable a direct transferability from laboratory to higher scales.
To achieve this research objective, the following sub-goals were defined and analyzed by
practical work as well as by a literature search:
Which parameters are necessary to be known and important for the pharmaceutical
industry (critical process and product parameters)?

Aim of the Work
17
Which information content can be derived from the different measurement
techniques?
Which limitations are present for the different measuring methods concerning their
application for pharmaceutical compounds which often have a high molecular weight
and typically have low solubilities and small particle sizes?
Which time effort for evaluation of data and for calibration model building is needed
(establishing new software)?
Can PAT tools used in the lab, also be applied in pilot plant reaction vessels? How can
they be integrated without time and cost intensive modifications in the existing
setups?
Is there a possibility to transfer the calibrations models developed for lab scale
applications directly to a pilot plant or industrial scale?
Are there problems during the application of PAT tools in the pilot plant which are
not present for the laboratory scale and how can the problems be solved?
The accomplishment of these points is described through the following.
Materials, Methods and Procedures
18
5. Materials, Methods and Procedures
5.1 Materials
The used materials are most often pharmaceutical model compounds with different physical
and chemical properties. The molecule weight ranges from 75 g/mol (small molecules) up to
> 500 g/mol (large molecules). Most of the pharmaceuticals exhibit polymorphism. Tab. 5-1
shows an overview of the examined materials and solvents. The used ethanol and methanol
(99.8 %, 1 % MEK) was purchased from Carl Roth GmbH + Co. KG. For citric acid absolute
ethanol (undenatured) obtained from Merck KGaA (Darmstadt, Germany) was used.
Chemical purity of Paracetamol was determined by HPLC (99.0 area-%). As a non-
pharmaceutical compound Ammonium sulphate was used, purchased from SKW Piesteritz.
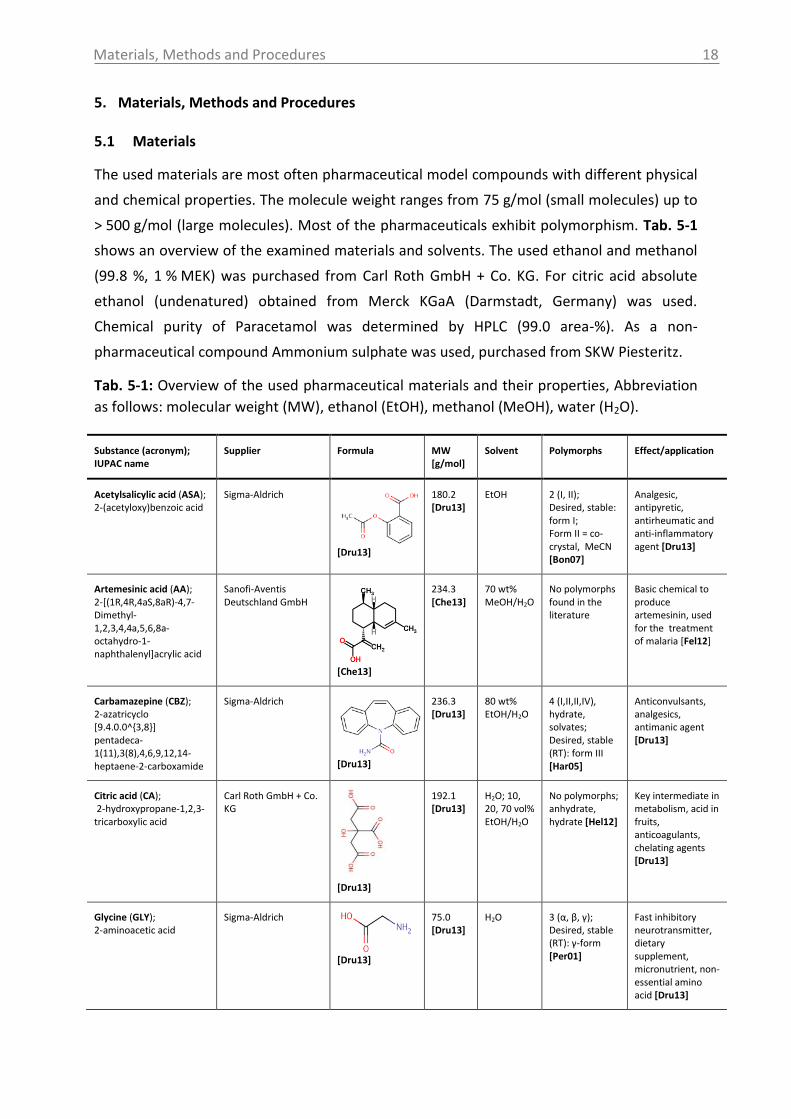
Tab. 5-1: Overview of the used pharmaceutical materials and their properties, Abbreviation
as follows: molecular weight (MW), ethanol (EtOH), methanol (MeOH), water (H2O).
Substance (acronym); IUPAC name
Supplier Formula MW [g/mol]
Solvent Polymorphs Effect/application
Acetylsalicylic acid (ASA); 2-(acetyloxy)benzoic acid
Sigma-Aldrich
[Dru13]
180.2 [Dru13]
EtOH 2 (I, II); Desired, stable: form I; Form II = co-crystal, MeCN [Bon07]
Analgesic, antipyretic, antirheumatic and anti-inflammatory agent [Dru13]
Artemesinic acid (AA); 2-[(1R,4R,4aS,8aR)-4,7-Dimethyl-1,2,3,4,4a,5,6,8a-octahydro-1-naphthalenyl]acrylic acid
Sanofi-Aventis Deutschland GmbH
[Che13]
234.3 [Che13]
70 wt% MeOH/H2O
No polymorphs found in the literature
Basic chemical to produce artemesinin, used for the treatment of malaria [Fel12]
Carbamazepine (CBZ); 2-azatricyclo [9.4.0.0^{3,8}] pentadeca-1(11),3(8),4,6,9,12,14-heptaene-2-carboxamide
Sigma-Aldrich
[Dru13]
236.3 [Dru13]
80 wt% EtOH/H2O
4 (I,II,II,IV), hydrate, solvates; Desired, stable (RT): form III [Har05]
Anticonvulsants, analgesics, antimanic agent [Dru13]
Citric acid (CA); 2-hydroxypropane-1,2,3-tricarboxylic acid
Carl Roth GmbH + Co. KG
[Dru13]
192.1 [Dru13]
H2O; 10, 20, 70 vol% EtOH/H2O
No polymorphs; anhydrate, hydrate [Hel12]
Key intermediate in metabolism, acid in fruits, anticoagulants, chelating agents [Dru13]
Glycine (GLY); 2-aminoacetic acid
Sigma-Aldrich
[Dru13]
75.0 [Dru13]
H2O 3 (α, β, γ); Desired, stable (RT): γ-form [Per01]
Fast inhibitory neurotransmitter, dietary supplement, micronutrient, non-essential amino acid [Dru13]
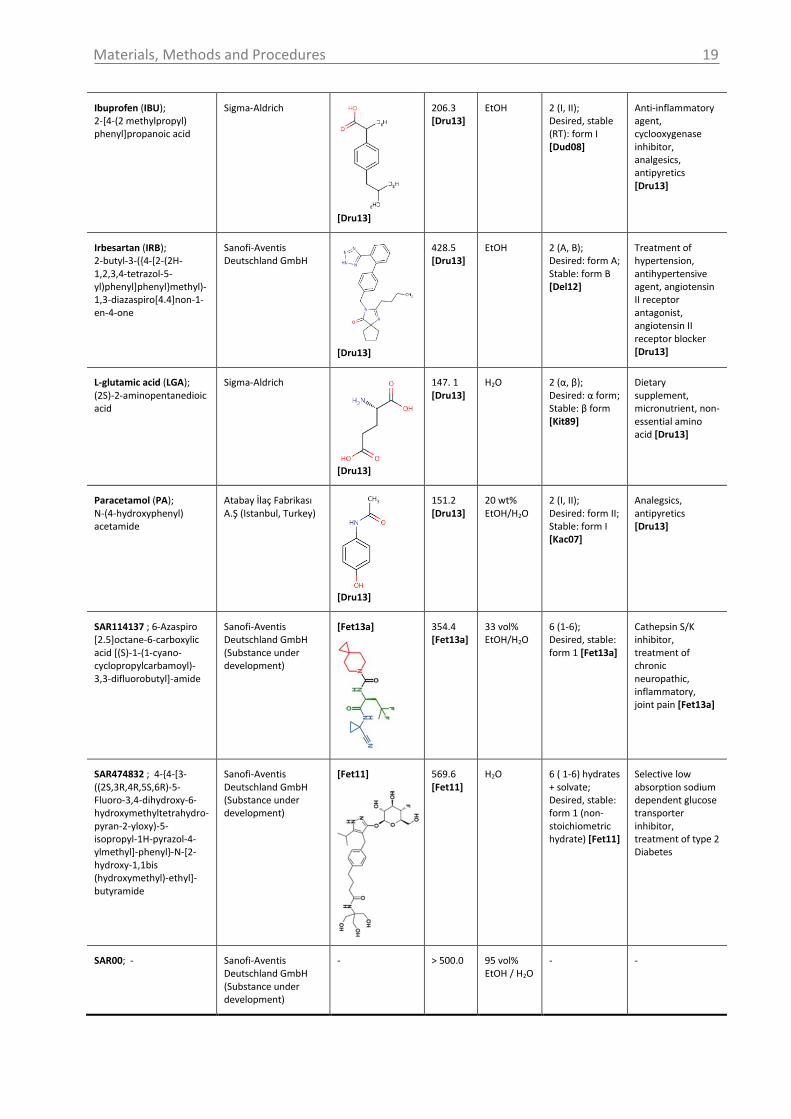
Materials, Methods and Procedures
19
Ibuprofen (IBU); 2-[4-(2 methylpropyl) phenyl]propanoic acid
Sigma-Aldrich
[Dru13]
206.3 [Dru13]
EtOH 2 (I, II); Desired, stable (RT): form I [Dud08]
Anti-inflammatory agent, cyclooxygenase inhibitor, analgesics, antipyretics [Dru13]
Irbesartan (IRB); 2-butyl-3-({4-[2-(2H-1,2,3,4-tetrazol-5-yl)phenyl]phenyl}methyl)-1,3-diazaspiro[4.4]non-1-en-4-one
Sanofi-Aventis Deutschland GmbH
[Dru13]
428.5 [Dru13]
EtOH 2 (A, B); Desired: form A; Stable: form B [Del12]
Treatment of hypertension, antihypertensive agent, angiotensin II receptor antagonist, angiotensin II receptor blocker [Dru13]
L-glutamic acid (LGA); (2S)-2-aminopentanedioic acid
Sigma-Aldrich
[Dru13]
147. 1 [Dru13]
H2O 2 (α, β); Desired: α form; Stable: β form [Kit89]
Dietary supplement, micronutrient, non-essential amino acid [Dru13]
Paracetamol (PA); N-(4-hydroxyphenyl) acetamide
Atabay İlaç Fabrikası A.Ş (Istanbul, Turkey)
[Dru13]
151.2 [Dru13]
20 wt% EtOH/H2O
2 (I, II); Desired: form II; Stable: form I [Kac07]
Analegsics, antipyretics [Dru13]
SAR114137 ; 6-Azaspiro [2.5]octane-6-carboxylic acid [(S)-1-(1-cyano-cyclopropylcarbamoyl)-3,3-difluorobutyl]-amide
Sanofi-Aventis Deutschland GmbH (Substance under development)
[Fet13a]
354.4 [Fet13a]
33 vol% EtOH/H2O
6 (1-6); Desired, stable: form 1 [Fet13a]
Cathepsin S/K inhibitor, treatment of chronic neuropathic, inflammatory, joint pain [Fet13a]
SAR474832 ; 4-{4-[3-((2S,3R,4R,5S,6R)-5-Fluoro-3,4-dihydroxy-6-hydroxymethyltetrahydro-pyran-2-yloxy)-5-isopropyl-1H-pyrazol-4-ylmethyl]-phenyl}-N-[2-hydroxy-1,1bis (hydroxymethyl)-ethyl]-butyramide
Sanofi-Aventis Deutschland GmbH (Substance under development)
[Fet11]
569.6 [Fet11]
H2O 6 ( 1-6) hydrates + solvate; Desired, stable: form 1 (non-stoichiometric hydrate) [Fet11]
Selective low absorption sodium dependent glucose transporter inhibitor, treatment of type 2 Diabetes
SAR00; -
Sanofi-Aventis Deutschland GmbH (Substance under development)
- > 500.0 95 vol% EtOH / H2O
- -
Materials, Methods and Procedures
20
5.2 Methods
5.2.1 Inline/online measurement techniques
5.2.1.1 Ultrasound
The ultrasound velocity, attenuation and temperature were analyzed using a LiquiSonic
50/30 sensor (SensoTech GmbH, Magdeburg, Germany) (used for MZW determination,
calibration of concentration) or a LiquiSonic OCM device (SensoTech GmbH, Magdeburg,
Germany) (used to test the application of the protected sensor with the model compound
ammonium sulphate). The OCM device is based on the LiquiSonic 50 probe and has in
addition a crystallization adapter, which prevents the measurement stretch against particles
(protected ultrasound sensor). By means of the protected sensor the liquid phase can be
measured. Only dust and abrasion particles with a size smaller than the mesh are able to
pass. The second sensor is not protected by a sieve and enables to measure the solid phase.
More information on the ultrasound devices, the measurement conditions and used
software is given in the appendix (section 14.1) and by SensoTech [Sen13].
5.2.1.2 Spectroscopic methods
ATR-MIR spectroscopy of liquids and suspensions
The spectra were recorded on a Fourier transform (FT)-IR spectrometer Matrix-MF
manufactured by Bruker Optic GmbH (Ettlingen, Germany) equipped with an IN350-T
diamond fiber ATR-probe (shaft made from molybdenum). Information on data acquisition
and used software can be observed in the appendix (section 14.2).
Dispersive Raman spectroscopy
Raman spectroscopic measurements on suspensions and solutions were performed in 180 °
backscattering geometry on a dispersive Raman system (RXN1 Workstation, Kaiser Optical
Systems, Ann Arbor, Michigan) equipped with a 785 nm laser diode (laser power: 400 mW,)
and a half-inch MR-immersion probe (laser spot size 150 µm). Information on data
acquisition, used software and laser calibration is given in the appendix (section 14.3).
NIR spectroscopy
NIR spectra were recorded on a Matrix-F FT-NIR spectrometer (Bruker Optik GmbH)
equipped with a transflection probe head. Information on data acquisition and used
software is given in the appendix (section 14.4).
UV-Vis Spectroscopy
UV-Vis spectra were recorded on an AvaSpec-3648-USB2-UA-25 spectrometer (Avantes)
equipped with a DAVA AvaLight-DHc deuterium-halogen light source and a DAVA FCR-
Materials, Methods and Procedures
21
7UV200-2-45-ME transmission probe. Information on data acquisition and used software is
given in the appendix (section 14.5).
5.2.1.3 Turbidity measurement techniques
Tubidimetric and nephelopmetric measurements were either performed with a turbidity
probe Trb8300 from Mettler Toledo (Switzerland) or using the Crystal16 multiple reactor
system from Avantium (Amsterdam, Netherlands) or the STEM Integrity 10 Reaction Station
(Electrothermal, United Kingdom). Information on data acquisition is given in the
appendix (section 14.6).
5.2.1.4 Optical reflectance measurement
The optical reflectance measurements were performed using the Advanced Particle
Analyzing System (APAS) with Multi Capture Signal Technology (MCST) (Sequip S&E GmbH,
Germany) (sensor name: APAS 14). Further information on the system is given in the
appendix (section 14.7). The measurement principle for this advanced technique is
described in detail in [Hel13c].
5.2.2 Offline measurement techniques
ATR-FT-MIR (FT-IR) spectroscopy of solids
Reference spectra of the used materials were acquired on a FTS 1000 ATR-FT-MIR
spectrometer from Varian (Agilent Technologies Inc., Palo Alto, USA). The spectra of the
powders were collected in a spectral range between 650 cm-1 and 4000 cm-1 using a spectral
resolution of 4 cm-1 and a scan number of 20.
Hotstage Raman spectroscopy
Raman spectroscopic measurements of the solids were performed in 180 ° backscattering
geometry on a dispersive Raman system (RXN1 Workstation, Kaiser Optical Systems, Ann
Arbor, Michigan) equipped with a 785 nm laser diode (laser power: 400 mW) and a PhAT
probe (laser spot size 6 mm). The experimental setup for the hotstage Raman spectroscopic
measurements is presented by Feth et al. [Fet11]. Further information on the system and
the hotstage measurements can be observed in the appendix (section 14.3).
X-Ray Powder Diffraction (XRPD)
The X-ray diffraction patterns were collected on a Bruker D4 Endeavor diffractometer using
Cu Kα1 (λ = 1.5405 Å) radiation.
Measurements in capillary mode were made on a STOE STADI P transmission diffractometer
(STOE & Cie GmbH, Darmstadt, Germany) using Cu Kα1 radiation, to analyze the purity of the
produced α-LGA polymorphic form used for the Raman calibration. The purity was calculated
Materials, Methods and Procedures
22
from the measured XRPD pattern using a convolution based profile fitting algorithm (Rietfeld
refinement) available in the Diffracplus Topas software (Bruker Optik GmbH), based on
crystallographic information (released lattice parameters and fixed atomic coordinates)
[Cam12].
Further information on data acquisition and used software is given in the appendix
(section 14.8).
SEM
SEM pictures were acquired on a Hitachi table microscope TM-1000 (Hitachi High
Technologies Europe GmbH, Krefeld, Germany). For the SEM measurements all samples
were coated with gold using SCD 055 sputter coater from Bal-TEC (Leica Mikrosysteme
GmbH, Wetzlar, Germany).
Optical microscopy
Optical microscopy was used to assess the particle size and shape/morphology of the APIs.
The analyses were performed with an OLYMPUS BX 51 polarization microscope and
documented with the analySIS software from OLYMPUS.
Laser diffraction
The volume-weighted particle diameters d90 were determined by a laser diffractometer
Mastersizer 2000 equipped with a Hydro 2000S (A) dispersion accessory from Malvern
Instruments GmbH (Herrenberg, Germany). Information on data acquisition and the used
method can be seen in the appendix (section 14.9).
Density meter
To analyze the density of solutions/suspensions a density meter (DE40) from Mettler Toledo,
(Giessen, Germany) was used.
5.3 Experimental procedures
5.3.1.1 Ultrasound
Determination of MZW
Suspensions of known concentrations were heated using a rate of 10 K/h (except for CA,
5 K/h) in the lab or a rate of 15 K/h in the pilot plant until all crystals were dissolved and
subsequently cooled down using the same rate until nucleation occurred.
Determination of concentrations and construction of a calibration curve (liquid phase)
To determine the concentration of the model compounds a calibration model was
developed as follows at first in the lab and subsequently in the pilot plant. Specific amounts

Materials, Methods and Procedures
23
of the substance and the solvent were weighed (total volume in the lab 200 mL and in the
pilot plant 150-170 L) and heated up until everything was dissolved and then cooled down
again with a rate 10 K/h (lab) or 6-10 K/h (pilot plant) until nucleation occurred. During the
cooling cycle the ultrasound velocities as well as the temperatures were measured in
dependency of the used concentrations. It should be noted that to build the calibration
model only the velocity and temperature data were taken which were measured without the
presence of particles. In comparison to the experiment performed in the lab, the calibration
samples in the pilot plant were not prepared independently, but by stepwise addition of
solid material to the solution with the lower concentration. After crystal addition the
solution was heated up to the maximum calibration temperature and was stirred for 15 min
in order to dissolve the material completely. The used concentration data to build the
calibration models for Acetylsalicylic acid, L-glutamic acid and Paracetamol in the lab and
pilot plant are shown in the appendix (section 14.11).
Application of the protected ultrasound sensor
A saturated solution of ammonium sulphate in water was prepared at 20 °C. Subsequently,
the ultrasound velocity and attenuation was measured with the protected and unprotected
sensor (OCM device). In order to analyze the effect of particles, two different mesh sizes
were tested as cover for the protected sensor (35µm and 150 µm). The heating of the cage
was switched off. Sieved particles with a size of 200-400 µm were added to the saturated
solution and a suspension density of 5 wt% was produced. In order to investigate the
protective effect of the covered sensor, the measurement results of the protected and the
protected sensor were compared.
In a second experiment a solution with a concentration of 44.75 wt% ammonium sulphate in
water (solubility temperature 40 °C, according to Buchfink [Buc11]) was prepared and
completely dissolved by heating up to a temperature of 45 °C. Subsequently, the
measurement was started and the temperature was kept constant for 1 hour. The clear
solution was cooled down with a rate of 10 K/h to approximately 10 °C in order to initiate
spontaneous nucleation.
Experimental setup
The experiments in the lab were performed in a 300 mL double-jacketed glass crystallizer
(filling volume 200 mL). Stirring was provided by a magnetic stirrer bar with a diameter of
3 cm and a stirring rate of 500 rpm. An external thermostat was used to control the
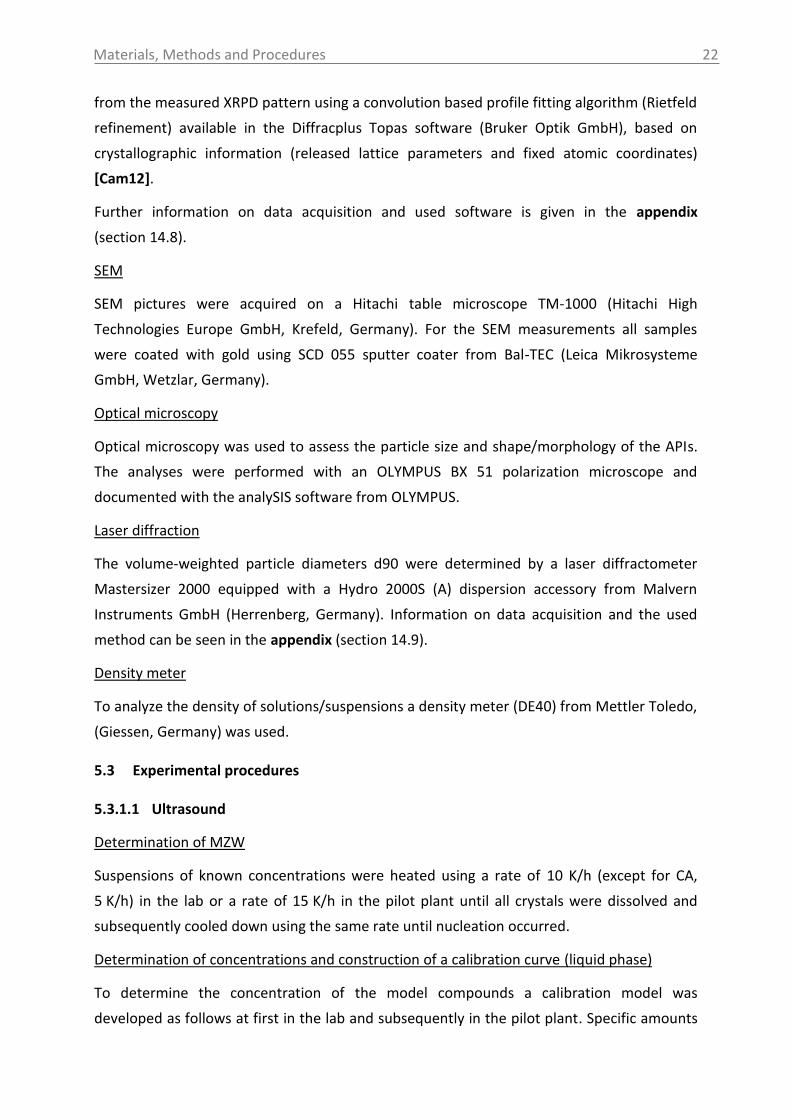
temperature. The experimental setup is shown in Fig. 5-1.
Materials, Methods and Procedures
24
Fig. 5-1: Experimental setup with ultrasound device at lab scale.
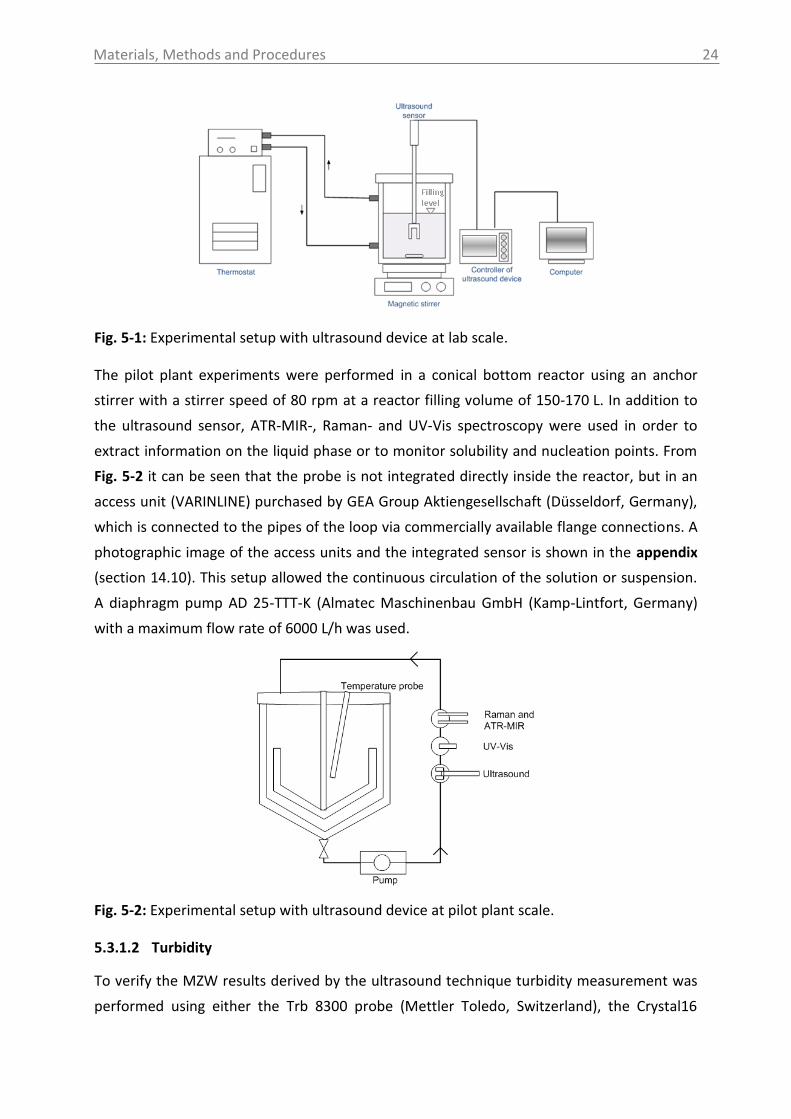
The pilot plant experiments were performed in a conical bottom reactor using an anchor
stirrer with a stirrer speed of 80 rpm at a reactor filling volume of 150-170 L. In addition to
the ultrasound sensor, ATR-MIR-, Raman- and UV-Vis spectroscopy were used in order to
extract information on the liquid phase or to monitor solubility and nucleation points. From
Fig. 5-2 it can be seen that the probe is not integrated directly inside the reactor, but in an
access unit (VARINLINE) purchased by GEA Group Aktiengesellschaft (Düsseldorf, Germany),
which is connected to the pipes of the loop via commercially available flange connections. A
photographic image of the access units and the integrated sensor is shown in the appendix
(section 14.10). This setup allowed the continuous circulation of the solution or suspension.
A diaphragm pump AD 25-TTT-K (Almatec Maschinenbau GmbH (Kamp-Lintfort, Germany)
with a maximum flow rate of 6000 L/h was used.
Fig. 5-2: Experimental setup with ultrasound device at pilot plant scale.
5.3.1.2 Turbidity
To verify the MZW results derived by the ultrasound technique turbidity measurement was
performed using either the Trb 8300 probe (Mettler Toledo, Switzerland), the Crystal16
Materials, Methods and Procedures
25
multiple reactor system (Avantium, Netherlands) or the STEM Integrity 10 Reaction Station
(Electrothermal, United Kingdom).
Trb 8300 probe (Mettler Toledo, Switzerland)
The inline measurements were performed in accordance to the procedure and the
experimental setup presented in section 5.3.1.1 (ultrasound – MZW).
Crystal16 multiple reactor system (Avantium, Netherlands)
Batch cooling crystallization experiments were performed in 1000 mg scale with a magnetic
stirrer at 700 rpm in a multiple reactor setup applying the same cooling rate as for the
ultrasound measurements. Before starting the measurement a background measurement
was performed using the solvent without solute (tuning step). The setup consists of 16 glass
reactors (HPLC vials) which can be stirred, heated and cooled independently. Each vessel is
equipped with a turbidity measurement cell (non-contact measurement). In order to prevent
condensation of water on the reactor the Crystal16 system provides an inlet for a dry purge
gas (nitrogen).
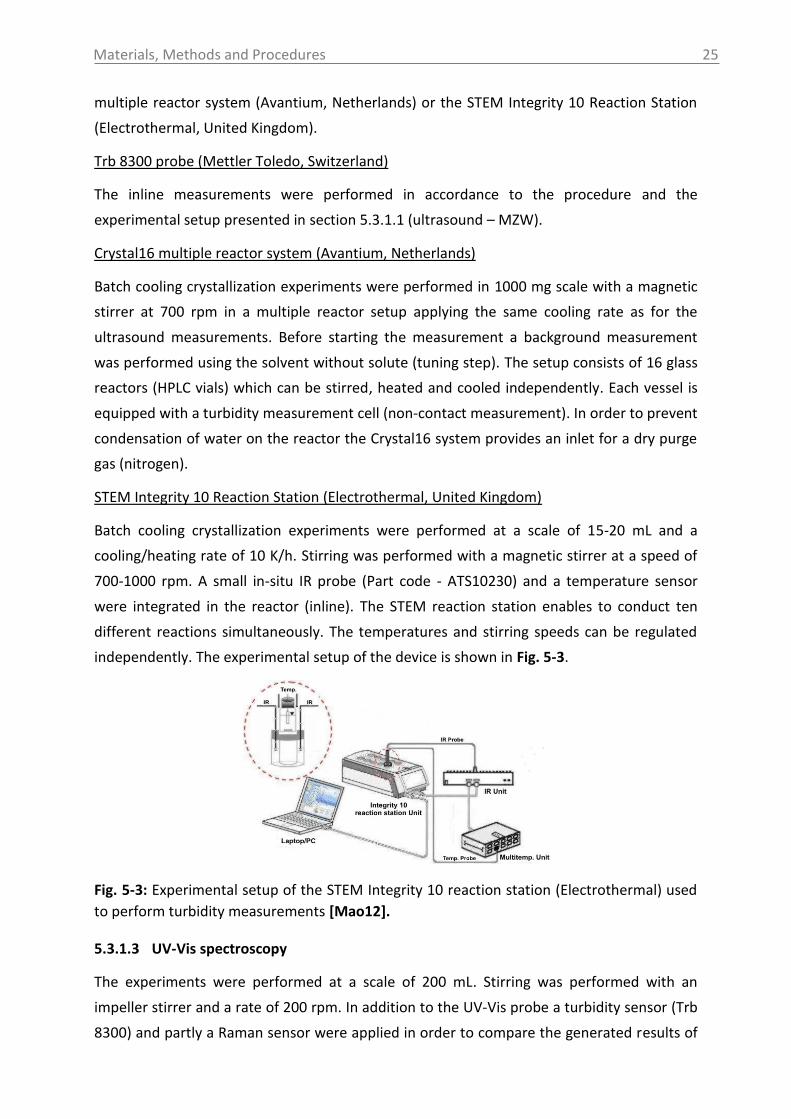
STEM Integrity 10 Reaction Station (Electrothermal, United Kingdom)
Batch cooling crystallization experiments were performed at a scale of 15-20 mL and a
cooling/heating rate of 10 K/h. Stirring was performed with a magnetic stirrer at a speed of
700-1000 rpm. A small in-situ IR probe (Part code - ATS10230) and a temperature sensor
were integrated in the reactor (inline). The STEM reaction station enables to conduct ten
different reactions simultaneously. The temperatures and stirring speeds can be regulated
independently. The experimental setup of the device is shown in Fig. 5-3.
Fig. 5-3: Experimental setup of the STEM Integrity 10 reaction station (Electrothermal) used
to perform turbidity measurements [Mao12].
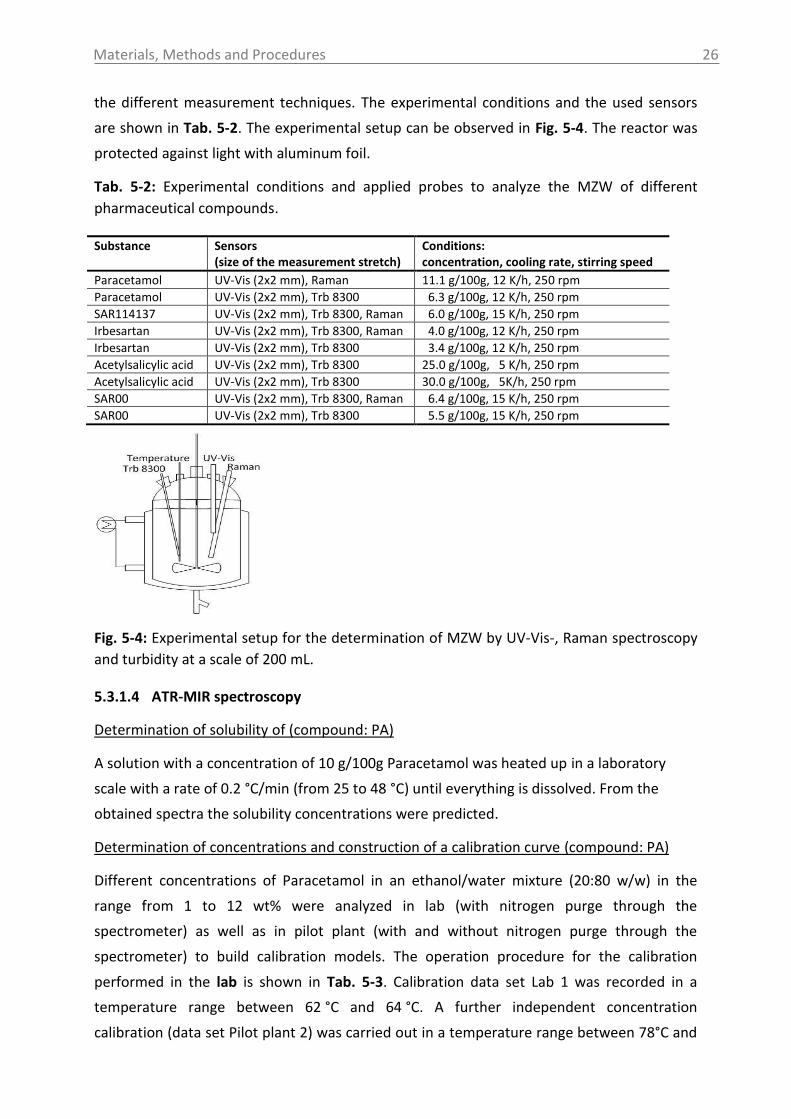
5.3.1.3 UV-Vis spectroscopy
The experiments were performed at a scale of 200 mL. Stirring was performed with an
impeller stirrer and a rate of 200 rpm. In addition to the UV-Vis probe a turbidity sensor (Trb
8300) and partly a Raman sensor were applied in order to compare the generated results of
Materials, Methods and Procedures
26
the different measurement techniques. The experimental conditions and the used sensors
are shown in Tab. 5-2. The experimental setup can be observed in Fig. 5-4. The reactor was
protected against light with aluminum foil.
Tab. 5-2: Experimental conditions and applied probes to analyze the MZW of different
pharmaceutical compounds.
Substance Sensors (size of the measurement stretch)
Conditions: concentration, cooling rate, stirring speed
Paracetamol UV-Vis (2x2 mm), Raman 11.1 g/100g, 12 K/h, 250 rpm
Paracetamol UV-Vis (2x2 mm), Trb 8300 6.3 g/100g, 12 K/h, 250 rpm
SAR114137 UV-Vis (2x2 mm), Trb 8300, Raman 6.0 g/100g, 15 K/h, 250 rpm
Irbesartan UV-Vis (2x2 mm), Trb 8300, Raman 4.0 g/100g, 12 K/h, 250 rpm
Irbesartan UV-Vis (2x2 mm), Trb 8300 3.4 g/100g, 12 K/h, 250 rpm
Acetylsalicylic acid UV-Vis (2x2 mm), Trb 8300 25.0 g/100g, 5 K/h, 250 rpm
Acetylsalicylic acid UV-Vis (2x2 mm), Trb 8300 30.0 g/100g, 5K/h, 250 rpm
SAR00 UV-Vis (2x2 mm), Trb 8300, Raman 6.4 g/100g, 15 K/h, 250 rpm
SAR00 UV-Vis (2x2 mm), Trb 8300 5.5 g/100g, 15 K/h, 250 rpm
Fig. 5-4: Experimental setup for the determination of MZW by UV-Vis-, Raman spectroscopy
and turbidity at a scale of 200 mL.
5.3.1.4 ATR-MIR spectroscopy
Determination of solubility of (compound: PA)
A solution with a concentration of 10 g/100g Paracetamol was heated up in a laboratory
scale with a rate of 0.2 °C/min (from 25 to 48 °C) until everything is dissolved. From the
obtained spectra the solubility concentrations were predicted.
Determination of concentrations and construction of a calibration curve (compound: PA)
Different concentrations of Paracetamol in an ethanol/water mixture (20:80 w/w) in the
range from 1 to 12 wt% were analyzed in lab (with nitrogen purge through the
spectrometer) as well as in pilot plant (with and without nitrogen purge through the
spectrometer) to build calibration models. The operation procedure for the calibration
performed in the lab is shown in Tab. 5-3. Calibration data set Lab 1 was recorded in a
temperature range between 62 °C and 64 °C. A further independent concentration
calibration (data set Pilot plant 2) was carried out in a temperature range between 78°C and

Materials, Methods and Procedures
27
27 °C in order to compare the pseudo-isothermal with the temperature dependent
calibration. For this purpose step 4 and 5 (Tab. 5-3) were repeated several times and the
solutions were cooled to observe the temperature dependence of the recorded solution
spectra (results are seen in Fig. 6-25 in section 6.2.2.2). The calibration spectra were
recorded in clear solution before the occurrence of nucleation.
Tab. 5-3: Operation procedure for the calibration performed in the lab.
Step Procedure
1 Preparation of independent samples in round bottomed flasks under reflux until perfect dissolution
2 Transfer of the sample into reactor equipped with MIR probe
3 Conditioning period of 20 min @ 65 °C
4 Cooling towards target temperature
5 Measurement in undersaturated, saturated and supersaturated solution before occurrence of nucleation
The operation procedure for the calibrations performed in the pilot plant can be observed in
Tab. 5-4. Completion of the dissolution procedure was visually controlled by a sight glass in
the reactor pipes (see appendix: section 14.10). In addition to a pseudo-isothermal
calibration at 57-60 °C a multi-temperature calibration was carried out in the range between
78 °C and 58 °C. For this purpose step 3 and 4 (Tab. 5-4) were repeated several times.
Tab. 5-4: Operation procedure for the calibration performed in the pilot plant.
Step Procedure
1 Preparation of dependent samples directly inside the stirred tank by stepwise addition of the required solid material starting from the most diluted solution
2 Conditioning period of 15 min @ 57-60 °C (data set 1&2) or 80 °C (data set 3)
3 Cooling towards target temperature
4 Measurement in undersaturated, saturated and supersaturated solution before occurrence of nucleation
Based on 20 or 26 training samples and 8 or 5 test samples (Lab 1 or 2, respectively) two
separate PI and PLS calibration models were developed at lab scale. For the pilot plant 20 or
14 or 20 training samples and 12 or 8 or 8 (Pilot plant 1 or 2 or 3) were used to build three
separate PI and PLS calibration models. The used data pretreatments as well as the used
concentration data to build the calibration models are shown in Tab. 5-5 and Fig. 5-5. A data
table referring to Fig. 5-5 is given in the appendix (section 14.11). Resulting by the conditions
selected for data pretreatment, peak normalization was performed at 1045 cm-1 (C-OH
vibrations of ethanol).
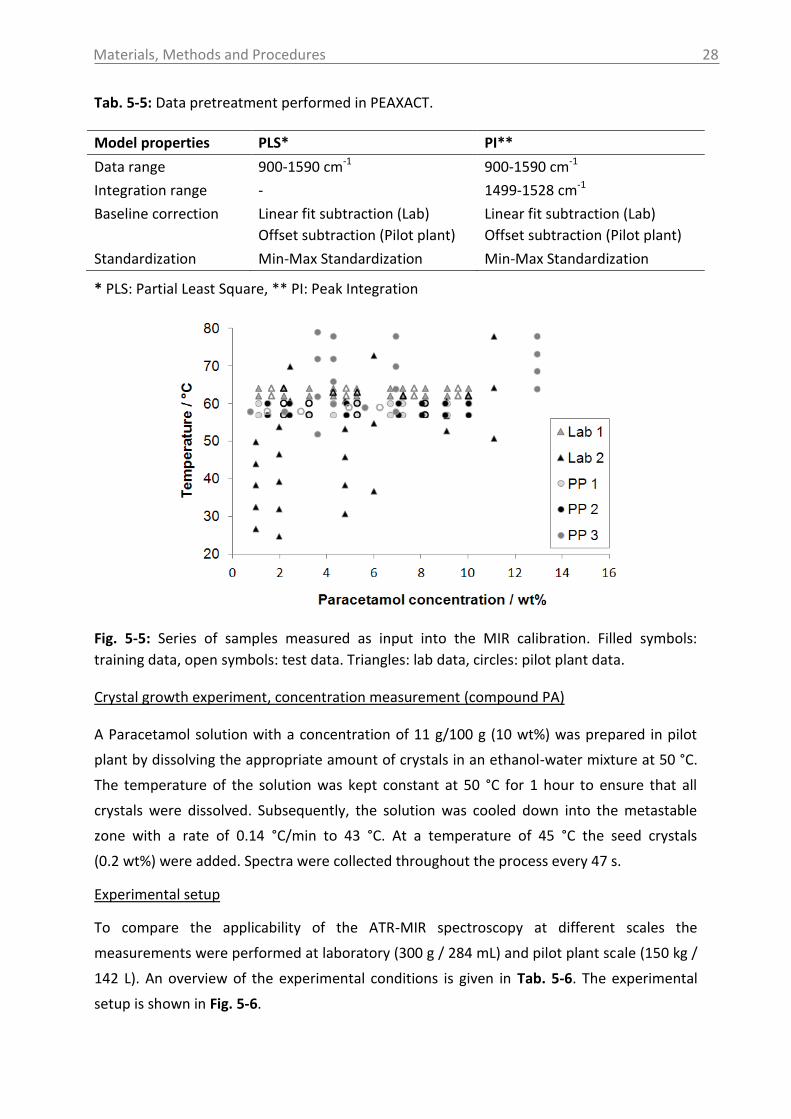
Materials, Methods and Procedures
28
Tab. 5-5: Data pretreatment performed in PEAXACT.
Model properties PLS* PI**
Data range 900-1590 cm-1 900-1590 cm-1
Integration range - 1499-1528 cm-1
Baseline correction Linear fit subtraction (Lab)
Offset subtraction (Pilot plant)
Linear fit subtraction (Lab)
Offset subtraction (Pilot plant)
Standardization Min-Max Standardization Min-Max Standardization
* PLS: Partial Least Square, ** PI: Peak Integration
Fig. 5-5: Series of samples measured as input into the MIR calibration. Filled symbols:
training data, open symbols: test data. Triangles: lab data, circles: pilot plant data.
Crystal growth experiment, concentration measurement (compound PA)
A Paracetamol solution with a concentration of 11 g/100 g (10 wt%) was prepared in pilot
plant by dissolving the appropriate amount of crystals in an ethanol-water mixture at 50 °C.
The temperature of the solution was kept constant at 50 °C for 1 hour to ensure that all
crystals were dissolved. Subsequently, the solution was cooled down into the metastable
zone with a rate of 0.14 °C/min to 43 °C. At a temperature of 45 °C the seed crystals
(0.2 wt%) were added. Spectra were collected throughout the process every 47 s.
Experimental setup
To compare the applicability of the ATR-MIR spectroscopy at different scales the
measurements were performed at laboratory (300 g / 284 mL) and pilot plant scale (150 kg /
142 L). An overview of the experimental conditions is given in Tab. 5-6. The experimental
setup is shown in Fig. 5-6.
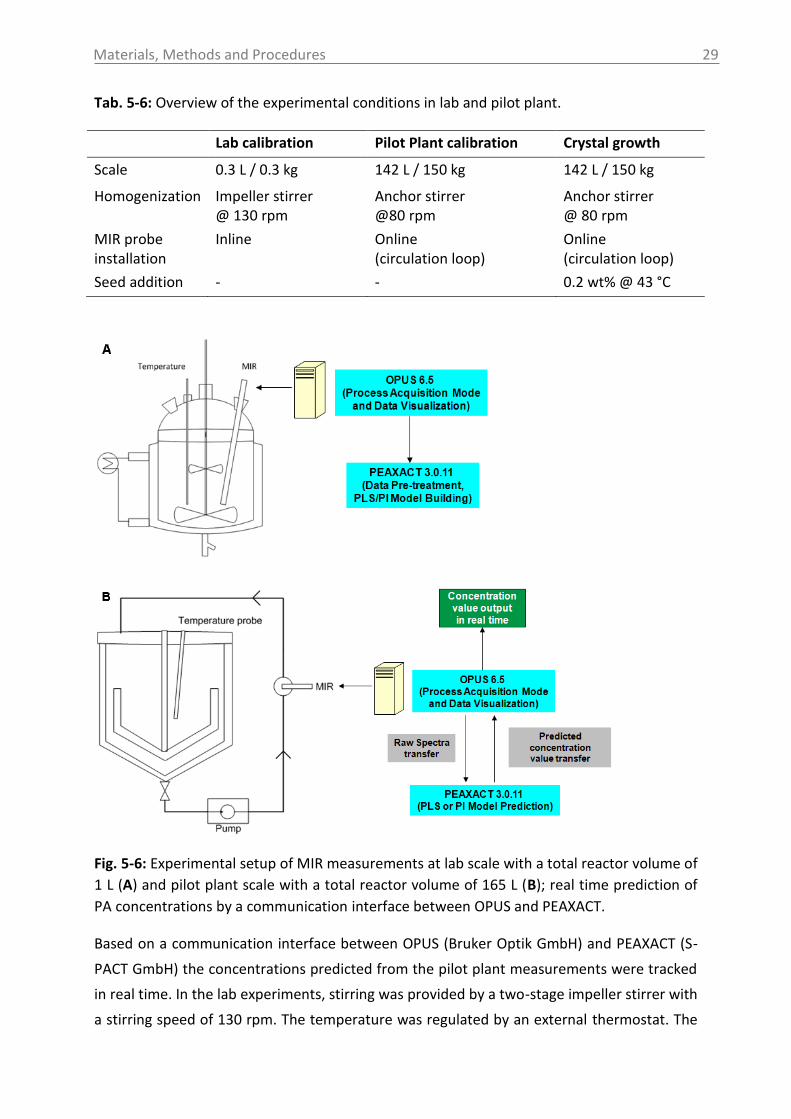
Materials, Methods and Procedures
29
Tab. 5-6: Overview of the experimental conditions in lab and pilot plant.
Lab calibration Pilot Plant calibration Crystal growth
Scale 0.3 L / 0.3 kg 142 L / 150 kg 142 L / 150 kg
Homogenization Impeller stirrer @ 130 rpm
Anchor stirrer @80 rpm
Anchor stirrer @ 80 rpm
MIR probe installation
Inline Online (circulation loop)
Online (circulation loop)
Seed addition - - 0.2 wt% @ 43 °C
Fig. 5-6: Experimental setup of MIR measurements at lab scale with a total reactor volume of
1 L (A) and pilot plant scale with a total reactor volume of 165 L (B); real time prediction of
PA concentrations by a communication interface between OPUS and PEAXACT.
Based on a communication interface between OPUS (Bruker Optik GmbH) and PEAXACT (S-
PACT GmbH) the concentrations predicted from the pilot plant measurements were tracked
in real time. In the lab experiments, stirring was provided by a two-stage impeller stirrer with
a stirring speed of 130 rpm. The temperature was regulated by an external thermostat. The
Materials, Methods and Procedures
30
ATR-MIR probe was integrated into the reactor by a commercially available Swagelok
connection (inline measurement). The pilot plant experiments were performed using an
anchor stirrer with a stirrer speed of 80 rpm. In the appendix (section 14.10) it can be seen
that the MIR probe is not integrated directly inside the reactor, but connected to an Argus
transmission flow cell (Solvias, Basel Switzerland), which was connected to the pipes of the
loop via commercially available flange connections. This setup allowed the continuous
circulation of the solution or suspension. A diaphragm pump AD 25-TTT-K (Almatec
Maschinenbau GmbH (Kamp-Lintfort, Germany) with a maximum flow rate of 6000 L/h was
used.
5.3.1.5 Raman spectroscopy
Determination of measurement sensitivity using the compound CA
A saturated solution of citric acid was prepared at 24 °C. During the isothermal experiments,
defined amounts of different particle size ranges, separated by sieving, were added to the
saturated solution at a scale of 200 mL. Therefore, different suspension densities (0-30 wt%),
each with different particle sizes (<250, 250-500, 500-630 µm), were observed by the Raman
sensor. The stirring rate was set to 250 rpm. In order to stabilize the particle flow and to
remove air bubbles after the crystal addition, a delay time up to 30 min was unfortunately
necessary before starting the next measurement. The experimental setup is in accordance to
that shown in Fig. 5-4 in section 5.3.1.3, only under application of the Raman sensor. The
reactor was protected against light with aluminum foil.
Production of α-LGA
The α-LGA was produced by a seeded cooling crystallization. A solution with a concentration
of 6.7g β-LGA in 100 g water was heated up to 95 °C until all solid was dissolved. The
temperature was held isothermal at 95 °C for 20 min in order to ensure that all particles are
dissolved. Afterwards the solution was cooled from 95 to 20 °C in 40 min. During the cooling
cycle alpha seed crystals were added at 65 °C (0.05 wt%). The seed material had an
approximately size of 800 µm in maximum and was added as dry material next to the stirrer.
The produced alpha crystals were filtered and the polymorphic form was controlled by
XRPD, Raman-spectroscopy and by microscopic investigations. The production of the alpha
crystals was performed in lab and pilot plant scale. Since the conditions of temperature
regulation (response behavior, accuracy) are different in both cases the temperature profile
of the pilot plant differs slightly (cooling from 98-25 °C in 152 min; seeding temperature
80 °C). Stirring was provided with a rate of 300 rpm in the lab experiments and with a rate of
120 rpm in the pilot plant experiments. Additionally, to the Raman spectroscopic
Materials, Methods and Procedures
31
investigations NIR- and UV-Vis spectroscopy were applied during the measurements in the
pilot plant.
Calibration of polymorph content of LGA
Two different techniques were used to generate a representative calibration data set. First
of all the calibration by the off-line Raman measurements of binary solid mixtures of the
alpha and beta polymorph were performed. The mixtures were created by mixing in a
mortar for 5 min. A total of 19 binary mixtures were investigated. Each solid mixture was
measured twice. The prediction error of the calibration created from the dry mixture was
investigated by the measurement of 12 different test samples (different alpha and beta
charges; different polymorphic content than used for calibration).
During a second experiment the possibility was tested to perform a calibration directly in
suspension. For this purpose 8 suspension samples with different polymorph contents at a
suspension density from 3-4 g solid in 100 g solution were investigated by inline Raman
spectroscopy (MR probe head). A saturated solution was prepared at 24 °C. The used reactor
volume was 1 L (total reactor volume 2 L). Stirring was provided by a two-stage impeller
stirrer at 300 rpm. Immediately, after adding the required amount of solid particle mixture
to the saturated solution the Raman measurement was started.
The alpha content of the mixtures (measured as solids and in suspensions) was calculated
from the produced alpha purity and the amounts of samples used to prepare the mixtures.
The used data pretreatments to build the calibration model are shown in Tab. 5-7. The used
α-contents of the training and test samples used for the calibration are given in the
appendix (section 14.13).
Tab. 5-7: Raman calibration model data pretreatment for the model compound LGA.
Alpha Beta
Integration range 1070-1080 cm-1 790-810 cm-1
Baseline Offset Offset
Baseline correction Linear fit subtraction Linear fit subtraction
Standardization Min-Max Standardization Min-Max Standardization
Polymorphic transformation of LGA
The polymorphic transformation experiments were performed according to a modified
method of Ono et al. [Ono04]. After the first step of the experiment (preparation of the α-
LGA crystals) the solution was kept for 20 min at 20 °C. Afterwards the solution was heated
up to 55 °C within 20 min and kept constant at this temperature until the polymorphic
transformation from the alpha to the beta form was complete. The polymorphic
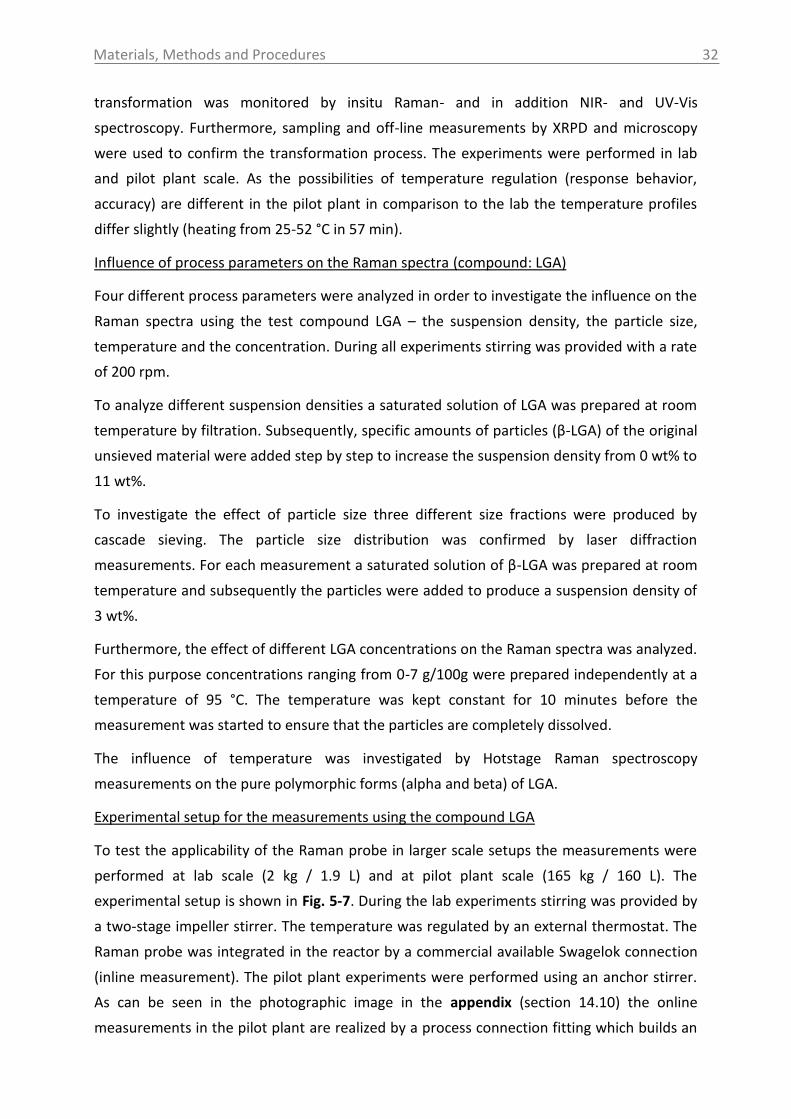
Materials, Methods and Procedures
32
transformation was monitored by insitu Raman- and in addition NIR- and UV-Vis
spectroscopy. Furthermore, sampling and off-line measurements by XRPD and microscopy
were used to confirm the transformation process. The experiments were performed in lab
and pilot plant scale. As the possibilities of temperature regulation (response behavior,
accuracy) are different in the pilot plant in comparison to the lab the temperature profiles
differ slightly (heating from 25-52 °C in 57 min).
Influence of process parameters on the Raman spectra (compound: LGA)
Four different process parameters were analyzed in order to investigate the influence on the
Raman spectra using the test compound LGA – the suspension density, the particle size,
temperature and the concentration. During all experiments stirring was provided with a rate
of 200 rpm.
To analyze different suspension densities a saturated solution of LGA was prepared at room
temperature by filtration. Subsequently, specific amounts of particles (β-LGA) of the original
unsieved material were added step by step to increase the suspension density from 0 wt% to
11 wt%.
To investigate the effect of particle size three different size fractions were produced by
cascade sieving. The particle size distribution was confirmed by laser diffraction
measurements. For each measurement a saturated solution of β-LGA was prepared at room
temperature and subsequently the particles were added to produce a suspension density of
3 wt%.
Furthermore, the effect of different LGA concentrations on the Raman spectra was analyzed.
For this purpose concentrations ranging from 0-7 g/100g were prepared independently at a
temperature of 95 °C. The temperature was kept constant for 10 minutes before the
measurement was started to ensure that the particles are completely dissolved.
The influence of temperature was investigated by Hotstage Raman spectroscopy
measurements on the pure polymorphic forms (alpha and beta) of LGA.
Experimental setup for the measurements using the compound LGA
To test the applicability of the Raman probe in larger scale setups the measurements were
performed at lab scale (2 kg / 1.9 L) and at pilot plant scale (165 kg / 160 L). The
experimental setup is shown in Fig. 5-7. During the lab experiments stirring was provided by
a two-stage impeller stirrer. The temperature was regulated by an external thermostat. The
Raman probe was integrated in the reactor by a commercial available Swagelok connection
(inline measurement). The pilot plant experiments were performed using an anchor stirrer.
As can be seen in the photographic image in the appendix (section 14.10) the online
measurements in the pilot plant are realized by a process connection fitting which builds an
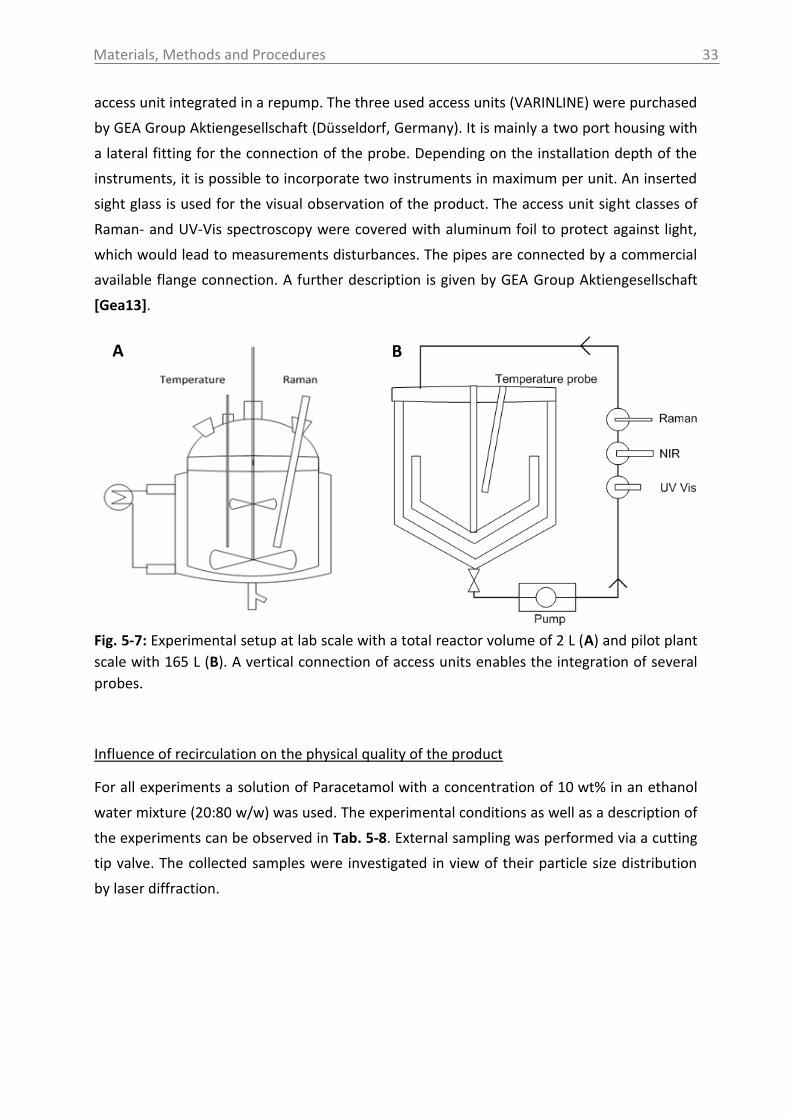
Materials, Methods and Procedures
33
access unit integrated in a repump. The three used access units (VARINLINE) were purchased
by GEA Group Aktiengesellschaft (Düsseldorf, Germany). It is mainly a two port housing with
a lateral fitting for the connection of the probe. Depending on the installation depth of the
instruments, it is possible to incorporate two instruments in maximum per unit. An inserted
sight glass is used for the visual observation of the product. The access unit sight classes of
Raman- and UV-Vis spectroscopy were covered with aluminum foil to protect against light,
which would lead to measurements disturbances. The pipes are connected by a commercial
available flange connection. A further description is given by GEA Group Aktiengesellschaft
[Gea13].
Fig. 5-7: Experimental setup at lab scale with a total reactor volume of 2 L (A) and pilot plant
scale with 165 L (B). A vertical connection of access units enables the integration of several
probes.
Influence of recirculation on the physical quality of the product
For all experiments a solution of Paracetamol with a concentration of 10 wt% in an ethanol
water mixture (20:80 w/w) was used. The experimental conditions as well as a description of
the experiments can be observed in Tab. 5-8. External sampling was performed via a cutting
tip valve. The collected samples were investigated in view of their particle size distribution
by laser diffraction.
A B
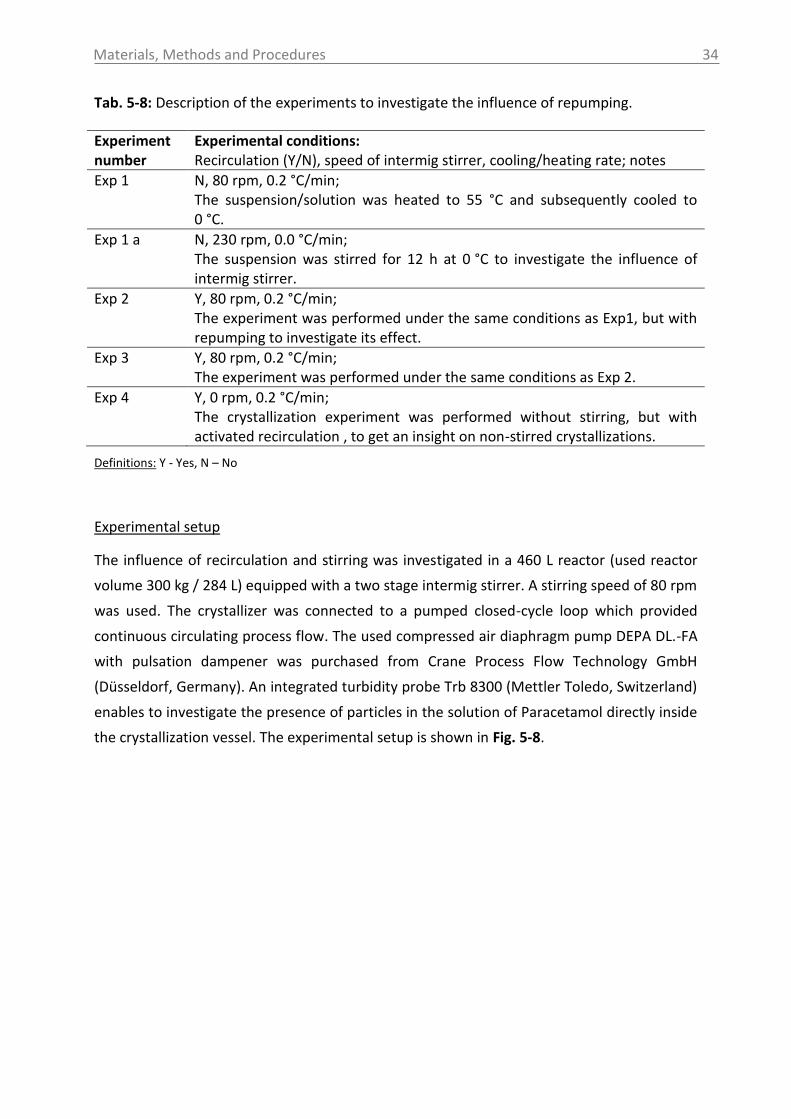
Materials, Methods and Procedures
34
Tab. 5-8: Description of the experiments to investigate the influence of repumping.
Experiment number
Experimental conditions: Recirculation (Y/N), speed of intermig stirrer, cooling/heating rate; notes
Exp 1 N, 80 rpm, 0.2 °C/min; The suspension/solution was heated to 55 °C and subsequently cooled to 0 °C.
Exp 1 a N, 230 rpm, 0.0 °C/min; The suspension was stirred for 12 h at 0 °C to investigate the influence of intermig stirrer.
Exp 2 Y, 80 rpm, 0.2 °C/min; The experiment was performed under the same conditions as Exp1, but with repumping to investigate its effect.
Exp 3 Y, 80 rpm, 0.2 °C/min; The experiment was performed under the same conditions as Exp 2.
Exp 4 Y, 0 rpm, 0.2 °C/min; The crystallization experiment was performed without stirring, but with activated recirculation , to get an insight on non-stirred crystallizations.
Definitions: Y - Yes, N – No
Experimental setup
The influence of recirculation and stirring was investigated in a 460 L reactor (used reactor
volume 300 kg / 284 L) equipped with a two stage intermig stirrer. A stirring speed of 80 rpm
was used. The crystallizer was connected to a pumped closed-cycle loop which provided
continuous circulating process flow. The used compressed air diaphragm pump DEPA DL.-FA
with pulsation dampener was purchased from Crane Process Flow Technology GmbH
(Düsseldorf, Germany). An integrated turbidity probe Trb 8300 (Mettler Toledo, Switzerland)
enables to investigate the presence of particles in the solution of Paracetamol directly inside
the crystallization vessel. The experimental setup is shown in Fig. 5-8.
Materials, Methods and Procedures
35
Fig. 5-8: Schematics (A) and photographic image (B) of the experimental setup at pilot plant
scale with a total reactor volume of 460 L, position of the turbidity probe is highlighted.
5.3.1.6 Optical Reflectance Measurement
Polymorphic transition of LGA
The isotherm experiment started with the preparation of a saturated solution with respect
to β-LGA at 45 °C in an external double walled and temperature controlled vessel.
Subsequently, the solution was transferred to the STEM integrity reaction vessel (volume:
30 mL). The temperature of the saturated solution was kept constant for 1 h before the
addition of the alpha crystals, to ensure a constant temperature in the vessel and then
during the whole experiment. Crystals of α-LGA were added into the saturated solution and
a suspension density of 0.6 wt% as adjusted. Stirring was applied with a rate of 1200 rpm.
Crystal growth experiment (compound: LGA)
A solution with a concentration of 3 g/100g (solubility temperature: 60 °C, volume: 17 mL)
was heated up to 70 °C until everything is dissolved. Subsequently, the solution was cooled
down with a rate of 0.1 °C/min to 56 °C. At 56 °C seed crystals (mass: 0.1 wt%, original dry
crystals, size: 63-90 µm) were added to the supersaturated solution (supersaturation:
0.5 g/100g). Stirring was applied with a rate of 1200 rpm.
Experimental setup
The experiments were performed in the STEM Integrity 10 reaction station (Electrothermal).
In addition to the turbidity and temperature sensor (Electrothermal) an APAS 14 sensor
(Sequip GmbH) was integrated in the reaction vessel in vertical direction. An potographic
image of the setup can be observed in the appendix (section 14.7).
A
Results and Discussion
36
6. Results and Discussion
In the following part of this work the results and its discussion are presented together. This
kind of presentation was chosen due to multipartite nature of the theses (12 different model
compounds, 8 different measurement techniques and different scales) and should enable
the reader a better understanding of the complex relationships and comparisons. For the
sake of clarity the name of the used model compounds are highlighted with bold font and
capital letters at the beginning of a new text section.
6.1 Determination of solubility and nucleation points
The development of a phase diagram as well as the determination of nucleation
temperatures is one of the first steps performed during the development of crystallization
processes, since the operating window of the process can be defined. Various techniques are
available to determine these data. However, different qualities of information can be
derived from the measurements and a different sensitivity of the devices to detect the
presence or absence of particles is expected. A high accuracy of the measured data is,
especially, important for compounds with small MZW´s since the performance of
crystallization processes in a pilot plant or industrial scale often results in different
temperature conditions (e.g. response behavior or accuracy). Consequently, this might lead
to the occurrence of early nucleation events resulting in unwanted product properties, such
as a too small mean particle size. In addition, information is required to identify new
polymorphs for crystallization processes under changing conditions (e.g. solvent) or to
detect polymorph transitions, since different polymorphs influence the physical and/or
chemical properties of the product. A precise measurement technique to detect solubility,
nucleation points and/or chemical characteristics represents, therefore, an essential part
during crystallization process development. In the following the application of different
measurement techniques for crystallization process development are tested and evaluated.
Parts of this section are published in [Hel12].
6.1.1 Ultrasound
6.1.1.1 Applicability for pharmaceutical compounds
To evaluate the applicability of the ultrasound device to analyze the MZW, in total 12
different pharmaceutical test compounds were analyzed within different concentration
ranges [see also [Hel13d]). An overview of the results and an evaluation of the result quality
is seen in Tab. 6-1. For most of the pharmaceutical compounds the solubility and nucleation
points can be extracted by ultrasound, except for SAR00 and SAR474832. In this case,
however, often the evaluation of the attenuation supplies useful information on the MZW.
An example for the evaluation of attenuation is given in the appendix (section 14.14).
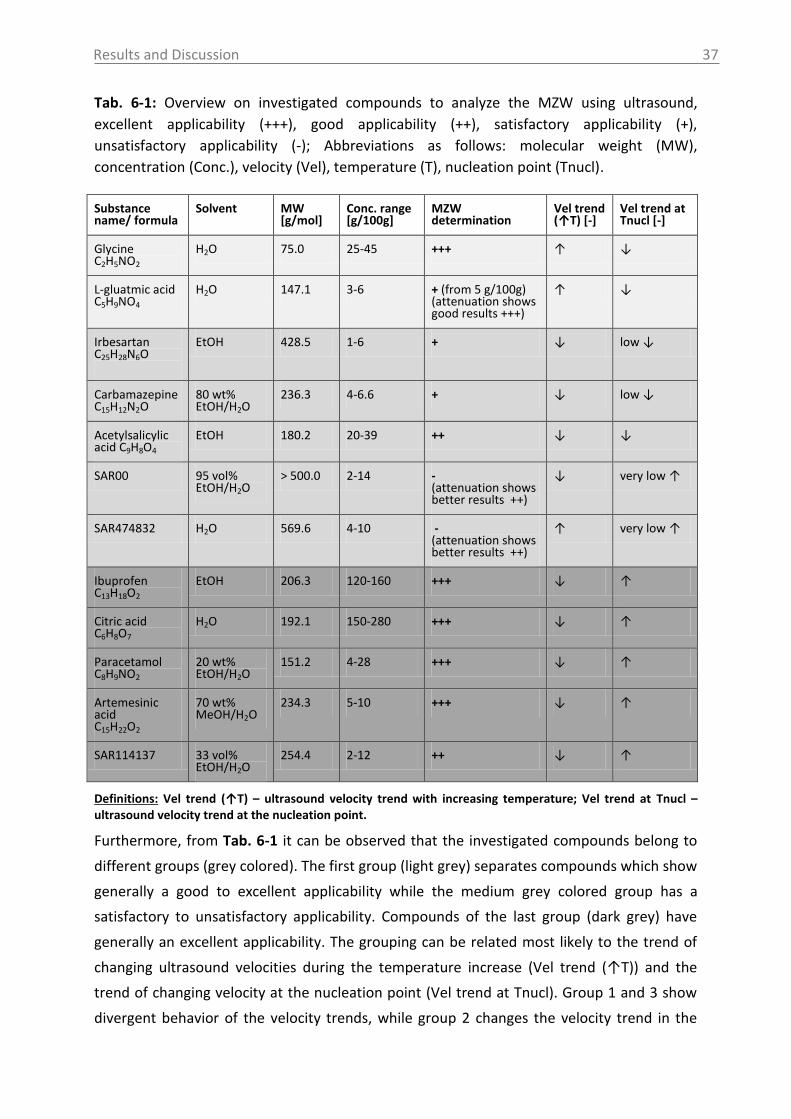
Results and Discussion
37
Tab. 6-1: Overview on investigated compounds to analyze the MZW using ultrasound,
excellent applicability (+++), good applicability (++), satisfactory applicability (+),
unsatisfactory applicability (-); Abbreviations as follows: molecular weight (MW),
concentration (Conc.), velocity (Vel), temperature (T), nucleation point (Tnucl).
Substance name/ formula
Solvent MW [g/mol]
Conc. range [g/100g]
MZW determination
Vel trend (↑T) [-]
Vel trend at Tnucl [-]
Glycine C2H5NO2
H2O 75.0 25-45 +++ ↑ ↓
L-gluatmic acid C5H9NO4
H2O 147.1 3-6 + (from 5 g/100g) (attenuation shows good results +++)
↑ ↓
Irbesartan C25H28N6O
EtOH 428.5 1-6 + ↓ low ↓
Carbamazepine C15H12N2O
80 wt% EtOH/H2O
236.3 4-6.6 + ↓ low ↓
Acetylsalicylic acid C9H8O4
EtOH 180.2 20-39 ++ ↓ ↓
SAR00 95 vol% EtOH/H2O
> 500.0 2-14 - (attenuation shows better results ++)
↓ very low ↑
SAR474832 H2O 569.6 4-10 - (attenuation shows better results ++)
↑ very low ↑
Ibuprofen C13H18O2
EtOH 206.3 120-160 +++ ↓ ↑
Citric acid C6H8O7
H2O 192.1 150-280 +++ ↓ ↑
Paracetamol C8H9NO2
20 wt% EtOH/H2O
151.2 4-28 +++ ↓ ↑
Artemesinic acid C15H22O2
70 wt% MeOH/H2O
234.3 5-10 +++ ↓ ↑
SAR114137 33 vol% EtOH/H2O
254.4 2-12 ++ ↓ ↑
Definitions: Vel trend (↑T) – ultrasound velocity trend with increasing temperature; Vel trend at Tnucl – ultrasound velocity trend at the nucleation point.
Furthermore, from Tab. 6-1 it can be observed that the investigated compounds belong to
different groups (grey colored). The first group (light grey) separates compounds which show
generally a good to excellent applicability while the medium grey colored group has a
satisfactory to unsatisfactory applicability. Compounds of the last group (dark grey) have
generally an excellent applicability. The grouping can be related most likely to the trend of
changing ultrasound velocities during the temperature increase (Vel trend (↑T)) and the
trend of changing velocity at the nucleation point (Vel trend at Tnucl). Group 1 and 3 show
divergent behavior of the velocity trends, while group 2 changes the velocity trend in the
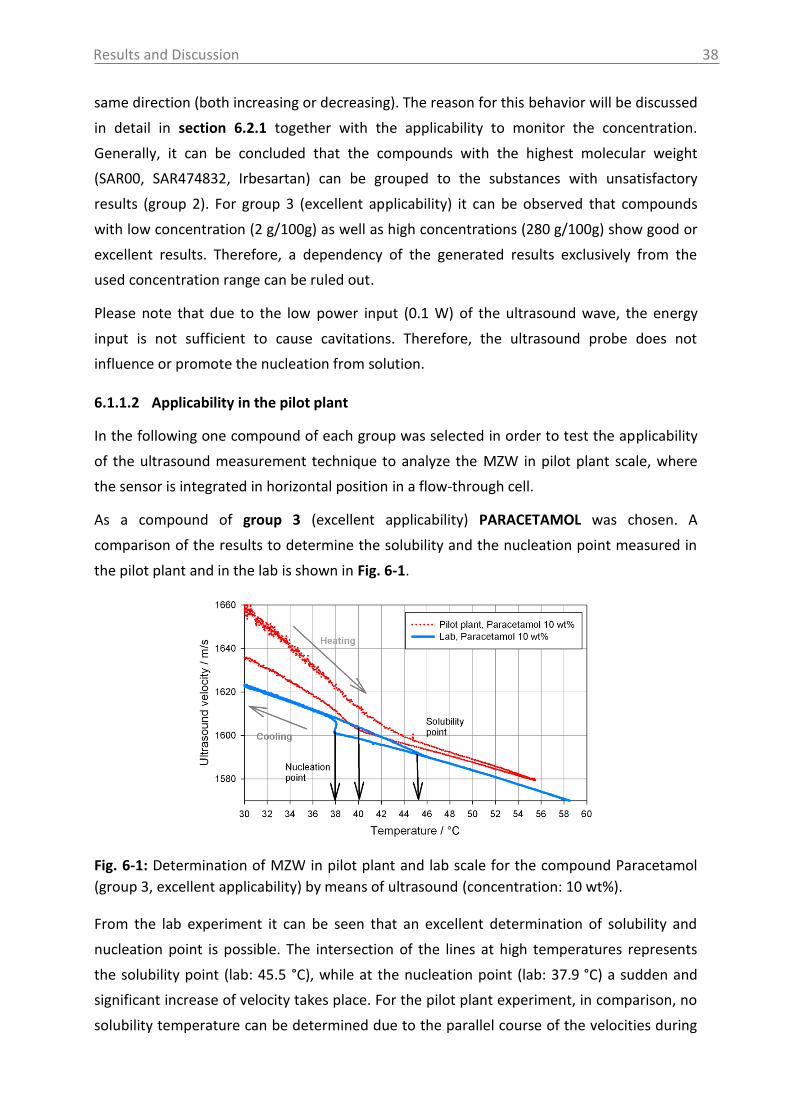
Results and Discussion
38
same direction (both increasing or decreasing). The reason for this behavior will be discussed
in detail in section 6.2.1 together with the applicability to monitor the concentration.
Generally, it can be concluded that the compounds with the highest molecular weight
(SAR00, SAR474832, Irbesartan) can be grouped to the substances with unsatisfactory
results (group 2). For group 3 (excellent applicability) it can be observed that compounds
with low concentration (2 g/100g) as well as high concentrations (280 g/100g) show good or
excellent results. Therefore, a dependency of the generated results exclusively from the
used concentration range can be ruled out.
Please note that due to the low power input (0.1 W) of the ultrasound wave, the energy
input is not sufficient to cause cavitations. Therefore, the ultrasound probe does not
influence or promote the nucleation from solution.
6.1.1.2 Applicability in the pilot plant
In the following one compound of each group was selected in order to test the applicability
of the ultrasound measurement technique to analyze the MZW in pilot plant scale, where
the sensor is integrated in horizontal position in a flow-through cell.
As a compound of group 3 (excellent applicability) PARACETAMOL was chosen. A
comparison of the results to determine the solubility and the nucleation point measured in
the pilot plant and in the lab is shown in Fig. 6-1.
Fig. 6-1: Determination of MZW in pilot plant and lab scale for the compound Paracetamol
(group 3, excellent applicability) by means of ultrasound (concentration: 10 wt%).
From the lab experiment it can be seen that an excellent determination of solubility and
nucleation point is possible. The intersection of the lines at high temperatures represents
the solubility point (lab: 45.5 °C), while at the nucleation point (lab: 37.9 °C) a sudden and
significant increase of velocity takes place. For the pilot plant experiment, in comparison, no
solubility temperature can be determined due to the parallel course of the velocities during
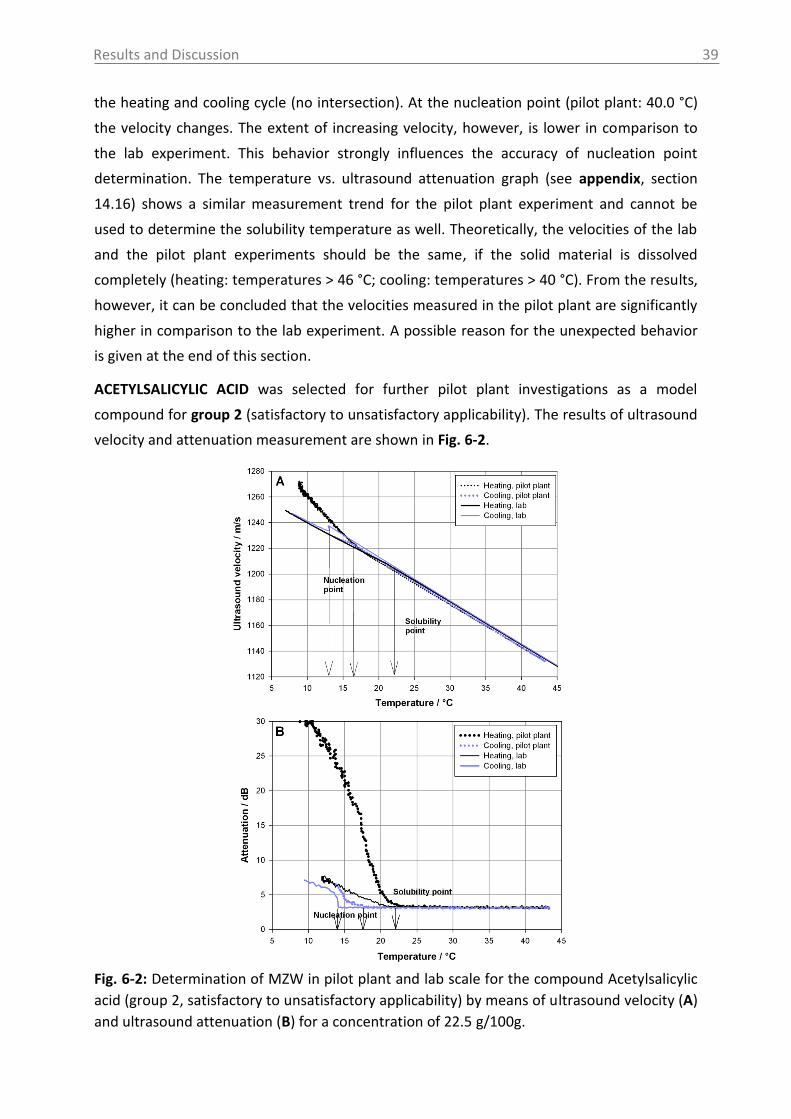
Results and Discussion
39
the heating and cooling cycle (no intersection). At the nucleation point (pilot plant: 40.0 °C)
the velocity changes. The extent of increasing velocity, however, is lower in comparison to
the lab experiment. This behavior strongly influences the accuracy of nucleation point
determination. The temperature vs. ultrasound attenuation graph (see appendix, section
14.16) shows a similar measurement trend for the pilot plant experiment and cannot be
used to determine the solubility temperature as well. Theoretically, the velocities of the lab
and the pilot plant experiments should be the same, if the solid material is dissolved
completely (heating: temperatures > 46 °C; cooling: temperatures > 40 °C). From the results,
however, it can be concluded that the velocities measured in the pilot plant are significantly
higher in comparison to the lab experiment. A possible reason for the unexpected behavior
is given at the end of this section.
ACETYLSALICYLIC ACID was selected for further pilot plant investigations as a model
compound for group 2 (satisfactory to unsatisfactory applicability). The results of ultrasound
velocity and attenuation measurement are shown in Fig. 6-2.
Fig. 6-2: Determination of MZW in pilot plant and lab scale for the compound Acetylsalicylic
acid (group 2, satisfactory to unsatisfactory applicability) by means of ultrasound velocity (A)
and ultrasound attenuation (B) for a concentration of 22.5 g/100g.
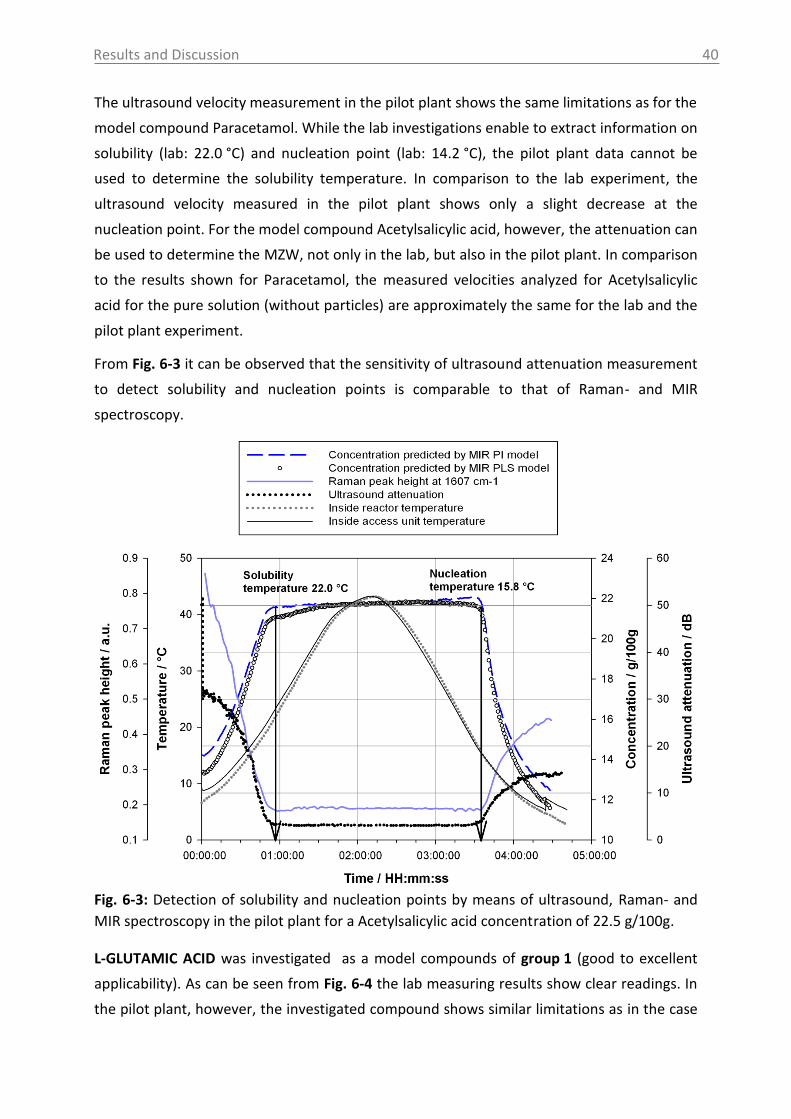
Results and Discussion
40
The ultrasound velocity measurement in the pilot plant shows the same limitations as for the
model compound Paracetamol. While the lab investigations enable to extract information on
solubility (lab: 22.0 °C) and nucleation point (lab: 14.2 °C), the pilot plant data cannot be
used to determine the solubility temperature. In comparison to the lab experiment, the
ultrasound velocity measured in the pilot plant shows only a slight decrease at the
nucleation point. For the model compound Acetylsalicylic acid, however, the attenuation can
be used to determine the MZW, not only in the lab, but also in the pilot plant. In comparison
to the results shown for Paracetamol, the measured velocities analyzed for Acetylsalicylic
acid for the pure solution (without particles) are approximately the same for the lab and the
pilot plant experiment.
From Fig. 6-3 it can be observed that the sensitivity of ultrasound attenuation measurement
to detect solubility and nucleation points is comparable to that of Raman- and MIR
spectroscopy.
Fig. 6-3: Detection of solubility and nucleation points by means of ultrasound, Raman- and
MIR spectroscopy in the pilot plant for a Acetylsalicylic acid concentration of 22.5 g/100g.
L-GLUTAMIC ACID was investigated as a model compounds of group 1 (good to excellent
applicability). As can be seen from Fig. 6-4 the lab measuring results show clear readings. In
the pilot plant, however, the investigated compound shows similar limitations as in the case
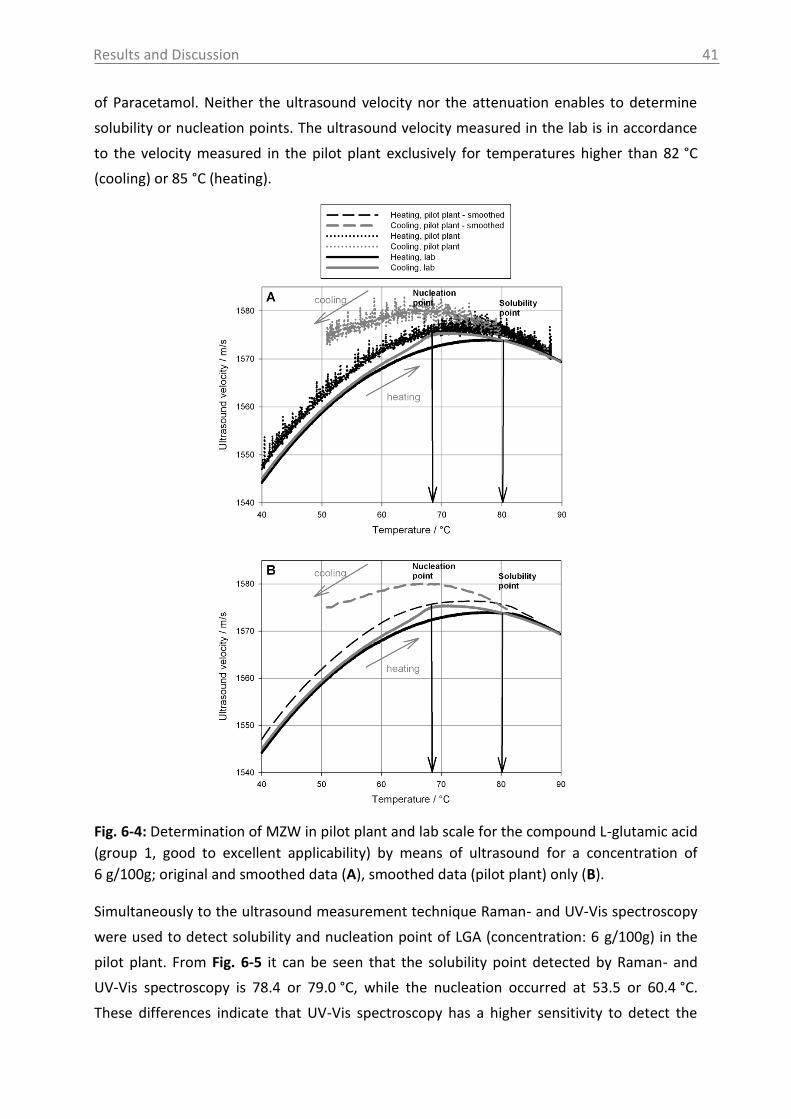
Results and Discussion
41
of Paracetamol. Neither the ultrasound velocity nor the attenuation enables to determine
solubility or nucleation points. The ultrasound velocity measured in the lab is in accordance
to the velocity measured in the pilot plant exclusively for temperatures higher than 82 °C
(cooling) or 85 °C (heating).
Fig. 6-4: Determination of MZW in pilot plant and lab scale for the compound L-glutamic acid
(group 1, good to excellent applicability) by means of ultrasound for a concentration of
6 g/100g; original and smoothed data (A), smoothed data (pilot plant) only (B).
Simultaneously to the ultrasound measurement technique Raman- and UV-Vis spectroscopy
were used to detect solubility and nucleation point of LGA (concentration: 6 g/100g) in the
pilot plant. From Fig. 6-5 it can be seen that the solubility point detected by Raman- and
UV-Vis spectroscopy is 78.4 or 79.0 °C, while the nucleation occurred at 53.5 or 60.4 °C.
These differences indicate that UV-Vis spectroscopy has a higher sensitivity to detect the
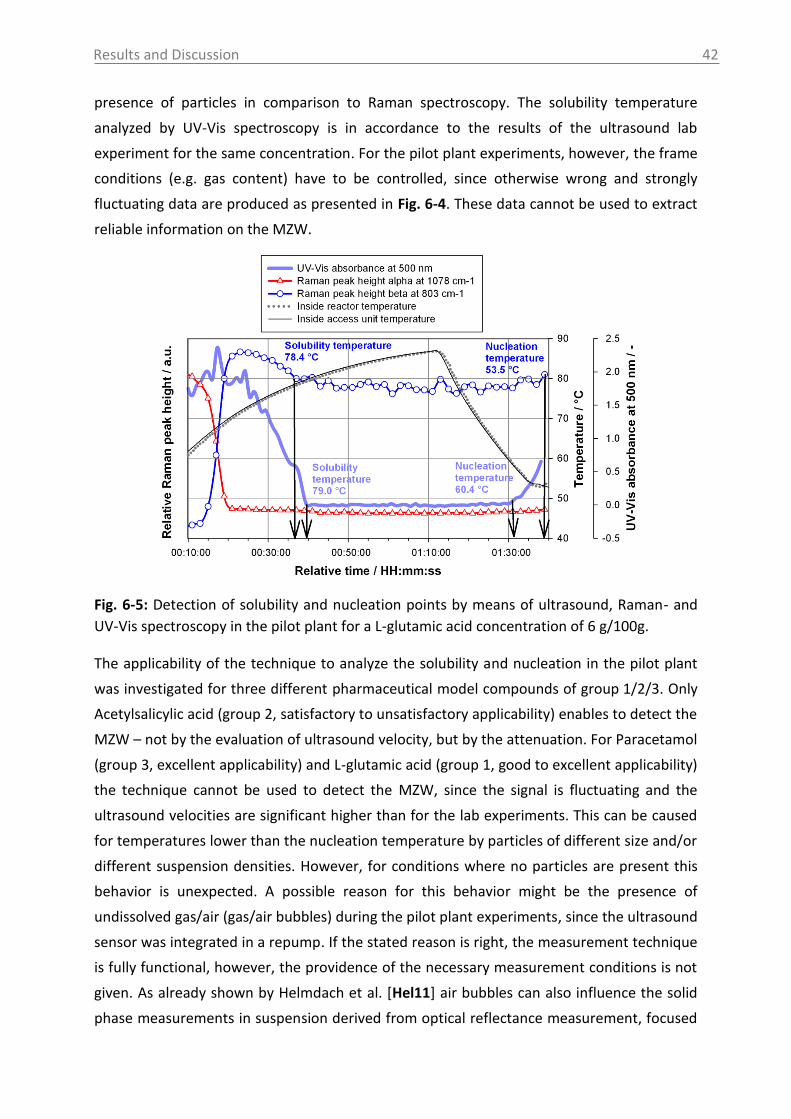
Results and Discussion
42
presence of particles in comparison to Raman spectroscopy. The solubility temperature
analyzed by UV-Vis spectroscopy is in accordance to the results of the ultrasound lab
experiment for the same concentration. For the pilot plant experiments, however, the frame
conditions (e.g. gas content) have to be controlled, since otherwise wrong and strongly
fluctuating data are produced as presented in Fig. 6-4. These data cannot be used to extract
reliable information on the MZW.
Fig. 6-5: Detection of solubility and nucleation points by means of ultrasound, Raman- and
UV-Vis spectroscopy in the pilot plant for a L-glutamic acid concentration of 6 g/100g.
The applicability of the technique to analyze the solubility and nucleation in the pilot plant
was investigated for three different pharmaceutical model compounds of group 1/2/3. Only
Acetylsalicylic acid (group 2, satisfactory to unsatisfactory applicability) enables to detect the
MZW – not by the evaluation of ultrasound velocity, but by the attenuation. For Paracetamol
(group 3, excellent applicability) and L-glutamic acid (group 1, good to excellent applicability)
the technique cannot be used to detect the MZW, since the signal is fluctuating and the
ultrasound velocities are significant higher than for the lab experiments. This can be caused
for temperatures lower than the nucleation temperature by particles of different size and/or
different suspension densities. However, for conditions where no particles are present this
behavior is unexpected. A possible reason for this behavior might be the presence of
undissolved gas/air (gas/air bubbles) during the pilot plant experiments, since the ultrasound
sensor was integrated in a repump. If the stated reason is right, the measurement technique
is fully functional, however, the providence of the necessary measurement conditions is not
given. As already shown by Helmdach et al. [Hel11] air bubbles can also influence the solid
phase measurements in suspension derived from optical reflectance measurement, focused
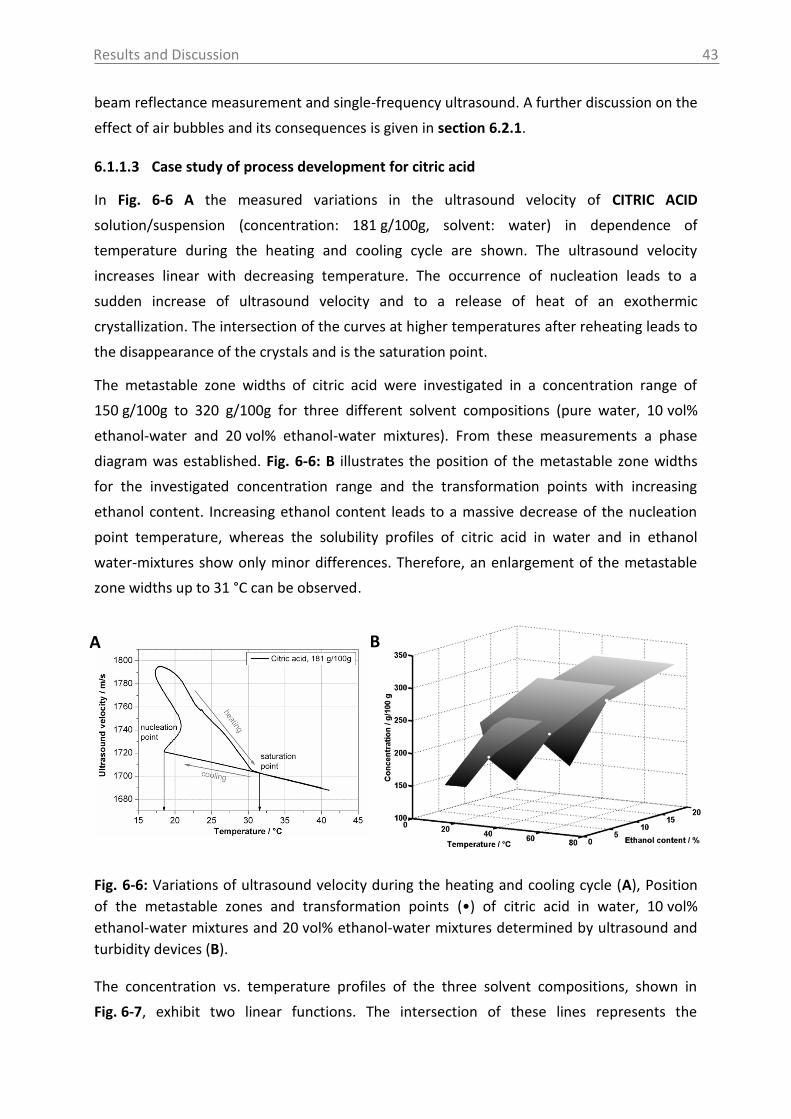
Results and Discussion
43
beam reflectance measurement and single-frequency ultrasound. A further discussion on the
effect of air bubbles and its consequences is given in section 6.2.1.
6.1.1.3 Case study of process development for citric acid
In Fig. 6-6 A the measured variations in the ultrasound velocity of CITRIC ACID
solution/suspension (concentration: 181 g/100g, solvent: water) in dependence of
temperature during the heating and cooling cycle are shown. The ultrasound velocity
increases linear with decreasing temperature. The occurrence of nucleation leads to a
sudden increase of ultrasound velocity and to a release of heat of an exothermic
crystallization. The intersection of the curves at higher temperatures after reheating leads to
the disappearance of the crystals and is the saturation point.
The metastable zone widths of citric acid were investigated in a concentration range of
150 g/100g to 320 g/100g for three different solvent compositions (pure water, 10 vol%
ethanol-water and 20 vol% ethanol-water mixtures). From these measurements a phase
diagram was established. Fig. 6-6: B illustrates the position of the metastable zone widths
for the investigated concentration range and the transformation points with increasing
ethanol content. Increasing ethanol content leads to a massive decrease of the nucleation
point temperature, whereas the solubility profiles of citric acid in water and in ethanol
water-mixtures show only minor differences. Therefore, an enlargement of the metastable
zone widths up to 31 °C can be observed.
Fig. 6-6: Variations of ultrasound velocity during the heating and cooling cycle (A), Position
of the metastable zones and transformation points (•) of citric acid in water, 10 vol%
ethanol-water mixtures and 20 vol% ethanol-water mixtures determined by ultrasound and
turbidity devices (B).
The concentration vs. temperature profiles of the three solvent compositions, shown in
Fig. 6-7, exhibit two linear functions. The intersection of these lines represents the
A B
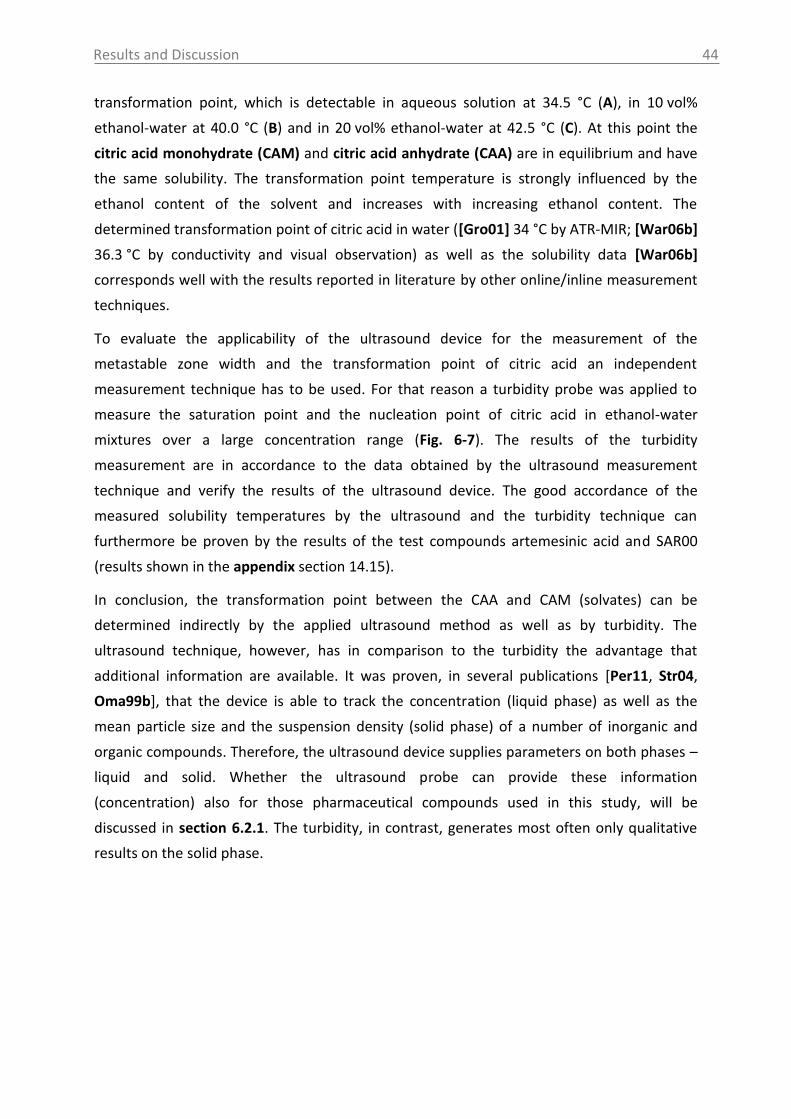
Results and Discussion
44
transformation point, which is detectable in aqueous solution at 34.5 °C (A), in 10 vol%
ethanol-water at 40.0 °C (B) and in 20 vol% ethanol-water at 42.5 °C (C). At this point the
citric acid monohydrate (CAM) and citric acid anhydrate (CAA) are in equilibrium and have
the same solubility. The transformation point temperature is strongly influenced by the
ethanol content of the solvent and increases with increasing ethanol content. The
determined transformation point of citric acid in water ([Gro01] 34 °C by ATR-MIR; [War06b]
36.3 °C by conductivity and visual observation) as well as the solubility data [War06b]
corresponds well with the results reported in literature by other online/inline measurement
techniques.
To evaluate the applicability of the ultrasound device for the measurement of the
metastable zone width and the transformation point of citric acid an independent
measurement technique has to be used. For that reason a turbidity probe was applied to
measure the saturation point and the nucleation point of citric acid in ethanol-water
mixtures over a large concentration range (Fig. 6-7). The results of the turbidity
measurement are in accordance to the data obtained by the ultrasound measurement
technique and verify the results of the ultrasound device. The good accordance of the
measured solubility temperatures by the ultrasound and the turbidity technique can
furthermore be proven by the results of the test compounds artemesinic acid and SAR00
(results shown in the appendix section 14.15).
In conclusion, the transformation point between the CAA and CAM (solvates) can be
determined indirectly by the applied ultrasound method as well as by turbidity. The
ultrasound technique, however, has in comparison to the turbidity the advantage that
additional information are available. It was proven, in several publications [Per11, Str04,
Oma99b], that the device is able to track the concentration (liquid phase) as well as the
mean particle size and the suspension density (solid phase) of a number of inorganic and
organic compounds. Therefore, the ultrasound device supplies parameters on both phases –
liquid and solid. Whether the ultrasound probe can provide these information
(concentration) also for those pharmaceutical compounds used in this study, will be
discussed in section 6.2.1. The turbidity, in contrast, generates most often only qualitative
results on the solid phase.
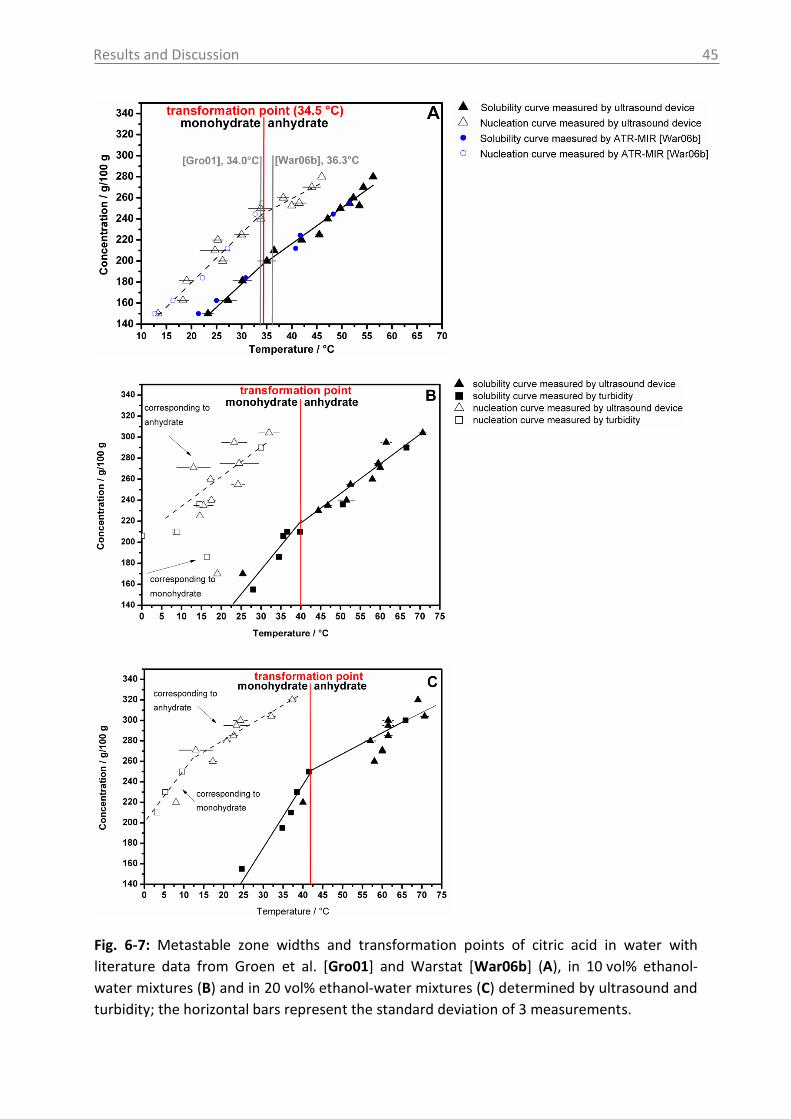
Results and Discussion
45
Fig. 6-7: Metastable zone widths and transformation points of citric acid in water with
literature data from Groen et al. [Gro01] and Warstat [War06b] (A), in 10 vol% ethanol-
water mixtures (B) and in 20 vol% ethanol-water mixtures (C) determined by ultrasound and
turbidity; the horizontal bars represent the standard deviation of 3 measurements.
Results and Discussion
46
Furthermore, from Fig. 6-7 it can be observed that the systems citric acid water as well as
citric acid ethanol-water exhibit an enantiotropic behavior, since the solubility curves
intersect at a lower temperature than the melting points. The relative stability of the
anhydrate and monohydrate form depends on the water content of the solvent mixture. The
higher the water content the lower the relative stability of the monohydrate. This behavior is
surprising since studies of other organic compounds, e.g. of carbamazepine in an ethanol-
water mixture [Lou06a, Cho08] and risedronate monosodium in a methanol-water mixture
[Ngu10] show an increasing stability of the monohydrate with increasing water content.
According to the thermodynamic description of hydrate stability the hydrate is more stable
at temperatures lower the equilibrium water activity and vice versa [Ngu10]. The reason for
this unexpected behavior might be a considerable complexity in the structure of
supersaturated ethanol-water solutions of citric acid (degree of hydrogen-bonding, effect of
acid on the ethanol-water structure, chain and cluster formation) [Mul68, Nos04]. It was
demonstrated by Nose et al. [Nos04] that acids could strengthen the ethanol-water
structure and promote the proton exchange between ethanol and water. Acids lead to a
strong hydrogen-bonding force and therefore the ethanol molecules are supposed to be
taken into the water network to associate with water molecules tightly. Furthermore,
Noskov et al. [Nos05] showed that the total number of hydrogen-bonds for water molecules
is stronger at low ethanol concentrations than in pure water. This complexibility might
promote an incorporation of water in the crystal lattice and is, therefore, increasing the
transformation point with increasing ethanol content.
6.1.2 Raman spectroscopy
Case study of process development for CITRIC ACID
A further valuable tool for the development of scalable crystallization processes is Raman
spectroscopy. By this method the formation of the solid phase during crystallization can be
monitored and the crystal phase forming can be directly identified [Fet11]. It was already
presented by Caillet et al. [Cai06, Cai07, Cai08] that Raman spectroscopy is a feasible
technique to monitor the solvent-mediated phase transformation of citric acid, since it is
possible to distinguish clearly the spectra of the anhydrate from those of the monohydrate.
In Fig. 6-8 and Fig. 6-9 the Raman data of a crystallization experiment of citric acid
(concentration: 250 g/100g) in 10 vol% ethanol-water mixture are shown. The monitoring of
the peak height at 796 cm-1 (Fig. 6-8) allows to get qualitative information on the liquid
phase and enables the direct investigation of the saturation and nucleation point. CAA was
suspended in the solvent-mixture and heated up from room temperature to a temperature
of 68 °C with a heating rate of 10 K/h and subsequently cooled back to 5 °C using a cooling
rate of 10 K/h. From the spectral changes (1800-1600 cm-1; 900-700 cm-1) and by comparison

Results and Discussion
47
with the reference spectra of solid CAA and CAM it can be concluded that CAA shows a fast
conversion into the monohydrate form when CAA is suspended in the solvent mixture at
20 °C (within a few minutes). This can be explained by the higher thermodynamic stability of
CAM below 34 °C than CAA. This fast solvent-mediated transformation of the CAA
(suspended in water) to the CAM at temperature between 15-20 °C was also investigated by
Caillet et al. [Cai06]. The authors showed that the phase transformation is completed 10 min
after the preparation of a suspension at 15 °C.
For the implemented experiment shown in Fig. 6-8 the dissolution process starts at 26 °C
and is finished (clear solution) at approximately 50 °C (refer to Fig. 6-9). The nucleation point
was determined by Raman in this experiment at about 9.8 °C. The crystallization was found
to be completed during the holding-temperature phase at 5 °C. By comparison of the Raman
spectra to the recorded solid state reference spectrum of CAA it becomes evident that the
crystalline product can be identified as CAA. However, it must be stated that additional
signals, which are not related to ethanol, were found in the spectra (e.g. at 1714 cm-1) of the
crystallization product in suspension.
Fig. 6-8: Raman signal intensity at 796 cm-1 (left ordinate) and temperature (right ordinate)
vs. time for a cooling crystallization of citric acid in 10 vol% ethanol-water mixture.
Results and Discussion
48
Fig. 6-9: Raman spectra in the range of 1800-1600 cm-1 (left) and 900-700 cm-1 (right) for the
heating and cooling ramp of a citric acid crystallization in 10 vol% ethanol-water mixture.
Explanation for unexpected Raman spectra
Generally, the influence of solute (amorphous phase) is small in relation to the Raman
scattering caused by the solid phase in the suspension. By the subtraction of a reference
spectrum (CAA) from the spectrum of the recrystallized product at the end of the
experiment as well as from the difference spectrum of the initial suspension and the CAM
reference spectrum, it can be proven that these additional peaks refer to the amorphous
phase of citric acid (citric acid in solution). The resulting difference spectra are in good
agreement with the main peaks of the spectrum of the dissolved compound (see Fig. 6-10,
main peaks are marked with arrows).
Resulting from the extremely high solubility of citric acid in water and in 10 vol% ethanol-
water mixtures there is a superposition of the spectra of citric acid as solid (CAM or CAA,
main contribution) and dissolved compound (minor contribution). This has to be considered
for the correct interpretation of the results applying compounds with extreme high
solubility. Although citric acid is a widely study model compound a superposition of liquid
phase and solid phase peaks measured with ATR-MIR spectroscopy was never described in
the literature yet.
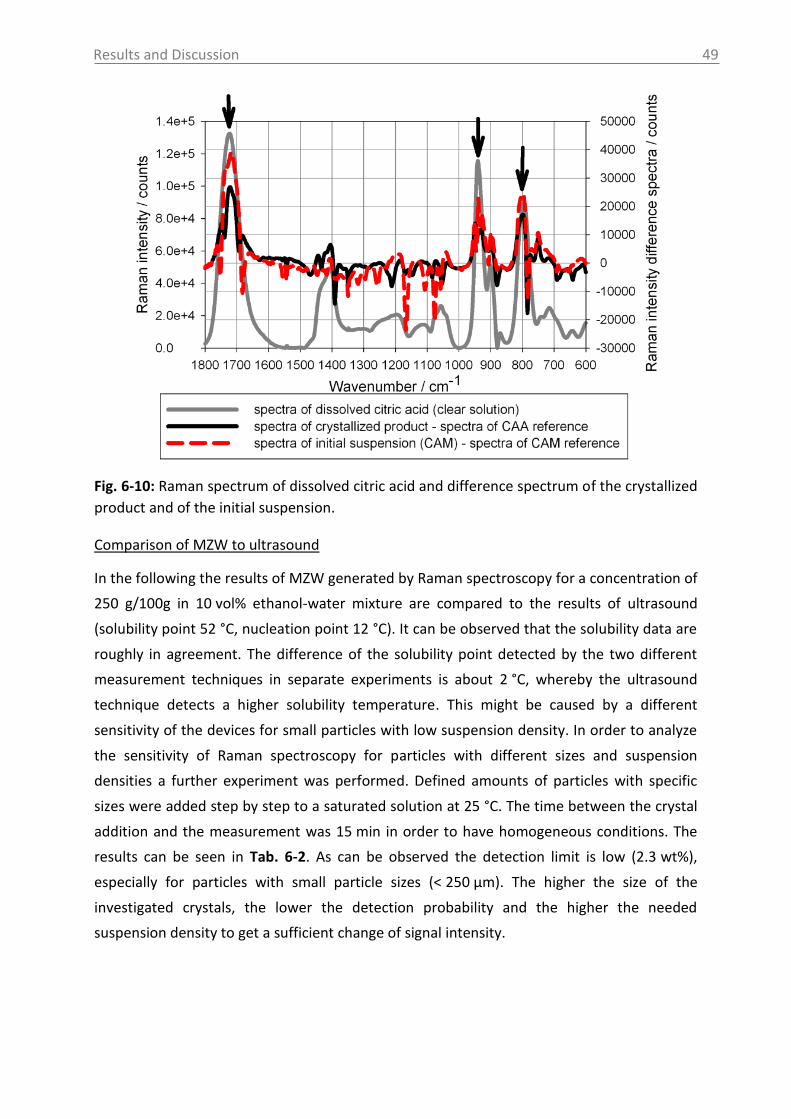
Results and Discussion
49
Fig. 6-10: Raman spectrum of dissolved citric acid and difference spectrum of the crystallized
product and of the initial suspension.
Comparison of MZW to ultrasound
In the following the results of MZW generated by Raman spectroscopy for a concentration of
250 g/100g in 10 vol% ethanol-water mixture are compared to the results of ultrasound
(solubility point 52 °C, nucleation point 12 °C). It can be observed that the solubility data are
roughly in agreement. The difference of the solubility point detected by the two different
measurement techniques in separate experiments is about 2 °C, whereby the ultrasound
technique detects a higher solubility temperature. This might be caused by a different
sensitivity of the devices for small particles with low suspension density. In order to analyze
the sensitivity of Raman spectroscopy for particles with different sizes and suspension
densities a further experiment was performed. Defined amounts of particles with specific
sizes were added step by step to a saturated solution at 25 °C. The time between the crystal
addition and the measurement was 15 min in order to have homogeneous conditions. The
results can be seen in Tab. 6-2. As can be observed the detection limit is low (2.3 wt%),
especially for particles with small particle sizes (< 250 µm). The higher the size of the
investigated crystals, the lower the detection probability and the higher the needed
suspension density to get a sufficient change of signal intensity.
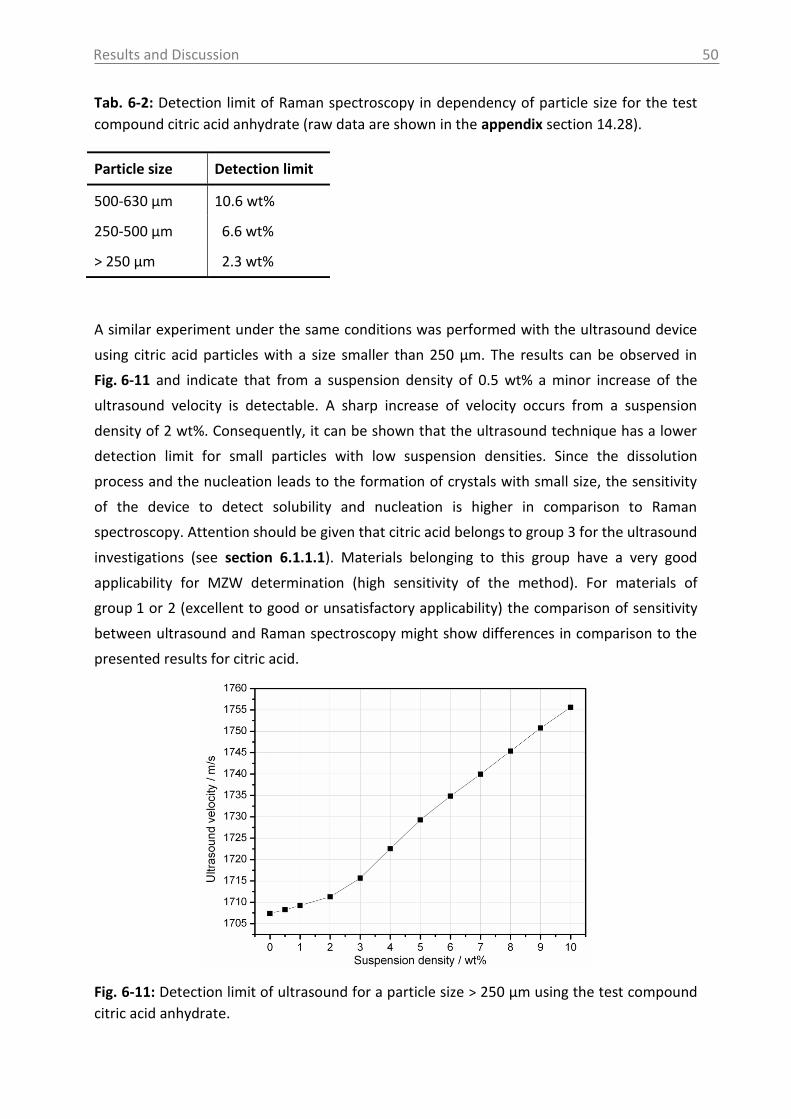
Results and Discussion
50
Tab. 6-2: Detection limit of Raman spectroscopy in dependency of particle size for the test
compound citric acid anhydrate (raw data are shown in the appendix section 14.28).
Particle size Detection limit
500-630 µm 10.6 wt%
250-500 µm 6.6 wt%
> 250 µm 2.3 wt%
A similar experiment under the same conditions was performed with the ultrasound device
using citric acid particles with a size smaller than 250 µm. The results can be observed in
Fig. 6-11 and indicate that from a suspension density of 0.5 wt% a minor increase of the
ultrasound velocity is detectable. A sharp increase of velocity occurs from a suspension
density of 2 wt%. Consequently, it can be shown that the ultrasound technique has a lower
detection limit for small particles with low suspension densities. Since the dissolution
process and the nucleation leads to the formation of crystals with small size, the sensitivity
of the device to detect solubility and nucleation is higher in comparison to Raman
spectroscopy. Attention should be given that citric acid belongs to group 3 for the ultrasound
investigations (see section 6.1.1.1). Materials belonging to this group have a very good
applicability for MZW determination (high sensitivity of the method). For materials of
group 1 or 2 (excellent to good or unsatisfactory applicability) the comparison of sensitivity
between ultrasound and Raman spectroscopy might show differences in comparison to the
presented results for citric acid.
Fig. 6-11: Detection limit of ultrasound for a particle size > 250 µm using the test compound
citric acid anhydrate.
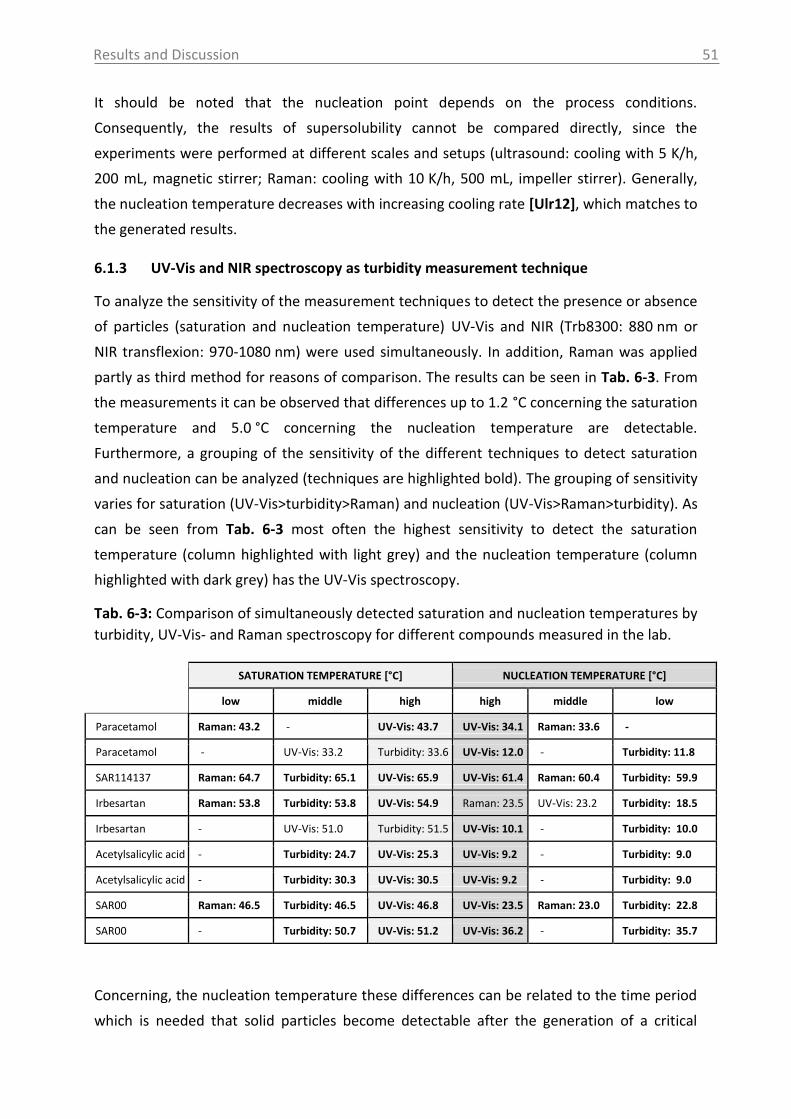
Results and Discussion
51
It should be noted that the nucleation point depends on the process conditions.
Consequently, the results of supersolubility cannot be compared directly, since the
experiments were performed at different scales and setups (ultrasound: cooling with 5 K/h,
200 mL, magnetic stirrer; Raman: cooling with 10 K/h, 500 mL, impeller stirrer). Generally,
the nucleation temperature decreases with increasing cooling rate [Ulr12], which matches to
the generated results.
6.1.3 UV-Vis and NIR spectroscopy as turbidity measurement technique
To analyze the sensitivity of the measurement techniques to detect the presence or absence
of particles (saturation and nucleation temperature) UV-Vis and NIR (Trb8300: 880 nm or
NIR transflexion: 970-1080 nm) were used simultaneously. In addition, Raman was applied
partly as third method for reasons of comparison. The results can be seen in Tab. 6-3. From
the measurements it can be observed that differences up to 1.2 °C concerning the saturation
temperature and 5.0 °C concerning the nucleation temperature are detectable.
Furthermore, a grouping of the sensitivity of the different techniques to detect saturation
and nucleation can be analyzed (techniques are highlighted bold). The grouping of sensitivity
varies for saturation (UV-Vis>turbidity>Raman) and nucleation (UV-Vis>Raman>turbidity). As
can be seen from Tab. 6-3 most often the highest sensitivity to detect the saturation
temperature (column highlighted with light grey) and the nucleation temperature (column
highlighted with dark grey) has the UV-Vis spectroscopy.
Tab. 6-3: Comparison of simultaneously detected saturation and nucleation temperatures by
turbidity, UV-Vis- and Raman spectroscopy for different compounds measured in the lab.
SATURATION TEMPERATURE [°C] NUCLEATION TEMPERATURE [°C]
low middle high high middle low
Paracetamol Raman: 43.2 - UV-Vis: 43.7 UV-Vis: 34.1 Raman: 33.6 -
Paracetamol - UV-Vis: 33.2 Turbidity: 33.6 UV-Vis: 12.0 - Turbidity: 11.8
SAR114137 Raman: 64.7 Turbidity: 65.1 UV-Vis: 65.9 UV-Vis: 61.4 Raman: 60.4 Turbidity: 59.9
Irbesartan Raman: 53.8 Turbidity: 53.8 UV-Vis: 54.9 Raman: 23.5 UV-Vis: 23.2 Turbidity: 18.5
Irbesartan - UV-Vis: 51.0 Turbidity: 51.5 UV-Vis: 10.1 - Turbidity: 10.0
Acetylsalicylic acid - Turbidity: 24.7 UV-Vis: 25.3 UV-Vis: 9.2 - Turbidity: 9.0
Acetylsalicylic acid - Turbidity: 30.3 UV-Vis: 30.5 UV-Vis: 9.2 - Turbidity: 9.0
SAR00 Raman: 46.5 Turbidity: 46.5 UV-Vis: 46.8 UV-Vis: 23.5 Raman: 23.0 Turbidity: 22.8
SAR00 - Turbidity: 50.7 UV-Vis: 51.2 UV-Vis: 36.2 - Turbidity: 35.7
Concerning, the nucleation temperature these differences can be related to the time period
which is needed that solid particles become detectable after the generation of a critical
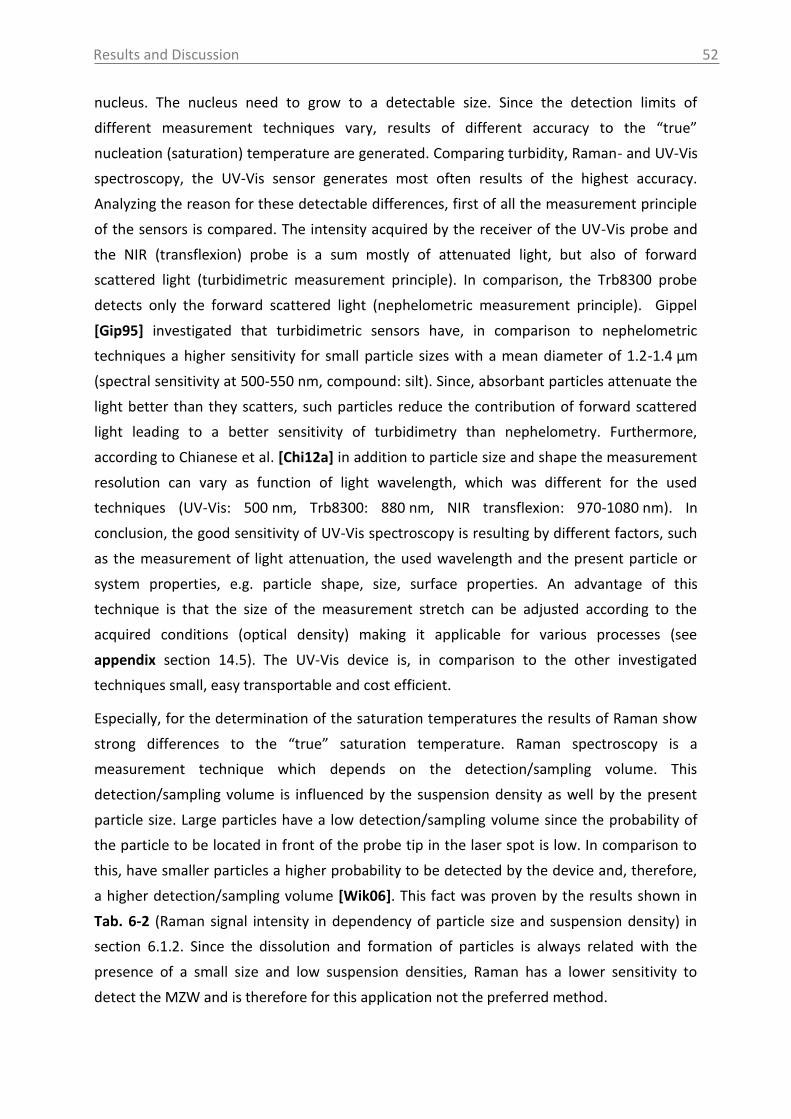
Results and Discussion
52
nucleus. The nucleus need to grow to a detectable size. Since the detection limits of
different measurement techniques vary, results of different accuracy to the “true”
nucleation (saturation) temperature are generated. Comparing turbidity, Raman- and UV-Vis
spectroscopy, the UV-Vis sensor generates most often results of the highest accuracy.
Analyzing the reason for these detectable differences, first of all the measurement principle
of the sensors is compared. The intensity acquired by the receiver of the UV-Vis probe and
the NIR (transflexion) probe is a sum mostly of attenuated light, but also of forward
scattered light (turbidimetric measurement principle). In comparison, the Trb8300 probe
detects only the forward scattered light (nephelometric measurement principle). Gippel
[Gip95] investigated that turbidimetric sensors have, in comparison to nephelometric
techniques a higher sensitivity for small particle sizes with a mean diameter of 1.2-1.4 µm
(spectral sensitivity at 500-550 nm, compound: silt). Since, absorbant particles attenuate the
light better than they scatters, such particles reduce the contribution of forward scattered
light leading to a better sensitivity of turbidimetry than nephelometry. Furthermore,
according to Chianese et al. [Chi12a] in addition to particle size and shape the measurement
resolution can vary as function of light wavelength, which was different for the used
techniques (UV-Vis: 500 nm, Trb8300: 880 nm, NIR transflexion: 970-1080 nm). In
conclusion, the good sensitivity of UV-Vis spectroscopy is resulting by different factors, such
as the measurement of light attenuation, the used wavelength and the present particle or
system properties, e.g. particle shape, size, surface properties. An advantage of this
technique is that the size of the measurement stretch can be adjusted according to the
acquired conditions (optical density) making it applicable for various processes (see
appendix section 14.5). The UV-Vis device is, in comparison to the other investigated
techniques small, easy transportable and cost efficient.
Especially, for the determination of the saturation temperatures the results of Raman show
strong differences to the “true” saturation temperature. Raman spectroscopy is a
measurement technique which depends on the detection/sampling volume. This
detection/sampling volume is influenced by the suspension density as well by the present
particle size. Large particles have a low detection/sampling volume since the probability of
the particle to be located in front of the probe tip in the laser spot is low. In comparison to
this, have smaller particles a higher probability to be detected by the device and, therefore,
a higher detection/sampling volume [Wik06]. This fact was proven by the results shown in
Tab. 6-2 (Raman signal intensity in dependency of particle size and suspension density) in
section 6.1.2. Since the dissolution and formation of particles is always related with the
presence of a small size and low suspension densities, Raman has a lower sensitivity to
detect the MZW and is therefore for this application not the preferred method.
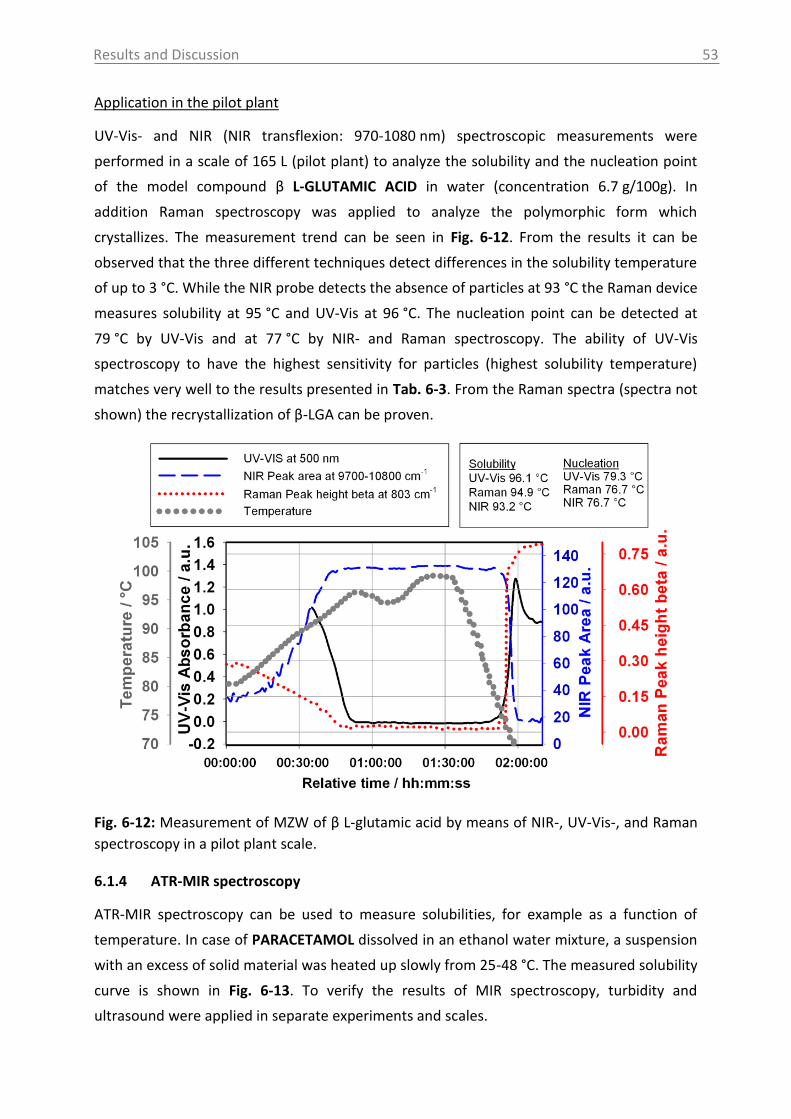
Results and Discussion
53
Application in the pilot plant
UV-Vis- and NIR (NIR transflexion: 970-1080 nm) spectroscopic measurements were
performed in a scale of 165 L (pilot plant) to analyze the solubility and the nucleation point
of the model compound β L-GLUTAMIC ACID in water (concentration 6.7 g/100g). In
addition Raman spectroscopy was applied to analyze the polymorphic form which
crystallizes. The measurement trend can be seen in Fig. 6-12. From the results it can be
observed that the three different techniques detect differences in the solubility temperature
of up to 3 °C. While the NIR probe detects the absence of particles at 93 °C the Raman device
measures solubility at 95 °C and UV-Vis at 96 °C. The nucleation point can be detected at
79 °C by UV-Vis and at 77 °C by NIR- and Raman spectroscopy. The ability of UV-Vis
spectroscopy to have the highest sensitivity for particles (highest solubility temperature)
matches very well to the results presented in Tab. 6-3. From the Raman spectra (spectra not
shown) the recrystallization of β-LGA can be proven.
Fig. 6-12: Measurement of MZW of β L-glutamic acid by means of NIR-, UV-Vis-, and Raman
spectroscopy in a pilot plant scale.
6.1.4 ATR-MIR spectroscopy
ATR-MIR spectroscopy can be used to measure solubilities, for example as a function of
temperature. In case of PARACETAMOL dissolved in an ethanol water mixture, a suspension
with an excess of solid material was heated up slowly from 25-48 °C. The measured solubility
curve is shown in Fig. 6-13. To verify the results of MIR spectroscopy, turbidity and
ultrasound were applied in separate experiments and scales.
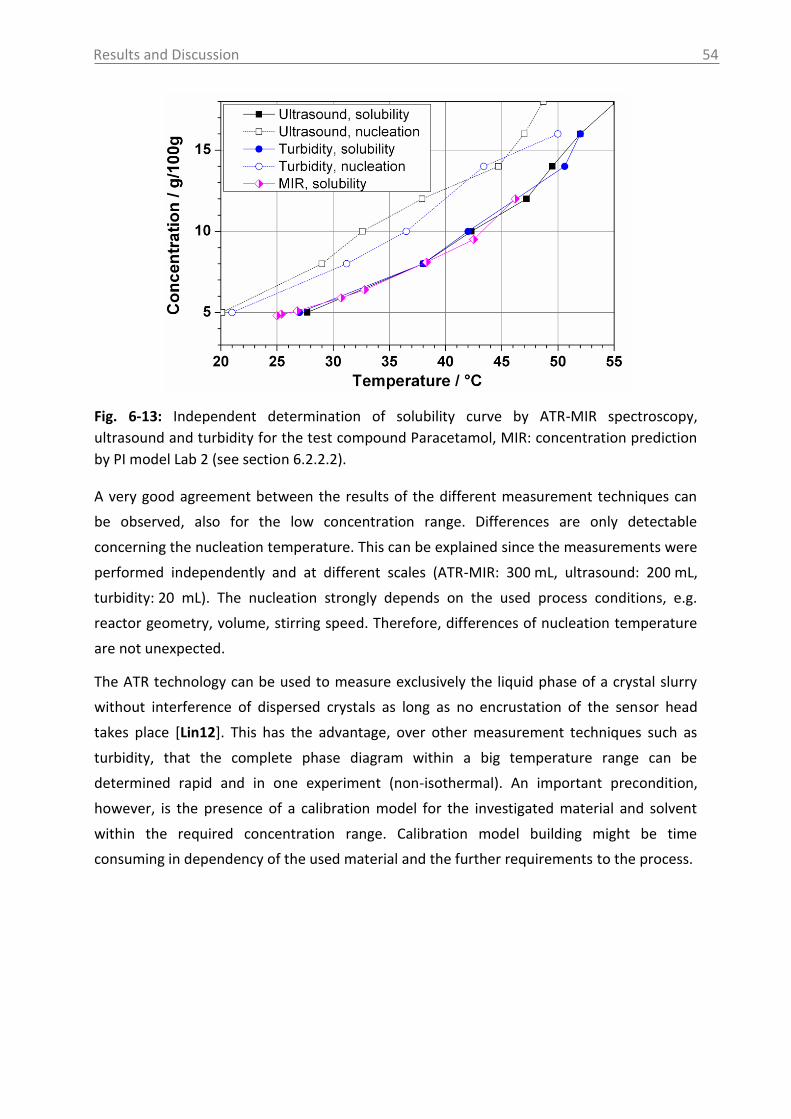
Results and Discussion
54
Fig. 6-13: Independent determination of solubility curve by ATR-MIR spectroscopy,
ultrasound and turbidity for the test compound Paracetamol, MIR: concentration prediction
by PI model Lab 2 (see section 6.2.2.2).
A very good agreement between the results of the different measurement techniques can
be observed, also for the low concentration range. Differences are only detectable
concerning the nucleation temperature. This can be explained since the measurements were
performed independently and at different scales (ATR-MIR: 300 mL, ultrasound: 200 mL,
turbidity: 20 mL). The nucleation strongly depends on the used process conditions, e.g.
reactor geometry, volume, stirring speed. Therefore, differences of nucleation temperature
are not unexpected.
The ATR technology can be used to measure exclusively the liquid phase of a crystal slurry
without interference of dispersed crystals as long as no encrustation of the sensor head
takes place [Lin12]. This has the advantage, over other measurement techniques such as
turbidity, that the complete phase diagram within a big temperature range can be
determined rapid and in one experiment (non-isothermal). An important precondition,
however, is the presence of a calibration model for the investigated material and solvent
within the required concentration range. Calibration model building might be time
consuming in dependency of the used material and the further requirements to the process.
Results and Discussion
55
6.2 Investigations in liquid phase
It is desired to operate the crystallization process in such a way that the operational point
(concentration) stays within the metastable zone. This can lead to a constant crystal growth
operation, which is always preferred over a process with frequent nucleation events, since
nucleation affects the product quality (e.g. to small mean particle size). For economic
reasons the operational point of a process is often maintained constant approximately in the
middle of the metastable zone width by a closed loop feedback control strategy. This kind of
process control, however, requires methods which can be used for a reliable real-time
prediction of concentration [Kal12]. In the following the ultrasound technique and ATR-MIR
spectroscopy are tested and the applicability is evaluated.
6.2.1 Ultrasound
6.2.1.1 Applicability for pharmaceutical compounds
According to the literature the ultrasound technique can be used to measure the
concentration, mostly of inorganic salts, but also of organic compounds [Gla04, Hei08,
Oma99b, Sto11, Str04]. Pharmaceutical compounds, however, have in comparison to
previously tested materials often partly different properties, such as high molecular weights,
low concentration ranges and/or extreme small particle sizes. Therefore, the application of
ultrasound might be limited for these kinds of materials. To evaluate the applicability of the
ultrasound technique for pharmaceuticals in total 12 different test compounds were
analyzed within different concentration ranges (see also [Hel13d]). Consequently, the data
were compared to the measurements shown in the literature. An overview of the results and
an evaluation of the result quality can be seen in Tab. 6-4. As can be observed for most of
the materials the concentrations can be analyzed, except for the compounds artemesinic
acid and SAR114137. The results are sorted by the sensitivity of concentration
measurement. The sensitivity is defined as the maximum change of ultrasound velocity for
the maximum concentration difference which was analyzed at isotherm conditions, in order
to exclude the influence of temperature on the measured velocity (T[°C]/∆c[g/100g]/∆VEL
[m/s]). Furthermore, information on the change of velocity with increasing temperature
(VEL trend (↑T)) and at the nucleation point (VEL trend at Tnucl) as well as of the root mean
square error of calibration and/or prediction (RMSE(C/P)) and the molecular weights (MW)
are given in Tab. 6-4.
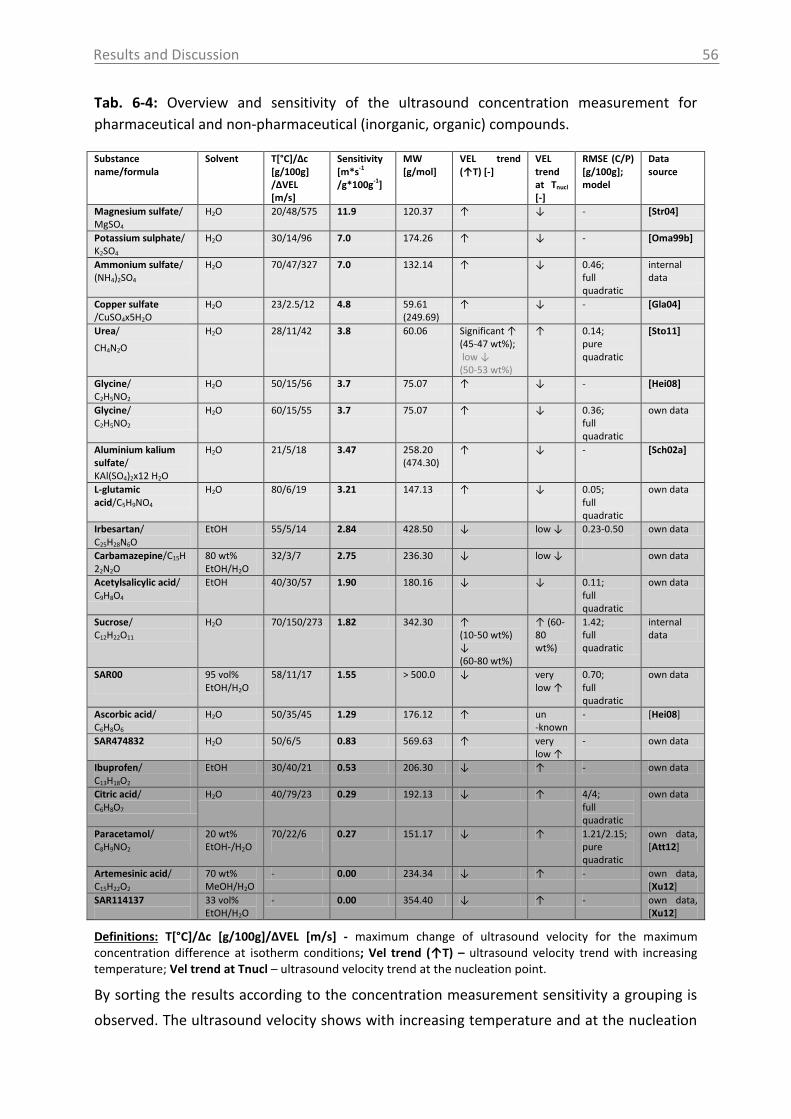
Results and Discussion
56
Tab. 6-4: Overview and sensitivity of the ultrasound concentration measurement for
pharmaceutical and non-pharmaceutical (inorganic, organic) compounds.
Substance name/formula
Solvent T[°C]/∆c [g/100g] /∆VEL [m/s]
Sensitivity [m*s-1
/g*100g-1]
MW [g/mol]
VEL trend (↑T) [-]
VEL trend at Tnucl
[-]
RMSE (C/P) [g/100g]; model
Data source
Magnesium sulfate/ MgSO4
H2O 20/48/575 11.9 120.37 ↑ ↓ - [Str04]
Potassium sulphate/ K2SO4
H2O 30/14/96 7.0 174.26 ↑ ↓ - [Oma99b]
Ammonium sulfate/ (NH4)2SO4
H2O 70/47/327 7.0 132.14 ↑ ↓ 0.46; full quadratic
internal data
Copper sulfate /CuSO4x5H2O
H2O 23/2.5/12 4.8 59.61 (249.69)
↑ ↓ - [Gla04]
Urea/
CH4N2O
H2O 28/11/42
3.8 60.06 Significant ↑ (45-47 wt%); low ↓ (50-53 wt%)
↑ 0.14; pure quadratic
[Sto11]
Glycine/ C2H5NO2
H2O 50/15/56 3.7 75.07 ↑ ↓ - [Hei08]
Glycine/ C2H5NO2
H2O 60/15/55 3.7 75.07 ↑ ↓ 0.36; full quadratic
own data
Aluminium kalium sulfate/ KAl(SO4)2x12 H2O
H2O 21/5/18 3.47 258.20 (474.30)
↑ ↓ - [Sch02a]
L-glutamic acid/C5H9NO4
H2O 80/6/19 3.21 147.13 ↑ ↓ 0.05; full quadratic
own data
Irbesartan/ C25H28N6O
EtOH 55/5/14 2.84 428.50 ↓ low ↓ 0.23-0.50
own data
Carbamazepine/C15H22N2O
80 wt% EtOH/H2O
32/3/7 2.75 236.30 ↓ low ↓ own data
Acetylsalicylic acid/ C9H8O4
EtOH 40/30/57 1.90 180.16 ↓ ↓ 0.11; full quadratic
own data
Sucrose/ C12H22O11
H2O 70/150/273 1.82 342.30 ↑ (10-50 wt%) ↓ (60-80 wt%)
↑ (60-80 wt%)
1.42; full quadratic
internal data
SAR00
95 vol% EtOH/H2O
58/11/17 1.55 > 500.0 ↓ very low ↑
0.70; full quadratic
own data
Ascorbic acid/ C6H8O6
H2O 50/35/45 1.29 176.12 ↑ un -known
- [Hei08]
SAR474832
H2O 50/6/5 0.83 569.63 ↑ very low ↑
- own data
Ibuprofen/ C13H18O2
EtOH 30/40/21 0.53 206.30 ↓ ↑ - own data
Citric acid/ C6H8O7
H2O 40/79/23 0.29 192.13 ↓ ↑ 4/4; full quadratic
own data
Paracetamol/ C8H9NO2
20 wt% EtOH-/H2O
70/22/6
0.27 151.17 ↓ ↑ 1.21/2.15; pure quadratic
own data, [Att12]
Artemesinic acid/ C15H22O2
70 wt% MeOH/H2O
- 0.00 234.34 ↓ ↑ - own data, [Xu12]
SAR114137
33 vol% EtOH/H2O
- 0.00 354.40 ↓ ↑ - own data, [Xu12]
Definitions: T[°C]/∆c [g/100g]/∆VEL [m/s] - maximum change of ultrasound velocity for the maximum concentration difference at isotherm conditions; Vel trend (↑T) – ultrasound velocity trend with increasing temperature; Vel trend at Tnucl – ultrasound velocity trend at the nucleation point.
By sorting the results according to the concentration measurement sensitivity a grouping is
observed. The ultrasound velocity shows with increasing temperature and at the nucleation
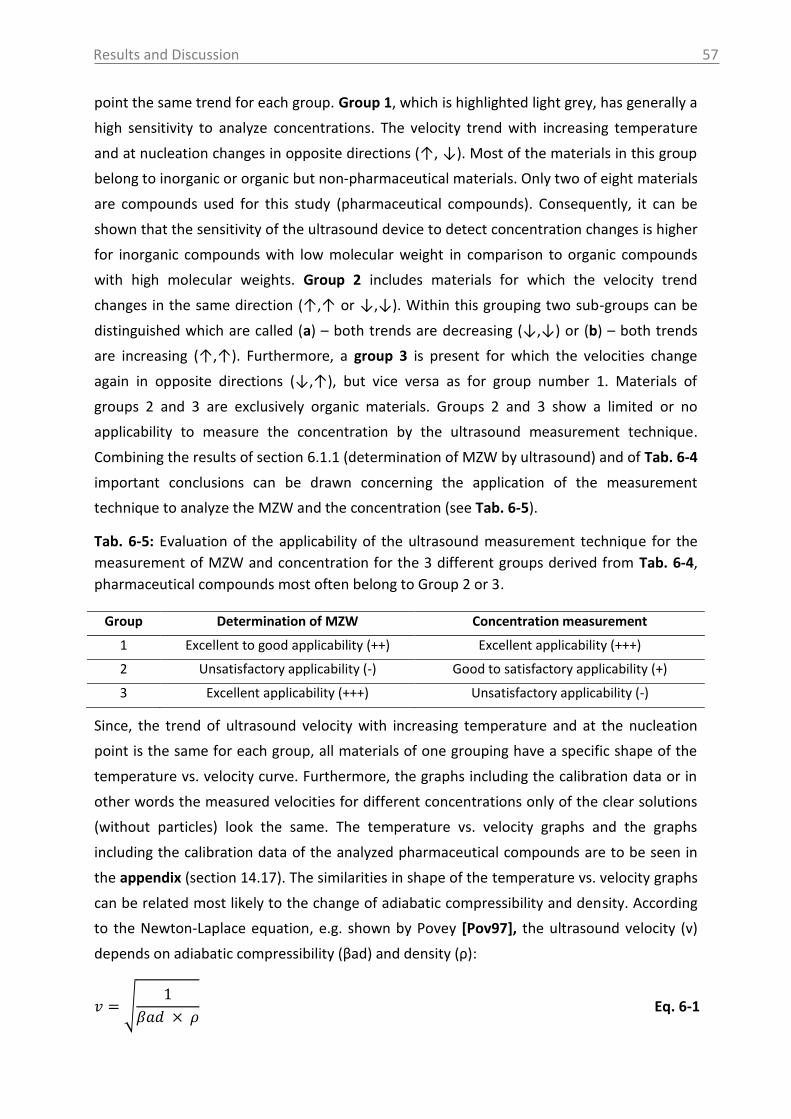
Results and Discussion
57
point the same trend for each group. Group 1, which is highlighted light grey, has generally a
high sensitivity to analyze concentrations. The velocity trend with increasing temperature
and at nucleation changes in opposite directions (↑, ↓). Most of the materials in this group
belong to inorganic or organic but non-pharmaceutical materials. Only two of eight materials
are compounds used for this study (pharmaceutical compounds). Consequently, it can be
shown that the sensitivity of the ultrasound device to detect concentration changes is higher
for inorganic compounds with low molecular weight in comparison to organic compounds
with high molecular weights. Group 2 includes materials for which the velocity trend
changes in the same direction (↑,↑ or ↓,↓). Within this grouping two sub-groups can be
distinguished which are called (a) – both trends are decreasing (↓,↓) or (b) – both trends
are increasing (↑,↑). Furthermore, a group 3 is present for which the velocities change
again in opposite directions (↓,↑), but vice versa as for group number 1. Materials of
groups 2 and 3 are exclusively organic materials. Groups 2 and 3 show a limited or no
applicability to measure the concentration by the ultrasound measurement technique.
Combining the results of section 6.1.1 (determination of MZW by ultrasound) and of Tab. 6-4
important conclusions can be drawn concerning the application of the measurement
technique to analyze the MZW and the concentration (see Tab. 6-5).
Tab. 6-5: Evaluation of the applicability of the ultrasound measurement technique for the
measurement of MZW and concentration for the 3 different groups derived from Tab. 6-4,
pharmaceutical compounds most often belong to Group 2 or 3.
Group Determination of MZW Concentration measurement
1 Excellent to good applicability (++) Excellent applicability (+++)
2 Unsatisfactory applicability (-) Good to satisfactory applicability (+)
3 Excellent applicability (+++) Unsatisfactory applicability (-)
Since, the trend of ultrasound velocity with increasing temperature and at the nucleation
point is the same for each group, all materials of one grouping have a specific shape of the
temperature vs. velocity curve. Furthermore, the graphs including the calibration data or in
other words the measured velocities for different concentrations only of the clear solutions
(without particles) look the same. The temperature vs. velocity graphs and the graphs
including the calibration data of the analyzed pharmaceutical compounds are to be seen in
the appendix (section 14.17). The similarities in shape of the temperature vs. velocity graphs
can be related most likely to the change of adiabatic compressibility and density. According
to the Newton-Laplace equation, e.g. shown by Povey [Pov97], the ultrasound velocity (v)
depends on adiabatic compressibility (βad) and density (ρ):
√
Eq. 6-1
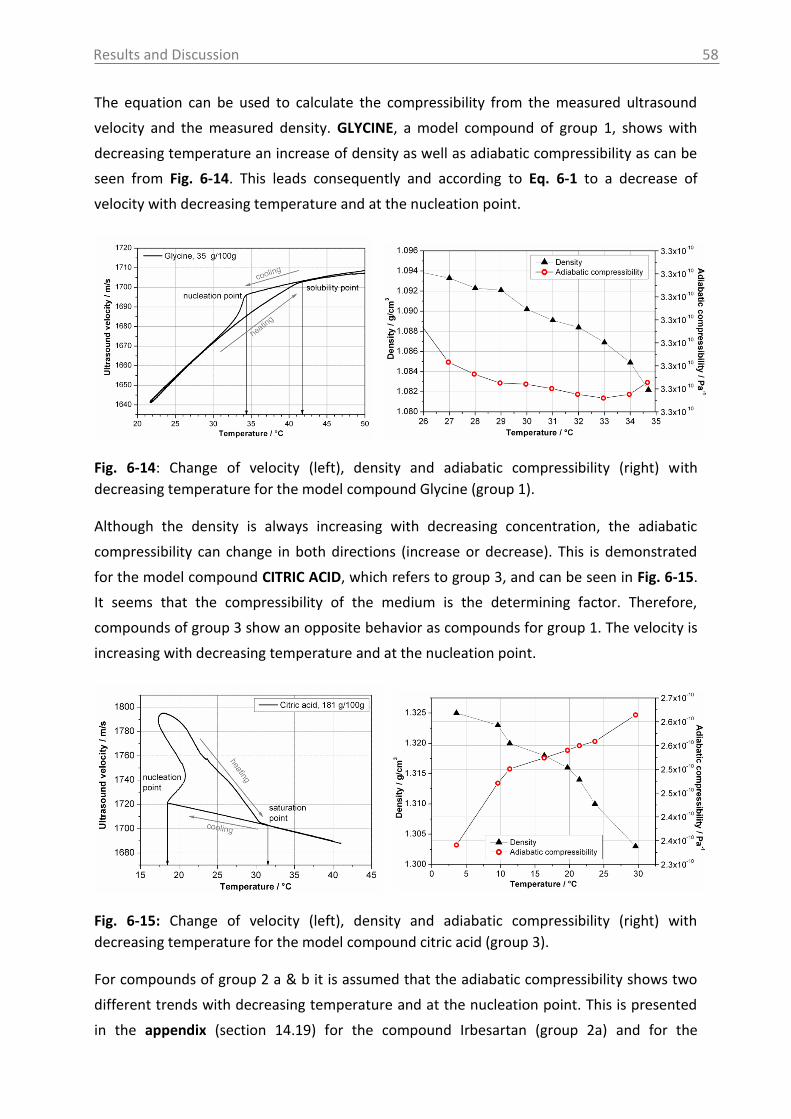
Results and Discussion
58
The equation can be used to calculate the compressibility from the measured ultrasound
velocity and the measured density. GLYCINE, a model compound of group 1, shows with
decreasing temperature an increase of density as well as adiabatic compressibility as can be
seen from Fig. 6-14. This leads consequently and according to Eq. 6-1 to a decrease of
velocity with decreasing temperature and at the nucleation point.
Fig. 6-14: Change of velocity (left), density and adiabatic compressibility (right) with
decreasing temperature for the model compound Glycine (group 1).
Although the density is always increasing with decreasing concentration, the adiabatic
compressibility can change in both directions (increase or decrease). This is demonstrated
for the model compound CITRIC ACID, which refers to group 3, and can be seen in Fig. 6-15.
It seems that the compressibility of the medium is the determining factor. Therefore,
compounds of group 3 show an opposite behavior as compounds for group 1. The velocity is
increasing with decreasing temperature and at the nucleation point.
Fig. 6-15: Change of velocity (left), density and adiabatic compressibility (right) with
decreasing temperature for the model compound citric acid (group 3).
For compounds of group 2 a & b it is assumed that the adiabatic compressibility shows two
different trends with decreasing temperature and at the nucleation point. This is presented
in the appendix (section 14.19) for the compound Irbesartan (group 2a) and for the

Results and Discussion
59
compound SAR474832 (group 2b). For Irbesartan for instance the velocity is increasing with
decreasing temperature and at the nucleation point a sudden decrease of velocity is
detected. From the results measured for the compounds Glycine (group 1) and citric acid
(group 3) it can be assumed that the compressibility is decreasing with decreasing
temperature. At the nucleation point, however, a low increase of adiabatic compressibility
might take place.
According to the presented results, compounds of group 1 show an excellent applicability to
analyze concentrations by means of ultrasound. Both variables - the density and the
compressibility change in the same direction. Therefore, the extent of the change of velocity
is maximal, according to the equation Eq. 6-1. For compounds of group 3 the applicability is
unsatisfactory since the density and the compressibility in Eq. 6-1 change in opposite
direction. Therefore, the velocity change is neglectable or very low. Group 2 takes an
intermediate position.
6.2.1.2 Applicability in the pilot plant
In the following one compound of each group was selected in order to test the applicability
of the ultrasound measurement technique to monitor the concentration in pilot plant scale,
where the sensor is integrated in horizontal direction in a flow-through cell. For this purpose
the ultrasound velocities of the different compound concentrations (solid material
completely dissolved) were investigated in dependency of temperature. As a compound of
group 3 (unsatisfactory applicability) PARACETAMOL in an ethanol water mixture
(20:80 w/w) was chosen. The results of the lab and the pilot plant experiments are shown in
Fig. 6-16.
Fig. 6-16: Calibration of concentration in pilot plant and lab scale for the compound
Paracetamol (group 3, unsatisfactory applicability) by means of ultrasound.
Results and Discussion
60
From the graphic it can be observed that there are significant differences of the analyzed
velocities for the same concentration range. The velocities analyzed in the pilot plant are
lower in comparison to the results of the lab experiment. The sensitivity to detect different
concentrations is higher in case of the laboratory experiments. From the pilot plant results it
can be seen that especially the measured velocities of the solvent are highly fluctuating.
An explanation for the systematic lower velocities in the pilot plant is the presence of
undissolved gas/air, which is resulting from pumping the solution in the pilot plant.
According to Povey [Pov97] even very small amounts of undissolved air can have a dramatic
influence on the velocity of sound. Although dissolved gas/air has a very small effect on the
velocity, small changes in pressure can bring dissolved air out of solution, creating bubbles.
The velocity of air is, e.g. 322.16 m/s (20 °C). The ethanol water mixture, which is used to
dissolve the Paracetamol has a velocity of 1570 m/s (60 °C). The presence of gas/air bubbles
therefore, leads to a significant reduction of velocity in dependency of the undissolved
gas/air content. This would also explain the strong fluctuations of velocities measured for
the solvent directly after addition to the reactor (see Fig. 6-16). In conclusion, a calibration
transfer for the test compound Paracetamol is not possible under the present conditions in
the pilot plant setup as long as the gas/air bubbles cannot be reduced. A dearation of the
solvents, e.g. by sonication (high-power ultrasound), by vacuum or nitrogen displacement
might solve the problems [Pov97]. The circumstance that the experiments are performed at
“big” scales, however, makes the application of these techniques more difficult. It should be
noted that Paracetamol has anyway a low sensitivity for concentration measurement with
ultrasound, since the compound belongs to group 3. This leads to relative high calibration
and prediction errors, which are 1.2 wt% and 2.1 wt% in case of the lab experiment and a
concentration range from 9-43 wt%. In comparison to other concentration measurement
techniques, such as MIR spectroscopy, the prediction error is significantly lower (7-times) for
the same compound (e.g. 0.29 wt% for a pilot plant peak integration model), whereby a
significantly lower concentration range (1-10 wt%) is used.
ACETYLSALICYLIC ACID dissolved in ethanol was used as a compound of group 2 (good to
satisfactory applicability). From the results shown in Fig. 6-17 it can be observed that the
ultrasound velocities measured in the lab and in the pilot plant for the same concentration
and temperature range show a very good agreement.
The low influence of gas/air for Acetylsalicylic acid dissolved in ethanol, in comparison to the
system Paracetamol dissolved in a 20 wt% ethanol-water mixture, might be explained since
gas is much more soluble in ethanol than in water [Dal06]. Therefore, the extent of non-
soluble gas, which forms air bubbles, is smaller for Acetylsalicylic acid. Furthermore, the
viscosity of the medium might have an influence on the degassing behavior.
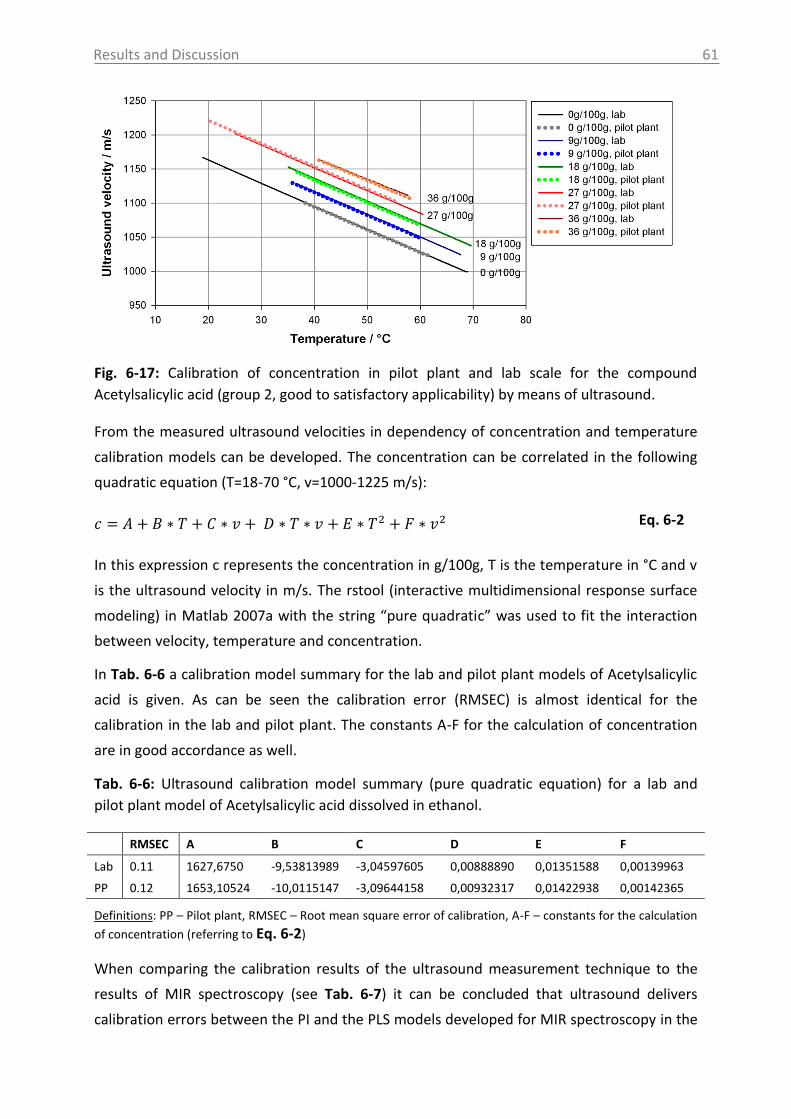
Results and Discussion
61
Fig. 6-17: Calibration of concentration in pilot plant and lab scale for the compound
Acetylsalicylic acid (group 2, good to satisfactory applicability) by means of ultrasound.
From the measured ultrasound velocities in dependency of concentration and temperature
calibration models can be developed. The concentration can be correlated in the following
quadratic equation (T=18-70 °C, v=1000-1225 m/s):
Eq. 6-2
In this expression c represents the concentration in g/100g, T is the temperature in °C and v
is the ultrasound velocity in m/s. The rstool (interactive multidimensional response surface
modeling) in Matlab 2007a with the string “pure quadratic” was used to fit the interaction
between velocity, temperature and concentration.
In Tab. 6-6 a calibration model summary for the lab and pilot plant models of Acetylsalicylic
acid is given. As can be seen the calibration error (RMSEC) is almost identical for the
calibration in the lab and pilot plant. The constants A-F for the calculation of concentration
are in good accordance as well.
Tab. 6-6: Ultrasound calibration model summary (pure quadratic equation) for a lab and
pilot plant model of Acetylsalicylic acid dissolved in ethanol.
RMSEC A B C D E F
Lab 0.11 1627,6750 -9,53813989 -3,04597605 0,00888890 0,01351588 0,00139963
PP 0.12 1653,10524 -10,0115147 -3,09644158 0,00932317 0,01422938 0,00142365
Definitions: PP – Pilot plant, RMSEC – Root mean square error of calibration, A-F – constants for the calculation
of concentration (referring to Eq. 6-2)
When comparing the calibration results of the ultrasound measurement technique to the
results of MIR spectroscopy (see Tab. 6-7) it can be concluded that ultrasound delivers
calibration errors between the PI and the PLS models developed for MIR spectroscopy in the

Results and Discussion
62
pilot plant. Tab. 6-8 shows the predictions of an independent test sample in the higher
concentration range derived from the ultrasound calibration in comparison to the prediction
results of MIR-spectroscopy for the PI and the PLS model. It should be noted, that the
prediction of more than one concentration is necessary in order to calculate the prediction
error reliably. Therefore, only the standard deviation is given in Tab. 6-8 for the prediction of
concentrations in temperature range from 23 to 42 °C.
Tab. 6-7: MIR spectroscopy calibration model summary for a pilot plant model of
Acetylsalicylic acid dissolved in ethanol using 32 training samples and 15 test samples (same
concentration, but different temperatures!).
PLS (rank 4) PI (quadratic)
R2 0.99993 0.99967
RMSEC 0.08 0.17 RMSEP 0.07 0.13
Definitions: R2 – Coefficient of determination, RMSEC/P – Root mean square error of calibration/prediction, PLS
– Partial Least Square, PI – Peak Integration.
Tab. 6-8: Predictions of independent test samples by ultrasound and MIR (PI and PLS model),
derived from a simultaneously measured data set in the pilot plant (true concentration
22.5 g/100g).
Ultrasound MIR – PI model MIR – PLS model
Mean predicted concentration [g/100g] 21.98 21.78 21.65
Standard deviation [g/100g] 0.53 0.72 0.86
Definitions: MIR – MIR spectroscopy, PLS – Partial Least Square, PI – Peak Integration.
As can be seen in Tab. 6-8 the predictions of the ultrasound technique have the lowest
deviation to the true concentration, followed by the MIR PI model and the MIR PLS model.
Since the prediction accuracy for the PLS model is lower in comparison to the PI model,
which is not consistent with Tab. 6-7, it is assumed that effects such as the movement of the
fiber optics after the calibration cause these differences. A further discussion on how MIR-
spectroscopy can be affected by external influences is given in section 6.2.2. In conclusion,
the accuracy of concentration measurements by ultrasound for the compound Acetylsalicylic
acid is comparable to other independent measurement techniques, such as MIR
spectroscopy. The MIR spectra as well as an overview of the calibration data set and the
used data pre-treatments are given in the appendix (section 14.18).
That the ultrasound calibration model for Acetylsalicylic acid dissolved in ethanol, which was
developed at lab scale, can also be used for predictions in a pilot plant scale is shown by the
recovery curve in Fig. 6-18. The black symbols represent pilot plant data predicted by the
pilot plant calibration model. The results show ideal recovery behavior. The prediction error
is with 0.12 g/100g very low. Furthermore, the pilot plant data were predicted by a
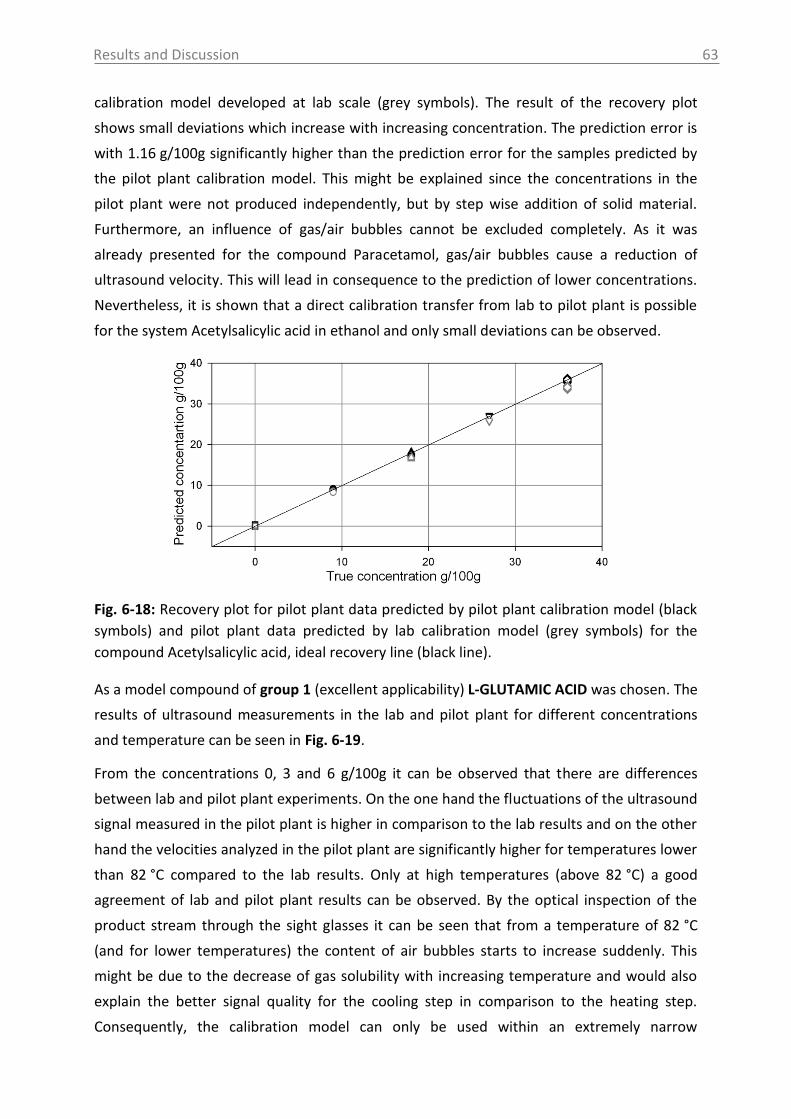
Results and Discussion
63
calibration model developed at lab scale (grey symbols). The result of the recovery plot
shows small deviations which increase with increasing concentration. The prediction error is
with 1.16 g/100g significantly higher than the prediction error for the samples predicted by
the pilot plant calibration model. This might be explained since the concentrations in the
pilot plant were not produced independently, but by step wise addition of solid material.
Furthermore, an influence of gas/air bubbles cannot be excluded completely. As it was
already presented for the compound Paracetamol, gas/air bubbles cause a reduction of
ultrasound velocity. This will lead in consequence to the prediction of lower concentrations.
Nevertheless, it is shown that a direct calibration transfer from lab to pilot plant is possible
for the system Acetylsalicylic acid in ethanol and only small deviations can be observed.
Fig. 6-18: Recovery plot for pilot plant data predicted by pilot plant calibration model (black
symbols) and pilot plant data predicted by lab calibration model (grey symbols) for the
compound Acetylsalicylic acid, ideal recovery line (black line).
As a model compound of group 1 (excellent applicability) L-GLUTAMIC ACID was chosen. The
results of ultrasound measurements in the lab and pilot plant for different concentrations
and temperature can be seen in Fig. 6-19.
From the concentrations 0, 3 and 6 g/100g it can be observed that there are differences
between lab and pilot plant experiments. On the one hand the fluctuations of the ultrasound
signal measured in the pilot plant is higher in comparison to the lab results and on the other
hand the velocities analyzed in the pilot plant are significantly higher for temperatures lower
than 82 °C compared to the lab results. Only at high temperatures (above 82 °C) a good
agreement of lab and pilot plant results can be observed. By the optical inspection of the
product stream through the sight glasses it can be seen that from a temperature of 82 °C
(and for lower temperatures) the content of air bubbles starts to increase suddenly. This
might be due to the decrease of gas solubility with increasing temperature and would also
explain the better signal quality for the cooling step in comparison to the heating step.
Consequently, the calibration model can only be used within an extremely narrow
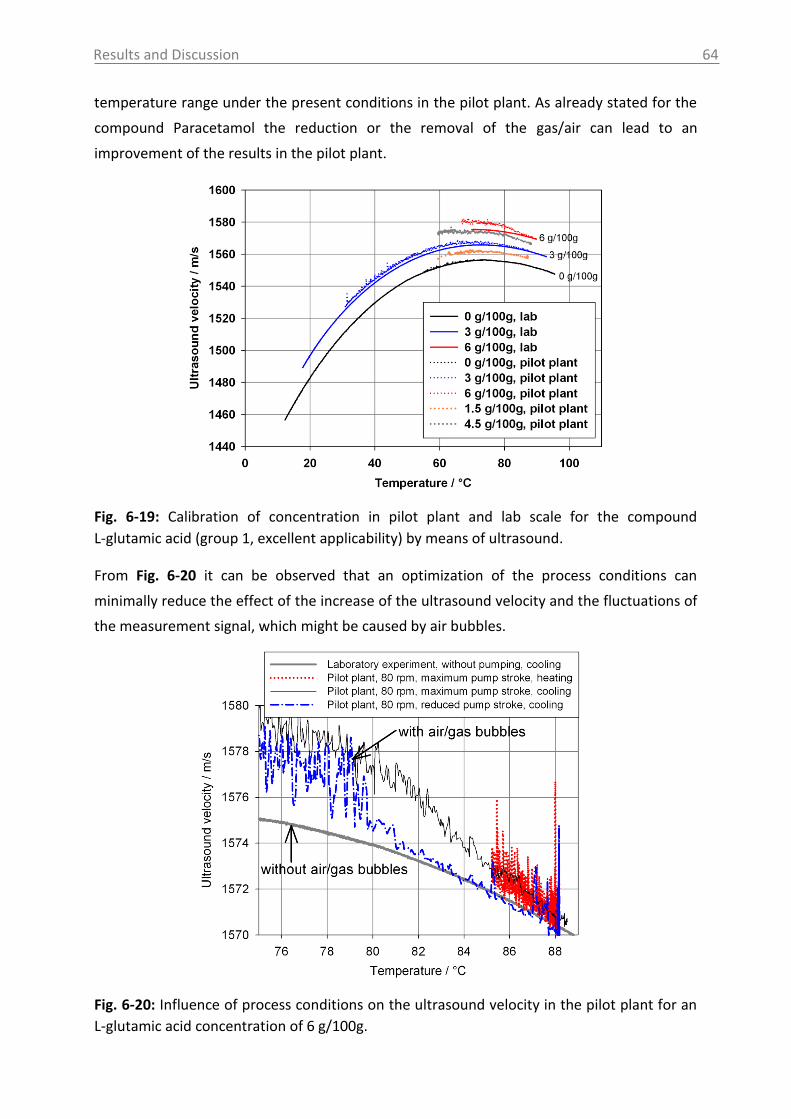
Results and Discussion
64
temperature range under the present conditions in the pilot plant. As already stated for the
compound Paracetamol the reduction or the removal of the gas/air can lead to an
improvement of the results in the pilot plant.
Fig. 6-19: Calibration of concentration in pilot plant and lab scale for the compound
L-glutamic acid (group 1, excellent applicability) by means of ultrasound.
From Fig. 6-20 it can be observed that an optimization of the process conditions can
minimally reduce the effect of the increase of the ultrasound velocity and the fluctuations of
the measurement signal, which might be caused by air bubbles.
Fig. 6-20: Influence of process conditions on the ultrasound velocity in the pilot plant for an
L-glutamic acid concentration of 6 g/100g.
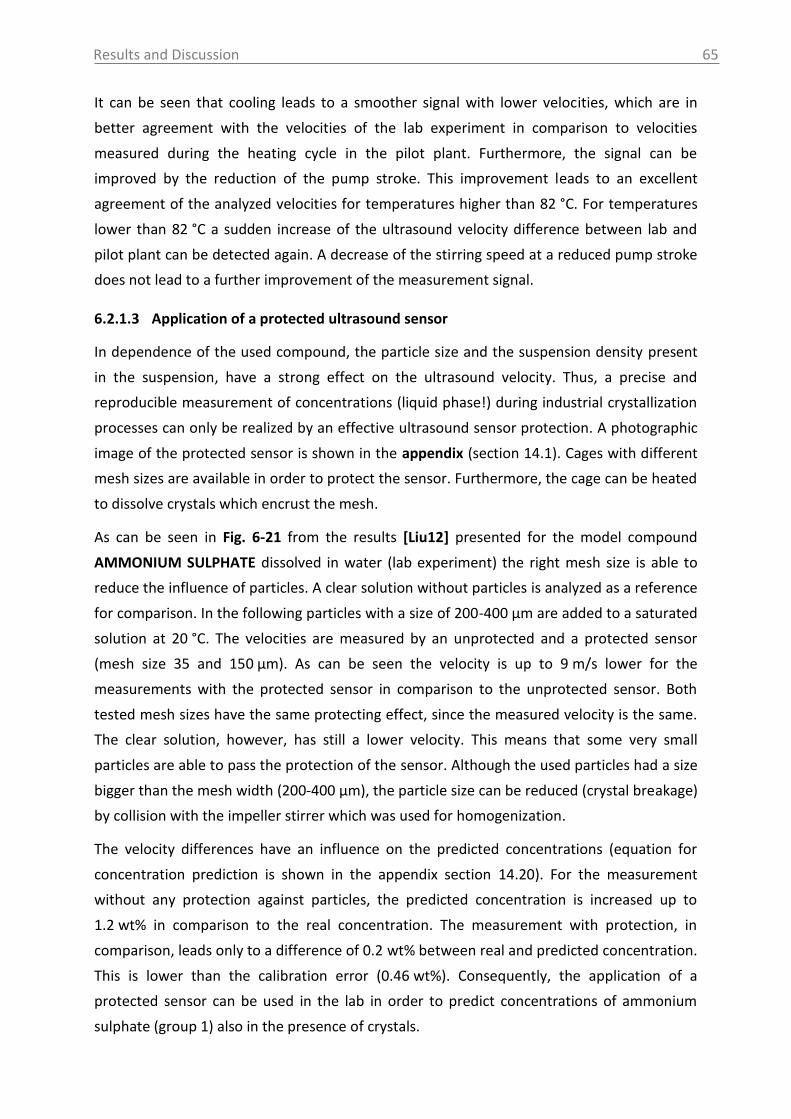
Results and Discussion
65
It can be seen that cooling leads to a smoother signal with lower velocities, which are in
better agreement with the velocities of the lab experiment in comparison to velocities
measured during the heating cycle in the pilot plant. Furthermore, the signal can be
improved by the reduction of the pump stroke. This improvement leads to an excellent
agreement of the analyzed velocities for temperatures higher than 82 °C. For temperatures
lower than 82 °C a sudden increase of the ultrasound velocity difference between lab and
pilot plant can be detected again. A decrease of the stirring speed at a reduced pump stroke
does not lead to a further improvement of the measurement signal.
6.2.1.3 Application of a protected ultrasound sensor
In dependence of the used compound, the particle size and the suspension density present
in the suspension, have a strong effect on the ultrasound velocity. Thus, a precise and
reproducible measurement of concentrations (liquid phase!) during industrial crystallization
processes can only be realized by an effective ultrasound sensor protection. A photographic
image of the protected sensor is shown in the appendix (section 14.1). Cages with different
mesh sizes are available in order to protect the sensor. Furthermore, the cage can be heated
to dissolve crystals which encrust the mesh.
As can be seen in Fig. 6-21 from the results [Liu12] presented for the model compound
AMMONIUM SULPHATE dissolved in water (lab experiment) the right mesh size is able to
reduce the influence of particles. A clear solution without particles is analyzed as a reference
for comparison. In the following particles with a size of 200-400 µm are added to a saturated
solution at 20 °C. The velocities are measured by an unprotected and a protected sensor
(mesh size 35 and 150 µm). As can be seen the velocity is up to 9 m/s lower for the
measurements with the protected sensor in comparison to the unprotected sensor. Both
tested mesh sizes have the same protecting effect, since the measured velocity is the same.
The clear solution, however, has still a lower velocity. This means that some very small
particles are able to pass the protection of the sensor. Although the used particles had a size
bigger than the mesh width (200-400 µm), the particle size can be reduced (crystal breakage)
by collision with the impeller stirrer which was used for homogenization.
The velocity differences have an influence on the predicted concentrations (equation for
concentration prediction is shown in the appendix section 14.20). For the measurement
without any protection against particles, the predicted concentration is increased up to
1.2 wt% in comparison to the real concentration. The measurement with protection, in
comparison, leads only to a difference of 0.2 wt% between real and predicted concentration.
This is lower than the calibration error (0.46 wt%). Consequently, the application of a
protected sensor can be used in the lab in order to predict concentrations of ammonium
sulphate (group 1) also in the presence of crystals.
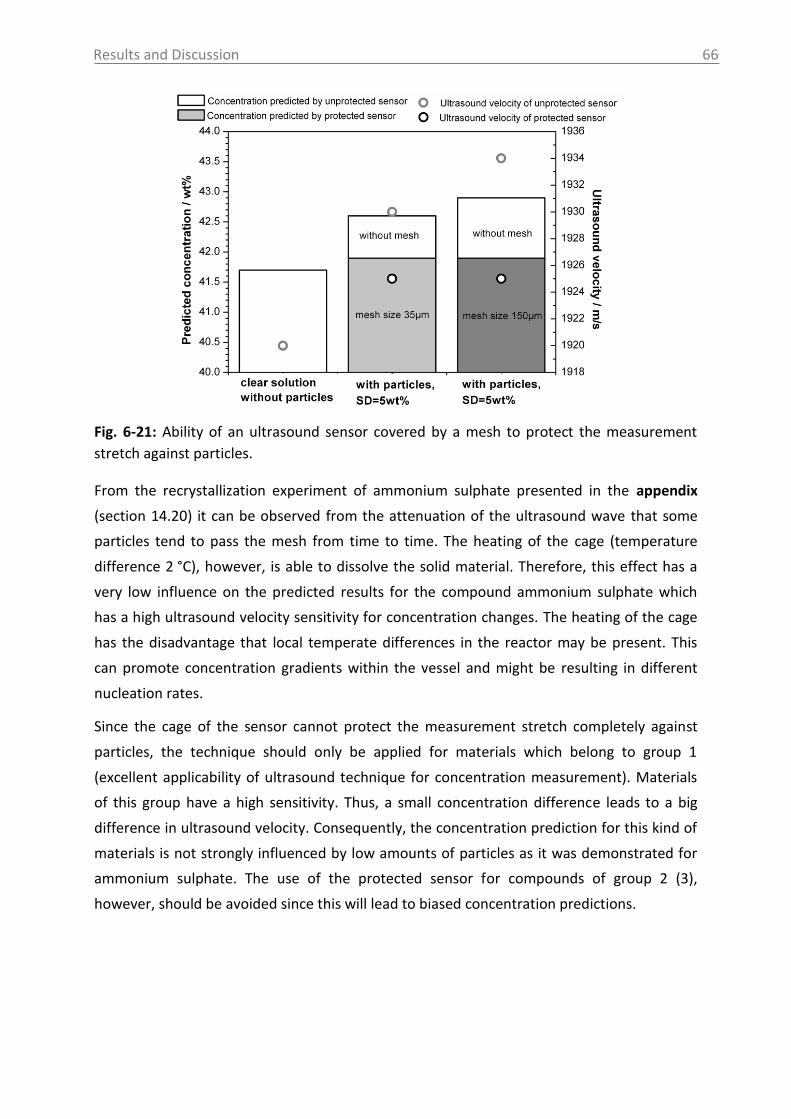
Results and Discussion
66
Fig. 6-21: Ability of an ultrasound sensor covered by a mesh to protect the measurement
stretch against particles.
From the recrystallization experiment of ammonium sulphate presented in the appendix
(section 14.20) it can be observed from the attenuation of the ultrasound wave that some
particles tend to pass the mesh from time to time. The heating of the cage (temperature
difference 2 °C), however, is able to dissolve the solid material. Therefore, this effect has a
very low influence on the predicted results for the compound ammonium sulphate which
has a high ultrasound velocity sensitivity for concentration changes. The heating of the cage
has the disadvantage that local temperate differences in the reactor may be present. This
can promote concentration gradients within the vessel and might be resulting in different
nucleation rates.
Since the cage of the sensor cannot protect the measurement stretch completely against
particles, the technique should only be applied for materials which belong to group 1
(excellent applicability of ultrasound technique for concentration measurement). Materials
of this group have a high sensitivity. Thus, a small concentration difference leads to a big
difference in ultrasound velocity. Consequently, the concentration prediction for this kind of
materials is not strongly influenced by low amounts of particles as it was demonstrated for
ammonium sulphate. The use of the protected sensor for compounds of group 2 (3),
however, should be avoided since this will lead to biased concentration predictions.
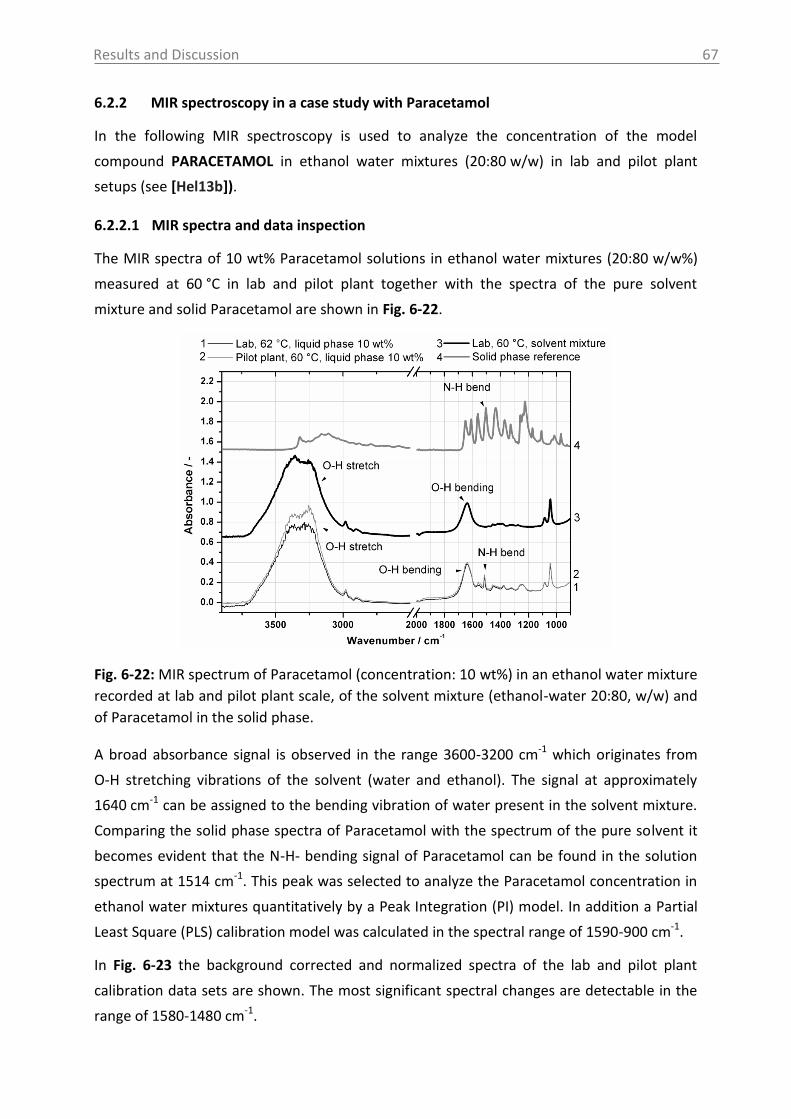
Results and Discussion
67
6.2.2 MIR spectroscopy in a case study with Paracetamol
In the following MIR spectroscopy is used to analyze the concentration of the model
compound PARACETAMOL in ethanol water mixtures (20:80 w/w) in lab and pilot plant
setups (see [Hel13b]).
6.2.2.1 MIR spectra and data inspection
The MIR spectra of 10 wt% Paracetamol solutions in ethanol water mixtures (20:80 w/w%)
measured at 60 °C in lab and pilot plant together with the spectra of the pure solvent
mixture and solid Paracetamol are shown in Fig. 6-22.
Fig. 6-22: MIR spectrum of Paracetamol (concentration: 10 wt%) in an ethanol water mixture
recorded at lab and pilot plant scale, of the solvent mixture (ethanol-water 20:80, w/w) and
of Paracetamol in the solid phase.
A broad absorbance signal is observed in the range 3600-3200 cm-1 which originates from
O-H stretching vibrations of the solvent (water and ethanol). The signal at approximately
1640 cm-1 can be assigned to the bending vibration of water present in the solvent mixture.
Comparing the solid phase spectra of Paracetamol with the spectrum of the pure solvent it
becomes evident that the N-H- bending signal of Paracetamol can be found in the solution
spectrum at 1514 cm-1. This peak was selected to analyze the Paracetamol concentration in
ethanol water mixtures quantitatively by a Peak Integration (PI) model. In addition a Partial
Least Square (PLS) calibration model was calculated in the spectral range of 1590-900 cm-1.
In Fig. 6-23 the background corrected and normalized spectra of the lab and pilot plant
calibration data sets are shown. The most significant spectral changes are detectable in the
range of 1580-1480 cm-1.
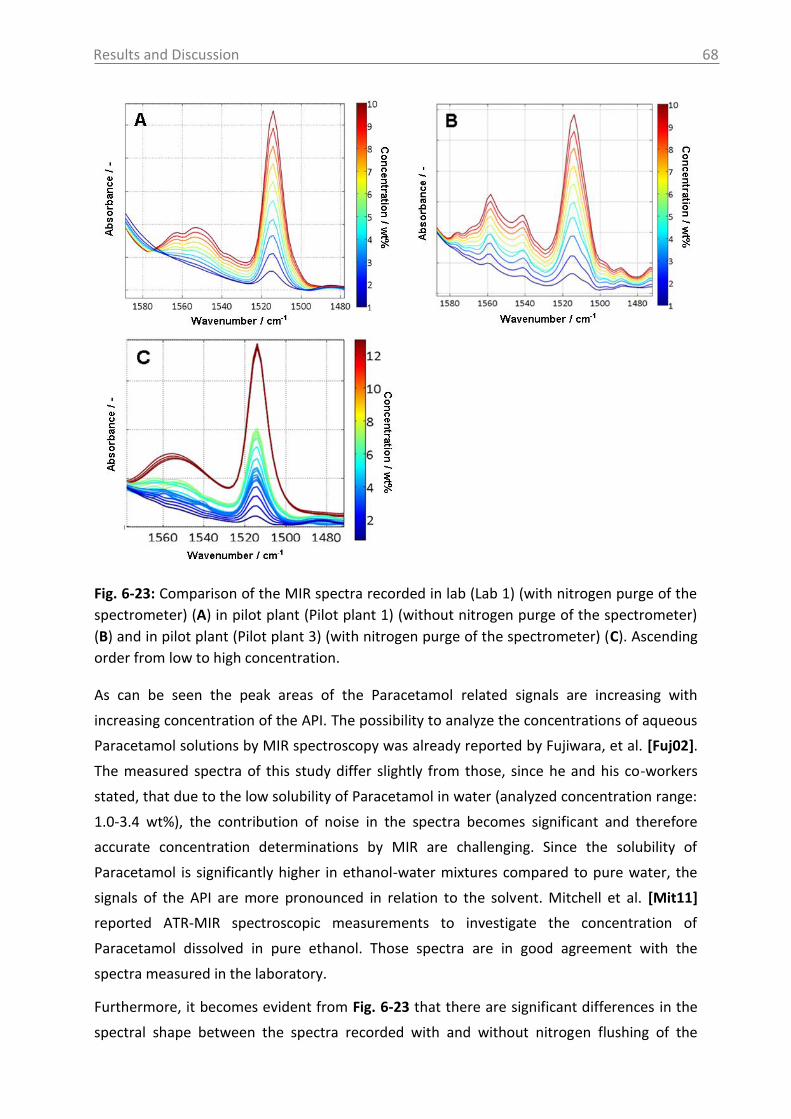
Results and Discussion
68
Fig. 6-23: Comparison of the MIR spectra recorded in lab (Lab 1) (with nitrogen purge of the
spectrometer) (A) in pilot plant (Pilot plant 1) (without nitrogen purge of the spectrometer)
(B) and in pilot plant (Pilot plant 3) (with nitrogen purge of the spectrometer) (C). Ascending
order from low to high concentration.
As can be seen the peak areas of the Paracetamol related signals are increasing with
increasing concentration of the API. The possibility to analyze the concentrations of aqueous
Paracetamol solutions by MIR spectroscopy was already reported by Fujiwara, et al. [Fuj02].
The measured spectra of this study differ slightly from those, since he and his co-workers
stated, that due to the low solubility of Paracetamol in water (analyzed concentration range:
1.0-3.4 wt%), the contribution of noise in the spectra becomes significant and therefore
accurate concentration determinations by MIR are challenging. Since the solubility of
Paracetamol is significantly higher in ethanol-water mixtures compared to pure water, the
signals of the API are more pronounced in relation to the solvent. Mitchell et al. [Mit11]
reported ATR-MIR spectroscopic measurements to investigate the concentration of
Paracetamol dissolved in pure ethanol. Those spectra are in good agreement with the
spectra measured in the laboratory.
Furthermore, it becomes evident from Fig. 6-23 that there are significant differences in the
spectral shape between the spectra recorded with and without nitrogen flushing of the
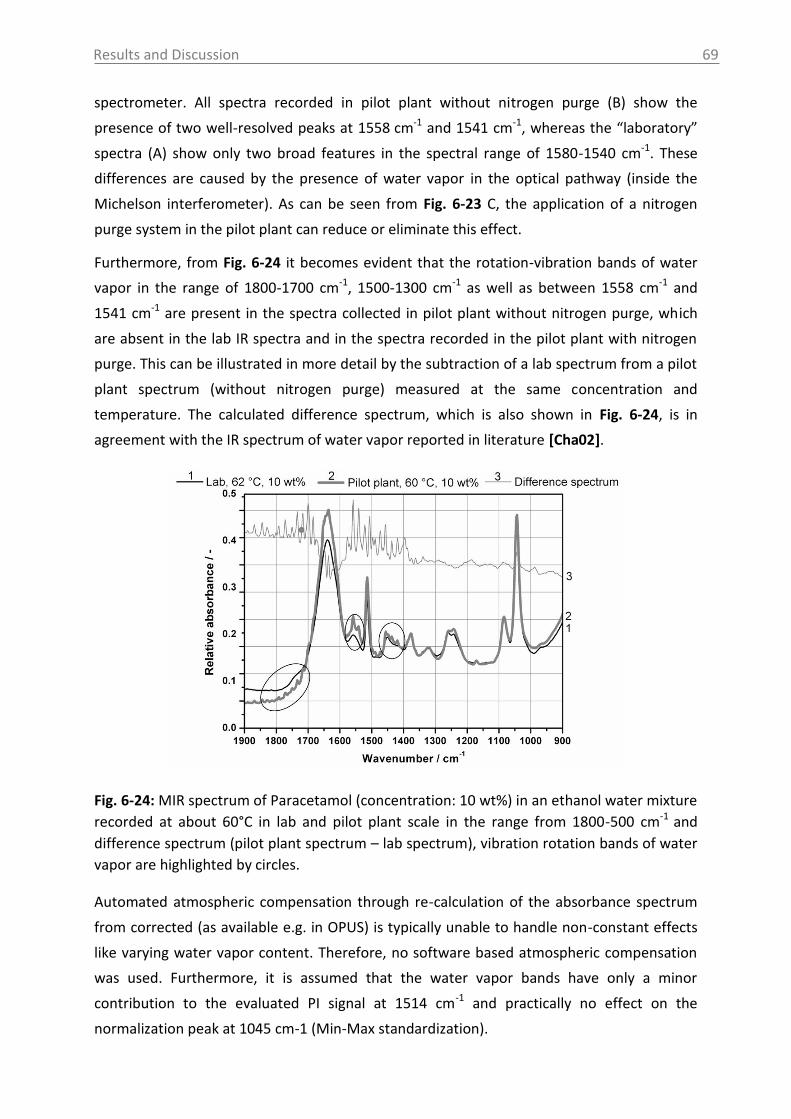
Results and Discussion
69
spectrometer. All spectra recorded in pilot plant without nitrogen purge (B) show the
presence of two well-resolved peaks at 1558 cm-1 and 1541 cm-1, whereas the “laboratory”
spectra (A) show only two broad features in the spectral range of 1580-1540 cm-1. These
differences are caused by the presence of water vapor in the optical pathway (inside the
Michelson interferometer). As can be seen from Fig. 6-23 C, the application of a nitrogen
purge system in the pilot plant can reduce or eliminate this effect.
Furthermore, from Fig. 6-24 it becomes evident that the rotation-vibration bands of water
vapor in the range of 1800-1700 cm-1, 1500-1300 cm-1 as well as between 1558 cm-1 and
1541 cm-1 are present in the spectra collected in pilot plant without nitrogen purge, which
are absent in the lab IR spectra and in the spectra recorded in the pilot plant with nitrogen
purge. This can be illustrated in more detail by the subtraction of a lab spectrum from a pilot
plant spectrum (without nitrogen purge) measured at the same concentration and
temperature. The calculated difference spectrum, which is also shown in Fig. 6-24, is in
agreement with the IR spectrum of water vapor reported in literature [Cha02].
Fig. 6-24: MIR spectrum of Paracetamol (concentration: 10 wt%) in an ethanol water mixture
recorded at about 60°C in lab and pilot plant scale in the range from 1800-500 cm-1 and
difference spectrum (pilot plant spectrum – lab spectrum), vibration rotation bands of water
vapor are highlighted by circles.
Automated atmospheric compensation through re-calculation of the absorbance spectrum
from corrected (as available e.g. in OPUS) is typically unable to handle non-constant effects
like varying water vapor content. Therefore, no software based atmospheric compensation
was used. Furthermore, it is assumed that the water vapor bands have only a minor
contribution to the evaluated PI signal at 1514 cm-1 and practically no effect on the
normalization peak at 1045 cm-1 (Min-Max standardization).
Results and Discussion
70
6.2.2.2 Model building: peak integration (PI) and partial least square (PLS)
To analyze the concentration in real time, different calibration models were generated from
the MIR calibration data sets. Commonly, two different types of calibration are applied for
model building: 1) the Peak Integration (PI) method [Heb04] and 2) the Partial Least Squares
(PLS) procedure [Nad05]. Furthermore, the possibility of 3) Indirect Hard Modeling (IHM) is
available as multivariate data analysis [Kri08, Eng11, Als04a, Als04b].
Separate calibration models were built from the data sets plotted in Fig. 5-5. Each set of data
was used for a PI and PLS calibration model. Mean calibration and validation errors (RMSEC,
RMSEP) are listed in Tab. 6-9. The applied data pretreatments are summarized in Tab. 5-5.
Tab. 6-9: Calibration summary, temperature 62-64 °C (Lab 1), 27-78 °C (Lab 2), 57-60 °C (Pilot
plant 1/2), 52-78 °C (Pilot plant 3); data used for comparison of lab and pilot plant calibration
model are highlighted by a grey background.
Lab1 Lab2 Pilot plant1 Pilot plant2 Pilot plant3
PLS
(rank 4) PI
(linear) PLS
(rank 6) PI
(linear) PLS
(rank 1) PI
(linear) PLS
(rank 1) PI
(linear) PLS
(rank 2) PI
(linear)
RMSEC 0.03 0.13 0.09 0.30 0.18 0.18 0.11 0.07 0.15 0.23
RMSEP 0.20 0.43 0.26 0.58 0.24 0.92 0.22 0.76 0.30 0.29
Definitions: Lab -– Laboratory calibration data set, Pilot plant – Pilot plant calibration data set, PLS - Partial
Least Square, PI - Peak Integration, RMSE(C,P) - root mean square error (of calibration/prediction)
Comparing the results of the PI and PLS models, it can be stated that the PLS model shows
most often the lower errors of calibration and prediction for both lab and pilot plant scale.
This can be related to the different mathematical complexity of the models. While PLS is a
multivariate calibration method the PI is a univariate method. Univariate methods describe
the dependency of an independent variable (e.g. concentration) to a dependent variable
(e.g. Absorbance). Multivariate calibrations, in contrast, show the relation not only to one
dependent variables, but to many dependent variables (e.g. absorbance over a large
wavenumber range). Since univariate calibration methods are based on the Lambert-Beer
law, intermolecular interactions as well as temperature dependencies etc. can strongly
influence the accuracy and the robustness of the PI model. In dependency of the
investigated compounds or compound mixtures this might result in a limited applicability of
the PI model, especially, for the analysis of multi-component systems [Lin12].
Influence of temperature
To test the influence of temperature on the calibration and prediction error, the data set
Lab 1 was performed within a narrow temperature range (62-64 °C) while data set Lab 2
includes spectra recorded within a range of 27-78 °C. From the RMSE(C/P) it can be seen that
the calibration as well as the prediction errors of the pseudo-isothermal calibration model
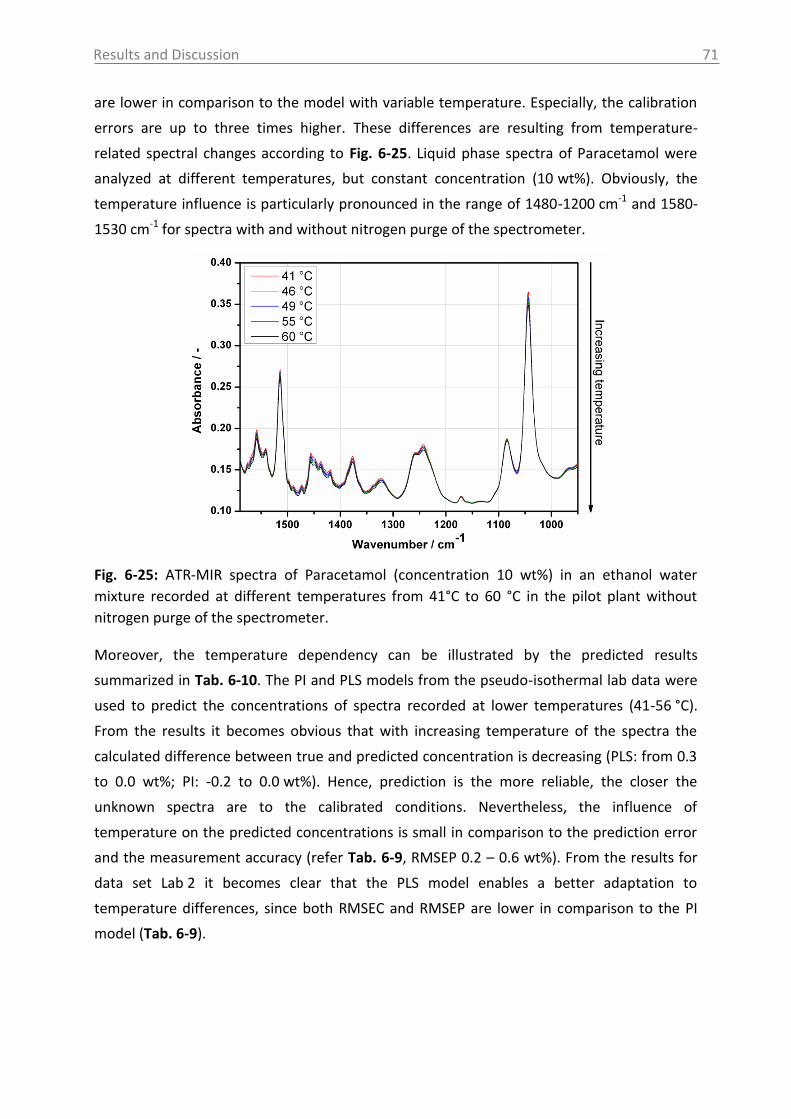
Results and Discussion
71
are lower in comparison to the model with variable temperature. Especially, the calibration
errors are up to three times higher. These differences are resulting from temperature-
related spectral changes according to Fig. 6-25. Liquid phase spectra of Paracetamol were
analyzed at different temperatures, but constant concentration (10 wt%). Obviously, the
temperature influence is particularly pronounced in the range of 1480-1200 cm-1 and 1580-
1530 cm-1 for spectra with and without nitrogen purge of the spectrometer.
Fig. 6-25: ATR-MIR spectra of Paracetamol (concentration 10 wt%) in an ethanol water
mixture recorded at different temperatures from 41°C to 60 °C in the pilot plant without
nitrogen purge of the spectrometer.
Moreover, the temperature dependency can be illustrated by the predicted results
summarized in Tab. 6-10. The PI and PLS models from the pseudo-isothermal lab data were
used to predict the concentrations of spectra recorded at lower temperatures (41-56 °C).
From the results it becomes obvious that with increasing temperature of the spectra the
calculated difference between true and predicted concentration is decreasing (PLS: from 0.3
to 0.0 wt%; PI: -0.2 to 0.0 wt%). Hence, prediction is the more reliable, the closer the
unknown spectra are to the calibrated conditions. Nevertheless, the influence of
temperature on the predicted concentrations is small in comparison to the prediction error
and the measurement accuracy (refer Tab. 6-9, RMSEP 0.2 – 0.6 wt%). From the results for
data set Lab 2 it becomes clear that the PLS model enables a better adaptation to
temperature differences, since both RMSEC and RMSEP are lower in comparison to the PI
model (Tab. 6-9).

Results and Discussion
72
Tab. 6-10: Influence of temperature on the predicted concentrations using the laboratory
scale PI and PLS calibration models (Lab1, T = 62-64°C).
True Predicted Difference
PLS model PI model PLS model PI model
T [°C] c [wt%] c [wt%] c [wt%] Difference c [wt%]
1 10.0 10.3 9.8 0.3 -0.2 44 10.0 10.3 9.8 0.3 -0.2 48 10.0 10.2 9.9 0.2 -0.1 52 10.0 10.1 9.9 0.1 -0.1 56 10.0 10.0 10.0 0.0 0.0
Definitions: PLS - Partial Least Square, PI - Peak Integration, T – Temperature, c - concentration
Transferability and influence of nitrogen purge
In the following it should be analyzed whether calibration models which were developed at
lab scale can be used directly for the predictions at pilot plant scale. The recovery plots from
a validation of the lab calibration models with the pilot plant spectra are given in Fig. 6-26.
From the results in Fig. 6-26 it can be observed that the differences between predicted and
true concentrations are higher for the PLS model (A & C) compared to the PI model (B & D).
These differences can be explained by the changes of the spectral shape due to water vapor
(see Fig. 6-22), since no nitrogen purge of the spectrometer was applied for pilot plant data
set 1 & 2. This is strongly influencing the PLS model including a complex spectral matrix. The
impact on the PI model, however, is lower since only a narrow spectral range (1528-
1499 cm-1) is used, which is almost independent of water vapor.
Furthermore, the results can be used to demonstrate the influence of nitrogen flushing.
While the spectrometer was purged with nitrogen for the lab data sets and for pilot plant
data set 3, no nitrogen flushing was applied for pilot plant data set 1 & 2. The results without
nitrogen purge (A & B) show differences up to 3.3 wt% for the PLS model while the PI model
has a maximum difference of 2 wt%. For the results with nitrogen purge (C & D) a significant
reduced difference of predicted and true concentrations can be observed for the PLS and the
PI model.
For the further comparison, the pseudo-isothermal lab PI model 1 and the pseudo-
isothermal pilot plant PI models 1 and 2 were used (refer to Tab. 6-9). The two pilot plant
calibration models 1 and 2 (without nitrogen purge) show approximately the same errors
concerning the calibration and the prediction. The prediction error of the pilot plant
calibration models (without nitrogen purge) is up to two times higher in comparison to the
prediction error of the lab model (with nitrogen purge). Nitrogen purge in the pilot plant
leads to a decreased prediction error for the PI model (from 0.92 to 0.29 wt%) as can be
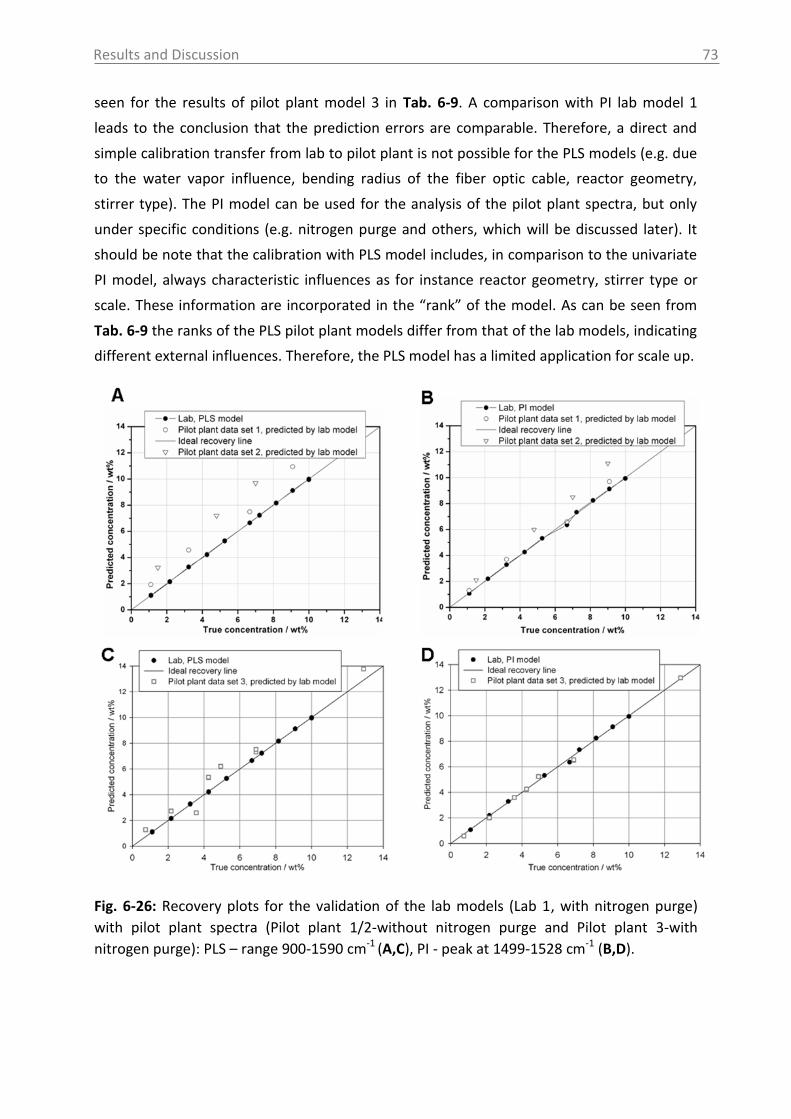
Results and Discussion
73
seen for the results of pilot plant model 3 in Tab. 6-9. A comparison with PI lab model 1
leads to the conclusion that the prediction errors are comparable. Therefore, a direct and
simple calibration transfer from lab to pilot plant is not possible for the PLS models (e.g. due
to the water vapor influence, bending radius of the fiber optic cable, reactor geometry,
stirrer type). The PI model can be used for the analysis of the pilot plant spectra, but only
under specific conditions (e.g. nitrogen purge and others, which will be discussed later). It
should be note that the calibration with PLS model includes, in comparison to the univariate
PI model, always characteristic influences as for instance reactor geometry, stirrer type or
scale. These information are incorporated in the “rank” of the model. As can be seen from
Tab. 6-9 the ranks of the PLS pilot plant models differ from that of the lab models, indicating
different external influences. Therefore, the PLS model has a limited application for scale up.
Fig. 6-26: Recovery plots for the validation of the lab models (Lab 1, with nitrogen purge)
with pilot plant spectra (Pilot plant 1/2-without nitrogen purge and Pilot plant 3-with
nitrogen purge): PLS – range 900-1590 cm-1 (A,C), PI - peak at 1499-1528 cm-1 (B,D).
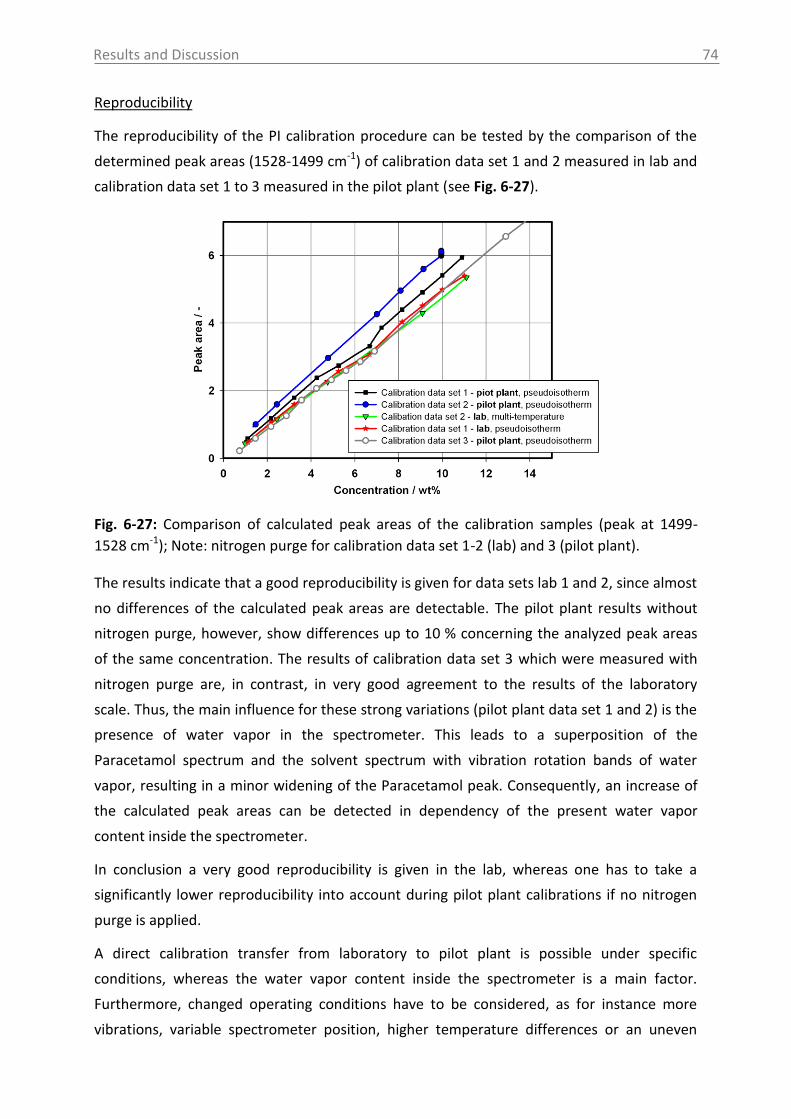
Results and Discussion
74
Reproducibility
The reproducibility of the PI calibration procedure can be tested by the comparison of the
determined peak areas (1528-1499 cm-1) of calibration data set 1 and 2 measured in lab and
calibration data set 1 to 3 measured in the pilot plant (see Fig. 6-27).
Fig. 6-27: Comparison of calculated peak areas of the calibration samples (peak at 1499-
1528 cm-1); Note: nitrogen purge for calibration data set 1-2 (lab) and 3 (pilot plant).
The results indicate that a good reproducibility is given for data sets lab 1 and 2, since almost
no differences of the calculated peak areas are detectable. The pilot plant results without
nitrogen purge, however, show differences up to 10 % concerning the analyzed peak areas
of the same concentration. The results of calibration data set 3 which were measured with
nitrogen purge are, in contrast, in very good agreement to the results of the laboratory
scale. Thus, the main influence for these strong variations (pilot plant data set 1 and 2) is the
presence of water vapor in the spectrometer. This leads to a superposition of the
Paracetamol spectrum and the solvent spectrum with vibration rotation bands of water
vapor, resulting in a minor widening of the Paracetamol peak. Consequently, an increase of
the calculated peak areas can be detected in dependency of the present water vapor
content inside the spectrometer.
In conclusion a very good reproducibility is given in the lab, whereas one has to take a
significantly lower reproducibility into account during pilot plant calibrations if no nitrogen
purge is applied.
A direct calibration transfer from laboratory to pilot plant is possible under specific
conditions, whereas the water vapor content inside the spectrometer is a main factor.
Furthermore, changed operating conditions have to be considered, as for instance more
vibrations, variable spectrometer position, higher temperature differences or an uneven

Results and Discussion
75
temperature distribution along the length of the ATR-MIR probe, weighing and substance
transfer into the vessel. As already shown by Kadam et al. [Kad11] the use of a PLS model
(for the test compound ammonium sulfate in water) developed at lab scale is leading to
biased concentration measurements on semi-industrial scale due to the differences in the
curvature of the fiber optics and an uneven thermal expansion of the probe.
6.2.2.3 Model building: indirect hard modeling (IHM)
Since it is difficult to work in the pilot plant under precisely the same conditions as during lab
experiments, an alternative solution is required to facilitate the transfer of the calibration
model from lab to pilot plant. Therefore, an additional calibration strategy was applied, the
Indirect Hard Modeling (IHM) [Kri08, Eng11, Als04a, Als04b]. In contrast to soft modeling
techniques such as PLS, IHM is no statistical model, but works with a physically motivated
model of the mixture spectra. Each component in the analyzed mixture (Paracetamol,
solvent, water vapor) is represented by a parameterized peak-shaped model created from
the pure component spectra. The pure component models are subsequently merged into
the spectral model of the mixture. Therefore, even non-linear effects can be captured
through adjustment of the spectral model parameters [Als04a]. Fig. 6-28 shows details of
the peak model.
Fig. 6-28: Fit of the IHM model (red line) to a measured spectrum (black line) with
contributions of the components (blue lines). Grey lines: Constituent peaks for Paracetamol
hard model.
To compare the application of the IHM for different measurement conditions (water vapor
content, measurement environment, temperature) a calibration model was built with the
spectra of data set Pilot plant 2. The spectra were recorded under isotherm conditions
without nitrogen purge of the spectrometer. The model was validated with independent
data sets recorded in the lab and pilot plant with or without nitrogen purge of the
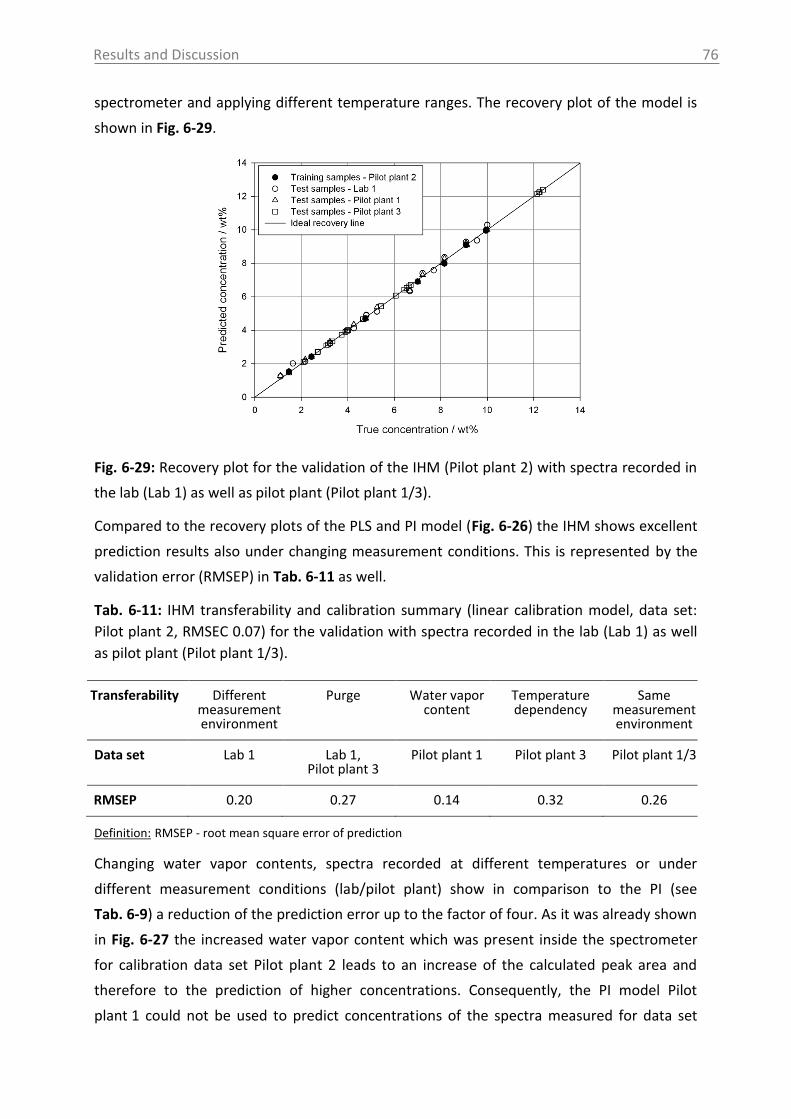
Results and Discussion
76
spectrometer and applying different temperature ranges. The recovery plot of the model is
shown in Fig. 6-29.
Fig. 6-29: Recovery plot for the validation of the IHM (Pilot plant 2) with spectra recorded in
the lab (Lab 1) as well as pilot plant (Pilot plant 1/3).
Compared to the recovery plots of the PLS and PI model (Fig. 6-26) the IHM shows excellent
prediction results also under changing measurement conditions. This is represented by the
validation error (RMSEP) in Tab. 6-11 as well.
Tab. 6-11: IHM transferability and calibration summary (linear calibration model, data set:
Pilot plant 2, RMSEC 0.07) for the validation with spectra recorded in the lab (Lab 1) as well
as pilot plant (Pilot plant 1/3).
Transferability Different measurement environment
Purge Water vapor content
Temperature dependency
Same measurement environment
Data set Lab 1 Lab 1, Pilot plant 3
Pilot plant 1 Pilot plant 3 Pilot plant 1/3
RMSEP 0.20 0.27 0.14 0.32 0.26
Definition: RMSEP - root mean square error of prediction
Changing water vapor contents, spectra recorded at different temperatures or under
different measurement conditions (lab/pilot plant) show in comparison to the PI (see
Tab. 6-9) a reduction of the prediction error up to the factor of four. As it was already shown
in Fig. 6-27 the increased water vapor content which was present inside the spectrometer
for calibration data set Pilot plant 2 leads to an increase of the calculated peak area and
therefore to the prediction of higher concentrations. Consequently, the PI model Pilot
plant 1 could not be used to predict concentrations of the spectra measured for data set
Results and Discussion
77
Pilot plant 2. According to Tab. 6-11 the IHM, however, allows the prediction of spectra
recorded under different water vapor contents with or without nitrogen purge. The
differences of the calculated prediction errors for the different measurement conditions are
very small.
In conclusion the IHM model can be transferred from the pilot plant to the lab (or vice versa)
without a loss of prediction accuracy. This is highly desirable for industrial applications since
the time needed for calibration model development and validation can be reduced
significantly.
Influence of sensor position
The main difference between the lab and pilot plant experiments, which might has an
influence on the transfer of calibration models, is the positioning of the probe. While in the
pilot plant a recirculation unit is used and the probe is connected in a horizontal position, the
reactor in the lab enables the integration of the probe vertically. To investigate the influence
of the ATR probe position and movement of the probe, the spectra of a saturated solution of
Paracetamol (room temperature) were analyzed for installations of the probe in horizontal
and vertical position. The concentration of the solution was predicted by the IHM as well as
the PI and PLS model in order to compare the results.
Before the start of the measurements a background spectrum in air was collected at the
same probe position. The black bars in Fig. 6-30 illustrate the influence of the measurement
in horizontal and vertical probe position. The concentrations were predicted by the PLS/PI
calibration model (Lab 2) and by the IHM (Pilot plant 2), whereby the IHM of the lab and
pilot plant lead to comparable results. As can be seen from Fig. 6-30 A & B the difference of
the predicted concentration values by the PLS/PI between the two installation positions
(vertical and horizontal) is about 0.4/0.3 g/100g. When the probe and the fiber optical cable
is further moved without a measurement of a new background spectrum (grey bars) the
predicted concentrations values show further changes compared to the initial values (black
bars).
The different probe positions (vertical or horizontal) influence the bending radius of the fiber
optics which is used to transfer the IR radiation. The effect, that a change of the instruments
operation positioning (curvature of the fiber optics) might influence the measured peak
intensities, is already reported by Kadam et al. [Kad11]. The authors stated that with an
increase in the curvature of the fiber optic cable, the absorption of the radiation inside the
fiber increases. This leads to the reduction in the intensity of the radiations available for the
measurement, e.g. of the N-H bending peak selected for Paracetamol. This effect can be
shown for the predictions of the PI model (N-H bend at 1528-1499 cm-1). While the
curvature of the fiber optics is low in case of the horizontal probe installation, the

Results and Discussion
78
installation in vertical position from the top of the reactor leads to an increase of the
bending radius. Therefore, the predicted concentrations in vertical positions are lower in
comparison to the horizontal probe position.
The IHM, in comparison, shows no differences concerning the predicted concentrations.
Neither the change of horizontal to vertical probe position nor the movement of the sensor
without measuring a new background spectrum is influencing the predictions. Consequently,
the model is able to compensate these geometric effects. The application of the model for
different process environments (e.g. lab and pilot plant) is, therefore, confirmed again. A
simple and direct transfer of the IHM from lab to pilot plant is possible by the validation with
a low number of test samples.
The direct calibration transfer of the PI (PLS) model can be performed if nitrogen flushing of
the spectrometer is applied. However, a lower prediction accuracy has be taken into account
in comparison to the IHM.
Fig. 6-30: Influence of probe position and moving of the fiber optic cable on the predicted
concentrations calculated by a PLS model (A), PI model (B) and IHM (C).
6.2.2.4 Crystal Growth
To test the applicability of ATR-MIR spectroscopy to monitor concentrations of the API
online and in real-time (see Fig. 5-6 B) a crystal growth experiment was performed in pilot
Results and Discussion
79
plant scale. The results are shown in Fig. 6-31. The experiment started with a clear solution
at 50 °C (solubility temperature: 48.5 °C). The solution was subsequently cooled down to 42-
43 °C into the metastable zone applying a cooling rate of 0.14 °C/min. During the cooling
process at 45 °C the seeds were added. At 42-43 °C the temperature was kept constant over
time. Please note that the temperature accuracy in the pilot plant (± 2 °C) is significantly
different to the accuracy in the lab (± 0.1 °C). The solid line in Fig. 6-31 represents the
predicted concentration values calculated by the IHM (calibration data set: Pilot plant 2). It
can be observed that the concentration of Paracetamol in solution drops directly after
seeding from initially 11.2 g/100g to 9.4 g/100g. For the rest of the experiment the
measured concentration is kept constant. The detected concentration under isotherm
conditions at the end of the experiment is in good agreement with the solubility
concentration at 42.5 °C (9.5 g/100g), which was measured in a previous experiment (see
Fig. 6-13, section: 6.1.4). The results indicate a fast crystal growth of the solid product due to
a high supersaturation at the seeding point.
The predicted concentrations can be used to calculate the supersaturation. The calculated
supersaturation is increasing during the cooling phase up to 1.7 g/100g, drops down after
seed addition and is getting constant at the solubility concentration.
The concentration predictions of the PI model show a similar trend as the IHM. However,
discontinuities of the predicted concentrations (Fig. 6-31 A) are detectable, which are not
present for the predictions of the IHM. They are induced from small movements of the MIR
fiber optic cable caused by the operator and lead to two sharp concentration jumps (up
0.6 g/100g). The movement of the fiber optics cause, as already shown in section 6.2.2.3, a
change of the bending radius and therefore an alteration of the IR intensity (absorbance).
This shows again that changes in the operation environment have a strong influence on the
accuracy of the PI model. In comparison the IHM is not influenced by such effects. It can be
observed that the disruptions caused e.g. by vibrations or a changed bending radius of the
fiber optics can be compensated efficiently. Therefore, no discontinuities can be detected in
the trend of the IHM.
This experiment confirms, furthermore, that ATR-MIR spectroscopy is an ideal tool to
monitor the concentrations of Paracetamol in solution in real time. The application of the
IHM enables the accurate prediction of concentrations also under different measurement
environments (e.g. lab and pilot plant), where the application of PLS or PI models is limited.
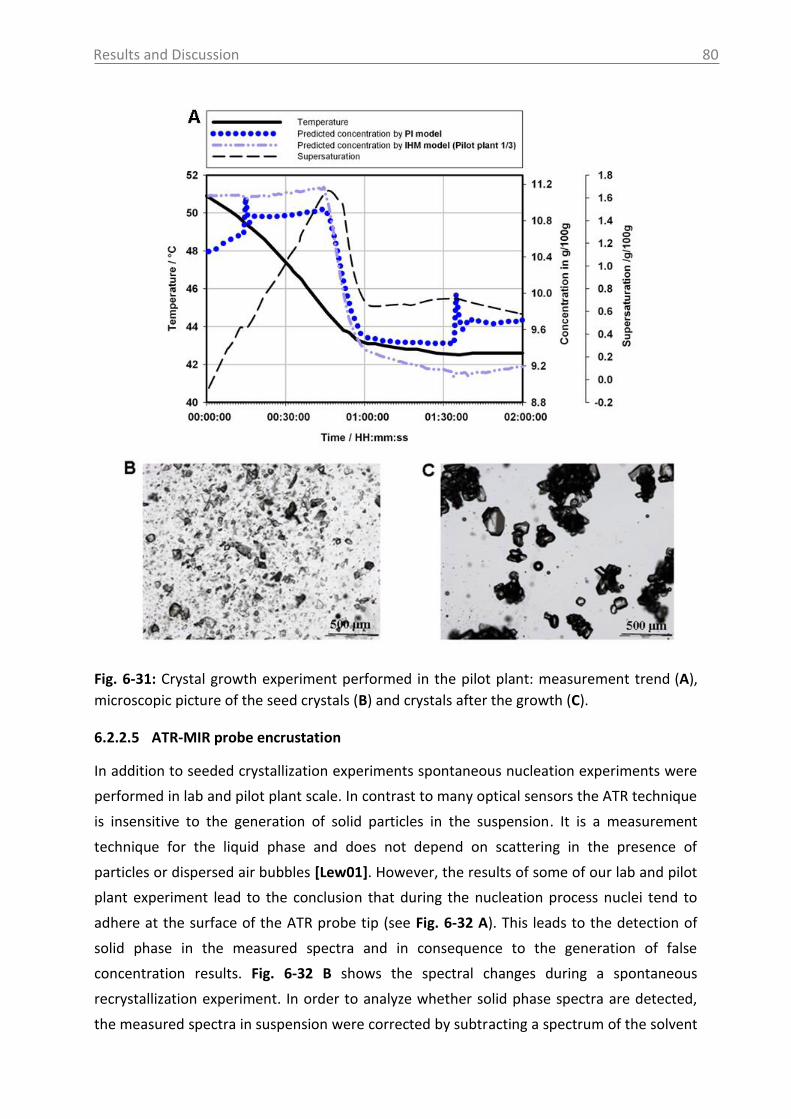
Results and Discussion
80
Fig. 6-31: Crystal growth experiment performed in the pilot plant: measurement trend (A),
microscopic picture of the seed crystals (B) and crystals after the growth (C).
6.2.2.5 ATR-MIR probe encrustation
In addition to seeded crystallization experiments spontaneous nucleation experiments were
performed in lab and pilot plant scale. In contrast to many optical sensors the ATR technique
is insensitive to the generation of solid particles in the suspension. It is a measurement
technique for the liquid phase and does not depend on scattering in the presence of
particles or dispersed air bubbles [Lew01]. However, the results of some of our lab and pilot
plant experiment lead to the conclusion that during the nucleation process nuclei tend to
adhere at the surface of the ATR probe tip (see Fig. 6-32 A). This leads to the detection of
solid phase in the measured spectra and in consequence to the generation of false
concentration results. Fig. 6-32 B shows the spectral changes during a spontaneous
recrystallization experiment. In order to analyze whether solid phase spectra are detected,
the measured spectra in suspension were corrected by subtracting a spectrum of the solvent
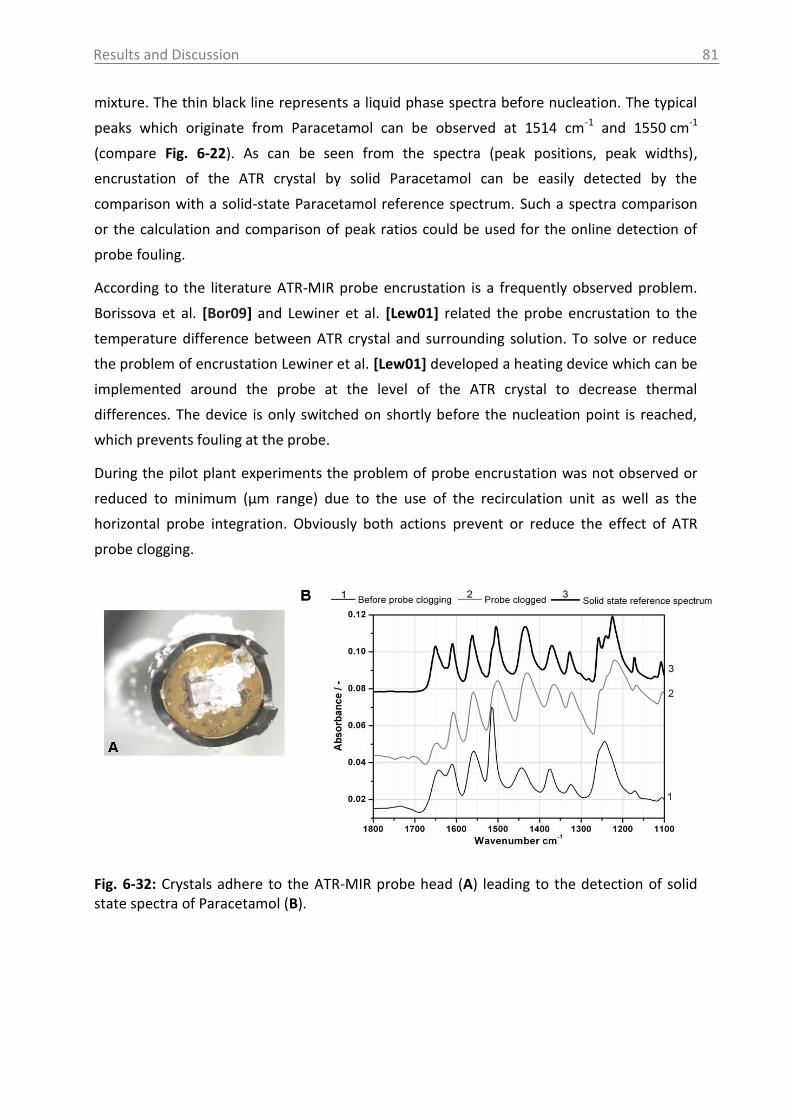
Results and Discussion
81
mixture. The thin black line represents a liquid phase spectra before nucleation. The typical
peaks which originate from Paracetamol can be observed at 1514 cm-1 and 1550 cm-1
(compare Fig. 6-22). As can be seen from the spectra (peak positions, peak widths),
encrustation of the ATR crystal by solid Paracetamol can be easily detected by the
comparison with a solid-state Paracetamol reference spectrum. Such a spectra comparison
or the calculation and comparison of peak ratios could be used for the online detection of
probe fouling.
According to the literature ATR-MIR probe encrustation is a frequently observed problem.
Borissova et al. [Bor09] and Lewiner et al. [Lew01] related the probe encrustation to the
temperature difference between ATR crystal and surrounding solution. To solve or reduce
the problem of encrustation Lewiner et al. [Lew01] developed a heating device which can be
implemented around the probe at the level of the ATR crystal to decrease thermal
differences. The device is only switched on shortly before the nucleation point is reached,
which prevents fouling at the probe.
During the pilot plant experiments the problem of probe encrustation was not observed or
reduced to minimum (µm range) due to the use of the recirculation unit as well as the
horizontal probe integration. Obviously both actions prevent or reduce the effect of ATR
probe clogging.
Fig. 6-32: Crystals adhere to the ATR-MIR probe head (A) leading to the detection of solid state spectra of Paracetamol (B).
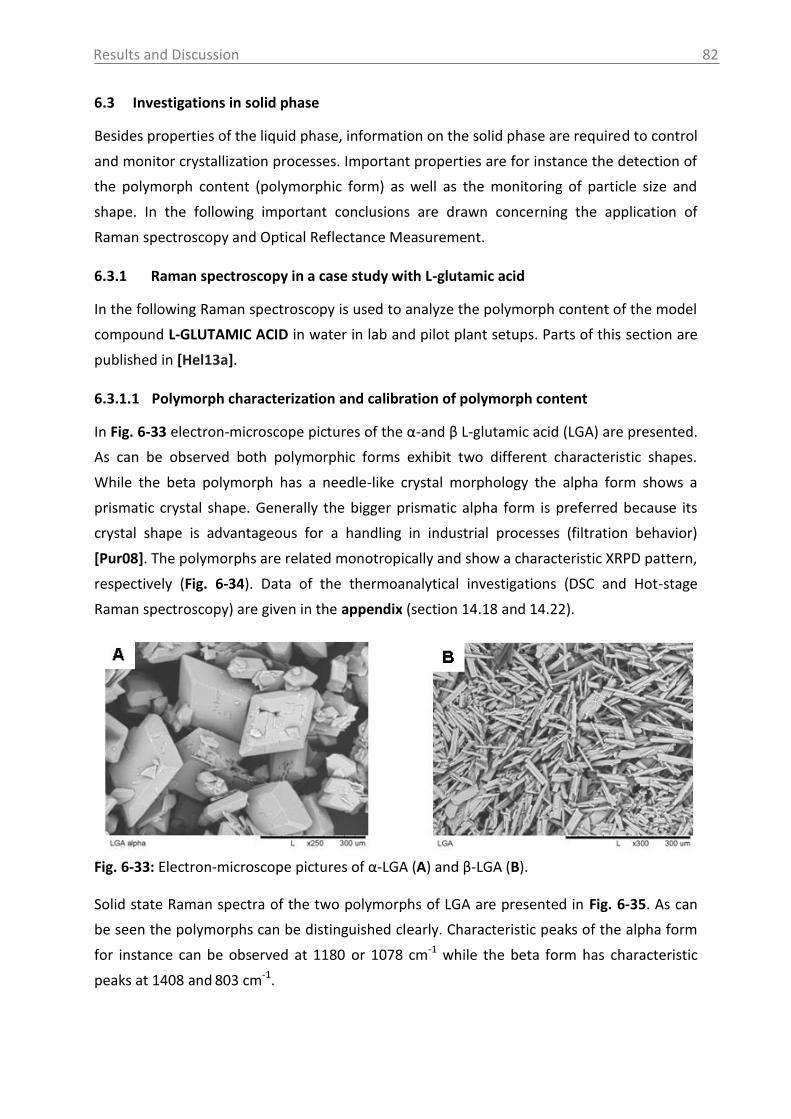
Results and Discussion
82
6.3 Investigations in solid phase
Besides properties of the liquid phase, information on the solid phase are required to control
and monitor crystallization processes. Important properties are for instance the detection of
the polymorph content (polymorphic form) as well as the monitoring of particle size and
shape. In the following important conclusions are drawn concerning the application of
Raman spectroscopy and Optical Reflectance Measurement.
6.3.1 Raman spectroscopy in a case study with L-glutamic acid
In the following Raman spectroscopy is used to analyze the polymorph content of the model
compound L-GLUTAMIC ACID in water in lab and pilot plant setups. Parts of this section are
published in [Hel13a].
6.3.1.1 Polymorph characterization and calibration of polymorph content
In Fig. 6-33 electron-microscope pictures of the α-and β L-glutamic acid (LGA) are presented.
As can be observed both polymorphic forms exhibit two different characteristic shapes.
While the beta polymorph has a needle-like crystal morphology the alpha form shows a
prismatic crystal shape. Generally the bigger prismatic alpha form is preferred because its
crystal shape is advantageous for a handling in industrial processes (filtration behavior)
[Pur08]. The polymorphs are related monotropically and show a characteristic XRPD pattern,
respectively (Fig. 6-34). Data of the thermoanalytical investigations (DSC and Hot-stage
Raman spectroscopy) are given in the appendix (section 14.18 and 14.22).
Fig. 6-33: Electron-microscope pictures of α-LGA (A) and β-LGA (B).
Solid state Raman spectra of the two polymorphs of LGA are presented in Fig. 6-35. As can
be seen the polymorphs can be distinguished clearly. Characteristic peaks of the alpha form
for instance can be observed at 1180 or 1078 cm-1 while the beta form has characteristic
peaks at 1408 and 803 cm-1.
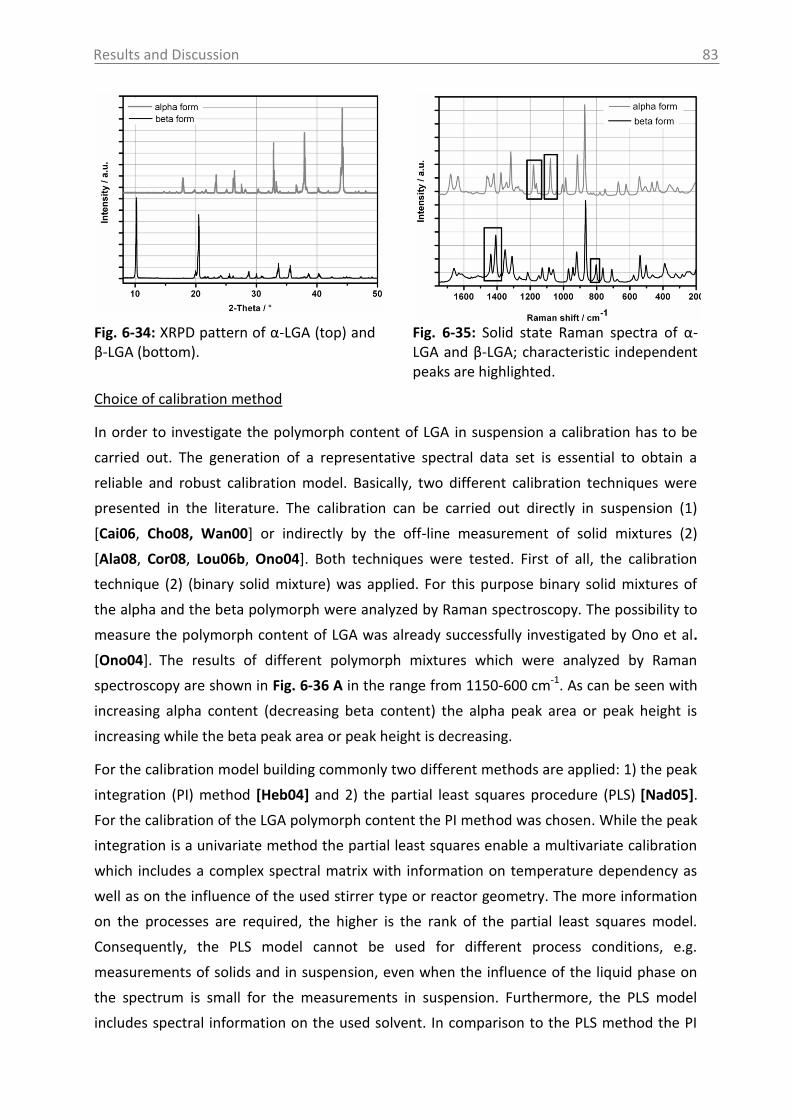
Results and Discussion
83
Fig. 6-34: XRPD pattern of α-LGA (top) and β-LGA (bottom).
Fig. 6-35: Solid state Raman spectra of α-LGA and β-LGA; characteristic independent peaks are highlighted.
Choice of calibration method
In order to investigate the polymorph content of LGA in suspension a calibration has to be
carried out. The generation of a representative spectral data set is essential to obtain a
reliable and robust calibration model. Basically, two different calibration techniques were
presented in the literature. The calibration can be carried out directly in suspension (1)
[Cai06, Cho08, Wan00] or indirectly by the off-line measurement of solid mixtures (2)
[Ala08, Cor08, Lou06b, Ono04]. Both techniques were tested. First of all, the calibration
technique (2) (binary solid mixture) was applied. For this purpose binary solid mixtures of
the alpha and the beta polymorph were analyzed by Raman spectroscopy. The possibility to
measure the polymorph content of LGA was already successfully investigated by Ono et al.
[Ono04]. The results of different polymorph mixtures which were analyzed by Raman
spectroscopy are shown in Fig. 6-36 A in the range from 1150-600 cm-1. As can be seen with
increasing alpha content (decreasing beta content) the alpha peak area or peak height is
increasing while the beta peak area or peak height is decreasing.
For the calibration model building commonly two different methods are applied: 1) the peak
integration (PI) method [Heb04] and 2) the partial least squares procedure (PLS) [Nad05].
For the calibration of the LGA polymorph content the PI method was chosen. While the peak
integration is a univariate method the partial least squares enable a multivariate calibration
which includes a complex spectral matrix with information on temperature dependency as
well as on the influence of the used stirrer type or reactor geometry. The more information
on the processes are required, the higher is the rank of the partial least squares model.
Consequently, the PLS model cannot be used for different process conditions, e.g.
measurements of solids and in suspension, even when the influence of the liquid phase on
the spectrum is small for the measurements in suspension. Furthermore, the PLS model
includes spectral information on the used solvent. In comparison to the PLS method the PI
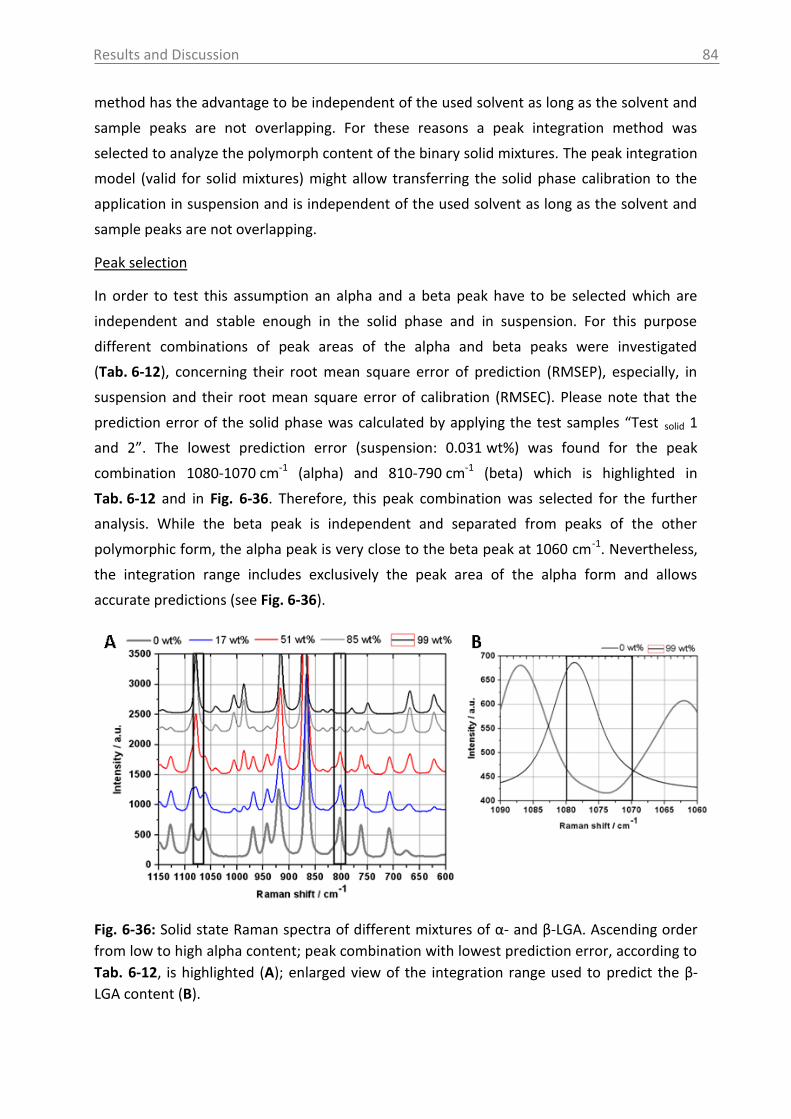
Results and Discussion
84
method has the advantage to be independent of the used solvent as long as the solvent and
sample peaks are not overlapping. For these reasons a peak integration method was
selected to analyze the polymorph content of the binary solid mixtures. The peak integration
model (valid for solid mixtures) might allow transferring the solid phase calibration to the
application in suspension and is independent of the used solvent as long as the solvent and
sample peaks are not overlapping.
Peak selection
In order to test this assumption an alpha and a beta peak have to be selected which are
independent and stable enough in the solid phase and in suspension. For this purpose
different combinations of peak areas of the alpha and beta peaks were investigated
(Tab. 6-12), concerning their root mean square error of prediction (RMSEP), especially, in
suspension and their root mean square error of calibration (RMSEC). Please note that the
prediction error of the solid phase was calculated by applying the test samples “Test solid 1
and 2”. The lowest prediction error (suspension: 0.031 wt%) was found for the peak
combination 1080-1070 cm-1 (alpha) and 810-790 cm-1 (beta) which is highlighted in
Tab. 6-12 and in Fig. 6-36. Therefore, this peak combination was selected for the further
analysis. While the beta peak is independent and separated from peaks of the other
polymorphic form, the alpha peak is very close to the beta peak at 1060 cm-1. Nevertheless,
the integration range includes exclusively the peak area of the alpha form and allows
accurate predictions (see Fig. 6-36).
Fig. 6-36: Solid state Raman spectra of different mixtures of α- and β-LGA. Ascending order
from low to high alpha content; peak combination with lowest prediction error, according to
Tab. 6-12, is highlighted (A); enlarged view of the integration range used to predict the β-
LGA content (B).
Results and Discussion
85
Tab. 6-12: Calibration results for the combination of different α and β peak areas (the
preferred model is highlighted).
Integration range α polymorph /cm-1
Integration range β polymorph / cm-1
RMSEC RMSEP
solid
RMSEP
suspension R2
Calibration
1080-1070 810-790 0.016 0.016 0.031 0.998
1015-1000 810-790 0.011 0.012 0.071 0.999
630-610 810-790 0.024 0.024 0.173 0.998
1080-1070 1415-1395 0.035 0.036 0.073 0.999
1080-1070 720-695 0.011 0.016 0.079 0.972
Definitions: RMSE(C,P) - root mean square error (of calibration/prediction), R2
- coefficient of determination
Comparison of PI and PLS model
Comparing the PI model for solid mixtures (results shown in Tab. 6-12) and a PLS model
(rank 5) for the solid mixtures no important differences concerning the calibration (PLS:
RMSEC=0.016, R2=0.998) and prediction error (PLS: RMSEP=0.019, test solid 1 and 2) are
detectable. Both models show a good recovery rate (see Fig. 6-38 for PI and appendix
section 14.24 for PLS). The differences of the predictions determined in duplicate (n=2) of
the test set solid 1 or 2, however, are higher for the PLS model (up to 1.3 wt% difference for
a duplicate determination) than for the PI model (up to 0.06 wt% difference for a duplicate
determination) (data are given in the appendix section 14.24). The complex spectral matrix
which is included in the PLS calibration model, depending on the process conditions and
physical properties of the compound, might cause this differences.
Influence of liquid phase
Since Raman spectroscopy measurements in suspension are always influenced by both the
solid as well as the liquid phase it has to be tested whether the alpha and beta peaks are
influenced by the liquid phase measurements. The results, which can be seen in Fig. 6-37,
indicate that the selected peaks 1070-1080 cm-1 for alpha and 790-810 cm-1 for beta are
sufficiently constant and independent with respect to the liquid phase. The low influence of
the solute on the solid phase spectrum can be explained by the relatively small solubility of
LGA in aqueous solutions. Furthermore, water as solvent hardly influences the Raman
spectra, since it is a poor Raman scatterer [Pel99]. Consequently, the selected peaks can be
used to build a calibration model not only for solid phase measurements, but also for the
measurements in suspension.
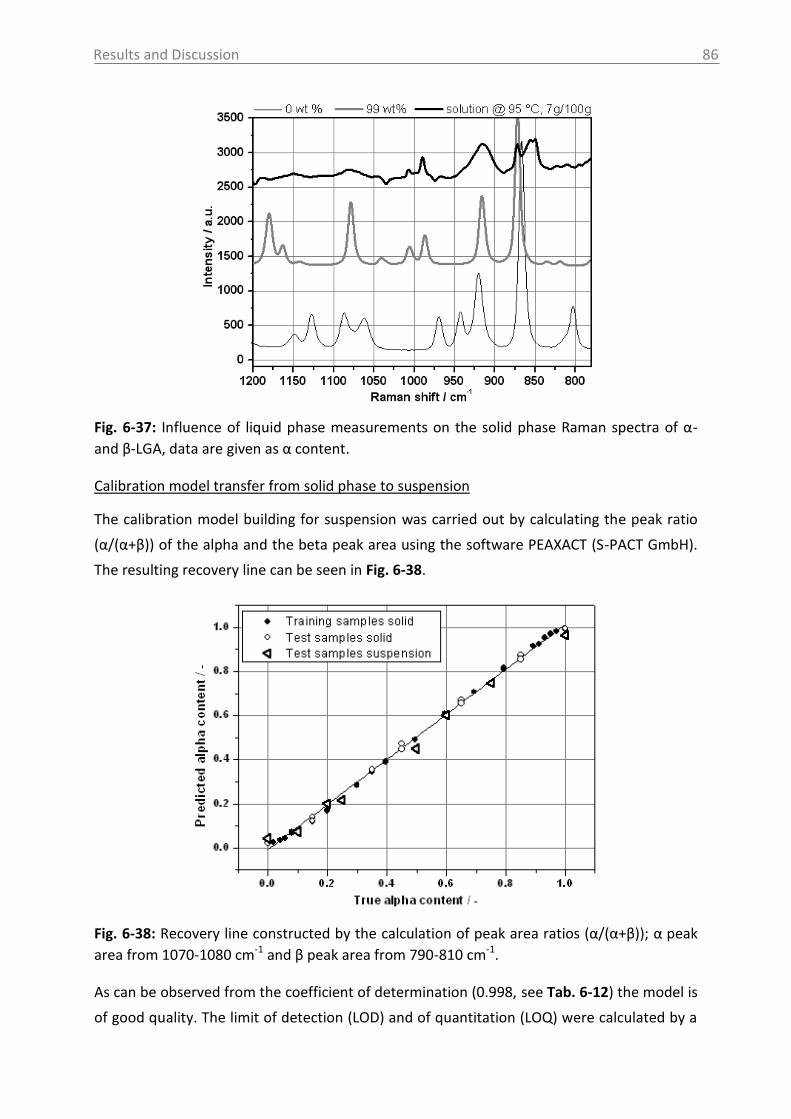
Results and Discussion
86
Fig. 6-37: Influence of liquid phase measurements on the solid phase Raman spectra of α-
and β-LGA, data are given as α content.
Calibration model transfer from solid phase to suspension
The calibration model building for suspension was carried out by calculating the peak ratio
(α/(α+β)) of the alpha and the beta peak area using the software PEAXACT (S-PACT GmbH).
The resulting recovery line can be seen in Fig. 6-38.
Fig. 6-38: Recovery line constructed by the calculation of peak area ratios (α/(α+β)); α peak
area from 1070-1080 cm-1 and β peak area from 790-810 cm-1.
As can be observed from the coefficient of determination (0.998, see Tab. 6-12) the model is
of good quality. The limit of detection (LOD) and of quantitation (LOQ) were calculated by a
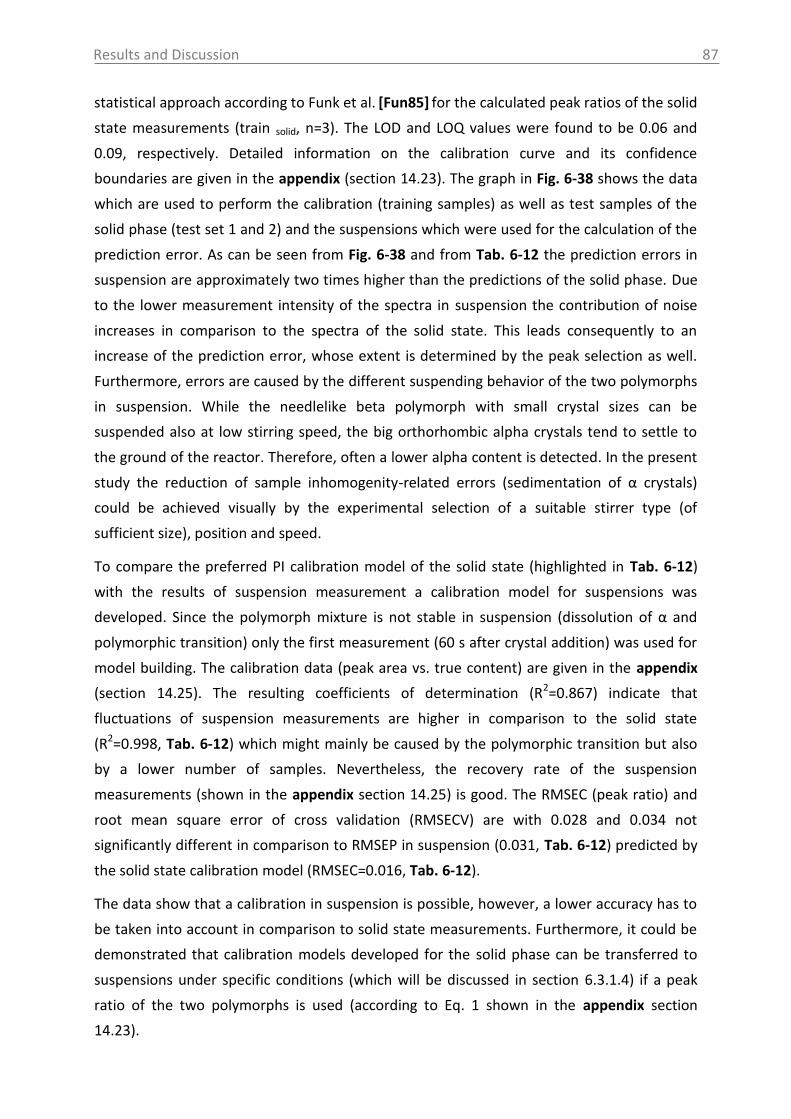
Results and Discussion
87
statistical approach according to Funk et al. [Fun85] for the calculated peak ratios of the solid
state measurements (train solid, n=3). The LOD and LOQ values were found to be 0.06 and
0.09, respectively. Detailed information on the calibration curve and its confidence
boundaries are given in the appendix (section 14.23). The graph in Fig. 6-38 shows the data
which are used to perform the calibration (training samples) as well as test samples of the
solid phase (test set 1 and 2) and the suspensions which were used for the calculation of the
prediction error. As can be seen from Fig. 6-38 and from Tab. 6-12 the prediction errors in
suspension are approximately two times higher than the predictions of the solid phase. Due
to the lower measurement intensity of the spectra in suspension the contribution of noise
increases in comparison to the spectra of the solid state. This leads consequently to an
increase of the prediction error, whose extent is determined by the peak selection as well.
Furthermore, errors are caused by the different suspending behavior of the two polymorphs
in suspension. While the needlelike beta polymorph with small crystal sizes can be
suspended also at low stirring speed, the big orthorhombic alpha crystals tend to settle to
the ground of the reactor. Therefore, often a lower alpha content is detected. In the present
study the reduction of sample inhomogenity-related errors (sedimentation of α crystals)
could be achieved visually by the experimental selection of a suitable stirrer type (of
sufficient size), position and speed.
To compare the preferred PI calibration model of the solid state (highlighted in Tab. 6-12)
with the results of suspension measurement a calibration model for suspensions was
developed. Since the polymorph mixture is not stable in suspension (dissolution of α and
polymorphic transition) only the first measurement (60 s after crystal addition) was used for
model building. The calibration data (peak area vs. true content) are given in the appendix
(section 14.25). The resulting coefficients of determination (R2=0.867) indicate that
fluctuations of suspension measurements are higher in comparison to the solid state
(R2=0.998, Tab. 6-12) which might mainly be caused by the polymorphic transition but also
by a lower number of samples. Nevertheless, the recovery rate of the suspension
measurements (shown in the appendix section 14.25) is good. The RMSEC (peak ratio) and
root mean square error of cross validation (RMSECV) are with 0.028 and 0.034 not
significantly different in comparison to RMSEP in suspension (0.031, Tab. 6-12) predicted by
the solid state calibration model (RMSEC=0.016, Tab. 6-12).
The data show that a calibration in suspension is possible, however, a lower accuracy has to
be taken into account in comparison to solid state measurements. Furthermore, it could be
demonstrated that calibration models developed for the solid phase can be transferred to
suspensions under specific conditions (which will be discussed in section 6.3.1.4) if a peak
ratio of the two polymorphs is used (according to Eq. 1 shown in the appendix section
14.23).
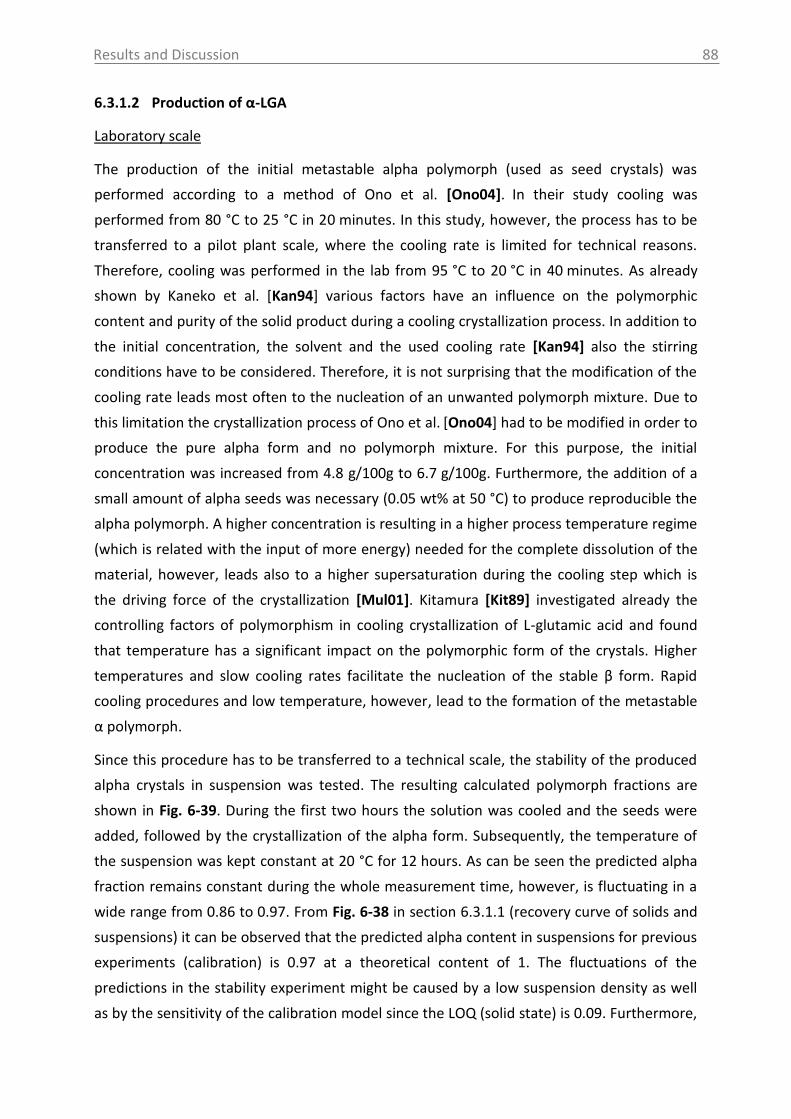
Results and Discussion
88
6.3.1.2 Production of α-LGA
Laboratory scale
The production of the initial metastable alpha polymorph (used as seed crystals) was
performed according to a method of Ono et al. [Ono04]. In their study cooling was
performed from 80 °C to 25 °C in 20 minutes. In this study, however, the process has to be
transferred to a pilot plant scale, where the cooling rate is limited for technical reasons.
Therefore, cooling was performed in the lab from 95 °C to 20 °C in 40 minutes. As already
shown by Kaneko et al. [Kan94] various factors have an influence on the polymorphic
content and purity of the solid product during a cooling crystallization process. In addition to
the initial concentration, the solvent and the used cooling rate [Kan94] also the stirring
conditions have to be considered. Therefore, it is not surprising that the modification of the
cooling rate leads most often to the nucleation of an unwanted polymorph mixture. Due to
this limitation the crystallization process of Ono et al. [Ono04] had to be modified in order to
produce the pure alpha form and no polymorph mixture. For this purpose, the initial
concentration was increased from 4.8 g/100g to 6.7 g/100g. Furthermore, the addition of a
small amount of alpha seeds was necessary (0.05 wt% at 50 °C) to produce reproducible the
alpha polymorph. A higher concentration is resulting in a higher process temperature regime
(which is related with the input of more energy) needed for the complete dissolution of the
material, however, leads also to a higher supersaturation during the cooling step which is
the driving force of the crystallization [Mul01]. Kitamura [Kit89] investigated already the
controlling factors of polymorphism in cooling crystallization of L-glutamic acid and found
that temperature has a significant impact on the polymorphic form of the crystals. Higher
temperatures and slow cooling rates facilitate the nucleation of the stable β form. Rapid
cooling procedures and low temperature, however, lead to the formation of the metastable
α polymorph.
Since this procedure has to be transferred to a technical scale, the stability of the produced
alpha crystals in suspension was tested. The resulting calculated polymorph fractions are
shown in Fig. 6-39. During the first two hours the solution was cooled and the seeds were
added, followed by the crystallization of the alpha form. Subsequently, the temperature of
the suspension was kept constant at 20 °C for 12 hours. As can be seen the predicted alpha
fraction remains constant during the whole measurement time, however, is fluctuating in a
wide range from 0.86 to 0.97. From Fig. 6-38 in section 6.3.1.1 (recovery curve of solids and
suspensions) it can be observed that the predicted alpha content in suspensions for previous
experiments (calibration) is 0.97 at a theoretical content of 1. The fluctuations of the
predictions in the stability experiment might be caused by a low suspension density as well
as by the sensitivity of the calibration model since the LOQ (solid state) is 0.09. Furthermore,
Results and Discussion
89
the particle size might have an influence, since higher particle sizes reduce the optical
density of the suspension in comparison to smaller particles. The effect of suspension
density and particle size will be discussed in detail in section 6.3.1.4.
Fig. 6-39: Predicted α-LGA solid fraction during the production (00:00-02:24) and test of
stability in suspension at 20 °C (02:24-14:24).
In conclusion, the stability of the alpha crystals in suspension at 20 °C for at least 12 hours
could be proven. The result was verified by offline XRPD measurements as well.
Pilot plant: considerations and remarks
In pilot plant and industrial scale setups the use of high cooling rates is limited. Therefore,
cooling ramps were performed from 98 °C to 25 °C within 152 minutes, which increases the
cooling time by 110 minutes in comparison to the lab experiments. The seed crystals
(0.05 wt%) were added at a temperature of 80 °C. Fig. 6-40 represents characteristic Raman
peak heights during the production process of α-LGA. The beta peak height is decreasing
with increasing temperature and remains constant at an inside vessel temperature of 89 °C.
This point is not consistent with the solubility temperature (approximately 95 °C) (data are
given in section 6.1.3), which was determined in a previous pilot plant experiment. As can be
seen in Fig. 6-40 there is a difference between the measured internal and bottom outlet
temperature of up to 26 °C. Therefore, it can be concluded that this difference is caused by
encrustations of crystals at the bottom of the reactor. Consequently, this effect lowers the
detected solubility temperature measured in the closed loop and leads to the generation of
falsified results. As soon as the encrustation is dissolved the measured internal and bottom
outlet temperatures are equal.
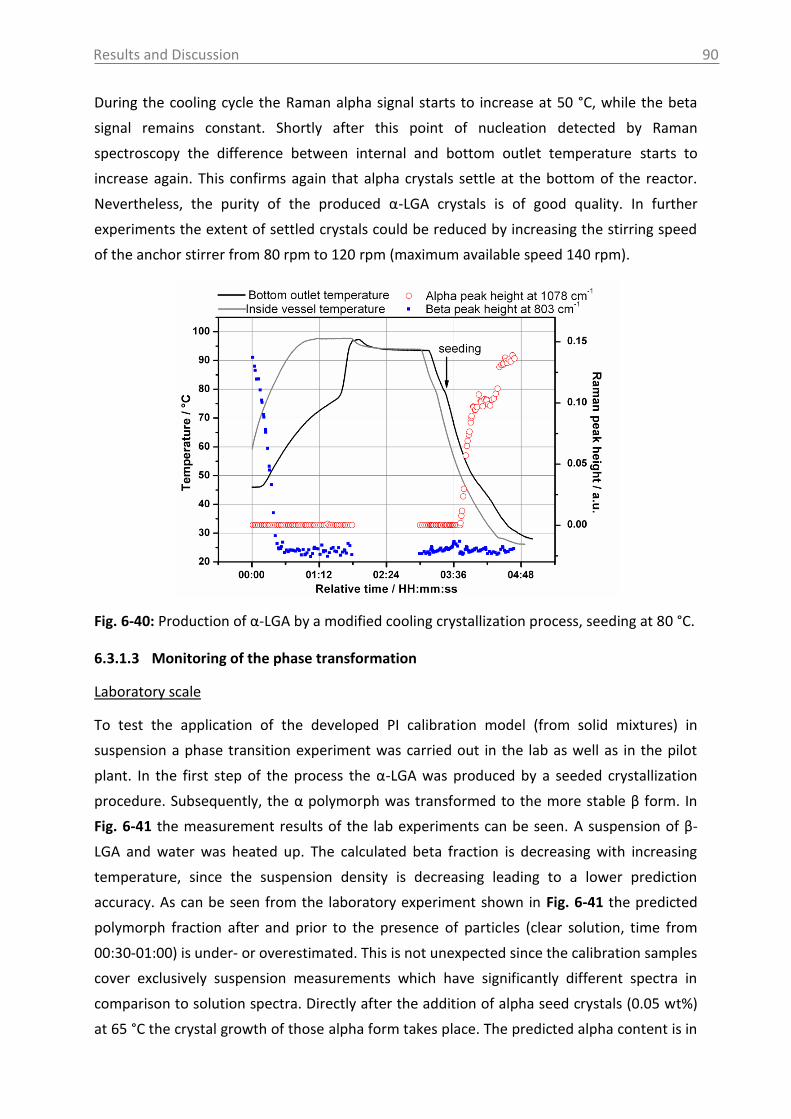
Results and Discussion
90
During the cooling cycle the Raman alpha signal starts to increase at 50 °C, while the beta
signal remains constant. Shortly after this point of nucleation detected by Raman
spectroscopy the difference between internal and bottom outlet temperature starts to
increase again. This confirms again that alpha crystals settle at the bottom of the reactor.
Nevertheless, the purity of the produced α-LGA crystals is of good quality. In further
experiments the extent of settled crystals could be reduced by increasing the stirring speed
of the anchor stirrer from 80 rpm to 120 rpm (maximum available speed 140 rpm).
Fig. 6-40: Production of α-LGA by a modified cooling crystallization process, seeding at 80 °C.
6.3.1.3 Monitoring of the phase transformation
Laboratory scale
To test the application of the developed PI calibration model (from solid mixtures) in
suspension a phase transition experiment was carried out in the lab as well as in the pilot
plant. In the first step of the process the α-LGA was produced by a seeded crystallization
procedure. Subsequently, the α polymorph was transformed to the more stable β form. In
Fig. 6-41 the measurement results of the lab experiments can be seen. A suspension of β-
LGA and water was heated up. The calculated beta fraction is decreasing with increasing
temperature, since the suspension density is decreasing leading to a lower prediction
accuracy. As can be seen from the laboratory experiment shown in Fig. 6-41 the predicted
polymorph fraction after and prior to the presence of particles (clear solution, time from
00:30-01:00) is under- or overestimated. This is not unexpected since the calibration samples
cover exclusively suspension measurements which have significantly different spectra in
comparison to solution spectra. Directly after the addition of alpha seed crystals (0.05 wt%)
at 65 °C the crystal growth of those alpha form takes place. The predicted alpha content is in
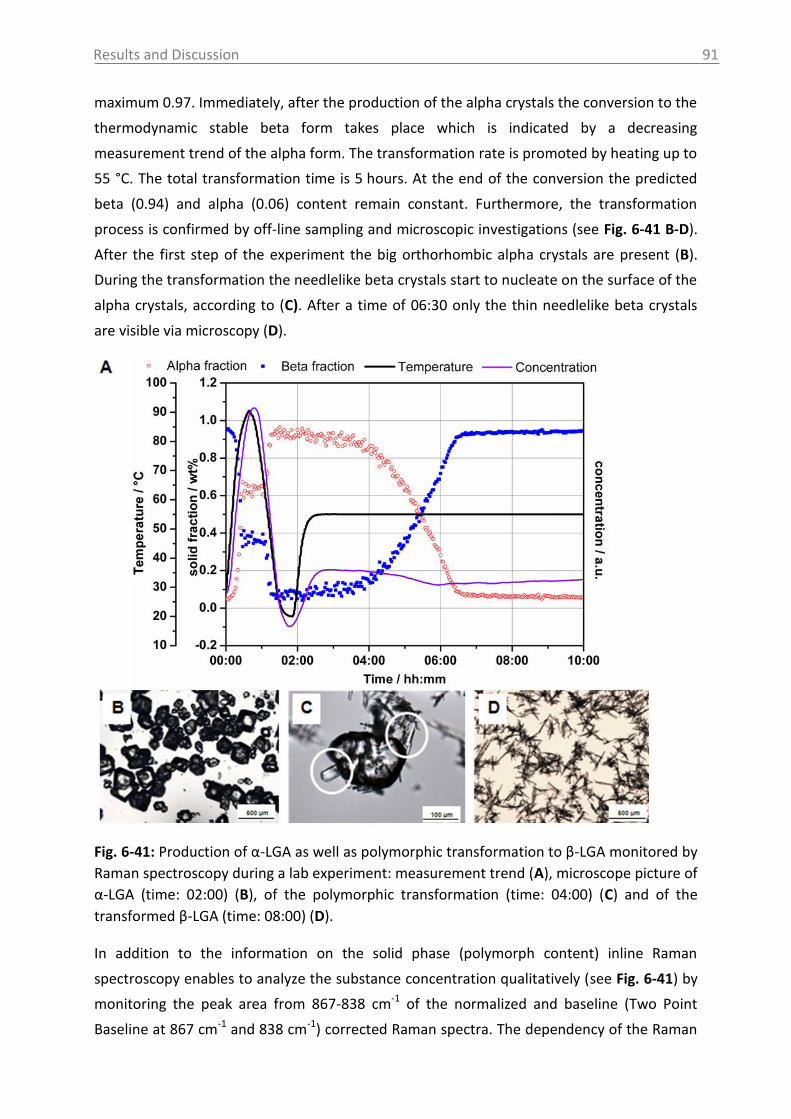
Results and Discussion
91
maximum 0.97. Immediately, after the production of the alpha crystals the conversion to the
thermodynamic stable beta form takes place which is indicated by a decreasing
measurement trend of the alpha form. The transformation rate is promoted by heating up to
55 °C. The total transformation time is 5 hours. At the end of the conversion the predicted
beta (0.94) and alpha (0.06) content remain constant. Furthermore, the transformation
process is confirmed by off-line sampling and microscopic investigations (see Fig. 6-41 B-D).
After the first step of the experiment the big orthorhombic alpha crystals are present (B).
During the transformation the needlelike beta crystals start to nucleate on the surface of the
alpha crystals, according to (C). After a time of 06:30 only the thin needlelike beta crystals
are visible via microscopy (D).
Fig. 6-41: Production of α-LGA as well as polymorphic transformation to β-LGA monitored by
Raman spectroscopy during a lab experiment: measurement trend (A), microscope picture of
α-LGA (time: 02:00) (B), of the polymorphic transformation (time: 04:00) (C) and of the
transformed β-LGA (time: 08:00) (D).
In addition to the information on the solid phase (polymorph content) inline Raman
spectroscopy enables to analyze the substance concentration qualitatively (see Fig. 6-41) by
monitoring the peak area from 867-838 cm-1 of the normalized and baseline (Two Point
Baseline at 867 cm-1 and 838 cm-1) corrected Raman spectra. The dependency of the Raman

Results and Discussion
92
peak intensities with changing liquid phase concentration is shown and will be discussed in
section 6.3.1.4. The concentration trend during the transformation of LGA is in excellent
agreement with the expected behavior and the results shown in the literature, e.g.
measured by ATR-MIR- or UV-Vis spectroscopy [Kit89]. In the beginning the concentration is
increasing until all crystals were dissolved. At 65 °C the seed crystals were added followed by
the crystal growth of the alpha polymorph, were a sudden decrease of concentration is
detectable. During the conversion process the concentration remains almost constant for
the first 1.5 hours after heating up to 55 °C. Subsequently, a slight decrease of concentration
is detectable. This is due to the solubility differences of the alpha and the beta form. Since
the metastable alpha polymorph has a higher solubility, the concentration is decreasing
during the transformation to the stable beta form.
It should be noted that concentrations measurements with Raman spectroscopy in
suspensions cannot be performed quantitatively. The Raman scattering is always influenced
by both phases (solid and liquid), whereby the scattering of solid phase particles is a very
complex process depending on particle shape, number and size [Rei03, Wan02, Wik06]. For
quantitative calibrations of solute concentration all these aspects need to be calibrated,
which would be highly time consuming. For quantitative measurements of concentration,
therefore, always other methods are used as for instance ATR-MIR spectroscopy.
From the measurement it can be concluded that the change of the polymorphic content can
be monitored in dependence of time by Raman spectroscopy. This is confirmed by the
measured test samples in suspension (results shown in Fig. 6-38) as well as by publications
of different authors [Ono04, Sch06, Cor08]. The technique enables to determine the end
point of polymorph conversions and allows the identification of the fundamental mechanism
that governs the transformation process.
Pilot plant scale
In the previous section the successful application of a solid state PI calibration model in
suspensions at lab scale, was shown. In general it would be beneficial to use this calibration
model developed in the lab for the processes in the pilot plant scale. This would minimize
the efforts needed for model development and model validation. In the following, the usage
of the PI solid state calibration model to predict the polymorph fractions in suspensions at
pilot plant scale will be reported. As in lab scale in a first step of the experiment the alpha
crystals are produced and in a second step the material is transformed to the more stable
beta form. The main difference between the setups of lab and pilot plant experiments is the
probe position. While the probe in the lab is integrated in a vertical position directly in the
reactor, in the pilot plant a closed loop connected to a pump is used and the probe is
installed horizontal in an external access unit. The pilot plant results are shown in Fig. 6-42.
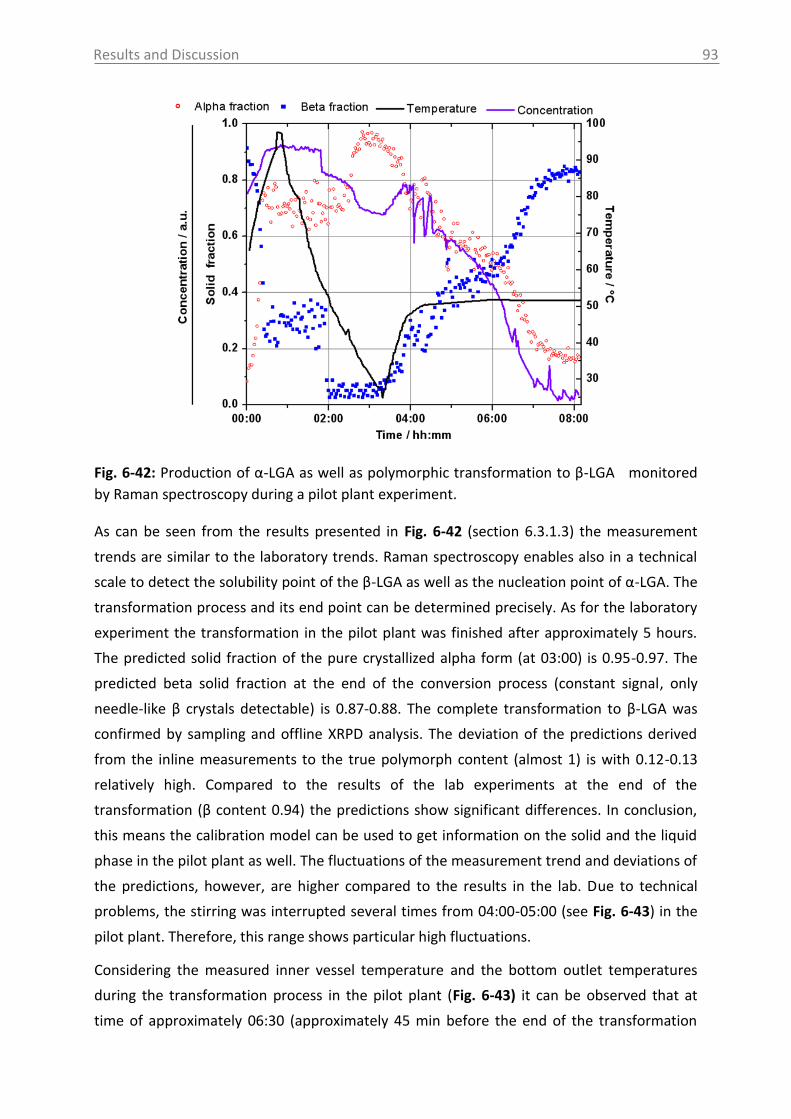
Results and Discussion
93
Fig. 6-42: Production of α-LGA as well as polymorphic transformation to β-LGA monitored
by Raman spectroscopy during a pilot plant experiment.
As can be seen from the results presented in Fig. 6-42 (section 6.3.1.3) the measurement
trends are similar to the laboratory trends. Raman spectroscopy enables also in a technical
scale to detect the solubility point of the β-LGA as well as the nucleation point of α-LGA. The
transformation process and its end point can be determined precisely. As for the laboratory
experiment the transformation in the pilot plant was finished after approximately 5 hours.
The predicted solid fraction of the pure crystallized alpha form (at 03:00) is 0.95-0.97. The
predicted beta solid fraction at the end of the conversion process (constant signal, only
needle-like β crystals detectable) is 0.87-0.88. The complete transformation to β-LGA was
confirmed by sampling and offline XRPD analysis. The deviation of the predictions derived
from the inline measurements to the true polymorph content (almost 1) is with 0.12-0.13
relatively high. Compared to the results of the lab experiments at the end of the
transformation (β content 0.94) the predictions show significant differences. In conclusion,
this means the calibration model can be used to get information on the solid and the liquid
phase in the pilot plant as well. The fluctuations of the measurement trend and deviations of
the predictions, however, are higher compared to the results in the lab. Due to technical
problems, the stirring was interrupted several times from 04:00-05:00 (see Fig. 6-43) in the
pilot plant. Therefore, this range shows particular high fluctuations.
Considering the measured inner vessel temperature and the bottom outlet temperatures
during the transformation process in the pilot plant (Fig. 6-43) it can be observed that at
time of approximately 06:30 (approximately 45 min before the end of the transformation
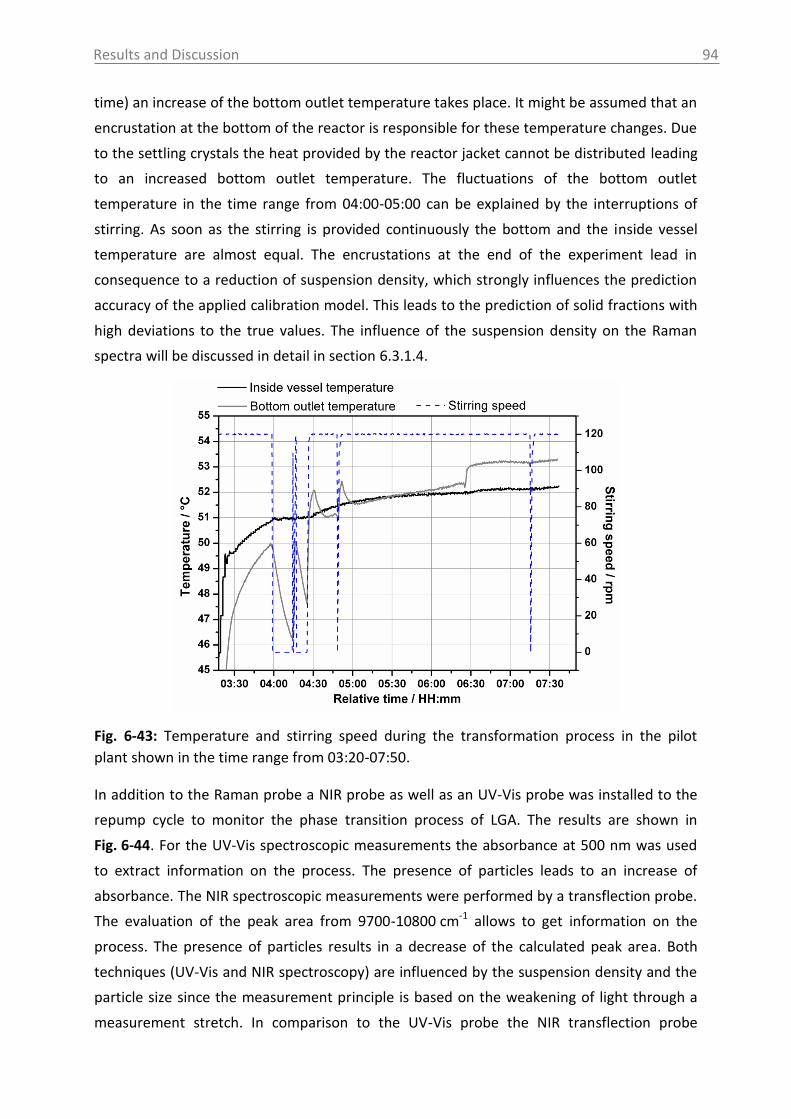
Results and Discussion
94
time) an increase of the bottom outlet temperature takes place. It might be assumed that an
encrustation at the bottom of the reactor is responsible for these temperature changes. Due
to the settling crystals the heat provided by the reactor jacket cannot be distributed leading
to an increased bottom outlet temperature. The fluctuations of the bottom outlet
temperature in the time range from 04:00-05:00 can be explained by the interruptions of
stirring. As soon as the stirring is provided continuously the bottom and the inside vessel
temperature are almost equal. The encrustations at the end of the experiment lead in
consequence to a reduction of suspension density, which strongly influences the prediction
accuracy of the applied calibration model. This leads to the prediction of solid fractions with
high deviations to the true values. The influence of the suspension density on the Raman
spectra will be discussed in detail in section 6.3.1.4.
Fig. 6-43: Temperature and stirring speed during the transformation process in the pilot
plant shown in the time range from 03:20-07:50.
In addition to the Raman probe a NIR probe as well as an UV-Vis probe was installed to the
repump cycle to monitor the phase transition process of LGA. The results are shown in
Fig. 6-44. For the UV-Vis spectroscopic measurements the absorbance at 500 nm was used
to extract information on the process. The presence of particles leads to an increase of
absorbance. The NIR spectroscopic measurements were performed by a transflection probe.
The evaluation of the peak area from 9700-10800 cm-1 allows to get information on the
process. The presence of particles results in a decrease of the calculated peak area. Both
techniques (UV-Vis and NIR spectroscopy) are influenced by the suspension density and the
particle size since the measurement principle is based on the weakening of light through a
measurement stretch. In comparison to the UV-Vis probe the NIR transflection probe
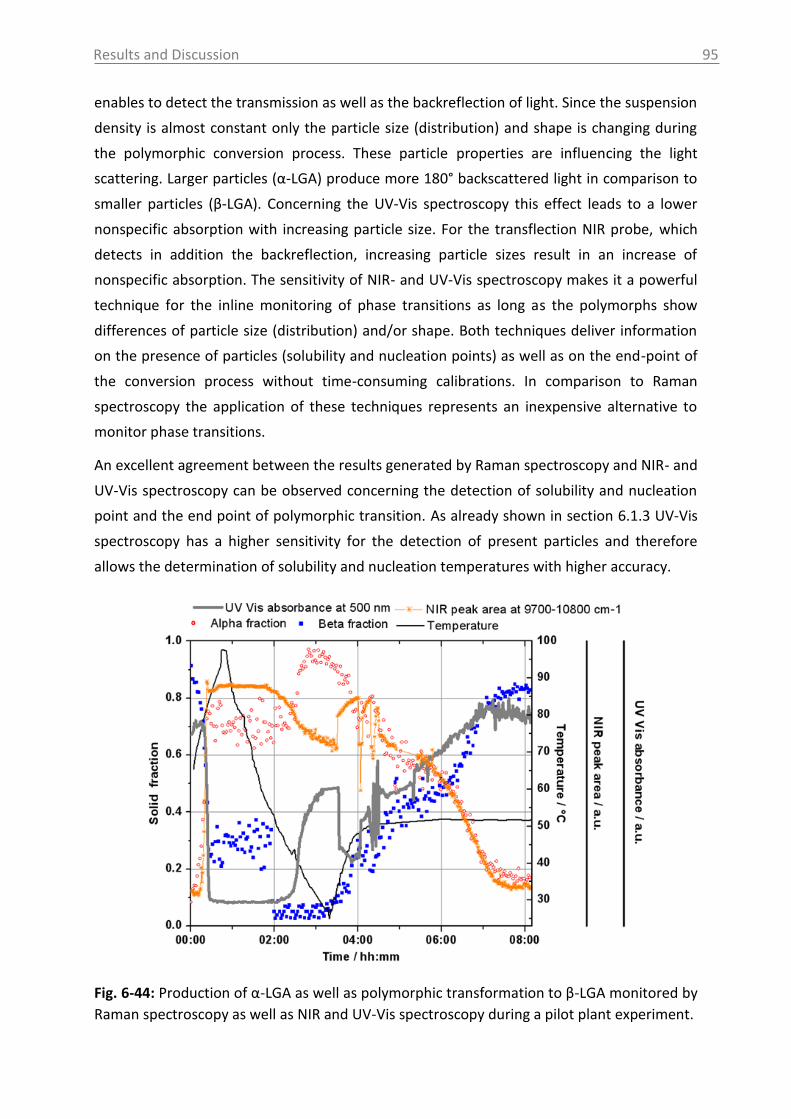
Results and Discussion
95
enables to detect the transmission as well as the backreflection of light. Since the suspension
density is almost constant only the particle size (distribution) and shape is changing during
the polymorphic conversion process. These particle properties are influencing the light
scattering. Larger particles (α-LGA) produce more 180° backscattered light in comparison to
smaller particles (β-LGA). Concerning the UV-Vis spectroscopy this effect leads to a lower
nonspecific absorption with increasing particle size. For the transflection NIR probe, which
detects in addition the backreflection, increasing particle sizes result in an increase of
nonspecific absorption. The sensitivity of NIR- and UV-Vis spectroscopy makes it a powerful
technique for the inline monitoring of phase transitions as long as the polymorphs show
differences of particle size (distribution) and/or shape. Both techniques deliver information
on the presence of particles (solubility and nucleation points) as well as on the end-point of
the conversion process without time-consuming calibrations. In comparison to Raman
spectroscopy the application of these techniques represents an inexpensive alternative to
monitor phase transitions.
An excellent agreement between the results generated by Raman spectroscopy and NIR- and
UV-Vis spectroscopy can be observed concerning the detection of solubility and nucleation
point and the end point of polymorphic transition. As already shown in section 6.1.3 UV-Vis
spectroscopy has a higher sensitivity for the detection of present particles and therefore
allows the determination of solubility and nucleation temperatures with higher accuracy.
Fig. 6-44: Production of α-LGA as well as polymorphic transformation to β-LGA monitored by
Raman spectroscopy as well as NIR and UV-Vis spectroscopy during a pilot plant experiment.

Results and Discussion
96
6.3.1.4 Influence of process parameters
During a phase transformation experiment the presence of different polymorphs and their
solid fraction is the major process variable which is influencing the Raman spectra. However,
also suspension density, particle size, temperature and the concentration can influence the
quality of the spectra. The Raman scattering signal results from the liquid and the solid
phase. Hence, there are numerous factors influencing the measurement, which makes the
quantitative application more challenging.
Suspension density
The influence of suspension density of β-LGA on the Raman spectra is shown in Fig. 6-45.
With increasing density the beta peak height is increasing, leading to a better spectra quality
and to a lower signal-noise ratio. Fig. 6-46 illustrates the predicted solid fraction of the pure
beta polymorph using different suspension densities ranging from 1-4.5 wt%. With
increasing suspension density the difference of the predicted value to the true value (1.0) is
decreasing. Especially for suspension densities lower than 3.0 wt% a strong decrease of the
predicted solid fraction is detectable. This can be explained since the Raman signal intensity
scales linearly with the amount of scattering material per unit volume [Cor08]. In conclusion,
from the prediction for suspension densities from 1-4.5 wt% at least a suspension density of
3 wt% is necessary to get accurate prediction results with the developed calibration model.
Fig. 6-45: Influence of β-LGA suspension
density on the measured Raman spectra in
suspension.
Fig. 6-46: Influence of β-LGA suspension
density on the predicted beta fraction in
suspension.
The effect of suspension density during the recrystallization of β-LGA is shown in detail in
Fig. 6-47 A. A solution of LGA was heated up until everything was dissolved and
subsequently cooled down. During the cooling ramp the nucleation starts at the surface of
the probe tip leading to their complete encrustation (B). Comparing the predicted solid
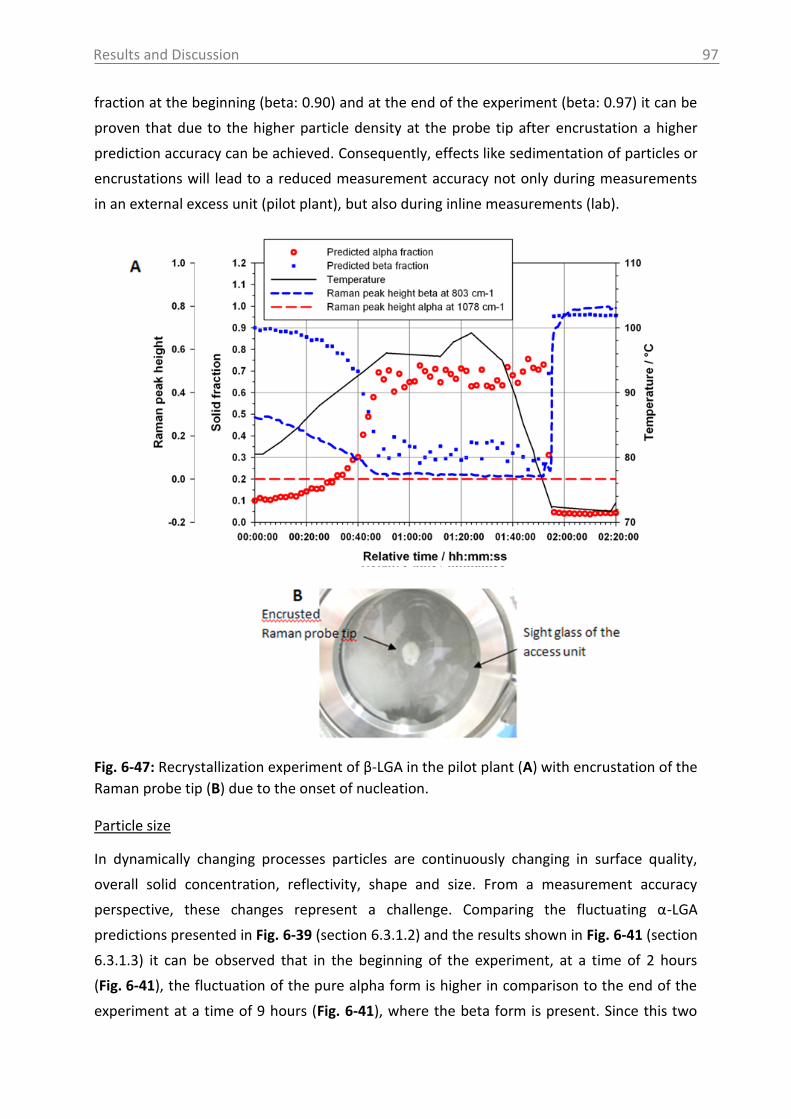
Results and Discussion
97
fraction at the beginning (beta: 0.90) and at the end of the experiment (beta: 0.97) it can be
proven that due to the higher particle density at the probe tip after encrustation a higher
prediction accuracy can be achieved. Consequently, effects like sedimentation of particles or
encrustations will lead to a reduced measurement accuracy not only during measurements
in an external excess unit (pilot plant), but also during inline measurements (lab).
Fig. 6-47: Recrystallization experiment of β-LGA in the pilot plant (A) with encrustation of the
Raman probe tip (B) due to the onset of nucleation.
Particle size
In dynamically changing processes particles are continuously changing in surface quality,
overall solid concentration, reflectivity, shape and size. From a measurement accuracy
perspective, these changes represent a challenge. Comparing the fluctuating α-LGA
predictions presented in Fig. 6-39 (section 6.3.1.2) and the results shown in Fig. 6-41 (section
6.3.1.3) it can be observed that in the beginning of the experiment, at a time of 2 hours
(Fig. 6-41), the fluctuation of the pure alpha form is higher in comparison to the end of the
experiment at a time of 9 hours (Fig. 6-41), where the beta form is present. Since this two
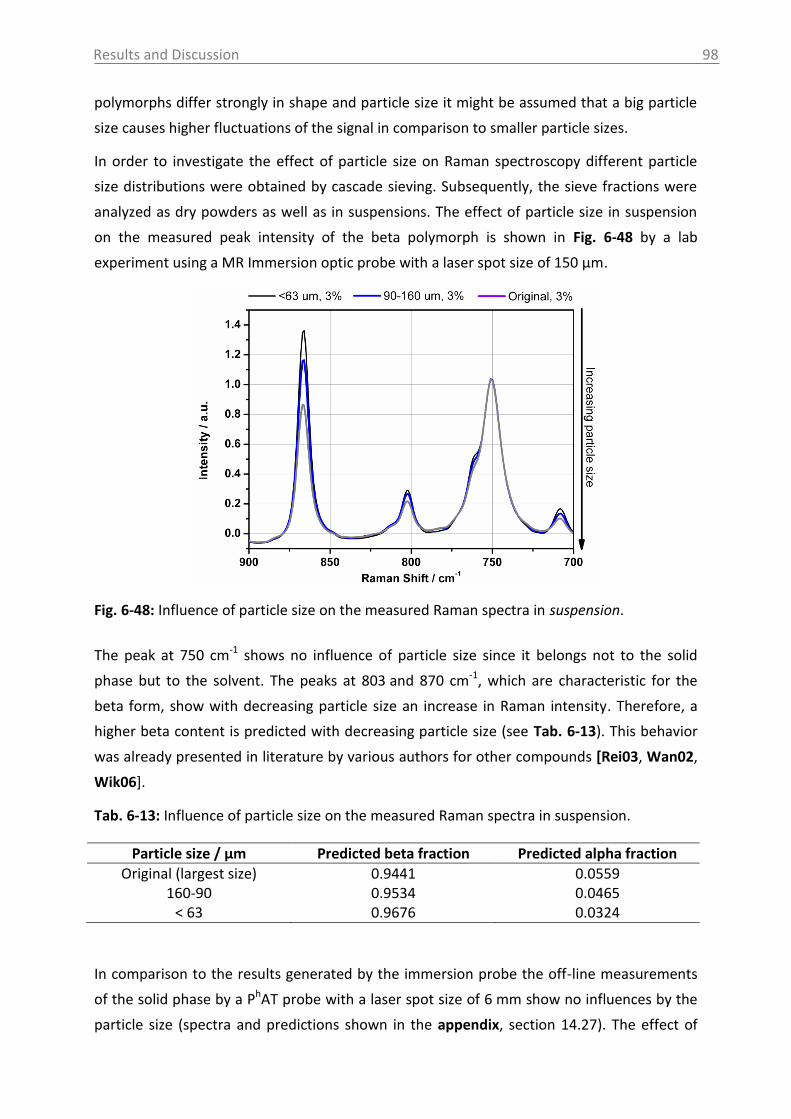
Results and Discussion
98
polymorphs differ strongly in shape and particle size it might be assumed that a big particle
size causes higher fluctuations of the signal in comparison to smaller particle sizes.
In order to investigate the effect of particle size on Raman spectroscopy different particle
size distributions were obtained by cascade sieving. Subsequently, the sieve fractions were
analyzed as dry powders as well as in suspensions. The effect of particle size in suspension
on the measured peak intensity of the beta polymorph is shown in Fig. 6-48 by a lab
experiment using a MR Immersion optic probe with a laser spot size of 150 µm.
Fig. 6-48: Influence of particle size on the measured Raman spectra in suspension.
The peak at 750 cm-1 shows no influence of particle size since it belongs not to the solid
phase but to the solvent. The peaks at 803 and 870 cm-1, which are characteristic for the
beta form, show with decreasing particle size an increase in Raman intensity. Therefore, a
higher beta content is predicted with decreasing particle size (see Tab. 6-13). This behavior
was already presented in literature by various authors for other compounds [Rei03, Wan02,
Wik06].
Tab. 6-13: Influence of particle size on the measured Raman spectra in suspension.
Particle size / µm Predicted beta fraction Predicted alpha fraction
Original (largest size) 0.9441 0.0559 160-90 0.9534 0.0465
< 63 0.9676 0.0324
In comparison to the results generated by the immersion probe the off-line measurements
of the solid phase by a PhAT probe with a laser spot size of 6 mm show no influences by the
particle size (spectra and predictions shown in the appendix, section 14.27). The effect of
Results and Discussion
99
particle size and shape has only rarely been investigated and studied and it has been
proposed that the particle size effects depend on the type of optics which is used for Raman
spectroscopy [Wan02, Wik06]. The differences between small spot size probes and big spot
size probes in terms of sensitivity to particle size effects and prediction accuracy can be
explained most likely by differences in sample/detection volume. Thus, when a larger sample
volume is analyzed (much larger than the particle size) the relative number of each particle
becomes less significant and the spectrum is more representative of the mass fraction
[Wik06]. This assumption might explain the differences between the analyzed polymorph
mixtures in suspension (immersion probe with smaller spot size) and in solid mixtures (PhAT-
probe with big spot size). Wikstrom et al. [Wik06] for instance reported an error up to 20 %
for the usage of a small spot size probe and compounds with extremely different particle
sizes, as they are present for the investigated compound LGA. In this study, however, the
error is around 3.1 % for suspensions (which differ in particle size) and even lower (1.6 %) for
solid state measurements. Therefore, it can be assumed that the influence of particle size for
the used Raman spectrometer, the investigated model compound and its calibration model
is small. Furthermore, the measurements in suspension can be affected by sample
inhomogenity-related errors as the flow conditions of the particles in suspension. During
stirring the centrifugal force throws bigger particles outwards towards the wall of the
reactor or to the bottom, while smaller particles are well distributed also in the middle of the
reactor, where the probe is located. This effect is reducing the probability of a big particle to
pass the detection volume of the Raman probe (to be in front of the probe window), which
reduces the detected intensity. It is assumed that a particle separation takes place in
dependence of the particle size. During the experiments in the pilot plant a recirculation unit
was used in addition to the stirrer. The repump might improve the homogenization process
since bigger particles which tend to settle or to throw out by stirring are recirculated by
pipes from the bottom of the reactor to the top.
Concentration
Since Raman scattering is based on the solid as well as the liquid phase properties, both
phases have to be considered for the quantitative application of Raman spectroscopy. As it
can be seen in Fig. 6-49 bands of LGA characteristic for the solution increase for an
increasing liquid phase concentration and could in principle be used for solute concentration
estimation in homogeneous processes (without particles). The two-point baseline corrected
peak area from 838-867 cm-1 derived from the measurements in clear solution, enable to
generate a linear calibration model with good quality. In heterogeneous processes, however,
the solid and the liquid phase can interact leading to the overlapping of peaks. Furthermore,
the presences of particles which differ in size, shape and suspension density are affecting the
available detection volume and have a higher Raman scattering potential in comparison to
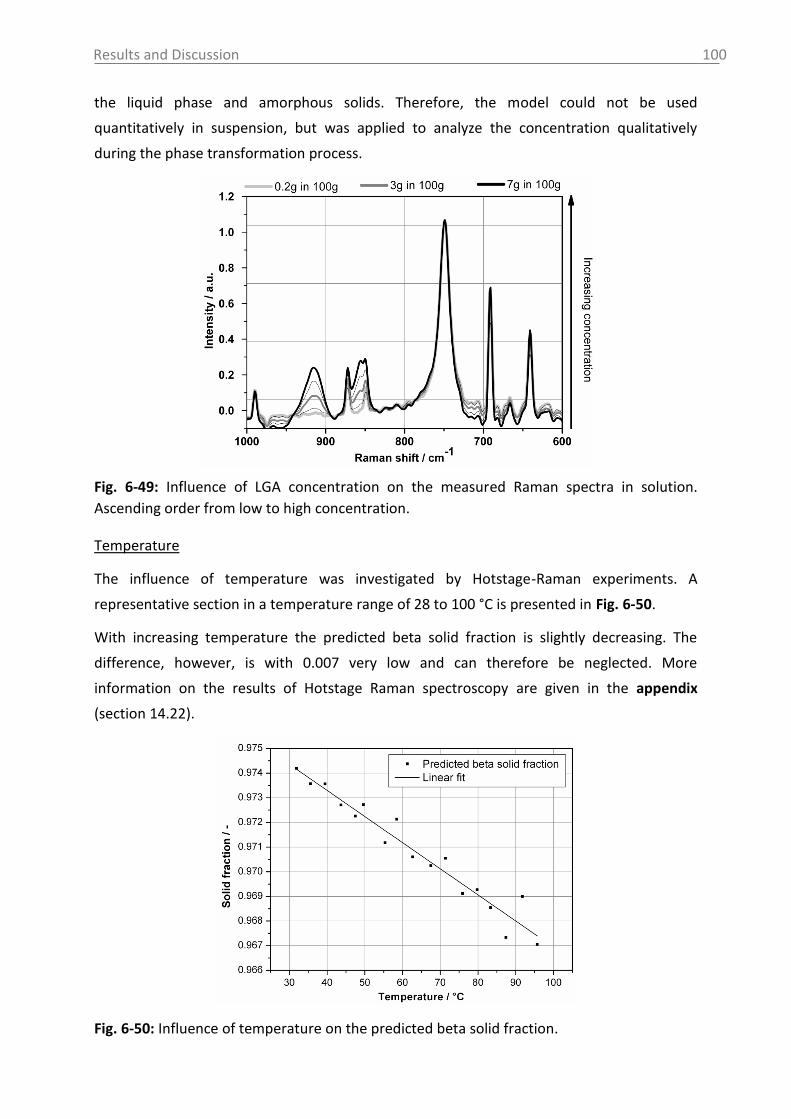
Results and Discussion
100
the liquid phase and amorphous solids. Therefore, the model could not be used
quantitatively in suspension, but was applied to analyze the concentration qualitatively
during the phase transformation process.
Fig. 6-49: Influence of LGA concentration on the measured Raman spectra in solution.
Ascending order from low to high concentration.
Temperature
The influence of temperature was investigated by Hotstage-Raman experiments. A
representative section in a temperature range of 28 to 100 °C is presented in Fig. 6-50.
With increasing temperature the predicted beta solid fraction is slightly decreasing. The
difference, however, is with 0.007 very low and can therefore be neglected. More
information on the results of Hotstage Raman spectroscopy are given in the appendix
(section 14.22).
Fig. 6-50: Influence of temperature on the predicted beta solid fraction.
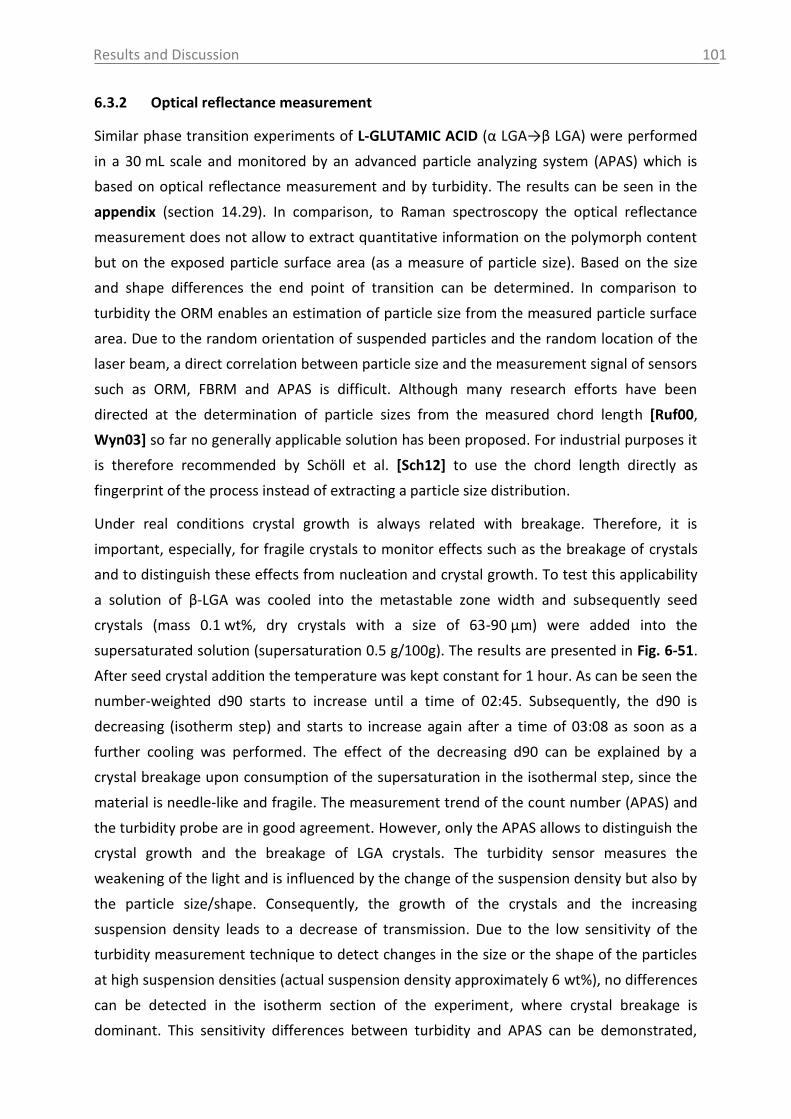
Results and Discussion
101
6.3.2 Optical reflectance measurement
Similar phase transition experiments of L-GLUTAMIC ACID (α LGA→β LGA) were performed
in a 30 mL scale and monitored by an advanced particle analyzing system (APAS) which is
based on optical reflectance measurement and by turbidity. The results can be seen in the
appendix (section 14.29). In comparison, to Raman spectroscopy the optical reflectance
measurement does not allow to extract quantitative information on the polymorph content
but on the exposed particle surface area (as a measure of particle size). Based on the size
and shape differences the end point of transition can be determined. In comparison to
turbidity the ORM enables an estimation of particle size from the measured particle surface
area. Due to the random orientation of suspended particles and the random location of the
laser beam, a direct correlation between particle size and the measurement signal of sensors
such as ORM, FBRM and APAS is difficult. Although many research efforts have been
directed at the determination of particle sizes from the measured chord length [Ruf00,
Wyn03] so far no generally applicable solution has been proposed. For industrial purposes it
is therefore recommended by Schöll et al. [Sch12] to use the chord length directly as
fingerprint of the process instead of extracting a particle size distribution.
Under real conditions crystal growth is always related with breakage. Therefore, it is
important, especially, for fragile crystals to monitor effects such as the breakage of crystals
and to distinguish these effects from nucleation and crystal growth. To test this applicability
a solution of β-LGA was cooled into the metastable zone width and subsequently seed
crystals (mass 0.1 wt%, dry crystals with a size of 63-90 µm) were added into the
supersaturated solution (supersaturation 0.5 g/100g). The results are presented in Fig. 6-51.
After seed crystal addition the temperature was kept constant for 1 hour. As can be seen the
number-weighted d90 starts to increase until a time of 02:45. Subsequently, the d90 is
decreasing (isotherm step) and starts to increase again after a time of 03:08 as soon as a
further cooling was performed. The effect of the decreasing d90 can be explained by a
crystal breakage upon consumption of the supersaturation in the isothermal step, since the
material is needle-like and fragile. The measurement trend of the count number (APAS) and
the turbidity probe are in good agreement. However, only the APAS allows to distinguish the
crystal growth and the breakage of LGA crystals. The turbidity sensor measures the
weakening of the light and is influenced by the change of the suspension density but also by
the particle size/shape. Consequently, the growth of the crystals and the increasing
suspension density leads to a decrease of transmission. Due to the low sensitivity of the
turbidity measurement technique to detect changes in the size or the shape of the particles
at high suspension densities (actual suspension density approximately 6 wt%), no differences
can be detected in the isotherm section of the experiment, where crystal breakage is
dominant. This sensitivity differences between turbidity and APAS can be demonstrated,
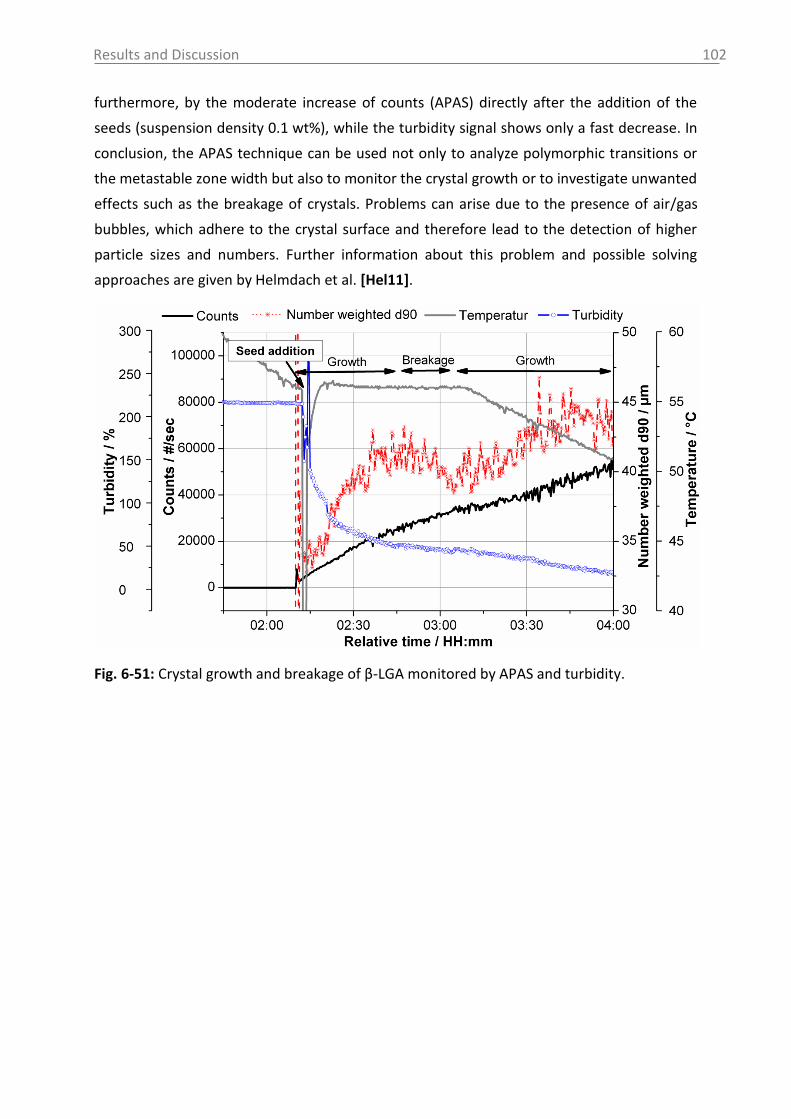
Results and Discussion
102
furthermore, by the moderate increase of counts (APAS) directly after the addition of the
seeds (suspension density 0.1 wt%), while the turbidity signal shows only a fast decrease. In
conclusion, the APAS technique can be used not only to analyze polymorphic transitions or
the metastable zone width but also to monitor the crystal growth or to investigate unwanted
effects such as the breakage of crystals. Problems can arise due to the presence of air/gas
bubbles, which adhere to the crystal surface and therefore lead to the detection of higher
particle sizes and numbers. Further information about this problem and possible solving
approaches are given by Helmdach et al. [Hel11].
Fig. 6-51: Crystal growth and breakage of β-LGA monitored by APAS and turbidity.
Results and Discussion
103
6.4 Access unit design in the pilot plant
The use of an external access unit in the pilot plant has the following advantages:
1) To integrate PAT tools in a pilot plant or industrial scale no modifications of the
existing reactor setup are required. This saves valuable time and also costs which
would have been necessary for the reactor modification.
2) The access unit design allows using the “small” laboratory probes in the pilot plant
setup. Therefore, additional acquisition costs for new devices can be saved.
3) The use of sight classes in the flow-through cell gives the possibility to examine the
product flow visually. Consequently, errors and possible system faults such as probe
fouling can be registered and eliminated early.
4) The access unit is modular in nature which allows installing various PAT tools at the
same time and to add or remove sensors as required.
5) The access unit can be transported from one location to another. Therefore, it can be
used also for different reactor designs and sizes.
6) Good flow conditions through the access unit ensure that the measurements by the
PAT tools are representative of the conditions in the crystallizer.
Apart from the numerous advantages also some drawbacks have to be taken into account
for the use of an external flow-through cell connected to a pump. In order to investigate the
influence of a recirculation unit on the physical properties of the recrystallized product a
solution of PARACETAMOL was crystallized without recirculation (cooling rate 0.2 °C/min,
stirring speed 80 rpm) and in a further experiment with the use of the recirculation unit
under the same conditions. Besides the influence of recirculation (in the pilot plant) the
effect of suspension inhomogeneities and stirring, which might be present during lab and
pilot plant experiments, is investigated. To get an inside of the crystallization experiments
the solubility and nucleation points were monitored by turbidity.
Influence of recirculation
As can be seen from the scanning electron-microscopic pictures in Fig. 6-52 A & C & D the
recirculation of the suspension leads to an enormous reduction of particle size in comparison
to the product which was recrystallized without recirculation. This was confirmed by laser
diffraction measurements. While the d90 without recirculation is 1398 ± 26 µm (refer to
Tab. 6-14), the particle size is reduced by more than the half to 512 ± 21 µm (experiment 2)
and 450 ± 30 µm (experiment 3) when the recirculation unit was used.
According to the results shown in Tab. 6-14 the recirculation of the suspension has no effect
on the solubility point but on the nucleation point. The nucleation point without
recirculation is 36 °C. The recirculation leads to an earlier initiation of the nucleation and
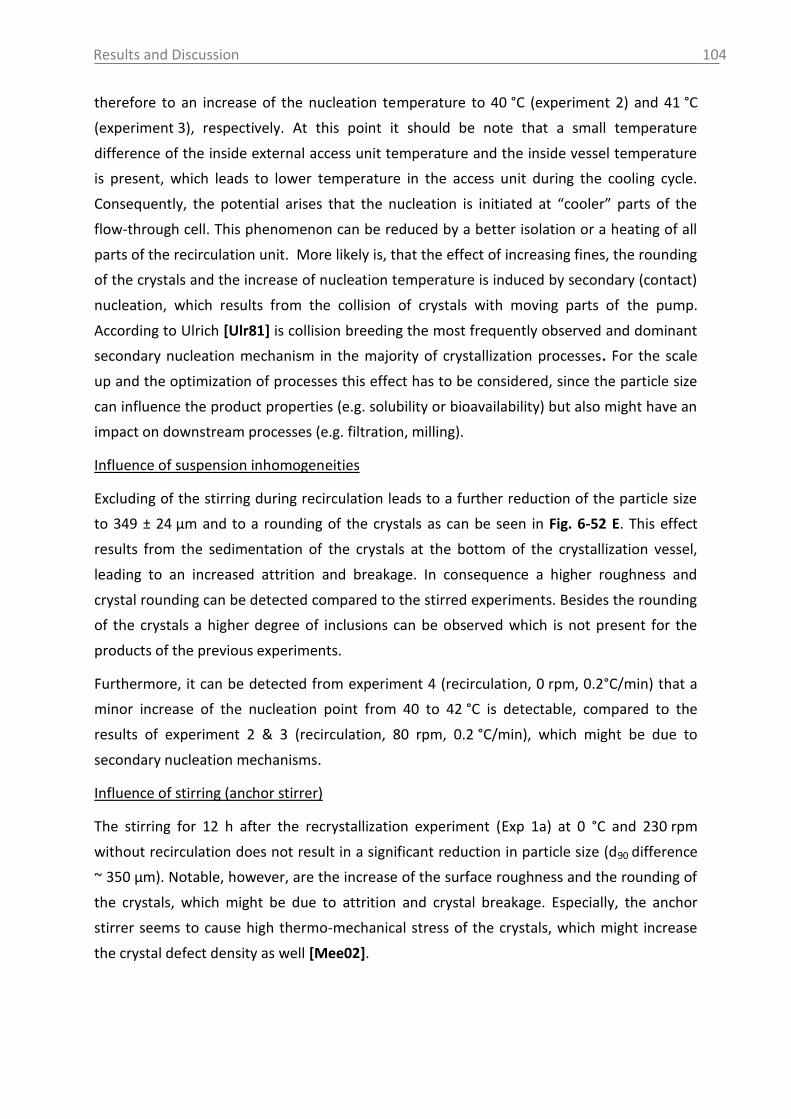
Results and Discussion
104
therefore to an increase of the nucleation temperature to 40 °C (experiment 2) and 41 °C
(experiment 3), respectively. At this point it should be note that a small temperature
difference of the inside external access unit temperature and the inside vessel temperature
is present, which leads to lower temperature in the access unit during the cooling cycle.
Consequently, the potential arises that the nucleation is initiated at “cooler” parts of the
flow-through cell. This phenomenon can be reduced by a better isolation or a heating of all
parts of the recirculation unit. More likely is, that the effect of increasing fines, the rounding
of the crystals and the increase of nucleation temperature is induced by secondary (contact)
nucleation, which results from the collision of crystals with moving parts of the pump.
According to Ulrich [Ulr81] is collision breeding the most frequently observed and dominant
secondary nucleation mechanism in the majority of crystallization processes. For the scale
up and the optimization of processes this effect has to be considered, since the particle size
can influence the product properties (e.g. solubility or bioavailability) but also might have an
impact on downstream processes (e.g. filtration, milling).
Influence of suspension inhomogeneities
Excluding of the stirring during recirculation leads to a further reduction of the particle size
to 349 ± 24 µm and to a rounding of the crystals as can be seen in Fig. 6-52 E. This effect
results from the sedimentation of the crystals at the bottom of the crystallization vessel,
leading to an increased attrition and breakage. In consequence a higher roughness and
crystal rounding can be detected compared to the stirred experiments. Besides the rounding
of the crystals a higher degree of inclusions can be observed which is not present for the
products of the previous experiments.
Furthermore, it can be detected from experiment 4 (recirculation, 0 rpm, 0.2°C/min) that a
minor increase of the nucleation point from 40 to 42 °C is detectable, compared to the
results of experiment 2 & 3 (recirculation, 80 rpm, 0.2 °C/min), which might be due to
secondary nucleation mechanisms.
Influence of stirring (anchor stirrer)
The stirring for 12 h after the recrystallization experiment (Exp 1a) at 0 °C and 230 rpm
without recirculation does not result in a significant reduction in particle size (d90 difference
~ 350 µm). Notable, however, are the increase of the surface roughness and the rounding of
the crystals, which might be due to attrition and crystal breakage. Especially, the anchor
stirrer seems to cause high thermo-mechanical stress of the crystals, which might increase
the crystal defect density as well [Mee02].
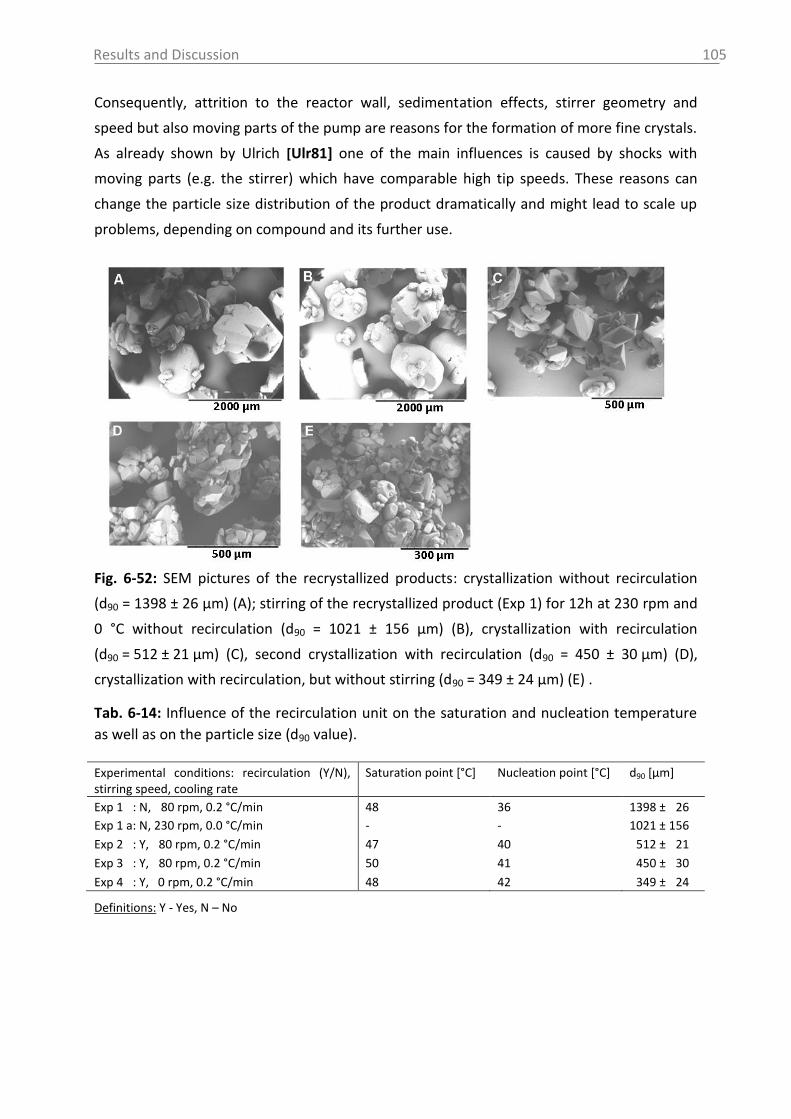
Results and Discussion
105
Consequently, attrition to the reactor wall, sedimentation effects, stirrer geometry and
speed but also moving parts of the pump are reasons for the formation of more fine crystals.
As already shown by Ulrich [Ulr81] one of the main influences is caused by shocks with
moving parts (e.g. the stirrer) which have comparable high tip speeds. These reasons can
change the particle size distribution of the product dramatically and might lead to scale up
problems, depending on compound and its further use.
Fig. 6-52: SEM pictures of the recrystallized products: crystallization without recirculation
(d90 = 1398 ± 26 µm) (A); stirring of the recrystallized product (Exp 1) for 12h at 230 rpm and
0 °C without recirculation (d90 = 1021 ± 156 µm) (B), crystallization with recirculation
(d90 = 512 ± 21 µm) (C), second crystallization with recirculation (d90 = 450 ± 30 µm) (D),
crystallization with recirculation, but without stirring (d90 = 349 ± 24 µm) (E) .
Tab. 6-14: Influence of the recirculation unit on the saturation and nucleation temperature
as well as on the particle size (d90 value).
Experimental conditions: recirculation (Y/N), stirring speed, cooling rate
Saturation point [°C] Nucleation point [°C] d90 [µm]
Exp 1 a: N, 080 rpm, 0.2 °C/min
48 36 1398 ± 026
Exp 1 a: N, 230 rpm, 0.0 °C/min - - 1021 ± 156
Exp 2 a: Y, 080 rpm, 0.2 °C/min 47 40 0512 ± 021
Exp 3 a: Y, 080 rpm, 0.2 °C/min 50 41 0450 ± 030
Exp 4 a: Y, 0 rpm, 0.2 °C/min 48 42 0349 ± 024
Definitions: Y - Yes, N – No
Overview of the results
106
7. Overview of the results
The results presented here should help to select suitable PAT tools which can be used for a
fast understanding and development of crystallization processes of APIs at lab as well as
industrial scale. In Fig. 7-1 an overview concerning the applied online analytical
measurement techniques and the investigated model compounds within this work is given.
As can be seen 7 different devices were used in order to investigate the solid and liquid
phase properties of 12 pharmaceutical compounds and 1 inorganic material. Tab. 7-1
summarizes some facts of the main and most important results.
Fig. 7-1: Overview of applied devices and investigated model compounds within this work.
Tab. 7-1: Summary of the results determined by 7 devices and 13 model compounds in lab
and pilot plant, definition: INFO – information content.
ULTRASOUND
INFO
Qualitative: presence or absence of particles Quantitative: mean particle size and suspension density, concentration
MA
IN R
ESU
LTS Grouping of compounds concerning the sensitivity to detect MZW and
concentration → Limited application for API`s Present conditions in the pilot plant (repump, diaphragm pump) lead to the
formation of air bubbles which strongly influence the ultrasound velocity → direct calibration model transfer from lab to pilot plant is therefore limited
Application of protected ultrasound (liquid phase!) sensor is limited
Overview of the results
107
RAMAN SPECTROSCOPY IN
FO
Qualitative: presence or absence of particles, polymorph form, concentration Quantitative: polymorph content
MA
IN R
ESU
LTS
Polymorphic phase transition can be tracked in lab and pilot plant scales Calibration model developed at lab (polymorph content) can be transferred to
pilot plant scale → higher fluctuations of the signals and predictions in pilot plant Process conditions, e.g. suspension density, can have a strong effect on prediction
accuracy of the calibration model For very soluble compounds (e.g. citric acid) a superposition of spectra belonging
to the solid and liquid phase takes place Low sensitivity to detect the presence of particles compared to other techniques
ATR-MIR SPECTROSCOPY
INFO
Quantitative: concentration Qualitative: chemical information
MA
IN R
ESU
LTS
Detection of solubility temperature over a wide range and in one experiment (calibration model development is necessary)
Desupersaturation tracking during crystal growth processes is possible Transfer of calibration model (concentration) developed at lab scale is possible for
PI model and IHM, not for PLS model Problems in the pilot plant: Water vapor inside the spectrometer, vibrations of the
fiber optics, changed geometry, encrustations → IHM enables a adaption to different conditions and has a higher prediction accuracy compared to PI model
UV-VIS-, NIR SPECTROSCOPY AND TURBIDITY
INFO
Qualitative: presence or absence of particles, chemical information Quantitative: concentration (requires ATR-technique)
MA
IN
RES
ULT
S UV-Vis: high sensitivity to detect particles, also at low suspension densities in lab and pilot plant
UV-Vis is a cheap, robust and easy transportable technique End point of phase transitions and effect of seed crystal addition can be tracked
APAS
INFO
Qualitative: presence or absence of particles, suspension density Quantitative: chord length distribution, mean chord length as fingerprint of PSD
MA
IN
RES
ULT
S End point of phase transitions can be tracked if particles differ in size and shape Distinction of crystal growth and breakage as well as detection of MZW is possible
ACCES UNIT DESIGN PILOT PLANT
MA
IN R
ESU
LTS
Fast integration of various “laboratory” PAT tools possible without cost intensive modifications of the setup
Application of analytical techniques in lab and pilot plant is possible, if the boundary conditions are maintained in the pilot plant as well (e.g. no gas intake into the solution for usage of ultrasound technique) – this is not always possible!
Disadvantage: possible influence on physical product properties by recirculation, possible sensor encrustation if no isolation of the pipes is present
Conclusions and recommendations
108
8. Conclusions and recommendations
In the following part conclusions of the main results are presented with respect to the aims
presented in section 4. Furthermore, recommendations for the selection of PAT tools and its
application at laboratory and pilot plant scale are given.
Apart from the knowledge of the MZW, which is necessary for process development, it is
important to monitor the concentration of API solutes in the solution during crystallization
processes. The actual value of concentration can provide the driving force for crystallization
during the process. According to the results presented for the ULTRASOUND sensor, the
application of this measurement technique for some pharmaceutical compounds shows
limits. In comparison most inorganic compounds promise in most cases an excellent
applicability for the concentration and MZW determination. Whether a compound is
analyzable by ultrasound can be determined very simple and fast by one experiment. For
this purpose the material is associated to a group (according to the grouping presented in
section 6.1) by the evaluation of the velocity change with increasing temperature and at the
nucleation points. Under the present conditions in the pilot plant a direct calibration model
transfer (concentration) was limited, most often, due to the influence of air/gas bubbles. In
conclusion, the technique requires in order to be applied for accurate concentration
prediction and for MZW determination, a low number of air/gas bubbles to be present. A
reduction of undissolved air/gas can be achieved e.g. by degassing with high power
ultrasound. The application of the protected ultrasound sensor to monitor the liquid phase
independent of the solid phase can only be recommended for material which belong to
group 1 (high sensitivity of velocity for concentration changes). Otherwise the small amount
of broken crystals which pass the measurement stretch might lead to strongly biased
concentration predictions for materials of group 2 or 3. For materials which belong to group
1 and 3 the technique can be used for accurate MZW determination. From such
measurements also important conclusions, e.g. concerning the transition temperature of
polymorphs or solvates can be drawn.
Since the application of ultrasound for concentration determination of API´s is limited,
further reliable tools are necessary which can be used to measure concentrations. In this
context ATR-MIR SPECTROSCOPY was tested. The technique was investigated in a case study
with 3 different pharmaceutical compounds, whereas the signal to noise ratio in case of
L-glutamic acid was too low in order to predict concentrations reliable. For Paracetamol and
Acetylsalicylic acid excellent results are presented and as it is shown for Acetylsalicylic acid
the calibrations errors of ATR-MIR are comparable to this of ultrasound. A direct transfer of
ATR-MIR spectroscopy and the application for concentration monitoring, however, seems to
Conclusions and recommendations
109
be easier in comparison to ultrasound. It is expected that the sieve of the protected
ultrasound sensor, which is necessary for concentration tracking, might get encrusted by the
installation in the used pilot plant setup of this study (repump). Furthermore, the ultrasound
velocity is strongly influenced by air/gas bubbles. The ATR-technology of MIR spectroscopy,
however, does not require a physical protection of particles and shows not influence by
air/gas bubbles. A direct transfer of the calibration model developed at lab scale, to the pilot
plant is possible for the PI model under specific conditions and for the IHM. For the
application of a PI model in the pilot plant it is recommended to work under the same
conditions as in the lab (nitrogen purge, geometry of fiber optics and type of sensor
integration, temperature range). Otherwise, a significantly lower reproducibility and
accuracy has to be taken into account. Since deviations to the lab conditions are sometimes
technically unavoidable (e.g. more vibrations in pilot plant) often an IHM is preferred to
facilitate the application to higher scales. As it was shown the IHM can be used to
compensate non-linear effects of the changed operating conditions. In conclusion the IHM
can be transferred from the pilot plant to the lab (or vice versa) without a loss of prediction
accuracy. This is highly desirable for industrial applications since the time needed for
calibration model development and validation can be reduced significantly. Within this work
the software PEAXACT (S-PACT GmbH) was established which can be recommended for a
fast visualization of the recorded spectra and data pretreatment, but also for a fast
calibration model building and real-time prediction of data recorded with spectroscopic
techniques. Especially during the lab experiments a problem during recrystallization
experiments was the encrustation of the ATR-MIR sensor. In this content the IHM might be
used to compensate encrustations, which are in “µm” range or an online detection and
warning system of probe fouling can be implemented in the process control system by a
simple real-time spectra comparison.
Apart from concentration measurement, process variables are required to get information
on the solid phase. For this purpose RAMAN SPECTROSCOPY was applied to monitor the
polymorph form. To analyze the polymorph content quantitatively, the development of the
calibration model based on offline solid state spectra has shown to be advantageous. The
spectra quality is not influenced by sampling problems or inhomogeneity related errors. This,
however, requires the use of a big laser spot size (e.g. 6 mm). Furthermore, the model is
independent of the liquid phase and can be applied for various solvents. For this kind of
application the PI method is preferred over a PLS method, since the PLS model is influenced
by the different process conditions. Concerning the selection of the peak areas for the
different polymorphs it is advantageous to use the peaks of the highest intensity, although
Conclusions and recommendations
110
when these peaks are only partly separated. In this case it could be shown that the use of a
separated part of the complete area, leads to a lower prediction error, due to the lower
signal-to-noise ratio. For a good reproducibility and accuracy it is recommended to develop
the PI model based on a peak area ratio of the different polymorphs. This allows the direct
transfer of the model from solid phase to suspension and from lab to pilot plant. For the
application in suspension a sufficient suspension density is necessary (e.g. 3 wt% for
L-glutamic acid). The technique cannot be applied for very low suspension densities (e.g.
1 wt%), since the results leads to statistically not representative data. For very low
suspension densities the use of UV-Vis spectroscopy (transmission probe) is recommendable
due to the high sensitivity of the technique for particles. The change of particle size and
shape can be used in order to track the end point of transition. In addition to the solid phase,
Raman spectroscopy enables to track the concentration qualitatively. Although a linearity of
the concentration signals are given for clear solution, it is not recommended to use this
technique for quantitative prediction of concentration in suspension due to the huge
complexity of the scattering of particles (depending on shape, size and density). In
conclusion, Raman spectroscopy has shown to be a highly desirable tool which can be used
for process development and optimization for polymorphic compounds. It delivers
information on both phases (solid and liquid). After development and understanding of the
process in the pilot plant or industrial scale, the technique might be replaced by a less
complex and simpler technique, where the information content which can be derived is
drastically reduced, as for instance UV-VIS- or NIR SPECTROSCOPY as turbidity technique.
Especially UV-Vis spectroscopy is a very sensitive, robust and cheap method which can be
applied to monitor the end point of the polymorphic transition (not the polymorphic
content!) in lab and pilot plant scales. A problem which can limit the application of Raman
spectroscopy is the presence of fluorescence (e.g. for the investigation pigments). Even weak
fluorescence can be stronger than Raman scattering leading to a hiding of Raman peaks.
If information on the particle size distribution is required, ORM (APAS) or FBRM can be used.
The direct correlation between measured chord length and particle size, however, is in most
cases difficult. As proposed by Schöll et al. [Sch12] it is recommended to use the chord
length directly as a fingerprint of the process instead of extracting particle size distributions.
It can be shown that PAT tools can be cost and time efficiently integrated into reaction or
crystallization setups of pilot plant or even production scale by the usage of an online access
unit and a recirculation unit. The probe integration does not require any modification of the
existing vessels. A further advantage of the access unit is the possibility to examine the
suspension or solution as well as the probe tip visually in the access unit by sight glasses.
Conclusions and recommendations
111
Consequently, errors and possible system faults such as probe fouling can be registered and
eliminated early. The use of an external process flow, however need special attention
otherwise it, can have drawbacks. Temperature differences between the reactor and the
external recirculation for instance can induce early nucleation events in the colder external
pipes, depending on the crystallization process used. This effect can be eliminated by a good
isolation or the heating of the parts of the external loop. Furthermore, it has to be
considered that the physicochemical properties of the product are influenced by the pump.
This might lead to scale up problems, depending on compound and its further use.
Concluding the presented results, it is advisable to use PAT tools to control crystallization
processes to ensure a good quality of the product and to keep costs of production down.
However, there is not the one technology in terms of the physical principle which can be
used for all the different applications. Therefore, it has to be chosen out of different
instrumentations concerning the wanted information content, the necessary precision, the
effort of installation and data evaluation and last but not least the costs of the instruments.
The results presented in this thesis are fundamental work in the field of the selection and
application of PAT tools at pilot plant scales. With the help of these results it is possible to
easily circumvent the problems associated with the integration of PAT tools in pilot plant
setups and calibration transfer from lab to pilot plant or industrial scales. The monitoring of
solid and liquid phase properties can be used for advanced control strategies.
Summary
112
9. Summary
The physical properties of active pharmaceutical ingredients (APIs), which are delivered in
crystalline form, have to meet stringent specifications such as a defined particle size
distribution and polymorphic form. These physical properties are often controlled in the final
API crystallization step by the application of process analytical technologies (PAT). PAT is
based on the application of sophisticated process analyzers (PAT tools) and multivariate data
acquisition and analysis tools. PAT tools can be placed in the process stream and provide
information about the process (e.g. concentration) and the product (e.g. polymorph content)
in real-time. Up-to-date manufacturing processes follow the quality by design (QbD)
approach, which involves the application of PAT strategies to reduce identified
manufacturing risks that have a negative impact on the product quality. So far, however, a
lot of scientific works have stopped with the implementation of PAT tools at the level of
laboratory scale. There remains the need of further investigations regarding the transfer to
pilot plant or production scale processes. The strategic selection and application of PAT tools
for the investigation of APIs at laboratory scale, which are beneficial for a rapid
understanding and development of crystallization processes, should be supported. In order
to facilitate the scale up the selected techniques and the calibration methods developed at
lab scale should have the potential to be used in industrial scales as well.
Here twelve different pharmaceutical compounds are analyzed by seven different online
analytical measurement techniques, which are attenuated total reflectance – mid infrared-
(ATR-MIR), Raman-, near infrared- (NIR) and ultraviolet visible (UV-Vis) spectroscopy as well
as turbidity, ultrasound and optical reflectance measurement in lab and pilot plant scales.
The techniques are used for metastable zone width (MZSW) determination, solute
concentration measurement and to provide information on the solid phase (e.g. polymorph
content) during crystallizations of APIs. The results demonstrate that the techniques differ
strongly in sensitivity e.g. to detect the presence of particles or to detect concentration
changes. It is found that UV-Vis spectroscopy has, in comparison to Raman- and NIR
spectroscopy, a very high sensitivity for the presence of particles also at low suspension
densities. By the analysis of 12 APIs with the ultrasound technique, which can be used for
MZW and concentration determination, it has been demonstrated that the technique has
only a limited applicability for pharmaceutical compounds (especially with high molecular
weights), due to special physical properties in many cases, while especially inorganic
compounds (with low molecular weights) have a very good applicability. As further
concentration measurement technique ATR-MIR spectroscopy is used, which allows the
prediction of concentrations for 2 of 3 model compounds. Here the new software PEAXACT
Summary
113
(S-PACT GmbH) is established and applied for data acquisition and real-time predictions of
concentrations with ATR-MIR spectroscopy.
Furthermore, the work is focused on the direct transferability of calibration models which
were developed at lab scale to pilot plant scales. It is found that various effects can have an
influence, which prevent or limit a direct transferability of calibration models. In case of
ultrasound, air/gas bubbles have been shown to be a problem when the sensor is integrated
in a recirculation unit. Only if the portion of undissolved air/gas is small a direct, successful
transferability of the calibration model is possible. Concerning ATR-MIR spectroscopy it is
demonstrated that a direct calibration model transfer from lab to pilot plant is only possible
for a peak integration (PI) model and the indirect hard model (IHM), but not for partial least
square (PLS) models. The application of a PI model for direct calibration transfer strongly
depends on the chosen process- and ambient conditions (e.g. water vapor content inside the
spectrometer, bending radius of the fiber optics, type of sensor installation), which should
be ideally exactly the same in the lab and pilot plant. In contrast, the IHM allows a non-linear
compensation of the different conditions and is, therefore, preferable to facilitate the scale
procedure under variable process- and ambient conditions. In this work the IHM is used to
compensate the effect of water vapor inside the spectrometer, which represents the major
problem in the pilot plant. Such application is new.
In this work Raman spectroscopy is used to analyze the polymorph content during phase
transitions in real-time. It has been found that a calibration model developed from solid
state spectra in the laboratory can be used for predictions in suspensions and in the pilot
plant as well. Limitations arise due to the minimal necessary suspension density, which is
relatively high in comparison to other techniques which deliver qualitative information on
phase transitions (e.g. NIR- and UV-Vis spectroscopy).
The integration of these measurements techniques in the pilot plant is realized by a
recirculation loop connected to a membrane pump. The setup has the advantage that
various techniques can be integrated fast and cost efficient in the existing pilot plant setup.
A disadvantage, however, is the influence of the pump on the physical product quality.
It is successfully demonstrated which expectations are realistic for the application of the
measurement technique in the lab and its direct transferability to industrial scales. From a
process engineering point of view, the future research concerns the design of crystallization
experiments in which a product or process parameter analyzed by a PAT tool, such as the
supersaturation, is selectively controlled within the metastable zone using a feedback loop
(e.g. regulation of temperature) to obtain quality crystals with consistent properties.
Zusammenfassung
114
10. Zusammenfassung
Die physikalischen Eigenschaften eines aktiven pharmazeutischen Wirkstoffs (API) in fester,
kristalliner Form müssen strenge Spezifikationen erfüllen wie z.B. eine definierte
Partikelgrößenverteilung oder polymorphe Form. Diese physikalischen Eigenschaften
werden oft während des finalen Kristallisationsschrittes durch die Anwendung sogenannter
Process Analytical Technologies (PAT) kontrolliert. PAT basiert auf der Anwendung
hochentwickelter Prozessanalysengeräte und multivariater Datenerfassungs- und
Analysetools. Die Analysengeräte können in den Prozessstrom eingebaut werden und liefern
zum einen Informationen über den Prozess (z.B. Konzentration) und zum anderen über das
Produkt (z.B. polymorpher Anteil) in Echtzeit. Moderne Herstellungsverfahren folgen dem
Quality-by-Design (QbD) Ansatz. Dieser Ansatz beinhaltet die Anwendung von PAT
Strategien, um identifizierte Herstellungsrisiken, die die Produktqualität negativ
beeinflussen, zu reduzieren. Im Moment findet die Anwendung dieser Techniken jedoch oft
nur im Labormaßstab statt. Dabei besteht eine zunehmende Notwendigkeit PAT auch in den
(semi-) industriellen Maßstab zu übertragen. Das Ziel dieser Arbeit ist die strategische
Auswahl und Anwendung von PAT Tools für die schnelle Entwicklung und das Verstehen von
Kristallisationsprozessen von APIs im Labormaßstab. Um das Scale-up zu erleichtern soll das
Potential dieser Techniken und der im Labor entwickelten Kalibrationsmodelle bezüglich
ihrer direkten Übertragbarkeit in den industriellen Maßstab ebenfalls untersucht werden.
Es werden 12 verschiedene APIs mit 7 verschiedenen Messtechniken im Labor- und
Technikumsmaßstab untersucht. Die Techniken werden genutzt um den metastabilen
Bereich und die Konzentration der gelösten Substanz zu bestimmen sowie zur Bereitstellung
von Informationen bezüglich der festen Phase (z.B. polymorpher Anteil). Die Ergebnisse
zeigen, dass sich die Messtechniken sehr stark bezüglich der Sensitivität zur Detektion von
Partikeln oder der Fähigkeit Konzentrationsunterschiede zu analysieren, unterscheiden. Es
wird festgestellt, dass UV-Vis Spektroskopie, im Vergleich zu Raman- oder NIR
Spektroskopie, eine sehr hohe Sensitivität hat, die Anwesenheit von Partikeln auch bei
geringen Suspensionsdichten anzuzeigen. Die Analyse von 12 pharmazeutischen Wirkstoffen
mittels Ultraschallmesstechnik, welche zur Bestimmung des metastabilen Bereichs und von
Konzentrationen eingesetzt werden kann, zeigt dass die Technik für eine gute
Anwendbarkeit bestimmte Stoffparameter vorrausetzt. Diese sind bei pharmazeutischer
Wirkstoffe oft nicht gegeben, während anorganische Substanzen eine sehr gute
Anwendbarkeit zeigen. Als weitere Messtechnik zur Konzentrationsbestimmung wird ATR-
MIR Spektroskopie eingesetzt. Die Technik erlaubt die Vorhersage von Konzentrationen für 2
der insgesamt 3 untersuchten Modelsubstanzen. Innerhalb der Arbeit wurde die Software
Zusammenfassung
115
PEAXACT (S-PACT GmbH) etabliert und für Datenaufnahme und Echtzeitvorhersage von
Konzentrationen mittels ATR-MIR Spektroskopie genutzt.
Bezüglich der direkten Übertragbarkeit vom im Labor entwickelten Kalibrationsmodellen in
den technischen Maßstab, wird gezeigt, dass verschiedenste Effekte einen Einfluss haben
und somit limitierend wirken. Im Fall der Ultraschallmesstechnik sind Gasblasen ein Problem,
wenn die Sonde in eine Rezirkulationseinheit integriert ist. Nur wenn der Anteil der
ungelösten Gase in der Flüssigkeit gering ist, kann eine direkte Übertragung des
Kalibrationsmodells erfolgreich durchgeführt werden. Bezüglich ATR-MIR Spektroskopie wird
nachgewiesen, dass eine direkte Übertragung der Kalibration vom Labor ins Technikum nur
für das Peakintegrations- (PI) Model und das Indirect Hard Model (IHM), aber nicht für das
Partial Least Square (PLS) Model möglich ist. Die Anwendung des PI Models im industriellen
Maßstab ist sehr stark von den gewählten Prozess- und Umgebungsbedingungen (z.B.
Wasserdampfgehalt im Spektrometer, Biegeradius des Lichtleiterkabels) abhängig. Im
Idealfall sollten diese Bedingungen im Labor und Technikum genau übereinstimmen. Im
Gegensatz zum PI Model ermöglicht das IHM die nicht-lineare Kompensation der
unterschiedlichen Bedingungen und ist daher das bevorzugte Model um den Scale-up, auch
unter variablen Prozess- und Umgebungsbedingungen, zu erleichtern. In dieser Arbeit wurde
das IHM genutzt um den Effekt des Wasserdampfes im Spektrometer zu kompensieren.
Die Raman Spektroskopie wird genutzt um den polymorphen Anteil einer polymorphen
Phasenumwandlung in Echtzeit zu verfolgen. Es wird gezeigt dass ein Kalibrationsmodel,
erstellt aus Feststoffmessungen im Labor, genutzt werden kann um den polymorphen Anteil
in Suspensionen und im Pilotmaßstab vorherzusagen. Limitationen ergeben sich aus der
minimal einsetzbaren Suspensionsdichte, welche höher ist im Vergleich zu anderen
Messtechniken (z.B. NIR- und UV-VIS Spektroskopie) welche qualitative Informationen
bezüglich polymorphen Phasenumwandlungen liefern.
Der Einbau der Messtechniken in die Pilotanlage wird durch einen Rezirkulationskreislauf in
Verbindung mit einer Membranpumpe realisiert. Der Aufbau hat den Vorteil, dass
verschiedenste Techniken schnell und kosteneffizient in die bestehende Anlage integriert
werden können. Ein Nachteil, jedoch, ist der Einfluss der Pumpe auf die physikalischen
Produktqualität.
Aus verfahrenstechnischer Sicht betrifft die zukünftige Forschung das Design von
Kristallisationsprozessen unter Anwendung sog. Feedback-Control-Strategien. Dabei werden
Produkt- oder Prozessparameter, die durch online Messtechniken erfasst werden, wie z.B.
die Übersättigung, gezielt gesteuert und innerhalb des metstabilen Bereichs gehalten (z.B.
durch die Regulierung der Temperatur) um Qualitätskristalle mit einheitlichen Eigenschaften
zu produzieren.
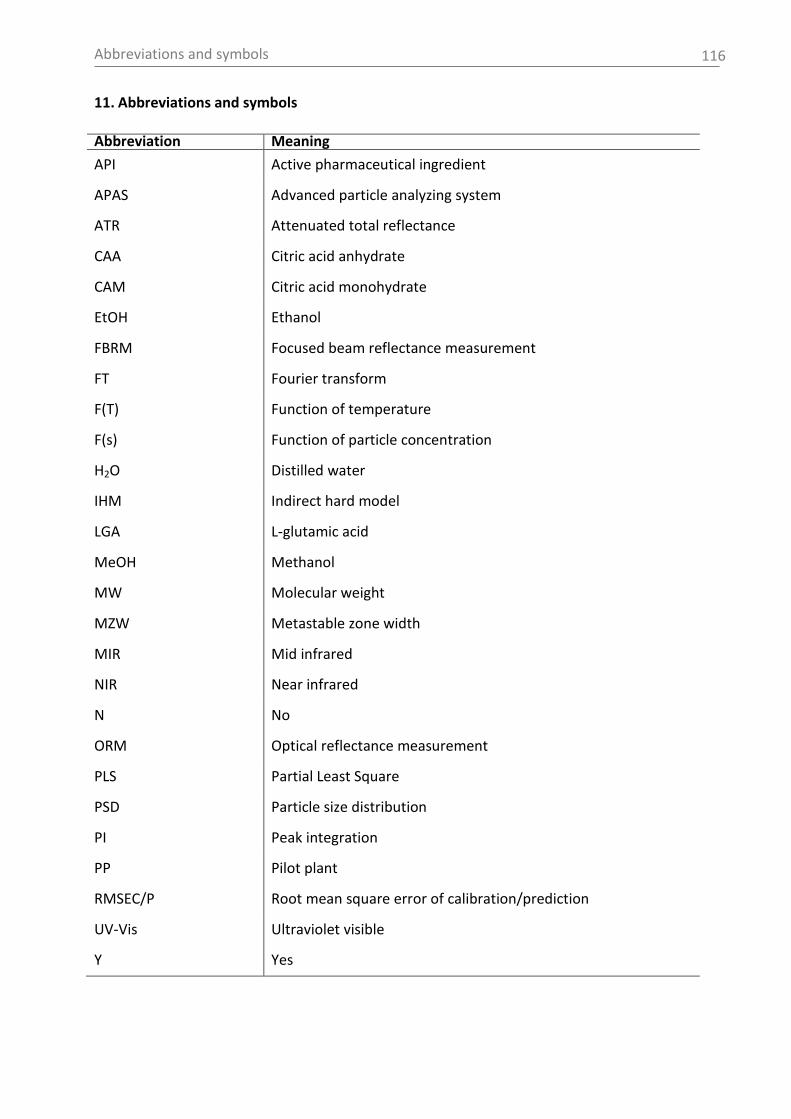
Abbreviations and symbols
116
11. Abbreviations and symbols
Abbreviation Meaning
API Active pharmaceutical ingredient
APAS Advanced particle analyzing system
ATR Attenuated total reflectance
CAA Citric acid anhydrate
CAM Citric acid monohydrate
EtOH Ethanol
FBRM Focused beam reflectance measurement
FT Fourier transform
F(T) Function of temperature
F(s) Function of particle concentration
H2O Distilled water
IHM Indirect hard model
LGA L-glutamic acid
MeOH Methanol
MW Molecular weight
MZW Metastable zone width
MIR Mid infrared
NIR Near infrared
N No
ORM Optical reflectance measurement
PLS Partial Least Square
PSD Particle size distribution
PI Peak integration
PP Pilot plant
RMSEC/P Root mean square error of calibration/prediction
UV-Vis Ultraviolet visible
Y Yes
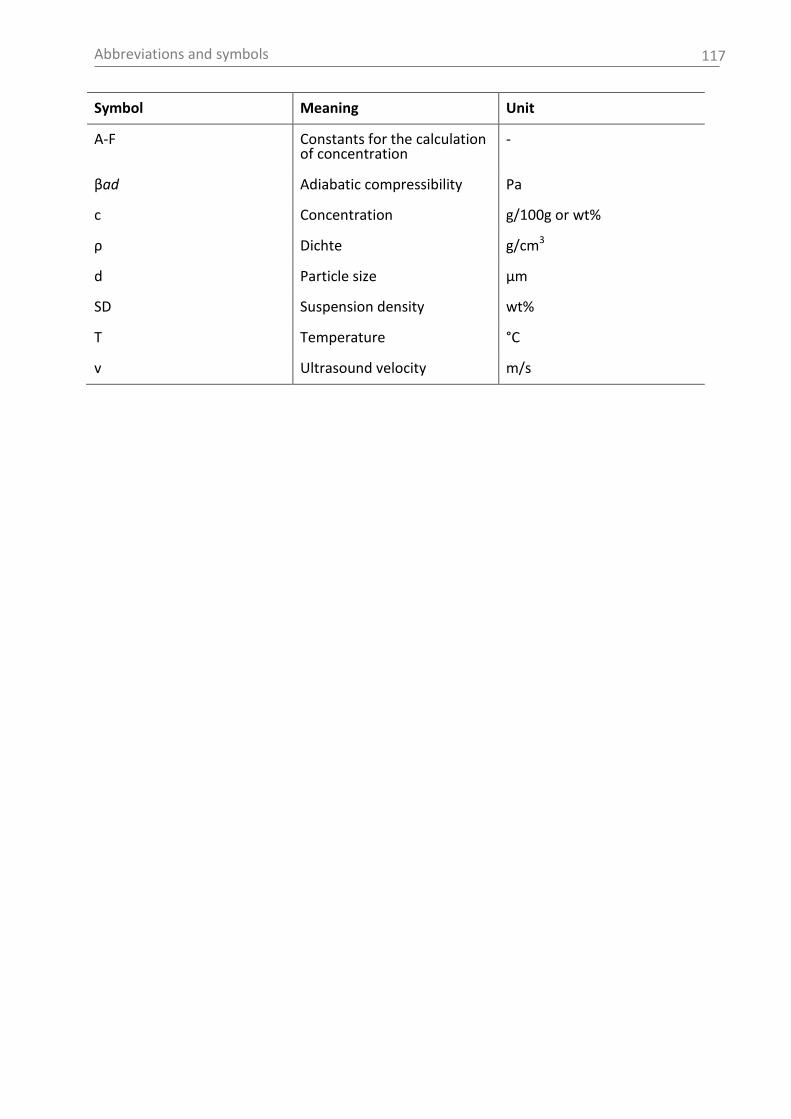
Abbreviations and symbols
117
Symbol Meaning Unit
A-F Constants for the calculation of concentration
-
βad Adiabatic compressibility Pa
c Concentration g/100g or wt%
ρ Dichte g/cm3
d Particle size µm
SD Suspension density wt%
T Temperature °C
v Ultrasound velocity m/s
References
118
12. References
[Abe08] Abebe, S. B., Wang, X. Z., Li, R., Roberts, K. J., Lai, X.: The information content in NIR
spectral data for slurries of organic crystals, Powder Technology, 179 (2008) 176-183.
[Ala08] Alatalo, H., Kohonen, J., Qu, H., Hatakka, H., Reinikainen, S.-P., Louhi-Kultanen, M.,
Kallas, J.: In-line monitoring of reactive crystallization process based on ATR–FTIR and Raman
spectroscopy, Journal of Chemometrics 22 (2008) 644-652.
[Als04a] Alsmeyer, F., Marquardt, W.: Automatic Generation of Peak-Shaped Models,
Applied Spectroscopy 58 (2004) 986-994.
[Als04b] Alsmeyer, F., Koß, H.-J., Marquardt, W.: Indirect Spectral Hard Modeling for the
Analysis of Reactive and Interacting Mixtures, Applied Spectroscopy 58 (2004) 975-985.
[Arm12] Armenta, S., De la Guardia, M.: Direct Analysis of Samples, in: Handbook of Green
Analytical Chemistry, De la Guardia, M., Garrigues, S. (Eds.), John Wiley & Sons, Chichester,
2012, 85-98.
[Att12] Atta, M.: Application of ultrasound measurement technique to monitor the
crystallization process of paracetamol, Master thesis, Martin-Luther Universität Halle-
Wittenberg, Halle (Saale), 2012.
[Bak05] Bakeev, K.: Process Analytical Technology. Spectroscopic Tools and Implementation
Strategies for the Chemical and Pharmaceutical Industries, Blackwell Publishing Ltd, Oxford,
2005.
[Bak10] Bakeev, A.: Process Analytical Technology: Spectroscopic Tools and Implementation,
Wiley-VCH, Weinheim, 2010.
[Bal03] Balboni, M. L.: Process Analytical Technology - Concepts and Principles,
Pharmaceutical Technology, 27 (2003) 54-66.
[Bee11] De Beer, T., Burggraeve, A., Fonteyne, M., Saerens, L., Remon, J. P., Vervaet, C.: Near
infrared and Raman spectroscopy for the in-process monitoring of pharmaceutical
production processes, International Journal of Pharmaceutics, 417 (2011) 32-47.
[Bon07] Bond, A. D., Boese, R., Desiraju, G. R.: On Polymorphism of Aspirin, Angewandte
Chemie, 46 (2007) 615-617.
[Bon11] Bondi, R. W., Drennen, J. K.: Quality by Design and the Importance of PAT in QbD,
in: Handbook of Modern Pharmaceutical Analysis, Ahuja, S., Scypinski, S. (Eds.), Vol. 10,
Elsevier Inc., Burlington, 2011, 195-224.

References
119
[Bor09] Borissova, A., Khan, S., Mahmud, T., Roberts, K. J., Andrews, J., Dallin, P., Chen, Z.-P.,
Morris, J.: In Situ Measurement of Solution Concentration during the Batch Cooling
Crystallization of L-Glutamic Acid using ATR-FTIR Spectroscopy Coupled with Chemometrics,
Crystal Growth & Design, 9 (2009) 2, 692-706.
[Bru13] Bruker Optic GmbH, www.bruker.com, downloaded January 2013.
[Buc11] Buchfink, R.: Effects of impurities on an industrial crystallization process of
ammonium sulfate, Martin-Luther-Universität Halle-Wittenberg, Shaker-Verlag, Halle (Saale),
2011.
[Cai06] Caillet, A., Puel F., Fevotte, G.: In-line monitoring of partial and overall solid
concentration during solvent-mediated phase transition using Raman spectroscopy,
International Journal of Pharmaceutics, 307 (2006) 2, 201-208.
[Cai07] Caillet, A., Rivoire, A., Galvan, J.-M., Puel, F., Fevotte, G.: Crystallization of
Monohydrate Citric Acid. 1. In Situ Monitoring through the Joint Use of Raman Spectroscopy
and Image Analysis, Crystal Growth & Design, 7 (2007) 10, 2080-2087.
[Cai08] Caillet, A., Puel, F., Fevotte, G.: Quantitative in situ monitoring of citric acid phase
transition in water using Raman spectroscopy, Chemical Engineering and Processing: Process
Intensification, 47 (2008) 3, 377-382.
[Cam12] Cambridge Crystallographic Data Centre: http://www.ccdc.cam.ac.uk/; requested
April 2012.
[Cha02] Chalmers, J. M.: Mid-Infrared Spectroscopy: Anomalies, Artifacts and Common
Errors. in Handbook of Vibrational Spectroscopy, Chalmers, J. M., Griffiths, P. R. (Eds.), John
Wiley & Sons, Ltd, Chichester, 2002, 2327-2347.
[Che07] Chew, J., Yu, Z., Chow, P., Tan, R.: Recent advances in crystallization control. An
industrial perspective, Chemical Engineering Research & Design, 85 (2007) A7, 893-905.
[Che11] Chen, J., Sarma, B., Evans, J. M. B., Myerson, A. S.: Pharmaceutical Crystallization.
Crystal Growth & Design, 11 (2011) 887–895.
[Che13] ChemSpider - The free chemical database, ID:9097710, online available:
http://www.chemspider.com/Chemical-Structure.9097710.html, accessed January 2013.
[Chi12a] Chianese, A., Parisi, M., Fazio, E.: Turbidity and Nephelometry, in Industrial
Crystallization Process Monitoring and Control, Chianese, A., Kramer, H. J. M. (Eds.), Wiley-
VCH Verlag, Weinheim, 2012, 51-57.
References
120
[Chi12b] Chianese, A., Bravi, M. Fazio, E.: Turbidity for the Estimation of Crystal Average Size,
in Industrial Crystallization Process Monitoring and Control, Chianese, A., Kramer, H. J. M.
(Eds.), Wiley-VCH Verlag, Weinheim, 2012, 29-34.
[Cho08] Chow, P. S., Li, Y., Tan, R. B. H., Black, S. N.: Effect of Water Activity on the
Transformation between Hydrate and Anhydrate of Carbamazepine Organic Process
Research & Development, 12 (2008) 264–270.
[Cor08] Cornel, J., Lindenberg, C., Mazzotti, M.: Quantitative Application of in Situ ATR-FTIR
and Raman Spectroscopy in Crystallization Processes, Industrial & Engineering Chemistry
Research 47 (2008) 14, 4870-4882.
[Cor12] Cornel, J., Lindenberg, C., Schöll, J., Mazzotti, M.: Raman spectroscopy, in: Industrial
Crystallization Process Monitoring and Control, Chianese, A., Kramer, H. J. M. (Eds.), Wiley-
VCH Verlag, Weinheim, 2012, 93-102.
[Cro11] Cronin, L., Kitson, P. J., Wilson, C. C., Process Understanding-Crystallization, in:
Process Understanding – For Scale-Up and Manufacture of Active Ingredients, Houson, I.
(Ed.), Wiley-VCH Verlag, Weinheim, 2011, 199-225.
[Dal06] Dalmolin, I., Skovroinski, E., Biasi, A., Corazza, M. L., Dariva, C., Vladimir Oliveira, J.:
Solubility of carbon dioxide in binary and ternary mixtures with ethanol and water, Fluid
Phase Equilibria 245 (2006) 193-200.
[Deb11] De Beer, T., Burggraeve, A., Fonteyne, M., Saerens, L., Remon, J. P., Vervaet, C.:
Near infrared and Raman spectroscopy for the in-process monitoring of pharmaceutical
production processes, International Journal of Pharmaceutics, 417 (2011) 1–2, 32–47.
[Del12] Delaney, S. P., Pan, D., Galella, M., Yin, S. X., Korter, T. M.: Understanding the Origins
of Conformational Disorder in the Crystalline Polymorphs of Irbesartan, Crystal Growth &
Design, 12 (2012) 5017-5024.
[Dha10] Dhanaraj, G., Byrappa, K., Prasad, V., Dudley, M., Crystal Growth Techniques and
Characterization: An Overview, in: Springer Handbook of Crystal Growth, Dhanaraj, G.,
Byrappa, K., Prasad, V., Dudley, M. (Eds.), Springer-Verlag, Heidelberg, 2010.
[Dru13] DrugBank: Open Data Drug & Drug Target Database, http://www.drugbank.ca,
accessed January 2013.
[Dud08] Dudognon, E., Danéde, F., Descamps, M., Correia, N. T.: Evidence for a New
Crystalline Phase of Racemic Ibuprofen, Pharmaceutical Research, 25 (2008) 12, 2853-2858.
References
121
[End11] Am Ende, J. D., Chemical engineering in the pharmaceutical industry: R&D to
manufacturing, John Wiley & Sons, New Jersey, 2011.
[Eng11] Engel, D., Minnich, C., Neue Lösungen machen es möglich – Online-Spektroskopie
schon in der Labor-Prozessentwicklung, CITplus 9 (2011) 34-36.
[Fda04] U. S. Department of Health and Human Services, Food and Drug Administration,
Guidance for Industry: PAT – a Framework for Innovative Pharmaceutical Development,
Manufacturing and Quality Assurance, 2004; online available:
http://www.fda.gov/downloads/Drugs/GuidanceComplianceRegulatoryInformation/Guidanc
es/UCM070305.pdf, downloaded Dezember 2012.
[Fed09] Federsel, H.-J.: ChemicaL Process Research and Development in 21st Century:
Challenges, Strategies, and Solutions from Pharmaceutical Industry Perspectives, Accounts of
Chemical Research, 42 (2009) 5, 671-680.
[Fel12] Feling, R., Lattemann, C., Göller, R., Burgard, A.: Artemisininsäure, ein
biosynthetischer Rohstoff aus Hefe Fermentation zur Synthese des Malariawirkstoffs
Artemisinin, Chemie Ingenieur Technik, 84 (2012) 8, 1326.
[Fet11] Feth, M. P., Nagel, N., Baumgartner, B., Bröckelmann, M., Rigala, D., Otto, B.,
Spitzenberg, M., Schulz, M., Becker, B., Fischera, F., Petzoldt, C.: Challenges in the
development of hydrate phases as active pharmaceutical ingredients – An example,
European Journal of Pharmaceutical Sciences, 42 (2011) 116-129.
[Fet13a] Feth, M. P., Heyse, W., Baumgartner, B., Nagel, N., Tappertzhofen, C., Olpp,
T., Jurascheck, J., Ulrich, J., Helmdach, L., Petzoldt, C.: From laboratory to pilot plant: The
solid-state process development of a highly potent cathepsin S/K inhibitor, European Journal
of Pharmaceutics and Biopharmaceutics, 83 (2013) 3, 436-448.
[Fet13b] Feth, M. P., Rossen, K., Burgard, A.: Pilot Plant Approach for the Diastereoselective
Diimide Reduction of Artemisinic Acid, Organic Process Research & Development, 17 (2013)
282-293.
[Fuj02] Fujiwara, M., Shan Chow, P., Ma, D. L., Braatz, R. D.: Paracetamol Crystallization
Using Laser Backscattering and ATR-FTIR Spectroscopy: Metastability, Agglomeration, and
Control, Crystal Growth & Design. 2 (2002) 5, 303-370.
[Fun85] Funk, W., Dammann, V., Vonderheit, C., Oehlmann, G. Statistische Methoden in der
Wasseranalytik; VCH-Verlag: Weinheim, 1985.
References
122
[Gea13] GEA Group Aktiengesellschaft: Inline Prozessanschlusse, online available:
http://www.tuchenhagen.com/de/komponenten/in-line-prozessanschluesse.html., accessed
January 2013.
[Gip95] Gippel, C. J.: Potential of Turbidity Monitoring for Measuring the Transport of
Suspended Solids in Streams, Hydrol. Process, 9 (1995) 1, 83–97.
[Gla04] Glade, H., Ilyaskarov, A. M., Ulrich, J.: Determination of Crystal Growth Kinetics Using
Ultrasonic Technique, Chemical Engineering & Technology, 27 (2004) 7, 736-740.
[Gor68] Gordon, P., Principles of Phase Diagrams in Material Science, McGraw-Hill Book Co.,
New York, 1968.
[Gro01] Groen, H, Roberts, K. J.: Nucleation, Growth, and Pseudo-Polymorphic Behavior of
Citric Acid As Monitored in Situby Attenuated Total Reflection Fourier Transform Infrared
Spectroscopy J. Phys. Chem. B. 105 (2001) 10723-10730.
[Har05] Harris, R. K., Ghi, P. Y., Puschmann, H., Apperley, D. C., Grisser, U. J., Hammond, R.
B., Ma, C., Roberts, K. J., Pearce, G. J., Yates, J. R., Pickard, C. J.: Structural Studies of the
Polymorphs of Carbamazepine, Its Dihydrate, and Two Solvates, Organic Process Research &
Development, 9 (2005) 902-910.
[Har09] Harner, R. S., Ressler, R. J., Briggs, R. L., Hitt, J. E., Larsen, P. A., Frank, T. C.: Use of a
Fiber-Optic Turbidity Probe to Monitor and Control Commercial-Scale Unseeded Batch
Crystallizations, Organic Research & Development, 13 (2009) 114-124.
[Heb04] Hebert, G. H., Odom, M. A., Bowman, S. C., Strauss, S. H.: Attenuated Total
Reflectance FTIR Detection and Quantification of Low Concentrations of Aqueous Polyatomic
Anions, Analytical Chemistry, 76 (2004) 781-787.
[Hei08] Heinrich, J.: Determination of Crystallization Kinetics using in-situ measurement
techniques and model-based experimental design and analysis, Dissertation, Martin-Luther-
Universität Halle-Wittenberg, Halle, 2008, online available: http://sundoc.bibliothek.uni-
halle.de/diss-online/08/09H002/t1.pdf.
[Hel11] Helmdach, L., Pertig, D., Rüdiger, S., Lee, K.-S., Stelzer, T., Ulrich, J.,: Bubbles -
Trouble-Makers in Crystallizers Classical Problems during Inline Measurements, Chemical
Engineering & Technology, 35 (2011) 6, 1017-1023.
[Hel12] Helmdach, L., Feth, M. P., Ulrich J.: Online analytical investigations on solvent-,
temperature- and water vapour-induced phase transformations of citric acid, Crystal
Research & Technology, 47 (2012) 9, 967-984.
References
123
[Hel13a] Helmdach, L., Feth, M. P., Ulrich, J.: Integration of process analytical technology
(PAT) tools in pilot plant setups for the real-time monitoring of crystallizations and phase
transitions, Organic Process Research & Development, 17 (2013) 3, 585-598.
[Hel13b] Helmdach, L., Feth, M. P., Ulrich, J.: Application of ATR-MIR Spectroscopy in the
Pilot Plant - Scope and Limitations using the Example of Paracetamol Crystallizations,
Chemical Engineering and Processing: Process Intensification, 70 (2013), 184-197.
[Hel13c] Helmdach, L., Schwartz, F., Ulrich, J.: Process Optimization using Advanced Particle
Analyzing Systems, Applications from Crystallization- to Fermentation Processes, 2013, in
press.
[Hel13d] Helmdach, L., Feth, M. P., Ulrich, J.: Application of ultrasound measurements as
PAT tools for industrial crystallization process development of pharmaceutical compounds,
Organic Process Research & Development, 2013, in press.
[Hil06] Hilfiker, R.: Polymorphism, Wiley-VCH, Weinheim, 2006.
[Hof04] Hofmann, G.: Kristallisation in der industriellen Praxis, Wiley-VCH, Weinheim, 2004.
[Jou10] Jouyban, A., Handbook of solubility data for pharmaceuticals, CRC Press, Boca Raton,
2010.
[Kac07] Kachrimanis, K., Braun, D. E., Griesser, U. J.: Quantitative analysis of paracetamol
polymorphs in powder mixtures by FT-Raman spectroscopy and PLS regression, Journal of
Pharmaceutical and Biomedical Analysis, 43 (2007) 17, 407-412.
[Kad10] Kadam, S. S., van der Windt, E., Daudey, P. J., Kramer, H. J. M.: A Comperative Study
of ATR-FTIR and FT-NIR spectroscopy for In situ Concentration Monitoring during Batch
Cooling Crystallization Processes, Crystal Growth & Design, 10 (2010) 6, 2629-2640.
[Kad11] Kadam, S. S., Mesbah, A., van der Windt, E., Kramer, H. J. M.: Rapid Online
Calibration for ATR-FTIR Spectroscopy during Batch Crystallization of Ammonium Sulfate in a
Semi-Industrial Scale Crystallizer, Chemical Engineering Research Design 89 (2011) 995-1005.
[Kad12] Kadam, S. S., Vissers, J. A. W., Forgione, M., Geertman, R. M., Daudey, P. J.,
Stankiewicz, A. I., Kramer, H. J. M.: Rapid Crystallization Process Development Strategy,
Organic Process Research & Development 16 (2012) 5, 769-780.
[Kai13] Kaiser Optical Systems Inc.: In Situ Crystallization Monitoring, Application Note
Number 301, online available: http://www.kosi.com/Raman_Spectroscopy/pharmaceutical.
php?ss=100, downloaded January 2013.
References
124
[Kal12] Kalbasenka, A. N., Huesman, A. E. M., Kramer, H. J. M.: Basic Recipe Control, in
Industrial Crystallization Process Monitoring and Control, Chianese, A., Kramer, H. J. M.
(Eds.), Wiley-VCH Verlag, Weinheim, 2012, 105- 122.
[Kan12] Kandelbauer, A., Rahe, M., Kessler, R. W., Industrial Perspectives (Process Control
and Quality Assurance), in: Popp, J., Tuchin, V. V., Chiou, A.,Heinemann, S. (Eds.), Handbook
of Biophotonics, Vol. 3: Photonics in Pharmaceutics, Bioanalysis and Enviromental Research,
Wiley-VCH Verlag, Weinheim, 2012, 3-63.
[Kan94] Kaneko, F., Sakashita, H., Kobayashi, M., Suzuki, M.: Infrared Spectroscopic and
Chemical Etching Study on the Crystallization Process of the B and E Forms of Stearic Acid:
Roles of Dislocations in Single Crystals, Journal of Physical Chemistry 98 (1994) 3801-3808.
[Kas00] Kashchiev, D., Nucleation - Basic Theory with Application, Butterworth-Heinemann,
Oxford, 2000.
[Kes06] Kessler, R. W., Strategien und Management in Prozessanalytik: Strategien und
Fallbeispiele aus der industriellen Praxis, Kessler, R. W. (Ed.), Wiley-VCH Verlag, Weinheim,
2006, 3-23.
[Kit89] Kitamura, M.: Polymorphism in the crystallization of L-glutamic acid, Journal of
Crystal Growth, 96 (1989) 3, 541-546.
[Kra12] Kramer, H. J. M., Kadam, S. S.: Imaging, in Industrial Crystallization Process
Monitoring and Control, Chianese, A., Kramer, H. J. M. (Eds.), Wiley-VCH Verlag, Weinheim,
2012, 105- 122.
[Kri08] Kriesten, E., Alsmeyer, F., Bardow, A., Marquardt,W.:Fully automated indirect hard
modeling of mixture spectra, Chemometrics and Intelligent Laboratory Systems 91 (2008)
181-193.
[Lar11] Larkin, P. J.: IR and Raman Spectroscopy – Principles and Spectral Interpretation,
Elsevier Inc., Waltham, 2011.
[Lew01] Lewiner, F., Klein, J. P., Puel, F., Fevotte, G.: On-line ATR FTIR measurement of
supersaturation during solution crystallization processes. Calibration and applications on
three solute/solvent systems, Chemical Engineering Science, 56 (2001) 6, 2069-2084.
[Lin12] Lindenberg, C., Cornel, J., Schöll, J., Mazzotti, M.: ATR-FTIR Spectroscopy, in Industrial
Crystallization Process Monitoring and Control, Chianese, A., Kramer, H. J. M. (Eds.), ATR-
FTIR Spectroscopy, Wiley-VCH Verlag GmbH & Co. KGaA, Weinheim, 2012, 81-90.
References
125
[Lio04] Lionberger, R. A., Yu, L. X., Raw, A. S., D’Costa, R., Wu, H., Hussain, A. S.: Applications
of process analytical technology to crystallization processes, Advanced Drug Delivery
Reviews, 56 (2004) 349–369.
[Liu12] Liu, P.: The Application of Ultrasound Technique to Monitor Crystallization Processes,
Diploma thesis, Martin-Luther Universität Halle-Wittenberg, Halle (Saale), 2012.
[Lou06a] Louhi-Kultanen, M., Qu, H., Kallas, J.: Solubility and stability of anhydrate/hydrate
in solvent mixtures, International Journal of Pharmaceutics, 321 (2006) 101-107.
[Lou06b] Louhi-Kultanen, M., Qu, H., Rantanen, J., Kallas, J.: Solvent-Mediated Phase
Transformation Kinetics of an Anhydrate/Hydrate System, Crystal Growth & Design 6 (2006)
9, 2053-2060.
[Lou08] Louhi-Kultanen, M., Qu, H., Kohonen, J., Louhi-Kultanen, M., Reinikainen, S.-P.,
Kallas, J.: Spectroscopic Monitoring of Carbamazepine Crystallization and Phase
Transformation in Ethanol-Water Solution, Ind. Eng. Chem. Res., 47 (2008) 6991–6998.
[Mao12] Maosoongnern, S., Diaz Borbon, V. P., Ulrich, J., Flood, A. E., Introducing a fast
method to determine the solubility and metastable zone width for proteins – Case study
Lyoszme, Industrial and Engineering Chemistry Research, 2012, 51 (2012) 46, 15251-15257.
[Mat13] MathWorks: Product Documentation Matlab R2012a, online available:
http://www.mathworks.de/de/help/stats/rstool.html, accessed January 2013.
[Mau04] Maugner, C. C., Mignani, G. A.: An Efficient and Safe Procedure for the Large-Scale
Pd-Catalyzed Hydrazonation of Aromatic Chlorides Using Buchwald Technology, Organic
Process Research & Development, 8 (2004), 1065-1071.
[Mee02] Meenan, P. A., Anderson, S. R., Klug, D. L., The influence of impurities and solvents
on crystallization, and Nucleation, in: Handbook of Industrial Crystallization, Myerson, A. S.
(Ed.), Butterworth-Heinemann, Boston, 2002, 67-67.
[Mer01a] Mersmann, A., Physical and Chemical Properties of Crystalline Systems, in:
Crystallization Technology Handbook, Mersmann, A. (Ed.), Marcel-Dekker, Inc., New York,
2001, 1-44.
[Mer01b] Mersmann, A., Heyer, C., Eble, A., Activated Nucleation, in: Crystallization
Technology Handbook, Mersmann, A. (Ed.), Marcel-Dekker, Inc., New York, 2001, 45-76.
[Mer09] Merkus, H. G., Particle Size Measurements – Fundamentals, Practice, Quality,
Springer Science+Business Media, Dordrecht, 2009.

References
126
[Met13] Mettler Toledo: Particle System Characterization - PVM Technology, online
available:
http://de.mt.com/de/de/home/products/L1_AutochemProducts/L2_ParticleSystemCharacte
rization/PVM/Lasentec_PVM_V819.html, downloaded January 2013.
[Mit11] Mitchell, N. A., Ó'Ciardhá, C. T., Frawley, P. J.: Estimation of the growth kinetics for
the cooling crystallisation of paracetamol and ethanol solutions, Journal of Crystal Growth
328 (2011) 1, 39-49.
[Mou03] Mougin, P., Wilkinson, D., Roberts, K. J., Jack, R., Kippax, P.: Sensitivity of particle
sizing by ultrasound attenuation spectroscopy to material properties, Powder Technology,
134 (2003) 243-248.
[Mul01] Mullin, J. W., Crystallization, fourth ed., Butterworth-Heinemann, Oxford, 2001.
[Mul68] Mullin, J. W., Leci, C. L.: Some nucleation characteristics of aqueous citric acid
solutions, Journal of Crystal Growth, 5 (1968) 1, 75-76.
[Mye02] Myerson, A. S., Ginde, R., Crystals, Crystal Growth, and Nucleation, in: Handbook of
Industrial Crystallization, Myerson, A. S. (Ed.), Butterworth-Heinemann, Boston, 2002, 33-66.
[Nad05] Nadler, B., Coifman, R.: Partial least squares, Beer’s law and the net analyte signal:
statistical modeling and analysis, Journal of Chemometrics 19 (2005) 45-54.
[Nei11] O’Neil, A., Edwards, H.: Spectroscopic Characterization, in: Solid State
Characterization of Pharamceuticals, Storey, R. A., Ymén, I. (Eds.), Wiley & Sons Ltd,
Chichester, 2011.
[Ngu10] Nguyen, T. N. P., Kim, K.-J.: Transformation of Monohydrate into Anhydrous Form of
Risedronate Monosodium in Methanol-Water Mixture, Ind. Eng. Chem. Res., 49 (2010)
4842–4849.
[Nos04] Nose, A., Hojo, M., Ueda, T.: Effects of Salts, Acids, and Phenols on the Hydrogen-
Bonding Structure of Water−Ethanol Mixtures, J. Phys. Chem. B., 108 (2004) 2, 798-804.
[Nos05] Noskov, S. Y., Lamoureux, G., Roux, B.: Molecular Dynamics Study of Hydration in
Ethanol−Water Mixtures Using a Polarizable Force Field, J. Phys. Chem B, 109 (2005) 6705-
6713.
[Oma99a] Omar, W., Ulrich, J.: Application of ultrasonics in the online determination of
supersaturation, Crystal Research & Technology, 34 (1999) 3, 379-389.
References
127
[Oma99b] Omar, W.: Zur Bestimmung von Kristallisationskinetiken auch unter der
Einwirkung von Additiven mittels Ultraschallmesstechnik, Dissertation, Universität Bremen,
Bremen, 1999.
[Ono04] Ono, T., ter Horst, J. H., Jansens, P. J.: Quantitative Measurement of the
Polymorphic Transformation of L-Glutamic Acid Using In-Situ Raman Spectroscopy, Crystal
Growth & Design, 4 (2004) 3, 465-469.
[Par08] Park, A., Chyall, L. J., Dunlap, J., Schertz, C., Jonaitis, D., Stahly, B. C., Shipplett, R.,
Childs, S.: New solid-state chemistry technologies to bring better drugs to market:
knowledge-based decision making, Expert Opinion Drug Discovery, 2 (2007) 1, 145-154.
[Pel99] Pelletier, M. J.: Analytical Applications of Raman Spectroscopy, Blackwell Science
Ltd., Oxford, 1999.
[Per01] Perlovich, G. L., Hansen, L. K., Bauer-Brandl, A.: The Polymorphism of Glycine –
Thermochemical and structural aspects, Journal of Thermal Analysis and Calorimetry, 66
(2001) 699-715.
[Per11] Pertig, D., Buchfink, R., Petersen, S., Stelzer, T., Ulrich, J.: Inline Analyzing of
Industrial Crystallization Processes by Innovative Ultrasonic Probe Technique, Chemical
Engineering & Technology, 34 (2011) 4, 639-646.
[Pov97] Povey, M. J. W., Ultrasonic techniques for fluid characterization, Acadamic press,
San Diego, California, 1997.
[Pra12] Prasanna Lakshimi, A., Anand Kumar, M., Vamshi Krishna, M., Annie Vijetha, K.,
Ashwini, G.: Formulation development of Irbesartan (poorly water-soluble drug) immediate
release tablets. International Research Journal of Pharamcy, 3 (2012) 2, 117-120.
[Pur08] Purba, E.: Determination of reaction kinetics using online X-ray diffraction,
Indonesian Journal of Chemistry, 8 (2008) 3, 337-341.
[Rei03] Reis, M. M.; Araújo, P. H.H., Sayer, C., Giudici, R.: Evidences of correlation between
polymer particle size and Raman scattering, Polymer 44 (2003) 20, 6123-6128.
[Reu06] Reutzel-Edens, S. M.: Achieving polymorph selectivity in the crystallization of
pharmaceutical solids: Basic considerations and recent advances, Current Opinion Drug
Discovery & Development, 9 (2006), 806-815.
[Ros81] Rosenberger, F., Fundamentals of Crystal Growth, Springer Verlag, New York, 1981.
References
128
[Ruf00] Ruf, A., Worlitschek, J., Mazzotti, M.: Modeling and experimental analysis of PSD
measurement through FBRM, Particle & Particle System Characterization, 17 (2000) 4, 167-
179.
[Sai09] Saifee, M., Inamdar, N., Dhamecha, D. L., Rathi, A. A.: Drug Polymorphism: A Review,
International Journal of Health Research, 2 (2009) 4, 291-306.
[San12] Sandipan, R.: Quality by design: A holistic concept of building quality in
pharmaceuticals, International Journal of Pharmaceutical and Biomedical Research, 3 (2012)
2, 100-108.
[Sch02a] Schwartz, A. M., Myerson, A. S., Solutions and solution properties, in: Handbook of
Industrial Crystallization, Myerson, A. S. (Ed.), Butterworth-Heinemann, Boston, 2002, 1-32.
[Sch02b] Schubert, C.: Bestimmung der Sättigung und des metastabilen Bereichs mittels
Ultraschalltechnologie, Studienarbeit, Martin-Luther-Universität Halle-Wittenberg, Halle,
2002.
[Sch06] Schöll, J., Bonalumi, D., Vicum, L., Mazotti, M.: In Situ Monitoring and Modeling of
the Solvent-Mediated Polymorphic Transformation of L-Glutamic Acid, Crystal Growth &
Design 6 (2006) 4, 881-891.
[Sch12] Schöll, J., Kempkes, M., Mazzotti, M.: Focused Beam Reflectance Measurement, in
Industrial Crystallization Process Monitoring and Control, Chianese, A., Kramer, H. J. M.
(Eds.), Wiley-VCH Verlag, Weinheim, 2012, 21- 27.
[Sco08] Scott, D. M., Industrial Process Sensors, CRC Press, Boca Raton, 2008.
[Sen13] SensoTech GmbH, LiquiSonic OCM – Inline analytical technology for online
crystallization monitoring, online available: http://www.sensotech.com/cms/fileadmin/
SensoTech/Dokumente/LSM100/LSM169_01.pdf, downloaded January 2013.
[Seq13] Sequip S&E GmbH: Insitu Particle Analyzing System - IPAS, online available:
http://www.sequip-particle-technology.de/home/unsere-produkte/apas-ipas, downloaded
January 2013.
[Söh78] Söhnel, O., Mullin, J. W.: Expressions of supersaturation for systems containing
hydrates, partially dissociated electrolytes and mixtures of electrolytes, Chemical
Engineering Science, 33 (1978) 11, 1535-1538.
[Sto11] Stolze, O.: In-Line Untersuchung von Suspensionen durch innovative
Ultraschalltechnik, Diplomarbeit, Martin-Luther-Universität Halle-Wittenberg, Halle, 2011.
References
129
[Str04] Strege, C.: On (pseudo-) polymorphic phase transitions, Dissertation, Martin-Luther-
Universität Halle-Wittenberg, Halle, 2004, online available: http://sundoc.bibliothek.uni-
halle.de/diss-online/04/04H318/prom.pdf.
[Taw09] Tawakkul, M., Wu, H., White, M., Khan, M.: Quality-by-Design (QbD): An integrated
multivariate approach for the component quantification in powder blends, International
Journal of Pharmaceutics, 372 (2009) 1-2, 39-48.
[Tit03] Titiz-Sargut, S., Ulrich, J.: Application of a protected ultrasound sensor for the
determination of the width of the metastable zone, Chemical Engineering and Processing, 42
(2003) 841-846.
[Ulr12] Ulrich, J., Jones, M. J.: Speed of Sound, in: Industrial Crystallization Process
Monitoring and Control, Chianese, A., Kramer, H. J. M. (Eds.), Wiley-VCH Verlag, Weinheim,
2012, 59-68.
[Ulr81] Ulrich, J.: Zur Kristallkeimbildung durch mechanischen Abrieb, Dissertation, RWTH
Aachen, 1981.
[Var08] Variankaval, N., Cote, A. S., Doherty, M. F.: From Form to Function: Crystallization of
Active Pharmaceutical Ingredients, American Institute of Chemical Engineers Journal, 54
(2008) 7, 1682-1688.
[Wan00] Wang, F., Wachter, J. A., Antosz, F. J., Berglund, K. A.: An Investigation of Solvent-
Mediated Polymorphic Transformation of Progesterone Using in Situ Raman Spectroscopy,
Organic Process Research & Development 4 (2000) 5, 391-395.
[Wan02] Wang, H., Mann, C. K., Vickers, T. J.: Effect of Powder Properties on the Intensity of
Raman Scattering by Crystalline Solids, Applied Spectroscopy 56 (2002) 12, 1538-1544.
[War06a] Warstat, A., Ulrich, J.: Seeding during Batch Cooling Crystallization – An Initial
Approach to Heuristic Rules, Chemical Engineering & Technology, 29 (2006) 2, 187-190.
[War06b] Warstat, A.: Heuristische Regeln zur Optimierung von Batch
Kühlungskristallisationen, Dissertation, Martin-Luther-Universität Halle-Wittenberg, Halle
(Saale), 2006, online available: http://sundoc.bibliothek.uni-halle.de/diss-
online/06/07H060/prom.pdf.
[Wei07] Wei-Qin, T.: Practical Aspects of Solubility Determination in Pharmaceutical
Preformulation, in: Solvent systems and their selection in pharmaceutics and
biopharmaceutics, Augustijns, P., Brewster, M. E. (Eds.), Springer, New York, Volume VI,
2007, 137-149.
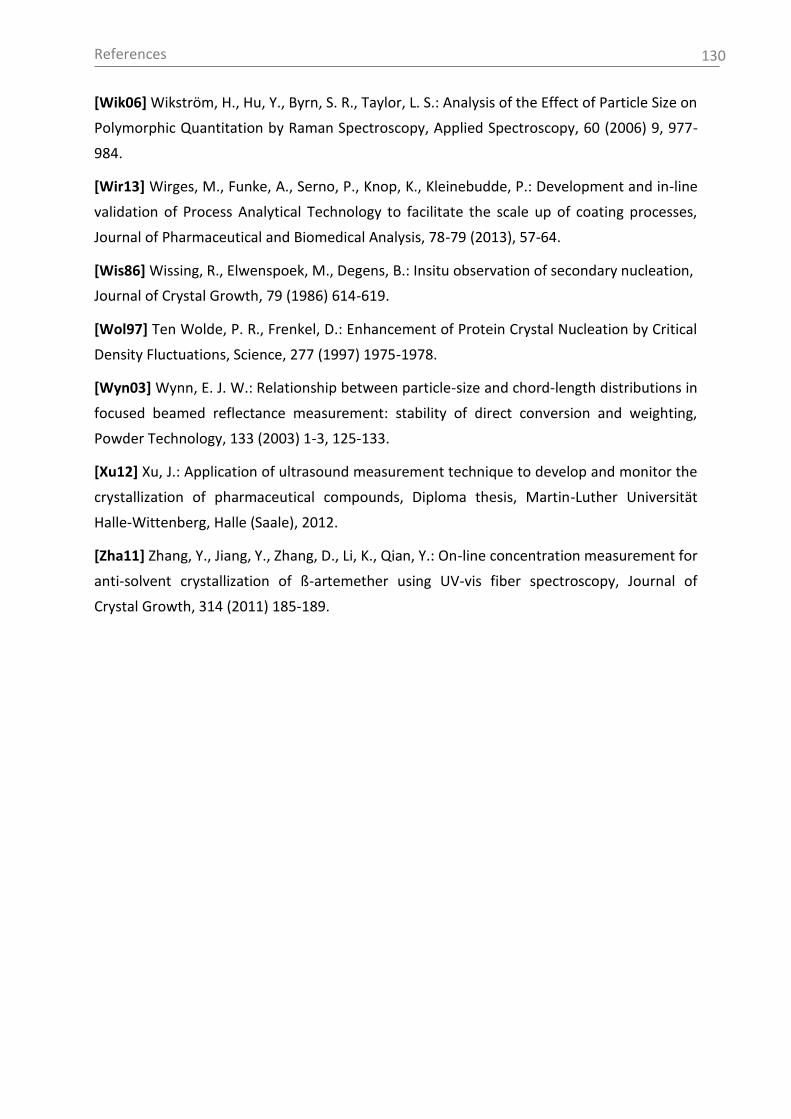
References
130
[Wik06] Wikström, H., Hu, Y., Byrn, S. R., Taylor, L. S.: Analysis of the Effect of Particle Size on
Polymorphic Quantitation by Raman Spectroscopy, Applied Spectroscopy, 60 (2006) 9, 977-
984.
[Wir13] Wirges, M., Funke, A., Serno, P., Knop, K., Kleinebudde, P.: Development and in-line
validation of Process Analytical Technology to facilitate the scale up of coating processes,
Journal of Pharmaceutical and Biomedical Analysis, 78-79 (2013), 57-64.
[Wis86] Wissing, R., Elwenspoek, M., Degens, B.: Insitu observation of secondary nucleation,
Journal of Crystal Growth, 79 (1986) 614-619.
[Wol97] Ten Wolde, P. R., Frenkel, D.: Enhancement of Protein Crystal Nucleation by Critical
Density Fluctuations, Science, 277 (1997) 1975-1978.
[Wyn03] Wynn, E. J. W.: Relationship between particle-size and chord-length distributions in
focused beamed reflectance measurement: stability of direct conversion and weighting,
Powder Technology, 133 (2003) 1-3, 125-133.
[Xu12] Xu, J.: Application of ultrasound measurement technique to develop and monitor the
crystallization of pharmaceutical compounds, Diploma thesis, Martin-Luther Universität
Halle-Wittenberg, Halle (Saale), 2012.
[Zha11] Zhang, Y., Jiang, Y., Zhang, D., Li, K., Qian, Y.: On-line concentration measurement for
anti-solvent crystallization of ß-artemether using UV-vis fiber spectroscopy, Journal of
Crystal Growth, 314 (2011) 185-189.
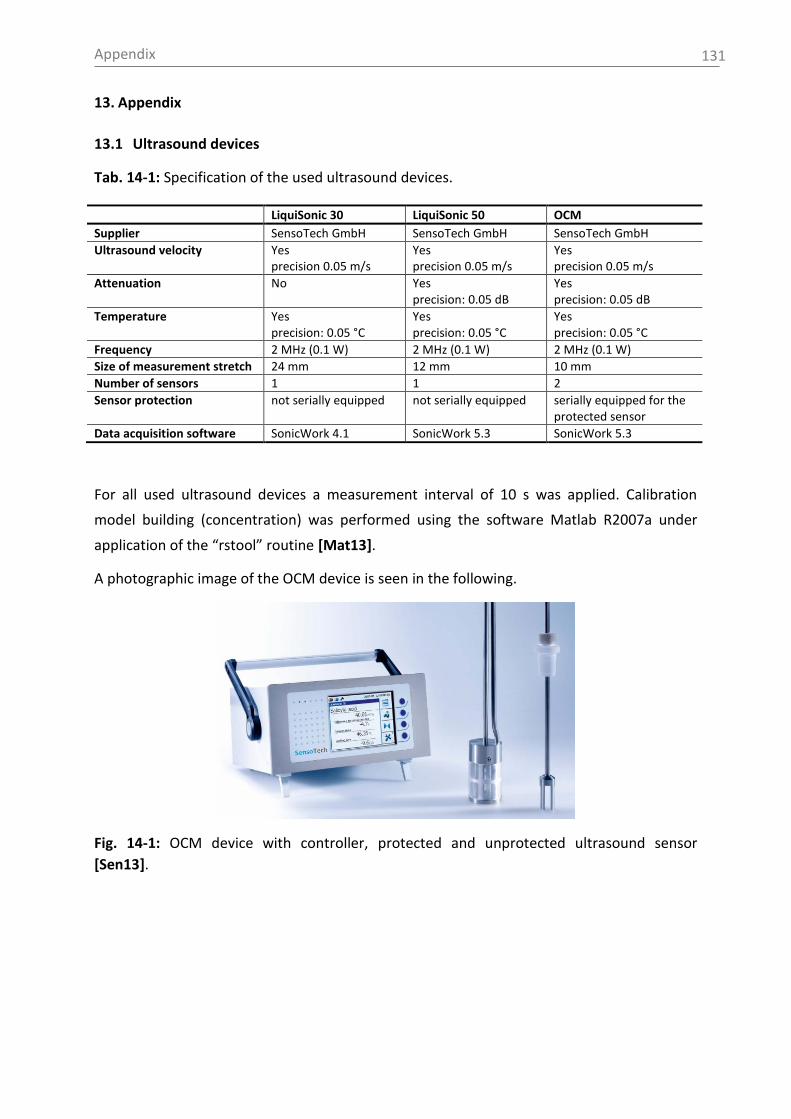
Appendix
131
13. Appendix
13.1 Ultrasound devices
Tab. 14-1: Specification of the used ultrasound devices.
LiquiSonic 30 LiquiSonic 50 OCM
Supplier SensoTech GmbH SensoTech GmbH SensoTech GmbH
Ultrasound velocity Yes precision 0.05 m/s
Yes precision 0.05 m/s
Yes precision 0.05 m/s
Attenuation No Yes precision: 0.05 dB
Yes precision: 0.05 dB
Temperature Yes precision: 0.05 °C
Yes precision: 0.05 °C
Yes precision: 0.05 °C
Frequency 2 MHz (0.1 W) 2 MHz (0.1 W) 2 MHz (0.1 W)
Size of measurement stretch 24 mm 12 mm 10 mm
Number of sensors 1 1 2
Sensor protection not serially equipped not serially equipped serially equipped for the protected sensor
Data acquisition software SonicWork 4.1 SonicWork 5.3 SonicWork 5.3
For all used ultrasound devices a measurement interval of 10 s was applied. Calibration
model building (concentration) was performed using the software Matlab R2007a under
application of the “rstool” routine [Mat13].
A photographic image of the OCM device is seen in the following.
Fig. 14-1: OCM device with controller, protected and unprotected ultrasound sensor
[Sen13].

Appendix
132
13.2 ATR-MIR spectroscopy for liquids and suspensions
Data acquisition: The spectra were collected in a spectral range between 550 cm-1 and
4000 cm-1 using a spectral resolution of 4 cm-1 and a scan number of 64. The background
measurement was performed in air at room temperature. Nitrogen flushing of the
spectrometer was performed at and pilot plant laboratory scale. Due to technical reasons for
some measurements with Paracetamol no nitrogen flushing could be performed at pilot
plant scale.
Software: Data acquisition and process control was performed using the software OPUS 6.5
(Bruker Optik GmbH). The OPUS software option “spectra subtraction” was used for the
calculation of the difference spectra. The software PEAXACT 3.0.11 (S-PACT GmbH, Aachen,
Germany) was used for raw data treatment, data evaluation and calibration model building.
An implementation of the spectral analysis software PEAXACT 3.0.11 into the OPUS 6.5
process control tool allows the calculation and output of concentration data (by a PLS or PI
calibration model) in real time. Before the start of the process monitoring, PEAXACT
modifications were integrated in the OPUS PROCESS scenario file.
A photographic image of the spectrometer is seen in the following.
Fig. 14-2: Bruker Matrix-MF spectrometer with ATR-probe [Bru13].
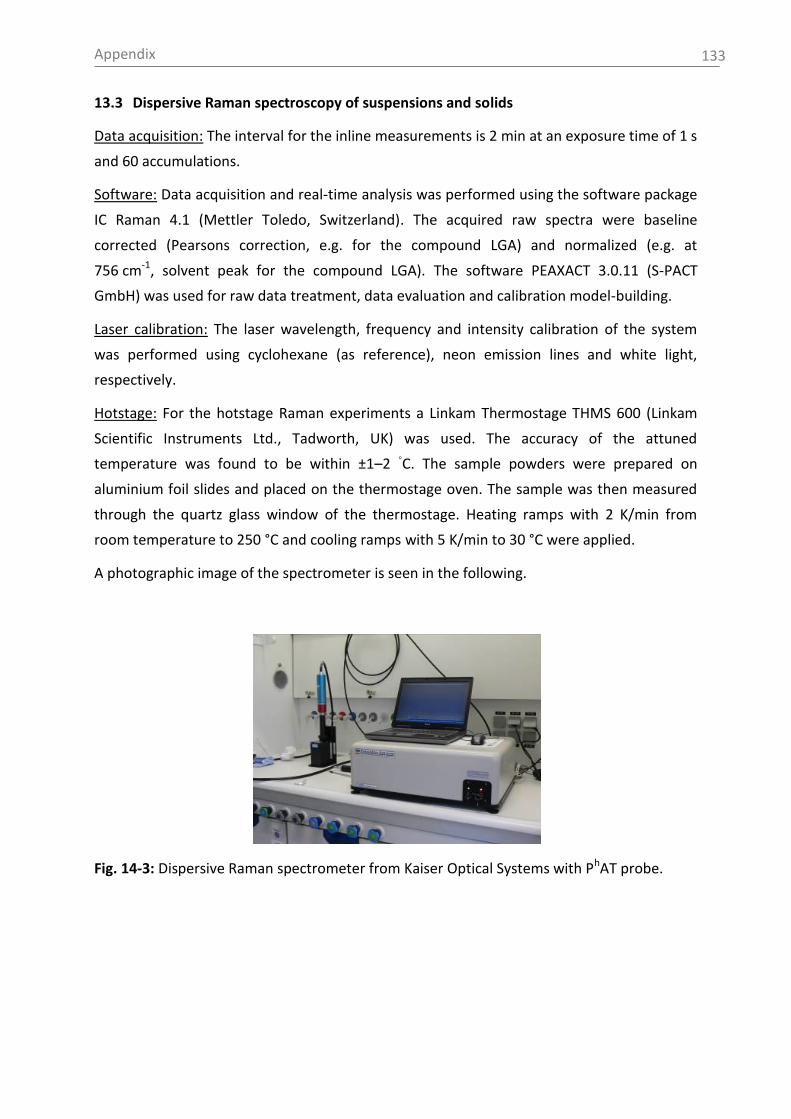
Appendix
133
13.3 Dispersive Raman spectroscopy of suspensions and solids
Data acquisition: The interval for the inline measurements is 2 min at an exposure time of 1 s
and 60 accumulations.
Software: Data acquisition and real-time analysis was performed using the software package
IC Raman 4.1 (Mettler Toledo, Switzerland). The acquired raw spectra were baseline
corrected (Pearsons correction, e.g. for the compound LGA) and normalized (e.g. at
756 cm-1, solvent peak for the compound LGA). The software PEAXACT 3.0.11 (S-PACT
GmbH) was used for raw data treatment, data evaluation and calibration model-building.
Laser calibration: The laser wavelength, frequency and intensity calibration of the system
was performed using cyclohexane (as reference), neon emission lines and white light,
respectively.
Hotstage: For the hotstage Raman experiments a Linkam Thermostage THMS 600 (Linkam
Scientific Instruments Ltd., Tadworth, UK) was used. The accuracy of the attuned
temperature was found to be within ±1–2 ◦C. The sample powders were prepared on
aluminium foil slides and placed on the thermostage oven. The sample was then measured
through the quartz glass window of the thermostage. Heating ramps with 2 K/min from
room temperature to 250 °C and cooling ramps with 5 K/min to 30 °C were applied.
A photographic image of the spectrometer is seen in the following.
Fig. 14-3: Dispersive Raman spectrometer from Kaiser Optical Systems with PhAT probe.
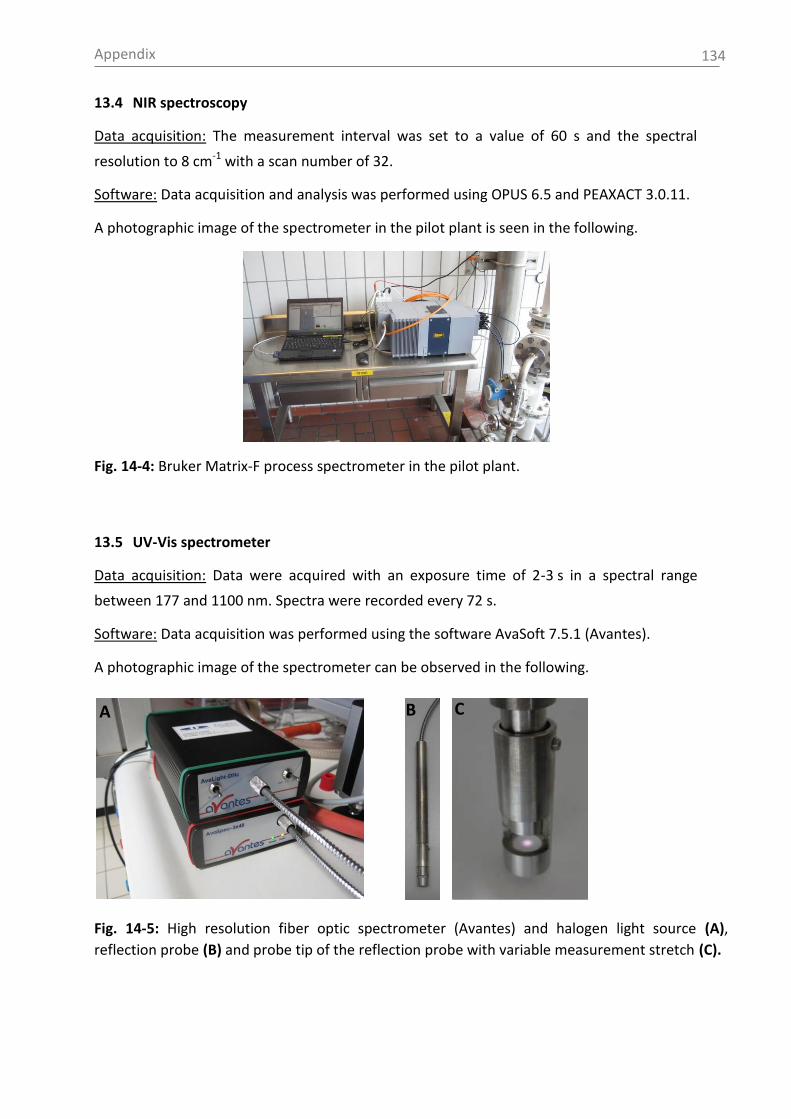
Appendix
134
13.4 NIR spectroscopy
Data acquisition: The measurement interval was set to a value of 60 s and the spectral
resolution to 8 cm-1 with a scan number of 32.
Software: Data acquisition and analysis was performed using OPUS 6.5 and PEAXACT 3.0.11.
A photographic image of the spectrometer in the pilot plant is seen in the following.
Fig. 14-4: Bruker Matrix-F process spectrometer in the pilot plant.
13.5 UV-Vis spectrometer
Data acquisition: Data were acquired with an exposure time of 2-3 s in a spectral range
between 177 and 1100 nm. Spectra were recorded every 72 s.
Software: Data acquisition was performed using the software AvaSoft 7.5.1 (Avantes).
A photographic image of the spectrometer can be observed in the following.
Fig. 14-5: High resolution fiber optic spectrometer (Avantes) and halogen light source (A),
reflection probe (B) and probe tip of the reflection probe with variable measurement stretch (C).
A B C
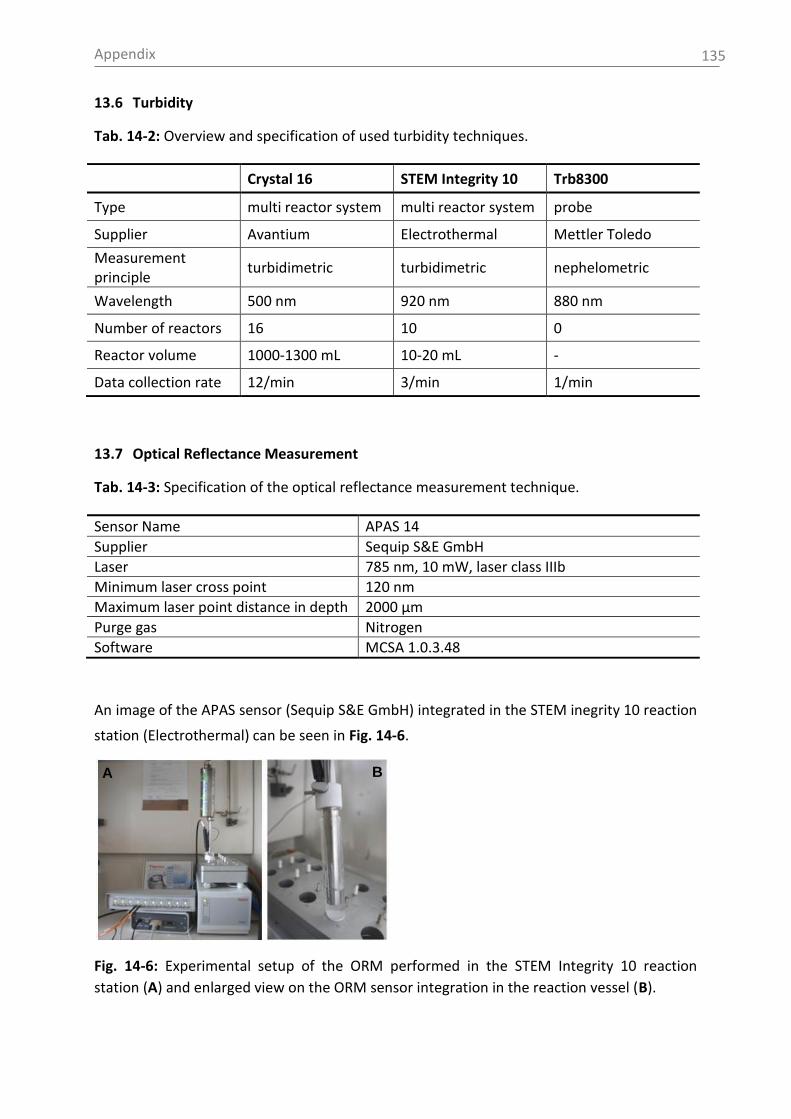
Appendix
135
13.6 Turbidity
Tab. 14-2: Overview and specification of used turbidity techniques.
Crystal 16 STEM Integrity 10 Trb8300
Type multi reactor system multi reactor system probe
Supplier Avantium Electrothermal Mettler Toledo
Measurement principle
turbidimetric turbidimetric nephelometric
Wavelength 500 nm 920 nm 880 nm
Number of reactors 16 10 0
Reactor volume 1000-1300 mL 10-20 mL -
Data collection rate 12/min 3/min 1/min
13.7 Optical Reflectance Measurement
Tab. 14-3: Specification of the optical reflectance measurement technique.
Sensor Name APAS 14
Supplier Sequip S&E GmbH
Laser 785 nm, 10 mW, laser class IIIb
Minimum laser cross point 120 nm
Maximum laser point distance in depth 2000 µm
Purge gas Nitrogen
Software MCSA 1.0.3.48
An image of the APAS sensor (Sequip S&E GmbH) integrated in the STEM inegrity 10 reaction
station (Electrothermal) can be seen in Fig. 14-6.
Fig. 14-6: Experimental setup of the ORM performed in the STEM Integrity 10 reaction
station (A) and enlarged view on the ORM sensor integration in the reaction vessel (B).
A B
Appendix
136
13.8 X-ray Powder Diffraction (XRPD)
Software: The data were visualized and evaluated with the software EVA. For data
evaluation the raw spectra were used.
Data acquisition: For the measurements with the Bruker D4 Endeavor diffractometer the
patterns were recorded in the range of 10 – 40 ° 2-Theta with a step width of 0.01 ° 2-Theta
and an acquisition time of 1 s per step. For the STOE STADI P transmission diffractometer the
patterns were recorded in the range of 8 – 60 ° 2-Theta with a step width of 0.01 ° 2-Theta.
Calibration: A 2-Theta calibration was carried out on the compound aluminium oxide
(bauxite).
13.9 Laser diffraction
Data acquisition and method: For the measurement the material was added to the
dispersant (n-heptane containing 0.1 % (v/v) Span20) in the Hydro S 2000 (A) cell until the
obscuration of the laser was about 10 %. Before the addition of the solid material a
background curve was measured and the dispersant was stirred (by a magnetic stirrer) for
1 min at a slowly increasing stirring speed up to a final speed of 2000 rpm in order to remove
air bubbles. During the measurement the following parameters were used: 2000 rpm stirrer
speed, Fraunhofer method, sensitivity normal, 12000 measurements. The measurements
were performed in repeated determination mode. As a result of the measurements the d90
values were calculated from the particle size distribution curves (volume distribution).
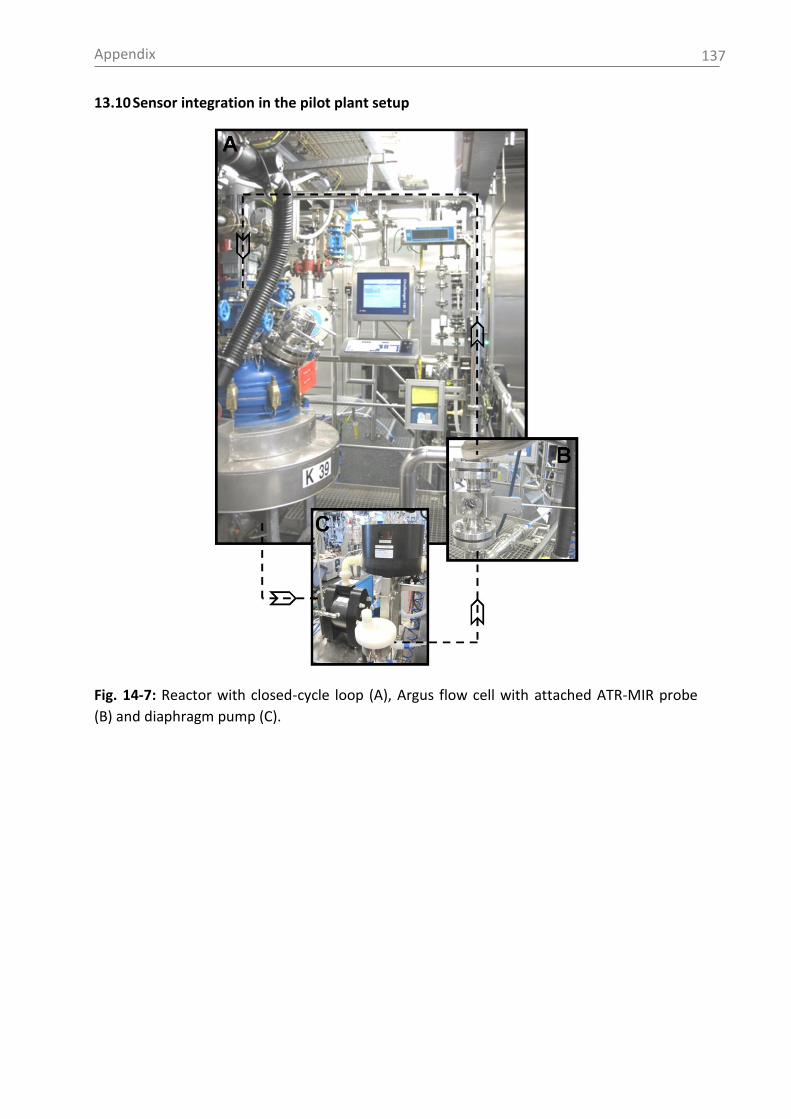
Appendix
137
13.10 Sensor integration in the pilot plant setup
Fig. 14-7: Reactor with closed-cycle loop (A), Argus flow cell with attached ATR-MIR probe
(B) and diaphragm pump (C).
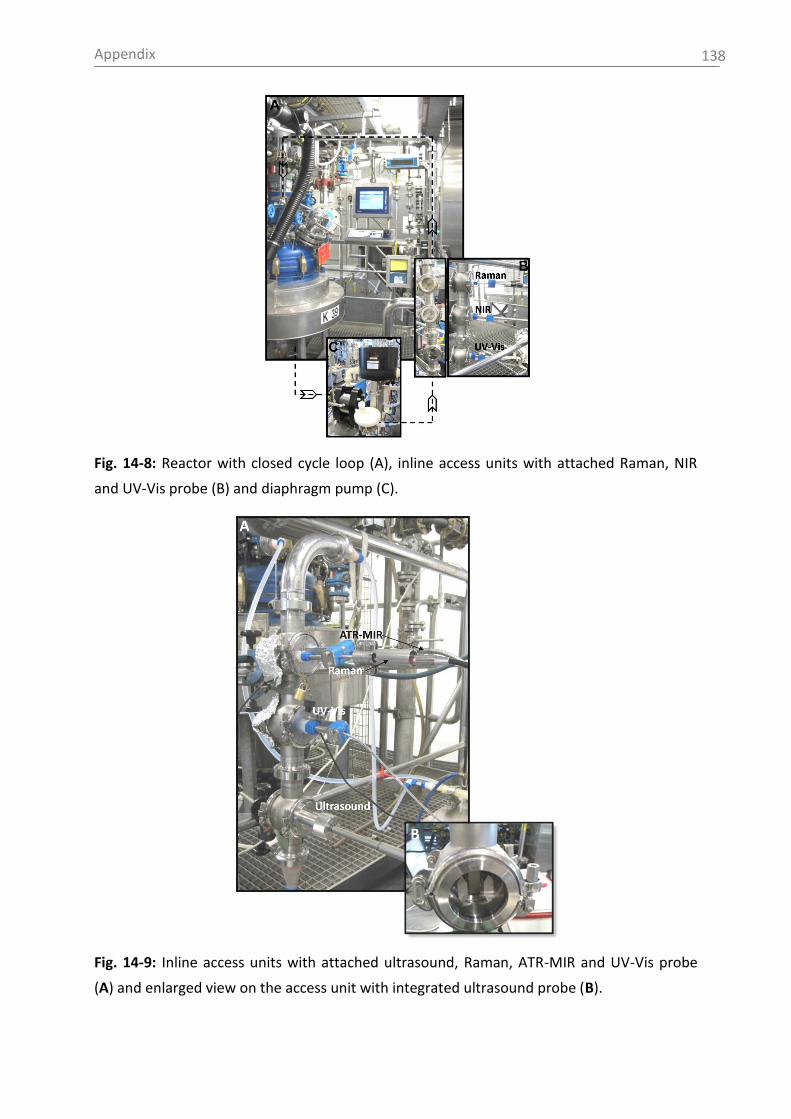
Appendix
138
Fig. 14-8: Reactor with closed cycle loop (A), inline access units with attached Raman, NIR
and UV-Vis probe (B) and diaphragm pump (C).
Fig. 14-9: Inline access units with attached ultrasound, Raman, ATR-MIR and UV-Vis probe
(A) and enlarged view on the access unit with integrated ultrasound probe (B).
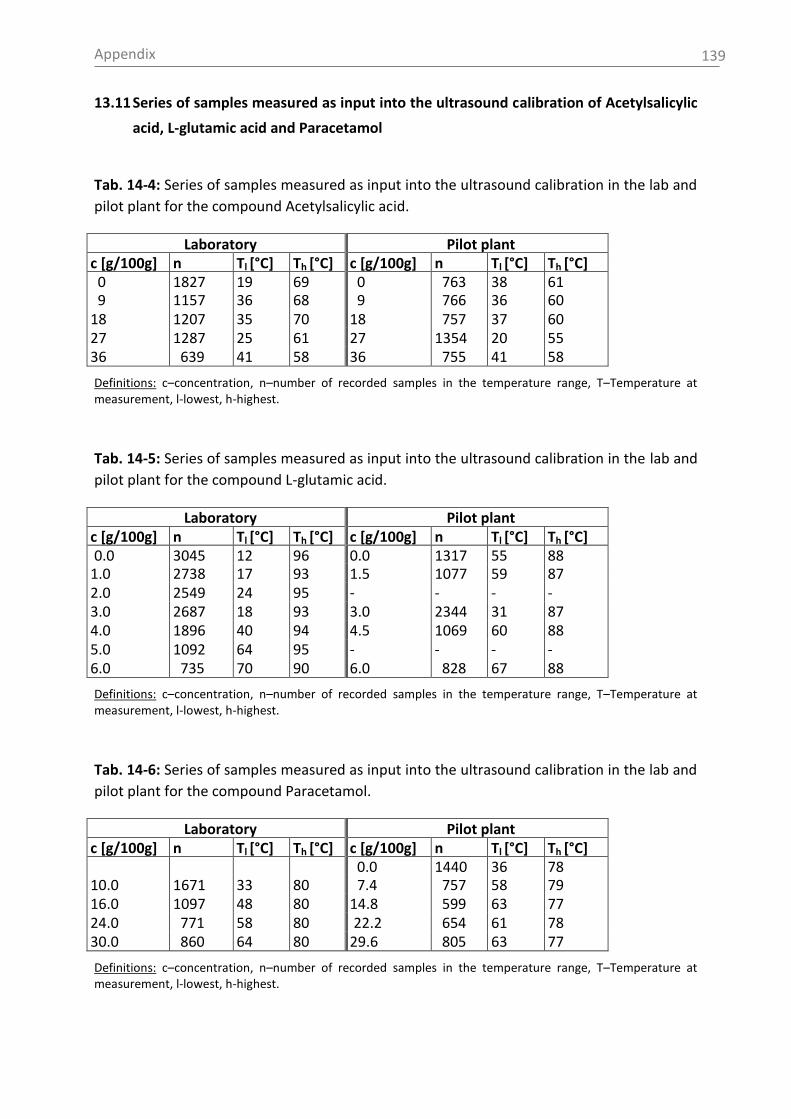
Appendix
139
13.11 Series of samples measured as input into the ultrasound calibration of Acetylsalicylic
acid, L-glutamic acid and Paracetamol
Tab. 14-4: Series of samples measured as input into the ultrasound calibration in the lab and
pilot plant for the compound Acetylsalicylic acid.
Laboratory Pilot plant c [g/100g] n Tl [°C] Th [°C] c [g/100g] n Tl [°C] Th [°C] 0 1827 19 69 0 763 38 61 9 1157 36 68 9 766 36 60 18 1207 35 70 18 757 37 60 27 1287 25 61 27 1354 20 55 36 639 41 58 36 755 41 58
Definitions: c–concentration, n–number of recorded samples in the temperature range, T–Temperature at measurement, l-lowest, h-highest.
Tab. 14-5: Series of samples measured as input into the ultrasound calibration in the lab and
pilot plant for the compound L-glutamic acid.
Laboratory Pilot plant c [g/100g] n Tl [°C] Th [°C] c [g/100g] n Tl [°C] Th [°C] 0.0 3045 12 96 0.0 1317 55 88
1.0 2738 17 93 1.5 1077 59 87 2.0 2549 24 95 -
3
- - - 3.0 2687 18 93 3.0 2344 31 87 4.0 1896 40 94 4.5 1069 60 88 5.0 1092 64 95 - - - - 6.0 735 70 90 6.0 828 67 88
Definitions: c–concentration, n–number of recorded samples in the temperature range, T–Temperature at measurement, l-lowest, h-highest.
Tab. 14-6: Series of samples measured as input into the ultrasound calibration in the lab and
pilot plant for the compound Paracetamol.
Laboratory Pilot plant c [g/100g] n Tl [°C] Th [°C] c [g/100g] n Tl [°C] Th [°C] 0.0 1440 36 78 10.0 1671 33 80 7.4 757 58 79 16.0 1097 48 80 14.8 599 63 77 24.0 771 58 80 22.2 654 61 78 30.0 860 64 80 29.6 805 63 77
Definitions: c–concentration, n–number of recorded samples in the temperature range, T–Temperature at measurement, l-lowest, h-highest.
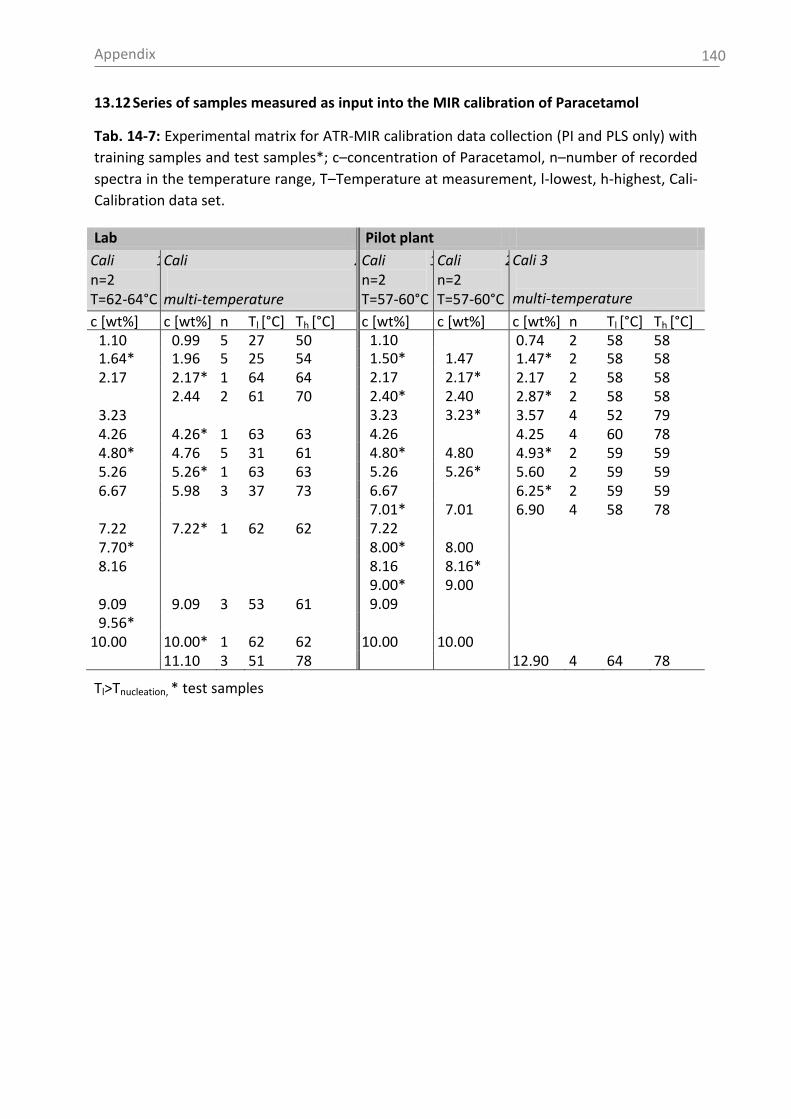
Appendix
140
13.12 Series of samples measured as input into the MIR calibration of Paracetamol
Tab. 14-7: Experimental matrix for ATR-MIR calibration data collection (PI and PLS only) with
training samples and test samples*; c–concentration of Paracetamol, n–number of recorded
spectra in the temperature range, T–Temperature at measurement, l-lowest, h-highest, Cali-
Calibration data set.
Lab Pilot plant
Cali 1 n=2 T=62-64°C
Cali 2 multi-temperature
Cali 1 n=2 T=57-60°C
Cali 2 n=2 T=57-60°C
Cali 3
multi-temperature
c [wt%] c [wt%] n Tl [°C] Th [°C] c [wt%] c [wt%] c [wt%] n Tl [°C] Th [°C] 01.10 00.99 5 27 50 01.10
0.74 2 58 58 01.64* 01.96 5 25 54 01.50*
01.47
1.47* 2 58 58 02.17 02.17* 1 64 64 02.17
02.17*
2.17 2 58 58 02.44 2 61 70 02.40*
02.40
2.87* 2 58 58 03.23 03.23
03.23*
3.57 4 52 79 04.26 04.26* 1 63 63 04.26
4.25 4 60 78 04.80* 04.76 5 31 61 04.80*
04.80
4.93* 2 59 59 05.26 05.26* 1 63 63 05.26
05.26*
5.60 2 59 59 06.67 05.98 3 37 73 06.67
6.25* 2 59 59 07.01*
07.01
6.90 4 58 78 07.22 07.22* 1 62 62 07.22
07.70* 08.00*
08.00
08.16 08.16
08.16*
09.00*
09.00
09.09 09.09 3 53 61 09.09
09.56*
10.00 10.00* 1 62 62 10.00 10.00 11.10 3 51 78 12.90 4 64 78
Tl>Tnucleation, * test samples

Appendix
141
13.13 Series of samples measured as input into the Raman calibration of L-glutamic acid
Tab. 14-8: Experimental matrix (alpha content) for Raman calibration data collection with
training and test samples of the solid phase and in suspension (compound: LGA),
Abbreviation as follows: number of spectra (n), Test samples (Test), Training samples (Train).
Trainsolid n=2
Testsolid1 n=2
Testsolid2 n=2
Train/Testsuspension n=1
0.000 0.000 0.000 0.000
0.019
0.040
0.059
0.079
0.098 0.100
0.198 0.150 0.150 0.200
0.299 0.250
0.397 0.350 0.350
0.495 0.450 0.450 0.500
0.595 0.600
0.692 0.650 0.650
0.792 0.750
0.891 0.850 0.850
0.912
0.930
0.950
0.970
1.000 1.000 1.000 1.000
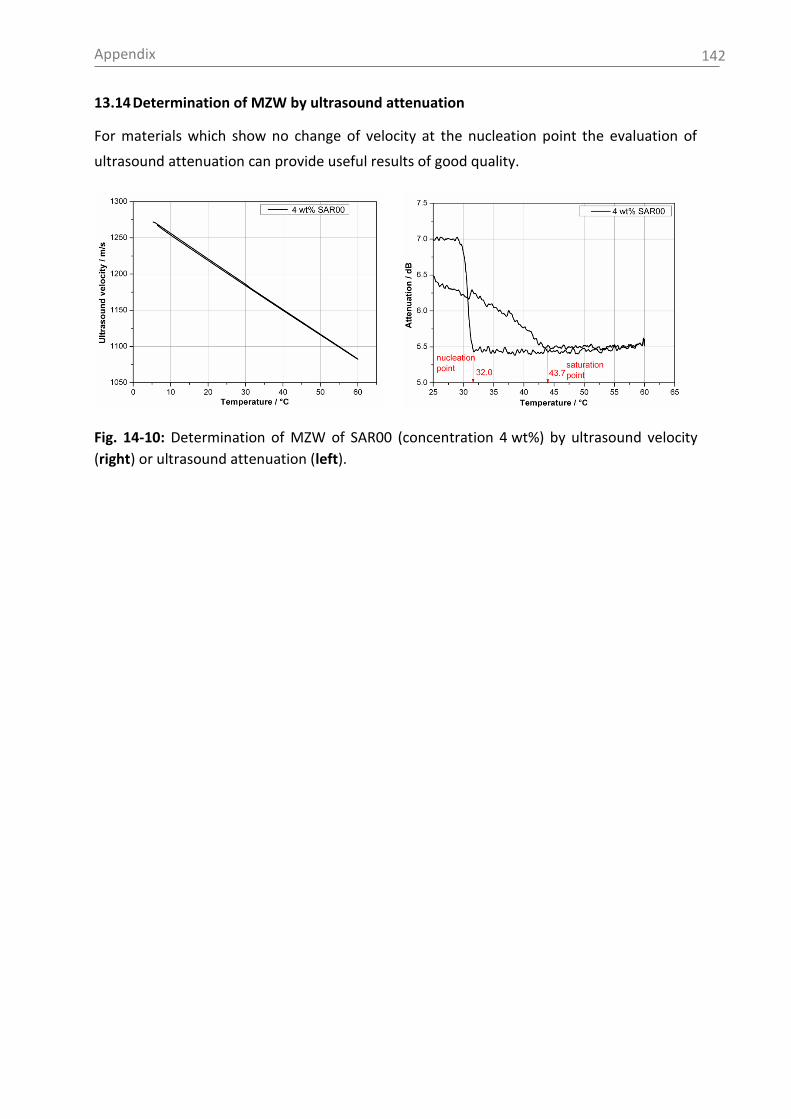
Appendix
142
13.14 Determination of MZW by ultrasound attenuation
For materials which show no change of velocity at the nucleation point the evaluation of
ultrasound attenuation can provide useful results of good quality.
Fig. 14-10: Determination of MZW of SAR00 (concentration 4 wt%) by ultrasound velocity
(right) or ultrasound attenuation (left).
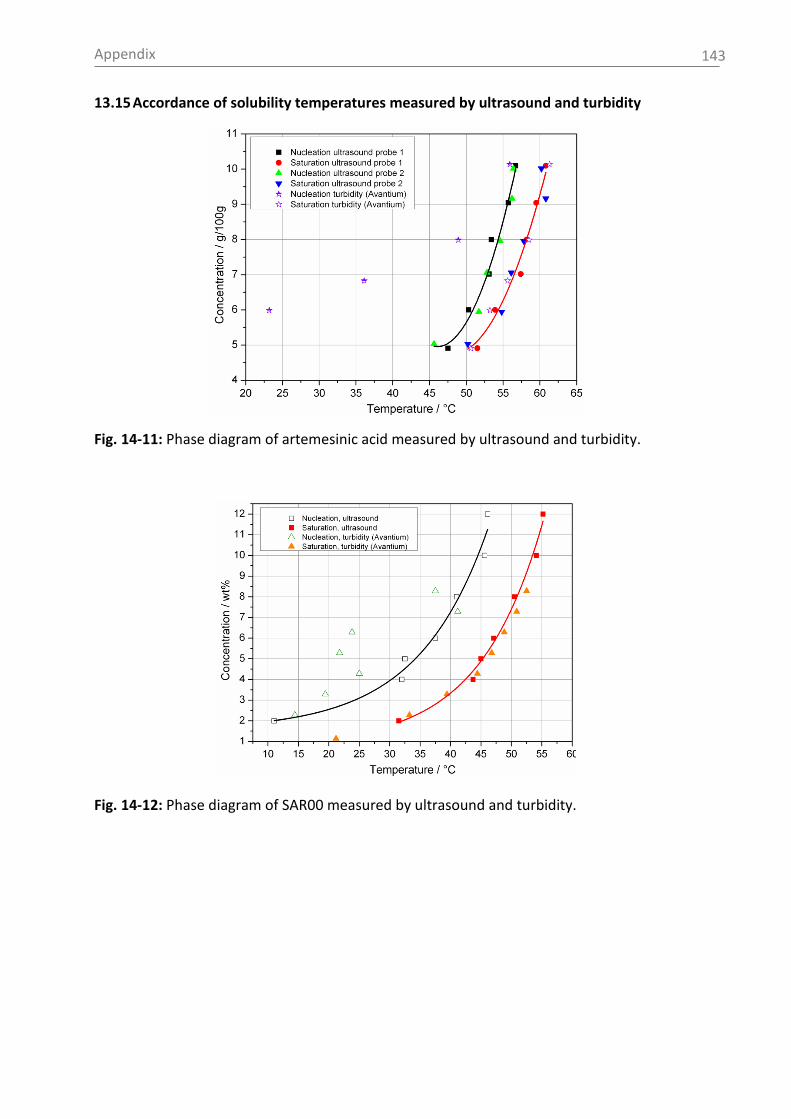
Appendix
143
13.15 Accordance of solubility temperatures measured by ultrasound and turbidity
Fig. 14-11: Phase diagram of artemesinic acid measured by ultrasound and turbidity.
Fig. 14-12: Phase diagram of SAR00 measured by ultrasound and turbidity.
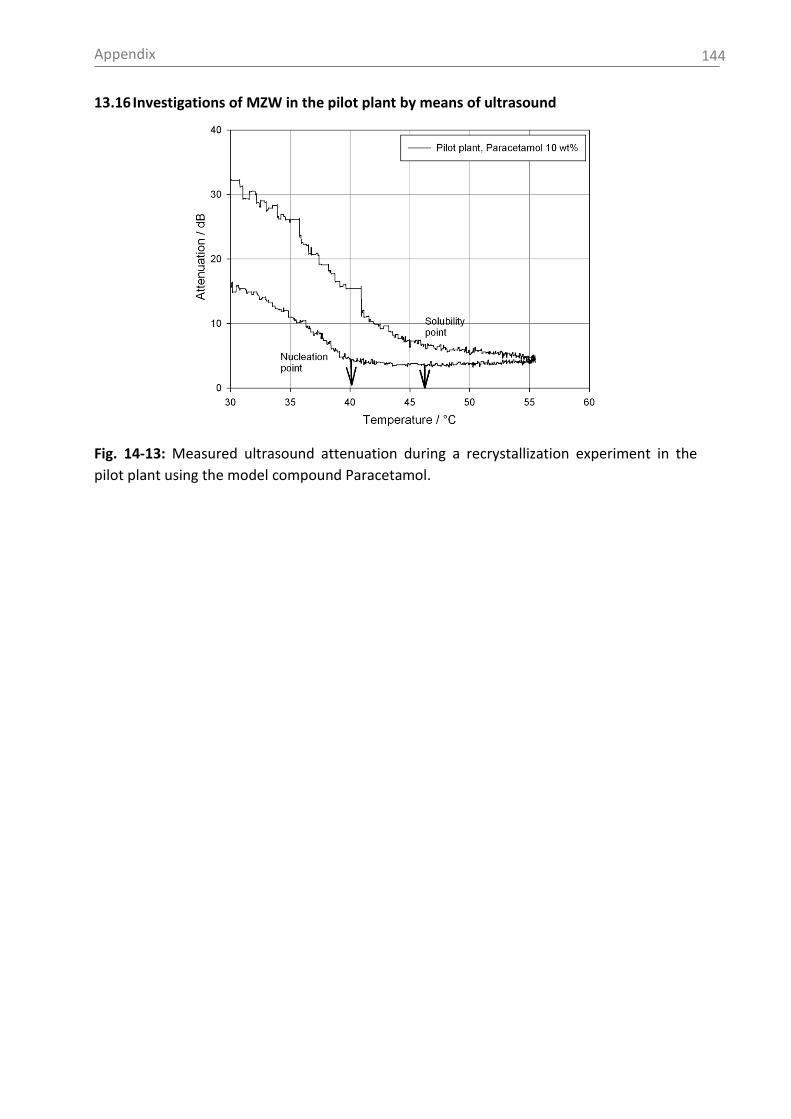
Appendix
144
13.16 Investigations of MZW in the pilot plant by means of ultrasound
Fig. 14-13: Measured ultrasound attenuation during a recrystallization experiment in the
pilot plant using the model compound Paracetamol.
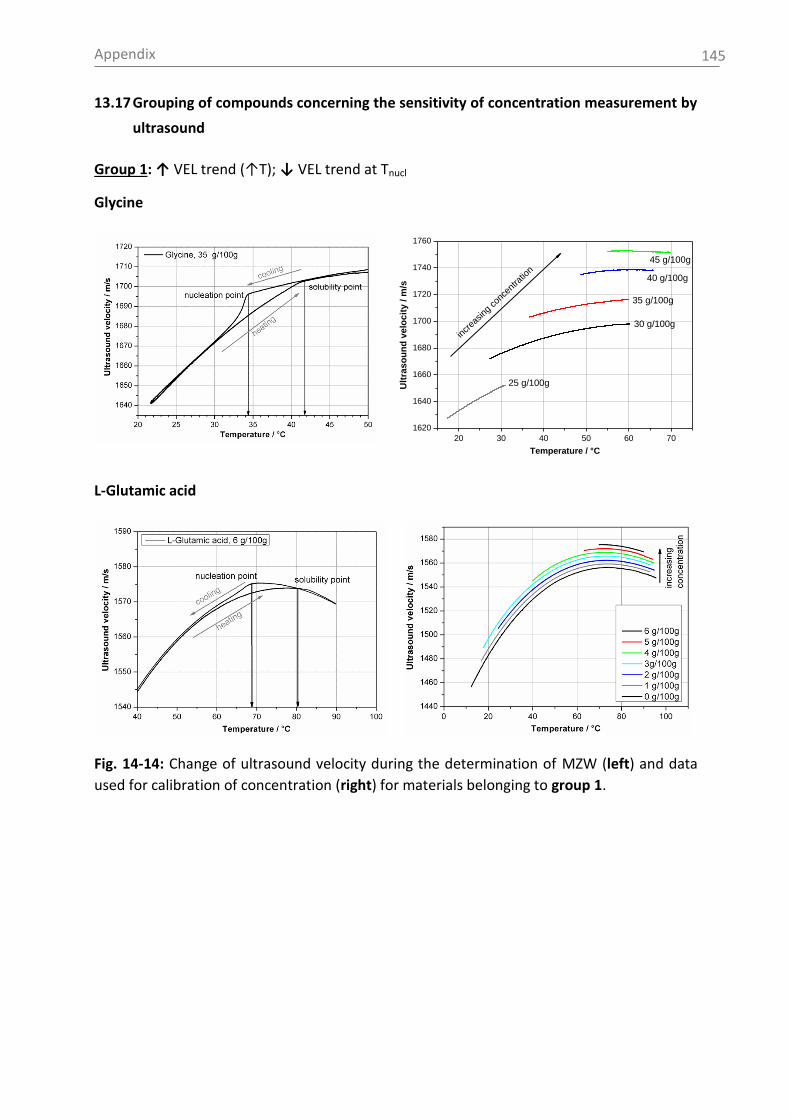
Appendix
145
13.17 Grouping of compounds concerning the sensitivity of concentration measurement by
ultrasound
Group 1: ↑ VEL trend (↑T); ↓ VEL trend at Tnucl
Glycine
20 30 40 50 60 70
1620
1640
1660
1680
1700
1720
1740
1760
45 g/100g
40 g/100g
35 g/100g
Ult
ras
ou
nd
ve
loc
ity
/ m
/s
Temperature / °C
incr
easing
con
cent
ratio
n
25 g/100g
30 g/100g
L-Glutamic acid
Fig. 14-14: Change of ultrasound velocity during the determination of MZW (left) and data
used for calibration of concentration (right) for materials belonging to group 1.
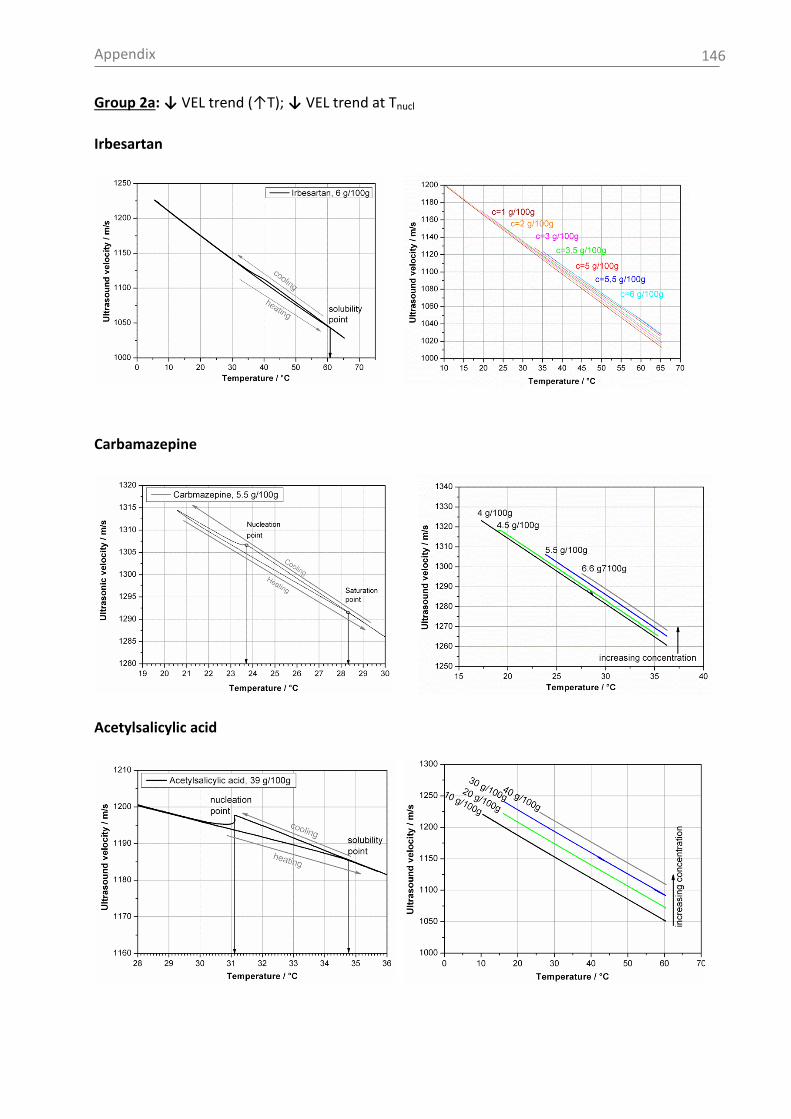
Appendix
146
Group 2a: ↓ VEL trend (↑T); ↓ VEL trend at Tnucl
Irbesartan
Carbamazepine
Acetylsalicylic acid
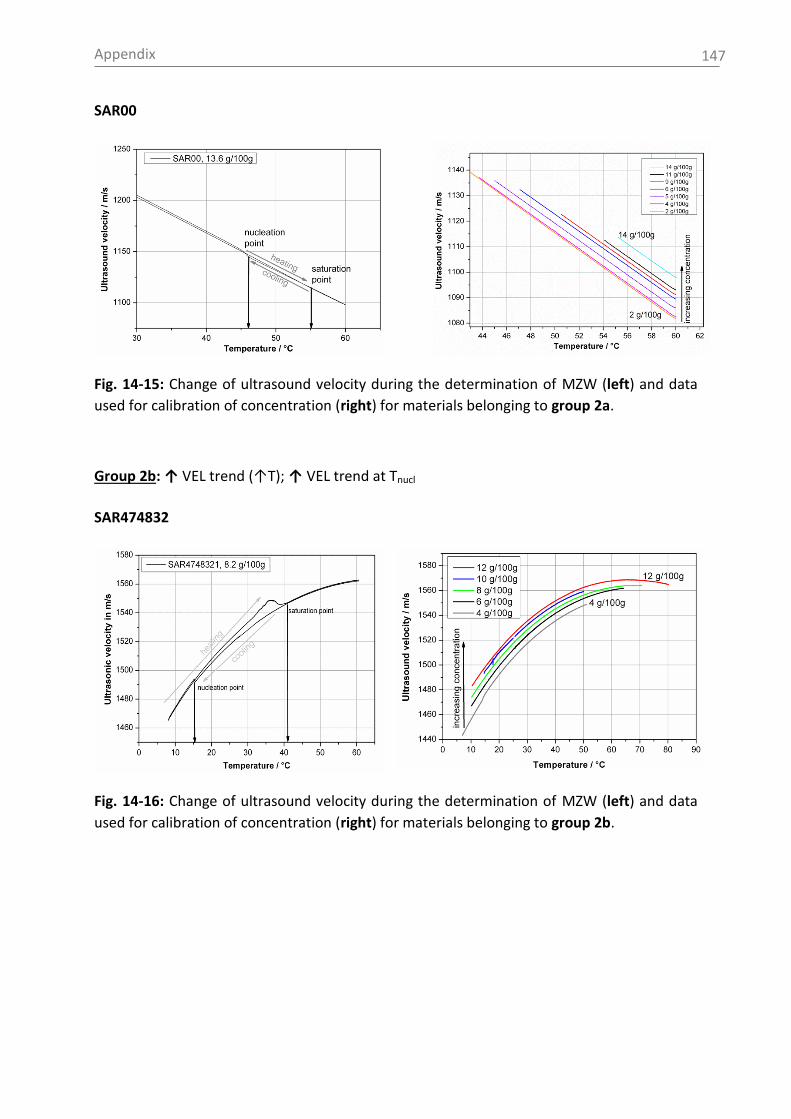
Appendix
147
SAR00
Fig. 14-15: Change of ultrasound velocity during the determination of MZW (left) and data
used for calibration of concentration (right) for materials belonging to group 2a.
Group 2b: ↑ VEL trend (↑T); ↑ VEL trend at Tnucl
SAR474832
Fig. 14-16: Change of ultrasound velocity during the determination of MZW (left) and data
used for calibration of concentration (right) for materials belonging to group 2b.
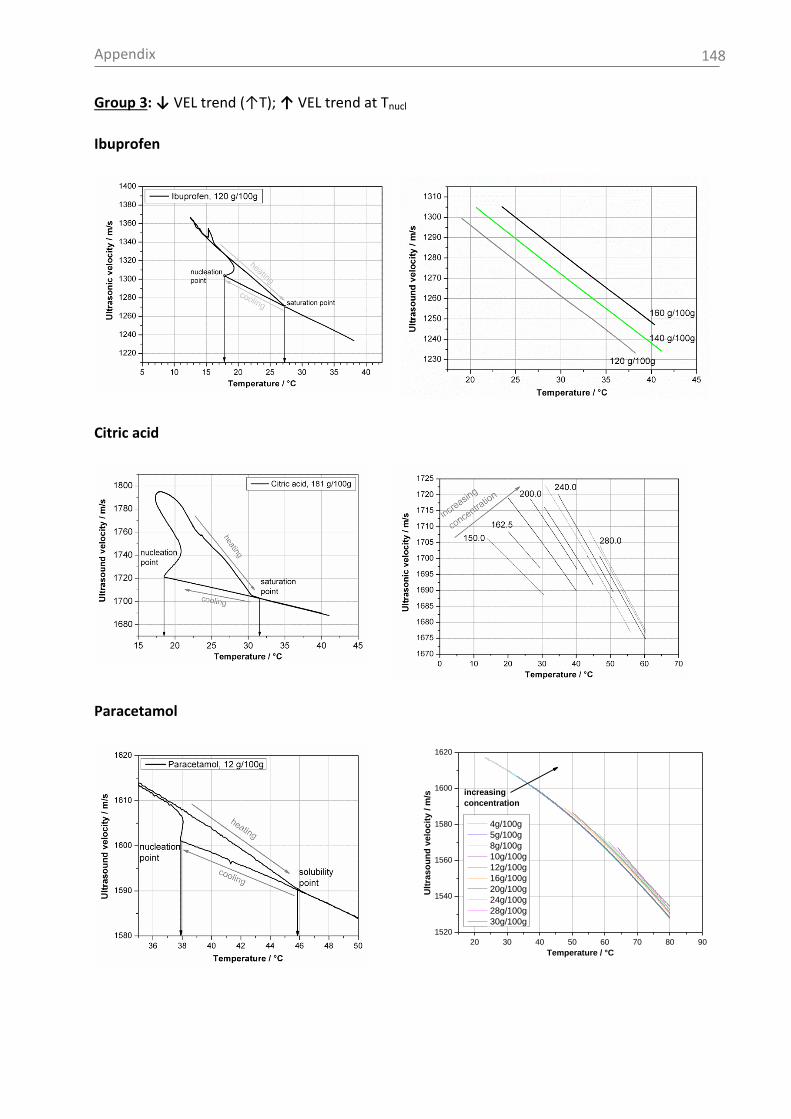
Appendix
148
Group 3: ↓ VEL trend (↑T); ↑ VEL trend at Tnucl
Ibuprofen
Citric acid
Paracetamol
20 30 40 50 60 70 80 90
1520
1540
1560
1580
1600
1620
Ult
ras
ou
nd
ve
loc
ity
/ m
/s
Temperature / °C
4g/100g
5g/100g
8g/100g
10g/100g
12g/100g
16g/100g
20g/100g
24g/100g
28g/100g
30g/100g
increasing
concentration
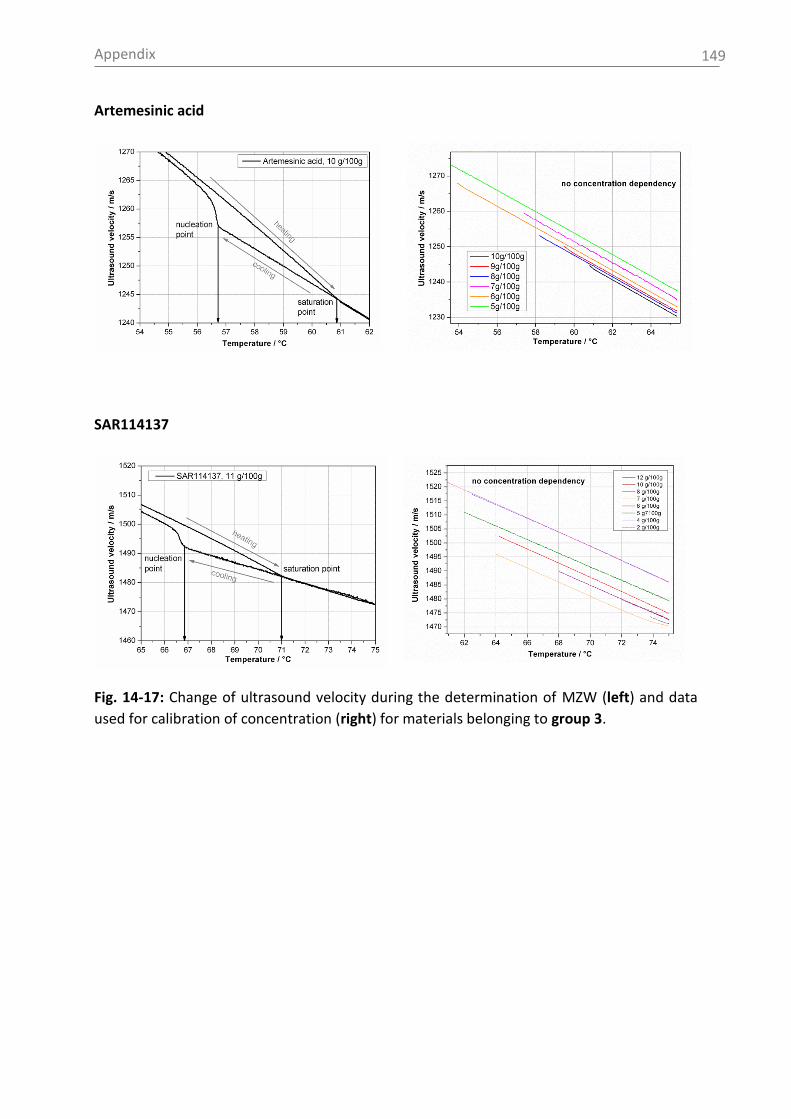
Appendix
149
Artemesinic acid
SAR114137
Fig. 14-17: Change of ultrasound velocity during the determination of MZW (left) and data
used for calibration of concentration (right) for materials belonging to group 3.
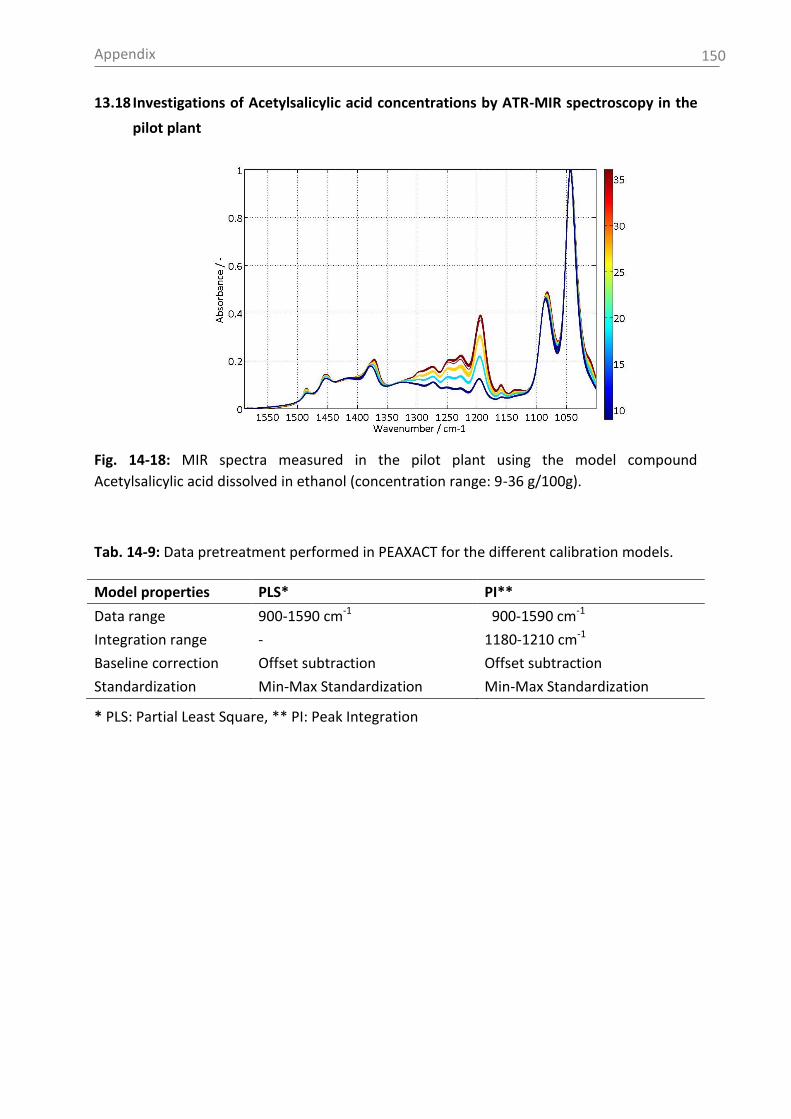
Appendix
150
13.18 Investigations of Acetylsalicylic acid concentrations by ATR-MIR spectroscopy in the
pilot plant
Fig. 14-18: MIR spectra measured in the pilot plant using the model compound
Acetylsalicylic acid dissolved in ethanol (concentration range: 9-36 g/100g).
Tab. 14-9: Data pretreatment performed in PEAXACT for the different calibration models.
Model properties PLS* PI**
Data range 900-1590 cm-1 900-1590 cm-1
Integration range - 1180-1210 cm-1
Baseline correction Offset subtraction Offset subtraction
Standardization Min-Max Standardization Min-Max Standardization
* PLS: Partial Least Square, ** PI: Peak Integration
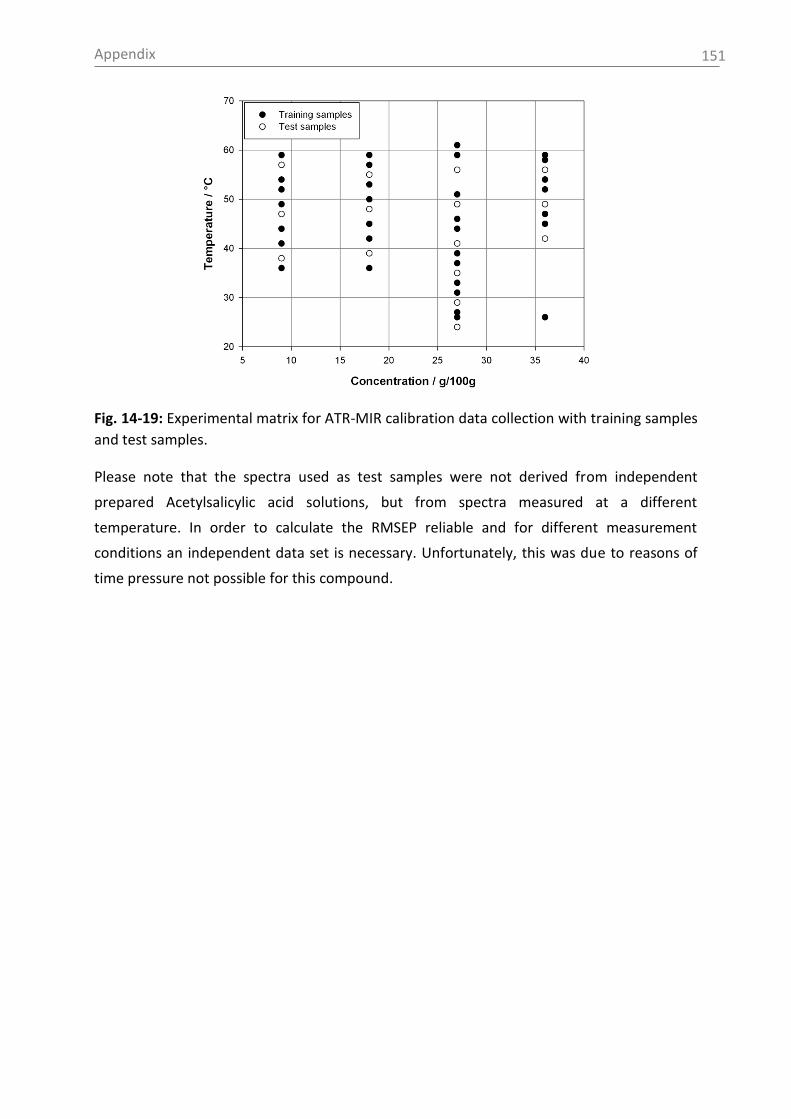
Appendix
151
Fig. 14-19: Experimental matrix for ATR-MIR calibration data collection with training samples
and test samples.
Please note that the spectra used as test samples were not derived from independent
prepared Acetylsalicylic acid solutions, but from spectra measured at a different
temperature. In order to calculate the RMSEP reliable and for different measurement
conditions an independent data set is necessary. Unfortunately, this was due to reasons of
time pressure not possible for this compound.
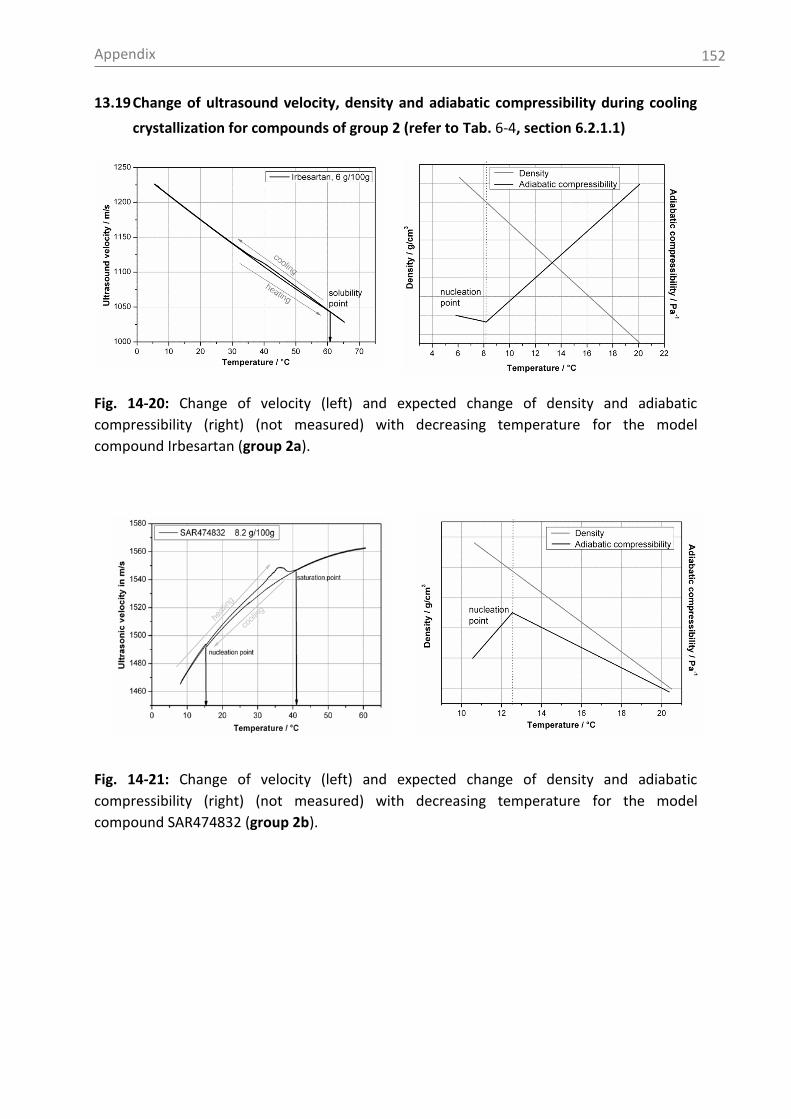
Appendix
152
13.19 Change of ultrasound velocity, density and adiabatic compressibility during cooling
crystallization for compounds of group 2 (refer to Tab. 6-4, section 6.2.1.1)
Fig. 14-20: Change of velocity (left) and expected change of density and adiabatic
compressibility (right) (not measured) with decreasing temperature for the model
compound Irbesartan (group 2a).
Fig. 14-21: Change of velocity (left) and expected change of density and adiabatic
compressibility (right) (not measured) with decreasing temperature for the model
compound SAR474832 (group 2b).

Appendix
153
13.20 Recrystallization of ammonium sulphate monitored by a protected ultrasound sensor
The following measurements were carried out by my student Arthur and are partly
presented in his Diploma thesis [Liu12].
Fig. 14-22: Concentration measurement of ammonium sulphate monitored by a protected
ultrasound sensor during a recrystallization experiment (∆T mesh = 2 °C).
The concentration (c) can be calculated according to the following equation, where T is the
temperature and V is the ultrasound velocity:
c = -199.5943 - 0.7884 T + 0.17603 V + 0.000356 TV +
0.001071 T2 - 2.576799e-05 V2
Eq. 14-1
The RMSEC is 0.46 wt%.
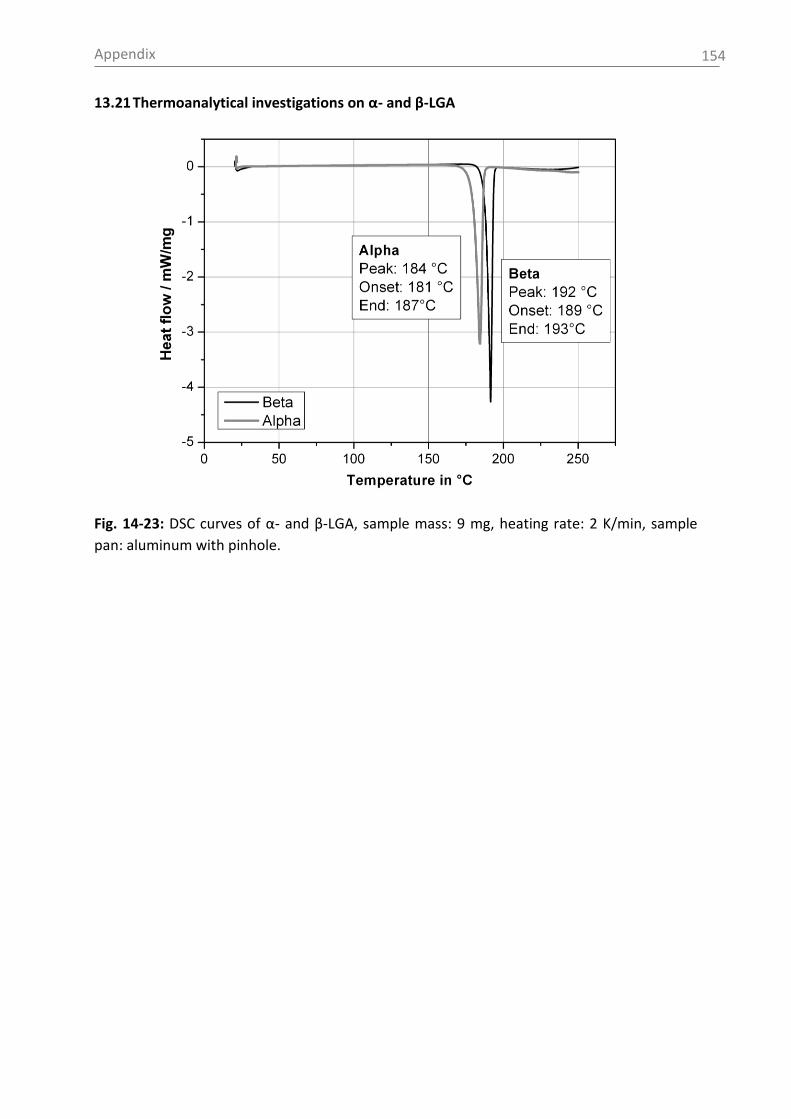
Appendix
154
13.21 Thermoanalytical investigations on α- and β-LGA
Fig. 14-23: DSC curves of α- and β-LGA, sample mass: 9 mg, heating rate: 2 K/min, sample
pan: aluminum with pinhole.
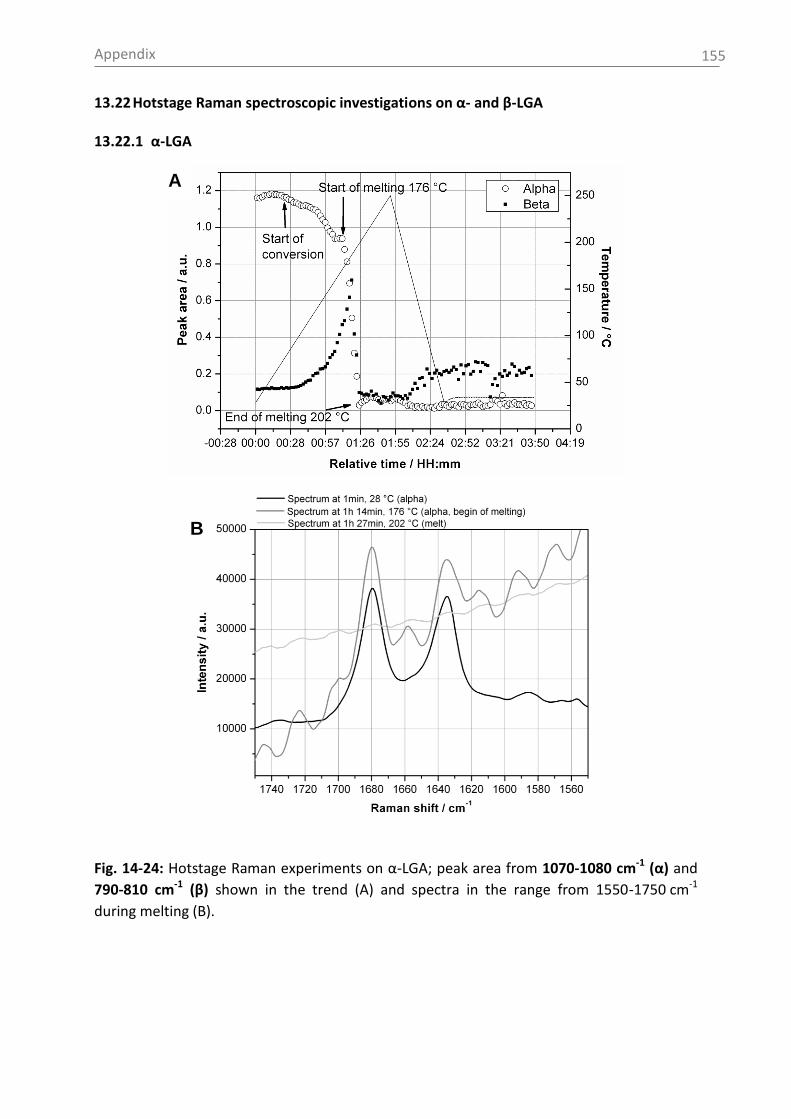
Appendix
155
13.22 Hotstage Raman spectroscopic investigations on α- and β-LGA
13.22.1 α-LGA
Fig. 14-24: Hotstage Raman experiments on α-LGA; peak area from 1070-1080 cm-1 (α) and
790-810 cm-1 (β) shown in the trend (A) and spectra in the range from 1550-1750 cm-1
during melting (B).
A
B
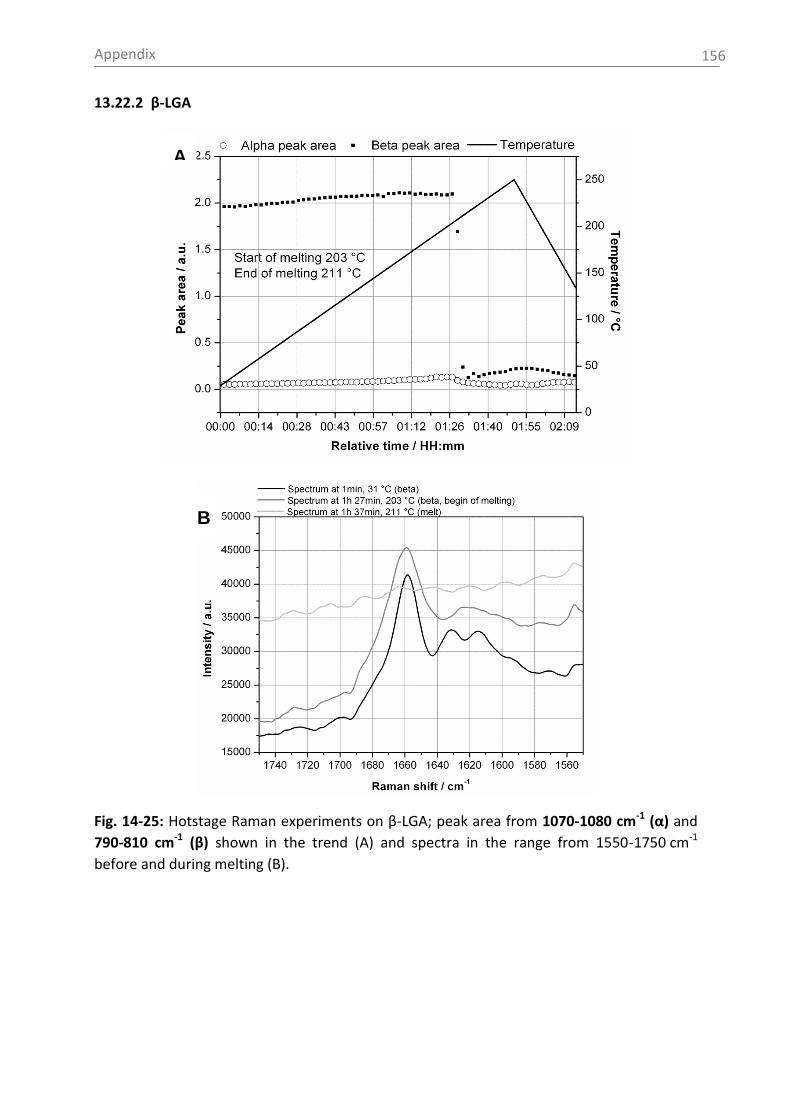
Appendix
156
13.22.2 β-LGA
Fig. 14-25: Hotstage Raman experiments on β-LGA; peak area from 1070-1080 cm-1 (α) and
790-810 cm-1 (β) shown in the trend (A) and spectra in the range from 1550-1750 cm-1
before and during melting (B).
A
B

Appendix
157
13.23 Linear calibration curve and confidence boundaries for Raman PI model
)cm 810-(780 areaPeak )cm 1080-(1070 areaPeak
)cm 1080-(1070 areaPeak ratio areaPeak
βα
α ratio areaPeak
1-1-
1-
areaPeak areaPeak
areaPeak
Eq. 14-2
Tab. 14-10: Mathematical functions of calibration and confidence boundaries derived by
solid state Raman spectroscopy of LGA as well as LOD and LOQ.
Calibration line function: y= -0.0093241 + 1.02345256 x
95 % lower confidence bound function: y = -0.0205903 + 1.005337 x
95 % upper confidence bound function:
LOD
LOQ
y = 0.00194217 + 1.04156812 x 0.06 [-]
0.09 [-]
Fig. 14-26: Linear calibration curve with confidence boundaries.
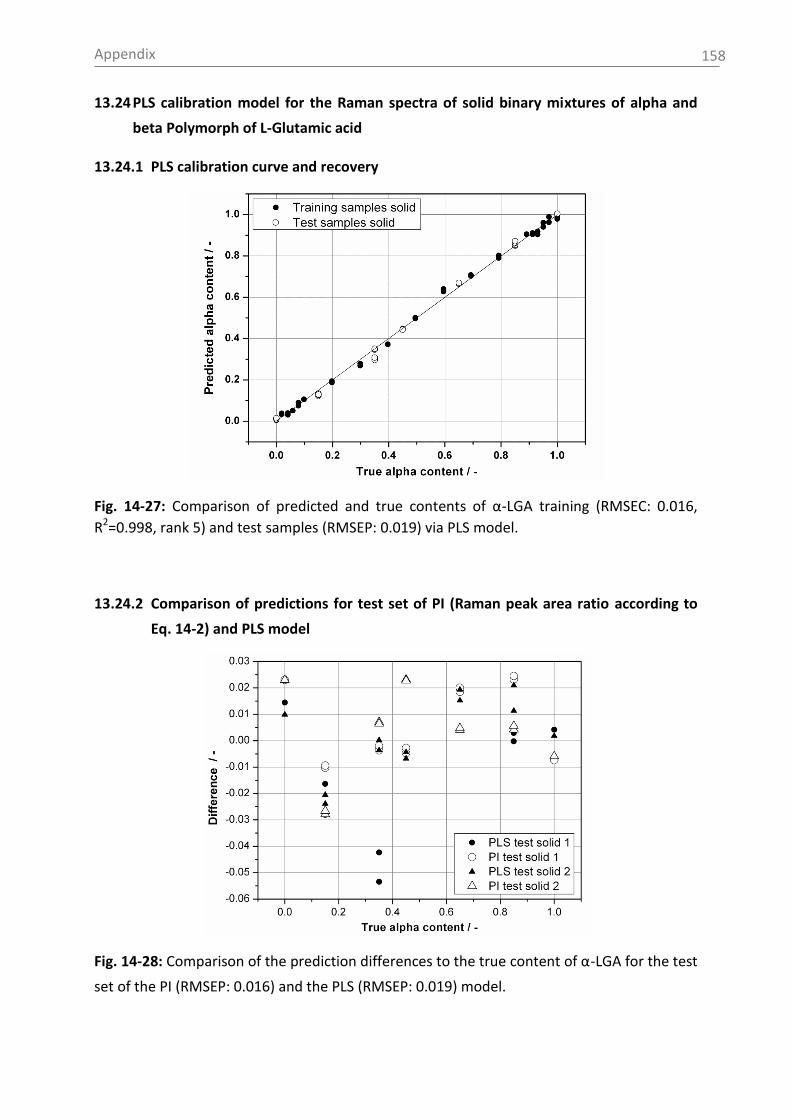
Appendix
158
13.24 PLS calibration model for the Raman spectra of solid binary mixtures of alpha and
beta Polymorph of L-Glutamic acid
13.24.1 PLS calibration curve and recovery
Fig. 14-27: Comparison of predicted and true contents of α-LGA training (RMSEC: 0.016,
R2=0.998, rank 5) and test samples (RMSEP: 0.019) via PLS model.
13.24.2 Comparison of predictions for test set of PI (Raman peak area ratio according to
Eq. 14-2) and PLS model
Fig. 14-28: Comparison of the prediction differences to the true content of α-LGA for the test
set of the PI (RMSEP: 0.016) and the PLS (RMSEP: 0.019) model.

Appendix
159
As can be seen in Fig. 14-28 the differences of the determinations in duplicates (same data
set) are higher for the PLS model as for the PI model. Most often the predictions of the PI
model show no differences for the same data set (data points of the same data set are
overlapping). The PLS model predictions, in comparison, show deviations especially for the
alpha contents 0.15 (PLS test solid 2), 0.35 (PLS test solid 1&2), 0.65 (PLS test solid 2), 0.84
(PLS solid 1&2).
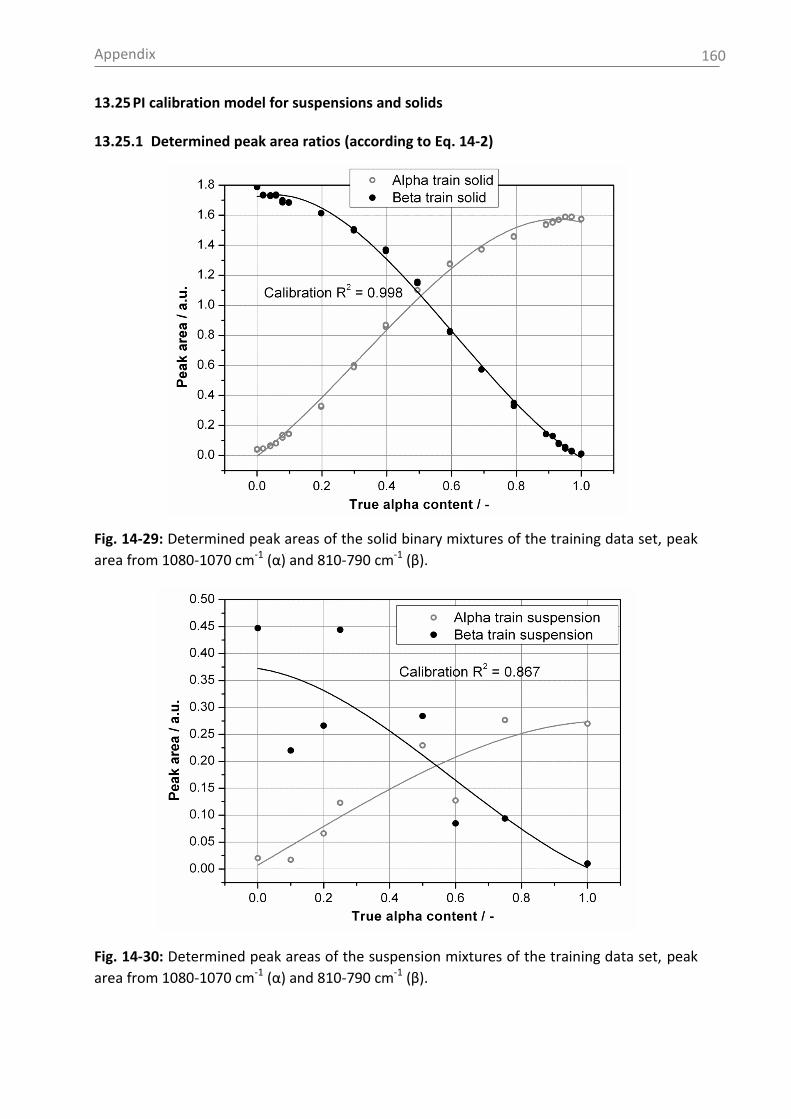
Appendix
160
13.25 PI calibration model for suspensions and solids
13.25.1 Determined peak area ratios (according to Eq. 14-2)
Fig. 14-29: Determined peak areas of the solid binary mixtures of the training data set, peak
area from 1080-1070 cm-1 (α) and 810-790 cm-1 (β).
Fig. 14-30: Determined peak areas of the suspension mixtures of the training data set, peak
area from 1080-1070 cm-1 (α) and 810-790 cm-1 (β).

Appendix
161
13.25.2 PI recovery curve
Fig. 14-31: Comparison of predicted and true contents of α-LGA for PI models of solids and
suspensions.
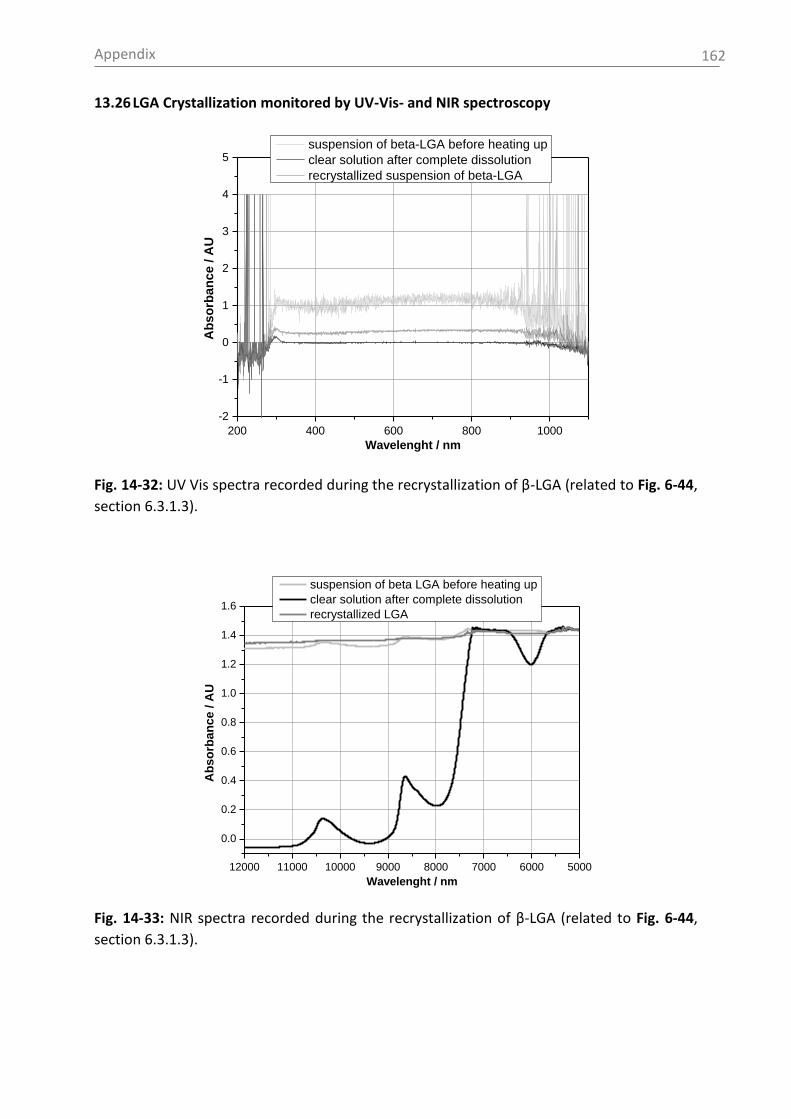
Appendix
162
13.26 LGA Crystallization monitored by UV-Vis- and NIR spectroscopy
Fig. 14-32: UV Vis spectra recorded during the recrystallization of β-LGA (related to Fig. 6-44,
section 6.3.1.3).
12000 11000 10000 9000 8000 7000 6000 5000
0.0
0.2
0.4
0.6
0.8
1.0
1.2
1.4
1.6
Ab
so
rba
nc
e / A
U
Wavelenght / nm
suspension of beta LGA before heating up
clear solution after complete dissolution
recrystallized LGA
Fig. 14-33: NIR spectra recorded during the recrystallization of β-LGA (related to Fig. 6-44,
section 6.3.1.3).
200 400 600 800 1000
-2
-1
0
1
2
3
4
5
Ab
so
rba
nc
e / A
U
Wavelenght / nm
suspension of beta-LGA before heating up
clear solution after complete dissolution
recrystallized suspension of beta-LGA
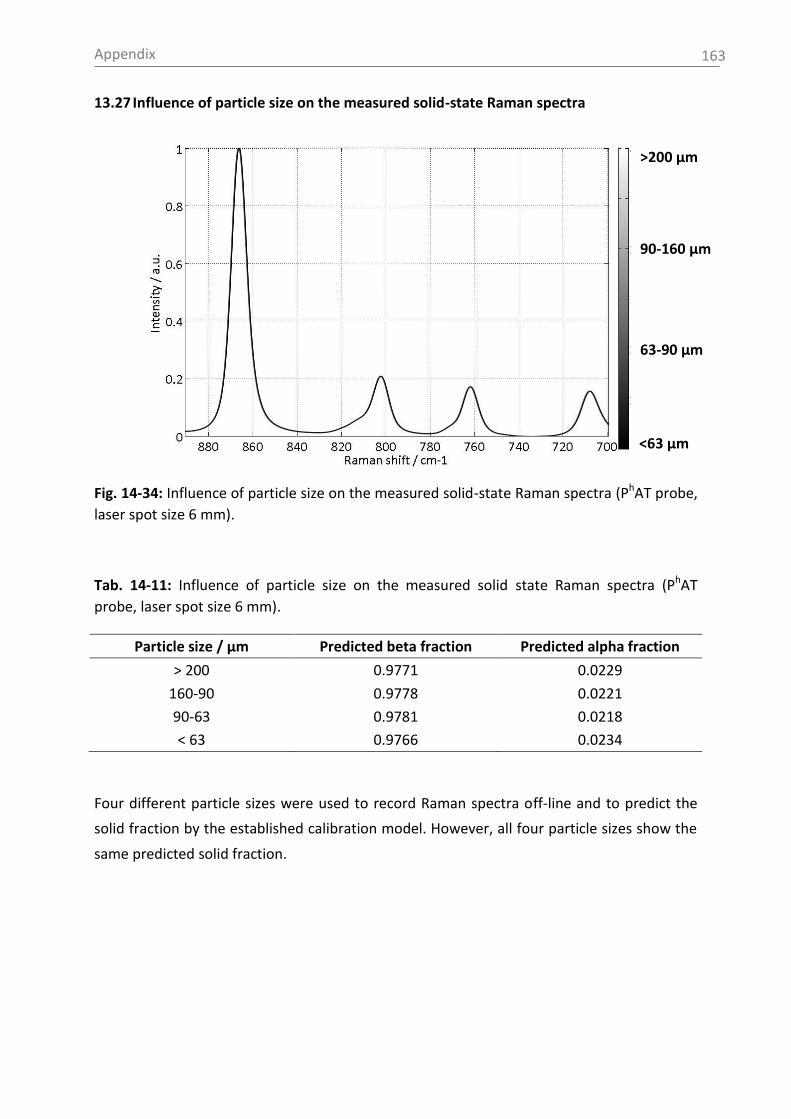
Appendix
163
13.27 Influence of particle size on the measured solid-state Raman spectra
Fig. 14-34: Influence of particle size on the measured solid-state Raman spectra (PhAT probe,
laser spot size 6 mm).
Tab. 14-11: Influence of particle size on the measured solid state Raman spectra (PhAT
probe, laser spot size 6 mm).
Particle size / µm Predicted beta fraction Predicted alpha fraction
> 200 0.9771 0.0229
160-90 0.9778 0.0221
90-63 0.9781 0.0218
< 63 0.9766 0.0234
Four different particle sizes were used to record Raman spectra off-line and to predict the
solid fraction by the established calibration model. However, all four particle sizes show the
same predicted solid fraction.
>200 µm
90-160 µm
63-90 µm
<63 µm

Appendix
164
13.28 Sensitivity of Raman spectroscopy in dependency of particle size and suspension
density
Fig. 14-35: Raman peak height at 1391 cm-1 (Pearsons background correction, normalized) in
dependency of used particle size and suspension density at 25 °C of the test compound citric
acid anhydrate.
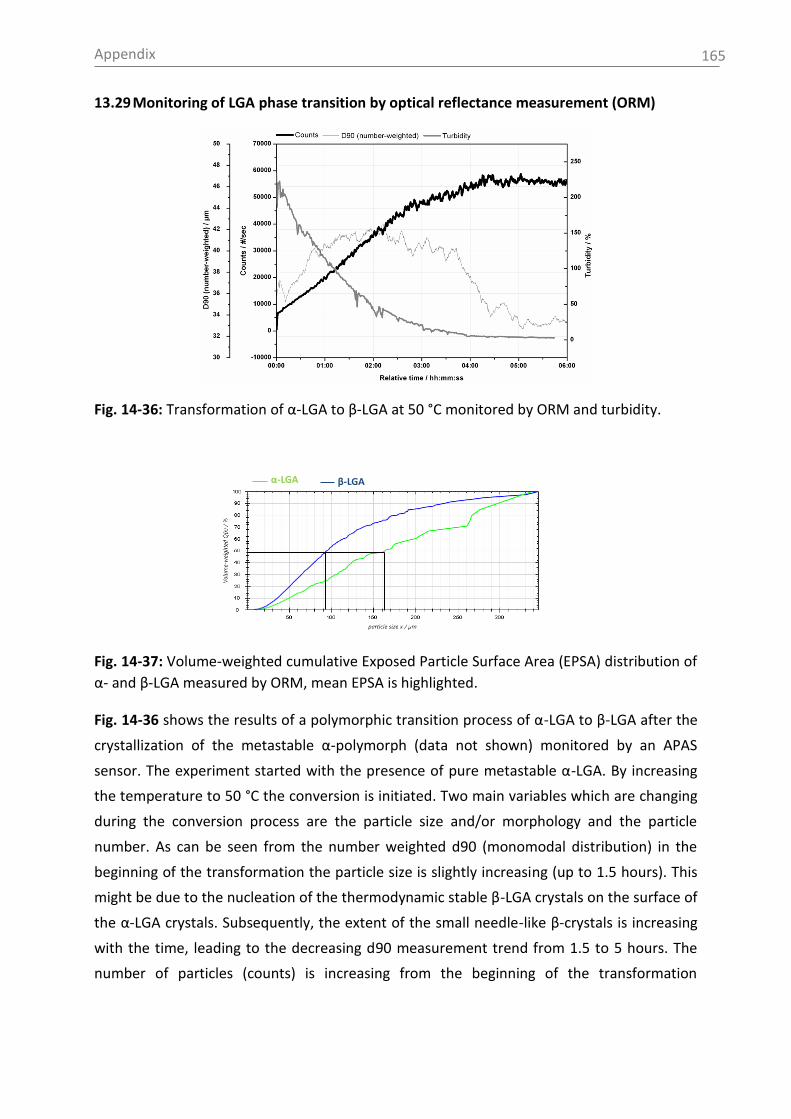
Appendix
165
13.29 Monitoring of LGA phase transition by optical reflectance measurement (ORM)
Fig. 14-36: Transformation of α-LGA to β-LGA at 50 °C monitored by ORM and turbidity.
Fig. 14-37: Volume-weighted cumulative Exposed Particle Surface Area (EPSA) distribution of
α- and β-LGA measured by ORM, mean EPSA is highlighted.
Fig. 14-36 shows the results of a polymorphic transition process of α-LGA to β-LGA after the
crystallization of the metastable α-polymorph (data not shown) monitored by an APAS
sensor. The experiment started with the presence of pure metastable α-LGA. By increasing
the temperature to 50 °C the conversion is initiated. Two main variables which are changing
during the conversion process are the particle size and/or morphology and the particle
number. As can be seen from the number weighted d90 (monomodal distribution) in the
beginning of the transformation the particle size is slightly increasing (up to 1.5 hours). This
might be due to the nucleation of the thermodynamic stable β-LGA crystals on the surface of
the α-LGA crystals. Subsequently, the extent of the small needle-like β-crystals is increasing
with the time, leading to the decreasing d90 measurement trend from 1.5 to 5 hours. The
number of particles (counts) is increasing from the beginning of the transformation
α-LGA β-LGA
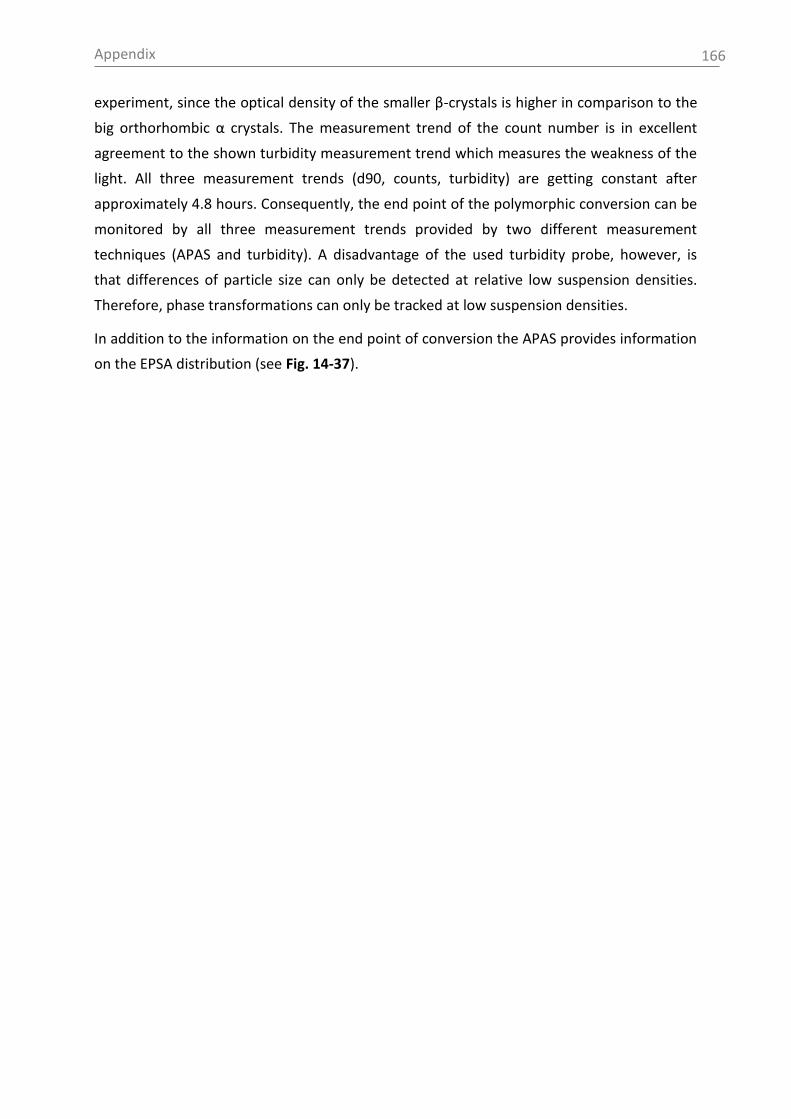
Appendix
166
experiment, since the optical density of the smaller β-crystals is higher in comparison to the
big orthorhombic α crystals. The measurement trend of the count number is in excellent
agreement to the shown turbidity measurement trend which measures the weakness of the
light. All three measurement trends (d90, counts, turbidity) are getting constant after
approximately 4.8 hours. Consequently, the end point of the polymorphic conversion can be
monitored by all three measurement trends provided by two different measurement
techniques (APAS and turbidity). A disadvantage of the used turbidity probe, however, is
that differences of particle size can only be detected at relative low suspension densities.
Therefore, phase transformations can only be tracked at low suspension densities.
In addition to the information on the end point of conversion the APAS provides information
on the EPSA distribution (see Fig. 14-37).

Statement of Authorship
167
14. Statement of Authorship
I declare that I have written this document on my own. It is a compilation of the results of
work carried out by my own or by students under my supervision. The used resources and
tools or previously cited information have been distinguished by quotation marks.
Kahla, 29.12.2013
Lydia Helmdach

Curriculum Vitae
168
15. Curriculum Vitae
Lydia Helmdach
Born 17.09.1984 in Karl-Marx-Stadt (Chemnitz)
Work experience
07/2013-present Product expert – quality assurance Sandoz GmbH / Aeropharm GmbH, Rudolstadt
Academic Studies
05/2010-04/2013 Research associate at the Chair of Thermal Process Technology, Martin Luther University Halle-Wittenberg
PhD thesis with the title: Application of Process Analytical Technology (PAT) tools to develop and monitor scalable crystallization processes of pharmaceuticals
09/2006-04/2010 Degree in chemical engineering
Hochschule Fresenius (University of applied science)
Field of specialization: bioanalytics, biotechnology, drug and food analytics
Diploma thesis with the title: Determination of Drug-Brain Tissue Binding to Assess the Availability of 16 Drugs: In-Vitro Method Comparison of Membrane Affinity and Equilibrium Dialysis Sovicell GmbH, Leipzig
Project thesis with the title: Development of a HPLC method for the quantitative determination of a three component analgesics
Hochschule Fresenius, Zwickau
Vocational education and training
09/2003-08/2006 Vocational training as medical-technical laboratory assistant (MTLA)
Medizinische Berufsfachschule Chemnitz
Fields of specialization: Clinical chemistry, microbiology, histology, hematology
School education
08/1997-06/2003 Allgemeine Hochschulreife
Lessing Gymnasium, Hohenstein-Ernstthal
Curriculum Vitae
169
Papers
2013 Lydia Helmdach, Martin P. Feth, Joachim Ulrich: Application of ultrasound measurements as PAT tools for industrial crystallization process development of
pharmaceutical compounds, Organic Process Research & Development 2013, in press. http://pubs.acs.org/doi/abs/10.1021/op4001803
2013
Lydia Helmdach, Friedel Schwartz, J. Ulrich: Process Optimization using Advanced Particle Analyzing Systems, Applications from Crystallization- to Fermentation Processes, Chemical Engineering & Technology 2013, in press. http://onlinelibrary.wiley.com/doi/10.1002/ceat.201300190/abstract
02/2013 Lydia Helmdach, Martin P. Feth, Joachim Ulrich: Integration of process analytical technology (PAT) tools in pilot plant setups for the real-time monitoring of crystallizations and phase transitions, Organic Process Research & Development 2013, 17 (3), 585-597. http://pubs.acs.org/doi/abs/10.1021/op300359p
2013 Lydia Helmdach, Martin P. Feth, Joachim Ulrich, Clemens Minnich: Application of ATR-MIR Spectroscopy in the Pilot Plant – Scope and Limitations using the Example of Paracetamol Crystallizations, Chemical Engineering and Processing: Process Intensification 2013, 70, 184-197. http://www.sciencedirect.com/science/article/pii/S0255270113000913
04/2013 Martin Philipp Feth, Winfried Heyse, Bruno Baumgartner, Norbert Nagel, Christoph Tappertzhofen, Thomas Olpp, Jörg Jurascheck, Joachim Ulrich, Lydia Helmdach, Christine Petzoldt: From Laboratory to Pilot plant: The solid-state process development of a highly potent cathepsin S/K inhibitor, European Journal of Pharmaceutics and Biopharmaceutics 2013, 83 (3), 436-448.
http://www.sciencedirect.com/science/article/pii/S0939641112003736
09/2012 Lydia Helmdach, Martin P. Feth, Joachim Ulrich: Online analytical investigations on solvent-, temperature- and water vapour-induced phase transformations of citric acid, Crystal Research and Technology 2012, 47 (9), 967-984. http://onlinelibrary.wiley.com/doi/10.1002/crat.201200215/abstract
06/2011 Lydia Helmdach, Dan Pertig, Stefanie Rüdiger, Kyeong-Sill Lee, Torsten Stelzer, Joachim Ulrich,: Bubbles - Trouble-Makers in Crystallizers Classical Problems during Inline Measurements, Chemical Engineering & Technology 2011, 35 (6), 1017-1023. http://onlinelibrary.wiley.com/doi/10.1002/ceat.201100719/abstract
11/2010 Raffaele Longhi, Silvia Corbioli, Stefano Fontana, Federicia Vinco, Simone Braggio, Lydia Helmdach, Jürgen Schiller, Hinnerk Boriss: Brain Tissue Binding of Drugs: Evaluation and Validation of Solid Supported
Curriculum Vitae
170
Porcine Brain Membrane Vesicles (TRANSIL) as a Novel High-Throughput Method, Drug Metabolism and Disposition 2010, 39 (2), 312-321. http://dmd.aspetjournals.org/content/39/2/312.full
Oral presentations
04/2013 The application of process analytical technology tools to develop scalable
industrial crystallization
La Londe Thesis day (Sanofi-Aventis Deutschland GmbH)
Saint Raphael,11.04.2013
09/2012 Online Messtechniken als PAT tools für Kristallisationen
8. Erfahrungsaustausch der PAT Arbeitsgruppe 18./19.09.2012
Merck KGaA Darmstadt, 19.09.2012
06/2012 Application of PAT tools for the development of scalable industrial crystallization processes
ACHEMA 2012
Frankfurt am Main, 18.06.12
09/2011 Bubbles - Trouble-Makers in Crystallizers Classical Problems during Inline Measurements
BIWIC 2011 (18th International Workshop on Industrial Crystallization)
Dleft, 08.09.2011
06/2011 Untersuchung von Suspensionen mit Ultraschall in der Praxis
SensoTech GmbH
Magdeburg, 21.06.2011
Posters
09/2011
Influence of solvent composition on crystallization of citric acid measured by an ultrasound device
ISIC 2011 (18th International Symposium on Industrial Crystallization)
Zürich, 15.09.2011
09/2011 Bubbles - Trouble-Makers in Crystallizers Classical Problems during Inline Measurements
BIWIC 2011 (18th International Workshop on Industrial Crystallization)
Dleft, 08.09.2011
02/2011 Influence of solvent composition on crystallization of citric acid measured by an ultrasound device
ProcessNet Fachausschuss Kristallisation
Bad Dürkheim, 24.02.2011
