appendix l egypt, israel, jordan, and turkey - usitc
TRANSCRIPT

APPENDIX LEGYPT ISRAEL JORDAN ANDTURKEY
1 Prepared by Douglas Newman Office of Industries 2 Institute of National Planning Egypt Human Development Report 20002001 Cairo 2001p 51 3 United Nations Industrial Development Organization (UNIDO) UNIDO Country IndustrialStatistics Egypt found at httpwwwunidoorgdatastatsshowstatcfmcc=EGY-b retrievedJan 13 2003 4 US Department of State telegram 4106 ldquoEgyptrsquos Textile Industry After Quotasrdquo prepared bythe US Embassy Cairo Apr 30 2002 p 4 Based on estimated sector output of $25 billion 5 See table 1-1 in chapter 1 of this report for data on textile and apparel export market shares foreach supplying country covered by this study Export data are for 2001
L-3
Egypt1
Overview
Textiles and apparel constitute Egyptrsquos third-largest industrial sector behind chemicals andfood processing2 The textile and apparel sector accounts for about one-quarter ofmanufacturing employment3 3 percent of gross domestic product (GDP)4 and 23 percentof total exports5
Egyptrsquos textile and apparel sector historically has been centered around the production ofcotton The government has directed or controlled cotton production primarily by settinga minimum price for cotton to support farmers In addition the government has maintainedownership of textile and apparel plants mainly to provide stable employment These policieshave had adverse effects on competitiveness both locally and globally
In response to increasing global competition the Egyptian textile and apparel sector has beenthe target of recent privatization efforts In addition there have been efforts to improvetechnology attract foreign investment diversify into manmade fiber-based products anddevelop export markets
Egypt has maintained high trade barriers both in terms of tariffs and quotas on its textilesand apparel imports Absolute quotas on certain sector products were changed to tariffs asa result of the Uruguay Round In general sector trade increased during 1997-2001 Exportsof fibers and apparel increased while those of textiles declined Imports of fibers and textilesdeclined while those of apparel rose Egypt maintained a positive balance of trade in thesector during 1997-2001
The competitive posture of Egyptrsquos textile and apparel sector is positively influenced by thecountryrsquos high-quality raw cotton relatively abundant labor and low labor costs and locationrelative to major markets mainly the United States and the EU Negative factors includeinefficient public sector ownership and other government involvement high raw-material(mainly cotton) costs owing to government-set minimum prices and high import tariffsexcess employment because of government policy and low productivity resulting fromexcess employment and outdated technology reportedly The Egyptian Government andindustry are taking steps to correct these deficiencies
6 British Trade International Textiles Interior Textiles amp Carpets Market in Egypt found at httpwwwtradepartnersgovuktextilesegypt-opportunitiesopportunitiesshtml retrievedFeb 10 2003 American Chamber of Commerce in Egypt Egyptian Textile Industry amp GATTPotential amp Uncertainty Business Studies and Analysis Center Cairo July 1998 p 1 7 Hanaa Kheir-El-Din and Hoda El-Sayed Potential Impact of a Free Trade Agreement with theEU on Egyptrsquos Textile Industry The Egyptian Center for Economic Studies Cairo Working PaperNo 15 July 1997 p 1 See also US Department of State telegram 4106 ldquoEgyptrsquos TextileIndustry After Quotasrdquo prepared by the US Embassy Cairo Apr 30 2002 8 Institute of National Planning Egypt Human Development Report 20002001 Cairo 2001p 51 9 The World Bank Group Egypt Arab Rep at a glance found at httpwwwworldbankorgcgi-binsendoffcgipage=2Fdata2Fcountrydata2Faag2Fegy_aagpdf retrievedFeb 7 2003 10 American Chamber of Commerce in Egypt p 4 11 Ibid and Embassy of Egypt ldquoA Memorandum on Egyptian Export of Yarn Textile andReady-Made Garments During 2002rdquo (sourced from the Egyptian Chamber of Textile Industries)received June 6 2003
L-4
Industry Profile
Industry structure and performance
The Egyptian textile and apparel sector is dominated by cotton fibers and goods Egypt hasa long history and tradition of cotton production particularly of high-quality long-staplevarieties Downstream industries are oriented toward production of cotton items
The textile and apparel sector comprises cotton growing yarn spinning fabric weavingdyeing and finishing and the production of garments and other goods The sector consistsof 42 public companies and more than 2000 private companies that are members of theEgyptian Textile Manufacturers Federation (ETMF) and thousands of small privateoperations not in the ETMF6 The public companies are controlled by the Textile IndustriesHolding Company Efforts to privatize the sector have been under way since the mid-1990sSector employment is estimated at about 5000007 with about 131000 officially reportedin public companies in 2001 (table L-1 found at the end of this country profile) The textileand apparel sector accounts for roughly 14 percent of Egyptrsquos manufacturing output8
manufacturing accounted for about 19 percent of Egyptrsquos GDP of $985 billion in 20019
Government involvement in the Egyptian textile industry is extensive but varies somewhatby sector For example the Egyptian Government provides production subsidies to cottonfarmers and sets grower and export prices Government-owned firms have dominated theindustry since the 1960s when private firms were nationalized There are 31 publiccompanies organized into 3 public holding companiesndashthe Holding Company for Spinningand Weaving (12 affiliates) the Holding Company for Textiles Manufacturing and Trade(12 affiliates) and the Holding Company for Cotton and International Trade (7 affiliates)10
In addition there are several firms with mixed ownership usually including banks or foreigngovernments According to a 1998 report public ownership declines as the level ofprocessing increases from 90 percent in spinning to 60 percent in weaving 40 percent inknitting and 30 percent in apparel11
12 Carana Corp Privatization Coordination Support Unit Privatization in Egypt QuarterlyReview July-Sept 2000 Cairo p 13 13 British Trade International Textiles Interior Textiles amp Carpets Market in Egypt AmericanChamber of Commerce in Egypt p 10 14 American Chamber of Commerce in Egypt p 1 Data source is the Egyptian TextileManufacturers Association data converted from 8 billion Egyptian pounds using an exchange rateof 1 US dollar=029487 Egyptian pounds 15 USDA FAS psd online found at httpwwwfasusdagovpsd retrieved Jan 22 2003 16 USDA FAS Egypt Cotton and Products Annual 2001 GAIN Report EG1013May 31 2001 p 2 17 Ibid GAIN Report EG2012 May 29 2002 p 2
L-5
The Government of Egypt has been pursuing a policy of privatization in the textile andapparel sector for several years Although a few firms have been privatized the process hasbeen slower than anticipated mainly the result of the poor financial condition of the firmsMany firms are undergoing restructuring measures such as plant closures and renovationsequipment upgrades and labor reductions to prepare for privatization12
The Egyptian textile and apparel sector traditionally has relied mainly on domesticallyproduced cotton for inputs However owing to government-set prices on raw cotton that areabove world prices firms have been importing cotton under a duty drawback system forproducts that are exported13 Egypt also imports manmade fibers for use as inputs Recentdata are not available on aggregate production in the Egyptian textile and apparel sector Thevalue of such production totaled about $24 billion in 199714
Egyptian production of raw cotton has been in a decades-long decline Production trendeddownward from 374000 metric tons in 1997 to 223000 metric tons in 2000 beforerecovering in 2001 to 315000 metric tons15 Virtually all Egyptian cotton production is oflong-staple varieties The primary reason for the decline in production is government-setcotton prices that usually are significantly higher than world prices16 Consumption of cottonby domestic textile mills declined by 8 percent during 1997-2001 (table L-1) Alsoproduction is affected by relative returns to growers for cotton and alternative crops suchas rice and wheat and government-guaranteed purchases and subsidies for cotton Favorablecotton prices and returns resulted in the rebound in production in 200117
Egyptian production of yarns decreased steadily during 1997-2001 by nearly a third(table L-1) The decline was driven by production of cotton yarn which declined nearly50 percent during the period to 125000 metric tons in 2001 Production of yarn frommanmade fibers increased 42 percent during the period to 78700 metric tons in 2001 Thedecline in cotton yarn production resulted from relatively high domestic cotton prices andinefficiencies in the dominant publically owned sector
Egyptian production of fabrics also declined during 1997-2001 by slightly more than50 percent (table L-1) The bulk of production and of the decline was accounted for bycotton woven fabric which accounted for 78 percent of total production in 2001 As withyarns high domestic cotton prices and public-sector inefficiencies contributed to the decline
Egyptian production of apparel is estimated to have totaled $43 billion in 2001 up44 percent from 1999 (table L-1) The Egyptian apparel industry is dominated by privatefirms which are more efficient than publically owned operations Also this industry utilizes
18 American Chamber of Commerce in Egypt p 1 19 International Cotton Advisory Committee Extra-Fine Cotton This Month Dec 10 2002 20 UNIDO International Yearbook of Industrial Statistics 2002 Vienna 2002 p 49 21 International Cotton Advisory Committee Extra-Fine Cotton This Month Dec 10 2002 22 US Department of State telegram 4106 ldquoEgyptrsquos Textile Industry After Quotasrdquo prepared bythe US Embassy Cairo Apr 30 2002 pp 6 and 9 23 Bharat Textilecom ldquoEgyptrsquos Textile Industry Suffers from Excessive State Interventionrdquofound at httpwwwbharattextilecomnewsitems1974817 retrieved Dec 11 2002
L-6
a variety of inputs and is not as dependent as the spinning and weaving industries on high-priced domestically produced cotton
Egyptian consumption of fibers increased by 4 percent during 1997-2001 Cotton fiberaccounted for the bulk of consumption 53 percent in 2001 Declines in yarn and fabricproduction contributed to the negative trend in consumption during the period
In 1997 exports accounted for about 37 percent of the value of production in the Egyptiantextile and apparel sector18 Exports of raw cotton accounted for about 27 percent of domesticproduction in 200119
Egypt is a relatively small global producer of textiles and apparel In 2000 Egypt accountedfor about 2 percent of the value added by developing countries in the textile industry and lessthan that in the apparel leather and footwear industries this share is even smaller for theglobal total20
Although Egypt is a relatively small global producer of all cotton accounting for about15 percent of the quantity of world production in 2001 it is the leading global producer oflong-staple or extra-fine cotton In 2001 Egypt produced an estimated 39 percent of thequantity of total global production of extra-fine cotton21
The Egyptian textile and apparel sector produces a wide range of products serving a varietyof market and price segments Egyptian cotton generally is regarded as premium qualityHowever some Egyptian yarns and fabrics have been considered to be of low quality22
Factors of production
The Egyptian textile and apparel sector enjoys access to high-quality raw materials and anample low-cost supply of labor However the sector has been lacking in the application ofnew technology a situation that is of concern and is being addressed by the sectorRaw materials
The sector supply chain has traditionally originated with raw cotton As noted above Egyptis a major producer of high-quality long-staple cotton varieties However Egyptian cottonis relatively high in price and accounts for a large share of finished good production costsas much as about two-thirds23 Also according to the government the industry does not useall of its high quality cotton to produce ldquospecial and distinguished kinds of spinning and
24 Embassy of Egypt ldquoA Memorandum on Egyptian Exports of Yarn Textile and Ready-MadeGarments during 2002rdquo received June 6 2003 25 Ibid 26 UNIDO UNIDO Country Industrial Statistics Egypt 27 Werner International Spinning and Weaving Labor Cost Comparisons 2002 28 International Textile Manufacturers Federation Country Statements 2002 Zuumlrich Sept 2002p 40 and Jassin - OrsquoRourke Group Global Competitiveness Report Selling to Full PackageProviders New York NY Nov 15 2002 29 ITMF Country Statements 2002 and prior years 30 Carana Corp p 13
L-7
textilesrdquo24 In addition there is insufficient production of short and medium staple cotton25
As a result downstream segmentsmdashmainly participants in a drawback program for endproducts that are exportedmdashalso import yarns and fabrics Although the manmade fiber-based segment is small compared with the cotton-based segment Egypt has been increasingits production of manmade fibers in recent years
Government policies have had a major impact on the availability and cost of raw materialsto the Egyptian textile and apparel sector High government-set raw cotton prices and importbans and high tariffs on inputs have diminished the competitiveness of the sector Althoughimport bans have been lifted high tariffs still limit access to critical inputs such as yarns andfabrics
Labor
The Egyptian textile and apparel sector has access to an ample supply of labor The sectoris a major employer accounting for about one-quarter of total manufacturing employment26
Egyptian labor costs are among the lowest in the world For example one survey estimatedhourly labor costs in the Egyptian spinning and weaving segment at $101 in 2002 comparedwith $1513 in the United States and $1891 in Germany among major markets and $213in Turkey a proximate competitor27 Of the countries surveyed such labor costs were lowerin several major textile and apparel producing countries in Asia including BangladeshChina India Indonesia and Pakistan Another survey estimated hourly labor costs at $080in Egyptrsquos textile industry in 2001 and $077 in its apparel industry in 200228
Although labor costs are low production inefficiencies have mitigated potential advantagesThe current privatization effort is addressing this situation The restructuring andprivatization of the public companies is resulting in a substantial reduction in the labor forceThe number of textile and apparel workers in the public sector fell by 26 percent to 131000during 1997-200129 Restructuring plans for two large public spinning and weavingcompanies in 2000 called for the reduction of nearly 10000 jobs30 These reductions areoccurring in concert with efforts to improve and update technology in the sector in order toattract investment
31 Embassy of Egypt ldquoA Memorandum on Egyptian Exports of Yarn Textile and Ready-MadeGarment During 2002rdquo received June 6 2003 32 Ibid 33 Ibid 34 Embassy of Egypt ldquoA Memorandum on Egyptian Exports of Yarn Textile and Ready-MadeGarment During 2002rdquo received June 6 2003 35 Ibid 36 US Department of State Investment Climate Report Egypt July 2002 prepared by the USEmbassy Cairo found at httpwwwusembassyegnetnetinvclreppdf retrieved Feb 19 2003p 2 37 United Nations Conference on Trade and Development (UNCTAD) Investment Policy ReviewEgypt 1999 pp 27-33
L-8
Technology
The Egyptian textile and apparel sector has been utilizing outdated technology particularlyin the government-owned spinning and weaving segment Most of Egyptrsquos spinningmachines consist of ring spinning frames with short-staple spindles as opposed to open-endframes (table L-1) Most of the spinning sector (90 percent of which is owned by thegovernment) uses old equipment31 In the weaving and knitting segment 10 percent of themachinery is relatively new that is no more then 5 years old32 The weaving segmentcomprises a large share of outdated shuttle looms as opposed to more efficient and versatileshuttleless looms which has contributed to low product quality and production inefficienciesthat have limited Egyptrsquos competitiveness A protected domestic market has contributed tothis situation However the sector is upgrading its technology largely in response torestructuring and privatization efforts For example restructuring plans of two large publicspinning and weaving companies in 2000 included approximately $51 million in investmentsto renovate and upgrade production facilities33 Another indication of the level of technologyemployed by the sector is the type of machinery used and the ratio of recent machineryshipments to the installed capacity Although short-staple spindles still dominate the spinningsector and shuttle looms account for the bulk of weaving machines recent shipments (1992-2000) of these types of machines accounted for a negligible share of their installed capacityShipments of long-staple spinning machines during 1992-2000 accounted for two-thirds ofinstalled capacity in 2000 while shipments of shuttleless looms during the period accountedfor more than three-fourths of such capacity In the dyeing and finishing segment 97 percentof the machinery is reportedly over 20 years old34 Reportedly about 40 percent of theapparel sector uses modern equipment35
Investment
Foreign investment in Egyptrsquos textile and apparel sector is regulated by the GeneralAuthority for Investment and the free zones (GAFI) under Investment Incentives andGuarantees Law 8 of 199736 Under this law which also provides investment incentivesforeign investors are permitted 100-percent ownership and can repatriate profits and capitalAlso the law provides guarantees against confiscation sequestration and nationalizationIncentives include tax holidays and exemptions37
Barriers to foreign investment in Egypt are structural Foreign investors in Egypt haveidentified the following obstacles to establishing and operating a business in Egypt political
38 Ibid p 24 39 Saudi Egyptian Petrochemical Co news found at httpwwwsepco-egcom retrievedNov 15 2002 40 Aroq Limited Just-stylecom ldquoEGYPT New $33m Fabric Plant To Be Builtrdquo June 25 2002found at httpjust-stylecomnews_printaspart=25399 retrieved June 27 2002 41 Aroq Limited Just-stylecom ldquoEgypt New $35m Textile Plant Announcedrdquo May 14 2002found at httpjust-stylecomnews_printaspart=24775 retrieved Oct 25 2002 42 Aroq Limited Just-stylecom ldquoEGYPT UK Knitter Cloverbrook To Open Fabric PlantrdquoOct 9 2002 found at httpjust-stylecomnews_printaspart=25399 retrieved Oct 25 2002
L-9
stability availability of business information predictability of macroeconomic conditionstax regime dispute settlements labor laws labor skills business establishment proceduresadequacy of investment incentives customs procedures tariff levels scope and pace ofprivatization distribution channels unofficial payments access to credit and land tenurepolicy38
There has been an increase in foreign investment in Egyptian textile and apparel plants inrecent years particularly in the manmade-fiber segment The largest project is a $650 millionplant to produce polyester products including chips yarn and fabric which will be thelargest such plant in the Middle East region and will include investors from Saudi Arabia39
Other recent investment activity include a $33 million polyester fabric plant40 a $35 millionyarn textiles and garment factory with investors from the United Arab Emirates41 and aknitwear plant with British investors42
Government Policies
Government policies have had a major impact on the structure and competitiveness of theEgyptian textile and apparel sector Domestic and trade policies designed to protect thedomestic industry and provide employment have stifled growth and productivityRecognizing the need to respond to increasing competition in domestic and export marketsthe government has undertaken major policy reforms in recent years including privatizationof public enterprises and import liberalization
Domestic policies
Domestic policies directed at the textile and apparel sector in Egypt have focused on settingprices for cotton as well as state ownership of much of the spinning weaving and apparelsegments The government-mandated minimum price for cotton often has been higher thanthe world price Egypt exports a large share of its cotton particularly extra-long-staplevarieties As noted above this also creates artificially high input prices for domesticdownstream industries
The Egyptian Government currently is privatizing publically owned textile and apparelplants However after an initial batch of sales the process has slowed The most efficientfirms were sold first and the remaining facilities are unattractive to investors Also inflated
43 Al-Ahram Weekly Online ldquoPrivatisation Phase Outrdquo 14-20 Feb 2002 Issue No 573 foundat httpweeklyahramorgeg2002573ec6htm retrieved Nov 21 2002 44 World Trade Organization (WTO) Trade Policy Review Egypt Report by the SecretariatWTTPRS55 May 18 1999 p 86 45 US Department of State telegram 21518 2003 National Trade Estimate Report For Egyptprepared by the US Embassy Cairo Dec 16 2002 pp 3-4 US Department of State telegram1307 January Surprise Egypt Replaces Ban On Garment Imports With Exorbitant Tariffsprepared by the US Embassy Cairo Feb 5 2002 pp 2-3 46 US Department of State telegram 1533 EU Concludes That Egypt In Breach Of WTOCommitments On Garment Tariffs prepared by the US Embassy Cairo Feb 12 2002 p 3 47 Al-Ahram Weekly Online ldquoInadequate Remediesrdquo 5-11 Apr 2001 Issue No 528 found athttpweeklyahramorgeg2001528ec2htm retrieved Nov 21 2002 48 US Department of State telegram 21518 2003 National Trade Estimate Report For Egyptprepared by the US Embassy Cairo Dec 16 2002 p 5 49 Al-Ahram Weekly Online
L-10
asset valuations deterred private investors43 Restructuring efforts are under way to improvethe marketability of the remaining firms
Trade policies
Egypt maintains relatively high tariffs on imports of textiles and apparel Until recentlythere were bans on imports of most textiles and apparel As a result of the Uruguay RoundEgypt committed to lift these restrictions However tariffs were set at high levels Textileimports were liberalized in 1998 at a tariff rate of 54 percent ad valorem44 while apparelimports were liberalized in 2002 with specific rates as high as $300 per item45 Ad valoremequivalents for apparel duties range between 100 percent and 2500 percent46 The duty onimports of raw cotton is 30 percent ad valorem47 However qualified textile and apparelenterprises may receive duty drawbacks on imports of inputs provided the finished productsare exported
Major nontariff barriers to Egyptian imports of textiles and apparel include untimely andburdensome customs procedures customs surcharges and marketing requirements forfabric48 These barriers affect downstream exporters because delays in obtaining inputsaffect the exportersrsquo ability to meet deadlines for international orders49
Foreign Trade
The Egyptian trade balance for textiles and apparel improved by about 2 percent during1997-2001 reaching a surplus of $485 million in 2001 (table L-1) The balance improvedfor apparel (31 percent) but deteriorated for textiles (61 percent) Apparel accounts for themajor share of the trade surplus (88 percent in 2001) followed by textiles (12 percent)
Textiles the leading import category are used as inputs by downstream producers Importsdeclined during 1997-2001 reflecting financial difficulties in the Egyptian textile andapparel sector as well as general economic conditions
Egyptian exports of apparel increased from $594 million to $683 million during 1997-2001reflecting the relative efficiency and competitiveness of this industry compared with
50 Hanaa Kheir-El-Din and Hoda El-Sayed p 3L-11
spinning and weaving (table L-1) During the same period textile exports fell from $635million to $446 million (table L-1) again reflecting industry financial difficulties
Imports
Egyptian imports of textiles and apparel increased during 1997-2000 before falling to$644 million in 2001 owing to adverse economic conditions (table L-1) Textiles were theprimary import category for most of the period accounting for 60 percent of the total in2001 Following were imports of apparel (40 percent)
Egyptian imports of textiles fluctuated during the period under review and ranged between$387 million in 2001 and $505 million in 2000 Primary imported products includedsynthetic filament yarn and cotton woven fabrics According to UN trade data as reportedby Egypt the EU was the leading source providing 18 percent of the total in 2001 followedby China (15 percent) Korea (14 percent) and Taiwan (13 percent) The United Statesremained a relatively minor supplier of Egyptian textile imports during the period
Egyptian imports of apparel during 1997-2001 peaked at $365 million in 1999 before fallingto $257 million in 2001 Menrsquos trousers shawls and scarves womenrsquos nightdresses andpajamas and womenrsquos trousers constituted most of the imports UN trade data show Chinawas by far the major source in 2001 accounting for 57 percent of the total followed byTurkey (12 percent) the EU (10 percent) and Indonesia (10 percent) There was a generalshift to Asian suppliers as imports from North American sources declined during1997 - 2001 The United States was a small supplier during the period
Exports
Exports of textiles and apparel from Egypt fluctuated during 1997-2001 and totaled about$11 billion in 2001 (table L-2) Apparel accounted for the largest share of such exports in2001 (61 percent) followed by textiles (39 percent) Exports of apparel trended upwardduring the period under review while textile exports declined Exports of textiles exceededthose of apparel in 1997 before trailing the remainder of the period These trends in partreflect lower productivity in the textile industry which is mostly publicly owned comparedwith the more efficient apparel industry which increasingly is privately owned50
Egyptian exports of textiles declined irregularly by 30 percent during 1997-2001 totaling$446 million in 2001 Primary products included cotton yarn and linen products andmanmade fiber textile floor coverings UN trade data show major export markets in 2001included the EU (53 percent of the total) and the United States (29 percent) Exports to theEU declined by 46 percent during the period under review while those to the United Statesrose by 56 percent
Egyptian exports of apparel increased irregularly by 15 percent during 1997-2001 reaching$683 million in 2001 Primary products included trousers t-shirts knit pullovers and shirtsPrincipal export markets in 2001 included the United States (60 percent of the total) and the
51 European Commission DG Trade Systegraveme Inteacutegreacute de Gestion de Licenses found athttpsiglceceuintqueryhtml retrieved Dec 31 2002
L-12
EU (37 percent) Exports increased to most major markets with no significant shifts duringthe period under review
Official US trade data show that US imports of textiles and apparel from Egypt increasedirregularly by 35 percent during 1997-2002 to 265 million square meters equivalent (SMEs)(table L-3) or about 1 percent of total US textile and apparel imports The imports werealmost equally divided between textile and apparel imports in 2002 The principal productcategory in 2002 was cotton products which accounted for 86 percent of the total Manmadefiber products accounted for almost all of the remainder The 2001 trade-weighted averageduty for US imports of textiles from Egypt was 63 percent ad valorem and for apparel itwas 172 percent ad valorem
The primary imported articles from Egypt under quota in 2002 were carded cotton yarn(28 percent of total textiles and apparel imports from Egypt) and cotton trousers and shorts(23 percent) Although most products from Egypt accounted for a relatively minor share oftotal US imports of textiles and apparel under quota from all sources carded cotton yarnfrom Egypt represented 11 percent of this total in 2002 demonstrating the importance ofcotton to Egyptrsquos exports
US quotas on imports of textiles and apparel from Egypt generally were not filled during1997-2002 Products with the largest quota fill rates in 2002 included cotton knit shirts andblouses (categories 338339 74 percent) and carded and combed cotton yarns (categories300301 67 percent) The EU maintains quotas on imports from Egypt of cotton yarn notput up for retail sale and of woven fabrics of cotton other than gauze terry fabrics pilefabrics chenille fabrics tulle and other net fabrics During 1997-2001 the quota fill rate forthese products declined from 81 percent to 30 percent for yarn and from 76 percent to19 percent for woven fabrics51
L-13
Table L-1Egypt Statistical profile of textile and apparel sector and foreign trade 1997-2001
Item 1997 1998 1999 2000 2001
Textile and apparel share of manufacturing value-added (percent) 13 12 12 (1) (1)
Number of establishmentsTextiles and apparel (1) (1) (1) (1) 2830Apparel (1) (1) (1) (1) 1661
Total (1) (1) (1) (1) 4491Number of textile and apparel workers (1) (1) (1) (1) 375874Apparel production (million dollars) (1) (1) 3000 3600 4320Yarn production index (1997=100) (1) (1) (1) 722 757Fabric production index (1997=100) (1) (1) (1) 779 688Installed spinning capacities
Short-staple spindles (1000) 29880 26000 24500 26000 (1)Long-staple spindles (1000) 850 850 980 980 (1)Open-end rotors (1000) 412 400 390 410 (1)
Installed weaving capacities Cotton system
Shuttleless looms 2560 2600 2600 2600 (1)Shuttle looms 13150 12000 10000 8000 (1)
Wool weaving looms (1) (1) (1) 1230 (1)Production of selected products
YarnsCotton (metric tons) 245000 228000 212000 180000 125000Manmade fibers (metric tons) 55500 61100 62800 63400 78700
Total (metric tons) 300500 289100 274800 243400 203700Fabrics
Cotton woven (metric tons) 65100 48200 39100 35800 28400Other woven (metric tons) 12000 2000 1000 1000 7000Knitted (metric tons) 1000 760 820 800 1000
Total (metric tons) 78100 50960 40920 37600 36400Mill fiber consumption
Cotton (1000 metric tons) 2250 1847 1711 1855 2074Manmade fibers (1000 metric tons) 1503 1469 1670 1659 1836Wool (1000 metric tons) 26 26 30 39 34
Total (1000 metric tons) 3779 3342 3411 3553 3944Foreign trade
ExportsTextiles (million dollars) 6346 5447 4294 5041 4456Apparel (million dollars) 5943 6865 6570 7269 6831
Total (million dollars) 12288 12312 10864 12311 11287Imports
Textiles (million dollars) 4831 4963 4534 5046 3869Apparel (million dollars) 2683 3189 3645 3306 2567
Total (million dollars) 7514 8151 8179 8352 6436
See footnote at end of table
L-14
Table L-1ndashContinuedEgypt Statistical profile of textile and apparel sector and foreign trade 1997-2001
Item 1997 1998 1999 2000 2001
Foreign tradendashContinuedTrade balance
Textiles (million dollars) 1514 484 -240 -05 586Apparel (million dollars) 3260 3677 2925 3963 4264
Total (million dollars) 4774 4161 2684 3959 48511 Not available
NotemdashBecause of rounding figures may not add to totals shown
Source Industry data compiled from the International Textile Manufacturers Federation (Zurich) International TextileMachinery Shipment Statistics vol 242001 Country Statements 2001 and selected back years Embassy of EgyptldquoA Memorandum on Egyptian Exports of Yarn Textile and Ready-Made Garments During 2002rdquo received June 62002 and US Department of Commerce International Trade Administration ITA Export Advantage millconsumption data from Geerdes International Inc Richmond VA and trade data are United Nations data asreported by Egyptrsquos trading partners
L-15
Table L-2Egypt Exports of textiles and apparel by selected markets 1997-2001
Item and market 1997 1998 1999 2000 2001
mdashmdashmdashndashmdashmdashmdashmdashmdashmdashmdash Million dollars mdashmdashmdashmdashmdashmdashmdashmdashmdashmdashTextiles (SITC 65)
Quota marketsUnited States 81 107 92 114 126European Union 436 330 259 300 237Canada 4 5 5 6 7ndashndashndashndashndashndashndashmdashmdashmdashndashndashndashndashndashndashndashndashndashndashndashndashndashndashndashndashndashndashndashndashndashndashndashndashndashndashndashndashndashndashndashndashndashndashndashndashndash
Subtotal 521 442 355 420 371All other
Turkey 17 13 14 11 12Korea 10 1 6 9 9Japan 7 6 6 7 6Other 79 82 49 58 48ndashndashndashndashndashndashndashmdashmdashmdashndashndashndashndashndashndashndashndashndashndashndashndashndashndashndashndashndashndashndashndashndashndashndashndashndashndashndashndashndashndashndashndashndashndashndashndashndash
Subtotal 113 102 74 84 75ndashndashndashndashndashndashndashmdashmdashmdashndashndashndashndashndashndashndashndashndashndashndashndashndashndashndashndashndashndashndashndashndashndashndashndashndashndashndashndashndashndashndashndashndashndashndashndashndash
Grand total 635 545 429 504 446
Apparel (SITC 84)Quota markets
United States 329 383 355 434 410European Union 227 258 277 272 251Canada 6 8 9 9 9ndashndashndashndashndashndashndashmdashmdashmdashndashndashndashndashndashndashndashndashndashndashndashndashndashndashndashndashndashndashndashndashndashndashndashndashndashndashndashndashndashndashndashndashndashndashndashndashndash
Subtotal 562 649 641 714 670All other 33 37 16 13 13ndashndashndashndashndashndashndashmdashmdashmdashndashndashndashndashndashndashndashndashndashndashndashndashndashndashndashndashndashndashndashndashndashndashndashndashndashndashndashndashndashndashndashndashndashndashndashndashndash
Grand total 594 687 657 727 683
Textiles and apparelQuota markets
United States 410 490 447 548 536European Union 663 588 535 572 488Canada 10 13 14 15 16ndashndashndashndashndashndashndashmdashmdashmdashndashndashndashndashndashndashndashndashndashndashndashndashndashndashndashndashndashndashndashndashndashndashndashndashndashndashndashndashndashndashndashndashndashndashndashndashndash
Subtotal 1083 1091 996 1134 1041All other 146 140 90 97 88ndashndashndashndashndashndashndashmdashmdashmdashndashndashndashndashndashndashndashndashndashndashndashndashndashndashndashndashndashndashndashndashndashndashndashndashndashndashndashndashndashndashndashndashndashndashndashndashndash
Grand total 1229 1231 1086 1231 1129
mdashmdashmdashmdashmdashmdashmdashmdashmdashmdashmdash Percent mdashmdashmdashmdashmdashmdashmdashmdashmdashmdashmdashmdashShare of exports going to quota markets
Textiles 82 81 83 83 83Apparel 95 95 98 98 98
Average 88 89 92 92 92
NotemdashBecause of rounding figures may not add to totals shown
Source Compiled from United Nations data
L-16
Table L-3Textiles and apparel US general imports from Egypt by specified product categories11997-2002CatNo Description 1997 1998 1999 2000 2001 2002 ndashndashndashndashndashndashndashndashndashndashndashndashndash1000 square meters equivalentndashndashndashndashndashndashndashndash
0 Textiles and apparel total 196114 247368 200977 254105 282441 2647621 Apparel 93145 108716 114364 132403 126367 1290702 Textiles 102969 138651 86613 121702 156074 13569130 Cotton textiles and apparel 170523 221271 175548 216821 246969 22808260 Manmade-fiber textiles and apparel 24006 24250 24997 36332 34600 35781237 Playsuits 685 933 126 37 129 80239 Babies apparel 1178 1505 2502 3500 3110 3006300 Carded cotton yarn 42963 65670 39098 47424 81343 73178301 Combed cotton yarn 15864 28805 9247 8001 13585 11862335 Cotton coats womengirls 552 216 721 450 208 3413336 Cotton dresses 2345 1482 2042 4483 3127 1639338 Cotton knit shirts menboys 9369 8415 6209 6326 6405 8078339 Cotton knit shirts womengirls 9024 11701 7838 10593 9251 9933340 Cotton not knit shirts menboys 9472 11859 12162 9320 7508 9077347 Cotton trousers menboys 13399 15487 16866 23909 22776 28702348 Cotton trousers womengirls 9478 13604 20048 28313 31875 31063351 Cotton nightwear 9776 10754 13564 10547 6729 6073352 Cotton underwear 3480 4086 5070 3750 2373 2978360 Cotton pillowcases 11 123 763 2837 2661 2271361 Cotton sheets 109 767 3602 8313 6870 4994362 Cotton bedspreads and quilts 88 2508 733 2063 1628 1372363 Cotton terry and other pile towels 2221 2497 2380 1674 1221 1760369 Other cotton manufactures 14599 16510 14390 15197 20168 16285634 Other manmade coats menboys 2218 6751 5315 4250 4529 3995635 Manmade-fiber coats womengirls 3486 3560 2188 4201 3980 2619638 Manmade knit shirts menboys 1306 1054 1843 2423 2898 3606640 Manmade not knit shirts menboys 232 85 440 2329 1823 1335647 Manmade-fiber trousers menboys 323 954 1276 1526 3299 4686648 Manmade-fiber trousers womengirls 159 385 696 787 2081 2163665 Manmade-fiber floor coverings 1302 2117 2425 2514 3236 5108
1 To administer the US textiles and apparel quota programs articles are grouped under 3-digit category numberswhich cover many 10-digit statistical reporting numbers under which goods are classified for statistical purposes inthe Harmonized Tariff Schedule of the United States (HTS) The 1-digit and 2-digit numbers represent specific levelsof import aggregation for articles covered by the quota program (eg the number ldquo1 represents total imports ofapparel while ldquo31 represents total imports of cotton apparel)
Source Compiled from official statistics of the US Department of Commerce found at httpotexaitadocgov
Prepared by Judith-Anne Webster Office of Industries1
Ramzi Gabbay Chairman Textile and Apparel Manufacturing Association of Israel (TAMA)2
Tel Aviv Israel written submission to the Commission Jan 30 2003 and Moshe Nahum
Director Division of Foreign Trade and International Relations TAMA Israel Tel Aviv Israel e-
mail correspondence to USITC staff Feb 11 2003
Except as noted information in the paragraph is from Moshe Nahum Director Division of3
Foreign Trade and International Relations TAMA Tel Avia e-mail correspondence USITC staff
Feb 11 and Mar 9 2003
L-17
Israel1
Overview
The textile and apparel sector in Israel has declined in relative importance since at least1997 Between 1997 and 2001 sector production fell by 10 percent to $26 billion and sectoremployment decreased by 22 percent to 31000 workers (table L-4 found at the end of thiscountry profile) During the first half of 2002 6000 employees in the sector were laid offAccording to industry sources the key reason for the decline has been the high cost ofmanufacturing in Israel which although partially offset by the use of advanced technologyand production of high quality products has pushed domestic firms offshore to more cost-competitive countries Israelrsquos domestic market base has experienced an influx ofinexpensive textile and apparel goods from East Asia particularly China
Since 1997 textile and apparel goods as a share of total exports have remained steady at4 percent Israelrsquos textile and apparel sector benefits from preferential access to both theEuropean and US markets The Textile and Apparel Manufacturing Association of Israelcontends that quota removal in 2005 would be detrimental to the Israeli industry byrewarding countries with lower labor costs and that about 60 percent of Israeli textile andapparel exports to the United States could be threatened when quotas are removed2
Industry Profile
Industry structure and performance
Israelrsquos textile and apparel sector is characterized by a few large vertically integratedcompanies and many small firms The vertically integrated firms are integrated from3
product design and development through spinning yarn fabric production and finishingcutting and sewing packaging and shipping For almost all textile segments dyeingprinting and finishing is carried out in Israel In the apparel industry Israeli firms tend toconcentrate on niche and high-end products in order to remain competitive in the global
Israeli Textiles and Apparel Israel Ministry of Foreign Affairs found at4
httpwwwus-israelorgjsourceEconomyeco7html retrieved Nov 26 2001 and ldquoClothing and
Textilesrdquo Up Israel found at httpwww1upinfocomcountry-guide-studyisraelisrael86html
Dec 1998 retrieved Dec 2 2002
Israeli Textiles and Apparel Israel Ministry of Foreign Affairs found at5
httpwwwus-israelorgjsourceEconomyeco7html retrieved Nov 26 2001
Moshe Nahum Mar 9 20036
ldquoCheaper Next Doorrdquo Textile Asia June 2001 p 100 7
L-18
marketplace Few Israeli companies have established independent brand names but they4
frequently manufacture products for companies with prestige labels According to the IsraeliExport Institute more than 90 percent of sector exports consist of branded merchandise5
Israelrsquos leading textile and apparel products are knitted products such as underwear T-shirts sweaters jogging suits and hosiery menrsquos suits swimwear towels and bed linen
Factors of production
Raw materials
Israelrsquos apparel industry relies on imports for most of its yarn and woven fabricrequirements There is some local production of woven fabrics The majority of the knittedfabrics used by the Israel apparel industry are made in Israel while the fibers are importedIsrael imports much of the raw materials needed for the apparel industry from the EUHowever in recent years cost-competitive Asian countries such as China and India havegrown in importance as raw material suppliers to the Israeli market
Labor
The number of workers in Israelrsquos textile and apparel sector decreased from 40000 in 1997to 31300 in 2001 (table L-4 found at the end of this country profile) This decline was mostapparent in the apparel industry which lost almost 5000 workers Labor costs in Israel arerelatively high particularly in comparison to other Middle Eastern and Asian countriesAccording to labor cost data compiled by Werner International for 2002 average hourlycompensation (including fringe benefits) for production workers in Israelrsquos spinning andweaving segment was $817 compared with $101 in Egypt compensation $213 in Turkeyand less than $1 in China India and Pakistan One reason for these high labor costs iscompulsory education laws in Israel which require at least 12 years of education makingIsraeli textile and apparel workers more educated and skilled than their counterparts incompeting countries6
These wage rates make it difficult for manufacturers in Israel to compete in world marketsAccording to an industry source many customers of Israeli textile firms particularly in theEU and the United States have put pressure on Israeli firms to cut prices owing tocompetition from lower-cost countries In response the industry in Israel has been7
ldquoUnemployment High Skills Lowrdquo EIU Viewwire Feb 21 2002 found at8
httpwwwviewswirecomindexasplayout=display_articleampsearch_text=textilesampdoc_id=1799
80 retrieved Dec 3 2002
ldquoOrder from Russiardquo Textile Asia Mar 2002 p 829
ldquoIsraeli Textiles and Apparelrdquo Israel Ministry of Foreign Affairs found at10
httpwwwus-israelorgjsourceEconomyeco7html retrieved Nov 26 2001
Information on Delta Galil in the paragraph is from its website found at11
httpwwwdeltagalilcom retrieved Dec 3 2002
ldquoProfitable at lastrdquo Textile Asia June 2002 p 86 12
ldquoIsraeli Textiles and Apparelrdquo Israel Ministry of Foreign Affairs found at13
httpwwwus-israelorgjsourceEconomyeco7html retrieved Nov 26 2001
L-19
downsizing andor moving operations offshore as it has faced increasingly stiff competitionfrom low-wage manufacturers in Turkey China and the Dominican Republic 8
Technology
The use of new technologies is one of Israelrsquos key competitive advantages and helps thecountry retain market share despite its high labor costs Elbit Vision Systems produces I-Tex(which automatically inspects raw fabrics) a technology used by Israeli firms to ensure highquality Tefrons use of computerized robotic manufacturing methods has also resulted in9
international recognition of the firm as a leader in the implementation of new manufacturingtechnologies Complete apparel production ndashfrom thread to completed garmentndash is aone-step operation replacing traditional finishing and cutting methods as well asconventional sewing processes Elyon one of Israelrsquos largest firms uses General Sewing10
Data software as well as other programs enabling methods analysis time and motionsimulations and product costing
Investment
High production costs have made it difficult for Israelrsquos textile and apparel sector to attractinvestment Israeli firms have disinvested in many cases and moved operations to more cost-competitive markets particularly for labor-intensive manufacturing Delta Galil IndustriesLtd an Israeli-based producer of apparel sold under brands such as Ralph Lauren DonnaKaran Calvin Klein Hugo Boss and Nike has shifted most of its production to low-costcountries Jordan Egypt Turkey Romania and Bulgaria and has recently begun to producein the Western Hemisphere and the Far East More than 75 percent of the firmrsquos11
manufacturing takes place in lower labor cost countries Tefron a manufacturer of intimateand leisure apparel continues to shift sewing production from both Israel and the UnitedStates to several manufacturing facilities situated around the world Currently 10 percent12
of the companys production is in Jordan with management aiming to increase this figureto 50 percent The recently developed QIZ program which allows duty and quota-free13
exports from Jordan to the United States along with low wage rates makes Jordan anattractive country from which to produce textile and apparel goods
Information in the paragraph is from ldquoMinistry Introducing Apparel Designer Fund To Support14
Textile Sectorrdquo June 10 2002 found at httpwwwbharattextilecomnewsitems1977806
retrieved Jan 7 2003
The United States-Israel Free Trade Area Implementation Act Public Law 99-47 approved15
June 11 1985 19 USC 2112
Public Law 104-234 approved October 2 199616
President Proclamation 6955 of November 13 1996 ldquoTo Provide Duty-Free Treatment to17
Products of the West Bank and the Gaza Strip and Qualifying Industrial Zonesrdquo published in the
Federal Register of November 18 1996 (61 FR 58759)
The trade benefits are intended to create economic opportunities for the Palestinian people in18
the West Bank and Gaza Strip and to promote economic cooperation among Israel Jordan Egypt
and the Palestinian Authority Statement by the White House Press Secretary ldquoFree Trade Area
Extended to West Bank and Gaza Striprdquo Oct 3 1996 found at
httpwwwlibrarywhitehousegovcgi-binweb retrieved Jan 13 1998
To date Israel and Egypt have not proposed any special manufacturing zones as QIZs19
L-20
Government Policies
Domestic policies
The Ministry of Industry and Trade (MIT) reportedly is considering the introduction of a$2 million fund to support Israelrsquos textile and apparel sector The grant is one of several14
measures that may be established to prevent the contraction of the sector and the subsequentloss of thousands of jobs Other government proposals include temporary wage cuts forproduction workers in the sector and the exemption of minimum wages on piecework andsewing both of which would serve as an incentive for companies to carry out suchoperations in Israel Another suggested measure for consideration by MIT is allowingfactories to depreciate equipment and machinery within 2 years in order to improveprofitability
Trade policies
Israel benefits from preferential market access in the European Union under the Israel-EECPreferential Agreement signed in 1977 and the United States under the 1985 United States-Israel Free Trade Area Agreement Under this Free-Trade Agreement (FTA) the UnitedStates and Israel phased out all tariffs on eligible bilateral trade in apparel textile and otherindustrial products by 1995 In October 1996 US legislation to implement the US -IsraelFTA was amended to give the president authority to proclaim duty-free treatment for15
imported goods made in ldquoqualifying industrial zonesrdquo (QIZs) along the border of Israel withEgypt and Jordan The President subsequently issued Proclamation 6955 to provide for16
such duty-free treatment and to delegate to the United States Trade Representative (USTR)the authority to designate an area as a QIZ In general the goods must be produced in and17
imported directly from the QIZ and the value added in the QIZ must be no less than35 percent of the total value of the article Under the QIZ program between Israel and18
Jordan goods manufactured in designated areas in Jordan that contain a minimum amount19
of Israeli input (8 percent fob value for apparel) and meet US rules of origin can enter
US Department of State telegram 2013 ldquoWorld Textile Trade Without Quotasrdquo prepared by20
US Embassy Amman Apr 23 2002
Moshe Nahum Mar 9 200321
ldquoT extile E xp o rts S lum p T ho usa nd s L o se Jo b srdquo fo und at httpwwwcybergtcomquota10-22
0217-03html retrieved Dec 2 2002
L-21
the US customs territory free of duty and quota According to the Textile and Apparel20
Manufacturing Association of Israel the Israeli textile and apparel sector has not benefiteddirectly from the QIZ program as the Jordanian industry is mainly buying low-valueproducts such as buttons However the Israeli sector has indirectly benefited as the21
program has promoted political stability between the two countries and given Israeli firmspursuing low-cost manufacturing the opportunity to move production to Jordan and stillhave duty- and quota-free access to the US market
Foreign Trade
Israelrsquos trade balance in textiles and apparel fluctuated during 1997-2001 changing froma trade deficit of $65 million in 1997 to a trade surplus of an estimated $15 million in 2001(table L-4) Israelrsquos major trading partners are the United States and the EU
Imports
Israelrsquos imports of textiles and apparel remained stable during 1997-2001 at about$11 billion annually (table L-4) Imports of textiles primarily used as inputs for Israelrsquosapparel industry grew during the period due in part to the departure of many textileproducers from Israel to more cost-competitive production markets Approximately43 percent of Israeli textile imports come from the EU India surpassed the United States in2000 as the second-largest supplier of textiles to Israel The share of Israelrsquos apparel importsaccounted for by the EU Canada and United States declined from a combined 85 percentin 1997 to 49 percent in 2000 while China and Hong Kong increased their respective sharesreflecting the recent shift toward greater reliance on East Asian sources
Exports
Israeli exports of textiles and apparel remained fairly stable at $12 billion during 1997-2001(table L-5) According to a trade source Israeli textile exports declined by 12 percent in thefirst half of 2002 compared with the first half of 2001 to $466 million Most of Israelrsquos22
exports of sector goods during 1997-2000 went to the United States and the EUUnited Nations trade data as reported by Israel show that Israelrsquos exports to the UnitedStates and to Jordan during 1997-2002 grew largely attributable to preferential access to theUS market under the US-Israel FTA and QIZ program with Jordan
Based on official US trade statistics the quantity of US imports of textiles and apparelfrom Israel doubled during 1997-2002 to 534 million square meters equivalent (SMEs)
L-22
(table L-6) In terms of value however imports of sector goods from Israel rose from$408 million in 1997 to a high of $651 million in 2000 and then fell to $620 million in2002 Apparel accounted for 22 percent (119 million SMEs) of the quantity but 67 percent($416 million) of the value of sector imports from Israel in 2002 Israelrsquos apparel shipmentsin 2002 were concentrated in cotton and manmade-fiber knit tops underwear brassieresand pants particularly for women and girls
The single-largest category of sector imports from Israel by quantity during 1997-2002 wasnonwoven fabrics which accounted for 55 percent (293 million SMEs) of the total quantitybut 10 percent ($60 million) of the total value in 2002
Other leading textile imports from Israel were knit fabrics and cotton terry towels bedlinens and bedspreads In 2002 Israel ranked among the 10 largest foreign suppliers ofcotton sheets bedspread and towels to the US market
The trade-weighted average US duty on imports of textiles and apparel from Israel in 2001was only 12 percent ad valorem reflecting the fact that almost all of the sector imports fromIsrael enter free of duty under the US-Israel FTA
L-23
Table L-4Israel Statistical profile of textile and apparel sector and foreign trade 1997-2001
Item 1997 1998 1999 2000 2001
Number of establishmentsTextiles 787 840 861 723 715Apparel 1309 1266 1147 943 817
Total 2096 2106 2008 1666 1532Number of workers
Textiles 22100 22700 22500 22000 19000Apparel 17900 15000 13600 13000 12300
Total 40000 37700 36100 35000 31300Installed spinning capacities
Short-staple spindles 35000 35000 35000 (1) (1)Long-staple spindles 15000 15000 15000 (1) (1)Open-end rotors 9000 9000 9000 (1) (1)
Installed weaving capacitiesShuttleless looms 1100 1100 1100 (1) (1)Shuttle looms 800 800 800 (1) (1)
Foreign tradeExports
Textiles (million dollars) 4407 4703 4752 4882 2 4500Apparel (million dollars) 6053 6531 7321 7300 2 7000
Total (million dollars) 10460 11235 12073 12182 2 11500Imports
Textiles (million dollars) 7687 7660 7539 7546 2 5850Apparel (million dollars) 3419 3649 3570 4736 2 5500
Total (million dollars) 11106 11309 11109 12282 2 11350Trade balance
Textiles (million dollars) -3280 -2957 -2786 -2664 2-1350Apparel (million dollars) 2634 2882 3751 2564 2 1500
Total (million dollars) -646 -74 965 -100 2 150 1 Not available 2 Estimated by the Commission based on the percentage change in world imports from Israel from 2000 to 2001
NotemdashBecause of rounding figures may not add to totals shown
Source Industry data are from the Israel Central Bureau of Statistics the International Textile ManufacturersFederation (Zurich) International Textile Machinery Shipment Statistics vol 252002 and selected back issues andtrade data are United Nations data as reported by Israel except as noted
L-24
Table L-5Israel Exports of textiles and apparel by selected markets 1997-2001
Item and market 1997 1998 1999 2000 2001
mdashmdashmdashndashmdashmdashmdashmdashmdashmdashmdash Million dollars mdashmdashmdashmdashmdashmdashmdashmdashmdashmdashTextiles (SITC 65)
Quota marketsUnited States 135 166 175 196 (1)European Union 235 239 231 209 (1)Canada 3 5 6 8 (1)ndashndashndashndashndashndashndashmdashmdashmdashndashndashndashndashndashndashndashndashndashndashndashndashndashndashndashndashndashndashndashndashndashndashndashndashndashndashndashndashndashndashndashndashndashndashndashndashndash
Subtotal 373 410 412 414 (1)All other 68 61 63 74 (1)ndashndashndashndashndashndashndashmdashmdashmdashndashndashndashndashndashndashndashndashndashndashndashndashndashndashndashndashndashndashndashndashndashndashndashndashndashndashndashndashndashndashndashndashndashndashndashndashndash
Grand total 441 470 475 488 (1)
Apparel (SITC 84)Quota markets
United States 284 357 395 448 (1)European Union 293 266 287 234 (1)Canada 4 6 6 8 (1)ndashndashndashndashndashndashndashmdashmdashmdashndashndashndashndashndashndashndashndashndashndashndashndashndashndashndashndashndashndashndashndashndashndashndashndashndashndashndashndashndashndashndashndashndashndashndashndashndash
Subtotal 580 629 688 690 (1)All other 25 24 44 40 (1)ndashndashndashndashndashndashndashmdashmdashmdashndashndashndashndashndashndashndashndashndashndashndashndashndashndashndashndashndashndashndashndashndashndashndashndashndashndashndashndashndashndashndashndashndashndashndashndashndash
Grand total 605 653 732 730 (1)
Textiles and apparelQuota markets
United States 419 524 571 644 (1)European Union 527 504 518 444 (1)Canada 7 11 12 16 (1)ndashndashndashndashndashndashndashmdashmdashmdashndashndashndashndashndashndashndashndashndashndashndashndashndashndashndashndashndashndashndashndashndashndashndashndashndashndashndashndashndashndashndashndashndashndashndashndashndash
Subtotal 953 1039 1101 1103 (1)All other 93 85 107 115 (1)ndashndashndashndashndashndashndashmdashmdashmdashndashndashndashndashndashndashndashndashndashndashndashndashndashndashndashndashndashndashndashndashndashndashndashndashndashndashndashndashndashndashndashndashndashndashndashndashndash
Grand total 1046 1123 1207 1218 (1)
mdashmdashmdashmdashmdashmdashmdashmdashmdashmdashmdash Percent mdashmdashmdashmdashmdashmdashmdashmdashmdashmdashmdashmdashShare of exports going to quota markets
Textiles 85 87 87 85 (1)Apparel 96 96 94 94 (1)
Average 91 92 91 91 (1)
1 No data reported
NotemdashBecause of rounding figures may not add to totals shown
Source Compiled from United Nations data
L-25
Table L-6Textiles and apparel US general imports from Israel by specified product categories1 1997-2002CatNo Description 1997 1998 1999 2000 2001 2002 mdashmdashmdashmdashmdashmdash1000 square meters equivalentmdashmdashmdashmdashmdashmdashmdash
0 Textiles and apparel total 266001 298416 359775 476367 517174 5339591 Apparel 56644 73504 90892 112146 112286 1188742 Textiles 209357 224912 268882 364221 404888 41508530 Cotton textiles and apparel 64376 78425 82600 96100 100321 11513660 Manmade-fiber textiles and apparel 199515 217048 273181 377001 414386 416610222 Knit fabric 25626 25900 36631 41930 45510 50162223 Nonwoven fabric 147903 154672 175811 261822 292117 292885229 Special purpose fabric 1986 1179 603 2559 12314 8457335 Cotton coats womengirls 314 196 814 393 1198 3334336 Cotton dresses 2024 1327 818 712 806 1429338 Cotton knit shirts menboys 1486 2062 2090 2039 2382 2000339 Cotton knit shirts womengirls 7260 9060 10645 9720 7205 7320345 Cotton sweaters 1375 1981 1074 738 732 2136347 Cotton trousers menboys 222 453 513 608 1704 898348 Cotton trousers womengirls 4665 6486 6987 10062 11769 9541349 Cotton brassieres 1335 1091 1446 1426 1537 1533350 Cotton robes 1185 856 906 500 372 2302351 Cotton nightwear 3696 2706 3422 2908 4031 4541352 Cotton underwear 19994 25781 25069 33141 31813 33168360 Cotton pillowcases 567 649 715 910 1407 1317361 Cotton sheets 5561 6475 5800 6973 9443 13626362 Cotton bedspreads and quilts 2604 2862 2881 2291 2691 3887363 Cotton terry and other pile towels 2368 2984 3830 4026 4782 4354369 Other cotton manufactures 5256 6903 9056 10414 10671 10088632 Manmade-fiber hosiery 2513 2588 2802 1372 571 449638 Manmade knit shirts menboys 115 233 428 2468 2086 335639 Manmade knit shirts womengirls 1870 1771 4221 4620 5049 5211645 Manmade-fiber sweaters menboys 418 488 961 1530 2613 1873647 Manmade-fiber trousers menboys 78 90 43 133 377 500648 Manmade-fiber trousers womengirls 388 449 709 2412 2317 1062649 Manmade-fiber brassieres 18 72 459 1079 1170 1146651 Manmade-fiber nightwear 14 27 44 246 642 4929652 Manmade-fiber underwear 1272 5691 14219 23616 21479 24897659 Other manmade-fiber apparel 2014 3217 6319 4728 4192 2422666 Other manmade-fiber furnishings 2499 7533 10708 9989 6922 2980
1 To administer the US textiles and apparel quota programs articles are grouped under 3-digit category numberswhich cover many 10-digit statistical reporting numbers under which goods are classified for statistical purposes inthe Harmonized Tariff Schedule of the United States (HTS) The 1-digit and 2-digit numbers represent specific levelsof import aggregation for articles covered by the quota program (eg the number ldquo1 represents total imports ofapparel while ldquo31 represents total imports of cotton apparel)
Source Compiled from official statistics of the US Department of Commerce which are available on its website athttpotexaitadocgov
1 Prepared by Judith-Anne Webster Office of Industries 2 The trade benefits provided by the US legislation were among other things intended topromote economic cooperation among Israel Jordan Egypt and the Palestinian AuthorityStatement by the White House Press Secretary ldquoFree Trade Area Extended to West Bank andGaza Striprdquo Oct 3 1996 found at httpwwwlibrarywhitehousegovcgi-binweb retrieved Jan13 1998 3 ldquoTextile Exports Jumprdquo BharatTextilecom Dec 14 2002 found athttpwwwbharattextilecomnewsitems1980350 retrieved Feb 10 2003 4 ldquoSector Report Apparel and Textilesrdquo Export and Finance Bank of Jordan Apr 4 2002
L-26
Jordan1
Overview
Jordanrsquos textile and apparel sector has grown significantly following implementation of USlegislation in 1996 that provided for the establishment of ldquoqualified industrial zonesrdquo (QIZs)encompassing portions of Israel and Jordan from which goods can enter the United Statesfree of duty2 Sector employment has more than doubled helping an economy withhistorically high unemployment Jordanian exports of textiles and apparel increased from$37 million in 1997 to $316 million in 2001 and the sector share of total exports increasedfrom 3 percent to 17 percent According to data of the Jordanian government as publishedin the trade press Jordanrsquos exports of sector goods increased significantly in the first10 months of 2002 compared with the corresponding period of 2001 to $398 million or22 percent of total Jordanian exports3
Jordanrsquos apparel industry is export oriented due to its small domestic customer base Becausethe Jordanian textile industry is small the apparel industry relies on imports for its inputswhich come mainly from Israel Hong Kong and the European Union The sector benefitsfrom relatively low wages Foreign direct investment in the sector has increased substantiallyin the last three years particularly from Asian firms seeking to benefit from duty- and quota-free access to the US market
Industry Profile
Industry structure and performance
The number of firms in Jordanrsquos textile and apparel sector rose by 29 percent during 1997-2000 to 2183 95 percent of which were apparel producers (table L-7) Jordanian textileproduction is limited because it consumes large amounts of water a scarce resource inJordan4 With the exception of one small spinning and knitting mill near Amman the apparelindustry consists almost entirely of cut-sew-pack operations There is no vertical integration
5 US Department of State telegram 2013 ldquoWorld Textile Trade Without Quotasrdquo prepared bythe US Embassy Amman Apr 23 2002 6 Ibid 7 Jordan K Speer ldquoMiddle East Marks the Maprdquo July 4 2001 Bobbin Publishing Group foundat httpjuststylecomfeatures_detailaspart=406 retrieved Dec 10 2002 8 See table 3-1 in chapter 3 of this report for data on hourly compensation in the textile andapparel industries of countries covered by the study Data on hourly compensation for apparelproduction workers are from Jassin-OrsquoRourke Group ldquoGlobal Competitiveness Report Selling toFull Package Providersrdquo New York NY 9 ldquoTextile and Apparel Industries Have Seen Unprecedented Growthrdquo BharatTextilecom foundat httpwwwbharattextilecomnewsitems1978642 retrieved Nov 7 2002 10 US Department of State telegram 2013 ldquoWorld Textile Trade Without Quotasrdquo
L-27
in the industry and opportunities for increasing vertical integration are limited because thescarcity of water eliminates many potential expansion options (eg dyeing)5
Factors of Production
Raw materials
Jordanrsquos apparel industry relies almost entirely on imports for its yarn and fabricrequirements primarily for China and Pakistan6 According to industry representatives theimportation of apparel inputs enables Jordanian apparel manufacturers to obtain the bestprice and benefit from Jordanrsquos proximity to supplying countries such as Egypt that producehigh-quality fibers7
Labor
The competitive labor cost in Jordan is considered to be a key factor providing Jordan anadvantage that attracts FDI According to labor cost data for 2002 the average hourlycompensation (including fringe benefits) for apparel production workers in Jordan was$081 compared with $077 in Egypt $068 in China and less than $050 in such Asiancountries as Bangladesh India and Pakistan8 A report by Jordanrsquos Finance and Export Bankindicates that average monthly salaries for Jordanian textile and apparel workers are $113to $141 per month for tailors and trainees $353 to $423 for supervisors and $1128 to$1141 for factory managers9
The textile and apparel sector in Jordan accounts for 22 percent of the countryrsquos workforceThe number of workers in the sector more than doubled from 7667 workers in 1997 to16561 workers in 2001 (table L-7) According to an April 2002 report prepared by the USEmbassy in Amman the number of workers in the Jordanian textile and apparel sector is26000 of whom 22000 are apparel workers employed by QIZ exporters10 The Embassyreport indicates that the sector accounts for about 3 percent of all jobs filled in Jordan (laborforce of 1 million minus 150000 unemployed) Jordanrsquos work forced is considered to be
11 ldquoJordan - A Success Moverdquo Jordan Investment Board found athttpwwwjordaninvestmentcomLastBroshurstextappemainpagehtm retrieved Dec 4 2002 12 ldquoTextile and Apparel Industries Have Seen Unprecedented Growthrdquo 13 Ibid 14 ldquoJordan - A Success Moverdquo 15 Office of the United States Trade Representative 2003 Trade Policy Agenda and 2002 AnnualReport Mar 2003 p 164 16 ldquoForeign Textile Firms Benefit from New Industrial Zonesrdquo Just-Stylecom Oct 31 2001found at httpjust-stylecomnew_printaspart=21853 retrieved Oct 25 2002 17 ldquoQIZrsquos Attract Hong Kong Garment Exportersrdquo BharatTextilecom Nov 30 1999 found athttpwwwbahrattextilecomnewitems1975031 retrieved Dec 11 2002 18 The World Bank Group ldquoHashemite Kingdom of Jordan Updaterdquo Second Quarter 2002p 15 found on the World Bank website at httpwwwworldbankorg retrieved Dec 4 2002
L-28
well-trained a factor which has reportedly encouraged investment in the sector11 As the bulkof Jordanrsquos labor force consists of skilled workers Jordanrsquos growing textile and apparelworkforce is supplemented by unskilled workers from Pakistan India China and othernations who reportedly are increasingly finding work in the textile and apparel sector inJordan where they can expect to be paid more for fewer hours worked than in their domesticindustries12
Technology
Jordanian apparel companies are typically at a technological disadvantage compared to otherforeign companies such as those in Israel which employ computer-based logistics programsthat Jordanian firms lack Further the majority of Jordanian manufacturers reportedlyexperience underutilized capacity and limited communication and coordination withassociated companies and factories13 Jordanian companies are trying to improve in thisregard by adopting computer-based design and logistics software14
Investment
Investment in Jordanrsquos QIZs of which there are 11 totals $85 million to $100 million andit is expected to reach $180 million to $200 million when all projected are completed15 Theinvestment has come from around the world particularly from Asian countries For examplePakistani companies reportedly have invested $30 million in up to 20 QIZ productionfacilities in Jordan and employ approximately 5000 Jordanians16 These new investmentsfollowed earlier investments by such companies as Boscan International a large Hong Kongfirm which reportedly entered Jordan in early 200017 Additionally Jordanrsquos apparelindustry has benefited from multilateral investment For example Jordan-based El-Zay amanufacturer of high-quality mens suits received funding from the International FinanceCorporation to help restructure its debt and diversify its product line by manufacturing mensouterwear18 The growing investment trend is expected to continue as Jordan offers numerousadvantages in addition to QIZ duty- and quota-free access to the US market including
19 Jordan K Speer ldquoMiddle East Marks the Maprdquo July 4 2001 Bobbin Publishing Group foundat httpjust-stylecomfeatures_detailaspart=406 retrieved Dec 10 2002 20 US Department of State telegram 2013 ldquoWorld Textiles Trade Without Quotasrdquo 21 ldquoMiddle East Gains Global Groundrdquo July 2 2001 found at httpwwwjust-stylecomfeatures_detailaspart=404ampapp=1ampfotw=sct retrieved Dec 10 2002 22 For further information on the QIZ program see the US International Trade Commission(USITC) ldquoTextiles and Apparel New US Trade Program Likely to Spur Imports from Israel andJordanrdquo Industry Trade and Technology Review USITC Pub 3099 Mar 1998 pp-1-8 23 Industry representative interview by USITC staff Hong Kong Feb 23 2003
L-29
exemptions from income taxes competitive rates for rent and electricity and low laborrates19
According to a report prepared by the US Embassy in Amman the elimination of quotasunder the WTO Agreement on Textiles and Clothing in 2005 likely will have a major impactof Jordanrsquos textile and apparel sector including its ability to attract new investment becausethe benefits of its free-trade agreement (FTA) with the United States may not be enough tosurpass the competitive advantages of other textile and apparel producing countries20
Further the political uncertainty in the region reportedly has caused some hesitation on thepart of investors For example one supplier of cotton pants to the US market reportedlyscaled back its expansion plan in the region due to the potential for conflict However thosecompanies that have been established in Jordan for several years are more solidified and thuslikely to maintain their operations21
Government Policies
Jordan has an FTA with the EU and benefits from preferential access to the US marketthrough the US-Jordan Free Trade Agreement (FTA) and the QIZ program The US-Jordan FTA went into effect in December 2001 and will eliminate tariffs on bilateral tradein textiles and apparel in goods within 10 years The impact of the FTA on the textile andapparel sector is unclear at this time due to its recent implementation By contrast the QIZprogram has been a successful initiative increasing production and employment in thesector Under the United States-Israel Free Trade Area Implementation Act products madein QIZs encompassing portions of Israel and Jordan are eligible to enter the United Statesfree of duty provided the product is imported directly from the QIZ the value added in theQIZ is not less than 35 percent of the total value of the article and contains a specifiedminimum amount of Israeli input (8 percent fob value for apparel)22 According to a HongKong-based representative of a firm sourcing apparel from Jordan for the US marketbecause many of the inputs used in the production of apparel in Jordan are shipped throughthe port of Haifa the cost of the ldquocarry bagsrdquo purchased at the port to ship the inputs toJordan meet the 8 percent Israeli content requirement23
The Jordanian Government has also taken other steps to improve the textile and apparelsector For example in late 2002 the Ministry of Trade and Industry along with supportfrom the Italian government established a Center for Garment Design and Training Services
24 ldquoProper Way To Enhance Garment and Textile Sectors Discussed In Seminarrdquo BharatTextilecom Aug 22 2002 found at httpwwwbharattextilecomnewsitems1978758 retrievedFeb 6 2003 25 ldquoJordan Woos Indian Knitwear Investorsrdquo BharatTextilecom Oct 8 2001 found athttpwwwbharattextilecomnewsitems1975717 retrieved Feb 6 2003
L-30
offering training programs for workers in the sector24 Further the Jordanian InvestmentBoard actively promotes QIZs as a viable opportunity for investors as well as preferentialaccess to US and European markets25
Foreign Trade
Jordanrsquos total trade in textiles and apparel (imports plus exports) increased significantlyfrom $186 million in 1997 to $686 million in 2001 However Jordan is not a large apparelconsumer and exports most of its apparel production Jordanrsquos trade deficit in sector goodsnarrowed from $112 million in 1997 to $53 million in 2001 reflecting a sevenfold increasein exports to $316 million and a 148-percent gain in imports to $370 million (table L-7)The growth in Jordanian imports of textiles and apparel during 1997-2001 was concentratedin textiles used as inputs for apparel products made in the QIZs The leading supplier in 2001was Israel which accounted for 47 percent of Jordanian textile imports
The substantial growth in Jordanrsquos exports of textiles and apparel during 1997-2001 wasaccounted for almost entirely by the United States (table L-8) Based on official US tradestatistics US imports of textiles and apparel from Jordan rose from 13 million square meterequivalent (SMEs) valued at $37 million in 1997 to 913 million SMEs valued at $386million in 2002 Sector imports consisted almost entirely of apparel and were concentratedin garments for which major suppliers are highly constrained by quotas particularly pantsand knit tops of cotton and manmade fibers (table L-9) The trade- weighted average USduty on sector imports from Jordan in 2001 was 20 percent ad valorem one of the lowestof the supplying countries covered by the study
L-31
Table L-7Jordan Statistical profile of textile and apparel sector and foreign trade 1997-2001
Item 1997 1998 1999 2000 2001
Number of establishmentsTextiles 98 99 122 100 (1)Apparel 1599 1614 2045 2083 (1)
Total 1697 1713 2167 2183 (1)Number of workers
Textiles 958 791 817 489 (1)Apparel 6709 7230 12108 16072 (1)
7667 8021 12925 16561 (1)Foreign trade
ExportsTextiles (million dollars) 248 319 357 281 298Apparel (million dollars) 125 466 495 1051 2865
Total (million dollars) 373 785 851 1332 3162Imports
Textiles (million dollars) 1099 1264 1125 1698 3037Apparel (million dollars) 390 621 642 626 659
Total (million dollars) 1488 1885 1767 2324 3696Trade balance
Textiles (million dollars) -851 -945 -768 -1416 -2739Apparel (million dollars) -265 -155 -147 425 2207
Total (million dollars) -1115 -1100 -916 -992 -533
1 Not available
NotemdashBecause of rounding figures may not add to totals shown
Source Industry data are from the Jordanian Department of Statistics Trade data are United Nations data asreported by Jordan
L-32
Table L-8Jordan Exports of textiles and apparel by selected markets 1997-2001
Item and market 1997 1998 1999 2000 2001
mdashmdashmdashndashmdashmdashmdashmdashmdashmdashmdash Million dollars mdashmdashmdashmdashmdashmdashmdashmdashmdashmdashTextiles (SITC 65)
Quota marketsUnited States 1 1 1 1 2European Union 2 1 2 2 1Canada (1) (1) (1) (1) 0ndashndashndashndashndashndashndashmdashmdashmdashndashndashndashndashndashndashndashndashndashndashndashndashndashndashndashndashndashndashndashndashndashndashndashndashndashndashndashndashndashndashndashndashndashndashndashndashndashSubtotal 3 2 3 3 3
ndashndashndashndashndashndashndashmdashmdashmdashndashndashndashndashndashndashndashndashndashndashndashndashndashndashndashndashndashndashndashndashndashndashndashndashndashndashndashndashndashndashndashndashndashndashndashndashndashAll other 22 29 33 25 27
ndashndashndashndashndashndashndashmdashmdashmdashndashndashndashndashndashndashndashndashndashndashndashndashndashndashndashndashndashndashndashndashndashndashndashndashndashndashndashndashndashndashndashndashndashndashndashndashndashGrand total 25 32 36 28 30
Apparel (SITC 84)Quota markets
United States 1 1 2 44 208European Union 4 12 13 10 7Canada (1) (1) (1) (1) 1ndashndashndashndashndashndashndashmdashmdashmdashndashndashndashndashndashndashndashndashndashndashndashndashndashndashndashndashndashndashndashndashndashndashndashndashndashndashndashndashndashndashndashndashndashndashndashndashndash
Subtotal 5 14 16 54 215All other 8 33 34 51 71ndashndashndashndashndashndashndashmdashmdashmdashndashndashndashndashndashndashndashndashndashndashndashndashndashndashndashndashndashndashndashndashndashndashndashndashndashndashndashndashndashndashndashndashndashndashndashndashndash
Grand total 13 47 49 105 286
Textiles and apparelQuota markets
United States 1 2 3 44 210European Union 6 14 15 12 7Canada (1) (1) (1) (1) 1ndashndashndashndashndashndashndashmdashmdashmdashndashndashndashndashndashndashndashndashndashndashndashndashndashndashndashndashndashndashndashndashndashndashndashndashndashndashndashndashndashndashndashndashndashndashndashndashndash
Subtotal 8 16 18 56 218All other 30 62 67 77 98ndashndashndashndashndashndashndashmdashmdashmdashndashndashndashndashndashndashndashndashndashndashndashndashndashndashndashndashndashndashndashndashndashndashndashndashndashndashndashndashndashndashndashndashndashndashndashndashndash
Grand total 37 78 85 133 316
mdashmdashmdashmdashmdashmdashmdashmdashmdashmdashmdash Percent mdashmdashmdashmdashmdashmdashmdashmdashmdashmdashmdashmdashShare of exports going to quota markets
Textiles 11 7 7 11 9Apparel 38 29 31 51 75
Average 25 18 19 30 42
1Less than $500000
NotemdashBecause of rounding figures may not add to totals shown
Source Compiled from United Nations data
L-33
Table L-9Textiles and apparel US general imports from Jordan by specified product categories11997-2002CatNo Description 1997 1998 1999 2000 2001 2002
mdashmdashmdashmdashmdash1000 square meters equivalentmdashmdashmdashmdashmdash
0 Textiles and apparel total 1331 2610 1365 20314 62667 913281 Apparel 1064 1709 906 9340 43713 876782 Textiles 267 901 458 10973 18954 365030 Cotton textiles and apparel 664 483 465 6662 31625 5239160 Manmade-fiber textiles and apparel 567 2115 861 13331 30765 38097335 Cotton coats womengirls (2) 0 (2) 1 137 1747338 Cotton knit shirts menboys 39 75 30 305 2679 6259339 Cotton knit shirts womengirls 102 0 0 744 4664 14646345 Cotton sweaters 0 0 0 0 2477 2610347 Cotton trousers menboys 1 87 328 1109 2725 2522348 Cotton trousers womengirls 158 0 28 1671 8371 16739351 Cotton nightwear 5 2 4 31 1569 2291352 Cotton underwear 0 1 0 81 1053 249359 Other cotton apparel 18 2 9 411 3207 3153634 Other manmade coats menboys 134 363 88 35 222 4673635 Manmade-fiber coats womengirls 1 299 (2) 14 176 2314638 Manmade knit shirts menboys 0 0 5 835 2259 4557639 Manmade knit shirts womengirls 0 0 0 339 3639 3703647 Manmade-fiber trousers menboys 59 172 70 161 692 1406648 Manmade-fiber trousers womengirls 23 130 0 850 1729 5954651 Manmade-fiber nightwear 0 0 0 92 428 1107652 Manmade-fiber underwear 0 0 0 0 570 3069659 Other manmade-fiber apparel 25 26 20 941 4491 4914666 Other manmade-fiber furnishings 16 592 43 1074 633 2051670 Manmade-fiber handbagsluggage 0 0 182 8059 14626 1327
1 To administer the US textiles and apparel quota programs articles are grouped under 3-digit category numberswhich cover many 10-digit statistical reporting numbers under which goods are classified for statistical purposes inthe Harmonized Tariff Schedule of the United States (HTS) The 1-digit and 2-digit numbers represent specific levelsof import aggregation for articles covered by the quota program (eg the number ldquo1 represents total imports ofapparel while ldquo31 represents total imports of cotton apparel)
2 Less than 500 square meters equivalent
Source Compiled from official statistics of the US Department of Commerce which are available on its website athttpotexaitadocgov
1 Prepared by Vincent DeSapio Office of Industries 2 ldquoThe Turkish Textile Industryrdquo The Istanbul Textile amp Apparel Exportersrsquo Association 2001at httpwwwitkiborgtrengFuarlarfact_sheethtm retrieved Jan 28 2003 3 Cargoes can be delivered to European destinations by road within 4 to 11 days and to Europeancoasts within 10 to 11 days by ship 4 Umit Sevim ldquoThe Turkish Fabric Industryrdquo Export Promotion Center of Turkey 2002 p 2 5 ldquoThe Cotton Industry in Turkeyrdquo Aegean Exportersrsquo Unions General Secretariat found at httpwwwfaoorges ESCesceescrcottonChina-ecap52TURhtm retrieved Oct 23 2002
L-34
Turkey1
Overview
Turkey ranks among the worldrsquos largest exporters of textiles and apparel and the textile andapparel industry is the countryrsquos largest industrial sector with 10 percent of its grossdomestic product and 21 percent of industrial output and total employment2 The textile andapparel sector is also its largest source of export earnings accounting for 33 percent of thetotal in 2001 Since implementation of the European Union (EU)-Turkey customs unionagreement (1996) Turkey has benefited from duty-free and quota-free access to the EUtextile and apparel market
Turkey has a modern and diverse textile and apparel infrastructure with production capacityin all sectors of the supply chain and a relatively flexible low-cost and highly skilledworkforce Turkeyrsquos strategic geographical location between Europe and Asia enablesTurkish producers to ship goods to both markets quickly3 and at reduced shipping costsFlexible manufacturing also results in shorter lead times and ability to quickly increaseproduction runs Turkey also has liberal foreign exchange regulations that facilitate transferof capital while its use of a noneuro currency may mitigate adverse effects during periodsin which the euro strengthens relative to the dollar
Industry Profile
Turkey is the worldrsquos seventh-largest exporter of apparel and 14th-largest exporter oftextiles reflecting its large modern and integrated production capacity a relatively low-costand skilled workforce and capacity to respond quickly to changes in fashions and retailerdemands Nearly 70 percent of Turkish textile and apparel production occurs in or nearIstanbul Turkeyrsquos diversified textile and apparel sector produces products in every segmentof the supply chain including fiber yarn fabric apparel and home textiles AlthoughTurkey is a leading producer of high-quality cotton and has the sixth-largest synthetic fibercapacity in the world with production of nearly 430 million meters4 in 2000 as textileoutput has increased it has become a major world importer of textile fibers principallycotton and manmade fibers and filaments The Turkish industry tends to be cotton orientedwith cotton-spinning capacity accounting for nearly 80 percent of its total spinning capacity5The Turkish manmade-fiber segment has also experienced rapid growth in recent years Mostof the raw materials for synthetic fibers and yarns are produced locally although the main
Sevim p 16
Ibid p 27
Umit Sevim ldquoHome Textiles in Turkeyrdquo Export Promotion Center of Turkey 2002 p 38
Nearly 60 percent of carpet produced in Turkey consists of tufted felt carpets and kilims9
35 percent consists of machine-made carpets and the remainder consists of handmade carpets
Umit Sevim ldquoHome Textiles in Turkeyrdquo p 310
Ibid ldquoThe Turkish Fabric Industryrdquo p 111
Umit Sevim ldquoHome Textiles in Turkeyrdquo p 112
L-35
raw material for acrylic fibers is imported Turkeyrsquos production of synthetic fiber andapparel accounts for the sixth-largest synthetic fiber capacity in the world with estimatedproduction of nearly 450 million meters in 2001 6
Turkey is the worldrsquos third-largest producer of mohair and the eighth-largest producer ofwool textiles and apparel it exports wool fine hair yarn and fabric In 2000 productionof woven wool fabrics totaled 81 million meters 7
The home textile industry in Turkey has shown steady growth in production and exportsduring 1997-2001 due to a rise in both domestic and external demand and accounts fornearly 3 percent of Turkeyrsquos total exports in 2001 Production of home textiles in Turkeyincreased by 45 percent during this period to 242000 metric tons (table L-10) Principal8
exports include carpeting bed linens bed spreads table linens towels and bathrobes9
Major markets include Germany which absorbed 26 percent of Turkish exports of hometextiles in 2001 the United States accounting for 21 percent of exports and France and theUnited Kingdom each with 11 percent of exports 10
Industry structure and performance
Textiles
Turkish textile manufacturers tend to be small independent firms that operate in specificsegments of the textile supply chain The number of integrated firms increased during the1990s although still representing a small segment of the entire industry The integrated firmstypically handle tasks ranging from fiber processing spinning and weaving to dyeingprinting and finishing operations and many also own apparel and home textilesmanufacturing facilities The 41 largest textile companies in Turkey account for nearly55 percent of all production capacity and they ranked among the 500 largest textile firmsin the world in 2000 11
Home textile producers are mainly located in Istanbul Denizli Bursa Izmir and GaziantepLarger producers in terms of production volume have integrated their production whichranges from yarn and fabric production to product design dyeing finishing and sewingSmall and medium-size producers tend to be concentrated in rural areas near such cities asDenizli Mugla and Kastamonu 12
Information provided by the Turkish Clothing Manufacturers Association Dec 30 200213
A large share of Turkish cotton is sold in the Cotlook A Index category of the Liverpool stock14
market
Turkish cotton is generally planted during early to mid spring while harvesting begins in mid-15
August and continues until November Most Turkish cotton is cultivated in three main areas the
Aegean region the Southeastern Anatolia and in Cukurova Aegean cotton is generally considered
to be superior in quality and is often preferred by the textile industry (see ldquoThe Cotton Industry in
Turkeyrdquo)
Ibid 16
Ibid 17
ldquoTurkeyrsquos Spun-yarn Output Set To Climb As Western Europe Suffers Further Setbacksrdquo18
Textiles Intelligence Ltd 2001 found at
httpwwwtextilesintelligencecomtilpresscfmprid=289 retrieved Oct 31 2002
L-36
Apparel
The apparel industry occupies a key role in the Turkish economy and accounted for23 percent of Turkeyrsquos exports in 2001 In 2000 21 Turkish firms were among the 400largest apparel firms in the world with 5 of these firms integrated from yarn production tofinished apparel Almost 70 percent of Turkeyrsquos apparel production is exported Although13
the number of large integrated firms making apparel increased during the 1990s the vastmajority of firms that produce apparel in Turkey are small- and medium-sized
Factors of production
Raw materials
CottonndashThe Turkish textile and apparel industries are afforded a competitive advantagebecause the cotton grown in the Aegean region of Turkey is considered among the highestquality in the world Turkey was the sixth-leading world producer of cotton in 2000 with14
production rising to 791000 metric tons from 614000 metric tons in 1994 Cotton isTurkeyrsquos leading industrial crop accounting for 11 percent of the total value of field15
crops The growth of Turkish cotton production and consumption stems largely from16
Turkeyrsquos rapidly expanding textile and apparel sector The rise in textile output in Turkeysince 1985 has stimulated an increase in cotton imports as domestic cotton productionbecame insufficient to satisfy the needs of the textile industry In 1997 the share ofimported cotton used in Turkish textile mills totaled nearly 36 percent 17
Spun yarnndashTurkey is the sixth-largest producer of spun yarn in the world In 2000 Turkishspinning mills produced 13 million tons of spun yarn accounting for nearly 5 percent of theworld total By the year 2010 Turkish spun yarn production is expected to reach 18 milliontons fueled by anticipated large increases in raw cotton production under the SoutheasternAnatolian Project (GAP) (see ldquoGovernment Policiesrdquo below ) Most of the increase in18
Turkish spun yarn production is expected to be consumed internally to meet Turkeyrsquosexpanded production of textiles and apparel However Turkey is also a major exporter ofspun yarns to eastern and western Europe including Italy Portugal and Spain Increased
Ibid19
According to industry sources because of Turkeyrsquos long-standing commercial relations with20
Germany during the last 20 years many of Turkeyrsquos mill employees have been trained in German
mills
Werner International Management Consultants ldquoSpinning and Weaving Labor Cost21
Comparisons 2002 (Reston VA) The labor cost data also include social benefits Country
Statements 2001 International Textile Manufacturers Federation (ITMF)
International Yearbook of Industrial Statistics 2002 United Nations Industrial Development22
Organization Vienna 2002 pp 70-73
Ibid23
Textile and Apparel from Turkey A Summary of Turkeyrsquos Potential General Secretariat of24
Istanbul Textile and Apparel Exporters Associations Nov 2001 at
httpwwwitkiborgtrRes800 ArgeEnglishdefaulthtm retrieved Dec 10 2002
L-37
Turkish exports of spun yarn into Western Europe has come at the expense of producers inWestern Europe where spun yarn production has declined by nearly 20 percent between1990 and 2000 due partly to implementation of the EU-Turkey customs union agreementand low Turkish export prices 19
Labor
Low labor costs as well as the high flexibility and high skill levels of Turkish labor are20
important competitive advantages for Turkeyrsquos textile and apparel sector The averagehourly labor cost per operator hour in the Turkish spinning and weaving segment in 2002was $213 compared with $057 in India $069 in the coastal region of China $1393 inItaly $478 in Portugal and $1513 in the United States Turkish labor costs as a21
percentage of textiles output averaged nearly 10 percent in 1997 compared with 1998averages of 10 percent in India 14 percent in Portugal 12 percent in Italy and a 1999average of 17 percent in the United States Labor costs in the Turkish apparel industry22
accounted for 9 percent of total output in 1997 compared with 1998 totals of 6 percent forIndia 12 percent for Italy 18 percent for Portugal and a 1999 total of 17 percent for theUnited States23
Technology
Since the implementation of the EU-Turkey customs union agreement the countryrsquos textileand apparel manufacturing capacity has been significantly modernized The technologicallevel of Turkeyrsquos capital equipment is considered to be among the best in the world Turkeyis also one of the leading importers of textile and apparel machinery in the world withannual imports peaking at $24 billion in 1997 before declining to $920 million in 200024
In 2001 installed weaving capacity of Turkish textile mills included 30000 shuttle loomsand 16000 shuttleless looms which are the more advanced technologically and the primarytype of loom imported since 1995 (table L-10) This compares with 578400 shuttle loomsand 82900 shuttleless looms in China and 129400 shuttle looms and 11800 shuttleless
International Textile Manufacturers Federation International Textile Machinery Shipment25
Statistics 2002
Ibid26
Textile and Apparel from Turkey A Summary of Turkeyrsquos Potential 27
Total investment in the textile and apparel sector in Turkey exceeds $150 billion of which28
more than $50 billion has been invested during the last 10 years (ldquoTurkish Textile and Apparel
Sectorrdquo Foreign Economic Relations Board July 2002 p 2)
ldquoTurkish Textile and Apparel Industry Position For EU-Turkey Customs Union and EU-Third29
Country Trade Relationsrdquo Turkish Textile Employersrsquo Association 2001
ldquoTurkish Textile and Apparel Sectorrdquo Foreign Economic Relations Board July 2002 p 1330
Siemon Smid and Fatma Taskesen ldquoTextile Apparel and Leather Sector in Turkeyrdquo PWC31
Consulting Sept 2002 p 13
ldquoTurkish Textile and Apparel Sectorrdquo p 1432
L-38
looms in India in 2001 Nearly all of the 19400 looms shipped to Turkey during the last25
10 years have been shuttleless looms with most of this capacity having been added since1995 attesting to the increasing efficiency of Turkish textile weaving capacity Similarlynearly one-half of Turkeyrsquos spinning capacity has been added within the last 10 yearsInstalled cotton-spinning capacity of Turkish mills included nearly 57 million short-staplespindles in 2001 compared to Indiarsquos installed capacity of 38 million short-staple spindlesand Egyptrsquos installed capacity of 26 million short-staple spindles Turkey reportedly26
accounts for about one-fourth of the installed cotton-spinning capacity in Europe27
Investment
Shortly before the implementation of the EU-Turkey customs union agreement significantinvestments were announced by domestic and foreign investors to modernize Turkishtechnology and infrastructure to enable Turkey to compete with highly automated textileindustries in Western Europe and in other world markets As a result of this investment28
the largest European capacity for the production of yarn weaving dyeing and finishinggoods exists in Turkey According to official Turkish Government data 265 textile and29
apparel firms in Turkey participated in joint ventures with foreign partners as of April 2002Germany was the leading foreign investor with 69 foreign partnerships followed by Britainwith 28 partnerships and the Netherlands with at least 22 partnerships Joint ventures wereestablished due to local manufacturersrsquo interest in establishing licensing and technologyagreements with foreign firms in order to increase Turkeyrsquos global competitiveness At the30
same time the level of foreign direct investment in the Turkish textile and apparel sectorshas declined since 1996 and the country suffers from low levels of capital investment31
Government Policies
The Government of Turkey has sought to create economic incentives for projects whosegoals are to ldquoreduce inequality among regions spread capital ownership create employmentmake use of advanced technology and increase competitivenessrdquo These incentives are32
Turkey has established 19 free-trade zones which permit the duty-free entry of textile33
products The most prominent of these are located in Mersin Istanbul (AHL Tuzla and Catalca)
Antalya Ismi Adana and Corlu Incentives offered by these free-trade zones include--100-percent
exemption from Turkish income and corporate taxes exemption from the European value-added
tax on the purchase of machinery and equipment exemption from banking and credit charges and
exemption from customs tariffs on imports into the zones
Derived using a 2001average foreign exchange rate of 1669000 Turkish lire per US dollar34
Textile and Apparel from Turkey A Summary of Turkeyrsquos Potential35
Smid and Taskesen p 2636
Cotton is currently cultivated on about 80 percent of a newly irrigated area in the Harran37
Plateau in southeastern Anatolia According to the initial implementation plan cotton production is
projected to reach 13 million short tons by 2005 and Turkey would again become a net exporter of
cotton (See ldquoThe Cotton Industry in Turkeyrdquo)
L-39
mainly provided in the form of investment allowances exemption from various taxes and33
credits from a newly created Investment Fund The apparel and cotton fabric industry hasreceived various incentives from the Government of Turkey totaling $600000 in 200134
(10 percent of all incentives provided by the government in that year) The EU-Turkeycustoms union agreement forced the Government of Turkey to eliminate certain exportsubsides that had the effect of reducing the cost of imported goods for Turkish firmsproducing for export The level of state subsidies to promote individual sectors of the35
Turkish economy are considered to be low in comparison to Turkish GDP 36
Domestic policies
The government has also taken measures to stimulate domestic cotton production to meetthe growing needs of the domestic textile industry The Agricultural Sales CooperativeUnions (ASCUs) quasi-governmental entities buy cotton produced by member farmers atgovernment-announced prices Cotton production is expected to increase in the near futuredue to the implementation of the GAP a rural and urban development project whose aim isto improve living standards in southeastern Anatolia The GAP consists of a series of damspower stations tunnels and canals to generate electricity and to irrigate the area surroundingthe Tigris and Euphrates Rivers Upon completion of the GAP Turkeyrsquos cotton production37
is anticipated to double from 1998 levels However the major challenges to increasingcotton production in Turkey in the past reportedly have been a shortage of farm labor whichhas resulted in higher labor costs for harvesting the high cost of capital since cottonproduction is more capital-intensive than other crops and the growing trend among textilefirms to blend synthetic fibers with cotton to reduce costs
Trade policies
Since implementation of the EU-Turkey customs union agreement Turkey and the EU haveeliminated all customs duties on imports of industrial products between the two regions Inaddition the EU has eliminated all quantitative quota restrictions on Turkish textile andapparel goods As a condition of the EU-Turkey customs union agreement common customs
ldquoTurkish Textile and Apparel Industry Positionrdquo 38
Correspondence received from Fikret Artan First Commercial Counselor Embassy of the39
Republic of Turkey Office of the Commercial Counselor Washington DC Dec 30 2002
US Department of State telegram ITC488 ldquoEU Customs Union - Istanbulrsquos Textile Sectorrdquo40
p 3
Textile quotas subject to EU monitoring were applied on textile imports from Belarus China41
Indonesia South Korea Macau Malaysia Egypt Pakistan Sri Lanka Taiwan and Vietnam in
2000 as part of the EU bilateral control system and on textile imports from Argentina Brazil the
Philippines India Hong Kong Uzbekistan Peru Singapore Thailand North Korea and
Yugoslavia under the EUrsquos unilateral control system in 2001
Textile and Apparel from Turkey A Summary of Turkeyrsquos Potential42
L-40
tariffs are applied on industrial goods imported from third countries In accordance with38
the EU-Turkey customs union agreement the Government of Turkey has signed free-tradeagreements (FTAs) with third countries including Israel in 1997 Romania the CzechRepublic Slovakia Lithuania Hungary and Estonia in 1998 Bulgaria in 1999 and PolandMacedonia Latvia and Slovenia in 2000 Agreements with Bosnia Herzegovina and Croatiawere signed in 2002 and are awaiting parliamentary approval for implementation Since39
1996 Turkish import duties on goods from third countries have dropped from 25-30 percentto 6 percent ad valorem in 2000 As part of its EU-Turkey customs union obligations and40
the EU bilateral and unilateral control systems Turkey imposes quantitative textile importquotas subject to monitoring on certain countries 41
Foreign Trade
Turkeyrsquos trade surplus in textiles and apparel rose by 5 percent during 1997-2001 to$84 billion reflecting an increase of 5 percent in exports to $106 billion and a decline inimports of 15 percent to $22 billion (table L-10) Apparel accounted for 63 percent ofsector exports in 2001 while textiles accounted for 86 percent of sector imports in 2001Turkish exports of textiles and apparel increased sharply immediately after implementationof the EU-Turkey customs union agreement in 1996 Although Turkey has concentrated onproducing higher value-added textile and apparel products in recent years T-shirts singletsand related garments are still the principal apparel items exported by Turkey
Imports
Major textile materials imported by Turkey include fibers yarns and fabrics while majorapparel items imported include knitted and woven ready-made garments Turkey has largelyimported intermediate textile inputs for use in the manufacture and export of finishedapparel items Cotton textiles in the form of fiber yarn and woven fabric accounted for34 percent of Turkeyrsquos total textile imports in 2000 followed by manmade staple fibersyarns and fabrics with 22 percent and manmade filaments yarns and fabrics with 21 percentof total textile imports 42
Information provided by the Turkish Clothing Manufacturers Association Dec 30 200243
Textile and Apparel from Turkey A Summary of Turkeyrsquos Potential44
L-41
According to UN trade data as reported by Turkey EU nations supplied 47 percent of allTurkish textile and apparel imports in 2001 EU nations supplied 46 percent of all Turkishtextile imports in 2001 led by Italy with 16 percent and followed by South Korea and Chinawith 8 percent and 7 percent respectively of total textile imports The EU was the leadingsupplier of apparel to Turkey in 2001 with 56 percent of the total again led by Italy with23 percent and followed by China with 14 percent of total apparel imports Turkish textilesand apparel imports from EU nations nearly tripled following the EU-Turkey customs unionagreement Turkish imports of textiles from the United States declined 24 percent during1997-2001 to $59 million in 2001 while Turkish imports of apparel from the United Statesduring this period declined 89 percent to $4 million Imports from the United Statesconsisted largely of manmade and artificial fibers and fabrics
Exports
The EU was the largest export market for Turkish textiles and apparel during 1997-2001absorbing 65 percent of Turkish exports in 2001 (table L-11) Turkeyrsquos textile and apparelexports to the EU increased by 6 percent during 1997-2001 to $69 billion Turkish productsare competitive in the EU due to a combination of favorable prices high product qualityquick response times and integration within the EU Turkey was the second-leading apparelsupplier (71 percent of its exports) and the fifth-leading textile supplier (51 percent of itsexports) to the EU in 2001 Germany was Turkeyrsquos single-largest market for textile andapparel exports in 2001 accounting for 27 percent of the total followed by the United Stateswith 14 percent of the total Turkish exports of textiles to the United States increased44 percent during 1997-2001 to $412 million in 2001 while Turkish apparel exports to theUnited States increased 62 percent during the period to $1 billion as Turkey concentratedon diversifying its export representation beyond the EU Although the EU is Turkeyrsquosprincipal foreign market the younger demographic age of the United States as comparedwith Europe serves as an important factor for Turkey to consider when developing amarketing strategy for future apparel exports 43
Principal apparel products exported by Turkey consist of T-shirts singlets and relatedgarments womenrsquos and girlsrsquo garments such as suits jackets blazers and menrsquos or boyrsquossuits ensembles jackets blazers and trousers Knitted apparel accounted for 51 percent ofTurkeyrsquos total apparel exports in 2000 followed by woven apparel (35 percent) and made-up articles (14 percent) Major textile products exported in 2000 consisted of woven cotton44
fabrics cotton fabrics blended with manmade fibers and woven synthetic fabrics and theirblends with cotton or wool Based on official US imports statistics between 1997 and2002 textiles and apparel imports from Turkey increased annually from 395 million SMEsto 11 billion SMEs US imports of textiles from Turkey totaled 721 million SMEs in 2002and accounted for 68 percent of the total (table L-12)
The United States applied quotas on 22 categories of textile and apparel products exportedfrom Turkey in 2002 Turkey competes with other major suppliers (such as China and India)
Textile and apparel categories in which Turkey filled its quotas in 2002 were cotton and45
manmade-fiber knit shirts and blouses cotton dressing gowns robes etc cotton and manmade
fiber nightwear and pajamas cotton and manmade-fiber underwear cotton sheets womenrsquos and
girlsrsquo wool slacks and shorts and yarn containing 85 percent or more by weight of synthetic staple
fiber
L-42
that currently are also constrained by US import quotas in those categories principallysupplied by Turkish producers Turkey filled between 95 and 100 percent of its quota inseven product categories in 2002 largely in cotton-related articles Turkey was the second-45
leading foreign supplier (behind China) to the United States of cotton robes and dressinggowns in 2002 third-leading supplier of yarn containing 85 percent or more by weight ofsynthetic staple fiber and the fifth-leading supplier of cotton sheets
On the basis of interviews by Commission staff with US retailers and other importers oftextiles and apparel Turkeyrsquos principal competitive advantages in the US market ascompared with its major competitors in certain Asian countries including India and someASEAN suppliers are shorter lead times from order placement to delivery of goods to eastcoast US ports partly reflecting faster shipping times For example shipments from Indiareportedly take 45 to 60 days but shipments from Turkey reportedly take about 14 to 18days In addition the quality of Turkish goods is high due in part to the countryrsquos skilledworkforce and state-of-the art manufacturing equipment while prices for apparel and textileitems are competitive with those of many of the major world exporters Industry sourcesreport that Turkey is skilled in making tailored clothing and can manufacture apparel on ashort turnaround basis According to the US importers Turkeyrsquos major competitivedisadvantage in the US market is that the quality of its apparel items is probably somewhatbelow that of similar goods from Hong Kong or China and that Turkish apparel prices arealso higher These same US customers for Turkish apparel and textiles indicated that whenquotas are eliminated in 2005 there might be some shift in supply patterns from Turkey toChina and Hong Kong because of the anticipated reduction in the prices of goods from thesetwo Asian suppliers
L-43
Table L-10Turkey Statistical profile of textile and apparel sector and foreign trade 1997-2001Item 1997 1998 1999 2000 2001
Number of textile establishments (1000) 49 49 49 49 49Number of textile workers1 (1000) 478 481 488 501 503Production of selected products
Yarns (1000 metric tons) 866 898 913 1005 (2)Fabrics (1000 metric tons) 450 440 420 480 (2)Apparel (1000 metric tons) 237 242 223 243 (2)Home textiles (1000 metric tons) 167 183 252 233 242
Installed spinning capacityShort-staple spindles (1000 spindles) 5382 5679 5465 5554 5737Long-staple spindles (1000 spindles) 743 743 743 743 743Open-end rotors (1000) 388 418 415 430 460
Installed weaving capacityShuttleless looms 18000 16000 16000 16000 16000Shuttle looms 40000 30000 30000 30000 30000
Average total textile labor cost per operator hour3 $330 $330 $430 $420 (2)Mill fiber consumption
Cotton (1000 metric tons) 7819 9092 9721 9856 10752Manmade fibers (1000 metric tons) 7722 8266 9066 9900 10120Wool (1000 metric tons) 493 537 538 460 466
Total (1000 metric tons) 16034 17895 19325 20216 21338Foreign trade
ExportsTextiles (million dollars) 31814 33448 32756 34837 37598Apparel (million dollars) 68683 72606 67157 67191 68412
Total (million dollars) 100497 106054 99913 102027 106010Imports
Textiles (million dollars) 23208 23145 19039 21196 19166Apparel (million dollars) 2331 2407 2024 2614 2370
Total (million dollars) 25539 25552 21062 23810 21537Trade balance
Textiles (million dollars) 8606 10303 13717 13640 18432Apparel (million dollars) 66352 70199 65133 64577 66042
Total (million dollars) 74958 80502 78851 78217 844731 Employment data for apparel are not available2 Not available3 Data for 1997-2000 which include social charges are from the International Textile Manufacturers Federation
Country Statements 2002 and selected back issues According to data of Werner International the averagecompensation (including fringe benefits) of production workers in Turkeyrsquos spinning and weaving industry was$213 per hour in 2002
NotemdashBecause of rounding figures may not add to totals shown
Source Industry data from the Turkish State Institute of Statistics and State Planning Organization InternationalTextile Manufacturers Federation (Zurich) International Textile Machinery Shipment Statistics vol 252002 andCountry Statements 2002 and selected back issues Geerdes International Inc Richmond VA facsimile to USITCstaff Feb 4 2003 Trade data are United Nations data as reported by Turkey
L-44
Table L-11Turkey Exports of textiles and apparel by selected markets 1997-2001
Item and market 1997 1998 1999 2000 2001
mdashmdashmdashndashmdashmdashmdashmdashmdashmdashmdash Million dollars mdashmdashmdashmdashmdashmdashmdashmdashmdashmdashTextiles (SITC 65)
Quota marketsUnited States 219 251 318 387 386European Union 1535 1717 1739 1758 1874Canada 28 44 24 28 25ndashndashndashndashndashndashndashmdashmdashmdashndashndashndashndashndashndashndashndashndashndashndashndashndashndashndashndashndashndashndashndashndashndashndashndashndashndashndashndashndashndashndashndashndashndashndashndashndash
Subtotal 1782 2012 2081 2173 2286All other
Unspecified 255 288 191 232 263Russia 138 90 55 58 89Israel 59 74 90 88 86Other 947 882 859 933 1036ndashndashndashndashndashndashndashmdashmdashmdashndashndashndashndashndashndashndashndashndashndashndashndashndashndashndashndashndashndashndashndashndashndashndashndashndashndashndashndashndashndashndashndashndashndashndashndashndash
Subtotal 1399 1333 1195 1311 1474ndashndashndashndashndashndashndashmdashmdashmdashndashndashndashndashndashndashndashndashndashndashndashndashndashndashndashndashndashndashndashndashndashndashndashndashndashndashndashndashndashndashndashndashndashndashndashndashndash
Grand total 3181 3345 3276 3484 3760
Apparel (SITC 84)Quota markets
United States 651 755 846 1062 1067European Union 4553 4886 4771 4873 5004Canada 16 22 27 36 44ndashndashndashndashndashndashndashmdashmdashmdashndashndashndashndashndashndashndashndashndashndashndashndashndashndashndashndashndashndashndashndashndashndashndashndashndashndashndashndashndashndashndashndashndashndashndashndashndash
Subtotal 5220 5664 5644 5971 6115All other 1648 1597 1071 748 726ndashndashndashndashndashndashndashmdashmdashmdashndashndashndashndashndashndashndashndashndashndashndashndashndashndashndashndashndashndashndashndashndashndashndashndashndashndashndashndashndashndashndashndashndashndashndashndashndash
Grand total 6868 7261 6716 6719 6841
Textiles and apparelQuota markets
United States 870 1006 1164 1449 1453European Union 6087 6604 6510 6630 6879Canada 45 65 51 64 70ndashndashndashndashndashndashndashmdashmdashmdashndashndashndashndashndashndashndashndashndashndashndashndashndashndashndashndashndashndashndashndashndashndashndashndashndashndashndashndashndashndashndashndashndashndashndashndashndash
Subtotal 7002 7675 7725 8144 8401All other 3047 2930 2266 2059 2200ndashndashndashndashndashndashndashmdashmdashmdashndashndashndashndashndashndashndashndashndashndashndashndashndashndashndashndashndashndashndashndashndashndashndashndashndashndashndashndashndashndashndashndashndashndashndashndashndash
Grand total 10050 10605 9991 10203 10601
mdashmdashmdashmdashmdashmdashmdashmdashmdashmdashmdash Percent mdashmdashmdashmdashmdashmdashmdashmdashmdashmdashmdashmdashShare of exports going to quota markets
Textiles 56 60 64 62 61Apparel 76 78 84 89 89
Average 66 69 74 76 75
NotemdashBecause of rounding figures may not add to totals shown
Source Compiled from United Nations data
L-45
Table L-12Textiles and apparel US general imports from Turkey by specified product categories11997-2002CatNo Description 1997 1998 1999 2000 2001 2002
mdashmdashmdashmdashmdashmdash1000 square meters equivalentmdashmdashmdashmdashmdashmdash
0 Textiles and apparel total 394563 511904 711634 866479 871097 10682371 Apparel 174149 202582 229945 297708 305709 3468872 Textiles 220414 309322 481689 568771 565388 72134911 Yarns 58724 60688 123779 114127 86880 8108112 Fabrics 80089 110913 135608 143462 156646 23820914 Other miscellaneous articles 81601 137720 222303 311182 321862 40206030 Cotton textiles and apparel 235242 321321 432675 491290 496787 56571831 Cotton apparel 160987 186409 209984 271930 273946 29980332 Cotton textiles 74256 134912 222691 219359 222842 26591640 Wool textiles and apparel 2742 2896 2601 3626 4904 513060 Manmade-fiber textiles and apparel 156070 186992 275485 370151 366863 49489561 Manmade-fiber apparel 11317 13990 17961 22528 25938 4080162 Manmade-fiber textiles 144753 173001 257524 347623 340925 45409480 Silk blendveg fiber textilesapparel 509 695 872 1413 2543 2493219 Duck fabric of cottonmanmade fiber 17312 31374 33454 31573 35173 53849223 Nonwoven fabric 0 1339 5134 9417 14655 58689239 Babies apparel 2522 3181 4150 6168 5688 7552300 Carded cotton yarn 14336 19579 56799 40074 23030 20925301 Combed cotton yarn 2256 4983 25873 23098 18879 5595332 Cotton hosiery 2319 2754 2907 6912 10093 15489338 Cotton knit shirts menboys 13245 14731 12606 11109 11086 16107339 Cotton knit shirts womengirls 17248 21127 24704 28664 27462 29879340 Cotton not knit shirts menboys 2923 2173 3084 3612 3903 7011341 Cotton not knit blouses 1806 1671 2271 3424 4001 4550347 Cotton trousers menboys 9468 8301 10744 17293 13799 11874348 Cotton trousers womengirls 23329 32661 37807 51627 49695 47635350 Cotton robes 21094 25274 25508 35722 36227 42755351 Cotton nightwear 35863 41085 49754 55168 50172 54947352 Cotton underwear 14311 16201 20265 32128 34551 34021361 Cotton sheets 8589 11426 11269 15675 13475 14284362 Cotton bedspreads and quilts 3495 30400 40184 45045 55975 63903363 Cotton terry and other pile towels 1027 1286 2501 4547 6559 10366369 Other cotton manufactures 12085 20099 28062 32320 32283 52510600 Textured filament yarn 35904 25202 21957 28451 11271 13643604 Yarn of synthetic staple fiber 2075 6964 9777 14458 25953 25126619 Polyester filament fabric lightweight 6327 12064 17011 35478 42497 48345666 Other manmade-fiber furnishings 24831 37319 95465 135912 127479 140201669 Other manmade-fiber manufactures 29918 34737 41918 73705 81378 115560
1 To administer the US textile and apparel quota program articles are grouped under 3-digit category numberswhich cover many 10-digit statistical reporting numbers under which goods are classified from statistical purposes inthe Harmonized Tariff Schedule of the United States (HTS) The 1-digit and 2-digit numbers represent specific levelsof import aggregation for articles covered by the quota program (eg the number ldquo1 represents total imports ofapparel while ldquo31 represents total imports of cotton apparel)
Source Compiled from official statistics of the US Department of Commerce which are available on its website athttpotexaitadocgov
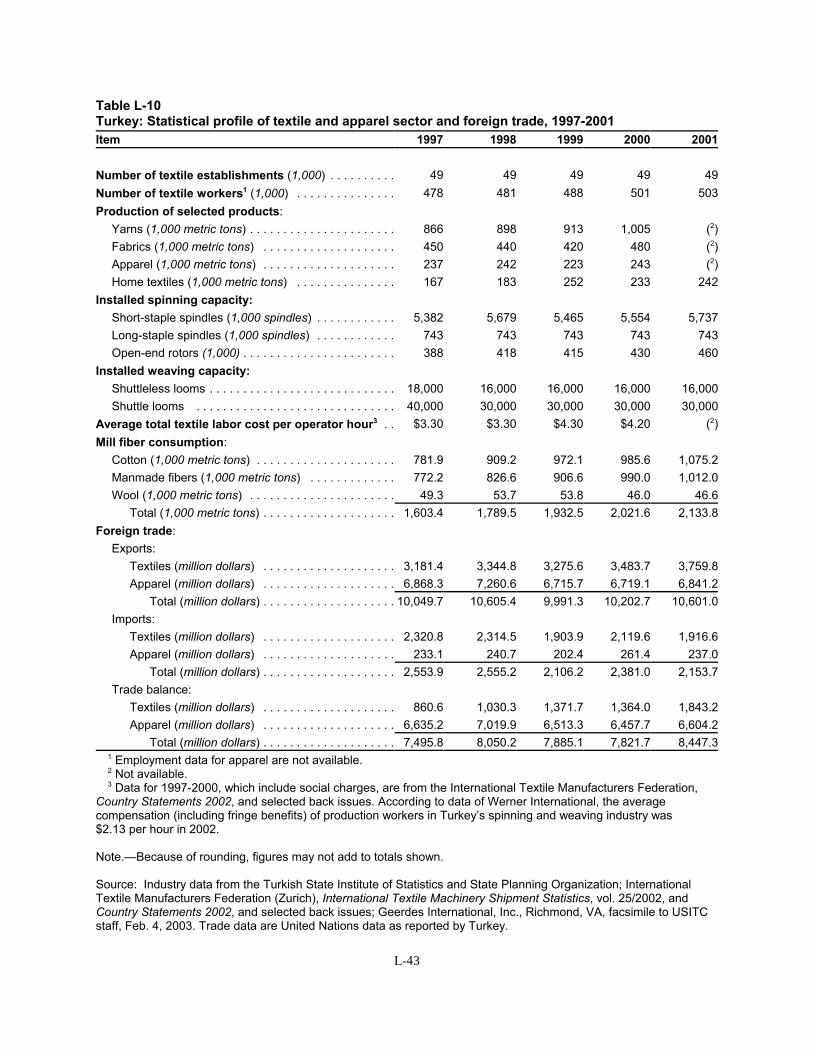