raspberries for processing - usitc
TRANSCRIPT
United States
International Trade Commission
Raspberries for Processing: Conditions of Competition between U.S. and Foreign Suppliers, with a Focus on Washington State
June 2021
Publication Number: 5194
Investigation Number: 332-577
United States International Trade Commission
Commissioners
Jason E. Kearns, Chair
Randolph J. Stayin, Vice Chair
David S. Johanson
Rhonda K. Schmidtlein
Amy A. Karpel
Catherine DeFilippo Director, Office of Operations
Jonathan Coleman Director, Office of Industries
Address all communications to Office of External Relations ([email protected])
United States International Trade Commission Washington, DC 20436
United States International Trade Commission
Raspberries for Processing: Conditions of Competition between U.S. and Foreign Suppliers, with a Focus on Washington State
June 2021 Publication Number: 5194 Investigation Number: 332-577
This report was prepared principally by:
Project Leader Jessica Pugliese
Deputy Project Leader
Mary Roop
Office of Industries Lesley Ahmed, Renee Berry, Art Chambers, Samantha DeCarlo, Diana Friedman, John Fry, Brad Gehrke,
Amanda Lawrence, Steven LeGrand, Sabina Neumann, Alissa Tafti, and Heather Wickramarachi
Office of Economics Tyler Daun
Office of Analysis and Research Services Ann Marie Carton, Lita David-Harris, and Maureen Letostak
Content Reviewers Katherine Linton and Caroline Peters
Statistical Reviewer Russell Duncan
Editorial Reviewers Judy Edelhoff and Peg Hausman
Production Support Byron Barlow, Gwenetta Duvall, and Monica Sanders
Under the direction of
Joanna Bonarriva
Agriculture and Fisheries Division
Office of Industries

Table of Contents
United States International Trade Commission | 1
Table of Contents
Glossary of Terms ............................................................................................. 11
Abbreviations and Acronyms ............................................................................ 13
Executive Summary .......................................................................................... 15
Chapter 1 Introduction ................................................................................. 25
Scope ......................................................................................................................................... 27
Approach ................................................................................................................................... 29
Report Organization .................................................................................................................. 30
Data Availability and Limitations .............................................................................................. 30
Production ............................................................................................................................. 30
Global Trade .......................................................................................................................... 31
U.S. Trade .............................................................................................................................. 31
Processed Raspberry Products ................................................................................................. 32
IQF Raspberries ..................................................................................................................... 33
Non-IQF Processed Raspberries ............................................................................................ 34
Market Channels for Raspberries ............................................................................................. 35
Farm-level Raspberry Production and Distribution .................................................................. 37
Product Standards and Certifications ....................................................................................... 39
Compliance with the U.S. Food Safety System ..................................................................... 39
Third-party Food Safety Certifications .................................................................................. 40
Organic Certifications ............................................................................................................ 41
USDA Marketing Standards................................................................................................... 42
Global Production, Consumption, and Trade ........................................................................... 42
Production ............................................................................................................................. 43
Consumption ......................................................................................................................... 46
Global Trade .......................................................................................................................... 46
Bibliography .............................................................................................................................. 53
Chapter 2 Cross-Country Comparison of Competitiveness ............................ 57
Industry Comparison ................................................................................................................. 58
Competitive Factor Comparison ............................................................................................... 62
Delivered Cost ....................................................................................................................... 66
Product Differentiation ......................................................................................................... 72
Reliability of Supply ............................................................................................................... 75
Symmetric Revealed Comparative Advantage ......................................................................... 76
SRCA Calculations and Data .................................................................................................. 77
Results ................................................................................................................................... 77
Bibliography .............................................................................................................................. 79
Chapter 3 U.S. Industry ................................................................................ 83
Raspberries for Processing
2 | www.usitc.gov
Summary ................................................................................................................................... 83
Industry Structure ..................................................................................................................... 84
Regions .................................................................................................................................. 84
Industry Composition ............................................................................................................ 86
Industry Organization ........................................................................................................... 87
Cultivars................................................................................................................................. 88
Production System ................................................................................................................ 90
Products and Supply Chain ................................................................................................... 95
Production, Consumption, and Trade....................................................................................... 99
Production and Processing ................................................................................................... 99
Consumption ....................................................................................................................... 101
Tariffs Lines and Rates ........................................................................................................ 103
Trade ................................................................................................................................... 106
Trade Actions and Concerns ............................................................................................... 115
Government Programs ........................................................................................................... 118
Compliance with Food Safety Standards ................................................................................ 118
Factors Affecting Competitiveness ......................................................................................... 118
Bibliography ............................................................................................................................ 126
Chapter 4 Canada ....................................................................................... 131
Summary ................................................................................................................................. 131
Industry Structure ................................................................................................................... 132
Regions ................................................................................................................................ 132
Industry Composition .......................................................................................................... 133
Industry Organization ......................................................................................................... 134
Cultivars............................................................................................................................... 135
Production System .............................................................................................................. 135
Products and Supply Chain ................................................................................................. 135
Production, Consumption, and Trade..................................................................................... 137
Production and Consumption ............................................................................................. 137
Trade ................................................................................................................................... 138
Government Programs ........................................................................................................... 143
Compliance with Food Safety Standards ................................................................................ 144
Factors Affecting Competitiveness ......................................................................................... 145
Bibliography ............................................................................................................................ 148
Chapter 5 Mexico ....................................................................................... 151
Summary ................................................................................................................................. 151
Industry Structure ................................................................................................................... 151
Regions ................................................................................................................................ 152
Industry Composition .......................................................................................................... 153
Industry Organization ......................................................................................................... 154
Cultivars............................................................................................................................... 155
Table of Contents
United States International Trade Commission | 3
Production System .............................................................................................................. 155
Products and Supply Chain ................................................................................................. 158
Production, Consumption, and Trade..................................................................................... 159
Production and Consumption ............................................................................................. 159
Trade ................................................................................................................................... 160
Government Programs ........................................................................................................... 162
Compliance with Food Safety Standards ................................................................................ 163
Factors Affecting Competitiveness ......................................................................................... 164
Bibliography ............................................................................................................................ 168
Chapter 6 Serbia ......................................................................................... 171
Summary ................................................................................................................................. 171
Industry Structure ................................................................................................................... 172
Regions ................................................................................................................................ 172
Industry Composition .......................................................................................................... 174
Industry Organization ......................................................................................................... 174
Cultivars............................................................................................................................... 175
Production System .............................................................................................................. 176
Products and Supply Chain ................................................................................................. 176
Production, Consumption, and Trade..................................................................................... 178
Production and Consumption ............................................................................................. 178
Trade ................................................................................................................................... 179
Government Programs ........................................................................................................... 182
Compliance with Food Safety Standards ................................................................................ 183
Factors Affecting Competitiveness ......................................................................................... 184
Bibliography ............................................................................................................................ 188
Chapter 7 Chile ........................................................................................... 193
Summary ................................................................................................................................. 193
Industry Structure ................................................................................................................... 194
Regions ................................................................................................................................ 194
Industry Composition .......................................................................................................... 195
Industry Organization ......................................................................................................... 196
Cultivars............................................................................................................................... 197
Production System .............................................................................................................. 198
Products and Supply Chain ................................................................................................. 199
Production, Consumption, and Trade..................................................................................... 201
Production and Consumption ............................................................................................. 201
Trade ................................................................................................................................... 202
Government Programs ........................................................................................................... 207
Compliance with Food Safety Standards ................................................................................ 208
Factors Affecting Competitiveness ......................................................................................... 208
Raspberries for Processing
4 | www.usitc.gov
Bibliography ............................................................................................................................ 211
Chapter 8 Pricing Analysis: Relationship between Imports and Prices in the U.S. Market ................................................................................ 215
Summary ................................................................................................................................. 215
Description of Price Data ........................................................................................................ 216
Observed Prices and Trends in the U.S. Market for Processed Raspberries .......................... 218
Estimating supply of raspberries in the U.S. processing market ........................................ 219
Frozen Raspberries: Non-IQF .............................................................................................. 221
Frozen Raspberries: IQF ...................................................................................................... 225
Chapter 9 Economic Impacts of Imports ..................................................... 231
Model Description .................................................................................................................. 232
Modeling Limitations .......................................................................................................... 233
Data and Trends ...................................................................................................................... 234
Estimated Economic Effects of Imports on the Raspberries for Processing Market .............. 236
IQF Raspberries ................................................................................................................... 236
Non-IQF Raspberries ........................................................................................................... 237
Appendix A Request Letter ......................................................................... 239
Appendix B Federal Register Notices .......................................................... 243
Appendix C Calendar of Hearing Witnesses ................................................ 249
Appendix D Summary of Views of Interested Parties .................................. 253
Appendix E Import Data Sorting for Modeling Inputs ................................ 263
Appendix F Economic Modeling Details ..................................................... 275
Appendix G Symmetric Revealed Comparative Advantage Details ............. 287
Appendix H Data Tables for Figures ............................................................ 293
Boxes Box 1.1 Newly Developing Processed Raspberry Industries ....................................................................... 51
Box 5.1 Wage rates and labor conditions in the Mexican produce industry ........................................... 156
Figures Figure ES.1 U.S. imports of frozen raspberries; U.S. production and field prices of raspberries for
processing, 2015‒20 ................................................................................................................................... 18
Figure ES.2 Global raspberry production by country, average 2015–19 .................................................... 20
Figure 1.1 Processed raspberry products (within the scope of this report) ............................................... 33
Figure 1.2 Marketing channels for raspberries ........................................................................................... 36
Figure 1.3 Global fresh raspberry production by country, average 2015–19 ............................................ 43
Figure 1.4 Global raspberry production, by country, 2015–19 .................................................................. 45
Figure 1.5 Frozen raspberries: Share of global imports by volume, 2019 .................................................. 48
Figure 1.6 Frozen raspberries: Share of global exports by volume, 2019 .................................................. 49
Table of Contents
United States International Trade Commission | 5
Figure 1.7 Fresh raspberries: Share of global imports by volume, 2019 .................................................... 50
Figure 1.8 Fresh raspberries: Share of global exports by volume, 2019 .................................................... 51
Figure 2.1 Factors that affect competitiveness in agricultural markets ..................................................... 63
Figure 3.1 Raspberry production in California, Oregon, and Washington,
by county and hectares ............................................................................................................................... 85
Figure 3.2 Mechanical harvesting in open fields ........................................................................................ 92
Figure 3.3 Handpicking raspberries under hoop houses ............................................................................ 93
Figure 3.4 Harvested raspberries in flats intended for IQF ........................................................................ 95
Figure 3.5 IQF raspberries packed in bulk containers ................................................................................ 97
Figure 3.6 Supply chains for raspberries for processing and for fresh consumption ................................. 98
Figure 3.7 Relative values of U.S. imports of fresh for processing and processed red
raspberries by product type, 2020 ............................................................................................................ 111
Figure 3.8 U.S. imports of frozen raspberries, by source country, July 2018–December 2020 ............... 112
Figure 3.9 U.S. imports of fresh raspberries from Mexico, July 2018–December 2020 ........................... 113
Figure 3.10 Monthly U.S. imports and U.S. stocks of frozen raspberry products, 2015–20 .................... 114
Figure 4.1 Raspberry Production in Canada, by province, 2019 ............................................................... 133
Figure 5.1 Raspberry production in Mexico, by state, 2019 ..................................................................... 153
Figure 6.1 Raspberry production in Serbia, by region, 2019 .................................................................... 173
Figure 7.1 Raspberry harvested area in Chile, by region, 2019 ................................................................ 195
Figure 9.1 U.S. imports for consumption and domestic gross sales of IQF raspberries,
by country, 2010–20 ................................................................................................................................. 235
Figure 9.2 U.S. imports for consumption and domestic sales of non-IQF raspberries, by country,
2010–20 .................................................................................................................................................... 235
Figure 9.3 Simulation of domestic IQF production and prices, 2010–20 ................................................. 237
Figure 9.4 Simulation of domestic non-IQF production and prices, 2010–20 .......................................... 238
Figure E.1 Fresh raspberries: Share of value of imports for consumption classified as IQF,
non-IQF, or out-of-scope by HTS statistical reporting number, total value 2010–20 ............................. 266
Figure E.2 Frozen mixed fruit: Share of value of imports for consumption classified as IQF,
non-IQF, or out-of-scope by HTS statistical reporting number, total value 2010–20 ............................. 268
Figure E.3 Single-product frozen: Share of value of imports for consumption classified as IQF,
non-IQF, or out-of-scope by HTS statistical reporting number, total value 2010–20 .............................. 270
Figure E.4 Cooked raspberries, raspberry juices, and other preparations:
Share of value of imports for consumption classified as IQF, non-IQF, or out-of-scope by HTS
statistical reporting number, total value 2010–20 ................................................................................... 271
Figure E.5 Related products: Share of value of imports for consumption classified as IQF,
non-IQF, or out-of-scope by HTS statistical reporting number, total value 2010–20 .............................. 272
Figure F.1 Actual and counterfactual percentage changes and levels for gross sales of
imported IQF raspberries, 2010–20 .......................................................................................................... 282
Figure F.2 Actual and counterfactual percentage changes and levels for gross sales of
imported non-IQF raspberries 2010–20 ................................................................................................... 283
Tables
Raspberries for Processing
6 | www.usitc.gov
Table ES.1 Comparison of competitive factor categories for processed raspberries in
selected countries, 2015–20 ....................................................................................................................... 17
Table ES.2 Summary of estimated impacts of imports on the Washington markets for IQF
and non-IQF raspberries, 2016–20 ............................................................................................................. 19
Table 1.1 Frozen exports to the world, selected countries, 2015–19 ........................................................ 49
Table 2.1 Raspberries: Industry summary concerning production, area harvested, and yield,
selected countries, yearly average 2015–19, exports 2019 ...................................................................... 60
Table 2.2 Comparison of competitive factor categories for processed raspberries in
selected countries, 2015–20 ....................................................................................................................... 65
Table 2.3 Processed raspberries and raspberries for processing supplied to the U.S.
market by country ....................................................................................................................................... 66
Table 2.4 Costs of production and price estimates for raspberries for processing in
selected countries ....................................................................................................................................... 68
Table 2.5 Hourly earnings for skilled agricultural, forestry, and fishery workers in
select countries, 2018 or most recent year available ................................................................................. 70
Table 2.6 Symmetric revealed comparative advantage, 2018–19 average (scale of −1 to +1) .................. 78
Table 3.1 Characteristics of raspberries for processing and for fresh consumption in
the United States ........................................................................................................................................ 91
Table 3.2 United States: Total raspberry production by state, area harvested,
and yield, 2015–19 ...................................................................................................................................... 99
Table 3.3 United States: Production of fresh raspberries for processing, by state, 2015–19 .................. 100
Table 3.4 Washington and Oregon: Production of raspberries, area harvested,
and yield, 2015–19 .................................................................................................................................... 101
Table 3.5 Apparent U.S. consumption of processed raspberry products by source, 2015–19 ................ 102
Table 3.6 Share of apparent U.S. consumption by quantity of processed raspberry
products by source, 2015–19 .................................................................................................................... 103
Table 3.7 U.S. statistical reporting numbers and tariff rates for fresh and processed
raspberries ................................................................................................................................................ 104
Table 3.8 United States: Imports of fresh raspberries by source, 2015–20 ............................................. 107
Table 3.9 United States: Imports of fresh raspberries from Mexico, by type, 2015–20 .......................... 108
Table 3.10 United States: Imports of frozen red raspberries by source, 2015–20 .................................. 109
Table 3.11 United States: Imports of IQF frozen berry mixes by source, 2019–20,
metric tons (mt) and percentages ............................................................................................................ 110
Table 3.12 United States: Imports of red raspberry juice concentrate by source, 2015–20 ................... 110
Table 3.13 United States: Exports of fresh raspberries by destination, 2015–20 .................................... 115
Table 3.14 United States: Exports of frozen raspberries by destination, 2015–20 .................................. 115
Table 4.1 Canada: Raspberry production, area harvested and yield, 2015–19........................................ 138
Table 4.2 Canada: Exports of frozen raspberries by destination market, 2015–20 ................................. 140
Table 4.3 Canada: Exports of frozen raspberries by destination market, 2015–20 ................................. 140
Table 4.4 Canada: Exports of fresh raspberries by destination market, 2015–20 ................................... 141
Table 4.5 Canada: Exports of fresh raspberries by destination market, 2015–20 ................................... 141
Table 4.6 Canada: Imports of fresh raspberries by source, 2015–20 ....................................................... 142
Table 4.7 Canada: Imports of fresh raspberries by source, 2015–20 ....................................................... 142
Table 4.8 Canada: Imports of frozen raspberries by source, 2015–20 ..................................................... 143
Table of Contents
United States International Trade Commission | 7
Table 4.9 Canada: Imports of frozen raspberries by source, 2015–20 ..................................................... 143
Table 5.1 Mexico: Production, area harvested, and yield, 2015–19 ........................................................ 160
Table 5.2 Mexico: Exports of frozen raspberries by destination market, 2015–20 ................................. 161
Table 5.3 Mexico: Exports of fresh raspberries by destination market, 2015–20 ................................... 162
Table 6.1 Serbia: Raspberry production, area harvested, and yield, 2015–19 ........................................ 179
Table 6.2 Serbia: Exports of frozen raspberries by destination market, 2015–20 ................................... 180
Table 6.3 Serbia: Exports of frozen raspberries by destination market, 2015–20 ................................... 181
Table 7.1 Chile: Production, area harvested and yield, 2015–19 ............................................................. 202
Table 7.3 Chile: Exports of frozen raspberries by destination market, 2015–20 ..................................... 203
Table 7.4 Chile: Exports of organic frozen raspberries by destination market, by quantity,
2015–20 .................................................................................................................................................... 204
Table 7.5 Chile: Exports of organic frozen raspberries by destination market, by value,
2015–20 .................................................................................................................................................... 205
Table 7.6 Chile: Average unit value of exports of organic frozen raspberries by
destination market, 2015–20 .................................................................................................................... 205
Table 7.7 Chile: Exports of conventional frozen raspberries by destination market, by
quantity, 2015–20 ..................................................................................................................................... 205
Table 7.8 Chile: Exports of conventional frozen raspberries by destination market,
by value, 2015–20 ..................................................................................................................................... 206
Table 7.9 Chile: Average unit value of exports of conventional frozen raspberries by
destination market, 2015–20 .................................................................................................................... 206
Table 9.1 Summary of estimated impact of imports on the Washington State markets for
IQF and non-IQF raspberries, 2016–20 ..................................................................................................... 236
Table E.1 Fresh raspberries: U.S. HTS statistical reporting numbers and descriptions
for imports ................................................................................................................................................ 265
Table E.2 Fresh raspberries: Annual value of U.S. imports by HTS statistical reporting
number, 2010–20 ...................................................................................................................................... 266
Table E.3 Fresh raspberries: Top five sources of U.S. imports by value by HTS statistical
reporting number, for total imports 2010–20 .......................................................................................... 267
Table E.4 Frozen mixed fruit: U.S. HTS statistical reporting numbers and descriptions
for imports ................................................................................................................................................ 267
Table E.5 Mixed frozen fruit: Annual value of U.S. imports by HTS statistical reporting
number (millions of U.S. dollars), 2010–20 .............................................................................................. 268
Table E.6 Mixed frozen fruit: Top five sources of U.S. imports by value by HTS statistical
reporting number, for total imports 2010–20 .......................................................................................... 268
Table E.7 Single-product frozen: U.S. HTS statistical reporting numbers and descriptions
for imports ................................................................................................................................................ 269
Table E.8 Country-level approximations of IQF percentage under HTS statistical reporting
number 0811.20.2025 .............................................................................................................................. 269
Table E.9 Single-product frozen: Annual value of U.S. imports by HTS statistical reporting n
umber, 2010–20 ........................................................................................................................................ 270
Table E.10 Single-product frozen: Top five sources of U.S. imports by value by HTS
statistical reporting number, for total imports 2010–20 .......................................................................... 270
Raspberries for Processing
8 | www.usitc.gov
Table E.11 Cooked raspberries, raspberry juices, and other preparations: U.S. HTS
statistical reporting numbers and descriptions for imports .................................................................... 271
Table E.12 Cooked raspberries, raspberry juices, and other preparations: Annual value of
U.S. imports by HTS statistical reporting number, 2010–20 .................................................................... 271
Table E.13 Cooked raspberries, raspberry juices, and other preparations: Top five sources of
U.S. imports by value by HTS statistical reporting number, for total imports 2010–20........................... 272
Table E.14 Related products: U.S. HTS statistical reporting numbers and descriptions for imports ....... 272
Table E.15 Related products: Annual value of U.S. imports by HTS statistical reporting
number, 2010–20 ...................................................................................................................................... 273
Table E.16 Related products: Top five sources of U.S. imports by value by HTS statistical reporting
number, for total imports 2010–20 .......................................................................................................... 273
Table F.1 Constant parameters ................................................................................................................ 280
Table F.2 Annual parameters .................................................................................................................... 280
Table F.3 Means and standard deviations for elasticity of substitution distributions ............................. 285
Table F.4 Summary of elasticity of substitution robustness check of model results for
Washington gross sales 2016–20 .............................................................................................................. 285
Table F.5 Summary of model results using elasticity of substitution robustness check for
counterfactual Washington prices and production above actual values 2016–20 .................................. 285
Table H.1 U.S. imports of frozen raspberries; Washington production and field prices for
raspberries for processing, 2015‒20 ....................................................................................................... 295
Table H.2 Global raspberry production by country, average 2015–19 .................................................... 295
Table H.3 Global raspberry production, by country, 2015–19 ................................................................. 296
Table H.4 Frozen raspberries: Share of global imports by volume, 2019 ................................................ 296
Table H.5 Frozen raspberries: Share of global exports by volume, 2019 ................................................. 297
Table H.6 Fresh raspberries: Share of global imports by volume, 2019 ................................................... 297
Table H.7 Fresh raspberries: Share of global exports by volume, 2019 ................................................... 297
Table H.8 Raspberry production in California, Oregon, and Washington, by county and hectares ........ 297
Table H.9 Relative values of U.S. imports of fresh for processing and processed red raspberries by
product type, 2020 .................................................................................................................................... 299
Table H.10 U.S. imports of frozen raspberries, by source country, July 2018–December 2020 .............. 300
Table H.11 U.S. imports of fresh raspberries from Mexico, July 2018–December 2020 ......................... 301
Table H.12 Monthly U.S. imports and U.S stocks of frozen raspberry products, 2015–20 ...................... 301
Table H.13 Raspberry production in Canada, by province, 2019 ............................................................. 303
Table H.14 Raspberry production in Mexico, by state, 2019 ................................................................... 303
Table H.15 Raspberry production in Serbia, by region, 2019 ................................................................... 303
Table H.16 Raspberry harvested area in Chile, by region, 2019 ............................................................... 304
Table H.17 U.S. imports of frozen raspberries and fresh raspberries for processing; Washington
production and field prices of raspberries for processing, 2015‒20 ........................................................ 304
Table H.18 U.S. imports of frozen raspberries from Mexico and Canada, Washington production of
straight pack raspberries, and Washington selling prices for straight pack frozen
raspberries, 2011‒20 ................................................................................................................................ 305
Table H.19 Volume of U.S. processed raspberry imports from Canada and Mexico, and
Washington straight pack selling prices, 2015–20.................................................................................... 305
Table of Contents
United States International Trade Commission | 9
Table H.20 Washington sales price of straight pack raspberries and AUVs for frozen raspberry
imports from Canada and Mexico, 2015‒20 ............................................................................................ 305
Table H.21 U.S. imports of frozen raspberries from Chile and Serbia, Washington
production of IQF raspberries, and U.S. selling prices for IQF raspberries, 2011‒20............................... 305
Table H.22 U.S. imports of frozen raspberries from Chile and Serbia and Washington selling
prices for IQF raspberries, 2015‒20 .......................................................................................................... 306
Table H.23 Import AUVs of frozen raspberries from Chile and Serbia and Washington selling
prices for IQF raspberries, 2015‒20 .......................................................................................................... 306
Table H.24 U.S. imports for consumption and Washington State gross sales of IQF raspberries, by
country, 2010–20 ...................................................................................................................................... 306
Table H.25 U.S. imports for consumption and Washington State sales of non-IQF raspberries,
by country, 2010–20 ................................................................................................................................. 307
Table H.26 Simulation of Washington IQF production and prices, 2010–20 ........................................... 307
Table H.27 Simulation of Washington non-IQF production and prices, 2010–20 .................................... 308
Table H.28 Fresh raspberries: Share of value of imports for consumption classified as IQF,
non-IQF, or out-of-scope by statistical reporting number, total value 2010–20 ..................................... 308
Table H.29 Frozen mixed fruit: Share of value of imports for consumption classified as IQF,
non-IQF, or out-of-scope by statistical reporting number, total value 2010–20 ..................................... 308
Table H.30 Single-product frozen: Share of value of imports for consumption classified as IQF,
non-IQF, or out-of-scope by statistical reporting number, total value 2010–20..................................... 309
Table H.31 Cooked raspberries, raspberry juices, and other preparations: Share of value of imports for
consumption classified as IQF, non-IQF, or out-of-scope by statistical reporting number, total value
2010–20 .................................................................................................................................................... 309
Table H.32 Related products: Share of value of imports for consumption classified as IQF,
non-IQF, or out-of-scope by statistical reporting number, total value 2010–20 ..................................... 309
Table H.33 Actual and counterfactual percentage changes and levels for gross sales of
imported IQF raspberries, 2010–20 .......................................................................................................... 309
Table H.34 Actual and counterfactual percentage changes and levels for gross sales of
imported IQF raspberries, 2010–20 .......................................................................................................... 310

10 | www.usitc.gov
Glossary of Terms
United States International Trade Commission | 11
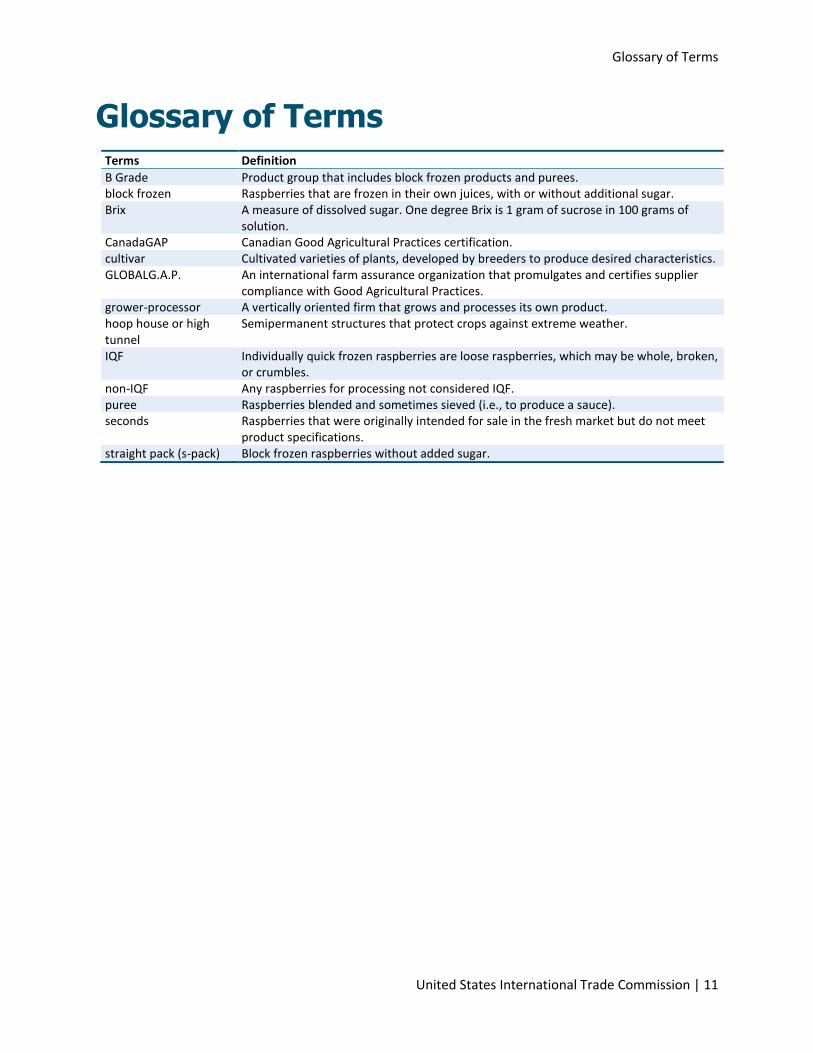
Glossary of Terms Terms Definition
B Grade Product group that includes block frozen products and purees. block frozen Raspberries that are frozen in their own juices, with or without additional sugar. Brix A measure of dissolved sugar. One degree Brix is 1 gram of sucrose in 100 grams of
solution. CanadaGAP Canadian Good Agricultural Practices certification. cultivar Cultivated varieties of plants, developed by breeders to produce desired characteristics. GLOBALG.A.P. An international farm assurance organization that promulgates and certifies supplier
compliance with Good Agricultural Practices. grower-processor A vertically oriented firm that grows and processes its own product. hoop house or high tunnel
Semipermanent structures that protect crops against extreme weather.
IQF Individually quick frozen raspberries are loose raspberries, which may be whole, broken, or crumbles.
non-IQF Any raspberries for processing not considered IQF. puree Raspberries blended and sometimes sieved (i.e., to produce a sauce). seconds Raspberries that were originally intended for sale in the fresh market but do not meet
product specifications. straight pack (s-pack) Block frozen raspberries without added sugar.

12 | www.usitc.gov
Abbreviations and Acronyms
United States International Trade Commission | 13
Abbreviations and Acronyms Item Definition
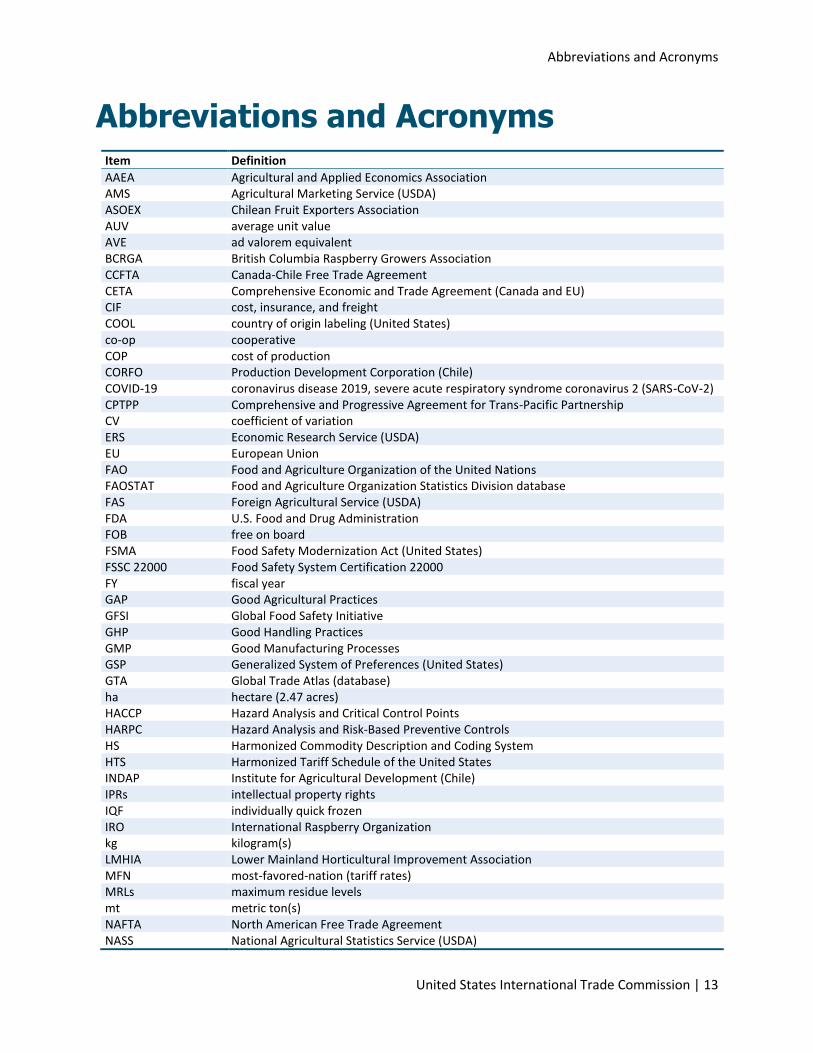
AAEA Agricultural and Applied Economics Association AMS Agricultural Marketing Service (USDA) ASOEX Chilean Fruit Exporters Association AUV average unit value AVE ad valorem equivalent BCRGA British Columbia Raspberry Growers Association CCFTA Canada-Chile Free Trade Agreement CETA Comprehensive Economic and Trade Agreement (Canada and EU) CIF cost, insurance, and freight COOL country of origin labeling (United States) co-op cooperative COP cost of production CORFO Production Development Corporation (Chile) COVID-19 coronavirus disease 2019, severe acute respiratory syndrome coronavirus 2 (SARS-CoV-2) CPTPP Comprehensive and Progressive Agreement for Trans-Pacific Partnership CV coefficient of variation ERS Economic Research Service (USDA) EU European Union FAO Food and Agriculture Organization of the United Nations FAOSTAT Food and Agriculture Organization Statistics Division database FAS Foreign Agricultural Service (USDA) FDA U.S. Food and Drug Administration FOB free on board FSMA Food Safety Modernization Act (United States) FSSC 22000 Food Safety System Certification 22000 FY fiscal year GAP Good Agricultural Practices GFSI Global Food Safety Initiative GHP Good Handling Practices GMP Good Manufacturing Processes GSP Generalized System of Preferences (United States) GTA Global Trade Atlas (database) ha hectare (2.47 acres) HACCP Hazard Analysis and Critical Control Points HARPC Hazard Analysis and Risk-Based Preventive Controls HS Harmonized Commodity Description and Coding System HTS Harmonized Tariff Schedule of the United States INDAP Institute for Agricultural Development (Chile) IPRs intellectual property rights IQF individually quick frozen IRO International Raspberry Organization kg kilogram(s) LMHIA Lower Mainland Horticultural Improvement Association MFN most-favored-nation (tariff rates) MRLs maximum residue levels mt metric ton(s) NAFTA North American Free Trade Agreement NASS National Agricultural Statistics Service (USDA)
Raspberries for Processing
14 | www.usitc.gov
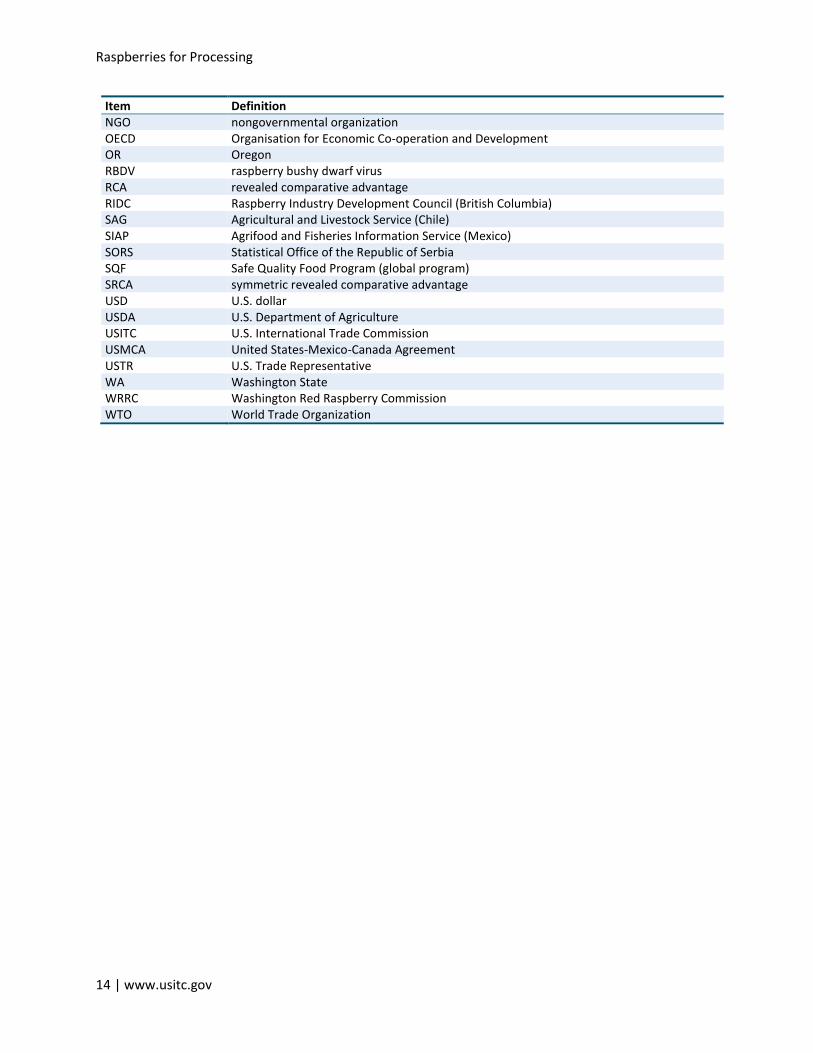
Item Definition NGO nongovernmental organization OECD Organisation for Economic Co-operation and Development OR Oregon RBDV raspberry bushy dwarf virus RCA revealed comparative advantage RIDC Raspberry Industry Development Council (British Columbia) SAG Agricultural and Livestock Service (Chile) SIAP Agrifood and Fisheries Information Service (Mexico) SORS Statistical Office of the Republic of Serbia SQF Safe Quality Food Program (global program) SRCA symmetric revealed comparative advantage USD U.S. dollar USDA U.S. Department of Agriculture USITC U.S. International Trade Commission USMCA United States-Mexico-Canada Agreement USTR U.S. Trade Representative WA Washington State WRRC Washington Red Raspberry Commission WTO World Trade Organization
Executive Summary
United States International Trade Commission | 15
Executive Summary The purpose of this investigation is to provide information and analysis on the U.S. processed raspberry
industry and its competitiveness compared to foreign suppliers to the U.S. market. The U.S. processed
raspberry industry consists of two segments. The first segment produces fresh raspberries used as an
input into processed products; the second is processed raspberry products—including frozen berries,
puree, and juice—which are used as ingredients in a range of processed foods and retail products. The
U.S. industry has reported increased competition with imports in the U.S. market in recent years for
both processed raspberry products and fresh raspberries for processing, as well as a decline in U.S.
prices for these products.
The U.S. processed raspberry industry is based largely in Washington State, with a small amount of fresh
raspberries for processing also grown in Oregon and some processing in California of fresh raspberry
“seconds.”1 From 2015 to 2020, sales of processed raspberry products supplied by the industry in
Washington were roughly $530 million, while U.S. imports were valued at about $740 million during this
period, for an estimated total U.S. market of over $1 billion over the period. Demand for raspberries in
the United States, as evidenced by apparent consumption, was largely steady from 2015 to 2019.
The U.S. industry has expressed concerns about U.S. imports of fresh raspberries for processing,
processed raspberries, and frozen mixed berries (which include raspberries). From 2015 to 2020, U.S.
imports of fresh and processed raspberries were supplied by four major source countries—Mexico,
Chile, Serbia, and Canada—which are profiled within this investigation along with the United States. Due
to several factors, including proximity, Mexico was the largest supplier of fresh raspberries for
processing to the United States from 2015 to 2020. Together, Mexico, Chile, Serbia, and Canada
supplied 99 percent of U.S. imports of processed raspberries in 2020. Meanwhile, in 2020, Canada was
the largest supplier by volume of frozen mixed berries to the United States, a product in high demand by
U.S. consumers.
The Request
U.S. Trade Representative Robert Lighthizer requested this investigation in a letter received by the U.S.
International Trade Commission (USITC or Commission) on April 9, 2020. The letter asked for
information on the conditions of competition between the United States (specifically in Washington
State) and foreign suppliers of both raspberries meant for processing and processed raspberries. The
letter noted that WRRC and its members (raspberry growers and processors) had raised concerns about
imports of fresh raspberries for processing (not for fresh consumption) and of processed raspberries
(including frozen) and had alleged that unfair practices were involved.
The Trade Representative requested the Commission conduct three overall assessments of the U.S.
processed raspberry industry and major suppliers of processed raspberries to the United States,
1 These are berries originally grown for the fresh market but later sold to the processed market because these fruits did not meet fresh market specifications.
Raspberries for Processing
16 | www.usitc.gov
including: (1) a cross-country comparison of competitiveness, (2) an analysis of U.S. prices, and (3) an
estimate of the economic impact of imports. The Trade Representative also requested information on
production, consumption, and trade, as well as profiles of processed raspberry industries in the United
States and in major supplier countries to the U.S. market. The report primarily focuses on the period
between 2015 to 2019, but includes 2020 in chapters 3 through 7 (the industry profiles), in chapter 8
(“Pricing Analysis: Relationship between Imports and Prices in the U.S. Market”), and chapter 9
(“Economic Impacts of Imports”).
Overall Findings
The study took a different approach for each of the three requested assessments:
The cross-country assessment used an agricultural competitiveness framework to provide a qualitative
analysis of competitiveness. The framework compared the United States’ processed raspberry industry
to industries in countries that are major suppliers to the U.S. market (Mexico, Chile, Serbia, and Canada)
in terms of delivered cost, product differentiation, and reliability of supply. Chapter 2 (“Cross-Country
Comparison of Competitiveness”) also provides an estimation of symmetric revealed comparative
advantage (SRCA) as another indicator of competitiveness of the profile countries.
A descriptive analysis of prices in the U.S. market was conducted using available price data. Along with
information on the product mix of imports, these data were used to provide a look at the relationship
between Washington State prices and import prices in the U.S. market for processed raspberries and
fresh for processing raspberries.
A partial equilibrium model was used to assess the economic impact of imports from major producing
and exporting countries on production and prices of Washington fresh for processing and processed
raspberries. This quantitative analysis used estimated results for two separate market segments:
individually quick frozen (IQF) raspberries and non-IQF raspberries (encompassing fresh for processing,
block frozen, puree, and juice, including concentrate).
The data and methodology used in this report, as well as its scope, as described in chapter 1
(“Introduction”), differ from those the Commission uses in import injury investigations. For example, in
contrast to this investigation, in import injury investigations the Commission utilizes questionnaire data
submitted by industry participants to measure such things as production and pricing.
Cross-Country Comparison of Competitiveness
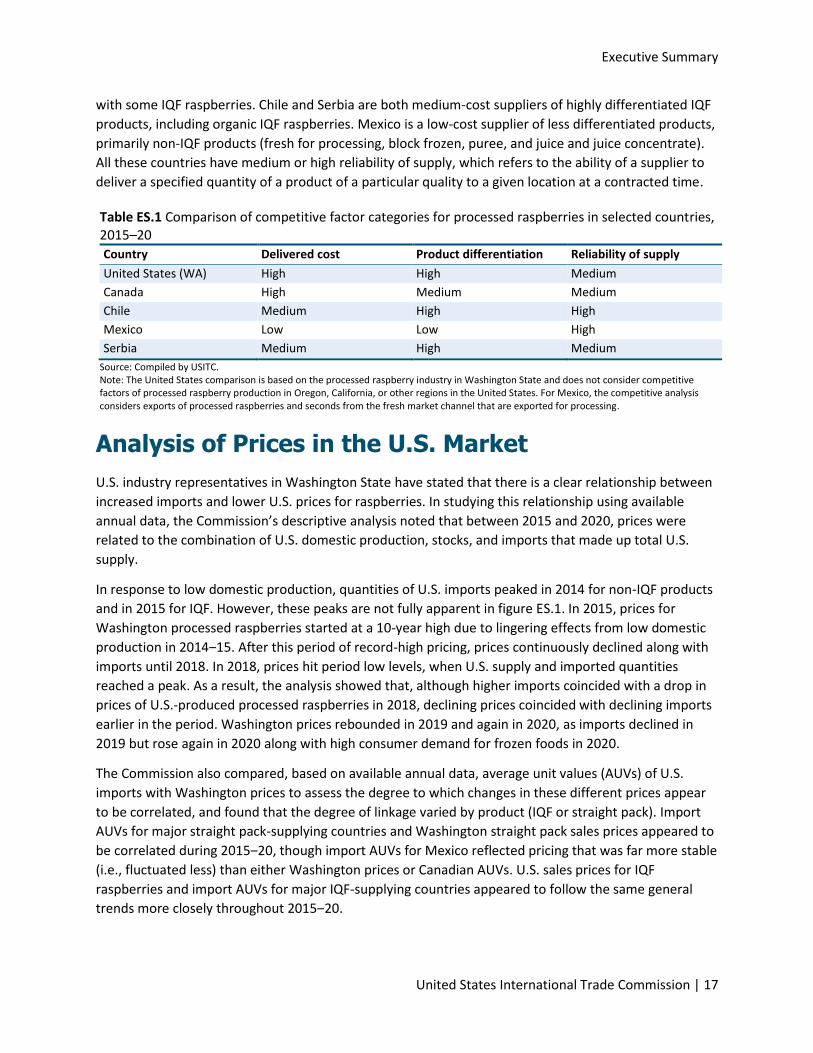
As shown in table ES.1, the U.S. processed raspberry industry in Washington State and the main
suppliers of imports were evaluated on three broad dimensions: delivered cost, product differentiation
and reliability of supply. The United States comparison is based on the processed raspberry industry in
Washington State and does not consider competitive factors of processed raspberry production in
Oregon, California, or other regions in the United States. The Commission found that the U.S. industry in
Washington is a high-cost producer of processed raspberry products including premium products—that
is, IQF raspberries—that have highly desirable product characteristics (based on reputation for food
safety, color, and sugar content) Canada is also a high-cost supplier of slightly less differentiated
products than the United States, producing primarily non-IQF products (purees and block frozen) along
Executive Summary
United States International Trade Commission | 17
with some IQF raspberries. Chile and Serbia are both medium-cost suppliers of highly differentiated IQF
products, including organic IQF raspberries. Mexico is a low-cost supplier of less differentiated products,
primarily non-IQF products (fresh for processing, block frozen, puree, and juice and juice concentrate).
All these countries have medium or high reliability of supply, which refers to the ability of a supplier to
deliver a specified quantity of a product of a particular quality to a given location at a contracted time.
Table ES.1 Comparison of competitive factor categories for processed raspberries in selected countries, 2015–20
Country Delivered cost Product differentiation Reliability of supply
United States (WA) High High Medium
Canada High Medium Medium
Chile Medium High High
Mexico Low Low High
Serbia Medium High Medium
Source: Compiled by USITC. Note: The United States comparison is based on the processed raspberry industry in Washington State and does not consider competitive factors of processed raspberry production in Oregon, California, or other regions in the United States. For Mexico, the competitive analysis considers exports of processed raspberries and seconds from the fresh market channel that are exported for processing.
Analysis of Prices in the U.S. Market
U.S. industry representatives in Washington State have stated that there is a clear relationship between
increased imports and lower U.S. prices for raspberries. In studying this relationship using available
annual data, the Commission’s descriptive analysis noted that between 2015 and 2020, prices were
related to the combination of U.S. domestic production, stocks, and imports that made up total U.S.
supply.
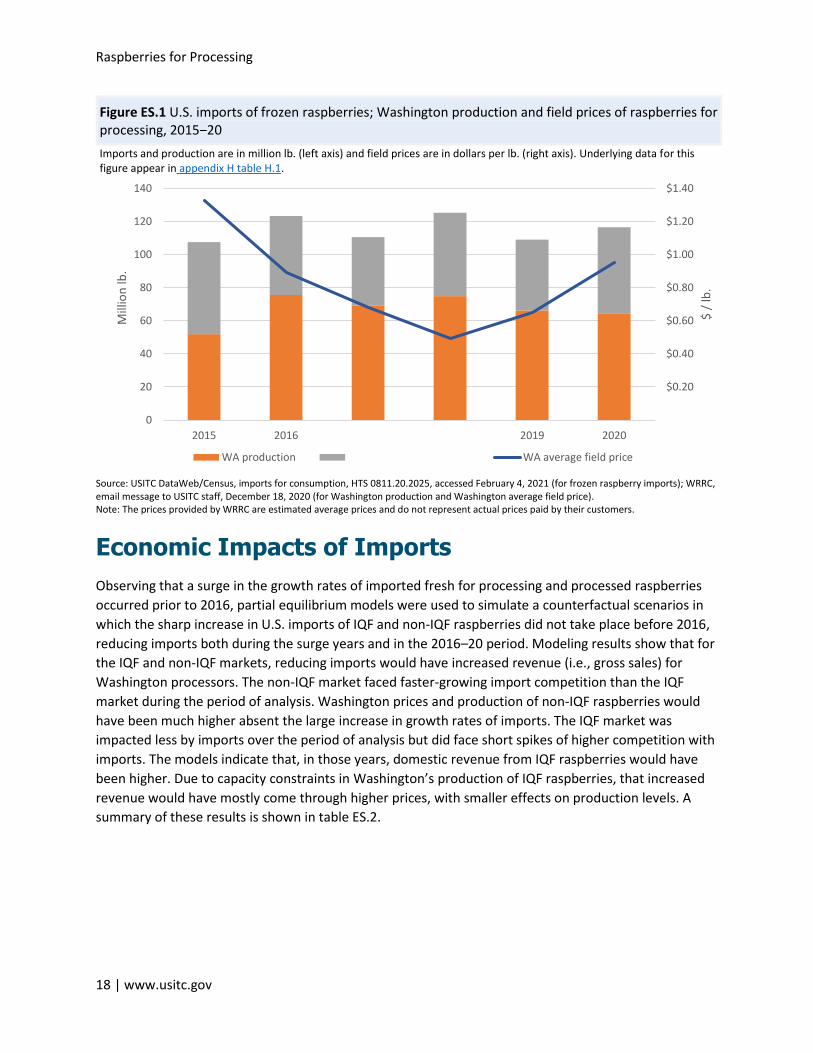
In response to low domestic production, quantities of U.S. imports peaked in 2014 for non-IQF products
and in 2015 for IQF. However, these peaks are not fully apparent in figure ES.1. In 2015, prices for
Washington processed raspberries started at a 10-year high due to lingering effects from low domestic
production in 2014‒15. After this period of record-high pricing, prices continuously declined along with
imports until 2018. In 2018, prices hit period low levels, when U.S. supply and imported quantities
reached a peak. As a result, the analysis showed that, although higher imports coincided with a drop in
prices of U.S.-produced processed raspberries in 2018, declining prices coincided with declining imports
earlier in the period. Washington prices rebounded in 2019 and again in 2020, as imports declined in
2019 but rose again in 2020 along with high consumer demand for frozen foods in 2020.
The Commission also compared, based on available annual data, average unit values (AUVs) of U.S.
imports with Washington prices to assess the degree to which changes in these different prices appear
to be correlated, and found that the degree of linkage varied by product (IQF or straight pack). Import
AUVs for major straight pack-supplying countries and Washington straight pack sales prices appeared to
be correlated during 2015‒20, though import AUVs for Mexico reflected pricing that was far more stable
(i.e., fluctuated less) than either Washington prices or Canadian AUVs. U.S. sales prices for IQF
raspberries and import AUVs for major IQF-supplying countries appeared to follow the same general
trends more closely throughout 2015‒20.
Raspberries for Processing
18 | www.usitc.gov
Figure ES.1 U.S. imports of frozen raspberries; Washington production and field prices of raspberries for processing, 2015‒20
Imports and production are in million lb. (left axis) and field prices are in dollars per lb. (right axis). Underlying data for this figure appear in appendix H table H.1.
Source: USITC DataWeb/Census, imports for consumption, HTS 0811.20.2025, accessed February 4, 2021 (for frozen raspberry imports); WRRC, email message to USITC staff, December 18, 2020 (for Washington production and Washington average field price). Note: The prices provided by WRRC are estimated average prices and do not represent actual prices paid by their customers.
Economic Impacts of Imports
Observing that a surge in the growth rates of imported fresh for processing and processed raspberries
occurred prior to 2016, partial equilibrium models were used to simulate a counterfactual scenarios in
which the sharp increase in U.S. imports of IQF and non-IQF raspberries did not take place before 2016,
reducing imports both during the surge years and in the 2016–20 period. Modeling results show that for
the IQF and non-IQF markets, reducing imports would have increased revenue (i.e., gross sales) for
Washington processors. The non-IQF market faced faster-growing import competition than the IQF
market during the period of analysis. Washington prices and production of non-IQF raspberries would
have been much higher absent the large increase in growth rates of imports. The IQF market was
impacted less by imports over the period of analysis but did face short spikes of higher competition with
imports. The models indicate that, in those years, domestic revenue from IQF raspberries would have
been higher. Due to capacity constraints in Washington’s production of IQF raspberries, that increased
revenue would have mostly come through higher prices, with smaller effects on production levels. A
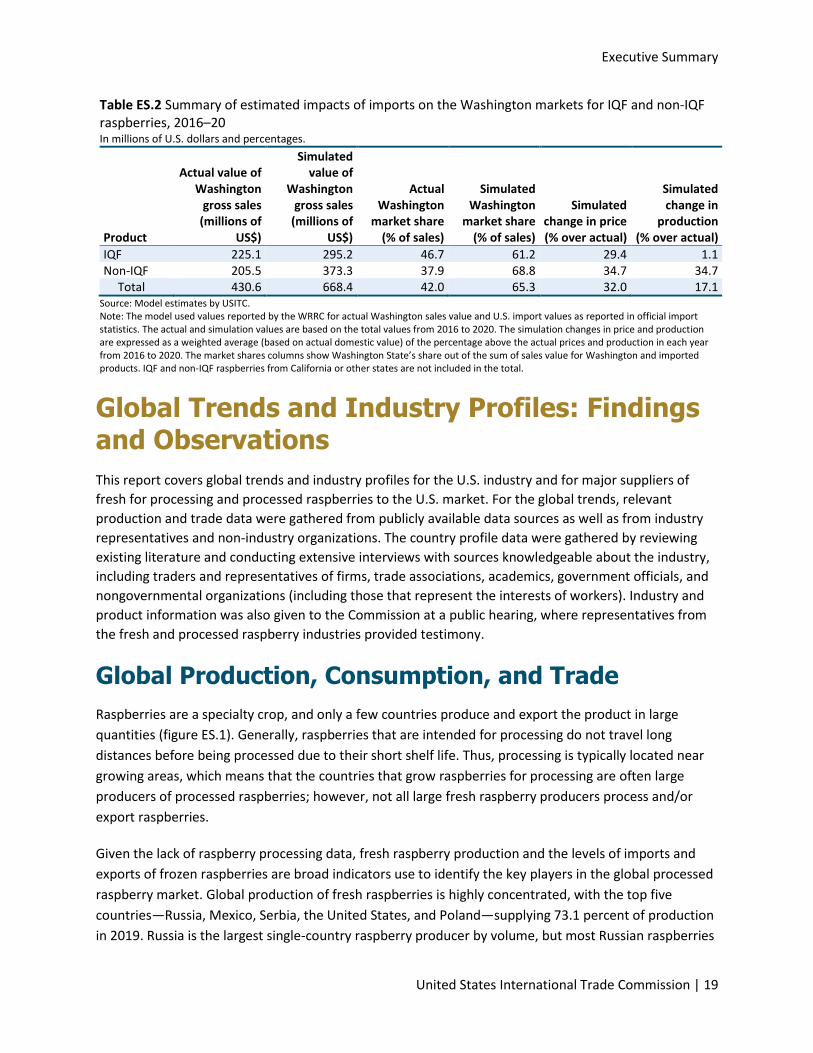
summary of these results is shown in table ES.2.
WA production WA average field price
$0.20
$0.40
$0.60
$0.80
$1.00
$1.20
$1.40
0
20
40
60
80
100
120
140
2015 2016 2019 2020
$ /
lb.
Mill
ion
lb.
Executive Summary
United States International Trade Commission | 19
Table ES.2 Summary of estimated impacts of imports on the Washington markets for IQF and non-IQF raspberries, 2016–20 In millions of U.S. dollars and percentages.
Product
Actual value of Washington
gross sales (millions of
US$)
Simulated value of
Washington gross sales
(millions of US$)
Actual Washington
market share (% of sales)
Simulated Washington
market share (% of sales)
Simulated change in price (% over actual)
Simulated change in
production (% over actual)
IQF 225.1 295.2 46.7 61.2 29.4 1.1 Non-IQF 205.5 373.3 37.9 68.8 34.7 34.7
Total 430.6 668.4 42.0 65.3 32.0 17.1 Source: Model estimates by USITC. Note: The model used values reported by the WRRC for actual Washington sales value and U.S. import values as reported in official import statistics. The actual and simulation values are based on the total values from 2016 to 2020. The simulation changes in price and production are expressed as a weighted average (based on actual domestic value) of the percentage above the actual prices and production in each year from 2016 to 2020. The market shares columns show Washington State’s share out of the sum of sales value for Washington and imported products. IQF and non-IQF raspberries from California or other states are not included in the total.
Global Trends and Industry Profiles: Findings and Observations
This report covers global trends and industry profiles for the U.S. industry and for major suppliers of
fresh for processing and processed raspberries to the U.S. market. For the global trends, relevant
production and trade data were gathered from publicly available data sources as well as from industry
representatives and non-industry organizations. The country profile data were gathered by reviewing
existing literature and conducting extensive interviews with sources knowledgeable about the industry,
including traders and representatives of firms, trade associations, academics, government officials, and
nongovernmental organizations (including those that represent the interests of workers). Industry and
product information was also given to the Commission at a public hearing, where representatives from
the fresh and processed raspberry industries provided testimony.
Global Production, Consumption, and Trade
Raspberries are a specialty crop, and only a few countries produce and export the product in large
quantities (figure ES.1). Generally, raspberries that are intended for processing do not travel long
distances before being processed due to their short shelf life. Thus, processing is typically located near
growing areas, which means that the countries that grow raspberries for processing are often large
producers of processed raspberries; however, not all large fresh raspberry producers process and/or
export raspberries.
Given the lack of raspberry processing data, fresh raspberry production and the levels of imports and
exports of frozen raspberries are broad indicators use to identify the key players in the global processed
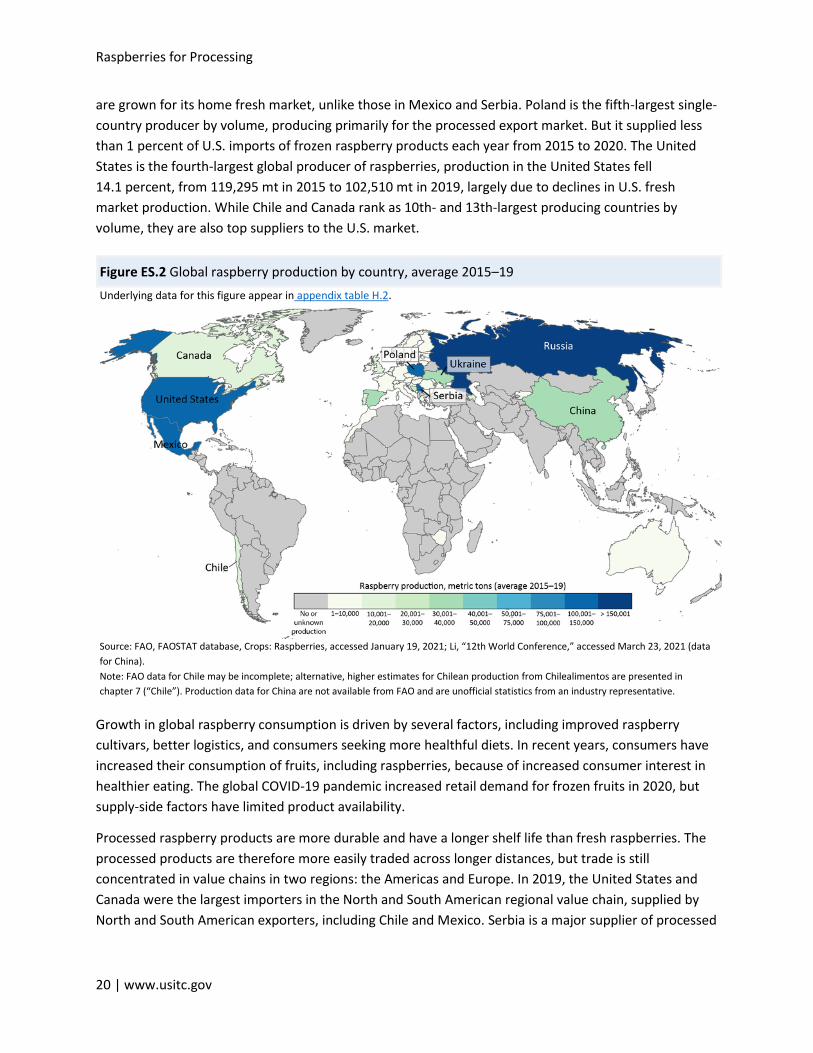
raspberry market. Global production of fresh raspberries is highly concentrated, with the top five
countries—Russia, Mexico, Serbia, the United States, and Poland—supplying 73.1 percent of production
in 2019. Russia is the largest single-country raspberry producer by volume, but most Russian raspberries
Raspberries for Processing
20 | www.usitc.gov
are grown for its home fresh market, unlike those in Mexico and Serbia. Poland is the fifth-largest single-
country producer by volume, producing primarily for the processed export market. But it supplied less
than 1 percent of U.S. imports of frozen raspberry products each year from 2015 to 2020. The United
States is the fourth-largest global producer of raspberries, production in the United States fell
14.1 percent, from 119,295 mt in 2015 to 102,510 mt in 2019, largely due to declines in U.S. fresh
market production. While Chile and Canada rank as 10th- and 13th-largest producing countries by
volume, they are also top suppliers to the U.S. market.
Figure ES.2 Global raspberry production by country, average 2015–19
Underlying data for this figure appear in appendix table H.2.
Source: FAO, FAOSTAT database, Crops: Raspberries, accessed January 19, 2021; Li, “12th World Conference,” accessed March 23, 2021 (data
for China).
Note: FAO data for Chile may be incomplete; alternative, higher estimates for Chilean production from Chilealimentos are presented in
chapter 7 (“Chile”). Production data for China are not available from FAO and are unofficial statistics from an industry representative.
Growth in global raspberry consumption is driven by several factors, including improved raspberry
cultivars, better logistics, and consumers seeking more healthful diets. In recent years, consumers have
increased their consumption of fruits, including raspberries, because of increased consumer interest in
healthier eating. The global COVID-19 pandemic increased retail demand for frozen fruits in 2020, but
supply-side factors have limited product availability.
Processed raspberry products are more durable and have a longer shelf life than fresh raspberries. The
processed products are therefore more easily traded across longer distances, but trade is still
concentrated in value chains in two regions: the Americas and Europe. In 2019, the United States and
Canada were the largest importers in the North and South American regional value chain, supplied by
North and South American exporters, including Chile and Mexico. Serbia is a major supplier of processed
Executive Summary
United States International Trade Commission | 21
raspberries to the United States; but Serbia primarily supplies European countries, primarily Germany
and France, the largest global importers of frozen raspberries.
Due to the perishability of fresh raspberries for processing, they are generally traded across shorter
distances. Thus, Mexico and Canada supply most of the United States’ imports of fresh raspberries for
processing. During 2015–20, the United States, however, was not a major global exporter of either
processed raspberries or fresh raspberries for processing because the United States consumes most of
what it produces and imports.
United States
The United States is the fourth-largest producer of raspberries in the world. The country produced over
100,000 metric tons in 2019, more than 10 percent of global production. Approximately one-third of the
volume of total U.S. production of raspberries is made up of raspberries for processing, valued at over
$60 million in 2020. Most production of U.S.-grown raspberries for processing occurs in Washington
State, and to a lesser extent in California and Oregon.2 The Washington industry is also a major producer
of processed raspberry products; its processed industry sales were estimated to be worth over
$90 million in 2020. California also processes raspberry seconds originally grown for the fresh market.
Two aspects of the U.S. processed raspberry industry distinguish it among the world’s major producers
of raspberries for processing. First, the industry machine-harvests raspberries instead of handpicking
them. Second, most of the U.S. industry is made up of vertically integrated firms that do both growing
and processing. These two characteristics allow for the quick harvesting and processing of large volumes
of raspberries in a highly localized area. However, two factors weaken U.S. competitiveness vis-à-vis
imports, particularly in lower-value processed products. One factor is geographic concentration, which
exposes the majority of the U.S. raspberries grown for processing to the same weather events. Also, the
United States’ relatively high production costs, driven by high labor costs, can limit the competitiveness
of U.S. products relative to imports. In addition, the highly concentrated growing region in Washington
has climate and pest pressures that make producing organic raspberries on a commercial scale difficult
and expensive.
Canada
Canada is a minor global producer and exporter of processed raspberry products, almost exclusively
serving its home market and the U.S. market. Nearly all processed raspberry production in Canada is in
the Fraser Valley, British Columbia, which is just over the border from Washington. Canadian processors
in British Columbia primarily convert fresh berries from Canada and the United States into IQF
raspberries, straight pack, puree, and juice concentrate. Canada also has a competitive repacking
industry, which sources large volumes of frozen inputs from U.S., Canadian, Chilean, and Serbian
2 California accounted for 26.0 percent of U.S. raspberries for processing while Oregon accounted for only 6.3 percent of U.S. raspberries for processing from 2015–2017, the last three years of available state level data. In some instances, production data for California and Oregon were included in the industry analysis, but the primary focus of this investigation is on the industry in Washington. California focuses its production on growing raspberries for the fresh market but also sells, at arm’s length, raspberry seconds to the processed market.
Raspberries for Processing
22 | www.usitc.gov
producers to supply the U.S. market with IQF raspberries and frozen mixed berry products that include
raspberries. Canadian exports of frozen processed raspberry products to the United States increased
from 2015 to 2020, even as production of domestic fresh raspberries for processing fell because of poor
weather, rising land rents, low yields, and farmers pulling canes (raspberry plants) to grow other berries.
To export more to the U.S. market, Canadian processors imported increasing volumes of fresh and
frozen raspberries as inputs.
The raspberry industries in Washington and British Columbia have a special relationship because of their
geographical proximity, similar production systems and cost structures, shared focus on processing, and
cross-border integration. Canadian frozen raspberry products remain competitive in the United States
due to Canadian processors’ access to fresh raspberries for processing grown in both British Columbia
and Washington. However, Canadian growing and processing costs are considered to be higher than
those in the United States, due to higher land costs. Despite high delivered costs, Canadian IQF
repackers benefit from access to large volumes of IQF raspberries from Canadian and imported sources.
Mexico
Mexico is the second-largest global producer of raspberries (after Russia), supplying 15 percent of global
production in 2019. Mexico’s raspberry production mainly serves the lucrative fresh market in the
United States. Mexico’s small raspberry processing industry grew out of this fresh market production.
That industry is driven solely by the availability of raspberry seconds, or raspberries that do not meet
the product specifications for the fresh market, whose volume has been growing in recent years as
overall raspberry production has grown. Mexican exports to the United States include processed
raspberry products produced in Mexico using raspberry seconds, as well as fresh raspberry seconds in
bulk form that are processed by U.S. firms. As shown in chapter 3 (“United States”), fresh raspberries for
processing from Mexico accounted for nearly all U.S. imports of fresh raspberries for processing.
Mexico’s competitiveness in the U.S. processed raspberry market is enhanced by favorable growing
conditions for raspberries, an extended growing season that allows product to be available almost
year-round, and relatively low delivered costs of raspberries both for the fresh market and for
processing. The raspberry industry in Mexico enjoys a delivered-cost advantage in the U.S. fresh market
from the lower costs of labor as well as the Mexican industry’s high yields and proximity to the U.S.
market, which increases the volume of raspberry seconds available for processing. To a certain degree,
these competitive strengths are mitigated by the fact that Mexican raspberries are grown to the
specifications of the fresh market, even those that are diverted to the processing market. This means
that for certain processing applications, these raspberries cannot necessarily be substituted for
raspberries grown specifically for processing in Washington.
Serbia
Export-oriented Serbia primarily supplies the European Union (EU) with processed raspberry products.
The United States accounted for less than 4 percent of Serbia’s total exports of frozen raspberries during
2015–20. However, within the U.S. market, Serbia is a major supplier. In 2019, Serbia was the second-
largest U.S. supplier by value, and the third largest by quantity after Chile and Mexico. The majority of
U.S. imports of frozen raspberries from Serbia are IQF products. Serbia has the ideal climate and land to
Executive Summary
United States International Trade Commission | 23
produce raspberries, including organic raspberries, and most of these products are destined for the
processed market. Serbia’s grower’s organic production allowed Serbia to achieve a highly competitive
position in terms of product differentiation among processed raspberry suppliers to the United States
from 2015 to 2020.
Several factors contribute to Serbia’s competitive position in the U.S. market. Serbia’s processors have
access to organic raspberries in volumes suitable for commercial sale. This is primarily due to the
country’s ideal growing climate and widely dispersed geographic growing areas. Data show that the
number of growers cultivating organic raspberries is growing each year. In addition, as a candidate for
accession to the EU, Serbia’s established relationships in the EU market and its compliance with the EU’s
stringent standards of quality and safety have contributed to the acceptance of its raspberry exports
(largely frozen) on the global stage. The EU-Serbia trade relationship also facilitates a trade route from
Serbia to United States. The low cost of the raw material, which is impacted by low labor costs, has
contributed to Serbia’s success as a global supplier in recent decades.
However, despite Serbia’s highly competitive position in the EU and United States, the Serbian raspberry
industry’s growth has largely plateaued. The lack of integration between growers and processors
prevents growers from receiving the full benefits of increased global market prices for the fresh input,
lending to instability at the Serbian grower level, including grower-led protests within Serbia. The
primary growing region within Serbia has also been hit with a series of adverse weather events over
recent years. These weather problems have contributed to inconsistent yields, which have depressed
export quantities of processed product in certain years. Nonetheless, even though the Serbian raspberry
industry has a few impediments to overcome in order to continue to expand and diversify, Serbia is
expected to continue to be a significant exporter of frozen raspberries, competing with processed
raspberries in the United States.
Chile
As of 2020, Chile is the second-largest source of U.S. imports of frozen raspberries and a major global
producer and exporter of processed raspberry products. The country continues to play a key role in the
global market, despite modest declines in both production and exports of processed raspberries
between 2015 and 2020. Frozen raspberries (including IQF whole and broken products) account for
most of Chile’s processed raspberry production. Chile has increasingly shifted into organic raspberry
production, with frozen organic raspberries accounting for over 20 percent of total production and
almost half of Chile’s frozen raspberry exports to the United States.
The U.S. industry filed trade remedy cases against imported Chilean IQF red raspberries in 2001, alleging
sales at less than fair value (which resulted in an antidumping order, since revoked in 2007). However,
since that time Chile has become a relatively high-cost supplier. Moreover, Chile’s exports to the United
States peak in months when U.S. raspberry stocks are declining, and Chile’s increasing emphasis on
organic products further reduces direct competition with frozen raspberries produced in the United
States. In 2020, the United States was the destination market for about 33 percent of Chile’s frozen
raspberry exports. Chilean exports of frozen raspberries to the United States have fallen over the period,
however, and Mexico surpassed Chile in 2020 to become the largest U.S. supplier.
Raspberries for Processing
24 | www.usitc.gov
Chile has a competitive processing industry that supplies frozen raspberries to the United States. Most
exports to the United States come from a small number of experienced processors using high-quality
freezing, sorting, and packing equipment. Chilean processors’ access to hand-picked raspberries and
strategic use of both belt and static freezers help them obtain a higher ratio of IQF output and more
whole IQF berries than most other countries. At the same time, the labor costs associated with
operating static freezers and buying handpicked berries drive up their costs of production. The labor
intensity of growing and handpicking raspberries (compared to other, more profitable fruit) has also
prompted a long-term decline in the quantity of raspberries that are available for processing in Chile.
The growth in organic raspberries in Chile reinforces Chile’s status as a relatively high-cost supplier
focusing on higher-value products. Chile’s climate, the prevalence of small raspberry growers, and
coordination between processors and small growers have supported the growth in organic exports.
Chapter 1: Introduction
United States International Trade Commission | 25
Chapter 1
Introduction
The purpose of this investigation is to provide information and analysis on the U.S. processed raspberry
industry and its competitiveness compared to foreign suppliers to the U.S. market.3 The U.S. processed
raspberry industry consists of two segments: fresh raspberries grown for use as an input into processed
products, and processed raspberry products, including frozen berries, puree, and juice, used as
ingredients in a range of processed foods and retail products. Recently, the U.S. industry has reported
increased competition from U.S. imports of both processed raspberry products and fresh raspberries for
processing, as well as a decline in U.S. prices for these products. 4 According to the Washington Red
Raspberry Commission (WRRC), these trends have led to lower U.S. profits, fewer acres in production,
and fewer raspberry growers.5
The U.S. processed raspberry industry is small relative to other global suppliers, even though U.S.
demand for raspberries, along with all types of berries, has grown in recent decades.6 This trend is
bolstered by increasing availability of higher quality berries year-round.7 The U.S. processed raspberry
industry is based in Washington State and, to a lesser extent, in California and Oregon, and is
characterized by a high level of vertical integration across the growing and processing stages of
production.8 From 2015 to 2020, sales of processed raspberry products supplied by the industry in
Washington were roughly $530 million, while U.S. imports of processed raspberries and fresh
raspberries for processing were valued at about $740 million during that period, for an estimated total
3 For purposes of this investigation, the term “U.S. processed raspberry industry” refers to growers and processors of fresh raspberries for processing and processed raspberry products. 4 This report uses the terms “processed raspberry products” and “processed raspberries” interchangeably; these terms refer to processed raspberries including frozen berries, puree, and juice. 5 USITC, hearing transcript, September 17, 2020, 12 (testimony of Jon Maberry, WRRC). 6 USDA, ERS, “Berries led Growth in Frozen Fruit Consumption” accessed February 14, 2021. 7 Barro, “Americans Are Eating a Lot More Berries,” December 1, 2014. 8 California accounted for 26.0 percent of U.S. raspberries for processing while Oregon accounted for only 6.3 percent of U.S. raspberries for processing from 2015–17, the last three years of available state level data. In some instances, production data for California and Oregon were included in the industry analysis, but the primary focus of this investigation is on the industry in Washington. California does not focus its production on growing raspberries for processing, but rather for the fresh market. USDA, NASS, Raspberries for Processing, Production, accessed June 20, 2021; WRRC, “Statistics,” accessed March 23, 2021 https://www.red-raspberry.org/statistics; industry representatives, interview by USITC staff, June 1, 2020; industry representative, interview by USITC staff, November 24, 2020.
Raspberries for Processing
26 | www.usitc.gov
U.S. processed raspberry market of over $1 billion over the period.9 The average annual value of sales of
the Washington processed raspberry industry was about $90 million from 2015 to 2020.10 By contrast,
California’s industry focuses on producing “fresh market” raspberries (raspberries consumed fresh),
although berries that do not meet fresh retail requirements (referred to as “seconds”) enter the
processed marketing channel along with raspberries specifically grown for processing.11 Between 2015
and 2019, California supplied roughly one-quarter of the U.S.-grown raspberries for processing, by
quantity.12
From 2015 to 2020, U.S. imports of fresh for processing and processed raspberries (including mixed fruit
blends) were supplied by four major sources: Mexico, Chile, Serbia, and Canada.13 Of these suppliers,
Mexico has been a significant concern to the U.S. industry because, in recent years, it has increased the
quantities of raspberries for processing it exports to the U.S. market.14 Mexico is currently the largest
supplier of fresh raspberries for processing to the United States, owing to its proximity to the United
States and its steady increase in production of all raspberries over the past decade.15 Although nearly all
9 USITC calculations of the U.S. processed raspberry market are based on Washington sales of processed raspberry products and U.S. imports of fresh raspberries for processing and processed raspberry products; however, this U.S. processed raspberry market calculation does not include U.S. sales of fresh raspberries for processing or processed product produced in California and Oregon, due to limited availability of state level data, or fresh raspberries for processing produced in Washington to avoid double counting those raspberries, which are then transformed into a processed raspberry products. U.S. import values also include shipping costs, which may over-estimate import market share. For a calculation of U.S. and import shares of consumption by quantities including for California and Oregon please see chapter 3 (“United States”), table 3.6. USITC calculations based on USDA, NASS, Raspberry Production, accessed November 27, 2020; USITC DataWeb/Census, HTS statistical reporting numbers 0810.20.1020, 0810.20.1022, 0810.20.1024, 0810.20.9020, 0810.20.9022, 0810.90.9024, 0811.20.2025 and schedule B number 0811.20.0000, accessed March 30, 2021; WRRC, email message to USITC staff, December 18, 2021. 10 WRRC, email message to USITC staff, December 18, 2021. 11 Driscoll’s, written submission to the USITC, September 8, 2020, 3–4. 12 The statistics in this sentence refer specifically to USDA NASS data. At the time of its survey, USDA NASS asks growers for the quantity, units, average unit value or value received of raspberries sold or to be sold to commercial processing. These raspberries are labeled as “meant for processing.” However, some raspberries may end up in other channels or discarded. Government representative, interview by USITC staff, June 18, 2020; USDA, NASS, “Raspberry Production, Area harvested and Yield,” accessed November 27, 2020. 13 USITC DataWeb/Census, HTS statistical reporting numbers 0810.20.1024, 0810.20.9024, and 0811.20.2025, accessed February 4, 2021. 14 U.S. import data for fresh raspberries for processing—“Fresh raspberries in containers other than those under 5kg”—were revised downward in early 2021 after the U.S. Census Bureau clarified container weight with importers of record. Data on fresh raspberries for processing in this report reflect these revisions. Staff at the U.S. Census Bureau expect further downward revisions. USITC DataWeb/Census, HTS statistical reporting numbers 0810.20.1024 and 0810.20.9024, accessed February 4, 2021. USITC, hearing transcript, September 17, 2020, 13 (testimony of Brad Rader, Rader Farms). 15 FAOSTAT database, “Production Quantity, Raspberries,” accessed January 19, 2021.
Chapter 1: Introduction
United States International Trade Commission | 27
fresh raspberries produced in Mexico are intended for the fresh market, a share of those berries do not
meet fresh-market standards and are sold for processing in both Mexico and the United States.16
U.S. growers and processors represented by the WRRC also report concerns about U.S. imports of
processed raspberries from Mexico and Serbia, and of frozen mixed berries (raspberries, blackberries,
blueberries, and strawberries) from Canada.17 Together with Chile, these four countries supplied
99 percent of U.S. imports of processed raspberries in 2020.18 Total U.S. imports of processed
raspberries from Mexico, Serbia, and Canada increased 40.5 percent by volume, or 4,788 metric tons
(mt), between 2015 and 2020. However, U.S. imports from Chile declined over the same period in terms
of value (by 52.6 percent) and volume (by 44.5 percent), resulting in an overall decline of 1,524 mt in the
absolute volume of U.S. imports of processed raspberries.19 In 2020, Canada was the largest supplier by
volume of frozen mixed berries to the United States, a product highly in demand by U.S. consumers.
Import quantities from all these suppliers fluctuated over the period due to weather events and other
dynamics of the global supply of raspberries.20
Scope
The U.S. Trade Representative requested that the U.S. International Trade Commission (Commission or
USITC) investigate and provide information on the conditions of competition between the United States
and foreign suppliers of raspberries meant for processing and processed raspberry products. In his
letter, the Trade Representative stated that the WRRC and its producer members had raised concerns
about imports of fresh raspberries for processing (not fresh consumption) and processed raspberries
(including frozen), citing unfair practices. He further stated that WRRC had raised concerns about
16 Due to data limitations for U.S. imports of fresh raspberries for processing, staff are unable to determine the trend for the share of Mexican fresh raspberries that became U.S. imported seconds over the 2015–20 period. In chapter 8, the pricing analysis estimates a share using 2019 and 2020 for import levels of earlier years. The qualitative analysis in chapter 5 found one industry representative who noted that the share was trending downward over the period due to advancements in yields of fresh market raspberry cultivars. Industry representative, interview by USITC staff, December 1, 2020; Driscoll’s, written submission to the USITC, September 8, 2020, 3–4; Driscoll’s, written submission to the USITC, September 24, 2020, 2–4; USITC, hearing transcript, September 17, 2020, 37–41 (testimony of Tony Miller, Cascade International Foods). 17 The term “processed raspberries” refers mainly to HTS statistical reporting number 0811.20.2025, frozen uncooked red raspberries, while frozen mixed berries refers to HTS 0811.90.8085, frozen mixed berries (blackberries, blueberries, raspberries, and strawberries). Processed raspberries and juice (including concentrate) may also enter under HTS 0811.90.8080, 0811.90.8095, 2007.99.6510, 2008.99.2120, 2009.89.6055, and 2009.89.7055. In addition, a share of 0810.20.1020 and 0810.20.9020 and 0810.20.1024 and 0810.20.9024 are considered fresh raspberries for processing, which are made into different processed raspberry products. As discussed in Appendix E “Import Data Sorting for Modeling Inputs.” Industry concerns are noted in the request letter from the Trade Representative and the hearing transcript. USITC, hearing transcript, September 17, 2020, 11 (testimony of Jon Maberry, Maberry Packing); 13–14 (testimony of Brad Rader, Rader Farms); 17 (testimony of Rolf Haugen, Northwest Berry Co-op). 18 USITC DataWeb/Census, HTS statistical reporting number 0811.20.2025, accessed February 4, 2021. 19 USITC DataWeb/Census, HTS statistical reporting number 0811.20.2025, accessed February 4, 2021. 20 USITC DataWeb/Census, HTS statistical reporting numbers 0811.20.2025 and 0811.90.8085, accessed February 4, 2021.
Raspberries for Processing
28 | www.usitc.gov
increased pesticide residue violations of imported product as well as misleading labeling of frozen mixed
berry packs imported from Canada that do not accurately identify the origin of raspberries in the pack.
Therefore, under authority delegated to him by the President of the United States and pursuant to
section 332(g) of the Tariff Act of 1930 (19 U.S.C. § 1332(g)), the Trade Representative requested that
the Commission conduct an investigation and prepare a report that provides an overview of the U.S.
raspberry industry in Washington State and assesses the conditions of competition between U.S. and
foreign suppliers of raspberries meant for processing.
The Trade Representative stated that the Commission’s report should focus primarily on the 2015 to
2019 period and include the following:21
• An overview of the U.S. raspberry industry in Washington State—including fresh raspberries for
processing, frozen, and juice—as well as an overview of the industries producing fresh and
processed raspberries in major producing and exporting countries. The overviews should include
information on production and processing volumes and trends, planted acreage, processing
capacity, supply chains, domestic consumption, imports, and exports of fresh and processed
raspberries.22
• Recent trends in production, pricing, and consumption for fresh and processed raspberries in
the United States and other major producing and exporting countries over the last five years. A
pricing analysis should include the relationship between prices of domestic products and
imports of fresh and processed raspberries in the U.S. market to the extent such data are
available.
• An overview of U.S. imports of fresh and processed raspberries including information on the
main country sources of supply, trade patterns, and supply chains of major suppliers to the
United States, as well as an overview of country of origin labeling practices in major U.S. supplier
countries.
• A description of foreign government policies, financial aid, and programs that directly or
indirectly affect production, infrastructure, exports, and imports of fresh and processed
raspberries, including product labeling and food safety regulations, producer support, and tariff
and nontariff measures.
• A comparison of the competitive strengths and weaknesses of production and exports of fresh
and processed raspberries in the United States and other major producing and exporting
countries, including such factors as cost of production, industry structure, technology, product
21 Trade data for full-year 2020 were incorporated into the industry overviews, but global 2020 data were not available for inclusion into the “Global Production, Consumption, and Trade Trends” section of chapter 1 (“Introduction”) or in chapter 2 (“Cross-country Comparison of Competitiveness”). 22 Area harvested data from FAOSTAT are used in lieu of planted acreage data, which are not available globally for raspberries.
Chapter 1: Introduction
United States International Trade Commission | 29
innovation, exchange rates, supply chains and distribution, pricing, marketing regimes, and
government policies.
• A qualitative and, to the extent possible, quantitative assessment of the economic impact of
imports from major producing and exporting countries on production and prices of U.S. fresh
and processed raspberries.
Approach
Based on the request from the Trade Representative, the Commission conducted three broad
assessments of the U.S. processed raspberry industry and major suppliers to the United States: (1) a
cross-country comparison of competitiveness, (2) an analysis of U.S. prices, and (3) an estimate of the
economic impact of imports. The report also provides information on production, consumption, and
trade for major global producers and exporters, as well as profiles of industries producing fresh and
processed raspberries in major supplier countries to the U.S. market (i.e., Canada, Chile, Mexico, and
Serbia and the United States itself). The report primarily focuses on the period between 2015 to 2019
but includes 2020 where available.
The cross-country assessment used an agricultural competitiveness framework as well as estimation of
symmetric revealed comparative advantage (SRCA). The framework and SRCA estimation compared the
United States’ processed raspberry industry to industries in countries that are major suppliers to the
U.S. market (Canada, Chile, Mexico, and Serbia). The framework connects analytic assumptions,
parameters, and structures that define competitive conditions in agricultural trade. Next, a descriptive
analysis of prices in the U.S. market was conducted using available price data. Along with information on
the product mix of imports, this information was used to provide a cursory look at the relationship
between Washington prices and import prices in the U.S. market. Finally, a partial equilibrium model
was used to assess the economic impact of U.S. imports from major supplier countries on production
and prices of Washington-produced individually quick frozen (IQF) and non-IQF (fresh for processing,
block frozen, puree, and juice, including concentrate) in the U.S. market. This quantitative analysis
estimated results for these two market segments.
As requested, the report also includes global trends and industry profiles for the U.S. industry and major
suppliers of fresh for processing and processed raspberry products to the U.S. market. Data for the
trends and profiles were gathered by reviewing existing literature and conducting extensive interviews
with sources knowledgeable about the industry. Among these sources were firm representatives, trade
associations, academia, traders, government officials, and nongovernmental organizations, including
those that represent the interests of agricultural workers. Commission staff identified sources with
expertise in each segment of the supply chain, from growers and processors to traders and purchasers.
In addition, staff conducted interviews with third parties outside of industry to verify data and obtain
unbiased information. The Commission also gathered industry and product information at a public
hearing, where representatives from the fresh and processed raspberry industries provided testimony.
Raspberries for Processing
30 | www.usitc.gov
In addition to a literature review and primary data collection, relevant production and trade data were
collected from publicly available data sources, as well as from industry representatives and
organizations outside of industry. Global production data were obtained from the Food and Agriculture
Organization of the United Nations (FAO). Trade data came from the Commission’s DataWeb, a
database built on U.S. Census Bureau data. Pricing data for domestic raspberries came from U.S.
industry representatives, and average unit values of imported raspberries were calculated using value
and quantity data from DataWeb. Primary sources for labor-related conditions and costs were the World
Bank, labor union-affiliated nongovernmental organizations, academia, and industry sources.
Report Organization
Chapter 1 provides an overview of processed raspberry products, including production systems and
marketing channels, as well as information on global raspberry production, consumption, and trade.
Chapter 2 gives a cross-country comparison of the competitiveness of the major processed raspberry
suppliers to the U.S. market. Chapters 3–7 present profiles of the processed raspberry industries of the
United States, Canada, Mexico, Serbia, and Chile. Chapter 8 provides information on prices of processed
raspberries in the U.S. market during the years analyzed. Lastly, chapter 9 presents estimated economic
impacts of reduced U.S. imports of fresh raspberries for processing and processed raspberries on
Washington production and prices of Washington-produced non-IQF and IQF raspberries.
Data Availability and Limitations
Production
Production data for processed raspberry products are extremely limited because the products are
largely intermediate goods. However, there are widely available data for fresh production of
raspberries. Data are available at the global and national level for fresh raspberry production, area
harvested, and yield from FAO during 2015–19. However, FAO production, area harvested, and yield
data do not break out raspberries intended for the fresh market versus for processing.23 The USDA
National Agricultural Statistics Service (NASS) reports U.S. production differentiated by raspberries for
fresh market and meant for processing for 2014–17 by state and on a more aggregate level for 2018–19.
Production data for Washington State for fresh raspberries are also available from the WRRC for the
years 2015–20 and are generally consistent with the available USDA NASS data. Washington State grows
raspberry primarily for processing. In this report, production data for fresh raspberry production
(regardless of end use) are presented as an indicator of available supply of raspberries for processed
23 FAO notes the following on its production, yield, and area harvested data, “There is limited geographical comparability due to differences between countries in methods and coverage, except for regions where countries are bound by regulations mandating harmonized methods, such as EU countries.” For more information visit FAO Stat at http://www.fao.org/faostat/en/#data/QC/metadata. FAO, FAOSTAT database. FAOSTAT, “Production Quantity, Raspberries,” accessed January 11, 2021.
Chapter 1: Introduction
United States International Trade Commission | 31
raspberry production and supplemented with quantitative (if available) and qualitative information
about the size of processed raspberry production for each country profiled.
Global Trade
Global trade data for fresh and processed raspberries are also limited. Trade data at the global level for
most exporting countries do not disaggregate raspberries from all other berries. In addition, global trade
data categories for processed raspberries contain multiple processed raspberry products, impacting the
ability to provide meaningful analysis of global trade flows by product. Global trade data presented in
this report are for two Harmonized Commodity Description and Coding System (HS) 6 digit subheadings:
1) HS 0810.20, certain fresh berries (covering raspberries, blackberries, mulberries, and loganberries),
which accounts for trade in fresh raspberries (for both the fresh market and for processing); and 2) HS
0811.20, certain frozen berries (covering raspberries, blackberries, mulberries, loganberries, currants
and gooseberries), which accounts for trade in frozen raspberries (IQF and other processed raspberry
products), but excludes some purees and juice. Of the berries classified under these two HS categories,
raspberries account for most of the trade.24
U.S. Trade
For analysis of fresh and processed raspberries in the U.S. market, U.S. import data (at the Harmonized
Tariff Schedule of the US (HTS) 8- and 10-digit level) are more useful than trade data at the global level.
Even so, U.S. import data are not broken out cleanly by most product types, which precludes precise
trade analysis of the main processed products that compete with U.S. production in the U.S. market
(namely, IQF, block frozen, puree, and juice). Further, some of the HTS breakouts that provide for more
product clarity were recently established and, as such, have no corresponding long-term data for
analysis. For example, until July 2018, the HTS statistical reporting numbers for fresh berries did not
break out bulk containers. In July 2018, a breakout for bulk fresh raspberries (raspberries in containers
of 5 kilograms or greater) was established. Given that raspberries for the fresh market are not shipped in
bulk containers whereas raspberries for processing are shipped in this manner, this breakout established
a way to distinguish between fresh market raspberries and fresh raspberries for processing.
In this report, U.S. import data are presented for fresh raspberries,25 frozen uncooked raspberries,26 and
juice (including juice concentrate).27
24 Government of British Columbia Ministry of Agriculture, “Market Analysis: Global Export Market Overview for British Columbia’s Raspberry Industry,” April 20, 2011, 8. 25 HTS 0810.20.1020 (all fresh September−June), 0810.20.1024 (bulk fresh September−June), 0810.20.9020 (all fresh July−August), and 0810.20.9024 (bulk fresh July−August). 26 HTS 0811.20.2025 (frozen uncooked red raspberries). 27 HTS 2009.89.6055 (red raspberry juice including concentrate before partial year 2018) and 2009.89.7055 (red raspberry juice including concentrate after partial year 2018).
Raspberries for Processing
32 | www.usitc.gov
The various HTS statistical reporting numbers for raspberries are presented in chapter 3 (“United
States”) in table 3.7. Clean U.S. import data are not available for other products of interest in this
investigation, including frozen mixes of berries (mixes of only raspberries, blackberries, blueberries, or
strawberries),28 cooked raspberry purees (e.g., aseptic purees),29 and for other purees (pasteurized
puree);30 therefore, information on trade in these products is estimated by other means, including
qualitative information collected from industry representatives. The estimated proportions of U.S.
imports of in-scope product under these lines have been included in the quantitative analysis presented
in chapter 9 of this report, (“Import Data Sorting for Modeling Inputs”).
Processed Raspberry Products
The products of interest in this investigation are frozen and otherwise processed raspberry products as
well as the main input into these products, fresh raspberries for processing. Processed raspberry
products include IQF raspberries, block frozen raspberries, purees, and juices, including concentrate (see
figure 1.1 for example images). In the United States, fresh raspberries intentionally grown for processing
are produced primarily by the industry in Washington and to a limited extent also in Oregon.31
Raspberries are available in other colored varieties, but only red raspberries are produced on a
commercial scale and are thus the focus of this investigation.32
In this report, the product scope is focused on products produced by the U.S. industry in Washington.
The term “processed raspberries” does not include further-processed raspberry products such as jams,
preserves, or raspberry yogurts.33 Nor are fresh market raspberries the focus of this investigation.
However, this report does present information on such raspberries, given that raspberry seconds, which
do not meet fresh market specifications, may enter the processed raspberry market channel to be made
into processed raspberry products. This is a practice common in fresh produce production, and for
raspberries it occurs in fresh market-focused industries, such as those in California and Mexico.34
Information on fresh market cultivars and raspberry production at the growing stage is also presented in
the report in the context of production costs and competitiveness of fresh market seconds. The
28 Imports of frozen mixes of berries containing red raspberries are classified under HTS 0811.90.8085, which is a basket category of mixes of berries containing only raspberries, blackberries, blueberries, or strawberries. There are limited data for this statistical reporting number because in midyear 2019, it was broken out from another HTS number that contained a larger basket of frozen mixed fruit mid-year 2019. 29 Aseptic purees of red raspberries are classified under HTS 2007.99.6510 cooked pastes and purees of red raspberries. This statistical reporting number includes other products such as fruit roll-ups, which are not in-scope. 30 Other purees of red raspberries are classified under HTS 2008.99.2120, it is unclear if this category is entirely composed of pasteurized purees. 31 Washington and Oregon are part of the Pacific Northwest raspberry-growing region along with British Columbia, Canada. As noted above, raspberries produced in California for the fresh market that do not meet fresh market standards (seconds) also enter the processing market. 32 USDA, NASS, “Raspberry Production, Area harvested and Yield,” accessed April 7, 2021. 33 WRRC lists its raspberry supplier members and the products they produce on its website. WRRC, “Suppliers,” accessed March 19, 2021, https://www.red-raspberry.org/suppliers; industry representatives, interview by USITC staff, June 1, 2020. 34 Industry representatives, interviews by USITC staff, June 23, 2020, September 15, 2020, and October 26, 2020.
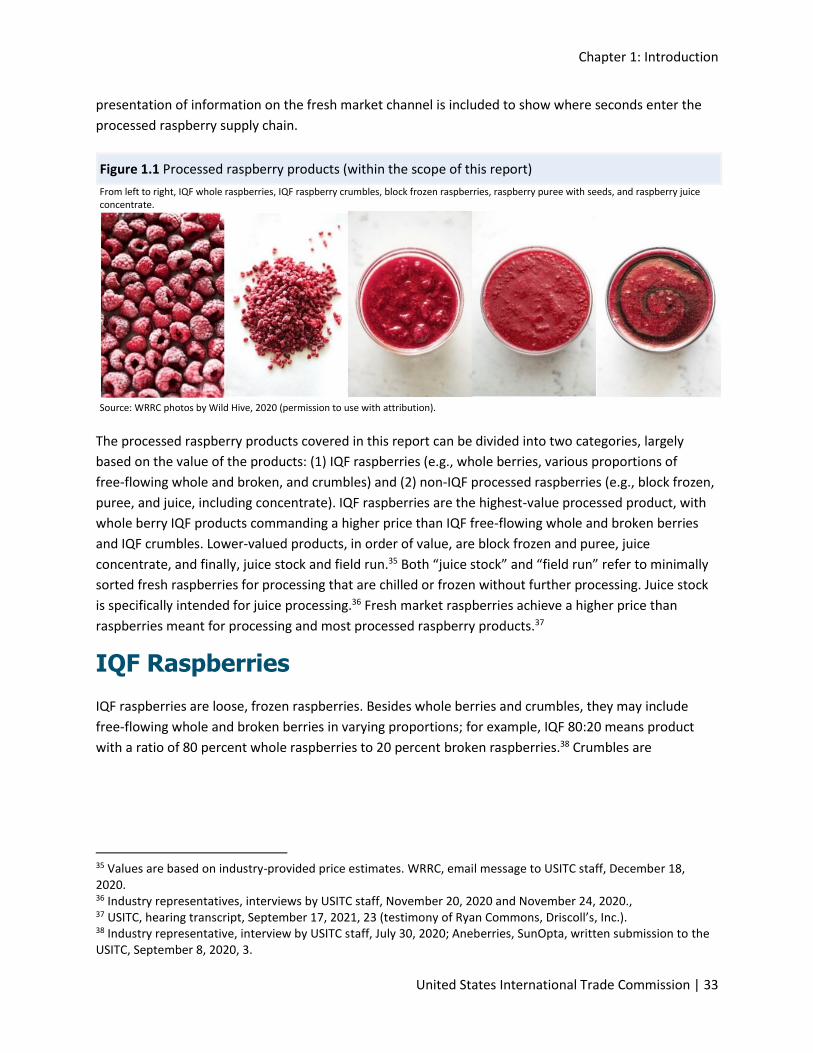
Chapter 1: Introduction
United States International Trade Commission | 33
presentation of information on the fresh market channel is included to show where seconds enter the
processed raspberry supply chain.
Figure 1.1 Processed raspberry products (within the scope of this report)
From left to right, IQF whole raspberries, IQF raspberry crumbles, block frozen raspberries, raspberry puree with seeds, and raspberry juice concentrate.
Source: WRRC photos by Wild Hive, 2020 (permission to use with attribution).
The processed raspberry products covered in this report can be divided into two categories, largely
based on the value of the products: (1) IQF raspberries (e.g., whole berries, various proportions of
free-flowing whole and broken, and crumbles) and (2) non-IQF processed raspberries (e.g., block frozen,
puree, and juice, including concentrate). IQF raspberries are the highest-value processed product, with
whole berry IQF products commanding a higher price than IQF free-flowing whole and broken berries
and IQF crumbles. Lower-valued products, in order of value, are block frozen and puree, juice
concentrate, and finally, juice stock and field run.35 Both “juice stock” and “field run” refer to minimally
sorted fresh raspberries for processing that are chilled or frozen without further processing. Juice stock
is specifically intended for juice processing.36 Fresh market raspberries achieve a higher price than
raspberries meant for processing and most processed raspberry products.37
IQF Raspberries
IQF raspberries are loose, frozen raspberries. Besides whole berries and crumbles, they may include
free-flowing whole and broken berries in varying proportions; for example, IQF 80:20 means product
with a ratio of 80 percent whole raspberries to 20 percent broken raspberries.38 Crumbles are
35 Values are based on industry-provided price estimates. WRRC, email message to USITC staff, December 18, 2020. 36 Industry representatives, interviews by USITC staff, November 20, 2020 and November 24, 2020., 37 USITC, hearing transcript, September 17, 2021, 23 (testimony of Ryan Commons, Driscoll’s, Inc.). 38 Industry representative, interview by USITC staff, July 30, 2020; Aneberries, SunOpta, written submission to the USITC, September 8, 2020, 3.
Raspberries for Processing
34 | www.usitc.gov
individually quick frozen drupelets (see figure 1.1 second photo from the left).39 IQF raspberries are
processed by rapidly blasting the berry with cold air to maintain the structure of the raspberry. IQF
raspberries can be frozen using continuous automated tunnels, which freeze berries on a belt in a
continuous line.40 Alternatively, some IQF berries are frozen on trays in static freezers.41 IQF raspberries
can be reprocessed into puree or juice concentrate, but the reverse is not possible—once raspberries
are block frozen (see description in “Non-IQF Processed Raspberries” section below), they cannot be
processed into IQF.
Bulk whole IQF raspberries are typically repacked by buyers into packaging for retail sale, either into
bags of a single fruit or bags of various fruits (these may be referred to as “repacked” or “rebagged”).
“Mixed bags” are combinations of IQF fruits—commonly raspberries, blackberries, blueberries, and
strawberries.42 These bagged raspberry products are purchased directly by consumers and made into
smoothies or used in various recipes. Free-flowing whole and broken raspberries can be used as
ingredients for further manufactured products such as jams and yogurts, or used for juice stock,
depending on the quality.43
Non-IQF Processed Raspberries
For purposes of this investigation, non-IQF processed raspberry products include block frozen
raspberries, pureed raspberries, and juice concentrate.44 Block frozen products are raspberries frozen in
their own juices. There are two types of block frozen products: without sugar added (“straight pack”)
and with sugar added (“sugar pack”).45 Pureed raspberries are sieved (i.e., passed through a screen) to
remove seeds fully or partially, and are typically made to customer specifications about the amount of
seeds left in the product, consistency, and sweetness. 46 Puree is typically produced in frozen form but
can also be produced in aseptic packaging, which extends the shelf life of the product without
refrigeration. In addition, puree can be pasteurized or concentrated.
39 One point of confusion is that the term “crumbles” is used to define different products among industries. For example, the Mexican industry refers to free-flowing whole and broken as “crumbles,” while Serbia calls this product type raspberry “mixtures.” In Chile, frozen pieces of raspberries that have broken off during the IQF tunnel freezing process are referred to as “raspberry crumbles.” For additional examples of IQF crumbles (individual drupelets) see Enfield Farms, “Bulk: Crumbles,” accessed April 25, 2021 https://www.enfieldfarms.com/bulk and Sicony, “Discover Raspberry Crumble,” accessed April 25, 2021, https://www.sicoly.com/transformed/raspberry-crumble-1060. 40 WRRC Channel, “Washington Red Raspberry Harvesting and Processing Tour,” August 12, 2020. 41 Industry representative, interview by USITC staff, March 5, 2021. 42 Industry representative, interview by USITC staff, June 1, 2020. 43 Industry representative, interview by USITC staff, June 23, 2020. 44 For purposes of our quantitative analysis in Chapter 9, fresh raspberries for processing are included in the non-IQF category because either they are transformed into non-IQF processed products once they enter the United States or they are used as substitutes for non-IQF products in further processed products. For more information see chapter 9 (“Economic Impacts of Imports”). 45 Funt and Hall, 2013, Raspberries, 2013, 197. 46 WRRC Channel, “Washington Red Raspberry Harvesting and Processing Tour,” August 12, 2020.
Chapter 1: Introduction
United States International Trade Commission | 35
Raspberry purees, like block frozen, are typically used as ingredients in consumer food products that
require raspberry flavor and texture, such as yogurts, ice creams, and bakery items.47 Block frozen
products and purees are also described as “B-grade” that is, one of the grades assigned by the
Agricultural Marketing Service (AMS) of the U.S. Department of Agriculture (USDA) to frozen raspberries
typically used in these products (see “Product Standards and Certification” section below).48 These
products are also called “bulk” because they tend to be packed in larger containers (28-pound pails or
355-pound plastic drums) than IQF raspberries (25-pound or custom-sized plastic lined boxes ).49
Juice stock is the minimally sorted fresh, chilled, or frozen input to juice and concentrate. Raspberry
juice is a liquid product of pressed juice stock berries, either of single strength or concentrate; to make
concentrate, single-strength juice is filtered and heated to remove water content for ease of transport.50
Industry representatives have noted that when raspberry juice is traded, it is predominantly in
concentrate form.51
Market Channels for Raspberries
In general, there are two broad marketing channels for fresh and processed raspberries: (1) the
processed market and (2) the fresh market (for fresh consumption) (figure 1.2). For purposes of this
report, the processed channel starts at the grower level with fresh raspberries grown from cultivars that
are optimized for processing. Fresh raspberries are sold to independent processors or processed
internally by integrated grower-processors.52 The processed products are then sold to distributors,
repackers, juice packers, food manufacturers, and food service (hotel, restaurants, or catering). These
customers may use the processed raspberry products in jams, yogurts, baked goods, and other foods, or
repack them into individual bags for retail sale. Various intermediaries are involved in aggregating fresh
berries (inputs) and processed products and directing them through the marketing channels.53
Meanwhile, fresh market growers start with fresh raspberries grown from cultivars optimized for fresh
consumption. These raspberries are often sold to large fresh fruit marketers directly by the growers.54
47 Industry representative, interview by USITC staff, June 23, 2020. 48 USDA, AMS, “Grades of Frozen Raspberries,” accessed April 7, 2021; industry representative, email message to USITC staff, August 21, 2021. 49 WRRC Channel, “Washington Red Raspberry Harvesting and Processing Tour,” August 12, 2020; Enfield Farms, “Our Products: Enfield Farms,” accessed February 13, 2021. 50 Industry representatives, interviews by USITC staff, June 23, 2020, and September 15, 2020. 51 Industry representatives, interviews by USITC staff, July 29, 2020, and September 15, 2020. 52 USITC, hearing transcript, September 17, 2021, 68 (testimony of Jon Maberry, Maberry Packing, LLC). 53 Industry representatives, interviews by USITC staff, September 15, 2020, and November 24, 2020. 54 In addition to sales to marketers, fresh raspberries are also sold direct to consumers via pick-your-own operations, farmer’s markets, community supported agriculture, and roadside stands. Funt and Hall, Raspberries, 2013, 191–98.
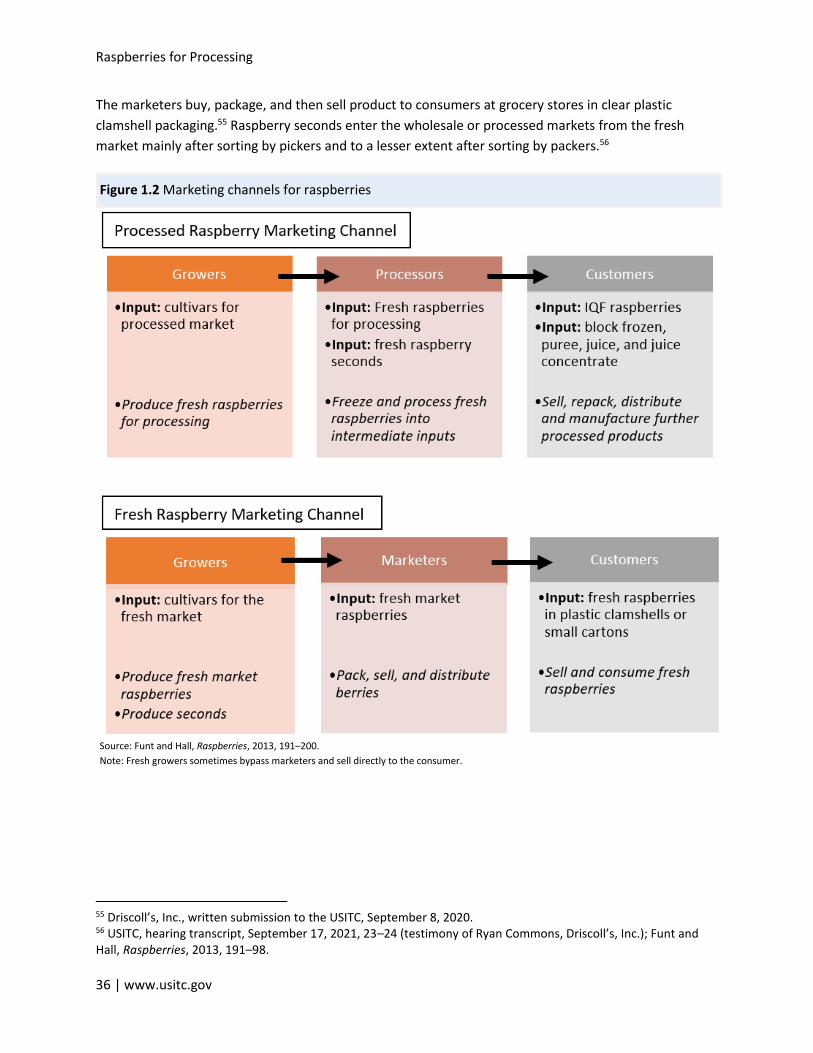
Raspberries for Processing
36 | www.usitc.gov
The marketers buy, package, and then sell product to consumers at grocery stores in clear plastic
clamshell packaging.55 Raspberry seconds enter the wholesale or processed markets from the fresh
market mainly after sorting by pickers and to a lesser extent after sorting by packers.56
Figure 1.2 Marketing channels for raspberries
Source: Funt and Hall, Raspberries, 2013, 191–200.
Note: Fresh growers sometimes bypass marketers and sell directly to the consumer.
55 Driscoll’s, Inc., written submission to the USITC, September 8, 2020. 56 USITC, hearing transcript, September 17, 2021, 23–24 (testimony of Ryan Commons, Driscoll’s, Inc.); Funt and Hall, Raspberries, 2013, 191–98.
Chapter 1: Introduction
United States International Trade Commission | 37
Farm-level Raspberry Production and
Distribution
Cool and temperate climatic conditions, achieved through geographic location or protected agriculture
(see discussion below), are ideal for raspberry production. In these conditions, raspberry plants receive
the appropriate amount of time at cool temperatures (“chill hours”) to produce berries and reduce pest
and disease pressures, such as fungus.57 Timing of extreme cold, heat, moisture (precipitation or
humidity), and wind also impacts plant health, and thereby yields.58
Whether cultivating raspberries for processing or fresh market, conventional or organic, raspberry
production requires year-round management, such as plant and soil care, plant health monitoring, field
cleaning, pruning, and applying any pest and disease applications. Additionally, water management,
including irrigation and drainage, is a critical part of good production practices. However, production
practices for fresh raspberries intended for processing differ from practices for raspberries for the fresh
market in several ways, including cultivar, timing of harvest (largely based on cultivar), choice of
production system, and distribution method.59
All commercial raspberry production relies on cultivars, meaning cultivated varieties of plant, rather
than wild plants.60 Cultivars are developed by breeders and subsequently selected by growers for
various berry characteristics. These include flavor, Brix level (sugar content), size, color, shape, and
firmness of the berry. 61 Other important characteristics of raspberry cultivars are resistance to root rot
and raspberry bushy dwarf virus; the cultivar’s harvest time, which can extend the market window of
the grower; and its ability to withstand certain climate elements such as rain, wind, heat, and
humidity.62
57 Different raspberry cultivars require a varying period in cold weather between harvest seasons, known as “chill hours.” If the canes (long thin stalks on which raspberries grow) do not get the required chill hours, or the canes are exposed to severe cold too late in the season, they may bloom or leaf out at unexpected times and may also produce lower quality fruit. Funt and Hall, Raspberries, 2013, 33–44 and 68–69. 58 Funt and Hall, Raspberries, 2013, 33–44. 59 Funt and Hall, Raspberries, 2013, 91, 103, 121, and 133; USITC, hearing transcript, September 17, 2021, 23 (testimony of Ryan Commons, Driscoll’s, Inc.). 60 The harvest season varies by cultivar and climate. A raspberry’s harvest time designates it as summer-bearing, fall-bearing, or everbearing. Funt and Hall, Raspberries, 2013, 58–65 and 68–69; industry representative, interview by USITC staff, March 5, 2021. 61 Brix level is the percentage of sugar solids in any liquid products made from plant materials. Industry representatives refer to Brix levels when measuring the sugar content in liquid processed raspberry products, e.g., puree, juice concentrate, single-strength juice, or reconstituted juice. Higher Brix levels indicate higher levels of sugars. USDA, AMS, Technical Procedures Manual, June 2020, 17. The standard Brix level for single strength raspberry juice is 10.5. Brix Values of Unconcentrated Natural Fruit Juices, 19 C.F.R. § 151.91, accessed March 22, 2021. 62 USITC, hearing transcript, September 17, 2020, 44–45 and 154 (testimony of Jean-Christophe Hesteau, SunOpta); industry representatives, interviews by USITC staff, July 24, 2020, October 26, 2020, and March 11, 2021.
Raspberries for Processing
38 | www.usitc.gov
Cultivars are selected based on characteristics that are desirable for the end use of the raspberries.63
Growers of raspberries for processing choose cultivars that are suited to withstand the freezing process
and, in some countries and regions, mechanical harvesting. Mechanical harvesters shake the raspberries
from the canes on which they grow, potentially damaging them. Additionally, berries that are processed
through a tunnel freezer are lightly shaken and tossed to blast all of them with cold air. Many raspberry
growers and processors prefer cultivars strong enough to keep their shape throughout harvesting and
freezing in order to produce as many whole IQF raspberries as possible.64 However, some food
manufacturers prioritize raspberry flavor and Brix level over berry structure. Cultivars considered as
having both durability and desirable flavor characteristics, such as Meeker and Willamette, are widely
grown.65
While there are many varieties of raspberries that do not require a fee for use, some firms have
developed fee-for-use cultivars for the processed and fresh markets. Generally, various licensing and
exclusivity arrangements govern the development and use of these cultivars in order to protect
intellectual property rights (IPRs).66 Costs for creating fee-for-use cultivars may include research and
development expenditures, plant breeder services to propagate the cultivar, and legal fees for IPR
protection and enforcement.67 In the fresh market, proprietary cultivars are generally developed by
large berry marketing firms and require growers to sign multiyear contracts stating that the grower will
sell the entire harvest of that proprietary berry back to the marketer.68
The processed raspberry market prefers to produce its fresh raspberry inputs using an open field
approach, which is a relatively extensive system (requiring less labor and capital).69 By contrast, the
fresh market favors a more intensive system because growers must achieve higher yields to pay for the
extra inputs of raspberries needed to produce fresh market raspberries. In open field systems,
raspberries are grown in fields exposed to the elements, while many growers for the fresh market use
“hoop houses” (or “high tunnels”) that shield the raspberry plants against severe weather. Hoop houses
reduce pests and diseases on plants, extend the harvest season, and increase yields overall, but require
63 Raspberry cultivars developed for the fresh market are developed for long shelf life that allows the berries to be transported long distances and maintain freshness until sold at retail. Other important traits for fresh market raspberries are bright berry color, large size, and consistent flavor and appearance. Driscoll’s, Inc., written submission to the USITC, September 8, 2020, 2; industry representative, email message to USITC staff, July 16, 2020. 64 Industry representative, interview by USITC staff, September 15, 2020. 65 Northwest Plant Company, “Raspberries,” accessed April 7, 2021, http://www.nwplant.com/raspberries/. 66 Industry representatives, interviews by USITC staff, December 3, 2020 and March 11, 2021; Funt and Hall, Raspberries, 2013, 58–65; Northwest Plant Company, “Raspberries,” accessed April 7, 2021, http://www.nwplant.com/raspberries/. 67 Industry representative, interview by USITC staff, March 11, 2021. 68 Industry representative, interview by USITC staff, December 3, 2020. 69 Intensive agriculture is the practice of using more labor and capital to maximize agricultural production or yields. Intensive farming can include using protective growing systems and using fertilizers and pesticides to protect crops. Conversely, extensive agriculture uses relatively less labor and capital in relation to the area of land used. The crop yield in extensive agriculture depends primarily on the natural soil, climate, and other weather factors. WRRC Channel, “Washington Red Raspberry Harvesting and Processing Tour,” August 12, 2020; BBC, “Feeding the Human Race,” accessed April 13, 2021; European Commission, “Glossary: Extensive Farming” accessed April 18, 2021; European Commission, “Glossary: Intensive Farming” accessed April 18, 20.
Chapter 1: Introduction
United States International Trade Commission | 39
more capital investment than open fields.70 Moreover, raspberries grown in hoop houses are picked by
hand, while open raspberry fields are organized to accommodate either handpicking or machine
harvesting.71 Generally, both production systems use a trellis system to support the bushes and allow
harvesters or pickers to access the berries easily.72
In general, raspberries grown for processing can be transported in bulk containers, while raspberries for
the fresh market or the IQF process cannot.73 Most non-IQF raspberry products can use fresh raspberry
inputs that have sustained damage during transport; to be suitable for the IQF process, however, the
fresh raspberries must be whole and intact. As such, fresh raspberries intended for the IQF process
cannot be transported in bulk containers, which would damage the whole raspberry.74 Raspberries for
fresh consumption are typically packed into small, retail-ready plastic clamshell packaging shortly after
harvesting and in nearby areas to limit transportation time.75
Product Standards and Certifications
Processors and growers of raspberries use various product standards and certifications to relay
information about product safety and quality to their customers. Some product standards are required
by U.S. law and must be met before either U.S.-grown or imported product can be sold in the U.S.
market.76 Certifications of compliance with standards are often presented on fresh and processed
raspberry suppliers’ websites, specification sheets, and labels for retail packaging. Standards can be
used to differentiate processed raspberry products and sometimes support higher prices.77
Compliance with the U.S. Food Safety System
Raspberries for processing and processed raspberries that are consumed by humans and animals—
whether produced domestically or imported—are required to meet U.S. food safety and labeling
standards. The Food Safety Modernization Act (FSMA) greatly expanded food safety oversight authority
70 Academic experts, interview by USITC staff, January 21, 2021; USITC, hearing transcript, September 17, 2020, 21–23 (testimony of Ryan Commons, Driscoll’s, Inc.). 71 Machine-harvested raspberries require enough space between rows, typically about 10 feet, to allow a machine harvester to pass. When raspberries are handpicked, rows can be spaced closer together than with machine harvesting. 72 Funt and Hall, Raspberries, 2013, 99 and 130−31. 73 USITC, hearing transcript, September 17, 2020, 35 (testimony of Lance Jungmeyer, Fresh Produce Association of the Americas or FPAA). 74 USITC, hearing transcript, September 17, 2020, 35 (testimony of Lance Jungmeyer, FPAA). 75 USITC, hearing transcript, September 17, 2020, 23 (testimony of Ryan Commons, Driscoll’s, Inc.). 76 USITC, hearing transcript, September 17, 2020, 56 (testimony of Antonio Dominguez, IRO) 115 (testimony of Lance Jungmeyer, FPAA). 77 For an example of food safety certifications on a company product website, see Enfield Farms, “Food Safety,” accessed April 8, 2021 https://www.enfieldfarms.com/food-safety; Enfield Farms, “Quality,” accessed April 8, 2021 https://www.enfieldfarms.com/food-safety; for an example of USDA organic certifications and U.S. marketing standard Grade A on retail packaging, see Nature’s Touch, “Organic Raspberries,” accessed April 8, 2021, https://www.naturestouchfrozenfoods.com/en/frozen-fruits/raspberry/organic-raspberries-usa.
Raspberries for Processing
40 | www.usitc.gov
at the U.S. Food and Drug Administration (FDA) through amendments to the Federal Food, Drug, and
Cosmetic Act (21 U.S.C. §§ 301 et seq.).78 FSMA governs the safety of many U.S.-grown, processed, and
imported food products, including fresh and processed raspberries.79
FDA has specific mandates concerning the safety of U.S. grown and processed food products as well as
imported products. The agency has the authority to administratively detain food, including imported
products, if it is adulterated by various hazards and to take other actions, such as mandatory recalls, to
enforce U.S. food safety standards.80 In addition, FSMA requires U.S. importers and suppliers to verify
the safety of their supply chains.81 In particular, the Foreign Supplier Verification program under FSMA
provides a mechanism for U.S. importers to confirm that their suppliers meet U.S. food safety standards
and to take legal responsibility for the safety of imported products.82 In addition, the Produce Safety
Rule applies to both domestic and imported produce, including raspberries, and sets science-based
minimum standards for the safe growing, harvesting, packing, and holding of fruits and vegetables
grown for human consumption.83
Third-party Food Safety Certifications
To ensure full compliance with U.S. and other countries’ food safety standards, suppliers often source
fresh and processed raspberries from growers and processing facilities that are using Good Agricultural
Practices (GAP), Good Handling Practices (GHP), and Good Manufacturing Processes (GMP).84 To identify
themselves as achieving high levels of compliance with food safety standards, many growers and traders
also become certified by third-party certifiers.85 For example, GLOBALG.A.P. is a private sector body that
certifies production, handling, and responsible supply chain practices for raspberries and other
78 FSMA, Pub.L. No. 111–353, §§ 101–405 (2011). 79 FDA, FSMA Facts: Background on the FDA Food Safety Modernization Act (FSMA), July 21, 2011. 80 FDA, FSMA Facts: Background on the FDA Food Safety Modernization Act (FSMA), July 21, 2011. 81 Foreign Supplier Verification Programs for Importers of Food for Humans and Animals, 80 Fed. Reg. 74225 (November 27, 2015). 82 Foreign Supplier Verification Programs for Importers of Food for Humans and Animals, 80 Fed. Reg. 74225 (November 27, 2015) provides details on this supplier program; see also FDA, FDA At a Glance: Final Rule on Foreign Supplier Verification Programs, May 11, 2017; USITC, hearing transcript, September 17, 2020, 114–15 (testimony of Lance Jungmeyer, FPAA). 83 Standards for the Growing, Harvesting, Packing, and Holding of Produce for Human Consumption, 80 Fed. Reg. 74353 (November 27, 2015) provides draft guidance on the Produce Safety Rule. For more information on Produce Safety Rule coverage and compliance dates see FDA, “FSMA Final Rule on Produce Safety,” accessed March 23, 2021 https://www.fda.gov/food/food-safety-modernization-act-fsma/fsma-final-rule-produce-safety. 84 AMS, “Good Agricultural Practices (GAP) & Good Handling Practices (GHP),” accessed August 30, 2020 https://www.ams.usda.gov/services/auditing/gap-ghp; Current Good Manufacturing Practice, Hazard Analysis, and Risk-Based Preventive Controls for Human Food, 80 Fed. Reg. 55907 (September 17, 2015); FDA, Key Facts: about Preventive Controls for Human Food, accessed March 21, 2021; USITC, hearing transcript, September 17, 2021, 33 and 114–15 (testimony of Lance Jungmeyer, FPAA). 85 FSMA has a third-party certifier accreditation program as noted in Accreditation of Third-Party Certification Bodies to Conduct Food Safety Audits and To Issue Certifications, 80 Fed. Reg. 74569 (November 27, 2015). Various industry representatives stated that third-party certifications are common in the global raspberry industry. Industry representatives, interviews by USITC staff, July 29, 2020, and July 30, 2020.
Chapter 1: Introduction
United States International Trade Commission | 41
agricultural products around the world.86 Likewise, raspberry-processing facilities are often certified by
third-party certifiers that use Global Food Safety Initiative (GFSI) standards.87 The Global Food Safety
Initiative is a global food safety benchmarking initiative that recognizes various food safety certifications
(e.g., Safe Quality Food or SQF) as meeting GFSI Standards.88 Import compliance with food safety
standards is further discussed as it relates to competitiveness in chapter 2 (“Cross-country Comparison
of Competitiveness”) and in the “Government Programs” and “Compliance with Food Safety Standards”
sections within each of the industry profiles.
Organic Certifications
As with quality grading, growers and processors of raspberries use USDA-accredited certifiers to verify
the organic status of their product.89 Consumers typically perceive organic products as having higher
“nutritive value, taste, and appearance” and associate their production with a “natural process, care for
the environment and animal welfare and the non-use of pesticides and fertilizers.”90 The real or
perceived difference between organic and conventional raspberries means that consumers are willing to
pay more for organic raspberries. Thus, organically grown raspberries can translate into larger returns
for processors and growers than conventionally grown raspberries.91
USDA-certified organic goods must be grown without using certain chemicals.92 A key challenge facing
organic production of raspberries is controlling mold while limiting or avoiding the use of fungicides.
Generally, most of the raspberry growers that produce product that achieves organic certification have
either dry weather during critical times of the growing season or use hoop houses to protect against wet
weather in order to limit or avoid the use of fungicides for mold.93
86 Funt and Hall, Raspberries, 2013, Glossary 1, 264. 87 Industry representatives, interviews by USITC staff July 29, 2020 and July 30, 2020. 88 GFSI, “Certification: Achieving a GFSI Certificate,” accessed March 23, 2021 https://mygfsi.com/how-to-implement/certification/; SQF Institute, “About the SQF Program,” March 23, 2021 https://www.sqfi.com/why-get-certified/about-sqf-program/. 89 To sell imported products as organic in the United States these products must be certified to either the USDA standard or an equivalent international standard. For example, Canadian and European Union organic standards have established equivalency with USDA organic certification. That is, products produced worldwide and certified organic in Canada (to Canada Organic Products Regulations), and product from the EU or packaged in the EU and certified organic in the European Union (to EU Organic Standards) can be sold as organic in the United States. USDA, AMS, “How to Become Certified,” accessed March 23, 2021 https://www.ams.usda.gov/services/organic-certification/becoming-certified; USDA, AMS, “Importing Organic Product into the United States,” December 1, 2016. 90 Shafie and Rennie, “Consumer Perceptions Towards Organic Food,” 2012, 360–67. 91 Industry representatives, interviews by USITC staff, June 1, 2020 and August 13, 2020. 92 USDA, AMS, “About Organic Labeling,” accessed February 13, 2021, https://www.ams.usda.gov/rules-regulations/organic/labeling. 93 FAO, “Production Quantity, Raspberries,” FAOSTAT database, accessed January 11, 2021; IHS Markit, Global Trade Atlas, HS subheading 0811.20, accessed July 7, 2020; industry representative, interview by USITC staff, July 24, 2020.
Raspberries for Processing
42 | www.usitc.gov
USDA Marketing Standards
Beyond certifications for food safety, the chain for supplying processed and fresh raspberries to the U.S.
market uses the USDA Agricultural Marketing Service (AMS) grading system to indicate the quality of
their products. Frozen and fresh raspberries sold in the United States are graded by AMS fee-for-service
graders, who indicate the quality (amount of foreign material, mold, or larvae) and characteristics
(whole or broken, color, etc.) of the berry. AMS designates frozen raspberries for manufacturing on
lettered scales (U.S. Grade A, or U.S. Grade B) and fresh raspberries on numbered scales (U.S. No. 1 or
U.S. No. 2).94 The U.S. industry commonly refers to processed products as Grade A or B and sometimes
Class A or B. Higher-value IQF products are always made from whole Grade A frozen raspberries; block
frozen and puree are typically made from Grade B berries, but can also be made from Grade A.
Global Production, Consumption, and Trade
Production of fresh raspberries lends itself to regions and countries with cool and temperate climates,
and processing is typically located adjacent to these growing regions. The largest global producers and
exporters of processed raspberry products are often also large producers of fresh raspberries; however,
not all large fresh raspberry producers process and/or export raspberries.
Production data for processed raspberry products are extremely limited because the products are
largely intermediate goods. However, there are widely available data for fresh production of raspberries
globally from FAO. Therefore, in this report, data on the production of fresh raspberries and the levels of
imports and exports of frozen raspberries are used to indirectly identify the key players in the global
processed raspberry industry. Global import data indicate that Europe and North America are large
consumers of processed raspberry products, and supply chains are concentrated in those two regions. In
recent years, U.S. consumers have increased their consumption of fruits, including raspberries.
Processed raspberry products are more durable and have a longer shelf life than fresh raspberries. As
such, they are more easily traded across borders, but trade is still concentrated within North and South
America and Europe.
94 The scale of U.S. No. 1 for fresh raspberries “consists of similar varietal characteristics, which are well colored and which are free from cores, mold or decay, and from dried and distinctly immature berries and from damage caused by over maturity, crushing, shriveling, dirt, or other foreign matter, hail, sunscald, wind-whips, and other scars, moisture, birds, disease, insects, discoloration, mechanical or other means.” U.S. Grade A (or “U.S. Fancy”), “is the quality of frozen raspberries that are whole and practically free from defects; possess a good character; possess a normal flavor and odor.” U.S. Grade B (or “U.S. Choice”) scores slightly lower on the AMS scoring sheet but berries maintain reasonably good color, an absence of defects, and character. USDA, AMS, “Grades and Standards of Raspberries,” accessed April 7, 2021; USDA, AMS “Grades of Frozen Raspberries,” accessed April 7, 2021.
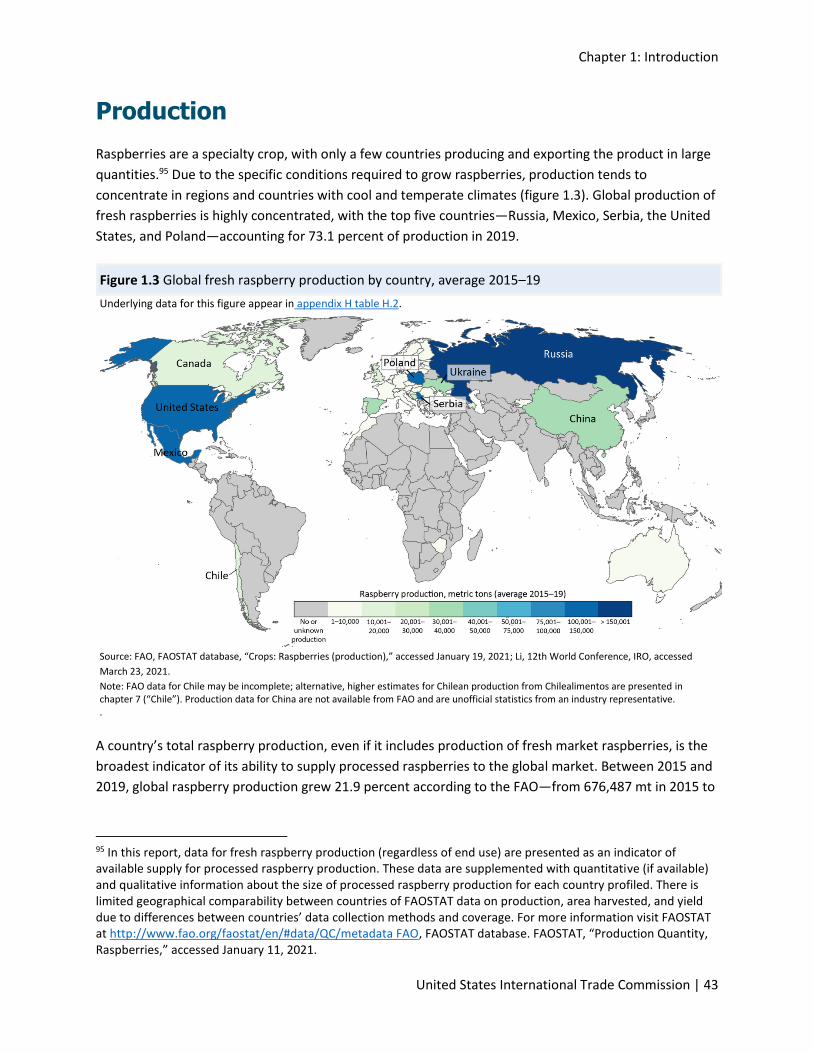
Chapter 1: Introduction
United States International Trade Commission | 43
Production
Raspberries are a specialty crop, with only a few countries producing and exporting the product in large
quantities.95 Due to the specific conditions required to grow raspberries, production tends to
concentrate in regions and countries with cool and temperate climates (figure 1.3). Global production of
fresh raspberries is highly concentrated, with the top five countries—Russia, Mexico, Serbia, the United
States, and Poland—accounting for 73.1 percent of production in 2019.
Figure 1.3 Global fresh raspberry production by country, average 2015–19
Underlying data for this figure appear in appendix H table H.2.
Source: FAO, FAOSTAT database, “Crops: Raspberries (production),” accessed January 19, 2021; Li, 12th World Conference, IRO, accessed
March 23, 2021.
Note: FAO data for Chile may be incomplete; alternative, higher estimates for Chilean production from Chilealimentos are presented in chapter 7 (“Chile”). Production data for China are not available from FAO and are unofficial statistics from an industry representative. .
A country’s total raspberry production, even if it includes production of fresh market raspberries, is the
broadest indicator of its ability to supply processed raspberries to the global market. Between 2015 and
2019, global raspberry production grew 21.9 percent according to the FAO—from 676,487 mt in 2015 to
95 In this report, data for fresh raspberry production (regardless of end use) are presented as an indicator of available supply for processed raspberry production. These data are supplemented with quantitative (if available) and qualitative information about the size of processed raspberry production for each country profiled. There is limited geographical comparability between countries of FAOSTAT data on production, area harvested, and yield due to differences between countries’ data collection methods and coverage. For more information visit FAOSTAT at http://www.fao.org/faostat/en/#data/QC/metadata FAO, FAOSTAT database. FAOSTAT, “Production Quantity, Raspberries,” accessed January 11, 2021.

Raspberries for Processing
44 | www.usitc.gov
822,493 mt in 2019 (figure 1.4).96 While Russia is the largest single-country raspberry producer by
volume, producing 174,000 mt in 2019, most of these raspberries are grown for Russia’s own fresh
market, and the country supplied negligible amounts of raspberries to the United States from 2015 to
2019.97 Mexico, the second-largest global player, produced 128,848 mt in 2019. Over the 2015–19
period, Mexican production of fresh raspberries nearly doubled.98 The country grows raspberries
primarily for the fresh market, but a stable share of raspberry seconds is produced as well.
Raspberry production in Serbia, the next largest global producer, fluctuated over the period, primarily
due to weather events. Overall, though, Serbia’s production increased by 23.6 percent, from 97,165 mt
in 2015 to 120,058 mt in 2019. Poland is the fifth-largest single-country producer by volume, producing
primarily for the processed export market, but it supplied less than 1 percent of U.S. imports of frozen
raspberry products from 2015 to 2019.99 The United States is the fourth-largest global producer of
raspberries, production in the United States fell 14.1 percent, from 119,295 mt in 2015 to 102,510 mt in
2019, largely due to declines in U.S. fresh market production. Chile and Canada, also important U.S.
suppliers, according to FAO produced 15,942 mt and 9,145 mt of fresh raspberries, respectively, in 2019.
An alternate data source for Chile estimated that Chile produced about 30,000 mt of fresh raspberries,
which is more in line with Chile’s level of processed raspberry exports.100
96 FAO, “Crops: Raspberries (production),” FAOSTAT database, accessed January 18, 2021. 97 FAO, “Crops: Raspberries (production),” FAOSTAT database, accessed January 19, 2021; USITC DataWeb/Census, HTS statistical reporting number 0811.20.2025, accessed November 3, 2020; USITC, hearing transcript, September 17, 2020, 143–44 (testimony of John Tentomas, Nature’s Touch). 98 FAO, “Crops: Raspberries (production),” FAOSTAT database, accessed January 19, 2021. 99 IHS Markit, Global Trade Atlas HS subheading 0811.20, accessed July 7, 2020; USITC DataWeb/Census, HTS statistical reporting number 0811.20.2025, accessed November 3, 2020. 100 Dominguez, “Chilean Raspberry Industry Report 2019,” August 2020, 3.
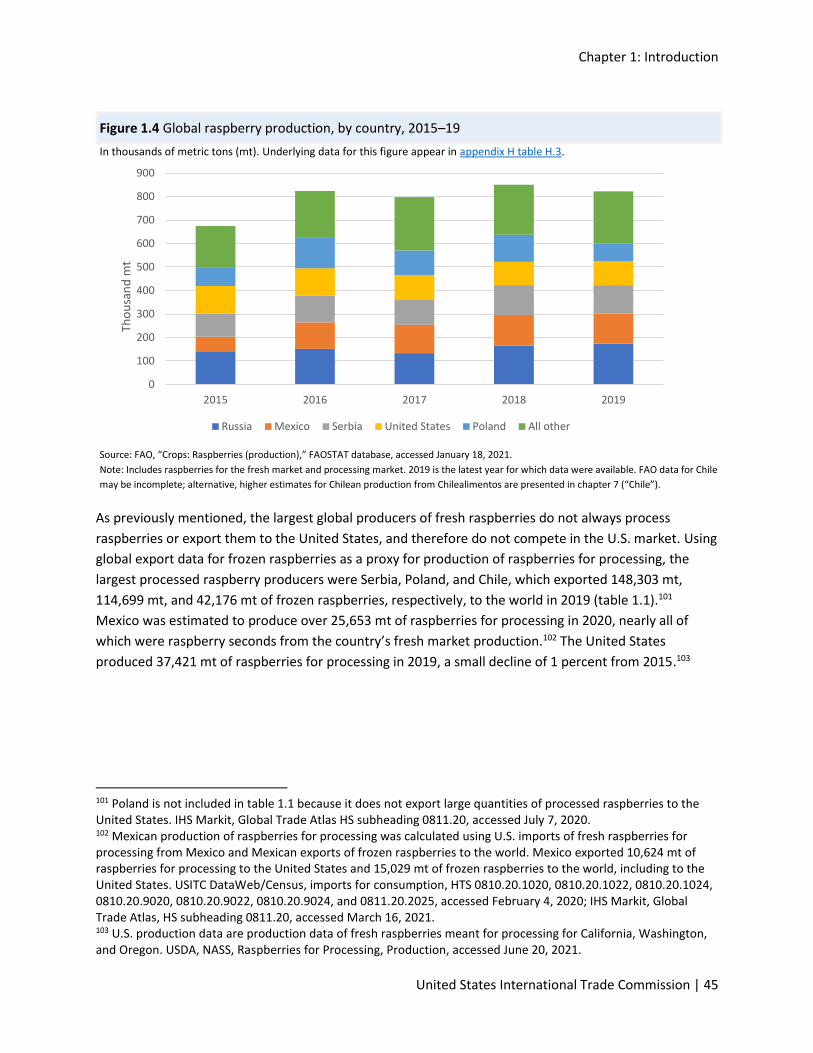
Chapter 1: Introduction
United States International Trade Commission | 45
Figure 1.4 Global raspberry production, by country, 2015–19
In thousands of metric tons (mt). Underlying data for this figure appear in appendix H table H.3.
Source: FAO, “Crops: Raspberries (production),” FAOSTAT database, accessed January 18, 2021.
Note: Includes raspberries for the fresh market and processing market. 2019 is the latest year for which data were available. FAO data for Chile
may be incomplete; alternative, higher estimates for Chilean production from Chilealimentos are presented in chapter 7 (“Chile”).
As previously mentioned, the largest global producers of fresh raspberries do not always process
raspberries or export them to the United States, and therefore do not compete in the U.S. market. Using
global export data for frozen raspberries as a proxy for production of raspberries for processing, the
largest processed raspberry producers were Serbia, Poland, and Chile, which exported 148,303 mt,
114,699 mt, and 42,176 mt of frozen raspberries, respectively, to the world in 2019 (table 1.1).101
Mexico was estimated to produce over 25,653 mt of raspberries for processing in 2020, nearly all of
which were raspberry seconds from the country’s fresh market production.102 The United States
produced 37,421 mt of raspberries for processing in 2019, a small decline of 1 percent from 2015.103
101 Poland is not included in table 1.1 because it does not export large quantities of processed raspberries to the United States. IHS Markit, Global Trade Atlas HS subheading 0811.20, accessed July 7, 2020. 102 Mexican production of raspberries for processing was calculated using U.S. imports of fresh raspberries for processing from Mexico and Mexican exports of frozen raspberries to the world. Mexico exported 10,624 mt of raspberries for processing to the United States and 15,029 mt of frozen raspberries to the world, including to the United States. USITC DataWeb/Census, imports for consumption, HTS 0810.20.1020, 0810.20.1022, 0810.20.1024, 0810.20.9020, 0810.20.9022, 0810.20.9024, and 0811.20.2025, accessed February 4, 2020; IHS Markit, Global Trade Atlas, HS subheading 0811.20, accessed March 16, 2021. 103 U.S. production data are production data of fresh raspberries meant for processing for California, Washington, and Oregon. USDA, NASS, Raspberries for Processing, Production, accessed June 20, 2021.
0
100
200
300
400
500
600
700
800
900
2015 2016 2017 2018 2019
Tho
usa
nd
mt
Russia Mexico Serbia United States Poland All other
Raspberries for Processing
46 | www.usitc.gov
Consumption
Growth in global raspberry consumption is driven by several factors, including improved raspberry
cultivars, better logistics, and consumers seeking more healthful diets. In recent years, consumers have
increased their consumption of fruits, including raspberries, as a result of increased consumer interest in
healthier eating.104 However, apparent consumption of processed raspberries in the U.S. market has
fallen 17.7 percent over the 2015 to 2019 period, from 83,063 mt in 2015 to 68,314 mt in 2019.105
Although, consumption data for processed raspberries in the U.S. market are limited, U.S. per capita
availability of frozen raspberries does offer a rough estimate of supply trends in response to demand for
IQF products.106 U.S. per capita frozen raspberry availability fell from 0.56 pounds in 2015 to
0.39 pounds in 2018, the latest year for which data are available.107 Over the longer term, per capita
availability of frozen raspberries has stayed roughly the same; in 2000, for example, per capita
availability of frozen raspberries was 0.37 pounds. The global COVID-19 pandemic increased retail
demand for frozen fruits in 2020, but supply-side factors have limited product availability.108 Another
source noted that sales of frozen fruit and vegetables in general grew by 22 percent in 2020 over the
previous year, outpacing the 10 percent increase in sales of fresh produce over the same period.109
Global Trade
The geographical pattern of trade flows varies by raspberry product, and these differences are largely
due to the fragile and perishable nature of fresh raspberries compared to the more durable nature of
frozen and processed raspberries. As a result, it is typically uneconomical to import fresh raspberries
from more remote producers like Chile,110 but processed raspberries can be traded over longer
distances.111 Regardless, most trade in processed raspberries occurs regionally.
104 Industry representative, interview by USITC staff, July 16, 2020. 105 For a more detailed analysis of apparent consumption, refer to chapter 3 (“United States”). USDA, NASS, “Raspberry Production, Area harvested and Yield,” Quick Stats database, accessed November 27, 2020; USITC calculations based on USDA, NASS, Raspberry Production, accessed November 27, 2020; USITC DataWeb/Census, HTS statistical reporting numbers 0810.20.1020, 0810.20.1022, 0810.20.1024, 0810.20.9020, 0810.20.9022, 0810.90.9024, 0811.20.2025 and schedule B number 0811.20.0000, accessed March 30, 2021. 106 Since availability is impacted by supply side factors it is not a true proxy for demand. 107 USDA, ERS, “Berries Led Growth in Frozen Fruit Consumption,” accessed February 14, 2021. 108 Roerink, “2020: A Year Like No Other,” January 13, 2021. 109 Roerink, “Fresh Produce Regains Market Share,” July 14, 2020. 110 Industry representative, interview by USITC staff, September 16, 2020. 111 Government of British Columbia, “A Global Export Market Overview,” 2010, 6.
Chapter 1: Introduction
United States International Trade Commission | 47
Imports of Frozen Raspberries
Most international trade in processed raspberries occurs adjacent to Europe and North America, where
most of the world’s importers of raspberries are located (figure 1.5).112 Germany was the largest single-
country importer of frozen raspberries by volume in 2019 (21.1 percent), followed by France and the
United States (8.2 percent and 7.5 percent, respectively). For Germany, the 10 largest sources of
processed raspberries by volume that year were other European countries, owing to proximity, well-
established trade relationships between regional partners, and the harmonization of rules across
European Union members.113 By contrast, the United States, the third-largest single-country importer,
sourced frozen raspberries from a diverse group of sources. Chile supplied 44.9 percent of U.S. imports
of frozen raspberries by quantity in 2019, followed by Mexico (21.6 percent), Serbia (18.3 percent),
Canada (15.1 percent), and France (less than 1 percent).114
112 Global trade data presented in this report use the Harmonized Commodity Description and Coding System (HS), maintained by the World Customs Organization (WCO). The two HS 6-digit subheadings used are: (1) subheading HS 0810.20, certain fresh berries (covering raspberries, blackberries, mulberries, and loganberries), which accounts for trade in fresh raspberries (for both the fresh market and for processing); and (2) HS subheading 0811.20, certain frozen berries (covering raspberries, blackberries, mulberries, loganberries, currants and gooseberries), which accounts for trade in frozen raspberries (IQF and other processed raspberry products), but excludes some purees, juice, and raspberry content in frozen berry mixes. Some profiled countries provide more granular breakouts of those data. In these cases, a presentation of the data is included in the relevant chapters. 113 IHS Markit, Global Trade Atlas database, HS subheading 0811.20, accessed July 7, 2020. 114 USITC DataWeb/Census, HTS statistical reporting number 0811.20.2025, accessed February 4, 2020.
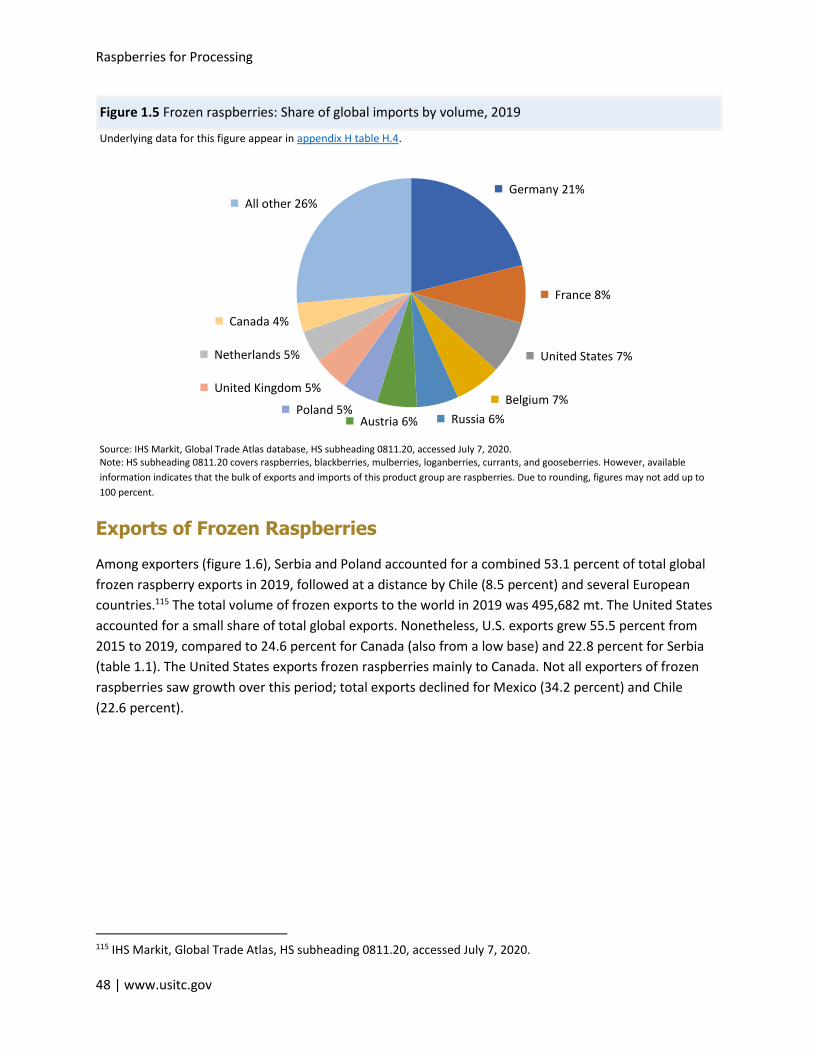
Raspberries for Processing
48 | www.usitc.gov
Figure 1.5 Frozen raspberries: Share of global imports by volume, 2019
Underlying data for this figure appear in appendix H table H.4.
Source: IHS Markit, Global Trade Atlas database, HS subheading 0811.20, accessed July 7, 2020. Note: HS subheading 0811.20 covers raspberries, blackberries, mulberries, loganberries, currants, and gooseberries. However, available
information indicates that the bulk of exports and imports of this product group are raspberries. Due to rounding, figures may not add up to
100 percent.
Exports of Frozen Raspberries
Among exporters (figure 1.6), Serbia and Poland accounted for a combined 53.1 percent of total global
frozen raspberry exports in 2019, followed at a distance by Chile (8.5 percent) and several European
countries.115 The total volume of frozen exports to the world in 2019 was 495,682 mt. The United States
accounted for a small share of total global exports. Nonetheless, U.S. exports grew 55.5 percent from
2015 to 2019, compared to 24.6 percent for Canada (also from a low base) and 22.8 percent for Serbia
(table 1.1). The United States exports frozen raspberries mainly to Canada. Not all exporters of frozen
raspberries saw growth over this period; total exports declined for Mexico (34.2 percent) and Chile
(22.6 percent).
115 IHS Markit, Global Trade Atlas, HS subheading 0811.20, accessed July 7, 2020.
Germany 21%
France 8%
United States 7%
Belgium 7%
Russia 6%Austria 6%Poland 5%
United Kingdom 5%
Netherlands 5%
Canada 4%
All other 26%
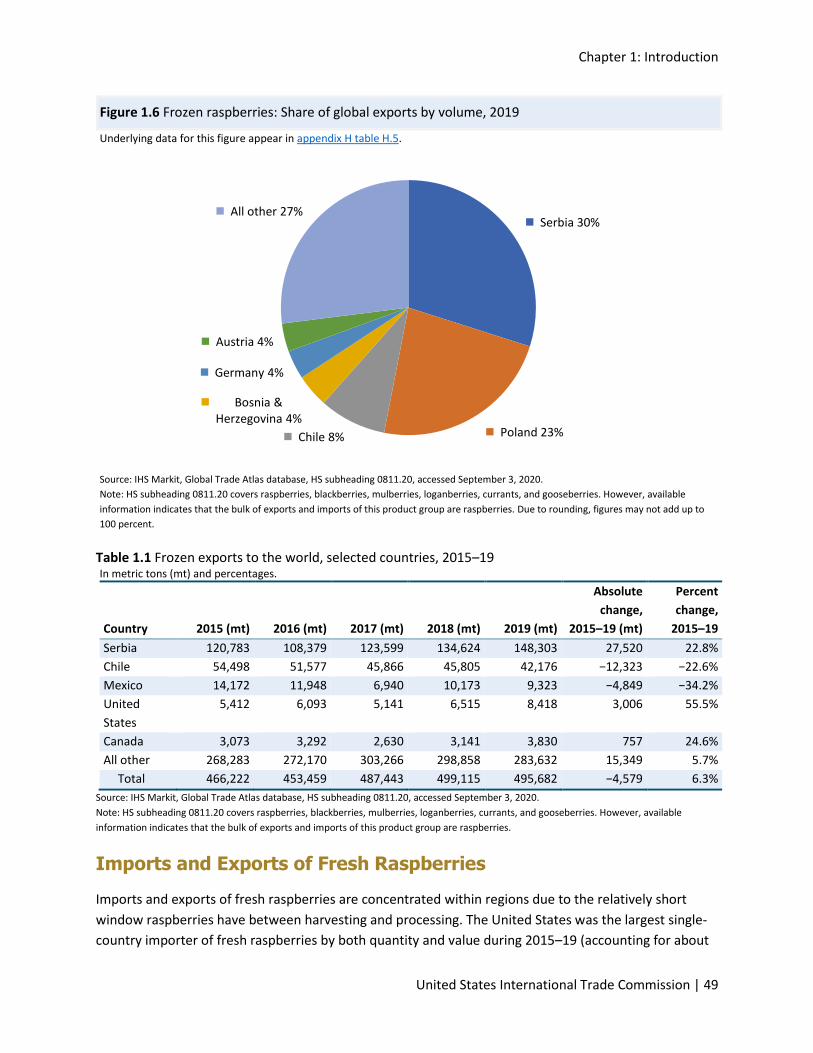
Chapter 1: Introduction
United States International Trade Commission | 49
Figure 1.6 Frozen raspberries: Share of global exports by volume, 2019
Underlying data for this figure appear in appendix H table H.5.
Source: IHS Markit, Global Trade Atlas database, HS subheading 0811.20, accessed September 3, 2020.
Note: HS subheading 0811.20 covers raspberries, blackberries, mulberries, loganberries, currants, and gooseberries. However, available
information indicates that the bulk of exports and imports of this product group are raspberries. Due to rounding, figures may not add up to
100 percent.
Table 1.1 Frozen exports to the world, selected countries, 2015–19 In metric tons (mt) and percentages.
Country 2015 (mt) 2016 (mt) 2017 (mt) 2018 (mt) 2019 (mt)
Absolute
change,
2015–19 (mt)
Percent
change,
2015–19
Serbia 120,783 108,379 123,599 134,624 148,303 27,520 22.8%
Chile 54,498 51,577 45,866 45,805 42,176 −12,323 −22.6%
Mexico 14,172 11,948 6,940 10,173 9,323 −4,849 −34.2%
United
States
5,412 6,093 5,141 6,515 8,418 3,006 55.5%
Canada 3,073 3,292 2,630 3,141 3,830 757 24.6%
All other 268,283 272,170 303,266 298,858 283,632 15,349 5.7%
Total 466,222 453,459 487,443 499,115 495,682 −4,579 6.3%
Source: IHS Markit, Global Trade Atlas database, HS subheading 0811.20, accessed September 3, 2020.
Note: HS subheading 0811.20 covers raspberries, blackberries, mulberries, loganberries, currants, and gooseberries. However, available
information indicates that the bulk of exports and imports of this product group are raspberries.
Imports and Exports of Fresh Raspberries
Imports and exports of fresh raspberries are concentrated within regions due to the relatively short
window raspberries have between harvesting and processing. The United States was the largest single-
country importer of fresh raspberries by both quantity and value during 2015–19 (accounting for about
Serbia 30%
Poland 23%Chile 8%
Bosnia & Herzegovina 4%
Germany 4%
Austria 4%
All other 27%
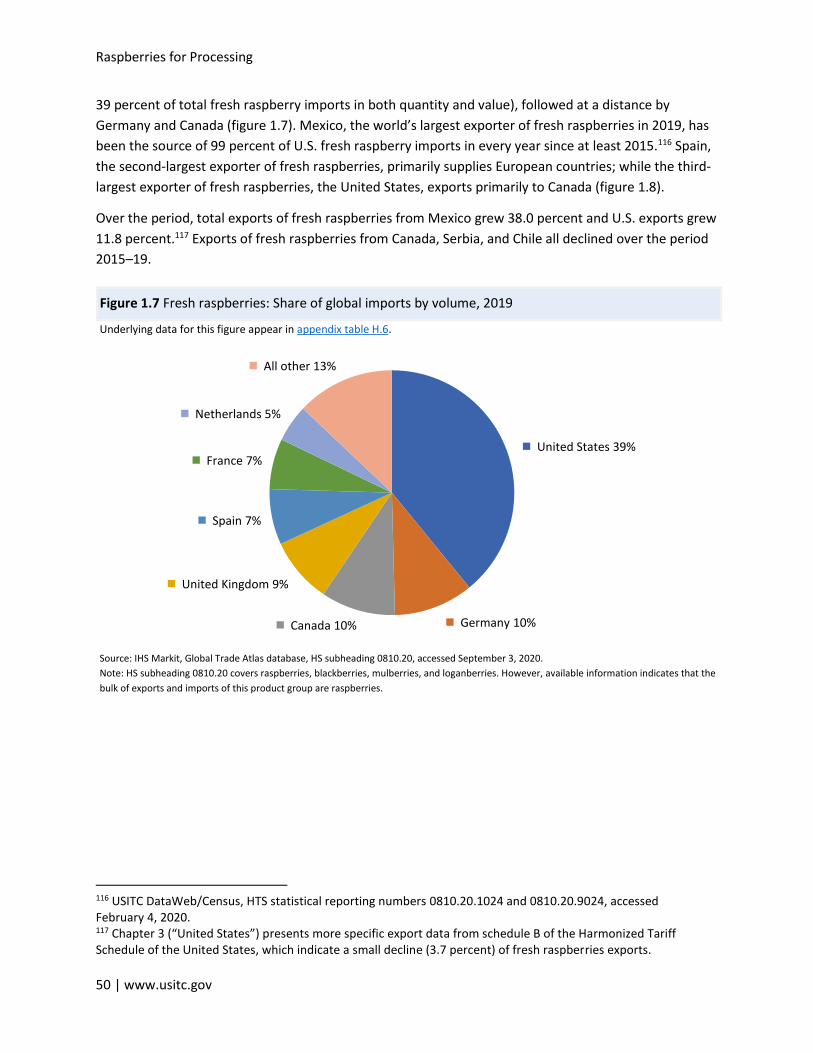
Raspberries for Processing
50 | www.usitc.gov
39 percent of total fresh raspberry imports in both quantity and value), followed at a distance by
Germany and Canada (figure 1.7). Mexico, the world’s largest exporter of fresh raspberries in 2019, has
been the source of 99 percent of U.S. fresh raspberry imports in every year since at least 2015.116 Spain,
the second-largest exporter of fresh raspberries, primarily supplies European countries; while the third-
largest exporter of fresh raspberries, the United States, exports primarily to Canada (figure 1.8).
Over the period, total exports of fresh raspberries from Mexico grew 38.0 percent and U.S. exports grew
11.8 percent.117 Exports of fresh raspberries from Canada, Serbia, and Chile all declined over the period
2015–19.
United States 39%
Germany 10%Canada 10%
United Kingdom 9%
Spain 7%
France 7%
Netherlands 5%
All other 13%
Figure 1.7 Fresh raspberries: Share of global imports by volume, 2019
Underlying data for this figure appear in appendix table H.6.
Source: IHS Markit, Global Trade Atlas database, HS subheading 0810.20, accessed September 3, 2020.
Note: HS subheading 0810.20 covers raspberries, blackberries, mulberries, and loganberries. However, available information indicates that the
bulk of exports and imports of this product group are raspberries.
116 USITC DataWeb/Census, HTS statistical reporting numbers 0810.20.1024 and 0810.20.9024, accessed February 4, 2020. 117 Chapter 3 (“United States”) presents more specific export data from schedule B of the Harmonized Tariff Schedule of the United States, which indicate a small decline (3.7 percent) of fresh raspberries exports.
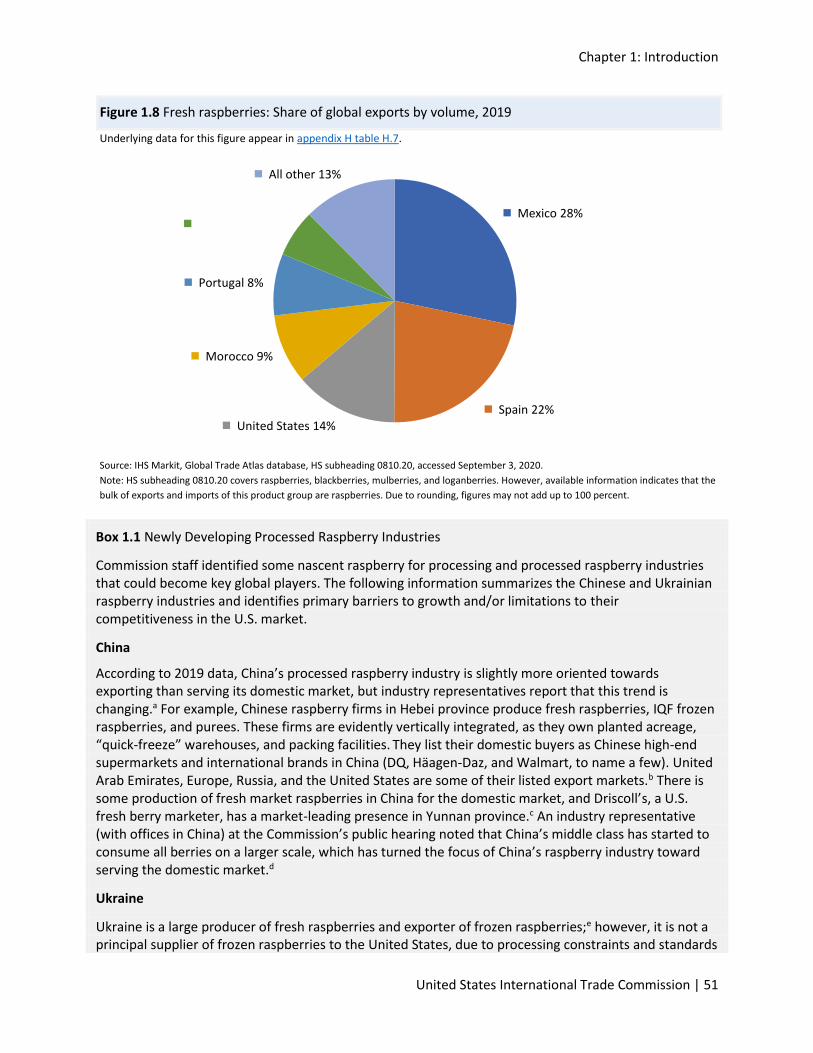
Chapter 1: Introduction
United States International Trade Commission | 51
Figure 1.8 Fresh raspberries: Share of global exports by volume, 2019
Underlying data for this figure appear in appendix H table H.7.
Source: IHS Markit, Global Trade Atlas database, HS subheading 0810.20, accessed September 3, 2020.
Note: HS subheading 0810.20 covers raspberries, blackberries, mulberries, and loganberries. However, available information indicates that the
bulk of exports and imports of this product group are raspberries. Due to rounding, figures may not add up to 100 percent.
Box 1.1 Newly Developing Processed Raspberry Industries
Commission staff identified some nascent raspberry for processing and processed raspberry industries that could become key global players. The following information summarizes the Chinese and Ukrainian raspberry industries and identifies primary barriers to growth and/or limitations to their competitiveness in the U.S. market.
China
According to 2019 data, China’s processed raspberry industry is slightly more oriented towards exporting than serving its domestic market, but industry representatives report that this trend is changing.a For example, Chinese raspberry firms in Hebei province produce fresh raspberries, IQF frozen raspberries, and purees. These firms are evidently vertically integrated, as they own planted acreage, “quick-freeze” warehouses, and packing facilities. They list their domestic buyers as Chinese high-end supermarkets and international brands in China (DQ, Häagen-Daz, and Walmart, to name a few). United Arab Emirates, Europe, Russia, and the United States are some of their listed export markets.b There is some production of fresh market raspberries in China for the domestic market, and Driscoll’s, a U.S. fresh berry marketer, has a market-leading presence in Yunnan province.c An industry representative (with offices in China) at the Commission’s public hearing noted that China’s middle class has started to consume all berries on a larger scale, which has turned the focus of China’s raspberry industry toward serving the domestic market.d
Ukraine
Ukraine is a large producer of fresh raspberries and exporter of frozen raspberries;e however, it is not a principal supplier of frozen raspberries to the United States, due to processing constraints and standards
Mexico 28%
Spain 22%United States 14%
Morocco 9%
Portugal 8%
All other 13%
Raspberries for Processing
52 | www.usitc.gov
concerns.f In 2019 Ukraine exported almost 6,800 mt of frozen raspberries, accounting for about 20 percent of its domestic raspberry production.g While the country exports primarily to markets within the European Union, sales in other parts of the world are expected to grow rapidly in the upcoming years due to industry and government efforts to shift away from local fresh market sales to regional and global processed markets.h Ukraine manufactures a variety of frozen raspberry products, including IQF, frozen berry mixes, purees, and juice concentrates.i The industry does not now have enough freezing facilities to support its output of raspberries suitable for processing, but there have been multiple initiatives and limited government support to ramp up infrastructure and production in the processing segment.j
a Fresh Plaza, “The Chinese Raspberry Industry Is Getting Ready,” March 13, 2017; Li, “12th World Conference,” IRO, accessed March 23, 2021; U.S. government representative, email message to USITC staff, December 12, 2020. b “Beijing Kingsberry Garden Agriculture Technology Co., Ltd,” accessed February 7, 2021 http://www.dfberry.cn/english/about/112.html; Fresh Plaza, “The Chinese Raspberry Industry Is Getting Ready,” March 13, 2017. c U.S. government representative, email message to USITC staff, December 12, 2020. d USITC, hearing transcript, September 17, 2020 (testimony of Tony Miller, Cascade International Foods). e Ukraine was the 7th-largest global producer of raspberries in 2019 and the 11th-largest exporter of frozen raspberries. FAO, “Crops: Raspberries (production),” FAOSTAT database, accessed January 18, 2021. IHS Markit, Global Trade Atlas database, HS subheading 0811.20, accessed July 7, 2020. f Industry representative, interview by USITC staff, July 24, 2020. g Ukraine did not export any frozen raspberries to the United States, as of 2019. IHS Markit, Global Trade Atlas database, HS 0811.20, accessed February 6, 2021. h Similarly, Bosnia and Herzegovina are growing producers of raspberries, totaling 52,289 mt and 7,206 mt of raspberries, respectively, in 2019. Bosnia and Herzegovina exported nearly 21,000 mt of raspberries in the same year. Bosnia and Herzegovina production varies year to year making their reliability of supply relatively low compared to other regional suppliers. FAO, “Crops: Raspberries (production),” FAOSTAT database, accessed January 18, 2021; IHS Markit, Global Trade Atlas database, HS subheading 0811.20, accessed various dates. i Ukrainian Berry Association, “The Ukrainian Berry Industry,” 2020. j Fresh Plaza, “Raspberry Production on the Rise Production,” November 23, 2017.
Chapter 1: Introduction
United States International Trade Commission | 53
Bibliography
Barro, Josh. “Americans Are Eating a Lot More Berries. Here’s Why,” New York Times: The Upshot, December 1, 2014. https://www.nytimes.com/2014/12/02/upshot/americans-are-eating-a-lot-more-berries-heres-why.html.
BBC. “Feeding the Human Race—OCR Gateway: Agricultural Solutions to Meet Food Demands.” BBC Bitesize Guides. Accessed April 13, 2021. https://www.bbc.co.uk/bitesize/guides/ztwg7p3/revision/3.
Dominguez, Antonio. “Chilean Raspberry Industry Report 2019.” Presented at the International Raspberry Organization, August 2020. https://www.internationalraspberry.net/wp-content/uploads/2020/08/Chile.pdf.
Driscoll’s, Inc. Written submission to U.S. International Trade Commission in connection with Inv. No. TA-332-577, Raspberries for Processing: Conditions of Competition Between U.S. and Foreign Suppliers, with a Focus on Washington State. September 17, 2020.
European Commission. “Glossary: Extensive Farming,” Eurostat Statistics Explained. Accessed April 18, 2021. https://ec.europa.eu/eurostat/statistics-explained/index.php?title=Glossary:Extensive_farming.
European Commission. “Glossary: Intensive Farming,” Eurostat Statistics Explained. Accessed April 18, 2021. https://ec.europa.eu/eurostat/statistics-explained/index.php?title=Glossary:Intensive_farming.
Food and Agriculture Organization of the United Nations (FAO). “Crops: Raspberries.” FAOSTAT database. Accessed various dates. http://faostat.fao.org/default.aspx.
Food and Agriculture Organization of the United Nations (FAO). “Production Quantity, Raspberries.” FAOSTAT database. Accessed various dates. http://faostat.fao.org/default.aspx.
Fresh Plaza. “The Chinese Raspberry Industry Is Getting Ready.” March 13, 2017. https://www.freshplaza.com/article/2172225/the-chinese-raspberry-industry-is-getting-ready/.
Fresh Plaza. “Raspberry Production on the Rise Production,” November 23, 2017.
https://www.freshplaza.com/article/2185388/raspberry-production-on-the-rise-in-ukraine/.
Funt, Richard C., and Harvey K. Hall, eds. Raspberries. Oxfordshire: CABI UK. 2013. https://www.cabi.org/bookshop/book/9781845937911/.
Galinato, Suzette P., and Lisa W. DeVetter. “2015 Cost Estimates of Establishing and Producing Red Raspberries in Washington State.” Washington State University Extension Technical Bulletin 21, 2015. http://hdl.handle.net/2376/6408.
Raspberries for Processing
54 | www.usitc.gov
Government of Canada. “Market Analysis Report: A Global Export Market Overview for British Columbia’s Raspberry Industry.” 2011. https://www2.gov.bc.ca/assets/gov/farming-natural-resources-and-industry/agriculture-and seafood/statistics/exports/global_export_market_bcraspberries.pdf.
IHS Markit. Global Trade Atlas database. Accessed various dates. https://connect.ihsmarkit.com/home.
Li, Tiger. 12th “World Conference International Raspberry Organization Special Report,” Slide presentation to the International Raspberry Organization. Accessed March 23, 2021. https://www.internationalraspberry.net/wp-content/uploads/2020/08/China.pdf.
National Processed Raspberry Council (NPRC). Food Safety: Its Critical. Accessed April 8, 2021. https://wildhive.wpengine.com/wp-content/uploads/2017/09/NPRC-Food-Safety-Education_Brochure.pdf (www.red razz.org).
Roerink, Anne-Marie. “Fresh Produce Regains Market Share Lost to Canned and Frozen.” Produce Blue Book. Accessed March 12, 2021. https://www.producebluebook.com/2020/07/14/fresh-produce-share-of-sales-back-back-to-normal-vs-canned-and-frozen/.
Roerink, Anne-Marie. “2020: A Year Like No Other for the Produce Department.” – Produce Blue Book. Accessed March 12, 2021 https://www.producebluebook.com/2021/01/14/2020-a-year-like-no-other-for-the-produce-department/.
Shafie, Farah Ayuni, and Denise Rennie. “Consumer Perceptions Towards Organic Food.” Procedia - Social and Behavioral Sciences 49, 2012. https://doi.org/10.1016/j.sbspro.2012.07.034.
Ukrainian Berries Association. Ukrainian Berry Association. “The Ukrainian Berry Industry Catalogue,
2020.” https://eu4business.eu/uploads/20/11/20/dcfc75ab80ca1a7d5cbf6a0c3e701c65.pdf.
United States Department of Agriculture (USDA). Agricultural Marketing Service (AMS). “Grades of Frozen Raspberries.” Accessed April 7, 2021. https://www.ams.usda.gov/grades-standards/frozen-raspberries-grades-and-standards.
United States Department of Agriculture (USDA). Agricultural Marketing Service (AMS). “Grade and Standards of Raspberries.” Accessed April 17, 2021. https://www.ams.usda.gov/grades-standards/raspberries-grades-and-standards.
United States Department of Agriculture (USDA). Agricultural Marketing Service (AMS). “Importing Organic Product into the United States,” December 1, 2016. https://www.ams.usda.gov/sites/default/files/media/Importing%20Organic%20Products%20Factsheet.pdf.
United States Department of Agriculture (USDA). Agricultural Marketing Service (AMS). Technical Procedures Manual, 2020. https://www.ams.usda.gov/sites/default/files/media/TechnicalProceduresManual%5B1%5D .pdf.
Chapter 1: Introduction
United States International Trade Commission | 55
United States Department of Agriculture (USDA). Economic Research Service (ERS). “Berries Led Growth
in Frozen Fruit Consumption over the Last Three Decades.” Accessed February 14, 2021.
https://www.ers.usda.gov/data-products/chart-gallery/gallery/chart-
detail/?chartId=84603#:~:text=Between%20the%20early%201980s%20and,2015's%20total%20
U.S.%20fruit%20availability.
United States Department of Agriculture (USDA). National Agricultural Statistics Service (NASS).
“Raspberry Production, Area harvested and Yield.” Quick Stats database. Accessed November
27, 2020. https://quickstats.nass.usda.gov/.
U.S. Food and Drug Administration (FDA). FDA At a Glance: Final Rule on Foreign Supplier Verification Programs. May 11, 2017. https://www.fda.gov/media/94746/download.
U.S. Food and Drug Administration (FDA). FSMA Facts: Background on the FDA Food Safety Modernization Act (FSMA). July 21, 2011. https://www.fda.gov/media/81051/download.
U.S. Food and Drug Administration (FDA). Key Facts: About Preventive Controls for Human Food. Accessed March 21, 2021. https://www.fda.gov/media/108775/download.
U.S. International Trade Commission (USITC). Hearing transcript in connection with Inv. No. TA-332-577, Raspberries for Processing: Conditions of Competition Between U.S. and Foreign Suppliers, with a Focus on Washington State. September 17, 2020.
U.S. International Trade Commission Interactive Tariff and Trade DataWeb (USITC DataWeb)/U.S. Census Bureau (Census). Accessed various dates. http://dataweb.usitc.gov.
Washington Red Raspberry Commission Channel. “Washington Red Raspberry Harvesting and Processing Tour.” Accessed various dates. August 12, 2020. https://www.youtube.com/watch?v=AdT2IczhebQ.

56 | www.usitc.gov
Chapter 2: Cross-Country Comparison of Competitiveness
United States International Trade Commission | 57
Chapter 2 Cross-Country Comparison of Competitiveness Several countries, including the United States itself, supply the U.S. market with raspberries that are
either processed or intended for processing; the competitiveness of these suppliers, however, vary
substantially.118 Sales of processed raspberry products supplied by the industry in Washington were
roughly $530 million from 2015 to 2020, while U.S. imports were valued at about $740 million during
this period, for an estimated total U.S. market of over $1 billion during the period.119 Measured by the
quantity of fresh raspberries for processing produced by Washington and California, U.S. producers are
estimated to have held at most 57 to 64 percent of the U.S. processed raspberry market from 2015 to
2019, with imports comprising nearly all the remainder, see chapter 3 (“United States”) table 3.6.
The Commission’s research showed that the U.S. processed raspberry industry in Washington State is a
high-cost producer of premium products—individually quick frozen (IQF) raspberries—that have a
reputation for highly desirable product characteristics in terms of food safety, color, and sugar
content.120 In other words, their products are highly differentiated. Canada is also a high-cost supplier of
raspberry products, but it offers slightly less differentiated goods than the United States, producing
primarily non-IQF products (purees and block frozen) with some production of IQF raspberries. Chile and
Serbia are both medium-cost suppliers of highly differentiated IQF products, including organic IQF
raspberries. Mexico is a low-cost supplier of less differentiated products, primarily non-IQF products
(fresh for processing, block frozen, puree, and juice and juice concentrate). All these countries are
reliable suppliers.
This chapter offers a cross-country comparison of the processed raspberry industries in the United
States and in countries that are major suppliers to the U.S. market. It identifies and evaluates several key
competitive factors for processed raspberries in a qualitative framework, as well as estimating what is
known as the symmetric revealed comparative advantage (SRCA) of each country. A country’s SRCA is a
measure, at once quantitative and relative, of its specialization and competitiveness in international
trade.121 The cross-country comparison draws from this report’s country profile chapters, which present
in-depth, country-specific industry profiles and detailed discussions of competitive factors.
118 See Chapter 3 (“United States”). 119 WRRC, email message to USITC staff, December 18, 2021; USITC DataWeb/Census, HTS statistical reporting numbers: a share of 0810.20.1020 and 0810.20.9020, 0810.20.1024, 0810.20.9024, 0811.20.2025, a share of 0811.90.8080, 0811.90.8085, 2008.99.2120, 2007.99.6510, and 2009.89.7055, accessed February 4, 2021. 120 The United States comparison is based on the processed raspberry industry in Washington State and does not consider competitive factors of processed raspberry production in Oregon, California, or other regions in the United States. Some of the competitiveness factors for the Washington industry may apply to Oregon and British Columbia, Canada, as well, however, the focus of this analysis is on Washington State. 121 A comparative advantage is the ability to produce a good or service at a lower opportunity cost than a trading partner. Oxford Reference, “Overview Comparative Advantage,” accessed April 26, 2021.
Raspberries for Processing
58 | www.usitc.gov
Chapters 3–7 of the report assess the competitive strengths and weaknesses of the processed raspberry
industries in the United States, with a focus on Washington State, and major sources of U.S. imports of
processed raspberries and raspberries for processing: Canada, Chile, Mexico, and Serbia. In 2019, these
countries combined accounted for 99.9 percent of the U.S. imports of processed raspberries and
raspberries for processing.122 The SRCA complements the qualitative cross-country comparisons by
giving a quantitative measure of the overall competitiveness of a country’s raspberry industry in the U.S.
and global markets. The SRCA is an expression of the revealed comparative advantage (RCA) index, in
which a positive value indicates a high degree of comparative advantage and a negative value indicates
a lack of comparative advantage.123
Competitive factors influence the ability of an industry to supply products with the characteristics
demanded by buyers, who base their purchasing decisions on three primary criteria: delivered cost,
product differentiation, and reliability of supply. For processed raspberries, delivered cost reflects the
cost to acquire or produce the primary input—fresh raspberries—as well as processing (freezing),
storage, transportation, trade, and compliance costs. Product differentiation refers to the ability to
provide processed raspberries in the form and packaging wanted by buyers and with the desired
product characteristics, e.g., grade, Brix (sugar level),124 flavor profile, color, viscosity, or cultivation
method (organic or conventional). Reliability of supply refers to the ability of suppliers to deliver an
agreed-on quantity of product to a specified location at a contracted time, which can depend on the
efficiency of supply chains, the functioning of marketing information systems, the weather, and other
supply and production factors.
The comparison of competitive factors in this chapter focuses on processed raspberries and fresh
raspberries for processing. Factors related to fresh raspberries (and to a lesser extent, raspberry seconds
from the fresh market) are also considered, however, since fresh raspberries are the primary input for
processed raspberries and can affect the delivered cost and product characteristics of processed
raspberries.125
Industry Comparison
Comparing production levels, yields, industry focus (fresh or processed), and industry orientation (home
market or export market) can give an idea of the relative strengths and weaknesses of a country’s
122 USITC, DataWeb/Census, HTS statistical reporting numbers 0810.20.1024, 0810.20.9024, 0811.20.2025, 2007.99.6510, 2008.99.2120, 2009.89.6055, and 2009.89.7055, accessed April 29, 2021. This calculation does not include raspberry content share of 0811.90.8080 and 0811.90.8085. 123 See appendix G for a summary of the literature on RCA and SRCA and how these measures were calculated for this report. 124 Brix level is the percentage of sugar solids in any liquid products made from plant materials. Industry representatives refer to Brix levels when measuring the sugar content in liquid processed raspberry products, e.g., puree, juice concentrate, single-strength juice, or reconstituted juice. Higher Brix levels indicate higher levels of sugars. USDA, AMS, Technical Procedures Manual, June 2020, 17. The standard Brix level for single-strength juice is 10.5. Brix Values of Unconcentrated Natural Fruit Juices, 19 C.F.R. § 151.91 (April 1, 2011). 125 Raspberry seconds, in the case of Mexican fresh raspberries, are defined as raspberries that do not meet the product specifications for the fresh market.
Chapter 2: Cross-Country Comparison of Competitiveness
United States International Trade Commission | 59
industry compared with its competitors. In the case of processed raspberries, fresh raspberries are a
primary input and an important component of the delivered cost for processed raspberries. Hence the
productivity of a country’s fresh raspberry industry is an important component of the total delivered
cost of processed raspberries. The focus of fresh raspberry production differs among the countries
included in this analysis, which affects the costs of fresh inputs for raspberry processors. It also affects
production practices, costs to produce fresh raspberries, and yields, which contribute to the
competitiveness of processed raspberry industries.
Production practices vary by industry focus, and these practices influence yields. In countries and
regions where the industry is focused on the fresh market, like Mexico and California, growers use
production practices that result in higher yields of fresh raspberries. These practices include a protected
field system (hoop houses), hand harvesting, and proprietary cultivars suited for the fresh market that
achieve high yields.126 Washington growers, who produce for the processing market, use an open field
production system exposed to weather elements that uses mechanical harvesting and cultivars
optimized for processing, which can lead to lower yields than growers in California and Mexico. Fresh
market raspberries receive higher prices than raspberries for processing.
Yield data from 2015 to 2019 correspond to production practices and industry focus. From 2015 to 2019,
fresh market-focused California and Mexico had the highest levels of productivity, with average yields of
21.3 and 18.3 metric tons (mt) per hectare, respectively (table 2.1).127 Countries and regions using open
field systems and focusing on the processing market had lower productivity over the period; in
particular, Washington, Chile, Serbia, and Canada had average yields of 9.2, 7.4, 5.4, and 5.3 mt per
hectare, respectively. Since these are average yields, they may not be reflective of the most productive
farms in these countries. For example, yields in Serbia range from 5–6 mt for traditional growers to 15–
20 mt for larger and more modern farms.128
126 Raspberries are grown in Mexico using production systems that are essentially identical to those for the fresh raspberries grown in California. Hoop houses in the United States or Mexico reportedly cost $30,000 per hectare and, though that is less than the cost of a greenhouse (which typically cost more than $100,000), they are a high-cost initial investment. Industry representative, email message to USITC staff, October 24, 2020; industry representatives, interviews by USITC staff, September 16, 2020, and October 26, 2020; academic experts, interview by USITC staff, January 12, 2021. 127 More details on California’s role in the U.S. processed raspberry industry are provided in chapter 3 (“United States”). 128 Džagić et al., “Integrated Report on Performance and Value Chain Analysis,” December 2017, 47.
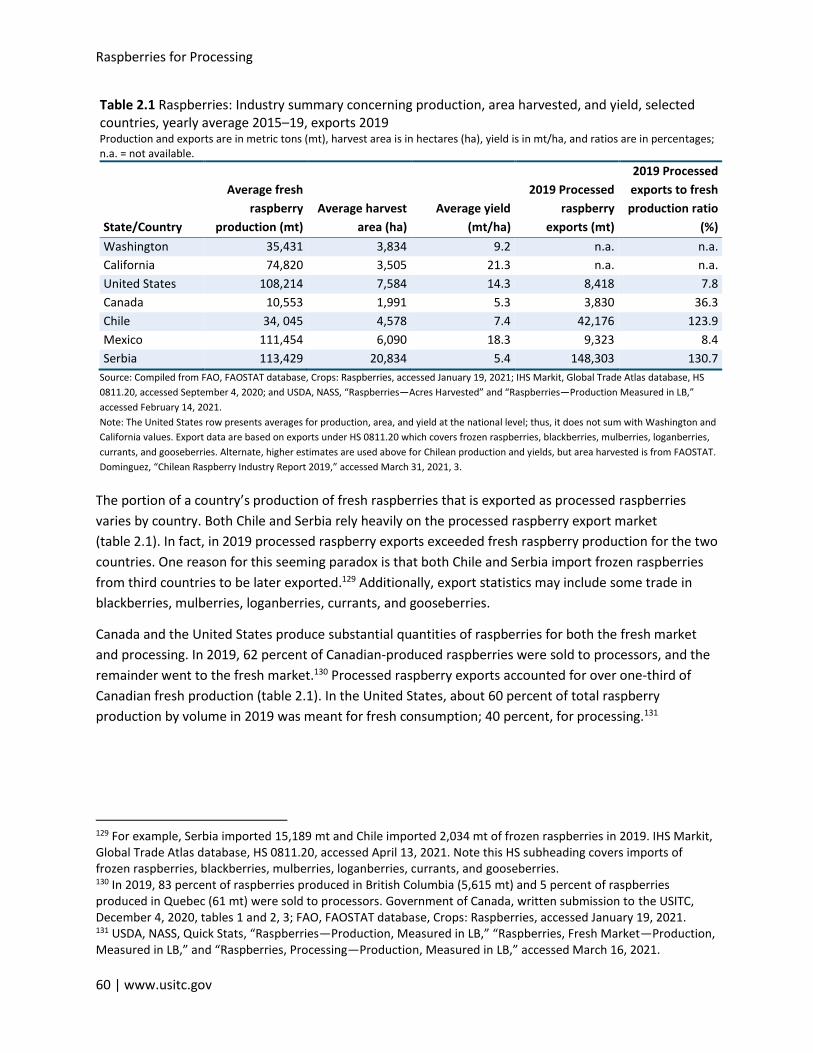
Raspberries for Processing
60 | www.usitc.gov
Table 2.1 Raspberries: Industry summary concerning production, area harvested, and yield, selected countries, yearly average 2015–19, exports 2019 Production and exports are in metric tons (mt), harvest area is in hectares (ha), yield is in mt/ha, and ratios are in percentages; n.a. = not available.
State/Country
Average fresh
raspberry
production (mt)
Average harvest
area (ha)
Average yield
(mt/ha)
2019 Processed
raspberry
exports (mt)
2019 Processed
exports to fresh
production ratio
(%)
Washington 35,431 3,834 9.2 n.a. n.a.
California 74,820 3,505 21.3 n.a. n.a.
United States 108,214 7,584 14.3 8,418 7.8
Canada 10,553 1,991 5.3 3,830 36.3
Chile 34, 045 4,578 7.4 42,176 123.9
Mexico 111,454 6,090 18.3 9,323 8.4
Serbia 113,429 20,834 5.4 148,303 130.7
Source: Compiled from FAO, FAOSTAT database, Crops: Raspberries, accessed January 19, 2021; IHS Markit, Global Trade Atlas database, HS
0811.20, accessed September 4, 2020; and USDA, NASS, “Raspberries—Acres Harvested” and “Raspberries—Production Measured in LB,”
accessed February 14, 2021.
Note: The United States row presents averages for production, area, and yield at the national level; thus, it does not sum with Washington and
California values. Export data are based on exports under HS 0811.20 which covers frozen raspberries, blackberries, mulberries, loganberries,
currants, and gooseberries. Alternate, higher estimates are used above for Chilean production and yields, but area harvested is from FAOSTAT.
Dominguez, “Chilean Raspberry Industry Report 2019,” accessed March 31, 2021, 3.
The portion of a country’s production of fresh raspberries that is exported as processed raspberries
varies by country. Both Chile and Serbia rely heavily on the processed raspberry export market
(table 2.1). In fact, in 2019 processed raspberry exports exceeded fresh raspberry production for the two
countries. One reason for this seeming paradox is that both Chile and Serbia import frozen raspberries
from third countries to be later exported.129 Additionally, export statistics may include some trade in
blackberries, mulberries, loganberries, currants, and gooseberries.
Canada and the United States produce substantial quantities of raspberries for both the fresh market
and processing. In 2019, 62 percent of Canadian-produced raspberries were sold to processors, and the
remainder went to the fresh market.130 Processed raspberry exports accounted for over one-third of
Canadian fresh production (table 2.1). In the United States, about 60 percent of total raspberry
production by volume in 2019 was meant for fresh consumption; 40 percent, for processing.131
129 For example, Serbia imported 15,189 mt and Chile imported 2,034 mt of frozen raspberries in 2019. IHS Markit, Global Trade Atlas database, HS 0811.20, accessed April 13, 2021. Note this HS subheading covers imports of frozen raspberries, blackberries, mulberries, loganberries, currants, and gooseberries. 130 In 2019, 83 percent of raspberries produced in British Columbia (5,615 mt) and 5 percent of raspberries produced in Quebec (61 mt) were sold to processors. Government of Canada, written submission to the USITC, December 4, 2020, tables 1 and 2, 3; FAO, FAOSTAT database, Crops: Raspberries, accessed January 19, 2021. 131 USDA, NASS, Quick Stats, “Raspberries—Production, Measured in LB,” “Raspberries, Fresh Market—Production, Measured in LB,” and “Raspberries, Processing—Production, Measured in LB,” accessed March 16, 2021.
Chapter 2: Cross-Country Comparison of Competitiveness
United States International Trade Commission | 61
Most U.S.-produced raspberries used for processing are grown in Washington State, and 95 percent of
Washington’s fresh raspberry production was destined for processing in 2017, the last year for which
state-level data are available.132 Most U.S. fresh and processed raspberries are used to fulfill domestic
demand, although there are some exports of processed and fresh raspberries.133
By contrast, in Mexico the industry is focused on exporting for the fresh market. This is indicated by the
large share of Mexican fresh raspberry production—nearly half in 2019—that is imported by the United
States in small containers, mostly plastic clamshells, and is meant for fresh consumption.134 Exports of
processed raspberries account for a much smaller proportion of Mexican production, with processed
exports accounting for 8.4 percent of fresh production in 2019 (table 2.1). Mexico also exports some
fresh raspberries to the United States in containers of 5 kg or more that are likely destined for
processing.135
The focus market channel of growers in each of the profiled industries affects processors’ costs for fresh
raspberry inputs. The portion of a grower’s production of raspberries meant for processing versus the
portion for the premium-priced fresh market influences the grower’s overall profitability and the prices
at which processors can purchase the grower’s input. In Mexico, for example, raspberry growers sell
most of their production to the fresh market, with around 10 percent of raspberry production sold as
residual products (or raspberry “seconds”) for wholesale marketing or processing.136 Compared to
raspberries for processing, raspberries sold to the fresh market receive premium prices, which increase
revenues and can boost grower profitability.
By contrast, raspberry growers in Washington, Canada (British Columbia), Serbia, and Chile primarily
produce for the processed market.137 The share of raspberry production going to processing in these
three countries and in Washington is roughly 90 percent or higher.138 Growers in these countries and in
132 USDA, NASS, Quick Stats, “Raspberries, Production, Measured in LB,” “Raspberries, Fresh Market—Production, Measured in LB,” and “Raspberries, Processing—Production Measured in LB,” accessed March 16, 2021. 133 For example, in 2019, the United States exported 21,211 mt of fresh raspberries and 4,814 mt of frozen raspberries, primarily to Canada. USITC DataWeb/Census, domestic exports, Schedule B number 0810.20.5000 and 0811.20.0000, accessed February 4, 2020. Schedule B numbers 0810.20.5000, 0810.20.2000, and 0811.20.0000 also cover blackberries, mulberries, and loganberries, in addition to raspberries. 134 USITC DataWeb/Census, imports for consumption, HTS 0810.20.1022 and 0810.20.9022, accessed April 29, 2021; FAO, FAOSTAT database, Crops: Raspberries, accessed June 2, 2020. 135 U.S. imports of fresh raspberries from Mexico in containers of 5 kg or more are likely destined for the processing sector. USITC, hearing transcript, September 17, 2020, 21–22, 25–26 (testimony of Ryan Commons, Driscoll’s, Inc.). 136 USITC, hearing transcript, September 17, 2020, 99–100 (testimony of Tony Miller, Cascade International Foods), 101–02 (testimony of Jean-Christophe Hesteau, Sunopta Inc.), and 18–21 (testimony of Ryan Commons, Driscoll’s, Inc.); industry representatives, interviews by USITC staff, September 16, 2020, December 1, 2020, and December 3, 2020. 137 The other significant Canadian provinces producing fresh raspberries (Quebec and Ontario) primarily produce raspberries for the fresh market. 138 USDA, NASS, Quick Stats, “Raspberries, Production, Measured in LB,” “Raspberries, Fresh Market—Production, Measured in LB,” and “Raspberries, Processing—Production Measured in LB,” accessed March 16, 2021; BC Ministry of Agriculture, A Global Export Market Overview, 2010, 9; industry representative, interview by USITC staff, February 11, 2021.
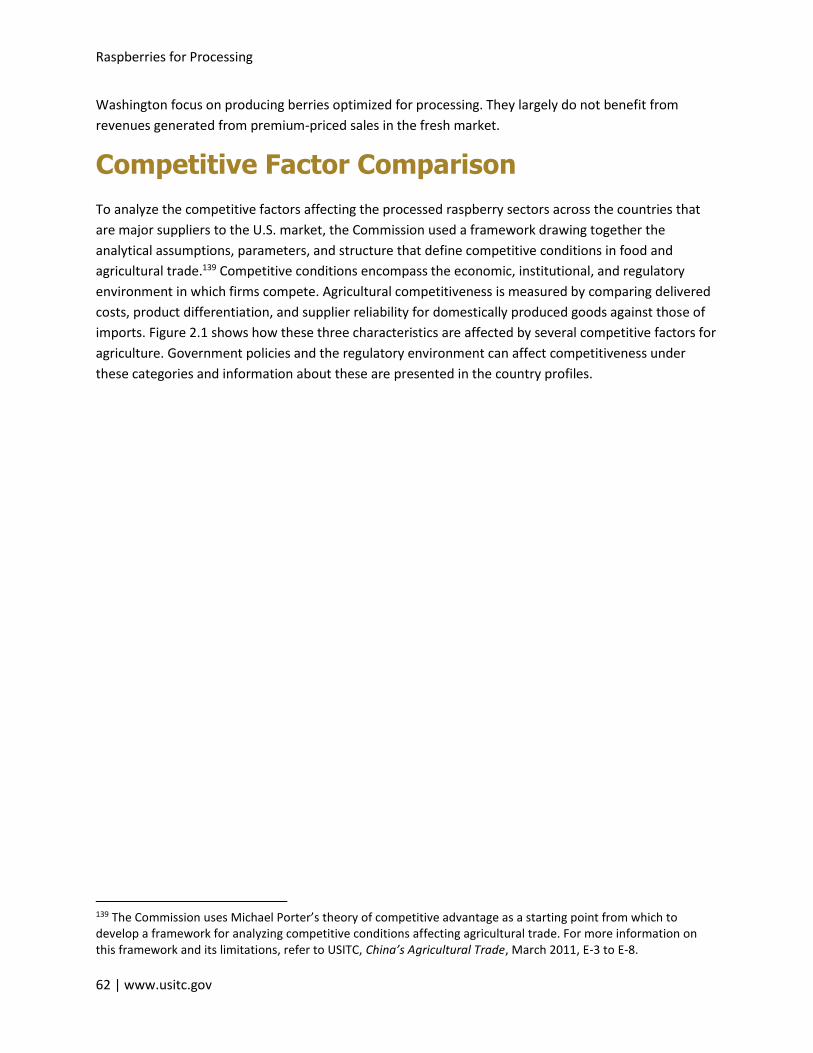
Raspberries for Processing
62 | www.usitc.gov
Washington focus on producing berries optimized for processing. They largely do not benefit from
revenues generated from premium-priced sales in the fresh market.
Competitive Factor Comparison
To analyze the competitive factors affecting the processed raspberry sectors across the countries that
are major suppliers to the U.S. market, the Commission used a framework drawing together the
analytical assumptions, parameters, and structure that define competitive conditions in food and
agricultural trade.139 Competitive conditions encompass the economic, institutional, and regulatory
environment in which firms compete. Agricultural competitiveness is measured by comparing delivered
costs, product differentiation, and supplier reliability for domestically produced goods against those of
imports. Figure 2.1 shows how these three characteristics are affected by several competitive factors for
agriculture. Government policies and the regulatory environment can affect competitiveness under
these categories and information about these are presented in the country profiles.
139 The Commission uses Michael Porter’s theory of competitive advantage as a starting point from which to develop a framework for analyzing competitive conditions affecting agricultural trade. For more information on this framework and its limitations, refer to USITC, China’s Agricultural Trade, March 2011, E-3 to E-8.
Chapter 2: Cross-Country Comparison of Competitiveness
United States International Trade Commission | 63
Figure 2.1 Factors that affect competitiveness in agricultural markets
Source: Compiled by USITC.
Delivered cost Reliability of
supply
Production costs
Input costs for . Raw materials . Resource base . Wage rates . Capital . Water . Chemicals . Other
Technology
Labor productivity
Industry structure
Tariffs/fees
Transportation
costs
Exchange rates
Proximity to market
Transportation
infrastructure
Most-favored-nation
(MFN) tariffs
Preferential tariffs
Market
information
Transportation
infrastructure
Food safety/quality
Health and
nutrition
Processor
specifications
Food labeling
Brand Identity
Product
convenience
Product
differentiation
Import
compliance
Sanitary and
phytosanitary
standards
Labeling/packaging
Supplier country’s
export controls
Off-season supply
Support services Product
availability
Government policies and foreign direct investment
can affect all three competitive factors.
systems
Raspberries for Processing
64 | www.usitc.gov
The analysis in this report explores the relative importance of particular factors in determining the
competitiveness of U.S. processed raspberry production vis-à-vis its foreign competitors in the U.S.
market. In this industry, competition occurs among processed products (e.g., IQF, puree, straight pack,
and juice). Therefore, factors of competitiveness affecting fresh raspberries used in producing the
downstream processed products—whether grown for processing or seconds diverted from the fresh
market—are expressed in terms of costs, product differentiation, and reliability of supply for processed
raspberries.
The competitiveness of producers in each of the selected countries in terms of delivered cost, product
differentiation, and reliability of supply of domestic processed raspberry production is summarized in
table 2.2. Countries have been assigned one of three broad designations—high, medium, or low—on
each factor in terms of their competitiveness in the U.S. market.
The competitive factor categories are based on data and information largely available for all countries,
and further discussed in the country profiles in chapters 3–7. The assessment for the United States
chiefly considers sales of Washington State processed raspberry products and excludes products from
Oregon in the U.S. market for three reasons: nearly all U.S. raspberry processors are located in
Washington, the majority of U.S. raspberries for processing are produced in Washington, and production
data for Oregon are not available after 2017.140 The assessments in this report also consider countries
that are major export suppliers to the U.S. market, including Chile, Mexico, Serbia, and Canada. The
competitiveness assessment for these countries focuses on their processed raspberry exports to the U.S.
market. These assessments are inherently subjective, based on analysis by Commission staff of the
factors described below using available data, hearing testimony, and communication with industry
experts.
• Delivered cost assessments were largely based on input costs (the cost of acquiring or
producing fresh raspberries); costs for freezing, processing, storing, and transporting the
raspberries; and other transaction costs, such as tariffs and exchange rate effects.141 Labor
costs are a significant component of input costs to produce fresh raspberries which affects the
input costs for processed raspberry producers. A high delivered cost makes producers less
competitive.
• Product differentiation was assessed based on producers’ ability to deliver products desirable
to buyers and end consumers, such as IQF berries and products with desirable traits, including
high sugar content and favorable flavor and color profiles. The ability to supply different forms
of processed berries (e.g., IQF, bulk products, or juice) and certified organic product was also
considered, along with products’ branding and packaging. High product differentiation makes
producers more competitive.
140 More details on California producers’ role in the U.S. processed raspberry industry are provided in chapter 3 (“United States”). 141 Although exchange rates were not found to be a major factor in delivered cost for processed raspberries, they can affect costs—for example, freight rates for shipments from Serbia are often priced in euros. Industry representatives, interviews by USITC staff, August 13, 2020, and December 3, 2020.
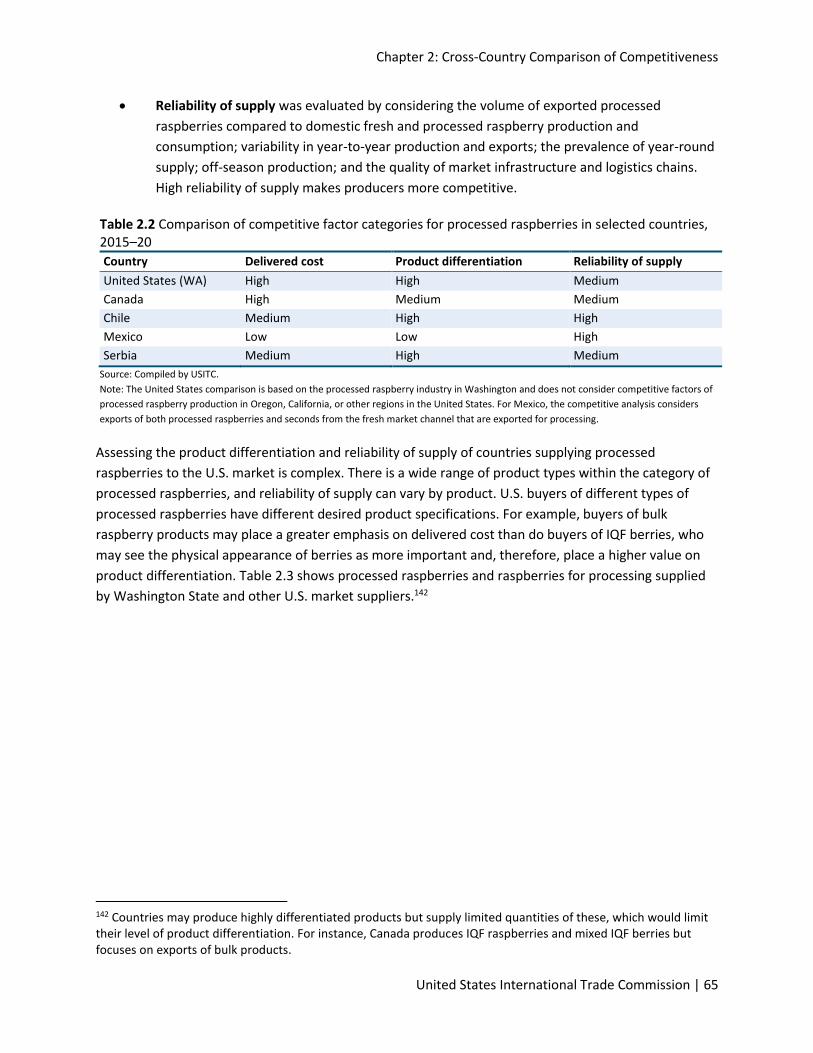
Chapter 2: Cross-Country Comparison of Competitiveness
United States International Trade Commission | 65
• Reliability of supply was evaluated by considering the volume of exported processed
raspberries compared to domestic fresh and processed raspberry production and
consumption; variability in year-to-year production and exports; the prevalence of year-round
supply; off-season production; and the quality of market infrastructure and logistics chains.
High reliability of supply makes producers more competitive.
Table 2.2 Comparison of competitive factor categories for processed raspberries in selected countries, 2015–20
Country Delivered cost Product differentiation Reliability of supply
United States (WA) High High Medium
Canada High Medium Medium
Chile Medium High High
Mexico Low Low High
Serbia Medium High Medium
Source: Compiled by USITC.
Note: The United States comparison is based on the processed raspberry industry in Washington and does not consider competitive factors of
processed raspberry production in Oregon, California, or other regions in the United States. For Mexico, the competitive analysis considers
exports of both processed raspberries and seconds from the fresh market channel that are exported for processing.
Assessing the product differentiation and reliability of supply of countries supplying processed
raspberries to the U.S. market is complex. There is a wide range of product types within the category of
processed raspberries, and reliability of supply can vary by product. U.S. buyers of different types of
processed raspberries have different desired product specifications. For example, buyers of bulk
raspberry products may place a greater emphasis on delivered cost than do buyers of IQF berries, who
may see the physical appearance of berries as more important and, therefore, place a higher value on
product differentiation. Table 2.3 shows processed raspberries and raspberries for processing supplied
by Washington State and other U.S. market suppliers.142
142 Countries may produce highly differentiated products but supply limited quantities of these, which would limit their level of product differentiation. For instance, Canada produces IQF raspberries and mixed IQF berries but focuses on exports of bulk products.
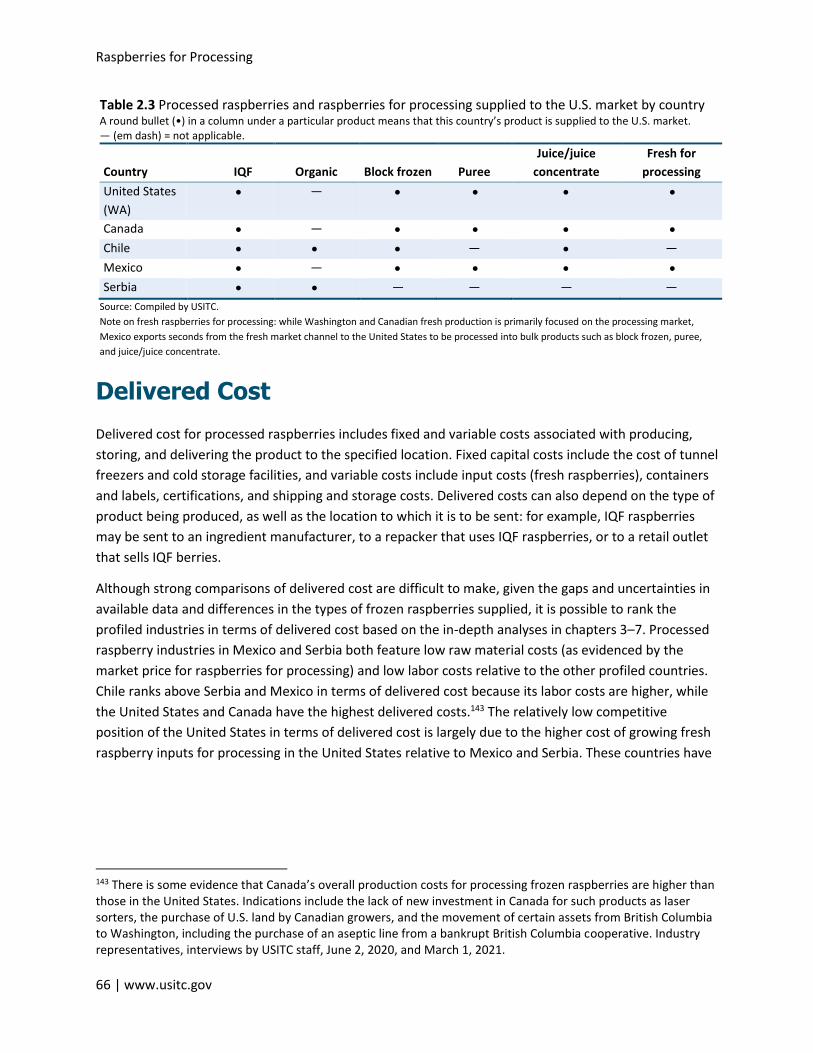
Raspberries for Processing
66 | www.usitc.gov
Table 2.3 Processed raspberries and raspberries for processing supplied to the U.S. market by country A round bullet (•) in a column under a particular product means that this country’s product is supplied to the U.S. market. — (em dash) = not applicable.
Country IQF Organic Block frozen Puree
Juice/juice
concentrate
Fresh for
processing
United States
(WA)
• — • • • •
Canada • — • • • •
Chile • • • — • —
Mexico • — • • • •
Serbia • • — — — —
Source: Compiled by USITC.
Note on fresh raspberries for processing: while Washington and Canadian fresh production is primarily focused on the processing market,
Mexico exports seconds from the fresh market channel to the United States to be processed into bulk products such as block frozen, puree,
and juice/juice concentrate.
Delivered Cost
Delivered cost for processed raspberries includes fixed and variable costs associated with producing,
storing, and delivering the product to the specified location. Fixed capital costs include the cost of tunnel
freezers and cold storage facilities, and variable costs include input costs (fresh raspberries), containers
and labels, certifications, and shipping and storage costs. Delivered costs can also depend on the type of
product being produced, as well as the location to which it is to be sent: for example, IQF raspberries
may be sent to an ingredient manufacturer, to a repacker that uses IQF raspberries, or to a retail outlet
that sells IQF berries.
Although strong comparisons of delivered cost are difficult to make, given the gaps and uncertainties in
available data and differences in the types of frozen raspberries supplied, it is possible to rank the
profiled industries in terms of delivered cost based on the in-depth analyses in chapters 3–7. Processed
raspberry industries in Mexico and Serbia both feature low raw material costs (as evidenced by the
market price for raspberries for processing) and low labor costs relative to the other profiled countries.
Chile ranks above Serbia and Mexico in terms of delivered cost because its labor costs are higher, while
the United States and Canada have the highest delivered costs.143 The relatively low competitive
position of the United States in terms of delivered cost is largely due to the higher cost of growing fresh
raspberry inputs for processing in the United States relative to Mexico and Serbia. These countries have
143 There is some evidence that Canada’s overall production costs for processing frozen raspberries are higher than those in the United States. Indications include the lack of new investment in Canada for such products as laser sorters, the purchase of U.S. land by Canadian growers, and the movement of certain assets from British Columbia to Washington, including the purchase of an aseptic line from a bankrupt British Columbia cooperative. Industry representatives, interviews by USITC staff, June 2, 2020, and March 1, 2021.
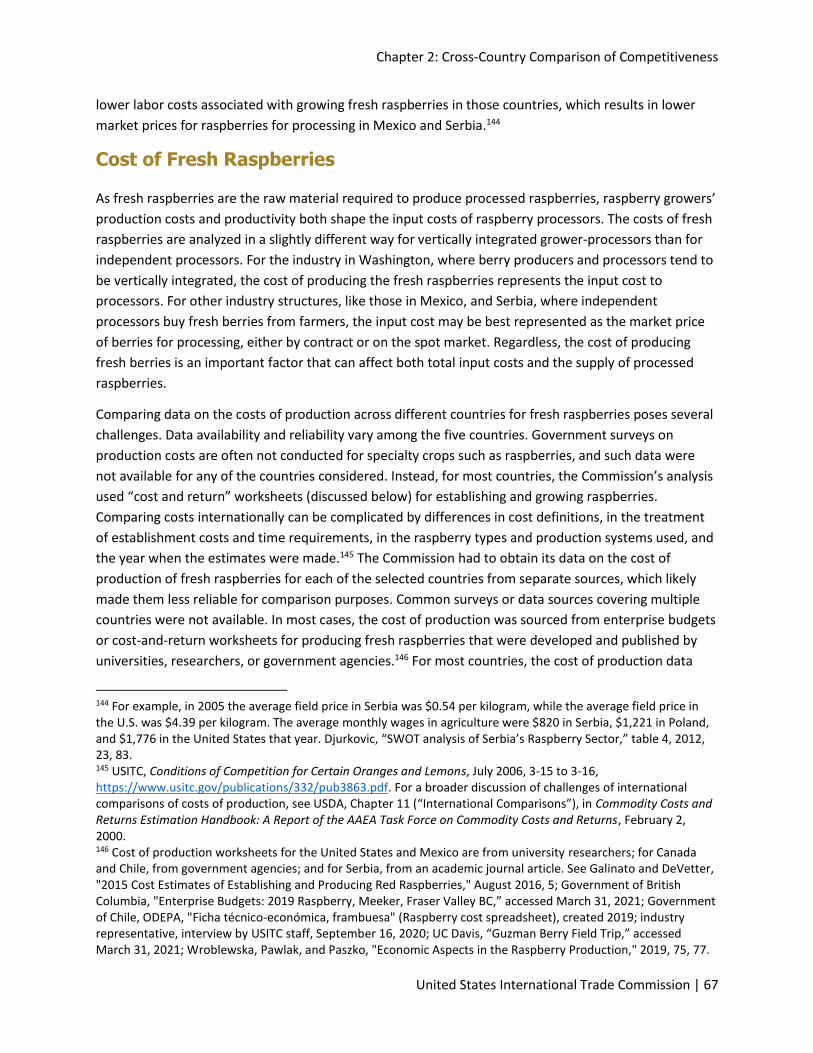
Chapter 2: Cross-Country Comparison of Competitiveness
United States International Trade Commission | 67
lower labor costs associated with growing fresh raspberries in those countries, which results in lower
market prices for raspberries for processing in Mexico and Serbia.144
Cost of Fresh Raspberries
As fresh raspberries are the raw material required to produce processed raspberries, raspberry growers’
production costs and productivity both shape the input costs of raspberry processors. The costs of fresh
raspberries are analyzed in a slightly different way for vertically integrated grower-processors than for
independent processors. For the industry in Washington, where berry producers and processors tend to
be vertically integrated, the cost of producing the fresh raspberries represents the input cost to
processors. For other industry structures, like those in Mexico, and Serbia, where independent
processors buy fresh berries from farmers, the input cost may be best represented as the market price
of berries for processing, either by contract or on the spot market. Regardless, the cost of producing
fresh berries is an important factor that can affect both total input costs and the supply of processed
raspberries.
Comparing data on the costs of production across different countries for fresh raspberries poses several
challenges. Data availability and reliability vary among the five countries. Government surveys on
production costs are often not conducted for specialty crops such as raspberries, and such data were
not available for any of the countries considered. Instead, for most countries, the Commission’s analysis
used “cost and return” worksheets (discussed below) for establishing and growing raspberries.
Comparing costs internationally can be complicated by differences in cost definitions, in the treatment
of establishment costs and time requirements, in the raspberry types and production systems used, and
the year when the estimates were made.145 The Commission had to obtain its data on the cost of
production of fresh raspberries for each of the selected countries from separate sources, which likely
made them less reliable for comparison purposes. Common surveys or data sources covering multiple
countries were not available. In most cases, the cost of production was sourced from enterprise budgets
or cost-and-return worksheets for producing fresh raspberries that were developed and published by
universities, researchers, or government agencies.146 For most countries, the cost of production data
144 For example, in 2005 the average field price in Serbia was $0.54 per kilogram, while the average field price in the U.S. was $4.39 per kilogram. The average monthly wages in agriculture were $820 in Serbia, $1,221 in Poland, and $1,776 in the United States that year. Djurkovic, “SWOT analysis of Serbia’s Raspberry Sector,” table 4, 2012, 23, 83. 145 USITC, Conditions of Competition for Certain Oranges and Lemons, July 2006, 3-15 to 3-16, https://www.usitc.gov/publications/332/pub3863.pdf. For a broader discussion of challenges of international comparisons of costs of production, see USDA, Chapter 11 (“International Comparisons”), in Commodity Costs and Returns Estimation Handbook: A Report of the AAEA Task Force on Commodity Costs and Returns, February 2, 2000. 146 Cost of production worksheets for the United States and Mexico are from university researchers; for Canada and Chile, from government agencies; and for Serbia, from an academic journal article. See Galinato and DeVetter, "2015 Cost Estimates of Establishing and Producing Red Raspberries," August 2016, 5; Government of British Columbia, "Enterprise Budgets: 2019 Raspberry, Meeker, Fraser Valley BC,” accessed March 31, 2021; Government of Chile, ODEPA, "Ficha técnico-económica, frambuesa" (Raspberry cost spreadsheet), created 2019; industry representative, interview by USITC staff, September 16, 2020; UC Davis, “Guzman Berry Field Trip,” accessed March 31, 2021; Wroblewska, Pawlak, and Paszko, "Economic Aspects in the Raspberry Production," 2019, 75, 77.
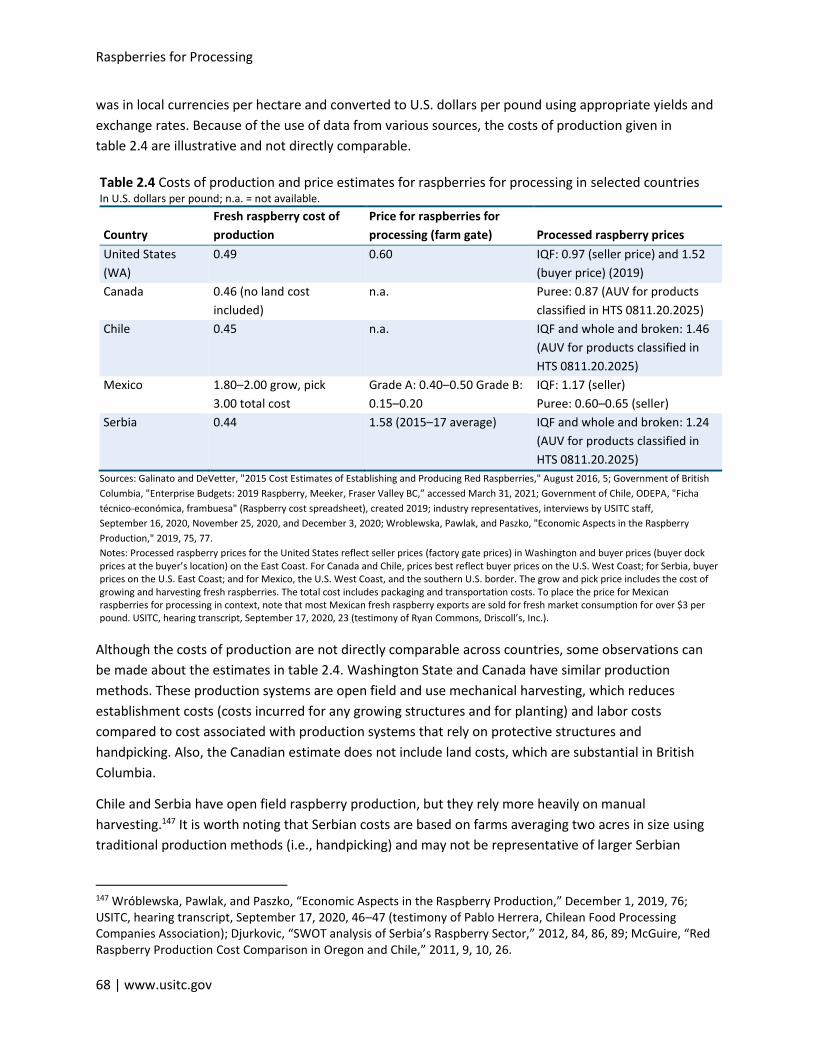
Raspberries for Processing
68 | www.usitc.gov
was in local currencies per hectare and converted to U.S. dollars per pound using appropriate yields and
exchange rates. Because of the use of data from various sources, the costs of production given in
table 2.4 are illustrative and not directly comparable.
Table 2.4 Costs of production and price estimates for raspberries for processing in selected countries In U.S. dollars per pound; n.a. = not available.
Country
Fresh raspberry cost of
production
Price for raspberries for
processing (farm gate) Processed raspberry prices
United States
(WA)
0.49 0.60 IQF: 0.97 (seller price) and 1.52
(buyer price) (2019)
Canada 0.46 (no land cost
included)
n.a. Puree: 0.87 (AUV for products
classified in HTS 0811.20.2025)
Chile 0.45 n.a. IQF and whole and broken: 1.46
(AUV for products classified in
HTS 0811.20.2025)
Mexico 1.80–2.00 grow, pick
3.00 total cost
Grade A: 0.40–0.50 Grade B:
0.15–0.20
IQF: 1.17 (seller)
Puree: 0.60–0.65 (seller)
Serbia 0.44 1.58 (2015–17 average) IQF and whole and broken: 1.24
(AUV for products classified in
HTS 0811.20.2025)
Sources: Galinato and DeVetter, "2015 Cost Estimates of Establishing and Producing Red Raspberries," August 2016, 5; Government of British
Columbia, "Enterprise Budgets: 2019 Raspberry, Meeker, Fraser Valley BC,” accessed March 31, 2021; Government of Chile, ODEPA, "Ficha
técnico-económica, frambuesa" (Raspberry cost spreadsheet), created 2019; industry representatives, interviews by USITC staff,
September 16, 2020, November 25, 2020, and December 3, 2020; Wroblewska, Pawlak, and Paszko, "Economic Aspects in the Raspberry
Production," 2019, 75, 77.
Notes: Processed raspberry prices for the United States reflect seller prices (factory gate prices) in Washington and buyer prices (buyer dock prices at the buyer’s location) on the East Coast. For Canada and Chile, prices best reflect buyer prices on the U.S. West Coast; for Serbia, buyer prices on the U.S. East Coast; and for Mexico, the U.S. West Coast, and the southern U.S. border. The grow and pick price includes the cost of growing and harvesting fresh raspberries. The total cost includes packaging and transportation costs. To place the price for Mexican raspberries for processing in context, note that most Mexican fresh raspberry exports are sold for fresh market consumption for over $3 per pound. USITC, hearing transcript, September 17, 2020, 23 (testimony of Ryan Commons, Driscoll’s, Inc.).
Although the costs of production are not directly comparable across countries, some observations can
be made about the estimates in table 2.4. Washington State and Canada have similar production
methods. These production systems are open field and use mechanical harvesting, which reduces
establishment costs (costs incurred for any growing structures and for planting) and labor costs
compared to cost associated with production systems that rely on protective structures and
handpicking. Also, the Canadian estimate does not include land costs, which are substantial in British
Columbia.
Chile and Serbia have open field raspberry production, but they rely more heavily on manual
harvesting.147 It is worth noting that Serbian costs are based on farms averaging two acres in size using
traditional production methods (i.e., handpicking) and may not be representative of larger Serbian
147 Wróblewska, Pawlak, and Paszko, “Economic Aspects in the Raspberry Production,” December 1, 2019, 76; USITC, hearing transcript, September 17, 2020, 46–47 (testimony of Pablo Herrera, Chilean Food Processing Companies Association); Djurkovic, “SWOT analysis of Serbia’s Raspberry Sector,” 2012, 84, 86, 89; McGuire, “Red Raspberry Production Cost Comparison in Oregon and Chile,” 2011, 9, 10, 26.
Chapter 2: Cross-Country Comparison of Competitiveness
United States International Trade Commission | 69
farms, which may use more modern machinery. Also, Serbian farm gate prices are 2015–17 average
prices received by two particular farms. Thus, the prices may not be representative of overall Serbian
farm prices and are not comparable to processed raspberry prices, which are from a different year. The
source used for Chilean production costs uses cost of production estimates for a scenario farm
producing for the fresh market, so production practices and costs may differ somewhat for farms
growing primarily for the processing market.148
For Mexico, the price for raspberries for processing is more indicative of input costs incurred by
raspberry processors.149 Mexican growers focus production on raspberries for the fresh market and have
highly capital-intensive production practices that use protected growing structures (hoop houses) and
handpicking, which enable higher yields and more sales of fruit to the premium-priced fresh
consumption market but also results in higher costs. The cultivars employed, developed by fresh berry
marketers and used under contract with these firms, are especially suited for the fresh market
channel.150 They enable high yields and greater production of both raspberries for the fresh market and
seconds that go into the processed market.
Market prices for raspberries for processing are also presented, as available. These prices may be a
better indication of the input cost for the Mexican raspberry industry, where raspberries for processing
are residual raspberries (“seconds”) from the premium fresh consumption market. Prices and average
unit values for processed raspberries are likewise presented, as available. Where available, they provide
some indication of delivered cost of raspberries for processing and of delivered cost of processed
raspberry products (table 2.4).
Labor Costs
The cost of fresh berries is the largest contributor to the delivered cost of processed raspberries, and
labor costs typically account for a large portion of the cost to produce raspberries.151 However, as with
other cost comparisons, comparing labor costs across countries is not entirely straightforward. How
labor costs are measured and valued is critical for establishing costs of production and for accurately
portraying labor’s relative share of the total cost of production.152 Adjustments for currency valuation
148 Often enterprise budgets, such as those used for this analysis, use costs of production for a “scenario farm” or a hypothetical farm that is similar to a typical farm for a specified crop and region. 149 USITC, hearing transcript, September 17, 2020, 128 (testimony of John Tentomas, Nature's Touch); academic representative, interview by USITC staff, January 12, 2021. 150 USITC, hearing transcript, September 17, 2020, 49 (testimony of Jean-Christophe Hesteau, SunOpta Inc.) and 93–94 (testimony of Ryan Commons, Driscoll’s, Inc.); industry representatives, interviews by USITC staff, September 16, 2020, and December 3, 2020. 151 Fresh raspberries that are harvested by hand are very labor intensive. By contrast, raspberry processing is not especially labor intensive, and labor costs from raspberry processing were not identified as a major competitive factor, although they affect the volume of fresh raspberry seconds available for processing. A high-quality tunnel freezer can be operated by one person, with four to five people needed on the front line for systems with manual dump trays. Industry representatives, interviews by USITC staff, February 3, 2021, and March 1, 2021. 152 Discussion in the following two paragraphs is based on AAEA’s handbook on estimating commodity costs and returns. AAEA Task Force on Commodity Costs and Returns, Commodity Costs and Returns Estimation Handbook, February 1, 2000, 8-1. The American Agricultural Economics Association has since changed its name to the Agricultural and Applied Economics Association, which has kept the acronym AAEA.
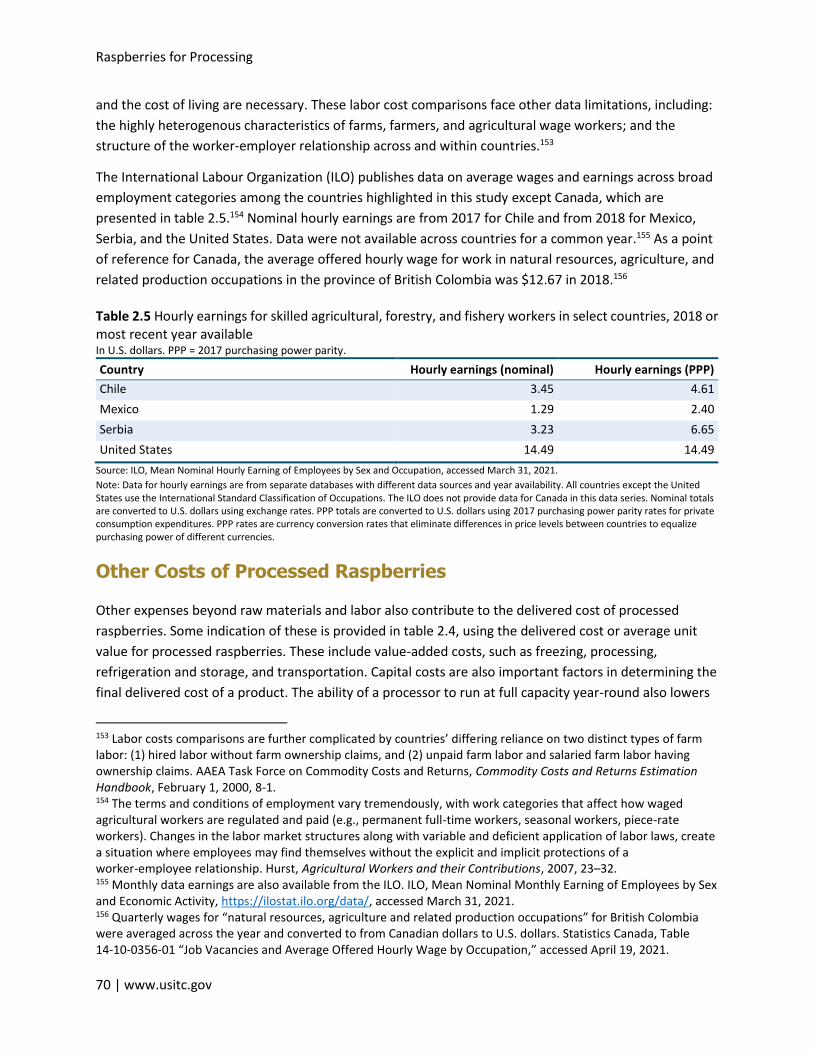
Raspberries for Processing
70 | www.usitc.gov
and the cost of living are necessary. These labor cost comparisons face other data limitations, including:
the highly heterogenous characteristics of farms, farmers, and agricultural wage workers; and the
structure of the worker-employer relationship across and within countries.153
The International Labour Organization (ILO) publishes data on average wages and earnings across broad
employment categories among the countries highlighted in this study except Canada, which are
presented in table 2.5.154 Nominal hourly earnings are from 2017 for Chile and from 2018 for Mexico,
Serbia, and the United States. Data were not available across countries for a common year.155 As a point
of reference for Canada, the average offered hourly wage for work in natural resources, agriculture, and
related production occupations in the province of British Colombia was $12.67 in 2018.156
Table 2.5 Hourly earnings for skilled agricultural, forestry, and fishery workers in select countries, 2018 or most recent year available In U.S. dollars. PPP = 2017 purchasing power parity.
Country Hourly earnings (nominal) Hourly earnings (PPP)
Chile 3.45 4.61
Mexico 1.29 2.40
Serbia 3.23 6.65
United States 14.49 14.49
Source: ILO, Mean Nominal Hourly Earning of Employees by Sex and Occupation, accessed March 31, 2021.
Note: Data for hourly earnings are from separate databases with different data sources and year availability. All countries except the United States use the International Standard Classification of Occupations. The ILO does not provide data for Canada in this data series. Nominal totals are converted to U.S. dollars using exchange rates. PPP totals are converted to U.S. dollars using 2017 purchasing power parity rates for private consumption expenditures. PPP rates are currency conversion rates that eliminate differences in price levels between countries to equalize purchasing power of different currencies.
Other Costs of Processed Raspberries
Other expenses beyond raw materials and labor also contribute to the delivered cost of processed
raspberries. Some indication of these is provided in table 2.4, using the delivered cost or average unit
value for processed raspberries. These include value-added costs, such as freezing, processing,
refrigeration and storage, and transportation. Capital costs are also important factors in determining the
final delivered cost of a product. The ability of a processor to run at full capacity year-round also lowers
153 Labor costs comparisons are further complicated by countries’ differing reliance on two distinct types of farm labor: (1) hired labor without farm ownership claims, and (2) unpaid farm labor and salaried farm labor having ownership claims. AAEA Task Force on Commodity Costs and Returns, Commodity Costs and Returns Estimation Handbook, February 1, 2000, 8-1. 154 The terms and conditions of employment vary tremendously, with work categories that affect how waged agricultural workers are regulated and paid (e.g., permanent full-time workers, seasonal workers, piece-rate workers). Changes in the labor market structures along with variable and deficient application of labor laws, create a situation where employees may find themselves without the explicit and implicit protections of a worker-employee relationship. Hurst, Agricultural Workers and their Contributions, 2007, 23–32. 155 Monthly data earnings are also available from the ILO. ILO, Mean Nominal Monthly Earning of Employees by Sex and Economic Activity, https://ilostat.ilo.org/data/, accessed March 31, 2021. 156 Quarterly wages for “natural resources, agriculture and related production occupations” for British Colombia were averaged across the year and converted to from Canadian dollars to U.S. dollars. Statistics Canada, Table 14-10-0356-01 “Job Vacancies and Average Offered Hourly Wage by Occupation,” accessed April 19, 2021.
Chapter 2: Cross-Country Comparison of Competitiveness
United States International Trade Commission | 71
the production cost. Delivered cost differs between different types of processed raspberry products—
for example, IQF and bulk raspberries.
Shipping and freight rates vary by supplier, destination, and shipping mode. Processed raspberries are
generally transported in refrigerated containers. Sea freight is the lowest-cost mode, followed by rail
and then road.157 Comparative advantages for shipping costs can shift depending on the location of the
point of delivery in the United States. Serbia may be more competitive when shipping to U.S. East Coast
markets, while Chile may be more competitive shipping to the West Coast markets, since product can be
primarily shipped by sea via more direct routes.158 Serbian processed raspberries are shipped longer
distances than processed raspberries from Mexico and Canada, although delivered cost, including sea
freight, for Serbian product to the United States is competitive, as indicated by buyers’ willingness to
import product from Serbia.159 Mexico has a cost advantage for sales to the U.S. market based on
geographic proximity and well-established, low-cost transportation channels.160 U.S. and Canadian
raspberry processors are based in the Western United States and likely benefit from geographical
proximity to the Western U.S. market.161
In addition to the variable costs discussed above, delivered cost can be affected by fixed costs from
processing equipment as well as by the percentage of processing capacity that is being utilized.
Processors in Mexico tend to benefit from a high degree of capacity utilization, which may lower the
capital costs per unit of processed raspberries and increase the overall profitability of processors.162
157 Sea freight is considered to be the least expensive way to transport goods to customers. Rail freight has lower costs per unit compared to truck freight. For example, freight costs from Houston, TX, to Cleveland, OH, were estimated to be $215 per mt by truck and $70 per mt by rail. Smith, “Choosing the Most Cost-effective Transportation Method,” 2017; RSI Logistics, “Comparing the Costs of Rail Shipping vs Truck,” April 20, 2020. Based on the U.S. product costs in table 2.4, freight and associated costs to move product from Washington to the Eastern United States are $0.55 per pound. 158 Broken down by district, U.S. import data indicate that in 2020 frozen raspberries from Serbia primarily arrive by vessel through New York, NY (AUV $1.48 per pound), and Seattle, WA (AUV $1.55 per pound). Imports from Chile were more widely spread by district, with significant import volumes through Seattle, WA (AUV $1.47 per pound), San Francisco, CA (AUV $1.57 per pound), Houston/Galveston, TX (AUV $1.61 per pound), New York, NY (AUV $1.52 per pound), Philadelphia, PA (AUV $1.52 per pound), and Los Angeles, CA (AUV $1.65 per pound). Product mixes may differ by district, which could affect AUVs (e.g., IQF would likely be higher priced than puree, and organic IQF would likely be higher priced than conventional). IHS Markit, Global Trade Atlas database, U.S. imports of U.S. HTS 0811.20.2025 by United States Districts, by vessel, accessed April 14, 2021. 159 Internal transportation infrastructure connecting Western and Central Europe with Southeastern Europe and the Middle East have facilitated trade between Serbia and importing countries. Such infrastructure connections are also relevant for exports to the United States. Djurkovic, “SWOT Analysis of Serbia’s Raspberry Sector,” 2012, 82. According to U.S. import data by district, the two primary U.S. districts importing frozen raspberries from Serbia in 2020 were New York, NY (AUV $1.48 per pound), and Seattle, WA (AUV $1.55 per pound). IHS Markit, Global Trade Atlas database, U.S. imports of U.S. HTS 0811.20.2025 by United States Districts, by vessel, accessed April 14, 2021. 160 Industry representatives, interviews by USITC staff, September 16, 2020, and February 5, 2021. 161 USITC, hearing transcript, September 17, 2020, 9 (testimony of Henry Bierlink, Washington Red Raspberry Commission). 162 In Mexico, strawberries are processed January to May, and mangoes are processed May to September. Raspberries are typically processed from September to January, with more limited raspberry processing from January to May. USITC, hearing transcript, September 17, 2020, 81 (testimony of Jean-Christophe Hesteau, SunOpta Inc. and Aneberries); industry representative, interview by USITC staff, December 1, 2020.
Raspberries for Processing
72 | www.usitc.gov
Most Mexican processors are diversified, with many other fruits in their product line. They use
raspberries to fill capacity when strawberries and mangoes—more profitable processed fruits—are not
in season.163 Mexican processors also have year-round access to fresh raspberries for processing.164
Processors in Washington, Canada, and Serbia, on the other hand, have limited input supplies, with
access to fresh raspberries for only a few months of the year. U.S. processors, for example, try to offset
the high capital costs of IQF processing equipment by extending the utilization of the equipment
through a larger portion of the year by processing blueberries and some other fresh fruits.165 In
Washington, where IQF tunnels are typically used for raspberries and blueberries, processors have fresh
fruit available only during harvest season, which runs from July to October.
Beyond the factors discussed above, several other components may affect delivered cost for some
suppliers. Among these are industry structure and characteristics. For example, in contrast to the
processed raspberry industry in other countries, the U.S. industry has a large degree of vertical
integration, meaning the cost of acquiring its major input is often limited to the cost of producing fresh
raspberries.166 The U.S. industry also enjoys some benefits of scale, with several relatively large growers
that are vertically integrated with processors. This aligns supplies of fresh raspberries with processing
demand and may reduce risk from input price fluctuations. By contrast, Serbia and Canada have low
levels of horizontal and vertical integration, meaning that growers and processors do not capture
economies of scale or have cost benefits comparable to those often found in the United States.167
Product Differentiation
A country’s ability to supply a broader range of premium products with desirable characteristics
increases its ability to compete via product differentiation (table 2.3). As shown previously in table 2.2,
based on the qualitative information presented in the following chapters, the United States, Chile, and
Serbia are suppliers of premium products (IQF and organic products)—i.e., products with the highest
163 Industry representatives, interviews by USITC staff, November 20, 2020, November 25, 2020, and December 1, 2020. 164 Government of Mexico, SIAP, Anuario estadístico de la producción agrícola (Agricultural production statistical yearbook), accessed December 4, 2020; Driscoll’s, “Product Guide 2019–2020” accessed September 3, 2020; industry representatives, interviews by USITC staff, November 25, 2020, December 1, 2020, and December 3, 2020. 165 U.S. processors have difficulty finding inputs in the off-season, which prevents them from using expensive IQF processing equipment on a year-round basis. This, in turn, can limit processing capacity, as processors invest less in IQF equipment because of its cost and limited utilization. Industry representatives, interviews by USITC staff, November 24, 2020, March 1, 2021, and March 11, 2021. 166 One example of vertical integration is the North West Berry Co-op, which originally represented a higher share of production, over 15 percent, but that share has declined as overall production increased. Industry representative, interview by USITC staff, June 23, 2020; NW Berry Co-op, “About the Berry Co-op” accessed March 19, 2021, https://www.nwberrycoop.com/. 167 Industry representatives, interviews by USITC staff, February 26, 2021, and March 1, 2021; Džagić et al., “Integrated Report on Performance and Value Chain Analysis,” December 2017, 47.
Chapter 2: Cross-Country Comparison of Competitiveness
United States International Trade Commission | 73
level of product differentiation.168 Meanwhile, Canada and Mexico are suppliers of less-premium
products (non-IQF products).169 Though the U.S. industry does not offer organic products, it maintains a
competitive position based on its ability to supply high-quality traits in its IQF and non-IQF processed
raspberry products.170
Purchasers look at product characteristics as well as cost in making their buying decisions. The more
differentiated the product, the more likely it is that product characteristics will be the basis of the
purchasing decision, potentially making delivered cost less important. Similar products are differentiated
from one another according to factors such as actual and perceived quality, brand identity, packaging,
and labeling. Individually quick frozen (IQF) raspberries are considered premium products, while block
frozen, purees, and juice concentrates and juices are considered lower value. Within IQF there are
characteristics that can further differentiate a product, such as a fruit’s ability to retain its shape when
thawed. Other traits are generally desirable across product types, including high levels of sweetness
(Brix) and the more subjective flavor and color profiles. Raspberry cultivars, including newer fee-for-use
types, can be used to produce raspberries with characteristics desirable for processing.171 Organic
certification is another factor that can differentiate processed raspberries. Although branding is not a
significant source of product differentiation for processed raspberries, a small number of processors and
repackers focusing on the retail market do use branding, primarily in the United States, Canada, and to
some extent Chile.172
Product differentiation is considered high in the United States (WA), Chile, and Serbia based on the
industry’s ability to supply processed raspberries in premium forms, particularly IQF, with desirable
characteristics. In the United States, processors produce IQF berries and crumble that are particularly
good at retaining their shape after thawing, a trait highly valued by buyers. Use of mechanical harvesting
results in berries that are uniformly at peak ripeness.173
168 Industry representative, interview by USITC staff, July 24, 2020; Wróblewska, Pawlak, and Paszko, “Economic Aspects in the Raspberry Production,” December 1, 2019, 78; USITC, hearing transcript, September 17, 2020, 49 (testimony of Pablo Herrera, JCP Foods); Herrera, written testimony to the USITC, September 9, 2020, 3. 169 Industry representative, interview by USITC staff, February 24, 2020. 170 Industry representatives, interviews by USITC staff, September 15, 2020, and October 20, 2020. 171 Stephens et al., “‘NN08002’ (Marketed as WakeHaven) Red Raspberry,” September 1, 2017, 1320–23. 172 Several examples of branded, frozen raspberries available to U.S. consumers include frozen raspberries from Dole, Wyman’s of Maine, Cascadian Farm, Earthbound Farm, and Nature’s Touch. Amazon, “Most Wished for in Frozen Raspberries,” https://www.amazon.com/gp/most-wished-for/grocery/6459168011/ref=zg_bs_tab_t_mw, accessed April 14, 2021; Safeway, search results for “frozen raspberries,” https://www.safeway.com/shop/search-results.html?q=frozen%20raspberries, accessed April 14, 2021; Costco, search for “frozen raspberries,” https://www.costcobusinesscentre.ca/frozen-fruits-vegetables.html, accessed April 14, 2021. 173 Oregon’s Fruit Growers, “Our Growers: Jon Maberry, ‘Grown with Purpose,’” accessed February 17, 2021.
Raspberries for Processing
74 | www.usitc.gov
In addition, the United States, Chile, and Serbia all produce products with high sugar content and
favorable flavor and color profiles.174 This is because processing is the primary market for raspberry
production in all three areas, so fresh berries have characteristics well suited for the processing market.
Other factors may also strengthen product differentiation. In the United States, the vertical integration
between growers and processors results in berries particularly well suited for processing. Chile and
Serbia have an added advantage in product differentiation based on their ability to produce and export
certified organic processed raspberries, which account for a growing share of exports.
Product differentiation is lower in Canada (British Columbia) and Mexico. These countries produce
primarily non-premium products like block frozen, purees, juice concentrates, and juices.175
Nonetheless, Canadian products are better positioned for the U.S. market in terms of product
characteristics than Mexican products. Their growers produce primarily for the processed market,
resulting in preferred sweetness, color, and flavor profiles.176 Although Mexican growers also supply
significant quantities of fresh for processing raspberries to the United States, they focus on producing
for the fresh market. As a result, the industry’s characteristic varieties and harvest periods produce
raspberries that are better suited to fresh consumption, with flavor and sweetness profiles that are less
tailored to processing.177 Canadian processors also re-export significant quantities of IQF raspberries
that are sourced from Chile, Serbia, and the United States—countries with higher product
differentiation—in retail packs of mixed berries (raspberries combined with other fruits, like
blackberries, blueberries, and strawberries).178 Mexico does not diversify its output in this way.
Organics are one industry area where Mexico holds an advantage. Canada does not produce certified
organic raspberries for the processing market, while Mexico has some organic production.
174 Industry representatives, interviews by USITC staff, September 15, 2020 and October 20, 2020; Government of British Columbia, Ministry of Agriculture, A Global Export Market Overview, 2010, 8; academic professional, interview by USITC staff, August 4, 2020; Stojanović et al., SUFISA Raspberry Report an Extended Summary, June 2018, 8; Stojanović et al., Serbia National Report, April 2018, 101–4. 175 Mexican processed raspberries often do not have the desired deep red color and higher Brix-levels for processed raspberries and tend to break apart during the IQF process. USITC, hearing transcript, September 17, 2020, 137 (testimony of Rolf Haugen, Northwest Berry Co-op); industry representatives, interviews by USITC staff, October 20, 2020, November 20, 2020, and November 24, 2020; industry representative, email message to USITC staff, October 24, 2020. 176 Canadian growers use cultivars that are excellent for machine harvesting, but rely heavily on the Meeker cultivar, which is not well suited for processing into IQF. Industry representative, interview by USITC staff, February 24, 2021; Government of Canada, Crop Profile for Raspberry in Canada, 2016, 2. 177 Although not the focus of this report, product differentiation for the California raspberry processing industry would be ranked like that of Mexico because California also uses raspberry seconds as input. Industry representative, interview by USITC staff, July 24, 2020; Driscoll’s, Inc., written submission to the USITC, September 24, 2020. 178 USITC, hearing transcript, September 17, 2020, 14 (testimony of Brad Rader, Rader Farms); USITC, hearing transcript, September 17, 2020, 30 (testimony of John Tentomas, Nature’s Touch); industry representatives, interviews by USITC staff, June 12, 2020, June 23, 2020, July 24, 2020, and October 20, 2020.
Chapter 2: Cross-Country Comparison of Competitiveness
United States International Trade Commission | 75
However, this limited advantage fails to offset Mexico’s inability to produce high-quality IQF raspberries
or processed raspberries with desirable flavor, sweetness, and color characteristics; as a result, product
differentiation for Mexican processed raspberries is still considered low.179
Reliability of Supply
Reliability of supply refers to the ability of a supplier to deliver a specified quantity of a product of a
particular quality to a given location at a contracted time. The inherent risks in agricultural production,
which can impact both the quantity and quality of supply, make this competitiveness factor particularly
important for purchasers. Several aspects affect reliability of supply. Particularly important is the
efficiency of the supply chain, including storage and transportation infrastructure as well as market
information systems. To be a reliable supplier to the export market, a country must have an exportable
surplus. In agriculture, several factors may disrupt reliability by shrinking a country’s exportable surplus,
including unstable quantities and quality (owing to poor weather) and poor transportation
infrastructure.
All the profiled national industries (including that of the United States) are reliable suppliers to the U.S.
market for processed raspberries, but not to an equal degree. Chile and Mexico are highly reliable
exporters of processed raspberries to the United States. By comparison, Canada, Serbia, and the United
States are moderately reliable suppliers. The supply of processed raspberries from Canada depends on
Canada’s ability to obtain IQF inputs for mixed berry products from Chile, Serbia, and the United States,
as well as raspberries for processing from the United States.180 For Serbia, the United States is a
secondary market, with most producers of processed raspberries focused on the European market.
Serbian growers also face growing weather challenges.181 That the United States is only a moderately
reliable supplier is due in part to its concentrated growing region and the confinement of its harvest
season to a few months of the year.182
Direct competition in the processed raspberry industry occurs at the level of the processors (e.g., the
companies that freeze, pack, and/or repack fresh fruit), whose reliability is affected by their ability to
access enough high-quality fresh fruit inputs at a reasonable price. Both the geographic location of fresh
raspberry production and the length of the growing season affect the reliability of supply of fresh
raspberries for processing. If all the production of a country is concentrated in one small area, an
adverse weather event may severely limit supplies. Most production of raspberries for processing in the
United States and Canada occurs in relatively small regions in Washington State, Oregon, and British
179 Industry representative, interview by USITC staff, February 26, 2021; Aneberries, written submission to the USITC, September 24, 2020, 4. 180 Industry representatives, interviews by USITC staff, July 24, 2020, and February 26, 2021. 181 Djurkovic, “SWOT Analysis of Serbia’s Raspberry Sector,” 2012, 102, 111. 182 A number of buyers of processed raspberry products have noted that swings in U.S. production volume lead to volatility in pricing from year to year, leading to efforts to diversify their sourcing to include raspberries from other suppliers, including imports. Industry representatives, interviews by USITC staff, September 24, 2020; Bellingham Herald, “Last Winter Was Bad for Whatcom County,” October 17, 2019.
Raspberries for Processing
76 | www.usitc.gov
Columbia.183 Production in these areas is also limited to one harvest per year. In British Columbia, where
fresh raspberry production is low and has been declining, the frozen market also relies on imported
raspberries, partly mitigating this vulnerability.184 Processors may be able to source fresh raspberries
used as inputs from neighboring countries, as processors do for example in British Columbia and
Washington and this diversity of sourcing may improve reliability. Processors may also be able to import
frozen raspberries for blending and repacking, as is the case in Canada.185 Serbia also has just one
raspberry harvest per year, and although growing regions are spread throughout the country, growers
are increasingly facing severe weather events.186 By contrast, Mexico and Chile both grow raspberries in
several regions, and both have extended raspberry-growing seasons as well.187
Symmetric Revealed Comparative Advantage
Below we analyze the symmetric revealed comparative advantage index (SRCA) to add a quantitative
aspect to the competitiveness comparison. This analysis provides a comparable measure across
countries of comparative advantage based on actual trade flow values, encompassing all forms of
processed raspberries and all factors that may be impacting comparative advantage between countries.
The SRCA is based on the market’s revealed comparative advantage index (RCA), which is calculated
using observed export statistics to reveal the underlying pattern of comparative advantage for a certain
country in a certain good.188 A country would be said to have a revealed comparative advantage in
processed raspberries when the ratio of its processed raspberry exports to its total goods exports is
greater than the same ratio for the world.189 The SRCA is then a mathematical manipulation of the RCA
so that the index is on a scale of -1 to +1 around the symmetric base of 0, rather than on a scale of 0 to
infinity. For more information on the SRCA and how it is calculated see appendix G.
183 For example, Canada had a 40 percent crop loss caused by a 2019 cold spell in the Fraser Valley. Bellingham Herald, “Last Winter Was Bad for Whatcom County,” October 17, 2019; industry representative, interview by USITC staff, September 24, 2020; Government of Canada, written submission to the USITC, December 4, 2020, 2. 184 As Canadian acreage shifts out of fresh raspberries grown for processing and into other berries, Canada has continued its production of frozen raspberries by importing fresh raspberries from the United States. Industry representatives, interviews by USITC staff, August 7, 2020, and February 24, 2021. 185 USITC, hearing transcript, September 17, 2020, 14 (testimony of Brad Rader, Rader Farms) and 30 (testimony of John Tentomas, Nature’s Touch); industry representatives, interviews by USITC staff, June 12, 2020, June 23, 2020, July 24, 2020, and October 20, 2020. 186 A series of weather events included snow, hail, stormy weather, and flooding in 2019, June 2010 (heavy rain and hail), and July 2020 (flooding). Serbian Monitor, “Raspberry Producers: 80% of Crop Destroyed,” accessed February 8, 2021; FAO, “Restoring Farmers’ Livelihoods,” accessed February 8, 2021; Fresh Plaza, “Floods Devastate Serbian Crops,” accessed February 8, 2021. 187 Although not the focus of this report, the reliability of supply for the California processed raspberry industry would be like that of Mexico. Industry representatives, interviews by USITC staff, October 26, 2020, November 25, 2020, and February 11, 2021; industry representative, email message to USITC staff, October 24, 2020; Smucker’s, written submission to the USITC, December 4, 2020, 1. 188 Balassa, “Trade Liberalisation and ‘Revealed’ Comparative Advantage,” 1965, 99–123; Laursen and Endegal, “The Role of the Technology Factor in Economic Growth,” 1995. 189 UNCTAD, “Revealed Comparative Advantage,” accessed May 20, 2021.
Chapter 2: Cross-Country Comparison of Competitiveness
United States International Trade Commission | 77
SRCA Calculations and Data
To calculate competitiveness in the U.S. market, U.S. import values by source were used in place of
exports by source. This allowed an analysis of competitiveness within the U.S. market using a more
specific product definition, since detailed U.S. statistical breakouts could be used. Raspberry products
considered for the U.S. market SRCA include IQF, block frozen, puree, juice and juice concentrate,
raspberries in frozen berry mixes, and fresh raspberries for processing.190 The country-specific RCA
calculations consisted of dividing U.S. imports of processed raspberries (as described above) from a
particular country by total U.S. imports (all goods) from that country. This ratio is then divided by the
ratio of U.S. imports of processed raspberries from the world, divided by all U.S. imports from the world.
A comparable proxy for the competitiveness of the U.S. processed raspberry industry within the U.S.
market was not available.
Calculations of global market competitiveness considered exports values by source at the 6-digit
subheading level in the HS.191 Export data used in the calculations included IQF, crumble, block frozen,
and some puree. Because of data limitations, data used in the calculation do not include juice or juice
concentrate, raspberries in frozen berry mixes, or fresh raspberries for processing. The country-specific
RCA calculations consisted of dividing a country’s exports of processed raspberries to the world by total
exports from that country to the world. This ratio is then divided by the ratio of global exports of
processed raspberries to the United States to total global exports.
Results
U.S. market SRCA scores indicate differences in country competitiveness in the processed raspberry
industry, with Canada the least competitive and Serbia and Chile the most competitive (table 2.6).
Although data for a comparable calculation for the United States were not available, the U.S. industry is
considered competitive because it supplied about 57–64 percent of the U.S. market for raspberries for
processing and processed raspberries from 2015 to 2019.192 Serbia and Chile have the highest SRCAs at
190 The analysis of U.S. market competitiveness considers U.S. imports under several statistical reporting numbers in the Harmonized Tariff Schedule of the United States (HTS), including a share of 0810.20.1020 and 0810.20.9020, HTS 0810.20.1024, 0810.20.9024, 0811.20.2025, shares of 0811.90.8080 and 0811.90.8085, 2007.99.6510, 2008.99.2120, 2009.89.6055, and 2009.89.7055. The HTS is harmonized with the international HS. 191 The 6-digit level is the most specific subheading level available for processed raspberries in the HS. The analysis of global market competitiveness in this report considers trade under HS 0811.20, which covers, raspberries, blackberries, mulberries, loganberries, currants, and gooseberries. 192 For a calculation of U.S. and import shares of consumption by quantities, including for California and Oregon, please see chapter 3 (“United States”), table 3.6. WRRC, email message to USITC staff, December 18, 2021; USITC calculations based on USDA NASS Raspberry Production, accessed November 27, 2020; USITC DataWeb/Census, HTS statistical reporting numbers 0810.20.1020, 0810.20.1022, 0810.20.1024, 0810.20.9020, 0810.20.9022, 0810.90.9024, 0811.20.2025 and schedule B number 0811.20.0000, accessed March 30, 2021.
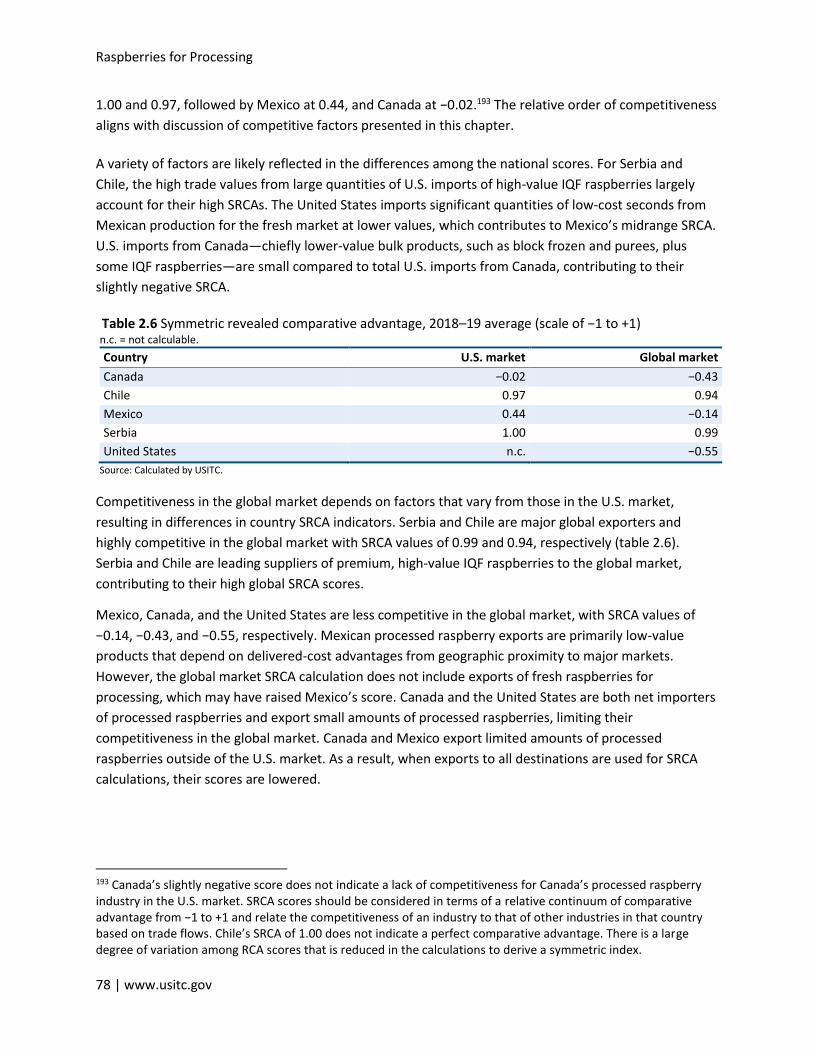
Raspberries for Processing
78 | www.usitc.gov
1.00 and 0.97, followed by Mexico at 0.44, and Canada at −0.02.193 The relative order of competitiveness
aligns with discussion of competitive factors presented in this chapter.
A variety of factors are likely reflected in the differences among the national scores. For Serbia and
Chile, the high trade values from large quantities of U.S. imports of high-value IQF raspberries largely
account for their high SRCAs. The United States imports significant quantities of low-cost seconds from
Mexican production for the fresh market at lower values, which contributes to Mexico’s midrange SRCA.
U.S. imports from Canada—chiefly lower-value bulk products, such as block frozen and purees, plus
some IQF raspberries—are small compared to total U.S. imports from Canada, contributing to their
slightly negative SRCA.
Table 2.6 Symmetric revealed comparative advantage, 2018–19 average (scale of −1 to +1) n.c. = not calculable.
Country U.S. market Global market
Canada −0.02 −0.43
Chile 0.97 0.94
Mexico 0.44 −0.14
Serbia 1.00 0.99
United States n.c. −0.55
Source: Calculated by USITC.
Competitiveness in the global market depends on factors that vary from those in the U.S. market,
resulting in differences in country SRCA indicators. Serbia and Chile are major global exporters and
highly competitive in the global market with SRCA values of 0.99 and 0.94, respectively (table 2.6).
Serbia and Chile are leading suppliers of premium, high-value IQF raspberries to the global market,
contributing to their high global SRCA scores.
Mexico, Canada, and the United States are less competitive in the global market, with SRCA values of
−0.14, −0.43, and −0.55, respectively. Mexican processed raspberry exports are primarily low-value
products that depend on delivered-cost advantages from geographic proximity to major markets.
However, the global market SRCA calculation does not include exports of fresh raspberries for
processing, which may have raised Mexico’s score. Canada and the United States are both net importers
of processed raspberries and export small amounts of processed raspberries, limiting their
competitiveness in the global market. Canada and Mexico export limited amounts of processed
raspberries outside of the U.S. market. As a result, when exports to all destinations are used for SRCA
calculations, their scores are lowered.
193 Canada’s slightly negative score does not indicate a lack of competitiveness for Canada’s processed raspberry industry in the U.S. market. SRCA scores should be considered in terms of a relative continuum of comparative advantage from −1 to +1 and relate the competitiveness of an industry to that of other industries in that country based on trade flows. Chile’s SRCA of 1.00 does not indicate a perfect comparative advantage. There is a large degree of variation among RCA scores that is reduced in the calculations to derive a symmetric index.
Chapter 2: Cross-Country Comparison of Competitiveness
United States International Trade Commission | 79
Bibliography
Chavarría, Juan Emilio. “Ficha de costo de la frambuesa, región del Maule (Raspberry cost spreadsheet, Maule region).” Oficina de Estudios y Políticas Agrarias (Odepa), 2019. https://www.odepa.gob.cl/fichas-de-costo/ficha-de-costo-de-la-frambuesa-region-del-maule.
Dominguez, Antonio. “Chilean Raspberry Industry Report 2019.” Slide presentation, August 2020. https://www.internationalraspberry.net/wp-content/uploads/2020/08/Chile.pdf.
Driscoll’s, Inc. “Product Guide 2019-2020.” Accessed September 3, 2020. https://driscolls.imgix.net/-/media/files/availability-calendar/availabilitycalendardris10190816.ashx?la=en.
Driscoll’s, Inc. Written submission to U.S. International Trade Commission in connection with Inv. No. TA-332-577, Raspberries for Processing: Conditions of Competition Between U.S. and Foreign Suppliers, with a Focus on Washington State. September 17, 2020.
Djurkovic, Marina. “SWOT Analysis of Serbia’s Raspberry Sector in the Competitive Marketplace.” Master’s thesis, Norwegian University of Life Sciences, 2012. https://core.ac.uk/download/pdf/30888827.pdf.
Džagić, Vidosava, Kori Udovički, Nemanja Šormaz, Danijela Bobić, Valentina Čolić, Mila Pejčić, and Jelisaveta Lazarević. Integrated Report on Performance and Value Chain Analysis of Selected Sectors within Manufacturing Industry. Center of Advanced Economic Studies and Chamber of Commerce and Industry of Serbia, December 2017. https://ceves.org.rs/wp-content/uploads/2019/04/Integrated-Report-on-Performance-and-Value-Chain-Analysis-of-Selected-Sectors.pdf.
Food and Agriculture Organization of the United Nations (FAO). “Restoring Farmers’ Livelihoods After Severe Floods in Serbia.” Accessed February 8, 2021. http://www.fao.org/in-action/restoring-farmers-livelihoods-after-severe-floods-in-serbia/en/.
Fresh Plaza. “Floods Devastate Serbian Crops and Raspberry Orchards.” Accessed February 8, 2021. https://www.freshplaza.com/article/9232470/floods-devastate-serbian-crops-and-raspberry-orchards/.
Galinato, Suzette P, and Lisa W. DeVetter. 2015 Cost Estimates of Establishing and Producing Red Raspberries in Washington State. Technical Bulletin 21, Washington State University Extension. Pullman, Washington, August 2016. http://hdl.handle.net/2376/6408.
Gallagher, Dave. “Last Winter Was Bad for Whatcom County Raspberry Farmers. A Look at What’s Ahead.” Bellingham Herald. Accessed April 9, 2021. https://www.bellinghamherald.com/news/business/article236317628.html.
Government of British Columbia. “Enterprise Budgets: 2019 Raspberry, Meeker, Fraser Valley BC,” July 14, 2017. https://www2.gov.bc.ca/assets/gov/farming-natural-resources-and-industry/agriculture-and-seafood/farm-management/farm-business-management/enterprise-budgets/2019_bc_raspberry_meeker_cop_budget_v01.xlsx.
Raspberries for Processing
80 | www.usitc.gov
Government of British Columbia. Ministry of Agriculture. A Global Export Market Overview for British Columbia’s Raspberry Industry, 2011. https://www2.gov.bc.ca/assets/gov/farming-natural-resources-and-industry/agriculture-and-seafood/statistics/exports/global_export_market_bcraspberries.pdf
Government of Canada. Crop Profile for Raspberry in Canada, 2016. Pest Management Program, Agriculture and Agri-Food Canada, 2016. http://publications.gc.ca/collections/collection_2019/aac-aafc/A118-10-18-2016-eng.pdf.
Government of Canada. “Wages by Commodity: Fruit and Vegetables (Including Processing of These Products If Grown on the Farm),” December 11, 2020. https://www.canada.ca/en/employment-social-development/services/foreign-workers/agricultural/agricultural-wages.html#h2.2.
Government of Mexico. Servicio de Información Agroalimentaria y Pesquera (SIAP). Anuario estadístico de la producción agrícola (Agricultural production statistical yearbook). Accessed December 4, 2020. https://nube.siap.gob.mx/cierreagricola/.
Hurst, Peter. Agricultural Workers and Their Contribution to Sustainable Agriculture and Rural Development. With Paola Termine and Marilee Karl. International Labour Organization (ILO), Food and Agriculture Organization of the United Nations, and International Union of Food and Allied Workers’ Associations. Geneva: ILO, 2007. https://www.ilo.org/wcmsp5/groups/public/---ed_dialogue/---actrav/documents/publication/wcms_113732.pdf.
IHS Markit. Global Trade Atlas database. Accessed various dates. https://connect.ihsmarkit.com/home.
International Labour Organization (ILO). “Mean Nominal Monthly Earnings of Employees by Sex and Economic Activity.” Accessed March 31, 2021. https://www.ilo.org/ilostat-files/Documents/Excel/INDICATOR/EAR_4MTH_SEX_ECO_CUR_NB_A_EN.xlsx.
International Labour Organization (ILO). “Mean Hourly Monthly Earnings of Employees by Sex and Occupation.” Accessed March 31, 2021. https://www.ilo.org/ilostat-files/Documents/Excel/INDICATOR/EAR_4HRL_SEX_OCU_CUR_NB_A_EN.xlsx.
McGuire, Madilynne J. “Red Raspberry Production Cost Comparison in Oregon and Chile.” Oregon State University, University Honors College, May 24, 2011. file://s1p-fsc-01/Home/lesley.ahmed/Downloads/McGuire_Thesis.pdf.
NW Berry Co-op. “About the Berry Co-Op.” Accessed March 19, 2021. https://www.nwberrycoop.com/.
Oregon’s Fruit Growers. “Our Growers: Jon Maberry; Grown with Purpose.” Oregon Fruit Products (blog). Accessed February 17, 2021. https://www.oregonfruit.com/our-story/growers/.
Oxford Reference. “Overview Comparative Advantage.” Accessed April 26, 2021. https://www.oxfordreference.com/view/10.1093/oi/authority.20110803095628607.
Porter, Michael E. Competitive Strategy: Techniques for Analyzing Industries and Competitors. New York: Free Press, 1980. https://www.hbs.edu/faculty/Pages/item.aspx?num=195.
Chapter 2: Cross-Country Comparison of Competitiveness
United States International Trade Commission | 81
RSI Logistics. “Comparing the Costs of Rail Shipping vs Truck.” RSI Blog, April 20, 2020. https://www.rsilogistics.com/blog/comparing-the-costs-of-rail-shipping-vs-truck/.
Serbian Monitor. “Raspberry Producers: 80% of Crop Destroyed.” Accessed February 8, 2021. https://www.serbianmonitor.com/en/raspberry-producers-80-of-crop-destroyed/.
Smith, Diana. “Choosing the Most Cost-Effective Transportation Method.” Money Outline (blog), 2017. http://www.moneyoutline.com/choosing-cost-effective-transportation-method/.
Statistics Canada. Table 14-10-0356-01, “Job Vacancies and Average Offered Hourly Wage by Occupation (Broad Occupational Category), Quarterly, Unadjusted for Seasonality.” Accessed April 19, 2021. DOI: https://doi.org/10.25318/1410035601-eng.
Stephens, Mark Joseph, Jenny R. Gaudion, Lisa A. Jones, and Julia R. Enfield. “‘NN08002’ (Marketed as Wake™Haven) Red Raspberry.” Horticultural Science 52, no. 9 (September 1, 2017): 1320–23. https://doi.org/10.21273/HORTSCI12137-17.
Stojanović, Žaklina, Emilija Manić, Radmila Dragutinović-MItrović, Saša RanĐelović, Irena Janković, Svetlana Popović, Tatjana Rakonjac-Antić, Bojan Ristić, and Marija Jovović. Serbia National Report. SUFISA H2020-SFS-2014–2, Faculty of Economics, University of Belgrade, April 2018. https://www.sufisa.eu/wp-content/uploads/2018/09/D__2.2-Serbia-National-Report.pdf.
Stojanović, Žaklina, Emilija Manić, Irena Janković, and Radmila Dragutinović-Mitrović. “SUFISA Raspberry Report: An Extended Summary.” European Union and Faculty of Economics, University of Belgrade, June 2018. https://www.sufisa.eu/wp-content/uploads/2018/09/D-2.2-Serbia-Summary-raspberry.pdf.
United Nations Conference on Trade and Development (UNCTAD). “Revealed Comparative Advantage.” Accessed May 20, 2021. https://unctadstat.unctad.org/en/RcaRadar.html.
University of California, Davis (UC Davis). “Guzman Berry Field Trip—Farm Labor and Mexican Produce Exports | Migration Dialogue.” Accessed March 31, 2021. https://migration.ucdavis.edu/farm-labor/field-research/2018/04/15/guzman-berry-field-trip/.
U.S. Department of Agriculture (USDA). Agricultural Marketing Service (AMS). Technical Procedures Manual. AIM Inspection Series, June 2020. https://www.ams.usda.gov/sites/default/files/media/TechnicalProceduresManual%5B1%5D.pdf.
U.S. Department of Agriculture (USDA). National Resource Conservation Service (NRCS). Commodity Costs and Returns Estimation Handbook: A Report of the AAEA Task Force on Commodity Costs and Return. Ames, Iowa: NCRS, February 1, 2000. https://www.nrcs.usda.gov/wps/portal/nrcs/detail/national/technical/econ/references/?cid=nrcs143_009751.
U.S. International Trade Commission (USITC). China’s Agricultural Trade: Competitive Conditions and Effects on U.S. Exports. USITC Publication 4219, March 2011. https://www.usitc.gov/publications/332/pub4219.pdf.
Raspberries for Processing
82 | www.usitc.gov
U.S. International Trade Commission (USITC). Conditions of Competition for Certain Oranges and Lemons. USITC Publication 3863, July 2006. https://www.usitc.gov/publications/332/pub3863.pdf.
U.S. International Trade Commission (USITC). Hearing transcript in connection with Inv. No. TA-332-577, Raspberries for Processing: Conditions of Competition between U.S. and Foreign Suppliers, with a Focus on Washington State, September 17, 2020.
U.S. International Trade Commission Interactive Tariff and Trade DataWeb (USITC DataWeb)/U.S. Census Bureau (Census). Accessed various dates. https://dataweb.usitc.gov/.
Wróblewska, Wioletta, Joanna Pawlak, and Dariusz Paszko. “Economic Aspects in the Raspberry Production on the Example of Farms from Poland, Serbia and Ukraine.” Journal of Horticultural Research 27, no. 2 (December 1, 2019): 71–80. https://doi.org/10.2478/johr-2019-0019.
Chapter 3: U.S. Industry
United States International Trade Commission | 83
Chapter 3 U.S. Industry
Summary
The United States is the fourth-largest producer of raspberries in the world, producing over 100,000
metric tons (mt) in 2019, more than 10 percent of global production.194 Approximately one-third of the
volume of total U.S. production of raspberries is of raspberries for processing, valued at over $60 million
in 2020.195 Nearly all of this production occurs in Washington State. Washington is also a major producer
of processed raspberry products, the state’s processed industry’s yearly output reported over
$90 million.196 Washington producers held about 40 percent of the U.S. processed raspberry market
from 2015 to 2020, measured by the value of Washington sales of processed raspberries and U.S.
imports of processed raspberries and fresh raspberries for processing.197 Alternatively, if measured by
the quantity of fresh raspberries for processing produced by Washington and California, U.S. producers
are estimated to have held at most 57 to 64 percent of the U.S. processed raspberry market over the
2015 to 2019 period, with imports comprising the remainder (table 3.6). As discussed below, however,
this estimated share is likely overstated due to data limitations. In recent years, raspberry seconds have
made up about one-third of total U.S. imports of raspberries for processing.
Two aspects of the U.S. processed raspberry industry make it stand out among other major producers of
this product. First, the U.S. processed raspberry industry machine-harvests raspberries. Second, most of
the U.S. industry is made up of vertically integrated firms that do both growing and processing. These
two characteristics allow the quick harvesting and processing of large volumes of raspberries in a highly
localized area. However, two factors weaken U.S. competitiveness vis-à-vis imports, particularly in
lower-value processed products. One factor is geographic concentration, which exposes the majority of
the U.S. raspberries grown for processing to the same weather events. Also, the United States’ relatively
194 USDA, NASS, Quick Stats, Raspberry Production, accessed November 27, 2020; FAO, FAOSTAT, total raspberry production, accessed January 21, 2021. The Food and Agriculture Organization of the United Nations (FAO) statistics do not break out raspberries by end use; for more information, refer to the Data Availability and Limitation section of chapter 1 (“Introduction”). 195 USDA, NASS Quick Stats, Utilized Raspberry Production, accessed September 2020–June 2021. 196 WRRC, email message to USITC staff, December 18, 2020. 197 USITC staff calculations of the U.S. processed raspberry market are based on Washington sales of processed raspberry products and U.S. imports of fresh raspberries for processing and processed raspberry products; however, this U.S. processed raspberry market calculation does not include U.S. sales of fresh raspberries for processing or processed product produced in California and Oregon, due to limited availability of state level data, or fresh raspberries for processing produced in Washington to avoid double counting those raspberries that are then transformed into a processed raspberry product. U.S. import values also include shipping costs, which may overestimate import market share. For a calculation of U.S. and import shares of consumption by quantities including for California and Oregon please see chapter 3 (“United States”), Table 3.6. WRRC, email message to USITC staff, December 18, 2021; USITC DataWeb/Census, HTS statistical reporting numbers: a share of 0810.20.1090 and 0810.20.2090, 0810.20.1024, 0810.20.9024, 0811.20.2025, a share of 0811.90.8080, 0811.90.8085, 2008.99.2120, 2007.99.6510, and 2009.89.7055, accessed February 4, 2021.
Raspberries for Processing
84 | www.usitc.gov
high production costs, driven by high labor costs, can limit the competitiveness of U.S. products relative
to imports. In addition, the highly concentrated growing region in Washington has climate and pest
pressures that make producing organic raspberries on a commercial scale difficult and expensive.
Industry Structure
Most U.S. commercial production of raspberries is in California, Washington, and Oregon. Growers in
Washington and Oregon grow raspberries exclusively for processing, while growers in California grow for
the fresh market. Raspberries grown in Washington and Oregon are predominantly used by the
processed raspberry industry in that region, but processors in other regions, including California, use
raspberries grown for fresh consumption that do not meet fresh market requirements (and are sold as
raspberry seconds).198 The U.S. processed raspberry industry primarily serves the domestic market and
produces several different types of products, including individually quick frozen (IQF) whole raspberries
and pieces, purees, and juice concentrate, among others. The bulk of processing occurs in Washington,
Oregon, and California, but there are facilities that process raspberries into further processed raspberry
products throughout the country.199
Regions
While many states may produce fruit for local markets or self-picking, U.S. commercial production of
fresh raspberries is centered in three states (figure 3.1).200 California accounts for more than half of the
United States’ total production of raspberries, with most grown for the fresh market.201 Washington
accounts for about one-third of U.S. total raspberry production, virtually all for processing, and the state
accounts for about 90 percent of U.S. production of raspberries grown for processing.202 Oregon
contributes the remainder of raspberries grown for processing after Washington and California.
Washington and Oregon are part of the Pacific Northwest (PNW) raspberry-growing region along with
British Columbia, Canada. Within Washington, Whatcom County has been responsible for as much as
99 percent of the state’s production and grows an estimated 85 percent of U.S. raspberries for
processing.203 The country’s 2020 harvest supplied an estimated value of over $60 million.204 Whatcom
198 Miller, written testimony to USITC, September 8, 2020, 4; USITC, hearing transcript, September 17, 2020, 69, 142 (testimony of Tony Miller, Cascade International Foods); industry representatives, interviews by USITC staff, September 15, 2020, and October 26, 2020. 199 Miller, written testimony to USITC, September 8, 2020, 4; USITC, hearing transcript, September 17, 2020, 142 (testimony of Tony Miller, Cascade International Foods); industry representatives, interviews by USITC staff, September 15, 2020, and October 26, 2020. 200 NARBA, “Overview of the Caneberry Industry,” accessed August 16, 2020. 201 USDA, NASS, Quick Stats, Raspberry Production, Area Harvested, and Yield, accessed November 27, 2020. 202 Oregon is the third-largest raspberry-producing state, accounting for less than 3 percent of U.S. production in 2017, the last year for which data for Oregon were collected. USDA, NASS, Quick Stats, Raspberry Production, Area Harvested, and Yield, accessed November 27, 2020; U.S. industry representative, email message to USITC staff, June 1, 2020. 203 WRRC, Newsletter, November 2019; NASS Quick Stats, accessed January 22, 2021. 204 Industry representative, email message to USITC, December 18, 2020.
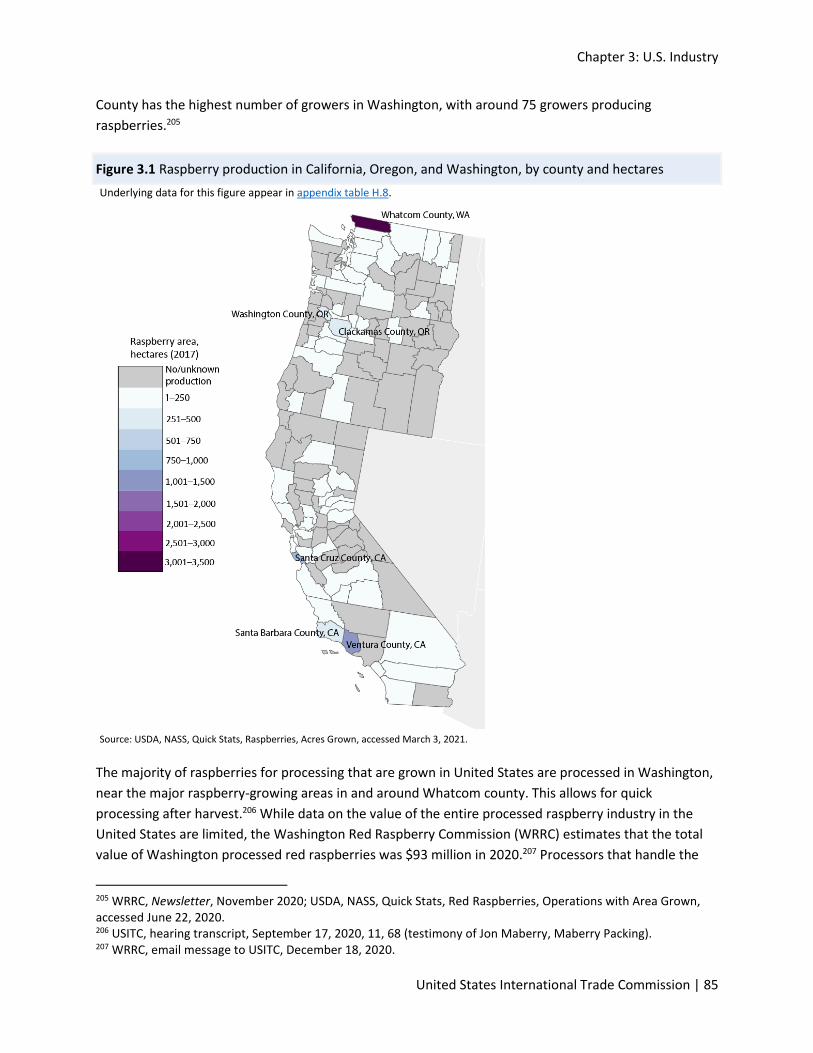
Chapter 3: U.S. Industry
United States International Trade Commission | 85
County has the highest number of growers in Washington, with around 75 growers producing
raspberries.205
Figure 3.1 Raspberry production in California, Oregon, and Washington, by county and hectares
Underlying data for this figure appear in appendix table H.8.
Source: USDA, NASS, Quick Stats, Raspberries, Acres Grown, accessed March 3, 2021.
The majority of raspberries for processing that are grown in United States are processed in Washington,
near the major raspberry-growing areas in and around Whatcom county. This allows for quick
processing after harvest.206 While data on the value of the entire processed raspberry industry in the
United States are limited, the Washington Red Raspberry Commission (WRRC) estimates that the total
value of Washington processed red raspberries was $93 million in 2020.207 Processors that handle the
205 WRRC, Newsletter, November 2020; USDA, NASS, Quick Stats, Red Raspberries, Operations with Area Grown, accessed June 22, 2020. 206 USITC, hearing transcript, September 17, 2020, 11, 68 (testimony of Jon Maberry, Maberry Packing). 207 WRRC, email message to USITC, December 18, 2020.
Raspberries for Processing
86 | www.usitc.gov
bulk of the processing generally specialize in raspberry and blueberry processing, but may process other
fruits to a lesser degree.208 California’s processing industry also processes raspberry seconds from its
production for fresh consumption as well as imported seconds, mainly from Mexico. These processors
differ from those in Washington in that the facilities in California mainly process other fruits grown in
the region and raspberry processing makes up a small share of total processing.209
Industry Composition
The U.S. raspberries for processing and processed raspberry industry is composed of a small number of
large grower-processors, a processing cooperative (co-op), and smaller growers that generally do not
have processing capacities. According to WRRC, there were less than 100 Washington red raspberry
growers in 2019. These numbers declined from over 200 in the 1970s and dropped by over one-third in
the last five years.210
Northwest Berry Cooperative, a raspberry co-op established in 2007 by some smaller growers of
raspberries for processing, is currently the only major co-op in North America for growers of processed
raspberries. It was established in order to create a more vertically integrated system accessible to
smaller-scale growers, and it currently supplies nearly 10 percent the production of raspberries for
processing in Washington State.211 The co-op receives fruit from the growers and then markets and sells
raw fruit, sieved raspberries, seedless raspberry puree, pasteurized seedless puree, concentrated puree,
and raspberry concentrate.212 Before the creation of the co-op, it was reported that the ability of smaller
growers to market their products was limited by the capacity constraints of the approximately four
major processors in operation at the time.213
Industry representatives indicate that approximately one dozen growers have the capacity to produce
all forms of processed raspberries, including for IQF, and that five to six of these grower-processors in
Washington supply nearly three-quarters of the Washington processed raspberry market. Smaller
growers and the berry co-op contribute the remaining 25 percent of Washington production.214 While
some smaller U.S. growers of fresh raspberries for processing may have access to processing equipment
to minimally process the berries, many rely on the co-op to process their berries. Because of the high
208 Industry representatives, interviews by USITC staff, November 24, 2020, and January 27, 2021. 209 USITC, hearing transcript, September 17, 2020, 69, 142 (testimony of Tony Miller, Cascade International Foods); industry representatives, interviews by USITC staff, September 15, 2020, and September 24, 2020. 210 USITC, hearing transcript, September 17, 2020, 9 (testimony of Henry Bierlink, WRRC) and 12 (testimony of Jon Maberry, Maberry Packing); industry representative, interview by USITC staff, December 18, 2020. 211 The NW Berry Co-op originally represented a higher share of production, over 15 percent, but that share has reportedly declined as smaller growers have left the industry. USITC, hearing transcript, September 17, 2020, 15–16 (testimony of Rolf Haugen, NW Berry Co-op); industry representative, interview by USITC staff, June 23, 2020; NW Berry Co-op, “About the Berry Co-op,” accessed March 19, 2021, https://www.nwberrycoop.com/. 212 NW Berry Co-op, “About the Berry Co-op: Products,” accessed March 19, 2021. 213 Industry representative, interview by USITC staff, June 23, 2020. 214 Industry representatives, interviews by USITC staff, October 19, 2020, November 24, 2020, December 18, 2020, and February 26, 2021.
Chapter 3: U.S. Industry
United States International Trade Commission | 87
cost of processing equipment, only the larger growers had been able to afford the machinery that allows
them to individually quick-freeze their raspberries as well as purchased raspberries.215
Industry Organization
Industry organizations serve to represent the interests of the growers and support research to expand
domestic and international markets, among other functions. The main organization that represents U.S.
commercial growers of fresh raspberries for processing is the state-level WRRC. As discussed below, a
marketing “checkoff” fund—a means for agricultural industries to collect financial resources to conduct
research and expand and strengthen markets—was organized and effective by 2012 but was terminated
in 2018.216 The U.S. industry in Washington is also a member of the International Raspberry
Organization.
The WRRC is a grower-funded and -operated organization that was founded in 1976. Its membership
currently includes over 40 suppliers of red raspberry products. Member growers are based in
Washington as well as Oregon. The WRRC oversees programs that include research, advocacy, and
activities that improve farming and harvesting. It also undertakes advertising and promotion for the
industry. The WRRC reports that its members account for about 90 percent of U.S. production of red
raspberries for processing and freezing.217
For a number of years, the industry pursued the establishment of a Processed Raspberry Promotion,
Research, and Information Order, a type of research and promotion board authorized by the U.S.
Department of Agriculture (USDA), which became effective on May 9, 2012.218 The resulting program
operated as the National Processed Raspberry Council. It was based in Lynden, Washington, and was
composed of producers, importers, foreign producers, and an at-large member.219 The order
implemented an assessment of one cent per pound on U.S. producers’ sales of raspberries for
processing and on imports of processed raspberries.220 The purpose of the program was, among other
things, to (1) develop and finance coordinated research, promotion, industry information, and consumer
education about processed raspberries, (2) strengthen the position of the processed raspberry industry,
215 WRRC, written submission to the USITC, September 8, 2020, 4; USITC, hearing transcript, September 17, 2020, 68 (testimony of Jon Maberry, Maberry Packing); industry representatives, interviews by USITC staff, June 23, 2020, October 20, 2020, and November 24, 2020. 216 A “checkoff fund” is a common term for the commodity research and promotion programs of the U.S. Department of Agriculture’s Agricultural Marketing Service (AMS). Funds are typically collected via per-unit assessment, i.e., by deductions from sales of importers, producers, and marketers. USDA, AMS, “Research and Promotion Programs,” accessed March 17, 2021. 217 WRRC, written submission to the USITC, September 8, 2020, 2–3. 218 USDA, AMS, “Processed Raspberry Promotion, Research, and Information Order,” May 8, 2012. These programs are authorized by the 1996 Commodity Promotion, Research, and Information Act. 84 Fed. Reg. 49942 (September 25, 2019). 219 The order covered anyone who grew 20,000 pounds or more of raspberries for processing in the United States or who imported 20,000 pounds or more of processed raspberries into the United States. USDA, AMS, “Processed Raspberry Promotion, Research, and Information Order,” May 8, 2012; Lynden Tribune, “National Raspberry Program Ending,” November 21, 2018. 220 USDA, AMS, “Processed Raspberry Promotion, Research, and Information Order,” May 8, 2012.
Raspberries for Processing
88 | www.usitc.gov
and (3) maintain, develop, and expand existing markets for processed raspberries.221 In 2017, the
Council is said to have collected about $1.2 million from just over 200 producers.222
While some report that the program showed promise, they also state that the research and promotion
efforts of the Council were too short-lived to demonstrate effectiveness.223 Sentiment about the value of
the program turned negative over time, in part, reportedly, as a result of prices of raspberries for
processing that industry representatives indicated were below break-even levels. USDA received a
petition for early termination of the program in March 2018.224 In the referendum that followed,
57 percent were in favor of ending the program.225 The program was terminated effective September
2019.226
The United States is also 1 of 14 members of the International Raspberry Organization (IRO), which was
created in the 1990s. The IRO’s purpose is to bring representatives from the raspberry industry together
to share information on raspberry production and food safety. To that end, the organization consists of
members from the major raspberry-producing markets and meets every two years.227
Cultivars
As noted in chapter 1, grower selection of raspberry cultivars generally depends on the intended use of
the raspberry.228 Raspberries grown for processing in the United States are mechanically harvested. To
do so, they must be easy to remove when ripe and firm enough to withstand shaking and dropping by
the harvester. The raspberries must also maintain a suitable flavor, shape, and color for the intended
processed product. High sugar content and bright red coloring are generally preferred traits for
processed products, though these traits vary in importance according to end use. Other important traits
for varieties for processing include the time when the fruit ripens, their degree of resistance to root rot
and raspberry bushy dwarf virus, and their yields.229
221 USDA, AMS, “Processed Raspberry Promotion, Research, and Information Order,” May 8, 2012. 222 84 Fed. Reg. 49942 (September 25, 2019). 223 Industry representatives, interviews by USITC staff, October 19, 2020, October 20, 2020, and December 18, 2020. 224 84 Fed. Reg. 49942 (September 25, 2019); Lynden Tribune, “National Raspberry Program Ending,” November 21, 2018. 225 Lynden Tribune, “USDA Raspberry Order Officially Ends,” March 13, 2019. 226 84 Fed. Reg. 49942 (September 25, 2019). 227 IRO, “About Us,” accessed August 26, 2020; USITC, hearing transcript, September 17, 2020, 52–56 (testimony of Antonio Dominguez, IRO). 228 A cultivar is a “cultivated variety” and is generally distinguished from a variety because it does not typically occur in nature, and seedlings grown from the parent plant of a cultivar may not have the same characteristics as the cultivar. The terms are often used interchangeably. Haynes, “Cultivar versus Variety,” accessed January 13, 2021; WRRC, written submission to the USITC, September 8, 2020, 3; USITC, hearing transcript, September 17, 2020, 21–23 (testimony of Ryan Commons, Driscoll’s, Inc.). 229 Raspberry bushy dwarf virus is a common plant disease that impacts raspberries grown in the Pacific Northwest. WRRC, “Cultivars,” accessed March 11, 2021; USITC, hearing transcript, September 17, 2020, 21–23 (testimony of Ryan Commons, Driscoll’s, Inc.); industry representative, interview by USITC staff, November 20, 2020; Funt and Hall, Raspberries, 2013, 57.
Chapter 3: U.S. Industry
United States International Trade Commission | 89
While one cultivar, Meeker, is responsible for most raspberry production in Washington and Oregon,
there are over 20 raspberry cultivars grown in Whatcom County in Washington, only some of which
require fees for use.230 The Meeker cultivar, which was developed by Washington State University and
released for use in 1967, is one of the most widely grown cultivars in the region with no associated fees
for use. Meeker plants produce large, sweet berries that can be used in any type of processed product
and are able to withstand mechanical harvesting.231 Meeker is now the most common cultivar grown for
commercial production in Washington and is estimated to make up about half of total Washington
raspberry acreage.232 While the Meeker cultivar accounted for nearly 70 percent of Washington State’s
production during 2001–08, this share has declined as some growers have shifted to newer, fee-for-use
varieties.233
Other cultivars that do not have associated fees for use include Chemainus, Rudi, Tulameen, and
Willamette, but these are grown on much more limited acreage than the Meeker.234 Washington State
University has more recently developed and released some new cultivars for use without fees and has
grouped these under the Cascade name, including Cascade Bounty, Cascade Delight, and Cascade
Harvest. The newest, Cascade Premier, which was released in 2018, is reported to have improved
resistance to root rot (a problem in the Pacific Northwest), increased yields, and have higher shares of
whole harvested berries best suited for IQF processing; its first full harvest is expected in 2021.235
Among the fee-for-use cultivar varieties are WakeField, released in 2012, and WakeHaven, released in
2017.236 Both are high-yielding raspberry plant types reported to produce sturdy berries that are well
suited to mechanical harvesting and that yield higher shares of whole IQF berries than those of other
cultivars.237 The two cultivars reportedly have resistance to root rot and raspberry bushy dwarf virus.238
Another important favorable characteristic of the Wake cultivars is said to be that their fruit can ripen
230 Generally, various licensing arrangements govern fee-for-use cultivars in order to protect the associated intellectual property rights. WRRC, “Cultivars,” accessed March 11, 2021; industry representative, interview by USITC staff, March 11, 2021; industry representative, interview by USITC staff, November 24, 2020. 231 WRRC, “Cultivars,” accessed March 11, 2021. 232 WRRC, “Cultivars,” accessed March 11, 2021; industry representative, interview by USITC staff, December 18, 2020. 233 WRRC, “Cultivars,” accessed March 11, 2021; industry representatives, interviews by USITC staff, October 20, 2020, November 20, 2020, and March 11, 2021. 234 Industry representatives, interviews by USITC staff, October 20, 2020, and November 20, 2020; WRRC, “Cultivars,” accessed March 11, 2021; Funt and Hall, “Chapter 5: Cultivar Development and Selection,” 2013, 58–65. 235 Truscott, “WSU Debuts Flavorful, Easy-to-Harvest New Raspberry, Cascade Premier,” July 30, 2019; WSU, “Small Fruit Breeding and Genetics: Raspberries,” accessed December 2, 2020. 236 WRRC, “Cultivars,” accessed March 11, 2021; Stephens et al., “‘NN08002’ (Marketed as WakeHaven) Red Raspberry,” September 1, 2017, 1320–23; Stephens, Enfield, and Hall, “‘Wakefield’ Red Raspberry,” October 1, 2012, 1556–58. 237 Stephens et al., “‘NN08002’ (Marketed as WakeHaven) Red Raspberry,” September 1, 2017, 1320–23; industry representatives, interviews by USITC staff, October 20, 2020, February 26, 2021, and March 11, 2021. 238 Stephens et al., “‘NN08002’ (Marketed as WakeHaven) Red Raspberry,” September 1, 2017, 1320–23.

Raspberries for Processing
90 | www.usitc.gov
earlier than Meeker; the latter is ready for harvest around July 4 in Lynden, Washington, and around
June 20 in the Oregon growing region.239
Some industry representatives suggest that these newer cultivars result in higher overall yields as well as
a greater share of IQF raspberries, though estimates vary.240 Others suggest that the yield rates between
the Wake and other cultivars are closer in practice and that these shares vary by year, depending on
climate conditions.241 Unlike most other cultivars in use, the two cultivars require substantial fees for
use.242 These high fees have reportedly limited their widespread planting; many growers choose to wait
for more data on their profitability before replacing their plants with these cultivars. The other cultivars,
those without fees for use, are considered by some industry representatives to have lower initial costs
than the Wake cultivars but may have higher associated costs resulting from their lack of disease
resistance as well as their lower contribution to the share of whole IQF berries.243
Production System
In the United States, raspberries grown for processing use different production methods than those
grown for the fresh market (table 3.1). Raspberry bushes in the Pacific Northwest are generally planted
in open fields (see figure 3.2). This allows growers to harvest the berries mechanically, reducing labor
costs and increasing the speed of harvest.244 The raspberries are then processed and frozen in nearby
facilities within hours of being picked.245 The United States and Canada are the only major processed
raspberry producers to predominantly harvest raspberries mechanically.246 The raspberry harvest in the
Pacific Northwest typically occurs in June or July and lasts four to six weeks, depending on the varieties
grown and weather conditions.247
By contrast, raspberries that are grown in California for the fresh market are generally grown under
hoop houses, which protect the raspberries from excessive moisture and extreme temperatures (see
figure 3.3).248 As a result, raspberries can be grown and harvested in California nearly year-round.249
239 Finn, Strik, and Moore, “Raspberry Cultivars for the Pacific Northwest,” February 2014, 4; industry representatives, interviews by USITC staff, January 28, 2021, and March 11, 2021. 240 Industry representatives, interviews by USITC staff, October 20, 2020, November 20, 2020, January 27, 2021, and March 11, 2021. 241 Industry representatives, interviews by USITC staff, November 24, 2020, and January 27, 2021. 242 Some industry reports list a price of $1,500 per acre. Industry representative, interview by USITC staff, October 20, 2020. 243 Industry representative, interview by USITC staff, March 11, 2021. 244 WRRC, written submission to the USITC, September 8, 2020, 3; industry representative, interview by USITC staff, October 20, 2020; USITC, hearing transcript, September 17, 2020, 11 (testimony of Jon Maberry, Maberry Packing). 245 WRRC, written submission to the USITC, September 8, 2020, 3. 246 USITC, hearing transcript, September 17, 2020, 55 (testimony of Antonio Dominguez, IRO). 247 WRRC, written submission to the USITC, September 8, 2020, 4. 248 Hoop houses are sometimes referred to as “high tunnels.” See chapter 1 for more information. WRRC, written submission to the USITC, September 8, 2020, 3; USITC, hearing transcript, September 17, 2020, 39 (testimony of Tony Miller, Cascade International Foods) and 21–23 (testimony of Ryan Commons, Driscoll’s, Inc.). 249 Driscoll’s, “Product Guide: 2019–2020,” accessed March 11, 2021; industry representative, interview by USITC staff, October 26, 2020.
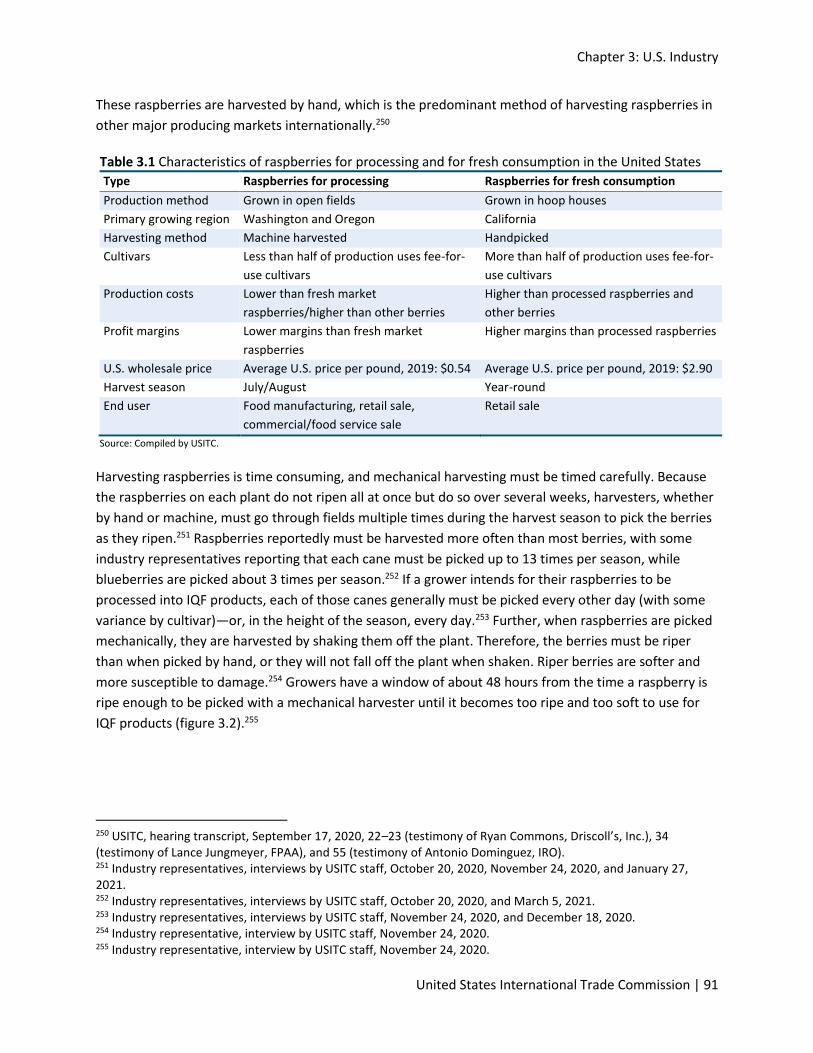
Chapter 3: U.S. Industry
United States International Trade Commission | 91
These raspberries are harvested by hand, which is the predominant method of harvesting raspberries in
other major producing markets internationally.250
Table 3.1 Characteristics of raspberries for processing and for fresh consumption in the United States
Type Raspberries for processing Raspberries for fresh consumption
Production method Grown in open fields Grown in hoop houses
Primary growing region Washington and Oregon California
Harvesting method Machine harvested Handpicked
Cultivars Less than half of production uses fee-for-
use cultivars
More than half of production uses fee-for-
use cultivars
Production costs Lower than fresh market
raspberries/higher than other berries
Higher than processed raspberries and
other berries
Profit margins Lower margins than fresh market
raspberries
Higher margins than processed raspberries
U.S. wholesale price Average U.S. price per pound, 2019: $0.54 Average U.S. price per pound, 2019: $2.90
Harvest season July/August Year-round
End user Food manufacturing, retail sale,
commercial/food service sale
Retail sale
Source: Compiled by USITC.
Harvesting raspberries is time consuming, and mechanical harvesting must be timed carefully. Because
the raspberries on each plant do not ripen all at once but do so over several weeks, harvesters, whether
by hand or machine, must go through fields multiple times during the harvest season to pick the berries
as they ripen.251 Raspberries reportedly must be harvested more often than most berries, with some
industry representatives reporting that each cane must be picked up to 13 times per season, while
blueberries are picked about 3 times per season.252 If a grower intends for their raspberries to be
processed into IQF products, each of those canes generally must be picked every other day (with some
variance by cultivar)—or, in the height of the season, every day.253 Further, when raspberries are picked
mechanically, they are harvested by shaking them off the plant. Therefore, the berries must be riper
than when picked by hand, or they will not fall off the plant when shaken. Riper berries are softer and
more susceptible to damage.254 Growers have a window of about 48 hours from the time a raspberry is
ripe enough to be picked with a mechanical harvester until it becomes too ripe and too soft to use for
IQF products (figure 3.2).255
250 USITC, hearing transcript, September 17, 2020, 22–23 (testimony of Ryan Commons, Driscoll’s, Inc.), 34 (testimony of Lance Jungmeyer, FPAA), and 55 (testimony of Antonio Dominguez, IRO). 251 Industry representatives, interviews by USITC staff, October 20, 2020, November 24, 2020, and January 27, 2021. 252 Industry representatives, interviews by USITC staff, October 20, 2020, and March 5, 2021. 253 Industry representatives, interviews by USITC staff, November 24, 2020, and December 18, 2020. 254 Industry representative, interview by USITC staff, November 24, 2020. 255 Industry representative, interview by USITC staff, November 24, 2020.
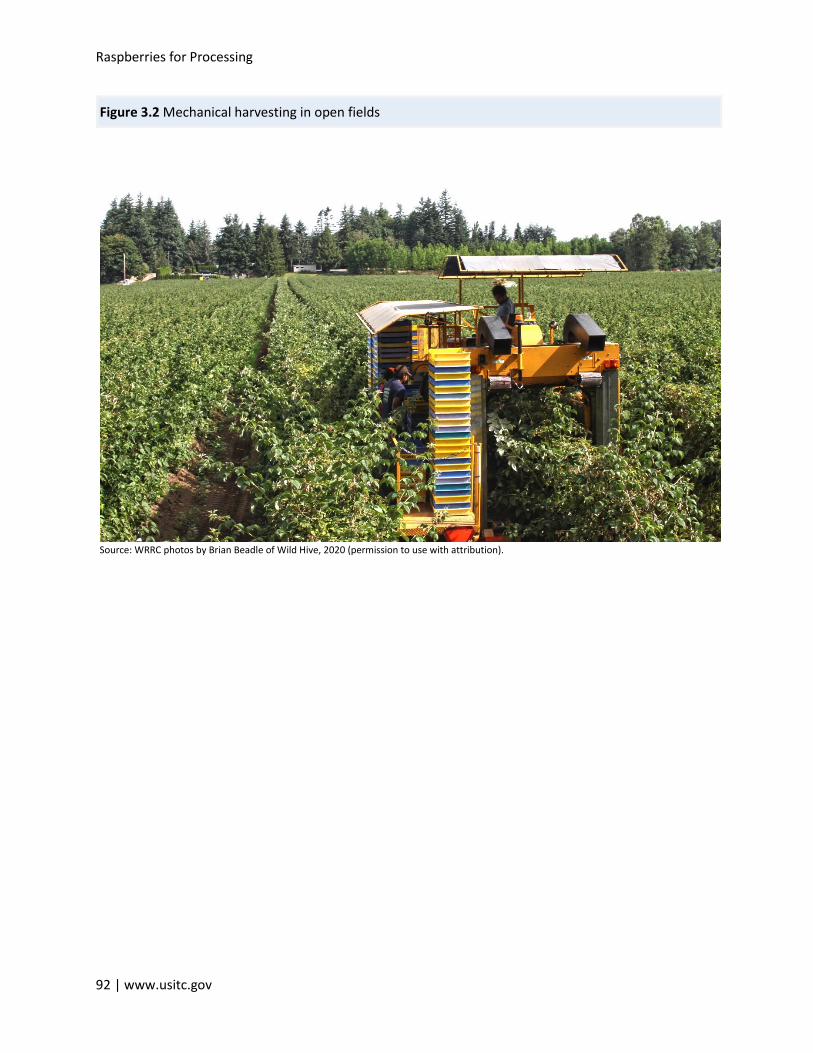
Raspberries for Processing
92 | www.usitc.gov
Figure 3.2 Mechanical harvesting in open fields
Source: WRRC photos by Brian Beadle of Wild Hive, 2020 (permission to use with attribution).
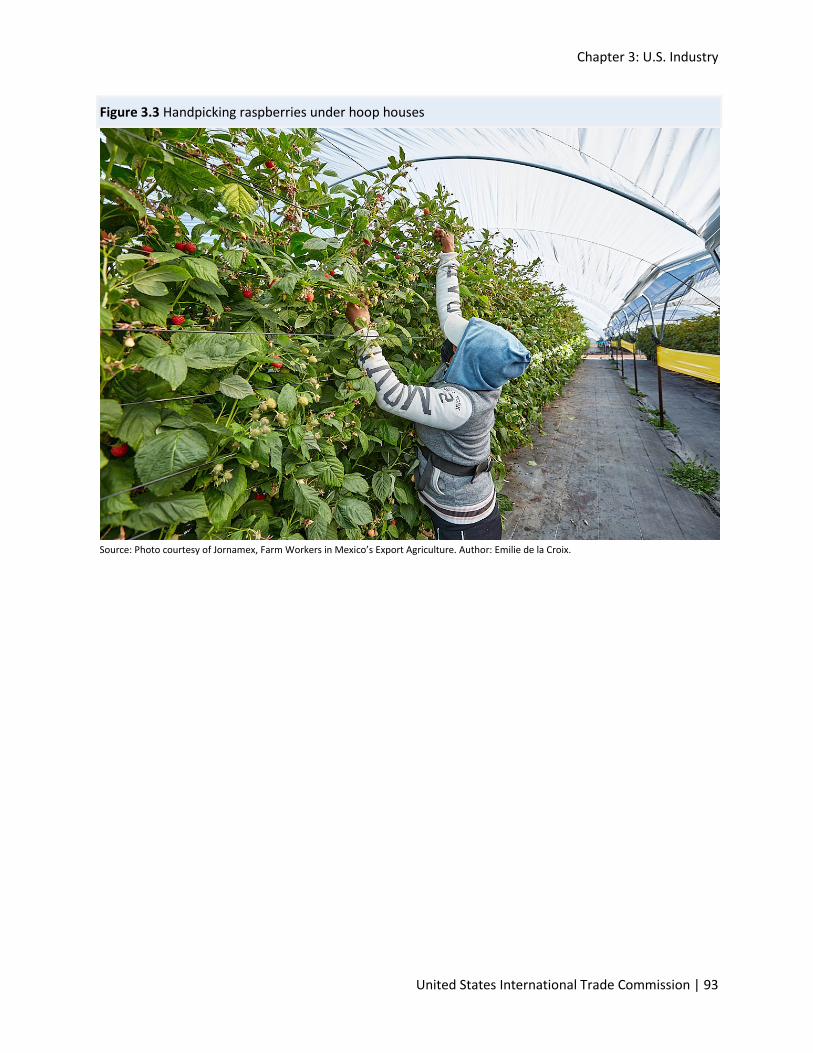
Chapter 3: U.S. Industry
United States International Trade Commission | 93
Figure 3.3 Handpicking raspberries under hoop houses
Source: Photo courtesy of Jornamex, Farm Workers in Mexico’s Export Agriculture. Author: Emilie de la Croix.
Raspberries for Processing
94 | www.usitc.gov
The containers used in the harvesting of raspberries for processing differs based on the intended final
use of the raspberries. For example, when raspberries are harvested for non-IQF products (e.g., B-grade
products) they are generally placed into a flat (tray) that is filled to hold up to 20 pounds of fruit.256
B-grade raspberries can also be harvested directly into pails (buckets) or barrels (drums), and then
chilled or frozen in these containers. This lowers the costs of harvesting but also results in a lower-value
processed product.257 The latter method is used for raspberries that are intended for products such as
juice concentrate.258
Because ripe raspberries are very delicate, berries that are intended for IQF products cannot be
harvested into large containers or they will be bruised and crushed. To maintain the quality of the whole
berry, flats of raspberries intended for IQF products can only be filled with 7 to 8 pounds of berries
(figure 3.4). As a result, the flats fill more quickly, and the harvester must be unloaded frequently. This
slows the speed of harvest and requires more laborers on the harvester—only three laborers are
typically needed when machine harvesting raspberries that will be processed into non-IQF products.259
The flats containing the harvest intended for IQF products are then emptied into a sorter, where the
berries will be sorted, washed, and inspected. These raspberries are then individually quick frozen
through a “tunnel,” a machine that quickly freezes the raspberries while moving them on a conveyor
belt.260 The tunnel freezing method reportedly prevents large ice crystals from forming and causes less
cellular damage to the berry, so that the final berry is firmer and the berries are less likely to clump
together.261 However, as the berries travel through the tunnel, they are shaken and dropped at various
stages of freezing, which can break the brittle raspberries. In the United States, whole berries and larger
pieces are frozen into whole IQF berries, whole and broken IQF, or IQF crumble through tunnel freezing
and packed in bulk packaging.262 Any raspberries that do not meet the specifications for IQF, as well as
pieces and juice, are separated and placed in pails or drums. Some of these raspberries are processed
immediately, and the rest are frozen to be processed later into puree or juice concentrate.263
256 “B-grade” is a designation used by USDA in grading raspberries according to a scoring system and applies to raspberries with scores above 70 and below 85. IQF raspberries use A-grade berries, while raspberries used for puree must be B-grade or higher. See chapter 1 for more information on USDA marketing standards. USDA, AMS, “Frozen Berries Grades and Standards,” accessed March 31, 2021; USDA, AMS, Commodity Specification for Frozen Fruit, April 2020, 11; industry representative, interview by USITC staff, October 20, 2020. 257 Industry representatives, interviews by USITC staff, October 20, 2020, November 20, 2020, November 23, 2020, November 24, and December 18, 2020. 258 Industry representatives, interviews by USITC staff, November 23, 2020, and December 18, 2020. 259 Industry representatives, interviews by USITC staff, October 20, 2020, November 20, 2020, and November 23, 2020. 260 WRRC, written submission to the USITC, September 8, 2020, 4; industry representatives, interviews by USITC staff, September 24, 2020, and February 3, 2021. 261 WRRC, written submission to the USITC, September 8, 2020, 4–5; Barbosa-Cánovas, Altunakar, and Mejía-Lorio, Freezing of Fruits and Vegetables, 2005, chapter 1. 262 As noted in chapter 1, IQF berries can be sold with varying shares of whole berries to crumbles, with higher shares of whole raspberries leading to higher prices received. Industry representatives, interviews by USITC staff, November 20, 2020, and November 24, 2020. 263 Industry representatives, interviews by USITC staff, November 20, 2020, and November 24, 2020.
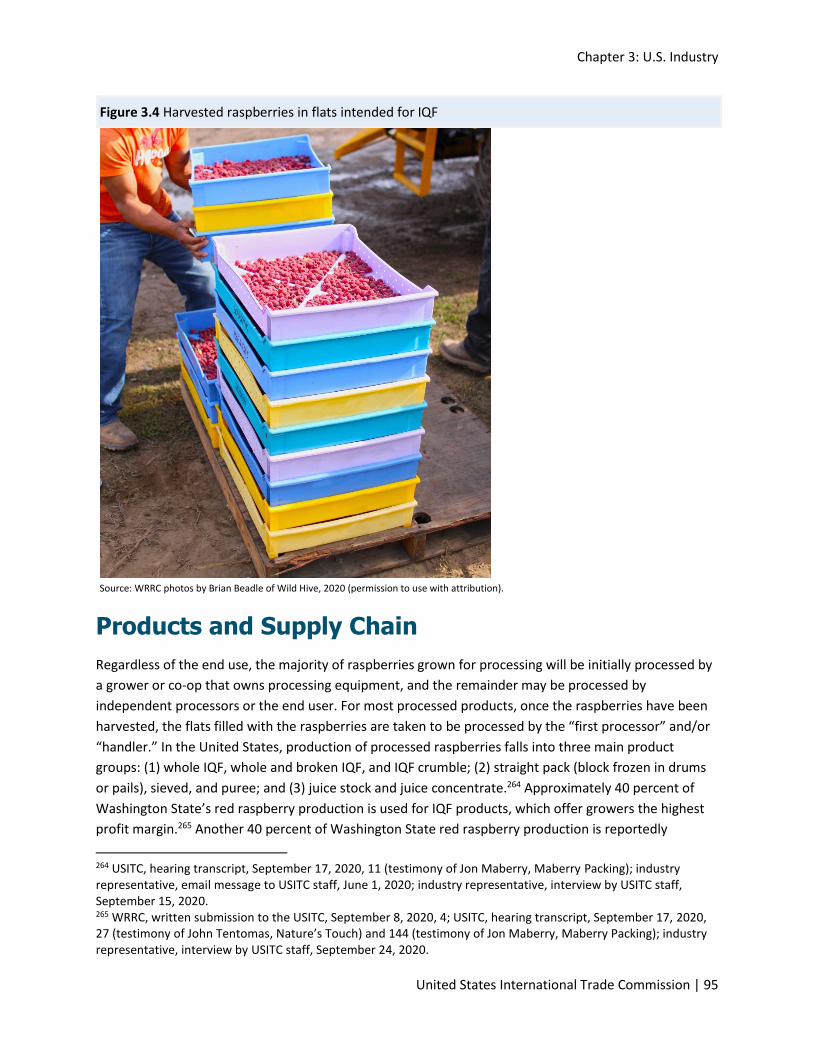
Chapter 3: U.S. Industry
United States International Trade Commission | 95
Figure 3.4 Harvested raspberries in flats intended for IQF
Source: WRRC photos by Brian Beadle of Wild Hive, 2020 (permission to use with attribution).
Products and Supply Chain
Regardless of the end use, the majority of raspberries grown for processing will be initially processed by
a grower or co-op that owns processing equipment, and the remainder may be processed by
independent processors or the end user. For most processed products, once the raspberries have been
harvested, the flats filled with the raspberries are taken to be processed by the “first processor” and/or
“handler.” In the United States, production of processed raspberries falls into three main product
groups: (1) whole IQF, whole and broken IQF, and IQF crumble; (2) straight pack (block frozen in drums
or pails), sieved, and puree; and (3) juice stock and juice concentrate.264 Approximately 40 percent of
Washington State’s red raspberry production is used for IQF products, which offer growers the highest
profit margin.265 Another 40 percent of Washington State red raspberry production is reportedly
264 USITC, hearing transcript, September 17, 2020, 11 (testimony of Jon Maberry, Maberry Packing); industry representative, email message to USITC staff, June 1, 2020; industry representative, interview by USITC staff, September 15, 2020. 265 WRRC, written submission to the USITC, September 8, 2020, 4; USITC, hearing transcript, September 17, 2020, 27 (testimony of John Tentomas, Nature’s Touch) and 144 (testimony of Jon Maberry, Maberry Packing); industry representative, interview by USITC staff, September 24, 2020.
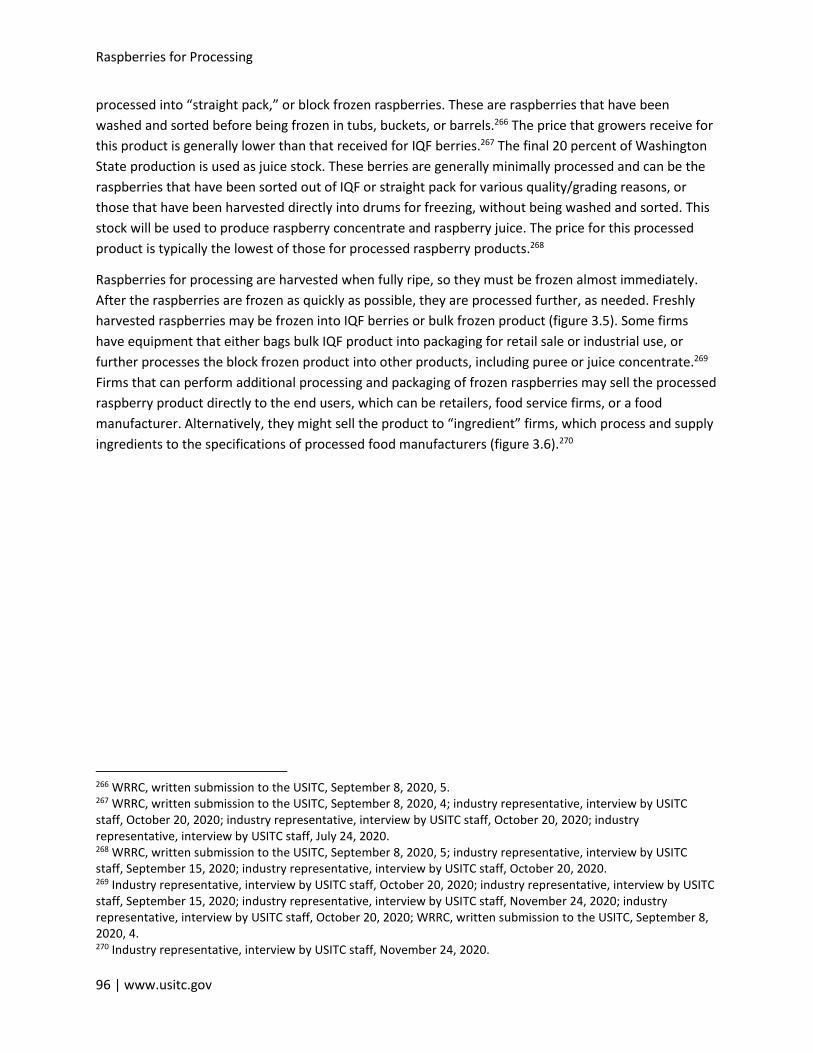
Raspberries for Processing
96 | www.usitc.gov
processed into “straight pack,” or block frozen raspberries. These are raspberries that have been
washed and sorted before being frozen in tubs, buckets, or barrels.266 The price that growers receive for
this product is generally lower than that received for IQF berries.267 The final 20 percent of Washington
State production is used as juice stock. These berries are generally minimally processed and can be the
raspberries that have been sorted out of IQF or straight pack for various quality/grading reasons, or
those that have been harvested directly into drums for freezing, without being washed and sorted. This
stock will be used to produce raspberry concentrate and raspberry juice. The price for this processed
product is typically the lowest of those for processed raspberry products.268
Raspberries for processing are harvested when fully ripe, so they must be frozen almost immediately.
After the raspberries are frozen as quickly as possible, they are processed further, as needed. Freshly
harvested raspberries may be frozen into IQF berries or bulk frozen product (figure 3.5). Some firms
have equipment that either bags bulk IQF product into packaging for retail sale or industrial use, or
further processes the block frozen product into other products, including puree or juice concentrate.269
Firms that can perform additional processing and packaging of frozen raspberries may sell the processed
raspberry product directly to the end users, which can be retailers, food service firms, or a food
manufacturer. Alternatively, they might sell the product to “ingredient” firms, which process and supply
ingredients to the specifications of processed food manufacturers (figure 3.6).270
266 WRRC, written submission to the USITC, September 8, 2020, 5. 267 WRRC, written submission to the USITC, September 8, 2020, 4; industry representative, interview by USITC staff, October 20, 2020; industry representative, interview by USITC staff, October 20, 2020; industry representative, interview by USITC staff, July 24, 2020. 268 WRRC, written submission to the USITC, September 8, 2020, 5; industry representative, interview by USITC staff, September 15, 2020; industry representative, interview by USITC staff, October 20, 2020. 269 Industry representative, interview by USITC staff, October 20, 2020; industry representative, interview by USITC staff, September 15, 2020; industry representative, interview by USITC staff, November 24, 2020; industry representative, interview by USITC staff, October 20, 2020; WRRC, written submission to the USITC, September 8, 2020, 4. 270 Industry representative, interview by USITC staff, November 24, 2020.
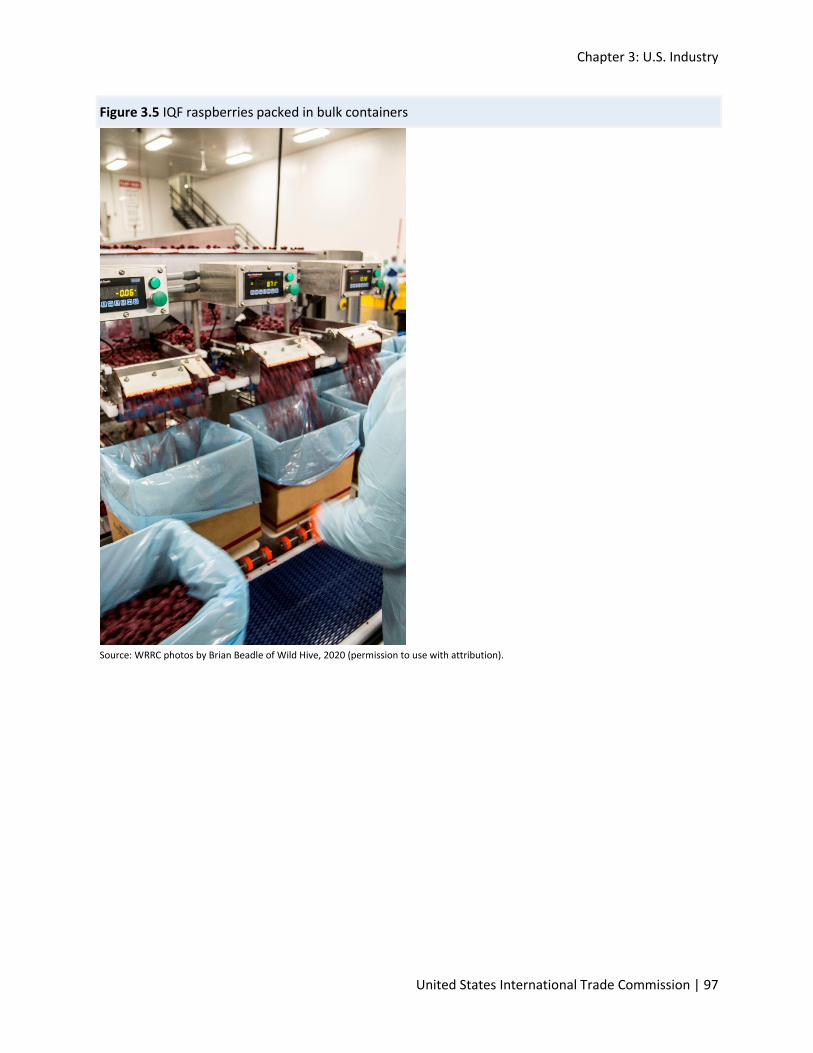
Chapter 3: U.S. Industry
United States International Trade Commission | 97
Figure 3.5 IQF raspberries packed in bulk containers
Source: WRRC photos by Brian Beadle of Wild Hive, 2020 (permission to use with attribution).
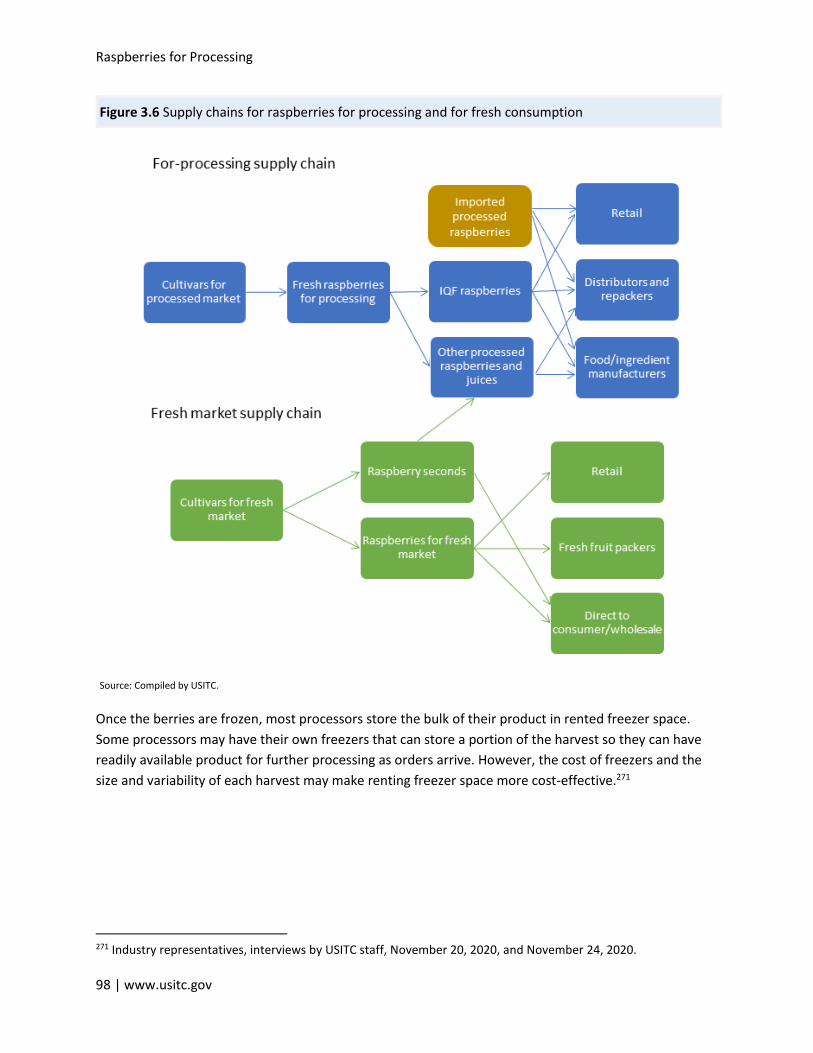
Raspberries for Processing
98 | www.usitc.gov
Figure 3.6 Supply chains for raspberries for processing and for fresh consumption
Source: Compiled by USITC.
Once the berries are frozen, most processors store the bulk of their product in rented freezer space.
Some processors may have their own freezers that can store a portion of the harvest so they can have
readily available product for further processing as orders arrive. However, the cost of freezers and the
size and variability of each harvest may make renting freezer space more cost-effective.271
271 Industry representatives, interviews by USITC staff, November 20, 2020, and November 24, 2020.
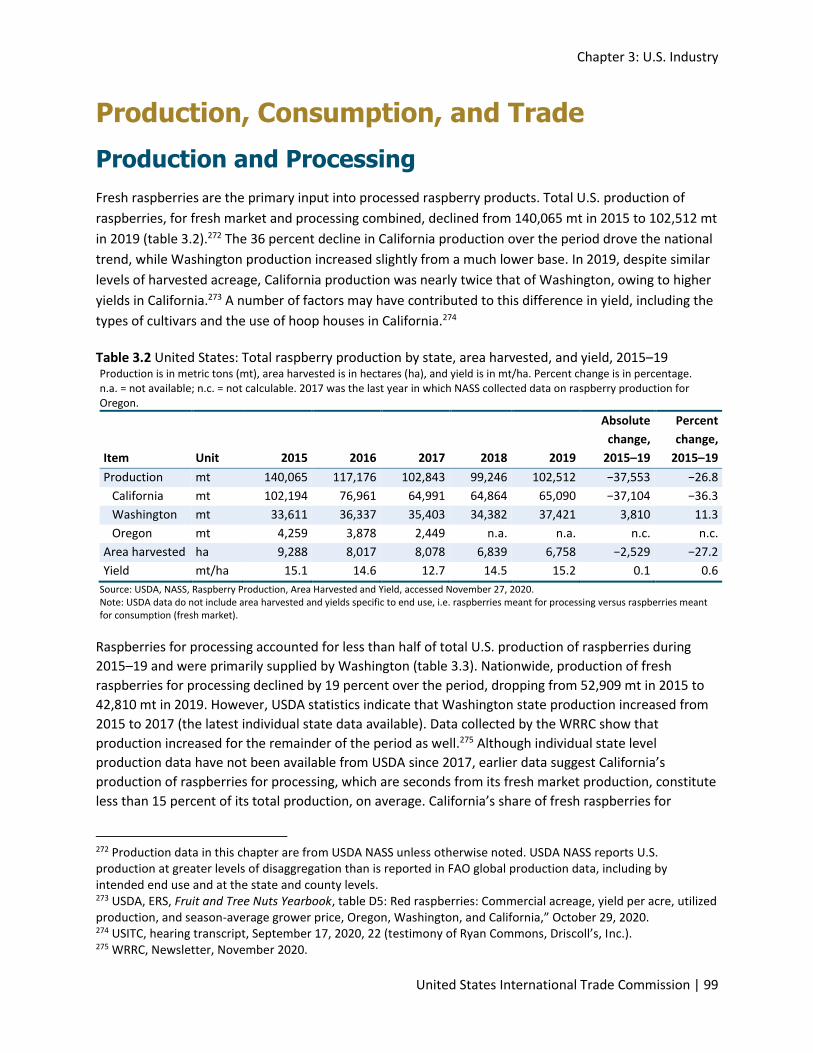
Chapter 3: U.S. Industry
United States International Trade Commission | 99
Production, Consumption, and Trade
Production and Processing
Fresh raspberries are the primary input into processed raspberry products. Total U.S. production of
raspberries, for fresh market and processing combined, declined from 140,065 mt in 2015 to 102,512 mt
in 2019 (table 3.2).272 The 36 percent decline in California production over the period drove the national
trend, while Washington production increased slightly from a much lower base. In 2019, despite similar
levels of harvested acreage, California production was nearly twice that of Washington, owing to higher
yields in California.273 A number of factors may have contributed to this difference in yield, including the
types of cultivars and the use of hoop houses in California.274
Table 3.2 United States: Total raspberry production by state, area harvested, and yield, 2015–19 Production is in metric tons (mt), area harvested is in hectares (ha), and yield is in mt/ha. Percent change is in percentage. n.a. = not available; n.c. = not calculable. 2017 was the last year in which NASS collected data on raspberry production for Oregon.
Item Unit 2015 2016 2017 2018 2019
Absolute
change,
2015–19
Percent
change,
2015–19
Production mt 140,065 117,176 102,843 99,246 102,512 −37,553 −26.8
California mt 102,194 76,961 64,991 64,864 65,090 −37,104 −36.3
Washington mt 33,611 36,337 35,403 34,382 37,421 3,810 11.3
Oregon mt 4,259 3,878 2,449 n.a. n.a. n.c. n.c.
Area harvested ha 9,288 8,017 8,078 6,839 6,758 −2,529 −27.2
Yield mt/ha 15.1 14.6 12.7 14.5 15.2 0.1 0.6
Source: USDA, NASS, Raspberry Production, Area Harvested and Yield, accessed November 27, 2020. Note: USDA data do not include area harvested and yields specific to end use, i.e. raspberries meant for processing versus raspberries meant for consumption (fresh market).
Raspberries for processing accounted for less than half of total U.S. production of raspberries during
2015–19 and were primarily supplied by Washington (table 3.3). Nationwide, production of fresh
raspberries for processing declined by 19 percent over the period, dropping from 52,909 mt in 2015 to
42,810 mt in 2019. However, USDA statistics indicate that Washington state production increased from
2015 to 2017 (the latest individual state data available). Data collected by the WRRC show that
production increased for the remainder of the period as well.275 Although individual state level
production data have not been available from USDA since 2017, earlier data suggest California’s
production of raspberries for processing, which are seconds from its fresh market production, constitute
less than 15 percent of its total production, on average. California’s share of fresh raspberries for
272 Production data in this chapter are from USDA NASS unless otherwise noted. USDA NASS reports U.S. production at greater levels of disaggregation than is reported in FAO global production data, including by intended end use and at the state and county levels. 273 USDA, ERS, Fruit and Tree Nuts Yearbook, table D5: Red raspberries: Commercial acreage, yield per acre, utilized production, and season-average grower price, Oregon, Washington, and California,” October 29, 2020. 274 USITC, hearing transcript, September 17, 2020, 22 (testimony of Ryan Commons, Driscoll’s, Inc.). 275 WRRC, Newsletter, November 2020.
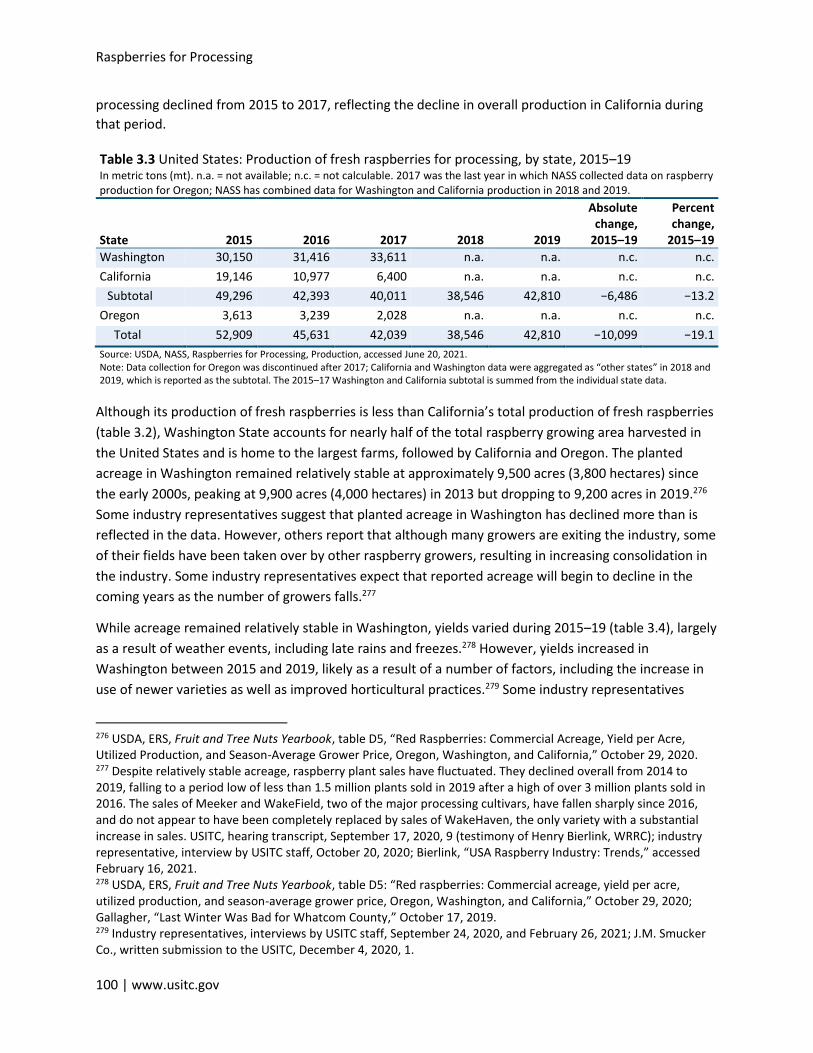
Raspberries for Processing
100 | www.usitc.gov
processing declined from 2015 to 2017, reflecting the decline in overall production in California during
that period.
Table 3.3 United States: Production of fresh raspberries for processing, by state, 2015–19 In metric tons (mt). n.a. = not available; n.c. = not calculable. 2017 was the last year in which NASS collected data on raspberry production for Oregon; NASS has combined data for Washington and California production in 2018 and 2019.
State 2015 2016 2017 2018 2019
Absolute change,
2015–19
Percent change,
2015–19
Washington 30,150 31,416 33,611 n.a. n.a. n.c. n.c.
California 19,146 10,977 6,400 n.a. n.a. n.c. n.c.
Subtotal 49,296 42,393 40,011 38,546 42,810 −6,486 −13.2
Oregon 3,613 3,239 2,028 n.a. n.a. n.c. n.c.
Total 52,909 45,631 42,039 38,546 42,810 −10,099 −19.1
Source: USDA, NASS, Raspberries for Processing, Production, accessed June 20, 2021. Note: Data collection for Oregon was discontinued after 2017; California and Washington data were aggregated as “other states” in 2018 and 2019, which is reported as the subtotal. The 2015–17 Washington and California subtotal is summed from the individual state data.
Although its production of fresh raspberries is less than California’s total production of fresh raspberries
(table 3.2), Washington State accounts for nearly half of the total raspberry growing area harvested in
the United States and is home to the largest farms, followed by California and Oregon. The planted
acreage in Washington remained relatively stable at approximately 9,500 acres (3,800 hectares) since
the early 2000s, peaking at 9,900 acres (4,000 hectares) in 2013 but dropping to 9,200 acres in 2019.276
Some industry representatives suggest that planted acreage in Washington has declined more than is
reflected in the data. However, others report that although many growers are exiting the industry, some
of their fields have been taken over by other raspberry growers, resulting in increasing consolidation in
the industry. Some industry representatives expect that reported acreage will begin to decline in the
coming years as the number of growers falls.277
While acreage remained relatively stable in Washington, yields varied during 2015–19 (table 3.4), largely
as a result of weather events, including late rains and freezes.278 However, yields increased in
Washington between 2015 and 2019, likely as a result of a number of factors, including the increase in
use of newer varieties as well as improved horticultural practices.279 Some industry representatives
276 USDA, ERS, Fruit and Tree Nuts Yearbook, table D5, “Red Raspberries: Commercial Acreage, Yield per Acre, Utilized Production, and Season-Average Grower Price, Oregon, Washington, and California,” October 29, 2020. 277 Despite relatively stable acreage, raspberry plant sales have fluctuated. They declined overall from 2014 to 2019, falling to a period low of less than 1.5 million plants sold in 2019 after a high of over 3 million plants sold in 2016. The sales of Meeker and WakeField, two of the major processing cultivars, have fallen sharply since 2016, and do not appear to have been completely replaced by sales of WakeHaven, the only variety with a substantial increase in sales. USITC, hearing transcript, September 17, 2020, 9 (testimony of Henry Bierlink, WRRC); industry representative, interview by USITC staff, October 20, 2020; Bierlink, “USA Raspberry Industry: Trends,” accessed February 16, 2021. 278 USDA, ERS, Fruit and Tree Nuts Yearbook, table D5: “Red raspberries: Commercial acreage, yield per acre, utilized production, and season-average grower price, Oregon, Washington, and California,” October 29, 2020; Gallagher, “Last Winter Was Bad for Whatcom County,” October 17, 2019. 279 Industry representatives, interviews by USITC staff, September 24, 2020, and February 26, 2021; J.M. Smucker Co., written submission to the USITC, December 4, 2020, 1.
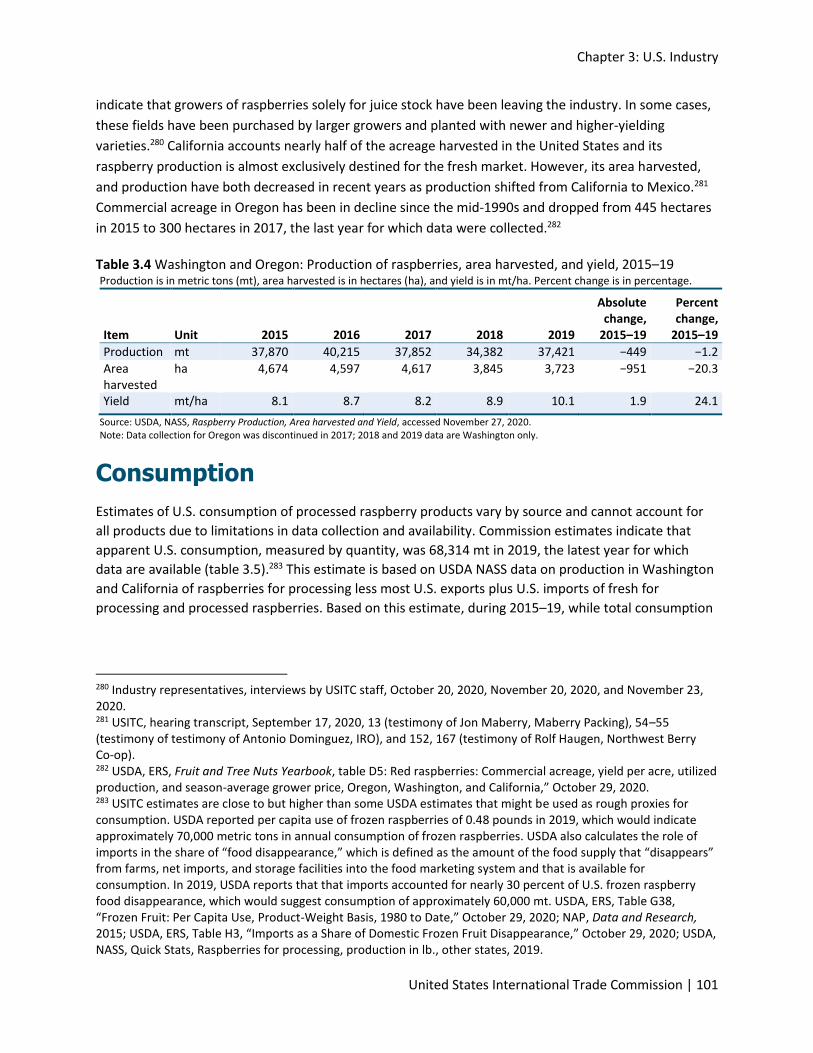
Chapter 3: U.S. Industry
United States International Trade Commission | 101
indicate that growers of raspberries solely for juice stock have been leaving the industry. In some cases,
these fields have been purchased by larger growers and planted with newer and higher-yielding
varieties.280 California accounts nearly half of the acreage harvested in the United States and its
raspberry production is almost exclusively destined for the fresh market. However, its area harvested,
and production have both decreased in recent years as production shifted from California to Mexico.281
Commercial acreage in Oregon has been in decline since the mid-1990s and dropped from 445 hectares
in 2015 to 300 hectares in 2017, the last year for which data were collected.282
Table 3.4 Washington and Oregon: Production of raspberries, area harvested, and yield, 2015–19 Production is in metric tons (mt), area harvested is in hectares (ha), and yield is in mt/ha. Percent change is in percentage.
Item Unit 2015 2016 2017 2018 2019
Absolute change,
2015–19
Percent change,
2015–19
Production mt 37,870 40,215 37,852 34,382 37,421 −449 −1.2
Area harvested
ha 4,674 4,597 4,617 3,845 3,723 −951 −20.3
Yield mt/ha 8.1 8.7 8.2 8.9 10.1 1.9 24.1
Source: USDA, NASS, Raspberry Production, Area harvested and Yield, accessed November 27, 2020. Note: Data collection for Oregon was discontinued in 2017; 2018 and 2019 data are Washington only.
Consumption
Estimates of U.S. consumption of processed raspberry products vary by source and cannot account for
all products due to limitations in data collection and availability. Commission estimates indicate that
apparent U.S. consumption, measured by quantity, was 68,314 mt in 2019, the latest year for which
data are available (table 3.5).283 This estimate is based on USDA NASS data on production in Washington
and California of raspberries for processing less most U.S. exports plus U.S. imports of fresh for
processing and processed raspberries. Based on this estimate, during 2015–19, while total consumption
280 Industry representatives, interviews by USITC staff, October 20, 2020, November 20, 2020, and November 23, 2020. 281 USITC, hearing transcript, September 17, 2020, 13 (testimony of Jon Maberry, Maberry Packing), 54–55 (testimony of testimony of Antonio Dominguez, IRO), and 152, 167 (testimony of Rolf Haugen, Northwest Berry Co-op). 282 USDA, ERS, Fruit and Tree Nuts Yearbook, table D5: Red raspberries: Commercial acreage, yield per acre, utilized production, and season-average grower price, Oregon, Washington, and California,” October 29, 2020. 283 USITC estimates are close to but higher than some USDA estimates that might be used as rough proxies for consumption. USDA reported per capita use of frozen raspberries of 0.48 pounds in 2019, which would indicate approximately 70,000 metric tons in annual consumption of frozen raspberries. USDA also calculates the role of imports in the share of “food disappearance,” which is defined as the amount of the food supply that “disappears” from farms, net imports, and storage facilities into the food marketing system and that is available for consumption. In 2019, USDA reports that that imports accounted for nearly 30 percent of U.S. frozen raspberry food disappearance, which would suggest consumption of approximately 60,000 mt. USDA, ERS, Table G38, “Frozen Fruit: Per Capita Use, Product-Weight Basis, 1980 to Date,” October 29, 2020; NAP, Data and Research, 2015; USDA, ERS, Table H3, “Imports as a Share of Domestic Frozen Fruit Disappearance,” October 29, 2020; USDA, NASS, Quick Stats, Raspberries for processing, production in lb., other states, 2019.
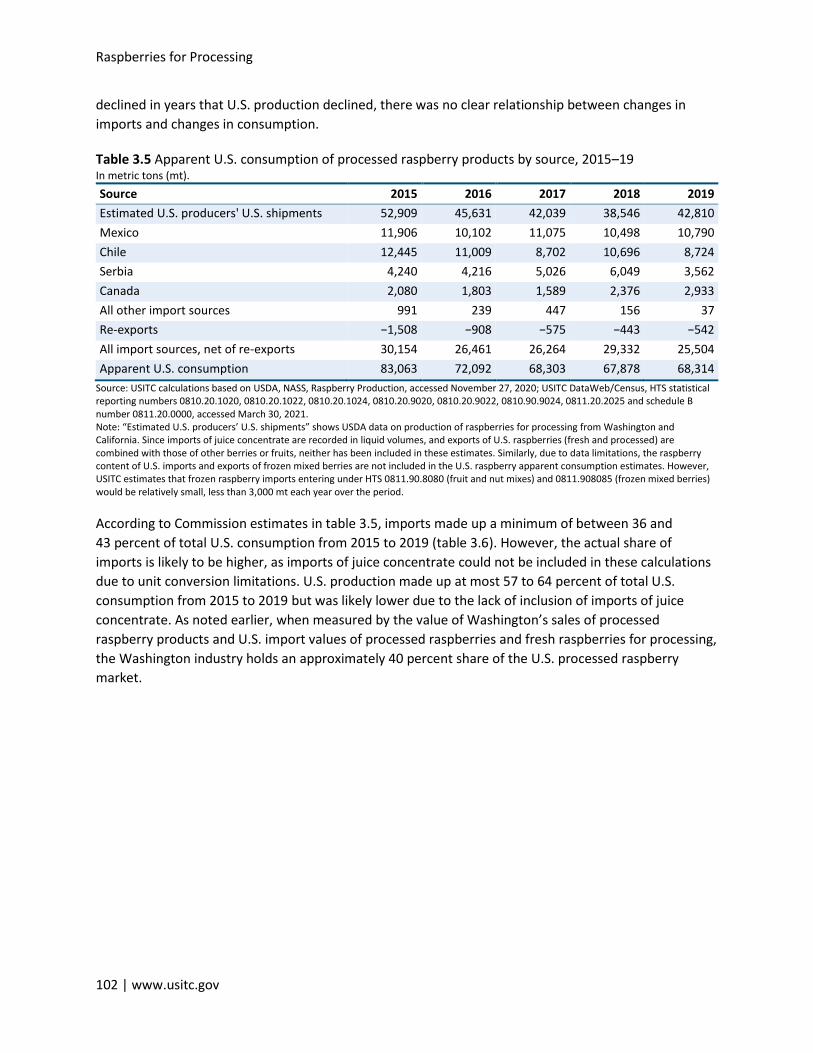
Raspberries for Processing
102 | www.usitc.gov
declined in years that U.S. production declined, there was no clear relationship between changes in
imports and changes in consumption.
Table 3.5 Apparent U.S. consumption of processed raspberry products by source, 2015–19 In metric tons (mt).
Source 2015 2016 2017 2018 2019
Estimated U.S. producers' U.S. shipments 52,909 45,631 42,039 38,546 42,810
Mexico 11,906 10,102 11,075 10,498 10,790
Chile 12,445 11,009 8,702 10,696 8,724
Serbia 4,240 4,216 5,026 6,049 3,562
Canada 2,080 1,803 1,589 2,376 2,933
All other import sources 991 239 447 156 37
Re-exports −1,508 −908 −575 −443 −542
All import sources, net of re-exports 30,154 26,461 26,264 29,332 25,504
Apparent U.S. consumption 83,063 72,092 68,303 67,878 68,314
Source: USITC calculations based on USDA, NASS, Raspberry Production, accessed November 27, 2020; USITC DataWeb/Census, HTS statistical reporting numbers 0810.20.1020, 0810.20.1022, 0810.20.1024, 0810.20.9020, 0810.20.9022, 0810.90.9024, 0811.20.2025 and schedule B number 0811.20.0000, accessed March 30, 2021. Note: “Estimated U.S. producers’ U.S. shipments” shows USDA data on production of raspberries for processing from Washington and California. Since imports of juice concentrate are recorded in liquid volumes, and exports of U.S. raspberries (fresh and processed) are combined with those of other berries or fruits, neither has been included in these estimates. Similarly, due to data limitations, the raspberry content of U.S. imports and exports of frozen mixed berries are not included in the U.S. raspberry apparent consumption estimates. However, USITC estimates that frozen raspberry imports entering under HTS 0811.90.8080 (fruit and nut mixes) and 0811.908085 (frozen mixed berries) would be relatively small, less than 3,000 mt each year over the period.
According to Commission estimates in table 3.5, imports made up a minimum of between 36 and
43 percent of total U.S. consumption from 2015 to 2019 (table 3.6). However, the actual share of
imports is likely to be higher, as imports of juice concentrate could not be included in these calculations
due to unit conversion limitations. U.S. production made up at most 57 to 64 percent of total U.S.
consumption from 2015 to 2019 but was likely lower due to the lack of inclusion of imports of juice
concentrate. As noted earlier, when measured by the value of Washington’s sales of processed
raspberry products and U.S. import values of processed raspberries and fresh raspberries for processing,
the Washington industry holds an approximately 40 percent share of the U.S. processed raspberry
market.
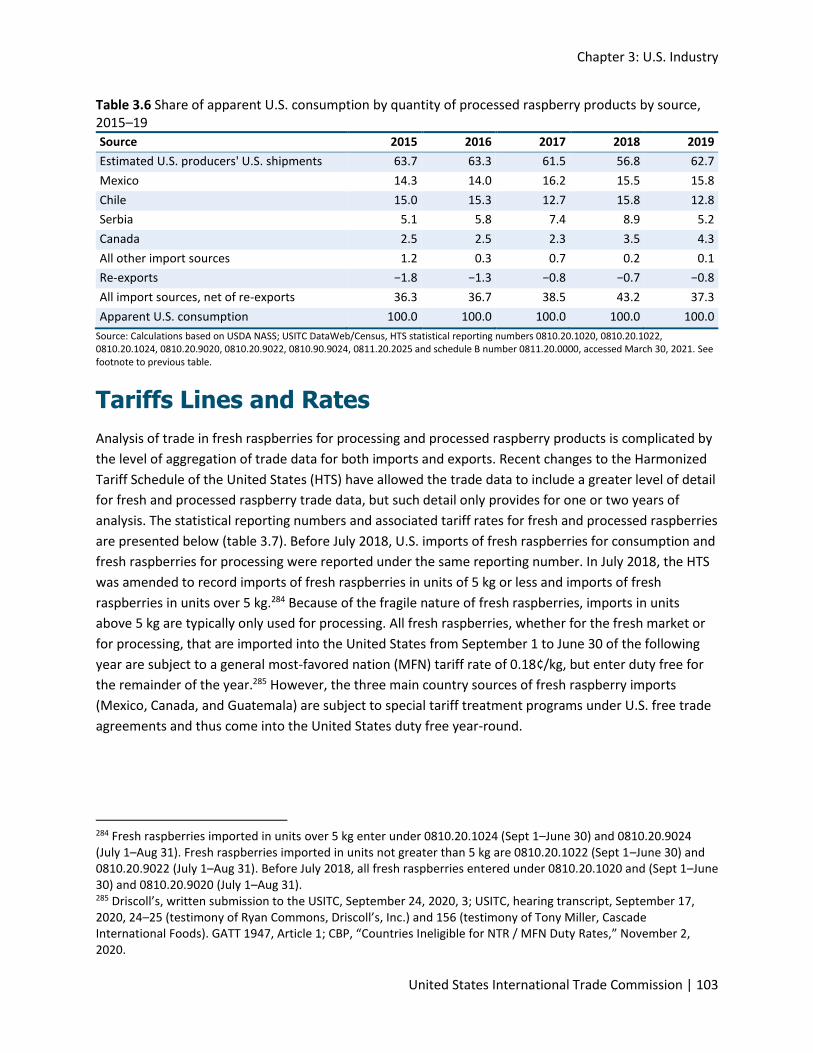
Chapter 3: U.S. Industry
United States International Trade Commission | 103
Table 3.6 Share of apparent U.S. consumption by quantity of processed raspberry products by source, 2015–19
Source 2015 2016 2017 2018 2019
Estimated U.S. producers' U.S. shipments 63.7 63.3 61.5 56.8 62.7
Mexico 14.3 14.0 16.2 15.5 15.8
Chile 15.0 15.3 12.7 15.8 12.8
Serbia 5.1 5.8 7.4 8.9 5.2
Canada 2.5 2.5 2.3 3.5 4.3
All other import sources 1.2 0.3 0.7 0.2 0.1
Re-exports −1.8 −1.3 −0.8 −0.7 −0.8
All import sources, net of re-exports 36.3 36.7 38.5 43.2 37.3
Apparent U.S. consumption 100.0 100.0 100.0 100.0 100.0
Source: Calculations based on USDA NASS; USITC DataWeb/Census, HTS statistical reporting numbers 0810.20.1020, 0810.20.1022, 0810.20.1024, 0810.20.9020, 0810.20.9022, 0810.90.9024, 0811.20.2025 and schedule B number 0811.20.0000, accessed March 30, 2021. See footnote to previous table.
Tariffs Lines and Rates
Analysis of trade in fresh raspberries for processing and processed raspberry products is complicated by
the level of aggregation of trade data for both imports and exports. Recent changes to the Harmonized
Tariff Schedule of the United States (HTS) have allowed the trade data to include a greater level of detail
for fresh and processed raspberry trade data, but such detail only provides for one or two years of
analysis. The statistical reporting numbers and associated tariff rates for fresh and processed raspberries
are presented below (table 3.7). Before July 2018, U.S. imports of fresh raspberries for consumption and
fresh raspberries for processing were reported under the same reporting number. In July 2018, the HTS
was amended to record imports of fresh raspberries in units of 5 kg or less and imports of fresh
raspberries in units over 5 kg.284 Because of the fragile nature of fresh raspberries, imports in units
above 5 kg are typically only used for processing. All fresh raspberries, whether for the fresh market or
for processing, that are imported into the United States from September 1 to June 30 of the following
year are subject to a general most-favored nation (MFN) tariff rate of 0.18¢/kg, but enter duty free for
the remainder of the year.285 However, the three main country sources of fresh raspberry imports
(Mexico, Canada, and Guatemala) are subject to special tariff treatment programs under U.S. free trade
agreements and thus come into the United States duty free year-round.
284 Fresh raspberries imported in units over 5 kg enter under 0810.20.1024 (Sept 1–June 30) and 0810.20.9024 (July 1–Aug 31). Fresh raspberries imported in units not greater than 5 kg are 0810.20.1022 (Sept 1–June 30) and 0810.20.9022 (July 1–Aug 31). Before July 2018, all fresh raspberries entered under 0810.20.1020 and (Sept 1–June 30) and 0810.20.9020 (July 1–Aug 31). 285 Driscoll’s, written submission to the USITC, September 24, 2020, 3; USITC, hearing transcript, September 17, 2020, 24–25 (testimony of Ryan Commons, Driscoll’s, Inc.) and 156 (testimony of Tony Miller, Cascade International Foods). GATT 1947, Article 1; CBP, “Countries Ineligible for NTR / MFN Duty Rates,” November 2, 2020.
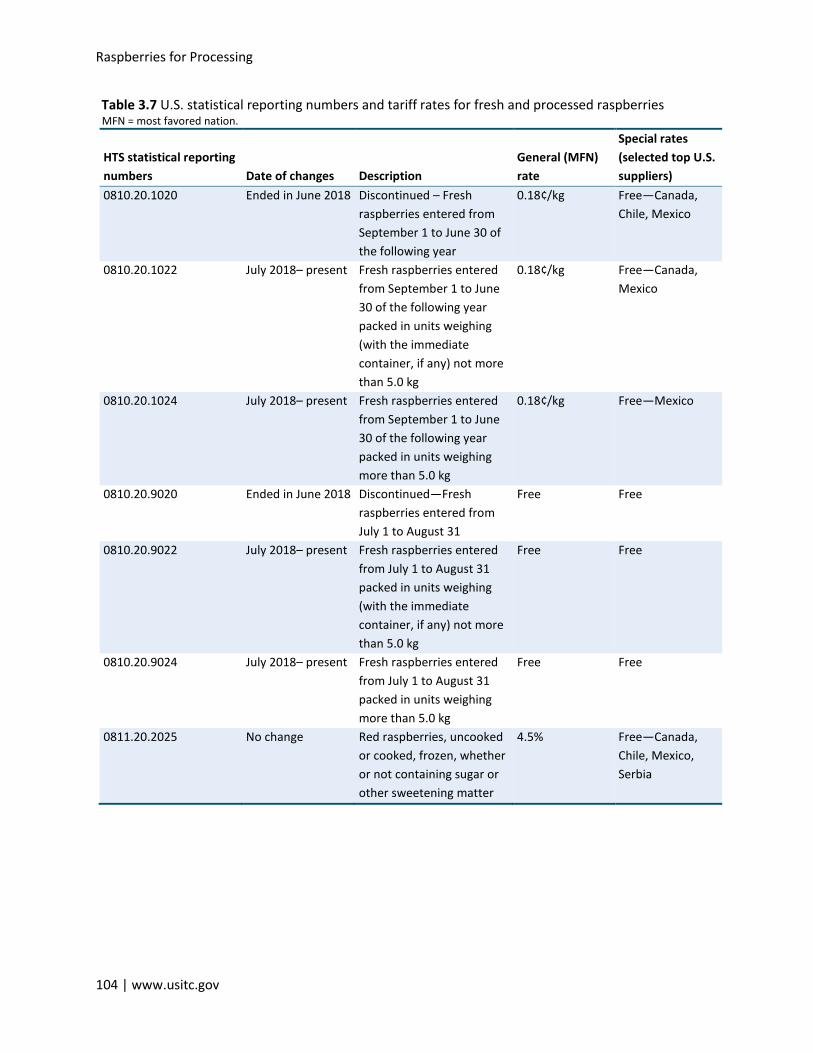
Raspberries for Processing
104 | www.usitc.gov
Table 3.7 U.S. statistical reporting numbers and tariff rates for fresh and processed raspberries MFN = most favored nation.
HTS statistical reporting
numbers Date of changes Description
General (MFN)
rate
Special rates
(selected top U.S.
suppliers)
0810.20.1020 Ended in June 2018 Discontinued – Fresh
raspberries entered from
September 1 to June 30 of
the following year
0.18¢/kg Free—Canada,
Chile, Mexico
0810.20.1022 July 2018– present Fresh raspberries entered
from September 1 to June
30 of the following year
packed in units weighing
(with the immediate
container, if any) not more
than 5.0 kg
0.18¢/kg Free—Canada,
Mexico
0810.20.1024 July 2018– present Fresh raspberries entered
from September 1 to June
30 of the following year
packed in units weighing
more than 5.0 kg
0.18¢/kg Free—Mexico
0810.20.9020 Ended in June 2018 Discontinued—Fresh
raspberries entered from
July 1 to August 31
Free Free
0810.20.9022 July 2018– present Fresh raspberries entered
from July 1 to August 31
packed in units weighing
(with the immediate
container, if any) not more
than 5.0 kg
Free Free
0810.20.9024 July 2018– present Fresh raspberries entered
from July 1 to August 31
packed in units weighing
more than 5.0 kg
Free Free
0811.20.2025 No change Red raspberries, uncooked
or cooked, frozen, whether
or not containing sugar or
other sweetening matter
4.5% Free—Canada,
Chile, Mexico,
Serbia
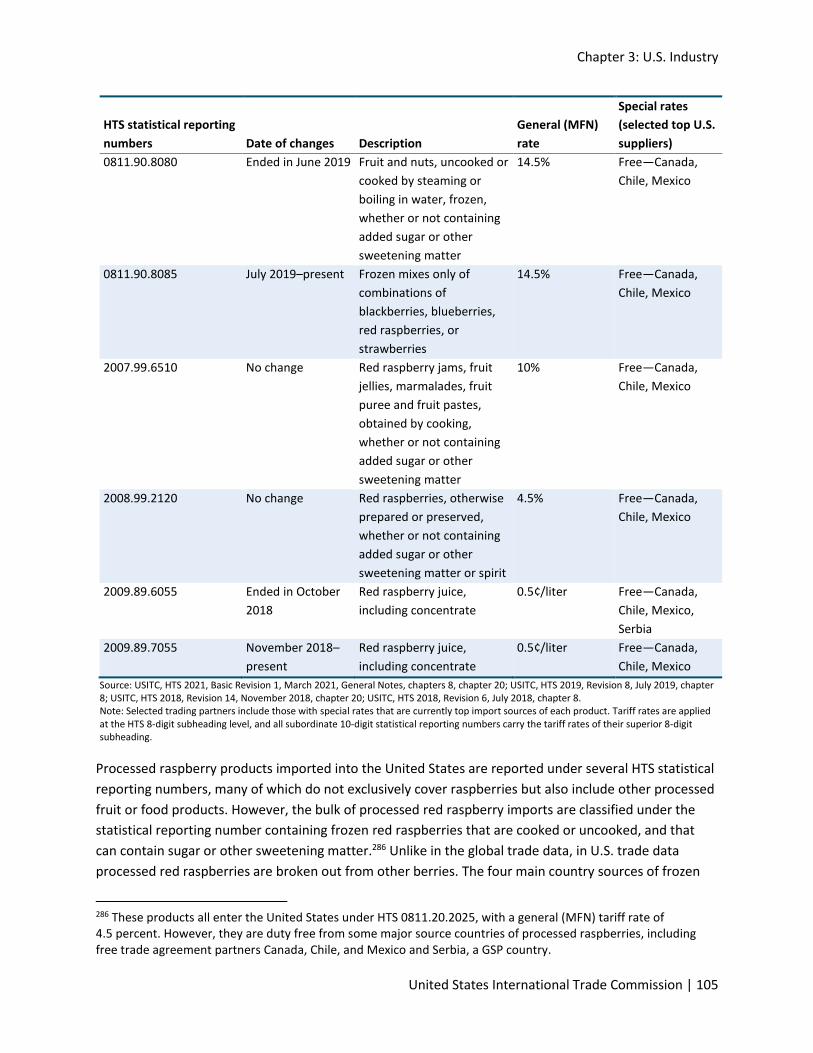
Chapter 3: U.S. Industry
United States International Trade Commission | 105
HTS statistical reporting
numbers Date of changes Description
General (MFN)
rate
Special rates
(selected top U.S.
suppliers)
0811.90.8080 Ended in June 2019 Fruit and nuts, uncooked or
cooked by steaming or
boiling in water, frozen,
whether or not containing
added sugar or other
sweetening matter
14.5% Free—Canada,
Chile, Mexico
0811.90.8085 July 2019–present Frozen mixes only of
combinations of
blackberries, blueberries,
red raspberries, or
strawberries
14.5% Free—Canada,
Chile, Mexico
2007.99.6510 No change Red raspberry jams, fruit
jellies, marmalades, fruit
puree and fruit pastes,
obtained by cooking,
whether or not containing
added sugar or other
sweetening matter
10% Free—Canada,
Chile, Mexico
2008.99.2120 No change Red raspberries, otherwise
prepared or preserved,
whether or not containing
added sugar or other
sweetening matter or spirit
4.5% Free—Canada,
Chile, Mexico
2009.89.6055 Ended in October
2018
Red raspberry juice,
including concentrate
0.5¢/liter Free—Canada,
Chile, Mexico,
Serbia
2009.89.7055 November 2018–
present
Red raspberry juice,
including concentrate
0.5¢/liter Free—Canada,
Chile, Mexico
Source: USITC, HTS 2021, Basic Revision 1, March 2021, General Notes, chapters 8, chapter 20; USITC, HTS 2019, Revision 8, July 2019, chapter 8; USITC, HTS 2018, Revision 14, November 2018, chapter 20; USITC, HTS 2018, Revision 6, July 2018, chapter 8. Note: Selected trading partners include those with special rates that are currently top import sources of each product. Tariff rates are applied at the HTS 8-digit subheading level, and all subordinate 10-digit statistical reporting numbers carry the tariff rates of their superior 8-digit subheading.
Processed raspberry products imported into the United States are reported under several HTS statistical
reporting numbers, many of which do not exclusively cover raspberries but also include other processed
fruit or food products. However, the bulk of processed red raspberry imports are classified under the
statistical reporting number containing frozen red raspberries that are cooked or uncooked, and that
can contain sugar or other sweetening matter.286 Unlike in the global trade data, in U.S. trade data
processed red raspberries are broken out from other berries. The four main country sources of frozen
286 These products all enter the United States under HTS 0811.20.2025, with a general (MFN) tariff rate of 4.5 percent. However, they are duty free from some major source countries of processed raspberries, including free trade agreement partners Canada, Chile, and Mexico and Serbia, a GSP country.
Raspberries for Processing
106 | www.usitc.gov
red raspberry imports are subject to special tariff treatment programs under U.S. free trade agreements
(Mexico, Canada, and Chile) or in accordance with Generalized System of Preferences (GSP) benefits
(Serbia) and thus come into the United States duty free and quota free. In July 2019, a new 10-digit HTS
statistical reporting number was created for frozen berry mixes that include blackberries, blueberries,
red raspberries, or strawberries, with an applicable tariff of 14.5 percent.287 Imports of these mixes
come into the U.S. market duty free under the United States-Mexico-Canada Agreement (USMCA) and
the United States-Chile Free Trade Agreement.288 Before July 2019, frozen berry mixes of blackberries,
blueberries, red raspberries, or strawberries were reported under a broader HTS category that included
any other frozen fruit and nut mixes, also with a 14.5 percent general (MFN) rate.289
Three other classification categories of raspberry product imports include cooked red raspberry pastes
and purees,290 other preparations of red raspberries,291 and red raspberry juice (including
concentrate).292 Further-processed raspberry products, such as raspberry jams, are not considered
“processed raspberry products” for the purpose of this report.
Trade
Imports of Raspberries and Raspberry Products
Nearly all (99.3 percent) fresh raspberries imported into the United States come from Mexico (table
3.8). Imports of fresh market raspberries from Mexico rose by over 50 percent from 2015 to 2020 as a
result of increased production in Mexico. Some of this increase was a result of a shift in production from
California to Mexico, while an increase in U.S. demand for fresh market raspberries also drove up
imports.293
287 HTS 0811.90.8085. USITC, HTS 2019, Revision 8, July 2019, chapter 8. 288 USITC, HTS 2021, Basic Revision 1, March 2021, chapter 8, chapter 18. 289 HTS 0811.90.8080. 290 HTS 2007.99.6510. 291 HTS 2008.99.2120. 292 HTS 2009.89.7055. This statistical reporting number changed in 2019; it was previously 2009.89.6055 but covered the same products. USITC, HTS 2018, Revision 14, November 2018, chapter 20. 293 USITC, hearing transcript, September 17, 2020, 13 (testimony of Jon Maberry, Maberry Packing), 54–55 (testimony of testimony of Antonio Dominguez, IRO), and 152, 167 (testimony of Rolf Haugen, Northwest Berry Co-op).
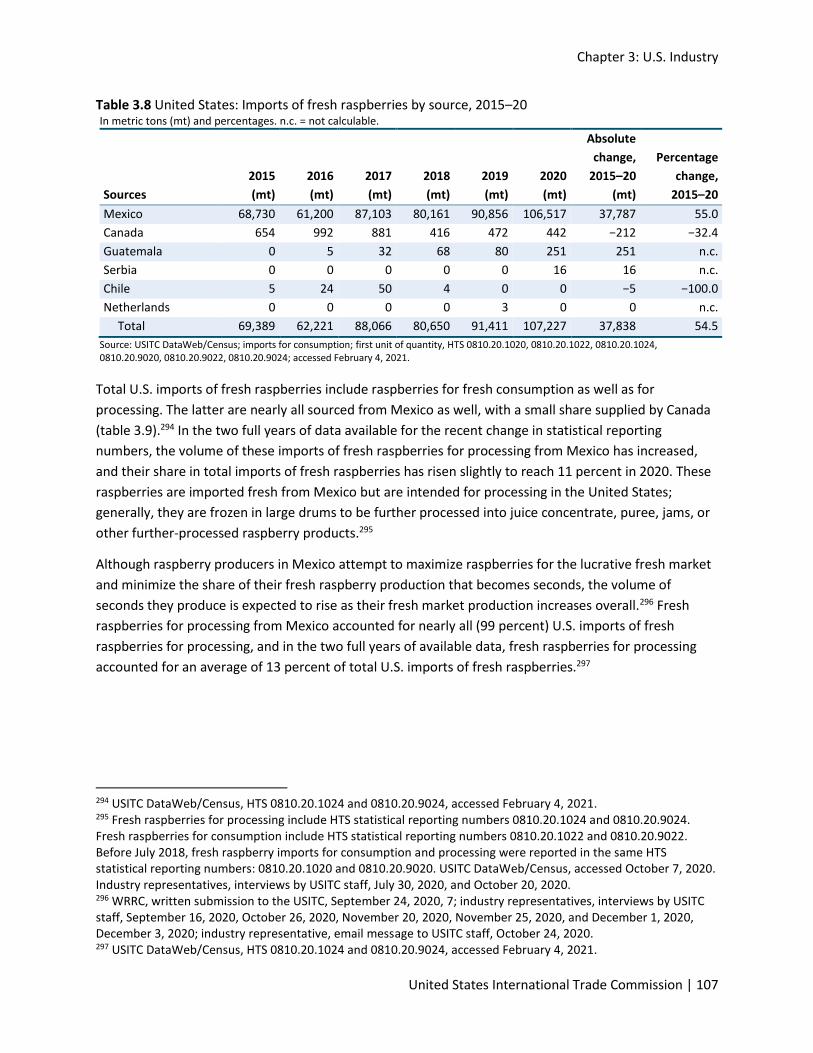
Chapter 3: U.S. Industry
United States International Trade Commission | 107
Table 3.8 United States: Imports of fresh raspberries by source, 2015–20 In metric tons (mt) and percentages. n.c. = not calculable.
Sources
2015
(mt)
2016
(mt)
2017
(mt)
2018
(mt)
2019
(mt)
2020
(mt)
Absolute
change,
2015–20
(mt)
Percentage
change,
2015–20
Mexico 68,730 61,200 87,103 80,161 90,856 106,517 37,787 55.0
Canada 654 992 881 416 472 442 −212 −32.4
Guatemala 0 5 32 68 80 251 251 n.c.
Serbia 0 0 0 0 0 16 16 n.c.
Chile 5 24 50 4 0 0 −5 −100.0
Netherlands 0 0 0 0 3 0 0 n.c.
Total 69,389 62,221 88,066 80,650 91,411 107,227 37,838 54.5
Source: USITC DataWeb/Census; imports for consumption; first unit of quantity, HTS 0810.20.1020, 0810.20.1022, 0810.20.1024, 0810.20.9020, 0810.20.9022, 0810.20.9024; accessed February 4, 2021.
Total U.S. imports of fresh raspberries include raspberries for fresh consumption as well as for
processing. The latter are nearly all sourced from Mexico as well, with a small share supplied by Canada
(table 3.9).294 In the two full years of data available for the recent change in statistical reporting
numbers, the volume of these imports of fresh raspberries for processing from Mexico has increased,
and their share in total imports of fresh raspberries has risen slightly to reach 11 percent in 2020. These
raspberries are imported fresh from Mexico but are intended for processing in the United States;
generally, they are frozen in large drums to be further processed into juice concentrate, puree, jams, or
other further-processed raspberry products.295
Although raspberry producers in Mexico attempt to maximize raspberries for the lucrative fresh market
and minimize the share of their fresh raspberry production that becomes seconds, the volume of
seconds they produce is expected to rise as their fresh market production increases overall.296 Fresh
raspberries for processing from Mexico accounted for nearly all (99 percent) U.S. imports of fresh
raspberries for processing, and in the two full years of available data, fresh raspberries for processing
accounted for an average of 13 percent of total U.S. imports of fresh raspberries.297
294 USITC DataWeb/Census, HTS 0810.20.1024 and 0810.20.9024, accessed February 4, 2021. 295 Fresh raspberries for processing include HTS statistical reporting numbers 0810.20.1024 and 0810.20.9024. Fresh raspberries for consumption include HTS statistical reporting numbers 0810.20.1022 and 0810.20.9022. Before July 2018, fresh raspberry imports for consumption and processing were reported in the same HTS statistical reporting numbers: 0810.20.1020 and 0810.20.9020. USITC DataWeb/Census, accessed October 7, 2020. Industry representatives, interviews by USITC staff, July 30, 2020, and October 20, 2020. 296 WRRC, written submission to the USITC, September 24, 2020, 7; industry representatives, interviews by USITC staff, September 16, 2020, October 26, 2020, November 20, 2020, November 25, 2020, and December 1, 2020, December 3, 2020; industry representative, email message to USITC staff, October 24, 2020. 297 USITC DataWeb/Census, HTS 0810.20.1024 and 0810.20.9024, accessed February 4, 2021.
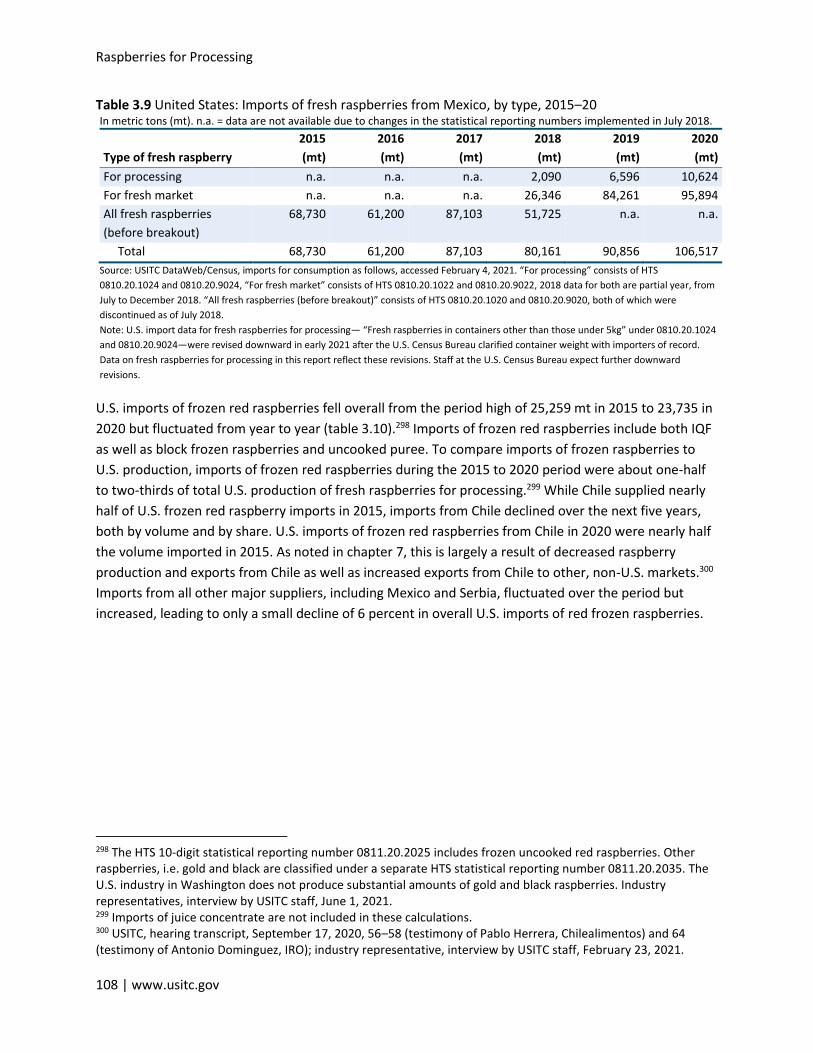
Raspberries for Processing
108 | www.usitc.gov
Table 3.9 United States: Imports of fresh raspberries from Mexico, by type, 2015–20 In metric tons (mt). n.a. = data are not available due to changes in the statistical reporting numbers implemented in July 2018.
Type of fresh raspberry
2015
(mt)
2016
(mt)
2017
(mt)
2018
(mt)
2019
(mt)
2020
(mt)
For processing n.a. n.a. n.a. 2,090 6,596 10,624
For fresh market n.a. n.a. n.a. 26,346 84,261 95,894
All fresh raspberries
(before breakout)
68,730 61,200 87,103 51,725 n.a. n.a.
Total 68,730 61,200 87,103 80,161 90,856 106,517
Source: USITC DataWeb/Census, imports for consumption as follows, accessed February 4, 2021. “For processing” consists of HTS
0810.20.1024 and 0810.20.9024, “For fresh market” consists of HTS 0810.20.1022 and 0810.20.9022, 2018 data for both are partial year, from
July to December 2018. “All fresh raspberries (before breakout)” consists of HTS 0810.20.1020 and 0810.20.9020, both of which were
discontinued as of July 2018.
Note: U.S. import data for fresh raspberries for processing— “Fresh raspberries in containers other than those under 5kg” under 0810.20.1024
and 0810.20.9024—were revised downward in early 2021 after the U.S. Census Bureau clarified container weight with importers of record.
Data on fresh raspberries for processing in this report reflect these revisions. Staff at the U.S. Census Bureau expect further downward
revisions.
U.S. imports of frozen red raspberries fell overall from the period high of 25,259 mt in 2015 to 23,735 in
2020 but fluctuated from year to year (table 3.10).298 Imports of frozen red raspberries include both IQF
as well as block frozen raspberries and uncooked puree. To compare imports of frozen raspberries to
U.S. production, imports of frozen red raspberries during the 2015 to 2020 period were about one-half
to two-thirds of total U.S. production of fresh raspberries for processing.299 While Chile supplied nearly
half of U.S. frozen red raspberry imports in 2015, imports from Chile declined over the next five years,
both by volume and by share. U.S. imports of frozen red raspberries from Chile in 2020 were nearly half
the volume imported in 2015. As noted in chapter 7, this is largely a result of decreased raspberry
production and exports from Chile as well as increased exports from Chile to other, non-U.S. markets.300
Imports from all other major suppliers, including Mexico and Serbia, fluctuated over the period but
increased, leading to only a small decline of 6 percent in overall U.S. imports of red frozen raspberries.
298 The HTS 10-digit statistical reporting number 0811.20.2025 includes frozen uncooked red raspberries. Other raspberries, i.e. gold and black are classified under a separate HTS statistical reporting number 0811.20.2035. The U.S. industry in Washington does not produce substantial amounts of gold and black raspberries. Industry representatives, interview by USITC staff, June 1, 2021. 299 Imports of juice concentrate are not included in these calculations. 300 USITC, hearing transcript, September 17, 2020, 56–58 (testimony of Pablo Herrera, Chilealimentos) and 64 (testimony of Antonio Dominguez, IRO); industry representative, interview by USITC staff, February 23, 2021.
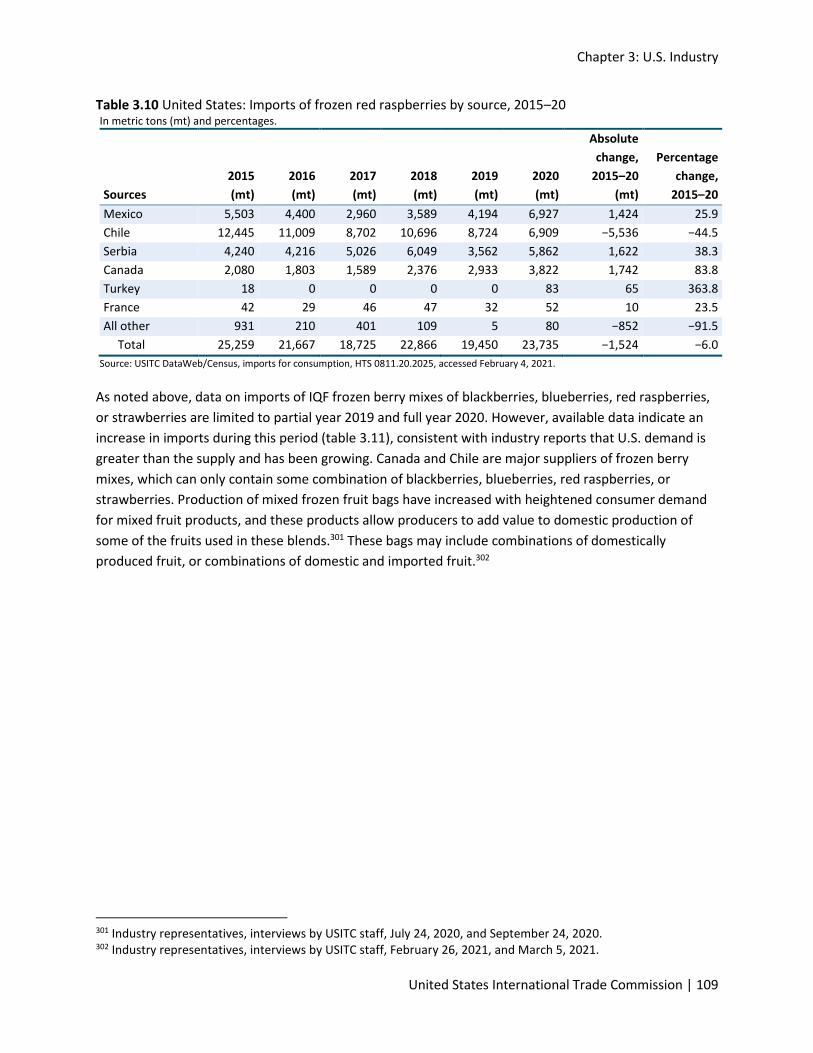
Chapter 3: U.S. Industry
United States International Trade Commission | 109
Table 3.10 United States: Imports of frozen red raspberries by source, 2015–20 In metric tons (mt) and percentages.
Sources
2015
(mt)
2016
(mt)
2017
(mt)
2018
(mt)
2019
(mt)
2020
(mt)
Absolute
change,
2015–20
(mt)
Percentage
change,
2015–20
Mexico 5,503 4,400 2,960 3,589 4,194 6,927 1,424 25.9
Chile 12,445 11,009 8,702 10,696 8,724 6,909 −5,536 −44.5
Serbia 4,240 4,216 5,026 6,049 3,562 5,862 1,622 38.3
Canada 2,080 1,803 1,589 2,376 2,933 3,822 1,742 83.8
Turkey 18 0 0 0 0 83 65 363.8
France 42 29 46 47 32 52 10 23.5
All other 931 210 401 109 5 80 −852 −91.5
Total 25,259 21,667 18,725 22,866 19,450 23,735 −1,524 −6.0
Source: USITC DataWeb/Census, imports for consumption, HTS 0811.20.2025, accessed February 4, 2021.
As noted above, data on imports of IQF frozen berry mixes of blackberries, blueberries, red raspberries,
or strawberries are limited to partial year 2019 and full year 2020. However, available data indicate an
increase in imports during this period (table 3.11), consistent with industry reports that U.S. demand is
greater than the supply and has been growing. Canada and Chile are major suppliers of frozen berry
mixes, which can only contain some combination of blackberries, blueberries, red raspberries, or
strawberries. Production of mixed frozen fruit bags have increased with heightened consumer demand
for mixed fruit products, and these products allow producers to add value to domestic production of
some of the fruits used in these blends.301 These bags may include combinations of domestically
produced fruit, or combinations of domestic and imported fruit.302
301 Industry representatives, interviews by USITC staff, July 24, 2020, and September 24, 2020. 302 Industry representatives, interviews by USITC staff, February 26, 2021, and March 5, 2021.
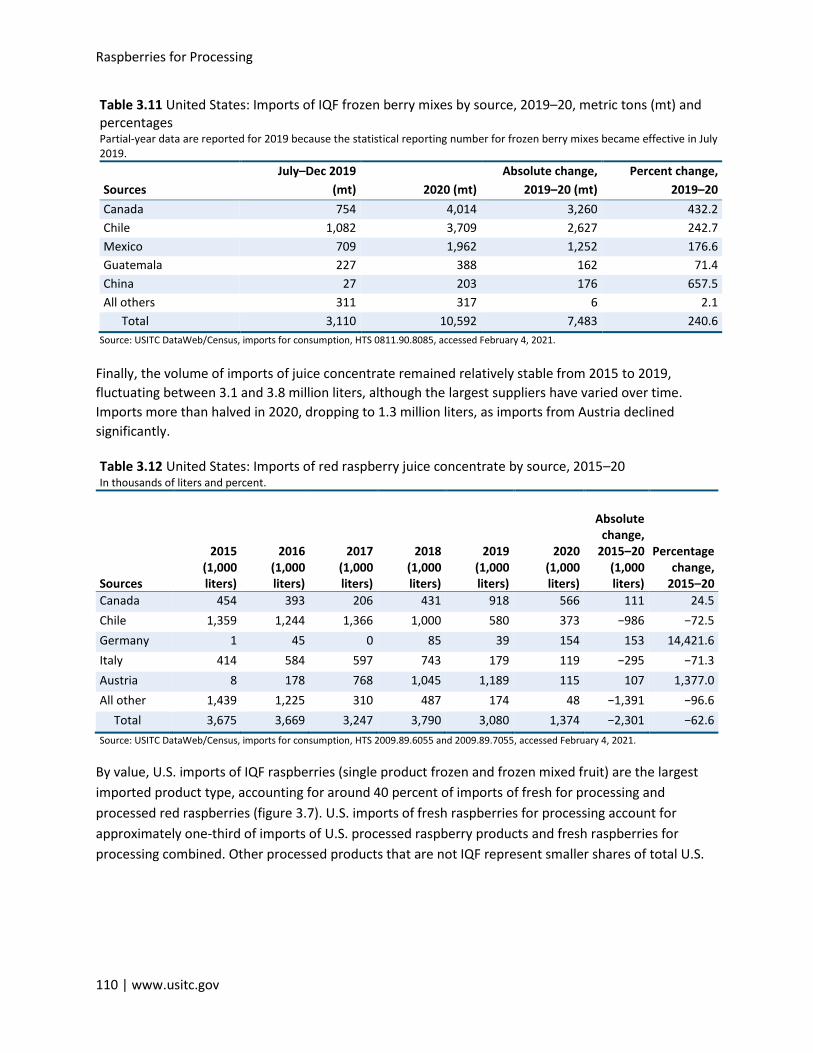
Raspberries for Processing
110 | www.usitc.gov
Table 3.11 United States: Imports of IQF frozen berry mixes by source, 2019–20, metric tons (mt) and percentages Partial-year data are reported for 2019 because the statistical reporting number for frozen berry mixes became effective in July 2019.
Sources
July–Dec 2019
(mt) 2020 (mt)
Absolute change,
2019–20 (mt)
Percent change,
2019–20
Canada 754 4,014 3,260 432.2
Chile 1,082 3,709 2,627 242.7
Mexico 709 1,962 1,252 176.6
Guatemala 227 388 162 71.4
China 27 203 176 657.5
All others 311 317 6 2.1
Total 3,110 10,592 7,483 240.6
Source: USITC DataWeb/Census, imports for consumption, HTS 0811.90.8085, accessed February 4, 2021.
Finally, the volume of imports of juice concentrate remained relatively stable from 2015 to 2019,
fluctuating between 3.1 and 3.8 million liters, although the largest suppliers have varied over time.
Imports more than halved in 2020, dropping to 1.3 million liters, as imports from Austria declined
significantly.
Table 3.12 United States: Imports of red raspberry juice concentrate by source, 2015–20 In thousands of liters and percent.
Sources
2015 (1,000 liters)
2016 (1,000 liters)
2017 (1,000 liters)
2018 (1,000 liters)
2019 (1,000 liters)
2020 (1,000 liters)
Absolute change,
2015–20 (1,000 liters)
Percentage change,
2015–20
Canada 454 393 206 431 918 566 111 24.5
Chile 1,359 1,244 1,366 1,000 580 373 −986 −72.5
Germany 1 45 0 85 39 154 153 14,421.6
Italy 414 584 597 743 179 119 −295 −71.3
Austria 8 178 768 1,045 1,189 115 107 1,377.0
All other 1,439 1,225 310 487 174 48 −1,391 −96.6
Total 3,675 3,669 3,247 3,790 3,080 1,374 −2,301 −62.6
Source: USITC DataWeb/Census, imports for consumption, HTS 2009.89.6055 and 2009.89.7055, accessed February 4, 2021.
By value, U.S. imports of IQF raspberries (single product frozen and frozen mixed fruit) are the largest
imported product type, accounting for around 40 percent of imports of fresh for processing and
processed red raspberries (figure 3.7). U.S. imports of fresh raspberries for processing account for
approximately one-third of imports of U.S. processed raspberry products and fresh raspberries for
processing combined. Other processed products that are not IQF represent smaller shares of total U.S.
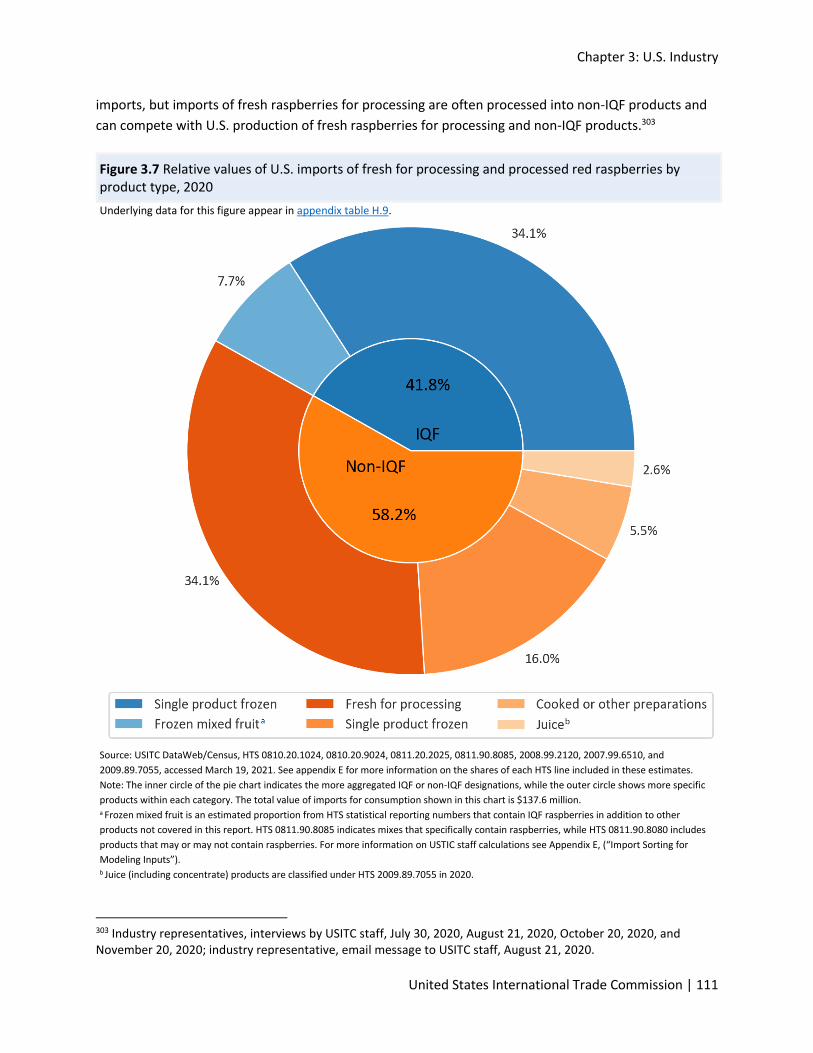
Chapter 3: U.S. Industry
United States International Trade Commission | 111
imports, but imports of fresh raspberries for processing are often processed into non-IQF products and
can compete with U.S. production of fresh raspberries for processing and non-IQF products.303
Figure 3.7 Relative values of U.S. imports of fresh for processing and processed red raspberries by product type, 2020
Underlying data for this figure appear in appendix table H.9.
Source: USITC DataWeb/Census, HTS 0810.20.1024, 0810.20.9024, 0811.20.2025, 0811.90.8085, 2008.99.2120, 2007.99.6510, and
2009.89.7055, accessed March 19, 2021. See appendix E for more information on the shares of each HTS line included in these estimates.
Note: The inner circle of the pie chart indicates the more aggregated IQF or non-IQF designations, while the outer circle shows more specific
products within each category. The total value of imports for consumption shown in this chart is $137.6 million. a Frozen mixed fruit is an estimated proportion from HTS statistical reporting numbers that contain IQF raspberries in addition to other
products not covered in this report. HTS 0811.90.8085 indicates mixes that specifically contain raspberries, while HTS 0811.90.8080 includes
products that may or may not contain raspberries. For more information on USTIC staff calculations see Appendix E, (“Import Sorting for
Modeling Inputs”). b Juice (including concentrate) products are classified under HTS 2009.89.7055 in 2020.
303 Industry representatives, interviews by USITC staff, July 30, 2020, August 21, 2020, October 20, 2020, and November 20, 2020; industry representative, email message to USITC staff, August 21, 2020.
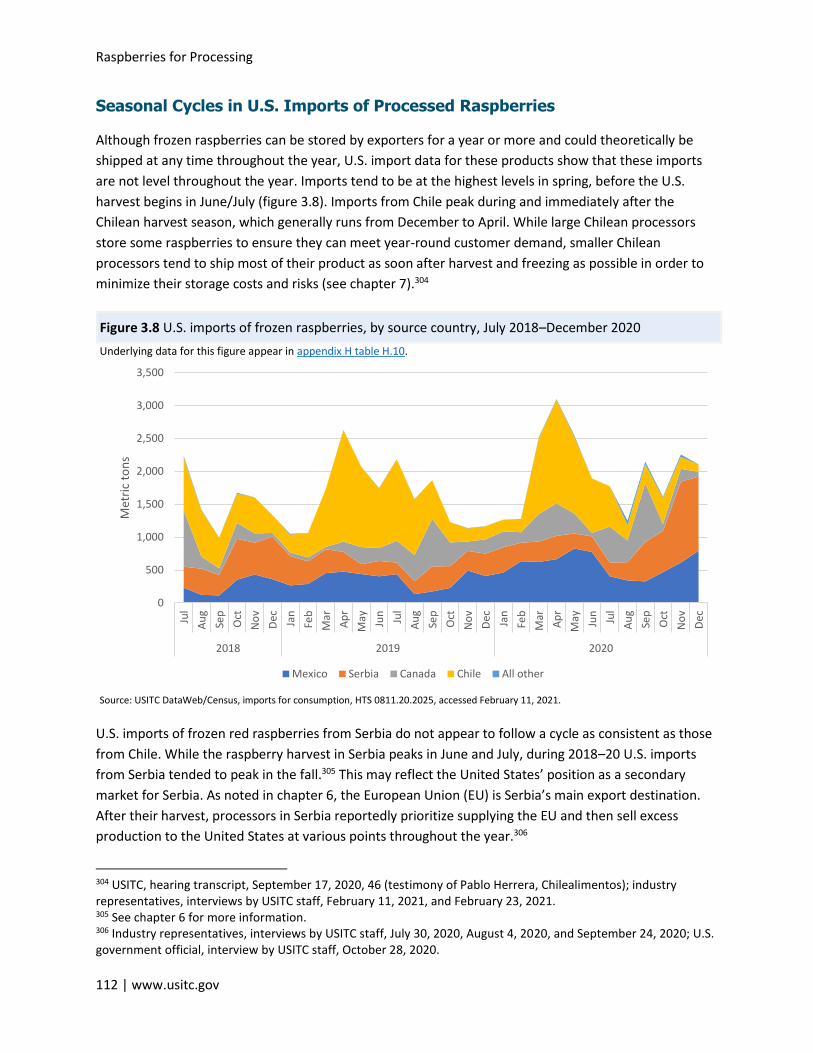
Raspberries for Processing
112 | www.usitc.gov
Seasonal Cycles in U.S. Imports of Processed Raspberries
Although frozen raspberries can be stored by exporters for a year or more and could theoretically be
shipped at any time throughout the year, U.S. import data for these products show that these imports
are not level throughout the year. Imports tend to be at the highest levels in spring, before the U.S.
harvest begins in June/July (figure 3.8). Imports from Chile peak during and immediately after the
Chilean harvest season, which generally runs from December to April. While large Chilean processors
store some raspberries to ensure they can meet year-round customer demand, smaller Chilean
processors tend to ship most of their product as soon after harvest and freezing as possible in order to
minimize their storage costs and risks (see chapter 7).304
Figure 3.8 U.S. imports of frozen raspberries, by source country, July 2018–December 2020
Underlying data for this figure appear in appendix H table H.10.
Source: USITC DataWeb/Census, imports for consumption, HTS 0811.20.2025, accessed February 11, 2021.
U.S. imports of frozen red raspberries from Serbia do not appear to follow a cycle as consistent as those
from Chile. While the raspberry harvest in Serbia peaks in June and July, during 2018–20 U.S. imports
from Serbia tended to peak in the fall.305 This may reflect the United States’ position as a secondary
market for Serbia. As noted in chapter 6, the European Union (EU) is Serbia’s main export destination.
After their harvest, processors in Serbia reportedly prioritize supplying the EU and then sell excess
production to the United States at various points throughout the year.306
304 USITC, hearing transcript, September 17, 2020, 46 (testimony of Pablo Herrera, Chilealimentos); industry representatives, interviews by USITC staff, February 11, 2021, and February 23, 2021. 305 See chapter 6 for more information. 306 Industry representatives, interviews by USITC staff, July 30, 2020, August 4, 2020, and September 24, 2020; U.S. government official, interview by USITC staff, October 28, 2020.
0
500
1,000
1,500
2,000
2,500
3,000
3,500
Jul
Au
g
Sep
Oct
No
v
Dec Jan
Feb
Mar
Ap
r
May Jun
Jul
Au
g
Sep
Oct
No
v
Dec Jan
Feb
Mar
Ap
r
May Jun
Jul
Au
g
Sep
Oct
No
v
Dec
2018 2019 2020
Met
ric
ton
s
Mexico Serbia Canada Chile All other
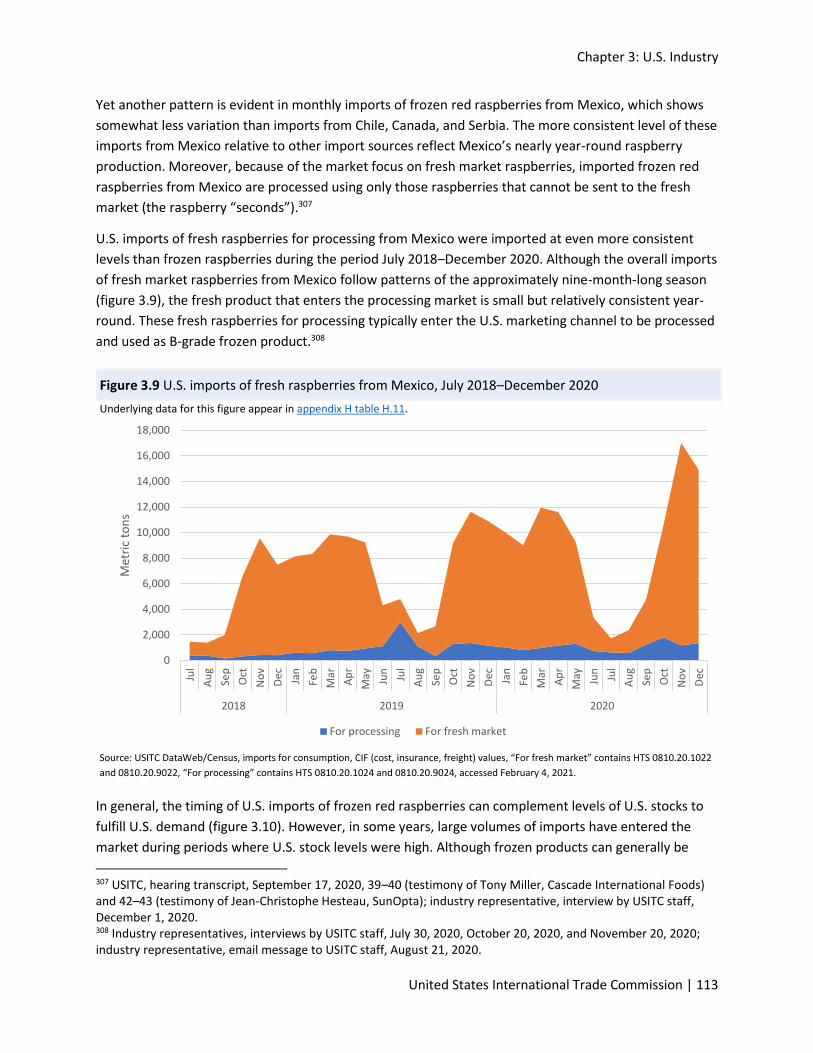
Chapter 3: U.S. Industry
United States International Trade Commission | 113
Yet another pattern is evident in monthly imports of frozen red raspberries from Mexico, which shows
somewhat less variation than imports from Chile, Canada, and Serbia. The more consistent level of these
imports from Mexico relative to other import sources reflect Mexico’s nearly year-round raspberry
production. Moreover, because of the market focus on fresh market raspberries, imported frozen red
raspberries from Mexico are processed using only those raspberries that cannot be sent to the fresh
market (the raspberry “seconds”).307
U.S. imports of fresh raspberries for processing from Mexico were imported at even more consistent
levels than frozen raspberries during the period July 2018–December 2020. Although the overall imports
of fresh market raspberries from Mexico follow patterns of the approximately nine-month-long season
(figure 3.9), the fresh product that enters the processing market is small but relatively consistent year-
round. These fresh raspberries for processing typically enter the U.S. marketing channel to be processed
and used as B-grade frozen product.308
Figure 3.9 U.S. imports of fresh raspberries from Mexico, July 2018–December 2020
Underlying data for this figure appear in appendix H table H.11.
Source: USITC DataWeb/Census, imports for consumption, CIF (cost, insurance, freight) values, “For fresh market” contains HTS 0810.20.1022
and 0810.20.9022, “For processing” contains HTS 0810.20.1024 and 0810.20.9024, accessed February 4, 2021.
In general, the timing of U.S. imports of frozen red raspberries can complement levels of U.S. stocks to
fulfill U.S. demand (figure 3.10). However, in some years, large volumes of imports have entered the
market during periods where U.S. stock levels were high. Although frozen products can generally be
307 USITC, hearing transcript, September 17, 2020, 39–40 (testimony of Tony Miller, Cascade International Foods) and 42–43 (testimony of Jean-Christophe Hesteau, SunOpta); industry representative, interview by USITC staff, December 1, 2020. 308 Industry representatives, interviews by USITC staff, July 30, 2020, October 20, 2020, and November 20, 2020; industry representative, email message to USITC staff, August 21, 2020.
0
2,000
4,000
6,000
8,000
10,000
12,000
14,000
16,000
18,000
Jul
Au
g
Sep
Oct
No
v
Dec Jan
Feb
Mar
Ap
r
May Jun
Jul
Au
g
Sep
Oct
No
v
Dec Jan
Feb
Mar
Ap
r
May Jun
Jul
Au
g
Sep
Oct
No
v
Dec
2018 2019 2020
Met
ric
ton
s
For processing For fresh market
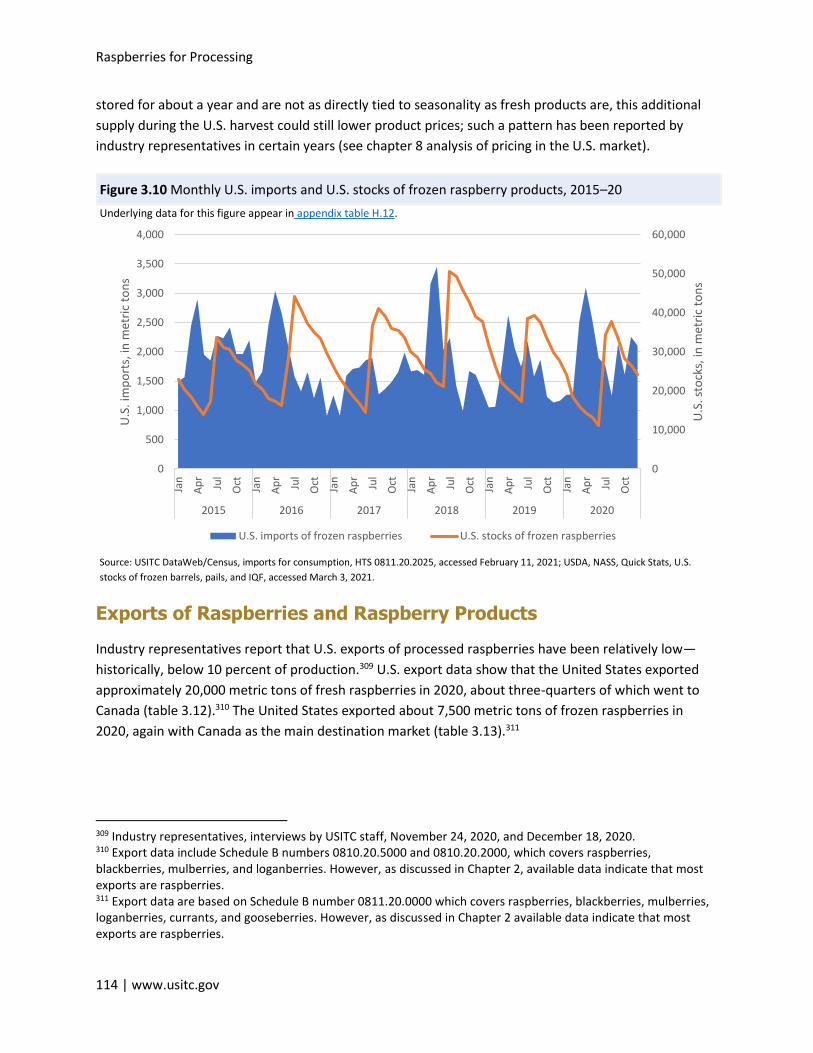
Raspberries for Processing
114 | www.usitc.gov
stored for about a year and are not as directly tied to seasonality as fresh products are, this additional
supply during the U.S. harvest could still lower product prices; such a pattern has been reported by
industry representatives in certain years (see chapter 8 analysis of pricing in the U.S. market).
Figure 3.10 Monthly U.S. imports and U.S. stocks of frozen raspberry products, 2015–20
Underlying data for this figure appear in appendix table H.12.
0
10,000
20,000
30,000
40,000
50,000
60,000
0
500
1,000
1,500
2,000
2,500
3,000
3,500
4,000
Jan
Ap
r
Jul
Oct
Jan
Ap
r
Jul
Oct
Jan
Ap
r
Jul
Oct
Jan
Ap
r
Jul
Oct
Jan
Ap
r
Jul
Oct
Jan
Ap
r
Jul
Oct
2015 2016 2017 2018 2019 2020
U.S
. sto
cks,
in m
etri
c to
ns
U.S
. im
po
rts,
in m
etri
c to
ns
U.S. imports of frozen raspberries U.S. stocks of frozen raspberries
Source: USITC DataWeb/Census, imports for consumption, HTS 0811.20.2025, accessed February 11, 2021; USDA, NASS, Quick Stats, U.S.
stocks of frozen barrels, pails, and IQF, accessed March 3, 2021.
Exports of Raspberries and Raspberry Products
Industry representatives report that U.S. exports of processed raspberries have been relatively low—
historically, below 10 percent of production.309 U.S. export data show that the United States exported
approximately 20,000 metric tons of fresh raspberries in 2020, about three-quarters of which went to
Canada (table 3.12).310 The United States exported about 7,500 metric tons of frozen raspberries in
2020, again with Canada as the main destination market (table 3.13).311
309 Industry representatives, interviews by USITC staff, November 24, 2020, and December 18, 2020. 310 Export data include Schedule B numbers 0810.20.5000 and 0810.20.2000, which covers raspberries, blackberries, mulberries, and loganberries. However, as discussed in Chapter 2, available data indicate that most exports are raspberries. 311 Export data are based on Schedule B number 0811.20.0000 which covers raspberries, blackberries, mulberries, loganberries, currants, and gooseberries. However, as discussed in Chapter 2 available data indicate that most exports are raspberries.
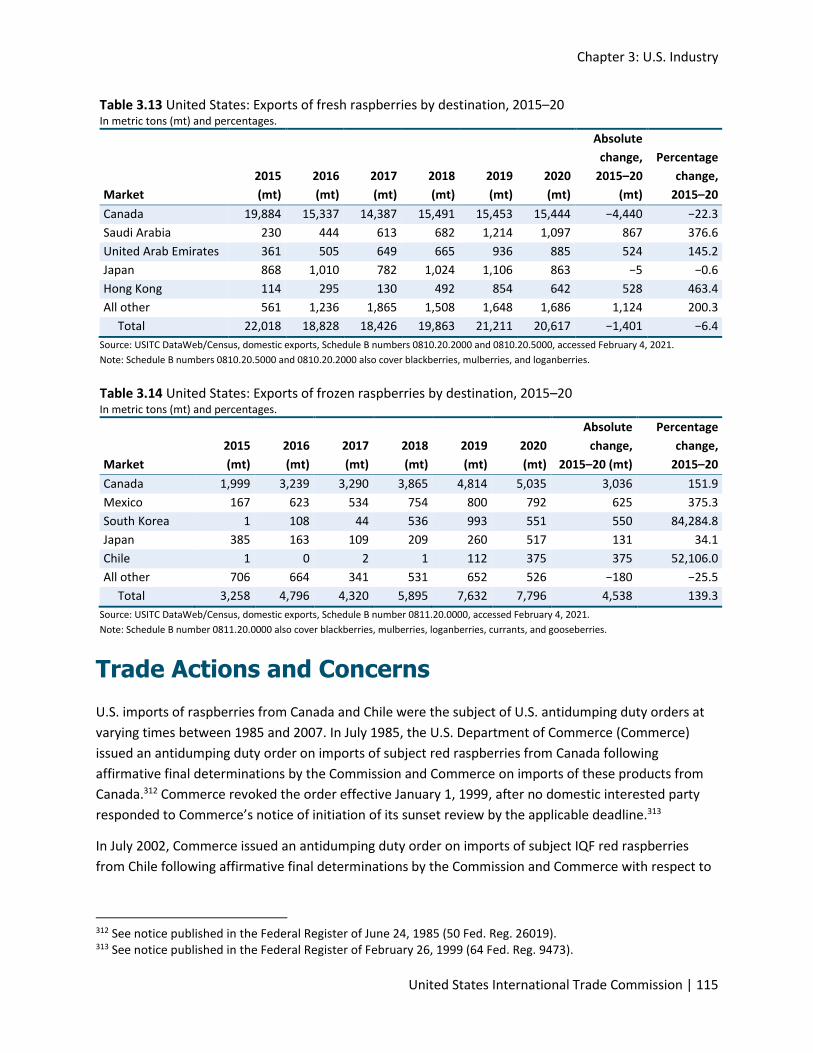
Chapter 3: U.S. Industry
United States International Trade Commission | 115
Table 3.13 United States: Exports of fresh raspberries by destination, 2015–20 In metric tons (mt) and percentages.
Market
2015
(mt)
2016
(mt)
2017
(mt)
2018
(mt)
2019
(mt)
2020
(mt)
Absolute
change,
2015–20
(mt)
Percentage
change,
2015–20
Canada 19,884 15,337 14,387 15,491 15,453 15,444 −4,440 −22.3
Saudi Arabia 230 444 613 682 1,214 1,097 867 376.6
United Arab Emirates 361 505 649 665 936 885 524 145.2
Japan 868 1,010 782 1,024 1,106 863 −5 −0.6
Hong Kong 114 295 130 492 854 642 528 463.4
All other 561 1,236 1,865 1,508 1,648 1,686 1,124 200.3
Total 22,018 18,828 18,426 19,863 21,211 20,617 −1,401 −6.4
Source: USITC DataWeb/Census, domestic exports, Schedule B numbers 0810.20.2000 and 0810.20.5000, accessed February 4, 2021.
Note: Schedule B numbers 0810.20.5000 and 0810.20.2000 also cover blackberries, mulberries, and loganberries.
Table 3.14 United States: Exports of frozen raspberries by destination, 2015–20 In metric tons (mt) and percentages.
Market
2015
(mt)
2016
(mt)
2017
(mt)
2018
(mt)
2019
(mt)
2020
(mt)
Absolute
change,
2015–20 (mt)
Percentage
change,
2015–20
Canada 1,999 3,239 3,290 3,865 4,814 5,035 3,036 151.9
Mexico 167 623 534 754 800 792 625 375.3
South Korea 1 108 44 536 993 551 550 84,284.8
Japan 385 163 109 209 260 517 131 34.1
Chile 1 0 2 1 112 375 375 52,106.0
All other 706 664 341 531 652 526 −180 −25.5
Total 3,258 4,796 4,320 5,895 7,632 7,796 4,538 139.3
Source: USITC DataWeb/Census, domestic exports, Schedule B number 0811.20.0000, accessed February 4, 2021.
Note: Schedule B number 0811.20.0000 also cover blackberries, mulberries, loganberries, currants, and gooseberries.
Trade Actions and Concerns
U.S. imports of raspberries from Canada and Chile were the subject of U.S. antidumping duty orders at
varying times between 1985 and 2007. In July 1985, the U.S. Department of Commerce (Commerce)
issued an antidumping duty order on imports of subject red raspberries from Canada following
affirmative final determinations by the Commission and Commerce on imports of these products from
Canada.312 Commerce revoked the order effective January 1, 1999, after no domestic interested party
responded to Commerce’s notice of initiation of its sunset review by the applicable deadline.313
In July 2002, Commerce issued an antidumping duty order on imports of subject IQF red raspberries
from Chile following affirmative final determinations by the Commission and Commerce with respect to
312 See notice published in the Federal Register of June 24, 1985 (50 Fed. Reg. 26019). 313 See notice published in the Federal Register of February 26, 1999 (64 Fed. Reg. 9473).
Raspberries for Processing
116 | www.usitc.gov
imports of these products from Chile.314 In May 2002, in a companion investigation under the U.S.
countervailing duty law, Commerce made a negative countervailing duty determination, and,
accordingly, no countervailing duty order was issued.315 After it did not receive a notice of intent to
participate from domestic interested parties in the sunset review by the deadline date, Commerce
revoked the antidumping duty order on this product from Chile effective July 9, 2007.316
More recently, in the context of this investigation, some U.S. industry representatives reported that
imports of frozen berry mixes from Canada may include raspberries imported from a third country, but
that the origin of the berries is not always reported on the label.317 U.S. country of origin labeling (COOL)
requirements apply to frozen fruits; however, “processed food items” are excluded from the
requirements. According to the COOL regulations, a bag of frozen raspberries sold at retail in the United
States must have the country of origin of the raspberry itself, not just the country where the raspberries
were packaged. However, once those raspberries are combined with other berries in a berry mix, they
become a “processed food item,” and only the country where the mixed berry bag was packaged must
be indicated on the label.318 Although no COOL or other regulations require it, importers report that the
source of each type of berry is often noted on the frozen mixed berry packs, in addition to labeling the
bag as a product of Canada.319
Additionally, there have been no actions alleging that such berries are mislabeled or misleadingly
labeled under the U.S. Perishable Agricultural Commodities Act.320 However, there have been some
concerns that these frozen mixed berries entered the United States from Canada duty free under
USMCA and the North American Free Trade Agreement (NAFTA), even when they contain berries from a
source outside North America.321 Trade data indicate that in 2018, imports of these frozen mixed berries
from Canada entered the U.S. market predominantly duty free. However, the following year, in 2019,
less than one-third of these imports, by value and by volume, claimed duty-free treatment under
NAFTA.322
WRRC members also have expressed that they are concerned about increased pesticide residue
violations of imported product and what they consider to be a low level of testing of imported products
314 See notice published in the Federal Register of July 9, 2002 (67 F.R. 45460). 315 See notice published in the Federal Register of May 22, 2002 (67 F.R. 35961). 316 See notice published in the Federal Register of July 20, 2007 (72 F.R. 39793). 317 USITC, hearing transcript, September 17, 2020, 14 (testimony of Brad Rader, Rader Farms); industry representatives, interviews by USITC staff, June 23, 2020, and November 20, 2020. 318 7 CFR 65.200; U.S. government representative, interview by USITC staff, November 23, 2021. 319 In some cases, however, the origin of only the type of berry with the highest percentage used may be listed on the label. Bratt, “Officials Hearing about Bleak 2018 Market Situation,” July 11, 2018; USITC, hearing transcript, September 17, 2020, 30 (testimony of John Tentomas, Nature’s Touch); industry representative, interview by USITC staff, September 24, 2020. 320 The Perishable Agricultural Commodities Act (PACA) is a USDA program administered by the Agricultural Marketing Service (AMS) to facilitate fair trade in the fresh and frozen fruit and vegetable industries. PACA establishes and enforces a code of fair business practices. USDA, AMS, Perishable Agricultural Commodities Act (PACA), accessed March 30, 2021; USDA, AMS, “PACA Press Releases,” accessed March 3, 2021. 321 Industry representative, interview by USITC staff, June 22, 2020. 322 USITC DataWeb/Census, HTS 0811.90.8085, accessed February 8, 2021.
Chapter 3: U.S. Industry
United States International Trade Commission | 117
for both pesticides and food contaminants.323 An additional WRRC member noted that any violations
have a negative impact on consumer demand for all raspberry products, both imported and domestic.324
Multiple U.S. federal government agencies are responsible for oversight of pesticides in or on food,
including fresh and processed raspberries.325 In particular, the U.S. Environmental Protection Agency
sets the acceptable pesticide residue tolerances (also known as “maximum residue levels”), while the
U.S. Food and Drug Administration (FDA) enforces these tolerances on U.S. grown and imported fresh
and processed raspberries.326
Two notable indicators of issues with pesticide residues are FDA’s pesticide residue tolerance violations
and pesticide import alerts for imported fresh raspberries for processing and processed raspberries.327
Between 2015 and 2018, raspberry fruits and juice did not appear on the list of imported commodities
that warrant special attention such as increased testing.328 But, the FDA reports that imported products
tend to be tested more than domestic products, because overall, imports have higher historical violation
rates.329 From 2015 to 2018, there were a total of eight violations of pesticide residue tolerances from
Chile, Mexico, Serbia, and Poland out of 168 samples of raspberries and raspberry juice from all import
sources, an average violation rate of nearly 5 percent.330 By comparison, U.S. products received two
violations in the same period, one in 2015 and another in 2016, out of 65 samples from the United
States, an average violation rate of 3 percent.331 In addition to pesticide monitoring, pesticide import
alerts are FDA notifications issued when an imported product is detained (without physical examination)
from entering U.S. commerce. Product detention happens when the FDA has information of a violation,
such as when an imported product has been adulterated or misbranded.332 From 2015 to 2020, two FDA
323 Request letter from the U.S. Trade Representative, April 9, 2020; USITC, hearing transcript, September 17, 2020, 114 (testimony of Jon Maberry, Maberry Packing); WRRC, written submission to the USITC, September 8, 2020, 15–16. 324 USITC, hearing transcript, September 17, 2020, 119 (testimony of Brad Rader, Rader Farms) 325 FDA, “Pesticide Residue Monitoring Program Questions and Answers,” content current as of September 15, 2020 https://www.fda.gov/food/pesticides/pesticide-residue-monitoring-program-questions-and-answers. 326 FDA monitors pesticides via three main approaches: its pesticide monitoring program, which tests U.S. product and imports for 800 pesticides; special sampling surveys of specific commodities or pesticide residues of special interest; and the Total Diet Study, which is an ongoing program to monitor contaminants and nutrients in the U.S. diet. FDA, Pesticide Residue Monitoring Program Fiscal Year 2018, 2020, 5. 327 The FDA sampling design targets commodities as well as specific domestic and import sources that are at higher risk of violation. FDA, “Pesticide Residue Monitoring Program Questions and Answers,” September 15, 2020; FDA, Pesticide Residue Monitoring Program Fiscal Year 2018, 2020, 11–12. 328 FDA, Pesticide Residue Monitoring Program Fiscal Year 2015, 2017; FDA, Pesticide Residue Monitoring Program Fiscal Year 2016, 2018; FDA, Pesticide Residue Monitoring Program Fiscal Year 2017, 2019; FDA, Pesticide Residue Monitoring Program Fiscal Year 2018, 2020. 329 For example, in 2015 FDA sampled 52 raspberry fruit and juice products from import sources, and 13 samples from U.S. sources. FDA, Pesticide Residue Monitoring Program Fiscal Year 2018, 2020, 11; FDA, Pesticide Residue Monitoring Program Fiscal Year 2015, 2017, 40 and 44. 330 FDA, Pesticide Residue Monitoring Program Fiscal Year 2015, 2017, 44; FDA, Pesticide Residue Monitoring Program Fiscal Year 2016, 2018, 46; FDA, Pesticide Residue Monitoring Program Fiscal Year 2017, 2019, 52; FDA, Pesticide Residue Monitoring Program Fiscal Year 2018, 2020, 44. 331 FDA, Pesticide Residue Monitoring Program Fiscal Year 2015, 2017, 40; FDA, Pesticide Residue Monitoring Program Fiscal Year 2016, 2018, 43; FDA, Pesticide Residue Monitoring Program Fiscal Year 2017, 2019, 48; FDA, Pesticide Residue Monitoring Program Fiscal Year 2018, 2020, 41. 332 FDA, Pesticide Residue Monitoring Program Fiscal Year 2018, 2020, 10.

Raspberries for Processing
118 | www.usitc.gov
import alerts for pesticides were issued, one for fresh raspberries from a supplier in Mexico and one for
IQF raspberries from a supplier in Serbia.333
A minimum of five consecutive non-violative commercial shipments are required to remove a grower’s,
manufacturer’s, or shipper’s product from an import alert.334 U.S. importers of fresh and processed
raspberries seek to use suppliers certified as following good agricultural, handling, and manufacturing
practices, and rely on various verification procedures. The high costs associated with detained products
and violations, including lost products or sales, incentivize importers to take the necessary steps to
minimize violations.335 For more information on U.S. food safety standards and certifications please
refer back to the chapter 1 section “Product Standards and Certifications.”
Government Programs
U.S. growers of raspberries for processing have access to some of the government programs that
support U.S. agriculture broadly. In 2020, USDA announced the purchase of raspberry puree for
distribution to food nutrition assistance programs.336
Compliance with Food Safety Standards
Processed and fresh raspberries grown in the United States or imported from other sources must
comply with the FDA Food, Drug and Cosmetic Act as amended by the Food Safety Modernization Act,
which governs the safety of food sold in the U.S. market.337 For more information, refer to chapter 1,
“Product Standards and Certifications.”
Factors Affecting Competitiveness
As described in chapter 2 of this report, competitiveness of raspberries for processing and processed
raspberry products can be measured by comparing delivered costs, product differentiation, and supplier
reliability for Washington products against those of imports. Certain key factors contribute to the
competitiveness of Washington processed raspberry products in the U.S. market.338 While raspberries
for processing grown in Washington have product characteristic advantages over imported products,
there are a number of other factors—such as the relatively high costs of producing fresh raspberries for
333 FDA, “Import Alert 99-05: Detention Without Physical Examination of Raw Agricultural Products for Pesticides," April 5, 2021 https://www.accessdata.fda.gov/cms_ia/importalert_258.html; FDA, Import Alert 99-08, "Detention without Physical Examination of Processed Human and Animal Foods for Pesticides,” April 1, 2021 https://www.accessdata.fda.gov/cms_ia/importalert_259.html. 334 FDA, Pesticide Residue Monitoring Program Fiscal Year 2018, 2020, 10. 335 USITC, hearing transcript, September 17, 2020, 107 and 117–18 (testimony of John Tentomas, Nature’s Touch), 115 (testimony of Lance Jungmeyer, FPAA), 116–17 (testimony of Jean-Christophe Hesteau, SunOpta), and 118 (testimony of Tony Miller, Cascade International Foods). 336 USDA, AMS, “Pre-Solicitation Announcement for section 32 Purchase of Red Raspberries,” February 28, 2020. 337 21 U.S.C. 301 et seq., Public Law 111.353. FDA, FSMA Facts: Background on the FDA Food Safety Modernization Act (FSMA), July 21, 2011. 338 Some of these competitiveness factors may apply to Oregon and British Columbia, Canada; however, the focus of this analysis is on Washington State.
Chapter 3: U.S. Industry
United States International Trade Commission | 119
processing and the pronounced production swings that increase price volatility—that limit the
competitiveness of the Washington industry.
Washington industry raspberries have desired product characteristics.
While price is an important factor for most raspberry product purchasers, most buyers also consider
certain raspberry characteristics in purchasing decisions. These traits are considered whether a buyer
purchases fresh berries for processing (e.g., juice manufacturers) or processed raspberry products (e.g.,
raspberry jam manufacturers). Important product characteristics of the raspberries include their Brix
(sugar) level, berry color, and freeze/thaw characteristics, which can be influenced by the cultivar used,
growing conditions, timing of the harvest, and processing method.
Raspberries and processed products produced in Washington have characteristics that are highly
desired by buyers for many of their end uses, particularly vis-à-vis unprocessed raspberries grown for
the fresh market which are diverted to the fresh for processing market. This diversion of raspberries
from the fresh market to the processing market mainly impacts the U.S. market in the form of fresh
raspberries for processing that are imported from Mexico and mainly enter the processing market
channels for B-grade products.339 Therefore, Washington raspberry growers compete directly for sales
with imports of fresh raspberries for processing from Mexico. Washington grower-processors also
compete directly with processed products that are produced in the United States using imported bulk
fresh raspberries from Mexico. In both of these cases, the Washington products differ from the products
produced with Mexican raspberries in several important ways.340
Raspberries grown for processing in Washington State, Oregon and British Columbia, Canada reportedly
have higher Brix levels than the raspberries that are grown for fresh consumption.341 Higher Brix levels
result in sweeter and more flavorful raspberries, which are important distinguishing features for IQF
berries. These features can also be important when these raspberries are used in purees or for juice.342
Higher Brix levels are a key characteristic reported by U.S. processors that differentiates raspberries
from the Pacific Northwest from the raspberry seconds from fresh market production that enter the
processed market.343 This is because the cultivars used and the timing of harvest in the Pacific
Northwest result in raspberries that are said to require less added sugar than fresh market seconds. As a
339 As in Mexico, California raspberries are grown exclusively for the fresh market. In both areas, a small share of raspberry production that is not suitable for fresh market sales is diverted to the processing market. Industry representatives, interviews by USITC staff, June 23, 2020, September 24, 2020, October 20, 2020, and November 20, 2020; industry representative, email message to USITC staff, August 21, 2020. 340 Industry representatives, interviews by USITC staff, October 20, 2020 and November 20, 2020; USITC, hearing transcript, September 17, 2020, 21–22, 156 (testimony of Rolf Haugen, Northwest Berry Co-op). 341 “Brix” levels measure the percent by weight of sugar solids in a pure sucrose solution. This acts as a measure of the sugar content in foods, with higher Brix levels indicating higher levels of sugars. USDA, AMS, Technical Procedures Manual, June 2020, 17. Industry representative, interview by USITC staff, October 20, 2020. 342 Industry representative, interview by USITC staff February 26, 2021. 343 Industry representatives, interviews by USITC staff, September 15, 2020, and October 20, 2020.
Raspberries for Processing
120 | www.usitc.gov
result, for at least some purchasers, there is said to be limited substitutability between the two
products, though the degree varies according to the end use.
Some industry representatives and processors report that, because of the lower Brix levels of the
raspberries, those imported from Mexico can make up at most 20 percent of the raspberry mix for their
processed products, including IQF crumbles that are used in jams, purees, and juice concentrate.344
However, other processors note that while raspberries from Mexico once were not as substitutable,
growers in Mexico have adapted and have begun picking berries later, which has led to Brix levels that
are closer to those grown in the Pacific Northwest.345 As a result, some processors report that raspberry
seconds from Mexico have become more substitutable with PNW berries, potentially allowing for
substitution rates as high as 50 percent in some of their processed products.346
Color continues to be a consideration for processed raspberry products, however, and the raspberry
seconds from Mexico reportedly are lighter in color than those grown in Washington and Oregon. This
limits substitutability for some processors, as the darker color is considered a positive characteristic in
IQF berries and in purees.347 However, some industry representatives report that beet juice can be used
as a natural ingredient to improve color, which allows for increased substitutability.348 Some have also
reported that raspberry seconds can complement the use of Pacific Northwest raspberries. Because the
color of Pacific Northwest berries can actually be too dark for some uses, they report that mixing in
small shares of raspberry seconds from Mexico can brighten the end product.349
Another distinguishing product characteristic is related to the freezing method used by processors. For
frozen whole raspberries and crumbles, the firmness of the raspberry when thawed is important.
Because the vast majority of IQF raspberries in Washington are frozen using tunnels, they freeze more
quickly than in the static freezing process that is used by some U.S. import suppliers.350 When
raspberries are frozen more quickly, they retain their shape better than when frozen slowly, because
longer freezing times result in greater cellular damage to the walls of the raspberries.351 Whole berries
or crumbles that better retain their shape when thawed and when processed can act as an advantage
when the processor would like to have whole pieces or whole berries distinguishable in the end product,
such as for certain jams or fillings.352
344 Industry representatives, interviews by USITC staff, September 15, 2020, October 20, 2020, November 20, 2020, and November 23, 2020. 345 Industry representatives, interviews by USITC staff, October 20, 2020, and October 26, 2020. 346 Industry representatives, interviews by USITC staff, September 15, 2020, October 20, 2020, and November 20, 2020. 347 Industry representatives, interviews by USITC staff, September 15, 2020, October 20, 2020, and November 20, 2020. 348 Industry representative, interview, by USITC staff, October 19, 2020, and November 20, 2020. 349 Industry representative, interview by USITC staff, October 20, 2020; industry representative, email message to USITC staff, June 1, 2020. 350 This statement applies to IQF raspberries in Canada and Oregon as well. 351 Industry representatives, interviews by USITC staff, September 24, 2020, and February 3, 2021. 352 Industry representative, interview by USITC staff, November 20, 2020.
Chapter 3: U.S. Industry
United States International Trade Commission | 121
Another distinguishing characteristic of the Washington industry is its strong reputation for food safety.
This stems from Washington raspberries’ traceability, in large part owing to the structure of the
industry. The larger farm sizes and the degree of vertical integration within the industry allows
Washington processed raspberry products to more easily be traced to their source.353 Source tracing is
more difficult in U.S. supplier industries like Mexico, Chile, and Serbia, which are characterized by large
numbers of small farms which are not vertically integrated with processors.354 The vertical integration in
Washington allows the sources of any discovered food safety issues to be more easily pinpointed and
therefore quickly addressed, and all affected product to be quickly and easily identified and removed
from shelves without the widespread loss of product.355 In addition, the highly automated nature of the
Washington industry, including mechanical harvesting, minimizes the number of times raspberries are
touched, which reportedly lowers the risk of infection by certain organisms, including E. coli and
norovirus.356 These traceability and food safety competitive advantages are strongest for products that
will be consumed uncooked or unpasteurized, though for products that will eventually be heated or
cooked, this may not have a significant impact on purchasing decisions.
One challenge for Washington State producers is in the production of organic raspberries. While
demand for organic products continues to rise in the United States, including demand for organic
processed raspberries (for baby food, for example), there is limited ability to produce organic
raspberries for processing in the Pacific Northwest. The damp climate contributes to pest pressures in
the region, and employing hoop houses, which would help protect plants and increase yields, would
require hand harvesting—a costly production system that is not used in Washington. As a result,
Washington producers are currently not able to meet the rising U.S. demand for organic processed
raspberries.357
Technology has only partially mitigated higher U.S. input costs.
The U.S. industry in Washington State has invested in certain technologies in harvesting and processing
raspberries to maximize efficiency and minimize costs. These efficiency gains include those for
353 Although the farm sizes in British Columbia, Canada and Oregon are typically smaller than in Washington, these locations have a small number of growers, thus traceability is not as problematic as in Chile and Serbia. Where there are many small growers supplying the processors. 354 USITC, hearing transcript, September 17, 2020, 45–46 (testimony of Pablo Herrera, Chilealimentos); industry representatives, interviews by USITC staff, June 23, 2020, July 24, 2020, July 29, 2020, September 24, 2020, October 19, 2020, and February 23, 2021; U.S. government representative, interview by USITC staff, October 28, 2020. 355 Industry representatives, interviews by USITC staff, June 23, 2020, and September 24, 2020. 356 Growers in Canada and Oregon also use mechanical harvesting. USITC, hearing transcript, September 17, 2020, 119 (testimony of Brad Rader, Rader Farms); industry representative, interview by USITC staff, June 23, 2020. 357 NW Berry Co-op, written submission to the USITC, September, 24, 2020, 5; Miller, written testimony to USITC, September 8, 2020, 2; USITC, hearing transcript, September 17, 2020, 29–30, 154–55 (testimony of John Tentomas, Nature’s Touch) and 154 (testimony of Jon Maberry, Maberry Packing); industry representatives, interviews by USITC staff, August 7, 2020, September 24, 2020, January 27, 2021, and March 11, 2021; industry representative, email message to USITC staff, June 1, 2020.
Raspberries for Processing
122 | www.usitc.gov
harvesting and processing raspberries.358 Some of these methods include using machine harvesting and
equipment to clean, sort, and process raspberries, and continuing to invest in technology and practices
that can lower labor and other production costs.359 However, these methods have a mixed impact on
the competitiveness of raspberries grown in Washington State. While they lead to some of the positive
product characteristics and food safety advantages noted above, they may also limit profitability in
some cases. For example, mechanical harvesting allows greater volumes of raspberries to be harvested
faster and with less labor. However, this method of harvesting, as well as the use of IQF tunnels, can
lead to lower shares of whole berries than handpicking and the use of static freezing methods.360
Although mechanical harvesting lowers labor costs, industry representatives report that such costs—for
planting, pruning, maintaining plants, spraying, and harvesting—continue to be a substantial component
of the total cost of production of processed raspberries in the United States.361 In one 2015 study of the
costs of growing raspberries for processing, labor costs make up over 30 percent of total costs of
production, on average.362 Industry representatives report that these costs have increased in recent
years and suggest that labor costs alone can reach up to 40 percent of total production costs.363
Several factors combine to drive up labor costs in the U.S. industry that grows raspberries for
processing. First, the wage rates are higher than those in other producing markets. Second, industry
representatives report that regulations also increase labor costs.364 Such regulations require the
monitoring of working conditions and require safety certifications for certain employees on farms and
processing facilities. In addition, during both the peak season and the off-season, when labor moves to
other regions, the industry reports labor scarcity as growers and processors both compete for limited
labor. This labor scarcity also leads to higher labor costs since wage rates increase during these periods
358 WRRC, written submission to the USITC, September 24, 2020, 2; USITC, hearing transcript, September 17, 2020, 19, 16, 168 (testimony of Rolf Haugen, Northwest Berry Co-op) and 29 (testimony of John Tentomas, Nature’s Touch). 359 Bratt, “Officials Hearing about Bleak 2018 Market Situation,” July 11, 2018; WRRC, written submission to the USITC, September 24, 2020, 2, 4; USITC, hearing transcript, September 17, 2020, 16 (testimony of Rolf Haugen, Northwest Berry Co-op); industry representative, interview by USITC staff, October 20, 2020. 360 Some industry representatives suggest the degree to which this occurs depends on the quality of the equipment used. Industry representatives, interviews by USITC staff, September 24, 2020, February 3, 2021, and March 11, 2021; USITC, hearing transcript, September 17, 2020, 22–23, 167 (testimony of Ryan Commons, Driscoll’s, Inc.). 361 In a 2015 estimate of costs, wage rates were reported as $0.25/plant for piece rate labor, $15/hour for hand labor/general labor, $17/hour for drivers, and $22/hour for spray crew. Washington State reports a $13.69 minimum wage for agricultural labor in 2021 that also applies when paying a piece rate, and the state will begin phasing in overtime pay for agricultural workers. Galinato and DeVetter, “2015 Cost Estimates of Establishing and Producing Red Raspberries,” 2015; Washington State Department of Labor Industries, Workers Rights, Agricultural Policies, Wages, accessed May 18, 2021. USITC, hearing transcript, September 17, 2020, 15–16 (testimony of Rolf Haugen, Northwest Berry Co-op); industry representatives, interviews by USITC staff, October 20, 2020, December 18, 2020, January 27, 2021, and March 1, 2021. 362 Labor’s share of total costs in this estimate are 14.2 percent in the first year of planting, 37.9 percent in the second year, and 36.9 percent in years 3–6. Galinato and DeVetter, “2015 Cost Estimates of Establishing and Producing Red Raspberries,” 2015, 9. 363 Industry representative, interview by USITC staff, October 20, 2020; Galinato and DeVetter, “2015 Cost Estimates of Establishing and Producing Red Raspberries,” 2015, 2–5. 364 USITC, hearing transcript, September 17, 2020, 16 (testimony of Rolf Haugen, Northwest Berry Co-op); industry representative, interview by USITC staff, November 24, 2020.
Chapter 3: U.S. Industry
United States International Trade Commission | 123
as growers and processor seek to attract and maintain employees.365 Estimates of the degree to which
labor costs are higher in the United States than in other producing markets vary, with some suggesting
that they can be 20 to 30 times as high as labor costs in other markets.366
Thus, in spite of widespread adoption of technology, high input costs, of which labor is one, can make it
nonetheless difficult for U.S. producers to compete with imports of raspberry seconds from Mexico as
well as the processed products made from them.367 Industry representatives report that the seconds
imported from Mexico are being sold at prices well below prices of U.S. raspberries. In some cases,
industry representatives report that these seconds may sell below the break-even price for U.S. growers.
Estimates on prices vary and are anecdotal, as price data are limited. But some report prices as low as 50
to 75 percent below U.S. market prices, and others suggest these raspberries are being sold for about
one-third of Washington costs of production.368 As discussed in chapter 5, raspberry seconds from
Mexico are reported to have little to no value assigned to producers of raspberries for the fresh market
because they are considered a byproduct, or residual, of fresh production that growers would otherwise
have to pay to dispose of.369 One industry representative reports that these berries represent roughly
15 percent of production in Mexico but account for only 1 percent of their revenue from sales.370
These imports are reported to have particularly impacted those growers in the Pacific Northwest who
grow older cultivars, such as Meeker and Willamette, or who do not have their own extensive
processing equipment. These growers have a lower share of berries that are IQF product quality, and
they must sell the rest as B-grade product. However, the raspberry seconds from Mexico (equivalent to
one-third of total U.S. production of fresh raspberries for processing in 2019) enter U.S. marketing
channels as B-grade processed products, competing with Washington B-grade product.371 While
adopting improved cultivars (such as WakeHaven and WakeField) to increase yields and expand the
share of high-value whole IQF berries in their total production could help U.S. growers facing
competition from raspberry seconds, growers must pay a fee for their use. As a result of the higher costs
due to the fee and the recent introduction of the newer cultivars, only some growers have switched
365 WRRC, written submission to the USITC, September 24, 2020, 4; industry representatives, interviews by USITC staff, November 24, 2020, December 18, 2020, and January 27, 2021; USITC, hearing transcript, September 17, 2020, 16 (testimony of Rolf Haugen, Northwest Berry Co-op). 366 Bratt, “Officials Hearing about Bleak 2018 Market Situation,” July 11, 2018. 367 Industry representatives, interviews by USITC staff, October 19, 2020, November 23, 2020, and December 18, 2020; USITC, hearing transcript, September 17, 2020, 16 (testimony of Rolf Haugen, Northwest Berry Co-op). 368 WRRC, written submission to USITC, September 24, 2020, 1–2; Northwest Berry Co-op, written submission to the USITC, September 24, 2020, 1; USITC, hearing transcript, September 17, 2020, 13 (testimony of Brad Rader, Rader Farms) and 82–83 (testimony of Steve Orava, King & Spalding); industry representatives, interviews by USITC staff, October 20, 2020, and November 20, 2020. 369 WRRC, written submission to the USITC, September 24, 2020, 1–2, 4–5; industry representative, interview by USITC staff, November 20, 2020. USITC, hearing transcript, September 17, 2020, 82–83 (testimony of Steve Orava, King & Spalding) and 67 (testimony of Jon Maberry, Maberry Packing). 370 USITC, hearing transcript, September 17, 2020, 18 (testimony of Rolf Haugen, Northwest Berry Co-op). 371 Industry representatives, interviews by USITC staff, October 19, 2020, October 20, 2020, and November 20, 2020; USITC, hearing transcript, September 17, 2020, 101 (testimony of Jean-Christophe Hesteau, SunOpta); WRRC, written submission to the USITC, September 8, 2020, 4.
Raspberries for Processing
124 | www.usitc.gov
production to these varieties.372 Some industry representatives have raised concerns about the risk of
not recovering fees for use in all years, though reports vary.373
Finally, the high cost of processing equipment and processors’ limited ability to use the IQF equipment
year-round may limit the ability of some growers to access this technology. Most processors report that
they maintain only enough processing capacity to support a level of berries that is guaranteed
annually.374 All or most of these berries are raspberries that they grow themselves in a normal year,
rather than a maximum potential yield that might occur in some years or through purchasing large
volumes of raspberries from other growers. This is because the equipment is costly and because they
have limited access to other products during the off-season, which would be needed to make it cost
effective for processors to increase capacity.375 Processors are therefore not able to maintain additional
capacity for high-yielding years. As a result, some growers may be unable to locate enough IQF
processing capacity in years when they harvest higher IQF-quality yields and are therefore unable to
earn additional income from those berries, which they must sell as B-grade. This further leads to a B-
grade glut on the market in those years, lowering the price of their products.376
Highly localized production benefits the industry but can create vulnerabilities.
The U.S. raspberry for processing industry is confined to a small part of the state of Washington. This
localization creates advantages for those U.S. growers and processors, as well as vulnerabilities that can
lead to volatility in the domestic supply. The high concentration of growers in a small region has
benefited the industry because it gives processors convenient access to the bulk of production of their
raw material input. This, in turn, contributes to lower production costs for processed products, including
transportation and storage costs.
The localization of production of fresh raspberries for processing in Washington, however, can also have
detrimental effects. For example, disruptions caused by weather events or pest pressures will likely
impact a large share of production.377 Weather events, such as an extreme freeze, can lead to lower
production levels than anticipated.378 And a particularly rainy season in the state, which has become
more common, will leave fewer whole berries available for IQF products. With too much rain,
raspberries become soft, break more easily, and become more susceptible to mold. When this occurs
372 Industry representatives, interviews by USITC staff, August 7, 2020, and October 20, 2020. 373 Industry representative, interview by USITC staff, November 24, 2020. 374 Industry representative, interview by USITC staff, November 24, 2020. 375 Industry representatives, interviews by USITC staff, October 19, 2020, and November 24, 2020; industry representative, email message to USITC staff, August 21, 2020. 376 Industry representatives, interviews by USITC staff, November 24, 2020, March 1, 2021, and March 11, 2021. 377 Gallagher, “Last Winter Was Bad for Whatcom County,” October 17, 2019; industry representatives, interviews by USITC staff, July 29, 2020, September 24, 2020, October 26, 2020, and February 26, 2021; J.M. Smucker Co., written submission to the USITC, December 4, 2020, 1. 378 Gallagher, “Last Winter was Bad for Whatcom County,” October 17, 2019; industry representative, interview by USITC staff, March 11, 2021; J.M. Smucker Co., written submission to the USITC, December 4, 2020, 1.

Chapter 3: U.S. Industry
United States International Trade Commission | 125
and supplies of domestic IQF-grade berries are limited, the share of B-grade raspberry products, sold at
lower prices, necessarily increases.379
The pronounced production swings that localized production can foster are problematic for the industry
in terms of both their raspberries’ delivered costs and their reliability of supply. A number of buyers of
processed raspberry products have noted that swings in U.S. production volume lead to volatility in
pricing from year to year. Buyers have sought to diversify their sourcing to include raspberries from
other suppliers, including imports.380 Purchasers report that years with extremely high prices have
driven demand for U.S. raspberries for processing down. When prices increase, buyers of raspberries
and processed raspberry products as ingredients shift to using different fruits or synthetic raspberry
flavorings, in addition to turning to imports.381 Similarly, buyers of IQF berries are able to replace
raspberries with other berries if prices go up too high or if supply varies significantly from year to
year.382 For example, a berry mix might decrease the share of raspberries used or replace them with a
different fruit, like cherries or pomegranates.383
379 Industry representatives, interviews by USITC staff, July 29, 2020, September 24, 2020, and October 20, 2020. 380 USITC, hearing transcript, September 17, 2020, 27 (testimony of John Tentomas, Nature’s Touch); J.M. Smucker Co., written submission to the USITC, December 4, 2020, 1; industry representatives, interviews by USITC staff, July 24, 2020, July 29, 2020, September 24, 2020, and October 20, 2020. 381 Industry representatives, interviews by USITC staff, July 29, 2020, September 15, 2020, October 19, 2020, and October 20, 2020. 382 Industry representatives, interviews by USITC staff, September 24, 2020, and October 19, 2020. 383 USITC, hearing transcript, September 17, 2020, 27 (testimony of John Tentomas, Nature’s Touch); industry representatives, interviews by USITC staff, September 24, 2020, and October 19, 2020.
Raspberries for Processing
126 | www.usitc.gov
Bibliography
Barbosa-Cánovas, Gustavo V., Bilge Altunakar, and Danilo J. Mejía-Lorio. Freezing of Fruits and
Vegetables: An Agri-Business Alternative for Rural and Semi-Rural Areas. FAO Agricultural
Services Bulletin 158. Rome: Food and Agriculture Organization of the United Nations, 2005.
http://www.fao.org/3/y5979e/y5979e00.htm#Contents.
Bierlink, Henry. “USA Raspberry Industry: Trends.” Presented at the 12th IRO Meeting, May 2020.
https://www.internationalraspberry.net/wp-content/uploads/2020/08/USA.pdf.
Bratt, Calvin. “Officials Hearing about Bleak 2018 Market Situation.” Lynden Tribune, July 11, 2018.
https://www.lyndentribune.com/news/officials-hearing-about-bleak-2018-market-
situation/article_831adc62-8536-11e8-a0d5-673c01952627.html.
Driscoll’s, Inc (Driscoll’s). “Product Guide: 20192020.” Accessed March 11, 2021.
https://driscolls.imgix.net/-/media/files/availability-
calendar/availabilitycalendardris10190816.ashx?la=en.
Driscoll’s, Inc. (Driscoll’s). Written submission to the U.S. International Trade Commission in connection
with Inv. No. 332-577, Raspberries for Processing: Conditions of Competition between U.S. and
Foreign Suppliers, with a Focus on Washington State. September 24, 2020.
Finn, Chad E., Bernadine C. Strik, and Patrick P. Moore. Raspberry Cultivars for the Pacific Northwest.
PNW 655, Oregon State University Extension, February 2014.
https://catalog.extension.oregonstate.edu/sites/catalog/files/project/pdf/pnw655.pdf.
Funt, Richard C., and Harvey K. Hall, eds. Raspberries. Oxfordshire: CABI UK. 2013.
https://www.cabi.org/bookshop/book/9781845937911/.
Galinato, Suzette P., and Lisa W. DeVetter. “2015 Cost Estimates of Establishing and Producing Red
Raspberries in Washington State,” 2015. http://pubs.cahnrs.wsu.edu/publications/pubs/tb21/.
Gallagher, Dave. “Last Winter Was Bad for Whatcom County Raspberry Farmers. A Look at What’s
Ahead.” Bellingham Herald, October 16, 2019.
https://www.bellinghamherald.com/news/business/article236317628.html.
Haynes, Cindy. “Cultivar versus Variety.” Horticulture and Home Pest News. Iowa State University,
February 6, 2008. https://hortnews.extension.iastate.edu/2008/2-6/CultivarOrVariety.html.
IHS Markit. Global Trade Atlas database. Accessed various dates. https://connect.ihsmarkit.com/home.
International Raspberry Organization (IRO). “About Us.” Accessed August 26, 2020.
http://www.internationalraspberry.net/about-us.
Chapter 3: U.S. Industry
United States International Trade Commission | 127
J.M. Smucker, Co. Written submission to the U.S. International Trade Commission in connection with
Inv. No. 332-577, Raspberries for Processing: Conditions of Competition between U.S. and
Foreign Suppliers, with a Focus on Washington State. December 4, 2020.
Lynden Tribune. “National Raspberry Program Ending,” November 21, 2018.
https://www.lyndentribune.com/news/national-raspberry-program-ending/article_76473d44-
e2e9-11e8-83ee-afb340ac6108.html.
Lynden Tribune. “USDA Raspberry Order Officially Ends,” March 13, 2019.
https://www.lyndentribune.com/news/usda-raspberry-order-officially-ends/article_89392e84-
4519-11e9-a272-3b2ea8c96cf7.html.
National Academies Press (NAP). Data and Research to Improve the U.S. Food Availability System and
Estimates of Food Loss: A Workshop Summary. Washington, DC: The National Academies Press.
https://doi.org/10.17226/18978.
North American Raspberry and Blackberry Association (NARBA). “Overview of the Caneberry Industry:
Facts & Figures.” Accessed August 16, 2020.
https://www.raspberryblackberry.com/consumers/overview-of-the-caneberry-industry-facts-
figures/.
Northwest Berry Co-operative (NW Berry Co-op). Written submission to the U.S. International Trade
Commission in connection with Inv. No. 332-577, Raspberries for Processing: Conditions of
Competition between U.S. and Foreign Suppliers, with a Focus on Washington State,
September 24, 2020.
Northwest Berry Co-operative (NW Berry Co-op). “About the Berry Co-op: Products.” Accessed April 27,
2021. https://www.nwberrycoop.com/products-2/.
Stephens, M. Joseph, Julia R. Enfield, and Harvey K. Hall. “‘Wakefield’ Red Raspberry.” HortScience 47,
no. 10 (October 1, 2012): 1556–58. https://doi.org/10.21273/HORTSCI.47.10.1556.
Stephens, Mark Joseph, Jenny R. Gaudion, Lisa A. Jones, and Julia R. Enfield. “‘NN08002’ (Marketed as
WakeTMHaven) Red Raspberry.” HortScience 52, no. 9 (September 1, 2017): 1320–23.
https://doi.org/10.21273/HORTSCI12137-17.
Truscott, Seth. “WSU Debuts Flavorful, Easy-to-Harvest New Raspberry, Cascade Premier.” WSU Insider
(blog), Washington State University, July 30, 2019. https://news.wsu.edu/2019/07/30/wsu-
debuts-flavorful-easy-harvest-new-raspberry-cascade-premier/.
Tunnel Berries. “High Tunnel Production Guide for Raspberries and Blackberries.” Cornell University, August 30, 2019. http://www.hort.cornell.edu/fruit/pdfs/high-tunnel-brambles.pdf.
Raspberries for Processing
128 | www.usitc.gov
U.S. Customs and Border Protection (CBP). “Column 1 / Column 2 / MFN / NTR - Countries the U.S. can do business with,” November 2, 2020. https://help.cbp.gov/s/article/Article-310?language=en_US.
U.S. Department of Agriculture (USDA). Agricultural Marketing Service (AMS). Commodity Specification for Frozen Fruit, April 2020. https://www.ams.usda.gov/sites/default/files/media/CommoditySpecificationsforFrozenFruitApril2020.pdf.
U.S. Department of Agriculture (USDA). Agricultural Marketing Service (AMS). “Frozen Berries Grades and Standards.” Accessed March 31, 2021. https://www.ams.usda.gov/grades-standards/frozen-berries-grades-and-standards.
U.S. Department of Agriculture (USDA). Agricultural Marketing Service (AMS). “PACA Press Releases.”
Accessed March 3, 2021. https://www.ams.usda.gov/press-
releases?field_term_programs_offices_target_id=All&date=&keys=PACA.
U.S. Department of Agriculture (USDA). Agricultural Marketing Service (AMS). “Pre-Solicitation
Announcement for Section 32 Purchase of Red Raspberries.” February 28, 2020.
https://www.ams.usda.gov/content/pre-solicitation-announcement-section-32-purchase-red-
raspberries.
U.S. Department of Agriculture (USDA). Agricultural Marketing Service (AMS). “Processed Raspberry
Promotion, Research, and Information Order,” May 9, 2012.
https://www.regulations.gov/document?D=AMS-FV-07-0077-0029.
U.S. Department of Agriculture (USDA). Agricultural Marketing Service (AMS). “Processed Raspberry
Promotion, Research, and Information Order.” Accessed October 6, 2020.
https://www.ams.usda.gov/rules-regulations/processed-raspberry-promotion-research-and-
information-order.
U.S. Department of Agriculture (USDA). Agricultural Marketing Service (AMS). “Research and Promotion
Program.” Accessed March 17, 2021. https://www.ams.usda.gov/rules-regulations/research-
promotion.
U.S. Department of Agriculture (USDA). Agricultural Marketing Service (AMS). Technical Procedures
Manual. June 2020. https://www.ams.usda.gov/sites/default/files/media/
TechnicalProceduresManual%5B1%5D.pdf.
U.S. Department of Agriculture (USDA). Economic Research Service (ERS), Table D5, “Red Raspberries:
Commercial Acreage, Yield Per Acre, Utilized Production, and Season-Average Grower Price,
Oregon, Washington, and California.” Fruit and Tree Nuts Yearbook, October 29, 2020.
https://www.ers.usda.gov/data-products/fruit-and-tree-nuts-data/fruit-and-tree-nuts-
yearbook-tables/.
Chapter 3: U.S. Industry
United States International Trade Commission | 129
U.S. Food and Drug Administration (FDA). Pesticide Residue Monitoring Program Fiscal Year 2015
Pesticide Report, November 2017. https://www.fda.gov/food/pesticides/pesticide-residue-
monitoring-2015-report-and-data.
U.S. Food and Drug Administration (FDA). Pesticide Residue Monitoring Program Fiscal Year 2016
Pesticide Report, October 2018. https://www.fda.gov/food/pesticides/pesticide-residue-
monitoring-2016-report-and-data.
U.S. Food and Drug Administration (FDA). Pesticide Residue Monitoring Program Fiscal Year 2017
Pesticide Report, September 2019. https://www.fda.gov/food/pesticides/pesticide-residue-
monitoring-2017-report-and-data.
U.S. Food and Drug Administration (FDA). Pesticide Residue Monitoring Program Fiscal Year 2018
Pesticide Report, September 2020. https://www.fda.gov/food/pesticides/pesticide-residue-
monitoring-report-and-data-fy-2018.
Washington Red Raspberry Commission (WRRC). “Cultivars.” Accessed March 11, 2021.
https://www.red-raspberry.org/cultivars.
Washington Red Raspberry Commission (WRRC). Newsletter, November 2019.
https://mailchi.mp/12e960b0a6c1/wa-red-raspberry-newsletter.
Washington Red Raspberry Commission (WRRC). Newsletter, November 2020.
https://mailchi.mp/02d5bb8b464b/wrrc-november-2020-newsletter.
Washington Red Raspberry Commission (WRRC). Written submission to the U.S. International Trade
Commission in connection with Inv. No. 332-577, Raspberries for Processing: Conditions of
Competition between U.S. and Foreign Suppliers, with a Focus on Washington State.
September 8, 2020.
Washington Red Raspberry Commission (WRRC). Written submission to the U.S. International Trade
Commission in connection with Inv. No. 332-577, Raspberries for Processing: Conditions of
Competition between U.S. and Foreign Suppliers, with a Focus on Washington State.
September 24, 2020.
Washington State University (WSU). “Small Fruit Breeding and Genetics: Raspberries.” Accessed
December 2, 2020. https://puyallup.wsu.edu/smallfruit/raspberries/.
World Trade Organization (WTO). General Agreement on Tariffs and Trade (GATT 1947).
https://www.wto.org/english/docs_e/legal_e/gatt47_01_e.htm#articleI.

130 | www.usitc.gov
Chapter 4: Canada
United States International Trade Commission | 131
Chapter 4 Canada
Summary
Canada is a minor global producer and exporter of processed raspberry products, almost exclusively
serving its home market and the U.S. market. Nearly all processed raspberry production in Canada is in
the Fraser Valley, British Columbia, which is just over the border from Washington State.384 Canadian
processors in British Columbia primarily convert fresh berries from Canada and the United States into
individually quick frozen (IQF) raspberries, straight pack, puree, juice concentrate.385 Canada also has a
competitive repacking industry, which sources large volumes of frozen raspberries from U.S., Canadian,
Chilean, and Serbian producers to supply the U.S. market with IQF raspberries and frozen mixed berry
products that include raspberries.386 Canadian exports of frozen processed raspberry products to the
United States increased from 2015 to 2020, even as production of domestic fresh raspberries for
processing fell because of poor weather, rising land rents, low yields, and farmers pulling canes
(raspberry plants) to grow other berries. To export more to the U.S. market, Canadian processors
imported increasing volumes of fresh and frozen raspberries as inputs.
The raspberry industries in Washington and British Columbia have a special relationship because of their
geographical closeness, similar production systems and cost structures, shared focus on processing, and
cross-border activity.387 Canadian frozen raspberry products remain competitive in the United States
due to Canadian processors’ access to fresh raspberries for processing grown in both British Columbia
and Washington. However, Canadian growing and processing costs are considered to be higher than
those in the United States, due to higher land costs.388 Despite high delivered costs, Canadian IQF
repackers benefit from access to large volumes of IQF raspberries from Canadian and imported sources.
384 Industry representative, interview by USITC staff, August 7, 2020; USITC, hearing transcript, September 17, 2020, 8 (testimony of Henry Bierlink, WRRC); Government of Canada, written submission to the USITC, December 4, 2020, 2. 385 Straight pack are block frozen raspberries packed in their own juices without sugar. For information on product definitions, see chapter 1 (“Introduction”). 386 Industry representatives, interviews by USITC staff, June 23, 2020, July 24, 2020, and August 7, 2020; USITC, hearing transcript, September 17, 2020, 14 (testimony of Brad Rader, Rader Farms) and 140–141 (testimony of John Tentomas, Nature’s Touch). 387 Industry representatives, interviews by USITC staff, October 20, 2020, and March 1, 2021. 388 Evidence that Canada’s overall production costs for processing frozen raspberries are higher than those in the United States includes the lack of new investment in Canada for such products as laser sorters, the purchase of U.S. land by Canadian growers, and the movement of certain assets from British Columbia to Washington, including the purchase of an aseptic line from a bankrupt British Columbia cooperative. Industry representative, interview by USITC staff, March 1, 2021.
Raspberries for Processing
132 | www.usitc.gov
Industry Structure
Growers in British Columbia grow raspberries primarily for processing, while growers in Ontario and
Quebec produce almost entirely for fresh consumption. The Canadian processed raspberry industry
primarily serves the domestic and U.S. markets and sells the full range of frozen products produced from
fresh raspberries, including IQF whole and broken raspberries, straight pack raspberries, raspberry
puree, and raspberry juice concentrate, among others. Virtually all commercial processing occurs in
British Columbia. For the most part, Canadian raspberry processors are not vertically integrated with
local growers to a significant degree.389
Regions
Raspberries are grown in all Canadian provinces. However, almost all commercial production is
concentrated in three provinces: British Columbia, Quebec, and Ontario (figure 4.1). These provinces
together account for over 97 percent of Canadian production by volume.390 Nearly all (99 percent)
Canadian raspberries for processing are grown in British Columbia, with most production occurring in
the Fraser Valley.391 In 2019, British Columbia produced 6,789 metric tons (mt) of raspberries.392 The
processing industry is centered around Abbotsford, just over the U.S.-Canadian border from
Washington. Raspberry production in other provinces is almost exclusively focused on supplying the
fresh market, largely to meet domestic demand.393
389 Industry representatives, interviews by USITC staff, February 26, 2021, and March 1, 2021. 390 Government of Canada, written submission to the USITC, December 4, 2020, 1. 391 Government of Canada, written submission to the USITC, December 4, 2020, 2. 392 Table 1: Canadian Raspberry Marketed Production, by Province, adapted from Government of Canada, written submission to the USITC, December 4, 2020, 2. 393 Government of Canada, written submission to the USITC, December 4, 2020, 2; table 4: Canada’s Fresh Raspberry Trade, 4.
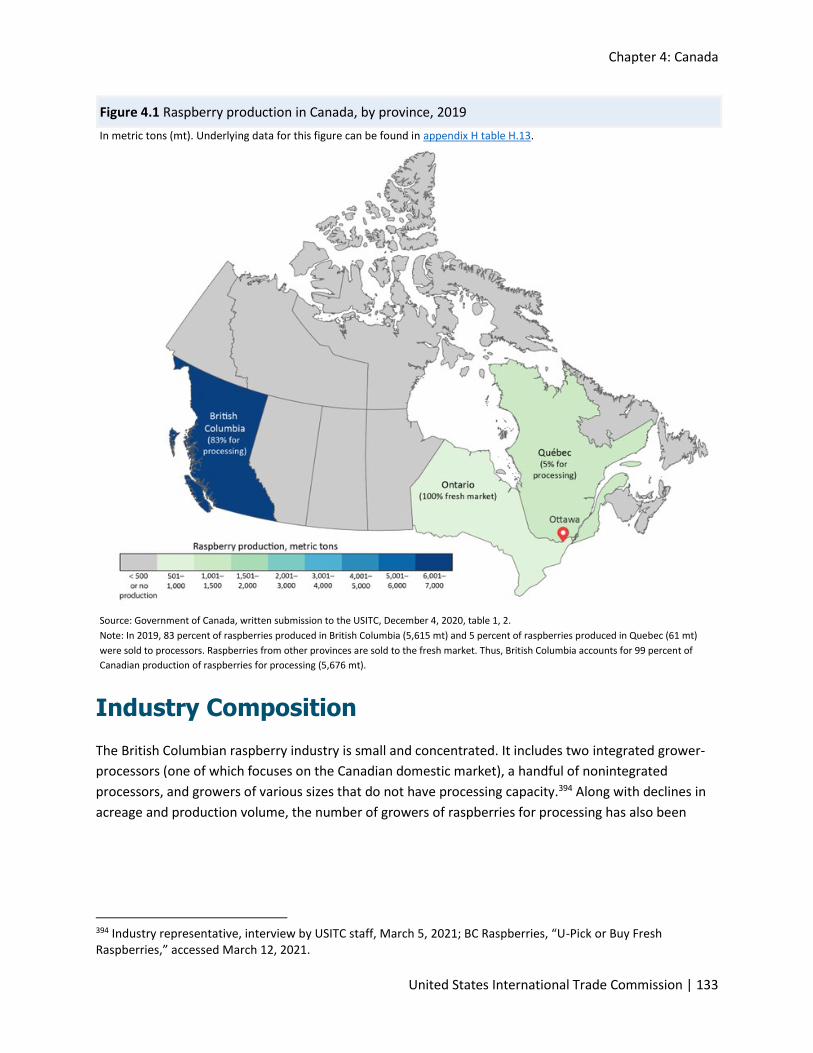
Chapter 4: Canada
United States International Trade Commission | 133
Figure 4.1 Raspberry production in Canada, by province, 2019
In metric tons (mt). Underlying data for this figure can be found in appendix H table H.13.
Source: Government of Canada, written submission to the USITC, December 4, 2020, table 1, 2.
Note: In 2019, 83 percent of raspberries produced in British Columbia (5,615 mt) and 5 percent of raspberries produced in Quebec (61 mt)
were sold to processors. Raspberries from other provinces are sold to the fresh market. Thus, British Columbia accounts for 99 percent of
Canadian production of raspberries for processing (5,676 mt).
Industry Composition
The British Columbian raspberry industry is small and concentrated. It includes two integrated grower-
processors (one of which focuses on the Canadian domestic market), a handful of nonintegrated
processors, and growers of various sizes that do not have processing capacity.394 Along with declines in
acreage and production volume, the number of growers of raspberries for processing has also been
394 Industry representative, interview by USITC staff, March 5, 2021; BC Raspberries, “U-Pick or Buy Fresh Raspberries,” accessed March 12, 2021.
Raspberries for Processing
134 | www.usitc.gov
steadily falling from roughly 500 at the industry's peak in the 1980s.395 Estimates of the current number
of growers vary from 90 to 175.396
There are eight raspberry processors in British Columbia.397 These processors reportedly process fresh
berries grown in Canada, the United States, and other countries for IQF, straight pack, puree, and juice
concentrate.398 Two Canadian processors, Berryhill Foods and Pacific Coast, account for most of the
frozen products processed from fresh volume, while the remainder process only a few hundred
thousand pounds of raspberries annually.399 Several, including a large processor called Nature’s Touch,
specialize in IQF, producing single berry bags or combining raspberries with other berries (blackberries,
blueberries, and strawberries) to make frozen mixed berry packs for sale in Canada and export.400 The
amount of IQF raspberries produced from Canadian fresh raspberries is limited, estimated at 900 mt
(two million pounds) annually, so Nature’s Touch also imports IQF berries from other sources.401
Industry Organization
The British Columbia Raspberry Industry Development Council (RIDC) is a Canadian grower organization
supported by a one-cent-per-pound levy on all raspberries grown in the province. RIDC promotes
raspberries and their use through information and educational services to growers, and it also helps
match raspberry product purchasers with growers and processors. The RIDC board consists of growers,
processors, and government representatives, and RIDC’s Research and Development Committee funds
research projects. The value of RIDC approved projects is about $40,000.402
In addition, the BC Raspberry Growers Association (BCRGA) represents the raspberry growers of British
Columbia regarding municipal, provincial, and federal governmental legislation and affairs. Growers in
395 Government of Canada, written submission to the USITC, December 4, 2020, 3. Quebec has about 230 raspberry growers, while the Ontario Berry Growers Association reports less than 100 raspberry growers for that province. 396 Government of Canada, written submission to the USITC, December 4, 2020, 3. The Raspberry Industry Development Council of BC’s video, however, states that there are about 175 growers in Fraser Valley, some of which may be fresh market growers. “BC Raspberries - Picked Fresh,” September 18, 2013, accessed March 31, 2021 https://www.youtube.com/watch?v=FO83okyALs0. 397 These include BC Frozen Foods (IQF and straight pack); Berryhill Foods Inc. (IQF, straight pack, sieved puree, seedless puree, bulk frozen, juice grade); Blue Ridge Produce Inc. (IQF); Kahlon Farms (IQF, straight pack, sieved puree, seedless puree, juice stock, juice concentrate); Nature’s Touch (IQF); Pacific Coast Fruit Products Ltd. (straight pack (block frozen), pasteurized and non-pasteurized puree with or without seeds, concentrated puree, NFC or single strength juice, juice concentrate, essence, pomace, sugar and other blends); Triple Crown Packers/Bergen Farms (IQF, juice); and Westberry Farms (IQF). BC Raspberry Industry Development Council, “Find Raspberries,” accessed March 12, 2021. 398 Industry representative, interview by USITC staff, August 7, 2020. 399 Industry representative, interview by USITC staff, October 20, 2020. 400 Headquartered in Saint-Laurent, Quebec, Canada, Nature’s Touch also has a freezing and packing operation in Abbotsford, BC, and a packing operation in Front Royal, VA. Nature’s Touch, “Frozen Fruits,” accessed June 1, 2021 https://www.naturestouchfrozenfoods.com/en; BC Raspberry Industry Development Council, “Find Raspberries,” accessed March 12, 2021; industry representative, interview by USITC staff, June 1, 2020. 401 Industry representative, interview by USITC staff, August 7, 2020; industry representative, email message to USITC staff, March 29, 2021. 402 BC Raspberry Industry Development Council, “About,” accessed March 12, 2021. In this chapter and throughout the entire report “$” refers to U.S. dollars.
Chapter 4: Canada
United States International Trade Commission | 135
the Pacific Northwest on both sides of the U.S.-Canada border also have a history of mutual
collaboration, and the British Columbian raspberry industry has benefited from the research and
breeding programs sponsored by the Washington Red Raspberry Commission (WRRC).403 A Canadian
raspberry cooperative operated in the 2000s but no longer exists.404
Cultivars
British Columbia’s production relies on about 10 cultivars of raspberries, nearly all intended for
processed supply channels.405 The Meeker variety, which is not fee for use, is the predominant raspberry
variety for processing in the Fraser Valley, while the Chemainus, Rudi, and Squamish cultivars are also
popular.406 The majority of British Columbia’s raspberry cultivars are excellent for machine harvesting.
Meeker currently represents about 35 percent of Canadian fresh raspberries for processing, but this
variety is not well suited for processing into IQF raspberries.407
Production System
As in the United States, Canadian production and harvesting methods vary depending on the intended
market segment—fresh or frozen (i.e., processed). The harvesting method and harvest season in Canada
also depend on how raspberries are produced (open field or high tunnel), geographic location, and
variety. Overall, grower production methods in British Columbia and Washington are quite similar.
Generally, the Canadian raspberry harvest season runs from June to early August.408
Raspberries for processing in British Columbia are typically grown in open fields and machine harvested
to reduce the cost of production, particularly labor costs. As in Washington, the raspberry varieties
chosen for machine harvesting are designed to allow growers to pick the fruit efficiently with less
concern for mitigating berry damage.409 As noted in chapter 3, labor associated with machine harvesting
of raspberries not intended for IQF typically includes three workers per harvester. For raspberries
intended for IQF, several more workers are typically added to the harvester to use smaller holding
containers that minimize damage to the berries once picked.410
Products and Supply Chain
The British Columbian processing industry produces the full range of raspberry products, including IQF,
straight pack (block frozen), puree, and juice stock or concentrate. Although fresh raspberries for
403 BC RIDC, written submission to the USITC, December 7, 2020, Summary; Government of Canada, Province of British Columbia. AgriService BC, Berry Production Guides, accessed March 31, 2021. 404 Industry representative, interview by USITC staff, June 23, 2020. 405 U.S. government representative, email message to USITC staff, September 10, 2020. 406 Industry representative, interview by USITC staff, October 20, 2020. 407 Industry representative, interview by USITC staff, February 24, 2021. 408 USITC, hearing transcript, September 17, 2020, 26 (testimony of Ryan Commons, Driscoll’s, Inc.); industry representative, interview by USITC staff, March 1, 2021. 409 USITC, hearing transcript, September 17, 2020, 22 (testimony of Ryan Commons, Driscoll’s, Inc.). 410 Industry representative, interview by USITC staff, October 20, 2020.
Raspberries for Processing
136 | www.usitc.gov
processing are sold into all of those product channels, Canadian growers sell mostly to processors
serving non-IQF markets because of the types of cultivars they raise.411 By volume, the percentage of
Canadian fresh raspberries intended for IQF was roughly 14 percent in 2020.412 Both Washington and
British Columbia supply raspberry puree to large jam companies, although one industry representative
reported that while the Canadian industry continues to focus on puree, Washington processors have
shifted more production to IQF berries, typically a higher-priced product.413
Canadian production of frozen raspberry products continues even as Canadian acreage shifts out of
fresh raspberries grown for processing and into other berries, particularly blueberries.414 Canada now
imports fresh raspberries from the United States to fill the gap left behind by Canadian growers. Like
other agricultural processing industries, Canadian raspberry processors must have access to enough
fresh raspberries to cover their operating costs and see a return on their capital investments.
As noted earlier, Canada also has a competitive repacking industry selling IQF raspberries and frozen
mixed berry products to the U.S. market. IQF raspberries can be sourced from processors in the United
States, Canada, or other high-volume suppliers because they are shipped already frozen. Nature’s Touch
is reportedly the largest repacker of IQF retail berry bags (both single berry and mixed berries) in Canada
and the third largest in the United States. To meet its needs, Nature’s Touch procures a large volume of
IQF raspberries from sources outside of Canada and the United States.415
While profitability data by product are not readily available either for the Canadian industry as a whole
or for individual processors, industry sources note that IQF berries normally fetch the highest price of all
frozen raspberry products from purchasers. However, the IQF segment of the processing industry can
also be more labor intensive.416 Canadian and American industry sources note that more IQF and
raspberries intended for IQF are sourced from Washington than British Columbia because the best
quality IQF raspberries require replanting vines every three or four years. Most Canadian growers have
insufficient capital to replant often enough to compete in that market segment.417
Canada does not produce organic raspberries for processing, reportedly because of the high labor costs
associated with organic production. In addition, industry representatives report that growers cannot
411 Industry representative, interview by USITC staff, February 26, 2021. 412 Industry representative, interview by USITC staff, February 24, 2021. 413 The price growers receive for block frozen raspberries is generally lower than for IQF berries. However,
depending on supply conditions, in some years there is almost no difference between IQF and block frozen berry
prices. The price for juice stock is typically the lowest of the processed raspberry products every year. Industry
representative, interview by USITC staff, July 24, 2020; industry representative, interview by USITC staff,
October 20, 2020. 414 According to industry sources, blueberries require less labor and are lower cost than raspberries. In particular, they require less pruning. Industry representatives, interviews by USITC staff, August 7, 2020, and February 24, 2021. 415 Industry representative, interview by USITC staff, July 24, 2020. 416 The price premium of IQF raspberries above the price of straight pack can vary between $0.10–$0.60 per lb. Industry representative, interview by USITC staff, March 1, 2021. 417 Industry representative, interview by USITC staff, August 7, 2020.
Chapter 4: Canada
United States International Trade Commission | 137
grow organic berries in open fields in British Columbia because of climate requirements, since dry
conditions are critical during certain periods.418
Production, Consumption, and Trade
Production and Consumption
Canada remains a minor global supplier of raspberries; its global rank has deteriorated over time as
domestic production declined and as other countries increased production.419 In 2019, Canada was the
12th-largest global producer by volume, accounting for only 1.1 percent of total global production. One
factor depressing Canada’s global ranking is low yield rates, which are a persistent problem. According
to data from the Food and Agriculture Organization of the United Nations (FAO), Canada’s raspberry
production yield of 4.9 metric tons (mt)/hectare (ha) in 2019 was quite low compared to those of the
United States (15.2 mt/ha) and Mexico (18.2 mt/ha) over the same period (table 4.1).420 Comparing
regions that primarily grow raspberries for processing, British Columbia’s yield of 6.2 mt/ha in 2019 was
still substantially lower than the Oregon/Washington yield of 9.0 mt/ha.421 Poor yields for British
Columbia in contrast to those of U.S. producers are not new or a one-year phenomenon; government
data indicate a range of 5.8–7.7 mt/ha during 2015–19. These are consistently lower than yields in
Washington and Oregon.
Total Canadian raspberry production fell from 10,868 mt in 2015 to 9,145 mt in 2019, declining almost
15.9 percent by volume in this period (table 4.1).422 Because most raspberries are grown in British
Columbia, provincial trends drive national production. British Columbia’s marketed production, most of
it raspberries for processing, declined from 8,068 mt in 2015 to 6,789 mt in 2019.423 According to
Canadian officials, the production decline is due to factors such as weather, increasingly competitive
market conditions, and rising input costs.424 Canadian officials attribute the substantial decrease in
British Columbia’s raspberry production in 2019 to very cold weather, noting that the Fraser Valley
experienced the coldest February on record, causing damage to the raspberry plants that reportedly
resulted in nearly a 40 percent crop loss.425 A 21.0 percent decline in planted area is another important
factor: British Columbian raspberry growers lost 117 ha between 2015 and 2019. In addition, Canadian
418 Industry representative, interview by USITC staff, July 24, 2020. 419 In 2000, Canada was the eighth-largest global producer of raspberries by volume and accounted for 4 percent of global production. FAO, FAOSTAT database, Crops: Raspberries, accessed January 5, 2021. 420 Country data are not directly comparable because the United States and Mexico grow a higher percentage of raspberries for the fresh market, with cultivars producing higher yields. Yield rates for BC’s raspberries for processing sector were compiled by USITC staff based on BC provincial data from Statistics Canada. 421 For a multi-country and multi-region comparison of yields, see chapter 2, “Cross-country comparison of competitiveness.” 422 There is limited organic raspberry production in Canada, reportedly accounting for 10 percent of total Canadian raspberry acreage. Government of Canada, Crop Profile for Raspberry in Canada 2016, October 18, 2016, 1. 423 Table 1: Canadian Raspberry Marketed Production, by Province, in Government of Canada, written submission to the USITC, December 4, 2020, 2. 424 Government of Canada, written submission to the USITC, December 4, 2020, 1‒2. 425 Government of Canada, written submission to the USITC, December 4, 2020, 2.
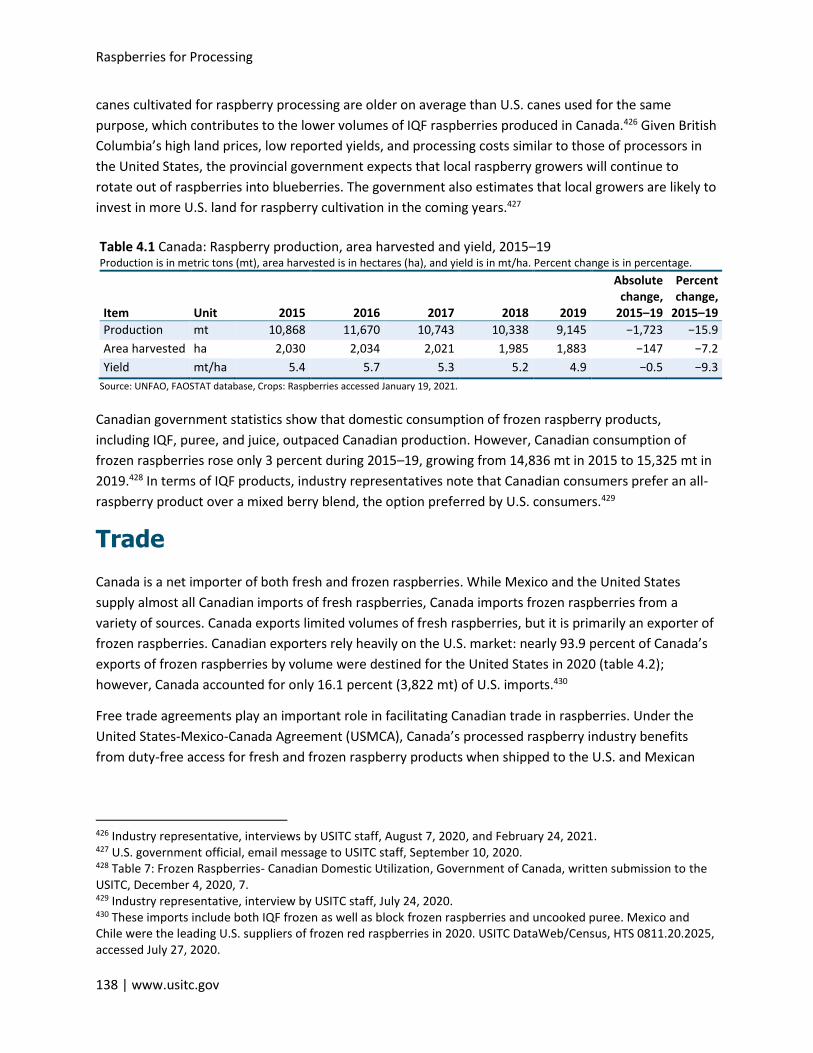
Raspberries for Processing
138 | www.usitc.gov
canes cultivated for raspberry processing are older on average than U.S. canes used for the same
purpose, which contributes to the lower volumes of IQF raspberries produced in Canada.426 Given British
Columbia’s high land prices, low reported yields, and processing costs similar to those of processors in
the United States, the provincial government expects that local raspberry growers will continue to
rotate out of raspberries into blueberries. The government also estimates that local growers are likely to
invest in more U.S. land for raspberry cultivation in the coming years.427
Table 4.1 Canada: Raspberry production, area harvested and yield, 2015–19 Production is in metric tons (mt), area harvested is in hectares (ha), and yield is in mt/ha. Percent change is in percentage.
Item Unit 2015 2016 2017 2018 2019
Absolute change,
2015–19
Percent change,
2015–19
Production mt 10,868 11,670 10,743 10,338 9,145 −1,723 −15.9
Area harvested ha 2,030 2,034 2,021 1,985 1,883 −147 −7.2
Yield mt/ha 5.4 5.7 5.3 5.2 4.9 −0.5 −9.3
Source: UNFAO, FAOSTAT database, Crops: Raspberries accessed January 19, 2021.
Canadian government statistics show that domestic consumption of frozen raspberry products,
including IQF, puree, and juice, outpaced Canadian production. However, Canadian consumption of
frozen raspberries rose only 3 percent during 2015–19, growing from 14,836 mt in 2015 to 15,325 mt in
2019.428 In terms of IQF products, industry representatives note that Canadian consumers prefer an all-
raspberry product over a mixed berry blend, the option preferred by U.S. consumers.429
Trade
Canada is a net importer of both fresh and frozen raspberries. While Mexico and the United States
supply almost all Canadian imports of fresh raspberries, Canada imports frozen raspberries from a
variety of sources. Canada exports limited volumes of fresh raspberries, but it is primarily an exporter of
frozen raspberries. Canadian exporters rely heavily on the U.S. market: nearly 93.9 percent of Canada’s
exports of frozen raspberries by volume were destined for the United States in 2020 (table 4.2);
however, Canada accounted for only 16.1 percent (3,822 mt) of U.S. imports.430
Free trade agreements play an important role in facilitating Canadian trade in raspberries. Under the
United States-Mexico-Canada Agreement (USMCA), Canada’s processed raspberry industry benefits
from duty-free access for fresh and frozen raspberry products when shipped to the U.S. and Mexican
426 Industry representative, interviews by USITC staff, August 7, 2020, and February 24, 2021. 427 U.S. government official, email message to USITC staff, September 10, 2020. 428 Table 7: Frozen Raspberries- Canadian Domestic Utilization, Government of Canada, written submission to the USITC, December 4, 2020, 7. 429 Industry representative, interview by USITC staff, July 24, 2020. 430 These imports include both IQF frozen as well as block frozen raspberries and uncooked puree. Mexico and Chile were the leading U.S. suppliers of frozen red raspberries in 2020. USITC DataWeb/Census, HTS 0811.20.2025, accessed July 27, 2020.
Chapter 4: Canada
United States International Trade Commission | 139
markets as long as they meet rules of origin requirements. All of these products had the same duty-free
access under the North American Free Trade Agreement (NAFTA).
Chile and Canada are members of two free trade agreements, the Canada-Chile Free Trade Agreement
(CCFTA) and the Comprehensive and Progressive Agreement for Trans-Pacific Partnership (CPTPP).431
Canadian imports of both fresh and frozen raspberries from Chile are free of duty under the CCFTA and
the CPTPP as long as they meet rules of origin requirements. Imports of fresh raspberries into Canada
from China, Poland, Serbia, and any other foreign suppliers are free of duty under Canada’s most-
favored-nation (MFN) rate.432 However, frozen raspberries from other foreign suppliers (primarily China
and Serbia), including IQF raspberries used in frozen mixed berry and single berry retail bags, are subject
to a 6 percent MFN rate of duty when entering Canada.433
Exports of Processed (Frozen) Raspberries
Canada’s frozen raspberry exports increased 54.7 percent by volume during 2015–20 but declined
0.1 percent by value (tables 4.2 and 4.3). The United States is the primary export market, accounting for
almost all exports by both volume and value. Exports to the United States rose by 73.3 percent over the
period, from 2,574 mt in 2015 to 4,461 mt in 2020. As Canada’s exports to other minor export markets
declined, the U.S. market share steadily grew, from 83.8 percent in 2015 to 93.9 percent in 2020 (by
volume). At the same time, Canada is the United States’ fourth-largest supplier of frozen raspberries,
and since 2015 has nearly doubled its market share by quantity to 16.1 percent in 2020.434 During 2017–
20, exports to the United States totaled over 90 percent of Canada’s exports by volume. However, unlike
fresh raspberries, frozen raspberries can travel long distances if given proper cold storage, and Canada’s
major export markets (after the United States) during 2015–20 included Australia, Chile, China, and
Japan.
431 OAS, Foreign Trade Information System, accessed March 12, 2021. Government of Canada, Comprehensive and Progressive Agreement for Trans-Pacific Partnership (CPTPP), accessed March 12, 2021. 432 GATT 1947, Article 1; CBP, “Countries ineligible for NTR/MFN duty rates,” November 2, 2020. 433 As a member of the European Union, Poland benefits from duty-free treatment for frozen raspberries (HS subheading 0811.20) under the Comprehensive Economic and Trade Agreement (CETA) with Canada starting in 2017. See: CBSA, Customs Tariff Schedule 2021-3, Chapter 8, April 1, 2021, accessed April 21, 2021. 434 USITC DataWeb/Census, HTS 0811.20.2025, accessed July 27, 2020.
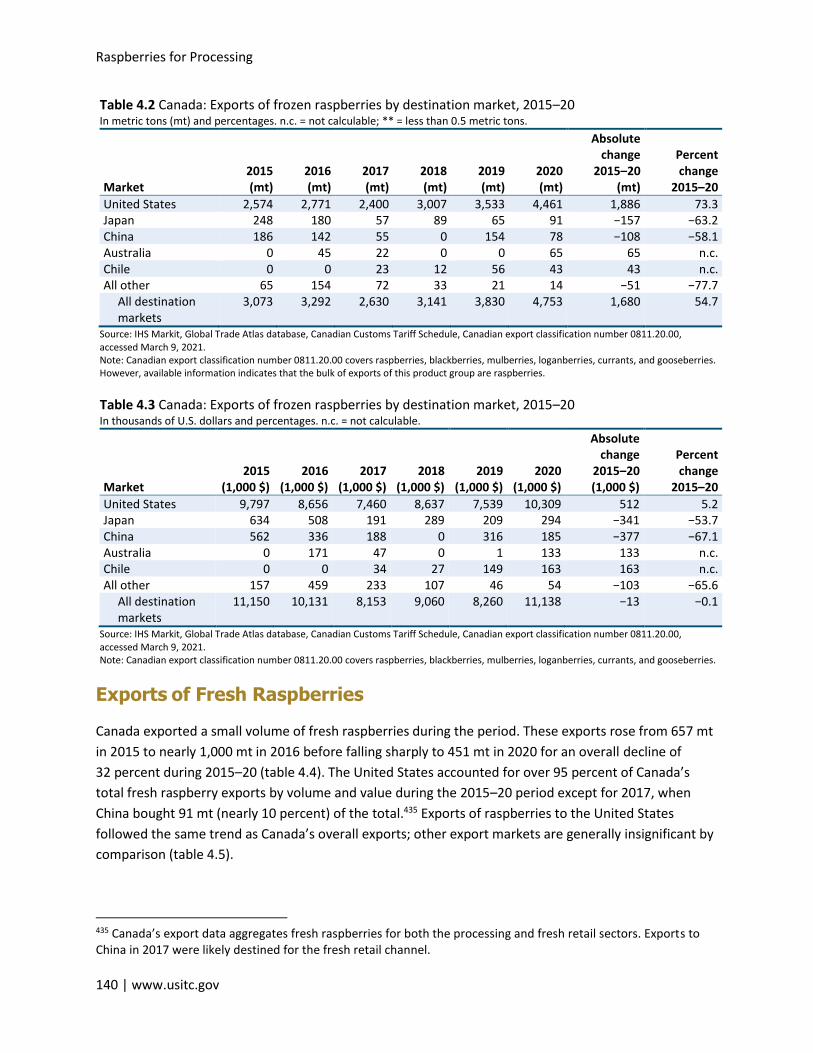
Raspberries for Processing
140 | www.usitc.gov
Table 4.2 Canada: Exports of frozen raspberries by destination market, 2015–20 In metric tons (mt) and percentages. n.c. = not calculable; ** = less than 0.5 metric tons.
Market 2015 (mt)
2016 (mt)
2017 (mt)
2018 (mt)
2019 (mt)
2020 (mt)
Absolute change
2015–20 (mt)
Percent change
2015–20
United States 2,574 2,771 2,400 3,007 3,533 4,461 1,886 73.3 Japan 248 180 57 89 65 91 −157 −63.2 China 186 142 55 0 154 78 −108 −58.1 Australia 0 45 22 0 0 65 65 n.c. Chile 0 0 23 12 56 43 43 n.c. All other 65 154 72 33 21 14 −51 −77.7
All destination markets
3,073 3,292 2,630 3,141 3,830 4,753 1,680 54.7
Source: IHS Markit, Global Trade Atlas database, Canadian Customs Tariff Schedule, Canadian export classification number 0811.20.00, accessed March 9, 2021. Note: Canadian export classification number 0811.20.00 covers raspberries, blackberries, mulberries, loganberries, currants, and gooseberries. However, available information indicates that the bulk of exports of this product group are raspberries.
Table 4.3 Canada: Exports of frozen raspberries by destination market, 2015–20 In thousands of U.S. dollars and percentages. n.c. = not calculable.
Market 2015
(1,000 $) 2016
(1,000 $) 2017
(1,000 $) 2018
(1,000 $) 2019
(1,000 $) 2020
(1,000 $)
Absolute change
2015–20 (1,000 $)
Percent change
2015–20
United States 9,797 8,656 7,460 8,637 7,539 10,309 512 5.2 Japan 634 508 191 289 209 294 −341 −53.7 China 562 336 188 0 316 185 −377 −67.1 Australia 0 171 47 0 1 133 133 n.c. Chile 0 0 34 27 149 163 163 n.c. All other 157 459 233 107 46 54 −103 −65.6
All destination markets
11,150 10,131 8,153 9,060 8,260 11,138 −13 −0.1
Source: IHS Markit, Global Trade Atlas database, Canadian Customs Tariff Schedule, Canadian export classification number 0811.20.00, accessed March 9, 2021. Note: Canadian export classification number 0811.20.00 covers raspberries, blackberries, mulberries, loganberries, currants, and gooseberries.
Exports of Fresh Raspberries
Canada exported a small volume of fresh raspberries during the period. These exports rose from 657 mt
in 2015 to nearly 1,000 mt in 2016 before falling sharply to 451 mt in 2020 for an overall decline of
32 percent during 2015–20 (table 4.4). The United States accounted for over 95 percent of Canada’s
total fresh raspberry exports by volume and value during the 2015–20 period except for 2017, when
China bought 91 mt (nearly 10 percent) of the total.435 Exports of raspberries to the United States
followed the same trend as Canada’s overall exports; other export markets are generally insignificant by
comparison (table 4.5).
435 Canada’s export data aggregates fresh raspberries for both the processing and fresh retail sectors. Exports to China in 2017 were likely destined for the fresh retail channel.
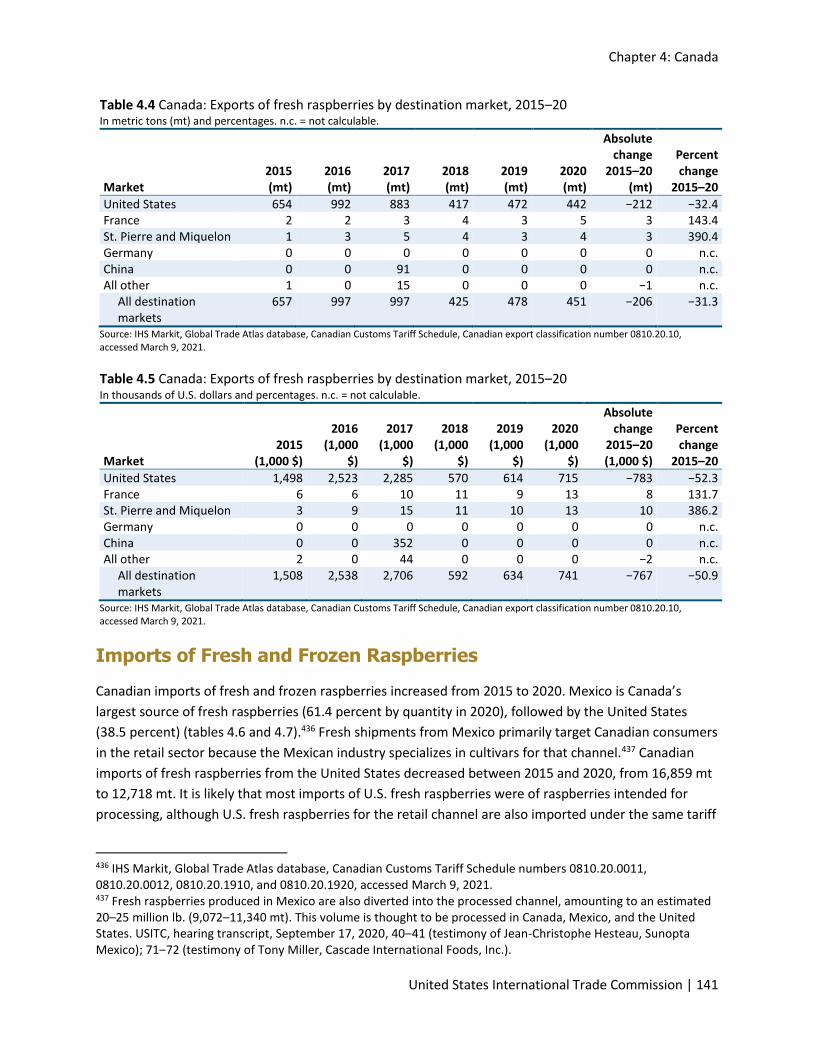
Chapter 4: Canada
United States International Trade Commission | 141
Table 4.4 Canada: Exports of fresh raspberries by destination market, 2015–20 In metric tons (mt) and percentages. n.c. = not calculable.
Market 2015 (mt)
2016 (mt)
2017 (mt)
2018 (mt)
2019 (mt)
2020 (mt)
Absolute change
2015–20 (mt)
Percent change
2015–20
United States 654 992 883 417 472 442 −212 −32.4 France 2 2 3 4 3 5 3 143.4 St. Pierre and Miquelon 1 3 5 4 3 4 3 390.4 Germany 0 0 0 0 0 0 0 n.c. China 0 0 91 0 0 0 0 n.c. All other 1 0 15 0 0 0 −1 n.c.
All destination markets
657 997 997 425 478 451 −206 −31.3
Source: IHS Markit, Global Trade Atlas database, Canadian Customs Tariff Schedule, Canadian export classification number 0810.20.10, accessed March 9, 2021.
Table 4.5 Canada: Exports of fresh raspberries by destination market, 2015–20 In thousands of U.S. dollars and percentages. n.c. = not calculable.
Market 2015
(1,000 $)
2016 (1,000
$)
2017 (1,000
$)
2018 (1,000
$)
2019 (1,000
$)
2020 (1,000
$)
Absolute change
2015–20 (1,000 $)
Percent change
2015–20
United States 1,498 2,523 2,285 570 614 715 −783 −52.3 France 6 6 10 11 9 13 8 131.7 St. Pierre and Miquelon 3 9 15 11 10 13 10 386.2 Germany 0 0 0 0 0 0 0 n.c. China 0 0 352 0 0 0 0 n.c. All other 2 0 44 0 0 0 −2 n.c.
All destination markets
1,508 2,538 2,706 592 634 741 −767 −50.9
Source: IHS Markit, Global Trade Atlas database, Canadian Customs Tariff Schedule, Canadian export classification number 0810.20.10, accessed March 9, 2021.
Imports of Fresh and Frozen Raspberries
Canadian imports of fresh and frozen raspberries increased from 2015 to 2020. Mexico is Canada’s
largest source of fresh raspberries (61.4 percent by quantity in 2020), followed by the United States
(38.5 percent) (tables 4.6 and 4.7).436 Fresh shipments from Mexico primarily target Canadian consumers
in the retail sector because the Mexican industry specializes in cultivars for that channel.437 Canadian
imports of fresh raspberries from the United States decreased between 2015 and 2020, from 16,859 mt
to 12,718 mt. It is likely that most imports of U.S. fresh raspberries were of raspberries intended for
processing, although U.S. fresh raspberries for the retail channel are also imported under the same tariff
436 IHS Markit, Global Trade Atlas database, Canadian Customs Tariff Schedule numbers 0810.20.0011, 0810.20.0012, 0810.20.1910, and 0810.20.1920, accessed March 9, 2021. 437 Fresh raspberries produced in Mexico are also diverted into the processed channel, amounting to an estimated 20–25 million lb. (9,072–11,340 mt). This volume is thought to be processed in Canada, Mexico, and the United States. USITC, hearing transcript, September 17, 2020, 40‒41 (testimony of Jean-Christophe Hesteau, Sunopta Mexico); 71‒72 (testimony of Tony Miller, Cascade International Foods, Inc.).
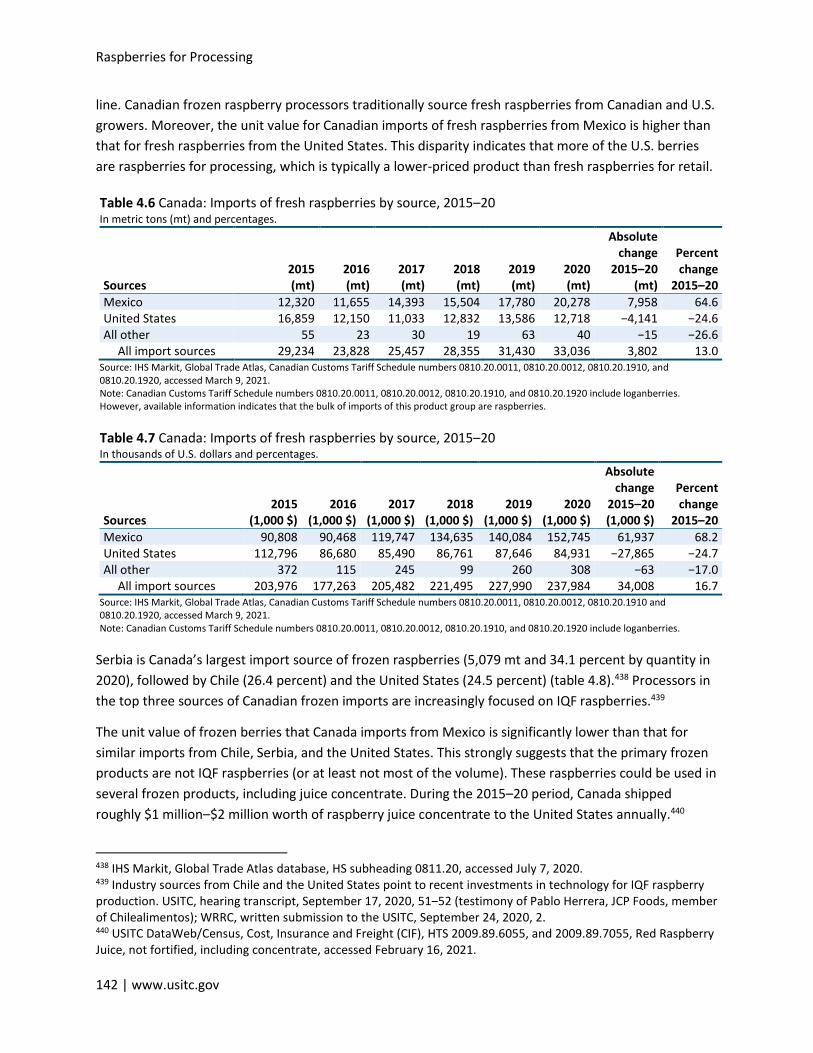
Raspberries for Processing
142 | www.usitc.gov
line. Canadian frozen raspberry processors traditionally source fresh raspberries from Canadian and U.S.
growers. Moreover, the unit value for Canadian imports of fresh raspberries from Mexico is higher than
that for fresh raspberries from the United States. This disparity indicates that more of the U.S. berries
are raspberries for processing, which is typically a lower-priced product than fresh raspberries for retail.
Table 4.6 Canada: Imports of fresh raspberries by source, 2015–20 In metric tons (mt) and percentages.
Sources 2015 (mt)
2016 (mt)
2017 (mt)
2018 (mt)
2019 (mt)
2020 (mt)
Absolute change
2015–20 (mt)
Percent change
2015–20
Mexico 12,320 11,655 14,393 15,504 17,780 20,278 7,958 64.6 United States 16,859 12,150 11,033 12,832 13,586 12,718 −4,141 −24.6 All other 55 23 30 19 63 40 −15 −26.6
All import sources 29,234 23,828 25,457 28,355 31,430 33,036 3,802 13.0 Source: IHS Markit, Global Trade Atlas, Canadian Customs Tariff Schedule numbers 0810.20.0011, 0810.20.0012, 0810.20.1910, and 0810.20.1920, accessed March 9, 2021. Note: Canadian Customs Tariff Schedule numbers 0810.20.0011, 0810.20.0012, 0810.20.1910, and 0810.20.1920 include loganberries. However, available information indicates that the bulk of imports of this product group are raspberries.
Table 4.7 Canada: Imports of fresh raspberries by source, 2015–20 In thousands of U.S. dollars and percentages.
Sources 2015
(1,000 $) 2016
(1,000 $) 2017
(1,000 $) 2018
(1,000 $) 2019
(1,000 $) 2020
(1,000 $)
Absolute change
2015–20 (1,000 $)
Percent change
2015–20
Mexico 90,808 90,468 119,747 134,635 140,084 152,745 61,937 68.2 United States 112,796 86,680 85,490 86,761 87,646 84,931 −27,865 −24.7 All other 372 115 245 99 260 308 −63 −17.0
All import sources 203,976 177,263 205,482 221,495 227,990 237,984 34,008 16.7 Source: IHS Markit, Global Trade Atlas, Canadian Customs Tariff Schedule numbers 0810.20.0011, 0810.20.0012, 0810.20.1910 and 0810.20.1920, accessed March 9, 2021. Note: Canadian Customs Tariff Schedule numbers 0810.20.0011, 0810.20.0012, 0810.20.1910, and 0810.20.1920 include loganberries.
Serbia is Canada’s largest import source of frozen raspberries (5,079 mt and 34.1 percent by quantity in
2020), followed by Chile (26.4 percent) and the United States (24.5 percent) (table 4.8).438 Processors in
the top three sources of Canadian frozen imports are increasingly focused on IQF raspberries.439
The unit value of frozen berries that Canada imports from Mexico is significantly lower than that for
similar imports from Chile, Serbia, and the United States. This strongly suggests that the primary frozen
products are not IQF raspberries (or at least not most of the volume). These raspberries could be used in
several frozen products, including juice concentrate. During the 2015–20 period, Canada shipped
roughly $1 million–$2 million worth of raspberry juice concentrate to the United States annually.440
438 IHS Markit, Global Trade Atlas database, HS subheading 0811.20, accessed July 7, 2020. 439 Industry sources from Chile and the United States point to recent investments in technology for IQF raspberry production. USITC, hearing transcript, September 17, 2020, 51‒52 (testimony of Pablo Herrera, JCP Foods, member of Chilealimentos); WRRC, written submission to the USITC, September 24, 2020, 2. 440 USITC DataWeb/Census, Cost, Insurance and Freight (CIF), HTS 2009.89.6055, and 2009.89.7055, Red Raspberry Juice, not fortified, including concentrate, accessed February 16, 2021.
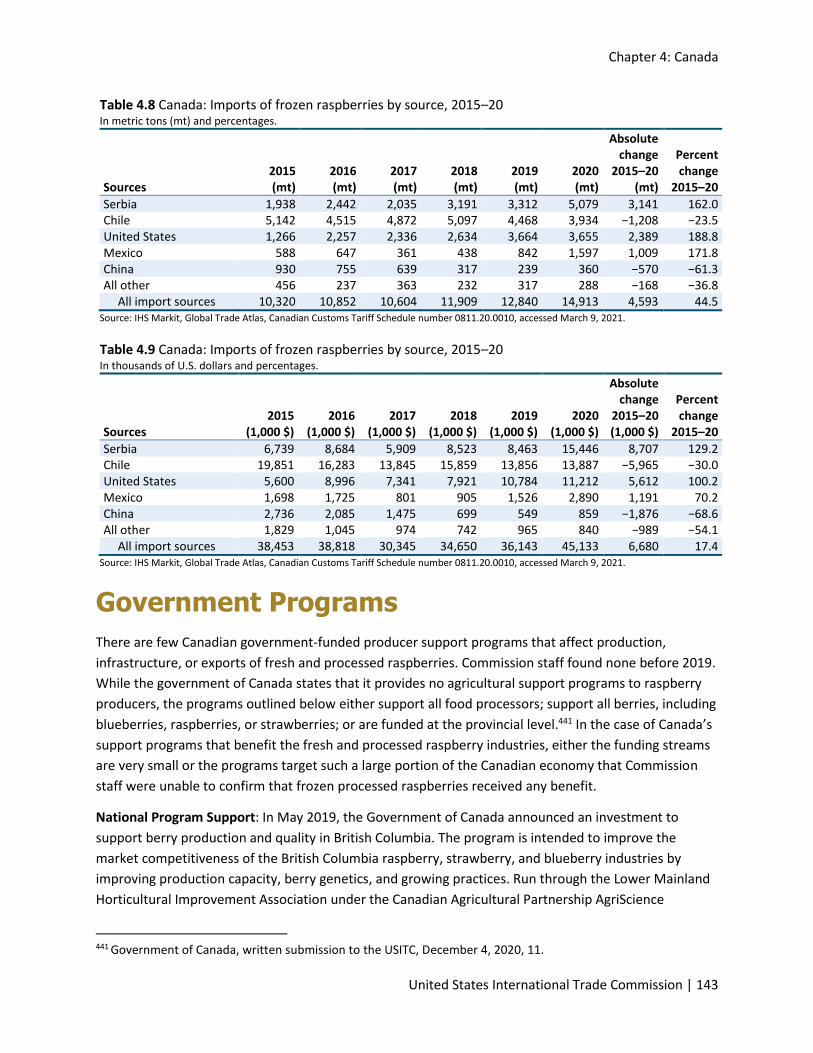
Chapter 4: Canada
United States International Trade Commission | 143
Table 4.8 Canada: Imports of frozen raspberries by source, 2015–20 In metric tons (mt) and percentages.
Sources 2015 (mt)
2016 (mt)
2017 (mt)
2018 (mt)
2019 (mt)
2020 (mt)
Absolute change
2015–20 (mt)
Percent change
2015–20
Serbia 1,938 2,442 2,035 3,191 3,312 5,079 3,141 162.0 Chile 5,142 4,515 4,872 5,097 4,468 3,934 −1,208 −23.5 United States 1,266 2,257 2,336 2,634 3,664 3,655 2,389 188.8 Mexico 588 647 361 438 842 1,597 1,009 171.8 China 930 755 639 317 239 360 −570 −61.3 All other 456 237 363 232 317 288 −168 −36.8
All import sources 10,320 10,852 10,604 11,909 12,840 14,913 4,593 44.5 Source: IHS Markit, Global Trade Atlas, Canadian Customs Tariff Schedule number 0811.20.0010, accessed March 9, 2021.
Table 4.9 Canada: Imports of frozen raspberries by source, 2015–20 In thousands of U.S. dollars and percentages.
Sources 2015
(1,000 $) 2016
(1,000 $) 2017
(1,000 $) 2018
(1,000 $) 2019
(1,000 $) 2020
(1,000 $)
Absolute change
2015–20 (1,000 $)
Percent change
2015–20
Serbia 6,739 8,684 5,909 8,523 8,463 15,446 8,707 129.2 Chile 19,851 16,283 13,845 15,859 13,856 13,887 −5,965 −30.0 United States 5,600 8,996 7,341 7,921 10,784 11,212 5,612 100.2 Mexico 1,698 1,725 801 905 1,526 2,890 1,191 70.2 China 2,736 2,085 1,475 699 549 859 −1,876 −68.6 All other 1,829 1,045 974 742 965 840 −989 −54.1
All import sources 38,453 38,818 30,345 34,650 36,143 45,133 6,680 17.4 Source: IHS Markit, Global Trade Atlas, Canadian Customs Tariff Schedule number 0811.20.0010, accessed March 9, 2021.
Government Programs
There are few Canadian government-funded producer support programs that affect production,
infrastructure, or exports of fresh and processed raspberries. Commission staff found none before 2019.
While the government of Canada states that it provides no agricultural support programs to raspberry
producers, the programs outlined below either support all food processors; support all berries, including
blueberries, raspberries, or strawberries; or are funded at the provincial level.441 In the case of Canada’s
support programs that benefit the fresh and processed raspberry industries, either the funding streams
are very small or the programs target such a large portion of the Canadian economy that Commission
staff were unable to confirm that frozen processed raspberries received any benefit.
National Program Support: In May 2019, the Government of Canada announced an investment to
support berry production and quality in British Columbia. The program is intended to improve the
market competitiveness of the British Columbia raspberry, strawberry, and blueberry industries by
improving production capacity, berry genetics, and growing practices. Run through the Lower Mainland
Horticultural Improvement Association under the Canadian Agricultural Partnership AgriScience
441 Government of Canada, written submission to the USITC, December 4, 2020, 11.
Raspberries for Processing
144 | www.usitc.gov
Program, this program is part of a $3 billion, five-year investment by federal, provincial, and territorial
governments to strengthen the agricultural and agri-food sector. The Lower Mainland Horticultural
Improvement Association will receive $200,000 in annual funding for the next five years to improve
berry genetics. The research will support a plant breeding program that produces superior berry
varieties that are suited to the local climate. The program is expected to lead to improved crops, higher
fruit quality, and increased pest and disease resistance.442
Provincial Producer Support: In early 2021, the British Columbia provincial government introduced a
berry producer support program called the British Columbia Raspberry Replant Program, intended to
increase the amount of acreage planted with raspberry varieties suitable for IQF and fresh raspberry
markets in the province.443 A limiting factor to the program is its emphasis on small-scale farming; new
or existing growers must plant eligible varieties on no more than 10 acres (4 ha) per applicant. In
addition, the program requirements exclude raspberry varieties grown primarily for bulk block frozen
markets (straight pack, puree, or juice). Cost-share funding were available for eligible raspberry fields
planted in the spring of 2021, provided on a per-plant basis.444
Compliance with Food Safety Standards
Canada’s domestic food safety standards are similar to those in the United States, and Canadian
processors (including those that export frozen raspberries) are able to meet U.S. Food Safety
Modernization Act (FSMA) requirements.445 Adherence to strict food safety requirements and a
reputation for high quality has traditionally been a competitive strength for the Canadian raspberry
processing industry selling into the U.S. market.446
442 Government of Canada, “British Columbia Berries Receive Funding Boost,” May 13, 2019. 443 Government of Canada, Province of British Columbia, Raspberry Replant Program Requirements, 2, accessed March 15, 2021. 444 Government of Canada, Province of British Columbia, Raspberry Replant Program Requirements, 3, accessed March 15, 2021. 445 Government of Canada, “Food Safety Standards and Guidelines,” accessed May 14, 2021; Government of Canada, “Guidelines for ‘Product of Canada’ and ‘Made in Canada’ Claims,” accessed March 12, 2021; BC RIDC, written submission to the USITC, December 7, 2020, 5; USDA, AMS, “Good Agricultural Practices (GAP) and Good Handling Practices (GHP),” accessed March 15, 2021; USDA, FDA, “Food Safety Modernization Act (FSMA),” accessed March 15, 2021. 446 USITC, hearing transcript, September 17, 2020, 29 (testimony of John Tentomas, Nature’s Touch).
Chapter 4: Canada
United States International Trade Commission | 145
Factors Affecting Competitiveness
As described in chapter 2 of this report, competitiveness of raspberries for processing and processed
raspberry products can be measured by comparing delivered costs, product differentiation, and supplier
reliability for U.S. products against those of imports. Certain key factors contribute to the
competitiveness of Canadian processed raspberry products in the U.S. market. The raspberry industries
in Washington and British Columbia are geographically close, have similar production systems and a
shared focus on processing. Canadian frozen raspberry products remain competitive in the United States
due to Canadian processors’ access to fresh raspberry inputs from British Columbia and Washington,
and frozen raspberry inputs from Chile, Serbia, and the United States. However, Canadian growing and
processing costs are higher than those in the United States.
British Columbia Growers Are Not Cost Competitive with Growers in Major Foreign Supplier Countries
British Columbia raspberry growers face many of the same competitive challenges as growers of
raspberries for processing in Washington and Oregon. However, Canadian grower costs are the highest
among the producers in the United States, Mexico, Chile, and Serbia, primarily because of the high cost
of suitable land in British Columbia, combined with labor costs similar to those in the United States. Not
only is British Columbian land very expensive, often multiple times as costly to rent as similar acreage in
the United States, but the supply of land suitable for raspberry production is also limited. Expanding
urban development in the Vancouver metropolitan area and attractive alternative growing options (such
as blueberries) have helped to shrink acreage and production volume for raspberries.447
Higher land costs also affect decisions about paying to use proprietary raspberry cultivars. New,
innovative raspberry cultivars have been developed to improve yields and resilience to changing
weather patterns in the Pacific Northwest. However, many British Columbia farmers rent land rather
than own it outright. They must therefore secure land leases that are long enough (ideally at least
10 years) to justify the cost of licensing plant varietals, pulling up old canes, and absorbing the financial
impact of having no harvest in the first year as the new varietals grow to maturity.448
Canadian growers and processors face higher labor costs than in Mexico, Chile, and Serbia, and similar
labor costs to their U.S. counterparts. As in the United States, Canadian growers have mitigated this to
an extent by investing in machine harvesting. Industry representatives report that labor costs for
countries competing with Canadian and U.S. growers are as much as 50–90 percent lower.449 In 2017,
the British Columbian government implemented minimum wage legislation that increased the minimum
wage from C$11.35 ($9.08)/hour to C$14.60 ($11.68)/hour.450 By June 1, 2021, the minimum wage in
British Columbia was slated to rise again, to C$15.20 ($12.16)/hour. The Canadian wage is slightly below
447 Industry representative, interview by USITC staff, February 26, 2021. 448 Industry representative, interview by USITC staff, August 7, 2020. 449 BC RIDC, written submission to the USITC, December 7, 2020, 5. 450 BC RIDC, written submission to the USITC, December 7, 2020, 5.
Raspberries for Processing
146 | www.usitc.gov
the minimum wage of $13.50/hour in Washington, but British Columbian processors are obligated to
pay a range of additional payroll costs (e.g., vacation pay, employment and workplace safety insurance,
overtime for certain workers, and pension contributions) higher than those paid by U.S. processors.451
Moreover, labor availability in both British Columbia and Washington for this sector is a continual
problem, according to industry representatives.452 Canadian growers reportedly face labor shortages
and compete for seasonal workers with U.S. growers and with other summer crops in Canada.453
Canadian Processors Adapted by Purchasing More Fresh and Frozen Raspberries from Foreign Suppliers
Canadian processors have duty-free access to fresh raspberries and frozen raspberry products
originating in the agreement partners of USMCA (Mexico and the United States), CETA (Poland), and
CPTPP (Chile). In addition, the MFN rate of duty for frozen raspberries from other suppliers such Serbia
is 6 percent ad valorem.454 Consequently, Canadian processors have access to raspberry inputs from the
largest producers in the world, an important consideration when success or failure largely depends on
access to high enough volumes of cost-competitive raspberries for processing.455
Because the Canadian processing sector is not vertically integrated with local growers in a significant
way, the decline in Canadian acreage of raspberries for processing has a more limited impact on the
processors than if they were jointly owned. The cost of procuring fresh raspberries for processing from
Canadian growers in British Columbia is comparable to the cost of similar raspberries from
Washington.456 Canadian processors are importing more fresh raspberries from the United States to
produce all frozen products. The proximity of Washington and Oregon to British Columbia processors
allows raspberries to be picked at peak ripeness and sold at competitive prices, in part because of low
transportation costs. Import data also point to increasing Canadian imports of Mexican frozen
raspberries (i.e., raspberry seconds not suitable for the fresh market) to make frozen raspberry products
in Canada (table 4.8).
Canada’s repackers are competitive suppliers of IQF raspberries to the United States, although IQF
comprises a small part of Canada’s processed raspberry industry overall. Repacking firms source whole
IQF raspberries from a growing list of suppliers to ensure a consistent inventory for producing retail
451 Industry representative, interview by USITC staff, February 26, 2021; BC RIDC, written submission to the USITC, December 7, 2020, 5. 452 USITC, hearing transcript, September 17, 2020, 123 (testimony of John Tentomas, Nature’s Touch). 453 Industry representative, interview by USITC staff, February 26, 2021. Raspberry production in the second-largest producing province, Quebec, is also decreasing, reportedly because of import competition with products from Mexico and California, poor weather conditions, and an increase in the minimum wage. Fresh Plaza, “Canada: Strawberry and Raspberry Producers Hampered,” May 24, 2019, accessed March 15, 2021. 454 For further information, see the “Trade” section of this chapter. 455 Industry representative, interview by USITC staff, February 26, 2021. 456 Industry representative, interview by USITC staff, March 1, 2021.
Chapter 4: Canada
United States International Trade Commission | 147
berry bags.457 U.S. processors meet some of Canada’s IQF requirements by investing in technology and
new varietals to increase their own supply of IQF raspberries.458 By remaining at arm’s length from the
declining acreage and financial fortunes of Canadian growers producing raspberries for processing,
Canadian repackers have been able to take advantage of these imports.459
Vertical Integration Is a Key Difference between the U.S. and Canadian Processing Sectors
Canadian processors as a group have far less vertical integration with local growers than processors in
the United States. In fact, they purchase more fresh raspberries for processing from U.S. growers than
from Canadian growers. This situation seems unlikely to change, as high land rents and conversion of
British Columbia agricultural land away from raspberries into blueberries makes vertical integration
impractical. The lack of significant vertical integration in Canada is a major difference from the U.S.
industry and is viewed as a disadvantage by most Canadian processors.460 These processors see vertical
integration as a means of better controlling their inputs (i.e., the supply of raspberries), enabling them
to focus on food safety and controlling the use of pesticides in the fields.461 In addition, Canadian
processors state that vertical integration would allow better yield management and variety
development, as seen in integrated raspberry operations in Washington.462 By contrast, the segment of
Canadian processors repacking IQF raspberries view vertical integration as a disadvantage. These
processors buy IQF raspberries to repackage for retail sale and prefer not to be responsible for selling
lower-value raspberries into other market channels (i.e., straight pack, puree, and juice).463
457 Industry representatives, interviews by USITC staff, June 12, 2020, June 23, 2020, and July 24, 2020. USITC, hearing transcript, September 17, 2020, 14 (testimony of Brad Rader, Rader Farms). 458 Industry representative, interview by USITC staff, February 26, 2021. 459 Industry representative, interview by USITC staff, February 26, 2021. 460 Industry representative, interview by USITC staff, February 26, 2021, and March 1, 2021. 461 Industry representative, interview by USITC staff, March 1, 2021. 462 Industry representative, interview by USITC staff, February 26, 2021. 463 There are exceptions in Canada to the view that IQF repackers are not interested in vertical integration. At least one of the IQF repackers produces for both the fresh and IQF retail segments, using only Canadian raspberries and selling almost entirely in Canada. The company’s business model is selling Canadian raspberries to Canadians, so controlling the raspberries from field to retail is important. Industry representative, interview by USITC staff, March 5, 2021.
148 | www.usitc.gov
Bibliography
British Columbia (BC) Raspberries. “U-Pick or Buy Fresh Raspberries.” Accessed March 12, 2021. https://bcraspberries.com/find-raspberries/.
British Columbia Raspberry Industry Development Council (BC RIDC). Written testimony submitted to the U.S. International Trade Commission in connection with Inv. No. 332-577, Raspberries for Processing: Conditions of Competition Between U.S. and Foreign Suppliers, with a Focus on Washington State, December 7, 2020.
British Columbia Raspberry Industry Development Council (BC RIDC). “BC Raspberries: Picked Fresh.” Video, September 18, 2013. https://www.youtube.com/watch?app=desktop&v=FO83okyALs0.
British Columbia Raspberry Industry Development Council (BC RIDC). “About.” Accessed March 3, 2021. https://bcraspberries.com/about/.
Canada Border Services Agency (CBSA). Customs Tariff Schedule (2021-3), April 1, 2021. https://www.cbsa-asfc.gc.ca/trade-commerce/tariff-tarif/2021/html/tblmod-3-eng.html.
Farms. “Emergency Processing Fund Supports 24 Meat Processing Companies Across the Prairies,” March 2, 2021. https://www.farms.com/news/emergency-processing-fund-supports-24-meat-processing-companies-across-the-prairies-165289.aspx.
Fresh Plaza. “Canada: Strawberry and Raspberry Producers Hampered by Rising Minimum Wage,” May 24, 2019. https://www.freshplaza.com/article/9105769/canada-strawberry-and-raspberry-producers-hampered-by-rising-minimum-wage/.
Fruit and Vegetable. “Emergency Processing Fund Opens: Funding Available for Food Processing and Production Sectors,” June 17, 2020. https://www.fruitandveggie.com/emergency-processing-fund-opens-funding-available-for-food-processing-and-production-sectors/.
Global Ag Media. “Canada Shores Up the Safety of Agri-food Workers.” The Pig Site, September 8, 2020. https://www.thepigsite.com/news/2020/09/canada-shores-up-the-safety-of-agri-food-workers.
Government of Canada. Province of British Columbia. “Raspberries.” Berry Production Guides, AgriService BC. Accessed March 25, 2021. https://www2.gov.bc.ca/gov/content/industry/agriservice-bc/production-guides/berries/raspberries.
Government of Canada. Province of British Columbia. “Raspberry Replant Program Requirements.” Accessed April 27, 2021. https://www2.gov.bc.ca/assets/gov/farming-natural-resources-and-industry/agriculture-and-seafood/programs/raspberry-replant-program/raspberry_replant_requirements.pdf.
Government of Canada. “Applicant Guide.” Accessed March 12, 2021. https://www.agr.gc.ca/eng/agricultural-programs-and-services/emergency-processing-fund/applicant-guide/?id=1591390848110#toc1.2.obj2.
Chapter 4: Canada
United States International Trade Commission | 149
Government of Canada. “British Columbia Berries Receive Funding Boost for Innovation and Market Growth.” News release, May 13, 2019. https://www.canada.ca/en/agriculture-agri-food/news/2019/05/british-columbia-berries-receive-funding-boost-for-innovation-and-market-growth.html.
Government of Canada. “Comprehensive and Progressive Agreement for Trans-Pacific Partnership (CPTPP).” Modified December 31, 2020. https://www.international.gc.ca/trade-commerce/trade-agreements-accords-commerciaux/agr-acc/cptpp-ptpgp/index.aspx?lang=eng.
Government of Canada. Crop Profile for Raspberry in Canada, 2016. Pest Management Program, Agriculture and Agri-Food Canada, 2019. http://publications.gc.ca/collections/collection_2019/aac-aafc/A118-10-18-2016-eng.pdf.
Government of Canada, “Emergency Processing Fund,” Accessed March 12, 2021. https://www.agr.gc.ca/eng/agricultural-programs-and-services/emergency-processing-fund/step-2-who-is-eligible/?id=1591389613517.
Government of Canada. “Food Safety Standards and Guidelines,” Accessed May 14, 2021. Canadian Food Inspection Agency. https://inspection.canada.ca/food-safety-for-industry/food-safety-standards-guidelines/eng/1526653035391/1526653035700.
Government of Canada. “Former—Labelling Requirements for Fresh Fruits or Vegetables.” Canadian Food Inspection Agency. Modified October 20, 2020. https://www.inspection.gc.ca/food-label-requirements/labelling/-f-for-industry/-f-fresh-fruits-and-vegetables/eng/1513366734896/1513366735645?chap=0#s11c13.
Government of Canada. “Government of Canada Supports Innovation in British Columbia’s Berry Industry.” News release, July 4, 2019. https://www.canada.ca/en/agriculture-agri-food/news/2019/07/government-of-canada-supports-innovation-in-british-columbias-berry-industry.html.
Government of Canada. “Guidelines for “Product of Canada” and “Made in Canada” Claims.” Accessed March 12, 2021.https://www.inspection.gc.ca/food-label-equirements/labelling/industry/origin-claims-on-food-labels/eng/1393622222140/1393622515592?chap=5.
Government of Canada. Province of British Columbia. “Market Analysis Report: A Global Export Market Overview for British Columbia’s Raspberry Industry.” 2011.https://www2.gov.bc.ca/assets/gov/farming-natural-resources-and-industry/agriculture-and seafood/statistics/exports/global_export_market_bcraspberries.pdf.
Government of Canada. “Origin Claims on Food Labels.” Canadian Food Inspection Agency. Modified May 28, 2019. https://www.inspection.gc.ca/food-label-requirements/labelling/industry/origin-claims-on-food-labels/eng/1393622222140/1393622515592?chap=5.
Government of Canada. Safe Food for Canadians Regulation, part 11, Labelling, Fresh Fruits or Vegetables [269(3), SFCR]. https://laws-lois.justice.gc.ca/eng/regulations/SOR-2018-108/page-27.html#docCont.
150 | www.usitc.gov
Government of Canada. Safe Food for Canadians Regulation, part 11, Labelling, Processed Fruit or Vegetable Products. SFCR[269(1-3)] https://laws-lois.justice.gc.ca/eng/regulations/SOR-2018-108/page-28.html#docCont.
Government of Canada. Safe Food for Canadians Regulation, part 11, Labelling, Processed Fruit or Vegetable Products. [272(1) SFCR] https://laws-lois.justice.gc.ca/eng/regulations/SOR-2018-108/page-28.html#docCont.
Government of Canada. Safe Food for Canadians Regulation, part 11, Labelling, Processed Fruit or Vegetable Products. [274(1) SFCR] https://laws-lois.justice.gc.ca/eng/regulations/SOR-2018-108/page-28.html#docCont.
Government of Canada. Statistics Canada. Table 32-10-0053-01, Supply and Disposition of Food in Canada (x 1,000). Accessed March 26, 2021. https://doi.org/10.25318/3210005301-eng.
Government of Canada. Written testimony submitted to the U.S. International Trade Commission in connection with Inv. No. 332-577, Raspberries for Processing: Conditions of Competition Between U.S. and Foreign Suppliers, with a Focus on Washington State, December 4, 2020.
IHS Markit. Global Trade Atlas database. Accessed various dates. https://connect.ihsmarkit.com/home.
Organization of American States (OAS). Foreign Trade Information System (SICE). “Canada-Chile.” Trade Policy Developments. Accessed March 26, 2021. http://www.sice.oas.org/TPD/CAN_CHL/CAN_CHL_e.ASP#:~:text=The%20environmental%20and%20labour%20cooperation,February%201997%20in%20Ottawa%2C%20Canada.&text=The%20Canada%2DChile%20Free%20Trade,force%20on%205%20July%201997.
U.S. Department of Agriculture (USDA). Agricultural Marketing System (AMS). “Good Agricultural Practices (GAP) and Good Handling Practices (GHP).” Accessed March 26, 2021. https://www.ams.usda.gov/services/auditing/gap-ghp.
U.S. Department of Agriculture (USDA), U.S. Food and Drug Administration (FDA) “Food Safety Modernization Act (FSMA).” Accessed March 26, 2021. https://www.fda.gov/food/guidance-regulation-food-and-dietary-supplements/food-safety-modernization-act-fsma.
Chapter 5: Mexico
United States International Trade Commission | 151
Chapter 5 Mexico
Summary
Mexico is the second-largest global producer of raspberries (after Russia), accounting for 15 percent of
global production in 2019. Mexico’s raspberry production mainly serves the lucrative fresh market in the
United States. Mexico’s small raspberry processing industry grew out of this fresh market production.
That industry is driven solely by the availability of raspberry seconds, or raspberries that do not meet
the product specifications for the fresh market. The volume of raspberry seconds has been growing in
recent years as overall raspberry production has expanded. Mexican exports to the United States
include processed raspberry products produced in Mexico using raspberry seconds, as well as fresh
raspberry seconds in bulk form to be used for processing by U.S. firms. As shown in Chapter 3 (“United
States”), fresh raspberries for processing from Mexico accounted for nearly all (99 percent) U.S. imports
of fresh raspberries for processing.464
Mexico’s competitiveness in the U.S. processed raspberry market is enhanced by favorable growing
conditions for raspberries, an extended growing season that allows product to be available almost year-
round, and relatively low delivered costs of both raspberries for the fresh market and for processing.
The raspberry industry in Mexico enjoys a delivered-cost advantage in the U.S. fresh market from the
lower costs of labor as well as the Mexican industry’s high yields and proximity to the U.S. market, which
increases the volume of raspberry seconds available for processing. To a certain degree, these
competitive strengths are mitigated by the fact that Mexican raspberries are grown to the specifications
of the fresh market, even those that are sold into the processing market. This means that for certain
processing applications, these raspberries cannot necessarily be substituted for raspberries grown
specifically for processing in Washington State.
Industry Structure
There are a number of firms that process raspberries in Mexico, but most of these focus on processing
other fruits, strawberries and mangoes in particular. Raspberries play only a small, but important, role in
these firms’ business, since they aim to keep their processing equipment in use year-round. Similarly,
Mexican raspberry growers enter the processing market only to a limited extent, selling raspberry
seconds that do not meet fresh market product specifications. In 2019, between 13.3 and 18.1 percent
464 This calculation considers the following HTS statistical reporting numbers: 0810.20.1024 and 0810.20.9024 (fresh raspberries for processing). U.S. import data for fresh raspberries for processing— “Fresh raspberries in containers other than those under 5kg”—were revised downward in early 2021 after the U.S. Census Bureau clarified container weight with importers of record. Data on fresh raspberries for processing in this report reflect these revisions. Staff at the U.S. Census Bureau expect further downward revisions. USITC DataWeb/Census, imports for consumption, HTS 0810.20.1020, 0810.20.1022, 0810.20.1024, 0810.20.9020, 0810.20.9022, 0810.20.9024, and 0811.20.2025, accessed February 4, 2020.
Raspberries for Processing
152 | www.usitc.gov
of all Mexican raspberries produced were seconds, with the majority sold to the processing market.465 In
2020, the Mexican processing sector exported 9,910 metric tons (mt) of frozen raspberries, including
individually quick frozen (IQF), straight pack, and purees, to the United States, its largest destination
market.466 In addition, Mexico exported a large share of its fresh raspberry seconds, supplying 15,797 mt
to the United States in 2020.467 The Mexican processing market also supplies the small domestic market.
There is little vertical integration between raspberry growers and fruit processors in Mexico. Instead, the
market dynamics in the processing sector are significantly impacted by the relationships between key
players in the fresh market (i.e., relationships between fresh berry marketers and raspberry growers) as
most farmers sell raspberries into the processing sector only when their harvested berries do not have
the qualities required for the fresh market.468 And typically, processors process raspberries only when
they have excess processing capacity during the off seasons of more popular fruits.469
Regions
Raspberry processing in Mexico takes place in the raspberry production regions because of the
perishability of the berry. Fresh production is highly concentrated in the central Mexican Federal Entities
(states) of Jalisco and Michoacán, which together accounted for 89.6 percent of fresh raspberry
production in 2019 (see figure 5.1).470 Baja California also has a small (9.1 percent) but notable share of
fresh raspberry production. All three states have temperate climates that are conducive to producing
fresh berries, including blackberries, blueberries, and strawberries, in addition to raspberries.471
Raspberries in these regions are grown for the U.S. fresh market. Processing facilities are primarily
located near berry- and fruit-growing locations in central Mexico and to a lesser extent, Baja
California.472
465 The processing of seconds is a common practice in the produce sector. The estimated range was based on USITC staff calculations. Mexican growers report that 10–12 percent of raspberry production are seconds at the farm level and that this percentage is declining, while fresh berry marketers report that 1–2 percent are seconds at their facilities. U.S. imports of processed and fresh for processing raspberries from Mexico represented a 13.3 percent share of total Mexican production of fresh raspberries in 2019. U.S. imports of processed and fresh for processing raspberries made up an 18.1 percent share of total raspberry imports from Mexico in 2019. USITC DataWeb/Census, imports for consumption, HTS 0810.20.1020, 0810.20.1022, 0810.20.1024, 0810.20.9020, 0810.20.9022, 0810.20.9024, and 0811.20.2025, accessed February 4, 2020; Government of Mexico, SIAP, Anuario estadístico de la producción agrícola (Agricultural production statistical yearbook), accessed December 4, 2020; U.S. government representative, email message to USITC staff, January 15, 2021; industry representative, interview by USITC staff, December 1, 2020. 466 IHS Market, Global Trade Atlas database, HS 0811.20, accessed March 16, 2020. 467 USITC DataWeb/Census, HTS 0810.20.1024 and 0810.20.9024, accessed February 4, 2021. 468 Industry representatives, interviews by USITC staff, November 25, 2020, and December 3, 2020. 469 Industry representatives, interviews by USITC staff, November 25, 2020, December 3, 2020, and December 1, 2020. 470 Government of Mexico, SIAP, Anuario estadístico de la producción agrícola (Agricultural production statistical yearbook), accessed December 4, 2020. 471 Industry representative, interview by USITC staff, October 26, 2020. 472 USITC, hearing transcript, September 17, 2020, 157 (testimony of Jean-Christophe Hesteau, SunOpta Inc.) and 158 (testimony of Tony Miller, Cascade International Foods); industry representative, interview by USITC staff, December 3, 2020.
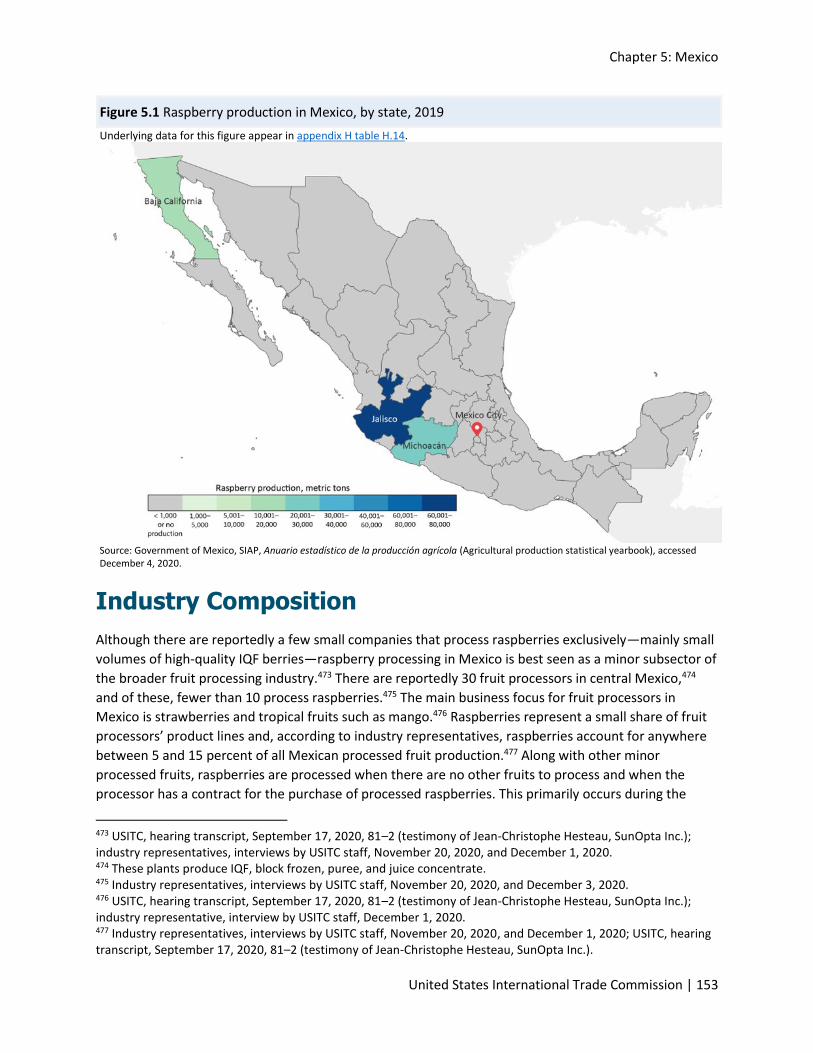
Chapter 5: Mexico
United States International Trade Commission | 153
Figure 5.1 Raspberry production in Mexico, by state, 2019
Underlying data for this figure appear in appendix H table H.14.
Source: Government of Mexico, SIAP, Anuario estadístico de la producción agrícola (Agricultural production statistical yearbook), accessed December 4, 2020.
Industry Composition
Although there are reportedly a few small companies that process raspberries exclusively—mainly small
volumes of high-quality IQF berries—raspberry processing in Mexico is best seen as a minor subsector of
the broader fruit processing industry.473 There are reportedly 30 fruit processors in central Mexico,474
and of these, fewer than 10 process raspberries.475 The main business focus for fruit processors in
Mexico is strawberries and tropical fruits such as mango.476 Raspberries represent a small share of fruit
processors’ product lines and, according to industry representatives, raspberries account for anywhere
between 5 and 15 percent of all Mexican processed fruit production.477 Along with other minor
processed fruits, raspberries are processed when there are no other fruits to process and when the
processor has a contract for the purchase of processed raspberries. This primarily occurs during the
473 USITC, hearing transcript, September 17, 2020, 81–2 (testimony of Jean-Christophe Hesteau, SunOpta Inc.); industry representatives, interviews by USITC staff, November 20, 2020, and December 1, 2020. 474 These plants produce IQF, block frozen, puree, and juice concentrate. 475 Industry representatives, interviews by USITC staff, November 20, 2020, and December 3, 2020. 476 USITC, hearing transcript, September 17, 2020, 81–2 (testimony of Jean-Christophe Hesteau, SunOpta Inc.); industry representative, interview by USITC staff, December 1, 2020. 477 Industry representatives, interviews by USITC staff, November 20, 2020, and December 1, 2020; USITC, hearing transcript, September 17, 2020, 81–2 (testimony of Jean-Christophe Hesteau, SunOpta Inc.).
Raspberries for Processing
154 | www.usitc.gov
period September to January, with limited raspberry processing January to May as spare capacity is
limited in those months.478
There are approximately 600 raspberry farms in Mexico averaging 10–20 acres in size that supply fresh
raspberry seconds for processing.479 Generally, raspberry farmers have experience with other crops,
such as broccoli, other berries, or agave, and have switched to growing raspberries because it is
considered a good business opportunity with the potential to generate high returns from the fresh
market.480
Industry Organization
Despite belonging to the same berry industry trade association, Aneberries,481 there is very little
integration between fruit processors and raspberry growers in Mexico, and the presence of raspberry
seconds available for processing is wholly a function of dynamics in the fresh raspberry market.482
Raspberry growers and fresh berry marketing companies work closely together through multiyear
contracts.483 Under the contracts, growers have access to the berry marketer’s raspberry cultivars, which
are not available to growers without contracts, as well as to farm financing and agronomic advice and
support.484 In return, the growers are required to sell all the raspberries they grow to the berry
marketer, as long as the berries meet the fresh export market quality standards. For berries that do not
meet these standards, growers are free to sell their raspberry seconds into processing channels
independently.485
For the raspberry seconds that will be sold into processing channels, growers and processors typically do
not have set contracts, but they do work out a price at the beginning of the raspberry season. However,
this price may change over the course of the growing season depending on the quality and volume of
the harvest, as well as the conditions in the fresh market. According to several industry representatives,
price changes are often initiated by the grower.486
478 Strawberries are processed January to May, and mangoes are processed May to September; industry representative, interview by USITC staff, December 1, 2020. 479 USITC, hearing transcript, September 17, 2020, 42 (testimony of Jean-Christophe Hesteau, SunOpta Inc.). 480 Johnson, “Mexico—Best Known for Tequila, Cactus,” March 6, 2015; Industry representatives, interviews by USITC staff, November 25, 2020, and December 3, 2020. 481 National Association of Berry Exporters (Aneberries) is an industry trade association in Mexico that represents companies involved in the fresh and processed berry export industry, including strawberries, blueberries, blackberries, and raspberries. Aneberries, “About Aneberries,” accessed June 15, 2020. 482 Industry representative, interviews by USITC staff, November 25, 2020, and December 3, 2020. 483 Reportedly, a few fresh berry marketing companies own some of their own farms. Approximately 90 percent of raspberries in Mexico are grown under contract. USITC, hearing transcript, September 17, 2020, 42 (testimony of Jean-Christophe Hesteau, SunOpta Inc.); industry representatives, interviews by USITC staff, September 16, 2020, and December 3, 2020. 484 USITC, hearing transcript, September 17, 2020, 93–4 (testimony of Ryan Commons, Driscoll’s, Inc.); industry representatives, interviews by USITC staff, November 25, 2020, and December 3, 2020. 485 USITC, hearing transcript, September 17, 2020, 93–4 (testimony of Ryan Commons, Driscoll’s, Inc.); industry representative, interview by USITC staff, December 3, 2020. 486 Industry representatives, interviews by USITC staff, November 25, 2020, and December 1, 2020.

Chapter 5: Mexico
United States International Trade Commission | 155
When they have outstanding contracts for processed raspberries, fruit processors are interested in
maximizing raspberry volume in order to meet contracts and keep their processing lines utilized. Hence,
they are typically willing to accept the price increases requested by the growers.487
Cultivars
Unlike raspberry growers in other U.S. import supplier countries, growers in Mexico use raspberry
cultivars tailored to producing high-quality raspberries for fresh consumption.488 Fresh berry marketing
companies provide Mexican growers with their own cultivars developed under contract by plant
breeders or from their own specialized breeding programs.489 Specifically, these raspberries, such as the
popular Adelita cultivar, are optimized for a long shelf life. The result is a more fragile berry that is
lighter in color and has a lower Brix value (sugar content) than berries from cultivars developed for
processing.490 As discussed in “Factors Affecting Competitiveness” below, these factors can limit the
uses of Mexican raspberry seconds in processed products.
Production System
Raspberry production in Mexico uses a mix of technology and manual labor. While growers use tractors
for tasks like soil preparation and laying plastic mulch for weed control, raspberries are harvested by
hand.491 The use of manual rather than machine harvesting is driven both by the fresh-market focus of
growers, who wish to maximize berry quality and appearance, and by the use of covered structures that
are too small for harvesting machines.492 As in California, raspberries in Mexico are grown under hoop
houses which extend the growing season, increase yields, and help protect the raspberries from wet
weather that can cause fungal issues.493 However, hand harvesting requires much more labor than
machine harvesting (see box 6.1 for a discussion of labor costs and conditions in Mexico).494 For most
487 Industry representatives, interviews by USITC staff, November 25, 2020, and December 1, 2020. 488 USITC, hearing transcript, September 17, 2020, 42–3 (testimony of Jean-Christophe Hesteau, SunOpta Inc.); industry representative, interview by USITC staff, December 3, 2020. 489 USITC, hearing transcript, September 17, 2020, 93–4 (testimony of Ryan Commons, Driscoll’s, Inc.); industry representatives, interviews by USITC staff, September 16, 2020, and December 3, 2020. 490 The Adelita cultivar was bred in Spain to produce well in warmer climates and to have a long shelf life and is used by at least nine companies in Mexico. Planasa, “Planasa Receives the Visit,” April 3, 2019; industry representative, interview by USITC staff, September 16, 2020. 491 Industry representatives, interviews by USITC staff, September 16, 2020, November 20, 2020, and December 3, 2020. 492 Industry representatives, interviews by USITC staff, September 16, 2020, October 26, 2020, and December 3, 2020. 493 Raspberries are grown in Mexico using production systems that are essentially identical to those used with the fresh raspberries grown in California. Hoop houses reportedly cost $30,000 per hectare and, though this is less than the $100,000 cost of a greenhouse, they are a high-cost initial investment; industry representative, email message to USITC staff, October 24, 2020; industry representatives, interviews by USITC staff, September 16, 2020, and October 26, 2020; Academic experts, interview by USITC staff, January 12, 2021. 494 USITC, hearing transcript, September 17, 2020, 23 (testimony of Ryan Commons, Driscoll’s, Inc.).
Raspberries for Processing
156 | www.usitc.gov
raspberries, the growing season runs from late September to early June, although there is some year-
round production in Baja California.495
Even though Mexico is a major raspberry producer globally, raspberries are one of the smaller berry
crops grown in the country. In 2019, fresh raspberries accounted for about 17 percent of the 40,676
hectares of total strawberry, blueberry, blackberry, and raspberry harvested area and for only
0.1 percent of total berry production volume.496
Box 5.1 Wage rates and labor conditions in the Mexican produce industry
Wages in the Mexican agriculture sector are much lower than in the U.S. agriculture sector, and there have been reports of poor labor conditions in Mexico’s fresh produce industry. As seen in table 2.5 in chapter 2 (“Cross-country Comparison of Competitiveness”), average monthly earnings in the Mexican agriculture sector are 8.6 percent of those in the U.S. agriculture sector.a This textbox presents information on the wage rates and labor conditions in Mexico’s produce industry, and to the extent available, in the raspberry and fruit processing industries.
In fruit-processing facilities where raspberries are processed, the wage rate for line workers is 250 to 300 pesos per day ($12.58 to $15.10)—comparable to that of farm workers.b There is reportedly competition between berry growers and fruit processors for workers.c According to an industry representative, some workers prefer working in the field because they can make the same wage picking berries in the field for two-thirds of a day as they can make in a full day working inside a fruit processing factory.d
Agricultural labor is more expensive in the major raspberry production regions of Mexico than in other parts of the country (see Escobar, Martin, and Stabridis, 2019). Moreover, wage rates have been rising in recent years.e Agricultural workers in the six Mexican states with the highest percentage of agricultural exports—including the major raspberry-producing states of Jalisco, Michoacán, and Baja California—earn 40 percent more per month than agricultural workers in states with a low share of agricultural exports.f Picking raspberries is a relatively high-skilled job compared to picking other fresh produce because the berries are particularly delicate.g The wages for raspberry farm workers can reportedly range from 200 to 400 pesos per day ($10.07 to $20.13), higher than the Mexican minimum wage of 123.22 pesos per day ($6.20).h In addition, workers may receive a range of other benefits such as housing, medical care, transportation to and from work, lunches, and school for children.i
The supply of labor in Mexico has been tightening for several decades, especially along the northern border regions, causing wages, and therefore the labor costs of growers, to rise. The tightening has become an especially acute dynamic in central Mexico, where 90 percent of the country’s raspberries are grown.j This is attributed to several factors, including an increase in manufacturing plants in central Mexico (which according to multiple industry observers are generally viewed as a better place to work than in agriculture).k Agricultural employers in Mexico also compete for workers against U.S.-based agricultural employers, who pay higher wages for similar work.l There is also competition for labor
495 Government of Mexico, SIAP, Anuario estadístico de la producción agrícola (Agricultural production statistical yearbook), accessed December 4, 2020; Driscoll’s, “Product Guide 2019–2020,” accessed September 3, 2020; industry representatives, interviews by USITC staff, November 25, 2020, December 1, 2020, and December 3, 2020. 496 FAO, FAOSTAT database, Crops: Raspberries (production, area harvested, yield), accessed January 19, 2021; Government of Mexico, SIAP, Anuario estadístico de la producción agrícola (Agricultural production statistical yearbook), accessed December 4, 2020.
Chapter 5: Mexico
United States International Trade Commission | 157
across the different types of berries; the expansion of blueberry production, for example, has reduced the availability of workers on other berry farms.m
While information on labor conditions in Mexico’s raspberry industry is limited, there are a number of reports on labor conditions in the broader agriculture sector. In countries around the world, the inability to form effective unions and bargain collectively can contribute to poor labor conditions and suppress wages across economic sectors, including agriculture, where unionization is low.n While workers in Mexico can collectively bargain with their employers, protection contracts are the norm. Under protection contracts, unions negotiate contracts between the employer and the worker without the worker’s knowledge or consent.o Such contracts typically have provisions that are weighted to benefit the employer.p There are reports that protection contracts depressed wages for raspberry workers in Baja California in the recent past.q The labor provisions in the United States-Mexico-Canada Agreement (USMCA) that Mexico implemented through changes to its labor law enacted on May 1, 2019, aim to address this issue with an annex that is specific to Mexico on worker representation in unions and collective bargaining rights.r Agriculture, however, is not currently on the priority sector list; therefore, it is not a focus for monitoring under the USMCA provisions.s
In 2014, the Los Angeles Times documented several instances of poor labor conditions in Mexico’s agricultural produce sector.t These include forced and child labor, debt bondage, and poor living conditions. The series of articles identified produce exported to the United States that had been grown by workers experiencing such conditions. These articles prompted a multiyear joint research project, funded by the Walmart Foundation, by the University of California’s Migration Center, the Center for Research and Higher Studies in Social Anthropology in Mexico, and the Wilson Center’s Mexico Institute on farm labor in Mexico’s export-oriented produce sectors.
The findings of the research project suggest that the majority of export farms are in compliance with Mexico’s labor laws, that most farm workers work on compliant farms, and that these workers are satisfied with their jobs.u They also found that most workers earn up to three times Mexico’s pre-2019 minimum wage, with under 5 percent earning less than the minimum, and that workers on export-oriented produce farms earn incomes above the poverty line.v Interestingly, the researchers found that while most workers are employed on a few large farms (typically export-oriented) that comply with labor regulations, the majority of farms are small (typically oriented locally), not compliant, and employ relatively few workers.w Some crops produced by the latter may ultimately end up in the export stream.
In addition, the researchers have found rapid changes in working conditions since the publication of the Los Angeles Times articlesx The researchers found that workers on berry farms earned wages 15 percent higher than workers on other produce farms, and that only 10 percent of workers got their job through recruiters, who are responsible for many of the poor labor conditions.y Also, just 2.5 percent of berry workers owed a debt to their employer, compared with 5 percent of all farm workers.z However, a representative from a workers’ rights organization reports that these wages are still low, especially compared with the costs of living, and that there are still ongoing labor issues in Mexico’s export agriculture sector.aa
a ILO, ILOSTAT, Mean Nominal Monthly Earning of Employees by Sex and Economic Activity, accessed March 2021. b Industry representative, interview by USITC staff, November 20, 2020. c USITC, hearing transcript, September 17, 2020, 149 (testimony of Jean-Christophe Hesteau, SunOpta Inc.); industry representative, interview by USITC staff, November 25, 2020. d Industry representative, interview by USITC staff, November 25, 2020. e Escobar, Martin, and Stabridis, “Farm Labor and Mexico’s Export Produce Industry,” October 2019, 121. f Rural Migration News Blog, “Workers on Mexico’s Export Farms,” November 9, 2019. g USITC, hearing transcript, September 17, 2020, 149 (testimony of Jean-Christophe Hesteau, SunOpta Inc.).
Raspberries for Processing
158 | www.usitc.gov
h On January 1, 2020, the minimum wage in Mexico was raised to 123.22 pesos ($6) per day from 102.68 ($5) pesos per day. University of California Davis, “Jocotepec Berry Field Trip,” March 2, 2018; USITC, hearing transcript, September 17, 2020, 34 (testimony of Lance Jungmeyer, Fresh Produce Association of the Americas); Gonzalez, “Mexico to Hike Daily Minimum Wage,” December 16, 2019. i USITC, hearing transcript, September 17, 2020, 34 (testimony of Lance Jungmeyer, Fresh Produce Association of the Americas); industry representative, interview by USITC staff, September 16, 2020.
j Zahniser et al., “Farm Labor Markets in the United States and Mexico,” November 2018, 1, 11–14; Iliff, “Mexico’s Boom Strains Labor Markets, Infrastructure for Suppliers,” September 9, 2016; industry representative, interview by USITC staff, September 16, 2020; USITC, hearing transcript, September 17, 2020, 149 (testimony of Jean-Christophe Hesteau, SunOpta Inc.).
k Iliff, “Mexico’s Boom Strains Labor Markets, Infrastructure for Suppliers,” September 9, 2016; USITC, hearing transcript, September 17, 2020, 150 (testimony of Lance Jungmeyer, Fresh Produce Association of the Americas); industry representative, interview by USITC staff, December 1, 2020.
l Industry representative, interview by USITC staff, November 25, 2020.
m Industry representative, interview by USITC staff, December 1, 2020.
n Labor actions in Baja California by workers in produce, including raspberries, have resulted in some positive changes to wages, benefits, and working conditions, though these have had limited impact on wage differentials between workers in Mexico and the United States. Dibble, “Grower Announces Pay Hikes,” March 31, 2015; Stevenson, “Mexican Growers Offer 15 Pct in Baja Farm Strike,” March 30, 2015; Marosi, “A Year after a Violent and Costly Strike,” May 21, 2016; Card, Lemieux, and Riddell, “Unions and Wage Inequality,” 2004, 519–59; Bryson, “The Effect of Trade Unions on Wages,” 2007, 33; academic experts, interview by USITC staff, January 12, 2021.
o Academic experts, interview by USITC staff, January 12, 2021; nongovernmental organization (NGO) representative, interview by USITC staff, February 5, 2021.
p Academic experts, interview by USITC staff, January 12, 2021; NGO representative, interview by USITC staff, February 5, 2021.
q Taylor-Rosner, “From the Fields of San Quintin,” December 11, 2018; academic experts, interview by USITC staff, January 12, 2021.
r USDOL, “Labor Rights and the United States-Mexico-Canada Agreement (USMCA),” accessed February 9, 2021; Government of Mexico, Decreto por el que se reforman, adicionan y derogan diversas disposiciones de la Ley Federal del Trabajo (Decree reforming, augmenting, and repealing various provisions of the Federal Labor Law . . .), May 1, 2019. s USMCA, chap 31, art 31.B.15. t Marosi, “Product of Mexico,” December 17, 2014.
u In addition to using the Government of Mexico’s National Survey of Occupation and Employment Project, the researchers systematically surveyed over 3,000 farm workers in Mexico in early 2019 using a randomized and stratified survey. Escobar, Martin, and Stabridis, “Farm Labor and Mexico’s Export Produce Industry,” October 2019, 155, 177; academic expert, interview by USITC staff, January 12, 2021; Rural Migration News Blog, “Workers on Mexico’s Export Farms,” November 19, 2019.
v Escobar, Martin, and Stabridis, “Farm Labor and Mexico’s Export Produce Industry,” October 2019, 9, 136–137; Academic experts, interview by USITC staff, January 12, 2021.
w Academic experts, interview by USITC staff, January 12, 2021.
x Escobar et al., “Farm Workers in Mexico’s Export Agriculture: Main Findings,” November 2020, 2.
y Escobar, Martin, and Stabridis, “Farm Labor and Mexico’s Export Produce Industry,” October 2019; Marosi, “Product of Mexico,” December 17, 2014; Rural Migration News Blog, “Workers in Mexico’s Export Agriculture,” August 26, 2019 Academic experts, interview by USITC staff, January 12, 2021. z Rural Migration News Blog, “Workers in Mexico’s Export Agriculture,” August 26, 2019.
aa NGO representative, interview by USITC staff, February 5, 2021.
Products and Supply Chain
Mexico is a supplier to the U.S. market of fresh raspberry seconds as well as processed raspberry
products. Processors in Mexico produce a number of products, most of which are used as ingredients for
other products, while a small amount are final goods. These products include IQF raspberries, which
account for about half of all Mexican processed raspberry production, as well as purees and straight
pack raspberries.497 Most of these raspberry products are conventional but, according to Aneberries,
about 10 percent of Mexico’s processed raspberry products are organic.498 Mexican processors sell their
products both domestically and for export, mostly to the United States and Canada. Some larger
processors have their own marketing departments which arrange sales to U.S.-based food
497 Industry representatives, interviews by USITC staff, October 26, 2020, November 25, 2020, and December 1, 2020. 498 Aneberries, written submission to the USITC, September 24, 2020, 4.
Chapter 5: Mexico
United States International Trade Commission | 159
manufacturers. Other Mexican processors may work with intermediaries, often U.S.-based, that import
frozen fruit and vegetables, including raspberries, and sell them to U.S.-based food manufacturers.499
Raspberry seconds for processing can be exported fresh, mostly to geographically close customers in the
United States. Fresh seconds are exported by brokers or other intermediaries rather than growers or
fresh marketing companies.500 Reportedly, fresh raspberry seconds from Baja California can be delivered
in about 7.5 hours to fruit processors across the border in southern California.501 While transport times
for seconds from Jalisco and Michoacán are longer, there are some reports of fresh seconds from central
Mexico being sold to buyers in the Texas border towns of McAllen and Laredo.502 These U.S.-based
buyers allegedly purchase large drums of chilled raspberries (similar to those used for straight pack and
puree) to freeze and warehouse raspberries for sales to other parties in the United States.503
Production, Consumption, and Trade
Production and Consumption
Mexican processed raspberry production is determined by the availability of raspberry seconds for
processing and has therefore been driven entirely by the rise in the production of raspberries for the
fresh market, mainly for export to the United States. In earlier years, growers had to pay to dispose of
raspberry seconds, but by 2012–14, they found a market for them in processing channels.504 Mexican
fruit processors started offering raspberries in their product lines because of the availability of seconds.
During 2015–20, processing volumes rose as raspberry production expanded. The percentage of U.S.
imports of frozen raspberries and fresh raspberries for processing as a share of total U.S. raspberry
imports from Mexico increased 1.9 percent from 2019 to 2020, from 18.1 percent to 20.0 percent.505
Industry and U.S. government representatives characterize the berry industry in Mexico as
sophisticated.506 Heavy investment from fresh marketing companies, many of which are based in the
United States, has driven the rapid expansion in fresh raspberry supply from Mexico.507 As seen in table
5.1, raspberry production in Mexico nearly doubled during 2015–19, driven by expanding acreage and,
to a lesser extent, a steadily rising yield.508 It was reported in 2015 that agave growers were switching to
499 Industry representatives, interviews by USITC staff, November 25, 2020, and December 1, 2020. 500 Industry representative, interview by USITC staff, October 26, 2020. 501 Industry representatives, interviews by USITC staff, October 24, 2020, October 26, 2020, and December 1, 2020; Google Maps, directions from San Quintín, Mexico, to Oxnard, California. 502 Industry representative, interview by USITC staff, July 30, 2020. 503 Industry representative, interview by USITC staff, July 30, 2020. 504 One industry representative reported that what was once a cost to growers of $25,000 per year is now worth $100,000 of revenue to them. Industry representatives, interviews by USITC staff, October 26, 2020, and December 3, 2020. 505 USITC DataWeb/Census, imports for consumption, HTS 0810.20.1020, 0810.20.1022, 0810.20.1024, 0810.20.9020, 0810.20.9022, 0810.20.9024, 0811.20.2025, accessed February 4, 2020. 506 U.S. government representative, interview by USITC staff, September 1, 2020; industry representative, email message to USITC staff, October 24, 2020. 507 U.S. government representative, interview by USITC staff, September 1, 2020. 508 FAO, FAOSTAT database, Crops: Raspberries (production, area harvested, yield), accessed January 19, 2021.
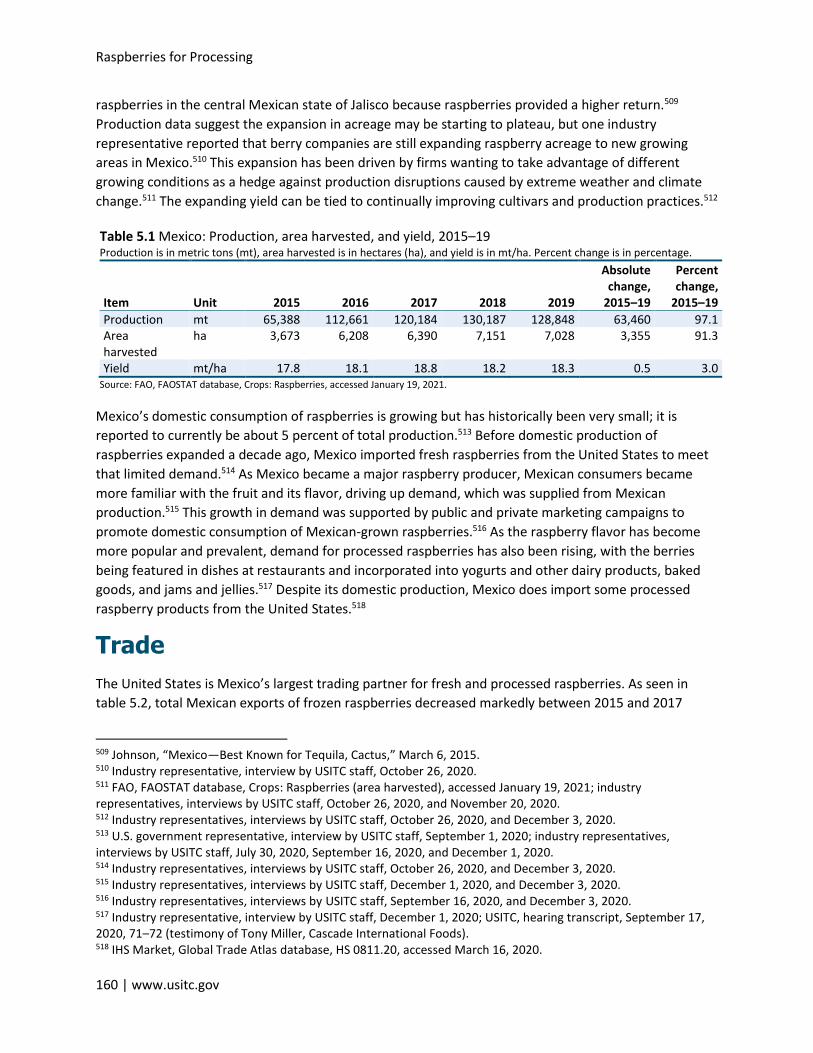
Raspberries for Processing
160 | www.usitc.gov
raspberries in the central Mexican state of Jalisco because raspberries provided a higher return.509
Production data suggest the expansion in acreage may be starting to plateau, but one industry
representative reported that berry companies are still expanding raspberry acreage to new growing
areas in Mexico.510 This expansion has been driven by firms wanting to take advantage of different
growing conditions as a hedge against production disruptions caused by extreme weather and climate
change.511 The expanding yield can be tied to continually improving cultivars and production practices.512
Table 5.1 Mexico: Production, area harvested, and yield, 2015–19 Production is in metric tons (mt), area harvested is in hectares (ha), and yield is in mt/ha. Percent change is in percentage.
Item Unit 2015 2016 2017 2018 2019
Absolute change,
2015–19
Percent change,
2015–19
Production mt 65,388 112,661 120,184 130,187 128,848 63,460 97.1 Area harvested
ha 3,673 6,208 6,390 7,151 7,028 3,355 91.3
Yield mt/ha 17.8 18.1 18.8 18.2 18.3 0.5 3.0 Source: FAO, FAOSTAT database, Crops: Raspberries, accessed January 19, 2021.
Mexico’s domestic consumption of raspberries is growing but has historically been very small; it is
reported to currently be about 5 percent of total production.513 Before domestic production of
raspberries expanded a decade ago, Mexico imported fresh raspberries from the United States to meet
that limited demand.514 As Mexico became a major raspberry producer, Mexican consumers became
more familiar with the fruit and its flavor, driving up demand, which was supplied from Mexican
production.515 This growth in demand was supported by public and private marketing campaigns to
promote domestic consumption of Mexican-grown raspberries.516 As the raspberry flavor has become
more popular and prevalent, demand for processed raspberries has also been rising, with the berries
being featured in dishes at restaurants and incorporated into yogurts and other dairy products, baked
goods, and jams and jellies.517 Despite its domestic production, Mexico does import some processed
raspberry products from the United States.518
Trade
The United States is Mexico’s largest trading partner for fresh and processed raspberries. As seen in
table 5.2, total Mexican exports of frozen raspberries decreased markedly between 2015 and 2017
509 Johnson, “Mexico—Best Known for Tequila, Cactus,” March 6, 2015. 510 Industry representative, interview by USITC staff, October 26, 2020. 511 FAO, FAOSTAT database, Crops: Raspberries (area harvested), accessed January 19, 2021; industry representatives, interviews by USITC staff, October 26, 2020, and November 20, 2020. 512 Industry representatives, interviews by USITC staff, October 26, 2020, and December 3, 2020. 513 U.S. government representative, interview by USITC staff, September 1, 2020; industry representatives, interviews by USITC staff, July 30, 2020, September 16, 2020, and December 1, 2020. 514 Industry representatives, interviews by USITC staff, October 26, 2020, and December 3, 2020. 515 Industry representatives, interviews by USITC staff, December 1, 2020, and December 3, 2020. 516 Industry representatives, interviews by USITC staff, September 16, 2020, and December 3, 2020. 517 Industry representative, interview by USITC staff, December 1, 2020; USITC, hearing transcript, September 17, 2020, 71–72 (testimony of Tony Miller, Cascade International Foods). 518 IHS Market, Global Trade Atlas database, HS 0811.20, accessed March 16, 2020.
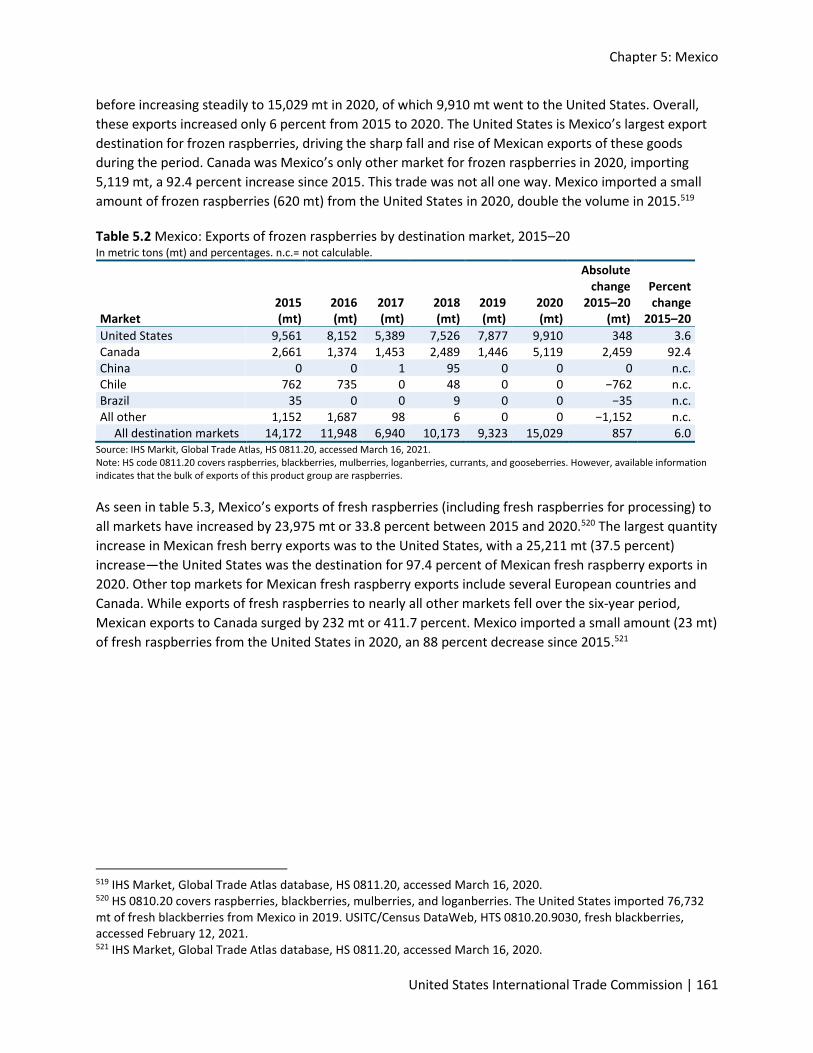
Chapter 5: Mexico
United States International Trade Commission | 161
before increasing steadily to 15,029 mt in 2020, of which 9,910 mt went to the United States. Overall,
these exports increased only 6 percent from 2015 to 2020. The United States is Mexico’s largest export
destination for frozen raspberries, driving the sharp fall and rise of Mexican exports of these goods
during the period. Canada was Mexico’s only other market for frozen raspberries in 2020, importing
5,119 mt, a 92.4 percent increase since 2015. This trade was not all one way. Mexico imported a small
amount of frozen raspberries (620 mt) from the United States in 2020, double the volume in 2015.519
Table 5.2 Mexico: Exports of frozen raspberries by destination market, 2015–20 In metric tons (mt) and percentages. n.c.= not calculable.
Market 2015 (mt)
2016 (mt)
2017 (mt)
2018 (mt)
2019 (mt)
2020 (mt)
Absolute change
2015–20 (mt)
Percent change
2015–20
United States 9,561 8,152 5,389 7,526 7,877 9,910 348 3.6 Canada 2,661 1,374 1,453 2,489 1,446 5,119 2,459 92.4 China 0 0 1 95 0 0 0 n.c. Chile 762 735 0 48 0 0 −762 n.c. Brazil 35 0 0 9 0 0 −35 n.c. All other 1,152 1,687 98 6 0 0 −1,152 n.c.
All destination markets 14,172 11,948 6,940 10,173 9,323 15,029 857 6.0 Source: IHS Markit, Global Trade Atlas, HS 0811.20, accessed March 16, 2021. Note: HS code 0811.20 covers raspberries, blackberries, mulberries, loganberries, currants, and gooseberries. However, available information indicates that the bulk of exports of this product group are raspberries.
As seen in table 5.3, Mexico’s exports of fresh raspberries (including fresh raspberries for processing) to
all markets have increased by 23,975 mt or 33.8 percent between 2015 and 2020.520 The largest quantity
increase in Mexican fresh berry exports was to the United States, with a 25,211 mt (37.5 percent)
increase—the United States was the destination for 97.4 percent of Mexican fresh raspberry exports in
2020. Other top markets for Mexican fresh raspberry exports include several European countries and
Canada. While exports of fresh raspberries to nearly all other markets fell over the six-year period,
Mexican exports to Canada surged by 232 mt or 411.7 percent. Mexico imported a small amount (23 mt)
of fresh raspberries from the United States in 2020, an 88 percent decrease since 2015.521
519 IHS Market, Global Trade Atlas database, HS 0811.20, accessed March 16, 2020. 520 HS 0810.20 covers raspberries, blackberries, mulberries, and loganberries. The United States imported 76,732 mt of fresh blackberries from Mexico in 2019. USITC/Census DataWeb, HTS 0810.20.9030, fresh blackberries, accessed February 12, 2021. 521 IHS Market, Global Trade Atlas database, HS 0811.20, accessed March 16, 2020.
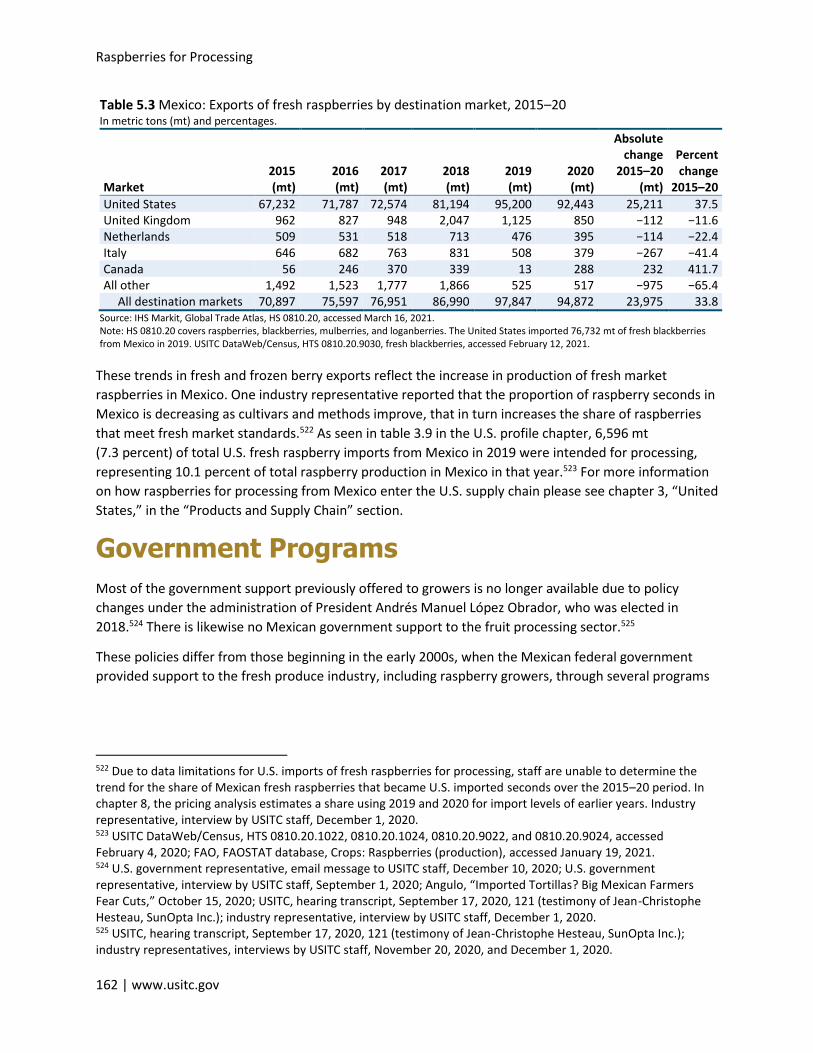
Raspberries for Processing
162 | www.usitc.gov
Table 5.3 Mexico: Exports of fresh raspberries by destination market, 2015–20 In metric tons (mt) and percentages.
Market 2015 (mt)
2016 (mt)
2017 (mt)
2018 (mt)
2019 (mt)
2020 (mt)
Absolute change
2015–20 (mt)
Percent change
2015–20
United States 67,232 71,787 72,574 81,194 95,200 92,443 25,211 37.5 United Kingdom 962 827 948 2,047 1,125 850 −112 −11.6 Netherlands 509 531 518 713 476 395 −114 −22.4 Italy 646 682 763 831 508 379 −267 −41.4 Canada 56 246 370 339 13 288 232 411.7 All other 1,492 1,523 1,777 1,866 525 517 −975 −65.4
All destination markets 70,897 75,597 76,951 86,990 97,847 94,872 23,975 33.8 Source: IHS Markit, Global Trade Atlas, HS 0810.20, accessed March 16, 2021. Note: HS 0810.20 covers raspberries, blackberries, mulberries, and loganberries. The United States imported 76,732 mt of fresh blackberries from Mexico in 2019. USITC DataWeb/Census, HTS 0810.20.9030, fresh blackberries, accessed February 12, 2021.
These trends in fresh and frozen berry exports reflect the increase in production of fresh market
raspberries in Mexico. One industry representative reported that the proportion of raspberry seconds in
Mexico is decreasing as cultivars and methods improve, that in turn increases the share of raspberries
that meet fresh market standards.522 As seen in table 3.9 in the U.S. profile chapter, 6,596 mt
(7.3 percent) of total U.S. fresh raspberry imports from Mexico in 2019 were intended for processing,
representing 10.1 percent of total raspberry production in Mexico in that year.523 For more information
on how raspberries for processing from Mexico enter the U.S. supply chain please see chapter 3, “United
States,” in the “Products and Supply Chain” section.
Government Programs
Most of the government support previously offered to growers is no longer available due to policy
changes under the administration of President Andrés Manuel López Obrador, who was elected in
2018.524 There is likewise no Mexican government support to the fruit processing sector.525
These policies differ from those beginning in the early 2000s, when the Mexican federal government
provided support to the fresh produce industry, including raspberry growers, through several programs
522 Due to data limitations for U.S. imports of fresh raspberries for processing, staff are unable to determine the trend for the share of Mexican fresh raspberries that became U.S. imported seconds over the 2015–20 period. In chapter 8, the pricing analysis estimates a share using 2019 and 2020 for import levels of earlier years. Industry representative, interview by USITC staff, December 1, 2020. 523 USITC DataWeb/Census, HTS 0810.20.1022, 0810.20.1024, 0810.20.9022, and 0810.20.9024, accessed February 4, 2020; FAO, FAOSTAT database, Crops: Raspberries (production), accessed January 19, 2021. 524 U.S. government representative, email message to USITC staff, December 10, 2020; U.S. government representative, interview by USITC staff, September 1, 2020; Angulo, “Imported Tortillas? Big Mexican Farmers Fear Cuts,” October 15, 2020; USITC, hearing transcript, September 17, 2020, 121 (testimony of Jean-Christophe Hesteau, SunOpta Inc.); industry representative, interview by USITC staff, December 1, 2020. 525 USITC, hearing transcript, September 17, 2020, 121 (testimony of Jean-Christophe Hesteau, SunOpta Inc.); industry representatives, interviews by USITC staff, November 20, 2020, and December 1, 2020.
Chapter 5: Mexico
United States International Trade Commission | 163
aimed at helping growers secure private financing for capital expenditures.526 As part of these programs,
grants were provided to fresh produce growers to invest in various forms of protected agriculture
technologies, notably hoop houses for raspberries.527
According to industry representatives, additional support was also provided by the government. The
government reportedly provided financing assistance to fresh produce growers in the form of
guarantees to private banks that enabled growers to access private financing they might not have
otherwise been able to obtain.528 In addition to general support that was provided to the fresh produce
industry, the Mexican government reportedly supported the promotion of berries, including raspberries,
in the domestic market.529 This promotional support included allowing berries to be featured in
marketing campaigns to promote consumption of fruit and of local, healthy food produced by Mexicans
for Mexicans.530
Compliance with Food Safety Standards
The main drivers of food safety compliance in the Mexican raspberry industry are private international
standards required by customers in the destination markets.531 These private food safety standards,
including Primus and GLOBALG.A.P. at the grower level and the Safe Quality Food Program, FSSC 2200,
and Primus at the processor level, are reportedly more stringent than Mexican or U.S. regulations.532
Since the private certification standards meet or exceed requirements found in the U.S. Food Safety
Modernization Act (FSMA), the raspberry industry in Mexico reports that no major operational changes
have been needed to comply with FSMA.533 Other factors driving a high level of compliance with food
safety requirements are the heavy involvement of U.S. fresh marketing companies and the potential
high costs to the industry of a food safety incident.534
526 Wu et al., “Government Support in Mexican Agriculture,” 2018, 7; Industry representatives, interviews by USITC staff, December 1, 2020 and December 3, 2020; U.S. government representative, email message to USITC staff, December 10, 2020; USITC, hearing transcript, September 17, 2020, 121 (testimony of Jean-Christophe Hesteau, SunOpta Inc.). 527 U.S. government representative, email message to USITC staff, December 10, 2020. 528 Industry representative, interview by USITC staff, December 1, 2020. 529 Industry representative, interview by USITC staff, December 3, 2020. 530 Industry representative, interview by USITC staff, December 3, 2020. 531 USITC, hearing transcript, September 17, 2020, 116–17 (testimony of Jean-Christophe Hesteau, SunOpta Inc.). 532 See chapter 1 (“Introduction”) for more information on how U.S. imports of raspberries comply with U.S. food safety standards. USITC, hearing transcript, September 17, 2020, 116–17 (testimony of Jean-Christophe Hesteau, SunOpta Inc.); industry representative, interview by USITC staff, December 1, 2020. 533 Aneberries, written submission to the USITC, September 24, 2020, 3–4. 534 Food safety incidents, such as outbreaks of foodborne illnesses, can result in multimillion dollar loses to growers of affected products. Ribera et al., “Cost of Foodborne Illness Outbreaks for Vegetable Producers,” accessed January 11, 2021; Romero, “Yuma Lettuce Growers Look to Rebuild Trust,” July 2, 2018; USITC, hearing transcript, September 17, 2020, 117–18 (testimony of Jon Mayberry, Mayberry Packing LLC); industry representatives, interviews by USITC staff, October 26, 2020, and November 20, 2020; industry representative, email message to USITC staff, October 24, 2020.
Raspberries for Processing
164 | www.usitc.gov
Factors Affecting Competitiveness
As described in chapter 2 of this report, the competitiveness of raspberries for processing and processed
raspberry products can be measured by comparing delivered costs, product differentiation, and
reliability of supply for U.S. products against those of imports. Certain key factors contribute to the
competitiveness of Mexican raspberries for processing and processed raspberry products in the U.S.
market. The raspberry industry in Mexico can produce fresh and processed raspberries at lower costs
over an extended season than other raspberry producers can. However, as noted earlier, the use of
fresh raspberry seconds limits the competitiveness of Mexican processed raspberries.
Mexican competitiveness in the fresh market drives increased production of raspberries for processing.
The raspberry industry in Mexico enjoys a delivered-cost advantage in the U.S. fresh consumption
market from the lower costs of labor as well as the Mexican industry’s high yields and proximity to the
U.S. market.535 Although the main reason for fresh berry marketing companies to invest in expanding
raspberry production in Mexico is to help ensure a year-round supply of fresh raspberries to satisfy U.S.
consumer demand, the increases in fresh market raspberry production boosts production of all
raspberries, including seconds for processing.536
Labor costs are lower in Mexico than in other countries profiled in this report, particularly the United
States.537 The share of labor as a percent of total grower costs has been estimated at 15 percent, the
largest component of that share is the harvest labor, which accounts for 12 percent of total grower
costs.538 The labor cost of harvesting one pound of raspberries in California and Mexico, where growers
use the same fresh market production methods, are $1.44 and $0.22, respectively.539 The relatively low
Mexican labor costs allow its raspberry industry to use production and harvesting methods that are not
practical in the U.S. raspberries for processing industry. Growers are able to use hoop houses that yield
more berries but require more labor, particularly at harvest.540 The high yields stemming from the use of
hoop houses, the good weather, and good soils in the growing regions also contribute to a low delivered
cost for Mexico’s fresh market raspberries.541
535 Industry representatives, interviews by USITC staff, September 16, 2020, October 26, 2020, November 20, 2020, November 25, 2020; industry representative, email message to USITC staff, October 24, 2020. 536 Industry representative, email message to USITC staff, October 24, 2020; industry representatives, interviews by USITC staff, October 26, 2020, December 3, 2020, and February 5, 2021. 537 ILO, “Mean Nominal Monthly Earning of Employees by Sex and Economic Activity”, accessed March 2021; academic expert, interview by USITC staff, January 12, 2021. 538 Escobar, Martin, and Stabridis, “Farm Labor and Mexico’s Export Produce Industry,” October 2019, 80, 83; industry representative, interview by USITC staff, September 16, 2020. 539 Escobar, Martin, and Stabridis, “Farm Labor and Mexico’s Export Produce Industry,” October 2019, 80, 83; Bolda et al., “Sample Costs to Produce and Harvest,” 2017, 6. 540 Industry representatives, interviews by USITC staff, September 16, 2020, and December 3, 2020. 541 Industry representatives, interviews by USITC staff, September 16, 2020, October 26, 2020, November 25, 2020, December 1, 2020, December 3, 2020; industry representative, email message to USITC staff, October 24, 2020.
Chapter 5: Mexico
United States International Trade Commission | 165
Another important cost factor is the proximity to the U.S. fresh raspberry market that Mexico enjoys,
which subsequently increases the number of seconds available for processing. Along with developed
infrastructure, low costs of shipping, and efficient supply chains, this proximity to market gives Mexico a
cost advantage compared with other potential supply sources of fresh raspberries, such as Chile.542
Mexico has an extended period of supply for raspberries.
Another important competitive factor noted as favoring the Mexican raspberry industry is its ability to
supply raspberries for both the fresh market and processing for an extended period of the year. The
main season for raspberries in Mexico is from September to June, which is the off-season for most U.S.
regions growing raspberries both for the fresh market and for processing. In addition, raspberries are
grown in multiple regions, each with different districts and valleys that can have distinct microclimates.
The diversity in geographic growing regions helps reduce and isolate the risks that adverse weather
conditions could pose to the Mexican raspberry crop. For example, if the rainy season starts early in
Jalisco and Michoacán, the growing conditions in Baja California are probably not affected.543 This
enhances the reliability of supply of Mexican fresh raspberries. In addition, the availability of raspberry
seconds for processing in central Mexico and Baja California coincides with the downtime for the
processors of more popular fruits, allowing processors to keep their processing lines running and to
spread their capital costs over more product.544
The reliability of raw fruit supply for processing from different growing regions, coupled with Mexican
fruit processors’ efforts to utilize spare capacity by taking contracts for processed raspberries, helps
reduce the price volatility of processed Mexican raspberries. This also helps make them a more
attractive product to food manufacturers. Industry representatives involved with U.S.-Mexican trade of
processed Mexican raspberries report that there are typically no big swings in the price of processed
raspberries from Mexico throughout the year.545
The steady availability of Mexican raspberries for processing benefits food manufacturing customers as
well because the fruit is available over a long period of time. This pattern reportedly reduces the food
manufacturers’ storage costs by as much as 50 percent compared with processed product from
Washington. Many growers in Washington try to sell their entire harvest after the season, requiring the
customer to take ownership and pay storage costs, even if it would not be further processed right
away.546 In addition, a steady supply over time is reported to ease the operations both in the
manufacturing lines and in cost accounting.547
542 Industry representatives, interviews by USITC staff, September 16, 2020, and February 5, 2021. 543 Industry representatives, interviews by USITC staff, October 26, 2020, and November 25, 2020; industry representative, email message to USITC staff, October 24, 2020; Smucker’s, written submission to the USITC, December 4, 2020, 1. 544 USITC, hearing transcript, September 17, 2020, 142 (testimony of Tony Miller, Cascade International Foods). 545 Industry representatives, interviews by USITC staff, November 20, 2020, and December 1, 2020. 546 Industry representative, interview by USITC staff, November 20, 2020. 547 Industry representatives, interviews by USITC staff, October 26, 2020, and November 2020; industry representative, email message to USITC staff, October 24, 2020; Smucker’s, written submission to the USITC, December 4, 2020, 1.
Raspberries for Processing
166 | www.usitc.gov
Raspberries play a minor role in the Mexican processed fruit industry.
Mexican processors diversify their fruit portfolio and keep their processing plants fully utilized by
purchasing raspberries in addition to other Mexican fruits.548 Mexican fruit processors have access to a
wide variety of fruits throughout the year which allows them to maximize efficiencies of their
manufacturing lines more so than processors in regions that only have fruit to process in the summer.549
In addition, processors prefer to have raspberries on hand to offer to customers in addition to their sales
of other processed fruits.
The Mexican processed fruit industry benefits from the relatively low delivered costs for raspberries for
processing. This is a result of raspberry growers focusing on the lucrative fresh rather than processing
market, where reportedly growers can get $0.15–0.50 per pound depending on quality for their
raspberry seconds, rather than paying to dispose of them as in earlier years.550 According to industry
representatives, the sale of the seconds allows Mexican growers to recover a portion of the $2 per
pound that it costs to produce both the fresh market raspberries and the seconds.551
Like the processors of Mexican raspberries, the brokers that buy processed raspberries from Mexico and
sell them to customers in the United States tend to specialize in fruit other than raspberries (e.g.,
strawberries and mangoes).552 One U.S.-based broker who primarily handles other fruit besides
raspberries reported that fruit brokers’ business interests in raspberries may be more for their value in
maintaining business relationships with processors and food manufacturers than for their value in trade.
For many of these brokers, raspberries represent a small portion of their portfolios, so they are not well
versed in the dynamics and pricing of the processed raspberry market.553
Substitutability of Mexican raspberries is limited for some applications, acceptable for others.
One factor that tempers the competitiveness of Mexican raspberries for processing is the limited
substitutability of Mexican processed raspberries in some applications. Compared with other sources,
such as the U.S. industry in Washington, the berries grown in Mexico are tailored to the fresh market
and are not viewed as suitable for all processor specifications, as noted in chapter 3. A number of
548 Industry representative, interview by USITC staff, November 20, 2020, and December 1, 2020; industry representative, email message to USITC staff, March 29, 2021. 549 These fruits include strawberries, mangoes, pineapple, guava, bananas, blueberries, blackberries, and raspberries. Industry representative, email message to USITC staff, March 29, 2021; industry representatives, interviews by USITC staff, November 20, 2020, and December 1, 2020. 550 Industry representatives, interviews by USITC staff, September 16, 2020, October 26, 2020, November 20, 2020, December 1, 2020, and December 3, 2020; academic experts, interview by USITC staff, January 12, 2021. 551 Industry representatives, interviews by USITC staff, September 16, 2020, October 26, 2020, November 20, 2020, December 1, 2020, and December 3, 2020; academic experts, interview by USITC staff, January 12, 2021. 552 Industry representative, email message to USITC staff, October 24, 2020; industry representatives, interviews by USITC staff, October 26, 2020, November 20, 2020, and November 25, 2020. 553 Industry representatives, interviews by USITC staff, November 20, 2020, and November 25, 2020.
Chapter 5: Mexico
United States International Trade Commission | 167
purchasers of raspberries for processing have noted differences between the Mexican product and
those from regions that grow raspberries specifically for processing. Several purchasers reported that
the puree and straight pack raspberry products imported from Mexico need to be mixed with
raspberries grown for processing in order to get the desired deeper red color and higher Brix levels.554 In
addition, U.S. buyers reported that the fresh market berries grown in Mexico are fragile and tend to
break apart during the IQF process, resulting in a lower-quality IQF product. As a result, several U.S.
purchasers of whole IQF frozen raspberries reported that they source IQF raspberries from Mexico only
as a last resort.555
However, for some in the industry these product differences are not a major concern, or, in some cases,
are even preferred. Reportedly, some food manufacturers find it is possible to reformulate their
products using Mexican raspberries and achieve a comparable final product. For instance, by adding
sugar or food coloring like beet juice to a final product, such as a low-value jam, a firm could produce an
acceptable raspberry product made from Mexican raspberry seconds.556 Also, some food manufacturers
prefer the lighter red color of the Mexican raspberry products for certain applications. It was reported
that in one case, a jam manufacturer prefers lighter-color raspberries because they naturally make for a
brighter red finished product that is pleasing to consumers, rather than the darker, almost brown jam
that results from raspberries grown for processing.557
Moreover, these differences in product characteristics between Mexican raspberry products and those
from other sources can fluctuate from year to year. For instance, the raspberries for processing industry
in the United States reportedly produced a lower-quality product in 2020 stemming from excessive
rainfall that reduced the Brix level. Some purchasers noted that raspberries from Washington that year
were unable to meet the minimum sweetness level specified in contracts.558
554 USITC, hearing transcript, September 17, 2020, 137 (testimony of Rolf Haugen, Northwest Berry Co-op); industry representative, interview by USITC staff, October 20, 2020. 555 Industry representatives, interviews by USITC staff, September 24, 2020, and November 20, 2020. 556 Industry representatives, interviews by USITC staff, October 19, 2020, October 20, 2020, and November 20, 2020. 557 Industry representative, interview by USITC staff, October 26, 2020. 558 Industry representative, interview by USITC staff, October 26, 2020; industry representative, email message to USITC staff, October 24, 2020.
Raspberries for Processing
168 | www.usitc.gov
Bibliography
Aneberries. Written submission to the U.S. International Trade Commission in connection with Inv. No. 332-577, Raspberries for Processing: Conditions of Competition between U.S. and Foreign Suppliers, with a Focus on Washington State. September 24, 2020.
Angulo, Sharay. “Imported Tortillas? Big Mexican Farmers Fear Cuts Will Hit Harvests.” Reuters, October 15, 2020. https://www.reuters.com/article/us-mexico-agriculture-analysis-idUSKBN2701N4.
Asociación Nacional de Exportadores de Berries (National Association of Berry Exporters) (Aneberries). “About Aneberries.” Accessed June 15, 2020. http://www.aneberries.mx/about-aneberries?lang=en.
Bolda, Mark, Laura Tourte, Jeremy Murdock, and Daniel A. Sumner. “Sample Costs to Produce and Harvest Fresh Market Raspberries, Primocane Bearing, Central Coast Region: 2017.” University of California Agriculture and Natural Resources Cooperative Extension and Agricultural Issues Center, Department of Agricultural and Resource Economics, University of California, Davis, 2017. https://coststudyfiles.ucdavis.edu/uploads/cs_public/20/e3/20e339eb-2ea7-41f0-8823-26939ff07c06/bpraspberry-cc-finaldraft.pdf.
Bryson, Alex. “The Effect of Trade Unions on Wages.” Reflets et Perspectives de La Vie Économique 46, no. 2 (2007): 33–45. https://doi.org/10.3917/rpve.462.0033.
Card, David, Thomas Lemieux, and W. Craig Riddell. “Unions and Wage Inequality.” Journal of Labor Research 25, no. 4 (2004): 519–59. https://link.springer.com/content/pdf/10.1007/s12122-004-1011-z.pdf.
Dibble, Sandra. “Grower Announces Pay Hikes.” Chicago Tribune, March 31, 2015. https://www.chicagotribune.com/sdut-san-quintin-strawberry-san-quintin-driscoll-2015mar31-htmlstory.html.
Driscoll’s. “Product Guide 2019–2020.” Accessed September 3, 2020. https://driscolls.imgix.net/-/media/files/availability-calendar/availabilitycalendardris10190816.ashx?la=en.
Escobar, Agustín, Omar Stabridis, Mercedes González de la Rocha, and Phil Martin. “Farm Workers in Mexico’s Export Agriculture: Main Findings.” Jornaleros en La Agricultura de Exportación (Farm Workers in Mexico’s Export Agriculture), November 2020. https://jornamex.com/textos/MainFindings_Nov2020_EN.pdf.
Escobar, Agustín, Philip Martin, and Omar Stabridis. Farm Labor and Mexico’s Export Produce Industry. Washington, DC: Wilson Center, October 2019. https://www.wilsoncenter.org/sites/default/files/media/documents/publication/farm_labor_and_mexico_export_produce_industry.pdf.
Food and Agriculture Organization of the United Nations (FAO). FAOSTAT. “Crops.” Accessed June 2, 2020. http://www.fao.org/faostat/en/#data/QC/.
Chapter 5: Mexico
United States International Trade Commission | 169
Gonzalez, A. “Mexico to Hike Daily Minimum Wage by 20%, Experts Worry about Inflation.” Reuters, December 16, 2019. https://www.reuters.com/article/us-mexico-wages/mexico-to-hike-daily-minimum-wage-by-20-experts-worry-about-inflation-idUSKBN1YL051.
Government of Mexico. Decreto por el que se reforman, adicionan y derogan diversas disposiciones de la Ley Federal del Trabajo, de la Ley Orgánica del Poder Judicial de la Federación, de la Ley Federal de la Defensoría Pública, de la Ley del Instituto del Fondo Nacional de la Vivienda para los Trabajadores y de la Ley del Seguro Social, en materia de Justicia Laboral, Libertad Sindical y Negociación Colectiva, (Decree reforming, augmenting, and repealing various provisions of the Federal Labor Law . . .). Diario Oficial de la Federación, May 1, 2019. http://dof.gob.mx/nota_detalle.php?codigo=5559131&fecha=01/05/2019.
Government of Mexico. Servicio de Información Agroalimentaria y Pesquera (SIAP). Anuario estadístico de la producción agrícola (Agricultural production statistical yearbook). Accessed December 4, 2020. https://nube.siap.gob.mx/cierreagricola/.
IHS Markit. Global Trade Atlas database. Accessed various dates. https://connect.ihsmarkit.com/home.
Iliff, Laurence. “Mexico’s Boom Strains Labor Markets, Infrastructure for Suppliers.” Crain’s Detroit Business, September 9, 2016. https://www.crainsdetroit.com/article/20160909/NEWS/160909854/mexicos-boom-strains-labor-markets-infrastructure-for-suppliers.
International Labour Organization (ILO). ILOSTAT. “Mean Nominal Monthly Earning of Employees by Sex and Economic Activity.” Accessed March 2021. https://ilostat.ilo.org/.
Johnson, Tim. “Mexico—Best Known for Tequila, Cactus—Is Now a Berry Powerhouse.” Charlotte Observer, March 6, 2015. https://www.mcclatchydc.com/news/nation-world/world/article24781093.html.
Marosi, Richard. “Product of Mexico: Hardship on Mexico’s Farms, a Bounty for U.S. Tables.” Los Angeles Times, December 17, 2014. https://graphics.latimes.com/product-of-mexico-camps/.
Marosi, Richard. “A Year after a Violent and Costly Strike, Baja Farm Laborers See Uneven Gains.” Los Angeles Times, May 21, 2016. https://www.latimes.com/world/mexico-americas/la-me-baja-farm-labor-snap-story.html.
Planasa. “Planasa Receives the Visit of Mexican and US Adelita Licensees.” News release, April 3, 2019. https://planasa.com/mexican-and-us-adelita-licensees-planasa/.
Ribera, Luis, Marco A. Palma, Mechel Paggi, Ronald Knutson, Juan Anciso, and Joseph Masabni. “Cost of Foodborne Illness Outbreaks for Vegetable Producers.” Texas A&M AgriLife Extension Service. Accessed January 11, 2021. https://agrilifeextension.tamu.edu/library/agricultural-business/cost-of-foodborne-illness-outbreaks-for-vegetable-producers/.
Romero, Conrad. “Yuma Lettuce Growers Look to Rebuild Trust after Deadly E. coli Outbreak.” Arizona Daily Star, July 2, 2018. https://tucson.com/business/yuma-lettuce-growers-look-to-rebuild-trust-after-deadly-e-coli-outbreak/article_8d663c35-a807-569a-9c00-582f8cb3bae5.html.
Raspberries for Processing
170 | www.usitc.gov
Rural Migration News Blog. “Workers in Mexico’s Export Agriculture.” University of California, Davis, August 26, 2019. https://migration.ucdavis.edu/rmn/blog/post/?id=2330.
Rural Migration News Blog. “Workers on Mexico’s Export Farms.” University of California, Davis, November 9, 2019. https://migration.ucdavis.edu/rmn/blog/post/?id=2367.
Smucker’s. Written submission to the U.S. International Trade Commission in connection with Inv. No. 332-577, Raspberries for Processing: Conditions of Competition between U.S. and Foreign Suppliers, with a Focus on Washington State. December 4, 2020.
Stevenson, Mark. “Mexican Growers Offer 15 Pct in Baja Farm Strike.” AP News, March 30, 2015. https://apnews.com/article/cc1a97a5ed7943d3b4f7c4b9ec780f2d.
Taylor-Rosner, Noémie. “From the Fields of San Quintin to the Supermarkets of North America: Mexican Farmworkers Call for Solidarity.” Equal Times, December 11, 2018. https://www.equaltimes.org/from-the-fields-of-san-quintin-to.
U.S. Department of Labor. “Labor Rights and the United States-Mexico-Canada Agreement (USMCA).” Accessed February 9, 2021. https://www.dol.gov/agencies/ilab/our-work/trade/labor-rights-usmca.
U.S. International Trade Commission Interactive Tariff and Trade DataWeb (USITC DataWeb)/U.S. Census Bureau (Census). Accessed various dates. https://dataweb.usitc.gov/.
University of California Davis. “Jocotepec Berry Field Trip.” Farm Labor and Mexican Produce Exports project, March 2, 2018. https://migration.ucdavis.edu/farm-labor/field-research/2018/03/02/jocotepec-berry-field-trip/.
World Trade Organization (WTO). “Agriculture—Backgrounder—Domestic Support Boxes.” Domestic Support in Agriculture. Accessed February 12, 2021. https://www.wto.org/english/tratop_e/agric_e/agboxes_e.htm.
Wu, Feng, Berdikul Qushim, Marcelo Calle, and Zhengfei Guan. “Government Support in Mexican Agriculture.” Choices Magazine 33, no. 3 (2018): 1–11. https://www.choicesmagazine.org/UserFiles/file/cmsarticle_647.pdf.
Zahniser, Steven, J. Edward Taylor, Thomas Hertz, and Diane Charlton. Farm Labor Markets in the United States and Mexico Pose Challenges for U.S. Agriculture. Economic Information Bulletin No. 201, Economic Research Service, U.S. Department of Agriculture, November 2018. https://www.ers.usda.gov/webdocs/publications/90832/eib-201.pdf?v=1521.2.
Chapter 6: Serbia
United States International Trade Commission | 171
Chapter 6 Serbia
Summary
Serbia is an export-oriented supplier of processed raspberry products, which it sells primarily to the
European Union (EU). The United States accounted for about 4 percent of Serbia’s total exports of
frozen raspberries during 2015–20. However, within the U.S. market, Serbia is a major supplier. In 2019,
Serbia was the second-largest U.S. supplier by value, and the third largest by quantity after Chile and
Mexico.559 The majority of U.S. imports of frozen raspberries from Serbia are IQF products. Serbia has
the ideal climate and land to produce raspberries, including organic raspberries. Serbia’s grower’s
organic production allowed Serbia to achieve a highly competitive position in terms of product
differentiation among processed raspberry suppliers to the United States from 2015 to 2020.
Several factors contribute to Serbia’s competitive position in the U.S. market. Serbia’s processors have
access to organic raspberries in volumes suitable for commercial sale. This is primarily due to the
country’s ideal growing climate and widely dispersed geographic growing areas. Data show that the
number of growers cultivating organic raspberries is growing each year. In addition, as a candidate for
accession to the EU, Serbia’s established relationships in the EU market and its compliance with the EU’s
stringent standards of quality and safety have contributed to the acceptance of its raspberry exports
(largely frozen) on the global stage. The EU-Serbia trade relationship also facilitates a trade route from
Serbia to United States. The low cost of the raw material, which is impacted by low labor costs, has
contributed to Serbia’s success as a global supplier in recent decades.
However, despite Serbia’s highly competitive position in both the EU and United States, growth in the
Serbian raspberry industry has largely plateaued. The lack of integration between growers and
processors prevents growers from receiving the full benefits of increased global market prices for the
fresh input, lending to instability at the Serbian grower level, including grower-led protests within
Serbia. The primary growing region within Serbia has also been hit with a series of adverse weather
events over recent years. These weather problems have contributed to inconsistent yields, which have
depressed export quantities of processed product in certain years. Nonetheless, even though the
Serbian raspberry industry has a few impediments to overcome in order to continue to expand and
diversify, Serbia is expected to continue to be a significant exporter of frozen raspberries, competing
with processed raspberries in the United States.
559 The Harmonized Commodity Description and Coding System (HS) international system maintained by the World Customs Organization (WCO) categorizes global trade in goods under 6-digit classification numbers. Frozen raspberries (including some other berries) are classified under HS 0811.20, which covers shipments of only one type of berry as opposed to mixes of berries and other fruit. The Harmonized Tariff Schedule of the United States (HTS) classifies frozen uncooked red raspberries (frozen red raspberries) under HTS 0811.20.2025. IHS Markit, Global Trade Atlas database, HS 0810.20 and 0811.20, accessed June 22, 2020; USITC DataWeb/Census, HTS 0811.20.2025, accessed February 4, 2020.
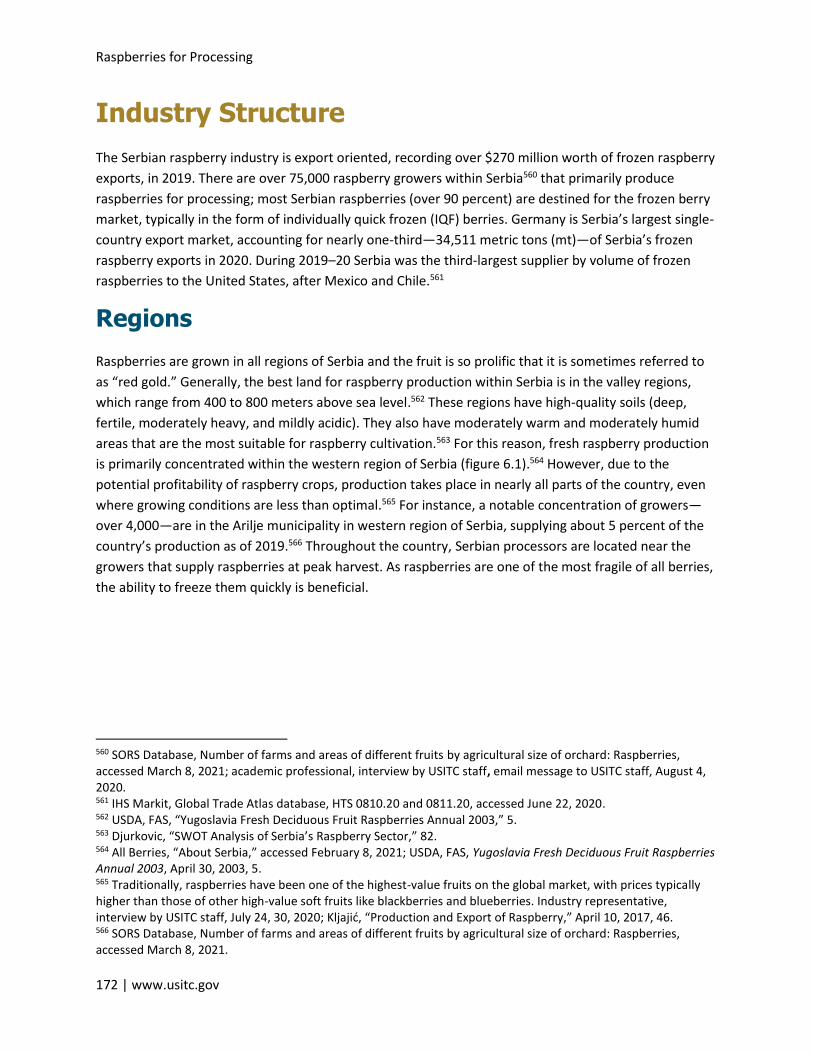
Raspberries for Processing
172 | www.usitc.gov
Industry Structure
The Serbian raspberry industry is export oriented, recording over $270 million worth of frozen raspberry
exports, in 2019. There are over 75,000 raspberry growers within Serbia560 that primarily produce
raspberries for processing; most Serbian raspberries (over 90 percent) are destined for the frozen berry
market, typically in the form of individually quick frozen (IQF) berries. Germany is Serbia’s largest single-
country export market, accounting for nearly one-third—34,511 metric tons (mt)—of Serbia’s frozen
raspberry exports in 2020. During 2019–20 Serbia was the third-largest supplier by volume of frozen
raspberries to the United States, after Mexico and Chile.561
Regions
Raspberries are grown in all regions of Serbia and the fruit is so prolific that it is sometimes referred to
as “red gold.” Generally, the best land for raspberry production within Serbia is in the valley regions,
which range from 400 to 800 meters above sea level.562 These regions have high-quality soils (deep,
fertile, moderately heavy, and mildly acidic). They also have moderately warm and moderately humid
areas that are the most suitable for raspberry cultivation.563 For this reason, fresh raspberry production
is primarily concentrated within the western region of Serbia (figure 6.1).564 However, due to the
potential profitability of raspberry crops, production takes place in nearly all parts of the country, even
where growing conditions are less than optimal.565 For instance, a notable concentration of growers—
over 4,000—are in the Arilje municipality in western region of Serbia, supplying about 5 percent of the
country’s production as of 2019.566 Throughout the country, Serbian processors are located near the
growers that supply raspberries at peak harvest. As raspberries are one of the most fragile of all berries,
the ability to freeze them quickly is beneficial.
560 SORS Database, Number of farms and areas of different fruits by agricultural size of orchard: Raspberries, accessed March 8, 2021; academic professional, interview by USITC staff, email message to USITC staff, August 4, 2020. 561 IHS Markit, Global Trade Atlas database, HTS 0810.20 and 0811.20, accessed June 22, 2020. 562 USDA, FAS, “Yugoslavia Fresh Deciduous Fruit Raspberries Annual 2003,” 5. 563 Djurkovic, “SWOT Analysis of Serbia’s Raspberry Sector,” 82. 564 All Berries, “About Serbia,” accessed February 8, 2021; USDA, FAS, Yugoslavia Fresh Deciduous Fruit Raspberries Annual 2003, April 30, 2003, 5. 565 Traditionally, raspberries have been one of the highest-value fruits on the global market, with prices typically higher than those of other high-value soft fruits like blackberries and blueberries. Industry representative, interview by USITC staff, July 24, 30, 2020; Kljajić, “Production and Export of Raspberry,” April 10, 2017, 46. 566 SORS Database, Number of farms and areas of different fruits by agricultural size of orchard: Raspberries, accessed March 8, 2021.

Chapter 6: Serbia
United States International Trade Commission | 173
Figure 6.1 Raspberry production in Serbia, by region, 2019
In metric tons (mt). Underlying data for this figure appear in appendix H table H.15.
Source: Compiled by USITC based on the Government of Serbia, Statistical Office, Crop Production from 2005 (Raspberries, 2019).
Serbia also hosts several microclimate regions, which allow raspberry production that meets the
requirements stipulated for organic certification.567 Historically, Serbia has dry weather at the
appropriate times during raspberry cultivation, which reduces mold growth without the use of synthetic
fungicides, optimizing conditions for organic production.568
567 Industry representative, interview by USITC staff, July 24, 2020; Wróblewska, Pawlak, and Paszko, “Economic Aspects in the Raspberry Production,” December 1, 2019, 78. 568 Industry representative, interview by USITC staff, July 24, 2020; academic professional, interview by USITC staff, email message to USITC staff, August 4, 2020.
Raspberries for Processing
174 | www.usitc.gov
Industry Composition
The Serbian raspberry industry is focused on processing berries and exporting most of them. There are
nearly 300 processors (firms with freezing and other processing operations) active within Serbia.569
Some processors also export processed raspberry products.570 As of 2017, nearly 200 companies,
including many small processors, exported raspberries to foreign markets. Four exporters accounted for
over one-quarter of total raspberry exports, but no single company had an export share greater than
10 percent. Serbian-owned companies are dominant among the largest exporters.571 At the same time
some of the large modern processors operating in Serbia, such as Crop S & Partners and Mondi Lamex,
are foreign owned.572
There are over 75,000 raspberry farms in Serbia that supply the fresh raspberry input for processed
raspberries. The raspberry farms in Serbia, which average only 0.5 hectares (ha) (1.2 acres), are typically
family-owned seasonal businesses that do not use newer technology or processes, instead relying on
traditional production methods. The workforce on these farms generally consists of family labor and,
when needed during the harvest season (early summer), seasonal workers from Serbia or neighboring
countries.573
Over the past several years, the number of these small family farms has begun to decrease due to a
variety of factors. These, include aging populations in rural villages, migration to the urban areas, and
lack of capital going to growers.574 As with raspberry production in other countries, periods of sustained
low pricing led to many new growers exiting the raspberry production sector; many growers entered the
market when prices were high, and then left when lower prices did not meet their expectations.575
Industry Organization
Cooperation and organization in the Serbian raspberry supply chain (i.e., producers, intermediaries, cold
stores) is very limited. There is some horizontal integration within the supply chain, but vertical
integration does not exist.576 Generally, raspberry growers do not have ownership stakes in cold storage
facilities, and specialized cooperatives for raspberry processing and export are underdeveloped.577 Thus,
569 Djurkovic, “SWOT Analysis of Serbia’s Raspberry Sector,” 27; SeedEv, Market Study, April 12, 2019, 71. 570 Academic professional, interview by USITC staff, email message to USITC staff, August 4, 2020. 571 Džagić et al., Integrated Report on Performance and Value Chain Analysis, December 2017, 48. 572 Džagić et al., Integrated Report on Performance and Value Chain Analysis, December 2017, 48. 573 The number of Serbian farms producing organic raspberries has increased significantly in recent years, from about 300 farms in 2013 to over 2,000 farms in 2018. Stojanović et al., “Market Analysis of Serbia’s Raspberry Sector,” 2018, 5; Djurkovic, “SWOT Analysis of Serbia’s Raspberry Sector,” 2012, 86. 574 USDA, FAS, “Yugoslavia Fresh Deciduous Fruit Raspberries Annual 2003,” 5. 575 Fruit Ukraine, “EU Lifts Additional Control Measures for Export,” accessed February 8, 2021. 576 Much research has been devoted to the fragmented production within Serbia, but it is worth noting that the fragmentation also applies to the processors and exporters. Nearly 200 companies within Serbia exported raspberries to foreign markets in 2018. Džagić et al., “Integrated Report on Performance and Value Chain Analysis," December 2017, 47; Stojanović et al., “Food Chain Structure, Price and Risk Management Strategies,” 2018, 5. 577 Parausić and Simeunović, “Market Analysis of Serbia’s Raspberry Sector,” December 31, 2016, 1424.
Chapter 6: Serbia
United States International Trade Commission | 175
the majority of raspberry growers are price takers—that is, they lack power to influence prices—when
selling fresh raspberries.
In recent years, media reports have covered growers’ protests over unfair pricing and purchasing
conditions, which occurred when raspberry prices were set lower.578 Despite these reports,579 some
researchers state that there is trust between growers and some operators of cold storage facilities,
particularly when long-term contracts have been established that feature agreed-upon raspberry
pricing.580
Cultivars
The vast majority (over 90 percent) of raspberries grown in Serbia are the Willamette cultivar from
Oregon.581 High-yielding, Willamette plantings produce berries that are good for freezing and processing
and are said to maintain a good flavor profile.582 In recent years, the Meeker cultivar has been
introduced, but production of this cultivar is still comparatively limited. Several other cultivars have
been introduced, including Promise and Grandina, but these plant types make up a small share of the
market.583 Attempts to diversify cultivars are driven, in part, by the goal of helping the Serbian raspberry
crop become more robust against mold and certain pests.584 A recent example is Fertodi Zamatos, a
Hungarian cultivar, that is high yielding and more resistant to moisture.585 There are also attempts to
expand production to autumn raspberry cultivars—such as the Polka, Polana, and Tulameen varieties—
in order to extend the harvesting season.586 Growth of more robust raspberry cultivars that are mold-
resistant without the use of certain chemicals could increase Serbia’s ability to produce organic
raspberries.
Newer cultivars, with stronger genetic potential, are typically imported because Serbia has few modern
nurseries. Serbian growers do not trust imported seedlings in general, so adoption of these newer
cultivars is very limited.587 Also, growers are said to lack knowledge in terms of choice, scope, and
method of using inputs. They rely primarily on the traditional way of production. One of the industry’s
578 Academic professional, interview by USITC staff, email message to USITC staff, August 4, 2020. 579 Stojanović et al., SUFISA Raspberry Report an Extended Summary, June 2018, 8; Džagić et al., Integrated Report on Performance and Value Chain Analysis, December 2017, 99–101. 580 Some regions in Serbia have associations for producers and cold storage facilities. However, reports indicate that associations largely do not represent the small producers and there is no benefit from the association such as joint purchase, building facilities, etc. Academic professional, interview by USITC staff, email message to USITC staff, August 4, 2020. 581 The Willamette variety has been cultivated in Serbia for nearly half a century. SeedEv, Market Study, April 12, 2019, 15. 582 Government of Canada, BC Ministry of Agriculture, A Global Export Market Overview, 2010, 8; Academic professional, interview by USITC staff, email message to USITC staff, August 4, 2020. 583 Academic professional, interview by USITC staff, email message to USITC staff, August 4, 2020; SeedEv, Market Study for Soft Fruits, April 12, 2019, 15. 584 Academic professional, interview by USITC staff, email message to USITC staff, August 4, 2020. 585 Academic professional, interview by USITC staff, email message to USITC staff, August 4, 2020; Floriva, “Malina Fertodi Zamatos,” August 27, 2018. 586 Academic professional, interview by USITC staff, email message to USITC staff, August 4, 2020. 587 Džagić et al., Integrated Report on Performance and Value Chain Analysis, December 2017, 47.
Raspberries for Processing
176 | www.usitc.gov
key challenges is to turn the growers’ focus onto education and encourage their adoption of modern
cultivation technologies and approaches, which include diversifying cultivars.588
Production System
Most raspberries in Serbia are planted and tended to manually, unlike in EU countries, where advanced
technical and technological practices are more frequently employed.589 Raspberries are predominantly
grown on small family-owned farms with the harvesting done primarily by hand. Even on farms where
machinery is used in planting or tending operations, the harvesting is still done solely by hand. As noted,
the Willamette cultivar dominates the market, which translates into one harvest season lasting only six
weeks from June through July.590 The Serbian raspberry harvest season involves the hiring of about
15,000 seasonal workers, of which over a third are “not local,” to assist the approximately 100,000
raspberry producers.591 Seasonal labor is not fully regulated, and legislation within Serbia to strengthen
seasonal laborers’ rights has not been passed.592
Products and Supply Chain
After the harvest, most Serbian raspberries (over 90 percent) enter the frozen market channel.593
Serbian processed raspberries products are primarily (1) whole IQF raspberries, (2) “raspberry mixtures”
(i.e., various proportions of free-flowing whole and broken raspberries),594 and (3) block frozen
raspberries. As recently as 2016, less than 3 percent of total Serbian raspberry production went to the
fresh market channel.595
The raspberry supply chain is short for both domestic and global markets; the last step after processing
is cold storage, since Serbian raspberries are largely exported as frozen product. Due to the
homogeneity of the product (mostly IQF), the supply chain is comparatively simple compared to that of
other countries. It can be described in three segments: growers (producers of the raw material);
588 Džagić et al., Integrated Report on Performance and Value Chain Analysis, December 2017, 47. 589 Wróblewska, Pawlak, and Paszko, “Economic Aspects in the Raspberry Production,” December 1, 2019, 76. 590 Džagić et al., Integrated Report on Performance and Value Chain Analysis, December 2017, 47. 591 Academic professional, email message to USITC staff, March 3, 2020; FAO, Smallholders and Family Farms in Serbia, 2020, 138; Government of the Netherlands. Ministry of Agriculture, Nature, and Food Quality, “Serbia Newsflash Week 24,” December 6, 2020. 592 The legislation that is being referenced is the “Law on Seasonal Labor.” FAO, Smallholders and Family Farms in Serbia, 2020, 122; Stojanović et al., “Food Chain Structure, Price and Risk Management Strategies,”2018, 5. 593 Due to the lack of processing technologies, Serbia converts very small quantities into local juice and puree products. Instead, the country exports most of its frozen raspberries to other European countries, where firms process them for re-export. Government of Canada, BC Ministry of Agriculture, A Global Export Market Overview, 2010, 9. 594 Raspberry mixtures consist of 40 to 50 percent frozen whole berries, 20 to 30 percent chopped raspberries, and 20 percent broken raspberries. All Berries, “About Serbia,” accessed February 8, 2021; USDA, FAS, “Yugoslavia Fresh Deciduous Fruit Raspberries,” April 30, 2003, 3. 595 Stojanović et al., Serbia National Report, April 2018,3, 97.
Chapter 6: Serbia
United States International Trade Commission | 177
processors (operators that purchase, store, process, and sell the product); and distributors (e.g.,
retailers, exporters, and foreign firms).596
The Serbian raspberry supply chain starts with the inputs that are needed for the growers to produce.597
There are no significant producers of fertilizers or pesticides within Serbia, so these materials are
primarily sourced through imports.598 Actual planting materials used for raspberries are sourced and
largely produced in Serbia. Growers generally are skeptical of the health of imported seedlings and
attribute instances of infected crops to seedling materials sourced from abroad.599 One local source, the
Fruit Research Institute (located in Čačak, Serbia), produces standard and certified propagating and
planting material. The Fruit Research Institute issues up to 600,000 certified seedlings annually to
growers, many seedlings are studied but some materials are sold commercially to nurseries and fruit
growers.600
Once Serbian growers harvest the raspberries, the supply chain moves forward to the processor stage.
This largely involves local intermediaries (brokers),601 the cold storage facilities that own processing
capacity (processors), and foreign intermediaries.602 After selling their harvest, growers typically have
little to no further involvement in the supply chain.603 During the 1990s, the processed raspberry sector
was run by state-owned cold storage facilities, and the growers’ sales were mostly directed to domestic
intermediaries (brokers who aggregate berries from small farms).604 Some of these brokers still exist
today, selling the product to processors.
The Serbian raspberry processing sector consists of Serbian cold storage facilities, which numbered over
300 in 2017. It is estimated that up to 95 percent of Serbia’s raspberry production is purchased by
processors. This segment of the industry is fragmented; plants range in size from micro-facilities, with
capacities of a few dozen metric tons, to large facilities, which can handle more than a thousand metric
tons.605 Smaller facilities work as intermediaries/brokers, while larger facilities can freeze, store,
596 Stojanović et al., “Food Chain Structure, Price and Risk Management Strategies,” 2018, 5. 597 For an overview of the different segments of the raspberry supply chain, please see chapter 1, “Introduction.” 598 Džagić et al., Integrated Report on Performance and Value Chain Analysis, December 2017, 46. 599 Academic professional, interview by USITC staff, email message to USITC staff, August 4, 2020; Stojanović et al., SUFISA Raspberry Report: An Extended Summary, June 2018, 6–7; Stojanović et al., Serbia National Report, April 2018, 117–18. 600 Stojanović et al., “Food Chain Structure, Price and Risk Management Strategies,” 2018, 5; Fruit Research Institute (Institut za voćarstvo) Čačak, “History (Istorijat),” accessed February 9, 2021. 601 “Micro” cold storage operators (capacity is not greater than a few dozen tons) act exclusively as intermediaries. Džagić et al., Integrated Report on Performance and Value Chain Analysis, December 2017, 47. 602 Some cold storage operations, usually “large” operations, are purchasers, processers, and exporters. Fruvela is one such example: it purchases, stores, and processes a variety of fruits in Serbia just outside of Belgrade. Fruvela, “Cold Storage for Fruits,” accessed February 9, 2021. 603 In Serbia, large processors (those that have thousands of tons of storage capacity) have been buying less and less raw material (i.e., raspberries) directly from growers due to the high number of small cold storage facilities spread across the country. Academic professional, interview by USITC staff, email message to USITC staff, August 4, 2020; Džagić et al., Integrated Report on Performance and Value Chain Analysis, December 2017, 46. 604 Džagić et al., Integrated Report on Performance and Value Chain Analysis, December 2017, 47. 605 Stojanović et al., Serbia National Report, 96.
Raspberries for Processing
178 | www.usitc.gov
package, and market frozen raspberry products.606 Cold storage operations are generally located close
to raspberry-growing areas, and reportedly have longstanding relationships with growers within their
localities.607 Serbian raspberry processors also freeze other fruit and vegetables with their equipment.
It is estimated that 15–20 percent of cold storage facilities in Serbia have Hazard Analysis Critical Control
Point (HACCP) certificates. “Modern” cold storage facilities that meet key standards, such as HACCP,608
and that have greater than 2,000 mt capacity account for around 30–40 percent of total final purchases
of frozen raspberries.609
Once frozen, the raspberries are mainly exported as IQF product in units of 10–20 kilograms (kg).610
Depending on the capabilities and established relationships of the processor, foreign intermediaries
negotiate with final customers and generally handle packaging and delivery of the final products.611
Serbia’s limited adoption of modern machinery and technology means that many processors do not
have access to packaging material that meets EU standards. Therefore, many EU buyers that require
raspberries to be packed in a specific size or style of packaging for retail purposes will supply the
packaging and labels to Serbian processors. Generally, when exported, IQF raspberries are packed into
plastic bags of 2.5 kg net weight in a standard five-layer carton box.612
Production, Consumption, and Trade
Production and Consumption
Serbia is the third-largest global producer of raspberries, behind Russia and Mexico.613 As noted
previously, it is generally accepted that 90 percent of raspberries produced in Serbia are frozen.614
Production in Serbia grew from 2015 to 2019, with peak production reported in 2018 (table 6.1).615
There have been reports from industry that adverse weather and poor growing conditions in 2019
606 SeedEv, Market Study for Soft Fruits, April 12, 2019, 69; Džagić et al., Integrated Report on Performance and Value Chain Analysis, December 2017, 43. 607 Depending on the size of the operations, sometimes growers operate as brokers and have cold storage capacity but generally are not involved in exporting operations. Nanni, “Serbian Raspberry Prices Unlikely to Decline,” September 29, 2020. 608 These facilities also meet British Retail Consortium (BRC) and other key standards. Džagić et al., Integrated Report on Performance and Value Chain Analysis, December 2017, 47; FAO, Smallholders and Family Farms in Serbia, 2020, 39–40. 609 Džagić et al., Integrated Report on Performance and Value Chain Analysis, December 2017, 47. 610 During the harvest season some fresh raspberries are also exported from Serbia in storage tanks, but the amounts exported are minuscule when compared to frozen raspberry exports. Industry representative, interview by USITC staff, July 29 and August 13, 2020; Džagić et al., Integrated Report on Performance and Value Chain Analysis, December 2017, 48; Government of Canada, BC Ministry of Agriculture, A Global Export Market Overview, 2010, 9–10. 611 Džagić et al., Integrated Report on Performance and Value Chain Analysis, December 2017, 53. 612 Government of Canada, BC Ministry of Agriculture, A Global Export Market Overview, 2010, 9. 613 FAO, FAOSTAT database, Crops: Raspberries, accessed June 2, 2020. 614 Academic professional, interview by USITC staff, email message to USITC staff, August 4, 2020. 615 Industry representative, interview by USITC staff, July 30, 2020.
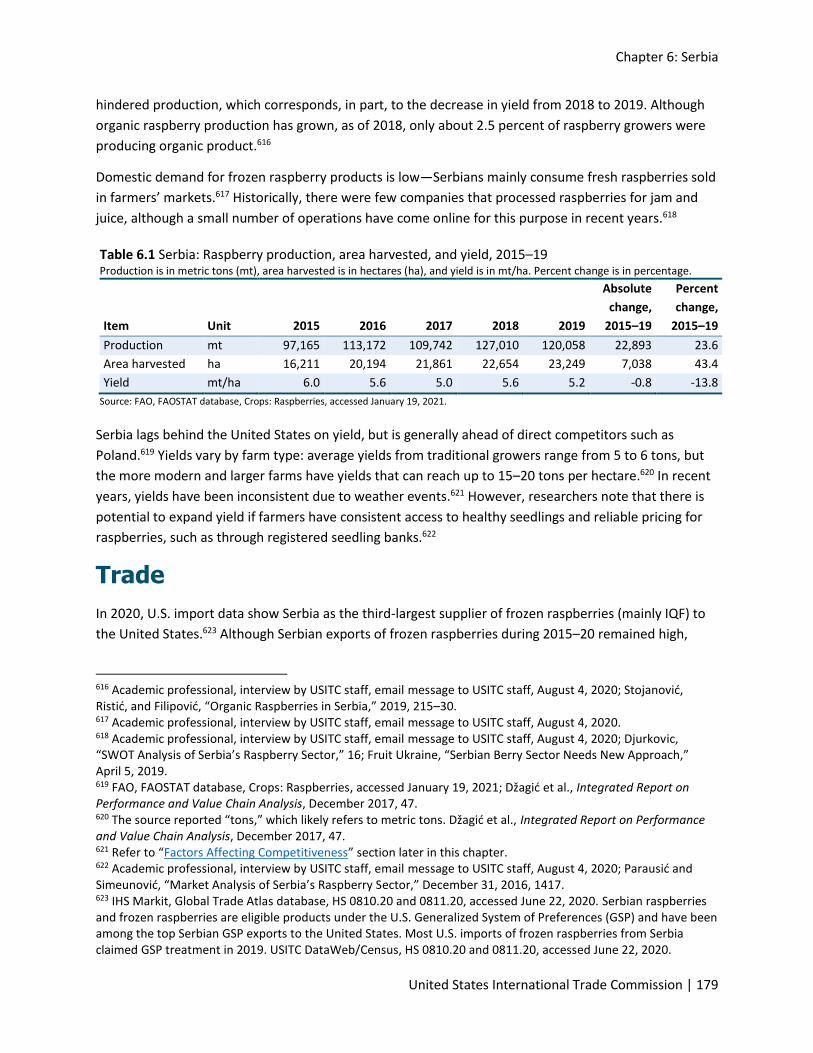
Chapter 6: Serbia
United States International Trade Commission | 179
hindered production, which corresponds, in part, to the decrease in yield from 2018 to 2019. Although
organic raspberry production has grown, as of 2018, only about 2.5 percent of raspberry growers were
producing organic product.616
Domestic demand for frozen raspberry products is low—Serbians mainly consume fresh raspberries sold
in farmers’ markets.617 Historically, there were few companies that processed raspberries for jam and
juice, although a small number of operations have come online for this purpose in recent years.618
Table 6.1 Serbia: Raspberry production, area harvested, and yield, 2015–19 Production is in metric tons (mt), area harvested is in hectares (ha), and yield is in mt/ha. Percent change is in percentage.
Item Unit 2015 2016 2017 2018 2019
Absolute
change,
2015–19
Percent
change,
2015–19
Production mt 97,165 113,172 109,742 127,010 120,058 22,893 23.6
Area harvested ha 16,211 20,194 21,861 22,654 23,249 7,038 43.4
Yield mt/ha 6.0 5.6 5.0 5.6 5.2 -0.8 -13.8
Source: FAO, FAOSTAT database, Crops: Raspberries, accessed January 19, 2021.
Serbia lags behind the United States on yield, but is generally ahead of direct competitors such as
Poland.619 Yields vary by farm type: average yields from traditional growers range from 5 to 6 tons, but
the more modern and larger farms have yields that can reach up to 15–20 tons per hectare.620 In recent
years, yields have been inconsistent due to weather events.621 However, researchers note that there is
potential to expand yield if farmers have consistent access to healthy seedlings and reliable pricing for
raspberries, such as through registered seedling banks.622
Trade
In 2020, U.S. import data show Serbia as the third-largest supplier of frozen raspberries (mainly IQF) to
the United States.623 Although Serbian exports of frozen raspberries during 2015–20 remained high,
616 Academic professional, interview by USITC staff, email message to USITC staff, August 4, 2020; Stojanović, Ristić, and Filipović, “Organic Raspberries in Serbia,” 2019, 215–30. 617 Academic professional, interview by USITC staff, email message to USITC staff, August 4, 2020. 618 Academic professional, interview by USITC staff, email message to USITC staff, August 4, 2020; Djurkovic, “SWOT Analysis of Serbia’s Raspberry Sector,” 16; Fruit Ukraine, “Serbian Berry Sector Needs New Approach,” April 5, 2019. 619 FAO, FAOSTAT database, Crops: Raspberries, accessed January 19, 2021; Džagić et al., Integrated Report on Performance and Value Chain Analysis, December 2017, 47. 620 The source reported “tons,” which likely refers to metric tons. Džagić et al., Integrated Report on Performance and Value Chain Analysis, December 2017, 47. 621 Refer to “Factors Affecting Competitiveness” section later in this chapter. 622 Academic professional, interview by USITC staff, email message to USITC staff, August 4, 2020; Parausić and Simeunović, “Market Analysis of Serbia’s Raspberry Sector,” December 31, 2016, 1417. 623 IHS Markit, Global Trade Atlas database, HS 0810.20 and 0811.20, accessed June 22, 2020. Serbian raspberries and frozen raspberries are eligible products under the U.S. Generalized System of Preferences (GSP) and have been among the top Serbian GSP exports to the United States. Most U.S. imports of frozen raspberries from Serbia claimed GSP treatment in 2019. USITC DataWeb/Census, HS 0810.20 and 0811.20, accessed June 22, 2020.
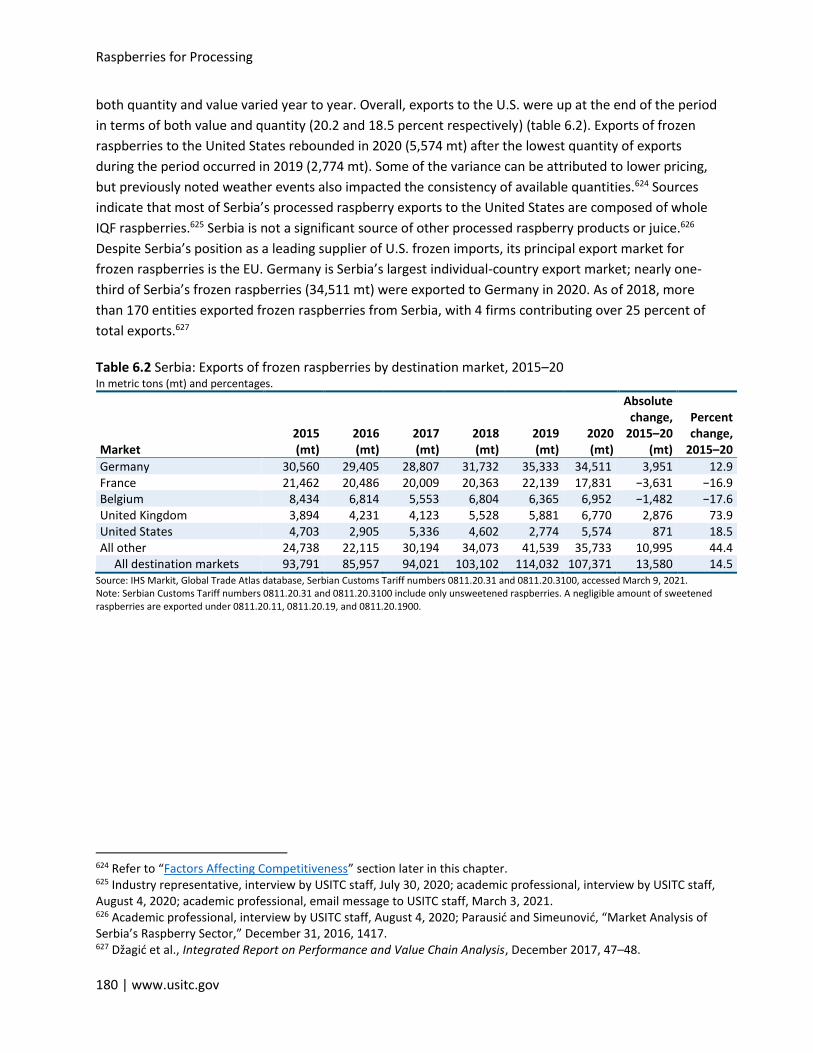
Raspberries for Processing
180 | www.usitc.gov
both quantity and value varied year to year. Overall, exports to the U.S. were up at the end of the period
in terms of both value and quantity (20.2 and 18.5 percent respectively) (table 6.2). Exports of frozen
raspberries to the United States rebounded in 2020 (5,574 mt) after the lowest quantity of exports
during the period occurred in 2019 (2,774 mt). Some of the variance can be attributed to lower pricing,
but previously noted weather events also impacted the consistency of available quantities.624 Sources
indicate that most of Serbia’s processed raspberry exports to the United States are composed of whole
IQF raspberries.625 Serbia is not a significant source of other processed raspberry products or juice.626
Despite Serbia’s position as a leading supplier of U.S. frozen imports, its principal export market for
frozen raspberries is the EU. Germany is Serbia’s largest individual-country export market; nearly one-
third of Serbia’s frozen raspberries (34,511 mt) were exported to Germany in 2020. As of 2018, more
than 170 entities exported frozen raspberries from Serbia, with 4 firms contributing over 25 percent of
total exports.627
Table 6.2 Serbia: Exports of frozen raspberries by destination market, 2015–20 In metric tons (mt) and percentages.
Market 2015 (mt)
2016 (mt)
2017 (mt)
2018 (mt)
2019 (mt)
2020 (mt)
Absolute change,
2015–20 (mt)
Percent change,
2015–20
Germany 30,560 29,405 28,807 31,732 35,333 34,511 3,951 12.9 France 21,462 20,486 20,009 20,363 22,139 17,831 −3,631 −16.9 Belgium 8,434 6,814 5,553 6,804 6,365 6,952 −1,482 −17.6 United Kingdom 3,894 4,231 4,123 5,528 5,881 6,770 2,876 73.9 United States 4,703 2,905 5,336 4,602 2,774 5,574 871 18.5 All other 24,738 22,115 30,194 34,073 41,539 35,733 10,995 44.4
All destination markets 93,791 85,957 94,021 103,102 114,032 107,371 13,580 14.5 Source: IHS Markit, Global Trade Atlas database, Serbian Customs Tariff numbers 0811.20.31 and 0811.20.3100, accessed March 9, 2021. Note: Serbian Customs Tariff numbers 0811.20.31 and 0811.20.3100 include only unsweetened raspberries. A negligible amount of sweetened raspberries are exported under 0811.20.11, 0811.20.19, and 0811.20.1900.
624 Refer to “Factors Affecting Competitiveness” section later in this chapter. 625 Industry representative, interview by USITC staff, July 30, 2020; academic professional, interview by USITC staff, August 4, 2020; academic professional, email message to USITC staff, March 3, 2021. 626 Academic professional, interview by USITC staff, August 4, 2020; Parausić and Simeunović, “Market Analysis of Serbia’s Raspberry Sector,” December 31, 2016, 1417. 627 Džagić et al., Integrated Report on Performance and Value Chain Analysis, December 2017, 47–48.
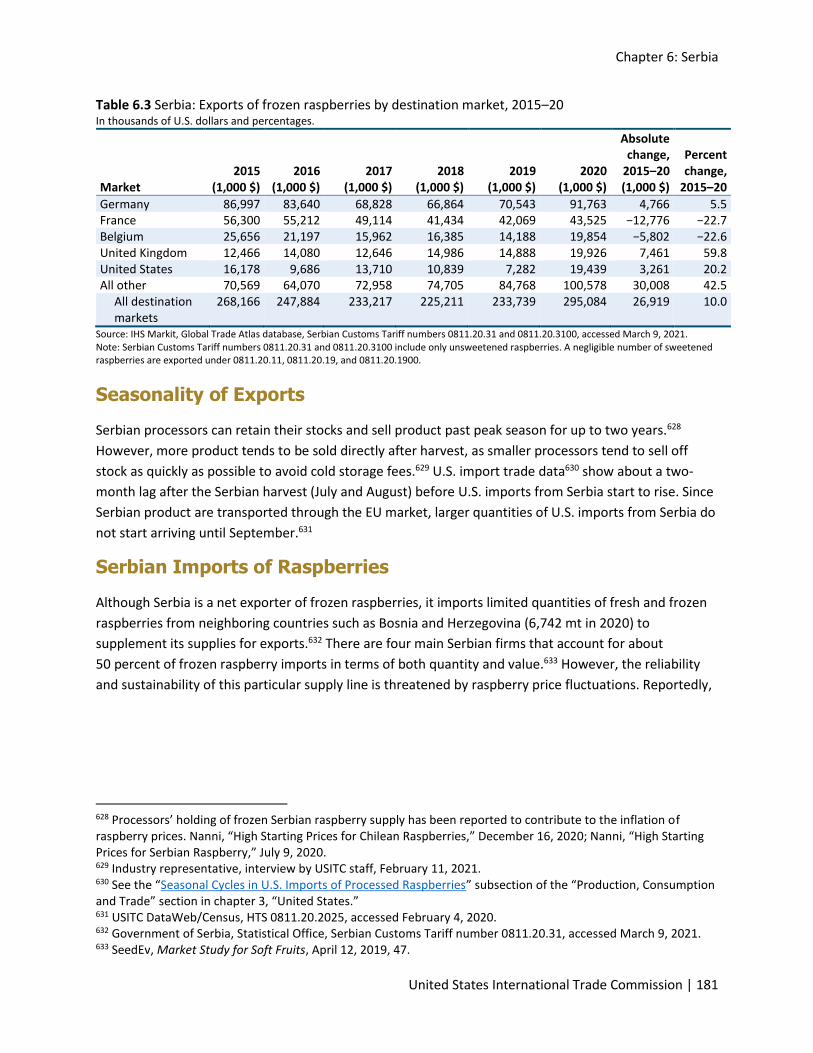
Chapter 6: Serbia
United States International Trade Commission | 181
Table 6.3 Serbia: Exports of frozen raspberries by destination market, 2015–20 In thousands of U.S. dollars and percentages.
Market 2015
(1,000 $) 2016
(1,000 $) 2017
(1,000 $) 2018
(1,000 $) 2019
(1,000 $) 2020
(1,000 $)
Absolute change,
2015–20 (1,000 $)
Percent change,
2015–20
Germany 86,997 83,640 68,828 66,864 70,543 91,763 4,766 5.5 France 56,300 55,212 49,114 41,434 42,069 43,525 −12,776 −22.7 Belgium 25,656 21,197 15,962 16,385 14,188 19,854 −5,802 −22.6 United Kingdom 12,466 14,080 12,646 14,986 14,888 19,926 7,461 59.8 United States 16,178 9,686 13,710 10,839 7,282 19,439 3,261 20.2 All other 70,569 64,070 72,958 74,705 84,768 100,578 30,008 42.5
All destination markets
268,166 247,884 233,217 225,211 233,739 295,084 26,919 10.0
Source: IHS Markit, Global Trade Atlas database, Serbian Customs Tariff numbers 0811.20.31 and 0811.20.3100, accessed March 9, 2021. Note: Serbian Customs Tariff numbers 0811.20.31 and 0811.20.3100 include only unsweetened raspberries. A negligible number of sweetened raspberries are exported under 0811.20.11, 0811.20.19, and 0811.20.1900.
Seasonality of Exports
Serbian processors can retain their stocks and sell product past peak season for up to two years.628
However, more product tends to be sold directly after harvest, as smaller processors tend to sell off
stock as quickly as possible to avoid cold storage fees.629 U.S. import trade data630 show about a two-
month lag after the Serbian harvest (July and August) before U.S. imports from Serbia start to rise. Since
Serbian product are transported through the EU market, larger quantities of U.S. imports from Serbia do
not start arriving until September.631
Serbian Imports of Raspberries
Although Serbia is a net exporter of frozen raspberries, it imports limited quantities of fresh and frozen
raspberries from neighboring countries such as Bosnia and Herzegovina (6,742 mt in 2020) to
supplement its supplies for exports.632 There are four main Serbian firms that account for about
50 percent of frozen raspberry imports in terms of both quantity and value.633 However, the reliability
and sustainability of this particular supply line is threatened by raspberry price fluctuations. Reportedly,
628 Processors’ holding of frozen Serbian raspberry supply has been reported to contribute to the inflation of raspberry prices. Nanni, “High Starting Prices for Chilean Raspberries,” December 16, 2020; Nanni, “High Starting Prices for Serbian Raspberry,” July 9, 2020. 629 Industry representative, interview by USITC staff, February 11, 2021. 630 See the “Seasonal Cycles in U.S. Imports of Processed Raspberries” subsection of the “Production, Consumption and Trade” section in chapter 3, “United States.” 631 USITC DataWeb/Census, HTS 0811.20.2025, accessed February 4, 2020. 632 Government of Serbia, Statistical Office, Serbian Customs Tariff number 0811.20.31, accessed March 9, 2021. 633 SeedEv, Market Study for Soft Fruits, April 12, 2019, 47.
Raspberries for Processing
182 | www.usitc.gov
producers in Bosnia and Herzegovina have been known to quickly abandon raspberry production when
faced with low prices, limiting Serbia’s import supply.634
Government Programs
Agricultural policy within Serbia has experienced frequent reform over the past quarter century.
Following the launch of the negotiations for Serbia’s accession to the EU at the end of 2013, Serbia
began a shift towards the common agricultural policy of the EU.635 In 2014 the Serbian government
adopted an Agricultural and Rural Development Strategy for the period 2014–24. This strategy provided
guidelines defining the basic reforms that are needed for Serbia’s agricultural industry to meet EU and
World Trade Organization requirements, which would benefit both the growers and processors (e.g.,
fresh raspberries for processing and frozen raspberries). The goal of the strategy is to improve Serbia’s
business environment and competitiveness, raise living conditions, and introduce greater stability for
Serbia’s farmers in rural areas.636
In 2015, the Ministry of Agriculture instituted specific National Development Programs that were
mentioned as assisting raspberry production.637 Monetary programs that were in place as of 2018 to
incentivize agricultural production included:638
• Loans granted to fruit producers (for investment in seedlings and equipment).
• Subsidies for expansion of land used for raspberry planting; purchase, certification, and
selection of seedlings; and purchase of equipment used in primary production (in the form of
refunds of 40 to 55 percent of investment in equipment).639
• Refunds for costs associated with fuel and fertilizers and seedling insurance premiums.
• Support for basic crop production; organic fruit production; and investments in certification of
geographical origin.
Despite the institution of such programs, reports indicate that raspberry production suffers from a lack
of machinery, investment, and vertical integration; insufficient state support and inadequate planning
by local policymakers; limited economic actions, including incentives; inadequate education of rural
producers; and limited membership in cooperatives or associations.640 Some of these insufficiencies are
634 Nanni, “Bosnia-Herzegovina Processed Fruit Exports,” April 22, 2020; Nanni, “High Starting Prices for Serbian Raspberry,” July 9, 2020; Životić et al., “Characteristics of Raspberry Production in Bosnia and Herzegovina,” May 7, 2019, 241. 635 FAO, Smallholders and Family Farms in Serbia, 2020, 92. 636 USDA, FAS, Serbian Agriculture Overview and Best Prospects, 2015, June 9, 2015, 3. 637 USDA, FAS, Serbian Agriculture Overview and Best Prospects, 2015, June 9, 2015, 3. 638 Stojanović et al., Serbia National Report, 100–3; Stojanović et al., SUFISA Raspberry Report an Extended Summary, June 2018, 5–6. 639 Certain investments in equipment are eligible for subsidies: for example, investments in cold storage and investments in equipment used in production and processing. 640 Academic professional, interview by USITC staff, email message to USITC staff, August 4, 2020; Stojanović et al., Serbia National Report, April 2018, 101–2.

Chapter 6: Serbia
United States International Trade Commission | 183
due, in part, to challenges in implementing the policies outlined above.641 As of 2020, specific organized
government support and programs facilitating raspberry production at a national level were limited,642
considering the importance of the raspberry supply chain to the overall agricultural and rural
development of Serbia.
The U.S. Agency for International Development (USAID) has aided the Serbian agriculture industry,
including support for raspberry production.643 Initially USAID support included providing technologies
and machinery to assist in raspberry planting. However, during 2015–19, USAID supported the raspberry
industry through industry education and networking help—for example, by connecting growers and
processors to facilitate transactions.644 This support for the Serbian raspberry industry continues as of
2021.645 Despite USAID’s earlier support, many Serbian raspberry producers do not use modern
technology in the cultivation of their raspberry crops, and have continued to rely on traditional methods
of production.646
Compliance with Food Safety Standards
Over the past several years there have been a number of actions taken to ensure that Serbian
raspberries meet EU health and food safety standards, which have facilitated the industry’s global
export compliance, including for the U.S. market. Some Serbian producers of agricultural goods are
certified via the private standards body GLOBALG.A.P.647 While certified producers in the overall
agricultural sector grew from 66 in 2013 to 1,011 by 2019, within the raspberry sector it is estimated
that the majority of producers (up to 70 percent) do not have GLOBALG.A.P. certification. Generally,
only large processors and large farming operations meet the standard because there is little incentive
641 FAO, Smallholders and Family Farms in Serbia, 93–4. 642 Academic professional, interview by USITC staff, email message to USITC staff, August 4, 2020; Stojanović et al., Serbia National Report, April 2018, 96; Stojanović et al., SUFISA Raspberry Report an Extended Summary, June 2018, 5–6, 8–10. 643 USAID, “Pioneering the Production of Raspberries,” June 13, 2019; USAID, “Fact Sheet: Serbia,” May 14, 2020; Cardno, “USAID Serbia Competitive Systems Strengthening (CSS),” accessed October 15, 2020. 644 Cardno, “USAID Serbia Competitive Systems Strengthening (CSS),” accessed October 15, 2020. 645 A provision in U.S. law, widely known as the Bumpers Amendment, prohibits U.S. government support for products for export in a foreign country that would compete with similar products produced by the United States in third-country markets. On January 11, 2019, USAID determined that the support it has been providing to Serbia’s agricultural sectors (including for the production, processing and trade of fresh and frozen berries) was consistent with Agency Policy Determination 15 through which USAID implements support. USAID/Serbia, “Action Memorandum for the Mission Director,” January 11, 2019. See Further Consolidated Appropriations Act, 2020, § 7025(b) (P.L.116-94, Dec. 20, 2019). https://www.congress.gov/bill/116th-congress/house-bill/1865/text. 646 Academic professional, interview by USITC staff, email message to USITC staff, August 4, 2020; Parausić and Simeunović, “Market Analysis of Serbia’s Raspberry Sector,” December 31, 2016, 1419. 647 According to Funt and Hall, Raspberries, March 22, 2013, this organization “sets voluntary standards for the certification of production processes of agricultural (including aquaculture) products around the globe,” chiefly “to reassure consumers about how food is produced on the farm by minimizing detrimental environmental impacts. GLOBALG.A.P. serves as a practical manual for good agricultural practice (G.A.P.) anywhere in the world.” See also Džagić et al., Integrated Report on Performance and Value Chain Analysis, December 2017, 60.
Raspberries for Processing
184 | www.usitc.gov
for small growers to get certified (i.e., the majority of small growers do not export), and they find it too
expensive to renew the annual certification.648
As the EU is Serbia’s primary export market for raspberries, the Serbian raspberry industry is focused on
meeting EU food and safety standards.649 Over the past several years, however, there have been reports
of Serbian raspberries not meeting food safety standards. As part of a 2013 assessment, controls were
put in place by the EU to help mitigate problems such as foodborne illness on raspberries imported from
Serbia.650 One of the controls put in place was to check every 10th truck against norovirus.651 In August
2020, all additional control measures from the audit were removed.652
Factors Affecting Competitiveness
As described in chapter 2 of this report, the competitiveness of raspberries for processing and processed
raspberry products can be measured by comparing delivered costs, product differentiation, and supplier
reliability for U.S. products against those of imports. Certain key factors contribute to the
competitiveness of Serbian processed raspberries in the U.S. market. One factor is Serbia’s production
system, which includes handpicking, allowing the industry to supply more whole berries to the
processed market. Another factor, the country’s climate, allows it to continue expanding production of
organic product. As the Serbian raspberry industry has grown on the global stage over the past couple of
decades, it has been bolstered by access to the EU market. Not only has the EU provided a customer
base, but it has also been a driver of improved health and safety practices intended to meet the EU’s
stringent food safety standards.
Serbia’s delivery costs are low, but lack of
integration inhibits expansion.
The Serbian processed raspberry industry benefits from several factors that contribute to a generally
lower delivered cost. These factors include the costs of inputs for processed raspberries, and the
industry’s structure. The low labor costs in Serbia contribute to the overall lower cost of the raw
material sold to processors. In general, labor costs for raspberry harvesting can represent over half of
total production costs, and on average Serbian agricultural wages are far lower than those of the U.S.
agricultural sector.653 Over the past several years the average labor cost for raspberry production in
648 Academic professional, interview by USITC staff, email message to USITC staff, August 4, 2020. 649 Djurkovic, “SWOT Analysis of Serbia’s Raspberry Sector,” 56, 69, 73, 111; Food Safety News, “EU Audit Finds Issues,” accessed February 8, 2021; Nanni, “EU Audit Detects Weakness of Serbian Soft Fruit,” November 19, 2019. 650 European Commission Directorate-General for Health and Food Safety, EU Audit Final Report, October 2019. 651 Instances of norovirus related to Serbian raspberries are primarily caused by the use of non-genuine and noncertified seedlings (i.e., raspberry cultivars that are not properly sourced), inadequate plant protection products, and insufficient hygiene of workers who are in direct contact with raspberries. Džagić et al., Integrated Report on Performance and Value Chain Analysis, December 2017, 62. 652 Fresh Plaza, “EU Lifts Additional Control Measures for Export,” August 31, 2020. 653 For example, in 2008 the average field price in Serbia was $0.87 per kilogram, while the average field price in the U.S. was $3.72 per kilogram. The average monthly wages in agriculture were $820 in Serbia, $1,221 in Poland, and $1,776 in the United States. Djurkovic, “SWOT analysis of Serbia’s Raspberry Sector,” 2012, 83.
Chapter 6: Serbia
United States International Trade Commission | 185
Serbia has been reported as being as little as one-fifth that of the EU.654 In addition, improvements in
internal transportation infrastructure through Serbia, connecting Western and Central Europe with
Southeastern Europe and the Middle East, have facilitated trade between Serbia and importing
countries, including the United States.655
The fragmented industry structure (many small farms with limited vertical and horizontal integration)
also contributes to lower input costs, particularly labor costs, but is often cited as a hindrance to stability
of raspberry production in Serbia.656 The field price is set by cold storage facilities, which are the main
processors and exporters, and farmers become price takers.657 Changes in prices in the world market are
not always transferred to prices paid to the growers for their raw material. Therefore, world prices have
a limited effect on domestic production (e.g., growers leave the market despite high global raspberry
prices).658 Some sources indicate that exporting processed raspberries provide limited value added, as
the exported products have a low degree of processing compared to other processed agricultural
products.659 If integration between the growers and processors were to increase, then it could close the
gap between payments to growers and the export prices.660
Serbian industry can produce organic product and meet external markets’ food safety standards.
The location of Serbian raspberry processors near many growers affords processors access to organic
raw material supplies. Selected growing operations deliver organic raspberries in volumes suitable for
commercial sale, which enhances Serbia’s competitive position based on product differentiation.661
Since consumers perceive organic raspberries as being higher quality, these products can achieve a
higher price point. Some industry representatives view small farms as better able to handle the
654 Historically, seasonal workers that are brought in to harvest Serbian raspberries have been paid around $1.80 per hour. Djurkovic, “SWOT Analysis of Serbia’s Raspberry Sector,” 2012, 84; Government of the Netherlands. Ministry of Agriculture, Nature, and Food Quality, “Serbia Newsflash Week 24.” December 6, 2020. See also chapter 2, “Cross-Country Comparison of Competitiveness.” 655 Improved infrastructure includes access to European Corridors. Djurkovic, “SWOT Analysis of Serbia’s Raspberry Sector,” 2012, 82, 84. 656 The fragmentation contributes to the lack of adoption of modern cultivation practices, including the use of technology and education about proper growing techniques. Academic professional, interview by USITC staff, email message to USITC staff, August 4, 2020; Parausić and Simeunović, “Market Analysis of Serbia’s Raspberry Sector,” December 31, 2016, 1422. 657 Džagić et al., Integrated Report on Performance and Value Chain Analysis, December 2017, 8; Stojanović et al., SUFISA Raspberry Report an Extended Summary, June 2018, 8. 658 Džagić et al., Integrated Report on Performance and Value Chain Analysis, December 2017, 9. 659 Djuric et al., “Export of Agricultural and Food Products,” 2017, 896; Džagić et al., Integrated Report on Performance and Value Chain Analysis, December 2017, 42–43; Stojanović et al., SUFISA Raspberry Report an Extended Summary, June 2018, 8. 660 Academic professional, interview by USITC staff, email message to USITC staff, August 4, 2020; Džagić et al., Integrated Report on Performance and Value Chain Analysis, December 2017, 9; Djurkovic, “SWOT Analysis of Serbia’s Raspberry Sector,” 105–6, 108; Stojanović et al., SUFISA Raspberry Report an Extended Summary, June 2018, 8. 661 Academic professional, interview by USITC staff, August 4, 2020; Stojanović et al., SUFISA Raspberry Report an Extended Summary, June 2018, 8; Stojanović et al., Serbia National Report, April 2018, 101–4.
Raspberries for Processing
186 | www.usitc.gov
requirements of organic certifications because tasks like clearing weeds or eliminating pests can be done
manually rather than with chemicals.662 As mentioned earlier, Serbia’s ability to produce organic
raspberries is also enhanced by the presence of microclimate regions.663 Sources indicate that the
number of growers producing organic raspberries has increased nearly sevenfold over the past several
years.664
There are many factors that would suggest further growth and development of Serbia’s organic
raspberry sector is forthcoming. For example, Serbia has large areas of agricultural land that are not
polluted and not intensively cultivated, making conversion easier; substantial interest of international
contributors; and close existing relations with established organic markets in Germany, Austria,
Switzerland, and the Netherlands.665 Despite these positive factors, the Serbian organic raspberry sector
has had difficulty penetrating foreign markets. Reportedly, some participants within Serbia have not
built good relationships with EU businesses, hindering international trade of Serbian organic
raspberries.666 Nonetheless, Serbia still maintains a competitive advantage over Washington, which is
unable to produce organic raspberries due to their rainy climates, which necessitate the use of chemical
treatments to stave off mold on the raspberries.667
The EU-Serbia trade relationship has helped facilitate Serbia’s ability to comply with U.S. quality and
food safety standards, and Serbian processed raspberry products largely meet EU’s high food safety
requirements. As outlined in the trade section of this chapter, Serbia’s exports of fresh and frozen
raspberries go to EU countries. These exports become part of a broader EU market channel and typically
comply with EU standards for quality and food safety.668
Serbia is a stable high-quality supplier, but input supply is challenged by weather events.
Frozen raspberries are one of Serbia’s largest export commodities and typically feature stable
production levels allowing for a reliable supply of frozen raspberry exports.669 In addition, Serbia
continues to be one of the largest fresh raspberry producers in the world.670 The country has a higher
production efficiency than its close competitors Poland and Ukraine, in part due to the high-yielding,
662 Industry representative, interview by USITC staff, February 11, 2021. 663 Industry representative, interview by USITC staff, July 24, 2020. 664 Academic professional, interview by USITC staff, email message to USITC staff, August 4, 2020; Stojanović, Ristić, and Filipović, “Organic Raspberries in Serbia,” 2019, 217. 665 Stojanović et al., Serbia National Report, April 2018, 103–4. 666 Stojanović et al., Serbia National Report, April 2018, 105. 667 Industry representative, interview by USITC staff, July 24, 2020. 668 Importers of Serbian raspberries work to ensure that there is compliance with EU requirements. Djurkovic, “SWOT Analysis of Serbia’s Raspberry Sector,” 2012, 93. 669 This was the case even during periods of embargo before 2015. Djurkovic, “SWOT Analysis of Serbia’s Raspberry Sector,” 2012, 96. 670 Despite being a top producer, to date, Serbia has not developed other raspberry market channels, such as the fresh market. Fruit Ukraine, “Serbian Berry Sector Needs New Approach,” April 5, 2019.
Chapter 6: Serbia
United States International Trade Commission | 187
easy-picking nature of the Willamette cultivar.671 Further, Serbia’s industry has a well-developed
capability to maintain the fruit’s quality when harvested and frozen. It also has access to well-
established supply chains within the EU that help ensure the supply of frozen raspberries available for
exports.672
However, U.S. raspberry importers state that it is difficult for new Serbian processors to enter the
market, and importers rely on relationships with processors and growers to maintain steady supplies.673
These relationships allow U.S. importers to meet stringent documentation requirements, including
GLOBALG.A.P., Global Food Safety Initiative (GFSI) benchmarks, and third-party certifications such as
those for Safe Quality Food (SQF), British Retail Consortium, and Kosher.674
Availability of fresh raspberry inputs to processors depends on production yields, which declined by
6,952 mt from 2018 to 2019. Although Serbia has the ideal climate and soil for raspberry production,
output has reportedly suffered from multiple instances of poor weather, such as flooding and
hailstorms. In May 2019, it was reported that up to 80 percent of the raspberry crop was destroyed in
some regions due to snow, hail, and stormy weather. Reported yields for 2019 were lower than in 2018
(5.2 mt/ha versus 5.6 mt/ha).675 A little over a year later, June 2020, it was reported that upwards of 30
percent of raspberries were destroyed by heavy rain and hail. This was soon followed by reports in July
of over 1,000 ha of raspberry fields destroyed due to flooding in Western Serbia.676 These events
represent significant damage to the industry, as it will take two years for new plantings to reach
maturity and bear fruit, and raspberry production is more concentrated within the region of Western
Serbia.677 Some attribute the decrease in Serbian raspberry production to changing weather patterns
that are increasing the frequency of these weather events.678
671 Wróblewska, Pawlak, and Paszko, “Economic Aspects in the Raspberry Production,” December 1, 2019, 78. 672 Serbian raspberry industry is largely Eurocentric. Industry representative, interview by USITC staff, August 13, 2020; Djurkovic, “SWOT Analysis of Serbia’s Raspberry Sector,” 2012, 96; Wróblewska, Pawlak, and Paszko, “Economic Aspects in the Raspberry Production,” December 1, 2019, 78. 673 Industry representatives, interviews by USITC staff, July 24, 2020, and July 30, 2020. 674 One importer, Lamex Food Group, acquired an ownership stake in a processing plant in Serbia. Industry representative, interview by USITC staff, July 30, 2020; Lamex Foods, “Fruits and Vegetables,” accessed February 8, 2021. 675 In general, growers in certain regions were reporting that the majority of raspberry crops were destroyed. Bjelotomic, “Raspberry Producers: 80% of Crop Destroyed,” May 22, 2019. 676 The 2020 flood was the second that led to widespread raspberry crop destruction in recent years. In 2014, support was given to the Serbian agricultural industry via the European Union Assistance for Flood Relief Programme. FAO, “Restoring Farmers’ Livelihoods,” accessed February 8, 2021. 677 Fresh Plaza, “Floods Devastate Serbian Crops,” accessed February 8, 2021. 678 Academic professional, interview by USITC staff, email message to USITC staff, August 4, 2020; Parausić and Simeunović, “Market Analysis of Serbia’s Raspberry Sector,” December 31, 2016, 1422.
Raspberries for Processing
188 | www.usitc.gov
Bibliography
All Berries. “About Serbia.” Accessed February 8, 2021. http://www.allberriesserbia.com/en/about-us/about-serbia.
André Thiemann. “‘The Red Gold of Serbia’: A Relational Account of the European Landscapes of Capitalism Through the Lens of Raspberries.” Central European University, February 17, 2018. https://events.ceu.edu/2018-02-07/red-gold-serbia-relational-account-european-landscapes-capitalism-through-lens.
Bjelotomic, Snezana. “Raspberry Producers: 80% of Crop Destroyed.” Serbian Monitor, May 22, 2019. https://www.serbianmonitor.com/en/raspberry-producers-80-of-crop-destroyed/.
Cardno. “USAID Serbia Competitive Systems Strengthening (CSS).” Accessed October 15, 2020. https://www.cardno.com/projects/usaid-serbia-competitive-systems-strengthening-css/.
Djuric, Dejan, Jelena Ristic, Dragana Djuric, and Ivana Vujanic. “Export of Agricultural and Food Products in the Function of Economic Growth of Republic of Serbia.” Ekonomika Poljoprivrede 64, no. 3 (2017): 887–900. https://doi.org/10.5937/ekoPolj1703887D.
Džagić, Vidosava, Kori Udovički, Nemanja Šormaz, Danijela Bobić, Valentina Čolić, Mila Pejčić, and Jelisaveta Lazarević. Integrated Report on Performance and Value Chain Analysis of Selected Sectors within Manufacturing Industry. Center of Advanced Economic Studies and Chamber of Commerce and Industry of Serbia: December 2017. https://ceves.org.rs/wp-content/uploads/2019/04/Integrated-Report-on-Performance-and-Value-Chain-Analysis-of-Selected-Sectors.pdf.
European Commission. Directorate-General for Health and Food Safety. Final Report of an Audit Carried Out in Serbia from 02 July 2019 to 11 July 2019 in Order to Evaluate the Systems in Place to Control Microbiological Contamination in Food of Non-Animal Origin Intended for Export to the European Union. Audit. DG(SANTE) 2019-6698, October 2019. http://ec.europa.eu/food/audits-analysis/act_getPDF.cfm?PDF_ID=14554.
Floriva (blog). “Malina Fertodi Zamatos,” August 27, 2018. https://www.floriva.com/2018/08/27/malina-fertodi-zamatos/.
Food and Agriculture Organization of the United Nations (FAO). “Red Gold—from EU and FAO—Yields Fruit in Serbia This Season.” Family Farming Knowledge Platform (blog). FAO Regional Office for Europe and Central Asia, 2016. http://www.fao.org/family-farming/detail/en/c/428936/.
Food and Agriculture Organization of the United Nations (FAO). “Restoring Farmers’ Livelihoods After Severe Floods in Serbia.” Accessed February 8, 2021. http://www.fao.org/in-action/restoring-farmers-livelihoods-after-severe-floods-in-serbia/en/.
Food and Agriculture Organization of the United Nations (FAO). Smallholders and Family Farms in Serbia: Regional Initiative on Empowering Smallholders and Family Farms for Improved Rural Livelihoods and Poverty Reduction. FAO: 2020. https://doi.org/10.4060/ca7449en.
Chapter 6: Serbia
United States International Trade Commission | 189
Food Safety News. “EU Audit Finds Issues with Serbian Controls of Fruit,” November 19, 2019. https://www.foodsafetynews.com/2019/11/eu-audit-finds-issues-with-serbian-controls-of-fruit/.
Fresh Plaza. “EU Lifts Additional Control Measures for Export of Raspberries from Serbia,” August 31, 2020. https://www.freshplaza.com/article/9245207/eu-lifts-additional-control-measures-for-export-of-raspberries-from-serbia/.
Fresh Plaza. “Floods Devastate Serbian Crops and Raspberry Orchards,” July 6, 2020. https://www.freshplaza.com/article/9232470/floods-devastate-serbian-crops-and-raspberry-orchards/.
Fruit Research Institute (Institut za voćarstvo) Čačak. “History (Istorijat).” Accessed February 9, 2021. http://institut-cacak.org/eng/istorijat.html.
Fruit Ukraine. “Serbian Berry Sector Needs New Approach for Fresh Market,” April 5, 2019. https://fruit-ukraine.org/eng/2019/04/05/serbian-berry-sector-needs-new-approach-fresh-market/.
Fruvela. “Cold Storage for Fruits.” Accessed February 9, 2021. http://www.fruvela.com/cold-storage/cold-storage-fruits-processing-purchase-freezing-export-of-fruits-serbia.html.
Funt, Richard C., and Harvey K. Hall, eds. Raspberries. Oxfordshire and Boston: CABI, 2013.
Government of Canada. Province of British Columbia (BC) Ministry of Agriculture. A Global Export Market Overview for British Columbia’s Raspberry Industry. BC Ministry of Agriculture: 2010. https://www2.gov.bc.ca/assets/gov/farming-natural-resources-and-industry/agriculture-and-seafood/statistics/exports/global_export_market_bcraspberries.pdf.
Government of the Netherlands. Ministry of Agriculture, Nature, and Food Quality. “Serbia Newsflash Week 24.” News bulletin, June 12, 2020. https://www.agroberichtenbuitenland.nl/actueel/nieuws/2020/06/12/serbia-newsflash-week-24.
IHS Markit. Global Trade Atlas database. Accessed various dates. https://connect.ihsmarkit.com/home.
Kljajić, Nataša. “Production and Export of Raspberry from the Republic of Serbia.” Ekonomika 63, no. 2 (April 10, 2017): 45–53. https://doi.org/10.5937/ekonomika1702045K.
Lamex Foods. “Fruits and Vegetables.” Accessed February 8, 2021. http://www.lamexfoods.eu/index.php/fruits-veg/fruits-veg.
Mitani, Yohei. “SWOT Analysis of Serbia’s Raspberry Sector in the Competitive Marketplace.” Master’s thesis, Norwegian University of Life Sciences, 2012. https://core.ac.uk/download/pdf/30888827.pdf.
Nanni, Cristina. “Higher Starting Prices for Chilean Raspberries.” Headline Analysis, Food and Agricultural Commodities, IHS Markit, December 16, 2020. https://connect.ihsmarkit.com/home (fee required).
Raspberries for Processing
190 | www.usitc.gov
Nanni, Cristina. “EU Audit Detects Weakness of Serbian Soft Fruit Production Chain.” Headline Analysis, Food and Agricultural Commodities, IHS Markit, November 19, 2019. https://connect.ihsmarkit.com/home (fee required).
Nanni, Cristina. “Bosnia-Herzegovina Processed Fruit Exports in Decline.” Headline Analysis, Food and Agricultural Commodities, IHS Markit, April 22, 2020. https://connect.ihsmarkit.com/home (fee required).
Nanni, Cristina. “High Starting Prices for Serbian Raspberry.” Headline Analysis, Food and Agricultural Commodities, IHS Markit, July 9, 2020. https://connect.ihsmarkit.com/home (fee required).
Nanni, Cristina. “Serbian Raspberry Prices Unlikely to Decline in the Short-Term.” Headline Analysis, Food and Agricultural Commodities, IHS Markit, September 29, 2020. https://connect.ihsmarkit.com/home (fee required).
Parausić, Vesna, and Ivana Simeunović. “Market Analysis of Serbia’s Raspberry Sector and Cluster Development Initiatives.” Economics of Agriculture 63, no. 4 (December 31, 2016): 1417–31. https://doi.org/10.5937/ekoPolj1604417P.
SeedEv. Market Study for Soft Fruits in Serbia, Bosnia and Herzegovina (BiH), Kosovo and North Macedonia. Netherlands Worldwide, April 12, 2019. https://www.netherlandsworldwide.nl/documents/publications/2019/04/12/market-study-for-soft-fruits-in-serbia-bosnia-and-herzegovina-bih-kosovo-and-north-macedonia.
Statistical Office of the Republic of Serbia (SORS). Stat database. https://data.stat.gov.rs/?caller=SDDB&languageCode=en-US (accessed various dates).
Stojanović, Žaklina, Bojan Ristić, and Jelena Filipović. “Organic Raspberries in Serbia.” In Sustainability of European Food Quality Schemes, edited by Filippo Arfini and Valentin Bellassen, 215–30. Springer International Publishing, 2019. https://doi.org/10.1007/978-3-030-27508-2_12.
Stojanović, Žaklina, Emilija Manić, Irena Janković, and Radmila Dragutinović-MItrović. SUFISA Raspberry Report: An Extended Summary. EU’s Horizon 2020 research and innovation programme under Grant Agreement No 635577, June 2018. https://www.sufisa.eu/wp-.content/uploads/2018/09/D__2.2-Serbia-Summary-raspberry.pdf.
Stojanović, Žaklina, Emilija Manić, Radmila Dragutinović-MItrović, Saša RanĐelović, Irena Janković, Svetlana Popović, Tatjana Rakonjac-Antić, Bojan Ristić, and Marija Jovović. Serbia National Report. SUFISA. H2020-SFS-2014–2. Faculty of Economics, University of Belgrade, April 2018. https://sufisa.files.wordpress.com/2018/05/d-2-2-serbia-national-report.pdf.
Stojanović, Žaklina, Radmila Dragutinović-Mitrović, Irena Janković, and Bojan Ristić. “Food Chain Structure, Price and Risk Management Strategies—Insights from the Serbian Raspberry Case Study,” 2018. http://ifsa.boku.ac.at/cms/fileadmin/Proceeding2018/Theme5_Stojanovic.pdf.
U.S. Agency for International Development (USAID). “Fact Sheet: Serbia,” May 14, 2020. https://www.usaid.gov/serbia/fact-sheets/usaid-competitive-economy-project.
Chapter 6: Serbia
United States International Trade Commission | 191
U.S. Agency for International Development (USAID). “Pioneering the Production of Raspberries.” Medium, June 13, 2019. https://medium.com/usaid-2030/pioneering-the-production-of-raspberries-692a8e344bc.
U.S. Department of Agriculture (USDA). Foreign Agricultural Service (FAS). Serbian Agriculture Overview and Best Prospects—2015, by Tatjana Maslac. GAIN Report no. RB1504, June 9, 2015. https://www.fas.usda.gov/data/serbia-serbian-agriculture-overview-and-best-prospects.
U.S. Department of Agriculture (USDA). Foreign Agricultural Service (FAS). Yugoslavia Fresh Deciduous Fruit Raspberries Annual 2003, by Tatjana Buric. GAIN Report no. YI3004. April 30, 2003. https://apps.fas.usda.gov/gainfiles/200305/145885534.pdf.
U.S. International Trade Commission Interactive Tariff and Trade DataWeb (USITC DataWeb)/U.S. Census
Bureau (Census). Accessed various dates. http://dataweb.usitc.gov.
Vidosava Džagić, Kori Udovički, Nemanja Šormaz, Danijela Bobić, Valentina Čolić, Mila Pejčić, and Jelisaveta Lazarević. Integrated Report on Performance and Value Chain Analysis of Selected Sectors within Manufacturing Industry. Center of Advanced Economic Studies and Chamber of Commerce and Industry of Serbia, December 2017. https://ceves.org.rs/wp-content/uploads/2019/04/Integrated-Report-on-Performance-and-Value-Chain-Analysis-of-Selected-Sectors.pdf.
Wróblewska, Wioletta, Joanna Pawlak, and Dariusz Paszko. “Economic Aspects in the Raspberry Production on the Example of Farms from Poland, Serbia and Ukraine.” Journal of Horticultural Research 27, no. 2 (December 1, 2019): 71–80. https://doi.org/10.2478/johr-2019-0019.
Životić, Aleksandar, Nikola Mićić, Velibor Trifković, and Miljan Cvetković. “Characteristics of Raspberry Production in Bosnia and Herzegovina.” АГРОЗНАЊЕ (Agro-knowledge journal) 19, no. 4 (May 7, 2019): 241. https://doi.org/10.7251/AGREN1804241Z.
Zoric Krzic, Aleksandra. “Policy Determination 15: Potential Impact of USAID Competitiveness Systems Strengthening (CSS) Activity.” Memorandum for the Mission Director, United States Agency for International Development (USAID) Serbia, January 11, 2019.

192 | www.usitc.gov
Chapter 7: Chile
United States International Trade Commission | 193
Chapter 7 Chile
Summary
Chile is a leading source of U.S. imports of frozen raspberries and a major global producer and exporter
of processed raspberry products. Chile continues to play a key role in the global market, despite modest
declines in production and exports of processed raspberries between 2015 and 2020. Frozen
raspberries—including whole and broken individually quick frozen (IQF) products—compose most of
Chile’s processed raspberry production. Chile has increasingly shifted into organic raspberry production,
with frozen organic raspberries making up over 20 percent of total production and almost half of Chile’s
frozen raspberry exports to the United States.679 The U.S. industry filed trade remedy cases against
imported Chilean IQF red raspberries in 2001 that led to the imposition of an antidumping order, but the
United States revoked the order in 2007.680 In fact, in recent years Chile’s average costs of production
have become comparable to average U.S. costs of production. Chile’s exports to the United States also
peak in months when U.S. inventories are declining, and the country’s increasing emphasis on organic
products further reduces direct competition with frozen raspberries produced in the United States. In
2020, the United States was the destination market for about 33 percent of Chile’s frozen raspberry
exports.681 Chilean exports of frozen raspberries to the United States fell from 2015 to 2020, with
Mexico surpassing Chile in 2020 to become the largest supplier of raspberries (by weight) to the U.S.
market.682
Chile has a competitive processing industry that supplies frozen raspberries to the United States. Most
exports to the United States come from a small number of experienced processors using high-quality
freezing, sorting, and packing equipment. Chilean processors have access to handpicked raspberries and
make strategic use of both belt and static freezers, which help them obtain a higher ratio of IQF output
and more whole IQF berries than most other processors. At the same time, the labor costs associated
with operating static freezers and buying handpicked berries drive up their costs of production. The
labor intensity of growing and handpicking raspberries (compared to other, more profitable fruit) has
also prompted a long-term decline in the number of raspberries that are available for processing in
Chile. The growth in organic raspberries in Chile reinforces the country’s status as a relatively high-cost
679 USITC, hearing transcript, September 17, 2020, 49 (testimony of Pablo Herrera, JCP Foods); Herrera, written testimony to USITC, September 8, 2020, 3; IHS Markit, Global Trade Atlas database, Chilean Tariff codes 0811.20.21 and 0811.20.29, accessed March 2, 2021. 680 See chapter 3 for more discussion of the U.S. industry. USITC, Individually Quick Frozen Red Raspberries From Chile (Preliminary), July 2001, 1; USITC, Individually Quick Frozen Red Raspberries From Chile (Final), June 2002, 1; 72 Fed. Reg. 41526 (July 30, 2007). 681 Export figures are based on Chilean export data for frozen red raspberries, including IQF and purees, but excluding raspberries exported in mixed berry packs. IHS Markit, Global Trade Atlas database, Chilean Tariff codes 0811.20.21 and 0811.20.29, accessed March 1, 2021. 682 USITC DataWeb/Census, HTS 0811.20.2025, accessed February 11, 2021.
Raspberries for Processing
194 | www.usitc.gov
supplier focusing on higher-value products. Three factors that have supported the growth in organic
exports are Chile’s climate, the prevalence of small-scale raspberry growers, and coordination between
processors and large numbers of small-scale growers.
Industry Structure
The Chilean industry is focused on producing frozen red raspberries, particularly IQF. Consequently,
growers use primarily raspberry cultivars designed for processing. Chile is estimated to have more than
80 processing plants capable of freezing raspberries.683 These processors typically also supply other IQF
fruits and vegetables for export, such as strawberries, blueberries, blackberries, and asparagus. Like
many other sectors of the Chilean produce industry, raspberry processing is heavily export-oriented.
Several large berry-focused processors supply most of Chile’s frozen raspberry exports, but many
smaller and less berry-oriented processors also contribute. Most of the supply of raspberry inputs is
sourced from independent growers through collection centers, brokers, or direct sales to processing
plants. Chile also has three large juice processors that supply nearly all U.S. imports of raspberry juice
concentrate from the country.684
Regions
Processors are located mostly in central and central-southern Chile, near where most of the raspberries
are grown. Raspberry processing and growing operations have traditionally been concentrated in the
Maule region, where the Andes Mountains open into a large, wide valley.685 However, Chile’s raspberry
orchards have been shifting south, in response to changing climate conditions for growing berries and
other fruit.686 Official Chilean survey data suggest the Ñuble region just south of Maule has the most
land devoted to raspberry orchards, containing more than half of the total hectares registered nationally
for raspberries.687 O’Higgins, Biobío, Araucanía, Los Ríos, and Los Lagos are other raspberry-producing
regions in Chile.688 Chile’s climate is considered to have ideal conditions for growing raspberries, with
temperature and rain levels that allow farmers to grow organic product. The absence of certain pests
683 USITC, hearing transcript, September 17, 2020, 47 (testimony of Pablo Herrera, JCP Foods); Herrera, written testimony to the USITC, September 8, 2020, 2; Dominguez, “Chilean Raspberry Industry Report 2019,” August 2020, 2. 684 Industry representative, email message to USITC staff, August 10, 2020. 685 Jara-Rojas et al., “Technical Efficiency and Marketing Channels,” March 20, 2018, 352; ASOEX, “Maule,” accessed March 10, 2021. 686 Blueberries Consulting, “2019 Fruit Cadastre,” September 2, 2019. 687 Official Chilean survey data exclude farms measuring 0.5 hectares or less. Data were collected at different times for different regions. The Ñuble region was formally established in 2018 from communes that previously were assigned to the Ñuble province within the Biobío region. CIREN, Catastro frutícola Maule (Fruit-growing land registry, Maule region), July 2019, 3, 7; BCN, “Creación de la XVI región de Ñuble (Creation of Ñuble, the 16th region),” accessed March 4, 2021. 688 CIREN, Catastro frutícola Maule (Fruit-growing land registry, Maule region), July 2019, 7.
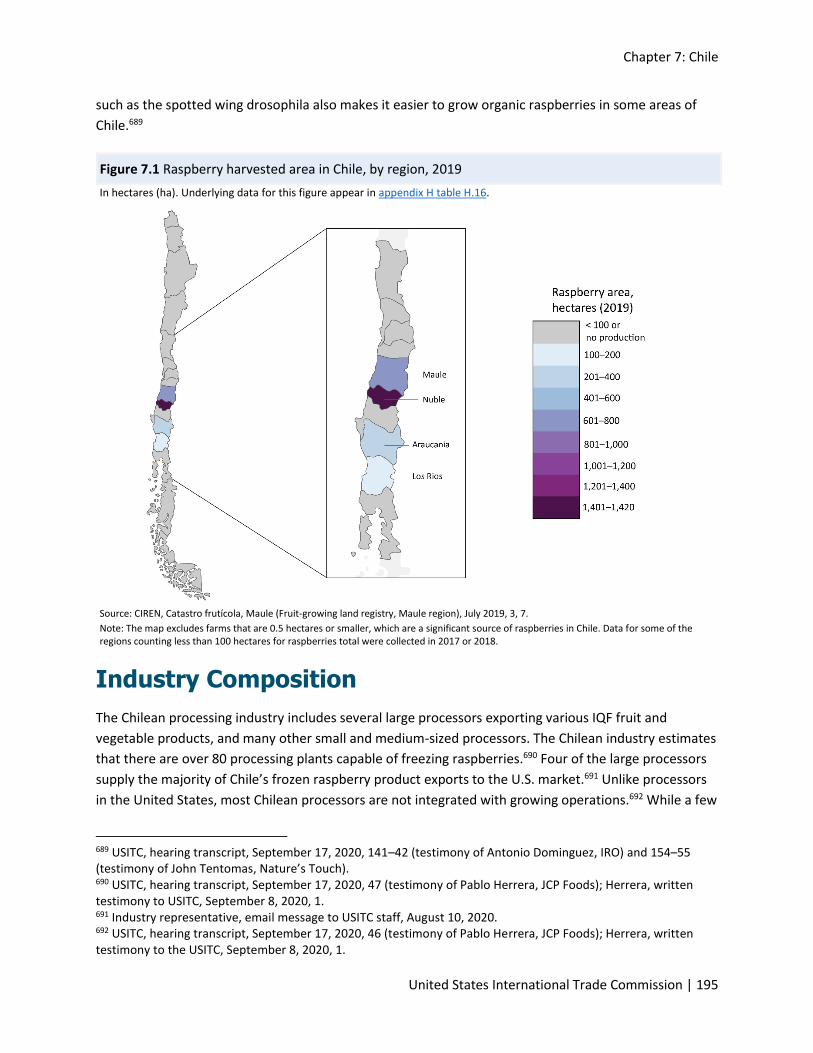
Chapter 7: Chile
United States International Trade Commission | 195
such as the spotted wing drosophila also makes it easier to grow organic raspberries in some areas of
Chile.689
Figure 7.1 Raspberry harvested area in Chile, by region, 2019
In hectares (ha). Underlying data for this figure appear in appendix H table H.16.
Source: CIREN, Catastro frutícola, Maule (Fruit-growing land registry, Maule region), July 2019, 3, 7.
Note: The map excludes farms that are 0.5 hectares or smaller, which are a significant source of raspberries in Chile. Data for some of the regions counting less than 100 hectares for raspberries total were collected in 2017 or 2018.
Industry Composition
The Chilean processing industry includes several large processors exporting various IQF fruit and
vegetable products, and many other small and medium-sized processors. The Chilean industry estimates
that there are over 80 processing plants capable of freezing raspberries.690 Four of the large processors
supply the majority of Chile’s frozen raspberry product exports to the U.S. market.691 Unlike processors
in the United States, most Chilean processors are not integrated with growing operations.692 While a few
689 USITC, hearing transcript, September 17, 2020, 141–42 (testimony of Antonio Dominguez, IRO) and 154–55 (testimony of John Tentomas, Nature’s Touch). 690 USITC, hearing transcript, September 17, 2020, 47 (testimony of Pablo Herrera, JCP Foods); Herrera, written testimony to USITC, September 8, 2020, 1. 691 Industry representative, email message to USITC staff, August 10, 2020. 692 USITC, hearing transcript, September 17, 2020, 46 (testimony of Pablo Herrera, JCP Foods); Herrera, written testimony to the USITC, September 8, 2020, 1.
Raspberries for Processing
196 | www.usitc.gov
Chilean processors own orchards, most raspberries are sourced from independent growers.693 Growers
in the raspberry industry are dispersed over large parts of the country and operate thousands of small
farms. Chilean industry representatives estimate that raspberries are grown on between 9,000 and
10,000 independent farms (usually family-owned), covering between 6,000 and 7,000 hectares.694
Many of the large Chilean processors are family-run companies that have been working in the industry
for decades, although some have established global business partnerships. VitaFoods was recently
formed through a merger of Alifrut (a leading Chilean processor of frozen fruit) and the Chilean frozen
berry business segment of Hortifrut (a Chile-based international producer and trader of berries).695
Chilean processor Altamira has a joint venture with United Kingdom-based trader Lamex Food Group,
while U.S.-headquartered BMC International has an IQF fruit and vegetable processing facility in Chile.696
There are reportedly four to five juice plants in Chile.697 The majority are large, export-oriented
processors focusing on other product lines (particularly juices from other fruits). Most appear to operate
primarily within Chile, although Cran Chile (which grows cranberries and processes raspberries and
blueberries into juice concentrate) has a strategic partnership with multinational cooperative Ocean
Spray.698
Industry Organization
Most of Chile’s raspberry processing industry is represented through the Chilean Food Processing
Companies Association (Chilealimentos), a trade association for Chile’s food processing sector.
Chilealimentos’ members account for about 67 percent of the raspberries processed into frozen form in
Chile and 96 percent of the raspberries processed into juice concentrate form in Chile.699 Chilealimentos
helps processors coordinate with growers and government agencies on matters such as food safety
requirements and represents raspberry processors in the public-private working group Mesa Nacional
de la Frambuesa (National Raspberry Roundtable).700 Chile also has a trade association for fruit growers,
Fedefruta. Fedefruta works in areas such as quality control, promotion of Chilean fruit in foreign
markets, research, and Good Agricultural Practices (GAP). It also helps manage publicly funded programs
693 Dominguez, “Chilean Raspberry Industry,” June 4, 2012, 15. 694 USITC, hearing transcript, September 17, 2020, 46 (testimony of Pablo Herrera, JCP Foods); Herrera, written testimony to the USITC, September 8, 2020, 1. 695 FreshPlaza, “Naturipe Foods Expands with Newly Formed Vitafoods,” October 1, 2020. 696 Lamex Food Group, “History,” accessed March 11, 2021; BMC International, “About Us and Our Market,” accessed March 11, 2021. 697 Dominguez, “Chilean Raspberry Industry Report 2019,” August 2020, 2. 698 Ocean Spray, “Ocean Spray Cranberries, Inc., Acquires Cranberry Operations in Chile,” January 10, 2013; Cran Chile, “About Us,” accessed February 11, 2021; Bayas del Sur, “Contacts,” accessed February 11, 2021; Patagoniafresh, “About Us,” accessed February 11, 2021. 699 USITC, hearing transcript, September 17, 2020, 45 (testimony of Pablo Herrera, JCP Foods); Herrera, written testimony to the USITC, September 8, 2020, 1. 700 USITC, hearing transcript, September 17, 2020, 48–49 (testimony of Pablo Herrera, JCP Foods). INDAP, “Mesa Nacional de la Frambuesa (National raspberry roundtable),” June 17, 2019.

Chapter 7: Chile
United States International Trade Commission | 197
that offer training classes and financial support to raspberry farmers.701 A third group, the Chilean Fruit
Exporters Association (ASOEX), is working with the Catholic University of Chile and government partners
to develop more productive raspberry cultivars.702 Additionally, Chile is an active member of the
International Raspberry Organization.703
Cultivars
Heritage is the dominant raspberry cultivar grown in Chile, accounting for about 79 to 85 percent of
Chile’s raspberries.704 The Heritage cultivar is well adapted to Chilean growing conditions.705 However,
Heritage raspberries in Chile reportedly have declined in yield, weakening over time due to the common
practice of reproducing plants from existing bushes rather than buying new plantlets.706 Regional data
also show that some orchards in Chile using other cultivars have significantly higher average yields.707
The Heritage has two flowerings, which yield two crops, extending the harvest season but also exposing
the crop to a higher risk of poor weather.708 The first crop is harvested in November through December,
but typically yields lower-quality berries. The canes are cut for a better second crop, which is typically
harvested at the end of January through April.709
The Meeker cultivar is the next most popular variety, estimated to supply about 8 percent of Chile’s
raspberry harvest.710 Other varieties include Dolomia (a cultivar exclusively licensed to Chilean frozen
fruit processor Comfrut), Regina, Chilliwack, Santa Teresa, Santa Catalina, and Santa Clara.711 These last
three varieties, known as the Santa cultivars, were developed in Chile through a breeding program
started in 2009 with the goal of developing raspberry plants optimized for Chilean growing conditions
701 Fedefruta, “Qué es Fedefruta (What is Fedefruta?),” accessed March 10, 2021; Fedefruta, “Frambuesero de San Carlos logra producir mejor (San Carlos raspberry is able to produce better),” February 19, 2021. 702 ASOEX represents fresh fruit growers and exporters, so it is not as directly involved with Chile’s frozen raspberry exports as Chilealimentos. ASOEX, “About Us,” accessed March 10, 2021; ASOEX, “Frambuesas 100% Chilenas para la reconversión varietal (100% Chilean raspberries in the conversion to new varietals),” October 3, 2019. 703 USITC, hearing transcript, September 17, 2020, 49 (testimony of Pablo Herrera, JCP Foods) and 52 (testimony of Antonio Dominguez, IRO). 704 Dominguez, “Chilean Raspberry Industry Report 2019,” August 2020, 2; FreshPlaza, “New 100% Chilean Raspberry Varieties,” October 7, 2019; ASOEX, “Frambuesas 100% Chilenas para la reconversión varietal (100% Chilean raspberries in the conversion to new varietals),” October 3, 2019. 705 Blueberries Consulting, “Better Plants, the Next Revolution,” October 27, 2015. 706 Expanding an orchard or replacing old plants using existing plants can weaken the plants and spread crop disease; aging orchards are one reason raspberry production has declined in Chile. Heritage cultivars within Chile may vary in productivity. For example, a representative for grower/processor Frule touted the fact that the firm was planting orchards with “a new variety” of Heritage with up to 65 percent higher yields. Ghilotti, “Raspberry Comeback,” 2015; Ghilotti, “Selling Food Safety,” 2015; Blueberries Consulting, “Better Plants, the Next Revolution,” October 27, 2015. 707 Data collected from farms of over 0.5 hectares in Ñuble show average yields of 7.1 mt per hectare for Heritage, compared to 8.9 mt per hectare for Meeker and 8.2 mt per hectare for Dolomia. CIREN, Catastro frutícola Ñuble (Fruit-growing land registry, Ñuble region), July 2019, 34. 708 Ghilotti, “Raspberry Comeback,” 2015. 709 Nanni, “Labour Shortage Lifts Chilean Raspberry Prices,” January 13, 2021. 710 Dominguez, “Chilean Raspberry Industry Report 2019,” August 2020, 2. 711 Dominguez, “Chilean Raspberry Industry Report 2019,” August 2020, 2; Comfrut, “Conventional Fruit - Raspberry,” accessed February 11, 2021.

Raspberries for Processing
198 | www.usitc.gov
and offering higher yields, larger fruit, and a certain flavor profile. Domestically, these new varieties
have been cultivated on small farms in the Maule and Araucania regions through two pilot programs
supported by ASOEX. While the Heritage cultivar in Chile typically yields less than 12 metric tons (mt)
per hectare, the Santa cultivars have a potential yield of 18 mt per hectare.712 The breeding program
continues to develop cultivars and is focusing on delivering varieties with improved resilience against
pests, disease, and water stress by 2024.713
Production System
Raspberries in Chile are typically grown in open, unprotected fields, and almost all of the crop is
harvested by hand.714 This is partly due to the small size of Chilean farms, although other factors such as
the use of the Heritage cultivar and layout of the farms also accommodate handpicking rather than
mechanical harvesting.715 One industry representative estimated that 60 to 80 percent of Chile’s
raspberry farms are small farms with acreage of less than half a hectare each.716 Variability in revenues
(due to high price volatility) and the high labor intensity of growing raspberries relative to other fruits
reportedly discourage larger Chilean farms from growing raspberries.717
In the beginning of Chile’s harvest season, production is primarily of the Meeker, Regina, and Dolomia
varieties, followed by Heritage.718 Growers mostly supply handpicked raspberries, which break less often
during processing than mechanically harvested berries. Handpicked berries also require less pre-sorting
than batches of mechanically harvested raspberries, which can contain leaves and sticks that were
shaken loose by the harvesting machines.719 Generally, the raspberry harvest season in Chile runs from
December to April.720
712 ASOEX, “Frambuesas 100% Chilenas para la reconversión varietal (100% Chilean raspberries in the conversion to new varietals),” October 3, 2019. 713 SimFruit, “Primero fueron las frambuesas ‘Santas’ (First came the ‘Santa’ raspberries),” November 19, 2020. 714 USITC, hearing transcript, September 17, 2020, 46 (testimony of Pablo Herrera, JCP Foods); Herrera, written testimony to the USITC, September 8, 2020, 2; Dominguez, “Chilean Raspberry Industry,” June 4, 2012, 11. 715 USITC, hearing transcript, September 17, 2020, 46–47 (testimony of Pablo Herrera, JCP Foods); Herrera, written testimony to the USITC, September 8, 2020, 1; Jara-Rojas et al., “Technical Efficiency and Marketing Channels,” March 20, 2018, 352–53. 716 USITC, hearing transcript, September 17, 2020, 46 (testimony of Pablo Herrera, JCP Foods); Herrera, written testimony to the USITC, September 8, 2020, 1. 717 USITC, hearing transcript, September 17, 2020, 50 (testimony of Pablo Herrera, JCP Foods); Herrera, written testimony to the USITC, September 8, 2020, 4; industry representative, interview by USITC staff, February 23, 2021; Jara-Rojas et al., “Production Efficiency and Commercialization Channels,” February 2016, 3. 718 Nanni, “Labour Shortage Lifts Chilean Raspberry Prices,” January 13, 2021. 719 Industry representative, interview by USITC staff, February 3, 2021. 720 USITC, hearing transcript, September 17, 2020, 46 (testimony of Pablo Herrera, JCP Foods); Herrera, written testimony to the USITC, September 8, 2020, 1.
Chapter 7: Chile
United States International Trade Commission | 199
Products and Supply Chain
Almost all of Chile’s raspberry crop is processed for export. The majority (over 75 percent) is processed
into IQF raspberries (including whole, broken, and crumble)721 for export. These IQF exports include
organic raspberries (about 21 percent of Chile’s total raspberry production) and raspberries in mixed
berry packs.722 Most of the remainder of Chile’s production goes toward juice concentrate for export
and various raspberry products sold to the domestic market (about 7 percent and 7–8 percent,
respectively).723 Unlike U.S. processors, Chilean processors rarely produce block frozen raspberries.724
Processors primarily source raspberry inputs from independent growers, often signing contracts with
growers in advance and sourcing raspberries from multiple areas.725 For example, processors often
employ agronomists and exchange technical assistance for the guarantee that the farmers will sell their
crop to the processor.726 While some growers deliver their crop directly to processing plants, most
instead sell to collection centers. These centers are located near raspberry fields across Chile, and some
are directly operated by processors.727 The centers have cold storage but no freezing capacity, and
handle transportation of the raspberries to processing plants.728 Informal brokers also buy raspberries
by the tray from growers and then transport and resell the fruit to processors. These intermediaries
generally offer growers a lower price, but provide immediate payment and handle transportation from
the fields.729 The selling price growers receive for their raspberries also varies based on daily supply-and-
demand conditions, as well as on the product quality.730 Industry representatives report that both
collection centers and brokers carefully track which farmers they source from, helping processors
guarantee traceability and certification of their products.731
721 One industry representative indicated that IQF generally refers to high-grade product with minimal shares of broken berries or crumble. The representative estimated that a Chilean freezer can process about 70 percent of raspberry inputs into Grade A whole frozen berries (including IQF raspberries packed into mixed berry blends). Industry representative, interview by USITC staff, February 11, 2021. 722 Industry representatives estimate that sales of raspberries in mixed berry packs increased from about 2,000 tons in 2015 to about 3,000 tons in 2019 (about 10 percent of total Chilean raspberry production in 2019). USITC, hearing transcript, September 17, 2020, 49–50 (testimony of Pablo Herrera, JCP Foods); Herrera, written testimony to the USITC, September 8, 2020, 3–4. 723 USITC, hearing transcript, September 17, 2020, 49 (testimony of Pablo Herrera, JCP Foods); Herrera, written testimony to the USITC, September 8, 2020, 3; Dominguez, “Chilean Raspberry Industry Report 2019,” August 2020, 3. 724 Industry representative, interview by USITC staff, February 11, 2021. 725 Industry representative, interview by USITC staff, February 23, 2021, and March 5, 2021; Dominguez, “Chilean Raspberry Industry,” June 4, 2012, 15. 726 Industry representatives, interviews by USITC staff, February 11, 2021, and February 23, 2021. 727 Industry representative, interview by USITC staff, March 5, 2021; Jara-Rojas et al., “Production Efficiency and Commercialization Channels,” February 2016, 7; JCP Foods, “Infrastructure,” accessed February 12, 2021. 728 Industry representative, interview by USITC staff, February 11, 2021. 729 Jara-Rojas et al., “Technical Efficiency and Marketing Channels,” March 20, 2018, 354. 730 USITC, hearing transcript, September 17, 2020, 47 (testimony of Pablo Herrera, JCP Foods); Herrera, written testimony to the USITC, September 8, 2020, 2. 731 Industry representatives, interviews by USITC staff, February 11, 2021, and March 5, 2021.
Raspberries for Processing
200 | www.usitc.gov
Large Chilean processors use some equipment and techniques similar to those of U.S. processors for
their frozen raspberry products. In particular, large Chilean processors use similar quality tunnels for IQF
products and automate some of the steps involved in freezing, sorting, and packing to save on labor
costs.732 However, these processors also use static freezers for overripe berries that tend to clump
together if frozen on a moving belt.733 This allows Chilean processors to obtain more IQF product than if
they only used tunnels. The IQF products command much higher prices than common alternatives for
overripe berries, such as block frozen or juice stock products. These greater revenues offset the high
costs associated with operating static freezers (a slower and more labor-intensive process than tunnels).
Chile’s handpicked berries are also less prone to breakage than mechanically harvested berries.
Consequently, processors report a relatively high share of whole IQF berries compared to countries that
mechanically harvest raspberries.734 Like processors in the United States and elsewhere, the main
Chilean processors have adopted precise sorting capabilities for IQF products (such as laser sorters).735
Several of the larger processors also operate repacking plants that export IQF raspberries and mixed IQF
fruit in customizable retail-size packaging.736
While Chile’s raspberry processing industry primarily consists of firms supplying frozen product, there
are also several producers of juice concentrate. These juice producers operate independently from
frozen raspberry producers. The juice producers may use block frozen raspberries and IQF crumbles as
inputs (along with a small quantity of fresh raspberries), but there do not appear to be any direct
ownership or management relationships between these two types of processors in Chile.737
Processors in Chile sell frozen raspberries through several different channels. These channels include
selling directly to independent foreign importers, selling to brokers or trading companies that market
the product, and maintaining foreign subsidiaries that import the product.738 Demand for retail
packaged berries (particularly berry mixes) has grown significantly, but most Chilean frozen raspberry
exports are still sold in bulk.739
732 Industry representatives, interviews by USITC staff, February 3, 2021, and March 5, 2021. 733 Industry representative, email message to USITC staff, March 5, 2021; industry representative, interview by USITC staff, March 5, 2021. 734 Industry representatives, interviews by USITC staff, February 3, 2021, February 11, 2021, and March 5, 2021. 735 USITC, hearing transcript, September 17, 2020, 51 (testimony of Pablo Herrera, JCP Foods); Herrera, written testimony to the USITC, September 8, 2020, 4. 736 Comfrut, “Packaging,” accessed February 10, 2021; JCP Foods, “Infrastructure,” accessed February 12, 2021; Alifrut, “Exports,” accessed February 10, 2021. 737 USITC, hearing transcript, September 17, 2020, 47 (testimony of Pablo Herrera, JCP Foods); Herrera, written testimony to the USITC, September 8, 2020, 2. 738 USITC, hearing transcript, September 17, 2020, 47–48 (testimony of Pablo Herrera, JCP Foods); Herrera, written testimony to the USITC, September 8, 2020, 2. 739 Industry representative, email message to USITC staff, March 5, 2021; industry representative, interview by USITC staff, March 5, 2021.
Chapter 7: Chile
United States International Trade Commission | 201
Production, Consumption, and Trade
Production and Consumption
There are no recent official statistics on Chile’s processing or raspberry freezing capacity.740 However,
Chile’s processed raspberry output is closely linked to its raspberry harvest: over 99 percent of the
raspberry harvest is processed, and Chile’s imports of fresh raspberries are minimal.741 Domestic
consumption of both fresh and processed raspberries is low. Industry representatives estimate that the
country’s domestic consumption of processed raspberries is about 7 or 8 percent of total production.742
Chile’s raspberry harvest season is also longer than in some other countries, allowing processors to
freeze, store, and ship raspberries in many batches throughout the harvest.743
Chile is currently the 10th-largest global producer of raspberries by volume and supplies less than
5 percent of total global production.744 Data from the United Nations Food and Agriculture Organization
(FAO) (table 7.1) and Chilean industry data both show significant declines in raspberry production from
2015 to 2019. However, industry data and official trade statistics indicate that Chilean raspberry
production was substantially higher than the FAO data show and steadily declined throughout the 2015
to 2019 period.745 Specifically, Chilealimentos reports Chilean raspberry production fell each year, from
37,092 mt in 2015 to 30,389 mt in 2019.746 Similarly, Chilealimentos estimates a larger area harvested
than FAO estimates, between 6,000 and 7,000 hectares in 2019.
740 Industry representative, interview by USITC staff, February 11, 2021. 741 As discussed further in the “Trade” section, Chile’s raspberry imports totaled about 348 mt in 2019 (about 1 percent of total production). Dominguez, “Chilean Raspberry Industry Report 2019,” August 2020, 3. 742 USITC, hearing transcript, September 17, 2020, 47 (testimony of Pablo Herrera, JCP Foods); Herrera, written testimony to the USITC, September 8, 2020, 2; Dominguez, “Chilean Raspberry Industry Report 2019,” August 2020, 3. 743 INDAP, “Mesa Nacional de la Frambuesa (National raspberry roundtable),” June 17, 2019; industry representative, interview by USITC staff, February 11, 2021. 744 Ranking is based on FAO data, which estimate that Chile supplies about 2 percent of total global output. However, data from the raspberry industry estimate greater Chilean production, ranking Chile as the ninth-largest producer and a supplier of 4.4 percent of total global production. FAO, FAOSTAT database, Crops: Raspberries, accessed January 19, 2021. IRO, “World Raspberry Production,” accessed March 9, 2021; Dominguez, “Chilean Raspberry Industry Report 2019,” August 2020, 3. 745 FAO notes that production data completeness “varies substantially by reporter” and that differences in methods and coverage may limit comparability between countries. One reason FAO data may underestimate Chilean production is that official Chilean survey data cover only farms larger than 0.5 hectares, and most of the Chilean raspberry crop is grown on small farms (see “Industry Composition” above). FAO, “Crops—Metadata,” accessed March 9, 2021. 746 See “Trade” discussion for data on Chile’s raspberry imports and frozen raspberry exports. Dominguez, “Chilean Raspberry Industry Report 2019,” August 2020, 3.
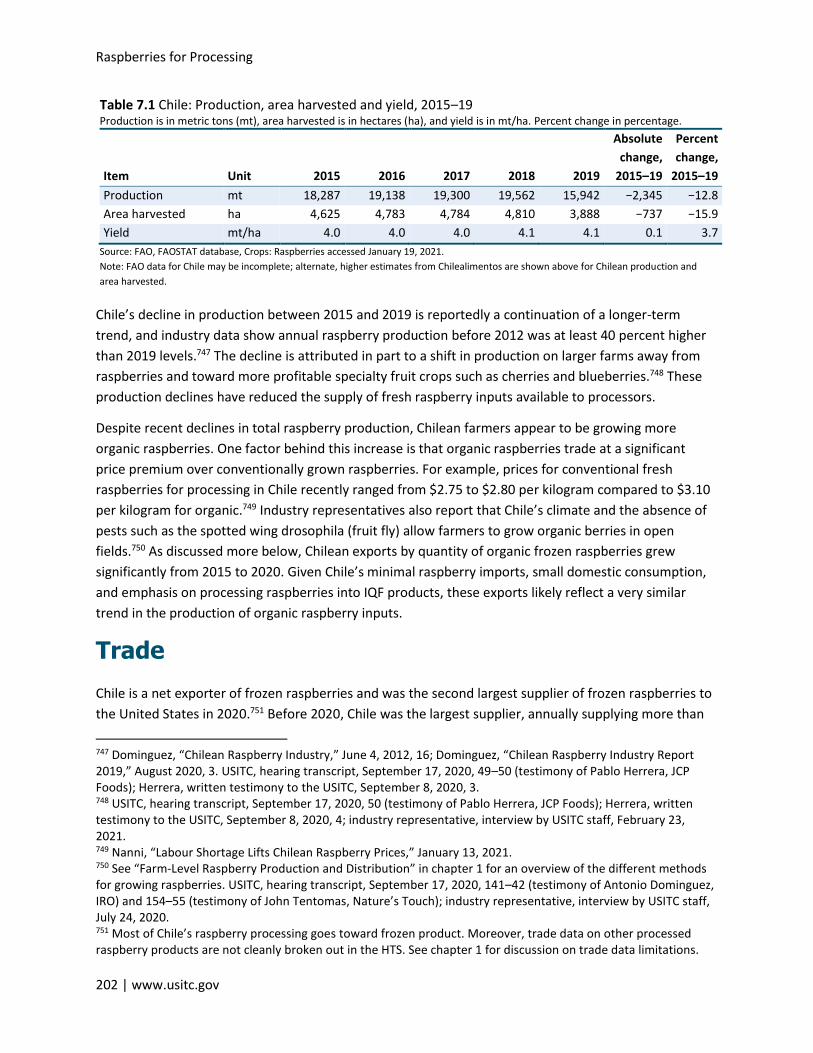
Raspberries for Processing
202 | www.usitc.gov
Table 7.1 Chile: Production, area harvested and yield, 2015–19 Production is in metric tons (mt), area harvested is in hectares (ha), and yield is in mt/ha. Percent change in percentage.
Item Unit 2015 2016 2017 2018 2019
Absolute
change,
2015–19
Percent
change,
2015–19
Production mt 18,287 19,138 19,300 19,562 15,942 −2,345 −12.8
Area harvested ha 4,625 4,783 4,784 4,810 3,888 −737 −15.9
Yield mt/ha 4.0 4.0 4.0 4.1 4.1 0.1 3.7
Source: FAO, FAOSTAT database, Crops: Raspberries accessed January 19, 2021.
Note: FAO data for Chile may be incomplete; alternate, higher estimates from Chilealimentos are shown above for Chilean production and
area harvested.
Chile’s decline in production between 2015 and 2019 is reportedly a continuation of a longer-term
trend, and industry data show annual raspberry production before 2012 was at least 40 percent higher
than 2019 levels.747 The decline is attributed in part to a shift in production on larger farms away from
raspberries and toward more profitable specialty fruit crops such as cherries and blueberries.748 These
production declines have reduced the supply of fresh raspberry inputs available to processors.
Despite recent declines in total raspberry production, Chilean farmers appear to be growing more
organic raspberries. One factor behind this increase is that organic raspberries trade at a significant
price premium over conventionally grown raspberries. For example, prices for conventional fresh
raspberries for processing in Chile recently ranged from $2.75 to $2.80 per kilogram compared to $3.10
per kilogram for organic.749 Industry representatives also report that Chile’s climate and the absence of
pests such as the spotted wing drosophila (fruit fly) allow farmers to grow organic berries in open
fields.750 As discussed more below, Chilean exports by quantity of organic frozen raspberries grew
significantly from 2015 to 2020. Given Chile’s minimal raspberry imports, small domestic consumption,
and emphasis on processing raspberries into IQF products, these exports likely reflect a very similar
trend in the production of organic raspberry inputs.
Trade
Chile is a net exporter of frozen raspberries and was the second largest supplier of frozen raspberries to
the United States in 2020.751 Before 2020, Chile was the largest supplier, annually supplying more than
747 Dominguez, “Chilean Raspberry Industry,” June 4, 2012, 16; Dominguez, “Chilean Raspberry Industry Report 2019,” August 2020, 3. USITC, hearing transcript, September 17, 2020, 49–50 (testimony of Pablo Herrera, JCP Foods); Herrera, written testimony to the USITC, September 8, 2020, 3. 748 USITC, hearing transcript, September 17, 2020, 50 (testimony of Pablo Herrera, JCP Foods); Herrera, written testimony to the USITC, September 8, 2020, 4; industry representative, interview by USITC staff, February 23, 2021. 749 Nanni, “Labour Shortage Lifts Chilean Raspberry Prices,” January 13, 2021. 750 See “Farm-Level Raspberry Production and Distribution” in chapter 1 for an overview of the different methods for growing raspberries. USITC, hearing transcript, September 17, 2020, 141–42 (testimony of Antonio Dominguez, IRO) and 154–55 (testimony of John Tentomas, Nature’s Touch); industry representative, interview by USITC staff, July 24, 2020. 751 Most of Chile’s raspberry processing goes toward frozen product. Moreover, trade data on other processed raspberry products are not cleanly broken out in the HTS. See chapter 1 for discussion on trade data limitations.
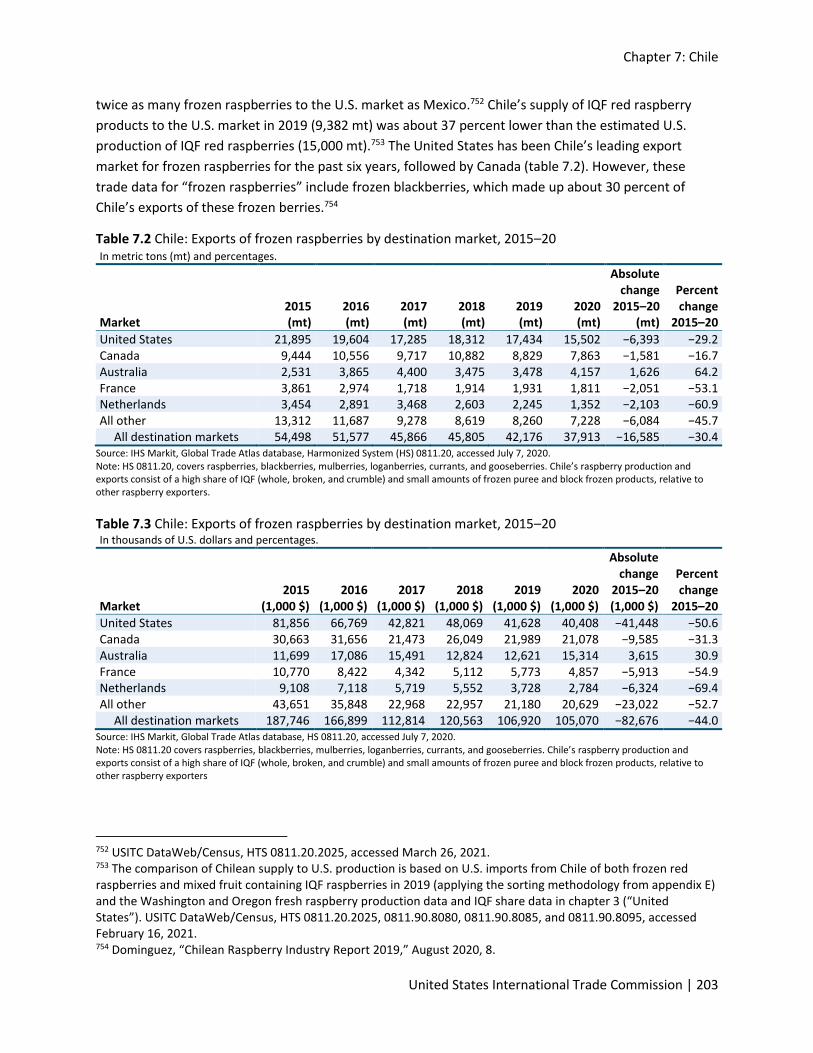
Chapter 7: Chile
United States International Trade Commission | 203
twice as many frozen raspberries to the U.S. market as Mexico.752 Chile’s supply of IQF red raspberry
products to the U.S. market in 2019 (9,382 mt) was about 37 percent lower than the estimated U.S.
production of IQF red raspberries (15,000 mt).753 The United States has been Chile’s leading export
market for frozen raspberries for the past six years, followed by Canada (table 7.2). However, these
trade data for “frozen raspberries” include frozen blackberries, which made up about 30 percent of
Chile’s exports of these frozen berries.754
Table 7.2 Chile: Exports of frozen raspberries by destination market, 2015–20 In metric tons (mt) and percentages.
Market 2015 (mt)
2016 (mt)
2017 (mt)
2018 (mt)
2019 (mt)
2020 (mt)
Absolute change
2015–20 (mt)
Percent change
2015–20
United States 21,895 19,604 17,285 18,312 17,434 15,502 −6,393 −29.2 Canada 9,444 10,556 9,717 10,882 8,829 7,863 −1,581 −16.7 Australia 2,531 3,865 4,400 3,475 3,478 4,157 1,626 64.2 France 3,861 2,974 1,718 1,914 1,931 1,811 −2,051 −53.1 Netherlands 3,454 2,891 3,468 2,603 2,245 1,352 −2,103 −60.9 All other 13,312 11,687 9,278 8,619 8,260 7,228 −6,084 −45.7
All destination markets 54,498 51,577 45,866 45,805 42,176 37,913 −16,585 −30.4 Source: IHS Markit, Global Trade Atlas database, Harmonized System (HS) 0811.20, accessed July 7, 2020. Note: HS 0811.20, covers raspberries, blackberries, mulberries, loganberries, currants, and gooseberries. Chile’s raspberry production and exports consist of a high share of IQF (whole, broken, and crumble) and small amounts of frozen puree and block frozen products, relative to other raspberry exporters.
Table 7.3 Chile: Exports of frozen raspberries by destination market, 2015–20 In thousands of U.S. dollars and percentages.
Market 2015
(1,000 $) 2016
(1,000 $) 2017
(1,000 $) 2018
(1,000 $) 2019
(1,000 $) 2020
(1,000 $)
Absolute change
2015–20 (1,000 $)
Percent change
2015–20
United States 81,856 66,769 42,821 48,069 41,628 40,408 −41,448 −50.6 Canada 30,663 31,656 21,473 26,049 21,989 21,078 −9,585 −31.3 Australia 11,699 17,086 15,491 12,824 12,621 15,314 3,615 30.9 France 10,770 8,422 4,342 5,112 5,773 4,857 −5,913 −54.9 Netherlands 9,108 7,118 5,719 5,552 3,728 2,784 −6,324 −69.4 All other 43,651 35,848 22,968 22,957 21,180 20,629 −23,022 −52.7
All destination markets 187,746 166,899 112,814 120,563 106,920 105,070 −82,676 −44.0 Source: IHS Markit, Global Trade Atlas database, HS 0811.20, accessed July 7, 2020. Note: HS 0811.20 covers raspberries, blackberries, mulberries, loganberries, currants, and gooseberries. Chile’s raspberry production and exports consist of a high share of IQF (whole, broken, and crumble) and small amounts of frozen puree and block frozen products, relative to other raspberry exporters
752 USITC DataWeb/Census, HTS 0811.20.2025, accessed March 26, 2021. 753 The comparison of Chilean supply to U.S. production is based on U.S. imports from Chile of both frozen red raspberries and mixed fruit containing IQF raspberries in 2019 (applying the sorting methodology from appendix E) and the Washington and Oregon fresh raspberry production data and IQF share data in chapter 3 (“United States”). USITC DataWeb/Census, HTS 0811.20.2025, 0811.90.8080, 0811.90.8085, and 0811.90.8095, accessed February 16, 2021. 754 Dominguez, “Chilean Raspberry Industry Report 2019,” August 2020, 8.
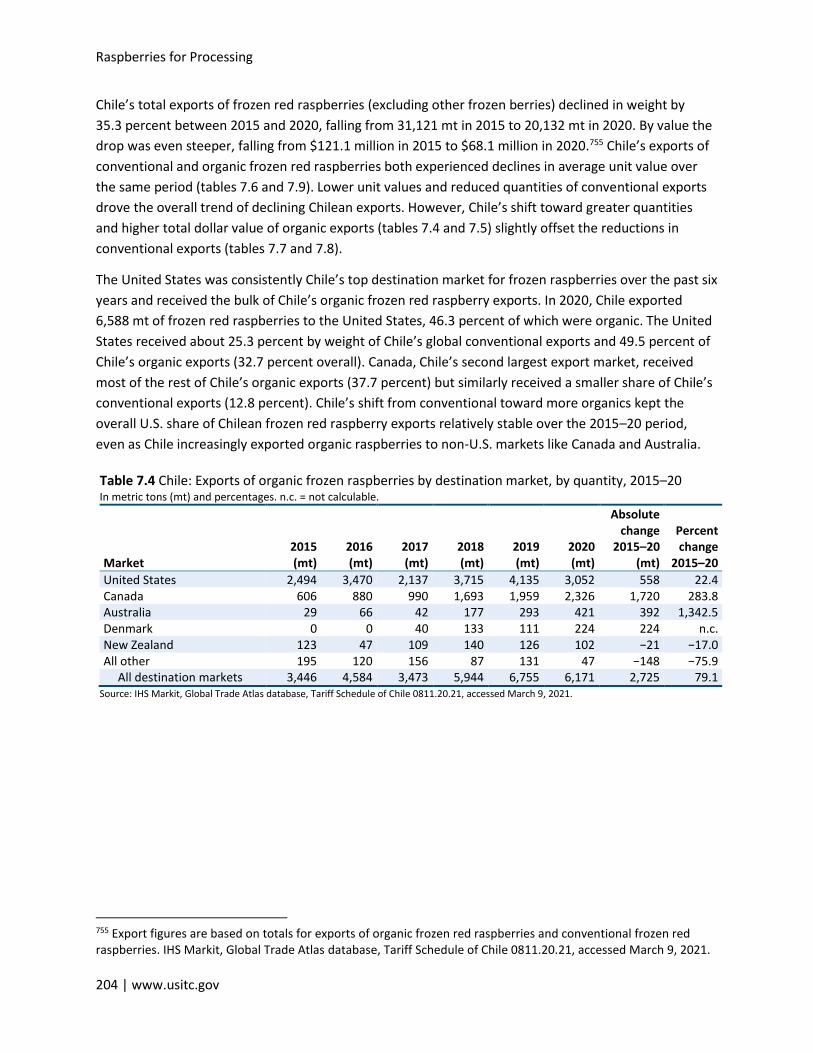
Raspberries for Processing
204 | www.usitc.gov
Chile’s total exports of frozen red raspberries (excluding other frozen berries) declined in weight by
35.3 percent between 2015 and 2020, falling from 31,121 mt in 2015 to 20,132 mt in 2020. By value the
drop was even steeper, falling from $121.1 million in 2015 to $68.1 million in 2020.755 Chile’s exports of
conventional and organic frozen red raspberries both experienced declines in average unit value over
the same period (tables 7.6 and 7.9). Lower unit values and reduced quantities of conventional exports
drove the overall trend of declining Chilean exports. However, Chile’s shift toward greater quantities
and higher total dollar value of organic exports (tables 7.4 and 7.5) slightly offset the reductions in
conventional exports (tables 7.7 and 7.8).
The United States was consistently Chile’s top destination market for frozen raspberries over the past six
years and received the bulk of Chile’s organic frozen red raspberry exports. In 2020, Chile exported
6,588 mt of frozen red raspberries to the United States, 46.3 percent of which were organic. The United
States received about 25.3 percent by weight of Chile’s global conventional exports and 49.5 percent of
Chile’s organic exports (32.7 percent overall). Canada, Chile’s second largest export market, received
most of the rest of Chile’s organic exports (37.7 percent) but similarly received a smaller share of Chile’s
conventional exports (12.8 percent). Chile’s shift from conventional toward more organics kept the
overall U.S. share of Chilean frozen red raspberry exports relatively stable over the 2015–20 period,
even as Chile increasingly exported organic raspberries to non-U.S. markets like Canada and Australia.
Table 7.4 Chile: Exports of organic frozen raspberries by destination market, by quantity, 2015–20 In metric tons (mt) and percentages. n.c. = not calculable.
Market 2015 (mt)
2016 (mt)
2017 (mt)
2018 (mt)
2019 (mt)
2020 (mt)
Absolute change
2015–20 (mt)
Percent change
2015–20
United States 2,494 3,470 2,137 3,715 4,135 3,052 558 22.4 Canada 606 880 990 1,693 1,959 2,326 1,720 283.8 Australia 29 66 42 177 293 421 392 1,342.5 Denmark 0 0 40 133 111 224 224 n.c. New Zealand 123 47 109 140 126 102 −21 −17.0 All other 195 120 156 87 131 47 −148 −75.9
All destination markets 3,446 4,584 3,473 5,944 6,755 6,171 2,725 79.1 Source: IHS Markit, Global Trade Atlas database, Tariff Schedule of Chile 0811.20.21, accessed March 9, 2021.
755 Export figures are based on totals for exports of organic frozen red raspberries and conventional frozen red raspberries. IHS Markit, Global Trade Atlas database, Tariff Schedule of Chile 0811.20.21, accessed March 9, 2021.
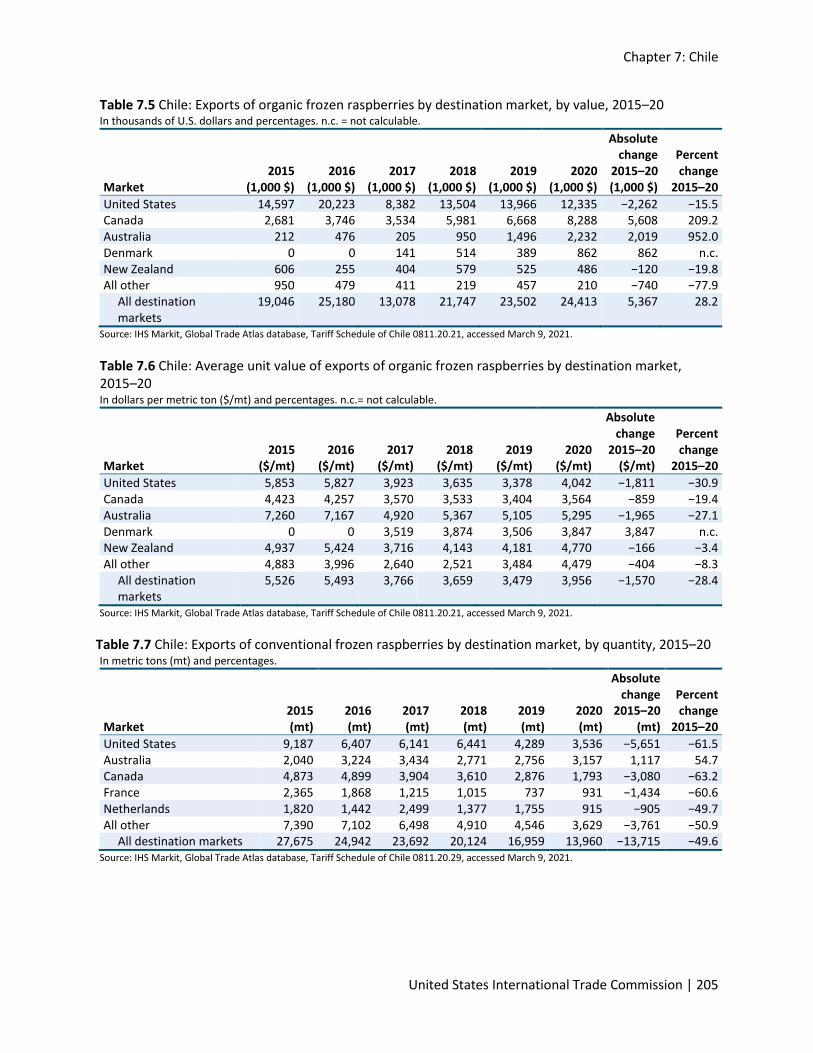
Chapter 7: Chile
United States International Trade Commission | 205
Table 7.5 Chile: Exports of organic frozen raspberries by destination market, by value, 2015–20 In thousands of U.S. dollars and percentages. n.c. = not calculable.
Market 2015
(1,000 $) 2016
(1,000 $) 2017
(1,000 $) 2018
(1,000 $) 2019
(1,000 $) 2020
(1,000 $)
Absolute change
2015–20 (1,000 $)
Percent change
2015–20
United States 14,597 20,223 8,382 13,504 13,966 12,335 −2,262 −15.5 Canada 2,681 3,746 3,534 5,981 6,668 8,288 5,608 209.2 Australia 212 476 205 950 1,496 2,232 2,019 952.0 Denmark 0 0 141 514 389 862 862 n.c. New Zealand 606 255 404 579 525 486 −120 −19.8 All other 950 479 411 219 457 210 −740 −77.9
All destination markets
19,046 25,180 13,078 21,747 23,502 24,413 5,367 28.2
Source: IHS Markit, Global Trade Atlas database, Tariff Schedule of Chile 0811.20.21, accessed March 9, 2021.
Table 7.6 Chile: Average unit value of exports of organic frozen raspberries by destination market, 2015–20 In dollars per metric ton ($/mt) and percentages. n.c.= not calculable.
Market 2015
($/mt) 2016
($/mt) 2017
($/mt) 2018
($/mt) 2019
($/mt) 2020
($/mt)
Absolute change
2015–20 ($/mt)
Percent change
2015–20
United States 5,853 5,827 3,923 3,635 3,378 4,042 −1,811 −30.9 Canada 4,423 4,257 3,570 3,533 3,404 3,564 −859 −19.4 Australia 7,260 7,167 4,920 5,367 5,105 5,295 −1,965 −27.1 Denmark 0 0 3,519 3,874 3,506 3,847 3,847 n.c. New Zealand 4,937 5,424 3,716 4,143 4,181 4,770 −166 −3.4 All other 4,883 3,996 2,640 2,521 3,484 4,479 −404 −8.3
All destination markets
5,526 5,493 3,766 3,659 3,479 3,956 −1,570 −28.4
Source: IHS Markit, Global Trade Atlas database, Tariff Schedule of Chile 0811.20.21, accessed March 9, 2021.
Table 7.7 Chile: Exports of conventional frozen raspberries by destination market, by quantity, 2015–20 In metric tons (mt) and percentages.
Market 2015 (mt)
2016 (mt)
2017 (mt)
2018 (mt)
2019 (mt)
2020 (mt)
Absolute change
2015–20 (mt)
Percent change
2015–20
United States 9,187 6,407 6,141 6,441 4,289 3,536 −5,651 −61.5 Australia 2,040 3,224 3,434 2,771 2,756 3,157 1,117 54.7 Canada 4,873 4,899 3,904 3,610 2,876 1,793 −3,080 −63.2 France 2,365 1,868 1,215 1,015 737 931 −1,434 −60.6 Netherlands 1,820 1,442 2,499 1,377 1,755 915 −905 −49.7 All other 7,390 7,102 6,498 4,910 4,546 3,629 −3,761 −50.9
All destination markets 27,675 24,942 23,692 20,124 16,959 13,960 −13,715 −49.6 Source: IHS Markit, Global Trade Atlas database, Tariff Schedule of Chile 0811.20.29, accessed March 9, 2021.

Raspberries for Processing
206 | www.usitc.gov
Table 7.8 Chile: Exports of conventional frozen raspberries by destination market, by value, 2015–20 In thousands of U.S. dollars and percentages.
Market 2015
(1,000 $) 2016
(1,000 $) 2017
(1,000 $) 2018
(1,000 $) 2019
(1,000 $) 2020
(1,000 $)
Absolute change
2015–20 (1,000 $)
Percent change
2015–20
United States 34,319 22,118 17,197 17,731 11,484 11,769 −22,550 −65.7 Australia 9,846 14,749 12,792 10,498 10,042 11,449 1,603 16.3 Canada 18,043 16,776 9,655 10,030 7,839 5,758 −12,285 −68.1 France 7,545 5,953 3,190 2,482 2,146 2,397 −5,149 −68.2 Netherlands 4,913 3,409 3,339 1,681 2,277 1,451 −3,461 −70.5 All other 27,368 24,307 15,663 13,015 11,539 10,908 −16,460 −60.1
All destination markets
102,034 87,312 61,837 55,436 45,327 43,732 −58,302 −57.1
Source: IHS Markit, Global Trade Atlas database, Tariff Schedule of Chile 0811.20.29, accessed March 9, 2021.
Table 7.9 Chile: Average unit value of exports of conventional frozen raspberries by destination market, 2015–20 In dollars per metric ton ($/mt) and percentages.
Market 2015
($/mt) 2016
($/mt) 2017
($/mt) 2018
($/mt) 2019
($/mt) 2020
($/mt)
Absolute change
2015–20 ($/mt)
Percent change
2015–20
United States 3,736 3,452 2,800 2,753 2,678 3,328 −407 −10.9 Australia 4,826 4,575 3,725 3,788 3,644 3,627 −1,199 −24.8 Canada 3,703 3,425 2,473 2,778 2,725 3,212 −491 −13.3 France 3,190 3,186 2,625 2,445 2,911 2,574 −617 −19.3 Netherlands 2,700 2,364 1,336 1,220 1,297 1,586 −1,113 −41.2 All other 3,703 3,423 2,410 2,651 2,538 3,006 −697 −18.8
All destination markets 3,687 3,501 2,610 2,755 2,673 3,133 −554 −15.0 Source: IHS Markit, Global Trade Atlas, Tariff Schedule of Chile 0811.20.29, accessed March 9, 2021.
Chile sources nearly all its raspberries domestically; the country imports a relatively small share of
frozen and fresh raspberries. Chile imports and re-exports some frozen raspberries, but these imports
were less than 2 percent of production between 2015 and 2019 and sharply declined over most of the
period.756 Chile’s total imports of frozen raspberries fell from 868 mt ($2.1 million) in 2015 to 241 mt
($542,730) in 2019, but increased to 1,827 mt ($4.2 million) in 2020. Its sourcing of frozen raspberry
imports also shifted considerably. Reduced imports from Mexico drove most of the overall decline, while
imports from China also fell and Serbia emerged as one of the main suppliers.757 Chile’s imports of fresh
raspberries were even smaller than its frozen imports and mostly came from Serbia and Turkey. Despite
an uptick (to 193 mt) in 2020, Chile’s raspberry imports remained minor compared to its own production
and exports.758
756 IHS Markit, Global Trade Atlas database, Chilean codes 0811.20.21, 0811.20.29, 0810.20.21, and 0810.20.29, accessed March 29, 2021; Dominguez, “Chilean Raspberry Industry Report 2019,” 4. 757 IHS Markit, Global Trade Atlas database, Chilean codes 0811.20.21 and 0811.20.29, accessed March 2, 2021. 758 IHS Markit, Global Trade Atlas database, Chilean codes 0810.20.21 and 0810.20.29, accessed March 2, 2021.
Chapter 7: Chile
United States International Trade Commission | 207
While Chile previously was among the top three sources of raspberry exports to the U.S. fresh market, it
has shifted almost entirely to exporting processed raspberries. Rising fresh raspberry exports from
Mexico rapidly displaced most of the Chilean fresh raspberries in the U.S. market in the late 2000s.759
Chile’s overall exports of fresh raspberries have remained volatile year to year, but since 2012 have
stayed below 300 mt.760 Chile supplied less than 0.1 percent of U.S. imports of fresh raspberries during
2015–20.761
Government Programs
The Chilean government has some programs in place to support farmers and the broader food
processing industry, but it is difficult to say the extent to which the raspberry industry is impacted by
these programs. Government support for the broader agro-industrial sector primarily consists of
research and technical support. In particular, the Ministry of Agriculture’s Institute for Agricultural
Development (INDAP) focuses on promoting the economic, social, and technological development of
small farms through local offices located across the country.762 Direct support to farmers is among the
lowest of Organisation for Economic Co-operation and Development (OECD) member countries, at
about 2.7 percent of gross farm receipts in 2019.763
INDAP’s technical assistance is one of its most far-reaching support programs. Since the 1980s, INDAP
has offered technical support by partnering with private consultant services. For raspberry farmers,
INDAP’s agricultural extension assistance focuses on helping farmers with production and compliance
with GAP regulations.764
The Chilean government generally prefers to coordinate its policies and support programs with trade
associations.765 Publicly funded support programs and training often directly involve trade associations
or other private organizations. For example, the trade association Fedefruta manages some training and
financing programs funded by the Chilean economic development agency, the Chilean Production
Development Corporation or Corporación de Fomento de la Producción de Chile (Corfo).766 Efforts to
develop Chilean raspberry cultivars are also supported with public funding from Corfo and have been
publicized in conferences organized with INDAP.767
759 USITC DataWeb/Census, HTS 0810.20.1020 and 0810.20.9020, accessed March 2, 2021. 760 Chilean raspberry trade data from before 2012 are classified under different codes. IHS Markit, Global Trade Atlas database, Chilean codes 0810.2021 and 0810.2029, accessed March 2, 2021. 761 USITC DataWeb/Census, HTS 0810.20.1020, 0810.20.9020, 0810.20.1022, 0810.20.1024, 0810.20.9022, and 0810.20.9024, accessed March 2, 2021. 762 INDAP, “Quiénes somos (Who we are),” accessed March 11, 2021. 763 OECD Data, “Agricultural Support,” accessed March 10, 2021. 764 Jara-Rojas et al., “Production Efficiency and Commercialization Channels,” February 2016, 14–15. 765 USDOS, U.S. Embassy, Santiago, “Chile Raspberry Market and Production Data,” December 2, 2020. 766 Fedefruta, “Frambuesero de San Carlos logra producir mejor (San Carlos raspberry is able to produce better),” February 19, 2021. 767 FreshPlaza, “New 100% Chilean Raspberry Varieties,” October 7, 2019.

Raspberries for Processing
208 | www.usitc.gov
Compliance with Food Safety Standards
On the policy side, the Chilean regulator Agricultural and Livestock Service, or Servicio Agricola y
Ganadero (SAG) developed food safety legislation (Regulation SAG 3410/2002) with input from the
Chilean raspberry industry in 2002. Implemented in 2003, objectives include ensuring product
traceability and verifying safety of the product for consumption.768 The law also covers farmers' welfare,
fresh fruit collecting points, processors, exporters, and transport.769 Under the legislation, all raspberry
farmers have to be registered, the raspberry industry supply chain is audited to confirm that certain
requirements are met to gain approval to export fruit, and water is sampled for agrochemicals.770
Industry representatives state that the regulation is being updated based on the Chilean industry’s
experience with the U.S. Food Safety Modernization Act (FSMA) enacted in 2011.771
In addition, many Chilean growers have Good Agricultural Practices (GAP) certification, and the industry
is generally able to meet U.S. FSMA requirements for the United States as well as the food safety
regulations of other importing markets such as the EU, Canada, and Australia.772
Factors Affecting Competitiveness
As described in chapter 2 of this report, the competitiveness of raspberries for processing and of
processed raspberry products can be measured by comparing delivered costs, product differentiation,
and supplier reliability for U.S. products against those of imports. While Chile is an experienced, export-
oriented raspberry processing industry that can produce large shares of high-value IQF product
(including organic), limited access to needed fresh raspberry inputs has prevented its processors from
expanding.
Chile supplies products from its experienced industry.
Chile has an experienced, export-oriented raspberry industry that focuses on supplying high-value IQF
raspberry products. The Chilean industry uses a combination of production systems and processing
equipment that result in higher shares of IQF products than in other countries. In particular, Chile’s
handpicked berries yield relatively high ratios of whole IQF berries. While the overall production system
is labor-intensive, the resulting IQF products sell at substantially higher prices than non-IQF products like
juice stock. As shown in chapter 2, Chile’s average costs of production for processed raspberries are
768 Dominguez, “Chilean Raspberry Industry,” June 4, 2012, 14; BCN, “Resolución 3410 Exenta (Exempt Resolution no. 3410),” November 11, 2002. 769 IHS Markit, “Chile’s Raspberry Processors Must Choose Correct Market,” November 22, 2007. 770 Dominguez, “Chilean Raspberry Industry,” June 4, 2012, 14. 771 USITC, hearing transcript, September 17, 2020, 48 (testimony of Pablo Herrera, JCP Foods); Herrera, written testimony to the USITC, September 8, 2020, 2. 772 USITC, hearing transcript, September 17, 2020, 48 (testimony of Pablo Herrera, JCP Foods) and 140–41 (testimony of John Tentomas, Nature’s Touch); Herrera, written testimony to the USITC, September 8, 2020, 2.
Chapter 7: Chile
United States International Trade Commission | 209
close to the costs of production in the United States and Canada. Large Chilean processors can also sort
and package IQF products to customer specifications. A few processors sell retail-sized bags of berry
mixes to grocery stores for an even greater profit margin than for IQF products in bulk packaging.773 Key
factors that support Chile’s status as a supplier of relatively high-quality IQF product include (1) the
emphasis on growing raspberries for processing, (2) growers’ familiarity with traceability and food safety
requirements, (3) the prevalence of handpicked harvesting, and (4) processors’ strategic use of both belt
and static freezers. Moreover, as the Chilean industry is almost exclusively export-oriented, Chilean
producers are known to adhere to strict food safety requirements and have a reputation for high
quality.
Chilean processors are also able to supply significant quantities of organic IQF raspberries and organic
frozen berry mixes for export due to the country’s fresh production system described earlier.
Representatives of the U.S. raspberry industry note that it is extremely challenging to control pests and
disease using organic methods in the United States, severely limiting the number of organic raspberries
grown in this country. By contrast, Chile’s climate is not conducive to the survival of pests such as the
spotted wing drosophila that threaten raspberry cultivation in the United States, and also has
microclimates that favor organic raspberry farming.774 Small farms also are better suited to the intensive
work of organic farming and caring for the plants by hand.775 This provides a competitive advantage to
Chile, where processors already regularly coordinate with many small-scale growers. For example,
processors often sign contracts to secure a supply of berry inputs; send agronomists to advise growers
on food safety and maximizing yields; and operate collection centers to trace raspberry input sourcing,
provide cold storage, and transport raspberry inputs from multiple farming areas to the processing
plant.
Chile offers reliable exports of processed raspberries, but a declining supply of fresh raspberries prevents growth.
Shrinking quantities of fresh raspberry inputs prevent competitive Chilean processors from significantly
expanding their business. Despite these declines, Chilean processors have several advantages because of
reliability and availability. The raspberry crop has an unusually long harvest season, due to both the
dual-harvest nature of the Heritage cultivar and the range of climates where raspberries are grown. This
long harvest reduces the risk of weather events significantly disrupting the availability of raspberry
inputs.776 Larger processors in Chile also have the capability to finance storage of their frozen product,
allowing them to meet customer demand for year-round deliveries (which is often a requirement for
773 Industry representative, interview by USITC staff, February 11, 2021. 774 USITC, hearing transcript, September 17, 2020, 154–55 (testimony of Jon Maberry, Washington Red Raspberry Commission and John Tentomas, Nature’s Touch). 775 Industry representative, interview by USITC staff, February 11, 2021. 776 Industry representative, interview by USITC staff, February 11, 2021.

Raspberries for Processing
210 | www.usitc.gov
contracts with retailers).777 Smaller processors are less likely to be able to hold inventory and cover
freezing expenses for several months, but benefit from Chilean raspberry production peaking during the
northern hemisphere’s winter months.778
777 This observation is reinforced by monthly data from 2015 to 2019, which show Chile typically supplying at least 15 percent of U.S. imports of frozen red raspberry products (even during off-season months). USITC DataWeb/Census, HTS 0811.20.2025, accessed February 12, 2021; industry representative, interview by USITC staff, February 11, 2021. 778 By contrast, the U.S. industry harvest is in summer. Industry representative, interview by USITC staff, February 11, 2021; industry representative, email message to USITC staff, March 5, 2021.
Chapter 7: Chile
United States International Trade Commission | 211
Bibliography
Alifrut. “Exports.” Minuto Verde. Accessed February 10, 2021. http://www.minutoverde.cl/en/exportaciones/.
Asociación de Exportadores de Frutas de Chile (ASOEX). “About Us.” Accessed March 10, 2021. https://fruitsfromchile.com/about/.
Asociación de Exportadores de Frutas de Chile (ASOEX). “Frambuesas 100% Chilenas Para La Reconversión Varietal En La Región de Ñuble (100% Chilean Raspberries in the Conversion to New Varietals in Ñuble Region),” October 3, 2019. https://www.asoex.cl/component/content/article/25-noticias/657-frambuesas-100-chilenas-para-la-reconversion-varietal-en-la-region-de-nuble.html.
Asociación de Exportadores de Frutas de Chile (ASOEX). “Maule.” Accessed March 10, 2021. https://fruitsfromchile.com/about/growing-regions/maule-region/.
Bayas del Sur. “Contacts.” Accessed February 11, 2021. https://bayasdelsur.com/contacts/.
Biblioteca del Congreso Nacional de Chile (BCN). “Creación de la XVI región de Ñuble: Actualidad territorial (Creation of Ñuble, the 16th region: regional facts).” Accessed March 4, 2021. https://www.bcn.cl/siit/actualidad-territorial/nueva-region-de-nuble.
Biblioteca del Congreso Nacional de Chile (BCN). “Resolución 3410 Exenta: Establece procedimiento para garantizar aptitud para el consumo de frambuesas para exportación (Exempt Resolution no. 3410: establishes a procedure to ensure that raspberries for export are fit for consumption),” November 11, 2002. https://www.bcn.cl/leychile/navegar?idNorma=204352.
Blueberries Consulting. “2019 Fruit Cadastre: Cranberries, the Main Species Planted in the Ñuble, Biobío, Los Ríos and Los Lagos Regions,” September 2, 2019. https://blueberriesconsulting.com/en/catastro-fruticola-2019-arandanos-la-principal-especie-plantada-en-las-regiones-de-nuble-biobio-los-rios-y-los-lagos/.
Blueberries Consulting. “Better Plants, the Next Revolution.” Blueberries Consulting, October 27, 2015. https://blueberriesconsulting.com/en/mejores-plantas-la-revolucion-que-viene/.
BMC International. “About Us and Our Market.” Accessed March 11, 2021. https://bmcint-us.com/about-dr-finzley/.
Centro de Información de Recursos Naturales (CIREN). Catastro frutícola : principales resultados. Región del Maule (Fruit-growing land registry: principal results, Maule region), July 2019. http://bibliotecadigital.ciren.cl//handle/123456789/28954.
Centro de Información de Recursos Naturales (CIREN). Catastro frutícola : principales resultados. Región del Ñuble (Fruit-growing land registry: principal results, Ñuble region), July 2019. http://bibliotecadigital.ciren.cl//handle/123456789/28957.
Raspberries for Processing
212 | www.usitc.gov
Comfrut. “Conventional Fruit—Raspberry.” Conventional Fruit - Raspberry. Accessed February 11, 2021. https://www.comfrut.com/conventional-fruit/.
Comfrut. “Packaging.” Accessed February 10, 2021. https://www.comfrut.com/home/packaging/.
Cran Chile. “About Us.” Accessed February 11, 2021. https://cranchile.com/site/farms/.
Dominguez, Antonio. “Chilean Raspberry Industry,” June 4, 2012. https://chilealimentos.com/wp-content/uploads/migracion/2013/phocadownload/Gremiales/irochile2012v3.pdf.
Dominguez, Antonio. “Chilean Raspberry Industry Report 2019,” August 2020. https://www.internationalraspberry.net/wp-content/uploads/2020/08/Chile.pdf.
Dominguez, Antonio. “Chilean Raspberry Industry Report 2019.” Presented at the International Raspberry Organization, August 2020. https://www.internationalraspberry.net/wp-content/uploads/2020/08/Chile.pdf.
Food and Agriculture Organization of the United Nations (FAO). “Crops—Metadata.” FAOSTAT database. Accessed March 9, 2021. http://www.fao.org/faostat/en/#data/QC/metadata.
Federación de Productores de Frutas de Chile (Fedefruta). “Frambuesero de San Carlos Logra Producir Mejor y Con Energía Limpia (San Carlos Raspberry Is Able to Produce Better and Uses Clean Energy),” February 19, 2021. http://fedefruta.cl/frambuesero-de-san-carlos-logra-producir-mejor-y-con-energia-limpia/.
Federación de Productores de Frutas de Chile (Fedefruta). “Qué Es Fedefruta (What Is Fedefruta?).” Accessed March 10, 2021. http://fedefruta.cl/que-hacemos/que-es-fedefruta/.
FreshPlaza. “Naturipe Foods Expands with Newly Formed Vitafoods Joining Ownership with Munger Farms,” October 1, 2020. https://www.freshplaza.com/article/9254776/naturipe-foods-expands-with-newly-formed-vitafoods-joining-ownership-with-munger-farms/.
FreshPlaza. “New 100% Chilean Raspberry Varieties for the Sector’s Varietal Reconversion,” October 7, 2019. https://www.freshplaza.com/article/9150659/new-100-chilean-raspberry-varieties-for-the-sector-s-varietal-reconversion/.
Ghilotti, Davide. “Raspberry Comeback.” FoodNews, 2015. Chile 2015 Special Supplement.
Ghilotti, Davide. “Selling Food Safety.” FoodNews, 2015. Chile 2015 Special Supplement.
Herrera, Pablo. JCP Foods. Written testimony submitted to the U.S. International Trade Commission in connection with Inv. No. 332-577, Raspberries for Processing: Conditions of Competition Between U.S. and Foreign Suppliers, with a Focus on Washington State, September 9, 2020.
IHS Markit. “Chile’s Raspberry Processors Must Choose Correct Market,” November 22, 2007. https://connect.ihsmarkit.com/home (fee required).
IHS Markit. Global Trade Atlas database. Accessed various dates. https://connect.ihsmarkit.com/home.
Chapter 7: Chile
United States International Trade Commission | 213
Instituto de Desarrollo Agropecuario (INDAP). “Mesa Nacional de la Frambuesa realiza primera reunión del año para analizar desafíos del rubro (National raspberry roundtable holds first meeting of the year to analyze challenges in the field),” June 17, 2019. http://www.indap.gob.cl/noticias/detalle/2019/06/18/mesa-nacional-de-la-frambuesa-realiza-primera-reuni%C3%B3n-del-a%C3%B1o-para-analizar-desaf%C3%ADos-del-rubro.
Instituto de Desarrollo Agropecuario (INDAP). “Quiénes Somos (Who We Are).” Accessed March 11, 2021. https://www.indap.gob.cl/indap/qu%C3%A9-es-indap.
International Raspberry Organization (IRO). “World Raspberry Production, 2007–2019.” Accessed March 9, 2021. https://www.internationalraspberry.net/.
Jara-Rojas, Roberto, Boris E. Bravo-Ureta, Daniel Solís, and Daniela Martínez. “Production Efficiency and Commercialization Channels Among Small-Scale Farmers: Evidence for Raspberry Production in Central Chile.” Paper presented at the Southern Agricultural Economics Association (SAEA) 2016 Annual Meeting, San Antonio, Texas, February 7–10, 2016. https://doi.org/10.22004/ag.econ.229330.
Jara-Rojas, Roberto, Boris E. Bravo-Ureta, Daniel Solís, and Daniela Martínez Arriagada. “Technical Efficiency and Marketing Channels among Small-Scale Farmers: Evidence for Raspberry Production in Chile.” International Food and Agribusiness Management Review 21, no. 3 (March 20, 2018): 351–64. https://doi.org/10.22434/IFAMR2016.0168.
JCP Foods. “Infrastructure.” Accessed February 12, 2021. https://jcpfoods.cl/infrastructure.
Lamex Food Group. “History.” Accessed March 11, 2021. http://www.lamexfoods.eu/index.php/history.
Nanni, Cristina. “Labour Shortage Lifts Chilean Raspberry Prices.” IHS Markit, January 13, 2021 https://connect.ihsmarkit.com/home (fee required).
Ocean Spray. “Ocean Spray Cranberries, Inc., Acquires Cranberry Operations in Chile,” January 10, 2013. https://www.businesswire.com/news/home/20130110005903/en/Ocean-Spray-Cranberries-Inc.-Acquires-Cranberry-Operations-in-Chile.
Organisation for Economic Co-operation and Development (OECD) Data. “Agricultural Support.” Accessed March 10, 2021. http://data.oecd.org/agrpolicy/agricultural-support.htm.
Patagoniafresh. “About Us.” Patagoniafresh. Accessed February 11, 2021. https://empresasiansa.cl/patagoniafresh/en/about-us/.
SimFruit. “Primero fueron las frambuesas ‘Santas’: Hoy, buscan desarrollar nuevas variedades con resistencia a plagas, enfermedades y estrés hídrico (First came the ‘Santa’ raspberries: now, researchers are working to develop new varieties with resistance to pests, disease, and water stress),” November 19, 2020. https://www.simfruit.cl/primero-fueron-las-frambuesas-santas-hoy-chile-busca-desarrollar-nuevas-variedades-de-frambuesas-con-resistencia-a-plagas-enfermedades-y-estres-hidrico/.
U.S. Department of State (USDOS). U.S. Embassy, Santiago. “Response to 20 STATE 103640: Chilean Fresh and Processed Raspberry Industry Data, 2015–2019,” December 2, 2020.
Raspberries for Processing
214 | www.usitc.gov
U.S. International Trade Commission (USITC). Individually Quick Frozen Red Raspberries From Chile (Final). Publication 3524. USITC. Washington, DC: June 2002. https://www.usitc.gov/publications/701_731/pub3524.pdf.
U.S. International Trade Commission (USITC). Individually Quick Frozen Red Raspberries From Chile (Preliminary). Publication 3441. USITC. Washington, DC: July 2001. https://www.usitc.gov/publications/701_731/pub3441.pdf.
U.S. International Trade Commission (USITC). Hearing transcript in connection with Inv. No. 332-577, Raspberries for Processing: Conditions of Competition Between U.S. and Foreign Suppliers, with a Focus on Washington State, September 17, 2020.
U.S. International Trade Commission Interactive Tariff and Trade DataWeb (USITC DataWeb)/U.S. Census Bureau (Census). Accessed various dates. http://dataweb.usitc.gov.
Chapter 8: Pricing Analysis: Relationship Between Imports and Prices in the U.S. Market
United States International Trade Commission | 215
Chapter 8 Pricing Analysis: Relationship between Imports and Prices in the U.S. Market
Summary
The Commission’s analysis in this chapter considers the relationship between imports and U.S. prices (as
represented by price data from Washington) during 2015‒20. The analysis finds that price trends based
on available annual data appear to be most closely related to changes in the total supply of processed
raspberries in the U.S. market. This is particularly true of the U.S. market for non-IQF raspberries. Only in
2018 did higher import levels coincide with lower Washington sales prices for processed raspberries,
although imports in other years may have kept prices lower than they otherwise would have been.
As described in the previous chapters of this report, there are a variety of factors that affect processed
raspberry pricing. Among the factors most relevant to pricing in the U.S. market are those related to the
total supply of processed products (differentiated by quality and type), which is made up of domestic
production, stocks, and imports. Because all processed raspberry products start from fresh raspberries,
supply of these products depends on growing conditions in Washington and the countries that are major
sources of U.S. imports. For example, industry representatives cite weather during the production
season as a major driver of processed raspberry prices due to its effect on yields of fresh raspberry
inputs.779 Seasonality (both the timing of the harvest season and the timing of imports relative to U.S.
supplies) is also an important factor affecting the volume of raspberries in the U.S. market at any given
time. Stocks are a more minor factor but can also affect total supply.
U.S. industry representatives, such as the Washington Red Raspberry Commission (WRRC), have stated
there is a clear relationship between increased imports and lower Washington sales prices. For example,
WRRC president Jon Maberry noted that since 2015, trends in the U.S. market included “increased
imports and downward pricing, leading to lower profits, fewer acres, and far fewer growers.”780 In his
request letter, the U.S. Trade Representative asked that this report contain a pricing analysis that
includes “the relationship between prices of domestic products and imports of fresh and processed
raspberries in the U.S. market to the extent such data [are] available.” This chapter responds to the
request by comparing available pricing data with imports from major supplying countries.
779 Industry representatives, interviews by USITC staff, September 15, 2020, and December 18, 2020; Government of British Columbia, “A Global Export Market Overview,” 2010, 6. 780 USITC, hearing transcript, September 17, 2020, 12 (testimony of Jonathan Maberry, WRRC).

Raspberries for Processing
216 | www.usitc.gov
Description of Price Data
Any attempt to draw conclusions about the relationship between imports and U.S. prices for processed
raspberries is confounded by three data limitations. The first limitation is the lack of import data before
July 2018 on fresh raspberries for processing. Previously, the Harmonized Tariff Schedule of the United
States (HTS) combined imports of fresh raspberries for processing with those packed for fresh
consumption. This aggregation in the trade data prohibits precise analysis of import trends for fresh
raspberries for processing because, as described in chapter 1, market characteristics and pricing for
these raspberries are very different from those for raspberries for fresh consumption. The Washington
industry believes that there has been a sharp increase in U.S. imports of fresh raspberries for processing
and that these imports led to lower prices for Washington raspberries for processing. However, the
pricing analysis that follows cannot fully evaluate the relationship between imports of fresh raspberries
for processing and Washington sales prices because of the lack of data before July 2018 on U.S. imports
of fresh raspberries for processing.781 For this reason, the analysis focuses only on frozen straight pack—
that is, raspberries packed and frozen in their own juices without sugar—and individually quick frozen
(IQF) raspberries. For these two categories of products, sufficient Washington price and U.S. import data
are available since 2011.782
The second limitation related to import data is that such data do not distinguish between imports of IQF
raspberries and non-IQF frozen raspberry products, such as block frozen raspberries and puree.783 This
aggregation in the trade data is problematic since, as described below, IQF and non-IQF raspberries face
different supply and demand conditions, which affect prices. In particular, non-IQF products are more
likely to face an oversupply in the market that results in price reductions, whereas IQF raspberry
suppliers consistently struggle to meet high demand that results in price increases for IQF raspberries.
As a result, industry representatives report that price pressure from imports is greater for non-IQF
products.784 However, the two industries are closely related and prices in one market tend to move in
tandem with the other, as shown below.
Despite the fact that import data for frozen raspberries do not differentiate between products, the
ability to draw conclusions from the data is aided by the fact that the major countries supplying imports
in this category tend to specialize in one product or the other: Mexico and Canada ship mostly non-IQF
raspberries, while Chile and Serbia ship mostly IQF raspberries. The representative Washington sales
prices used below for non-IQF frozen raspberry products are for “straight pack” raspberries. In the
analysis of import data for frozen raspberries below, observations of imports from Mexico and Canada
were used to represent straight pack prices most closely, while observations of U.S. frozen imports from
only Chile and Serbia were used to analyze IQF product prices.
The third limitation is the lack of data on prices of imported products in the U.S. market. This limits the
ability to compare the price of imports to Washington industry sales prices. The only data available on
781 Monthly data on the volumes of fresh raspberries for processing can be found in chapter 5, “Mexico.” 782 By focusing on IQF and non-IQF frozen raspberries, this section accounts for about 80 percent of the Washington processed raspberry market. The other 20 percent of Washington production goes to the juice market, which is not considered in this section due to data limitations. 783 Block frozen raspberries can also be used to make puree. 784 USITC, hearing transcript, September 17, 2020, 137 (testimony of Jon Maberry, WRRC).
Chapter 8: Pricing Analysis: Relationship Between Imports and Prices in the U.S. Market
United States International Trade Commission | 217
the value of imports are average unit values (AUVs). Import AUVs are not prices, but instead reflect the
value of shipments declared in customs forms at the point of import. For this reason, import AUVs may
not reflect the U.S. market price that the product will sell for, or the total cost of the imported product
versus the domestic product to a purchaser.785 In addition, import AUVs reflect a mix of products
shipped under the same tariff code, despite variations in product characteristics and quality. This makes
import AUVs unlike market prices, which better reflect differences between products and quality levels.
Nevertheless, in the absence of pricing data on imports other than AUVs, some of the figures below
compare import AUVs to Washington sales prices. Although the price levels between these different
sources are not directly comparable, the comparisons are made in order to show price trends and assess
the degree to which changes in Washington prices and import AUVs appear to be linked. These
comparisons are supplemented by figures that compare import volumes to Washington sales prices,
since U.S. industry representatives have linked price changes to an increased quantity of imported
raspberries in the U.S. market since 2015.
U.S. industry representatives have acknowledged these data limitations and found them to be
challenges to analyzing prices in their industry.786 For example, at the Commission hearing, an industry
representative testifying on behalf of the WRRC stated that, due partly to lack of product-specific codes
in the HTS, U.S. import data “simply does not align with our extensive market experience and other
objective data regarding market conditions.”787 Aware of these challenges, U.S. industry representatives
provided a variety of pricing data (table 8.1) that informed the analysis shown below.788
785 For instance, imports might be brought in by a marketer and later sold to a domestic purchaser with an additional mark up when sold to the final customer. Alternatively, if the importer is a direct importer of the product, they might incur additional costs to import the product. 786 In addition to the pricing analysis below, this report also considers the relationship between imports and Washington prices in the economic modeling exercise presented in chapter 9. The model is fundamentally different from the analysis below because it holds all features in a year constant, changing only the quantity of imported processed raspberries and raspberries for processing and evaluating the resulting short-run adaptations to prices and quantities in the domestic market. 787 USITC, hearing transcript, September 17, 2020, 14 (testimony of Brad Rader, Rader Farms). 788 Price information from Washington Red Raspberry Commission reflects estimated average prices of surveyed WRRC members, not actual prices paid by customers. WRRC, email message to USITC staff, December 18, 2021.
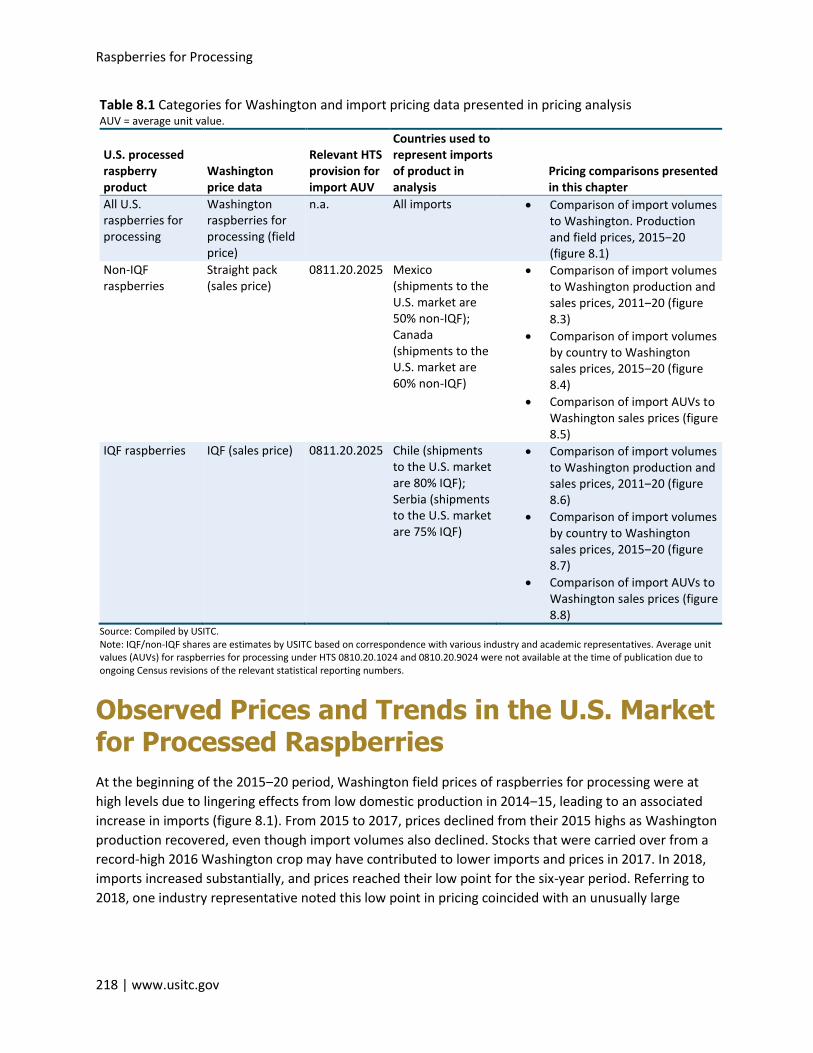
Raspberries for Processing
218 | www.usitc.gov
Table 8.1 Categories for Washington and import pricing data presented in pricing analysis AUV = average unit value.
U.S. processed raspberry product
Washington price data
Relevant HTS provision for import AUV
Countries used to represent imports of product in analysis
Pricing comparisons presented in this chapter
All U.S. raspberries for processing
Washington raspberries for processing (field price)
n.a. All imports • Comparison of import volumes to Washington. Production and field prices, 2015‒20 (figure 8.1)
Non-IQF raspberries
Straight pack (sales price)
0811.20.2025 Mexico (shipments to the U.S. market are 50% non-IQF); Canada (shipments to the U.S. market are 60% non-IQF)
• Comparison of import volumes to Washington production and sales prices, 2011‒20 (figure 8.3)
• Comparison of import volumes by country to Washington sales prices, 2015‒20 (figure 8.4)
• Comparison of import AUVs to Washington sales prices (figure 8.5)
IQF raspberries IQF (sales price) 0811.20.2025 Chile (shipments to the U.S. market are 80% IQF); Serbia (shipments to the U.S. market are 75% IQF)
• Comparison of import volumes to Washington production and sales prices, 2011‒20 (figure 8.6)
• Comparison of import volumes by country to Washington sales prices, 2015‒20 (figure 8.7)
• Comparison of import AUVs to Washington sales prices (figure 8.8)
Source: Compiled by USITC. Note: IQF/non-IQF shares are estimates by USITC based on correspondence with various industry and academic representatives. Average unit values (AUVs) for raspberries for processing under HTS 0810.20.1024 and 0810.20.9024 were not available at the time of publication due to ongoing Census revisions of the relevant statistical reporting numbers.
Observed Prices and Trends in the U.S. Market for Processed Raspberries
At the beginning of the 2015‒20 period, Washington field prices of raspberries for processing were at
high levels due to lingering effects from low domestic production in 2014‒15, leading to an associated
increase in imports (figure 8.1). From 2015 to 2017, prices declined from their 2015 highs as Washington
production recovered, even though import volumes also declined. Stocks that were carried over from a
record-high 2016 Washington crop may have contributed to lower imports and prices in 2017. In 2018,
imports increased substantially, and prices reached their low point for the six-year period. Referring to
2018, one industry representative noted this low point in pricing coincided with an unusually large
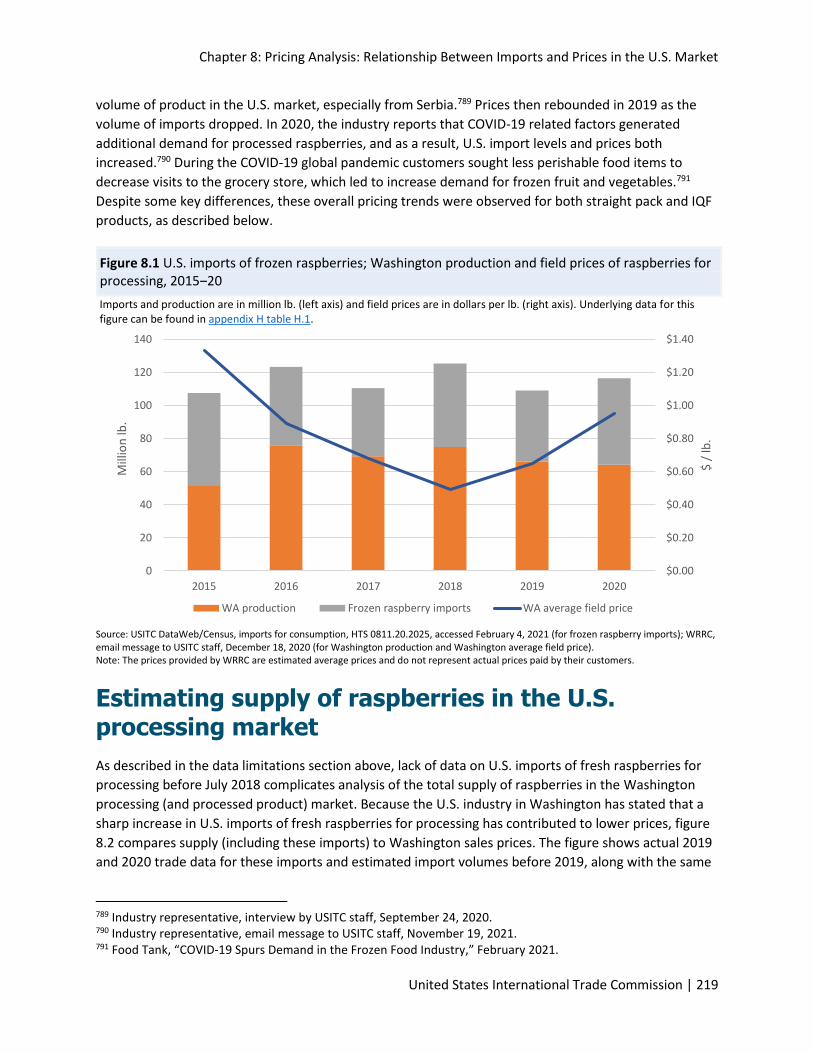
Chapter 8: Pricing Analysis: Relationship Between Imports and Prices in the U.S. Market
United States International Trade Commission | 219
volume of product in the U.S. market, especially from Serbia.789 Prices then rebounded in 2019 as the
volume of imports dropped. In 2020, the industry reports that COVID-19 related factors generated
additional demand for processed raspberries, and as a result, U.S. import levels and prices both
increased.790 During the COVID-19 global pandemic customers sought less perishable food items to
decrease visits to the grocery store, which led to increase demand for frozen fruit and vegetables.791
Despite some key differences, these overall pricing trends were observed for both straight pack and IQF
products, as described below.
Figure 8.1 U.S. imports of frozen raspberries; Washington production and field prices of raspberries for processing, 2015‒20
Imports and production are in million lb. (left axis) and field prices are in dollars per lb. (right axis). Underlying data for this figure can be found in appendix H table H.1.
Source: USITC DataWeb/Census, imports for consumption, HTS 0811.20.2025, accessed February 4, 2021 (for frozen raspberry imports); WRRC, email message to USITC staff, December 18, 2020 (for Washington production and Washington average field price). Note: The prices provided by WRRC are estimated average prices and do not represent actual prices paid by their customers.
Estimating supply of raspberries in the U.S. processing market
As described in the data limitations section above, lack of data on U.S. imports of fresh raspberries for
processing before July 2018 complicates analysis of the total supply of raspberries in the Washington
processing (and processed product) market. Because the U.S. industry in Washington has stated that a
sharp increase in U.S. imports of fresh raspberries for processing has contributed to lower prices, figure
8.2 compares supply (including these imports) to Washington sales prices. The figure shows actual 2019
and 2020 trade data for these imports and estimated import volumes before 2019, along with the same
789 Industry representative, interview by USITC staff, September 24, 2020. 790 Industry representative, email message to USITC staff, November 19, 2021. 791 Food Tank, “COVID-19 Spurs Demand in the Frozen Food Industry,” February 2021.
$0.00
$0.20
$0.40
$0.60
$0.80
$1.00
$1.20
$1.40
0
20
40
60
80
100
120
140
2015 2016 2017 2018 2019 2020
$ /
lb.
Mill
ion
lb.
WA production Frozen raspberry imports WA average field price
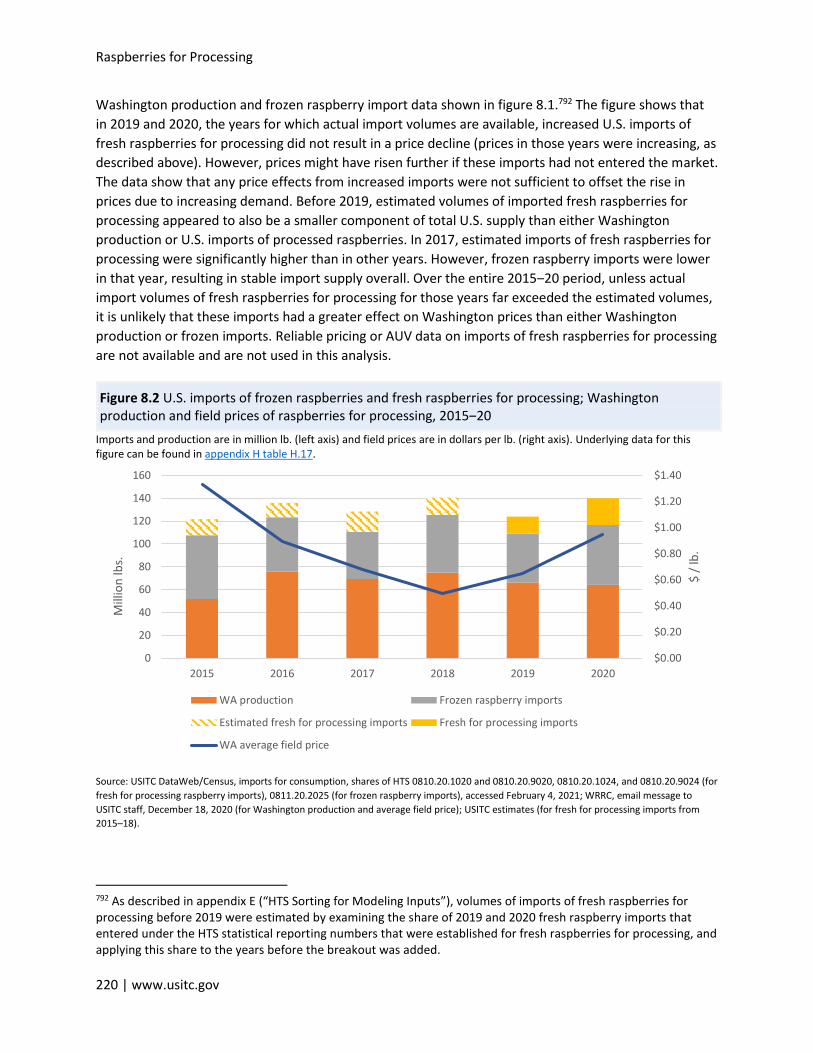
Raspberries for Processing
220 | www.usitc.gov
Washington production and frozen raspberry import data shown in figure 8.1.792 The figure shows that
in 2019 and 2020, the years for which actual import volumes are available, increased U.S. imports of
fresh raspberries for processing did not result in a price decline (prices in those years were increasing, as
described above). However, prices might have risen further if these imports had not entered the market.
The data show that any price effects from increased imports were not sufficient to offset the rise in
prices due to increasing demand. Before 2019, estimated volumes of imported fresh raspberries for
processing appeared to also be a smaller component of total U.S. supply than either Washington
production or U.S. imports of processed raspberries. In 2017, estimated imports of fresh raspberries for
processing were significantly higher than in other years. However, frozen raspberry imports were lower
in that year, resulting in stable import supply overall. Over the entire 2015‒20 period, unless actual
import volumes of fresh raspberries for processing for those years far exceeded the estimated volumes,
it is unlikely that these imports had a greater effect on Washington prices than either Washington
production or frozen imports. Reliable pricing or AUV data on imports of fresh raspberries for processing
are not available and are not used in this analysis.
Figure 8.2 U.S. imports of frozen raspberries and fresh raspberries for processing; Washington production and field prices of raspberries for processing, 2015‒20
Imports and production are in million lb. (left axis) and field prices are in dollars per lb. (right axis). Underlying data for this figure can be found in appendix H table H.17.
Source: USITC DataWeb/Census, imports for consumption, shares of HTS 0810.20.1020 and 0810.20.9020, 0810.20.1024, and 0810.20.9024 (for
fresh for processing raspberry imports), 0811.20.2025 (for frozen raspberry imports), accessed February 4, 2021; WRRC, email message to
USITC staff, December 18, 2020 (for Washington production and average field price); USITC estimates (for fresh for processing imports from
2015–18).
792 As described in appendix E (“HTS Sorting for Modeling Inputs”), volumes of imports of fresh raspberries for processing before 2019 were estimated by examining the share of 2019 and 2020 fresh raspberry imports that entered under the HTS statistical reporting numbers that were established for fresh raspberries for processing, and applying this share to the years before the breakout was added.
$0.00
$0.20
$0.40
$0.60
$0.80
$1.00
$1.20
$1.40
0
20
40
60
80
100
120
140
160
2015 2016 2017 2018 2019 2020
$ /
lb.
Mill
ion
lbs.
WA production Frozen raspberry imports
Estimated fresh for processing imports Fresh for processing imports
WA average field price
Chapter 8: Pricing Analysis: Relationship Between Imports and Prices in the U.S. Market
United States International Trade Commission | 221
Frozen Raspberries: Non-IQF
The United States imports non-IQF raspberry products mainly from Mexico and Canada, which are the
import sources used to compare U.S. imports to Washington sales prices in this section.793 According to
industry representatives, the U.S. market for straight pack frozen raspberries is characterized by
oversupply due to relatively cheap imports, and purchasers hold pricing power because of this excess
supply.794 The block frozen segment of the market was the segment of particular concern to WRRC at
the Commission hearing due to what it views as a clear effect of imports from Mexico on Washington
prices. According to WRRC, block frozen raspberries are imported from Mexico at “prices 50 to 75
percent below U.S. market prices. Such substantial underselling, particularly during harvest time, has a
very serious adverse effect on overall prices.”795
Supply and Price Trends, 2011–20
After several years of relative stability, imports of frozen raspberries from Canada and Mexico in the U.S.
market increased substantially in 2015. As noted in table 8.1, imports of frozen raspberries from Canada
and Mexico are about 60 percent and 50 percent non-IQF products, respectively, and are used in this
section to analyze the relationship between imports and prices in the non-IQF market. These imports
were purchased to partially offset the shortfall in domestic supply, which fell 23 percent between 2014
and 2015 owing to poor weather conditions.796 This shortage led to Washington straight pack frozen
raspberry prices reaching 10-year highs in 2015, despite high volumes of imports (figure 8.3).797 The
period from 2016 to 2018 was characterized by high Washington production volumes that seemed to be
correlated with declining prices, despite low-to-average volumes of imports. In 2019 and 2020,
Washington production declined while imports and prices rose.
793 As shown in table 8.1, the other major suppliers of U.S. frozen raspberry imports—Chile and Serbia—ship mostly IQF raspberries. 794 USITC, hearing transcript, September 17, 2020, 136 (testimony of Rolf Haugen, Northwest Berry Co-op). 795 USITC, hearing transcript, September 17, 2020, 13 (testimony of Brad Rader, Rader Farms). 796 Smuckers, written submission to the USITC, posthearing brief, December 4, 2020, 2; industry representative, email message to USITC staff, December 18, 2021; Relyea, “Whatcom Country Raspberry Harvest Down,” November 15, 2015. 797 Smuckers, written submission to the USITC, posthearing brief, December 4, 2020, 2.
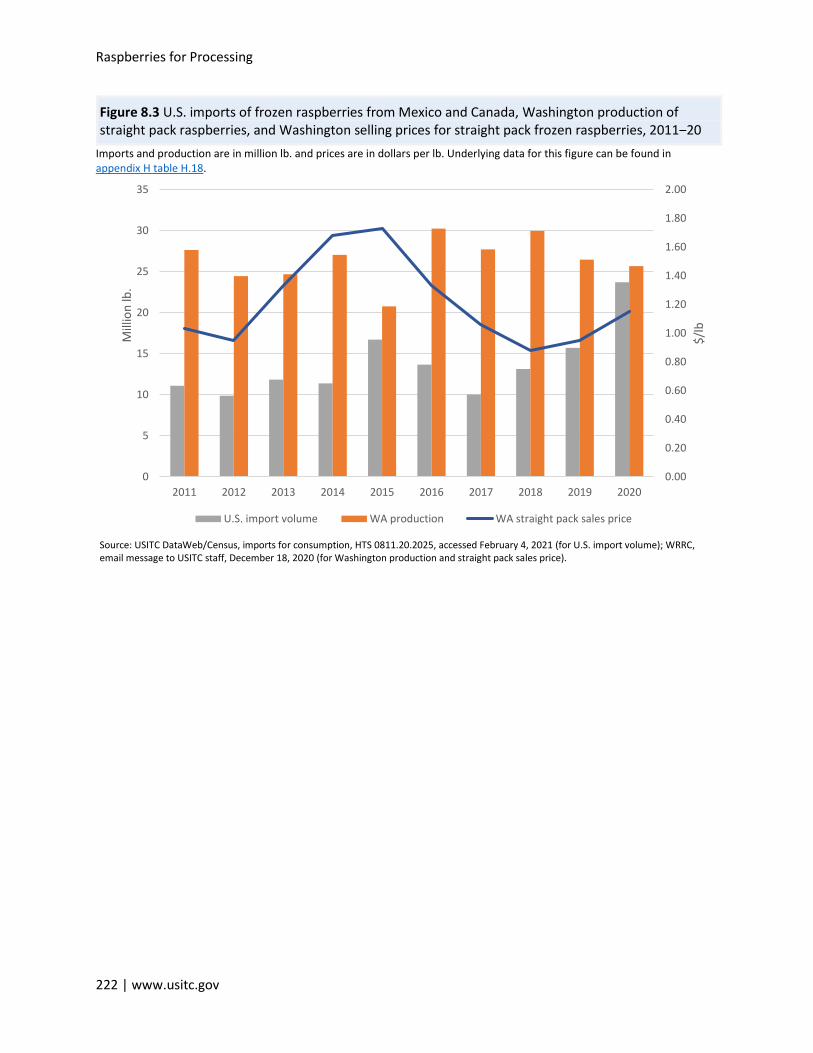
Raspberries for Processing
222 | www.usitc.gov
Figure 8.3 U.S. imports of frozen raspberries from Mexico and Canada, Washington production of straight pack raspberries, and Washington selling prices for straight pack frozen raspberries, 2011‒20
Imports and production are in million lb. and prices are in dollars per lb. Underlying data for this figure can be found in appendix H table H.18.
Source: USITC DataWeb/Census, imports for consumption, HTS 0811.20.2025, accessed February 4, 2021 (for U.S. import volume); WRRC, email message to USITC staff, December 18, 2020 (for Washington production and straight pack sales price).
0.00
0.20
0.40
0.60
0.80
1.00
1.20
1.40
1.60
1.80
2.00
0
5
10
15
20
25
30
35
2011 2012 2013 2014 2015 2016 2017 2018 2019 2020
$/l
b
Mill
ion
lb.
U.S. import volume WA production WA straight pack sales price
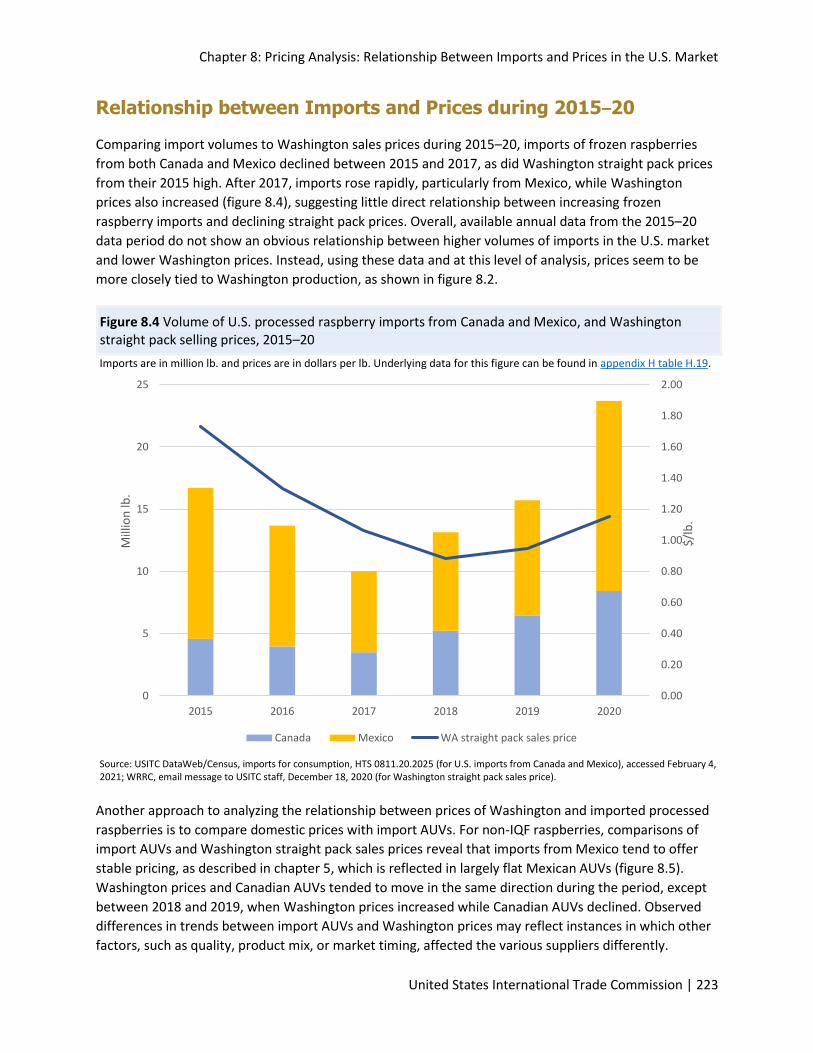
Chapter 8: Pricing Analysis: Relationship Between Imports and Prices in the U.S. Market
United States International Trade Commission | 223
Relationship between Imports and Prices during 2015–20
Comparing import volumes to Washington sales prices during 2015–20, imports of frozen raspberries
from both Canada and Mexico declined between 2015 and 2017, as did Washington straight pack prices
from their 2015 high. After 2017, imports rose rapidly, particularly from Mexico, while Washington
prices also increased (figure 8.4), suggesting little direct relationship between increasing frozen
raspberry imports and declining straight pack prices. Overall, available annual data from the 2015–20
data period do not show an obvious relationship between higher volumes of imports in the U.S. market
and lower Washington prices. Instead, using these data and at this level of analysis, prices seem to be
more closely tied to Washington production, as shown in figure 8.2.
Figure 8.4 Volume of U.S. processed raspberry imports from Canada and Mexico, and Washington straight pack selling prices, 2015–20
Imports are in million lb. and prices are in dollars per lb. Underlying data for this figure can be found in appendix H table H.19.
Source: USITC DataWeb/Census, imports for consumption, HTS 0811.20.2025 (for U.S. imports from Canada and Mexico), accessed February 4, 2021; WRRC, email message to USITC staff, December 18, 2020 (for Washington straight pack sales price).
Another approach to analyzing the relationship between prices of Washington and imported processed
raspberries is to compare domestic prices with import AUVs. For non-IQF raspberries, comparisons of
import AUVs and Washington straight pack sales prices reveal that imports from Mexico tend to offer
stable pricing, as described in chapter 5, which is reflected in largely flat Mexican AUVs (figure 8.5).
Washington prices and Canadian AUVs tended to move in the same direction during the period, except
between 2018 and 2019, when Washington prices increased while Canadian AUVs declined. Observed
differences in trends between import AUVs and Washington prices may reflect instances in which other
factors, such as quality, product mix, or market timing, affected the various suppliers differently.
0.00
0.20
0.40
0.60
0.80
1.00
1.20
1.40
1.60
1.80
2.00
0
5
10
15
20
25
2015 2016 2017 2018 2019 2020
$/l
b.
Mill
ion
lb.
Canada Mexico WA straight pack sales price
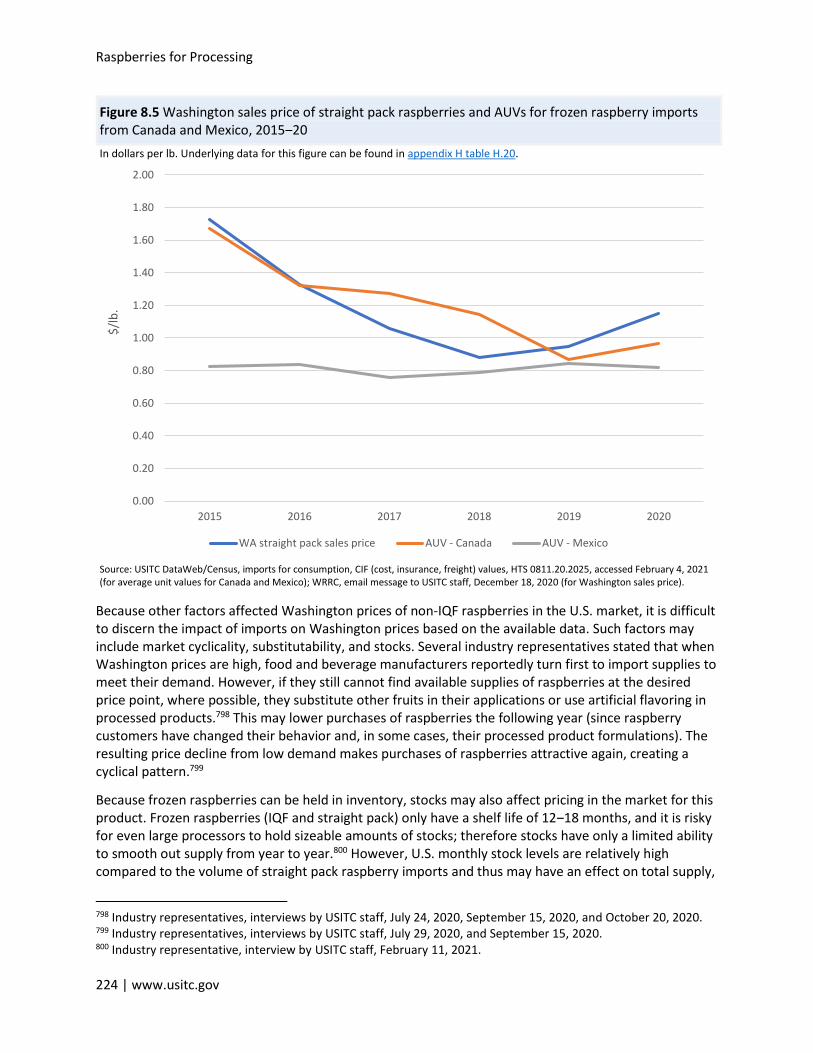
Raspberries for Processing
224 | www.usitc.gov
Figure 8.5 Washington sales price of straight pack raspberries and AUVs for frozen raspberry imports from Canada and Mexico, 2015‒20
In dollars per lb. Underlying data for this figure can be found in appendix H table H.20.
Source: USITC DataWeb/Census, imports for consumption, CIF (cost, insurance, freight) values, HTS 0811.20.2025, accessed February 4, 2021 (for average unit values for Canada and Mexico); WRRC, email message to USITC staff, December 18, 2020 (for Washington sales price).
Because other factors affected Washington prices of non-IQF raspberries in the U.S. market, it is difficult to discern the impact of imports on Washington prices based on the available data. Such factors may include market cyclicality, substitutability, and stocks. Several industry representatives stated that when Washington prices are high, food and beverage manufacturers reportedly turn first to import supplies to meet their demand. However, if they still cannot find available supplies of raspberries at the desired price point, where possible, they substitute other fruits in their applications or use artificial flavoring in processed products.798 This may lower purchases of raspberries the following year (since raspberry customers have changed their behavior and, in some cases, their processed product formulations). The resulting price decline from low demand makes purchases of raspberries attractive again, creating a cyclical pattern.799
Because frozen raspberries can be held in inventory, stocks may also affect pricing in the market for this product. Frozen raspberries (IQF and straight pack) only have a shelf life of 12‒18 months, and it is risky for even large processors to hold sizeable amounts of stocks; therefore stocks have only a limited ability to smooth out supply from year to year.800 However, U.S. monthly stock levels are relatively high compared to the volume of straight pack raspberry imports and thus may have an effect on total supply,
798 Industry representatives, interviews by USITC staff, July 24, 2020, September 15, 2020, and October 20, 2020. 799 Industry representatives, interviews by USITC staff, July 29, 2020, and September 15, 2020. 800 Industry representative, interview by USITC staff, February 11, 2021.
0.00
0.20
0.40
0.60
0.80
1.00
1.20
1.40
1.60
1.80
2.00
2015 2016 2017 2018 2019 2020
$/l
b.
WA straight pack sales price AUV - Canada AUV - Mexico
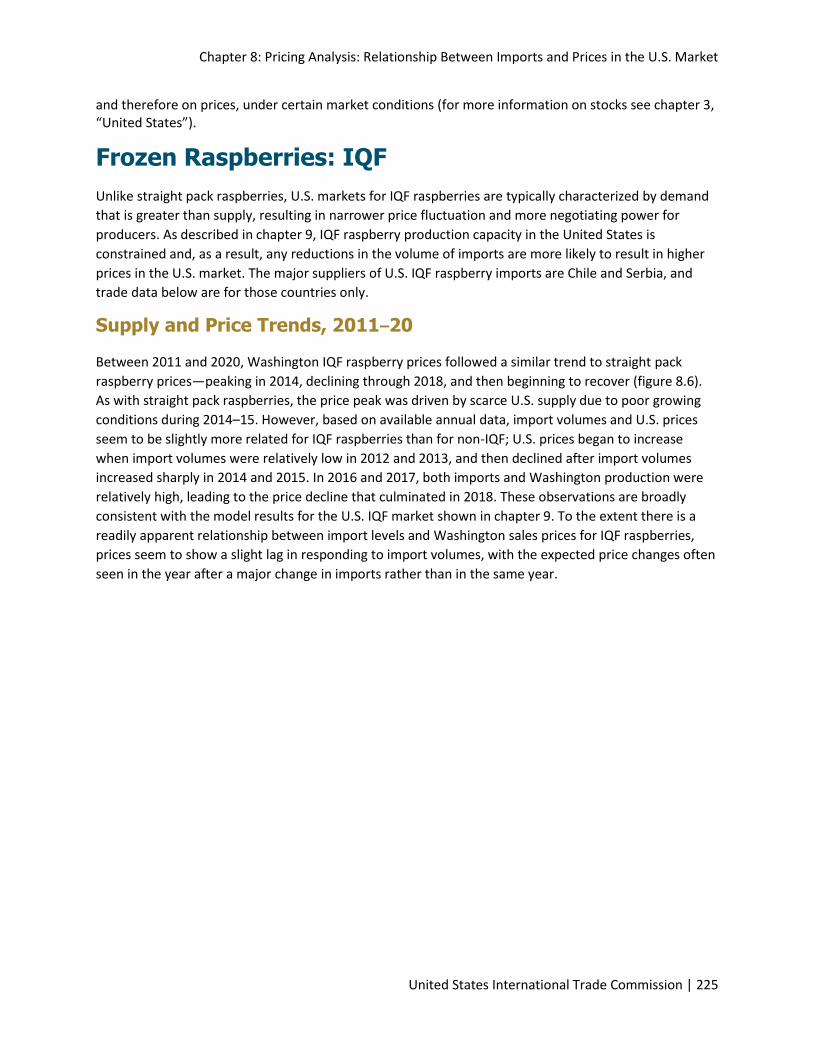
Chapter 8: Pricing Analysis: Relationship Between Imports and Prices in the U.S. Market
United States International Trade Commission | 225
and therefore on prices, under certain market conditions (for more information on stocks see chapter 3, “United States”).
Frozen Raspberries: IQF
Unlike straight pack raspberries, U.S. markets for IQF raspberries are typically characterized by demand
that is greater than supply, resulting in narrower price fluctuation and more negotiating power for
producers. As described in chapter 9, IQF raspberry production capacity in the United States is
constrained and, as a result, any reductions in the volume of imports are more likely to result in higher
prices in the U.S. market. The major suppliers of U.S. IQF raspberry imports are Chile and Serbia, and
trade data below are for those countries only.
Supply and Price Trends, 2011–20
Between 2011 and 2020, Washington IQF raspberry prices followed a similar trend to straight pack
raspberry prices—peaking in 2014, declining through 2018, and then beginning to recover (figure 8.6).
As with straight pack raspberries, the price peak was driven by scarce U.S. supply due to poor growing
conditions during 2014–15. However, based on available annual data, import volumes and U.S. prices
seem to be slightly more related for IQF raspberries than for non-IQF; U.S. prices began to increase
when import volumes were relatively low in 2012 and 2013, and then declined after import volumes
increased sharply in 2014 and 2015. In 2016 and 2017, both imports and Washington production were
relatively high, leading to the price decline that culminated in 2018. These observations are broadly
consistent with the model results for the U.S. IQF market shown in chapter 9. To the extent there is a
readily apparent relationship between import levels and Washington sales prices for IQF raspberries,
prices seem to show a slight lag in responding to import volumes, with the expected price changes often
seen in the year after a major change in imports rather than in the same year.
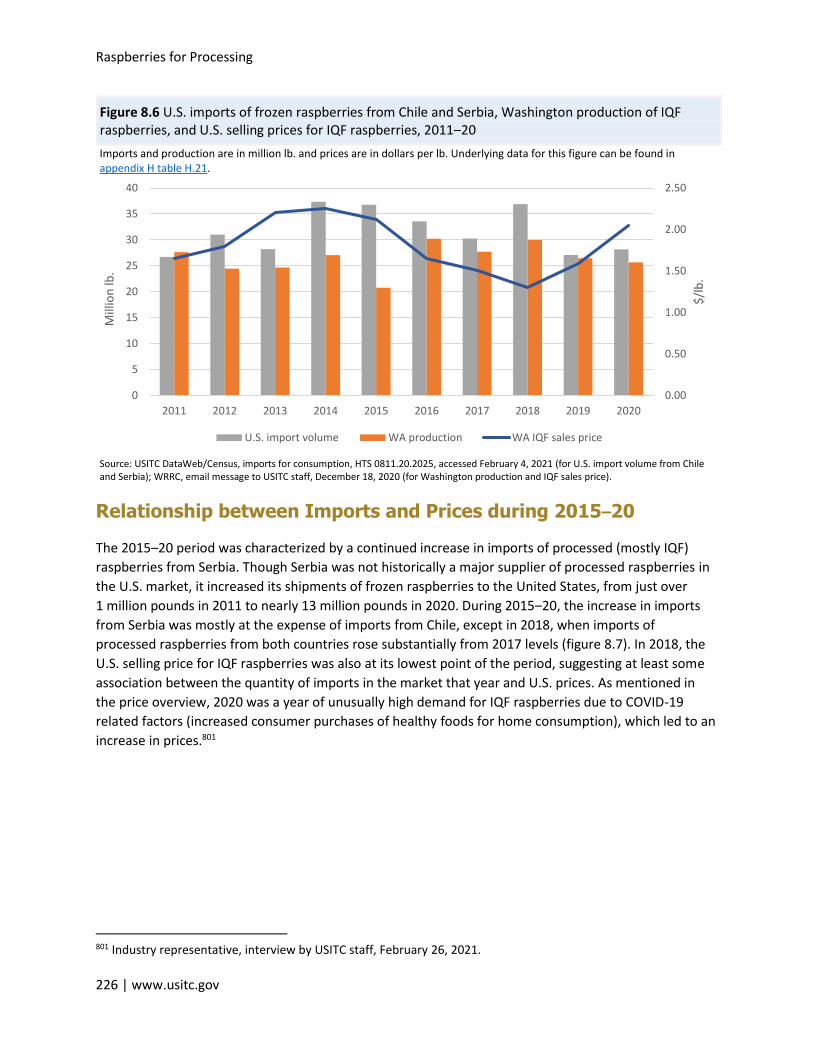
Raspberries for Processing
226 | www.usitc.gov
Figure 8.6 U.S. imports of frozen raspberries from Chile and Serbia, Washington production of IQF raspberries, and U.S. selling prices for IQF raspberries, 2011‒20
Imports and production are in million lb. and prices are in dollars per lb. Underlying data for this figure can be found in appendix H table H.21.
Source: USITC DataWeb/Census, imports for consumption, HTS 0811.20.2025, accessed February 4, 2021 (for U.S. import volume from Chile and Serbia); WRRC, email message to USITC staff, December 18, 2020 (for Washington production and IQF sales price).
Relationship between Imports and Prices during 2015–20
The 2015–20 period was characterized by a continued increase in imports of processed (mostly IQF)
raspberries from Serbia. Though Serbia was not historically a major supplier of processed raspberries in
the U.S. market, it increased its shipments of frozen raspberries to the United States, from just over
1 million pounds in 2011 to nearly 13 million pounds in 2020. During 2015‒20, the increase in imports
from Serbia was mostly at the expense of imports from Chile, except in 2018, when imports of
processed raspberries from both countries rose substantially from 2017 levels (figure 8.7). In 2018, the
U.S. selling price for IQF raspberries was also at its lowest point of the period, suggesting at least some
association between the quantity of imports in the market that year and U.S. prices. As mentioned in
the price overview, 2020 was a year of unusually high demand for IQF raspberries due to COVID-19
related factors (increased consumer purchases of healthy foods for home consumption), which led to an
increase in prices.801
801 Industry representative, interview by USITC staff, February 26, 2021.
0.00
0.50
1.00
1.50
2.00
2.50
0
5
10
15
20
25
30
35
40
2011 2012 2013 2014 2015 2016 2017 2018 2019 2020
$/l
b.
Mill
ion
lb.
U.S. import volume WA production WA IQF sales price

Chapter 8: Pricing Analysis: Relationship Between Imports and Prices in the U.S. Market
United States International Trade Commission | 227
Figure 8.7 U.S. imports of frozen raspberries from Chile and Serbia and Washington selling prices for IQF raspberries, 2015‒20
Imports are in million lb. and prices are in dollars per lb. Underlying data for this figure can be found in appendix H table H.22.
Source: USITC DataWeb/Census, imports for consumption, HTS 0811.20.2025, accessed February 4, 2021 (for U.S. import volume from Chile and Serbia); WRRC, email message to USITC staff, December 18, 2020 (for Washington IQF sales price).
Prices for IQF raspberries from Washington, Chile, and Serbia appear to be closely linked, despite the slight shift in supply from Chile to Serbia. AUVs for processed raspberry imports from Chile and Serbia generally tracked Washington selling prices during 2015‒20 (figure 8.8), with all three prices moving in the same direction most years. According to one industry representative at the Commission hearing, U.S., Chilean, and Serbian producers of IQF raspberries all face similar challenges from increasing price pressure that has reduced profitability, and farms producing raspberries for processing have gone out of business in all three countries as a result.802
802 USITC, hearing transcript, September 17, 2020, 129 (testimony of John Tentomas, Nature's Touch).
0.00
0.50
1.00
1.50
2.00
2.50
0
5
10
15
20
25
30
35
40
2015 2016 2017 2018 2019 2020
$/l
b.
Mill
ion
po
un
ds
Chile Serbia WA IQF sales price
Raspberries for Processing
228 | www.usitc.gov
Figure 8.8 Import AUVs of frozen raspberries from Chile and Serbia and Washington selling prices for IQF raspberries, 2015‒20
In dollars per lb. Underlying data for this figure can be found in appendix H table H.23
Source: USITC DataWeb/Census, imports for consumption, CIF (cost, insurance, freight) values, HTS 0811.20.2025, accessed February 4, 2021 (for import AUVs of frozen raspberries from Chile and Serbia); WRRC, email message to USITC staff, December 18, 2020 (for Washington IQF sales price).
Seasonality plays a larger role in prices for IQF raspberries, especially since the largest import supplier
(Chile) has a different growing season from that in Washington, while Serbia has much the same
growing season. U.S. monthly import data show imports of frozen raspberries from Serbia tend to arrive
shortly after the Washington harvest period, when U.S. stocks are highest, whereas imports from Chile
tend to arrive in higher quantities during the period when U.S. stocks are drawing down (as described in
chapter 3). As a result, it is possible that imports from Serbia have a greater effect on Washington prices
than imports from Chile since they are more likely to compete directly with Washington domestic
supplies.
0.00
0.50
1.00
1.50
2.00
2.50
2015 2016 2017 2018 2019 2020
$/l
b.
Frozen AUV - Chile Frozen AUV - Serbia WA sales price
Chapter 8: Pricing Analysis: Relationship Between Imports and Prices in the U.S. Market
United States International Trade Commission | 229
Bibliography
Food Tank. “COVID-19 Spurs Demand in the Frozen Food Industry,” February 2021. https://foodtank.com/news/2021/02/covid-spurs-demand-in-the-frozen-food-industry/#:~:text=%E2%80%9CUnited%20States%20based%20frozen%20food,pandemic%20are%20now%20doing%20so.
Government of Canada. Province of British Columbia. “A Global Export Market Overview,” 2010. https://www2.gov.bc.ca/assets/gov/farming-natural-resources-and-industry/agriculture-and-seafood/statistics/exports/global_export_market_bcraspberries.pdf.
Relyea, Kim. “Whatcom Country Raspberry Harvest Down.” The Bellingham Herald, November 15, 2015. https://www.bellinghamherald.com/news/local/article44810784.html.
Smuckers. Written submission to the U.S. International Trade Commission in connection with Inv. No. 332-577, Raspberries for Processing: Conditions of Competition between U.S. and Foreign Suppliers, with a Focus on Washington State, December 4, 2020.
U.S. International Trade Commission (USITC). Hearing transcript in connection with inv. no. 332-577, Raspberries for Processing: Conditions of Competition between U.S. and Foreign Suppliers, with a Focus on Washington State, September 17, 2020.

230 | www.usitc.gov
Chapter 9: Economic Impacts of Imports
U.S. International Trade Commission | 231
Chapter 9 Economic Impacts of Imports Individually quick frozen (IQF) and non-IQF raspberries (fresh for processing, block frozen, puree, and
juice concentrate) face very different environments in terms of production and competition.803 Whereas
the previous chapters compare the competitive position of Washington State with those of U.S. top
import suppliers of processed raspberries and fresh raspberries for processing, this chapter quantifies
the impacts of imported raspberries on the prices and production of producers in Washington based on
data from 2010–20. The model only covers U.S. production of IQF and non-IQF raspberries produced in
Washington, and not California or Oregon due to data limitations.804 Observing that both markets
experienced surges in the growth rates of imports during the 2010–2015 period, the partial equilibrium
models simulate counterfactual scenarios in which the surges did not occur and the growth rates of
imports of IQF and non-IQF raspberries are reduced. The surge in growth rates had a lasting effect after
2015; import levels of IQF and non-IQF raspberries did not return to earlier levels. Thus, without the
surge, imports of these products are reduced both during the surge years and over the latter part of the
period modeled. The full period is used to estimate the model, but the model results focus on the most
recent five years, i.e., 2016–20.
Modeling results show that for both the IQF and non-IQF markets, reducing imports would have
increased revenue (i.e., gross sales) for Washington processors. The non-IQF market faced faster-
growing import competition than the IQF market during the period of analysis. The simulated reduction
in imports in this market from actual levels, results in estimated prices and production of non-IQF
raspberries from Washington that are much higher than those observed in the actual market in 2016–
20. The estimated impact in the IQF market by the counterfactual reduction in imports was less over the
period of analysis. In those years, domestic revenue from IQF raspberries would have been higher. Due
to capacity constraints in the production of IQF raspberries, that increased revenue would have mostly
come through higher prices, with smaller effects on production levels.
The results in this chapter are complementary but not directly comparable to the pricing analysis in
chapter 8. Chapter 8 analyzes observed changes and trends in pricing data for raspberries for
processing. These models hold all things constant except the quantity of imported raspberries for
processing, allowing the Washington market to adapt with changes in prices and quantities.805 In both
chapters 8 and 9, Washington prices in the IQF market are found to be relatively responsive to imports.
803 As discussed in chapter 1, IQF raspberry products include whole berries, products with varying percentages of whole and broken raspberries, and crumbles of raspberries; non-IQF raspberry products include straight- and sugar-packed raspberries and purees, and juice. Non-IQF raspberry products also include fresh raspberries intended for processing, which is further explained in appendix E. Throughout this chapter, IQF and non-IQF raspberries refer only to processed raspberries and raspberries for processing, not raspberries for the fresh market. 804 Domestic data on U.S. production of IQF and non-IQF raspberries are limited. Only data for Washington production, provided by the Washington Red Raspberry Commission, were used to calibrate the models presented in this chapter. 805 The changes should be interpreted as short-run effects, as the model does not incorporate dynamic features. Chapter 8 discusses the role of lagged responses to price changes, which do not occur in the static models.
Raspberries for Processing
232 | www.usitc.gov
Data availability limits the chapter 8 pricing analysis to specific subsets of non-IQF products, whereas the
modeling for this chapter incorporates all non-IQF products, limiting direct comparisons between the
two chapters for those products. The primary results of the models are the simulated Washington
shares of the value of total sales. Levels of revenue, production, and prices are evaluated in the context
of the model, with discussion in the chapter and in appendix F on how additional considerations would
likely impact the precise values of those estimates.
Model Description
The quantitative analysis in this report uses separate partial equilibrium models806 for the IQF and non-
IQF raspberry markets. Both models use three parameters that are held constant across all years: a
constant elasticity of substitution between foreign and Washington sources, a price elasticity of total
demand, and one of the supply function parameters. All other model parameters are year specific.807
While the models for the two markets are similar, both have some unique features due to differences in
the supply and demand between IQF and non-IQF raspberries. The IQF model uses a capacity-
constrained marginal cost function to account for the limited IQF freezing capacity in the Washington
industry. Given the market features described in chapter 3, information from industry representatives,
and limited availability of data, the Washington IQF sector of the market is modeled using a monopoly
pricing structure as an approximation of the market. The non-IQF model uses constant price elasticity of
supply and perfectly competitive pricing for the Washington market.808
Both models assume that the historical surge in imports was driven by supply conditions in the exporting
countries, not by price changes in the U.S. market. This assumption is reasonable for non-IQF raspberry
imports based on staff analysis as well as public hearing testimony and industry interviews. In particular,
Mexico is the largest source of non-IQF raspberry imports to the United States. Non-price factors
affected the increased non-IQF raspberry imports from Mexico to the United States. This is because the
supply of raspberries for processing is the byproduct of the production of raspberries for fresh
consumption. Given that and the fact that the price for fresh raspberries for consumption is so much
higher than the price of raspberries for processing, the quantities of raspberries grown in Mexico and
then exported to the United States as raspberries for processing are responding to factors other than
the price of raspberries for processing.809 The IQF model uses the same assumption, although there is
little evidence that IQF imports should be insensitive to price. However, the construction of the
806 Partial equilibrium models estimate the way a market might react to changes in policy, technology, or other factors, holding other markets or features of the overall economy constant. 807 The markets are modeled using different forms of supply functions, but each function is characterized by two parameters. One parameter is held constant across years and is set by USITC staff based on qualitative market features. The other parameter is calibrated each year. More details about the estimation and calibration of model parameters can be found in appendix F. 808 The capacity constraint for IQF raspberries is applied due to the specialized equipment required for the IQF process and the limited excess capacity of that equipment. While the production of non-IQF raspberries is constrained by land dedicated to growing raspberries for processing, this constraint is assumed to not bind production within the model for the reasons explained in appendix F. 809 The United States also imports non-IQF raspberries from Canada and other countries, but Mexico is the biggest source; as such, the models apply the assumption that imports respond to changes in the exporting country, not price changes in the United States to imports from all countries.
Chapter 9: Economic Impacts of Imports
U.S. International Trade Commission | 233
simulation scenario means the import supply function would have limited impact on results for the
Washington market.810 This modeling assumption means that prices of IQF and non-IQF raspberries in
the United States respond to changes in the quantity of imports, but the quantity of imports will not
respond to changes in U.S. prices—in other words, the interaction only goes one way.
After the models are calibrated using actual trade and sales data and the parameters described above,
the models are used to simulate the impact of reducing U.S. imports of raspberries for processing and
processed raspberries beginning in 2012 and continuing through 2020. The simulation allows
Washington prices and production and import prices to adjust to a new equilibrium with the lower
quantity of imports.811
Modeling Limitations
Some of the assumptions used in these models are shaped by data availability. For example, products
had to be aggregated into IQF and non-IQF categories, but the makeup of non-IQF products is not the
same across Washington and import data. Commission staff used product and country information to
map 10-digit statistical reporting numbers of the Harmonized Tariff Schedule of the United States (HTS)
in the import data to the IQF and non-IQF categories.812 Model parameters allow for differences in
product quality to account for differences between Washington and imported products.
In addition, due to limitations in data on investment and dynamic features of the market, the model is
static, i.e. it estimates and simulates each year separately. Thus, the models do not account for any
increased investment that may have occurred due to higher prices and led to increased domestic
production in later years. In particular, this limits the IQF model due to the constraint put on capacity.
For instance, investment in IQF machinery might have increased if IQF prices had been higher, which
could have raised maximum IQF capacity in later years in the model.813 The non-IQF model is also static,
but unlike the IQF model, capacity constraints are not imposed. The static nature of the model does not
take into account that available acreage is an important factor limiting production and is strongly
influenced by acreage in previous years. This means that in years of the simulation where Washington
production greatly increases, ignoring the current year’s production limitations based on prior years’
capacity will lead to an overestimate of increases in production but underestimate of increases in price.
However, the results focus on later years in the period, when actual imports (and as a result, simulated
Washington production) do not see a big increase between years, so this limitation would not have a big
effect on the results in the years of interest.814 These assumptions are discussed in greater detail in
appendix F, along with the limitations resulting from these assumptions.
810 The simulation reduces the quantity of raspberry imports and lets prices for those imports adapt. While the model uses an inelastic supply function, the same quantities could be generated in the simulation with an elastic supply function by adjusting marginal costs. 811 Additional results, robustness checks, and alternate specifications are presented in appendix F. 812 This process is detailed in appendix E of this report. 813 More details regarding model and data limitations are discussed in appendix F. 814 This limitation is discussed in more detail in appendix F.
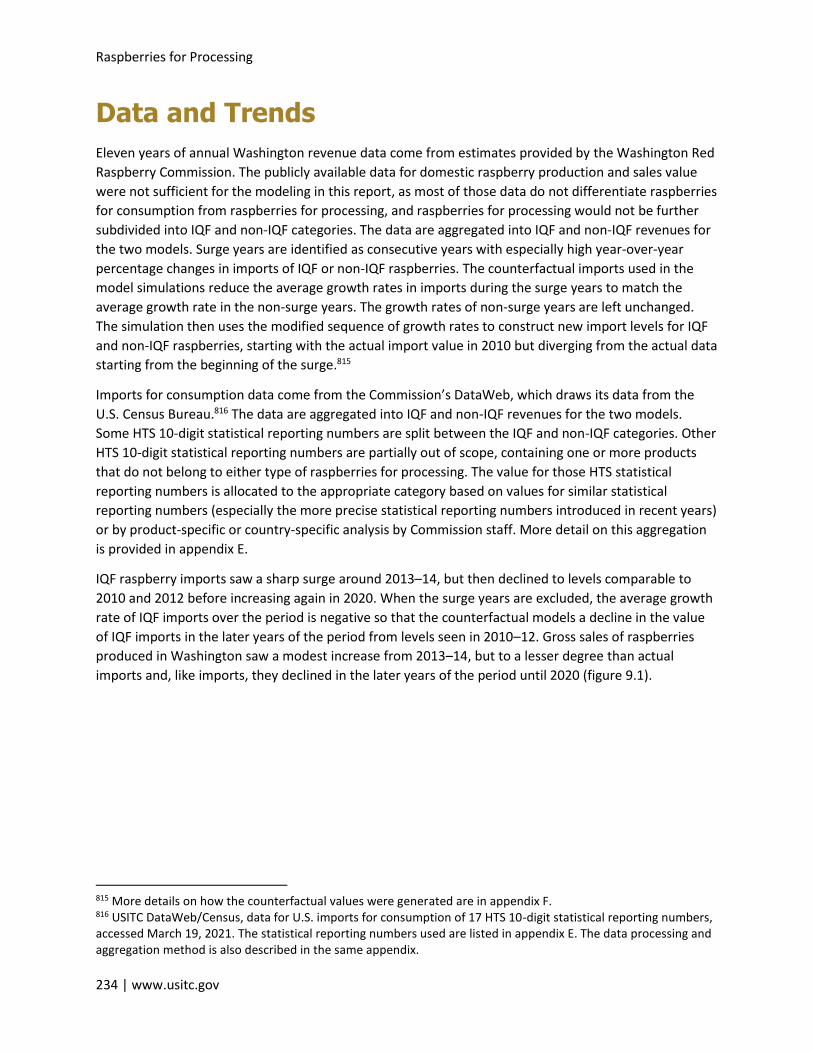
Raspberries for Processing
234 | www.usitc.gov
Data and Trends
Eleven years of annual Washington revenue data come from estimates provided by the Washington Red
Raspberry Commission. The publicly available data for domestic raspberry production and sales value
were not sufficient for the modeling in this report, as most of those data do not differentiate raspberries
for consumption from raspberries for processing, and raspberries for processing would not be further
subdivided into IQF and non-IQF categories. The data are aggregated into IQF and non-IQF revenues for
the two models. Surge years are identified as consecutive years with especially high year-over-year
percentage changes in imports of IQF or non-IQF raspberries. The counterfactual imports used in the
model simulations reduce the average growth rates in imports during the surge years to match the
average growth rate in the non-surge years. The growth rates of non-surge years are left unchanged.
The simulation then uses the modified sequence of growth rates to construct new import levels for IQF
and non-IQF raspberries, starting with the actual import value in 2010 but diverging from the actual data
starting from the beginning of the surge.815
Imports for consumption data come from the Commission’s DataWeb, which draws its data from the
U.S. Census Bureau.816 The data are aggregated into IQF and non-IQF revenues for the two models.
Some HTS 10-digit statistical reporting numbers are split between the IQF and non-IQF categories. Other
HTS 10-digit statistical reporting numbers are partially out of scope, containing one or more products
that do not belong to either type of raspberries for processing. The value for those HTS statistical
reporting numbers is allocated to the appropriate category based on values for similar statistical
reporting numbers (especially the more precise statistical reporting numbers introduced in recent years)
or by product-specific or country-specific analysis by Commission staff. More detail on this aggregation
is provided in appendix E.
IQF raspberry imports saw a sharp surge around 2013–14, but then declined to levels comparable to
2010 and 2012 before increasing again in 2020. When the surge years are excluded, the average growth
rate of IQF imports over the period is negative so that the counterfactual models a decline in the value
of IQF imports in the later years of the period from levels seen in 2010–12. Gross sales of raspberries
produced in Washington saw a modest increase from 2013–14, but to a lesser degree than actual
imports and, like imports, they declined in the later years of the period until 2020 (figure 9.1).
815 More details on how the counterfactual values were generated are in appendix F. 816 USITC DataWeb/Census, data for U.S. imports for consumption of 17 HTS 10-digit statistical reporting numbers, accessed March 19, 2021. The statistical reporting numbers used are listed in appendix E. The data processing and aggregation method is also described in the same appendix.
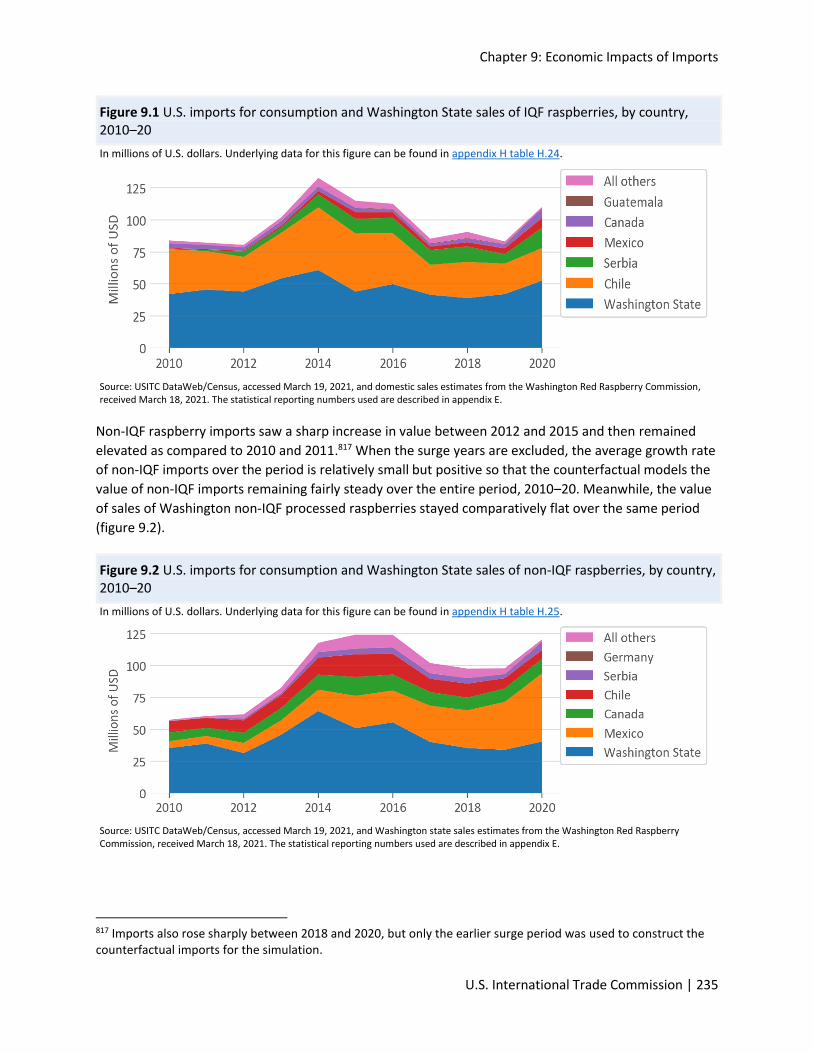
Chapter 9: Economic Impacts of Imports
U.S. International Trade Commission | 235
Figure 9.1 U.S. imports for consumption and Washington State sales of IQF raspberries, by country, 2010–20
In millions of U.S. dollars. Underlying data for this figure can be found in appendix H table H.24.
Source: USITC DataWeb/Census, accessed March 19, 2021, and domestic sales estimates from the Washington Red Raspberry Commission, received March 18, 2021. The statistical reporting numbers used are described in appendix E.
Non-IQF raspberry imports saw a sharp increase in value between 2012 and 2015 and then remained
elevated as compared to 2010 and 2011.817 When the surge years are excluded, the average growth rate
of non-IQF imports over the period is relatively small but positive so that the counterfactual models the
value of non-IQF imports remaining fairly steady over the entire period, 2010–20. Meanwhile, the value
of sales of Washington non-IQF processed raspberries stayed comparatively flat over the same period
(figure 9.2).
Figure 9.2 U.S. imports for consumption and Washington State sales of non-IQF raspberries, by country, 2010–20
In millions of U.S. dollars. Underlying data for this figure can be found in appendix H table H.25.
Source: USITC DataWeb/Census, accessed March 19, 2021, and Washington state sales estimates from the Washington Red Raspberry Commission, received March 18, 2021. The statistical reporting numbers used are described in appendix E.
817 Imports also rose sharply between 2018 and 2020, but only the earlier surge period was used to construct the counterfactual imports for the simulation.
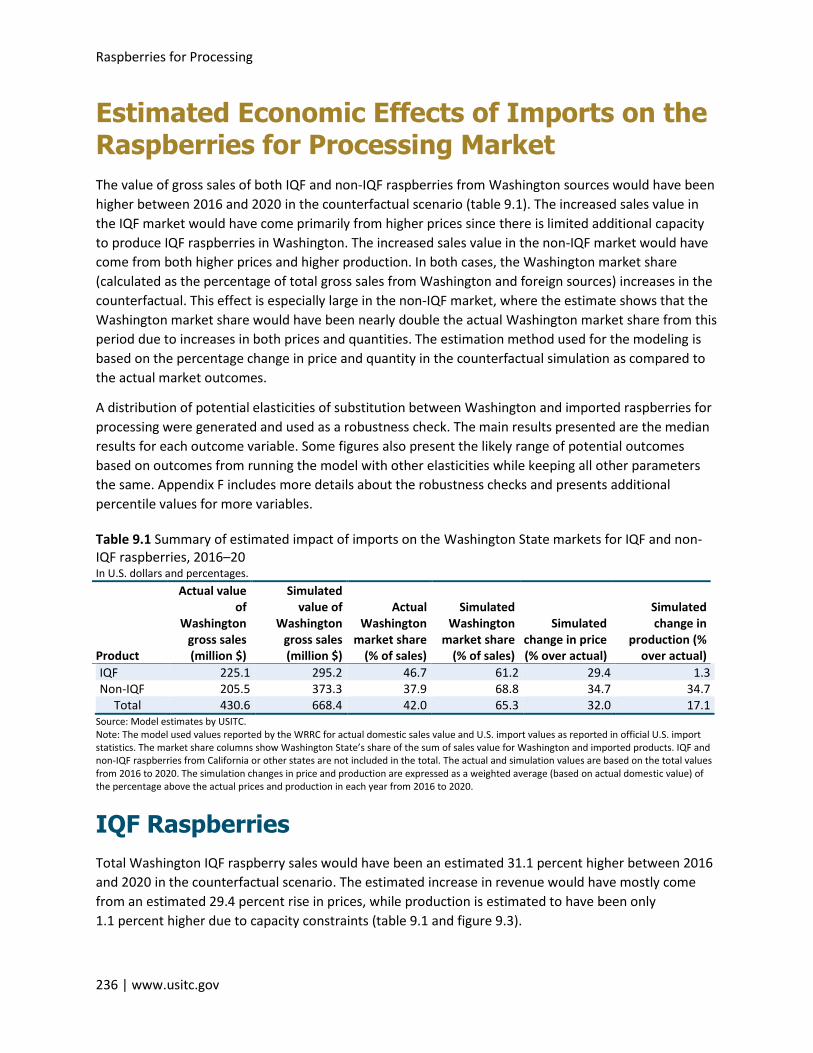
Raspberries for Processing
236 | www.usitc.gov
Estimated Economic Effects of Imports on the Raspberries for Processing Market
The value of gross sales of both IQF and non-IQF raspberries from Washington sources would have been
higher between 2016 and 2020 in the counterfactual scenario (table 9.1). The increased sales value in
the IQF market would have come primarily from higher prices since there is limited additional capacity
to produce IQF raspberries in Washington. The increased sales value in the non-IQF market would have
come from both higher prices and higher production. In both cases, the Washington market share
(calculated as the percentage of total gross sales from Washington and foreign sources) increases in the
counterfactual. This effect is especially large in the non-IQF market, where the estimate shows that the
Washington market share would have been nearly double the actual Washington market share from this
period due to increases in both prices and quantities. The estimation method used for the modeling is
based on the percentage change in price and quantity in the counterfactual simulation as compared to
the actual market outcomes.
A distribution of potential elasticities of substitution between Washington and imported raspberries for
processing were generated and used as a robustness check. The main results presented are the median
results for each outcome variable. Some figures also present the likely range of potential outcomes
based on outcomes from running the model with other elasticities while keeping all other parameters
the same. Appendix F includes more details about the robustness checks and presents additional
percentile values for more variables.
Table 9.1 Summary of estimated impact of imports on the Washington State markets for IQF and non-IQF raspberries, 2016–20 In U.S. dollars and percentages.
Product
Actual value of
Washington gross sales (million $)
Simulated value of
Washington gross sales (million $)
Actual Washington
market share (% of sales)
Simulated Washington
market share (% of sales)
Simulated change in price (% over actual)
Simulated change in
production (% over actual)
IQF 225.1 295.2 46.7 61.2 29.4 1.3 Non-IQF 205.5 373.3 37.9 68.8 34.7 34.7
Total 430.6 668.4 42.0 65.3 32.0 17.1 Source: Model estimates by USITC. Note: The model used values reported by the WRRC for actual domestic sales value and U.S. import values as reported in official U.S. import statistics. The market share columns show Washington State’s share of the sum of sales value for Washington and imported products. IQF and non-IQF raspberries from California or other states are not included in the total. The actual and simulation values are based on the total values from 2016 to 2020. The simulation changes in price and production are expressed as a weighted average (based on actual domestic value) of the percentage above the actual prices and production in each year from 2016 to 2020.
IQF Raspberries
Total Washington IQF raspberry sales would have been an estimated 31.1 percent higher between 2016
and 2020 in the counterfactual scenario. The estimated increase in revenue would have mostly come
from an estimated 29.4 percent rise in prices, while production is estimated to have been only
1.1 percent higher due to capacity constraints (table 9.1 and figure 9.3).
Chapter 9: Economic Impacts of Imports
U.S. International Trade Commission | 237
Figure 9.3 Simulation of Washington IQF production and prices, 2010–20
In percent over actual. Underlying data for this figure can be found in appendix table H.26.
Source: USITC calculations from model simulations. Note: Simulation production and prices are displayed as percentages over the actual production and prices for each year. The box and whiskers plots show the distribution of likely outcomes for each year. The middle line shows the median result, with the box bounding the 25th through 75th percentiles and the whiskers bounding the maximum and minimum. See appendix F for details on how the confidence intervals were generated.
Non-IQF Raspberries
On average, total Washington non-IQF raspberry sales between 2016 and 2020 would have been an
estimated 81.7 percent higher in the counterfactual scenario. This increase in revenue is estimated to
have come from 34.7 percent higher prices and production (table 9.1 and figure 9.4). The fact that the
percentage changes in prices and production are identical is due to the assumption that the value
change was split equally between output and prices.818
818 This limitation, along with other model assumptions, is discussed in appendix F.
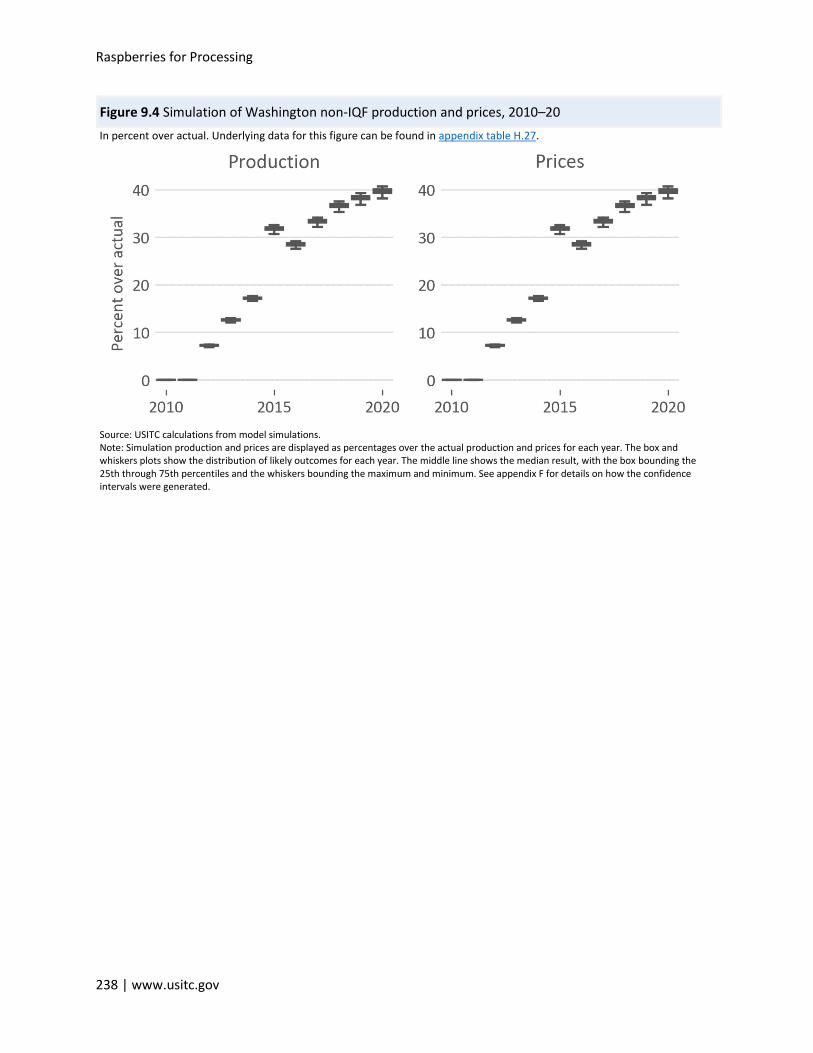
Raspberries for Processing
238 | www.usitc.gov
Figure 9.4 Simulation of Washington non-IQF production and prices, 2010–20
In percent over actual. Underlying data for this figure can be found in appendix table H.27.
Source: USITC calculations from model simulations. Note: Simulation production and prices are displayed as percentages over the actual production and prices for each year. The box and whiskers plots show the distribution of likely outcomes for each year. The middle line shows the median result, with the box bounding the 25th through 75th percentiles and the whiskers bounding the maximum and minimum. See appendix F for details on how the confidence intervals were generated.
Appendix A: Request Letter
United States International Trade Commission | 239
Appendix A Request Letter

240 | www.usitc.gov
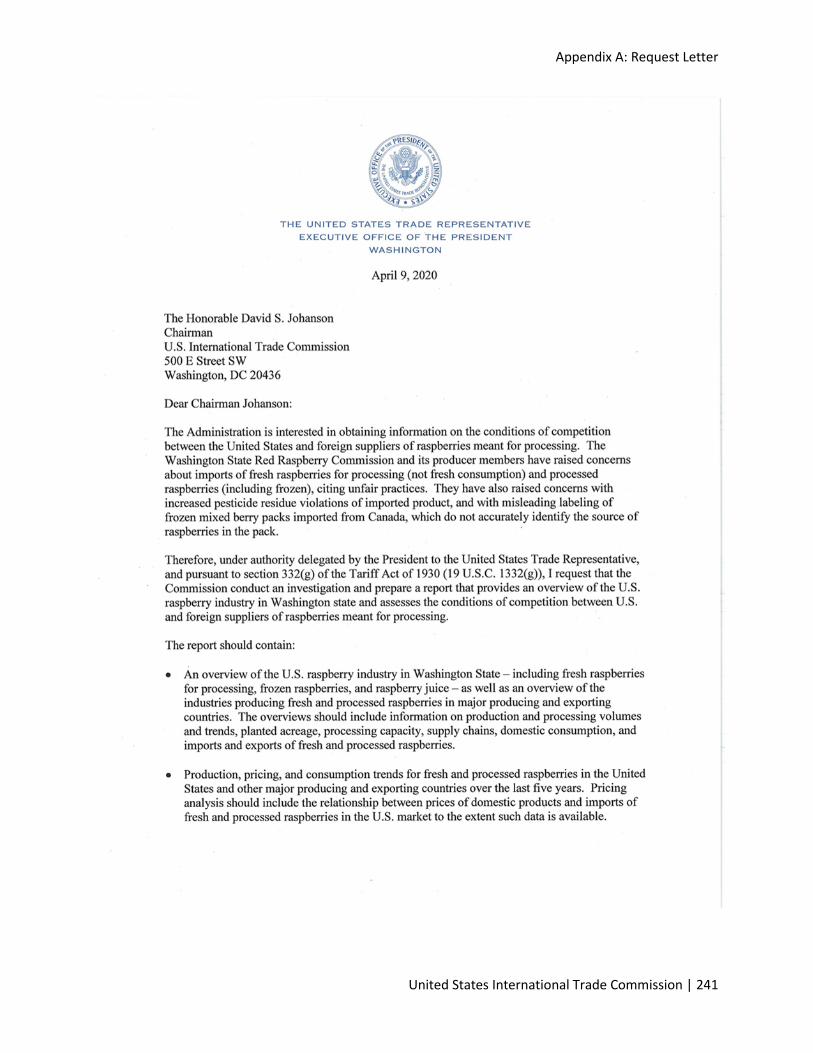
Appendix A: Request Letter
United States International Trade Commission | 241
Raspberries for Processing
242 | www.usitc.gov

Appendix B: Federal Register Notices
United States International Trade Commission | 243
Appendix B Federal Register Notices

244 | www.usitc.gov
Appendix B: Federal Register Notices
United States International Trade Commission | 245
Raspberries for Processing
246 | www.usitc.gov
Appendix B: Federal Register Notices
United States International Trade Commission | 247

248 | www.usitc.gov

Appendix C: Calendar of Hearing Witnesses
United States International Trade Commission | 249
Appendix C Calendar of Hearing Witnesses

250 | www.usitc.gov
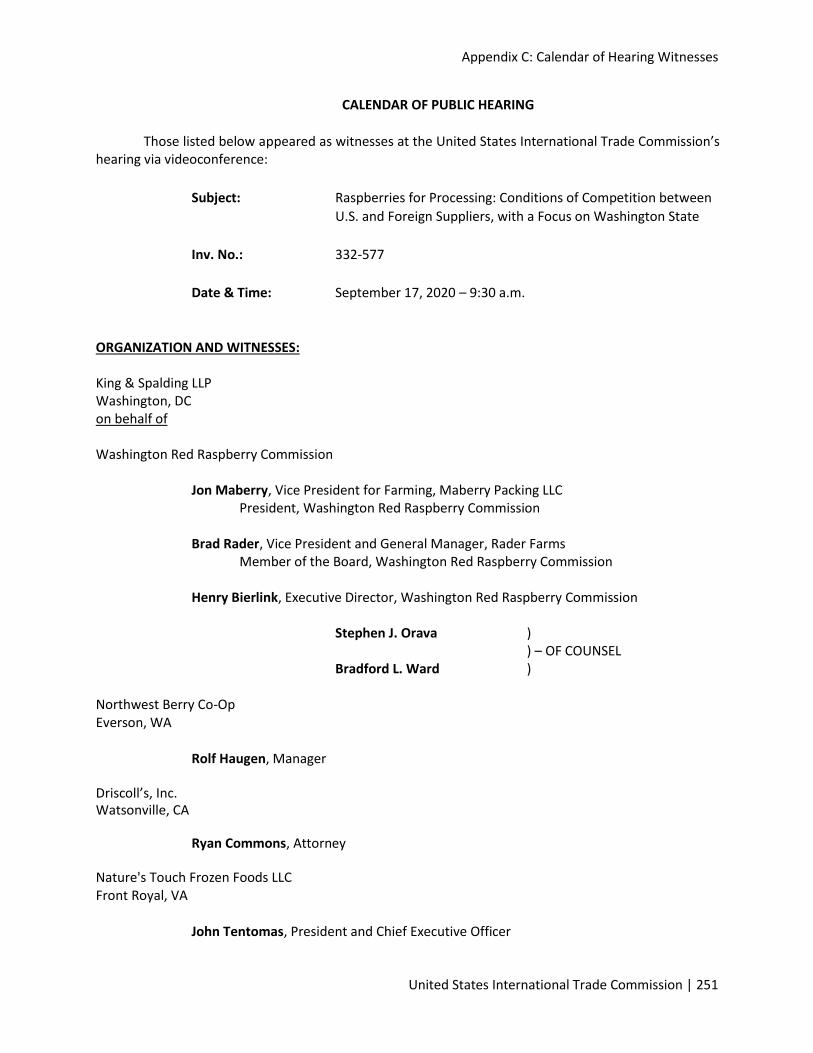
Appendix C: Calendar of Hearing Witnesses
United States International Trade Commission | 251
CALENDAR OF PUBLIC HEARING
Those listed below appeared as witnesses at the United States International Trade Commission’s
hearing via videoconference:
Subject: Raspberries for Processing: Conditions of Competition between
U.S. and Foreign Suppliers, with a Focus on Washington State
Inv. No.: 332-577
Date & Time: September 17, 2020 – 9:30 a.m.
ORGANIZATION AND WITNESSES: King & Spalding LLP Washington, DC on behalf of Washington Red Raspberry Commission
Jon Maberry, Vice President for Farming, Maberry Packing LLC President, Washington Red Raspberry Commission
Brad Rader, Vice President and General Manager, Rader Farms
Member of the Board, Washington Red Raspberry Commission
Henry Bierlink, Executive Director, Washington Red Raspberry Commission
Stephen J. Orava ) ) – OF COUNSEL
Bradford L. Ward ) Northwest Berry Co-Op Everson, WA
Rolf Haugen, Manager Driscoll’s, Inc. Watsonville, CA Ryan Commons, Attorney Nature's Touch Frozen Foods LLC Front Royal, VA
John Tentomas, President and Chief Executive Officer
Raspberries for Processing
252 | www.usitc.gov
ORGANIZATION AND WITNESSES: Fresh Produce Association of the Americas Nogales, AZ
Lance Jungmeyer, President Cameron LLP Washington, DC on behalf of Aneberries, A.C.
Tony Miller, President, Cascade International Foods, Inc. Jean-Christophe Hesteau, Managing Director, Mexico for SunOpta Inc.
Thomas Skilton ) – OF COUNSEL Chilean Food Processing Companies Association (“Chilealimentos”) Metropolitana, Chile
Pablo Herrera G., Commercial Director of JCP Foods, Member of Chilealimentos
International Raspberry Organization Santiago, Chile
Antonio Dominguez, President
-END-

Appendix D: Summary of Views of Interested Parties
United States International Trade Commission | 253
Appendix D Summary of Views of Interested Parties

254 | www.usitc.gov
Appendix D: Summary of Views of Interested Parties
United States International Trade Commission | 255
Positions of Interested Parties
Interested parties had the opportunity to file written submissions to the Commission in the course of this investigation and to provide summaries of the positions expressed in the submissions for inclusion in this report. This appendix contains these written summaries, provided that they meet certain requirements set out in the notice of investigation. The Commission has not edited these summaries. A copy of all written submissions is available in the Commission’s Electronic Docket Information System (EDIS), https://www.edis.usitc.gov. The Commission also held a public hearing in connection with this investigation on September 3, 2020, on a virtual platform. The full text of the transcript of the Commission’s hearing is also available on EDIS.
Written Submissions
Government of Canada
The Government of Canada (Canada) welcomes the opportunity to provide this submission to the
United States International Trade Commission (the “Commission”) as part of the Commission’s
investigation into Raspberries for Processing: Conditions of Competition Between U.S. and Foreign
Suppliers, With a Focus on Washington State. In this submission, we describe how Canada’s raspberry
industry has seen decreasing production in the last decade as a result of factors such as increasing input
costs, strong global competition and challenging weather conditions.
We understand that these are circumstances also facing the raspberry industry in the United States. As
per the Commission’s request, Canada has also provided information regarding its labelling regulations
or policies and information on government support provided at the federal level. We trust that this
submission will assist the Commission in gaining a better understanding of the overall structure of
Canada’s raspberry industry, with a particular focus on exports to the United States and related
conditions of competition.
Aneberries, A.C.
Aneberries, A.C. (“Aneberries”) is the principal trade association for Mexican berry producers and
exporters. Its members account for approximately 90% of Mexico’s fresh raspberry exports and 80% of
the country’s processed raspberry exports. Since its founding, Aneberries has focused its efforts on
ensuring that Mexican berries meet the highest global phytosanitary, food safety, and quality standards.
Aneberries also assists its members in identifying and opening new markets around the world. Unlike
some countries that grow raspberries primarily to produce frozen raspberry products, the Mexican
raspberry industry is geared toward fresh product for export. As such, the raspberry varieties utilized by
Mexican farmers are those developed with the superior color, texture and taste expected by consumers
of fresh raspberries. And the rigorous phytosanitary, food safety and quality requirements adhered to by
Mexican farms are those required for fresh berry exports to the U.S. and other markets. Mexican
growers utilize the same methods employed by U.S. farmers of raspberries for fresh consumption which
bestows significant advantages over many operations geared towards processed products. Aneberries
estimates that less than 10% of total Mexican raspberry production is diverted to processing. Generally,
Raspberries for Processing
256 | www.usitc.gov
Mexican raspberry processors produce frozen product, principally individually quick frozen (IQF)
raspberries. Importantly, unlike most other IQF raspberry producing countries including the United
States, the vast majority of Mexican processors utilize static blast freezers, as opposed to continuous
tunnel freezers. Using blast freezers reduces breakage of the raspberries so that the final frozen product
best maintains the integrity of the original fresh berries.
The Mexican raspberry industry adheres to best production practices at all levels, including compliance
with the highest national and international standards. Because of the emphasis on exports, Mexican
growers, shippers and processors comply with the food safety requirements of the United States,
including those set forth in the Food Safety Modernization Act of 2011 and the multiple rules issued to
implement it. Additionally, Mexican regulations (including NOM-251-SSA1-2009) set forth requirements
for good hygiene practices that must be observed at all stages in the production of food, beverages and
nutritional supplements in Mexico, including production of raw materials, in order to avoid
contamination at any point in the production process. These laws and regulations apply to all persons in
the food production chain and are enforced by the Mexican Ministry of Health (Secretaría de Salud).
Furthermore, many Mexican raspberry processors maintain additional commercial food safety
certifications that are preferred by foreign importers and purchasers. As consumer demand for year-
round supply of fresh raspberries has grown in the United States and other countries, Mexico has risen
to the occasion and increased its cultivation of this fruit over the past five years. Exports to the U.S. of
frozen raspberries, however, have remained steady (and declined in some categories) as the demand for
fresh raspberries continues to outpace supply and as Mexican processors continue to develop new
markets around the world for their raspberry products. For example, during this period, Mexican
processors exported frozen raspberries to 29 countries.
British Columbia Raspberries
British Columbia (BC) raspberry growers face many of the same competitive challenges as growers in
Washington. High land and labour costs, as well as continuously increasing agricultural input costs, are
challenges that Canadian and US growers share. When selling and marketing our raspberries, we
compete in a global raspberry market against countries that have much lower land, labour, and input
costs. In addition to scarcity of labour, exceptionally high land prices make it difficult for Canadian
growers to justify purchasing new land to plant raspberries, resulting in the re-use of land that has been
in raspberry production for decades. Therefore, viability of Canadian production will require adaptation
in farming practices to minimize labour and input costs, just to stay in business. For these reasons, the
BC raspberry industry has consistently declined over the past 20 years in both acreage and production
volume. In just the last few years, production volume has declined from 19.9 million pounds in 2016 to
14.9 million pounds in 2019. During this time, Canada has gone from being a net exporter of frozen
raspberries to the US to a net importer from the US. Further, Canada has always been a net importer of
fresh raspberries, a large portion of this product coming from the US. Ensuring food safety is essential to
raspberry production in British Columbia.
With the implementation of the Food Safety Modernization Act (FSMA), any Canadian growers shipping
raspberries to the US must complete a food safety audit. Consequently, most processors/packers now
require growers to conduct an annual third-party food safety audit. Despite the US/Canada border, the
BC and Washington raspberry industries have a unique relationship as part of the broader Pacific
Appendix D: Summary of Views of Interested Parties
United States International Trade Commission | 257
Northwest region. Representing BC growers, the BC Raspberry Industry Development Council (RIDC) has
a long history of collaboration in research and breeding with the Washington Red Raspberry Commission
(WRRC). Many BC growers also own land in the US, growing raspberries on both sides of the border.
Moreover, Canadian growers rely on US-based companies for planting material. Also, with the ability to
freely move goods back and forth, growers on both sides of the border utilize packing and processing
facilities in both Canada and the US. In summary, growers in BC have many of the same concerns as
growers in Washington. The increase of cheaper fruit from other countries has led to the decline of the
BC raspberry industry, both in acreage and production. However, we understand that Washington
growers’ primary concern is the ability of Canadian end-use processors to bring in fruit from other
countries and then export into the US market. All raspberry product must be labelled according to the
policies of the country where it is sold. Consequently, the RIDC believes that all raspberry product labels
should indicate the country of origin.
Chilealimentos
Chilealimentos (The Chilean Food Processing Companies Association) is a non-profit organization
dedicated to developing and representing Chilean companies in the food processing sector. Of particular
importance to Chilealimentos and its members is food safety and ensuring that Chilean food products
satisfy the most stringent quality standards in the world. Chilealimentos estimates that its members
account for approximately 67% of the raspberries processed into frozen form in Chile and 96% of the
raspberries processed into juice concentrate in Chile. The Chilean raspberry industry focuses on the
production of processed (as opposed to fresh) raspberries for export. Chilealimentos estimates that 92%
of Chile’s total raspberry production is processed and exported, with the vast majority (>90%) of these
exports consisting of individually quick frozen (IQF) raspberry products. Food safety is of paramount
importance to Chile’s raspberry farmers and processors. As a food exporting country, Chilean farmers
and food processors know that they must satisfy the highest global standards.
As such, Chilean raspberry processors ensure that their plants and entire supply chain satisfy the legal
requirements of the United States (including the Food Safety Modernization Act) and of other specific
export markets like Australia, Canada and the EU. Chile also has implemented rigorous domestic food
safety practices legislation such as Regulation 3410 that specifically is designed for the raspberry
industry and which is overseen and enforced by the Servicio Agrícola y Ganadero (SAG), an arm of the
Chilean Government, which also imposes significant requirements on the entire production chain. The
Chilean frozen raspberry industry also utilizes state-of-the-art processing equipment, including precise
laser sorters, that ensure superior quality. Chile and its raspberry industry have been responsible leaders
in developing and fostering the global market for raspberries. Chileans founded the International
Raspberry Organization (IRO) in 1998 to promote the fruit and good production practices. More
recently, Chilean raspberry processors joined with their U.S. colleagues in establishing the National
Processed Raspberry Council, a commodity research and promotion program overseen by the U.S.
Department of Agriculture. In recent years, Chilean raspberry production and resulting processed
raspberry exports have declined, in part because farmers have switched to other crops. Since 2015,
overall raspberry production has declined in Chile from approximately 39,119 MT to 31,633 MT. This
decrease is a continuation of a longer trend, as the Chilean raspberry harvest is roughly half of what it
was ten years ago.
Raspberries for Processing
258 | www.usitc.gov
During the past five years, processed raspberry exports to the U.S. have decreased from approximately
14,019 MT to 9,431 MT, with only the frozen organic raspberry subproduct seeing an increase.
Furthermore, exports to the U.S. have decreased as a percentage of total Chilean processed raspberry
exports as Chilean producers have successfully sought new markets for their products. Competing
globally is a hallmark of Chile. The country has free trade agreements with countries representing 88%
of the world’s GDP and 67% of the world’s population. Going forward, Chile will continue to grow and
process raspberries of the highest quality, and export these products to markets around the globe.
Driscoll’s, Inc.
My name is Ryan Commons and I am corporate counsel for Driscoll’s, Inc., with oversight over our
domestic and foreign transactional legal matters. Driscoll’s is a family-owned company headquartered in
California. We breed strawberry, raspberry, blueberry, and blackberry plants through traditional plant
breeding techniques. Independent farmers then grow the fruit and we market it. Driscoll’s berries are
now grown in 19 countries on six continents to provide reliable year-round supply to consumers. In the
United States, Driscoll’s sources from independent growers in California, Florida, Georgia, New Jersey,
Oregon, and Washington. Driscoll’s began sourcing fresh raspberries from regions of Mexico in the early
1990s to provide U.S. consumers fresh raspberries year-round. Most of Driscoll’s imported fresh
raspberries originate in Mexico. Driscoll’s has filed written comments on the fresh raspberry and
processed raspberry industries.
I will briefly summarize those comments. With very few exceptions, raspberries that are grown for fresh
are not sold for processing. To the best of our knowledge, raspberries grown for processing are never
sold as fresh. The fate of a raspberry to the fresh or the processed market is determined before plants
even go into the ground. There are four important differences between raspberries grown for fresh and
raspberries grown for processing: (1) the variety of raspberry, (2) field setup, (3) harvesting methods,
and (4) packaging. These differences economically incentivize all parties involved in the production and
marketing of fresh raspberries to sell the berries as fresh raspberries. I will briefly expand on each
difference. First, raspberry varieties for processing prioritize the ease of mechanical harvesting and high
yields at the expense of appearance, taste, texture, and shipping durability. In contrast, fresh raspberry
varieties are developed for appearance, taste, texture, and shipping durability— and they must be
picked by hand. Second, all fresh raspberries sold by Driscoll’s are grown under tents in a semi-
controlled environment. These tents are comprised of metal hoops with plastic covers that provide a
protected environment for the raspberries. The field setup cost (including labor, tents, and materials)
for fresh raspberries is about $40,000/acre comprising a material part of a grower’s total cost of
production. In contrast, raspberries for processing are rarely grown in controlled environments.
They are typically grown in open fields to reduce cost. Third, raspberry varieties used for processing
nearly fall off the plant and are harvested using large machines that efficiently harvest raspberries with
little concern for mitigating damage to the raspberries. Meanwhile, each fresh raspberry is carefully
hand harvested to preserve appearance and avoid damage that may accelerate the degradation of a
raspberry in transit Raspberries for Processing (Inv. No. 332-577) Ryan Commons, Driscoll’s Inc. between
the field and end customer. As a result, the labor cost associated with fresh raspberries is much higher
than for raspberries for processing. Fourth, raspberries for processing use bulk packaging. Fresh
raspberries are packaged in small volumes in consumer-focused clamshells. Driscoll’s experience is that
Appendix D: Summary of Views of Interested Parties
United States International Trade Commission | 259
the packaging cost for fresh raspberries can be up to 15 times higher per pound for fresh raspberries
compared to raspberries for processing. These four differences result in a significant cost differential
between producing and marketing fresh and processed raspberries. As a result, selling fresh raspberries
into the processed market is economically unattractive as compared to selling to the fresh market.
Driscoll’s sees fresh raspberries selling for over $3 per pound and processed berries selling between
$0.30 - $1.20 per pound, not including juice. Given the less attractive economics in selling fresh
raspberries as processed berries, Driscoll’s does not import raspberries to the United States and then
sell them into the processing market. Rejected fruit instead goes to the secondary market (sold through
wholesalers) and our experience is that they do not sell into the processing market for two reasons.
First, wholesalers’ receive higher prices in the secondary fresh market than in the processing market.
Second, the cost of transporting and unpacking clamshells is generally higher than the revenue
wholesalers could receive in the processing market, such that it would be more economical to simply
discard the berries. Less than 2% of Driscoll’s raspberries grown in Mexico are sold to the juice or frozen
processing industry, but these sales occur in Mexico, prior to importation into the United States. As a
final matter, we respectfully submit that the Commission’s investigation should be limited to products
covered under Harmonized Tariff Schedule subheadings 0810.20.1024 and 0810.20.9024 (which
generally cover raspberries packed in units weighing more than 5 kg), and should exclude HTSUS
subheadings 0810.20.1022 and 0810.20.9022 (which generally cover raspberries packed in units weigh 5
kg or less). The Commission can distinguish between raspberries grown for fresh consumption and those
grown for processing by the weight of the packed unit. Fresh raspberries are carefully packed in small
volumes in clamshells, while raspberries grown for processing are packaged in bulk. This administrable
distinction will allow the Commission to focus on the market that is the target of its investigation:
raspberries for processing in units weighing more than 5.0 kg. To conclude, given the significant
differences between raspberries grown for fresh and raspberries grown for processing, we do not see
any reason for Washington growers to be concerned about competition from raspberries grown for
fresh consumption in Mexico. Thank you for your time and attention. I would be happy to address any
questions the Commission may have.
The J.M. Smucker Company
Smucker Position on Red Raspberry Sourcing We need the flexibility of sourcing Red Raspberries globally
as necessary to guarantee a steady supply of berries that meet our quality standards at a competitive
price. Red Raspberries are sourced from different areas of the world, such as Washington, California,
Mexico, Chile and Serbia. Red Raspberries require a specific climate and weather changes are always a
concern, particularly on the west coast. Weather changes can drastically impact Red Raspberry crop
yields which, in turn, impact price.
1. About The J.M. Smucker Company Each generation of consumers leaves their mark on culture by
establishing new expectations for food and the companies that make it. At The J.M. Smucker Company,
it is our privilege to be at the heart of this dynamic with a portfolio that appeals to each generation of
people and pets and is found in 90 percent of U.S. homes and countless restaurants. This includes a mix
of iconic brands consumers have always loved such as Smucker’s®, Folgers®, Jif® and Milk-Bone® and
new favorites like Café Bustelo®, Smucker’s® Uncrustables® and Rachael Ray® Nutrish®. Over the past
Raspberries for Processing
260 | www.usitc.gov
two decades, The J.M. Smucker Company has grown rapidly while mindfully ensuring the business has a
positive impact on its employees, the communities in which it operates, and the planet.
2. Raspberries for Processing Versus Raspberries for Fresh Consumption We primarily source Whole and
Broken Red Raspberries. These are good quality berries for processed products; however, they do not
meet the quality requirements of individually quick frozen (IQF) berries or berries for fresh
consumption. Raspberries vary in flavor and color profiles depending on growing region. We may blend
small percentages of berries from different regions to achieve the consistent flavor and color profile
consumers expect in fruit-based products.
3. Pricing and Quality of Raspberries by Source All Red Raspberries, whether foreign or domestically
sourced by our Company, must meet our very strict quality requirements. Qualified suppliers have
excellent programs in place that guarantee the quality of the berries we source. Our qualified foreign
suppliers have excellent field programs, and pesticide residues have not been an issue. Prices vary
depending on region. Washington raspberries are sold at a premium cost compared to other
raspberries. This can create a competitive imbalance for products to the consumer. This year has been
very challenging for buyers as demand for Whole and Broken Red Raspberries exceeded supply and
prices are up 20% plus vs. prior year.
4. Contracts with Suppliers Working with reliable and reputable sources that can deliver value, quality
and consistent supply of berries is very important to us. As with any other commodity and agricultural
product, Raspberry pricing is dependent on crop yield, weather, supply and demand. It is very important
to maintain sustainable prices and a consistent supply to remain competitive on shelf and bring value to
the consumer.
5. Pricing Spike in 2014/2015 The 2015 crop in Washington State was down approximately 30% (vs. prior
year) which drove up prices of Raspberries. This was the lowest crop yield in the past 10 years. Bad
weather and acreage reductions are drivers for shorter crops. Raspberry pricing is set every year.
Weather, demand, limited supply base are factors that affect pricing. Based on the industry-wide supply
conditions described above, we respectfully urge the maintenance of flexibility of sourcing Red
Raspberries globally. Thank you for your consideration of these comments.
King and Spalding on behalf of the Washington Red Raspberry Commission
As explained in the WRRC’s pre-hearing brief and at the hearing, a number of serious problems threaten
the continued viability of the processed red raspberry industry in the Pacific Northwest. Imports of
various red raspberry products from Mexico, particularly block frozen imports, are entering the U.S.
market in higher volumes and at ultra-low prices that are 50 to 75 percent below U.S. market prices.
Low-priced individually quick frozen (“IQF”) red raspberries from Eastern Europe, with support from
various governments including our own, are of significant concern because import volumes are
increasing and import prices are decreasing. Overall, as a result of these imports, the value of U.S.
harvested and processed red raspberries have dropped significantly since 2015.
The disruptive nature of these imports, however, is only partially apparent in the official import
statistics, given that various types of frozen red raspberries are classified in a single Harmonized Tariff
Appendix D: Summary of Views of Interested Parties
United States International Trade Commission | 261
item number and that a significant volume of fresh raspberries are imported but not intended for sale
on the fresh market. Repackaging and mislabeling of the country of origin further obscures the impact
and source of these and other disruptive imports. Finally, the inadequate inspection and testing of
imports exacerbates the harm to the U.S. market because exporters are able to avoid compliance costs
and undercut the domestic industry, to the detriment of the health of U.S. consumers. Attached hereto
as Exhibit 1 are Answers to Questions posed during the recent Hearing. The WRRC looks forward to a
comprehensive examination of these and other issues as the Commission conducts this investigation
and prepares its report.
Northwest Berry Co-Op
Thank you for taking the time to listen to our concerns about the survival of the raspberry industry in
the USA. Like many forms of agriculture, the Washington state raspberry industry faces multiple serious
challenges including cheap labor that is available in other parts of the world and the cost to US farmers
to follow the rules to produce the safest food in the world here at home. Buyers of berries like other
fruit and agriculture products, are telling the world that they want to be friendly to the environment,
practice sustainability, use fewer and safer chemicals, grow perfect fruit without a single blemish, pay
for health care for all our workers, give the worker a safe work environment and a living wage equal to
the average person working in the USA. We as growers think these are all good things and we work hard
to do them all and we like doing this for all the people that work so hard for us.
The problem comes when companies, some of them being US companies, move their production to
Mexico where they are paying at the most $7.00 per day for a worker in the raspberry field and then let
them bring those raspberries to the USA and sell them at 1/3 or less of what it costs the USA farmer to
produce the same fruit. Their quality of fruit is not better. The head of one company that has moved
production says that he needs to work with his plant breeders to get some flavor into the fresh
raspberries they are growing in Mexico. We all see what is going one whether it is cars, tennis shoes,
electronic, appliances or raspberries. People are moving their production to where the costs are the
lowest and where they can make the most profit. Raspberry growers can’t compete against the cheap
labor and lack of regulations in the Mexican raspberry production. The new rules that we thought might
protect us against imports have only added another layer of regulations on to the US producers. Eastern
Europe is different than Mexico where farms that are controlled by big companies from the USA.
Eastern Europe is made up of small farms with 1 or 2 acres of raspberries with most of the labor being
supplied by the family that owns the farm. If they work out, they are making $600 per month working 6
days a week. That gives them a yearly income of $7,200 per year. If they have 2 acres of raspberries and
they pick 7,000 pounds per acre and the get paid $.50 per pound on their 2 acres they have a gross
income of $7,000 for that 2 acres and they probably have almost no cost to go against this income. They
have doubled their income and they are very excited. Almost all of these people have been encouraged
to plant raspberries by their government, the EU or even our own USAID. Encouragement comes in the
form of grants.

262 | www.usitc.gov

Appendix E: Import Data Sorting for Modeling Inputs
U.S. International Trade Commission | 263
Appendix E Import Data Sorting for Modeling Inputs

264 | www.usitc.gov
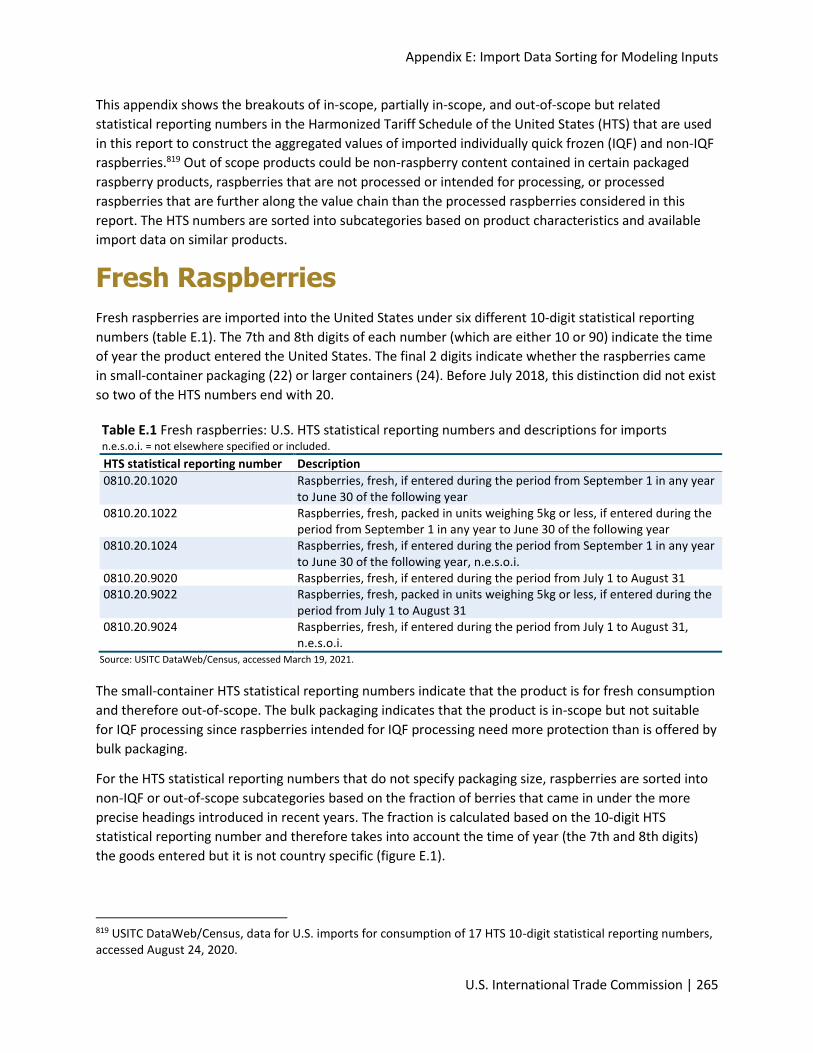
Appendix E: Import Data Sorting for Modeling Inputs
U.S. International Trade Commission | 265
This appendix shows the breakouts of in-scope, partially in-scope, and out-of-scope but related
statistical reporting numbers in the Harmonized Tariff Schedule of the United States (HTS) that are used
in this report to construct the aggregated values of imported individually quick frozen (IQF) and non-IQF
raspberries.819 Out of scope products could be non-raspberry content contained in certain packaged
raspberry products, raspberries that are not processed or intended for processing, or processed
raspberries that are further along the value chain than the processed raspberries considered in this
report. The HTS numbers are sorted into subcategories based on product characteristics and available
import data on similar products.
Fresh Raspberries
Fresh raspberries are imported into the United States under six different 10-digit statistical reporting
numbers (table E.1). The 7th and 8th digits of each number (which are either 10 or 90) indicate the time
of year the product entered the United States. The final 2 digits indicate whether the raspberries came
in small-container packaging (22) or larger containers (24). Before July 2018, this distinction did not exist
so two of the HTS numbers end with 20.
Table E.1 Fresh raspberries: U.S. HTS statistical reporting numbers and descriptions for imports n.e.s.o.i. = not elsewhere specified or included.
HTS statistical reporting number Description
0810.20.1020 Raspberries, fresh, if entered during the period from September 1 in any year to June 30 of the following year
0810.20.1022 Raspberries, fresh, packed in units weighing 5kg or less, if entered during the period from September 1 in any year to June 30 of the following year
0810.20.1024 Raspberries, fresh, if entered during the period from September 1 in any year to June 30 of the following year, n.e.s.o.i.
0810.20.9020 Raspberries, fresh, if entered during the period from July 1 to August 31 0810.20.9022 Raspberries, fresh, packed in units weighing 5kg or less, if entered during the
period from July 1 to August 31 0810.20.9024 Raspberries, fresh, if entered during the period from July 1 to August 31,
n.e.s.o.i. Source: USITC DataWeb/Census, accessed March 19, 2021.
The small-container HTS statistical reporting numbers indicate that the product is for fresh consumption
and therefore out-of-scope. The bulk packaging indicates that the product is in-scope but not suitable
for IQF processing since raspberries intended for IQF processing need more protection than is offered by
bulk packaging.
For the HTS statistical reporting numbers that do not specify packaging size, raspberries are sorted into
non-IQF or out-of-scope subcategories based on the fraction of berries that came in under the more
precise headings introduced in recent years. The fraction is calculated based on the 10-digit HTS
statistical reporting number and therefore takes into account the time of year (the 7th and 8th digits)
the goods entered but it is not country specific (figure E.1).
819 USITC DataWeb/Census, data for U.S. imports for consumption of 17 HTS 10-digit statistical reporting numbers, accessed August 24, 2020.
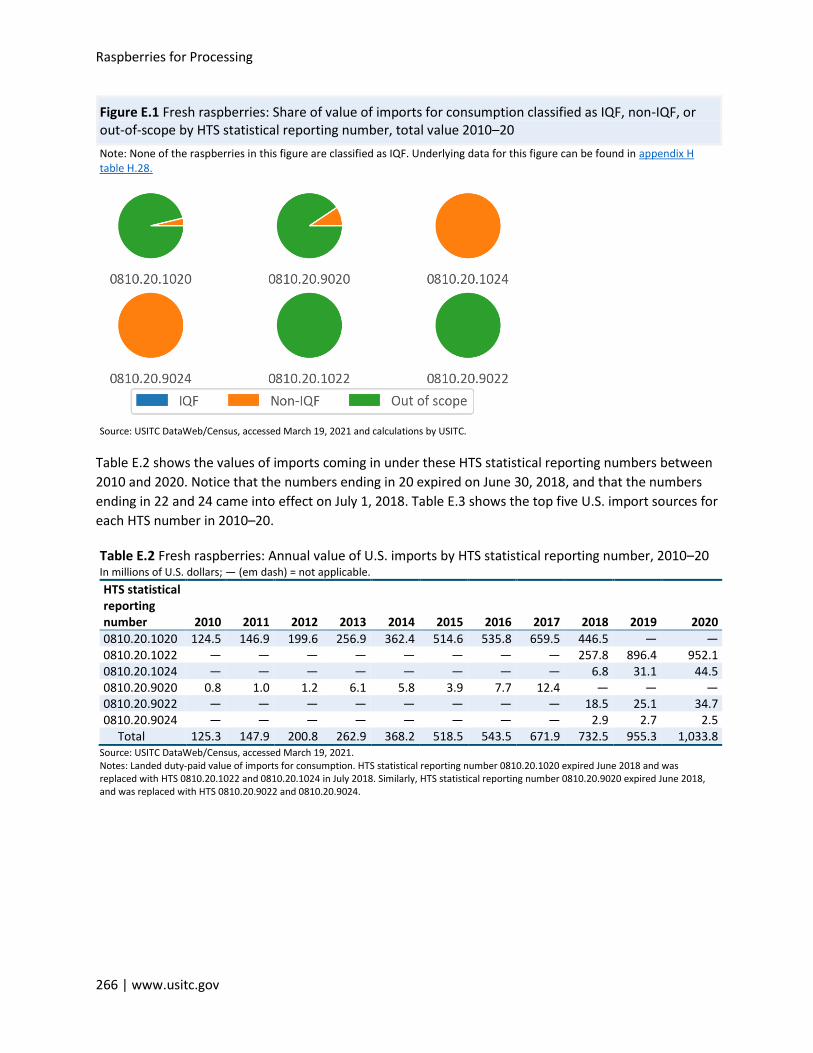
Raspberries for Processing
266 | www.usitc.gov
Figure E.1 Fresh raspberries: Share of value of imports for consumption classified as IQF, non-IQF, or out-of-scope by HTS statistical reporting number, total value 2010–20
Note: None of the raspberries in this figure are classified as IQF. Underlying data for this figure can be found in appendix H table H.28.
Source: USITC DataWeb/Census, accessed March 19, 2021 and calculations by USITC.
Table E.2 shows the values of imports coming in under these HTS statistical reporting numbers between
2010 and 2020. Notice that the numbers ending in 20 expired on June 30, 2018, and that the numbers
ending in 22 and 24 came into effect on July 1, 2018. Table E.3 shows the top five U.S. import sources for
each HTS number in 2010–20.
Table E.2 Fresh raspberries: Annual value of U.S. imports by HTS statistical reporting number, 2010–20 In millions of U.S. dollars; — (em dash) = not applicable.
HTS statistical reporting number 2010 2011 2012 2013 2014 2015 2016 2017 2018 2019 2020
0810.20.1020 124.5 146.9 199.6 256.9 362.4 514.6 535.8 659.5 446.5 — — 0810.20.1022 — — — — — — — — 257.8 896.4 952.1 0810.20.1024 — — — — — — — — 6.8 31.1 44.5 0810.20.9020 0.8 1.0 1.2 6.1 5.8 3.9 7.7 12.4 — — — 0810.20.9022 — — — — — — — — 18.5 25.1 34.7 0810.20.9024 — — — — — — — — 2.9 2.7 2.5
Total 125.3 147.9 200.8 262.9 368.2 518.5 543.5 671.9 732.5 955.3 1,033.8 Source: USITC DataWeb/Census, accessed March 19, 2021. Notes: Landed duty-paid value of imports for consumption. HTS statistical reporting number 0810.20.1020 expired June 2018 and was replaced with HTS 0810.20.1022 and 0810.20.1024 in July 2018. Similarly, HTS statistical reporting number 0810.20.9020 expired June 2018, and was replaced with HTS 0810.20.9022 and 0810.20.9024.
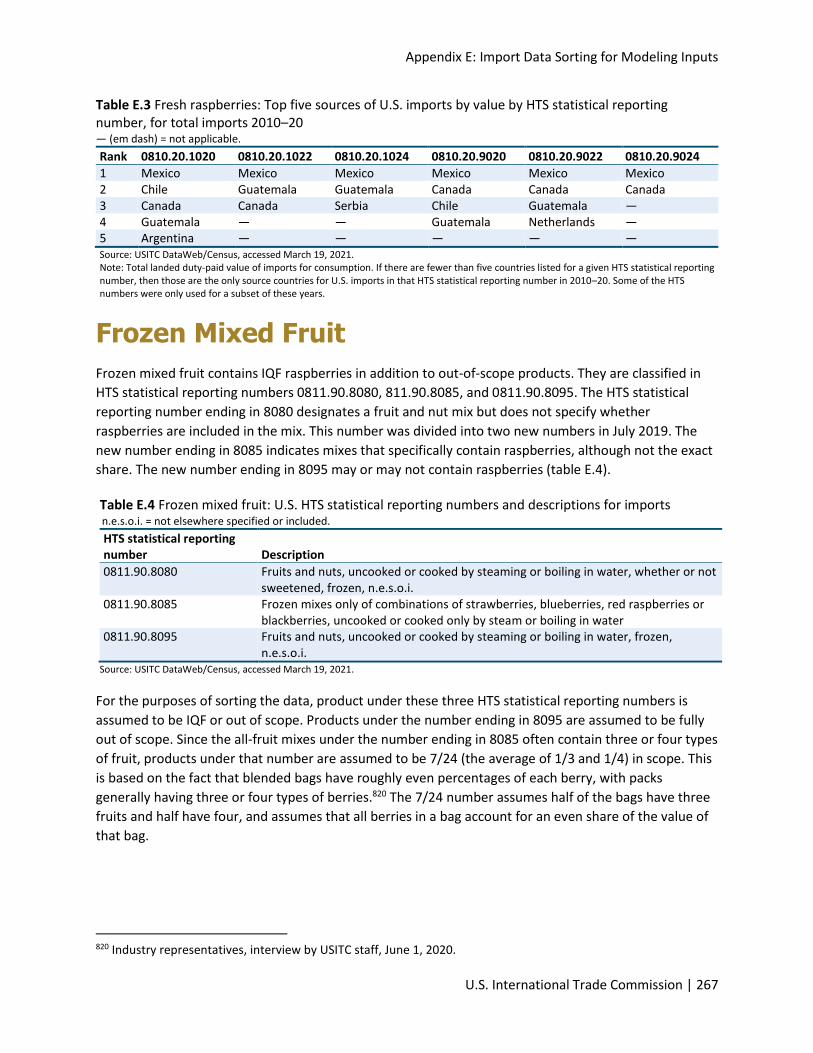
Appendix E: Import Data Sorting for Modeling Inputs
U.S. International Trade Commission | 267
Table E.3 Fresh raspberries: Top five sources of U.S. imports by value by HTS statistical reporting number, for total imports 2010–20 — (em dash) = not applicable.
Rank 0810.20.1020 0810.20.1022 0810.20.1024 0810.20.9020 0810.20.9022 0810.20.9024
1 Mexico Mexico Mexico Mexico Mexico Mexico 2 Chile Guatemala Guatemala Canada Canada Canada 3 Canada Canada Serbia Chile Guatemala — 4 Guatemala — — Guatemala Netherlands — 5 Argentina — — — — — Source: USITC DataWeb/Census, accessed March 19, 2021. Note: Total landed duty-paid value of imports for consumption. If there are fewer than five countries listed for a given HTS statistical reporting number, then those are the only source countries for U.S. imports in that HTS statistical reporting number in 2010–20. Some of the HTS numbers were only used for a subset of these years.
Frozen Mixed Fruit
Frozen mixed fruit contains IQF raspberries in addition to out-of-scope products. They are classified in
HTS statistical reporting numbers 0811.90.8080, 811.90.8085, and 0811.90.8095. The HTS statistical
reporting number ending in 8080 designates a fruit and nut mix but does not specify whether
raspberries are included in the mix. This number was divided into two new numbers in July 2019. The
new number ending in 8085 indicates mixes that specifically contain raspberries, although not the exact
share. The new number ending in 8095 may or may not contain raspberries (table E.4).
Table E.4 Frozen mixed fruit: U.S. HTS statistical reporting numbers and descriptions for imports n.e.s.o.i. = not elsewhere specified or included.
HTS statistical reporting number Description
0811.90.8080 Fruits and nuts, uncooked or cooked by steaming or boiling in water, whether or not sweetened, frozen, n.e.s.o.i.
0811.90.8085 Frozen mixes only of combinations of strawberries, blueberries, red raspberries or blackberries, uncooked or cooked only by steam or boiling in water
0811.90.8095 Fruits and nuts, uncooked or cooked by steaming or boiling in water, frozen, n.e.s.o.i.
Source: USITC DataWeb/Census, accessed March 19, 2021.
For the purposes of sorting the data, product under these three HTS statistical reporting numbers is
assumed to be IQF or out of scope. Products under the number ending in 8095 are assumed to be fully
out of scope. Since the all-fruit mixes under the number ending in 8085 often contain three or four types
of fruit, products under that number are assumed to be 7/24 (the average of 1/3 and 1/4) in scope. This
is based on the fact that blended bags have roughly even percentages of each berry, with packs
generally having three or four types of berries.820 The 7/24 number assumes half of the bags have three
fruits and half have four, and assumes that all berries in a bag account for an even share of the value of
that bag.
820 Industry representatives, interview by USITC staff, June 1, 2020.
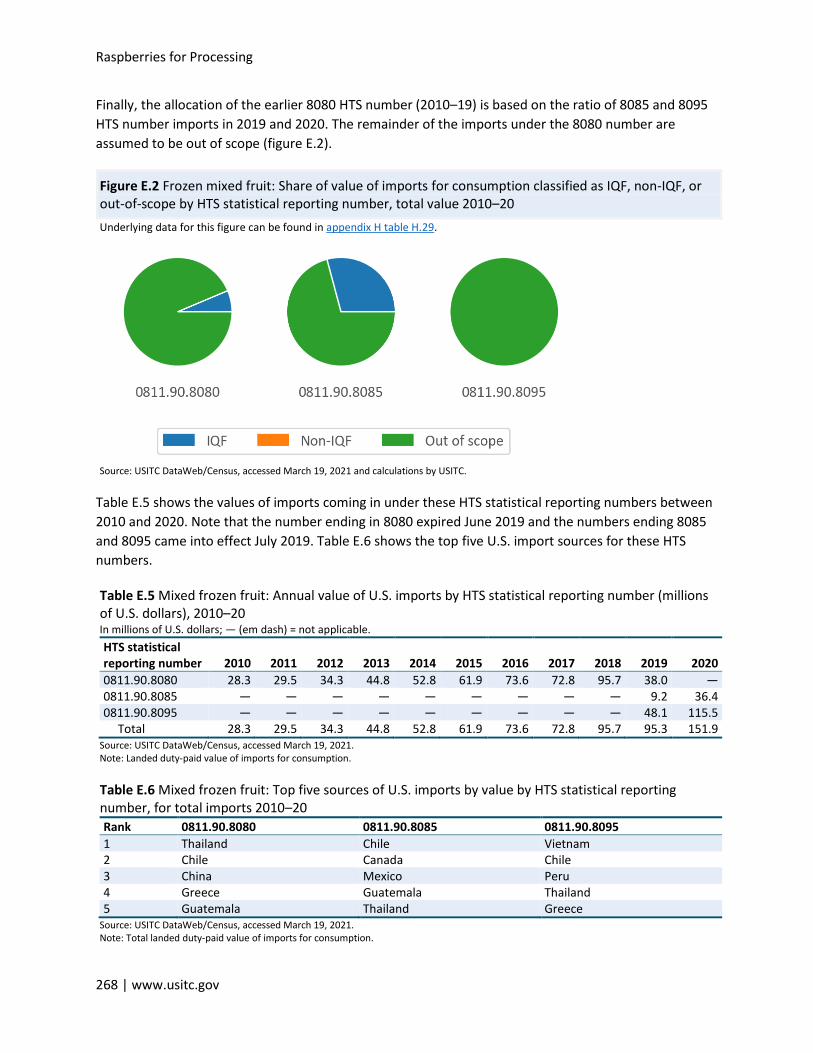
Raspberries for Processing
268 | www.usitc.gov
Finally, the allocation of the earlier 8080 HTS number (2010–19) is based on the ratio of 8085 and 8095
HTS number imports in 2019 and 2020. The remainder of the imports under the 8080 number are
assumed to be out of scope (figure E.2).
Figure E.2 Frozen mixed fruit: Share of value of imports for consumption classified as IQF, non-IQF, or out-of-scope by HTS statistical reporting number, total value 2010–20
Underlying data for this figure can be found in appendix H table H.29.
Source: USITC DataWeb/Census, accessed March 19, 2021 and calculations by USITC.
Table E.5 shows the values of imports coming in under these HTS statistical reporting numbers between
2010 and 2020. Note that the number ending in 8080 expired June 2019 and the numbers ending 8085
and 8095 came into effect July 2019. Table E.6 shows the top five U.S. import sources for these HTS
numbers.
Table E.5 Mixed frozen fruit: Annual value of U.S. imports by HTS statistical reporting number (millions of U.S. dollars), 2010–20 In millions of U.S. dollars; — (em dash) = not applicable.
HTS statistical reporting number 2010 2011 2012 2013 2014 2015 2016 2017 2018 2019 2020
0811.90.8080 28.3 29.5 34.3 44.8 52.8 61.9 73.6 72.8 95.7 38.0 — 0811.90.8085 — — — — — — — — — 9.2 36.4 0811.90.8095 — — — — — — — — — 48.1 115.5
Total 28.3 29.5 34.3 44.8 52.8 61.9 73.6 72.8 95.7 95.3 151.9 Source: USITC DataWeb/Census, accessed March 19, 2021. Note: Landed duty-paid value of imports for consumption.
Table E.6 Mixed frozen fruit: Top five sources of U.S. imports by value by HTS statistical reporting number, for total imports 2010–20
Rank 0811.90.8080 0811.90.8085 0811.90.8095
1 Thailand Chile Vietnam 2 Chile Canada Chile 3 China Mexico Peru 4 Greece Guatemala Thailand 5 Guatemala Thailand Greece
Source: USITC DataWeb/Census, accessed March 19, 2021. Note: Total landed duty-paid value of imports for consumption.

Appendix E: Import Data Sorting for Modeling Inputs
U.S. International Trade Commission | 269
Single-Product Frozen
These HTS statistical reporting numbers—0811.20.2025 and 0811.20.2035—contain only frozen
raspberries (table E.7).
Table E.7 Single-product frozen: U.S. HTS statistical reporting numbers and descriptions for imports
HTS statistical reporting number Description
0811.20.2025 Raspberries, red, frozen, uncooked or cooked by boiling or steaming in water, whether or not sweetened
0811.20.2035 Raspberries, frozen, uncooked or cooked by boiling or steaming in water, whether or not sweetened, excluding red raspberries
Source: USITC DataWeb/Census, accessed March 19, 2021.
The HTS statistical reporting number ending in 2035 is frozen black or gold raspberries and is considered
out of scope. The number ending in 2025 is red raspberries but is not precise enough to sort IQF from
non-IQF raspberries. The allocation of this number to IQF and non-IQF is based on country-level
approximations provided by Commission staff according to table E.8. The default value is used in the
absence of a country-specific approximation. Table E.9 shows U.S. import values by HTS number and
table E.10 shows the top sources for U.S. imports in 2010–20 by HTS number.
Table E.8 Country-level approximations of IQF percentage under HTS statistical reporting number 0811.20.2025
Country IQF approximation (%)
Canada 40 Chile 80 Mexico 50 Serbia 75 Default 60
Source: Estimates by USITC based on industry interviews and email messages to various industry and academic representatives. Note: The default value is used for all other countries that exported products under these HTS statistical reporting numbers to the United States.
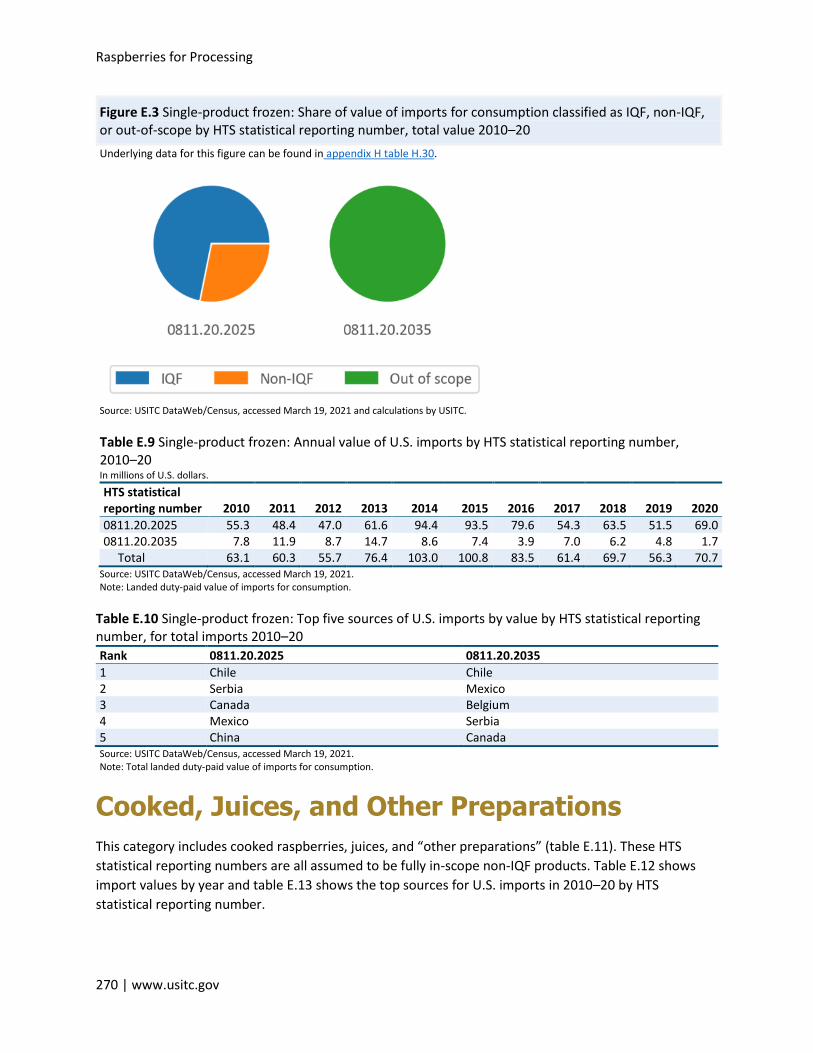
Raspberries for Processing
270 | www.usitc.gov
Figure E.3 Single-product frozen: Share of value of imports for consumption classified as IQF, non-IQF, or out-of-scope by HTS statistical reporting number, total value 2010–20
Underlying data for this figure can be found in appendix H table H.30.
Source: USITC DataWeb/Census, accessed March 19, 2021 and calculations by USITC.
Table E.9 Single-product frozen: Annual value of U.S. imports by HTS statistical reporting number, 2010–20 In millions of U.S. dollars.
HTS statistical reporting number 2010 2011 2012 2013 2014 2015 2016 2017 2018 2019 2020
0811.20.2025 55.3 48.4 47.0 61.6 94.4 93.5 79.6 54.3 63.5 51.5 69.0 0811.20.2035 7.8 11.9 8.7 14.7 8.6 7.4 3.9 7.0 6.2 4.8 1.7
Total 63.1 60.3 55.7 76.4 103.0 100.8 83.5 61.4 69.7 56.3 70.7 Source: USITC DataWeb/Census, accessed March 19, 2021. Note: Landed duty-paid value of imports for consumption.
Table E.10 Single-product frozen: Top five sources of U.S. imports by value by HTS statistical reporting number, for total imports 2010–20
Rank 0811.20.2025 0811.20.2035
1 Chile Chile 2 Serbia Mexico 3 Canada Belgium 4 Mexico Serbia 5 China Canada Source: USITC DataWeb/Census, accessed March 19, 2021. Note: Total landed duty-paid value of imports for consumption.
Cooked, Juices, and Other Preparations
This category includes cooked raspberries, juices, and “other preparations” (table E.11). These HTS
statistical reporting numbers are all assumed to be fully in-scope non-IQF products. Table E.12 shows
import values by year and table E.13 shows the top sources for U.S. imports in 2010–20 by HTS
statistical reporting number.
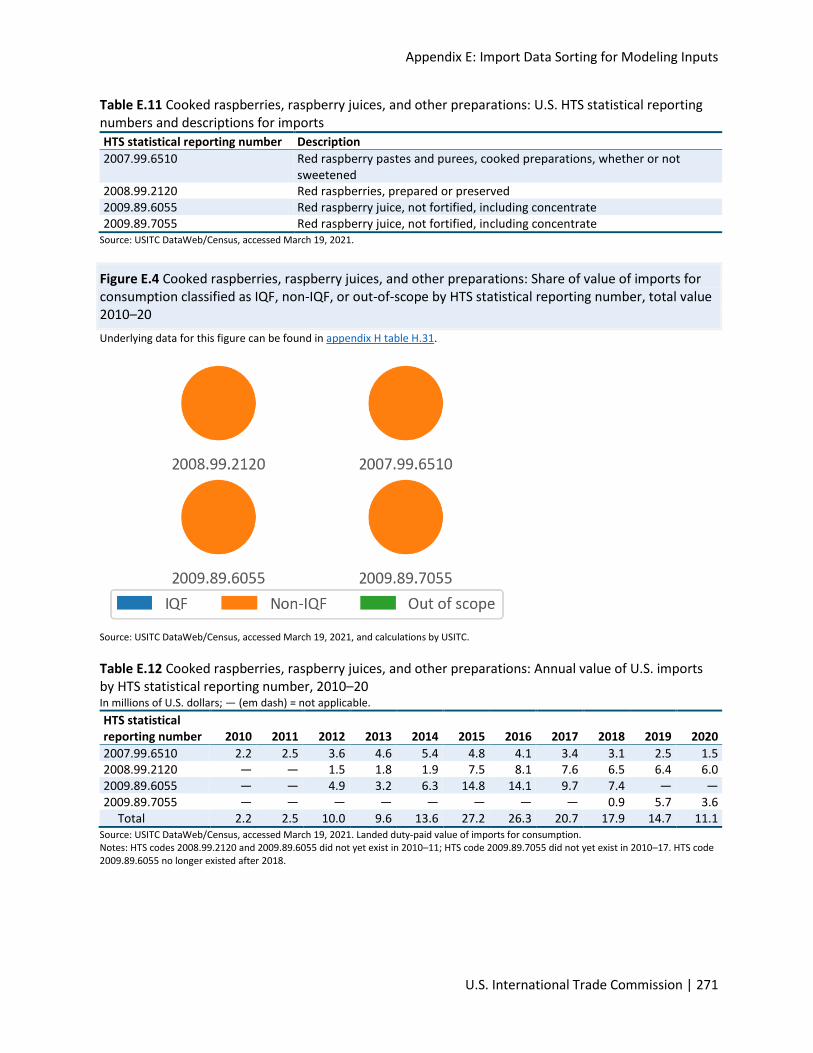
Appendix E: Import Data Sorting for Modeling Inputs
U.S. International Trade Commission | 271
Table E.11 Cooked raspberries, raspberry juices, and other preparations: U.S. HTS statistical reporting numbers and descriptions for imports
HTS statistical reporting number Description
2007.99.6510 Red raspberry pastes and purees, cooked preparations, whether or not sweetened
2008.99.2120 Red raspberries, prepared or preserved 2009.89.6055 Red raspberry juice, not fortified, including concentrate 2009.89.7055 Red raspberry juice, not fortified, including concentrate
Source: USITC DataWeb/Census, accessed March 19, 2021.
Figure E.4 Cooked raspberries, raspberry juices, and other preparations: Share of value of imports for consumption classified as IQF, non-IQF, or out-of-scope by HTS statistical reporting number, total value 2010–20
Underlying data for this figure can be found in appendix H table H.31.
Source: USITC DataWeb/Census, accessed March 19, 2021, and calculations by USITC.
Table E.12 Cooked raspberries, raspberry juices, and other preparations: Annual value of U.S. imports by HTS statistical reporting number, 2010–20 In millions of U.S. dollars; — (em dash) = not applicable.
HTS statistical reporting number 2010 2011 2012 2013 2014 2015 2016 2017 2018 2019 2020
2007.99.6510 2.2 2.5 3.6 4.6 5.4 4.8 4.1 3.4 3.1 2.5 1.5 2008.99.2120 — — 1.5 1.8 1.9 7.5 8.1 7.6 6.5 6.4 6.0 2009.89.6055 — — 4.9 3.2 6.3 14.8 14.1 9.7 7.4 — — 2009.89.7055 — — — — — — — — 0.9 5.7 3.6
Total 2.2 2.5 10.0 9.6 13.6 27.2 26.3 20.7 17.9 14.7 11.1 Source: USITC DataWeb/Census, accessed March 19, 2021. Landed duty-paid value of imports for consumption. Notes: HTS codes 2008.99.2120 and 2009.89.6055 did not yet exist in 2010–11; HTS code 2009.89.7055 did not yet exist in 2010–17. HTS code 2009.89.6055 no longer existed after 2018.
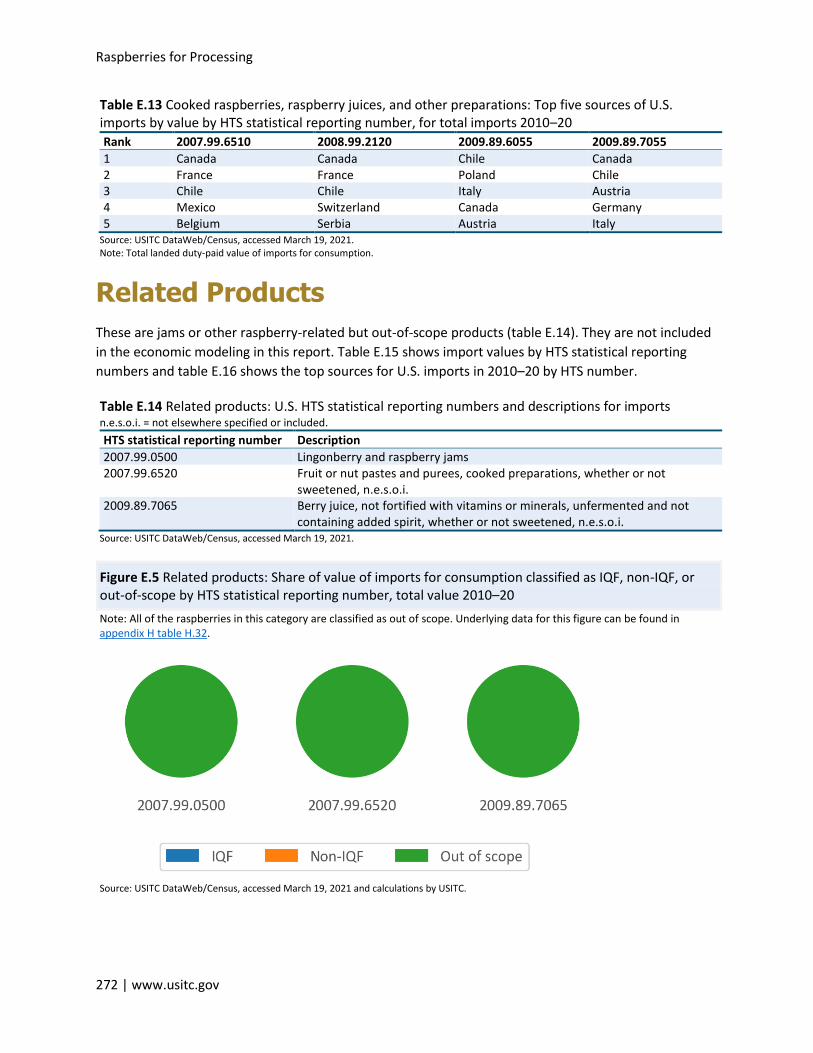
Raspberries for Processing
272 | www.usitc.gov
Table E.13 Cooked raspberries, raspberry juices, and other preparations: Top five sources of U.S. imports by value by HTS statistical reporting number, for total imports 2010–20
Rank 2007.99.6510 2008.99.2120 2009.89.6055 2009.89.7055
1 Canada Canada Chile Canada 2 France France Poland Chile 3 Chile Chile Italy Austria 4 Mexico Switzerland Canada Germany 5 Belgium Serbia Austria Italy
Source: USITC DataWeb/Census, accessed March 19, 2021. Note: Total landed duty-paid value of imports for consumption.
Related Products
These are jams or other raspberry-related but out-of-scope products (table E.14). They are not included
in the economic modeling in this report. Table E.15 shows import values by HTS statistical reporting
numbers and table E.16 shows the top sources for U.S. imports in 2010–20 by HTS number.
Table E.14 Related products: U.S. HTS statistical reporting numbers and descriptions for imports n.e.s.o.i. = not elsewhere specified or included.
HTS statistical reporting number Description
2007.99.0500 Lingonberry and raspberry jams 2007.99.6520 Fruit or nut pastes and purees, cooked preparations, whether or not
sweetened, n.e.s.o.i. 2009.89.7065 Berry juice, not fortified with vitamins or minerals, unfermented and not
containing added spirit, whether or not sweetened, n.e.s.o.i. Source: USITC DataWeb/Census, accessed March 19, 2021.
Figure E.5 Related products: Share of value of imports for consumption classified as IQF, non-IQF, or out-of-scope by HTS statistical reporting number, total value 2010–20
Note: All of the raspberries in this category are classified as out of scope. Underlying data for this figure can be found in appendix H table H.32.
Source: USITC DataWeb/Census, accessed March 19, 2021 and calculations by USITC.
Appendix E: Import Data Sorting for Modeling Inputs
U.S. International Trade Commission | 273
Table E.15 Related products: Annual value of U.S. imports by HTS statistical reporting number, 2010–20 In millions of U.S. dollars; — (em dash) = not applicable.
HTS statistical reporting number 2010 2011 2012 2013 2014 2015 2016 2017 2018 2019 2020
2007.99.0500 13.5 18.0 16.8 17.1 19.9 21.5 24.1 25.9 28.8 30.8 33.5 2007.99.6520 8.2 20.0 23.5 27.0 25.2 28.8 29.1 32.9 41.1 51.7 54.4 2009.89.7065 — — — — — — — — 13.2 49.2 55.1
Total 21.7 38.0 40.3 44.1 45.1 50.3 53.3 58.8 83.1 131.7 142.9 Source: USITC DataWeb/Census, accessed March 19, 2021. Note: Landed duty-paid value of imports for consumption. HTS statistical reporting number 2009.89.7065 did not yet exist in 2010–17.
Table E.16 Related products: Top five sources of U.S. imports by value by HTS statistical reporting number, for total imports 2010–20
Rank 2007.99.0500 2007.99.6520 2009.89.7065
1 France France Brazil 2 Canada Chile Poland 3 Sweden Canada Austria 4 Belgium Spain Turkey 5 Switzerland Mexico Canada
Source: USITC DataWeb/Census, accessed March 19, 2021. Note: Total landed duty-paid value of imports for consumption.

274 | www.usitc.gov

Appendix F: Economic Modeling Details
United States International Trade Commission | 275
Appendix F Economic Modeling Details

276 | www.usitc.gov
Appendix F: Economic Modeling Details
United States International Trade Commission | 277
Model Details
In this report, the markets in Washington State for individually quick frozen (IQF) and non-IQF821
raspberries, either processed or intended for processing, are analyzed using separate partial equilibrium
models. The models assume that the prices in the IQF market have no bearing on the non-IQF market
and vice versa. This is consistent with the limited substitutability between IQF and non-IQF raspberries,
and the fresh raspberries used to produce each, as evidenced by the distinct market channels for the
two product categories described in chapter 3. Buyers’ preferences in each market are modeled by
demand in which there is a constant elasticity of substitution between the domestic and imported
products.822 The two models account for supply of raspberries from two sources, Washington and
imports. Consumers in the models do not differentiate between raspberries from different countries of
import, which would have limited impact on the domestic results.823 The model estimates the elasticity
of substitution between Washington raspberries and imports based on the elasticity of substitution from
different source countries using trade data and an econometric model. The model is then calibrated to
the market shares of Washington raspberries and imports in order to capture the extent of substitution
between these sources.
In the model markets for both product categories, the quantity of imports is treated as exogenous to the
model, meaning that changes in the price of imports (an output of the model) do not change the
quantities of imports (treated as an input to the model).
The Washington marginal cost curve in the IQF market is upward sloping, reflecting capacity constraints
stemming from limited availability of freezing tunnels and specialized equipment.824 As discussed in
chapter 3, five to six processors account for three-fourths of Washington production. Because of the
high cost of the equipment, most small processors do not have IQF capacity. As a result, these few
processors may have an even higher market share in IQF production and likely have some price setting
power. Given these market features, information from industry representatives, and limited availability
of data, the Washington IQF sector of the market is modeled using a monopoly pricing structure as an
approximation of the market. The Washington industry for non-IQF raspberries is less concentrated,
with more growers and processors than the IQF sector. Washington supply of non-IQF raspberries is
modeled as perfectly competitive and with a constant elasticity of supply. While available acreage would
also limit the maximum capacity for non-IQF raspberry product, that constraint is assumed not to bind in
821 The IQF and non-IQF classifications are described in chapter 9. Both product categories are limited to raspberries for processing and processed raspberries—raspberries intended for fresh consumption are not included in either product category. 822 The constant elasticity of substitution structure assumes that in percentage terms, the rate at which consumers are willing to substitute between domestic and imported versions of the product does not change based on the amount of each that they are currently consuming. 823 For instance, Serbia and Chile have differentiated their products by producing organic raspberries. This limits their direct competition with domestic and other import sources that do not supply organic products. See chapter 2 for a further discussion of competitive factors between sources. 824 Industry representative, email message to USITC staff, August 2020.
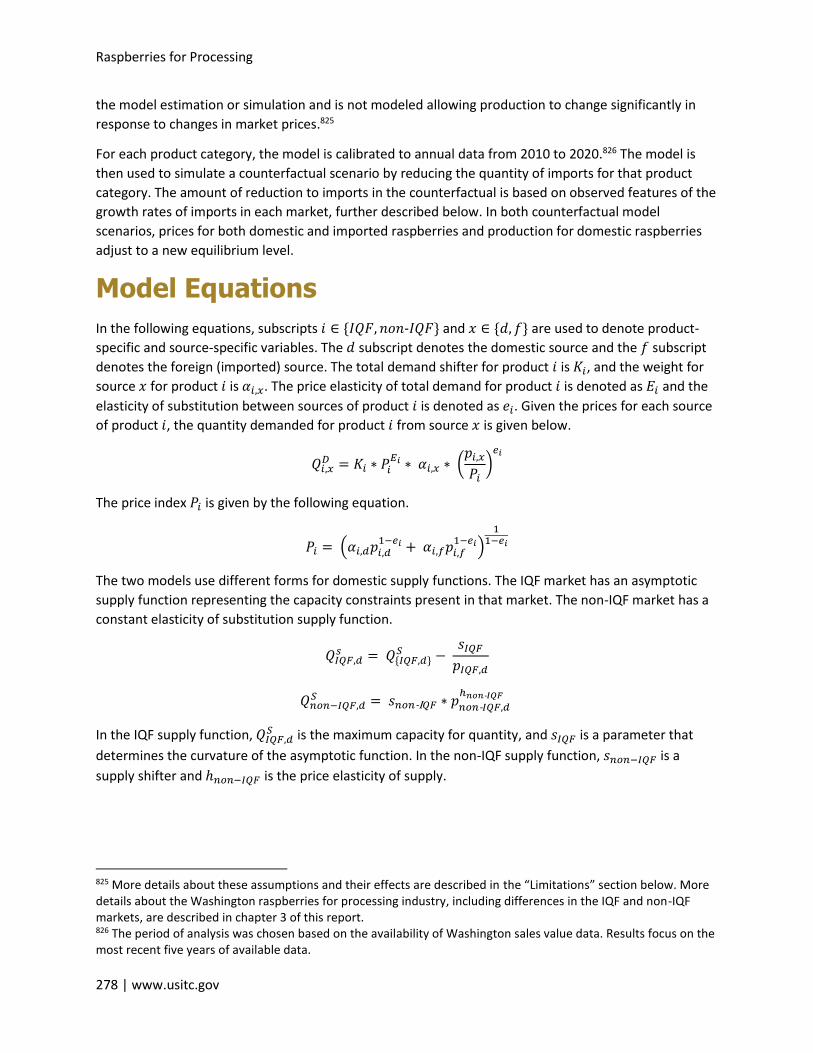
Raspberries for Processing
278 | www.usitc.gov
the model estimation or simulation and is not modeled allowing production to change significantly in
response to changes in market prices.825
For each product category, the model is calibrated to annual data from 2010 to 2020.826 The model is
then used to simulate a counterfactual scenario by reducing the quantity of imports for that product
category. The amount of reduction to imports in the counterfactual is based on observed features of the
growth rates of imports in each market, further described below. In both counterfactual model
scenarios, prices for both domestic and imported raspberries and production for domestic raspberries
adjust to a new equilibrium level.
Model Equations
In the following equations, subscripts 𝑖 ∈ {𝐼𝑄𝐹, 𝑛𝑜𝑛-𝐼𝑄𝐹} and 𝑥 ∈ {𝑑, 𝑓} are used to denote product-
specific and source-specific variables. The 𝑑 subscript denotes the domestic source and the 𝑓 subscript
denotes the foreign (imported) source. The total demand shifter for product 𝑖 is 𝐾𝑖, and the weight for
source 𝑥 for product 𝑖 is 𝛼𝑖,𝑥. The price elasticity of total demand for product 𝑖 is denoted as 𝐸𝑖 and the
elasticity of substitution between sources of product 𝑖 is denoted as 𝑒𝑖. Given the prices for each source
of product 𝑖, the quantity demanded for product 𝑖 from source 𝑥 is given below.
𝑄𝑖,𝑥𝐷 = 𝐾𝑖 ∗ 𝑃𝑖
𝐸𝑖 ∗ 𝛼𝑖,𝑥 ∗ (𝑝𝑖,𝑥
𝑃𝑖)
𝑒𝑖
The price index 𝑃𝑖 is given by the following equation.
𝑃𝑖 = (𝛼𝑖,𝑑𝑝𝑖,𝑑1−𝑒𝑖 + 𝛼𝑖,𝑓𝑝𝑖,𝑓
1−𝑒𝑖)
11−𝑒𝑖
The two models use different forms for domestic supply functions. The IQF market has an asymptotic
supply function representing the capacity constraints present in that market. The non-IQF market has a
constant elasticity of substitution supply function.
𝑄𝐼𝑄𝐹,𝑑𝑠 = 𝑄
{𝐼𝑄𝐹,𝑑}𝑆 −
𝑠𝐼𝑄𝐹
𝑝𝐼𝑄𝐹,𝑑
𝑄𝑛𝑜𝑛−𝐼𝑄𝐹,𝑑𝑆 = 𝑠𝑛𝑜𝑛-I𝑄𝐹 ∗ 𝑝𝑛𝑜𝑛-𝐼𝑄𝐹,𝑑
ℎ𝑛𝑜𝑛-𝐼𝑄𝐹
In the IQF supply function, 𝑄 𝐼𝑄𝐹,𝑑𝑆 is the maximum capacity for quantity, and 𝑠𝐼𝑄𝐹 is a parameter that
determines the curvature of the asymptotic function. In the non-IQF supply function, 𝑠𝑛𝑜𝑛−𝐼𝑄𝐹 is a
supply shifter and ℎ𝑛𝑜𝑛−𝐼𝑄𝐹 is the price elasticity of supply.
825 More details about these assumptions and their effects are described in the “Limitations” section below. More details about the Washington raspberries for processing industry, including differences in the IQF and non-IQF markets, are described in chapter 3 of this report. 826 The period of analysis was chosen based on the availability of Washington sales value data. Results focus on the most recent five years of available data.
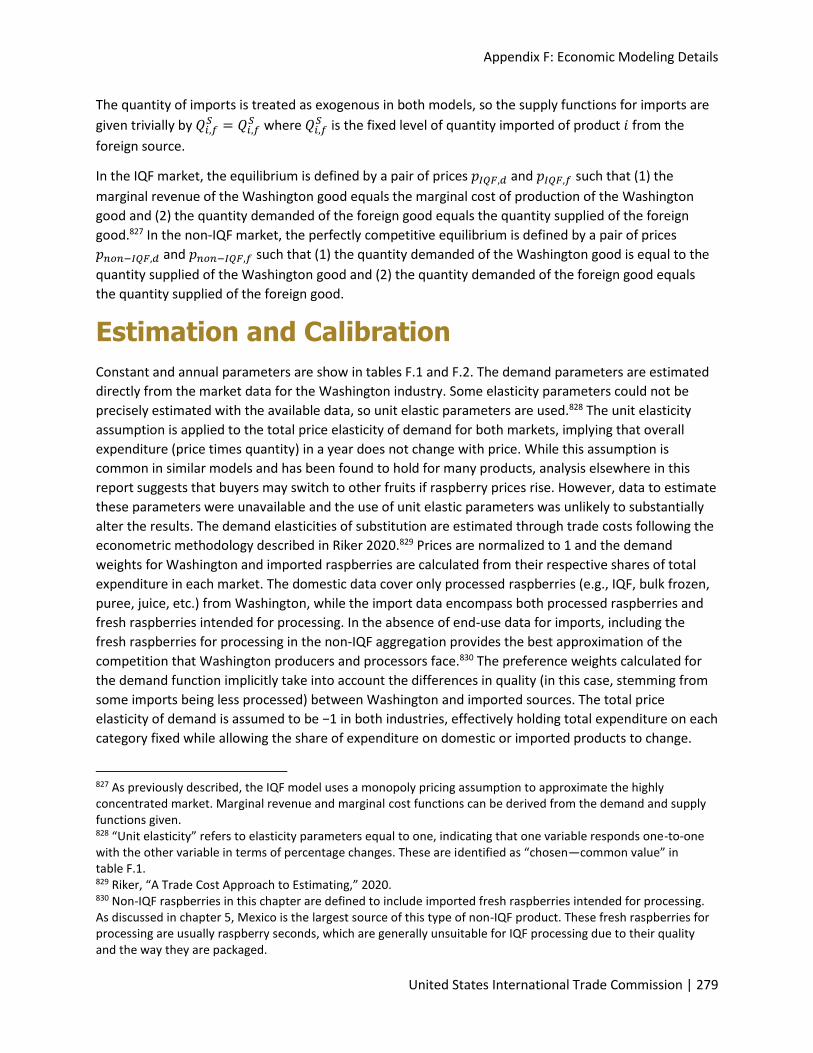
Appendix F: Economic Modeling Details
United States International Trade Commission | 279
The quantity of imports is treated as exogenous in both models, so the supply functions for imports are
given trivially by 𝑄𝑖,𝑓𝑆 = 𝑄
𝑖,𝑓𝑆 where 𝑄
𝑖,𝑓𝑆 is the fixed level of quantity imported of product 𝑖 from the
foreign source.
In the IQF market, the equilibrium is defined by a pair of prices 𝑝𝐼𝑄𝐹,𝑑 and 𝑝𝐼𝑄𝐹,𝑓 such that (1) the
marginal revenue of the Washington good equals the marginal cost of production of the Washington
good and (2) the quantity demanded of the foreign good equals the quantity supplied of the foreign
good.827 In the non-IQF market, the perfectly competitive equilibrium is defined by a pair of prices
𝑝𝑛𝑜𝑛−𝐼𝑄𝐹,𝑑 and 𝑝𝑛𝑜𝑛−𝐼𝑄𝐹,𝑓 such that (1) the quantity demanded of the Washington good is equal to the
quantity supplied of the Washington good and (2) the quantity demanded of the foreign good equals
the quantity supplied of the foreign good.
Estimation and Calibration
Constant and annual parameters are show in tables F.1 and F.2. The demand parameters are estimated
directly from the market data for the Washington industry. Some elasticity parameters could not be
precisely estimated with the available data, so unit elastic parameters are used.828 The unit elasticity
assumption is applied to the total price elasticity of demand for both markets, implying that overall
expenditure (price times quantity) in a year does not change with price. While this assumption is
common in similar models and has been found to hold for many products, analysis elsewhere in this
report suggests that buyers may switch to other fruits if raspberry prices rise. However, data to estimate
these parameters were unavailable and the use of unit elastic parameters was unlikely to substantially
alter the results. The demand elasticities of substitution are estimated through trade costs following the
econometric methodology described in Riker 2020.829 Prices are normalized to 1 and the demand
weights for Washington and imported raspberries are calculated from their respective shares of total
expenditure in each market. The domestic data cover only processed raspberries (e.g., IQF, bulk frozen,
puree, juice, etc.) from Washington, while the import data encompass both processed raspberries and
fresh raspberries intended for processing. In the absence of end-use data for imports, including the
fresh raspberries for processing in the non-IQF aggregation provides the best approximation of the
competition that Washington producers and processors face.830 The preference weights calculated for
the demand function implicitly take into account the differences in quality (in this case, stemming from
some imports being less processed) between Washington and imported sources. The total price
elasticity of demand is assumed to be −1 in both industries, effectively holding total expenditure on each
category fixed while allowing the share of expenditure on domestic or imported products to change.
827 As previously described, the IQF model uses a monopoly pricing assumption to approximate the highly concentrated market. Marginal revenue and marginal cost functions can be derived from the demand and supply functions given. 828 “Unit elasticity” refers to elasticity parameters equal to one, indicating that one variable responds one-to-one with the other variable in terms of percentage changes. These are identified as “chosen—common value” in table F.1. 829 Riker, “A Trade Cost Approach to Estimating,” 2020. 830 Non-IQF raspberries in this chapter are defined to include imported fresh raspberries intended for processing. As discussed in chapter 5, Mexico is the largest source of this type of non-IQF product. These fresh raspberries for processing are usually raspberry seconds, which are generally unsuitable for IQF processing due to their quality and the way they are packaged.
Raspberries for Processing
280 | www.usitc.gov
The marginal cost functions each have one parameter with a selected value and one parameter that is
calibrated in the model. For the asymptotic marginal cost function in the IQF market, the maximum
possible quantity in each year was set at 10 percent past the actual quantity produced in Washington.831
The curvature of the asymptotic marginal cost function was calibrated so that the equilibrium
production in the model matched the actual production given the selected capacity constraint. In the
non-IQF market, the constant price elasticity of supply was set to a standard value of 1.0 given data
limitations preventing estimating this parameter. This assumption means that percentage changes in the
quantity supplied are exactly equal to percentage changes in price. The supply shift parameter was
calibrated so that the equilibrium production in the model matched the actual production, given the
selected supply elasticity.
Table F.1 Constant parameters
Parameter Symbol Value Method
IQF Total elasticity of demand 𝐸𝐼𝑄𝐹 –1 Chosen—common value
Non-IQF total elasticity of demand 𝐸𝑛𝑜𝑛−𝐼𝑄𝐹 –1 Chosen—common value
Non-IQF elasticity of supply ℎ𝑛𝑜𝑛−𝐼𝑄𝐹 1 Chosen—common value
IQF elasticity of substitution 𝑒𝐼𝑄𝐹 4.7 Econometric estimate
Non-IQF elasticity of substitution 𝑒𝑛𝑜𝑛−𝐼𝑄𝐹 8.5 Econometric estimate
IQF normalized price 𝑝𝐼𝑄𝐹,𝑥 1 Numeraire
Non-IQF normalized price 𝑝𝑛𝑜𝑛−𝐼𝑄𝐹,𝑥 1 Numeraire Source: USITC staff.
Table F.2 Annual parameters
Parameter Symbol Method
IQF supply function curvature 𝑠𝐼𝑄𝐹 Calibrated to match observed quantity given normalized price
Non-IQF supply shifter 𝑠𝐼𝑄𝐹 Calibrated to match observed quantity given normalized price
IQF demand shifters 𝛼𝐼𝑄𝐹,𝑥 Matched ratio of Washington to imported sales
Non-IQF demand shifters 𝛼𝑛𝑜𝑛−𝐼𝑄𝐹,𝑥 Matched ratio of Washington to imported sales
IQF import quantity 𝑄 𝐼𝑄𝐹,𝑓𝑆 IQF imported customs value given normalized price
Non-IQF import quantity 𝑄 𝑛𝑜𝑛−𝐼𝑄𝐹,𝑓𝑆 Non-IQF imported customs value given normalized price
IQF capacity constraint 𝑄 𝐼𝑄𝐹,𝑑𝑆 Observed quantity multiplied by 1.1 (see explanation in
text) Source: Model calibration performed by USITC staff from multiple data sources.
Counterfactual Scenarios
The counterfactual scenarios do not correspond to any analysis of specific policy alternatives. Instead,
they were chosen based on aggregate import trends. The country profiles in chapters 4–7 discuss the
country-specific factors that impacted the overall U.S. import trade trends.
Both scenarios involve identifying a marked increase or surge in the value of imports and then reducing
the growth rate of imports in the identified surge years to simulate growth rates in the years outside of
831 Given that maximum, the curvature of the marginal cost function was calibrated for each year so that, given all other model parameters estimated from the actual data, the equilibrium quantity in the model matches the actual quantity.

Appendix F: Economic Modeling Details
United States International Trade Commission | 281
the surge. A surge here refers to a short number of years with growth rates that are significantly higher
than the average growth rate in the period overall. For the counterfactual scenario, the difference
between the average surge growth rate and the average non-surge growth rate is subtracted from the
growth rate in each surge year. The simulation then creates a counterfactual level of imports for each
year from the beginning of the surge to 2020 based on the import volume of the prior year and the new
counterfactual growth rate in the surge years, or actual growth rate in the non-surge years, for each
year in IQF and non-IQF imports. This brings the average growth rate of the 11-year period down to the
average non-surge growth rate while still allowing variation between years.
In the IQF scenario, raspberry imports saw a sharp surge in imports from 2013–14, but then declined to
levels comparable to 2010 and 2012 before increasing again in 2020. The average growth rate in the
surge years is 40.8 percent, compared to −2.3 percent for non-surge years. When the surge is removed,
the counterfactual models a decline in the value of IQF imports in the later years of the period from
levels seen in 2010–12. Figure F.1 shows the actual and counterfactual percentage change in value of
IQF imports and value of IQF imports.
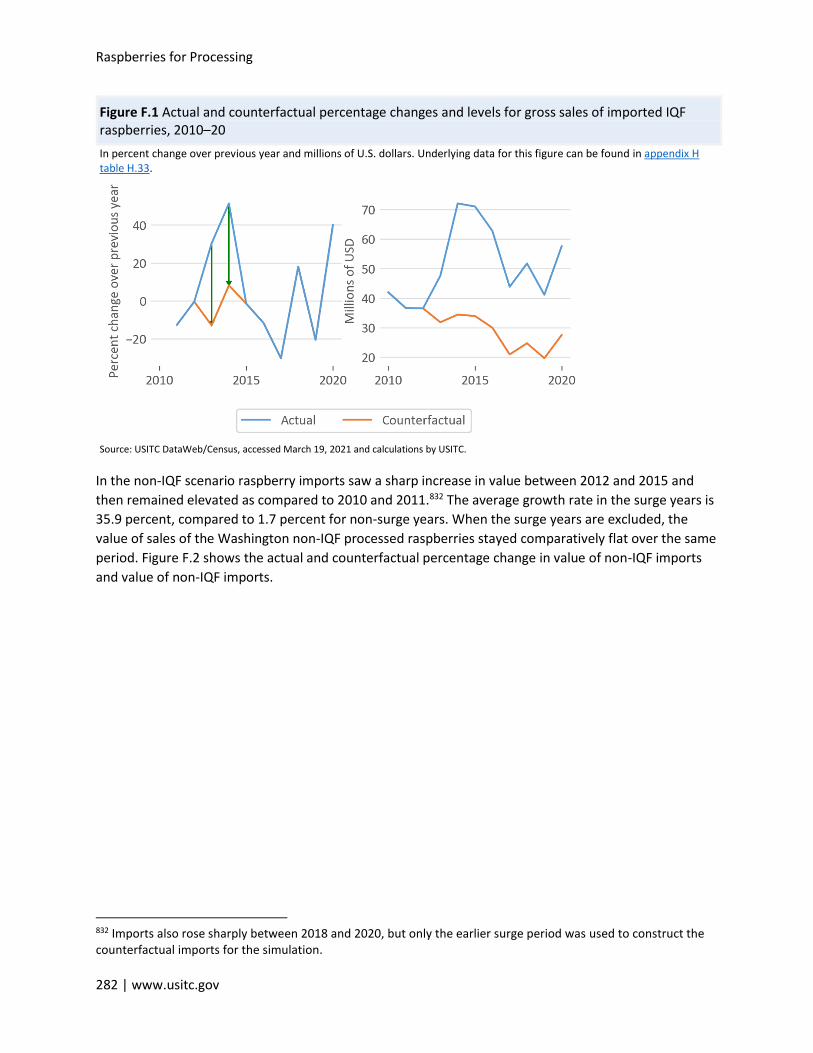
Raspberries for Processing
282 | www.usitc.gov
Figure F.1 Actual and counterfactual percentage changes and levels for gross sales of imported IQF raspberries, 2010–20
In percent change over previous year and millions of U.S. dollars. Underlying data for this figure can be found in appendix H table H.33.
Source: USITC DataWeb/Census, accessed March 19, 2021 and calculations by USITC.
In the non-IQF scenario raspberry imports saw a sharp increase in value between 2012 and 2015 and
then remained elevated as compared to 2010 and 2011.832 The average growth rate in the surge years is
35.9 percent, compared to 1.7 percent for non-surge years. When the surge years are excluded, the
value of sales of the Washington non-IQF processed raspberries stayed comparatively flat over the same
period. Figure F.2 shows the actual and counterfactual percentage change in value of non-IQF imports
and value of non-IQF imports.
832 Imports also rose sharply between 2018 and 2020, but only the earlier surge period was used to construct the counterfactual imports for the simulation.
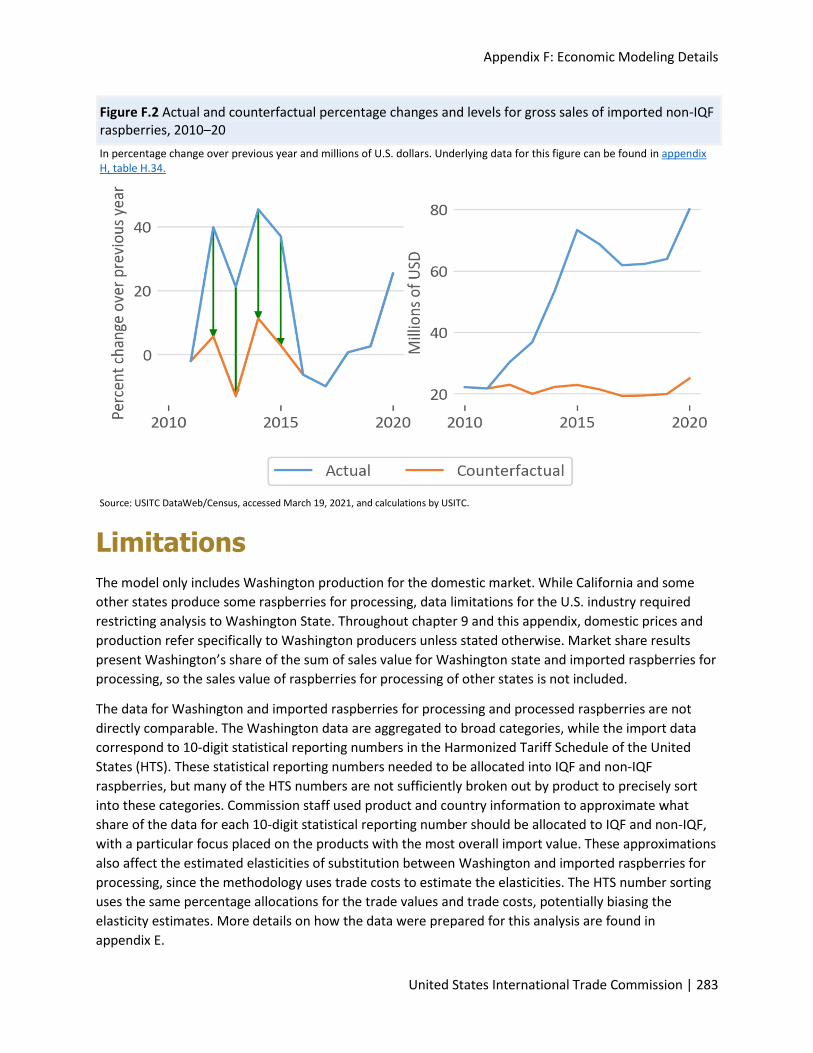
Appendix F: Economic Modeling Details
United States International Trade Commission | 283
Figure F.2 Actual and counterfactual percentage changes and levels for gross sales of imported non-IQF raspberries, 2010–20
In percentage change over previous year and millions of U.S. dollars. Underlying data for this figure can be found in appendix H, table H.34.
Source: USITC DataWeb/Census, accessed March 19, 2021, and calculations by USITC.
Limitations
The model only includes Washington production for the domestic market. While California and some
other states produce some raspberries for processing, data limitations for the U.S. industry required
restricting analysis to Washington State. Throughout chapter 9 and this appendix, domestic prices and
production refer specifically to Washington producers unless stated otherwise. Market share results
present Washington’s share of the sum of sales value for Washington state and imported raspberries for
processing, so the sales value of raspberries for processing of other states is not included.
The data for Washington and imported raspberries for processing and processed raspberries are not
directly comparable. The Washington data are aggregated to broad categories, while the import data
correspond to 10-digit statistical reporting numbers in the Harmonized Tariff Schedule of the United
States (HTS). These statistical reporting numbers needed to be allocated into IQF and non-IQF
raspberries, but many of the HTS numbers are not sufficiently broken out by product to precisely sort
into these categories. Commission staff used product and country information to approximate what
share of the data for each 10-digit statistical reporting number should be allocated to IQF and non-IQF,
with a particular focus placed on the products with the most overall import value. These approximations
also affect the estimated elasticities of substitution between Washington and imported raspberries for
processing, since the methodology uses trade costs to estimate the elasticities. The HTS number sorting
uses the same percentage allocations for the trade values and trade costs, potentially biasing the
elasticity estimates. More details on how the data were prepared for this analysis are found in
appendix E.

Raspberries for Processing
284 | www.usitc.gov
In addition, the import data include fresh raspberries intended for processing along with processed
raspberries, while Washington data include only IQF raspberries, B-grade raspberries, and raspberry
juice (these are slightly more processed products than the fresh berries intended for processing).
The models use imports as an exogenous input rather than a model output. Due to how import
quantities are constructed in the IQF and non-IQF simulation scenarios, this assumption has limited
impacts on the results for both domestic markets, and it is therefore a reasonable assumption in both
models. In addition, the assumption that imports are not sensitive to prices in the United States seems
especially reasonable for the non-IQF market. Mexico is the largest source of these imports and is
mainly responsible for the increase in these imports in recent years. As described in chapter 5, the
changes in the supply of non-IQF raspberries from Mexico, especially fresh raspberries for processing,
were largely driven by factors other than the price of raspberries for processing in the United States.
This is also consistent with public hearing testimony and industry interviews that suggested that the
increase in fresh raspberries for processing from Mexico is a side effect of changes in the market for
raspberries for fresh consumption.
The quantitative analysis is carried out using a series of static single-year simulations, which leads to
some limitations in the analysis that come from ignoring dynamic features in marginal cost functions. In
the IQF model, the capacity constraints (stemming from specialized freezing equipment) are calibrated
based on the actual production in each year, and do not account for the fact that additional investment
would likely have occurred if prices were higher. In that case, production would likely change by more
and prices would change by less compared to the static model results.
In the non-IQF model, domestic supply is allowed to increase without a set constraint. In reality,
available acreage (and therefore maximum quantity) depends partially on acreage in previous years. In
particular, this limits how much production would actually be able to increase from one year to the next.
The large increases in simulated Washington production in the surge years would likely have been more
modest, although prices would have risen more. The simulated increase in production in the most
recent five years were not as sharp, so this limitation is unlikely to have a large impact on the non-IQF
results for the years of interest.
Robustness Check with Distribution of Substitution Elasticities
The models were recalibrated using a range of alternative elasticities of substitution between domestic
and imported products to assess the sensitivity of the model results to those parameters (table F.3). The
distribution of results generated by the range of elasticities is used to display confidence intervals for
some variables of interest, such as the price and production figures in the main text. For each model, a
normal distribution of alternative elasticities was produced using the point estimates and standard
errors from the econometric estimation of the elasticity parameter. The distribution was approximated
by 101 points, with alternative models being calibrated and simulated at each point.
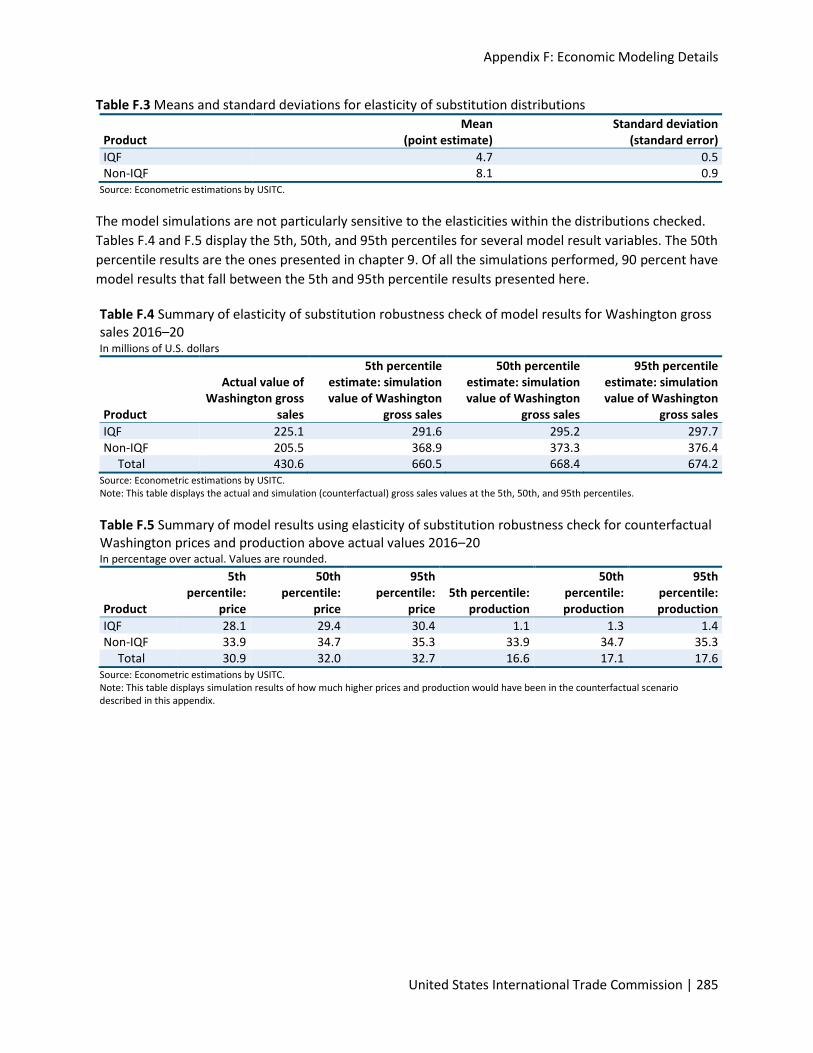
Appendix F: Economic Modeling Details
United States International Trade Commission | 285
Table F.3 Means and standard deviations for elasticity of substitution distributions
Product Mean
(point estimate) Standard deviation
(standard error)
IQF 4.7 0.5 Non-IQF 8.1 0.9
Source: Econometric estimations by USITC.
The model simulations are not particularly sensitive to the elasticities within the distributions checked.
Tables F.4 and F.5 display the 5th, 50th, and 95th percentiles for several model result variables. The 50th
percentile results are the ones presented in chapter 9. Of all the simulations performed, 90 percent have
model results that fall between the 5th and 95th percentile results presented here.
Table F.4 Summary of elasticity of substitution robustness check of model results for Washington gross sales 2016–20 In millions of U.S. dollars
Product
Actual value of Washington gross
sales
5th percentile estimate: simulation value of Washington
gross sales
50th percentile estimate: simulation value of Washington
gross sales
95th percentile estimate: simulation value of Washington
gross sales
IQF 225.1 291.6 295.2 297.7 Non-IQF 205.5 368.9 373.3 376.4
Total 430.6 660.5 668.4 674.2 Source: Econometric estimations by USITC. Note: This table displays the actual and simulation (counterfactual) gross sales values at the 5th, 50th, and 95th percentiles.
Table F.5 Summary of model results using elasticity of substitution robustness check for counterfactual Washington prices and production above actual values 2016–20 In percentage over actual. Values are rounded.
Product
5th percentile:
price
50th percentile:
price
95th percentile:
price 5th percentile:
production
50th percentile: production
95th percentile: production
IQF 28.1 29.4 30.4 1.1 1.3 1.4 Non-IQF 33.9 34.7 35.3 33.9 34.7 35.3
Total 30.9 32.0 32.7 16.6 17.1 17.6 Source: Econometric estimations by USITC. Note: This table displays simulation results of how much higher prices and production would have been in the counterfactual scenario described in this appendix.
Raspberries for Processing
286 | www.usitc.gov
Bibliography
Riker, David. “A Trade Cost Approach to Estimating the Elasticity of Substitution.” Economics Working Paper Series 2020-07-D, U.S. International Trade Commission, July 2020. https://www.usitc.gov/publications/332/working_papers/ecwp_2017-07-d.pdf.
U.S. International Trade Commission Interactive Tariff and Trade DataWeb (USITC DataWeb)/U.S. Census
Bureau (Census). Accessed various dates. http://dataweb.usitc.gov.

Appendix G: Symmetric Revealed Comparative Advantage Details
U.S. International Trade Commission | 287
Appendix G Symmetric Revealed Comparative Advantage Details

288 | www.usitc.gov
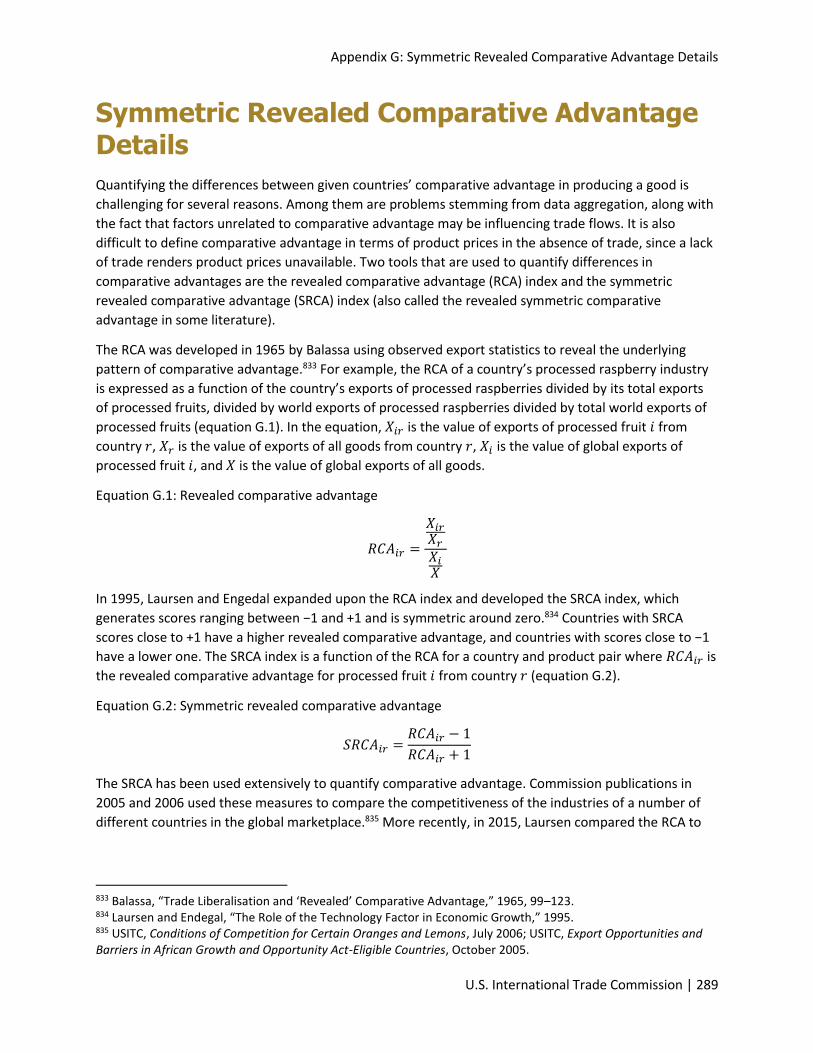
Appendix G: Symmetric Revealed Comparative Advantage Details
U.S. International Trade Commission | 289
Symmetric Revealed Comparative Advantage Details
Quantifying the differences between given countries’ comparative advantage in producing a good is
challenging for several reasons. Among them are problems stemming from data aggregation, along with
the fact that factors unrelated to comparative advantage may be influencing trade flows. It is also
difficult to define comparative advantage in terms of product prices in the absence of trade, since a lack
of trade renders product prices unavailable. Two tools that are used to quantify differences in
comparative advantages are the revealed comparative advantage (RCA) index and the symmetric
revealed comparative advantage (SRCA) index (also called the revealed symmetric comparative
advantage in some literature).
The RCA was developed in 1965 by Balassa using observed export statistics to reveal the underlying
pattern of comparative advantage.833 For example, the RCA of a country’s processed raspberry industry
is expressed as a function of the country’s exports of processed raspberries divided by its total exports
of processed fruits, divided by world exports of processed raspberries divided by total world exports of
processed fruits (equation G.1). In the equation, 𝑋𝑖𝑟 is the value of exports of processed fruit 𝑖 from
country 𝑟, 𝑋𝑟 is the value of exports of all goods from country 𝑟, 𝑋𝑖 is the value of global exports of
processed fruit 𝑖, and 𝑋 is the value of global exports of all goods.
Equation G.1: Revealed comparative advantage
𝑅𝐶𝐴𝑖𝑟 =
𝑋𝑖𝑟𝑋𝑟
𝑋𝑖𝑋
In 1995, Laursen and Engedal expanded upon the RCA index and developed the SRCA index, which
generates scores ranging between −1 and +1 and is symmetric around zero.834 Countries with SRCA
scores close to +1 have a higher revealed comparative advantage, and countries with scores close to −1
have a lower one. The SRCA index is a function of the RCA for a country and product pair where 𝑅𝐶𝐴𝑖𝑟 is
the revealed comparative advantage for processed fruit 𝑖 from country 𝑟 (equation G.2).
Equation G.2: Symmetric revealed comparative advantage
𝑆𝑅𝐶𝐴𝑖𝑟 =𝑅𝐶𝐴𝑖𝑟 − 1
𝑅𝐶𝐴𝑖𝑟 + 1
The SRCA has been used extensively to quantify comparative advantage. Commission publications in
2005 and 2006 used these measures to compare the competitiveness of the industries of a number of
different countries in the global marketplace.835 More recently, in 2015, Laursen compared the RCA to
833 Balassa, “Trade Liberalisation and ‘Revealed’ Comparative Advantage,” 1965, 99–123. 834 Laursen and Endegal, “The Role of the Technology Factor in Economic Growth,” 1995. 835 USITC, Conditions of Competition for Certain Oranges and Lemons, July 2006; USITC, Export Opportunities and Barriers in African Growth and Opportunity Act-Eligible Countries, October 2005.
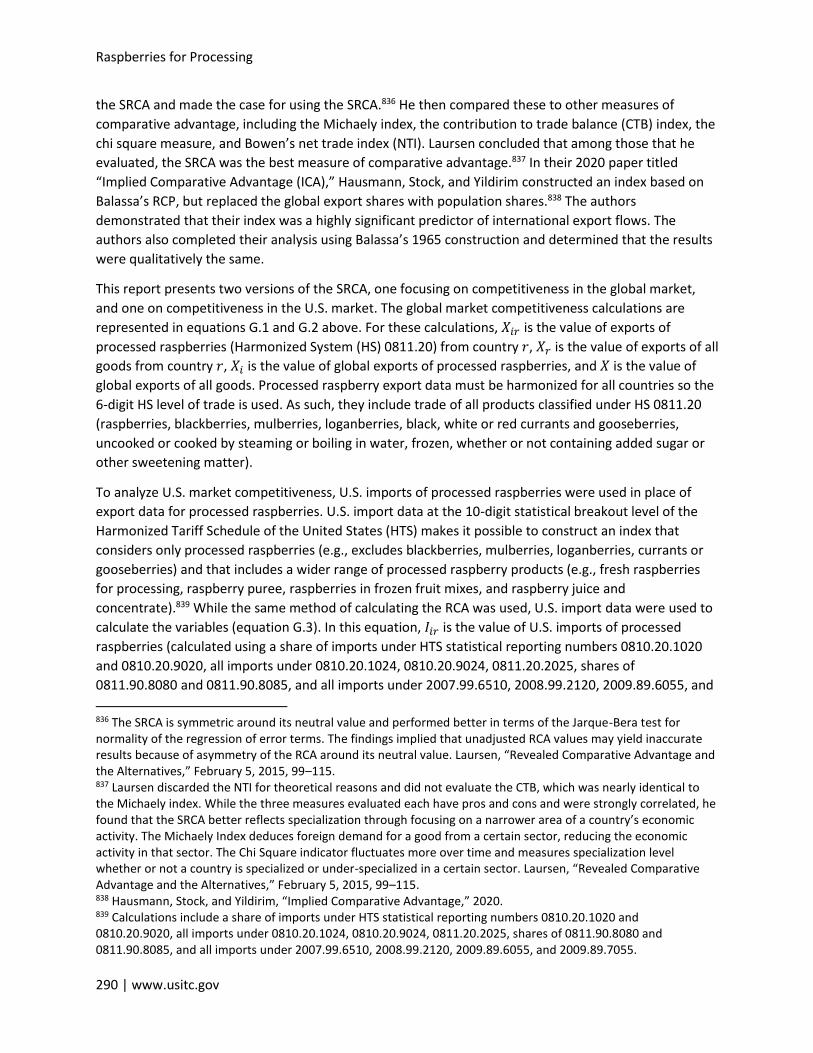
Raspberries for Processing
290 | www.usitc.gov
the SRCA and made the case for using the SRCA.836 He then compared these to other measures of
comparative advantage, including the Michaely index, the contribution to trade balance (CTB) index, the
chi square measure, and Bowen’s net trade index (NTI). Laursen concluded that among those that he
evaluated, the SRCA was the best measure of comparative advantage.837 In their 2020 paper titled
“Implied Comparative Advantage (ICA),” Hausmann, Stock, and Yildirim constructed an index based on
Balassa’s RCP, but replaced the global export shares with population shares.838 The authors
demonstrated that their index was a highly significant predictor of international export flows. The
authors also completed their analysis using Balassa’s 1965 construction and determined that the results
were qualitatively the same.
This report presents two versions of the SRCA, one focusing on competitiveness in the global market,
and one on competitiveness in the U.S. market. The global market competitiveness calculations are
represented in equations G.1 and G.2 above. For these calculations, 𝑋𝑖𝑟 is the value of exports of
processed raspberries (Harmonized System (HS) 0811.20) from country 𝑟, 𝑋𝑟 is the value of exports of all
goods from country 𝑟, 𝑋𝑖 is the value of global exports of processed raspberries, and 𝑋 is the value of
global exports of all goods. Processed raspberry export data must be harmonized for all countries so the
6-digit HS level of trade is used. As such, they include trade of all products classified under HS 0811.20
(raspberries, blackberries, mulberries, loganberries, black, white or red currants and gooseberries,
uncooked or cooked by steaming or boiling in water, frozen, whether or not containing added sugar or
other sweetening matter).
To analyze U.S. market competitiveness, U.S. imports of processed raspberries were used in place of
export data for processed raspberries. U.S. import data at the 10-digit statistical breakout level of the
Harmonized Tariff Schedule of the United States (HTS) makes it possible to construct an index that
considers only processed raspberries (e.g., excludes blackberries, mulberries, loganberries, currants or
gooseberries) and that includes a wider range of processed raspberry products (e.g., fresh raspberries
for processing, raspberry puree, raspberries in frozen fruit mixes, and raspberry juice and
concentrate).839 While the same method of calculating the RCA was used, U.S. import data were used to
calculate the variables (equation G.3). In this equation, 𝐼𝑖𝑟 is the value of U.S. imports of processed
raspberries (calculated using a share of imports under HTS statistical reporting numbers 0810.20.1020
and 0810.20.9020, all imports under 0810.20.1024, 0810.20.9024, 0811.20.2025, shares of
0811.90.8080 and 0811.90.8085, and all imports under 2007.99.6510, 2008.99.2120, 2009.89.6055, and
836 The SRCA is symmetric around its neutral value and performed better in terms of the Jarque-Bera test for normality of the regression of error terms. The findings implied that unadjusted RCA values may yield inaccurate results because of asymmetry of the RCA around its neutral value. Laursen, “Revealed Comparative Advantage and the Alternatives,” February 5, 2015, 99–115. 837 Laursen discarded the NTI for theoretical reasons and did not evaluate the CTB, which was nearly identical to the Michaely index. While the three measures evaluated each have pros and cons and were strongly correlated, he found that the SRCA better reflects specialization through focusing on a narrower area of a country’s economic activity. The Michaely Index deduces foreign demand for a good from a certain sector, reducing the economic activity in that sector. The Chi Square indicator fluctuates more over time and measures specialization level whether or not a country is specialized or under-specialized in a certain sector. Laursen, “Revealed Comparative Advantage and the Alternatives,” February 5, 2015, 99–115. 838 Hausmann, Stock, and Yildirim, “Implied Comparative Advantage,” 2020. 839 Calculations include a share of imports under HTS statistical reporting numbers 0810.20.1020 and 0810.20.9020, all imports under 0810.20.1024, 0810.20.9024, 0811.20.2025, shares of 0811.90.8080 and 0811.90.8085, and all imports under 2007.99.6510, 2008.99.2120, 2009.89.6055, and 2009.89.7055.
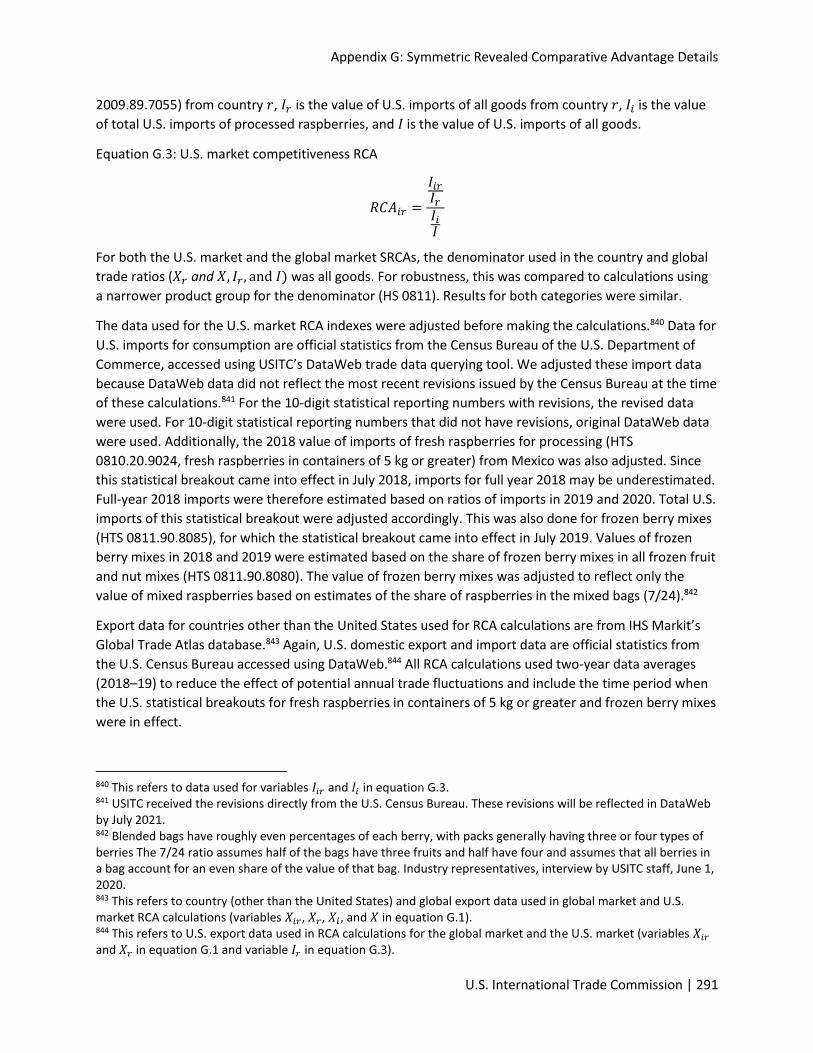
Appendix G: Symmetric Revealed Comparative Advantage Details
U.S. International Trade Commission | 291
2009.89.7055) from country 𝑟, 𝐼𝑟 is the value of U.S. imports of all goods from country 𝑟, 𝐼𝑖 is the value
of total U.S. imports of processed raspberries, and 𝐼 is the value of U.S. imports of all goods.
Equation G.3: U.S. market competitiveness RCA
𝑅𝐶𝐴𝑖𝑟 =
𝐼𝑖𝑟𝐼𝑟
𝐼𝑖𝐼
For both the U.S. market and the global market SRCAs, the denominator used in the country and global
trade ratios (𝑋𝑟 and 𝑋, 𝐼𝑟, and 𝐼) was all goods. For robustness, this was compared to calculations using
a narrower product group for the denominator (HS 0811). Results for both categories were similar.
The data used for the U.S. market RCA indexes were adjusted before making the calculations.840 Data for
U.S. imports for consumption are official statistics from the Census Bureau of the U.S. Department of
Commerce, accessed using USITC’s DataWeb trade data querying tool. We adjusted these import data
because DataWeb data did not reflect the most recent revisions issued by the Census Bureau at the time
of these calculations.841 For the 10-digit statistical reporting numbers with revisions, the revised data
were used. For 10-digit statistical reporting numbers that did not have revisions, original DataWeb data
were used. Additionally, the 2018 value of imports of fresh raspberries for processing (HTS
0810.20.9024, fresh raspberries in containers of 5 kg or greater) from Mexico was also adjusted. Since
this statistical breakout came into effect in July 2018, imports for full year 2018 may be underestimated.
Full-year 2018 imports were therefore estimated based on ratios of imports in 2019 and 2020. Total U.S.
imports of this statistical breakout were adjusted accordingly. This was also done for frozen berry mixes
(HTS 0811.90.8085), for which the statistical breakout came into effect in July 2019. Values of frozen
berry mixes in 2018 and 2019 were estimated based on the share of frozen berry mixes in all frozen fruit
and nut mixes (HTS 0811.90.8080). The value of frozen berry mixes was adjusted to reflect only the
value of mixed raspberries based on estimates of the share of raspberries in the mixed bags (7/24).842
Export data for countries other than the United States used for RCA calculations are from IHS Markit’s
Global Trade Atlas database.843 Again, U.S. domestic export and import data are official statistics from
the U.S. Census Bureau accessed using DataWeb.844 All RCA calculations used two-year data averages
(2018–19) to reduce the effect of potential annual trade fluctuations and include the time period when
the U.S. statistical breakouts for fresh raspberries in containers of 5 kg or greater and frozen berry mixes
were in effect.
840 This refers to data used for variables 𝐼𝑖𝑟 and 𝐼𝑖 in equation G.3. 841 USITC received the revisions directly from the U.S. Census Bureau. These revisions will be reflected in DataWeb by July 2021. 842 Blended bags have roughly even percentages of each berry, with packs generally having three or four types of berries The 7/24 ratio assumes half of the bags have three fruits and half have four and assumes that all berries in a bag account for an even share of the value of that bag. Industry representatives, interview by USITC staff, June 1, 2020. 843 This refers to country (other than the United States) and global export data used in global market and U.S. market RCA calculations (variables 𝑋𝑖𝑟 , 𝑋𝑟, 𝑋𝑖, and 𝑋 in equation G.1). 844 This refers to U.S. export data used in RCA calculations for the global market and the U.S. market (variables 𝑋𝑖𝑟 and 𝑋𝑟 in equation G.1 and variable 𝐼𝑟 in equation G.3).
Raspberries for Processing
292 | www.usitc.gov
Bibliography
Balassa, Bela. “Trade Liberalisation and ‘Revealed’ Comparative Advantage.” The Manchester School 33, no. 2 (1965): 99–123. https://doi.org/10.1111/j.1467-9957.1965.tb00050.x.
Hausmann, Ricardo, Daniel P. Stock, and Muhammed A. Yıldırım. “Implied Comparative Advantage.” Research Policy, article 104143, 2020. https://doi.org/10.1016/j.respol.2020.104143.
Laursen, Keld. “Revealed Comparative Advantage and the Alternatives as Measures of International Specialisation.” Eurasian Business Review 5 (February 5, 2015): 99–115. https://doi.org/10.1007/s40821-015-0017-1.
Laursen, Keld, and Carsten Endegal. “The Role of the Technology Factor in Economic Growth: A Theoretical and Empirical Inquiry into New Approaches to Economic Growth.” MS thesis, University of Aalborg, 1995.

Appendix H: Data Tables for Figures
United States International Trade Commission | 293
Appendix H Data Tables for Figures

294 | www.usitc.gov
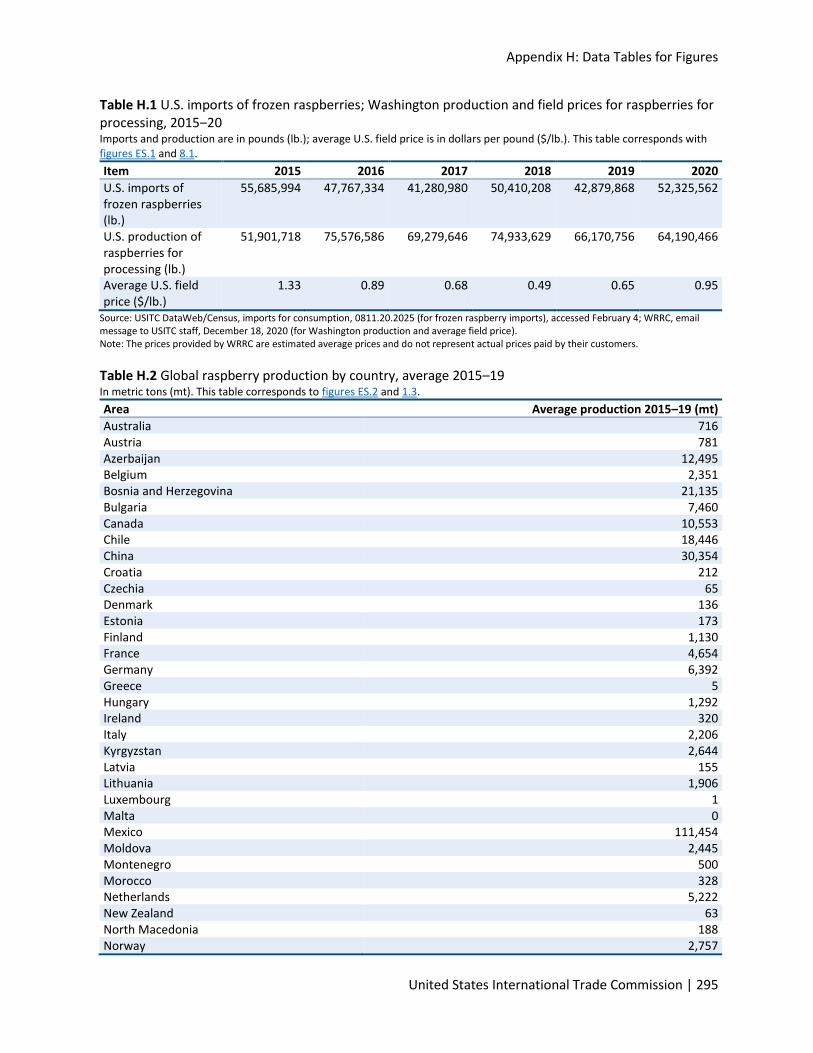
Appendix H: Data Tables for Figures
United States International Trade Commission | 295
Table H.1 U.S. imports of frozen raspberries; Washington production and field prices for raspberries for processing, 2015‒20 Imports and production are in pounds (lb.); average U.S. field price is in dollars per pound ($/lb.). This table corresponds with figures ES.1 and 8.1.
Item 2015 2016 2017 2018 2019 2020
U.S. imports of frozen raspberries (lb.)
55,685,994 47,767,334 41,280,980 50,410,208 42,879,868 52,325,562
U.S. production of raspberries for processing (lb.)
51,901,718 75,576,586 69,279,646 74,933,629 66,170,756 64,190,466
Average U.S. field price ($/lb.)
1.33 0.89 0.68 0.49 0.65 0.95
Source: USITC DataWeb/Census, imports for consumption, 0811.20.2025 (for frozen raspberry imports), accessed February 4; WRRC, email message to USITC staff, December 18, 2020 (for Washington production and average field price). Note: The prices provided by WRRC are estimated average prices and do not represent actual prices paid by their customers.
Table H.2 Global raspberry production by country, average 2015–19 In metric tons (mt). This table corresponds to figures ES.2 and 1.3.
Area Average production 2015–19 (mt)
Australia 716 Austria 781 Azerbaijan 12,495 Belgium 2,351 Bosnia and Herzegovina 21,135 Bulgaria 7,460 Canada 10,553 Chile 18,446 China 30,354 Croatia 212 Czechia 65 Denmark 136 Estonia 173 Finland 1,130 France 4,654 Germany 6,392 Greece 5 Hungary 1,292 Ireland 320 Italy 2,206 Kyrgyzstan 2,644 Latvia 155 Lithuania 1,906 Luxembourg 1 Malta 0 Mexico 111,454 Moldova 2,445 Montenegro 500 Morocco 328 Netherlands 5,222 New Zealand 63 North Macedonia 188 Norway 2,757

Raspberries for Processing
296 | www.usitc.gov
Area Average production 2015–19 (mt) Poland 100,942 Portugal 15,837 Romania 108 Russian Federation 152,500 Serbia 113,429 Slovakia 18 Slovenia 96 Spain 37,187 Sweden 524 Switzerland 3,447 United Kingdom 16,226 Ukraine 33,426 United States of America 108,214 Zimbabwe 97
Source: FAO, FAOSTAT database, Crops: Raspberries, accessed January 19, 2021. Li, 12th World Conference, IRO, accessed March 23, 2021. Note: FAO data for Chile may be incomplete; alternative, higher estimates for Chilean production are presented in chapter 7. Production data for China are not available from FAO and are provided by industry.
Table H.3 Global raspberry production, by country, 2015–19 In thousands of metric tons (mt). This table corresponds to figure 1.4.
Country 2015 (mt) 2016 (mt) 2017 (mt) 2018 (mt) 2019 (mt)
Russia 137,800 151,700 133,200 165,800 174,000 Mexico 65,388 112,661 120,184 130,187 128,848 Serbia 97,165 113,172 109,742 127,010 120,058 United States 119,295 117,177 102,840 99,250 102,510 Poland 79,895 129,063 104,482 115,610 75,660 All other 175,391 199,656 227,776 212,565 221,417
Total 674,934 823,429 798,224 850,422 822,493 Source: UNFAO, FAOSTAT database, Crops: Raspberries, accessed January 18, 2021 Note: Includes raspberries for the fresh market and processing market. 2019 is the latest year for which data were available. FAO data for Chile may be incomplete; alternative, higher estimates for Chilean production from Chilealimentos are presented in chapter 7 ("Chile").
Table H.4 Frozen raspberries: Share of global imports by volume, 2019 In metric tons (mt) and percentages. This table corresponds to figure 1.5.
Country Share of quantity (percent)
Germany 21 France 8 United States 7 Belgium 7 Russia 6 Austria 6 Poland 5 United Kingdom 5 Netherlands 5 Canada 4 All other 26
Total 100 Source: IHS Markit, Global Trade Atlas database, HS subheading 0811.20, accessed July 7, 2020. Note: HS subheading 0811.20 covers raspberries, blackberries, mulberries, loganberries, currants, and gooseberries. However, available information indicates that the bulk of exports and imports of this product group are raspberries.
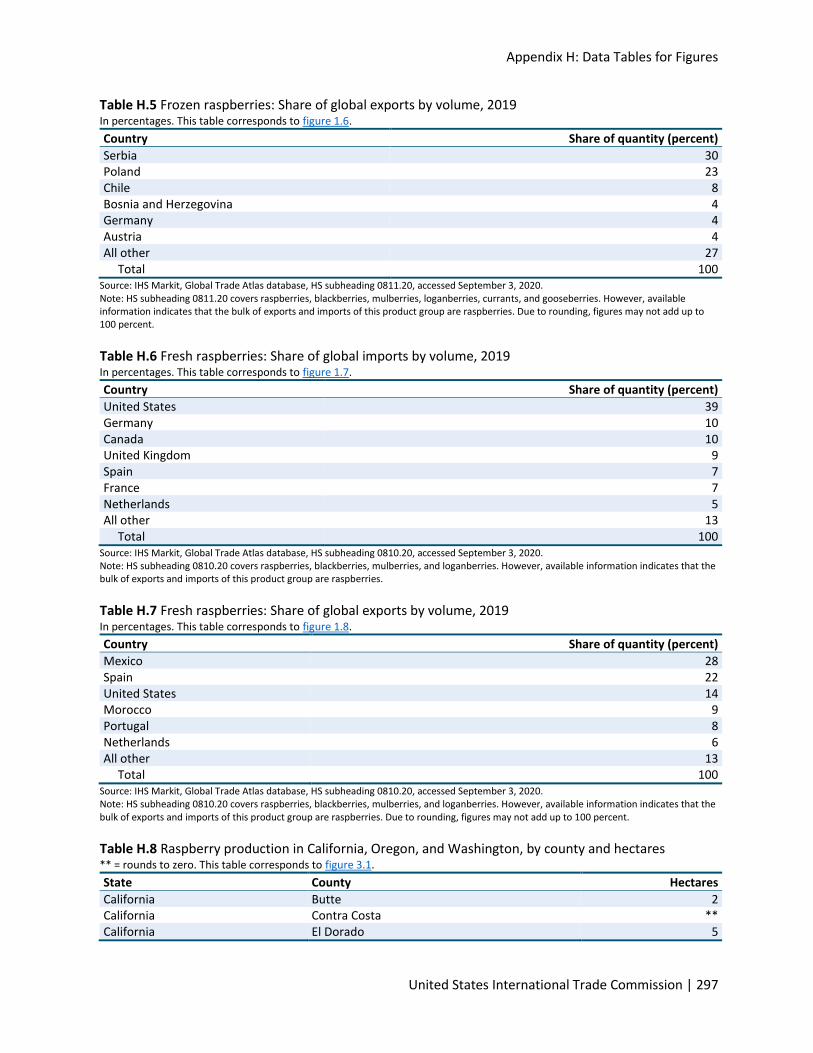
Appendix H: Data Tables for Figures
United States International Trade Commission | 297
Table H.5 Frozen raspberries: Share of global exports by volume, 2019 In percentages. This table corresponds to figure 1.6.
Country Share of quantity (percent)
Serbia 30 Poland 23 Chile 8 Bosnia and Herzegovina 4 Germany 4 Austria 4 All other 27
Total 100 Source: IHS Markit, Global Trade Atlas database, HS subheading 0811.20, accessed September 3, 2020. Note: HS subheading 0811.20 covers raspberries, blackberries, mulberries, loganberries, currants, and gooseberries. However, available information indicates that the bulk of exports and imports of this product group are raspberries. Due to rounding, figures may not add up to 100 percent.
Table H.6 Fresh raspberries: Share of global imports by volume, 2019 In percentages. This table corresponds to figure 1.7.
Country Share of quantity (percent)
United States 39 Germany 10 Canada 10 United Kingdom 9 Spain 7 France 7 Netherlands 5 All other 13
Total 100 Source: IHS Markit, Global Trade Atlas database, HS subheading 0810.20, accessed September 3, 2020. Note: HS subheading 0810.20 covers raspberries, blackberries, mulberries, and loganberries. However, available information indicates that the bulk of exports and imports of this product group are raspberries.
Table H.7 Fresh raspberries: Share of global exports by volume, 2019 In percentages. This table corresponds to figure 1.8.
Country Share of quantity (percent)
Mexico 28 Spain 22 United States 14 Morocco 9 Portugal 8 Netherlands 6 All other 13
Total 100 Source: IHS Markit, Global Trade Atlas database, HS subheading 0810.20, accessed September 3, 2020. Note: HS subheading 0810.20 covers raspberries, blackberries, mulberries, and loganberries. However, available information indicates that the bulk of exports and imports of this product group are raspberries. Due to rounding, figures may not add up to 100 percent.
Table H.8 Raspberry production in California, Oregon, and Washington, by county and hectares ** = rounds to zero. This table corresponds to figure 3.1.
State County Hectares
California Butte 2 California Contra Costa ** California El Dorado 5
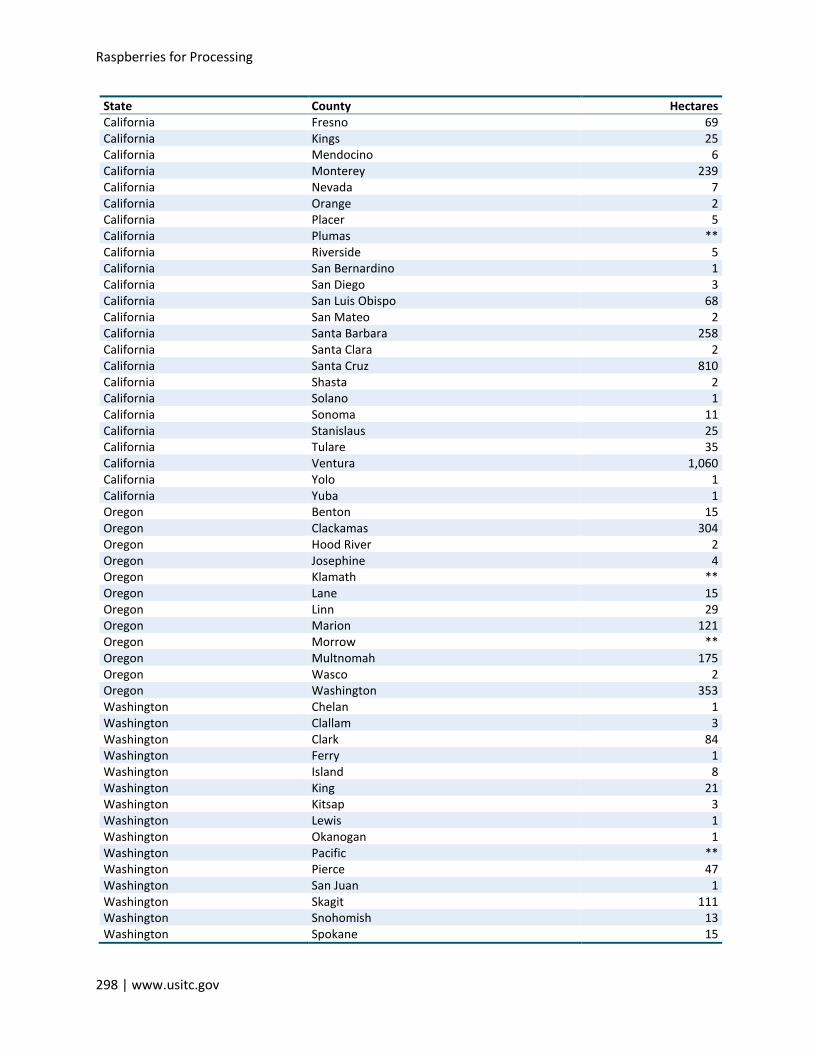
Raspberries for Processing
298 | www.usitc.gov
State County Hectares California Fresno 69 California Kings 25 California Mendocino 6 California Monterey 239 California Nevada 7 California Orange 2 California Placer 5 California Plumas ** California Riverside 5 California San Bernardino 1 California San Diego 3 California San Luis Obispo 68 California San Mateo 2 California Santa Barbara 258 California Santa Clara 2 California Santa Cruz 810 California Shasta 2 California Solano 1 California Sonoma 11 California Stanislaus 25 California Tulare 35 California Ventura 1,060 California Yolo 1 California Yuba 1 Oregon Benton 15 Oregon Clackamas 304 Oregon Hood River 2 Oregon Josephine 4 Oregon Klamath ** Oregon Lane 15 Oregon Linn 29 Oregon Marion 121 Oregon Morrow ** Oregon Multnomah 175 Oregon Wasco 2 Oregon Washington 353 Washington Chelan 1 Washington Clallam 3 Washington Clark 84 Washington Ferry 1 Washington Island 8 Washington King 21 Washington Kitsap 3 Washington Lewis 1 Washington Okanogan 1 Washington Pacific ** Washington Pierce 47 Washington San Juan 1 Washington Skagit 111 Washington Snohomish 13 Washington Spokane 15
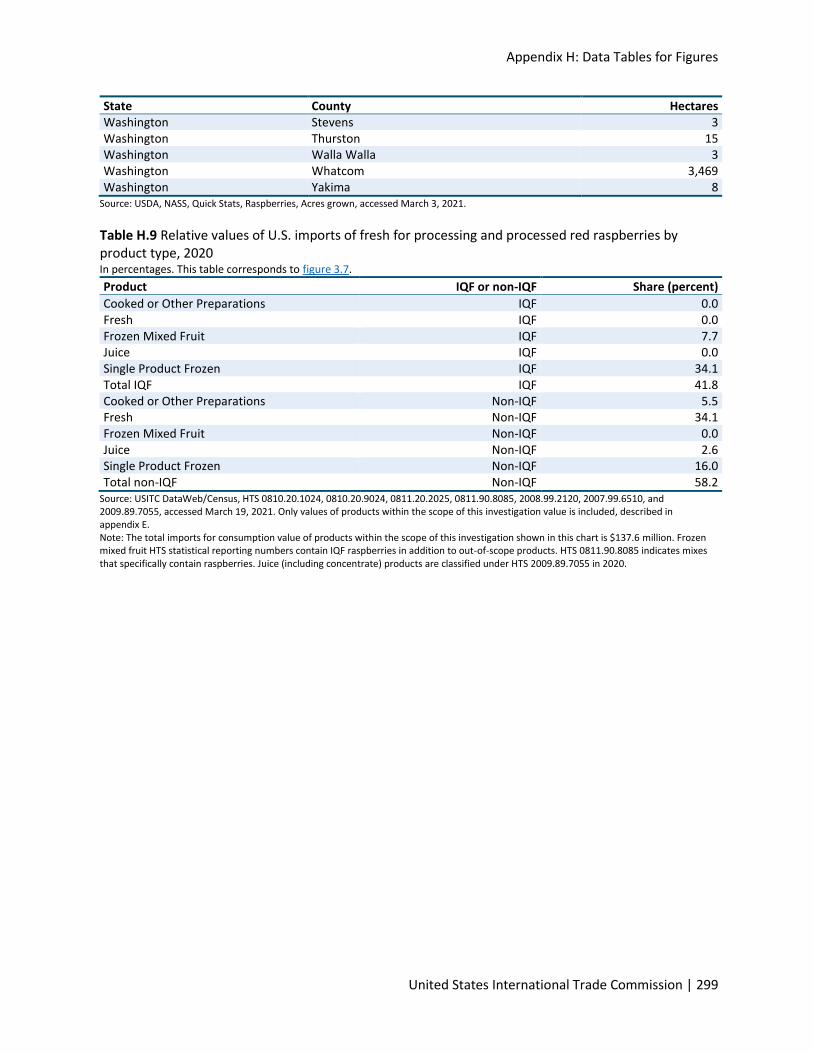
Appendix H: Data Tables for Figures
United States International Trade Commission | 299
State County Hectares Washington Stevens 3 Washington Thurston 15 Washington Walla Walla 3 Washington Whatcom 3,469 Washington Yakima 8
Source: USDA, NASS, Quick Stats, Raspberries, Acres grown, accessed March 3, 2021.
Table H.9 Relative values of U.S. imports of fresh for processing and processed red raspberries by product type, 2020 In percentages. This table corresponds to figure 3.7.
Product IQF or non-IQF Share (percent)
Cooked or Other Preparations IQF 0.0 Fresh IQF 0.0 Frozen Mixed Fruit IQF 7.7 Juice IQF 0.0 Single Product Frozen IQF 34.1 Total IQF IQF 41.8 Cooked or Other Preparations Non-IQF 5.5 Fresh Non-IQF 34.1 Frozen Mixed Fruit Non-IQF 0.0 Juice Non-IQF 2.6 Single Product Frozen Non-IQF 16.0 Total non-IQF Non-IQF 58.2
Source: USITC DataWeb/Census, HTS 0810.20.1024, 0810.20.9024, 0811.20.2025, 0811.90.8085, 2008.99.2120, 2007.99.6510, and 2009.89.7055, accessed March 19, 2021. Only values of products within the scope of this investigation value is included, described in appendix E. Note: The total imports for consumption value of products within the scope of this investigation shown in this chart is $137.6 million. Frozen mixed fruit HTS statistical reporting numbers contain IQF raspberries in addition to out-of-scope products. HTS 0811.90.8085 indicates mixes that specifically contain raspberries. Juice (including concentrate) products are classified under HTS 2009.89.7055 in 2020.
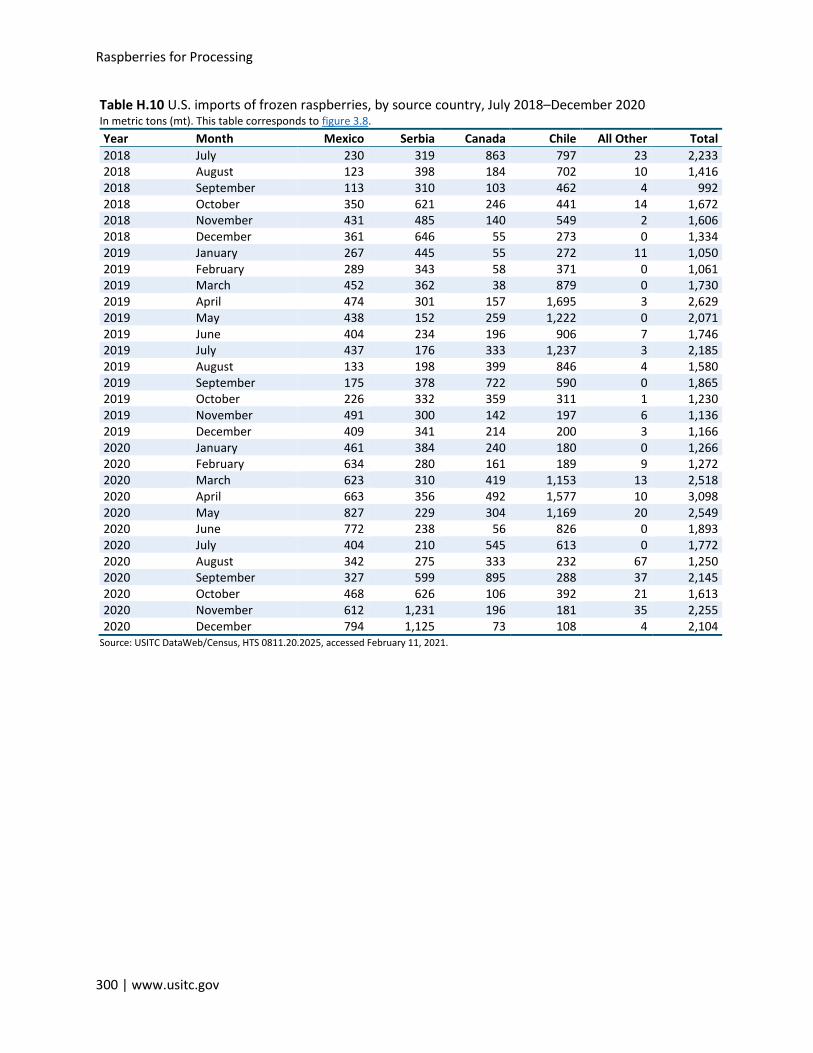
Raspberries for Processing
300 | www.usitc.gov
Table H.10 U.S. imports of frozen raspberries, by source country, July 2018–December 2020 In metric tons (mt). This table corresponds to figure 3.8.
Year Month Mexico Serbia Canada Chile All Other Total
2018 July 230 319 863 797 23 2,233 2018 August 123 398 184 702 10 1,416 2018 September 113 310 103 462 4 992 2018 October 350 621 246 441 14 1,672 2018 November 431 485 140 549 2 1,606 2018 December 361 646 55 273 0 1,334 2019 January 267 445 55 272 11 1,050 2019 February 289 343 58 371 0 1,061 2019 March 452 362 38 879 0 1,730 2019 April 474 301 157 1,695 3 2,629 2019 May 438 152 259 1,222 0 2,071 2019 June 404 234 196 906 7 1,746 2019 July 437 176 333 1,237 3 2,185 2019 August 133 198 399 846 4 1,580 2019 September 175 378 722 590 0 1,865 2019 October 226 332 359 311 1 1,230 2019 November 491 300 142 197 6 1,136 2019 December 409 341 214 200 3 1,166 2020 January 461 384 240 180 0 1,266 2020 February 634 280 161 189 9 1,272 2020 March 623 310 419 1,153 13 2,518 2020 April 663 356 492 1,577 10 3,098 2020 May 827 229 304 1,169 20 2,549 2020 June 772 238 56 826 0 1,893 2020 July 404 210 545 613 0 1,772 2020 August 342 275 333 232 67 1,250 2020 September 327 599 895 288 37 2,145 2020 October 468 626 106 392 21 1,613 2020 November 612 1,231 196 181 35 2,255 2020 December 794 1,125 73 108 4 2,104
Source: USITC DataWeb/Census, HTS 0811.20.2025, accessed February 11, 2021.
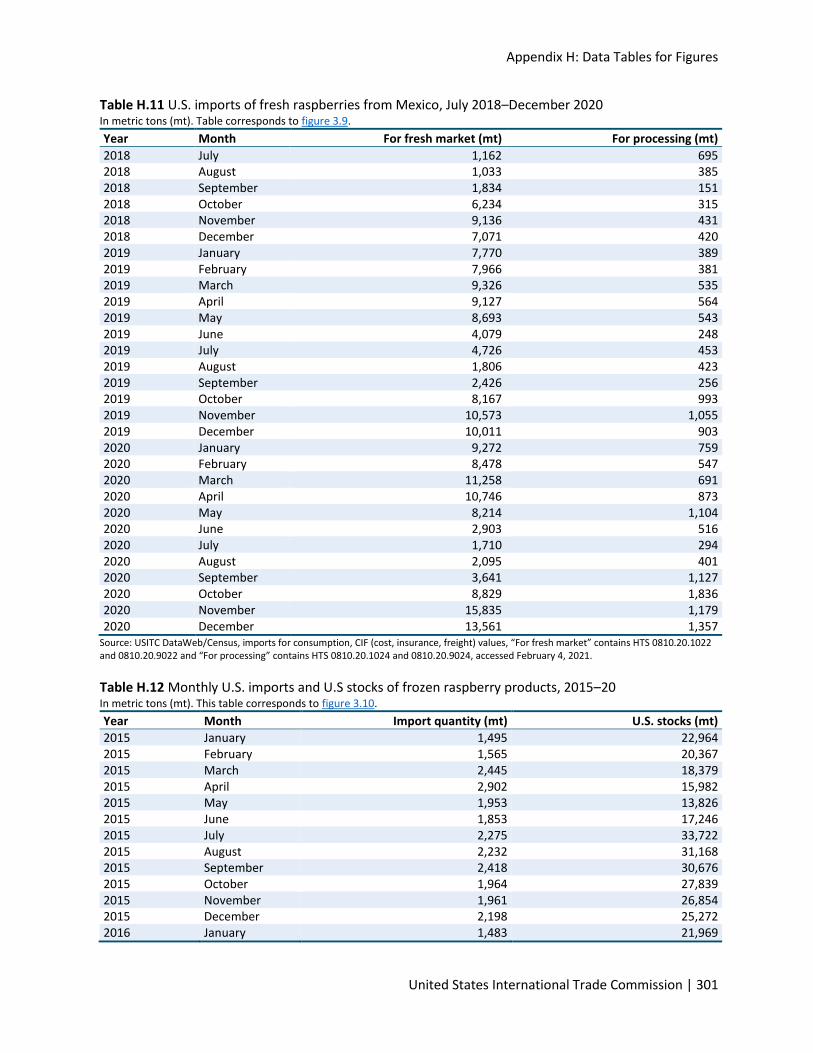
Appendix H: Data Tables for Figures
United States International Trade Commission | 301
Table H.11 U.S. imports of fresh raspberries from Mexico, July 2018–December 2020 In metric tons (mt). Table corresponds to figure 3.9.
Year Month For fresh market (mt) For processing (mt)
2018 July 1,162 695 2018 August 1,033 385 2018 September 1,834 151 2018 October 6,234 315 2018 November 9,136 431 2018 December 7,071 420 2019 January 7,770 389 2019 February 7,966 381 2019 March 9,326 535 2019 April 9,127 564 2019 May 8,693 543 2019 June 4,079 248 2019 July 4,726 453 2019 August 1,806 423 2019 September 2,426 256 2019 October 8,167 993 2019 November 10,573 1,055 2019 December 10,011 903 2020 January 9,272 759 2020 February 8,478 547 2020 March 11,258 691 2020 April 10,746 873 2020 May 8,214 1,104 2020 June 2,903 516 2020 July 1,710 294 2020 August 2,095 401 2020 September 3,641 1,127 2020 October 8,829 1,836 2020 November 15,835 1,179 2020 December 13,561 1,357
Source: USITC DataWeb/Census, imports for consumption, CIF (cost, insurance, freight) values, “For fresh market” contains HTS 0810.20.1022 and 0810.20.9022 and “For processing” contains HTS 0810.20.1024 and 0810.20.9024, accessed February 4, 2021.
Table H.12 Monthly U.S. imports and U.S stocks of frozen raspberry products, 2015–20 In metric tons (mt). This table corresponds to figure 3.10.
Year Month Import quantity (mt) U.S. stocks (mt)
2015 January 1,495 22,964 2015 February 1,565 20,367 2015 March 2,445 18,379 2015 April 2,902 15,982 2015 May 1,953 13,826 2015 June 1,853 17,246 2015 July 2,275 33,722 2015 August 2,232 31,168 2015 September 2,418 30,676 2015 October 1,964 27,839 2015 November 1,961 26,854 2015 December 2,198 25,272 2016 January 1,483 21,969
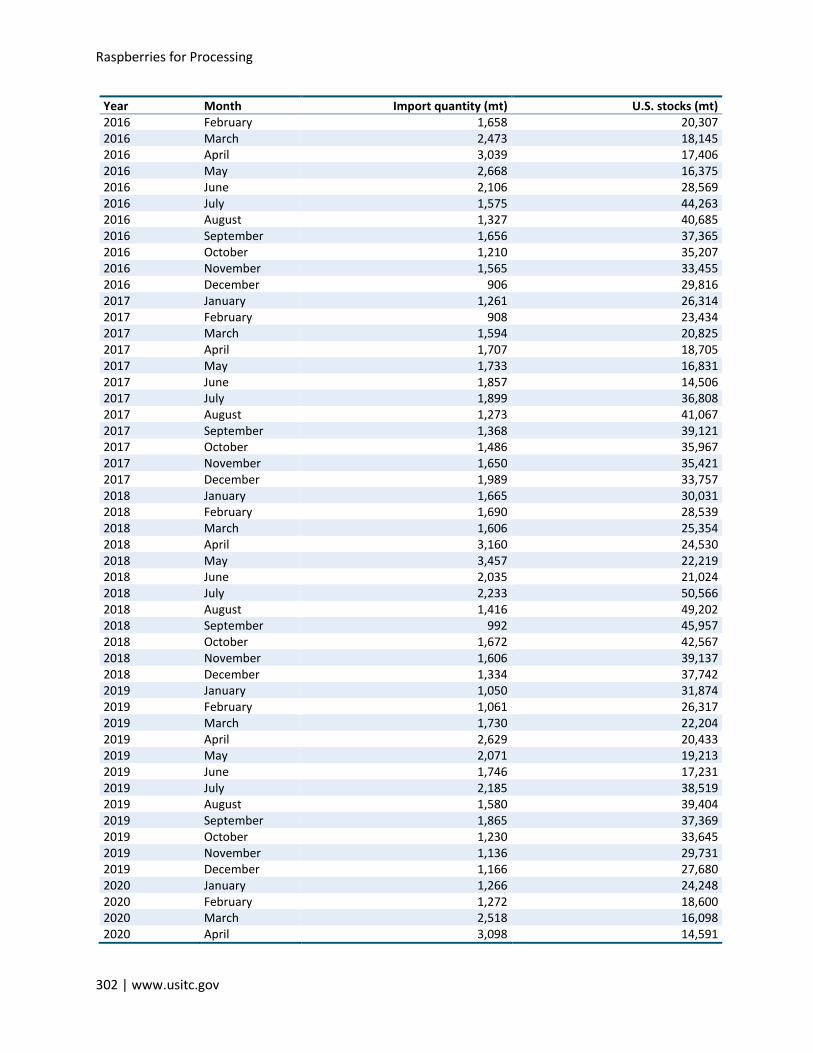
Raspberries for Processing
302 | www.usitc.gov
Year Month Import quantity (mt) U.S. stocks (mt) 2016 February 1,658 20,307 2016 March 2,473 18,145 2016 April 3,039 17,406 2016 May 2,668 16,375 2016 June 2,106 28,569 2016 July 1,575 44,263 2016 August 1,327 40,685 2016 September 1,656 37,365 2016 October 1,210 35,207 2016 November 1,565 33,455 2016 December 906 29,816 2017 January 1,261 26,314 2017 February 908 23,434 2017 March 1,594 20,825 2017 April 1,707 18,705 2017 May 1,733 16,831 2017 June 1,857 14,506 2017 July 1,899 36,808 2017 August 1,273 41,067 2017 September 1,368 39,121 2017 October 1,486 35,967 2017 November 1,650 35,421 2017 December 1,989 33,757 2018 January 1,665 30,031 2018 February 1,690 28,539 2018 March 1,606 25,354 2018 April 3,160 24,530 2018 May 3,457 22,219 2018 June 2,035 21,024 2018 July 2,233 50,566 2018 August 1,416 49,202 2018 September 992 45,957 2018 October 1,672 42,567 2018 November 1,606 39,137 2018 December 1,334 37,742 2019 January 1,050 31,874 2019 February 1,061 26,317 2019 March 1,730 22,204 2019 April 2,629 20,433 2019 May 2,071 19,213 2019 June 1,746 17,231 2019 July 2,185 38,519 2019 August 1,580 39,404 2019 September 1,865 37,369 2019 October 1,230 33,645 2019 November 1,136 29,731 2019 December 1,166 27,680 2020 January 1,266 24,248 2020 February 1,272 18,600 2020 March 2,518 16,098 2020 April 3,098 14,591

Appendix H: Data Tables for Figures
United States International Trade Commission | 303
Year Month Import quantity (mt) U.S. stocks (mt) 2020 May 2,549 13,143 2020 June 1,893 11,181 2020 July 1,772 34,361 2020 August 1,250 37,714 2020 September 2,145 33,246 2020 October 1,613 28,230 2020 November 2,255 26,520 2020 December 2,104 24,132
Source: USITC DataWeb/Census, HTS 0811.20.2025, accessed February 11, 2021; USDA, NASS, Quick Stats, U.S. stocks of frozen barrels, pails, and IQF, accessed March 3, 2021.
Table H.13 Raspberry production in Canada, by province, 2019 In metric tons (mt). This table corresponds to figure 4.1.
Canadian province Production (mt)
Newfoundland and Labrador 10 Prince Edward Island 8 Nova Scotia 64 New Brunswick 52 Quebec 1,192 Ontario 764 Manitoba 15 Saskatchewan 20 Alberta 69 British Columbia 6,952
Source: Government of Canada, written submission to the USITC, December 4, 2020, table 1, 3. Note: In 2019, 83 percent of raspberries produced in British Columbia (5,615 mt) and 5 percent of raspberries produced in Quebec (61 mt) were sold to processors. Raspberries from other provinces are sold to the fresh market. Thus, British Columbia accounts for 99 percent of Canadian production of raspberries for processing (5,676 mt).
Table H.14 Raspberry production in Mexico, by state, 2019 In metric tons (mt). This table corresponds to figure 5.1.
State Production (mt)
Jalisco 89,497 Michoacán 25,988 Baja California 11,739 Guanajuato 962 Puebla 558 México State 71 Colima 22 Mexico City 10
Source: Government of Mexico, SIAP, Anuario estadístico de la producción agrícola (Agricultural production statistical yearbook), accessed December 4, 2020.
Table H.15 Raspberry production in Serbia, by region, 2019 In metric tons (mt). This table corresponds to figure 6.1.
Region Production (mt)
Beogradski region 2,828 Region Vojvodine 6,849 Region Šumadije 102,653 Region Južne i Istočne 7,728
Source: Compiled by the USITC based on the Government of Serbia, Statistical Office, Crop Production from 2005 (Raspberries, 2020)
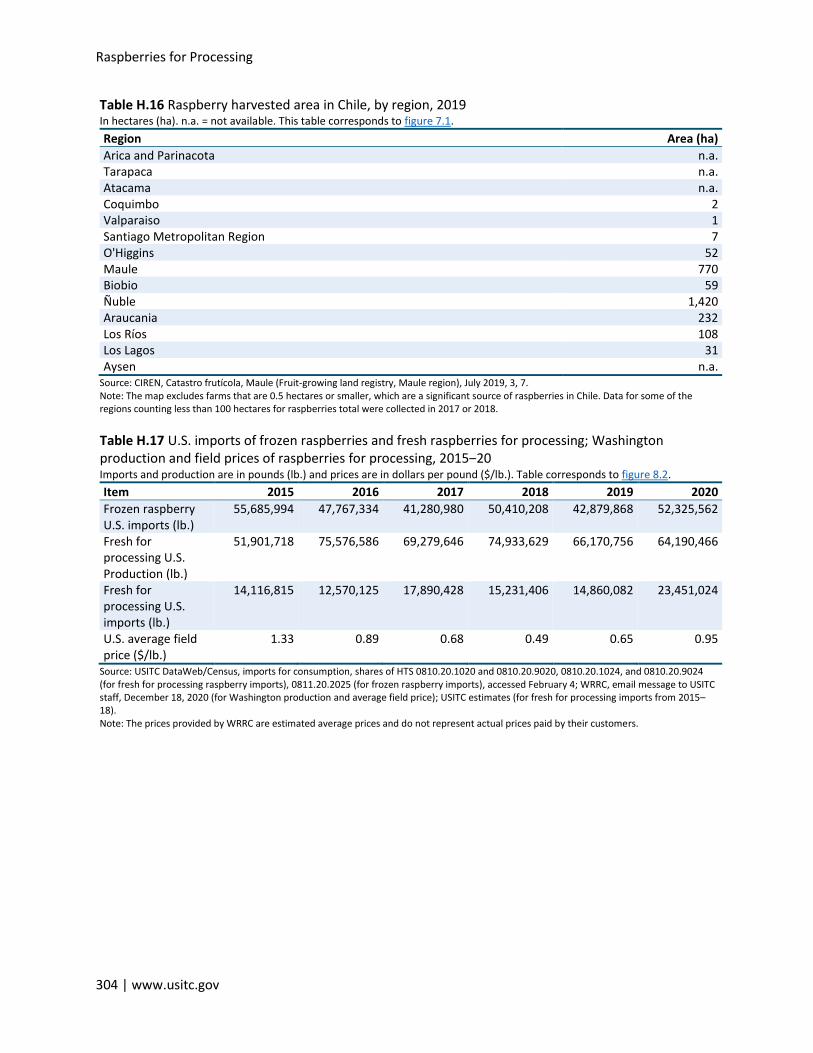
Raspberries for Processing
304 | www.usitc.gov
Table H.16 Raspberry harvested area in Chile, by region, 2019 In hectares (ha). n.a. = not available. This table corresponds to figure 7.1.
Region Area (ha)
Arica and Parinacota n.a. Tarapaca n.a. Atacama n.a. Coquimbo 2 Valparaiso 1 Santiago Metropolitan Region 7 O'Higgins 52 Maule 770 Biobio 59 Ñuble 1,420 Araucania 232 Los Ríos 108 Los Lagos 31 Aysen n.a.
Source: CIREN, Catastro frutícola, Maule (Fruit-growing land registry, Maule region), July 2019, 3, 7. Note: The map excludes farms that are 0.5 hectares or smaller, which are a significant source of raspberries in Chile. Data for some of the regions counting less than 100 hectares for raspberries total were collected in 2017 or 2018.
Table H.17 U.S. imports of frozen raspberries and fresh raspberries for processing; Washington production and field prices of raspberries for processing, 2015‒20 Imports and production are in pounds (lb.) and prices are in dollars per pound ($/lb.). Table corresponds to figure 8.2.
Item 2015 2016 2017 2018 2019 2020
Frozen raspberry U.S. imports (lb.)
55,685,994 47,767,334 41,280,980 50,410,208 42,879,868 52,325,562
Fresh for processing U.S. Production (lb.)
51,901,718 75,576,586 69,279,646 74,933,629 66,170,756 64,190,466
Fresh for processing U.S. imports (lb.)
14,116,815 12,570,125 17,890,428 15,231,406 14,860,082 23,451,024
U.S. average field price ($/lb.)
1.33 0.89 0.68 0.49 0.65 0.95
Source: USITC DataWeb/Census, imports for consumption, shares of HTS 0810.20.1020 and 0810.20.9020, 0810.20.1024, and 0810.20.9024 (for fresh for processing raspberry imports), 0811.20.2025 (for frozen raspberry imports), accessed February 4; WRRC, email message to USITC staff, December 18, 2020 (for Washington production and average field price); USITC estimates (for fresh for processing imports from 2015–18). Note: The prices provided by WRRC are estimated average prices and do not represent actual prices paid by their customers.
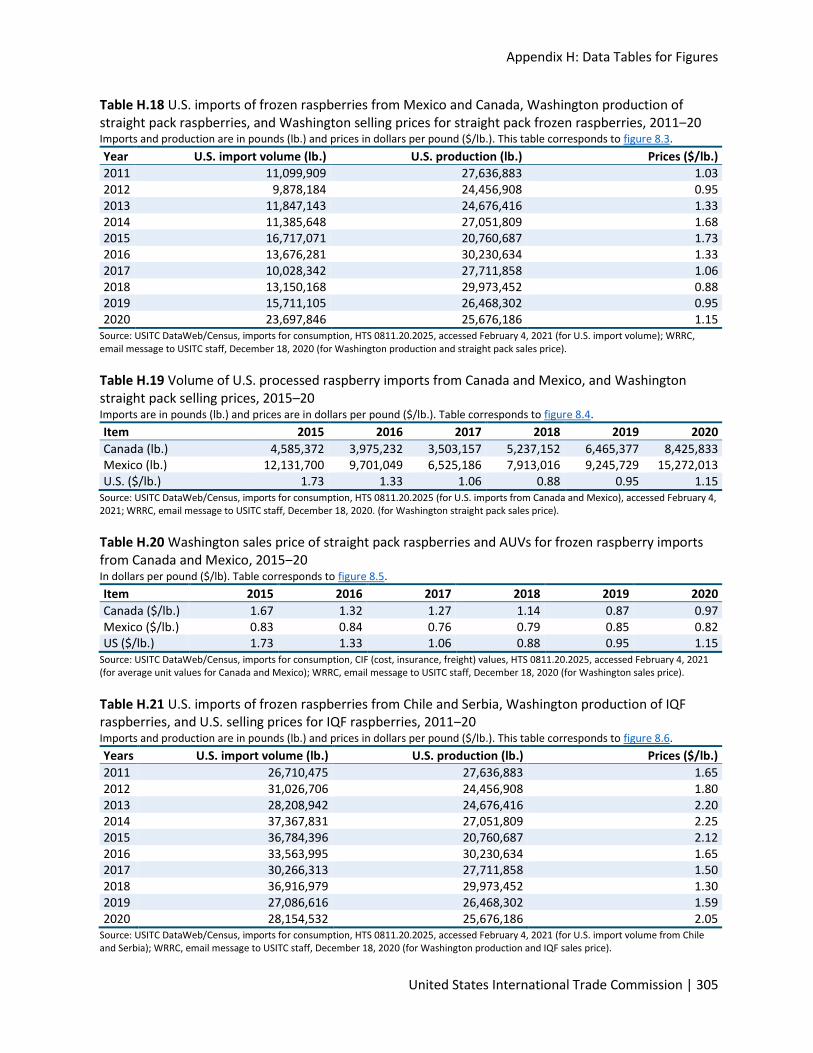
Appendix H: Data Tables for Figures
United States International Trade Commission | 305
Table H.18 U.S. imports of frozen raspberries from Mexico and Canada, Washington production of straight pack raspberries, and Washington selling prices for straight pack frozen raspberries, 2011‒20 Imports and production are in pounds (lb.) and prices in dollars per pound ($/lb.). This table corresponds to figure 8.3.
Year U.S. import volume (lb.) U.S. production (lb.) Prices ($/lb.)
2011 11,099,909 27,636,883 1.03 2012 9,878,184 24,456,908 0.95 2013 11,847,143 24,676,416 1.33 2014 11,385,648 27,051,809 1.68 2015 16,717,071 20,760,687 1.73 2016 13,676,281 30,230,634 1.33 2017 10,028,342 27,711,858 1.06 2018 13,150,168 29,973,452 0.88 2019 15,711,105 26,468,302 0.95 2020 23,697,846 25,676,186 1.15
Source: USITC DataWeb/Census, imports for consumption, HTS 0811.20.2025, accessed February 4, 2021 (for U.S. import volume); WRRC, email message to USITC staff, December 18, 2020 (for Washington production and straight pack sales price).
Table H.19 Volume of U.S. processed raspberry imports from Canada and Mexico, and Washington straight pack selling prices, 2015–20 Imports are in pounds (lb.) and prices are in dollars per pound ($/lb.). Table corresponds to figure 8.4.
Item 2015 2016 2017 2018 2019 2020
Canada (lb.) 4,585,372 3,975,232 3,503,157 5,237,152 6,465,377 8,425,833 Mexico (lb.) 12,131,700 9,701,049 6,525,186 7,913,016 9,245,729 15,272,013 U.S. ($/lb.) 1.73 1.33 1.06 0.88 0.95 1.15
Source: USITC DataWeb/Census, imports for consumption, HTS 0811.20.2025 (for U.S. imports from Canada and Mexico), accessed February 4, 2021; WRRC, email message to USITC staff, December 18, 2020. (for Washington straight pack sales price).
Table H.20 Washington sales price of straight pack raspberries and AUVs for frozen raspberry imports from Canada and Mexico, 2015‒20 In dollars per pound ($/lb). Table corresponds to figure 8.5.
Item 2015 2016 2017 2018 2019 2020
Canada ($/lb.) 1.67 1.32 1.27 1.14 0.87 0.97 Mexico ($/lb.) 0.83 0.84 0.76 0.79 0.85 0.82 US ($/lb.) 1.73 1.33 1.06 0.88 0.95 1.15
Source: USITC DataWeb/Census, imports for consumption, CIF (cost, insurance, freight) values, HTS 0811.20.2025, accessed February 4, 2021 (for average unit values for Canada and Mexico); WRRC, email message to USITC staff, December 18, 2020 (for Washington sales price).
Table H.21 U.S. imports of frozen raspberries from Chile and Serbia, Washington production of IQF raspberries, and U.S. selling prices for IQF raspberries, 2011‒20 Imports and production are in pounds (lb.) and prices in dollars per pound ($/lb.). This table corresponds to figure 8.6.
Years U.S. import volume (lb.) U.S. production (lb.) Prices ($/lb.)
2011 26,710,475 27,636,883 1.65 2012 31,026,706 24,456,908 1.80 2013 28,208,942 24,676,416 2.20 2014 37,367,831 27,051,809 2.25 2015 36,784,396 20,760,687 2.12 2016 33,563,995 30,230,634 1.65 2017 30,266,313 27,711,858 1.50 2018 36,916,979 29,973,452 1.30 2019 27,086,616 26,468,302 1.59 2020 28,154,532 25,676,186 2.05
Source: USITC DataWeb/Census, imports for consumption, HTS 0811.20.2025, accessed February 4, 2021 (for U.S. import volume from Chile and Serbia); WRRC, email message to USITC staff, December 18, 2020 (for Washington production and IQF sales price).
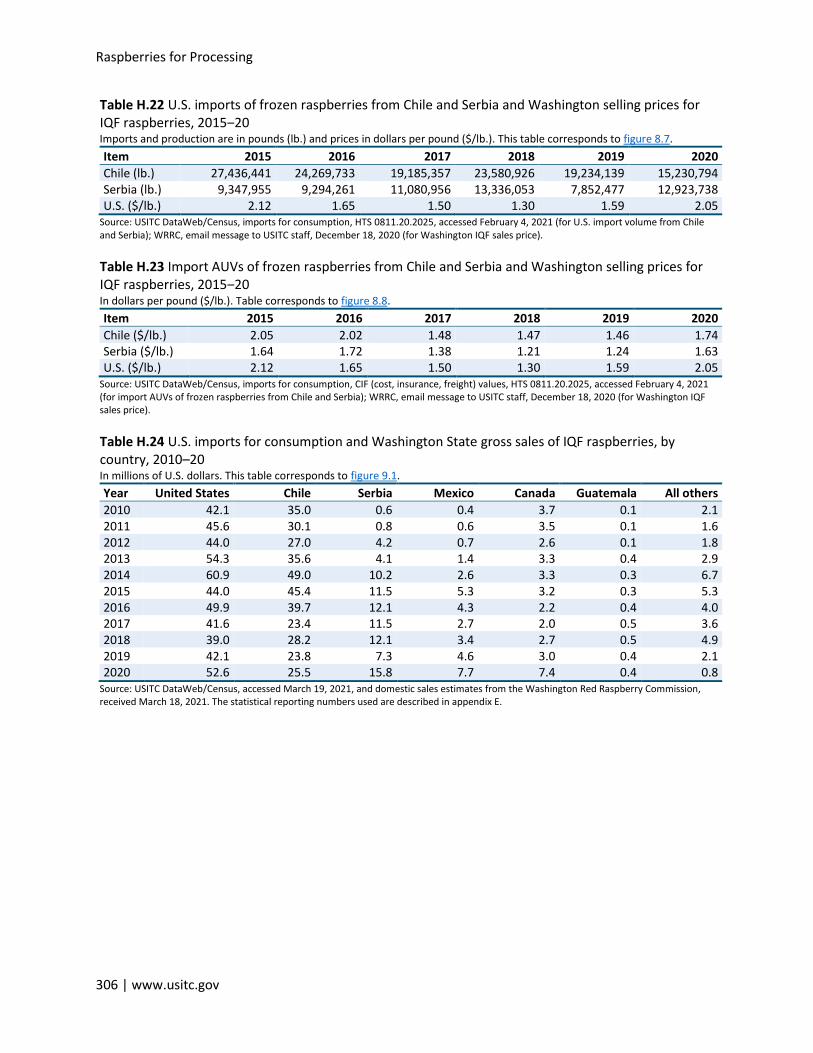
Raspberries for Processing
306 | www.usitc.gov
Table H.22 U.S. imports of frozen raspberries from Chile and Serbia and Washington selling prices for IQF raspberries, 2015‒20 Imports and production are in pounds (lb.) and prices in dollars per pound ($/lb.). This table corresponds to figure 8.7.
Item 2015 2016 2017 2018 2019 2020
Chile (lb.) 27,436,441 24,269,733 19,185,357 23,580,926 19,234,139 15,230,794 Serbia (lb.) 9,347,955 9,294,261 11,080,956 13,336,053 7,852,477 12,923,738 U.S. ($/lb.) 2.12 1.65 1.50 1.30 1.59 2.05
Source: USITC DataWeb/Census, imports for consumption, HTS 0811.20.2025, accessed February 4, 2021 (for U.S. import volume from Chile and Serbia); WRRC, email message to USITC staff, December 18, 2020 (for Washington IQF sales price).
Table H.23 Import AUVs of frozen raspberries from Chile and Serbia and Washington selling prices for IQF raspberries, 2015‒20 In dollars per pound ($/lb.). Table corresponds to figure 8.8.
Item 2015 2016 2017 2018 2019 2020
Chile ($/lb.) 2.05 2.02 1.48 1.47 1.46 1.74 Serbia ($/lb.) 1.64 1.72 1.38 1.21 1.24 1.63 U.S. ($/lb.) 2.12 1.65 1.50 1.30 1.59 2.05
Source: USITC DataWeb/Census, imports for consumption, CIF (cost, insurance, freight) values, HTS 0811.20.2025, accessed February 4, 2021 (for import AUVs of frozen raspberries from Chile and Serbia); WRRC, email message to USITC staff, December 18, 2020 (for Washington IQF sales price).
Table H.24 U.S. imports for consumption and Washington State gross sales of IQF raspberries, by country, 2010–20 In millions of U.S. dollars. This table corresponds to figure 9.1.
Year United States Chile Serbia Mexico Canada Guatemala All others
2010 42.1 35.0 0.6 0.4 3.7 0.1 2.1 2011 45.6 30.1 0.8 0.6 3.5 0.1 1.6 2012 44.0 27.0 4.2 0.7 2.6 0.1 1.8 2013 54.3 35.6 4.1 1.4 3.3 0.4 2.9 2014 60.9 49.0 10.2 2.6 3.3 0.3 6.7 2015 44.0 45.4 11.5 5.3 3.2 0.3 5.3 2016 49.9 39.7 12.1 4.3 2.2 0.4 4.0 2017 41.6 23.4 11.5 2.7 2.0 0.5 3.6 2018 39.0 28.2 12.1 3.4 2.7 0.5 4.9 2019 42.1 23.8 7.3 4.6 3.0 0.4 2.1 2020 52.6 25.5 15.8 7.7 7.4 0.4 0.8
Source: USITC DataWeb/Census, accessed March 19, 2021, and domestic sales estimates from the Washington Red Raspberry Commission, received March 18, 2021. The statistical reporting numbers used are described in appendix E.
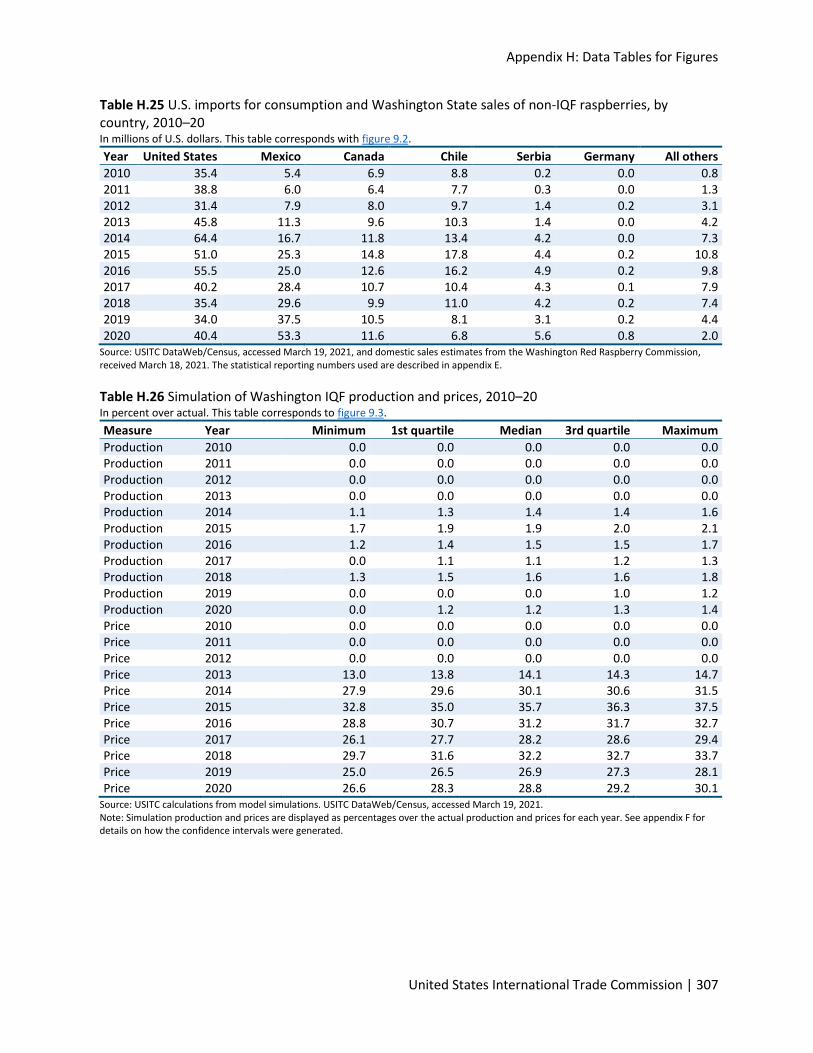
Appendix H: Data Tables for Figures
United States International Trade Commission | 307
Table H.25 U.S. imports for consumption and Washington State sales of non-IQF raspberries, by country, 2010–20 In millions of U.S. dollars. This table corresponds with figure 9.2.
Year United States Mexico Canada Chile Serbia Germany All others
2010 35.4 5.4 6.9 8.8 0.2 0.0 0.8 2011 38.8 6.0 6.4 7.7 0.3 0.0 1.3 2012 31.4 7.9 8.0 9.7 1.4 0.2 3.1 2013 45.8 11.3 9.6 10.3 1.4 0.0 4.2 2014 64.4 16.7 11.8 13.4 4.2 0.0 7.3 2015 51.0 25.3 14.8 17.8 4.4 0.2 10.8 2016 55.5 25.0 12.6 16.2 4.9 0.2 9.8 2017 40.2 28.4 10.7 10.4 4.3 0.1 7.9 2018 35.4 29.6 9.9 11.0 4.2 0.2 7.4 2019 34.0 37.5 10.5 8.1 3.1 0.2 4.4 2020 40.4 53.3 11.6 6.8 5.6 0.8 2.0
Source: USITC DataWeb/Census, accessed March 19, 2021, and domestic sales estimates from the Washington Red Raspberry Commission, received March 18, 2021. The statistical reporting numbers used are described in appendix E.
Table H.26 Simulation of Washington IQF production and prices, 2010–20 In percent over actual. This table corresponds to figure 9.3.
Measure Year Minimum 1st quartile Median 3rd quartile Maximum
Production 2010 0.0 0.0 0.0 0.0 0.0 Production 2011 0.0 0.0 0.0 0.0 0.0 Production 2012 0.0 0.0 0.0 0.0 0.0 Production 2013 0.0 0.0 0.0 0.0 0.0 Production 2014 1.1 1.3 1.4 1.4 1.6 Production 2015 1.7 1.9 1.9 2.0 2.1 Production 2016 1.2 1.4 1.5 1.5 1.7 Production 2017 0.0 1.1 1.1 1.2 1.3 Production 2018 1.3 1.5 1.6 1.6 1.8 Production 2019 0.0 0.0 0.0 1.0 1.2 Production 2020 0.0 1.2 1.2 1.3 1.4 Price 2010 0.0 0.0 0.0 0.0 0.0 Price 2011 0.0 0.0 0.0 0.0 0.0 Price 2012 0.0 0.0 0.0 0.0 0.0 Price 2013 13.0 13.8 14.1 14.3 14.7 Price 2014 27.9 29.6 30.1 30.6 31.5 Price 2015 32.8 35.0 35.7 36.3 37.5 Price 2016 28.8 30.7 31.2 31.7 32.7 Price 2017 26.1 27.7 28.2 28.6 29.4 Price 2018 29.7 31.6 32.2 32.7 33.7 Price 2019 25.0 26.5 26.9 27.3 28.1 Price 2020 26.6 28.3 28.8 29.2 30.1
Source: USITC calculations from model simulations. USITC DataWeb/Census, accessed March 19, 2021. Note: Simulation production and prices are displayed as percentages over the actual production and prices for each year. See appendix F for details on how the confidence intervals were generated.
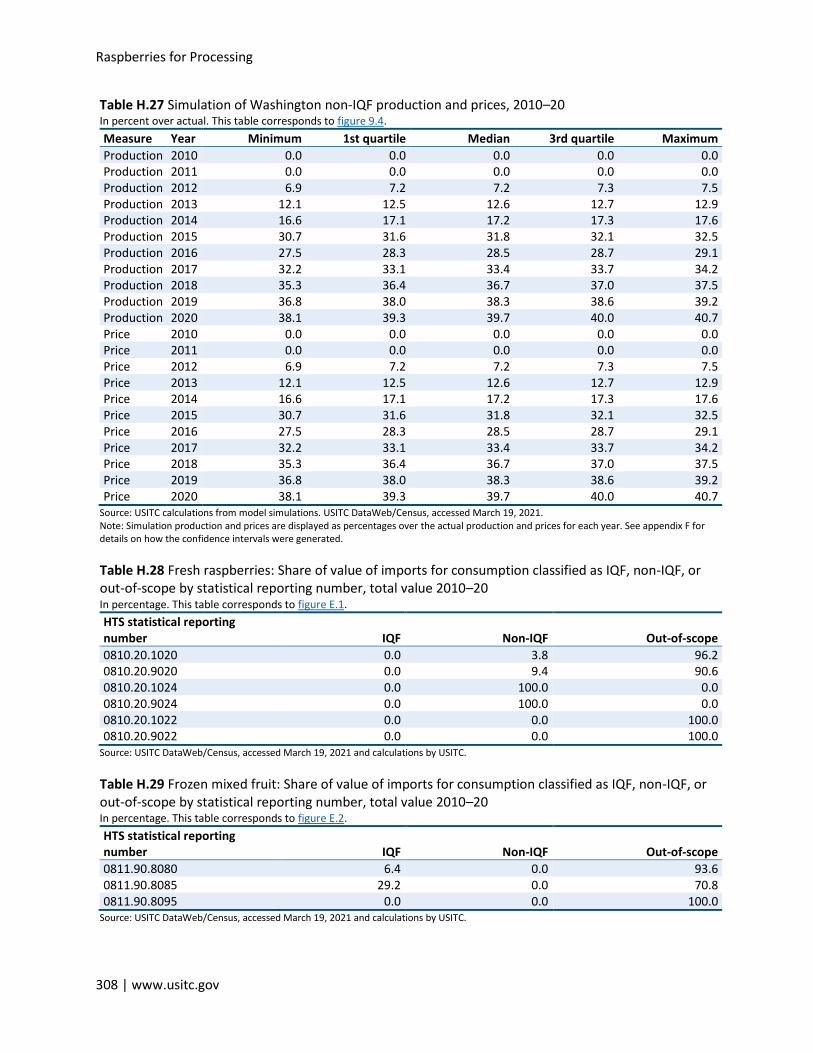
Raspberries for Processing
308 | www.usitc.gov
Table H.27 Simulation of Washington non-IQF production and prices, 2010–20 In percent over actual. This table corresponds to figure 9.4.
Measure Year Minimum 1st quartile Median 3rd quartile Maximum
Production 2010 0.0 0.0 0.0 0.0 0.0 Production 2011 0.0 0.0 0.0 0.0 0.0 Production 2012 6.9 7.2 7.2 7.3 7.5 Production 2013 12.1 12.5 12.6 12.7 12.9 Production 2014 16.6 17.1 17.2 17.3 17.6 Production 2015 30.7 31.6 31.8 32.1 32.5 Production 2016 27.5 28.3 28.5 28.7 29.1 Production 2017 32.2 33.1 33.4 33.7 34.2 Production 2018 35.3 36.4 36.7 37.0 37.5 Production 2019 36.8 38.0 38.3 38.6 39.2 Production 2020 38.1 39.3 39.7 40.0 40.7 Price 2010 0.0 0.0 0.0 0.0 0.0 Price 2011 0.0 0.0 0.0 0.0 0.0 Price 2012 6.9 7.2 7.2 7.3 7.5 Price 2013 12.1 12.5 12.6 12.7 12.9 Price 2014 16.6 17.1 17.2 17.3 17.6 Price 2015 30.7 31.6 31.8 32.1 32.5 Price 2016 27.5 28.3 28.5 28.7 29.1 Price 2017 32.2 33.1 33.4 33.7 34.2 Price 2018 35.3 36.4 36.7 37.0 37.5 Price 2019 36.8 38.0 38.3 38.6 39.2 Price 2020 38.1 39.3 39.7 40.0 40.7
Source: USITC calculations from model simulations. USITC DataWeb/Census, accessed March 19, 2021. Note: Simulation production and prices are displayed as percentages over the actual production and prices for each year. See appendix F for details on how the confidence intervals were generated.
Table H.28 Fresh raspberries: Share of value of imports for consumption classified as IQF, non-IQF, or out-of-scope by statistical reporting number, total value 2010–20 In percentage. This table corresponds to figure E.1.
HTS statistical reporting number IQF Non-IQF Out-of-scope
0810.20.1020 0.0 3.8 96.2 0810.20.9020 0.0 9.4 90.6 0810.20.1024 0.0 100.0 0.0 0810.20.9024 0.0 100.0 0.0 0810.20.1022 0.0 0.0 100.0 0810.20.9022 0.0 0.0 100.0
Source: USITC DataWeb/Census, accessed March 19, 2021 and calculations by USITC.
Table H.29 Frozen mixed fruit: Share of value of imports for consumption classified as IQF, non-IQF, or out-of-scope by statistical reporting number, total value 2010–20 In percentage. This table corresponds to figure E.2.
HTS statistical reporting number IQF Non-IQF Out-of-scope
0811.90.8080 6.4 0.0 93.6 0811.90.8085 29.2 0.0 70.8 0811.90.8095 0.0 0.0 100.0
Source: USITC DataWeb/Census, accessed March 19, 2021 and calculations by USITC.
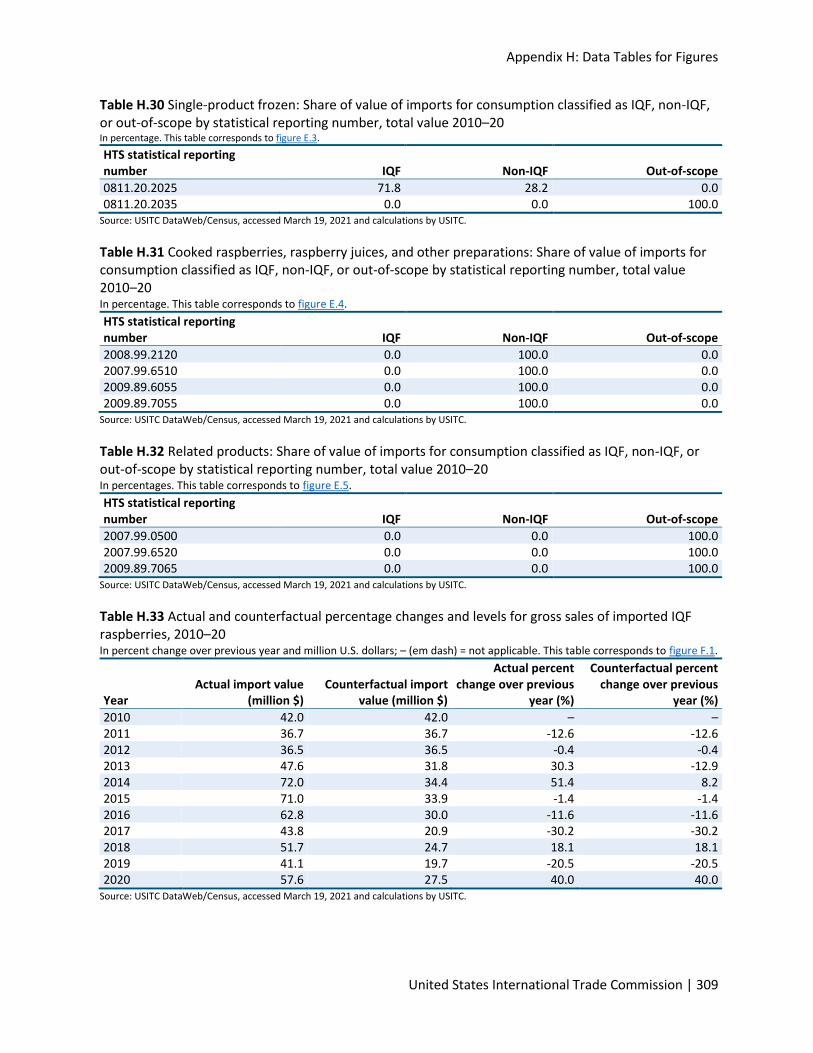
Appendix H: Data Tables for Figures
United States International Trade Commission | 309
Table H.30 Single-product frozen: Share of value of imports for consumption classified as IQF, non-IQF, or out-of-scope by statistical reporting number, total value 2010–20 In percentage. This table corresponds to figure E.3.
HTS statistical reporting number IQF Non-IQF Out-of-scope
0811.20.2025 71.8 28.2 0.0 0811.20.2035 0.0 0.0 100.0
Source: USITC DataWeb/Census, accessed March 19, 2021 and calculations by USITC.
Table H.31 Cooked raspberries, raspberry juices, and other preparations: Share of value of imports for consumption classified as IQF, non-IQF, or out-of-scope by statistical reporting number, total value 2010–20 In percentage. This table corresponds to figure E.4.
HTS statistical reporting number IQF Non-IQF Out-of-scope
2008.99.2120 0.0 100.0 0.0 2007.99.6510 0.0 100.0 0.0 2009.89.6055 0.0 100.0 0.0 2009.89.7055 0.0 100.0 0.0
Source: USITC DataWeb/Census, accessed March 19, 2021 and calculations by USITC.
Table H.32 Related products: Share of value of imports for consumption classified as IQF, non-IQF, or out-of-scope by statistical reporting number, total value 2010–20 In percentages. This table corresponds to figure E.5.
HTS statistical reporting number IQF Non-IQF Out-of-scope
2007.99.0500 0.0 0.0 100.0 2007.99.6520 0.0 0.0 100.0 2009.89.7065 0.0 0.0 100.0
Source: USITC DataWeb/Census, accessed March 19, 2021 and calculations by USITC.
Table H.33 Actual and counterfactual percentage changes and levels for gross sales of imported IQF raspberries, 2010–20 In percent change over previous year and million U.S. dollars; – (em dash) = not applicable. This table corresponds to figure F.1.
Year Actual import value
(million $) Counterfactual import
value (million $)
Actual percent change over previous
year (%)
Counterfactual percent change over previous
year (%)
2010 42.0 42.0 – – 2011 36.7 36.7 -12.6 -12.6 2012 36.5 36.5 -0.4 -0.4 2013 47.6 31.8 30.3 -12.9 2014 72.0 34.4 51.4 8.2 2015 71.0 33.9 -1.4 -1.4 2016 62.8 30.0 -11.6 -11.6 2017 43.8 20.9 -30.2 -30.2 2018 51.7 24.7 18.1 18.1 2019 41.1 19.7 -20.5 -20.5 2020 57.6 27.5 40.0 40.0
Source: USITC DataWeb/Census, accessed March 19, 2021 and calculations by USITC.
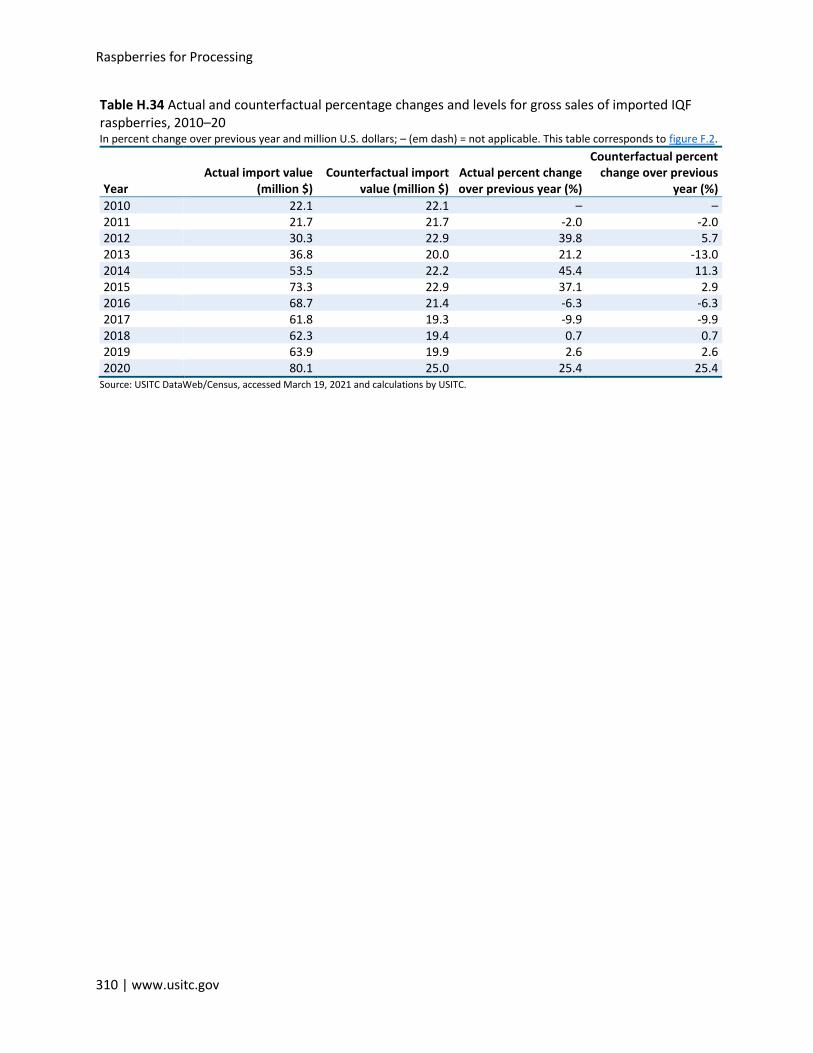
Raspberries for Processing
310 | www.usitc.gov
Table H.34 Actual and counterfactual percentage changes and levels for gross sales of imported IQF raspberries, 2010–20 In percent change over previous year and million U.S. dollars; – (em dash) = not applicable. This table corresponds to figure F.2.
Year Actual import value
(million $) Counterfactual import
value (million $) Actual percent change over previous year (%)
Counterfactual percent change over previous
year (%)
2010 22.1 22.1 – – 2011 21.7 21.7 -2.0 -2.0 2012 30.3 22.9 39.8 5.7 2013 36.8 20.0 21.2 -13.0 2014 53.5 22.2 45.4 11.3 2015 73.3 22.9 37.1 2.9 2016 68.7 21.4 -6.3 -6.3 2017 61.8 19.3 -9.9 -9.9 2018 62.3 19.4 0.7 0.7 2019 63.9 19.9 2.6 2.6 2020 80.1 25.0 25.4 25.4
Source: USITC DataWeb/Census, accessed March 19, 2021 and calculations by USITC.