appendix c engineering – flood risk management
TRANSCRIPT
APPENDIX C
ENGINEERING –
FLOOD RISK MANAGEMENT
1
HYDRAULIC ENGINEERING
TECHNICAL MEMORANDUM
FOR
EXISTING CONDITION ANALYSIS FOR RISK INFORMED DECISION MAKING FOR PROJECT ALTERNATIVE
SELECTION
DELTA ISLANDS AND LEVEES FEASIBILITY STUDY, CALIFORNIA
Prepared By:
U.S. Army Corps of Engineers
Sacramento District
Hydrology & Hydraulics Branch
Hydraulic Analysis Section
12 August 2013
2
Table of Contents
1.0 Introduction and Background………………………………………………………….….3 1.1 Purpose……………………………………………………………………….……3 1.2 Background…………………………………………………………………….….4 1.3 Data Sources for the Delta Levee System Risk and Vulnerability Analysis……...6 1.4 Delta Levee System Risk and Vulnerability Analysis Summary…………………7
2.0 Delta Risk Management Strategy (DRMS)……………………………………………….9 2.1 Hazards and Assessment Measures……………………………………………….9 2.2 Consequences and Assessment Measures………………………………………..10 2.3 Future Risks……………………………………………………………………...13 2.4 Risk Management (DRMS Phase 2)……………………………………………..14 2.5 Evaluation of Results…………………………………………………………….15
3.0 Sacramento-San Joaquin Delta Levee Risk Assessment………………………………...16 3.1 Translation Approach…………………………………………………………….17 3.2 Translated Hazards and Consequences Matrices………………………………...17 3.3 Evaluation of Results………………………………………………………...…..22 3.4 Final Site Selection for FRM Analysis…………………………………………..30
4.0 Flood Risk Analysis……………………………………………………………………...30 4.1 Bethel Island……………………………………………………………………..32 4.2 Discovery Bay……………………………………………………………………34 4.3 Isleton (Brannen Andrus Island)…………………………………………………35 4.4 Walnut Grove…………………………………………………………………….36 4.5 Summary of Hydraulic Handoffs………………………………………………...37
5.0 Conclusions………………………………………………………………………………37 6.0 References……………………………………………………………………………..…52 Appendix A – USACE & Army Risk Assessment and Management…………………………...53 Appendix B – Risk Calculations…………………………………………………………………66
3
1.0 INTRODUCTION AND BACKGROUND
1.1 Purpose
On February 2012, Major General Walsh, Deputy Commanding General for Civil Works and Emergency Operations issued a memorandum of feasibility study program execution and delivery. This memorandum issued guidance for the current portfolio of feasibility studies to produce a more efficient, effective, and quality decision document and introduced the 3x3x3 rule for USACE planning studies. In deference to the memorandum, this technical memorandum presents the feasibility-level hydraulic evaluation of the existing conditions, conclusions, and recommendations for the Delta Islands and Levees Feasibility Study (DILFS). This memorandum has been developed in accordance with our new Planning Paradigm using the “SMART” Planning Criteria.
According to the USACE Planning Community Toolbox ,“SMART” is a mnemonic giving criteria to guide in the setting of project management objectives that shifts the emphasis from discipline specific tasks to multi-criterion decision making. The letters conform to the words Specific, Measureable, Attainable, Risk-Informed, and Timely. The development and use of these criteria in the context of the USACE SMART Planning are described below:
1. The “Specific” criterion stresses the need for a specific goal rather than a more general one. For DILFS our specific criteria is to identify projects and features within the study area that can be evaluated within USACE business lines, for a recommendation of USACE investment. For this study, alternatives that focus on Ecosystem Restoration and Flood Risk Management are the USACE business lines are under evaluation.
2. The “Measurable” criterion stresses the need to develop concrete criteria for measuring progress toward plan selection of the Tentatively Selected Plan. For DILFS our measurement requirement, or decision criteria, is defined by a system evaluation criterion in the form of National Economic Benefit (NED), Environmental Quality (EQ), Regional Economic Development (RED), Other Social Effects (OSE), Cost, and Real Estate evaluation.
3. The “Attainable” criterion stresses the importance of project alternatives that are realistic and attainable, or actionable, and are in the national interest. Following the evaluation of alternatives using the measurable criteria listed above, a comparison of measures using the system of accounts, multi-criteria Decision and Trade-off analyses are completed to inform the recommendation of a Plan.
4. The fourth criterion, “Risk-Informed,” stresses the importance of using risk analysis to improve decision making under uncertainty. For the DILFs Study the USACE is working in coordination with the State of California’s Bay Delta Conservation Plan (BDCP) and the Delta Risk Management Strategy (DRMS) to leverage the USACE’s national objective to develop water resources projects based on sound science that maximize net national economic, environmental, and social benefits. Another key performance guideline gives priority to projects that address a significant risk to human safety.
5. The final criterion is “Timely” and stresses the importance for grounding project goals within a timeframe along with a commitment to a deadline in order to focus team efforts for study completion. The SMART feasibility study process uses a series of study milestones to
4
The image part with relationship ID rId9 was not found in the file.
ensure all of the discipline specific study efforts meet the 3-year SMART Planning objective.
This feasibility-level SMART planned study hydraulic evaluation and recommendations are based upon a summary of existing, best available knowledge of hydrology and hydraulics in the Sacramento San Joaquin Delta. The information presented is intended to guide the Project Delivery Team’s focus away from legacy, task driven, efforts to the new risk-informed decision making orientation in the selection of alternatives and measures. The conclusions and recommendations presented in this report are generalized for local conditions and uncertainties about the values given in this report have been identified within the Study Risk Register.
1.2 Background
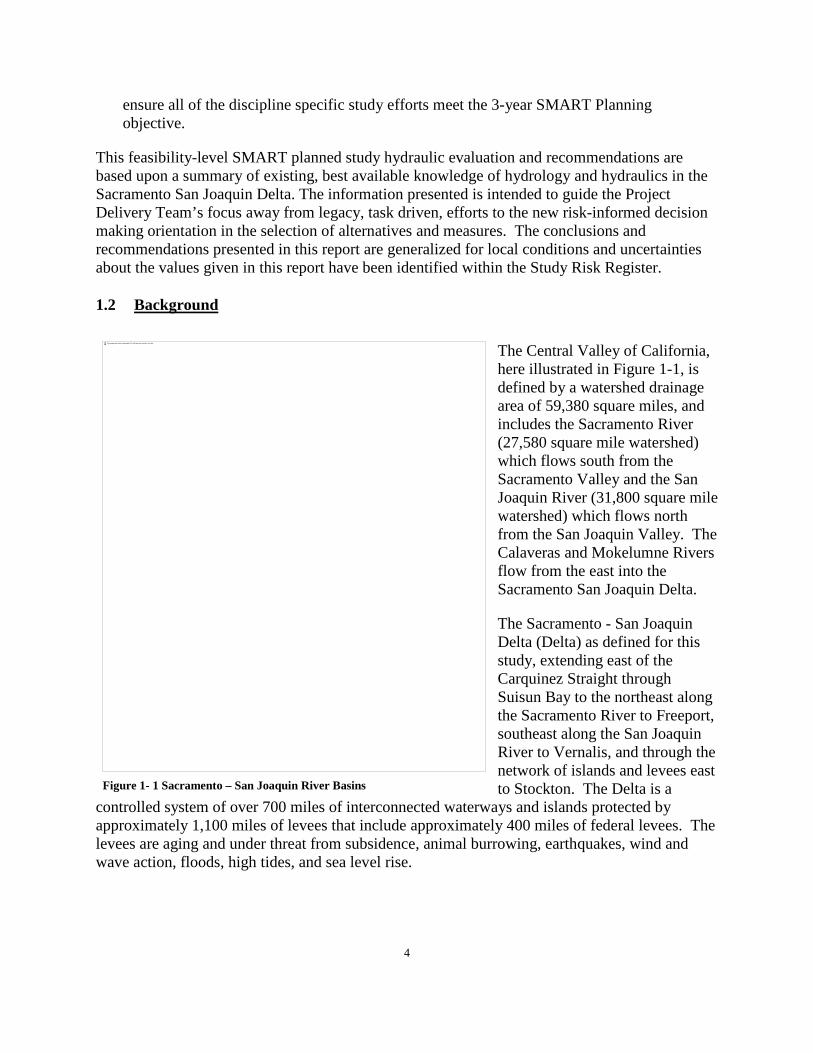
The Central Valley of California, here illustrated in Figure 1-1, is defined by a watershed drainage area of 59,380 square miles, and includes the Sacramento River (27,580 square mile watershed) which flows south from the Sacramento Valley and the San Joaquin River (31,800 square mile watershed) which flows north from the San Joaquin Valley. The Calaveras and Mokelumne Rivers flow from the east into the Sacramento San Joaquin Delta.
The Sacramento - San Joaquin Delta (Delta) as defined for this study, extending east of the Carquinez Straight through Suisun Bay to the northeast along the Sacramento River to Freeport, southeast along the San Joaquin River to Vernalis, and through the network of islands and levees east to Stockton. The Delta is a
controlled system of over 700 miles of interconnected waterways and islands protected by approximately 1,100 miles of levees that include approximately 400 miles of federal levees. The levees are aging and under threat from subsidence, animal burrowing, earthquakes, wind and wave action, floods, high tides, and sea level rise.
Figure 1- 1 Sacramento – San Joaquin River Basins
5
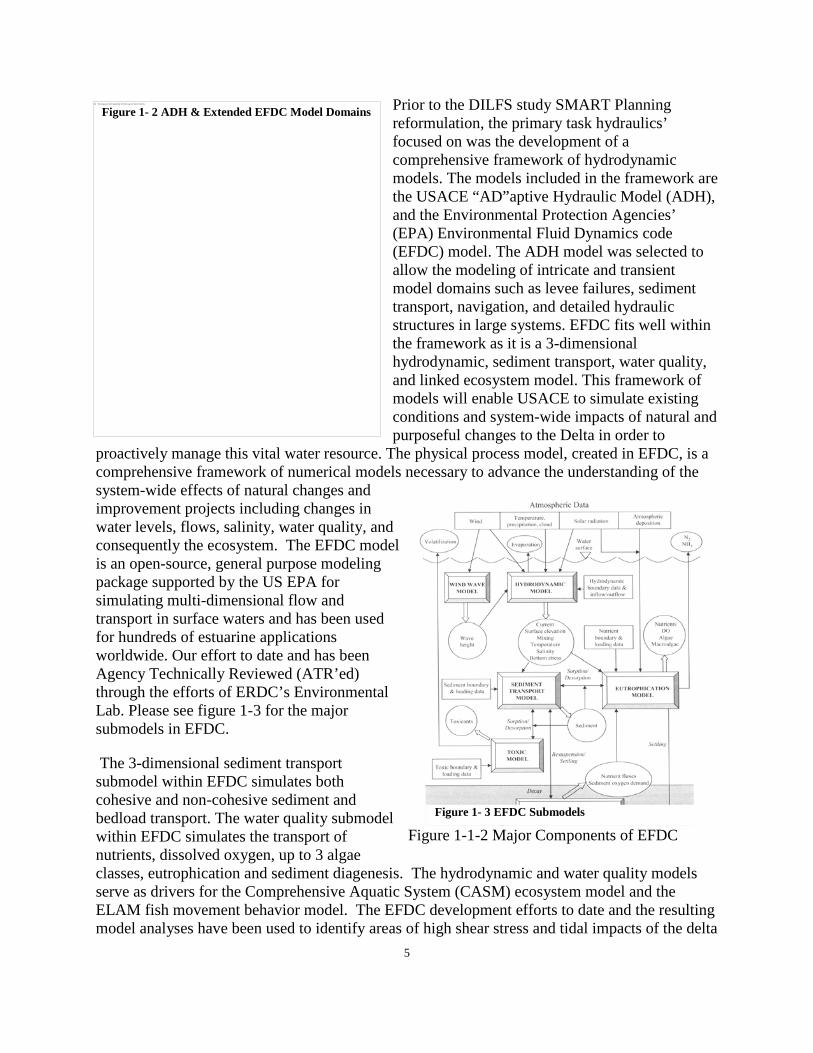
The image part with relationship ID rId11 was not found in the file. Prior to the DILFS study SMART Planning reformulation, the primary task hydraulics’ focused on was the development of a comprehensive framework of hydrodynamic models. The models included in the framework are the USACE “AD”aptive Hydraulic Model (ADH), and the Environmental Protection Agencies’ (EPA) Environmental Fluid Dynamics code (EFDC) model. The ADH model was selected to allow the modeling of intricate and transient model domains such as levee failures, sediment transport, navigation, and detailed hydraulic structures in large systems. EFDC fits well within the framework as it is a 3-dimensional hydrodynamic, sediment transport, water quality, and linked ecosystem model. This framework of models will enable USACE to simulate existing conditions and system-wide impacts of natural and purposeful changes to the Delta in order to
proactively manage this vital water resource. The physical process model, created in EFDC, is a comprehensive framework of numerical models necessary to advance the understanding of the system-wide effects of natural changes and improvement projects including changes in water levels, flows, salinity, water quality, and consequently the ecosystem. The EFDC model is an open-source, general purpose modeling package supported by the US EPA for simulating multi-dimensional flow and transport in surface waters and has been used for hundreds of estuarine applications worldwide. Our effort to date and has been Agency Technically Reviewed (ATR’ed) through the efforts of ERDC’s Environmental Lab. Please see figure 1-3 for the major submodels in EFDC.
The 3-dimensional sediment transport submodel within EFDC simulates both cohesive and non-cohesive sediment and bedload transport. The water quality submodel within EFDC simulates the transport of nutrients, dissolved oxygen, up to 3 algae classes, eutrophication and sediment diagenesis. The hydrodynamic and water quality models serve as drivers for the Comprehensive Aquatic System (CASM) ecosystem model and the ELAM fish movement behavior model. The EFDC development efforts to date and the resulting model analyses have been used to identify areas of high shear stress and tidal impacts of the delta
Figure 1-1-2 Major Components of EFDC
Figure 1- 2 ADH & Extended EFDC Model Domains
Figure 1- 3 EFDC Submodels
6
and have been used to analyze risk in the Delta. Both the ADH and the EFDC models have been developed, calibrated, and validated to simulate existing conditions in the Delta. Additional refinements and analysis using our comprehensive modeling framework have been placed on hold until federal interest has been identified and future work authorized.
1.3 Data Sources for the Delta Levee System Risk and Vulnerability Analysis
1.3.1 Previous work for this project includes studies done by the State of California Department of Water (DWR). The Corps of Engineers supported the joint state-federal Delta Risk Management Strategy (DRMS) effort that has produced detailed reports on risks and risk management for the Sacramento-San Joaquin Delta. These documents provided much of the risk informed data included in this memorandum. Important sections for DRMS can be found at: http://www.water.ca.gov/floodsafe/fessro/levees/drms/ .
1.3.2 The hydrology used for the subsequent downscaling of the hydraulic analysis effort to support SMART Planning of the Sacramento San Joaquin Delta FRM analysis was the 1992 Sacramento District Office Report labeled “Sacramento-San Joaquin Delta Special Study. This report will serve as the baseline data source for the simplified Inundation modeling framework used in the simplified hydraulic analysis whose output will be used as input for the project economic decision model. This report presents stage-frequency curves for 24 tide gage locations, wave runup data for 12 locations and 1:50-, 1:100-, and 1:300 ACE maximum water surface elevation plots around the islands of the Sacramento San Joaquin Delta. The stage-frequency curves in this report are updates to the stage-frequency presented in a similarly named document dated December 1976. Data in this 1992 report include stage data recorded through water year 1988. Stage values given in the 1992 report have been converted to NAVD’88 values via the NGS website VertCon conversion at the URL listed below. http://www.ngs.noaa.gov/cgi-bin/VERTCON/vert_con.prl.
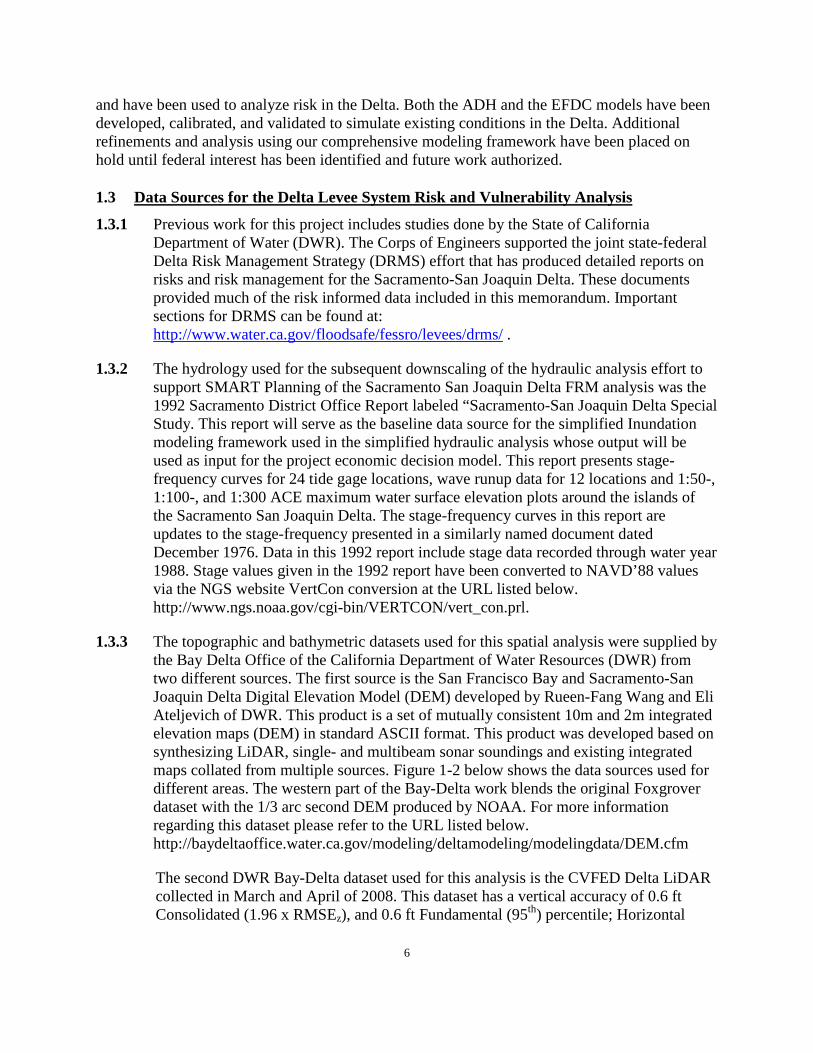
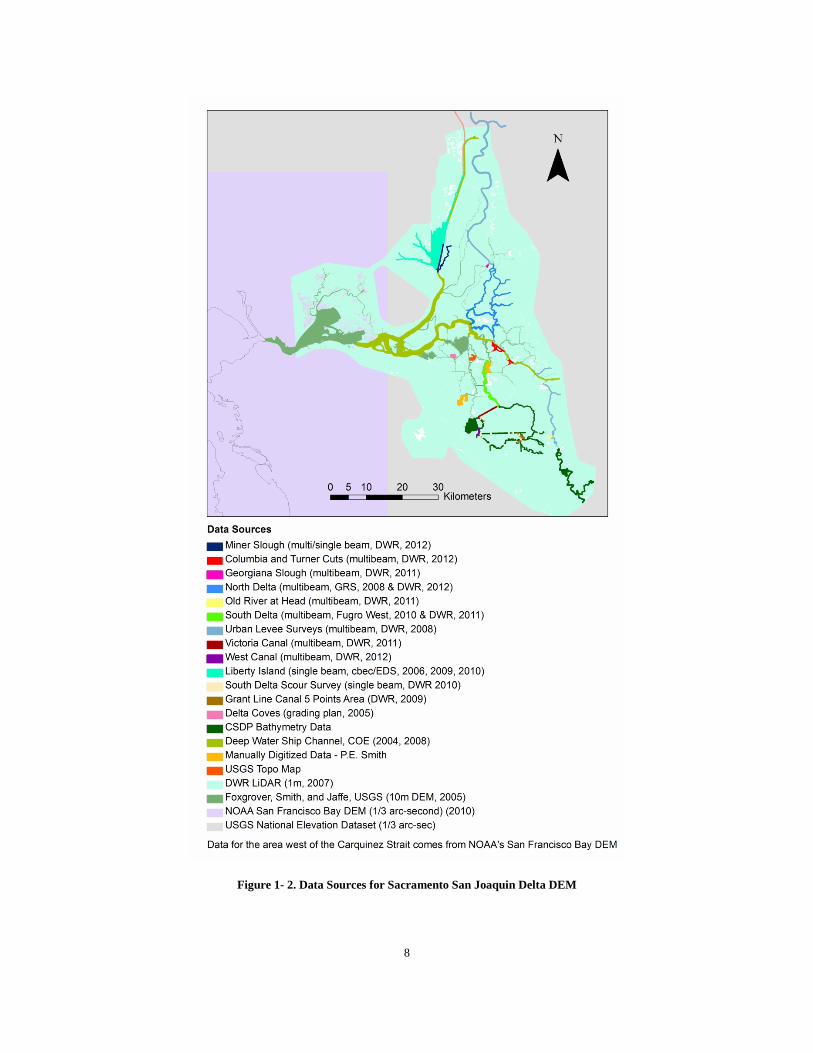
1.3.3 The topographic and bathymetric datasets used for this spatial analysis were supplied by the Bay Delta Office of the California Department of Water Resources (DWR) from two different sources. The first source is the San Francisco Bay and Sacramento-San Joaquin Delta Digital Elevation Model (DEM) developed by Rueen-Fang Wang and Eli Ateljevich of DWR. This product is a set of mutually consistent 10m and 2m integrated elevation maps (DEM) in standard ASCII format. This product was developed based on synthesizing LiDAR, single- and multibeam sonar soundings and existing integrated maps collated from multiple sources. Figure 1-2 below shows the data sources used for different areas. The western part of the Bay-Delta work blends the original Foxgrover dataset with the 1/3 arc second DEM produced by NOAA. For more information regarding this dataset please refer to the URL listed below. http://baydeltaoffice.water.ca.gov/modeling/deltamodeling/modelingdata/DEM.cfm
The second DWR Bay-Delta dataset used for this analysis is the CVFED Delta LiDAR collected in March and April of 2008. This dataset has a vertical accuracy of 0.6 ft Consolidated (1.96 x RMSEz), and 0.6 ft Fundamental (95th) percentile; Horizontal
7
accuracy of 3.5 ft (1.75 x RMSEx,y). Native Projection and datum is UTM 10N, NAD83, US Foot; Vertical Datum NAVD’88. This dataset is void of bathymetric or hydrographic data and was used as a consistency check for in-island terrain analysis.
1.4 Delta Levee System Risk and Vulnerability Analysis Summary
The National Research Council [NRC1994] defines risk analysis as having three core elements. They are risk assessment, risk management, and, risk communication.
The first element of risk analysis is risk assessment and it is the process through which the probability of loss within a system is estimated and the magnitude, or consequence, is also measured or estimated. Risk management is the process through which the potential frequency of magnitude and contributing factors to risk are estimated, evaluated, minimized, and controlled. Risk communication is the process through which information about the nature of risk and consequences are communicated to support Risk-Informed decision making.
This analysis uses the best available existing information to assemble composite risk management information useful to USACE for Risk-Informed decision making. It summarizes the Delta Risk Management Study (DRMS); expresses the DRMS and other findings in terms of the USACE’s Composite Risk Management matrix; and examines the results for management decision support.
Army and Corps of Engineers guidance documents define risk as the “probability and severity of loss linked to hazards” and prescribe a composite risk assessment method to be used in USACE projects. The Delta Risk Management Strategy Phase 1 and 2 reports are sound and rigorous analyses of the relative probability of hazards and severity of risks in the Delta and provide the information needed for risk analysis compliance within Corps of Engineers’ requirements.
The tables listed in the body of this document below provide rank-ordered lists of the highest risk zones – those with the greatest probability of failure combined with the most severe consequences. Those tables and the Appendices are used in this DILFS risk management framework to identify needed risk management efforts.
While uncertainties in the absolute magnitude of the results make them most useful for comparisons, the actual values of the probabilities and consequences are alarming. For example, Sargent Barnhart Tract, northwest of Stockton, has a mean annual failure rate of 0.07, or an expected levee failure every 14 years, with a probable 96 fatalities for a nighttime seismic-induced failure. Adjacent tracts with only slightly lower failure probabilities put another 500 lives at risk. Zone SM-124 has a projected failure rate of 0.5, or once every 2 years, with maximum possible damages exceeding $250 million. The Sacramento Pocket Area, with a mean annual failure rate of 0.006, has over $9 billion at risk.
8
Figure 1- 2. Data Sources for Sacramento San Joaquin Delta DEM
9
While refinements to these risk estimates are possible, this report and the Delta Risk Management Strategy analyses provide more than sufficient evidence that flooding in the Sacramento –San Joaquin Delta presents significant risks to California and the nation. Hundreds of lives and billions of dollar damages are at high probability of occurrence. Urgent action is necessary to manage those risks.
2.0 DELTA RISK MANAGEMENT STRATEGY (DRMS)
The California Department of Water Resources commissioned the Delta Risk Management Study (DRMS) on behalf of the CALFED agencies – more than 20 state and Federal organizations with resource management responsibilities in the Sacramento-San Joaquin Delta. The purposes of the DRMS were to:
… assess expected performance of Delta and Suisun Marsh levees (under various stressors and hazards) and the potential economic, environmental, and public health and safety consequences of levee failures to the Delta region and to California as a whole (Phase 1). After the completion of Phase 1, the purpose of DRMS is to address the consequences of levee failures by developing and evaluating risk reduction strategies (Phase 2). (URS/JBA 2008)
The DRMS Phase 1 report was published (still labeled as a draft) in October 2008, following a final revision in response to reviews by a panel of independent peer reviewers. Those documents (URS/JBA 2008 and CALFED Science Program Independent Review Panel 2008) are used here for the DRMS Phase 1 findings. Phase 2 findings were reported in URS/JBA (2011)
2.1 Hazards and Assessment Measures
DRMS evaluated three hazard categories as potential threats to Delta and Suisun levees: • Seismic Events • Hydrologic Events (floods) • Normal Events
Seismic events were expressed as the probability of a given ground motion in each area of the Delta for an earthquake of a given type and magnitude on a given fault. Flood events were expressed in terms of a combined probability of water level occurrence, given (a) inflows from all streams using a Log-Pearson Type III distribution of historical flows plus the predicted change in flow probabilities arising from climate change; and (b) tidal elevation probabilities from historical gauged water level stations adjusted for projected sea level rise. Normal events included non-seismic, non-flood events, such as those precipitated by high tides, rodent damage, etc. Sea level change and climate change were considered to be part of the Delta environment (i.e., not hazards), with an associated probability for each in a given year (2005 (base year), 2050, and 2100). Detailed zone-by-zone analysis was performed for 2005 conditions. For future
10
conditions, analyses predicted the overall changes of risk for the Delta. Section 3.3 of this report (below) summarizes the future risks.
For each category the threat was quantified in terms of a “Hazard Analysis” or probability of occurrence and a “Levee Vulnerability Analysis” that is the conditional probability of failure for a levee. A “System Model” was used to evaluate the combination of events and levee damage for a number of threat scenarios.
The System Model considered the combination of a hazard and levee vulnerability to have three possible levee outcomes – No Damage, Damage without Breaching, and Breaching. The latter two were assumed to constitute events with consequences – Emergency Response costs for Damage without Breaching and all assumed consequences (next section) for Breaching. The result was a tree-structure sequence of events and consequences (Section 3.3 below). For more information regarding the system model please refer to the DRMS URL listed above.
2.2 Consequences and Assessment Methods
Consequences of levee failures and subsequent flooding were considered in three main categories:
• Life Safety • Water Quality • Economic
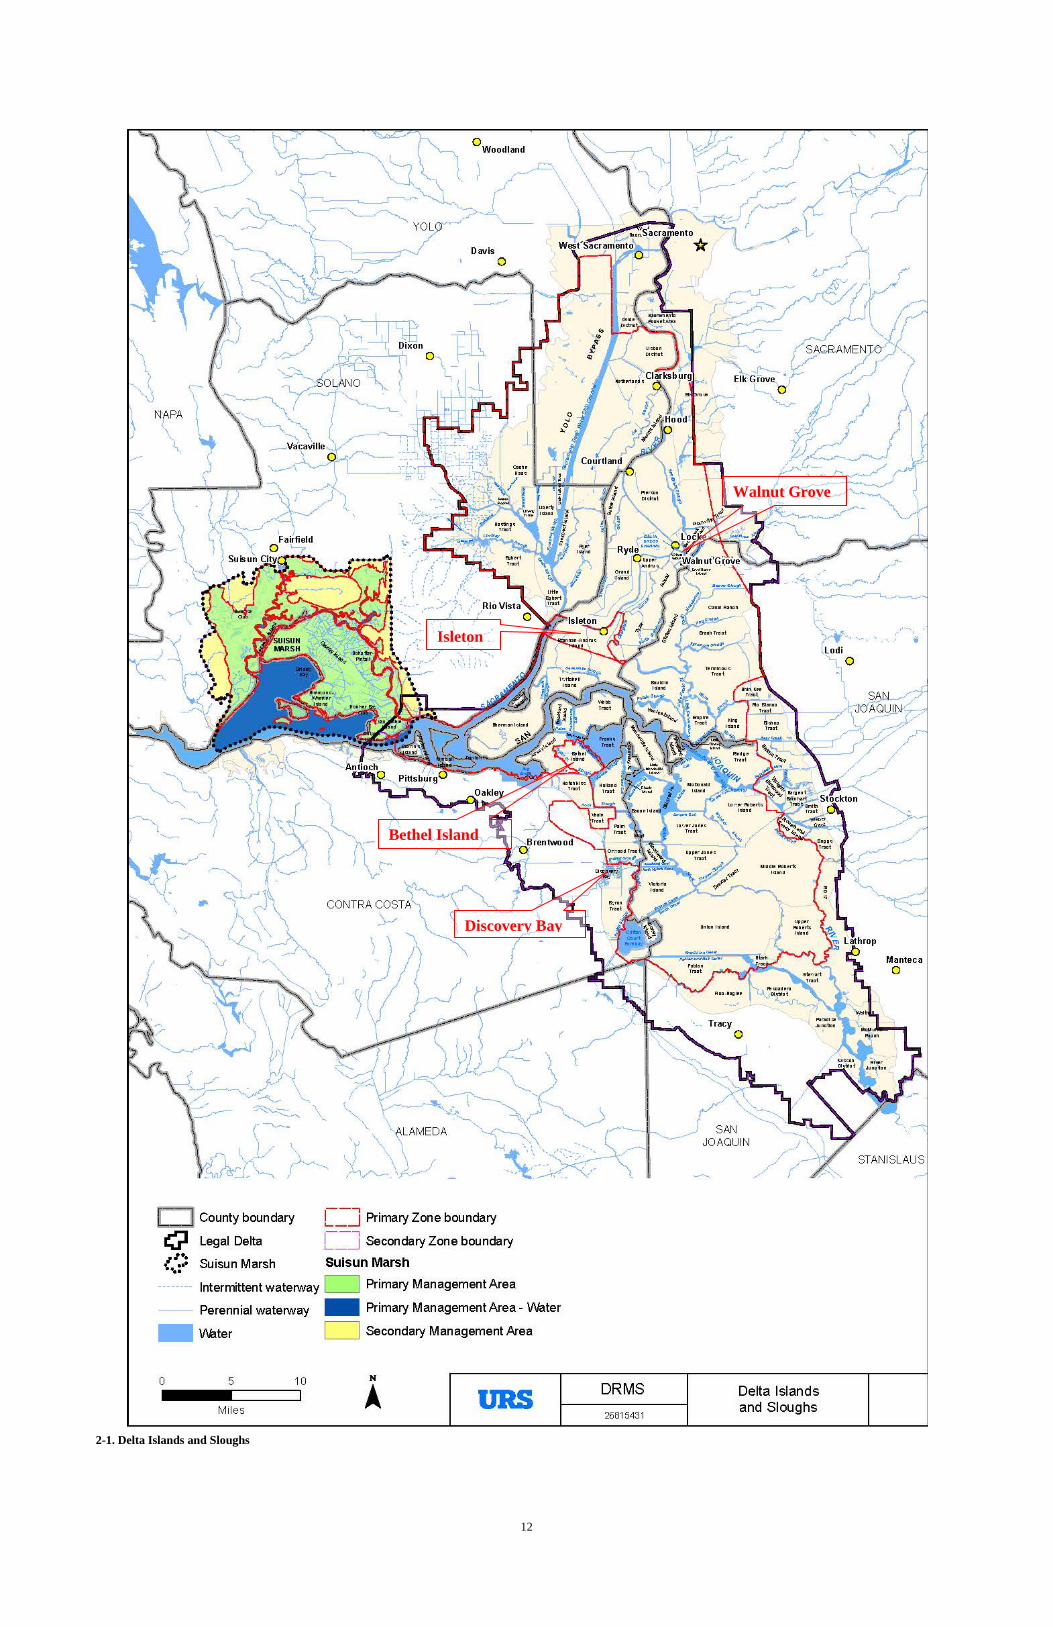
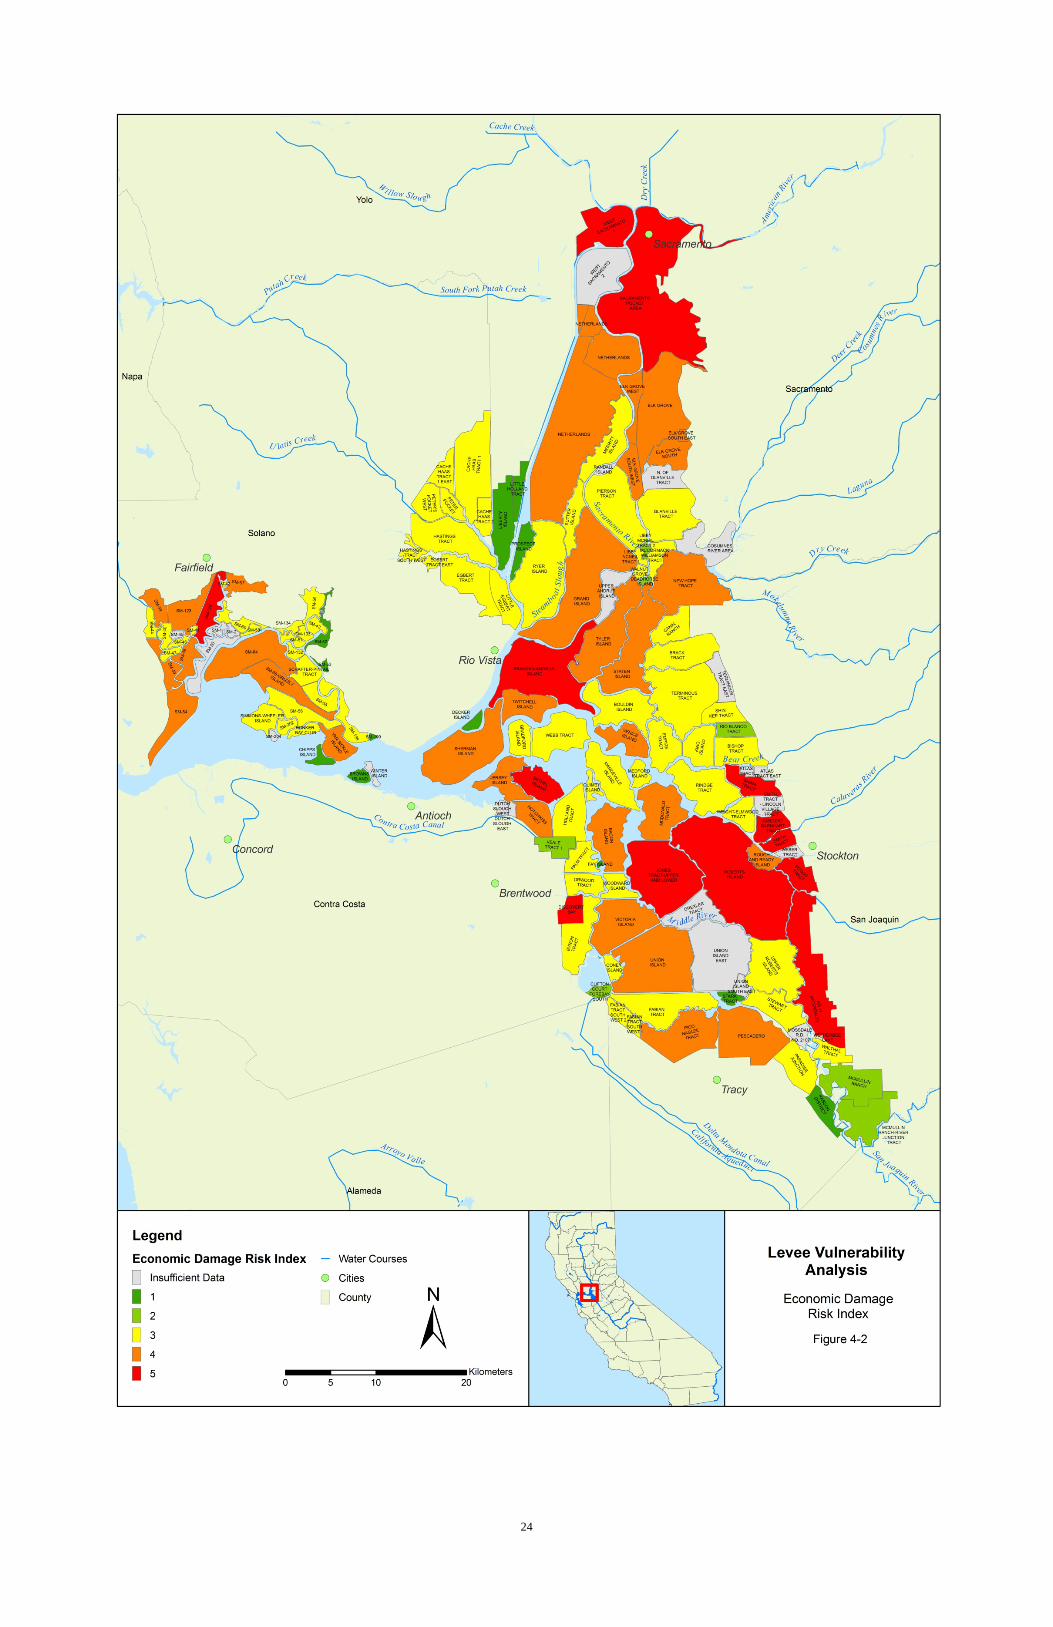
Consequences were evaluated quantitatively where possible and qualitatively otherwise. They were also evaluated on a per-island and Delta/state-wide basis. Per-island economic consequences were evaluated for 182 individual zones – islands and a few non-island areas adjacent to the levees – for life loss and damage costs specific to those zones, which are mapped in Figure 4-1. Delta-wide and state-wide consequences were presented for scenarios of 1 to 50 islands experiencing levee failure.
Life safety impacts were evaluated for life-loss probability using a simplified form of the LIFESim model (Aboelata et al. 2003) which considered six scenarios of flood, seismic, and sunny day failures during daytime and nighttime through evaluations of:
• Flood routing • Population exposure • Warning and evacuation
The System Model assessed the potential for events that would damage the levees and included uncertainty for natural variability (aleatory uncertainty) and for limited knowledge (epistemic uncertainty). The DRMS Phase 1 report described it as:
The system model defines the relationship between hazards and their possible combination to assess the state of the Delta immediately after an event (e.g., an earthquake of magnitude [M] 6 on the Hayward Fault). The term “state-of-the- Delta” refers to the condition of all levees and islands immediately after the event. Given an earthquake and the probabilistic nature of levee performance (see levee vulnerability
11
above), numerous combinations exist in which various levees will breach and different islands flood. The system model describes the potential combination of events and the framework for calculating their frequency of occurrence. Each combination of flooded islands is referred to as a levee failure sequence.
The system model also models islands that have not flooded, but whose levees may be damaged and could deteriorate (as a result of wave action) and result in further island flooding. Other factors or random events such as the time of year an event occurs, the type of hydrologic water year, etc. are also included in the system model because of their importance in assessing the hydrodynamic response to and consequences of levee failures. (URS/JBA 2008)
The analysis showed that 10 zones had at least a 10 percent probability of 100 deaths or more if a breach occurred in their protecting levees:
• 57_124 • Lincoln_Village_Tract • Sacramento_Pocket_Area • Sargent_Barnhart_Tract 2 • Sargent_Barnhart_Tract 2
• Shima_Tract • Smith_Tract • West Sacramento North • Zone 158 • Zone 185
Twenty-six zones had at least a 10 percent probability of 10 deaths or more if a breach occurred:
• 57_124 • Bethel_Island • Bishop_Tract • Boggs_Tract • Elk_Grove 1 • Hotchkiss_Tract 1 • Kasson_District • Libby_McNeil_Tract 1 • Lincoln_Village_Tract • Paradise Junction • RD 17 (Mossdale) • Rio_Blanco_Tract
• Sacramento_Pocket_Area • Sargent_Barnhart_Tract 2 • Sargent_Barnhart_Tract 3 • Sherman_Island • Shima_Tract • Smith_Tract • Veale_Tract 1 • Walnut_Grove • West Sacramento North • Wright-Elmwood_Tract • Zone 158 • Zone 185
The zones listed in italics are not shown in Figure 3-1. Sensitivity tests indicated that the above probabilities could be 2 to 5 times higher or lower, depending on the validity of assumptions in the analysis. Despite this wide range, the results are very useful in ranking the relative probability of adverse consequences among islands.
Economic consequences were calculated as: • Impacts – Value of lost output – Lost jobs
– Lost labor income – Lost value added

2-2
• Costs – In-Delta – Statewide – Total
12
2-1. Delta Islands and Sloughs
Isleton
Walnut Grove
Discovery Bay
Bethel Island
13
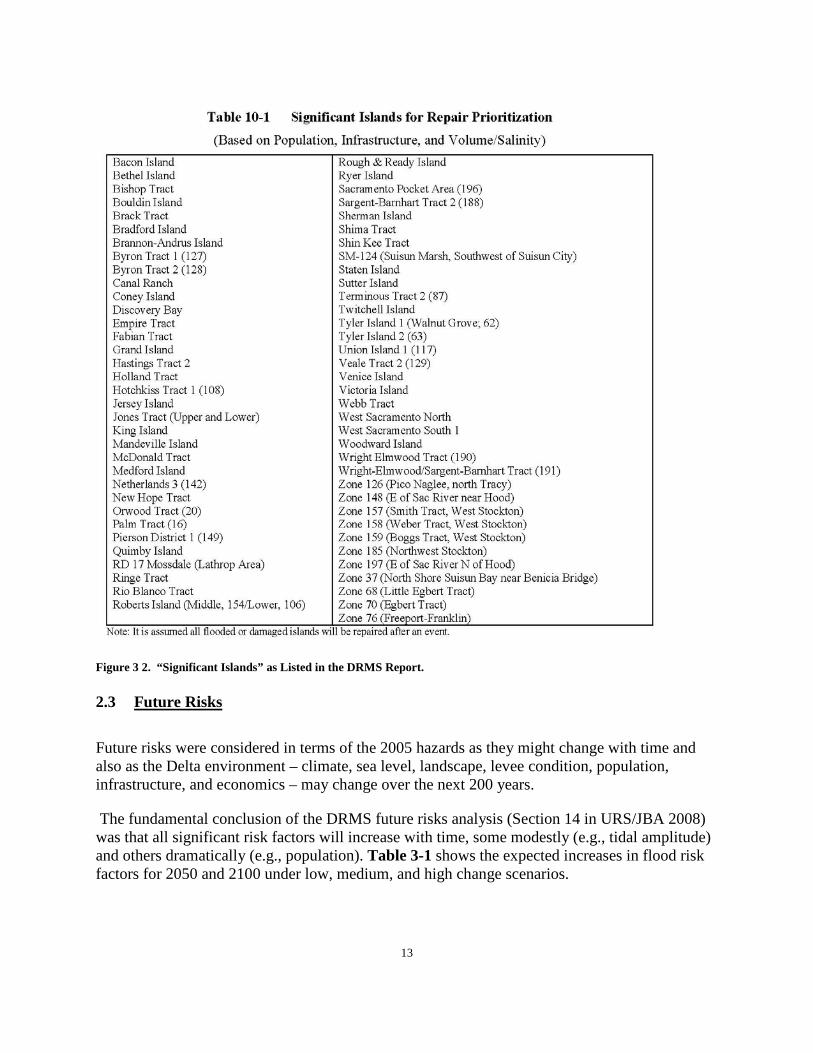
Figure 3 2. “Significant Islands” as Listed in the DRMS Report.
2.3 Future Risks
Future risks were considered in terms of the 2005 hazards as they might change with time and also as the Delta environment – climate, sea level, landscape, levee condition, population, infrastructure, and economics – may change over the next 200 years.
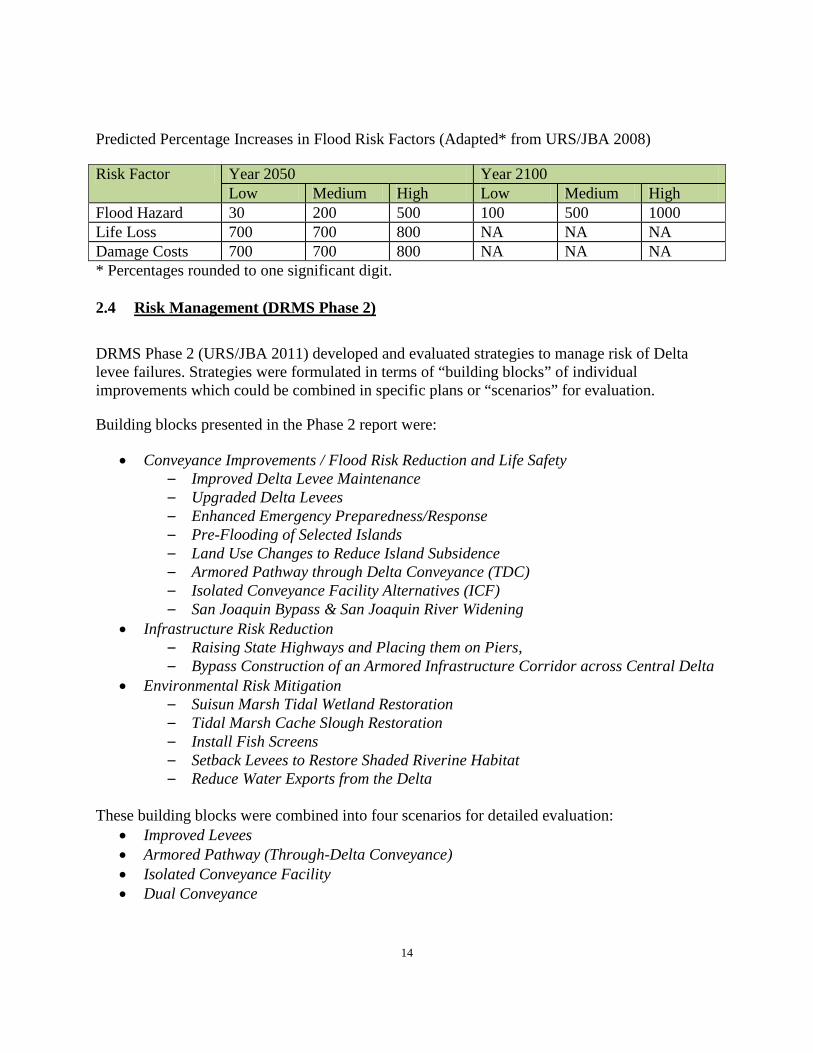
The fundamental conclusion of the DRMS future risks analysis (Section 14 in URS/JBA 2008) was that all significant risk factors will increase with time, some modestly (e.g., tidal amplitude) and others dramatically (e.g., population). Table 3-1 shows the expected increases in flood risk factors for 2050 and 2100 under low, medium, and high change scenarios.
14
Predicted Percentage Increases in Flood Risk Factors (Adapted* from URS/JBA 2008)
Risk Factor Year 2050 Year 2100 Low Medium High Low Medium High
Flood Hazard 30 200 500 100 500 1000 Life Loss 700 700 800 NA NA NA Damage Costs 700 700 800 NA NA NA * Percentages rounded to one significant digit.
2.4 Risk Management (DRMS Phase 2)
DRMS Phase 2 (URS/JBA 2011) developed and evaluated strategies to manage risk of Delta levee failures. Strategies were formulated in terms of “building blocks” of individual improvements which could be combined in specific plans or “scenarios” for evaluation.
Building blocks presented in the Phase 2 report were:
• Conveyance Improvements / Flood Risk Reduction and Life Safety – Improved Delta Levee Maintenance – Upgraded Delta Levees – Enhanced Emergency Preparedness/Response – Pre-Flooding of Selected Islands – Land Use Changes to Reduce Island Subsidence – Armored Pathway through Delta Conveyance (TDC) – Isolated Conveyance Facility Alternatives (ICF) – San Joaquin Bypass & San Joaquin River Widening
• Infrastructure Risk Reduction – Raising State Highways and Placing them on Piers, – Bypass Construction of an Armored Infrastructure Corridor across Central Delta
• Environmental Risk Mitigation – Suisun Marsh Tidal Wetland Restoration – Tidal Marsh Cache Slough Restoration – Install Fish Screens – Setback Levees to Restore Shaded Riverine Habitat – Reduce Water Exports from the Delta
These building blocks were combined into four scenarios for detailed evaluation:
• Improved Levees • Armored Pathway (Through-Delta Conveyance) • Isolated Conveyance Facility • Dual Conveyance
15
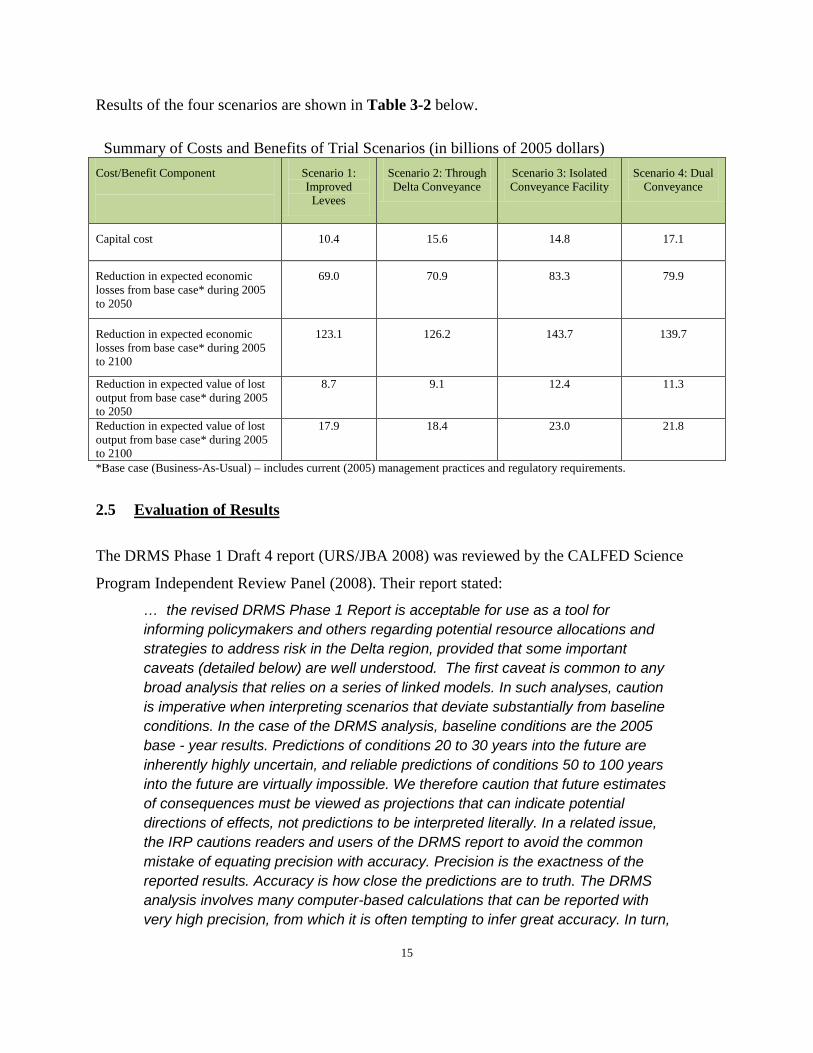
Results of the four scenarios are shown in Table 3-2 below.
Summary of Costs and Benefits of Trial Scenarios (in billions of 2005 dollars) Cost/Benefit Component
Scenario 1: Improved
Levees
Scenario 2: Through Delta Conveyance
Scenario 3: Isolated Conveyance Facility
Scenario 4: Dual Conveyance
Capital cost 10.4 15.6 14.8 17.1
Reduction in expected economic losses from base case* during 2005 to 2050
69.0 70.9 83.3 79.9
Reduction in expected economic losses from base case* during 2005 to 2100
123.1 126.2 143.7 139.7
Reduction in expected value of lost output from base case* during 2005 to 2050
8.7 9.1 12.4 11.3
Reduction in expected value of lost output from base case* during 2005 to 2100
17.9 18.4 23.0 21.8
*Base case (Business-As-Usual) – includes current (2005) management practices and regulatory requirements.
2.5 Evaluation of Results
The DRMS Phase 1 Draft 4 report (URS/JBA 2008) was reviewed by the CALFED Science
Program Independent Review Panel (2008). Their report stated:
… the revised DRMS Phase 1 Report is acceptable for use as a tool for informing policymakers and others regarding potential resource allocations and strategies to address risk in the Delta region, provided that some important caveats (detailed below) are well understood. The first caveat is common to any broad analysis that relies on a series of linked models. In such analyses, caution is imperative when interpreting scenarios that deviate substantially from baseline conditions. In the case of the DRMS analysis, baseline conditions are the 2005 base - year results. Predictions of conditions 20 to 30 years into the future are inherently highly uncertain, and reliable predictions of conditions 50 to 100 years into the future are virtually impossible. We therefore caution that future estimates of consequences must be viewed as projections that can indicate potential directions of effects, not predictions to be interpreted literally. In a related issue, the IRP cautions readers and users of the DRMS report to avoid the common mistake of equating precision with accuracy. Precision is the exactness of the reported results. Accuracy is how close the predictions are to truth. The DRMS analysis involves many computer-based calculations that can be reported with very high precision, from which it is often tempting to infer great accuracy. In turn,
16
this could lead to misinterpretation of the DRMS results, and thus to incorrect decisions. The second caveat is specific to the DRMS analysis and is due to the minimal ecosystem consequences that are actually assessed in the revised DRMS Phase I Report. Estimates of the effect of island flooding on vegetation and wildlife were much reduced from what was described in the methods section of the first draft of the DRMS Phase I Report and in the Impact to Ecosystems Technical Memoranda (TM). Furthermore, there was no assessment of consequences for aquatic resources (i.e., fish). With ecosystem consequences minimally represented in the current DRMS models, and with fish absent from the predictions, the IRP believes this could easily lead to erroneous interpretations of DRMS model results. Thus, anyone using the results of the DRMS scenarios must be very aware that ecosystem effects are not fully captured in the analysis, and that, in particular, the lack of ecosystem consequences reported does not imply small ecosystem impacts. Rather, the IRP notes that some scenarios could result in extremely large ecosystem disturbances, but these impacts will not be quantified because ecosystem consequences are inadequately accounted for in the current DRMS modeling framework. The IRP believes that these caveats require users of the DRMS model framework to exercise due diligence to ensure scientifically credible interpretations of the results.
To these caveats can be added that the DRMS analysis, as comprehensive as it was, did not include consideration of human-induced threats, such as terrorism and vandalism, nor did it include the compounding effect of an upstream dam break on flood levels.
Previous work for this project includes studies done by the local sponsors, the State of California Department of Water (DWR). DWR conducted a study of the Delta under the Delta Risk Management Study (DRMS). This work was reviewed and utilized as part of the basis of our evaluation of the existing conditions. The probability of failure curves for the existing condition was directly converted to a format that is compatible with the USACE Flood Damage Assessment (FDA) model. These reports indicate that most of the Delta islands and tracks are vulnerable to failure from underseepage and from deformation as a result of seismic activity. The extent to which each reach fails to meet design criteria varies, but without exception, each island or tract has locations that have a high probability of failure, often along multiple reaches.
3.0 SACRAMENTO-SAN JOAQUIN DELTA LEVEE RISK ASSESSMENT
To achieve the first objective of presenting available Sacramento-San Joaquin Delta levee risk information in a matrix form consistent with USACE and Army policies and suitable for
17
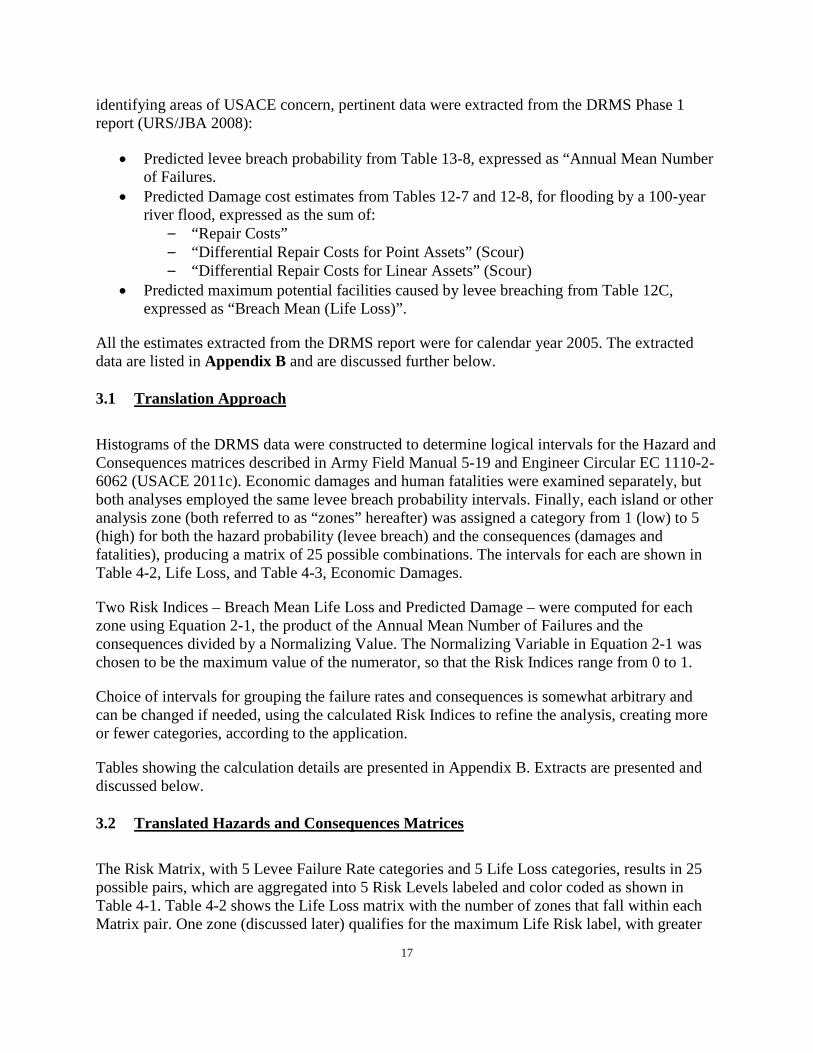
identifying areas of USACE concern, pertinent data were extracted from the DRMS Phase 1 report (URS/JBA 2008):
• Predicted levee breach probability from Table 13-8, expressed as “Annual Mean Number of Failures.
• Predicted Damage cost estimates from Tables 12-7 and 12-8, for flooding by a 100-year river flood, expressed as the sum of:
– “Repair Costs” – “Differential Repair Costs for Point Assets” (Scour) – “Differential Repair Costs for Linear Assets” (Scour)
• Predicted maximum potential facilities caused by levee breaching from Table 12C, expressed as “Breach Mean (Life Loss)”.
All the estimates extracted from the DRMS report were for calendar year 2005. The extracted data are listed in Appendix B and are discussed further below.
3.1 Translation Approach
Histograms of the DRMS data were constructed to determine logical intervals for the Hazard and Consequences matrices described in Army Field Manual 5-19 and Engineer Circular EC 1110-2-6062 (USACE 2011c). Economic damages and human fatalities were examined separately, but both analyses employed the same levee breach probability intervals. Finally, each island or other analysis zone (both referred to as “zones” hereafter) was assigned a category from 1 (low) to 5 (high) for both the hazard probability (levee breach) and the consequences (damages and fatalities), producing a matrix of 25 possible combinations. The intervals for each are shown in Table 4-2, Life Loss, and Table 4-3, Economic Damages.
Two Risk Indices – Breach Mean Life Loss and Predicted Damage – were computed for each zone using Equation 2-1, the product of the Annual Mean Number of Failures and the consequences divided by a Normalizing Value. The Normalizing Variable in Equation 2-1 was chosen to be the maximum value of the numerator, so that the Risk Indices range from 0 to 1.
Choice of intervals for grouping the failure rates and consequences is somewhat arbitrary and can be changed if needed, using the calculated Risk Indices to refine the analysis, creating more or fewer categories, according to the application.
Tables showing the calculation details are presented in Appendix B. Extracts are presented and discussed below.
3.2 Translated Hazards and Consequences Matrices
The Risk Matrix, with 5 Levee Failure Rate categories and 5 Life Loss categories, results in 25 possible pairs, which are aggregated into 5 Risk Levels labeled and color coded as shown in Table 4-1. Table 4-2 shows the Life Loss matrix with the number of zones that fall within each Matrix pair. One zone (discussed later) qualifies for the maximum Life Risk label, with greater
18
than 0.1 failures per year and over 100 lives at risk. Using the five Levels of Table 4-1, 7 zones fall within the Highest Risk level and 14 Fall within the Higher Risk level. Fifty are in the High, 4 are in the Lower, and 2 are in the Lowest Risk level, totaling 77 unique zones categorized for Life Loss Risk.
Table 3-1. Matrix Risk Levels and shading for Tables 4-2 through 4-6
Risk Level Key
5. Highest
4. Higher
3. High
2. Lower
1. Lowest
Table 3-2. Life Loss Risk Matrix with Number of Zones within Each Risk Category
Maximum “Mean Life Loss” (Category)
Annual Mean Number of Failures (Category) 0-0.01
(1) 0.01-0.025
(2) 0.025-0.05
(3) 0.05-0.1
(4) >0.1 (5)
>100 (5) 0 0 2 2 1
50-100 (4) 0 0 2 0 2
10-50 (3) 1 0 4 3 2
1-10 (2) 0 0 8 14 7
0-1 (1) 2 0 4 14 9
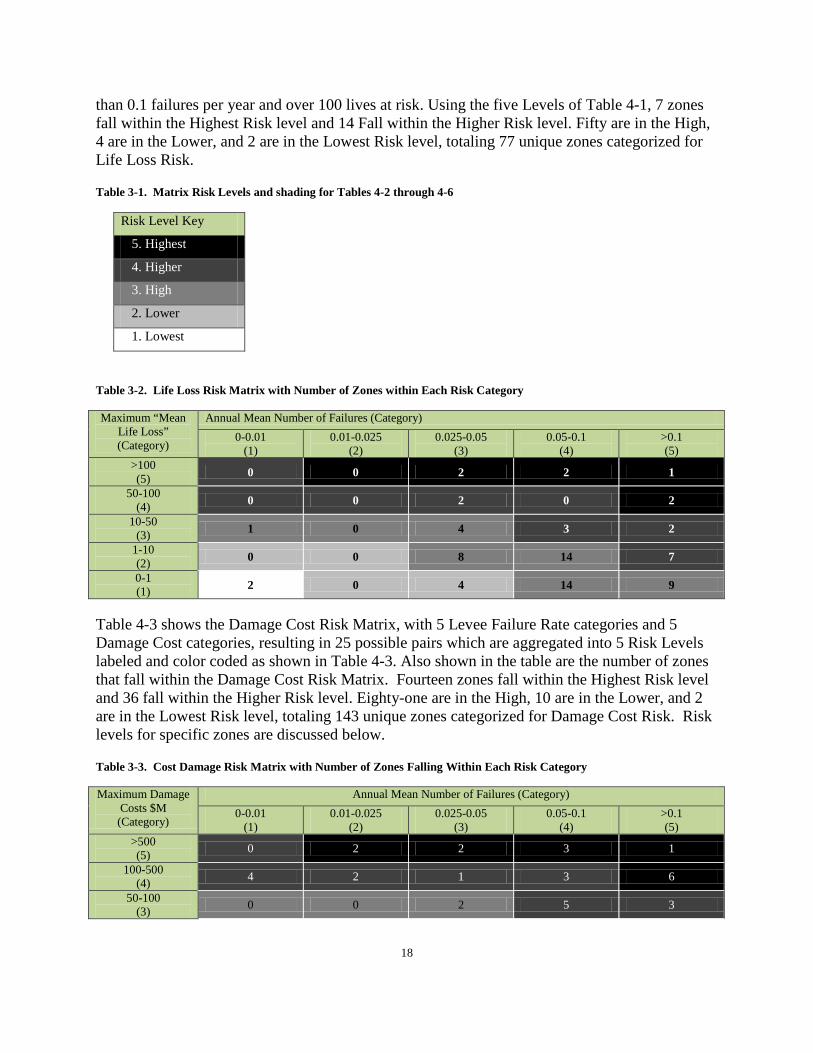
Table 4-3 shows the Damage Cost Risk Matrix, with 5 Levee Failure Rate categories and 5 Damage Cost categories, resulting in 25 possible pairs which are aggregated into 5 Risk Levels labeled and color coded as shown in Table 4-3. Also shown in the table are the number of zones that fall within the Damage Cost Risk Matrix. Fourteen zones fall within the Highest Risk level and 36 fall within the Higher Risk level. Eighty-one are in the High, 10 are in the Lower, and 2 are in the Lowest Risk level, totaling 143 unique zones categorized for Damage Cost Risk. Risk levels for specific zones are discussed below.
Table 3-3. Cost Damage Risk Matrix with Number of Zones Falling Within Each Risk Category
Maximum Damage Costs $M (Category)
Annual Mean Number of Failures (Category) 0-0.01
(1) 0.01-0.025
(2) 0.025-0.05
(3) 0.05-0.1
(4) >0.1 (5)
>500 (5) 0 2 2 3 1
100-500 (4) 4 2 1 3 6
50-100 (3) 0 0 2 5 3
19
10-50 (2) 1 1 13 21 18
0-10 (1) 2 1 7 23 22
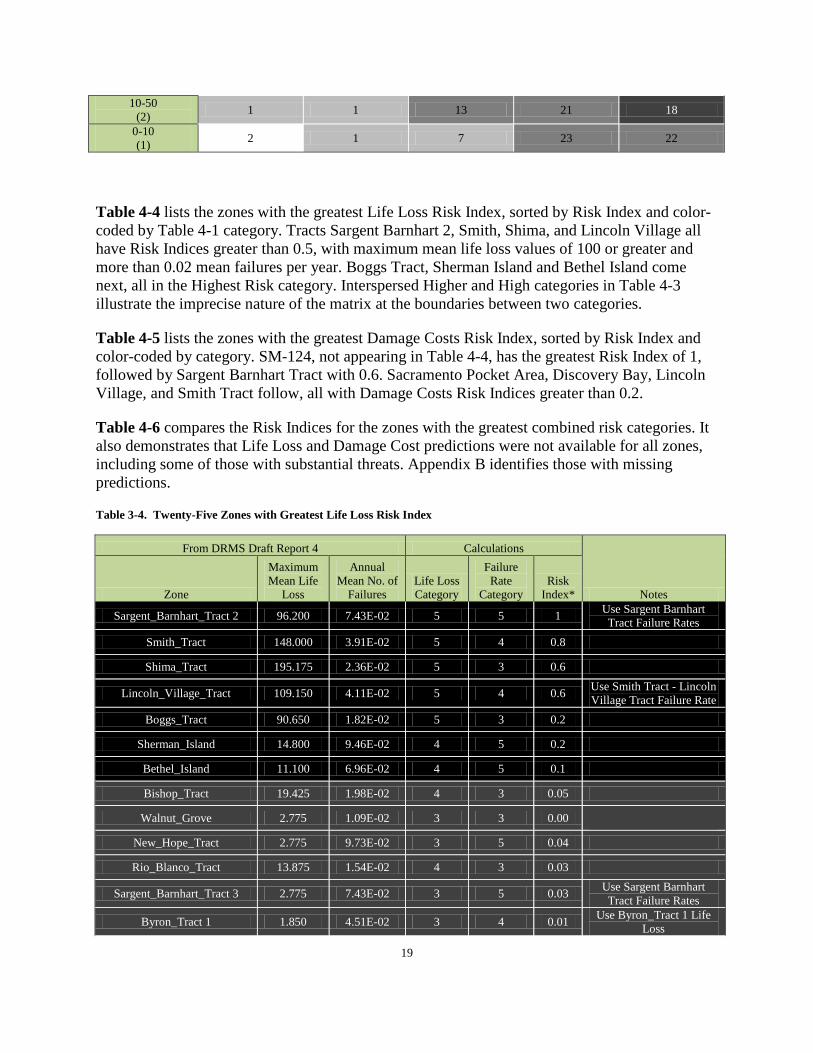
Table 4-4 lists the zones with the greatest Life Loss Risk Index, sorted by Risk Index and color-coded by Table 4-1 category. Tracts Sargent Barnhart 2, Smith, Shima, and Lincoln Village all have Risk Indices greater than 0.5, with maximum mean life loss values of 100 or greater and more than 0.02 mean failures per year. Boggs Tract, Sherman Island and Bethel Island come next, all in the Highest Risk category. Interspersed Higher and High categories in Table 4-3 illustrate the imprecise nature of the matrix at the boundaries between two categories.
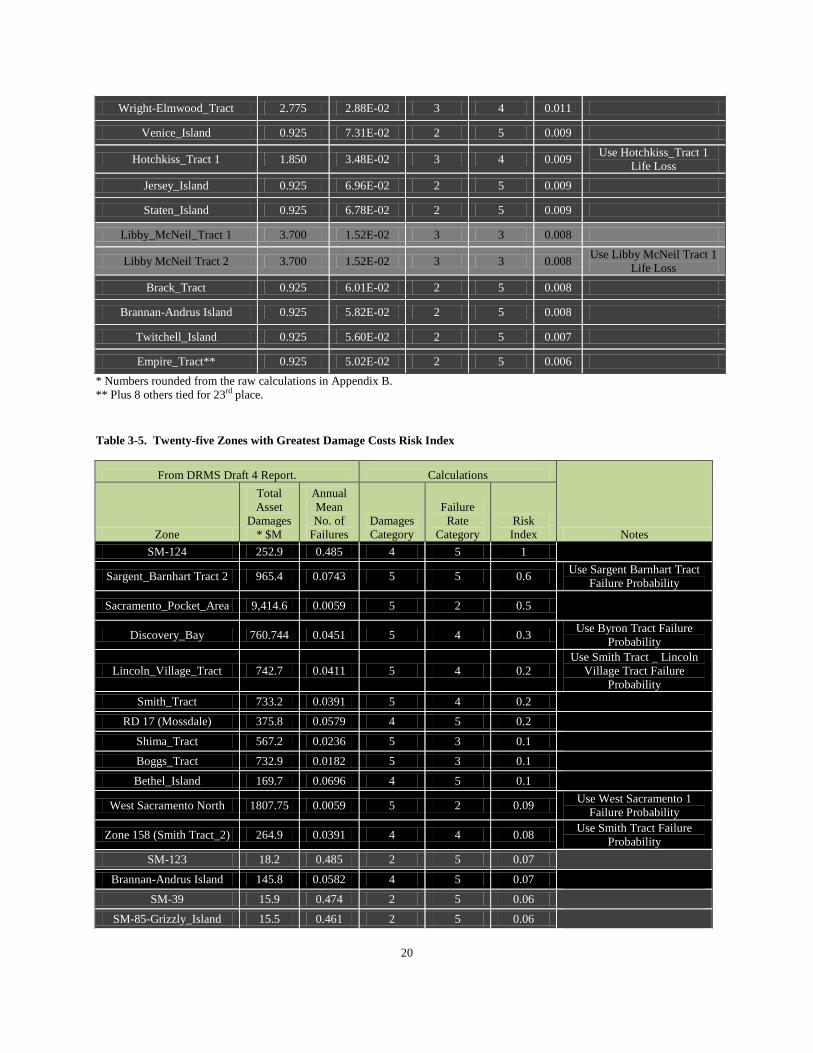
Table 4-5 lists the zones with the greatest Damage Costs Risk Index, sorted by Risk Index and color-coded by category. SM-124, not appearing in Table 4-4, has the greatest Risk Index of 1, followed by Sargent Barnhart Tract with 0.6. Sacramento Pocket Area, Discovery Bay, Lincoln Village, and Smith Tract follow, all with Damage Costs Risk Indices greater than 0.2.
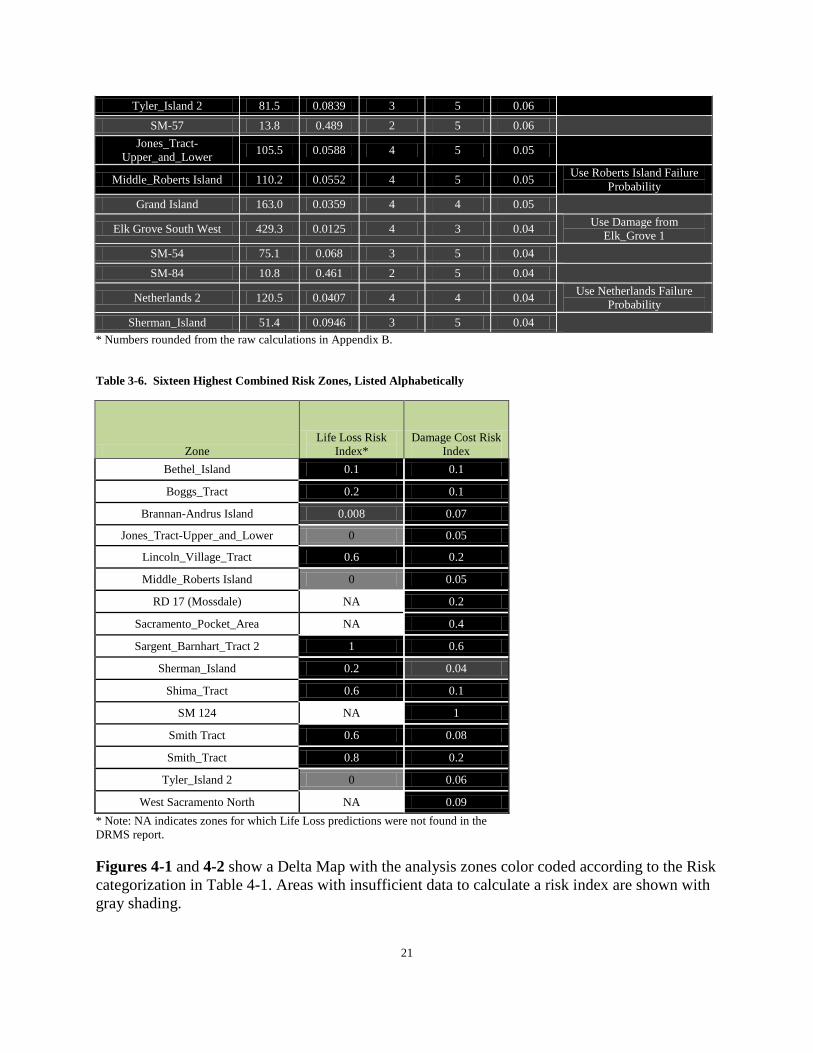
Table 4-6 compares the Risk Indices for the zones with the greatest combined risk categories. It also demonstrates that Life Loss and Damage Cost predictions were not available for all zones, including some of those with substantial threats. Appendix B identifies those with missing predictions.
Table 3-4. Twenty-Five Zones with Greatest Life Loss Risk Index
From DRMS Draft Report 4 Calculations
Notes Zone
Maximum Mean Life
Loss
Annual Mean No. of
Failures Life Loss Category
Failure Rate
Category Risk
Index*
Sargent_Barnhart_Tract 2 96.200 7.43E-02 5 5 1 Use Sargent Barnhart Tract Failure Rates
Smith_Tract 148.000 3.91E-02 5 4 0.8
Shima_Tract 195.175 2.36E-02 5 3 0.6
Lincoln_Village_Tract 109.150 4.11E-02 5 4 0.6 Use Smith Tract - Lincoln Village Tract Failure Rate
Boggs_Tract 90.650 1.82E-02 5 3 0.2
Sherman_Island 14.800 9.46E-02 4 5 0.2
Bethel_Island 11.100 6.96E-02 4 5 0.1
Bishop_Tract 19.425 1.98E-02 4 3 0.05
Walnut_Grove 2.775 1.09E-02 3 3 0.00 New_Hope_Tract 2.775 9.73E-02 3 5 0.04
Rio_Blanco_Tract 13.875 1.54E-02 4 3 0.03
Sargent_Barnhart_Tract 3 2.775 7.43E-02 3 5 0.03 Use Sargent Barnhart Tract Failure Rates
Byron_Tract 1 1.850 4.51E-02 3 4 0.01 Use Byron_Tract 1 Life Loss
20
Wright-Elmwood_Tract 2.775 2.88E-02 3 4 0.011
Venice_Island 0.925 7.31E-02 2 5 0.009
Hotchkiss_Tract 1 1.850 3.48E-02 3 4 0.009 Use Hotchkiss_Tract 1 Life Loss
Jersey_Island 0.925 6.96E-02 2 5 0.009
Staten_Island 0.925 6.78E-02 2 5 0.009
Libby_McNeil_Tract 1 3.700 1.52E-02 3 3 0.008
Libby McNeil Tract 2 3.700 1.52E-02 3 3 0.008 Use Libby McNeil Tract 1 Life Loss
Brack_Tract 0.925 6.01E-02 2 5 0.008
Brannan-Andrus Island 0.925 5.82E-02 2 5 0.008
Twitchell_Island 0.925 5.60E-02 2 5 0.007
Empire_Tract** 0.925 5.02E-02 2 5 0.006 * Numbers rounded from the raw calculations in Appendix B. ** Plus 8 others tied for 23rd place.
Table 3-5. Twenty-five Zones with Greatest Damage Costs Risk Index
From DRMS Draft 4 Report. Calculations
Notes Zone
Total Asset
Damages* $M
Annual Mean No. of
Failures Damages Category
Failure Rate
Category Risk Index
SM-124 252.9 0.485 4 5 1 Sargent_Barnhart Tract 2 965.4 0.0743 5 5 0.6 Use Sargent Barnhart Tract
Failure Probability
Sacramento_Pocket_Area 9,414.6 0.0059 5 2 0.5
Discovery_Bay 760.744 0.0451 5 4 0.3 Use Byron Tract Failure Probability
Lincoln_Village_Tract 742.7 0.0411 5 4 0.2 Use Smith Tract _ Lincoln
Village Tract Failure Probability
Smith_Tract 733.2 0.0391 5 4 0.2 RD 17 (Mossdale) 375.8 0.0579 4 5 0.2
Shima_Tract 567.2 0.0236 5 3 0.1 Boggs_Tract 732.9 0.0182 5 3 0.1 Bethel_Island 169.7 0.0696 4 5 0.1
West Sacramento North 1807.75 0.0059 5 2 0.09 Use West Sacramento 1 Failure Probability
Zone 158 (Smith Tract_2) 264.9 0.0391 4 4 0.08 Use Smith Tract Failure Probability
SM-123 18.2 0.485 2 5 0.07 Brannan-Andrus Island 145.8 0.0582 4 5 0.07
SM-39 15.9 0.474 2 5 0.06 SM-85-Grizzly_Island 15.5 0.461 2 5 0.06
21
Tyler_Island 2 81.5 0.0839 3 5 0.06 SM-57 13.8 0.489 2 5 0.06
Jones_Tract-Upper_and_Lower 105.5 0.0588 4 5 0.05
Middle_Roberts Island 110.2 0.0552 4 5 0.05 Use Roberts Island Failure Probability
Grand Island 163.0 0.0359 4 4 0.05 Elk Grove South West 429.3 0.0125 4 3 0.04 Use Damage from
Elk_Grove 1 SM-54 75.1 0.068 3 5 0.04 SM-84 10.8 0.461 2 5 0.04
Netherlands 2 120.5 0.0407 4 4 0.04 Use Netherlands Failure Probability
Sherman_Island 51.4 0.0946 3 5 0.04 * Numbers rounded from the raw calculations in Appendix B.
Table 3-6. Sixteen Highest Combined Risk Zones, Listed Alphabetically
Zone Life Loss Risk
Index* Damage Cost Risk
Index Bethel_Island 0.1 0.1
Boggs_Tract 0.2 0.1
Brannan-Andrus Island 0.008 0.07
Jones_Tract-Upper_and_Lower 0 0.05
Lincoln_Village_Tract 0.6 0.2
Middle_Roberts Island 0 0.05
RD 17 (Mossdale) NA 0.2
Sacramento_Pocket_Area NA 0.4
Sargent_Barnhart_Tract 2 1 0.6
Sherman_Island 0.2 0.04
Shima_Tract 0.6 0.1
SM 124 NA 1
Smith Tract 0.6 0.08
Smith_Tract 0.8 0.2
Tyler_Island 2 0 0.06
West Sacramento North NA 0.09 * Note: NA indicates zones for which Life Loss predictions were not found in the DRMS report.
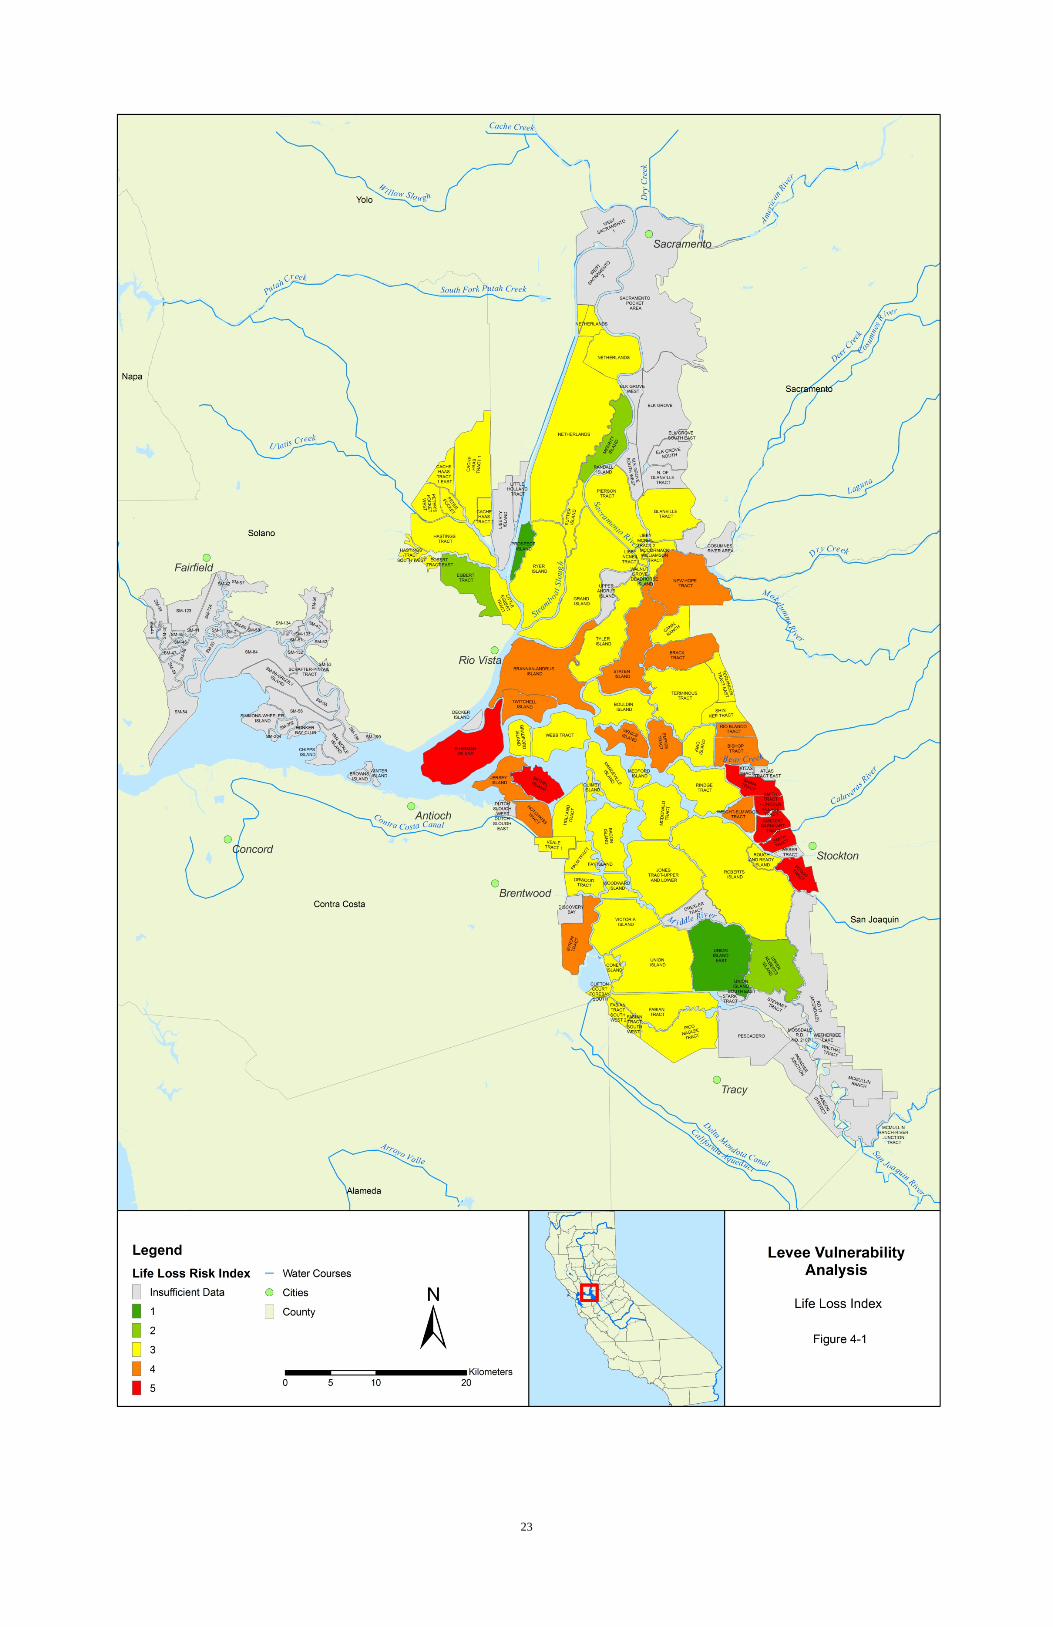
Figures 4-1 and 4-2 show a Delta Map with the analysis zones color coded according to the Risk categorization in Table 4-1. Areas with insufficient data to calculate a risk index are shown with gray shading.
22
Complete results can be found in Appendix B.
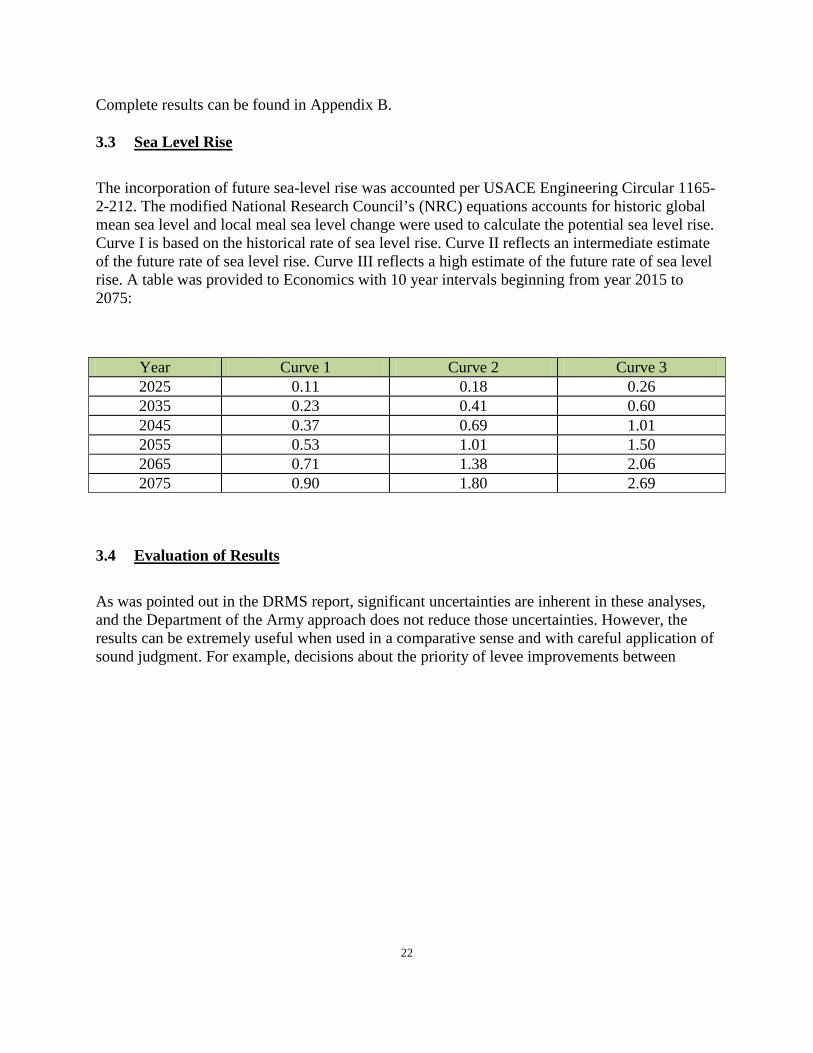
3.3 Sea Level Rise
The incorporation of future sea-level rise was accounted per USACE Engineering Circular 1165-2-212. The modified National Research Council’s (NRC) equations accounts for historic global mean sea level and local meal sea level change were used to calculate the potential sea level rise. Curve I is based on the historical rate of sea level rise. Curve II reflects an intermediate estimate of the future rate of sea level rise. Curve III reflects a high estimate of the future rate of sea level rise. A table was provided to Economics with 10 year intervals beginning from year 2015 to 2075:
Year Curve 1 Curve 2 Curve 3 2025 0.11 0.18 0.26 2035 0.23 0.41 0.60 2045 0.37 0.69 1.01 2055 0.53 1.01 1.50 2065 0.71 1.38 2.06 2075 0.90 1.80 2.69
3.4 Evaluation of Results
As was pointed out in the DRMS report, significant uncertainties are inherent in these analyses, and the Department of the Army approach does not reduce those uncertainties. However, the results can be extremely useful when used in a comparative sense and with careful application of sound judgment. For example, decisions about the priority of levee improvements between
23
24
27
Bethel Island and Boggs Tract using Table 4-6 alone are inadvisable: the differences between their Life Loss and Damage Cost indices are small and statistically insignificant, respectively. However, Sargent Barnhart Tract 2 is shown by Table 4-6 to be clearly at greater Risk (indices of 1 and 0.6) than either Bethel or Boggs. In the absence of other information, Sargent Barnhart Tract would clearly be a levee repair and rehabilitation priority over most other zones shown.
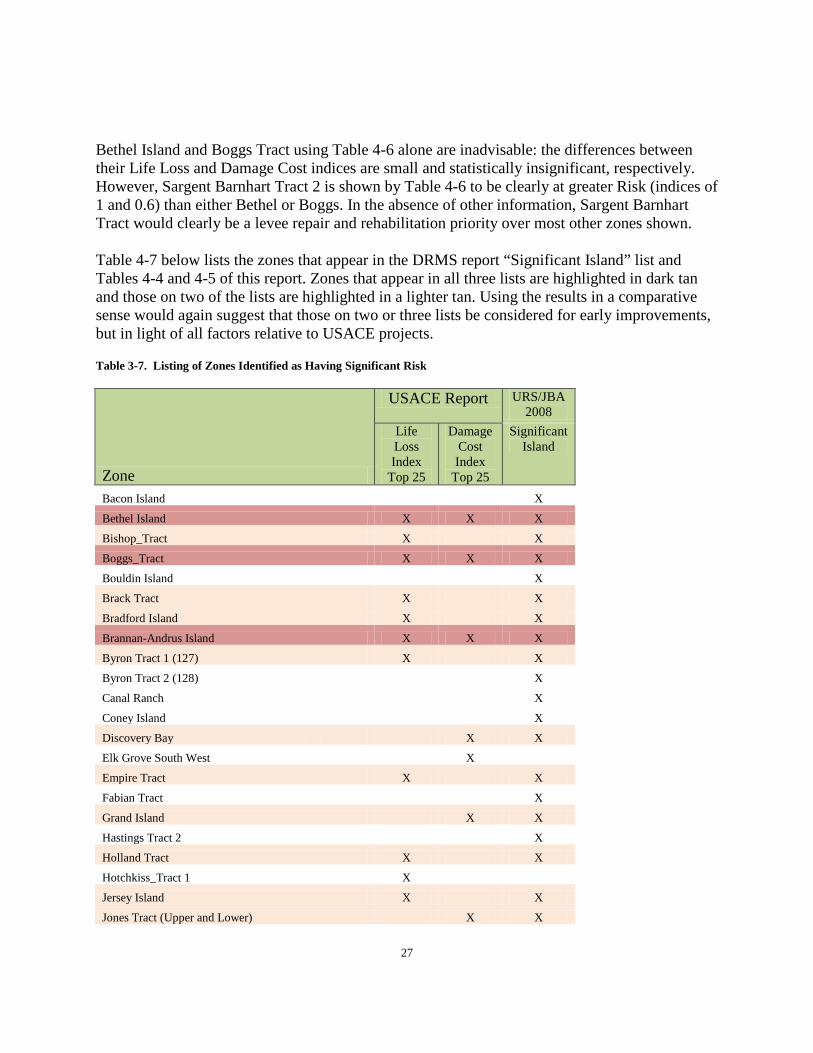
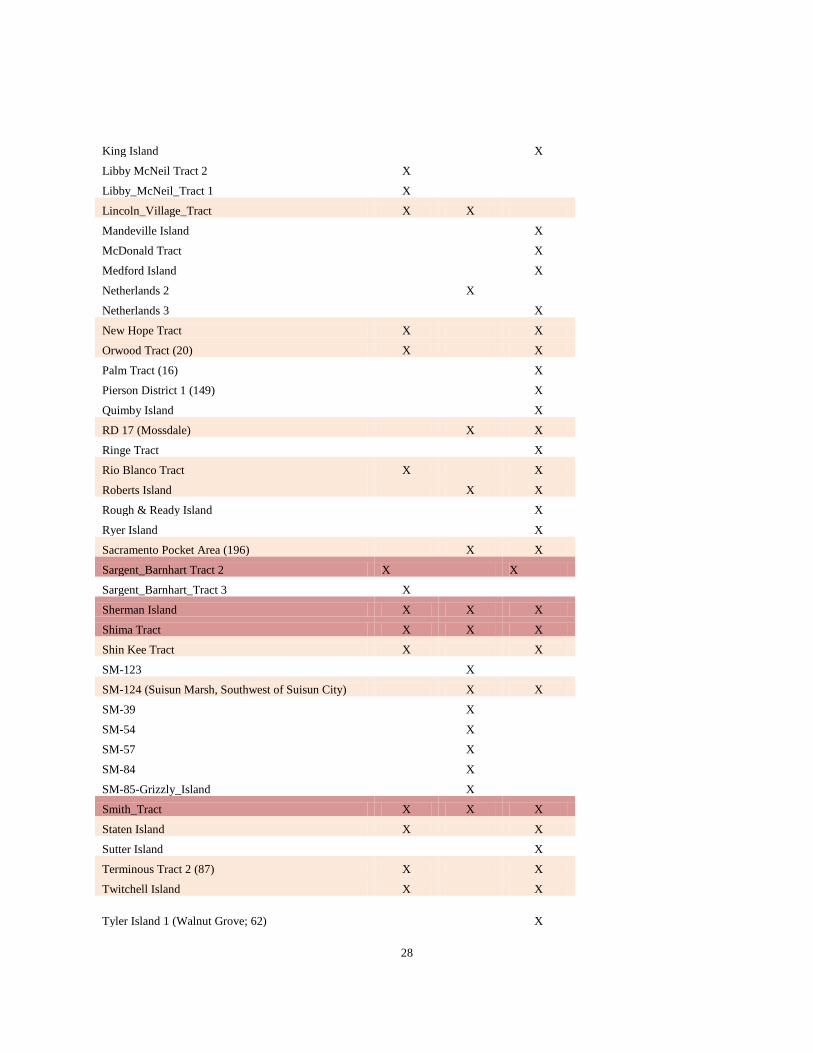
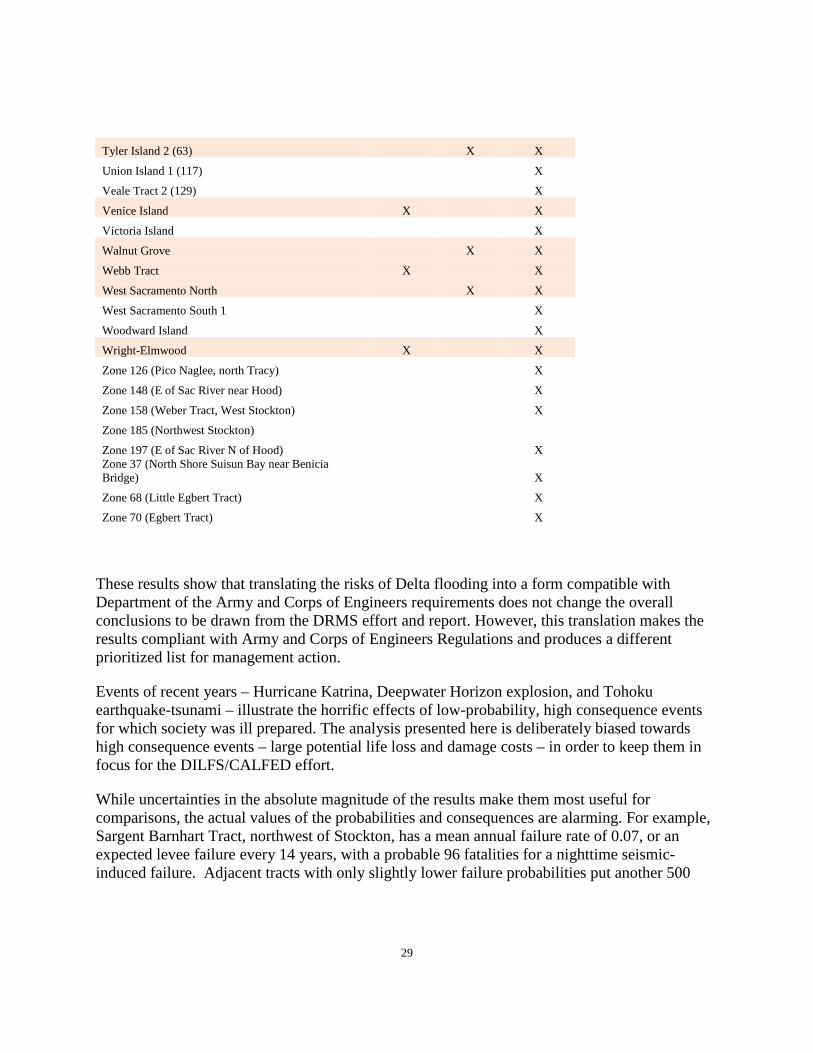
Table 4-7 below lists the zones that appear in the DRMS report “Significant Island” list and Tables 4-4 and 4-5 of this report. Zones that appear in all three lists are highlighted in dark tan and those on two of the lists are highlighted in a lighter tan. Using the results in a comparative sense would again suggest that those on two or three lists be considered for early improvements, but in light of all factors relative to USACE projects.
Table 3-7. Listing of Zones Identified as Having Significant Risk
Zone
USACE Report URS/JBA 2008
Life Loss Index
Top 25
Damage Cost Index
Top 25
Significant Island
Bacon Island
X
Bethel Island X X X
Bishop_Tract X X
Boggs_Tract X X X
Bouldin Island
X
Brack Tract X X
Bradford Island X X
Brannan-Andrus Island X X X
Byron Tract 1 (127) X X
Byron Tract 2 (128)
X
Canal Ranch
X
Coney Island
X
Discovery Bay X X
Elk Grove South West
X Empire Tract X X
Fabian Tract
X
Grand Island X X
Hastings Tract 2
X
Holland Tract X X
Hotchkiss_Tract 1 X Jersey Island X X
Jones Tract (Upper and Lower) X X
28
King Island
X
Libby McNeil Tract 2 X Libby_McNeil_Tract 1 X Lincoln_Village_Tract X X
Mandeville Island
X
McDonald Tract
X
Medford Island
X
Netherlands 2
X Netherlands 3
X
New Hope Tract X X
Orwood Tract (20) X X
Palm Tract (16)
X
Pierson District 1 (149)
X
Quimby Island
X
RD 17 (Mossdale) X X
Ringe Tract
X
Rio Blanco Tract X X
Roberts Island X X
Rough & Ready Island
X
Ryer Island
X
Sacramento Pocket Area (196) X X
Sargent_Barnhart Tract 2 X X
Sargent_Barnhart_Tract 3 X Sherman Island X X X
Shima Tract X X X
Shin Kee Tract X X
SM-123
X SM-124 (Suisun Marsh, Southwest of Suisun City) X X
SM-39
X SM-54
X
SM-57
X SM-84
X
SM-85-Grizzly_Island
X Smith_Tract X X X
Staten Island X X
Sutter Island
X
Terminous Tract 2 (87) X X
Twitchell Island X X
Tyler Island 1 (Walnut Grove; 62)
X
29
Tyler Island 2 (63) X X
Union Island 1 (117)
X
Veale Tract 2 (129)
X
Venice Island X X
Victoria Island
X
Walnut Grove X X
Webb Tract X X
West Sacramento North X X
West Sacramento South 1
X
Woodward Island
X
Wright-Elmwood X X
Zone 126 (Pico Naglee, north Tracy)
X
Zone 148 (E of Sac River near Hood)
X
Zone 158 (Weber Tract, West Stockton)
X
Zone 185 (Northwest Stockton) Zone 197 (E of Sac River N of Hood)
X Zone 37 (North Shore Suisun Bay near Benicia Bridge)
X
Zone 68 (Little Egbert Tract)
X
Zone 70 (Egbert Tract)
X
These results show that translating the risks of Delta flooding into a form compatible with Department of the Army and Corps of Engineers requirements does not change the overall conclusions to be drawn from the DRMS effort and report. However, this translation makes the results compliant with Army and Corps of Engineers Regulations and produces a different prioritized list for management action.
Events of recent years – Hurricane Katrina, Deepwater Horizon explosion, and Tohoku earthquake-tsunami – illustrate the horrific effects of low-probability, high consequence events for which society was ill prepared. The analysis presented here is deliberately biased towards high consequence events – large potential life loss and damage costs – in order to keep them in focus for the DILFS/CALFED effort.
While uncertainties in the absolute magnitude of the results make them most useful for comparisons, the actual values of the probabilities and consequences are alarming. For example, Sargent Barnhart Tract, northwest of Stockton, has a mean annual failure rate of 0.07, or an expected levee failure every 14 years, with a probable 96 fatalities for a nighttime seismic-induced failure. Adjacent tracts with only slightly lower failure probabilities put another 500
30
lives at risk. Zone SM-124 has a projected failure rate of 0.5, or once every 2 years, with maximum potential damages exceeding $250 million1. The Sacramento Pocket Area, with a mean annual failure rate of 0.006, has over $9 billion at risk.
3.5 Final Site Selection for FRM Analysis
Using a systems approach, the analysis described above uses the best available information to assemble risk management information useful to USACE for Risk-Informed decision making. It summarizes the Delta Risk Management Study (DRMS); expresses the DRMS and other findings in terms of the USACE’s Composite Risk Management matrix (See Appendix A); and examines the results for management decision support.
Using CRM described above we have used Risk-Informed decision making to reduce the study effort from more than 70 Islands in the Sacramento San Joaquin Delta to the “Top 25” in terms of Life loss and infrastructure damage consequences. Using additional management controls we can further refine the list through the elimination of those “Top 25” islands located within the footprint of other ongoing USACE Planning efforts. These efforts include the American River Common Features Study and the West Sacramento Studies to the north, and the Lower San Joaquin Study to the south. By eliminating the islands within the footprint of other planning studies currently underway we can further refine the list and focus on those remaining “Top 25”. In order to evaluate the sensitivity of our decision criterion we started by analyzing the 3 of the next remaining islands of the “Top 25” and adding a fourth, Discovery Bay, from input by our sponsor . By selecting to carry out an FRM analysis of the four islands on the list that have the next highest life loss and infrastructure damage consequences we can evaluate the need to analyze the remaining islands on the list. Listed below are the islands the PDT has selected to analyze in terms of Flood Risk Management:
• Bethel Island • Walnut Grove • Brannen Andrus Island (Isleton), and • Discovery Bay
4.0 FLOOD RISK ANALYSIS
All 1,100+ miles of Delta levees surrounding each island are made up of sediment dredged from adjacent channels, excavated from island interiors, or imported from other areas by truck or barge. The height of a levee surrounding any island is a function of the depth of subsidence and the magnitude of water elevation change, due either to tides or floods. Since subsidence has
1 Note that “sunny day” failures for SM-124 would not produce this level of loss, which corresponds to the value of
all property at risk that might occur under flood conditions.
31
occurred slowly over the last 100 years, Delta levees have grown more expansive with the addition of material on the top and sides, rather than being constructed all at one time. For this reason, few levees in the Delta meet modern engineering standards. In addition, most Delta levees rest on weak, seismically unstable foundations that have little resiliency to conditions that increase the likelihood of levee failures. As described in DRMS phase 1, floods, earthquakes, and high tides can cause local or widespread levee failures along these poorly constructed levees on weak foundations as evidenced by 166 levee failures in the past 100 years with the last levee failure occurring in 2004 at Jones tract. It is worth noting that Delta levees are not levees, per se. While levees within the Sacramento and San Joaquin watersheds hold back water only during flood events, Delta levees have high water always against them. These “levees” are more accurately described as polders and are similar to those protecting the Dutch from the sea. Webster’s Dictionary defines Polders “…as a tract of low land reclaimed from the sea…and protected by dikes”. A dike is defined as “…an embankment built to prevent flooding from the sea”. However, since dikes in the Delta are widely referred to as “levees”, we continue with that convention. The levees in the Delta are prone to overtopping and erosion during storms, principally when high winds create large waves at high tides. Levees also fail due to seepage. The elevation difference between the water surface in the channel and the floor of the subsided island causes water to flow both through and under the levee. Seepage is common for most levees and does not normally lead to failure. However, when water pressure gradients are great, seepage can erode material within and under the levee, causing sand boils on the levee interior, eventually leading to collapse. Rodents, particularly beavers, can exacerbate this problem. Poor foundations or levee construction materials can lead to slumping, cracking or sagging of levees that allows water to flow through and over the levee, leading to its failure. And finally, levees can fail during earthquakes as shaking causes either the foundation or embankments to lose cohesion, deform, or collapse. The levee failure mechanisms described above have one thing in common: the forces that cause these failures are all increasing or will worsen in the future. This stems from both the natural degradation of levees with time and the progressive changes in physical forces acting on them. For this reason, it is prudent to assume that, without intervention, levee failures will increase in the future. Although Delta levees can fail in many ways, this evaluation will not focus on the mechanism of levee failure but rather the consequences of flooding if the levees of an island were to fail. This scaled down hydraulic evaluation was conducted to support the SMART planning of the Delta Islands and Levees Feasibility study. The purpose being to develop Depth-Frequency information for each parcel within the island used to support the economic decision making technique of “Cost-Benefit.” This method evaluates risk in terms of reducing the frequency of occurrence of an undesirable hydrologic event and the associated consequences are appraised using damages to the impacted asset using some form of monetary lost value analysis. This methodology is the traditional USACE approach to flood risk management (FRM) decision
32
making and expresses the ratio of cost versus benefit to evaluate alternatives in terms of economic “Benefits” to the Nation.
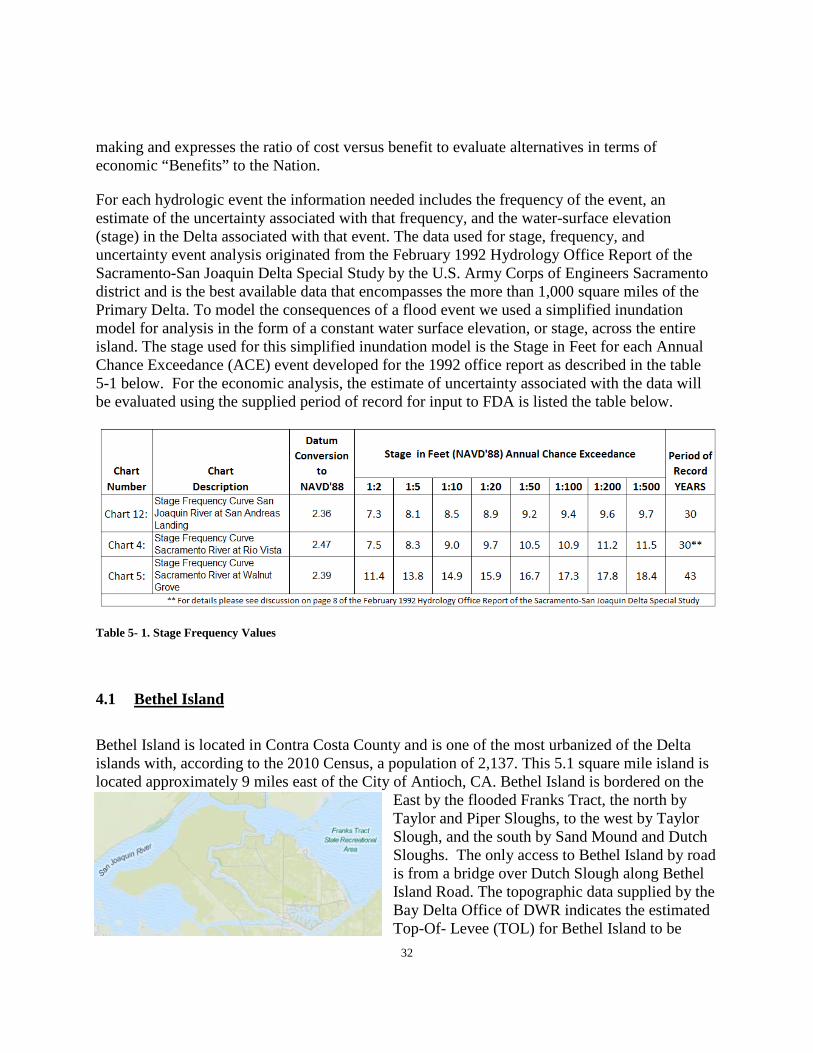
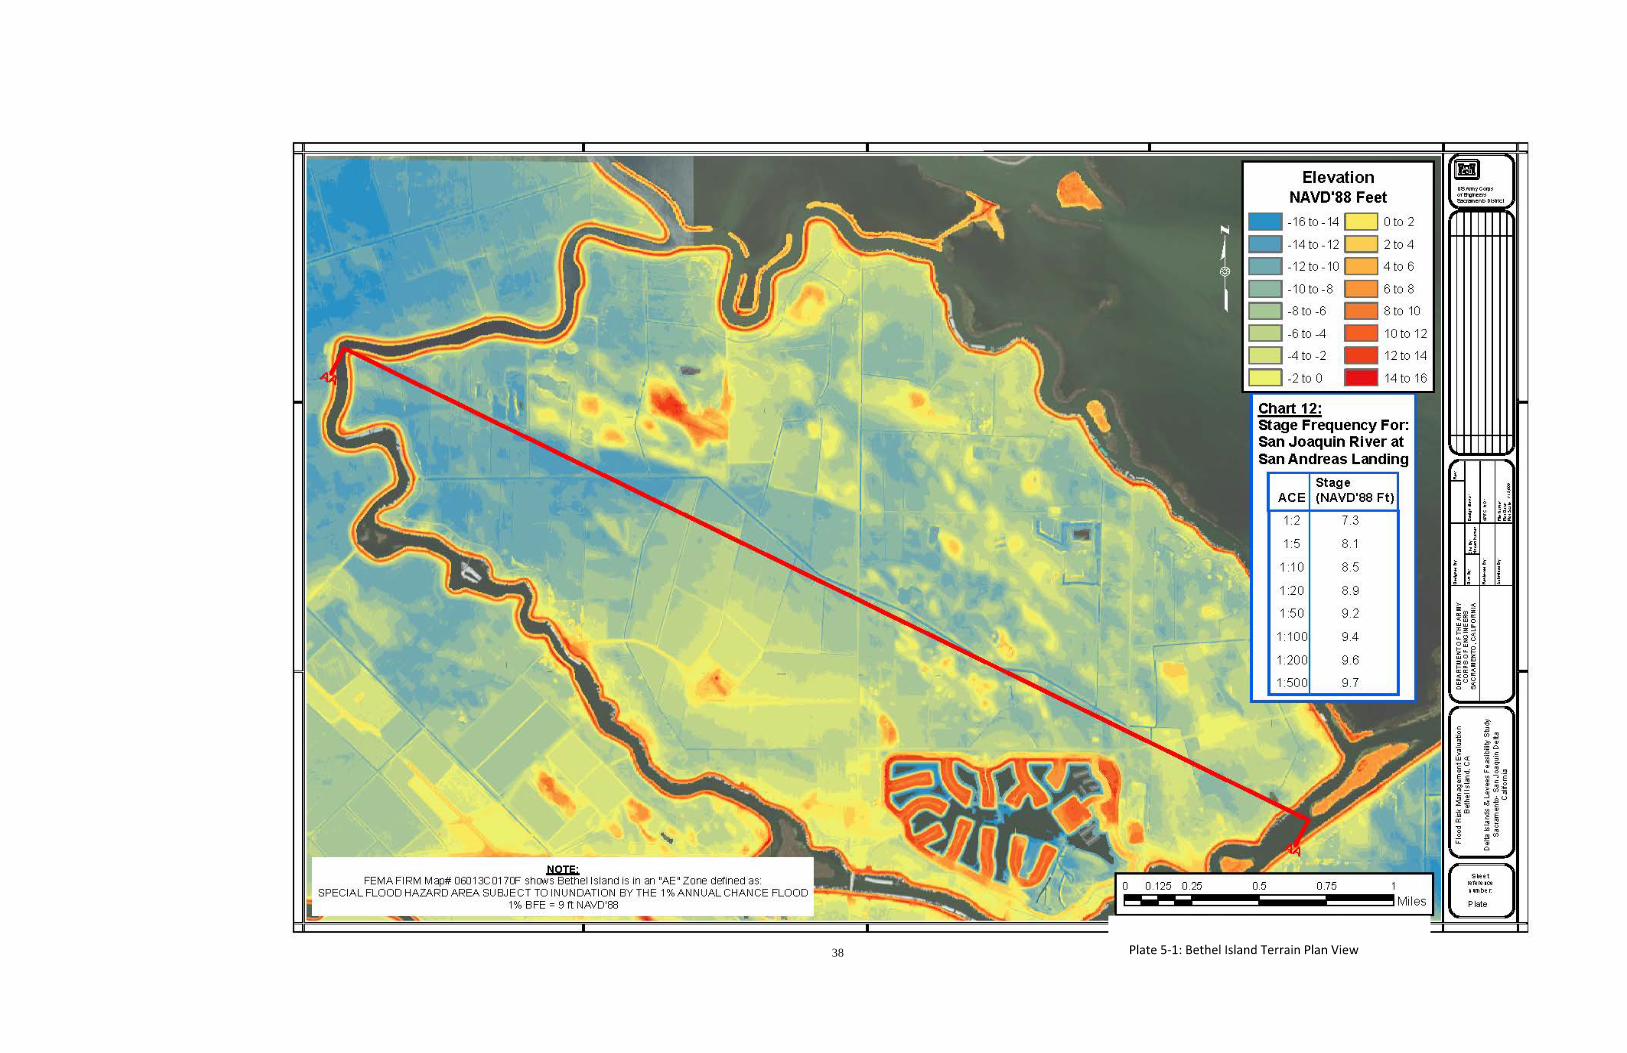
For each hydrologic event the information needed includes the frequency of the event, an estimate of the uncertainty associated with that frequency, and the water-surface elevation (stage) in the Delta associated with that event. The data used for stage, frequency, and uncertainty event analysis originated from the February 1992 Hydrology Office Report of the Sacramento-San Joaquin Delta Special Study by the U.S. Army Corps of Engineers Sacramento district and is the best available data that encompasses the more than 1,000 square miles of the Primary Delta. To model the consequences of a flood event we used a simplified inundation model for analysis in the form of a constant water surface elevation, or stage, across the entire island. The stage used for this simplified inundation model is the Stage in Feet for each Annual Chance Exceedance (ACE) event developed for the 1992 office report as described in the table 5-1 below. For the economic analysis, the estimate of uncertainty associated with the data will be evaluated using the supplied period of record for input to FDA is listed the table below.
Table 5- 1. Stage Frequency Values
4.1 Bethel Island
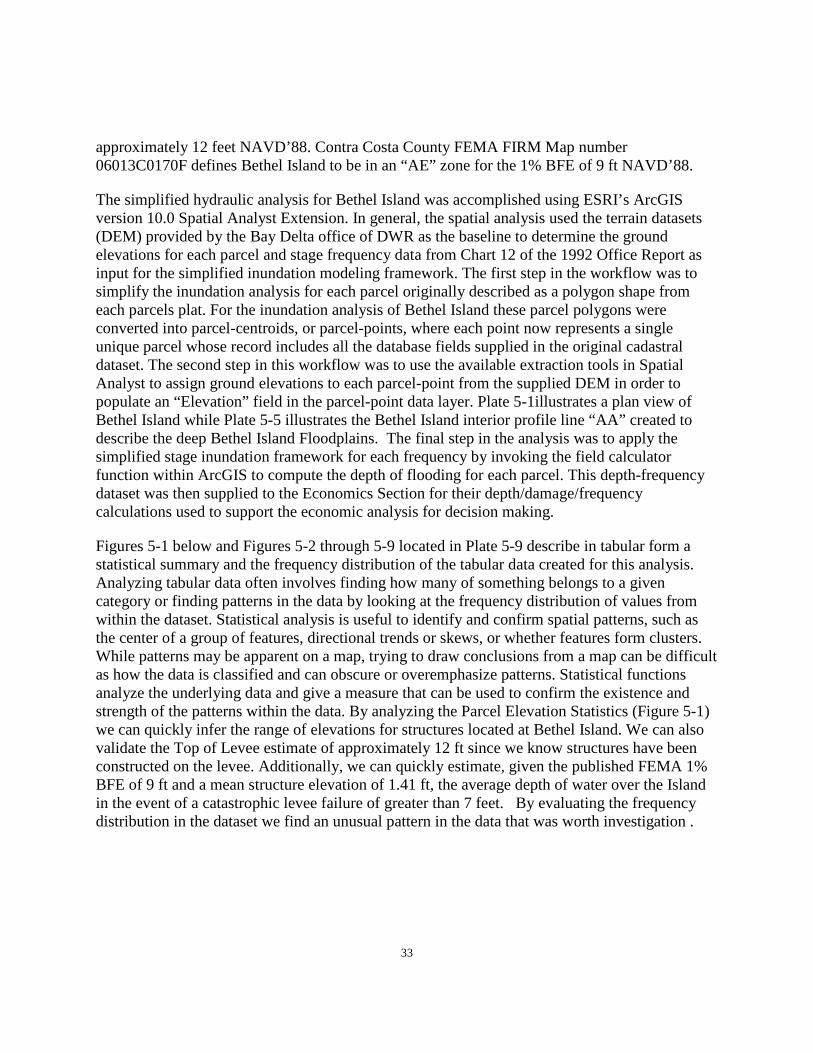
Bethel Island is located in Contra Costa County and is one of the most urbanized of the Delta islands with, according to the 2010 Census, a population of 2,137. This 5.1 square mile island is located approximately 9 miles east of the City of Antioch, CA. Bethel Island is bordered on the
East by the flooded Franks Tract, the north by Taylor and Piper Sloughs, to the west by Taylor Slough, and the south by Sand Mound and Dutch Sloughs. The only access to Bethel Island by road is from a bridge over Dutch Slough along Bethel Island Road. The topographic data supplied by the Bay Delta Office of DWR indicates the estimated Top-Of- Levee (TOL) for Bethel Island to be
33
approximately 12 feet NAVD’88. Contra Costa County FEMA FIRM Map number 06013C0170F defines Bethel Island to be in an “AE” zone for the 1% BFE of 9 ft NAVD’88.
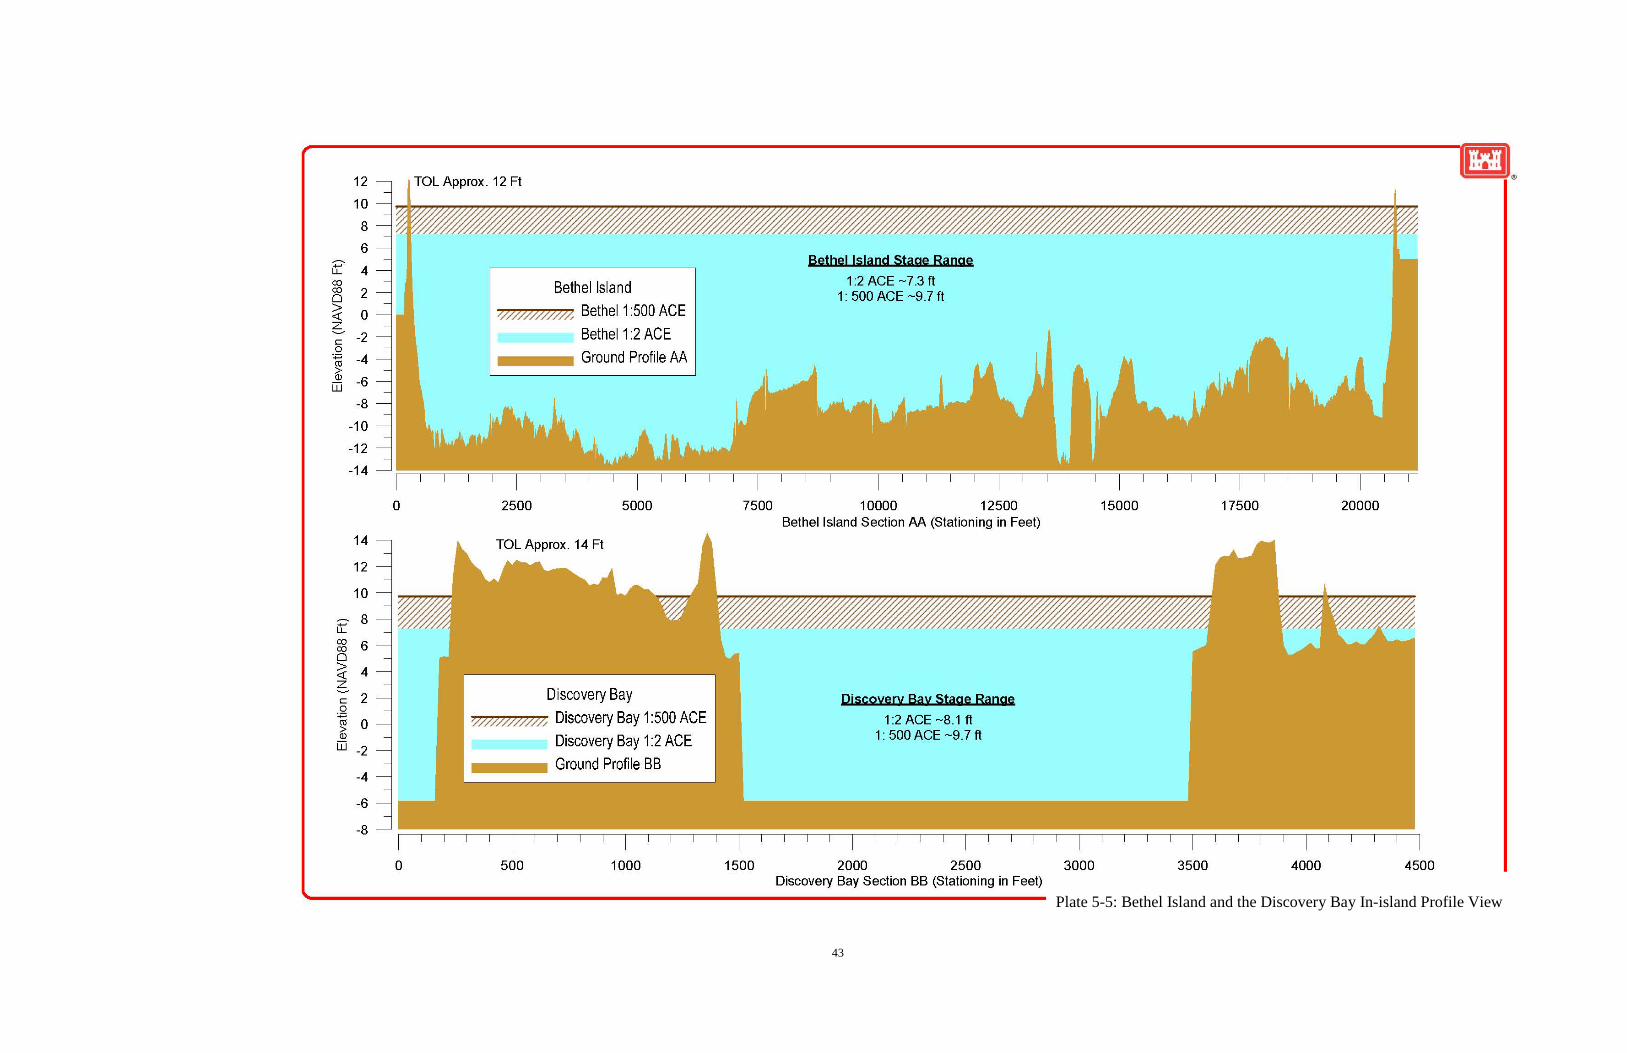
The simplified hydraulic analysis for Bethel Island was accomplished using ESRI’s ArcGIS version 10.0 Spatial Analyst Extension. In general, the spatial analysis used the terrain datasets (DEM) provided by the Bay Delta office of DWR as the baseline to determine the ground elevations for each parcel and stage frequency data from Chart 12 of the 1992 Office Report as input for the simplified inundation modeling framework. The first step in the workflow was to simplify the inundation analysis for each parcel originally described as a polygon shape from each parcels plat. For the inundation analysis of Bethel Island these parcel polygons were converted into parcel-centroids, or parcel-points, where each point now represents a single unique parcel whose record includes all the database fields supplied in the original cadastral dataset. The second step in this workflow was to use the available extraction tools in Spatial Analyst to assign ground elevations to each parcel-point from the supplied DEM in order to populate an “Elevation” field in the parcel-point data layer. Plate 5-1illustrates a plan view of Bethel Island while Plate 5-5 illustrates the Bethel Island interior profile line “AA” created to describe the deep Bethel Island Floodplains. The final step in the analysis was to apply the simplified stage inundation framework for each frequency by invoking the field calculator function within ArcGIS to compute the depth of flooding for each parcel. This depth-frequency dataset was then supplied to the Economics Section for their depth/damage/frequency calculations used to support the economic analysis for decision making.
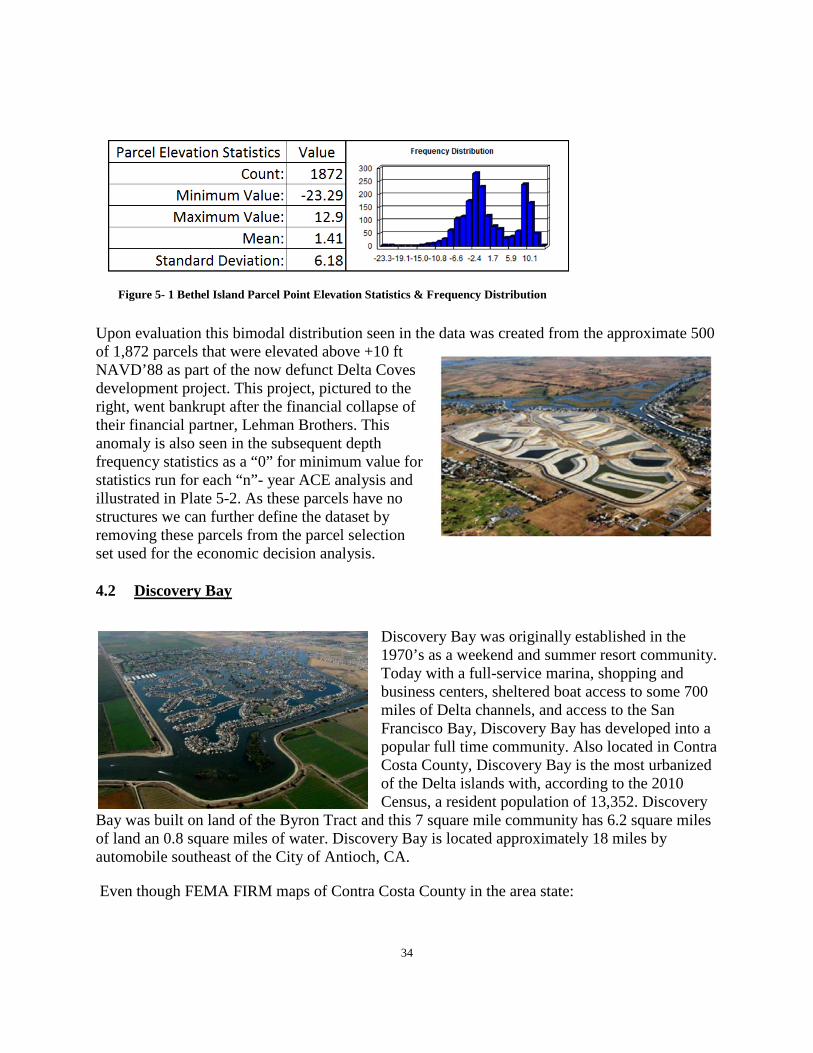
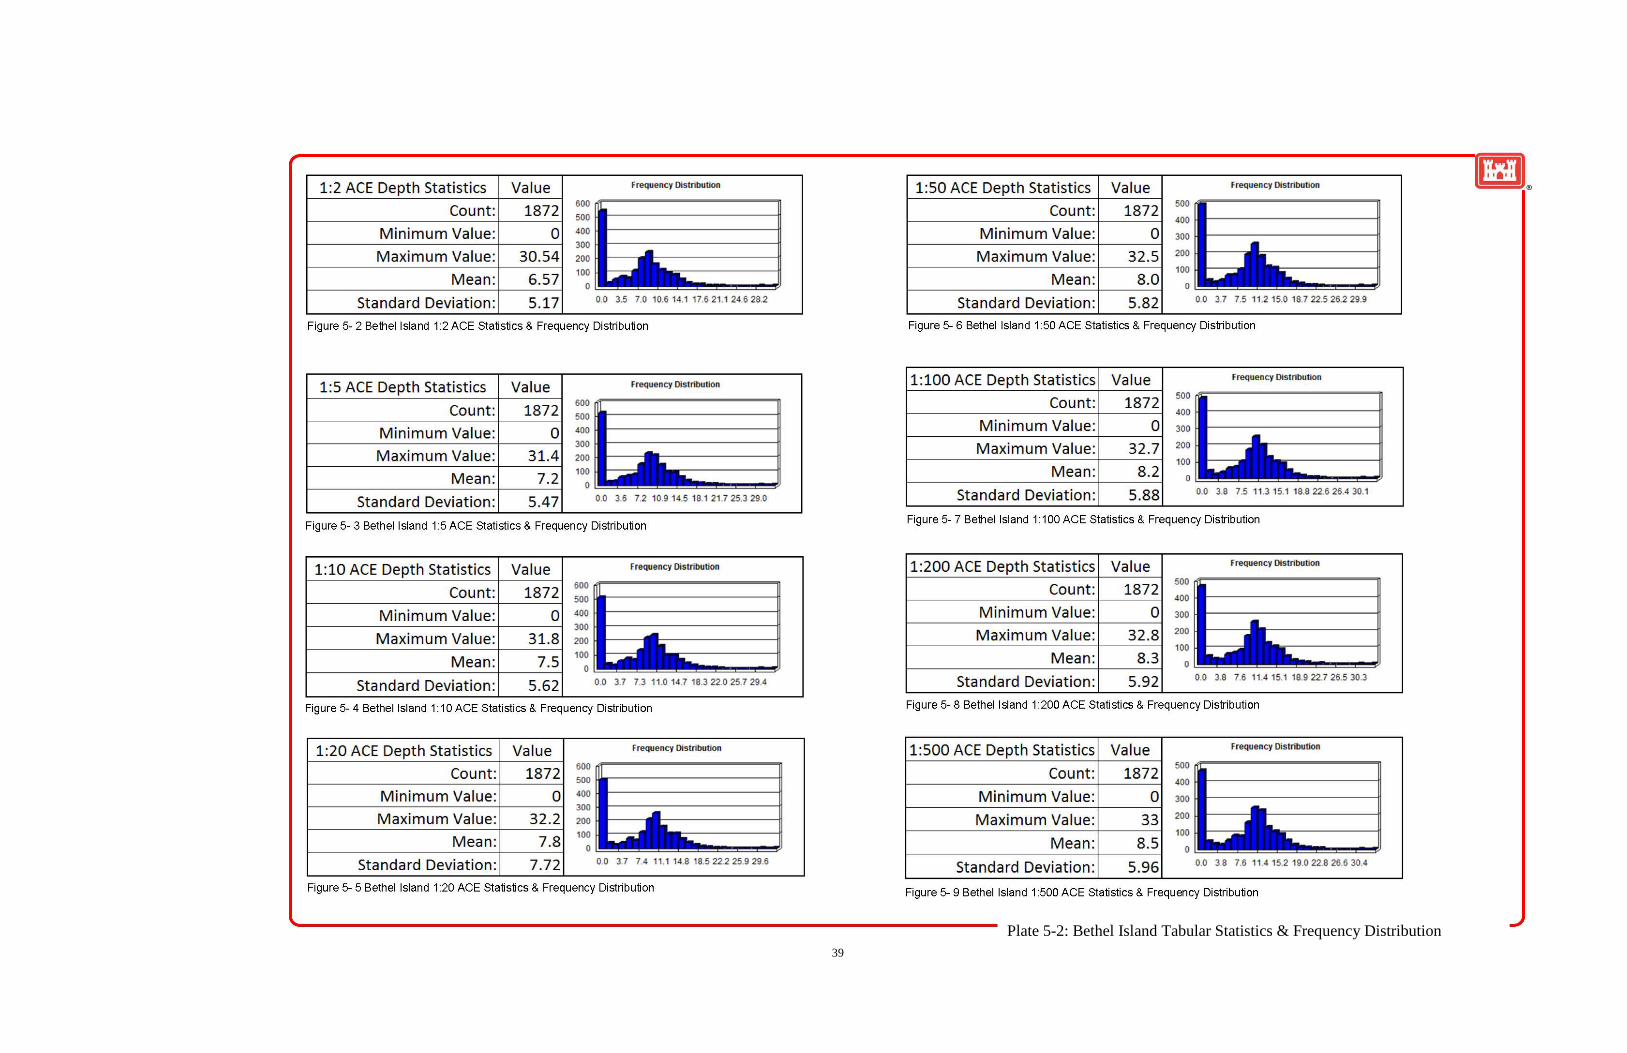
Figures 5-1 below and Figures 5-2 through 5-9 located in Plate 5-9 describe in tabular form a statistical summary and the frequency distribution of the tabular data created for this analysis. Analyzing tabular data often involves finding how many of something belongs to a given category or finding patterns in the data by looking at the frequency distribution of values from within the dataset. Statistical analysis is useful to identify and confirm spatial patterns, such as the center of a group of features, directional trends or skews, or whether features form clusters. While patterns may be apparent on a map, trying to draw conclusions from a map can be difficult as how the data is classified and can obscure or overemphasize patterns. Statistical functions analyze the underlying data and give a measure that can be used to confirm the existence and strength of the patterns within the data. By analyzing the Parcel Elevation Statistics (Figure 5-1) we can quickly infer the range of elevations for structures located at Bethel Island. We can also validate the Top of Levee estimate of approximately 12 ft since we know structures have been constructed on the levee. Additionally, we can quickly estimate, given the published FEMA 1% BFE of 9 ft and a mean structure elevation of 1.41 ft, the average depth of water over the Island in the event of a catastrophic levee failure of greater than 7 feet. By evaluating the frequency distribution in the dataset we find an unusual pattern in the data that was worth investigation .
34
Upon evaluation this bimodal distribution seen in the data was created from the approximate 500 of 1,872 parcels that were elevated above +10 ft NAVD’88 as part of the now defunct Delta Coves development project. This project, pictured to the right, went bankrupt after the financial collapse of their financial partner, Lehman Brothers. This anomaly is also seen in the subsequent depth frequency statistics as a “0” for minimum value for statistics run for each “n”- year ACE analysis and illustrated in Plate 5-2. As these parcels have no structures we can further define the dataset by removing these parcels from the parcel selection set used for the economic decision analysis.
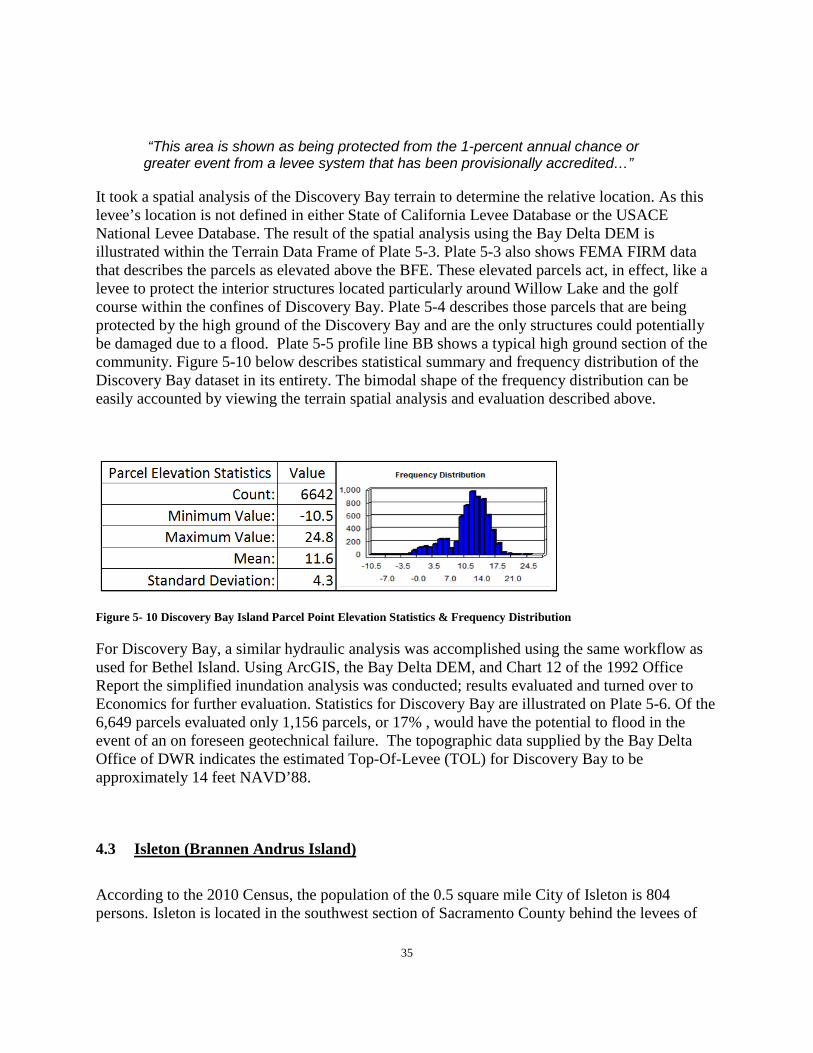
4.2 Discovery Bay
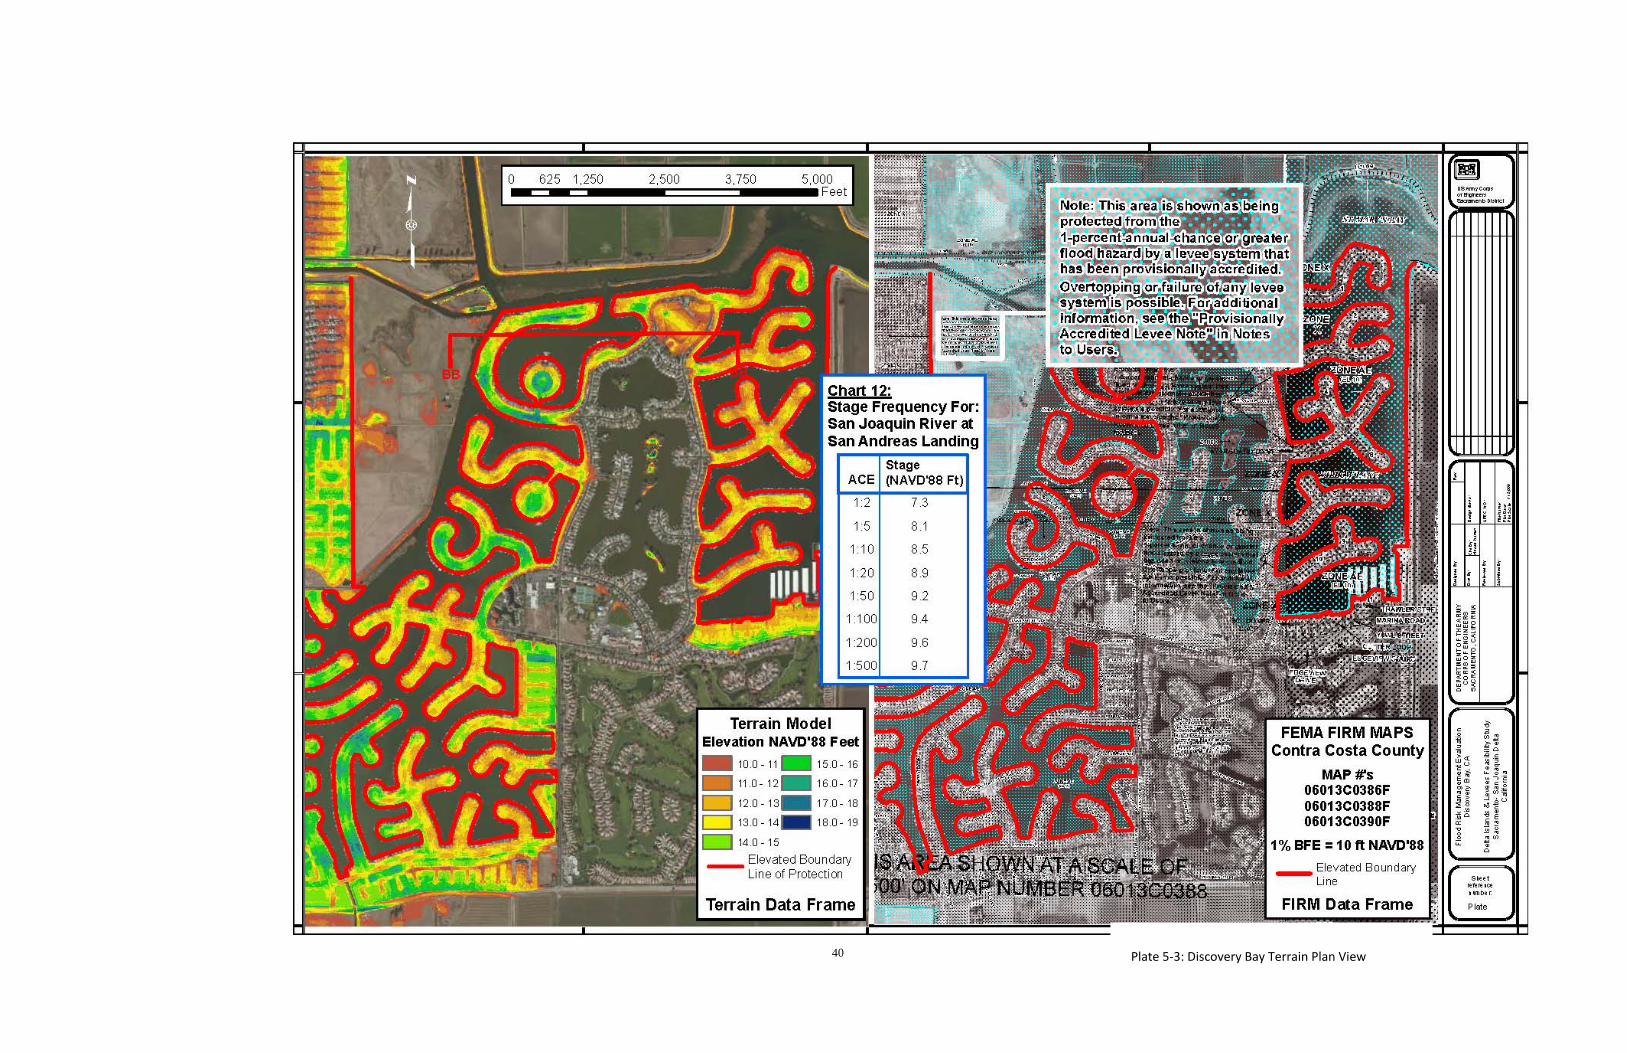
Discovery Bay was originally established in the 1970’s as a weekend and summer resort community. Today with a full-service marina, shopping and business centers, sheltered boat access to some 700 miles of Delta channels, and access to the San Francisco Bay, Discovery Bay has developed into a popular full time community. Also located in Contra Costa County, Discovery Bay is the most urbanized of the Delta islands with, according to the 2010 Census, a resident population of 13,352. Discovery
Bay was built on land of the Byron Tract and this 7 square mile community has 6.2 square miles of land an 0.8 square miles of water. Discovery Bay is located approximately 18 miles by automobile southeast of the City of Antioch, CA.
Even though FEMA FIRM maps of Contra Costa County in the area state:
Figure 5- 1 Bethel Island Parcel Point Elevation Statistics & Frequency Distribution
35
“This area is shown as being protected from the 1-percent annual chance or greater event from a levee system that has been provisionally accredited…”
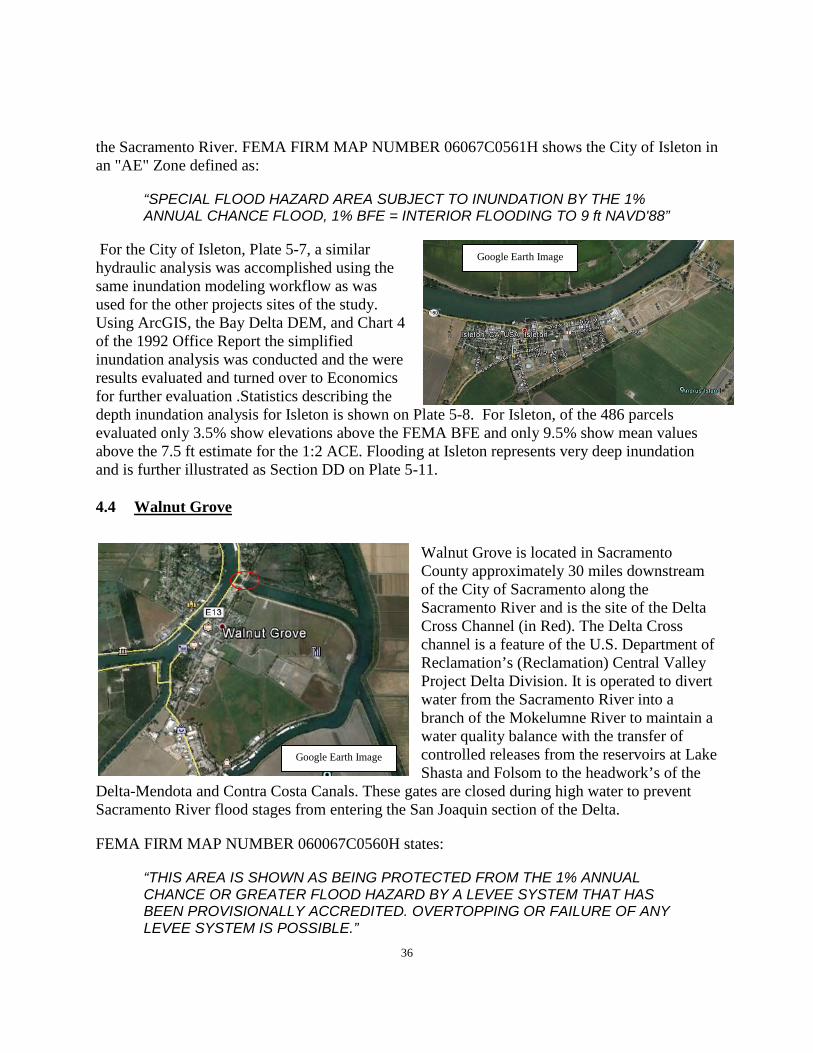
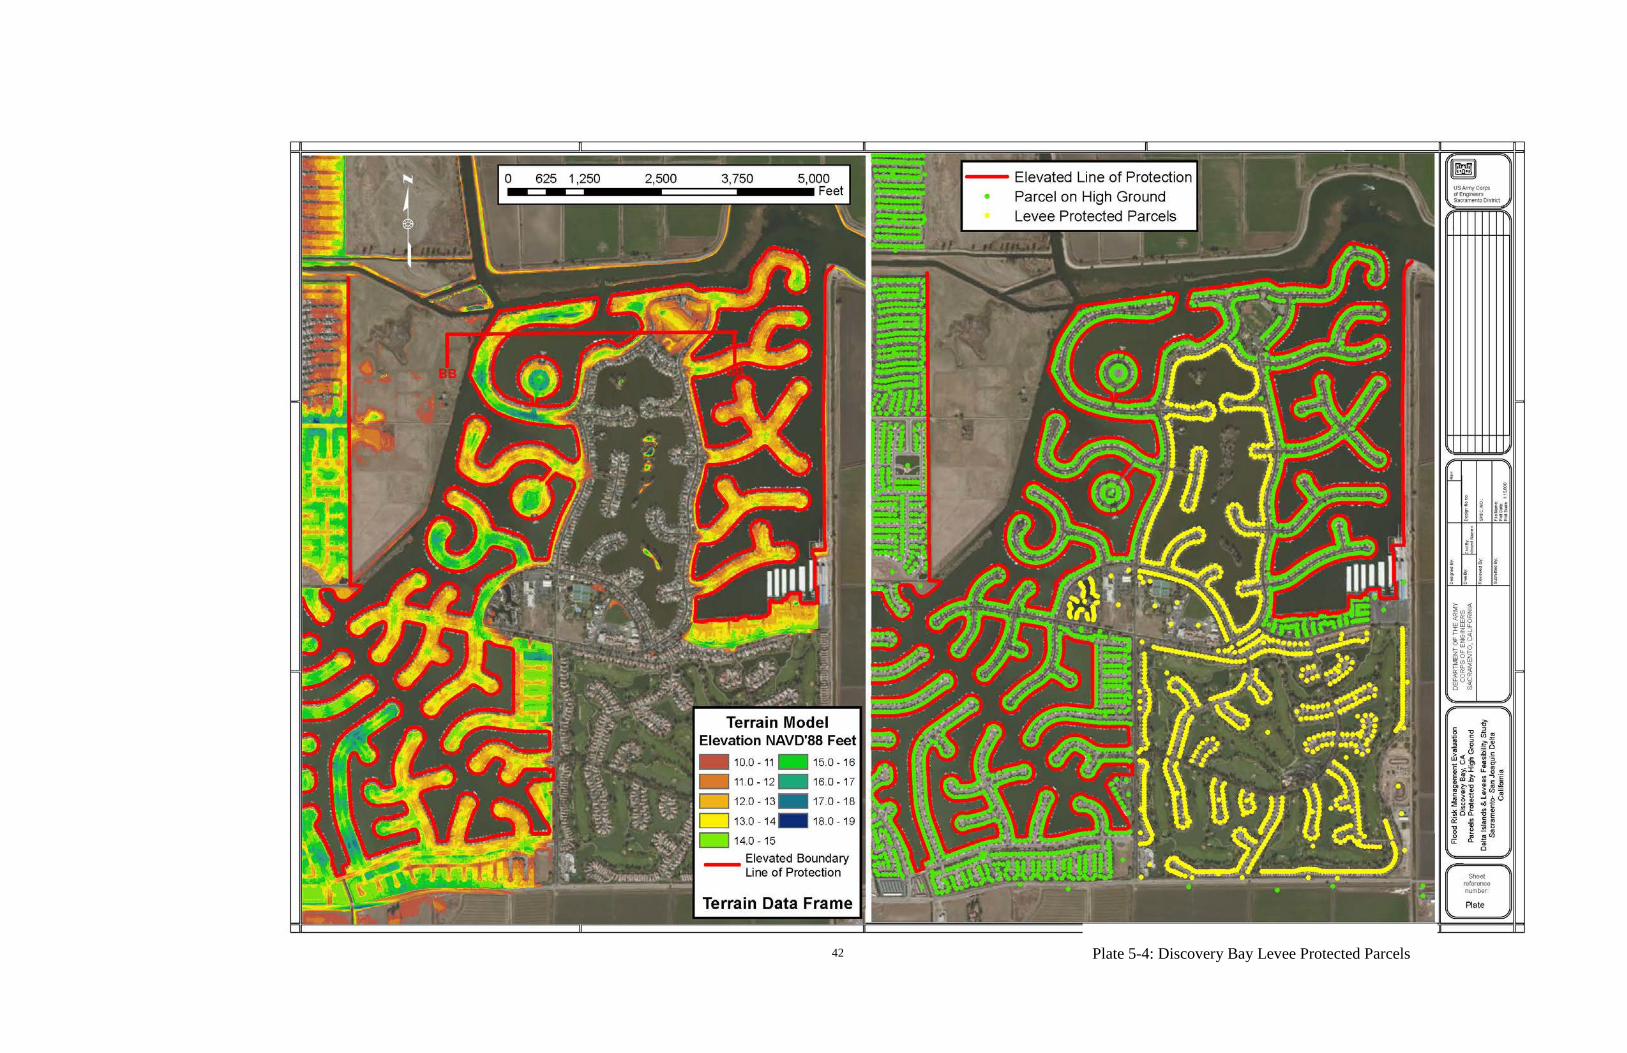
It took a spatial analysis of the Discovery Bay terrain to determine the relative location. As this levee’s location is not defined in either State of California Levee Database or the USACE National Levee Database. The result of the spatial analysis using the Bay Delta DEM is illustrated within the Terrain Data Frame of Plate 5-3. Plate 5-3 also shows FEMA FIRM data that describes the parcels as elevated above the BFE. These elevated parcels act, in effect, like a levee to protect the interior structures located particularly around Willow Lake and the golf course within the confines of Discovery Bay. Plate 5-4 describes those parcels that are being protected by the high ground of the Discovery Bay and are the only structures could potentially be damaged due to a flood. Plate 5-5 profile line BB shows a typical high ground section of the community. Figure 5-10 below describes statistical summary and frequency distribution of the Discovery Bay dataset in its entirety. The bimodal shape of the frequency distribution can be easily accounted by viewing the terrain spatial analysis and evaluation described above.
Figure 5- 10 Discovery Bay Island Parcel Point Elevation Statistics & Frequency Distribution
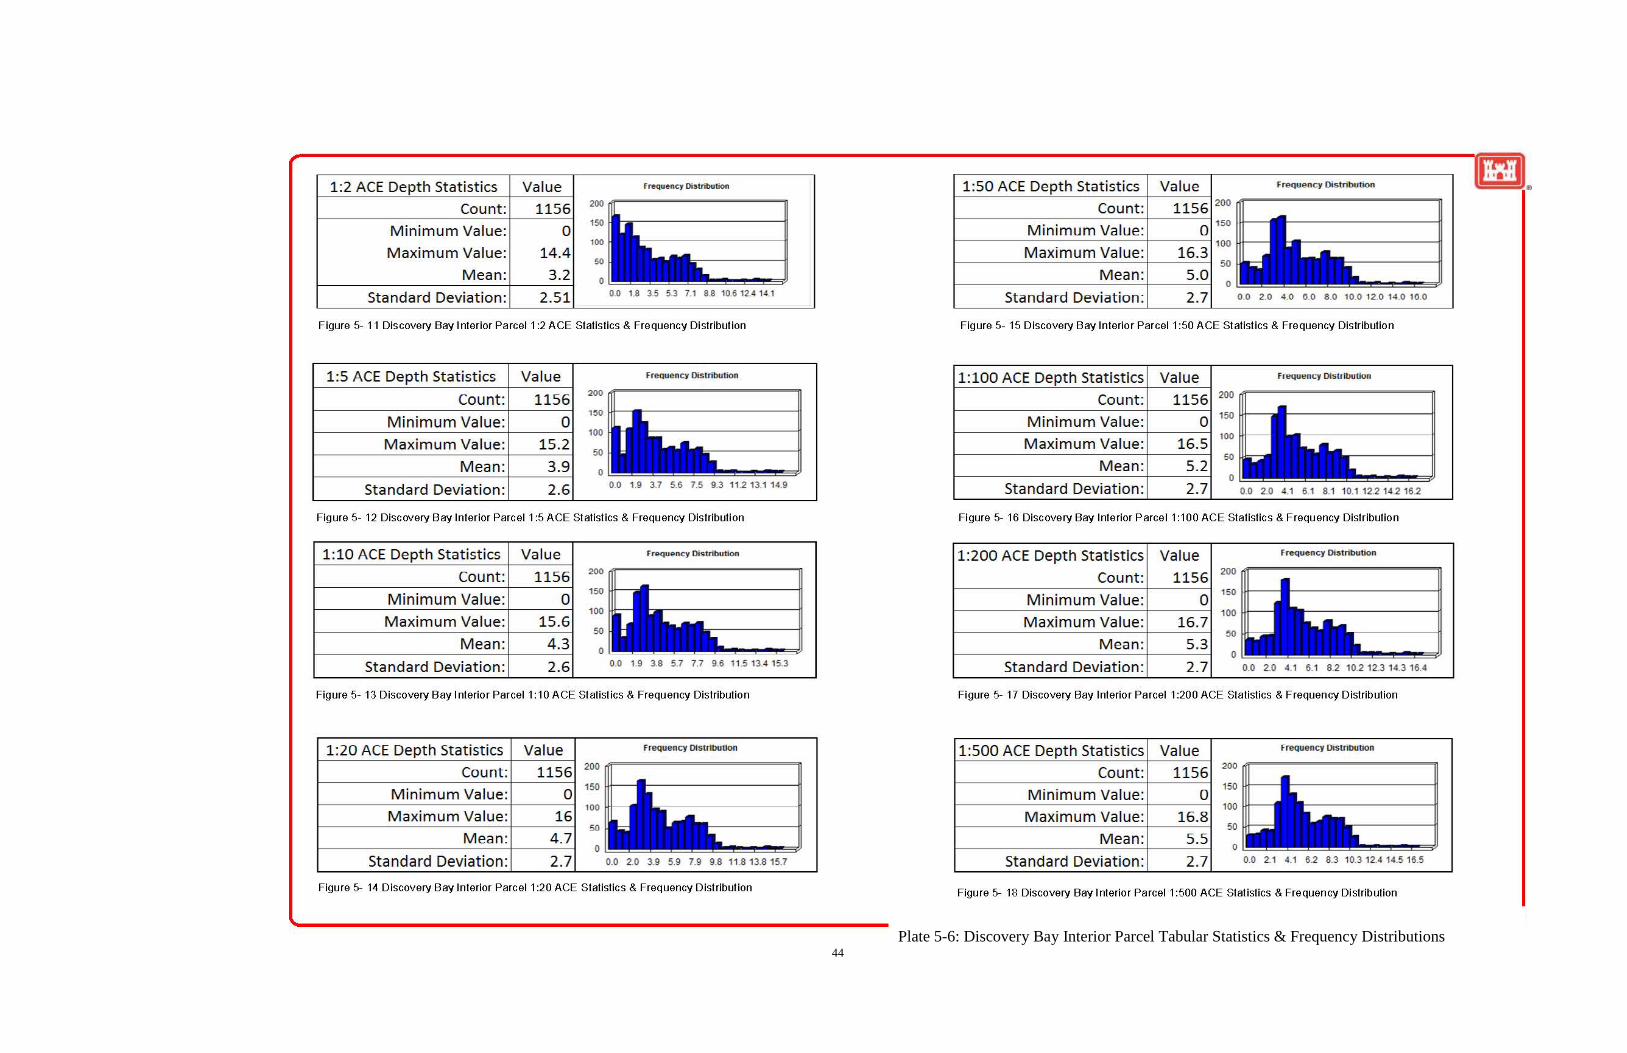
For Discovery Bay, a similar hydraulic analysis was accomplished using the same workflow as used for Bethel Island. Using ArcGIS, the Bay Delta DEM, and Chart 12 of the 1992 Office Report the simplified inundation analysis was conducted; results evaluated and turned over to Economics for further evaluation. Statistics for Discovery Bay are illustrated on Plate 5-6. Of the 6,649 parcels evaluated only 1,156 parcels, or 17% , would have the potential to flood in the event of an on foreseen geotechnical failure. The topographic data supplied by the Bay Delta Office of DWR indicates the estimated Top-Of-Levee (TOL) for Discovery Bay to be approximately 14 feet NAVD’88.
4.3 Isleton (Brannen Andrus Island)
According to the 2010 Census, the population of the 0.5 square mile City of Isleton is 804 persons. Isleton is located in the southwest section of Sacramento County behind the levees of
36
the Sacramento River. FEMA FIRM MAP NUMBER 06067C0561H shows the City of Isleton in an "AE" Zone defined as:
“SPECIAL FLOOD HAZARD AREA SUBJECT TO INUNDATION BY THE 1% ANNUAL CHANCE FLOOD, 1% BFE = INTERIOR FLOODING TO 9 ft NAVD'88”
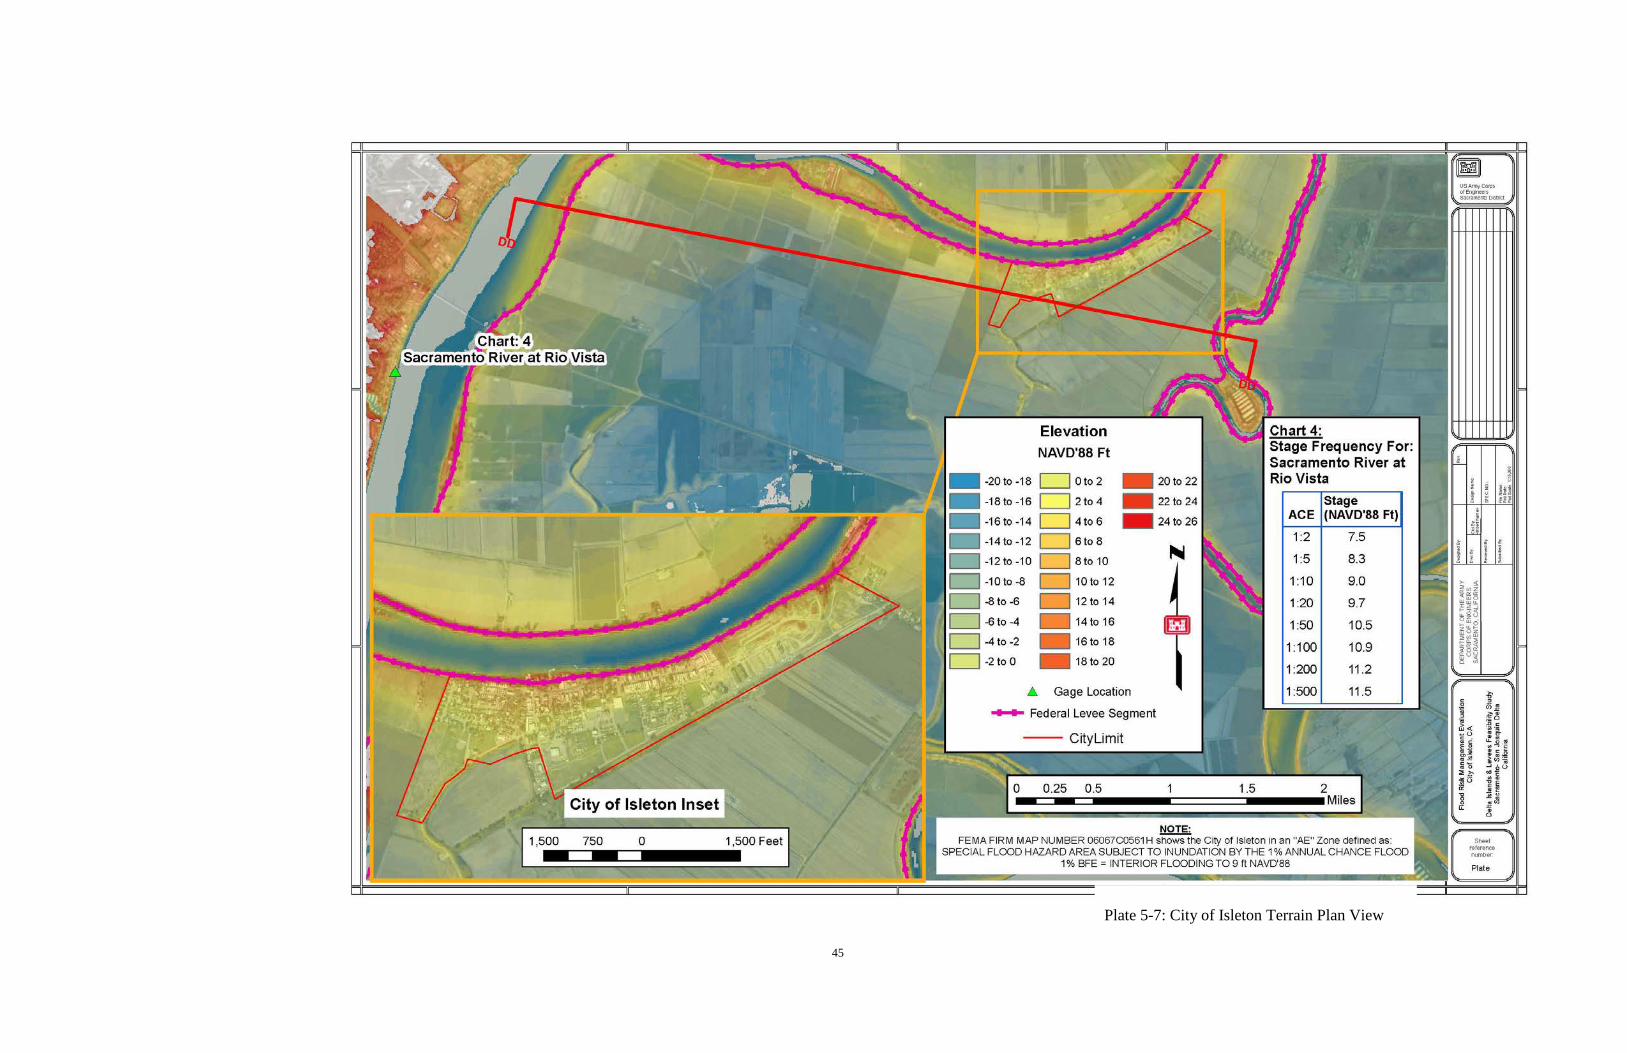
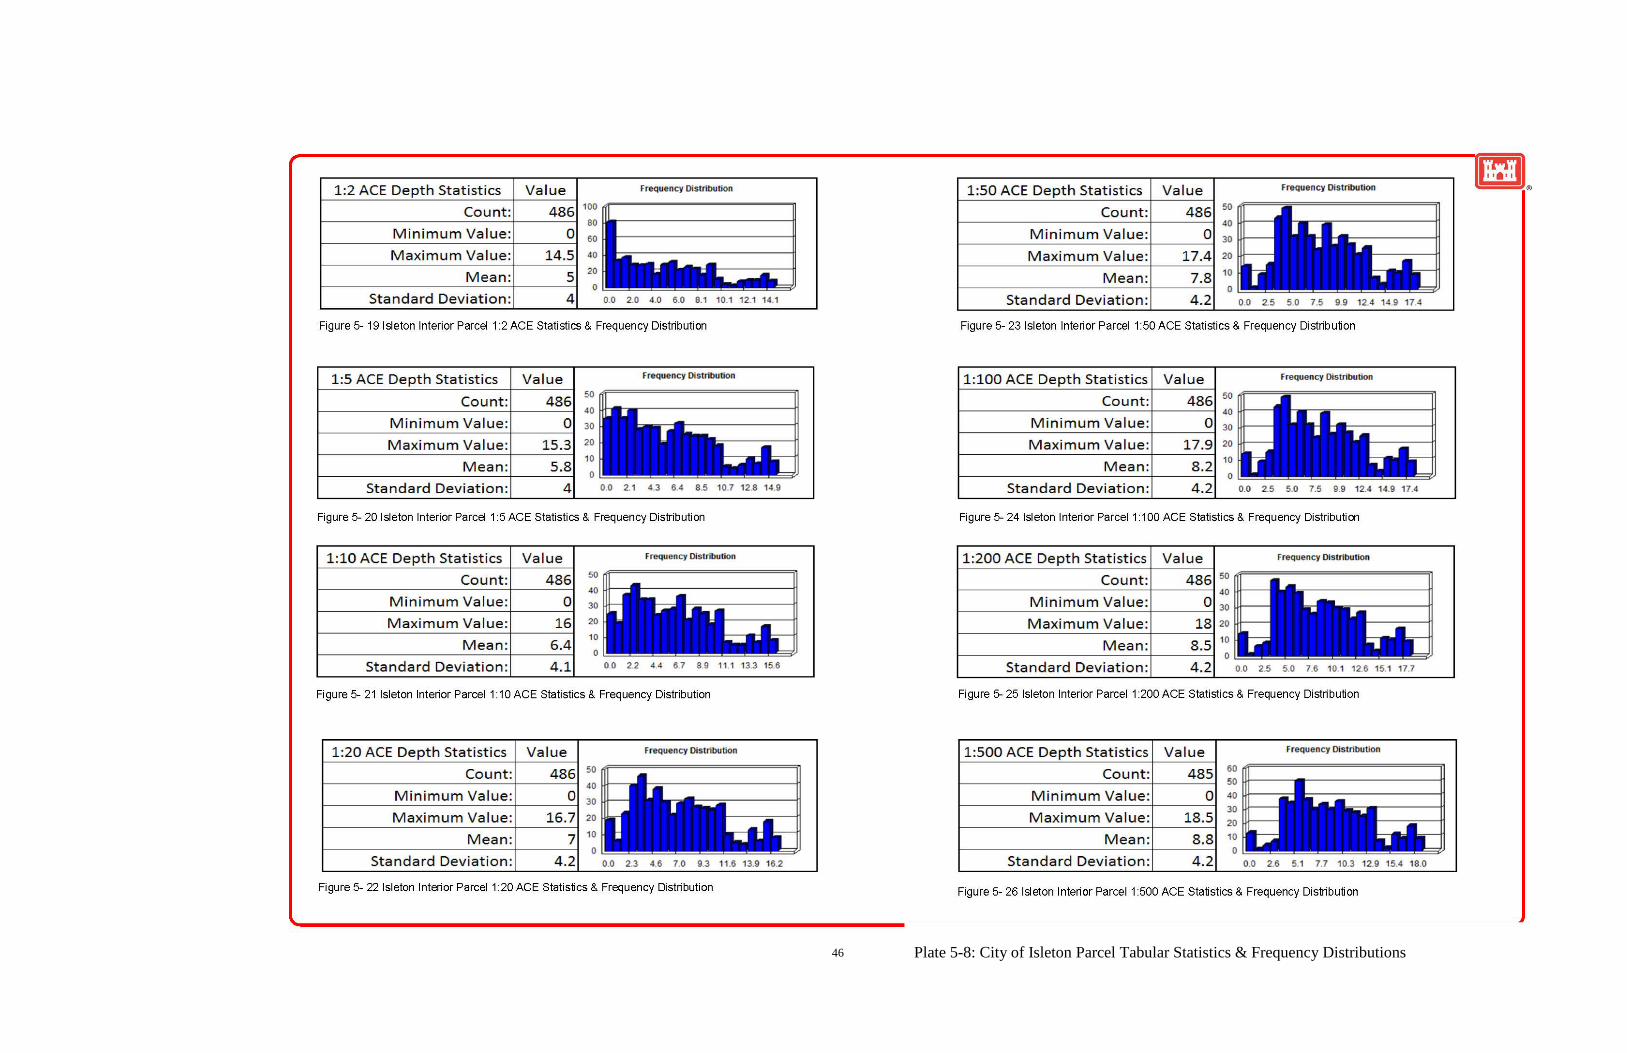
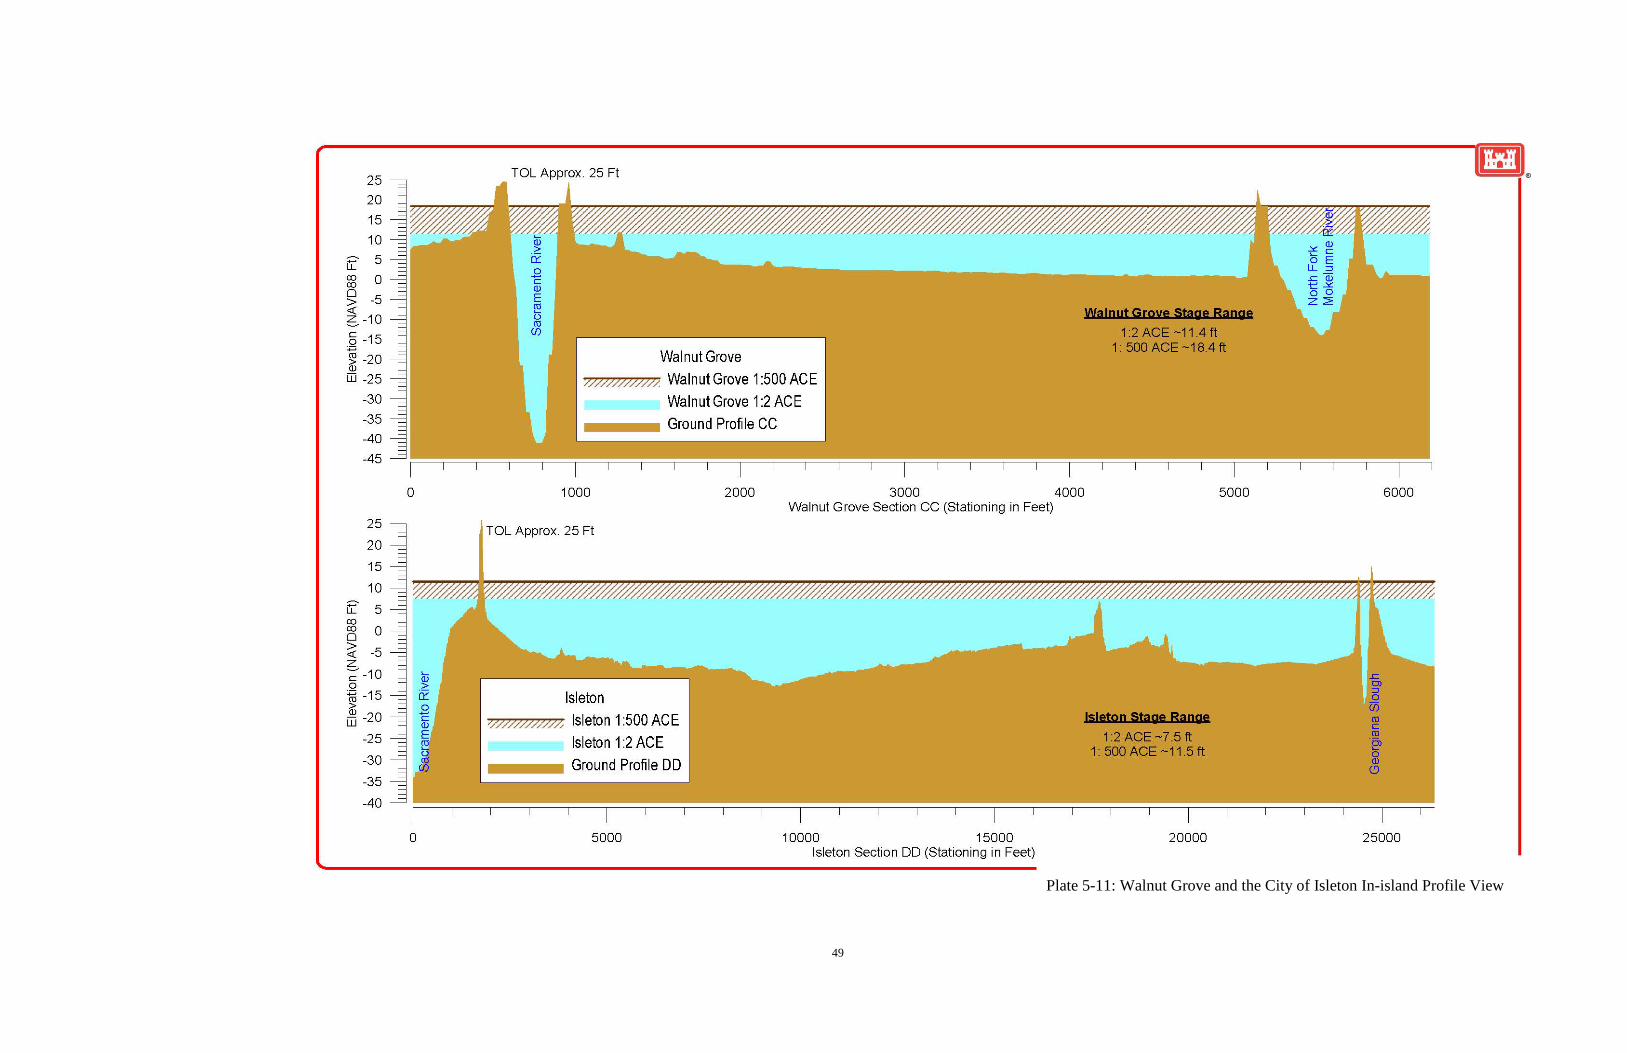
For the City of Isleton, Plate 5-7, a similar hydraulic analysis was accomplished using the same inundation modeling workflow as was used for the other projects sites of the study. Using ArcGIS, the Bay Delta DEM, and Chart 4 of the 1992 Office Report the simplified inundation analysis was conducted and the were results evaluated and turned over to Economics for further evaluation .Statistics describing the depth inundation analysis for Isleton is shown on Plate 5-8. For Isleton, of the 486 parcels evaluated only 3.5% show elevations above the FEMA BFE and only 9.5% show mean values above the 7.5 ft estimate for the 1:2 ACE. Flooding at Isleton represents very deep inundation and is further illustrated as Section DD on Plate 5-11.
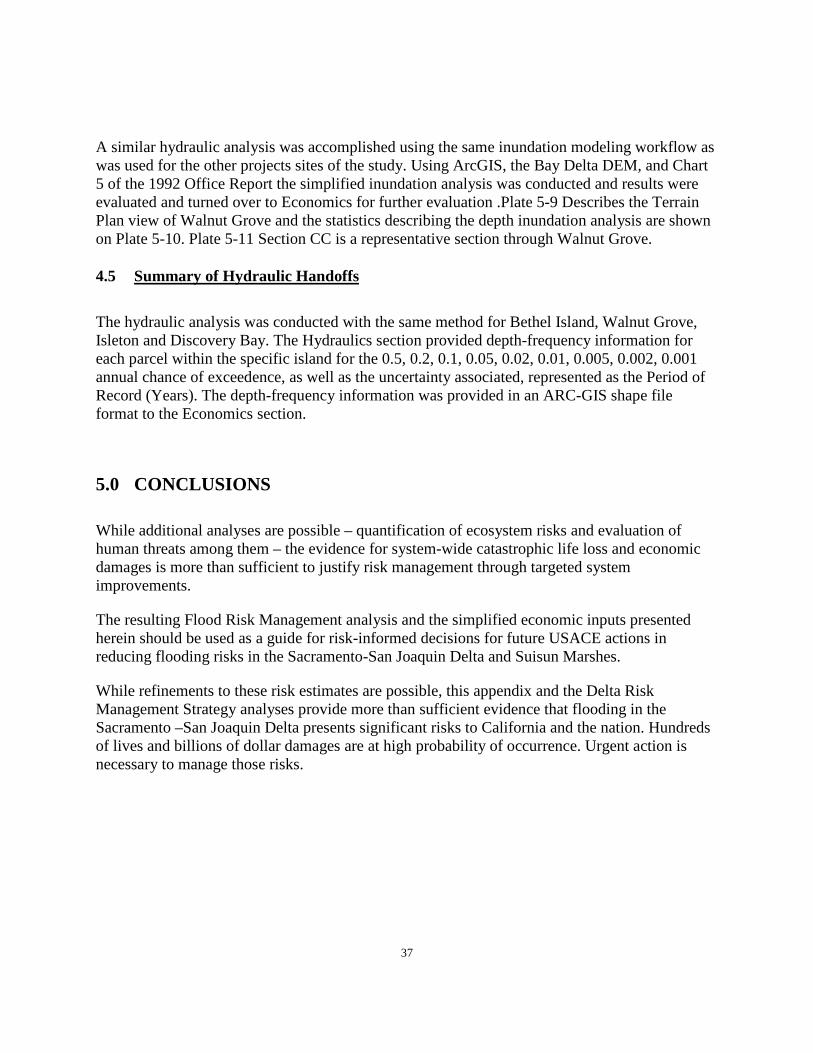
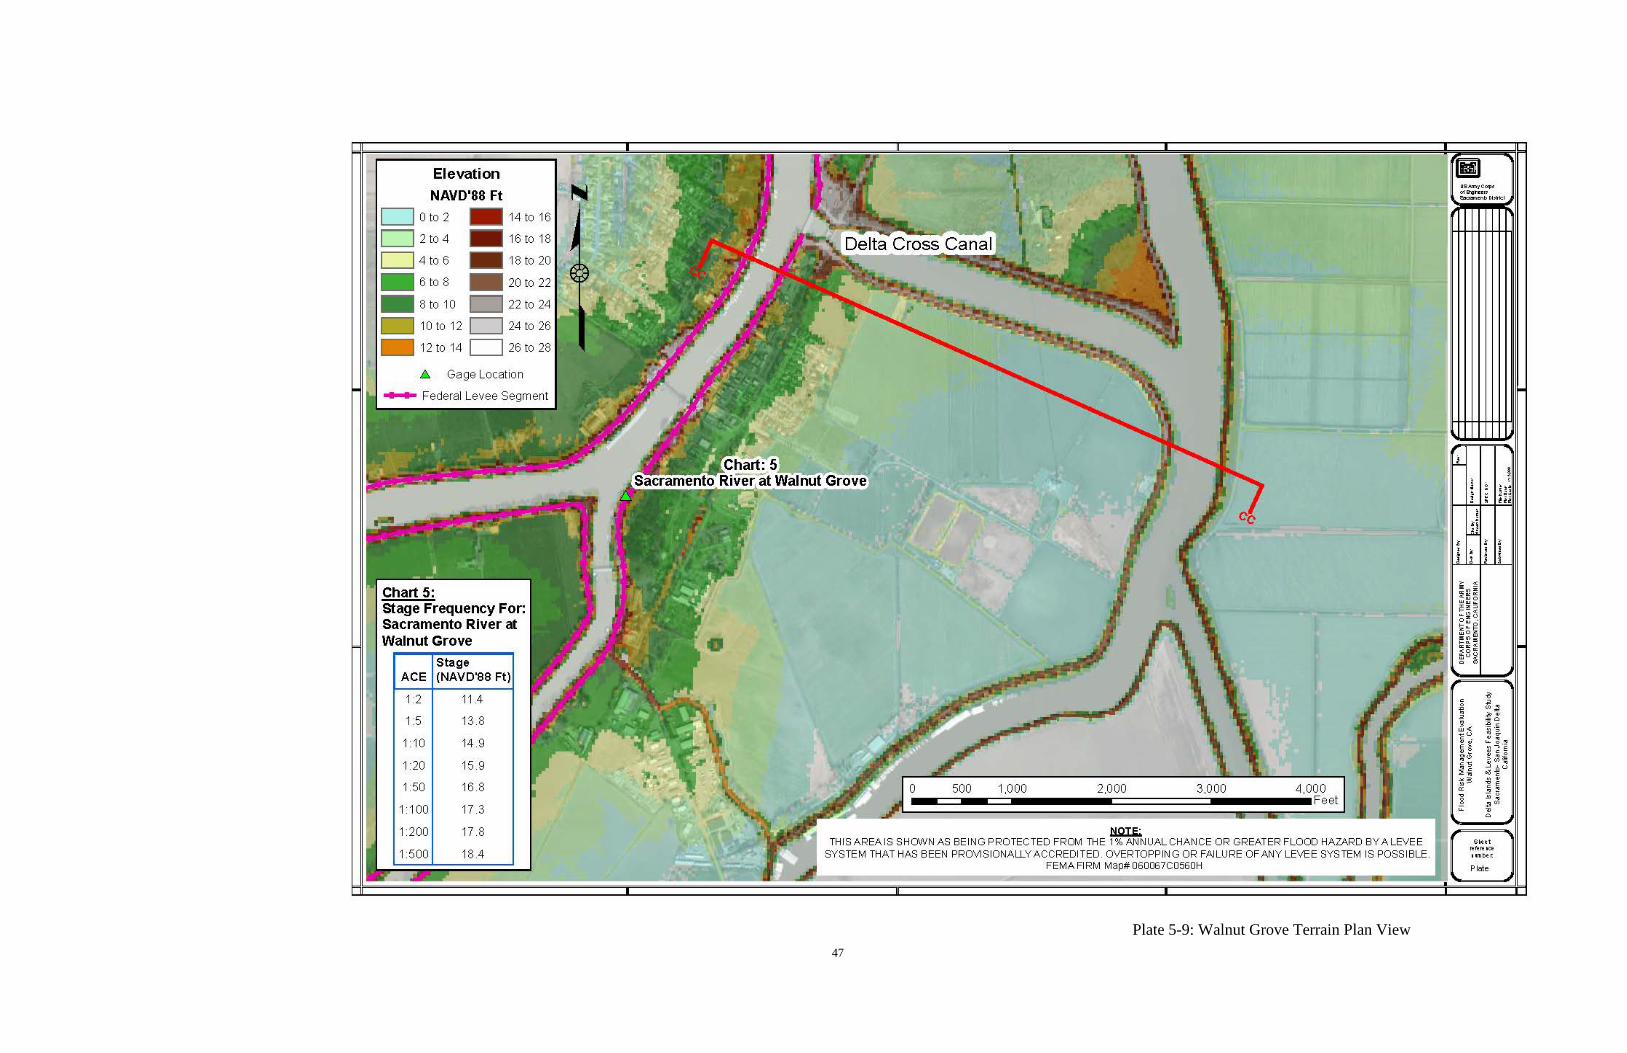
4.4 Walnut Grove
Walnut Grove is located in Sacramento County approximately 30 miles downstream of the City of Sacramento along the Sacramento River and is the site of the Delta Cross Channel (in Red). The Delta Cross channel is a feature of the U.S. Department of Reclamation’s (Reclamation) Central Valley Project Delta Division. It is operated to divert water from the Sacramento River into a branch of the Mokelumne River to maintain a water quality balance with the transfer of controlled releases from the reservoirs at Lake Shasta and Folsom to the headwork’s of the
Delta-Mendota and Contra Costa Canals. These gates are closed during high water to prevent Sacramento River flood stages from entering the San Joaquin section of the Delta.
FEMA FIRM MAP NUMBER 060067C0560H states:
“THIS AREA IS SHOWN AS BEING PROTECTED FROM THE 1% ANNUAL CHANCE OR GREATER FLOOD HAZARD BY A LEVEE SYSTEM THAT HAS BEEN PROVISIONALLY ACCREDITED. OVERTOPPING OR FAILURE OF ANY LEVEE SYSTEM IS POSSIBLE.”
Google Earth Image
Google Earth Image
37
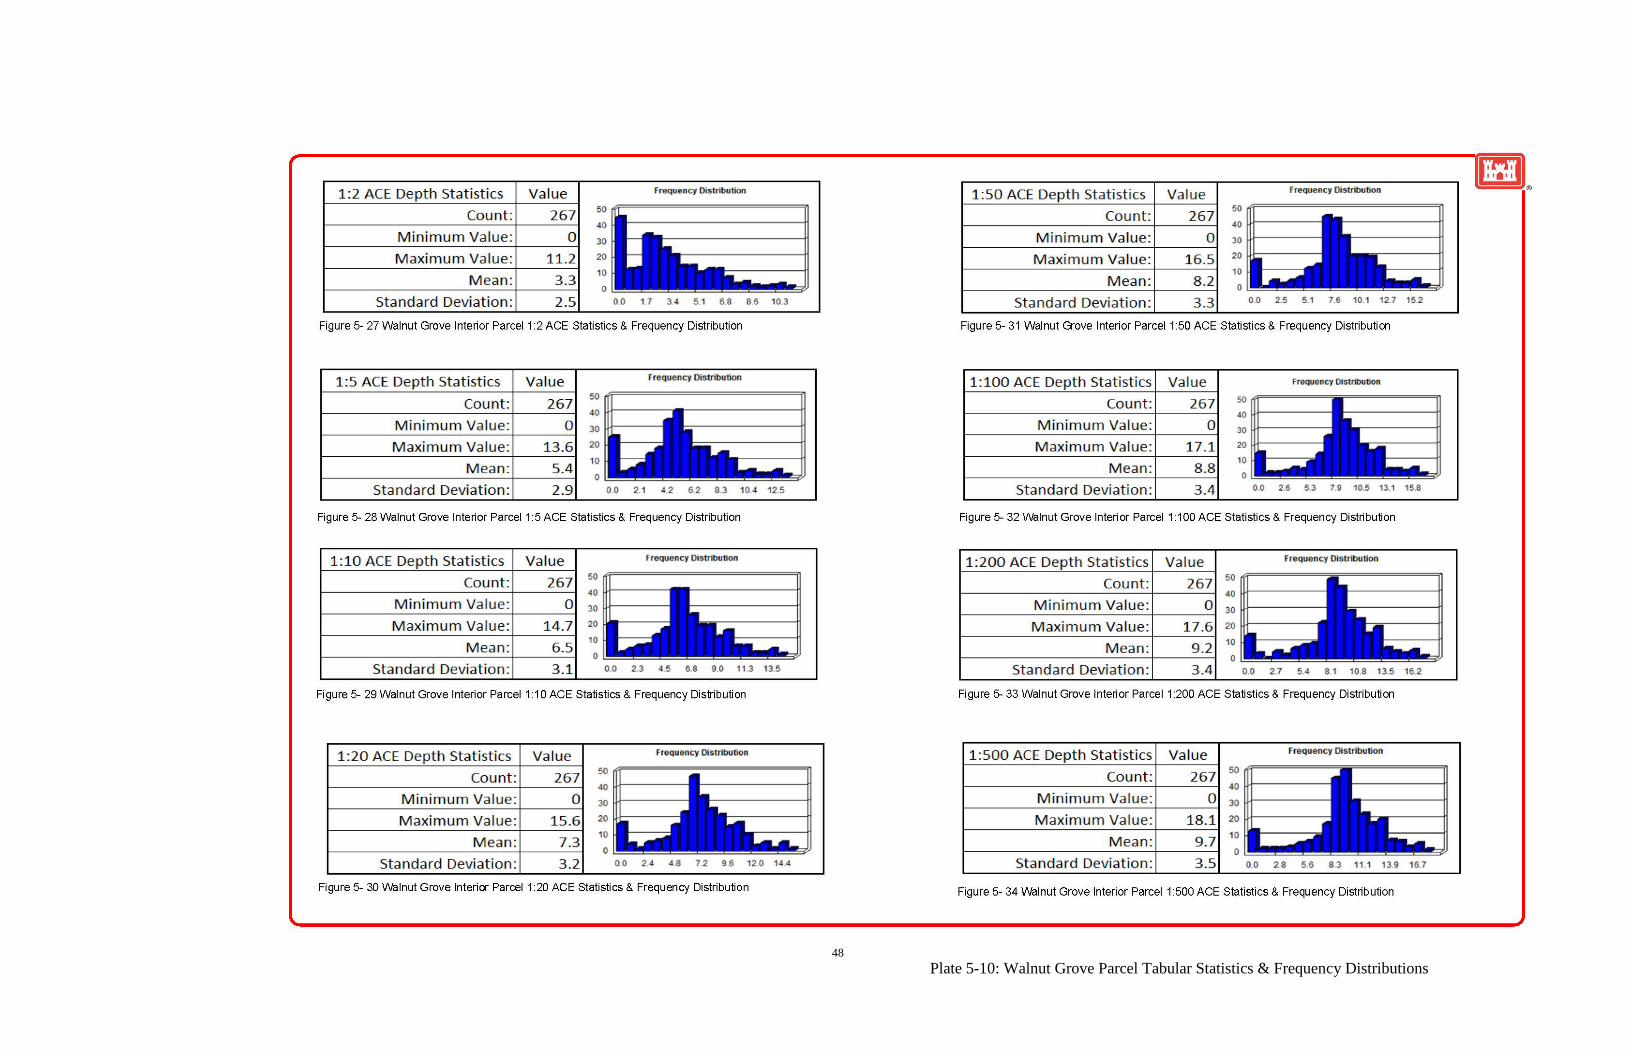
A similar hydraulic analysis was accomplished using the same inundation modeling workflow as was used for the other projects sites of the study. Using ArcGIS, the Bay Delta DEM, and Chart 5 of the 1992 Office Report the simplified inundation analysis was conducted and results were evaluated and turned over to Economics for further evaluation .Plate 5-9 Describes the Terrain Plan view of Walnut Grove and the statistics describing the depth inundation analysis are shown on Plate 5-10. Plate 5-11 Section CC is a representative section through Walnut Grove.
4.5 Summary of Hydraulic Handoffs
The hydraulic analysis was conducted with the same method for Bethel Island, Walnut Grove, Isleton and Discovery Bay. The Hydraulics section provided depth-frequency information for each parcel within the specific island for the 0.5, 0.2, 0.1, 0.05, 0.02, 0.01, 0.005, 0.002, 0.001 annual chance of exceedence, as well as the uncertainty associated, represented as the Period of Record (Years). The depth-frequency information was provided in an ARC-GIS shape file format to the Economics section.
5.0 CONCLUSIONS
While additional analyses are possible – quantification of ecosystem risks and evaluation of human threats among them – the evidence for system-wide catastrophic life loss and economic damages is more than sufficient to justify risk management through targeted system improvements.
The resulting Flood Risk Management analysis and the simplified economic inputs presented herein should be used as a guide for risk-informed decisions for future USACE actions in reducing flooding risks in the Sacramento-San Joaquin Delta and Suisun Marshes.
While refinements to these risk estimates are possible, this appendix and the Delta Risk Management Strategy analyses provide more than sufficient evidence that flooding in the Sacramento –San Joaquin Delta presents significant risks to California and the nation. Hundreds of lives and billions of dollar damages are at high probability of occurrence. Urgent action is necessary to manage those risks.
38
Plate 5-1: Bethel Island Terrain Plan View
39
Plate 5-2: Bethel Island Tabular Statistics & Frequency Distribution
40
Plate 5-3: Discovery Bay Terrain Plan View

41
42
Plate 5-4: Discovery Bay Levee Protected Parcels
43
Plate 5-5: Bethel Island and the Discovery Bay In-island Profile View
44
Plate 5-6: Discovery Bay Interior Parcel Tabular Statistics & Frequency Distributions
45
Plate 5-7: City of Isleton Terrain Plan View
46
Plate 5-8: City of Isleton Parcel Tabular Statistics & Frequency Distributions
47
Plate 5-9: Walnut Grove Terrain Plan View
48
Plate 5-10: Walnut Grove Parcel Tabular Statistics & Frequency Distributions
49
Plate 5-11: Walnut Grove and the City of Isleton In-island Profile View
52
6.0 REFERENCES
Aboelata, M., D.S. Bowles, and D.M. McClelland. 2003. A model for estimating dam failure life loss. In: Proceedings of the Australian Committee on Large Dams Risk Workshop. Launcestion, Australia. October.
Army, 2006. Composite Risk Management, Field Manual No. 5-19 (100-14), Headquarters Department of the Army, Washington, DC, July.
CALFED Science Program Independent Review Panel 2008. Review of the Delta Risk Management Strategy Phase 1 Report (Draft 4). <http://www.water.ca.gov/floodmgmt/dsmo/sab/drmsp/docs/IRP_DRMS_Review-main_plus_appendices.pdf>, Accessed November 2011.
EPA 2011. Frequently Asked Questions on Mortality Risk Valuation, Environmental Protection Agency, <http://yosemite.epa.gov/ee/epa/eed.nsf/pages/MortalityRiskValuation.html#whatisvsl> Accessed Sep 2011.
Greeley-Polhemus Group, Inc., 1992. Guidelines for Risk and Uncertainty Analysis in Water Resources Planning, Volume I, IWR Report 92-R-1, U.S. Army Corps of Engineers, Institute for Water Resources, Fort Belvoir, VA.
Haimes, Y. Y., R. Petrackian, P.-O. Karrlsson, and J. Mitsiopoulos. 1988, Multi-Objective Risk-Partitioning: an Application to Dam Safety Risk Analysis. IWR Report 88-R-4, U.S. Army Corps of Engineers, Institute for Water Resources, Ft. Belvoir, VA.
IPET, 2009. Performance Evaluation of the New Orleans and Southeast Louisiana Hurricane Protection System, Final Report of the Interagency Performance Evaluation Task Force, Volume VIII – Engineering and Operational Risk and Reliability Analysis, U.S. Army Corps of Engineers, Washington, DC.
ISO, 2009. Risk management -- Principles and guidelines, ISO 31000:2009, International Organization for Standardization, Geneva.
Males, R. M. 2002. Beyond Expected Value: Making Decisions Under Risk and Uncertainty, IWR 2002-RPT-RSK-04, U.S. Army Corps of Engineers, Institute for Water Resources, Fort Belvoir, VA.
NRC 1994. Science and Judgment in Risk Assessment, National Research Council, National Academies Press Washington, DC, 1994.
NRC 2007a. Scientific Review of the Proposed Risk Assessment Bulletin from the Office of Management and Budget. Washington, DC: National Academies Press. National Research Council, ISBN: 0-309-66876-X, 302 p. free PDF downloaded from: <http://www.nap.edu/catalog/11811.html>
NRC 2009. National Research Council. Committee on Improving Risk Analysis Approaches Used by the U.S. EPA. Science and decisions : advancing risk assessment / Committee on Improving Risk Analysis Approaches Used by the U.S. EPA, Board on Environmental
53
Studies and Toxicology, Division on Earth and Life Studies. The National Academies Press, Washington, DC.
Russell, C. A. and K. O’Grady. 1996, Applied Risk Communication Within the Corps Of Engineers, IWR REPORT 96-R-14, U.S. Army Corps of Engineers, Institute for Water Resources, Fort Belvoir, VA.
URS/JBA 2008, Delta Risk Management Strategy (DRMS) Phase 1: Risk Analysis Report Draft 4. URS Corporation/Jack R. Benjamin & Associates, Inc., California Department of Water Resources (DWR), July.
URS/JBA 2011, Delta Risk Management Strategy (DRMS) Phase 2 Report. URS Corporation/ Jack R. Benjamin & Associates, Inc., California Department of Water Resources.
USACE 1996. Risk-Based Analysis for Flood Damage Reduction Studies, EM 1110-2-1619, U.S. Army Corps of Engineers, Washington, DC.
USACE 2006a. ETL 1110-2-561, Reliability Analysis and Risk Assessment for Seepage and Slope Stability Failure Modes for Embankment Dams, U.S. Army Corps of Engineers, Washington, DC.
USACE 2006b. Risk Analysis for Flood Damage Reduction Studies, ER 1105-2-101, U.S. Army Corps of Engineers, Washington, DC.
USACE 2008. Coastal Engineering Manual, EM 1110-2-1100, U.S. Army Corps of Engineers, Washington, DC.
USACE 2010, USACE Process for The National Flood Insurance Program (NFIP) Levee System Evaluation, EC 1110-2-6067, U.S. Army Corps of Engineers, Washington, DC.
USACE 2011a. Introduction to Risk Analysis, Risk Analysis Gateway, <http://corpsriskanalysisgateway.us/lms/ch2-Risks.cfm> Accessed August 2011.
USACE 2011b. Introduction to Risk Analysis, Risk Analysis Gateway, U.S. Army Corps of Engineers, <http://corpsriskanalysisgateway.us/lms/ch2-Risks.cfm>. U.S. Army Corps of Engineers, Washington, DC.
USACE 2011c. EC 1110-2-6062, Risk and Reliability Engineering for Major Rehabilitation Studies, U.S. Army Corps of Engineers, Washington, DC.
Wang, R. & Ateljevich, E. (2012). A Continuous Surface Elevation Map for Modeling (Chapter 6). In Methodology for Flow and Salinity Estimates in the Sacramento-San Joaquin Delta and Suisun Mars, 23rd Annual Progress Report to the State Water Resources Control Board. California Department of Water Resources, Bay-Delta Office, Delta Modeling Section.
WRC, 1983, Economic and Environmental Principles and Guidelines for Water and Related Land Resources Implementation Studies dated March 10, 1983. Water Resources Council, Washington, DC.
APPENDIX A
54
Appendix A: USACE & Army Risk Assessment and Management
A. Definitions
1. Risk
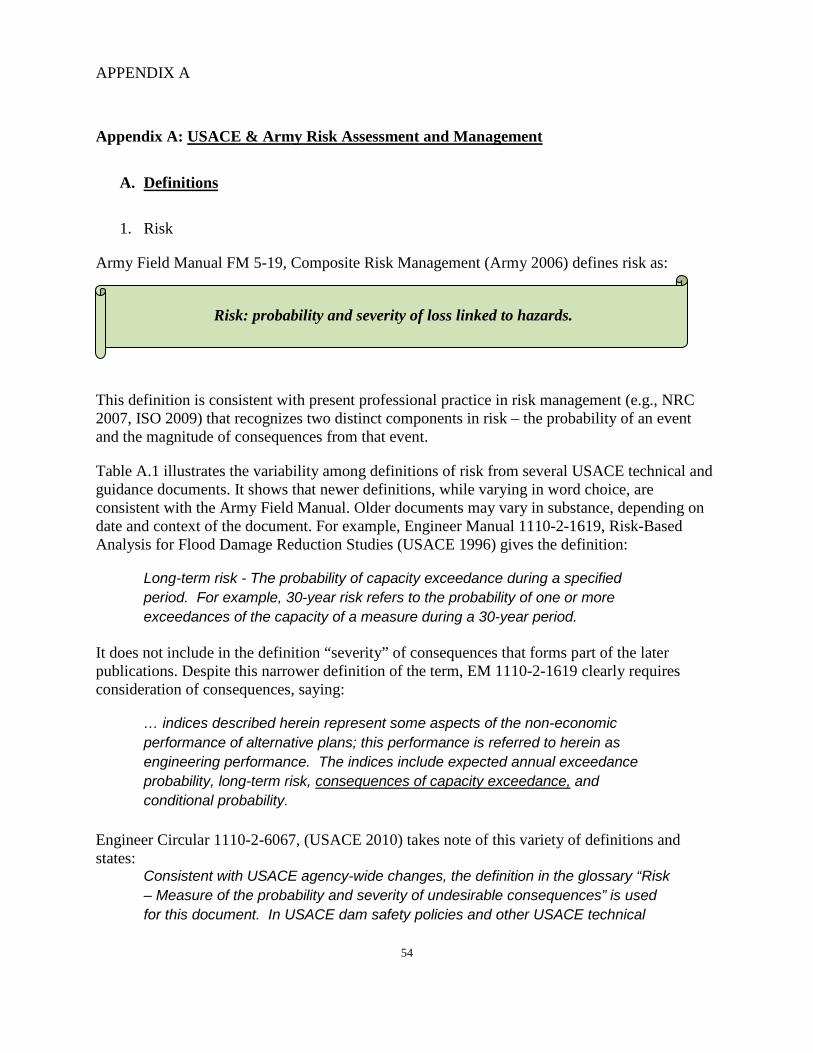
Army Field Manual FM 5-19, Composite Risk Management (Army 2006) defines risk as:
This definition is consistent with present professional practice in risk management (e.g., NRC 2007, ISO 2009) that recognizes two distinct components in risk – the probability of an event and the magnitude of consequences from that event.
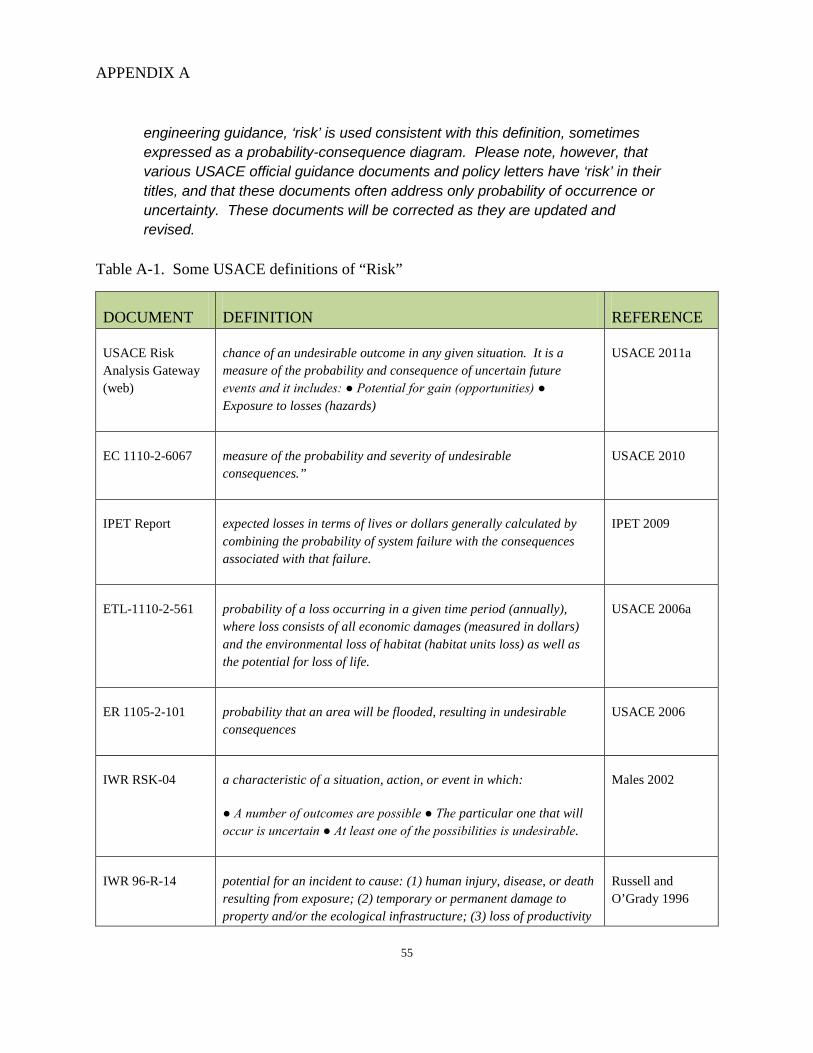
Table A.1 illustrates the variability among definitions of risk from several USACE technical and guidance documents. It shows that newer definitions, while varying in word choice, are consistent with the Army Field Manual. Older documents may vary in substance, depending on date and context of the document. For example, Engineer Manual 1110-2-1619, Risk-Based Analysis for Flood Damage Reduction Studies (USACE 1996) gives the definition:
Long-term risk - The probability of capacity exceedance during a specified period. For example, 30-year risk refers to the probability of one or more exceedances of the capacity of a measure during a 30-year period.
It does not include in the definition “severity” of consequences that forms part of the later publications. Despite this narrower definition of the term, EM 1110-2-1619 clearly requires consideration of consequences, saying:
… indices described herein represent some aspects of the non-economic performance of alternative plans; this performance is referred to herein as engineering performance. The indices include expected annual exceedance probability, long-term risk, consequences of capacity exceedance, and conditional probability.
Engineer Circular 1110-2-6067, (USACE 2010) takes note of this variety of definitions and states:
Consistent with USACE agency-wide changes, the definition in the glossary “Risk – Measure of the probability and severity of undesirable consequences” is used for this document. In USACE dam safety policies and other USACE technical
Risk: probability and severity of loss linked to hazards.
APPENDIX A
55
engineering guidance, ‘risk’ is used consistent with this definition, sometimes expressed as a probability-consequence diagram. Please note, however, that various USACE official guidance documents and policy letters have ‘risk’ in their titles, and that these documents often address only probability of occurrence or uncertainty. These documents will be corrected as they are updated and revised.
Table A-1. Some USACE definitions of “Risk”
DOCUMENT DEFINITION REFERENCE
USACE Risk Analysis Gateway (web)
chance of an undesirable outcome in any given situation. It is a measure of the probability and consequence of uncertain future events and it includes: ● Potential for gain (opportunities) ● Exposure to losses (hazards)
USACE 2011a
EC 1110-2-6067 measure of the probability and severity of undesirable consequences.”
USACE 2010
IPET Report expected losses in terms of lives or dollars generally calculated by combining the probability of system failure with the consequences associated with that failure.
IPET 2009
ETL-1110-2-561 probability of a loss occurring in a given time period (annually), where loss consists of all economic damages (measured in dollars) and the environmental loss of habitat (habitat units loss) as well as the potential for loss of life.
USACE 2006a
ER 1105-2-101 probability that an area will be flooded, resulting in undesirable consequences
USACE 2006
IWR RSK-04 a characteristic of a situation, action, or event in which:
● A number of outcomes are possible ● The particular one that will occur is uncertain ● At least one of the possibilities is undesirable.
Males 2002
IWR 96-R-14 potential for an incident to cause: (1) human injury, disease, or death resulting from exposure; (2) temporary or permanent damage to property and/or the ecological infrastructure; (3) loss of productivity
Russell and O’Grady 1996
APPENDIX A
56
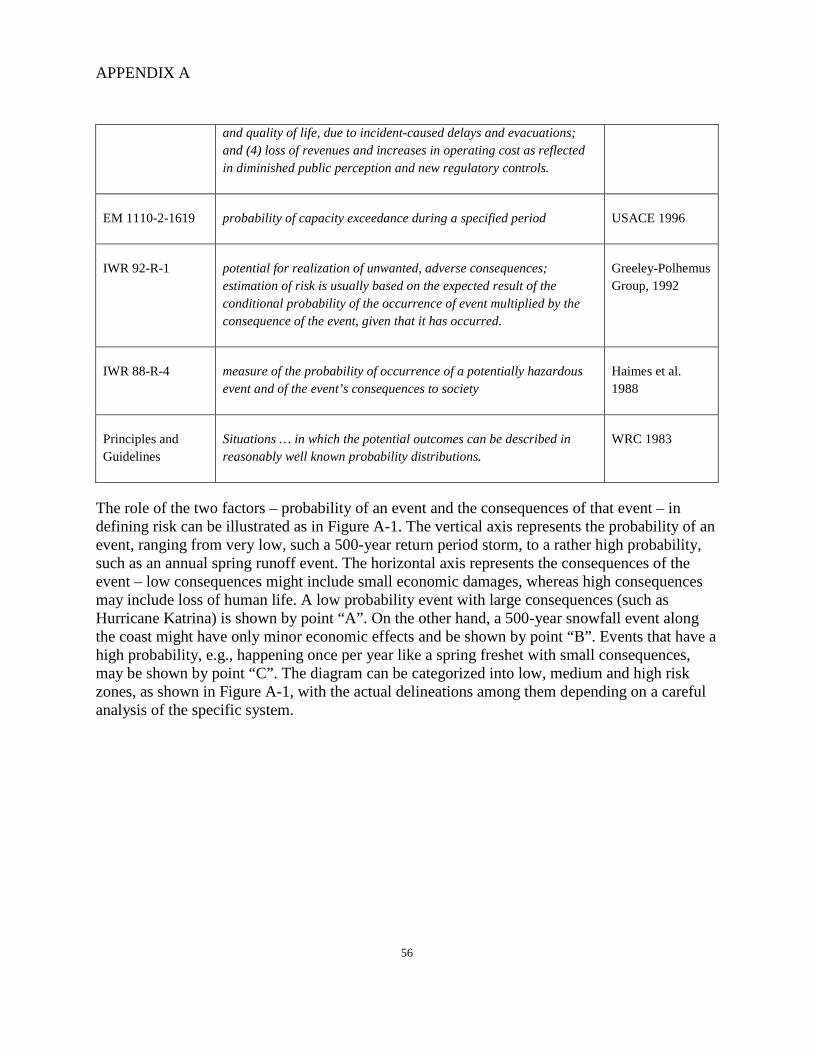
and quality of life, due to incident-caused delays and evacuations; and (4) loss of revenues and increases in operating cost as reflected in diminished public perception and new regulatory controls.
EM 1110-2-1619 probability of capacity exceedance during a specified period USACE 1996
IWR 92-R-1 potential for realization of unwanted, adverse consequences; estimation of risk is usually based on the expected result of the conditional probability of the occurrence of event multiplied by the consequence of the event, given that it has occurred.
Greeley-Polhemus Group, 1992
IWR 88-R-4 measure of the probability of occurrence of a potentially hazardous event and of the event’s consequences to society
Haimes et al. 1988
Principles and Guidelines
Situations … in which the potential outcomes can be described in reasonably well known probability distributions.
WRC 1983
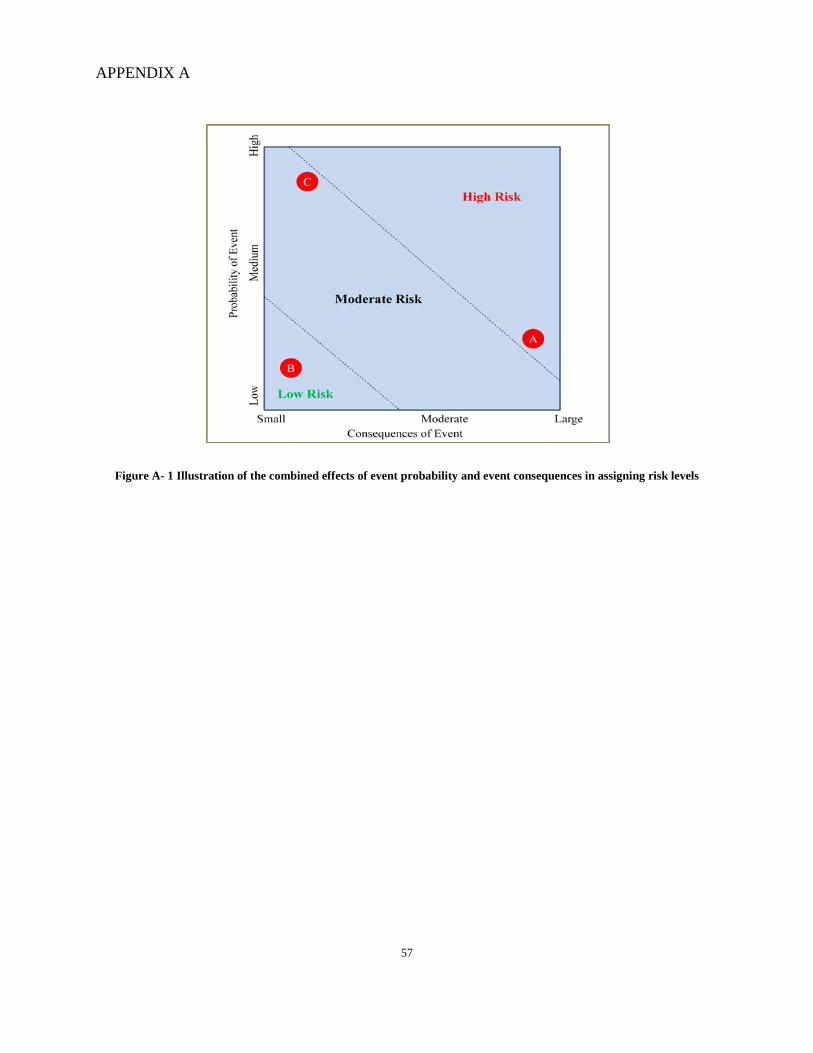
The role of the two factors – probability of an event and the consequences of that event – in defining risk can be illustrated as in Figure A-1. The vertical axis represents the probability of an event, ranging from very low, such a 500-year return period storm, to a rather high probability, such as an annual spring runoff event. The horizontal axis represents the consequences of the event – low consequences might include small economic damages, whereas high consequences may include loss of human life. A low probability event with large consequences (such as Hurricane Katrina) is shown by point “A”. On the other hand, a 500-year snowfall event along the coast might have only minor economic effects and be shown by point “B”. Events that have a high probability, e.g., happening once per year like a spring freshet with small consequences, may be shown by point “C”. The diagram can be categorized into low, medium and high risk zones, as shown in Figure A-1, with the actual delineations among them depending on a careful analysis of the specific system.
APPENDIX A
57
Figure A- 1 Illustration of the combined effects of event probability and event consequences in assigning risk levels
APPENDIX A
58
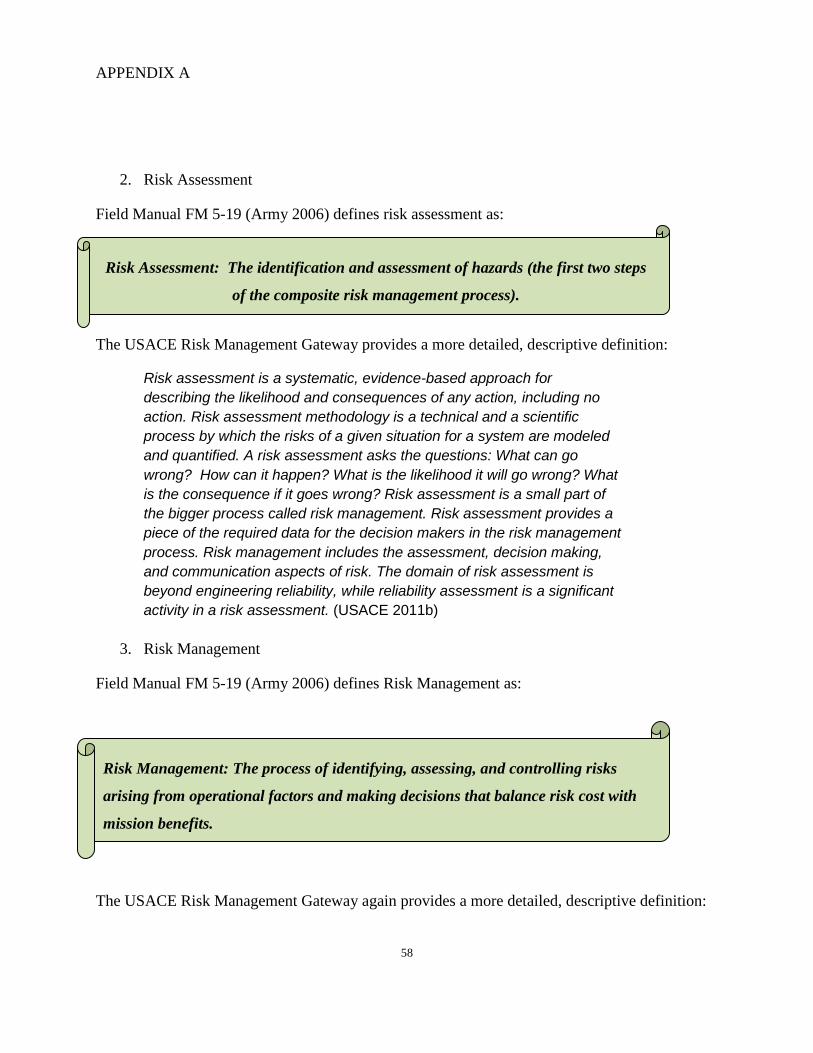
2. Risk Assessment
Field Manual FM 5-19 (Army 2006) defines risk assessment as:
The USACE Risk Management Gateway provides a more detailed, descriptive definition:
Risk assessment is a systematic, evidence-based approach for describing the likelihood and consequences of any action, including no action. Risk assessment methodology is a technical and a scientific process by which the risks of a given situation for a system are modeled and quantified. A risk assessment asks the questions: What can go wrong? How can it happen? What is the likelihood it will go wrong? What is the consequence if it goes wrong? Risk assessment is a small part of the bigger process called risk management. Risk assessment provides a piece of the required data for the decision makers in the risk management process. Risk management includes the assessment, decision making, and communication aspects of risk. The domain of risk assessment is beyond engineering reliability, while reliability assessment is a significant activity in a risk assessment. (USACE 2011b)
3. Risk Management
Field Manual FM 5-19 (Army 2006) defines Risk Management as:
The USACE Risk Management Gateway again provides a more detailed, descriptive definition:
Risk Assessment: The identification and assessment of hazards (the first two steps
of the composite risk management process).
Risk Management: The process of identifying, assessing, and controlling risks
arising from operational factors and making decisions that balance risk cost with
mission benefits.
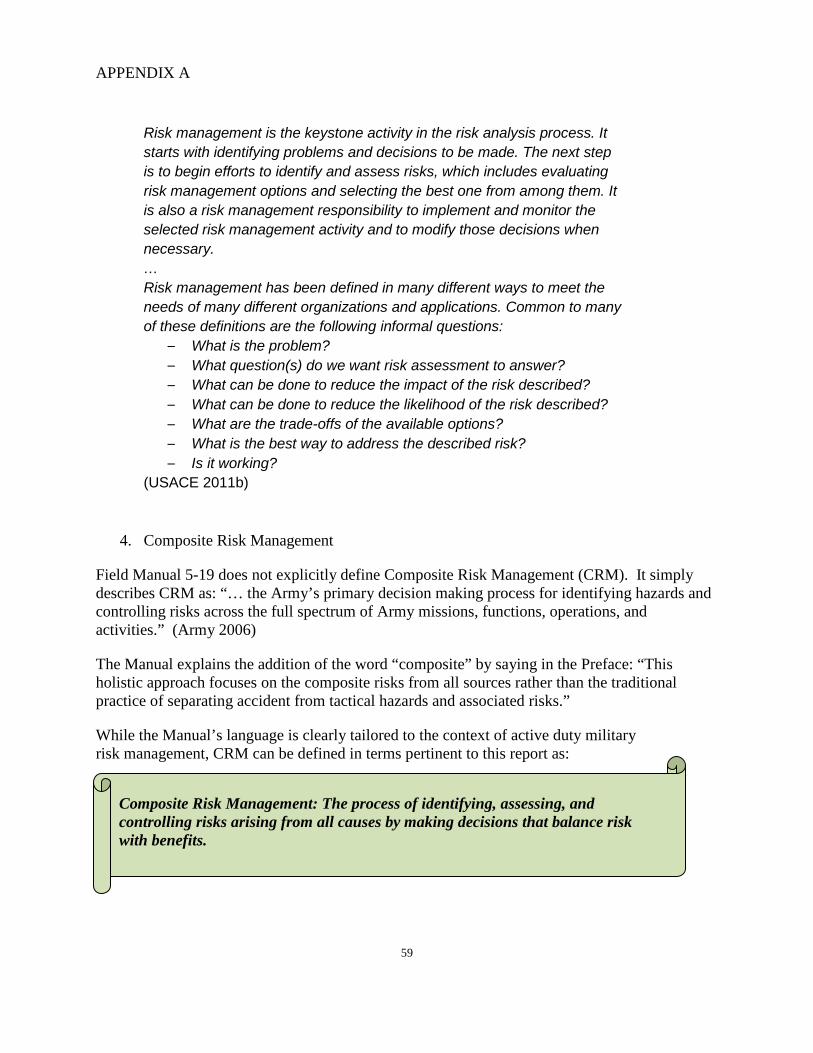
APPENDIX A
59
Risk management is the keystone activity in the risk analysis process. It starts with identifying problems and decisions to be made. The next step is to begin efforts to identify and assess risks, which includes evaluating risk management options and selecting the best one from among them. It is also a risk management responsibility to implement and monitor the selected risk management activity and to modify those decisions when necessary. … Risk management has been defined in many different ways to meet the needs of many different organizations and applications. Common to many of these definitions are the following informal questions:
– What is the problem? – What question(s) do we want risk assessment to answer? – What can be done to reduce the impact of the risk described? – What can be done to reduce the likelihood of the risk described? – What are the trade-offs of the available options? – What is the best way to address the described risk? – Is it working?
(USACE 2011b)
4. Composite Risk Management
Field Manual 5-19 does not explicitly define Composite Risk Management (CRM). It simply describes CRM as: “… the Army’s primary decision making process for identifying hazards and controlling risks across the full spectrum of Army missions, functions, operations, and activities.” (Army 2006)
The Manual explains the addition of the word “composite” by saying in the Preface: “This holistic approach focuses on the composite risks from all sources rather than the traditional practice of separating accident from tactical hazards and associated risks.”
While the Manual’s language is clearly tailored to the context of active duty military risk management, CRM can be defined in terms pertinent to this report as:
Composite Risk Management: The process of identifying, assessing, and controlling risks arising from all causes by making decisions that balance risk with benefits.
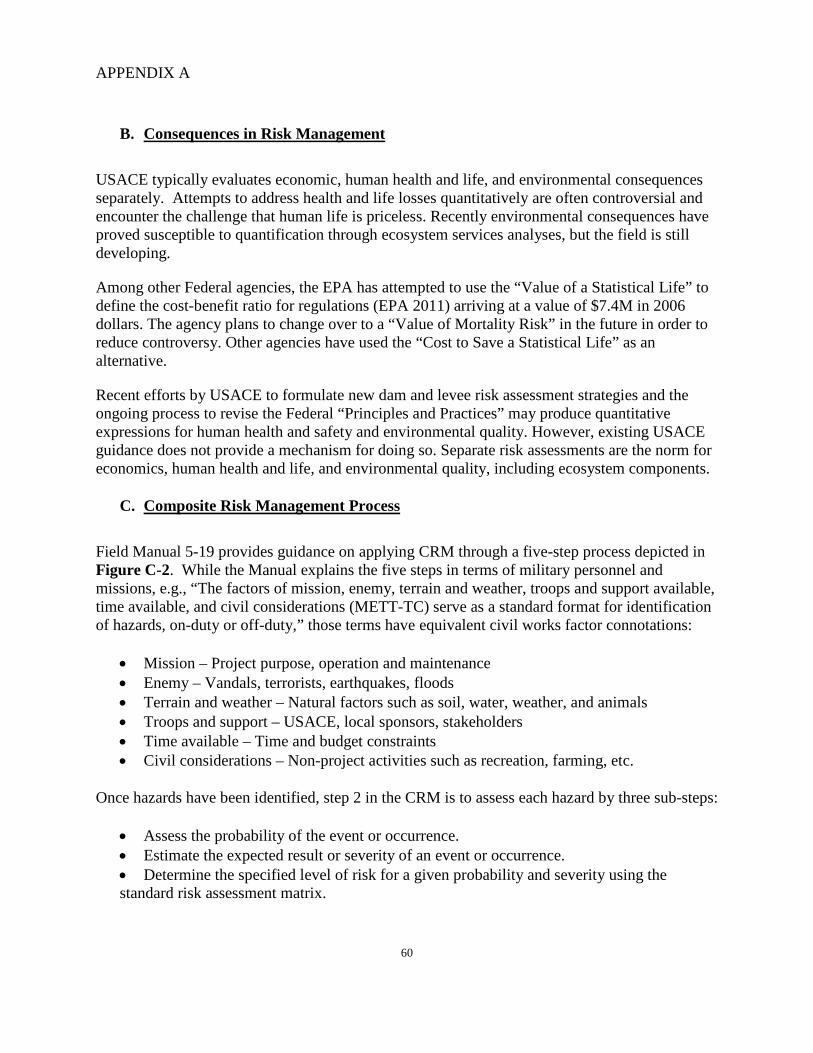
APPENDIX A
60
B. Consequences in Risk Management
USACE typically evaluates economic, human health and life, and environmental consequences separately. Attempts to address health and life losses quantitatively are often controversial and encounter the challenge that human life is priceless. Recently environmental consequences have proved susceptible to quantification through ecosystem services analyses, but the field is still developing.
Among other Federal agencies, the EPA has attempted to use the “Value of a Statistical Life” to define the cost-benefit ratio for regulations (EPA 2011) arriving at a value of $7.4M in 2006 dollars. The agency plans to change over to a “Value of Mortality Risk” in the future in order to reduce controversy. Other agencies have used the “Cost to Save a Statistical Life” as an alternative.
Recent efforts by USACE to formulate new dam and levee risk assessment strategies and the ongoing process to revise the Federal “Principles and Practices” may produce quantitative expressions for human health and safety and environmental quality. However, existing USACE guidance does not provide a mechanism for doing so. Separate risk assessments are the norm for economics, human health and life, and environmental quality, including ecosystem components.
C. Composite Risk Management Process
Field Manual 5-19 provides guidance on applying CRM through a five-step process depicted in Figure C-2. While the Manual explains the five steps in terms of military personnel and missions, e.g., “The factors of mission, enemy, terrain and weather, troops and support available, time available, and civil considerations (METT-TC) serve as a standard format for identification of hazards, on-duty or off-duty,” those terms have equivalent civil works factor connotations:
• Mission – Project purpose, operation and maintenance • Enemy – Vandals, terrorists, earthquakes, floods • Terrain and weather – Natural factors such as soil, water, weather, and animals • Troops and support – USACE, local sponsors, stakeholders • Time available – Time and budget constraints • Civil considerations – Non-project activities such as recreation, farming, etc.
Once hazards have been identified, step 2 in the CRM is to assess each hazard by three sub-steps:
• Assess the probability of the event or occurrence. • Estimate the expected result or severity of an event or occurrence. • Determine the specified level of risk for a given probability and severity using the standard risk assessment matrix.
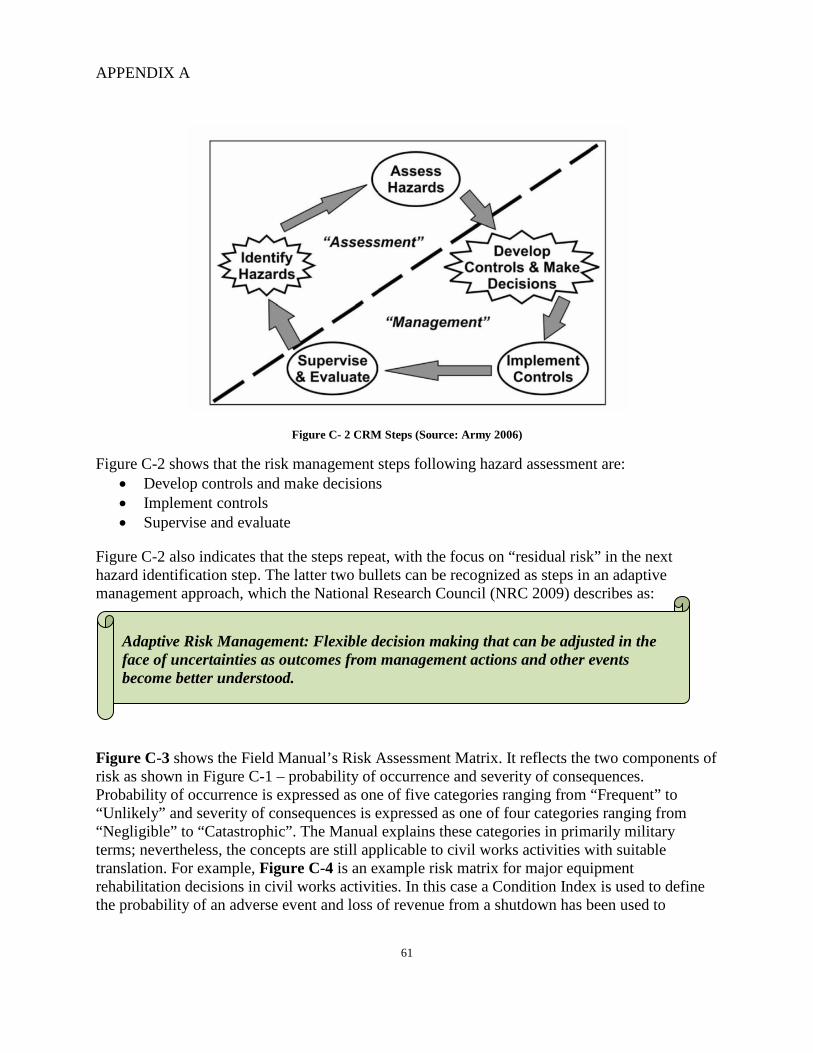
APPENDIX A
61
Figure C- 2 CRM Steps (Source: Army 2006)
Figure C-2 shows that the risk management steps following hazard assessment are: • Develop controls and make decisions • Implement controls • Supervise and evaluate
Figure C-2 also indicates that the steps repeat, with the focus on “residual risk” in the next hazard identification step. The latter two bullets can be recognized as steps in an adaptive management approach, which the National Research Council (NRC 2009) describes as:
Figure C-3 shows the Field Manual’s Risk Assessment Matrix. It reflects the two components of risk as shown in Figure C-1 – probability of occurrence and severity of consequences. Probability of occurrence is expressed as one of five categories ranging from “Frequent” to “Unlikely” and severity of consequences is expressed as one of four categories ranging from “Negligible” to “Catastrophic”. The Manual explains these categories in primarily military terms; nevertheless, the concepts are still applicable to civil works activities with suitable translation. For example, Figure C-4 is an example risk matrix for major equipment rehabilitation decisions in civil works activities. In this case a Condition Index is used to define the probability of an adverse event and loss of revenue from a shutdown has been used to
Adaptive Risk Management: Flexible decision making that can be adjusted in the face of uncertainties as outcomes from management actions and other events become better understood.
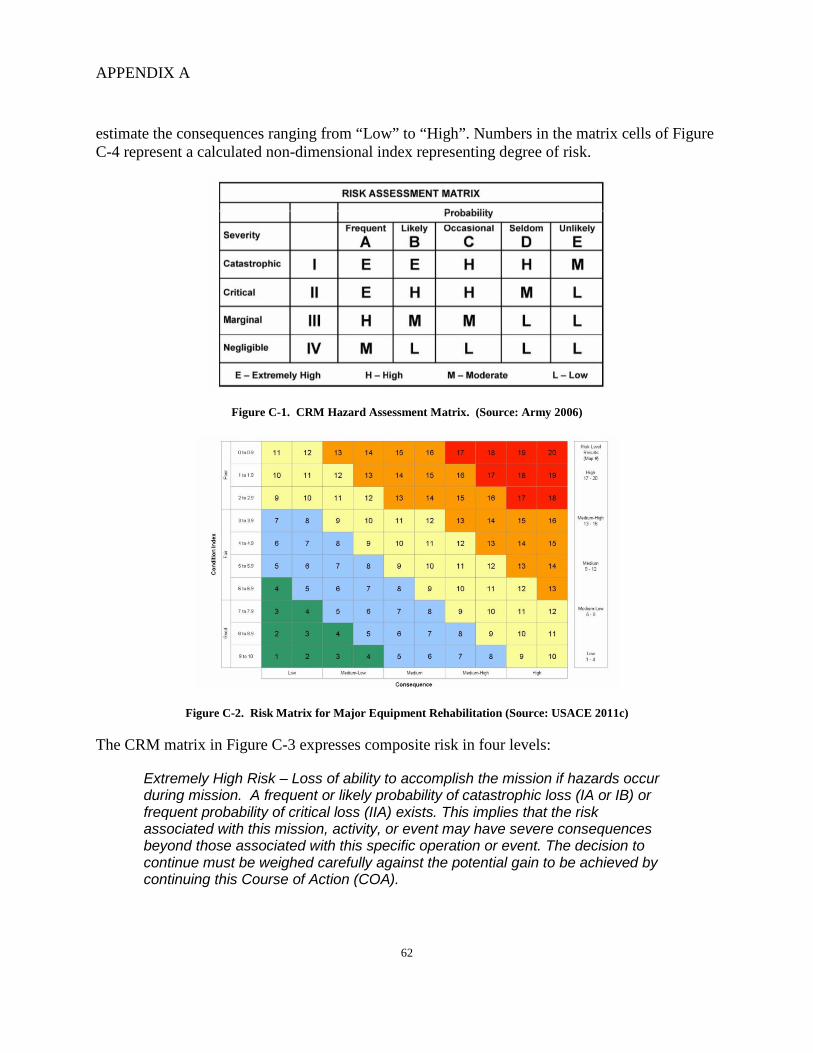
APPENDIX A
62
estimate the consequences ranging from “Low” to “High”. Numbers in the matrix cells of Figure C-4 represent a calculated non-dimensional index representing degree of risk.
Figure C-1. CRM Hazard Assessment Matrix. (Source: Army 2006)
Figure C-2. Risk Matrix for Major Equipment Rehabilitation (Source: USACE 2011c)
The CRM matrix in Figure C-3 expresses composite risk in four levels:
Extremely High Risk – Loss of ability to accomplish the mission if hazards occur during mission. A frequent or likely probability of catastrophic loss (IA or IB) or frequent probability of critical loss (IIA) exists. This implies that the risk associated with this mission, activity, or event may have severe consequences beyond those associated with this specific operation or event. The decision to continue must be weighed carefully against the potential gain to be achieved by continuing this Course of Action (COA).
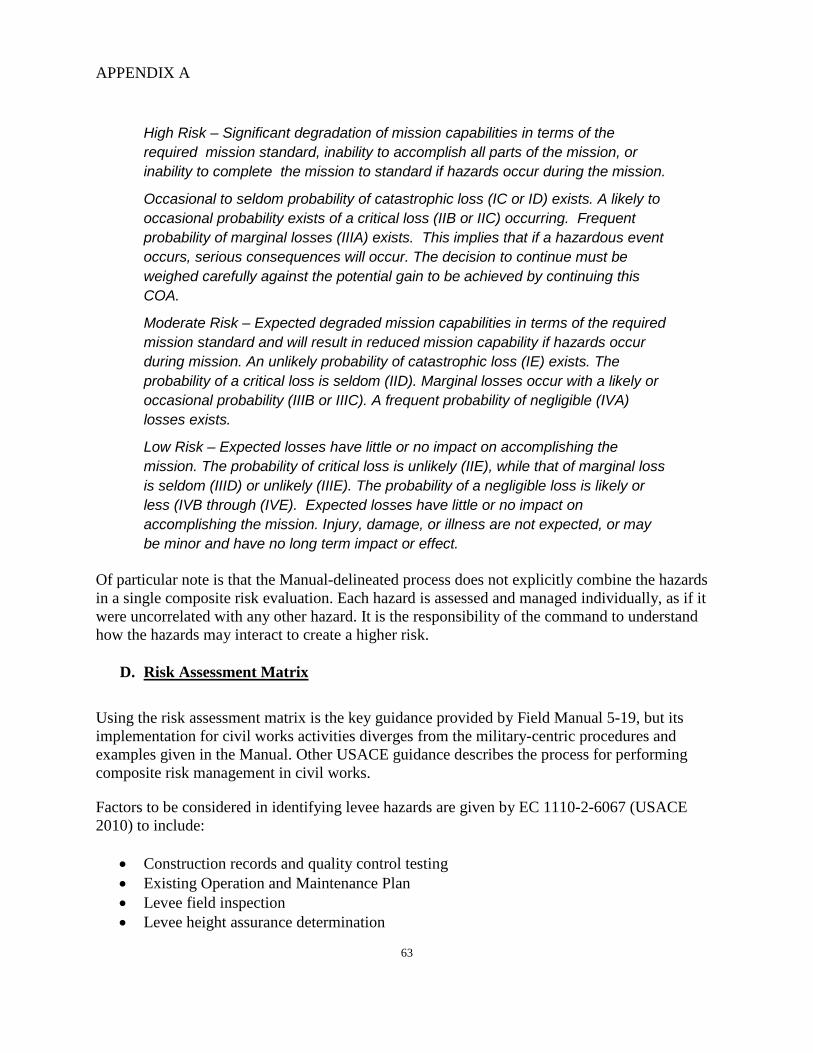
APPENDIX A
63
High Risk – Significant degradation of mission capabilities in terms of the required mission standard, inability to accomplish all parts of the mission, or inability to complete the mission to standard if hazards occur during the mission.
Occasional to seldom probability of catastrophic loss (IC or ID) exists. A likely to occasional probability exists of a critical loss (IIB or IIC) occurring. Frequent probability of marginal losses (IIIA) exists. This implies that if a hazardous event occurs, serious consequences will occur. The decision to continue must be weighed carefully against the potential gain to be achieved by continuing this COA.
Moderate Risk – Expected degraded mission capabilities in terms of the required mission standard and will result in reduced mission capability if hazards occur during mission. An unlikely probability of catastrophic loss (IE) exists. The probability of a critical loss is seldom (IID). Marginal losses occur with a likely or occasional probability (IIIB or IIIC). A frequent probability of negligible (IVA) losses exists.
Low Risk – Expected losses have little or no impact on accomplishing the mission. The probability of critical loss is unlikely (IIE), while that of marginal loss is seldom (IIID) or unlikely (IIIE). The probability of a negligible loss is likely or less (IVB through (IVE). Expected losses have little or no impact on accomplishing the mission. Injury, damage, or illness are not expected, or may be minor and have no long term impact or effect.
Of particular note is that the Manual-delineated process does not explicitly combine the hazards in a single composite risk evaluation. Each hazard is assessed and managed individually, as if it were uncorrelated with any other hazard. It is the responsibility of the command to understand how the hazards may interact to create a higher risk.
D. Risk Assessment Matrix
Using the risk assessment matrix is the key guidance provided by Field Manual 5-19, but its implementation for civil works activities diverges from the military-centric procedures and examples given in the Manual. Other USACE guidance describes the process for performing composite risk management in civil works.
Factors to be considered in identifying levee hazards are given by EC 1110-2-6067 (USACE 2010) to include:
• Construction records and quality control testing • Existing Operation and Maintenance Plan • Levee field inspection • Levee height assurance determination
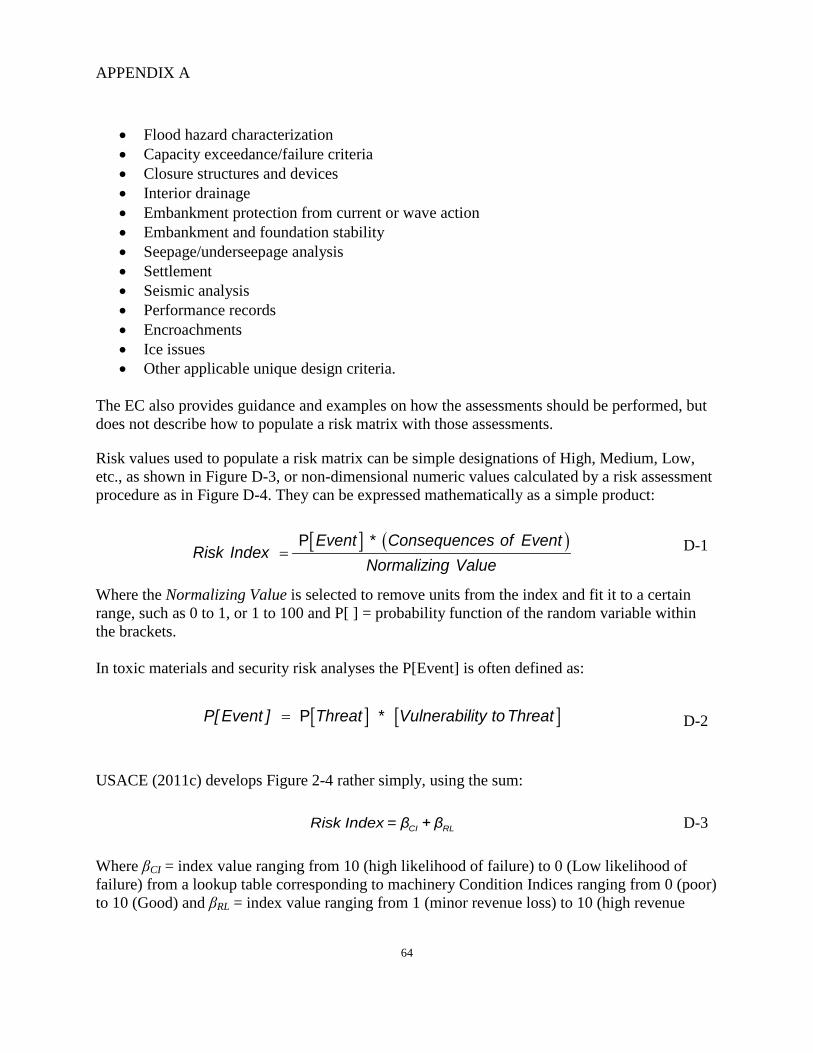
APPENDIX A
64
• Flood hazard characterization • Capacity exceedance/failure criteria • Closure structures and devices • Interior drainage • Embankment protection from current or wave action • Embankment and foundation stability • Seepage/underseepage analysis • Settlement • Seismic analysis • Performance records • Encroachments • Ice issues • Other applicable unique design criteria.
The EC also provides guidance and examples on how the assessments should be performed, but does not describe how to populate a risk matrix with those assessments.
Risk values used to populate a risk matrix can be simple designations of High, Medium, Low, etc., as shown in Figure D-3, or non-dimensional numeric values calculated by a risk assessment procedure as in Figure D-4. They can be expressed mathematically as a simple product:
[ ] ( )=
P *
Event Consequences of EventRisk Index
Normalizing Value D-1
Where the Normalizing Value is selected to remove units from the index and fit it to a certain range, such as 0 to 1, or 1 to 100 and P[ ] = probability function of the random variable within the brackets. In toxic materials and security risk analyses the P[Event] is often defined as:
[ ] [ ]= P P[ Event ] Threat * Vulnerability to Threat D-2
USACE (2011c) develops Figure 2-4 rather simply, using the sum:
CI RLRisk Index = β + β D-3
Where βCI = index value ranging from 10 (high likelihood of failure) to 0 (Low likelihood of failure) from a lookup table corresponding to machinery Condition Indices ranging from 0 (poor) to 10 (Good) and βRL = index value ranging from 1 (minor revenue loss) to 10 (high revenue
APPENDIX A
65
loss). The result are the index values ranging from 1 (low risk) to 20 (high risk) and the diagonal division into four risk categories.
Engineer Circular 1110-2-6062 (USACE 2011c) applies a more complex analysis to an example dam breach problem, defining the risk as:
R = H P[F] P[E] X L
2-5
Where R = Risk in expected losses per year; H = number of expected events per year; P[F] = probability of failure of a project feature for each event; P[E] = probability of a breach, given event and feature failure; X = conditional exposure of people or property caused by the event; and L = loss rate for the exposed people and property.
While these mathematical forms are useful in understanding the interactions and separating high risk from low risk, risk values are not typically treated as precise magnitudes. They are more often scaled to a linear relationship appropriate for assigning classes of risk as displayed in Figures D-3 and D-4, and shown in Equation D-1.
These examples serve to illustrate the variety of ways risk can be estimated and expressed. Other than the overall approach, the conceptual form of the risk matrix, and requirement for sound analyses, USACE risk assessment has considerable latitude. In the words of Field Manual 5-19: “Technical competency, operational experience, and lessons-learned weigh higher than any set of alpha-numeric codes. Mathematics and matrixes are not a substitute for sound judgment.” (Army 2006)
E. Uncertainty and Risk Assessment
Engineer Circular EC 1110-2-6067 (USACE 2010) defines uncertainty in National Flood Insurance Program levee evaluations as:
The EC also states:
USACE policy is to apply a probability and uncertainty analysis framework to NFIP levee system evaluations for all engineering elements. As of the publication date of this EC, probability and uncertainty-based methodologies for the hydrology and hydraulics in Riverine situations is more advanced; elements
Uncertainty: A measure of the imprecision of knowledge of variables and functions used in the risk analysis.
APPENDIX A
66
of the uncertainty for NFIP levee system evaluation exist and will be applied as outlined below. Probability of exceedance and uncertainty assessment methods for coastal, estuarine, and lake settings are less mature, but being developed currently, and should be used as noted in paragraph 9.f., but with caution and appropriately applied until they become more codified into engineering guidance. Probability of exceedance and uncertainty-based methodologies are under development and emerging for structural and geotechnical engineering elements but are not yet sufficiently mature for direct application in NFIP levee system evaluations. (USACE 2010)
Paragraph 9f cited in the quotation above provides guidance for hydrology and hydraulics uncertainty analyses in river and coastal environments, citing EM 1110-2-1619, Risk-Based Analysis for Flood Damage Reduction Studies (USACE 1996); Part II (Chapters 2 and 3) of EM 1110-2-1100, Coastal Engineering Manual (USACE 2008); and the Performance Evaluation of the New Orleans and Southeast Louisiana Hurricane Protection System (IPET 2009).
APPENDIX B
67
APPENDIX B: RISK CALCULATIONS
Data used in the risk calculations were taken from the Delta Risk Management Strategy report (URS/JBA 2008).
Table B1 – B2
Table B1 lists the Life Loss analysis zones alphabetically, with parallel columns for DRMS report data and calculations for those data. Table A2 contains the same list, sorted by Risk Index. Column details are:
“Zone” and “Maximum Mean Life Loss”: Names of zones for which DRMS Appendix 12C provides estimated fatalities and the maximum value (usually a night-time event) of Mean Life Loss. Blanks indicate that the zone in “URS Name” column could not be identified in DRMS Appendix 12C. Shaded values in the “Maximum Mean Life Loss” column indicate that a value was assumed based on similarity of “URS Name” or apparent co-location on maps. The “Notes” column indicates where the assumed value was drawn from.
“URS_ID”, “URS Name”, and “Annual Mean No. of Failures”: Numbers, names, and annual mean failures from DRMS Table 13-8. Blanks indicate that the zone in the “Zone” column could not be identified in DRMS Table 13-8. Shaded values in “Annual Mean Number of Failures” indicate that a value was assumed based on similarity of “Zone” name or apparent co-location on maps. The “Notes” column indicates where the assumed value was drawn from.
“Life Loss Category”: Life Loss category for the “Zone”, using “Maximum Mean Life Loss” and the categories in Table 4-2.
“Failure Rate Category”: Failure Rate category for the zone named in “URS Name”, using “Annual Mean No. of Failures” and the categories in Table 4-3.
“Life Loss Risk Index”: Life Loss Risk Index calculated by Equation 2-1.
“Risk Category (Table 4-1)”: Risk Level Category as defined by “Life Loss Category” and “Failure Rate Category” and Table 4-1 in the text.
“Notes”: Notes indicate which values were assumed and where they were drawn from.
Table B3 – B4
Table A3 lists the Damage Costs analysis zones alphabetically; with parallel columns for DRMS report data and calculations for those data. Table A4 contains the same list, sorted by Risk Index. Column details are:
“Island Name”, “Old Island Name”, and “Total Asset Damages”: Names of zones for which DRMS tables 12.7 and 12.8 provides estimated Damage Costs. Blanks indicate that the zone in
APPENDIX B
68
“URS Name” could not be identified in DRMS Part 12. Shaded values in “Total Asset Damages” indicate that a value was assumed based on similarity of “URS Name” name or apparent co-location on maps. “Notes” indicates where the assumed value was drawn from.
“URS Name” and “Annual Mean No. of Failures”: Names and annual mean failures from DRMS Table 13-8. Blanks indicate that the zone in “Island Name” could not be identified in DRMS Table 13-8. Shaded values in “Annual Mean No. of Failures” indicate that a value was assumed based on similarity of “Island Name” name or apparent co-location on maps. “Notes” indicates where the assumed value was drawn from.
“Damages Category”: Damage Costs category for the zone named in “Island Name”, using “Total Asset Damages” and the categories in Table 4-2.
“Failure Rate Category”: Failure Rate category for the zone named in “Island Name” or “URS Name”, using “Annual Mean No. of Failures” and the categories in Table 4-3.
“Risk Index”: Damage Costs Risk Index calculated by Equation 2-1.
“Damages Risk Category”: Risk Level category as defined by “Damages Category” and “Failure Rate Category” and Table 4-1 in the text.
“Notes”: Notes indicate which values were assumed and where they were drawn from.
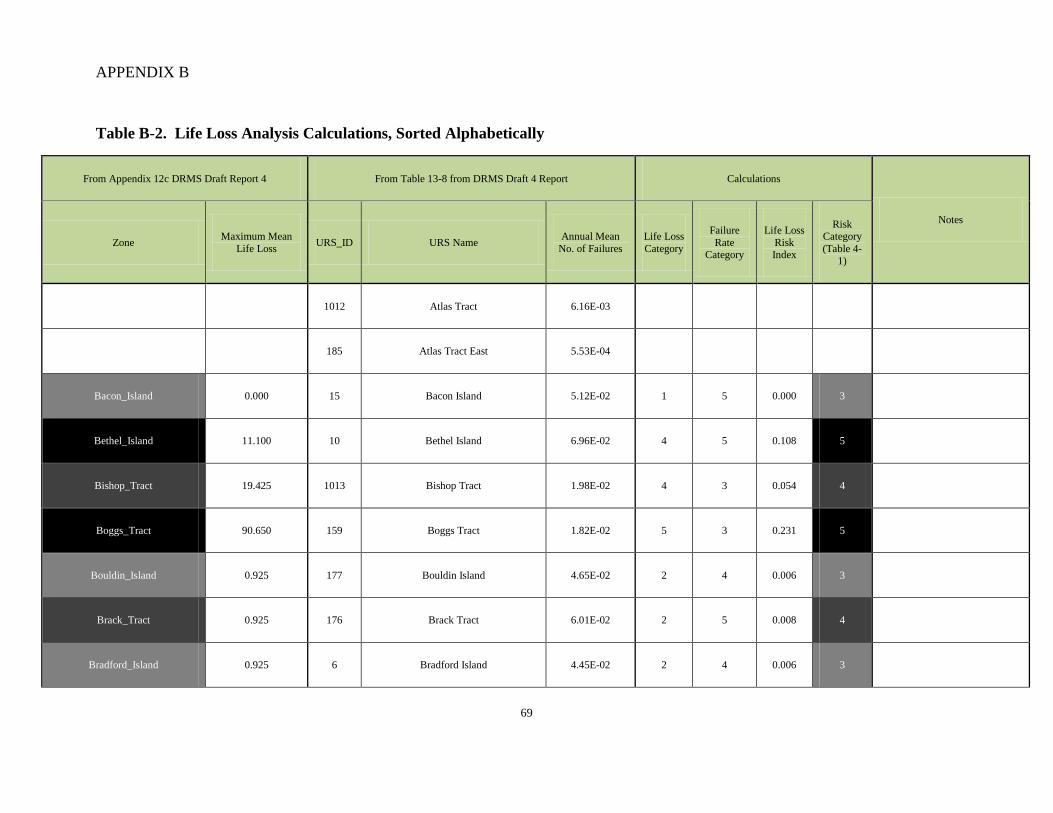
APPENDIX B
69
Table B-2. Life Loss Analysis Calculations, Sorted Alphabetically
From Appendix 12c DRMS Draft Report 4 From Table 13-8 from DRMS Draft 4 Report Calculations
Notes
Zone Maximum Mean Life Loss URS_ID URS Name Annual Mean
No. of Failures Life Loss Category
Failure Rate
Category
Life Loss Risk Index
Risk Category (Table 4-
1)
1012 Atlas Tract 6.16E-03
185 Atlas Tract East 5.53E-04
Bacon_Island 0.000 15 Bacon Island 5.12E-02 1 5 0.000 3
Bethel_Island 11.100 10 Bethel Island 6.96E-02 4 5 0.108 5
Bishop_Tract 19.425 1013 Bishop Tract 1.98E-02 4 3 0.054 4
Boggs_Tract 90.650 159 Boggs Tract 1.82E-02 5 3 0.231 5
Bouldin_Island 0.925 177 Bouldin Island 4.65E-02 2 4 0.006 3
Brack_Tract 0.925 176 Brack Tract 6.01E-02 2 5 0.008 4
Bradford_Island 0.925 6 Bradford Island 4.45E-02 2 4 0.006 3
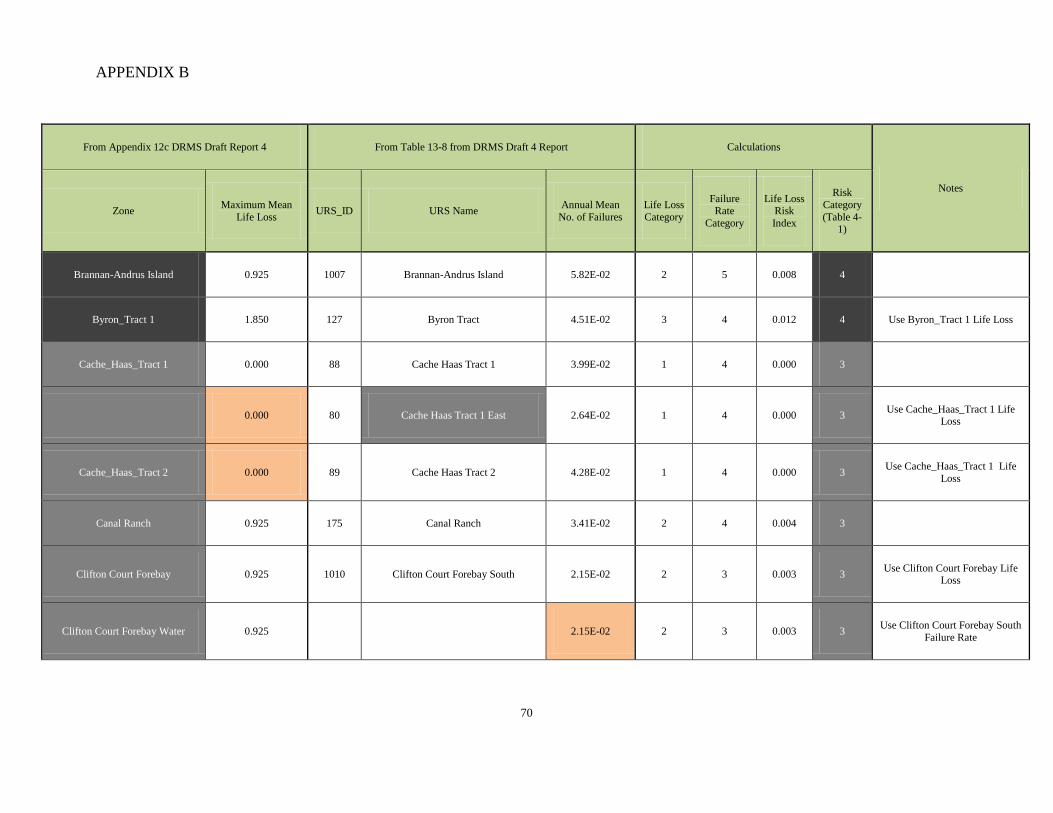
APPENDIX B
70
From Appendix 12c DRMS Draft Report 4 From Table 13-8 from DRMS Draft 4 Report Calculations
Notes
Zone Maximum Mean Life Loss URS_ID URS Name Annual Mean
No. of Failures Life Loss Category
Failure Rate
Category
Life Loss Risk Index
Risk Category (Table 4-
1)
Brannan-Andrus Island 0.925 1007 Brannan-Andrus Island 5.82E-02 2 5 0.008 4
Byron_Tract 1 1.850 127 Byron Tract 4.51E-02 3 4 0.012 4 Use Byron_Tract 1 Life Loss
Cache_Haas_Tract 1 0.000 88 Cache Haas Tract 1 3.99E-02 1 4 0.000 3
0.000 80 Cache Haas Tract 1 East 2.64E-02 1 4 0.000 3 Use Cache_Haas_Tract 1 Life Loss
Cache_Haas_Tract 2 0.000 89 Cache Haas Tract 2 4.28E-02 1 4 0.000 3 Use Cache_Haas_Tract 1 Life Loss
Canal Ranch 0.925 175 Canal Ranch 3.41E-02 2 4 0.004 3
Clifton Court Forebay 0.925 1010 Clifton Court Forebay South 2.15E-02 2 3 0.003 3 Use Clifton Court Forebay Life Loss
Clifton Court Forebay Water 0.925 2.15E-02 2 3 0.003 3 Use Clifton Court Forebay South Failure Rate
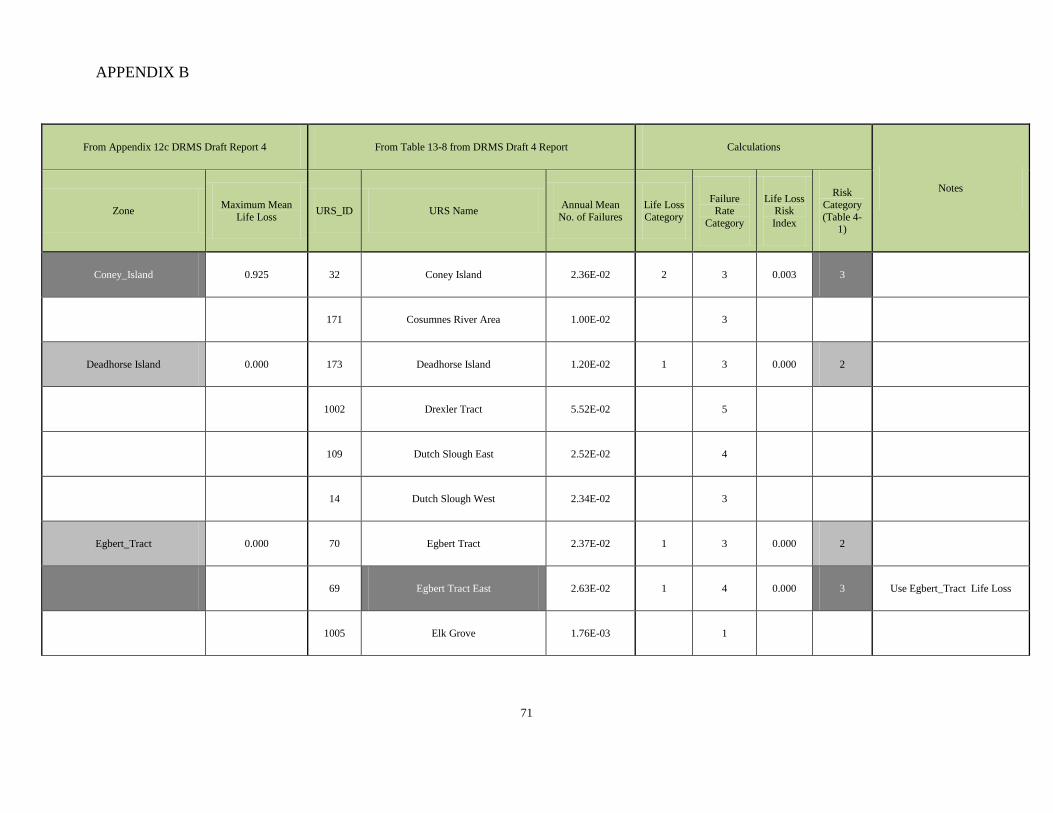
APPENDIX B
71
From Appendix 12c DRMS Draft Report 4 From Table 13-8 from DRMS Draft 4 Report Calculations
Notes
Zone Maximum Mean Life Loss URS_ID URS Name Annual Mean
No. of Failures Life Loss Category
Failure Rate
Category
Life Loss Risk Index
Risk Category (Table 4-
1)
Coney_Island 0.925 32 Coney Island 2.36E-02 2 3 0.003 3
171 Cosumnes River Area 1.00E-02 3
Deadhorse Island 0.000 173 Deadhorse Island 1.20E-02 1 3 0.000 2
1002 Drexler Tract 5.52E-02 5
109 Dutch Slough East 2.52E-02 4
14 Dutch Slough West 2.34E-02 3
Egbert_Tract 0.000 70 Egbert Tract 2.37E-02 1 3 0.000 2
69 Egbert Tract East 2.63E-02 1 4 0.000 3 Use Egbert_Tract Life Loss
1005 Elk Grove 1.76E-03 1
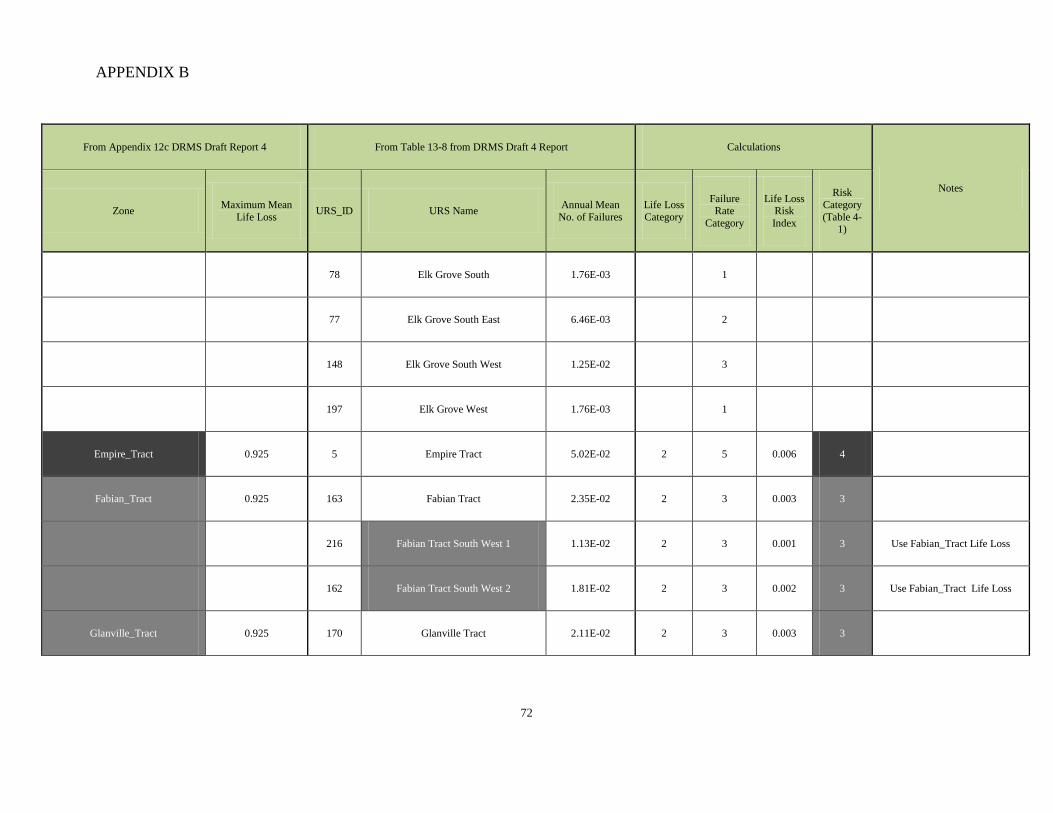
APPENDIX B
72
From Appendix 12c DRMS Draft Report 4 From Table 13-8 from DRMS Draft 4 Report Calculations
Notes
Zone Maximum Mean Life Loss URS_ID URS Name Annual Mean
No. of Failures Life Loss Category
Failure Rate
Category
Life Loss Risk Index
Risk Category (Table 4-
1)
78 Elk Grove South 1.76E-03 1
77 Elk Grove South East 6.46E-03 2
148 Elk Grove South West 1.25E-02 3
197 Elk Grove West 1.76E-03 1
Empire_Tract 0.925 5 Empire Tract 5.02E-02 2 5 0.006 4
Fabian_Tract 0.925 163 Fabian Tract 2.35E-02 2 3 0.003 3
216 Fabian Tract South West 1 1.13E-02 2 3 0.001 3 Use Fabian_Tract Life Loss
162 Fabian Tract South West 2 1.81E-02 2 3 0.002 3 Use Fabian_Tract Life Loss
Glanville_Tract 0.925 170 Glanville Tract 2.11E-02 2 3 0.003 3
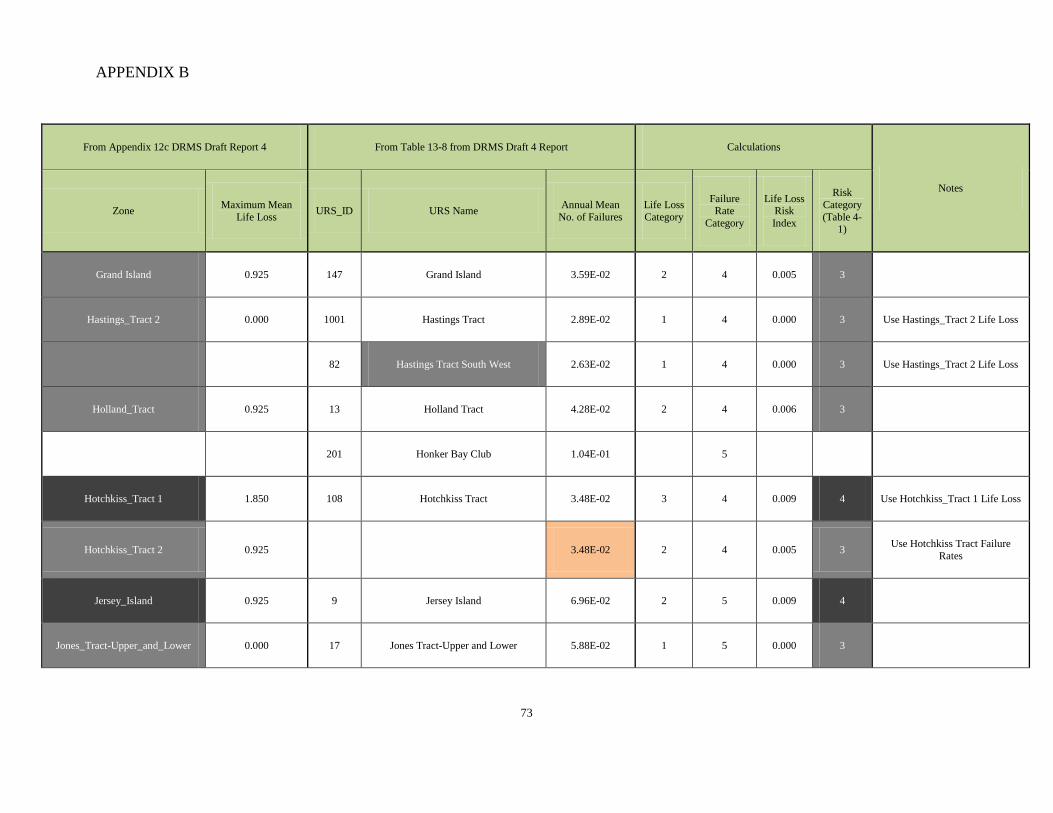
APPENDIX B
73
From Appendix 12c DRMS Draft Report 4 From Table 13-8 from DRMS Draft 4 Report Calculations
Notes
Zone Maximum Mean Life Loss URS_ID URS Name Annual Mean
No. of Failures Life Loss Category
Failure Rate
Category
Life Loss Risk Index
Risk Category (Table 4-
1)
Grand Island 0.925 147 Grand Island 3.59E-02 2 4 0.005 3
Hastings_Tract 2 0.000 1001 Hastings Tract 2.89E-02 1 4 0.000 3 Use Hastings_Tract 2 Life Loss
82 Hastings Tract South West 2.63E-02 1 4 0.000 3 Use Hastings_Tract 2 Life Loss
Holland_Tract 0.925 13 Holland Tract 4.28E-02 2 4 0.006 3
201 Honker Bay Club 1.04E-01 5
Hotchkiss_Tract 1 1.850 108 Hotchkiss Tract 3.48E-02 3 4 0.009 4 Use Hotchkiss_Tract 1 Life Loss
Hotchkiss_Tract 2 0.925 3.48E-02 2 4 0.005 3 Use Hotchkiss Tract Failure Rates
Jersey_Island 0.925 9 Jersey Island 6.96E-02 2 5 0.009 4
Jones_Tract-Upper_and_Lower 0.000 17 Jones Tract-Upper and Lower 5.88E-02 1 5 0.000 3
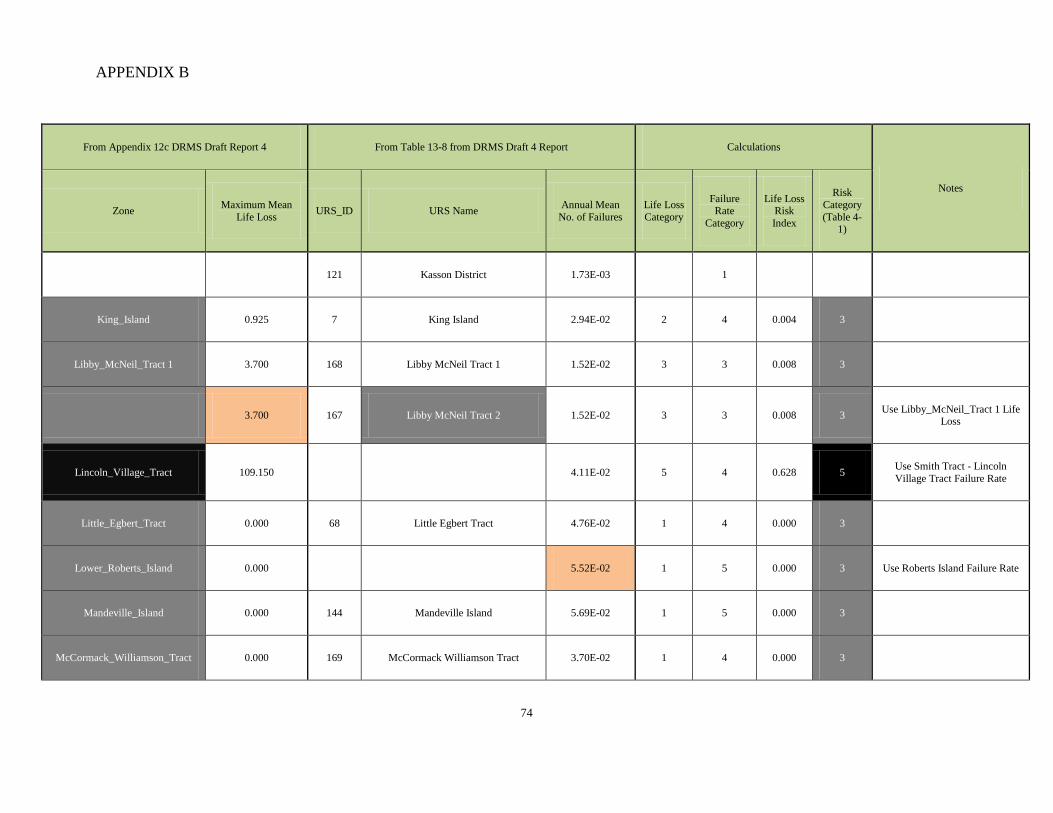
APPENDIX B
74
From Appendix 12c DRMS Draft Report 4 From Table 13-8 from DRMS Draft 4 Report Calculations
Notes
Zone Maximum Mean Life Loss URS_ID URS Name Annual Mean
No. of Failures Life Loss Category
Failure Rate
Category
Life Loss Risk Index
Risk Category (Table 4-
1)
121 Kasson District 1.73E-03 1
King_Island 0.925 7 King Island 2.94E-02 2 4 0.004 3
Libby_McNeil_Tract 1 3.700 168 Libby McNeil Tract 1 1.52E-02 3 3 0.008 3
3.700 167 Libby McNeil Tract 2 1.52E-02 3 3 0.008 3 Use Libby_McNeil_Tract 1 Life Loss
Lincoln_Village_Tract 109.150 4.11E-02 5 4 0.628 5 Use Smith Tract - Lincoln Village Tract Failure Rate
Little_Egbert_Tract 0.000 68 Little Egbert Tract 4.76E-02 1 4 0.000 3
Lower_Roberts_Island 0.000 5.52E-02 1 5 0.000 3 Use Roberts Island Failure Rate
Mandeville_Island 0.000 144 Mandeville Island 5.69E-02 1 5 0.000 3
McCormack_Williamson_Tract 0.000 169 McCormack Williamson Tract 3.70E-02 1 4 0.000 3
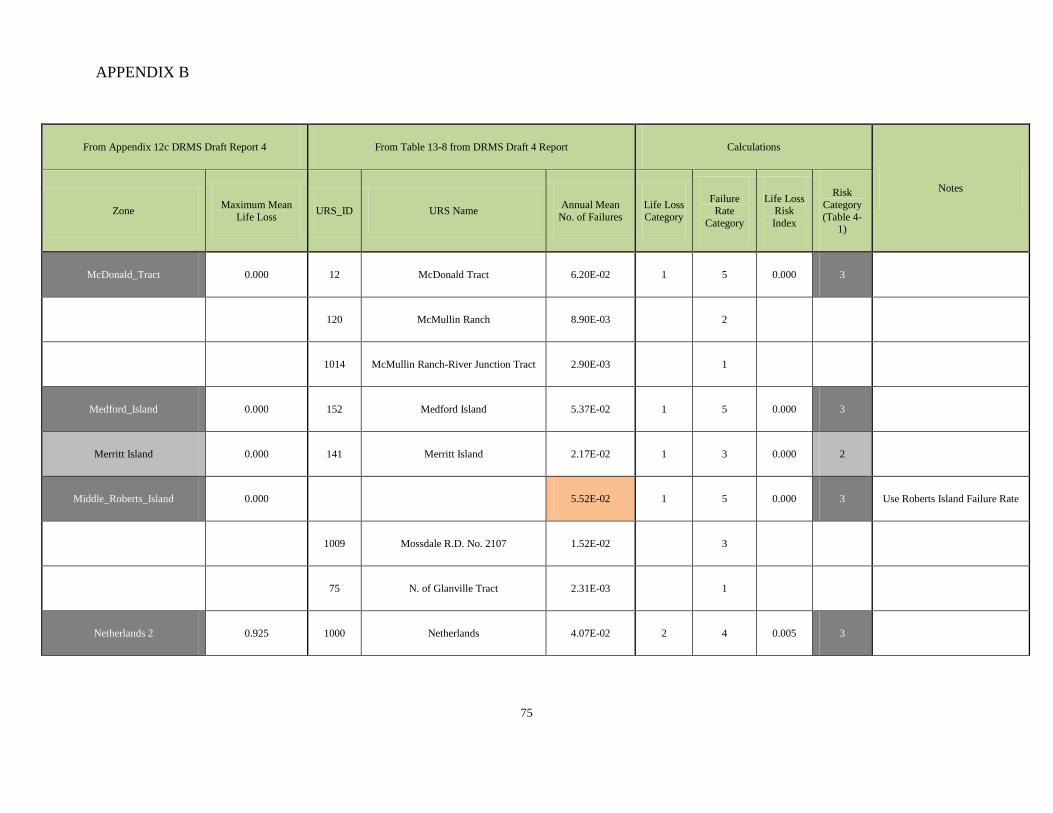
APPENDIX B
75
From Appendix 12c DRMS Draft Report 4 From Table 13-8 from DRMS Draft 4 Report Calculations
Notes
Zone Maximum Mean Life Loss URS_ID URS Name Annual Mean
No. of Failures Life Loss Category
Failure Rate
Category
Life Loss Risk Index
Risk Category (Table 4-
1)
McDonald_Tract 0.000 12 McDonald Tract 6.20E-02 1 5 0.000 3
120 McMullin Ranch 8.90E-03 2
1014 McMullin Ranch-River Junction Tract 2.90E-03 1
Medford_Island 0.000 152 Medford Island 5.37E-02 1 5 0.000 3
Merritt Island 0.000 141 Merritt Island 2.17E-02 1 3 0.000 2
Middle_Roberts_Island 0.000 5.52E-02 1 5 0.000 3 Use Roberts Island Failure Rate
1009 Mossdale R.D. No. 2107 1.52E-02 3
75 N. of Glanville Tract 2.31E-03 1
Netherlands 2 0.925 1000 Netherlands 4.07E-02 2 4 0.005 3
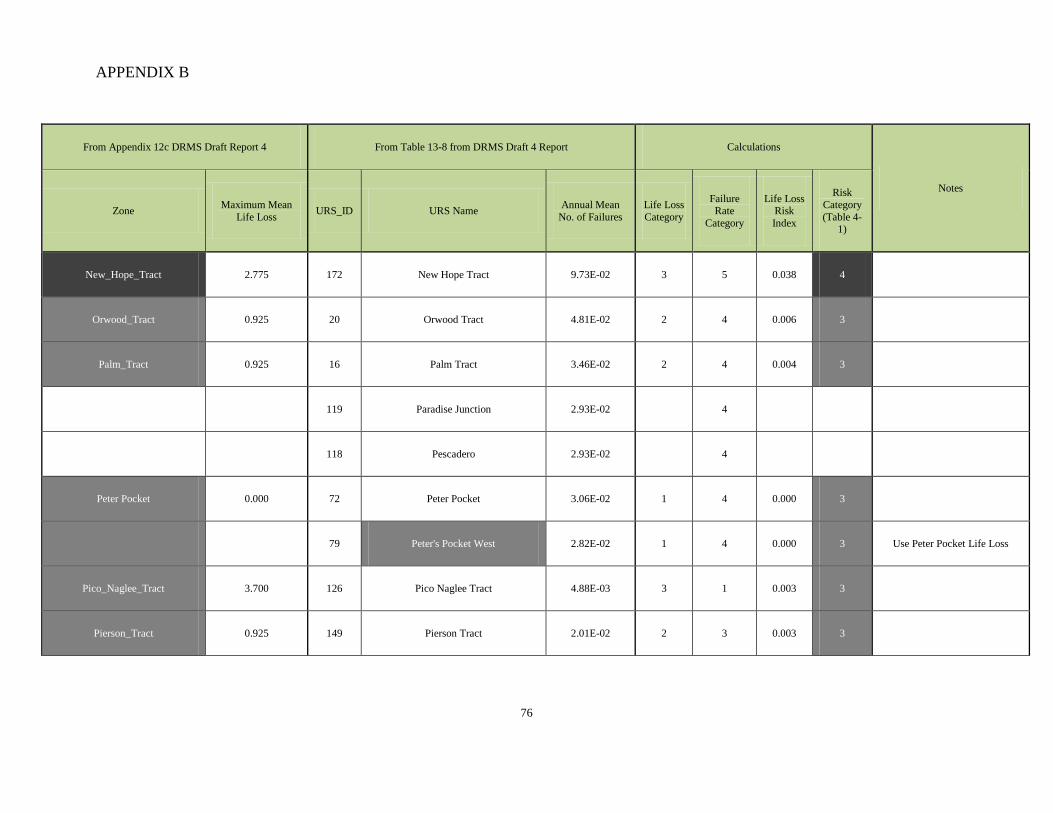
APPENDIX B
76
From Appendix 12c DRMS Draft Report 4 From Table 13-8 from DRMS Draft 4 Report Calculations
Notes
Zone Maximum Mean Life Loss URS_ID URS Name Annual Mean
No. of Failures Life Loss Category
Failure Rate
Category
Life Loss Risk Index
Risk Category (Table 4-
1)
New_Hope_Tract 2.775 172 New Hope Tract 9.73E-02 3 5 0.038 4
Orwood_Tract 0.925 20 Orwood Tract 4.81E-02 2 4 0.006 3
Palm_Tract 0.925 16 Palm Tract 3.46E-02 2 4 0.004 3
119 Paradise Junction 2.93E-02 4
118 Pescadero 2.93E-02 4
Peter Pocket 0.000 72 Peter Pocket 3.06E-02 1 4 0.000 3
79 Peter's Pocket West 2.82E-02 1 4 0.000 3 Use Peter Pocket Life Loss
Pico_Naglee_Tract 3.700 126 Pico Naglee Tract 4.88E-03 3 1 0.003 3
Pierson_Tract 0.925 149 Pierson Tract 2.01E-02 2 3 0.003 3
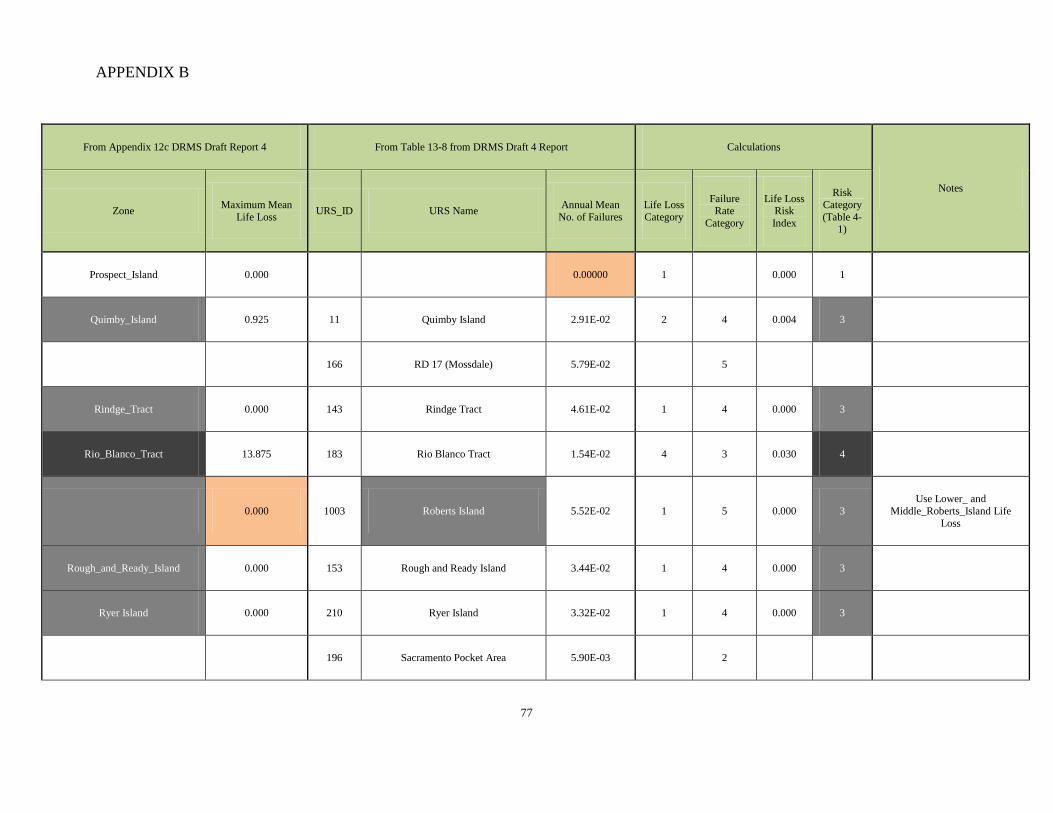
APPENDIX B
77
From Appendix 12c DRMS Draft Report 4 From Table 13-8 from DRMS Draft 4 Report Calculations
Notes
Zone Maximum Mean Life Loss URS_ID URS Name Annual Mean
No. of Failures Life Loss Category
Failure Rate
Category
Life Loss Risk Index
Risk Category (Table 4-
1)
Prospect_Island 0.000 0.00000 1 0.000 1
Quimby_Island 0.925 11 Quimby Island 2.91E-02 2 4 0.004 3
166 RD 17 (Mossdale) 5.79E-02 5
Rindge_Tract 0.000 143 Rindge Tract 4.61E-02 1 4 0.000 3
Rio_Blanco_Tract 13.875 183 Rio Blanco Tract 1.54E-02 4 3 0.030 4
0.000 1003 Roberts Island 5.52E-02 1 5 0.000 3 Use Lower_ and
Middle_Roberts_Island Life Loss
Rough_and_Ready_Island 0.000 153 Rough and Ready Island 3.44E-02 1 4 0.000 3
Ryer Island 0.000 210 Ryer Island 3.32E-02 1 4 0.000 3
196 Sacramento Pocket Area 5.90E-03 2
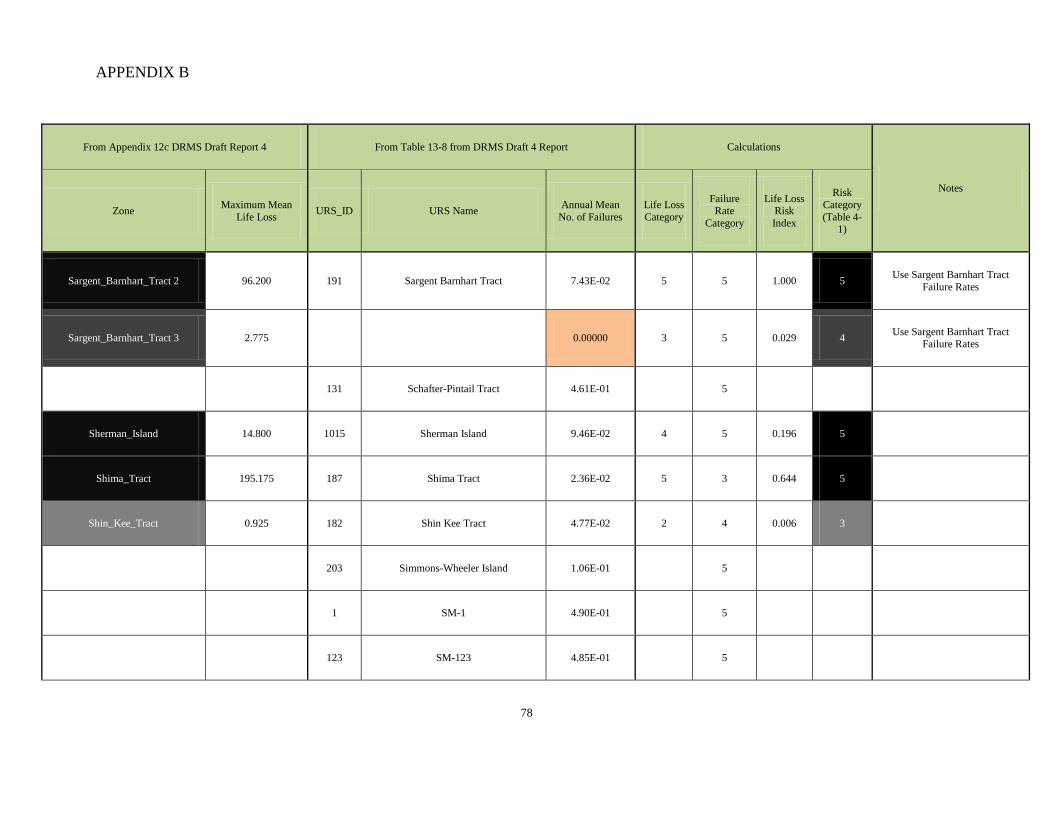
APPENDIX B
78
From Appendix 12c DRMS Draft Report 4 From Table 13-8 from DRMS Draft 4 Report Calculations
Notes
Zone Maximum Mean Life Loss URS_ID URS Name Annual Mean
No. of Failures Life Loss Category
Failure Rate
Category
Life Loss Risk Index
Risk Category (Table 4-
1)
Sargent_Barnhart_Tract 2 96.200 191 Sargent Barnhart Tract 7.43E-02 5 5 1.000 5 Use Sargent Barnhart Tract Failure Rates
Sargent_Barnhart_Tract 3 2.775 0.00000 3 5 0.029 4 Use Sargent Barnhart Tract Failure Rates
131 Schafter-Pintail Tract 4.61E-01 5
Sherman_Island 14.800 1015 Sherman Island 9.46E-02 4 5 0.196 5
Shima_Tract 195.175 187 Shima Tract 2.36E-02 5 3 0.644 5
Shin_Kee_Tract 0.925 182 Shin Kee Tract 4.77E-02 2 4 0.006 3
203 Simmons-Wheeler Island 1.06E-01 5
1 SM-1 4.90E-01 5
123 SM-123 4.85E-01 5
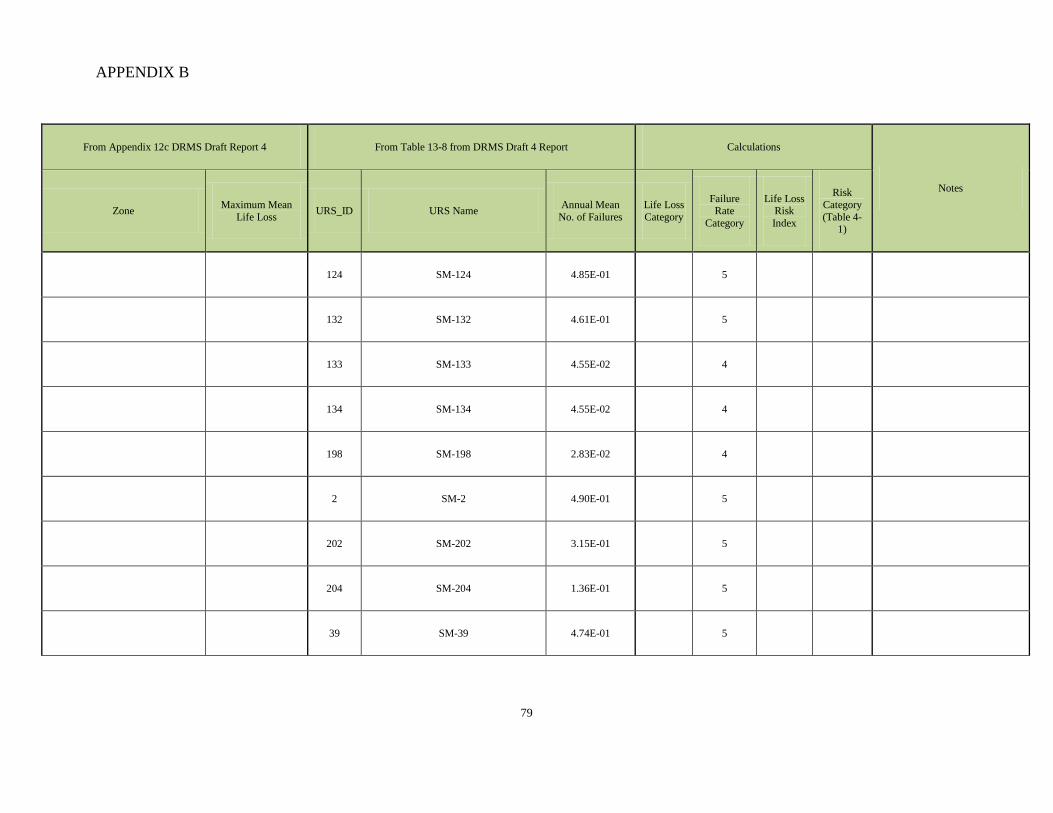
APPENDIX B
79
From Appendix 12c DRMS Draft Report 4 From Table 13-8 from DRMS Draft 4 Report Calculations
Notes
Zone Maximum Mean Life Loss URS_ID URS Name Annual Mean
No. of Failures Life Loss Category
Failure Rate
Category
Life Loss Risk Index
Risk Category (Table 4-
1)
124 SM-124 4.85E-01 5
132 SM-132 4.61E-01 5
133 SM-133 4.55E-02 4
134 SM-134 4.55E-02 4
198 SM-198 2.83E-02 4
2 SM-2 4.90E-01 5
202 SM-202 3.15E-01 5
204 SM-204 1.36E-01 5
39 SM-39 4.74E-01 5

APPENDIX B
80
From Appendix 12c DRMS Draft Report 4 From Table 13-8 from DRMS Draft 4 Report Calculations
Notes
Zone Maximum Mean Life Loss URS_ID URS Name Annual Mean
No. of Failures Life Loss Category
Failure Rate
Category
Life Loss Risk Index
Risk Category (Table 4-
1)
40 SM-40 3.80E-01 5
41 SM-41 5.01E-01 5
42 SM-42 4.78E-01 5
43 SM-43 3.04E-02 4
44 SM-44 8.18E-02 5
45 SM-45 5.96E-02 5
46 SM-46 3.15E-01 5
47 SM-47 6.01E-02 5
48 SM-48 1.08E-01 5
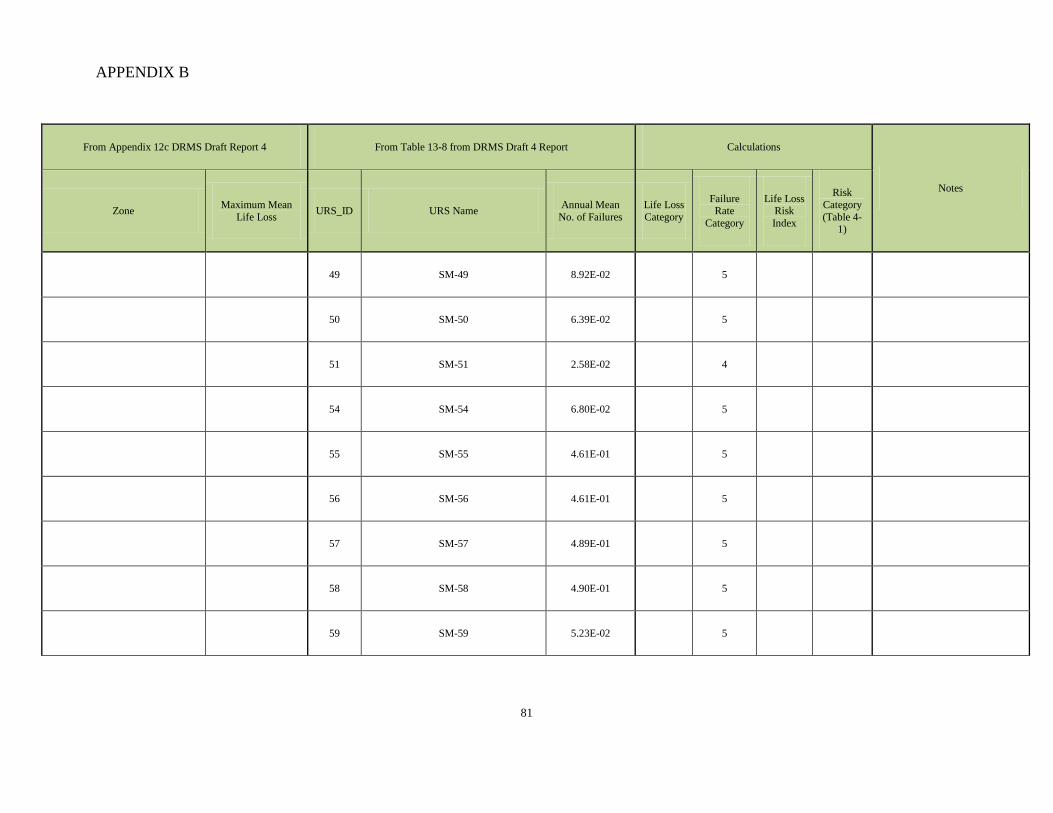
APPENDIX B
81
From Appendix 12c DRMS Draft Report 4 From Table 13-8 from DRMS Draft 4 Report Calculations
Notes
Zone Maximum Mean Life Loss URS_ID URS Name Annual Mean
No. of Failures Life Loss Category
Failure Rate
Category
Life Loss Risk Index
Risk Category (Table 4-
1)
49 SM-49 8.92E-02 5
50 SM-50 6.39E-02 5
51 SM-51 2.58E-02 4
54 SM-54 6.80E-02 5
55 SM-55 4.61E-01 5
56 SM-56 4.61E-01 5
57 SM-57 4.89E-01 5
58 SM-58 4.90E-01 5
59 SM-59 5.23E-02 5
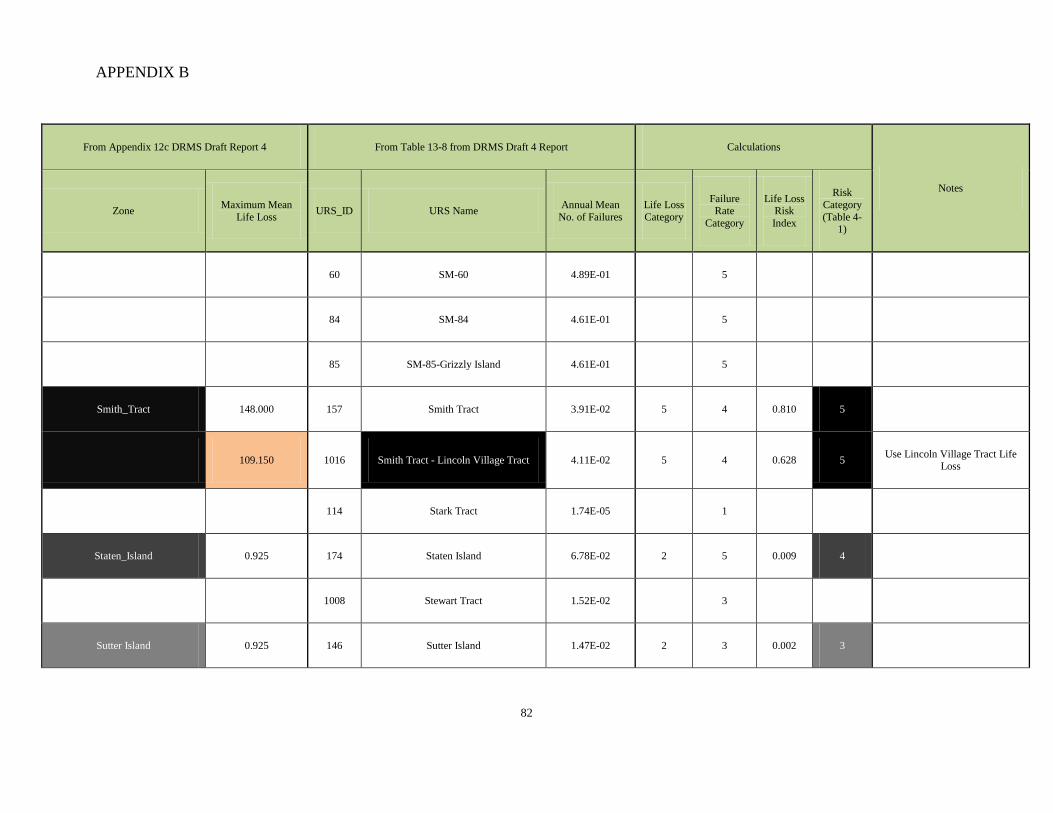
APPENDIX B
82
From Appendix 12c DRMS Draft Report 4 From Table 13-8 from DRMS Draft 4 Report Calculations
Notes
Zone Maximum Mean Life Loss URS_ID URS Name Annual Mean
No. of Failures Life Loss Category
Failure Rate
Category
Life Loss Risk Index
Risk Category (Table 4-
1)
60 SM-60 4.89E-01 5
84 SM-84 4.61E-01 5
85 SM-85-Grizzly Island 4.61E-01 5
Smith_Tract 148.000 157 Smith Tract 3.91E-02 5 4 0.810 5
109.150 1016 Smith Tract - Lincoln Village Tract 4.11E-02 5 4 0.628 5 Use Lincoln Village Tract Life Loss
114 Stark Tract 1.74E-05 1
Staten_Island 0.925 174 Staten Island 6.78E-02 2 5 0.009 4
1008 Stewart Tract 1.52E-02 3
Sutter Island 0.925 146 Sutter Island 1.47E-02 2 3 0.002 3
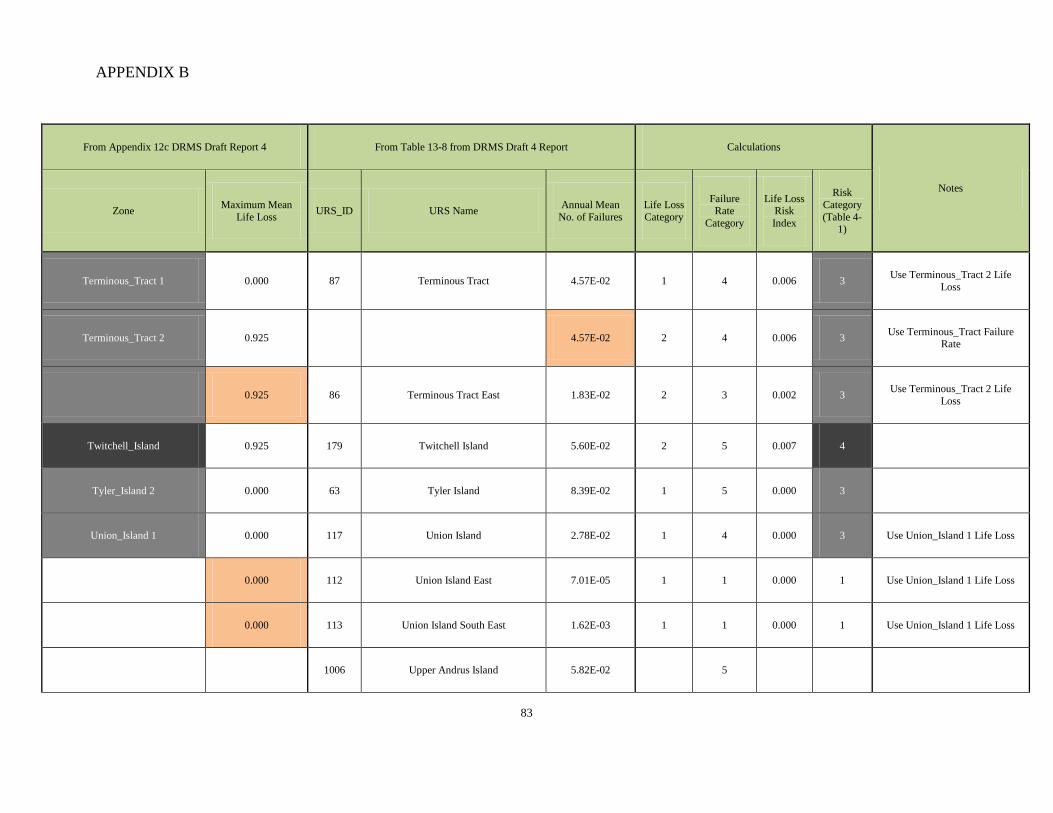
APPENDIX B
83
From Appendix 12c DRMS Draft Report 4 From Table 13-8 from DRMS Draft 4 Report Calculations
Notes
Zone Maximum Mean Life Loss URS_ID URS Name Annual Mean
No. of Failures Life Loss Category
Failure Rate
Category
Life Loss Risk Index
Risk Category (Table 4-
1)
Terminous_Tract 1 0.000 87 Terminous Tract 4.57E-02 1 4 0.006 3 Use Terminous_Tract 2 Life Loss
Terminous_Tract 2 0.925 4.57E-02 2 4 0.006 3 Use Terminous_Tract Failure Rate
0.925 86 Terminous Tract East 1.83E-02 2 3 0.002 3 Use Terminous_Tract 2 Life Loss
Twitchell_Island 0.925 179 Twitchell Island 5.60E-02 2 5 0.007 4
Tyler_Island 2 0.000 63 Tyler Island 8.39E-02 1 5 0.000 3
Union_Island 1 0.000 117 Union Island 2.78E-02 1 4 0.000 3 Use Union_Island 1 Life Loss
0.000 112 Union Island East 7.01E-05 1 1 0.000 1 Use Union_Island 1 Life Loss
0.000 113 Union Island South East 1.62E-03 1 1 0.000 1 Use Union_Island 1 Life Loss
1006 Upper Andrus Island 5.82E-02 5
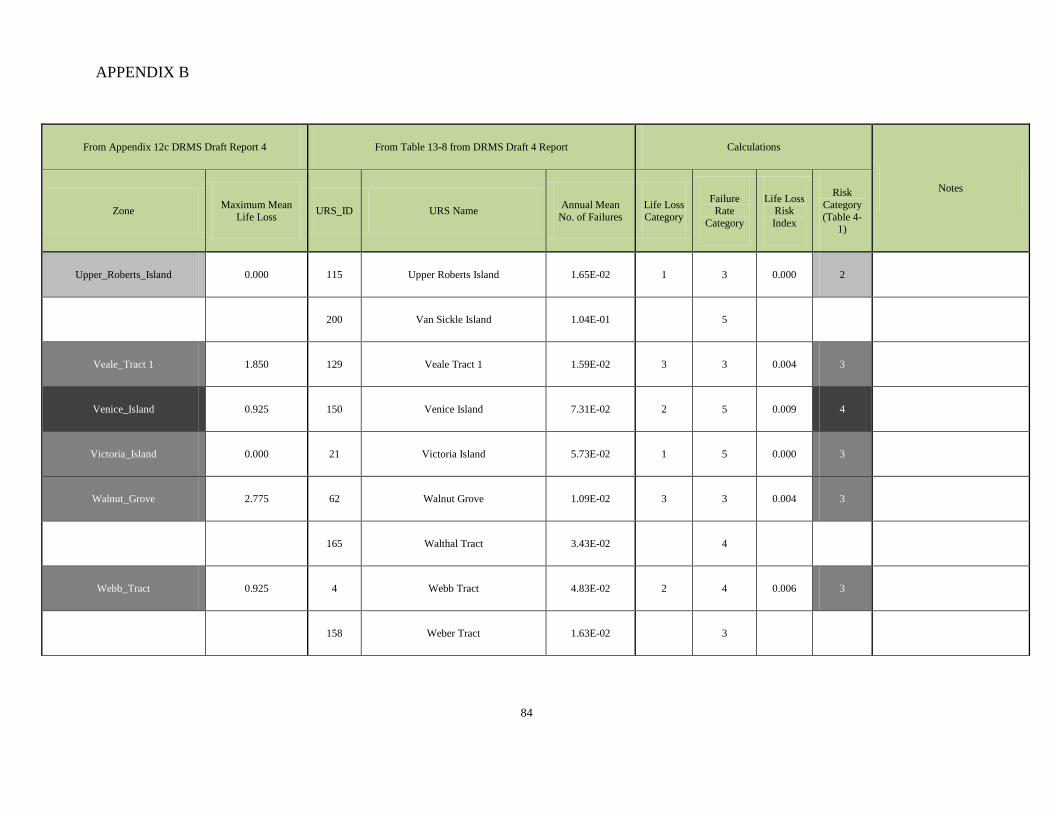
APPENDIX B
84
From Appendix 12c DRMS Draft Report 4 From Table 13-8 from DRMS Draft 4 Report Calculations
Notes
Zone Maximum Mean Life Loss URS_ID URS Name Annual Mean
No. of Failures Life Loss Category
Failure Rate
Category
Life Loss Risk Index
Risk Category (Table 4-
1)
Upper_Roberts_Island 0.000 115 Upper Roberts Island 1.65E-02 1 3 0.000 2
200 Van Sickle Island 1.04E-01 5
Veale_Tract 1 1.850 129 Veale Tract 1 1.59E-02 3 3 0.004 3
Venice_Island 0.925 150 Venice Island 7.31E-02 2 5 0.009 4
Victoria_Island 0.000 21 Victoria Island 5.73E-02 1 5 0.000 3
Walnut_Grove 2.775 62 Walnut Grove 1.09E-02 3 3 0.004 3
165 Walthal Tract 3.43E-02 4
Webb_Tract 0.925 4 Webb Tract 4.83E-02 2 4 0.006 3
158 Weber Tract 1.63E-02 3
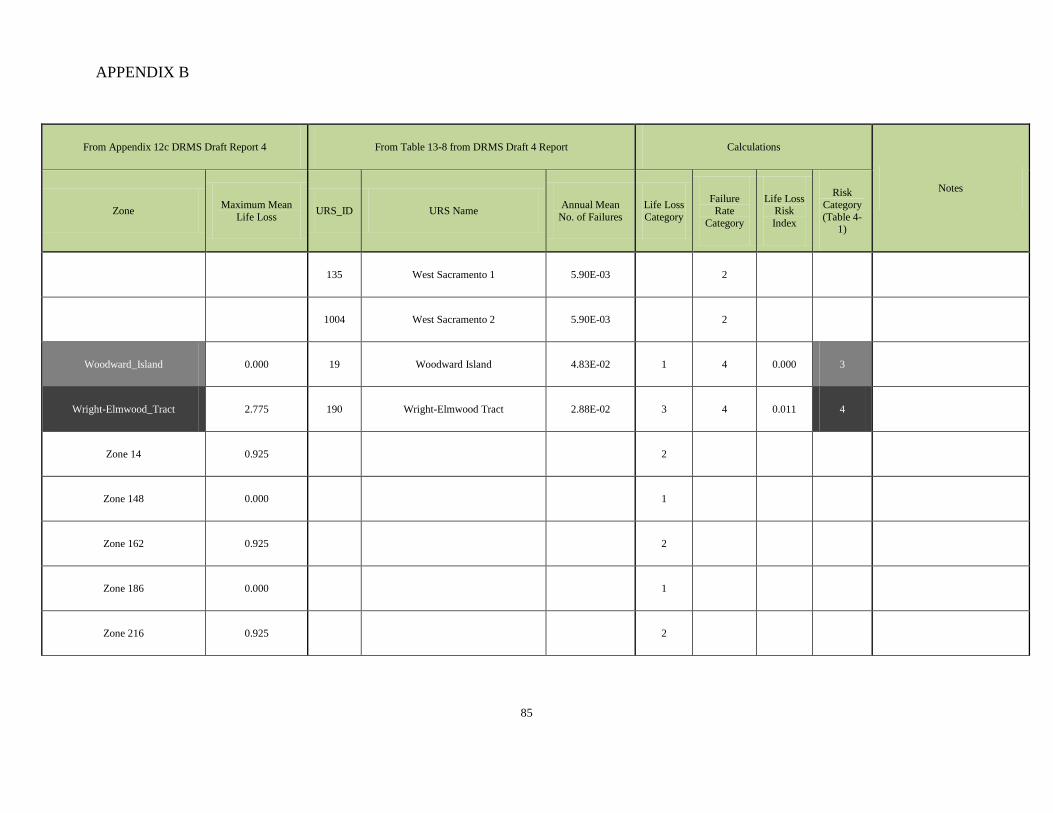
APPENDIX B
85
From Appendix 12c DRMS Draft Report 4 From Table 13-8 from DRMS Draft 4 Report Calculations
Notes
Zone Maximum Mean Life Loss URS_ID URS Name Annual Mean
No. of Failures Life Loss Category
Failure Rate
Category
Life Loss Risk Index
Risk Category (Table 4-
1)
135 West Sacramento 1 5.90E-03 2
1004 West Sacramento 2 5.90E-03 2
Woodward_Island 0.000 19 Woodward Island 4.83E-02 1 4 0.000 3
Wright-Elmwood_Tract 2.775 190 Wright-Elmwood Tract 2.88E-02 3 4 0.011 4
Zone 14 0.925 2
Zone 148 0.000 1
Zone 162 0.925 2
Zone 186 0.000 1
Zone 216 0.925 2
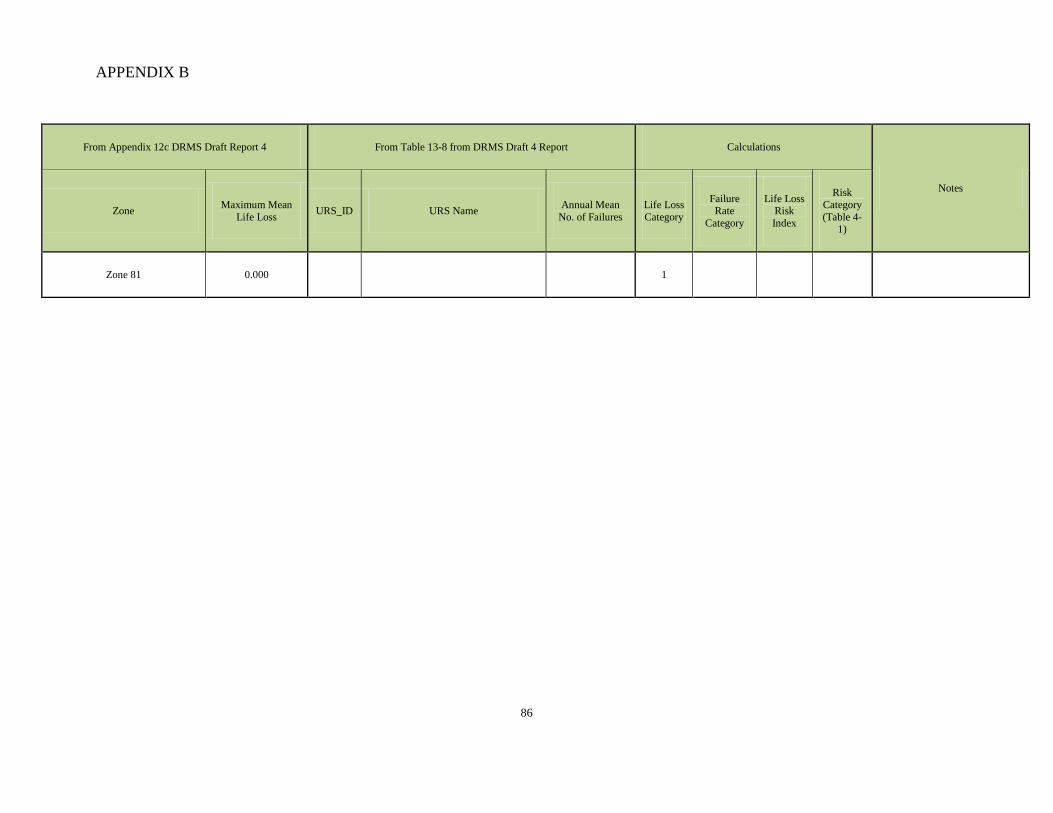
APPENDIX B
86
From Appendix 12c DRMS Draft Report 4 From Table 13-8 from DRMS Draft 4 Report Calculations
Notes
Zone Maximum Mean Life Loss URS_ID URS Name Annual Mean
No. of Failures Life Loss Category
Failure Rate
Category
Life Loss Risk Index
Risk Category (Table 4-
1)
Zone 81 0.000 1
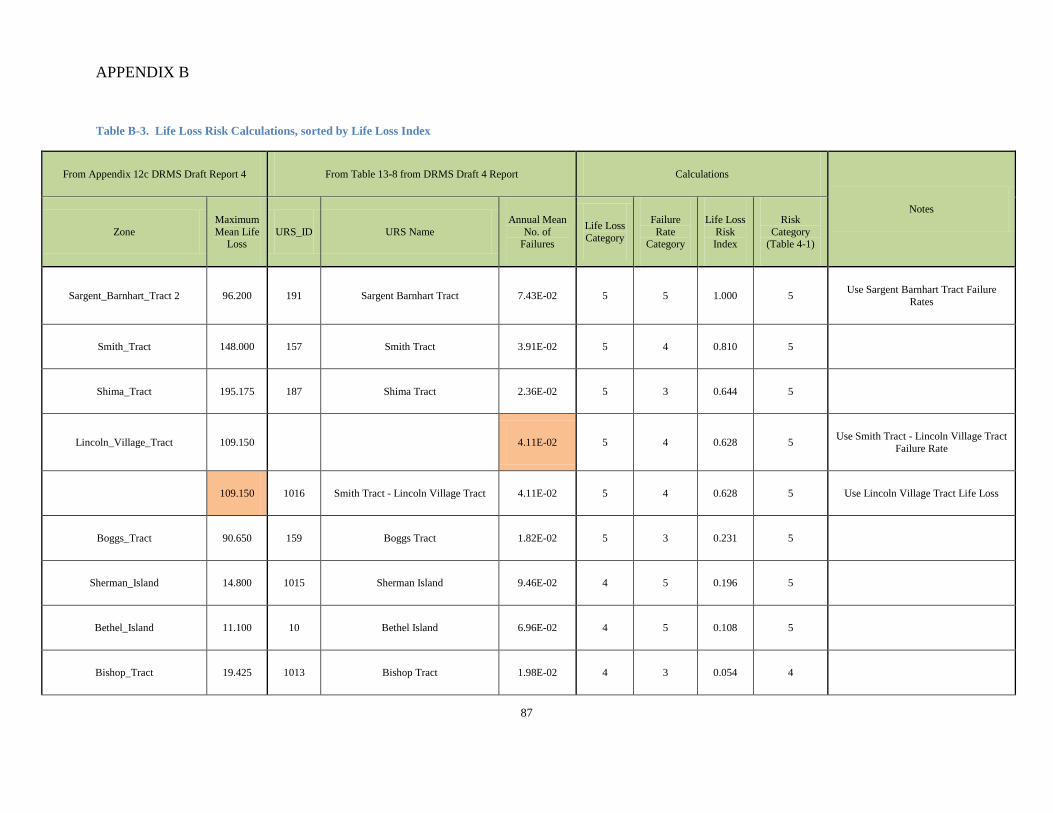
APPENDIX B
87
Table B-3. Life Loss Risk Calculations, sorted by Life Loss Index
From Appendix 12c DRMS Draft Report 4 From Table 13-8 from DRMS Draft 4 Report Calculations
Notes
Zone Maximum Mean Life
Loss URS_ID URS Name
Annual Mean No. of
Failures
Life Loss Category
Failure Rate
Category
Life Loss Risk Index
Risk Category
(Table 4-1)
Sargent_Barnhart_Tract 2 96.200 191 Sargent Barnhart Tract 7.43E-02 5 5 1.000 5 Use Sargent Barnhart Tract Failure Rates
Smith_Tract 148.000 157 Smith Tract 3.91E-02 5 4 0.810 5
Shima_Tract 195.175 187 Shima Tract 2.36E-02 5 3 0.644 5
Lincoln_Village_Tract 109.150 4.11E-02 5 4 0.628 5 Use Smith Tract - Lincoln Village Tract Failure Rate
109.150 1016 Smith Tract - Lincoln Village Tract 4.11E-02 5 4 0.628 5 Use Lincoln Village Tract Life Loss
Boggs_Tract 90.650 159 Boggs Tract 1.82E-02 5 3 0.231 5
Sherman_Island 14.800 1015 Sherman Island 9.46E-02 4 5 0.196 5
Bethel_Island 11.100 10 Bethel Island 6.96E-02 4 5 0.108 5
Bishop_Tract 19.425 1013 Bishop Tract 1.98E-02 4 3 0.054 4
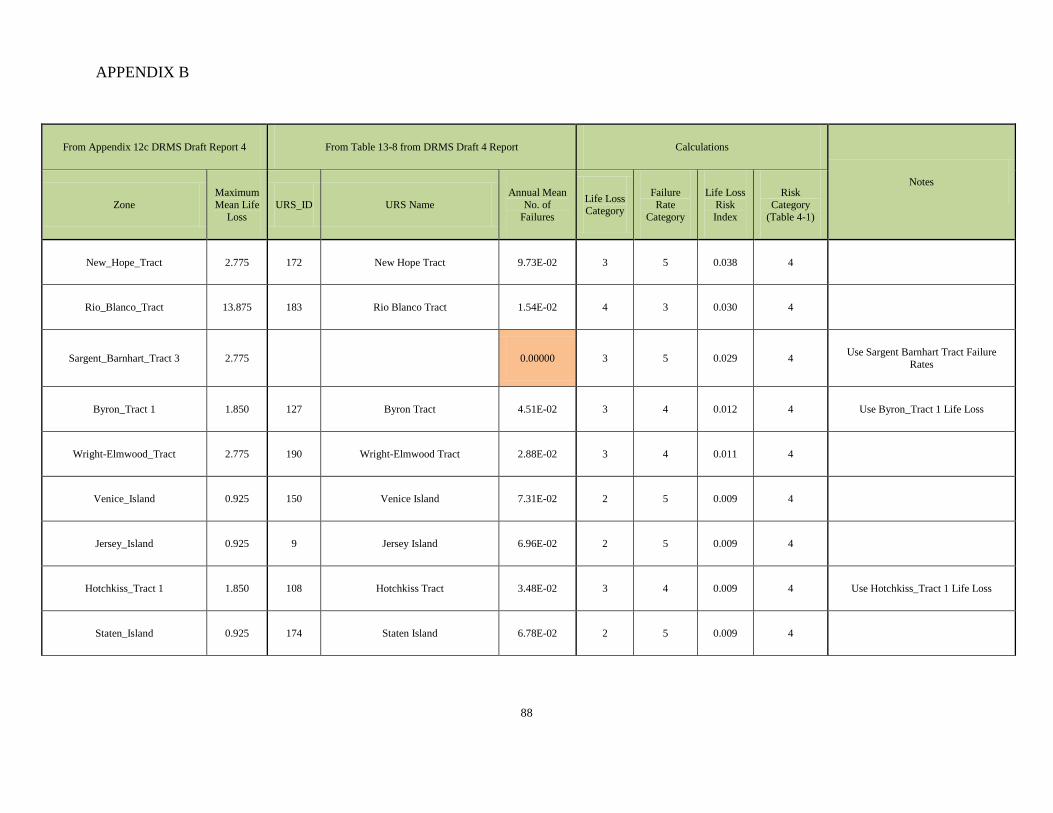
APPENDIX B
88
From Appendix 12c DRMS Draft Report 4 From Table 13-8 from DRMS Draft 4 Report Calculations
Notes
Zone Maximum Mean Life
Loss URS_ID URS Name
Annual Mean No. of
Failures
Life Loss Category
Failure Rate
Category
Life Loss Risk Index
Risk Category
(Table 4-1)
New_Hope_Tract 2.775 172 New Hope Tract 9.73E-02 3 5 0.038 4
Rio_Blanco_Tract 13.875 183 Rio Blanco Tract 1.54E-02 4 3 0.030 4
Sargent_Barnhart_Tract 3 2.775 0.00000 3 5 0.029 4 Use Sargent Barnhart Tract Failure Rates
Byron_Tract 1 1.850 127 Byron Tract 4.51E-02 3 4 0.012 4 Use Byron_Tract 1 Life Loss
Wright-Elmwood_Tract 2.775 190 Wright-Elmwood Tract 2.88E-02 3 4 0.011 4
Venice_Island 0.925 150 Venice Island 7.31E-02 2 5 0.009 4
Jersey_Island 0.925 9 Jersey Island 6.96E-02 2 5 0.009 4
Hotchkiss_Tract 1 1.850 108 Hotchkiss Tract 3.48E-02 3 4 0.009 4 Use Hotchkiss_Tract 1 Life Loss
Staten_Island 0.925 174 Staten Island 6.78E-02 2 5 0.009 4
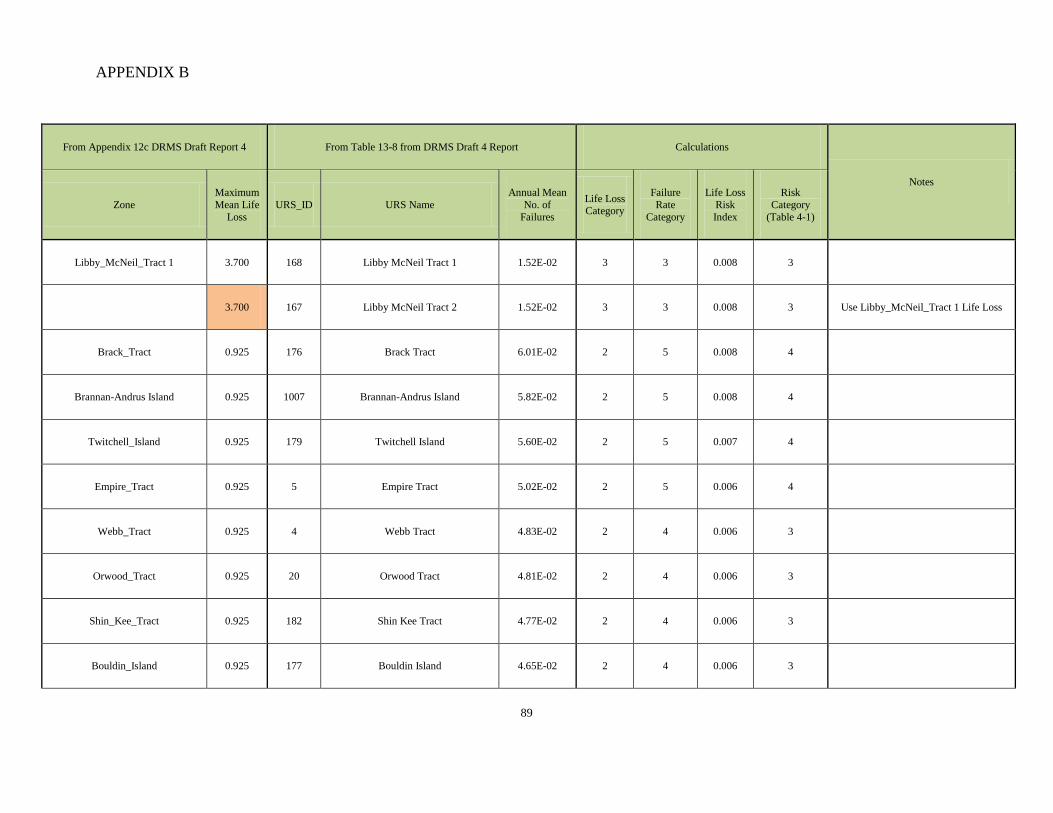
APPENDIX B
89
From Appendix 12c DRMS Draft Report 4 From Table 13-8 from DRMS Draft 4 Report Calculations
Notes
Zone Maximum Mean Life
Loss URS_ID URS Name
Annual Mean No. of
Failures
Life Loss Category
Failure Rate
Category
Life Loss Risk Index
Risk Category
(Table 4-1)
Libby_McNeil_Tract 1 3.700 168 Libby McNeil Tract 1 1.52E-02 3 3 0.008 3
3.700 167 Libby McNeil Tract 2 1.52E-02 3 3 0.008 3 Use Libby_McNeil_Tract 1 Life Loss
Brack_Tract 0.925 176 Brack Tract 6.01E-02 2 5 0.008 4
Brannan-Andrus Island 0.925 1007 Brannan-Andrus Island 5.82E-02 2 5 0.008 4
Twitchell_Island 0.925 179 Twitchell Island 5.60E-02 2 5 0.007 4
Empire_Tract 0.925 5 Empire Tract 5.02E-02 2 5 0.006 4
Webb_Tract 0.925 4 Webb Tract 4.83E-02 2 4 0.006 3
Orwood_Tract 0.925 20 Orwood Tract 4.81E-02 2 4 0.006 3
Shin_Kee_Tract 0.925 182 Shin Kee Tract 4.77E-02 2 4 0.006 3
Bouldin_Island 0.925 177 Bouldin Island 4.65E-02 2 4 0.006 3
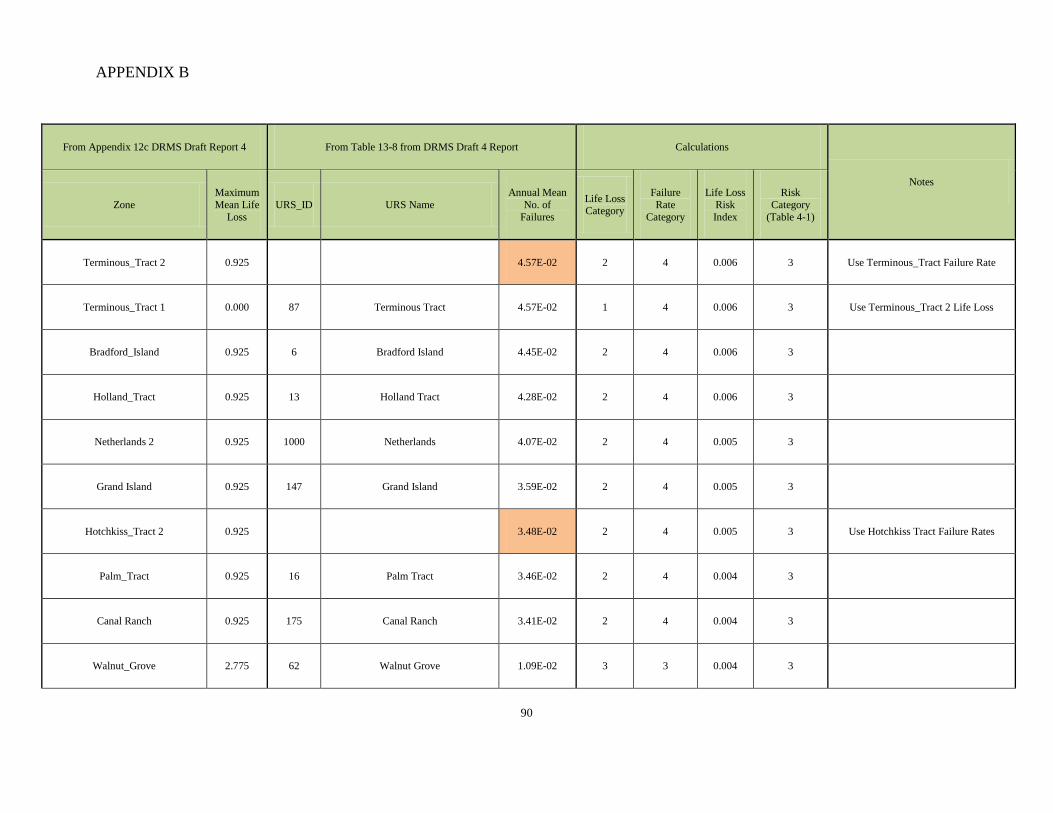
APPENDIX B
90
From Appendix 12c DRMS Draft Report 4 From Table 13-8 from DRMS Draft 4 Report Calculations
Notes
Zone Maximum Mean Life
Loss URS_ID URS Name
Annual Mean No. of
Failures
Life Loss Category
Failure Rate
Category
Life Loss Risk Index
Risk Category
(Table 4-1)
Terminous_Tract 2 0.925 4.57E-02 2 4 0.006 3 Use Terminous_Tract Failure Rate
Terminous_Tract 1 0.000 87 Terminous Tract 4.57E-02 1 4 0.006 3 Use Terminous_Tract 2 Life Loss
Bradford_Island 0.925 6 Bradford Island 4.45E-02 2 4 0.006 3
Holland_Tract 0.925 13 Holland Tract 4.28E-02 2 4 0.006 3
Netherlands 2 0.925 1000 Netherlands 4.07E-02 2 4 0.005 3
Grand Island 0.925 147 Grand Island 3.59E-02 2 4 0.005 3
Hotchkiss_Tract 2 0.925 3.48E-02 2 4 0.005 3 Use Hotchkiss Tract Failure Rates
Palm_Tract 0.925 16 Palm Tract 3.46E-02 2 4 0.004 3
Canal Ranch 0.925 175 Canal Ranch 3.41E-02 2 4 0.004 3
Walnut_Grove 2.775 62 Walnut Grove 1.09E-02 3 3 0.004 3
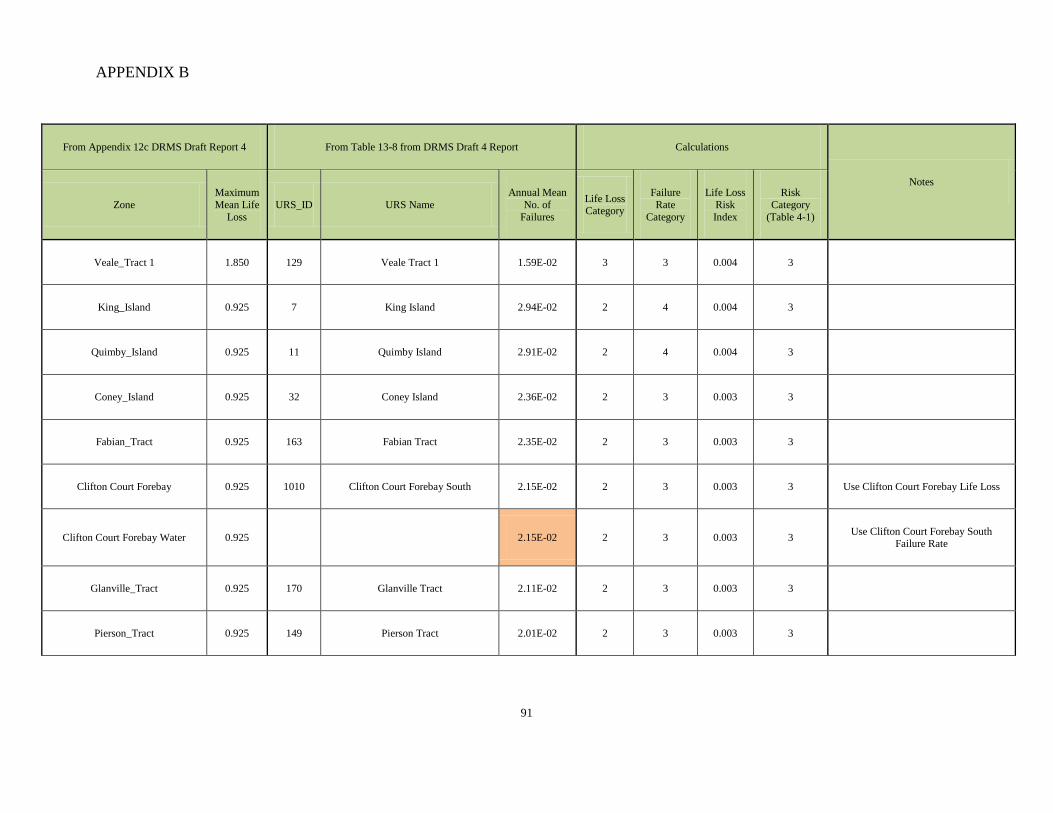
APPENDIX B
91
From Appendix 12c DRMS Draft Report 4 From Table 13-8 from DRMS Draft 4 Report Calculations
Notes
Zone Maximum Mean Life
Loss URS_ID URS Name
Annual Mean No. of
Failures
Life Loss Category
Failure Rate
Category
Life Loss Risk Index
Risk Category
(Table 4-1)
Veale_Tract 1 1.850 129 Veale Tract 1 1.59E-02 3 3 0.004 3
King_Island 0.925 7 King Island 2.94E-02 2 4 0.004 3
Quimby_Island 0.925 11 Quimby Island 2.91E-02 2 4 0.004 3
Coney_Island 0.925 32 Coney Island 2.36E-02 2 3 0.003 3
Fabian_Tract 0.925 163 Fabian Tract 2.35E-02 2 3 0.003 3
Clifton Court Forebay 0.925 1010 Clifton Court Forebay South 2.15E-02 2 3 0.003 3 Use Clifton Court Forebay Life Loss
Clifton Court Forebay Water 0.925 2.15E-02 2 3 0.003 3 Use Clifton Court Forebay South Failure Rate
Glanville_Tract 0.925 170 Glanville Tract 2.11E-02 2 3 0.003 3
Pierson_Tract 0.925 149 Pierson Tract 2.01E-02 2 3 0.003 3
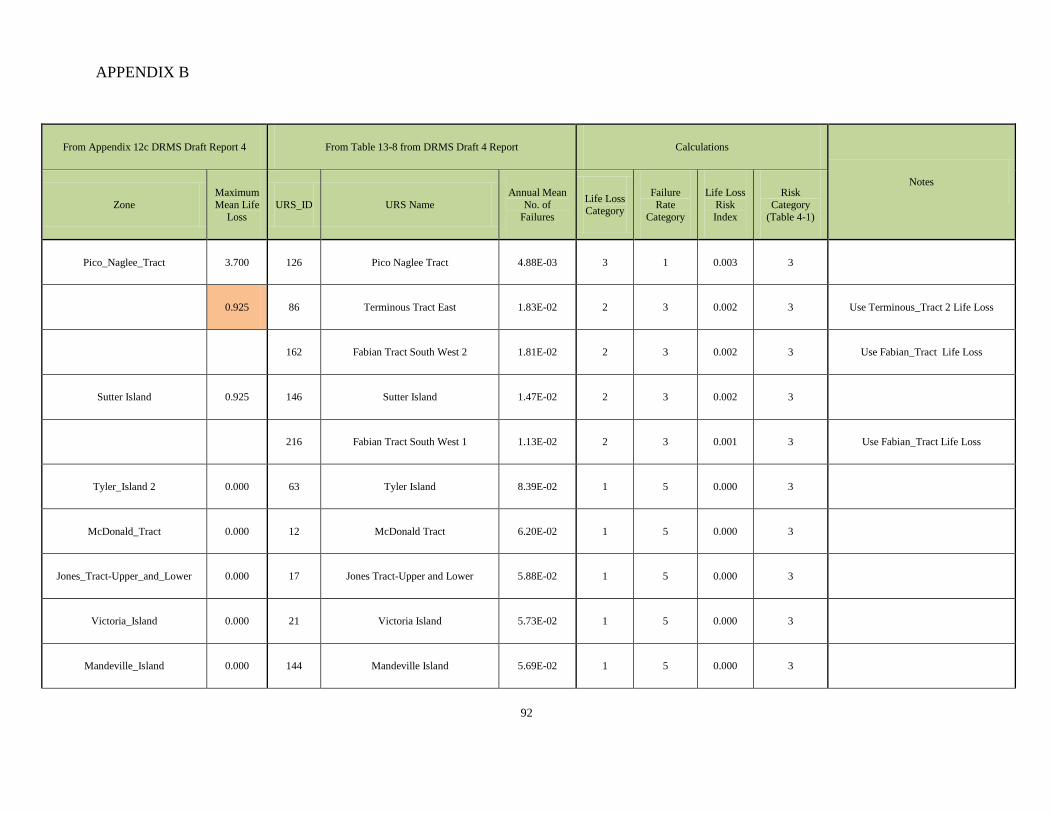
APPENDIX B
92
From Appendix 12c DRMS Draft Report 4 From Table 13-8 from DRMS Draft 4 Report Calculations
Notes
Zone Maximum Mean Life
Loss URS_ID URS Name
Annual Mean No. of
Failures
Life Loss Category
Failure Rate
Category
Life Loss Risk Index
Risk Category
(Table 4-1)
Pico_Naglee_Tract 3.700 126 Pico Naglee Tract 4.88E-03 3 1 0.003 3
0.925 86 Terminous Tract East 1.83E-02 2 3 0.002 3 Use Terminous_Tract 2 Life Loss
162 Fabian Tract South West 2 1.81E-02 2 3 0.002 3 Use Fabian_Tract Life Loss
Sutter Island 0.925 146 Sutter Island 1.47E-02 2 3 0.002 3
216 Fabian Tract South West 1 1.13E-02 2 3 0.001 3 Use Fabian_Tract Life Loss
Tyler_Island 2 0.000 63 Tyler Island 8.39E-02 1 5 0.000 3
McDonald_Tract 0.000 12 McDonald Tract 6.20E-02 1 5 0.000 3
Jones_Tract-Upper_and_Lower 0.000 17 Jones Tract-Upper and Lower 5.88E-02 1 5 0.000 3
Victoria_Island 0.000 21 Victoria Island 5.73E-02 1 5 0.000 3
Mandeville_Island 0.000 144 Mandeville Island 5.69E-02 1 5 0.000 3
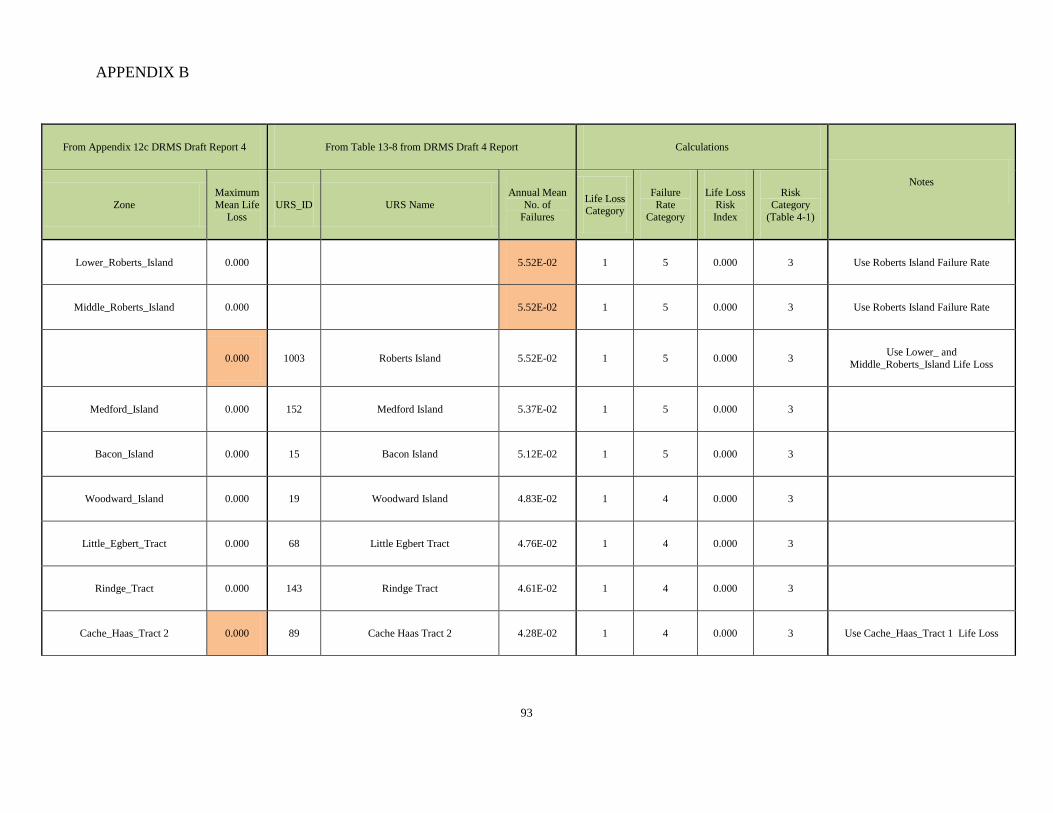
APPENDIX B
93
From Appendix 12c DRMS Draft Report 4 From Table 13-8 from DRMS Draft 4 Report Calculations
Notes
Zone Maximum Mean Life
Loss URS_ID URS Name
Annual Mean No. of
Failures
Life Loss Category
Failure Rate
Category
Life Loss Risk Index
Risk Category
(Table 4-1)
Lower_Roberts_Island 0.000 5.52E-02 1 5 0.000 3 Use Roberts Island Failure Rate
Middle_Roberts_Island 0.000 5.52E-02 1 5 0.000 3 Use Roberts Island Failure Rate
0.000 1003 Roberts Island 5.52E-02 1 5 0.000 3 Use Lower_ and Middle_Roberts_Island Life Loss
Medford_Island 0.000 152 Medford Island 5.37E-02 1 5 0.000 3
Bacon_Island 0.000 15 Bacon Island 5.12E-02 1 5 0.000 3
Woodward_Island 0.000 19 Woodward Island 4.83E-02 1 4 0.000 3
Little_Egbert_Tract 0.000 68 Little Egbert Tract 4.76E-02 1 4 0.000 3
Rindge_Tract 0.000 143 Rindge Tract 4.61E-02 1 4 0.000 3
Cache_Haas_Tract 2 0.000 89 Cache Haas Tract 2 4.28E-02 1 4 0.000 3 Use Cache_Haas_Tract 1 Life Loss
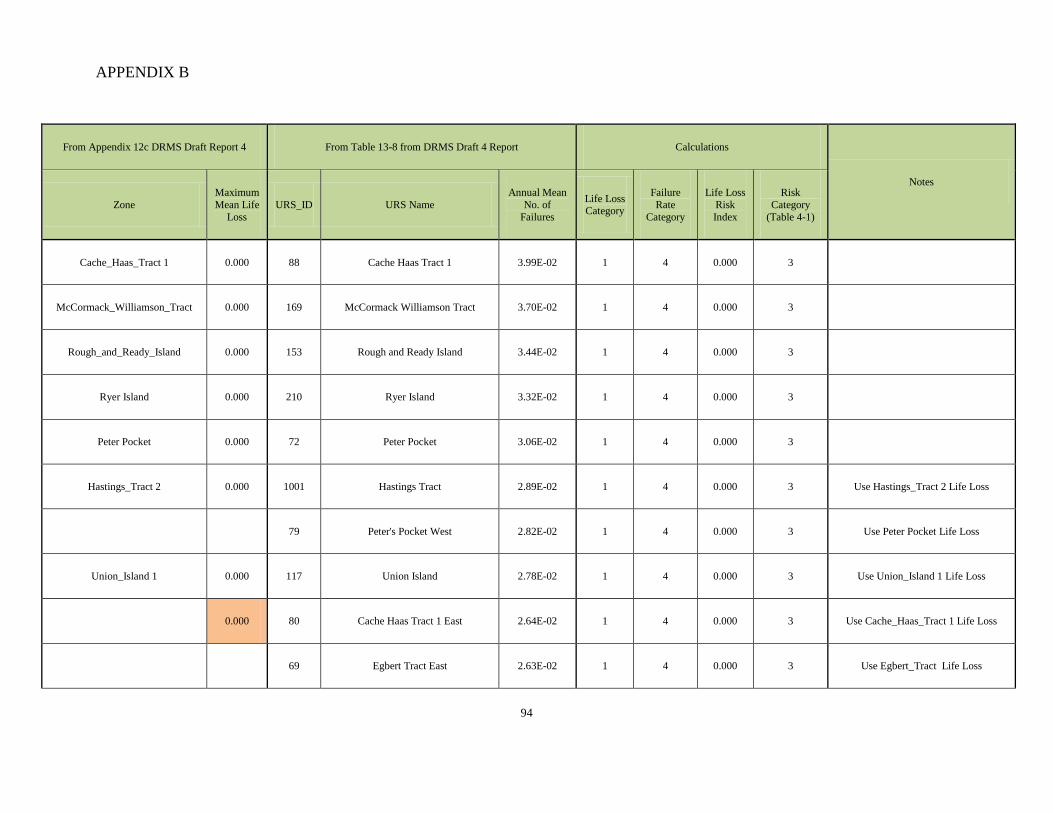
APPENDIX B
94
From Appendix 12c DRMS Draft Report 4 From Table 13-8 from DRMS Draft 4 Report Calculations
Notes
Zone Maximum Mean Life
Loss URS_ID URS Name
Annual Mean No. of
Failures
Life Loss Category
Failure Rate
Category
Life Loss Risk Index
Risk Category
(Table 4-1)
Cache_Haas_Tract 1 0.000 88 Cache Haas Tract 1 3.99E-02 1 4 0.000 3
McCormack_Williamson_Tract 0.000 169 McCormack Williamson Tract 3.70E-02 1 4 0.000 3
Rough_and_Ready_Island 0.000 153 Rough and Ready Island 3.44E-02 1 4 0.000 3
Ryer Island 0.000 210 Ryer Island 3.32E-02 1 4 0.000 3
Peter Pocket 0.000 72 Peter Pocket 3.06E-02 1 4 0.000 3
Hastings_Tract 2 0.000 1001 Hastings Tract 2.89E-02 1 4 0.000 3 Use Hastings_Tract 2 Life Loss
79 Peter's Pocket West 2.82E-02 1 4 0.000 3 Use Peter Pocket Life Loss
Union_Island 1 0.000 117 Union Island 2.78E-02 1 4 0.000 3 Use Union_Island 1 Life Loss
0.000 80 Cache Haas Tract 1 East 2.64E-02 1 4 0.000 3 Use Cache_Haas_Tract 1 Life Loss
69 Egbert Tract East 2.63E-02 1 4 0.000 3 Use Egbert_Tract Life Loss
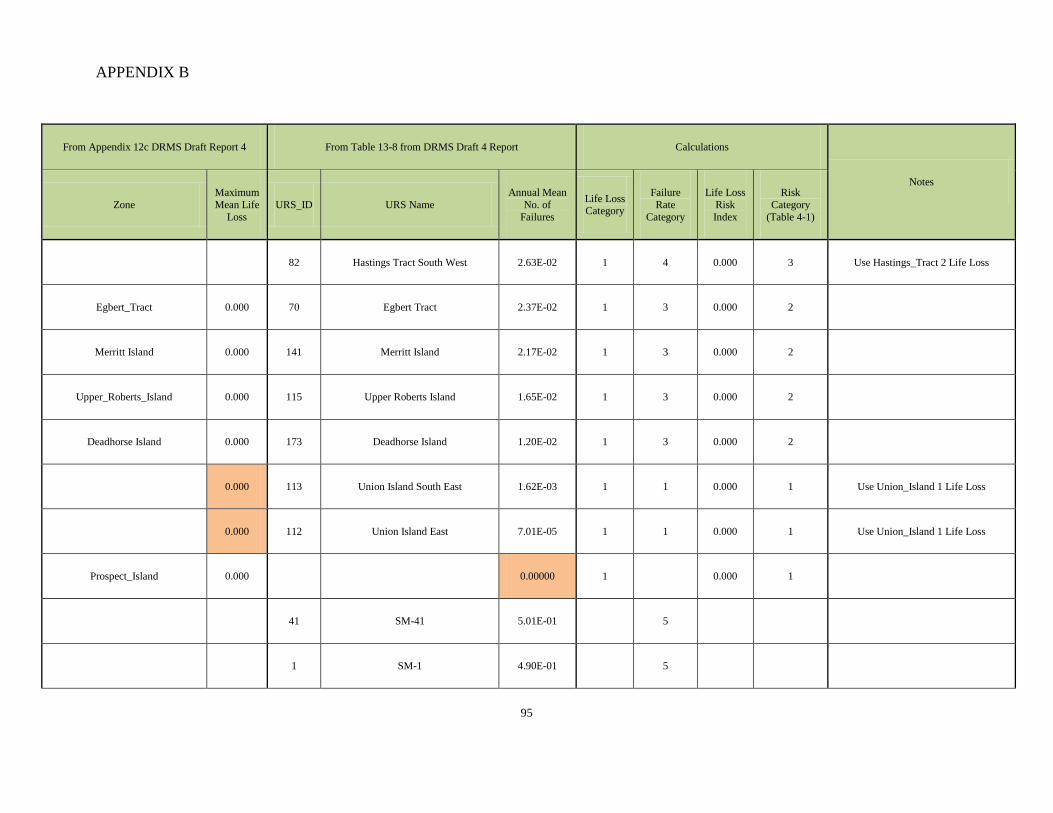
APPENDIX B
95
From Appendix 12c DRMS Draft Report 4 From Table 13-8 from DRMS Draft 4 Report Calculations
Notes
Zone Maximum Mean Life
Loss URS_ID URS Name
Annual Mean No. of
Failures
Life Loss Category
Failure Rate
Category
Life Loss Risk Index
Risk Category
(Table 4-1)
82 Hastings Tract South West 2.63E-02 1 4 0.000 3 Use Hastings_Tract 2 Life Loss
Egbert_Tract 0.000 70 Egbert Tract 2.37E-02 1 3 0.000 2
Merritt Island 0.000 141 Merritt Island 2.17E-02 1 3 0.000 2
Upper_Roberts_Island 0.000 115 Upper Roberts Island 1.65E-02 1 3 0.000 2
Deadhorse Island 0.000 173 Deadhorse Island 1.20E-02 1 3 0.000 2
0.000 113 Union Island South East 1.62E-03 1 1 0.000 1 Use Union_Island 1 Life Loss
0.000 112 Union Island East 7.01E-05 1 1 0.000 1 Use Union_Island 1 Life Loss
Prospect_Island 0.000 0.00000 1 0.000 1
41 SM-41 5.01E-01 5
1 SM-1 4.90E-01 5
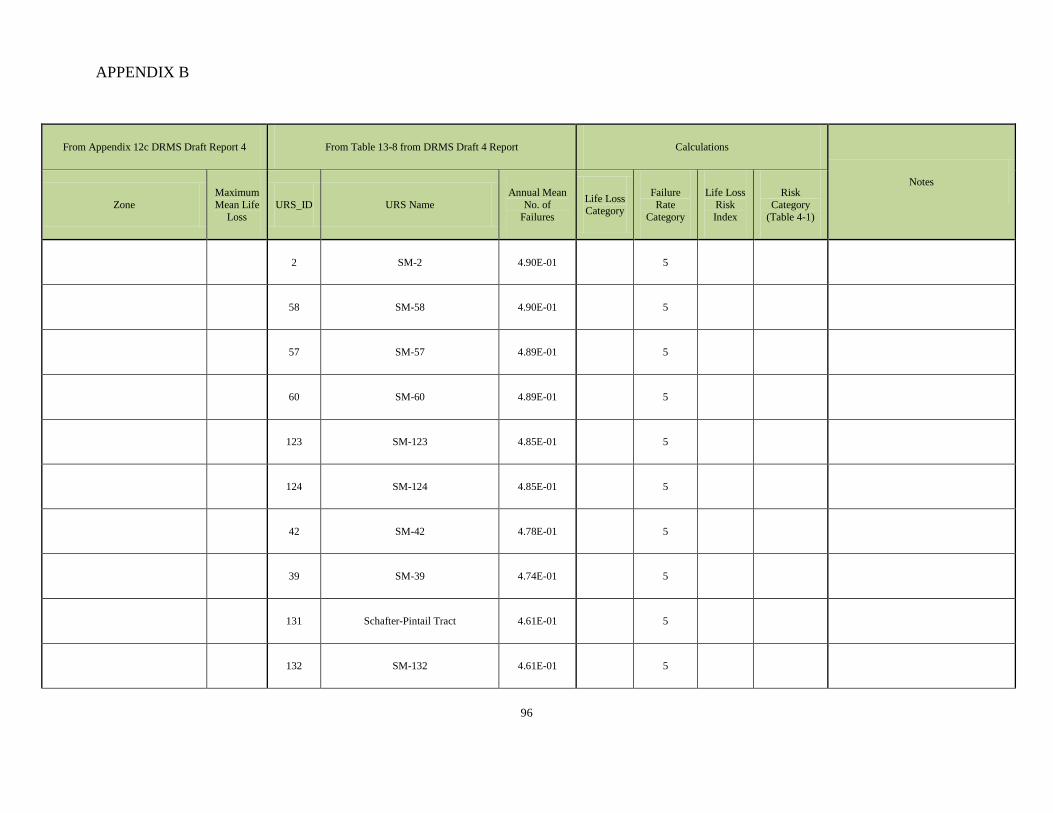
APPENDIX B
96
From Appendix 12c DRMS Draft Report 4 From Table 13-8 from DRMS Draft 4 Report Calculations
Notes
Zone Maximum Mean Life
Loss URS_ID URS Name
Annual Mean No. of
Failures
Life Loss Category
Failure Rate
Category
Life Loss Risk Index
Risk Category
(Table 4-1)
2 SM-2 4.90E-01 5
58 SM-58 4.90E-01 5
57 SM-57 4.89E-01 5
60 SM-60 4.89E-01 5
123 SM-123 4.85E-01 5
124 SM-124 4.85E-01 5
42 SM-42 4.78E-01 5
39 SM-39 4.74E-01 5
131 Schafter-Pintail Tract 4.61E-01 5
132 SM-132 4.61E-01 5
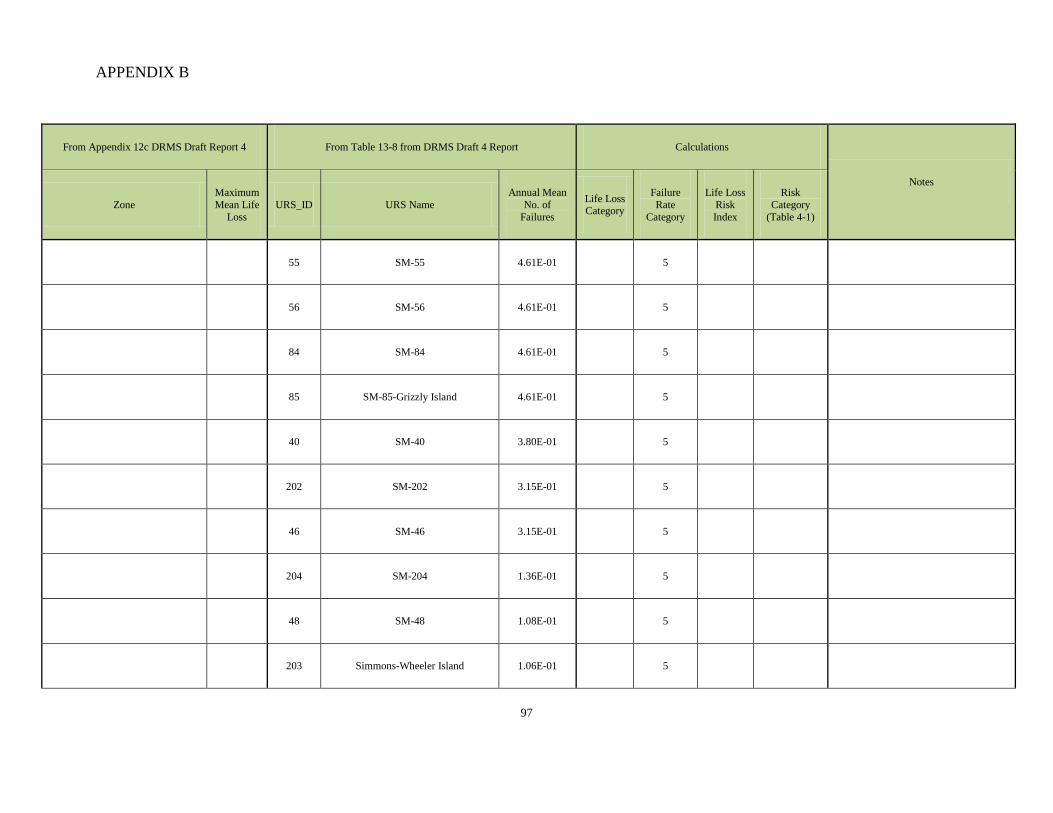
APPENDIX B
97
From Appendix 12c DRMS Draft Report 4 From Table 13-8 from DRMS Draft 4 Report Calculations
Notes
Zone Maximum Mean Life
Loss URS_ID URS Name
Annual Mean No. of
Failures
Life Loss Category
Failure Rate
Category
Life Loss Risk Index
Risk Category
(Table 4-1)
55 SM-55 4.61E-01 5
56 SM-56 4.61E-01 5
84 SM-84 4.61E-01 5
85 SM-85-Grizzly Island 4.61E-01 5
40 SM-40 3.80E-01 5
202 SM-202 3.15E-01 5
46 SM-46 3.15E-01 5
204 SM-204 1.36E-01 5
48 SM-48 1.08E-01 5
203 Simmons-Wheeler Island 1.06E-01 5
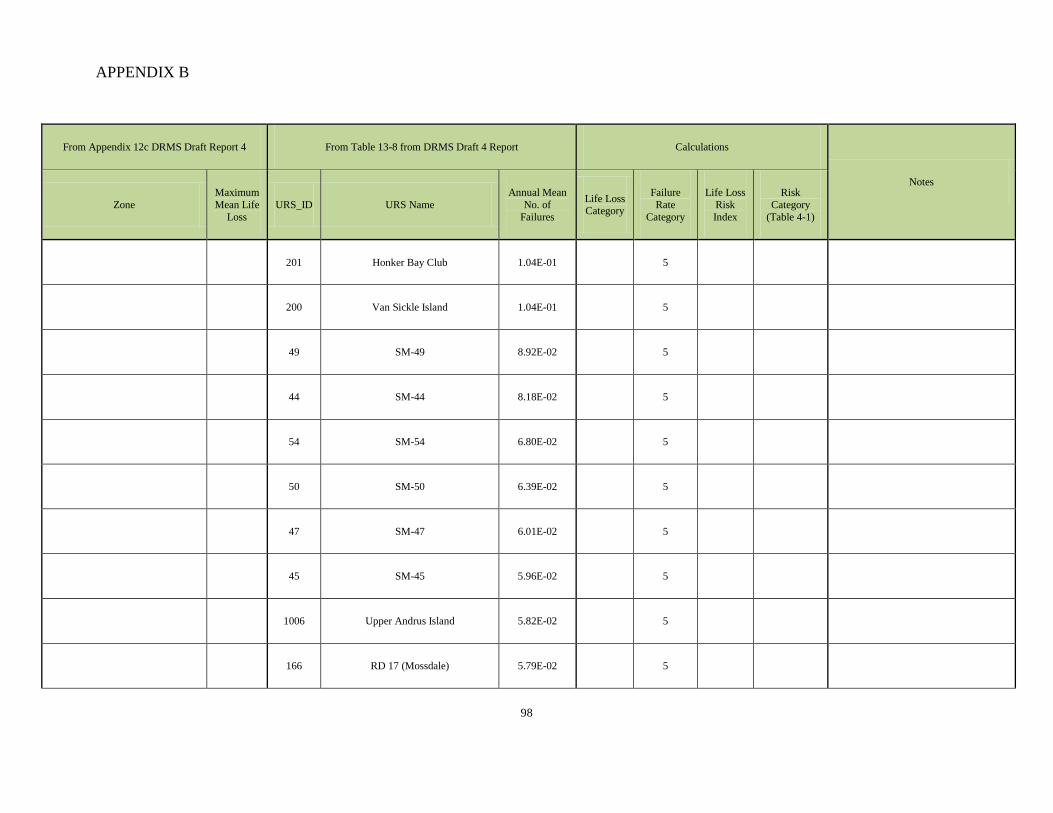
APPENDIX B
98
From Appendix 12c DRMS Draft Report 4 From Table 13-8 from DRMS Draft 4 Report Calculations
Notes
Zone Maximum Mean Life
Loss URS_ID URS Name
Annual Mean No. of
Failures
Life Loss Category
Failure Rate
Category
Life Loss Risk Index
Risk Category
(Table 4-1)
201 Honker Bay Club 1.04E-01 5
200 Van Sickle Island 1.04E-01 5
49 SM-49 8.92E-02 5
44 SM-44 8.18E-02 5
54 SM-54 6.80E-02 5
50 SM-50 6.39E-02 5
47 SM-47 6.01E-02 5
45 SM-45 5.96E-02 5
1006 Upper Andrus Island 5.82E-02 5
166 RD 17 (Mossdale) 5.79E-02 5
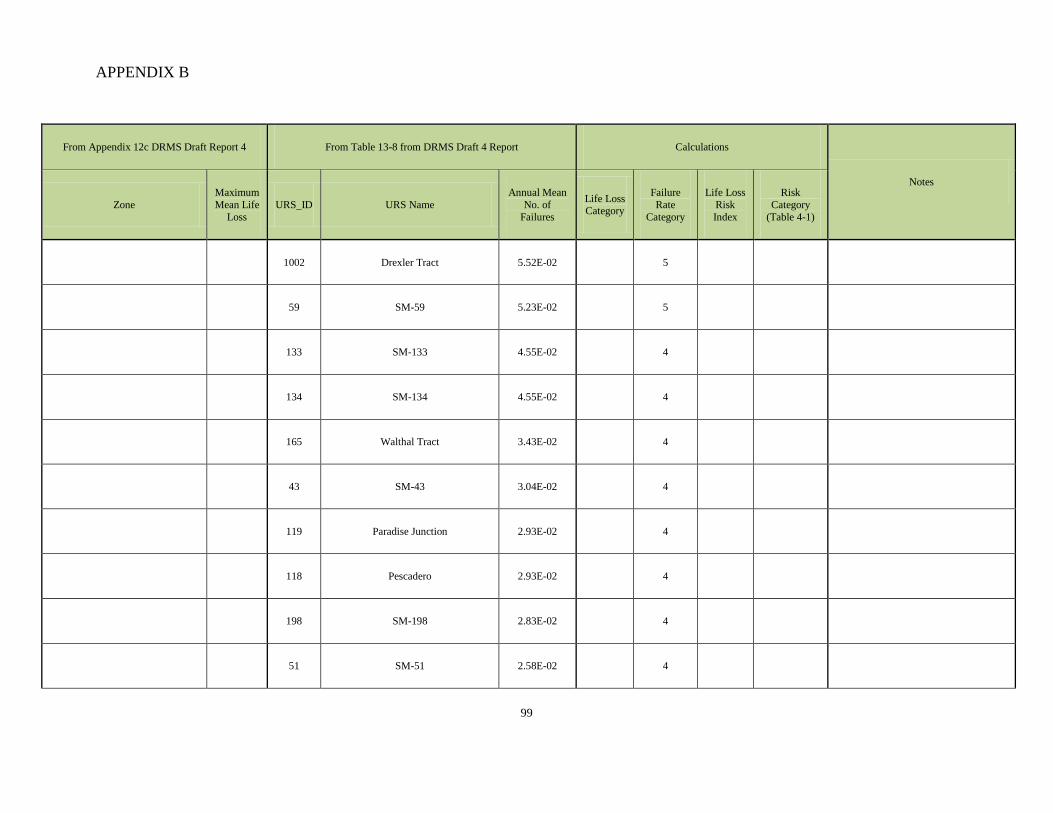
APPENDIX B
99
From Appendix 12c DRMS Draft Report 4 From Table 13-8 from DRMS Draft 4 Report Calculations
Notes
Zone Maximum Mean Life
Loss URS_ID URS Name
Annual Mean No. of
Failures
Life Loss Category
Failure Rate
Category
Life Loss Risk Index
Risk Category
(Table 4-1)
1002 Drexler Tract 5.52E-02 5
59 SM-59 5.23E-02 5
133 SM-133 4.55E-02 4
134 SM-134 4.55E-02 4
165 Walthal Tract 3.43E-02 4
43 SM-43 3.04E-02 4
119 Paradise Junction 2.93E-02 4
118 Pescadero 2.93E-02 4
198 SM-198 2.83E-02 4
51 SM-51 2.58E-02 4
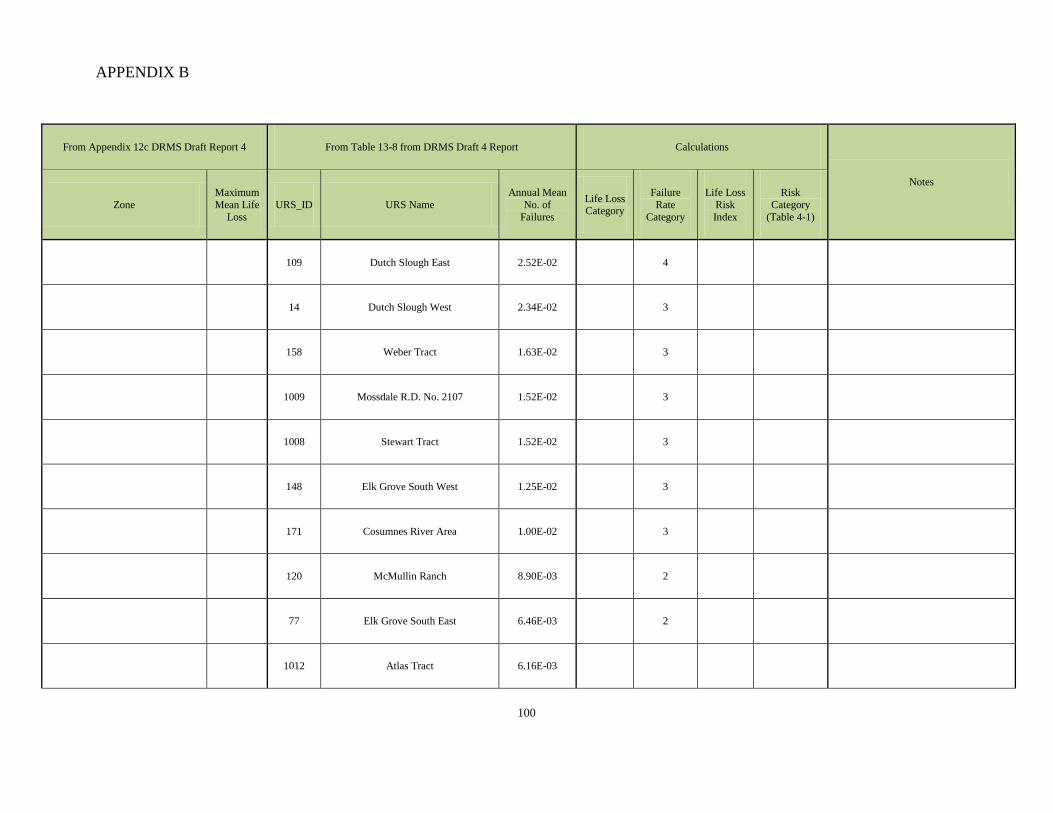
APPENDIX B
100
From Appendix 12c DRMS Draft Report 4 From Table 13-8 from DRMS Draft 4 Report Calculations
Notes
Zone Maximum Mean Life
Loss URS_ID URS Name
Annual Mean No. of
Failures
Life Loss Category
Failure Rate
Category
Life Loss Risk Index
Risk Category
(Table 4-1)
109 Dutch Slough East 2.52E-02 4
14 Dutch Slough West 2.34E-02 3
158 Weber Tract 1.63E-02 3
1009 Mossdale R.D. No. 2107 1.52E-02 3
1008 Stewart Tract 1.52E-02 3
148 Elk Grove South West 1.25E-02 3
171 Cosumnes River Area 1.00E-02 3
120 McMullin Ranch 8.90E-03 2
77 Elk Grove South East 6.46E-03 2
1012 Atlas Tract 6.16E-03
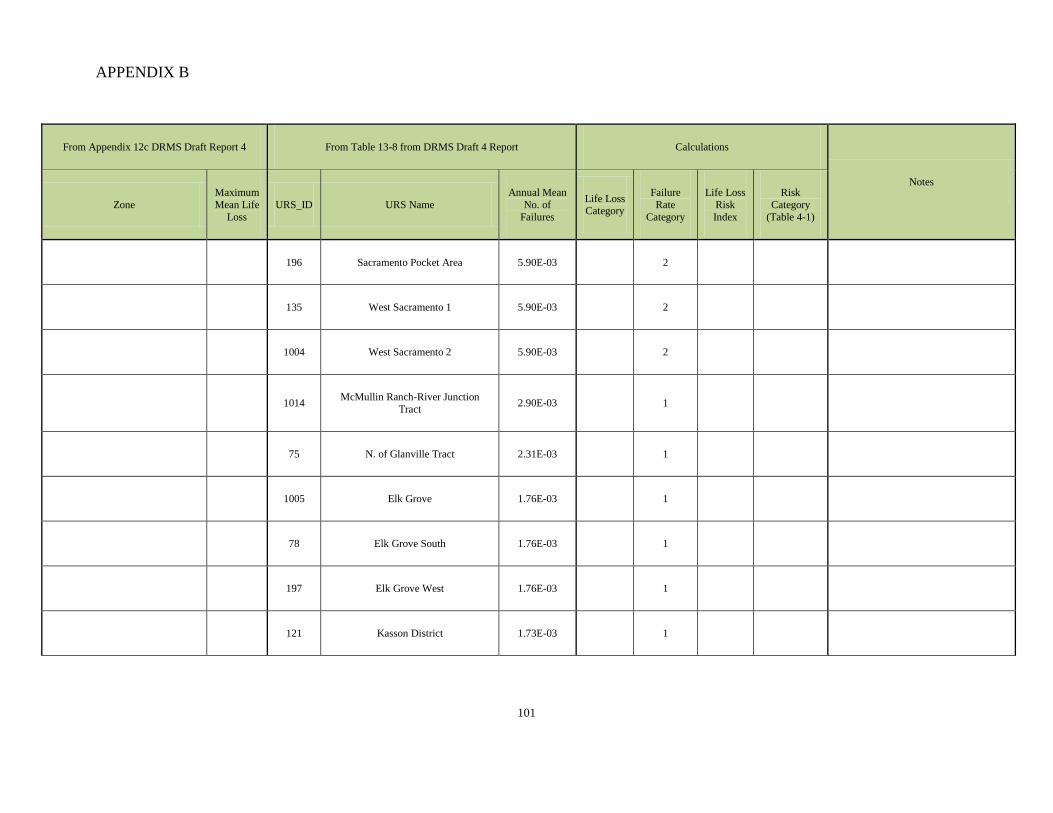
APPENDIX B
101
From Appendix 12c DRMS Draft Report 4 From Table 13-8 from DRMS Draft 4 Report Calculations
Notes
Zone Maximum Mean Life
Loss URS_ID URS Name
Annual Mean No. of
Failures
Life Loss Category
Failure Rate
Category
Life Loss Risk Index
Risk Category
(Table 4-1)
196 Sacramento Pocket Area 5.90E-03 2
135 West Sacramento 1 5.90E-03 2
1004 West Sacramento 2 5.90E-03 2
1014 McMullin Ranch-River Junction Tract 2.90E-03 1
75 N. of Glanville Tract 2.31E-03 1
1005 Elk Grove 1.76E-03 1
78 Elk Grove South 1.76E-03 1
197 Elk Grove West 1.76E-03 1
121 Kasson District 1.73E-03 1
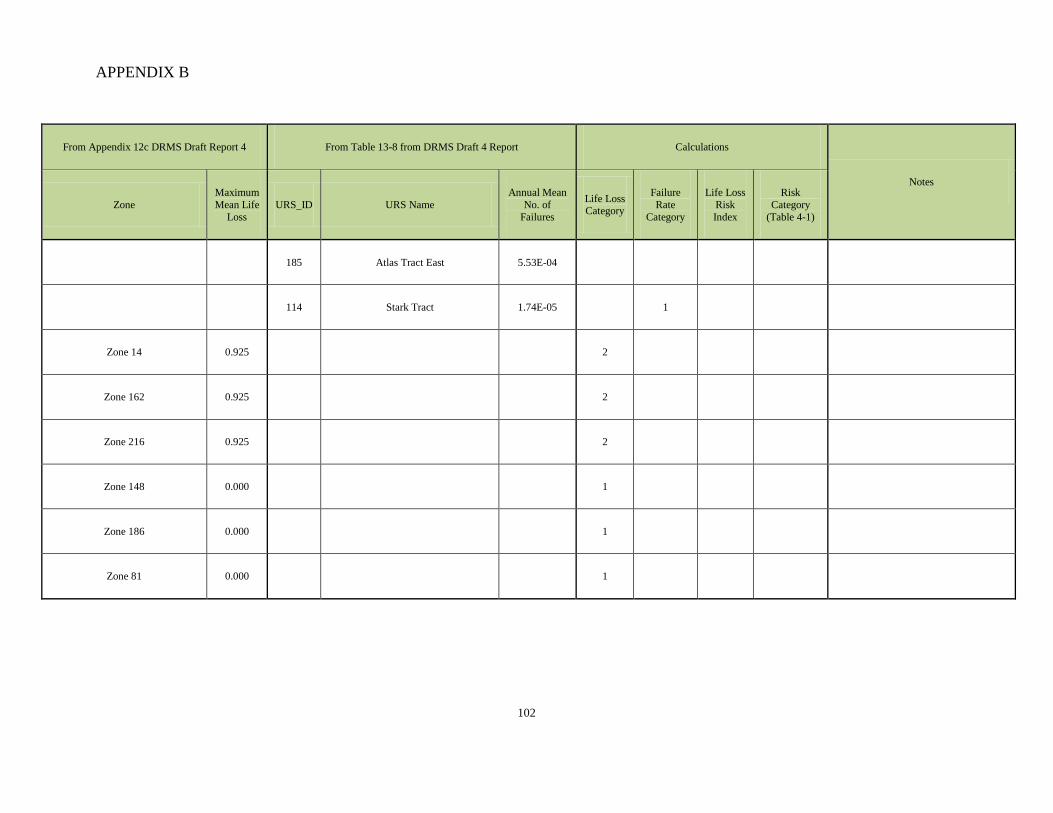
APPENDIX B
102
From Appendix 12c DRMS Draft Report 4 From Table 13-8 from DRMS Draft 4 Report Calculations
Notes
Zone Maximum Mean Life
Loss URS_ID URS Name
Annual Mean No. of
Failures
Life Loss Category
Failure Rate
Category
Life Loss Risk Index
Risk Category
(Table 4-1)
185 Atlas Tract East 5.53E-04
114 Stark Tract 1.74E-05 1
Zone 14 0.925 2
Zone 162 0.925 2
Zone 216 0.925 2
Zone 148 0.000 1
Zone 186 0.000 1
Zone 81 0.000 1
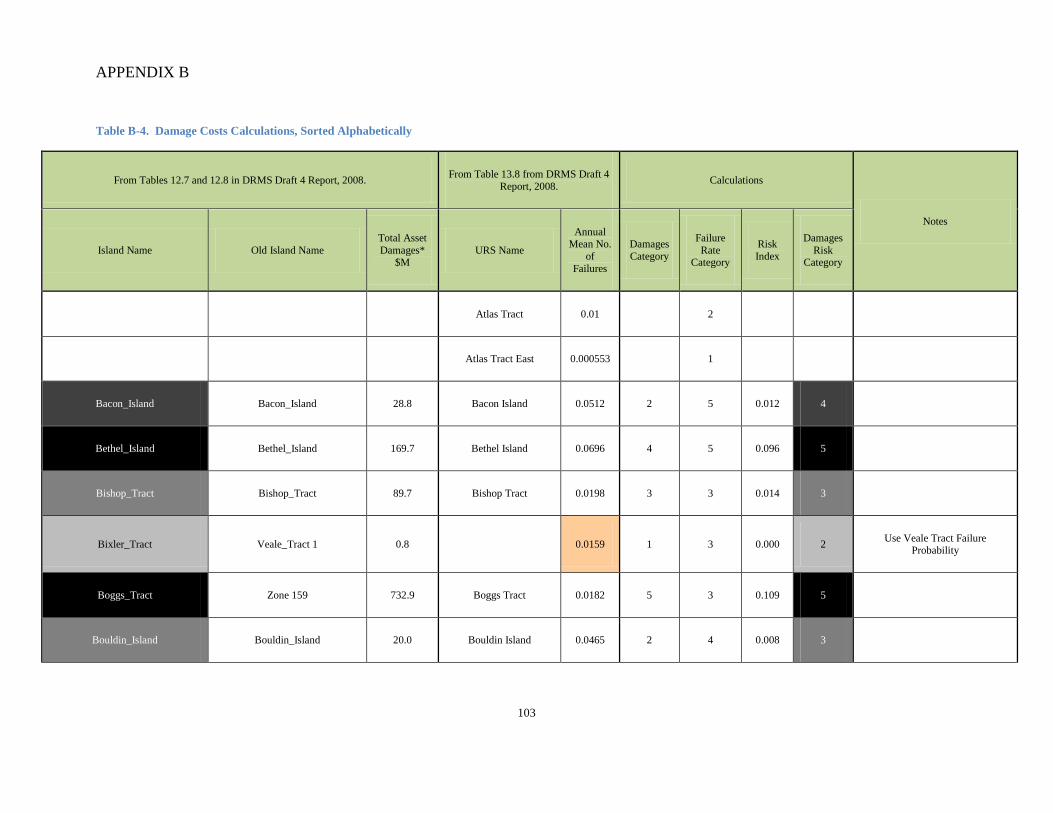
APPENDIX B
103
Table B-4. Damage Costs Calculations, Sorted Alphabetically
From Tables 12.7 and 12.8 in DRMS Draft 4 Report, 2008. From Table 13.8 from DRMS Draft 4 Report, 2008. Calculations
Notes
Island Name Old Island Name Total Asset Damages*
$M URS Name
Annual Mean No.
of Failures
Damages Category
Failure Rate
Category
Risk Index
Damages Risk
Category
Atlas Tract 0.01 2
Atlas Tract East 0.000553 1
Bacon_Island Bacon_Island 28.8 Bacon Island 0.0512 2 5 0.012 4
Bethel_Island Bethel_Island 169.7 Bethel Island 0.0696 4 5 0.096 5
Bishop_Tract Bishop_Tract 89.7 Bishop Tract 0.0198 3 3 0.014 3
Bixler_Tract Veale_Tract 1 0.8 0.0159 1 3 0.000 2 Use Veale Tract Failure Probability
Boggs_Tract Zone 159 732.9 Boggs Tract 0.0182 5 3 0.109 5
Bouldin_Island Bouldin_Island 20.0 Bouldin Island 0.0465 2 4 0.008 3
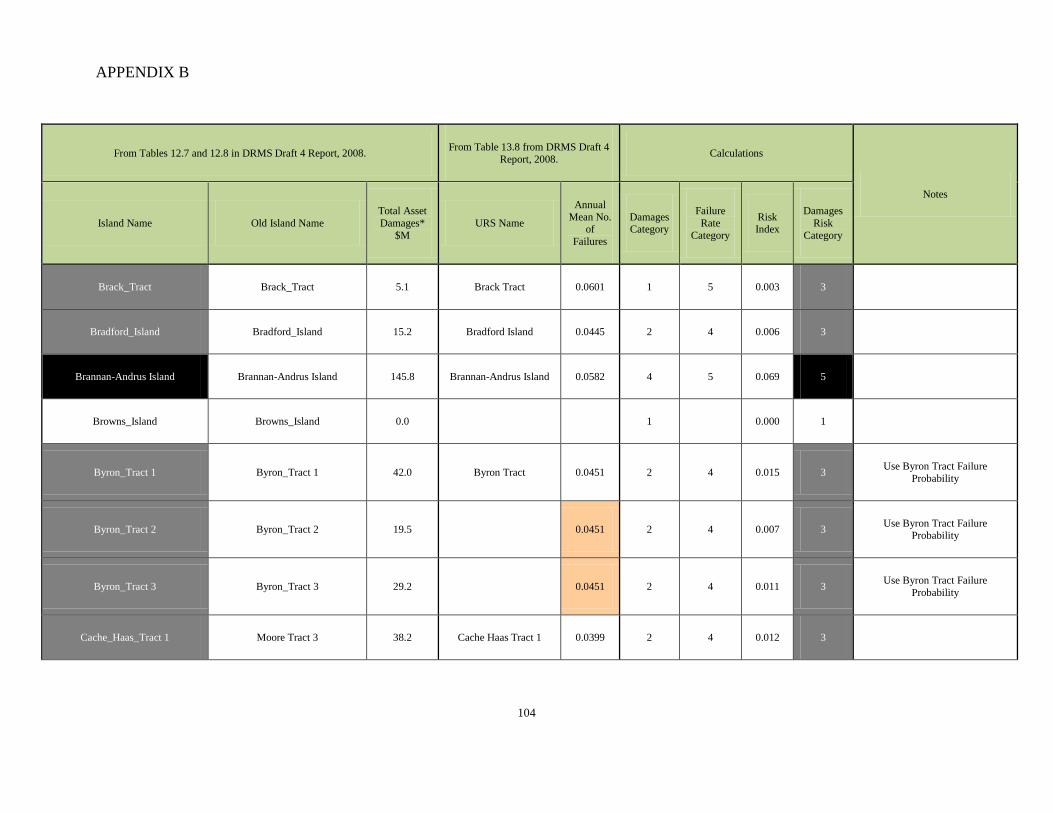
APPENDIX B
104
From Tables 12.7 and 12.8 in DRMS Draft 4 Report, 2008. From Table 13.8 from DRMS Draft 4 Report, 2008. Calculations
Notes
Island Name Old Island Name Total Asset Damages*
$M URS Name
Annual Mean No.
of Failures
Damages Category
Failure Rate
Category
Risk Index
Damages Risk
Category
Brack_Tract Brack_Tract 5.1 Brack Tract 0.0601 1 5 0.003 3
Bradford_Island Bradford_Island 15.2 Bradford Island 0.0445 2 4 0.006 3
Brannan-Andrus Island Brannan-Andrus Island 145.8 Brannan-Andrus Island 0.0582 4 5 0.069 5
Browns_Island Browns_Island 0.0 1 0.000 1
Byron_Tract 1 Byron_Tract 1 42.0 Byron Tract 0.0451 2 4 0.015 3 Use Byron Tract Failure Probability
Byron_Tract 2 Byron_Tract 2 19.5 0.0451 2 4 0.007 3 Use Byron Tract Failure Probability
Byron_Tract 3 Byron_Tract 3 29.2 0.0451 2 4 0.011 3 Use Byron Tract Failure Probability
Cache_Haas_Tract 1 Moore Tract 3 38.2 Cache Haas Tract 1 0.0399 2 4 0.012 3
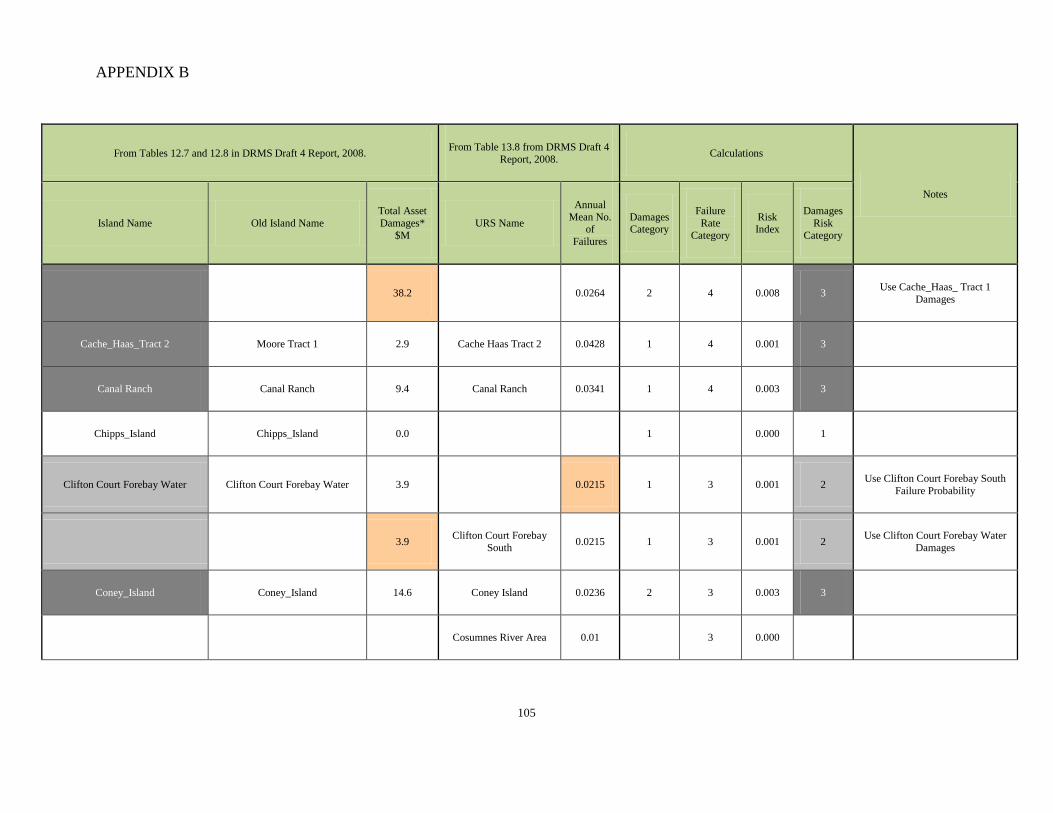
APPENDIX B
105
From Tables 12.7 and 12.8 in DRMS Draft 4 Report, 2008. From Table 13.8 from DRMS Draft 4 Report, 2008. Calculations
Notes
Island Name Old Island Name Total Asset Damages*
$M URS Name
Annual Mean No.
of Failures
Damages Category
Failure Rate
Category
Risk Index
Damages Risk
Category
38.2 Cache Haas Tract 1 East 0.0264 2 4 0.008 3 Use Cache_Haas_ Tract 1 Damages
Cache_Haas_Tract 2 Moore Tract 1 2.9 Cache Haas Tract 2 0.0428 1 4 0.001 3
Canal Ranch Canal Ranch 9.4 Canal Ranch 0.0341 1 4 0.003 3
Chipps_Island Chipps_Island 0.0 1 0.000 1
Clifton Court Forebay Water Clifton Court Forebay Water 3.9 0.0215 1 3 0.001 2 Use Clifton Court Forebay South Failure Probability
3.9 Clifton Court Forebay South 0.0215 1 3 0.001 2 Use Clifton Court Forebay Water
Damages
Coney_Island Coney_Island 14.6 Coney Island 0.0236 2 3 0.003 3
Cosumnes River Area 0.01 3 0.000
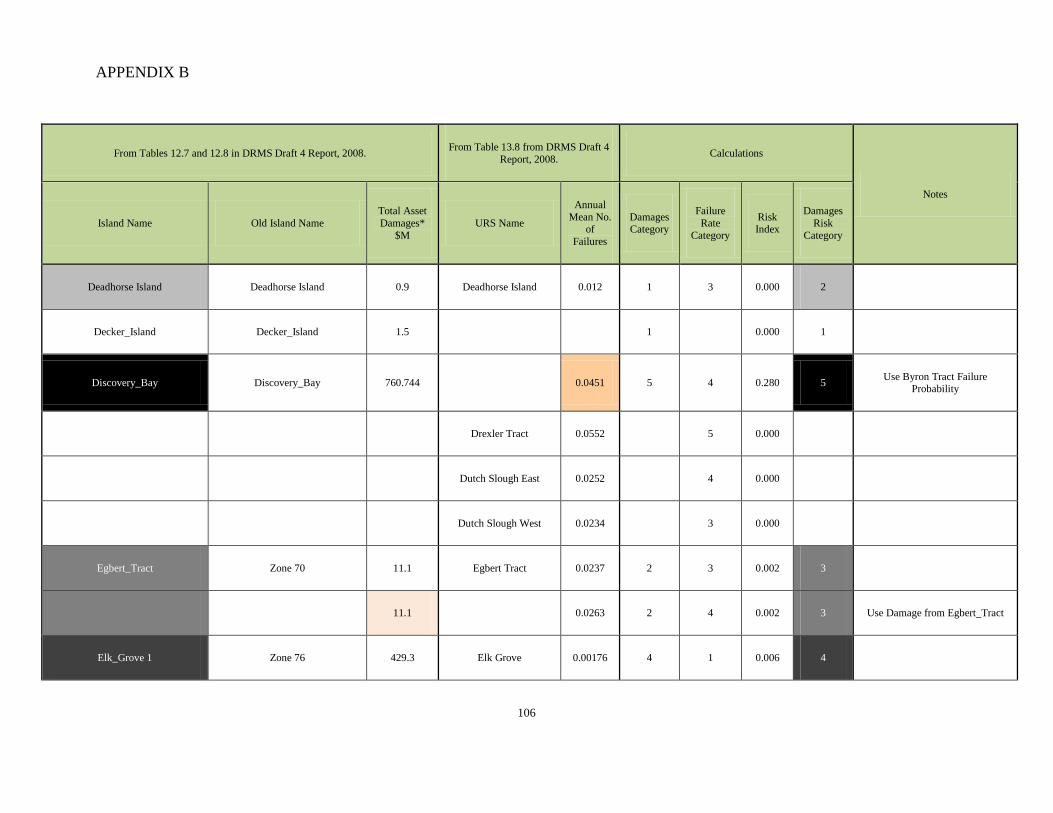
APPENDIX B
106
From Tables 12.7 and 12.8 in DRMS Draft 4 Report, 2008. From Table 13.8 from DRMS Draft 4 Report, 2008. Calculations
Notes
Island Name Old Island Name Total Asset Damages*
$M URS Name
Annual Mean No.
of Failures
Damages Category
Failure Rate
Category
Risk Index
Damages Risk
Category
Deadhorse Island Deadhorse Island 0.9 Deadhorse Island 0.012 1 3 0.000 2
Decker_Island Decker_Island 1.5 1 0.000 1
Discovery_Bay Discovery_Bay 760.744 0.0451 5 4 0.280 5 Use Byron Tract Failure Probability
Drexler Tract 0.0552 5 0.000
Dutch Slough East 0.0252 4 0.000
Dutch Slough West 0.0234 3 0.000
Egbert_Tract Zone 70 11.1 Egbert Tract 0.0237 2 3 0.002 3
11.1 Egbert Tract East 0.0263 2 4 0.002 3 Use Damage from Egbert_Tract
Elk_Grove 1 Zone 76 429.3 Elk Grove 0.00176 4 1 0.006 4
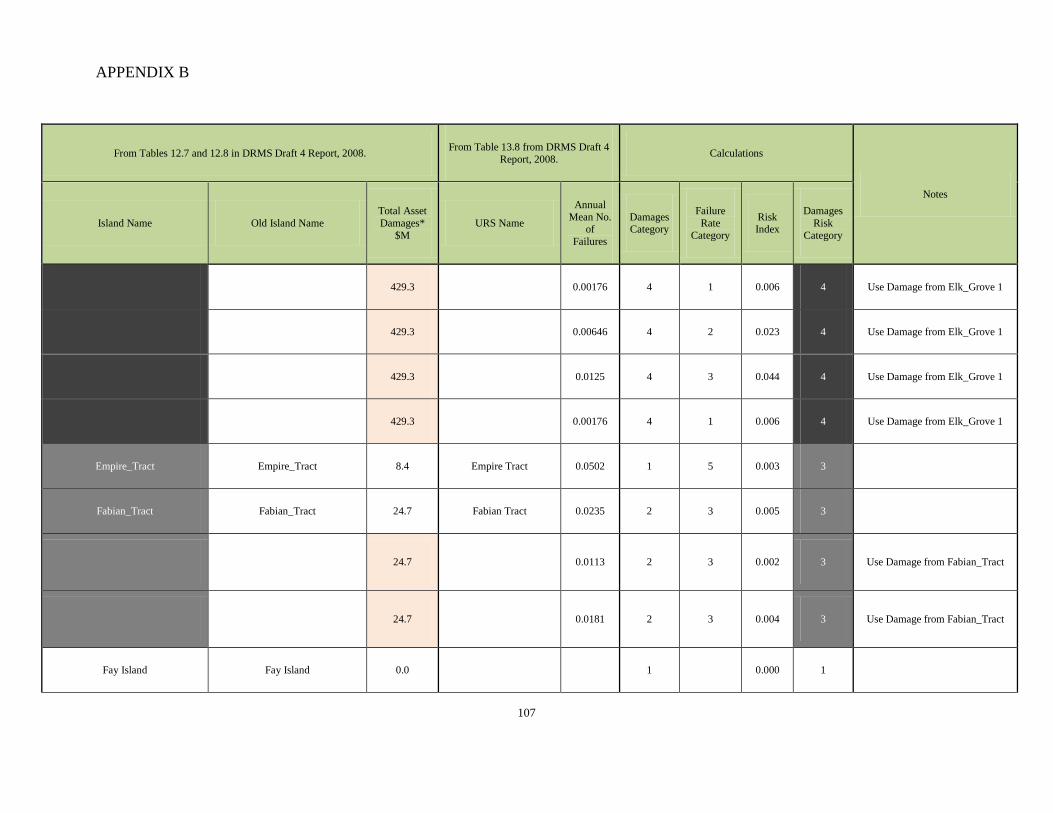
APPENDIX B
107
From Tables 12.7 and 12.8 in DRMS Draft 4 Report, 2008. From Table 13.8 from DRMS Draft 4 Report, 2008. Calculations
Notes
Island Name Old Island Name Total Asset Damages*
$M URS Name
Annual Mean No.
of Failures
Damages Category
Failure Rate
Category
Risk Index
Damages Risk
Category
429.3 Elk Grove South 0.00176 4 1 0.006 4 Use Damage from Elk_Grove 1
429.3 Elk Grove South East 0.00646 4 2 0.023 4 Use Damage from Elk_Grove 1
429.3 Elk Grove South West 0.0125 4 3 0.044 4 Use Damage from Elk_Grove 1
429.3 Elk Grove West 0.00176 4 1 0.006 4 Use Damage from Elk_Grove 1
Empire_Tract Empire_Tract 8.4 Empire Tract 0.0502 1 5 0.003 3
Fabian_Tract Fabian_Tract 24.7 Fabian Tract 0.0235 2 3 0.005 3
24.7 Fabian Tract South West 1 0.0113 2 3 0.002 3 Use Damage from Fabian_Tract
24.7 Fabian Tract South West 2 0.0181 2 3 0.004 3 Use Damage from Fabian_Tract
Fay Island Fay Island 0.0 1 0.000 1
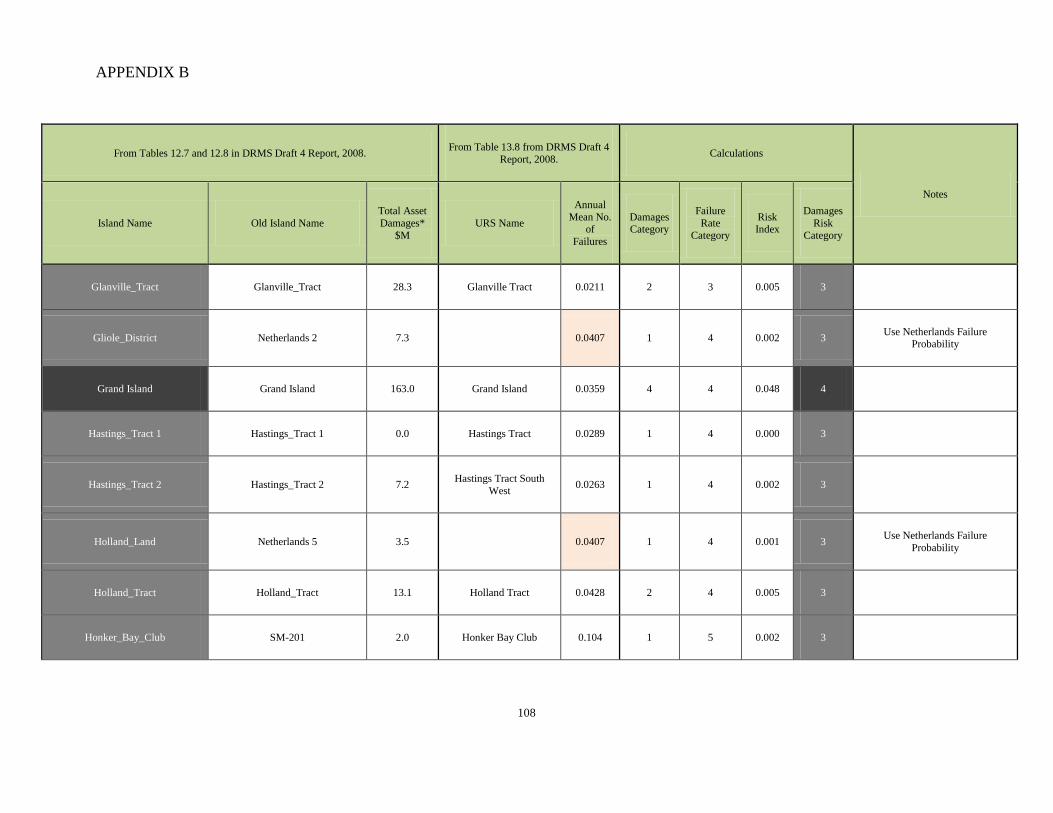
APPENDIX B
108
From Tables 12.7 and 12.8 in DRMS Draft 4 Report, 2008. From Table 13.8 from DRMS Draft 4 Report, 2008. Calculations
Notes
Island Name Old Island Name Total Asset Damages*
$M URS Name
Annual Mean No.
of Failures
Damages Category
Failure Rate
Category
Risk Index
Damages Risk
Category
Glanville_Tract Glanville_Tract 28.3 Glanville Tract 0.0211 2 3 0.005 3
Gliole_District Netherlands 2 7.3 0.0407 1 4 0.002 3 Use Netherlands Failure Probability
Grand Island Grand Island 163.0 Grand Island 0.0359 4 4 0.048 4
Hastings_Tract 1 Hastings_Tract 1 0.0 Hastings Tract 0.0289 1 4 0.000 3
Hastings_Tract 2 Hastings_Tract 2 7.2 Hastings Tract South West 0.0263 1 4 0.002 3
Holland_Land Netherlands 5 3.5 0.0407 1 4 0.001 3 Use Netherlands Failure Probability
Holland_Tract Holland_Tract 13.1 Holland Tract 0.0428 2 4 0.005 3
Honker_Bay_Club SM-201 2.0 Honker Bay Club 0.104 1 5 0.002 3
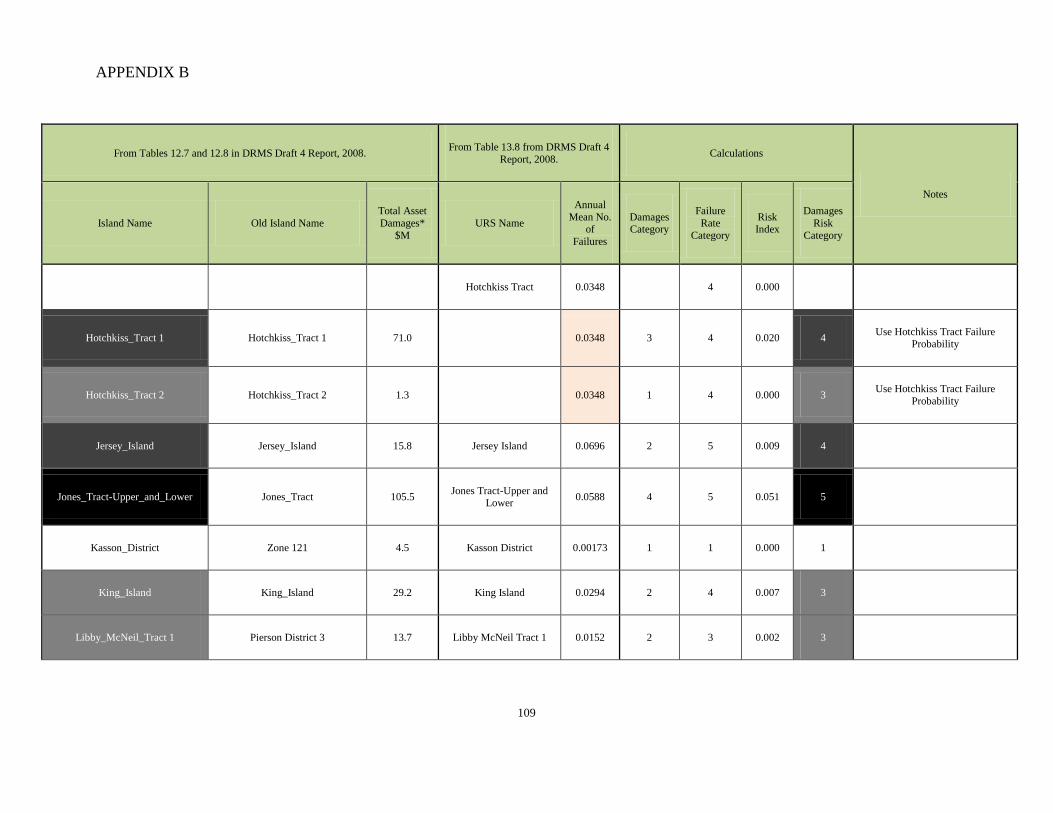
APPENDIX B
109
From Tables 12.7 and 12.8 in DRMS Draft 4 Report, 2008. From Table 13.8 from DRMS Draft 4 Report, 2008. Calculations
Notes
Island Name Old Island Name Total Asset Damages*
$M URS Name
Annual Mean No.
of Failures
Damages Category
Failure Rate
Category
Risk Index
Damages Risk
Category
Hotchkiss Tract 0.0348 4 0.000
Hotchkiss_Tract 1 Hotchkiss_Tract 1 71.0 0.0348 3 4 0.020 4 Use Hotchkiss Tract Failure Probability
Hotchkiss_Tract 2 Hotchkiss_Tract 2 1.3 0.0348 1 4 0.000 3 Use Hotchkiss Tract Failure Probability
Jersey_Island Jersey_Island 15.8 Jersey Island 0.0696 2 5 0.009 4
Jones_Tract-Upper_and_Lower Jones_Tract 105.5 Jones Tract-Upper and Lower 0.0588 4 5 0.051 5
Kasson_District Zone 121 4.5 Kasson District 0.00173 1 1 0.000 1
King_Island King_Island 29.2 King Island 0.0294 2 4 0.007 3
Libby_McNeil_Tract 1 Pierson District 3 13.7 Libby McNeil Tract 1 0.0152 2 3 0.002 3
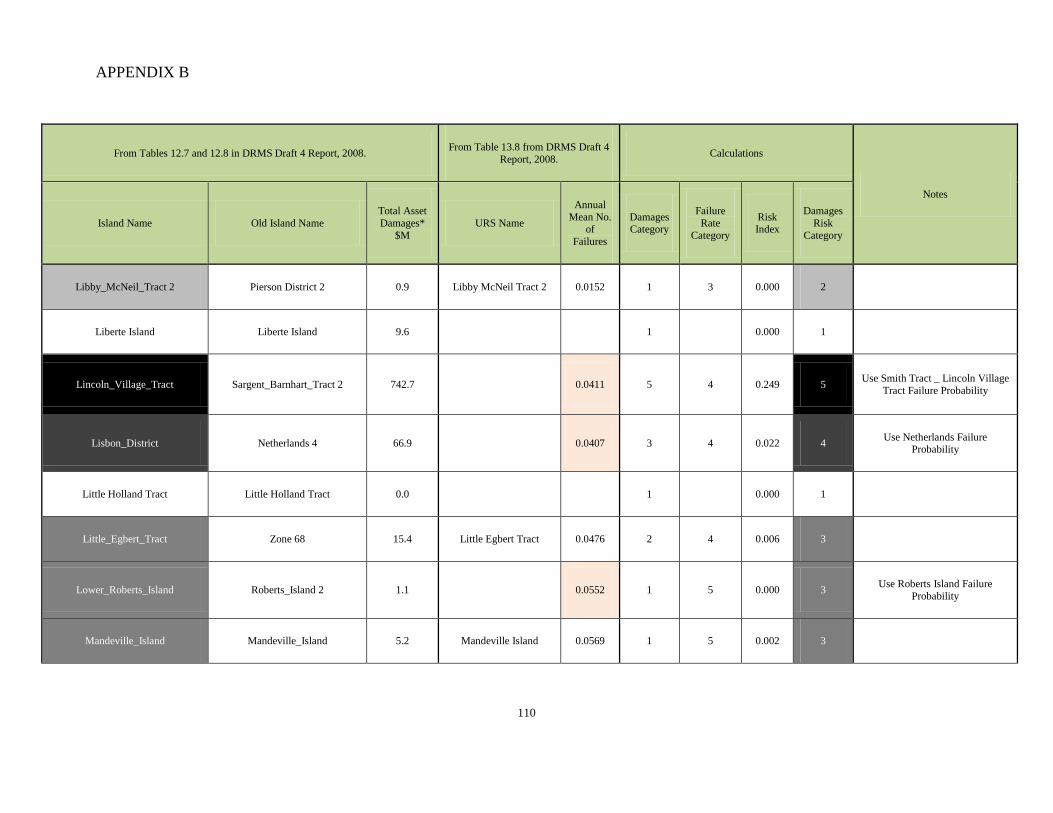
APPENDIX B
110
From Tables 12.7 and 12.8 in DRMS Draft 4 Report, 2008. From Table 13.8 from DRMS Draft 4 Report, 2008. Calculations
Notes
Island Name Old Island Name Total Asset Damages*
$M URS Name
Annual Mean No.
of Failures
Damages Category
Failure Rate
Category
Risk Index
Damages Risk
Category
Libby_McNeil_Tract 2 Pierson District 2 0.9 Libby McNeil Tract 2 0.0152 1 3 0.000 2
Liberte Island Liberte Island 9.6 1 0.000 1
Lincoln_Village_Tract Sargent_Barnhart_Tract 2 742.7 0.0411 5 4 0.249 5 Use Smith Tract _ Lincoln Village Tract Failure Probability
Lisbon_District Netherlands 4 66.9 0.0407 3 4 0.022 4 Use Netherlands Failure Probability
Little Holland Tract Little Holland Tract 0.0 1 0.000 1
Little_Egbert_Tract Zone 68 15.4 Little Egbert Tract 0.0476 2 4 0.006 3
Lower_Roberts_Island Roberts_Island 2 1.1 0.0552 1 5 0.000 3 Use Roberts Island Failure Probability
Mandeville_Island Mandeville_Island 5.2 Mandeville Island 0.0569 1 5 0.002 3
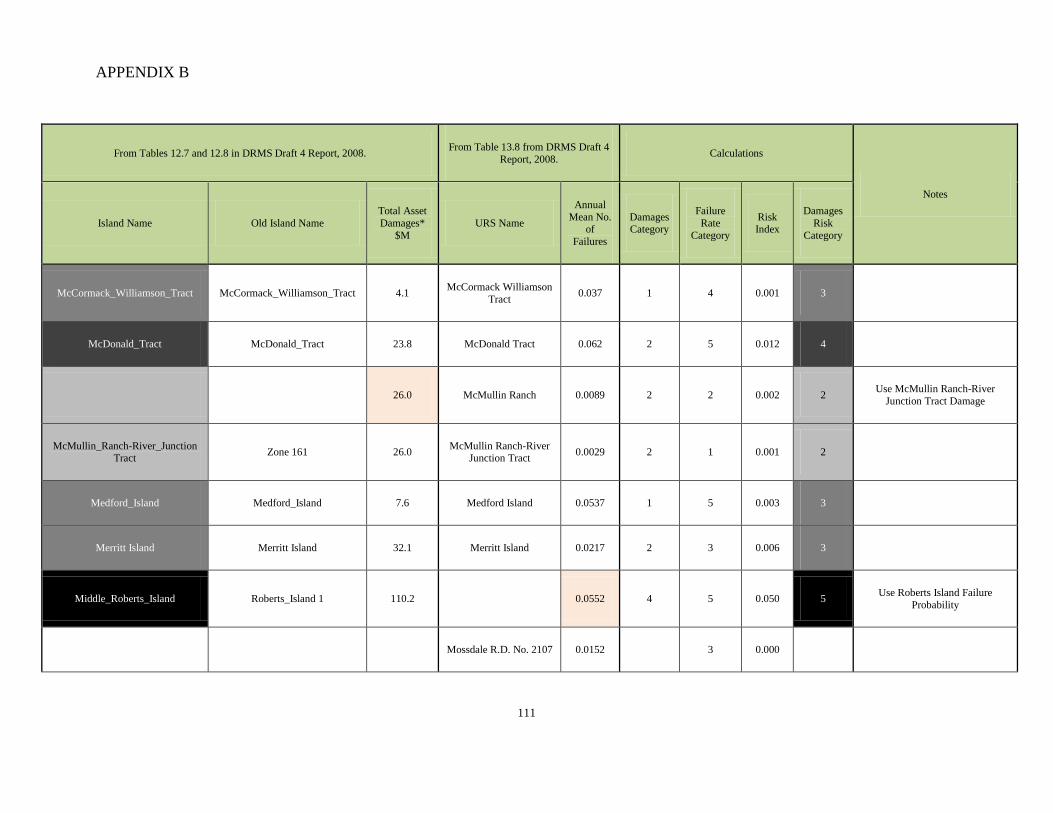
APPENDIX B
111
From Tables 12.7 and 12.8 in DRMS Draft 4 Report, 2008. From Table 13.8 from DRMS Draft 4 Report, 2008. Calculations
Notes
Island Name Old Island Name Total Asset Damages*
$M URS Name
Annual Mean No.
of Failures
Damages Category
Failure Rate
Category
Risk Index
Damages Risk
Category
McCormack_Williamson_Tract McCormack_Williamson_Tract 4.1 McCormack Williamson Tract 0.037 1 4 0.001 3
McDonald_Tract McDonald_Tract 23.8 McDonald Tract 0.062 2 5 0.012 4
26.0 McMullin Ranch 0.0089 2 2 0.002 2 Use McMullin Ranch-River Junction Tract Damage
McMullin_Ranch-River_Junction Tract Zone 161 26.0 McMullin Ranch-River
Junction Tract 0.0029 2 1 0.001 2
Medford_Island Medford_Island 7.6 Medford Island 0.0537 1 5 0.003 3
Merritt Island Merritt Island 32.1 Merritt Island 0.0217 2 3 0.006 3
Middle_Roberts_Island Roberts_Island 1 110.2 0.0552 4 5 0.050 5 Use Roberts Island Failure Probability
Mossdale R.D. No. 2107 0.0152 3 0.000
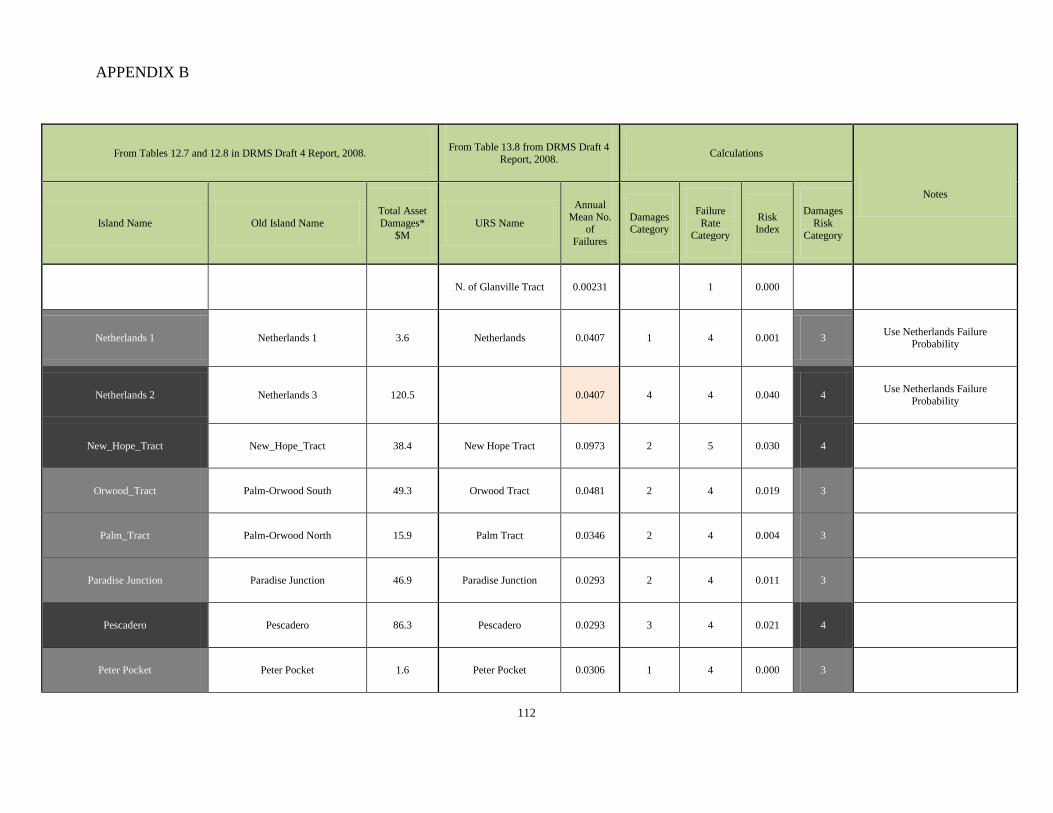
APPENDIX B
112
From Tables 12.7 and 12.8 in DRMS Draft 4 Report, 2008. From Table 13.8 from DRMS Draft 4 Report, 2008. Calculations
Notes
Island Name Old Island Name Total Asset Damages*
$M URS Name
Annual Mean No.
of Failures
Damages Category
Failure Rate
Category
Risk Index
Damages Risk
Category
N. of Glanville Tract 0.00231 1 0.000
Netherlands 1 Netherlands 1 3.6 Netherlands 0.0407 1 4 0.001 3 Use Netherlands Failure Probability
Netherlands 2 Netherlands 3 120.5 0.0407 4 4 0.040 4 Use Netherlands Failure Probability
New_Hope_Tract New_Hope_Tract 38.4 New Hope Tract 0.0973 2 5 0.030 4
Orwood_Tract Palm-Orwood South 49.3 Orwood Tract 0.0481 2 4 0.019 3
Palm_Tract Palm-Orwood North 15.9 Palm Tract 0.0346 2 4 0.004 3
Paradise Junction Paradise Junction 46.9 Paradise Junction 0.0293 2 4 0.011 3
Pescadero Pescadero 86.3 Pescadero 0.0293 3 4 0.021 4
Peter Pocket Peter Pocket 1.6 Peter Pocket 0.0306 1 4 0.000 3
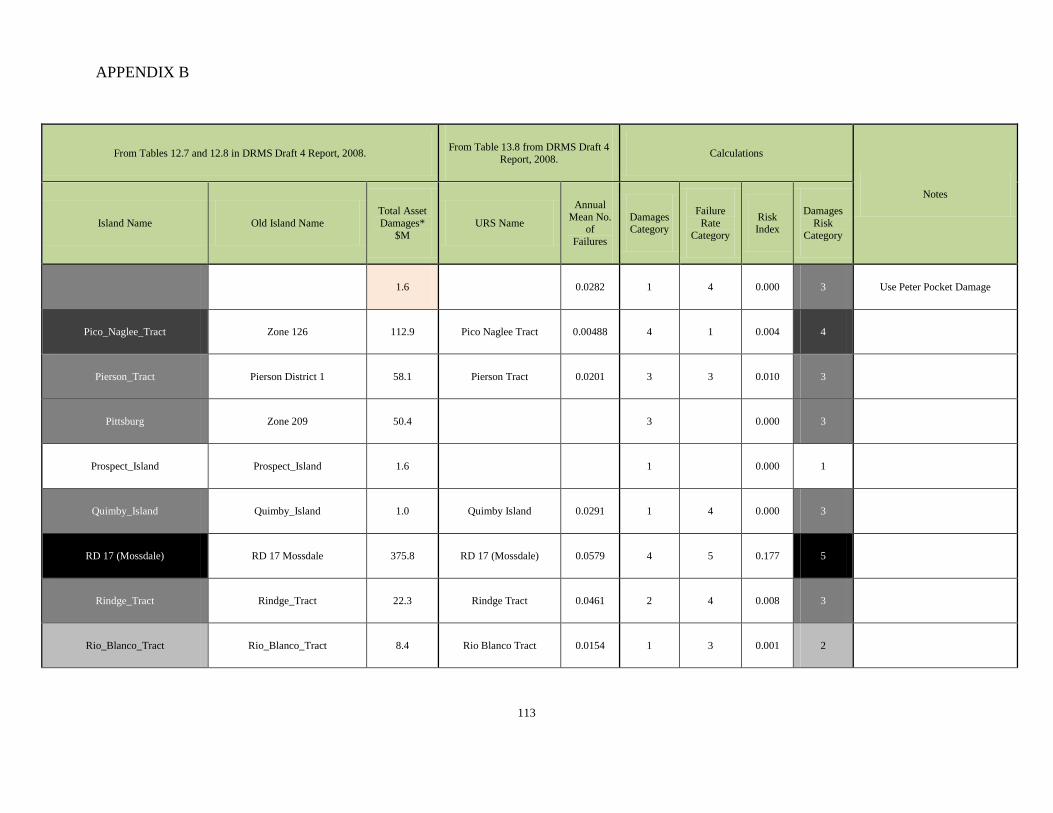
APPENDIX B
113
From Tables 12.7 and 12.8 in DRMS Draft 4 Report, 2008. From Table 13.8 from DRMS Draft 4 Report, 2008. Calculations
Notes
Island Name Old Island Name Total Asset Damages*
$M URS Name
Annual Mean No.
of Failures
Damages Category
Failure Rate
Category
Risk Index
Damages Risk
Category
1.6 Peter's Pocket West 0.0282 1 4 0.000 3 Use Peter Pocket Damage
Pico_Naglee_Tract Zone 126 112.9 Pico Naglee Tract 0.00488 4 1 0.004 4
Pierson_Tract Pierson District 1 58.1 Pierson Tract 0.0201 3 3 0.010 3
Pittsburg Zone 209 50.4 3 0.000 3
Prospect_Island Prospect_Island 1.6 1 0.000 1
Quimby_Island Quimby_Island 1.0 Quimby Island 0.0291 1 4 0.000 3
RD 17 (Mossdale) RD 17 Mossdale 375.8 RD 17 (Mossdale) 0.0579 4 5 0.177 5
Rindge_Tract Rindge_Tract 22.3 Rindge Tract 0.0461 2 4 0.008 3
Rio_Blanco_Tract Rio_Blanco_Tract 8.4 Rio Blanco Tract 0.0154 1 3 0.001 2
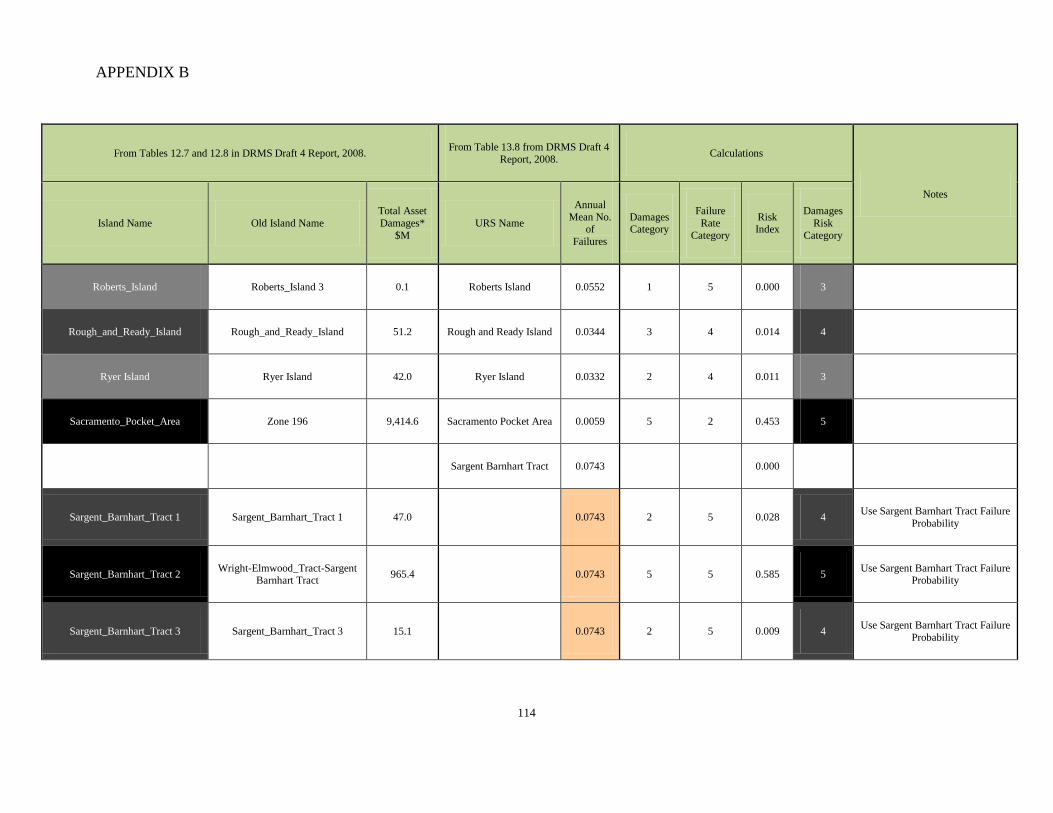
APPENDIX B
114
From Tables 12.7 and 12.8 in DRMS Draft 4 Report, 2008. From Table 13.8 from DRMS Draft 4 Report, 2008. Calculations
Notes
Island Name Old Island Name Total Asset Damages*
$M URS Name
Annual Mean No.
of Failures
Damages Category
Failure Rate
Category
Risk Index
Damages Risk
Category
Roberts_Island Roberts_Island 3 0.1 Roberts Island 0.0552 1 5 0.000 3
Rough_and_Ready_Island Rough_and_Ready_Island 51.2 Rough and Ready Island 0.0344 3 4 0.014 4
Ryer Island Ryer Island 42.0 Ryer Island 0.0332 2 4 0.011 3
Sacramento_Pocket_Area Zone 196 9,414.6 Sacramento Pocket Area 0.0059 5 2 0.453 5
Sargent Barnhart Tract 0.0743 0.000
Sargent_Barnhart_Tract 1 Sargent_Barnhart_Tract 1 47.0 0.0743 2 5 0.028 4 Use Sargent Barnhart Tract Failure Probability
Sargent_Barnhart_Tract 2 Wright-Elmwood_Tract-Sargent Barnhart Tract 965.4 0.0743 5 5 0.585 5 Use Sargent Barnhart Tract Failure
Probability
Sargent_Barnhart_Tract 3 Sargent_Barnhart_Tract 3 15.1 0.0743 2 5 0.009 4 Use Sargent Barnhart Tract Failure Probability
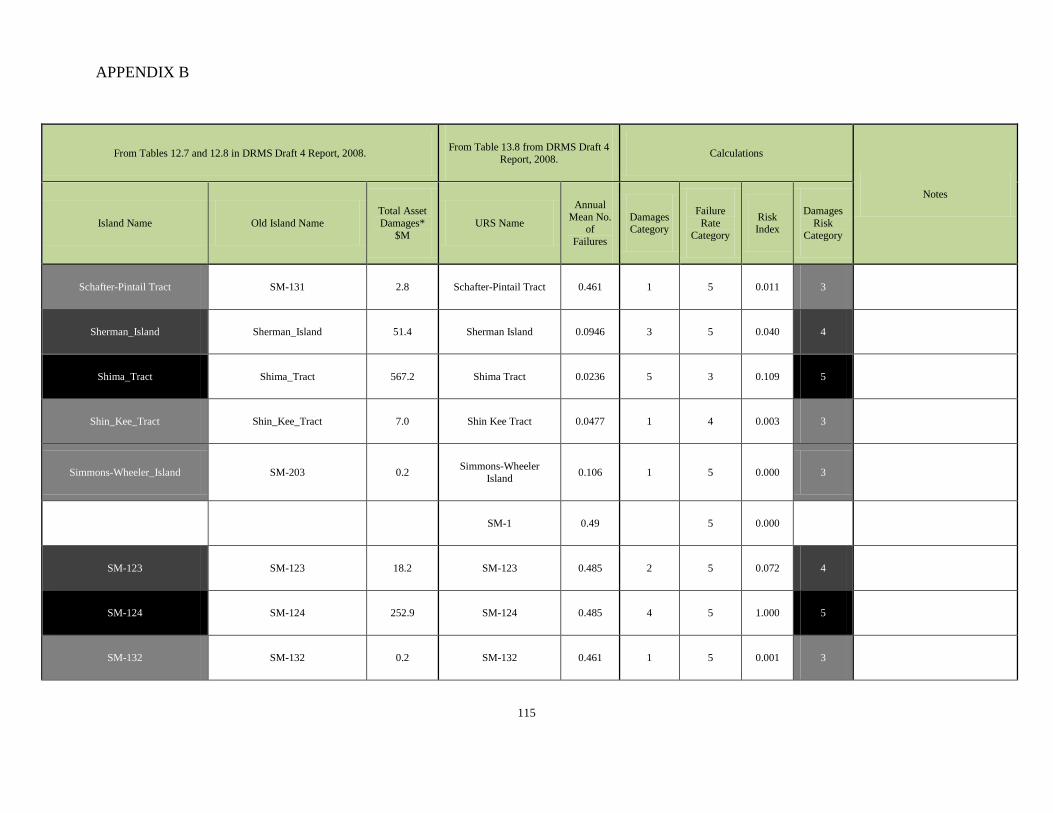
APPENDIX B
115
From Tables 12.7 and 12.8 in DRMS Draft 4 Report, 2008. From Table 13.8 from DRMS Draft 4 Report, 2008. Calculations
Notes
Island Name Old Island Name Total Asset Damages*
$M URS Name
Annual Mean No.
of Failures
Damages Category
Failure Rate
Category
Risk Index
Damages Risk
Category
Schafter-Pintail Tract SM-131 2.8 Schafter-Pintail Tract 0.461 1 5 0.011 3
Sherman_Island Sherman_Island 51.4 Sherman Island 0.0946 3 5 0.040 4
Shima_Tract Shima_Tract 567.2 Shima Tract 0.0236 5 3 0.109 5
Shin_Kee_Tract Shin_Kee_Tract 7.0 Shin Kee Tract 0.0477 1 4 0.003 3
Simmons-Wheeler_Island SM-203 0.2 Simmons-Wheeler Island 0.106 1 5 0.000 3
SM-1 0.49 5 0.000
SM-123 SM-123 18.2 SM-123 0.485 2 5 0.072 4
SM-124 SM-124 252.9 SM-124 0.485 4 5 1.000 5
SM-132 SM-132 0.2 SM-132 0.461 1 5 0.001 3
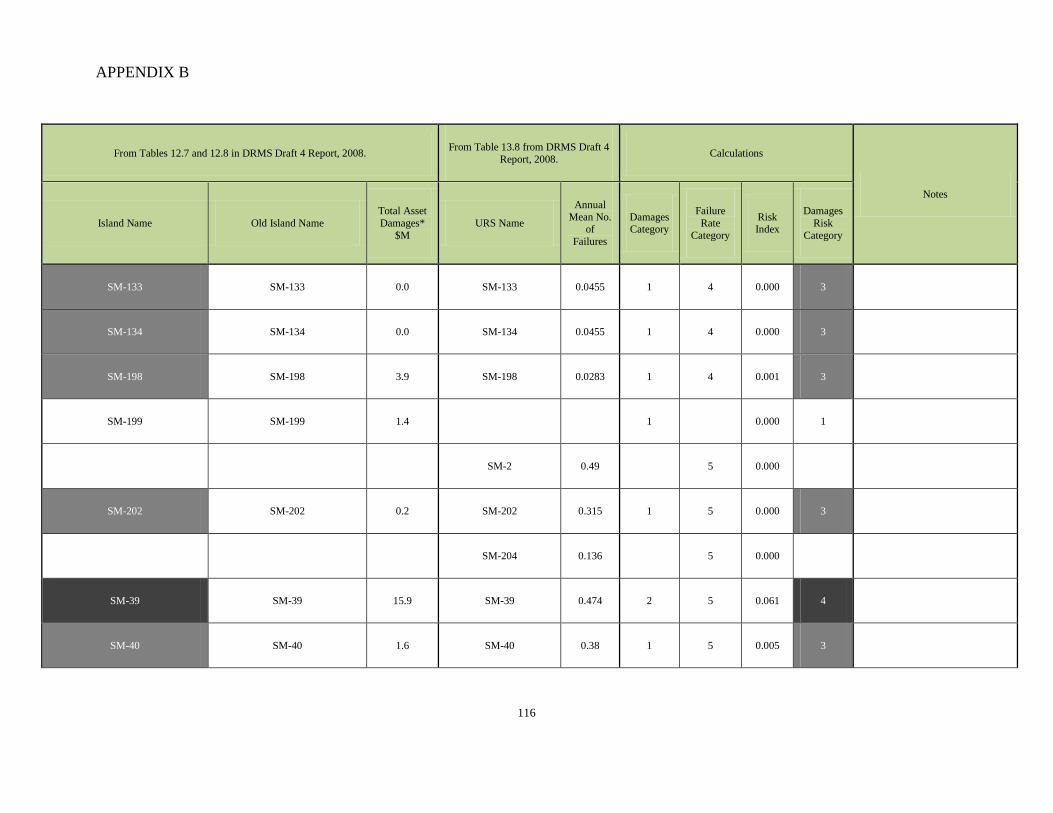
APPENDIX B
116
From Tables 12.7 and 12.8 in DRMS Draft 4 Report, 2008. From Table 13.8 from DRMS Draft 4 Report, 2008. Calculations
Notes
Island Name Old Island Name Total Asset Damages*
$M URS Name
Annual Mean No.
of Failures
Damages Category
Failure Rate
Category
Risk Index
Damages Risk
Category
SM-133 SM-133 0.0 SM-133 0.0455 1 4 0.000 3
SM-134 SM-134 0.0 SM-134 0.0455 1 4 0.000 3
SM-198 SM-198 3.9 SM-198 0.0283 1 4 0.001 3
SM-199 SM-199 1.4 1 0.000 1
SM-2 0.49 5 0.000
SM-202 SM-202 0.2 SM-202 0.315 1 5 0.000 3
SM-204 0.136 5 0.000
SM-39 SM-39 15.9 SM-39 0.474 2 5 0.061 4
SM-40 SM-40 1.6 SM-40 0.38 1 5 0.005 3
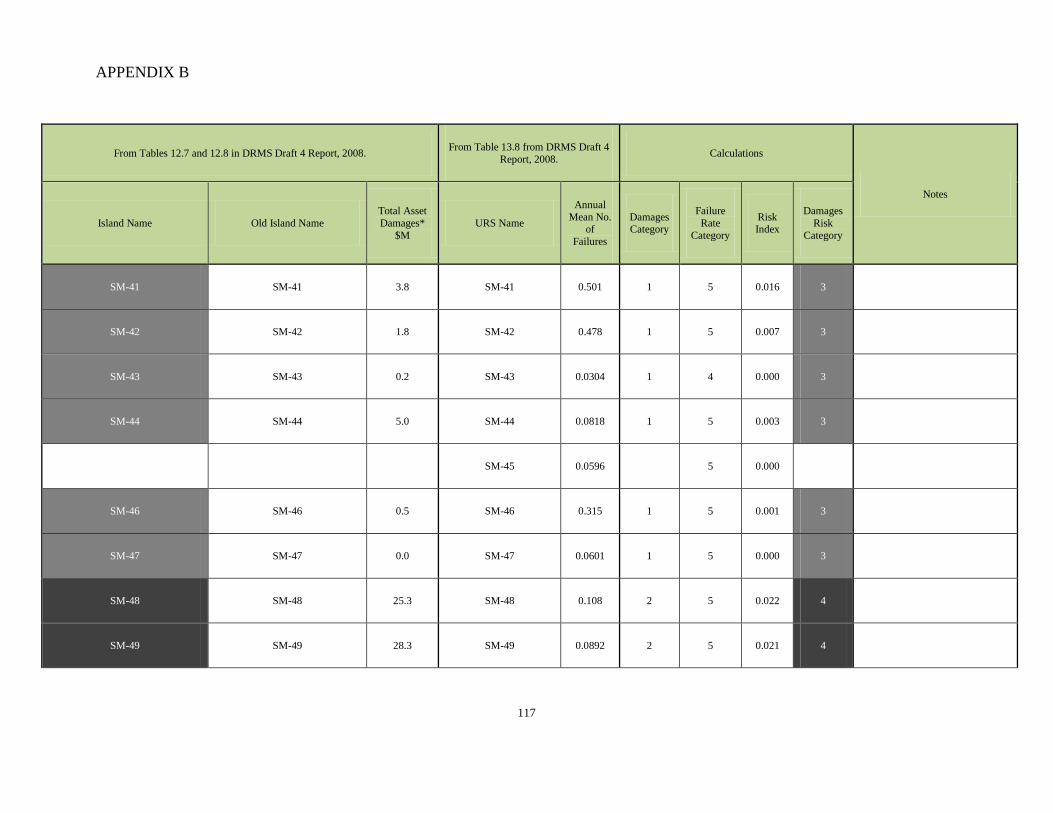
APPENDIX B
117
From Tables 12.7 and 12.8 in DRMS Draft 4 Report, 2008. From Table 13.8 from DRMS Draft 4 Report, 2008. Calculations
Notes
Island Name Old Island Name Total Asset Damages*
$M URS Name
Annual Mean No.
of Failures
Damages Category
Failure Rate
Category
Risk Index
Damages Risk
Category
SM-41 SM-41 3.8 SM-41 0.501 1 5 0.016 3
SM-42 SM-42 1.8 SM-42 0.478 1 5 0.007 3
SM-43 SM-43 0.2 SM-43 0.0304 1 4 0.000 3
SM-44 SM-44 5.0 SM-44 0.0818 1 5 0.003 3
SM-45 0.0596 5 0.000
SM-46 SM-46 0.5 SM-46 0.315 1 5 0.001 3
SM-47 SM-47 0.0 SM-47 0.0601 1 5 0.000 3
SM-48 SM-48 25.3 SM-48 0.108 2 5 0.022 4
SM-49 SM-49 28.3 SM-49 0.0892 2 5 0.021 4
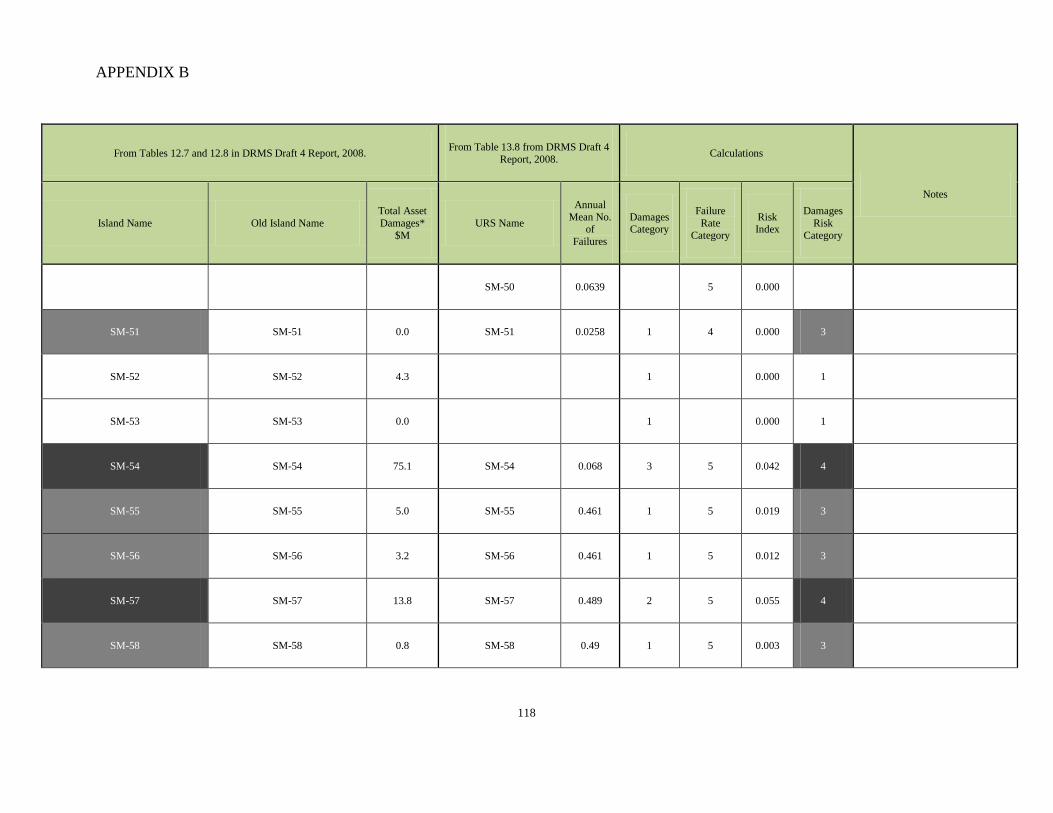
APPENDIX B
118
From Tables 12.7 and 12.8 in DRMS Draft 4 Report, 2008. From Table 13.8 from DRMS Draft 4 Report, 2008. Calculations
Notes
Island Name Old Island Name Total Asset Damages*
$M URS Name
Annual Mean No.
of Failures
Damages Category
Failure Rate
Category
Risk Index
Damages Risk
Category
SM-50 0.0639 5 0.000
SM-51 SM-51 0.0 SM-51 0.0258 1 4 0.000 3
SM-52 SM-52 4.3 1 0.000 1
SM-53 SM-53 0.0 1 0.000 1
SM-54 SM-54 75.1 SM-54 0.068 3 5 0.042 4
SM-55 SM-55 5.0 SM-55 0.461 1 5 0.019 3
SM-56 SM-56 3.2 SM-56 0.461 1 5 0.012 3
SM-57 SM-57 13.8 SM-57 0.489 2 5 0.055 4
SM-58 SM-58 0.8 SM-58 0.49 1 5 0.003 3
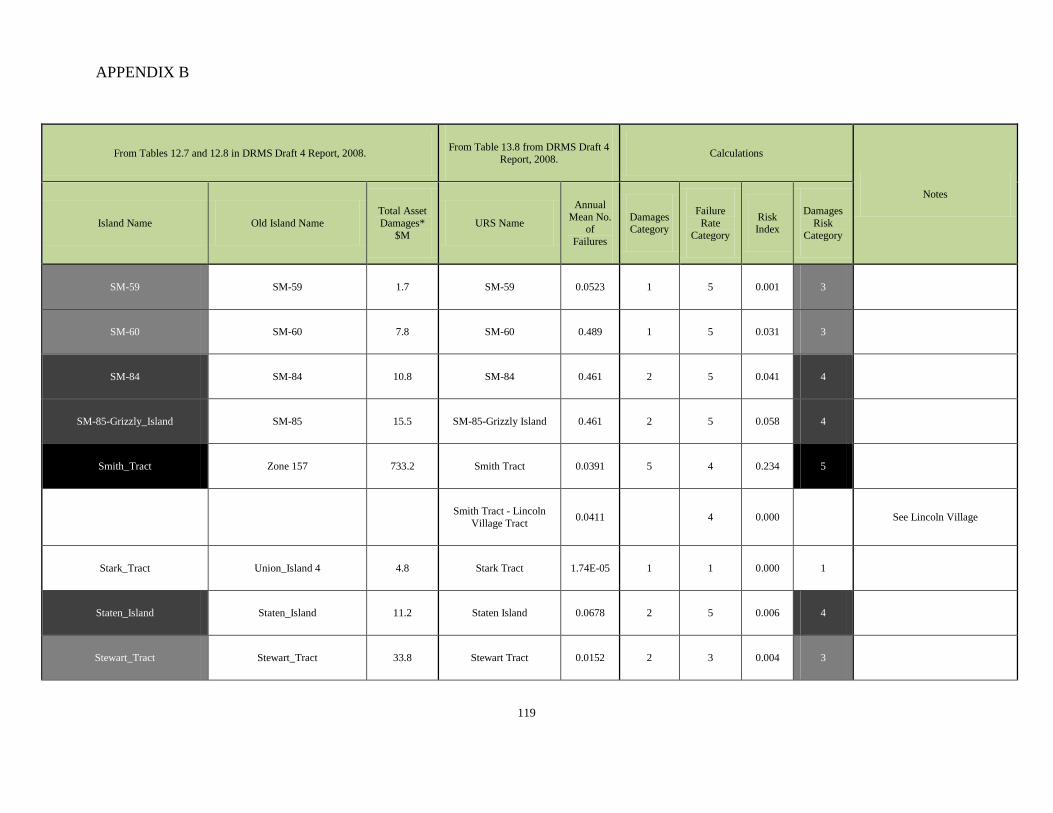
APPENDIX B
119
From Tables 12.7 and 12.8 in DRMS Draft 4 Report, 2008. From Table 13.8 from DRMS Draft 4 Report, 2008. Calculations
Notes
Island Name Old Island Name Total Asset Damages*
$M URS Name
Annual Mean No.
of Failures
Damages Category
Failure Rate
Category
Risk Index
Damages Risk
Category
SM-59 SM-59 1.7 SM-59 0.0523 1 5 0.001 3
SM-60 SM-60 7.8 SM-60 0.489 1 5 0.031 3
SM-84 SM-84 10.8 SM-84 0.461 2 5 0.041 4
SM-85-Grizzly_Island SM-85 15.5 SM-85-Grizzly Island 0.461 2 5 0.058 4
Smith_Tract Zone 157 733.2 Smith Tract 0.0391 5 4 0.234 5
Smith Tract - Lincoln Village Tract 0.0411 4 0.000 See Lincoln Village
Stark_Tract Union_Island 4 4.8 Stark Tract 1.74E-05 1 1 0.000 1
Staten_Island Staten_Island 11.2 Staten Island 0.0678 2 5 0.006 4
Stewart_Tract Stewart_Tract 33.8 Stewart Tract 0.0152 2 3 0.004 3
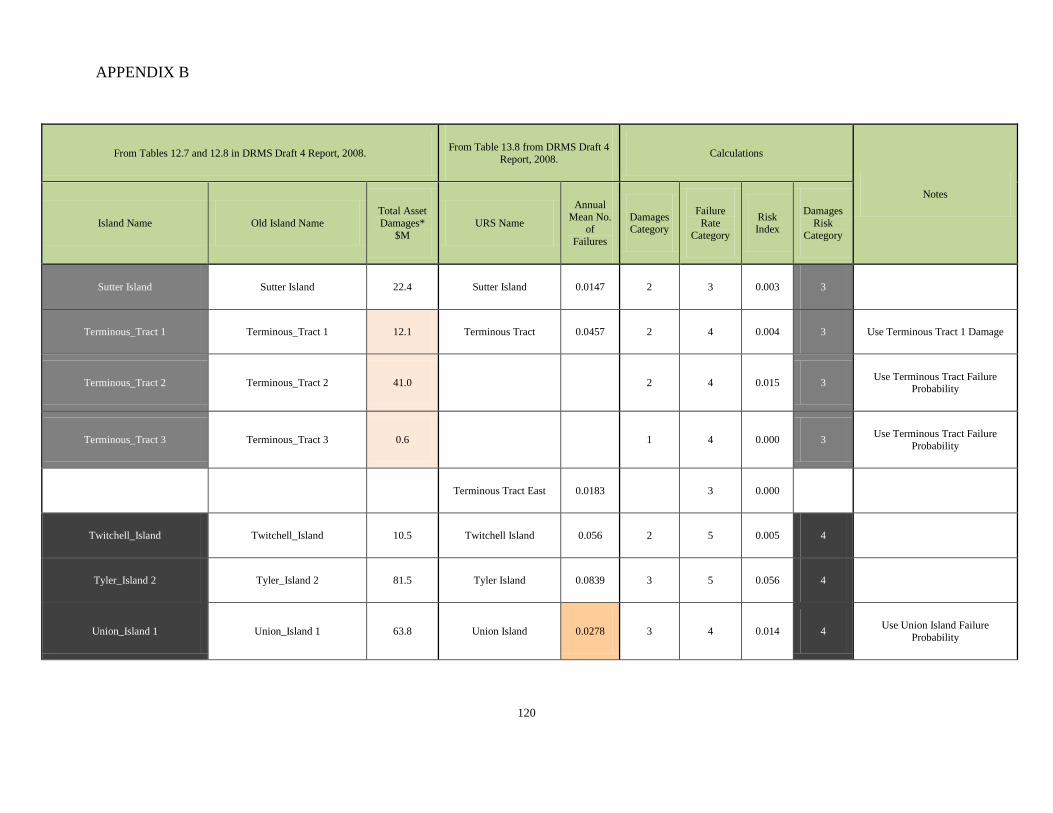
APPENDIX B
120
From Tables 12.7 and 12.8 in DRMS Draft 4 Report, 2008. From Table 13.8 from DRMS Draft 4 Report, 2008. Calculations
Notes
Island Name Old Island Name Total Asset Damages*
$M URS Name
Annual Mean No.
of Failures
Damages Category
Failure Rate
Category
Risk Index
Damages Risk
Category
Sutter Island Sutter Island 22.4 Sutter Island 0.0147 2 3 0.003 3
Terminous_Tract 1 Terminous_Tract 1 12.1 Terminous Tract 0.0457 2 4 0.004 3 Use Terminous Tract 1 Damage
Terminous_Tract 2 Terminous_Tract 2 41.0 2 4 0.015 3 Use Terminous Tract Failure Probability
Terminous_Tract 3 Terminous_Tract 3 0.6 1 4 0.000 3 Use Terminous Tract Failure Probability
Terminous Tract East 0.0183 3 0.000
Twitchell_Island Twitchell_Island 10.5 Twitchell Island 0.056 2 5 0.005 4
Tyler_Island 2 Tyler_Island 2 81.5 Tyler Island 0.0839 3 5 0.056 4
Union_Island 1 Union_Island 1 63.8 Union Island 0.0278 3 4 0.014 4 Use Union Island Failure Probability
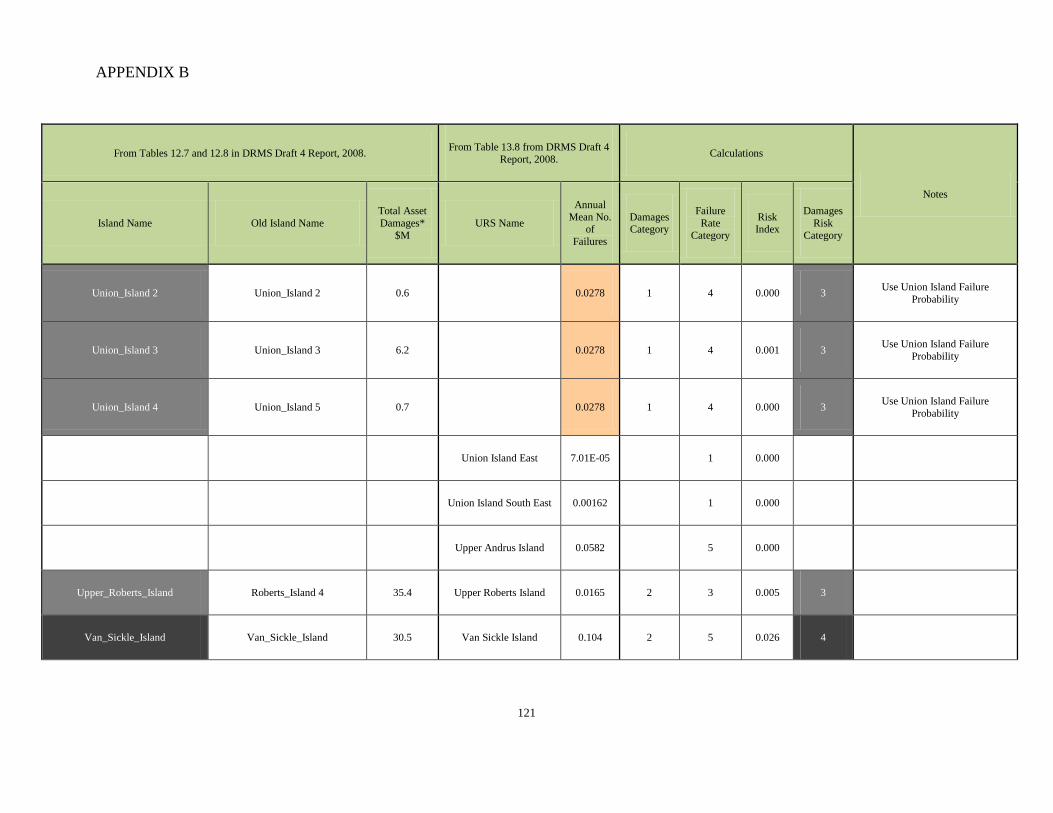
APPENDIX B
121
From Tables 12.7 and 12.8 in DRMS Draft 4 Report, 2008. From Table 13.8 from DRMS Draft 4 Report, 2008. Calculations
Notes
Island Name Old Island Name Total Asset Damages*
$M URS Name
Annual Mean No.
of Failures
Damages Category
Failure Rate
Category
Risk Index
Damages Risk
Category
Union_Island 2 Union_Island 2 0.6 0.0278 1 4 0.000 3 Use Union Island Failure Probability
Union_Island 3 Union_Island 3 6.2 0.0278 1 4 0.001 3 Use Union Island Failure Probability
Union_Island 4 Union_Island 5 0.7 0.0278 1 4 0.000 3 Use Union Island Failure Probability
Union Island East 7.01E-05 1 0.000
Union Island South East 0.00162 1 0.000
Upper Andrus Island 0.0582 5 0.000
Upper_Roberts_Island Roberts_Island 4 35.4 Upper Roberts Island 0.0165 2 3 0.005 3
Van_Sickle_Island Van_Sickle_Island 30.5 Van Sickle Island 0.104 2 5 0.026 4
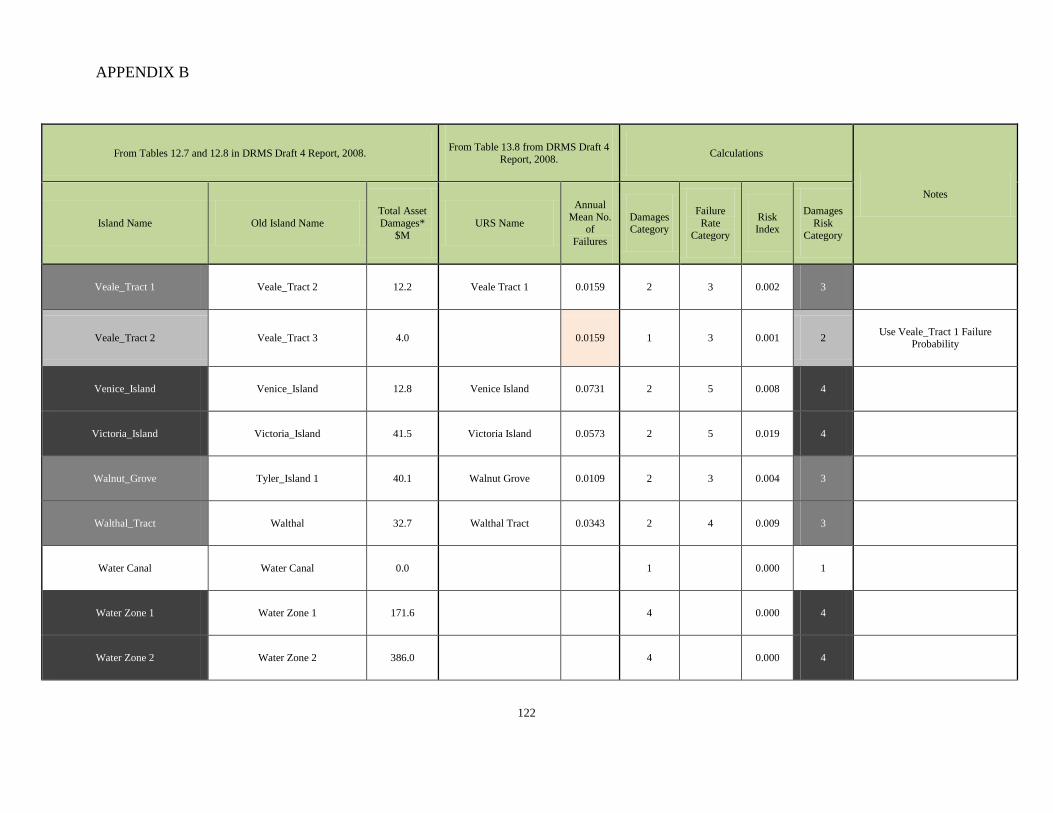
APPENDIX B
122
From Tables 12.7 and 12.8 in DRMS Draft 4 Report, 2008. From Table 13.8 from DRMS Draft 4 Report, 2008. Calculations
Notes
Island Name Old Island Name Total Asset Damages*
$M URS Name
Annual Mean No.
of Failures
Damages Category
Failure Rate
Category
Risk Index
Damages Risk
Category
Veale_Tract 1 Veale_Tract 2 12.2 Veale Tract 1 0.0159 2 3 0.002 3
Veale_Tract 2 Veale_Tract 3 4.0 0.0159 1 3 0.001 2 Use Veale_Tract 1 Failure Probability
Venice_Island Venice_Island 12.8 Venice Island 0.0731 2 5 0.008 4
Victoria_Island Victoria_Island 41.5 Victoria Island 0.0573 2 5 0.019 4
Walnut_Grove Tyler_Island 1 40.1 Walnut Grove 0.0109 2 3 0.004 3
Walthal_Tract Walthal 32.7 Walthal Tract 0.0343 2 4 0.009 3
Water Canal Water Canal 0.0 1 0.000 1
Water Zone 1 Water Zone 1 171.6 4 0.000 4
Water Zone 2 Water Zone 2 386.0 4 0.000 4
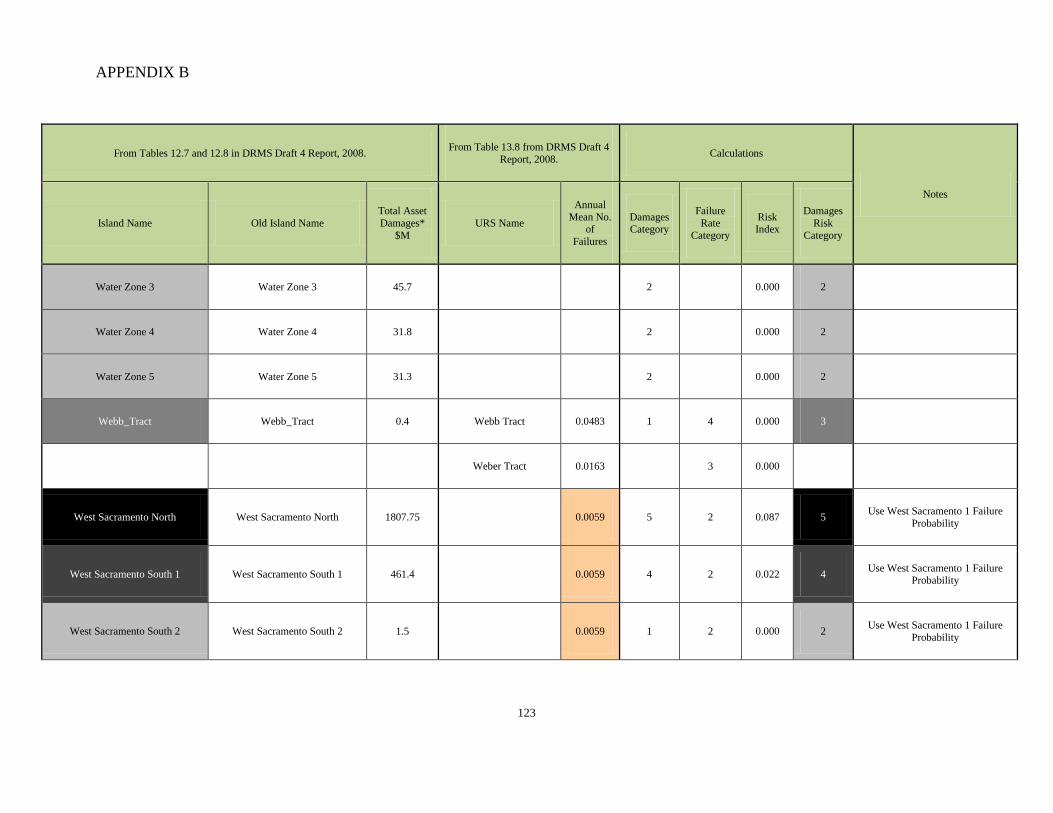
APPENDIX B
123
From Tables 12.7 and 12.8 in DRMS Draft 4 Report, 2008. From Table 13.8 from DRMS Draft 4 Report, 2008. Calculations
Notes
Island Name Old Island Name Total Asset Damages*
$M URS Name
Annual Mean No.
of Failures
Damages Category
Failure Rate
Category
Risk Index
Damages Risk
Category
Water Zone 3 Water Zone 3 45.7 2 0.000 2
Water Zone 4 Water Zone 4 31.8 2 0.000 2
Water Zone 5 Water Zone 5 31.3 2 0.000 2
Webb_Tract Webb_Tract 0.4 Webb Tract 0.0483 1 4 0.000 3
Weber Tract 0.0163 3 0.000
West Sacramento North West Sacramento North 1807.75 0.0059 5 2 0.087 5 Use West Sacramento 1 Failure Probability
West Sacramento South 1 West Sacramento South 1 461.4 0.0059 4 2 0.022 4 Use West Sacramento 1 Failure Probability
West Sacramento South 2 West Sacramento South 2 1.5 0.0059 1 2 0.000 2 Use West Sacramento 1 Failure Probability
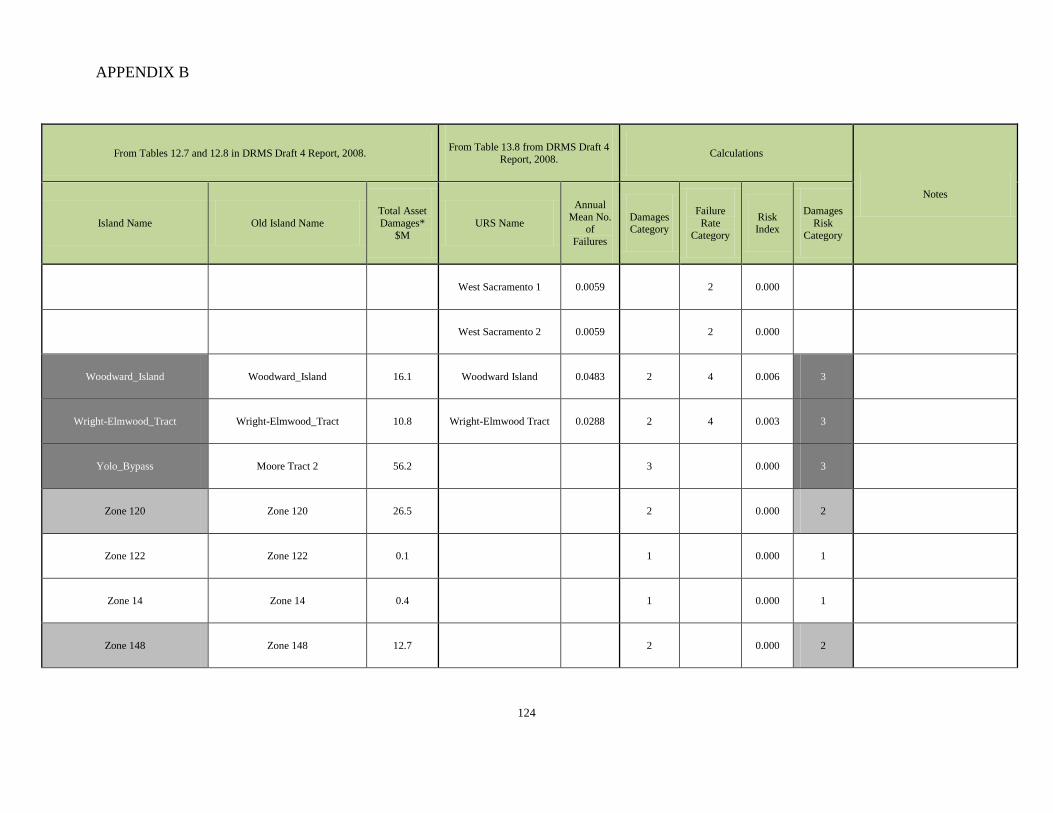
APPENDIX B
124
From Tables 12.7 and 12.8 in DRMS Draft 4 Report, 2008. From Table 13.8 from DRMS Draft 4 Report, 2008. Calculations
Notes
Island Name Old Island Name Total Asset Damages*
$M URS Name
Annual Mean No.
of Failures
Damages Category
Failure Rate
Category
Risk Index
Damages Risk
Category
West Sacramento 1 0.0059 2 0.000
West Sacramento 2 0.0059 2 0.000
Woodward_Island Woodward_Island 16.1 Woodward Island 0.0483 2 4 0.006 3
Wright-Elmwood_Tract Wright-Elmwood_Tract 10.8 Wright-Elmwood Tract 0.0288 2 4 0.003 3
Yolo_Bypass Moore Tract 2 56.2 3 0.000 3
Zone 120 Zone 120 26.5 2 0.000 2
Zone 122 Zone 122 0.1 1 0.000 1
Zone 14 Zone 14 0.4 1 0.000 1
Zone 148 Zone 148 12.7 2 0.000 2
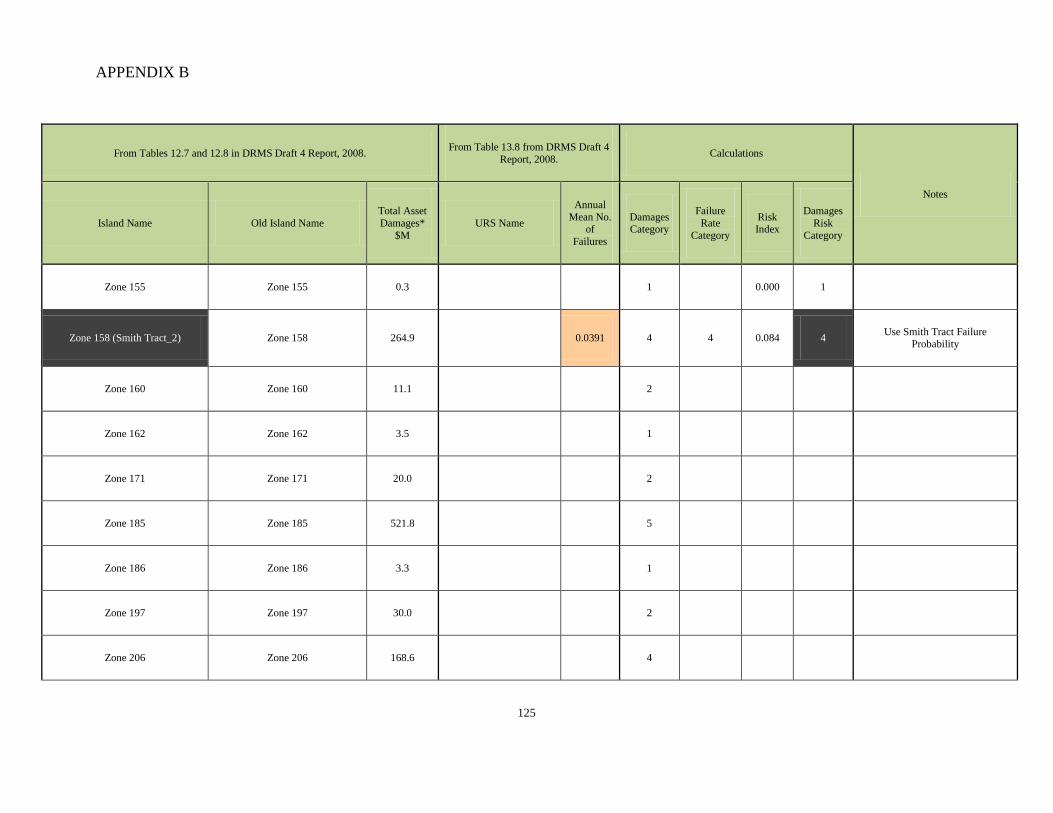
APPENDIX B
125
From Tables 12.7 and 12.8 in DRMS Draft 4 Report, 2008. From Table 13.8 from DRMS Draft 4 Report, 2008. Calculations
Notes
Island Name Old Island Name Total Asset Damages*
$M URS Name
Annual Mean No.
of Failures
Damages Category
Failure Rate
Category
Risk Index
Damages Risk
Category
Zone 155 Zone 155 0.3 1 0.000 1
Zone 158 (Smith Tract_2) Zone 158 264.9 0.0391 4 4 0.084 4 Use Smith Tract Failure Probability
Zone 160 Zone 160 11.1 2
Zone 162 Zone 162 3.5 1
Zone 171 Zone 171 20.0 2
Zone 185 Zone 185 521.8 5
Zone 186 Zone 186 3.3 1
Zone 197 Zone 197 30.0 2
Zone 206 Zone 206 168.6 4
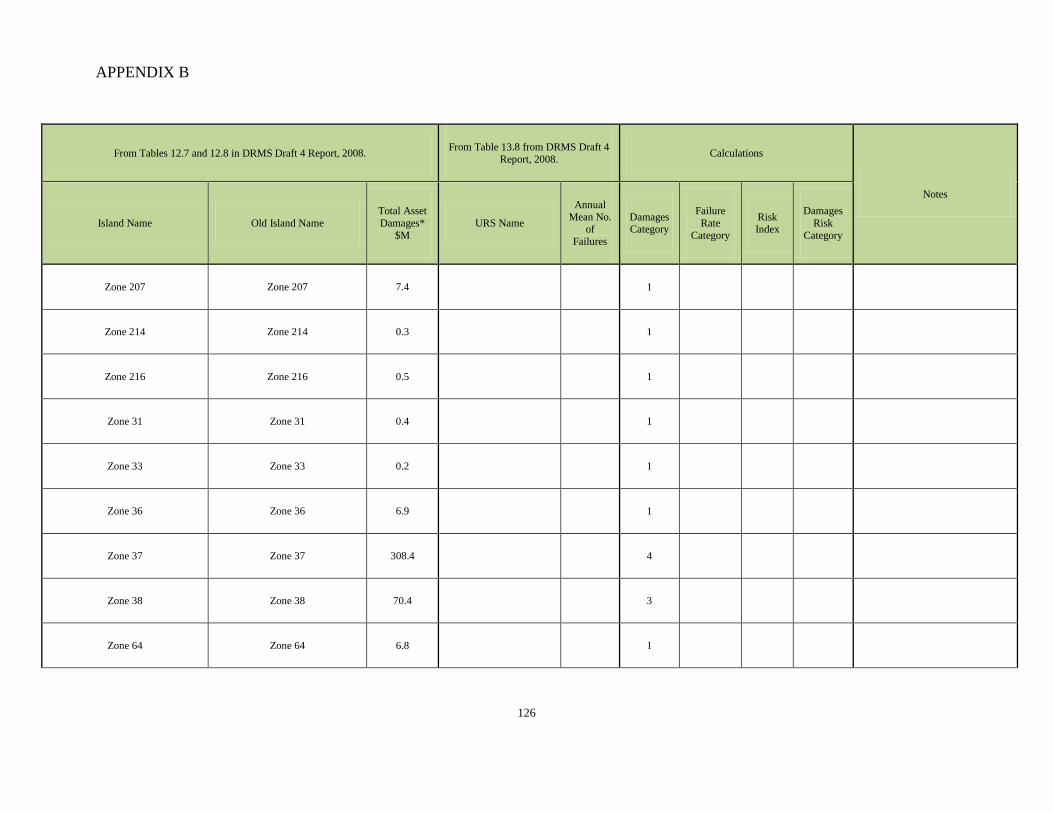
APPENDIX B
126
From Tables 12.7 and 12.8 in DRMS Draft 4 Report, 2008. From Table 13.8 from DRMS Draft 4 Report, 2008. Calculations
Notes
Island Name Old Island Name Total Asset Damages*
$M URS Name
Annual Mean No.
of Failures
Damages Category
Failure Rate
Category
Risk Index
Damages Risk
Category
Zone 207 Zone 207 7.4 1
Zone 214 Zone 214 0.3 1
Zone 216 Zone 216 0.5 1
Zone 31 Zone 31 0.4 1
Zone 33 Zone 33 0.2 1
Zone 36 Zone 36 6.9 1
Zone 37 Zone 37 308.4 4
Zone 38 Zone 38 70.4 3
Zone 64 Zone 64 6.8 1
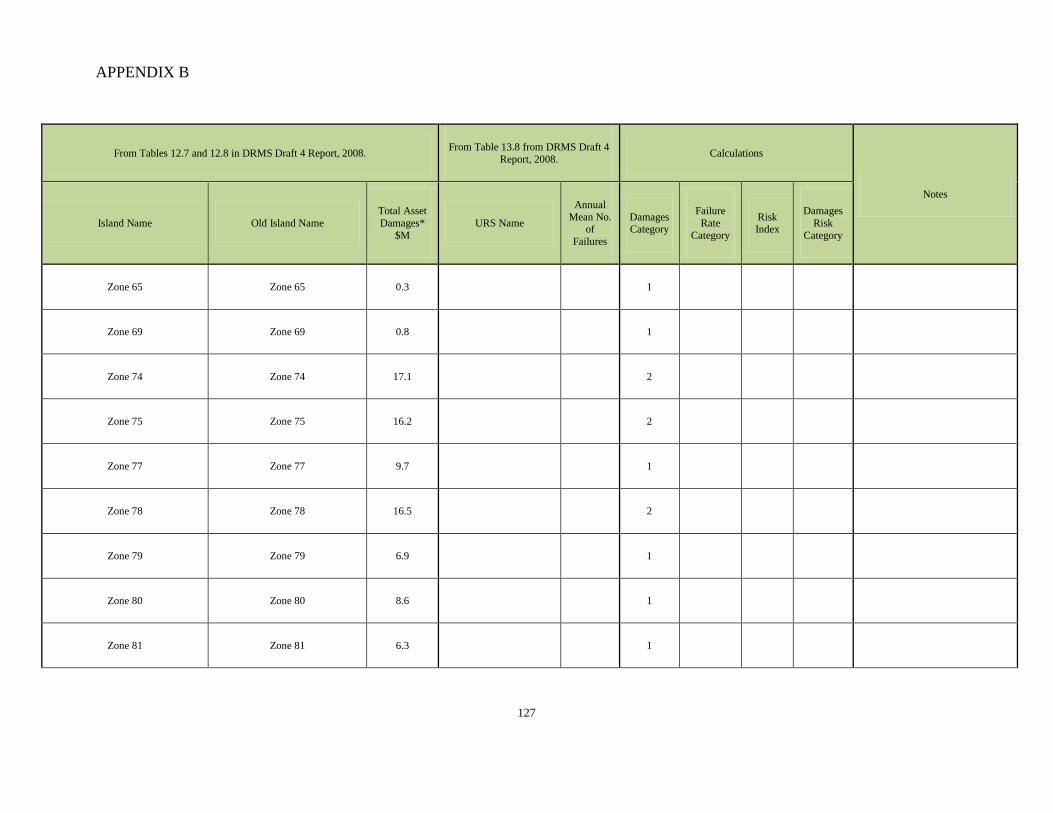
APPENDIX B
127
From Tables 12.7 and 12.8 in DRMS Draft 4 Report, 2008. From Table 13.8 from DRMS Draft 4 Report, 2008. Calculations
Notes
Island Name Old Island Name Total Asset Damages*
$M URS Name
Annual Mean No.
of Failures
Damages Category
Failure Rate
Category
Risk Index
Damages Risk
Category
Zone 65 Zone 65 0.3 1
Zone 69 Zone 69 0.8 1
Zone 74 Zone 74 17.1 2
Zone 75 Zone 75 16.2 2
Zone 77 Zone 77 9.7 1
Zone 78 Zone 78 16.5 2
Zone 79 Zone 79 6.9 1
Zone 80 Zone 80 8.6 1
Zone 81 Zone 81 6.3 1
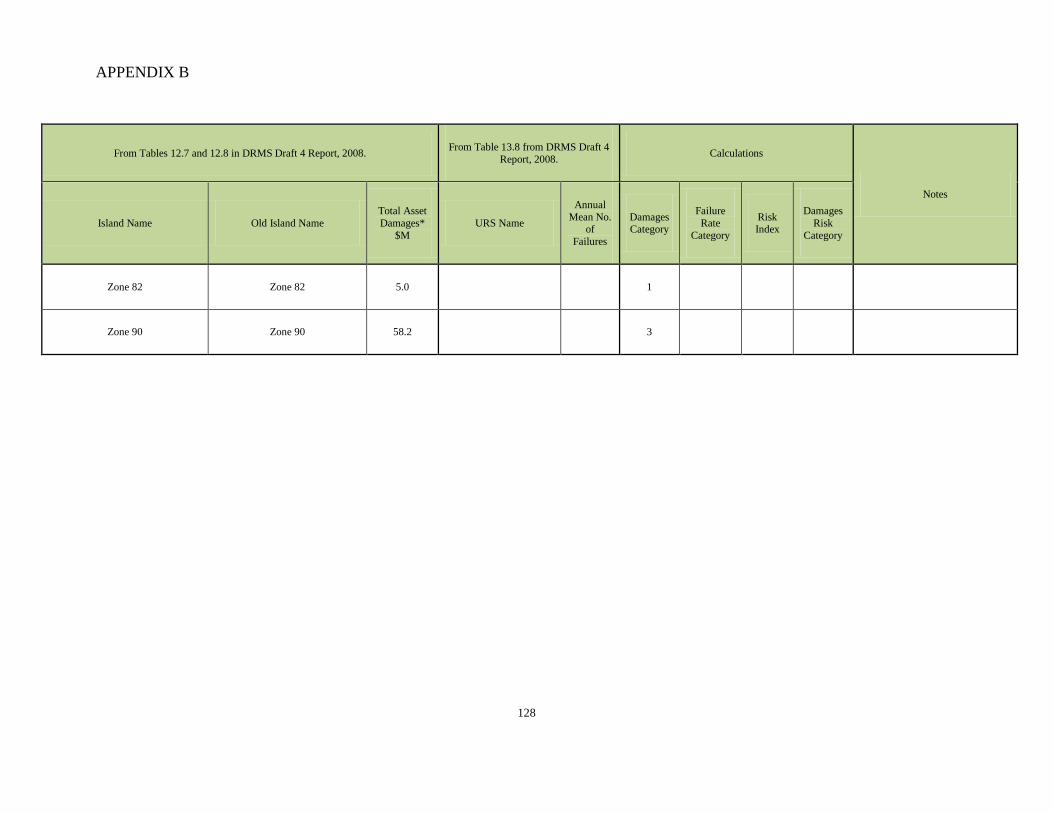
APPENDIX B
128
From Tables 12.7 and 12.8 in DRMS Draft 4 Report, 2008. From Table 13.8 from DRMS Draft 4 Report, 2008. Calculations
Notes
Island Name Old Island Name Total Asset Damages*
$M URS Name
Annual Mean No.
of Failures
Damages Category
Failure Rate
Category
Risk Index
Damages Risk
Category
Zone 82 Zone 82 5.0 1
Zone 90 Zone 90 58.2 3
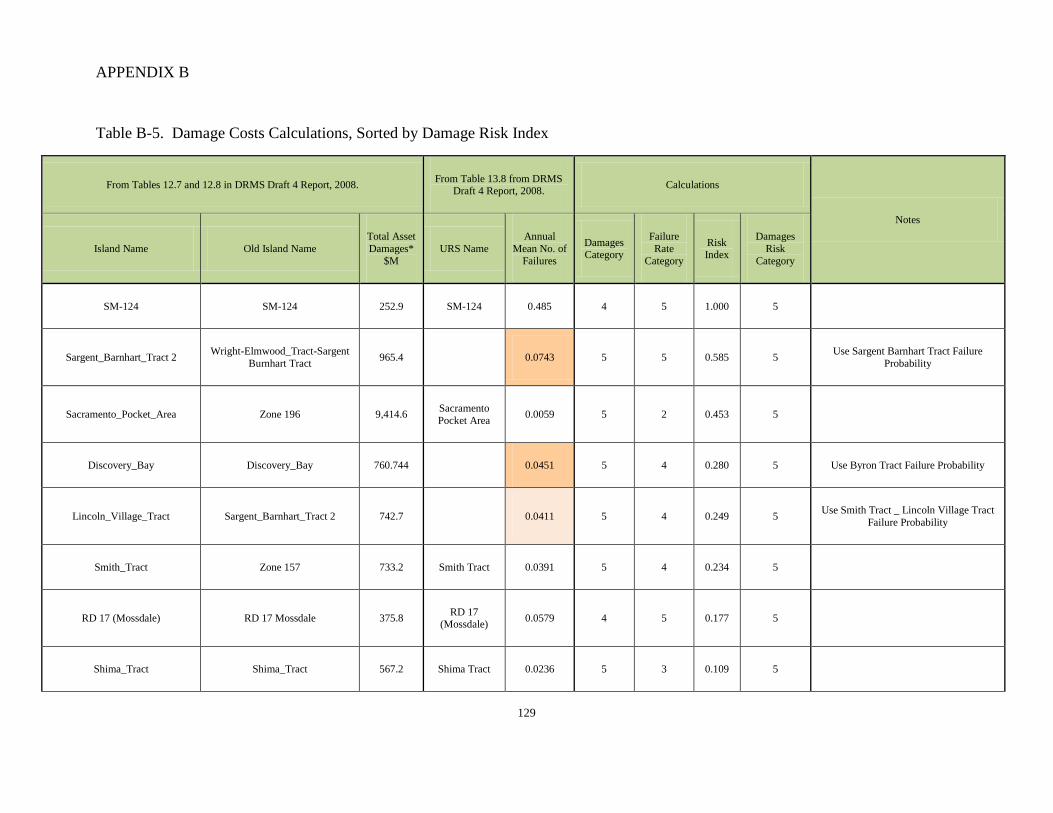
APPENDIX B
129
Table B-5. Damage Costs Calculations, Sorted by Damage Risk Index
From Tables 12.7 and 12.8 in DRMS Draft 4 Report, 2008. From Table 13.8 from DRMS Draft 4 Report, 2008. Calculations
Notes
Island Name Old Island Name Total Asset Damages*
$M URS Name
Annual Mean No. of
Failures
Damages Category
Failure Rate
Category
Risk Index
Damages Risk
Category
SM-124 SM-124 252.9 SM-124 0.485 4 5 1.000 5
Sargent_Barnhart_Tract 2 Wright-Elmwood_Tract-Sargent Burnhart Tract 965.4 0.0743 5 5 0.585 5 Use Sargent Barnhart Tract Failure
Probability
Sacramento_Pocket_Area Zone 196 9,414.6 Sacramento Pocket Area 0.0059 5 2 0.453 5
Discovery_Bay Discovery_Bay 760.744 0.0451 5 4 0.280 5 Use Byron Tract Failure Probability
Lincoln_Village_Tract Sargent_Barnhart_Tract 2 742.7 0.0411 5 4 0.249 5 Use Smith Tract _ Lincoln Village Tract Failure Probability
Smith_Tract Zone 157 733.2 Smith Tract 0.0391 5 4 0.234 5
RD 17 (Mossdale) RD 17 Mossdale 375.8 RD 17 (Mossdale) 0.0579 4 5 0.177 5
Shima_Tract Shima_Tract 567.2 Shima Tract 0.0236 5 3 0.109 5
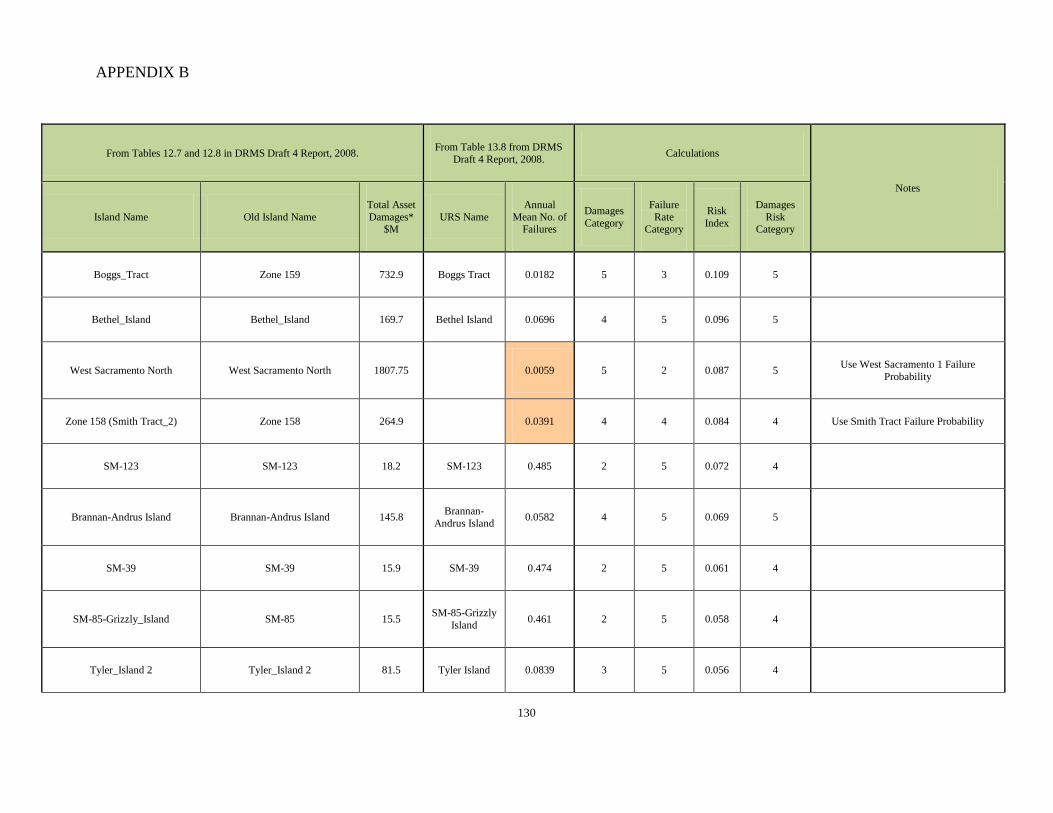
APPENDIX B
130
From Tables 12.7 and 12.8 in DRMS Draft 4 Report, 2008. From Table 13.8 from DRMS Draft 4 Report, 2008. Calculations
Notes
Island Name Old Island Name Total Asset Damages*
$M URS Name
Annual Mean No. of
Failures
Damages Category
Failure Rate
Category
Risk Index
Damages Risk
Category
Boggs_Tract Zone 159 732.9 Boggs Tract 0.0182 5 3 0.109 5
Bethel_Island Bethel_Island 169.7 Bethel Island 0.0696 4 5 0.096 5
West Sacramento North West Sacramento North 1807.75 0.0059 5 2 0.087 5 Use West Sacramento 1 Failure Probability
Zone 158 (Smith Tract_2) Zone 158 264.9 0.0391 4 4 0.084 4 Use Smith Tract Failure Probability
SM-123 SM-123 18.2 SM-123 0.485 2 5 0.072 4
Brannan-Andrus Island Brannan-Andrus Island 145.8 Brannan-Andrus Island 0.0582 4 5 0.069 5
SM-39 SM-39 15.9 SM-39 0.474 2 5 0.061 4
SM-85-Grizzly_Island SM-85 15.5 SM-85-Grizzly Island 0.461 2 5 0.058 4
Tyler_Island 2 Tyler_Island 2 81.5 Tyler Island 0.0839 3 5 0.056 4
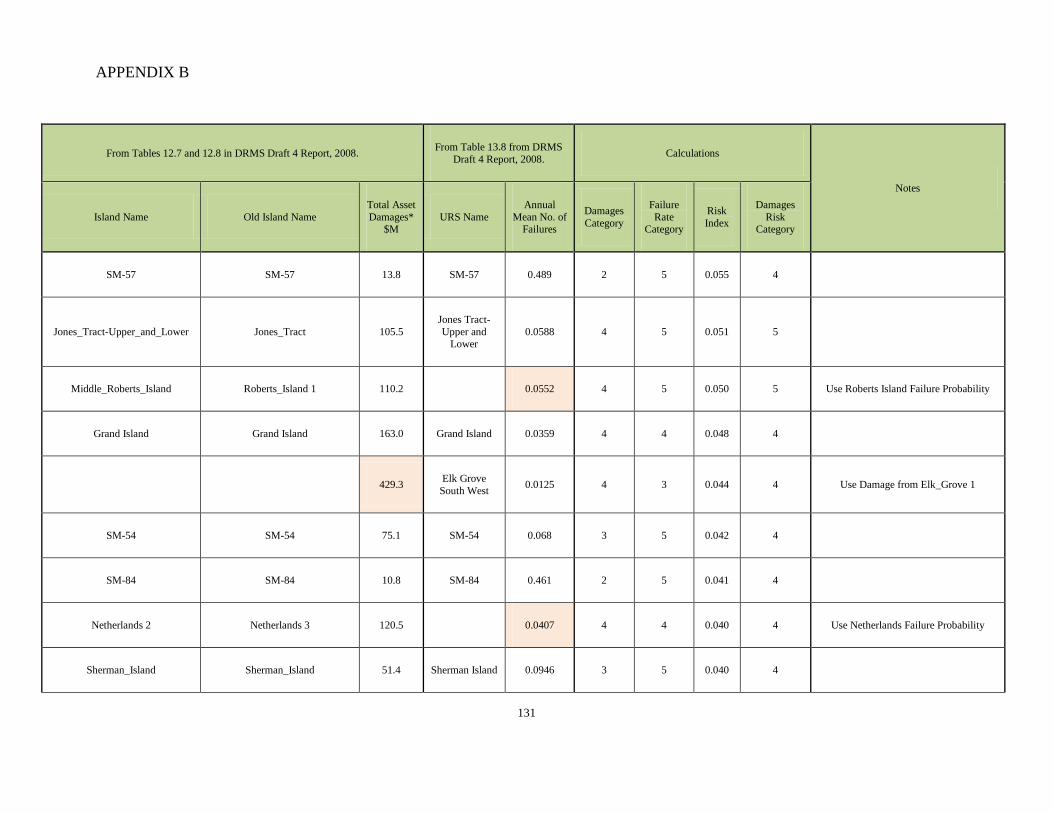
APPENDIX B
131
From Tables 12.7 and 12.8 in DRMS Draft 4 Report, 2008. From Table 13.8 from DRMS Draft 4 Report, 2008. Calculations
Notes
Island Name Old Island Name Total Asset Damages*
$M URS Name
Annual Mean No. of
Failures
Damages Category
Failure Rate
Category
Risk Index
Damages Risk
Category
SM-57 SM-57 13.8 SM-57 0.489 2 5 0.055 4
Jones_Tract-Upper_and_Lower Jones_Tract 105.5 Jones Tract-Upper and
Lower 0.0588 4 5 0.051 5
Middle_Roberts_Island Roberts_Island 1 110.2 0.0552 4 5 0.050 5 Use Roberts Island Failure Probability
Grand Island Grand Island 163.0 Grand Island 0.0359 4 4 0.048 4
429.3 Elk Grove South West 0.0125 4 3 0.044 4 Use Damage from Elk_Grove 1
SM-54 SM-54 75.1 SM-54 0.068 3 5 0.042 4
SM-84 SM-84 10.8 SM-84 0.461 2 5 0.041 4
Netherlands 2 Netherlands 3 120.5 0.0407 4 4 0.040 4 Use Netherlands Failure Probability
Sherman_Island Sherman_Island 51.4 Sherman Island 0.0946 3 5 0.040 4
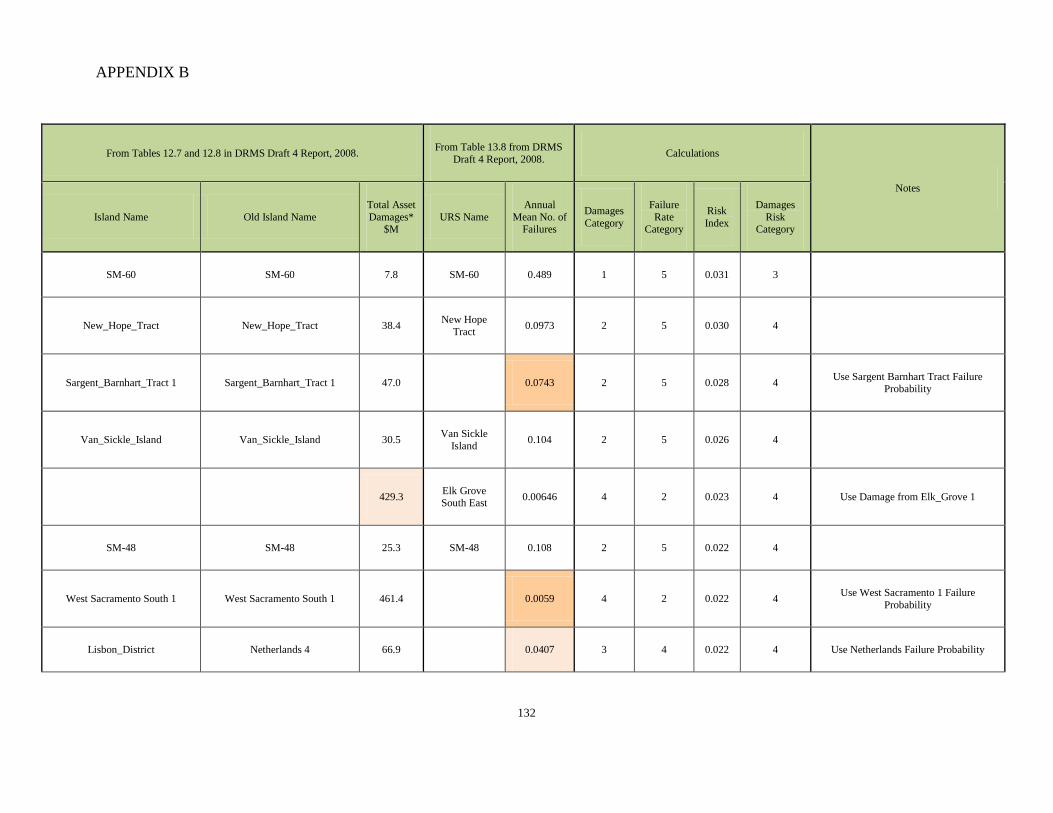
APPENDIX B
132
From Tables 12.7 and 12.8 in DRMS Draft 4 Report, 2008. From Table 13.8 from DRMS Draft 4 Report, 2008. Calculations
Notes
Island Name Old Island Name Total Asset Damages*
$M URS Name
Annual Mean No. of
Failures
Damages Category
Failure Rate
Category
Risk Index
Damages Risk
Category
SM-60 SM-60 7.8 SM-60 0.489 1 5 0.031 3
New_Hope_Tract New_Hope_Tract 38.4 New Hope Tract 0.0973 2 5 0.030 4
Sargent_Barnhart_Tract 1 Sargent_Barnhart_Tract 1 47.0 0.0743 2 5 0.028 4 Use Sargent Barnhart Tract Failure Probability
Van_Sickle_Island Van_Sickle_Island 30.5 Van Sickle Island 0.104 2 5 0.026 4
429.3 Elk Grove South East 0.00646 4 2 0.023 4 Use Damage from Elk_Grove 1
SM-48 SM-48 25.3 SM-48 0.108 2 5 0.022 4
West Sacramento South 1 West Sacramento South 1 461.4 0.0059 4 2 0.022 4 Use West Sacramento 1 Failure Probability
Lisbon_District Netherlands 4 66.9 0.0407 3 4 0.022 4 Use Netherlands Failure Probability
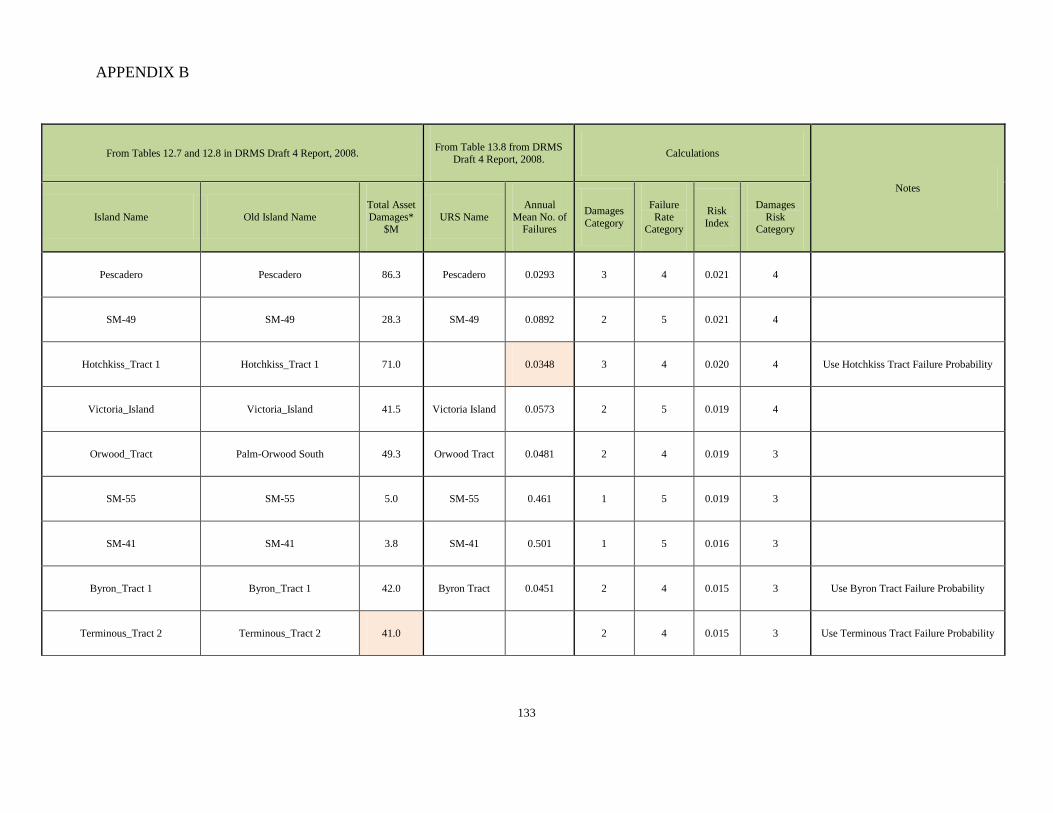
APPENDIX B
133
From Tables 12.7 and 12.8 in DRMS Draft 4 Report, 2008. From Table 13.8 from DRMS Draft 4 Report, 2008. Calculations
Notes
Island Name Old Island Name Total Asset Damages*
$M URS Name
Annual Mean No. of
Failures
Damages Category
Failure Rate
Category
Risk Index
Damages Risk
Category
Pescadero Pescadero 86.3 Pescadero 0.0293 3 4 0.021 4
SM-49 SM-49 28.3 SM-49 0.0892 2 5 0.021 4
Hotchkiss_Tract 1 Hotchkiss_Tract 1 71.0 0.0348 3 4 0.020 4 Use Hotchkiss Tract Failure Probability
Victoria_Island Victoria_Island 41.5 Victoria Island 0.0573 2 5 0.019 4
Orwood_Tract Palm-Orwood South 49.3 Orwood Tract 0.0481 2 4 0.019 3
SM-55 SM-55 5.0 SM-55 0.461 1 5 0.019 3
SM-41 SM-41 3.8 SM-41 0.501 1 5 0.016 3
Byron_Tract 1 Byron_Tract 1 42.0 Byron Tract 0.0451 2 4 0.015 3 Use Byron Tract Failure Probability
Terminous_Tract 2 Terminous_Tract 2 41.0 2 4 0.015 3 Use Terminous Tract Failure Probability
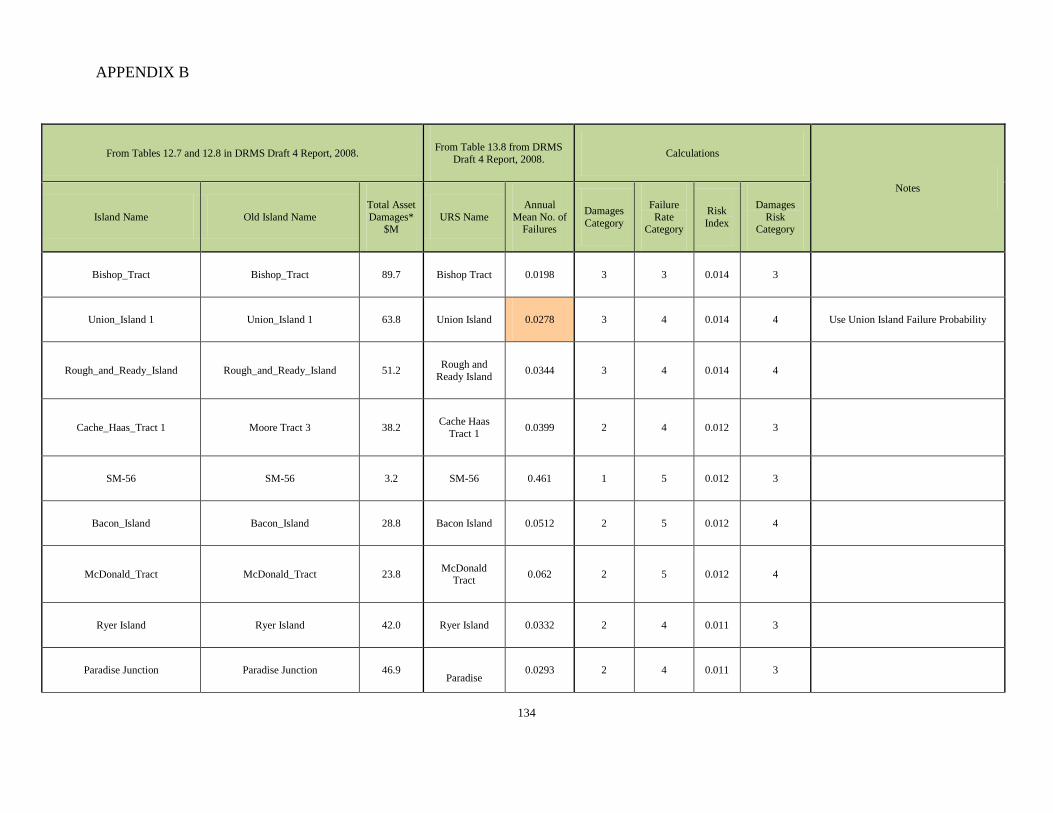
APPENDIX B
134
From Tables 12.7 and 12.8 in DRMS Draft 4 Report, 2008. From Table 13.8 from DRMS Draft 4 Report, 2008. Calculations
Notes
Island Name Old Island Name Total Asset Damages*
$M URS Name
Annual Mean No. of
Failures
Damages Category
Failure Rate
Category
Risk Index
Damages Risk
Category
Bishop_Tract Bishop_Tract 89.7 Bishop Tract 0.0198 3 3 0.014 3
Union_Island 1 Union_Island 1 63.8 Union Island 0.0278 3 4 0.014 4 Use Union Island Failure Probability
Rough_and_Ready_Island Rough_and_Ready_Island 51.2 Rough and Ready Island 0.0344 3 4 0.014 4
Cache_Haas_Tract 1 Moore Tract 3 38.2 Cache Haas Tract 1 0.0399 2 4 0.012 3
SM-56 SM-56 3.2 SM-56 0.461 1 5 0.012 3
Bacon_Island Bacon_Island 28.8 Bacon Island 0.0512 2 5 0.012 4
McDonald_Tract McDonald_Tract 23.8 McDonald Tract 0.062 2 5 0.012 4
Ryer Island Ryer Island 42.0 Ryer Island 0.0332 2 4 0.011 3
Paradise Junction Paradise Junction 46.9 Paradise
0.0293 2 4 0.011 3
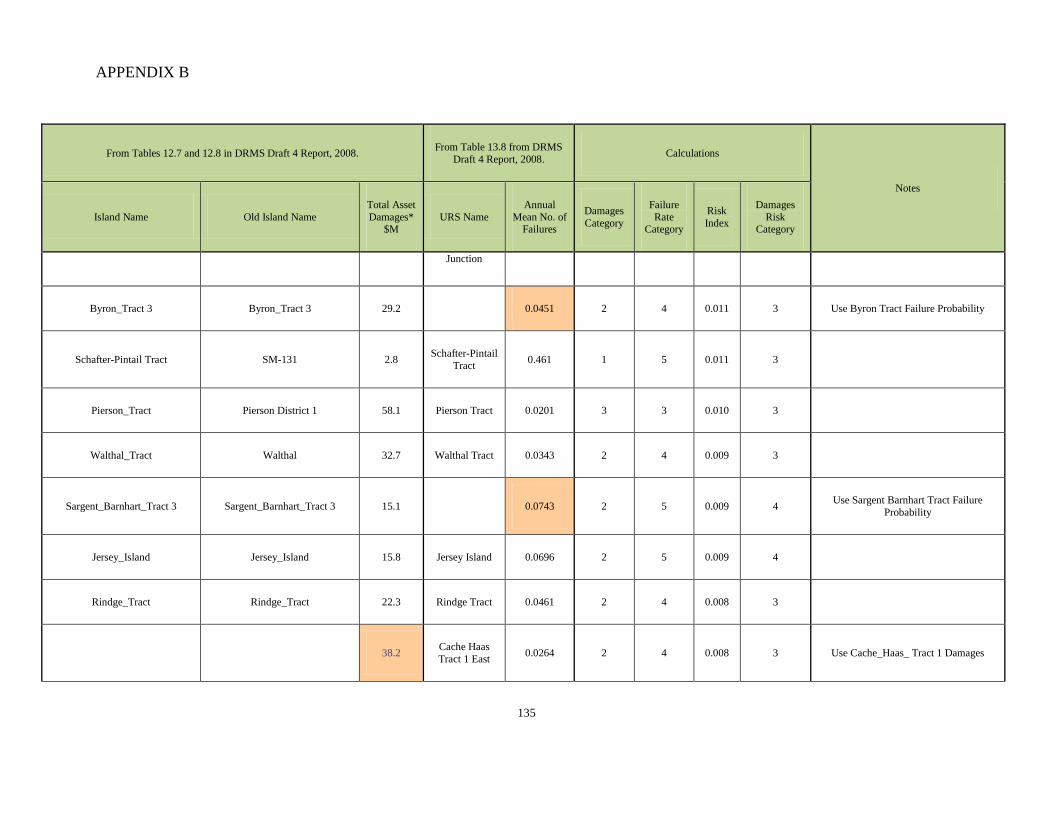
APPENDIX B
135
From Tables 12.7 and 12.8 in DRMS Draft 4 Report, 2008. From Table 13.8 from DRMS Draft 4 Report, 2008. Calculations
Notes
Island Name Old Island Name Total Asset Damages*
$M URS Name
Annual Mean No. of
Failures
Damages Category
Failure Rate
Category
Risk Index
Damages Risk
Category
Junction
Byron_Tract 3 Byron_Tract 3 29.2 0.0451 2 4 0.011 3 Use Byron Tract Failure Probability
Schafter-Pintail Tract SM-131 2.8 Schafter-Pintail Tract 0.461 1 5 0.011 3
Pierson_Tract Pierson District 1 58.1 Pierson Tract 0.0201 3 3 0.010 3
Walthal_Tract Walthal 32.7 Walthal Tract 0.0343 2 4 0.009 3
Sargent_Barnhart_Tract 3 Sargent_Barnhart_Tract 3 15.1 0.0743 2 5 0.009 4 Use Sargent Barnhart Tract Failure Probability
Jersey_Island Jersey_Island 15.8 Jersey Island 0.0696 2 5 0.009 4
Rindge_Tract Rindge_Tract 22.3 Rindge Tract 0.0461 2 4 0.008 3
38.2 Cache Haas Tract 1 East 0.0264 2 4 0.008 3 Use Cache_Haas_ Tract 1 Damages
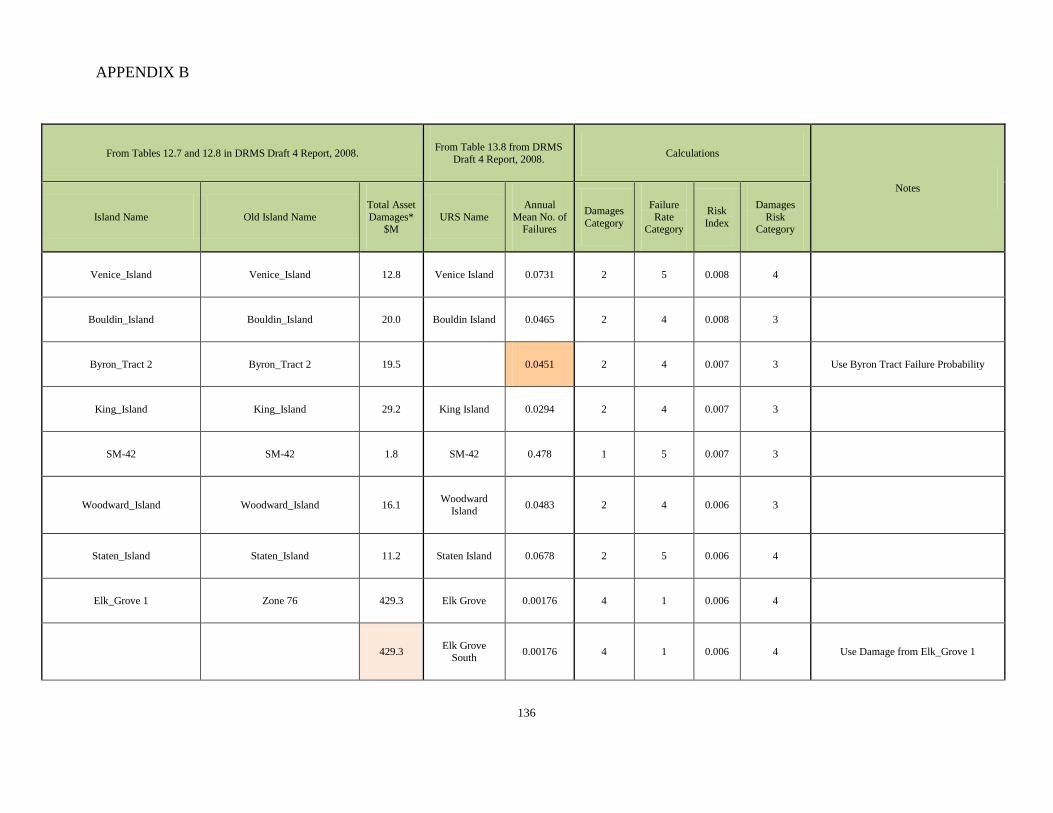
APPENDIX B
136
From Tables 12.7 and 12.8 in DRMS Draft 4 Report, 2008. From Table 13.8 from DRMS Draft 4 Report, 2008. Calculations
Notes
Island Name Old Island Name Total Asset Damages*
$M URS Name
Annual Mean No. of
Failures
Damages Category
Failure Rate
Category
Risk Index
Damages Risk
Category
Venice_Island Venice_Island 12.8 Venice Island 0.0731 2 5 0.008 4
Bouldin_Island Bouldin_Island 20.0 Bouldin Island 0.0465 2 4 0.008 3
Byron_Tract 2 Byron_Tract 2 19.5 0.0451 2 4 0.007 3 Use Byron Tract Failure Probability
King_Island King_Island 29.2 King Island 0.0294 2 4 0.007 3
SM-42 SM-42 1.8 SM-42 0.478 1 5 0.007 3
Woodward_Island Woodward_Island 16.1 Woodward Island 0.0483 2 4 0.006 3
Staten_Island Staten_Island 11.2 Staten Island 0.0678 2 5 0.006 4
Elk_Grove 1 Zone 76 429.3 Elk Grove 0.00176 4 1 0.006 4
429.3 Elk Grove South 0.00176 4 1 0.006 4 Use Damage from Elk_Grove 1
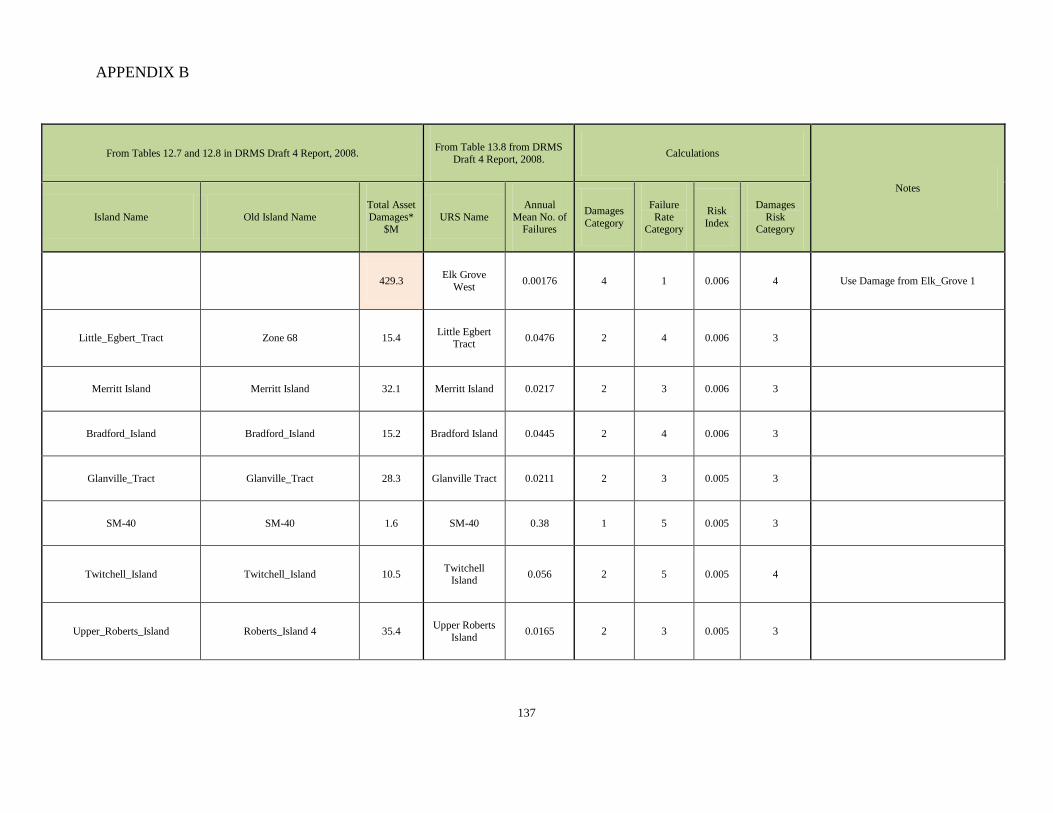
APPENDIX B
137
From Tables 12.7 and 12.8 in DRMS Draft 4 Report, 2008. From Table 13.8 from DRMS Draft 4 Report, 2008. Calculations
Notes
Island Name Old Island Name Total Asset Damages*
$M URS Name
Annual Mean No. of
Failures
Damages Category
Failure Rate
Category
Risk Index
Damages Risk
Category
429.3 Elk Grove West 0.00176 4 1 0.006 4 Use Damage from Elk_Grove 1
Little_Egbert_Tract Zone 68 15.4 Little Egbert Tract 0.0476 2 4 0.006 3
Merritt Island Merritt Island 32.1 Merritt Island 0.0217 2 3 0.006 3
Bradford_Island Bradford_Island 15.2 Bradford Island 0.0445 2 4 0.006 3
Glanville_Tract Glanville_Tract 28.3 Glanville Tract 0.0211 2 3 0.005 3
SM-40 SM-40 1.6 SM-40 0.38 1 5 0.005 3
Twitchell_Island Twitchell_Island 10.5 Twitchell Island 0.056 2 5 0.005 4
Upper_Roberts_Island Roberts_Island 4 35.4 Upper Roberts Island 0.0165 2 3 0.005 3
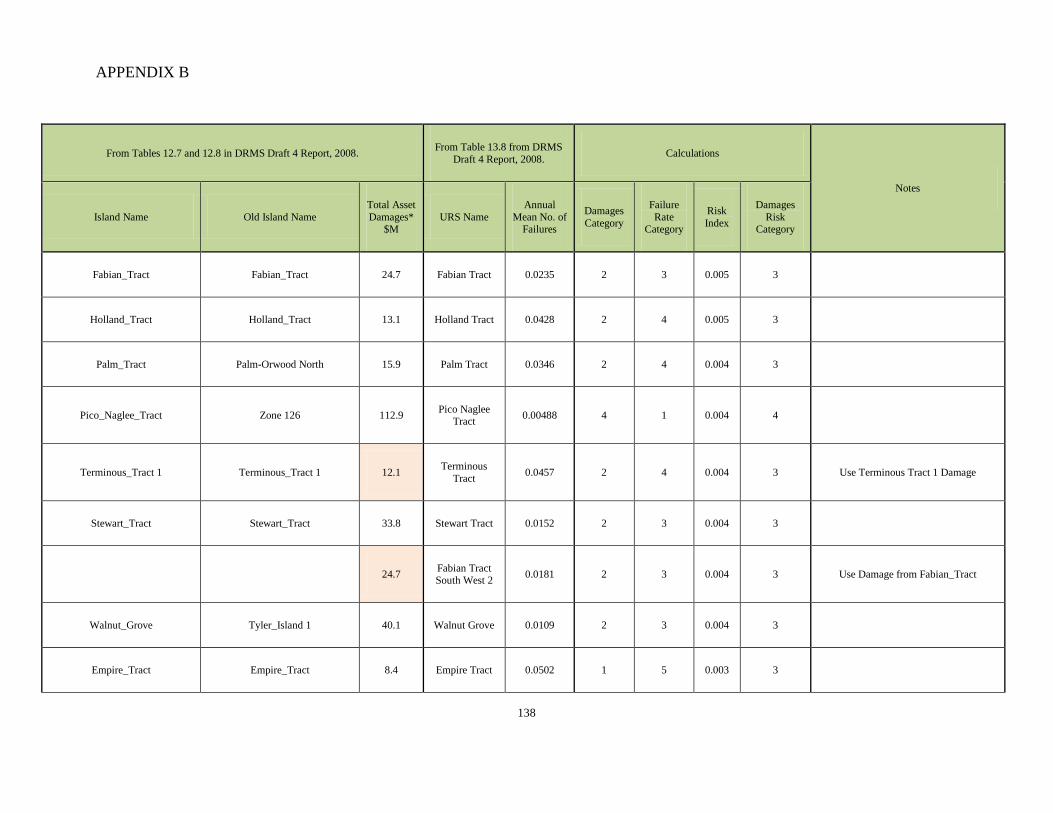
APPENDIX B
138
From Tables 12.7 and 12.8 in DRMS Draft 4 Report, 2008. From Table 13.8 from DRMS Draft 4 Report, 2008. Calculations
Notes
Island Name Old Island Name Total Asset Damages*
$M URS Name
Annual Mean No. of
Failures
Damages Category
Failure Rate
Category
Risk Index
Damages Risk
Category
Fabian_Tract Fabian_Tract 24.7 Fabian Tract 0.0235 2 3 0.005 3
Holland_Tract Holland_Tract 13.1 Holland Tract 0.0428 2 4 0.005 3
Palm_Tract Palm-Orwood North 15.9 Palm Tract 0.0346 2 4 0.004 3
Pico_Naglee_Tract Zone 126 112.9 Pico Naglee Tract 0.00488 4 1 0.004 4
Terminous_Tract 1 Terminous_Tract 1 12.1 Terminous Tract 0.0457 2 4 0.004 3 Use Terminous Tract 1 Damage
Stewart_Tract Stewart_Tract 33.8 Stewart Tract 0.0152 2 3 0.004 3
24.7 Fabian Tract South West 2 0.0181 2 3 0.004 3 Use Damage from Fabian_Tract
Walnut_Grove Tyler_Island 1 40.1 Walnut Grove 0.0109 2 3 0.004 3
Empire_Tract Empire_Tract 8.4 Empire Tract 0.0502 1 5 0.003 3
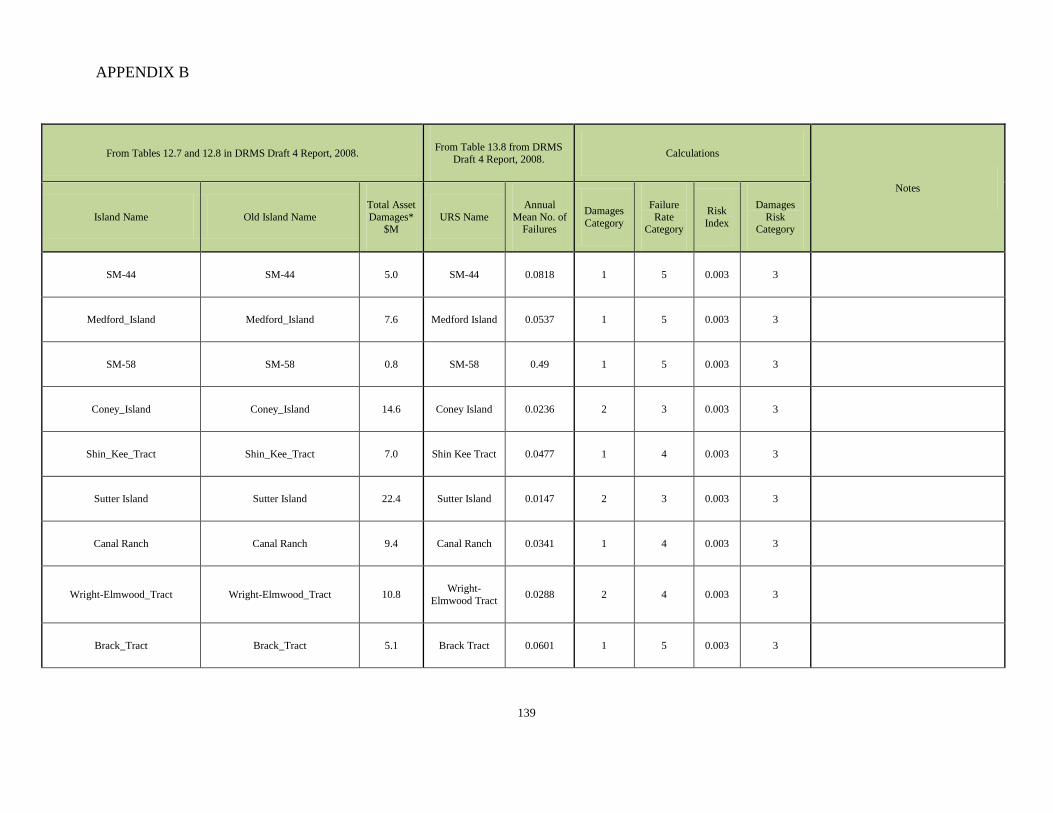
APPENDIX B
139
From Tables 12.7 and 12.8 in DRMS Draft 4 Report, 2008. From Table 13.8 from DRMS Draft 4 Report, 2008. Calculations
Notes
Island Name Old Island Name Total Asset Damages*
$M URS Name
Annual Mean No. of
Failures
Damages Category
Failure Rate
Category
Risk Index
Damages Risk
Category
SM-44 SM-44 5.0 SM-44 0.0818 1 5 0.003 3
Medford_Island Medford_Island 7.6 Medford Island 0.0537 1 5 0.003 3
SM-58 SM-58 0.8 SM-58 0.49 1 5 0.003 3
Coney_Island Coney_Island 14.6 Coney Island 0.0236 2 3 0.003 3
Shin_Kee_Tract Shin_Kee_Tract 7.0 Shin Kee Tract 0.0477 1 4 0.003 3
Sutter Island Sutter Island 22.4 Sutter Island 0.0147 2 3 0.003 3
Canal Ranch Canal Ranch 9.4 Canal Ranch 0.0341 1 4 0.003 3
Wright-Elmwood_Tract Wright-Elmwood_Tract 10.8 Wright-Elmwood Tract 0.0288 2 4 0.003 3
Brack_Tract Brack_Tract 5.1 Brack Tract 0.0601 1 5 0.003 3
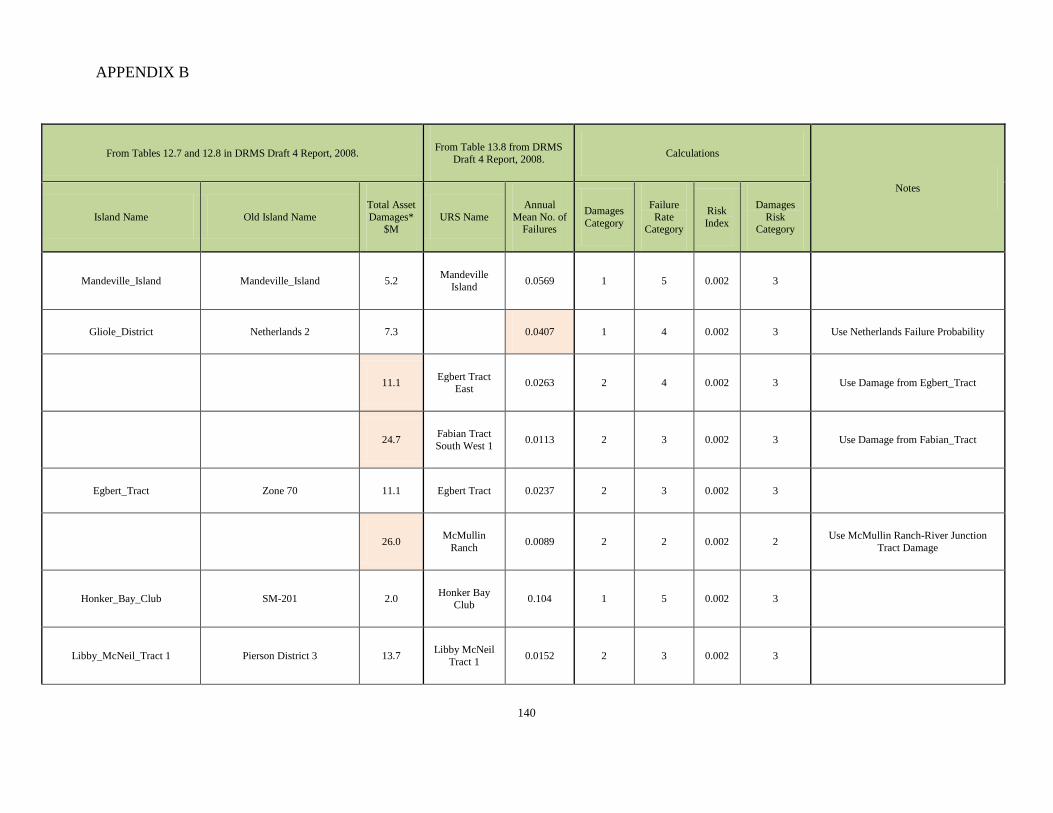
APPENDIX B
140
From Tables 12.7 and 12.8 in DRMS Draft 4 Report, 2008. From Table 13.8 from DRMS Draft 4 Report, 2008. Calculations
Notes
Island Name Old Island Name Total Asset Damages*
$M URS Name
Annual Mean No. of
Failures
Damages Category
Failure Rate
Category
Risk Index
Damages Risk
Category
Mandeville_Island Mandeville_Island 5.2 Mandeville Island 0.0569 1 5 0.002 3
Gliole_District Netherlands 2 7.3 0.0407 1 4 0.002 3 Use Netherlands Failure Probability
11.1 Egbert Tract East 0.0263 2 4 0.002 3 Use Damage from Egbert_Tract
24.7 Fabian Tract South West 1 0.0113 2 3 0.002 3 Use Damage from Fabian_Tract
Egbert_Tract Zone 70 11.1 Egbert Tract 0.0237 2 3 0.002 3
26.0 McMullin Ranch 0.0089 2 2 0.002 2 Use McMullin Ranch-River Junction
Tract Damage
Honker_Bay_Club SM-201 2.0 Honker Bay Club 0.104 1 5 0.002 3
Libby_McNeil_Tract 1 Pierson District 3 13.7 Libby McNeil Tract 1 0.0152 2 3 0.002 3
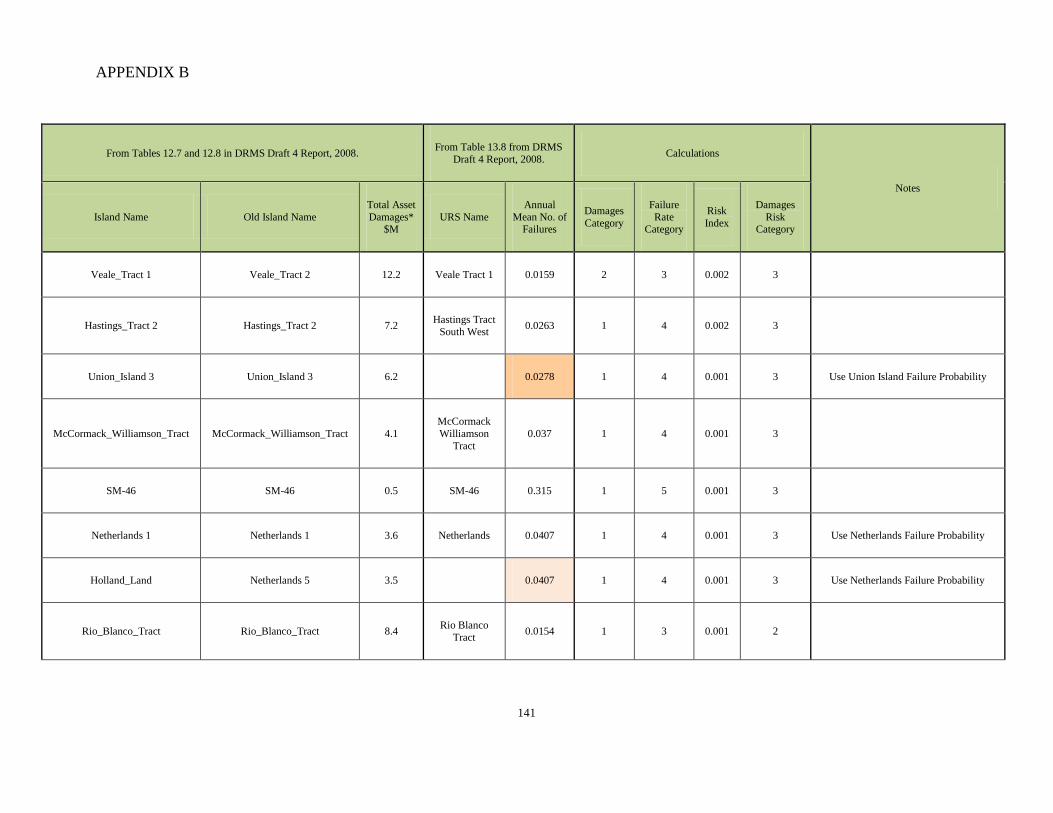
APPENDIX B
141
From Tables 12.7 and 12.8 in DRMS Draft 4 Report, 2008. From Table 13.8 from DRMS Draft 4 Report, 2008. Calculations
Notes
Island Name Old Island Name Total Asset Damages*
$M URS Name
Annual Mean No. of
Failures
Damages Category
Failure Rate
Category
Risk Index
Damages Risk
Category
Veale_Tract 1 Veale_Tract 2 12.2 Veale Tract 1 0.0159 2 3 0.002 3
Hastings_Tract 2 Hastings_Tract 2 7.2 Hastings Tract South West 0.0263 1 4 0.002 3
Union_Island 3 Union_Island 3 6.2 0.0278 1 4 0.001 3 Use Union Island Failure Probability
McCormack_Williamson_Tract McCormack_Williamson_Tract 4.1 McCormack Williamson
Tract 0.037 1 4 0.001 3
SM-46 SM-46 0.5 SM-46 0.315 1 5 0.001 3
Netherlands 1 Netherlands 1 3.6 Netherlands 0.0407 1 4 0.001 3 Use Netherlands Failure Probability
Holland_Land Netherlands 5 3.5 0.0407 1 4 0.001 3 Use Netherlands Failure Probability
Rio_Blanco_Tract Rio_Blanco_Tract 8.4 Rio Blanco Tract 0.0154 1 3 0.001 2
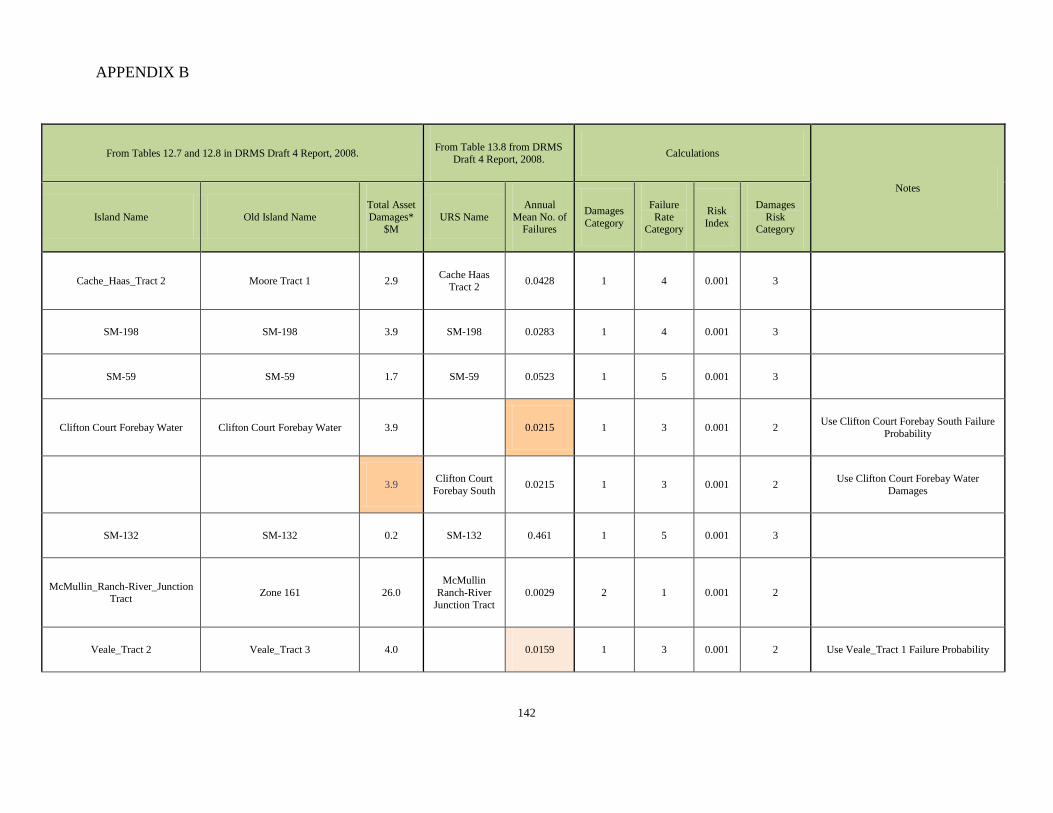
APPENDIX B
142
From Tables 12.7 and 12.8 in DRMS Draft 4 Report, 2008. From Table 13.8 from DRMS Draft 4 Report, 2008. Calculations
Notes
Island Name Old Island Name Total Asset Damages*
$M URS Name
Annual Mean No. of
Failures
Damages Category
Failure Rate
Category
Risk Index
Damages Risk
Category
Cache_Haas_Tract 2 Moore Tract 1 2.9 Cache Haas Tract 2 0.0428 1 4 0.001 3
SM-198 SM-198 3.9 SM-198 0.0283 1 4 0.001 3
SM-59 SM-59 1.7 SM-59 0.0523 1 5 0.001 3
Clifton Court Forebay Water Clifton Court Forebay Water 3.9 0.0215 1 3 0.001 2 Use Clifton Court Forebay South Failure Probability
3.9 Clifton Court Forebay South 0.0215 1 3 0.001 2 Use Clifton Court Forebay Water
Damages
SM-132 SM-132 0.2 SM-132 0.461 1 5 0.001 3
McMullin_Ranch-River_Junction Tract Zone 161 26.0
McMullin Ranch-River
Junction Tract 0.0029 2 1 0.001 2
Veale_Tract 2 Veale_Tract 3 4.0 0.0159 1 3 0.001 2 Use Veale_Tract 1 Failure Probability
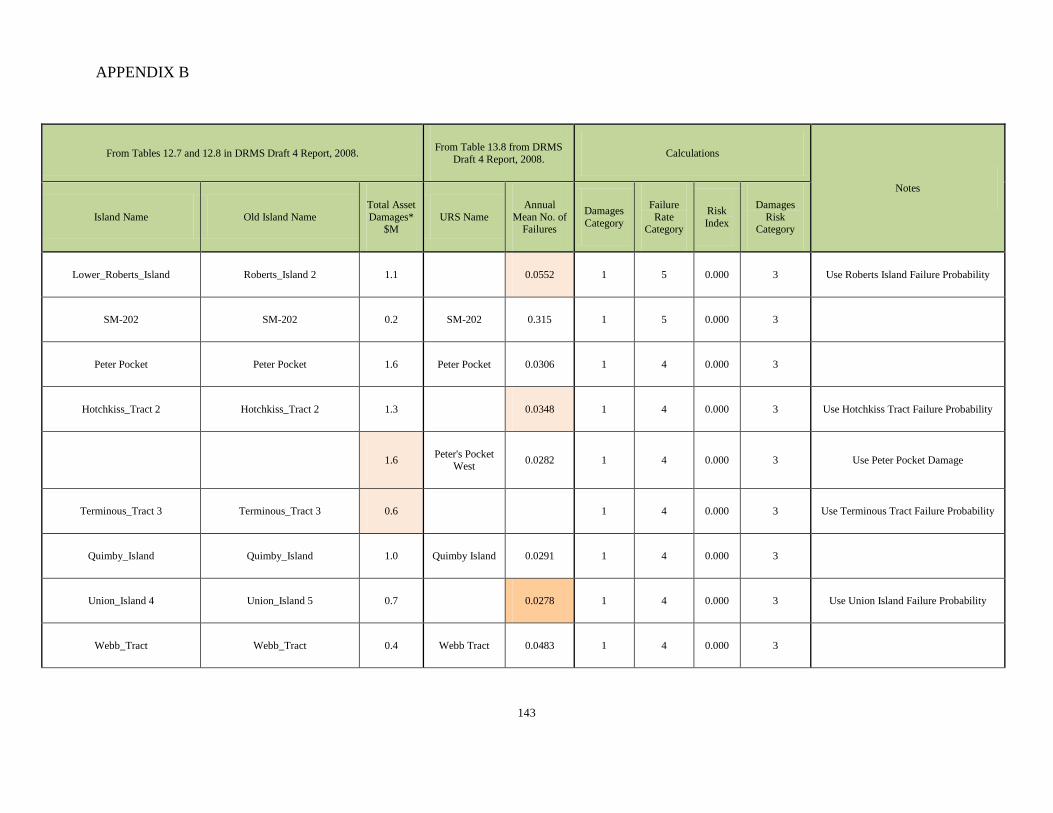
APPENDIX B
143
From Tables 12.7 and 12.8 in DRMS Draft 4 Report, 2008. From Table 13.8 from DRMS Draft 4 Report, 2008. Calculations
Notes
Island Name Old Island Name Total Asset Damages*
$M URS Name
Annual Mean No. of
Failures
Damages Category
Failure Rate
Category
Risk Index
Damages Risk
Category
Lower_Roberts_Island Roberts_Island 2 1.1 0.0552 1 5 0.000 3 Use Roberts Island Failure Probability
SM-202 SM-202 0.2 SM-202 0.315 1 5 0.000 3
Peter Pocket Peter Pocket 1.6 Peter Pocket 0.0306 1 4 0.000 3
Hotchkiss_Tract 2 Hotchkiss_Tract 2 1.3 0.0348 1 4 0.000 3 Use Hotchkiss Tract Failure Probability
1.6 Peter's Pocket West 0.0282 1 4 0.000 3 Use Peter Pocket Damage
Terminous_Tract 3 Terminous_Tract 3 0.6 1 4 0.000 3 Use Terminous Tract Failure Probability
Quimby_Island Quimby_Island 1.0 Quimby Island 0.0291 1 4 0.000 3
Union_Island 4 Union_Island 5 0.7 0.0278 1 4 0.000 3 Use Union Island Failure Probability
Webb_Tract Webb_Tract 0.4 Webb Tract 0.0483 1 4 0.000 3
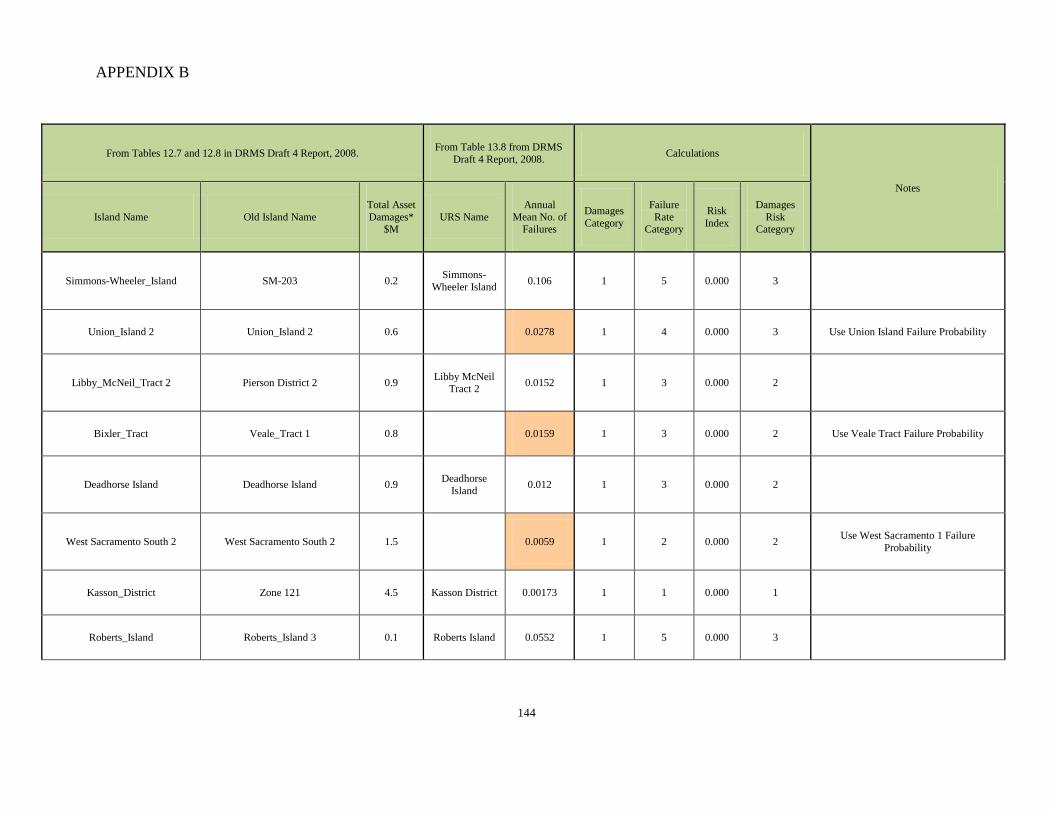
APPENDIX B
144
From Tables 12.7 and 12.8 in DRMS Draft 4 Report, 2008. From Table 13.8 from DRMS Draft 4 Report, 2008. Calculations
Notes
Island Name Old Island Name Total Asset Damages*
$M URS Name
Annual Mean No. of
Failures
Damages Category
Failure Rate
Category
Risk Index
Damages Risk
Category
Simmons-Wheeler_Island SM-203 0.2 Simmons-Wheeler Island 0.106 1 5 0.000 3
Union_Island 2 Union_Island 2 0.6 0.0278 1 4 0.000 3 Use Union Island Failure Probability
Libby_McNeil_Tract 2 Pierson District 2 0.9 Libby McNeil Tract 2 0.0152 1 3 0.000 2
Bixler_Tract Veale_Tract 1 0.8 0.0159 1 3 0.000 2 Use Veale Tract Failure Probability
Deadhorse Island Deadhorse Island 0.9 Deadhorse Island 0.012 1 3 0.000 2
West Sacramento South 2 West Sacramento South 2 1.5 0.0059 1 2 0.000 2 Use West Sacramento 1 Failure Probability
Kasson_District Zone 121 4.5 Kasson District 0.00173 1 1 0.000 1
Roberts_Island Roberts_Island 3 0.1 Roberts Island 0.0552 1 5 0.000 3
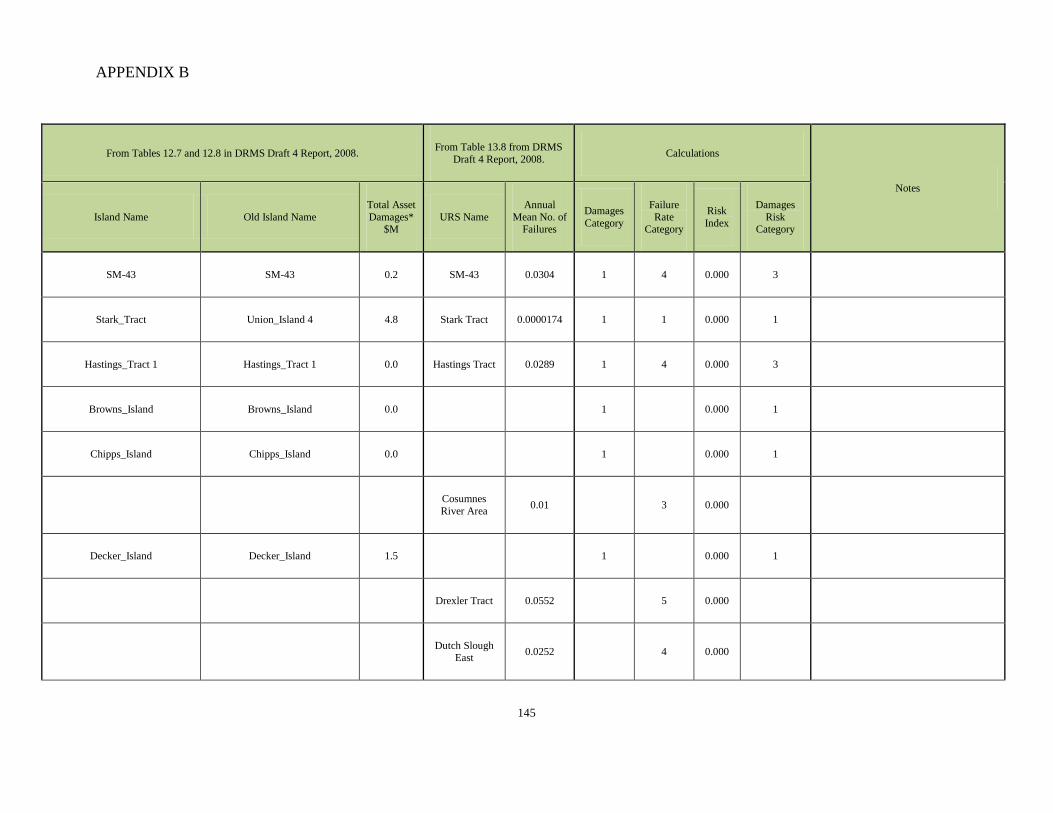
APPENDIX B
145
From Tables 12.7 and 12.8 in DRMS Draft 4 Report, 2008. From Table 13.8 from DRMS Draft 4 Report, 2008. Calculations
Notes
Island Name Old Island Name Total Asset Damages*
$M URS Name
Annual Mean No. of
Failures
Damages Category
Failure Rate
Category
Risk Index
Damages Risk
Category
SM-43 SM-43 0.2 SM-43 0.0304 1 4 0.000 3
Stark_Tract Union_Island 4 4.8 Stark Tract 0.0000174 1 1 0.000 1
Hastings_Tract 1 Hastings_Tract 1 0.0 Hastings Tract 0.0289 1 4 0.000 3
Browns_Island Browns_Island 0.0 1 0.000 1
Chipps_Island Chipps_Island 0.0 1 0.000 1
Cosumnes River Area 0.01 3 0.000
Decker_Island Decker_Island 1.5 1 0.000 1
Drexler Tract 0.0552 5 0.000
Dutch Slough East 0.0252 4 0.000
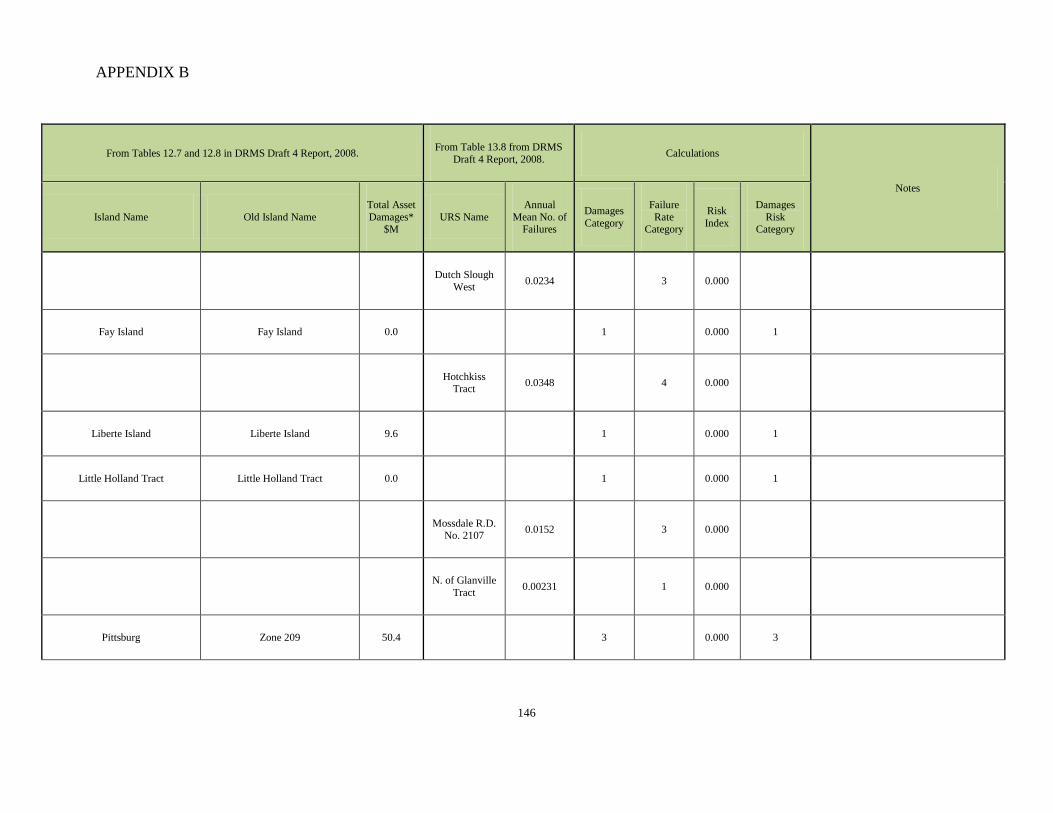
APPENDIX B
146
From Tables 12.7 and 12.8 in DRMS Draft 4 Report, 2008. From Table 13.8 from DRMS Draft 4 Report, 2008. Calculations
Notes
Island Name Old Island Name Total Asset Damages*
$M URS Name
Annual Mean No. of
Failures
Damages Category
Failure Rate
Category
Risk Index
Damages Risk
Category
Dutch Slough West 0.0234 3 0.000
Fay Island Fay Island 0.0 1 0.000 1
Hotchkiss Tract 0.0348 4 0.000
Liberte Island Liberte Island 9.6 1 0.000 1
Little Holland Tract Little Holland Tract 0.0 1 0.000 1
Mossdale R.D. No. 2107 0.0152 3 0.000
N. of Glanville Tract 0.00231 1 0.000
Pittsburg Zone 209 50.4 3 0.000 3
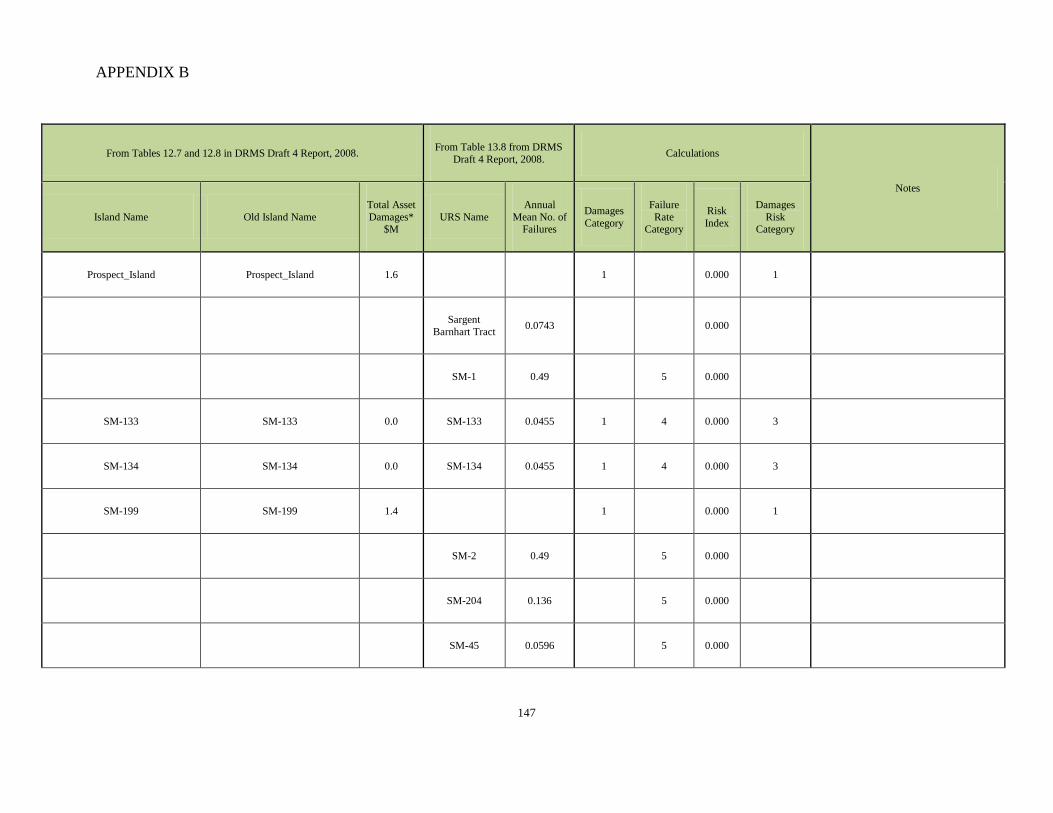
APPENDIX B
147
From Tables 12.7 and 12.8 in DRMS Draft 4 Report, 2008. From Table 13.8 from DRMS Draft 4 Report, 2008. Calculations
Notes
Island Name Old Island Name Total Asset Damages*
$M URS Name
Annual Mean No. of
Failures
Damages Category
Failure Rate
Category
Risk Index
Damages Risk
Category
Prospect_Island Prospect_Island 1.6 1 0.000 1
Sargent Barnhart Tract 0.0743 0.000
SM-1 0.49 5 0.000
SM-133 SM-133 0.0 SM-133 0.0455 1 4 0.000 3
SM-134 SM-134 0.0 SM-134 0.0455 1 4 0.000 3
SM-199 SM-199 1.4 1 0.000 1
SM-2 0.49 5 0.000
SM-204 0.136 5 0.000
SM-45 0.0596 5 0.000
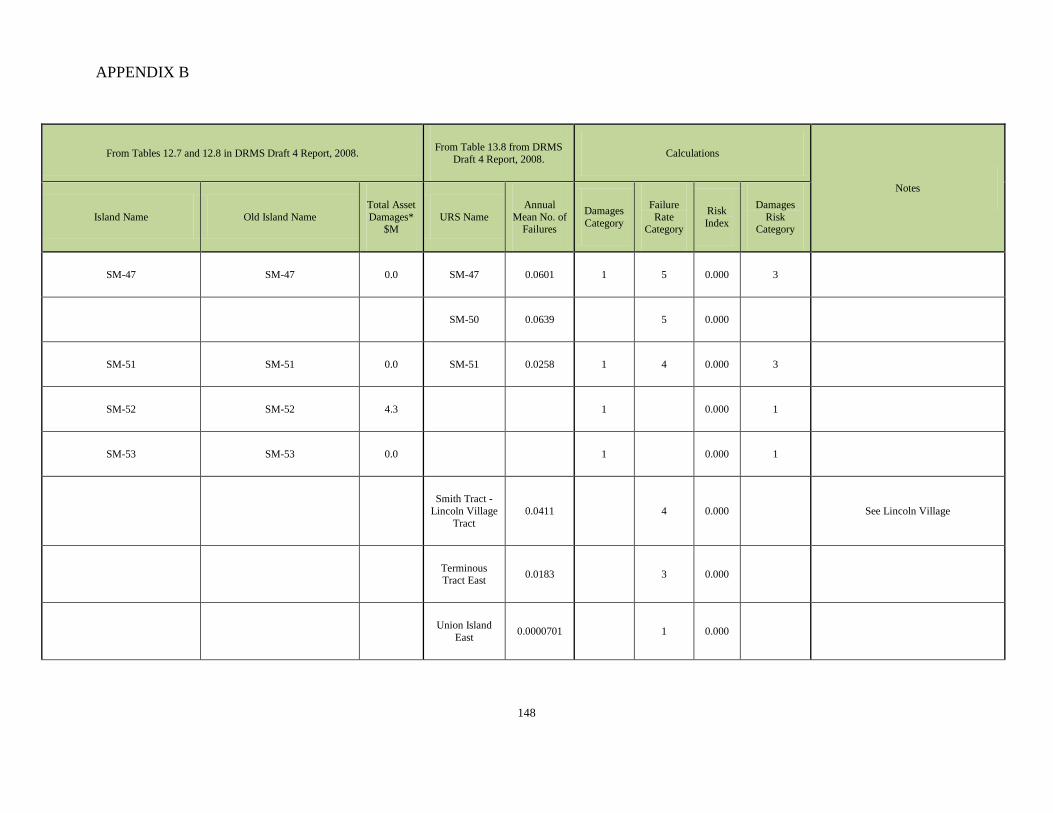
APPENDIX B
148
From Tables 12.7 and 12.8 in DRMS Draft 4 Report, 2008. From Table 13.8 from DRMS Draft 4 Report, 2008. Calculations
Notes
Island Name Old Island Name Total Asset Damages*
$M URS Name
Annual Mean No. of
Failures
Damages Category
Failure Rate
Category
Risk Index
Damages Risk
Category
SM-47 SM-47 0.0 SM-47 0.0601 1 5 0.000 3
SM-50 0.0639 5 0.000
SM-51 SM-51 0.0 SM-51 0.0258 1 4 0.000 3
SM-52 SM-52 4.3 1 0.000 1
SM-53 SM-53 0.0 1 0.000 1
Smith Tract -
Lincoln Village Tract
0.0411 4 0.000 See Lincoln Village
Terminous Tract East 0.0183 3 0.000
Union Island East 0.0000701 1 0.000
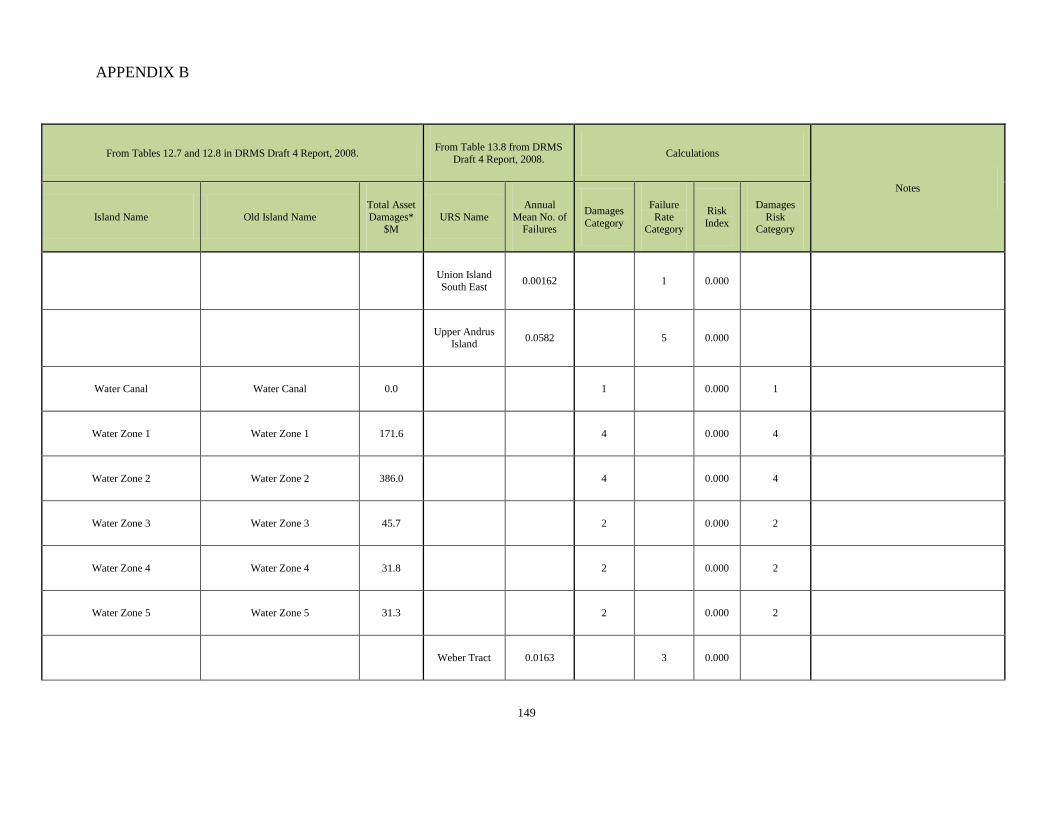
APPENDIX B
149
From Tables 12.7 and 12.8 in DRMS Draft 4 Report, 2008. From Table 13.8 from DRMS Draft 4 Report, 2008. Calculations
Notes
Island Name Old Island Name Total Asset Damages*
$M URS Name
Annual Mean No. of
Failures
Damages Category
Failure Rate
Category
Risk Index
Damages Risk
Category
Union Island South East 0.00162 1 0.000
Upper Andrus Island 0.0582 5 0.000
Water Canal Water Canal 0.0 1 0.000 1
Water Zone 1 Water Zone 1 171.6 4 0.000 4
Water Zone 2 Water Zone 2 386.0 4 0.000 4
Water Zone 3 Water Zone 3 45.7 2 0.000 2
Water Zone 4 Water Zone 4 31.8 2 0.000 2
Water Zone 5 Water Zone 5 31.3 2 0.000 2
Weber Tract 0.0163 3 0.000
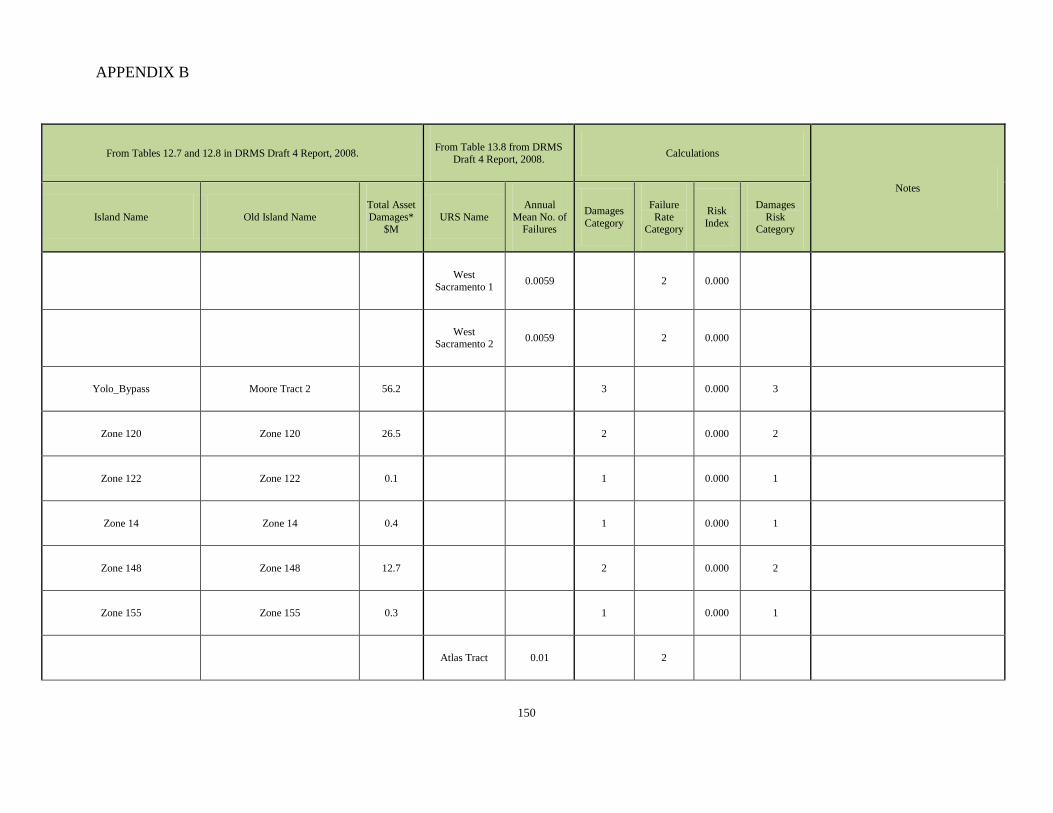
APPENDIX B
150
From Tables 12.7 and 12.8 in DRMS Draft 4 Report, 2008. From Table 13.8 from DRMS Draft 4 Report, 2008. Calculations
Notes
Island Name Old Island Name Total Asset Damages*
$M URS Name
Annual Mean No. of
Failures
Damages Category
Failure Rate
Category
Risk Index
Damages Risk
Category
West Sacramento 1 0.0059 2 0.000
West Sacramento 2 0.0059 2 0.000
Yolo_Bypass Moore Tract 2 56.2 3 0.000 3
Zone 120 Zone 120 26.5 2 0.000 2
Zone 122 Zone 122 0.1 1 0.000 1
Zone 14 Zone 14 0.4 1 0.000 1
Zone 148 Zone 148 12.7 2 0.000 2
Zone 155 Zone 155 0.3 1 0.000 1
Atlas Tract 0.01 2
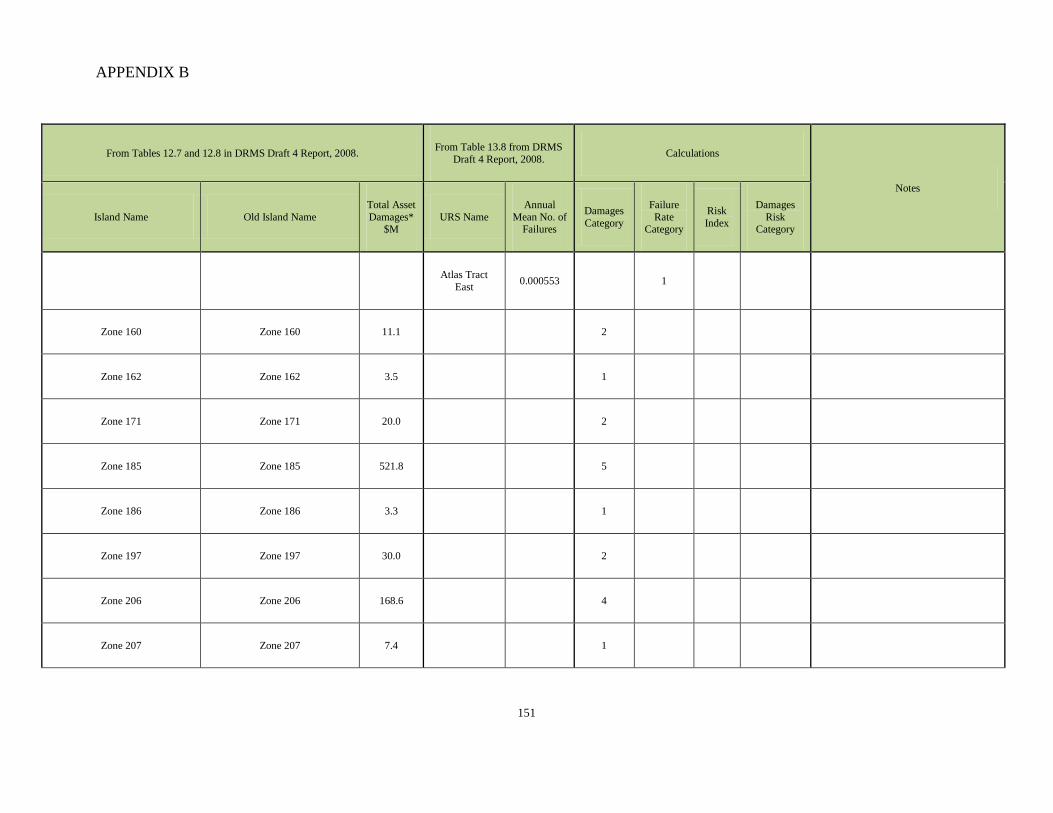
APPENDIX B
151
From Tables 12.7 and 12.8 in DRMS Draft 4 Report, 2008. From Table 13.8 from DRMS Draft 4 Report, 2008. Calculations
Notes
Island Name Old Island Name Total Asset Damages*
$M URS Name
Annual Mean No. of
Failures
Damages Category
Failure Rate
Category
Risk Index
Damages Risk
Category
Atlas Tract East 0.000553 1
Zone 160 Zone 160 11.1 2
Zone 162 Zone 162 3.5 1
Zone 171 Zone 171 20.0 2
Zone 185 Zone 185 521.8 5
Zone 186 Zone 186 3.3 1
Zone 197 Zone 197 30.0 2
Zone 206 Zone 206 168.6 4
Zone 207 Zone 207 7.4 1
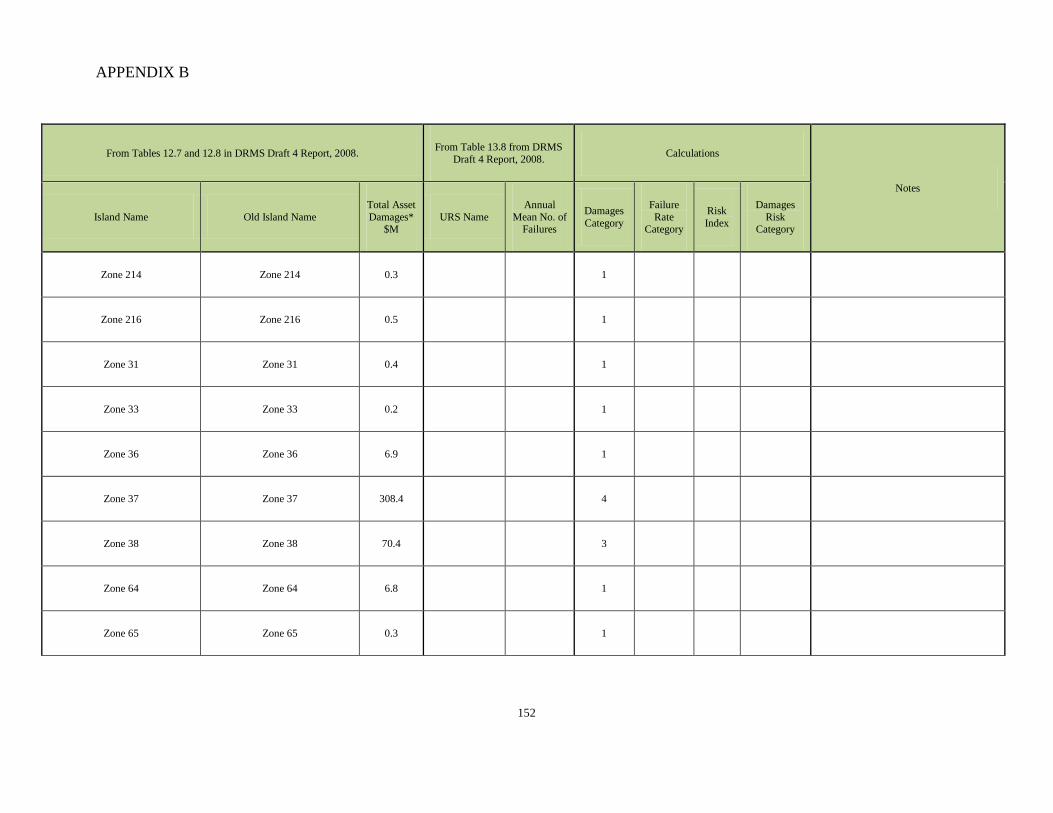
APPENDIX B
152
From Tables 12.7 and 12.8 in DRMS Draft 4 Report, 2008. From Table 13.8 from DRMS Draft 4 Report, 2008. Calculations
Notes
Island Name Old Island Name Total Asset Damages*
$M URS Name
Annual Mean No. of
Failures
Damages Category
Failure Rate
Category
Risk Index
Damages Risk
Category
Zone 214 Zone 214 0.3 1
Zone 216 Zone 216 0.5 1
Zone 31 Zone 31 0.4 1
Zone 33 Zone 33 0.2 1
Zone 36 Zone 36 6.9 1
Zone 37 Zone 37 308.4 4
Zone 38 Zone 38 70.4 3
Zone 64 Zone 64 6.8 1
Zone 65 Zone 65 0.3 1

APPENDIX B
153
From Tables 12.7 and 12.8 in DRMS Draft 4 Report, 2008. From Table 13.8 from DRMS Draft 4 Report, 2008. Calculations
Notes
Island Name Old Island Name Total Asset Damages*
$M URS Name
Annual Mean No. of
Failures
Damages Category
Failure Rate
Category
Risk Index
Damages Risk
Category
Zone 69 Zone 69 0.8 1
Zone 74 Zone 74 17.1 2
Zone 75 Zone 75 16.2 2
Zone 77 Zone 77 9.7 1
Zone 78 Zone 78 16.5 2
Zone 79 Zone 79 6.9 1
Zone 80 Zone 80 8.6 1
Zone 81 Zone 81 6.3 1
Zone 82 Zone 82 5.0 1
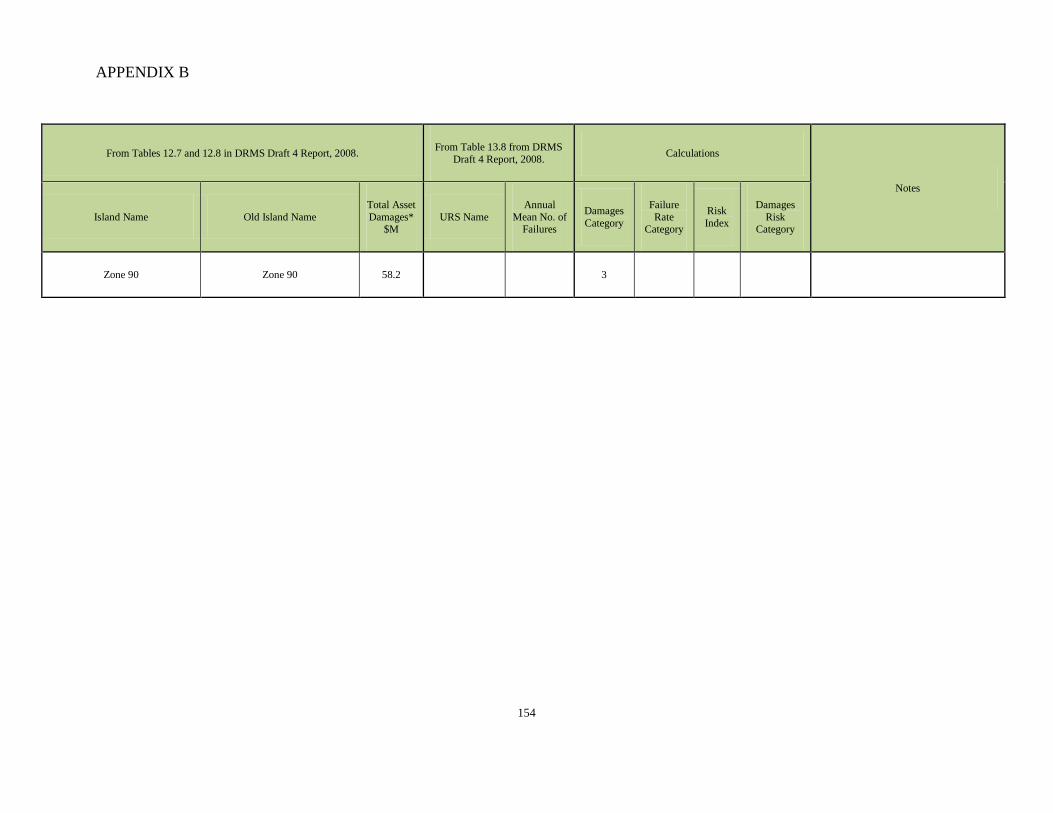
APPENDIX B
154
From Tables 12.7 and 12.8 in DRMS Draft 4 Report, 2008. From Table 13.8 from DRMS Draft 4 Report, 2008. Calculations
Notes
Island Name Old Island Name Total Asset Damages*
$M URS Name
Annual Mean No. of
Failures
Damages Category
Failure Rate
Category
Risk Index
Damages Risk
Category
Zone 90 Zone 90 58.2 3