appendix b draft eis comments and responses
TRANSCRIPT
APPENDIX B
DRAFT EIS COMMENTS AND RESPONSES

Version 7.8.2014 Page 1
PUBLIC NOTICE
Issue Date: August 28, 2015 Comment Deadline: October 13, 2015
Corps Action ID Number: SAW-2011-01914 The Wilmington District, Corps of Engineers (Corps) received an application from the Town of Holden Beach (Town) seeking Department of the Army authorization to discharge fill material into waters of the United States, associated with the construction of a 700-ft-long terminal groin with a 300-ft shore anchorage system and associated long-term beach nourishment component, in order to address erosion and protect infrastructure, roads, homes, beaches, dunes and wildlife habitat in Holden Beach, Brunswick County, North Carolina. Specific plans and location information are described below and shown on the attached plans. This notice serves to announce receipt of a DA permit application in accordance with 33 CFR 325.3, and release of the draft Environmental Impact Statement (DEIS) for this project in accordance with 33 CFR 325 Appendix B, and 40 CFR 1502.19 - 1506.10. Comments will be received for 45 days, with an end comment period date of October 13, 2015. A public hearing to receive public comment will be held at the Holden Beach Town Hall at 110 Rothschild Street, Holden Beach, NC 28462, on September 24th, at 6:00pm. Beginning August 28, 2015, the DEIS may be obtained from the following link: http://www.saw.usace.army.mil/Missions/RegulatoryPermitProgram/MajorProjects Comments received from the DEIS will be used in the development of a Final EIS (FEIS) for this project. APPLICANT: Town of Holden Beach Attn: Mr. David Hewett, Town Manger AGENT (if applicable): Dial Cordy & Associates Attn: Mrs. Dawn York, Project Manager Authority The Corps evaluates this application and decides whether to issue, conditionally issue, or deny the proposed work pursuant to applicable procedures of the following Statutory Authorities:
US Army Corps Of Engineers Wilmington District
Version 7.8.2014 Page 2
Section 404 of the Clean Water Act (33 U.S.C. 1344)
Section 10 of the Rivers and Harbors Act of 1899 (33 U.S.C. 403)
Section 103 of the Marine Protection, Research and Sanctuaries Act of 1972 (33 U.S.C. 1413)
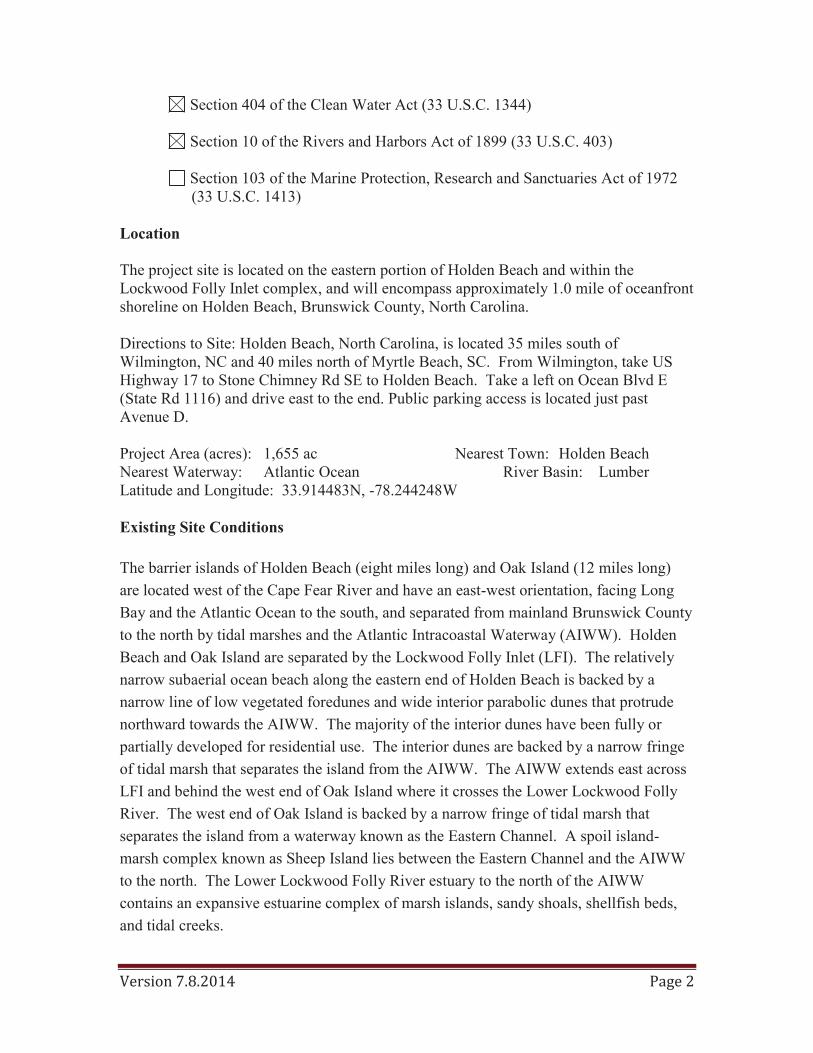
Location The project site is located on the eastern portion of Holden Beach and within the Lockwood Folly Inlet complex, and will encompass approximately 1.0 mile of oceanfront shoreline on Holden Beach, Brunswick County, North Carolina. Directions to Site: Holden Beach, North Carolina, is located 35 miles south of Wilmington, NC and 40 miles north of Myrtle Beach, SC. From Wilmington, take US Highway 17 to Stone Chimney Rd SE to Holden Beach. Take a left on Ocean Blvd E (State Rd 1116) and drive east to the end. Public parking access is located just past Avenue D. Project Area (acres): 1,655 ac Nearest Town: Holden Beach Nearest Waterway: Atlantic Ocean River Basin: Lumber Latitude and Longitude: 33.914483N, -78.244248W Existing Site Conditions The barrier islands of Holden Beach (eight miles long) and Oak Island (12 miles long) are located west of the Cape Fear River and have an east-west orientation, facing Long Bay and the Atlantic Ocean to the south, and separated from mainland Brunswick County to the north by tidal marshes and the Atlantic Intracoastal Waterway (AIWW). Holden Beach and Oak Island are separated by the Lockwood Folly Inlet (LFI). The relatively narrow subaerial ocean beach along the eastern end of Holden Beach is backed by a narrow line of low vegetated foredunes and wide interior parabolic dunes that protrude northward towards the AIWW. The majority of the interior dunes have been fully or partially developed for residential use. The interior dunes are backed by a narrow fringe of tidal marsh that separates the island from the AIWW. The AIWW extends east across LFI and behind the west end of Oak Island where it crosses the Lower Lockwood Folly River. The west end of Oak Island is backed by a narrow fringe of tidal marsh that separates the island from a waterway known as the Eastern Channel. A spoil island-marsh complex known as Sheep Island lies between the Eastern Channel and the AIWW to the north. The Lower Lockwood Folly River estuary to the north of the AIWW contains an expansive estuarine complex of marsh islands, sandy shoals, shellfish beds, and tidal creeks.

Version 7.8.2014 Page 3
The marine component of the Permit Area encompasses the subtidal ocean bottom (benthic) and ocean water column (pelagic) habitats and communities that occur seaward of the intertidal ocean beach to approximately the 40-ft isobath on the inner continental shelf of Long Bay. The shoreface and inner shelf along Holden Beach contain underlying ancient hard strata (sandstones and limestones) that are covered by a thin and discontinuous veneer of modern sand. The Permit Area includes a variety of biotic community types and sizes:
Biotic communities in the Permit Area. Habitat Type Size (ac) Residential 107.3 Beach and Foredune 70.0 Dune Grasses 34.4 Upland Mixed Forest 35.1 Upland Shrub-Scrub 70.5 Wetland Mixed Forest 59.3 Wetland Shrub-Scrub 19.6 Low Marsh 148.2 Intertidal 208.8 Subtidal 902.7
Applicant’s Stated Purpose The purpose of the Proposed Action is to establish a comprehensive shoreline protection program, under the independent authority of the Town of Holden Beach, which will restore and maintain the East End beach and provide for the short- and long-term protection of residential structures, Town infrastructure, and recreational assets. The Proposed Action is needed to mitigate ongoing and chronic East End shoreline erosion, which is projected to continue for the foreseeable future and threatens residential structures, Town infrastructure, recreational assets, and natural resources. Furthermore, based on the increasing need for additional shore protection beyond that provided by federal beneficial use placements, and the trend of declining federal funding for nourishment projects, an independent shore protection program under the authority of the Town is needed to ensure that the East End shoreline will be adequately protected.

Version 7.8.2014 Page 4
Project Description In June 2011, Senate Bill 110 authorized the permitting of terminal groins at four (4) inlets in North Carolina. As part of the Senate Bill, requests for terminal groins must include the following provisions: a monitoring plan; a baseline for assessing adverse impacts and thresholds for when adverse impacts must be mitigated; a description of mitigation measures to be undertaken should the impact thresholds be reached; and a plan to modify or remove the terminal groin if adverse impacts cannot be mitigated. The following additional alternatives are being considered in the evaluation of the least environmentally damaging practicable alternative: Alternative 1 - No Action (Status-Quo) Under the No-Action Alternative (Alternative 1), the Town would continue to rely solely on the Corps’ beneficial use projects for shore protection of the East End of Holden Beach. Since 2002, the East End has been nourished nine times with dredged material derived from the AIWW Lockwood Folly Inlet Crossing (LFIX) navigation channel. On average, these nourishment events placed ~77,000 cy of dredged material on the East End of Holden Beach at two-year intervals. Alternative 2 - Abandon and Retreat Under Alternative 2, the Town would not pursue a long-term management plan, and there would not be any Federally implemented or federally permitted actions undertaken to mitigate erosion along the East End of Holden Beach. Thus, the Corps would not conduct any East End Beneficial Use Projects, and the Town would not implement any actions, such as beach nourishment, beach scraping, dune restoration, temporary sandbag placement, and inlet dredging, which require a federal dredge and fill permit. Instead, the Town would develop and implement a 30-year managed retreat plan under which structures that are threatened with erosional damage would be either relocated to unimproved interior lots or demolished. This plan would establish an erosional threshold that would trigger preemptive relocations or demolitions prior to the point of imminent structural failure. Alternative 3 - Beach Nourishment Under Alternative 3, the Town would assume responsibility for East End shore protection through the implementation of an independent, 30-year nourishment-only beach management plan. Under the proposed plan, the East End of Holden Beach would be nourished with ~100,000 to 150,000 cy of sand every two years. The conceptual beach
Version 7.8.2014 Page 5
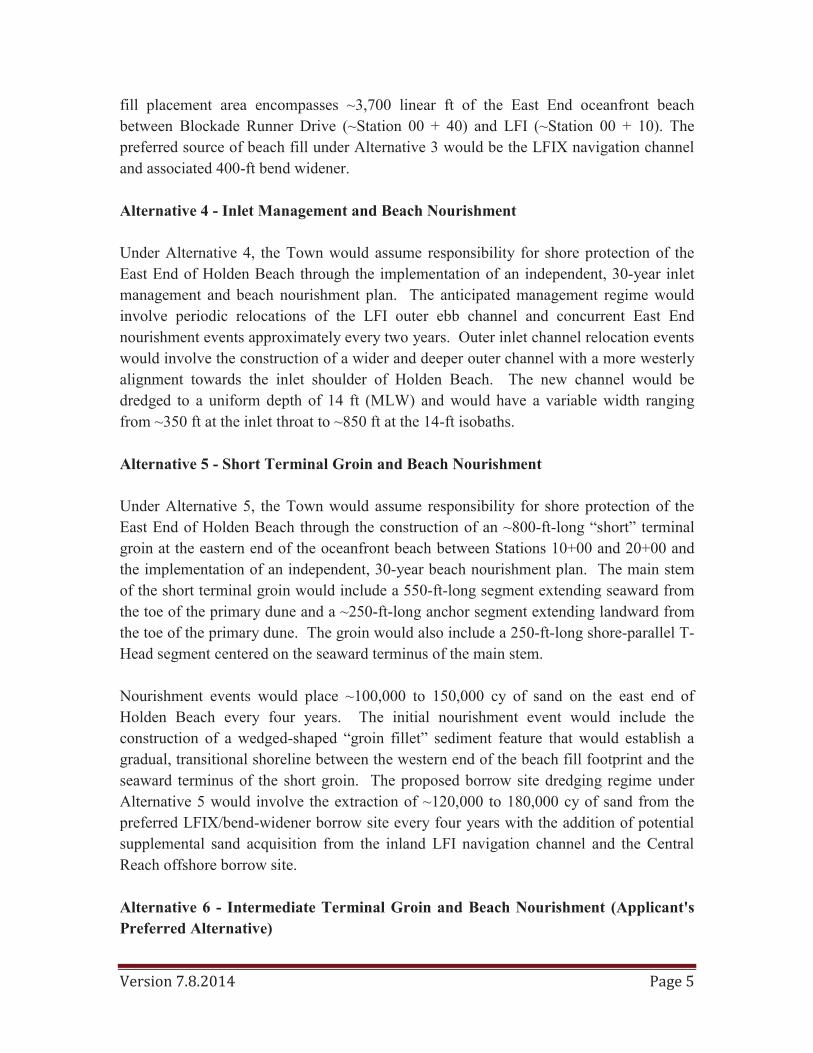
fill placement area encompasses ~3,700 linear ft of the East End oceanfront beach between Blockade Runner Drive (~Station 00 + 40) and LFI (~Station 00 + 10). The preferred source of beach fill under Alternative 3 would be the LFIX navigation channel and associated 400-ft bend widener. Alternative 4 - Inlet Management and Beach Nourishment Under Alternative 4, the Town would assume responsibility for shore protection of the East End of Holden Beach through the implementation of an independent, 30-year inlet management and beach nourishment plan. The anticipated management regime would involve periodic relocations of the LFI outer ebb channel and concurrent East End nourishment events approximately every two years. Outer inlet channel relocation events would involve the construction of a wider and deeper outer channel with a more westerly alignment towards the inlet shoulder of Holden Beach. The new channel would be dredged to a uniform depth of 14 ft (MLW) and would have a variable width ranging from ~350 ft at the inlet throat to ~850 ft at the 14-ft isobaths. Alternative 5 - Short Terminal Groin and Beach Nourishment Under Alternative 5, the Town would assume responsibility for shore protection of the East End of Holden Beach through the construction of an ~800-ft-long “short” terminal groin at the eastern end of the oceanfront beach between Stations 10+00 and 20+00 and the implementation of an independent, 30-year beach nourishment plan. The main stem of the short terminal groin would include a 550-ft-long segment extending seaward from the toe of the primary dune and a ~250-ft-long anchor segment extending landward from the toe of the primary dune. The groin would also include a 250-ft-long shore-parallel T-Head segment centered on the seaward terminus of the main stem. Nourishment events would place ~100,000 to 150,000 cy of sand on the east end of Holden Beach every four years. The initial nourishment event would include the construction of a wedged-shaped “groin fillet” sediment feature that would establish a gradual, transitional shoreline between the western end of the beach fill footprint and the seaward terminus of the short groin. The proposed borrow site dredging regime under Alternative 5 would involve the extraction of ~120,000 to 180,000 cy of sand from the preferred LFIX/bend-widener borrow site every four years with the addition of potential supplemental sand acquisition from the inland LFI navigation channel and the Central Reach offshore borrow site. Alternative 6 - Intermediate Terminal Groin and Beach Nourishment (Applicant's Preferred Alternative)

Version 7.8.2014 Page 6
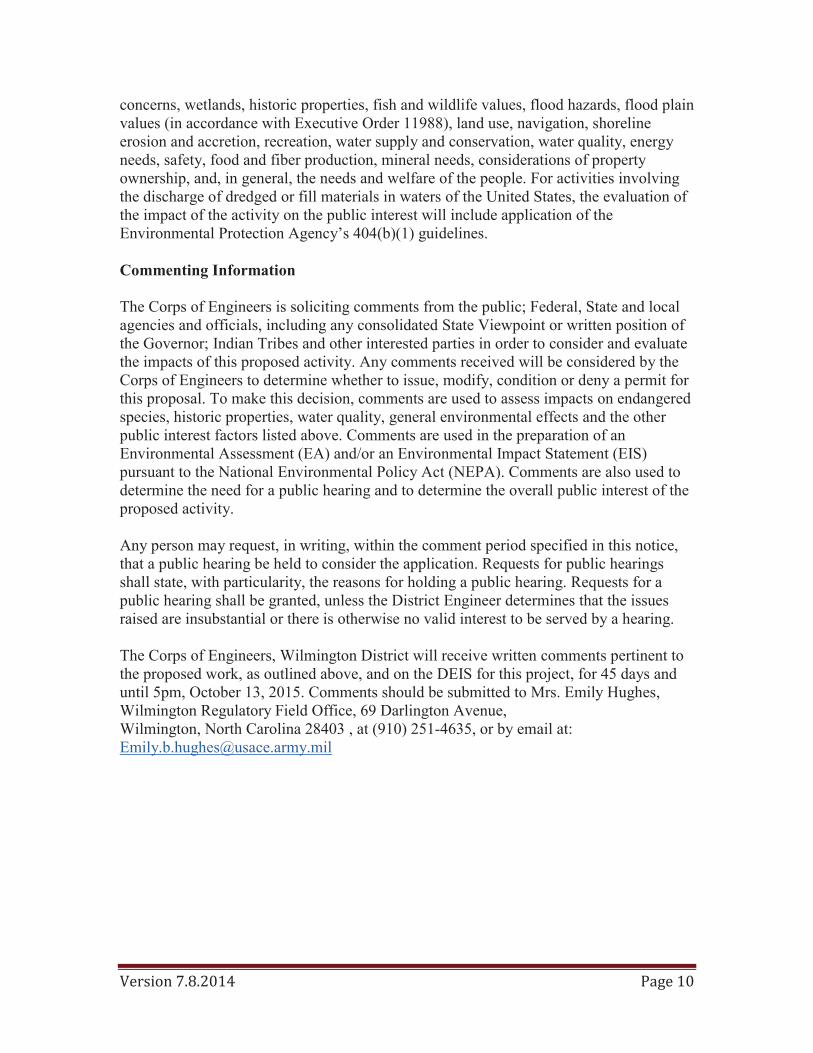
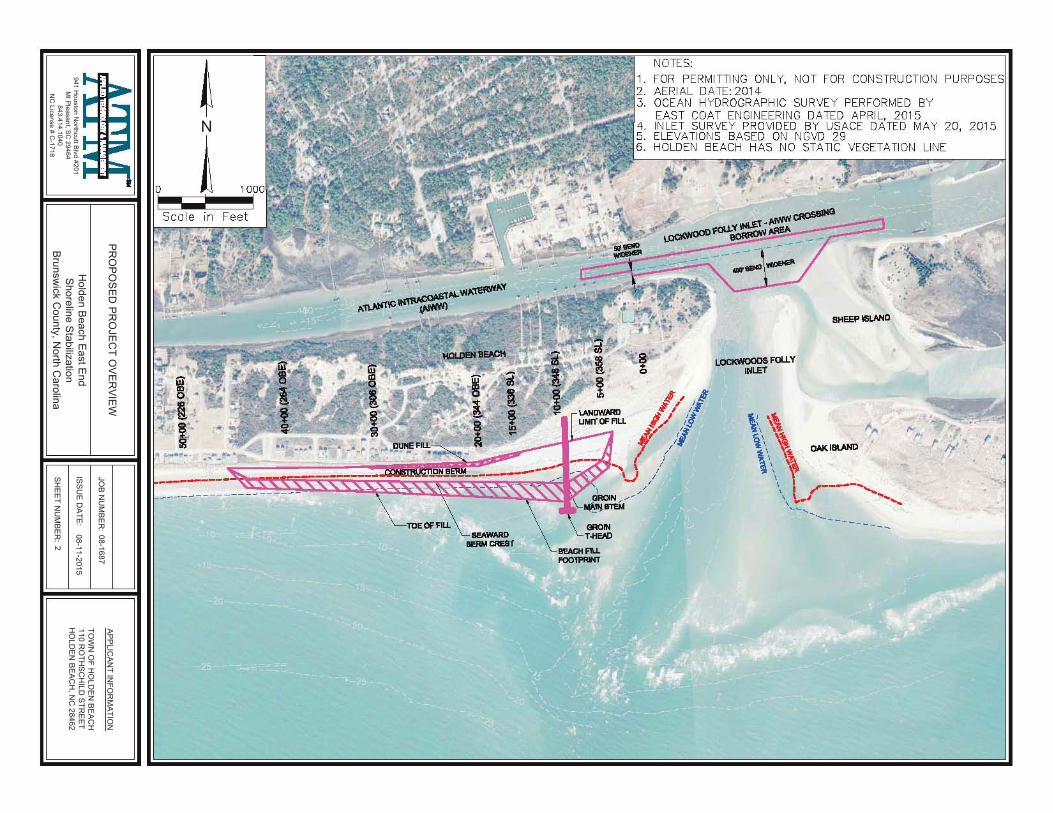
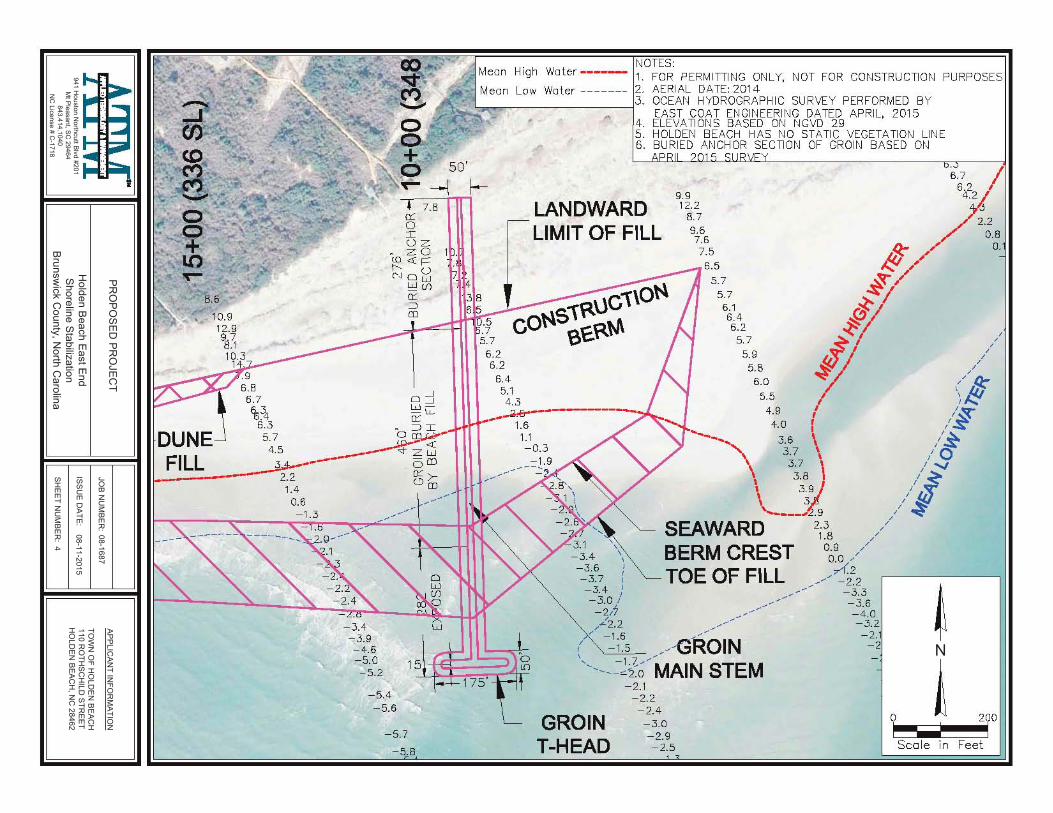
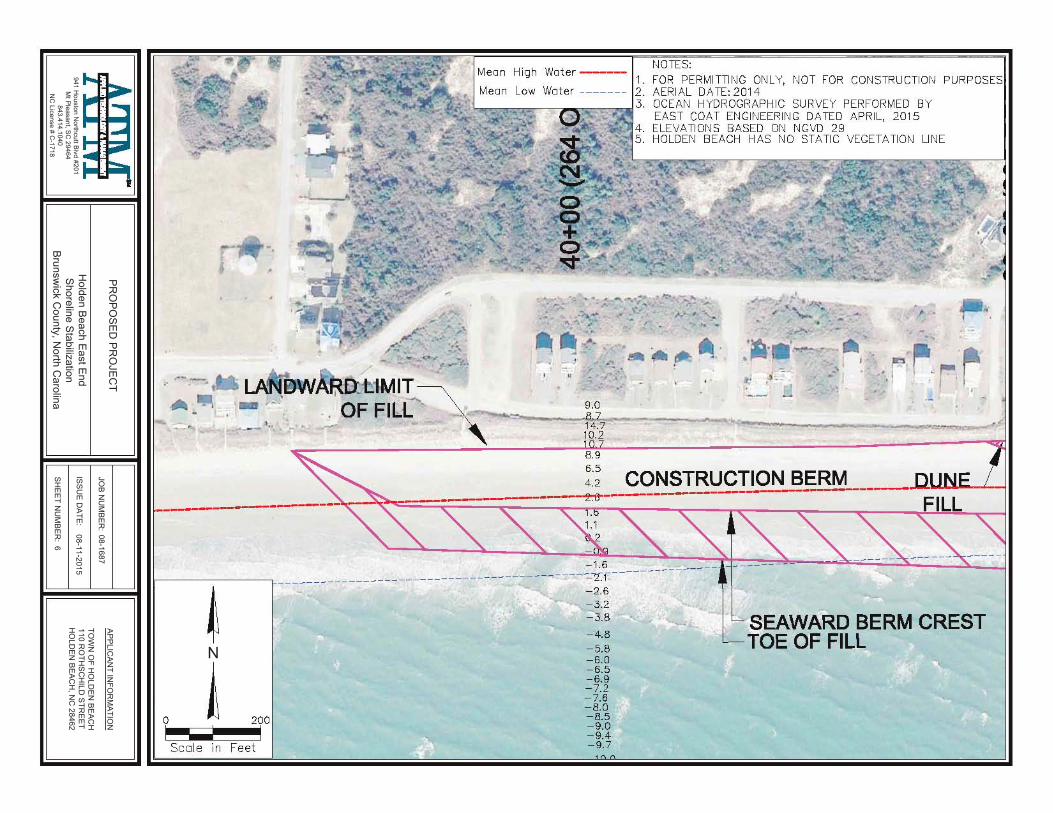
Under Alternative 6, the Town would assume responsibility for shore protection of the East End of Holden Beach through the construction of a ~1,000-ft-long intermediate terminal groin at the eastern end of the oceanfront beach between Stations 00+00 and 10+00 and the implementation of an independent, 30-year beach nourishment plan. The main stem of the intermediate terminal groin would include a 700-ft-long segment extending seaward from the toe of the primary dune and a ~300-ft anchor segment extending landward from the toe of the primary dune. The groin would also include a 120-ft-long shore-parallel T-Head segment centered on the seaward terminus of the main stem. The projected beach nourishment regime would involve the placement of ~100,000 to 150,000 cy of sand on the East End of Holden Beach every four years. The beach fill profile design would be similar to that of Alternatives 3, 4, and 5 and include a +9-ft NAVD high dune with a 50-ft-wide crest, a +7-ft NAVD high, 200-ft-wide berm, and a 90- to 200-ft-wide transition with a 15 percent slope. The anticipated borrow sites and dredging regimes would be the same as those described under Alternative 5. Avoidance and Minimization The applicant provided the following information in support of efforts to avoid and/or minimize impacts to the aquatic environment: The Applicant has completed an Inlet Management Plan (IMP) that provides detailed information regarding required plan components including: (1) determination and type of data to define the baseline condition; (2) post construction monitoring to compare baseline data and assess potential adverse impacts; (3) timeframes for post construction monitoring; (4) identification of thresholds for implementation of mitigation measures; and (5) mitigation measures that may be implemented. In addition, terminal groin construction and beach fill placement activities would adhere to a 16 November to 30 April environmental window; thereby avoiding the sea turtle nesting season, the majority of the shorebird breeding season, the majority of the seabeach amaranth growing season, and peak benthic invertebrate recruitment periods. Compensatory Mitigation The applicant offered the following compensatory mitigation plan to offset unavoidable functional loss to the aquatic environment: The project as proposed will not impact wetlands. Therefore, no compensatory mitigation will be required for the applicant's project as proposed. Changes to the project and/or additional information received which suggest impacts to wetlands and or waters of the United States, will warrant further
Version 7.8.2014 Page 7
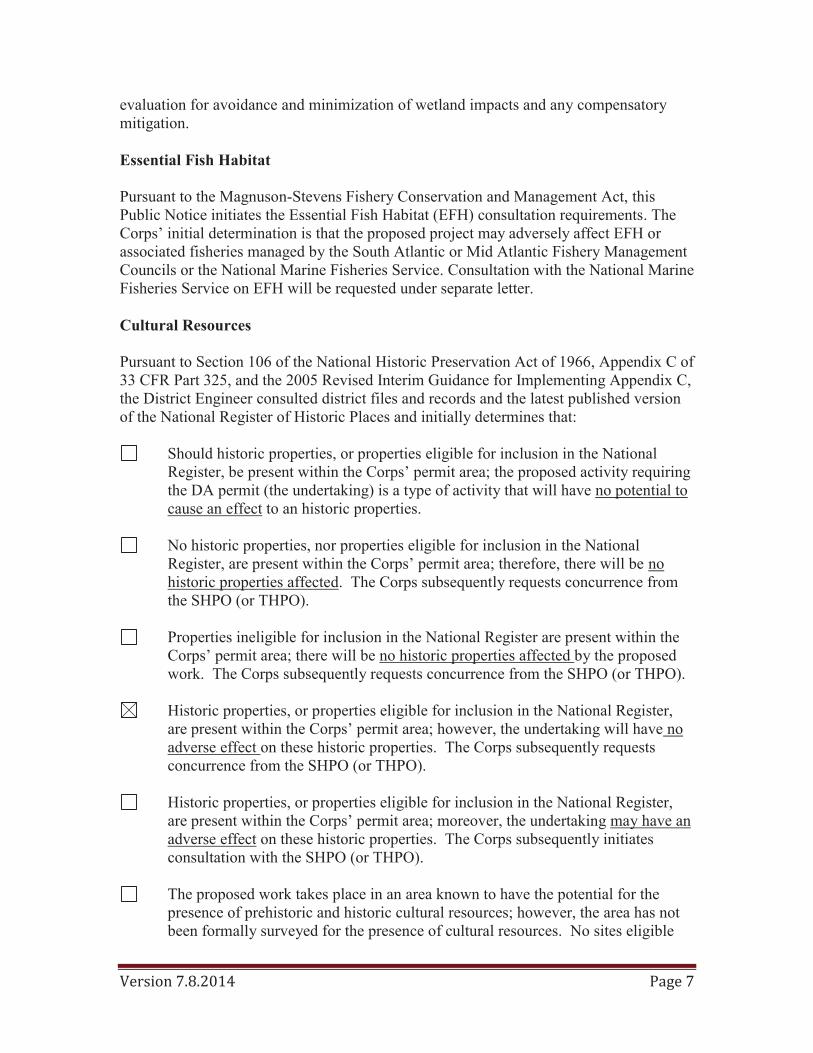
evaluation for avoidance and minimization of wetland impacts and any compensatory mitigation. Essential Fish Habitat Pursuant to the Magnuson-Stevens Fishery Conservation and Management Act, this Public Notice initiates the Essential Fish Habitat (EFH) consultation requirements. The Corps’ initial determination is that the proposed project may adversely affect EFH or associated fisheries managed by the South Atlantic or Mid Atlantic Fishery Management Councils or the National Marine Fisheries Service. Consultation with the National Marine Fisheries Service on EFH will be requested under separate letter. Cultural Resources Pursuant to Section 106 of the National Historic Preservation Act of 1966, Appendix C of 33 CFR Part 325, and the 2005 Revised Interim Guidance for Implementing Appendix C, the District Engineer consulted district files and records and the latest published version of the National Register of Historic Places and initially determines that:
Should historic properties, or properties eligible for inclusion in the National Register, be present within the Corps’ permit area; the proposed activity requiring the DA permit (the undertaking) is a type of activity that will have no potential to cause an effect to an historic properties.
No historic properties, nor properties eligible for inclusion in the National
Register, are present within the Corps’ permit area; therefore, there will be no historic properties affected. The Corps subsequently requests concurrence from the SHPO (or THPO).
Properties ineligible for inclusion in the National Register are present within the Corps’ permit area; there will be no historic properties affected by the proposed work. The Corps subsequently requests concurrence from the SHPO (or THPO).
Historic properties, or properties eligible for inclusion in the National Register, are present within the Corps’ permit area; however, the undertaking will have no adverse effect on these historic properties. The Corps subsequently requests concurrence from the SHPO (or THPO).
Historic properties, or properties eligible for inclusion in the National Register, are present within the Corps’ permit area; moreover, the undertaking may have an adverse effect on these historic properties. The Corps subsequently initiates consultation with the SHPO (or THPO).
The proposed work takes place in an area known to have the potential for the
presence of prehistoric and historic cultural resources; however, the area has not been formally surveyed for the presence of cultural resources. No sites eligible

Version 7.8.2014 Page 8
for inclusion in the National Register of Historic Places are known to be present in the vicinity of the proposed work. Additional work may be necessary to identify and assess any historic or prehistoric resources that may be present.
The District Engineer’s final eligibility and effect determination will be based upon coordination with the SHPO and/or THPO, as appropriate and required, and with full consideration given to the proposed undertaking’s potential direct and indirect effects on historic properties within the Corps-indentified permit area. Endangered Species Pursuant to the Endangered Species Act of 1973, the Corps reviewed the project area, examined all information provided by the applicant and consulted the latest North Carolina Natural Heritage Database. Based on available information:
The Corps determines that the proposed project would not affect federally listed endangered or threatened species or their formally designated critical habitat.
The Corps determines that the proposed project may affect federally listed
endangered or threatened species or their formally designated critical habitat. Initiation of formal consultation, pursuant to Section 7, ESA, will be requested with the U.S. Fish and Wildlife Service under separate letter for effects on nesting sea turtles and critical habitat. Also, informal consultation and a concurrence dtermination that the project may affect, but is not likely to adversely affect whales, marine sea turtles, sebeach amaranth, red knot, piping plover, Atlantic sturgeon, and manatee will be coordinated with the National Marine Fisheries Service and U.S. Fish and Wildlife Service under separate letters. The Federal resource agencies (i.e., FWS and NMFS) will be requested to initiate consultation under Section 7 of the ESA on the above effect determinations. The Corps will not make a permit decision until the consultation process is complete.
The Corps is not aware of the presence of species listed as threatened or
endangered or their critical habitat formally designated pursuant to the Endangered Species Act of 1973 (ESA) within the project area. The Corps will make a final determination on the effects of the proposed project upon additional review of the project and completion of any necessary biological assessment and/or consultation with the U.S. Fish and Wildlife Service and/or National Marine Fisheries Service.
Other Required Authorizations The Corps forwards this notice and all applicable application materials to the appropriate State agencies for review.

Version 7.8.2014 Page 9
North Carolina Division of Water Resources (NCDWR): The Corps will generally not make a final permit decision until the NCDWR issues, denies, or waives the state Certification as required by Section 401 of the Clean Water Act (PL 92-500). The receipt of the application and this public notice, combined with the appropriate application fee, at the NCDWR Central Office in Raleigh constitutes initial receipt of an application for a 401 Certification. A waiver will be deemed to occur if the NCDWR fails to act on this request for certification within sixty days of receipt of a complete application. Additional information regarding the 401 Certification may be reviewed at the NCDWR Central Office, 401 and Buffer Permitting Unit, 512 North Salisbury Street, Raleigh, North Carolina 27604-2260. All persons desiring to make comments regarding the application for a 401 Certification should do so, in writing, by October 13, 2015 to:
NCDWR Central Office Attention: Ms. Karen Higgins, 401 and Buffer Permitting Unit (USPS mailing address): 1617 Mail Service Center, Raleigh, NC 27699-1617 Or, (physical address): 512 North Salisbury Street, Raleigh, North Carolina 27604
North Carolina Division of Coastal Management (NCDCM):
The application did not include a certification that the proposed work complies with and would be conducted in a manner that is consistent with the approved North Carolina Coastal Zone Management Program. Pursuant to 33 CFR 325.2 (b)(2) the Corps cannot issue a Department of Army (DA) permit for the proposed work until the applicant submits such a certification to the Corps and the NCDCM, and the NCDCM notifies the Corps that it concurs with the applicant’s consistency certification. As the application did not include the consistency certification, the Corps will request, upon receipt,, concurrence or objection from the NCDCM.
Based upon all available information, the Corps determines that this application for a Department of Army (DA) permit does not involve an activity which would affect the coastal zone, which is defined by the Coastal Zone Management (CZM) Act (16 U.S.C. § 1453). Evaluation The decision whether to issue a permit will be based on an evaluation of the probable impacts including cumulative impacts of the proposed activity on the public interest. That decision will reflect the national concern for both protection and utilization of important resources. The benefit which reasonably may be expected to accrue from the proposal must be balanced against its reasonably foreseeable detriments. All factors which may be relevant to the proposal will be considered including the cumulative effects thereof; among those are conservation, economics, aesthetics, general environmental
Version 7.8.2014 Page 10
concerns, wetlands, historic properties, fish and wildlife values, flood hazards, flood plain values (in accordance with Executive Order 11988), land use, navigation, shoreline erosion and accretion, recreation, water supply and conservation, water quality, energy needs, safety, food and fiber production, mineral needs, considerations of property ownership, and, in general, the needs and welfare of the people. For activities involving the discharge of dredged or fill materials in waters of the United States, the evaluation of the impact of the activity on the public interest will include application of the Environmental Protection Agency’s 404(b)(1) guidelines. Commenting Information The Corps of Engineers is soliciting comments from the public; Federal, State and local agencies and officials, including any consolidated State Viewpoint or written position of the Governor; Indian Tribes and other interested parties in order to consider and evaluate the impacts of this proposed activity. Any comments received will be considered by the Corps of Engineers to determine whether to issue, modify, condition or deny a permit for this proposal. To make this decision, comments are used to assess impacts on endangered species, historic properties, water quality, general environmental effects and the other public interest factors listed above. Comments are used in the preparation of an Environmental Assessment (EA) and/or an Environmental Impact Statement (EIS) pursuant to the National Environmental Policy Act (NEPA). Comments are also used to determine the need for a public hearing and to determine the overall public interest of the proposed activity. Any person may request, in writing, within the comment period specified in this notice, that a public hearing be held to consider the application. Requests for public hearings shall state, with particularity, the reasons for holding a public hearing. Requests for a public hearing shall be granted, unless the District Engineer determines that the issues raised are insubstantial or there is otherwise no valid interest to be served by a hearing. The Corps of Engineers, Wilmington District will receive written comments pertinent to the proposed work, as outlined above, and on the DEIS for this project, for 45 days and until 5pm, October 13, 2015. Comments should be submitted to Mrs. Emily Hughes,Wilmington Regulatory Field Office, 69 Darlington Avenue, Wilmington, North Carolina 28403 , at (910) 251-4635, or by email at: [email protected]

FILL
AN
D G
RO
INPR
OJE
CT
LIM
ITS
BO
RR
OW
AR
EA
3 N
AU
TIC
AL
MIL
E LI
MIT
N
NO
RTH
CAR
OLI
NA
(NO
T TO
SC
ALE)
Holden Beach East EndShoreline Stabilization
Brunswick County, North Carolina
JOB NUMBER:
ISSUE DATE:
SHEET NUMBER:
08-1687
08-11-2015941 Houston Northcutt Blvd #201Mt Pleasant, SC 29464
843.414.1040NC License # C-1718
APPLICANT INFORMATION
TOWN OF HOLDEN BEACH110 ROTHSCHILD STREETHOLDEN BEACH, NC 28462
1
LOCATION MAP
N
Holden Beach East End
Shoreline StabilizationBrunsw
ick County, N
orth Carolina
JOB N
UM
BER:
ISSUE D
ATE:
SHEET N
UM
BER: 08-1687
08-11-2015941 H
ouston Northcutt Blvd #201
Mt Pleasant, SC
29464843.414.1040
NC
License # C-1718
APPLICAN
T INFO
RM
ATION
TOW
N O
F HO
LDEN
BEACH
110 RO
THSC
HILD
STREET
HO
LDEN
BEACH
, NC
28462
PRO
POSED
PRO
JECT O
VERVIEW
2
~
.........
~
~~OTES:
FOR PERMITTI~~G m~LY, r~OT FOR Cm~STRUCTlm~ PURPOSESII AERIAL DATE:2014 OCEM~ HYDROGRAPHIC SURVEY PERFORMED BY EAST COAT Er~WjEERlrjG DATED APRIL, 2015 IrJLET SURVEY PROVlDED BY USACE DATED MAY 20, 2015 ELEVATIGrJS BASED mJ rJGVD 29 HOLDErJ BEACH HAS rw STATIC VEGETATlmJ LlrJE
""""""'" ""-Y .... '
SHEEP ISLNID
\(\ .~ " 'i' '~ r_ ~\ ~~ 0AK11llAND
~\ "t \ r--""'" , - -~-',-- .....
, It'

N
Holden Beach East End
Shoreline StabilizationBrunsw
ick County, N
orth Carolina
JOB N
UM
BER:
ISSUE D
ATE:
SHEET N
UM
BER: 08-1687
08-11-2015941 H
ouston Northcutt Blvd #201
Mt Pleasant, SC
29464843.414.1040
NC
License # C-1718
APPLICAN
T INFO
RM
ATION
TOW
N O
F HO
LDEN
BEACH
110 RO
THSC
HILD
STREET
HO
LDEN
BEACH
, NC
28462
PRO
POSED
PRO
JECT
3
~ High Water ----
. , 1
~
'1 ....
1
SHEET 6 SHEETS
FOR PERMITTI~jG mjLY, r~OT FOR CmSTRUCTlm PURPOSESIII AERIAL DATE: 2014 OCEAr~ HYDROGRAPHIC SURVEY PERFORMED BY EAST COAT Ermr~EERlrjG DATED APRIL, 2015 IrJLET SURVEY PROV1DED BY USACE DATED MAY 20, 2015 ELEVATlmJS BASED mJ rJGVD 29 HOLDErJ BEACH HAS rw STATIC VEGETATIDrj WJE BRUrJSVI'1CK COUrny PAF
.\ i, do ~ ': ' _t;ji'I":?"
~
.. . ,/"'
N
Holden Beach East End
Shoreline StabilizationBrunsw
ick County, N
orth Carolina
JOB N
UM
BER:
ISSUE D
ATE:
SHEET N
UM
BER: 08-1687
08-11-2015941 H
ouston Northcutt Blvd #201
Mt Pleasant, SC
29464843.414.1040
NC
License # C-1718
APPLICAN
T INFO
RM
ATION
TOW
N O
F HO
LDEN
BEACH
110 RO
THSC
HILD
STREET
HO
LDEN
BEACH
, NC
28462
PRO
POSED
PRO
JECT
4
,
:--1 .~·""~::~~:,' -$.?A· Mean High Woter--- ~~.o~~~: PERMITTlr~G mJLY, r~OT FOR Cm~STRUCTlm~ PURPOSES ~-t< .. ~ .. -... ~ .. :"...'fN'i. A:" Mean Low Water ------- 2. AERIAL DATE: 2014 ~~~~ .~~.; "- ~,,~ , ,; 3. DeEM HYDROGRAPHIC SURIlEY PERFORMED BY ~ ,-_d' "'.....=~ _ ,.. EAST COAT ErjGlrjEERlr~G DATED APRIL, 2015
.,
9
7.8 <L o I uz zO
-(0 <Of: ~
" 0 C'-J 0 W wen <r =0 m
6.El O:::J 6.7 _ IL w-&3 <r 15.4 _ ~:r: ,..,
6.3 o ~ DUNE-.l 5.7 ~~ ;5
4.5 ____ - " 0 m
FILL ~22 -- i'5i;; I ~ --- . 1.4
0.6 -1.3 ~~~~~r
-3.4 -3.9 -4.6 -5.0 -5.2
15
-5.4 -5.6
-5.7
-5.8
rrr~~'
w
.. 4. ELEVATlmS BASED m r1GVD 29 5. HOLDErJ BEACH HAS rm STATIC VEGETATlm~ LlrJE 6. BURIED MJCHOR SECTlorJ OF GROlrJ BASED mJ
LANDWARD LIMIT OF FILL
99 12.2
8.7
6.7 I
2.2 0.8 9.6
7.6 7.5
/;
6,22 '
~ o. f!I/ ~;/
0/ ~ 18 6.5
.1 CO~S1R\.lC1\O~ 5;7
5.7 o."::O~' 6.1 6 2 ,,~f'W' 6.4 6 6.'
.2 5.7 l~ " P' /
~ /~~ 5.5 '; f:!I
6.0 6.4 51 59 5.8
4.' ~-------, ...... 1.6 '
1.1 -0.3 -1.9
~~---~
4.9 I I~ '_ 4.0 f /.:s: --" 3.6 \ !~
\ 3.7 \ /0
--- , 3.8 / ~ \ '.7y, ! "
" m 175
\ ';9 / W SEAWARD'---- ,,, ,,/ ~
\, BERM CREST 0690 ,/ ~ 1.8 •
, . : TOE OF FILL / " ,'2
-3. 4 / rrr/ -3.3 -3.0 I // -3.6
- ; ; ;, r///~ -4.0
. /'<-!"~6 /~/~ -:::} ( " -1.5 / GROIN -2
'",'~~{~ - MAIN STEM
GROIN T-HEAD
-2.1 -2.2 -2.4 -3.0 -2.9 -2.5
~
::'CGle In Feet
i 200 o ; 1 I, .
N
Holden Beach East EndShoreline Stabilization
Brunswick County, North Carolina
JOB NUMBER:
ISSUE DATE:
SHEET NUMBER:
08-1687
08-11-2015941 Houston Northcutt Blvd #201Mt Pleasant, SC 29464
843.414.1040NC License # C-1718
APPLICANT INFORMATION
TOWN OF HOLDEN BEACH110 ROTHSCHILD STREETHOLDEN BEACH, NC 28462
PROPOSED PROJECT
5
N
Holden Beach East End
Shoreline StabilizationBrunsw
ick County, N
orth Carolina
JOB N
UM
BER:
ISSUE D
ATE:
SHEET N
UM
BER: 08-1687
08-11-2015941 H
ouston Northcutt Blvd #201
Mt Pleasant, SC
29464843.414.1040
NC
License # C-1718
APPLICAN
T INFO
RM
ATION
TOW
N O
F HO
LDEN
BEACH
110 RO
THSC
HILD
STREET
HO
LDEN
BEACH
, NC
28462
PRO
POSED
PRO
JECT
6
• .:. ... ~'
-~~ ¥.
I
- .... _--
--------
~ ! ~ o ,
I ~cale in Feet
..... ,
.:; .. :6,
Mean High Water -----
,l_ . .-;L: wa:-:-~ -Ji
...... ' . ... ~ ................. --. J ~.:; _ ' ,," y. : ... , .:;. .... .~. -' .
" ;,.;.. ,.. .'
r~OTES:
FOR PERMITm~G mJLY, r~OT FOR cmjSTRUCTlmJ AERIAL DATE: 2014 DeEM HYDROGRAPHIC SURVEY PERFORMED BY EAST COAT E~jGI~jEERI~jG DATED APRIL, 2015
;ED mj ~jGVD 29
PURPOSES
HAS ~W STATIC VEGETATlm~ U~jE
"'" ~«~
N ' -..'" " . '. ¥
, '·-<.~ ·".A' ___ '" ',- -, --.. ,
• ~.
:~.
'1!b -, . ~.-•. .,....,. ~ ~i"-' .... ,..~ -
~ • ,f: .... , -.' ! " ,
,.rl ~' r~ :. , ~.' W ._ or"~ , I: f +-&
,'j 9,0 - .. ~ - '''" .. .. '" ..,.~
8,9 6,5
_ -.4",." ,_ C~~ST~~CTI.9N BE~M ___ D UNE I II --------- "". FILL
-1.6 ocr
-2.6
. '- .... -3.2 =-3.8
-4.8
-5.8 -6.0 -6.5 -6.9 -7.2 -7.6 -8.0 -8.5 -9.0 -9.4 -9.7
'" , " SEAWARD BERM CREST TOE OF FILL

JOB N
UM
BER:
ISSUE D
ATE:
SHEET N
UM
BER: 08-1687
08-11-2015941 H
ouston Northcutt Blvd #201
Mt Pleasant, SC
29464843.414.1040
NC
License # C-1718
APPLICAN
T INFO
RM
ATION
TOW
N O
F HO
LDEN
BEACH
110 RO
THSC
HILD
STREET
HO
LDEN
BEACH
, NC
28462
MEAN HIGH WATER2.7'NAVD 881.0'MEAN SEA LEVEL0.5'NGVD 290.0'MEAN LOW WATER-2.0'
LOCKWOOD FOLLY INLET TIDAL DATUMS
PRO
FILE VIEWS
TYPICAL BEAC
H FILL
Holden Beach East End
Shoreline StabilizationBrunsw
ick County, N
orth Carolina
7
~ ~ P"'U""1 •
~~otes:
II II I II
I~' FOR PERMITTI~~G m~L Y, ~WT FOR Cm~STRUCTlm~ PURPOSES f". HYDROGRAPHIC SURVEY PERFORMED BY
EAST COAT E~~GI~~EERI~~G DATED APRIL, 2015
II II I II 3. HORIZmnAL COORDI~MTES ARE ~K GRID UMD83) 4. ELEVATlm~S BASED m~ ~~GVD 29 5. HOLDE~~ BEACH HAS ~W STATIC VEGETATlm~ LI~~E
FILL
EXISTING SURFACE
STA 10+00 PROFILE 1 5 CONSTRUC110N BERM 8.0 (130-400 WIDTH VARIES)
C; : 15:1(H:V) CONSTRUCTION Sl.OPE (TYP) 0' 1 Of SEAWARD BERM CREST
2S 5 ! _ BEACH.!'ILL _____________________ MEANHIGHWATER2T
is 0--: i TOE OF FIll. . F + ' ---'""' ---- -----MEANLOWWATER-2.0 « -5 : ~ L _______________________________________________________________________________________________________________________________ _
~10
w l l l l l l l l l L L L L L L LL
15 20t 0' 10
G 5 z
';: 0*-, g -5
~-10 w-15
-20
HORlzmHAL
I
o
o 250 I .
~cale In Feet
o 0 0 0 0 0 0 0 0 0 0 0 0 0 0 0 0 ~ N n ~ ~ ~ ~ ro rn 0 N n ~ ~ w W
° I
I 0 0
CROSS SHORE DISTA~JCE (FEET)
STA 30+00 PROFILE
DUNE CREST (25.0' TYP) 5:1 (H:V) CONSTRUCTION SLOPE (TYP)
CONSTRUCTION BERM 8.0 (130-400 WIDTH VARIES) SEAWARD BERM CREST
15:1(H:V) CONSTRUCTION SLOPE (TYP) BEACH FILL
__________________________________ MEANHIGHWATER2.7'
_ -rm;..QPE1l,.L _________________________ -MEAN LOWWATER-2.0
I I I I I I I I L L L L L L L L 0 0 0 0 0 0 0 0 0 0 0 0 0 0 0 0 0 0 0 0 0 0 0 0 6 C~ n -+ en m '" co OJ 0
C~ n -+ en co " CD
CROSS SHOOE DIST#,CE (FEETr
VERTICAL 25
I Scale in Feel

JOB N
UM
BER:
ISSUE D
ATE:
SHEET N
UM
BER: 08-1687
08-11-2015941 H
ouston Northcutt Blvd #201
Mt Pleasant, SC
29464843.414.1040
NC
License # C-1718
APPLICAN
T INFO
RM
ATION
TOW
N O
F HO
LDEN
BEACH
110 RO
THSC
HILD
STREET
HO
LDEN
BEACH
, NC
28462
GR
OIN
PRO
FILE VIEW
Holden Beach East End
Shoreline StabilizationBrunsw
ick County, N
orth Carolina
8
HORlzmHAL VERTICAL EXISTING GRADE (EXCAVATION NOT SHOWN)
~~otes: o 150 o 15 1. FOR PERMITTI~,G Qf,L Y, ~mT FOR cm,STRUCTlm, PURPOSES I I I . 2. ELEVATlm,S BASED m, ~,GVD 29 ~cale In Feet ~cale In Feet
BEACH FILL 3. HOLDE~, BEACH HAS ~m STATIC VEGETATlm, LI~,E
15
10
o [; 5 z
is 0 F ;; ~ -5 w
-10
GROIN IT-HEAD
4. ~W CORE STOf,E PROPOSED TO ALLOW MORE PERMEABILITY 5. BURIED M,CHOR SECTIOf, OF GROI~, BASED Of, APRIL 2015
SURVEY
GROIN PROFILE 276' -460'
I-----BBIURIED ANCHOR GROIN BURIED EX~ED'------~ SECTION BY BEACH FIll.
o
CONSTRUCTION BERM 8.0 (130'-420' WIDTH VARIES) SEAWARD BERM CREST
15:1(H:V} CONSTRUCTION SLOPE (TYP)
GROIN
____________ ~~~~~ MEAN HIGH WATER 27' ~ .
I d ;;;::J ______ ~MEANLOWWATER-2.0
BURIED GROIN~ EXISTING GROIN BURIa: '''--GROIN T-HEAD (BASED ON GRADE BY BEACH FILL
EXISTING SURFACE)
ARMOR STONE MEAN DIA. 3'-5'
THICK
GROIN CREST
MEAN HIGH WAi ER 2.7' _ __ _
o o "' CD
CROSS SHORE DISTMJCE (FEET)
10' - I +5.0' " I 7 \Q 7' \J)i '\v-
TOE OF FILL
ba.:
o o
o
~~ EXISTING~ ~~~~ GRADE MEAN LOWWATER-2.0 _ _ --.A'( _ _ _ _ _ _ - - - - - - --~ra\~ r-.~.r--. ~ r-.~~ -
- ~2.5' ~--
BEACH FIll. (VARIES ALONG
PROFILE)
TYPICAL GROIN CROSS SECTION (MAIN STEM)
(NOT TO SCALE)
MARINE MATTRESS FILLED WITH 3.5- DIA.
STONE 1'THICK
--EXISTING/
GRADE

JOB N
UM
BER:
ISSUE D
ATE:
SHEET N
UM
BER: 08-1687
08-11-2015941 H
ouston Northcutt Blvd #201
Mt Pleasant, SC
29464843.414.1040
NC
License # C-1718
APPLICAN
T INFO
RM
ATION
TOW
N O
F HO
LDEN
BEACH
110 RO
THSC
HILD
STREET
HO
LDEN
BEACH
, NC
28462H
olden Beach East EndShoreline Stabilization
Brunswick C
ounty, North C
arolina
BOR
RO
W AR
EA
9
MEAN HIGH WATER2.7'NAVD 881.0'MEAN SEA LEVEL0.5'NGVD 290.0'MEAN LOW WATER-2.0'
LOCKWOOD FOLLY INLET TIDAL DATUMS
• ~~->
•
FOR PERMITm~G mL Y, r~OT FOR Cm~STRUCTlm~ PURPOSES AERIAL DATE: 2014 HYDROGRAPHIC SURVEY PERFORMED BY USACE DATED rwv 2013 (REPRESE~nATIVE OF PRE-PROJECT CmmlTIONS) ELEVATlm~s BASED m~ MLW BORlr~G LOCATlm~S FROM 1998. 2002, 2008, Arm 2009 VlBRACORES
•• . ., " , "- - ' -~ .
o . ,,~ooo feLL 'I INLEI - f>lV'I'N CROSSING _~... BORROW I>J'!.EA
B C ---
f'
,
'" ,-~
.....- -" . -----......-
• ,,~
.,>
lOCKWOOOS FOllY INLET
0 __
. . f; • 0 • .. . . ', . • ,
C'. It.
SHEEP ISLANU
~-BORlr~G SITE
~~

MEAN HIGH WATER2.7'NAVD 881.0'MEAN SEA LEVEL0.5'NGVD 290.0'MEAN LOW WATER-2.0'
LOCKWOOD FOLLY INLET TIDAL DATUMS
INSH
OR
E BOR
RO
W PR
OFILES
JOB N
UM
BER:
ISSUE D
ATE:
SHEET N
UM
BER: 08-1687
08-11-2015941 H
ouston Northcutt Blvd #201
Mt Pleasant, SC
29464843.414.1040
NC
License # C-1718
APPLICAN
T INFO
RM
ATION
TOW
N O
F HO
LDEN
BEACH
110 RO
THSC
HILD
STREET
HO
LDEN
BEACH
, NC
28462H
olden Beach East EndShoreline Stabilization
Brunswick C
ounty, North C
arolina10
•
II II I II
II II I II
10
5
§2 0 (')
2;-5
6-10 ~-15 > ~20 w
-25
BORROW AREA PROFILE A
EDClE OF EDGE OF IiO' BEtID CHflNNEL \ I WIDENER
:-1 :d~ ~= ------ % '
AREA. TO BE --.l """'W
b I I I I o 0 g g g g
C'-j n q-CROSS SHORE DISTNJCE (FEET)
12' DREDOE LINE 1,(' OYER DREDGE ALLOWANCE
BORROW AREA PROFILE C
~WTES: AREAS TO 1 FOR PERMITTI~jG mjL Y, ~WT FOR CmjSTRUCTlmj PURPOSES BE DREDGED 2 HYDROGRAPHIC SURVEY PERFORMED BY
USACE DATED ~WV. 2013 (REPRESE~HATIVE EXISTI"G OF PRE-PROJECT CmWlTlmjS) GRADE 3 HORIZmHAL COORDI~jATES ARE ~jC GRID (~jAD83)
10
5
0' 0 > '" 2S -5
6-10
~-15 > :1-20 w
-25
4. ELEVATlmjS BASED m~ MLW 5. HOLDE~~ BEACH HAS IW STATIC VEGETATlm~ LI~~E
BORROW AREA PROFILE B
EDGE OF \ r EDGE OF 400' lIEN)
CHANNEL \ I WIDENER
-~. I '~, '~ ------ t:::,~ "" :::::::::::::: 14' OVER DREDGE ALLOWANCE
AAMro~ ,
-1 -1 b o o
I
,_W
I I I I o 0 0 0 o 0 0 0
('~ n "T CROSS SHORE DISTMCE (FEET)
-1 b o on
-1 b o ill
BORROW AREA PROFILE D
J b o "
15
~ 10 o ('; 5 z ~ 0 z g -5
:......J~'.:. ('~~-~" WIDENER
~~-~ • ,~ ~ /~=.::,:,,,,,,,,,,,,,
10
5 o ('; 0 z ~-5 z ~ 10
"""~\ CHANNEL \
'" ~1-~
r"""~ I CHANNEL
~ '" ~-10 ~
w-15
-"
I
b o
I
o
I I o o
Nt"oIOBE---'
I r-
I I I I 0 0 0 0 0 0 0 0 0 0 0 0 C" n " on ill " CROSS SHORE DISTAfJCE (FEET)
HORlzmnAL o 250 I '
~cale In Feet
I 0 0 CD
J b o m
'" ~-15 ~
w- 20
VERTICAL o 25
I I ,
:)COle In Feet
-1 b o
~ AREA TO BE ~~,
I I I o 0 0 o 0 0 0
C" n CROSS SHffiE DISTAfJCE (FEET)
-1 b o
"
11' DREDGE LINE '14' OYER DREDOEALLOW.¥ICE
J b o on
Holden Beach East End Shore Protection Project Final Environmental Impact Statement
Appendix B
Comments Received on Draft Environmental Impact Statement (DEIS) and Summary Table of Comment-Response
I. Summary Table of Contents on DEIS and EIS Updates II. Federal Agency Comments
A. U.S. Fish and Wildlife Service (FWS - Benjamin) B. U.S. Environmental Protection Agency (EPA - Mueller) C. U.S. Department of Interior (DOI - Stanley) D. National Marine Fisheries Service (NMFS - Fay) E. National Marine Fisheries Service (NMFS - Crabtree)
III. State Agency Comments
A. NC Department of Administration - State Environmental Review Clearinghouse (NCDOA - Best)
B. NC Department of Environment and Natural Resources (NCDENR - Hardison) C. NC Division of Coastal Management (NCDCM - Huggett) D. NC Department of Cultural Resources - State Historic Preservation Office (SHPO -
Gledhill-Early) (No Comment)
IV. Non-Governmental Organization Comments
A. North Carolina Coastal Federation (NCCF - Zivonavic-Nenadovic) B. Southern Environmental Law Center (SELC - Gisler) C. Audubon North Carolina (Audubon - Golder)
V. Local Government Comments
A. Town of Oak Island (Holloman) B. Town of Oak Island Meeting C. Holden Beach (Hewett) D. Town of Oak Island (Stites)
VI. General Public Comments
A. Sandra Brooks-Mathers B. Skip Klapheke C. Eileen Governale D. Peter and Catherine Meyer E. Vicki Y. Myers F. April Ozamiz G. Robert Peek H. Pam Sabalos I. Lora Sharkey

J. Richard S. Weigand K. Diana Willard L. Terry Willard
VII. Public Hearing Transcript

Holden Beach Final Environmental Impact Statement Dial Cordy and Associates Inc. Appendix B Draft EIS Comments and Responses February 2018
B-1
Nature of Comment (Summary) Commenting Agency/Entity Comment Type
FEIS Revised
to Address
Comment (Y/N)
FEIS Chapter
FEIS Page Response to Comment
Appendix (unspecified) cites Delaware study to support assertion that relocation/abandonment are much more costly than beach nourishment and other shoreline erosion mitigation options, but provides no details on Delaware study. Relative to the DEIS analyses, it is unclear if the Delaware study was based on an equivalently small number of properties and limited infrastructure.
USFWS Alt 2 relocation analysis N N/A N/A
The Delaware study (Parsons and Powell 2001) was a state-wide assessment that compared the cost of retreat to the cost of nourishment over a 50-year period. The cost parameters used in the Delaware study were the same as those employed in the Holden Beach EIS (see App O); including land loss, structure loss, beach proximity loss, and transition costs. For the Delaware study, the 50-yr cost of retreat was determined to be $291 million, compared with a 50-yr nourishment cost of $60 million.
The extended 4-year nourishment interval under Alt 6 may not accurately reflect the actual nourishment interval that will be required to prevent property impacts. DEIS indicates that a 2-3 year nourishment interval would be required under Alt 6.
USFWS Alt 6 nourishment interval Y Chapter 5
5-3
The 4-year modeling simulations were designed to be conservative and included the erosional effects of Hurricanes Hanna (2008) and Irene (2011). Therefore, the model-predicted erosion rates are expected to be higher than the long-term averages. The occurrence of two hurricanes over a 4-year period could potentially require an expedited nourishment event; however, an average nourishment interval of 4 years is expected over the life of the project. Even with the inclusion of 2 hurricanes in the modeling runs, the modeling results show that the groin alternative lengthens the nourishment interval by a factor of 2 in comparison with the nourishment-only alternative.
Service is concerned that 4-year nourishment interval under Alt 6 will not be adequate. Service is concerned that acceleration of nourishment interval may occur due to storm surge, sea level rise, or other factors.
USFWS Alt 6 nourishment interval/sea level rise N N/A N/A
A discussion of sea level rise is included in the Engineering Report (FEIS Appendix H). Generally, the influence of sea level rise over the next 30 years is very minor in comparison with the effects of major storms. The four-year modeling simulations incorporate elevated water level events associated with Hurricanes Hanna and Irene.
Chapter 5: for all alternatives, indicate whether sandbags will remain in front of properties or will be removed.
USFWS Fate of existing sandbags Y Chapter 5
5-144
NCDCM issues sandbag permits to individual homeowners, and the Town has no authority over their installation or removal. However, sandbags are permitted on a temporary basis and must eventually be removed when a more permanent solution to the erosional hazard is implemented.
The DEIS indicates that the proposed groin is not expected to mitigate erosion due to the regional westward transport of sand, which is the principal cause of erosion within the project area.
USFWS Groin effectiveness
N
N/A N/A
The principal cause of East End erosion is localized inlet-driven eastward sediment transport, not regional westward transport. As in the case of many NC inlets, there is a localized reversal of the regional transport pattern along the adjoining inlet-influenced (East End) shoreline reach. As described in Chapter 5 of the EIS, the model-projected mitigative effects of both groin alternatives include a consistently wider East End beach and an extended 4-year nourishment interval (as opposed to a much narrower beach and a 2-year nourishment interval under all other nourishment alternatives).

Holden Beach Final Environmental Impact Statement Dial Cordy and Associates Inc. Appendix B Draft EIS Comments and Responses February 2018
B-2
Nature of Comment (Summary) Commenting Agency/Entity Comment Type
FEIS Revised
to Address
Comment (Y/N)
FEIS Chapter
FEIS Page Response to Comment
Chapter 6, page 6-2: DEIS indicates construction of sand fillet, but Chapter 5 figures show no fillet.
USFWS Groin fillet missing from figures Y
Chapter 5 Chapter 6
3-18 5-124 6-2
The beach fill template extends beyond the fillet footprint, thus the fillet is not distinguishable from the filled template. The cusp-shaped fillet will take shape over time as the main beach fill erodes. The figures have been revised to show a fillet.
DEIS indicates that groin will cause erosion on both sides of groin. USFWS Groin shoreline effects N N/A N/A
The 4-year modeling simulations were designed to be conservative and included the erosional effects of Hurricanes Hanna (2008) and Irene (2011). Therefore, substantial erosion occurs under all the alternatives. However, as described in Chapter 5 of the EIS (see Table 5.4), the projected relative beach width under Alternative 6 at the end of the 4-year simulation is three times that of the no action and nourishment only alternatives. Thus, the modeling results indicate that the groin reduces erosion in relation to the other alternatives.
The modeling indicates that the groin is expected to cause accelerated erosion east of the groin.
USFWS Groin shoreline effects N N/A N/A
The modeling indicates a relative reduction in the erosion rate along the east side of the groin. Although East End shoreline erosion occurs under all of the alternatives; as described in Chapter 5 of the EIS, the intermediate terminal groin significantly reduces erosion in relation to all other alternatives. See figures 5.6 through 5.9 in the EIS.
Other than beach width at year 4, the modeling does not show a significant difference between the Alternatives 1, 3, 4, 5, and 6.
USFWS Relative effectiveness of alternatives N N/A N/A
The 4-year modeling simulations were designed to be conservative and included the erosional effects of Hurricanes Hanna (2008) and Irene (2011). Therefore, substantial erosion occurs under all the alternatives. However, as described in Chapter 5 of the EIS (see Table 5.4), the projected relative beach width under Alternative 6 at the end of the 4-year simulation is three times that of the nourishment only alternative, and the number of properties at risk under the preferred alternative is reduced by nearly 50 percent in relation to the no-project alternative (Alt 2). Based on modeling results, the terminal groin will extend the nourishment interval from 2 to 4 years, thereby reducing sand placement impacts and costs in relation to existing practices and the non-structural nourishment alternatives. Given the high DCM erosion rate for the East End of 7 feet per year, the benefits are significant.
Alternative 4 actually appears to cause more erosion than Alternative 2.
USFWS Relative effectiveness of alternatives N N/A N/A
As described in Chapter 5 of the EIS, the modeling results indicate that Alternative 4 (wide outer channel and nourishment) has adverse effects on inlet hydrodynamics. As a result, erosion along the Holden Beach inlet shoreline is increased in relation to Alternative 2.

Holden Beach Final Environmental Impact Statement Dial Cordy and Associates Inc. Appendix B Draft EIS Comments and Responses February 2018
B-3
Nature of Comment (Summary) Commenting Agency/Entity Comment Type
FEIS Revised
to Address
Comment (Y/N)
FEIS Chapter
FEIS Page Response to Comment
The preferred alternative (Alt 6) results in more erosion and property damage than Alt 5.
USFWS Relative effectiveness of alternatives N N/A N/A
The criteria used to define “properties at risk” (MHW line within 25 ft of parcel boundary) do not necessarily indicate “property damage.” Although minor differences in the model-projected Year-4 MHW lines result in a slightly higher number of properties at risk, Alternative 6 maintains a significantly wider beach and a higher beach profile sand volume. The added width and volume under Alternative 6 is expected to provide a higher level of protection against hotspot erosion and storm damage. As described in Chapter 5 of the EIS (see Table 5.3), model-projected net habitat changes are essentially the same under Alternatives 5 and 6.
The modeling indicates significant erosion under all of the alternatives at year 4.
USFWS Relative effectiveness of alternatives N N/A N/A
The 4-year modeling simulations were designed to be conservative and included the erosional effects of Hurricanes Hanna (2008) and Irene (2011). Therefore, substantial erosion occurs under all the alternatives. However, as described in Chapter 5 of the EIS (see Table 5.4), the model-projected relative beach width under Alternative 6 at the end of the 4-year simulation is three times that of the nourishment only alternative.
Differences in property impacts under the alternatives are small; therefore, given that modeling is not a precise science, the projected differences may be moot.
USFWS Relative effectiveness of alternatives N N/A N/A
The proposed project encompasses a relatively short shoreline reach; and consequently, the relative impacts are generally on a small scale. However, as described in Chapter 5 of the EIS (see Table 5.4), the model-projected relative beach width under Alternative 6 at the end of the 4-year simulation is three times that of the nourishment only alternative, and the number of properties at risk under the preferred alternative is reduced by nearly 50 percent in relation to the no-project alternative (Alt 2). Based on modeling results, the terminal groin will extend the nourishment interval from 2 to 4 years, thereby reducing sand placement impacts and costs in relation to existing practices and the non-structural nourishment alternatives. Given the high DCM erosion rate for the East End of 7 feet per year, the benefits are significant.
DEIS should clarify differences between the alternatives and provide data showing that a 4-year nourishment interval under Alt 6 will protect properties and infrastructure.
USFWS Relative effectiveness of
alternatives/Alt 6 nourishment interval
N N/A N/A
The 4-year modeling simulations were designed to be conservative and included the erosional effects of Hurricanes Hanna (2008) and Irene (2011). Therefore, substantial erosion occurs under all the alternatives. However, as described in Chapter 5 of the EIS (see Table 5.4), the model-projected relative beach width under Alternative 6 at the end of the 4-year simulation is three times that of the nourishment only alternative, and the number of properties at risk under the preferred alternative is reduced by nearly 50 percent in relation to the no-project alternative (Alt 2). The criteria used to define “properties at risk” (MHW line within 25 ft of parcel boundary) do not necessarily indicate “property damage.” Based on modeling results, Alternative 6 out performs all other alternatives in terms of maintaining beach width and profile volume; and consequently, is expected to provide the highest level of protection against hotspot erosion and storm damage.
Holden Beach Final Environmental Impact Statement Dial Cordy and Associates Inc. Appendix B Draft EIS Comments and Responses February 2018
B-4
Nature of Comment (Summary) Commenting Agency/Entity Comment Type
FEIS Revised
to Address
Comment (Y/N)
FEIS Chapter
FEIS Page Response to Comment
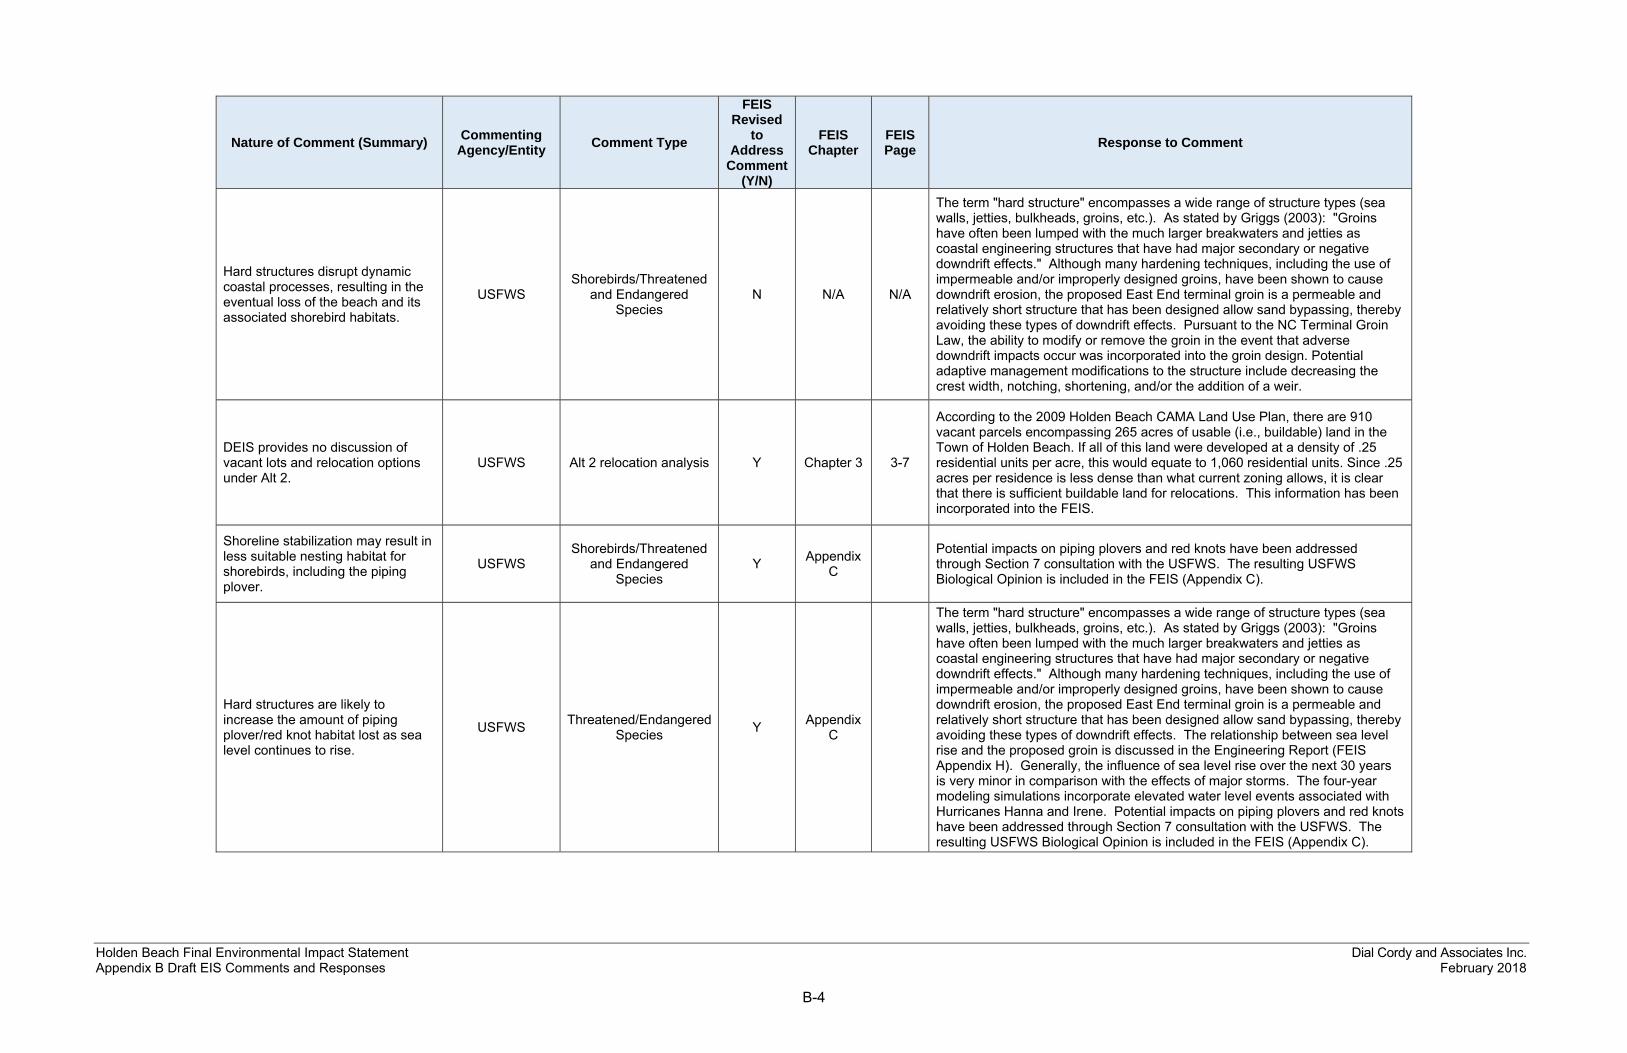
Hard structures disrupt dynamic coastal processes, resulting in the eventual loss of the beach and its associated shorebird habitats.
USFWS Shorebirds/Threatened
and Endangered Species
N N/A N/A
The term "hard structure" encompasses a wide range of structure types (sea walls, jetties, bulkheads, groins, etc.). As stated by Griggs (2003): "Groins have often been lumped with the much larger breakwaters and jetties as coastal engineering structures that have had major secondary or negative downdrift effects." Although many hardening techniques, including the use of impermeable and/or improperly designed groins, have been shown to cause downdrift erosion, the proposed East End terminal groin is a permeable and relatively short structure that has been designed allow sand bypassing, thereby avoiding these types of downdrift effects. Pursuant to the NC Terminal Groin Law, the ability to modify or remove the groin in the event that adverse downdrift impacts occur was incorporated into the groin design. Potential adaptive management modifications to the structure include decreasing the crest width, notching, shortening, and/or the addition of a weir.
DEIS provides no discussion of vacant lots and relocation options under Alt 2.
USFWS Alt 2 relocation analysis Y Chapter 3 3-7
According to the 2009 Holden Beach CAMA Land Use Plan, there are 910 vacant parcels encompassing 265 acres of usable (i.e., buildable) land in the Town of Holden Beach. If all of this land were developed at a density of .25 residential units per acre, this would equate to 1,060 residential units. Since .25 acres per residence is less dense than what current zoning allows, it is clear that there is sufficient buildable land for relocations. This information has been incorporated into the FEIS.
Shoreline stabilization may result in less suitable nesting habitat for shorebirds, including the piping plover.
USFWS Shorebirds/Threatened
and Endangered Species
Y Appendix C
Potential impacts on piping plovers and red knots have been addressed through Section 7 consultation with the USFWS. The resulting USFWS Biological Opinion is included in the FEIS (Appendix C).
Hard structures are likely to increase the amount of piping plover/red knot habitat lost as sea level continues to rise.
USFWS Threatened/Endangered Species Y Appendix
C
The term "hard structure" encompasses a wide range of structure types (sea walls, jetties, bulkheads, groins, etc.). As stated by Griggs (2003): "Groins have often been lumped with the much larger breakwaters and jetties as coastal engineering structures that have had major secondary or negative downdrift effects." Although many hardening techniques, including the use of impermeable and/or improperly designed groins, have been shown to cause downdrift erosion, the proposed East End terminal groin is a permeable and relatively short structure that has been designed allow sand bypassing, thereby avoiding these types of downdrift effects. The relationship between sea level rise and the proposed groin is discussed in the Engineering Report (FEIS Appendix H). Generally, the influence of sea level rise over the next 30 years is very minor in comparison with the effects of major storms. The four-year modeling simulations incorporate elevated water level events associated with Hurricanes Hanna and Irene. Potential impacts on piping plovers and red knots have been addressed through Section 7 consultation with the USFWS. The resulting USFWS Biological Opinion is included in the FEIS (Appendix C).
Holden Beach Final Environmental Impact Statement Dial Cordy and Associates Inc. Appendix B Draft EIS Comments and Responses February 2018
B-5
Nature of Comment (Summary) Commenting Agency/Entity Comment Type
FEIS Revised
to Address
Comment (Y/N)
FEIS Chapter
FEIS Page Response to Comment
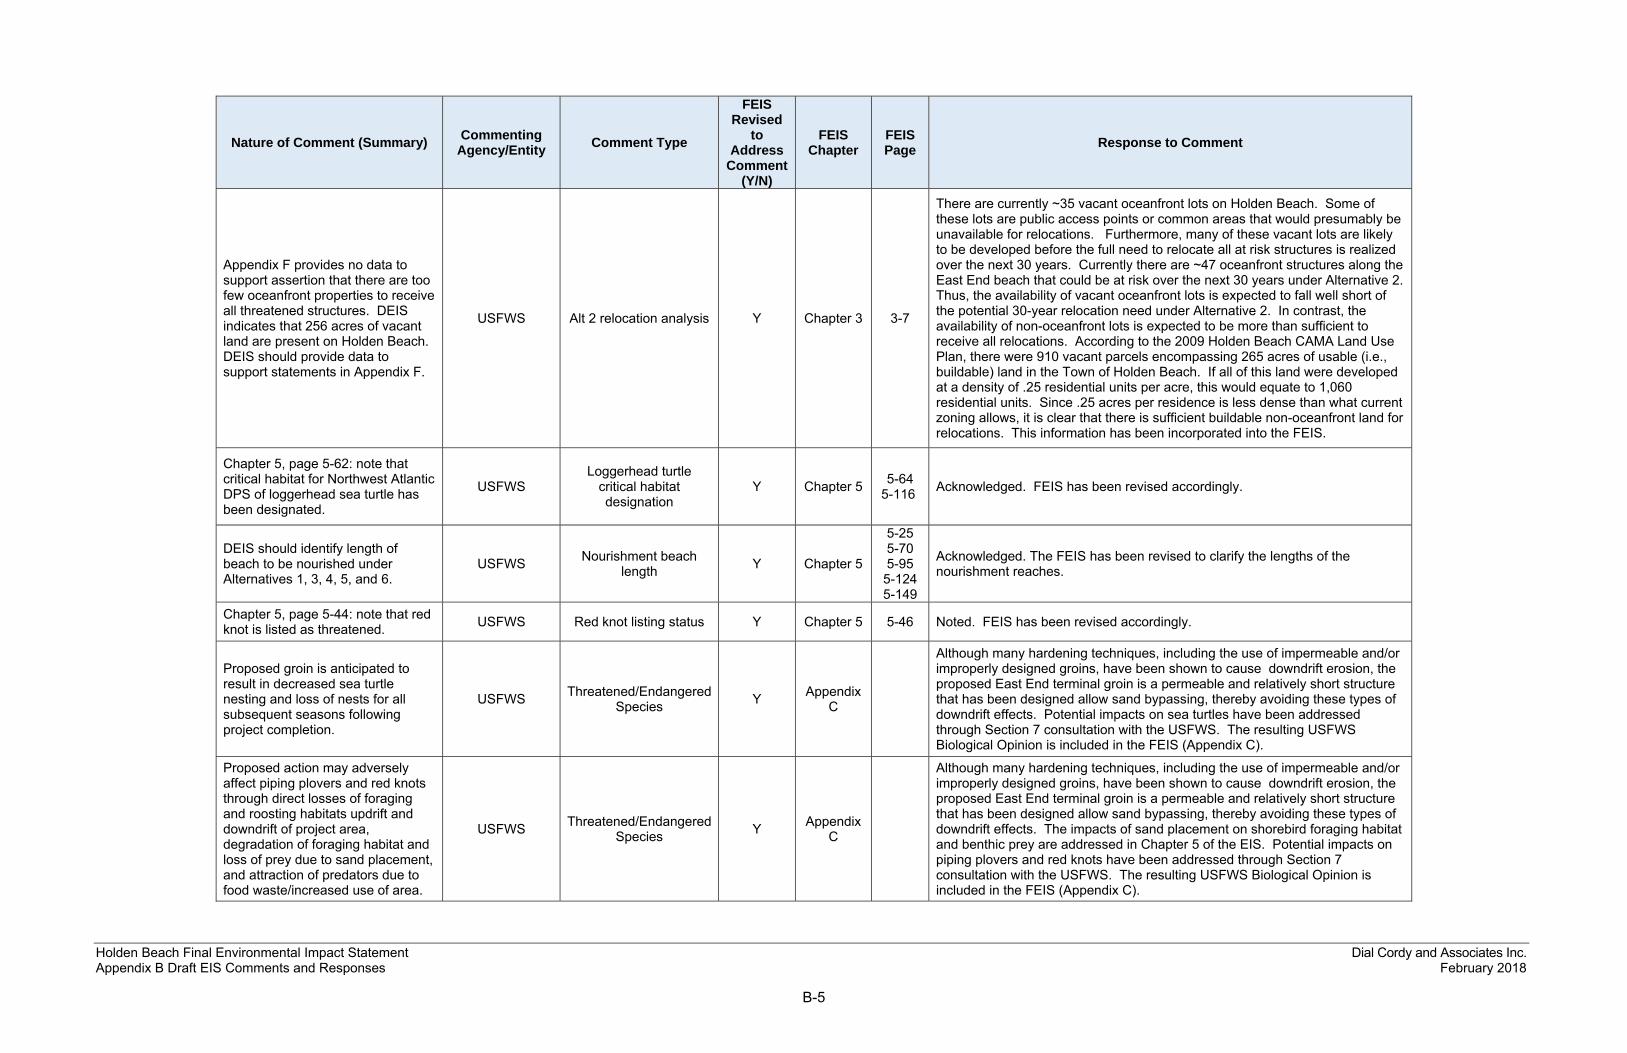
Appendix F provides no data to support assertion that there are too few oceanfront properties to receive all threatened structures. DEIS indicates that 256 acres of vacant land are present on Holden Beach. DEIS should provide data to support statements in Appendix F.
USFWS Alt 2 relocation analysis Y Chapter 3 3-7
There are currently ~35 vacant oceanfront lots on Holden Beach. Some of these lots are public access points or common areas that would presumably be unavailable for relocations. Furthermore, many of these vacant lots are likely to be developed before the full need to relocate all at risk structures is realized over the next 30 years. Currently there are ~47 oceanfront structures along the East End beach that could be at risk over the next 30 years under Alternative 2. Thus, the availability of vacant oceanfront lots is expected to fall well short of the potential 30-year relocation need under Alternative 2. In contrast, the availability of non-oceanfront lots is expected to be more than sufficient to receive all relocations. According to the 2009 Holden Beach CAMA Land Use Plan, there were 910 vacant parcels encompassing 265 acres of usable (i.e., buildable) land in the Town of Holden Beach. If all of this land were developed at a density of .25 residential units per acre, this would equate to 1,060 residential units. Since .25 acres per residence is less dense than what current zoning allows, it is clear that there is sufficient buildable non-oceanfront land for relocations. This information has been incorporated into the FEIS.
Chapter 5, page 5-62: note that critical habitat for Northwest Atlantic DPS of loggerhead sea turtle has been designated.
USFWS Loggerhead turtle
critical habitat designation
Y Chapter 5 5-64 5-116 Acknowledged. FEIS has been revised accordingly.
DEIS should identify length of beach to be nourished under Alternatives 1, 3, 4, 5, and 6.
USFWS Nourishment beach length Y Chapter 5
5-25 5-70 5-95 5-124 5-149
Acknowledged. The FEIS has been revised to clarify the lengths of the nourishment reaches.
Chapter 5, page 5-44: note that red knot is listed as threatened. USFWS Red knot listing status Y Chapter 5 5-46 Noted. FEIS has been revised accordingly.
Proposed groin is anticipated to result in decreased sea turtle nesting and loss of nests for all subsequent seasons following project completion.
USFWS Threatened/Endangered Species Y Appendix
C
Although many hardening techniques, including the use of impermeable and/or improperly designed groins, have been shown to cause downdrift erosion, the proposed East End terminal groin is a permeable and relatively short structure that has been designed allow sand bypassing, thereby avoiding these types of downdrift effects. Potential impacts on sea turtles have been addressed through Section 7 consultation with the USFWS. The resulting USFWS Biological Opinion is included in the FEIS (Appendix C).
Proposed action may adversely affect piping plovers and red knots through direct losses of foraging and roosting habitats updrift and downdrift of project area, degradation of foraging habitat and loss of prey due to sand placement, and attraction of predators due to food waste/increased use of area.
USFWS Threatened/Endangered Species Y Appendix
C
Although many hardening techniques, including the use of impermeable and/or improperly designed groins, have been shown to cause downdrift erosion, the proposed East End terminal groin is a permeable and relatively short structure that has been designed allow sand bypassing, thereby avoiding these types of downdrift effects. The impacts of sand placement on shorebird foraging habitat and benthic prey are addressed in Chapter 5 of the EIS. Potential impacts on piping plovers and red knots have been addressed through Section 7 consultation with the USFWS. The resulting USFWS Biological Opinion is included in the FEIS (Appendix C).
Holden Beach Final Environmental Impact Statement Dial Cordy and Associates Inc. Appendix B Draft EIS Comments and Responses February 2018
B-6
Nature of Comment (Summary) Commenting Agency/Entity Comment Type
FEIS Revised
to Address
Comment (Y/N)
FEIS Chapter
FEIS Page Response to Comment
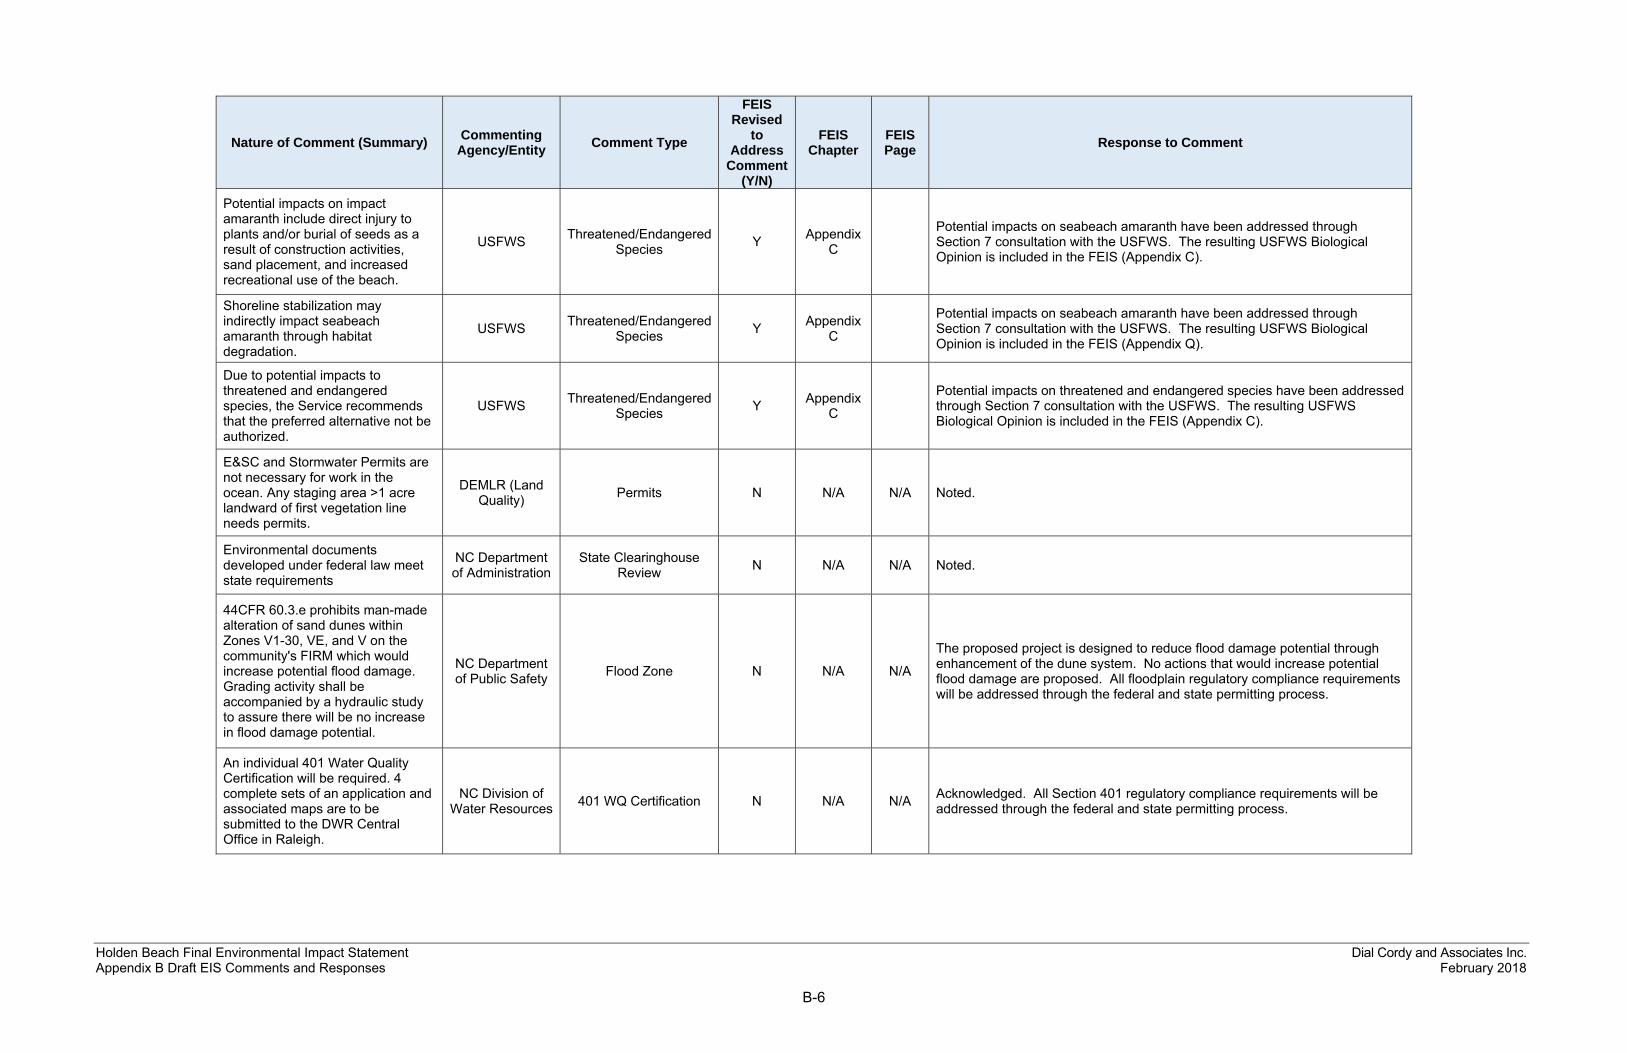
Potential impacts on impact amaranth include direct injury to plants and/or burial of seeds as a result of construction activities, sand placement, and increased recreational use of the beach.
USFWS Threatened/Endangered Species Y Appendix
C Potential impacts on seabeach amaranth have been addressed through Section 7 consultation with the USFWS. The resulting USFWS Biological Opinion is included in the FEIS (Appendix C).
Shoreline stabilization may indirectly impact seabeach amaranth through habitat degradation.
USFWS Threatened/Endangered Species Y Appendix
C Potential impacts on seabeach amaranth have been addressed through Section 7 consultation with the USFWS. The resulting USFWS Biological Opinion is included in the FEIS (Appendix Q).
Due to potential impacts to threatened and endangered species, the Service recommends that the preferred alternative not be authorized.
USFWS Threatened/Endangered Species Y Appendix
C Potential impacts on threatened and endangered species have been addressed through Section 7 consultation with the USFWS. The resulting USFWS Biological Opinion is included in the FEIS (Appendix C).
E&SC and Stormwater Permits are not necessary for work in the ocean. Any staging area >1 acre landward of first vegetation line needs permits.
DEMLR (Land Quality) Permits N N/A N/A Noted.
Environmental documents developed under federal law meet state requirements
NC Department of Administration
State Clearinghouse Review N N/A N/A Noted.
44CFR 60.3.e prohibits man-made alteration of sand dunes within Zones V1-30, VE, and V on the community's FIRM which would increase potential flood damage. Grading activity shall be accompanied by a hydraulic study to assure there will be no increase in flood damage potential.
NC Department of Public Safety Flood Zone N N/A N/A
The proposed project is designed to reduce flood damage potential through enhancement of the dune system. No actions that would increase potential flood damage are proposed. All floodplain regulatory compliance requirements will be addressed through the federal and state permitting process.
An individual 401 Water Quality Certification will be required. 4 complete sets of an application and associated maps are to be submitted to the DWR Central Office in Raleigh.
NC Division of Water Resources 401 WQ Certification N N/A N/A Acknowledged. All Section 401 regulatory compliance requirements will be
addressed through the federal and state permitting process.

Holden Beach Final Environmental Impact Statement Dial Cordy and Associates Inc. Appendix B Draft EIS Comments and Responses February 2018
B-7
Nature of Comment (Summary) Commenting Agency/Entity Comment Type
FEIS Revised
to Address
Comment (Y/N)
FEIS Chapter
FEIS Page Response to Comment
East End could experience increase in rip current frequency which could accelerate erosion requiring additional nourishment and altering foraging grounds for surf zone species.
NCDEQ - NCDCM
Accelerated Erosion from TG N N/A N/A
No accelerated erosion due to rip currents is anticipated under the preferred alternative. While the modeling did show some temporary rip current formations, no quantifiable sediment loss occurred in these areas. Rip currents are not a significant contributor to sediment transport in the project area. According to Spencer Rogers, "rip currents are generally only an issue for about 5 days a year in NC." Rare rip currents are a public safety concern, and the T-Head design has been incorporated as a measure to minimize this risk.
Alternatives 1, 2 and 3 would be least impactful to fisheries resources.
NCDEQ - NCDCM Impacts on fisheries N N/A N/A Noted.
Hardbottom surveys within outer channel footprint
NCDEQ - NCDCM
Hardbottom surveys/impacts N N/A N/A
In the event that Alternative 4 is determined by the USACE to be the Least Environmentally Damaging Practicable Alternative, hardbottom surveys will be conducted prior to construction.
If Alternative 4 is pursued a hardbottom survey should be conducted and agency coordination for buffer development
NCDEQ - NCDCM
Hardbottom surveys/impacts N N/A N/A In the event that Alternative 4 is selected for implementation, hardbottom
surveys and agency coordination will be conducted prior to construction.
DEIS does not provide estimation of larval distribution within Long Bay.
NCDEQ - NCDCM Larval Transport N N/A N/A
According to NMFS, larval transport in Long Bay is similar to that of Onslow Bay. The results of long term larval transport monitoring in Beaufort Inlet (Onslow Bay) were incorporated into the analyses of potential impacts on larval transport in Lockwood Folly Inlet.

Holden Beach Final Environmental Impact Statement Dial Cordy and Associates Inc. Appendix B Draft EIS Comments and Responses February 2018
B-8
Nature of Comment (Summary) Commenting Agency/Entity Comment Type
FEIS Revised
to Address
Comment (Y/N)
FEIS Chapter
FEIS Page Response to Comment
CMS model is designed for sediment transport and not larval transport, therefore concludsions may be unrepresentative of larval transport impacts. Need further description to understand accuracy of CMS model to predict larval transport effects.
NCDEQ - NCDCM
Larval Transport Modeling N N/A N/A
The capabilities of the CMS model extend well beyond sediment transport, including modeling the movements of neutrally buoyant particles in the water column. As described in the Engineering Report (FEIS Appendix H), biological particles (larvae, micro/macroscopic marine invertebrates) can be both active and passive travelers in the water column. Especially in higher energy environments such as the surf and intertidal zones of the project area, patterns of biological transport are not significantly affected by active biological movement, and transport can be represented by passive particles that are controlled exclusively by physical dynamics (Kim et al. 2010). Therefore, the CMS hydrodynamic and sediment transport simulations (physical dynamics interacting with passive particles) were used to correlate larval transport in the project area. The procedures used to model larval transport with the CMS application were identical to those used by Bald Head Island to model larval transport for its terminal groin project. Kim, C.K., K. Park, S.P. Powers, W.M. Graham, and K.M. Bayha. 2010. Oyster larval transport in coastal Alabama: Dominance of physical transport over biological behavior in a shallow estuary. J. Geophys. Res., 115, C10.
Larval transport monitoring methodology recommended along with relevant research regarding larval transport through inlets
NCDEQ - NCDCM
Larval Transport Monitoring N N/A N/A
Studies at Beaufort Inlet (e.g., Churchill et al. 1999; Luettich et al. 1999) have not reported any impacts attributable to the Fort Macon terminal groin. Based on studies indicating that larvae passing seaward of inlet shoals may bypass the inlet withdrawal zone, researchers have suggested that the placement of “any obstacles such as jetties that would block what appears to be a natural conduit” could be detrimental to larval ingress (Blanton et al. 1999). However, the in-water portion of the proposed Holden Beach groin is relatively short in comparison to the much broader longshore sediment transport corridor and the existing seaward-protruding inlet ebb tidal shoal. As described in Chapter 5 of the EIS, the current vector modeling results show that under flood tide conditions the potential for any deflection of longshore currents by the groin is overridden by the expansive tidal push of water into the inlet; and consequently, easterly longshore currents along the oceanfront shoreline are driven tightly around the groin and into the inlet where they resume their normal pattern of flow.

Holden Beach Final Environmental Impact Statement Dial Cordy and Associates Inc. Appendix B Draft EIS Comments and Responses February 2018
B-9
Nature of Comment (Summary) Commenting Agency/Entity Comment Type
FEIS Revised
to Address
Comment (Y/N)
FEIS Chapter
FEIS Page Response to Comment
Chpt 5.2.1 - Modeling should include activities that can contribute to cumulative effect (AIWW nav dredging)
NCDEQ - NCDCM Modeling N N/A N/A
The 4-year modeling simulations were designed to identify project-related effects on coastal processes and morphology in relation to natural background processes. In order to avoid masking proposed action effects, separate engineering projects such as AIWW dredging were excluded from the 4-year modeling runs. As stated in the EIS, the modeling results were used primarily to assess the relative effects of alternatives on coastal processes and general patterns of morphological change. As described in the Engineering Report (FEIS Appendix H), other components of the modeling analyses did incorporate AIWW dredging and dredging of the LFI AIWW crossing bend-widener.
Inlet Management Plan is insufficient to satisfy 113A-115.1(f)(5)
NCDEQ - NCDCM Inlet Management Plan Y Appendix
E See the revised Inlet Management Plan (Appendix E of the FEIS).
Appendix C - 2.3, include commitment to monitor Oak Island side of the inlet as part of annual survey
NCDEQ - NCDCM Inlet Management Plan Y Appendix
E See the revised Inlet Management Plan (Appendix E of the FEIS).
Appendix C - 2.4, commit to aerial photography of entire project horizon
NCDEQ - NCDCM Inlet Management Plan Y Appendix
E See the revised Inlet Management Plan (Appendix E of the FEIS).
Appendix C - 2.6, Elaborate on shoreline change analysis would be performed and consistency of data
NCDEQ - NCDCM Inlet Management Plan Y Appendix
E See the revised Inlet Management Plan (Appendix E of the FEIS).
Appendix C - 3.2, Town should commit to continuing post-con sampling surveys for a period greater than 2 years unless approval from DCM is obtained.
NCDEQ - NCDCM Inlet Management Plan Y Appendix
E See the revised Inlet Management Plan (Appendix E of the FEIS).
Appendix C - 5.3, Figure D-9 is incorrect
NCDEQ - NCDCM Inlet Management Plan Y Appendix
E See the revised Inlet Management Plan (Appendix E of the FEIS).
Appendix C - 5.4, Baseline and thresholds should be established for both sides of the inlet and should be more comprehensive than applying a single trigger at one point along the shoreline
NCDEQ - NCDCM Inlet Management Plan Y Appendix
E See the revised Inlet Management Plan (Appendix E of the FEIS).
Chpt 6 (pg 6-7), Include TAC proposal to the Inlet Management Plan
NCDEQ - NCDCM Inlet Management Plan Y Appendix
E Acknowledged. FEIS has been revised accordingly.
Holden Beach Final Environmental Impact Statement Dial Cordy and Associates Inc. Appendix B Draft EIS Comments and Responses February 2018
B-10
Nature of Comment (Summary) Commenting Agency/Entity Comment Type
FEIS Revised
to Address
Comment (Y/N)
FEIS Chapter
FEIS Page Response to Comment
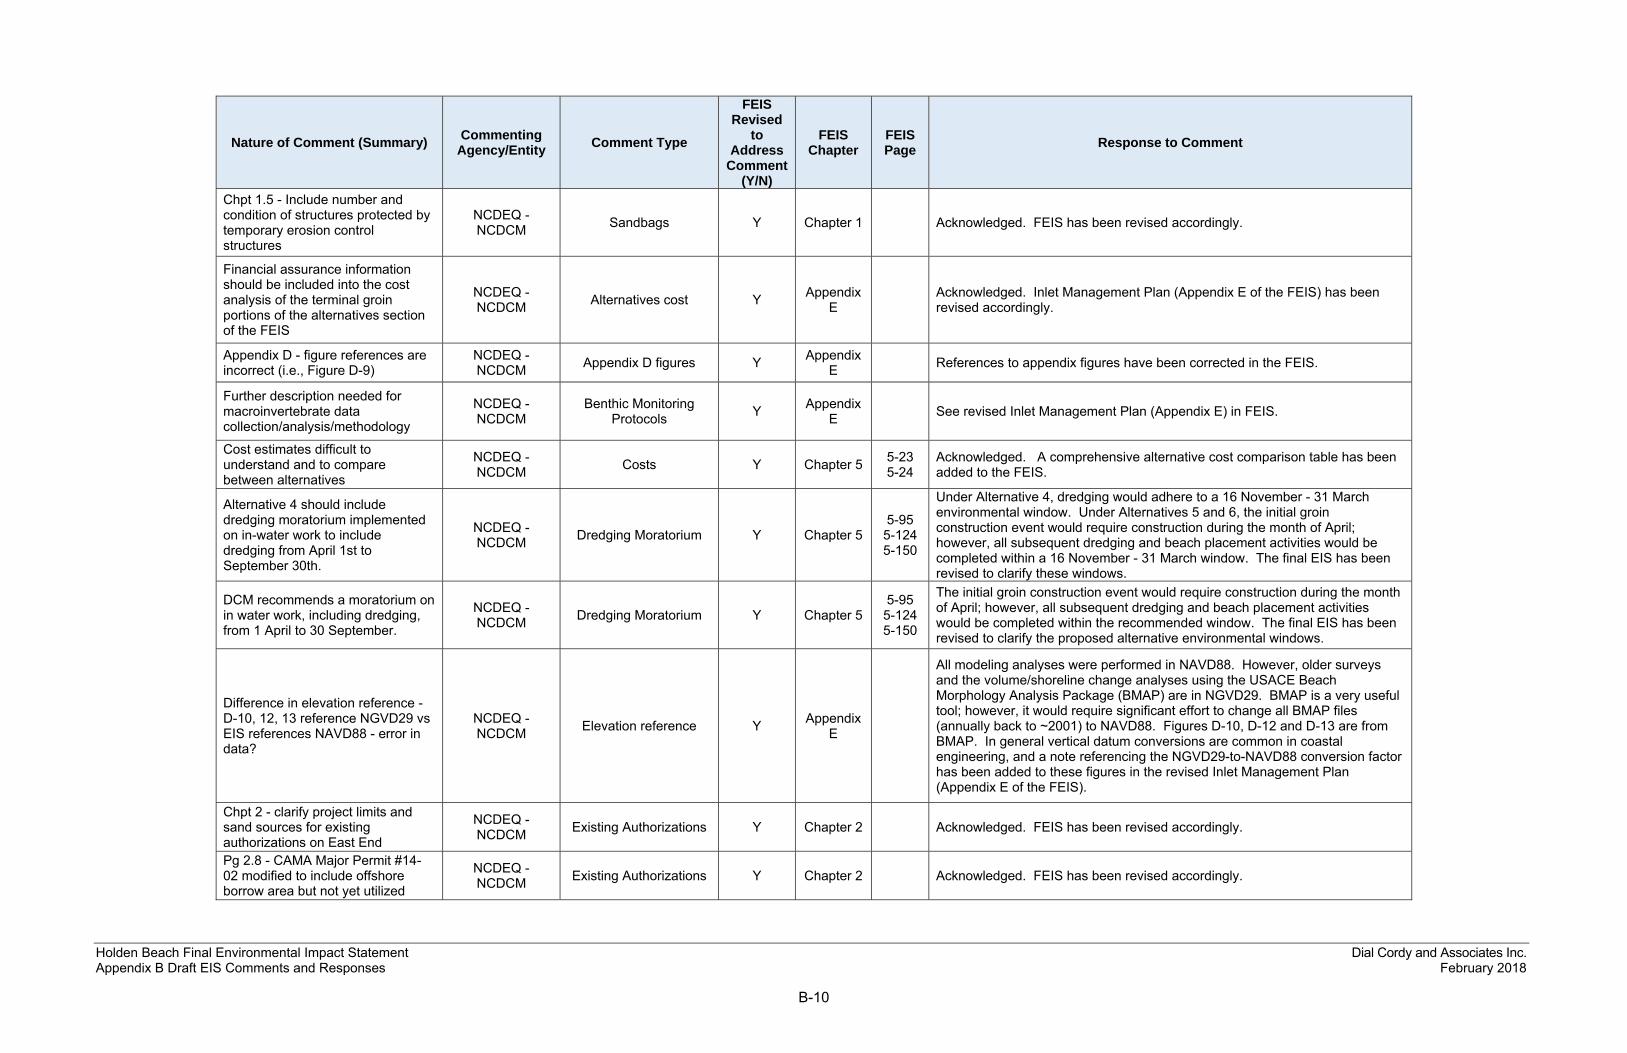
Chpt 1.5 - Include number and condition of structures protected by temporary erosion control structures
NCDEQ - NCDCM Sandbags Y Chapter 1 Acknowledged. FEIS has been revised accordingly.
Financial assurance information should be included into the cost analysis of the terminal groin portions of the alternatives section of the FEIS
NCDEQ - NCDCM Alternatives cost Y Appendix
E Acknowledged. Inlet Management Plan (Appendix E of the FEIS) has been revised accordingly.
Appendix D - figure references are incorrect (i.e., Figure D-9)
NCDEQ - NCDCM Appendix D figures Y Appendix
E References to appendix figures have been corrected in the FEIS.
Further description needed for macroinvertebrate data collection/analysis/methodology
NCDEQ - NCDCM
Benthic Monitoring Protocols Y Appendix
E See revised Inlet Management Plan (Appendix E) in FEIS.
Cost estimates difficult to understand and to compare between alternatives
NCDEQ - NCDCM Costs Y Chapter 5 5-23
5-24 Acknowledged. A comprehensive alternative cost comparison table has been added to the FEIS.
Alternative 4 should include dredging moratorium implemented on in-water work to include dredging from April 1st to September 30th.
NCDEQ - NCDCM Dredging Moratorium Y Chapter 5
5-95 5-124 5-150
Under Alternative 4, dredging would adhere to a 16 November - 31 March environmental window. Under Alternatives 5 and 6, the initial groin construction event would require construction during the month of April; however, all subsequent dredging and beach placement activities would be completed within a 16 November - 31 March window. The final EIS has been revised to clarify these windows.
DCM recommends a moratorium on in water work, including dredging, from 1 April to 30 September.
NCDEQ - NCDCM Dredging Moratorium Y Chapter 5
5-95 5-124 5-150
The initial groin construction event would require construction during the month of April; however, all subsequent dredging and beach placement activities would be completed within the recommended window. The final EIS has been revised to clarify the proposed alternative environmental windows.
Difference in elevation reference - D-10, 12, 13 reference NGVD29 vs EIS references NAVD88 - error in data?
NCDEQ - NCDCM Elevation reference Y Appendix
E
All modeling analyses were performed in NAVD88. However, older surveys and the volume/shoreline change analyses using the USACE Beach Morphology Analysis Package (BMAP) are in NGVD29. BMAP is a very useful tool; however, it would require significant effort to change all BMAP files (annually back to ~2001) to NAVD88. Figures D-10, D-12 and D-13 are from BMAP. In general vertical datum conversions are common in coastal engineering, and a note referencing the NGVD29-to-NAVD88 conversion factor has been added to these figures in the revised Inlet Management Plan (Appendix E of the FEIS).
Chpt 2 - clarify project limits and sand sources for existing authorizations on East End
NCDEQ - NCDCM Existing Authorizations Y Chapter 2 Acknowledged. FEIS has been revised accordingly.
Pg 2.8 - CAMA Major Permit #14-02 modified to include offshore borrow area but not yet utilized
NCDEQ - NCDCM Existing Authorizations Y Chapter 2 Acknowledged. FEIS has been revised accordingly.

Holden Beach Final Environmental Impact Statement Dial Cordy and Associates Inc. Appendix B Draft EIS Comments and Responses February 2018
B-11
Nature of Comment (Summary) Commenting Agency/Entity Comment Type
FEIS Revised
to Address
Comment (Y/N)
FEIS Chapter
FEIS Page Response to Comment
Financial costs associated with requirements of SB151 should be included in FEIS - request more detailed cost information in FEIS.
NCDEQ - NCDCM Financial Assurances Y Appendix
E Acknowledged. Inlet Management Plan (Appendix E of the FEIS) has been revised accordingly.
Financial assurances include information such as: costs associated with additional monitoring initiatives, development and operation of TAC, financial assurance plan verified by DEQ or CRC, detailed cost estimate for full removal of the terminal groin structure.
NCDEQ - NCDCM Financial Assurances Y Appendix
E Acknowledged. Inlet Management Plan (Appendix E of the FEIS) has been revised accordingly.
Reference SB151 throughout all documents vs SB110
NCDEQ - NCDCM Legislative update Y Chapter
1 Acknowledged. FEIS has been revised accordingly.
Long-term shoreline change rates - differences of rates as discussed
NCDEQ - NCDCM
Shoreline Change Rates Y Appendix
E See the revised Inlet Management Plan (Appendix E of the FEIS).
Statistical analysis of development of threshold of volumetric baseline rate - and how comparable the linear DCM erosion rate and how these rates compare would be beneficial
NCDEQ - NCDCM
Shoreline Change Rates Y Appendix
E See the revised Inlet Management Plan (Appendix E of the FEIS).
Appendix C - 2.1, update to reflect Town's most recent annual survey
NCDEQ - NCDCM Survey data Y Appendix
E See the revised Inlet Management Plan (Appendix E of the FEIS).
Placement of dredged materials along a swimming beach has potential to cause localized increase in bacteria concentrations within waters surrounding project
NCDEQ - Shellfish
Sanitation Public Health N N/A N/A
All placement of dredged material is expected to occur within the Nov 1 - March 31 window cited by the commenter. All regulatory compliance requirements will be addressed through the federal and state permitting process.
If placement of dredged material occurs along the beach after March 31st then a swimming advisory must be issued, notifying public of risks
NCDEQ - Shellfish
Sanitation Public Health N N/A N/A
All placement of dredged material is expected to occur within the Nov 1 - March 31 window cited by the commenter. All regulatory compliance requirements will be addressed through the federal and state permitting process.
Swimming advisories can be avoided by scheduling project between November 1 - March 31, outside of swimming season
NCDEQ - Shellfish
Sanitation Public Health N N/A N/A
All placement of dredged material is expected to occur within the Nov 1 - March 31 window cited by the commenter. All regulatory compliance requirements will be addressed through the federal and state permitting process.

Holden Beach Final Environmental Impact Statement Dial Cordy and Associates Inc. Appendix B Draft EIS Comments and Responses February 2018
B-12
Nature of Comment (Summary) Commenting Agency/Entity Comment Type
FEIS Revised
to Address
Comment (Y/N)
FEIS Chapter
FEIS Page Response to Comment
Groin will impact fishes by interrupting larval transport, replacement of the native fish community by a hard structure associated community, and direct mortality to surf zone fishes.
Audubon Fish communities N N/A N/A
Analyses of groin-related effects on fish communities and larval transport, including the results of larval transport modeling, were presented in Chapter 5 of the EIS. As described in Chapter 5, the fish communities associated with groins are comparable to the native fish communities of natural nearshore hardbottom habitats.
Larval fish are not adapted for high mobility in response to habitat burial or increased turbidity levels.
Audubon Fish communities N N/A N/A
The EIS acknowledges the impacts of project-related turbidity increases on the behavior (e.g., feeding, predator avoidance, habitat selection) and physiological functions (e.g., photosynthesis, gill-breathing, filter-feeding) of marine pelagic organisms. As described in Chapter 5, sediment suspension and turbidity effects would be short term and localized.
Beach nourishment degrades important swash-zone feeding habitats for demersal surf zone fishes.
Audubon Fish communities N N/A N/A
The EIS acknowledges the impacts of sand placement on surf zone foraging habitat and benthic prey for demersal fishes. As described in Chapter 5 of the EIS, the use of compatible beach fill material and avoidance of peak infaunal recruitment periods is expected to minimize the duration of these effects.
Impacts to benthic invertebrate prey may have indirect effects of surf zone fishes.
Audubon Fish communities N N/A N/A
The EIS acknowledges the impacts of sand placement on surf zone foraging habitat and benthic prey for demersal fishes. As described in Chapter 5 of the EIS, the use of compatible beach fill material and avoidance of peak infaunal recruitment periods is expected to minimize the duration of these effects.
The 4-yr nourishment interval is questionable given that Wrightsville Beach, Masonboro Island, Mason Inlet, southern Figure 8 Island, Oregon Inlet, and Fort Macon require nourishment more frequently than every four-years.
Audubon 4-yr nourishment interval N N/A N/A
The Wrightsville Beach, Masonboro Island, Oregon Inlet, and Fort Macon structures are relatively long, impermeable jetties or groins that are not comparable to the proposed leaky groin. Nourishment intervals are highly site specific and dependent on local erosion rates and sediment transport dynamics. Holden Beach is located in Long Bay where wave energy and coastal processes are different from those of the groin locations cited. Dynamics are more similar to those of the nearby Grand Strand (North Myrtle Beach, Myrtle Beach, Garden City), where groin nourishment intervals are much longer (~10 years).
Alternative 2, as presented in the DEIS, is the only alternative in the DEIS that can and should be considered.
Audubon Alt 2 is the only viable alternative N N/A N/A Pursuant to NEPA requirements, the EIS must consider a range of reasonable
alternatives.
The alternatives in the DEIS that involve hard structures or channelization (Alternatives 4, 5, and 6) at Lockwood Folly Inlet should be permanently removed from further consideration.
Audubon Alts 4, 5, and 6 should be removed from DEIS N N/A N/A
Pursuant to NEPA requirements, the EIS considers a range of reasonable alternatives. Hard structures and channelization are included as alternatives that may potentially meet the identified purpose and need of the project.
Predominantly westward longshore transport along East End beach indicates groin will accelerate erosion and place all homes on Holden Beach at risk.
Audubon Groin shoreline effects N N/A N/A
The principal cause of East End erosion is localized inlet-driven eastward sediment transport, not regional westward transport. As in the case of many NC inlets, there is a localized reversal of the regional transport pattern along the adjoining inlet-influenced (East End) shoreline reach. As described in Chapter 5 of the EIS, the model-projected mitigative effects of both groin alternatives include a consistently wider East End beach and an extended 4-year nourishment interval (as opposed to a much narrower beach and a 2-year nourishment interval under all other nourishment alternatives).

Holden Beach Final Environmental Impact Statement Dial Cordy and Associates Inc. Appendix B Draft EIS Comments and Responses February 2018
B-13
Nature of Comment (Summary) Commenting Agency/Entity Comment Type
FEIS Revised
to Address
Comment (Y/N)
FEIS Chapter
FEIS Page Response to Comment
DEIS does not address likelihood that groin will cause the beach to narrow farther to the west, thus requiring additional/more frequent beach nourishment.
Audubon Groin shoreline effects N N/A N/A
As in the case of many NC inlets, there is a localized reversal of the regional transport pattern along the adjoining inlet-influenced East End shoreline reach. The functional design of the groin is related to the localized eastward sediment transport pattern and not regional westward transport. Rigorous modeling analyses have demonstrated that the influence of the groin is limited to the localized inlet-influenced zone of net eastward sediment transport along the relatively short East End beach. The modeling results do not show any negative groin-related effects on regional westward sediment transport.
Studies show that other NC groins such the Ft Macon and Oregon inlet jetties have caused downdrift erosion.
Audubon Groin shoreline effects N N/A N/A
The Fort Macon and Oregon Inlet groins are relatively long, impermeable structures that are not comparable to the relatively short and leaky proposed East End terminal groin. Similar leaky groins located in Long Bay (e.g., North Myrtle Beach, Myrtle Beach, Surfside/Garden City) have long (~10-year) nourishment intervals. Pawleys Island is another example where groins have resulted in long nourishment intervals without causing downdrift impacts (see Kana 2004).
DEIS does not address groin-related losses of sand from the inlet system and loss of salt marsh habitat.
Audubon Groin shoreline effects N N/A N/A
Intertidal habitat impacts are analyzed extensively in Chapter 5 of the EIS. As detailed in Chapter 5, the potential for downdrift/inlet sediment budget impacts and associated intertidal marsh habitat effects were a major focus of the modeling analyses. Model-projected shoreline and intertidal habitat changes are quantified and discussed extensively in Chapter 5.
Masonboro Inlet study demonstrates that groins cause loss of ebb and flood tidal shoals.
Audubon Groin shoreline effects N N/A N/A
Masonboro Inlet is flanked by 2 relatively long (~3,000 ft), impermeable jetties that are not comparable to the relatively short and leaky proposed East End terminal groin. Jetties are primarily designed to maintain navigation channels, whereas terminal groins are designed to minimize beach erosion.
DEIS fails to address cumulative impacts of sand mining and groin on the adjacent downdrift beach. The regular removal of sand from Lockwood Folly Inlet and the proposed groin would disrupt longshore sand transport and potentially threaten Holden Beach.
Audubon Groin shoreline effects N N/A N/A
As in the case of many NC inlets, there is a localized reversal of the regional transport pattern along the adjoining inlet-influenced (East End) shoreline reach. As a result of local net eastward transport, sand placed on the East End beach is transported back into Lockwoods Folly Inlet. The functional design of the groin is related to the localized eastward sediment transport pattern and not regional westward transport. Rigorous modeling analyses have demonstrated that the influence of the groin is limited to the localized inlet-influenced zone of net eastward sediment transport along the relatively short East End beach. The modeling results do not show any negative groin-related effects on regional westward sediment transport.
Peer-reviewed literature shows that terminal groins do not function as presented in the DEIS and cause more harm than good.
Audubon Groin shoreline effects N N/A N/A
Although many hardening techniques, including the use of impermeable and/or improperly designed groins (in most cases without concurrent beach nourishment), have been shown to cause downdrift erosion, the proposed East End project employs a permeable and relatively short terminal groin and concurrent nourishment to avoid these types of downdrift effects. A study by Galgano (2004) found that “in many circumstances, groins have functioned effectively and stabilized an eroding beach without seriously harming adjacent areas….the groins, in conjunction with beach fill, arrested beach erosion at the site and effectively stabilized the beach for nearly 50 years notwithstanding their structural deficiencies.”
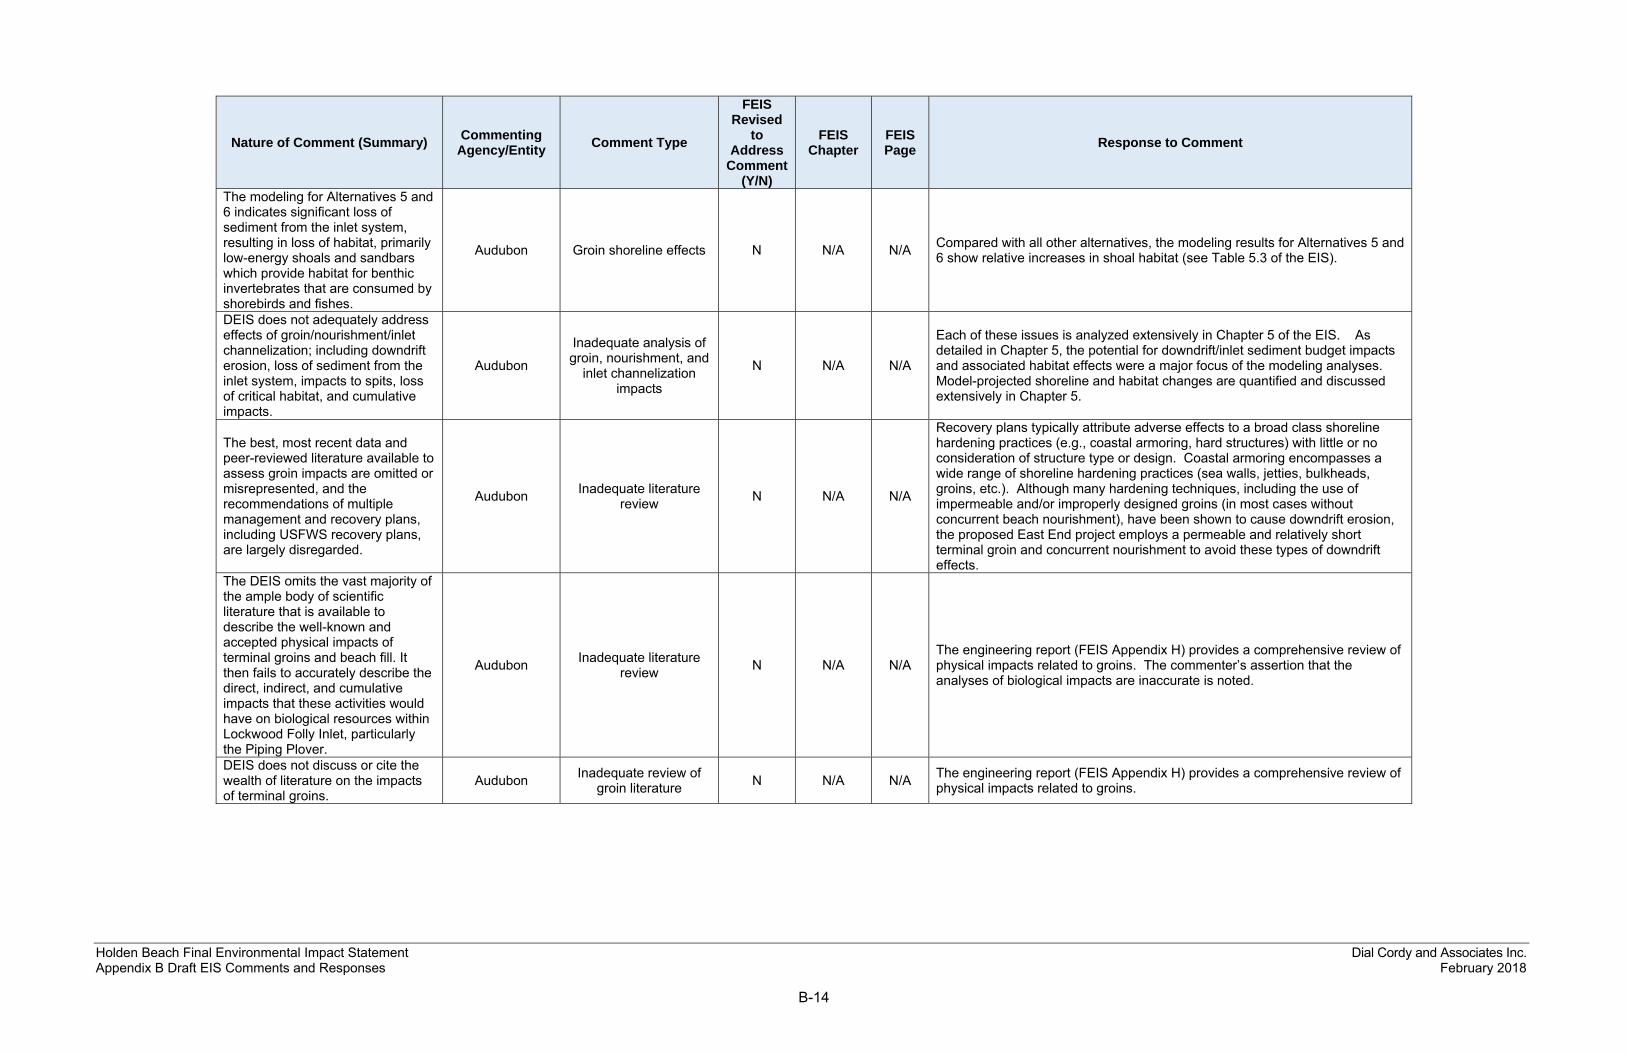
Holden Beach Final Environmental Impact Statement Dial Cordy and Associates Inc. Appendix B Draft EIS Comments and Responses February 2018
B-14
Nature of Comment (Summary) Commenting Agency/Entity Comment Type
FEIS Revised
to Address
Comment (Y/N)
FEIS Chapter
FEIS Page Response to Comment
The modeling for Alternatives 5 and 6 indicates significant loss of sediment from the inlet system, resulting in loss of habitat, primarily low-energy shoals and sandbars which provide habitat for benthic invertebrates that are consumed by shorebirds and fishes.
Audubon Groin shoreline effects N N/A N/A Compared with all other alternatives, the modeling results for Alternatives 5 and 6 show relative increases in shoal habitat (see Table 5.3 of the EIS).
DEIS does not adequately address effects of groin/nourishment/inlet channelization; including downdrift erosion, loss of sediment from the inlet system, impacts to spits, loss of critical habitat, and cumulative impacts.
Audubon
Inadequate analysis of groin, nourishment, and
inlet channelization impacts
N N/A N/A
Each of these issues is analyzed extensively in Chapter 5 of the EIS. As detailed in Chapter 5, the potential for downdrift/inlet sediment budget impacts and associated habitat effects were a major focus of the modeling analyses. Model-projected shoreline and habitat changes are quantified and discussed extensively in Chapter 5.
The best, most recent data and peer-reviewed literature available to assess groin impacts are omitted or misrepresented, and the recommendations of multiple management and recovery plans, including USFWS recovery plans, are largely disregarded.
Audubon Inadequate literature review N N/A N/A
Recovery plans typically attribute adverse effects to a broad class shoreline hardening practices (e.g., coastal armoring, hard structures) with little or no consideration of structure type or design. Coastal armoring encompasses a wide range of shoreline hardening practices (sea walls, jetties, bulkheads, groins, etc.). Although many hardening techniques, including the use of impermeable and/or improperly designed groins (in most cases without concurrent beach nourishment), have been shown to cause downdrift erosion, the proposed East End project employs a permeable and relatively short terminal groin and concurrent nourishment to avoid these types of downdrift effects.
The DEIS omits the vast majority of the ample body of scientific literature that is available to describe the well-known and accepted physical impacts of terminal groins and beach fill. It then fails to accurately describe the direct, indirect, and cumulative impacts that these activities would have on biological resources within Lockwood Folly Inlet, particularly the Piping Plover.
Audubon Inadequate literature review N N/A N/A
The engineering report (FEIS Appendix H) provides a comprehensive review of physical impacts related to groins. The commenter’s assertion that the analyses of biological impacts are inaccurate is noted.
DEIS does not discuss or cite the wealth of literature on the impacts of terminal groins.
Audubon Inadequate review of groin literature N N/A N/A The engineering report (FEIS Appendix H) provides a comprehensive review of
physical impacts related to groins.
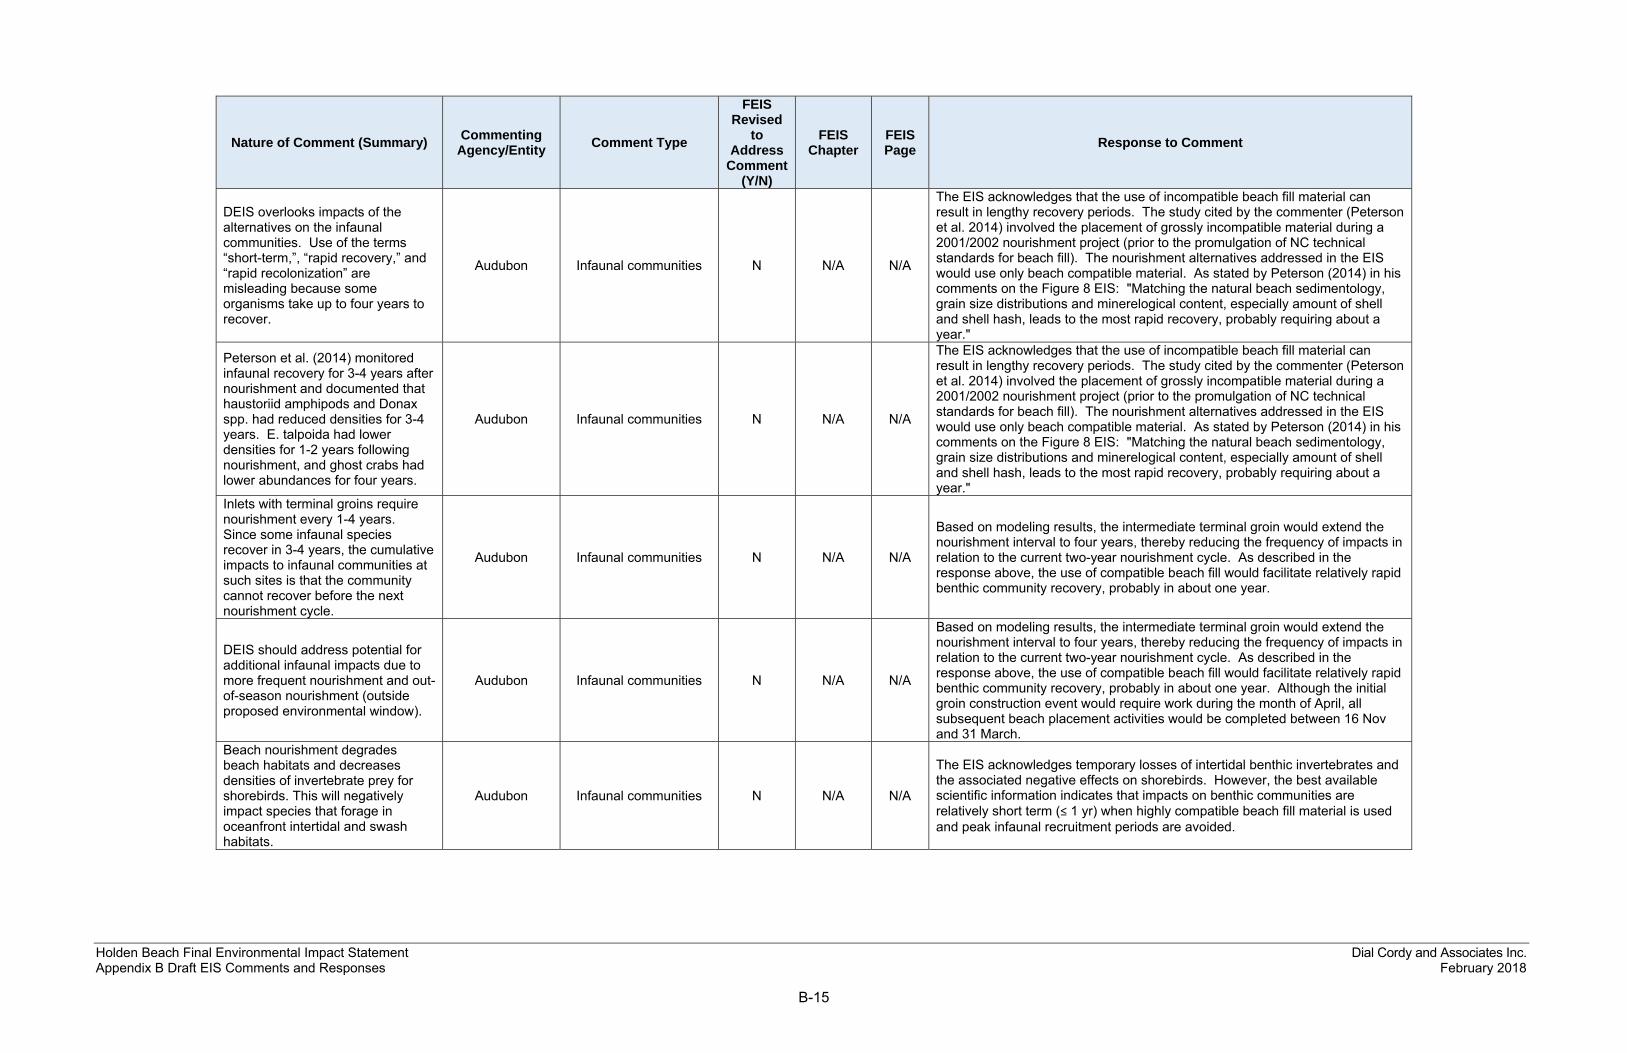
Holden Beach Final Environmental Impact Statement Dial Cordy and Associates Inc. Appendix B Draft EIS Comments and Responses February 2018
B-15
Nature of Comment (Summary) Commenting Agency/Entity Comment Type
FEIS Revised
to Address
Comment (Y/N)
FEIS Chapter
FEIS Page Response to Comment
DEIS overlooks impacts of the alternatives on the infaunal communities. Use of the terms “short-term,”, “rapid recovery,” and “rapid recolonization” are misleading because some organisms take up to four years to recover.
Audubon Infaunal communities N N/A N/A
The EIS acknowledges that the use of incompatible beach fill material can result in lengthy recovery periods. The study cited by the commenter (Peterson et al. 2014) involved the placement of grossly incompatible material during a 2001/2002 nourishment project (prior to the promulgation of NC technical standards for beach fill). The nourishment alternatives addressed in the EIS would use only beach compatible material. As stated by Peterson (2014) in his comments on the Figure 8 EIS: "Matching the natural beach sedimentology, grain size distributions and minerelogical content, especially amount of shell and shell hash, leads to the most rapid recovery, probably requiring about a year."
Peterson et al. (2014) monitored infaunal recovery for 3-4 years after nourishment and documented that haustoriid amphipods and Donax spp. had reduced densities for 3-4 years. E. talpoida had lower densities for 1-2 years following nourishment, and ghost crabs had lower abundances for four years.
Audubon Infaunal communities N N/A N/A
The EIS acknowledges that the use of incompatible beach fill material can result in lengthy recovery periods. The study cited by the commenter (Peterson et al. 2014) involved the placement of grossly incompatible material during a 2001/2002 nourishment project (prior to the promulgation of NC technical standards for beach fill). The nourishment alternatives addressed in the EIS would use only beach compatible material. As stated by Peterson (2014) in his comments on the Figure 8 EIS: "Matching the natural beach sedimentology, grain size distributions and minerelogical content, especially amount of shell and shell hash, leads to the most rapid recovery, probably requiring about a year."
Inlets with terminal groins require nourishment every 1-4 years. Since some infaunal species recover in 3-4 years, the cumulative impacts to infaunal communities at such sites is that the community cannot recover before the next nourishment cycle.
Audubon Infaunal communities N N/A N/A
Based on modeling results, the intermediate terminal groin would extend the nourishment interval to four years, thereby reducing the frequency of impacts in relation to the current two-year nourishment cycle. As described in the response above, the use of compatible beach fill would facilitate relatively rapid benthic community recovery, probably in about one year.
DEIS should address potential for additional infaunal impacts due to more frequent nourishment and out-of-season nourishment (outside proposed environmental window).
Audubon Infaunal communities N N/A N/A
Based on modeling results, the intermediate terminal groin would extend the nourishment interval to four years, thereby reducing the frequency of impacts in relation to the current two-year nourishment cycle. As described in the response above, the use of compatible beach fill would facilitate relatively rapid benthic community recovery, probably in about one year. Although the initial groin construction event would require work during the month of April, all subsequent beach placement activities would be completed between 16 Nov and 31 March.
Beach nourishment degrades beach habitats and decreases densities of invertebrate prey for shorebirds. This will negatively impact species that forage in oceanfront intertidal and swash habitats.
Audubon Infaunal communities N N/A N/A
The EIS acknowledges temporary losses of intertidal benthic invertebrates and the associated negative effects on shorebirds. However, the best available scientific information indicates that impacts on benthic communities are relatively short term (≤ 1 yr) when highly compatible beach fill material is used and peak infaunal recruitment periods are avoided.
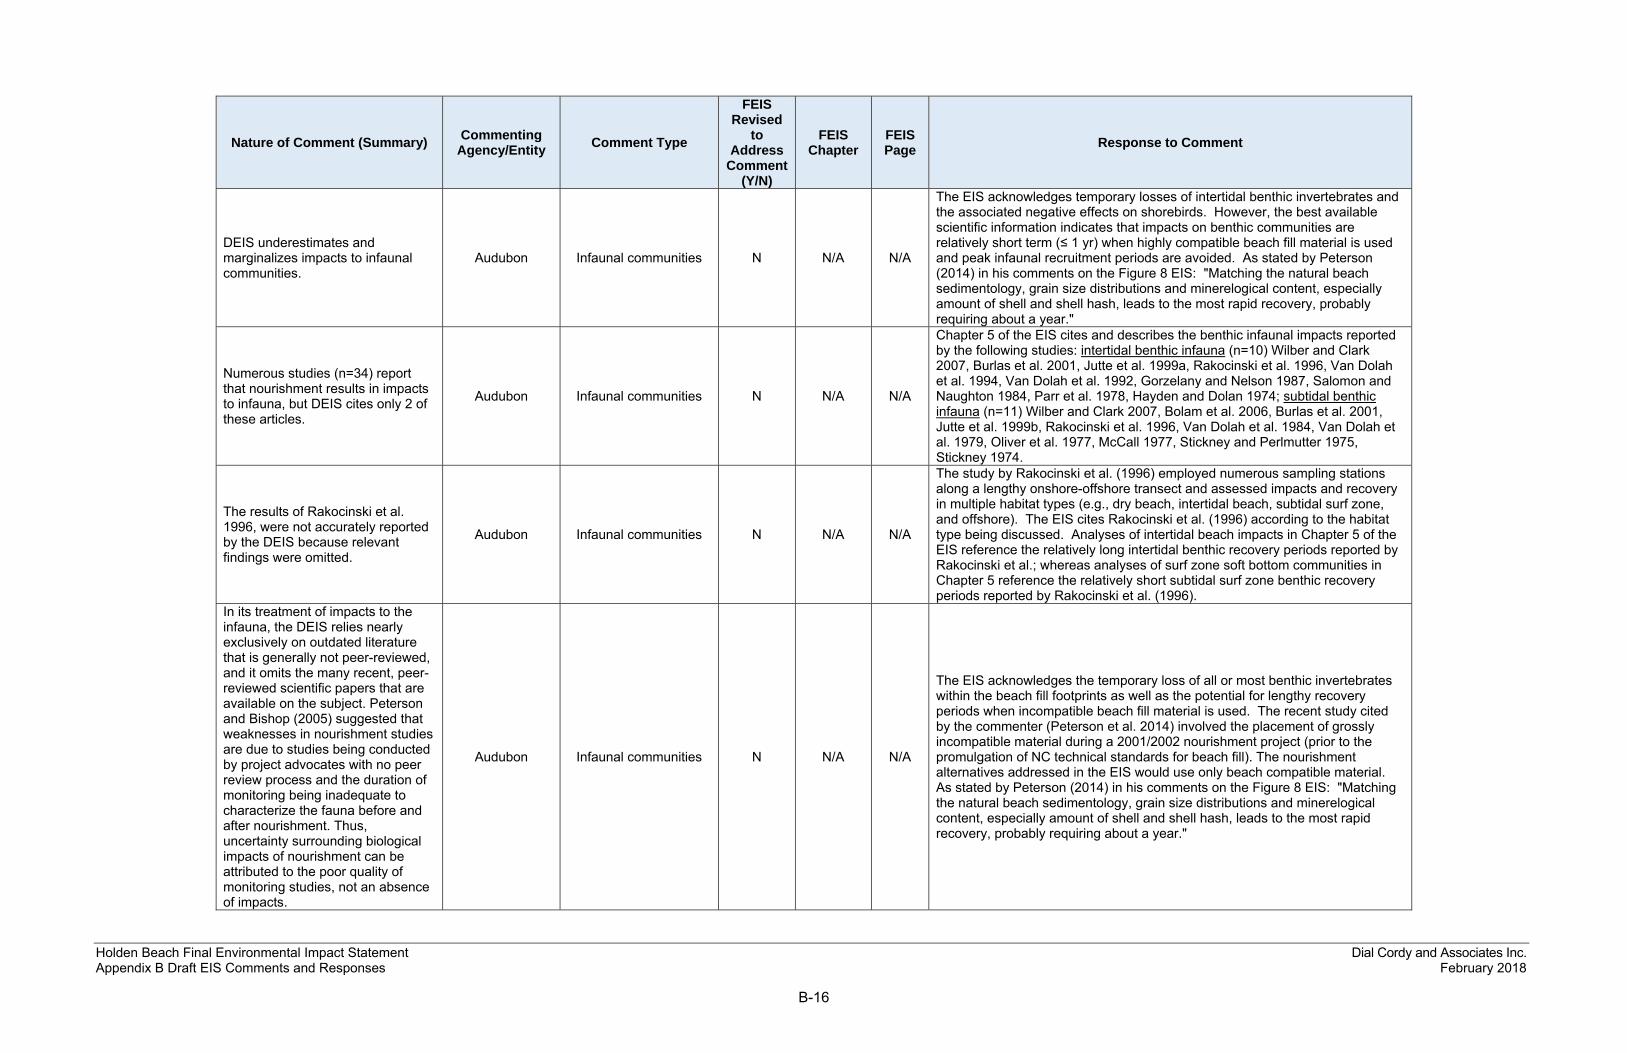
Holden Beach Final Environmental Impact Statement Dial Cordy and Associates Inc. Appendix B Draft EIS Comments and Responses February 2018
B-16
Nature of Comment (Summary) Commenting Agency/Entity Comment Type
FEIS Revised
to Address
Comment (Y/N)
FEIS Chapter
FEIS Page Response to Comment
DEIS underestimates and marginalizes impacts to infaunal communities.
Audubon Infaunal communities N N/A N/A
The EIS acknowledges temporary losses of intertidal benthic invertebrates and the associated negative effects on shorebirds. However, the best available scientific information indicates that impacts on benthic communities are relatively short term (≤ 1 yr) when highly compatible beach fill material is used and peak infaunal recruitment periods are avoided. As stated by Peterson (2014) in his comments on the Figure 8 EIS: "Matching the natural beach sedimentology, grain size distributions and minerelogical content, especially amount of shell and shell hash, leads to the most rapid recovery, probably requiring about a year."
Numerous studies (n=34) report that nourishment results in impacts to infauna, but DEIS cites only 2 of these articles.
Audubon Infaunal communities N N/A N/A
Chapter 5 of the EIS cites and describes the benthic infaunal impacts reported by the following studies: intertidal benthic infauna (n=10) Wilber and Clark 2007, Burlas et al. 2001, Jutte et al. 1999a, Rakocinski et al. 1996, Van Dolah et al. 1994, Van Dolah et al. 1992, Gorzelany and Nelson 1987, Salomon and Naughton 1984, Parr et al. 1978, Hayden and Dolan 1974; subtidal benthic infauna (n=11) Wilber and Clark 2007, Bolam et al. 2006, Burlas et al. 2001, Jutte et al. 1999b, Rakocinski et al. 1996, Van Dolah et al. 1984, Van Dolah et al. 1979, Oliver et al. 1977, McCall 1977, Stickney and Perlmutter 1975, Stickney 1974.
The results of Rakocinski et al. 1996, were not accurately reported by the DEIS because relevant findings were omitted.
Audubon Infaunal communities N N/A N/A
The study by Rakocinski et al. (1996) employed numerous sampling stations along a lengthy onshore-offshore transect and assessed impacts and recovery in multiple habitat types (e.g., dry beach, intertidal beach, subtidal surf zone, and offshore). The EIS cites Rakocinski et al. (1996) according to the habitat type being discussed. Analyses of intertidal beach impacts in Chapter 5 of the EIS reference the relatively long intertidal benthic recovery periods reported by Rakocinski et al.; whereas analyses of surf zone soft bottom communities in Chapter 5 reference the relatively short subtidal surf zone benthic recovery periods reported by Rakocinski et al. (1996).
In its treatment of impacts to the infauna, the DEIS relies nearly exclusively on outdated literature that is generally not peer-reviewed, and it omits the many recent, peer-reviewed scientific papers that are available on the subject. Peterson and Bishop (2005) suggested that weaknesses in nourishment studies are due to studies being conducted by project advocates with no peer review process and the duration of monitoring being inadequate to characterize the fauna before and after nourishment. Thus, uncertainty surrounding biological impacts of nourishment can be attributed to the poor quality of monitoring studies, not an absence of impacts.
Audubon Infaunal communities N N/A N/A
The EIS acknowledges the temporary loss of all or most benthic invertebrates within the beach fill footprints as well as the potential for lengthy recovery periods when incompatible beach fill material is used. The recent study cited by the commenter (Peterson et al. 2014) involved the placement of grossly incompatible material during a 2001/2002 nourishment project (prior to the promulgation of NC technical standards for beach fill). The nourishment alternatives addressed in the EIS would use only beach compatible material. As stated by Peterson (2014) in his comments on the Figure 8 EIS: "Matching the natural beach sedimentology, grain size distributions and minerelogical content, especially amount of shell and shell hash, leads to the most rapid recovery, probably requiring about a year."
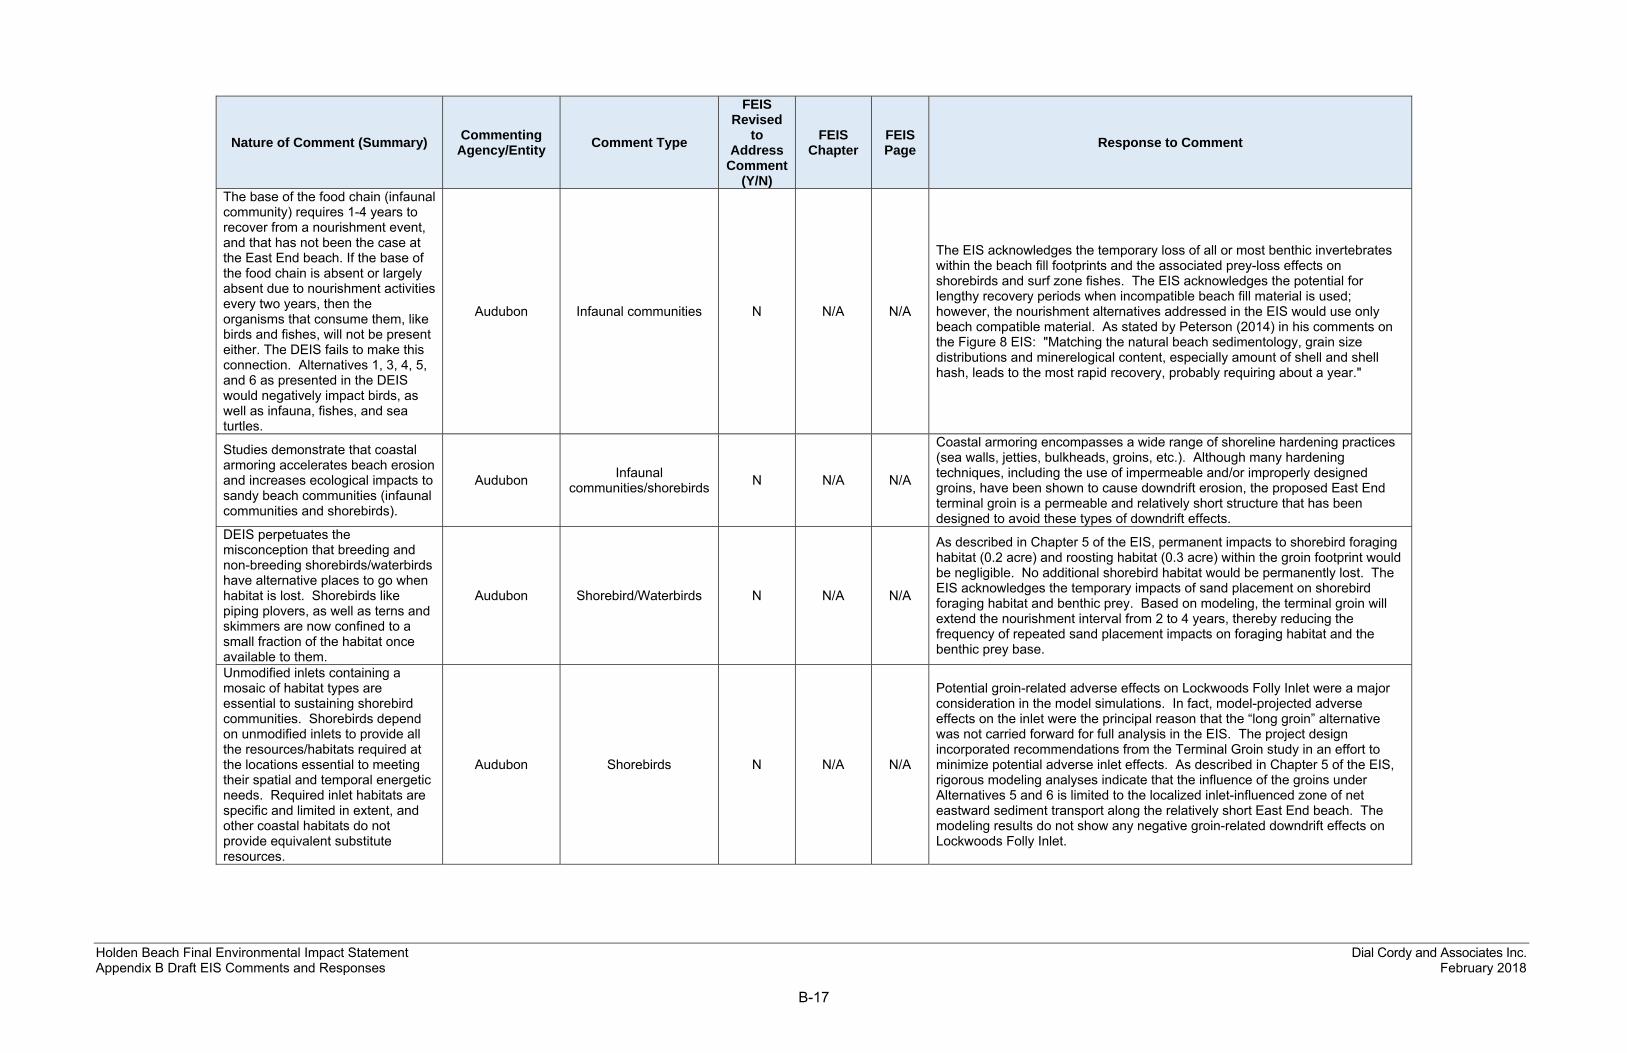
Holden Beach Final Environmental Impact Statement Dial Cordy and Associates Inc. Appendix B Draft EIS Comments and Responses February 2018
B-17
Nature of Comment (Summary) Commenting Agency/Entity Comment Type
FEIS Revised
to Address
Comment (Y/N)
FEIS Chapter
FEIS Page Response to Comment
The base of the food chain (infaunal community) requires 1-4 years to recover from a nourishment event, and that has not been the case at the East End beach. If the base of the food chain is absent or largely absent due to nourishment activities every two years, then the organisms that consume them, like birds and fishes, will not be present either. The DEIS fails to make this connection. Alternatives 1, 3, 4, 5, and 6 as presented in the DEIS would negatively impact birds, as well as infauna, fishes, and sea turtles.
Audubon Infaunal communities N N/A N/A
The EIS acknowledges the temporary loss of all or most benthic invertebrates within the beach fill footprints and the associated prey-loss effects on shorebirds and surf zone fishes. The EIS acknowledges the potential for lengthy recovery periods when incompatible beach fill material is used; however, the nourishment alternatives addressed in the EIS would use only beach compatible material. As stated by Peterson (2014) in his comments on the Figure 8 EIS: "Matching the natural beach sedimentology, grain size distributions and minerelogical content, especially amount of shell and shell hash, leads to the most rapid recovery, probably requiring about a year."
Studies demonstrate that coastal armoring accelerates beach erosion and increases ecological impacts to sandy beach communities (infaunal communities and shorebirds).
Audubon Infaunal communities/shorebirds N N/A N/A
Coastal armoring encompasses a wide range of shoreline hardening practices (sea walls, jetties, bulkheads, groins, etc.). Although many hardening techniques, including the use of impermeable and/or improperly designed groins, have been shown to cause downdrift erosion, the proposed East End terminal groin is a permeable and relatively short structure that has been designed to avoid these types of downdrift effects.
DEIS perpetuates the misconception that breeding and non-breeding shorebirds/waterbirds have alternative places to go when habitat is lost. Shorebirds like piping plovers, as well as terns and skimmers are now confined to a small fraction of the habitat once available to them.
Audubon Shorebird/Waterbirds N N/A N/A
As described in Chapter 5 of the EIS, permanent impacts to shorebird foraging habitat (0.2 acre) and roosting habitat (0.3 acre) within the groin footprint would be negligible. No additional shorebird habitat would be permanently lost. The EIS acknowledges the temporary impacts of sand placement on shorebird foraging habitat and benthic prey. Based on modeling, the terminal groin will extend the nourishment interval from 2 to 4 years, thereby reducing the frequency of repeated sand placement impacts on foraging habitat and the benthic prey base.
Unmodified inlets containing a mosaic of habitat types are essential to sustaining shorebird communities. Shorebirds depend on unmodified inlets to provide all the resources/habitats required at the locations essential to meeting their spatial and temporal energetic needs. Required inlet habitats are specific and limited in extent, and other coastal habitats do not provide equivalent substitute resources.
Audubon Shorebirds N N/A N/A
Potential groin-related adverse effects on Lockwoods Folly Inlet were a major consideration in the model simulations. In fact, model-projected adverse effects on the inlet were the principal reason that the “long groin” alternative was not carried forward for full analysis in the EIS. The project design incorporated recommendations from the Terminal Groin study in an effort to minimize potential adverse inlet effects. As described in Chapter 5 of the EIS, rigorous modeling analyses indicate that the influence of the groins under Alternatives 5 and 6 is limited to the localized inlet-influenced zone of net eastward sediment transport along the relatively short East End beach. The modeling results do not show any negative groin-related downdrift effects on Lockwoods Folly Inlet.

Holden Beach Final Environmental Impact Statement Dial Cordy and Associates Inc. Appendix B Draft EIS Comments and Responses February 2018
B-18
Nature of Comment (Summary) Commenting Agency/Entity Comment Type
FEIS Revised
to Address
Comment (Y/N)
FEIS Chapter
FEIS Page Response to Comment
Piping plovers and other shorebirds are dependent of inlets and associated intertidal flats that support benthic invertebrate prey.
Audubon Shorebirds N N/A N/A
The EIS acknowledges the importance of inlet complex habitats for shorebirds. As described above, potential inlet effects were a major consideration in the modeling analyses. As described in Chapter 5, the model-projected inlet responses under the groin alternatives (Alts 5 and 6) are essentially the same as the response under Alternative 2, thus indicating little to no effect on inlet habitats.
Shorebird populations are declining, and the cumulative loss or degradation of habitat, including that associated with coastal engineering projects, is a primary threat to shorebird conservation.
Audubon Shorebirds N N/A N/A
Cumulative effects on shorebirds and their habitats were evaluated in Section 5 of the EIS. The scope of the cumulative effects analysis in the FEIS has been expanded to a more regional scale encompassing the southeastern NC coast south of Cape Lookout. This expanded scope has been applied to the analysis of cumulative effects under each alternative in Chapter 5 of the FEIS.
Alternatives 1, 3, 4, 5, and 6 will have significant and lasting negative direct, indirect, and cumulative impacts on birds and other wildlife that depend on the dynamism of mid-Atlantic coastal inlets.
Audubon Wildlife N N/A N/A The direct, indirect, and cumulative impacts of these alternatives on birds and other wildlife are evaluated in Chapter 5 of the EIS.
NC study indicates piers and groins negatively affect sea turtle nesting. Audubon Threatened/Endangered
Species Y Appendix C
Although many hardening techniques, including the use of impermeable and/or improperly designed groins, have been shown to cause downdrift erosion and habitat loss, the proposed East End terminal groin is a permeable and relatively short structure that has been designed allow sand bypassing, thereby avoiding these types of downdrift effects. Potential impacts on sea turtles have been addressed through Section 7 consultation with the USFWS. The resulting USFWS Biological Opinion is included in the FEIS (Appendix C).
Florida study indicates managed inlets negatively affect sea turtle nesting.
Audubon Threatened/Endangered Species Y Appendix
C
Although many hardening techniques, including the use of impermeable and/or improperly designed groins, have been shown to cause downdrift erosion and habitat loss, the proposed East End terminal groin is a permeable and relatively short structure that has been designed allow sand bypassing, thereby avoiding these types of downdrift effects. Potential impacts on sea turtles have been addressed through Section 7 consultation with the USFWS. The resulting USFWS Biological Opinion is included in the FEIS (Appendix C).
DEIS does not address impacts to sea turtles should the nourishment interval turn out to be similar to those at other NC inlets with hardened structures, rather than the projected four-year interval.
Audubon Threatened/Endangered Species Y Appendix
C
The 4-year modeling simulations were designed to be conservative and included the erosional effects of Hurricanes Hanna (2008) and Irene (2011). Therefore, a nourishment interval of at least 4 years is expected. Potential impacts on sea turtles have been addressed through Section 7 consultation with the USFWS. The resulting USFWS Biological Opinion is included in the FEIS (Appendix C).
DEIS does not address impacts to sea turtles in the event of groin-induced downdrift erosion.
Audubon Threatened/Endangered Species Y Appendix
C
The modeling results do not indicate any downdrift effects on sea turtle nesting habitat. Potential impacts on sea turtles have been addressed through Section 7 consultation with the USFWS. The resulting USFWS Biological Opinion is included in the FEIS (Appendix C).

Holden Beach Final Environmental Impact Statement Dial Cordy and Associates Inc. Appendix B Draft EIS Comments and Responses February 2018
B-19
Nature of Comment (Summary) Commenting Agency/Entity Comment Type
FEIS Revised
to Address
Comment (Y/N)
FEIS Chapter
FEIS Page Response to Comment
Studies of hard structures found negative impacts to sea turtles. Modification of the subtidal beach profile may negatively affect sea turtle nesting. Studies report that seawalls and pilings negatively affect sea turtle nesting.
Audubon Threatened/Endangered Species Y Appendix
C
The term "hard structures" encompasses a wide range of structure types (sea walls, jetties, bulkheads, groins, etc.). As stated by Griggs (2003): "Groins have often been lumped with the much larger breakwaters and jetties as coastal engineering structures that have had major secondary or negative downdrift effects." Although many hardening techniques, including the use of impermeable and/or improperly designed groins, have been shown to cause downdrift erosion, the proposed East End terminal groin is a permeable and relatively short structure that has been designed allow sand bypassing, thereby avoiding these types of downdrift effects. Sea walls and pilings are not comparable to the proposed East End terminal groin. Potential impacts on sea turtles have been addressed through Section 7 consultation with the USFWS. The resulting USFWS Biological Opinion is included in the FEIS (Appendix C).
Beach nourishment can cause compaction, escarpment formation, and other substrate changes that can negatively affect sea turtle nesting.
Audubon Threatened/Endangered Species Y Appendix
C Potential impacts on sea turtles have been addressed through Section 7 consultation with the USFWS. The resulting USFWS Biological Opinion is included in the FEIS (Appendix C).
Sea turtles may be impacted by beach construction (obstructions) or dredging (entrainment), especially when work takes place outside the environmental window for sea turtles.
Audubon Threatened/Endangered Species Y Appendix
C Potential impacts on sea turtles have been addressed through Section 7 consultation with the USFWS. The resulting USFWS Biological Opinion is included in the FEIS (Appendix C).
DEIS does not accurately address the cumulative impacts of the preferred alternative. The cumulative impacts of groin construction along the NC coast and US Atlantic Coast have been one of the most significant contributing factors to the loss of habitat for birds.
Audubon Cumulative groin effects Y Chapter 5
5-28 5-31 5-38 5-41 5-74 5-99 5-137 5-138
The scope of the cumulative effects analysis in the FEIS has been expanded to a more regional scale encompassing the southeastern NC coast south of Cape Lookout. This expanded scope has been applied to the analysis of cumulative effects under each alternative in Chapter 5 of the FEIS.
Appendix "Q" was a typo, should be appendix "M"
Lindsay Addison, Audubon Typo Y Chapter 5
5-23 5-52 5-68 5-147 5-165
Acknowledged. FEIS has been revised accordingly.
Biological opinion (appendix A) of appendix P was overlooked and needs to be re-added
Lindsay Addison, Audubon Typo Y Appendix
C USFWS Biological Opinion is included in the FEIS (Appendix C).
Best alternative for management of the Lockwood Folly Inlet is Alternative 4, Inlet Management and Beach Nourishment
North Carolina Coastal
Federation Alternative Analysis N N/A N/A Noted.
Alternative 2 could be least damaging and cost effective alternative
North Carolina Coastal
Federation Alternative Analysis N N/A N/A Noted.

Holden Beach Final Environmental Impact Statement Dial Cordy and Associates Inc. Appendix B Draft EIS Comments and Responses February 2018
B-20
Nature of Comment (Summary) Commenting Agency/Entity Comment Type
FEIS Revised
to Address
Comment (Y/N)
FEIS Chapter
FEIS Page Response to Comment
Alternative 4 should be explored further as to long term costs and benefits
North Carolina Coastal
Federation
Alternative Analysis/Cost benefits N N/A N/A The long-term costs and benefits of all alternatives, including Alternative 4, are
discussed in Chapter 5 and Appendix H of the FEIS.
Comparison of benefits between alternatives shows little added protection from structure
North Carolina Coastal
Federation
Benefits of terminal groin N N/A N/A
As described in the EIS, the modeling results indicate that the intermediate terminal groin will extend the protective life of each nourishment event by at least 2 years. The modeling results also indicate that the number of properties at risk under the preferred alternative (Alt 6) is reduced by nearly 50 percent in relation to the no-project alternative (Alt 2). The 4-year modeling simulations were run under highly erosional conditions, and thus are conservative in terms of predicting the mitigative effects of the alternatives on shoreline erosion. The starting (Year 0) shoreline position corresponds to the highly eroded 2008 shoreline, and four-year simulations incorporate the erosional effects of Hurricanes Hanna (2008) and Irene (2011). Therefore, the model-predicted erosion rates are higher than the expected long-term averages, and substantial beach erosion occurs under all the alternatives.
Exactly how much the project will cost taxpayers and how many individual homes will be protected
North Carolina Coastal
Federation
Construction costs and value N N/A N/A
The implementation costs of each alternative over the 30-year planning cycle are provided in Chapter 5 of the EIS. The preferred alternative is designed to save money over the 30-yr planning cycle when compared with the other alternatives (nourishment only, retreat, etc.). Economic benefits would be realized through maintenance and enhancement of the existing beach system as well as protection of existing homes and infrastructure. The 4-year modeling simulations were designed to be conservative and included the erosional effects of Hurricanes Hanna (2008) and Irene (2011). Therefore, substantial erosion is predicted under all of the alternatives (including the preferred alternative). However, the number of properties at risk under the preferred alternative is reduced by nearly 50 percent in relation to the no-project alternative (Alt 2).
USACE is responsible for protecting Lockwood Folly Inlet for all citizens
North Carolina Coastal
Federation Federal authority N N/A N/A Noted.
GENESIS does not take into account wind-dominated currents
North Carolina Coastal
Federation Modeling N N/A N/A
Wind-dominated currents represent a negligible influence in shoreline processes. Significant literature is devoted to wind stresses and drag coefficients as they relate to the water/air boundary, and it is generally found that the influence of wind dominated currents is negligible in comparison with tidal and wave-generated currents. GENESIS-T is based on the wave field, which constitutes the dominant sediment transport mechanism. Although the EIS analyses rely heavily on the CMS model results, the GENESIS-T model was used to provide additional valuable information related to the effects of the nourishment and groin alternatives.
GENESIS cannot model channel realignment therefore a cannot provide analysis for all alternatives and therefore should not be used
North Carolina Coastal
Federation Modeling N N/A N/A
In terms of modeling, the EIS analyses rely heavily on the CMS model results; however, the GENESIS model, while not used to simulate channel realignment, provides additional valuable information related to the effects of nourishment under Alternatives 1, 3, 4, 5, and 6 and groin construction under Alternatives 5 and 6. As described in the Engineering Report (FEIS Appendix H), while the model is capable of simulating groin and beach fill alternatives, inlet-related changes such as channel relocation and LWFIX borrow area inclusion are more difficult to model with the GENESIS-T model application.

Holden Beach Final Environmental Impact Statement Dial Cordy and Associates Inc. Appendix B Draft EIS Comments and Responses February 2018
B-21
Nature of Comment (Summary) Commenting Agency/Entity Comment Type
FEIS Revised
to Address
Comment (Y/N)
FEIS Chapter
FEIS Page Response to Comment
Modeling study flawed due to: calibration limited to two weeks compared to 30-yr lifetime of TG, analysis include 7 out of 42 variables, only 2 of 10 deployed gauges were used to assess model accuracy
North Carolina Coastal
Federation Modeling (accuracy) N N/A N/A
The calibration was a rigorous effort that employed a time period sufficient to capture the hydrodynamics of the LWF inlet system. All gages deployed within or near the study area boundaries were used in the development of the model. All gage data was used in the calibration and development of the model applications. Calibration and model development incorporated all necessary components and parameters and were based on sound and widely accepted engineering/scientific protocols (comparisons of measured and simulated data for water levels, tide phasing, current directions and magnitudes, etc.).
Engineering modeling analysis uses changing/disparate timelines and prevents meaningful analysis and comparison of data among alternatives
North Carolina Coastal
Federation Modeling (methodology) N N/A N/A
The model used comprehensive topo/bathy data sets from 2000, 2004, 2008, and 2012; and was run under many different conditions. The incorporation of data from different time periods is an essential component of the modeling analyses that allows an assessment of project alternatives under a range of historical conditions (inlet/shoreline configurations, topo/bathy, water levels, waves, etc.). The 4-year modeling simulations described in the EIS used identical time periods and forcing conditions for each of the alternatives.
Terminal groin in not in public interest and will benefit only a few private property owners
North Carolina Coastal
Federation
Public interest/cost-benefit N N/A N/A
The benefits identified by the commenter are limited to property value, whereas the EIS considers a more comprehensive set of economic and natural resource values (e.g., reduced nourishment costs, recreation and tourism, habitat).
The DEIS does not comply with the Endangered Species Act, no Section 7 consultation has been initiated
North Carolina Coastal
Federation Section 7 consultation Y Appendix
C Section 7 consultation has been completed and the resulting USFWS Biological Opinion is included in the FEIS (Appendix C).
As required by state law, the inlet channel has to be managed if a groin is constructed
North Carolina Coastal
Federation State law Y Appendix
E Acknowledged. See the revised Inlet Management Plan (Appendix E of the FEIS).
Pursuant to the CWA, the Corps is only allowed to permit the least environmentally damaging practicable alternative. The DEIS shows that each of the alternatives is practicable. Alternatives 5 and 6 will permanently impact benthic communities, habitats, and hydrodynamics; and therefore, are the most environmentally damaging when evaluated according to the CWA. Alternative 2 would have no impact on communities, habitats, and hydrodynamics; and therefore, is the least environmentally damaging practicable alternative.
SELC Alt 2 is the least environmentally
damaging alternative N N/A N/A
As described in Chapter 5 of the EIS, permanent impacts on dry beach (0.3 acre) and intertidal beach (0.2 acre) habitats within the Alternative 5 and 6 groin footprints would be negligible. No additional habitat would be permanently lost. The EIS acknowledges the temporary impacts of sand placement on benthic habitats and communities. Based on modeling, the terminal groins under Alternatives 5 and 6 would extend the nourishment interval from 2 to 4 years, thereby reducing the frequency of repeated sand placement impacts on benthic habitats and communities. The modeling results indicate that groin-related hydrodynamic effects under Alternatives 5 and 6 are minor and highly localized to the groin structures. As described in Chapter 5 of the EIS, the modeling results indicate that erosional losses of dry and intertidal beach habitat along the East End beach are by far the highest under Alternative 2. In the absence of beach management under Alternative 2, the modeling results indicate that unmitigated erosion would rapidly eliminate the majority of the subaerial East End beach. The responses of individual homeowners would likely involve armoring the shoreline with sandbags, which are beyond the control of the Town and could remain in place indefinitely without a longer-term mitigative solution.

Holden Beach Final Environmental Impact Statement Dial Cordy and Associates Inc. Appendix B Draft EIS Comments and Responses February 2018
B-22
Nature of Comment (Summary) Commenting Agency/Entity Comment Type
FEIS Revised
to Address
Comment (Y/N)
FEIS Chapter
FEIS Page Response to Comment
The model overestimates the erosion rate under Alternative 2 at 20 ft/yr.
SELC Alt 2 shoreline erosion rate overestimated N N/A N/A
The 4-year modeling simulation was designed to be conservative and included the erosional effects of Hurricanes Hanna (2008) and Irene (2011). Therefore, the model-predicted erosion rates are expected to be higher than the long-term averages.
Projected loss of property/infrastructure under the preferred alternative does not meet the purpose and need for action.
SELC Alt 6 property impacts
not consistent with purpose and need
N N/A N/A
The 4-year modeling simulations were designed to be conservative and included the erosional effects of Hurricanes Hanna (2008) and Irene (2011). Therefore, substantial erosion is predicted under all of the alternatives (including the preferred alternative). However, the number of properties at risk under the preferred alternative is reduced by nearly 50 percent in relation to the no-project alternative (Alt 2).
Corps cannot assume that preferred alternative will be beneficial, as many properties would continue to be adversely affected under Alternative 6.
SELC Beneficial effects of Alt 6 N N/A N/A
The 4-year modeling simulations were designed to be conservative and include the erosional effects of Hurricanes Hanna (2008) and Irene (2011). Therefore, substantial erosion is predicted under all of the alternatives (including the preferred alternative). However, the number of properties at risk under the preferred alternative is reduced by nearly 50 percent in relation to the no-project alternative (Alt 2).
DEIS states that preferred alternative will have long-term benefits, but benefits are not identified or estimated.
SELC Beneficial effects of Alt 6 N N/A N/A
Compared with the model-projected two-year nourishment intervals under Alternatives 1, 3, and 4; the longer four-year nourishment interval under the preferred alternative (Alt 6) would have economic benefits in the form of substantially reduced nourishment costs. Additional economic benefits would be realized through enhanced protection of property, infrastructure, and the recreational beach. These economic benefits are described in Chapter 5 of the EIS.
The DEIS does not comply with NEPA, and the deficiencies are too significant to be remedied in a final EIS. Therefore the Corps should issue a revised or supplemental EIS that addresses the limited scope of modeling analyses and the inadequate evaluation of indirect and cumulative effects.
SELC Corps must issue a
revised or supplemental EIS
N N/A N/A
The EIS evaluates the direct, indirect, and cumulative effects of each alternative in accordance the Corps NEPA regulation (33 CFR part 230) and CEQ regulations for implementing NEPA (40 CFR 1500–1508). Public and agency scoping and participation were integral components of the NEPA process leading up to the release of the FEIS. The modeling constitutes a rigorous and comprehensive approach that was employed in the iterative design of project alternatives. Although coastal models are limited in their capability to predict precise multi-decadal effects, they represent the best tool for assessing potential long-term morphological change. The application of USACE coastal models to the NEPA process in this manner is a long-established and accepted practice. The scope of the cumulative effects analysis in the FEIS has been expanded to a more regional scale encompassing the southeastern NC coast south of Cape Lookout. This expanded scope has been applied to the analysis of cumulative effects under each alternative in Chapter 5 of the FEIS.
The costs of Alternative 6 outweigh the benefits provided in terms of protection for properties and infrastructure. Lost revenue and assessed property value under Alternative 2 is far less than the cost of Alternative 6. Alternative 2 is the only economically feasible alternative.
SELC Costs of Alt 6 outweigh benefits N N/A N/A
The benefits identified by the commenter are limited to tax value and tax revenue, whereas the EIS considers a more comprehensive set of economic values (e.g., reduced nourishment costs, recreation and tourism).

Holden Beach Final Environmental Impact Statement Dial Cordy and Associates Inc. Appendix B Draft EIS Comments and Responses February 2018
B-23
Nature of Comment (Summary) Commenting Agency/Entity Comment Type
FEIS Revised
to Address
Comment (Y/N)
FEIS Chapter
FEIS Page Response to Comment
Erosional effects attributable to the inlet are limited to a short segment of the beach and threaten only a small number of properties. Since there is no indication that inlet-induced erosion will spread beyond the east end beach, the potentially affected properties should be relocated, thereby allowing natural processes to restore the beach.
SELC Costs outweigh benefits N N/A N/A
The erosional effects identified by the commenter are limited to property value, whereas the EIS considers a more comprehensive set of economic, recreational, and natural resource values (e.g., reduced nourishment costs, recreation and tourism, beach habitat). Under Alternative 2 (abandon and retreat), natural processes would not be expected to restore the beach. As described in the EIS, the East End beach has experienced chronic erosion for many decades and has one the highest long-term erosion rates in the state. In the absence of beach management, the modeling results indicate that unmitigated erosion would rapidly eliminate the majority of the subaerial East End beach. The responses of individual homeowners would likely involve armoring the shoreline with sandbags, which are beyond the control of the Town and could remain in place indefinitely without a longer-term mitigative solution.
The CRC Terminal Groin Study indicates that groins modify inlet processes in ways that substantially eliminate inlet habitats for shorebirds, waterbirds, and other species.
SELC Groin effects on inlet habitats/wildlife N N/A N/A
The CRC Terminal Groin study identifies the potential for both beneficial and adverse effects on inlet habitats. Furthermore, a number of groins included in the study are relatively long, impermeable structures that are not comparable to the relatively short and leaky (permeable) proposed East End terminal groin. The project design incorporated recommendations from the Terminal Groin study in an effort to minimize potential adverse habitat impacts. Pursuant to the NC Terminal Groin Law, the ability to modify or remove the groin in the event that adverse impacts occur was incorporated into the groin design. Potential adaptive management modifications to the structure include decreasing the crest width, notching, shortening, and/or the addition of a weir.
The recreational beach would be eliminated at year 4 under the preferred alternative.
SELC Groin shoreline effects N N/A N/A
The 4-year modeling simulations were run under highly erosional conditions, and thus are conservative in terms of predicting the mitigative effects of the alternatives on shoreline erosion. The starting (Year 0) shoreline position corresponds to the highly eroded 2008 shoreline, and four-year simulations incorporate the erosional effects of Hurricanes Hanna (2008) and Irene (2011). Therefore, the model-predicted erosion rates are higher than the expected long-term averages, and substantial beach erosion occurs under all the alternatives. However, as described in Chapter 5 of the EIS (see Table 5.4), the projected relative beach width under Alternative 6 at the end of the 4-year simulation is three times that of the nourishment only alternative.
The Corps Coastal Engineering Manual and a DCM report analyzing the Oregon Inlet and Fort Macon jetties indicate that groins result in adverse erosional effects on downdrift beaches.
SELC Groin shoreline effects N N/A N/A
The Corps Coastal Engineering Manual also states that "present coastal engineering knowledge and predictive tools have advanced to the point where competent functional design of groins and groin fields is now possible." The Fort Macon and Oregon Inlet groins are relatively long, impermeable structures that are not comparable to the relatively short and leaky proposed East End terminal groin. The project design incorporated recommendations from the Terminal Groin study in an effort to minimize potential negative downdrift impacts.

Holden Beach Final Environmental Impact Statement Dial Cordy and Associates Inc. Appendix B Draft EIS Comments and Responses February 2018
B-24
Nature of Comment (Summary) Commenting Agency/Entity Comment Type
FEIS Revised
to Address
Comment (Y/N)
FEIS Chapter
FEIS Page Response to Comment
The CRC Terminal Groin Study indicates that the adverse effects of groins are likely increased when groins are installed at shallow draft inlets such as Lockwoods Folly Inlet.
SELC Groin shoreline effects N N/A N/A
Potential groin-related adverse effects on Lockwoods Folly Inlet were a major consideration in the model simulations. In fact, model-projected adverse effects on the inlet were the principal reason that the “long groin” alternative was not carried forward for full analysis in the EIS. The CRC Terminal Groin study identifies the potential for both beneficial and adverse effects on inlets. Furthermore, a number of groins included in the study are relatively long, impermeable structures that are not comparable to the relatively short and leaky proposed East End terminal groin. The project design incorporated recommendations from the Terminal Groin study in an effort to minimize potential adverse inlet effects, and rigorous modeling analyses indicate that the influence of the groins under Alternatives 5 and 6 is limited to the localized inlet-influenced zone of net eastward sediment transport along the relatively short East End beach. As described in Chapter 5 of the EIS, the modeling results do not show any increased risk of negative groin-related downdrift effects on Lockwoods Folly Inlet.
DEIS does not adequately incorporate the modeling analyses provided in Appendix F. The relation of the DEIS analyses to Appendix F is not adequately explained.
SELC Inadequate description of modeling N N/A N/A
A discussion of the modeling methods and the use of modeling results in the impact analyses is provided in Chapter 5.1 of the FEIS (Impact Analysis Methodology).
Use of CMS model is inconsistent with other terminal groin EIS documents. Corps has failed to explain why different models were used.
SELC Inconsistent use of CMS model N N/A N/A
The USACE CMS model is one of several accepted and widely-employed coastal models that are used to assess coastal engineering projects. Although different applicants for NC terminal groin projects have opted to use different coastal models, all of the models employed are suitable for terminal groin applications. The USACE conducts a rigorous review of the engineering analyses for all projects to ensure that appropriate models and modeling procedures are used.
Corps must evaluate alternatives based on their effectiveness in providing long-term protection of properties, infrastructure, and recreational assets. Such an evaluation would show that Alternative 2 is the only reasonable alternative.
SELC Insufficient modeling N N/A N/A
In evaluating the alternatives, the EIS considers a more comprehensive set of economic, recreational, and natural resource values (e.g., reduced nourishment costs, recreation and tourism, habitat and wildlife). As described in Chapter 5 of the EIS, Alternative 2 is the least effective alternative in terms of providing long-term protection of properties, infrastructure, and recreational assets.
Short-term modeling time periods do not account for long-term indirect and cumulative effects of terminal groin.
SELC Insufficient modeling N N/A N/A
The modeling used available comprehensive topo/bathy data sets from 2000, 2004, 2008, and 2012; and the model was run under many different conditions. The modeling constitutes a rigorous and comprehensive approach that was employed in the iterative design and fine tuning of the project alternatives. Although coastal models are limited in their capability to predict precise multi-decadal effects, they represent the best tool for assessing potential long-term morphological change. The application of USACE coastal models to the NEPA process in this manner is a long-established and accepted practice.

Holden Beach Final Environmental Impact Statement Dial Cordy and Associates Inc. Appendix B Draft EIS Comments and Responses February 2018
B-25
Nature of Comment (Summary) Commenting Agency/Entity Comment Type
FEIS Revised
to Address
Comment (Y/N)
FEIS Chapter
FEIS Page Response to Comment
Limited 4-yr modeling analysis violates NEPA. SELC Insufficient modeling N N/A N/A
The modeling used available comprehensive topo/bathy data sets from 2000, 2004, 2008, and 2012; and the model was run under many different conditions. The modeling constitutes a rigorous and comprehensive approach that was employed in the iterative design and fine tuning of the project alternatives. Although coastal models are limited in their capability to predict precise multi-decadal effects, they represent the best tool for assessing potential long-term morphological change. The application of USACE coastal models to the NEPA process in this manner is a long-established and accepted practice.
DEIS fails to adequately describe baseline data. No baseline data provided for years 5-30 of the 30-year project.
SELC Insufficient modeling N N/A N/A
The modeling used available comprehensive topo/bathy baseline data sets from 2000, 2004, 2008, and 2012; and the model was run under many different conditions. The CMS model requires substantial bathymetric and topographic baseline data. The baseline years selected have comprehensive data and are sufficiently spaced in time to capture a range of different beach conditions (beach width, inlet channel alignments, shoal configurations, etc.). The modeling constitutes a rigorous and comprehensive approach that was employed in the iterative design and fine tuning of the project alternatives. Although coastal models are limited in their capability to predict precise multi-decadal effects, they represent the best tool for assessing potential long-term morphological change. The application of USACE coastal models to the NEPA process in this manner is a long-established and accepted practice.
DEIS fails to evaluate the indirect effects of the terminal groin alternatives. Limited 4-year indirect effects analysis does not adequately assess the indirect effects of the terminal groin alternatives.
SELC Insufficient modeling N N/A N/A
The modeling used available comprehensive topo/bathy data sets from 2000, 2004, 2008, and 2012; and the model was run under many different conditions. The modeling constitutes a rigorous and comprehensive approach that was employed in the iterative design and fine tuning of the project alternatives. Although coastal models are limited in their capability to predict precise multi-decadal effects, they represent the best tool for assessing potential long-term morphological change. The application of USACE coastal models to the NEPA process in this manner is a long-established and accepted practice.
DEIS fails to provide information necessary for public to compare alternatives. Limited 4-year analysis does not provide information necessary to fully evaluate the environmental and economic impacts of the alternatives over the 30-year project.
SELC Insufficient modeling N N/A N/A
The EIS employs a wide range of quantitative and qualitative methods of analysis and is not limited to the modeling results. The modeling used available comprehensive topo/bathy data sets from 2000, 2004, 2008, and 2012; and the model was run under many different conditions. The modeling constitutes a rigorous and comprehensive approach that was employed in the iterative design and fine tuning of the project alternatives. Although coastal models are limited in their capability to predict precise multi-decadal effects, they represent the best tool for assessing potential long-term morphological change. The application of USACE coastal models to the NEPA process in this manner is a long-established and accepted practice.

Holden Beach Final Environmental Impact Statement Dial Cordy and Associates Inc. Appendix B Draft EIS Comments and Responses February 2018
B-26
Nature of Comment (Summary) Commenting Agency/Entity Comment Type
FEIS Revised
to Address
Comment (Y/N)
FEIS Chapter
FEIS Page Response to Comment
It is well established that a terminal groin will degrade inlet habitats by disrupting natural inlet processes. Effects that take hold after 4 years should be analyzed.
SELC Insufficient modeling N N/A N/A
The EIS employs a wide range of quantitative and qualitative methods of analysis and is not limited to the modeling results (see EIS Section 5.1 - Impact Analysis Methodology). The overall CMS modeling effort involved an extensive suite of model simulations representing a wide range of timeframes, physical conditions, and actions within the Permit Area. Modeling runs of 6 months, 1 year, 2 years and 4 years were conducted to assess short to long term morphological responses. Modeling simulations were also conducted under a wide range of local forcing conditions representing various physical data sets ranging from 2000 to 2012. In addition to the analysis of alternatives, specific modeling runs were used to assess the response of the system to separate actions such as federal navigation dredging. For impact analysis purposes, the EIS focuses on a specific suite of four-year modeling runs that are based on local physical data sets from 2008-2011. Although coastal models are limited in their capability to predict precise multi-decadal effects, they represent the best tool for assessing potential long-term morphological change. The application of USACE coastal models to the NEPA process in this manner is a long-established and accepted practice.
The DEIS should address potential groin effects beyond the 4-year modeling period.
SELC Insufficient modeling N N/A N/A
The EIS employs a wide range of quantitative and qualitative methods of analysis and is not limited to the modeling results. The modeling used available comprehensive topo/bathy data sets from 2000, 2004, 2008, and 2012; and the model was run under many different conditions. The modeling constitutes a rigorous and comprehensive approach that was employed in the iterative design and fine tuning of the project alternatives. Although coastal models are limited in their capability to predict precise multi-decadal effects, they represent the best tool for assessing potential long-term morphological change. The application of USACE coastal models to the NEPA process in this manner is a long-established and accepted practice.
DEIS does not identify the shoreline data that represents year 0 in the modeling analyses.
SELC Model year 0 shoreline data not identified N N/A N/A
The starting point for the 4-year modeling runs described in the EIS is the eroded 2008 East End shoreline. The modeling was a very conservative approach that started with the shoreline in a highly erosional state and included the erosional effects of Hurricane Hanna (2008) and Hurricane Irene (2011).

Holden Beach Final Environmental Impact Statement Dial Cordy and Associates Inc. Appendix B Draft EIS Comments and Responses February 2018
B-27
Nature of Comment (Summary) Commenting Agency/Entity Comment Type
FEIS Revised
to Address
Comment (Y/N)
FEIS Chapter
FEIS Page Response to Comment
The conclusions of no cumulative effects under Alternatives 5 and 6 are in error given the unlawful (4-yr modeling) analysis of indirect effects in the DEIS.
SELC NEPA
compliance/indirect and cumulative effects
N N/A N/A
The EIS employs a wide range of quantitative and qualitative methods to assess indirect and cumulative effects and is not limited to the modeling results. The model was run under a wide range of different conditions based on comprehensive topo/bathy data sets from 2000, 2004, 2008, and 2012. The modeling constitutes a rigorous and comprehensive approach that was employed in the iterative design and fine tuning of the project alternatives. Although coastal models are limited in their capability to predict precise multi-decadal effects, they represent the best tool for assessing potential long-term morphological change. The application of USACE coastal models to the NEPA process in this manner is a long-established and accepted practice. The modeling results indicate that the long-term indirect effects of the terminal groin under Alternative 5 would be minor and highly localized to the groin structure. Therefore, groin-related cumulative effects would not be expected. Based on modeling results, the terminal groin will extend the nourishment interval from 2 to 4 years, thereby reducing the frequency of recurring sand placement impacts and the potential for long-term cumulative effects.
The preferred alternative does not provide even short-term protection for properties, infrastructure, and recreational assets. The DEIS does not show any meaningful difference in recreational beach width between the alternatives.
SELC Relative effectiveness of alternatives N N/A N/A
The 4-year modeling simulations were designed to be conservative and included the erosional effects of Hurricanes Hanna (2008) and Irene (2011). Therefore, substantial erosion occurs under all the alternatives. However, as described in Chapter 5 of the EIS (see Table 5.4), the projected relative beach width under Alternative 6 at the end of the 4-year simulation is three times that of the nourishment only alternative, and the number of properties at risk under the preferred alternative is reduced by nearly 50 percent in relation to the no-project alternative (Alt 2). Based on modeling results, the terminal groin will extend the nourishment interval from 2 to 4 years, thereby reducing sand placement impacts and costs in relation to existing practices and the non-structural nourishment alternatives.
The DEIS fails to adequately address direct, indirect, and cumulative effects; and therefore, does not provide the information necessary for the Corps to conduct its required analyses pursuant to Section 404 of the CWA.
SELC Section 404 permit decision N N/A N/A
The FEIS evaluates the direct, indirect, and cumulative effects of each alternative in accordance the Corps NEPA regulation (33 CFR part 230), NEPA Implementation Procedures for the Regulatory Program (33 CFR 325 - Appendix B), and CEQ regulations (40 CFR 1500–1508).
The 5-year piping plover status review and the recovery plans for all 3 piping plover populations identify habitat loss and degradation attributable to groins and inlet stabilization as a serious threat to piping plover populations.
SELC Threatened/Endangered Species Y Appendix
C Potential impacts on piping plovers have been addressed through Section 7 consultation with the USFWS. The resulting USFWS Biological Opinion is included in the FEIS (Appendix C).

Holden Beach Final Environmental Impact Statement Dial Cordy and Associates Inc. Appendix B Draft EIS Comments and Responses February 2018
B-28
Nature of Comment (Summary) Commenting Agency/Entity Comment Type
FEIS Revised
to Address
Comment (Y/N)
FEIS Chapter
FEIS Page Response to Comment
The DEIS should address the cumulative effects of Alternative 6 in combination with proposed groins at Bald Head Island, Ocean Isle Beach, Figure Eight Island, and other NC inlets.
SELC Cumulative effects Y Chapter 5
5-28 5-31 5-38 5-41 5-74 5-99 5-137 5-138
The scope of the cumulative effects analysis in the FEIS has been expanded to a more regional scale encompassing the southeastern NC coast south of Cape Lookout. This expanded scope has been applied to the analysis of cumulative effects under each alternative in Chapter 5 of the FEIS.
Use of Oak Island Shorebird Monitoring data with no financial contribution, agreement between the two town's establishing responsibilities should be developed.
Town of Oak Island Bird Monitoring N N/A N/A Noted.
What is the potential and timeframe estimated for the recharge of the Central Reach borrow source
Town of Oak Island
Central Reach borrow source N N/A N/A
Due to its offshore location in relatively deep water, recharge will likely occur slowly at the Central Reach borrow site. The North Myrtle Beach borrow area, which is similar in geology and location, exhibited a recharge rate of less than 0.5 ft/yr during the 1st post-project year. Sediment mobilization is limited at these depths; and consequently, bottom sediments are relatively static.
Will dredging of the Central Reach borrow source alter the symmetry of the ebb-tidal delta complex or channel alignment in LFI?
Town of Oak Island
Oak Island shoreline effects N N/A N/A
Due to its offshore location (~3.3 miles seaward of the ebb tidal delta) in relatively deep water (~36 ft MSL), dredging at the Central Reach borrow site will not affect the ebb tidal delta.
EIS does not address Oak Island's 2012 comments regarding concerns over offshore Central Reach borrow area and alignment of LFI to Oak Island's shoreline.
Town of Oak Island
Oak Island shoreline effects N N/A N/A
The letter in question was submitted to the USACE, and the Town of Holden Beach addressed this comment through direct consultation with Oak Island during the Central Reach Project NEPA/permitting process.
Are any circumstances expected where a volume greater than 150,000 cy every 4 years will be needed?
Town of Oak Island Preferred borrow source N N/A N/A
Erosional losses attributable to major storm events and/or higher than normal wave energy years could increase the volumetric need to more than 150,000 cy every 4 years. However, on average, a volumetric need of 150,000 cy every 4 years is anticipated over the 30-year life of the project.
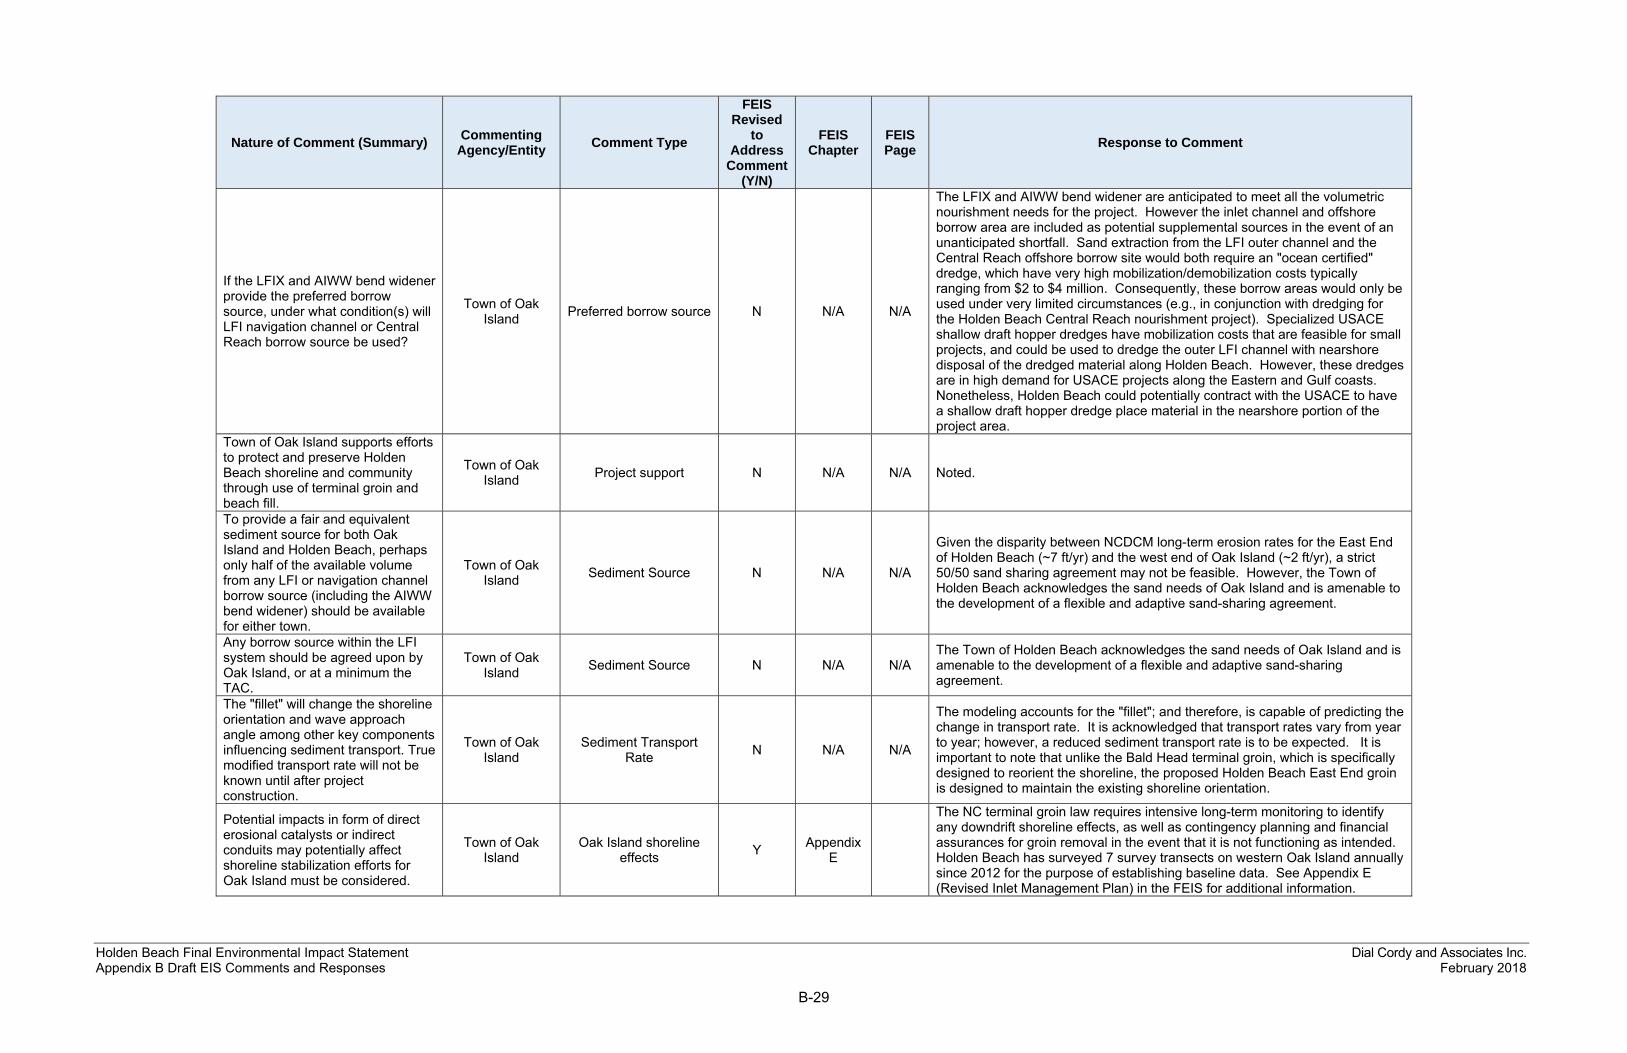
Holden Beach Final Environmental Impact Statement Dial Cordy and Associates Inc. Appendix B Draft EIS Comments and Responses February 2018
B-29
Nature of Comment (Summary) Commenting Agency/Entity Comment Type
FEIS Revised
to Address
Comment (Y/N)
FEIS Chapter
FEIS Page Response to Comment
If the LFIX and AIWW bend widener provide the preferred borrow source, under what condition(s) will LFI navigation channel or Central Reach borrow source be used?
Town of Oak Island Preferred borrow source N N/A N/A
The LFIX and AIWW bend widener are anticipated to meet all the volumetric nourishment needs for the project. However the inlet channel and offshore borrow area are included as potential supplemental sources in the event of an unanticipated shortfall. Sand extraction from the LFI outer channel and the Central Reach offshore borrow site would both require an "ocean certified" dredge, which have very high mobilization/demobilization costs typically ranging from $2 to $4 million. Consequently, these borrow areas would only be used under very limited circumstances (e.g., in conjunction with dredging for the Holden Beach Central Reach nourishment project). Specialized USACE shallow draft hopper dredges have mobilization costs that are feasible for small projects, and could be used to dredge the outer LFI channel with nearshore disposal of the dredged material along Holden Beach. However, these dredges are in high demand for USACE projects along the Eastern and Gulf coasts. Nonetheless, Holden Beach could potentially contract with the USACE to have a shallow draft hopper dredge place material in the nearshore portion of the project area.
Town of Oak Island supports efforts to protect and preserve Holden Beach shoreline and community through use of terminal groin and beach fill.
Town of Oak Island Project support N N/A N/A Noted.
To provide a fair and equivalent sediment source for both Oak Island and Holden Beach, perhaps only half of the available volume from any LFI or navigation channel borrow source (including the AIWW bend widener) should be available for either town.
Town of Oak Island Sediment Source N N/A N/A
Given the disparity between NCDCM long-term erosion rates for the East End of Holden Beach (~7 ft/yr) and the west end of Oak Island (~2 ft/yr), a strict 50/50 sand sharing agreement may not be feasible. However, the Town of Holden Beach acknowledges the sand needs of Oak Island and is amenable to the development of a flexible and adaptive sand-sharing agreement.
Any borrow source within the LFI system should be agreed upon by Oak Island, or at a minimum the TAC.
Town of Oak Island Sediment Source N N/A N/A
The Town of Holden Beach acknowledges the sand needs of Oak Island and is amenable to the development of a flexible and adaptive sand-sharing agreement.
The "fillet" will change the shoreline orientation and wave approach angle among other key components influencing sediment transport. True modified transport rate will not be known until after project construction.
Town of Oak Island
Sediment Transport Rate N N/A N/A
The modeling accounts for the "fillet"; and therefore, is capable of predicting the change in transport rate. It is acknowledged that transport rates vary from year to year; however, a reduced sediment transport rate is to be expected. It is important to note that unlike the Bald Head terminal groin, which is specifically designed to reorient the shoreline, the proposed Holden Beach East End groin is designed to maintain the existing shoreline orientation.
Potential impacts in form of direct erosional catalysts or indirect conduits may potentially affect shoreline stabilization efforts for Oak Island must be considered.
Town of Oak Island
Oak Island shoreline effects Y Appendix
E
The NC terminal groin law requires intensive long-term monitoring to identify any downdrift shoreline effects, as well as contingency planning and financial assurances for groin removal in the event that it is not functioning as intended. Holden Beach has surveyed 7 survey transects on western Oak Island annually since 2012 for the purpose of establishing baseline data. See Appendix E (Revised Inlet Management Plan) in the FEIS for additional information.

Holden Beach Final Environmental Impact Statement Dial Cordy and Associates Inc. Appendix B Draft EIS Comments and Responses February 2018
B-30
Nature of Comment (Summary) Commenting Agency/Entity Comment Type
FEIS Revised
to Address
Comment (Y/N)
FEIS Chapter
FEIS Page Response to Comment
Establishment of a technical advisory committee (TAC) to review monitoring results is not required until after construction has commenced. Does not provide Oak Island reasonable assurances the committee will form with enough time to QA/QC and inspect construction operations.
Town of Oak Island
Technical Advisory Committee Y Appendix
E The Town of Holden Beach is amenable to the establishment of a TAC prior to construction. See the revised Inlet Management Plan (Appendix E of the FEIS).
The Inlet Management Plan does not reference specific volumetric or shoreline change thresholds proposed for determining if impacts occur.
Town of Oak Island Inlet Management Plan Y Appendix
E See the revised Inlet Management Plan (Appendix E of the FEIS).
Monitoring survey timeframes are not specified
Town of Oak Island Inlet Management Plan Y Appendix
E See the revised Inlet Management Plan (Appendix E of the FEIS).
No guaranteed funding source available for mitigation efforts, BPART's balance or escrow account.
Town of Oak Island Mitigation funding Y Appendix
E See the revised Inlet Management Plan (Appendix E of the FEIS).
Opposition to building hardened structures April O Ecosystem preservation N N/A N/A Noted.
Worried about the longevity of building the groin and environmental impacts associated with placement of a hardened structure
April O Ecosystem preservation Y Appendix E
While the groin is designed to be a relatively permanent structure, the NC terminal groin law requires intensive long-term monitoring to identify any downdrift shoreline effects, as well as contingency planning and financial assurances for groin removal in the event that it is not functioning as intended. See Appendix E (Revised Inlet Management Plan) in the FEIS for additional information.
There are fiscal conflicts associated with any of the alternatives that will contend for tax dollars.
Charles Klapheke (Skip) Cost prohibitive N N/A N/A
The groin construction costs under Alternatives 5 and 6 make up only ~7% of the total project costs, whereas beach nourishment and dredge mobilization/demobilization account for ~80% of total project costs. Based on modeling results, the terminal groin will extend the nourishment interval from 2 to 4 years, thereby reducing costs in relation to the non-structural alternatives.
What other major town initiatives will be differed or abandoned to implement this one?
Charles Klapheke (Skip) Differed town initiatives N N/A N/A
Modifications to other major town initiatives are not anticipated. The groin construction costs under Alternatives 5 and 6 make up only ~7% of the total project costs, whereas beach nourishment and dredge mobilization/demobilization account for ~80% of total project costs. Based on modeling results, the terminal groin will extend the nourishment interval from 2 to 4 years, thereby reducing costs in relation to existing practices and the non-structural nourishment alternatives.

Holden Beach Final Environmental Impact Statement Dial Cordy and Associates Inc. Appendix B Draft EIS Comments and Responses February 2018
B-31
Nature of Comment (Summary) Commenting Agency/Entity Comment Type
FEIS Revised
to Address
Comment (Y/N)
FEIS Chapter
FEIS Page Response to Comment
Without knowing if the alternatives 5 and 6 will work the town may be forced to remove the groin at its own expense, however alternatives 1-4 allow for some flexibility and periodic review with potential course change.
Charles Klapheke (Skip) Insufficient information N N/A N/A
While the groin is designed to be a relatively permanent structure, the NC terminal groin law requires contingency planning and financial assurances for groin removal in the event that it is not functioning as intended. The groin construction costs under Alternatives 5 and 6 make up only ~7% of the total project costs, whereas beach nourishment and dredge mobilization/demobilization account for ~80% of total project costs. Based on modeling results, the terminal groin will extend the nourishment interval from 2 to 4 years, thereby reducing costs in relation to the non-structural alternatives.
More information is needed as to where the funding for the alternatives will come from (Federal, State, Town) and what revenue vehicle will be used (grants, appropriations, additional taxes?).
Charles Klapheke (Skip) Insufficient information N N/A N/A
The groin construction costs under Alternatives 5 and 6 make up only ~7% of the total project costs, whereas beach nourishment and dredge mobilization/demobilization account for ~80% of total project costs. Based on modeling results, the terminal groin will extend the nourishment interval from 2 to 4 years, thereby reducing nourishment costs in relation to the non-structural alternatives. Nourishment funding is anticipated to come from the existing BPART fund as well as State and Federal Navigation Dredging Funds. Nourishment of the East End using LWF inlet crossing dredged material has been occurring for decades, with the primary sponsor being the USACE. While USACE funding is expected to continue; increased funding from the State, County, and Town will likely be needed in the future. The State has recently established a shallow inlet dredging fund that can provide up to 50 percent of the total project cost. No tax increases are proposed.
The study is not sufficient enough to allow for a well-informed discussion of the proposed alternatives.
Charles Klapheke (Skip) Insufficient information N N/A N/A Noted. The USACE Legal Counsel will evaluate the legal sufficiency of the
FEIS in conjunction with the decision process.
Alternatives 5 and 6 should have included the 12 properties on Serenity lane as they will be impacted though aesthetics and tax increases.
Charles Klapheke (Skip) Missing information N N/A N/A No tax increases are proposed. The aesthetic impacts of the groin alternatives
are addressed in Chapter 5 of the FEIS.
Information provided about the predictive model is insufficient, the majority of the study is based on the results of one model which has not been successful on predicting sand movement in other locations.
Charles Klapheke (Skip) Modeling N N/A N/A
As described in the Engineering Report (FEIS Appendix H), analyses employed two sediment transport models developed by the USACE: CMS (Coastal Modeling System) and GENESIS-T (Generalized Model for Simulating Shoreline Change). Both models have been applied to coastal engineering projects throughout the US and abroad. The USACE ERDC Coastal Inlets Research Program (CIRP) maintains a website specifically dedicated to these models and their applications (http://cirpwiki.info/wiki/Main_Page). The principal intent of the modeling analyses is to provide a relative comparison of shoreline and physical process responses under the various alternatives. As described in Chapter 5 of the FEIS, although the modeling results are presented as quantitative projections, the projected changes are not intended to represent a precise estimate of future conditions.

Holden Beach Final Environmental Impact Statement Dial Cordy and Associates Inc. Appendix B Draft EIS Comments and Responses February 2018
B-32
Nature of Comment (Summary) Commenting Agency/Entity Comment Type
FEIS Revised
to Address
Comment (Y/N)
FEIS Chapter
FEIS Page Response to Comment
Because this study only utilized one model for predicting sand movement and erosion patterns the conclusion drawn are seriously undermined, also because the study relies highly on the predictive model there should be more information on the details of the model used, including limitations and probability of successfully predicting the future.
Charles Klapheke (Skip) Modeling N N/A N/A
As described in the Engineering Report (FEIS Appendix H), analyses employed two sediment transport models developed by the USACE: CMS (Coastal Modeling System) and GENESIS-T (Generalized Model for Simulating Shoreline Change). Both models have been applied to coastal engineering projects throughout the US and abroad. The USACE ERDC Coastal Inlets Research Program (CIRP) maintains a website specifically dedicated to these models and their applications (http://cirpwiki.info/wiki/Main_Page).
Study appears to begin with a preordained outcome
Charles Klapheke (Skip) Potential bias N N/A N/A
The FEIS was prepared in accordance with the Corps NEPA regulation (33 CFR part 230), NEPA Implementation Procedures for the Regulatory Program (33 CFR 325 - Appendix B), and CEQ regulations for implementing NEPA (40 CFR 1500–1508). Pursuant to these regulations, the FEIS presents an objective evaluation of all reasonable alternatives.
What is the time frame for the Town commissioners to receive the final study, solicit input from their constituency, select an alternative, and determine sources and impact funding?
Charles Klapheke (Skip) Project timeline N N/A N/A
The NEPA decision process is conducted independently by the USACE. Subsequent actions by the Holden Beach Town Commissioners are not a component of this process. The FEIS will serve as the basis for a permit decision by the USACE, but is not in and of itself a decision document. After considering all comments on the FEIS, the USACE will issue its decision in a separate Record of Decision (ROD) document.
A review of the alternatives of the study would be a little easier to conduct if the tables summarizing the costs and benefits were located in the corresponding sub-sections of chapter 5.
Charles Klapheke (Skip) Formatting Y Chapter 5 5-23
5-24 A comprehensive alternative cost comparison table has been added to the FEIS.
There does not appear to be any conclusion as to the impact of this project on any of the named federally endangered species
Charles Klapheke (Skip)
Natural resource protection Y Appendix
C
Chapter 5 of the EIS describes the anticipated direct, indirect, and cumulative impacts of each alternative on federally listed threatened and endangered species. Additionally, ESA Section 7 consultation has been completed and the resulting USFWS Biological Opinion is included in the FEIS (Appendix C).
The financials of the alternatives may not be credible and therefore evaluation is impossible, infrastructure costs are considered in alternative 6 however not in alternative 5.
Charles Klapheke (Skip) Insufficient information Y Chapter 5
5-94 5-123 5-148 5-166
It is acknowledged that the EIS text contained some typographical errors related to costs, and these errors have been corrected in the FEIS. Appendix O of the FEIS provides a more comprehensive discussion of the economic analyses.
In favor of the terminal groin Diana Willard Beneficial coastal economics N N/A N/A Noted.
The ecological and economic impacts to Oak Island were not thoroughly addressed.
Eileen Governale Oak Island consideration N N/A N/A
The ecological and economic impacts to Oak Island were fully evaluated and described in Chapter 5 of the FEIS. However, the model-projected effects of the alternatives on Oak Island are minimal to non-existent; and consequently, the effect descriptions are relatively limited in comparison with the discussion of impacts on Holden Beach.

Holden Beach Final Environmental Impact Statement Dial Cordy and Associates Inc. Appendix B Draft EIS Comments and Responses February 2018
B-33
Nature of Comment (Summary) Commenting Agency/Entity Comment Type
FEIS Revised
to Address
Comment (Y/N)
FEIS Chapter
FEIS Page Response to Comment
On page 5-156, the Holden Beach DEIS refers to an Appendix Q. The appendices on the website only go to Appendix P. Is there an Appendix Q?
Geoff Gisler Appendix Y Chapter 5
5-23 5-52 5-68 5-147 5-165
References to appendices have been corrected in the FEIS.
Collaboration between government agencies and the towns of Brunswick county is needed to produce a comprehensive erosion control master plan.
Lora Sharkey Comprehensive erosion control plan N N/A N/A
A comprehensive inter-local erosion control master plan is beyond the scope of the EIS. However, the project will adhere to all sediment and erosion control best management practices (BMPs) as well as all State, County, and Town erosion control regulations and protocols.
Disturbance caused by placement of groin will disrupt endagered birds through reduction of food.
Lora Sharkey Ecosystem preservation N N/A N/A
The FEIS acknowledges groin-related impacts on shorebird foraging habitat. As described in Chapter 5 of the FEIS, permanent impacts to shorebird intertidal foraging habitat within the groin footprint (0.2 acre) would be negligible. Based on modeling results, the terminal groin will extend the nourishment interval from 2 to 4 years, thereby reducing the frequency of repeated sand placement impacts on foraging habitat.
Terminal groins are not aesthetically pleasing. Pam Sabalos Aesthetics N N/A N/A Noted. The aesthetic impacts of the groin alternatives are evaluated in Chapter
5 of the FEIS.
Expensive to build/remove and only protects a small number of homes that were a bad investment choice.
Pam Sabalos Cost prohibitive N N/A N/A
The groin construction costs under Alternatives 5 and 6 make up only ~7% of the total project costs, whereas beach nourishment and dredge mobilization/demobilization account for ~80% of total project costs. Based on modeling results, the terminal groin will extend the nourishment interval from 2 to 4 years, thereby reducing costs in relation to the non-structural alternatives.
The potential environmental degradation is not worth the benefits of a few home owners.
Pam Sabalos Ecosystem preservation N N/A N/A
The benefits identified by the commenter are limited to property value, whereas the FEIS considers a more comprehensive set of economic and natural resource values (e.g., reduced nourishment costs, recreation and tourism, habitat). Based on modeling results, the terminal groin will extend the nourishment interval from 2 to 4 years, thereby reducing costs in relation to existing practices and the non-structural nourishment alternatives.
Opposition to building hardened structures Pam Sabalos Ecosystem preservation N N/A N/A Noted.
The models associated with sand movement around terminal groins may not predict correctly.
Pam Sabalos Modeling N N/A N/A
As described in the Engineering Report (FEIS Appendix H), analyses employed two sediment transport models developed by the USACE: CMS (Coastal Modeling System) and GENESIS-T (Generalized Model for Simulating Shoreline Change). Both models have been applied to coastal engineering projects throughout the US and abroad.
Does not eliminate the need for renourishment. Pam Sabalos Still need periodic
renourisment N N/A N/A
The FEIS acknowledges that continuing nourishment is a major component of the preferred alternative. However, based on modeling results, the terminal groin will extend the nourishment interval from 2 to 4 years, thereby reducing costs in relation to the non-structural alternatives.
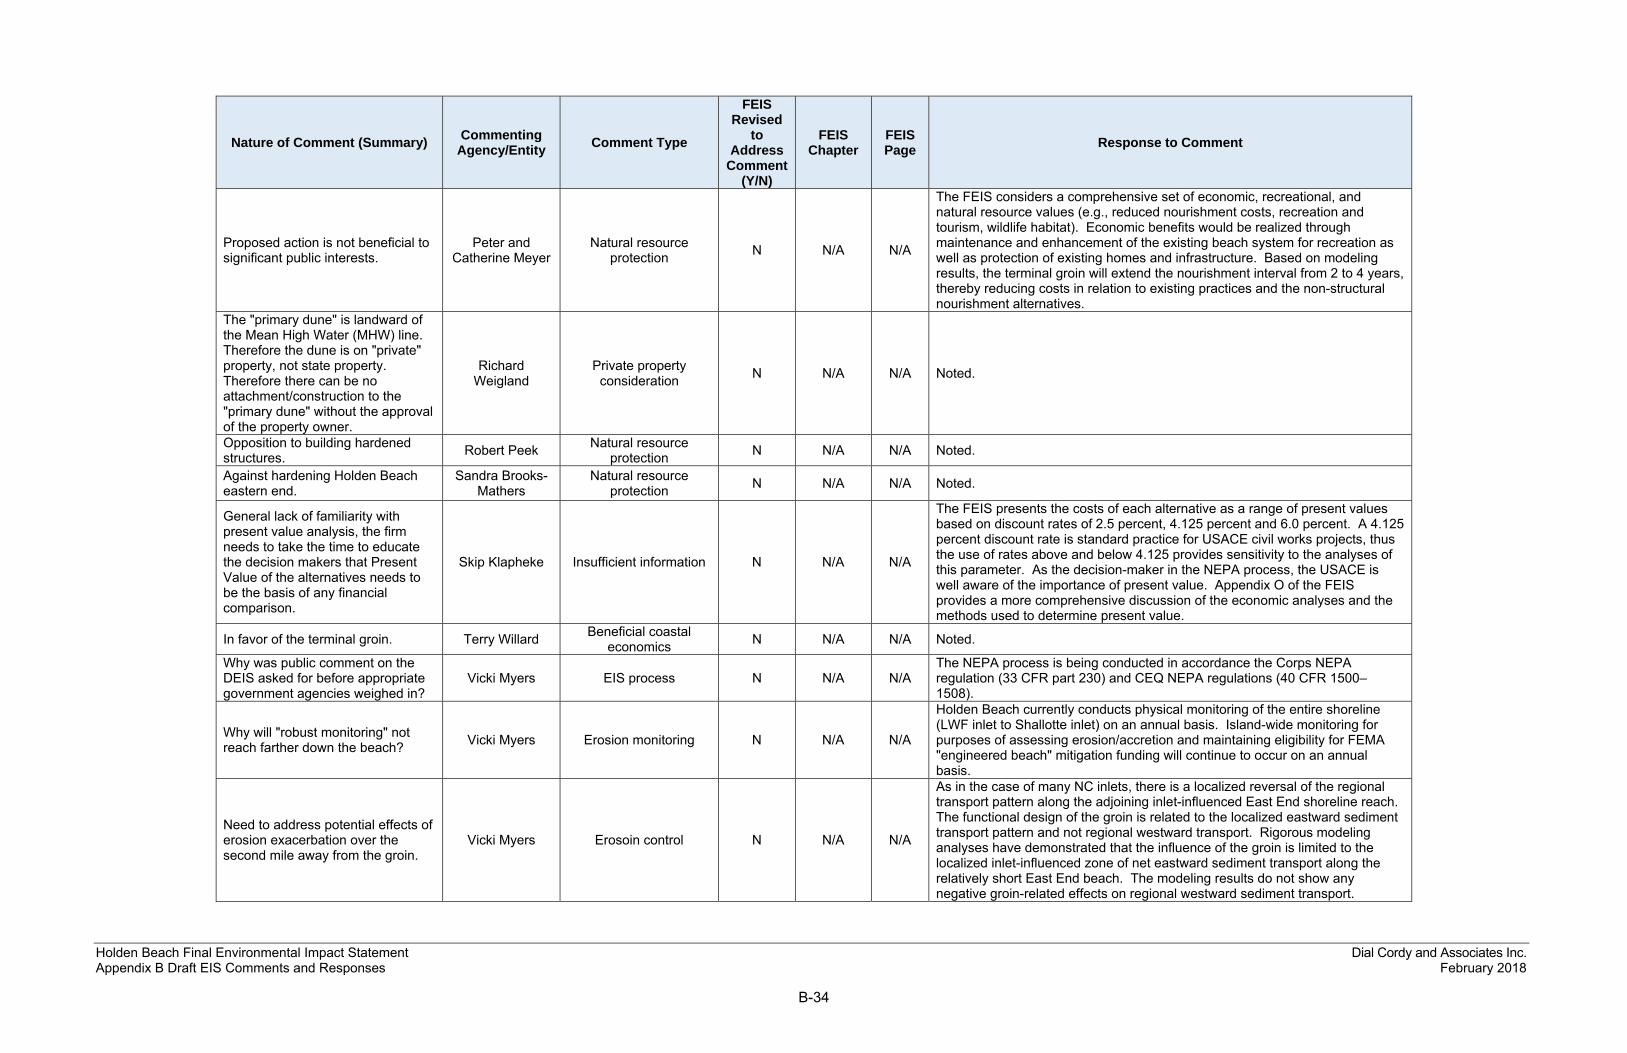
Holden Beach Final Environmental Impact Statement Dial Cordy and Associates Inc. Appendix B Draft EIS Comments and Responses February 2018
B-34
Nature of Comment (Summary) Commenting Agency/Entity Comment Type
FEIS Revised
to Address
Comment (Y/N)
FEIS Chapter
FEIS Page Response to Comment
Proposed action is not beneficial to significant public interests.
Peter and Catherine Meyer
Natural resource protection N N/A N/A
The FEIS considers a comprehensive set of economic, recreational, and natural resource values (e.g., reduced nourishment costs, recreation and tourism, wildlife habitat). Economic benefits would be realized through maintenance and enhancement of the existing beach system for recreation as well as protection of existing homes and infrastructure. Based on modeling results, the terminal groin will extend the nourishment interval from 2 to 4 years, thereby reducing costs in relation to existing practices and the non-structural nourishment alternatives.
The "primary dune" is landward of the Mean High Water (MHW) line. Therefore the dune is on "private" property, not state property. Therefore there can be no attachment/construction to the "primary dune" without the approval of the property owner.
Richard Weigland
Private property consideration N N/A N/A Noted.
Opposition to building hardened structures. Robert Peek Natural resource
protection N N/A N/A Noted.
Against hardening Holden Beach eastern end.
Sandra Brooks-Mathers
Natural resource protection N N/A N/A Noted.
General lack of familiarity with present value analysis, the firm needs to take the time to educate the decision makers that Present Value of the alternatives needs to be the basis of any financial comparison.
Skip Klapheke Insufficient information N N/A N/A
The FEIS presents the costs of each alternative as a range of present values based on discount rates of 2.5 percent, 4.125 percent and 6.0 percent. A 4.125 percent discount rate is standard practice for USACE civil works projects, thus the use of rates above and below 4.125 provides sensitivity to the analyses of this parameter. As the decision-maker in the NEPA process, the USACE is well aware of the importance of present value. Appendix O of the FEIS provides a more comprehensive discussion of the economic analyses and the methods used to determine present value.
In favor of the terminal groin. Terry Willard Beneficial coastal economics N N/A N/A Noted.
Why was public comment on the DEIS asked for before appropriate government agencies weighed in?
Vicki Myers EIS process N N/A N/A The NEPA process is being conducted in accordance the Corps NEPA regulation (33 CFR part 230) and CEQ NEPA regulations (40 CFR 1500–1508).
Why will "robust monitoring" not reach farther down the beach? Vicki Myers Erosion monitoring N N/A N/A
Holden Beach currently conducts physical monitoring of the entire shoreline (LWF inlet to Shallotte inlet) on an annual basis. Island-wide monitoring for purposes of assessing erosion/accretion and maintaining eligibility for FEMA "engineered beach" mitigation funding will continue to occur on an annual basis.
Need to address potential effects of erosion exacerbation over the second mile away from the groin.
Vicki Myers Erosoin control N N/A N/A
As in the case of many NC inlets, there is a localized reversal of the regional transport pattern along the adjoining inlet-influenced East End shoreline reach. The functional design of the groin is related to the localized eastward sediment transport pattern and not regional westward transport. Rigorous modeling analyses have demonstrated that the influence of the groin is limited to the localized inlet-influenced zone of net eastward sediment transport along the relatively short East End beach. The modeling results do not show any negative groin-related effects on regional westward sediment transport.
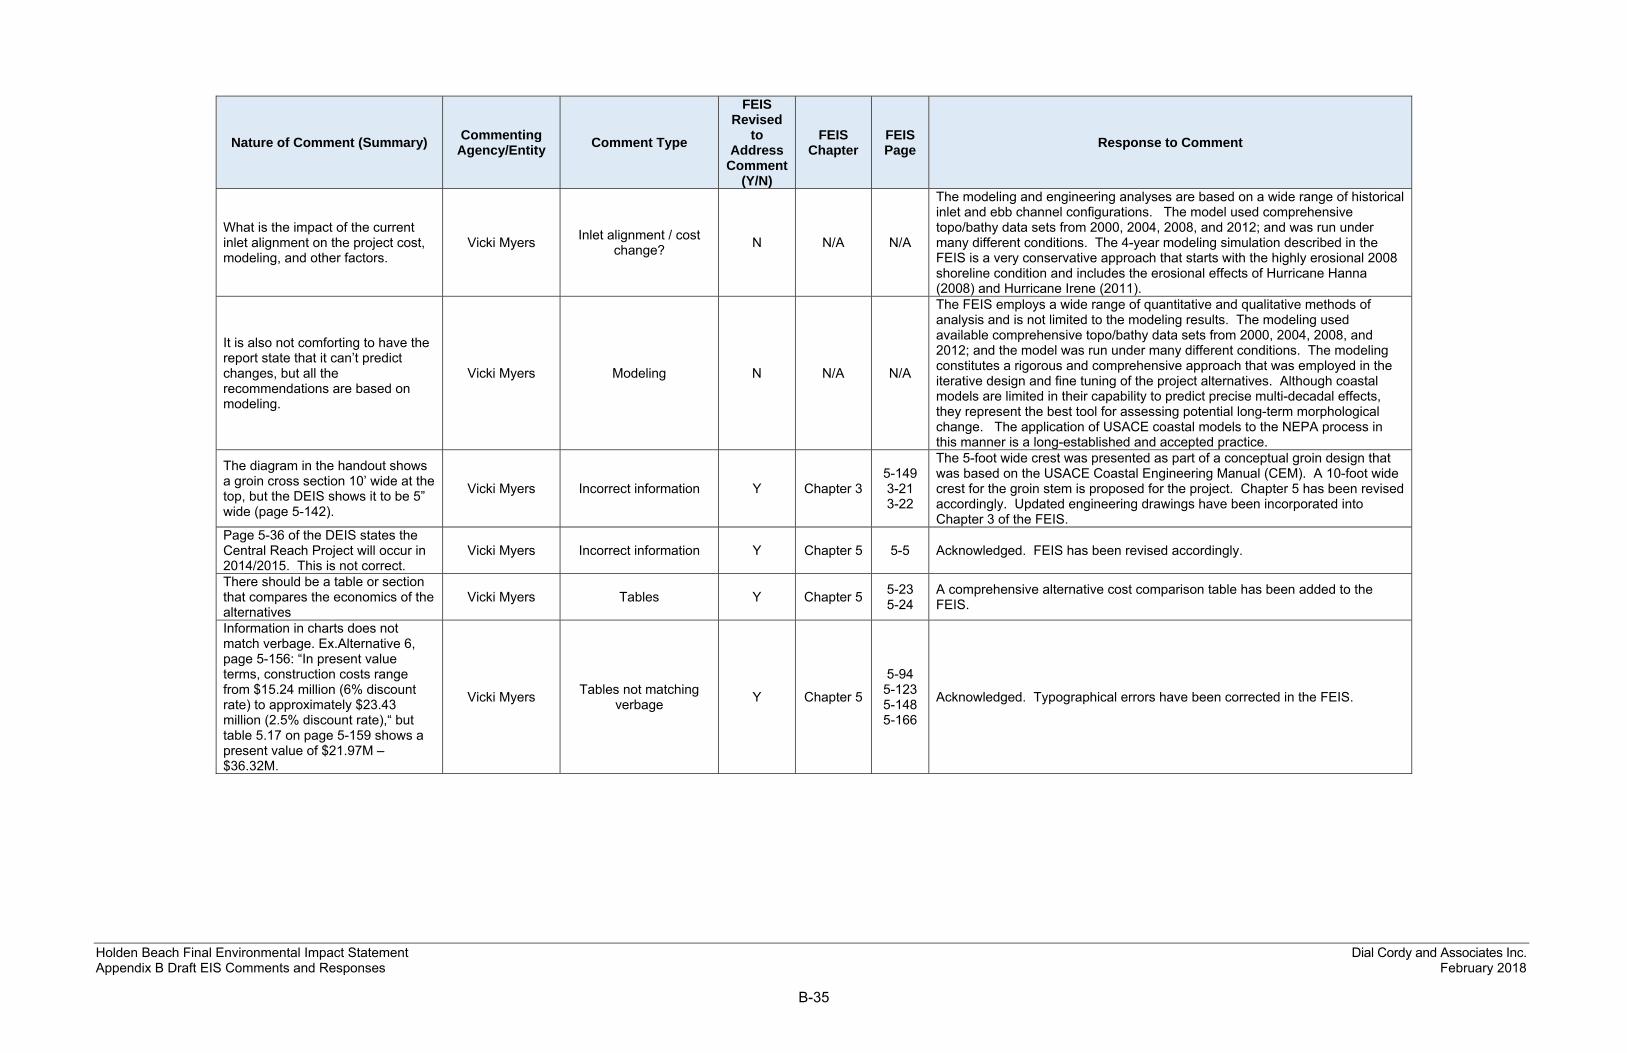
Holden Beach Final Environmental Impact Statement Dial Cordy and Associates Inc. Appendix B Draft EIS Comments and Responses February 2018
B-35
Nature of Comment (Summary) Commenting Agency/Entity Comment Type
FEIS Revised
to Address
Comment (Y/N)
FEIS Chapter
FEIS Page Response to Comment
What is the impact of the current inlet alignment on the project cost, modeling, and other factors.
Vicki Myers Inlet alignment / cost change? N N/A N/A
The modeling and engineering analyses are based on a wide range of historical inlet and ebb channel configurations. The model used comprehensive topo/bathy data sets from 2000, 2004, 2008, and 2012; and was run under many different conditions. The 4-year modeling simulation described in the FEIS is a very conservative approach that starts with the highly erosional 2008 shoreline condition and includes the erosional effects of Hurricane Hanna (2008) and Hurricane Irene (2011).
It is also not comforting to have the report state that it can’t predict changes, but all the recommendations are based on modeling.
Vicki Myers Modeling N N/A N/A
The FEIS employs a wide range of quantitative and qualitative methods of analysis and is not limited to the modeling results. The modeling used available comprehensive topo/bathy data sets from 2000, 2004, 2008, and 2012; and the model was run under many different conditions. The modeling constitutes a rigorous and comprehensive approach that was employed in the iterative design and fine tuning of the project alternatives. Although coastal models are limited in their capability to predict precise multi-decadal effects, they represent the best tool for assessing potential long-term morphological change. The application of USACE coastal models to the NEPA process in this manner is a long-established and accepted practice.
The diagram in the handout shows a groin cross section 10’ wide at the top, but the DEIS shows it to be 5” wide (page 5-142).
Vicki Myers Incorrect information Y Chapter 3 5-149 3-21 3-22
The 5-foot wide crest was presented as part of a conceptual groin design that was based on the USACE Coastal Engineering Manual (CEM). A 10-foot wide crest for the groin stem is proposed for the project. Chapter 5 has been revised accordingly. Updated engineering drawings have been incorporated into Chapter 3 of the FEIS.
Page 5-36 of the DEIS states the Central Reach Project will occur in 2014/2015. This is not correct.
Vicki Myers Incorrect information Y Chapter 5 5-5 Acknowledged. FEIS has been revised accordingly.
There should be a table or section that compares the economics of the alternatives
Vicki Myers Tables Y Chapter 5 5-23 5-24
A comprehensive alternative cost comparison table has been added to the FEIS.
Information in charts does not match verbage. Ex.Alternative 6, page 5-156: “In present value terms, construction costs range from $15.24 million (6% discount rate) to approximately $23.43 million (2.5% discount rate),“ but table 5.17 on page 5-159 shows a present value of $21.97M – $36.32M.
Vicki Myers Tables not matching verbage Y Chapter 5
5-94 5-123 5-148 5-166
Acknowledged. Typographical errors have been corrected in the FEIS.
United States Department of the Interior
Emily Hughes
FISH AND WILDLIFE SERVICE Raleigh Field Office
Post Office Box 33726 Raleigh, North Carolina 27636-3726
October 2, 2015
Wilmington Regulatory Field Office U. S. Army Corps of Engineers 69 Darlington Ave. Wilmington, North Carolina 28403
Subject: Town of Holden Beach, Draft Environmentallmpact Statement for Terminal Groin USACE Action ill #SAW-2011-01914
Dear Ms. Hughes:
This is in response to your August 28, 2015 Public Notice, requesting comments on the Draft Environmental Impact Statement (DEIS) for the Town of Holden Beach. The Town of Holden Beach has applied for Department of Army (DA) authorization to construct a terminal groin and
conduct a long-term beach nourishment program along oceanfront beach in Brunswick County, North Carolina. The U.S. Fish and Wildlife Service, Raleigh Ecological Services office (Service) has reviewed the public notice and DEIS for the project and our comments are listed below. These comments are submitted in accordance with the Fish and Wildlife Coordination Act
(FWCA) (48 Stat 401, as amended; 16 U.S.C. 661-667d). Comments related to the FWCA are to be used in your determination of compliance with 404(b)(1) guidelines (40 CFR 230) and in your public interest review (33 CFR 320.4) in relation to the protectionoffish and wildlife resources. Additional comments are provided regarding the District Engineer's determination of project impacts pursuant to Section 7 of the Endangered Species Act (ESA) of 1973, as amended (16 U.S.C. 1531-1543).
Project Area, Proposed Activities, and Anticipated Impacts
The project area is the eastern end of Holden Beach and the adjacent Atlantic Ocean, and Lockwoods Folly Inlet The purpose of the project, as stated in the DEIS is "to reduce or
mitigate ongoing and chronic erosion at the East End of Holden Beach and to protect and secure public infrastructure, roads, homes, businesses, rental properties, beaches, recreational assets, and protective dunes."
Six alternatives are proposed: (1) No Action (Status-Quo), (2) Abandon and Retreat, (3) Beach Nourishment, (4) Inlet Management and Beach Nourishment, (5) Short Terminal Groin and
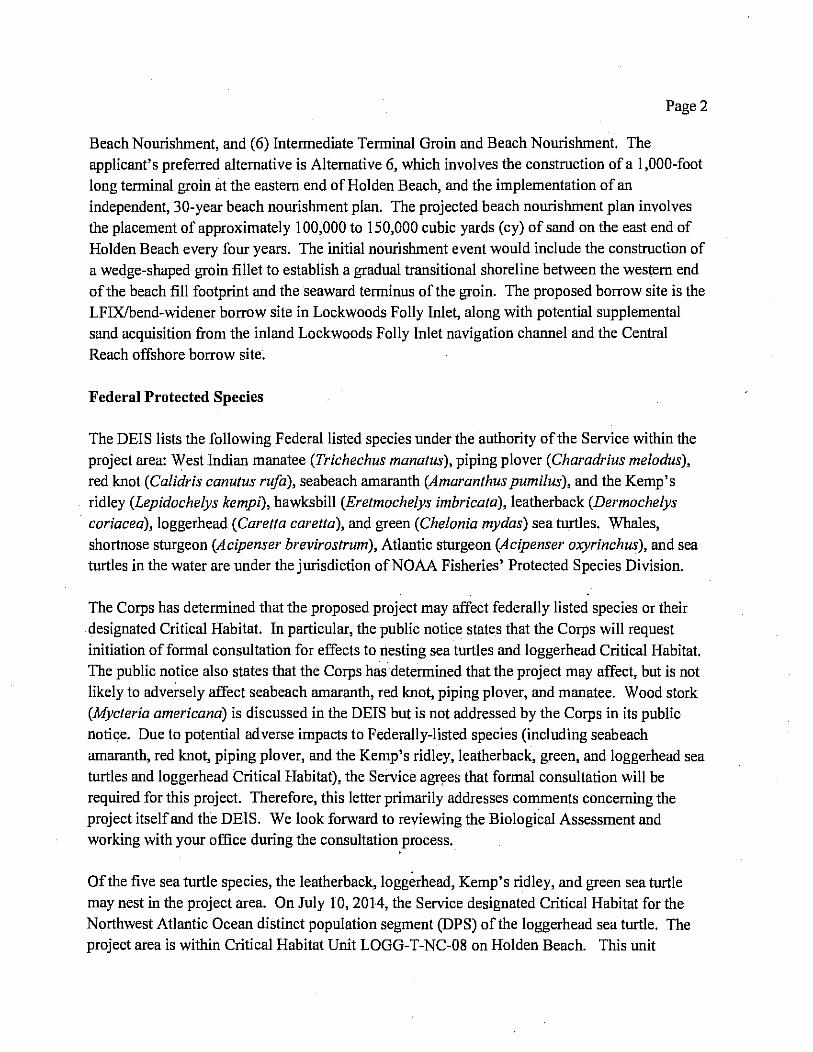
Page 2
Beach Nourishment, and (6) Intermediate Terminal Groin and Beach Nourishment. The applicant's preferred alternative is Alternative 6, which involves the construction of a 1,000-foot long terminal groin at the eastern end of Holden Beach, and the implementation of an
independent, 30-year beach nourishment plan. The projected beach nourishment plan involves the placement of approximately 100,000 to 150,000 cubic yards (cy) of sand on the east end of
Holden Beach every four years. The initial nourishment event would include the construction of a wedge-shaped groin fillet to establish a gradual transitional shoreline between the western end of the beach fill footprint and the seaward terminus of the groin. The proposed borrow site is the LFIXIbend-widener borrow site in Lockwoods Folly Inlet, along with potential supplemental sand acquisition from the inland Lockwoods Folly Inlet navigation channel and the Central
Reach offshore borrow site.
Federal Protected Species
The DEIS lists the following Federal listed species under the authority of the Service within the project area: West Indian manatee (Trichechus manatus), piping plover (Charadrius melodus), red knot (Calidris canutus rzlfa), seabeach amaranth (Amaranthus pumilus), and the Kemp's ridley (Lepidochelys kempi), hawksbill (Eretmochelys imbricata), leatherback (Dermochelys coriacea), loggerhead (Caretta caretta), and green (Chelonia mydas) sea turtles. Whales,
shortnose sturgeon (Acipenser brevirostrum), Atlantic sturgeon (Acipenser oxyrinchus), and sea turtles in the water are under the jurisdiction of NOAA Fisheries' Protected Species Division.
The Corps has determined that the proposed project may affect federally listed species or their designated Critical Habitat. In particular, the public notice states that the Corps will request initiation offormal consultation for effects to nesting sea turtles and loggerhead Critical Habitat. The public notice also states that the Corps has determined that the project may affect, but is not likely to adversely affect seabeach amaranth, red knot, piping plover, and manatee. Wood stork (Mycteria americana) is discussed in the DEIS but is not addressed by the Corps in its public notice. Due to potential adverse impacts to Federally-listed species (including seabeach amaranth, red knot, piping plover, and the Kemp's ridley, leatherback, green, and loggerhead sea
turtles and loggerhead Critical Habitat), the Service agr~es that formal consultation will be required for this project. Therefore, this letter primarily addresses comments concerning the project itself and the DEIS. We look forward to reviewing the Biological Assessment and working with your office during the consultationyrocess ..
Of the five sea turtle species, the leatherback, loggerhead, Kemp's ridley, and green sea turtle may nest in the project area. On July 10,2014, the Service designated Critical Habitat for the Northwest Atlantic Ocean distinct population segment (DPS) of the loggerhead sea turtle. The project area is within Critical Habitat Unit LOGG-T-NC-08 on Holden Beach. This unit
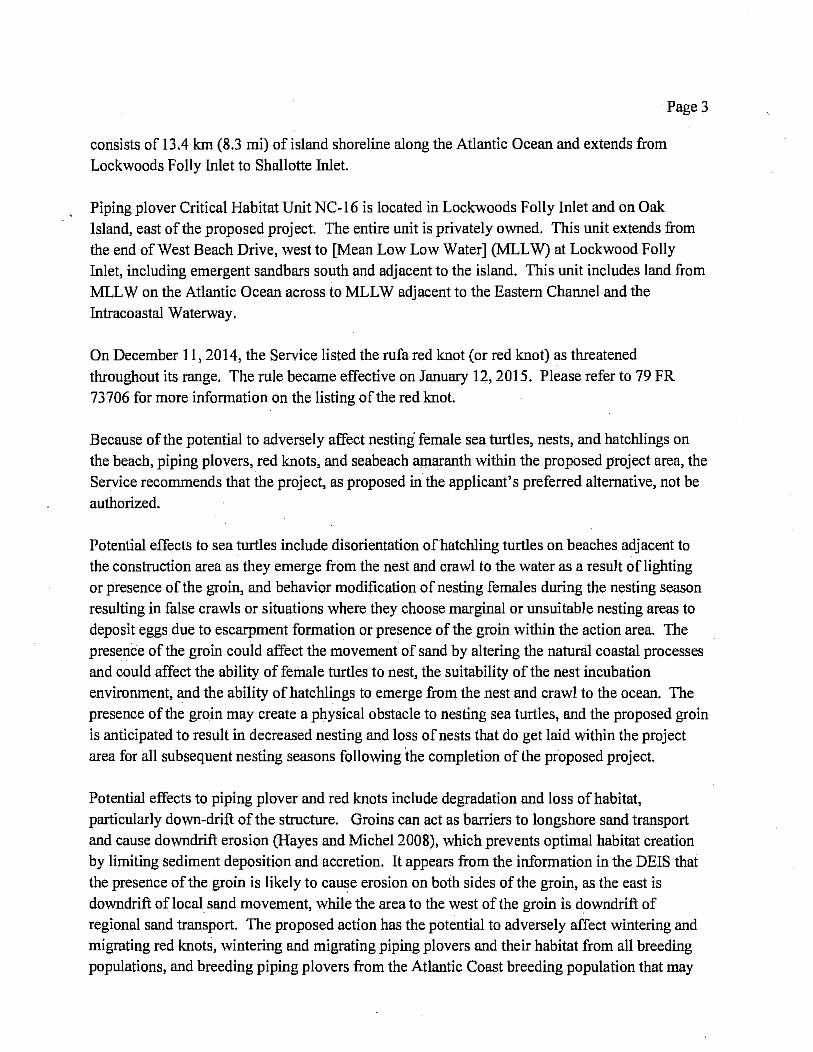
· Page 3
consists of 13.4 km (8.3 mi) of island shoreline along the Atlantic Ocean and extends from Lockwoods Folly Inlet to Shallotte Inlet.
Piping plover Critical Habitat Unit NC-16 is located in Lockwoods Folly Inlet and on Oak Island, east ofthe proposed project. The entire unit is privately owned. This unit extends from the end of West Beach Drive, west to [Mean Low Low Water] CMLL W) at Lockwood Folly Inlet, including emergent sandbars south and adjacent to the island. This unit includes land from MLL Won the Atlantic Ocean across to MLL W adjacent to the Eastern Channel and the Intracoastal Waterway.
On December 11, 2014, the Service listed the rufared knot Cor red knot) as threatened
throughout its range. The rule became effective on January 12,2015. Please refer to 79 FR 73706 for more information on the listing of the red knot.
Because of the potential to adversely affect nesting female sea turtles, nests, and hatchlings on the beach, piping plovers, red knots, and seabeach amaranth within the proposed project area, the Service recommends that the project, as proposed in the applicant's preferred alternative, not be authorized.
Potential effects to sea turtles include disorientation of hatchling turtles on beaches adjacent to the construction area as they emerge from the nest and crawl to the water as a result oflighting or presence of the groin, and behavior modification of nesting females during the nesting season
resulting in false crawls or situations where they choose marginal or unsuitable nesting areas to deposit eggs due to escarpment formation or presence of the groin within the action area. The presence of the groin.could affect the movement of sand by altering the natural coastal processes and could affect the ability of female turtles to nest, the suitability of the nest incubation environment, and the ability of hatchlings to emerge from the nest and crawl to the ocean. The presence of the groin may create a physical obstacle to nesting sea turtles, and the proposed groin is anticipated to result in decreased nesting and loss of nests that do get laid within the project area for all subsequent nesting seasons following the completion of the proposed project.
Potential effects to piping plover and red knots include degradation and loss of habitat, particularly down-drift ofthe structure. Groins can act as barriers to longshore sand transport and cause downdrift erosion (Hayes and Michel 2008), which prevents optimal habitat creation by limiting sediment deposition and accretion. It appears from the information in the DEIS that the presence of the groin is likely to cause erosion on both sides of the groin, as the east is downdrift oflocal sand movement, while the area to the west of the groin is downdrift of regional sand transport. The proposed action has the potential to adversely affect wintering and migrating red knots, wintering and migrating piping plovers and their habitat from all breeding populations, and breeding piping plovers from the Atlantic Coast breeding population that may

Page 4
use the project area. Potential effects to piping plovers and red knots include direct loss of foraging and roosting habitat in the Action Area and in the updrift and downdrift portions of the project area, degradation of foraging habitat and destruction of the prey base from sand disposal, and attraction of predators due to food waste from increased use of the area during and following construction. Plovers and red knots face predation by avian and mammalian predators that are present year-round on the wintering and nesting grounds. Although the piping plover is not
currently known to nest in the Action Area, the stabilization of the shoreline may also result in less suitable nesting habitat for all shorebirds, including the piping plover.
Structural development along the shoreline and manipulation of natural inlets upset the naturally dynamic coastal processes and result in loss or degradation of beach habitat (Melvin et al. 1991). As beaches narrow, the reduced habitat can directly lower the diversity and abundance of biota, especially in the upper intertidal zone. Shorebirds may be impacted both by reduced habitat area for roosting and foraging, and by declining intertidal prey resources (Defeo et al. 2009; Dugan and Hubbard 2006). Shorebird habitat has been, and may continue to be, lost where hard
structures have been built (Clark in Farrell and Martin 1997). In addition to directly eliminating red knot habitat, hard structures interfere with the creation of new shorebird habitats by interrupting the natural processes of overwash and inlet formation. Where hard stabilization is installed, the eventual loss of the beach and its associated habitats is virtually assured (Rice 2009), absent beach nourishment, whlch may also impact piping plover and red knots. Where they are maintained, hard structures are likely to significantly increase the amount of piping plover and red knot habitat lost as sea levels continue to rise.
Potential impacts to seabeach amaranth include burying, trampling, or injuring plants as a result
of construction operations and/or sediment disposal activities; burying seeds to a depth that would prevent future germination as a result of construction operations and/or sediment disposal activities; and, destruction of plants by trampling or breaking as a result of increased recreational activities. The Applicant proposes to place sand between November 15 and March 31 of any
given year. However, given favorable weather, seabeach amaranth plants may persist until January. Therefore, there is still the potential for sand placement to adversely impact plants in the Action Area. Indirect impacts to seabeach amaranth include degradation of habitat from stabilization ofthe shoreline.
General Comments
1. Alternatives Analysis
In multiple places throughout the DEIS and Appendices, a strong net transport of sand from east to west is identified as a significant erosion factor. Appendix C of the DEIS, the Draft Inlet Management Plan (DIMP), states on Page D-Il that in a regional net transport sense, Holden
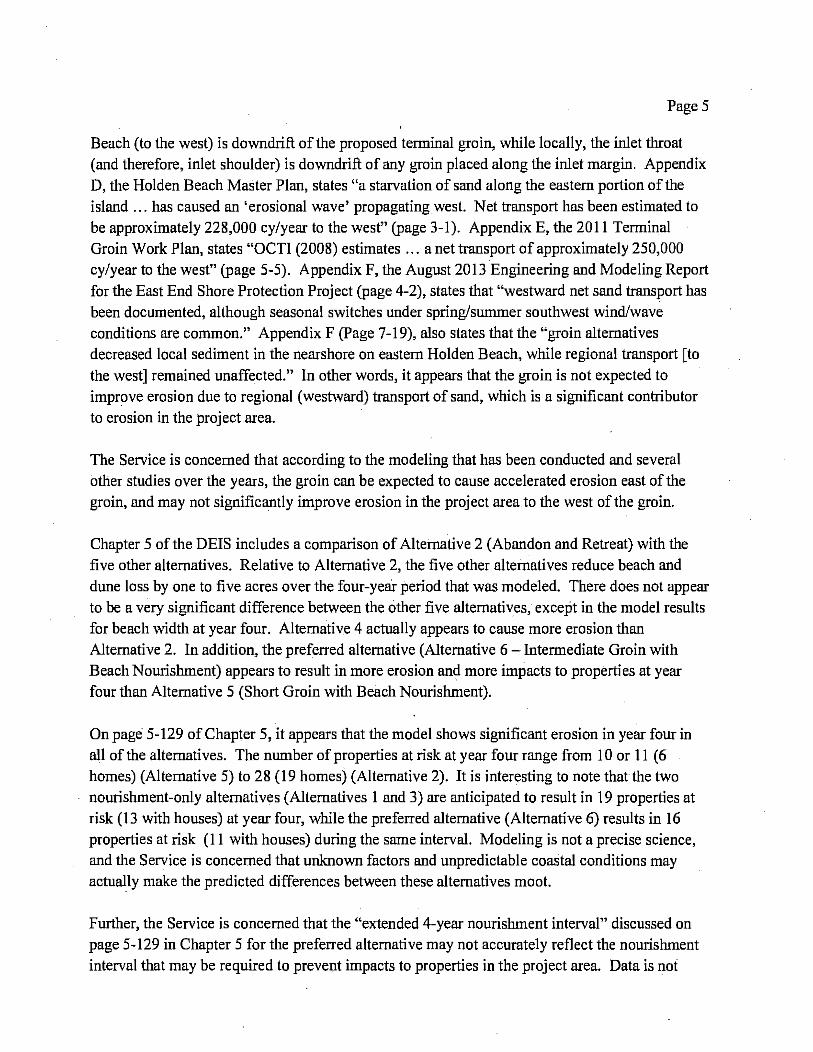
Page 5
Beach (to the west) is downdrift of the proposed tenninal groin, while locally, the inlet throat (and therefore, inlet shoulder) is downdrift of any groin placed along the inlet margin. Appendix
D, the Holden Beach Master Plan, states "a starvation of sand along the eastern portion of the island ... has caused an 'erosional wave' propagating west. Net transport has been estimated to be approximately 228,000 cy/year to the west" (page 3-1). Appendix E, the 2011 Tenninal Groin Work Plan, states "OCT! (2008) estimates ... a net transport of approximately 250,000 cy/year to the west" (page 5-5). Appendix F, the August 2013 Engineering and Modeling Report for the East End Shore Protection Project (page 4-2), states that "westward net sand transport has been documented, although seasonal switches under spring/summer southwest wind/wave conditions are conunon." Appendix F (Page 7-19), also states that the "groin alternatives decreased local sediment in the nearshore on eastern Holden Beach, while regional transport [to
the west] remained unaffected." In other words, it appears that the groin is not expected to improve erosion due to regional (westward) transport of sand, which is a significant contributor to erosion in the project.area.
The Service is concerned that according to the modeling that has been conducted and several other studies over the years, the groin can be expected to cause accelerated erosion east of the groin, and may not significantly improve erosion in the project area. to the west of the groin.
Chapter 5 of the DEIS includes a comparison of Alternative 2 (Abandon and Retreat) with the five other alternatives. Relative to Alternative 2, the five other alternatives reduce beach and dune loss by one to five acres over the four-year period that was modeled. There does not appear
to be a very significant difference between the other five alternatives, except in the model results for beach width at year four. Alternative 4 actually appears to cause more erosion than Alternative 2. In addition, the preferred alternative (Alternative 6 - Intennediate Groin with Beach Nourishment) appears to result in more erosion and more impacts to properties at year four than Alternative 5 (Short Groin with Beach Nourishment).
On page 5-129 of Chapter 5, it appears that the model shows significant erosion in year four in all of the alternatives. The number of properties at risk at year four range from 10 or 11 (6 homes) (Alternative 5) to 28 (19 homes) (Alternative 2). It is interesting to note that the two nourishment-only alternatives (Alternatives 1 and 3) are anticipated to result in 19 properties at risk (13 with houses) at year four, while the preferred alternative (Alternative 6) results in 16 properties at risk (11 with houses) during the same interval. Modeling is not a precise science, and the Service is concerned that unknown factors and unpredictable coastal conditions may actually make the predicted differences between these alternatives moot.
Further, the Service is concerned that the "extended 4-year nourishment interval" discussed on page 5-129 in Chapter 5 for the preferred alternative may not accurately reflect the nourishment interval that may be required to prevent impacts to properties in the project area. Data is not
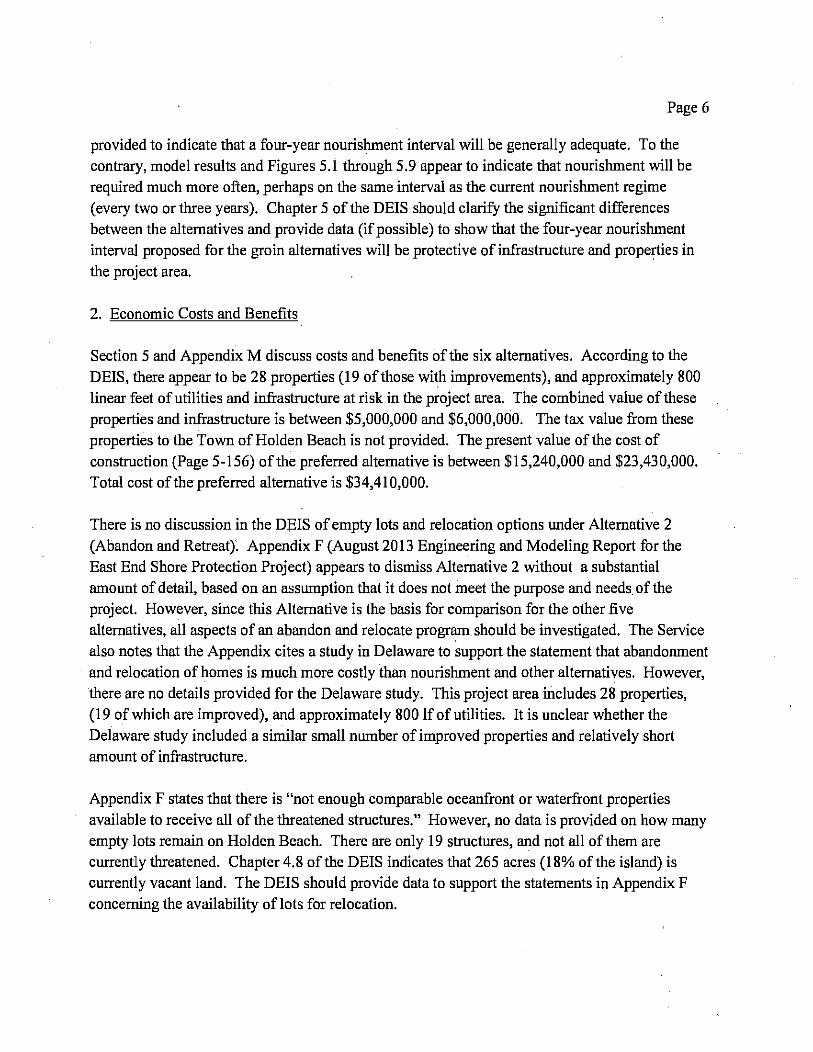
Page 6
provided to indicate that a four-year nourishment interval will be generally adequate. To the contrary, model results and Figures 5.1 through 5.9 appear to indicate that nourishment will be required much more often, perhaps on the same interval as the current nourishment regime
(every two or three years). Chapter 5 of the DEIS should clarify the significant differences between the alternatives and provide data (if possible) to show that the four-year nourishment interval proposed for the groin alternatives will be protective of infrastructure and properties in the project area.
2. Economic Costs and Benefits
Section 5 and Appendix M discuss costs and benefits of the six alternatives. According to the DEIS, there appear to be 28 properties (19 of those with improvements), and approximately 800 linear feet of utilities and infrastructure at risk in the project area. The combined value of these
properties and infrastructure is between $5,000,000 and $6,000,000. The tax value from these properties to the Town of Holden Beach is not provided. The present value of the cost of construction (page 5-156) of the preferred alternative is between $15,240,000 and $23,430,000. Total cost of the preferred alternative is $34,410,000.
There is no discussion in the DEIS of empty lots and relocation options under Alternative 2 (Abandon and Retreat). Appendix F (August 2013 Engineering and Modeling Report for the East End Shore Protection Project) appears to dismiss Alternative 2 without a substantial amount of detail, based on an assumption that it does not meet the purpose and needs of the project. However, since this Alternative is the basis for comparison for the other five alternatives, all aspects of an abandon and relocate program should be investigated. The Service
also notes that the Appendix cites a study in Delaware to support the statement that abandonment and relocation of homes is much more costly than nourishment and other alternatives. However, there are no details provided for the Delaware study. This project area includes 28 properties, (19 of which are improved), and approximately 800 If of utilities. It is unclear whether the Delaware study included a similar small number of improved properties and relatively short amount of infrastructure.
Appendix F states that there is "not enough comparable oceanfront or waterfront properties available to receive all of the threatened structures." However, no data is provided on how many empty lots remain on Holden Beach. There are only 19 structures, and not all of them are currently threatened. Chapter 4.8 of the DEIS indicates that 265 acres (18% of the island) is currently vacant land. The DEIS should provide data to support the statements in Appendix F concerning the availability oflots for relocation.

Page 7
3. Sea Level Rise and Nourishment Intervals
A nourishment schedule of four years is proposed for the preferred alternative. However, it appears from the DEIS that at the end of four years, erosion is expected to impact 16 properties (11 buildings) and 130 If of utilities (for the preferred alternative). Erosion does not happen in a controlled, even fashion, but often as a result of storm events. The Service is concerned that a four-year nourishment schedule will not be adequate, and that, regardless of the presence of a
groin, a two- or three-year nourishment schedule will be needed to prevent impacts to infrastructure and properties. The Service would be concerned with the acceleration of nourishment schedules based upon increased storm surge or sea level rise, or other factors.
4. For Alternatives 1,3,4,5, and 6, the description should include the length of beach that is proposed for nourishment. Currently, Alternative :3 appears to be the only one with a clear statement of the length of beach proposed for nourishment.
5. Chapter 5, page 5-44: Please note that the red knot was listed on December 11,2014 as threatened throughout its range.
6. Chapter 5, page 5-62: Please note that Critical Habitat was designated on July 10,2014 for
the Northwest Atlantic DPS of the loggerhead sea turtle.
7. Chapter 5, all alternatives: please indicate whether sandbags are anticipated to remain in front of properties, or whether the sandbags will be removed.
8. Chapter 6, page 6-2 indicates that the initial nourishment includes the construction of a sand fillet. However, the figures in Chapter 5 do not appear to show a sand fillet in the groin alternatives.
9. The Service appreciates the Town's involvement in the shorebird monitoring for the Eastern Channel project. We note that with respect to this proposed project, the Service will examine the adequacy of that effort during formal consultation and determine whether additional monitoring should be required.
Page 8
Summary of Service Recommendations
Based upon our concerns outlined above for potential impacts to our trust resources, at this time
the Service reconunends denial of the Corps permit for the project as proposed. In particular, the Service is concerned that according to the modeling and several other studies, the groin can be expected to cause accelerated erosion east of the groin, and may not significantly improve erosion in the project area to the west of the groin. We look forward to working with the Corps and the applicant to address our concerns. Thank you for the opportunity to conunent on this project. We look forward to working with you. If you have any questions or conunents, please
contact Kathy Matthews at 919-856-4520, x27.
Sincerely yours,
(,~f=~"'tr'll Y Field Supervisor
Raleigh Ecological Services Office
cc: Fritz Rohde, NMFS, Beaufort, NC Maria Dunn, NCWRC, Washington, NC Doug Huggett, NCDCM, Morehead City, NC
Dan Holliman, USEP A Todd Bowers, USEPA
References:
Defeo, 0., A. McLachlan, D.S. Schoeman, T.A. Schlacher, J. Dugan, A. Jones, M. Lastra, and F. Scapini. 2009. Threats to sandy beach ecosystems: a review. Estuarine, Coastal "and Shelf Science 81:1-12 .
. Dugan and Hubbard. 2006. Ecological responses to coastal armoring on exposed sandy beaches. Journal of the American Shore and Beach Preservation Association. Winter. Volume 74, No.1.
Farrell, J.G., and C.S. Martin. 1997. Proceedings of the Horseshoe Crab Forum: Status of the resource. University of Delaware, Sea Grant College Program, Newark, Delaware.
Hayes, M.O. and J. Michel. 2008. A coast for all seasons: A naturalist's guide to the coast of South Carolina. Pandion Books, Columbia, South Carolina. 285 pp.

Page 9
Melvin, S.M., C.R. Griffin, and L.H. MacIvor. 1991. Recovery strategies for piping plovers in Managed coastal landscapes. Coastal Management 19: 21-34.
Rice, T.M. 2009. Best management practices for shoreline stabilization to avoid and minimize . adverse environmental impacts. Unpublished report prepared for the USFWS, Panama
City Ecological Services Field Office, Available at http://www.fws.gov/charleston/pdfJPIPLlBMPs%20For%20Shoreline%20Stabilization% 20To%20Avoid%20And%20Minimize%20Adverse%20Environmental%20Irnpacts.pdf.
UNITED STATES ENVIRONMENTAL PROTECTION AGENCY REGION 4
ATLANTA FEDERAL CENTER 61 FORSYTH STREET
ATLANTA, GEORGIA 30303-8960
October 13,2015
Mr. Scott McLendon Chief, Wilmington Regulatory Division Department of the Army Wilmington District, US Army Corps of Engineers 69 Darlington Avenue Wilmington, NC 28403
Subject: Draft Environmental Impact Statement (DEIS) for Holden Beach East End Shore Protection Project, Holden Beach, NC; CEQ Number: 20150243; ERP Number:COE-E30047-NC; CEQ Federal Register Date: 08128/2015
Dear Mr. McLendon:
Pursuant to Section 309 of the Clean Air Act and Section 102(2)(C) of the National Environmental Policy Act (NEPA), the EPA Region 4 Office has reviewed the Draft Environmental Impact Statement (DEIS) for the Holden Beach Shoreline Protection Project. This DEIS features an evaluation of the environmental consequences of a proposed protection project of the barrier island of Holden Beach which is eight miles long. The EPA notes that Holden Beach Island is located west ofthe Cape Fear River and has an east-west orientation, facing Long Bay and the open Atlantic Ocean to the south, and separated from mainland Brunswick County to the north by tidal marshes and the Atlantic Intracoastal Waterway (AIWW). Holden Beach is located along the eastern portion of Brunswick County. The island was incorporated in 1969 and has a current year-round resident population of approximately 575, with a seasonal population of over 10,000. The Town of Holden Beach is seeking Federal and state permits to allow for the construction of a 30-year shoreline protection project that would serve to mitigate chronic erosion experienced along the eastern portion on the Town's oceanfront shoreline. The purpose of the project is to protect and secure public infrastructure, roads, homes, businesses, beaches, recreational assets, and its protective dunes.
Previously, a temporary terminal groin field was constructed in the 1970s along the East End of Holden Beach due to extreme erosion. Although the groin field was successful and economical, the temporary nature ofthe nylon material and the lack of ongoing sand nourishment activities limited its long-term effectiveness. According to the DEIS, the Town sponsored projects have collectively placed 825,900 cubic yards (cy) of beach compatible material on the oceanfront shoreline, primarily to the east of station 110+00. The Town has not implemented any beach fill projects on the East End but instead has relied on United States Army Corps of Engineers' (USACE) navigation maintenance dredging projects for East End sand placement.
Internet Address (URL) • hltp:l/www,epa,gov
Recycled/Recyclable. Printed with Vegetable Oil Based Inks on Recycled Paper (Minimum 30% Postconsumer)
The EPA notes that the DEIS appropriately includes a section on "purpose and need" for the Proposed Action and that is to establish a comprehensive shoreline protection program. Furthermore, the program is to be under the independent authority of the Town of Holden Beach which will restore and maintain the East End beach and provide for the short- and long-term protection of residential structures, Town infrastructure, and recreational assets. The Proposed Action is needed to mitigate ongoing and chronic East End shoreline erosion which is projected to continue for the foreseeable future and that it threatens residential structures, Town infrastructure, recreational assets, and natural resources. Based upon our review ofthe DEIS, we have provided detailed comments in an attachment to this letter (See Attachment A).
Based upon the EPA's review, a NEPA rating ofEC- 2 has been assigned to this DEIS, meaning that we have environmental concerns and have requested that the FEIS include updated information (where available) on a number of environmental issues. The DEIS did not provide a full analysis of potential Greenhouse gas (GHG) emissions and climate change effects. The EPA also has environmental concerns for water quality impacts that may result from the proposed project. If you have any questions, please contact Mr. Larry Gissentanna of my staff at [email protected] or (404) 562-8248.
Attachment: Detailed comments
Sincerely,
/);7,') ~J~ Christopher A. Militscher Chief, NEP A Program Office Resource Conservation and Restoration Division
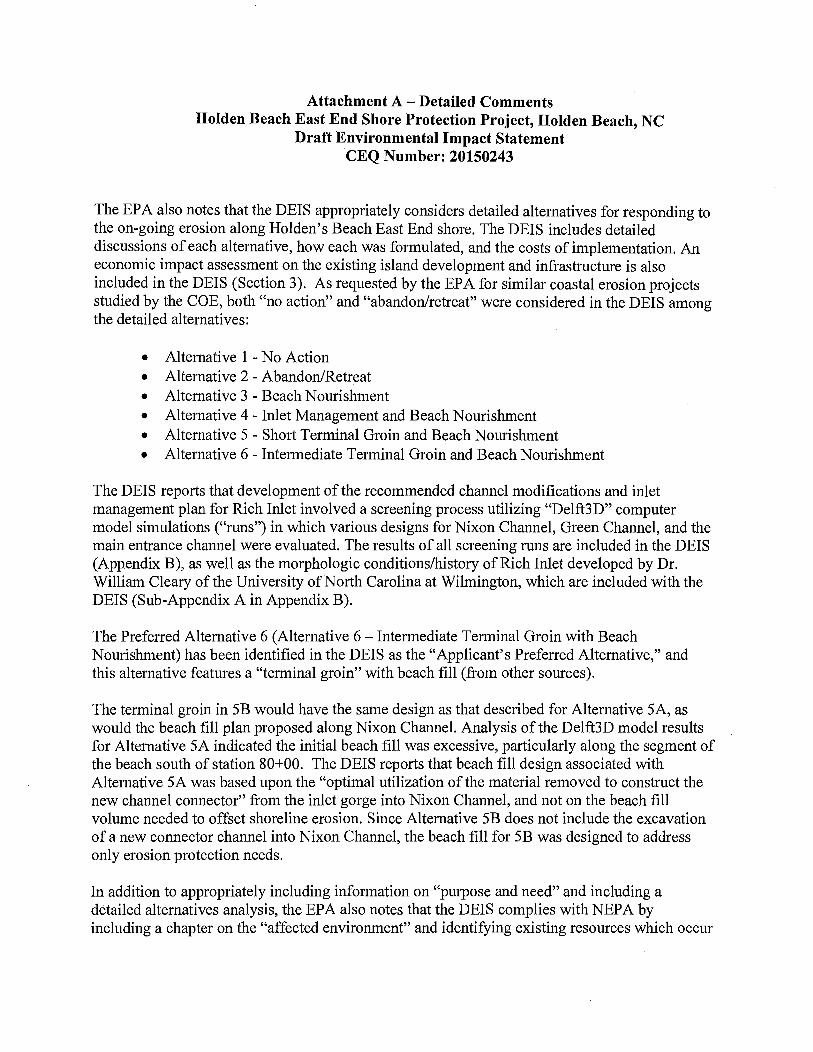
Attachment A - Detailed Comments Holden Beach East End Shore Protection Project, Holden Beach, NC
Draft Environmental Impact Statement CEQ Number: 20150243
The EPA also notes that the DEIS appropriately considers detailed alternatives for responding to the on-going erosion along Holden's Beach East End shore. The DEIS includes detailed discussions of each alternative, how each was formulated, and the costs of implementation. An economic impact assessment on the existing island development and infrastructure is also included in the DEIS (Section 3). As requested by the EPA for similar coastal erosion projects studied by the COE, both "no action" and "abandon/retreat" were considered in the DEIS among the detailed alternatives:
• Alternative 1 - No Action • Alternative 2 - Abandon/Retreat • Alternative 3 - Beach Nourishment • Alternative 4 - Inlet Management and Beach Nourishment • Alternative S - Short Terminal Groin and Beach Nourishment • Alternative 6 - Intermediate Terminal Groin and Beach Nourishment
The DEIS reports that development of the recommended channel modifications and inlet management plan for Rich Inlet involved a screening process utilizing "Delft3D" computer model simulations ("runs") in which various designs for Nixon Channel, Green Channel, and the main entrance channel were evaluated. The results of all screening runs are included in the DEIS (Appendix B), as well as the morphologic conditions/history of Rich Inlet developed by Dr. William Cleary of the University of North Carolina at Wilmington, which are included with the DEIS (Sub-Appendix A in Appendix B).
The Preferred Alternative 6 (Alternative 6 - Intermediate Terminal Groin with Beach Nourishment) has been identified in the DEIS as the "Applicant's Preferred Alternative," and this alternative features a "terminal groin" with beach fill (from other sources).
The terminal groin in SB would have the same design as that described for Alternative SA, as would the beach fill plan proposed along Nixon Channel. Analysis of the Delft3D model results for Alternative SA indicated the initial beach fill was excessive, particularly along the segment of the beach south of station 80+00. The DEIS reports that beach fill design associated with Alternative SA was based upon the "optimal utilization of the material removed to construct the new channel connector" from the inlet gorge into Nixon Channel, and not on the beach fill volume needed to offset shoreline erosion. Since Alternative SB does not include the excavation of a new connector channel into Nixon Channel, the beach fill for SB was designed to address only erosion protection needs.
In addition to appropriately including information on "purpose and need" and including a detailed alternatives analysis, the EPA also notes that the DEIS complies with NEP A by including a chapter on the "affected environment" and identifying existing resources which occur
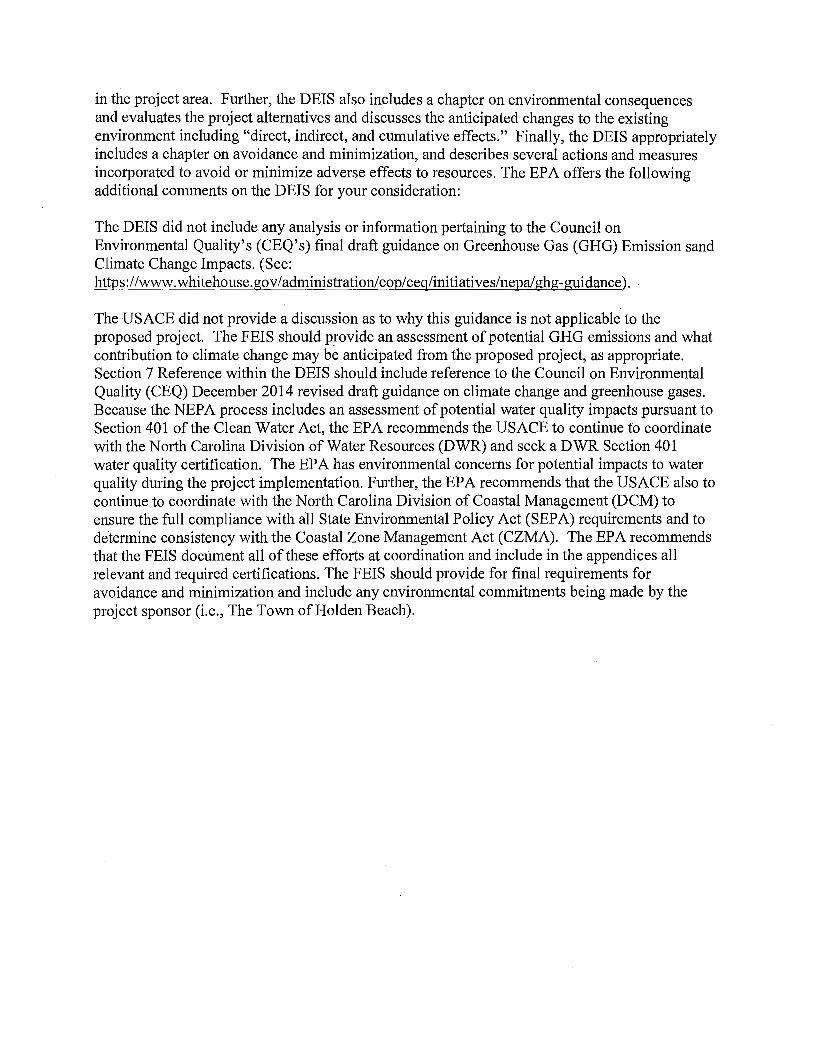
in the project area. Further, the DEIS also includes a chapter on environmental consequences and evaluates the project alternatives and discusses the anticipated changes to the existing environment including "direct, indirect, and cumulative effects." Finally, the DEIS appropriately includes a chapter on avoidance and minimization, and describes several actions and measures incorporated to avoid or minimize adverse effects to resources. The EPA offers the following additional comments on the DEIS for your consideration:
The DEIS did not include any analysis or information pertaining to the Council on Environmental Quality's (CEQ's) final draft guidance on Greenhouse Gas (GHG) Emission sand Climate Change Impacts. (See: https://www. whitehouse.gov / administrationleop/ ceq/initiatives/nepal ghg -guidance).
The USACE did not provide a discussion as to why this guidance is not applicable to the proposed project. The FEIS should provide an assessment of potential GHG emissions and what contribution to climate change may be anticipated from the proposed project, as appropriate. Section 7 Reference within the DEIS should include reference to the Council on Environmental Quality (CEQ) December 2014 revised draft guidance on climate change and greenhouse gases. Because the NEP A process includes an assessment of potential water quality impacts pursuant to Section 401 of the Clean Water Act, the EPA recommends the USACE to continue to coordinate with the North Carolina Division of Water Resources (DWR) and seek a DWR Section 401 water quality certification. The EPA has environmental concerns for potential impacts to water quality during the project implementation. Further, the EPA recommends that the USACE also to continue to coordinate with the North Carolina Division of Coastal Management (DCM) to ensure the full compliance with all State Environmental Policy Act (SEP A) requirements and to determine consistency with the Coastal Zone Management Act (CZMA). The EPA recommends that the FEIS document all of these efforts at coordination and include in the appendices all relevant and required certifications. The FEIS should provide for final requirements for avoidance and minimization and include any environmental commitments being made by the project sponsor (i.e., The Town of Holden Beach).

United States Department of the Interior OFFICE OF THE SECRETARY
Office of Environmental Policy and Compliance Richard B. Russell Federal Building
75 Ted Turner Drive, S.W., Suite 1144 Atlanta, Georgia 30303
ER 15/0475 9043.1
October 7, 2015
Mrs. Emily Hughes Wilmington District Regulatory Division U. S. Army Corps of Engineers 69 Darlington Ave. Wilmington, NC 28403 -1343 Attn: File Number SAW-2011-0194
Re: Comments on the Draft Environmental Impact Statement, Department of Defense, Department of the Army, Corps of Engineers, Installation of a Terminal Groin Structure at the Eastern End of Holden Beach
Dear Mrs. Hughes: The U.S. Department of the Interior (Department) has reviewed the Draft Environmental Impact Statement (DEIS), Department of Defense, Department of the Army, Corps of Engineers, Installation of a Terminal Groin Structure at the Eastern End of Holden Beach, extending into the Atlantic Ocean, west of Lockwood Folly Inlet located in Brunswick County, North Carolina. We have no comments at this time. Thank you for the opportunity to comment on this project. I can be reached via email at [email protected] or on (404) 331-4524. Sincerely,
Joyce Stanley, MPA Regional Environmental Protection Specialist cc: Christine Willis – FWS Gary Lecain – USGS Anita Barnett – NPS Robin Ferguson – OSMRE Chester McGhee – BIA OEPC – WASH

Scott C. McLendon Chief, Regulatory Division Wilmington District Corps of Engineers Department of the Army 69 Darlington Avenue Wilmington, North Carolina 28403-1343
Dear Mr. McLendon:
UNITED STATES DEPARTMENT OF COMMERCE National Oceanic and Atmospheric Administration NATIONAL MARINE FISHERIES SERVICE Southeast Regional Office 263 13th Avenue South SI. Petersburg, Florida 33701·5505 htlp:/Isero.nmfs.noaa.gov
AlfG 3~ 0 rom
F /SER31 :KBD
This letter responds to your request for consultation with us, the National Marine Fisheries Service (NMFS), pursuant to Section 7 of the Endangered Species Act (ESA) for the following action.
Permit Number Applicant SERNumber Project Type
SAW-2011-01914 Town of Holden SER-2016-17731 Terminal groin Beach, North construction and Carolina beach nourishment
Consultation History We received your letter and Biological Assessment (BA) requesting consultation on January 27, 2016. We received a revised BA on February 10,2016, and initiated consultation that day
P tL f rOJec oca IOn Address Latitude/Longitude Water body Holden Beach Island, 33.9146°N, 78.2439°W (North Lockwoods Folly Brunswick County, North American Datum 1983) Inlet, Atlantic Ocean Carolina
Existing Site Conditions The project area includes the east end of Holden Beach Island, Lockwoods Folly Inlet, and the Central Reach offshore borrow site that is located 1.8 -3 miles offshore. The purpose of the proposed project is to implement a shore protection project to provide protection to residential structures, infrastructure, and recreational assets. It consists of a 30-year beach nourishment plan and construction of a terminal groin. Chronic erosion has contributed to dune breaching and flooding along the east end of the island and the loss of approximately 27 oceanfront properties since 1993. Sediments in the proj ect area generally consist of sands, silts, and clays occurring in various mixtures. No seagrasses or corals are present.
Figure 1. Holden Beach Island and Lockwoods Folly Inlet project area «©20 16 GoogleEarth)
Project Description The project includes the construction of a terminal groin perpendicular to the shore at the east end of Holden Beach Island, nourishment of the beach using sand from dredging the Atlantic Intracoastal Waterway (AIWW) at the Lockwoods Folly Inlet or obtaining sand from the Central Reach offshore borrow site .. and renourishment every 4 years during a 3D-year period. The Central Reach offshore borrow site is not the preferred source of sand due to the high cost of mobilizing an ocean-certified dredge. The purpose of the project is to mitigate chronic erosion on the east end of Holden beach that threatens residences, infrastructure, and recreational assets. The construction of the groin and beach nourishment are designed to address tidal currentinduced shoreline changes associated with the continuous ebb channel alignment.
2

NOTES I CONCEPTUAl LAYOUTS ONLY FINAL DESIGN V>1LL BE BASED I .... ~..,""'" .... ON eXISTING SITE CONDITIONS AT TIME OF PROJECT 2. DATE 0 ; AERIAL PHOTOGRAPIIS JANUARY~ AP~IL 201<
Ahcrnalh'c 11 Conccpl- Inlermediale rerminal Groin and Beach Nourishment
LOCKWOODS FOLLY IN~ET:
Figure 2. Proposed groin construction and nourishment area (ATM 2016)
The groin would be 1,000 feet (ft) long and would have a 120-ft-Iong terminal end in the ocean. It would consist of a 700-ft-Iong segment extending seaward and a 300-ft anchor segment extending landward from the toe of the primary dune. The 700 ft segment would be constructed of rock rubble and would have a crest width of approximately 5 ft and a geo-textile base layer with a width of approximately 40-45 ft. The groin would be composed of loosely placed armor stone on top of a foundation mat or mattress with a crest elevation of +5 ft NA YD. The 4-5 ft diameter armor stone would facilitate the movement of littoral material through the structure while the relative low crest elevation would allow some sediment to pass over the structure during periods of high tide. The groin would be constructed entirely from shore.
The beach nourishment would consist of the placement of 100,000 to 150,000 cubic yards (cy) of sand every 4 years along approximately 0.75 mile of shoreline. The nourishment sand would be dredged from the AIWW where it crosses Lockwoods Folly Inlet or from within the Lockwoods Folly Inlet navigation channel or possibly would be excavated from the existing Central Reach offshore borrow. A cutterhead dredge would be used to excavate the sand required for the nourishment. The sand would be transported to the beachfront via a submerged pipeline. Hopper dredges would be used if the sand is excavated from the Central Reach offshore borrow site.
3
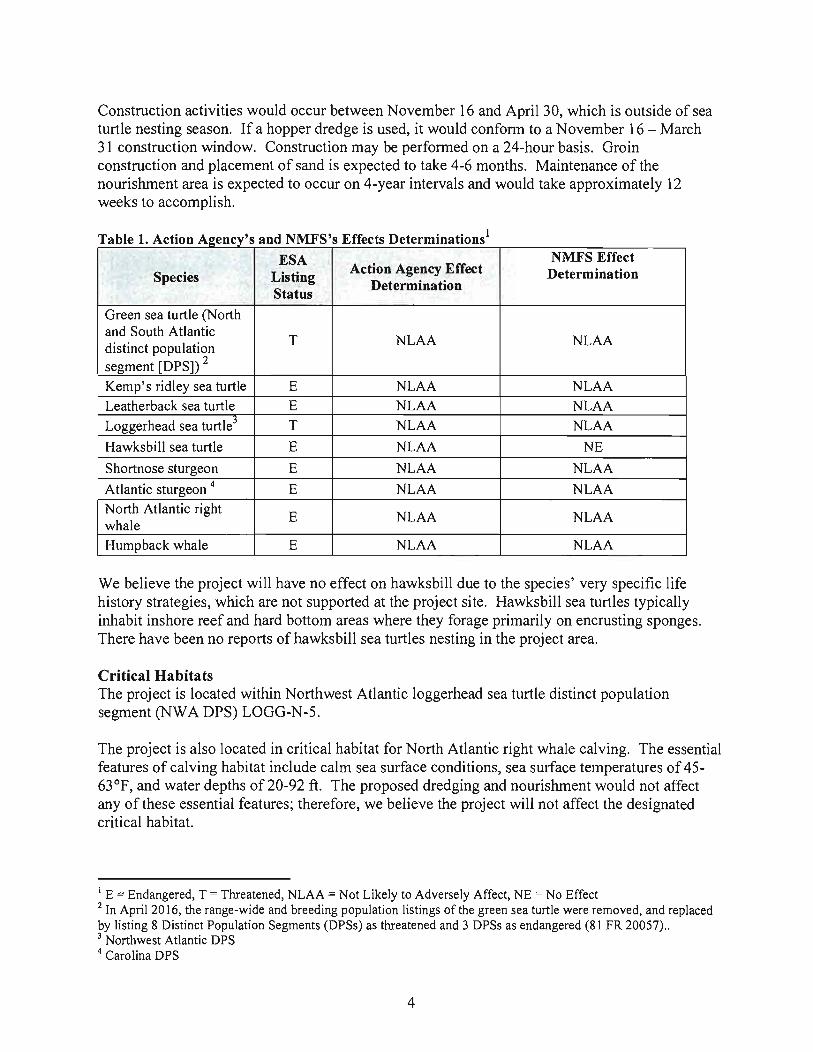
Construction activities would occur between November 16 and April 30, which is outside of sea turtle nesting season. If a hopper dredge is used, it would conform to a November 16 - March 31 construction window. Construction may be performed on a 24-hour basis. Groin construction and placement of sand is expected to take 4-6 months. Maintenance of the nourishment area is expected to occur on 4-year intervals and would take approximately 12 weeks to accomplish.
T bl 1 A· A a e . chon .gencys an d NMFS' Effi s ects D etermmatlOns
ESA NMFS Effect Species Listing
Action Agency Effect Determination Status
Determination
Green sea turtle (North and South Atlantic
T NLAA NLAA distinct population segment [DPSD 2
Kemp's ridley sea turtle E NLAA NLAA
Leatherback sea turtle E NLAA NLAA
Loggerhead sea turtle3 T NLAA NLAA
Hawksbill sea turtle E NLAA NE
Shortnose sturgeon E NLAA NLAA
Atlantic sturgeon 4 E NLAA NLAA North Atlantic right
E NLAA NLAA whale Humpback whale E NLAA NLAA
We believe the project will have no effect on hawksbill due to the species' very specific life history strategies, which are not supported at the project site. Hawksbill sea turtles typically inhabit inshore reef and hard bottom areas where they forage primarily on encrusting sponges. There have been no reports of hawksbill sea turtles nesting in the project area.
Critical Habitats The project is located within Northwest Atlantic loggerhead sea turtle distinct population segment (NWA DPS) LOGG-N-5.
The project is also located in critical habitat for North Atlantic right whale calving. The essential features of calving habitat include calm sea surface conditions, sea surface temperatures of 45-63 OF, and water depths of 20-92 ft. The proposed dredging and nourishment would not affect any of these essential features; therefore, we believe the project will not affect the designated critical habitat.
IE = Endangered, T '= Threatened, NLAA = Not Likely to Adversely Affect, NE = No Effect 2 In April 2016, the range-wide and breeding population listings of the green sea turtle were removed, and replaced by listing 8 Distinct PopUlation Segments (DPSs) as threatened and 3 DPSs as endangered (81 FR 20057) .. 3 Northwest Atlantic DPS 4 Carolina DPS
4
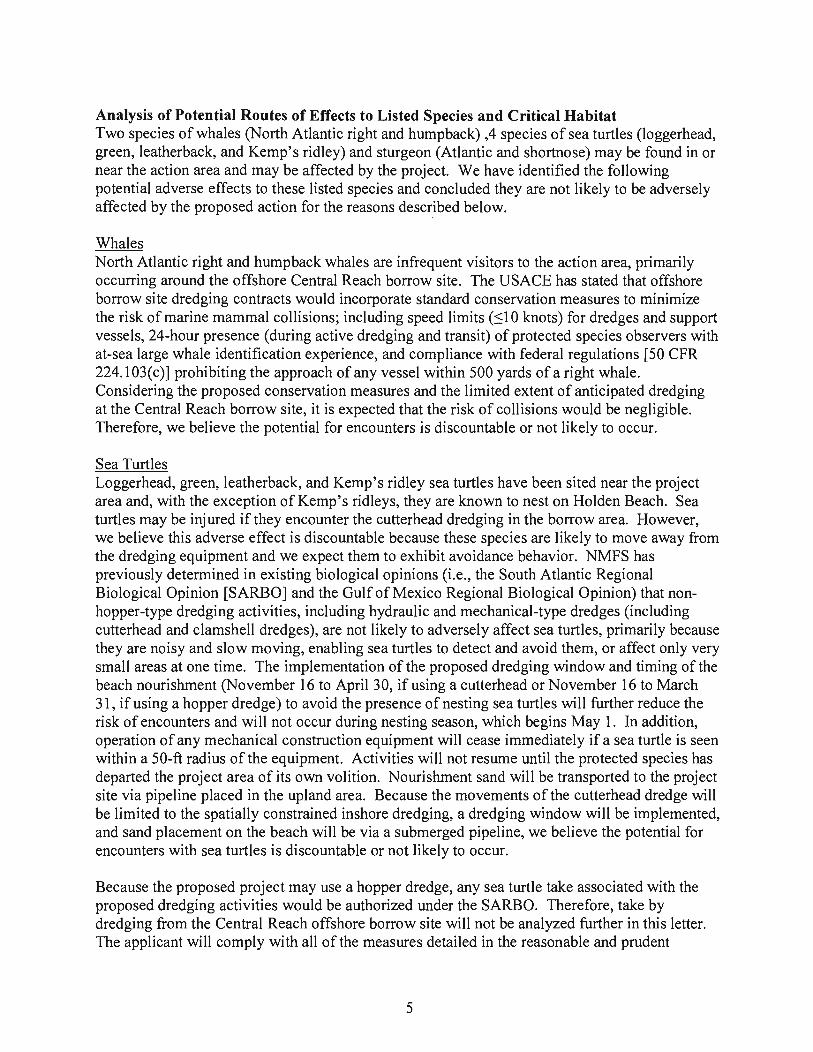
Analysis of Potential Routes of Effects to Listed Species and Critical Habitat Two species of whales (North Atlantic right and humpback) ,4 species of sea turtles (loggerhead, green, leatherback, and Kemp's ridley) and sturgeon (Atlantic and shortnose) may be found in or near the action area and may be affected by the project. We have identified the following potential adverse effects to these listed species and concluded they are not likely to be adversely affected by the proposed action for the reasons described below.
Whales North Atlantic right and humpback whales are infrequent visitors to the action area, primarily occurring around the offshore Central Reach borrow site. The USACE has stated that offshore borrow site dredging contracts would incorporate standard conservation measures to minimize the risk of marine mammal collisions; including speed limits (~1 0 knots) for dredges and support vessels, 24-hour presence (during active dredging and transit) of protected species observers with at-sea large whale identification experience, and compliance with federal regulations [50 CFR 224.103(c)] prohibiting the approach of any vessel within 500 yards of a right whale. Considering the proposed conservation measures and the limited extent of anticipated dredging at the Central Reach borrow site, it is expected that the risk of collisions would be negligible. Therefore, we believe the potential for encounters is discountable or not likely to occur.
Sea Turtles Loggerhead, green, leatherback, and Kemp's ridley sea turtles have been sited near the project area and, with the exception of Kemp's ridleys, they are known to nest on Holden Beach. Sea turtles may be injured if they encounter the cutterhead dredging in the borrow area. However, we believe this adverse effect is discountable because these species are likely to move away from the dredging equipment and we expect them to exhibit avoidance behavior. NMFS has previously determined in existing biological opinions (i.e., the South Atlantic Regional Biological Opinion [SARBO] and the Gulf of Mexico Regional Biological Opinion) that nonhopper-type dredging activities, including hydraulic and mechanical-type dredges (including cutterhead and clamshell dredges), are not likely to adversely affect sea turtles, primarily because they are noisy and slow moving, enabling sea turtles to detect and avoid them, or affect only very small areas at one time. The implementation of the proposed dredging window and timing of the beach nourishment (November 16 to April 30, if using a cutterhead or November 16 to March 31, if using a hopper dredge) to avoid the presence of nesting sea turtles will further reduce the risk of encounters and will not occur during nesting season, which begins May 1. In addition, operation of any mechanical construction equipment will cease immediately if a sea turtle is seen within a 50-ft radius of the equipment. Activities will not resume until the protected species has departed the project area of its own volition. Nourishment sand will be transported to the project site via pipeline placed in the upland area. Because the movements of the cutterhead dredge will be limited to the spatially constrained inshore dredging, a dredging window will be implemented, and sand placement on the beach will be via a submerged pipeline, we believe the potential for encounters with sea turtles is discountable or not likely to occur.
Because the proposed project may use a hopper dredge, any sea turtle take associated with the proposed dredging activities would be authorized under the SARBO. Therefore, take by dredging from the Central Reach offshore borrow site will not be analyzed further in this letter. The applicant will comply with all of the measures detailed in the reasonable and prudent
5
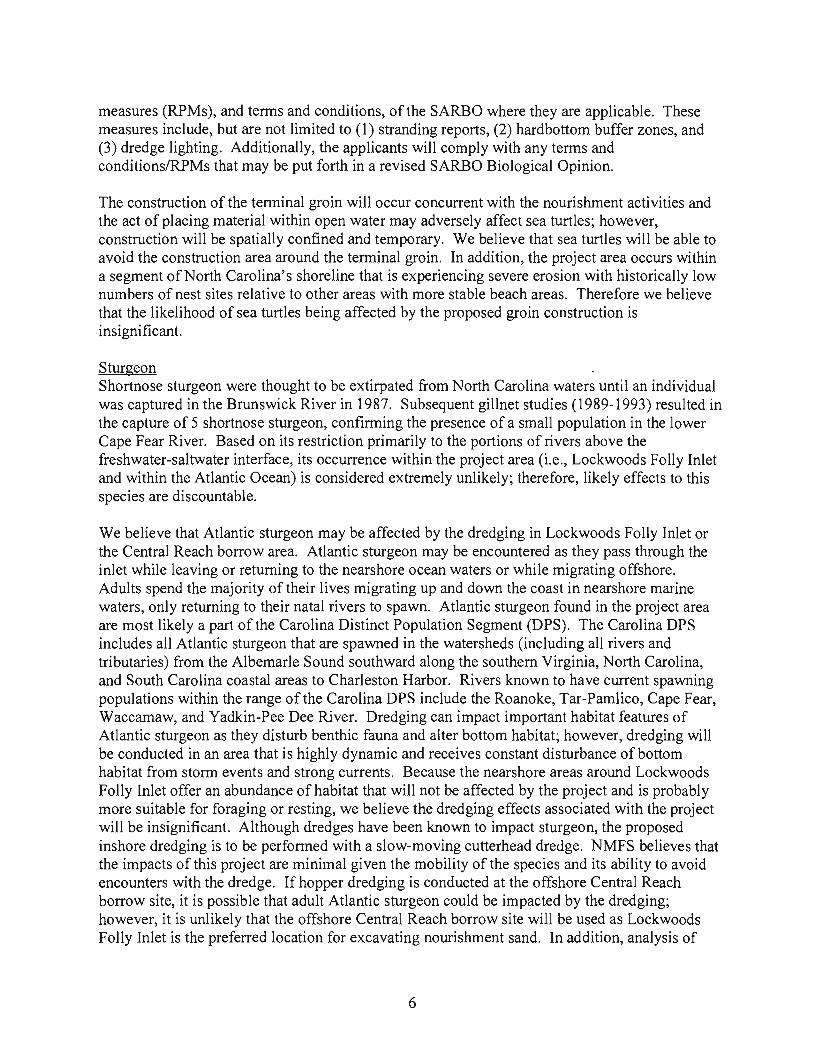
measures (RPMs), and terms and conditions, of the SARBO where they are applicable. These measures include, but are not limited to (1) stranding reports, (2) hardbottom buffer zones, and (3) dredge lighting. Additionally, the applicants will comply with any terms and conditions/RPMs that may be put forth in a revised SARBO Biological Opinion.
The construction of the terminal groin will occur concurrent with the nourishment activities and the act of placing material within open water may adversely affect sea turtles; however, construction will be spatially confined and temporary. We believe that sea turtles will be able to avoid the construction area around the terminal groin. In addition, the project area occurs within a segment of North Carolina's shoreline that is experiencing severe erosion with historically low numbers of nest sites relative to other areas with more stable beach areas. Therefore we believe that the likelihood of sea turtles being affected by the proposed groin construction is insignificant.
Sturgeon Shortnose sturgeon were thought to be extirpated from North Carolina waters until an individual was captured in the Brunswick River in 1987. Subsequent gillnet studies (1989-1993) resulted in the capture of 5 shortnose sturgeon, confirming the presence of a small population in the lower Cape Fear River. Based on its restriction primarily to the portions of rivers above the freshwater-saltwater interface, its occurrence within the project area (Le., Lockwoods Folly Inlet and within the Atlantic Ocean) is considered extremely unlikely; therefore, likely effects to this species are discountable.
We believe that Atlantic sturgeon may be affected by the dredging in Lockwoods Folly Inlet or the Central Reach borrow area. Atlantic sturgeon may be encountered as they pass through the inlet while leaving or returning to the nearshore ocean waters or while migrating offshore. Adults spend the majority of their lives migrating up and down the coast in nearshore marine waters, only returning to their natal rivers to spawn. Atlantic sturgeon found in the project area are most likely a part of the Carolina Distinct Population Segment (DPS). The Carolina DPS includes all Atlantic sturgeon that are spawned in the watersheds (including all rivers and tributaries) from the Albemarle Sound southward along the southern Virginia, North Carolina, and South Carolina coastal areas to Charleston Harbor. Rivers known to have current spawning populations within the range of the Carolina DPS include the Roanoke, Tar-Pamlico, Cape Fear, Waccamaw, and Yadkin-Pee Dee River. Dredging can impact important habitat features of Atlantic sturgeon as they disturb benthic fauna and alter bottom habitat; however, dredging will be conducted in an area that is highly dynamic and receives constant disturbance of bottom habitat from storm events and strong currents. Because the nearshore areas around Lockwoods Folly Inlet offer an abundance of habitat that will not be affected by the project and is probably more suitable for foraging or resting, we believe the dredging effects associated with the project will be insignificant. Although dredges have been known to impact sturgeon, the proposed inshore dredging is to be performed with a slow-moving cutterhead dredge. NMFS believes that the impacts ofthis project are minimal given the mobility of the species and its ability to avoid encounters with the dredge. If hopper dredging is conducted at the offshore Central Reach borrow site, it is possible that adult Atlantic sturgeon could be impacted by the dredging; however, it is unlikely that the offshore Central Reach borrow site will be used as Lockwoods Folly Inlet is the preferred location for excavating nourishment sand. In addition, analysis of
6
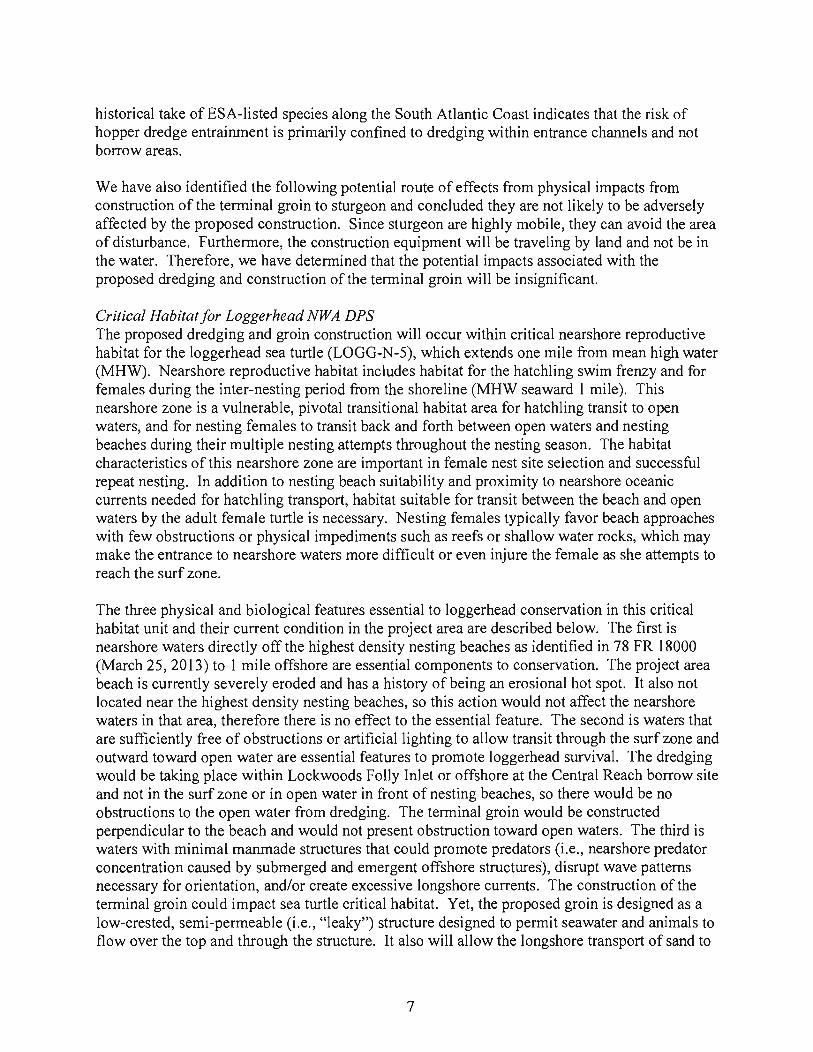
historical take of ESA-listed species along the South Atlantic Coast indicates that the risk of hopper dredge entrainment is primarily confined to dredging within entrance channels and not borrow areas.
We have also identified the following potential route of effects from physical impacts from construction of the terminal groin to sturgeon and concluded they are not likely to be adversely affected by the proposed construction. Since sturgeon are highly mobile, they can avoid the area of disturbance. Furthermore, the construction equipment will be traveling by land and not be in the water. Therefore, we have determined that the potential impacts associated with the proposed dredging and construction of the terminal groin will be insignificant.
Critical Habitat for Loggerhead NWA DPS The proposed dredging and groin construction will occur within critical nearshore reproductive habitat for the loggerhead sea turtle (LOGG-N-5), which extends one mile from mean high water (MHW). Nearshore reproductive habitat includes habitat for the hatchling swim frenzy and for females during the inter-nesting period from the shoreline (MHW seaward 1 mile). This nearshore zone is a vulnerable, pivotal transitional habitat area for hatchling transit to open waters, and for nesting females to transit back and forth between open waters and nesting beaches during their multiple nesting attempts throughout the nesting season. The habitat characteristics of this nearshore zone are important in female nest site selection and successful repeat nesting. In addition to nesting beach suitability and proximity to nearshore oceanic currents needed for hatchling transport, habitat suitable for transit between the beach and open waters by the adult female turtle is necessary. Nesting females typically favor beach approaches with few obstructions or physical impediments such as reefs or shallow water rocks, which may make the entrance to nearshore waters more difficult or even injure the female as she attempts to reach the surf zone.
The three physical and biological features essential to loggerhead conservation in this critical habitat unit and their current condition in the project area are described below. The first is nearshore waters directly off the highest density nesting beaches as identified in 78 FR 18000 (March 25, 2013) to 1 mile offshore are essential components to conservation. The project area beach is currently severely eroded and has a history of being an erosional hot spot. It also not located near the highest density nesting beaches, so this action would not affect the nearshore waters in that area, therefore there is no effect to the essential feature. The second is waters that are sufficiently free of obstructions or artificial lighting to allow transit through the surf zone and outward toward open water are essential features to promote loggerhead survival. The dredging would be taking place within Lockwoods Folly Inlet or offshore at the Central Reach borrow site and not in the surf zone or in open water in front of nesting beaches, so there would be no obstructions to the open water from dredging. The terminal groin would be constructed perpendicular to the beach and would not present obstruction toward open waters. The third is waters with minimal manmade structures that could promote predators (i.e., nearshore predator concentration caused by submerged and emergent offshore structures), disrupt wave patterns necessary for orientation, and/or create excessive longshore currents. The construction of the terminal groin could impact sea turtle critical habitat. Yet, the proposed groin is designed as a low-crested, semi-permeable (i.e., "leaky") structure designed to permit seawater and animals to flow over the top and through the structure. It also will allow the longshore transport of sand to
7

occur in a normal manner, so it should not disrupt wave patterns or create excessive longshore currents. It is possible that the groin could cause some predator concentration, but the majority of the rocks comprising the groin will be submerged too deep to accommodate resting seabirds that could prey on hatchlings. NMFS believes that the addition of the terminal groin will improve the condition of the nesting beach overall, and it will not cause a net increase in the likelihood of predator concentration, or cause wave patterns to be modified to the extent that it will disrupt orientation nor cause excessive longshore currents. Beach widening due to sand entrapment behind the terminal groin will result in increasing the amount of available turtle nesting habitat. Once the beach is stabilized and restored, we expect that nesting activity may increase in the project area. For these reasons, NMFS concludes that the effects of the proposed action on loggerhead sea turtle critical habitat are insignificant.
Conclusion Because all potential project effects to listed species and critical habitat were found to be discountable, insignificant, or may be beneficial we conclude that the proposed action is not likely to adversely affect listed species under NMFS's purview. This concludes your consultation responsibilities under the ESA for species under NMFS's purview. Consultation must be reinitiated if a take occurs or new information reveals effects of the action not previously considered, or if the identified action is subsequently modified in a manner that causes an effect to the listed species or critical habitat in a manner or to an extent not previously considered, or if a new species is listed or critical habitat designated that may be affected by the identified action. NMFS's findings on the project's potential effects are based on the project description in this response. Any changes to the proposed action may negate the findings of this consultation and may require reinitiation of consultation with NMFS.
We have enclosed additional relevant information for your review. We look forward to further cooperation with you on other projects to ensure the conservation of our threatened and endangered marine species and designated critical habitat. If you have any questions on this consultation, please contact Kay Davy, Consultation Biologist, at (727) 415-9271, or bye-mail at kay [email protected].
~in(relY~
Roy E. Crabtree, Ph.D. Regional Administrator
Enc.: 1. Sea Turtle and Smalltooth Sawfish Construction Conditions (Revised March 23, 2006) 2. PCTS Access and Additional Considerations for ESA Section 7 Consultations
(Revised March 10,2015)
File: 1514-22.F.l
8

SEA TURTLE AND SMALLTOOTH SAWFISH CONSTRUCTION CONDITIONS
The permittee shall comply with the following protected species construction conditions:
a. The permittee shall instruct all personnel associated with the project of the potential presence of these species and the need to avoid collisions with sea turtles and smalltooth sawfish. All construction personnel are responsible for observing water-related activities for the presence of these species.
b. The permittee shall advise all construction personnel that there are civil and criminal penalties for harming, harassing, or killing sea turtles or smalltooth sawfish, which are protected under the Endangered Species Act of 1973.
c. Siltation barriers shall be made of material in which a sea turtle or smalltooth sawfish cannot become entangled, be properly secured, and be regularly monitored to avoid protected species entrapment. Barriers may not block sea turtle or smalltooth sawfish entry to or exit from designated critical habitat without prior agreement from the National Marine Fisheries Service’s Protected Resources Division, St. Petersburg, Florida.
d. All vessels associated with the construction project shall operate at “no wake/idle” speeds at all times while in the construction area and while in water depths where the draft of the vessel provides less than a four-foot clearance from the bottom. All vessels will preferentially follow deep-water routes (e.g., marked channels) whenever possible.
e. If a sea turtle or smalltooth sawfish is seen within 100 yards of the active daily construction/dredging operation or vessel movement, all appropriate precautions shall be implemented to ensure its protection. These precautions shall include cessation of operation of any moving equipment closer than 50 feet of a sea turtle or smalltooth sawfish. Operation of any mechanical construction equipment shall cease immediately if a sea turtle or smalltooth sawfish is seen within a 50-ft radius of the equipment. Activities may not resume until the protected species has departed the project area of its own volition.
f. Any collision with and/or injury to a sea turtle or smalltooth sawfish shall be reported
immediately to the National Marine Fisheries Service’s Protected Resources Division (727-824- 5312) and the local authorized sea turtle stranding/rescue organization.
g. Any special construction conditions, required of your specific project, outside these general conditions, if applicable, will be addressed in the primary consultation.
Revised: March 23, 2006

PCTS Access and Additional Considerations for ESA Section 7 Consultations (Revised 03-10-2015)
Public Consultation Tracking System (PCTS) Guidance: PCTS is a Web-based query system at https://pcts.nmfs.noaa.gov/ that allows all federal agencies (e.g., U.S. Army Corps of Engineers - USACE), project managers, permit applicants, consultants, and the general public to find the current status of NMFS’s Endangered Species Act (ESA) and Essential Fish Habitat (EFH) consultations which are being conducted (or have been completed) pursuant to ESA Section 7 and the Magnuson-Stevens Fishery Conservation and Management Act’s (MSA) Sections 305(b)2 and 305(b)(4). Basic information including access to documents is available to all.
The PCTS Home Page is shown below. For USACE-permitted projects, the easiest and quickest way to look up a project’s status, or review completed ESA/EFH consultations, is to click on either the “Corps Permit Query” link (top left); or, below it, click the “Find the status of a consultation based on the Corps Permit number” link in the golden “I Want To…” window.
Then, from the “Corps District Office” list pick the appropriate USACE district. In the “Corps Permit #” box, type in the 9-digit USACE permit number identifier, with no hyphens or letters. Simply enter the year and the permit number, joined together, using preceding zeros if necessary after the year to obtain the necessary 9-digit (no more, no less) number. For example, the USACE Jacksonville District’s issued permit number SAJ-2013-0235 (LP-CMW) must be typed in as 201300235 for PCTS to run a proper search and provide complete and accurate results. For querying permit applications submitted for ESA/EFH consultation by other USACE districts, the procedure is the same. For example, an inquiry on Mobile District’s permit MVN201301412 is entered as 201301412 after selecting the Mobile District from the “Corps District Office” list. PCTS questions should be directed to Kelly Shotts at [email protected] or (727) 551-5603.
EFH Recommendations: In addition to its protected species/critical habitat consultation requirements with NMFS’ Protected Resources Division pursuant to Section 7 of the ESA, prior to proceeding with the proposed action the action agency must also consult with NMFS’ Habitat Conservation Division (HCD) pursuant to the MSA requirements for EFH consultation (16 U.S.C. 1855 (b)(2) and 50 CFR 600.905-.930, subpart K). The action agency should also ensure that the applicant understands the ESA and EFH processes; that ESA and EFH consultations are separate, distinct, and guided by different statutes, goals, and time lines for responding to the action agency; and that the action agency will (and the applicant may) receive separate consultation correspondence on NMFS letterhead from HCD regarding their concerns and/or finalizing EFH consultation.
Marine Mammal Protection Act (MMPA) Recommendations: The ESA Section 7 process does not authorize incidental takes of listed or non-listed marine mammals. If such takes may occur an incidental take authorization under MMPA Section 101 (a)(5) is necessary. Please contact NMFS’ Permits, Conservation, and Education Division at (301) 713-2322 for more information regarding MMPA permitting procedures.
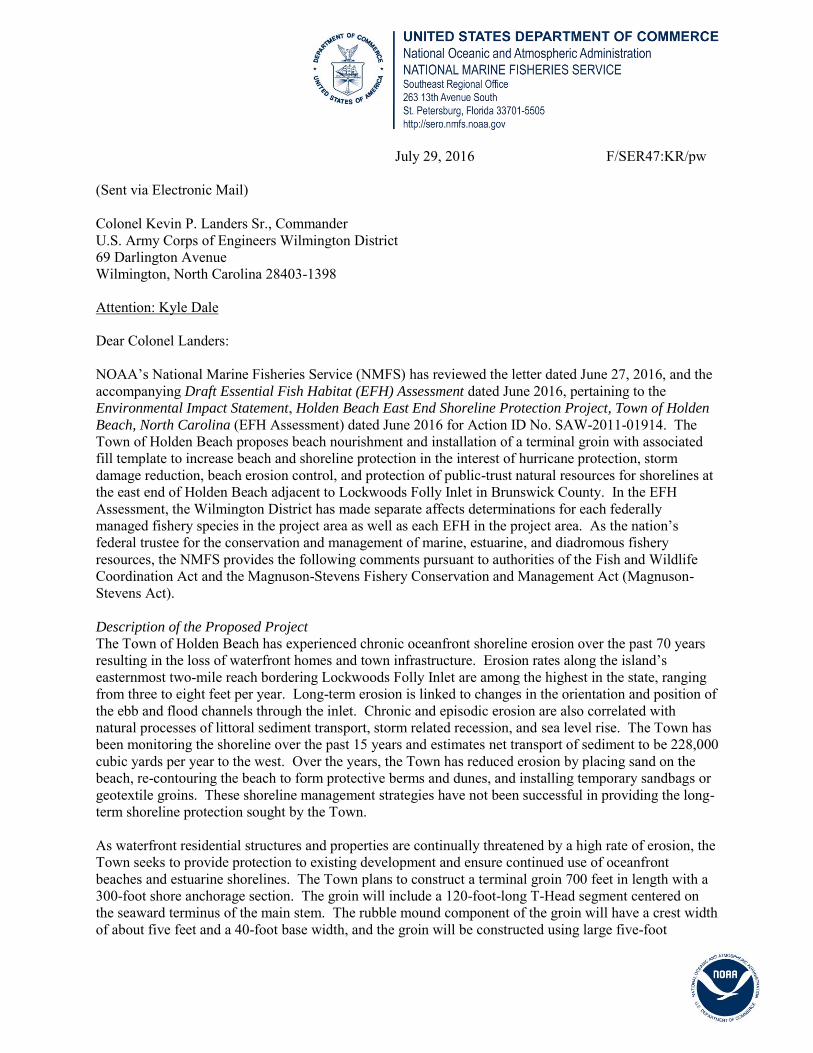
July 29, 2016 F/SER47:KR/pw (Sent via Electronic Mail) Colonel Kevin P. Landers Sr., Commander U.S. Army Corps of Engineers Wilmington District 69 Darlington Avenue Wilmington, North Carolina 28403-1398 Attention: Kyle Dale Dear Colonel Landers: NOAA’s National Marine Fisheries Service (NMFS) has reviewed the letter dated June 27, 2016, and the accompanying Draft Essential Fish Habitat (EFH) Assessment dated June 2016, pertaining to the Environmental Impact Statement, Holden Beach East End Shoreline Protection Project, Town of Holden
Beach, North Carolina (EFH Assessment) dated June 2016 for Action ID No. SAW-2011-01914. The Town of Holden Beach proposes beach nourishment and installation of a terminal groin with associated fill template to increase beach and shoreline protection in the interest of hurricane protection, storm damage reduction, beach erosion control, and protection of public-trust natural resources for shorelines at the east end of Holden Beach adjacent to Lockwoods Folly Inlet in Brunswick County. In the EFH Assessment, the Wilmington District has made separate affects determinations for each federally managed fishery species in the project area as well as each EFH in the project area. As the nation’s federal trustee for the conservation and management of marine, estuarine, and diadromous fishery resources, the NMFS provides the following comments pursuant to authorities of the Fish and Wildlife Coordination Act and the Magnuson-Stevens Fishery Conservation and Management Act (Magnuson-Stevens Act). Description of the Proposed Project
The Town of Holden Beach has experienced chronic oceanfront shoreline erosion over the past 70 years resulting in the loss of waterfront homes and town infrastructure. Erosion rates along the island’s easternmost two-mile reach bordering Lockwoods Folly Inlet are among the highest in the state, ranging from three to eight feet per year. Long-term erosion is linked to changes in the orientation and position of the ebb and flood channels through the inlet. Chronic and episodic erosion are also correlated with natural processes of littoral sediment transport, storm related recession, and sea level rise. The Town has been monitoring the shoreline over the past 15 years and estimates net transport of sediment to be 228,000 cubic yards per year to the west. Over the years, the Town has reduced erosion by placing sand on the beach, re-contouring the beach to form protective berms and dunes, and installing temporary sandbags or geotextile groins. These shoreline management strategies have not been successful in providing the long-term shoreline protection sought by the Town. As waterfront residential structures and properties are continually threatened by a high rate of erosion, the Town seeks to provide protection to existing development and ensure continued use of oceanfront beaches and estuarine shorelines. The Town plans to construct a terminal groin 700 feet in length with a 300-foot shore anchorage section. The groin will include a 120-foot-long T-Head segment centered on the seaward terminus of the main stem. The rubble mound component of the groin will have a crest width of about five feet and a 40-foot base width, and the groin will be constructed using large five-foot

2
diameter granite stones. The Town expects the design of the groin to allow littoral transport of sand over, around, and through the structure by leaving large voids between the rocks. In addition to construction of the groin, the Town will nourish approximately 3,700 feet of shoreline adjacent to the groin with material excavated from the previously permitted borrow area within Lockwoods Folly Inlet Crossing navigation channel and, if needed, from the Central Reach offshore borrow site. To achieve the management objectives, dredging of Lockwoods Folly Inlet and nourishment activities are expected to occur every four years over a 30-year period.
Consultation History
On March 26, 2012, the NMFS provided the Wilmington District with comments on plans to develop the Holden Beach East End Shore Protection Project Environmental Impact Statement (EIS). The NMFS recommended the Wilmington District prepare a formal EFH Assessment for the project separate from the EIS. Comments of EFH Assessment
The EFH Assessment reviews anticipated environmental impacts within the proposed 1,655-acre project area. The authors describe with depth, detail, and scientific support direct and indirect effects expected to occur within the estuarine and coastal habitats of the project area. Further, the authors provide detailed review of EFH for managed species that occur within the project area and habitats designated by the State of North Carolina as Primary Nursery Area. An effects determination is provided for each habitat type and for each managed fishery species. The focal habitats in the EFH Assessment are the marine water column, shallow sand bottoms, and live/hardbottom habitats. The EFH Assessment also includes descriptions of downstream and far-field impacts to estuarine emergent wetlands, oyster reefs and shell banks, and submerged aquatic vegetation (SAV). Generalized environmental impacts are expected to be temporary in nature and of short duration (days) following construction and maintenance activities. Impacts from dredging and nourishment activities include an increase in the turbidity and total suspended solids from sediments, silt, and organic materials. High concentrations of suspended solids for extended durations can impair biological productivity and ecological function by clogging fish gills, affecting recruitment of fish and invertebrates (crustaceans and invertebrates), and suppressing growth of SAV and shellfish (e.g., oysters, clams, scallops). Activities such as beach nourishment typically have more severe impacts that take longer periods of time (months and years) for ecological recovery. Ocean beach and estuarine shorelines can be extraordinarily dynamic and resilient ecosystems. These ecosystems are often able to recover quickly despite experiencing extreme disturbance events from storms and hurricanes. Nourishment activities that bury infaunal communities results in direct mortality of many forage species. These infaunal species provide important trophic linkages coupling benthic-pelagic ecosystems. Many of the organisms that utilize these habitats also provide trophic linkages between inshore and offshore populations. The NMFS previously recommended the EIS and EFH Assessment include characterizations of nursery habitat and larval fish transport associated with Lockwoods Folly Inlet and the barrier island complex that includes Holden Beach and Oak Island. The NMFS appreciates the EFH Assessment recognizing inlets serve as migratory corridors for larvae entering nursery areas and for sub-adults leaving nursery areas for maturation and spawning offshore. The NMFS agrees with the recommendation that environmental windows (seasonal restrictions) be used for timing of any in-water construction and maintenance activities to protect fish during sensitive life stages. The EFH Assessment states the construction, dredging, and maintenance schedule would include a work moratorium for May 1 through November 15 to minimize environmental impacts and provide protections for seasonal migrations of fish and protected species (i.e., sturgeon, sea turtles). Dredging would occur from November 16 through March 31, and groin construction and associated sand placement would occur from November 16 through April 30.
3
The NMFS believes the EFH Assessment includes a significant improvement in EFH conservation measures over those included in the Draft EIS dated August 2015. Most notably is the description of the construction practices including dredge selection, engineering for terminal groin structure, sediment compatibility for beach nourishment, water quality controls, and habitat mapping. These descriptions complement the environmental modeling, cumulative impact analysis, and sediment transport and shoreline models in the Draft EIS. The NMFS believes the effects determinations, environmental windows, monitoring schedule, and habitat mapping included in the EFH Assessment will significantly improve the Holden Beach East End Shoreline Protection Project. These decision-making tools address opportunities for practicable avoidance and minimization of impacts to EFH and provide measures for adaptive management. Based on the information provided, the NMFS has no EFH conservation recommendations for the project. The NMFS may provide EFH conservation recommendations in the future based on new information or changes in the project design that show adverse impacts would occur to EFH or federally-managed fishery species. Thank you for the opportunity to provide these comments on the EFH Assessment, and the NMFS looks forward to further cooperation with this project that is so important for North Carolina. Please direct related questions or comments to the attention of Dr. Ken Riley at our Beaufort Field Office, 101 Pivers Island Road, Beaufort, North Carolina 28516-9722, or at (252) 728-8750. Sincerely,
/ for
Virginia M. Fay Assistant Regional Administrator
Habitat Conservation Division cc: COE, [email protected]
USFWS, [email protected] NCDCM, [email protected] NCDCM, [email protected] EPA, [email protected] SAFMC, [email protected] F/SER4, [email protected] F/SER47, [email protected]
North Carolina Department of Administration
Pat McCrory, Governor Bill Daughtridge, Jr., Secretary
Ms. Emily Hughes Department of the Army U.S. Army Corps of Engineers Wilmington District 69 Darlington Avenue Wilmington, NC 28403
October 7, 2015
Re: SCH File #16-E-OOOO-0070; DEIS; Proposed project is for the construction of a terminal groin and supplemental beach nourishment project at the east end of Holden Beach, to the west of the Lockwood Folly Inlet.
Dear Ms. Hughes:
The above referenced environmental impact information has been submitted to the State Clearinghouse under the provisions of the National Environmental Policy Act. According to G.S. 113A-IO, when a state agency is required to prepare an environmental document under the provisions of federal law, the environmental document meets the provisions of the State Environmental Policy Act. Attached to this letter for your consideration are the comments made by agencies in the course of this review.
If any further environmental review documents are prepared for this project, they should be forwarded to this office for intergovernmental review.
Should you have any questions, please do not hesitate to call.
Attachments
Cc: Region 0
Mailing Address: 130 I Mail Service Center Raleigh, NC 27699·1301
Sincerely,
0'uu~~ Teresa Matthews State Environmental Review Clearinghouse
Telephone: (9/9)807-2425 Fax (919)733-9571
State Courier #51-01-00 e-mail [email protected]
An Equ.al Opportunity/Affirmative Action Employer
Locotion Address: 116 West Jones Street Raleigh, North Carolina
Pat McCrory Governor
North Carolina Department of Environmental Quality
Donald R. van der Vaart Secretary
MEMORANDUM
TO:
FROM:
RE:
Department of Administration State Clearinghouse
Lyn Hardison ~) Division of Envlr~~mental Assistance and Customer Service Permit Assistance & Project Review Coordinator
16-0070 Draft Environmental Impact Statement Proposed project is for the construction of a terminal groin and supplement beach nourishment project at the east end of Holden Beach, to the west of the Lockwood Folly Inlet - Brunswick County
Date: October 1, 2015
The Department of Environmental Quality has reviewed the proposal for the referenced project. The comments are attached for the applicant review.
The Department appreciates the cooperative efforts and open communication the applicant has with our agencies and we encourage these efforts to continue as they move forward with the project.
Thank you for the opportunity to respond.
Attachment
943 Washinglon Square Mall. Washington NC 27889 Phone: 252-948-3842 i Internet: www.ncdenr.gov

AVA RCDiRI
North Carolina Department of Environment and Natural Resources
Pat McCrory Governor
MEMORANDUM September 11 111 , 2015
TO: lyn Hardison Environmental Assistance and SEPA Coordinator
FROM: Andrew Haines Environmental Program Supervisor
THROUGH: Patti Fowler Shellfish Sanitation & Recreational Water Quality Section Chief
Donald R. van der Vaart Secretary
SUBJECT: Draft EIS- Holden Beach East End Terminal Groin and Beach Nourishment US Army Corps #16-0070
The proposed project includes a dredging and beach nourishment window of November 16 - April 30. The placement of dredged materials along a swimming beach has the potential to cause a localized increase in bacteria concentrations within the waters surrounding the project. Thus, the placement ofthese dredged materials along the beach any time after March 31 8t may necessitate that a swimming advisory be issued, notifying the public ofthe risks associated with swimming in the area. In conjunction with this swimming advisory, notification signs will be placed throughout the project area. Swimming advisories can be avoided by scheduling these types of projects between November 1st and March 31" of a given year, which falls outside of the swimming season.
1601 Mail Service Center, Raleigh, Norlh Carolina 27699·1601 Phooo: 919·707·8600 \ Intemel: _,IlCdtlnLQOV
An Equal OpplfllJtlity\~Aclion EM~- Madeifl pari by rec~led pape1
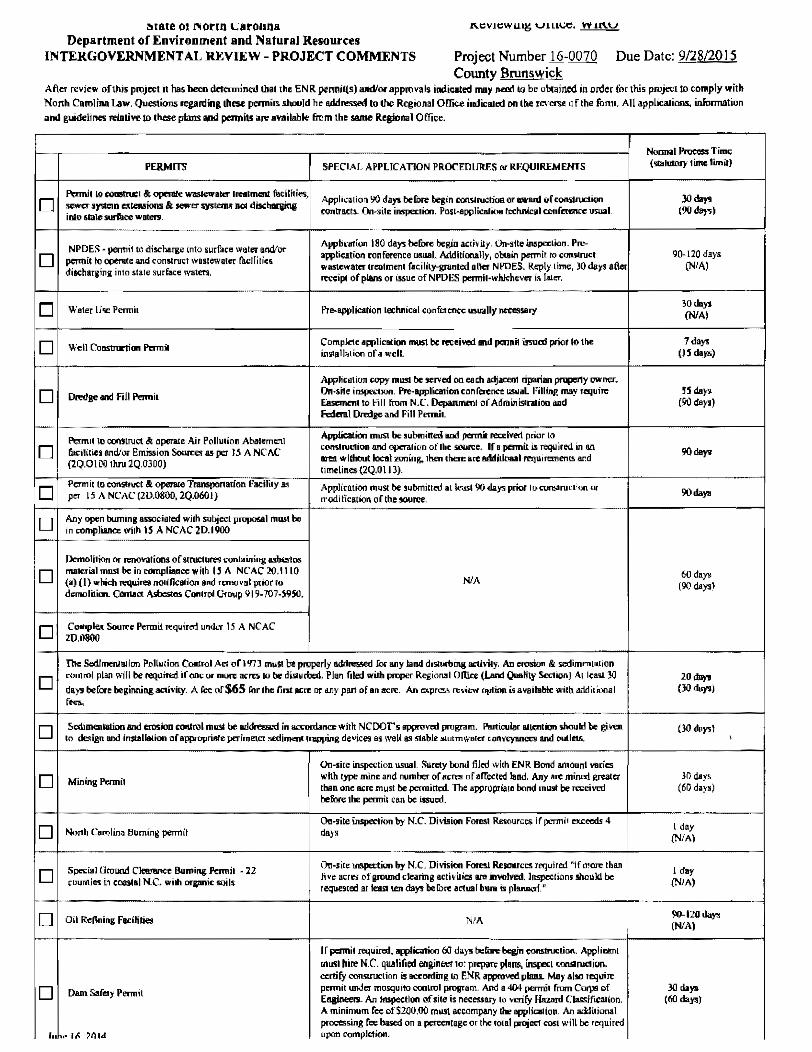
lItate 01 NOrtn Laronna Department of Environment and Natural Resources
INTER GOVERNMENT AL REVIEW - PROJECT COMMENTS Project Number lQ-0070 Comly Brunswick
Due Date: 9/28/2015
After review ofthis project it has been determined that the ENR pennit(s) and/or approvals indicated may need io be oiJ(ained in order for this project to comply with North Carolina Law. Questions regarding these penniIS should be addressed to the Regwnal Office indicated M tile reverse of the fonn, All applicaJions. information :lind guidelines relative to these plans and permits are available from the same Regional Office.
Nonnal Proeess Time
PERMITS SPECIAL APPLICATION PROCEDURES ot REQUIREMENTS (statutruy time limit)
D Permit t() ~t &; opemte wastewater treatment t8eili1ies, Application 90 days before begin constructiun or award of (0f'lSlttIcti0n JOday> sewer systt:m extensions &. sewer systems not d*harging contTact1. Qn·site inspeclion. Post-applicalioo technical confmmcc usual. (9Qday» into state surface water5.
NPDES ~ pt':nt1il to discharge inlo surface water and/or ApplicatiOll 180 days before begin acdvity, On-site inspeclion. Pre-
D permit to OptnIh: and conslrur;;t was1ewaler facUities apptic:atioo conference usual Additionally I obtam petmlt to construct 9(}-120 days wastewater treulmen( facility-granted slier NPDES, Reply time, )0 days after (NtA)
di&<:hargil1g into stale surface waters. receipt of plans or issue of NPOES permiHvhk:hever is Ialer, -",-",
D Water Use Permi.t Pre-application technical CQnference: usually me8sary 30deys (NtA)
D Well CoMtruttion Pennil Complete application must be received and permit issued priot to the 7 days installation ora well. (IS days)
Application copy must be served on each adjaccn1 riparian prupeny owner.
D Dredge and Fill Pmnit O,Hite inspcdioo. Pre·applkation conference ~aL FiUing may require 5S day. Easement to Fill from N.C. Department of Administration and (90 day.) FedeTaI J:)redge and Fill Petmil.
Permll to conStruct & operate Air Pollution Abatement Application must be submitted and permit received poor to
D Iilcmtit9 and/or Emission Sources- as per i5 A NCAC COMIruciion and operation of lhe SOUt'tC, If a permit is required in an 9Qday> (2Q.0100 Ihru 2Q.0300) area without local zoning. 1hen there IUt: additional requirements and
timeli ... (2Q.01ll).
D Permit to construct & openue Transportatfon'Facilily as Application must be submitted at least 90 days prior 10 consIruclloo or 9Qdays per 15 A NCAC(2D.0lI00,2Q.06OI) moditlciltiQn of the source.
D Any open burning associated with subject proposal must be in compliance with IS A NCAC 20.1900
Demolition or- reoo'ialions of structuR'$ containing asbestos
0 material must be in compliance with IS A NCAC 20.1110 60 day> (a) Cl)which requiresnotifl,ation 8Ad mnovut prior to NlA
(90 day» demolition. Contact: Asbestos Contro1 Groop 919· 707~5950.
D CompJer; Source Permit requiroo under 15 A NCAC 2D.01I00
The So:timenlation Pclturion Control Act or 1973 must be properly addressed for any land disturoing activity, An erosion & sedimentation
D control plan wiU be required ifoncOt lllQft: aC'1G to be disturbed, Plan filed with proper Regional Office (LaodQuelity Section} At least 30 20 day> days before beginning activity, A fee of 565 for the first Kre or any part of an acre. An express review option is 8vaitab«: with additional (31) day>J
r .... ----
0 Sedime.ntation and erosion control must be addressed in accordance with NCDOT's approved program. Particulor attention should be given (JO <In)'$) 10 dedgn and installation of appropriate perimeter sediment trapping devices 8S well as stable stormwata con·.eyancc:s and outletS. ,
On~site inspection ususl. Surety bond filed wl(h ENR Bond amonnt varies
D Mining Permit with type mine and number ofllc~ ofarrected land. Any arc mined greater 30 days tban one acre must be permitted. The appropriate bond must be received (60 days) before the pennit can be issued,
D On·site inspection by N.C, DMsion Forest Resources if permit ex.ceeds 4 1 day North Carolina Burning permit days
(N/A)
D S~ial Ground Cleerance Buming Permit ·22 On-site inspection by N.C" Divisioo. N>rest Re50Ufces required ~if more than I day
counties in coastal N.C. with organic soils five acres: of ground clearing activities are involved, JnspectlOI'lS sOOuJd be (N/A) requested atleai1 ten days before actual bum is planned."
0 on Refining Facilities NiA 9Q-12Qday> (NIAI
If perm!! required, application 60 days befure begin construction, Applicant Must hire N.C. qualified engineer 10: prepare phtl1$., inspect cOOSll1K1ion. certify oonstruclion is llCCording t.o ENR approved plans. Mey also require
D Dam Safety Permit permit WIder mosquito coo1rol program. And II 404 permit fum Corps of JO da)'$ Ef18ineers.. An inspection of site is necessary 10 'Verify Hazard Classifu;alion, (60 days) A minimum fee of $200.00 m\l$\ accompany the application. An ackHlional processing ree based on II percentage or the total project cost will be required
I. p l~ ?fH.4 upon completion.
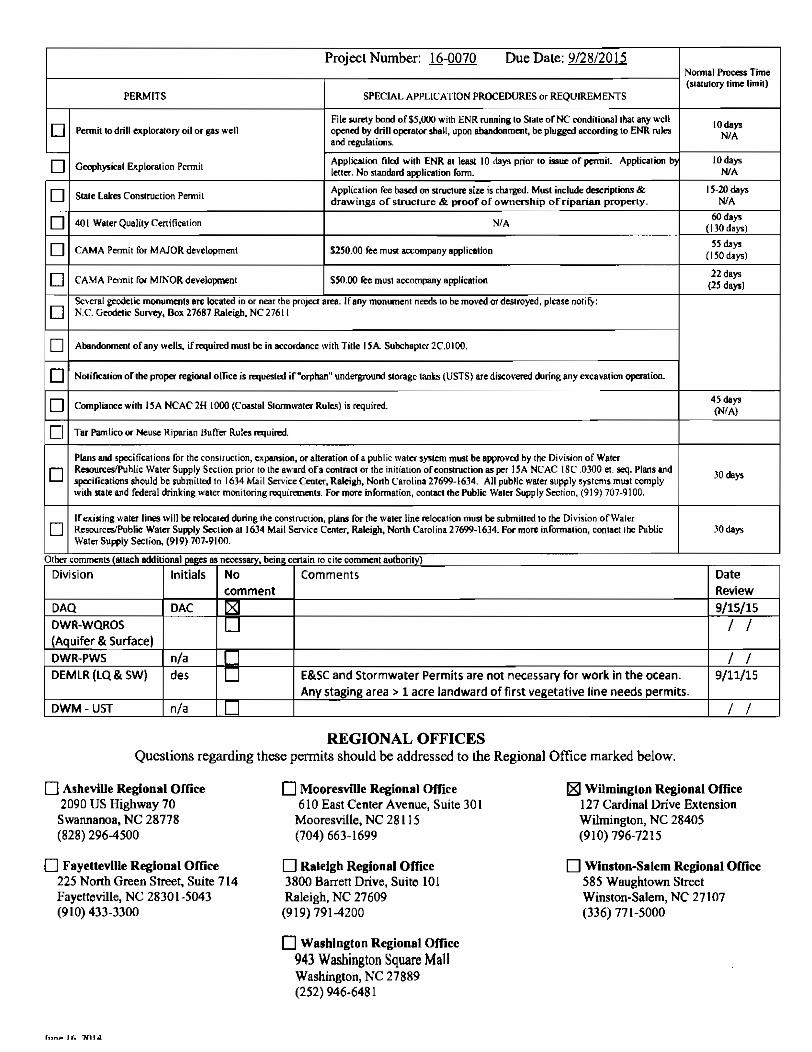
Project Number: l§-0070 Due Date: 9/28/2015 Normal Process Time (statutory lime limit)
PERMITS SPECIAL APPLICATION PROCEDURES or REQUIREMENTS
0 File surely bond of$5,OOO with ENR running to State orNe conditional that any well 10 days
Permit tadrilt exploratory oil or gas well opened by drill operator shall, upon abandonment, be plugged according to ENR rules N/A and regulations.
-Application filed with ENR at least 10 days prior to issue or pennit Application b) 10 days 0 Geophysical Ex.ploration Penni! letter. No standard application fonn. NlA
0 State lakes Construction Permit Application fee based on structure size is charged. Must include descriptions & 11-20 00" drawings of structure & proof of own~hip of riparian property. N/A
0 401 Water Quality Certification N/A 60 days (130 d,,,)
0 CAMA Permit for MAJOR development $250.00 fee must accompany application II da"
(llOd,,,)
0 CAMA Permit fOl" MINOR development 550.00 fee must accompany application 22 d,,,
(21 d,,,)
D Several geodetic monuments are located in or near the project area. If any monument needs to be moved or destroyed, please notify: N.C. Geodetic Survey, Box 27687 Raleigh, NC27611
0 Abandonment of any wells. if required must be in accordance with Title ISA Subchapter 2C.0IOO.
D Notification oflhe proper regional office is requested if "orphan" underground storagc tanks (USTS) are discovered during any excavation operation.
0 Compliance with I SA NCAC 2H 1000 (Coastal Stonnwater Rules) is required. 4S days (N/A)
0 Tar Pamlico or Neuse Riparian Buffer Rules required.
Plans and specifications for the construction, C}l;paIlsion, or alteration of a public waler syslt1n must be approved by the Division of Water
D Resources/Public Water Supply Section prior to the award ofa contract or the initiation oCconstruction as per \SA NCAC 18C .0){l0 et. seq. Plans and 30 days
spccilicalions should be iNbmitted to 16)4 Mail Service Center. Raleigh, North Carolina 21699-1634. All public water supply systems must comply with state and federal drinking water monitoring requirements. For more information, contact the Public Water Supply Section, (919) 701-9100.
0 Ife~isting water lines will be relocated during the construction, plans for the water line relocation must be iNbmilled to the Division of Water ResourceslPublic Water Supply Section at 1634 Mail Service Cetlter, Raleigh, North Carolina 27699-1634. For more infonnation, contact the Public 30 days Water Supply Section, (919) 707-9100.
Other comments (attach additional pages as necessary, being certain to cite comment authority)
Division Initials No Comments Date comment Review
DAQ DAC ~ 9/15/15 DWR-WQROS U / / (Aquifer & Surface) DWR-PWS n/a U / / DEMLR(LQ&SW) des U E&SC and Stormwater Permits are not necessary for work in the ocean. 9/11/15
Any staging area> 1 acre landward of first vegetative line needs permits. DWM-UST n/a [] / /
REGIONAL OFFICES Questions regarding these pennits should be addressed to the Regional Office marked below.
o A.heville Regional Office 2090 US Highway 70 Swannanoa, NC 28778 (828) 2964500
D Fayetteville Regional Office 225 North Green Street, Suite 714 Fayetteville, NC 28301-5043 (910) 433-3300
r ...... I (:, 'JIlI.ll
D Mooresville Regional Office 610 East Center Avenue, Suite 301
Mooresville, NC 28115 (704) 663-1699
o Raleigh Regional Office 3800 Barrett Drive, Suite 101 Raleigh, NC 27609 (919) 7914200
D Washington Regional Office 943 Washington Square Mall Washington, NC 27889 (252) 946-6481
IZI Wilmington Regional Office 127 Cardinal Drive Extension Wilmington, NC 28405 (910) 796-7215
o Winston-Salem Regional Omce 585 Waughtown Street Winston-Salem, NC 27107 (336) 771-5000

NORTH CAROLINA STATE CLEARINGHOUSE DEPARTMENT OF ADMINISTRATION
INTERGOVERNMENTAL REVIEW COUNTY, BRUNSWICK H12: OTHER STATE N1JMBllR: 16-E-OOOO-0070
DATll RECEIVED: 09/01/2015
AGENCl" RESPONSE: 09/28/2015
MS CAROLYN PENNY CLEARINGHOUSE COORDINATOR DPS DIV OF EMERGENCY MANAGE¥£NT
FLOODPLAIN ~~AGEMENT PROGRAM MSC # 4218
RALEIGH NC
REVIEW DISTRIBUTION
CAPE FEAR COG
DE~~ - COAS~AL MG~
DENR LEGISLATIVE AFFAIRS DEP~ OF CULTURAL RESOURCES DEPT OF TRANSPORTATION DPS - DIV OF EMERGENCY MANAGEMENT
PROJllCT INFORMATION APPLICANT: Department of the Army TYPE: National Environmental Policy Act
Draft Environmental Impact Statement
REVIEW CLOSED: 10/01/2015
SEP 0 t. 2015
DESC: Proposed ect is for the construction of a terminal groin and supplemental beach nourishment project at the east end of Holden Beach, to the west of the Lockwood Folly Inlet. - View documents at: http://www.saw.usace.army.mil/Missions/RegulatoryPermitProgram/MajorProjects
The attached project has been submitted to the N. C. State Clearinghouse for intergovernmental review. Please review and submit your response by the above indicated date to 1301 Mail Service Center, Raleigh NC 27699-1301.
If additional review time is needed; please contact this office at (919)807-2425.
AS A RESULT OF ~HIS REVIEW THE FOLLCWING IS SUBMITTED: c=J NO COMMENT
SIGNED BY: ~,1Y614N6J.~ DATE:
COMMENTS A~ACHED

North Carolina Department of Public Safety Emergency Management
Pat McCrory, Governor Frank L. Perry, Secretary
State Clearinghouse N.C. Department of Administration 1301 Mail Service Center Raleigh, North Carolina 27699-1301
September 10, 2015
Subject: Intergovernmental Review State Number: 16-E-0000-0070
Michael A. Sprayberry, Director
Holden Beach Terminal Groin and Supplemental Beach Nourishment
As requested by the North Carolina State Clearinghouse, the North Carolina Department of Public Safety Division of Emergency Management Risk Management reviewed the proposed project listed above and offers the following comment:
44 CFR 60.3.e prohibits man-made alteration of sand dunes and mangrove stands within Zones VI-30, VE, and V on the community's FIRM which would increase potential flood damage. Grading activity within one of these zones shall be accompanied by a hydraulic study to assure there will be no increase in flood damage potential.
Thank you for your cooperation and consideration. If you have any questions concerning tbe above comments, please contact Dan Brubaker, P.E., CFM, the NC NFIP Engineer at (919) 825-2300, by email at dan.brubaker(a),ncdps.gov or at the address ShO"\\l1 on the footer of this document.
ec: John Dorman, Program. Director John Gerber, NFIP State Coordinator
Sincerely,
John D. Brubaker, P.E., CFM NFIP Engineer Risk Management
Rhonda Wooten, Assistant Building Inspector, Holden Beach
File
MAILING ADDRESS: 4218 Mail Service Center Raleigh NC 21699-4218
www.ncem.org
An Equal Opportunity Employer
GTM OFFICE LOCATION: 4105 Reedy Creek Road
Raleigh, NC 27607 Telephone: (919) 825-2341
Fax: (919) 825-0408

COtINTY: BRUNSWICK
NORTH CAROLINA STATE CLEARINGHOUSE DEPARTMENT OF ADMINISTRATION
INTERGOVERNMENTAL REVIEW
H12: OTHER STATE NUMBER:
DATE RBCEIVED: 16-E-OOOO-C07C 09/01/2015
AGENCY RESPONSB: 09/28/2015 ~EW CLOSED, 10/01/2015
MS CARRIE ATKINSON
CLEARINGHOUSE COORDINATOR
DEPT OF TR~SPORTATION
STATEWIDE PLANNING - !~SC #1554
RALEIGH NC
REVIEW DISTRIBUTION
CAPE FEAR COG
DENR - COASTAL MGT
DENR ~EGISLATIVE AFFAIRS
DEPT OF CULTURAL RESOURCES
DEPT OF TRANSPORTATION
DPS - DIV OF EMERGENCY MANAGEMENT
PROJECT INFORMATION APPLICANT: Department of the Army TYPE: National Environmental Policy Act
Draft Environmental Impact Statement
DESe: Proposed project is far the construction of a termina: groin and supplemental beach nourishment project at the east end of Holden Beach, cO the wesc of the Lockwood Folly Inlet, View documents at: http://www.saw.usace.army.mil/Missions/RegulatoryPermitProgram/MajorProjects
The attached project has been submit~ed to ~he N. C. State Clearinghouse for intergovernmental review. Please review and submit your response by the above indicaced date to 1301 Mail Service Center, Raleigh NC 27699-130:.
If additional review time is needed, please contact this office at (919)807-2425.
AS A RES~T OF THIS REVIEW THE FOL~OWING IS SUBMITTED: NO COMMENT c=J COMMENTS ATTACHED
SIGNED BY: DATE: '''1ft/4,O/ ;;
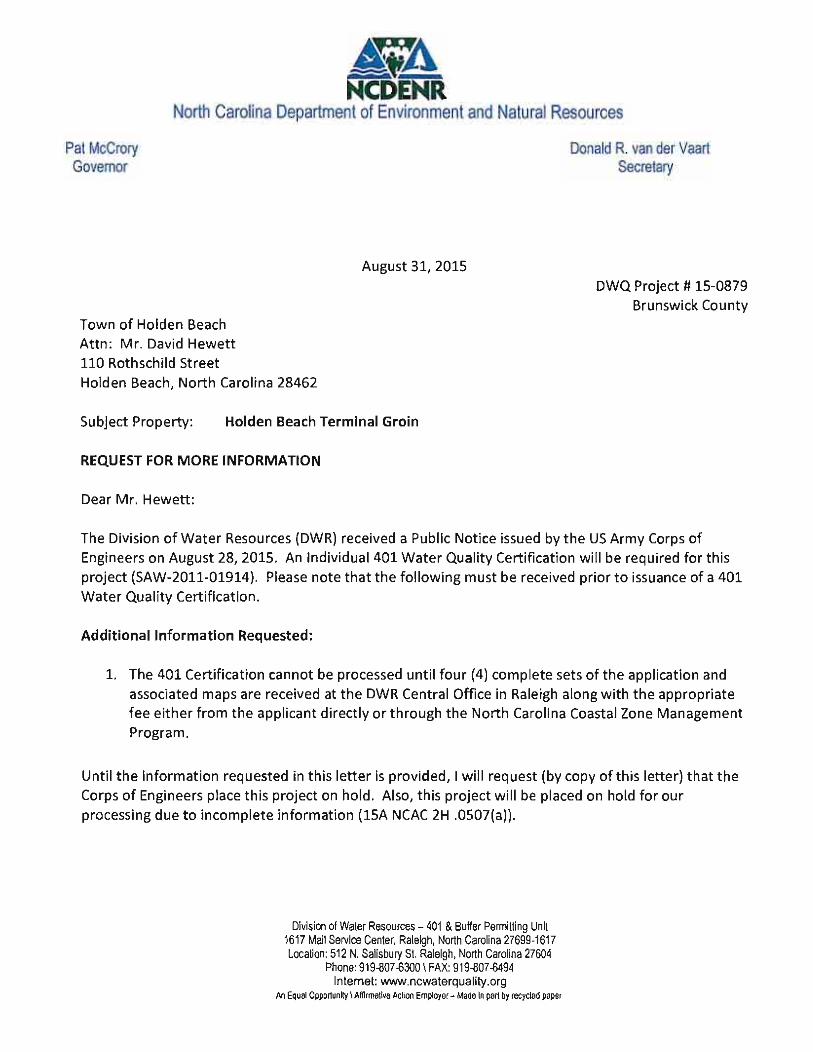
AVA NCDENR
North Carolina Department of Environment and Natural Resources
Pal McCrory Governor
Town of Holden Beach Attn : Mr. David Hewett 110 Rothschild Street Holden Beach, North Carolina 28462
August 31, 2015
Subject Property: Holden Beach Terminal Groin
REQUEST FOR MORE INFORMATION
Dear Mr. Hewett:
Donald R. van der Vaart Secrelary
DWQ Project # 15-0879 Brunswick County
The Division of Water Resources (DWR) received a Public Notice issued by the US Army Corps of Engineers on August 28, 2015. An Individual 401 Water Quality Certification will be required for this project (SAW-2011-01914). Please note that the following must be received prior to issuance of a 401 Water Quality Certification.
Additional Information Requested:
1. The 401 Certification cannot be processed until four (4) complete sets of the application and associated maps are received at the DWR Central Office in Raleigh along with the appropriate fee either from the applicant directly or through the North Carolina Coastal Zone Management Program.
Until the information requested in this letter is provided, I will request (by copy ofthis letter) that the Corps of Engineers place this project on hold. Also, this project will be placed on hold for our processing due to incomplete information (15A NCAC 2H .OS07(a)) .
Division of Waler Resources - 401 & Buffer Permfiling Unfl 1617 Mall Service Cenler, Raleigh, North Carolina 27699-1617 Location: 512 N. Salisbury St. Raleigh, North Carolina 27604
Phooe: 919-807-6300 \ FAX: 919-807-6494 Intemet: www.ncwalerqualily.org
An Equal Opportunity \ Affirmative Action Employer - Mad!) In part by recycled paper

Town of Holden Beach DWR Project #: 15-0879
Request for Additional Information Page 2 of2
Thank you for your attention. If you have any questions, please contact me at 919-807-6360 or karen .higgins@ ncden r.gov or Jennifer Burdette at (919) 807-6364 or [email protected].
KAH/jab
Sincerely,
¥OJS;V\ Karen A. Higgins, Supervisor 401 & Buffers Permitting Unit
cc: Dawn York, Dial Cordy & Associates, 201 N Front Street, Ste 601, Wilmington, NC 28401 USACE Wilmington Regulatory Field Office DWR WiRO file DWR 401 & Buffer Permitting Unit file
Filename: 150879TOHoldenBeachTerminaIGroln(BrunswickLHold_IP _NeedSetsJee.docx
North Carolina Department of Environmental Quality
Pat McCrory Governor
October 16,2015
u.s. Army Corps of Engineers - Wilmington District c/o Emily Hughes, Project Manager 69 Darlington Avenue Wilmington, NC 28403-1343
Dear Sirs:
Donald R. van der Vaart Secretary
The Division of Coastal Management (DCM) has completed our review of the Draft Environmental Impact Statement (DEIS) for the proposed Holden Beach terminal groin project located in Brunswick County, North Carolina. As you are aware, in 2011 the General Assembly of North Carolina enacted Senate Bill 110 (SB 110), which amended the Coastal Area Management Act (CAMA) to allow for the permitting of up to four terminal groins in North Carolina. SB 110 was further amended by Senate Bill 151 (SB 151) in 2013. For communities pursuing a terminal groin project, the amended SB 151 set out several specific requirements that must be met before a CAMA permit can be issued. DCM staff have therefore reviewed the DEIS in light of these requirements, as well as the laws of the CAMA and Dredge and Fill Act, and rules of the Coastal Resources Commission, and we provide the following comments for your consideration.
General Comments
The Division found the cost estimates and other financial information presented throughout the document difficult to understand and compare between different alternatives. It is recommended that this issue be re-examined during the development of the Final EIS so that data presented can be properly analyzed over varying time periods and between various alternatives.
Chapter 1.5 - The applicant may want to include the number and condition of structures that have been protected by temporary erosion control structures as a result of erosion.
Chapter 2 - The applicant should clarify the project limits and sand sources for the Town's existing authorization to renourish the beach-front and the ACOE spoil disposal on the East End.
Page 2.8 - The applicant should clarify that CAMA major permit #14-02 was recently modified to include an off-shore borrow area, although the Town has yet to utilize this sand source.
Chapter 5 (5.2.1- Direct and Indirect Impact Analysis- Numerical Modeling) states "some anthropogenic activities, such as AIWW navigation dredging, were purposely excluded from
1601 Mail Service Center, Raleigh, North Carolina 27699-1601 Phone: 919-707-8600 \ Internet: www,ncdenr.gov
An Equal Opportunity \ Affirmative Action Employer - Made in part by recycled paper

the modeling runs to minimize the potential for masking of project-induced changes. " It would seem that modeling should also be performed to include activities that can be assumed to be continuing as outside the scope of this project but potentially contributing to a cumulative effect on the project area. At a minimum, the potential for these cumulative impacts should be addressed in more detail.
There are potential errors in some of the figure references. For example, Section 5.3 seems to have an error in a referenced figure. The final sentence in paragraph one refers to survey transects presented in Figure D-9. Figure D-9 shows post-Hurricane Hanna storm damage and not survey transects. Figure D-12 is not referenced in Appendix C. Page D-14 notes that figures D-1 0 and D-11 have a three survey moving average. D-11 and D-12 identify a moving average in their legends, D-10 does not.
Figures D-lO, D-12 and D-13 reference NGVD29 for elevation, whereas the majority of the DEIS references NAVD88 for elevation. We would question if there is a risk of potential errors if data are mixed in this way?
Inlet Management Plan
It does not appear that the Inlet Management Plan (IMP) contained in Section 6.4 and Appendix C is sufficient to satisfy 113A -115.1 (f)( 5), which requires the finding that "The inlet management plan is adequate for purposes of monitoring the impacts of the proposed terminal groin and mitigating any adverse impacts identijiedas a result of the monitoring." The following comments should be taken into consideration as the applicant revises the IMP in accordance with the requirements of 113A-115.1(f)(5).
Appendix C, Subsection 1.0, references SBII0 rather than SB151 (SL 2013-384). Please update this reference. This update should also be appied to any other references to SB 11 0 in the document.
Appendix C, Subsection 2.1, references the "latest Town survey" from April 2012 but should be updated to reflect the Town's most recent annual survey.
Appendix C, Subsection 2.3, describes the beach profile and inlet monitoring schedule, and should specifically include a commitment to also monitor the Oak Island side of the inlet as part of their annual surveys.
Appendix C, Subsection 2.4, states that "at the end of 5 years, the applicant will coordinate with regulatory agencies to determine whether additional annual photographs are required". The Town should commit to continuing aerial photography for the entirety of the project horizon of the project, but should also acknowledge that future approval may be requested from the Division to shorten, modify, or terminate this monitoring.
Appendix C, Subsection 2.6, states, "the shoreline (typically the mean high water line) positions between consecutive surveys will be compared, plotted, and analyzed for mean and

extreme changes." More explanation should be given on how the shoreline change analysis would be performed, in which cases the mean high water line would not be used, and how every consistency in the analysis is ensured if other means are used.
Appendix C, Subsection 3.2, states, "a i-year and 2-year post-construction sampling survey will also occur while additional surveys following the 2-year post-construction event may be required, depending on previous results". The Town should commit to continuing postconstruction sampling for a period of greater than 2 years, unless approval from the Division is first obtained.
Appendix C, Subsection 5.3 (Paragraph 1), references a depiction of the surveyed transects in Figure D-9, yet shows an image of an eroded dune post-Hurricane Hanna.
Appendix C, Subsection 5.4 (Thresholds), does not adequately establish the baseline for assessing any adverse impacts due to the project and the thresholds for when the adverse impacts must be mitigated, as required by law in 113A-115.1 (e)(5)(b). The baseline and thresholds should be established for both sides of the inlet and should be more comprehensive than applying a single trigger of a 53cy/ft/year loss at one point along the shoreline.
Chapter 6 (page 6-7) of the DEIS addressing mitigative measures describes the formation of a technical advisory committee (T AC) to review the monitoring data and determine whether any adverse shoreline impacts should be attributed to the proj ect and any appropriate mitigation measures. This proposal is absent from the Inlet Management Plan.
DCM utilizes long-term shoreline change at a linear rate of feet/year. The applicant proposes a volumetric rate (cubic yards/foot/year) to take into account short-term change. The DCM rate for Station 10+00 is 7ft/year. The applicant proposes that the volumetric rate of 7 cy/ft/yr can be equated to the DCM shoreline change rate of 7ft/yr. More information on how these rates compare would be beneficial.
Fourteen beach profiles were taken over 12 years as a baseline to determine mitigation thresholds. The small sample size was taken with varying intervals between events, from five months to two years. The analysis determined a standard deviation (SD) of 47.9 cy/ft/yr (Section 5.3) or 46.1 cy/ft/yr (Section 5.4). The SD calculation assumes normal distribution of the data, though no normality testes) are discussed. Section 5.4 does develop a threshold of the volumetric baseline rate (7 cy/ft/yr) + SD (46.1 cy/ft/yr) > 53 cy/ft/yr erosion rate over three consecutive surveys, though without a normality test describing the data's distribution, it is difficult to determine if the SD is representative. Further information regarding the statistical analysis and how comparable the linear DCM erosion rate and how these rates compare would be beneficial.
Appendix C outlines the biological monitoring and the development of thresholds that may trigger mitigation.
Monitoring consists of sample cores, visual observations and sediment samples for three species and associated macroinveliebrates common to the intertidal and supratidal beach

habitats. Cores will be sampled for coquina clams and mole crabs, visual observations will be made for ghost crabs, and sediment will be sampled for associated macro invertebrates. The description of the data to be collected is difficult to interpret. It is recommended that individuals are identified to species, counted and size classed to show abundance and distribution. Ghost crab burrows will be visual counted and evidence of burrow activity will be recorded. It is recommended that the diameter of burrow holes be recorded as well to provide a metric for size distribution. There is no discussion on the methods to collect macro invertebrate data. It is recommended that individuals be identified to a minimum of lowest taxonomic level possible and abundance recorded.
There is no mention of larval transport monitoring. The characterization of fish composition and abundance within the project area, a compilation of relevant research regarding larval transport through inlets, especially inlets with hardened structures, and the development of larval transport monitoring methodology is recommended to identify the most highly utilized areas for larval transport and to describe effects of hardened structures on fish life history stages.
Senate Bill 151 (Session Law 2013-384) requires that the applicant for a terminal groin project address certain financial obligations for the project, including long-term maintenance. In order to ensure that the required financial information is provided in an acceptable fashion, the financial costs associated with the requirements of Senate Bill 151 (Session Law 2013-384) should be included in the DEIS in as detailed a manner as is possible at this stage in the project development process. The Division would therefore request more detailed cost information in the Final EIS. Items of specific interest include:
o Costs associated with any additional monitoring initiatives.
o Cost associated with development and operations of the Technical Advisory Committee.
o With regards to verification of the final financial assurance package, 113A-115.1 (e)( 6) requires that a financial assurance plan be verified either by the Secretary of the Department of Environmental Quality (DEQ) or by the Coastal Resources Commission (CRC). DCM and the Depmiment have taken the position that the choice of verification pathway (DEQ Secretary or CRC) should fall to the discretion of the applicant. Therefore, as the financial assurance package becomes more detailed and refined, and the project moves closer to the permit application stage, the Division suggests a meeting between the Town and the Division to determine which of the two verification pathways are preferred by the Town.
o Detailed cost estimates for the full removal of the terminal groin structure should be stated if it is determined that the structure is not functioning as intended, and groin modifications are deemed ineffective in minimizing or eliminating these negative impacts.
The inclusion of the above-listed financial information into the cost analysis of the terminal
groin portions of the alternatives section of the DEIS.

Fisheries-Related Impacts
Alternatives 1,2, and 3 would be the least impactful to fisheries resources. Under alternative 4, which would utilize inlet management and beach nourishment as shoreline protection, dredging frequency is expected to be every two years. The applicant states that they believe there is no hard bottom within the outer channel footprint, though no surveys have been conducted beyond sediment deposit cores. If this alternative is pursued, it is recommended that a hard bottom survey be conducted to identify any potential hard bottom locations. Coordination with appropriate resource agencies should then be conducted to determine buffers around any hard bottom identified for borrow sites. Due to dredging occurring within the inlet and estuarine waters under alternative 4, it is recommended that a moratorium be implemented on in water work, to include dredging, from April 1 stto September 30th. This moratorium reduces the negative effects on critical fish life history activities, to include spawning migrations and nursery functions.
Alternatives 5 and 6 both propose construction of terminal groins, with associated nourishment. Borrow sites include Lockwood Folly Inlet crossing, the bend widener, with Lockwood Folly Inlet and the Central Reach if needed. Dredging for nourishment would occur every four years. The primary fisheries concern with terminal groin projects are potential impacts to larval fish transport. The applicant utilized the Coastal Modeling System (CMS) developed by the USACE to predict the impact on larval transport. The CMS was developed to "predict long-term effects of the alternatives on coastal processes and morphology". The model looks at particle concentrations and change relative to the groin to simulate flow, sediment transport and morphological changes in response to local environmental conditions. There is concern that since the CMS model is designed for sediment transport and not larval transport, the conclusions stated within the DEIS may be unrepresentative of larval transport impacts. Sediment transport models commonly utilize passive transport mechanics based on metrics such as grain size and weight, and how they are effected by environmental processes. Larval transport includes active behavior such as diel migrations within the water column and other ontogenetic behaviors. Further description of the potential for CMS to accurately predict larval transport effects, including any scientific literature, is recommended to fully understand the potential impacts.
The DEIS does not provide an estimation of larval distribution within the proposed location's waterbody, Long Bay. References are instead made to Beaufort Inlet. Terminal groins have the potential to interfere with larval and juvenile passage from spawning grounds to estuarine nursery areas. Obstacles like terminal groins could block the passage of larvae into inlets and reduce recruitment success (Blanton et al. 1999; Churchill et al. 1997; Deaton et al. 2010; Kapolnai et al. 1996). Larval distribution can identify the most highly utilized areas and serve as baseline data to compare larval and juvenile fish monitoring after groin construction.
There is concern the use of hardened structures along high energy shorelines could accelerate erosion along neighboring stretches of the beach due to the alteration of longshore sediment transport. As an example the DEIS states the East End could experience an increase in rip current frequency. An increase in rip current frequency could accelerate erosion along the East End, requiring additional nourishment and altering the foraging grounds for many surf zone species.
As a general comment, throughout the DEIS the applicant references an environmental window of November 16th through April 30th for all operat ions. This window was chosen to account for beach nourishment and invertebrate recruitment periods, larval ingress and sea turtle and shore bird nesting seasons. Larval ingress in North Carolina is species dependent, but occurs on average throughout the spring. Entrainment of larvae through dredging operations is discussed in the DEIS and is usually mitigated through moratoria. Due to dredging occurring within the inlet and estuarine waters, DCM recommends a moratorium on in water work, to include dredging, from 1 April to 30 September. This moratorium reduces the negative effects on critical fi sh life history activities, to include spawning migrations and nursery functions. This moratorium is commonly requested by staff and is recommended here in place of the applicant 's proposed environmental window.
In closing, the Division of Coastal Management appreciates the opportunity to comment on this project, and we look forward to further discussions on the issues raised in thi s letter. Please note that internal consistency throughout the document should be verified fo llowing any revisions made subject to the above comments. If yo u have any questions concerning any of these comments, please feel free 10 conlacl me al (252) 808-2808 ext. 2 12.
Cc: Braxton Davis, OCM Debbie Wilson, DCM Holley Snider, DCM
Sincerely,
p~ )f~ Doug Huggett Manager, Major Permits Section N.C. Division of Coastal Management

Blanton, l 0., F.E. Werner, A. Kapolnai, B.O. Blanton, D. Knott, and E.L. Wenner. 1999. Windgenerated transport of fictitious passive larvae into shallow tidal estuaries. Fisheries Oceanography 8(2): 210-223. Bowen, M. L., and R. Dolan. 1985. The relationship of Emerita talpoida to beach characteristics. l Coast. Res. 1: 151-163.
Churchill, J.B., lO. Blanton, lL. Hench, R.A. Luettich, Jr. and F.E. Werner. 1997. Flood tide circulation near Beaufort Inlet, North Carolina: Implications for Larval Recruitment. Estuaries. 22: 1 057-1 070.
Deaton, A.S., W.S. Chappell, K. Hart, l O'Neal, B. Boutin. 2010. North Carolina Coastal Habitat Protection Plan. North Carolina Department of Environment and Natural Resources. Division of Marine Fisheries, NC. 639 pp.
Kapolnai, A., R.E. Werner, and lO. Blanton. 1996. Circulation, mixing, and exchange processes in the vicinity of tidal inlets. Journal of Geophysical Research 101(14): 253-268.

NORTH CAROLINA STATE CLEARINGHOOSE DEPARTMENT OF ADMINISTRATION
INTERGOVERNMENTAL REVIEW'
COUNTY : BRUNSWICK 8 12 : OTHER STATB NUMBER : 16-E-00 00-0070
MS RENEE GLEDHILL-EARLEY CLEARINGHOUSE COORDINATOR DEPT OF CULTURAL RESOURCES
STATE HISTORIC PRESERVATION OFFICE MSC 4617 - ARCHIVES BUILDING
RALEIGH Ne
REVZBW DISTRIBUTION
CAPE FEAR COG
DENR - COASTAL MGT
DENR LEGISLATIVE AFFAIRS DEPT OF CULTURAL RESOURCES
DEPT OF TRANSPORTATION DPS - Drv OF EMERGENCY MANAGEMENT
PROJECT INFORMATION APPLICANT: Departrnenc of the Army
TYPE: National Environmental Policy Act Draft Environmental Impact Statement
DATE RECEIVED: 09 / 01 / 2015 AGENCY RBSPONSE : 09 / 28 / 2015 RXVIEW CLOSED : 10/ 01 / 2015
DEse: Proposed project is for the construction of a terminal groin and supplemental beach nourishment project at the east end of Holden seach , to the west of the Lockwood Folly Inlet. - view documents at: http: //www.saw.usace.army.mil/Missions/RegulatoryPe~tProgram/MajorProjects
Tbe attached project has been submitted to the N. C. State Clearinghouse for intergovernmental revie~. please review and submit your response by the above indicated date to 1301 Mail Service Center, Raleigh NC 27699-1301.
If additional review time is needed , please contact this office at (919)807-2425.
AS A RESULT OF THIS REVIEW THE FOLLOWING IS SUBMITTED: ~ NO COMMENT 0 COMMENTS ATTACHED
SIGNED BY: DATE: (0 ·~·15-
SEP 0 9 2015
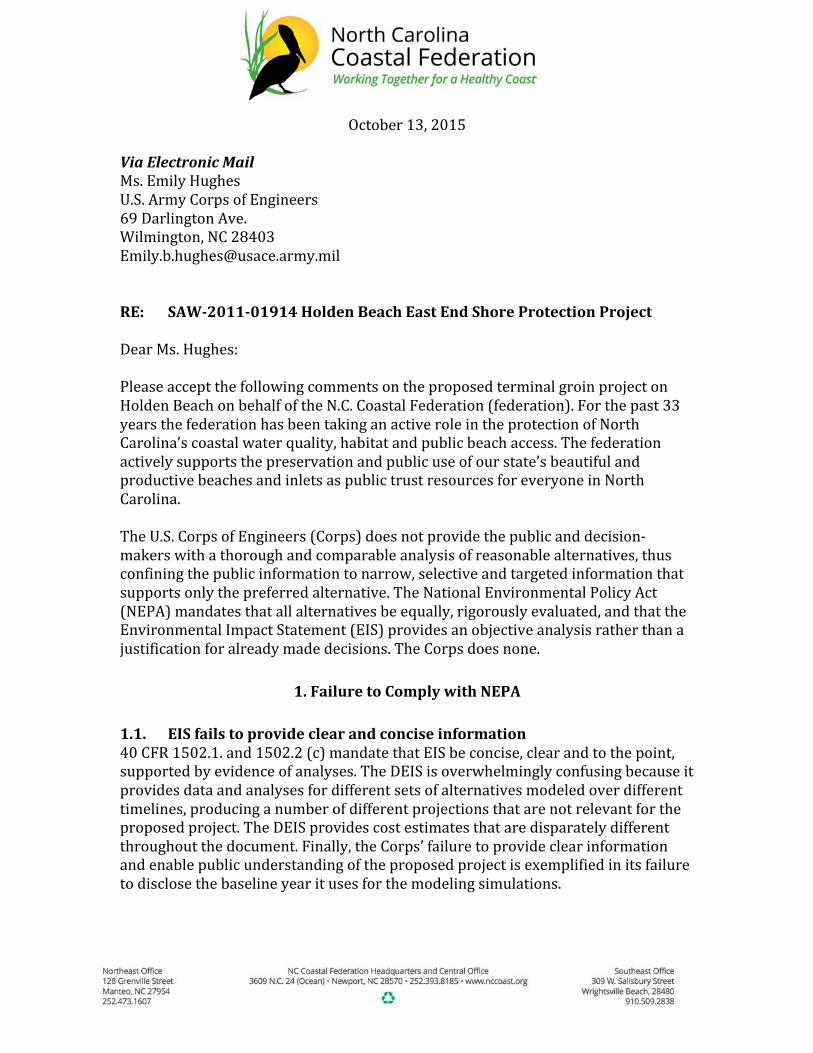
October 13, 2015
Via Electronic Mail Ms. Emily Hughes U.S. Army Corps of Engineers 69 Darlington Ave. Wilmington, NC 28403 [email protected] RE: SAW-‐2011-‐01914 Holden Beach East End Shore Protection Project Dear Ms. Hughes: Please accept the following comments on the proposed terminal groin project on Holden Beach on behalf of the N.C. Coastal Federation (federation). For the past 33 years the federation has been taking an active role in the protection of North Carolina’s coastal water quality, habitat and public beach access. The federation actively supports the preservation and public use of our state’s beautiful and productive beaches and inlets as public trust resources for everyone in North Carolina. The U.S. Corps of Engineers (Corps) does not provide the public and decision-‐makers with a thorough and comparable analysis of reasonable alternatives, thus confining the public information to narrow, selective and targeted information that supports only the preferred alternative. The National Environmental Policy Act (NEPA) mandates that all alternatives be equally, rigorously evaluated, and that the Environmental Impact Statement (EIS) provides an objective analysis rather than a justification for already made decisions. The Corps does none.
1. Failure to Comply with NEPA
1.1. EIS fails to provide clear and concise information 40 CFR 1502.1. and 1502.2 (c) mandate that EIS be concise, clear and to the point, supported by evidence of analyses. The DEIS is overwhelmingly confusing because it provides data and analyses for different sets of alternatives modeled over different timelines, producing a number of different projections that are not relevant for the proposed project. The DEIS provides cost estimates that are disparately different throughout the document. Finally, the Corps’ failure to provide clear information and enable public understanding of the proposed project is exemplified in its failure to disclose the baseline year it uses for the modeling simulations.

2
1.1.1. Failure to provide the baseline year used in the assessment and modeling of future shoreline changes
The Corps relies on modeling results to justify its choice of the preferred alternative. A range of modeling simulations, discussed further below, shows how the change in shoreline over a period of four years will drive the mean high water mark close to the structures on the east end of the island. Yet, nowhere in the document does the Corps identify the baseline year. Failure to provide this essential piece of information renders the entire document useless given that the reader cannot make any meaningful conclusions based upon the information presented in the document.
1.1.2. Failure to justify evaluation of a 30-‐year project over 4 years The EIS states that “long term project performance was investigated using several suites of 4-‐year simulation runs under various alternatives.”1 This is an unacceptable time span for a project with a life of 30 years. It is clear that the 30-‐year project life is recognized because the DEIS provides cost and benefit analyses that are projected 30 years into the future, yet no simulations were run for this time span. Similarly, to allow for the equitable comparison and assessment, the Corps needs to model the effects and performance of the proposed project for a period of 30 years or at least use the same timeline it used for other terminal groin proposals. Alternatively, the Corps needs to provide a justification for using a 4-‐year period.
1.2. Failure to rigorously explore and objectively evaluate all alternatives In describing the treatment of project alternatives as the heart of the EIS, 40 CFR 1502.14 requires agencies to: (1) rigorously explore and objectively evaluate all alternatives; (2) dedicate substantial treatment to each alternative to allow for evaluation of their comparative merits. The Corps fails to comply with both of these legal requirements. To allow for the objective, equal and rigorous analysis of all the alternatives the Corps needs to establish objective and comparable set of baseline data, analyses and results for all alternatives. The Corps does none of this.
1.2.1. Contrasting and disparate cost analyses that prevent equitable comparison of alternatives are provided
The DEIS provides two completely different economic analyses that individually provide insufficient information and are at odds with each other. Further, the two analyses provide estimates for completely different sets of alternatives. The cost assessment in the engineering report states that the cost table (Table 9-‐8) includes assessment of five alternatives, yet the table lists seven alternatives.2 In addition, five of these seven alternatives are at odds with the six alternatives presented in the main DEIS document. Further, the DEIS states that this table is
1 Appx. F, p. 7-‐16 2 Appx. F, p. 9-‐21

3
based on a table 9-‐7.3 Yet, in table 9-‐7 the DEIS only presents data for five alternatives omitting Alternative 1 and 2, failing to show how it arrived at an estimated 30-‐year cost for Alternative 2 of $121-‐166 million.4 This same Alternative is estimated to cost $5.8 million in the main DEIS document.5 Finally the skewed financial analysis provided in the engineering report is demonstrated in the assessment of damages and losses due to the groin. The DEIS falsely states that these factors are not applicable to groins. Further, this analysis does not include the costs for long-‐term maintenance and monitoring of the groin, implementation of mitigation measures and eventual modification or removal of the groin, actions required by the GS §113A -‐115.1(e)(5). The cost and benefit estimates provided in Chapter 5 of the document provide estimates for a different set of alternatives and factors and omit numeric estimates on reduction in tax base and transition costs, among others. These two disparate and inconsistent, yet individually skewed and insufficient economic analyses illustrate the inadequacy of the DEIS document to provide meaningful and realistic data that would enable objective comparison of all alternatives.
1.2.2. Failure to provide comparable data The DEIS provides a number of simulated conditions in the engineering report some of which are modeled for 190 days, some for one year, and some for four years, a period that the unjustifiably considered “long term”. Yet, none of these conditions are consistently applied to all alternatives. The following is a list of all the simulation options provided in the engineering report, cited directly from the document:6
Set 1 Time period: June 2009 – December 2009 Modeling interval length: 190 days
• Baseline no action • Short groin and 60,000 cy nourishment • Long groin and 90,000 cy nourishment • 60,000 cy nourishment • 90,000 cy nourishment • Short groin only • Long groin only • 1,310,000 cy central reach nourishment • Outer channel relocation • Short groin, 60,000 cy nourishment and outer channel relocation
3 Appx. F, p. 9-‐18 4 Appx. F, p. 9-‐21 5 DEIS, p. 5-‐57 6 Names of alternatives cited directly from the Appx. F

4
Set 2 Time period: 2004 Modeling interval length: 1 year
• No action • Sg + Nr • Sg+NR+INL+BRW
Set 3a Time period: June 2009 – December 2009 Modeling interval length: 190 days Location: Area 1&2
• 60,000 cy nourishment only • Short groin only • Groin and nourishment • Channel relocation • Central reach nourishment • Groin nourishment channel relocation LWFIX borrow area
Set 3b Time period: June 2009 – December 2009 Modeling interval length: 190 days Location: Area 3&4
• 90,000 cy nourishment • Long groin only • Groin and nourishment • Channel relocation • Central reach nourishment
Set 4 Time period: Unknown Baseline Bathymetry: 2004-‐2008 Modeling interval length: one year
• Short groin and 80,000 cy nourishment • Short groin without a T head and 80,000 cy nourishment • Short groin 80,000 cy nourishment, bend widener borrow area and outer
channel relocation • Dredged eastern channel • Wide outer channel dredging and 120,000 cy nourishment
Set 5 -‐ Long-‐term modeling Time period: Unknown Modeling interval length: 4 years
• No action • Nourishment only • Short groin and nourishment • Long groin and nourishment • Intermediate groin and nourishment
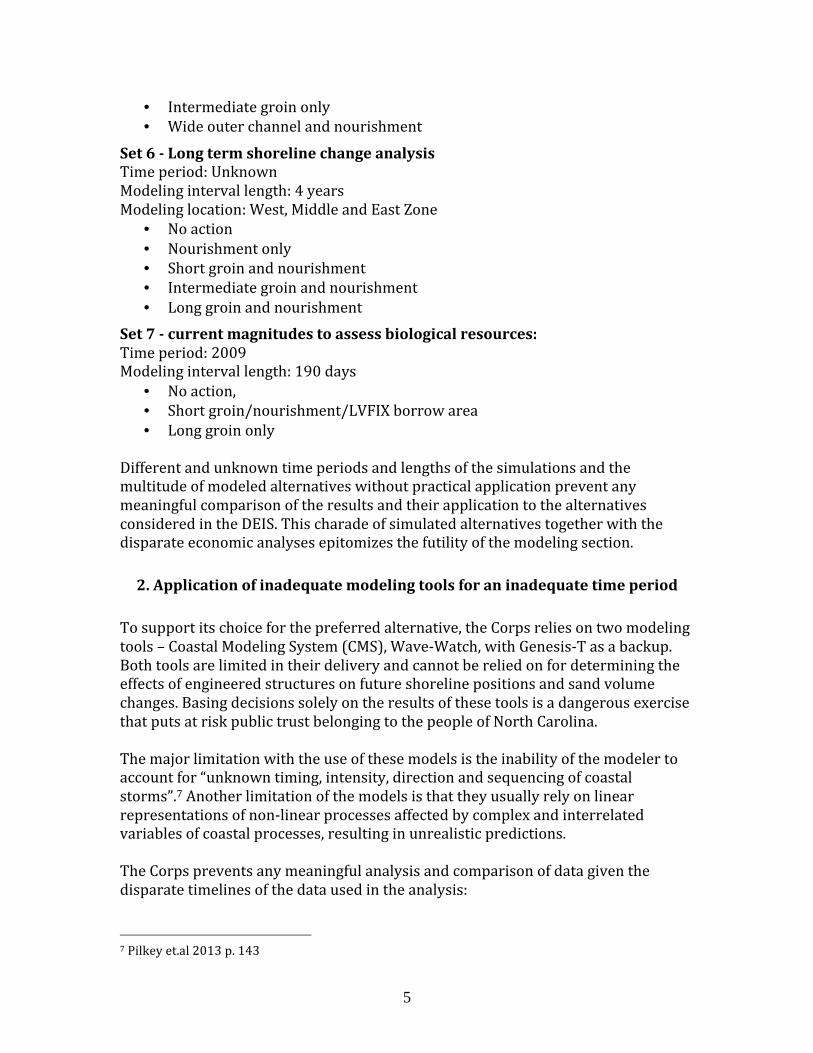
5
• Intermediate groin only • Wide outer channel and nourishment
Set 6 -‐ Long term shoreline change analysis Time period: Unknown Modeling interval length: 4 years Modeling location: West, Middle and East Zone
• No action • Nourishment only • Short groin and nourishment • Intermediate groin and nourishment • Long groin and nourishment
Set 7 -‐ current magnitudes to assess biological resources: Time period: 2009 Modeling interval length: 190 days
• No action, • Short groin/nourishment/LVFIX borrow area • Long groin only
Different and unknown time periods and lengths of the simulations and the multitude of modeled alternatives without practical application prevent any meaningful comparison of the results and their application to the alternatives considered in the DEIS. This charade of simulated alternatives together with the disparate economic analyses epitomizes the futility of the modeling section.
2. Application of inadequate modeling tools for an inadequate time period
To support its choice for the preferred alternative, the Corps relies on two modeling tools – Coastal Modeling System (CMS), Wave-‐Watch, with Genesis-‐T as a backup. Both tools are limited in their delivery and cannot be relied on for determining the effects of engineered structures on future shoreline positions and sand volume changes. Basing decisions solely on the results of these tools is a dangerous exercise that puts at risk public trust belonging to the people of North Carolina. The major limitation with the use of these models is the inability of the modeler to account for “unknown timing, intensity, direction and sequencing of coastal storms”.7 Another limitation of the models is that they usually rely on linear representations of non-‐linear processes affected by complex and interrelated variables of coastal processes, resulting in unrealistic predictions. The Corps prevents any meaningful analysis and comparison of data given the disparate timelines of the data used in the analysis:
7 Pilkey et.al 2013 p. 143
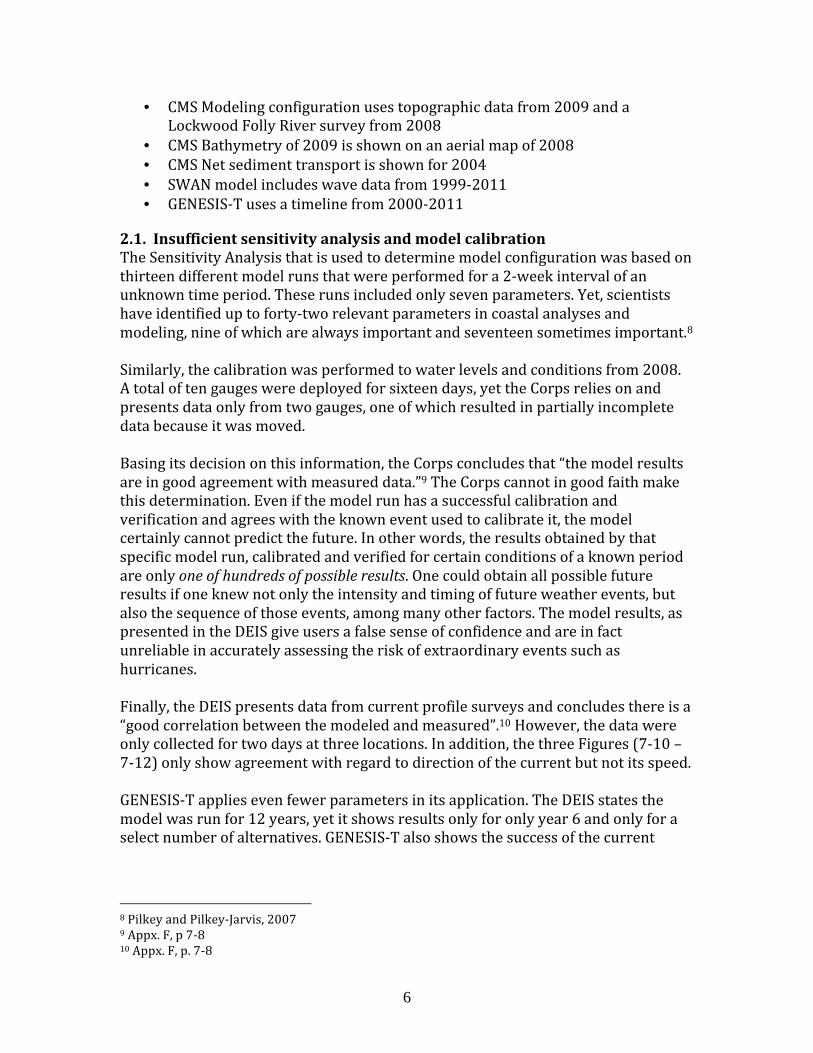
6
• CMS Modeling configuration uses topographic data from 2009 and a Lockwood Folly River survey from 2008
• CMS Bathymetry of 2009 is shown on an aerial map of 2008 • CMS Net sediment transport is shown for 2004 • SWAN model includes wave data from 1999-‐2011 • GENESIS-‐T uses a timeline from 2000-‐2011
2.1. Insufficient sensitivity analysis and model calibration The Sensitivity Analysis that is used to determine model configuration was based on thirteen different model runs that were performed for a 2-‐week interval of an unknown time period. These runs included only seven parameters. Yet, scientists have identified up to forty-‐two relevant parameters in coastal analyses and modeling, nine of which are always important and seventeen sometimes important.8 Similarly, the calibration was performed to water levels and conditions from 2008. A total of ten gauges were deployed for sixteen days, yet the Corps relies on and presents data only from two gauges, one of which resulted in partially incomplete data because it was moved. Basing its decision on this information, the Corps concludes that “the model results are in good agreement with measured data.”9 The Corps cannot in good faith make this determination. Even if the model run has a successful calibration and verification and agrees with the known event used to calibrate it, the model certainly cannot predict the future. In other words, the results obtained by that specific model run, calibrated and verified for certain conditions of a known period are only one of hundreds of possible results. One could obtain all possible future results if one knew not only the intensity and timing of future weather events, but also the sequence of those events, among many other factors. The model results, as presented in the DEIS give users a false sense of confidence and are in fact unreliable in accurately assessing the risk of extraordinary events such as hurricanes. Finally, the DEIS presents data from current profile surveys and concludes there is a “good correlation between the modeled and measured”.10 However, the data were only collected for two days at three locations. In addition, the three Figures (7-‐10 – 7-‐12) only show agreement with regard to direction of the current but not its speed. GENESIS-‐T applies even fewer parameters in its application. The DEIS states the model was run for 12 years, yet it shows results only for only year 6 and only for a select number of alternatives. GENESIS-‐T also shows the success of the current
8 Pilkey and Pilkey-‐Jarvis, 2007 9 Appx. F, p 7-‐8 10 Appx. F, p. 7-‐8

7
management strategy (Alternative 1) because it confirms the “overall accretional trend”11 for most of the Holden Beach shoreline. Furthermore, GENESIS-‐T assumes that wave-‐generated currents dominate longshore sediment transport. It ignores wind-‐dominated currents and tides that are common on the coast of North Carolina. Finally, as admitted by the Corps, this tool cannot model channel realignment. GENESIS has been critically reviewed as relying on poor assumptions and widespread use of smoothing averages (Young et al. 1995; Thieler et al. 2000). The Corps needs to reject the use of this tool in the DEIS because the tool cannot provide analysis for all the alternatives for the proposed project. The models used to simulate the effects of the alternatives do not, and cannot, account for the dynamic nature of events of tides, currents, storms, and winds as well as of the order in which these occur. This issue is further compounded by the Corps’ use of inadequate, incomplete and contrasting data when running simulations. The Corps needs to re-‐evaluate the modeling systems employed to compare alternatives, as well as the data used to calibrate and run simulations.
3. Failure to prove that the chosen preferred alternative is the most feasible
As discussed above, the DEIS provides two disparate sets of economic assessments. One is provided in the engineering report and the other in Chapter 5 of the DEIS. Neither of these two documents provides a sound economic analysis of the proposed project. In fact, they only support the notion that economically, the proposed project does not have any merit. The economic analysis provided in Chapter 5 of the DEIS provides an insufficient cost and benefit analysis of the alternatives. Appendix F provides a completely different economic analysis. This analysis is based on an entirely different set of factors and provides cost estimates based on the costs of projects done in South Carolina. Table 1 summarizes the cost of each Alternative as well as the number of structures and lots each is projected to protect at the end of four years, according to the DEIS.
11 Appx .F, p. 7-‐71

8
Alternative Total Cost* (millions)
# of Affected Properties (land only)
# of Affected Properties (structures only)
Total # of Affected Properties
1 $49.5 6 13 19 2 $5.8 9 19 28 3 $58.9 6 13 19 4 $58.7 6 13 19 5 $35.4 5 6 11 6 $36.6 5 11 16
Table 1: Costs and affected properties and structures for each alternative as presented in Chapter 5 of the DEIS *Denotes sum of construction and maintenance, assessed tax value of affected parcels and infrastructure replacement costs as presented in Chapter 5 of the DEIS Table 2 shows comparison of Alternatives relative to Alternative 2. It stands that Alternative 6 would marginally protect only four structures and eight lots more than what would otherwise be affected under Alternative 2. Alternative Difference in
Total Cost (millions)
# of Affected Properties (land only)
# of Affected Properties (structures only)
Total # of Affected Properties
1 $43.7 -‐3 -‐6 -‐9 2 n/a n/a n/a n/a 3 $53.1 -‐3 -‐6 -‐9 4 $52.9 -‐3 -‐6 -‐9 5 $29.6 -‐4 -‐13 -‐17 6 $30.8 -‐4 -‐8 -‐12
Table 2: Costs and affected properties and structures relative to Alternative 2 The suggested protection would be marginal because as Figure 1 indicates, even if a groin is built, after four years the mean high water line mark (red line) would be in a similar location as it would be under Alternative 2 (Figure 2). Comparing these figures shows that the difference in position of the mean high water line between the two options is negligible.

9
Figure 1: Projected properties at risk and infrastructure impacts at year four end under Alternative 612
Figure 2: Projected properties at risk and infrastructure impacts at year four end under Alternative 213 12 DEIS, p. 5-‐157 13 DEIS, p. 5-‐65

10
Given that exact locations and sizes of the properties “saved” under Alternative 6 were not identified in the DEIS it was not possible to determine their exact value. For comparison purposes using the assessed value of properties under Alternative 2 (28 properties are valued at $5.18 million14) renders that the approximate value of the 12 properties (4 land and 8 structure) that Alternative 6 could only marginally protect is $2.2 million. In conclusion, the Corps maintains that the best alternative for the proposed project is to spend $30.8 million more in order to protect land and structures valued at $2.2 million. This is unacceptable. Further relative comparison of alternatives indicates that it would take about $10 million more to implement alternatives 3 and 4 than it would to continue with the currently employed management strategy (Table 3). Yet all three alternatives would render the same number of affected properties – six lots and thirteen structures. Alternative Difference in
Total Cost (millions)
# of Affected Properties (land only)
# of Affected Properties (structures only)
Total # of Affected Properties
1 n/a n/a n/a n/a 3 $53.1 0 0 0 4 $52.9 0 0 0
Table 3: Comparison of costs and affected properties and structures of Alternatives 3 & 4 relative to Alternative 1. The negligible difference among the projected modeled alternatives is also shown in the relative comparison of the preferred Alternative 6 and the strategies currently employed by the applicant (Alternative 1). This comparison indicates that the proposed preferred alternative would only marginally protect one property and two houses more than what the current strategies are doing. Drawing from these relative comparisons it stands that the best and the most financially practicable alternative is for the applicant to allow the natural inlet process to occur and if necessary relocate existing structures. Alternatively, if the applicant is not ready to take this step, the next best solution for the Applicant is to continue with the current strategies explained under Alternative 1.
14 DEIS, p. 5-‐67

11
4. Failure to comply with the federally required Section 7 of the Endangered Species Act
The DEIS fails to fulfill the basic legal requirements to provide a multilateral assessment of the effects on the environment. The proposed project would affect fourteen federally listed species and their critical habitat hence it requires the Corps to consult with expert agencies U.S. Fish and Wildlife Service (USFWS) and National Marine Fishery Service (NMFS). These agencies need to issue Biological Opinion stating their assessment of the effect of the proposed project on the species and their habitat. 50 CFR §402.10 requires Federal agencies to confer with the Service on actions that are likely to jeopardize the continued existence of any proposed species or result in destruction of their habitat at early stages in the planning process so that potential conflicts can be identified and resolved. Further, 50 CFR §402.11 describes that the “early consultation is designed to reduce likelihood of conflicts between listed species or critical habitat and proposed action” of Federal agency. Finally, 50 CFR §402.14 requires the Federal agency “to review its actions at an earliest possible time” [emphasis added] to determine any possible effects of its proposed action to the enlisted species and their habitat. The DEIS fails to provide documents to show that the any type of consultation has occurred with the expert agencies. The DEIS also fails to supply the Biological Opinion of expert agencies. Without the Biological Opinion, the public cannot know what the response of the expert agencies to the effects of the proposed project to these species. The Section 7 Consultation provision was put in place in the ESA so that opinions of all relevant parties are taken into consideration before the public can comment on the project. The Corps needs to comply with the ESA and consult with the USFWS and NMFS to receive their Biological Opinion on the effects of the project on the listed species of Lockwoods Folly Inlet. Without it, the DEIS is incomplete.
Conclusion
For the reasons described above, the Corps cannot issue a Final Environmental Impact Statement for this project. The Corps has failed to comply with the requirements established by NEPA and with other federal laws. The DEIS is replete with deficiencies that must be addressed. Based on the data presented in the DEIS it stands that the most economic option for the town of Holden Beach is Alternative 2. The Corps cannot justify its choice of the preferred alternative. These deficiencies must be fully explained in a supplemental EIS and released for public review and comment.
12
Thank you for considering these comments. Please contact me at (252) 393-‐8185 or [email protected] if you have any questions regarding their content.
Sincerely,
Ana Zivanovic-‐Nenadovic Program and Policy Analyst Cc: Todd Miller, N.C. Coastal Federation Derb Carter, Southern Environmental Law Center Walker Golder, North Carolina Audubon Braxton Davis, N.C. Division of Coastal Management
13
Literature Cited Pilkey, O., Young, R., Cooper, A. 2013. Quantitative modeling of coastal processes: A
boom or a bust for society? The Geological Society of America. Special paper 512.135-‐144.
Pilkey, O.H., and Pilkey-‐Jarvis, L. 2007. Useless Arithmetic: New York, Columbia University Press, 230 p.

SOUTHERN ENVIRONMENTAL LAW CENTER
Telephone 919-967-1450
Via U.S. and Electronic Mail Emily Hughes
601 WEST ROSEMARY STREET, SUITE 220 CHAPEL HILL, I--JC 27516-2356
October 13,2015
Wilmington Regulatory Field Office u.s. Army Corps of Engineers 69 Darlington Ave. Wilmington, NC 28403 Emily. [email protected]
Facsimile 919-929-9421
Re: SAW-2011-01914 Holden Beach East End Shore Protection Project
Dear Ms. Hughes:
Please accept these comments on the Town of Holden Beach's East End Shore Protection Project Draft Environmental Impact Statement ("DEIS"). The Southern Environmental Law Center submits these comments on behalf of the North Carolina Coastal Federation and Audubon North Carolina. As discussed below, the DEIS does not comply with the National Environmental Policy Act ("NEP A"). Moreover, the limited analysis in the DEIS reveals that the only alternative that addresses the Town's long-term erosion issues is Alternative 2: Abandon and Retreat. Not only is Alternative 2 substantially cheaper than any other alternative, it does not have the adverse environmental effects of dredging, beach renourishment, or shoreline hardening. Therefore, none of the alternatives that require a Clean Water Act Section 404 permit can be authorized.
I. The DEIS Analysis Is Inconsistent with Other Terminal Groin Projects.
This is the fourth DEIS the Corps has published analyzing a terminal groin project in North Carolina since 2012. Each uses a different approach to assessing impacts. The Bald Head Island DEIS modeled shoreline change for nine years using primarily the Delft3D model. The Figure Eight Island DEIS modeled shoreline change for five years using the Delft3D model. The Ocean Isle DEIS modeled shoreline change for three years using the Delft3D model. The Figure Eight SEIS modeled shoreline change for five to seven years using the Delft3D model and ten years using the GENESIS model. This DEIS models shoreline change for four years using the CMS model. The Corps has not provided any explanation in these documents regarding why it has been so inconsistent in evaluating substantially similar projects. Failing to explain the different treatment of similar projects is an obstacle to public understanding of the Corps' limited analysis.
Perhaps most troubling regarding this discrepancy is the Corps' apparent deference to third-party consultants regarding the time period to run each model. These consultants are engaged by the project proponents to advocate for the construction of their preferred alternatives. That purpose has been reflected in the approach taken in each EIS. One of the most obvious
Charlottesville • Chapel Hill ' Atlanta • Asheville • Birmingham • Charleston • Nashville • Richmond • Washington, DC
100% recycled paper
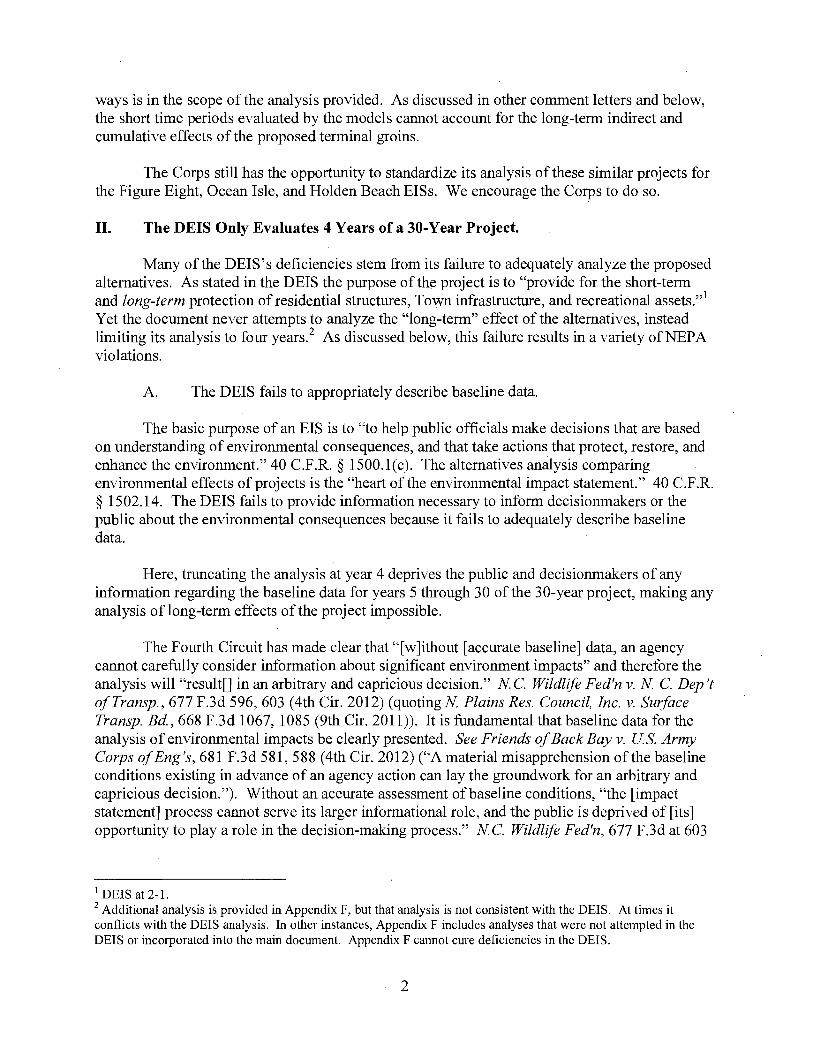
ways is in the scope of the analysis provided. As discussed in other comment letters and below, the short time periods evaluated by the models cannot account for the long-term indirect and cumulative effects of the proposed terminal groins.
The Corps still has the opportunity to standardize its analysis of these similar projects for the Figure Eight, Ocean Isle, and Holden Beach EISs. We encourage the Corps to do so.
II. The DEIS Only Evaluates 4 Years of a 30-Year Project.
Many of the DEIS's deficiencies stem from its failure to adequately analyze the proposed alternatives. As stated in the DEIS the purpose of the project is to "provide for the short-term and long-term protection of residential structures, Town infrastructure, and recreational assets."l Yet the document never attempts to analyze the "long-term" effect of the alternatives, instead limiting its analysis to four years.2 As discussed below, this failure results in a variety ofNEPA violations.
A. The DEIS fails to appropriately describe baseline data.
The basic purpose of an EIS is to "to help public officials make decisions that are based on understanding of environmental consequences, and that take actions that protect, restore, and enhance the environment." 40 C.F.R. § 1500.1(c). The alternatives analysis comparing environmental effects of projects is the "heart of the environmental impact statement." 40 C.F.R. § 1502.14. The DEIS fails to provide information necessary to inform decisionmakers or the public about the environmental consequences because it fails to adequately describe baseline data.
Here, truncating the analysis at year 4 deprives the public and decisionmakers of any information regarding the baseline data for years 5 through 30 of the 30-year project, making any analysis oflong-term effects of the project impossible.
The Fomih Circuit has made clear that "[w]ithout [accurate baseline] data, an agency cannot carefully consider information about significant environment impacts" and therefore the analysis will "result[] in an arbitrary and capricious decision." N C Wildlife Fed'n v. N C Dep't of Transp. , 677 F.3d 596, 603 (4th Cir. 2012) (quoting N Plains Res. Council, Inc. v. Surface Transp. Bd., 668 F.3d 1067, 1085 (9th Cir. 2011)). It is fundamental that baseline data for the analysis of environmental impacts be clearly presented. See Friends of Back Bay v. Us. Army Corps of Eng's, 681 F.3d 581,588 (4th Cir. 2012) ("A material misapprehension of the baseline conditions existing in advance of an agency action can lay the groundwork for an arbitrary and capricious decision."). Without an accurate assessment of baseline conditions, "the [impact statement] process cannot serve its larger informational role, and the public is deprived of [its] opportunity to playa role in the decision-making process." NC Wildlife Fed'n, 677 F.3d at 603
1 DEIS at 2-1. 2 Additional analysis is provided in Appendix F, but that analysis is not consistent with the DEIS. At times it conflicts with the DEIS analysis. In other instances, Appendix F includes analyses that were not attempted in the DEIS or incorporated into the main document. Appendix F cannot cure deficiencies in the DEIS.
2
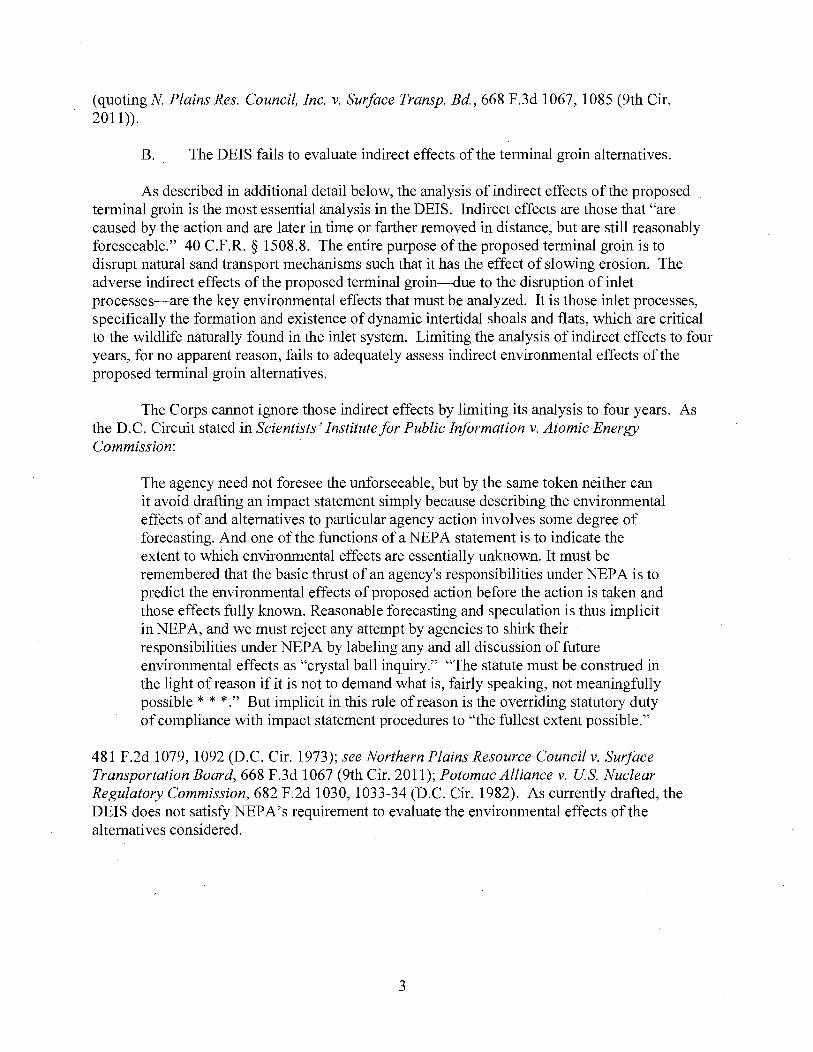
(quoting N Plains Res. Council, Inc. v. Surface Transp. Bd., 668 F.3d 1067, 1085 (9th Cir. 2011)).
B. The DEIS fails to evaluate indirect effects of the terminal groin alternatives.
As described in additional detail below, the analysis of indirect effects of the proposed terminal groin is the most essential analysis in the DEIS. Indirect effects are those that "are caused by the action and are later in time or farther removed in distance, but are still reasonably foreseeable." 40 C.F.R. § 1508.8. The entire purpose of the proposed terminal groin is to disrupt natural sand transport mechanisms such that it has the effect of slowing erosion. The adverse indirect effects of the proposed terminal groin-due to the disruption of inlet processes-are the key environmental effects that must be analyzed. It is those inlet processes, specifically the formation and existence of dynamic intertidal shoals and flats, which are critical to the wildlife naturally found in the inlet system. Limiting the analysis of indirect effects to four years, for no apparent reason, fails to adequately assess indirect environmental effects of the proposed terminal groin alternatives.
The Corps cannot ignore those indirect effects by limiting its analysis to four years. As the D.C. Circuit stated in Scientists' Institute for Public Information v. Atomic Energy Commission:
The agency need not foresee the unforseeable, but by the same token neither can it avoid drafting an impact statement simply because describing the environmental effects of and alternatives to particular agency action involves some degree of forecasting. And one of the functions of a NEP A statement is to indicate the extent to which environmental effects are essentially unknown. It must be remembered that the basic thrust of an agency's responsibilities under NEP A is to predict the environmental effects of proposed action before the action is taken and those effects fully known. Reasonable forecasting and speculation is thus implicit in NEPA, and we must reject any attempt by agencies to shirk their responsibilities under NEP A by labeling any and all discussion of future environmental effects as "crystal ball inquiry." "The statute must be construed in the light of reason if it is not to demand what is, fairly speaking, not meaningfully possible * * *." But implicit in this rule of reason is the overriding statutory duty of compliance with impact statement procedures to "the fullest extent possible."
481 F.2d 1079, 1092 (D.C. Cir. 1973); see Northern Plains Resource Council v. Surface Transportation Board, 668 F.3d 1067 (9th Cir. 2011); Potomac Alliance v. Us. Nuclear Regulatory Commission, 682 F.2d 1030, 1033-34 (D.C. Cir. 1982). As currently drafted, the DEIS does not satisfy NEPA's requirement to evaluate the environmental effects of the alternatives considered.
3

C. The DEIS fails to provide information necessary for decisionmakers and the public to compare alternatives.
By limiting the analysis to 4 years of a 30-year project, the DEIS fails to provide information to evaluate the full environmental and economic impacts of alternatives across the 30-year period. Evaluating only those four years does not provide the information regarding environmental, economic, or social effects for consideration by the Town, the public, the Corps, or other regulatory and resource agencies. Implicit in the DE IS is the assumption that the Town's preferred alternative would have long-term benefits, but those benefits have not been identified or estimated. As demonstrated in the DEIS, many properties would continue to be adversely affected even with Alternative 6, so the Corps cannot presume that the Town's preferred alternative will be beneficial. Likewise, the Corps cannot assume that the environmental effects of the preferred alternative would be benign. As discussed in more detail below, it is well-established that construction of a terminal groin will result in the degradation of inlet habitats due to the disruption of natural inlet processes. Those effects, which take hold after four years, must be analyzed.
III. The Purpose and Need Must Be Viewed in Proper Context.
As described in the DEIS, the purpose of the project is to "provide for the short-term and long-term protection of residential structures, Town infrastructure, and recreational assets.,,3 This purpose and need statement must be put in the proper context. The Applicant's preferred alternative, as discussed in more detail below does not provide for even the "short-term" protection of all residential structures, town infrastructure, and recreational assets. Under Alternative 6, erosion would still affect 16 properties, including 11 houses. More than $100,000 in infrastructure would be lost. Further, there is no meaningful distinction between the width of the recreational beach in front of the residential properties under Alternative 6 as compared to any other alternative.4 As depicted in Figure 5.28, the MHW line in year four of Alternative 6 would be at the back door of numerous properties, and the recreational use of the beach would be eliminated. The only meaningful "recreational beach" would be in close proximity to the terminal groin-a poor substitute for the recreational beach that currently exists on the natural inlet. As described in more detail below, east of the groin, the wide beach that currently exists can be expected to erode substantially.
It is unclear how the Corps intends to evaluate these various impacts as meeting the Purpose and Need because that analysis is unlawfully omitted from the DEIS (and cannot be done based on four years of modeling). What is clear is that the standard cannot be that only alternatives that protect all residential structures, infrastructure, and recreational beach where they currently exist meet the Purpose and Need. None of the alternatives meet that standard. The Corps must evaluate which alternatives provide for long-term protection of property, infrastructure, and recreational opportunities in a way that accounts for the Town's actual economic costs from lost property and the reality of barrier island geology. With that analysis, Alternative 2 is the only reasonable, practicable alternative.
3 DEIS at 2-1. 4 See id at 5-157.
4
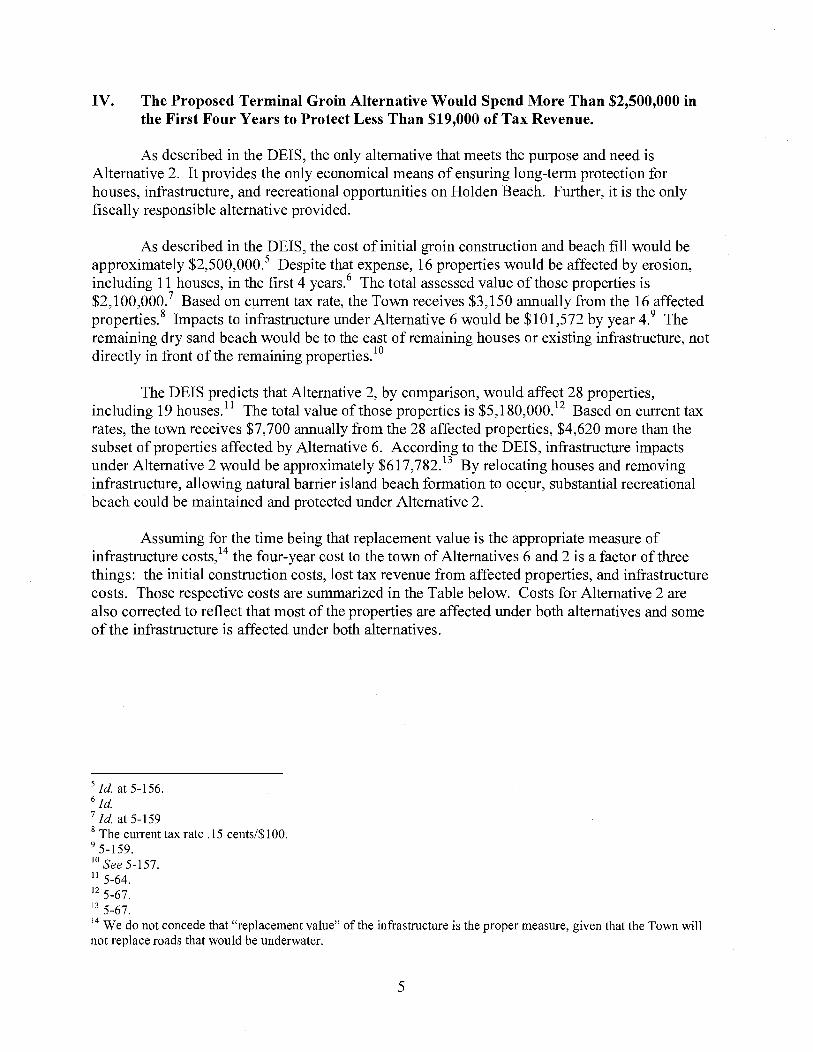
IV. The Proposed Terminal Groin Alternative Would Spend More Than $2,500,000 in the First Four Years to Protect Less Than $19,000 of Tax Revenue.
As described in the DEIS, the only alternative that meets the purpose and need is Alternative 2. It provides the only economical means of ensuring long-term protection for houses, infrastructure, and recreational opportunities on Holden Beach. Further, it is the only fiscally responsible alternative provided.
As described in the DEIS, the cost of initial groin construction and beach fill would be approximately $2,500,000.5 Despite that expense, 16 properties would be affected by erosion, including 11 houses, in the first 4 years. 6 The total assessed value of those properties is $2,100,000.7 Based on current tax rate, the Town receives $3,150 annually from the 16 affected properties. 8 Impacts to infrastructure under Alternative 6 would be $101,572 by year 4.9 The remaining dry sand beach would be to the east of remaining houses or existing infrastructure, not directly in front of the remaining properties. 10
The DEIS predicts that Alternative 2, by comparison, would affect 28 properties, including 19 houses. I I The total value of those properties is $5,180,000. 12 Based on current tax rates, the town receives $7,700 annually from the 28 affected properties, $4,620 more than the subset of properties affected by Alternative 6. According to the DEIS, infrastructure impacts under Alternative 2 would be approximately $617,782. 13 By relocating houses and removing infrastructure, allowing natural barrier island beach formation to occur, substantial recreational beach could be maintained and protected under Alternative 2.
Assuming for the time being that replacement value is the appropriate measure of infrastructure costs,14 the four-year cost to the town of Alternatives 6 and 2 is a factor of three things: the initial construction costs, lost tax revenue from affected properties, and infrastructure costs. Those respective costs are summarized in the Table below. Costs for Alternative 2 are also corrected to reflect that most of the properties are affected under both alternatives and some of the infrastructure is affected under both alternatives.
5 Id. at 5-156. 6 Id. 7 I d. at 5-159 8 The current tax rate . 15 cents/$1 00. 9 5-159. 10 See 5-157. 11 5_64. 12 5_67. 13 5-67. 14 We do not concede that "replacement value" of the infrastructure is the proper measure, given that the Town will not replace roads that would be underwater.
5
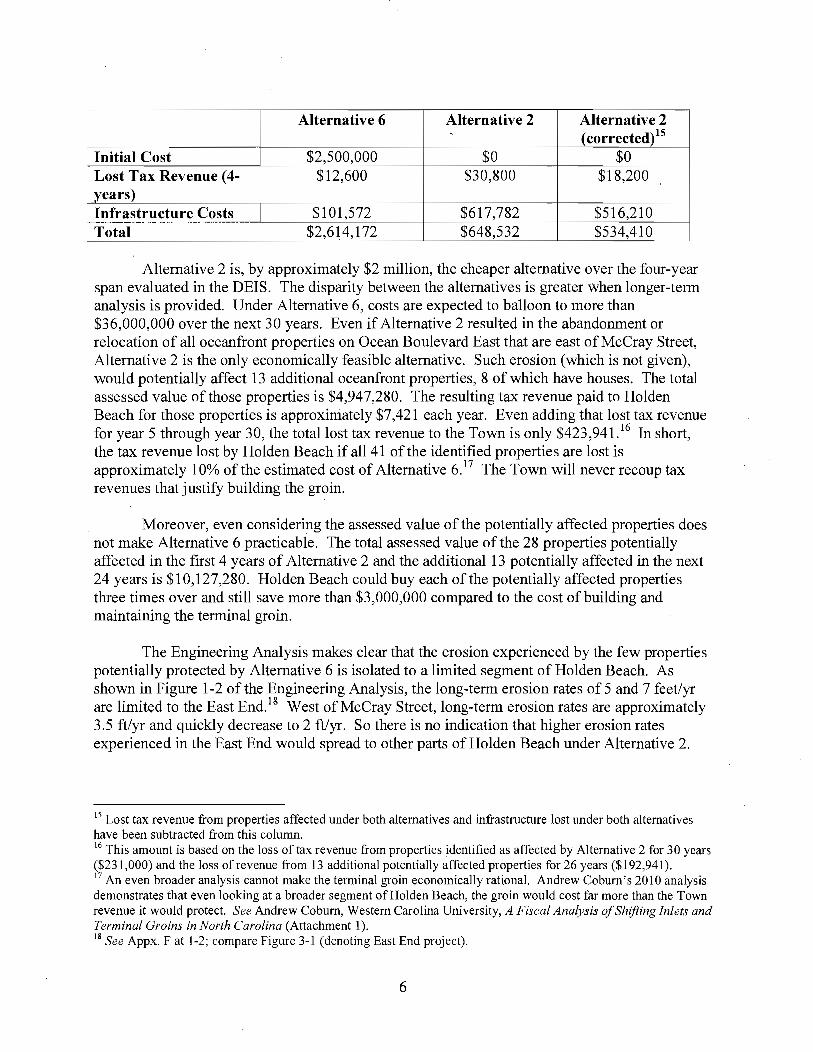
Alternative 6 Alternative 2 Alternative 2 ( corrected)15
Initial Cost $2,500,000 $0 $0 Lost Tax Revenue (4- $12,600 $30,800 $18,200 years) Infrastructure Costs $101,572 $617,782 $516,210 Total $2,614,172 $648,532 $534,410
Alternative 2 is, by approximately $2 million, the cheaper alternative over the four-year span evaluated in the DEIS. The disparity between the alternatives is greater when longer-term analysis is provided. Under Alternative 6, costs are expected to balloon to more than $36,000,000 over the next 30 years. Even if Alternative 2 resulted in the abandonment or relocation of all oceanfront properties on Ocean Boulevard East that are east of McCray Street, Alternative 2 is the only economically feasible alternative. Such erosion (which is not given), would potentially affect 13 additional oceanfront properties, 8 of which have houses. The total assessed value of those properties is $4,947,280. The resulting tax revenue paid to Holden Beach for those properties is approximately $7,421 each year. Even adding that lost tax revenue for year 5 through year 30, the total lost tax revenue to the Town is only $423,941. 16 In short, the tax revenue lost by Holden Beach if all 41 of the identified properties are lost is approximately 10% of the estimated cost of Alternative 6.17 The Town will never recoup tax revenues that justify building the groin.
Moreover, even considering the assessed value of the potentially affected properties does not make Alternative 6 practicable. The total assessed value ofthe 28 properties potentially affected in the first 4 years of Alternative 2 and the additional 13 potentially affected in the next 24 years is $10,127,280. Holden Beach could buy each of the potentially affected properties three times over and still save more than $3,000,000 compared to the cost of building and maintaining the terminal groin.
The Engineering Analysis makes clear that the erosion experienced by the few properties potentially protected by Alternative 6 is isolated to a limited segment of Holden Beach. As shown in Figure 1-2 of the Engineering Analysis, the long-term erosion rates of 5 and 7 feet/yr are limited to the East End. 18 West of McCray Street, long-term erosion rates are approximately 3.5 ft/yr and quickly decrease to 2 ft/yr. So there is no indication that higher erosion rates experienced in the East End would spread to other parts of Holden Beach under Alternative 2.
15 Lost tax revenue from properties affected under both alternatives and infrastructure lost under both alternatives have been subtracted from this column. 16 This amount is based on the loss of tax revenue from properties identified as affected by Alternative 2 for 30 years ($231,000) and the loss of revenue from 13 additional potentially affected properties for 26 years ($192,941). 17 An even broader analysis cannot make the terminal groin economically rational. Andrew Coburn's 2010 analysis demonstrates that even looking at a broader segment of Holden Beach, the groin would cost far more than the Town revenue it would protect. See Andrew Coburn, Western Carolina University, A Fiscal Analysis a/Shifting Inlets and Terminal Groins in North Carolina (Attachment 1). 18 See Appx. F at 1-2; compare Figure 3-1 (denoting East End project).
6

The DEIS further demonstrates there is no reason to expect widespread extreme erosion in the future based on inlet movement. As conceded in the DEIS, Lockwood Folley Inlet is very stable.!9 It has not moved significantly since 1938?O Although the orientation of the inlet has changed, aerial photography in Appendix I demonstrates that fluctuations in inlet alignment have not resulted in substantial changes to the island's shoreline. Therefore, removing residential structures and infrastructure built on the most erosive part of the island-allowing natural processes to restore the beach in that area-is the only viable means of providing long-term protection.
V. The DEIS's Modeling Analysis Is Not Clearly Explained.
The modeling analysis included in the DEIS contains several deficiencies. First, it is unclear what shoreline data the model relies on as year O?! Because the purpose of the DEIS is to evaluate the environmental effect of each alternative on existing environmental conditions, it is critical that the modeling analysis use the most up-to-date information available. The DEIS does not appear to specify the date of shoreline data used in its analysis, undermining the entire analysis.
Moreover, the DEIS does not reconcile its analysis with the analysis presented in Appendix F. The only references to Appendix F in Chapter 5 are with respect to alternatives not carried forward for detailed analysis22 and sand source characteristics?3 Given that it appears that the DEIS modeling analysis relies to some extent on Appendix F,24 the relation of the analyses in the documents should be more fully explained.
Finally, the model result for Alternative 2, an erosion rate of20 ft/yr,25 must be explained. Appendix F variously describes the long-term erosion rate as 5-7 ft/yr26 and approximately 10 ftlyr. 27 It appears, therefore, that the model significantly overestimates the rate of erosion under Alternative 2.
VI. The DEIS Fails to Adequately Assess Environmental Effects of the Proposed Terminal Groin.
The DEIS is required to evaluate all reasonably foreseeable environmental effects of each alternative. It fails to do so in both its assessment of indirect effects and cumulative effects. For those reasons, the DEIS violates NEP A.
19 Id. at 4-3. 20 I d.
21 See id. at 5-4 (describing modeling). 22 Id. at 5-l. 23 I d. at 5-38. 24 Id. at 5-125,5-126,5-127 (including figures prepared by ATM). 25 I d. at 5-10 26 See Appx Fat 1-2 (showing DCM long-term erosion rates); 4-10, Figure 4-6 (depicting erosion rates less than 7.5 ft/yr). 27 I d. at 4-3, Figure 4-1 (showing past erosion west of the groin at approximately 10 ft/yr between 1983 and 2000).
7
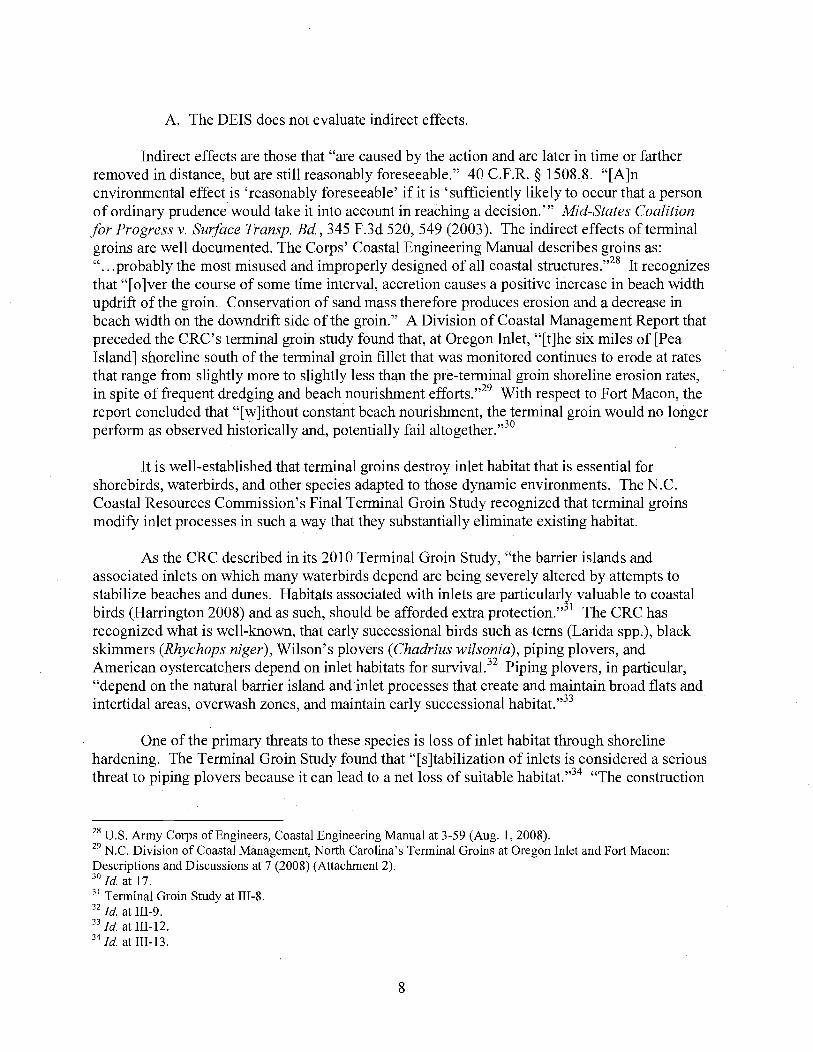
A. The DEIS does not evaluate indirect effects.
Indirect effects are those that "are caused by the action and are later in time or farther removed in distance, but are still reasonably foreseeable." 40 C.F.R. § 1508.8. "[A]n environmental effect is 'reasonably foreseeable' if it is 'sufficiently likely to occur that a person of ordinary prudence would take it into account in reaching a decision. ", Mid-States Coalition for Progress v. Surface Tran''Jp. Bd., 345 F.3d 520,549 (2003). The indirect effects of terminal groins are well documented. The Corps' Coastal Engineering Manual describes groins as: " ... probably the most misused and improperly designed of all coastal structures.,,28 It recognizes that "[0 ]ver the course of some time interval, accretion causes a positive increase in beach width updrift of the groin. Conservation of sand mass therefore produces erosion and a decrease in beach width on the downdrift side of the groin." A Division of Coastal Management Report that preceded the CRC's terminal groin study found that, at Oregon Inlet, "[t]he six miles of [Pea Island] shoreline south of the terminal groin fillet that was monitored continues to erode at rates that range from slightly more to slightly less than the pre-terminal groin shoreline erosion rates, in spite of frequent dredging and beach nourishment efforts.,,29 With respect to Fort Macon, the report concluded that "[w]ithout constant beach nourishment, the terminal groin would no longer perform as observed historically and, potentially fail altogether.,,3o
It is well-established that terminal groins destroy inlet habitat that is essential for shorebirds, waterbirds, and other species adapted to those dynamic environments. The N.C. Coastal Resources Commission's Final Terminal Groin Study recognized that terminal groins modify inlet processes in such a way that they substantially eliminate existing habitat.
As the CRC described in its 2010 Terminal Groin Study, "the barrier islands and associated inlets on which many waterbirds depend are being severely altered by attempts to stabilize beaches and dunes. Habitats associated with inlets are particularl~ valuable to coastal birds (Harrington 2008) and as such, should be afforded extra protection." 1 The CRC has recognized what is well-known, that early successional birds such as terns (Larida spp.), black skimmers (Rhychops niger), Wilson's plovers (Chadrius wi/sonia), piping plovers, and American oystercatchers depend on inlet habitats for surviva1.32 Piping plovers, in particular, "depend on the natural barrier island and inlet processes that create and maintain broad flats and intertidal areas, overwash zones, and maintain early successional habitat.,,33
One of the primary threats to these species is loss of inlet habitat through shoreline hardening. The Terminal Groin Study found that "[s]tabilization of inlets is considered a serious threat to piping plovers because it can lead to a net loss of suitable habitat.,,34 "The construction
28 U.S. Army Corps of Engineers, Coastal Engineering Manual at 3-59 (Aug. 1, 200S). 29 N.C. Division of Coastal Management, North Carolina's Terminal Groins at Oregon Inlet and Fort Macon: Descriptions and Discussions at 7 (200S) (Attachment 2). 30 I d. at 17. 31 Terminal Groin Study at III-S. 32 I d. at III-9. 33 Id. at III-12. 34 I d. at III-13.
8

of a terminal groin, beach nourishment, and dune construction prevents overwash and contributes to a loss of habitat for breeding and non-breeding waterbirds, including piping plovers.,,35
The Recovery Plan for the critically endangered Great Lakes piping plover population states that "[i]nlet dredging and artificial structures, such as breakwalls and groins, can eliminate breeding and wintering areas and alter sedimentation patterns leading to the loss of nearby habitat.,,36 The 5-year Status Review for Piping Plover states: "The three recovery plans state that shoreline development throughout the wintering range poses a threat to all populations of piping plovers. The plans further state that beach maintenance and nourishment, inlet dredging, and artificial structures, such as jetties and groins, can eliminate wintering areas and alter sedimentation patterns leading to the loss of nearby habitat.,,37 The Status Review concludes: "Habitat loss and degradation on winter and migration grounds from shoreline and inlet stabilization efforts, both within and outside of designated critical habitat, remain a serious threat to all piping plover populations.,,38
The piping plover status report discusses the impacts of groins and inlet stabilization on these key elements:
Inlet stabilization with rock jetties and associated channel dredging for navigation alter the dynamics of longshore sediment transport and affect the location and movement rate of barrier islands (Camfield and Holmes 1995), typically causing downdrift erosion. Sediment is then dredged and added back to islands which subsequently widen. Once the island becomes stabilized, vegetation encroaches on the bayside habitat, thereby diminishing and eventually destroying its value to piping plovers. Accelerated erosion may compound future habitat loss, depending on the degree of sea-level rise. Unstabilized inlets naturally migrate, re-forming important habitat components, whereas jetties often trap sand and cause significant erosion of the downdrift shoreline. These combined actions affect the availability of piping plover habitat (Cohen et al. 2008).39
That degradation of habitat has been observed at North Carolina terminal groins. The Terminal Groin Study recognized that "the Pea Island Fillet is rapidly evolving which jeopardizes the overall nesting habitats for many of the species.,,4o At Fort Macon, the shoreline "does not appear to be suitable for either colonial nesters or shorebirds based on preliminary analysis of historical aerial photographs and available historical shorebird and colonial waterbird data.,,41
35 I d. at III-19. 36 U.S. Fish & Wildlife Service, Recovery Plan for the Great Lakes Piping Plover (Charadrius melodus) (September 2003) at 23. 37 U.S. Fish & Wildlife Service, Piping Plover (Charadrius melodus) 5-Year Status Review: Summary and Evaluation (2009) at 31. 38 I d. at 39. 39 I d.
40 Terminal Groin Study at III-34. 41 Id. at III-58.
9
Those adverse impacts are heightened in shallow-draft inlets such as Lockwoods Folly. The CRC's study concluded that "[t]he relative impact of these structures on adjacent areas is likely increased when sited next to natural or minimally managed shallow-draft inlets.,,42
Yet despite these well-established effects of terminal groins, the DEIS adopts the unsupported position that any and all effects of the proposed groin would be revealed by year four of the modeling. That assumption must be supported. It is "reasonably foreseeable" that Alternative 6 will affect inlet processes and impede the development of essential intertidal and shoal habitat beyond year 4 as modeled. The CRC has not only recognized as much, it has stated that those effects are even more likely to occur in this situation. Therefore, it is inescapable that "a person of ordinary prudence" would evaluate the effect of the terminal groin alternatives on inlet habitat well beyond year 4 of the proposed terminal groin.
B. The DEIS must evaluate cumulative impacts of Alternative 6 combined with proposed terminal groins at Figure Eight Island, Ocean Isle, other inlets in North Carolina, and the in-construction terminal groin at Bald Head Island.
A "[ c ]umulative impact is the impact on the environment which results from the incremental impact of the action when added to other past, present, and reasonably foreseeable future actions regardless of what agency (Federal or non-Federal) or person undertakes such other actions." 40 C.F.R. § 1508.7. In the DEIS, the Corps identifies the projects considered in its cumulative impacts analysis. 43 Excluded from that list are existing modified inlets described in the Terminal Groin Study, the in-progress terminal groin at Bald Head Island, or the two other terminal groin projects currently under consideration by the Corps. Given the known impacts of terminal groins and the increasing rarity of natural inlets, the Corps must evaluate the hardening ofthis inlet in the overall context of available inlet habitat. The birds displaced by the construction of the proposed terminal groin cannot go elsewhere, because inlet shorelines along the entire North Carolina coast are increasingly being sandbagged or hardened. The North Carolina General Assembly recently increased the cap for terminal groins in the state, meaning that the Corps is likely to soon have two additional tenninal groin proposals before it. The cumulative effect of these projects on inlet-dependent wildlife is significant and must be considered.44
The DEIS further errs by concluding that there are no cumulative impacts to the Inlet Complex based on a finding that there are no direct or indirect effects from Alternatives 5 and 6.45 That finding is erroneous based on the unlawful analysis of indirect effects of the project.
VII. The DEIS Does Not Provide Information Required to Satisfy the 404(b)(1) Guidelines.
The purpose of the DEIS in this context is to provide information for the Corps to conduct its required analysis under Section 404 of the Clean Water Act. Because of its failure to
42 I d. VII-5. 43 DEIS at 5-5. 44 See Letter from W. Golder, Audubon NC, to M. Sugg, USACE (Sept. 14,2015) (Attachment 3). 45 See DEIS at 5-132-33.
10
adequately evaluate direct, indirect, and cumulative impacts, this DEIS fails to meet that goal. For the reasons described above, the analysis of environmental impacts based on a terminalgroin-oriented analysis does not provide the objective evaluation necessary to complete that analysis. The DEIS does not "consider[] the alternatives in sufficient detail to respond to the requirements of these Guidelines" discussed below and it is "necessary to supplement these NEPA documents with this additional information." 40 C.F.R. § 230.10(4).
Under the Clean Water Act, the Corps is only able to permit the least environmentally damaging practicable alternative ("LEDPA"). Practicable means "available and capable of being done after taking into consideration cost, existing technology, and logistics." 40 C.F.R. § 230.3(q). Although the Corps has not defined practicability in the DEIS-thereby unlawfully denying the opportunity for public comment on that essential element of the analysis-it is apparent that each alternative is practicable.
The alternatives fall into two categories. The first includes the non-structural alternatives, whose environmental impacts - dredging, smothering benthic organisms, altered beach profile, etc. - vary by degree. The second category includes the terminal groin alternatives, whose unique environmental impacts - hardening of the shoreline, loss of overwash areas, etc. - are permanent.
In its application of the 404(b)(1) Guidelines, the Corps must evaluate "the nature and degree of effect that the proposed discharge will have, individually and cumulatively, on the characteristics at the proposed disposal sites." 40 C.F.R. § 230.11(a). That effect is measured by how the discharges change the "physical, chemical, and biological characteristics of the substrate" and affect "bottom-dwelling organisms at the site by smothering immobile forms or forcing mobile forms to migrate." 40 C.F.R. § 230.20(b).
The analysis of these factors reveals a clear divide. The non-structural alternatives-with the exception of Alternative 2-will have varying degrees of impact on infaunal communities in both the dredged areas and the nourished areas. Unlike any of the non-structural alternatives, however, the terminal groin alternatives will permanently alter the characteristics of the inlet. The intertidal areas lost in the area that would be impacted by the terminal groin will not redevelop, eliminating the possibility that the benthic organisms buried or displaced could repopulate the area. The groin alternatives will fundamentally change the nature of the eastern end of the island, eliminating overwash areas and permanently altering substrate and eliminating habit for benthic organisms. Alternatives 5 and 6 are the most environmentally damaging alternatives when evaluated under the factors in 40 C.F.R. § 230.20.
The Corps must also evaluate "the nature and degree of effect that the proposed discharge will have individually and cumulatively on water, current patterns, circulation including downstream flows, and normal water fluctuation." 40 C.F.R. § 230.11(b). These effects are measured by the "adverse changes" that occur in "[l]ocation, structure, and dynamics of aquatic communities; shoreline and substrate erosion and deposition rates; [and] the deposition of suspended particulates." 40 C.F.R. § 230.23(b).
11
As with impacts to substrate, Alternative 2 clearly has the least environmental impact on the aquatic communities and deposition of suspended particles. It would not adversely affect aquatic communities and would continue to allow deposition of suspended particles on the overwash areas at the eastern end of the island (as would the other non-structural alternatives). By comparison, the terminal groin alternatives would permanently displace aquatic communities at the eastern end of the island and eliminate overwash, cementing the accompanying adverse environmental impacts.
The Corps' consideration of the fluctuation of normal water level must include consideration of "modifications [that] can alter or destroy communities and populations of aquatic animals and vegetation, ... modify habitat, reduce food supply, restrict movement of aquatic fauna, destroy spawning areas, and change adjacent, upstream, and downstream areas." 40 C.F.R. § 230.24.
For the reasons described above and the impacts on the benthic communities, Alternative 2 has the least environmental impact. Alternative 2 would have no adverse environmental effect on wet beach habitat, adjacent dry beach habitat, and back beach habitat. Other non-structural alternatives would similarly have temporally limited environmental impacts to these habitats. Alternatives 5 and 6 would have significant, permanent impacts to these areas. These alternatives would eliminate wet beach habitats and the associated benthic organisms, significantly modify dry beach habitats, and result in dense vegetation of what are now sparsely vegetated back beach habitats. They would therefore have the greatest adverse impacts of any of the alternatives.
In addition to the Corps' endangered and threatened species analysis under the ESA, it must also consider listed species under the 404(b)(1) Guidelines. The Corps must compare alternatives based on their potential impact on "nesting areas, protective cover, adequate and reliable food supply and resting areas for migratory species." 40 C.F.R. § 230.30(b)(2).
Alternative 2 and the other non-structural alternatives would maintain habitat for piping plover on Holden Beach and allow habitat for piping plover and other shorebirds and waterbirds in Lockwoods Folly Inlet.
Finally, the Corps must consider "the loss or change of breeding and nesting areas, escape cover, travel corridors, and preferred food sources for resident and transient wildlife species associated with the aquatic system." 40 C.F.R. § 230.32(b).
Construction of Alternative 5 or 6 would eliminate habitat for all shorebirds that rely on relatively unvegetated back beach, wet beach, and intertidal habitats. Therefore, the adverse effects described above for piping plover are likely to be felt by red knots and other shorebirds.
It is clear from the DEIS that under the 404(b)(1) Guidelines, the Corps cannot permit either Alternative 5 or 6. All would have significantly greater environmental impact than Alternative 2. Based on the available information, it appears that Alternative 2 is the LEDPA and is the only alternative that can be permitted by the Corps.
12
VIII. Conclusion
For the reasons described above, the DElS does not comply with NEP A. Because the deficiencies are so significant, they cannot be remedied in a final EIS. We request that the Corps issue a revised or supplemental DElS that addresses the shortcomings of this document, specifically the limited scope of the modeling analysis and resulting failure to adequately assess reasonably foreseeable indirect and cumulative impacts of the proposed project. lfthe Corps makes a permitting decision based on the information provided in the DEIS, it must deny the requested Clean Water Act Section 404 permit. It is clear that Alternative 2 is not only the lea.st environmentally damaging practicable alternative, it is substantially more economical for the Town of Holden Beach over the short and long term.
Please contact me at (919) 967-1450 or [email protected] if you have any questions regarding these comments.
GRG/rgd Enclosures
Cc: Walker Golder (email) Mike Giles (email)
Sincerely,
~~~)~ Senior Attorney
13

1
7741 Market Street, Unit D Wilmington, North Carolina 20411 910-686-7527 October 12, 2015
Via U.S. and Electronic Mail Emily Hughes Wilmington Regulatory Field Office U.S. Army Corps of Engineers 69 Darlington Ave. Wilmington, NC 28403 [email protected] Re: SAW-2011-01914 Holden Beach East End Shore Protection Project
Ms. Hughes:
Please accept these comments on behalf of the National Audubon Society’s North Carolina State Office regarding the draft Environmental Impact Statement (DEIS) for the project known as “Holden Beach East End Shore Protection Project.” The Town of Holden Beach’s preferred alternative is to construct a ~1,000 foot-long terminal groin on the east end of Holden beach and a beach nourishment regime that would place ~120,000-180,000 cy of sand on the East End beach extracted from Lockwood Folly AIWW Inlet Crossing borrow site. This alternative, as well as other alternatives that include the construction of a terminal groin or any other hard structure (Alternative 5), the stabilization of the inlet through channelization (Alternative 4), beach nourishment activities (Alternatives 1, 3, 4, 5, and 6), or the dredging or other removal of sand from Lockwood Folly Inlet or the associated ebb and flood tidal deltas (Alternatives 1, 3, 4, 5, and 6) will have significant and lasting negative direct, indirect, and cumulative impacts on birds and other wildlife that depend on the dynamism of mid-Atlantic coastal inlets at critical points in their life cycles. Additionally, for the applicant’s preferred alternative (Alternative 6), the models used in the DEIS show that East End beach will continue to experience erosion even with the construction of a terminal groin. The DEIS takes the “make them go somewhere else” approach when addressing the impact of the preferred alternative and most of the other alternatives on birds. It perpetuates the common misconception that breeding and non-breeding shorebirds and waterbirds have alternative places

2
to go when habitat is lost and that, because birds have wings, they will simply move somewhere else. The truth is, the birds are already occupying alternative locations. They have been relentlessly forced to abandon high-quality habitats throughout their range because of habitat loss and degradation. Shorebirds like Piping Plovers, as well as terns and skimmers are now confined to a small fraction of the habitat once available to them, and if alternative locations were available, the birds would already be there. This is reflected in the elevated conservation status of many of the species that depend on inlets and barrier islands, including those that depend on Lockwood Folly Inlet; nearly all are state listed, federally listed, listed as species of conservation concern, or similarly designated in documents such as the U.S. Shorebird Conservation Plan (Brown et al. 2001). Geophysical Impacts of Terminal Groins, Other Hard Structures, and Beach Renourishment: In order to assess environmental impacts, it is necessary to accurately describe how terminal groins and other coastal engineering projects affect inlets and adjacent beaches. The DEIS fails to cite the applicable, most recent scientific literature and fails to accurately describe the impacts a terminal groin, beach renourishment, and inlet channelization would have on Lockwood Folly Inlet and adjacent areas. Some of the impacts that are insufficiently addressed are the narrowing of downdrift oceanfront beach, loss of sediment from the inlet system, impacts to spits at ends of adjacent islands, loss of critical wildlife habitat, and cumulative impacts of the alternatives. Terminal groins are designed to interrupt longshore transport of sand. It is well documented that terminal groins actually accelerate erosion of the shoreline downdrift of the structure (McDougal et al. 1987, Kraus et al. 1994, Bruun 1995, Cleary and Pilkey 1996, Komar 1998, McQuarrie and Pilkey 1998, Pilkey et al. 1998, Brown and McLachlan 2002, Greene 2002, USACE 2002, Morton 2003, Morton et al. 2004, Basco and Pope 2004, Speybroeck et al. 2006, Rice 2009, Riggs et al. 2009, Riggs and Ames 2011, Ells and Murray 2012, Knapp 2012, Pietrafesa 2012, Berry et al. 2013), which in turn requires regular replenishment of sand to compensate for sand loss (Hay and Sutherland 1988, Bruun 1995, McQuarrie and Pilkey 1998, French 2001, Galgano 2004, Basco 2006, Riggs et al. 2009, Riggs and Ames 2011, Pietrafesa 2012). An open letter on the subject of downdrift erosion signed by 43 of the leading coastal geologists in the U.S. states:
The negative impact of groins and jetties on downdrift shorelines is well understood. When they
work as intended, sand moving along the beach in the so-called downdrift direction is trapped on
the updrift side, causing a sand deficit and increasing erosion rates on the downdrift side. This
well-documented and unquestioned impact is widely cited in the engineering and geologic
literature (Young et al. undated). Fenster and Dolan (1996) found that inlets in Virginia and North Carolina exert influence over adjacent shorelines up to 5.4-13.0 km away and that they are a dominant factor in shoreline change for up to 4.3 km. Permanently modifying Lockwood Folly Inlet through construction of a terminal groin, or through channelization (Nordstrom 2000), will significantly increase the erosion rate on the downdrift shoreline of Holden Beach. Longshore currents run predominantly westward in the area of East End beach, placing nearly all of the oceanfront homes on Holden Beach in danger from accelerated erosion, should a terminal groin be built.
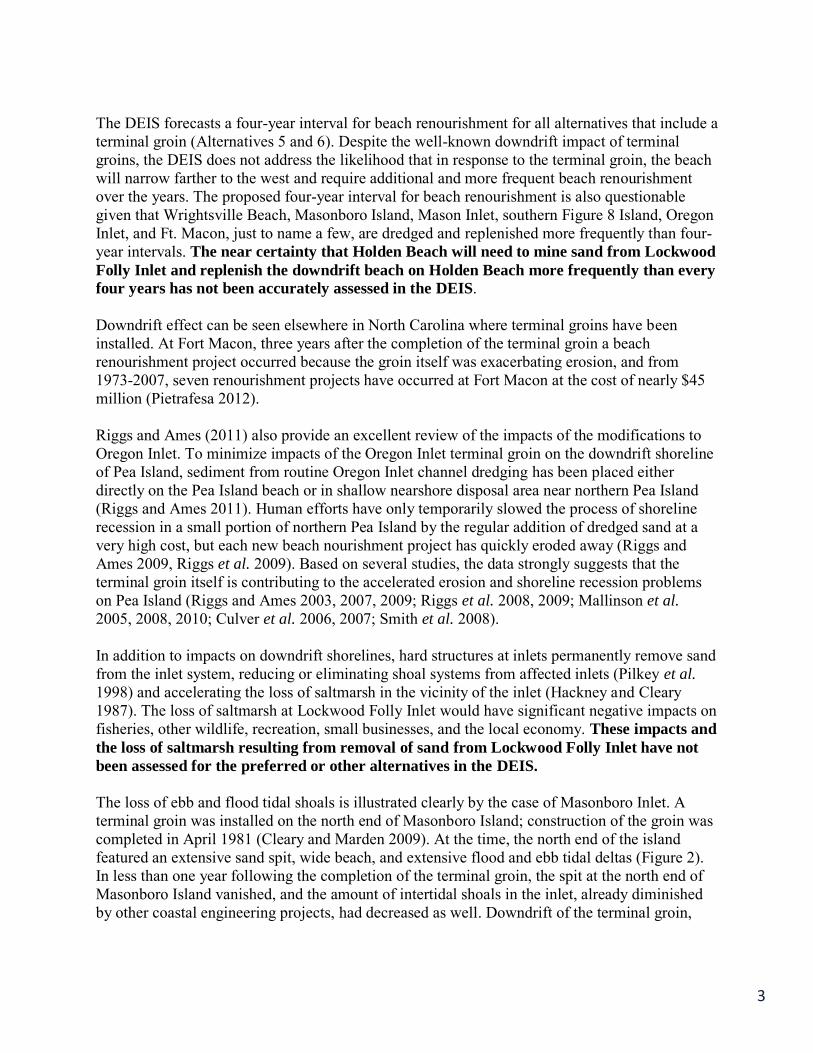
3
The DEIS forecasts a four-year interval for beach renourishment for all alternatives that include a terminal groin (Alternatives 5 and 6). Despite the well-known downdrift impact of terminal groins, the DEIS does not address the likelihood that in response to the terminal groin, the beach will narrow farther to the west and require additional and more frequent beach renourishment over the years. The proposed four-year interval for beach renourishment is also questionable given that Wrightsville Beach, Masonboro Island, Mason Inlet, southern Figure 8 Island, Oregon Inlet, and Ft. Macon, just to name a few, are dredged and replenished more frequently than four-year intervals. The near certainty that Holden Beach will need to mine sand from Lockwood
Folly Inlet and replenish the downdrift beach on Holden Beach more frequently than every
four years has not been accurately assessed in the DEIS. Downdrift effect can be seen elsewhere in North Carolina where terminal groins have been installed. At Fort Macon, three years after the completion of the terminal groin a beach renourishment project occurred because the groin itself was exacerbating erosion, and from 1973-2007, seven renourishment projects have occurred at Fort Macon at the cost of nearly $45 million (Pietrafesa 2012). Riggs and Ames (2011) also provide an excellent review of the impacts of the modifications to Oregon Inlet. To minimize impacts of the Oregon Inlet terminal groin on the downdrift shoreline of Pea Island, sediment from routine Oregon Inlet channel dredging has been placed either directly on the Pea Island beach or in shallow nearshore disposal area near northern Pea Island (Riggs and Ames 2011). Human efforts have only temporarily slowed the process of shoreline recession in a small portion of northern Pea Island by the regular addition of dredged sand at a very high cost, but each new beach nourishment project has quickly eroded away (Riggs and Ames 2009, Riggs et al. 2009). Based on several studies, the data strongly suggests that the terminal groin itself is contributing to the accelerated erosion and shoreline recession problems on Pea Island (Riggs and Ames 2003, 2007, 2009; Riggs et al. 2008, 2009; Mallinson et al.
2005, 2008, 2010; Culver et al. 2006, 2007; Smith et al. 2008). In addition to impacts on downdrift shorelines, hard structures at inlets permanently remove sand from the inlet system, reducing or eliminating shoal systems from affected inlets (Pilkey et al.
1998) and accelerating the loss of saltmarsh in the vicinity of the inlet (Hackney and Cleary 1987). The loss of saltmarsh at Lockwood Folly Inlet would have significant negative impacts on fisheries, other wildlife, recreation, small businesses, and the local economy. These impacts and
the loss of saltmarsh resulting from removal of sand from Lockwood Folly Inlet have not
been assessed for the preferred or other alternatives in the DEIS. The loss of ebb and flood tidal shoals is illustrated clearly by the case of Masonboro Inlet. A terminal groin was installed on the north end of Masonboro Island; construction of the groin was completed in April 1981 (Cleary and Marden 2009). At the time, the north end of the island featured an extensive sand spit, wide beach, and extensive flood and ebb tidal deltas (Figure 2). In less than one year following the completion of the terminal groin, the spit at the north end of Masonboro Island vanished, and the amount of intertidal shoals in the inlet, already diminished by other coastal engineering projects, had decreased as well. Downdrift of the terminal groin,

4
Masonboro Island’s oceanfront beach formed the expected fillet immediately adjacent to the terminal groin, while narrowing significantly along the downdrift beach. The DEIS also fails to address the cumulative impacts of sand mining and the proposed terminal groin at Lockwood Folly Inlet on the adjacent downdrift beach. The regular removal of sand from Lockwood Folly Inlet and the proposed terminal groin at the East End beach would disrupt the longshore transport of sand and potentially threaten Holden Beach—the adjacent downdrift shoreline—and the real estate thereon. There are at least 100 published studies that address the impacts of terminal groins on inlets, beaches, and natural resources. The majority (78%) of peer-reviewed literature we collected regarding the impacts of hard structures at inlets concluded that terminal groins do not function in the manner presented in the DEIS and cause more harm than good. The wealth of literature on the impacts of terminal groins is not discussed nor cited in the DEIS. A complete review of the relevant literature is necessary to accurately and objectively evaluate all alternatives presented in the DEIS. Impacts to Birds: Natural, unmodified coastal inlets are essential to many shorebird species (sandpipers, plovers, and their allies), as well as other coastal species because they provide the variety of habitat types these species require at critical times of their annual and lifecycles. Inlets have expansive, low-energy intertidal flats which are rich with invertebrate prey that wintering and migrating shorebirds require to fuel their migratory flights, sustain them during winter, and support adults and chicks during the nesting season. Inlets have open, sandy spits that serve as resting and roosting sites that shorebirds need to rest, digest, and conserve energy; and they have open or sparsely vegetated sandy habitat that many shorebird species, as well as terns and skimmers require for nesting. (Gochfeld and Burger 1994, Thompson et al. 1997, Elliott-Smith and Haig 2004, Nol and Humphrey 2012). Shorebird communities require habitat heterogeneity to meet their basic and varied fundamental needs for survival, which is why unmodified inlets containing a mosaic of habitat types are essential to sustaining shorebird communities (VanDusen et al. 2012). Many shorebird species breed in the far north in order to exploit the seasonal abundance of food resources and they stopover around inlets during migration in order to refuel before continuing migration (Colwell 2010). Proximity between foraging and roosting sites has been found to be a key element in determining habitat suitability and use for shorebird species such as the Piping Plover (Cohen et
al. 2008), Dunlin (Calidris alpina) (Dias et al. 2006), Red Knot (Rogers et al. 2006), and others. In short, natural inlets provide all the resources and habitats shorebirds require in a small geographic area and at the locations essential to meeting their spatial and temporal energetic needs. These resources are generally not available or not sufficient to meet the energetic needs of shorebirds at other coastal features. Reflecting this fact, the occurrence and numbers of shorebirds that use coastal habitats in the southeastern U.S. is greater at inlets than most other coastal features. Seven shorebird species: the Threatened Piping Plover (Charadrius melodus) and the Threatened Red Knot (Calidris
canutus rufa), as well as Black-bellied Plovers (Pluvialis squatarola), Ruddy Turnstones (Arenaria interpres), Snowy Plovers (Charadrius alexandrinus), Western Sandpipers (Calidris

5
mauri), and Wilson’s Plovers (Charadrius wilsonia) are significantly more abundant at inlets indicating that Piping Plovers have a small home range during the non-breeding season and use a variety of habitats throughout the tidal cycle (Drake et al. 2001, Rabon 2006, Cohen et al. 2008, Maddock et al. 2009). Foraging activity is strongly associated with mud or sandflats (Nicholls and Baldassarre 1990), and roost sites are most used by Piping Plovers when located within close proximity to foraging areas (Cohen et al. 2008). Piping Plovers also exhibit strong site fidelity both during the same year and across several years (Drake et al. 2001, Noel and Chandler 2006). These characteristics demonstrate that Piping Plovers depend on very specific places that with these habitats, and that these places are important year after year as the same birds return to them every migration or winter. than other coastal habitats (Harrington 2008). Multiple studies support the significance of inlets to birds, designating inlets as essential habitat by Red Knots, as well as breeding and non-breeding Piping Plovers (Nicholls and Baldassarre 1990, Harrington 2008, Kisiel 2009a, 2009b, Riggs et al. 2009, Niles et al. 2010, Maslo et al. 2011, USFWS 2012a, 2013). Piping Plovers: Piping Plovers are an excellent example of a species that relies on inlet-associated habitats throughout the year. During nesting, Piping Plovers are often associated with natural coastlines, including unmodified inlets and overwash fans. In New Jersey, Piping Plovers nest primarily near inlets, particularly those that were not stabilized with structures: 70.6% of all Piping Plover pairs nested closer to an unstabilized inlet than a stabilized inlet (Kisiel 2009a, 2009b). Piping Plovers in North Carolina also exhibit a pattern of nesting near inlets, and the majority of Piping Plover nests in Cape Hatteras National Seashore and Cape Lookout National Seashore were located near inlets (NPS 2014a, 2014b), largely because suitable nesting habitat does not exist elsewhere on the coast. Piping Plovers spend up to nine months out of the year away from nesting grounds (Elliott-Smith and Haig 2004). During this time, Piping Plovers engage in two essential behaviors, foraging and roosting (resting). A core wintering area or stopover site must provide habitat suitable for roosting, typically backshore above the high-tide line, and foraging, typically wet sand in low-energy intertidal areas that support invertebrates such polychaetes which are an important prey item for wintering and migrating Piping Plovers (Elliott-Smith and Haig 2004). There is a robust body of peer-reviewed scientific literature showing use of inlets and associated low-energy intertidal flats by Piping Plovers, particularly migrating or wintering Piping Plovers (Haig and Oring 1985, Johnson and Baldassarre 1988, Nicholls and Baldassarre 1990), indicating that Piping Plovers have a small home range during the non-breeding season and use a variety of habitats throughout the tidal cycle (Drake et al. 2001, Rabon 2006, Cohen et al. 2008, Maddock et al. 2009). Foraging activity is strongly associated with mud or sandflats (Nicholls and Baldassarre 1990), and roost sites are most used by Piping Plovers when located within close proximity to foraging areas (Cohen et al. 2008). Piping Plovers also exhibit strong site fidelity both during the same year and across several years (Drake et al. 2001, Noel and Chandler 2006). These characteristics demonstrate that Piping Plovers depend on very specific places that with these habitats, and that these places are important year after year as the same birds return to them every migration or winter.
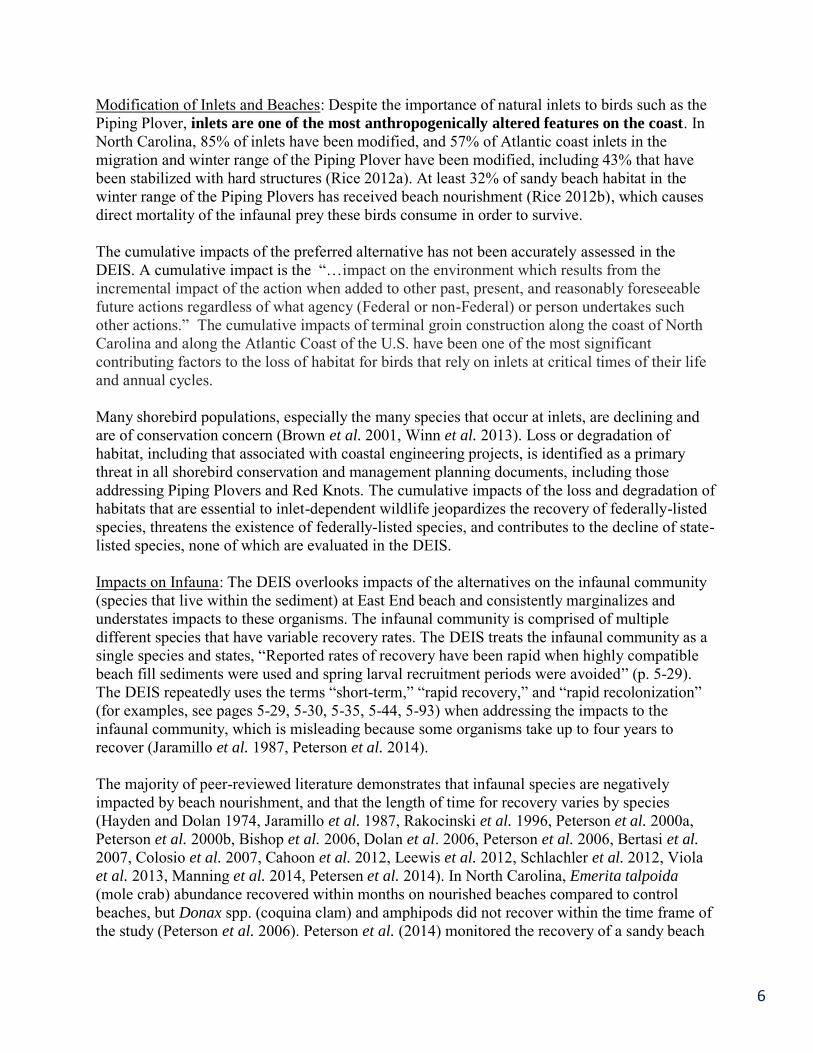
6
Modification of Inlets and Beaches: Despite the importance of natural inlets to birds such as the Piping Plover, inlets are one of the most anthropogenically altered features on the coast. In North Carolina, 85% of inlets have been modified, and 57% of Atlantic coast inlets in the migration and winter range of the Piping Plover have been modified, including 43% that have been stabilized with hard structures (Rice 2012a). At least 32% of sandy beach habitat in the winter range of the Piping Plovers has received beach nourishment (Rice 2012b), which causes direct mortality of the infaunal prey these birds consume in order to survive. The cumulative impacts of the preferred alternative has not been accurately assessed in the DEIS. A cumulative impact is the “…impact on the environment which results from the incremental impact of the action when added to other past, present, and reasonably foreseeable future actions regardless of what agency (Federal or non-Federal) or person undertakes such other actions.” The cumulative impacts of terminal groin construction along the coast of North Carolina and along the Atlantic Coast of the U.S. have been one of the most significant contributing factors to the loss of habitat for birds that rely on inlets at critical times of their life and annual cycles. Many shorebird populations, especially the many species that occur at inlets, are declining and are of conservation concern (Brown et al. 2001, Winn et al. 2013). Loss or degradation of habitat, including that associated with coastal engineering projects, is identified as a primary threat in all shorebird conservation and management planning documents, including those addressing Piping Plovers and Red Knots. The cumulative impacts of the loss and degradation of habitats that are essential to inlet-dependent wildlife jeopardizes the recovery of federally-listed species, threatens the existence of federally-listed species, and contributes to the decline of state-listed species, none of which are evaluated in the DEIS. Impacts on Infauna: The DEIS overlooks impacts of the alternatives on the infaunal community (species that live within the sediment) at East End beach and consistently marginalizes and understates impacts to these organisms. The infaunal community is comprised of multiple different species that have variable recovery rates. The DEIS treats the infaunal community as a single species and states, “Reported rates of recovery have been rapid when highly compatible beach fill sediments were used and spring larval recruitment periods were avoided” (p. 5-29). The DEIS repeatedly uses the terms “short-term,” “rapid recovery,” and “rapid recolonization” (for examples, see pages 5-29, 5-30, 5-35, 5-44, 5-93) when addressing the impacts to the infaunal community, which is misleading because some organisms take up to four years to recover (Jaramillo et al. 1987, Peterson et al. 2014). The majority of peer-reviewed literature demonstrates that infaunal species are negatively impacted by beach nourishment, and that the length of time for recovery varies by species (Hayden and Dolan 1974, Jaramillo et al. 1987, Rakocinski et al. 1996, Peterson et al. 2000a, Peterson et al. 2000b, Bishop et al. 2006, Dolan et al. 2006, Peterson et al. 2006, Bertasi et al.
2007, Colosio et al. 2007, Cahoon et al. 2012, Leewis et al. 2012, Schlachler et al. 2012, Viola et al. 2013, Manning et al. 2014, Petersen et al. 2014). In North Carolina, Emerita talpoida
(mole crab) abundance recovered within months on nourished beaches compared to control beaches, but Donax spp. (coquina clam) and amphipods did not recover within the time frame of the study (Peterson et al. 2006). Peterson et al. (2014) monitored the recovery of a sandy beach
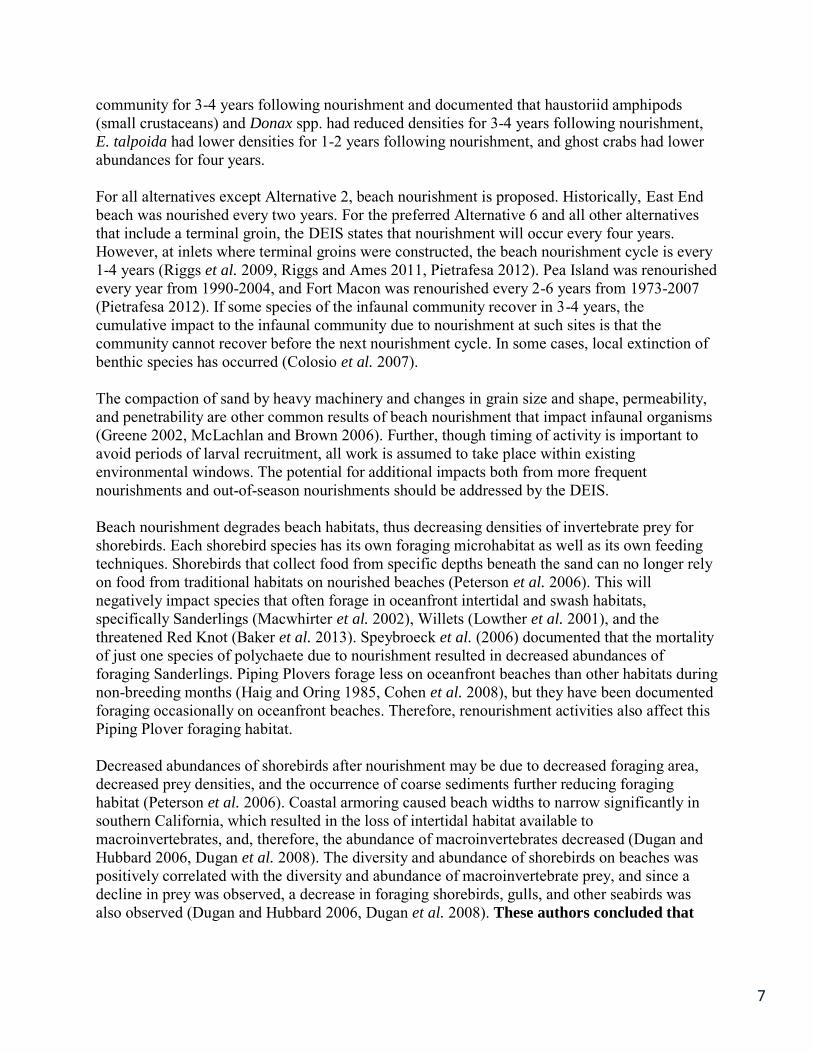
7
community for 3-4 years following nourishment and documented that haustoriid amphipods (small crustaceans) and Donax spp. had reduced densities for 3-4 years following nourishment, E. talpoida had lower densities for 1-2 years following nourishment, and ghost crabs had lower abundances for four years. For all alternatives except Alternative 2, beach nourishment is proposed. Historically, East End beach was nourished every two years. For the preferred Alternative 6 and all other alternatives that include a terminal groin, the DEIS states that nourishment will occur every four years. However, at inlets where terminal groins were constructed, the beach nourishment cycle is every 1-4 years (Riggs et al. 2009, Riggs and Ames 2011, Pietrafesa 2012). Pea Island was renourished every year from 1990-2004, and Fort Macon was renourished every 2-6 years from 1973-2007 (Pietrafesa 2012). If some species of the infaunal community recover in 3-4 years, the cumulative impact to the infaunal community due to nourishment at such sites is that the community cannot recover before the next nourishment cycle. In some cases, local extinction of benthic species has occurred (Colosio et al. 2007). The compaction of sand by heavy machinery and changes in grain size and shape, permeability, and penetrability are other common results of beach nourishment that impact infaunal organisms (Greene 2002, McLachlan and Brown 2006). Further, though timing of activity is important to avoid periods of larval recruitment, all work is assumed to take place within existing environmental windows. The potential for additional impacts both from more frequent nourishments and out-of-season nourishments should be addressed by the DEIS. Beach nourishment degrades beach habitats, thus decreasing densities of invertebrate prey for shorebirds. Each shorebird species has its own foraging microhabitat as well as its own feeding techniques. Shorebirds that collect food from specific depths beneath the sand can no longer rely on food from traditional habitats on nourished beaches (Peterson et al. 2006). This will negatively impact species that often forage in oceanfront intertidal and swash habitats, specifically Sanderlings (Macwhirter et al. 2002), Willets (Lowther et al. 2001), and the threatened Red Knot (Baker et al. 2013). Speybroeck et al. (2006) documented that the mortality of just one species of polychaete due to nourishment resulted in decreased abundances of foraging Sanderlings. Piping Plovers forage less on oceanfront beaches than other habitats during non-breeding months (Haig and Oring 1985, Cohen et al. 2008), but they have been documented foraging occasionally on oceanfront beaches. Therefore, renourishment activities also affect this Piping Plover foraging habitat. Decreased abundances of shorebirds after nourishment may be due to decreased foraging area, decreased prey densities, and the occurrence of coarse sediments further reducing foraging habitat (Peterson et al. 2006). Coastal armoring caused beach widths to narrow significantly in southern California, which resulted in the loss of intertidal habitat available to macroinvertebrates, and, therefore, the abundance of macroinvertebrates decreased (Dugan and Hubbard 2006, Dugan et al. 2008). The diversity and abundance of shorebirds on beaches was positively correlated with the diversity and abundance of macroinvertebrate prey, and since a decline in prey was observed, a decrease in foraging shorebirds, gulls, and other seabirds was also observed (Dugan and Hubbard 2006, Dugan et al. 2008). These authors concluded that
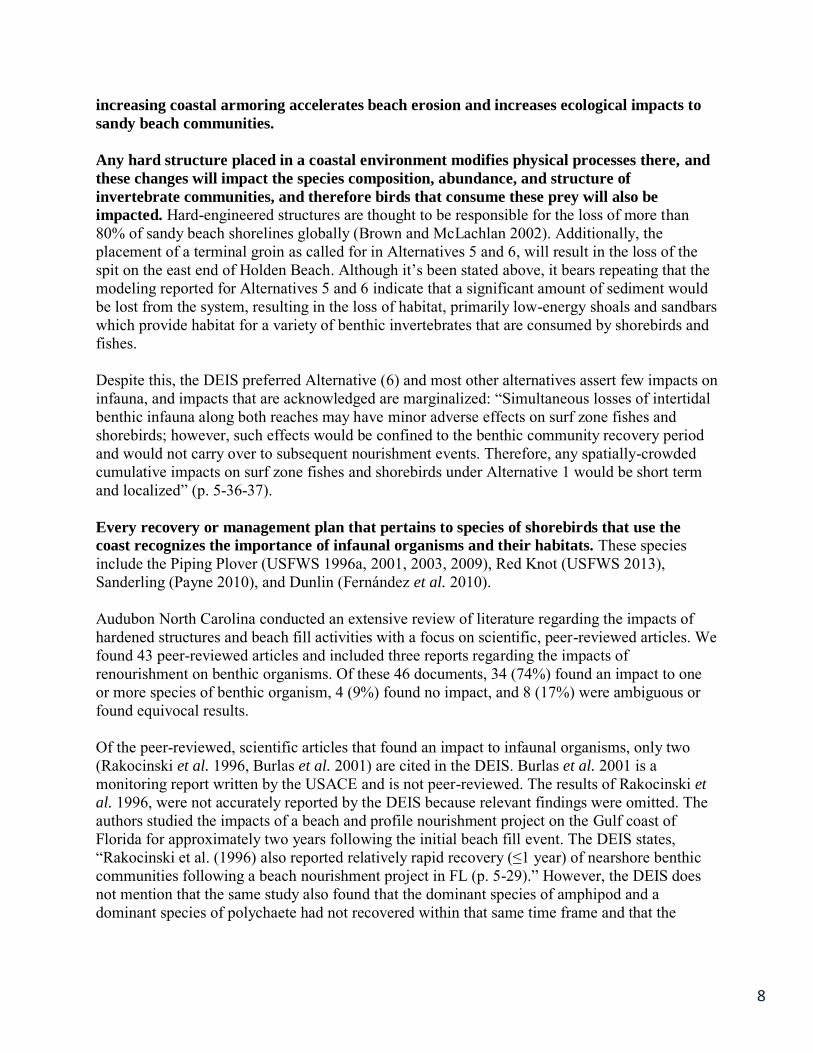
8
increasing coastal armoring accelerates beach erosion and increases ecological impacts to
sandy beach communities.
Any hard structure placed in a coastal environment modifies physical processes there, and
these changes will impact the species composition, abundance, and structure of
invertebrate communities, and therefore birds that consume these prey will also be
impacted. Hard-engineered structures are thought to be responsible for the loss of more than 80% of sandy beach shorelines globally (Brown and McLachlan 2002). Additionally, the placement of a terminal groin as called for in Alternatives 5 and 6, will result in the loss of the spit on the east end of Holden Beach. Although it’s been stated above, it bears repeating that the modeling reported for Alternatives 5 and 6 indicate that a significant amount of sediment would be lost from the system, resulting in the loss of habitat, primarily low-energy shoals and sandbars which provide habitat for a variety of benthic invertebrates that are consumed by shorebirds and fishes. Despite this, the DEIS preferred Alternative (6) and most other alternatives assert few impacts on infauna, and impacts that are acknowledged are marginalized: “Simultaneous losses of intertidal benthic infauna along both reaches may have minor adverse effects on surf zone fishes and shorebirds; however, such effects would be confined to the benthic community recovery period and would not carry over to subsequent nourishment events. Therefore, any spatially-crowded cumulative impacts on surf zone fishes and shorebirds under Alternative 1 would be short term and localized” (p. 5-36-37). Every recovery or management plan that pertains to species of shorebirds that use the
coast recognizes the importance of infaunal organisms and their habitats. These species include the Piping Plover (USFWS 1996a, 2001, 2003, 2009), Red Knot (USFWS 2013), Sanderling (Payne 2010), and Dunlin (Fernández et al. 2010). Audubon North Carolina conducted an extensive review of literature regarding the impacts of hardened structures and beach fill activities with a focus on scientific, peer-reviewed articles. We found 43 peer-reviewed articles and included three reports regarding the impacts of renourishment on benthic organisms. Of these 46 documents, 34 (74%) found an impact to one or more species of benthic organism, 4 (9%) found no impact, and 8 (17%) were ambiguous or found equivocal results. Of the peer-reviewed, scientific articles that found an impact to infaunal organisms, only two (Rakocinski et al. 1996, Burlas et al. 2001) are cited in the DEIS. Burlas et al. 2001 is a monitoring report written by the USACE and is not peer-reviewed. The results of Rakocinski et
al. 1996, were not accurately reported by the DEIS because relevant findings were omitted. The authors studied the impacts of a beach and profile nourishment project on the Gulf coast of Florida for approximately two years following the initial beach fill event. The DEIS states, “Rakocinski et al. (1996) also reported relatively rapid recovery (≤1 year) of nearshore benthic communities following a beach nourishment project in FL (p. 5-29).” However, the DEIS does not mention that the same study also found that the dominant species of amphipod and a dominant species of polychaete had not recovered within that same time frame and that the

9
amphipod did not recover until two years after the beach renourishment. Like the mole crab, amphipods and polychaetes are common shorebird prey items. In its treatment of impacts to the infauna, the DEIS relies nearly exclusively on outdated literature that is generally not peer-reviewed, and it omits the many recent, peer-reviewed scientific papers that are available on the subject. Peterson and Bishop (2005) suggested that weaknesses in nourishment studies are due to studies being conducted by project advocates with no peer review process and the duration of monitoring being inadequate to characterize the fauna before and after nourishment. Thus, uncertainty surrounding biological impacts of nourishment can be attributed to the poor quality of monitoring studies, not an absence of impacts. Impacts on Sea Turtles: Threatened loggerhead sea turtles (Caretta caretta) nest along the length of North Carolina’s coast, including on Holden Beach and Oak Island. Information on the impacts of hard structures to sea turtles is extremely limited, but the few studies that exist found negative impacts to sea turtles. Lamont and Houser (2014) documented that loggerhead turtle nest site selection is dependent on nearshore characteristics, therefore any activity that alters the nearshore environment, such as the construction of groins or jetties, may impact loggerhead nest distribution. Loggerhead nesting activity decreased significantly in the presence of exposed pilings, and a 41% reduction in nesting occurred where pilings were present (Bouchard et al.
1998). In a study of the impact of coastal armoring structures on sea turtle nesting behavior, Mosier (1998) demonstrated that fewer turtles emerged onto beaches in front of seawalls than onto adjacent, non-walled beaches, and of those that did emerge in front of seawalls, more turtles returned to the water without nesting. Loggerhead sea turtle nests on North Carolina beaches increased in number as distance from hard structures including piers and terminal groins increased (Randall and Halls 2014). Studies in Florida have also found avoidance behavior and decreased hatching success associated with a managed inlet (Herren 1999).
Beach renourishment also negatively impacts loggerhead sea turtle nesting. Renourishment can cause beach compaction, which can decrease loggerhead nesting success, alter nest chamber geometry, and alter nest concealment, and nourishment can create escarpments, which can prevent turtles from reaching nesting areas (Crain et al. 1995). Nourishment can decrease survivorship of eggs and hatchlings by altering characteristics such as sand compaction, moisture content, and temperature of the sand (Leonard Ozan 2011), all of which are variables that can affect the proper development of eggs. The success of incubating eggs may be reduced when the sand grain size, density, shear resistance, color, gas diffusion rates, organic composition, and moisture content of the nourished sand is different from the natural beach sand (Nelson 1991). Negative impacts from beach renourishment include decreases in nesting activity and decreases in hatching success due to the use of incompatible material, sand compaction, and suboptimal beach profile (NMFS and USFWS 1991). Sea turtles may be impacted by construction on beaches or dredge equipment, especially when work takes place outside the environmental window for sea turtles. During the spring and summertime construction phase of the Bald Head Island terminal groin, an adult female was trapped inside the construction zone for one day and a nest was destroyed when it was dug up by construction equipment (Sarah Finn pers. com. 2015). Pipeline and other obstructions placed on the beach may obstruct hatchling emergences or impede their path to the ocean (NMFS and

10
USFWS 1991). Hopper and cutterhead dredges may also kill sea turtles during dredge work (NMFS and USFWS 1991). The loggerhead sea turtle recovery plan emphasizes that the only beneficial impacts of nourishment are in cases where beaches are so highly eroded, there is “a complete absence of dry beach” (NMFS and USFWS 1991). The DEIS does not address the impacts to sea turtles should beach renourishment intervals
turn out to be similar to those at other North Carolina inlets with hardened structures,
rather than at the four-year intervals it forecasts. Nesting activity on nourished beaches decreased for one to three years following a nourishment event due to changes in the sand compaction, escarpment, and beach profile (NMFS and USFWS 1991, Steinitz et al. 1998, Trindell et al. 1998, Rumbold 2001, Brock et al. 2009). The DEIS also does not address the impacts to sea turtle nesting should the east end of Holden Beach experience downdrift erosion that would narrow the beach west of the groin where nesting occurs. The loggerhead recovery plan does include these negative impacts: “In preventing normal sand transport, these structures accrete updrift beaches while causing accelerated beach erosion downdrift of the structures [groins and jetties] (Komar 1983, Pilkey et al. 1984, National Research Council 1987), a process that results in degradation of sea turtle nesting habitat” (NMFS and USFWS 1991). Impacts on Fishes: Fishes would be negatively impacted by the construction of a terminal groin and the subsequent beach nourishment projects at Lockwood Folly Inlet in the following ways: 1) the groin would interrupt larval transport through the inlet, therefore impacting recruitment; 2) the native fish community would be replaced with a completely different structure-associated fish community; and 3) surf zone fishes would suffer from direct mortality. Hard structures reduce the successful passage of fish larvae from the open ocean to the estuarine nurseries they inhabit until reaching maturity (Hettler and Barker 1993, Pilkey et al. 1998). Inlets are critical pathways for adult fishes to get to offshore spawning sites and larvae immigrate through inlets to get to estuarine nurseries (Able et al. 2010). Many surf zone fishes are larval and juvenile individuals that benefit from the shallow water nursery habitat because it provides refuge from predators and foraging areas (Layman 2000). Due to their early weak swimming ontogenetic stage, fish larvae are not adapted for high mobility in response to habitat burial or increased turbidity levels. Studies have shown that beach nourishment degrades the important swash-zone feeding habitat for both probing shorebirds and demersal surf fishes (Quammen 1982, Manning et al. 2013, VanDusen et al. 2014). Surf habitats with hardened structures typically support a different community of fishes and benthic prey. Impacted species would include Atlantic menhaden, striped anchovy, bay anchovy, rough silverside, Atlantic silverside, Florida pompano, spot, Gulf kingfish, and striped mullet. Florida pompano and Gulf kingfish use the surf zone almost exclusively as a juvenile nursery area and as juveniles, they are rarely found outside the surf zone (Hackney et al. 1996). The dominant benthic prey for pompano and kingfish were coquina clams (Donax) and mole crabs (Emerita). Despite the fact that fishes in the surf zone are adapted to a high energy environment, rapid changes in their habitat can still cause mortality and other negative impacts. There are
documented negative impacts of renourishment on some of the invertebrates (especially
mole crabs and coquinas) that are major foods of the fishes (Reilly 1978, Baca et al. 1991);
therefore, negative impacts could be indirectly transferred to the surf zone fish community.
11
Manning et al. (2013) states: Beach nourishment can degrade the intertidal and shallow subtidal foraging habitats for
demersal surf fishes by three major processes: (1) inducing mass mortality of macrobenthic
infaunal prey through rapid burial by up to 1 m or more of dredged fill materials; (2) modifying
the sedimentology of these beach zones through filling with excessive proportions of coarse,
often shelly sediments that are incompatible with habitat requirements of some important benthic
invertebrates, such as beach bivalves; and (3) incorporating into the beach fill excessive
quantities of fine sediments in silt and clay sizes, which can induce higher near-shore turbidity
during periods of erosion as onshore winds or distant storms generate wave action, thereby
inhibiting detection of prey by visually orienting fishes. The opinion repeated in many
environmental impact statements and environmental assessments that marine benthic
invertebrates of ocean beach habitats are well adapted to surviving the sediment deposition of
beach nourishment because of evolutionary experience with frequent erosion and deposition
events associated with intense storms and high waves is unsupportable. A recent review of the
literature on impacts of storms on ocean-beach macrofauna (Harris et al. 2011) reveals that
about half the studies report massive reductions of beach infaunal populations after storms.
Conclusion: A unique ecological community exists at Lockwood Folly Inlet that is connected to the base of the food chain. The base of the food chain (infaunal community) requires 1-4 years to recover from a nourishment event, and that has not been the case at the East End beach. If the base of the food chain is absent or largely absent due to nourishment activities every two years, then the organisms that consume them, like birds and fishes, will not be present either. The DEIS fails to make this connection. Alternatives 1, 3, 4, 5, and 6 as presented in the DEIS would negatively impact birds, as well as infauna, fishes, and sea turtles. The DEIS omits the vast majority of the ample body of scientific literature that is available to describe the well-known and accepted physical impacts of terminal groins and beach fill. It then fails to accurately describe the direct, indirect, and cumulative impacts that these activities would have on biological resources within Lockwood Folly Inlet, particularly the Piping Plover. Instead, adverse impacts to Piping Plovers, Red Knots, and other bird species are largely dismissed or ignored. The best, most recent data and peer-reviewed literature available to assess those impacts are omitted or misrepresented, and the recommendations of multiple management and recovery plans, including USFWS recovery plans, are largely disregarded. Alternatives 1, 3, 4, 5, and 6 as presented in the DEIS would jeopardize the recovery and/or persistence of the Great Lakes breeding population of Piping Plover, the Atlantic coast breeding population of Piping Plover, Seabeach Amaranth, and Red Knot; and a terminal groin would permanently eliminate habitats for these species listed under the Endangered Species Act without any chance of restoration or reformation in other areas. The alternatives in the DEIS that involve hard structures or channelization (Alternatives 4, 5, and 6) at Lockwood Folly Inlet should be permanently removed from further consideration and other alternatives should be considered.
12
Alternative 2, as presented in the DEIS, is the only alternative in the DEIS that can and should be considered. We urge the Corps to reject all other alternatives presented in the DEIS and consider non-destructive, long-term and economically feasible solutions for the Town of Holden Beach. Thank you for the opportunity to comment on this important project. Please do not hesitate to contact me if you have questions or concerns. Sincerely,
Walker Golder Deputy Director

A Fiscal Analysis of Shifting Inlets and Terminal Groins
in North Carolina
Andrew S. Coburn, Associate Director
Program for the Study of Developed Shorelines Western Carolina University
294 Belk Cullowhee, NC 28723
psds.wcu.edu 828-227-7519
Attachment 1
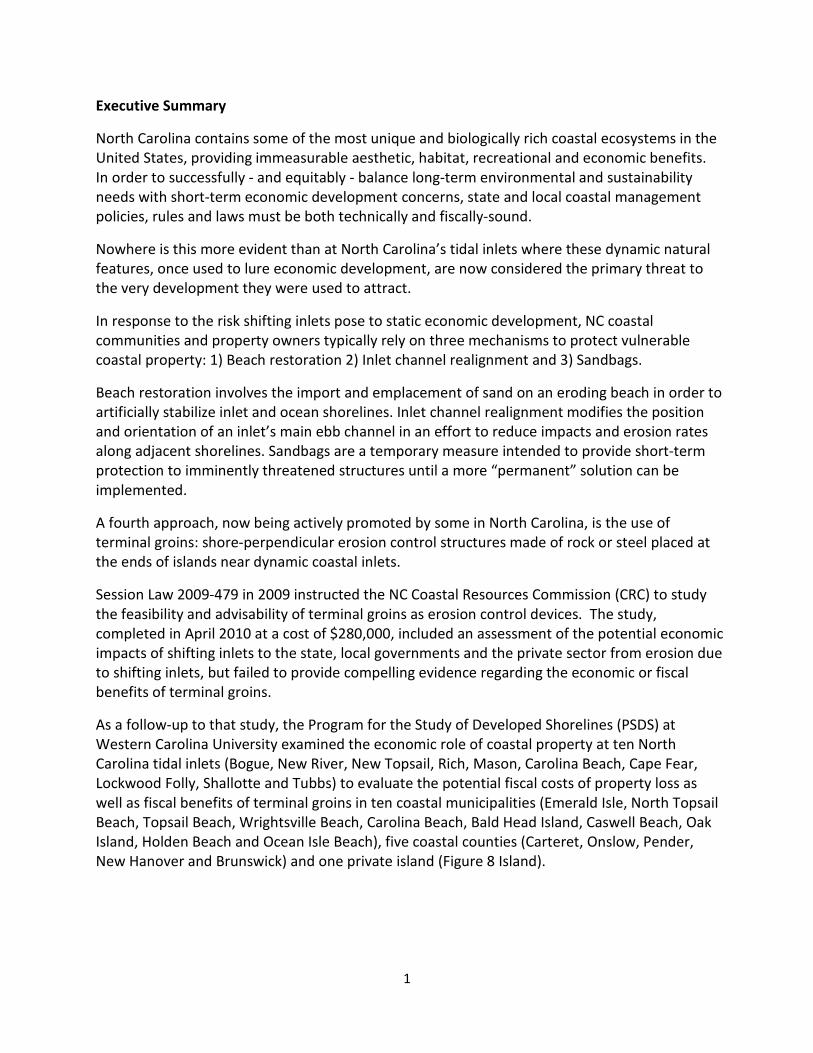
1
Executive Summary
North Carolina contains some of the most unique and biologically rich coastal ecosystems in the United States, providing immeasurable aesthetic, habitat, recreational and economic benefits. In order to successfully - and equitably - balance long-term environmental and sustainability needs with short-term economic development concerns, state and local coastal management policies, rules and laws must be both technically and fiscally-sound.
Nowhere is this more evident than at North Carolina’s tidal inlets where these dynamic natural features, once used to lure economic development, are now considered the primary threat to the very development they were used to attract.
In response to the risk shifting inlets pose to static economic development, NC coastal communities and property owners typically rely on three mechanisms to protect vulnerable coastal property: 1) Beach restoration 2) Inlet channel realignment and 3) Sandbags.
Beach restoration involves the import and emplacement of sand on an eroding beach in order to artificially stabilize inlet and ocean shorelines. Inlet channel realignment modifies the position and orientation of an inlet’s main ebb channel in an effort to reduce impacts and erosion rates along adjacent shorelines. Sandbags are a temporary measure intended to provide short-term protection to imminently threatened structures until a more “permanent” solution can be implemented.
A fourth approach, now being actively promoted by some in North Carolina, is the use of terminal groins: shore-perpendicular erosion control structures made of rock or steel placed at the ends of islands near dynamic coastal inlets.
Session Law 2009-479 in 2009 instructed the NC Coastal Resources Commission (CRC) to study the feasibility and advisability of terminal groins as erosion control devices. The study, completed in April 2010 at a cost of $280,000, included an assessment of the potential economic impacts of shifting inlets to the state, local governments and the private sector from erosion due to shifting inlets, but failed to provide compelling evidence regarding the economic or fiscal benefits of terminal groins.
As a follow-up to that study, the Program for the Study of Developed Shorelines (PSDS) at Western Carolina University examined the economic role of coastal property at ten North Carolina tidal inlets (Bogue, New River, New Topsail, Rich, Mason, Carolina Beach, Cape Fear, Lockwood Folly, Shallotte and Tubbs) to evaluate the potential fiscal costs of property loss as well as fiscal benefits of terminal groins in ten coastal municipalities (Emerald Isle, North Topsail Beach, Topsail Beach, Wrightsville Beach, Carolina Beach, Bald Head Island, Caswell Beach, Oak Island, Holden Beach and Ocean Isle Beach), five coastal counties (Carteret, Onslow, Pender, New Hanover and Brunswick) and one private island (Figure 8 Island).

2
Based on this study, PSDS has determined that:
1) Assessed value does not reflect the potential fiscal impacts of shifting inlets to the state or local governments from erosion due to shifting inlets,
2) The fiscal benefits of protecting property at-risk to shifting inlets are small compared to the costs of protection,
3) The use of terminal groins would provide limited fiscal and economic benefits to state taxpayers and local communities and
4) Long-term costs of a terminal groin exceed potential long-term benefits at every developed NC inlet.
This analysis indicates that, even ignoring environmental concerns, terminal groins are not a fiscally-sound strategy for dealing with coastal property at-risk to shifting inlets and, due to their limited fiscal benefits, the expenditure of state funds for groin construction/maintenance is bad public policy. 1) Assessed value does not accurately reflect the fiscal contribution investment property at-
risk to shifting inlets makes to North Carolina’s coastal municipal and county economies
According to the CRC terminal groin study, the purpose of the economic assessment component of the study was to assess economic value within areas around developed inlets called 30-year risk areas (30 YRAs) that contain a level of risk approximately equal to the risk indicated by setbacks in adjacent oceanfront areas, as well as the economic value of properties in 30 YRAs having temporary sandbag protection (Table 1).
Table 1: North Carolina 30-Year Risk Areas
1. Emerald Isle/Bogue Inlet 2. North Topsail Beach/New River Inlet 3. Topsail Beach/New Topsail Inlet 4. Figure 8 Island/Rich Inlet 5. Figure 8 Island/Mason Inlet 6. Wrightsville Beach/Mason Inlet 7. Carolina Beach/Carolina Beach Inlet
8. Bald Head Island/Cape Fear Inlet 9. Caswell Beach/Cape Fear Inlet 10. Oak Island/Lockwood Folly Inlet 11. Holden Beach/Lockwood Folly Inlet 12. Holden Beach/Shallotte Inlet 13. Ocean Isle Beach/Shallotte Inlet 14. Ocean Isle Beach/Tubbs Inlet
A number of components of economic value within these 30 YRAs were considered including residential property, commercial property, government property, road infrastructure, waterline infrastructure, sewer infrastructure, property tax base and revenues and recreation and environmental value. The greatest potential economic impact of shifting inlets, according to the CRC study, is to residential property, which the study quantifies in terms of assessed value.
But an economic assessment that focuses almost exclusively on assessed coastal property value - the dollar value of an asset assigned by a public tax assessor for the purposes of taxation - is misleading because changes in value do not accurately reflect actual fiscal impacts coastal counties, municipalities and the state may experience as a result of shifting inlets.
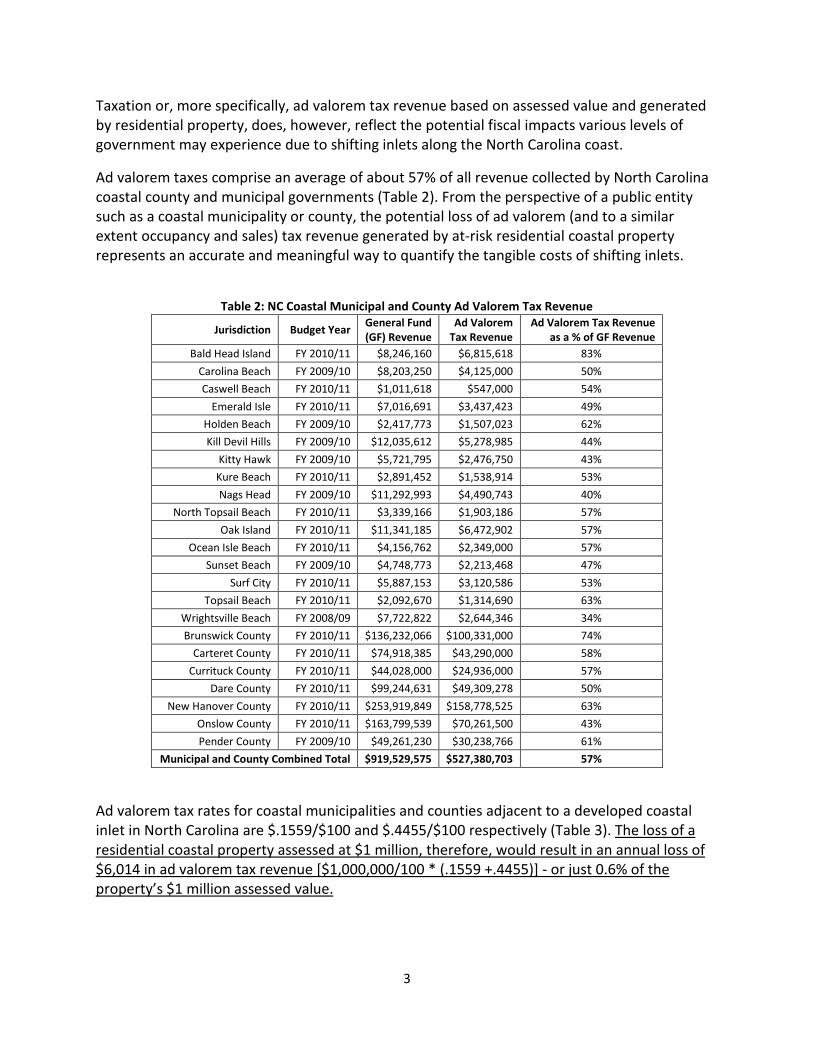
3
Taxation or, more specifically, ad valorem tax revenue based on assessed value and generated by residential property, does, however, reflect the potential fiscal impacts various levels of government may experience due to shifting inlets along the North Carolina coast.
Ad valorem taxes comprise an average of about 57% of all revenue collected by North Carolina coastal county and municipal governments (Table 2). From the perspective of a public entity such as a coastal municipality or county, the potential loss of ad valorem (and to a similar extent occupancy and sales) tax revenue generated by at-risk residential coastal property represents an accurate and meaningful way to quantify the tangible costs of shifting inlets.
Table 2: NC Coastal Municipal and County Ad Valorem Tax Revenue
Jurisdiction Budget Year General Fund (GF) Revenue
Ad Valorem Tax Revenue
Ad Valorem Tax Revenue as a % of GF Revenue
Bald Head Island FY 2010/11 $8,246,160 $6,815,618 83%
Carolina Beach FY 2009/10 $8,203,250 $4,125,000 50%
Caswell Beach FY 2010/11 $1,011,618 $547,000 54%
Emerald Isle FY 2010/11 $7,016,691 $3,437,423 49%
Holden Beach FY 2009/10 $2,417,773 $1,507,023 62%
Kill Devil Hills FY 2009/10 $12,035,612 $5,278,985 44%
Kitty Hawk FY 2009/10 $5,721,795 $2,476,750 43%
Kure Beach FY 2010/11 $2,891,452 $1,538,914 53%
Nags Head FY 2009/10 $11,292,993 $4,490,743 40%
North Topsail Beach FY 2010/11 $3,339,166 $1,903,186 57%
Oak Island FY 2010/11 $11,341,185 $6,472,902 57%
Ocean Isle Beach FY 2010/11 $4,156,762 $2,349,000 57%
Sunset Beach FY 2009/10 $4,748,773 $2,213,468 47%
Surf City FY 2010/11 $5,887,153 $3,120,586 53%
Topsail Beach FY 2010/11 $2,092,670 $1,314,690 63%
Wrightsville Beach FY 2008/09 $7,722,822 $2,644,346 34%
Brunswick County FY 2010/11 $136,232,066 $100,331,000 74%
Carteret County FY 2010/11 $74,918,385 $43,290,000 58%
Currituck County FY 2010/11 $44,028,000 $24,936,000 57%
Dare County FY 2010/11 $99,244,631 $49,309,278 50%
New Hanover County FY 2010/11 $253,919,849 $158,778,525 63%
Onslow County FY 2010/11 $163,799,539 $70,261,500 43%
Pender County FY 2009/10 $49,261,230 $30,238,766 61%
Municipal and County Combined Total $919,529,575 $527,380,703 57%
Ad valorem tax rates for coastal municipalities and counties adjacent to a developed coastal inlet in North Carolina are $.1559/$100 and $.4455/$100 respectively (Table 3). The loss of a residential coastal property assessed at $1 million, therefore, would result in an annual loss of $6,014 in ad valorem tax revenue [$1,000,000/100 * (.1559 +.4455)] - or just 0.6% of the property’s $1 million assessed value.

4
According to the CRC study, 1,983 residential properties with an assessed value of about $1.4 billion are within the state’s fourteen 30 YRAs. While losing all at-risk properties is unlikely, the potential fiscal impact to North Carolina’s coastal municipalities and counties would be $7,127,087 - the combined local and county ad valorem tax revenue these properties currently generate but would not in the future (Table 4). Over 30 years, using a discount rate of 3% and price appreciation rate of 5%, the loss of 1,983 at-risk coastal properties would result in a loss of ad valorem tax revenue totaling about $292 million - or about 25% of assessed value.
Table 3: NC Coastal Municipal and County Ad Valorem Tax Rates Municipality FY 2010-11 Tax Rate County FY 2010-11 Tax Rate
Bald Head Island 0.2700 Brunswick County 0.3050 Carolina Beach 0.1750 Carteret County 0.2300 Caswell Beach 0.1300 New Hanover County 0.4525
Emerald Isle 0.0800 Onslow County 0.5900 Holden Beach 0.0690 Pender County 0.6500
North Topsail Beach 0.2355 AVERAGE 0.4455 Oak Island 0.1400
Ocean Isle Beach 0.0900 Topsail Beach 0.3100
Wrightsville Beach 0.0800 AVERAGE 0.1559
Table 4: Properties “At-Risk” to Shifting Inlets
Municipality Year Total Ad Valorem
Tax Revenue Collected “At-Risk”
Properties Ad Valorem Tax Revenue
Generated by At-Risk Properties Bald Head Island FY 2010/2011 $6,815,618 323 $1,017,647
Carolina Beach FY 2009/2010 $4,125,000 39 $60,776
Caswell Beach FY 2010/2011 $547,000 100 $135,483
Emerald Isle FY 2010/2011 $3,437,423 96 $71,560
Figure 8 Island N/A N/A 114 N/A
Holden Beach FY 2009/2010 $1,507,023 343 $207,756
North Topsail Beach FY 2010/2011 $1,903,186 376 $157,356
Oak Island FY 2010/2011 $6,472,902 102 $181,335
Ocean Isle Beach FY 2009/2010 $2,349,000 124 $54,931
Topsail Beach FY 2010/2011 $1,314,690 184 $103,165
Wrightsville Beach FY 2008/2009 $2,644,346 182 $83,863
$31,116,188 1983 $2,073,872
County
Brunswick County FY 2010/2011 $100,331,000 992 $2,705,286
Carteret County FY 2010/2011 $43,290,000 96 $205,735
New Hanover County FY 2010/2011 $158,778,525 335 $1,531651
Onslow County FY 2010/2011 $70,261,500 376 $394,224
Pender County FY 2009/2010 $30,238,766 184 $216,313
$402,899,791 1983 $5,053,209
Total Ad Valorem Tax Revenue generated by properties in 30 YRA $7,127,087
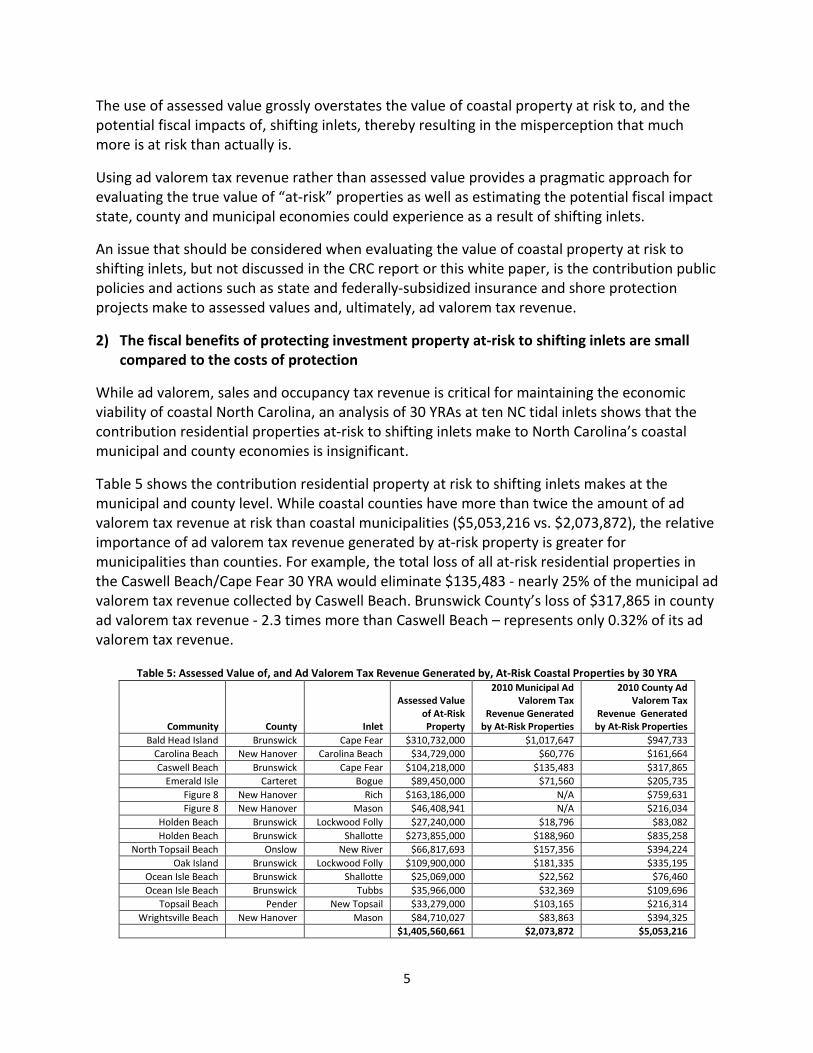
5
The use of assessed value grossly overstates the value of coastal property at risk to, and the potential fiscal impacts of, shifting inlets, thereby resulting in the misperception that much more is at risk than actually is.
Using ad valorem tax revenue rather than assessed value provides a pragmatic approach for evaluating the true value of “at-risk” properties as well as estimating the potential fiscal impact state, county and municipal economies could experience as a result of shifting inlets.
An issue that should be considered when evaluating the value of coastal property at risk to shifting inlets, but not discussed in the CRC report or this white paper, is the contribution public policies and actions such as state and federally-subsidized insurance and shore protection projects make to assessed values and, ultimately, ad valorem tax revenue.
2) The fiscal benefits of protecting investment property at-risk to shifting inlets are small compared to the costs of protection
While ad valorem, sales and occupancy tax revenue is critical for maintaining the economic viability of coastal North Carolina, an analysis of 30 YRAs at ten NC tidal inlets shows that the contribution residential properties at-risk to shifting inlets make to North Carolina’s coastal municipal and county economies is insignificant.
Table 5 shows the contribution residential property at risk to shifting inlets makes at the municipal and county level. While coastal counties have more than twice the amount of ad valorem tax revenue at risk than coastal municipalities ($5,053,216 vs. $2,073,872), the relative importance of ad valorem tax revenue generated by at-risk property is greater for municipalities than counties. For example, the total loss of all at-risk residential properties in the Caswell Beach/Cape Fear 30 YRA would eliminate $135,483 - nearly 25% of the municipal ad valorem tax revenue collected by Caswell Beach. Brunswick County’s loss of $317,865 in county ad valorem tax revenue - 2.3 times more than Caswell Beach – represents only 0.32% of its ad valorem tax revenue.
Table 5: Assessed Value of, and Ad Valorem Tax Revenue Generated by, At-Risk Coastal Properties by 30 YRA
Community County Inlet
Assessed Value of At-Risk Property
2010 Municipal Ad Valorem Tax
Revenue Generated by At-Risk Properties
2010 County Ad Valorem Tax
Revenue Generated by At-Risk Properties
Bald Head Island Brunswick Cape Fear $310,732,000 $1,017,647 $947,733 Carolina Beach New Hanover Carolina Beach $34,729,000 $60,776 $161,664 Caswell Beach Brunswick Cape Fear $104,218,000 $135,483 $317,865
Emerald Isle Carteret Bogue $89,450,000 $71,560 $205,735 Figure 8 New Hanover Rich $163,186,000 N/A $759,631 Figure 8 New Hanover Mason $46,408,941 N/A $216,034
Holden Beach Brunswick Lockwood Folly $27,240,000 $18,796 $83,082 Holden Beach Brunswick Shallotte $273,855,000 $188,960 $835,258
North Topsail Beach Onslow New River $66,817,693 $157,356 $394,224 Oak Island Brunswick Lockwood Folly $109,900,000 $181,335 $335,195
Ocean Isle Beach Brunswick Shallotte $25,069,000 $22,562 $76,460 Ocean Isle Beach Brunswick Tubbs $35,966,000 $32,369 $109,696
Topsail Beach Pender New Topsail $33,279,000 $103,165 $216,314 Wrightsville Beach New Hanover Mason $84,710,027 $83,863 $394,325
$1,405,560,661 $2,073,872 $5,053,216
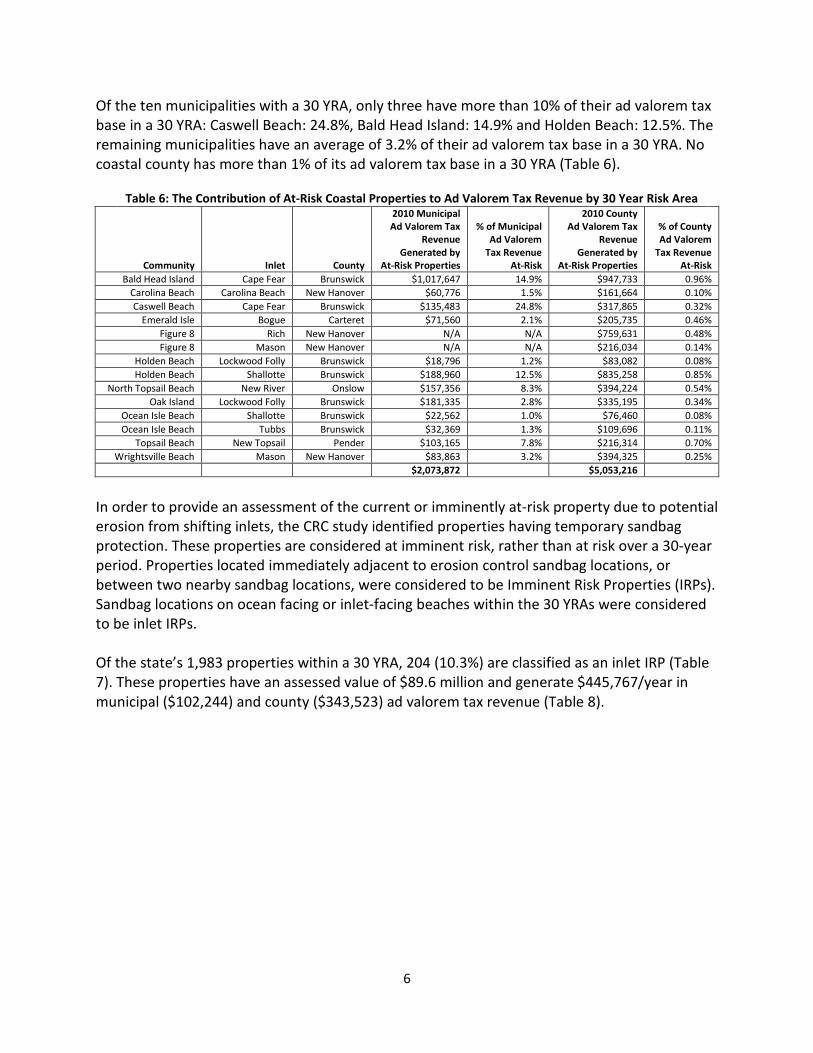
6
Of the ten municipalities with a 30 YRA, only three have more than 10% of their ad valorem tax base in a 30 YRA: Caswell Beach: 24.8%, Bald Head Island: 14.9% and Holden Beach: 12.5%. The remaining municipalities have an average of 3.2% of their ad valorem tax base in a 30 YRA. No coastal county has more than 1% of its ad valorem tax base in a 30 YRA (Table 6).
In order to provide an assessment of the current or imminently at-risk property due to potential erosion from shifting inlets, the CRC study identified properties having temporary sandbag protection. These properties are considered at imminent risk, rather than at risk over a 30-year period. Properties located immediately adjacent to erosion control sandbag locations, or between two nearby sandbag locations, were considered to be Imminent Risk Properties (IRPs). Sandbag locations on ocean facing or inlet-facing beaches within the 30 YRAs were considered to be inlet IRPs. Of the state’s 1,983 properties within a 30 YRA, 204 (10.3%) are classified as an inlet IRP (Table 7). These properties have an assessed value of $89.6 million and generate $445,767/year in municipal ($102,244) and county ($343,523) ad valorem tax revenue (Table 8).
Table 6: The Contribution of At-Risk Coastal Properties to Ad Valorem Tax Revenue by 30 Year Risk Area
Community Inlet County
2010 Municipal Ad Valorem Tax
Revenue Generated by
At-Risk Properties
% of Municipal Ad Valorem
Tax Revenue At-Risk
2010 County Ad Valorem Tax
Revenue Generated by
At-Risk Properties
% of County Ad Valorem
Tax Revenue At-Risk
Bald Head Island Cape Fear Brunswick $1,017,647 14.9% $947,733 0.96% Carolina Beach Carolina Beach New Hanover $60,776 1.5% $161,664 0.10% Caswell Beach Cape Fear Brunswick $135,483 24.8% $317,865 0.32%
Emerald Isle Bogue Carteret $71,560 2.1% $205,735 0.46% Figure 8 Rich New Hanover N/A N/A $759,631 0.48% Figure 8 Mason New Hanover N/A N/A $216,034 0.14%
Holden Beach Lockwood Folly Brunswick $18,796 1.2% $83,082 0.08% Holden Beach Shallotte Brunswick $188,960 12.5% $835,258 0.85%
North Topsail Beach New River Onslow $157,356 8.3% $394,224 0.54% Oak Island Lockwood Folly Brunswick $181,335 2.8% $335,195 0.34%
Ocean Isle Beach Shallotte Brunswick $22,562 1.0% $76,460 0.08% Ocean Isle Beach Tubbs Brunswick $32,369 1.3% $109,696 0.11%
Topsail Beach New Topsail Pender $103,165 7.8% $216,314 0.70% Wrightsville Beach Mason New Hanover $83,863 3.2% $394,325 0.25%
$2,073,872 $5,053,216

7
As table 9 shows, the loss of all imminent risk properties, a more plausible scenario than the loss of all at-risk properties, would result in an insignificant loss of municipal and county ad valorem tax revenue in every 30 YRA:
• Bald Head Island has $35,920 in municipal ad valorem tax revenue at imminent risk in the Bald Head Island/Cape Fear 30 YRA – the most of any NC coastal municipality. This amount, however, represents only 0.55% of the town’s total ad valorem tax revenue.
• New Hanover County has $120,881 in county ad valorem tax revenue considered in imminent risk in the Figure 8/Rich 30 YRA – the most of any NC coastal county. This amount represents only 0.08% of the ad valorem tax revenue collected by the county in 2010.
• Topsail Beach is the only municipality with more than 1% of its ad valorem revenue classified as being in imminent risk. Pender County is the only county with even 0.1% of its ad valorem tax revenue in imminent risk.
Table 7: Imminent Risk Properties Within 30-Year Risk Areas
Community Inlet County At-Risk
Properties Imminent Risk
Properties (IRP) IRPs as a % of
At-Risk Properties Bald Head Island Cape Fear Brunswick 323 22 6.8% Carolina Beach Carolina Beach New Hanover 39 0 0.0% Caswell Beach Cape Fear Brunswick 100 0 0.0% Emerald Isle Bogue Carteret 96 13 13.6% Figure 8 Island Rich New Hanover 89 16 18.0% Figure 8 Island Mason New Hanover 25 0 0.0% Holden Beach Lockwood Folly Brunswick 150 32 21.3% Holden Beach Shallotte Brunswick 193 0 0.0% North Topsail Beach New River Onslow 376 37 9.8% Oak Island Lockwood Folly Brunswick 102 0 0.0% Ocean Isle Beach Shallotte Brunswick 85 24 28.2% Ocean Isle Beach Tubbs Brunswick 39 3 7.7% Topsail Beach New Topsail Pender 184 57 31.0% Wrightsville Beach Mason New Hanover 182 0 0.0%
TOTAL 1983 204 10.3%
Table 8: Summary of Imminent Risk Properties (IRP) # Imminent Risk Properties (IRP) 204
% of all Properties in 30 YRA that are IRP 10.3% Assessed Value of IRPs $89,610,211
2010 Municipal Tax Revenue generated by IRPs $102,244 2010 County Tax Revenue generated by IRPs $343,523
Total 2010 Tax Revenue generated by IRPs $445,767

8
3) The use of terminal groins would provide limited fiscal and economic benefits
to state taxpayers and local coastal communities
Because the CRC study leaves the efficacy of constructing terminal groins at developed North Carolina inlets unresolved, it is difficult to accurately quantify the long-term fiscal benefits terminal groins may or may not produce over a period of 30 years.
It is possible, however, to make two assumptions about terminal groins based on the study:
1. All IRPs in North Carolina will be lost over the next 30 years without terminal groins and 2. If they work intended, terminal groins may protect IRPs for the next 30 years.
Because the effectiveness of terminal groins beyond IRPs is highly uncertain, IRPs represent at-risk coastal properties most likely to benefit from terminal groins and the continued generation of municipal and county ad valorem tax revenue by IRPs within 30 YRAs is the primary fiscal benefit of constructing a terminal groin in a 30 YRA.
In the Ocean Isle Beach/Shallotte Inlet 30 YRA, for example, the primary annual benefit of constructing a terminal groin is $10,147 - the combined municipal and county ad valorem tax revenue currently generated by 24 IRPs in this 30 YRA. Over 30 years, using a discount rate of 3% and price appreciation rate of 5%, the primary fiscal benefit of constructing a terminal groin in Ocean Isle Beach at Shallotte Inlet is $415,633 (Table 10).
Table 10 shows that the estimated annual primary fiscal benefit of constructing a terminal groin in each of the state’s 30 YRAs is $445,767. Over 30 years, using a discount rate of 3% and price appreciation rate of 5%, the primary fiscal benefit of constructing terminal groins in all 30 YRAs (even though six have no IRPs) is $18,259,148. Note that this table includes only municipal and county ad valorem tax revenue due to the small number of impacted properties (204) and limited contribution of other revenue sources.
Table 9: Contribution of IRPs to Ad Valorem Tax Revenue by 30 Year Risk Area
Community Inlet County
2010 Municipal Ad Valorem Tax
Revenue Generated by IRPs
% of Municipal Ad Valorem
Tax Revenue in Imminent Risk
2010 County Ad Valorem Tax
Revenue Generated by
IRPs
% of County Ad Valorem
Tax Revenue in Imminent
Risk Bald Head Island Cape Fear Brunswick $35,920 0.55% $33,452 0.03%
Carolina Beach Carolina Beach New Hanover $0 0.00% $0 0.00% Caswell Beach Cape Fear Brunswick $0 0.00% $0 0.00%
Emerald Isle Bogue Carteret $11,500 0.34% $33,062 0.07% Figure 8 Rich New Hanover $0 0.00% $120,881 0.08% Figure 8 Mason New Hanover $0 0.00% $0 0.00%
Holden Beach Lockwood Folly Brunswick $12,024 0.79% $53,152 0.05% Holden Beach Shallotte Brunswick $0 0.00% $0 0.00%
North Topsail Beach New River Onslow $6,863 0.35% $17,193 0.02% Oak Island Lockwood Folly Brunswick $0 0.00% $0 0.00%
Ocean Isle Beach Shallotte Brunswick $2,312 0.10% $7,835 0.01% Ocean Isle Beach Tubbs Brunswick $5,760 0.24% $19,520 0.02%
Topsail Beach New Topsail Pender $27,865 2.11% $58,428 0.19% Wrightsville Beach Mason New Hanover $0 0.00% $0 0.00%
$102,244 $343,523

9
4) Long-term costs of a terminal groin exceed potential long-term benefits
at every developed NC inlet
The CRC study estimates the initial cost of constructing a 1,500-foot terminal groin, similar in size to the structure currently at Fort Macon, to be $10,850,000 with total annual maintenance costs of about $2,250,000. Using a 3% discount rate and price appreciation rate of 5%, the estimated total cost of constructing and maintaining one terminal groin in North Carolina over 30 years is approximately $54,950,993.
This amount is more than ten times greater than the potential long-term fiscal benefit of constructing a groin at Figure 8/Rich Inlet ($4,951,430) and about three times greater than the combined long-term benefit of constructing terminal groins at all fourteen 30 YRAs ($18,259,148).
Given the CRC study and an evaluation of other terminal structures, a scenario in which terminal groins protect only IRPs over a 30-year period is rational. However, due to uncertainty in the efficacy of terminal groins, PSDS also assessed a “best-case” scenario in which the benefits of terminal groins extend to every at-risk property within every 30 YRA for 30 years.
In this scenario, long-term costs are projected to exceed potential long-term benefits (measured by the continued generation of ad valorem tax revenue) in every 30 YRA except Bald Head Island/Cape Fear (Table 11). It should be noted that the potential fiscal benefits of constructing and maintaining a terminal groin at Bald Head Island over a period of 30 years are split almost equally between Bald Head Island ($41,684,034) and Brunswick County ($38,820,273).
Table 10: Primary Fiscal Benefit of a Terminal Groin by 30 Year Risk Area
Community Inlet County
2010 Municipal Ad Valorem Tax
Revenue Generated by
IRPs
2010 County Ad Valorem Tax
Revenue Generated by
IRPs
2010 Combined Ad Valorem Tax
Revenue Generated by
IRPs
NPV of Ad Valorem Tax
Revenue Generated by IRPs Over 30
Years Bald Head Island Cape Fear Brunswick $35,920 $33,452 $69,372 $2,841,560
Carolina Beach Carolina Beach New Hanover $0 $0 $0 $0 Caswell Beach Cape Fear Brunswick $0 $0 $0 $0
Emerald Isle Bogue Carteret $11,500 $33,062 $44,562 $1,825,313 Figure 8 Rich New Hanover $0 $120,881 $120,881 $4,951,430 Figure 8 Mason New Hanover $0 $0 $0 $0
Holden Beach Lockwood Folly Brunswick $12,024 $53,152 $65,176 $2,669,687 Holden Beach Shallotte Brunswick $0 $0 $0 $0
North Topsail Beach New River Onslow $6,863 $17,193 $24,056 $985,362 Oak Island Lockwood Folly Brunswick $0 $0 $0 $0
Ocean Isle Beach Shallotte Brunswick $2,312 $7,835 $10,147 $415,633 Ocean Isle Beach Tubbs Brunswick $5,760 $19,520 $25,280 $1,035,499
Topsail Beach New Topsail Pender $27,865 $58,428 $86,293 $3,534,664 Wrightsville Beach Mason New Hanover $0 $0 $0 $0
$102,244 $343,523 $445,767 $18,259,148

10
Discussion
Assessed property values do not reflect the potential costs of shifting inlets to coastal municipalities, counties or the state. Ad valorem tax revenue generated by at-risk coastal property represents a more realistic and accurate way to quantify the potential fiscal impacts a North Carolina coastal county or municipality might expect as a result of shifting inlets.
The assessed value of 1,983 properties at-risk to shifting inlets in North Carolina is approximately $1.4 billion. Losing every at-risk property, however, would translate into an annual loss of $7,127,087 in county and municipal ad valorem tax revenue – a figure that is 0.5% of assessed value. Over 30 years, using a discount rate of 3% and price appreciation rate of 5%, the NPV of this statewide loss is $292 million.
While $7,127,087 in annual lost ad valorem tax revenue seems significant, it represents less than 5% of municipal ad valorem tax revenue and 0.37% of county ad valorem tax revenue collected by NC coastal communities and counties containing a developed in 2010.
Of the state’s 1,983 at-risk properties, 204 are classified as Imminent Risk Properties (IRPs). These properties represent 0.45% of coastal municipal ad valorem tax revenue and 0.04% of coastal county ad valorem tax revenue collected in 2010.
IRPs also represent the primary beneficiaries of terminal groins, and the continued generation of ad valorem tax revenue by IRPs resulting from the emplacement of terminal groins can be used to quantify the potential fiscal benefits of terminal groins.
Using IRPs as a proxy to estimate the impacts of terminal groins, annual municipal benefits range from $0 in seven locations (Carolina Beach/Carolina Beach Inlet, Caswell Beach/Cape Fear Inlet, Figure 8/Rich Inlet, Figure 8/Mason Inlet, Holden Beach/Shallotte Inlet, Oak Island/Lockwood Folly Inlet and Wrightsville Beach/Mason Inlet) to $35,920 in Bald Head Island.
Table 11: Estimated “Best-Case” Fiscal Benefit of a Terminal Groin by 30 Year Risk Area
Community Inlet County
2010 Municipal Ad Valorem Tax
Revenue Generated by all
At-Risk Properties
2010 County Ad Valorem Tax
Revenue Generated by all
At-Risk Properties
2010 Total Ad Valorem Tax
Revenue Generated by
all At-Risk Properties
NPV of Ad Valorem Tax
Revenue Generated by all
At-Risk Properties Over 30 Years
Bald Head Island Cape Fear Brunswick $1,017,647 $947,733 $1,965,380 $80,504,307 Carolina Beach Carolina Beach New Hanover $60,776 $161,664 $222,440 $9,111,408 Caswell Beach Cape Fear Brunswick $135,483 $317,865 $453,348 $18,569,674
Emerald Isle Bogue Carteret $71,560 $205,735 $277,295 $11,358,334 Figure 8 Rich New Hanover N/A $759,631 $759,631 $31,115,391 Figure 8 Mason New Hanover N/A $216,034 $216,034 $8,849,010
Holden Beach Lockwood Folly Brunswick $18,796 $83,082 $101,878 $4,173,044 Holden Beach Shallotte Brunswick $188,960 $835,258 $1,024,218 $41,953,190
North Topsail Beach New River Onslow $157,356 $394,224 $551,580 $22,593,374 Oak Island Lockwood Folly Brunswick $181,335 $335,195 $516,530 $21,157,684
Ocean Isle Beach Shallotte Brunswick $22,562 $76,460 $99,022 $4,056,059 Ocean Isle Beach Tubbs Brunswick $32,369 $109,696 $142,065 $5,819,152
Topsail Beach New Topsail Pender $103,165 $216,314 $319,479 $13,086,241 Wrightsville Beach Mason New Hanover $83,863 $394,325 $478,188 $19,587,150
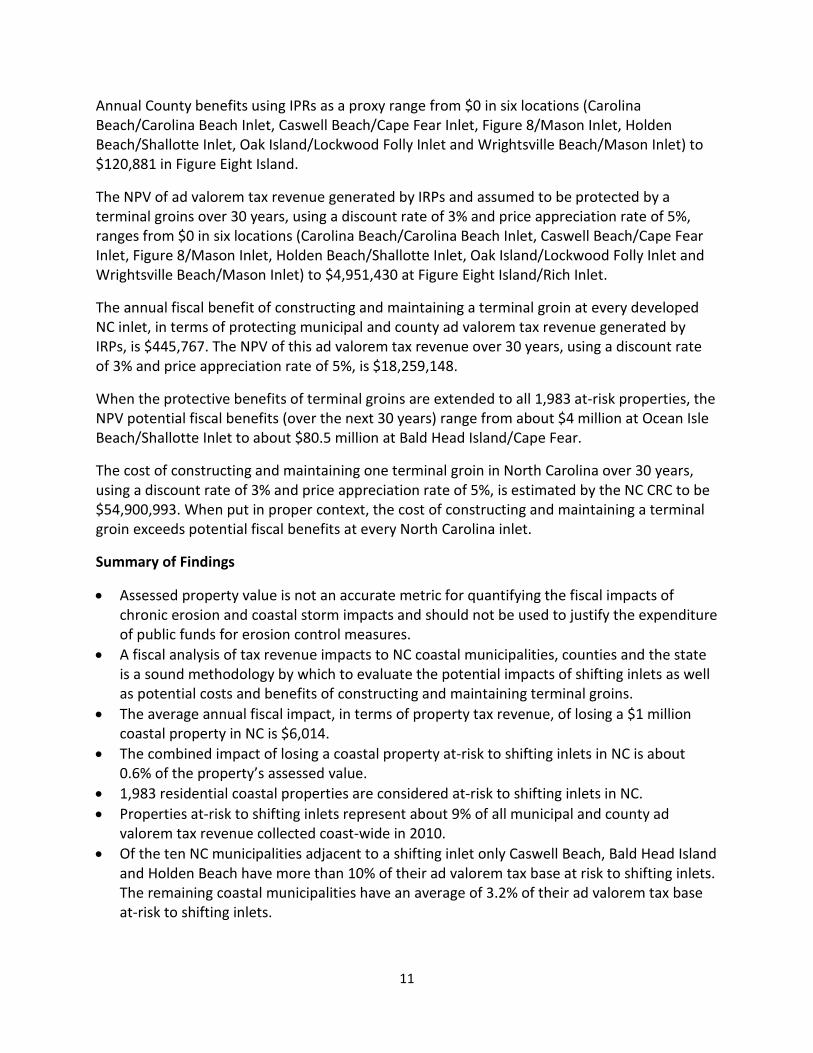
11
Annual County benefits using IPRs as a proxy range from $0 in six locations (Carolina Beach/Carolina Beach Inlet, Caswell Beach/Cape Fear Inlet, Figure 8/Mason Inlet, Holden Beach/Shallotte Inlet, Oak Island/Lockwood Folly Inlet and Wrightsville Beach/Mason Inlet) to $120,881 in Figure Eight Island.
The NPV of ad valorem tax revenue generated by IRPs and assumed to be protected by a terminal groins over 30 years, using a discount rate of 3% and price appreciation rate of 5%, ranges from $0 in six locations (Carolina Beach/Carolina Beach Inlet, Caswell Beach/Cape Fear Inlet, Figure 8/Mason Inlet, Holden Beach/Shallotte Inlet, Oak Island/Lockwood Folly Inlet and Wrightsville Beach/Mason Inlet) to $4,951,430 at Figure Eight Island/Rich Inlet.
The annual fiscal benefit of constructing and maintaining a terminal groin at every developed NC inlet, in terms of protecting municipal and county ad valorem tax revenue generated by IRPs, is $445,767. The NPV of this ad valorem tax revenue over 30 years, using a discount rate of 3% and price appreciation rate of 5%, is $18,259,148.
When the protective benefits of terminal groins are extended to all 1,983 at-risk properties, the NPV potential fiscal benefits (over the next 30 years) range from about $4 million at Ocean Isle Beach/Shallotte Inlet to about $80.5 million at Bald Head Island/Cape Fear.
The cost of constructing and maintaining one terminal groin in North Carolina over 30 years, using a discount rate of 3% and price appreciation rate of 5%, is estimated by the NC CRC to be $54,900,993. When put in proper context, the cost of constructing and maintaining a terminal groin exceeds potential fiscal benefits at every North Carolina inlet.
Summary of Findings
• Assessed property value is not an accurate metric for quantifying the fiscal impacts of chronic erosion and coastal storm impacts and should not be used to justify the expenditure of public funds for erosion control measures.
• A fiscal analysis of tax revenue impacts to NC coastal municipalities, counties and the state is a sound methodology by which to evaluate the potential impacts of shifting inlets as well as potential costs and benefits of constructing and maintaining terminal groins.
• The average annual fiscal impact, in terms of property tax revenue, of losing a $1 million coastal property in NC is $6,014.
• The combined impact of losing a coastal property at-risk to shifting inlets in NC is about 0.6% of the property’s assessed value.
• 1,983 residential coastal properties are considered at-risk to shifting inlets in NC. • Properties at-risk to shifting inlets represent about 9% of all municipal and county ad
valorem tax revenue collected coast-wide in 2010. • Of the ten NC municipalities adjacent to a shifting inlet only Caswell Beach, Bald Head Island
and Holden Beach have more than 10% of their ad valorem tax base at risk to shifting inlets. The remaining coastal municipalities have an average of 3.2% of their ad valorem tax base at-risk to shifting inlets.
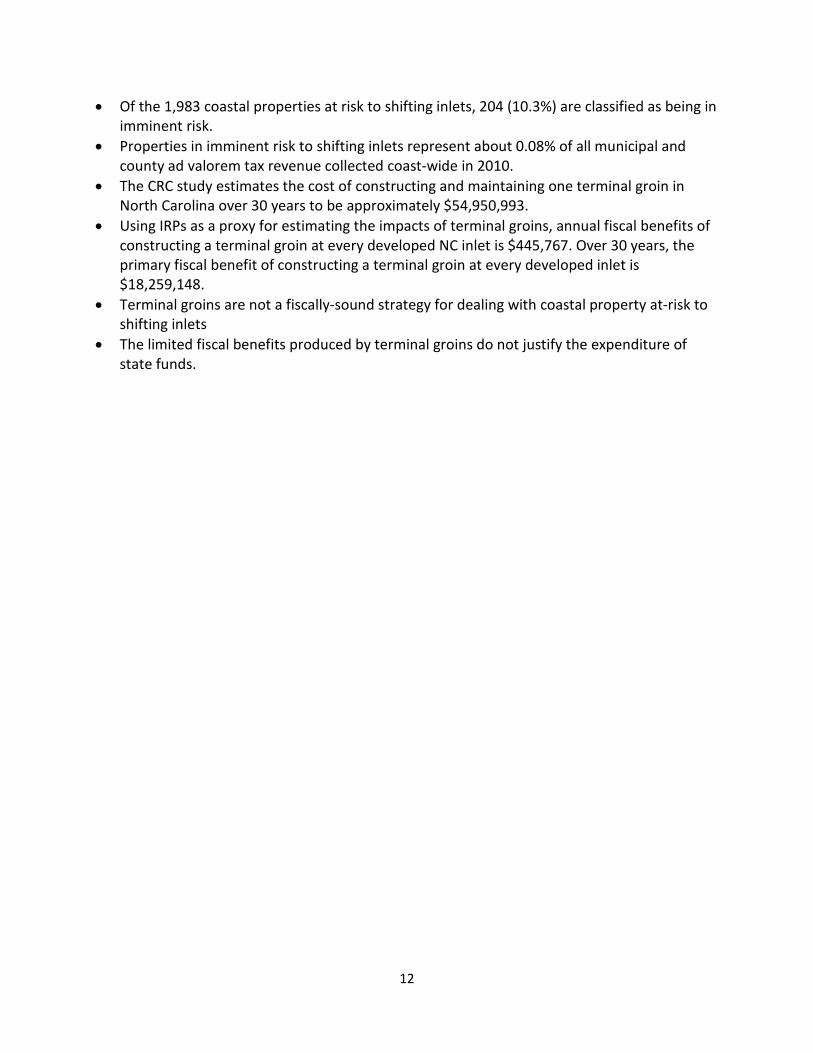
12
• Of the 1,983 coastal properties at risk to shifting inlets, 204 (10.3%) are classified as being in imminent risk.
• Properties in imminent risk to shifting inlets represent about 0.08% of all municipal and county ad valorem tax revenue collected coast-wide in 2010.
• The CRC study estimates the cost of constructing and maintaining one terminal groin in North Carolina over 30 years to be approximately $54,950,993.
• Using IRPs as a proxy for estimating the impacts of terminal groins, annual fiscal benefits of constructing a terminal groin at every developed NC inlet is $445,767. Over 30 years, the primary fiscal benefit of constructing a terminal groin at every developed inlet is $18,259,148.
• Terminal groins are not a fiscally-sound strategy for dealing with coastal property at-risk to shifting inlets
• The limited fiscal benefits produced by terminal groins do not justify the expenditure of state funds.
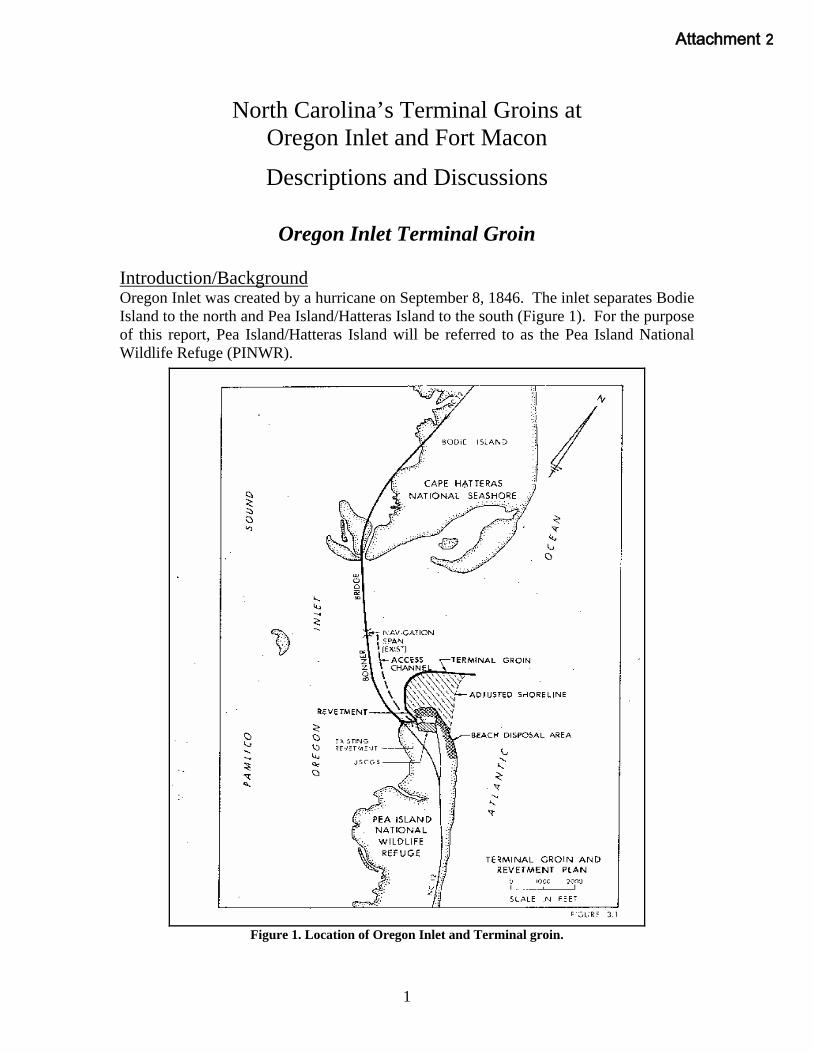
North Carolina’s Terminal Groins at Oregon Inlet and Fort Macon
Descriptions and Discussions
Oregon Inlet Terminal Groin
Introduction/Background Oregon Inlet was created by a hurricane on September 8, 1846. The inlet separates Bodie Island to the north and Pea Island/Hatteras Island to the south (Figure 1). For the purpose of this report, Pea Island/Hatteras Island will be referred to as the Pea Island National Wildlife Refuge (PINWR).
Figure 1. Location of Oregon Inlet and Terminal groin.
1
Attachment 2

As with most natural tidal inlets, Oregon Inlet has had a history of dynamic change and migration since it’s opening, having migrated more than 2 miles south of its original location. Because of the constantly shifting features of Oregon Inlet (Figure 2), the existing Herbert C. Bonner Bridge has been a maintenance issue for the North Carolina Department Of Transportation (NCDOT) since it was constructed in 1962. This highly turbulent area requires the US Army Corps of Engineers (USACE) to spend approximately five million dollars per year for dredging the Oregon Inlet channel. The USACE is only able to maintain the authorized 14-foot depth of the channel, on average about 25% of the time (Bill Dennis Pers Comm 2008). Shoreline change rates along both sides of the inlet are highly erosive with long-term rates of –5 ft to –17 ft/yr (Dennis and Miller 1993). The persistent southward Oregon Inlet migration has resulted in shorter-term erosion rates documented from 1981-1988, of approximately 180 ft/yr (Dennis and Miller 1993). Moreover, between April 1988 and March 1989, the erosion at the northern end of PINWR occurred at a rate of 1,150 ft/year. During one severe “nor’easter” in March 1989, the northern end of PINWR eroded 350 to 400 feet southward. This series of storms created the potential of destroying the southern abutment of the Bonner Bridge and severing the land transportation link between Bodie Island and PINWR. NCDOT data from 2002 show an average daily traffic of 5,400 vehicles per day with the highest daily traffic volume being 14,270 vehicles on Saturday, July 6. To ensure the Highway 12 transportation corridor was not lost, the USACE utilized engineering and design analysis of navigation jetties for Oregon Inlet in conjunction with the Manteo Shallowbag Bay project (NCDOT 1989) to design a terminal groin for the northern end of PINWR. The terminal groin was designed to be a portion of and incorporated into the jetties if and when they were constructed. The terminal groin construction was financed by the Federal Highway Administration with any maintenance and monitoring to be completed by the NCDOT.
.
Pea Island
Bodie Island
Figure 2. Dramatic aerial view of Oregon Inlet. Note the extensive sand bodies on the ocean (left) and sound side (right).
2

Terminal Groin Structure and Construction Description The terminal groin at Oregon Inlet is located on the southern side of the inlet along the north end of the PINWR (Figure 1). The project consists of a terminal groin and revetment (3,125 and 625 feet long, respectively) starting at the US Coast Guard Station bulkhead. The groin extends from the bulkhead in a northwest direction, curving 90 degrees towards the northeast, and then straightening out again to be perpendicular with the natural inlet shoreline of PINWR. This alignment places the groin near the position that the north point of PINWR occupied in April 1985. An accretionary fillet was designed to impound sediment transported alongshore towards the inlet in order to provide enough wave sheltering for protection of the southern Bonner Bridge abutment. Once filled, the areal extent of this fillet was planned to be 60 acres. The groin was designed to withstand a still water level of eight feet above mean sea level (msl) and waves between 9 and 15 feet. The groin ranges in width between 110 to 170 feet at the base and 25 feet at the landward end to 39 feet at the seaward end. The design elevation ranged between 8 and 9.5 feet above msl (NCDOT 1989). Toe protection on the inlet side of the groin is provided by a 43 feet wide single layer of armor stone on top of a layer of core material (NCDOT 1989). Construction began in 1989 and was completed in October 1991 at a cost of 13.4 million dollars (1991 dollars). The freestanding nature of the terminal groin in a position mimicking the 1985 shoreline relied on the natural coastal processes to deposit sediment along its landward (southern) side. For example, sediment transported towards the structure would begin to occupy the fillet until its design capacity was exceeded, at which point sediment would be transported around the end of the structure and towards the inlet. Therefore, the principal of a terminal groin is a temporary interruption of the sediment pathways with normal restoration of sediment pathways once the terminal groin fillet was impounded to capacity and sediment moved around the structure. Although the net sediment transport direction at Oregon Inlet is from the north to the south, a substantial south-to-north component also exists in this area. 1992 estimates used for design and construction purposes by the USACE assumed an average northward transport (toward the inlet from PINWR) of 611,000 cubic yards with the southward transport (from Bodie Island) to be 1,473,000 cubic yards. Terminal Groin Monitoring and Local Impacts A monitoring program, developed by the USACE, NC DOT and the US Fish and Wildlife Service (USFWS), was required as part of the USACE permit by the Department of the Interior. Specifically the permit required that the six miles of shoreline south of the groin be monitored (Overton and Fisher 2007), and that the structure be designed to ensure that any accretion within the terminal groin fillet was not at the expense of the erosion along downdrift beach shorelines. Any adverse impacts above the historical erosion rates for this area would be mitigated by beach nourishment provided by NCDOT (Overton 2007). The monitoring program, which has been in place since construction, includes aerial photography, flown every other month and immediately after severe storms, as well as bi-annual seasonal (spring and autumn) field surveys during high tide,
3
the NC DOT completes the flights and surveys, and the shoreline analysis is contracted to North Carolina State University (NCSU). Whenever possible, dredged material from Oregon Inlet is to be placed on PINWR to mitigate the naturally occurring high erosion rates. Based on the most recent erosion data calculated by the North Carolina Division of Coastal Management (NCDCM), the long-term averages (50-60 years) for the 6 miles of shoreline south of the terminal groin range from 16 to 6.5 feet per year. The quantity and disposal location(s) of sediment derived from dredging of the channel beneath the navigation span of Bonner Bridge and/or the ocean sand bar between August 31, 1989 and November 3, 2005 is shown in Table 1.
Table 1: Dredging activities for Oregon Inlet from August 31, 1989 through November 3, 2005.
Disposal Method/Location Quantity (cubic yards) Offshore 522,799 Nearshore of PINWR (1.5 miles south, 16-20 ft water depth)
2,100,390
Piped to PINWR Beaches 4,914,920 Placed on a Disposal Island 167,258 Total 7,705,367 Total possible to affect PINWR 7,015,310
Inlet Migration and Sediment Bypassing The inlet has persistently migrated southward since it opened in 1846, albeit with considerable variability. Alternate widening and narrowing of the inlet, due to hurricanes and northeasters, have accompanied this southward movement. Moreover, the channel throat has also undergone significant changes in both position and alignment. The channel has tended to follow two basic alignments, one approximately perpendicular to the adjacent shorelines (indicative of post-storm periods), and the other a more northerly alignment almost parallel to the shore (storm-free periods) (Figure 3.) (Sheldon et al. 1992). The latter description occurs when the north shoulder of the inlet (i.e., the southern end of Bodie Island) is in the form of an elongated spit, and the channel tends to rotate towards a more northerly alignment. As the inlet alignment changes, the inlet cross-section changes as well. A narrow and deep cross-section with steep banks occurs in relatively storm-free periods, while a shallow channel with wide overbanks occurs after stormy periods. The construction of the terminal groin at the north end of PINWR does alter the natural processes described above at Oregon Inlet. With the PINWR groin in place, the migration of the north end of PINWR has ceased because the terminal groin immobilizes the south shoulder of the inlet. Therefore, future changes in inlet widths, channel depths, and channel orientations may not be in strict accordance with established historical norms. The inlet’s stability, updrift and downdrift erosion rates are highly dependent on the natural bypassing of material across the inlet. Unfortunately, with or without the
4

terminal groin, natural bypassing is not efficient at Oregon Inlet (Miller et al. 1996). The causes for this decrease in downdrift bypassing efficiency (producing downdrift shoreline erosion) include: periodic increases of sediment immediately updrift of Oregon Inlet causing accretion along southern Bodie Island, the renewed use of hopper dredges to maintain the navigation channel across the ocean bar removing sediment out of the nearshore system; and high retention rates of sand in the sound caused by frequent water circulation changes from storms. All of these factors influence Oregon Inlet’s ability to bypass sediment downdrift.
Figure 3. Top picture (1975) is indicative of pre-storm configurations of the Barrier Islands and channel orientation. Bottom picture (1962) is a typical post-storm configuration. (Sheldon et al 2000)
5
PINWR
Bodie Island
PINWR
Bodie Island
Shoreline Changes and Downdrift Impacts (1990-2006) The USACE conducted a study in 1993 (Dennis and Miller 1993) of the pre- and post-construction shoreline changes in order to assess the overall impact of the terminal groin on the northern end of PINWR. The study assessed the shoreline up to four miles south of the terminal groin and reviewed five years of pre-construction and 2.5 years of post-construction data. The 50-acre fillet became impounded to capacity two years after the terminal groin entered the water (Jan 1990 to Jan 1992). This fairly short-term effect was attributed to a number of factors: (1) the fairly large south to north (toward the terminal groin) sediment transport rate of 611,000 cy/yr; (2) in the fall of 1991, the rate of northward sediment transport was greatly accelerated to 202,900 cy/month, due to two very large storms (1991 Halloween storm, and January 1992 storm); and (3) the placement of approximately 470,000 cy of fill material on to the PINWR beach from April to November of 1991. All of these factors contributed to positive impacts (i.e. oceanfront accretion) along an area that was approximately two miles south of the terminal groin. For the remaining two miles of shoreline to the south of this area, there has been no generalized trend in the shoreline response. In other words, the measured shoreline changes appear to be within the range of natural variability for this area. Similar findings over an area of six miles south of the terminal groin were reported by monitoring conducted by NCDOT (Overton, et al. 1996) Inlet Navigation Morphological Changes Joyner et al in 1998, conducted a study of the post-stabilization morphology of Oregon Inlet. The investigation examined data from the USACE and NCDOT programs from October 1989 through April 1997, to determine the relationship between the growth of the Bodie Island spit to the north and the resulting bathymetric changes in the inlet. This study provided insight as to the expected changes in configuration of the main inlet channel as the southern migration of Bodie Island spit approached the terminal groin along northern PINWR. Changes in the inlet’s bathymetric configuration were observed in both the inlet width and orientation. Accretion of the spit on Bodie Island and the location of the terminal groin were responsible for a change in location and orientation of the main channel section. The shifting of the channel became noticeable in April 1995, which coincided with the beginning of a significant widening of the Bodie Island spit at the bridge. The shift of the channel bayward (landward) required a rotation of the inlet channel section, since the terminal groin remained fixed at the southern extent of the inlet. The inlet channel continued to move bayward and orient it self in a more northerly direction. Channel deepening also occurred along with its lateral migration. In order to maintain a constant cross-sectional area, a narrowing inlet must become deeper to accommodate the same discharge volume (also known as tidal prism). The data shows that this has happened since the terminal groin was constructed. According to Joyner et al. (1998), Oregon Inlet exhibited changes as expected with the stabilization of a single side of a tidal inlet.
6

Structure Maintenance There has not been any maintenance needed to date on the Oregon Inlet terminal groin. Any maintenance that becomes necessary is to be conducted by the North Carolina Department of Transportation with potential federal funding from the Federal Highway Administration. Summary and Conclusions The terminal groin has stopped the southerly migration of Oregon Inlet and protected the base of the southern end of the Herbert C. Bonner Bridge. The terminal groin has impounded sediment resulting in a fillet with an approximate area of 50 acres. The six miles of PINWR shoreline south of the terminal groin fillet that was monitored, continues to erode at rates that range from slightly more to slightly less than the pre-terminal groin shoreline erosion rates, in spite of frequent dredging and beach nourishment efforts. Approximately 7.7 million cubic yards of sediment have been dredged from Oregon Inlet and mined from the terminal groin fillet to be either deposited on the PINWR beaches or in the nearshore ocean environment from one to six miles south of the terminal groin. The main navigation channel has shifted laterally and has deepened to adjust to the reduced inlet width between the northern side of Bodie Island and the stabilized downdrift side of PINWR. The consequences of this continued channel migration south are problematic for the maintenance of a navigation channel within the current fixed navigation span of the bridge, and require increased frequencies of channel dredging. Locking an inlet in place with a terminal groin takes away the natural self-adjusting mechanisms that inlets possess (e.g., sediment bypass across the inlet, migration and depth change of the channel(s) within the inlet, shoreline migration along the inlet, changes in ebb tidal delta morphology). One of the most observable effects is the impact to sediment bypassing between the adjacent shorelines, and the exchange of sediment to the shoals that lie on the ocean side (ebb-tidal delta) and the estuarine side (flood-tidal delta). Overall, the sum of all coastal processes active within an inlet, and how these processes affect the transport and storage of sediment, are extremely important in not only how inlets function but also to the long-term survival and evolution of the barrier islands. Over time, potentially within the next 10-20 years, and with continued southward migration of the Bodie Island spit, the main channel in Oregon Inlet may migrate against the terminal groin structure itself. If this were to occur, the result would be severe scour and an increase in the maintenance necessary to preserve the threatened integrity of the structure itself.
7

Beaufort Inlet/Fort Macon Terminal Groin Introduction/Background Beaufort Inlet has been continuously open since 1585, although the exact year of its creation is unknown (Payne 1985). Beaufort Inlet’s adjacent beaches, Bogue Banks (west) and Shackleford Banks (east), are south facing beaches. The Bogue Banks area is sheltered somewhat from the damaging effects of winter extratropical nor’easters because of the very large shoal complex of Cape Lookout that lies approximately 12 miles to the east (Figure 4). Beaufort Inlet is utilized as part of the commercial navigation project
connecting the Atlantic Ocean to the waterways of the NC State Ports’ Morehead City (MHC) harbor and the Town of Beaufort (Figure 5). Improvements for navigation at Beaufort Inlet began in 1911 when a 300-ft wide channel was dredged through the ebb tidal shoal to a depth of –20 ft. In 1936, the outer bar channel was deepened to –30 ft and widened to 400 feet, and the channel location became fixed at this time. In 1997, the channel was dredged to -47 feet and 450 feet wide along the outer channel for approximately 2.5 miles. Interior channels and the Port of MHC are
maintained at –45 ft depth. Since 1911, the navigation project channel depth and
width has steadily increased, hastening the erosion along Beaufort Point (western side of inlet). Property in this area includes the historical Fort Macon, which was incorporated into the State Park system in 1924. In 2007, 1.2 million guests made the park the most visited State Park in the State. Erosion control structures have been a common occurrence adjacent to Beaufort Inlet since the construction of Fort Macon from 1829 to 1834. Around Fort Macon, there have been approximately 25 “hardened” erosion control structures including groins, breakwaters, timber cribbing, revetments, sand-fencing, and seawalls as well as numerous beach nourishment projects (“soft” erosion control). When emplaced, a hardened shoreline was deemed necessary to save Fort Macon from being lost to the sea (Figure 6).
Figure 4. Location of Beaufort Inlet in proximity to Cape Lookout shoals (Olsen and Associates, 2004)
8
Figure 5. Location of federal navigation channel (red dotted line) in Morehead City and adjacent to Beaufort (Olsen and Associates, 2004)
9
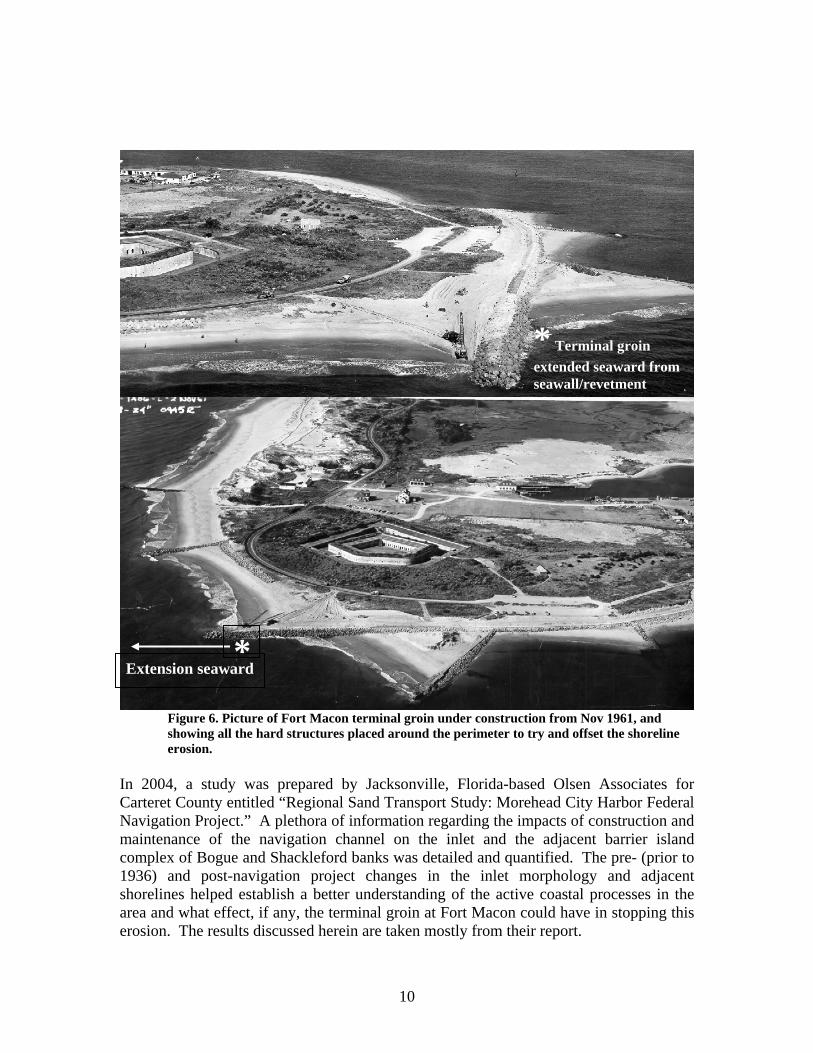
* Terminal groin
extended seaward from seawall/revetment
Extension seaward *
Figure 6. Picture of Fort Macon terminal groin under construction from Nov 1961, and showing all the hard structures placed around the perimeter to try and offset the shoreline erosion.
In 2004, a study was prepared by Jacksonville, Florida-based Olsen Associates for Carteret County entitled “Regional Sand Transport Study: Morehead City Harbor Federal Navigation Project.” A plethora of information regarding the impacts of construction and maintenance of the navigation channel on the inlet and the adjacent barrier island complex of Bogue and Shackleford banks was detailed and quantified. The pre- (prior to 1936) and post-navigation project changes in the inlet morphology and adjacent shorelines helped establish a better understanding of the active coastal processes in the area and what effect, if any, the terminal groin at Fort Macon could have in stopping this erosion. The results discussed herein are taken mostly from their report.
10

Structure Description and Local Impacts The construction of the Fort Macon terminal groin, revetment, and seawall was completed in three phases. The first phase began in 1961 and featured the construction of a seawall, revetment, and a portion of the terminal groin that, due to financial constraints, was only built to a length of 720 feet at an elevation of six feet instead of nine and excluded the structure’s top armor layer. The revetment (250 feet) and seawall (530 feet) were constructed along the dune bank starting just north of the present-day Fort Macon parking lot in a southeastern direction. Phase two began in 1965 and extended the groin by an additional 410 feet oceanward. An additional groin was constructed west of the revetment due to extensive erosion on the back, or sound side, of the island and its impact to the US Coast Guard Station. Beach fill (93,000 cubic yards) was also placed on the beach between the present day bathhouse and boardwalk region and the terminal groin. The third and final phase began in August 1970, extended the terminal groin by an additional 400 feet to a total length of 1,530 feet. A stone groin, 480 feet long, was built near the bathhouse in an effort to stabilize beach fill placed in the area. Another 100,000 cubic yards of sand was placed in the bathhouse and boardwalk area for erosion mitigation. The total cost of the terminal groin, beach fill, seawall, and revetment was $1,348,000 (1960s dollars). The two-thirds Federal cost share was $894,000. A study completed by the USACE Wilmington District (USACE 1970) on possible placement of jetties at Beaufort Inlet discusses the impacts of the terminal groin between 1961 and 1970. According to that report, the terminal groin was functioning somewhat as a littoral barrier, with some sand passing through voids in the structures. By 1968, the fillet was full and sand was bypassing the outer end of the structure. Erosion had continued near the boardwalk and bathhouse area (approximately 7,000 feet west of the terminal groin) and is the reason for the additional groin placement during the third phase of construction. The volume of the westward accretion of sediment that began to occur when the fillet reached capacity was not calculated by the USACE in their 1970 investigation, but was determined not to have any effect on shoaling in the Port of MHC. DCM has approximated from a series of ortho-photographs dating back from 1962 – 2004, that the shoreline has migrated seaward approximately 400 feet over the past 40 years. Inlet Morphological Changes Records prior to 1839 indicate that the direction of the main ebb channel within the inlet had varied from somewhat west of south to southeast (USACE 1962). The inlet channel naturally migrated between the two islands. To illustrate this point, the locations of the inlet channel from a number of time periods between 1850 and 1960 are shown in Figure 7. Sand was exchanged between the adjacent shorelines and the inlet, and bypassed across the bar. The sediment transport movement was east to west, bypassing
11

approximately 94,000 cy/yr, and the ebb shoal gained volume at a net rate of approximately 200,000 cubic yards per year. The inlet morphology was broader in nature with a semi-symmetrical ebb tidal shoal extending out into 10 to 15 feet of water (Figure 8).
Figure 7. Various locations of the inlet channel from 1850 – 1908 (pre-project) and 1936-1960 (post project) (Modified from USACE 1962)
12
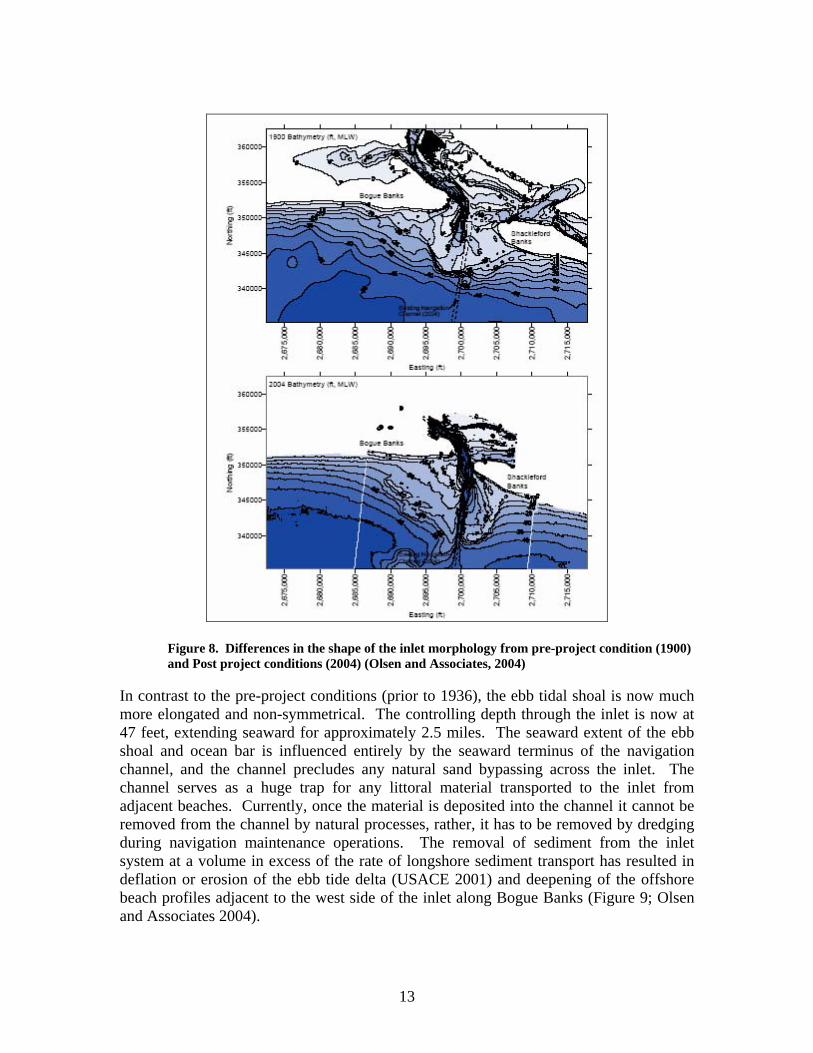
Figure 8. Differences in the shape of the inlet morphology from pre-project condition (1900) and Post project conditions (2004) (Olsen and Associates, 2004)
In contrast to the pre-project conditions (prior to 1936), the ebb tidal shoal is now much more elongated and non-symmetrical. The controlling depth through the inlet is now at 47 feet, extending seaward for approximately 2.5 miles. The seaward extent of the ebb shoal and ocean bar is influenced entirely by the seaward terminus of the navigation channel, and the channel precludes any natural sand bypassing across the inlet. The channel serves as a huge trap for any littoral material transported to the inlet from adjacent beaches. Currently, once the material is deposited into the channel it cannot be removed from the channel by natural processes, rather, it has to be removed by dredging during navigation maintenance operations. The removal of sediment from the inlet system at a volume in excess of the rate of longshore sediment transport has resulted in deflation or erosion of the ebb tide delta (USACE 2001) and deepening of the offshore beach profiles adjacent to the west side of the inlet along Bogue Banks (Figure 9; Olsen and Associates 2004).
13

Figure 9. With the amount of material being removed from the inlet system by dredging exceeding the rate of longshore sediment transport, the result is deflation or erosion of the ebb tide delta (Olsen and Associates, 2004)
The deepening of the ebb tidal delta and offshore beach profiles has increased the wave energy along the western side of the channel along the Bogue Banks/Fort Macon area (Figure 10). This increase along Bogue Banks was three times greater than along Shackleford Banks. Future increases in wave energy are predicted, based upon the continued deflation of the ebb tidal shoal. This increase in wave energy will undoubtedly have an adverse impact on navigation and increase the wave energy within the inner harbors and sound including portions of the Rachel Carson National Estuarine Research Reserve (Olsen and Associates 2004).
14
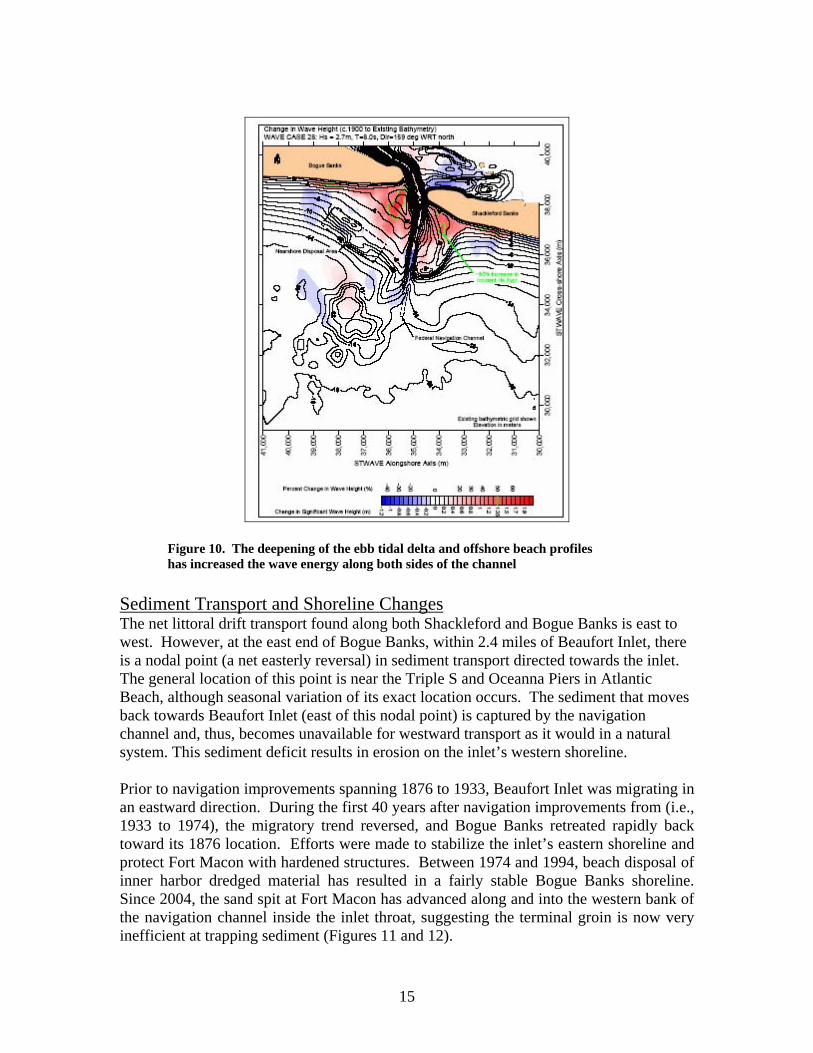
Figure 10. The deepening of the ebb tidal delta and offshore beach profiles has increased the wave energy along both sides of the channel
Sediment Transport and Shoreline Changes The net littoral drift transport found along both Shackleford and Bogue Banks is east to west. However, at the east end of Bogue Banks, within 2.4 miles of Beaufort Inlet, there is a nodal point (a net easterly reversal) in sediment transport directed towards the inlet. The general location of this point is near the Triple S and Oceanna Piers in Atlantic Beach, although seasonal variation of its exact location occurs. The sediment that moves back towards Beaufort Inlet (east of this nodal point) is captured by the navigation channel and, thus, becomes unavailable for westward transport as it would in a natural system. This sediment deficit results in erosion on the inlet’s western shoreline. Prior to navigation improvements spanning 1876 to 1933, Beaufort Inlet was migrating in an eastward direction. During the first 40 years after navigation improvements from (i.e., 1933 to 1974), the migratory trend reversed, and Bogue Banks retreated rapidly back toward its 1876 location. Efforts were made to stabilize the inlet’s eastern shoreline and protect Fort Macon with hardened structures. Between 1974 and 1994, beach disposal of inner harbor dredged material has resulted in a fairly stable Bogue Banks shoreline. Since 2004, the sand spit at Fort Macon has advanced along and into the western bank of the navigation channel inside the inlet throat, suggesting the terminal groin is now very inefficient at trapping sediment (Figures 11 and 12).
15
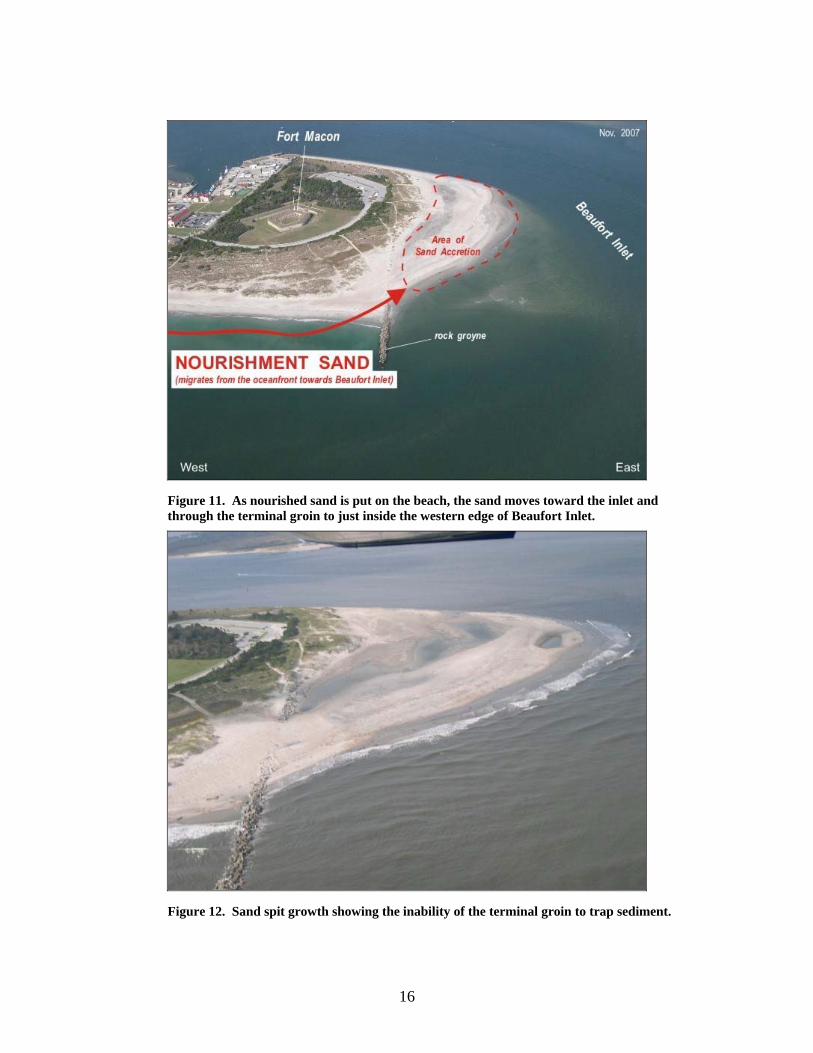
Figure 11. As nourished sand is put on the beach, the sand moves toward the inlet and through the terminal groin to just inside the western edge of Beaufort Inlet.
Figure 12. Sand spit growth showing the inability of the terminal groin to trap sediment.
16
Summary and Conclusions Existing structures along Fort Macon include a terminal groin east of the fort and a relic groin field along the oceanfront and inlet throat shorelines. The low elevation and porous nature of these structures allow significant quantities of sand to be transported into the inlet resulting in persistent deposition of sand along the west bank of the inlet. Ten years of shoreline change data (1997 to 2007) provided by Carteret County show no shoreline change along the five miles of oceanfront west of the groin. Since 2002, approximately 600,000 cubic yards were placed along this stretch of beach. This beach fill, at least in part, accounts for the “no net change” in shoreline position. The ebb shoal deflation over time has exasperated the erosion along the Fort Macon side of the inlet. This loss of sediment volume steepened the nearshore beach profiles that, in turn, increased the wave energy reaching the coast and inner harbor area. Erosion of the shorelines adjacent to the inlet occurs as the inlet attempts to move sediment into the inlet to establish equilibrium and maintain its own sediment balance. Overall, Beaufort Inlet’s historical sediment bypassing capability, and its ability to maintain some form of stability/equilibrium with its adjacent shorelines, has been impeded, if not totally lost, by the additional trapping effect of the USACE-maintained navigation channel through the inlet. The placement of sediment along the shoreline to the west of the inlet is still required for the Fort Macon State Park area, without which the vulnerability of Fort Macon to the forces of nature would be increased. The terminal groin and other hard structures, by themselves, would not be able to provide adequate protection to coastal hazards such as storms, tides and sea level rise. Without constant beach nourishment, the terminal groin would no longer perform as observed historically and, potentially fail altogether.
17

References Basco, David R. 2006. Shore Protection Projects. In: Donald L. Ward, Coastal
Engineering Manual, Part V, Coastal Project Planning and Design, Chapter V-3, Engineer Manual 1110-2-1100, U.S. Army Corps of Engineers, Washington, DC.
Burcharth, Hans F. and Steven A. Hughes. 2002. Types and Functions of Coastal
Structures. In: Steven Hughes, Coastal Engineering Manual, Part VI, Design of Coastal Project Elements, Chapter VI-2 , Engineer Manual 1110-2-1100, U.S.
Army Corps of Engineers, Washington, DC. Dean, Robert G. and Robert A. Dalrymple. 2002. Coastal Processes with Engineering
Applications. Cambridge University Press. New York, NY. Dean, Robert G. 1993. Terminal Structures at Ends of Littoral Systems. Journal of
Coastal Research, Special Issue 18, pp. 195 - 210. Dennis, W. and Miller, H. 1993. Shoreline Response: Oregon Inlet Terminal Groin
Construction. Proceedings of the Hilton Head Island South Carolina USA International Coastal Symposium. June 6-9, 1993.
Douglass, Scott. L. 2002. Saving America’s Beaches: The Causes of and Solutions to
Beach Erosion. World Scientific Publishing, River Edge, NJ. Florida Department of Environmental Protection (2007) Draft Strategic Beach
Management Plan Revisions. Introduction to the Strategic Beach Management Plan - Draft June 2007.
Joyner, Brian P., Margery F. Overton, John S. Fisher. 1998. Post-Stabilization
Morphology of Oregon Inlet, NC. International Conference of Coastal Engineering 1998 Conference Proceedings.
Miller, Herman C., William A. Dennis, and Michael J. Wutkowski. 1996. A Unique
Look at Oregon Inlet, NC USA. International Conference of Coastal Engineering 1996 Conference Proceedings.
North Carolina Department of Transportation. 1989. Environmental Assessment and
Finding of No Significant Impact; Construction of a Terminal Groin and Revetment at Pea Island, Protection of the Herbert C. Bonner Bridge and North Carolina Highway 12. Dare County, North Carolina.
Olsen and Associates 2004, Regional Sand Transport Study: Morehead City Harbor
Federal Navigation Project. Overton, Margery F. 2007. Shoreline Monitoring at Oregon Inlet Terminal Groin:
Report 31 August – December 2006. Department of Civil Construction and
18
19
Environmental Engineering, North Carolina State University, Raleigh, North Carolina.
Overton, MF, Fisher JS, Dolan, R, Dennis, WA, Miller HC. Shoreline Change at Oregon
Inlet Terminal Groin. Payne, Roger L., 1985. Place names of the outer Banks. USACE, 1962. Fort Macon, Atlantic Beach, and Vicinity, North Carolina, Beach
Erosion Cooperative Study USACE. (Approximately 1970) Morehead City Harbor, NC - Jetties at Beaufort Inlet –
Restudy Report. US Army Engineer District, Wilmington. USACE 2001. Section 111 Report: Morehead city/ Pine Knoll Shores, North Carolina.
Audubon North Carolina 1
September 14, 2015
Via U.S. and Electronic Mail Mr. Mickey Sugg U.S. Army Corps of Engineers 69 Darlington Ave. Wilmington, NC 28403 [email protected]
RE: Figure Eight Island Shoreline Management Project – SAW-2006-41158
Dear Mr. Sugg:
Please accept these comments on behalf of the National Audubon Society’s North Carolina State Office regarding the draft Supplemental Environmental Impact Statement (SEIS) for the project known as “Figure Eight Island Shoreline Management Project.”
The Figure 8 Island Homeowners Association Board of Director’s (HOA) preferred alternative is to construct a ~1,500 foot-long terminal groin on the northern end of Figure 8 Island and to periodically renourish approximately one mile of oceanfront beach and approximately 1,500 feet of back barrier shoreline with sand obtained from adjacent Nixon Channel and three upland spoil islands located at the junction of Nixon Channel and the Atlantic Intracoastal Waterway. This alternative, as well as all other alternatives that include the construction of a terminal groin or any other hard structure (Alternatives 5A-5D), the stabilization of the inlet through channelization (Alternative 3), beach renourishment activities (Alternatives 1, 3-5D), or the dredging or other removal of sand from Rich Inlet or the associated ebb and flood tidal deltas (Alternatives 1, 3-5D) will have significant and lasting negative direct, indirect, and cumulative impacts on birds and other wildlife that depend on the dynamism of mid-Atlantic coastal inlets at critical points in their life cycles.
After reviewing the document and appendices, we find that the SEIS:
1. Fails to consider negative biological impacts of the preferred alternative and otherproposed alternatives on federally listed species, state-listed species, Critical Habitat for afederally listed species, and essential habitats for state and federally listed species.
2. Fails to accurately describe the negative physical impacts of a terminal groin(Alternatives 5A-5D), beach renourishment, dredging, and inlet channelization(Alternative 3) on habitats for state and federally listed species.
3. Draws significant conclusions based on questionable models that have already failed topredict current conditions, that the SEIS itself admits should not be used to predict future
Attachment 3

Audubon North Carolina
2
conditions, and that experts in the field have stated are being misused in this application. 4. Lacks the basic legal requirements to proceed. 5. Omits or distorts relevant, peer-reviewed, and significant research and data regarding
impacts of terminal groins and other engineering practices, as proposed, on wildlife, wildlife habitats, and the physical properties of the project area; and omits the conclusions and recommendations of every relevant Threatened and Endangered species recovery plan.
We believe the SEIS does not satisfy the basic requirements of NEPA and cannot proceed, and no Final Environmental Impact Statement can be issued. Furthermore, due to the numerous, egregious errors and omissions in the SEIS, we recommend that the SEIS be rejected until such a time that the most basic information regarding the alternatives and impacts can be accurately and objectively presented for review and the legal requirements for the project to proceed have been satisfied. We are also seriously concerned that data used throughout the SEIS and upon which many conclusions are drawn, are not available for public or peer review. For example, a report that was cited several times in the SEIS, “Cleary, W.J. 2009. Rich Inlet: History and inlet related oceanfront and estuarine shoreline changes. Final report submitted to Figure Eight Beach Homeowners Association. 61 p.”, does not exist. Audubon North Carolina contacted Dr. Cleary, CP&E, USACE, and the Figure 8 Island HOA in an attempt to obtain a copy of this report, yet no one could or would produce it, even though it was stated CP&E could answer questions about the content of the report. We were informed by Dr. Cleary, the author, that the report and the data were deliberately “destroyed” when he retired. The SEIS consistently takes the “make them go somewhere else” approach when addressing the impact of the preferred alternative and most of the other alternatives on birds. It perpetuates the common misconception that breeding and non-breeding shorebirds and waterbirds have alternative places to go when habitat is lost and that, because birds have wings, they will simply move somewhere else. Truth is, the birds are already occupying alternative locations. They have been relentlessly forced to abandon high-quality habitats throughout their range because of habitat loss and degradation. Shorebirds like Piping Plovers, as well as terns and skimmers are now confined to a small fraction of the habitat once available to them, and if alternative locations were available, the birds would already be there. This is reflected in the elevated conservation status of many of the species that depend on inlets and barrier islands, including those that depend on Rich Inlet; nearly all are state listed, federally listed, listed as species of conservation concern, or similarly designated in documents such as the U.S. Shorebird Conservation Plan (Brown et al. 2001). The SEIS is a public document and transparency is essential. All data, modeling, reports, literature cited, and any other information used in preparation of the draft SEIS should be made available to the public for review and analysis. It is clear that the SEIS was not prepared by the responsible federal agency, and it is equally clear that it has not been reviewed for accuracy, environmental impacts, reasonable alternatives, or completeness. As such, the draft SEIS should be rejected.
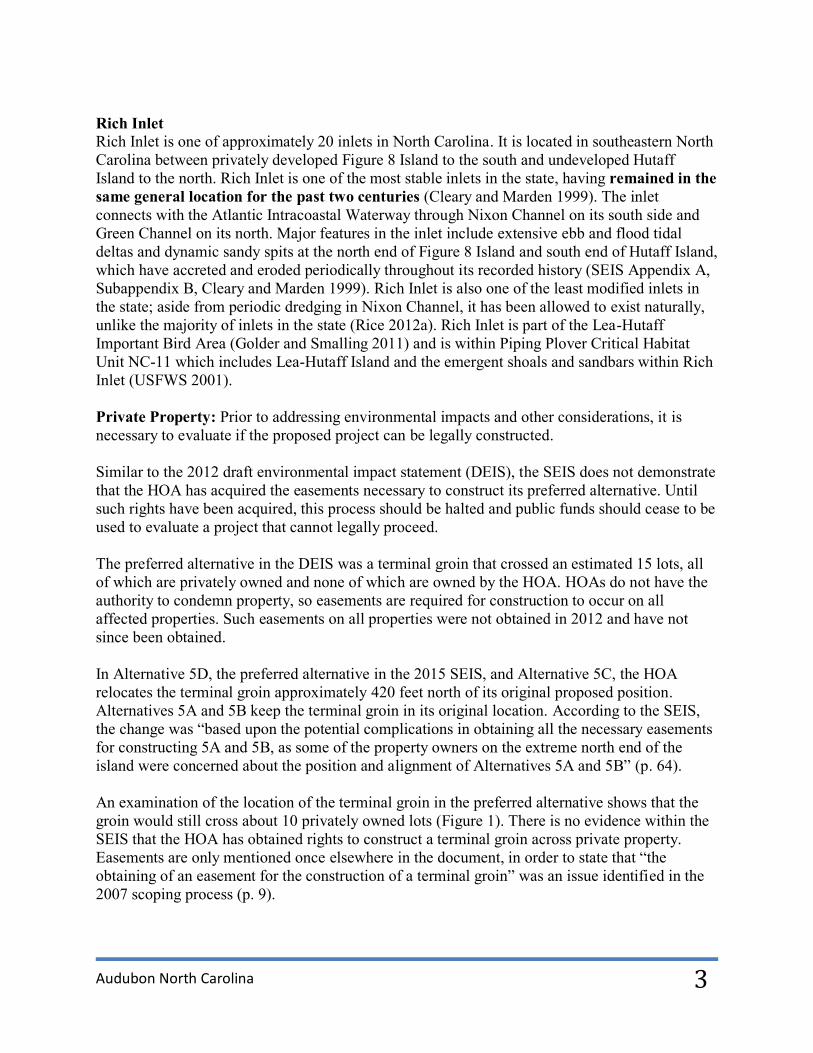
Audubon North Carolina
3
Rich Inlet Rich Inlet is one of approximately 20 inlets in North Carolina. It is located in southeastern North Carolina between privately developed Figure 8 Island to the south and undeveloped Hutaff Island to the north. Rich Inlet is one of the most stable inlets in the state, having remained in the same general location for the past two centuries (Cleary and Marden 1999). The inlet connects with the Atlantic Intracoastal Waterway through Nixon Channel on its south side and Green Channel on its north. Major features in the inlet include extensive ebb and flood tidal deltas and dynamic sandy spits at the north end of Figure 8 Island and south end of Hutaff Island, which have accreted and eroded periodically throughout its recorded history (SEIS Appendix A, Subappendix B, Cleary and Marden 1999). Rich Inlet is also one of the least modified inlets in the state; aside from periodic dredging in Nixon Channel, it has been allowed to exist naturally, unlike the majority of inlets in the state (Rice 2012a). Rich Inlet is part of the Lea-Hutaff Important Bird Area (Golder and Smalling 2011) and is within Piping Plover Critical Habitat Unit NC-11 which includes Lea-Hutaff Island and the emergent shoals and sandbars within Rich Inlet (USFWS 2001). Private Property: Prior to addressing environmental impacts and other considerations, it is necessary to evaluate if the proposed project can be legally constructed. Similar to the 2012 draft environmental impact statement (DEIS), the SEIS does not demonstrate that the HOA has acquired the easements necessary to construct its preferred alternative. Until such rights have been acquired, this process should be halted and public funds should cease to be used to evaluate a project that cannot legally proceed. The preferred alternative in the DEIS was a terminal groin that crossed an estimated 15 lots, all of which are privately owned and none of which are owned by the HOA. HOAs do not have the authority to condemn property, so easements are required for construction to occur on all affected properties. Such easements on all properties were not obtained in 2012 and have not since been obtained. In Alternative 5D, the preferred alternative in the 2015 SEIS, and Alternative 5C, the HOA relocates the terminal groin approximately 420 feet north of its original proposed position. Alternatives 5A and 5B keep the terminal groin in its original location. According to the SEIS, the change was “based upon the potential complications in obtaining all the necessary easements for constructing 5A and 5B, as some of the property owners on the extreme north end of the island were concerned about the position and alignment of Alternatives 5A and 5B” (p. 64). An examination of the location of the terminal groin in the preferred alternative shows that the groin would still cross about 10 privately owned lots (Figure 1). There is no evidence within the SEIS that the HOA has obtained rights to construct a terminal groin across private property. Easements are only mentioned once elsewhere in the document, in order to state that “the obtaining of an easement for the construction of a terminal groin” was an issue identified in the 2007 scoping process (p. 9).
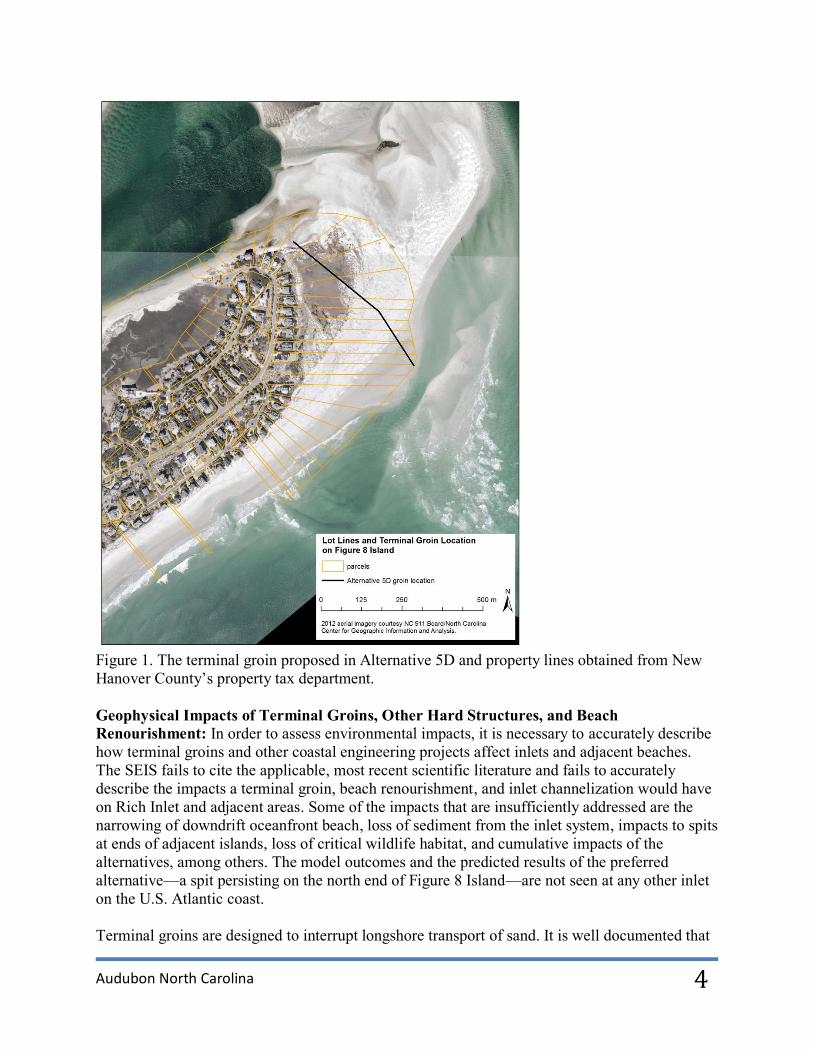
Audubon North Carolina
4
Figure 1. The terminal groin proposed in Alternative 5D and property lines obtained from New Hanover County’s property tax department. Geophysical Impacts of Terminal Groins, Other Hard Structures, and Beach Renourishment: In order to assess environmental impacts, it is necessary to accurately describe how terminal groins and other coastal engineering projects affect inlets and adjacent beaches. The SEIS fails to cite the applicable, most recent scientific literature and fails to accurately describe the impacts a terminal groin, beach renourishment, and inlet channelization would have on Rich Inlet and adjacent areas. Some of the impacts that are insufficiently addressed are the narrowing of downdrift oceanfront beach, loss of sediment from the inlet system, impacts to spits at ends of adjacent islands, loss of critical wildlife habitat, and cumulative impacts of the alternatives, among others. The model outcomes and the predicted results of the preferred alternative—a spit persisting on the north end of Figure 8 Island—are not seen at any other inlet on the U.S. Atlantic coast. Terminal groins are designed to interrupt longshore transport of sand. It is well documented that
Audubon North Carolina
5
terminal groins actually accelerate erosion of the shoreline downdrift of the structure (McDougal et al. 1987, Kraus et al. 1994, Bruun 1995, Cleary and Pilkey 1996, Komar 1998, McQuarrie and Pilkey 1998, Pilkey et al. 1998, Brown and McLachlan 2002, Greene 2002, USACE 2002, Morton 2003, Morton et al. 2004, Basco and Pope 2004, Speybroeck et al. 2006, Rice 2009, Riggs et al. 2009, Riggs and Ames 2011, Ells and Murray 2012, Knapp 2012, Pietrafesa 2012, Berry et al. 2013), which in turn requires regular replenishment of sand to compensate for sand loss (Hay and Sutherland 1988, Bruun 1995, McQuarrie and Pilkey 1998, French 2001, Galgano 2004, Basco 2006, Riggs et al. 2009, Riggs and Ames 2011, Pietrafesa 2012). An open letter on the subject of downdrift erosion signed by 43 of the leading coastal geologists in the U.S. states: The negative impact of groins and jetties on downdrift shorelines is well understood. When they work as intended, sand moving along the beach in the so-called downdrift direction is trapped on the updrift side, causing a sand deficit and increasing erosion rates on the downdrift side. This well-documented and unquestioned impact is widely cited in the engineering and geologic literature (Young et al. undated). Fenster and Dolan (1996) found that inlets in Virginia and North Carolina exert influence over adjacent shorelines up to 5.4-13.0 km away and that they are a dominant factor in shoreline change for up to 4.3 km. Permanently modifying Rich Inlet through construction of a terminal groin, or through channelization (Nordstrom 2000), will significantly increase the erosion rate on the downdrift shoreline of Figure 8 Island. Longshore currents run predominantly north to south in the area of Figure 8 Island, placing nearly all of the oceanfront homes on Figure 8 Island in danger from accelerated erosion, should a terminal groin be built. The SEIS forecasts a five-year interval for beach renourishment for all alternatives that include a terminal groin (Alternatives 5A-D). Despite the well-known downdrift impact of terminal groins, the SEIS does not address the very real likelihood that in response to the terminal groin, the beach will narrow farther to the south and require additional and more frequent beach renourishment over the years. The proposed five-year interval for beach renourishment is also questionable given that Wrightsville Beach, Masonboro Island, Mason Inlet, southern Figure 8 Island, Oregon Inlet, and Ft. Macon, just to name a few, are dredged and replenished more frequently than five-year intervals. The near certainty that Figure 8 Island will need to mine sand from Rich Inlet and replenish the downdrift beach on Figure 8 Island more frequently than every five years has not been accurately assessed in the preferred or other alternatives presented in the SEIS. Downdrift effect can be seen elsewhere in North Carolina where terminal groins have been installed. At Fort Macon, which the SEIS cites as a success, three years after the completion of the terminal groin a beach renourishment project occurred because the groin itself was exacerbating erosion, and from 1973-2007, seven renourishment projects have occurred at Fort Macon at the cost of nearly $45 million (Pietrafesa 2012). The SEIS also cites Oregon Inlet, NC as an example of a successful terminal groin project that has not “caused adverse impacts to the shoreline” (p. 232). One need only drive Highway 12

Audubon North Carolina
6
along Pea Island to see the fallacy of this conclusion. Riggs and Ames (2011) also provide an excellent review of the impacts of the modifications to Oregon Inlet. The SEIS relies exclusively on one source—Overton (2011) and personal communications with Overton—to make this assertion. Recent and relevant literature is available, and the conclusions are different than those cited in the SEIS. To minimize impacts of the Oregon Inlet terminal groin on the downdrift shoreline of Pea Island, sediment from routine Oregon Inlet channel dredging has been placed either directly on the Pea Island beach or in shallow nearshore disposal area near northern Pea Island (Riggs and Ames 2011). Human efforts have only temporarily slowed the process of shoreline recession in a small portion of northern Pea Island by the regular addition of dredged sand at a very high cost, but each new beach nourishment project has quickly eroded away (Riggs and Ames 2009, Riggs et al. 2009). Based on several studies, the data strongly suggests that the terminal groin itself is contributing to the accelerated erosion and shoreline recession problems on Pea Island (Riggs and Ames 2003, 2007, 2009; Riggs et al. 2008, 2009; Mallinson et al. 2005, 2008, 2010; Culver et al. 2006, 2007; Smith et al. 2008). In addition to impacts on downdrift shorelines, hard structures at inlets permanently remove sand from the inlet system, reducing or eliminating shoal systems from affected inlets (Pilkey et al. 1998) and accelerating the loss of saltmarsh in the vicinity of the inlet (Hackney and Cleary 1987). The loss of saltmarsh at Rich Inlet would have significant negative impacts on fisheries, other wildlife, recreation, small businesses, and the local economy. These impacts and the loss of saltmarsh resulting from removal of sand from Rich Inlet have not been assessed for the preferred or other alternatives in the SEIS. The loss of ebb and flood tidal shoals is illustrated clearly by the case of Masonboro Inlet. A terminal groin was installed on the north end of Masonboro Island; construction of the groin was completed in April 1981 (Cleary and Marden 2009). At the time, the north end of the island featured an extensive sand spit, wide beach, and extensive flood and ebb tidal deltas (Figure 2). In less than one year following the completion of the terminal groin, the spit at the north end of Masonboro Island vanished, and the amount of intertidal shoals in the inlet, already diminished by other coastal engineering projects, had decreased as well (Figure 2). Downdrift of the terminal groin, Masonboro Island’s oceanfront beach can be seen forming the expected fillet immediately adjacent to the terminal groin, while narrowing significantly along the downdrift beach.

Audubon North Carolina
7
Figure 2. Masonboro Inlet before and after the installation of a terminal groin on the north end of Masonboro Island. The star represents the north end of Masonboro Island. This situation is analogous to the proposed terminal groin on Figure 8 Island. Not only would the shoals and the sand spit be lost from the north end of Figure 8 Island, but oceanfront beach narrowing would occur downdrift of the groin, placing nearly all oceanfront homes and real estate at risk and increasing the need for more frequent beach renourishment projects. Despite predictions of losses of shoals and other intertidal habitats in modeling for Alternatives 5A-C under 2012 conditions (see summary table on p. 202), the SEIS predicts that the result of Alternative 5D under 2012 conditions will be the persistence of a smaller spit north of the terminal groin (Figure 5.45b on p. 261). The SEIS states, “The sand spit on the north end of Figure Eight Island experienced some erosion under Alternative 5D, but the mean high water shoreline did not reach the terminal groin” (p. 261). Meanwhile, the modeling reported for Alternatives 5A-5C under 2012 conditions predict that the spit would disappear, resulting in the loss of about 35 acres of current intertidal habitat.
Audubon North Carolina
8
This is a gross underestimate of the amount of habitat that will be lost under all alternatives that include a terminal groin (Alternatives 5A-5D). The amount of habitat that will be lost is actually approximately 241 acres of high quality habitat that supports shorebirds, including two federally-listed species, plus additional saltmarsh. The habitat lost would be primarily low-energy shoals and sandbars which provide habitat for a variety of benthic invertebrates that are essential food for shorebirds and fishes, and the sandy spit which is prime nesting habitat. Such a loss constitutes the some of the highest quality habitat in the entire Rich Inlet complex. This disparity in the predicted fate of the spit on the north end of Figure 8 Island is not explained in the SEIS. This calls into question the utility of the Delft3D models in predicting the responses of Rich Inlet to the placement of a terminal groin or the channelization of the inlet. In comments responding to the 2012 DEIS, experts cited “inappropriate use of models” as one of the major flaws in the document. In practice, the Delft3D models produced with 2006 data failed to accurately predict the state of the inlet in 2012. It is not clear how results that have been proven to be inaccurate can be used to assess environmental impacts, calculate costs, or make any other determinations regarding the proposed project. Furthermore, in order to see how hard structures affect habitat in real life, we used Google Earth to examine the U.S. Atlantic and Florida Gulf coasts for inlets with one or more hard structures. We found 144 inlets with one or more hard structures; 124 had a terminal groin or a jetty. None of the 124 inlets had a spit extending from the terminal groin or jetty into the inlet as predicted in some of the Delft3D models. In addition, only 26 of the inlets with terminal groins or jetties had apparent intertidal shoals. Reality suggests that if a terminal groin is installed on the north end of Figure 8 Island, whether it is 400 feet to the north or the south, or 200 feet longer or shorter, intertidal habitat will be permanently lost, along with the spit on Figure 8 Island. The SEIS also fails to address the cumulative impacts of sand mining and the proposed terminal groin at Rich Inlet, and the frequent sand mining at Mason Inlet, on the adjacent downdrift beach. The regular removal of sand from both inlets and the proposed terminal groin at Rich Inlet would disrupt the longshore transport of sand and potentially threaten Wrightsville Beach—the adjacent downdrift shoreline—and the real estate thereon. There are at least 100 published studies that address the impacts of terminal groins on inlets, beaches, and natural resources. The majority (78%) of peer-reviewed literature we collected regarding the impacts of hard structures at inlets concluded that terminal groins do not function in the manner presented in the SEIS and cause more harm than good. The wealth of literature on the impacts of terminal groins is not discussed nor cited in the SEIS. A complete review of the relevant literature is necessary to accurately and objectively evaluate all alternatives presented in the SEIS. Biological Impacts of Terminal Groins, Other Hard Structures, and Beach Renourishment: The SEIS is extraordinarily flawed in its treatment of environmental impacts to birds. The SEIS fails to accurately and objectively describe the environmental impacts of the alternatives, especially the HOA’s preferred alternative on birds and essential habitats for birds. In particular,
Audubon North Carolina
9
the SEIS:
inaccurately summarizes and in some cases omits entirely the vast majority of the scientific literature that is available regarding birds;
misrepresents, misinterprets, and otherwise fails to accurately summarize data provided by relevant agencies and organizations;
inaccurately summarizes the direct, indirect, and cumulative impacts to state and federally listed bird species and omits key state-listed species;
inaccurately summarizes the impacts on habitats for shorebirds, waterbirds, and other wildlife, including severe and permanent adverse impacts to the NC-11 Piping Plover Critical Habitat Unit;
ignores and disregards the pertinent recommendations of leading scientists, including those made in U.S. Fish and Wildlife Service (USFWS) Threatened and Endangered species recovery plans;
relies on dubious models that were not intended for this application in order to predict how habitat in Rich Inlet would respond to the alternatives; and
presents an extraordinary number of factual errors. Eight alternatives are presented in the SEIS. Four alternatives (5A-5D) include terminal groins that would, as described in the section above, permanently eliminate habitats for nesting, migrating, and wintering birds, and would threaten state and federally listed species. Seven alternatives (1, 3, 4, 5A, 5B, 5C, and 5D) include sand mining in Rich Inlet, primarily in Nixon Channel, that would directly and/or indirectly eliminate foraging habitat required by migrating and wintering shorebirds, threaten nesting habitat for birds, and threaten state and federally listed species. Seven alternatives (1, 3, 4, 5A, 5B, 5C, and 5D) include beach fill, in which dredged material would be placed on oceanfront beach. Placement of dredged sand would adversely impact foraging habitats used by migrating and wintering shorebirds by directly killing their prey species and removing their prey species’ habitat. Therefore, Alternatives 1, 3, 4, 5A, 5B, 5C, and 5D have significant direct, indirect, and cumulative adverse impacts on habitats used by state and federally listed species, including migrating, wintering, and nesting Piping Plovers (federally Threatened), migrating Red Knots (federally Threatened), and other species of shorebirds, as well as negative impacts on nesting terns and Black Skimmers (all beach-nesting species nesting on Figure 8 Island are state-listed with the exception of the Willet). Natural, unmodified coastal inlets are essential to many shorebird species (sandpipers, plovers, and their allies), as well as other coastal species because they provide the variety of habitat types these species require at critical times of their annual and lifecycles. Inlets have expansive, low-energy intertidal flats which are rich with invertebrate prey that wintering and migrating shorebirds require to fuel their migratory flights, sustain them during winter, and support adults and chicks during the nesting season. Inlets have open, sandy spits that serve as resting and roosting sites that shorebirds need to rest, digest, and conserve energy; and they have open or sparsely vegetated sandy habitat that many shorebird species, as well as terns and skimmers require for nesting. (Gochfeld and Burger 1994, Thompson et al. 1997, Elliott-Smith and Haig

Audubon North Carolina
10
2004, Nol and Humphrey 2012). Shorebird communities require habitat heterogeneity to meet their basic and varied fundamental needs for survival, which is why unmodified inlets containing a mosaic of habitat types are essential to sustaining shorebird communities (VanDusen et al. 2012). Many shorebird species breed in the far north in order to exploit the seasonal abundance of food resources and they stopover around inlets during migration in order to refuel before continuing migration (Colwell 2010). Proximity between foraging and roosting sites has been found to be a key element in determining habitat suitability and use for shorebird species such as the Piping Plover (Cohen et al. 2008), Dunlin (Calidris alpina) (Dias et al. 2006) and Red Knot (Rogers et al. 2006), and others. In short, natural inlets provide all the resources and habitats shorebirds require in a small geographic area and at the locations essential to meeting their spatial and temporal energetic needs. These resources are generally not available or not sufficient to meet the energetic needs of shorebirds at other coastal features. Reflecting this fact, the occurrence and numbers of shorebirds that use coastal habitats in the southeastern U.S. is greater at inlets than most other coastal features. Seven shorebird species: the Threatened Piping Plover (Charadrius melodus) and the Threatened Red Knot (Calidris canutus rufa), as well as Black-bellied Plovers (Pluvialis squatarola), Ruddy Turnstones (Arenaria interpres), Snowy Plovers (Charadrius alexandrinus), Western Sandpipers (Calidris mauri), and Wilson’s Plovers (Charadrius wilsonia) are significantly more abundant at inlets than other coastal habitats (Harrington 2008). Multiple studies support the significance of inlets to birds, designating inlets as essential habitat by Red Knots, as well as breeding and non-breeding Piping Plovers (Nicholls and Baldassarre 1990, Harrington 2008, Kisiel 2009a, 2009b, Riggs et al. 2009, Niles et al. 2010, Maslo et al. 2011, USFWS 2012a, 2013). Piping Plovers: Piping Plovers are an excellent example of a species that relies on inlet-associated habitats throughout the year. During nesting, Piping Plovers are often associated with natural coastlines, including unmodified inlets and overwash fans. In New Jersey, Piping Plovers nest primarily near inlets, particularly those that were not stabilized with structures: 70.6% of all Piping Plover pairs nested closer to an unstabilized inlet than a stabilized inlet (Kisiel 2009a, 2009b). Piping Plovers in North Carolina also exhibit a pattern of nesting near inlets, and the majority of Piping Plover nests in Cape Hatteras National Seashore and Cape Lookout National Seashore were located near inlets (NPS 2014a, 2014b), largely because suitable nesting habitat does not exist elsewhere on the coast. Piping Plovers spend up to nine months out of the year away from nesting grounds (Elliott-Smith and Haig 2004). During this time, Piping Plovers engage in two essential behaviors, foraging and roosting (resting). A core wintering area or stopover site must provide habitat suitable for roosting, typically backshore above the high-tide line, and foraging, typically wet sand in low-energy intertidal areas that support invertebrates such polychaetes which are an important prey item for wintering and migrating Piping Plovers (Elliott-Smith and Haig 2004). There is a robust body of peer-reviewed scientific literature showing use of inlets and associated low-energy intertidal flats by Piping Plovers, particularly migrating or wintering Piping Plovers (Haig and Oring 1985, Johnson and Baldassarre 1988, Nicholls and Baldassarre 1990), and

Audubon North Carolina
11
indicating that Piping Plovers have a small home range during the non-breeding season and use a variety of habitats throughout the tidal cycle (Drake et al. 2001, Rabon 2006, Cohen et al. 2008, Maddock et al. 2009). Foraging activity is strongly associated with mud or sandflats (Nicholls and Baldassarre 1990), and roost sites are most used by Piping Plovers when located within close proximity to foraging areas (Cohen et al. 2008). Piping Plovers also exhibit strong site fidelity both during the same year and across several years (Drake et al. 2001, Noel and Chandler 2006). These characteristics demonstrate that Piping Plovers depend on very specific places that with these habitats, and that these places are important year after year as the same birds return to them every migration or winter. Critical Habitat Unit NC-11 for Wintering Piping Plovers: Rich Inlet and the north end of Figure 8 Island are within the NC-11 Critical Habitat Unit for wintering Piping Plovers (Figure 3). By eliminating the spit on the north end of Figure 8 Island and interfering with natural sediment transport throughout the inlet system, the preferred alternative would severely and adversely impact the Critical Habitat Unit, eliminating approximately 60% (241 acres) of the total primary constituent elements of habitat for Piping Plovers in Rich Inlet and at least 25% of all the primary constituent elements of habitat for Piping Plovers in Critical Habitat Unit NC-11. The preferred alternative, as well as Alternatives 5A-5D, would not only destroy essential foraging and roosting habitat in the Critical Habitat Unit NC-11, but also prevent such habitats from forming again. All other alternatives besides Alternative 2, would also result in negative impacts to Piping Plovers and Critical Habitat Unit NC-11.

Audubon North Carolina
12
Figure 3. Primary constituent elements of habitat in NC-11 Critical Habitat Unit and rates of Piping Plover use during 2010-2015 (heavy: seen on appropriate tide approximately >75% of visits; moderate: seen on appropriate tide approximately 25%-50% of visits; slight: seen on appropriate tide approximately <25% of visits; rare to none: not seen or seen fewer than 5 visits in a year). The NC-11 Critical Habitat Unit is described as follows: Unit NC–11: Topsail. 451 ha (1114 ac) in Pender County and Hanover County. The entire area is privately owned. This unit extends southwest from 1.0 km (0.65 mi) northeast of MLLW of New Topsail Inlet on Topsail Island to 0.53 m (0.33 mi) southwest of MLLW of Rich Inlet on Figure Eight Island. It includes both Rich Inlet and New Topsail Inlet and the former Old Topsail Inlet. All land, including emergent sandbars, from MLLW on Atlantic Ocean and sound side to where densely vegetated habitat, not used by the piping plover, begins and where the constituent elements no longer occur. In Topsail Sound, the unit stops as the entrance to tidal creeks become narrow and channelized (USFWS 2001).
Critical habitat is defined the Endangered Species Act (ESA) as the specific areas within the geographical area occupied by a species, at the time it is listed in

Audubon North Carolina
13
accordance with the provisions of section 4 of this Act, on which are found those physical or biological features (I) essential to the conservation of the species and (II) which may require special management considerations or protection; and (ii) specific areas outside the geographical area occupied by the species at the time it is listed in accordance with the provisions of section 4 of this Act, upon a determination by the Secretary that such areas are essential for the conservation of the species (Section 3 (5) (A)).
Primary constituent elements (PCEs) of critical habitat for the Piping Plover are the habitat components that support foraging, roosting, and sheltering and the physical features necessary for maintaining the natural processes that support these habitat components. The primary constituent elements are: (1) Intertidal sand beaches (including sand flats) or mud flats (between annual low tide and annual high tide) with no or very sparse emergent vegetation for feeding. In some cases, these flats may be covered or partially covered by a mat of blue-green algae. (2) Unvegetated or sparsely vegetated sand, mud, or algal flats above annual high tide for roosting. Such sites may have debris or detritus and may have micro-topographic relief (less than 20 in (50 cm) above substrate surface) offering refuge from high winds and cold weather. (3) Surf-cast algae for feeding. (4) Sparsely vegetated backbeach, which is the beach area above mean high tide seaward of the dune line, or in cases where no dunes exist, seaward of a delineating feature such as a vegetation line, structure, or road. Backbeach is used by plovers for roosting and refuge during storms. (5) Spits, especially sand, running into water for foraging and roosting. (6) Salterns, or bare sand flats in the center of mangrove ecosystems that are found above mean high water and are only irregularly flushed with sea water. (7) Unvegetated washover areas with little or no topographic relief for feeding and roosting. Washover areas are formed and maintained by the action of hurricanes, storm surges, or other extreme wave actions. (8) Natural conditions of sparse vegetation and little or no topographic relief mimicked in artificial habitat types (e.g., dredge spoil sites) (USFWS 2008). Of these seven PCEs, only two, salterns and artificial habitat such as dredge spoil, are not found in Rich Inlet. It is important to note that in the context above, “beaches” are oceanfront or sound side and include intertidal flats and sandbars. The ESA requires that actions are funded, authorized, or carried out by federal agencies are “not likely to jeopardize the continued existence of any endangered species or threatened species or result in the destruction or adverse modification of habitat of such species” (Section 7 (a) (2)). According to the USFWS, The key factor related to the adverse modification determination is whether, with implementation of the proposed Federal action, the affected critical habitat would remain functional (or retain the current ability for the PCEs to be functionally established) to serve its intended conservation role for the species. Activities that may destroy or adversely modify critical habitat are those that alter the physical and biological features to an extent that appreciably reduces the conservation value of critical habitat for the piping plover […] These activities include, but are not limited to: (1) Actions that would significantly and detrimentally alter the hydrology of tidal flats. (2) Actions that would significantly and

Audubon North Carolina
14
detrimentally alter inputs of sediment and nutrients necessary for the maintenance of geomorphic and biologic processes that insure appropriately configured and productive systems. (3) Actions that would introduce significant amounts of emergent vegetation (either through actions such as marsh restoration on naturally unvegetated sites, or through changes in hydrology such as severe rutting or changes in storm or wastewater discharges). (4) Actions that would significantly and detrimentally alter the topography of a site (such alteration may affect the hydrology of an area or may render an area unsuitable for roosting). 5) Actions that would reduce the value of a site by significantly disturbing piping plovers from activities such as foraging and roosting (including levels of human presence significantly greater than those currently experienced). (6) Actions that would significantly and detrimentally alter water quality, which may lead to decreased diversity or productivity of prey organisms or may have direct detrimental effects on piping plovers (as in the case of an oil spill). (7) Actions that would impede natural processes that create and maintain washover passes and sparsely vegetated intertidal feeding habitats (USFWS 2008). When critical habitat was designated for wintering Piping Plovers, the USFWS specifically addressed the fact that habitats they depend upon are dynamic: These habitat components are a result of the dynamic geological processes that dominate coastal landforms throughout the wintering range of piping plovers. These geologically dynamic coastal regions are controlled by processes of erosion, accretion, succession, and sea-level change. The integrity of the habitat components depends upon daily tidal events and regular sediment transport processes, as well as episodic, high-magnitude storm events; these processes are associated with the formation and movement of barrier islands, inlets, and other coastal landforms. By their nature, these features are in a constant state of change; they may disappear, only to be replaced nearby as coastal processes act on these habitats. Given that piping plovers evolved in this dynamic system, and that they are dependent upon these ever-changing features for their continued survival and eventual recovery, our critical habitat boundaries incorporate sites that experience these natural processes and include sites that may lose and later develop appropriate habitat components (USFWS 2001). Impact of the Proposed Project on Piping Plover Critical Habitat PCEs: The HOA’s preferred alternative includes actions 1, 2, 4, 5, and 7 above. As a result, all of the PCEs found in Rich Inlet would be adversely impacted by the HOA’s preferred alternative, as well as by Alternatives 1, 3, 4, 5A, 5B, and 5C. As explained above, the consequences of different management practices (e.g., dredging, beach fill, hard structures [jetties, groins, sea walls, and breakwaters], and coastal development) can lead to extensive changes in coastal and inlet habitats, resulting in a permanent loss of habitat that birds require for nesting, foraging, and roosting. Terminal groins permanently eliminate habitat that Piping Plovers rely on throughout the year and prevent the formation of new habitats. Dredging and beach nourishment cause disturbances to both borrow and placement sites and cause significant changes in habitat structure that can lead to decreased diversity and abundance in invertebrate species that shorebirds prey upon. Channelization of inlets in order to maintain a particular channel alignment has similar effects on bird habitats.

Audubon North Carolina
15
The construction of a terminal groin at Rich Inlet and alternatives that include channelization of the inlet will permanently and adversely impact critical habitat for Piping Plovers, and threaten the Endangered Great Lakes breeding population and the recovery of the Threatened Atlantic breeding population. The USACE should not permit an action that would degrade high-quality habitat in a critical habitat unit and jeopardize either the survival or recovery of a species. Breeding Sites of Banded Piping Plovers Found at Rich Inlet: Piping Plovers nest in three breeding populations: the Great Plains, Great Lakes, and Atlantic coast. All Piping Plovers are considered Threatened in their non-breeding rage. The Great Lakes breeding population is Endangered, and the Atlantic coast and Great Plains breeding populations are Threatened. Banded Piping Plovers seen at Rich Inlet represent all three nesting populations. A total of 43 uniquely banded individual Piping Plovers were observed at Rich Inlet during January 2007-September 2015. These birds were banded in Michigan, South Carolina, New York, Canada, North Dakota, North Carolina, Wisconsin, Virginia, and the Bahamas and resighted throughout their breeding and non-breeding range. The greatest number of banded Piping Plovers (29 individuals) documented at Rich Inlet were from the Endangered Great Lakes breeding population; 9 were from the Atlantic coast population, 4 were from the Great Plains population, and 1, which was banded in the Bahamas, was not seen on its breeding grounds. More recently, from September 2009-September 2015, we documented 38 individuals (9 Atlantic coast, 25 Great Lakes, 3 Great Plains, and 1 unknown) (Audubon North Carolina unpublished data). The Endangered Great Lakes breeding population consisted of between 55-73 breeding pairs from 2010-2015 (Vincent Cavalieri pers. com.), with an average of 64 pairs or 128 breeding adults. Between January 2007 and September 2015, Audubon North Carolina documented at least 29 banded individuals from the Endangered Great Lakes breeding population (Addison and McIver 2014, Audubon North Carolina unpublished data). It is highly likely that more individuals from the Great Lakes breeding population depend on Rich Inlet during migration and winter, because it is highly unlikely weekly surveys document every individual that utilizes Rich Inlet during migration, and sub-adults in the Great Lakes are banded with identical “brood marker” bands therefore distinguishing individuals is not possible. Furthermore, an estimated 5% of the Great Lakes population is not banded. The importance of Rich Inlet to the Endangered Great Lakes breeding population of Piping Plovers cannot be overstated. Based on published rates of adult survival, juvenile survival, fledging success, and detectability, we estimate that Rich Inlet supports between 18% and 24% of the Great Lakes breeding population. Modeling shows that Piping Plover populations in general (Calvert et al. 2006, Brault 2007) and the Great Lakes population in particular (Wemmer et al. 2000) are most sensitive to small variations in adult survivorship. In the Atlantic coast population, modeled decreases of 5% in first-year plovers and 10% in after-first-year adult plovers found high probabilities of the population going extinct within 100 years, even with a very high productivity rate of 1.5 fledglings/pair (Melvin and Gibbs 1994). The authors found such declines could be caused by one or more of several factors, including declines in availability of high-quality winter and migration habitat and increased human disturbance on wintering grounds (Melvin and Gibbs

Audubon North Carolina
16
1994). In the New England and Canadian population of Piping Plovers, modeling found that that populations’ growth rate was most affected by adult annual survivorship. A 1% decline in annual adult survival would have to be offset by a 2.25% increase in productivity—an unrealistic goal—in order to prevent impacts to the population’s growth rate (Brault 2007). Population growth rates modeled among eastern Canadian breeding Piping Plovers were also found to be sensitive to small changes in adult and post-fledging survival (Calvert et al. 2006). Modeling specific to the Great Lakes population produced similar findings. In a habitat-based population model of the Great Lakes population, when productivity rates and habitat capacity were high, decreasing adult or fledging survivorship by 20% resulted in never achieving the recovery goal of 100 breeding pairs, and the probability of the population persisting for 100 years dropped to 0; conversely, increasing those rates by 20% resulted in 100% of model runs meeting the recovery goal (Wemmer et al. 2001). The authors point out that increasing productivity as well as increasing adult survival are challenging, but both are necessary for the population’s survival. Conditions on wintering grounds can impact fitness and productivity during spring migration and the subsequent nesting season, in addition to affecting survival (Fernandez et al. 2003, Baker et al. 2004, Norris et al. 2004, Morrison et al. 2007). Since adults spend the majority of the year away from nesting sites, habitat availability and quality during migration and winter are important factors in the survival and recovery of Piping Plovers, especially for the small, Endangered Great Lakes population. Adversely impacting the NC-11 Critical Habitat Unit by removing 60% of the foraging habitat, plus additional roosting habitat from Rich Inlet where significant numbers of Piping Plovers stop over and winter, and preventing any future chance of this habitat being restored, would threaten the Great Lakes population’s prospect for recovery. The five-year status review of the Piping Plover states: The most consistent finding in the various population viability analyses (PVAs) conducted for piping plovers (Ryan et al. 1993, Melvin and Gibbs 1996, Plissner and Haig 2000, Wemmer et al. 2001, Larson et al. 2002, Calvert et al. 2006, Brault 2007) is the sensitivity of extinction risk to even small declines in adult and/or juvenile survival rates. […] Calvert et al. (2006) found that changes in productivity (% increase in chicks fledged per pair) required to attain long-term growth rates in eastern Canada would be approximately threefold the change required in adult apparent survival (% increase in annual survival of adults). Similarly, modeling by Brault (2007) for the New England and Eastern Canada recovery units indicated that a 1% reduction in annual adult survival would need to be offset by a 2.25% increase in fledglings produced in order to maintain a stable population. Progress toward recovery would be quickly slowed or reversed by even small sustained decreases in survival, and it would be difficult to increase current fecundity levels sufficiently to compensate for widespread long-term declines in survival (USFWS 2009). In addition to the 29 banded Great Lakes population individuals, additional banded individuals from the Atlantic coast and Great Plains populations have been seen at Rich Inlet (Audubon North Carolina unpublished data). Though the Atlantic coast population is larger than the Great

Audubon North Carolina
17
Lakes population, proportionally very few birds from the Atlantic breeding population have been banded. A range-wide band resight study found that Piping Plovers using the southeast coast during non-breeding months are predominantly from the Atlantic and Great Lakes breeding populations (Gratto-Trevor et al. 2009). The population of Atlantic coast breeding Piping Plovers averaged 1,836 pairs or 3,672 breeding adults from 2008-2012 (the most recent years for which final data is available) (USFWS 2010, 2011, 2012b). The peak, single survey counts of Piping Plovers at Rich Inlet in fall 2014 and 2015 (38 and 44, respectively) comprise more than 1% of the Atlantic breeding population of Piping Plovers (Addison and McIver 2014, Audubon North Carolina unpublished data). This qualifies the Rich Inlet complex as a Wetland of International Importance under the Ramsar Convention and a site of hemispheric significance by the Western Hemisphere Shorebird Network. Peak migration counts do not reflect the total number of individual Piping Plovers that depend on habitats at Rich Inlet. Most individuals using Rich Inlet during migration to refuel, rest and gain sufficient energetic reserves to make the next leg of migration that may carry them to breeding areas or wintering areas. Stopover duration can vary from just a few days to as much as one month (Noel and Chandler 2005; Stucker and Cuthbert 2006). Surveys conducted weekly during migration surveys at Rich Inlet indicated that stopover duration for the majority of banded Piping Plovers was one week or less during spring (99.1%) and fall (63.2%). The mean number of non-breeding Piping Plovers that depend on Rich Inlet based on stopover duration of one week for calendar years 2011-2015 is estimated at 256 individuals (range 96-443). At Rich Inlet, from 2010-2014 the total number of Piping Plovers was greatest during fall migration, but the species is present every month of the year (Addison and McIver 2014). Seasonal use of Rich Inlet by Piping Plovers during the most recent years (2014 and 2015) is presented in Figure 4.
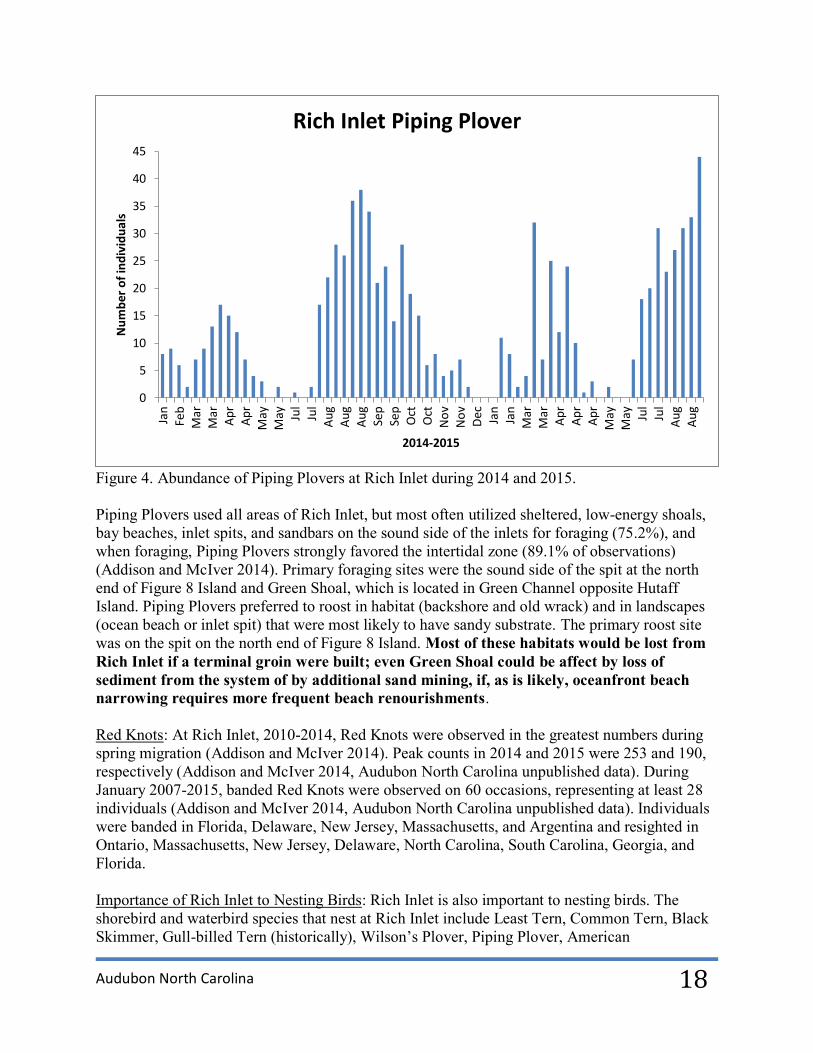
Audubon North Carolina
18
Figure 4. Abundance of Piping Plovers at Rich Inlet during 2014 and 2015. Piping Plovers used all areas of Rich Inlet, but most often utilized sheltered, low-energy shoals, bay beaches, inlet spits, and sandbars on the sound side of the inlets for foraging (75.2%), and when foraging, Piping Plovers strongly favored the intertidal zone (89.1% of observations) (Addison and McIver 2014). Primary foraging sites were the sound side of the spit at the north end of Figure 8 Island and Green Shoal, which is located in Green Channel opposite Hutaff Island. Piping Plovers preferred to roost in habitat (backshore and old wrack) and in landscapes (ocean beach or inlet spit) that were most likely to have sandy substrate. The primary roost site was on the spit on the north end of Figure 8 Island. Most of these habitats would be lost from Rich Inlet if a terminal groin were built; even Green Shoal could be affect by loss of sediment from the system of by additional sand mining, if, as is likely, oceanfront beach narrowing requires more frequent beach renourishments. Red Knots: At Rich Inlet, 2010-2014, Red Knots were observed in the greatest numbers during spring migration (Addison and McIver 2014). Peak counts in 2014 and 2015 were 253 and 190, respectively (Addison and McIver 2014, Audubon North Carolina unpublished data). During January 2007-2015, banded Red Knots were observed on 60 occasions, representing at least 28 individuals (Addison and McIver 2014, Audubon North Carolina unpublished data). Individuals were banded in Florida, Delaware, New Jersey, Massachusetts, and Argentina and resighted in Ontario, Massachusetts, New Jersey, Delaware, North Carolina, South Carolina, Georgia, and Florida. Importance of Rich Inlet to Nesting Birds: Rich Inlet is also important to nesting birds. The shorebird and waterbird species that nest at Rich Inlet include Least Tern, Common Tern, Black Skimmer, Gull-billed Tern (historically), Wilson’s Plover, Piping Plover, American
0
5
10
15
20
25
30
35
40
45Ja
nFe
bM
arM
arA
pr
Ap
rM
ayM
ay Jul
Jul
Au
gA
ug
Au
gSe
pSe
pO
ctO
ctN
ov
No
vD
ec Jan
Jan
Mar
Mar
Ap
rA
pr
Ap
rM
ayM
ay Jul
Jul
Au
gA
ug
Nu
mb
er o
f in
div
idu
als
2014-2015
Rich Inlet Piping Plover
Audubon North Carolina
19
Oystercatcher and Willet. All of these species with the exception of the Willet require open, sandy, sparsely vegetated habitats for nesting. These habitats occur on spits at the ends of barrier islands, such as the spit on the north end of Figure 8 Island, and on overwash fans where storms push dunes backwards, creating wide, sandy areas along the length of barrier islands. Historically, prior to the development of many barrier islands, overwash fans were more common, as buildings, roads, and other developments were not present to block their formation following hurricanes or nor’easters. The limitations on the formation of overwash fans makes inlet spits essential to nesting birds as few alternatives exist. This is reflected in southern North Carolina where, from New River Inlet south to Brunswick County, little quality beach-nesting bird habitat exists due to hardened structures at inlets, channelization of inlets, other coastal engineering projects, and development. The north end of Figure 8 Island has provided some of the best nesting habitat in southern North Carolina the past several years. American Oystercatchers, Piping Plovers, Wilson’s Plovers and 840 pairs of Least Terns nested on the north end of Figure 8 Island in 2014. The Least Tern colony represented nearly all of southern North Carolina’s Least Tern population and was the largest on record in North Carolina in 41 years of record-keeping; additionally, it represented 26% of the state’s nesting Least Terns (NCWRC Colonial Waterbird Database). This year, two pairs of Piping Plovers nested on the north end of Figure 8 Island (Schweitzer 2015). Other nesting species were not counted in 2015, as it was not a state census year, but another large colony of Least Terns formed there. The peak count of Least Tern adults in the area was 816, suggesting approximately 400 pairs (Audubon North Carolina unpublished data). Common Terns, American Oystercatchers, and Wilson’s Plovers also nested there in 2015. No terns or skimmers have nested on the north end of Masonboro Island since 1989, though prior to the construction of the jetty there, a large amount of suitable habitat supported large nesting colonies of Least Terns, Common Terns, and Black Skimmers (NCWRC Colonial Waterbird Database). A similar pattern is found at all inlets with terminal groins. Importance of Rich Inlet to all Birds: A total of 90 species of birds were observed at Rich Inlet from January 2010-September 2014, including 25 species of shorebirds (sandpipers, plovers, and their relatives) (Addison and McIver 2014). One additional species, the Snowy Plover, was observed in 2015, for a total of 91 species observed at Rich Inlet (Audubon North Carolina unpublished data). Of these 91 species, 28 (31%) are of conservation concern, either as federally listed species, state-listed species, or identified as declining or otherwise vulnerable by various watch lists. Birds use Rich Inlet in large numbers throughout the year (Figure 5). Migrating birds pass through from late February to late May; wintering birds arrive as early as mid-July and stay as late as late May; nesting birds begin to arrive in March and remain through August. Annual peak counts from 2010-2015 occurred in the spring, winter, and fall, and were as great as 3,532 birds seen on one occasion (Addison and McIver 2014, Audubon North Carolina unpublished data). From January 2010-September 2014, a total of 228,823 birds were observed at Rich Inlet (Addison and McIver 2014).
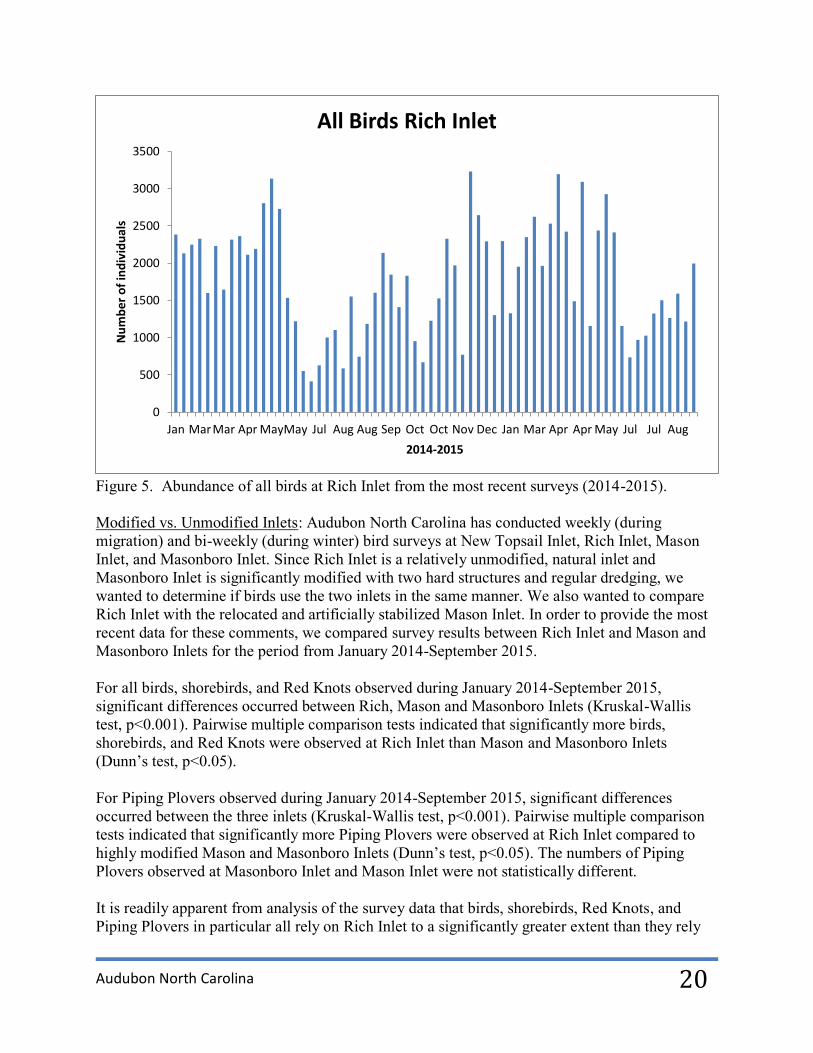
Audubon North Carolina
20
Figure 5. Abundance of all birds at Rich Inlet from the most recent surveys (2014-2015). Modified vs. Unmodified Inlets: Audubon North Carolina has conducted weekly (during migration) and bi-weekly (during winter) bird surveys at New Topsail Inlet, Rich Inlet, Mason Inlet, and Masonboro Inlet. Since Rich Inlet is a relatively unmodified, natural inlet and Masonboro Inlet is significantly modified with two hard structures and regular dredging, we wanted to determine if birds use the two inlets in the same manner. We also wanted to compare Rich Inlet with the relocated and artificially stabilized Mason Inlet. In order to provide the most recent data for these comments, we compared survey results between Rich Inlet and Mason and Masonboro Inlets for the period from January 2014-September 2015. For all birds, shorebirds, and Red Knots observed during January 2014-September 2015, significant differences occurred between Rich, Mason and Masonboro Inlets (Kruskal-Wallis test, p<0.001). Pairwise multiple comparison tests indicated that significantly more birds, shorebirds, and Red Knots were observed at Rich Inlet than Mason and Masonboro Inlets (Dunn’s test, p<0.05). For Piping Plovers observed during January 2014-September 2015, significant differences occurred between the three inlets (Kruskal-Wallis test, p<0.001). Pairwise multiple comparison tests indicated that significantly more Piping Plovers were observed at Rich Inlet compared to highly modified Mason and Masonboro Inlets (Dunn’s test, p<0.05). The numbers of Piping Plovers observed at Masonboro Inlet and Mason Inlet were not statistically different. It is readily apparent from analysis of the survey data that birds, shorebirds, Red Knots, and Piping Plovers in particular all rely on Rich Inlet to a significantly greater extent than they rely
0
500
1000
1500
2000
2500
3000
3500
Jan MarMar Apr MayMay Jul Aug Aug Sep Oct Oct Nov Dec Jan Mar Apr Apr May Jul Jul Aug
Nu
mb
er o
f in
div
idu
als
2014-2015
All Birds Rich Inlet
Audubon North Carolina
21
on the two nearby modified inlets. Because Piping Plovers exhibit site fidelity (Drake et al. 2001, Noel and Chandler 2006, Addison and McIver 2014) and use small core home ranges during the winter months (Drake et al. 2001), the importance of specific inlets such as Rich Inlet to individuals is magnified even more, since they are unlikely to move between inlets and because they return to the same site year after year. Modification of Inlets and Beaches: Despite the importance of natural inlets to birds such as the Piping Plover, inlets are one of the most anthropogenically altered features on the coast. In North Carolina, 85% of inlets have been modified, and 57% of Atlantic coast inlets in the migration and winter range of the Piping Plover have been modified, including 43% that have been stabilized with hard structures (Rice 2012a). At least 32% of sandy beach habitat in the winter range of the Piping Plovers has received beach nourishment (Rice 2012b). Many shorebird populations, including those of many species that occur at inlets, are declining and are of conservation concern (Brown et al. 2001, Winn et al. 2013). Loss or degradation of wintering habitat, including that associated with coastal engineering projects, is identified as a primary threat in all shorebird conservation and management planning documents, including those addressing Piping Plovers and Red Knots. For example, the impacts of terminal groins and modifications of inlets are specifically addressed in the five-year status review for the Piping Plover: Inlet stabilization/relocation
Many navigable mainland or barrier island tidal inlets along the Atlantic and Gulf of Mexico coasts are stabilized with jetties, groins, or by seawalls and/or adjacent industrial or residential development (see section WM 2.2.1.4 summary of studies documenting piping plover reliance on inlet habitats). Jetties are structures built perpendicular to the shoreline that extend through the entire nearshore zone and past the breaker zone (Hayes and Michel 2008) to prevent or decrease sand deposition in the channel. Inlet stabilization with rock jetties and associated channel dredging for navigation alter the dynamics of longshore sediment transport and affect the location and movement rate of barrier islands (Camfield and Holmes 1995), typically causing downdrift erosion. Sediment is then dredged and added back to islands which subsequently widen. Once the island becomes stabilized, vegetation encroaches on the bayside habitat, thereby diminishing and eventually destroying its value to piping plovers. Accelerated erosion may compound future habitat loss, depending on the degree of sea-level rise. Unstabilized inlets naturally migrate, re-forming important habitat components, whereas jetties often trap sand and cause significant erosion of the downdrift shoreline. These combined actions affect the availability of piping plover habitat (Cohen et al. 2008).
Sand mining/dredging Sand mining, the practice of extracting (dredging) sand from sand bars, shoals, and inlets in the nearshore zone, is a less expensive source of sand than obtaining sand from offshore shoals for beach nourishment. Sand bars and shoals are sand sources that move onshore over time and act as natural breakwaters. Inlet dredging reduces the formation of exposed ebb and flood tidal shoals considered to be primary or optimal piping plover roosting and foraging habitat. Removing these sand sources can alter depth contours and change wave refraction as well as

Audubon North Carolina
22
cause localized erosion (Hayes and Michel 2008). Exposed shoals and sandbars are also valuable to piping plovers, as they tend to receive less human recreational use (because they are only accessible by boat) and therefore provide relatively less disturbed habitats for birds. We do not have a good estimate of the amount of sand mining that occurs across the piping plover wintering range, nor do we have a good estimate of the number of inlet dredging projects that occur. […]
Groins Groins (structures made of concrete, rip rap, wood, or metal built perpendicular to the beach in order to trap sand) are typically found on developed beaches with severe erosion. Although groins can be individual structures, they are often clustered along the shoreline. Groins act as barriers to longshore sand transport and cause downdrift erosion, which prevents piping plover habitat creation by limiting sediment deposition and accretion (Hayes and Michel 2008). These structures are found throughout the southeastern Atlantic Coast, and although most were in place prior to the piping plover’s1986 ESA listing, installation of new groins continues to occur (USFWS 2009). The impact of projects, such as proposed in Alternatives 1, 3, 4, and 5A-5D in this SEIS, on Threatened Red Knots is addressed specifically in the “Status of the Red Knot in the Western Hemisphere”: NC: Along the coast, threats to migrant and wintering Red Knot habitat include beach stabilization works (nourishment, channel relocation, and bulkhead construction), and housing development. [Note: Terminal groins and hardened structures were illegal in NC at the time when this paper was published.] FL: Shoreline hardening, dredging, and deposition, including beach-nourishment activities, are significantly altering much of Florida’s coastline. … Furthermore, the impacts on Red Knots and other shorebirds is [sic] not well known but is thought to be significant (Niles et al. 2008). The Red Knot was listed as Threatened under the Endangered Species Act in November 2014. One of the primary factors in its listing was “U.S. shoreline stabilization and coastal development” (USFWS 2013): In addition to directly eliminating red knot habitat, hard structures interfere with the creation of new shorebird habitats by interrupting the natural processes of overwash and inlet formation. Where hard stabilization is installed, the eventual loss of the beach and its associated habitats is virtually assured (Rice 2009, p. 3), absent beach nourishment, which may also impact red knots as discussed below. Where they are maintained, hard structures are likely to significantly increase the amount of red knot habitat lost as sea levels continue to rise (USFWS 2013). Beach renourishment and inlet channelization are also cited as threats to Red Knots because they impact prey availability, habitat suitability, and habitat formation (USFWS 2013). Factual Errors and Other Inaccuracies Regarding Impacts to Birds: Because accurate information
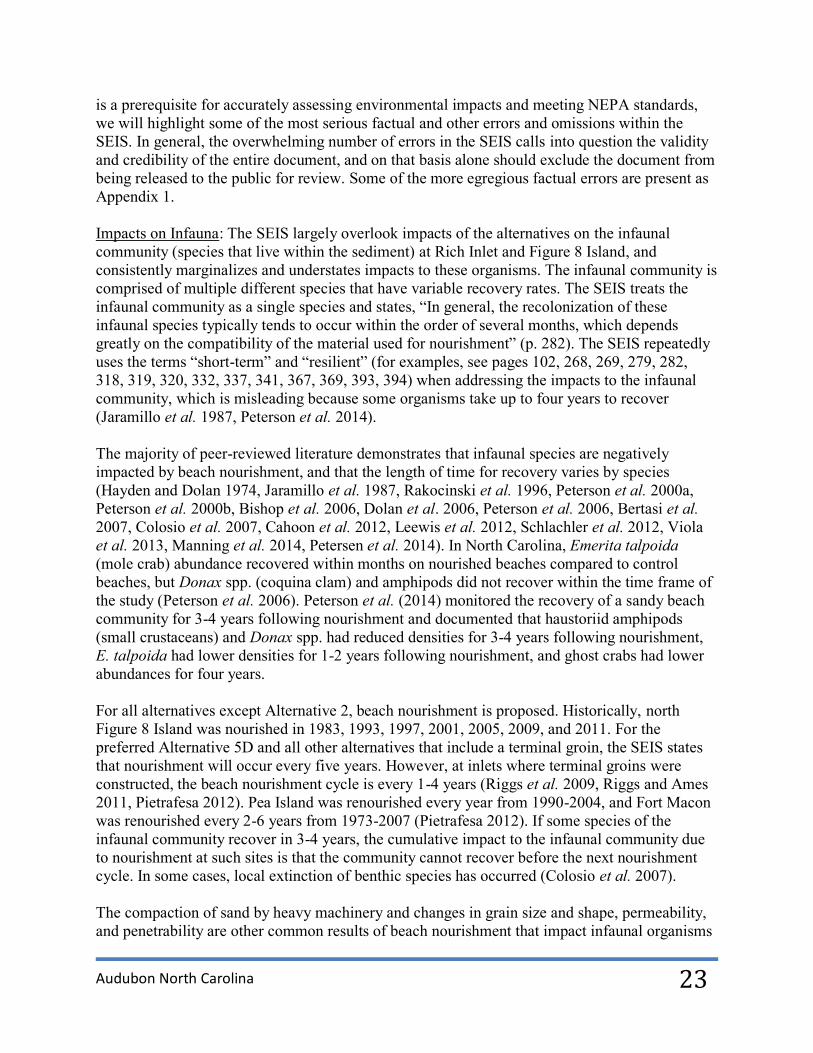
Audubon North Carolina
23
is a prerequisite for accurately assessing environmental impacts and meeting NEPA standards, we will highlight some of the most serious factual and other errors and omissions within the SEIS. In general, the overwhelming number of errors in the SEIS calls into question the validity and credibility of the entire document, and on that basis alone should exclude the document from being released to the public for review. Some of the more egregious factual errors are present as Appendix 1. Impacts on Infauna: The SEIS largely overlook impacts of the alternatives on the infaunal community (species that live within the sediment) at Rich Inlet and Figure 8 Island, and consistently marginalizes and understates impacts to these organisms. The infaunal community is comprised of multiple different species that have variable recovery rates. The SEIS treats the infaunal community as a single species and states, “In general, the recolonization of these infaunal species typically tends to occur within the order of several months, which depends greatly on the compatibility of the material used for nourishment” (p. 282). The SEIS repeatedly uses the terms “short-term” and “resilient” (for examples, see pages 102, 268, 269, 279, 282, 318, 319, 320, 332, 337, 341, 367, 369, 393, 394) when addressing the impacts to the infaunal community, which is misleading because some organisms take up to four years to recover (Jaramillo et al. 1987, Peterson et al. 2014). The majority of peer-reviewed literature demonstrates that infaunal species are negatively impacted by beach nourishment, and that the length of time for recovery varies by species (Hayden and Dolan 1974, Jaramillo et al. 1987, Rakocinski et al. 1996, Peterson et al. 2000a, Peterson et al. 2000b, Bishop et al. 2006, Dolan et al. 2006, Peterson et al. 2006, Bertasi et al. 2007, Colosio et al. 2007, Cahoon et al. 2012, Leewis et al. 2012, Schlachler et al. 2012, Viola et al. 2013, Manning et al. 2014, Petersen et al. 2014). In North Carolina, Emerita talpoida (mole crab) abundance recovered within months on nourished beaches compared to control beaches, but Donax spp. (coquina clam) and amphipods did not recover within the time frame of the study (Peterson et al. 2006). Peterson et al. (2014) monitored the recovery of a sandy beach community for 3-4 years following nourishment and documented that haustoriid amphipods (small crustaceans) and Donax spp. had reduced densities for 3-4 years following nourishment, E. talpoida had lower densities for 1-2 years following nourishment, and ghost crabs had lower abundances for four years. For all alternatives except Alternative 2, beach nourishment is proposed. Historically, north Figure 8 Island was nourished in 1983, 1993, 1997, 2001, 2005, 2009, and 2011. For the preferred Alternative 5D and all other alternatives that include a terminal groin, the SEIS states that nourishment will occur every five years. However, at inlets where terminal groins were constructed, the beach nourishment cycle is every 1-4 years (Riggs et al. 2009, Riggs and Ames 2011, Pietrafesa 2012). Pea Island was renourished every year from 1990-2004, and Fort Macon was renourished every 2-6 years from 1973-2007 (Pietrafesa 2012). If some species of the infaunal community recover in 3-4 years, the cumulative impact to the infaunal community due to nourishment at such sites is that the community cannot recover before the next nourishment cycle. In some cases, local extinction of benthic species has occurred (Colosio et al. 2007). The compaction of sand by heavy machinery and changes in grain size and shape, permeability, and penetrability are other common results of beach nourishment that impact infaunal organisms
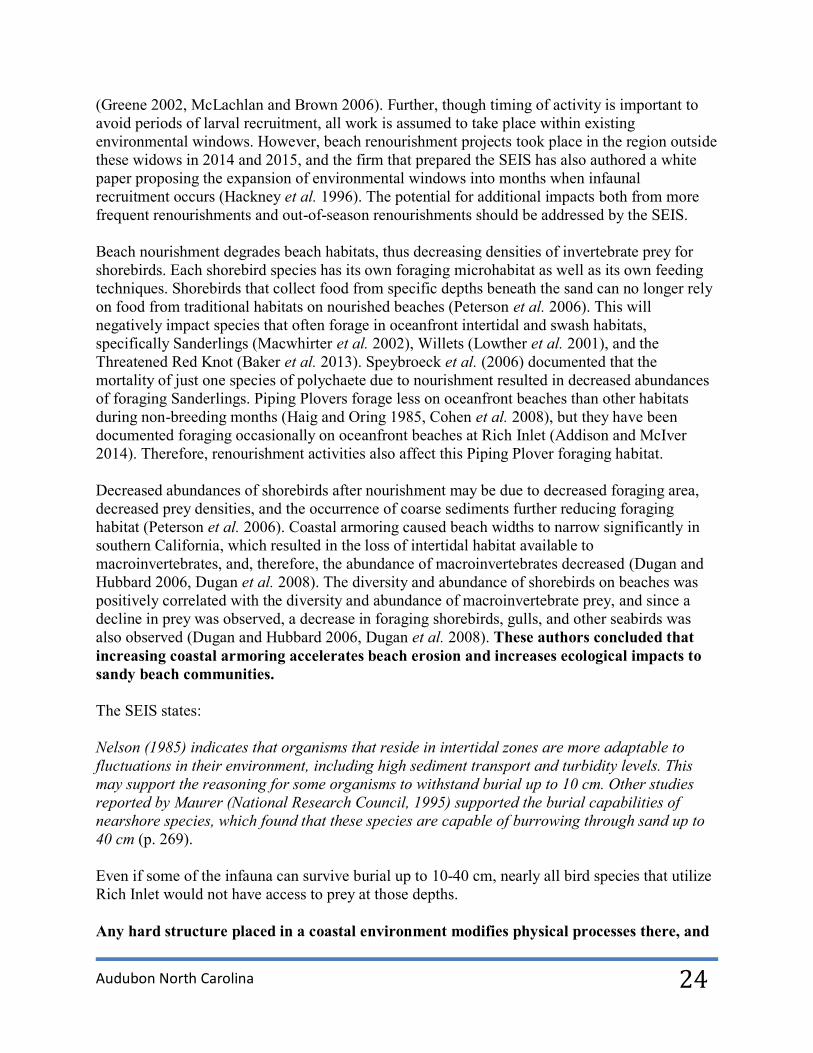
Audubon North Carolina
24
(Greene 2002, McLachlan and Brown 2006). Further, though timing of activity is important to avoid periods of larval recruitment, all work is assumed to take place within existing environmental windows. However, beach renourishment projects took place in the region outside these widows in 2014 and 2015, and the firm that prepared the SEIS has also authored a white paper proposing the expansion of environmental windows into months when infaunal recruitment occurs (Hackney et al. 1996). The potential for additional impacts both from more frequent renourishments and out-of-season renourishments should be addressed by the SEIS. Beach nourishment degrades beach habitats, thus decreasing densities of invertebrate prey for shorebirds. Each shorebird species has its own foraging microhabitat as well as its own feeding techniques. Shorebirds that collect food from specific depths beneath the sand can no longer rely on food from traditional habitats on nourished beaches (Peterson et al. 2006). This will negatively impact species that often forage in oceanfront intertidal and swash habitats, specifically Sanderlings (Macwhirter et al. 2002), Willets (Lowther et al. 2001), and the Threatened Red Knot (Baker et al. 2013). Speybroeck et al. (2006) documented that the mortality of just one species of polychaete due to nourishment resulted in decreased abundances of foraging Sanderlings. Piping Plovers forage less on oceanfront beaches than other habitats during non-breeding months (Haig and Oring 1985, Cohen et al. 2008), but they have been documented foraging occasionally on oceanfront beaches at Rich Inlet (Addison and McIver 2014). Therefore, renourishment activities also affect this Piping Plover foraging habitat. Decreased abundances of shorebirds after nourishment may be due to decreased foraging area, decreased prey densities, and the occurrence of coarse sediments further reducing foraging habitat (Peterson et al. 2006). Coastal armoring caused beach widths to narrow significantly in southern California, which resulted in the loss of intertidal habitat available to macroinvertebrates, and, therefore, the abundance of macroinvertebrates decreased (Dugan and Hubbard 2006, Dugan et al. 2008). The diversity and abundance of shorebirds on beaches was positively correlated with the diversity and abundance of macroinvertebrate prey, and since a decline in prey was observed, a decrease in foraging shorebirds, gulls, and other seabirds was also observed (Dugan and Hubbard 2006, Dugan et al. 2008). These authors concluded that increasing coastal armoring accelerates beach erosion and increases ecological impacts to sandy beach communities. The SEIS states: Nelson (1985) indicates that organisms that reside in intertidal zones are more adaptable to fluctuations in their environment, including high sediment transport and turbidity levels. This may support the reasoning for some organisms to withstand burial up to 10 cm. Other studies reported by Maurer (National Research Council, 1995) supported the burial capabilities of nearshore species, which found that these species are capable of burrowing through sand up to 40 cm (p. 269). Even if some of the infauna can survive burial up to 10-40 cm, nearly all bird species that utilize Rich Inlet would not have access to prey at those depths. Any hard structure placed in a coastal environment modifies physical processes there, and
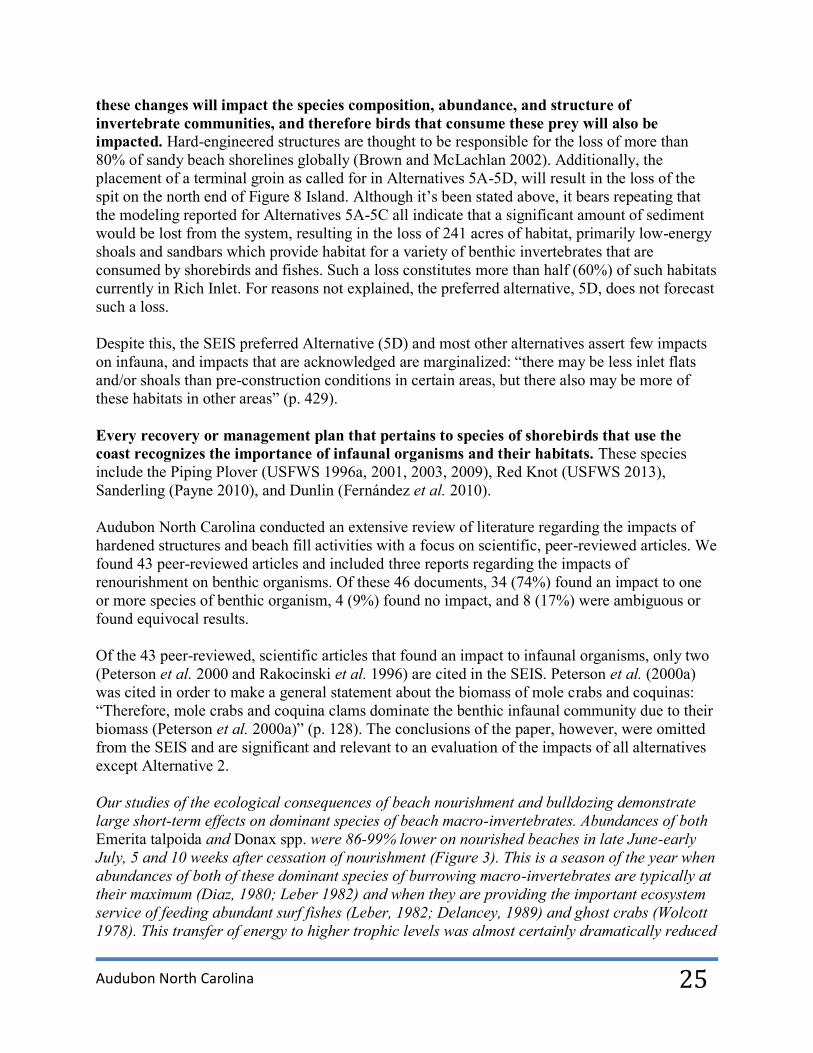
Audubon North Carolina
25
these changes will impact the species composition, abundance, and structure of invertebrate communities, and therefore birds that consume these prey will also be impacted. Hard-engineered structures are thought to be responsible for the loss of more than 80% of sandy beach shorelines globally (Brown and McLachlan 2002). Additionally, the placement of a terminal groin as called for in Alternatives 5A-5D, will result in the loss of the spit on the north end of Figure 8 Island. Although it’s been stated above, it bears repeating that the modeling reported for Alternatives 5A-5C all indicate that a significant amount of sediment would be lost from the system, resulting in the loss of 241 acres of habitat, primarily low-energy shoals and sandbars which provide habitat for a variety of benthic invertebrates that are consumed by shorebirds and fishes. Such a loss constitutes more than half (60%) of such habitats currently in Rich Inlet. For reasons not explained, the preferred alternative, 5D, does not forecast such a loss. Despite this, the SEIS preferred Alternative (5D) and most other alternatives assert few impacts on infauna, and impacts that are acknowledged are marginalized: “there may be less inlet flats and/or shoals than pre-construction conditions in certain areas, but there also may be more of these habitats in other areas” (p. 429). Every recovery or management plan that pertains to species of shorebirds that use the coast recognizes the importance of infaunal organisms and their habitats. These species include the Piping Plover (USFWS 1996a, 2001, 2003, 2009), Red Knot (USFWS 2013), Sanderling (Payne 2010), and Dunlin (Fernández et al. 2010). Audubon North Carolina conducted an extensive review of literature regarding the impacts of hardened structures and beach fill activities with a focus on scientific, peer-reviewed articles. We found 43 peer-reviewed articles and included three reports regarding the impacts of renourishment on benthic organisms. Of these 46 documents, 34 (74%) found an impact to one or more species of benthic organism, 4 (9%) found no impact, and 8 (17%) were ambiguous or found equivocal results. Of the 43 peer-reviewed, scientific articles that found an impact to infaunal organisms, only two (Peterson et al. 2000 and Rakocinski et al. 1996) are cited in the SEIS. Peterson et al. (2000a) was cited in order to make a general statement about the biomass of mole crabs and coquinas: “Therefore, mole crabs and coquina clams dominate the benthic infaunal community due to their biomass (Peterson et al. 2000a)” (p. 128). The conclusions of the paper, however, were omitted from the SEIS and are significant and relevant to an evaluation of the impacts of all alternatives except Alternative 2. Our studies of the ecological consequences of beach nourishment and bulldozing demonstrate large short-term effects on dominant species of beach macro-invertebrates. Abundances of both Emerita talpoida and Donax spp. were 86-99% lower on nourished beaches in late June-early July, 5 and 10 weeks after cessation of nourishment (Figure 3). This is a season of the year when abundances of both of these dominant species of burrowing macro-invertebrates are typically at their maximum (Diaz, 1980; Leber 1982) and when they are providing the important ecosystem service of feeding abundant surf fishes (Leber, 1982; Delancey, 1989) and ghost crabs (Wolcott 1978). This transfer of energy to higher trophic levels was almost certainly dramatically reduced
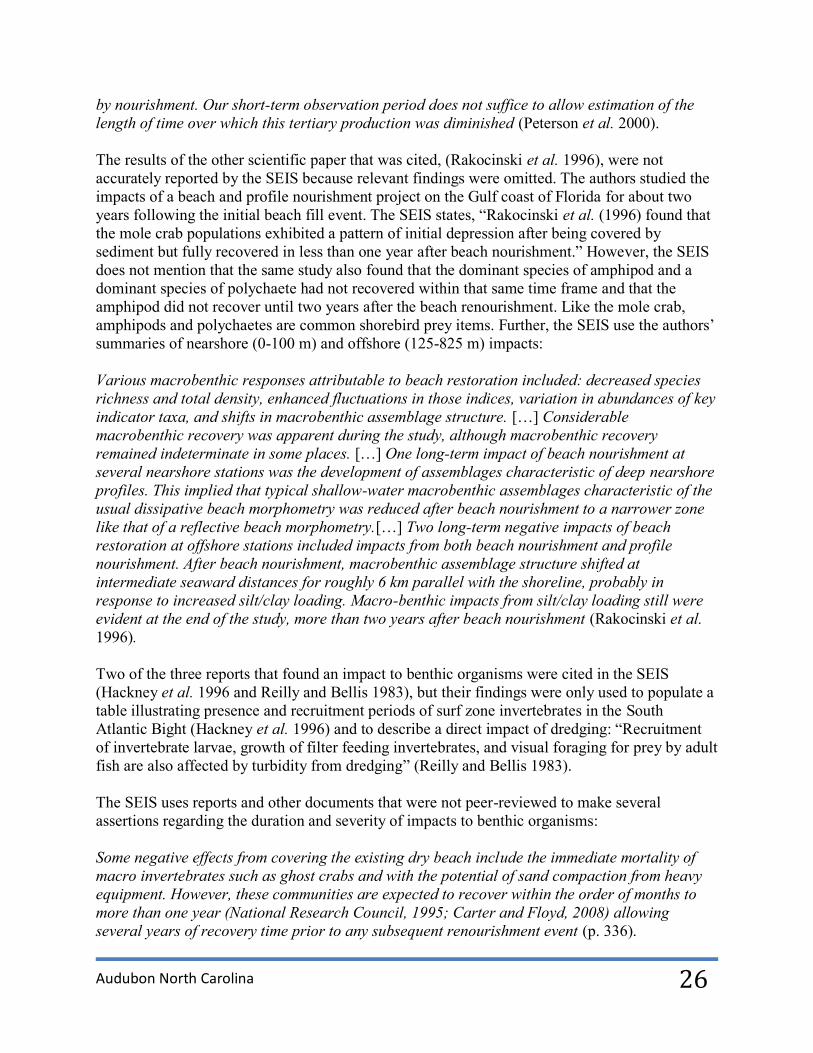
Audubon North Carolina
26
by nourishment. Our short-term observation period does not suffice to allow estimation of the length of time over which this tertiary production was diminished (Peterson et al. 2000). The results of the other scientific paper that was cited, (Rakocinski et al. 1996), were not accurately reported by the SEIS because relevant findings were omitted. The authors studied the impacts of a beach and profile nourishment project on the Gulf coast of Florida for about two years following the initial beach fill event. The SEIS states, “Rakocinski et al. (1996) found that the mole crab populations exhibited a pattern of initial depression after being covered by sediment but fully recovered in less than one year after beach nourishment.” However, the SEIS does not mention that the same study also found that the dominant species of amphipod and a dominant species of polychaete had not recovered within that same time frame and that the amphipod did not recover until two years after the beach renourishment. Like the mole crab, amphipods and polychaetes are common shorebird prey items. Further, the SEIS use the authors’ summaries of nearshore (0-100 m) and offshore (125-825 m) impacts: Various macrobenthic responses attributable to beach restoration included: decreased species richness and total density, enhanced fluctuations in those indices, variation in abundances of key indicator taxa, and shifts in macrobenthic assemblage structure. […] Considerable macrobenthic recovery was apparent during the study, although macrobenthic recovery remained indeterminate in some places. […] One long-term impact of beach nourishment at several nearshore stations was the development of assemblages characteristic of deep nearshore profiles. This implied that typical shallow-water macrobenthic assemblages characteristic of the usual dissipative beach morphometry was reduced after beach nourishment to a narrower zone like that of a reflective beach morphometry.[…] Two long-term negative impacts of beach restoration at offshore stations included impacts from both beach nourishment and profile nourishment. After beach nourishment, macrobenthic assemblage structure shifted at intermediate seaward distances for roughly 6 km parallel with the shoreline, probably in response to increased silt/clay loading. Macro-benthic impacts from silt/clay loading still were evident at the end of the study, more than two years after beach nourishment (Rakocinski et al. 1996). Two of the three reports that found an impact to benthic organisms were cited in the SEIS (Hackney et al. 1996 and Reilly and Bellis 1983), but their findings were only used to populate a table illustrating presence and recruitment periods of surf zone invertebrates in the South Atlantic Bight (Hackney et al. 1996) and to describe a direct impact of dredging: “Recruitment of invertebrate larvae, growth of filter feeding invertebrates, and visual foraging for prey by adult fish are also affected by turbidity from dredging” (Reilly and Bellis 1983). The SEIS uses reports and other documents that were not peer-reviewed to make several assertions regarding the duration and severity of impacts to benthic organisms: Some negative effects from covering the existing dry beach include the immediate mortality of macro invertebrates such as ghost crabs and with the potential of sand compaction from heavy equipment. However, these communities are expected to recover within the order of months to more than one year (National Research Council, 1995; Carter and Floyd, 2008) allowing several years of recovery time prior to any subsequent renourishment event (p. 336).

Audubon North Carolina
27
The macrobenthic communities of the intertidal and nearshore subtidal environments were sampled during the construction of the jetties and once again five (5) years later. Comparison of species abundance between years and among localities (updrift and downdrift) suggested no widespread impacts to macrobenthic fauna were attributable to jetty construction” (Knott et al. 1984) (p. 368). Carter and Floyd (2008) is a report prepared by CP&E, and Knott et al. (1984) is a report written by the USACE. The report results include community composition data and seasonality of dominant species; pre- and post-project abundance is not included in the body of the report, but is one of six appendices (counting Appendices 6a-e as one appendix). The appendices were not supplied when the document was requested. The findings of these reports are not consistent with findings of readily available peer-reviewed scientific literature. In its treatment of impacts to the infauna, the SEIS relies nearly exclusively on outdated literature that is generally not peer-reviewed, and it omits the many recent, peer-reviewed scientific papers that are available on the subject. The SEIS’s reliance on non-peer-reviewed reports and other gray literature is troubling, and this has been recognized as such by experts in the field. Peterson and Bishop (2005) suggested that weaknesses in nourishment studies are due to studies being conducted by project advocates with no peer review process and the duration of monitoring being inadequate to characterize the fauna before and after nourishment. Thus, uncertainty surrounding biological impacts of nourishment can be attributed to the poor quality of monitoring studies, not to an absence of impacts. We find it extraordinary that in a 513-page SEIS and over 2,000 additional pages of appendices only two peer-reviewed scientific articles are cited in reference to infauna—and that one is not cited to report its findings. It is equally troubling that a good-faith effort to accurately and fully describe and discuss the impacts these actions would have on the infaunal community would fail to actually describe the results of the only other peer-reviewed article it did reference. Impacts on Seabeach Amaranth: Seabeach amaranth (Amaranthus pumilus) is a federally Threatened plant historically found on Atlantic beaches from Massachusetts to South Carolina; it currently occurs in New York, New Jersey, Delaware, Virginia, North Carolina, and South Carolina (USFWS 2007). It is found on barrier island beaches where it occurs in sparsely vegetated areas on overwash fans, the accreting ends of barrier islands, and the toe of foredunes. Seabeach amaranth was listed due to its extirpation from two-thirds of its historic range and its vulnerability to threats including the construction of beach stabilization structures, beach erosion, beach grooming, pedestrian and vehicular traffic, and consumption by insects and feral animals. Of these threats, habitat loss and degradation resulting from coastal engineering were considered the most serious (USFWS 1996b, USFWS 2007). Because of its reliance on dynamic, newly formed habitat and its inability to persist in heavily vegetated areas, according to its recovery plan, it “appears to need extensive areas of barrier island beaches and inlets, functioning in a relatively natural and dynamic manner, allowing it to

Audubon North Carolina
28
move around in the landscape, occupying suitable habitat as it becomes available” (USFWS 1996b). Therefore, attempts to stabilize shorelines that lead to vegetative succession are detrimental to seabeach amaranth. Due to these needs, Attempts to halt beach erosion in the Carolinas and New York through beach hardening (sea walls, jetties, groins, bulkheads, etc.) appear invariably to destroy habitat for seabeach amaranth. Simply put, any stabilization of the shoreline is detrimental to a pioneer, upper beach annual, whose niche of “life strategy” is the colonization of unstable, unvegetated, or new land and which is unable to compete with perennial grasses. […] Groins have mixed effects on seabeach amaranth. Immediately upstream from a groin, accretion sometimes provides or maintains, at least temporarily, habitat for seabeach amaranth; immediately downstream, erosion usually destroys seabeach amaranth habitat. [...] In the long run, groins (if they are successful) stabilize upstream beach, allowing succession to perennials, rendering even the upstream side only marginally suitable for seabeach amaranth (USFWS 1996b). In addition to these problems, “jetties and terminal groins may prevent the movement of seabeach amaranth seeds along the beach (by blocking blowing sand) or in the water (by affecting longshore current at the micro level” (USFWS 2007). According to the SEIS, seabeach amaranth has been documented on Figure 8 Island in six of the nine years from 2002-2010; no plants were found in 2008 and 2009, and no data was collected in 2006 (p. 161). As many as 768 plants were found on the island during those years, and plants were located within the permit area in 2002, 2003, 2004, 2005, and 2010 (p. 162-170). The SEIS presents no data from 2011-2015. In the early to mid-2000s the spit at the north end eroded and was replaced with intertidal shoals. It was following 2011 that the north end of Figure 8 Island again transitioned from a shoal complex to an attached spit that remained emergent more regularly than the shoals, creating dry, sandy habitat that seabeach amaranth colonizes. Since recent, relevant data was lacking, we surveyed from the north end of Figure 8 Island. We found 262 seabeach amaranth plants, concentrated in the area north of the location proposed for a terminal groin in Alternative 5D. The SEIS mischaracterizes the impacts that the alternatives would have on seabeach amaranth. Regarding impacts to seabeach amaranth from Alternative 2, the SEIS states: Seabeach amaranth prefers overwash flats at accreting ends of islands and lower foredunes and upper strands of non-eroding beaches; these preferred habitats are located on the middle and southern portions of Figure Eight Island. As mentioned in Chapter 4, seabeach amaranth is an effective sand binder, building dunes where it grows. Due to lack of long-term protection against storm influenced damage, negative cumulative impacts to the dune-stabilizing seabeach amaranth, and subsequently the dune communities at Figure Eight Island in general, are expected (p 294). Seabeach amaranth’s preferred habitats are found in some years along the length of Figure 8 Island, as demonstrated by its distribution in 2004 and 2005 (p. 164-165). However, as can be seen in Figure 6, it also prefers accreting ends of islands, which is habitat the construction of a terminal groin would remove. Second, storms are natural events that can create or maintain
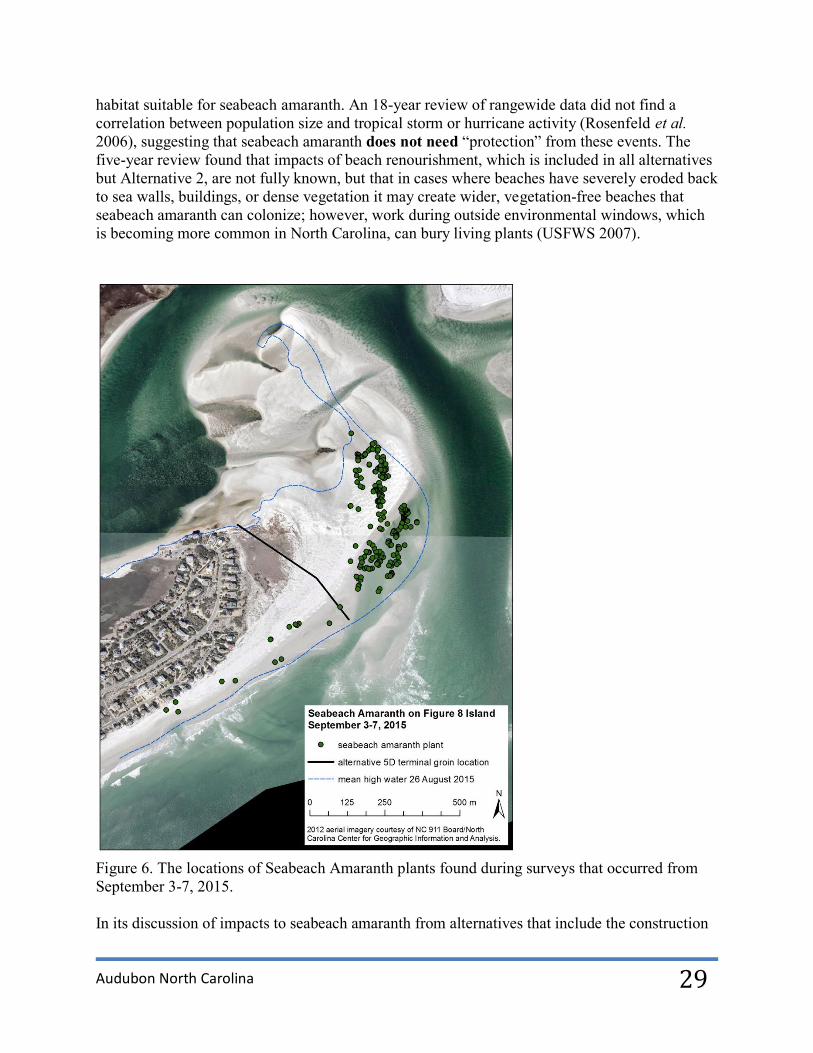
Audubon North Carolina
29
habitat suitable for seabeach amaranth. An 18-year review of rangewide data did not find a correlation between population size and tropical storm or hurricane activity (Rosenfeld et al. 2006), suggesting that seabeach amaranth does not need “protection” from these events. The five-year review found that impacts of beach renourishment, which is included in all alternatives but Alternative 2, are not fully known, but that in cases where beaches have severely eroded back to sea walls, buildings, or dense vegetation it may create wider, vegetation-free beaches that seabeach amaranth can colonize; however, work during outside environmental windows, which is becoming more common in North Carolina, can bury living plants (USFWS 2007).
Figure 6. The locations of Seabeach Amaranth plants found during surveys that occurred from September 3-7, 2015. In its discussion of impacts to seabeach amaranth from alternatives that include the construction
Audubon North Carolina
30
of a terminal groin, the SEIS attempts to compensate for the loss of a natural inlet spit and associated dry sandy habitat. For example: As discussed for Alternative 5B, the Delft3D 5-year model simulation for Alternative 5D indicated erosion is expected to occur on the north side of the terminal groin potentially affecting the habitat for nesting turtles, seabeach amaranth, and shorebirds. The location of the groin structure is situated near the transition point from oceanfront dry beach to inlet dry beach habitats, but is 420 feet closer to the inlet throat than Alternative 5B. The increased area of dry beach on the south side of the groin as a result of nourishment as well as the retention of sediment within the accretion fillet will result in positive indirect impacts including the increased habitat for nesting sea turtles, resting and nesting shorebirds, and seabeach amaranth (p. 433). It is not clear how much wide, vegetation-free beach would persist south of the terminal groin, as downdrift erosion is likely to cause narrowing of the oceanfront beach on Figure 8 Island. Further, the stabilization of the fillet adjacent to the terminal groin would result in vegetative succession and the likelihood that seabeach amaranth would be crowded out by other species. Therefore, the habitat lost by the removal of the spit would not be compensated for. In order to mitigate for potential impacts to seabeach amaranth, the SEIS proposes monitoring (p. 451). Monitoring in and of itself does not affect negative impacts, and no remedies are proposed if negative impacts should be detected. We are also concerned that the SEIS does not cite the recovery plan or status review for seabach amaranth and only cites the 1993 final rule for its listing in order to describe its colonization of dynamic, newly formed habitats (p. 161). Impacts on Sea Turtles: Threatened loggerhead sea turtles (Caretta caretta) nest along the length of North Carolina’s coast, including on Figure 8 Island, which is adjacent to the LOGG-N-04 critical habitat unit. Information on the impacts of hard structures to sea turtles is extremely limited, but the few studies that exist found negative impacts to sea turtles. Lamont and Houser (2014) documented that loggerhead turtle nest site selection is dependent on nearshore characteristics, therefore any activity that alters the nearshore environment, such as the construction of groins or jetties, may impact loggerhead nest distribution. Loggerhead nesting activity decreased significantly in the presence of exposed pilings, and a 41% reduction in nesting occurred where pilings were present (Bouchard et al. 1998). In a study of the impact of coastal armoring structures on sea turtle nesting behavior, Mosier (1998) demonstrated that fewer turtles emerged onto beaches in front of seawalls than onto adjacent, non-walled beaches, and of those that did emerge in front of seawalls, more turtles returned to the water without nesting. Loggerhead sea turtle nests on North Carolina beaches increased in number as distance from hard structures including piers and terminal groins increased (Randall and Halls 2014). Studies in Florida have also found avoidance behavior and decreased hatching success associated with a managed inlet (Herren 1999). Beach renourishment also negatively impacts loggerhead sea turtle nesting. Renourishment can cause beach compaction, which can decrease loggerhead nesting success, alter nest chamber geometry, and alter nest concealment, and nourishment can create escarpments, which can
Audubon North Carolina
31
prevent turtles from reaching nesting areas (Crain et al. 1995). Nourishment can decrease survivorship of eggs and hatchlings by altering characteristics such as sand compaction, moisture content, and temperature of the sand (Leonard Ozan 2011), all of which are variables that can affect the proper development of eggs. The success of incubating eggs may be reduced when the sand grain size, density, shear resistance, color, gas diffusion rates, organic composition, and moisture content of the nourished sand is different from the natural beach sand (Nelson 1991). Negative impacts from beach renourishment include decreases in nesting activity and decreases in hatching success due to the use of incompatible material, sand compaction, and suboptimal beach profile (NMFS and USFWS 1991). Sea turtles may be impacted by construction on beaches or dredge equipment, especially when work takes place outside the environmental window for sea turtles. During the spring and summertime construction phase of the Bald Head Island terminal groin, an adult female was trapped inside the construction zone for one day and a nest was destroyed when it was dug up by construction equipment (Sarah Finn pers. com. 2015). Pipeline and other obstructions placed on the beach may obstruct hatchling emergences or impede their path to the ocean (NMFS and USFWS 1991). Hopper and cutterhead dredges may also kill sea turtles during dredge work (NMFS and USFWS 1991). The loggerhead sea turtle recovery plan emphasizes that the only beneficial impacts of nourishment are in cases where beaches are so highly eroded, there is “a complete absence of dry beach” (NMFS and USFWS 1991). Although the SEIS states that beach renourishment activities would take place outside of the sea turtle nesting season, in both 2014 and 2015 beach renourishment projects extended far into the nesting season exposing sea turtles not only to interference during nesting emergences but also to hazards from active dredges (NMFS and USFWS 1991). The possibility that beach renourishment will take place during nesting season is not discussed in the SEIS, although in addition to the now commonplace exceptions to the environmental windows, the CRC has actively been pursuing the expansion of the windows. The SEIS does not address the impacts to sea turtles should beach renourishment intervals turn out to be similar to those at other North Carolina inlets with hardened structures, rather than at the five-year intervals it forecasts. Nesting activity on nourished beaches decreased for one to three years following a nourishment event due to changes in the sand compaction, escarpment, and beach profile (NMFS and USFWS 1991, Steinitz et al. 1998, Trindell et al. 1998, Rumbold 2001, Brock et al. 2009). The SEIS also does not address the impacts to sea turtle nesting should Figure 8 Island experience downdrift erosion that would narrow the beach south of the groin where, as maps in the SEIS (p. 146-155) show, nesting occurs. Unlike the SEIS, the loggerhead recovery plan does include these negative impacts: “In preventing normal sand transport, these structures accrete updrift beaches while causing accelerated beach erosion downdrift of the structures [groins and jetties] (Komar 1983, Pilkey et al. 1984, National Research Council 1987), a process that results in degradation of sea turtle nesting habitat” (NMFS and USFWS 1991). Finally, the SEIS does not cite the recovery plan or the status review for the Threatened loggerhead sea turtle. Such documents are blueprints for conservation of listed species, and we are seriously concerned that the SEIS apparently overlooked and does not cite these documents.
Audubon North Carolina
32
Impact on Fishes: No mention of direct or indirect mortality or other impacts on fishes was made in the SEIS other than acknowledging that increased turbidity would clog fish gills. Fishes would be negatively impacted by the construction of a terminal groin and the subsequent beach nourishment projects at Rich Inlet in the following ways: 1) the groin would interrupt larval transport through the inlet, therefore impacting recruitment; 2) the native fish community would be replaced with a completely different structure-associated fish community; and 3) surf zone fishes would suffer from direct mortality. Hard structures reduce the successful passage of fish larvae from the open ocean to the estuarine nurseries they inhabit until reaching maturity (Hettler and Barker 1993, Pilkey et al. 1998). Inlets are critical pathways for adult fishes to get to offshore spawning sites and larvae immigrate through inlets to get to estuarine nurseries (Able et al. 2010). Many surf zone fishes are larval and juvenile individuals that benefit from the shallow water nursery habitat because it provides refuge from predators and foraging areas (Layman 2000). Due to their early weak swimming ontogenetic stage, fish larvae are not adapted for high mobility in response to habitat burial or increased turbidity levels. Studies have shown that beach nourishment degrades the important swash-zone feeding habitat for both probing shorebirds and demersal surf fishes (Quammen 1982, Manning et al. 2013, VanDusen et al. 2014). Surf habitats with hardened structures typically support a different community of fishes and benthic prey. Impacted species would include Atlantic menhaden, striped anchovy, bay anchovy, rough silverside, Atlantic silverside, Florida pompano, spot, Gulf kingfish, and striped mullet. Florida pompano and Gulf kingfish use the surf zone almost exclusively as a juvenile nursery area and as juveniles, they are rarely found outside the surf zone (Hackney et al. 1996). The dominant benthic prey for pompano and kingfish were coquina clams (Donax) and mole crabs (Emerita). Despite the fact that fishes in the surf zone are adapted to a high energy environment, rapid changes in their habitat can still cause mortality and other negative impacts. There are documented negative impacts of renourishment on some of the invertebrates (especially mole crabs and coquinas) that are major foods of the fishes (Reilly 1978, Baca et al. 1991); therefore, negative impacts could be indirectly transferred to the surf zone fish community. Manning et al. (2013) states: Beach nourishment can degrade the intertidal and shallow subtidal foraging habitats for demersal surf fishes by three major processes: (1) inducing mass mortality of macrobenthic infaunal prey through rapid burial by up to 1 m or more of dredged fill materials; (2) modifying the sedimentology of these beach zones through filling with excessive proportions of coarse, often shelly sediments that are incompatible with habitat requirements of some important benthic invertebrates, such as beach bivalves; and (3) incorporating into the beach fill excessive quantities of fine sediments in silt and clay sizes, which can induce higher near-shore turbidity during periods of erosion as onshore winds or distant storms generate wave action, thereby inhibiting detection of prey by visually orienting fishes. The opinion repeated in many environmental impact statements and environmental assessments that marine benthic invertebrates of ocean beach habitats are well adapted to surviving the sediment deposition of beach nourishment because of evolutionary experience with frequent erosion and deposition events associated with intense storms and high waves is unsupportable. A recent review of the
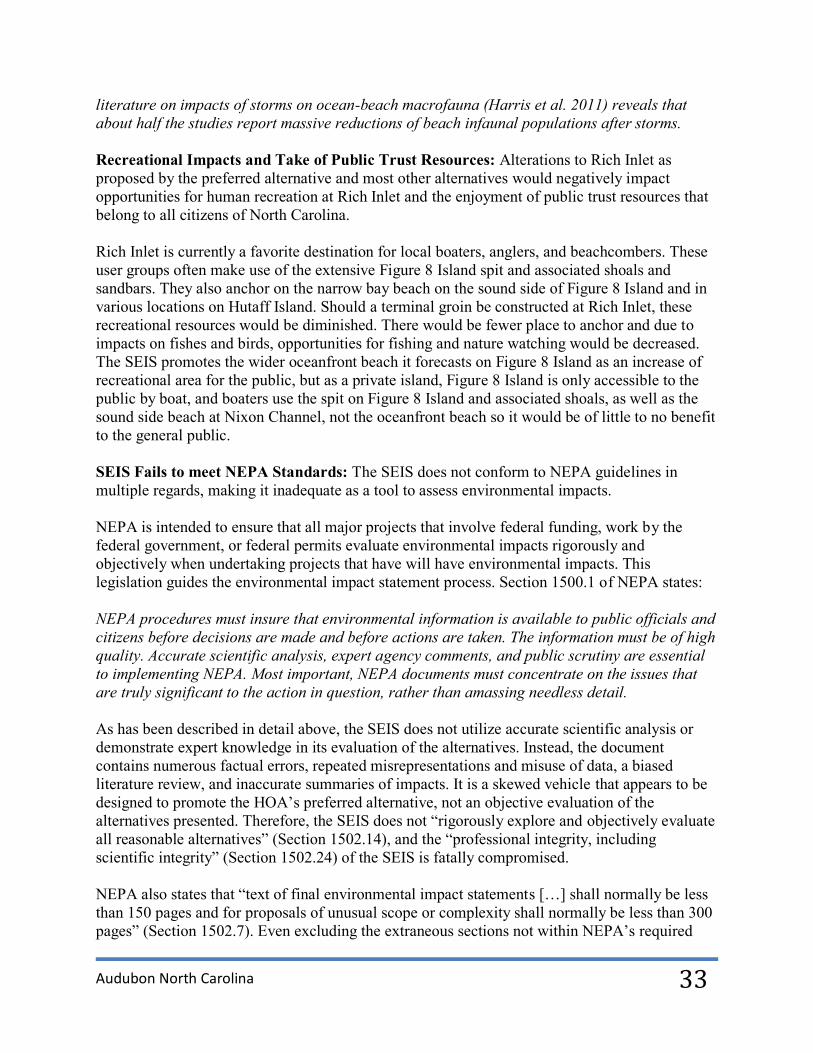
Audubon North Carolina
33
literature on impacts of storms on ocean-beach macrofauna (Harris et al. 2011) reveals that about half the studies report massive reductions of beach infaunal populations after storms. Recreational Impacts and Take of Public Trust Resources: Alterations to Rich Inlet as proposed by the preferred alternative and most other alternatives would negatively impact opportunities for human recreation at Rich Inlet and the enjoyment of public trust resources that belong to all citizens of North Carolina. Rich Inlet is currently a favorite destination for local boaters, anglers, and beachcombers. These user groups often make use of the extensive Figure 8 Island spit and associated shoals and sandbars. They also anchor on the narrow bay beach on the sound side of Figure 8 Island and in various locations on Hutaff Island. Should a terminal groin be constructed at Rich Inlet, these recreational resources would be diminished. There would be fewer place to anchor and due to impacts on fishes and birds, opportunities for fishing and nature watching would be decreased. The SEIS promotes the wider oceanfront beach it forecasts on Figure 8 Island as an increase of recreational area for the public, but as a private island, Figure 8 Island is only accessible to the public by boat, and boaters use the spit on Figure 8 Island and associated shoals, as well as the sound side beach at Nixon Channel, not the oceanfront beach so it would be of little to no benefit to the general public. SEIS Fails to meet NEPA Standards: The SEIS does not conform to NEPA guidelines in multiple regards, making it inadequate as a tool to assess environmental impacts. NEPA is intended to ensure that all major projects that involve federal funding, work by the federal government, or federal permits evaluate environmental impacts rigorously and objectively when undertaking projects that have will have environmental impacts. This legislation guides the environmental impact statement process. Section 1500.1 of NEPA states: NEPA procedures must insure that environmental information is available to public officials and citizens before decisions are made and before actions are taken. The information must be of high quality. Accurate scientific analysis, expert agency comments, and public scrutiny are essential to implementing NEPA. Most important, NEPA documents must concentrate on the issues that are truly significant to the action in question, rather than amassing needless detail. As has been described in detail above, the SEIS does not utilize accurate scientific analysis or demonstrate expert knowledge in its evaluation of the alternatives. Instead, the document contains numerous factual errors, repeated misrepresentations and misuse of data, a biased literature review, and inaccurate summaries of impacts. It is a skewed vehicle that appears to be designed to promote the HOA’s preferred alternative, not an objective evaluation of the alternatives presented. Therefore, the SEIS does not “rigorously explore and objectively evaluate all reasonable alternatives” (Section 1502.14), and the “professional integrity, including scientific integrity” (Section 1502.24) of the SEIS is fatally compromised. NEPA also states that “text of final environmental impact statements […] shall normally be less than 150 pages and for proposals of unusual scope or complexity shall normally be less than 300 pages” (Section 1502.7). Even excluding the extraneous sections not within NEPA’s required
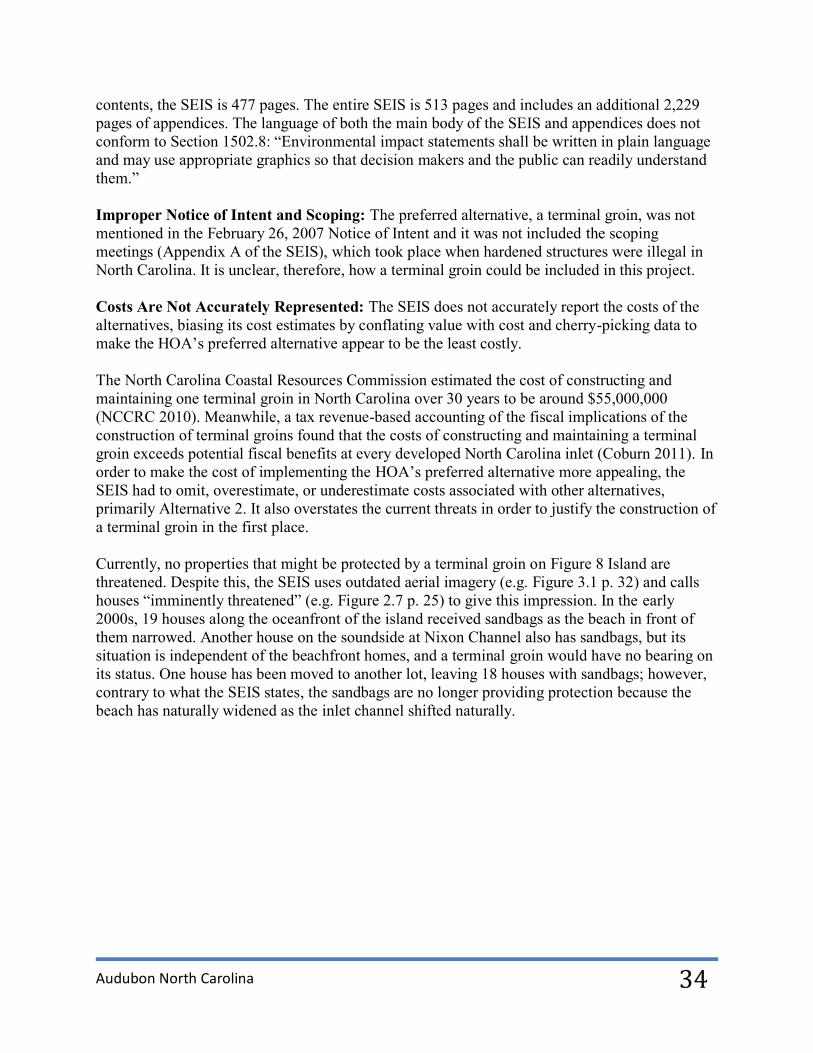
Audubon North Carolina
34
contents, the SEIS is 477 pages. The entire SEIS is 513 pages and includes an additional 2,229 pages of appendices. The language of both the main body of the SEIS and appendices does not conform to Section 1502.8: “Environmental impact statements shall be written in plain language and may use appropriate graphics so that decision makers and the public can readily understand them.” Improper Notice of Intent and Scoping: The preferred alternative, a terminal groin, was not mentioned in the February 26, 2007 Notice of Intent and it was not included the scoping meetings (Appendix A of the SEIS), which took place when hardened structures were illegal in North Carolina. It is unclear, therefore, how a terminal groin could be included in this project. Costs Are Not Accurately Represented: The SEIS does not accurately report the costs of the alternatives, biasing its cost estimates by conflating value with cost and cherry-picking data to make the HOA’s preferred alternative appear to be the least costly. The North Carolina Coastal Resources Commission estimated the cost of constructing and maintaining one terminal groin in North Carolina over 30 years to be around $55,000,000 (NCCRC 2010). Meanwhile, a tax revenue-based accounting of the fiscal implications of the construction of terminal groins found that the costs of constructing and maintaining a terminal groin exceeds potential fiscal benefits at every developed North Carolina inlet (Coburn 2011). In order to make the cost of implementing the HOA’s preferred alternative more appealing, the SEIS had to omit, overestimate, or underestimate costs associated with other alternatives, primarily Alternative 2. It also overstates the current threats in order to justify the construction of a terminal groin in the first place. Currently, no properties that might be protected by a terminal groin on Figure 8 Island are threatened. Despite this, the SEIS uses outdated aerial imagery (e.g. Figure 3.1 p. 32) and calls houses “imminently threatened” (e.g. Figure 2.7 p. 25) to give this impression. In the early 2000s, 19 houses along the oceanfront of the island received sandbags as the beach in front of them narrowed. Another house on the soundside at Nixon Channel also has sandbags, but its situation is independent of the beachfront homes, and a terminal groin would have no bearing on its status. One house has been moved to another lot, leaving 18 houses with sandbags; however, contrary to what the SEIS states, the sandbags are no longer providing protection because the beach has naturally widened as the inlet channel shifted naturally.

Audubon North Carolina
35
Figure 7. Houses with sandbags on the north end of Figure 8 Island. In order to lower projected costs of beach fill activities, the SEIS optimistically forecasts five-year intervals for beach renourishment events following the installation of a terminal groin. Beaches near Fort Macon and Oregon Inlet require renourishment at more frequent intervals than the SEIS predicts, and nearby Wrightsville Beach and the south end of Figure 8 Island receive sand every three or four years. Using the SEIS’s cost per nourishment, shorter beach fill intervals would increase costs by $2.5 to $3 million per event, or over $10 million over a 30-year period, greatly increasing the cost of a terminal groin. Further, in Tables 3.11a and 3.11b (p. 96), the SEIS states that there will be a $0 cost for long-term erosion damages for Alternatives 3-5D. A zero dollar amount in the Long-Term Erosion Damages & Response Cost column is inaccurate, given the downdrift effects of terminal groins. Potential damage to properties from downdrift erosion is not discussed in the SEIS. Fenster and Dolan (1996) found an area of inlet influence between 5.4 km and 13.0 km, and Riggs and Ames (2011) found increased rates of erosion over 6 miles (9.6 km) south of Oregon Inlet following
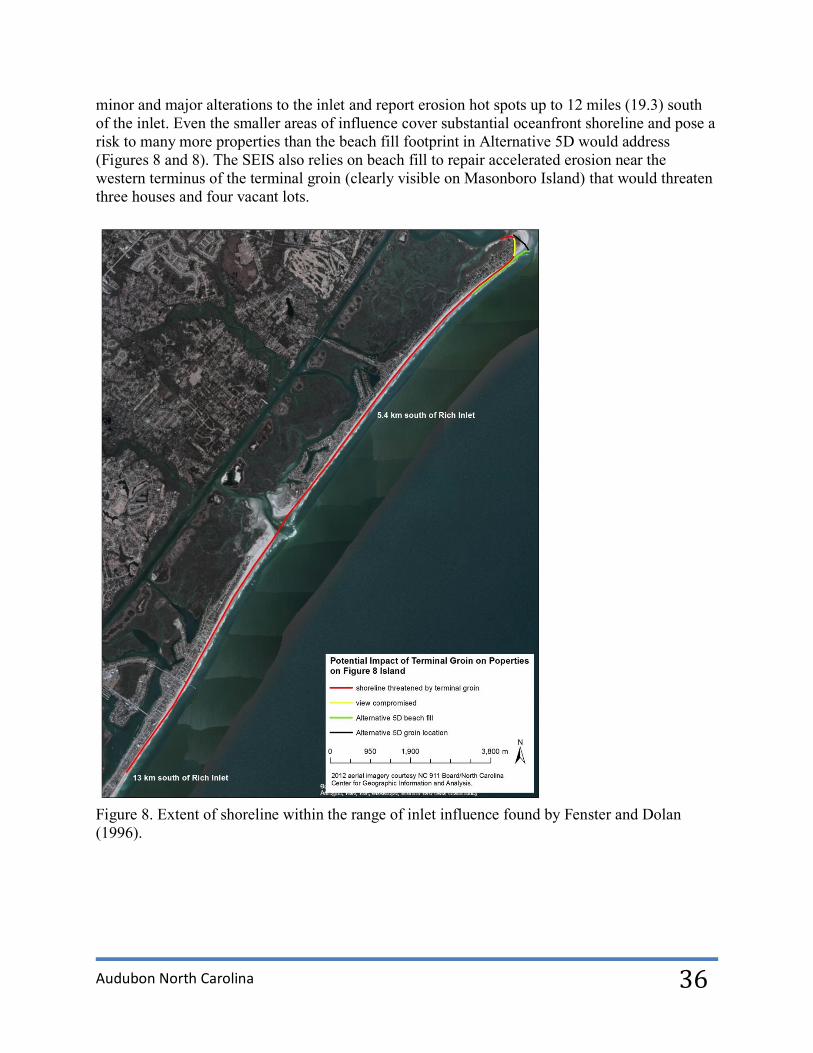
Audubon North Carolina
36
minor and major alterations to the inlet and report erosion hot spots up to 12 miles (19.3) south of the inlet. Even the smaller areas of influence cover substantial oceanfront shoreline and pose a risk to many more properties than the beach fill footprint in Alternative 5D would address (Figures 8 and 8). The SEIS also relies on beach fill to repair accelerated erosion near the western terminus of the terminal groin (clearly visible on Masonboro Island) that would threaten three houses and four vacant lots.
Figure 8. Extent of shoreline within the range of inlet influence found by Fenster and Dolan (1996).

Audubon North Carolina
37
Figure 9. Potentially impacted shoreline on the north end of Figure 8 Island. The SEIS vastly overstates the risks associated with its non-preferred alternatives. For example, the SEIS uses atypical worst-case erosion rates to assume that 40 houses will be at risk over the next 30 years—over twice as many more than the 19 oceanfront homes that received sandbags when the beach was in its narrowest condition—and that all but 10 of the 40 would be demolished instead of relocated (p. 34). However, even its own consultant’s report (Appendix B, Sub-appendix A) found that from 1938-2007, on Figure 8 Island, “net progradation has characterized the past seven decades of oceanfront shoreline change” (p. 56). Therefore, it is also possible that no houses would have to be moved or demolished in the next 30 years. What is most likely, however, is that some houses would eventually need to be moved in response to natural barrier island shoreline change. Though the SEIS does not consistently report the number of unbuilt lots available on Figure 8 Island—80 or 93—with scores of lots available, 76 of which are waterfront (p. 33), if a future change at the inlet necessitates relocating, lots could be purchased without much trouble.
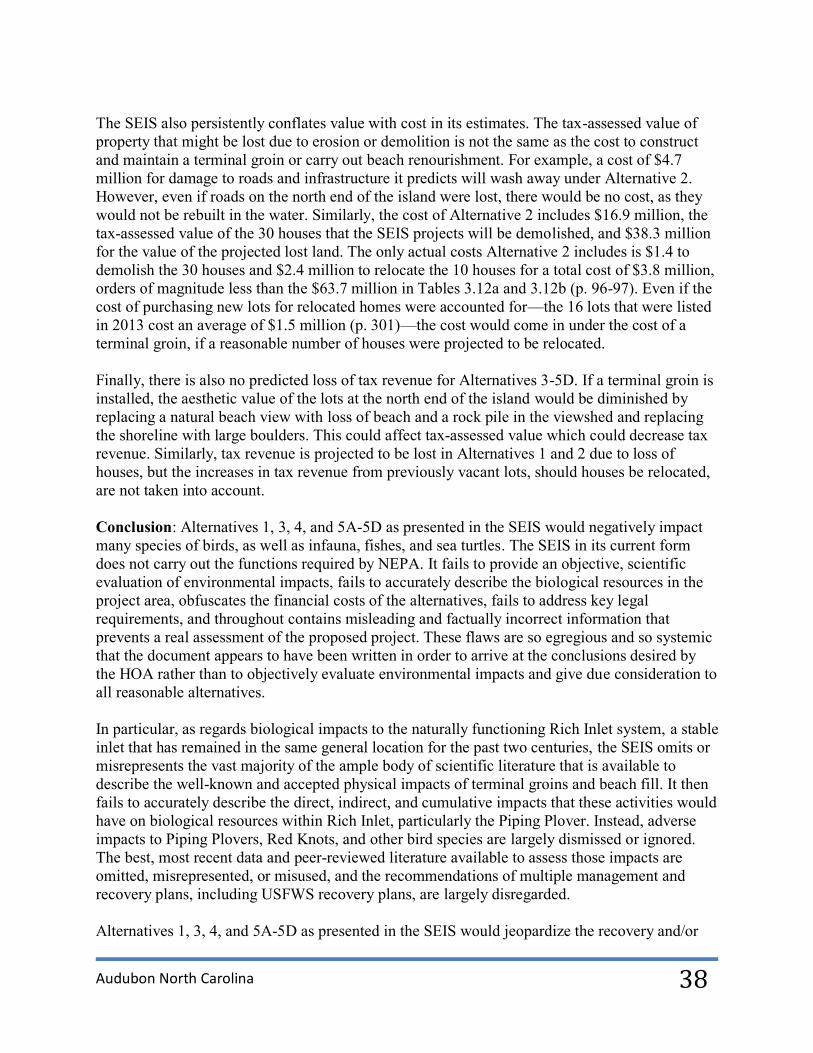
Audubon North Carolina
38
The SEIS also persistently conflates value with cost in its estimates. The tax-assessed value of property that might be lost due to erosion or demolition is not the same as the cost to construct and maintain a terminal groin or carry out beach renourishment. For example, a cost of $4.7 million for damage to roads and infrastructure it predicts will wash away under Alternative 2. However, even if roads on the north end of the island were lost, there would be no cost, as they would not be rebuilt in the water. Similarly, the cost of Alternative 2 includes $16.9 million, the tax-assessed value of the 30 houses that the SEIS projects will be demolished, and $38.3 million for the value of the projected lost land. The only actual costs Alternative 2 includes is $1.4 to demolish the 30 houses and $2.4 million to relocate the 10 houses for a total cost of $3.8 million, orders of magnitude less than the $63.7 million in Tables 3.12a and 3.12b (p. 96-97). Even if the cost of purchasing new lots for relocated homes were accounted for—the 16 lots that were listed in 2013 cost an average of $1.5 million (p. 301)—the cost would come in under the cost of a terminal groin, if a reasonable number of houses were projected to be relocated. Finally, there is also no predicted loss of tax revenue for Alternatives 3-5D. If a terminal groin is installed, the aesthetic value of the lots at the north end of the island would be diminished by replacing a natural beach view with loss of beach and a rock pile in the viewshed and replacing the shoreline with large boulders. This could affect tax-assessed value which could decrease tax revenue. Similarly, tax revenue is projected to be lost in Alternatives 1 and 2 due to loss of houses, but the increases in tax revenue from previously vacant lots, should houses be relocated, are not taken into account. Conclusion: Alternatives 1, 3, 4, and 5A-5D as presented in the SEIS would negatively impact many species of birds, as well as infauna, fishes, and sea turtles. The SEIS in its current form does not carry out the functions required by NEPA. It fails to provide an objective, scientific evaluation of environmental impacts, fails to accurately describe the biological resources in the project area, obfuscates the financial costs of the alternatives, fails to address key legal requirements, and throughout contains misleading and factually incorrect information that prevents a real assessment of the proposed project. These flaws are so egregious and so systemic that the document appears to have been written in order to arrive at the conclusions desired by the HOA rather than to objectively evaluate environmental impacts and give due consideration to all reasonable alternatives. In particular, as regards biological impacts to the naturally functioning Rich Inlet system, a stable inlet that has remained in the same general location for the past two centuries, the SEIS omits or misrepresents the vast majority of the ample body of scientific literature that is available to describe the well-known and accepted physical impacts of terminal groins and beach fill. It then fails to accurately describe the direct, indirect, and cumulative impacts that these activities would have on biological resources within Rich Inlet, particularly the Piping Plover. Instead, adverse impacts to Piping Plovers, Red Knots, and other bird species are largely dismissed or ignored. The best, most recent data and peer-reviewed literature available to assess those impacts are omitted, misrepresented, or misused, and the recommendations of multiple management and recovery plans, including USFWS recovery plans, are largely disregarded. Alternatives 1, 3, 4, and 5A-5D as presented in the SEIS would jeopardize the recovery and/or

Audubon North Carolina
39
persistence of the Great Lakes breeding population of Piping Plover, the Atlantic coast breeding population of Piping Plover, Seabeach Amaranth, and Red Knot; and a terminal groin would permanently eliminate habitats for these species listed under the Endangered Species Act without any chance of restoration or reformation in other areas. Alternatives 1, 3, 4, and 5A-5D as presented in the SEIS would jeopardize state populations of Least Terns, Black Skimmers, and American Oystercatchers, among other species. Lastly, the SEIS fails to acknowledge the human impacts: the impacts to public trust resources that belong to every citizen of North Carolina. The SEIS should be rejected by the permitting agencies and the alternatives that involve hard structures or channelization at Rich Inlet should be permanently removed from further consideration. Sincerely,
Walker Golder Deputy Director Todd Miller, North Carolina Coastal Federation Derb Carter, Southern Environmental Law Center

Audubon North Carolina
40
Audubon North Carolina
41
Literature Cited Able, K.W., Wilber, D.H., Muzeni-Corino, A., and Clarke, D.G. 2010. Spring and Summer
Larval Fish Assemblages in the Surf Zone and Nearshore off Northern New Jersey, USA. Estuaries and Coasts, 33: 211-222.
Addison, L. and McIver, T. 2014. Rich Inlet Bird Surveys, 2008-2014: Preliminary Summary
Results. Audubon North Carolina Report. 26 p. Baca, B.J., Dodge, R.E., and Mattison, C. 1991. Predicting Environmental Impacts from Beach
Nourishment Projects. Proceedings of the 4th National Beach Preservation Technical Conference. Florida Shore and Beach Preservation Association, Tallahassee, FL, 249-310.
Baker, A.J., Gonzalez, P.M., Piersma, T., Niles, L.J., Serrano do Nascimento, I., Atkinson, P.W., Clark, N.A., Minton, C.D.T., Peck, M.K., and Aarts, G. 2004. Rapid Population Decline in Red Knots: Fitness Consequences of Decreased Refuelling Rates and Late Arrival in Delaware Bay. Proceedings of the Royal Society of London, 271: 875-882.
Baker, A., Gonzalez, P., Morrison, R.I.G., and Harrington, B.A. 2013. Red Knot (Calidris
canutus), The Birds of North America Online (A. Poole, Ed.). Ithaca: Cornell Lab of Ornithology; Retrieved from the Birds of North America Online: http://bna.birds.cornell.edu/bna/species/563
Basco, D.R. 2006. Seawall Impacts on Adjacent Beaches: Separating Fact from Fiction. Journal
of Coastal Research, SI 39: 741-744. Basco, D.R. and Pope, J. 2004. Groin Functional Design Guidance from the Coastal Engineering
Manual. Journal of Coastal Research, SI 33: 121-130. Berry, A., Fahey, S., and Meyers, N. 2013. Changing of the Guard: Adaptation Options that
Maintain Ecologically Resilient Sandy Beach Ecosystems. Journal of Coastal Research, 29(4): 899-908.
Bertasi, F., Colangelo, M.A., Abbiati, M., and Ceccherelli, V.U. 2007. Effects of an Artificial
Protection Structure on the Sandy Shore Macrofaunal Community: The Special Case of Lido di Dante (Northern Adriatic Sea). Hydrobiologia, 586: 277-290.
Bishop, M.J., Peterson, C.H., Summerson, H.C., Lenihan, H.S., and Grabowski, J.H. 2006.
Deposition and Long-Shore Transport of Dredge Spoils to Nourish Beaches: Impacts on Benthic Infauna of an Ebb-Tidal Delta. Journal of Coastal Research, 22(3): 530-546.
Bouchard, S., Moran K., Tiwari, M., Wood, D., Bolten, A., Eliazar, P, and Bjorndal, K. 1998. Effects of Exposed Pilings on Sea Turtle Nesting Activity at Melbourne Beach, Florida. Journal
of Coastal Research, 14(4): 1343-1347.

Audubon North Carolina
42
Brown, S., Hickey, C., Harrington, B., and Gill, R. 2001. United States Shorebird Conservation Plan. Manomet Center for Conservation Sciences. 64 p.
Brown, A.C. and McLachlan, A. 2002. Sandy Shore Ecosystems and the Threats Facing Them:
Some Predictions for the Year 2025. Environmental Conservation, 29(1): 62-77. Brault, S. 2007. Population Viability Analysis for the New England Population of the Piping
Plover (Charadrius melodus). Report 5.3.2-4. Prepared for Cape Wind Associates, L.L.C., Boston, Massachusetts.
Brock, K.A., Reece, J.S., and Ehrhart, L.M. 2009. The Effects of Artificial Beach Nourishment
on Marine Turtles: Differences between Loggerhead and Green Turtles. Restoration Ecology, 17(2): 297-307.
Bruun, P. 1995. The Development of Downdrift Erosion. Journal of Coastal Research, 11(4):
1242-1257. Burger, J. 1984. Colony Stability in Least Terns. The Condor, 86: 61-67. Cahoon, L.B., Carey, E.S., and Blum, J.E. 2012. Benthic Microalgal Biomass on Ocean Beaches:
Effects of Sediment Grain Size and Beach Renourishment. Journal of Coastal Research, 28(4): 853-859.
Calvert, A.M., Amirault, D.L., Shaffer, F., Elliot, R., Hanson, A., McKnight, J., and Taylor, P.D.
2006. Population Assessment of an Endangered Shorebird: The Piping Plover (Charadrius melodus melodus) in Eastern Canada. Avian Conservation and Ecology, 1(3): 4.
Cleary, W.J. and Marden, T.P. 1999. Shifting Shorelines: A Pictorial Atlas of North Carolina’s
Inlets, NC Sea Grant Program Publication No. UNC-SG-99-04, Raleigh, NC. 51 p. Cleary, W.J. and Pilkey, O.H. 1996. Environmental Coastal Geology: Cape Lookout to Cape
Fear, North Carolina, Regional Overview. In: Environmental Coastal Geology: Cape Lookout to Cape Fear, NC. Cleary, W.J., (ed), Carolina Geological Society Field Guidebook: 73-107.
Coburn, A.S. 2011. A Fiscal Analysis of Shifting Inlets and Terminal Groins in North
Carolina.Available online at http://coastalcare.org/2011/01/a-fiscal-analysis-of-shifting-inlets-andterminal-groins-in-north-carolina/.
Cohen, J.B., Karpanty, S.M., Catlin, D.H., Fraser, J.D., and Fischer, R.A. 2008. Winter Ecology
of Piping Plovers at Oregon Inlet, North Carolina. Waterbirds, 31: 472-479. Colosio, F., Abbiati, M., and Airoldi, L. 2007. Effects of Beach Nourishment on Sediments and
Benthic Assemblages. Marine Pollution Bulletin, 54: 1197-1206.

Audubon North Carolina
43
Colwell, M.A. 2010. Shorebird Ecology, Conservation and Management. University of California Press, Berkeley, USA. 344 p.
Corbat, C.A. and Bergstrom, P.W. 2000. Wilson's Plover (Charadrius wilsonia), The Birds of
North America Online (A. Poole, Ed.). Ithaca: Cornell Lab of Ornithology; Retrieved from the Birds of North America Online: http://bna.birds.cornell.edu/bna/species/516
Crain, D.A., Bolten, A.B., and Bjorndal, K.A. 1995. Effects of Beach Nourishment on Sea
Turtles: Review and Research Initiatives. Restoration Ecology, 3(2): 95-104. Culver, S.J., Ames, D.V., Reide Corbett, D., Mallison, D.J., Riggs, S.R., Smith, C.G., and Vance,
D.J. 2006. Foraminiferal and Sedimentary Record of Late Holocene Barrier Island Evolution, Pea Island, North Carolina: The Role of Storm Overwash, Inlet Processes, and Anthropogenic Modification. Journal of Coastal Research, 22(4): 836-846.
Culver, S.J., Grand Pre, C.A., Mallinson, D.J., Riggs, S.R., Corbett, D.R., Foley, J., Male, M.,
Ricardo, J., Rosenberger, J., Smith, C.G., Smith, C.W., Snyder, S.W., Twamley, D., Farrell, K., and Horton, B.P. 2007. Late Holocene Barrier Island Collapse: Outer Banks, North Carolina, U.S.A. The Sedimentary Record, 5(4): 4-8.
Dias, M.P., Granadeiro, J.P., Lecoq, M., Santos, C.D., and Palmeirim, J.M. 2006. Distance to
High-tide Roosts Constrains the Use of Foraging Areas by Dunlins: Implications for the Management of Estuarine Wetlands. Biological Conservation, 131(3): 446-452.
Dolan, R., Donogue, C., and Stewart, D. 2006. Long-term Impacts of Tidal Inlet Bypassing on
the Swash Zone Filter Feeder Emerita talpoida Oregon Inlet and Pea Island, North Carolina. Shore and Beach, 74(1): 23-27.
Drake, K.R., Thompson, J.E., and Drake, K.L. 2001. Movements, Habitat Use, and Survival of
Nonbreeding Piping Plovers. The Condor, 103: 259-267. Dugan, J.E. and Hubbard, D.M. 2006. Ecological Responses to Coastal Armoring on Exposed
Sandy Beaches. Shore and Beach, 74(1): 10-16. Dugan, J.E., Hubbard, D.M., Rodil, I.F., Revell, D.L., and Schroeter, S. 2008. Ecological Effects
of Coastal Armoring on Sandy Beaches. Marine Ecology, 29(Suppl. 1): 160-170. Elliott-Smith, E. and Haig, S.M. 2004. Piping Plover (Charadrius melodus), The Birds of North
America Online (A. Poole, Ed.). Ithaca: Cornell Lab of Ornithology; Retrieved from the Birds of North America Online: http://bna.birds.cornell.edu/bna/species/002
Ells, K. and Murray, A.B. 2012. Long-term, Non-local Coastline Responses to Local Shoreline
Stabilization. Geophysical Research Letters, 39: L19401. Fenster, M. and Dolan, R. 1996. Assessing the Impact of Tidal Inlets on Adjacent Barrier Island
Shorelines. Journal of Coastal Research, 12(1): 294-310.
Audubon North Carolina
44
Fernández, G., Buchanan, J.B., Gill, R.E., Jr., Lanctot, R., and Warnock, N. 2010. Conservation
Plan for Dunlin with Breeding Populations in North America (Calidris alpina arcticola, C. a. pacifica, and C. a. hudsonia), Version 1.1. Manomet Center for Conservation Sciences, Manomet, Massachusetts.
Fernández, G., de la Cueva, H., Warnock, N., and Lank, D.B. 2003. Apparent Survival Rates of
Western Sandpiper (Calidris mauri) Wintering in Northwest Baja California, Mexico. Auk, 120: 55-61.
French, P.W. 2001. Coastal Defences: Processes, Problems and Solutions. Routledge, London.
388 p. Galgano, F.A., Jr. 2004. Long-term Effectiveness of a Groin and Beach Fill System: A Case
Study Using Shoreline Change Maps. Journal of Coastal Research, SI 33: 3-18. Gilstrap, Z., Addison, L., and Golder, W. 2013. Mason Inlet Waterbird Habitat Management
Area 2013 Nesting Season and Project Summary. Audubon North Carolina Report. 17 p. Gittman, R.K., Bruno, J.F., Currin, C.A., Fodrie, F.J., Keller, D.A., Charles H. Peterson, C.H.,
Piehler, M.F., Popowich, A.M. 2015. The Living Shoreline Approach as an Alternative to Shoreline Hardening: Implications for the Ecology and Ecosystem Service Delivery of Salt Marshes. 100th Ecological Society of America Annual Meeting (August 9-14, 2015), Baltimore, MD, Abstract OOS 77-5.
Gochfeld, M. and Burger, J. 1994. Black Skimmer (Rynchops niger), The Birds of North
America Online (A. Poole, Ed.). Ithaca: Cornell Lab of Ornithology; Retrieved from the Birds of North America Online: http://bna.birds.cornell.edu/bna/species/108
Golder, W. and Smalling, C. 2011. Important Bird Areas of North Carolina 2010 Edition.
Audubon North Carolina. 153 p. Gratto-Trevor, C., Amirault-Langlais, D., Catlin, D., Cuthbert, F., Fraser, J., Maddock, S.,
Roche, E.A., and Shaffer, F. 2009. Winter Distribution of Four Different Piping Plover Breeding Populations. Report to U.S. Fish and Wildlife Service. 11 p.
Greene, K. 2002. Beach Nourishment: A Review of the Biological and Physical Impacts.
Washington (DC): Atlantic States Marine Fisheries Commission. ASMFC Habitat Management Series No. 7. 174 p.
Hackney, C.T. and Cleary, W.J. 1987. Saltmarsh Loss in Southeastern North Carolina Lagoons:
Importance of Sea Level Rise and Inlet Dredging. Journal of Coastal Research, 3: 93-97. Hackney, C.T., Posey, M.H., Ross, S.W., and Norris, A.R. 1996. A Review and Synthesis of
Data on Surf Zone Fishes and Invertebrates in the South Atlantic Bight and the Potential Impacts from Beach Nourishment. Prepared for U.S. Army Corps of Engineers,

Audubon North Carolina
45
Wilmington District, Wilmington, NC. 111 p. Haig, S.M. and Oring, L.W. 1985. Distribution and Status of the Piping Plover Throughout the
Annual Cycle. Journal of Field Ornithology, 56(4): 334-345. Harrington, B.R. 2008. Coastal Inlets as Strategic Habitat for Shorebirds in the Southeastern
United States. DOER Technical Notes Collection. ERDC TN-DOER-E25. Vicksburg, MS: U.S. Army Engineer Research and Development Center, available at http://el.erdc.usace.army.mil/elpubs/pdf/doere25.pdf.
Hay, M.E. and Sutherland, J.P. 1988. The Ecology of Rubble Structures of the South Atlantic
Bight: A Community Profile. U.S. Fish and Wildlife Service Biological Report 85(7.20). 67 p.
Hayden, B. and Dolan, R. 1974. Impact of Beach Nourishment on Distribution of Emerita
talpoida, the Common Mole Crab. Journal of the Waterways, Harbors and Coastal Engineering Division, 100: 123-132.
Herren, R.M. 1999. The Effect of Beach Nourishment on Loggerhead (Caretta caretta)Nesting
and Reproductive Success at Sebastian Inlet, Florida. M.S. Thesis. University of Central Florida. 150 p.
Hettler, W.F., Jr. and Barker, D.L. 1993. Distribution and Abundance of Larval Fishes at Two
North Carolina Inlets. Estuarine, Coastal and Shelf Science, 37: 161-179. Jaramillo, E., Croker, R.A., and Hatfield, E.B. 1987. Long-term Structure, Disturbance, and
Recolonization of Macroinfauna in a New Hampshire Sand Beach. Canadian Journal of Zoology, 65: 3024-3031.
Johnson, C.M. and Baldassarre, G.A. 1988. Aspects of the Wintering Ecology of Piping Plovers
in Coastal Alabama. Wilson Bulletin, 100: 214-223. Kisiel, C.L. 2009a. The Spatial and Temporal Distribution of Piping Plovers in New Jersey:
1987-2007. M.S. Thesis. New Brunswick, New Jersey, The State University of New Jersey, Rutgers. 75 p.
Kisiel, C.L. 2009b. The Role of Inlets in Piping Plover Nest Site Selection in New Jersey 1987-
2007. New Jersey Birds, 35(3): 45-52. Knapp, K. 2012. Impacts of Terminal Groins on North Carolina’s Coasts. M.E.M. Thesis.
Durham, North Carolina, Duke University. 49 p. Komar, P.D. 1998. Beach Processes and Sedimentation. Prentice-Hall, Inc., Upper Saddle River,
New Jersey. 544 p. Kraus, N.C., Hanson, H., and Blomgren, S.H. 1994. Modern Functional Design of Groin
Audubon North Carolina
46
Systems. Proceedings of the 24th International Conference on Coastal Engineering, American Society of Civil Engineers: New York, 1327-1342.
Lamont, M.M. and Houser, C. 2014. Spatial Distribution of Loggerhead Turtle (Caretta caretta)
Emergences along a Highly Dynamic Beach in the Northern Gulf of Mexico. Journal of Experimental Marine Biology and Ecology, 453: 98-107.
Layman, C.A. 2000. Fish Assemblage Structure of the Shallow Ocean Surf-Zone on the Eastern
Shore of Virginia Barrier Islands. Estuarine, Coastal and Shelf Science, 51: 201-213. Leewis, L., van Bodegoma, P.M., Rozema, J., and Janssen, G.M. 2012. Does Beach
Nourishment Have Long-term Effects on Intertidal Macroinvertebrate Species Abundance? Estuarine, Coastal and Shelf Science, 113: 172-181.
Leonard Ozan, C.R. 2011. Evaluating the Effects of Beach Nourishment on Loggerhead Sea
Turtle (Caretta caretta) Nesting in Pinellas County, Florida. M.S. Thesis. Tampa, Florida, University of South Florida. 60 p.
Lowther, P.E., Douglas, H.D., III, and Gratto-Trevor, C.L. 2001. Willet (Tringa semipalmata),
The Birds of North America Online (A. Poole, Ed.). Ithaca: Cornell Lab of Ornithology; Retrieved from the Birds of North America Online: http://bna.birds.cornell.edu/bna/species/579
Macwhirter, B., Austin-Smith, P., Jr., and Kroodsma, D. 2002. Sanderling (Calidris alba), The
Birds of North America Online (A. Poole, Ed.). Ithaca: Cornell Lab of Ornithology; Retrieved from the Birds of North America Online: http://bna.birds.cornell.edu/bna/species/653
Maddock, S., Bimbi, M., and Golder, W. 2009. South Carolina Shorebird Project, Draft 2006-
2008 Piping Plover Summary Report. Audubon North Carolina and U.S. Fish and Wildlife Service, Charleston, South Carolina. 135 p.
Mallinson, D.J., Culver, S.J., Riggs, S.R., Walsh, J.P., Ames, D., and Smith, C.W. 2008. Past,
Present and Future Inlets of the Outer Banks Barrier Islands, North Carolina: A White Paper. East Carolina University, Greenville, North Carolina. 22 p.
Mallinson, D.J., Culver, S.J., Riggs, S.R., Thieler, E.R., Foster, D., Wehmiller, J., Farrell, K.M.,
and Pierson, J. 2010. Regional Seismic Stratigraphy and Controls on the Quaternary Evolution of the Cape Hatteras Region of the Atlantic Passive Margin, USA. Marine Geology, 268: 16-33.
Mallinson, D.A., Riggs, S.R., Thieler, E.R., Culver, S.J., Foster, D., Corbett, D.R., Farrell, K.,
and Wehmiller, J. 2005. Late Neogene Evolution of the Northeastern Coastal System: Filling the Northern Albemarle Sound. Marine Geology, 217: 97-117.
Manning, L.M., Peterson, C.H., and Bishop, M.J. 2014. Dominant Macrobenthic Populations
Audubon North Carolina
47
Experience Sustained Impacts from Annual Disposal of Fine Sediments on Sandy Beaches. Marine Ecology Progress Series, 508: 1-15.
Manning, L.M., Peterson, C.H., and Fegley, S.R. 2013. Degradation of Surf Fish Foraging
Habitat Driven by Sedimentological Modifications Caused by Beach Nourishment. Bulletin of Marine Science, 89: 83-106.
Maslo, B., Handel, S.N., and Pover, T. 2011. Restoring Beaches for Atlantic Coast Piping
Plovers (Charadrius melodus): A Classification and Regression Tree Analysis of Nest-Site Selection. Restoration Ecology, 19(201): 194-203.
McDougall, W.G., Sturtevant, M.A., and Komar, P.D. 1987. Laboratory and Field Investigations
of the Impact of Shoreline Stabilization Structures on Adjacent Properties. Coastal Sediments '87, American Society of Civil Engineers: New York, 961-973.
McLachlan, A., and Brown, A.C. 2006. The Ecology of Sandy Shores. Academic Press,
Burlington, MA. 392 p. McQuarrie, M. and Pilkey, O.H. 1998. Evaluation of Alternative or Non-Traditional Devices for
Shoreline Stabilization. Journal of Coastal Research, SI 26: 269-272. Melvin, S.M. and Gibbs, J.P. 1994. Sora. Pages 209-218 in Migratory Shore and Upland Game
Bird Management in North America (T.C. Tacha and C.E. Braun, eds.). International Association of Fish and Wildlife Agencies, Washington, D.C.
Morrison, R.I.G., Davidson, N.C., and Wilson, J.R. 2007. Survival of the Fattest: Body Stores on
Migration and Survival in Red Knots Calidris canutus islandica. Journal of Avian Biology, 38: 479-487.
Morton, R.A. 2003. An Overview of Coastal Land Loss: With Emphasis on the Southeastern
United States. USGS Open File Report 03-337. U.S. Geological Survey Center for Coastal and Watershed Studies, St. Petersburg, FL, Available at <http://pubs.usgs.gov/of/2003/of03-337/pdf.html>.
Morton, R.A., Miller, T.L., and Moore, L.J. 2004. National Assessment of Shoreline Change:
Part 1: Historical Shoreline Changes and Associated Coastal Land Loss Along the U.S. Gulf of Mexico. Open-file report 2004-1043. U.S. Geological Survey Center for Coastal and Watershed Studies, St. Petersburg, FL, Available at<http://pubs.usgs.gov/of/2004/1043/>.
Mosier, A.E. 1998. The Impact of Coastal Armoring Structures on Sea Turtle Nesting Behavior
at Three Beaches on the East Coast of Florida. M.S. Thesis. St. Petersburg, Florida, University of South Florida. 112 p.
National Marine Fisheries Service [NMFS] and U.S. Fish and Wildlife Service [USFWS]. 1991.
Recovery Plan for U.S. Population of Loggerhead Turtle. National Marine Fisheries
Audubon North Carolina
48
Service, Washington, D.C. 64 p. National Park Service [NPS]. 2014a. Piping Plover 2014 Annual Report from Cape Hatteras.
Cape Hatteras National Seashore. 13 p. National Park Service [NPS]. 2014b. Piping Plover (Charadrius melodus) Monitoring at Cape
Lookout National Seashore 2014 Summary Report. Cape Lookout National Seashore. 23 p.
Nelson, D.A. 1991. Issues Associated with Beach Nourishment and Sea Turtle
Nesting.Proceedings of the Fourth Annual National Beach Preservation Technology Conference. Florida Shore and Beach Association, Tallahassee, FL, p. 277-294.
Nicholls, J.L. 1989. Distribution and Other Ecological Aspects of Piping Plovers
(Charadriusmelodus) Wintering Along the Atlantic and Gulf Coasts. M.S. Thesis. Auburn, Alabama, Auburn University. 150 p.
Nicholls, J.L. and Baldassarre, G.A. 1990. Habitat Selection and Interspecific Associations of
Piping Plovers Wintering in the United States. Wilson Bulletin, 102: 581-590. Niles, L.J., Sitters, H.P., Dey, A.D., Atkinson, P.W., Baker, A.J., Bennett, K.A., Carmona, R.,
Clark, K.E., Clark, N.A., and Espoz, C. 2008. Status of the Red Knot (Calidris canutus rufa) in the Western Hemisphere. Studies in Avian Biology, 36: 1-185.
Niles, L., Sitters, H., Dey, A., and Red Knot Status Assessment Group. 2010. Red Knot
Conservation Plan for the Western Hemisphere (Calidris canutus), Version 1.1. Manomet Center for Conservation Sciences, Manomet, Massachusetts, USA.
Nisbet, I.C. 2002. Common Tern (Sterna hirundo), The Birds of North America Online (A.
Poole, Ed.). Ithaca: Cornell Lab of Ornithology; Retrieved from the Birds of North America Online: http://bna.birds.cornell.edu/bna/species/618
Noel, B.L. and C.R. Chandler. 2005. Report on Migrating and Wintering Piping Plover Activity
on Little St. Simons Island, Georgia in 2003-2004 and 2004-2005. Report to U.S. Fish and Wildlife Service; Panama City, Florida. 38 p.
Noel, B.L. and Chandler, C.R. 2008. Spatial Distribution and Site Fidelity of Non-breeding
Piping Plovers on the Georgia Coast. Waterbirds, 31: 241-251. Nol, E. and Humphrey, R.C. 2012. American Oystercatcher (Haematopus palliatus), The Birds
of North America Online (A. Poole, Ed.). Ithaca: Cornell Lab of Ornithology; Retrieved from the Birds of North America Online: http://bna.birds.cornell.edu/bna/species/082
Nordstrom, K.F. 2000. Beaches and Dunes of Developed Coasts. Cambridge University Press,
Cambridge, UK. 338 p.
Audubon North Carolina
49
Norris D.R., Marra P.P., Kyser T.K., Sherry T.W., and Ratcliffe, L.M. 2004. Tropical Winter Habitat Limits Reproductive Success on the Temperate Breeding Grounds in a Migratory Bird. Proceedings of the Royal Society of London, 271:59-64.
North Carolina Coastal Resources Commission [NCCRC]. 2010. Terminal Groins Study
Recommendations. 9 p. North Carolina Wildlife Resources Commission. [NCWRC]. 2015. North Carolina Colonial
Waterbird Database, https://ncpaws.org/PAWS/Wildlife/ColonialWaterBird/CWBHome.aspx. Accessed 17 September 2014.
Parnell, J.F. and Shields, M.A. 1990. Management of North Carolina's Colonial Waterbirds.
UNC Sea Grant College Program. 169 p. Payne, L.X. 2010. Conservation Plan for the Sanderling (Calidris alba).Version 1.1. Manomet
Center for Conservation Sciences, Manomet, Massachusetts. Peterson, C.H. and Bishop, M.J. 2005. Assessing the Environmental Impacts of Beach
Nourishment. BioScience, 55: 887-896. Peterson, C.H., Bishop, M.J., D'Anna, L.M., and Johnson, G.A. 2014. Multi-year Persistence of
Beach Habitat Degradation from Nourishment Using Coarse Shelly Sediments. Science of the Total Environment, 487: 481-492.
Peterson, C.H., Bishop, M.J., Johnson, G.A., D'Anna, L.M., and Manning, L.M. 2006.
Exploiting Beach Filling as an Unaffordable Experiment: Benthic Intertidal Impacts Propagating Upwards to Shorebirds. Journal of Experimental Marine Biology and Ecology, 338: 205-221.
Peterson, C.H., Hickerson, D.H.M., and Johnson, G.G. 2000a. Short-Term Consequences of
Nourishment and Bulldozing on the Dominant Large Invertebrates of a Sandy Beach. Journal of Coastal Research, 16: 368-378.
Peterson, C.H., Summerson, H.C., Thomson, E., Lenihan, H.S., Grabowski, J., Manning, L.,
Micheli, F., and Johnson, G. 2000b. Synthesis of Linkages between Benthic and Fish Communities as a Key to Protecting Essential Fish Habitat. Bulletin of Marine Science, 66: 759-774.
Pietrafesa, L.J. 2012. On the Continued Cost of Upkeep Related to Groins and Jetties. Journal of
Coastal Research, 28(5): iii-ix. Pilkey, O.H., Neal, W.J., Riggs, S.R., Webb, C.G., Bush, D.M., Pilkey, D.F., Bullock, J., and
Cowan, B.A., 1998. The North Carolina Shore and Its Barrier Islands: Restless Ribbons of Sand. Duke University Press, Durham, North Carolina. 318 p.

Audubon North Carolina
50
Quammen, M.L. 1982. Influence of Subtle Substrate Differences on Feeding by Shorebirds on Intertidal Mudflats. Marine Biology, 71: 339-343.
Rabon, D.R. (compiler). 2006. Proceedings of the Symposium on the Wintering Ecology and
Conservation of Piping Plovers. U.S. Fish and Wildlife Service, Raleigh, NC. Rakocinski, C.F., Heard, R.W., LeCroy, S.E., McLelland, J.A., and Simons, T. 1996. Responses
by Macrobenthic Assemblages to Extensive Beach Restoration at Perdido Key, Florida, U.S.A. Journal of Coastal Research, 12(1): 326-353.
Randall, A.L. and Halls, J.N. 2015. Modeling the Nesting Suitability of Loggerhead Sea Turtles
(Caretta caretta) in North Carolina Using Geospatial Technologies. Presentation: NC Sea Turtle Holders’ Permit Meeting. Fort Macon, North Carolina.
Reilly, F.J. 1978. A Study of the Ecological Impact of Beach Nourishment with Dredged
Material on the Intertidal Zone. M.S. Thesis. Greenville, North Carolina. East Carolina University. 108 p.
Reilly, F.J. and Bellis, V.J. 1983. The Ecological Impact of Beach Nourishment with Dredged
Materials on the Intertidal Zone at Bogue Banks, North Carolina. U.S. Army Corps of Engineers, Coastal Engineering Research Center, Misc. Rept. No. 83-3. 73 p.
Rice, T.M. 2009. Best Management Practices for Shoreline Stabilization to Avoid and Minimize
Adverse Environmental Impacts. Prepared for the USFWS, Panama City Ecological Services Field Office. 22 p.
Rice, T.M. 2012a. Inventory of Habitat Modifications to Tidal Inlets in the Coastal Migration
and Wintering Range of the Piping Plover (Charadrius melodus). Appendix 1B in Draft Comprehensive Conservation Strategy for the Piping Plover (Charadrius melodus) Coastal Migration and Wintering Range, U.S. Fish and Wildlife Service. 35 p.
Rice, T.M. 2012b. The Status of Sandy, Oceanfront Beach Habitat in the Coastal Migration and
Wintereing Range of the Piping Plover (Charadrius melodus). Appendix 1C in Draft Comprehensive Conservation Strategy for the Piping Plover (Charadrius melodus) Coastal Migration and Wintering Range, U.S. Fish and Wildlife Service. 40 p.
Riggs, S.R. and Ames, D.V. 2003. Drowning of North Carolina: Sea-Level Riseand Estuarine
Dynamics. NC Sea Grant College Program, Raleigh, NC, Pub.No. UNC-SG-03-04. 152 p.
Riggs, S.R. and Ames, D.V. 2007. Effect of Storms on Barrier Island Dynamics, Core Banks,
Cape Lookout National Seashore, North Carolina, 1960-2001. U.S.Geological Survey Scientific Investigations Report 2006-5309. 78 p.
Riggs, S.R. and Ames, D.V. 2009. Impact of the Oregon Inlet Terminal Groin on Downstream
Beaches of Pea Island, NC Outer Banks. A White Paper. East Carolina University,

Audubon North Carolina
51
Greenville, North Carolina. 19 p. Riggs, S.R. and Ames, D.V. 2011. Consequences of Human Modifications of Oregon Inlet to the
Down-drift Pea Island, North Carolina Outer Banks. Southeastern Geology, 48(3): 103-128.
Riggs, S.R., Ames, D.V., Culver, S.J., Mallinson, D.J., Corbett, D.R., and Walsh, J.P. 2009. Eye
of a Human Hurricane: Pea Island, Oregon Inlet, and Bodie Island, Northern Outer Banks, North Carolina, in Kelley, J.T., Pilkey, O.H., and Cooper, J.A.G., eds., America’s Most Vulnerable Coastal Communities: Geological Society of America Special Paper 460: 43-72.
Riggs, S.R., Culver, S.J., Ames, D.V., Mallinson, D.J., Corbett, D.R., and Walsh, J.P. 2008.
North Carolina’s Coasts in Crisis: A Vision for the Future. A White Paper. East Carolina University, Greenville, North Carolina. 28 p.
Rogers, D.I., Piersma, T., and Hassell, C.J. 2006. Roost Availability May Constrain Shorebird
Distribution: Exploring the Energetic Costs of Roosting and Disturbance Around a Tropical Bay. Biological Conservation, 133(2): 225-235.
Rosenfeld, K., Bartel Sexton, R., and Wentworth, T. 2006. Population Viability and Status of the
Threatened Beach Plant Amaranthus pumilus (Seabeach Amaranth). Abstract: Ecological Society of America, Memphis, TN.
Rumbold, D.G., Davis, P.W., and Perretta, C. 2001. Estimating the Effect of Beach Nourishment
on Caretta Caretta (Loggerhead Sea Turtle) Nesting. Restoration Ecology, 9(3): 304-310.
Schlacher, T.A., Noriega, R., Jones, A., and Dye, T. 2012. The Effects of Beach Nourishment on
Benthic Invertebrates in Eastern Australia: Impacts and Variable Recovery. Science of the Total Environment, 435-436: 411-417.
Schweitzer, S. 2015. Draft Report Numbers of Piping Plover Pairs and Individuals Recorded
during the 1‐9 June 2015 Census Window and During the Breeding Season Overall. North Carolina Wildlife Resources Commission, 1 p.
Schweitzer, S. 2015. North Carolina Wildlife Resources Commission. Personal communication
regarding shorebird data throughout North Carolina. Schweitzer, S. and Abraham, M. 2014. 2014 Breeding Season Report for the Piping Plover in
North Carolina. North Carolina Wildlife Resources Commission, 6 p. Smith, C.G., Culver, S.J., Riggs, S.R., Ames, D., Corbett, D.R., and Mallinson, D. 2008.
Geospatial Analysis of Barrier Island Width of Two Segments of the Outer Banks, North Carolina, USA: Anthropogenic Curtailment of Natural Self-sustaining Processes. Journal of Coastal Research, 24(1): 70-83.
Audubon North Carolina
52
Speybroeck, J., Bonte, D., Courtens, W., Gheskiere, T., Grootaert, P., Maelfait, J., Mathys, M.,
Provoost, S., Sabbe, K., Stienen, E., VanLancker, V., Vincx, M., and Degraer, S. 2006. Beach Nourishment: An Ecologically Sound Coastal Defence Alternative? A Review. Aquatic Conservation: Marine and Freshwater Ecosystems, 16: 419-435.
Steinitz, M.J., Salmon, M., and Wyneken, J. 1998. Beach Renourishment and Loggerhead Turtle
Reproduction: A Seven Year Study at Jupiter Island, Florida. Journal of Coastal Research, 14(3): 1000-1013.
Stucker, J.H. and F.J Cuthbert. 2006. Distribution of Nonbreeding Great Lakes Piping Plovers
along Atlantic and Gulf Coastlines: 10 years of Band Resightings. Report to the U.S. Fish and Wildlife Service, East Lansing, Michigan and Panama City, Florida Field Offices. 20 p.
Thompson, B.C., Jackson, J.A., Burger, J., Hill, L.A., Kirsch, E.M., and Atwood, J.L. 1997.
Least Tern (Sternula antillarum), The Birds of North America Online (A. Poole, Ed.). Ithaca: Cornell Lab of Ornithology; Retrieved from the Birds of North America Online: http://bna.birds.cornell.edu/bna/species/290
Titus, J.G. 2000. Does the U.S. Government Realize that the Sea is Rising? How to Restructure
Federal Programs so that Wetlands and Beaches Survive. Golden Gate University Law Review, 30(4): 717-786. http://digitalcommons.law.ggu.edu/ggulrev/vol30/iss4/2
Trindell, R., Arnold, D., Moody, K., and Morford, B. 1998. Post-construction Marine Turtle
Nesting Monitoring Results on Nourished Beaches. Pages 77-92 in Tait, L.S. (compiler), Rethinking the Role of Structures in Shore Protection. Proceedings of the 1998 National Conference on Beach Preservation Technology. Florida Shore and Beach Preservation Association, Tallahassee, Florida.
U.S. Army Corps of Engineers. [USACE]. 2002. Coastal Engineering Manual. Engineer Manual
1110-2-1100. USACE, Washington, DC, Available at http://chl.erdc.usace.army.mil/cem>.
U.S. Fish and Wildlife Service. [USFWS]. 1996a. Piping Plover (Charadrius melodus), Atlantic
Coast Population, Revised Recovery Plan. Hadley, Massachusetts. U.S. Fish and Wildlife Service. [USFWS]. 1996b. Recovery Plan for Seabeach
Amaranth(Amaranthus pumilus) Rafinesque. Atlanta, Georgia. U.S. Fish and Wildlife Service. [USFWS]. 2001. Final Determination of Critical Habitat for
Wintering Piping Plover. Federal Register 66 (132): 36037-36086. U.S. Fish and Wildlife Service. [USFWS]. 2003. Recovery Plan for the Great Lakes Piping
Plover (Charadrius melodus). U.S. Fish and Wildlife Service, Fort Snelling, Minnesota.

Audubon North Carolina
53
U.S. Fish and Wildlife Service. [USFWS]. 2007. Seabeach Amaranth (Amaranthus pumilus)5-Year Review: Summary and Evaluation. Raleigh, North Carolina.
U.S. Fish and Wildlife Service. [USFWS]. 2008. Revised Designation of Critical Habitat for the
Wintering Population of the Piping Plover (Charadrius melodus) in North Carolina. Federal Register 73:62816-62841.
U.S. Fish and Wildlife Service. [USFWS]. 2009. Piping Plover (Charadrius melodus) 5-Year
Review: Summary and Evaluation. Hadley, Massachusetts and East Lansing, Michigan. U.S. Fish and Wildlife Service. [USFWS]. 2010. Preliminary 2010 Atlantic Coast Piping Plover
Abundance and Productivity Estimates. Office of Endangered Species, Hadley, MA; available at: http://www.fws.gov/northeast/pipingplover/pdf/Abundance&Productivity2010Update.pdf
U.S. Fish and Wildlife Service. [USFWS]. 2011. Preliminary 2011 Atlantic Coast Piping Plover
Abundance and Productivity Estimates. Office of Endangered Species, Hadley, MA; available at: http://www.fws.gov/northeast/pipingplover/pdf/2011abundance&productivity.pdf
U.S. Fish and Wildlife Service. [USFWS]. 2012a. Comprehensive Conservation Strategy for the
Piping Plover (Charadrius melodus) in its Coastal Migration and Wintering Range in the Continental United States. East Lansing, Michigan.
U.S. Fish and Wildlife Service. [USFWS]. 2012b. Preliminary 2012 Atlantic Coast Piping Plover
Abundance and Productivity Estimates. Office of Endangered Species, Hadley, MA; available at: http://www.fws.gov/northeast/pipingplover/pdf/preliminary2012_18April2013.pdf
U.S. Fish and Wildlife Service. [USFWS]. 2013. Endangered and Threatened Wildlife and
Plants; Proposed Threatened Status for the Rufa Red Knot (Calidris canutus rufa). Federal Register Vol. 78, No. 189: 60024-60098.
Van Dusen, B.M., Fegley, S.R., and Peterson, C.H. 2012. Prey Distribution, Physical Habitat
Features, and Guild Traits Interact to Produce Contrasting Shorebird Assemblages among Foraging Patches. PLoS ONE, 7(12): e52694.
Van Zoeren, Alice. 2014. University of Minnesota Research Assistant for Piping Plover Research Program. Personal communication regarding number of Great Lakes Piping Plover breeding pairs.
Viola, S.M., Hubbard, D.M., Dugan, J.E., and Schooler, N.K. 2014. Burrowing Inhibition by
Fine Textured Beach Fill: Implications for Recovery of Beach Ecosystems. Estuarine, Coastal and Shelf Science, 150: 142-148.
Audubon North Carolina
54
Wemmer, L.C., Özesmi, U., and Cuthbert, F.J. 2001. A Habitat-based Population Model for the Great Lakes Population of the Piping Plover (Charadrius melodus). Biological Conservation, 99: 169-181.
Wilkinson, P.M. and Spinks, M. 1994. Winter Distribution and Habitat Utilization of Piping
Plovers in South Carolina. The Chat, 58: 33-37. Winn, B., Brown, S., Spiegel, C., Reynolds, D., and Johnston, S. 2013. Atlantic Flyway
Shorebird Conservation Business Strategy. Manomet Center for Conservation Sciences. 26 p.
Young, P.G. et al. Undated. Coastal Scientist Groin Statement.Western Carolina University
Program for the Study of Developed Shorelines. http://www.wcu.edu/WebFiles/PDFs/Coastal_Scientist_Groin_Statement.pdf
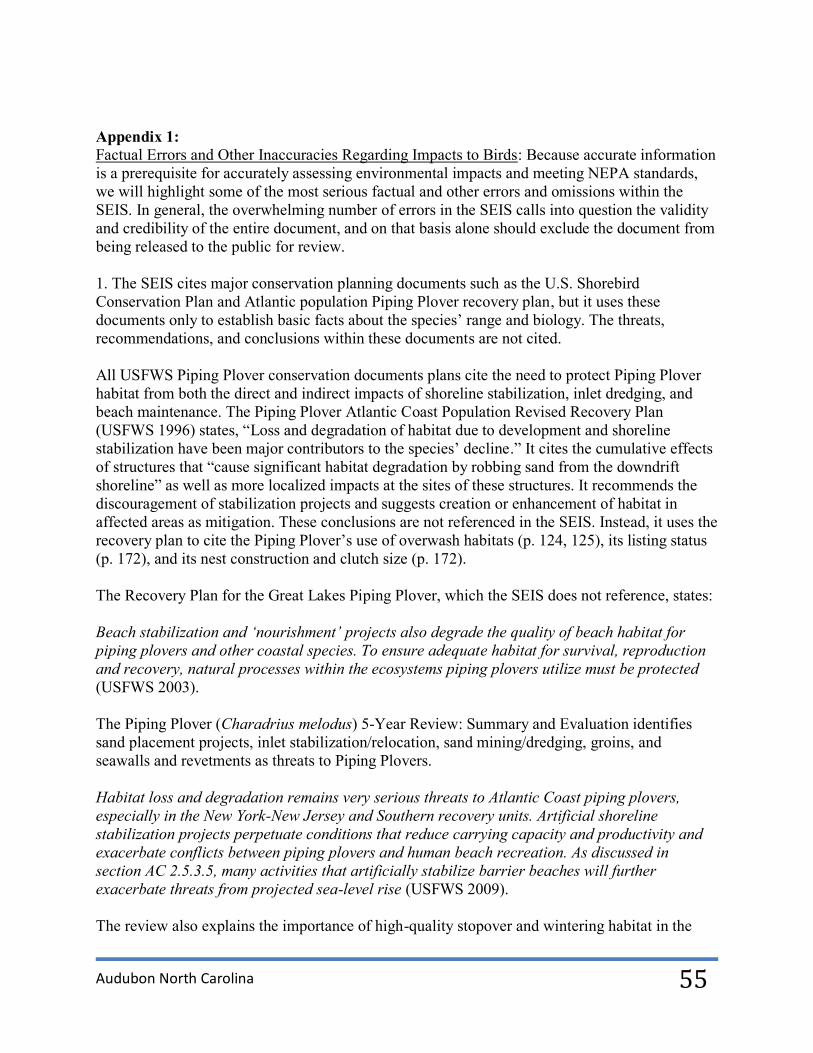
Audubon North Carolina
55
Appendix 1: Factual Errors and Other Inaccuracies Regarding Impacts to Birds: Because accurate information is a prerequisite for accurately assessing environmental impacts and meeting NEPA standards, we will highlight some of the most serious factual and other errors and omissions within the SEIS. In general, the overwhelming number of errors in the SEIS calls into question the validity and credibility of the entire document, and on that basis alone should exclude the document from being released to the public for review. 1. The SEIS cites major conservation planning documents such as the U.S. Shorebird Conservation Plan and Atlantic population Piping Plover recovery plan, but it uses these documents only to establish basic facts about the species’ range and biology. The threats, recommendations, and conclusions within these documents are not cited. All USFWS Piping Plover conservation documents plans cite the need to protect Piping Plover habitat from both the direct and indirect impacts of shoreline stabilization, inlet dredging, and beach maintenance. The Piping Plover Atlantic Coast Population Revised Recovery Plan (USFWS 1996) states, “Loss and degradation of habitat due to development and shoreline stabilization have been major contributors to the species’ decline.” It cites the cumulative effects of structures that “cause significant habitat degradation by robbing sand from the downdrift shoreline” as well as more localized impacts at the sites of these structures. It recommends the discouragement of stabilization projects and suggests creation or enhancement of habitat in affected areas as mitigation. These conclusions are not referenced in the SEIS. Instead, it uses the recovery plan to cite the Piping Plover’s use of overwash habitats (p. 124, 125), its listing status (p. 172), and its nest construction and clutch size (p. 172). The Recovery Plan for the Great Lakes Piping Plover, which the SEIS does not reference, states: Beach stabilization and ‘nourishment’ projects also degrade the quality of beach habitat for piping plovers and other coastal species. To ensure adequate habitat for survival, reproduction and recovery, natural processes within the ecosystems piping plovers utilize must be protected (USFWS 2003). The Piping Plover (Charadrius melodus) 5-Year Review: Summary and Evaluation identifies sand placement projects, inlet stabilization/relocation, sand mining/dredging, groins, and seawalls and revetments as threats to Piping Plovers. Habitat loss and degradation remains very serious threats to Atlantic Coast piping plovers, especially in the New York-New Jersey and Southern recovery units. Artificial shoreline stabilization projects perpetuate conditions that reduce carrying capacity and productivity and exacerbate conflicts between piping plovers and human beach recreation. As discussed in section AC 2.5.3.5, many activities that artificially stabilize barrier beaches will further exacerbate threats from projected sea-level rise (USFWS 2009). The review also explains the importance of high-quality stopover and wintering habitat in the

Audubon North Carolina
56
context of a small population that spends most of its annual cycle away from nesting grounds: Piping plover populations are highly vulnerable to even small declines in survival rates of adults and fledged juveniles. Population growth gained through high productivity on the breeding grounds will be quickly reversed if survival rates or breeding fitness decline due to stressors experienced during the two-thirds of the annual cycle spent in migration and wintering. Although management of threats in the nonbreeding range has begun to increase in recent years, considerably more attention and effort are required (USFWS 2009). Other shorebird species conservation plans are clear about the importance of non-breeding habitat. The U.S. Shorebird Conservation Plan is cited twice in the SEIS, on p. 104 to substantiate use of salt marsh habitat for foraging by shorebirds and on p. 176 in reference to the conservation status of the Wilson’s Plover. Other examples include: To safeguard Dunlin populations, we have to protect the interconnected chains of wetlands they depend upon from further deterioration and disappearance. Because adult survival is a critical variable in determining population size of [long-lived] migratory shorebirds, it is very important to maintain and secure high-quality habitats (Fernández et al. 2010) and Habitat loss has particularly significant implications for Sanderlings during migration—a time when they must put on fat to fuel their long flights—and also in winter (stressful weather). The potential cost during migration is clear: without enough fuel (fat), Sanderlings may not be able to complete the next leg of their journey, may arrive on breeding grounds with too few resources to breed, or may not survive. On the wintering grounds (e.g., California, North Carolina, and Peru), many individuals exhibit strong site fidelity and spend most of their time (or return to) the same 5- to 10-kilometer stretch of beach year after year (Myers et al. 1979a, Connor et al. 1981, Myers et al. 1988, Dinsmore et al. 1998). Thus, the loss of even small stretches of coastline could alter social dynamics of local winter populations, with potentially harmful (although currently unknown) consequences (Payne 2010). 2. The SEIS does not accurately assess impacts to birds. Most critically, it fails to consider cumulative impacts. Cumulative impacts to birds in and around Rich Inlet would be the continued loss of habitat due to repeated beach fill activities and the permanent removal of shoals and the spit on the north end of Figure 8 Island. The natural inlet system needed to sustain wintering Piping Plover critical habitat would be lost, and the carrying capacity for shorebirds, including Piping Plovers, and nesting terns and skimmers in the region would be diminished. Typically, when a groin fails, it is not removed, but additional structures are constructed, thus impacting even more habitat. Cumulative impacts not only ripple through time, but through geography. Comparable habitats elsewhere in North Carolina are few. After New Topsail Inlet, the next closest comparable inlet to Rich Inlet is Ophelia Inlet on Cape Lookout National Seashore, 100 miles north. To the south, the next best Piping Plover habitat is in Cape Romain, SC, approximately 150 miles south. Humans are not creating new habitat for birds to use in North Carolina or indeed on the Atlantic
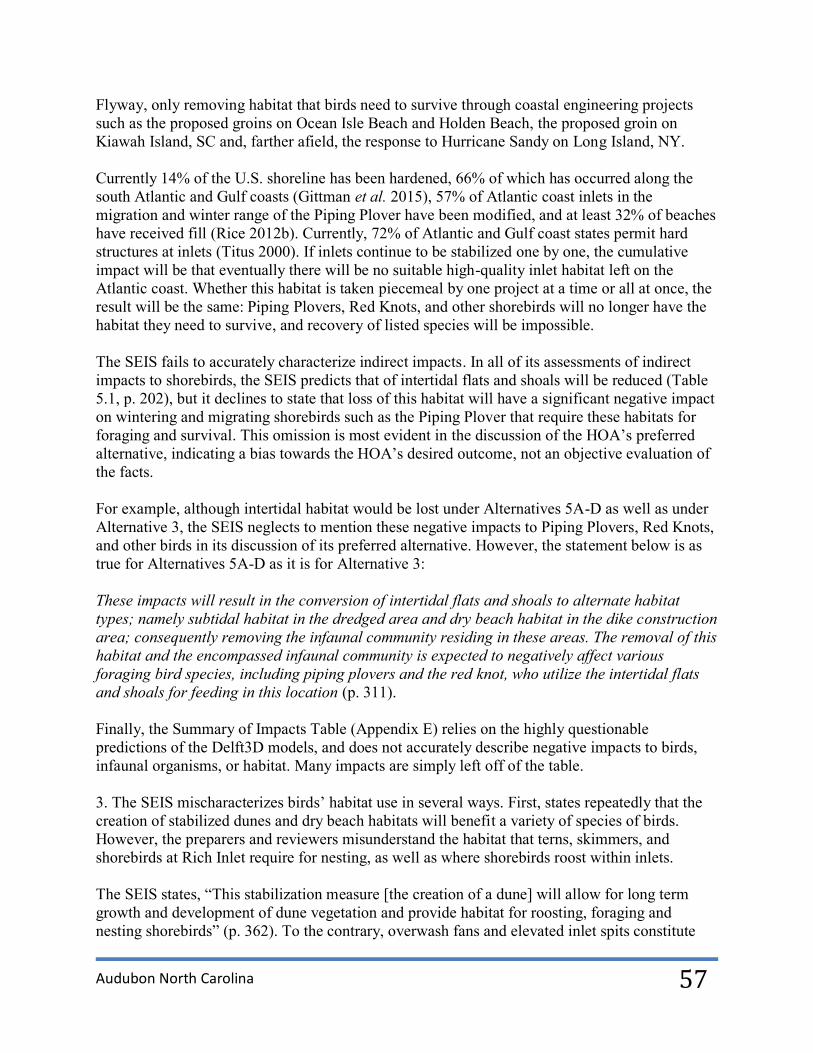
Audubon North Carolina
57
Flyway, only removing habitat that birds need to survive through coastal engineering projects such as the proposed groins on Ocean Isle Beach and Holden Beach, the proposed groin on Kiawah Island, SC and, farther afield, the response to Hurricane Sandy on Long Island, NY. Currently 14% of the U.S. shoreline has been hardened, 66% of which has occurred along the south Atlantic and Gulf coasts (Gittman et al. 2015), 57% of Atlantic coast inlets in the migration and winter range of the Piping Plover have been modified, and at least 32% of beaches have received fill (Rice 2012b). Currently, 72% of Atlantic and Gulf coast states permit hard structures at inlets (Titus 2000). If inlets continue to be stabilized one by one, the cumulative impact will be that eventually there will be no suitable high-quality inlet habitat left on the Atlantic coast. Whether this habitat is taken piecemeal by one project at a time or all at once, the result will be the same: Piping Plovers, Red Knots, and other shorebirds will no longer have the habitat they need to survive, and recovery of listed species will be impossible. The SEIS fails to accurately characterize indirect impacts. In all of its assessments of indirect impacts to shorebirds, the SEIS predicts that of intertidal flats and shoals will be reduced (Table 5.1, p. 202), but it declines to state that loss of this habitat will have a significant negative impact on wintering and migrating shorebirds such as the Piping Plover that require these habitats for foraging and survival. This omission is most evident in the discussion of the HOA’s preferred alternative, indicating a bias towards the HOA’s desired outcome, not an objective evaluation of the facts. For example, although intertidal habitat would be lost under Alternatives 5A-D as well as under Alternative 3, the SEIS neglects to mention these negative impacts to Piping Plovers, Red Knots, and other birds in its discussion of its preferred alternative. However, the statement below is as true for Alternatives 5A-D as it is for Alternative 3: These impacts will result in the conversion of intertidal flats and shoals to alternate habitat types; namely subtidal habitat in the dredged area and dry beach habitat in the dike construction area; consequently removing the infaunal community residing in these areas. The removal of this habitat and the encompassed infaunal community is expected to negatively affect various foraging bird species, including piping plovers and the red knot, who utilize the intertidal flats and shoals for feeding in this location (p. 311). Finally, the Summary of Impacts Table (Appendix E) relies on the highly questionable predictions of the Delft3D models, and does not accurately describe negative impacts to birds, infaunal organisms, or habitat. Many impacts are simply left off of the table. 3. The SEIS mischaracterizes birds’ habitat use in several ways. First, states repeatedly that the creation of stabilized dunes and dry beach habitats will benefit a variety of species of birds. However, the preparers and reviewers misunderstand the habitat that terns, skimmers, and shorebirds at Rich Inlet require for nesting, as well as where shorebirds roost within inlets. The SEIS states, “This stabilization measure [the creation of a dune] will allow for long term growth and development of dune vegetation and provide habitat for roosting, foraging and nesting shorebirds” (p. 362). To the contrary, overwash fans and elevated inlet spits constitute

Audubon North Carolina
58
the best habitat for beach-nesting birds, such as Least Terns, Common Terns, Black Skimmers, American Oystercatchers, and Wilson’s Plovers, which are found on Figure 8 Island (Gochfeld and Burger 1994, Thompson et al. 1997, Nisbet 2002, Corbat and Bergstrom 2000, Nol and Humphrey 2012). This is because they are sparsely vegetated or bare and maintained in that state through natural processes. Within three to five years without overwash, dune vegetation will become too dense and eliminate or significantly degrade nesting habitat (Parnell and Shields 1990). Roosting shorebirds also prefer elevated but open areas that allow them to see the approach of predators. They do not roost within dune systems or seek vegetation. When assessing impacts to birds, the SEIS fails to make the connection between stabilizing the north end of Figure 8 Island, vegetative succession, and the loss of nesting and roosting habitat for shorebirds during both the breeding and non-breeding season that will result from the construction of a terminal groin and other actions proposed in the SEIS. Second, the SEIS repeatedly attempts to substitute the dry beach habitat currently found on the large spit on the north end of Figure 8 Island for oceanfront beach that it predicts will be maintained or created by a terminal groin (p. 426). However, these two habitats are not interchangeable. The inlet spit dry beach provides habitat for nesting and roosting birds, and there is also a large amount of intertidal zone for foraging on the sound side. If the spit is removed by a terminal groin, the oceanfront dry beach on the south side of the groin will not be suitable habitat for the birds. Shorebirds at Rich Inlet prefer to roost on spits, where they are far away from dunes and other features that would block their view of avian or other predators. Most of the nesting at Rich Inlet also takes place on the spit. Third, the SEIS misrepresents Piping Plover habitat use in various ways. When the Delft3D model predicts an increase in beach width or oceanfront beach, either on Hutaff or Figure 8 Island, the SEIS attempts to emphasize the importance of wide beaches to Piping Plovers: “As shown by research, wintering plovers on the Atlantic coast prefer wide beaches in the vicinity of inlets (Nicholls and Baldassarre 1990, Wilkinson and Spinks 1994)” (p. 354). However, Nicholls and Baldassarre (1990) found that wide beaches were a significant predictor of Piping Plover presence on the Gulf Coast, not the Atlantic coast, and differentiated between the more important predictive factors for Piping Plover occupancy on the Atlantic coast—the number of large inlets and passes, the presence of mudflats, and the number of tidepools—and the Gulf coast—beach width, number of small inlets, and beach area. Similarly, Wilkinson and Spinks (1994) found Piping Plovers were on open sandy beaches near inlets, but the SEIS does not examine the factors that attract Piping Plovers to the vicinity of inlets. There is a growing body of peer-reviewed scientific literature emphasizing habitat heterogeneity at inlets and use of inlet-associated low-energy intertidal flats, particularly by migrating or wintering Piping Plovers (Haig and Oring 1985, Johnson and Baldassarre 1988, Nicholls and Baldassarre 1990), and indicating that Piping Plovers use a variety of habitats throughout the tidal cycle within a small home range during the non-breeding season (Drake et al. 2001, Rabon 2006, Cohen et al. 2008, Maddock et al. 2009). The SEIS misreports the results of Audubon North Carolina’s Rich Inlet report (Addison and McIver 2014a) when it states:

Audubon North Carolina
59
A review of data collected by Audubon North Carolina for piping plover between 2008 and 2014 showed that piping plovers have continued to utilize the habitats within the Rich Inlet complex despite the natural modifications over time. Specifically, of the seven landscape types where piping plovers were observed foraging within this area, the oceanfront beach in proximity to the inlet was the second most utilized habitat type for foraging piping plovers (Addison and McIver, 2014) (p. 275). The seven landscape types listed in the report were ocean beach, bay beach, inlet spit, ebb shoal island, flood shoal island, sandbar, and tidal creek/lagoon. However, many of these landscape types provide the same habitat type: intertidal habitat. The SEIS does not mention the report’s results on habitat use, which documented far more observations on landscapes that provided low-energy intertidal habitats (75.2% of Piping Plover observations) than high-energy intertidal habitat on oceanfront beaches. Those are the habitats that a terminal groin would have the greatest negative impact on. Additionally, asserting that because Piping Plovers have used Rich Inlet even though it changes naturally over time has no bearing on whether they would be able to use it if significant amounts of foraging and roosting habitat were permanently lost due to the construction of a terminal groin or the channelization of the inlet. The accretion of the spit at the north end of Figure 8 Island has improved habitat in Rich Inlet, which is reflected by the increase in Piping Plover sightings at Rich Inlet; peak counts in 2013, 2014, and 2015 are greater than they have been in previous survey years (Addison and McIver 2014a and Audubon North Carolina unpublished data). 4. The SEIS does not correctly describe the timing of birds’ use of Rich Inlet. The SEIS states: Under Alternative 5D, the groin and beach nourishment construction activity may stress shorebirds, including the endangered piping plover, from foraging along the intertidal flats that are located in close proximity of the construction area. However, as shown with the channel relocation project in New River Inlet discussed in Alternative 3 and 5A, during-construction bird monitoring revealed continual bird use of the inlet resources as dredging and inlet beach activity was in operation. As with that project, construction for Alternative 5D will take place between November 16th and March 31st when some migratory bird species are not present and bird populations are at their lowest (p. 428). Because it does not acknowledge the seasonal patterns of inlet use by migrating and wintering shorebirds, the SEIS cannot accurately assess impacts of wintertime construction activities. Such activities would directly impact migrating and wintering shorebirds, including the Piping Plover, whose spring migration numbers peak in March or April, and which overwinters at Rich Inlet (Addison and McIver 2014). Other species that winter at Rich Inlet include Dunlin (peak November-March count: 1,446), Short-billed Dowitcher (peak November-March count: 384), Semipalmated Plover (peak November-March count: 250), and Black-bellied Plover (peak November-March count: 164) (Addison and McIver 2014). From fall 2009-spring 2015, average November 16-March 31 counts were higher by 9-48% than average counts during the rest of the year in all years but one (Audubon North Carolina unpublished data). A substantial portion of this data was provided to CP&E during the previous DEIS process.

Audubon North Carolina
60
5. Several figures in Addison and McIver (2014) are interpreted incorrectly in the SEIS. Correctly represented, the figures in the report show that Piping Plovers used the spit on the north end of Figure 8 Island throughout the study period (2010-2014) and that the spit was used for foraging and roosting. However, the SEIS repeatedly treats the dots as actual numbers of Piping Plovers. This misrepresentation is used to state that the habitats used by birds on the north end of Figure 8 Island and the south end of Hutaff Island are comparable and interchangeable, and that the loss of the spit on Figure 8 Island will not impact birds because they will move to Hutaff Island: “Like the Figure Eight side of the inlet, Hutaff’s southern spit has been shown by the Audubon North Carolina 5-year survey data to be heavily used for foraging and roosting by piping plover” (p. 354). In order to determine whether birds used north Figure 8 Island to the same degree as Hutaff Island, we statistically compared the mean numbers of Piping Plovers, Red Knots, and all shorebirds observed at these two locations from 2010-2015. Significantly more Piping Plovers, Red Knots, shorebirds, and all birds were observed on north Figure 8 Island than Hutaff Island during 2010-2015 (Mann-Whitney test, p<0.001). This indicates that Hutaff Island is not equivalent to the north end of Figure 8 Island since significantly more Piping Plovers, Red Knots, shorebirds, and birds used north Figure 8 Island. 6. The SEIS fails to include the recent return of nesting Piping Plovers to the north end of Figure 8 Island, does not report the most recent 2015 nesting numbers, and includes Piping Plovers nesting outside of the project area which has the effect of minimizing the relative significance of the north end of Figure 8 Island to nesting Piping Plovers. The NCWRC collects data for a statewide nesting Piping Plover census every year. Neither the single pair of Piping Plovers that nested on north Figure 8 Island in 2014 nor the two pairs of Piping Plovers that nested in 2015 are reported (Schweitzer 2015, Schweitzer and Abraham 2014). Instead, about nesting Piping Plovers, the SEIS states: The UNCW, NCWRC, Audubon North Carolina and partners have conducted piping plover surveys of the project area during various seasons since 1987. There are three areas that have been monitored, Figure Eight Island, Rich Inlet and Hutaff Island. Only one (1) breeding pair, observed in 1996, has been located on Figure Eight Island. Hutaff Island, however, appears to be an important breeding area based upon the annual observations of breeding pairs. Since 1989, the peak number of breeding pairs observed on Hutaff was five (5) (Cameron pers. comm., 2007) (p. 172-173). Dating back to 2003, no Piping Plovers have been reported nesting on Hutaff Island within the project area. The project area includes only a small portion of Hutaff Island. Piping Plover nesting on Hutaff Island occurred farther north and has not occurred at all since 2013. 7. The SEIS misrepresents the results of monitoring that took place at Mason Inlet following the relocation and channelization of Mason Inlet. Accurately understanding the impacts of other inlet management projects are essential to assessing potential impacts at Rich Inlet. The SEIS states:
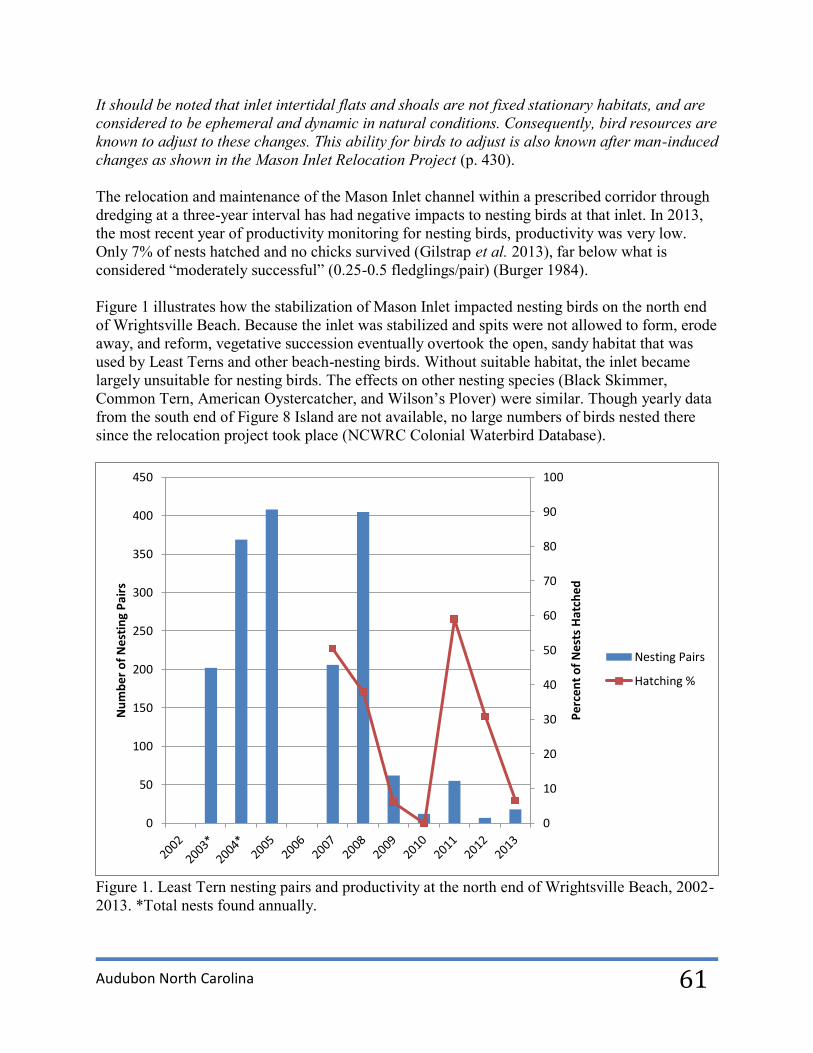
Audubon North Carolina
61
It should be noted that inlet intertidal flats and shoals are not fixed stationary habitats, and are considered to be ephemeral and dynamic in natural conditions. Consequently, bird resources are known to adjust to these changes. This ability for birds to adjust is also known after man-induced changes as shown in the Mason Inlet Relocation Project (p. 430). The relocation and maintenance of the Mason Inlet channel within a prescribed corridor through dredging at a three-year interval has had negative impacts to nesting birds at that inlet. In 2013, the most recent year of productivity monitoring for nesting birds, productivity was very low. Only 7% of nests hatched and no chicks survived (Gilstrap et al. 2013), far below what is considered “moderately successful” (0.25-0.5 fledglings/pair) (Burger 1984). Figure 1 illustrates how the stabilization of Mason Inlet impacted nesting birds on the north end of Wrightsville Beach. Because the inlet was stabilized and spits were not allowed to form, erode away, and reform, vegetative succession eventually overtook the open, sandy habitat that was used by Least Terns and other beach-nesting birds. Without suitable habitat, the inlet became largely unsuitable for nesting birds. The effects on other nesting species (Black Skimmer, Common Tern, American Oystercatcher, and Wilson’s Plover) were similar. Though yearly data from the south end of Figure 8 Island are not available, no large numbers of birds nested there since the relocation project took place (NCWRC Colonial Waterbird Database).
Figure 1. Least Tern nesting pairs and productivity at the north end of Wrightsville Beach, 2002-2013. *Total nests found annually.
0
10
20
30
40
50
60
70
80
90
100
0
50
100
150
200
250
300
350
400
450
Pe
rce
nt
of
Ne
sts
Hat
ched
Nu
mb
er o
f N
est
ing
Pai
rs
Nesting Pairs
Hatching %

Audubon North Carolina
62
In summarizing the overall outcome of the project, it was concluded that “given the continued degradation of the habitat that shore and waterbirds require for nesting, along with the extremely low hatching success and no chicks surviving to fledge, the Mason Inlet Waterbird Management Area currently provides poor-quality habitat for nesting terns, skimmers and shorebirds” (Gilstrap et al. 2013). 8. The SEIS makes large claims with no publications or other data to support its assertions. For example: On-going monitoring along the North Carolina coastline by private, local, and State entities has shown the presence of shorebirds continuing to use the oceanfront beach resources. This is occurring even with more recent beach fill activities and the presence of existing structures. Much of this can be attributed to more public awareness of the species, an expected shortened recovery time for their benthic community food source, the presence of adjacent undisturbed protected beaches, and the inclusion of beach fill moratoriums. These factors are also part of the Figure Eight proposal and if implemented, should reduce any potential cumulative impacts on shorebird resources (p. 27). Accurate baseline information for birds using oceanfront beach is lacking for most of the state’s developed beaches and does not show what the SEIS asserts (S. Schweitzer pers. com. 2015). The rest of the paragraph is also incorrect since there is no moratorium mentioned in the SEIS for placement of beach fill as part of the Figure 8 Island project, the firm producing the report was directly involved in the North Topsail Island beach renourishment project that occurred during the environmental window for birds and sea turtles, and no reason to expect shorter infaunal recovery times is provided. 9. The SEIS inaccurately downplays the conservation status of the shorebirds it considers, citing a 2006 report from the North Carolina Natural Heritage Program: “All shorebirds considered for the purpose of this CEA, with the exception of the piping plover, are globally ranked as G4 (apparently globally secure) or G5 (globally secure)” (Appendix F, p. 16), ignoring several other assessments such as North Carolina NCWRC, the Partners in Flight Watchlist, and U.S. Shorebird Conservation Plan which consider state populations as well as hemispheric populations and do not draw the same conclusions. 10. The SEIS does not address avoidance or mitigation in a meaningful way, and it does not present a robust monitoring protocol. Instead, after selecting an alternative that would significantly and permanently adversely impact Piping Plover, Red Knot, and other wildlife habitat, it proposes: The University of North Carolina at Wilmington (UNCW), under the direction of Dr. David Webster, conducts shorebird and colonial waterbird monitoring throughout the year along the beachfront of Figure Eight Island and the areas surrounding Mason and Rich Inlet. In addition, Audubon North Carolina has monitored the Rich Inlet complex which includes Figure Eight Island’s northern spit since 2008. These monitoring efforts are expected to continue for the foreseeable future (Webster, pers. comm.) (p. 450).

Audubon North Carolina
63
Monitoring is not mitigation. Further, monitoring one side of an inlet, as Dr. Webster does, is not adequate to assess impacts to birds. Monitoring does nothing to minimize adverse impacts to resources. Without thresholds for unacceptable impacts and a detailed, enforceable, feasible plan to reverse those impacts, monitoring does little to no good.

Holden Beach East End Shore Protection Project (Terminal Groin)
EIS Review
The Town of Holden Beach has submitted an Environmental Impact Statement (EIS) to the Wilmington District Army Corps of Engineers (USACE) for the construction of a terminal groin and an independent 30-year beach nourishment plan. The plan addresses chronic erosion on the east end of Holden Beach and proposes to protect public and private property including businesses, homes, public utilities, roads, and recreational areas. The Town of Oak Island supports the efforts to protect and preserve the Holden Beach shoreline and community through the use of a terminal groin and beach fill. However, potential impacts in the form of direct erosional catalysts or indirect conduits that may potentially affect shoreline stabilization efforts for Oak Island must be considered. Lockwood’s Folly Inlet (LFI) separates Oak Island from the east end of Holden Beach and provides a significant influence for sediment transport trends between both islands. Therefore, both towns should review any potential change to the inlet dynamics planned as part of the project.
Holden Beach’s preferred alternative for the East End Shore Protection Project consists of a 1,000 ft intermediate length T-head groin and beach fill. The structure location falls approximately 1,500 ft from LFI at approximate station 10+00 along the USACE baseline. The beach fill template extends westward from approximate USACE baseline station 5+00, east of the groin structure, to approximate station 45+00. Approximately 700-ft of the groin structure extends seaward of the primary dune with the remaining 300-ft providing an anchor system into and landward of the primary dune system. The T-head on the seaward limit of the structure extends approximately 60-ft in a perpendicular direction on either side of the groin. Granite rock on the order of 4’ to 5’ diameter will comprise the structure and T-head feature.
The terminal groin will consist of an approximate 25% void ratio and a lowered crest elevation to facilitate a reduced sediment transport across the structure, but not a complete elimination. To further limit blockage of the estimated 150,000 cy/yr migrating eastward off Holden Beach into LFI, sand placement will occur immediately updrift of the groin to form a ‘fillet’. The sand placement portion of the plan consists of hydraulically dredging between 100,000 and 150,000 CY from the bend widner located at the AIWW crossing in LFI. The LFI navigation channel and the Central Reach offshore borrow site provide alternate borrow sources for the project. The plan estimates a 4-year maintenance interval for sand placement. The ‘fillet’ is designed to fill the sediment cell expected to be blocked or anchored by the terminal groin. Theoretically, by constructing the ‘fillet’ the same sediment budget that existed prior to the project will continue post construction. However, the ‘fillet’ will change the shoreline orientation and wave approach angle among other key components influencing sediment transport. Thus, the true modified transport rate will not be known until after project construction.
Holden Beach has proposed to monitor shoreline on Oak Island to identify if negative erosional impacts occur. Semi-annual monitoring reports will provide a shoreline and volumetric change analysis for the beach strand extending approximately 4,400 feet from LFI to roughly 500 ft east of 66th Place West. Surveys covering six (6) transects will provide the monitoring data for the analysis. The transects extend from the primary dune out to an elevation of -25 ft NAVD88 along profiles designated as Oak 1 through Oak 5. (Two (2) transects extend from Oak 1 along different azimuths in LFI.) However, the full transects will only be surveyed during annual monitoring events. Semi-annual monitoring events will only cover the transects out to wading depth or approximately -6 ft NAVD88. Additional survey data covering the AIWW bend widner and crossing through LFI, in addition to the LFI navigation channel, will be obtained from the USACE or surveyed separately for inclusion in the monitoring analysis.
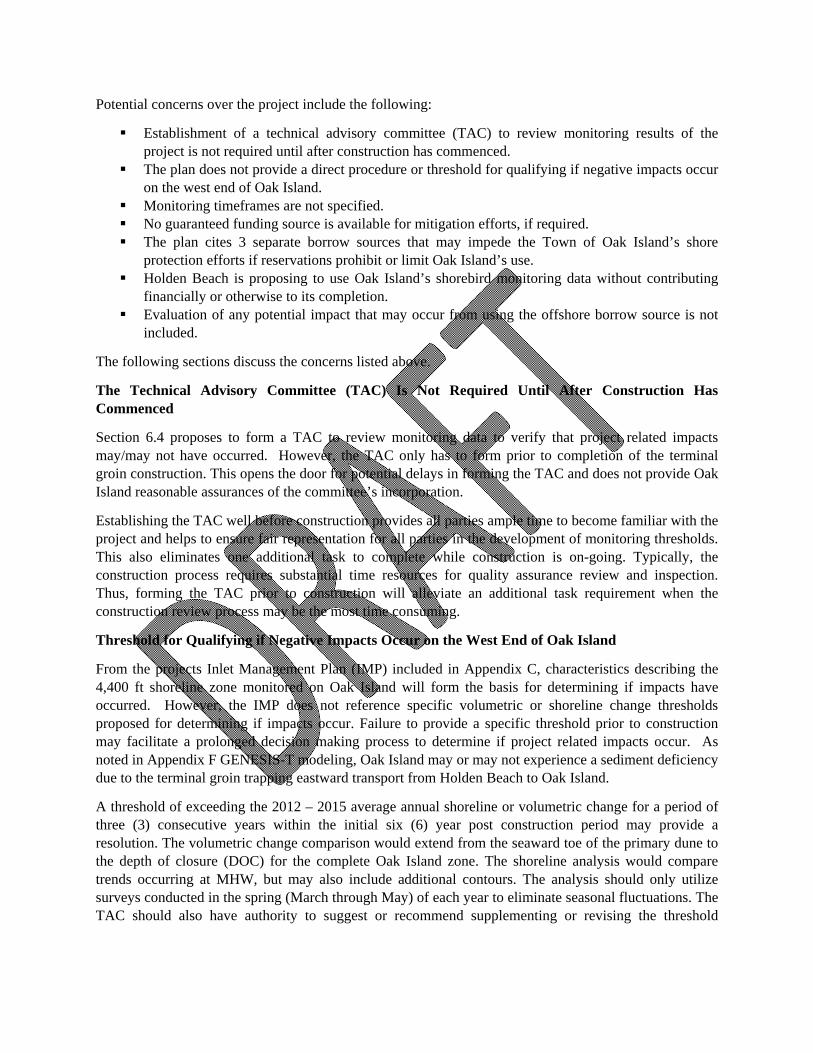
Potential concerns over the project include the following:
Establishment of a technical advisory committee (TAC) to review monitoring results of the project is not required until after construction has commenced.
The plan does not provide a direct procedure or threshold for qualifying if negative impacts occur on the west end of Oak Island.
Monitoring timeframes are not specified. No guaranteed funding source is available for mitigation efforts, if required. The plan cites 3 separate borrow sources that may impede the Town of Oak Island’s shore
protection efforts if reservations prohibit or limit Oak Island’s use. Holden Beach is proposing to use Oak Island’s shorebird monitoring data without contributing
financially or otherwise to its completion. Evaluation of any potential impact that may occur from using the offshore borrow source is not
included.
The following sections discuss the concerns listed above.
The Technical Advisory Committee (TAC) Is Not Required Until After Construction Has Commenced
Section 6.4 proposes to form a TAC to review monitoring data to verify that project related impacts may/may not have occurred. However, the TAC only has to form prior to completion of the terminal groin construction. This opens the door for potential delays in forming the TAC and does not provide Oak Island reasonable assurances of the committee’s incorporation.
Establishing the TAC well before construction provides all parties ample time to become familiar with the project and helps to ensure fair representation for all parties in the development of monitoring thresholds. This also eliminates one additional task to complete while construction is on-going. Typically, the construction process requires substantial time resources for quality assurance review and inspection. Thus, forming the TAC prior to construction will alleviate an additional task requirement when the construction review process may be the most time consuming.
Threshold for Qualifying if Negative Impacts Occur on the West End of Oak Island
From the projects Inlet Management Plan (IMP) included in Appendix C, characteristics describing the 4,400 ft shoreline zone monitored on Oak Island will form the basis for determining if impacts have occurred. However, the IMP does not reference specific volumetric or shoreline change thresholds proposed for determining if impacts occur. Failure to provide a specific threshold prior to construction may facilitate a prolonged decision making process to determine if project related impacts occur. As noted in Appendix F GENESIS-T modeling, Oak Island may or may not experience a sediment deficiency due to the terminal groin trapping eastward transport from Holden Beach to Oak Island.
A threshold of exceeding the 2012 – 2015 average annual shoreline or volumetric change for a period of three (3) consecutive years within the initial six (6) year post construction period may provide a resolution. The volumetric change comparison would extend from the seaward toe of the primary dune to the depth of closure (DOC) for the complete Oak Island zone. The shoreline analysis would compare trends occurring at MHW, but may also include additional contours. The analysis should only utilize surveys conducted in the spring (March through May) of each year to eliminate seasonal fluctuations. The TAC should also have authority to suggest or recommend supplementing or revising the threshold

requirements for establishing if negative impacts occur. The TAC should work with the USACE and DCM regulatory staff to initiate any changes to the threshold requirements.
Monitoring Timeframes Not Specified
Appendix C states Holden Beach will survey the beachfront on Oak Island twice per year in efforts to determine if negative impacts have occurred. However, the surveys will only extend across the complete active profile (-25 ft NAVD88) during annual events, with the semi-annual events terminating at wading depth (-6 NAVD88). Also, the appendix does not provide a specific timeframe (fall or spring) to correspond with an annual event or semi-annual event.
In efforts to capture the most reliable monitoring data, the surveys should be conducted during the same time period each year and should cover the same area. The survey plan should state when surveys will be conducted and all surveys should extend to -25 ft NAVD88 or beyond the Depth of Closure (DOC). Generally, monitoring surveys commence in the spring of each year. This helps to eliminate seasonal fluctuations observed in shoreline movement and allows a direct annual comparison with previous surveys. Semi-annual surveys may be conducted during the fall of each year to collect a balanced illustration of the annual shoreline influences.
No Guaranteed Funding Source Available for Mitigation Efforts
Section 6.4 specifies the Town of Holden Beach will fund all mitigation efforts through the Beach, Parks, Access and Recreation/Tourism Fund (BPART). However, Holden Beach also proposes to fund the construction and maintenance of the terminal groin project through the BPART. The EIS does not provide an available balance or escrow account established for the sole purpose of potential mitigation requirements. Based on the BPART’s previous funding efforts described throughout the EIS, a reasonable conclusion suggests the fund maintains an adequate balance for any potential mitigation. However, no guarantee exists to provide any potential mitigation if the project maintenance or future construction costs exceed the BPART’s available balance.
Requiring the prioritization of all mitigation efforts ahead of maintenance or future construction efforts provides an additional assurance that funds will be available.
The Plan Cites 3 Separate Borrow Sources that may Impede the Town of Oak Island’s Shore Protection Efforts if Reservations Prohibit or Limit Oak Island’s Use
Section 3.1.6 states a nourishment volume up to approximately 150,000 CY would be required to maintain the ‘fillet’ and protective beach along the project shoreline. The LFIX and AIWW bend widener serves as the preferred borrow source but the LFI navigation channel and the Central Reach offshore borrow source provide alternate sources. Based on the Holden Beach – Beach Management Plan (Appendix D) an estimated 625,000 CY may also be necessary to fulfill the nourishment requirements for the remainder of the island every 4 years. Coupled with the estimated western transport quantity of 228,000 cy/yr (Section 3.0), this equates to an annual volumetric reduction of approximately 420,000 cy/yr. The components of LFI may not be able to sustain this level of volumetric change and still provide adequate material for nourishing Oak Island.
Concerns with sediment needs exist for Oak Island given the recent shoreline behavior that necessitate clarification of the Holden Beach nourishment plan. The list below provides the requested clarifications.
If the LFIX and AIWW bend widener provide the preferred borrow source, under what condition(s) will LFI navigation channel or Central Reach borrow source be used?

Are any circumstances expected where a volume greater than 150,000 CY every 4 years will be needed?
To provide a fair and equivalent sediment source for both Oak Island and Holden Beach, perhaps only half of the available volume from any LFI or navigation channel borrow source (including the AIWW bend widner) should be available for either town. Evidence would be needed to show an equivalent volume of beach compatible material remained in the respective borrow source as the volume proposed for removal. To help support an equal distribution, the volume comparison should account for equivalent grain size characteristics between the volume removed and the volume left in place.
In addition, the use of any borrow source within the LFI system should also be agreed upon by Oak Island, or at a minimum the TAC. Both Oak Island and Holden Beach have a vested interest in identifying the most suitable sand resources within LFI for shoreline initiatives. This would reduce the potential for using a questionable borrow source such as the outer inlet channel in the LFI ebb shoal proposed under alternative 4. Oak Island agrees, use of the designated borrow source under alternative 4 may create adverse impacts for both Holden Beach and Oak Island. A more centralized channel borrow source may be advantageous for both towns.
Use of Oak Island Shore Bird Monitoring Data with No Financial Contribution
Section 6.5 states the Town of Oak Island’s shorebird monitoring data will be used to satisfy monitoring requirements for the Town of Holden Beach. Although the Town of Oak Island remains open and amenable to sharing data, Oak Island cannot assume the responsibility of collecting data to serve the purposes of Holden Beach. Prior to accepting Holden Beach’s proposal to use data collected by Oak Island there should be an understood agreement between the two town’s establishing the responsibilities of each. This may involve a partnering opportunity to collaboratively collect the necessary shorebird data or some other agreement to share resources. However, with no agreement in place Oak Island shall not assume the responsibility of collecting data for the purposes of Holden Beach.
Potential Impacts from Using Offshore Borrow Source Not Included
The Town of Oak Island provided initial comments to the USACE in a letter dated March 23, 2012. The comments included concerns over use of the offshore Central Reach borrow area and potential impacts to the Oak Island shoreline and alignment of LFI. The EIS document does not appear to address the concerns listed in the March 23rd letter. A comprehensive decision regarding this project’s path forward must include the analysis of all proposed project alternatives to fully understand the potential impacts. The list below provides the referenced concerns from the March 23, 2012 letter.
Are impacts to the Oak Island shoreline likely from the proposed dredging of the Central Reach borrow source?
Will dredging of the Central Reach borrow source alter the symmetry of the ebb-tidal delta complex or channel alignment in LFI?
What is the potential and timeframe estimated for the recharge of the Central Reach borrow source?
The comments above represent the concerns cited for the Town of Oak Island in reference to the Holden Beach East End Shore Protection Project. Again, Oak Island fully supports Holden Beach’s initiative to utilize a terminal groin and beach fill for shoreline stabilization. However, the thorough review of any proposed action that may impact the adjacent LFI system or Oak Island shoreline must be completed and understood prior to moving forward. Your time on this project is appreciated, and please let me know if there are additional questions.

Sincerely, Town of Oak Island
Tim Holloman Town Mangel'

Sincerely, Town of Oak Island
Tim Holloman Town Mangel'

Holden Beach East End Shore Protection Project
Meeting with Town of Oak Island
January 29, 2016
10:30 am
Attendees: Fran Way, Johnny Martin, Robert Neal, Todd Roessler, David Hewett, Christy Ferguson, Tim
Holloman
Todd thanked everyone for coming. The Town of Holden Beach has reviewed the Town of Oak Island’s
comments (attached) and would like to come to a resolution today.
The purpose of today’s meeting is reach consensus on the Town of Oak Island’s comments and
concerns regarding the Town of Holden Beach’s East End Shore Protection Project and Inlet
Management Plan.
Town of Oak Island’s Concerns
Inlet Management Plan
The Inlet Management Plan (IMP) was developed to establish thresholds and baseline. The Draft
IMP set up one profile for baseline. We would like to expand a baseline to capture each profile.
What survey data will it be based on?
Fran indicated that sediment transport around the Lockwood Folly Inlet (LFI) and the groin will
not impact Oak Island’s (OI’s) shoreline, but with that said Holden Beach (HB) will monitor the
west end of OI and east end of HB. The Town of HB is proposing monitoring stations as shown in
the Draft IMP (new figure D‐3). The Town of HB needs OI’s blessing to go to DCM and indicate
there is an agreement. The approved Bald Head Island Inlet Management Plan was used as a
template to establish thresholds.
Analysis (volume – out to depth of closure (‐15) such as Oak 1 – 7) will include monitoring
stations on Oak Island and Holden Beach. Official triggers would be based on stations: Oak 3, 4,
5, 6.
Technical Advisory Committee (TAC) – would include an engineer representing Oak Island and
would be formulated prior to construction. The TAC would also include an engineer from the
USACE.
Cleary studies/transects only go to MLW. His data will be used (transects 9 and 10 line up with Oak 5
and 6) to serve as a baseline.
Same baseline/thresholds as Bald Head proposed. Ocean Isle is using aerial photography to monitor
changes. Oak Island would like to use volumetric change to show the whole picture. A large change in
MHW could equate to not a large change when reviewing the entire profile. Need the full picture to
determine impacts. Beneficial to Holden Beach. Pattern on OI is erosional on west end. 2012 is baseline
– HB has been surveying since then. OI could share survey data within the area to incorporate into the
trigger analysis.
Threshold would be 50% trigger of baseline – mitigation triggered is the TAC is formed and evaluate.
Data is limited with respect to below MLW and would be consideration of evaluation of threshold data.
HB will do volumetric calculations. MHW threshold + volume calculations. TAC’s discretion would be to
determine that 2 years of data would be needed prior to determination. The TAC will evaluate all factors
including storms, ebb channel changes. Given the small structure, impacts will likely be small.
OI is in favor of project moving forward.
Funding for COE representation would need to come from Holden Beach.
OI will review the revised IMP and determine if changes are sufficient.
Volume thresholds won’t be identified now due to limited data. Semi‐annual monitoring is going on now
to wading depths. ATM will continue aerial photography. DCM proposes to conduct long‐term
monitoring (30 years?). Annual monitoring will always continue Oak 1 – 7. Will OI continue surveying the
oceanfront? OI is currently working on an island‐wide feasibility study. Annual profile surveys will be
conducted but to what extent is unsure at this point. Sharing data will be best case.
HB annually collects data along 48 profiles from Shallotte to LFI – every 1,000 feet.
HB is permit holder for the groin – by perpetuating the surveys and engineered beach – a storm event
causing erosion could provide for FEMA reimbursement.
East Coast Engineering (Chris Stanley) is used for HB. Geodynamics and TI Coastal is used for OI.
OI will place material east of the inlet hazard area and therefore surveys would stop at Oak 5.
Monitoring timeframes is spring and fall – first 6 years will be every 6 months, then annual after
indefinitely. Annual surveys are always in the spring.
Funding source for mitigation – if mitigation is required/prioritized in front of nourishment – if funding
came after nourishment then money wouldn’t be available. Mitigation is preferential over future beach
renourishment if the TAC determines that?
Shorebird monitoring – will discuss further once it is determined if bird monitoring. Dawn will call Kathy
Matthews to discuss this issue further. Ask if Oak Island’s monitoring can be reduced after first year?
Fillet – terminal groin will maintain shoreline orientation and not change it. Modeling proves that.
Borrow area(s) – need for volumes greater than 150,000 cy. OI wants to continue conversation to
develop sand management strategies and determine greatest need.
How does COE make the decision to beneficially place AIWW material on Holden Beach every time? Has
the COE ever placed material on OI via beneficial use? Matter of cost and convenience to the COE? OI
wouldn’t mind adding in funds to alternate use. OI has never asked because there hadn’t been a need.
HB has needed it more in the past.
OI will ask the COE to help clean out mouth of Eastern Channel when they conduct the AIWW bend
widener. HB has one‐time permits to help maintain the bend widener. There have been 2 bend widener
projects – first time the COE funded fully, the second time HB funded the delta to receive material from
bend widener. HB utilized existing CAMA Major to modify and a GP 291. Approximately 100,000 cy was
placed.
OI has an existing CAMA Major permit and a GP 291 to place material – they could modify to include an
additional borrow source from the AIWW bend widener. Approximately 100,000 cy is deposited in the
bend widener every year – therefore the two towns could share the resource every 2 years – piggyback
on the COE’s maintenance event. Benefits to both towns to approach the COE together to utilize the
resource.
OI – across 9 miles – volumetric need based on little data – 125,000 cy/year – 1,000,000 every 8 years.
Multiple borrow sources as well as inlet management in LFI. Jaybird and Frying Pan are on the table but
Jaybird has been contentious as it relates to changes in shoreline on Caswell Beach. An initial project
would be needed (several million yards) to reach a 10‐year level of protection – vary across island and
would include the entire island. Maintain level of protection. Sources of 2 million cy are diverse, could
include Central Reach.
LFI would be maintenance material for the west end of the beach. Timeframe for initial project would be
4‐5 years.
Confirmation that there is enough material in the TG’s main borrow source within the AIWW LFIX. On a
normal year 150,000 will be enough to maintain the fillet, it is likely there will be additional material to
be shared between the Towns if a need arises.
Central Reach Borrow Area – under what conditions would be required to utilize. Mobilization would be
too high as it would require a larger dredge. Upland material would be priority – just for the TG project.
The Central Reach project’s main borrow source is the central reach borrow area ‐ $16‐18 million
project.
The LFI is not included in the East End Shore Protection Project – just the AIWW LFIX.
Central Reach borrow area is in 35 feet of water, approximately 2‐3 miles offshore. Cuts are shallow.
Similar studies indicate that Long Bay is sand starved. Discussions were had with OI and HB to discuss
the central reach borrow area and potential concerns/impacts.
OI submitted a letter to COE in 2011 but letter was not provided to HB. ATM provide additional data to
determine changes to wave heights if central reach borrow area would be dredged. Incorporate
additional information from similar studies, i.e. Myrtle Beach.
The Central Reach project already evaluated this in the CAMA Major permit and ATM will provide a
paragraph in response to this concern.
Central Reach borrow area recharge will be relatively slow due to depth and location. OI understands
and agrees. Similar to Jay Bird shoal where it was dredged for Bald Head’s private project. Dredge cuts
still show up, no sloughing has occurred. Increased wave energy of 1 – 2% on Caswell Beach has
occurred. Caswell Beach should receive the next sand allotment in 2017, approximately 300,000 cy of
material. Sand Management Plan is still proposed and not final.
Sand sources within the LFI – under normal condition, there will be enough material to meet the needs
of HB and OI. HB is open to future discussions to proactively manage sand needs. The TAC will be
formulated to support this strategy.

Dawn will summarize meeting minutes and provide to the group and will serve as a baseline response to
the Town to reach an agreement on concerns.
TG construction has no timeframe at this time. A permit is needed first. Central Reach project is already
permitted. TG construction will be approximately $2 million and funding is in place. East end of beach is
hanging on, no dune currently exists in front of Amazing Grace.
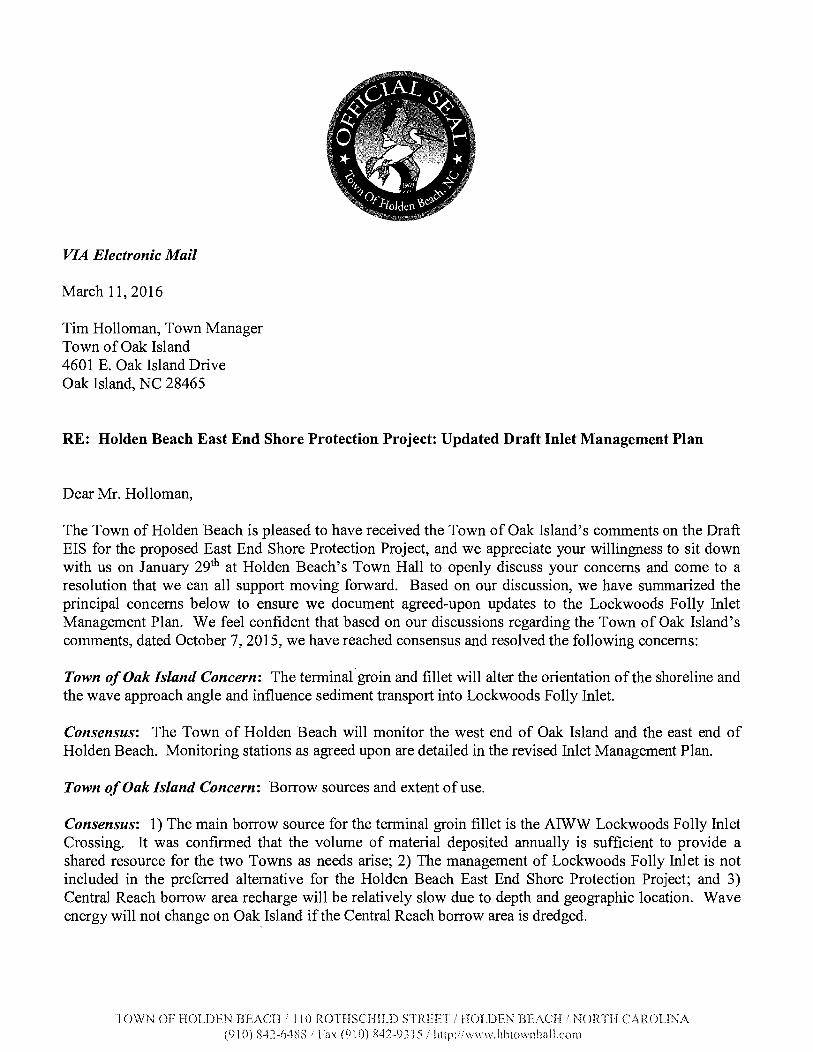
VIA Electronic Mail
March 11,2016
Tim Holloman, Town Manager Town of Oak Island 4601 E. Oak Island Drive Oak Island, NC 28465
RE: Holden Beach East End Shore Protection Project: Updated Draft Inlet Management Plan
Dear Mr. Holloman,
The Town of Holden Beach is pleased to have received the Town of Oak Island's comments on the Draft EIS for the proposed East End Shore Protection Project, and we appreciate your willingness to sit down with us on January 29th at Holden Beach's Town Hall to openly discuss your concerns and come to a resolution that we can all support moving forward. Based on our discussion, we have summarized the principal concerns below to ensure we document agreed-upon updates to the Lockwoods Folly Inlet Management Plan. We feel confident that based on our discussions regarding the Town of Oak Island's comments, dated October 7,2015, we have reached consensus and resolved the following concerns:
Town of Oak Island Concern: The terminal groin and fillet will alter the orientation of the shoreline and the wave approach angle and influence sediment transport into Lockwoods Folly Inlet.
Consensus: The Town of Holden Beach will monitor the west end of Oak Island and the east end of Holden Beach. Monitoring stations as agreed upon are detailed in the revised Inlet Management Plan.
Town of Oak Island Concern: Borrow sources and extent of use.
Consensus: 1) The main borrow source for the terminal groin fillet is the AIWW Lockwoods Folly Inlet Crossing. It was confirmed that the volume of material deposited annually is sufficient to provide a shared resource for the two Towns as needs arise; 2) The management of Lockwoods Folly Inlet is not included in the preferred alternative for the Holden Beach East End Shore Protection Project; and 3) Central Reach borrow area recharge will be relatively slow due to depth and geographic location. Wave energy will not change on Oak Island if the Central Reach borrow area is dredged.
TOWN OF HOLDEN BEACH i 110 I{OTHSCHILD STRI]?T ! HOLDEN m::ACH ! NORTH CAROLINA (910) 842··64x8 ! Fax (910) g42-93! -"! hHp:!!www.hhtownhalLcom
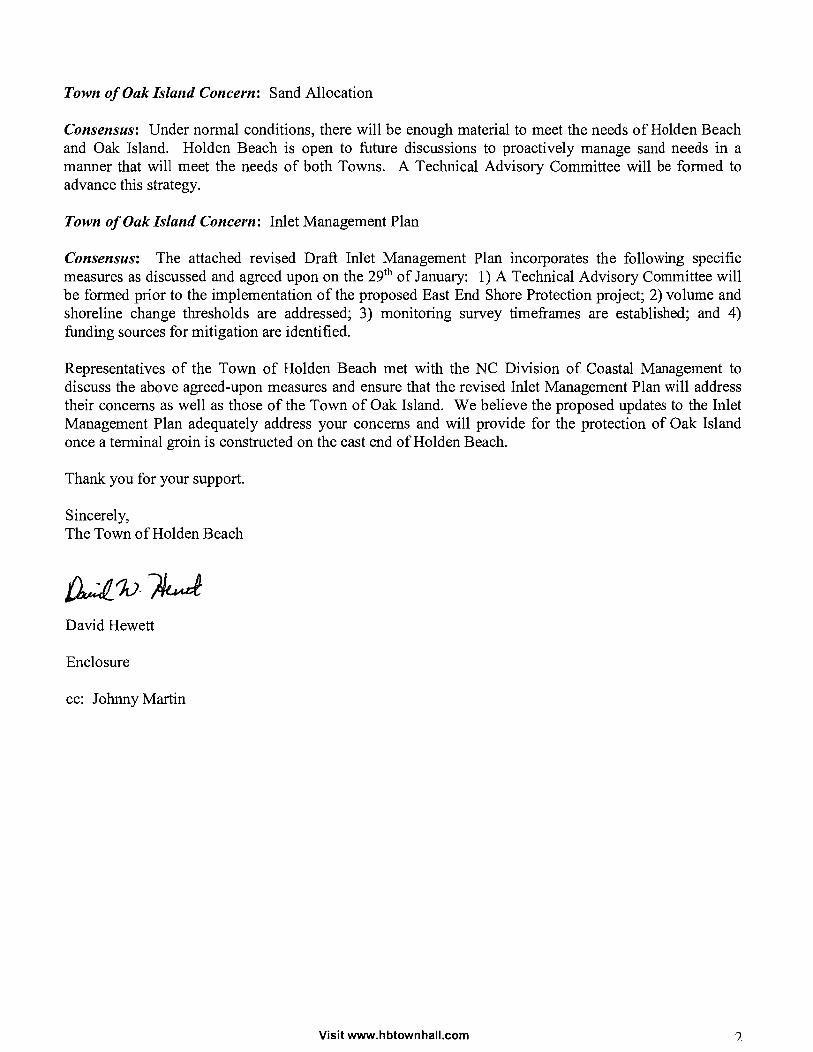
Town of Oak Island Concern: Sand Allocation
Consensus: Under normal conditions, there will be enough material to meet the needs of Holden Beach and Oak Island. Holden Beach is open to future discussions to proactively manage sand needs in a manner that will meet the needs of both Towns. A Technical Advisory Committee will be formed to advance this strategy.
Town of Oak Island Concern: Inlet Management Plan
Consensus: The attached revised Draft Inlet Management Plan incorporates the following specific measures as discussed and agreed upon on the 29th of January: 1) A Technical Advisory Committee will be formed prior to the implementation of the proposed East End Shore Protection project; 2) volume and shoreline change thresholds are addressed; 3) monitoring survey timefrarnes are established; and 4) funding sources for mitigation are identified.
Representatives of the Town of Holden Beach met with the NC Division of Coastal Management to discuss the above agreed-upon measures and ensure that the revised Inlet Management Plan will address their concerns as well as those of the Town of Oak Island. We believe the proposed updates to the Inlet Management Plan adequately address your concerns and will provide for the protection of Oak Island once a terminal groin is constructed on the east end of Holden Beach.
Thank you for your support.
Sincerely, The Town of Holden Beach
David Hewett
Enclosure
cc: Johnny Martin
Visit www.hbtownhall.com
April 6, 20 16
Mr. David Hewett Town Manager Town of Ha l den Beach 110 Rothschild Street Holden Beach, NC 28462
Re: Comments On Revised Inlet Management Plan for Holden Beach Terminal Groin Draft EIS
Dear Mr. Hewett,
The Town of Oak Island appreciates the opportunity to comment on the revised inlet management plan provided by the Town of Holden Beach for the Terminal Groin Draft EIS . We have reviewed the revised plan and find that it has addressed all the previous comments provided by the Town of Oak Island. As for the Draft EIS, the on ly remaining issue that needs to be addressed is the addition ofa few sentences outlining the reasons why use of the offshore borrow site is not expected to cause increased wave energy to reach the Oak Island shore line.
Again, the Town of Oak Island apprec iates the opportunity to comment on this project and strongly supports the approva l ofa termina l groin on Holden Beach , We appreciate our re lationship with the Town of Holden Beach and look forward to continuing to share data and the precious sed iment resources adjacent to both our islands,
If you have any questions, please do not hesitate to contact me at (9 10) 201 -8004.
Sincerely,
~u,--;?~-Lisa P. Stites Interim Town Manager Town of Oak Island (910) 20 1-8004
4601 E, Oak Island Drive· Oak Island, North Caroli na 28465 Phone: (910) 278-5011· Fax: (910) 278-3400· Website: www.oakislandnc.com
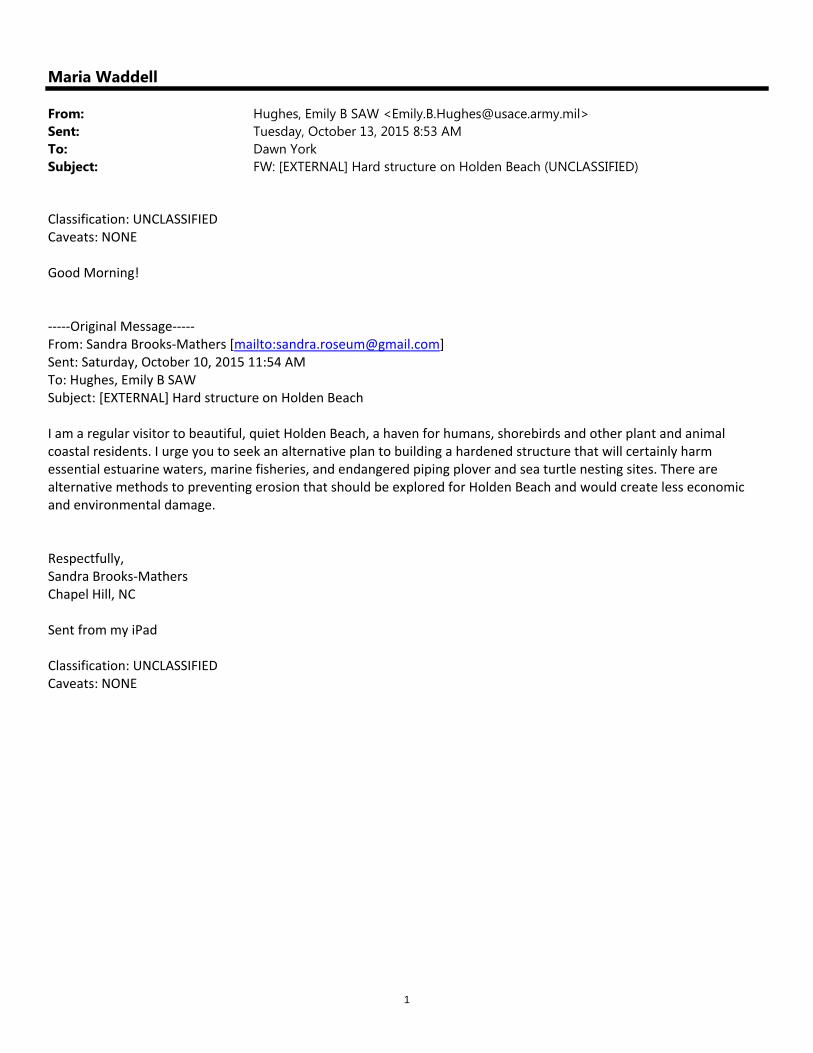
1
Maria Waddell
From: Hughes, Emily B SAW <[email protected]>Sent: Tuesday, October 13, 2015 8:53 AMTo: Dawn YorkSubject: FW: [EXTERNAL] Hard structure on Holden Beach (UNCLASSIFIED)
Classification: UNCLASSIFIED Caveats: NONE Good Morning! ‐‐‐‐‐Original Message‐‐‐‐‐ From: Sandra Brooks‐Mathers [mailto:[email protected]] Sent: Saturday, October 10, 2015 11:54 AM To: Hughes, Emily B SAW Subject: [EXTERNAL] Hard structure on Holden Beach I am a regular visitor to beautiful, quiet Holden Beach, a haven for humans, shorebirds and other plant and animal coastal residents. I urge you to seek an alternative plan to building a hardened structure that will certainly harm essential estuarine waters, marine fisheries, and endangered piping plover and sea turtle nesting sites. There are alternative methods to preventing erosion that should be explored for Holden Beach and would create less economic and environmental damage. Respectfully, Sandra Brooks‐Mathers Chapel Hill, NC Sent from my iPad Classification: UNCLASSIFIED Caveats: NONE
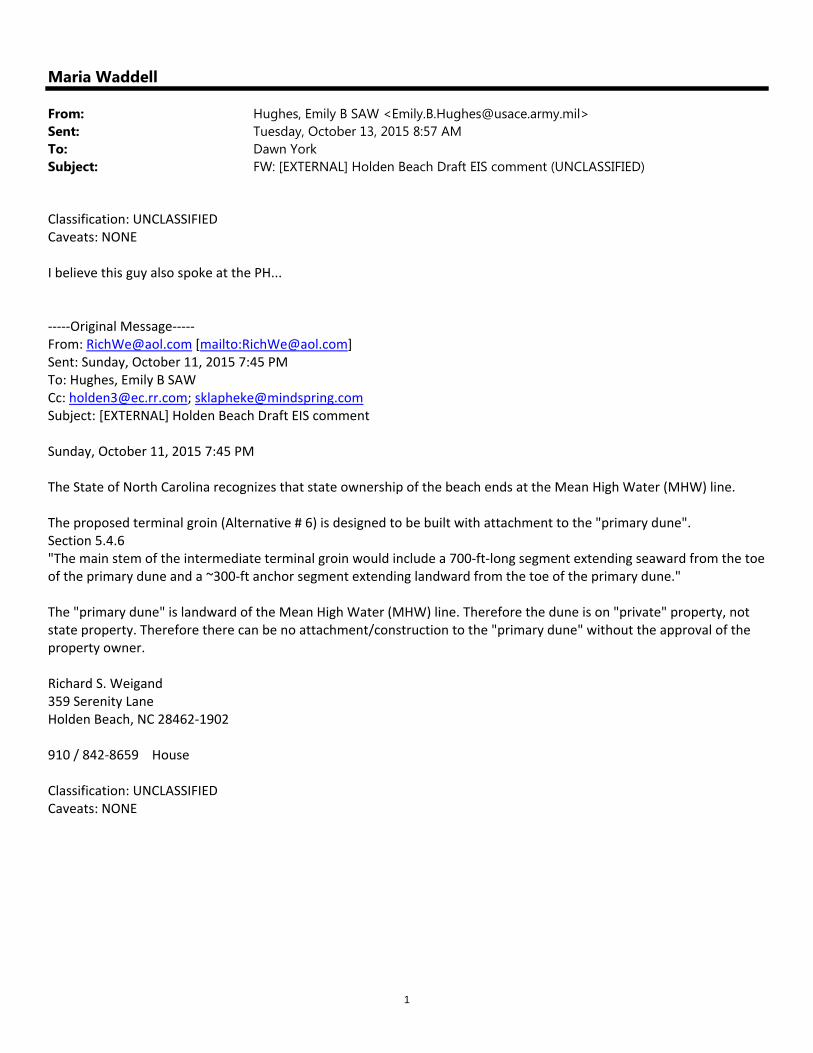
1
Maria Waddell
From: Hughes, Emily B SAW <[email protected]>Sent: Tuesday, October 13, 2015 8:57 AMTo: Dawn YorkSubject: FW: [EXTERNAL] Holden Beach Draft EIS comment (UNCLASSIFIED)
Classification: UNCLASSIFIED Caveats: NONE I believe this guy also spoke at the PH... ‐‐‐‐‐Original Message‐‐‐‐‐ From: [email protected] [mailto:[email protected]] Sent: Sunday, October 11, 2015 7:45 PM To: Hughes, Emily B SAW Cc: [email protected]; [email protected] Subject: [EXTERNAL] Holden Beach Draft EIS comment Sunday, October 11, 2015 7:45 PM The State of North Carolina recognizes that state ownership of the beach ends at the Mean High Water (MHW) line. The proposed terminal groin (Alternative # 6) is designed to be built with attachment to the "primary dune". Section 5.4.6 "The main stem of the intermediate terminal groin would include a 700‐ft‐long segment extending seaward from the toe of the primary dune and a ~300‐ft anchor segment extending landward from the toe of the primary dune." The "primary dune" is landward of the Mean High Water (MHW) line. Therefore the dune is on "private" property, not state property. Therefore there can be no attachment/construction to the "primary dune" without the approval of the property owner. Richard S. Weigand 359 Serenity Lane Holden Beach, NC 28462‐1902 910 / 842‐8659 House Classification: UNCLASSIFIED Caveats: NONE

1
Maria Waddell
From: Hughes, Emily B SAW <[email protected]>Sent: Friday, October 09, 2015 1:08 PMTo: Dawn YorkSubject: FW: [EXTERNAL] Holden Beach terminal groin project. (UNCLASSIFIED)
Classification: UNCLASSIFIED Caveats: NONE ‐‐‐‐‐Original Message‐‐‐‐‐ From: [email protected] [mailto:[email protected]] Sent: Friday, October 09, 2015 12:41 PM To: Hughes, Emily B SAW Subject: [EXTERNAL] Holden Beach terminal groin project. Dear Ms Hughes, I'd like to submit my comments in support of the proposed terminal groin project for Holden Beach. I believe this is the best strategy to prevent shoreline erosion. I also believe this project will also protect infrastructure, roads, wildlife as well as the beaches and dunes. Could you send me any updated information relating to this project? Thank you Diana Willard 230 Ocean Blvd East Holden Beach, N.C. 28462 Classification: UNCLASSIFIED Caveats: NONE
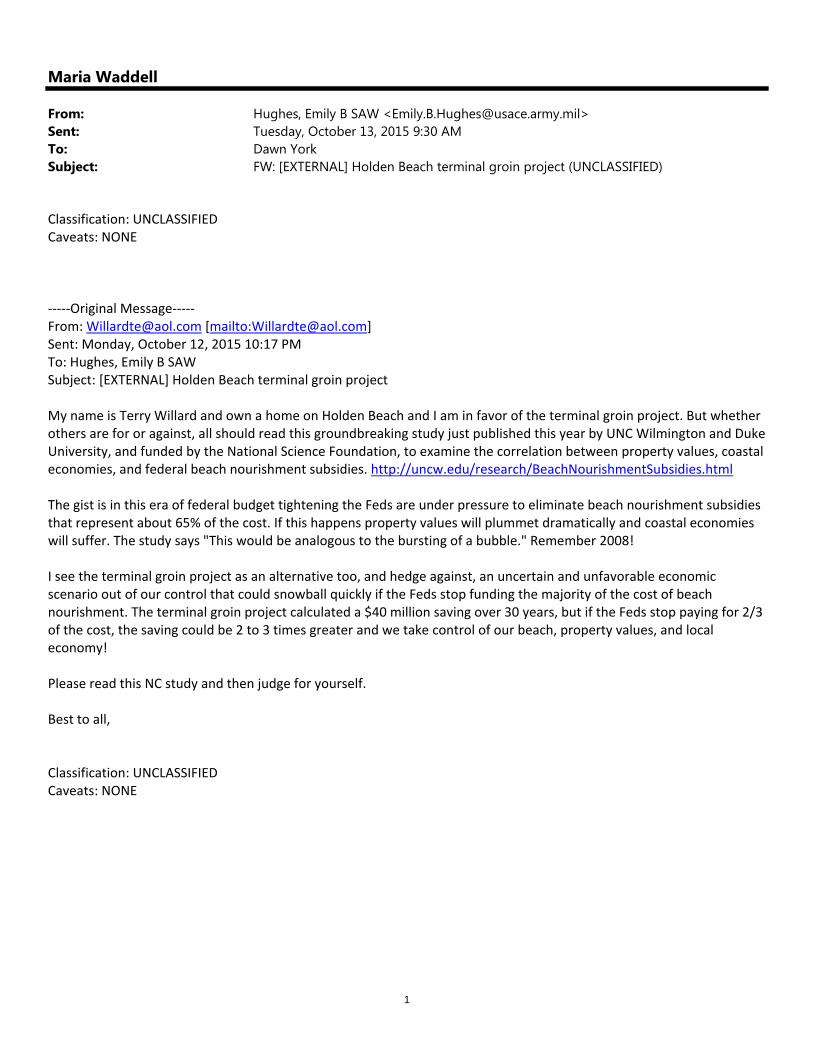
1
Maria Waddell
From: Hughes, Emily B SAW <[email protected]>Sent: Tuesday, October 13, 2015 9:30 AMTo: Dawn YorkSubject: FW: [EXTERNAL] Holden Beach terminal groin project (UNCLASSIFIED)
Classification: UNCLASSIFIED Caveats: NONE ‐‐‐‐‐Original Message‐‐‐‐‐ From: [email protected] [mailto:[email protected]] Sent: Monday, October 12, 2015 10:17 PM To: Hughes, Emily B SAW Subject: [EXTERNAL] Holden Beach terminal groin project My name is Terry Willard and own a home on Holden Beach and I am in favor of the terminal groin project. But whether others are for or against, all should read this groundbreaking study just published this year by UNC Wilmington and Duke University, and funded by the National Science Foundation, to examine the correlation between property values, coastal economies, and federal beach nourishment subsidies. http://uncw.edu/research/BeachNourishmentSubsidies.html The gist is in this era of federal budget tightening the Feds are under pressure to eliminate beach nourishment subsidies that represent about 65% of the cost. If this happens property values will plummet dramatically and coastal economies will suffer. The study says "This would be analogous to the bursting of a bubble." Remember 2008! I see the terminal groin project as an alternative too, and hedge against, an uncertain and unfavorable economic scenario out of our control that could snowball quickly if the Feds stop funding the majority of the cost of beach nourishment. The terminal groin project calculated a $40 million saving over 30 years, but if the Feds stop paying for 2/3 of the cost, the saving could be 2 to 3 times greater and we take control of our beach, property values, and local economy! Please read this NC study and then judge for yourself. Best to all, Classification: UNCLASSIFIED Caveats: NONE

1
Maria Waddell
From: Hughes, Emily B SAW <[email protected]>Sent: Friday, October 02, 2015 8:34 AMTo: Skip KlaphekeCc: Dahl, Kyle J SAW; Dawn YorkSubject: RE: [EXTERNAL] Comment re: Holden Beach DEIS (UNCLASSIFIED)
Classification: UNCLASSIFIED Caveats: NONE Thank you Skip. It was a pleasure meeting you at the Public Hearing. Your comments have been received and added to the record. You're interest in this project is much appreciated. Sincerely, Emily Hughes U.S. Army Corps of Engineers Wilmington District Environmental Resources Section 69 Darlington Avenue Wilmington, North Carolina 28403 Office: (910) 251‐4635 ‐‐‐‐‐Original Message‐‐‐‐‐ From: Skip Klapheke [mailto:[email protected]] Sent: Friday, October 02, 2015 8:16 AM To: Hughes, Emily B SAW Subject: [EXTERNAL] Comment re: Holden Beach DEIS At the public hearing held at Holden Beach on September 24, 2015, it was apparent that there was general lack of familiarity with Present Value analysis. Since relative cost is, and should be, a key determinate in deciding how to proceed, failure to appreciate that the Present Value of the alternatives is far more important than nominal cost will inevitably lead to incorrect conclusions. The study needs to make this point clearly, and the firm conducting the study, should take the time to educate the decision makers that the Present Value of the alternatives needs to be the basis of any financial comparison. Skip Klapheke 704 365 6774

2
Classification: UNCLASSIFIED Caveats: NONE

Comments in response to the Holden Beach Draft Environmental Impact Statement {DE IS)
.. ~u I' Dated August 19, 2015
by Charles KI ph eke of 342 Serenity Lane, Holden Beach, North Carolina
Summary Comments
This study is not sufficient to allow a well -inform ed discussion of the proposed alternatives. The DEIS omits any analysis of we ll over 50% of the Holden Beach portion of the affected project area . The financial presentation contains significant errors. The model, upon which so much of the study rel ies, if similar to the models lI sed in prior studies, has proven unable to predict erosion patterns or even sand movement. Some specif ics foll ow.
Perceived Shortcomings and Omissions of the Study
a NON E of the six alternatives perm anentl y addresses the east end erosion issue. Whatever
approach is taken will require continuous funding. Alternatives 5 and 6 commit the Town to a
3D-year plan with all the inherent costs, tax impacts, and visual degradation rega rdl ess of
outcome. Even worse, the structures proposed in alternatives 5 and 6 are required t o be
removed at the Town's expense in the event of negative outcomes, resulting in costs for both
constructi on and removal w ith potent ially no benefi t. Alternat ives 1, 2, 3, and 4, however, allow
for periodic review and adjustments or easy change of course, including reconsideration of
altern atives 5 or 6 if the desired results are not achieved. Perhaps th e best approach Is to
evaluate the success of other efforts underway elsewhere before the Town makes such a
substant ial, not eas il y reversible commitment, especia lly since t he recent action by the
Legislature indicat es that all of the studi ed alternatives wi ll remain viable opt ions.
a The sta tement that the groin fiel d built during the 1970's was "effective and efficient" is a huge
lea p. There are analysis avai lable th at indi ca ted th at the accretion of sand during this tim e was
more likely related to the pos it ion of the in let channel.
a All th e alternatives speak to the impact on the houses near the eastern end of McCray Street.
The number of impacted properties vari es f rom 11 under alternative 6 to 28 under altern ative 2.
The tax base affected va ries from $.995 MM under alternative 5 to $5 .18MM under alte rn ative
2. However the document is silent as to the impact to 8 oceanfront homes, 4 oceanfront lot s,
infrast ructure, and recreationa l amenit ies on Seren ity Lane. These homes and the
neighborhood will experi ence subst ant ia l aesthetic and t ax impacts from any al t ern ative, but
ce rtainly from alternatives 5 and 6. Th ere is also scant mention of the potential impact to the
homes and beaches at the western end of Oak Island.
o Using the figures in the stu dy (which are very questionable) the altern ative recommended
alternative 6 {Intermed iate terminal groin)- improves on Altern ative 1 (Status quo) by pos itively
affecting only three addit iona l parcels. For these addit ional parcels the Town will spend an
additional $3.52MM (PV) and forgo any fl exibility for the foreseeable future.
1
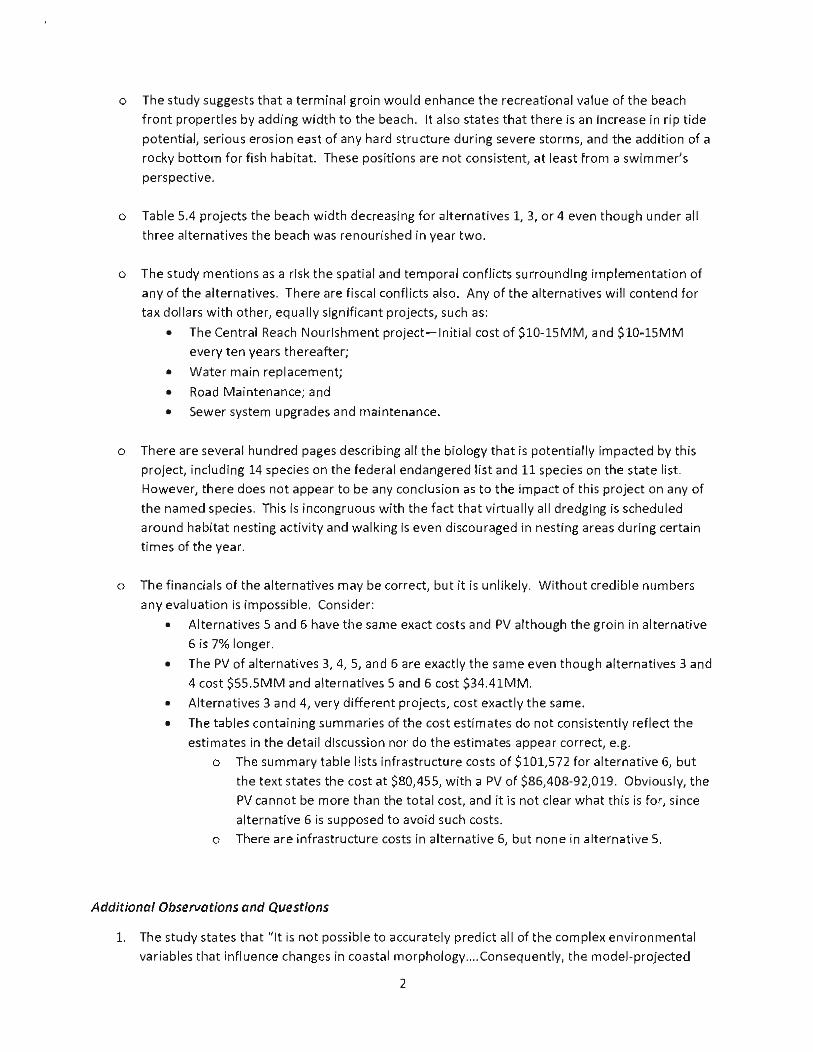
o The study suggests that a terminal groin wou ld enhance the recreational value of the beach front properties by addi ng width to the beach. It also states that there is an increase in rip tide potential, serious erosion east of any hard structure during severe storm s, an d the addition of a rocky bottom for fish habitat. These positions are not consistent, at least from a swimmer's
perspective.
o Table 5.4 projects the beach width decreasing for alternatives 1, 3, or 4 even though under all
three alternatives the beach was renourished in year two.
o The study mentions as a risk the spatia l and temporal conflicts surround ing implementation of
any of the alternatives. There are fiscal conflicts also. Any of the alternatives will contend for tax dollars with other, equa lly sign ifica nt projects, such as:
• The Central Reach Nourishment project-Initial cost of $10-15MM, and $10-15MM every ten years thereafter;
• Water main replacement;
• Road Maintenance; and • Sewer system upgrades and maintenance.
o There are several hundred pages describing all the biology that is potentia lly impacted by this project, including 14 species on the federal endangered list and 11 species on the state li st. However, there does not appear to be any conclusion as to the impact of th is project on a ny of the named species. Thi s is in congru ous with the fact that virtually a ll dredging is schedul ed around habitat nesting activity and walking is even discouraged in nesting areas during certain times of the year.
o The financials of the alternatives may be correct, but it is unlikely . Without cred ible numbers any eva lu ation is impossible. Conside r:
• Alternatives 5 and 6 have th e sa me exact costs and PV although the groin in alternative 6 is 7% longer.
• The PV of alternatives 3, 4, 5, and 6 are exactly the same even though alternatives 3 and 4 cost $55.5MM and alternatives 5 and 6 cost $34.41MM.
• Alternat ives 3 and 4, very different projects, cost exact ly the same.
• The tables contai ning summaries of the cost estimates do not consistently reflect the
estimates in the detail discussion nor do the estimates appear correct, e.g. o The summ ary table lists infrastructure costs of $101,572 for alte rnative 6, but
the text states the cost at $80,455, with a PV of $86,408-92,019. Obviously, the PV cannot be more than the tota l cost, and it is not clear what this is for, since
alte rnat ive 6 is supposed to avoid such costs. o There are infrastructure costs in alternative 6, but none in alternative 5.
Additional Observations and Questions
1. The study states that "It is not possible to accurately predict a ll of the complex environmenta l variables that influence changes in coastal morphology .. .. Consequently, the model -projected
2

changes should not be interpreted as a precise estimate of future conditions in the Permit Area". Since this whole analysis depends on the results of a single model, this disclaimer
seriously undermines the study's conclusions. In fact, the model used for the Ocean Isle DEIS,
even when calibrated using historica l data, was unable to predict the known direction of sand
movement or erosion patterns . This same model incorrectly pred icted shoreline movement at
North Topsail. Its use is also prompting are-analysis of the resu lts predicted in the Figure Eight
Study. Because of the heavy dependence on modeling results, this study needs to include the
deta il s of the model used, including its limitations and the probability of successfull y projecting the future, especially in light of the poor results of prior modeling. To appreciate the diff iculty
of predicting natural phenomena, consider the va ri ation in hurricane modeling that only
attempts to project weather for the fo llow ing week or two. This study, on the other hand, recommends a huge long term commitment based on the outcome a single model attempting to
project natural occurrences 30 years into the future.
2. A review of the alternatives of the study would be a little easier to conduct if the tables
summarizing the costs and benefits were located in the corresponding sub-sections of chapter 5.
3. Repeated references were made to the uncertainl y of federal funding for beach renourishment
projects. While this may be t rue, projects that support navigation of the waterway and inlet,
which produce sand, do have a relatively higher probability of being funded.
4. It is the purpose of studies such as this one to determine the best alternative. The init ial pages
of the study refer to "The Town's Preferred Altern ative (Alternative 6- lnterm ediate Terminal
Groin with Beach Nourishment. )" Neither the Town nor any other entity should have had a preferred alte rnative four years before any analysis was done. The presence of this statement
call s into question the objectivity of this study.
5. What is the source of funding for these alternatives (Federal, State, Town), and what is the
revenue vehicle (grants, appropriations, additional taxes )? 6. What other major Town initiatives will be deferred or abandoned to implement this one?
7. What is the process, timeframe, and forum for the town commissioners to receive the final
study, solicit input from their constituency, select an alternative, and determine sources and
impact of funding?
Conclusion
This study appears to begin with a preordained outcome, omits analysis that are not supportive
of that outcome, reli es solely on modeling that does not appear credib le, and erroneously concludes
that an expense of $34MM to build a 1,120 foot long terminal groin is the most effective and efficient
alternative.
3
1
Maria Waddell
From: Hughes, Emily B SAW <[email protected]>Sent: Tuesday, October 13, 2015 9:12 AMTo: Beter, Dale E SAW; Dahl, Kyle J SAW; McLendon, Scott C SAW; Pruitt, Carl E SAWSubject: FW: [EXTERNAL] Holden Beach Terminal Groin Project Comments (UNCLASSIFIED)
Classification: UNCLASSIFIED Caveats: NONE Scott and I engaged with this woman the night of the PH. She was very passionate on the idea that we had failed to provide this document to the public in a convenient manner ‐ meaning that we should be providing all of the local libraries with hard copies of the DEIS and Appendices. Is this our responsibility? We have members of the PRT representing Oak Island and the other municipalities ‐ shouldn't they perhaps be the ones to make a hard copy available in their library/Town Hall/etc.? How do we address this? Thanks, Emily ‐‐‐‐‐Original Message‐‐‐‐‐ From: Eileen Governale [mailto:[email protected]] Sent: Monday, October 12, 2015 12:25 PM To: Hughes, Emily B SAW Subject: [EXTERNAL] Holden Beach Terminal Groin Project Comments I am provided two comments on the DEIS for this project The first is an administrative one, and an important one: The DEIS is on‐line only, and you have disenfranchised all those who are not able to manage the complexity of this on‐line document (mostly those over 65 (at least 25% of this population). Further, there was one public meeting held in the evening at Holden Beach, at night, in the rain. Due to geographic constraints, Holden Beach is at least a 40 minute drive from Oak Island, and many people do not drive at night. In addition, none of the figures, especially those in Sections 4 and 5 are legible in the on‐line version. These figures are important visual aids to accompany the technical language presented in the document. To summarize; This is an important project, not only for Holden Beach, but for Oak Island. As a resident of oak island (in the study area), we have been largely excluded from the decision making process.The DEIS should have been made available to stakeholders in various forms, including print, poster sessions, etc. and at locations that are convenient to the relevant stakeholders. Most importantly, the DEIS should have been available in print for all residents in the study area at their local public libraries. The second comment relates to the DEIS itself:
2
While alterrnative 6 will probably result in a stable wider beachfront for Holden (albeit at great cost), this is not a benign structure, and loss of tidal and intertidal acreage is expected to occur on the west end of oak island and our tidal flats. These habitats are 'critical', even as stated in the DEIS (section 4), yet the ecological and economic impacts to Oak Island are not addressed to the extent that they should be. After reading this DEIS, I am still in the dark as to what happens on OKI! Our shorelines are precious to all of us. If potential impacts from this structure are poorly understood, the T.G. should not be selected as the best option. Sincerely; Eileen Governale 122 NE 18th St Oak Island, NC 28465 Classification: UNCLASSIFIED Caveats: NONE

1
Maria Waddell
From: Hughes, Emily B SAW <[email protected]>Sent: Friday, October 02, 2015 8:33 AMTo: [email protected]: Dahl, Kyle J SAW; Dawn YorkSubject: RE: [EXTERNAL] Lockwood Folly/Holden Beach Terminal Groin (UNCLASSIFIED)
Classification: UNCLASSIFIED Caveats: NONE Thank you Mr. and Mrs. Meyer. Your comments have been received and added to the record. You're interest in this project is much appreciated. Sincerely, Emily Hughes U.S. Army Corps of Engineers Wilmington District Environmental Resources Section 69 Darlington Avenue Wilmington, North Carolina 28403 Office: (910) 251‐4635 ‐‐‐‐‐Original Message‐‐‐‐‐ From: [email protected] [mailto:[email protected]] Sent: Friday, October 02, 2015 12:26 AM To: Hughes, Emily B SAW Cc: [email protected]; [email protected]; [email protected] Subject: [EXTERNAL] Lockwood Folly/Holden Beach Terminal Groin Emily Hughes, Project Manager 69 Darlington Avenue Wilmington, NC 28403 [email protected] October 2, 2015 Ms. Hughes and Corps of Engineers Managers: We have reviewed the Lockwood Folly Inlet/Holden Beach Terminal Groin proposal. We would like to submit our comments for inclusion in the public record. We speak on behalf of public beach users in North Carolina.
2
In 2010 to 2012, we walked every mile of shorefront on the North Carolina coast. One of our goals was to become familiar with the entire coast, to get a grasp on the entire NC shoreline. We accomplished that goal, and we learned much from our journey. One firm conclusion we formed on our coastal trek was that any and every human‐made structure on the public beach has a detrimental impact on public use of our beaches. Currently, at least fourteen such structures exist on the North Carolina coast. Construction of any other human‐made structures should be considered only if clear evidence of significant public benefit exists. Clearly, such is not the case with the Holden Beach/Lockwood Folly Inlet proposal. The Holden Beach/Lockwood Folly proposal states one of its main purposes is to ensure the continued use of the oceanfront beach. Construction of a terminal groin would not serve this stated purpose. In fact, a terminal groin would be detrimental to public use of the beach. If you doubt this fact, please walk the Bald Head Island Groin Field on the south end of Bald Head Island. Then walk the unimpeded east beach on Bald Head. No doubt will remain in your mind that terminal groins impede the use of public beach. The proposal states that infrastructure, private property, and public beach are threatened by erosion. Public beach will exist wherever ocean meets the shore. The “threat” occurs whenever a structure is erected close to the shoreline; the threat is to the structure, not the beach. A terminal groin will not protect the public beach; it is designed to protect private property. Any action that is harmful to public beach and waters (including inlets, sound, and ocean water) and not clearly beneficial to significant public interests should not even be considered. In summary, please do not approve this terminal groin project. Clearly, this project violates NC laws of public trust that protect public beaches for the benefit of all. If the project is approved, we would hope that this decision would be challenged in court as a breach of public trust laws. Respectfully submitted, Peter K. Meyer Catherine E. Meyer 1616 Jetty’s Reach Wilmington, NC 28409 cc: D. Rader D. McNaught NC Environmental Defense Fund Mike Giles North Carolina Coastal Federation Classification: UNCLASSIFIED Caveats: NONE
1
Maria Waddell
From: Hughes, Emily B SAW <[email protected]>Sent: Wednesday, October 14, 2015 8:17 AMTo: Dawn YorkSubject: FW: [EXTERNAL] Holden Beach Draft Environmental Impact Statement (UNCLASSIFIED)Attachments: VMyers Comments DEIS.docx
Classification: UNCLASSIFIED Caveats: NONE G'mornin'! ‐‐‐‐‐Original Message‐‐‐‐‐ From: Vicki Myers [mailto:[email protected]] Sent: Tuesday, October 13, 2015 4:42 PM To: Hughes, Emily B SAW Subject: [EXTERNAL] Holden Beach Draft Environmental Impact Statement Hello Emily, Attached are my comments. Thanks! Vicki Y. Myers [email protected] Classification: UNCLASSIFIED Caveats: NONE
1
Vicki Y. Myers 155 Scotch Bonnet Drive Holden Beach, NC 28462
704-517-4280 cell 910-846-5872 hm
October 13, 2015 Ms. Emily Hughes Wilmington Regulatory Field Office 69 Darlington Avenue Wilmington, NC 28403 [email protected] Ms. Hughes, I have reviewed the Draft Environmental Impact Statement (DEIS) and attended the Public Hearing. This massive document and the appendices contain a lot of information, however, I am left with more questions than when I started. My concerns center around several key areas: financial impact (economics of the alternatives), impacts outside of the project area, and general questions about the project. I emailed you some of my questions previously. Please see my email of September 29, 2015. Terminal Groin Economics It is difficult to even make assumptions about the costs related to the project because there are so many errors in the DEIS. This is disappointing because Holden Beach is a very small community with many residents living on a fixed income. Unlike our neighboring islands we do not have a commercial area on the mainland to generate tax revenue. As an island, we have many demands on our tax monies for multiple projects and constructing a groin with the additional required nourishment and monitoring will be a big commitment and cannot help but impact other projects. There are errors in the DEIS. The information in the charts doesn’t match the verbiage. For example, for Alternative 6, page 5-156: “In present value terms, construction costs range from $15.24 million (6% discount rate) to approximately $23.43 million (2.5% discount rate),“ but table 5.17 on page 5-159 shows a present value of $21.97M – $36.32M. In addition, the present value of Alternatives 3, 4, 5, and 6 all show the same amount according to the tables, even though the project costs vary. In fact, for Alternative 6 the present value at the 2.5% rate is higher than the total construction cost.
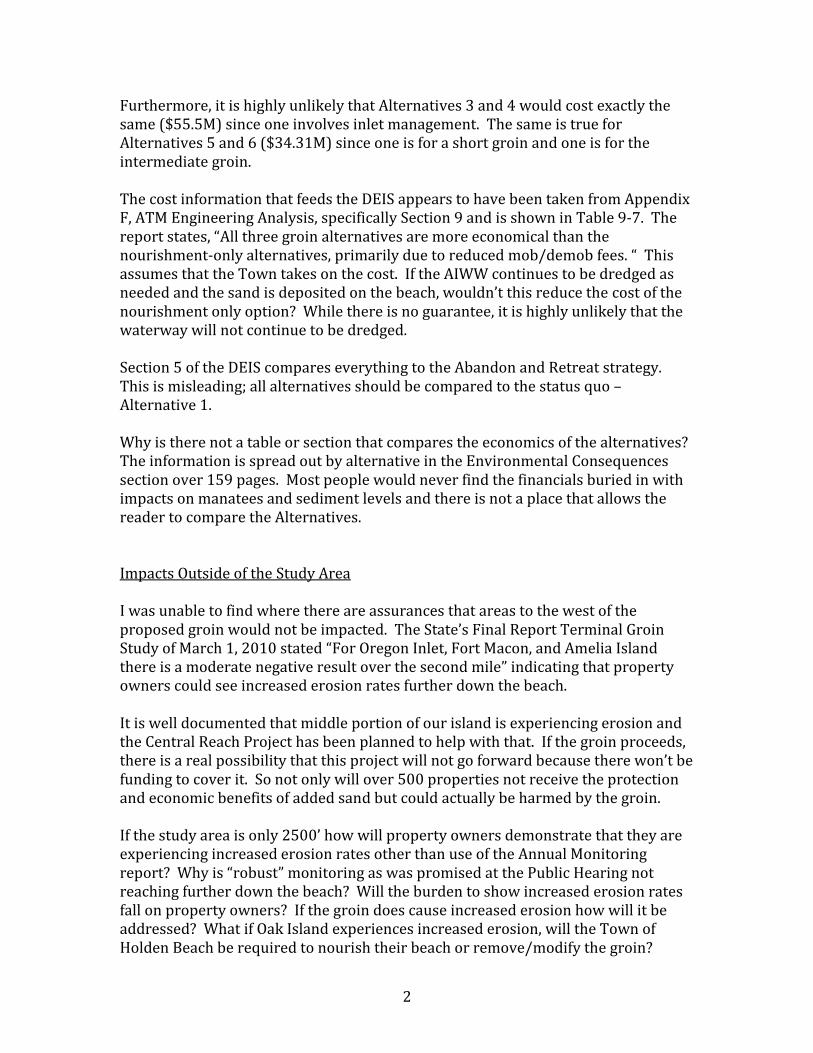
2
Furthermore, it is highly unlikely that Alternatives 3 and 4 would cost exactly the same ($55.5M) since one involves inlet management. The same is true for Alternatives 5 and 6 ($34.31M) since one is for a short groin and one is for the intermediate groin. The cost information that feeds the DEIS appears to have been taken from Appendix F, ATM Engineering Analysis, specifically Section 9 and is shown in Table 9-7. The report states, “All three groin alternatives are more economical than the nourishment-only alternatives, primarily due to reduced mob/demob fees. “ This assumes that the Town takes on the cost. If the AIWW continues to be dredged as needed and the sand is deposited on the beach, wouldn’t this reduce the cost of the nourishment only option? While there is no guarantee, it is highly unlikely that the waterway will not continue to be dredged. Section 5 of the DEIS compares everything to the Abandon and Retreat strategy. This is misleading; all alternatives should be compared to the status quo – Alternative 1. Why is there not a table or section that compares the economics of the alternatives? The information is spread out by alternative in the Environmental Consequences section over 159 pages. Most people would never find the financials buried in with impacts on manatees and sediment levels and there is not a place that allows the reader to compare the Alternatives. Impacts Outside of the Study Area I was unable to find where there are assurances that areas to the west of the proposed groin would not be impacted. The State’s Final Report Terminal Groin Study of March 1, 2010 stated “For Oregon Inlet, Fort Macon, and Amelia Island there is a moderate negative result over the second mile” indicating that property owners could see increased erosion rates further down the beach. It is well documented that middle portion of our island is experiencing erosion and the Central Reach Project has been planned to help with that. If the groin proceeds, there is a real possibility that this project will not go forward because there won’t be funding to cover it. So not only will over 500 properties not receive the protection and economic benefits of added sand but could actually be harmed by the groin. If the study area is only 2500’ how will property owners demonstrate that they are experiencing increased erosion rates other than use of the Annual Monitoring report? Why is “robust” monitoring as was promised at the Public Hearing not reaching further down the beach? Will the burden to show increased erosion rates fall on property owners? If the groin does cause increased erosion how will it be addressed? What if Oak Island experiences increased erosion, will the Town of Holden Beach be required to nourish their beach or remove/modify the groin?

3
Other Questions and Concerns
This report is based on the old alignment of the inlet. The inlet is currently strongly oriented to the southwest. I expect the 2015 annual beach monitoring report will show accretion in the study area. What is the impact of the current inlet alignment on the project costs, modeling, and other factors?
Why did the handout from the Public Hearing not match the information in
the DEIS? Which one is correct? For example, the diagram in the handout shows a groin cross section 10’ wide at the top, but the DEIS shows it to be 5” wide (page 5-142).
Page 5-36 of the DEIS states the Central Reach Project will occur in
2014/2015. This is not correct.
Figure 5.10 and Table 5.4 show Alt. #6 starts at 93’ width, all other alternatives start at 85’ (Page 5-20). Why is this? Shouldn’t they start at the same point?
Section 5.2.1 states, “It is not possible to accurately predict all of the complex
environmental variables that influence changes in coastal morphology. In fact, some anthropogenic activities, such as AIWW navigation dredging, were purposely excluded from the modeling runs to minimize the potential for masking of project-induced changes.” Is this realistic? The AIWW will continue to be dredged. It is also not comforting to have the report state that it can’t predict changes, but all the recommendations are based on modeling.
Why are you asking for public comment on an EIS when the appropriate
environmental agencies have not yet weighed in? This process should be sequential, not parallel. This project is designated as one of four approved by the state to study the impact of terminal groins, it should not proceed without full input from all agencies and the public should have the opportunity to comment on it.
Why has there not been a public question and answer session for this project.
How can you expect to get public input when there are so many questions and the source document is a technical paper thousands of pages long?
The report refers to the “Town’s preferred option” – who is the Town? Who
decided this?
4
In summary, I am disappointed. How can our Town leaders make good decisions with flawed information? It is clear that the report was written with the end in mind: that the best alternative was Alternative 6. The report is not unbiased; it takes a position and supports it. This report and the supporting documentation were prepared by firms that have a financial interest in the outcome. While I am not opposed to a terminal groin on Holden Beach, I am concerned about the information that has been provided and feel that questions need to be addressed before it proceeds. Best Regards, Vicki Y. Myers
1
Maria Waddell
From: Hughes, Emily B SAW <[email protected]>Sent: Monday, September 21, 2015 11:42 AMTo: Dawn YorkSubject: FW: [EXTERNAL] Holden Beach (UNCLASSIFIED)
Classification: UNCLASSIFIED Caveats: NONE ‐‐‐‐‐Original Message‐‐‐‐‐ From: april o [mailto:[email protected]] Sent: Saturday, September 19, 2015 6:16 PM To: Hughes, Emily B SAW Subject: [EXTERNAL] Holden Beach Dear Emily, One thing that makes NC unique from other states is its historical respect and hard work to preserve biodiversity; I hope I don't live to see this strength crumble with the increase in population and industry in the area. Many man‐made structures do not work in the long run from the perspective of ecosystems and natural forests that took millions of years to evolve and develop. I hope you can work as a team with the NC Coastal federation on alternative ideas. Happy endings to conflict are those in which two opposing sides are flexible to work together recognizing each have their own areas of expertise. It is very dangerous to make assumptions for biological systems. Piping plovers and sea turtles are endangered animals and should be protected as the USA has always tried to preserve our indigenous species. If it were up to me, I don't think any homes or structures should be built on the coast, it seems like walking up a mudslide, and a huge moneypit when considering potential hurricane damage, any sea level rise, and erosion. All may not support the idea of sea level rise, but one interesting fact is that insurance companies "do" for obvious strategic reasons that are unfair to the retiring population of adults. For this reason, it is also better not to perpetuate habitation and construction on sensitive lands/sands. Thank You, April Classification: UNCLASSIFIED Caveats: NONE

1
Maria Waddell
From: Hughes, Emily B SAW <[email protected]>Sent: Monday, September 21, 2015 11:41 AMTo: Dawn YorkSubject: FW: [EXTERNAL] Terminal groin at Lockwood Folly Inlet at Holden Beach
(UNCLASSIFIED)
Classification: UNCLASSIFIED Caveats: NONE ‐‐‐‐‐Original Message‐‐‐‐‐ From: bob peek [mailto:[email protected]] Sent: Saturday, September 19, 2015 4:05 PM To: Hughes, Emily B SAW Subject: [EXTERNAL] Terminal groin at Lockwood Folly Inlet at Holden Beach I am very much opposed to building any hard structures on the coast of North Carolina. The Army Corps of Engineers should be about protecting our natural resources, not constructing structures that will eventually and inevitably degrade those resources. Sincerely, Robert Peek Classification: UNCLASSIFIED Caveats: NONE

1
Maria Waddell
From: Hughes, Emily B SAW <[email protected]>Sent: Thursday, September 24, 2015 12:56 PMTo: Dawn YorkSubject: FW: [EXTERNAL] Holden Beach Terminal Groin DEIS (UNCLASSIFIED)
Classification: UNCLASSIFIED Caveats: NONE 1st receipt of well thought out comments... ‐‐‐‐‐Original Message‐‐‐‐‐ From: Pam Sabalos [mailto:[email protected]] Sent: Thursday, September 24, 2015 12:48 PM To: Hughes, Emily B SAW Subject: [EXTERNAL] Holden Beach Terminal Groin DEIS My name is Pam Sabalos. I am a Brunswick County resident. I have several concerns about the proposed terminal groin at Holden Beach. 1. We are an affluent community. We can make choices to build homes on shifting sands. The DEIS beautifully describes the history of migration, realignment, erosion and accretion of our barrier islands. We know how this ecosystem functions. And still some make bad investment decisions. 2. Terminal groins are ugly. Look at pictures of the New Jersey coast line. After being banned in North Carolina for 30 years because they don’t work, legislators again ignored the wisdom of the Coastal Resources Commission and just raised the cap on terminal groins from 4 to 6. 3. The computer models which are used to predict the effects of a terminal groin can be wrong. They are based on assumptions about highly complex and ever changing currents, sands and storms. They are developed by contractors who are an economically interested third party. Given the 30 years of accumulated wisdom about terminal groins, I hope the models are verified, not just adopted by the Corp. 4. Terminal groins rob sand from Peter to pay Paul. Therefore, if you have one, you have to have many. 5. They do not eliminate the need for ongoing beach nourishment. 6. They are expensive to build and expensive to remove. A recent fiscal analysis of shifting inlets and terminal groins by the Western Carolina University Program for the Study of Developed Shorelines says that the benefits of groins in protecting beach homes from erosion are unlikely to outweigh the costs. To quote the author, Andrew Coburn, “The bottom line is that, while it may hold the tip of an island in place, a terminal groin will do so for the benefit of only a very small number of property owners at the expense of other private property owners and/or taxpayers…From a scientific perspective, it is not coastal erosion that has removed or narrowed the beach. The beach has narrowed because there is a building in the way of its natural, landward retreat. If there were no buildings, the beach would still be there.”
2
7. And then there are the other expenses. Over the past 20 years I have watched the degradation of our unique environment. I have heard the assurances of local governments that projects would not affect our pristine waters, and then I have seen waters close. The permit area is rich in endangered and threatened species. The promises of protection involve many “maybes” and monitoring after the fact. That’s when it is too late. I’ve heard these generic promises before and learned they are impossible to keep, disingenuous, financially driven and often ultimately destructive. Thank you for considering my concerns. Sincerely, Pam Sabalos Classification: UNCLASSIFIED Caveats: NONE

1
Maria Waddell
From: Hughes, Emily B SAW <[email protected]>Sent: Friday, October 09, 2015 8:15 AMTo: Dawn YorkSubject: FW: [EXTERNAL] Holden beach terminal groin (UNCLASSIFIED)
Classification: UNCLASSIFIED Caveats: NONE ‐‐‐‐‐Original Message‐‐‐‐‐ From: Lora Sharkey [mailto:[email protected]] Sent: Thursday, October 08, 2015 4:43 PM To: Hughes, Emily B SAW Subject: [EXTERNAL] Holden beach terminal groin I am registering my concerns that the disturbance caused by groin placement will harm nesting and foraging areas used by endangered birds such as Red Knots and Piping Plovers. I understand the mitigation plan contends that nourishment sand will provide suitable material, but once the beach is disturbed it will take time for the organisms in the sand to become reestablished. Food that would normally be located in the sand will not be available for the birds to feed on. Construction on the beach will undoubtedly relocate the birds accustomed to nesting and feeding in that area. Too many threatened or endangered species will be effected by Alternative 6. I am against the installation of a permanent groin structure. There is already in place a plan to dredge Lockwood Folly inlet to improve water quality. This action should be supported by the town of Holden Beach and the government should work together with Oak Island to accomplish inlet management. What is the potential disruption to the plans by Oak Island to manage the inlet if the groin is installed? I urge the Army Corps of Engineers to encourage the incorporated towns of Brunswick County to work together on a master plan for erosion control and beach nourishment so outcomes could be more predictable and environmental impact minimized. Respectfully, Lora Sharkey 432 Cades Trail Southport, NC 28461 Sent from Surface Classification: UNCLASSIFIED Caveats: NONE

holden beach public hearing - Vol. I, (Pages 1:1 to 13:12) 1 1 HOLDEN BEACH TERMINAL GROIN PUBLIC HEARING 2 3 DATE: SEPTEMBER 24, 2015 4 5 6:00 P.M. 6 7 LOCATION: 8 TOWN HALL, PUBLIC ASSEMBLY ROOM 9 110 ROTHSCHILD STREET HOLDEN BEACH, NC 28462 10 11 12 13 ORIGINAL TRANSCRIPT 14 15 16 GEAN M. SEAY, INC. 17 NORTH CAROLINA STATE CERTIFIED COURT REPORTER 18 PO Box 4624, Wilmington, North Carolina 28406 19 (910) 538-4385 [email protected] fax (888) 543-7420 20 21 22 23 ASCII - E-Transcript - Summation - Condensed - Indexing - 24 25 Video 2 1 APPEARANCES 2 3 FOR THE U.S. ARMY CORPS OF ENGINEERS: 4 Colonel Kevin P. Landers, Sr., Commander 5 Emily Hughes, Project Manager 6 Dale Beter, Regulatory 7 Scott McLendon, Regulatory 8 FOR NC DEPARTMENT OF ENVIRONMENT & NATURAL RESOURCES: 9 Doug Huggett 10 Debbie Wilson 11 Heather Coats 12 FOR THE TOWN OF HOLDEN BEACH: 13 Alan Holden, Mayor 14 David Hewett, Town Manager 15 Sandy Miller, Commissioner 16 Dennis Harrington, Commissioner 17 18 SPEAKERS
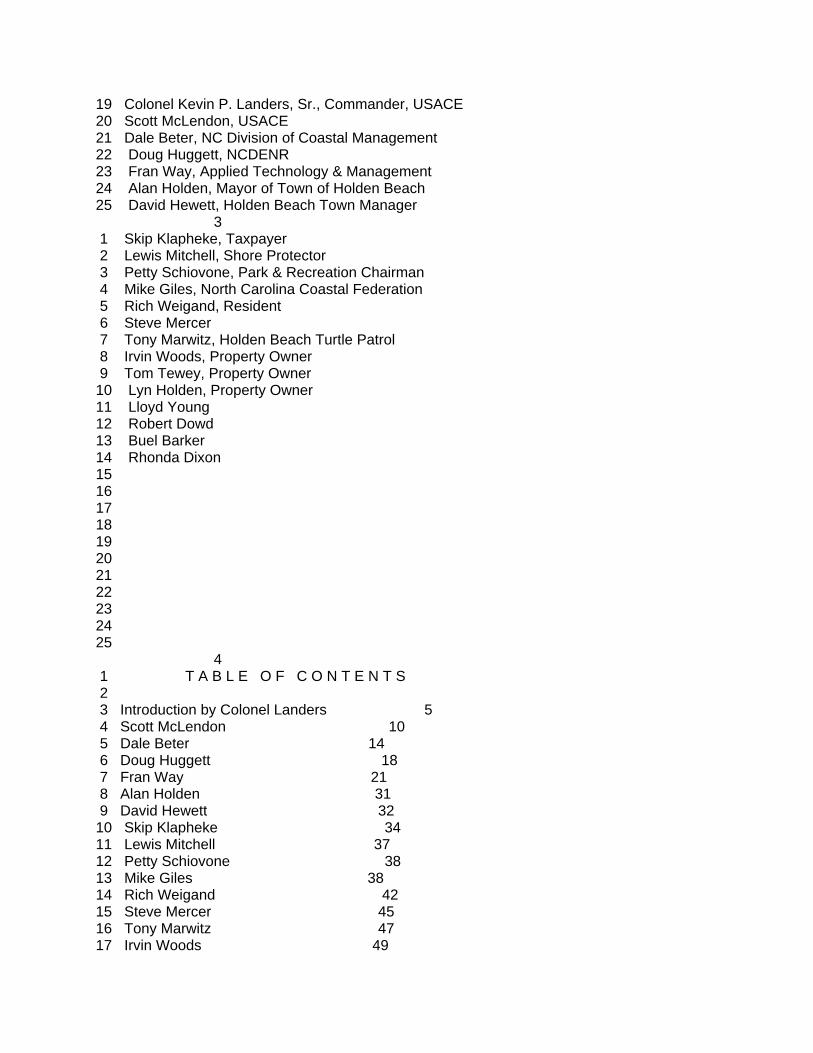
19 Colonel Kevin P. Landers, Sr., Commander, USACE 20 Scott McLendon, USACE 21 Dale Beter, NC Division of Coastal Management 22 Doug Huggett, NCDENR 23 Fran Way, Applied Technology & Management 24 Alan Holden, Mayor of Town of Holden Beach 25 David Hewett, Holden Beach Town Manager 3 1 Skip Klapheke, Taxpayer 2 Lewis Mitchell, Shore Protector 3 Petty Schiovone, Park & Recreation Chairman 4 Mike Giles, North Carolina Coastal Federation 5 Rich Weigand, Resident 6 Steve Mercer 7 Tony Marwitz, Holden Beach Turtle Patrol 8 Irvin Woods, Property Owner 9 Tom Tewey, Property Owner 10 Lyn Holden, Property Owner 11 Lloyd Young 12 Robert Dowd 13 Buel Barker 14 Rhonda Dixon 15 16 17 18 19 20 21 22 23 24 25 4 1 T A B L E O F C O N T E N T S 2 3 Introduction by Colonel Landers 5 4 Scott McLendon 10 5 Dale Beter 14 6 Doug Huggett 18 7 Fran Way 21 8 Alan Holden 31 9 David Hewett 32 10 Skip Klapheke 34 11 Lewis Mitchell 37 12 Petty Schiovone 38 13 Mike Giles 38 14 Rich Weigand 42 15 Steve Mercer 45 16 Tony Marwitz 47 17 Irvin Woods 49

18 Tom Tewey 52 19 Lyn Holden 54 20 Lloyd Young 57 21 Robert Dowd 58 22 Buel Barker 61 23 Rhonda Dixon 63 24 Closing by Colonel Landers 65 25 5 1 INTRODUCTION BY COLONEL LANDERS: 2 Good evening. I appreciate y’all coming out tonight in 3 such lovely weather that I’ve brought with me. My name 4 is Colonel Kevin Landers. I’m the District Engineer or 5 the District Commander for the Wilmington Corps of 6 Engineers District, and I’m gonna start out by 7 officiating and kind of setting the stage, setting the 8 ground rules for you. 9 Then I’m going to turn it over to a succession of 10 speakers; and when I say speakers, they’re gonna give you 11 a brief kind of overview as to what their portion of this 12 project or potential project is; and then also we’re 13 gonna have the Project Manager or the Project Engineer 14 from the project itself give a quick little over brief. 15 I’m gonna introduce a few people, establish those ground 16 rules and then be ready to get on with it to allow for 17 the public comment speakers. 18 So, let me start by giving you an agenda, kind of 19 give you a road map as to where we’re heading tonight. 20 First, I’m gonna start with some introductions and 21 they’re gonna talk about what a public hearing is; and 22 even more importantly from my standpoint what a public 23 hearing is not; establish those ground rules and then 24 Scott McLendon, who is my Chief of Regulatory at the 25 District will give an overview of the regulatory program. 6 1 Dale Beter will offer an overview on his project 2 specifically, will have some comments by the North 3 Carolina Division of Coastal Management; a project 4 overview by the Project Engineer himself; and then what 5 we’ll do is we’ll open up the floor up here at the 6 microphone for public comment. 7 So, we’ll start with any elected officials that 8 might want to have a comment before we turn it over to 9 the – open the floor. We’ll finish up with closing 10 remarks and we’ll finish and we’ll stick around for a few 11 minutes if anybody’s got any conversation that can be 12 had. 13 So, let me start with the purpose. What is the 14 purpose of this? Well, the purpose is defined by the 15 Code of Federal Regulations. I’m an Army guy, I’m been 16 an Army guy for twenty-six years, we have regulations for

17 everything. So, this is no different. This process is 18 outlined in the Code of Federal Regulations, and it’s 19 fivefold. I’m gonna read all five of those real quick. 20 A public hearing may be held to acquire information 21 which will be considered in evaluating a DA permit. So 22 much like me as a civilian – as a citizen, if I wanted to 23 go get a permit to put a garage up in my yard, I’d have 24 to go through a permitting action. This is no different 25 in that the Town has come to us and asked us for a permit 7 1 for a potential project; and we’re evaluating the merits 2 of that as we speak, and this is part of that process. 3 This affords the public the opportunity to present 4 their views, opinions and information about such a 5 permit. The public hearing is not a question and answer 6 session. This is just one mechanism by which we’re 7 taking in information. So much like we seek advice or an 8 opinion from the National Marine Fisheries, we’re asking 9 the opinion of the public to help inform us, for me to 10 make ultimately the decision as whether I approve or deny 11 a permit. 12 The information gathered will be used to develop the 13 final Environmental Impact Statement, which the draft is 14 currently on the internet; and the Corps is neither a 15 proponent of nor an opponent to this project. So, right 16 now I sit on the fence. I don’t have an opinion on this 17 project, I’m gathering all the facts in order to make 18 that informed decision. 19 Now, let me start by introducing a few people. 20 We’ll start with the head table first. So, we’ll start 21 out with Scott McLendon, who is the Chief of Regulatory 22 in the Wilmington District. Mr. Dale Beter next to him, 23 which is the Wilmington Regulation Chief for our 24 Wilmington Field Office. We have Ms. Emily Hughes, who 25 is the Project Manager for this. Jonathan Howell from 8 1 the North Carolina Division of Coastal Management – 2 DOUG BETER: (INTERPOSING) Nope, no Jonathan. He’s been 3 promoted. 4 COLONEL LANDERS: We’ve got Doug Huggett from the North 5 Carolina Coastal Management; and then lastly in the front 6 row here, we have Fran Way, who’s gonna give us a 7 presentation – from ATM, is it? 8 MR. WAY: Yes. 9 COLONEL LANDERS: He is the Project Engineer for the 10 project itself. Let me introduce a couple of officials; 11 and if I miss somebody, I’ll ask you at the end to stand 12 up and recognize yourself. First, we have Alan Holden, 13 the Mayor of Holden Beach. We have David Hewett, the 14 Town Manager; Sandy Miller, one of the Commissioners; 15 Dennis Harrington, another Commissioner; Ms. Debbie
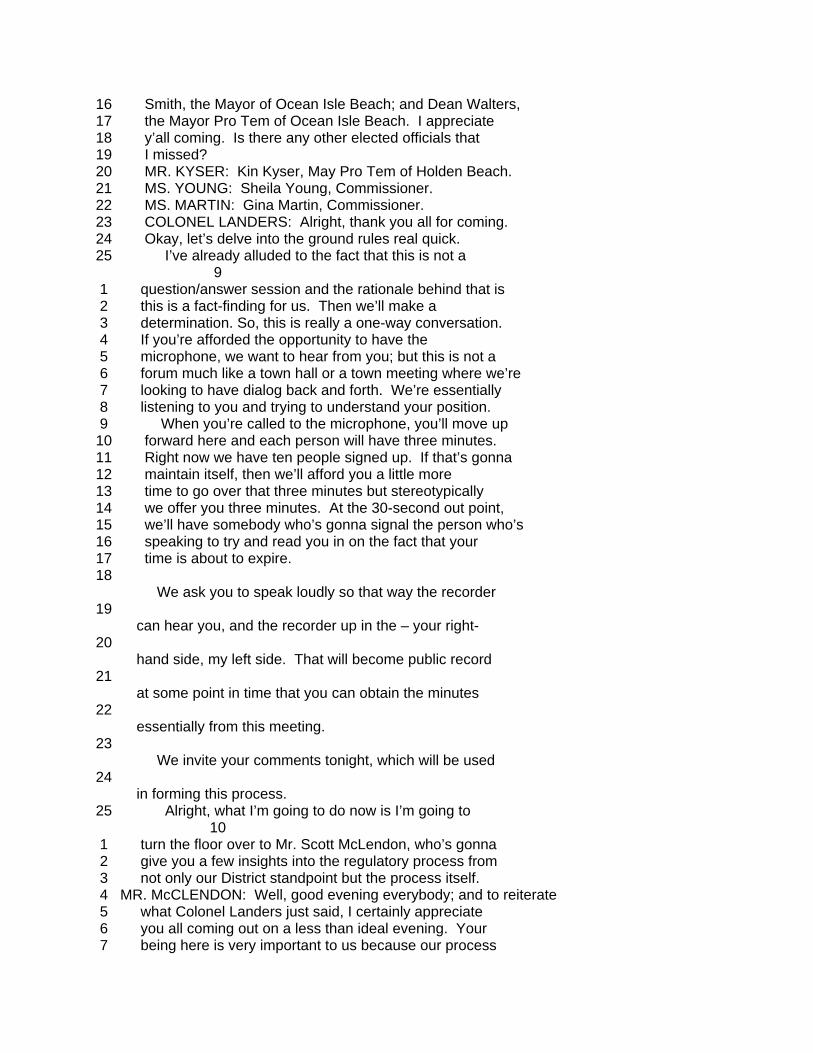
16 Smith, the Mayor of Ocean Isle Beach; and Dean Walters, 17 the Mayor Pro Tem of Ocean Isle Beach. I appreciate 18 y’all coming. Is there any other elected officials that 19 I missed? 20 MR. KYSER: Kin Kyser, May Pro Tem of Holden Beach. 21 MS. YOUNG: Sheila Young, Commissioner. 22 MS. MARTIN: Gina Martin, Commissioner. 23 COLONEL LANDERS: Alright, thank you all for coming. 24 Okay, let’s delve into the ground rules real quick. 25 I’ve already alluded to the fact that this is not a 9 1 question/answer session and the rationale behind that is 2 this is a fact-finding for us. Then we’ll make a 3 determination. So, this is really a one-way conversation. 4 If you’re afforded the opportunity to have the 5 microphone, we want to hear from you; but this is not a 6 forum much like a town hall or a town meeting where we’re 7 looking to have dialog back and forth. We’re essentially 8 listening to you and trying to understand your position. 9 When you’re called to the microphone, you’ll move up 10 forward here and each person will have three minutes. 11 Right now we have ten people signed up. If that’s gonna 12 maintain itself, then we’ll afford you a little more 13 time to go over that three minutes but stereotypically 14 we offer you three minutes. At the 30-second out point, 15 we’ll have somebody who’s gonna signal the person who’s 16 speaking to try and read you in on the fact that your 17 time is about to expire. 18 We ask you to speak loudly so that way the recorder 19 can hear you, and the recorder up in the – your right- 20 hand side, my left side. That will become public record 21 at some point in time that you can obtain the minutes 22 essentially from this meeting. 23 We invite your comments tonight, which will be used 24 in forming this process. 25 Alright, what I’m going to do now is I’m going to 10 1 turn the floor over to Mr. Scott McLendon, who’s gonna 2 give you a few insights into the regulatory process from 3 not only our District standpoint but the process itself. 4 MR. McCLENDON: Well, good evening everybody; and to reiterate 5 what Colonel Landers just said, I certainly appreciate 6 you all coming out on a less than ideal evening. Your 7 being here is very important to us because our process
8 that we’re going through right now, while it’s lengthy, 9 invites public comments. So, your input into this 10 process is very important to us; and this is an 11 opportunity to do so beyond the permit process when we 12 do public notice, and I’ll get into that in just a 13 minute. 14 But um, so thanks for being here. You may be 15 wondering why the Corps of Engineers is involved with 16 this process. This is gonna be a very high level view 17 I’m gonna give you here in just a few minutes; but the 18 Wilmington District, um the Chief Engineer is the 19 delegated permit authority down here, Colonel Landers, 20 relative to Section 404, the Clean Water Act, and 21 Section 10 of the Rivers and Habors Act. Those are two 22 authorities that we have that the Wilmington District 23 administers; and I’m the Chief of that division, the 24 Regulatory Division. Y’all have heard of Wetlands and 25 Streams and the permitting process probably, a program 11 1 everybody loves to hate but that Section 404 authority 2 is one authority that we have and the Section 10 3 authority. 4 Okay, it’s by virtue of the District issuing a 5 permit for a license, okay, so a permit is kind of like 6 a license, right. We’re required to comply with a whole 7 host of other federal statutes and mandates. 8 One of those is NEPA, the National Environmental 9 Policy Act of 1969. That’s the law that says that the 10 District will have to prepare an Environmental Impact 11 Statement for this project, and that’s the process that 12 we’re in tonight. And by virtue of that requirement, 13 the District is required to satisfy all the other 14 federal statutes and laws that come in play. 15 So, for example, we’re gonna have to look at 16 endangered species for this project, we’re gonna have to 17 satisfy the – what’s called essential fish habitat 18 requirement, we’re gonna have to look at historical 19 properties, we have to look at impact on marine mammals. 20 So, our program pulls in a whole bunch of other federal 21 statutes; and before making a decision – and I’ll stop 22 right there for just a second just to make sure 23 everybody understands me – we have not made a decision, 24 we’re still in the process and gathering comments 25 leading to a decision. 12 1 And as Colonel Landers said, I want to reaffirm 2 that, too, the District has zero position on the 3 project. We’re not an opponent or a proponent. We are 4 here to gather the facts and render a decision at the 5 end of the process. 6 So, our process is fairly complicated. I’m not

7 gonna sugar coat that to you. We do draw on a lot of 8 things; in fact, Regulations tell us that we’ll look at 9 least twenty more of those things relative to what we 10 call our public interest review. And so what we do is 11 we’re balancing what we call the reasonably foreseeable 12 adverse impact associated with the project balanced 13 against the benefits the project would bring. 14 Obviously, there’s some erosion problems and the 15 proposal is to build a terminal groin out there to fix 16 that problem. The terminal groin may have some effects 17 that we have to look at; and so, through this process, 18 what we’ll do through NEPA and through our requirements 19 under 404, we’re gonna look at alternatives to the 20 proposed action. 21 So, it’s not just an applicant comes up and says I 22 want to build this. The District is required by law to 23 say okay, this is what the applicant wants to do, are 24 there alternatives to that action that may have less 25 damage on the environment, and let’s look at those, too. 13 1 So, that’s a very, very important component of our 2 process. 3 The other thing I wanted to mention relative to our 4 partners here – I’m standing right in front of them – I 5 probably shouldn’t do that. But the Division of Coastal 6 Management is a really important partner in this 7 process, too; because they have a separate regulatory or 8 permitting responsibility in this process as well; and 9 so, what we do is like to work very closely, hand-in- 10 hand because you don’t want the feds out there saying 11 you gotta do A and the state saying well, you gotta do 12 B. That doesn’t help the town. holden beach public hearing - Vol. I, (Pages 13:13 to 26:19) 13 13 So, it’s very important that we coordinate our 14 actions together and hopefully – I’m not saying we 15 always agree but we usually do agree. And at the end of 16 the day we’d like to come out with an answer that’s 17 consistent with the State’s desire to protect the 18 coastal resources and the Federal requirement to look at 19 a very broad array of – of things. 20 So, we’re in mid-process now. The comments that we 21 get tonight and the comments that we’ll receive in 22 writing from you – and we’ll talk about that a little 23 more later – will be given to us and we’ll address those 24 comments in the preparation of the draft Environmental 25 Impact Statement. 14 1 So, that’s my high level look. One more thing I did 2 want to mention is that obviously the public is an 3 important part of this process but we deal with a whole

4 array of Federal and State agencies that are very 5 important to us and in telling us what they think the 6 potential effect, adverse and beneficial, might be 7 relative to the proposed project. So, I’m trying to 8 convey a sense that the District doesn’t work in a 9 vacuum on this. The District needs to hear from all 10 sides so that we can come out and hopefully be in the 11 middle on this. 12 We’re gonna deal with the adverse effects and we’ll 13 deal with the beneficial effects; and hopefully, we’ll 14 come out with a decision that will satisfy the needs of 15 the Town relative to the needs of protecting fish and 16 mammals and birds and water quality and all those other 17 things that we’re responsible for. 18 So, I know I just threw a lot at you but that’s an 19 overview. Thank you, and I’m gonna turn it over to 20 Dale. 21 MR. BETER: Again, good evening and thank you guys for coming 22 out. As Scott mentioned, it’s probably not the most, 23 uh, well, it’s a little rainy out there; so, we 24 appreciate your participation. And with that said, as 25 Scott alluded to and the Colonel also, this is a public 15 1 process. 2 Your being here tells us that you have an interest 3 in this project and this process as well; so, what I’m 4 gonna do is just take a couple of minutes and just go 5 through some of the – where the project is, how we got 6 where we are right now, and where we’re gonna need to go 7 with this project in the future. 8 The project started out pretty much with a need, 9 what we call purpose and need, a need to address 10 erosion, protection of property and infrastructure. 11 Back in 2012 we put out a Notice of Intent for, you 12 know, noticing to the public, you guys, and the 13 interested parties that this terminal groin project was 14 gonna be proposed. We made a determination internally 15 that we would review this under an EIS, which is an 16 option under NEPA, because of the significance of it. 17 We don’t have a lot of terminal groins currently in the 18 state, and we have three other terminal groins that we 19 are reviewing in tandem with this project, one we 20 permitted last year. 21 But we made this determination. Here we are right 22 now at what we call coming out of the scoping phase into 23 the evaluation phase of the project; and what that means 24 is that while we’re evaluating the project, we’re 25 relying on your input. So, again, emphasis on your 16 1 input into this process will help the Corps of Engineers 2 to make a decision; and ultimately that will conclude
3 with two documents, chiefly a final Environmental Impact 4 Statement and a decision document we call a Record of 5 Decision. 6 So, what we’re gonna do tonight by hearing from you 7 all and gathering these comments, is synthesize these 8 comments and incorporate them in the final document or 9 the final EIS. That process right now is a few months 10 away. Right now we’re still in the – in the process of 11 receiving comments on the draft Environmental Impact 12 Statement. 13 And with that said, there are six alternatives 14 typically underneath – always underneath that actually. 15 You always propose a No Action alternative and then 16 other alternatives, including applicant’s preferred 17 alternative, which is what we’re gonna see in the 18 presentation and which is what you guys are interested 19 in here. 20 Just a few other things and then we’ll turn it over 21 to the State and let them talk about their process in 22 this, in this evaluation and under NEPA. 23 First of all, I wanted to let you guys know that as 24 you guys come up and talk, we will let you know when 25 your time is coming up. Henry Wicker will be timing the 17 1 actual comments; so, just be attentive to that. When 2 you do come up, we want you to speak clearly into the 3 mic, state your name, if you’re an elected official, 4 make that known as well. 5 The comments that we receive in the process that 6 we’re going through now is closely coordinated with the 7 State so that we don’t duplicate effort, which is a 8 requirement of NEPA. 9 Some other things that – and Scott kind of touched 10 on this, some of you guys will have comments about 11 aquatic resources including fish and wildlife resources 12 and things of that nature. While we’re going through 13 this review, this EIS process, we also deal with related 14 Federal laws including the Endangered Species Act. So, 15 we’re in the process of right now looking at making our 16 effective determinations and coordinating this project 17 and the preferred alternative with the Federal resource 18 agencies and State agencies as well. So, we’re going to 19 be doing that. 20 And I’d just like to cap it off with, um, with 21 saying that this is an important event. This is the 22 last public hearing of all the terminal groins that 23 we’ve received application for, okay. So, we appreciate 24 your attendance, we need your participation in this 25 process to help us make the best decision possible and 18 1 with that said, I’ll turn it over to the State Division
2 of Coastal Management. 3 MR. HUGETT: Well, good evening from the State as well. First 4 off, I’d like to apologize. My name is Doug Huggett and 5 as a biologist, I only have a certain number of dress 6 shirts and I chose one tonight that would show rain 7 drops and I apologize for that. But we do appreciate 8 you being here. 9 I’d like to introduce a couple of other folks. 10 Coastal Management has a team of folks that are gonna be 11 working on this project. In addition to Ms. Wilson, we 12 have Heather Coats up here at the front table; and if 13 I’m not mistaken, Mr. Greg Bodnar is in the back. So, 14 we have a lot of – we’ve got a lot of expertise that 15 we’re trying to bring to bear to this project. 16 I’m not gonna go over the types of resource issues 17 that we are going to be listing for and studying and 18 looking into because those are most of the same types of 19 issues that the Corps of Engineers have brought up, and 20 we are very clearly joint partners with the Corps on 21 this project. The Division of Coastal Management is the 22 State lead for the terminal groin permitting under the 23 Coastal Area Management Act. 24 And just a little bit of history to that, many may 25 know that until recently a structure like a terminal 19 1 groin or something else that was considered a hardened 2 structure was prohibited by law. Well, that state law 3 has changed several years ago to allow originally for 4 the construction – well, for the permitting and 5 construction of four terminal groins. Under the budget 6 bill that was passed, I believe last week, the four had 7 been increased to six; but as of right now, there are 8 four communities actively pursuing this. So, we are 9 here today with that terminal groin legislation, the 10 terminology we use, in mind. 11 Now, in addition to the NEPA requirements that the 12 Corps of Engineers have talked to you about, of which we 13 are an active participant, there are various things that 14 the terminal groin legislation also requires from an 15 applicant, and we will be looking into those issues as 16 well. 17 First and foremost of that is the terminal groin 18 legislation requires the applicant prepare what is known 19 as an Inlet Management Plan; and its most basic, I kind 20 of view the Inlet Management Plan as a process that 21 steps up and requires a town to implement a – what we 22 hope is a very robust monitoring plan that tries to 23 ensure that the terminal groin, if it is ultimately 24 permitted, and again we are taking no position on that 25 ourselves either as a permit agency; but if a terminal 20
1 groin is chosen, permitted and constructed, we want a 2 monitoring plan in place that will assure that the groin 3 is working as it’s intended to and that it doesn’t have 4 unintended consequences or negative impacts on up or 5 down drift beaches or properties, habitat, things of 6 that nature. 7 So, this robust monitoring plan that will be 8 developed will also have to include a set of triggers 9 that if you hit a certain threshold or trigger with an 10 erosion event or loss of beach or something of that 11 nature, that some mitigation measures will be 12 implemented, which may include modifications to the groin 13 structure, putting additional sand on the beach, and 14 things of that nature to try and minimize the potential 15 adverse effects of these unintended consequences. 16 Kind of the worst case of the mitigation is 17 modification of the groin structure itself up to and 18 including potentially removal of the groin if it just is 19 shown not to be working at all and we can’t figure out 20 how to fix it, working with the town, the applicant, and 21 the engineers for the project. 22 The Inlet Management Plan also has to include a 23 financial assurance package which the State has to 24 certify that shows that over the life of the project, the 25 Town has money available or has the ability or the 21 1 authority to pay for this mitigation and monitoring plan, 2 any remedial actions that have to be taken, up to and 3 including removal of the terminal groin. So, we’ll be 4 working - as the plan gets potentially refined, we’ll be 5 working with the applicant on that. 6 But in closing, though, I would like to say again we 7 are very, very close partners with our friends at the 8 Corps of Engineers. And this draft Environmental Impact 9 Statement that they are working on also satisfies a 10 requirement of the State terminal groin legislation; so, 11 we’re very active partners. 12 We want and need to hear concerns that the members 13 of the public have, plus or minus, pro or con, because we 14 as an agency are still reviewing the draft Environmental 15 Impact Statement ourselves to provide comment and 16 recommendation back to the Corps and we – while we have 17 issues we look at, you folks know this area better than 18 we do, we need your help in trying to figure out where 19 those issues may be and make sure the document is 20 accurately addressing those concerns. 21 So, again, we are actively involved. These are very 22 important projects for us, we’re working very closely 23 with the Corps of Engineers and we do want to hear your 24 concerns; so, I appreciate your time. 25 MR. WAY: Hi, my name is Fran Way; and I’m a coastal engineer
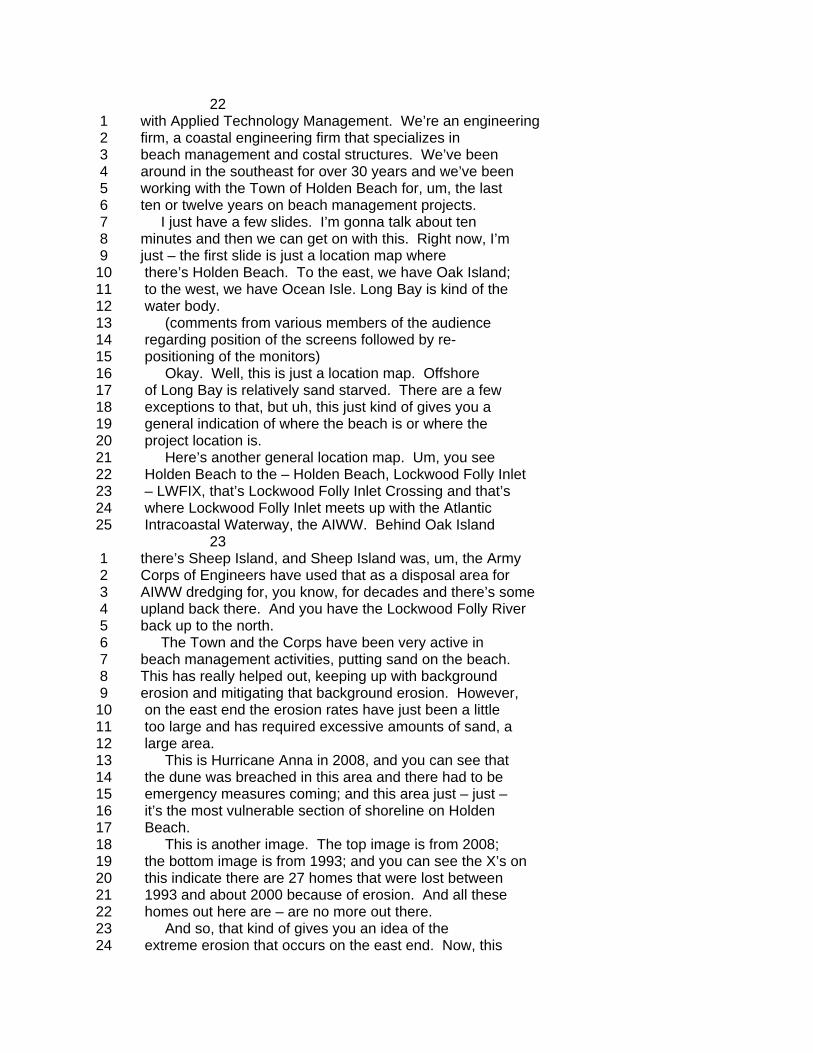
22 1 with Applied Technology Management. We’re an engineering 2 firm, a coastal engineering firm that specializes in 3 beach management and costal structures. We’ve been 4 around in the southeast for over 30 years and we’ve been 5 working with the Town of Holden Beach for, um, the last 6 ten or twelve years on beach management projects. 7 I just have a few slides. I’m gonna talk about ten 8 minutes and then we can get on with this. Right now, I’m 9 just – the first slide is just a location map where 10 there’s Holden Beach. To the east, we have Oak Island; 11 to the west, we have Ocean Isle. Long Bay is kind of the 12 water body. 13 (comments from various members of the audience 14 regarding position of the screens followed by re- 15 positioning of the monitors) 16 Okay. Well, this is just a location map. Offshore 17 of Long Bay is relatively sand starved. There are a few 18 exceptions to that, but uh, this just kind of gives you a 19 general indication of where the beach is or where the 20 project location is. 21 Here’s another general location map. Um, you see 22 Holden Beach to the – Holden Beach, Lockwood Folly Inlet 23 – LWFIX, that’s Lockwood Folly Inlet Crossing and that’s 24 where Lockwood Folly Inlet meets up with the Atlantic 25 Intracoastal Waterway, the AIWW. Behind Oak Island 23 1 there’s Sheep Island, and Sheep Island was, um, the Army 2 Corps of Engineers have used that as a disposal area for 3 AIWW dredging for, you know, for decades and there’s some 4 upland back there. And you have the Lockwood Folly River 5 back up to the north. 6 The Town and the Corps have been very active in 7 beach management activities, putting sand on the beach. 8 This has really helped out, keeping up with background 9 erosion and mitigating that background erosion. However, 10 on the east end the erosion rates have just been a little 11 too large and has required excessive amounts of sand, a 12 large area. 13 This is Hurricane Anna in 2008, and you can see that 14 the dune was breached in this area and there had to be 15 emergency measures coming; and this area just – just – 16 it’s the most vulnerable section of shoreline on Holden 17 Beach. 18 This is another image. The top image is from 2008; 19 the bottom image is from 1993; and you can see the X’s on 20 this indicate there are 27 homes that were lost between 21 1993 and about 2000 because of erosion. And all these 22 homes out here are – are no more out there. 23 And so, that kind of gives you an idea of the 24 extreme erosion that occurs on the east end. Now, this

25 was in the 90’s and the Army Corps of Engineers and the 24 1 Town of Holden Beach have really stepped up the 2 nourishment program in the last fifteen years or so; but 3 this still is a vulnerable area. 4 And this is another image of – of photos from the 5 90’s on the east end, and you can see the homes out in 6 the active beach are falling apart. And even today, 7 under erosive conditions, you can go out on the beach and 8 there’s road debris and structure debris out there under 9 – under more erosive conditions. 10 So, groins, we’ll just talk about groins really 11 quickly. On the top image, this is the Fort Macon 12 terminal groin. It’s been around since about the, uh, 13 1840’s. It’s been around. You can see how it’s – the 14 terminal groin terminal indicates at the end of an 15 island. The terminal groin here, you can see how there’s 16 just a transition from the front beach to kind of the 17 inlet beach. About half of that groin is buried right 18 now and there’s some other, there’s a spur beach that you 19 can’t even see on the terminal groin at Fort Macon. 20 This is uh, right here is the Bald Head Island 21 geotextile tube groin and you can kind of see that saw 22 tooth pattern that is typical in some groin features 23 where you have an up drift and a down drift signature. 24 And then here’s another image of the Bald Head 25 Island terminal groin and this is under construction now 25 1 and it’s uh, Phase 1 is 1,300 feet and then phase 2 is 2 1,900 feet. 3 Here’s another groin that’s got a small t-head 4 feature out in the front of the structure. This is a 5 common feature, the small t-head, that kind of reduces 6 rip currents and loss of sand offshore and the terminal 7 groin that we are proposing for Holden Beach has one of 8 those features. 9 Groin versus jetty, just real quick. Jetties really 10 get out there. Jetties are much longer than groins 11 typically and they’re going out into much deeper water 12 and they can adversely affect beach processes, literal 13 sand drift, that sort of thing. 14 Terminal groins are trying to – being designed with 15 these processes in mind. We’re trying to enhance the 16 beach and make that beach more resilient in storm damage 17 and just make it wider and stronger and healthier. 18 And there’s the Oregon Inlet terminal groin in the 19 top photo and down on the lower right, that’s the 20 Masonboro Inlet jetties, which are much longer and may, 21 you know, they do require sand management from up drift 22 and down drift. 23 Here is the preferred alternative and this is just a
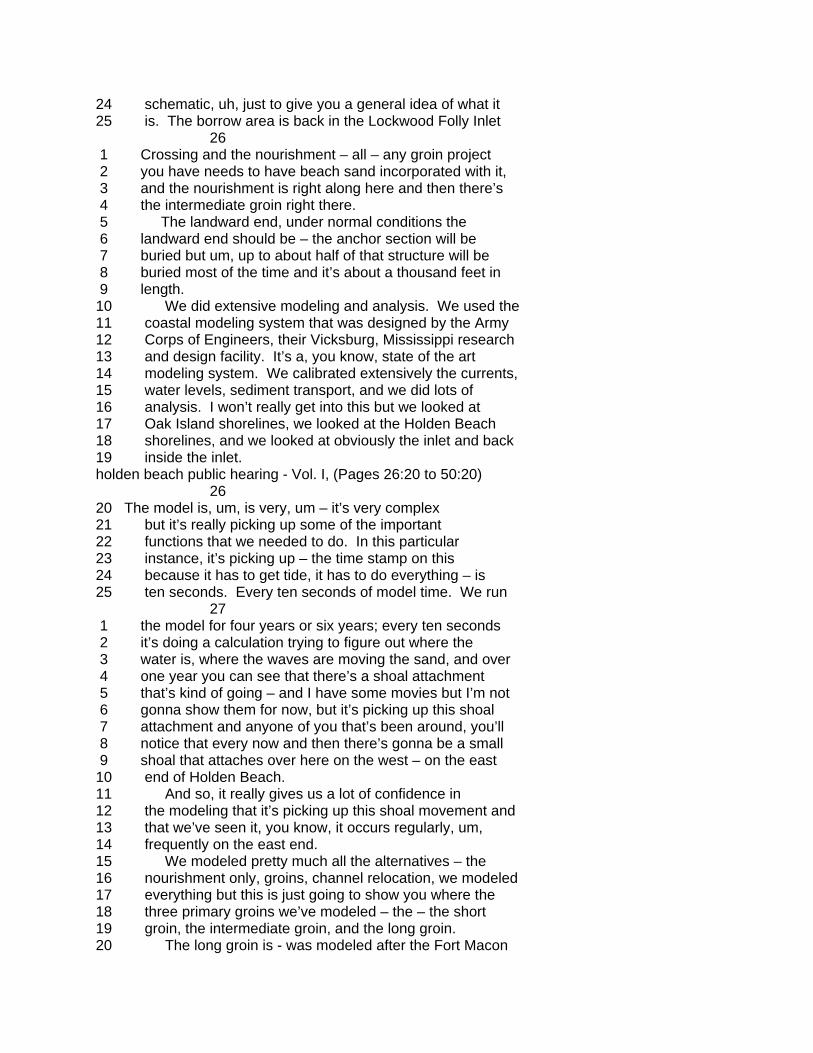
24 schematic, uh, just to give you a general idea of what it 25 is. The borrow area is back in the Lockwood Folly Inlet 26 1 Crossing and the nourishment – all – any groin project 2 you have needs to have beach sand incorporated with it, 3 and the nourishment is right along here and then there’s 4 the intermediate groin right there. 5 The landward end, under normal conditions the 6 landward end should be – the anchor section will be 7 buried but um, up to about half of that structure will be 8 buried most of the time and it’s about a thousand feet in 9 length. 10 We did extensive modeling and analysis. We used the 11 coastal modeling system that was designed by the Army 12 Corps of Engineers, their Vicksburg, Mississippi research 13 and design facility. It’s a, you know, state of the art 14 modeling system. We calibrated extensively the currents, 15 water levels, sediment transport, and we did lots of 16 analysis. I won’t really get into this but we looked at 17 Oak Island shorelines, we looked at the Holden Beach 18 shorelines, and we looked at obviously the inlet and back 19 inside the inlet. holden beach public hearing - Vol. I, (Pages 26:20 to 50:20) 26 20 The model is, um, is very, um – it’s very complex 21 but it’s really picking up some of the important 22 functions that we needed to do. In this particular 23 instance, it’s picking up – the time stamp on this 24 because it has to get tide, it has to do everything – is 25 ten seconds. Every ten seconds of model time. We run 27 1 the model for four years or six years; every ten seconds 2 it’s doing a calculation trying to figure out where the 3 water is, where the waves are moving the sand, and over 4 one year you can see that there’s a shoal attachment 5 that’s kind of going – and I have some movies but I’m not 6 gonna show them for now, but it’s picking up this shoal 7 attachment and anyone of you that’s been around, you’ll 8 notice that every now and then there’s gonna be a small 9 shoal that attaches over here on the west – on the east 10 end of Holden Beach. 11 And so, it really gives us a lot of confidence in 12 the modeling that it’s picking up this shoal movement and 13 that we’ve seen it, you know, it occurs regularly, um, 14 frequently on the east end. 15 We modeled pretty much all the alternatives – the 16 nourishment only, groins, channel relocation, we modeled 17 everything but this is just going to show you where the 18 three primary groins we’ve modeled – the – the short 19 groin, the intermediate groin, and the long groin. 20 The long groin is - was modeled after the Fort Macon

21 terminal groin but it really wasn’t our preferred 22 alternative. And the short groin also didn’t really – 23 with those shoal attachments and everything, it was just 24 a little too far west to really kind of take advantage of 25 those shoal attachments and to really try to integrate 28 1 with the beach processes in that area. 2 This is just a model run of the intermediate groin 3 and the highlighted area here is the gain in beach width 4 after two years. And you can see that the model, the 5 groin is working as intended, keeping more sand here and 6 actually there’s even more sand here up on this side of 7 the, uh, on the project. 8 In terms of hydrodynamics of the tide, the inlet 9 system, the Lockwood Folly Inlet is a, you know, a large 10 system that – relatively large, the estuarine push or 11 flow going in and out of the Lockwood Folly Inlet. You 12 can see that it’s just a huge flood tide push of – of 13 water getting in here. 14 In the surf zone, you do see some – these are 15 current vectors. You do see some eddies and things in 16 the surf zone, and you do see some eddies around the 17 terminal groin itself; but in general, just the 18 domination of the flow in and out of Lockwood Folly Inlet 19 is pretty clear. 20 And this one is the ebb tide. These are current 21 vectors again, and you see right here – you see some rip 22 currents or possible rip currents or eddies along the 23 shoreline here in the beach area around the terminal 24 groin as well but you still see the eject here. If you 25 were swimming, this would be by far the most dangerous 29 1 place to swim, right near the inlet. And this is just 2 kind of showing you generally what is going on there. 3 In the grand scheme of the inlet hydrodynamics, this 4 terminal groin is not affecting the hydrodynamics and 5 obviously we did that on purpose. 6 And so, this is the last image; you’ve already seen 7 this. We’re gonna put sand on both sides of the groin. 8 Most of it’s gonna be on this side but we are gonna still 9 put some on that side of the groin; and that’s almost 10 like advance mitigation, and in terms of what Doug was 11 talking about with the Inlet Management Plan. There is 12 going to be a lot; there’s gonna be rigorous monitoring. 13 We’re gonna monitor – there’s gonna be a lot of 14 monitoring, there’s gonna be a lot of coordination with 15 natural resource agencies to ensure that this is working 16 as intended; and if it isn’t, then we will revisit it. 17 And that’s it. Thank you. And here’s a copy of the 18 EIS right here (indicating). You can see that a lot of 19 research went into that.

20 COLONEL LANDERS: Alright, so what we’re gonna do is we’re 21 gonna transition now into the comment period. So, I have 22 deployed all over the world and the Army typically send 23 me into places that are less than ideal for vacationing, 24 and most of those places don’t have a democratic type of 25 environment to where you can be heard, where you can 30 1 voice your opinions. So, I encourage you to step up to 2 the microphone tonight if you have some comments and take 3 advantage of our democratic system. It’s a wonderful 4 system and I fight for it. So, at the end of the day, 5 we’re gonna transition to that. 6 I would ask one thing of you, though. These 7 meetings at times get emotionally laden. Although I know 8 you’re passionate about your beaches, you’re passionate 9 about your town, I would just ask you to be respectful as 10 we kind of go through this. We want to hear you, we want 11 to hear what your comments are, and we’ll take all that 12 to heart as we kind of work our way through this. But I 13 would just ask you to be respectful to the people on the 14 other side of the desk here. They’re doing their jobs 15 just like everybody else and I’d appreciate it. 16 Without further ado, Emily is gonna start calling 17 names and then Henry is gonna start with the 3-minute 18 clock. 19 MR. WICKER: You’ll have 30 seconds left when I flash this up, 20 just so you can wrap up your comments, to give you an 21 opportunity to kind of close. 22 MS. HUGHES: Thank you all for being here. We’re gonna start 23 with the elected officials in the room. If there are any 24 comments from them, we’d ask that you come up to the 25 podium, state your name, speak clearly, and again, look 31 1 to Henry for the 30 seconds signal. So, would any 2 elected officials like to come up? Mr. Holden. 3 MAYOR HOLDEN: Thank you, ma’am. I’m Alan Holden, the Mayor 4 of Holden Beach. I’m happy to see all these happy faces 5 here, most of you are smiling; and um, thank you so much 6 for being here and thank you for being here as well. I 7 don’t know which way you’re supposed to face – it must be 8 that way. 9 On behalf of the Town of Holden Beach, obviously we 10 support this and obviously we support your being here to 11 put forth your ideas pro or con, because we all want 12 what’s best for this community. What the Town of Holden 13 Beach feels is this is the best for our community. 14 Me individually, personally, I’ve lived here over 66 15 years, nowhere else. I have a little bit of recollection 16 of what’s going on here and I have a little bit of 17 insight, maybe more than some of the others, that haven’t 18 been here that long. It doesn’t make me right but I’m

19 pretty thoroughly convinced we’re on the right track. 20 And as I look around, there are maybe some others in the 21 room that have lived here as well, but common knowledge 22 and observation does carry some weight. 23 I don’t have the credentials that some of you in the 24 room have, but I’ve seen a lot and I’ve heard a lot from 25 people like you that visit here and own property here, 32 1 and we are here tonight to take all that information from 2 all of you and do what’s best for this community. And 3 I’m gonna make my words real short and simple, and I 4 think Mr. Hewlett is gonna carry on in a few minutes, the 5 Town Manager, with more insightful and more technical 6 information. I thank you for being here. 7 MS. HUGHES: Thank you. Mr. Hewlett. 8 MR. HEWLETT: I’m David Hewett, the Town Manager and I will 9 speak to the Board here. There is something to be said 10 for the wisdom of multigenerational perspectives that 11 Mayor Holden has so succinctly shared with us this 12 evening. It only took a whole team of engineers and 13 scientists almost three years and a foot-thick document 14 to parrot that, what you’ve so succinctly said. And oh, 15 by the way, about a truck load full of money, too. 16 The study, which of course is one of the 17 requirements to evaluate the efficacy of constructing the 18 terminal groin at Holden Beach, those requirements are 19 established by law, include evaluations of alternatives 20 ranging all the way from doing nothing to the groin 21 construction and almost everything in between; but we 22 have been limited to six. 23 Using significant numerical modeling and engineering 24 analysis, the groin is selected as the preferred 25 alternative because it best meets the project’s purpose. 33 1 It will reduce the chronic erosion on the east end, 2 protecting homes and infrastructure while simultaneously 3 providing a viable recreational beach. 4 It will provide a long-term cost-effective and 5 independent solution, independent solution to chronic 6 erosion; and I stressed independent here because that is 7 where the town is as a community. There is no federal 8 50-year project with its promised manna from the White 9 House that’s gonna take care of all the sand that we’ll 10 ever need in perpetuity, because it’s not a viable 11 project according to the national interest. 12 Along with that, federal funding that has up to the 13 near recent past nourished the east end via the least 14 cost method of disposal for the Intracoastal Waterway 15 navigation maintenance sand is gone. We’ve had some 16 drifts and dribbles of late, but that’s really a residual 17 funding resulting from recent storms and emergency

18 appropriations. But the federal money is gone, y’all. 19 The Town is standing on its own two feet here. 20 The terminal groin is the linchpin in the Town’s 21 beach management plan; and stabilizing the east end by 22 its construction will provide the anchor for all future 23 beach management and renourishment efforts, making them 24 more effective by lasting longer and ultimately costing 25 less. Thank you. 34 1 MS. HUGHES: Thank you, David. Are there any other elected 2 officials that would like to speak? (no response) Okay. 3 I’m gonna begin calling the names of the people who 4 signed up to speak and then if anyone wants to speak 5 who’s not on the list, you’re welcome to. I’ll open it 6 up to anybody else who’d like to make comments. I 7 apologize if I butcher your name – um, the first name is 8 Skip – 9 (laughter) 10 MS. HUGHES: If we could have more order, please. And then 11 we’ll have Lewis Mitchell on deck. 12 MR. KLAPHEKE: My name is Skip Klapheke, and I live – 13 (from the audience) It’s very hard to hear. 14 (from the audience) - Can I make a suggestion. Could 15 the podium be moved to the side so the speaker could face 16 everyone in the room? 17 (from the audience) Yes, please. 18 (the podium was moved) 19 MR. KLAPHEKE: Okay, let me see if I can get this down to three 20 minutes. I’m gonna start with a summary. I think the 21 study is not sufficient to allow a well-informed 22 discussion of the alternatives. It omits analysis of 23 well over 50% of the Holden Beach portion of the affected 24 area. The financial presentation contained a lot of 25 errors. I’ve read a lot of that. The model on which it 35 1 so much relies is similar to the model used in prior 2 studies hasn’t been particularly correct. 3 Let me give you some specifics. Alternatives 1, 2, 4 3, and 4 allow Holden Beach to undertake a project and 5 adjust it as needed. 5 and 6 don’t. We’re committed for 6 thirty years. If it’s wrong, we have to pay to take it 7 out. 8 It would seem to me that with other projects under 9 way, it might make sense to try the 1, 2, 3, or 4 and see 10 how their project worked before we sink our cost in 11 something that we’re forever stuck with. 12 All of the alternatives speak to the impact of the 13 houses at the east end of McCray, but it’s absolutely 14 silent as to the impact on the eight oceanfront homes, 15 four oceanfront lots and the infrastructure and the 16 recreational amenities at Serenity Lane. These homes and
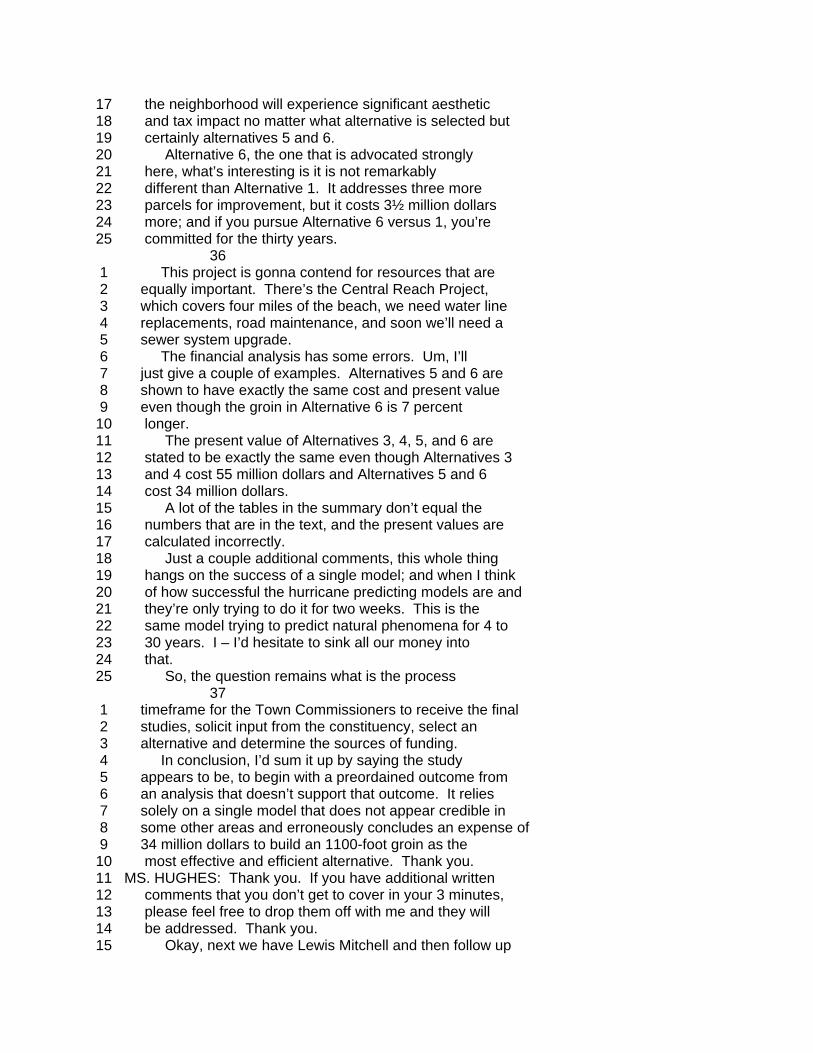
17 the neighborhood will experience significant aesthetic 18 and tax impact no matter what alternative is selected but 19 certainly alternatives 5 and 6. 20 Alternative 6, the one that is advocated strongly 21 here, what’s interesting is it is not remarkably 22 different than Alternative 1. It addresses three more 23 parcels for improvement, but it costs 3½ million dollars 24 more; and if you pursue Alternative 6 versus 1, you’re 25 committed for the thirty years. 36 1 This project is gonna contend for resources that are 2 equally important. There’s the Central Reach Project, 3 which covers four miles of the beach, we need water line 4 replacements, road maintenance, and soon we’ll need a 5 sewer system upgrade. 6 The financial analysis has some errors. Um, I’ll 7 just give a couple of examples. Alternatives 5 and 6 are 8 shown to have exactly the same cost and present value 9 even though the groin in Alternative 6 is 7 percent 10 longer. 11 The present value of Alternatives 3, 4, 5, and 6 are 12 stated to be exactly the same even though Alternatives 3 13 and 4 cost 55 million dollars and Alternatives 5 and 6 14 cost 34 million dollars. 15 A lot of the tables in the summary don’t equal the 16 numbers that are in the text, and the present values are 17 calculated incorrectly. 18 Just a couple additional comments, this whole thing 19 hangs on the success of a single model; and when I think 20 of how successful the hurricane predicting models are and 21 they’re only trying to do it for two weeks. This is the 22 same model trying to predict natural phenomena for 4 to 23 30 years. I – I’d hesitate to sink all our money into 24 that. 25 So, the question remains what is the process 37 1 timeframe for the Town Commissioners to receive the final 2 studies, solicit input from the constituency, select an 3 alternative and determine the sources of funding. 4 In conclusion, I’d sum it up by saying the study 5 appears to be, to begin with a preordained outcome from 6 an analysis that doesn’t support that outcome. It relies 7 solely on a single model that does not appear credible in 8 some other areas and erroneously concludes an expense of 9 34 million dollars to build an 1100-foot groin as the 10 most effective and efficient alternative. Thank you. 11 MS. HUGHES: Thank you. If you have additional written 12 comments that you don’t get to cover in your 3 minutes, 13 please feel free to drop them off with me and they will 14 be addressed. Thank you. 15 Okay, next we have Lewis Mitchell and then follow up

16 with Peggy Schiavone. 17 MR. MITCHELL: I’m Lewis Mitchell. I own property down on 18 Tarpon Drive about three quarters of the way down the 19 beach, and I (3 inaudible words), and I’m gonna be really 20 short so I won’t need any of your water. 21 I think it’s good to know that the EI’s evaluated 22 reasonable alternatives to the east end inlet management 23 and beach nourishment. I realize we cannot continue to 24 rely on the federal government to handle these necessary 25 functions due to possible budget cutbacks. 38 1 I want to know that the EIS evaluated potential 2 impacts to our wildlife, fish, birds, turtles and such. 3 I would like to know what the environment impact will be 4 on the various wildlife in our area to include threatened 5 and endangered species and habit modification. 6 Short enough? 7 MS. HUGHES: Very good, thank you, Lewis. Peggy and then Mike 8 Giles with NC Coastal Federation. 9 MS. SCHIAVONE: I’m Peggy Schiavone and I live near the west 10 end of Holden Beach and have for many years. Um, my 11 concern was how the terminal groin was going to affect, 12 um, our vacationers, our beach, our recreational beach, 13 and um, from looking at the models and doing some of the 14 research, it seems that it’s going to result in a wider 15 beach and provide shore protection benefits, and that is 16 my concern. So, that’s the way I feel. Thank you. 17 MS. HUGHES: Mike and then we have Rich Weigand. 18 MR. GILES: Well, I’m glad I’m facing y’all so y’all can’t 19 throw darts at my back. Good evening, my name is Mike 20 Giles. I represent the North Carolina Coastal 21 Federation, I’m a coastal advocate with the Federation. 22 The Federation actively supports preservation and public 23 use of our state’s beautiful and productive beaches. We 24 will submit detailed comments to the Corps after these 25 brief comments. 39 1 As a public trust resource, the beaches here at 2 Holden Beach are spectacular. The US Army Corps of 3 Engineers are responsible for the protection of the 4 immense natural and cultural values of the Lockwood Folly 5 Inlet for all citizens of North Carolina. This proposal 6 to wall off the inlet with a terminal groin is not in the 7 public interest and will benefit only a few property 8 owners at the expense – let me repeat that, at the 9 expense of many taxpayers. 10 The information presented in the draft study is 11 insufficient to support the decision to build a terminal 12 groin here. It’s very difficult to determine based on 13 the draft document exactly how much the project would 14 cost the taxpayers and how many individual homes would be

15 protected. 16 The estimated construction cost of the groin is 17 extremely low compared to what other similar structures 18 are estimated to cost elsewhere, including Ocean Isle 19 Beach. 20 Looking at the modeling and based on the modeling, 21 the proposed project will only benefit possibly eight 22 homes. The modeling shows that after years four under 23 Alternative 2, 28 properties and 19 homes would be 24 affected by erosion; and under Alternative 6, 11 homes 25 will still have water lapping at the doors. 40 1 A comparison of benefits between the various 2 alternatives shows very little added protection coming in 3 from this extensive structure that will have a lifetime 4 cost upwards somewhere exceeding 36, 40, 45 million 5 dollars. We just don’t know. We still believe this is a 6 gross underestimate of the total cost based on what other 7 studies (inaudible word due to coughing in audience). 8 The taxpayers at Holden Beach who will be asked to 9 pay for this structure should examine these costs 10 carefully. 11 In crunching the numbers, I have extensive comments 12 on the modeling, which I’m not gonna talk about tonight 13 because I want to get to the cost. Looking at the 14 economic cost, predicted cost for Alternative No. 2, it’s 15 less than 2 million dollars. The laws tax revenues for 16 those structures, estimated at 5.2 million dollars tax 17 value, resulting in $6500 per year at a cost of 35 to 40 18 million dollars to build this terminal groin. 19 So, I think the taxpayers really need the correct 20 information, the cost estimate for this project needs to 21 be delved in more and more in depth. 22 The purpose of a groin is to manage a beach and even 23 if a groin is built, the inlet channel will keep 24 shifting. They’re required by state law the channel to 25 be managed if the groin is constructed. 41 1 For Bogue Inlet up in Carteret County, a terminal 2 groin was found not to be the most cost effective by the 3 local government there because the inlet channel still 4 had to be managed with or without constructing a terminal 5 groin. The same situation exists for Lockwood Folly 6 Inlet. 7 The document does not comply, currently does not 8 comply with the Endangered Species Act. No Section 7 9 consultation has been initiated even though 14 (inaudible 10 word) and 6 critical habitats for threatened and 11 endangered species occur in the permit area. This Section 12 7 consultation with the US Fish & Wildlife Service and 13 the National Marine Fishery Services should have already

14 been conducted. 15 So, now we don’t have all the information we need to 16 make an informed decision, to make informed comments; and 17 the Federation has asked the Corps of Engineers and the 18 other applicants, the other terminal groins in North 19 Carolina why this consultation doesn’t happen as 20 prescribed by the National Environment Policy Act and the 21 Corps’ own regulatory controls. It states that Section 7 22 consultation should happen early in the draft 23 Environmental Impact Statement. 24 At present, we believe the best alternative for 25 management of the Lockwood Folly Inlet is no action or 42 1 Alternative 4. This alternative will be less 2 environmentally damaging, allow for unrestricted beach 3 access for the public, and not anchor the end of a 4 dynamic island and inlet system with a permanent 5 structure. 6 This alternative should further be explored for the 7 long-term costs and benefits compared with Alternative 2, 8 Abandon and Retreat, which in the long run could be the 9 least damaging and the most cost effective alternative to 10 the citizens of Holden Beach. Thank you. 11 MS. HUGHES: Thank you, Mike. Next up we have Rich and on 12 deck Steve Mercer. 13 MR. WEIGAND: Hi, my name is Richard Weigand; and I’m a 14 resident and taxpayer in Holden Beach. First, there are 15 two major disclaimers appearing in the document. The 16 first is in Section 4.81 and just a couple of excerpts – 17 these values should not be considered definitive and 18 should not be used as the sole basis for the choice or 19 ranking of alternatives. It goes on to say this section 20 should not be considered on a formal cost-benefit 21 analysis, it is not an attempt to monetize all aspects of 22 the range of market and non-market costs and befits 23 associated with the alternative actions. And then it 24 talks about things left out – these services provided by 25 the affected natural environment constitute real economic 43 1 costs but are not monetized as part of this report. 2 The second disclaimer is in Section 5.21, the 3 Numerical Modeling. And it says, Although the modeling 4 results are presented in quantitative numerical 5 projections, these estimates must be considered within 6 the context of the model limitations. It is not possible 7 to accurately predict all of the complex environmental 8 variables that influence changes in coastal morphology. 9 So, how can you use the EIS if you can’t use it for 10 a cost benefit analysis. If you can’t predict the 11 environmental variables, then how can the town rely on 12 this report to make such a critical and significant
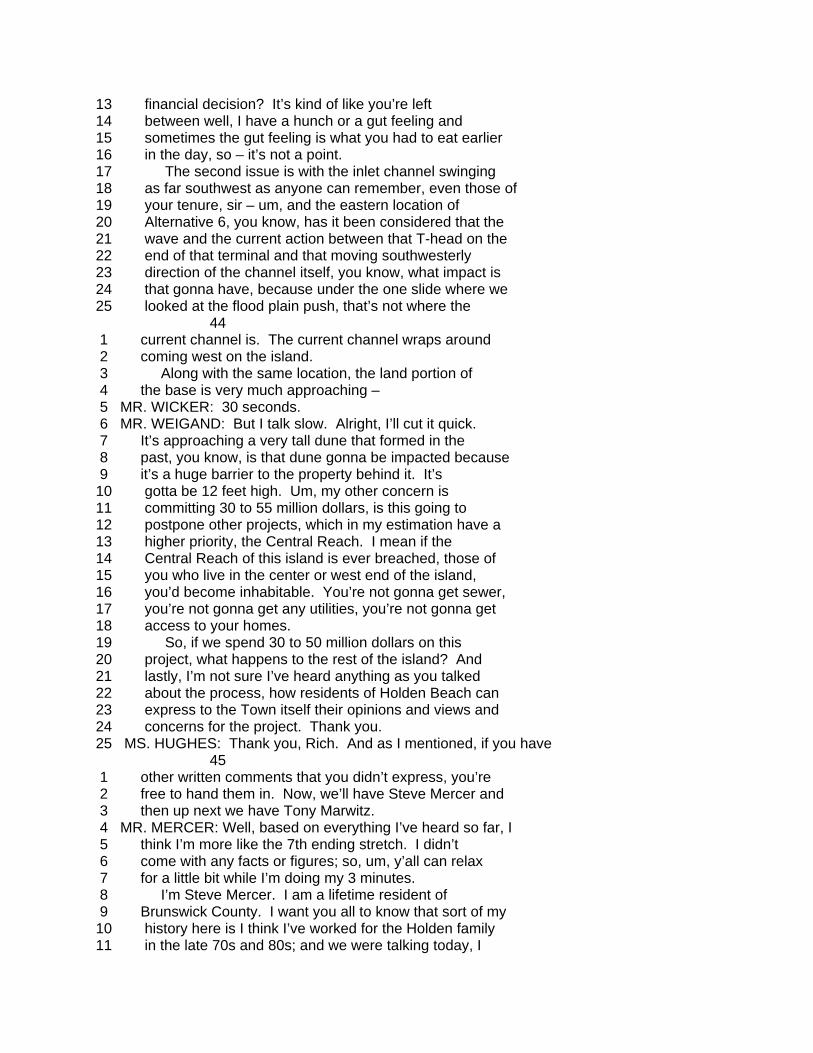
13 financial decision? It’s kind of like you’re left 14 between well, I have a hunch or a gut feeling and 15 sometimes the gut feeling is what you had to eat earlier 16 in the day, so – it’s not a point. 17 The second issue is with the inlet channel swinging 18 as far southwest as anyone can remember, even those of 19 your tenure, sir – um, and the eastern location of 20 Alternative 6, you know, has it been considered that the 21 wave and the current action between that T-head on the 22 end of that terminal and that moving southwesterly 23 direction of the channel itself, you know, what impact is 24 that gonna have, because under the one slide where we 25 looked at the flood plain push, that’s not where the 44 1 current channel is. The current channel wraps around 2 coming west on the island. 3 Along with the same location, the land portion of 4 the base is very much approaching – 5 MR. WICKER: 30 seconds. 6 MR. WEIGAND: But I talk slow. Alright, I’ll cut it quick. 7 It’s approaching a very tall dune that formed in the 8 past, you know, is that dune gonna be impacted because 9 it’s a huge barrier to the property behind it. It’s 10 gotta be 12 feet high. Um, my other concern is 11 committing 30 to 55 million dollars, is this going to 12 postpone other projects, which in my estimation have a 13 higher priority, the Central Reach. I mean if the 14 Central Reach of this island is ever breached, those of 15 you who live in the center or west end of the island, 16 you’d become inhabitable. You’re not gonna get sewer, 17 you’re not gonna get any utilities, you’re not gonna get 18 access to your homes. 19 So, if we spend 30 to 50 million dollars on this 20 project, what happens to the rest of the island? And 21 lastly, I’m not sure I’ve heard anything as you talked 22 about the process, how residents of Holden Beach can 23 express to the Town itself their opinions and views and 24 concerns for the project. Thank you. 25 MS. HUGHES: Thank you, Rich. And as I mentioned, if you have 45 1 other written comments that you didn’t express, you’re 2 free to hand them in. Now, we’ll have Steve Mercer and 3 then up next we have Tony Marwitz. 4 MR. MERCER: Well, based on everything I’ve heard so far, I 5 think I’m more like the 7th ending stretch. I didn’t 6 come with any facts or figures; so, um, y’all can relax 7 for a little bit while I’m doing my 3 minutes. 8 I’m Steve Mercer. I am a lifetime resident of 9 Brunswick County. I want you all to know that sort of my 10 history here is I think I’ve worked for the Holden family 11 in the late 70s and 80s; and we were talking today, I
12 think where I work is actually sort of the high tide line 13 right now - so, down in the area where we’ve been 14 affected here and where we’re talking about. 15 I own a company called Coastal Transplants, and I’ve 16 actually had the privilege of working with the Corps and 17 the State, the Department of Defense – so, some of you 18 may have seen me at some conferences. You may have heard 19 my name and may have silently cursed me under your 20 breath; but I hope some of you will recognize that my job 21 is environmental restoration of coastal dunes. 22 In that capacity, I’m a member of the NC Byways, 23 American Shore & Beach Preservation. I’m also a member 24 of the North Carolina Coastal Federation and in conflict 25 of interest on (few inaudible words). 46 1 Locally, I’m a member of the Holden Beach 2 Nourishment Association. I’ve attended CRC meetings, 3 seminars – technical seminars, conferences with all those 4 folks and I’ve actually been on a couple of panels with 5 the Coastal Federation. 6 In the past years the CRC have addressed the 7 instability of the inlet areas and in doing so, (an 8 unintelligible words due to coughing in audience) the 9 Corps with the problems we were having here. I think 10 this terminal groin is one of the tools sort of in the 11 toolbox to solve some of those problems. The CRC and the 12 State have had to handle it from a regulatory standpoint. 13 The towns are trying to handle it from grass root methods 14 and actually put something permanent in the ground to 15 address that situation. 16 As Fran says, anybody who knows me has known that 17 I’ve been diligent and have read every page in that 18 report sitting on that desk over there and will be using 19 that in the future, I’m sure. 20 I didn’t come with a lot of technical information, 21 because I assumed y’all had read that already. I know 22 that some of the issues about mitigation and endangered 23 species, they’re already – they’re covered in that 24 report, and we already deal with a lot of those issues in 25 the environmental statements and as we move forward with 47 1 our current dredging. 2 These structures aren’t new. They’re located all 3 around the country. As far as modeling goes, I know each 4 model is independent based on the site’s specific 5 situation; but those models come with history that’s 6 gathered from around the nation. 7 I’d like you to remember one thing if anything, a 8 stable beach is a resource. It’s a resource not just for 9 homes and tourism and other things, it’s a resource for 10 habitat, both wildlife and plant. It’s also a research

11 opportunity. 12 And, Colonel, you mentioned in the beginning that 13 this was all about gathering information. If you’re 14 really serious about that, next week you can join me. 15 I’m gonna be fishing off one of those structures down in 16 Texas and hopefully I’ll catch some fish down there. 17 Come join me and we’ll catch some. Thank you very much. 18 MS. HUGHES: Thank you, Steve. Tony is up next and then Irvin 19 Woods is on deck. 20 MR. MARWITZ: Thank you. My name is Tony Marwitz. I live on 21 Holden Beach. Tonight I’m basically speaking as the 22 President of the Holden Beach Turtle Patrol. I’m not 23 gonna talk money, I’m gonna talk what I’ve seen. I’ve 24 been involved with the Turtle Patrol for twenty years on 25 this beach. 48 1 During that time, we’ve had to deal with a very 2 fragile and changing beach. We’ve had to move nests 3 constantly. We’ve had nests destroyed because of over- 4 wash or sand erosion. We’ve had to work around beach 5 renourishment programs. The Town is excellent with us. 6 We have an excellent relationship as far as doing that, 7 but we have to do it. 8 I believe that the studies show we will have a wider 9 more stable beach if we have this terminal groin. If we 10 have a wider more stable beach, that means we don’t have 11 to move as many nests, we have much more attractive 12 nesting places for turtles. I think any of the other 13 wildlife that’s endangered, the birds and all that lay on 14 the beach, that’s not my field of expertise but I think 15 common sense says that a stable, more wider beach would 16 be better for those. 17 We also will cut down on the need for the periodic 18 renourishment. That’s an expense and it’s a hassle to 19 work around that, so we’ll get around that. 20 Basically, it appears to me that the terminal groin 21 will give us a more stable beach, keep nests from eroding 22 and yield more and better turtle nesting sites. Thank 23 you. 24 MS. HUGHES: Thank you, Tony. Irvin, and then lastly we have 25 Tom Tewey. 49 1 MR. WOODS: Good evening. I’m Irvin Woods. I live in Hume, 2 Virginia but I wanna live at Holden Beach. I’ve got – my 3 wife and I have two houses on the east end as you’re 4 looking at the maps, the nourishment section. Both of 5 our homes are – for those of you from Holden Beach, 6 they’re in the 2-block section of Ocean Boulevard where 7 all the houses are behind the street, from Avenue A to 8 uh, to Dunescape Avenue. There are only 13 houses in 9 that two blocks between the ocean and the Intracoastal

10 Waterway, but this project is not for the benefit only of 11 those of us who’ve invested a lot of money there. 12 A lot of - I would love the beach to be deserted 13 except for me and my renters from Ohio or Pennsylvania or 14 wherever during the summer. I can tell you on Saturdays 15 and Sundays there are a lot of people that are residents 16 of Holden Beach, taxpayers of Holden Beach, or renters or 17 people who are dropping a lot of dollars while they’re 18 here. They come and enjoy Holden Beach. They enjoy that 19 end of the beach. 20 In terms of the State involvement, uh, our two 21 properties generate approximately three times - from the 22 local level, approximately three times as much occupancy 23 tax to the Town as they do real estate property tax. 24 They generate over $10,000 sales tax, just from those two 25 properties, and yet we welcome more than we like 50 1 sometimes. We welcome anybody to come and enjoy the 2 beach. It is a public beach. 3 I grew up in South Carolina with a family home on 4 Edisto Beach, which for those of you who might be 5 familiar with it, it’s got an interesting set of groins, 6 not a thousand foot but about a hundred feet long that 7 were installed in the 1950s. I was down there two weeks 8 ago. They’re still there and there’s a good bit of sand 9 out front. 10 I’ve reviewed part of the 500 pages of whatever this 11 draft EIS, not all of it. I think Alternative 6 is the 12 best long-term plan to the extent that we’re not needing 13 to come back and do dredging, pumping sand on the beach 14 for a little longer duration in interval between um, 15 between events. I think it will be a long-term benefit 16 for those of you who are on other parts of the beach to 17 the extent that we’re able to get a long-term fix to the 18 east end of the beach, we’ve got more resources available 19 to the Central Reach or to other areas that might need 20 it. holden beach public hearing - Vol. I, (Pages 50:21 to 67:21) 50 21 Um, I’m a member of the American Shore & Beach 22 Preservation Association. In a meeting last winter in 23 Washington, the Corps of Engineers handout, “hard truth, 24 project backlog, tough choices”. My take away long 25 before that was that the priorities are not gonna be 51 1 dredge – federal priorities are not gonna be dredging 2 inlets like Lockwood Folly, Shallotte or whatever the 3 other inlets are in – in this country. 4 The projects are gonna be the Charleston Harbor, 5 Wilmington, Jacksonville, those kinds of places. To the 6 extent we can get a long-term fix that works, and I’m
7 convinced – my mother, late mother, was an avid turtle 8 program person in Edisto Beach, South Carolina, and was 9 interviewed by Walter Cronkite. I’ve watched the east 10 end of the beach and if we don’t have beach out there, 11 dry beach for habitat, we won’t have any more turtles 12 nesting on that end. It’s in better shape now than it 13 has been in some of the last ten years; but I think the 14 overall benefit is gonna be both to everybody that’s a 15 resident and taxpayer at Holden Beach, the people who 16 come and generate the revenue that helps subsidize the 17 local residents of Holden Beach and people from across 18 the bridge who come and enjoy the beach. 19 MS. HUGHES: Thank you, I think we have to wrap it up. 20 MR. WOODS: I happen to be a member of the Holden Beach 21 Renourishment Association, but I’m not speaking on their 22 behalf. I’m speaking on behalf of myself and my wife. 23 Thank you. 24 MS. HUGHES: Thank you, Irvin. And now we have Tom Tewey with 25 the Cape Fear River Watch and then I’ll open it up to 52 1 anybody else that would like to make comments. 2 MR. TEWEY: I’m not here really speaking on behalf of Cape 3 Fear River Watch, but um, I, um, am gonna take the 4 liberty of speaking as an elder. I, um, visited today 5 the house that I built on Holden Beach in 1970 and um, I 6 lived on Holden Beach; and then moved over and lived on – 7 and had a business in Brunswick County for, um, 30 years 8 – 35 years and I moved to be near my business. I lived 9 on Oak Island; and during that time I became intimate 10 with this inlet between these two places. The fish, the 11 birds, the animals, the children, the people who use 12 these places, who experience the thrill that I 13 experienced on coming to this place some – eight years 14 ago. 15 I wanna – I’m gonna speak for the elders who are no 16 longer here. And one of the people I wanted to speak on 17 behalf of is, um, Bill Favor. Bill Favor was the first 18 town administrator of Holden Beach, and he was also my 19 best friend. You remember Bill. And um, Bill was the 20 person who really educated all of us about this 21 environment, about who – what (two unintelligible words) 22 were and how - what the life cycle of the skimmers, the 23 Black Skimmers; and what the fish fed off, and what was 24 in the sand. 25 Bill wrote a column for five years, at least five 53 1 years, in the Brunswick Beacon about the environment. I 2 urge you to include in the, um, documentation for this 3 some work that Bill wrote about this, as he experienced 4 it as a resident and town manager of Holden Beach during 5 that time.
6 And um, he left a legacy in photographs. Actually, 7 I have a photographic exhibit in my gallery called Seaway 8 Gallery, Blue Dolphin Gallery; and it was, uh, part, the 9 educational thing that Bill did about the things like 10 photographing this habitat. Those photographs are all 11 present – I went over to the Brunswick Beacon today and 12 looked back at the old Brunswick Beacons. It was a 13 really nostalgic tact for me because I saw all my old 14 friends there and the letters they had written to – we’ve 15 had other Environmental Impact Statements. 16 Bill Favor was responsible, was given the commission 17 to handle bringing potable water to Holden Beach – isn’t 18 that right? Right. And um, and he did that and went to 19 all these environmental impact things with the Corps of 20 Engineers, the Fish & Wildlife Service, and all these 21 other people. 22 These people have done an immense amount of things 23 in Brunswick County to preserve – we did not have the 24 number of – the kinds of wildlife here that are here 25 today because of the preservationists of the past 54 1 throughout the Lockwood Folly River all the way up to 2 Supply where the shrimpers in the past took their boats 3 during hurricanes. Go through the Lockwood Folly – go up 4 the Lockwood Folly River and see – it’s not the same 5 river that it was, um, fifty years ago. Thank you (to 6 time keeper) 7 But anyhow I ask you to widen the time range that 8 you’re looking at as the people who are the scientists 9 and biologists and so forth who are looking at this about 10 the way the system works and what our role is in it. 11 I’m not advocating for or against this but I’m 12 advocating to educate yourself more about the total 13 environment system in which we live. We don’t own this 14 land, this land owns us. 15 MS. HUGHES: Thank you, Tom. Would anybody else like to take 16 the mic at this time? Sir, in the back. Please state 17 your name clearly. 18 MR. LYN HOLDEN: My name is Lyn Holden. I don’t have any 19 credentials like some of these other people, but I’ve 20 lived here all my life. I’m a property owner down here, 21 and I watched my father over the years try to get a jetty 22 in this town; and um, he went to numerous meetings in 23 Raleigh to see the politicians. He met with the Corps of 24 Engineers numerous times. He never saw it materialize. 25 There are several reasons for that. Back then, 55 1 there was not as many people at Holden Beach as there is 2 now. Um, when the politicians would come down here right 3 before each election and they’d promise that we’ve got a 4 jetty coming soon, it’s on the way. And we all voted for

5 them and we did every two years. 6 And New Hanover County the whole time were getting 7 jetties, moving right along; and we sat right here and 8 never got anything. And that was one of my father’s 9 aims, was to get a jetty. These groins are not jetties. 10 I understand that; but I’ve heard enough from the 11 research and what I know that Lockwood Folly would have 12 been a lot better off if they had put a jetty down there 13 40 years ago. Holden Beach would not be having the 14 problems they have right now. 15 Like I say, I don’t have any degrees but I’ve 16 watched a lot of things. I watched my father put groins 17 down at Holden Beach until the town started, a different 18 type of groins. These are things he paid for with his 19 personal money, no grants, nothing. And we learned a 20 lot. Before Hurricane Hazel, he made little old rafts of 21 myrtle bushes out there, from before Hurricane Hazel, and 22 they would gather sand. No money spent except your 23 labor. 24 After Hurricane Hazel, they built a wall of sand 25 going down the beach. They cut every myrtle bush on 56 1 Holden Beach to put on that dune on Holden Beach. They 2 was no myrtle bushes left but those myrtle bushes grow 3 back every five years, they come right back. And 4 watching him, what he did with those groins and listening 5 to some of the older people on Lockwood Folly River, 6 realized that we did not have the flow of water in and 7 out that inlet. 8 As a kid, I saw banks of oyster shells on Galloway 9 Flats up and down the Intracoastal Waterway. I don’t 10 mean a few oyster shells. They were this high when you’d 11 stand by the bank, up and down the waterway. That’s the 12 type of oysters Brunswick County had. 13 And those old-timers said that we were losing the 14 flow in the Lockwood Folly River; and if you use a little 15 common sense and if you look at some of these maps, I 16 think you will agree with that. 17 Another thing, I flew to Orlando, Florida from about 18 ’80 to 2000 once or twice a year. I learned to get a 19 side seat in that airplane, and I would take off here 20 and go to Orlando; and if you picked the right—hand seat, 21 window, going South, more than 50% of the time you went 22 right down that shoreline. You could see all those 23 jetties, from South Carolina all the way to Florida. And 24 there’s no mystery about what those jetties do. We’re 25 talking about groins, which are not as long as the 57 1 jetties, but when you look out that window and I’m going 2 south, some of these jetties have one on each side of the 3 inlet, some of them have one just on the south side.

4 But when you look out that window, at every one of 5 them, if they had one groin on the south side, on the 6 back side of that, there was a mound of sand for a mile 7 or mile and a half past that. On the other side, not as 8 great; but the sand would build up on the other side that 9 did not even have a groin. 10 And I saw that for 15 or 20 years and like I said, I 11 don’t have any degrees; but I think the Town is on the 12 right path. Something needs to be done. All this 13 dredging down there is wasting a lot of federal money and 14 the ones of y’all that fish in and out there, they can 15 pump it and a good northeaster kind of little storm come 16 by and it’ll fill right back up. 17 But I think the Town is heading in the right 18 direction, and I’m all for them trying it. Thank you. 19 MS. HUGHES: Thank you. The man in the green – that’s you. 20 Please state your name clearly. 21 MR. YOUNG: Good evening. My name is Lloyd Young. I’m a 22 resident of Winding River Plantation, and we own property 23 on Holden Beach. We have a beach house and a swimming 24 pool, and I’m very interested in the public comments. I 25 am relatively new here, moving from California a year 58 1 ago. So, I know none of the history and background of 2 Holden Beach other than what I’ve heard tonight. 3 I am a civil engineer and so I’ve seen presentations 4 like he made and the results of the modeling that you 5 showed on those several slides are similar to what I’ve 6 seen before, that terminal groins do work; and their 7 effect though tends to be limited. And I’m interested in 8 the beach areas further to the west and I would hope – 9 I’ve not looked at the IES but I would hope that you’ve 10 also evaluated the potential for beach erosion further to 11 the west as a result of the terminal groin. 12 And also, you’ve evaluated the effect of 13 renourishment of the beach from the currents and the flow 14 in Lockwood Folly and moving from east to west. 15 So, that’s my comments. Thank you very much. 16 MS. HUGHES: Anybody else? 17 MR. DOWD: Hello everyone. My name is Robert Dowd. I think 18 we need to look at a few things here. We have a very 19 dynamic situation in the Atlantic Intracoastal Waterway 20 and a very unique situation here at Holden Beach. 21 I’ll be honest, I live on Oak Island. I came here 22 tonight because everybody’s talking about Holden Beach 23 and how it’s gonna affect Holden Beach. We have members 24 from Ocean Island. I wish they would have spoke about 25 how it’s going – how - their interest in how it’s going 59 1 to affect Ocean Island. 2 Oak Island, we’ve got a terminal groin going in at
3 Bald Head Island; we don’t know what that’s gonna do. 4 Now, we’re looking at putting one here at Holden Beach; 5 we don’t know really what that’s gonna do. 6 Let’s be honest. I’m a realist, I’m from Maryland. 7 We’ve got four of these things that we’re allowed to be 8 approved. This is the fourth one. Do we really think 9 it’s about turtles and birds? No. It’s about money, 10 it’s about bringing money in and the effect that it’s 11 going to have on resources coming in and people spending 12 their money. That’s the honest bit of it, right? Let’s 13 not kid ourselves; it’s not about birds, it’s not about 14 turtles. If it were about that, move off the island. 15 The turtles will live, they’ll come back. Move 16 everything off and the beach will be theirs. 17 We don’t want change. When we buy property on an 18 island, we want the beach to stay exactly the way it is 19 and we don’t want anybody to come visit it. We want to 20 be able to go to the beach and enjoy it and it be ours. 21 That’s not the way it works, alright. Anybody who – 22 we sailed down here from the Chesapeake Bay to live on 23 Oak Island. Anybody who’s ever sailed down that 24 Intracoastal Waterway, an artificial waterway that made 25 these islands, islands – knows that it changes. It 60 1 changes all the time. The oldtimers talk about Lockwood 2 Folly used to be a whole different river fifty years ago. 3 Well, it didn’t change because we put in terminals. But 4 now we want to put in terminals to make sure it doesn’t 5 change from what it is now. 6 How is this going to affect Oak Island? How is it 7 going to affect Sunset Beach, how is it going to affect 8 Ocean Isle, how is it going to affect everything? Right 9 now, we don’t know. 10 We have a unique beach. It faces south. Every other 11 beach up and down this coast faces which way? East, 12 alright. So, do the models work? Do we know? Do we know 13 that the models work? Our beach faces south. It’s a 14 different ever changing dynamic situation. 15 Heck, just sailing up and down the Intracoastal 16 Waterway here at Lockwood Folly, how many times do we 17 have to move those buoys? You move those buoys all the 18 time. I have a 4-foot shoal boat. I’d love to have an 19 island packet with a 6-foot V-keel so I could get out 20 there and really sail. Why do I have a 4-foot shoal 21 boat? It shoals. It changes all the time. That river 22 changes, the shoaling changes, all of it changes. 23 We don’t want change, we’re humans. We’ve gotta come 24 in and make sure that it is the way that we want it to 25 be, right? Realize, I’m from the Chesapeake. We brought 61 1 in Nutria, we brought in all kinds of different species

2 to make things better. We have a swan problem up there. 3 You get to kill them down here, we can’t. They’re eating 4 up our seagrass. Remember, every effect that we do as 5 mankind to whatever nature is doing, has beneficial 6 effects for some and detrimental effects for others. 7 Really make sure you know what you’re doing before 8 you start anything. Thank you. 9 MS. HUGHES: Thank you. Anybody else? There in the back. 10 Just asking, will there be any other comments from the 11 crowd? If we’re gonna end here, anybody else, feel free 12 to write on the notecards that were passed out if you 13 have comments, you can leave them with us. Or there’s 14 information on the handout as far as where to send them 15 to – written or email or by call. You can call me at any 16 time. 17 MR. BARKER: My name is Buel Barker. I’ve looked down here 18 for a place twenty years ago and we – we bought one over 19 off of Lockwood Folly. We look out into the, uh, inlet; 20 and I watch this sand move all the time. I’m for this 21 terminal groin because we built a new place out on the 22 east end five/six years ago; and we fought to get to 23 build there. It wasn’t a pretty thing. We spent a lot 24 of money, over $200,000 to get to put a place there, just 25 to build it before we started. We don’t want it to wash 62 1 away. 2 Anybody that doesn’t have a place on the east end, 3 you know, I don’t know what you’re thinking. I know you 4 don’t have a dog in this fight and it’s not all about 5 preserving the property either; but yes, it is. Uh, the 6 gentleman that spoke about the cost of – of putting this 7 in versus the cost of losing our houses down there, I – I 8 would say no, it’s no, it’s not worth 35 or 40 million 9 dollars to some but it may be worth that to me to have my 10 place there, you know. They’re not losing theirs, we’re 11 losing ours. 12 And, you know, if it weren’t for the dredging of 13 Holden Beach, it just keeps getting smaller down there 14 and if they haven’t dredged and put it back on the beach, 15 it would have been eroded on up onto all of those houses 16 down there. And every time they dredge, the sand goes 17 further on out and makes the bottom, which I’m an avid 18 fisherman down there and I go out that inlet all the 19 time, and uh, it makes the bottom fill up out further, so 20 it’s filling up the oyster beds or the clams or 21 whatever’s out there and they can’t survive either. 22 So, I mean when you’re pumping out there, you’re 23 just creating a more flatter bottom on down through the 24 beach but it’s not helping as far as preserving the land 25 out there. 63
1 My existing home that I live in is directly straight 2 out through there. Of course, this water flow is flowing 3 this way now; but that is due to the Army Corps dredging 4 it that way this last time. I’ve watched that thing get 5 dredged 2 and 3 and 4 times a year it seems like. 6 You talk about money, of this 35 million dollars or 7 whatever, how much does it cost to dredge that thing out 8 3 or 4 times a year and how much is it gonna be for all 9 the years coming up? I’m just a common sense person. I 10 think if the groin was put in, it would force the flow to 11 be what it should be, it’s gonna stay there, it’s gonna 12 keep the bottom washed out more, it’s not gonna have to 13 be dredged as much. 14 And I mean, you know, that may not be so but that’s 15 how I feel. 16 MR. HUGHES: Thank you. We have one more speaker. 17 MS. DIXON: I’ll be brief. My name is – can you hear me? 18 Everybody can hear me. My name is Rhonda Dixon and um, I 19 think everybody here is trying to do the right thing, you 20 know, I – you know, everybody here is trying to do the 21 right thing; but the previous gentleman who just spoke 22 about the inlet, I don’t think it’s the Corps of 23 Engineers’ charter to move that inlet. They are to 24 dredge that inlet where the inlet naturally moves to and 25 it’s in a very strong southwest position right now, which 64 1 is actually favorable for the beach to build up. So, 2 that’s just one thing. I don’t think they – that the 3 people who – are dredging the inlet actually move it. 4 But I would just urge the homeowners and the taxpayers of 5 Holden Beach to really look at this study. 6 There are a lot of alternatives here. There are six 7 of them. They’re – it appears to me that it’s a foregone 8 conclusion that the right thing is a groin. I think 9 there’s many other alternatives here and with the cost 10 associated with the groin, I would urge the homeowners 11 and the taxpayers to really take a look at that and 12 decide whether that’s the way we want to spend our 13 dollars here and all the other things that are available 14 to us with the Central Reach and the other alternatives 15 for beach renourishment other than a permanent structure 16 on the east end of the island. 17 And I do not – I’ve read that study – and I do not 18 think a lot of consideration was given to the homes and 19 the impact on the downside of this terminal groin and I 20 think it’s an excellent point that we face south. It’s a 21 different scenario here. So, I urge you to decide who’s 22 gonna pay for this and how are we gonna pay for it. It’s 23 a very, very costly proposition. There are many, many 24 different alternatives and I would just urge everyone to 25 take a look at that and decide for yourself what you

65 1 think is the right thing. 2 And I think we have an election coming up in 3 November, and I think it’s a really important point when 4 we go to vote for the commissioners to be elected for the 5 Town of Holden Beach this year because I think that it’s 6 a real election issue this time and I would urge everyone 7 to educate yourself, especially now. Thank you. 8 MS. HUGHES: Thank you. Okay, so your handouts mention that 9 the end of the comment period is October 13th; so, you 10 have until then to submit comments, like I said, either 11 by mail or email, phone call. And these will become 12 public record. So, once all the comments are compiled, 13 we’ll put them out on our website so they’ll be available 14 to everybody. 15 COLONEL LANDERS: Okay, so what happens next is really the 16 question. So, after we do all the comments and we absorb 17 all those comments, we’ll reach out to other federal 18 agencies, that by the way I don’t have control over their 19 timelines, they tell me what their timelines are, to a 20 frustration point. Uh, but they’ll come back with their 21 – their opinions as well. 22 At the end of the day, this document and then some 23 is what the team back at the Wilmington District gets to 24 consume to make a recommendation to me as to whether we 25 approve a permit if a permit is asked for or deny that 66 1 permit. As of today, there is no permit. This is a 2 precursor to that process. So, in building in, the Town 3 has charged an engineering firm to develop all this for 4 them, and whatever is presented with a permit back to us, 5 then we’ll make a decision on. 6 So, that’s kind of the next steps here, is that we 7 have to continue to collect all the information, we kind 8 of sort through all that information, and then ultimately 9 the team will present to me what is the permit that’s 10 being asked for and here’s the data that supports, 11 denies, or whatever that recommendation looks like. 12 So, this process tonight was part of that 13 information gathering in that you’re gonna take the 14 information that you’ve absorbed, you’re gonna feed that 15 to us. Some of you have already fed that to us, others 16 will write us and comment in other ways; and then we’ll 17 take all that together and we’ll make a determination if 18 indeed a permit is brought to our table. 19 Okay. I appreciate all your participation. This is 20 an important step in the process, but this is a precursor 21 to a permitting action; and we’ll just continue to follow 22 the process as we move along. So, I appreciate your 23 participation, and I hope y’all have a safe ride home. 24 (PUBLIC HEARING ENDED AT 7:41 P.M.)
25 67 1 STATE OF NORTH CAROLINA : CERTIFICATE 2 COUNTY OF NEW HANOVER : 3 4 I, GEAN M. SEAY, a Notary Public and Court Reporter in 5 and for the State of North Carolina, County of New Hanover, do 6 hereby certify that the foregoing 66 pages constitute a true 7 and accurate transcript of the Holden Beach Terminal Groin 8 Public Hearing, held in the Town Hall of Holden Beach, 110 9 Rothschild Street, Holden Beach, North Carolina, at 6 P.M. on 10 September 24, 2015, which was taken down and transcribed by me 11 on the date set forth in the record and before the persons 12 named therein. I further certify that I am not a relative, 13 employee, attorney or counsel of any of the parties, or a 14 relative or employee of such attorney or counsel, nor am I 15 financially interested in this action. 16 WITNESS my hand and notarial seal this 4th day of 17 October, 2015. 18 ______________________________ 19 Gean M. Seay, CCR 20 Notary Public No. 19922450057 21